2 minute read
100% Equation

from INFLUENCE OF SITE AND SYSTEM PARAMETERS ON THE PERFORMANCE OF ROOF-TOP GRID-CONNECTED PV SYSTEMS INS

International Research Journal of Engineering and Technology (IRJET) e-ISSN: 2395-0056 Volume: 09 Issue: 02 | Feb 2022 www.irjet.net p-ISSN: 2395-0072
affected by an AC system loss (LS). It is associated with system losses due to inverter conversion efficiency in gridconnected and given by equation (7).
Advertisement
LS = YA YF Equation 7
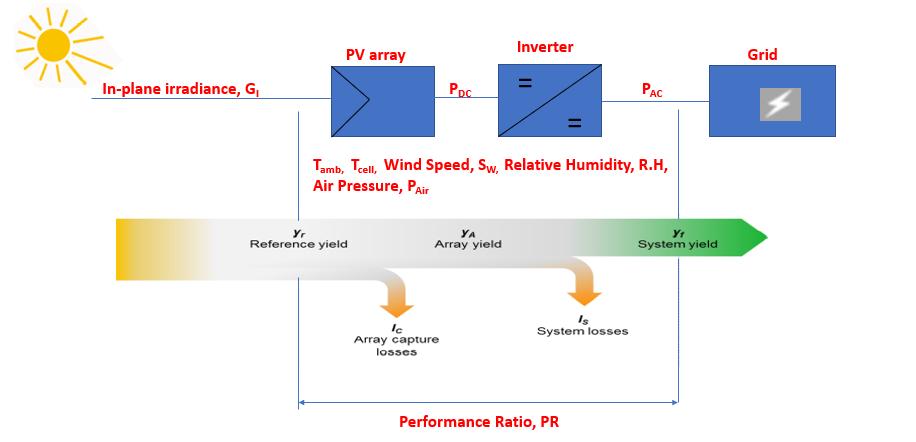
3.2 Relationship between AC final yield (yf), DC array yield (yA) and Reference yield (yr)
Figure 2 (a) showsthe AC final yield, yf versus reference yield, yr. The system final yield, yf versus reference yield, yr forms the general set of performance parameters for a grid-connected PV system. This figure shows that system yield, yf is proportional to the reference yield, yr. The average system and array performance ratio of the Harlequins site is 92.53% which is found by the slope of the graph and the coefficient of determination, the R2 value is approximated to 1 which shows that the data from the Harlequins site installation is in proper operation. This means that there is no form of shading observed on the site. Therefore, the relationship between system final yield, yf and reference yield, yr stands for the overall conversion efficiency of the Harlequinssite installation.
Figures 2 (b) illustratesthe DC array yield, yA versus reference yield, yr. This Figure showsthat when the measurement of DC array yield, yA is plotted over reference yield, yr, its relationshipcan be approximated to 1 as seen by its coefficient of determination, the R2 value. This is because the DC array yield, yA is proportional to the reference yield, yr. The average array performance ratio of the Harlequinssite is 94.35% andis found by the slope of the graph which showsthat the data from the Harlequins siteinstallation is in proper operation since their R2 value is approximate to 1. This means that there is no form of shading observed in the sites.
(a) (b)
30
(h/d)
f AC Final Yield, y
25
20
15
10
5
0
0 yf = 0.9253yr + 0.2054 R² = 0.9959
10
20 Reference Yield, yr (h/d)
30 30
(h/d)
A DC Array Yield, y
25
20
15
10
5
0
0 yA = 0.9435yr + 0.2496 R² = 0.9961
10
20 Reference Yield, yr (h/d)
30
Figure 2. (a) System final yield (yf) versus reference yield (yr) (b) Array yield (yA) versus reference yield (yr) for hourly data from Harlequins site from 2017-2021
3.3 Effect of Cell/Module Temperature on PV System and Array Performance
Figure 3 (a) shows the plot of system performance ratio (PRSyst) as a function of solar cell temperature. Harlequins site shows inverter performance with an intercept value of approximate 95.43% respectively. The slope of Figure 3 (a) shows the temperature coefficient of power whose value in the datasheet is given as -0.4%/oC or -0.004/oC. The temperature coefficient, α, influences the system performance. For instance, an increase in temperature coefficient, α, reduces the system performance and efficiency. Figures 3 (b) illustrates the plot of array performance ratio (PRArray) as a function of solar cell temperature. Just like the system performance, Harlequins site shows a normal operation of the PV array at approximate97.79% and the PV array began to reduce its array performance ratio as the solar cell temperature increases. The increase in temperature coefficient of power also influences the array performance and efficiency. The temperature coefficient of power is determined using the slope of Figure 3 (b). Therefore, the relationship between the array performance ratio and solar cell temperature shows the thermal behaviour of the PV array.