Multi-channel analysis of Surface Wave (MASW) profiling for delineation of sub surface stratigraphy at various locations within and surrounded Kolkata High Court
Pravendra Singh¹, Vinit J. Ganvir², Dr Sudhakar Shukla³¹M. tech Student, Remote Sensing Applications Centre-U.P., India
²Scientist (SE), Remote Sensing Applications Centre-U.P., India

³Scientist (SE), Head - School of Geoinformatics, Remote Sensing Applications Centre-U.P., India
Abstract - Hon’ble High Court Building, Kolkata is a heritage structure in India. This Building is situated by the river Ganga. It Was Observed that Building some portion settlement for a long period. Cause of this settlement building have some cracks are developed in some area. It was decided to identify of Sub surface stratigraphy of surrounding Hon’ble High Court Building due to some cracks was developed in Building. A comprehensive Integration of remote sensing, GIS and Multi-channel Analysis of Surface Wave (MASW) method in study of sub surface strata surrounding the Hon’ble High Court Building Kolkata.
Key Words: Multi-channel Analysis of Surface Wave (MASW),Kolkata,SoilStrata,GIS.
1.INTRODUCTION
Application of Remote Sensing, GIS and Geophysical techniques for Identification of Sub Surface Strata using physical properties of Soil. Each Soil and Rock have own physicalproperties.Identifyingthisphysicalproperty,We categoriesSubSurfaceStrata.Usingthesebothtechniques we identify Hon’ble High Court Building within and surroundedareaSoilStrata.
2. DESCRIPTION OF THE STUDY AREA
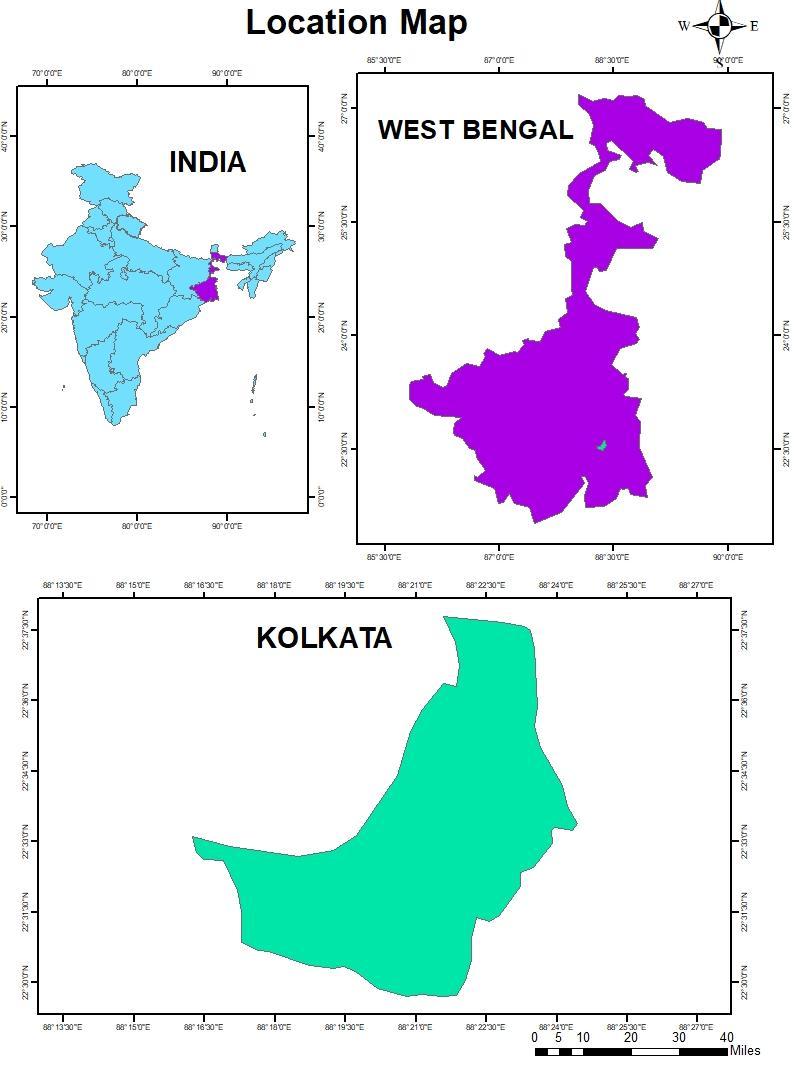
TheStudyareafallinthecityofKolkata,inthestateofwest Bengal,India.Thegeologyoftheareasurroundingthestudy area is characterized by the alluvial plain of the River Hooghly,whichflowsnearby.
TheStudyareaissituatedinthecentralpartofthecity,near thebank oftheRiverHooghly.Thearea ismostlyflatand low-lying,withtheriverbeingthedominantfeatureofthe landscape.TheSoilintheareaispredominantlyclayedand loamy,withoccasionalsandypatches
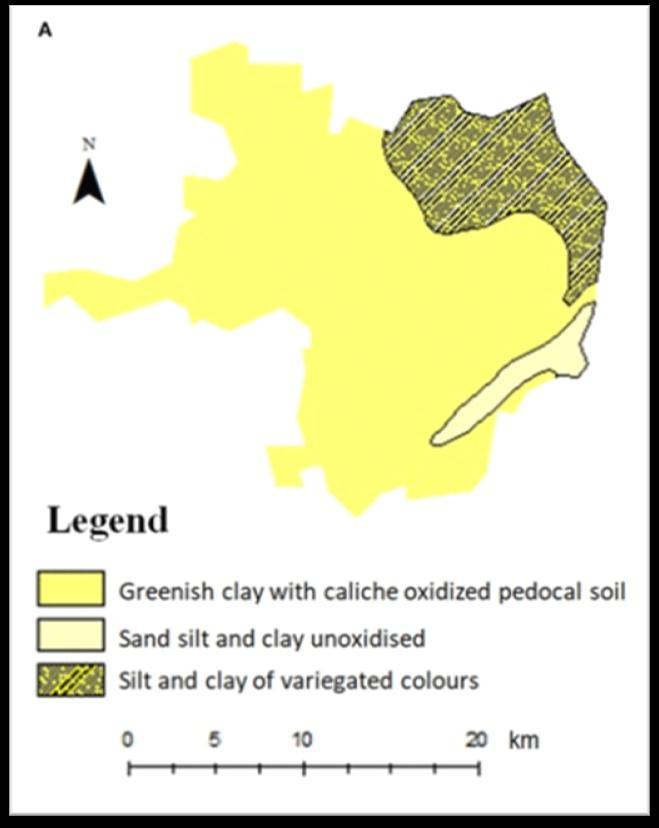
Intermsofgeology,KolkataislocatedintheGangesDelta, whichisavastregionofsedimentarydepositsformedbythe Ganges, Brahmaputra, and Meghna rivers. The soil in this regionispredominantlyalluvial,consistingoffine-grained sediments like clay, silt, and sand, and is known for its fertility.
TheregionsurroundingKolkataispartoftheBengalBasin, whichisalargesedimentarybasinthatextendsacrossparts ofIndia,Bangladesh,andMyanmar.Thegeologicalhistoryof the area is characterized rivers, which has resulted in the formationofextensivealluvialdeposits.

3.3 MULTICHANNEL ANALYSIS OF SURFACE WAVES (MASW)
Themultichannelanalysisofsurfacewave(MASW)method, apowerfulgeophysicalexplorationtechniquehasbeenused increasinglysince1980inapplicationsshallowerthan30-50 m depth. The MASW method provides the velocity of Swavesinsubsurfacematerials.TheS-wavevelocityisagood indicatoroftheshearpropertyofsoilorrockforevaluating the elastic condition (stiffness) of the ground for geotechnicalengineeringpurposes.


3.3.1 EQUIPMENT DEPLOYED
3.3.1.1 SEISMIC SOURCE

Seismic Source means generate a wave in surface. Lot of sourceavailableaccordingtoourneedlikesledgehammers, impact plates, Vibratory. Using this source, we create a Swavesformeasurements.
3.3.1.2 GEOPHONES
GeophonesisperformingareceiverworkforMASESurvey. Thatcollectas-wavearrivaltimingfromsource.Geophones convert the ground vibration into electrical signal. These electricalsignalsisrecordedandprocessinSeismography. In this survey we used PASI 24 Geophone Seismography. MostlyMASWsurveyusea24or48Geophonesused.
Geophone arrange Vertically in equally space this 4.5 frequencygeophone.Geophonesdetectthegroundmotion causedbytheseismicwaves.
3.3.1.3 RECORDING UNIT
RecordingunitisthecentralcomponentforMASWSurvey. AllSignalreceivedfromthegeophonesandconvertanalogto digital converts and data storage the recording unit also calledSeismograph.
3.3.1.4 TRIGGER DEVICE
InMultichannelAnalysisSurfaceWaves(MASW),atrigger device is used to initiate the seismic wave Source. The purposeofthetriggerdevicetogeneratea controlledand synchronized seismic waves that propagates through the groundandisdetectedbythegeophonesforsubsequently analysis. The Trigger device used in in MASW can vary dependingupontheseismicsource.
3.3.2 SURVEY GEOMETRY
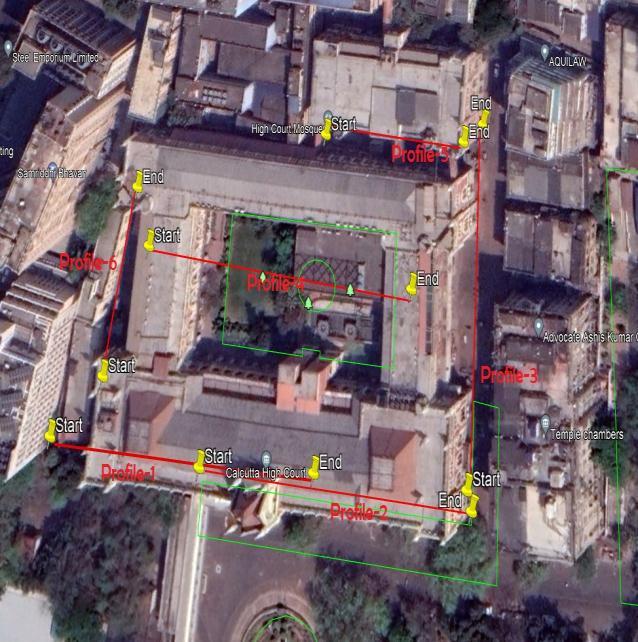
AtypicalMASESurveyiscarriedoutusingreceiverspreadof 24or48Geophones1meterto10-meterintervalmakinga spread length 20 to 470 meter. We can also make this spreadlengthaccordingtoourneedinfield.
This spread length depends upon our need and field conditionwhichtypeofsurveyfieldandwhat’sourpurpose andneedinSurvey.Wealsotakefiveshotpointalongthe spreadlength,thisshortpointpositionarefollowing
Shot Point 24GeophonesReceiver 48 Geophones Receiver
First Offset double distance betweentwogeophones Offset double distance betweentwogeophones
Second Between6-7Geophones Between 12-13 Geophones
Third Between12-13Geophones Between 24-25 Geophones
Fourth Between18-19Geophones Between 36-37 Geophones
Fifth Offset double distance betweentwogeophones Offset double distance betweentwogeophones
3.3.3 APPLICABLE STANDARDS
The following standards and guidelines were applied in equipment,fieldprocedures,andinterpretationmethodsfor theassessmentofsubsurfaceconditions whileconducting theMASWSurvey:
1. ASTM Standard Designation D5777-00: Standard GuideforUsingtheMASWMethodforSubsurface Investigation
2. IS 15681: 2006 – Geological Exploration by GeophysicalMethod(MASW)–CodeofPractice

3.4 DATA ANALYSIS
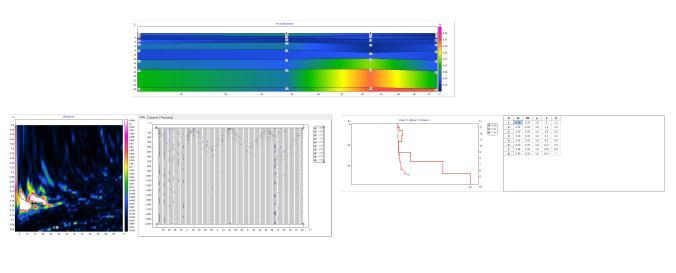
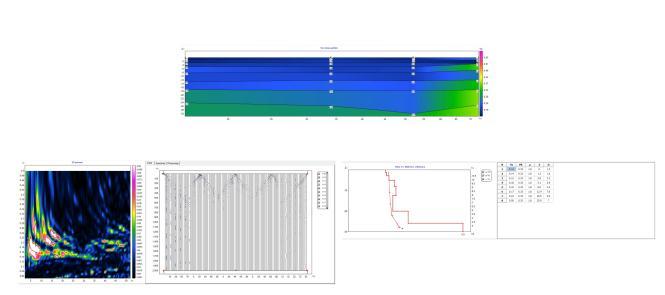
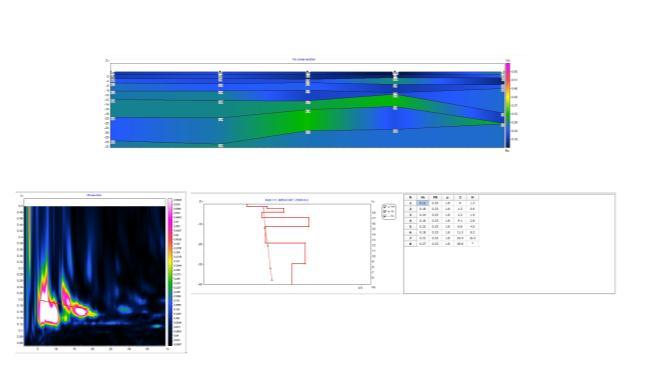
FieldDatainSegFormatafterprocessallfiveshot.Createa dispersion curve refers to a plot that show relationship between the s- wave velocity and frequency waves propagation through the surface. It provides valuable informationaboutsharewavevelocityprofileofthesoilor rocklayers.

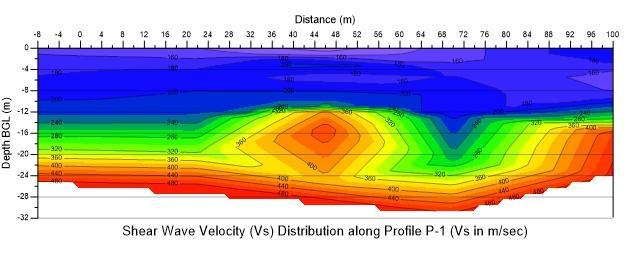

The 1D dispersion curve is obtained by assuming a horizontally layered subsurface model, where the shear wave velocity is assumed to vary only with depth. It representstherelationshipbetweenthephasevelocityofthe surface waves and the corresponding frequency. The 1D dispersioncurveprovidesasimplifiedrepresentationofthe subsurface,assumingauniformshearwavevelocityprofile withineachlayer.Itiscommonlyusedforpreliminarysite investigations or when a relatively simple subsurface structureisanticipated.
The2Ddispersioncurveisderivedbyconsideringa more realisticandcomplexsubsurfacemodel.Itconsiderslateral variations in the shear wave velocity, allowing for a more accuraterepresentationofthesubsurfacestructure.The2D dispersion curve represents the relationship between the phasevelocityofthesurfacewaves,frequency,andthewave
propagationdirection(usuallyazimuth).Itprovidesamore detailed and spatially varying picture of the subsurface, which is particularly useful when investigating complex geologicalconditionsornear-surfaceheterogeneities.
Obtaining1Dand2DdispersioncurvesinMASWinvolves similardataacquisitionandprocessingsteps.Theprimary differenceliesintheinterpretationandinversionmethods usedtoextracttheshearwavevelocityprofile.Inthecaseof 1D dispersion curves, simpler inversion algorithms assuminglayeredstructuresaretypicallyemployed.For2D dispersioncurves,moresophisticatedinversiontechniques consideringlateralvariationsintheshearwavevelocityare applied.




3.5 SITE CLASSIFICATION

Shearwavevelocity(VS)hasbeenanessentialparameterfor evaluationofdynamicpropertiesofsoils.Theaverageshear wave velocity in the top 30 m, based on travel time from surfacetoadepthof30m,isknownasVS30.Traditionally, VS30isdeterminedbyseismicmeasurementsinboreholes, usingdownhole,cross-holeorsuspensionloggingmethod. However, MASW technique, based on the inversion of surfacewavedispersiondata,offersadvantages of(a)not requiringboreholesand(b)samplingofalargervolumeof soil.
Vs30 is used in the NEHRP Provisions (BSSC, 1994) and 1997 Uniform Building Code (UBC) to classify sites for engineering design with the expectation that sites in the sameclasswillrespondsimilarlytoagivenearthquake.The 2000 International Building Code (IBC) permits a similar approachforsiteclassificationfortheupper100ftofsoil. Thesurveyedsiteisinterpretedinthisreportinaccordance withtheaboveVsbasedNEHRPsiteclassification
3.6 DISCUSSION OF RESULTS
Table 4-SixProfileofMASWResult
Profile No Result
P-1 Vs Value (140-190) m/sec in Depth
GroundLevelto10m
VsValue(190-390)m/secin10mto 30m
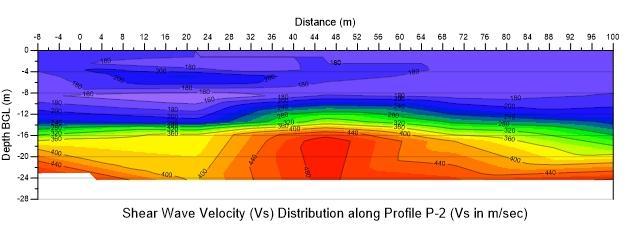
P-2 Vs Value (180-170) m/sec in Depth
GroundLevelto8.5m
VsValue(240-500)m/secin8.5mto 25m
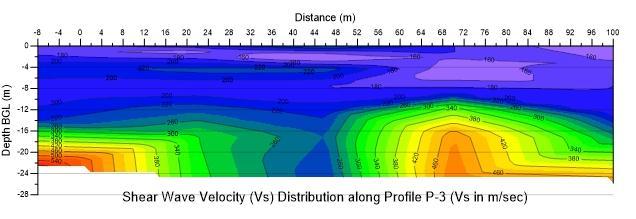
P-3 Vs Value (180-230) m/sec in Depth
GroundLevelto14m
ClassE
ClassF
ClassE
SiteClassF
VsValue(230-500)m/secin14mto 25m SiteClassE
P-4 Vs Value (140-170) m/sec in Depth
GroundLevelto13m
VsValue(240-500)m/secin13mto 25m
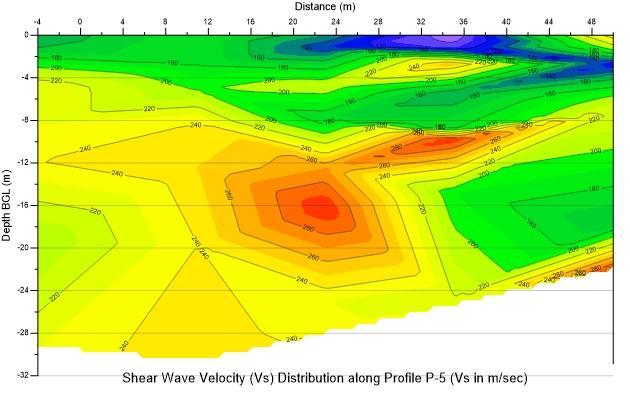
P-5 Vs Value (110-180) m/sec in Depth
GroundLevelto12m
VsValue(180-270)m/secin13mto 18m
P-6 Vs Value (140-210) m/sec in Depth
GroundLevelto5m
Vs Value (290-340) m/sec in 5m to 18m
3.7 CONCLUSION
SiteClassF
SiteClassE
SiteClassF
SiteClassE
SiteClassF
SiteClassE
3.6 SOIL LIQUEFACTION SUSCEPTIBILITY

Soilliquefactionsusceptibilityreferstothepotentialofasoil deposit to undergo liquefaction when subjected to cyclic loading, typically induced by seismic events. Liquefaction occurswhensaturatedorpartiallysaturatedsoilslosetheir shear strength and stiffness due to the buildup of excess porewaterpressure,resultinginalossofbearingcapacity andpotentialgroundfailure
Standard Penetration Test (SPT), Cone Penetration Test (CPT), Share Wave Velocity Measurement, Laboratory Testing, Empirical Correlations, Liquefaction Hazard AnalysisismethodforSoilLiquefactionSusceptibility
After getting MASW result Hon’ble High Court Building, Kolkata Area Ground level to mostly 15m depth their SVelocityisverylow<200.So,thenwecansaythatisoneof problemofsettlementofBuilding.
ACKNOWLEDGEMENT
ThanksforDrS.N.ShuklaManagingDirectorofGaveshana Geosciences Private Limited New Delhi. who provide me valuablesuggestionandchancetoperformingaFieldWork andDataInterpretationworkofKolkataSite.
ThanksforValuableSuggestionDr.ShashankTripathiand AnilKumar Chaurasiya, Project Scientist Remote Sensing ApplicationCenters,Lucknow,India
REFERENCES
[1] Building Seismic Safety Council (BSSC), 1994, NEHRP Recommended Provisions for the Development of Seismic Regulations for New Buildings, Part I: Provisions
[2] C P Lin et al, The Use of MASW Method in the AssessmentofSoilLiquefactioPotential. Soil Dynamics and Earthquake Engg, 24(2004)
[3] An Introduction to Using Surface Geophysical to characterize Sand and Gravel Deposits, Jefferey E. Lucius,WilliamH.Langer,andkariJ.Ellefsen,USGS,2006

[4] www.masw.com
[5] Ground water Information Booklet Kolkata Municipal Corporation,WestBengal
