1 Architectural Engineering Department - Fayoum University - (specializing in environmental design and planning).
2 Professor of Architecture and Environmental Design, Department of Architecture Faculty of Engineering, Fayoum University.
3 Professor of Architecture and Urban Design, Department of Architecture Faculty of Engineering, Fayoum University.
Abstract: Cities are complex systems in constant confrontation with dangers, due to the many dangers that cities are exposed to, the most important of which are: Economic (lack of resources), risks and natural disasters, where natural disasters are among the most severe types of risks to which the globe is exposed, climate change and its natural threats, human risks and disruption of ecosystems. These factors all bring about drastic changes in the city, urban components and fixed assets. Natural phenomena are considered one of the most important dangersandchallengesfac-ingthehumanracethroughout its history. Many societies in the Arab countries have suffered and are still suffering from the occurrence of these phenomena and the resulting serious social, economicandpsychologicaleffects.Recentyearshaveseenan increasing convergence between dis-aster risk reduction and climate change adaptation, but they have not fully overlapped. In general, disaster risk reduction addresses all risks, while climate change adaptation addresses risks associ-ated with climate changes. Resilience is the ability ofa system, entity,society orpersonto with-standshocks while maintaining its basic functions. It is the ability to recoverquickly,effectivelyandwithgreaterstrengthfrom disasters and the ability to withstand greater stress. The research concludes with extracting the evaluation methodology for the risks faced by cities through a set of dimensions,indicatorsandcriteriaforresilientsustainable development, and extracting the ex-tent to which the city achievestheelementsofsustainableresilience.
Keywords: natural hazards, human hazards, climate change risks, resilient cities, urban, ecological and engineering resilience, characteristics of resilient cities, resilient urban design, resilience and sustainability, dimensions, indicators and criteria of resilient sustainable development
1.Introduction
Disasters have caused significant unrest in both low- and middle-income countries, rapidly elimi-nating populations and increasing disasters in developing countries. Earthquakes include in (early 2010), more than 220,000 people killed, and in Indonesia (2009) more than 1,000 killed. Cyclone Nargis in Myanmar (2008), which killed more than 138,000 people and the Sichuan earthquake in China (2008) (1), which killed more than 87,000 people. Finally, the earthquake in Syria and Turkey (2023), which killed22,000peopleandlefttensofthousandsinjured,and itseffectsspreadtomillionsofpeopleinthetwocountries. Onaverage,about82,000peoplearekilledannuallydueto disasters, with most deaths concentrated in low- and middle-incomecountries(2).
2.Causes of risks in the urban environment
1-Increasing urban population density, which increases pressure on land and services, and in areas exposed to dangers.
2- Concentration of resources and capacities at the national level, lack of clear mandates for disaster risk reductionandresponse.
3- Non-participation in local governance by local stakeholdersinurbanplanningandmanagement.
4-Inefficient management of water resources, sewage networks,andsolidwastemanagement.

5-The deterioration of environmental systems as a result ofhumanactivitiessuchas:roadconstructionandwetland reclamation, which threatens the ability to provide basic services.
6-Dilapidatedinfrastructureandunsafebuildingmaterials, whichmayleadtothecollapseofbuildings.
"A methodology for assessing to what extent are resilient cities facing and adapting to risks"
7-Uncoordinatedemergencyservices,whichreducesrapid responsecapacityandpreparedness.
8-Theharmful effectsofclimatechangethatmayleadtoa rise or fall in temperature, and an increase or decrease in precipitation,dependingonlocalconditions.
3-3-1-Types of natural hazards (3):

Natural hazards
Earthquakes
3- Risks of the urban
Types of risks
Natural hazards human risks Climate change risks

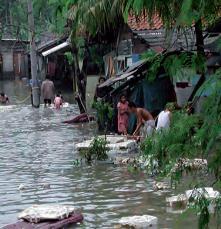
Fig-3:Typesofrisks
3-1- Definition of risks:
Risks are the events that occur in the environment as a resultofnaturalorhumanfactorsorclimaticchangesthat result in human and material losses, some of which are very dangerous, medium, weak or low risk, and some of them directly or indirectly affect lives and property and somehavenoeffect.
3-2-Risk classifications:
1- A classification according to the factors causing the occurrenceofnaturalhazards.
2-AClassificationaccordingtothespeedofimpactofrisks.
3-AClassificationaccordingtobeingnormal,semi-natural, human.
4-Classification of risks into (biological, geophysical, meteorological,hydrologicalandclimaticrisks).
3-3-Natural hazards and their different sources:
Natural hazards are one of the results of natural phenomenathatoccurwhentheearthdumpsaverysmall part of its enormous energy on the surface of the earth, and natural phenomena have several sources that cause humanandmateriallosses.
The description
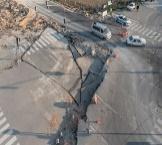
They are considered sudden vibrations of the earth's surface, accompanied by a release of energy, and this energy erupts through a sudden disturbance in the layers oftheearth
Volcanos
It is a conical mountain with a crater connected to a reservoir in the ground containing molten lava. Volcanoes erupt whenthegaspressureishigh.
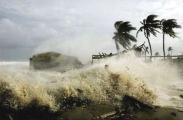
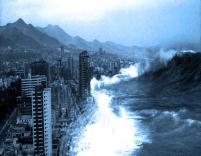
Tsunamis It is a group of intense waves emanating fromthemovementofalargeareaofwater, such as the ocean. Tsunamis arise from earthquakes, volcanic eruptions, and eruptions under or on the surface of the water.
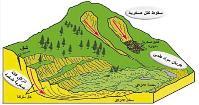
Landslides
It is the movement of rocky or dirt masses onthemountainslopesduetomanyfactors, and they vary in speed from slow creep to violentsliding.
Floods

Sand storms

Desertification

Water affects human life, whetherit is little oralot.Ifthewateristoolittle,itisacause ofdrought,andifitistoomuch,itislikelyto lead to floods and torrents, and in both casesitposesathreattosocieties.
Itisfastwindsloadedwithfinesandcoming from the deserts. They are formed when there is loose soil devoid of vegetation and windsexceeding5meterspersecond
It is the transformation of large areas of fertile arable land into lands poor in plant andanimallife.Desertificationisacreeping phenomenoninaridandsemi-aridregions.
Hurricanes
A violent storm that arises in the tropics, accompanied by high-speed winds, heavy rains that cause floods, and sea waves that sweepthecoasts.
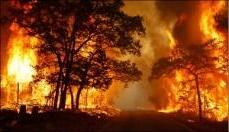
Wild fires
It is the outbreak of fires in the vegetation cover,resultinginflames,intenseheat,thick smoke,andlight.
Tab.1:Typesofnaturalhazards.
3-4- Human Risks:
Thesearetherisksthatoccurasaresultofhumanactions and various activities, such as the use of pesticides, or

radioactiveleakagefromnuclearpowerplants.Theserisks arerepresentedinthesourcesofenvironmentalpollution. Environmentalpollutionisthepresenceofhighlypolluting substances in different concentrations that are harmful to livingorganisms,soil,water,andair(4).
3-4-1-Types of Human Risks:
Environmentalpollutionisthepresenceofhighlypolluted substances in different concentrations that are harmful to living organisms, soil, water and air. They may be natural and unnatural sources and cause great harm to the environment.Belowarethetypesofhumanpollution(5).

Human Risks The description
Marine pollution the harmful effects resulting from the entry of waste or chemicals, whether industrial, agriculturalorhuman,withtheentryofgaseous pollutants into the ocean, where 80% of marine pollutioncomesfromland.

Air pollution Air pollution means the combination of pollutantsintheair,suchasvehicleexhaustand smoke. Air pollution may occur Various natural sources, such as: storms, thunder, rain, earthquakesandfloods.Peoplecontributetoit

Soil pollution Environmental pollution is closely linked to the general environmental system, as the efficiency of the system decreases significantly when a change occurs between the various elements, which causes a defect in the environmental system.

Tab.2:TypesofHumanRisks.
3-5-Climate change risks
Climate change has harmful effects that may lead to a rise or fall in temperature, and an increase or decrease in precipitation, which has a significant impact on the frequency of floods and climate-related disasters. In addition to the rest of the natural phenomena associated with climate change, it was therefore important to know thephenomenonofclimatechangeandadapttoit.
3-5-1-Definition of climate change:
It is a change in the climate that extends for several decades or more, and is caused by natural hazards or humanactivityhazards.WheretheEarth'sclimatechanges continuously, and all components of the system develop during different periods of time, and changes in the atmosphere take a few hours, and it is difficult to predict the weather situation for more than a few days, and the layers of the upper oceans change during a few seasons, while changes in the depths of the oceans take several centuries. Animal and plant life that affects precipitation andtemperaturechangesoverdecades(6)
3-5-2-Types of climate change: Fig.4: Typesofclimatechange.
First: Regular climate changes: They are the changes that occur periodically as their amount and time of occurrence can be determined, for example: the change in temperature throughout the day, we find that it has a maximum end during the day and a minimum end during the night, and this means that there is a daily change in temperature whose value and time of occurrence are determined.
Second: Irregular climate changes: Theyarethechanges that occur and it is difficult to determine the amount and places of their occurrence, for example: a rise in the temperatureinthewinterorsummerthanitsnormalrates for a period of time and then returns to normal. This type isdividedintotwoparts:
A. Irregular natural changes: These are the changes whoseoccurrenceandregularityareunknownintime,and theoutcomeoftheirimpacthasnotbeenidentified.
B. Abnormal irregular changes: These are the changes resulting from human activity, and if these changes continue for long periods (about 100 years) and over a largearea(7)
3-5-3-The issues represented by climate change globally:
A. High temperature:
Global warming will range from 1.4 to 5.8 degrees Celsius between 1990 and 2100, and this is indicated by current climate models. These projections are due to a number of key assumptions affecting future emissions, such as: population growth and technological change. The value of thepotentialrisewillbegreaterthananyriseinacentury, and these projections take into account the impact on the oceans(8).
B. Environmental disruption of ecosystems:
It is defined as human interference in the environment in an unintended way and causing a change in its elements, which leads to disturbance in the interrelationships between the parts of the system and the emergence of environmental problems. The geographic composition of ecosystems will change in response to the conditions
resulting from climate change. The human mass response may decrease and species that do not adapt quickly enoughmaybecomeextinctforgood.
C. Sea level rise:
Itisexpectedthattheaveragesealevelwillrisefrom18to 59cmbytheyear2100,andthethermal expansion of the upper layers of the ocean is caused by the melting of glaciers, and with the increase of large and variable ocean currents,landsubsidence andlocal andregional factors,it will cause a rise more or less than the average height globalsealevel.
D. Beach erosion:
It is the phenomenon resulting from the erosion of waves on the beaches and results in the displacement of sand from onearea to another, andits rates increased afterthe construction of the High Dam due to the loss of the available environmental balance due to the silt deposited onthebeach
3-5-4-Adaptation and prevention of climate change risks:
a. Adaptation from the risks of climate change: Itisthe modification of natural or human systems in response to actualorexpectedclimaticstimuliortheireffects,andthis workstoreducedamagesorseizebeneficialopportunities.
B. Climate Change Risk Prevention: It is an approach that seeks to integrate climate change issues into policies and programs and analyze them in relation to the current andfuturechallengesposedbyclimatechange.Adaptation toclimatechangeworkstomakeadjustmentsinnaturalor human systems in response to expected climatic stimuli, andtoexploitbeneficialopportunities.
3-6-Reducing and adapting to disaster risks:
Disaster risks are the expected losses resulting from the disaster (natural or human), in the lives of people, their livelihood, their health status, their properties and their services, which occur in particular in a society in a clear futureperiod.Inordertofacetheserisks,thedefinitionsof disasterriskreductionmustbeknown.
3-6-1-Definition of Disaster Risk Reduction: This concept explained systematic efforts to analyze and manage the factors that cause disasters, including clarifying the reduction of exposure to risks, reducing the vulnerability of property, governing management, and preparingtofacenegativeevents.
3-6-2-Risk management and the importance of its management (9):
Risk management is a set of procedures necessary to deal with an abnormal situation with the aim of minimizing damage to the maximum extent, by addressing the risk, and there are three stages to confront the risk, which are asfollows:
A. The pre-risk stage. The stage of adopting prevention methods and planning to face expected future risks, educatingcitizens,andpayingattentiontowarnings.
B. danger stage. Determiningthenecessaryproceduresto confront risks, reduce their effects, provide relief to those affected,andrestorenormallifeforthem.
C. Post-hazard. The procedures used to rehabilitate and rebuild the buildings at risk, then re-populate the abandoned human communities, and isolate the danger fromtherestofthepartsandregularactivities.
3-7-Problems of not investing in resilience:
Failure to pay attention to risk reduction leads to many problems,asfollows:
1- A severe deterioration in the economy and environmental systems, and a loss of confidence on the partofthepopulationandinvestors.
2- Recurrence of disasters with a small and medium impact, as one major disaster may lead to paralysis of the meansoflifeinsociety.
3- Investors and the private sector may evade these cities fortheirlackofinterestindisasterriskreduction.
3-8-The ability to confront in different fields (10):
The ability to confront in different fields
Institutional political field:
- Enhancing coordination between departments and leadership to reduce disasterrisks.
- Enhancing institutional capacity building andresourceallocation.

-Regulatingurbanandlocaldevelopmentin linewiththeprinciplesofriskreduction. Social field:
- Ensure access to basic services for all, and providesafetynetsafterdisasters.
- Allocate safe lands for all strategic activitiesandhousing.
- Encouraging the participation of stakeholders in all stages and strengthening alliancesandsocialnetworks.
Environmental field:
- Protect, restore and enhance ecosystems, drainage,unstableslopes,andcoastalareas.
- Participate in ecosystem-based risk management.
- Commitment to reduce pollution, improve waste management, and reduce greenhouse gasemissions.
Economic field: - Protect, restore and enhance ecosystems, drainage,unstableslopes,andcoastalareas.
- Participate in ecosystem-based risk management.
- Commitment to reduce pollution, improve waste management, and reduce greenhouse gasemissions.


Tab.3:Theabilitytoconfrontindifferentfields


Through the above, it can be concluded that a city that is abletofacedisastersisacityinwhichtheimpactofrisksis minimal, and it has an efficient and accountable local government, and it takes steps to mitigate the effects of risks, and the authorities and residents are aware of the risks, and are able to respond and implement recovery strategies. immediate, and its residents are empowered to participate in decision-making, so it was important to study the ability to cope in various fields (environmental, economic,politicalandsocial).
4-Definitions of resilience, its origin and important theories:
Resilience is the ability of a system, society or person to withstand shocks while maintaining its basic functions. It is the ability to recover quickly, effectively and with greater strength from disasters and the ability to withstand greater stress. So building resilience makes people, communities and systems better prepared to withstand disaster risks. Man is not born with an innate ability to be flexible. Rather, it learns and adapts to it, as wellasinorganizationsandsocieties.Intimesofdisasters, local governments are the first line of response when it comes to management and disaster risk reduction, and they have great responsibilities but insufficient capacities todealwithdisasters.
4-1- Resilience theories (11):
In an article by Folke in 2010, the most prominent characteristics and theories of resilience were explained. Hesaidthat“flexiblethinkingaddressesthedynamicsand evolution of complex social-environmental systems.” He identifiedthreebasiccharacteristicsofresilience:
First: the ability of resilience. It is the ability of socialenvironmentalsystemstoconstantlychangeandadapt.
Second: the ability to adapt. It represents the ability to adjust responses when external stimuli change, and to returntoastateofequilibriumandstability.
Third: the ability to transform. It is the ability to overcome and overcome obstacles in the paths of new development.
Itisimportanttorealizethatresilienceisnotrelatedtothe continuity or strength of disturbance only, but rather to the opportunities that such disturbances provide for restructuring and the development of ecosystem renewal processes.
4-2-The genesis of resilience (12):

1973
Holling, concept help understand the ability of ecosystems to continue in their original state under the influence of disturbances
1981
Walker, ability to adapt to change by investing in an instability and it is not just the ability to absorb the disturbance and return to a stable state after it
1984
Stewart, elasticity measure of how quickly a system returns to equilibrium after a perturbation
1986
Holling, developed his definition and defined face of disturbance.
1995
Holling, ability of a system to absorb disturbances, or the amount of disturbance that can be absorbed before the structure of the system changes and the processes that control the behavior of the system change
2003
Adger, says ability persevere and the ability to adapt
Fig.5:Thegenesisofresilience.
4-3-Characteristics and benefits of Resilience cities (13):
Asthereareasetofmaincharacteristicsandadvantagesin citiesthatcanbeconsideredflexible,andbelowwewillget toknoweachofthem:
Characteristics
Flexibility and diversity
Definitions
Theabilitytoperformessentialtasksunderany circumstances, transforming assets and properties to provide new ways to achieve the basicgoalsofresilience.Andthedistributionof assets so that not all of them are affected by a particularriskthatoccurredatanytime.
Adaptable It takes into account not only expected risks, but also current and future risks. As it diversifies its services by creating alternatives, andtransformingchangeintoanopportunity.
Persistent
Thecityofperseveranceanticipatesimpactsso that it can prepare for current and future shocks.
Inclusive An inclusive city is people-centered, understandingthatresilienceentailsprotecting people from any negative impact. It strives towards social inclusion, equality, and the developmentofresilience.
Redundancy, modularity
-The ability to accommodate emergencies, mounting events, and high pressures, creating multipleoptionsfordeliveryServices, Orinteractingcomponentsconsistingofsimilar partsthatreplaceeachotherifoneormanyfail.
Safe failure Theabilitytoabsorbtheshocksandcumulative effects of slow-onset challenges in ways that avoiddisasterfailure.
Resourcefulness The ability to conceptualize, act, identify problems and priorities, and mobilize resources.
Responsiveness and rapidity
The ability to organize and quickly return it, andestablishthejobinatimelymannerbefore andafterfailure.
Integrated Resilientcitiesarecharacterizedbytheconcept of integration, where integrated operations are brought together with city systems to promote decision-making, exchange of information betweenthecomponentsofthesystemtowork onthespeedofresponse.
Learning Through formal processes absorb past experiences and change strategies based on knowledgeandexperience.
Reflective Resilient cities are reflexive as people and institutions learn from past experiences, learning and enlightening for future decisionmaking.
Robustness Resilient cities are resilient as physical assets are designed and maintained in high impact weatherevents.
Tab.4:CharacteristicsandbenefitsofResiliencecities.
4-5-Dimensions, indicators and criteria for resilient sustainable development (14):

The dimensions of sustainable and resilient development are divided into five main sections, and each of them is a setofindicatorsandcriteria.
4-5-1- The social dimension:
Thisdimensionreceivesgreatattentioninurbanresilience frameworks, due to its strong impact on achieving social resilience. This dimension is divided into several indicatorsthatincludeasetofcriteria.
4-5-2-Economic dimension:
The economic dimension of resilience includes criteria related to the structure and stability of the economy. Economic flexibility depends on the ability of the working population to support dependents. Providing well-paying jobsisassociatedwithflexibility.
4-5-3- Environmental dimension:
Thecriteriaoftheenvironmentaldimensionarerelatedto the ecosystem and to the quality, availability and accessibilityofnaturalresources.Environmentalelements play an important role in increasing the resilience of societies. Availability and access to clean resources is important for the survival of human societies and for the resilienceofsocieties.
4-5-4- Infrastructure dimension:
The infrastructure is long-lived. Therefore, it must be taken care of to avoid the risks of its vulnerability. Emphasis was placed on transportation and communication systems, and communication and informationexchangeisessentialtoachievingflexibility.
4-5-5- Governance dimension:
It is the dimension that includes many interrelationships with the other previous dimensions. Here, the governance standards become clear and institutions, which can be used to assess the efficiency and effectiveness of relationships between and within community organizations.
4-6-Dar es Salaam city as case study:
First: an overview of Dar es Salaam:
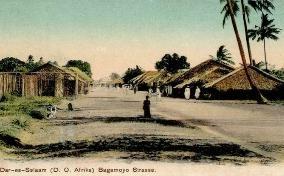
DaresSalaamistheformercapitalofTanzania,locatedon the country's eastern coast on the Indian Ocean. With an area of 1,350 square kilometers, it is the largest city in Tanzania in terms of population. It is also the most important economic center in the country and the largest population. This makes it the third fastest growing city in Africa. More than 70% of the population of Dar es Salaam liveinslumsandunplannedsettlementsthatlackservices and infrastructure, and more than half of them live on approximately one dollar a day. City authorities face significant challenges in providing or even maintaining newinfrastructureservices(1).
development
The case study summary provides a comprehensive overview of the intersection between climate change and
disaster risk in Dar es Salaam. It seeks to understand the following:
1-The main aspects of vulnerability of the urban population in the city, climate change increases with this vulnerability.
2-Policiesandprogramsthatcanbedevelopedthatreduce the vulnerability of the poor, taking into account current andfutureclimatechange.
4-7-Apply dimensions, indicators and criteria for sustainable and resilient development:
Through the application of dimensions, indicators and criteria for sustainable and resilient development in the cityofDaresSalaamasacasestudyforacitythathasbeen exposed to certain types of risks and the extent to which these dimensions are achieved to assess the city’s resilience, these dimensions, indicators and criteria represent a methodology that assesses the extent of the city’sresilience.
4-7-1-The social dimension (16):
The social dimension of sustainable and resilient developmentisdividedintoasetofindicatorsandcriteria, whichareillustratedinthefollowingtable:
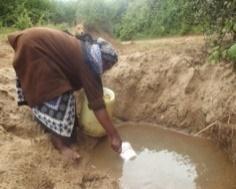
Secondly: dangers to which the city was exposed (15): Floods-Drought-Landslide-Extremetemperature.
Third: The main results of the study (16):
1- RapidunplannedurbanizationinDar es Salaamhasled to flood risks in many slums, in addition to health and populationrelatedproblems.

2- Lack of understanding of the hydrological and environmental role of wetlands in urban development planning.
3-Disasterriskmanagementisnotaddressedasitmustbe integratedintoallaspectsofurbanplanning.
4- Poor sustainability of infrastructure development and maintenanceinitiatives.
5- Industries should be moved away from residential areas,andaccesstowastecollectionarea.
6- Programs to raise awareness at the local level and improvesanitationpractices.
The social dimension contains (5 indicators and 20 criteria), the share of the social dimension is 20 points
The soci al dim ensi on
First: Social and Economic Characteri stics:
Second: Communit y Links, Social Support, and Social Institution s:
-demographics.
-Languageabilities.
-Ownershipofland,house andcar.
-Variousskillsatthetime ofdisaster.
-Thedegreeof interconnectednessofthe layersofsocietyand memories.
-Volunteeringandcivic participationinsocial networks.
-Sharedassets,strong internationalcivil organizations.

-Existenceofconflict resolutionmechanisms.
-Participationofvulnerable groups.
Third: Safety and Quality of Life:
-Securityservicessuchas thepoliceandcrime preventionandreduction.
-Preventivehealth measuresandresponseto events.
-Physicalandmental health.
Fourth: Local Culture and Traditions:
-Previousexperiencein disasterrecovery.
-Learningfromthepast, preservingculturaland historicalidentity.
-Awarenessofindigenous knowledgeandtraditions andrespectforlocalculture andcharacteristics.
Fifth: Equity and Diversity:
- Social and cultural norms andpositivebehaviour.
-Racialequalityand minorityparticipation.
-Culturaldiversityofthe workforce.
indicatorsandcriteriaforThesocialdimension. 4-7-2-The Economic dimension:
The economic dimension contains (3 indicators and 16 criteria), the share of the economic dimension is 16 points
Building:Employment rate, opportunity, andincome (parity, multiple sources).
Qualification softhe populationof workingage.
-Individuals withhigh andmultiple skills.
-Literacy (education).
-Functional density (proximity between housingand work,and easeof movement).
Domestic investment, investment inthegreen economy.

Integration withthe globaland regional economy.
livelihood strategies.
Encouraging small projects, financing them,and selfemployment.
Security and Stability:
-Collective ownershipof community assets.
-Savingsof individuals andsociety (stocksof supplies, cash,etc.).
-Business easingand redevelopme nt. -Insurance (localand non-local) andsocial care. -Financial instruments (emergency fundsand capital).
Tab.6:indicatorsandcriteriaforTheEconomicdimension.
Environmental dimension:
The environmental dimension contains (8 criteria), the share of the environmental dimension is 8 points
(differenttypesofpollution).
-Availabilityofandaccessto resources(air,energy,water,food andsoil).
-Qualityofresources,biodiversity andwildlifeconservation. -
Tab.7:CriteriaforTheEnvironmentaldimension.
The Infrastructure dimension contains (5 indicators and 18 criteria), the share of the Infrastructure dimension is 18 points
maintainingand modernizing infrastructure, sanitation,water supply,andwaste management.
-
The durability of the vital infrastruct
-Theabundanceof infrastructureand facilities.
-Thespatial distributionofthe infrastructureandits durabilityand fortification.
-Integrationof importantfacilities andcooperation betweenservice providers.

Land Use and Urban
-Accesstobasic needsandservices.
-Siteselectionand avoidingvulnerable areas.
-Streettype, development intensity,public spacesand communityfacilities.
-Percentageof unstablesurfacesand mobilityonfoot.
-Natural temperaturecontrol basedonnatural elements,natural lighting,passive heating(non-energy dependent).
-Passivecooling(not dependenton energy).
andcriteriaforInfrastructuredimension 4-7-5-Governance dimension:
The dimension of governance contains (4 criteria), the share of the dimension of governance is 4 points
-Citizenparticipationindecisionmakingtoenhancethelegitimacyof theprocedures.
-Buildingacommonvisionand directingallcommunityactivities.This istoenhanceflexibility.
-Organizationalcommunicationand theexistenceofinterconnected networksareimportanttoenhance flexibility
-Collaborationandexchangeof informationandknowledge,whichare importantelementsinresilience planning.
The overall percentage of urban resilience assessment for the governance dimension is 6%. 6%
CriteriaforTheGovernancedimension.
4-8-Results:
From the previous five tables, the percentage of flexibility for each of the dimensions of flexible sustainable developmentforthecityof DaresSalaamwasreached,as showninthefollowingdetailedtable:
importance of its management and the three stages of its management (The pre-risk stage, danger stage, Posthazard). And learn about the concept of flexibility and the different areas that concern them (the political, social, environmental, economic), And knowing Definitions of resilience, its origin and important theories (the ability of resilience, the ability to adapt, the ability to transform). And Characteristics and benefits of Resilience cities (Flexibility and diversity, Adaptable, Persistent, Inclusive, Redundancy, modularity, Safe failure, Resourcefulness, Responsiveness and rapidity, Integrated, Learning, Reflective,Robustness).AndFinallyDimensions,indicators and criteria for resilient sustainable development (The social, Economic, Environmental, Infrastructure, Governance) When applying these dimensions, indicators and standards to the city of Dar es Salaam, the city achieved the social dimension 22.5%, The Economic dimensionachieved16.5%, TheEnvironmental dimension achieved 9%, The Infrastructure dimension achieved 19.5%,TheGovernancedimensionachieved6%, andfrom the previous table, we can say that the city of Dar es Salaamachievedanurbanflexibilityrateof(73.5%).
4-10-Reference
Tab.10:Theresilienceratioofeachdimensioninresilient sustainabledevelopmentandthefinalresilienceratioof thecity.

And from the previous table resulting from analyzing the information obtained for the flexible sustainable development of the city and linking it to the dimensions, indicators and criteria for the flexible urban development ofthecity,andfromtheprevioustable,wecansaythatthe city of Dar es Salaam achieved an urban flexibility rate of (73.5%).
4-9-Conclusion
Cities are complex systems in constant confrontation with risks, due to the different types of risks that cities are exposed to, whether natural, human, or climate change risks. At the beginning of the research, the causes of risks in the urban environment were addressed, including the riskstowhichcitiesareexposed,whicharerepresentedin natural and human risks and the risks of climate changes, where the risks and their different descriptions were defined, including the types of natural risks, which are represented in (earthquakes, volcanoes, tsunamis landslides, floods, sandstorms, desertification, hurricanes, and forest burning), Then, human hazards and their types were identified, such as (marine pollution, air pollution, and soil pollution). Finally, defining climate changes and their types in terms of whether they are regular or irregular, and identifying the issues that climate change representsglobally,suchas(hightemperatures,disruption of ecosystems, sea level rise, and coastal erosion). Learn aboutadaptationandpreventionofclimatechangerisksas well as disaster risks. Learn about risk management, the
(1) Eric Dickson, Judy L. Baker, Daniel Hoornweg, and Asmita Tiwari, URBAN RISK ASSESSMENTS Understanding Disaster and Climate Risk in Cities, International Bank for Reconstruction and Development / TheWorldBank,2012.
(2) Dilley,Maxx,RobertSChen,UweDeichmann,ArthurL Lerner-Lam, and Margaret Arnold.. Natural Disaster Hotspots: A Global Risk Analysis Washington,DC:World Bank.2005.
(3)TheUnitedNationsEducational,Scientificand Cultural Organization, Natural Phenomena Towards Building a Culture of Disaster Prevention in the Arab Countries, UNESCORegionalOfficeinCairo2013.
(4) Abdal kareem M.Adawagreh, Al-Balqa Applied university,Environmental Pollution,December,2017.
(5) US Department of Commerce, National Oceanic and Atmospheric Administration "What is the biggest source of pollution in the ocean",2020.
(6) Dr.Ali Mohamed Shaker, Shared Adaptive Management as a Tool to Achieve Flexible, Sustainable Urban Development, Unpublished PhD Thesis, Department of Architectural Engineering, Faculty of Engineering,MatariaUniversity,May2022.
(7) Dr. Maged Mohamed El-Husseini El-Mahdy, Journal of the Egyptian Engineers Society, Climate Change and its Impact on the Northern Coasts of Egypt, Fourth Issue 2013.
(8) Prof. Dr. Ahmed Othman El-Khouly, Eng. Ezzat AbdelHamid, Project of Methods for Reducing the Negative Effects of Climate Change,KafrEl-SheikhGovernorate.
(9) United Nations Educational, Scientific and Cultural OrganizationUNESCO,2016.
(10) A Handbook For LocalGovernment Leaders, How To Make Cities More Resilient, A contribution to the global campaign,Geneva,2015.
(11) Folk,C.Resilience:The Emergence of a Perspective for Social-Ecological System Analyses. Global Environmentalchange,2006.
(12) United Habitat for A Better Urban Future, Building sustainable and resilient cities,WorldCitiesDay,2018
(13) United Habitat for A Better Urban Future, Building sustainable and resilient cities,WorldCitiesDay,2018
(14) Frankenberger,T., Mueller, M., Spangler, T., & Alexander, Community resilience: Conceptual framework and measurement feed the future learning Agenda(P.I)Rockville,MDWestat.(2013).
(15) The World Bank, The Institute of Resource Assessment of the University of Dar es Salaam, Ardhi University, the Tanzania Meteorological Agency (TMA), International START Secretariat, and the Dar es Salaam CityCouncil
(16) Sharifi, Ayyoob & Yamagata, Yoskiki, “Urban Resilience Assessment: Multiple Dimensions, Criteria and Indicators” In A Yamagata and H. Maruyama, Urban Resilience Advance Sciences and Technologies for Security Applications, Springer International Publishing Switzerland.(2016).

