Human Activity Recognition Using AccelerometerData
Aishwarya G Shenoy1 , Rohit Keswani2 , Subhadeep Das3Abstract - Human Activity Recognition (HAR) has a wide range of applications due to the widespread usage of acquisition devices such as smartphones and its abilityto capture human activity data. The ability to retrieve deeply embedded information for precise detection and its interpretation has been transformed by breakthroughs in Artificial Intelligence (AI). In this paper, the time series dataset, acquired from Wireless Sensor Data Mining Lab (WISDM) Lab, is used to extract features of common human activities from a raw signal data of smartphone accelerometer. A 2D convolutional neural network is used to visualize the data.
Keywords: Human Activity Recognition, StratifiedKfoldcross validation, CNN
I. INTRODUCTION
Human Activity Recognition (HAR) is the technique of utilizing Artificial Intelligence (AI) to recognize and classify human activities from raw activity data collected by a range of devices. A few examples of such devices include smartphonesand smartwatches. Smartphones and smartwatches consist of accelerometer sensors (tri-axial accelerometers) that is used tomeasure acceleration in three different dimensions. The orien-tationofthe device can be determined by these accelerometers,which can be helpful information for activity detection. The time series dataset used in this paper consists of raw data that is collected from 36 different participants performing different activities such as walking, jogging, sitting, standing, ascending and descending for specific time periods. The data iscollectedusinga sample rate of 20 Hz (1 sample every 50 milliseconds)which is equivalent to 20 samples per second. There are six different attributes in the dataset namely user, activity, timestamp, x-axis,y-axisandz-axis.Thedatasetcontainsoveramillion rows and 6 columns that needs to be cleaned and processed. The challenge of significant feature extraction from the raw sensor data has become easier with the introduction ofDeep Learning (DL) in the HAR domain. A 2DConvolutionalNeuralNetwork(CNN)isusedtoclassify the data and aStratifiedKfold cross validation is used to splitthedataintotrain and test data.

II. APPROACH
A. Pre-processing and Data Exploration
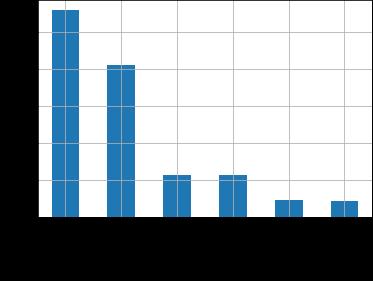
The raw dataset, containing over a million rows, has a lot of noise that needs to be eliminated. In order to improve the accuracy, we first clean the dataset by condensing the dataframe. We are shortening the dataframe by reducing the number of participants to five. Then, the existence of any null values is checked. After checkingfornullvalues,wedeterminethedata distribution of five participants performing several activities. Through this data distribution we can deduce that the data is unbalanced. Standing examples are fewer in number as comparedto Walking examples.Asa result,using this data directlywillcauseoverfitting,whichwillskewtheresultsin favour of walking. To avoid this issue, we need to balancethe data by eliminating unnecessary data that is covered inthe further section of this paper. Now, we plot thetri-axialorientationtoobservethevariationinthedata and convert all the data from string type to float type. Figure 1 represents the time taken to perform different activities by the participants.
Fig.1. Representation ofdata ina bargraph
In order to determine the ratio between training and testset, the variation in the signal values of time taken by theparticipantswhileengagingindifferentactivitieshasto
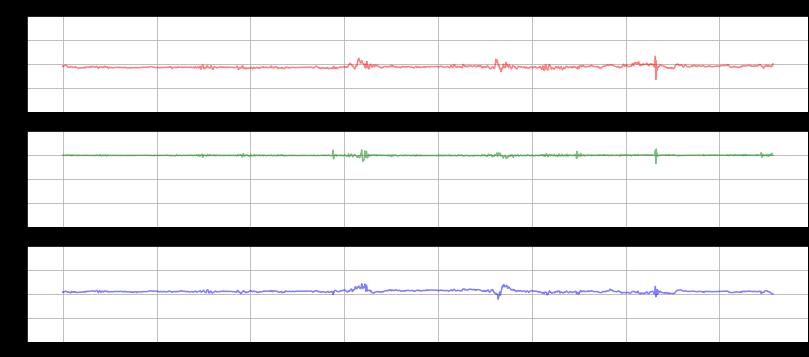
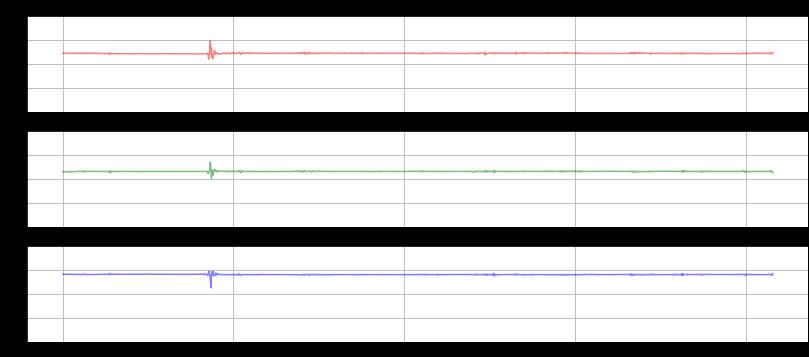
be ob-served.Firstly,letusvisualizethetimeseriessignal waves of a single participant. In this scenario, we have selectedparticipant5asanexample.Thefollowingfigures represent the time taken by participant 5 to perform activities such as Walking, Jogging, Descending Downstairs, Ascending Upstairs, Sitting and Standing in tri-axial orientation.
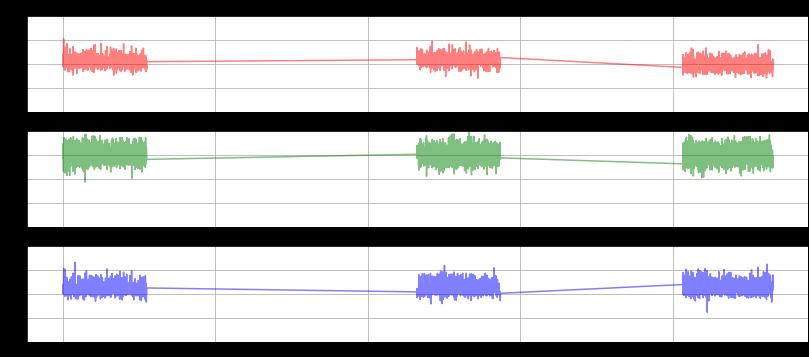
Fromthefigures,wecandeducethatthesignalsshowa drastic change in the period behaviour for the activities such as Walking, Jogging, Upstairs and Downstairs but there is a minimalmovementwhileperformingstationary activitiessuchas Sitting and Standing.

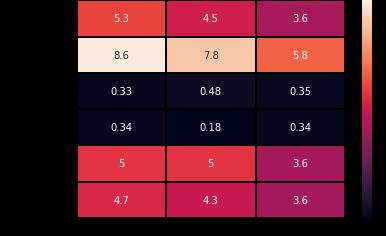
Thestatisticalmeasuressuchasstandarddeviationthat measurethefeatures ofthe signal windowsare extracted to identify patterns in the data. We evaluate the standard deviation with respect to each user and the activity performedinthreedifferentdimensions(xaxis,yaxisand zaxis).Themeanof standarddeviationacrossallusersis evaluated and we have used a heatmap to visualize the results.Thefeatureextractionhasbeenperformedonthe dataset before standardization to visualize the unbalanced nature of the dataset. This helps us to eliminate unnecessary data values which would lead our model to be skewed after training.


8. Heatmap
C. Standardization of Data
After visualizing the unbalanced dataset, the data is balanced by considering only the first 4339 lines for each activity and we create a balanced dataset. As the class Standing has theleast samples (4339), we select the exact amount of samples for the other classes as well. We convert the tri-axial valuesin x, y and z columns from string type to numeric type. As standard classification algorithms cannot be applied directly, asliding window technique is used to transform the raw series data. The data is first split into a window of 4 seconds and thenwe aggregate80rawsamplespresentineachofthe4second window to generate new features. The reason behind choosinga window size of 4 seconds is because a window size that is either too small or too large can affect how well the motionis captured in the modified dataset for training. We select the action that occurs most frequently in that window to apply a class label to the modified characteristics. The frequency is multiplied by 4 seconds resulting in a hop size of 40 but there will be some overlapping due to this. The overlapping ensures that every successive row in the transformed dataset contains some information from the data in previous window as well.Eachofthesixactivitiescontains4339exampleswith atotalof(4339*6)observations.Thisisequaltoabout649 whendivided by the hop size.
D. StratifiedKFold Cross Validation
Supervised learning algorithms aim to simulate how features(independent variables) and labels relate to each other.The model isfirst trained byusingthe featuresand labels of some observations. Then the model is tested by only providing the features and expecting it to predict labels fromthegivenfeatures.Asa result,thedataissplit into training and testing subsets. The model learns from thetrainingsetand wecan predicttheaccuracyusingthe
testing set. In this scenario, a StratifiedKFold cross validationmethodisusedtosplitthedatafor training and testing. The class distribution in the dataset is retained during the training and testing splits. After applying StratifiedKFold Cross Validation, the dataset is 3 dimensional. However each sample in the dataset is 2 dimensional andneeds to reshaped as the Convolutional NeuralNetwork(CNN)
model uses 3 dimensional data.
III. RESULTS

A. 2D Convolutional Neural Network (CNN) Model
A2D Convolutional Neural Network (CNN) comprises of convolutional layers that helps in improving the model performance and accuracy with the notable decrease in
the computation time. The main challenge in building a model is to achieve a good balance between the computational time and accuracy that can be achieved using a CNN model. We have used a sequential model combined with a 2D convolutionlayer as it is appropriate fora simplestack oflayerswhere eachlayerhasoneinput and one output tensor. A tensor of outputs is produced by the2Dconvolutionlayerbywrappinga convolution kernel with the input layers. In this scenario,a total of 16 filters with a size of (2,2) are assigned in thefirst convolution layer. We have used ReLU, also known asthe rectified linearactivationfunction,thatreturnstheinput directly in the case of a positive outcome and returns zeroif the result is negative. The outgoing edges of hidden unitsare randomly set to 0 at each update of the training phase usingadropoutlayer.Theprobabilityatwhichtheoutputs of the layers are dropped out is indicated by the value passed in dropout. The data is transformed into a 1 dimensional array using the flatten() function before proceedingtothenextlayer.The convolution model has a dense layer with 64 neuronsand an output layer with 6 neurons for each of the 6 classes. The results are then produced as a probability distributionusing softmax. Next, wecompileandfitthe modeltothetraining data by using 10 epochs. At the end of each epoch,thevalidationofdata ischeckedtoevaluatethelossandmodelmetrics.
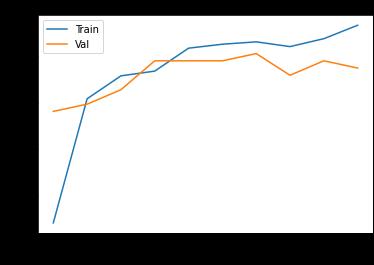
The overall model accuracy and model loss is plotted. From
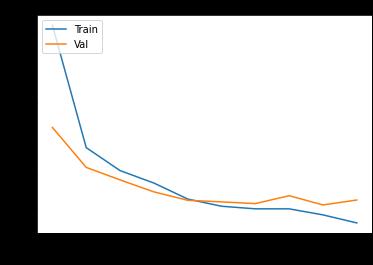
the figures we can deduce that the accuracy of the training setbecomes better with the iteration of each epoch. Ourmodel has learned from the training and is able toaccuratelypredicteachclassinthevalidationset. Overall, we have achieved an accuracy of 96.75% by training themodelusingthismethod.
B. Confusion Matrix

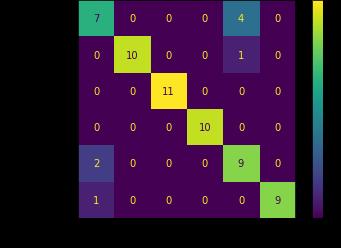
A confusion matrix represents the performance of a clas-sificationmodelbasedonthegroundtruthvaluesof thetestdataset.Therowsrepresentdatainstancesofthe predictedclassandthecolumnsrepresentdatainstances of the actual class. The figure 11: Confusion Matrix-1 representsthefol-lowing:
0 : Downstairs
1 : Jogging
2 : Sitting
3 : Standing
4 : Upstairs
5 :Walking
IV. DISCUSSION
After computing the Confusion Matrix, we are able to draw various conclusions from the data in the dataset in relationto the model that we created. We have received 100% accuracy in the classes ’Jogging’, ’Sitting’ and ’Standing’. This shows that our model is able to classify co-ordinates relating to these classes effectively. However, our model is not without flaws. We can also deduce that our model is getting confused between coordinates relating to the classes ’Upstairs’ and ’Downstairs’. If we observe Fig. 11, we can see that the True label ’Downstairs’ denoted by Row 0 shows that only 64%of the test data has been correctly classified. The rest has been classified as ’Upstairs’. This can be attributedtovariousreasons.Themajorreasonbeingthat ouroriginaldatasetwas highlyunbalanced-thedatawas skewed towards the class ’Walking’. Thus in our endeavour to balance the dataset, we had to drop a lotof dataamongstclasses.Wecertainlywouldhave had better results otherwise.

V. CONCLUSION
Human Activity Recognition has a vast array of applications including biometric signature, health and fitness monitoring, and eldercare. One of the main challenges in this field is the estimation of human poses. Traditionally, we have used a hand crafted model that requires specific initialisation and parameterestimation. But thanks to advances in Deep Learning, we are able to use Neural Networks for pose-tracking.
In conclusion, we have got a decent accuracy for this data. We have chosen StratifiedKFold for splitting the data because the class distribution in the dataset is preserved in the training and test splits, making it ideal for imbalanced datasets. In orderto further increase the accuracy, we can play around with a fewthings. We can trytrainingthemodelwithmoredataoreven try tuning the frame size and hop size. Furthermore, insteadof usingDeepNeuralNetworksforclassification,wecanuse techniques such as Support Vector Machine (SVM), RandomForest (RF), and k-Nearest Neighbour.
REFERENCES
[1]JeffreyW.Lockhart,TonyPulickal,andGaryM.Weiss (2012). ”Ap- plications of Mobile Activity Recognition,” Proceedings of the ACM UbiComp International Workshop on Situation, Activity, and GoalAwareness, Pittsburgh, PA.
[2]Gary M. Weiss and Jeffrey W. Lockhart (2012). ”The Impact of Person- alization on Smartphone-Based Activity Recognition,” Proceedings of the AAAI-12 Workshop on Activity Context Representation: TechniquesandLanguages, Toronto, CA.

[3]Jennifer R. Kwapisz, Gary M. Weiss and Samuel A. Moore(2010).”ActivityRecognitionusingCellPhone Accelerometers,” Proceedings of the Fourth International Workshop on Knowledge Discovery fromSensorData (at KDD-10), Washington DC.
[4]Gupta, N., Gupta, S.K., Pathak, R.K. et al. Human activity recognition in artificial intelligence framework: a narrative review. Artif Intell Rev 55, 4755–4808(2022).
[5]Jennifer R. Kwapisz, Gary M. Weiss and Samuel A. Moore(2010).ActivityRecognitionusing Cell Phone Accelerometers, Proceedings of the Fourth International Workshop on Knowledge Discovery fromSensorData (at KDD-10), Washington DC.
[6]Davide Anguita, Alessandro Ghio, Luca Oneto, Xavier Parra and Jorg L. Reyes-Ortiz. A Public Domain Dataset for Human Activity Recogni- tion Using Smartphones. 21th European Symposium on Artificial Neural Networks, Computational IntelligenceandMachineLearning,ESANN2013.
