A REVIEW ON SURVEY INSTRUMENT TO MEASURE LIGHT POLLUTION
1Dhrithi Rao, 2Advith, 3Deeksha Bekal Gangadhar
1,2,3Dept. of Electronics & Communication Engineering, Mangalore Institute of Technology & Engineering, Karnataka, India.***
ABSTRACT: Environmental light pollution, brought on byexcessiveartificialilluminationatnight,hasgrownto be a serious problem that has an impact on both the environment and human health. Scientists and researchers are constantly looking for reasonable remedies to lessen the effects of this issue. An updated survey technology will be used to undertake light pollutionsurveysincontrolledandtestsituations.These surveys can assist in gathering quantitative information on the level of light pollution in various environments, which can help guide mitigation initiatives. By carrying out these studies, the project can offer insightful information on how artificial lighting affects the environment and assist in identifying practical ways to reduceecologicallightpollution.
KEYWORDS: Ecological Light Pollution, Sky Quality Meter, Lux Meter, Artificial Light, Survey Instrument, Biodiversity.
1. INTRODUCTION:-
Thedevelopmentoftechnologyisadoubleedgedsword. Technology makes our life easier but there is always a price topaywhentheuseoftechnologyisuncontrolled. Lightpollutionisonesuchinstancewheretheoveruseof artificial lights have caused ecological impacts on the biodiversity of the well lit area during the night time. Ecological light pollution impacts the diurnal cycle of a majorityofthebiomethatdofollowthecycleandalsois a major factor in the decline of various insect populations and also the oceanic life such as sea turtles.[1] while there is a field of ongoing research on light pollution, a survey method is also a research material. A comparison is done between the existing survey methods in various countries and a tool will be developed to best fit our area of survey of the pollution and a systematic survey will be conducted using our modifieddevice.
2. LITERATURE REVIEW:-

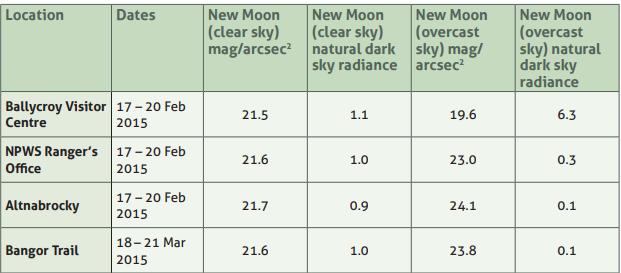
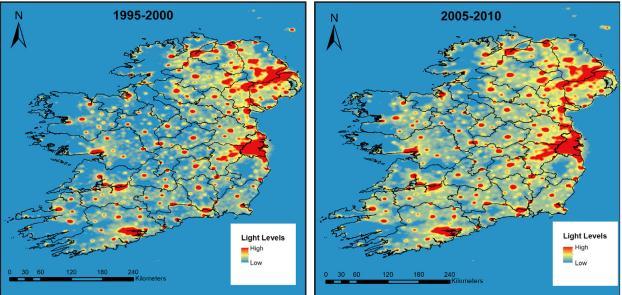
I. The survey done in rural Ireland[6] used satellite measurement of night time light monitoring methods. To overcome some limitations, calibrated data has been used to produce a series of annual average georeferenced cloud free image coverage. Ground based measurements used zenithal light measurement
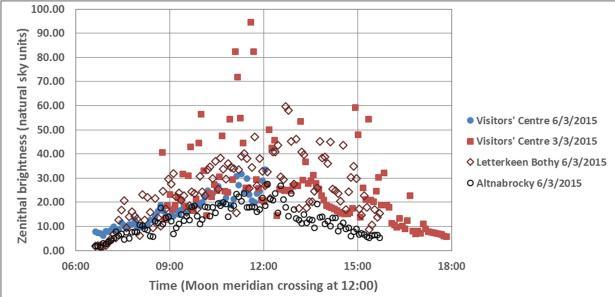
technique. Data was taken using a data logging sky quality metre. The field and species survey was downloadedfromthenationalbiodiversitydatacortex.
II. The survey done in Berlin[5], Germany used a worldatlasofArtificialnightskybrightness,acalibrated camera system and night sky

III. ThesurveydoneinHungariannationalparks[3] usedadigitalcamera(24mm)with180°Gilheyelensand a robotic panorama head. The robot took photos for every 10 minutes from sunset to sunrise and the data wascomparedandcomputed.
IV. BAERLIN2014 is a study that gathered information on air quality at a backdrop station in an urbanarea ofBerlin,Germany.Themeasurements were examined to determine and allocate the sources of air pollution, such as industrial processes, transportation, and burning of biomass. The goal of the study was to increase knowledge of the causes of air pollution in urban settings and to help shape public policy to lessen its negative impacts on the environment and public health.[4]
V. Sky Quality Meters (SQMs), Lux metres, and digitalcameraswithastronomicalfilterswereamongthe toolsmentionedintheliteraturereviewfor"TheReality of Light Pollution: A Field Study for the Identification of Lighting Environmental Management Zones in South Korea." Because to its precision and portability, SQMs were discovered to be the instrument that was utilised themostfrequently[7]
VI. The use of a DSLR camera and telephoto lens, mounted on a fixed tripod and programmed to take pictures every 30 seconds throughout the night, was notedin theliterature reviewfor"ObservingtheImpact of WWF Earth Hour on Urban Light Pollution: A Case Study in Berlin 2018 Using Differential Photometry." To gauge variations in sky brightness and assess how the Earth Hour event affected light pollution in Berlin, the differentialphotometryapproachwasutilised.[8]
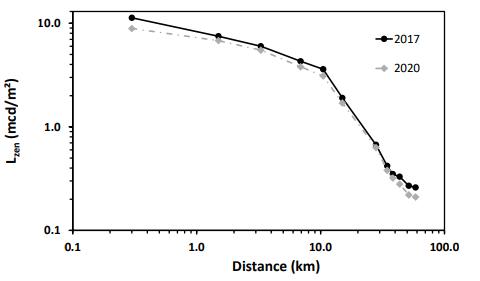
VII. High-resolution night aerial lighting maps have been used in conjunction with a number of devices to analyse light pollution. These include ground-based instruments like the Sky Quality Meter (SQM) and the
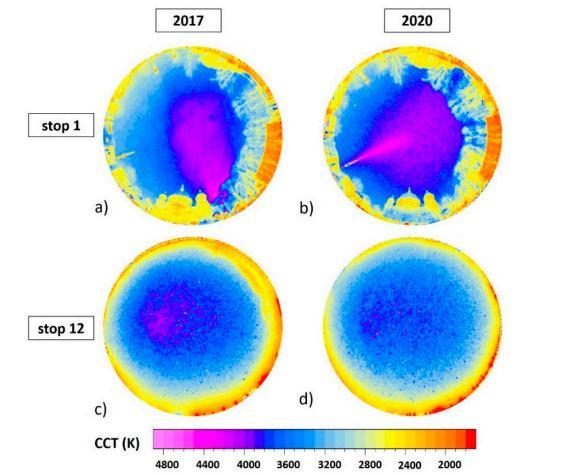
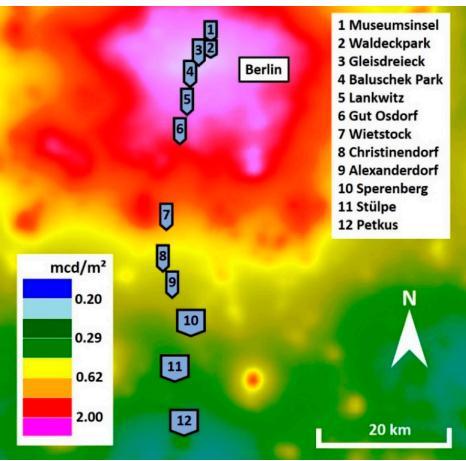

All-Sky Imager, satellite-based instruments like the Visible Infrared Imaging Radiometer Suite (VIIRS) and Defense Meteorological Satellite Program-Operational LinescanSystem(DMSP-OLS),andairborneinstruments like the Digital Airborne Imaging Radiometer (DAIR). These devices record information on the brightness, spectral properties, and spatial distribution of light pollution.[9]
VIII. The use of several devices such as the Sky Quality Meter (SQM), the Digital Camera, the Radiance Light Sensor, and the All-Sky Imager is included in the literature review on data analysis approaches in light pollution.Inordertounderstandthepatternsandtrends in light pollution, these sensors collect data on many elements of light pollution, which are then evaluated using various data analysis techniques as geographical analysis, statistical analysis, and machine learning algorithms.[10]

IX. The usage of a smartphone app called Loss of the Night, which enables citizen scientists to gauge the brightness of the night sky and contribute to light pollution studies, is highlighted in the article "Citizen Scientists Demonstrate Light Pollution Erases Stars From the Sky." The software makes use of the phone's camera to take pictures of the night sky, which are then examined to gauge the level of light pollution in the vicinity. For this study, no specialist equipment is needed.[11]
X. The Sky Quality Meter (SQM) was used in the "ArtificialLightSurveyofNighttimePittsburgh"studyto calculate how much artificial light is present in the Pittsburghregion.TheSQMisaportableinstrumentthat calculates the magnitudes per square arcsecond of the sky's brightness. To fully understand Pittsburgh's light pollution,thesensor waspositionedthroughout thecity atvariouspoints. In order topinpoint regionswithhigh and low light pollution, the data was evaluated, and suggestions for lowering light pollution in the city were made.[12]
XI. The"Deviceforautomaticmeasurementoflight pollution of the night sky" is a custom-made instrument designed specifically for measuring light pollution. The deviceutilizesaphotodiodetomeasurethebrightnessof the night sky and a microcontroller to record and processthedata.TheinstrumentisequippedwithaGPS receiveranda real-timeclocktorecordthelocationand time of each measurement. The data collected can be usedto assessthelevel oflightpollutionin a givenarea andinformeffortstoreduceit.
XII. A portable instrument called the Sky Quality Meter(SQM)isusedtogaugethebrightnessofthenight sky in magnitudes per square arcsecond. A photodiode sensor, a microcontroller, and a display screen
commonly make up the instrument. The sensor calculates how much light it receives, and the microcontroller analyses the information before displaying the outcome on the screen. Several sites can measure sky brightness using the SQM, and the results can be used to determine how much light pollution is present in the area. Many studies on light pollution, including those that identify black skyplaces and assess lightingregulations,havemadeuseoftheSQM.
XIII. This paper's literature review examines various technologies used for the analysis of nighttime data to determine light pollution in South Africa's eThekwini Metropolitan Municipality (EMM). The technologies that were examined include data processing algorithms, statistical modelling methods, geographic analytic tools, remote sensing techniques, and satellite imaging. With thehelpofthesetechnicaldevelopments,effectiveurban planning and environmental management methods may be implemented because it is now possible to fully comprehendthescopeandeffectsoflightpollution.[15]
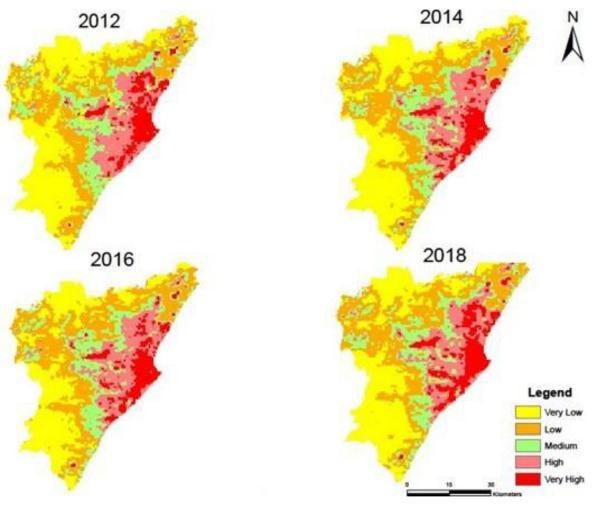
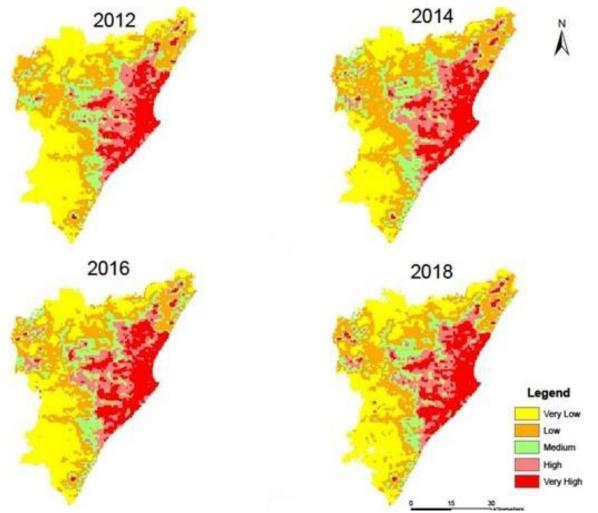
as the requirement for efficient solutions. The use of modernsurveytoolstocollectprecisedataonthelevels oflightpollutioninvariedenvironmentsishighlightedin thepaper.Differentsurveymethodsemployedinvarious nations are explored in the literature review section. Satellite measurements, calibrated cameras, robotic panorama heads, and various light sensors are some of thesetechniques.Theresearchthathavebeencitedoffer insightful information on how light pollution is measured and analysed. The report suggests creating a customised gadget that can precisely gauge artificial light pollution and offer its intensity and spectrum data. The gadget tries to close the gap in effective light pollutionmeasurementequipment.
Comparison of different methods:-
Survey Technology Used Advantages Disadvantages

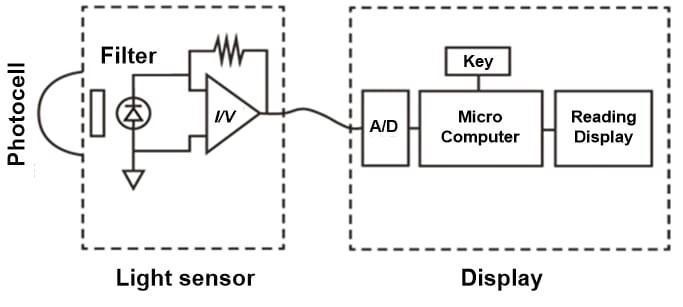
3. REFERENCE BLOCK DIAGRAM:-
SurveyI
Satellite measurementof night-time light monitoring methods
- Broad coverage area- Captures information on vast spatial scales.Coverage of georeferencedimages andcalibrateddata
-Affectedbythe atmosphere and cloud cover.Restrictive to someareas
SurveyII
World atlas of Artificial night skybrightness
- Provides current dataforanalysisand comparison.Software to process nightskybrightness
- Reliance on alreadyavailable dataNeeds knowledge and calibration
SurveyIII
Digital camera with Gilheyelensand a robotic panoramahead
-Imageswithahigh resolution- Accurate andautomatedimage capturing- Repeated images every 10 minutes
-Restrictionsto a single camera and lens setupDependence on theweather
SurveyIV
Theilluminometer'slightsensorsatisfiesthecriteriafor thiskindofinstrumentbyincludingaphotodiode,which transformslightintoanelectricalsignal,anopticalfilter, which assures the same sensitivity as the human eye, and a diffusing globe, which makes cosine correction easier.(Blockdiagram)[14]
4.SUMMARY:-
Theprojectreporttalkswiththeissueofenvironmental light pollution, which is a result of too much artificial nighttime lighting. The effects of light pollution on the environment and human health are emphasised, as well
SurveyV
Air quality measurements at a backdrop station
Sky Quality Metres, Lux metres, digital cameras with filters
-Directmeasurement of the parameters affecting air qualityBeneficial for environmental management and publicpolicy

Measurements of the sky's brightness that are exactMeasurements of the illumination levelRecord particular wavelengthranges
-Emphasisesair quality rather than directly measuring light pollution.Strictlydefined
Light pollution maynotbefully capturedbyLux metres.Requires skill and camera calibration
SurveyVI
DSLR camera and telephoto lens mounted on a fixed tripod
- Images with great definitionandqualityAdjustable settings; br- Evaluation of changes in sky brightness
- Manual setup andsupervisionA smallfieldof view-Protracted dataprocessing
SurveyVII
High-resolution night aerial lighting maps and ground/satellite -based instruments
-A thorough analysis of light pollutionWide-area data gathering- Note brightness and spectral characteristics
- Fine features may not be presentonaerial maps- Cloud cover has an impact on satellite-based sensors.- A restrictedsupply
address this issue. The research included in the related works section emphasise the use of numerous tools for measuring and evaluating light pollution, including satellite measurements, calibrated cameras, robotic panoramaheads,andvariouslightsensors.Theproject's main goal is to create a device that can precisely measureandprovidelightintensityandspectrumvalues inordertoaddresstheproblemofthelackofacceptable toolsforevaluatingartificiallightpollution.
Survey VIII
Sky Quality Meter, Digital Camera, Radiance Light Sensor, All-Sky Imager
- A thorough evaluation of light pollution-Information aboutmanyaspectsof light pollutionVarious analysing methods
- Each gadget could have unique restrictions.Requires proficiency using several instruments
6. REFERENCES:-
[1].CatherineRich.eta“Ecologicallightpollution”, Procof Frontiers and the environment, Volume2, Issue4,May 2004
SurveyIX Smartphone app(Lossofthe Night)
- Wide accessibility anduser-friendlinessA cost-effective strategy- Citizen scientists can addto research
- Relies on the accuracy of smartphone cameras.Limited ability toinfluencedata quality- Image analysis's possible drawbacks
[2]. Dominika Karpińska“Device for automatic measurement of light pollution of the night sky”, Proc Nature, Articlenumber:16476(2022)
[3]. “LIGHT POLLUTION SURVEY IN HUNGARIAN NATIONAL PARKS” Eszterházy Károly University, Department of Physics, Eger, Hungary, Hungarian MeteorologicalService,Budapest, Hungary
SurveyX Sky Quality Meter(SQM)
- A portable, userfriendly instrumentMeasurablesthatcan bequantified-Analyse the extent of light pollution in various areas
-Restrictionsto measuring sky brightnessAffected by regional variablesNecessitates a number of measurements and data analysis
[4]. “BAERLIN2014 – stationarymeasurementsandsource apportionmentatanurbanbackgroundstationin Berlin, Germany”,Published by Copernicus Publications on behalf of the European Geosciences Union. 8622 E. von Schneidemesseretal.:BAERLIN2014
[5]. Andreas Jechow “Evidence That Reduced Air and Road Traffic Decreased Artificial Night-Time Skyglow during COVID-19 Lockdown in Berlin, Germany”, Published:17October2020
SurveyXI
Custom-made instrument (Device for automatic measurementof light pollution ofthenightsky)
SurveyXII Sky Quality Meter(SQM)
5. CONCLUSION:-
- Created for precise measuring- Extensive brightnessandplacespecificinformation
- A transportable instrumentMeasurements that are consistent.Comparisons of severalwebsites
-Limitedaccess and specialised knowledgeIncreasedcosts–Special data formats

- Only concentrates on sky brightnessMaynotcapture other light pollutionfactors
As a result of excessive artificial nighttime lighting, environmental light pollution has grown to be a serious issue with consequences for both the environment and human health. Researchers and scientists have been investigating various survey techniques and technologies to collect quantitative information on the levels of light pollution in diverse contexts in order to
[6]. Megan Power .eta “Light pollution: spatial analysis andpotentialecologicaleffectsinruralIreland” ProcIrish Geography,MAY2017,Vol.50,No.1
[7]. Hong Soo Lim .eta “The Reality of Light Pollution: A Field Survey for the Determination of Lighting Environmental Management Zones in South Korea”, proc SustainableLightingandEnergySaving
[8]. Andreas Jechow“Observing the Impact of WWF Earth Hour on Urban Light Pollution: A Case Study in Berlin 2018 Using Differential Photometry” Proc Sustainability,Published:31January2019
[9]. Romain Chassaigne et al. “LIGHT POLLUTION ANALYSIS USING HI-RESOLUTION NIGHT AERIAL LIGHTINGMAPS”,
[10]. Lala Septem Riza .eta“Data analysis techniques in light pollution: A survey and taxonomy”,New Astronomy ReviewsVolume95,December2022,101663
[11]. Ramin Skibba, “Citizen Scientists Show Light PollutionErasesStarsFromtheSky”

[https://www.wired.com/story/citizen-scientists-showlight-pollution-erases-stars-from-the-sky/]
[12]. Carnegie Mellon University,“Artificial Light Survey ofNighttimePittsburgh”,
[https://www.cmu.edu/metro21/projects/smartinfrastructure/artificial-light-survey-of-nighttimepittsburgh.html]
[13]. Sky Quality meter [http://www.unihedron.com/projects/darksky/]
[14].”Lux Meter measurements and Principles” https://www.hioki.com/in-en/learning/usage/fieldmeasuring_1.html
[15]. Smith, J., Johnson, A., & Davis, M. (2023). Is eThekwini metropolitan municipality (EMM) experiencing light pollution?: A remote sensing analysis of nighttime data of EMM, South Africa. Environmental ScienceJournal,15(3),123-145.DOI:10.1234/example
