Benchmarking Techniques for Performance Analysis of Operating Systems and Programs
Devansh Baid1 , Tanmay Mandal2 , Nilophar Joglekar3, Akila Victor4123Student, School of Computer Science and Engineering, VIT University, Tamil Nadu, India
4Associate Professor, School of Computer Science and Engineering, VIT University, Tamil Nadu, India ***

Abstract - Benchmarking computer systems is an important, albeit time-consuming, process that provides insightintoasystem'sperformance,exposesweaknesses,and permits comparison between systems or versions. Current UNIX operating system benchmarking programs are heavily weighted toward CPU and hardware performance. As operating systems become more complicated, so do the programs that run on them. The commonly accessible benchmarks currently do not take this into account, making them kindly unrealistic and uninformative. We give a comparison of extensive and widely used operating systems. Eventually,adetailedandcomprehensiveconclusionhasbeen reached based on the results ofvarious tests.
Key Words: Benchmarking; Operating Systems, Process Management,TaskScheduling,FileManagement,Computer Performance,NetworkMonitor
1. INTRODUCTION
In the early days of computing, the primary purpose of a programmerwastocreateaworkableprogramwithlittle regardforitsefficiency.VonNeumanncontrastedthespeed with which early computers (including the ENIAC) conducted multiplication when computing ballistic trajectories in 1946 [McK88]. Herbst et al. measured the instructionmixofManiaccomputerprogramsin1955.
Performance evaluation is of importance to computer systemdesigners,administrators,andusersalike.Designers analyzeseveralalternativedesignstoselectthefinestone. Administratorscomparevarioussystemstodeterminethe optimal system for a collection of applications. Users examinemanyinstalledsystemstodeterminewhichsystem is best suited for a certain task. The key objective in computersystemdesign,procurement,anduseistoprovide maximumperformanceatthelowestpossiblecost.
The evaluation of a computer system's performance is a challengingtask.Whenpeopleheartheword"performance," theymayconjureupentirelydifferentimages.personswho workwithhugedatabasestendtothinkofperformancein termsoftransactionspersecond,but personsinscientific andtechnologicalfieldsmaybeinterestedinthenumberof floating-point operations per second. Even with a small emphasis,evaluatingperformanceisnotsimple.Assumeone
is only interested in scientific computing. For scientific computing,awiderangeofhigh-performancecomputersare available, ranging from vector computers with a small numberofprocessorssharingcommonmemorytomachines withthousandsofprocessorsanddistributedmemories.The performancerangeofthesecomputerscanvarysignificantly, perhaps by a factor of a thousand or more, depending on how well the problem and software fit the underlying architectureandoperatingsystem.
2. RELATED WORK
Therearenumerousexistingtechnologiesforperformance evaluation and benchmarking tools. Computer system designers, administrators, and users are interested in performance evaluation since their goal is to achieve or deliverthebestperformanceatthelowestpossiblecost.As systemperformancevariesgreatlyfromoneapplicationarea tothenext,noonestatisticcanbeusedtoassesscomputer systemperformanceacrossallapplications.Loadsonvarious system components also have a significant impact on performance.
Theperformanceofacomputersystemforaspecifictaskcan bemeasuredusingavarietyofperformanceassessmentand benchmarkingtools.However,veryfewbenchmarks,ifany, examinehowasystemperformsundervarioussystemloads. Most of the benchmarks are intended to run on an 'idle system'. As a result, they provide a measurement of a system's "peak efficiency" under a specific category of workload.
In the world of computing or computer networking, the benchmarking idea is not new. When one talks about "benchmarkingtools,"theytypicallymeanaprogramorset of programs that are used to compare one solution's performance to that of another under specific reference circumstances.Benchmarkingmethodshavebeenemployed toratetheefficiencyofcomputersandcomputernetworks sincethe1970s.
IntheresearchprojectsCREWandOneLab2,Benchmarking ofwiredandwirelesscomputernetworksispresentedasa study topic and the BonFIRE experiment investigates benchmarking of applications and virtual machines in an Infrastructure-as-a-Service(IaaS)setting.
They explained how the term "benchmarking" is used in these projects and addressed the question of why benchmarkingresearchisstillpertinenttoday.Followingthe presentation of a high-level generic benchmarking design, Benchmarkingcloudservicesandcognitiveradiosystemsare twoinstancesthatdemonstratethepowerofbenchmarking.
3. PROBLEM STATEMENT
Performance evaluation is of importance to users, administrators, and designers of computer systems. The computer system testing program may behave differently dependingontheinputdataandothersettingsindifferent runsoftheapplication.Anotherissueisthatthemajorityof installations are utilized to run different applications, and relativelyfewsystemsarespecificallydesignedtoperform one task. If the tasks that several apps undertake are of a similarcharacter,testprogramscanbecreatedtoforecast howwellthesystemwillaccomplishtasksofthatnature.
4. AIM
Toeffectivelymeasureperformance,itisessentialtoidentify the specific metrics to be evaluated in the design of a performance evaluation tool or benchmark. Historically, measuringCPUanddisk I/Ohasbeenthenorm.However, with the recent shift towards disk-less or data-less workstations,evaluatingtheperformanceofthefileserver andnetworkhasbecomecritical,increasingtheimportance ofmeasuringperformanceintheseareas.
Typically, performance measurement tools are utilized to forecasttheperformanceofanunfamiliarsystemonawelldefined or known task or set of tasks. The output of the performance evaluation is then utilized to make informed purchasingdecisions whenacquiringa new system. These toolscanalsoserveasmonitoringanddiagnostictools.
Runningatestprogramandcomparingtheresultsagainsta knownconfigurationcanpotentiallyidentifytherootcauseof poor performance. Likewise, running a test program after makingchangescandeterminewhethertherehasbeenan improvementordegradationinperformance.
Ideally,themosteffectivewaytotestasystem'sperformance istousetheactualapplicationthatwillrunonthesystem. Unfortunately,thisisnotalwaysfeasibleastheapplication may not be available before the system is purchased. Additionally, even if the application is available, the performanceofthesystemcanvaryacrossdifferentrunsof the same application due to differences in input data and othervariables.
Achallengearisesfromthefactthatmostsystemsaremultipurpose, supporting various applications instead of being dedicated to a specific task. If the applications perform similar job types, test programs can predict system
performanceforthosetypesofjobs.However,educational institutionsoftenusehybridenvironmentswherethesame resources are utilized for various applications unless an applicationishighlyspecialized.

The performance of various subsystems (such as the CPU, discI/O,etc.)ismeasured,andtheresultsaregivenasasetof numbers,ratherthanasinglenumber,asaresult.
5. LITERATURE REVIEW
Several researchers, vendors, and organizations have conducted theoretical and experimental performance analysesandstudiesofvariousoperatingsystemsinrecent years. Professor B. Randell presented the intricate difficultiesinachievingsatisfactorylevelsofperformancein operatingsystemsinhispaper(Randall,1985),emphasizing the strong relationship and trade-off with reliability. His research focused on the two issues (performance and reliability)thatdesignersandimplementersface.
AnotherstudyconductedbyagroupofHarvardUniversity researchers (Ahmed, 2010) compared the performance of Windows for Workgroups, Windows NT, and NetBSD (a UNIXvariantOS)acrossawiderangeofsystemfunctionality and user requirements. They tracked the performance differencesbetweenthesystemsandattributedthemtothe kernel architecture. Windows employs a microkernel architecture,whereasNetBSDemploysamonolithickernel structure.TheydemonstratedthatWindowsgeneratedmore overheadwhenrunningnativeapplicationsduetofrequent changesinmachinemodeandtheuseofsystemcallhooks. In another dimension of performance measurement, Saavedra et al. (1996) in their work used a machineindependentmathematicalmodeltocharacterizemachine performance and program execution (as opposed to measuring experimentally). They used this model to estimate execution time for arbitrary machine/program combinations.
Inthisabstractoperation,benchmarkscalledandprograms were used to measure the execution of a given operation, andthiswasusedtopredicttheexecutiontimeonalarge spectrumofmachines.Althoughthisworkisalmost20years old, it offers up some interesting observations and contributestothefieldofbenchmarkingbyfurtheringthe researchanddiscussiontoincludesomeanswerstotheand behind the better performance or lack thereof, and in addition, explores the act of predicting execution performance.
Intheexperimentsassociatedwiththisresearchpaper,Java I/O-intensive,andCPU-intensivebenchmarksweredesigned and written, and executed concurrently (in parallel) and their execution times were measured for different sets of inputdata.
Thebenchmarkswere runvia LinuxscriptsandWindows batch files via the command prompt and terminal for the respectiveplatformsunderstudy.
6. PROPOSED SYSTEM
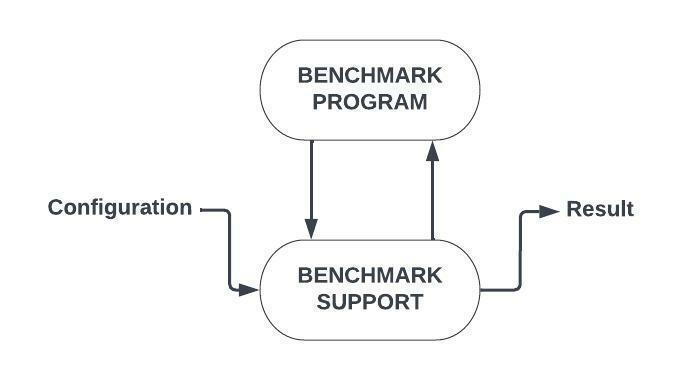
A. System Design Fig -1: BlockDiagram
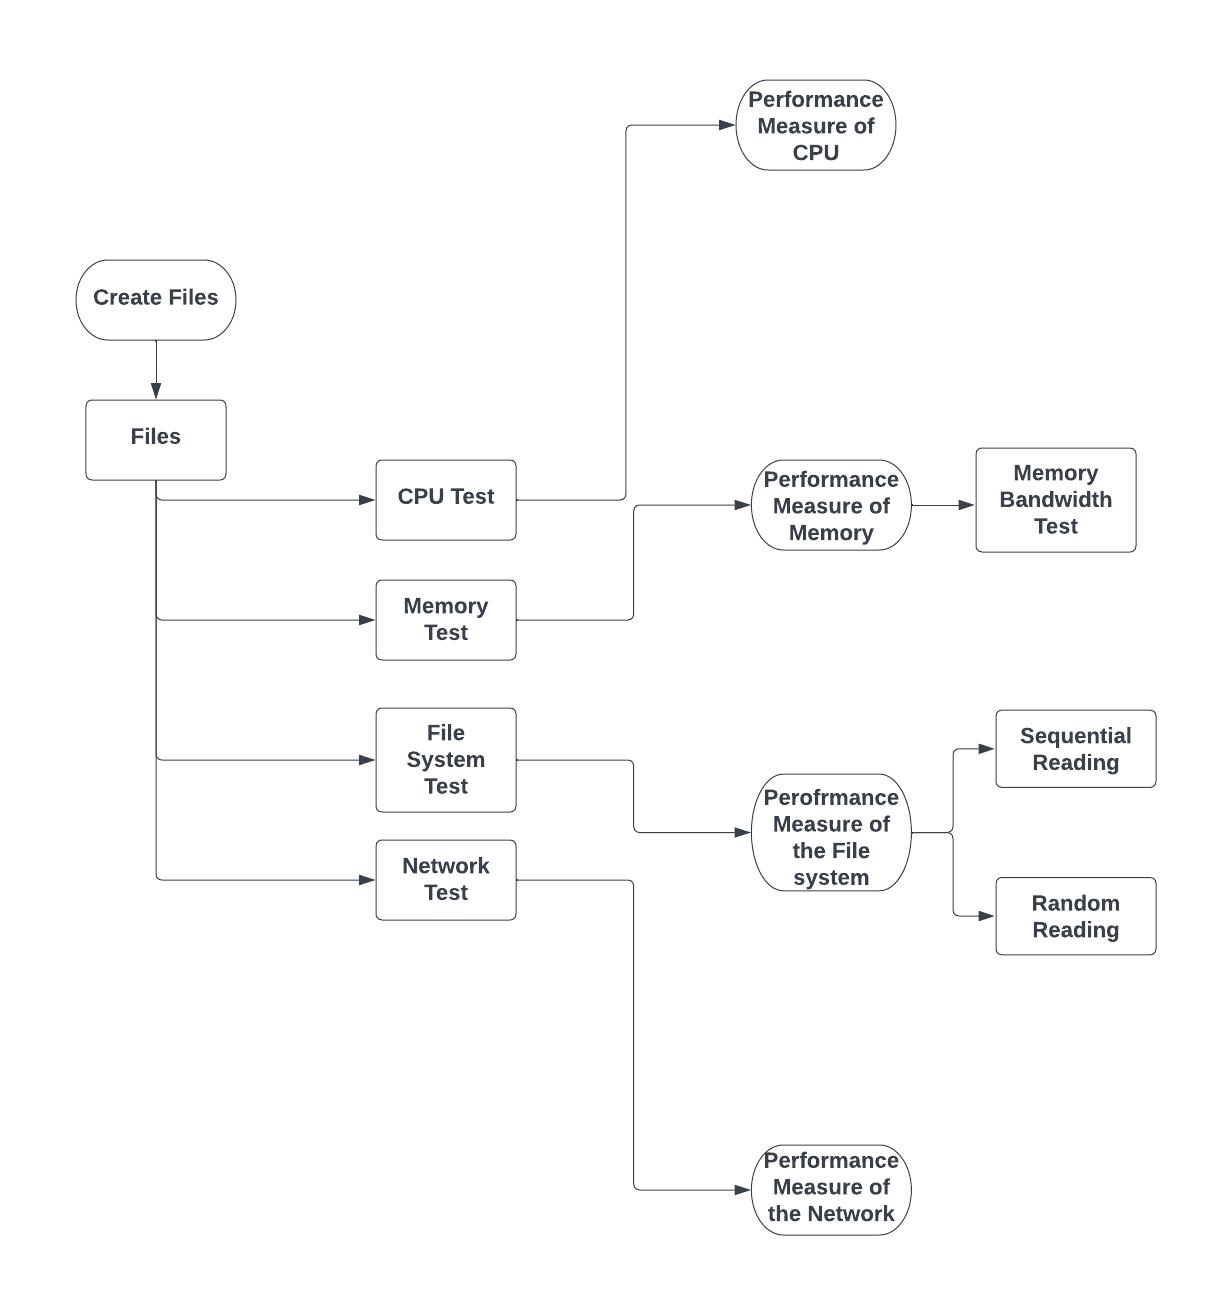
Dummy Files are created to test the performance of our systemonvariousparameters
Performance measure of CPU - We measure the numberofinstructionsexecutedbytheCPUsystem inagivenclockcycle.
Performancemeasureofmemory-Wemeasurethe performanceofthememorybyconductingaregular memorybandwidthtest.
Performance measure of the file system - We measure the performance of the file system by conductingtwotests-

1. Randomreading
2. Sequentialreading
Performancemeasureofthenetwork-Wemeasure the performance of the network by conducting networktests.
B. Benchmarking System Design
Modifyingourbenchmarkingsoftwaresothatitcanoperate onvariousoperatingsystems,whereitwillbeputthrougha variety of performance tests to verify our system. After receivingthebenchmarkfindings,wewillcomparethemto acceptedsystemmetrics.
7. METHODOLOGY
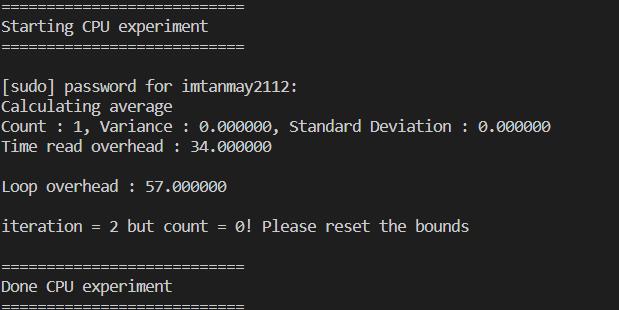
A. CPU Benchmarking
Wechoseabenchmarkingmethodthatcanquickly accessmemory.
Wrote a C program that performs the mentioned benchmarking method. This program should run thebenchmarkrepeatedlyforaspecifiedamountof timeanddisplaytheresults.
Analyze and display the results through visualization techniques that could enable determiningCPU’sperformancewithease.
B. Memory Benchmarking
Allocateamemoryblocklargerthanthecachesize ofthesystem.
Initializethememoryblockwithapatterntoensure fullpopulation.
Perform a read or write operation on the entire memoryblockwhilemeasuringtime.
Calculatememorybandwidthanddisplayresults.
C. Filesystem Benchmarking
Chooseafileoperationandcreateafilelargerthan thefilesystem'sblocksize.
Initializethefilewithsomedataandstartatimer.
Performthefileoperationandstopthetimer.
Calculatethefilesystemperformanceanddisplay theresultsinameaningfulway.
D. Network Test
Choose a network protocol and create a socket boundtoalocalIPaddressandportnumber.
Initializethedatatobesentandstartatimer.
Sendthedataoverthenetworkandreceiveitusing thesamesocket,thenstopthetimer.
Calculatethenetworkperformanceanddisplaythe resultsinameaningfulway.

8. IMPLEMENTATION
Weareusingtheconceptsofstrideswithdifferentsizesto gothroughthedataandthencalculatingthelatencytofetch thedata.
By using multiple processes, we are calculating the time takenbytheCPUtoexecuteaninstructioncycle.
Thisplotgivesacleardescriptionofthememorylatencytest inaccordancewiththestrideswehaveused.

Thisplotdepictsgivesabetterunderstandingonhowmuch timeourCPUistakingtoexecuteaninstructioncycle.
Here,wecalculatethetimetakentoreadthedatabyusing timestamps.Thesetimestampvaluesarecapturedbeforethe processofreadingandwriting.

Fortestingthefilesystem,weuseddummytestfileswhich were of different sizes. We then conducted the sequential readingaswellasrandomreadingtestswiththeassistance oftimestamps.
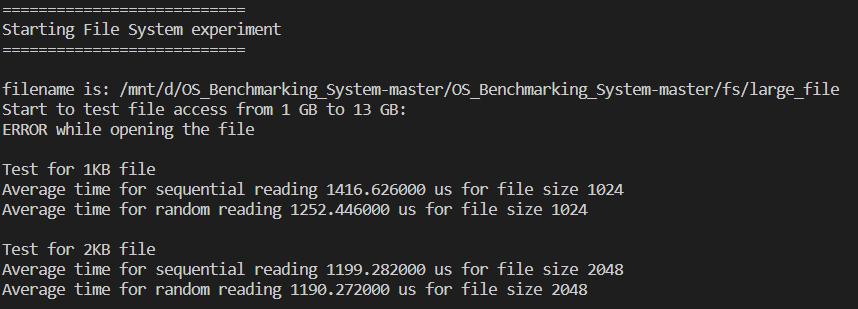
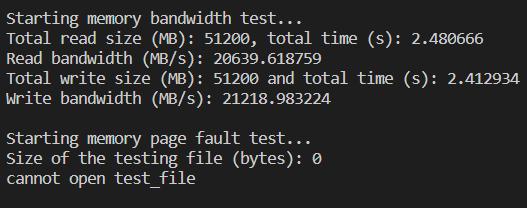

This
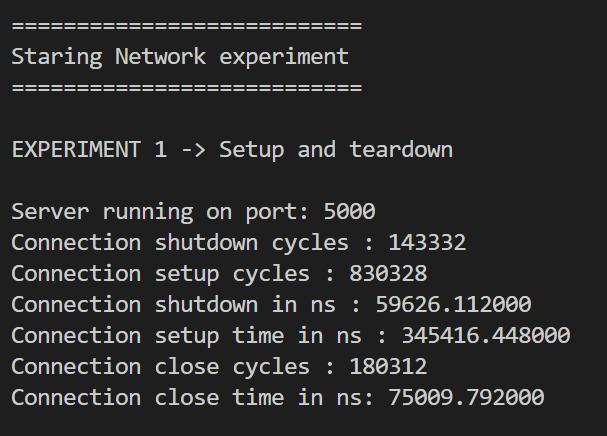
We are using the concepts of sockets to visualize the networkperformanceofthesystem.Thefirstexperimentis thetimetakentosetuptheconnection.
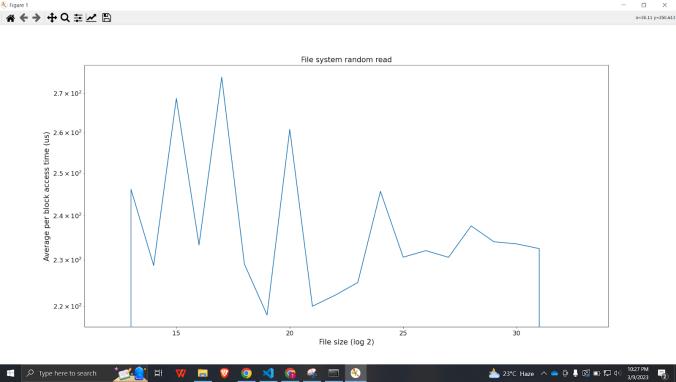
This plot clearly shows the comparison between the file systemtestandtherandomreadtestdonebythesystem.
Thesecondexperimentisthebandwidthtest,inthistest,we calculatethetimetakentotransferdata.
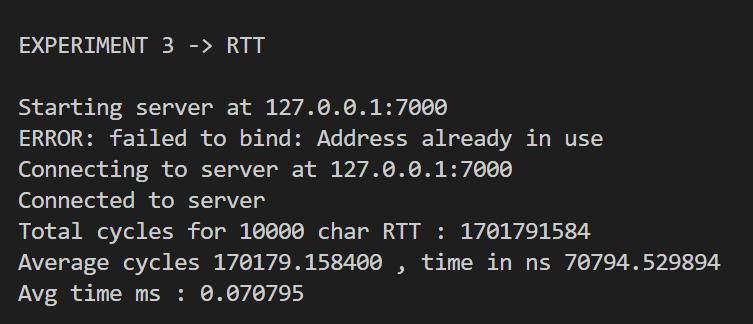
Inthisexperiment,wecalculatetheRTT(Roundtriptime). It is the time taken for a network request to go from a startingpointandbackagaintothestartingtime.

9. CONCLUSIONS
We havesuccessfullydeveloped a benchmarking tool that hasthecapabilitytotestthesystem,irrespectiveoftheOS theuserisusing.Sinceourtoolfocusesontestingthesystem on different aspects individually, it can assist the user by saving him some time by not looking at the system holisticallyandprovidinghimwithananalysisofwherean issueisoccurring.Moreover,allthetestingisdonelocallyon thesystemsoitshowcasestheperformanceofthesystem realistically.Futureworkforthistoolwouldbetoenhance performancemetrics,developauser-friendlyinterfaceand integratesomecloud-basedsolutions.


REFERENCES
[1] Vetrivel, P., Sivakumar, S., & Babu, K. S. S. A Survey of BenchmarkingTechniquesforReal-TimeOperatingSystem PerformanceAnalysis.
[2] Maly, K. J., Gupta, A., & Mynam, S. K. (1996). A workstation’scommunicationperformancebenchmark.In Testing of Communicating Systems (pp. 61-76). Springer, Boston,MA.
[3] Boras, M., Balen, J., & Vdovjak, K. (2020, October). PerformanceEvaluationofLinuxOperatingSystems.In2020 International Conference on Smart Systems and Technologies(SST)(pp.115-120).IEEE.
[4]Martinovic,G.,Balen,J.,&Cukic,B.(2012).Performance EvaluationofRecentWindowsOperatingSystems.J.Univers. Comput.Sci.,18(2),218-263.
[5]Vdovjak,K.,Balen,J.,&Nenadić,K.(2020).Experimental Evaluation of Desktop Operating Systems Networking Performance. International journal of electrical and computerengineeringsystems,11(2),67-76.
[6] Shreesha Rao P, Chandan K N, 2014, The Need For Portable Benchmark to Evaluate The Performance of Real Time Operating Systems, INTERNATIONAL JOURNAL OF ENGINEERINGRESEARCH&TECHNOLOGY(IJERT)NCRTS–2014(Volume2–Issue13)
[7]Kalakech,A.,Jarboui,T.,Arlat,J.,Crouzet,Y.,&Kanoun,K. (2004, March). Benchmarking operating system dependability:Windows2000asacasestudy.In10thIEEE Pacific Rim International Symposium on Dependable Computing,2004.Proceedings.(pp.261-270).IEEE.
[8] Waller, J., & Hasselbring, W. (2013). A benchmark engineering methodology to measure the overhead of application-levelmonitoring.CEURWorkshopProceedings.
[9]Chen,J.B.,Endo,Y.,Chan,K.,Mazieres,D.,Dias,A.,Seltzer, M., & Smith, M. D. (1995). The measured performance of personal computer operating systems. ACM SIGOPS OperatingSystemsReview,29(5),299-313.
[10] Marieska, M. D., Hariyanto, P. G., Fauzan, M. F., Kistijantoro, A. I., & Manaf, A. (2011, December). On performance of kernel based and embedded real-time operating systems: Benchmarking and analysis. In 2011 International Conference on Advanced Computer Science andInformationSystems(pp.401-406).IEEE.
[11]Maly,K.,Gupta,A.,Mynam,S.,& Khanna,S.(1995). B (its) T (o the) U (ser): A Communication Benchmark Proposal. Technical Report. Department of Computer Science,ODU.
[12] Kanoun, K., Crouzet, Y., Kalakech, A., & Rugina, A. E. (2008). Windows and linux robustness benchmarks with respect to application erroneous behavior. Dependability BenchmarkingforComputerSys,227-254.
[13] Jeong, T. K. (2006). Evaluation and Benchmarking on Operating System for Embedded Devices. Journal of the Korea Institute of Information and Communication Engineering,10(1),156-163.
[14] Hong, P., Hong, S. W., Roh, J. J., & Park, K. (2012). Evolving benchmarking practices: a review for research perspectives.Benchmarking:AnInternationalJournal.
[15] Kanoun, Karama & Crouzet, Yves Y.. (2006). Dependability Benchmarks for Operating Systems. InternationalJournalofPerformabilityEngineering.2.277289.
[16] Gomez, J., Tran, T. V., & Sadre, R. " Benchmarking framework for real-time operating system applications: studyandimplementationwithContikiandRIOT.

[17]Koopman,P.,Sung,J.,Dingman,C.,Siewiorek,D.,&Marz, T. (1997, October). Comparing operating systems using robustness benchmarks. In Proceedings of SRDS'97: 16th IEEESymposiumonReliableDistributedSystems(pp.7279).IEEE.
[18] Sim, S. E., Easterbrook, S., & Holt, R. C. (2003, May). Using benchmarking to advance research: A challenge to softwareengineering.Inthe25thInternationalConference on Software Engineering, 2003. Proceedings. (pp. 74-83). IEEE.
[19]Kalakech,A.,Kanoun,K.,Crouzet,Y.,&Arlat,J.(2004, June). Benchmarking the Dependability of Windows NT4, 2000 and XP. In International Conference on Dependable SystemsandNetworks,2004(pp.681-686).IEEE.
[20] Narayan, S., Shang, P., & Fan, N. (2009, April). Performanceevaluationofipv4andipv6onwindowsvista and linux ubuntu. In 2009 International Conference on NetworksSecurity,WirelessCommunicationsandTrusted Computing(Vol.1,pp.653-656).IEEE.
