Shear Strength Assessment of Pile’s Concrete Interface with different (Varying Moisture Content) Soil Layers

1School of Civil Engineering and Architecture, Anhui University of Science and Technology, No. 168 Taifeng Road, Huainan 232001, Anhui, China
2School of big data and Mathematics, Anhui University of Science and Technology, No. 168 Taifeng Road, Huainan 232001, Anhui, China.
3Department of Civil Engineering, CECOS University of IT & Emerging Sciences Peshawar KPK, Pakistan. ***
Abstract - This research is based on to investigating the shear strength interface between concrete and different soil layers like (Clay, Sand and lime mix with other soil), which is very important to ensure the safety and stability of geotechnicalengineeringstructures.Deepfoundationslike pile and retaining walls heavily rely on theshearstrengthbetween these materialstowithstandexternalloadsandenvironmental conditions. In this paper, several types of soils including clay, sand and lime-treated clay are study to know their effect on the shear strength interface. Experimental trials and numerical simulations are supervised to analyze the behavior of the interface under different moisture content conditions. Components like, fine content, sand content, clay content, and moisture content are studied to obtain their impact on shear strength. The results gained give valuable insights into the behavior of the concrete-soil interface and its vulnerability to these factors. The findings of this research identify the important of comprehension the shear strength properties of the concrete-soil interface for designing and constructingsafe structures. By identifying the crucial elements affect shear strength, designers and engineers can make decisions concerning material selection, construction techniques, and structural strength analysis. This research adds to the field of geotechnical engineering by increasing knowledge on the shear strength behavior of the Pile foundation concrete-soil interface. The findings can be utilized to increase the design and construction elements, ultimately leading to stable and more efficient civil engineering structures
Key Words: Shear Strength, Soil Layers, Pile Foundation, Moisture content, Concrete.
1.INTRODUCTION
Shearstrengthinterfacebetweenconcreteandsoilisvery crucialphenomenainthefieldofGeotechnicalengineering. This phenomenon can be seen in deep pile foundations, retainingwalls'backandbackfillandfoundationbaseand soil.Itisimportantbecauseitisthataspectofgeotechnical engineeringinwhichshearstrengthplaysanimportantrole in stability of the civil engineering structure. The shear strength of the interface is due to adhesion between two different materials like concrete surface and soil in pile
foundations. This shear strength is expressed by MohrCoulomblawofshearstrengthshowninequation(1.1)
= c + n tan
Where: c is the cohesion of soil if any; n effective normal stressontheshearingfailureplaneand tan istheangleof internalfrictionofsoil.Indeepfoundationsofpilesystem, equation(1.1)takesthefollowingshapeshowninequation (1.2).
= c + hK tan
Here istheunitweightofsoil;histhedepthwhereskin friction, is measured; K is the coefficient of lateral earth pressureathlevelwhichafunctionof and istheangleof adhesion at depth h. For pile foundation, when the soil is sand,theangleofadhesionforskinfrictionisreasonablein therangeof3/4thof , itisestablishedfactthatmoisture contentdoesnotaffecttheangleoffrictionofsandtogreater extent;butitisnominalasaworstconditionofgreatervalue ofmoisturecontentwhenthesoilisclay.Thiswillmakethe secondterminequations(1.1)and(1.2)negligibleincaseof clay. Anotherscenariomayalsoarisewhenthepileisupper layer of clayand the underlying layer of sand. During pile installation,theclaycontentmaygetsandwichedbetween the pile and sand layer, smear effect that will reduce the angleofadhesiontoalmostzeroathighermoisturecontent. Totrytoreducetheeffectofnominaladhesionbetweenclay andconcretepilesurface,theclayistreatedwithlime.The limereactswithclayandNaandKionsinclayarereplaced byCaofthelime.Thisincreasestheangleoffrictionoflimetreated clay up to 40o and to some extent cohesion is increasedbutatmildrate(Szendefy,2013).Pureclayand pure sand are also used as interfacing members with concrete surface for the determination of shear strength. Sand - clay mixture and concrete surface interface is also investigatedforshearstrengthbehavior.Theseresultsare comparedwiththeinterfaceshearstrengthoflime-treated clay and concrete surface. The internal resistance of soil massperunitareathatasoilmasscanoffertoresistsliding andfailurealonganyplaneinsideitiscalledshearstrength () Thisisaverycriticalphenomenarelatedtosoilbecause itmostlyfailsintensionandshear.Therearetwoimportant shearstrengthparametersconsideredforstabilitythatare Cohesion (c) and angle of internal friction (Փ). The shear strength interface between Concrete and Soil is of unique
properties and are mainly concerned with the bonding betweenSoilandconcrete,theslippingactionbetweenthese twoandtheirstiffnessbehaviorunderNormalpressureand shearingvelocityisveryimportanttoknowforconstructing safeandstablestructures.CompactedSoilsareanalyzedin unsaturated state for the calculation of Effective stress or totalstresses.IneffortsoffindingShearstrengthinterface phenomenamanyresearchershaveputtheircontributionin thefieldofGeotechnicalengineering.
1.2 Review of Literature

MillerandSower[1]statedthattheshearstrengthofsand claymixdependsontheeffectofsandcontent,sandcontent upto67percentnoapparentchangeinstrengthisobserved while increasing sand content in the range of 67 to 74 percentdecreaseincohesionandfastincrementinfrictional angle was reported. The mixture was dominated by sand whensandismorethan67percentinplaceofclay.Liu,R.H (2004)[2]studied“Soil-structureinterfacewithideasofsoil mechanicshavingcriticalstatesandpresentedaconstitutive model”. He Use numerical simulation and appropriate modelingofthesoilandstructureinterface.Thecriticalcase of soil mechanics has been used in his studies, and this modelisusedtocompressinthecaseofstiffness,softening, while natural expansion also emphasizes the pathways. Adunoye (2014) [3] performed “Study of the lateritic soil having fine content with internal angle friction angle”. He reported the following points from his research: The frictionalangleofsoilsampleconsidereddecreasedasthe finecontentincreases.Heexpressedapolynomialequation between the fine contents and cohesion of the soil. He expressedhisempiricalequationforhisresearchmadeon differentcollectedsoilsamples.AkayuliD.CandO.Bernard (2013)[4]conductedresearchon“Impactofclaycontenton the shear strength and compressibility of sandy soils”. He publisheshisworkinJournalofEngineeringResearchand applicationsVol.3,July-August2013.Heconcludedthatthere isaverystrongrelationbetweenshearstrengthandamount ofclaycontentandthecompressibilityofsandysoil.Ahmed andJahangir(2008)[5]supervised12seriesofdirectshear strengthtrialsontheinterfacebetweenundisturbedOCsilty clayey soiland concrete. With strain rates of 0.2 mm/min and 0.3 mm/min, they noticed the inventiveness of shear resistancestrengthatastrainof10%,gavevaluableinsights intotheinterfacefrictionanglebetweencohesivesoiland concrete. The research also added the collection of soil samples from different depths in Babel Province Iraq, increasingtheconcernofnaturalsoilcharacteristicsinthe tested area. Gan and Rahardjo [6] conducted direct shear tests on unsaturated dry soil, finding that matric suction affects shear strength parameters. Failure envelopes for unsaturated soil nonlinearly follow matric suction values from0-500kPa.HammoudandBoumekik(2006)[7]stated thattheshearstrengthbetweentheinterfacesofcohesive soil-solidmaterialdependsontheroughnessatinterfaceand soilproperties.Increase in roughnessincreasing interface
shear strength. Lavanya (2014) [8] studied “Interface Behavior between carbon fiber reinforced polymer and gravelsoils”inhisworkheusedconcretespecimenwrapped in reinforced carbon polymer and gravels for the determination of shear strength properties. He concluded thatthereisamarkeddecreaseintheangleoftheinterface withCRPwrapping.Itmeanstheconclusionwasthatfriction angle with the well graded gravel is higher than poorly graded gravel. Pakbaz and Moqaddam (2012) [9] studied “wayofBehavingandpropertiesofclay-sandmediumwith sandofdifferentgradations”inthisstudyheusedclay-sand interface with varying gradation of sand and fines percentage. He noticed consolidated drained Conditions through his trials performed he made the following observationsfromhis analysis:Thereisa basicdifference whenfinecontentreaches30%.Thus,thecharacteristicsof theshearstress-straincurvearesignificantlychangeatthis rateoffinesandFinecontentmixturedependsonthesand gradation. He noticed that for soil used in his work with cementgroutinsuctionrangeof0-300kilopascalcurvewas notlinear.Changesinsurfaceadhesionsareaboutsameto the angle of the friction interface. Potyondy J. G. [10] performed his studies regarding “Experimental data with modifiedformofdirectsheartest”Thetestwascarriedout onasteelinterfacewithdifferentroughnessconditionssuch as a smooth surface whiles the other coarse surface. The results show that the friction angle is connected at a 24 ° angleat the smooth surface while 34 °for the roughsteel surface. No roughness limits were determined. Also with varyingnormalloads,slightvariationswereobservedinthe valuesofshearondryandwetsand.Thefrictionangleofthe sand used ranges from 39° to 44°, while the sand density was not discussed by the author. Uesugi and Kishida [11] Conducted research on “Influential factors of friction between steel and dry sands”. They Conducted Series of manylaboratorytestsonfrictionbetweenairdrysandsteel, he examined significance of many factors by analyzing experimentaldata.Slidingdisplacementwasobtainedonthe contactsurfaceanddisplacementduetothedeformationof theshearofthesandblock.Sheardeformationwasfoundfor thesandmassthatisnotaffected bytheroughnessofthe surface of the steel. Chen and Schreyer [12] studied “A constitutivemodelforsimulatingsoil-concreteinterfaces”. HeemphasizedthatduetoEarth'smovementduetoearth's earthquake and explosive material, the importance of soil and concrete interface behavior can be studied due to structural failure. He said that Coulombs law may not be applicableasslippingdoesn’toccurtotheborderinterface. He concluded that no slip occurs at interface between Concrete-soilandashearbandappearedatinterface.After his testing and numerical calculation, he presented a new nonlocalmodelthatcanjudgethebehaviorofsofteningfor various construction materials knowing appropriate properties for material used during consideration. Shakir andZhu(2009)[13]studied“Theshearstrengthproperties ofinterfacebetweenclayandconcrete”.inhisresearchwork he used two categories of concrete that are surface
roughnessandsmoothsurface.interfaceshearstrengthtest performed for clay with concrete having smooth surface generallyshowedlargerdisplacements,sheardeformations continue till a point where ultimate shear strength is achievedandsheardeformationbecomeceased. Testwas conductedonroughconcreteinterfacesurfaceandincreased moistureconditionsheardeformationwasseenmorethan sheardisplacementwithanormalloadof150kpa.Moisture contentplaysavitalroleforthedeterminationofincreased or decreased interface shear strength. Wang. D and J. X. Zhang (2011) [14] Conducted "Research on the shear strengthtestbyusingvarioussoil-pilemedium/interface". To determine the frictional properties of the interface between the soil and pile, experiments were performed three laboratory experiments were carried out in three differentgroupsatinterface.Thefirstwassoil-concrete,and second wassoil-steel,and thirdgroup wassoil-HDPE. For analysisofshearstrengthpropertiessixnormalloadswere appliedanditwasseenthatbyincreasingnormalloadthe shearstrengthincreasedaslikethecasestudiedforsoil-pile interface under constant normal load. Minor variation observedforsheardeformationandshearstress.itwasalso observedforchangeinnormalloadchangeinshearstressat interfacewasless.ForPile-HDPEcasechangesinthenormal loadincreasedshearstrength.PengandL.JianKun(2013) [15]conducted“Testsoninterfacebetweensoilandconcrete while the soil is frozen to study the dynamic shear resistance”. He concluded from his research that, deformationmodulusandshearstrengthoffrozensoilare greater than unfrozen soil. Slip resistance of the frozen concrete-soil remainslower thanshearstress ofunfrozen soil. Wang, L.C and W. Long (2014) [16] conducted his research“Variationofshearstrengthonremoldeddryclay, with different voids ratio and moisture content by adding differentproportionsofsand”.Purposeoftheremoldingwas topreparea samplefordirectsheartest,aftercontrolling moisturecontent.Specific margin ratiosinadditionto the sand content of the clay sample were added in order to determinetheeffectoftheseparametersonthetransferof shearstrengthpropertiestotheclay.Laboratorytestswere performedusingfourverticalloadvaluesof100to400kPa using 100 kPa increments for each test. The higher the moisture content, the less friction angle in addition to the cohesioncwasobserved.Resultsweresameforincreasing ratio of the voids and sand content fraction, so the shear strengthlimitsi.e.,c,φfordryremoldedclaydecreasedwith increase in water content. Nie and Wang (2015) [17] did experimentson“studyofinterfacebetweensoilandpileby performing interface shear strength tests” Slippage on shearing in soil and the concrete interface is the main problemofpiling.Astheloadincreasesintheupperpartof the pile, shear stress increases, so that after the friction forcesareovercome,thesystem'seventualfailurewilloccur atthebottomandsidesofthepilesurroundingthesoil.So,in order to get a safe mechanism study of the interface is essential. For this purpose, a medium shear test was conducted for the soil and concrete interface. He further
elaboratedhisresearchworkonthefollowingobservations: Concrete interface and ultimate shear stress of soil has a vividlinearproportionundervariousnormalstressesthat followMohrcoulombfailureenvelop.Cohesiveforcesexist incaseofclayeysoilandheshowedaparticularcaseofbond strength 30 KPA with angle of internal friction (18°) responsible for shear strength. Test results indicated that shear strength of sand is greater due to angle of friction. Hong-FaXuandJi-XiangZhang2020[18]haveanalyzedthe influencelawsofparametersuandmonthepilesoilsystem characteristics by written MATLAB program for the analyticalmodel.Andwrotetheback-analysismethodand stepsofthepile-soilsystemcharacteristicswereproposed. Accordinglyanalyticalmodel.ParthAkbariandHardikPatel [19]studiedsomeresearcharticlesandmadeareviewon pile foundation concealing with different soils, they did experiments on numbers of pile like 2, 3, 5, 6 and 9 piles togetherintriangular,squareandrectangulargroupshapes. InTheresultdeclaredtheultimatebearingcapacityaffected bydifferentsoilswhenpilesconcealingwithdifferenttypeof soils.GhaziAbouElHosn2015[20]diddetailsthesishowto improve pile capacity and used hooks cast-in-place piles with and without hook system in soft clay and sand. And increased apparent adhesion from 19 KPA to 34 KPA by testingaseriesofpile-loadtestsatfieldcast-in-placeinsoft clayandsandforinvestigatingtheeffectpassiveinclusionon pile bearing capacity. All the researchers did not work on pilefoundationConcreteconcealing/Interfacewithdifferent soilslayersvaryingdifferentmoisturecontent(5,15and25 Percent)like(Concreteinterfacewithclay,Sand,Clay+lime, sand+lime)atratio(1:1)respectively.Thispaperisbased onPile’sConcreteinterfacewithdifferentsoilslayersinthe presenceofdifferentmoisturecontent
1.3 EXPERIMENTAL APPARATUS,MATERIALS AND PROCEDURE
This paper is on the interface between Soils to pile foundation Concrete under varying moisture content at laboratory.inthisresearchworkselectedareclayandsand, both of them has been collected from district Nowshera. Differentcaseshavebeenselectedwhicharedescribedsuch as(1)ConcreteinterfacewithClayat5,15and25percent moisturecontent(2)ConcreteinterfacewithSandat5,15 and25percentmoisturecontent(3)Concreteinterfacewith Sand + Clay mix (1:1) at 5, 15 and 25 percent moisture contentand(4)ConcreteinterfacewithClay+limemix(1:1) at5,15and25percentmoisturecontent.Directsheartest apparatus is used in the laboratory on undisturbed soil specimencollectedfromfieldandconsolidatedundrained conditions will be applied during performing test under differentmoisturecontentandnormal loads.Astheshear strengthatinterfacevarieswithmoisturecontent,sounder different moisture conditions results is compared for differentcasesinthisresearch.PrecastConcretesampleis testedagainstsoil.Theconcretespecimenusedinthedirect shear test is having nearly smooth surface, however field

conditionswerenotsimulated.Disturbedsoilsampleswere usedinperformingdirectsheartests.Interfacesheartests forconcrete-sand/clayweretestedunderconstantnormal load.
Following tasks is done for achieving the abovementioned objectives
Clay, sand and lime (unheated, quick) samples are collected from tehsil Pabbi District Nowshera KPK Pakistan.
Concrete (1:2:4) cast in steel boxes of 60mmx60mmx25mmforfacing.
Preparation of sample and precast Concrete specimen andtestingagainstsoil.
DisturbedSoilsamplesareusedduringresearchwork
Directshearstrengthtestisconductedtoevaluatethe shearstrengthpropertiesatinterfacebetweenconcretesand clay and concrete-clay lime mix in equal proportion,underdifferentmoisturecontentsat5,15, 25%.
Constant Normal loads are maintained during direct shearstrengthtest
1.4 Materials used
1.4.1 Sand
Sandusedinthisresearchworkwasbroughtfromdistrict Nowshera and tests were being conducted as per ASTM standardssuchas(BasicPropertiesofSand)UnitWeightof sandsample(naturalmoisturecontent),Specificgravityof sand using ASTM D 854-00, Voids ratio of Sand (under naturalmoisturecontent),Naturalmoisture/watercontent usingASTM-D2216-10,itwasplacedinovenfor24hours. AndthenIndexPropertiesofsandanalyzed.ForGradationof sand(ASTMD2487-00)testproceduremethodwasapplied forthegradationofsand.Relativedensity(Dr.%)testwas performedtofindouttherelativedensitybasedonstandard ASTMD4254.beforesubjectingitforinterfacephenomena with concrete. The Index properties were found for the purpose of identification and classification after that Engineering properties were also sorted out. Sand is a frictional material and its interface with concrete is very important to be properly analyzed for calculating best results.
1.4.2 Clay
The clay was also collected from district Nowshera tehsil Pabbiwhichmostlyexpandsomuchwhencomeincontact withwater,thecolorismostlyred.Allthetestswerebeing conductedasperASTMsuchas(BasicPropertiesofClayey Soil)Naturalmoisture/watercontentusingASTM-D2216-10 standard, Unit Weight of soil sample under different moisturecontent,SpecificgravityofsoilsolidsunderASTM D 854-00 standard, and Voids ratio of soil in natural
moisture content. For Index Properties of soil ASTM standard (ASTM D 2487-00) test procedure method was applied for the gradation of sand obtained from District Nowshera.AndforDeterminationofLiquidlimit(LL),Plastic limit (PL) and Plasticity index (PI), The Atterberg above limitsweredeterminedbyusingASTMD4318-10,basedon the moisture content of sample soil. in order to find the Index properties as well as engineering properties. The naturalmoisturecontentoftheclaywasalsoevaluated
1.4.3 Lime
ThelimewasbroughtfromDistrictNowsherawhichmostly camefrommarbleindustrieslocatedneartoAttockBridge.
1.4.4 Concrete
SampleofconcretewaspreparedaccordingtoASTMC109 standardmethod.Theratioofthesamplewas1:2:4andthe strength were 3000 psi for 28 days. The sand used in concretemoldpreparationfortestswasthesameasused under consideration for interface shear strength that is Concrete-soil. Cement used in concrete was available in market while 3/8” down aggregates were also used for concretemoldpreparation.
1.5 Procedure for small scale interface test
Sandspecimenwasfirstpouredintheupperpartofshear box;itcomesinfullcontacttotheconcretesurface.Thesand wasthencompactedinordertoattainthesamedensitywith naturalmoisturecontentthatis5%.Screwsofshearboxwas loosedinordertoallowtheshearingbetweensand,Concrete andnormalverticalstressthatwasappliedwithhelpofUframe.Initiallytheloadingwasappliedonthesample,after sampleplacementandsettingoutofmachinery,sheargauge (displacement/shearstrain)andprovingringgauge(Shear stressmeasuring)devicewasfixedtoareadingofzero.Both ofthedialgaugereadingswerenoteduntilmaximumshear stresswasattained.Sameprocedurewasthenfollowedfor other loads under same moisture conditions. Shear stress wasthenplottedversusthesheardisplacement.Andthen shear stress was plotted versus vertical stress then the failureenvelopwasobtainedbythehelpofMohr’sCoulomb Criteria.Now procedure wasrepeatedforsamesample of thesandwithsamedensity,butthemoisturecontentwas 15%, poured in shear box and test data was then plotted. Similarprocedurewasrepeatedfor25%moisturecontent, and the result curves was then plotted. Now after finding basicandindex propertiesforclayeysoilthecurves were plottedfor5%,15%,and25%moisturecontentswithsame procedure. Further modification was made by enhancing interfaceofSoil-Concrete,Claywasmixedwithsandin(1:1) andclaywithlimewasalsomixedin(1:1).Similarprocedure was adopted by maintaining 5%, 15%, and 25% moisture contentconditions.

1.6 Objective of the Study
The objectives of this study are to analyze interface shear strength at different moisture contents for the following combinationsandtoseetheeffectsoflimeandsandaddition with clay. And for the future what to add for better shear strengthwithpilefoundationconcrete.Shearstrengthofthe interfacebetweendifferentmaterialsare:
PileFoundation’sConcreteinterfacewithClayat5,15 and25percentmoisturecontent.
PileFoundation’sConcreteinterfacewithSandat5,15 and25percentmoisturecontent.
Pile Foundation’s Concrete interface with Sand + Clay mix(1:1)at5,15and25percentmoisturecontent.
Pile Foundation’s Concrete interface with Clay + lime mix(1:1)at5,15and25percentmoisturecontent.
2. Methods and Materials
2.1
General
This section will cover the estimation of shear strength exists on the interface between Soils to Concrete under varying moisture content at laboratory, as this type of phenomenawillsimulateactualfieldconditions.Soilsinthis researchworkselectedareclayandsand,bothofthemhas beencollectedfromdistrictNowshera.Differentcaseshave beenselectedwhicharedescribedbelowandshownintable 3.1:
Table 1:Natureofinterfaceindirectsheartests.
Caseno InterfaceNature
1 Concrete interface with Clay at 5, 15 and 25 percentmoisturecontent.
2 Concrete interface with Sand at 5, 15 and 25 percentmoisturecontent.
3 ConcreteinterfacewithSand+Claymix(1:1) at5,15and25percentmoisturecontent.
4 ConcreteinterfacewithClay+limemix(1:1)at 5,15and25percentmoisture
Directsheartestapparatuswillbeusedinthelaboratoryon undisturbed soil specimen collected from field and consolidated undrained conditions will be applied during performing test under different moisture content and normalloads.Astheshearstrengthatinterfacevarieswith moisture content, so under different moisture conditions resultswillbecomparedfordifferentcasesinthisresearch.
2.2 Limitations of the Research
Followingarethelimitationsforresearchconducted:

PrecastConcretesamplewillbetestedagainstsoil
The concrete specimen used in the direct shear test is havingnearlysmoothsurface,howeverfieldconditions werenotsimulated
Disturbed soil samples were used in performing direct sheartests.
Interfacesheartestsforconcrete-sand/clayweretested underconstantnormalload.
2.3 Research Methodology
Following tasks are to be done for achieving the abovementionedobjectives.
Clay, sand and lime (unheated, quick) samples are collectedfromtehsilPabbiDistrictNowshera.
Concrete (1:2:4) cast in steel boxes of 60mmx60mmx25mmforfacing.
Preparation of sample and precast Concrete specimen andtestingagainstsoil.
DisturbedSoilsamplesareusedduringresearchwork
Direct shear strength test is conducted to evaluate the shearstrengthpropertiesatinterfacebetweenconcretesand clay and concrete-clay lime mix in equal proportion,underdifferentmoisturecontentsat5,15, 25%.
Constant Normal loads are maintained during direct shearstrengthtest
2.4 Materials used 2.4.1 Clay
The clay was also collected from district Nowshera tehsil Pabbiwhichmostlyexpandsomuchwhencomeincontact withwater,thecolorismostlyred.Allthetestswerebeing conductedasperASTMinordertofindtheIndexproperties as well as engineering properties. The natural moisture contentoftheclaywasalsoevaluated.Basicpropertiesof clayare:
2.4.2 Natural moisture/water content
For determination of the in-situ moisture content the following ASTM-D2216-10 standard test method was applied,weightofthesamplewasdeterminedfirstandthen it was placed in oven for 24 hours in order to make to it completelydry.Followingcalculationswereusedinorderto findthedryweightofsand
Procedure:
The container should be clean and dry its weighs is (W1)."Afterthebalancewastarred"
Takespecimenofsampleincontainerandweightitwith lid(W2).
Keepscontainerinovenwithlidbeingremoved.Make thespecimendrytoaconstantweightbymaintaining thetemperatureinbetween105ºCto110ºCforperiod varyingfrom16to24hours.
Record final reading that is constant weight (W3) of containerwithdriedsampleofthesoil.
W(%)= W2-W3/W3-W1 *100…(2.1)
2.4.3 Unit Weight of soil sample under different moisture content
For evaluation of the unit weight of soil sample under consideration, it was placed in a sampler and it was graduatedfortakingitsweight.Thenmeasuredweightwas dividedbythevolumeofsample.Therequiredvalueforunit weightwasthennoted.
Procedure
MakedryingofthePycnometerandweighitcombinedly withcap(W1).
Take 200 to 300 g of oven dry soil that is passing through the 4.75mm sieve into Pycnometer with weighingitagainas(W2).
Addsomeamountofwaterinordertocoverthesoil.
Pycnometer should be shake well and connect it with thevacuumpumpinordertoremovetheentrappedair. 10to20minutesarerequiredforthisprocess.
Afterremovalofair,fillPycnometerwiththewaterand weighitas(W3).
CleanthePycnometerwithwaterthoroughly.
Cleaned Pycnometer should be filled completely with thewateruptothetopwithacaponscrew.
Weight Pycnometer after making it dries thoroughly (W4).
TheSpecificgravityofthesoilsolids(Gs)arecalculated byusingfollowingequation.
=(W2–W1)/[(W4–1)-(W3-W2)]…. (2.2)
2.4.4 Voids ratio of soil in natural moisture content
Thevoidsratio(e)isdefinedas,ratiobetweenvolumesof voidstothevolumeofsolids.Numerically;e=Vv/Vs:Vv= VolumeofVoids,Vs=Volumeofsoil solids,itisgenerally abbreviated(Dimensionless)andexpressedinnumber.
2.3.5 Gradation of soil
ASTMstandard(ASTMD2487-00)testproceduremethod wasappliedforthegradationofsandobtainedfromDistrict Nowshera.Thesampleofsandwasfirstovendriedand500 gramofsamplewasthentaken.Thesandsamplewasplaced in a series of different sieve sizes and shake properly by shaking machine. The retained weight on all sieves was
measured and the accumulative mass for each sieve was measured.Thengraphwasthenplottedbywritingmeshsize atx-axisandpercentfinerony-axis.co-efficientofcurvature, Uniformityco-efficientandtheeffectivesizesD10,D30,D60 werethenevaluatedfromresultingcurve.
2.4.6 Determination of Liquid limit, Plastic limit and Plasticity index
TheAtterberglimitsare:Liquidlimit(LL),Plasticlimit(P), Plasticindex(PI).Thementionedlimitsweredeterminedby using ASTM D4318-10, based on the moisture content of sample soil. The water content on which it changes from semi solid state to plastic state and the specific water contentonwhichitchangesfromplastictoviscidcondition iscalledasliquidlimit.Followingaretheequipmentusedin laboratory.Casagrandeapparatus/liquidlimittool,grooving tool,moisturecans,weightingbalance,spatula,washedflask filledwithpurifiedwater,ovenandglassplate.Soilsample wasthenovendriedon105°Candthenpassedonsieve#40. 200gramofsoilsamplewastakenandasmallamountofthe distilled water was then added to soil sample and mixed thoroughly. Portion of the mixed soil was then placed in Casagrandeapparatusandsurfacebecameleveledwiththe help of a spatula. Soil surface was then leveled in such fashion that lower surface become in same height to the loweredgeofcup.Cutwasmadeonthecenterofsoilsample withagroovingtool.Thecrankofthetoolwasturnonand theblowswasgiventosampleinsuchamannersothat2 blowspersecondweregivenundertwohalvesshouldtouch eachotheralongthedistanceof13mm(1/2in).Numberof theblowswasnoteddownasN-1.Thesoilsamplewasthen placedinthecaneanddriedinovenfor16hours,moisture content in some amount was added and number of blows thattouchingthegroovedecreasedfromarangeof25-35,in anothertrailfor20-30andfor15-25wasalsoexecuted.We obtained4readingofblowsthatareNa,Nb,Nc,Ndalsowe get 4 moisture contents Wa, Wb, Wc, and Wd, a graphical relationwasplottedbetweenwatercontentandnumberof blows.Thepointplottedony-axiswascorrespondingtothe 25numbersofblowsandwasnotedthatwillgivesusliquid limitforthesoilsample,50gramofthesoilspecimenwas thenmeasuredandthedistilledwaterwasmixedintothe soilsamplesothatitwillrollwithoutstickingtothehand. Afterthoroughlymixingwatertothesoil,apieceofthesoil was taken in hands and transformed into elliptical shape with the help of fingers. The elliptical shape was then converted into uniform threads with the help of applying sufficientpressure.Thethreadwasrolledinbackwardand forwardmovementsothatthreadofsoilgetsconvertedinto a 3mmdiameterthread,thenitcrumbled into pieces.The crumbled portions were united and same process was continued till thread gather into pieces and no longer crumbled. Now the gathered pieces were collected into moisturecanandthenitwasplacedinovenfor16hoursat 105°C, performing this experiment it was continued for 3 trialsandthentheaveragemoisturecontentwasnotedas

P.L of the soil sample. Plasticity index was calculated by usingformula:Plasticityindex=liquidlimit–plasticlimit

2.5 Sand
Sandusedinthisresearchworkwasbroughtfromdistrict Nowshera and tests were being conducted as per ASTM standardsbeforesubjectingitforinterfacephenomenawith concrete.TheIndexpropertieswerefoundforthepurposeof identification and classification after that Engineering propertieswerealsosortedout.Sandisafrictionalmaterial and its interface with concrete is very important to be properly analyzed for calculating best results. Basic propertiesofsandare:
2.5.1 Unit Weight of sand sample (naturalmoisture content)
In order to evaluate the unit weight for the sand sample underconsideration,itwasplacedinasamplerandthenit wasgraduatedtakingitsweight.Themeasuredweightwas thendividedbythevolumeofsampleandthentherequired valueofitsunitweightwasnotedownforfurthernecessary procedure.
2.5.2 Specific gravity of sand
Inordertofindthespecificgravityofsandsampleitcanbe evaluatedwiththehelpofatestthatusePycnometerdevice. It can be defined as the ratio of unit weight of a soil at specific temperature to the weight of equivalent volume filled with distilled water at that specified temperature. Followingstepswascarriedoutinordertodeterminethe specificgravityofsandbyusingASTMD854-00whichisthe standardprocedurefordeterminationofthespecificgravity.
2.5.3 Voids ratio of Sand (under natural moisture content)
Thevoidsratio(e)isdefinedas,ratiobetweenvolumesof voidstothevolumeofsolids.Numericallye=Vv/Vs,Vv= VolumeofVoids,Vs=Volumeofsoil solids,itisgenerally abbreviated(Dimensionless).
2.5.4 Natural moisture/water content
For determination of the in-situ moisture content the following ASTM-D2216-10 standard test method was applied,weightofthesamplewasdeterminedfirstandthen it was placed in oven for 24 hours in order to make to it completelydry.Followingcalculationswereusedinorderto findthedryweightofsand.
2.5.5 Gradation of sand
ASTMstandard(ASTMD2487-00)testproceduremethod wasappliedforthegradationofsandobtainedfromDistrict Nowshera.Thesampleofsandwasfirstovendriedand400
gramofsamplewasthentaken.Thesandsamplewasplaced in a series of different sieve sizes and shake properly by shaking machine. The retained weight on all sieves was measured and the accumulative mass for each sieve was measured.Thengraphwasthenplottedbywritingmeshsize at x-axis and percent finer on y-axis. Co-efficient of curvature,Uniformityco-efficientandtheeffectivesizesD10, D30,D60werethenevaluatedfromresultingcurve.
2.4.6 Relative density (Dr. %)
This test was performed to find out the relative density basedonstandardASTMD4254.Moldwasfilledwithsand as loosely as possible. The mass of sand and mold was determined as and noted as M1. The guide sleeves were attachedwithmold,andadditionalweightwasloweredon baseplateafterwhichvibrationof8minutesdurationwas giventotheassembly,followingbytakingthefinalreading Rf.usingthesameprocedureinpreviousstep.Themasswas determinedasM2.Thesizeofmoldismeasuredtohavethe dimensionsofmold,i.e.,heightanddiameterofmold,sothat volumewascalculatedasVcandalso,thicknessofthebase plateusedassurcharge,Tp wascarried out,SothatMs1= massofdrysand=(massofloosesand+mold)–(massof mold), Vc= Calibrated volume of mold, Ms2 = mass of dry sand=(massofsandaftervibration)–(massofmold),V= Drysandvolume=Vc–(Ac*H),Ac=crosssectionalareaof moldaftercalibration.
2.6 Lime
ThelimewasboughtfromDistrictNowsherawhichmostly camefrommarbleindustrieslocatedneartoAttockBridge.
2.7 Concrete
SampleofconcretewaspreparedaccordingtoASTMC109 standardmethod.Theratioofthesamplewas1:2:4andthe strength were 3000 psi for 28 days. The sand used in concretemoldpreparationfortestswasthesameasused under consideration for interface shear strength that is Concrete-soil. Cement used in concrete was available in market3/8”downaggregateswerealsousedforconcrete moldpreparation.
2.8 Concrete sample preparation
A sample of concrete was prepared by using standard techniqueASTMC109,whichisStandardtestprocedurefor thecompressivestrengthofthehydrauliccementmortars.
Procedure:
For preparing Concrete mortar specimen mixing wasmadeon1:2:4ratios.1part ofcementand2 partsofsandwasmixedwith4partsofthecrushed aggregatecollected.
Spatulawasusedtoleveltheconcretesurfacethe concretewasthenplacedintowoodenmoldwhose sizeisequaltothehalfportionofdirectshearbox thatissquareinsizeof6cmx6cmx1cm.
Afterconcretecastingpropercuringwasmadefor the sample that is 28 days in order to achieve its completestrength.Aftercompletingcuringperiod Sample was collected and made air dried for 24 hours.
The said sample was handled carefully so that its sides should not get rough so much in order to performdirectsheartestonit.
2.9 Procedure for small scale interface test

Sandspecimenwasfirstpouredintheupperpartofshear box;itcomesinfullcontacttotheconcretesurface.Thesand wasthencompactedinordertoattainthesamedensitywith naturalmoisturecontentthatis5%.Screwsofshearboxwas loosedinordertoallowtheshearingbetweensand,Concrete andnormalverticalstressthatwasappliedwithhelpofUframe.Initiallytheloadingwasappliedonthesample,after sampleplacementandsettingoutofmachinery,sheargauge (displacement/shearstrain)andprovingringgauge(Shear stressmeasuring)devicewasfixedtoareadingofzero.Both ofthedialgaugereadingswerenoteduntilmaximumshear stresswasattained.Sameprocedurewasthenfollowedfor other loads under same moisture conditions. Shear stress wasthenplottedversusthesheardisplacement.Andthen shear stress was plotted versus vertical stress then the failureenvelopwasobtainedbythehelpofMohr’sCoulomb Criteria.Now procedure wasrepeatedforsamesample of thesandwithsamedensity,butthemoisturecontentwas 15%, poured in shear box and test data was then plotted. Similarprocedurewasrepeatedfor25%moisturecontent, and the result curves was then plotted. Now after finding basicandindex propertiesforclayeysoilthecurves were plottedfor5%,15%,and25%moisturecontentswithsame procedure. Further modification was made by enhancing interfaceofSoil-Concrete,Claywasmixedwithsandin(1:1) andclaywithlimewasalsomixedin(1:1).Similarprocedure was adopted by maintaining 5%, 15%, and 25% moisture contentconditions.
3. Results and Analysis
3.1 Clay – Concrete interface Shear strength
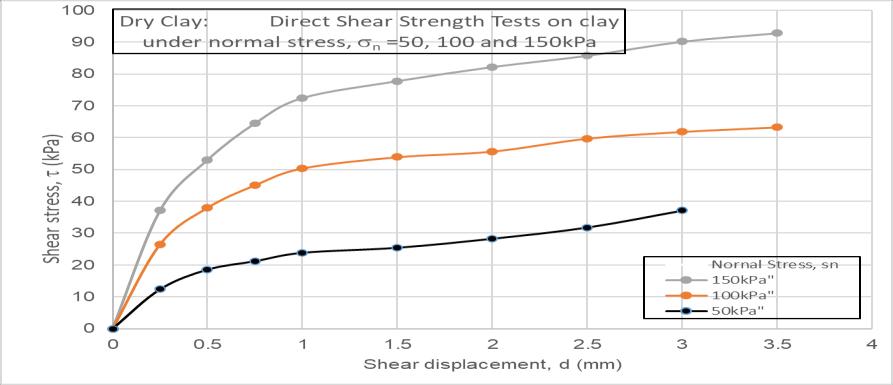

Shearstrengthdeterminationiscarriedoutinthelaboratory directsheartestapparatusfortheclay–concreteinterface indifferentmoisturecontents.Thesemoisturecontentsare zero, 5, 15 and 25 %. The consistency is found to be soft. Resultsareshowninfigures3.1,3.2and3.3.Theyshowthat theshearstrengthofthisclayisdependentonthemoisture content. It is maximum for dry state but decreases with increaseinmoisturecontent.theshearstrengthismaximum fordrysoilwhenthenormalstressismorethan40kPabut
wetclayat25%moisturecontentdominatesthisresistance below40kPaofnormalstressduetosticking.
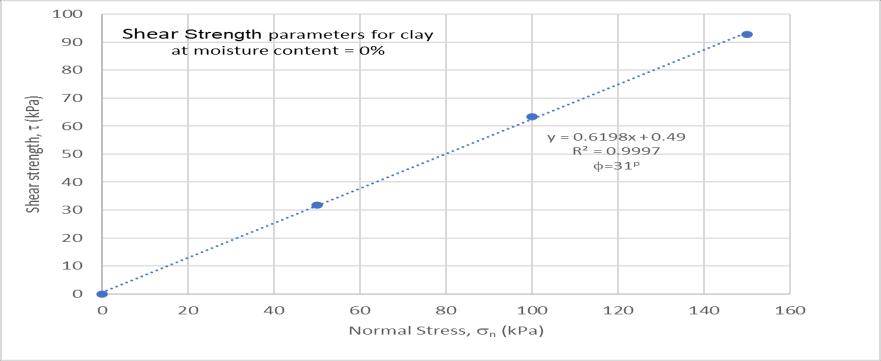
Themaximumoftheshearstressesisplottedagainstnormal stress to determine the shear strength parameters of the pureclayindrystate.Thisisshowninfigure4.2.Sinceitis normallyconsolidated,therefore,itsshearstrengthatzero normalstressiszero,whichiscohesioninterceptisabsent.
The rest of the shear strengths under 5, 15 and 25 % of moisturecontentsareshowninfigures3.3and3.4
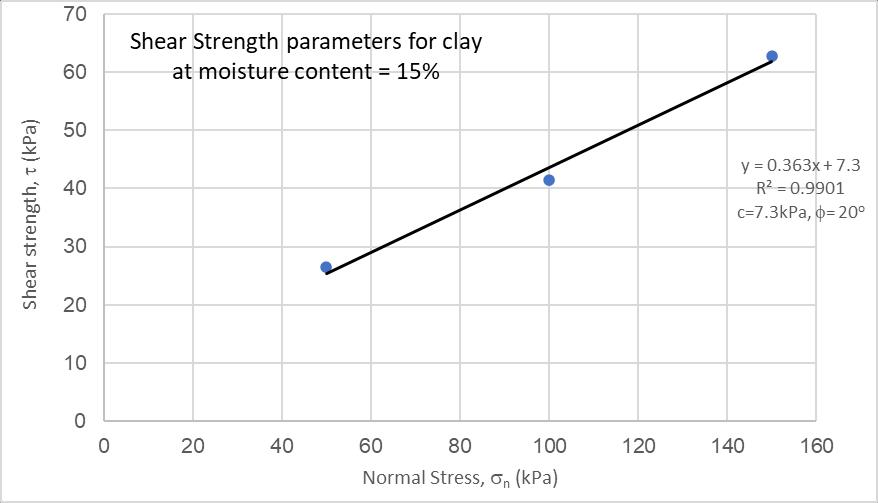
Itcanbeseenfromfigure3.4thatsomecohesiondevelops withmoisturecontent.
The new cohesion, c is 7.3 kPa and the angle of internal friction of moist clay is reduced to 20o. 25% moisture contentengineeringbehavioroftheclayisshowninfigures 3.7andinfigure3.8.
With5%moisturecontent,theshearstrengthparametersof theclayarethatcohesion,cis7.87kPaandangleofinternal ofclayindirectsheartestisshowninfigures4.5and4.6
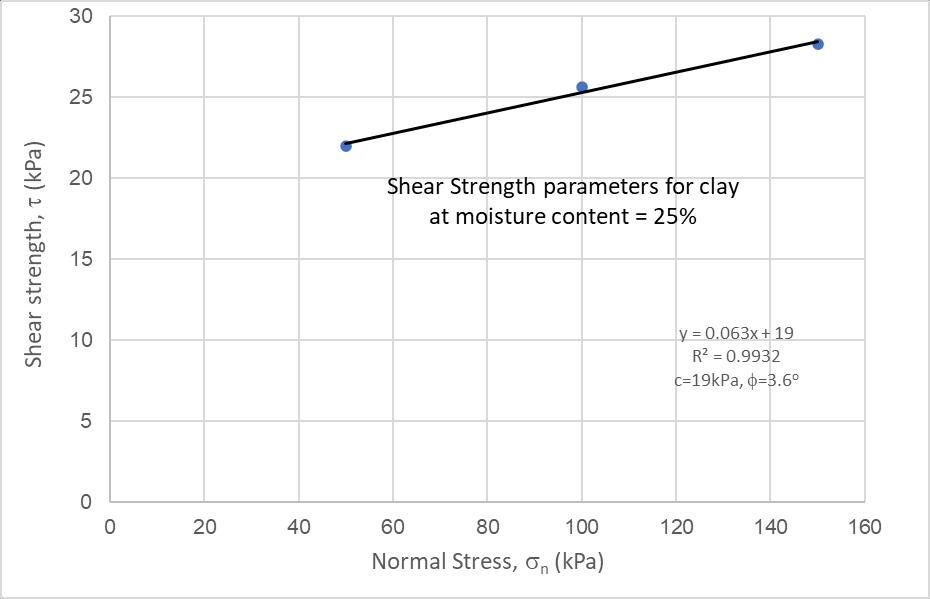

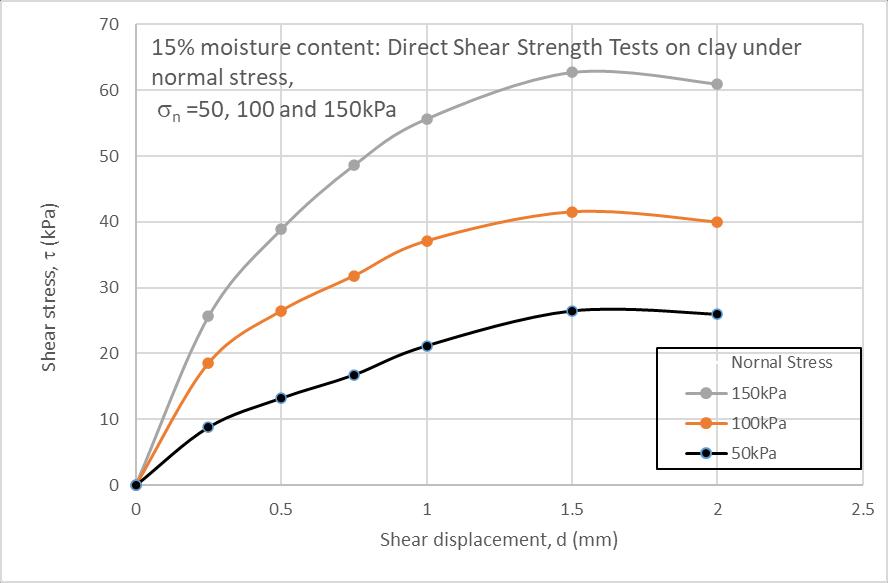
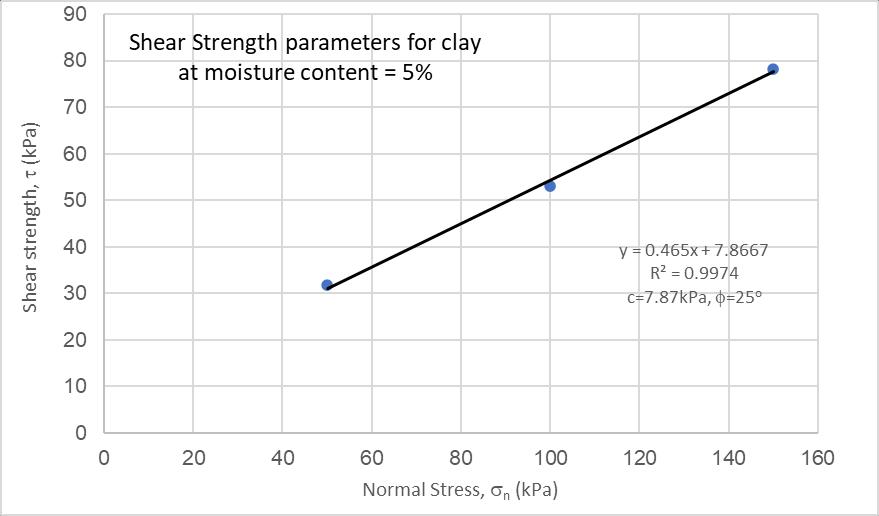
Fromtheobservationoffigures3.7and3.8,itisseen that increaseinmoisturecontentdrasticallychangestheshear strengthbehaviorofclay.Cohesion,cincreasesto19kPaand angleofinternalfrictionreducesto3.6o.Theoverallshear behavior of clay with moisture content is accumulated in figure3.9.

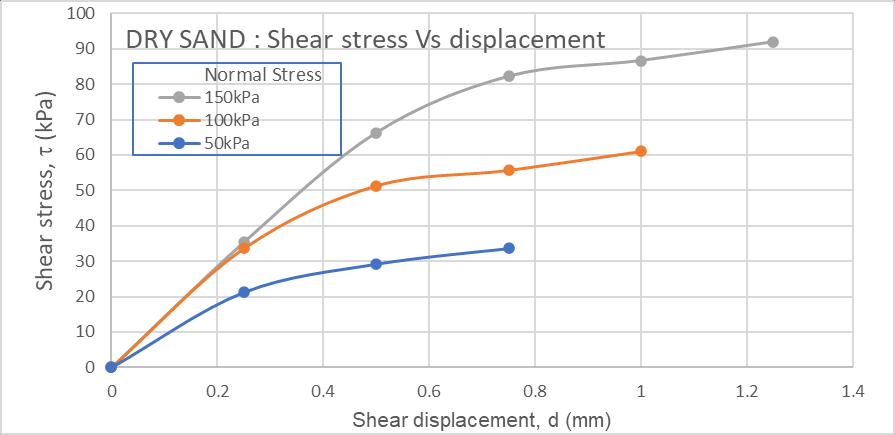
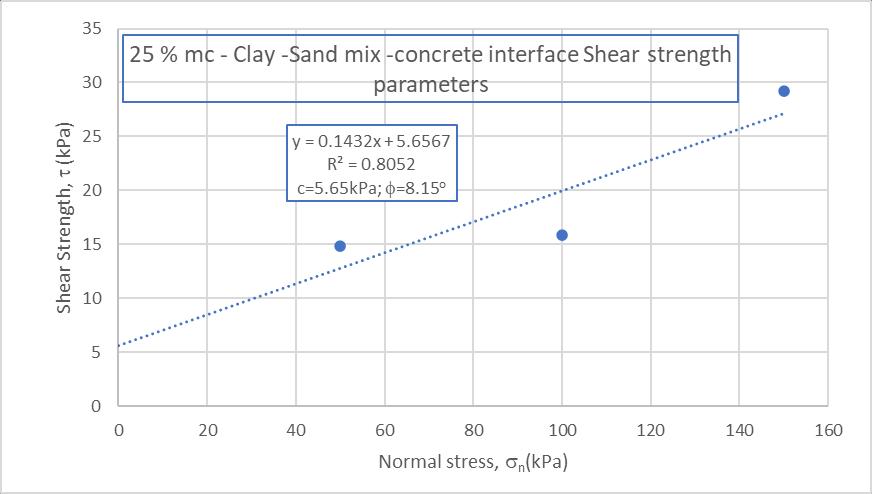
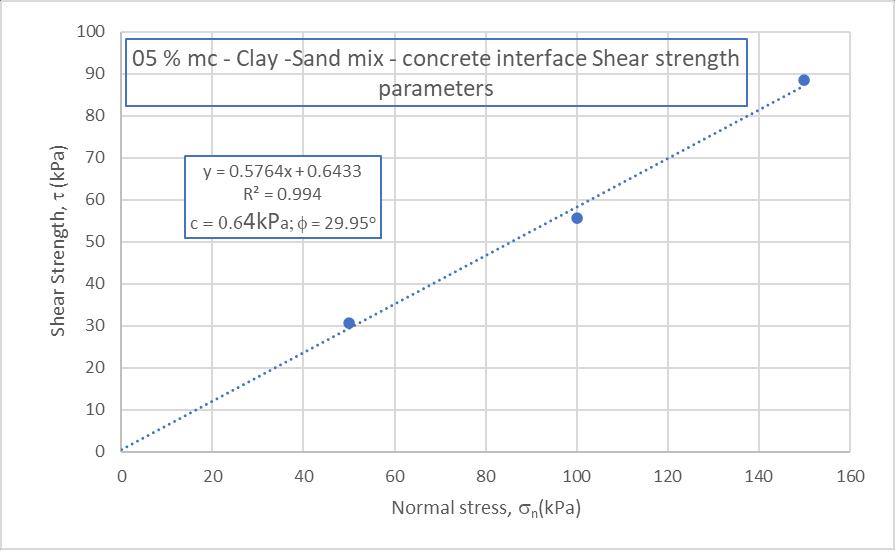
Interface test for shear strength on small scale was conducted for concrete-soil interface in soil mechanics laboratoryatGSKConsultantsPeshawar,byusingtheDirect SheartestapparatusaPre-castconcretesamplewasplaced on lower half portion and soil was also placed above concretespecimen.Soilwasalsocompactedtosamedensity byintroducingfullcontactwiththeconcreteinterface.Tests wasperformedon5%,15%,and25%moisturecontent,by application of different normal stresses we got different Results from series of tests conducted, resulting shear strengthatdifferentmoisturecontentsandnormalstresses as shown in Figure given below. Graphs showed that as shear stress increases, the shear deformation (z) also increases until a maximum shear stress value is reached. Reachingtheultimatestress,theshearstrainalsoincreases ataconstantshearstressandstraightportionofthelineis obtainedbeyondthispoint.Resultsalsoshowthatthereis decrease in the shear strength of interface as moisture content(%)isincreased,Soilsincludeclay,sand,clay-sand mix,clay-limemix.Theinterfaceofconcretewastestedwith thesementionedsoils.


3.3
For the determination of shear strength properties of the interface, direct shear test apparatus is used in the laboratory.Fourmoistureconditionsofzero,5,15and25% areselectedtoo,likeclayintheprevioussection,asshownin figures 3.1 to 3.9. The state of packing is loose as canbe seenfromtheshearstressvssheardisplacementdata andplots.


Fromthefigurethatshowsthecombinedresultsofthetests, it is seen that the effect of moisture content on the shear strengthoftheinterfacebetweentheclay-sand-concreteis largebeyond05%.Thisstrengthdrasticallydecreaseswhen themoisturecontentismorethan05%duetothereduction offrictionalpropertiesofthesystemofclay-sand-concrete.It widensasthenormalstressincreasesseeninthefigure
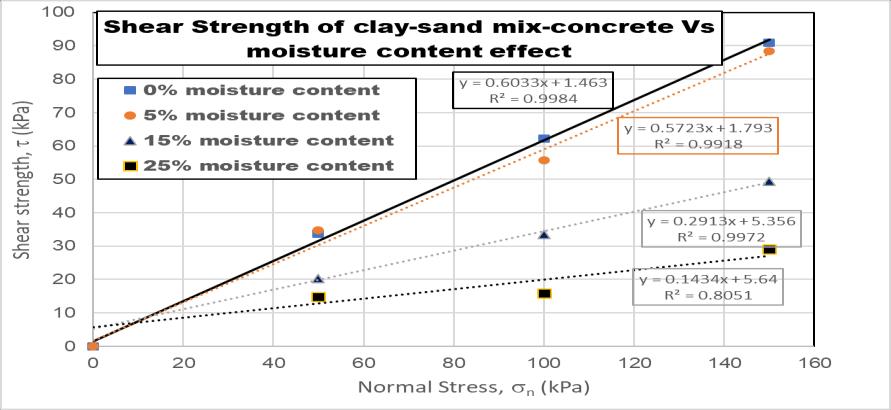



3.4 Clay – Lime – Concrete interface shear strength properties


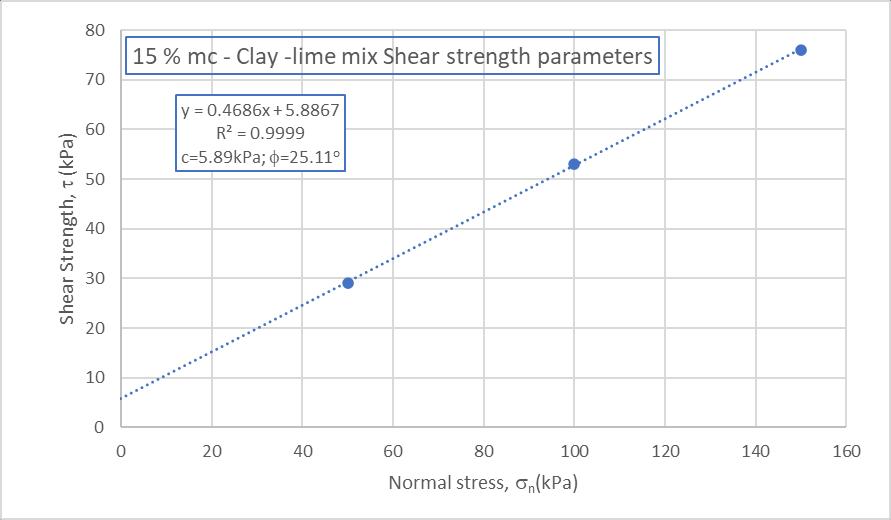


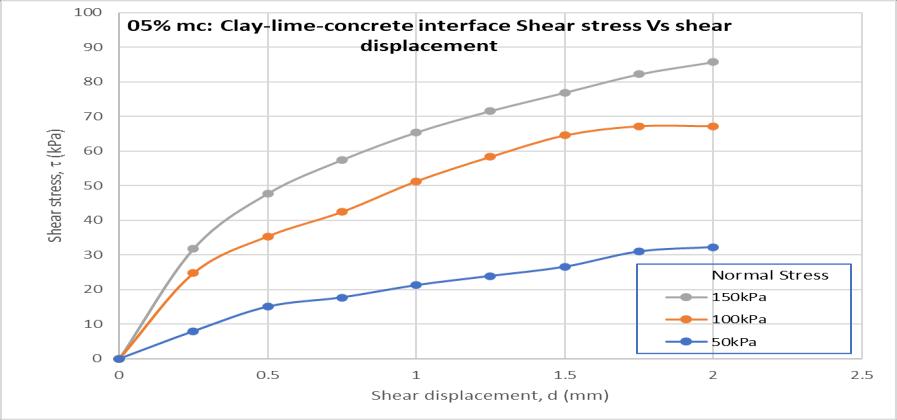
AsClay-limeMixinterfacewastestedthroughdirectshear testapparatusunderdifferentmoisturecontentsandgraphs hasbeenplottedfordifferentmoistureconditions.Following belowresultshasbeenmade:

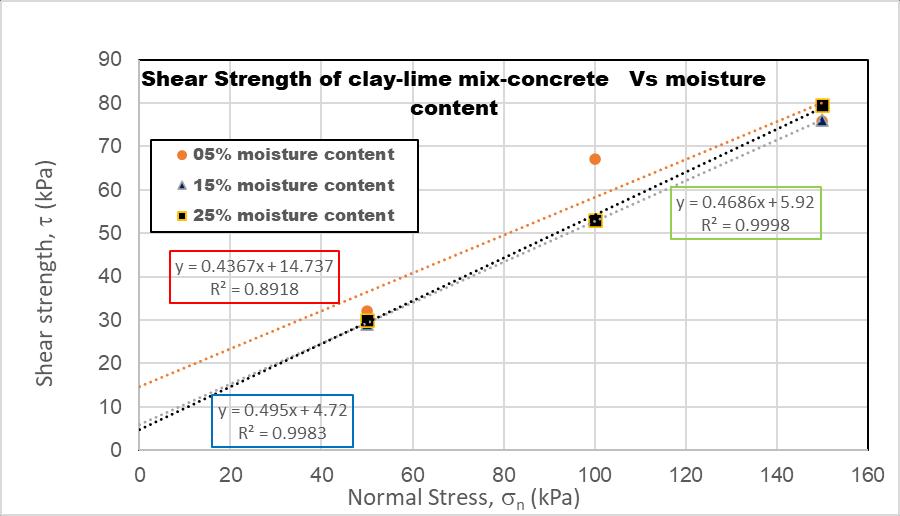
Thecombinedplotoftheeffectofthemoisturecontenton the shear strength shows that there is little bearing of moisturecontentontheshearstrengthbehavioroftheclaylime- concrete interface. However, a slight increase in the angleofinternalresistanceofthesystemcanbeseenwith increaseinmoisturecontentwhichmightbeduetoreaction withclayexchangeions,cation exchangecapacity(CEC) –sodium ion (Na+) being replaced by calcium (Ca+). AccordingtoBell(1996),claysoilcanbestabilizedbythe addition of small percentages, by weight, of lime, thereby enhancingmanyoftheengineeringpropertiesofthesoiland producinganimprovedconstructionmaterial.
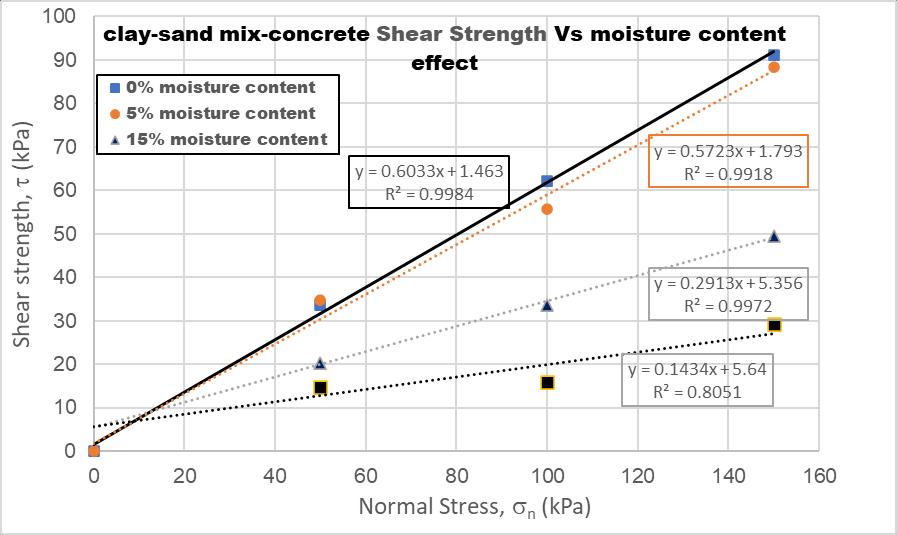


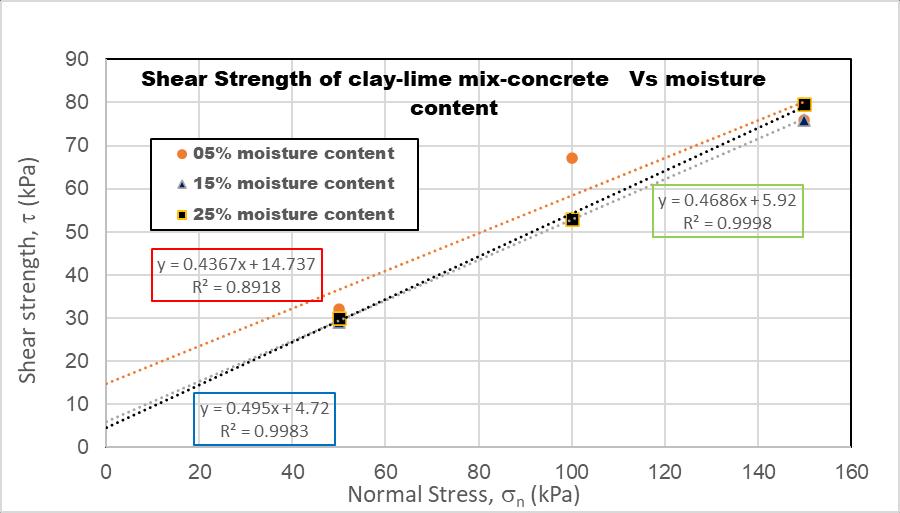
Theoverallscenariooftheeffectofmoisturecontentonthe shearstrengthoftheinterfaceiscollectivelyshownintable 3.1Theinterfacebetweenthesandandconcreteisseento givegoodresultsprovidedthatitisnottarnishedbyclay.

When a trace of clay is found in sand from any means reducestheskinfrictionefficiencyofthesystem.
4. Clay-lime-concrete interface shear strength is little affected;however,frictionalpropertiesareenhancedbutnot verymuch.
Recommendations for future work
Following recommendations are suggested for future work in this specific area
1. Clay mix should be carried out with fly ash, Cement, in order to analyze interface shear strength behavior with concretesample.
2.Sandmixshouldbecarriedoutwithflyash,Cement,and bitumen in order to analyze interface shear strength behaviorwithconcretesample.
4. Summary
This research work was carried for evaluating results of interface shear strength between Concrete-soil interfaces under different moisture content conditions through experimental observations, for this purpose the Concrete interface wastestedagainst clay,sand,clayandsandmix, plusclayandlimemix.Experimentalworkwascarriedout onsmallscale“Interfacesheartestapparatus”atlaboratory. Concrete surface was smooth despite occasional irregularities and constant normal loadings were applied. Claypropertieswerefoundedfirstandthenitwassubjected to interface test on small scale with concrete. Similar procedure for sand and Blends of soil (Clay-sand mix and clay-lime)wascarriedoutforinterfacetestingwithconcrete.
5. Conclusions and Recommendations for future work
Following conclusions are made from this research study
1. Shear resistance of the interface between sand and concreteismaximumandvariationinmoisturecontentis noteffective
2.Theinterfaceresistancebetweentheconcreteandclayis heavily moisture dependent; maximum for dry state and minimumfor25%moisturecontentduetowhichfrictional propertiesarealmostlostwithincreaseinmoisturecontent. The cohesion at 25% moisture content is maximum but creeptypeofbehaviorleadstomaximumsettlement.
3.Thesand-clay-concreteinterfacebehavioriscontrolledby both clay content and moisture content. Increase in both decreasesshearresistance.Incaseofpiling,thesmeareffect ofclaygoingdowntomixwithsanddeterioratedfrictional properties.Butifsandgoesdowntomixwithclay,increases frictionalpropertiesofclaywithconcretepilesurface.
3.Differentmoistureconditionsaresuggestedforinterface shearstrengthphenomenaotherthenusedinthisresearch work.
6. ACKNOWLEDGMENTS
IwouldliketoSincerethankstomySupervisor,Professor HaibingCaiforhisvaluableguidancesupportandfinancial fundingthroughoutmyresearchpaperprocess.Ialsowant to thanks my brother Architect Yar Muhammad and Department’scolleaguesWeijingYao,ShiHu,SchoolofCivil Engineering andArchitecture,AnhuiUniversityofScience andTechnology,Huainan,China,fortheirhelpfulfeedback andsupport.
REFERENCES
[1] Miller, E.A., Sowers, G.F. (1957), “The Strength CharacteristicsofSoil-AggregateMixture.HighwayResearch BoardBulletin,”No:183,pp.16-23.
[2] Liming,H.,andP.JiaLiu.2004,”TestingandModelingof soil-structureinterface,”JGGE130:851-860.

[3] Adunoye,G.O.2014,“Finescontentandangleofinternal friction of a lateritic soil, an experimental study,” AJER 03:16-21.
[4] Akayuli,D.C.,O.Bernard,S.O.Nyako.,andK.O. Opuni. 2013, “The Influence of observed clay content on shear strengthandcompressibilityofresidualsandysoils,”BRRI 3:1-5.
[5] Ahmed, A.A., and Z. K. Jahangir. 2008, “Skin friction betweenundisturbedoverconsolidatedsiltyclaysoilsand concrete,”J.E14:3068-3076.
[6] Gan, J.K.M., D. G. Fredlund, and H. Rahardjo. 1988, “Determination of the shear strength parameters of an unsaturatedsoilusingthedirectsheartest.Can,”Geotech. 25:500-510.
[7] Hammoud, F., and A. Boumekik. 2006, “Experimental Study of the Behavior of Interfacial Shearing between Cohesive Soilsand SolidMaterialsatLarge Displacement” AJCE07:39-44.
[8] Lavanya,I.,R.Prabha,andM.Murugan.2014,“Behavior ofinterfacesbetweencarbonfiberreinforcedpolymerand gravelsoils,”IJRET.3:1-4.
[9] Pakbaz,M.S.,andA.S.Moqaddam.2012,EffectofSand GradationontheBehaviorofSand-ClayMixtures,”GEOMAT 3:1-7.

[10] Potyondy,J.G.1961,“SkinFrictionbetweenVarious SoilsandConstructionMaterials,”GJ11:339-353.
[11] Uesugi,M.andKishida,H.,1986,“Frictionalresistance at Yield between dry sand and mild steel. Soils and foundations,”26(4),pp.139-149.
[12] Zhen,C.,andH.LSchreyer.1986,“Aconstitutivemodel forsimulatingsoil-concreteinterfaces,”IJTE30:60-67.
[13] Shakir,R.R.,andJ.Zhu,2009,“Behaviorofcompacted clay-concreteInterface”.p.1-8.Front.Archit.Civ.Eng.China, 3(1):85–92.
[14] Wang,D.,J.X.Zhang, B.Tian.,andJ.Cao.2011,“The ContrastiveResearchofDirectShearTestonDifferentPileSoilInterface,”ICCET90-93:1743-1747.

[15] Peng,L.,L.JianKun,andC.Yinghui.2013,“Astudyon dynamicshearstrengthonfrozensoil-concreteinterface,” 5(4):408–412.
[16] Wang, L.C., W. Long, and S.J. GAO. 2014, “Effect of MoistureContent,VoidRatioandcompactedSandContent ontheShearStrengthofRemoldedUnsaturatedclay,”EJGE 19:8-11.
[17] Nie,L.,andT.Wang,“2015.Analysisofshearteston pile-soilinterface,”CET46:1-6.
[18] Hong-Fa Xu and Ji-Xiang Zhang. 2020, “Analytical ModelandBack-AnalysisforPile-SoilSystemBehaviorunder Axial Loading,” Volume 2020, Article ID 1369348 https://doi.org/10.1155/2020/1369348.
[19] Parth Akbari and Hardik Patel. 2020, “Review on AnalysisandDesignofPileFoundationConcealingDifferent Soil Layers,” ISSN: 2321-9939. IJEDR 2020 Year 2020, Volume8,Issue1.
[20] Abou El Hosn, G. (2015), "Enhancement of Shaft Capacity of Cast-in-Place Piles Using a Hook System,”(Doctoraldissertation,CarletonUniversity).
BIOGRAPHIES:
Ikram Ullah (PhD)

Corresponding Author & PhD Civil Engineering Student, School of Civil Engineering and Architecture, Anhui UniversityofScienceandTechnology, Huainan,City,AnhuiProvince,China. Current research interest is Pile Foundationanalysisanddesign.

Haibing Cai (PhD)
Supervisor&Professor, School of Civil Engineering and Architecture, Anhui University of ScienceandTechnology,HuainanCity, AnhuiProvince,China

Weijing Yao (PhD)
Associate professor, School of Civil Engineering and Architecture, Anhui UniversityofScienceandTechnology, Huainancity,AnhuiProvince,China.

Shi Hu (PhD)
Lecturer, School of Civil Engineering andArchitecture,AnhuiUniversityof ScienceandTechnology,HuainanCity, AnhuiProvinceChina.
Mohd Kashif Qureshi (PhD)

School of Big data and Mathematics, Anhui University of Science and Technology, Huainan, City, Anhui Province,China
Muhammad Sulaiman (MS)
MS Civil Engineering Graduated (2021), Department of Civil Engineering,CECOSUniversityofIT& Emerging Sciences Peshawar, KPK, Pakistan.
