New Similarity Index for Finding Followers in Leaders Based Community Detection
Sunil Patel1, Dr Kumar Gaurav21M.tech Scholar, Dept. Of Electronics Engineering, HBTU, Uttar Pradesh, India
2Assistant Professor, Dept. Of Electronics Engineering, HBTU, Uttar Pradesh, India

Abstract - Currently, the problem of social research has emerged as a challenge, there have been various debate to understand and analyze human relationships in the network. Many researchers have found ways to search the community and select a leader individually, but the algorithm discussed in this paper is suitable for detection of community and community leaders. Generally speaking, people love to connect with people who share the same behaviour of interest, and to form communities based on shared ideas. A small number of residents in the communityare incharge ofspreading consciousness there, i.e. leader, they represent a group who have conveyed their thoughtsandexperiences.
The existing algorithms are based on modularity optimization techniques. Leader based community detection method is not modularity optimization dependent techniques. The accuracy of this technique decreases as network size increases so this paper tells about a modified similarity indexing in leader based selectionmethodtoincreasetheaccuracyofthemethod.
Keywords Community Detection, Similarity Method, LFR Benchmark
1. INTRODUCTION
A network is defined as group or connection system between people or things. These include a number of devicessuchascomputers,servers,peripherals,humans, etc. These things are known as nodes in the context of network science,andtheconnectionsbetweenthemare knownasedges.Theinternetisoneofthebestexamples ofanetworksinceitconnectsmillionsofindividualstoa single platform and offers a variety of information and services, including the World Wide Web and e-mail. The people gather together in a place called social network. People tend to connect with people who share the same personalityorinterest.Theyformagroupofpeoplewho havecommoninterestandinteractmorewitheachother as compared to others, these group of people are called community. When people within a community interact more, this is referred to as an intercommunity link, and when those outside the community interact less, this is referredtoasanintercommunitylink.
Currently the goal of banks and business houses is to lookforactivegroupsintheirnetworkaswellasintheir customer network. In many communities, some nodes play an important role in innovation, with knowledge andideassharedinthecommunity.Thesenodesactasa catalyst to cause turmoil in community. Many researcherslookforthiscatalystnodeormostimportant personinthecommunity[1].
Identifying useful nodes in the network is one of the biggest tasks. In biological system, identification of important node in communities is important, for example in cancer therapy, which require the identification and destruction of cancer cells from the blood and require the maintenance of the body. The second example is the September 11 attack, which involved a network of 62 nodes and 153 connections made up of 5 communities. To keep these communities in control the owners of these communities should be keptincheck.
Finding the most influential node in a network depends on the network's structure and centrality. In order to determineanode'spowerwithinanetwork,centralityis utilizedtodetermine whichnodeisthe mostinfluential. There exist two types of centrality local centrality and global centrality [2]. Local centrality includes degree centrality and betweenness centrality. The total number offocalnodesconnectingonenodetoanotherisusedto determine degree centrality. The shortest path between each pair of nodes is used to determine betweenness centrality. Closeness centrality is a sort of global centralitythathasaninverseconnectionwiththesumof shortest distances between network nodes. This influential node acts as tools in community to share ideasandinformationmakingcommunitypowerful.
2. LITERATURE REVIEW
The research related to community detection has been started by Girvan and Newman [3]. They proposed GN algorithm in 2002 that detects the community by continuously removing the edges according to the betweenness centrality but this algorithm cannot be applied to large network. They also coined the term "modularity" to describe the strength of a community's
structure. In 2006 a new method was introduced by Pascal pons and Mattieu Latapy called as Walk Trap method [4]. This method works can be applied in directed network. In 2008 again Girvan and Newman improved the algorithm to increase the speed of community detection. This was called Leading Eigen Vector [5]. A new method called Louvain Algorithm was introduced in 2008 by Blondel et al. This is also called fast unfolding method; it works in two phases: Modularity Optimization and Community Aggregation [6]. This method increases the speed of detection along with its modularity. This method is unable to detect internally disconnected community.V.A Traag et al discovered the problem in Louvain method and proposed a solution called Leiden Method [7]. It operates in three stages: (1) local node movement, (2) partitionrefinement,and(3)networkaggregationbased on refined particles. The above algorithm mentioned optimizes the modularity. Santo Fortunato et al. found that modularity optimization may not work if modules identifiedareofsmallersizecomparedtothesizeofthe network [8].In 2014 Sorn Jarukemratana et al. detected the community on the basis of centrality and node closeness [9]. In 2020 leader-based community detection was introduced by A. sarwani etal. which was divided in two stages. First we leader is found then accordingtotheleaderfollowersare foundaccording to thesimilarityindex.
3. PROBLEM STATEMENT
The existing algorithms in community detection are based on modularity optimization techniques. Leader basedcommunitydetectiondoesnotincludemodularity, but similarity. The existing Leader based community detection fails for the network size above 2000 nodes. Here in this paper we shall discuss the method for the selection of the followers which helps in detecting community using LBSD for network size above 2000, maintainingitsaccuracy.
4. LEADER BASED COMMUNITY DETECTION
Leader-based community detection is a method used to identify communities or clusters within a network or graph structure. This approach relies on the concept of leaders, which are nodes that act as representatives or centralpointsfortheirrespectivecommunities.
Leader-based community detection is a method used to identify and analyze communities within a network or graph.Thisapproachinvolvestheconceptof"leaders"or "representatives" that act as central nodes within their respectivecommunities.Byidentifyingtheseleadersand examining their connections, it becomes possible to
uncover cohesive groups of nodes that share similar attributes or exhibit strong interconnections. Leader Based Community Detection involves three steps. The initial step is to locate or pick the network's leader nodes.Thenextstageistolocateallofthefollowerswho arepresent.Afterfindingall the followers wewill check if any isolated node is present or not if isolated node is found it is added list of followers. Now all the followers form a community for a particular leader and this communityisremovedfromthenetwork.
4.1 LEADER SELECTION
In each community there is most important nodes ,the most important nodes we consider as a leader of the community. To measure the importance of nodewecalculatethecentralityofanyeachnode. argmax
There is various method available to measure the centrality of any network. To find the leader of the community we calculate the centrality of the network of each node. To calculate the centrality, we have used eigen vector centrality method. It measuresthecentralityofthenodeconsideringthe neighbors of node. The eigenvector centrality for node i is theith element of the vectorxdefined by theequation
Ax=x (2)
WhereisAistheadjacencymatrixofgraphGand is eigen value. The node with maximum centrality valueisselectedastheleadernode.
4.2 FIND THE FOLLOWER
To find the follower nodes of the particular leader node,similaritywiththeleadernodeismeasured.
Inthispaperanewtomethodtofindfollowernode hasbeenproposed.
Graph G(u,v), A is the leader node of Graph ,B is nodeofGraph, isthenumberofcommonneighbor ofleadernodeandnodeB,YistheDegreeofB (3)
TheFollowerIndexvaluedefinethehowstrengthof connectivitybetweenbothnodeits valuevariesfrom1to0

4.3 FINDING THE COMMUNITY
In this step wefind any isolated node which is part of the community but not detected by this method. to find such isolated node we calculate the connectedcomponentofthenetwork.ifanyisolated nodes available in network we add that isolated network to the community. the communities have alreadybeendetected,ifanyisolatednodehasbeen detecteditismergedwiththecommunity.
5. STEPS FOR COMMUNITY DETECTION
Step1:Calculatethenodecentralityofthe network.
Step2:Considerthenodewithmaximumcentralityas theleadernode.
Step3:Calculatethefollowerindexofeverynodeusing eqn(1)
Step4: Arrangethenodesinascendingorderaccording tothefollowerindex.
Step5:Allthenodeswhosefollowerindexvalueis greaterthanthresholdvalueisremovedfrom thegraphandaddedtothecommunity.
Step6:Checkallthenodes,ifanyisolatednodeis founditisaddedtothecommunityand removedfromthegraph.
Step7:Checkthegraph,ifanynodeisfoundgotoSTEP 1.
Step8:Ifnonodeisfoundterminatethealgorithm,all thecommunitiesarefound.
6. SIMULATION STEPS
ThissectionsimulatesCommunitydetectionalgorithmto obtain a leader using similarity method. We have performed the simulation in Python Language in Anaconda Navigator. The code is executed onJupyter Notebook in Anaconda Navigator on an Intel(R)Core
(TM) i5-7200UCPU running at2.50GHz with 16GBRAM onWindows1064-bits.
The synthetic network is created using LFR Model [10]. The performance of the community detection is measured using Normalized Mutual Information (NMI) andAdjacentRankIndex(ARI)[11].
6.1 EVALUATION METRICS
To measure the performances of community detectionbycomparingwithgroundtruth.
Adjusted Rand index(ARI): The Adjusted Rand Index (ARI) is a measure of the similarity between ground truth and detected community, but it has the disadvantage of being sensitive to chance. ARI ranges from-1 to 1. Negative 1 means there is no agreement between ground truth and detected community and 1 means there is full agreement betweengroundtruthanddetectedcommunity.Let a,b,candddenotethenumberofpairsofnodesthat arerespectivelyinthesamecommunityinGandR, in the same community in G but in different communities in R , in different communities in G but in same communities in R and in different communities in G and R then ARI is computed by thefollowingformula[11]
ARI= (2 �� )(��+��) [(��+��)(��+��)+(��+��)(��+��)]
(2 �� )2 [(��+��)(��+��)+(��+��)(��+��)] (4)
NORMALIZED MUTUAL INFORMATION (NMI): NormalizedMutualInformation(NMI)isameasure usedtoevaluatenetworkpartitioningperformedby communityfindingalgorithms.TocomputetheNMI weusefollowingformula[11]
NMI(G,R)= 2����(��,��) ��(��)+��(��) (5)

Where I(G,R) mutual information of G and R H(G) andH(R)isentropy
Itsvaluerangefrom0to1.
6.2 DATASET
The proposed method is run on synthetic network social network. there are limited number of real social network dataset are available. There are various model available to generate the social network but LFR model is network is so close to real world network and give better control to generatetonetwork.
7. SIMULATION
A synthetic network is created and leader-based community detection method is applied to it. The various parameter considered to make synthetic networkare:
TABLE1:ParametersofLFR
7.1 STEPS OF SIMULATION
Step1:Createanetwork.
Step2:Definethethresholdvalue.
Step3:Applytheabovealgorithmonthenetwork.
Step 4: If number of detected communities is less than The Number of ground truth community, update ThethresholdvalueandgotoSTEP2.
Step 5: Calculate the NMI, ARI value. Step 6: Store the results Step 7: Plot theresult.

8. RESULTS
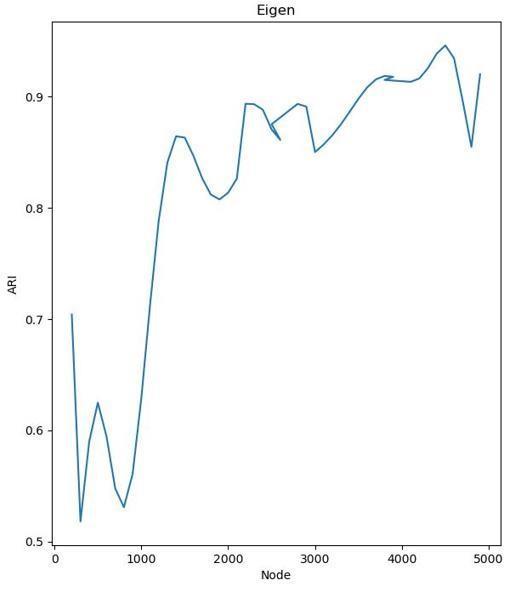
a) To find the accuracy of the algorithm, we plot the graph between number of network size and ARI value. This is shown in fig 1. The graph showsthatARI value will lie between 0.8 to 0.9 asnetworksizeincreasesfrom2000to4000.
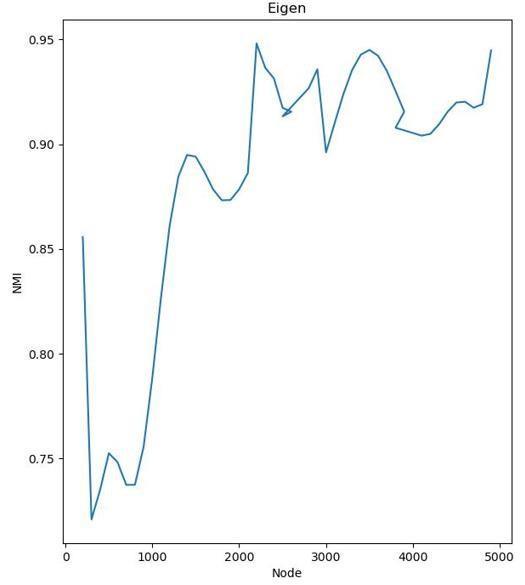
b) To find the accuracy of the algorithm, we plot thegraph between number ofnetwork size and NMI value. This is shown in fig 2. The graph shows that NMI value will lie between 0.85 to 0.95 as network size increases from 2000 to 4000.


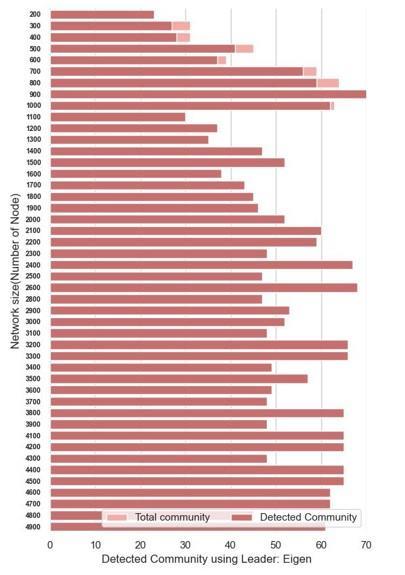
c) Plot between number of detected community andnumber of ground truthcommunity. This is showninfig3.Thisgraphshowsthatnumberof communities found are equal in number to the numberofcommunitiesformedbyLFR
Benchmarkalsocalledasgroundtruth.
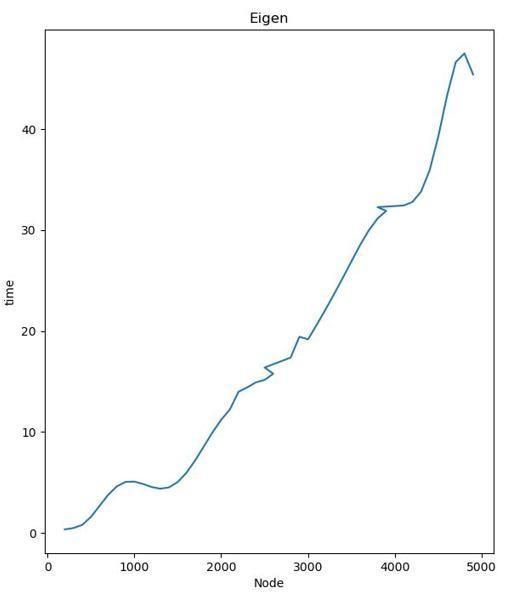
This is shown in fig 4. This graph shows that as the networksizeincreases,theexecutiontimealsoincreases alongit.


9. CONCLUSION
The aim of this paper was to detect the community in thelargenetworkwithoutusingmodularityoptimization with high accuracy. The leader based community detectionwasusedforthispurposeasitisthetechnique which does not uses modularity optimization. The drawbackofthismethodisthatfornetwork sizegreater than 2000, it fails to detect the community and the accuracy of this method decreases. To overcome this problem,wehaveused“NewSimilarityIndexforFinding FollowersinLeadersBasedCommunityDetection”
The ARI value ranges from 0.8 to 0.9 for the network withnodesizebetween2000-4000.TheNMIvalueranges from0.85to0.95forthenetworkwithnodesizebetween 2000-4000.These results shows that the proposed similaritymethodforthecommunitydetectioniscapable to detect the community in the network size range of 2000-4000 with high accuracy. The disadvantage this algorithm is that the time increases with the network size.
REFERENCES
[1] Wang, Y., Di, Z., Fan, Y., Identifying and characterizing nodes important to community structure using the spectrum of the graph. PLoS One6(11),p.e27418,(2018).
[2] Gao,S.,Ma,J.,Chen,Z.,Wang,G.,Xing,C.,Ranking the spreading ability of nodes in complex networks based on local structure. Phys. Stat. Mech.Appl.403,130–147,(2014).
[3] Girvan, Michelle, and Mark EJ Newman. "Community structure in social and biologicalnetworks."Proceedingsofthenational academyof sciences99.12(2002):7821-7826.
[4] Pons, P., Latapy, M.. “Computing Communities in Large Networks Using Random Walks”. In: Yolum,p.,Gungor,T.,Gurgen,F.,Ozturan,C.(eds) Computer and Information Sciences - ISCIS 2005. ISCIS 2005. Lecture Notes in Computer Science,vol3733.Springer,Berlin,Heidelberg

[5] M. E. J. Newman, “Finding community structure in networks using the eigenvectors of matrices,” PhysicalReviewE,vol.74,no.3,Sep.2006
[6] Blondel, V. D., Guillaume, J.-L., Lambiotte, R., and Lefebvre, E., “Fast unfolding of communities in large networks”,Journal of Statistical Mechanics:
Theory and Experiment, vol. 2008, no. 10, p. 10008,2008.
[7] Traag, V.A., Waltman, L. & van Eck, N.J. “From Louvain to Leiden: guaranteeing well-connected communities”.SciRep 9,5233,2019
[8] A. Lancichinetti, S. Fortunato, and F. Radicchi, “Benchmark graphs for testing community detectionalgorithms,”PhysicalReviewE,vol.78, no.4,Oct.2008
[9] S. Jarukasemratana, T. Murata, and X. Liu, “Community Detection Algorithm based on Centrality and Node Closeness in Scale-Free Networks,” Transactions of the Japanese Society for Artificial Intelligence, vol. 29, no. 2, pp. 234–244,2014

[10] Avani Kesarwani, Ashutosh Kumar Singh, Kumar Gaurav, and Ashok Kumar Shankhwar,“LeaderSimilarityBasedCommunity Detection Approach for Social Networks,” Nov. 2020
[11] Liu, Xin, Hui-Min Cheng, and ZhongYuanZhang."Evaluationofcommunitydetection methods." IEEE Transactions on Knowledge and DataEngineering32.9(2019).
[12] Dao, V., Bothorel, C., & Lenca, P. (2020).“Community structure: A comparative evaluation of community detection methods.” NetworkScience,8(1),1-41.
[13] Taha, Kamal. "Detecting disjoint communities in a social network based on the degrees of association between edges and influential nodes." IEEE Transactions on Knowledge and Data Engineering 33.3 (2019): 935-950
