Volume: 10 Issue: 07 | Jul 2023 www.irjet.net


Volume: 10 Issue: 07 | Jul 2023 www.irjet.net

Abstract - The development of small, localized pits causes distributed faults in rolling element bearings. This raises the cost of maintaining industrial machinery by causing rotor systems to fail prematurely or even catastrophically if not promptly monitored. This study proposed a technique for diagnosing rolling element bearings using vibration analysis (VS) to find distributed problems. The internal experimental test rig was created and constructed to allow for the experimental investigation of the vibrational properties of distributed faults. Analytical models are contrasted with experimental outcomes. Here, the thresholdlifeofanybearing may be predicted after the introduction of the flaw.
Here, localized and spread defects are compared, and the vibrational signatures of both are correlated with healthy bearings. This studyoffersamethodforestimatingthe bearing life following the introduction of a fault.
Key Words: Bearing failure, life of bearing, vibration-based analysis, etc
Thenumberofrotationsabearingcanwithstandbefore failingduetorollingfatigueorfailureoftheinnerring,outer ring,orrollingelement(ballorroller)aretwowaysthatthe service life of a bearing is stated. When equipment or a machinecomponentfailsundertheprescribedconditionsof use as stipulated by its manufacturer, it is said to have reachedtheendofitsratedlife.Thebearing'sservicelifeis different from its rated life because it may fail due to improperlubrication,misalignment,andmountingdamage beforeitreachesitsreallife.
The bearing's mounted accelerometer collects data, which is then analyzed on an FFT analyzer. Separating undesired data from other energy sources within the machine is a crucial component of processing. By incorporatingselectivedigitalfilteringintothesoftware,this is accomplished. In this study, data from damaged and undamaged bearings are compared to pinpoint the flaw. After a set amount of time, the bearings are regularly monitoredto see if they are operating within acceptable limits.
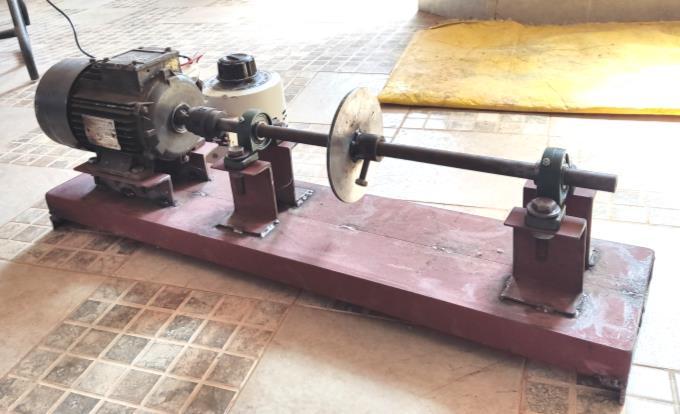
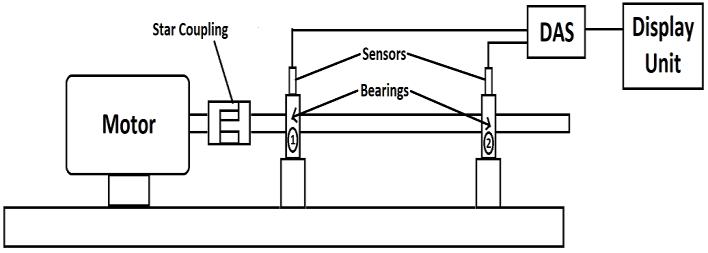
Theproposedexperimentalsetupshowninfig.no.2 is rotor bearing system used for study. Numbers of experiments were executed and validated with Analyticalresults.
Toapplysameloadingcondition,wechoosediscofsteel withdiameter150mmandthicknesshaving5mm.
D=150mm
t=5mm
V=π/4*(r2)t =π/4*(0.0752)*0.005 =0.0000221m³
Ρ=m\v
m=ρ*v=7850*0.0000221=0.1735N
m=1.702kg
F=m*g=1.702*9.81=16.69N
Ꞇ =F*L=16.697*0.29
HereL=0.29m
Ꞇ =4.84Nm
P=2πNꞆ/60
P=2π*1440*4084/60
P=729.85W
P = 0.72985 KW
P = 0.978 hp
Therefore,weselectmotorhaving1HPpowerand1440 RPM.
Shaft Calculation:
PowerofMotorP=1Hp=0.746Kw
N=1440rpm
Sytvalueofsteel=265N/mm2
FOS(FactorofSafety)=3
ςt =Syt/FOS =265/3
σt =88.33 N/mm2
Ꞇ =0.5Syt/FOS =0.5×265/3
Ꞇ =44.165 N/mm2
A) Shaft is subjected to pure bending load:
ςt =ςb=Mb×Y/I =Mb/(π/64)d4 ×(d/2)
ςt =Mb/(π/32)d3
Mb =180×16.69/2
Mb = 1502.1 N/mm2
d =(Mb/(π/32)ςt)1/3 =(1502.1/(π/32)88.33)1/3
d =13.161mm
B) Shaft subjected to Torsion moment:

Ꞇ =(Mt/J)×R
R =d/2
Mt=(P×60×106)/(2πN) =(0.746×60×106)/(2π×1440)
Mt = 4947.06 Nmm
Ꞇ =[Mt/(π/32)d4]×(d/2)
Ꞇ =16Mt/πd3
d =(16×4947.07/π×44.165)
d = 8.29 mm
Fromthisweselected20mmdiameterofrod.
Theexperimentsareperformedat1440rpmrotorspeed and16.7Nradialload.Thelengthoftheshaftfortherotor bearing system is 290mm, and diameter of the rotor is 20mm. the shaft is supported by two bearing (bearing number:UCP204)atthedriveandnon-driveend.
TherotorspeedisvariedbyDimmerstat.theconditionof thebearingmountedtowardsloadingarrangementsideis monitoredbyusinganaccelerometer.Bearingundertestis placed at this position only. The accelerometer is placed rightabovethebearingcasingperpendiculartotheaxisof therotationoftheshaftinsuchawaysothatitcanacquire verticalacceleration.
Vibration analysis by using FFT analyzer and the software named is T-ViB sound and vibration analysis software has been used for the frequency analysis of the bearings.
2.3.1.
Piezo-Electric accelerometer is used as sensor. It is an accelerometer that employs the piezo electric effect of certainmaterialtomeasuredynamicchangesinmechanical variables (Ex. Acceleration, vibration, and mechanical shock).
Using the general sensing method upon which all accelerometers are based, acceleration acts upon seismic mass that is restrained by a spring or suspended on a cantilever beam and converts a physical force into an electrical signal. Before the acceleration can be converted into an electrical quantity it must first be converted into eitheraforceordisplacement.
Accelerometer:S/N372662
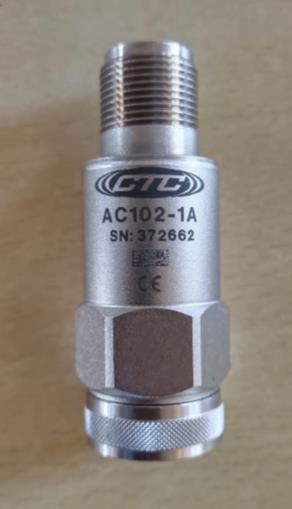
Sensitivity:95.51mV/g
BIAS:12.06V
International Research Journal of Engineering and Technology (IRJET) e-ISSN: 2395-0056

Volume: 10 Issue: 07 | Jul 2023 www.irjet.net p-ISSN: 2395-0072
2.3.2. DAS (Data Acquisition System) – FFT Analyzer:
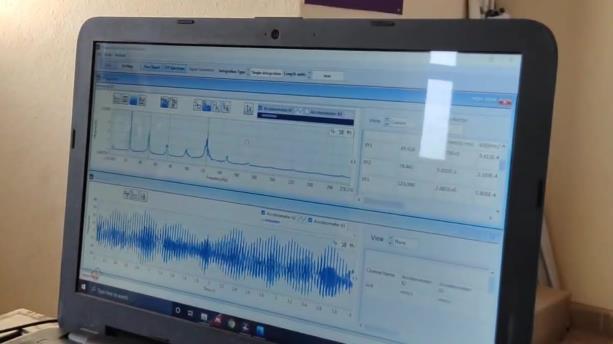
Dataacquisitionistheprocessofsamplingsignalsthat measures real-world physical condition and converting resulting sample into digital numerical values that can be manipulatebycomputer.
2) Outerracedefectivefrequency(Fdo)
Fdo =(ZN/2)×(1-(d/P)cosα)
=(8×1440/2)×(1-(7.94/34.56)cos0) =4436.67cpm =73.94Hz
3) Rollingelementdefectivefrequency(Fdr)
Fdr =(PN/2d)×(1-(d/P)²cos²α) =(34.56×1440/2×7.94) ×(1-(7.94/34.56)²cos²0) =2968.49cpm =49.47Hz
4) Cagedefect =1.5×N =1.5×1440 =2160cpm =36Hz
4. RESULT AND DISCUSSION
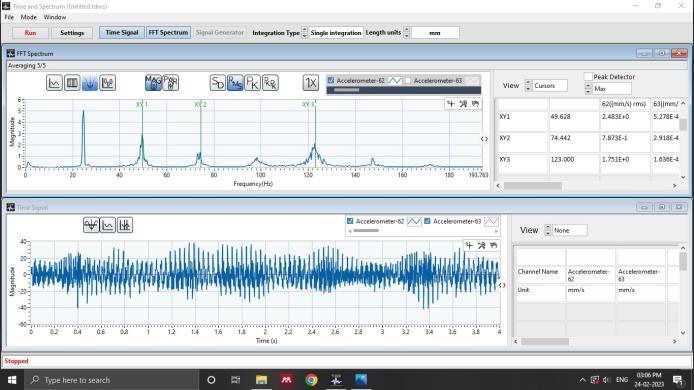
Herearesomeimagesofthereadingswegotduringthe experimentation:
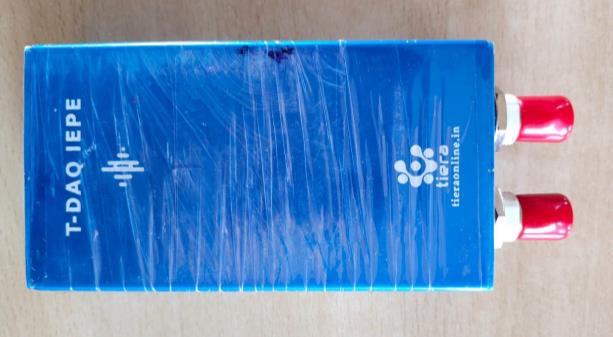
Itdisplaysthedataindigitalformat.T-ViBsoundand vibrationanalysissoftwareisused.
3. ANALYTICAL ESTIMATION OF DEFECT FREQUENCIES
TocalculateDefectfrequenciesofAntifrictionBearings werequired
N=1440rpm
d=7.94mm(diameterofballofbearing)
P=17.28×2=34.58mm
Z=8(no.ofballsofbearing)
α=0(helixangle)
1) Innerracedefectivefrequency(Fdi)
Fdi =(ZN/2)×(1+(d/P)cosα) =(8×1440/2)×(1+(7.94/34.56)cos0) =7083.33cpm =118.055Hz
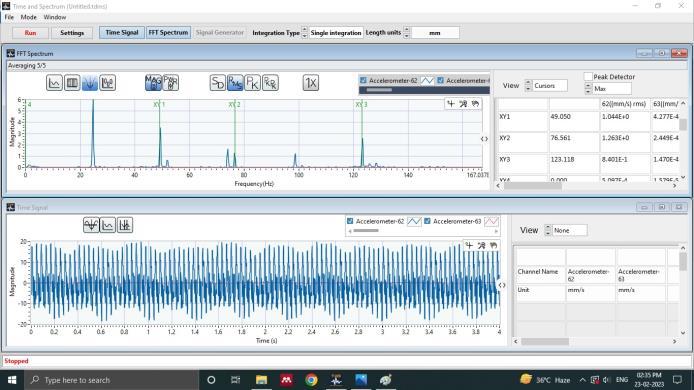
Here(Fig.no-6)cursoriskepton49.05(rollerelement defect),76.56(outerracedefect)and123.118(innerrace defect)forwhichweget1.044mm/s,1.263mm/sand0.84 mm/svaluesofamplituderespectively
Here(Fig.no-7)cursoriskepton49.62(rollerelement defect), 74.44 (outer race defect0 and 123 (inner race defect) for which we get 2.48 mm/s, 0.78 mm/s and 1.75 mm/svaluesofamplituderespectively
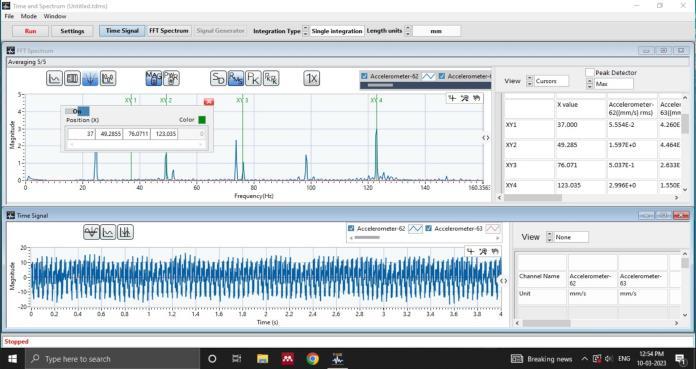
Here(Fig.no-10)cursoriskepton49.28(rollerelement defect),76.07(outerracedefect)and123.035(innerrace defect) for which we get 1.59 mm/s, 0.50 mm/s and 2.99 mm/svaluesofamplituderespectively

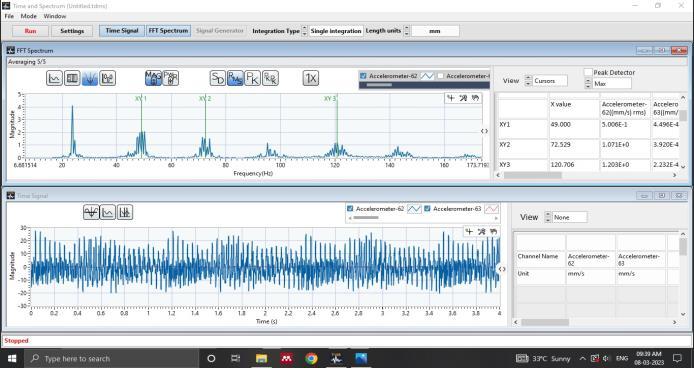
HeretheUppergraphrepresentsfrequencydomainand loweronerepresentstimedomaingraph.
Forourexperimentationwehaveconsideredfrequency domaingraphonwhichxaxisitrepresentsmagnitudeandy axisrepresentsfrequency(hz).
Here (Fig. no-8) cursor is kept on 49 (roller element defect), 72.52 (outer race defect) and 120.70 (inner race defect) for which we get 0.50 mm/s, 1.07 mm/s and 1.20 mm/svaluesofamplituderespectively
The3-defectedfrequencywhichwecalculatedforroller element,outerracedefectandinnerracedefectare49.47 Hz,73.94Hz,118.055Hzrespectively.InFrequencydomain graphXY1peakrepresentsrollerelementdefect,XY2peak representsouterracedefectandXY3peakrepresentsinner race defect so according to it we put the cursor on the followingpointsandobtainedamplitudepeaksforthem.As thedefectisbeenintroducedtobearing2(Fig-2)soreadings areobtainedfromaccelerometer62whichconnecttoFFT channel A. To get precise value 5 times averaging is done whicharesuperimposedoneachother.
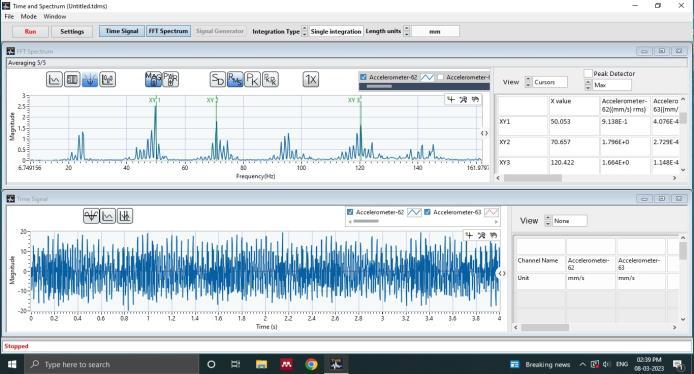
Here(Fig.no-9)cursoriskepton50.05(rollerelement defect), 70.65 (outer race defect) and 120.44 (inner race defect) for which we get 0.91 mm/s, 1.79 mm/s and 1.66 mm/svaluesofamplituderespectively.
The values obtained from the experimentation a graphicalrepresentationisdoneinwhichx-axisrepresents hrs. which is independent function and y-axis represents frequencywhichisdependent
From fig. no1[2] we studied that different satisfactory andunsatisfactoryconditionsofvibrationsofbearingwhich dividedintofourclasses.Fromfig.no1[2]VibrationSeverity ISO10816wecametoknowthat4.5mm/sthereisadefect whichcannotbeprevent.So,afterthatconditionwechange thebearing.
3differentgraphsareplottedfor3differentdefects.after plottingthegraphleastsquaremethodisusedtopredictthe futurepoints.
leastsquaremethodisnothingbutastatisticalprocedure tofindthebestfitforasetofdatapointsbyminimizingthe sum of the offsets or residuals of points from the plotted curve.
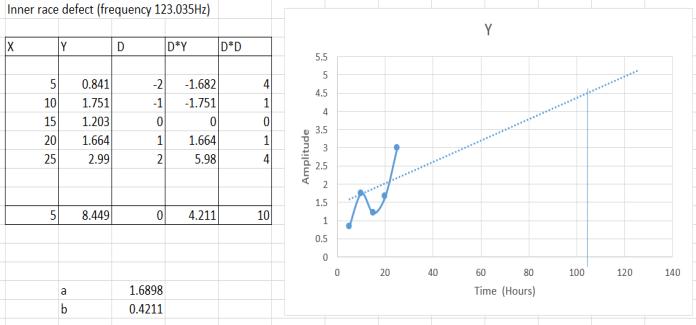
Leastsquaresregressionisusedtopredictthebehavior of dependent variables. After finding the best fit line a progressionoflinefrom4.5mm/samplitudeisdoneonbest fit line the graph point at which intersection occurs from threetherea strain projectionon xaxisthatishr.isdone whichdonewhichcancalledasthresholdlifeofbearingthat isthe of hr. of timesupto which bearing canstill be used afterbeenuseddefectisoccurred.
Generally,whateveryonedoesthatoncethatthedefect inbearingisdetectedthecompanyreplacesthebearingwith new one but from our study, we came to know that immediatelyreplacementofbearingisnotnecessary.
In our study we purposefully introduced the defect on innerraceandcarriedtheexperimentandformwecameto knowthatevenifthedefectisintroducedthebearingstill canbeusedforapprox.104hrs.safely.
But here some unwanted noise occurs. Which can be removedbyproperlubricantwhicheventuallyincreasesits life.
[1] R. K. Upadhyay, L. A. Kumaraswamidhas, and M. S. Azam,“Rollingelementbearingfailureanalysis:Acase study,” Case Stud Eng Fail Anal,vol.1,no.1,pp.15–17, Jan.2013,doi:10.1016/j.csefa.2012.11.003.
[2] B.Artono,A.Susanto,andN.A.Hidayatullah,“Designof Smart Device for Induction Motor Condition Monitoring,”in Journal ofPhysics:ConferenceSeries,IOP Publishing Ltd, Mar. 2021. doi: 10.1088/17426596/1845/1/012035.
[3] D.KumarPrasad,M.Amarnath,andH.Chelladurai,“An experimentalapproachtostudytheeffectofwearon traction coefficient and dynamic response of roller bearing,”in Materials Today: Proceedings,ElsevierLtd, 2019, pp. 9889–9892. doi: 10.1016/j.matpr.2021.01.408.
[4] E. Wescoat, L. Mears, J. Goodnough, and J. Sims, “Frequencyenergyanalysisindetectingrollingbearing faults,” Elsevier B.V., 2020, pp. 980–991. doi: 10.1016/j.promfg.2020.05.137.
[5] G. L. Suryawanshi, S. K. Patil, and R. G. Desavale, “Dynamicmodeltopredictvibrationcharacteristicsof rolling element bearings with inclined surface fault,” Measurement (Lond), vol. 184, Nov. 2021, doi: 10.1016/j.measurement.2021.109879.
[6] L.Renaudin,F.Bonnardot,O.Musy,J.B.Doray,andD. Rémond, “Natural roller bearing fault detection by
angular measurement of true instantaneous angular speed,” in Mechanical Systems and Signal Processing, Academic Press, 2010, pp. 1998–2011. doi: 10.1016/j.ymssp.2010.05.005.
[7] L.H.Zhao,Q.C.Li,J.Z.Feng,andS.L.Zheng,“Service life prediction method for wheel-hub-bearing under randommulti-axialwheelloading,” Eng Fail Anal,vol. 122, Apr. 2021, doi: 10.1016/j.engfailanal.2020.105211.
[8] J. Viola, Y. Q. Chen, and J. Wang, “FaultFace: Deep Convolutional Generative Adversarial Network (DCGAN)basedBall-Bearingfailuredetectionmethod,” Inf Sci (N Y), vol. 542, pp. 195–211, Jan. 2021, doi: 10.1016/j.ins.2020.06.060.
[9] J. Park, S. Kim, J. H. Choi, and S. H. Lee, “Frequency energyshiftmethodforbearingfaultprognosisusing microphonesensor,” Mech Syst Signal Process,vol.147, Jan.2021,doi:10.1016/j.ymssp.2020.107068.
[10] N.W.NirwanandH.B.Ramani,“Conditionmonitoring andfaultdetectioninrollerbearingusedinrollingmill by acoustic emission and vibration analysis,” in Materials Today: Proceedings, Elsevier Ltd, 2021, pp. 344–354.doi:10.1016/j.matpr.2021.05.447.
[11] R. Kumar and M. Singh, “Outer race defect width measurement in taper roller bearing using discrete wavelet transform of vibration signal,” Measurement (Lond), vol. 46, no. 1, pp. 537–545, 2013, doi: 10.1016/j.measurement.2012.08.012.
[12] P. Maurya, N. Mulani, C. Michael, and D. Jebaseelan, “Failure Analysis of Drive Axle Shaft failed under TorsionalStress,” IOP Conf Ser Mater Sci Eng,vol.1128, no. 1, p. 012011, Apr. 2021, doi: 10.1088/1757899x/1128/1/012011.
[13] P. K. Kankar, S. C. Sharma, and S. P. Harsha, “Fault diagnosis of rolling element bearing using cyclic autocorrelation and wavelet transform,” Neurocomputing, vol. 110, pp. 9–17, Jun. 2013, doi: 10.1016/j.neucom.2012.11.012.
[14] M. S. Rao, “Reliability Analysis based Condition Monitoring of Process Equipments,” 2017. [Online]. Available:www.internationaljournalssrg.org

[15] N. D. Dhote et al., “A Case Study-Failure of Roller Spherical Bearing of Shakeout Used In Foundry Industry,”2014.[Online].Available:www.ijesi.org
[16] P. M. Jadhav, S. G. Kumbhar, R. G. Desavale, and S. B. Patil, “Distributed fault diagnosis of rotor-bearing system using dimensional analysis and experimental
International Research Journal of Engineering and Technology (IRJET) e-ISSN: 2395-0056

Volume: 10 Issue: 07 | Jul 2023 www.irjet.net p-ISSN: 2395-0072
methods,” Measurement(Lond),vol.166,Dec.2020,doi: 10.1016/j.measurement.2020.108239.
[17] V. G. Salunkhe, R. G. Desavale, and T. Jagadeesha, “A numericalmodelforfaultdiagnosisindeepgrooveball bearing using dimension theory,” in Materials Today: Proceedings, Elsevier Ltd, 2021, pp. 3077–3081. doi: 10.1016/j.matpr.2021.06.072.