ANALYSIS AND DESIGN OF VYTILA’S WATCH TOWER INTO AIR PURIFICATION SYSTEM
INTRODUCTION
Pollution has become one of the most debated and concerned topics of all time by global citizens. Air and water pollution are the most significant. There are also many more types of pollution like soil contamination, noise pollution, light pollution, etc. Air pollution is the largest cause of pollution death, responsible for about 6.5 million deaths according to a recent study. It refers to the contamination oftheatmosphere byharmful chemicalsor biological materials. Air quality is disturbed by the interaction between natural and anthropogenic environmental conditions. People exposed to poor-quality air result in major health issues. These all reflect the urge for innovations and advancements that can make the best use of science and technology. To handle the increasingly serious air pollution issue, the concept of an atmospheric air purification tower already has been proposed. The prototype of such a novel system had been built in Xian, China. A 60-meter-high chimney stands in a sea of highrise buildings. Our project topic is inspired by China’s air purification tower. Air pollution contributes to the prematuredeathsof2millionIndianseveryyear.
PROBLEM IDENTIFICATION
Outdoorairpollutionissuesarenotcommonlyconsidered compared to indoor air pollution, nevertheless, the AQI in our city has been compromised lately. The prominent Air pollutantinVytilaisPM2.5 whichisharmfultoourimmune system.Duetothesereasons,anairpurificationtowerwill bethebestsolutionthatcanbeimplemented.
OBJECTIVES
Themainobjectivesoftheprojectare:
1. To collect the information of air quality index of Vyttila


2. To prepare a mini prototype model and check its efficiency
3. To design a 3D model of Vyttila’s traffic watch tower with air purification tower using Revit Architecture
4. To design Vyttila’s traffic watch tower including anairpurificationtowerusingSTAADPro.
SCOPE
Air pollution has been a major concern throughout recent years and has proved to be fatal. The major air pollutants are from industries, dense traffics, etc Some of the most common and dangerous pollutants are CO, CO2, NO, NO2, PM,ground-levelozone,etc.Itisofimmenseimportanceto control and take measures for the safety of our future. So manymethodsareusedtoreduceairpollutionalloverthe world. But most of the methods are for indoor air
purification. So, we have to find new techniques to purify the outdoor air too. An air purification tower already has been proposed by China. And its prototype is already on the trial run. This project idea was inspired by China’s air purification tower. The tower can be implemented in a cost-effective way and can introduce many labor opportunities.
METHODOLOGY
An air purification tower is a tower prepared to clear out pollutants and purify the air near us. The air flowing throughanairpurificationtowerpassesthroughafilterto provide clean air coming out of it. These methods of cleaning air are scientifically well established and used widely for cleaning indoor air where the air is exchanged withtheoutdoors.
DataCollection
Miniprototypeforefficiencytest
Sitevisit
Studyofcomponentsofairpurificationtower
3-D Modelling (Revit architecture): A detailed 3-d model of traffic watch tower with air purification towerwascreatedusingrevitarchitecture.
Structural designing (STAAD Pro). Using the 3-d model,structurewasdetailedanddesigned.
DATA COLLECTED FROM CENTRAL POLLUTION CONTROL BOARD
According to the WHO, India has 14 out of the 15 most polluted cities in the world in terms of PM2.5 concentrations.
5.1Top13CitiesinIndiawiththehighestlevelof
In November 2016, the Great Smog of Delhi was anenvironmental eventthatsawNewDelhiandadjoining areas in a dense blanket of smog, which was the worst in 17years
India's Central Pollution Control Board now routinely monitors four air pollutants namely sulfur dioxide (SO2), oxides of nitrogen (NOx), suspended particulate matter (SPM),andrespirableparticulatematter(PM10).Theseare target air pollutants for regular monitoring at 308 operating stations in 115 cities/towns in 25 states and 4 UnionTerritoriesofIndia.
These are the findings of India's central pollution control board.
Adecreasingtrendhasbeenobservedinnitrogen dioxide levels in residential areas of some cities such as Bhopal and Solapur during the last few years.
MostIndiancitiesgreatlyexceedacceptablelevels of suspended particulate matter. This may be because of refuse and biomass burning, vehicles, powerplantemissions,andindustrialsources.
The Indian air quality monitoring stations reported lower levels of PM10 and suspended particulate matter during monsoon months possibly due to wet deposition and air scrubbing by rainfall. In other words, India's air quality worsens in winter months and improves with the onsetofthemonsoonseason.

The average annual SOx and NOx emissions level andperiodicviolationsinindustrialareasofIndia weresignificantlyandsurprisinglylowerthanthe emission and violations in residential areas of India.
Of the four major Indian cities, air pollution was consistently worse in Delhi, every year over 5 years (2004–2018). Kolkata was a close second, followed by Mumbai.Chennaiairpollutionwastheleastofthefour
Table5.2NationalAmbientAirQualityStandards
method after sampling on EPM 2000 or equivalent filterpaper
*
arithmetic means of minimum 104 measurements in a year at a particular site taken twiceaweek24hoursatuniformintervals.
** 24 hourly or 08 hourly or 01 hourly monitored values, as applicable, shall be complied with 98% of the time in a year. 2% of the time, they may exceedthelimitsbutnotontwoconsecutivedays ofmonitoring
Note. Whenever and wherever monitoring results on two consecutive days of monitoring exceed the limit specified above for the respective category, it shall be considered an adequate reason to institute regular or continuousmonitoringandfurtherinvestigation.

5.3
5.3.1 How
Kerala is a state in India located on the southwestern coastline. It is bordered by Tamil Nadu and Karnataka, with the region, having been a prominent spice producer and exporter going back thousands of years. Nowadays Kerala still finds itself as a large producer of goods, with items such as coconuts, tea, coffee, and spices still being exported,makingitseconomythe10thlargestinIndia.
As with all cities, states, and countries that see large volumes of movement involving goods, there are always boundtobepollution-relatedissuesarisingfromthelarge useofcars,lorries,andtruckstomovetheseitems,aswell as for day-to-day commuting for people living in the state ofKerala.

Observingthedata registry inyearspast, Kerala currently only has the city of Thiruvananthapuram on record with itspollutionlevels Thiruvananthapuram,commonlycalled by its former name of Trivandrum, came in with PM2.5 readingsof27.9μg/m³intheyear2019.

Many of the cities besides the capital have the same infrastructureorasimilareconomy
5.3.2 The main causes of pollution in Kerala
Kerala is home to a large number of factories, many of which are located not far from the coast. These factories would be major contributors to the ambient year-round pollution levels, due to them running off large amounts of fossilfuelssuchasdieselorcoaltoprovideenergy,aswell as creating secondary pollutants as a result of their industrial processes, with chemical plants, food processing, and packaging factories as well other industrialitemrelatedproductionlines.
With a heavy export-based industry, Kerala would see largeamounts oftruckstakinggoodstootherpartsofthe country, as well as many cargo ships doing the same for localorglobalexport.Shipsalonegiveofflargeamountsof pollution, usually of a more dangerous nature due to a difference in fuel regulation regarding what ships can use intheirengines,oftencontaininghighercontentsofsulfur which ends up making its way into the atmosphere after combustion.
Carsandtrucks,particularlyonesthatrunondiesel,would give off large amounts of chemical compounds as well as fine particulate matter, with a whole host of ill health effects on those exposed, as well as having a knock-on effectontheenvironment.
Open burn fires are present as well, being a persistent probleminmanypartsofIndia,withavarietyofmaterials being burnt that should instead be disposed of in a much safermanner.
5.3.3 The main pollutants found in the air in Kerala
Regarding the construction sites and road repairs, these alonewouldgiveoffahugenumberofdangerousparticles. Whenamaterialsuchasvariousformsofrockorconcrete isbrokendown,itcanreleasefinesilicadust,dirtparticles, and other particulate matter that can make its way deep intothelungs,duetoitstinysize,thereforemakingitpast thebody’snaturalfiltrationsystemspresentinthenoseor throat.
Silicadustisknownashavingcarcinogenicproperties,and whentherearehundreds,ifnotthousandsofconstruction or repair sites taking place across the state, then these particles can easily find their way into the atmosphere if not properlytended to, whichisoften thecase withmany construction sites improperly maintained and thus prone tomassiverunoffofthesefinematerials.
Besides the particulate matter, other pollutants would include nitrogen dioxide (NO2) and sulfur dioxide (S02), both of which are found released from vehicles as well as factories, with nitrogen dioxide having particular prominencein the releasefromcarsand trucks,withhigh volumes of it being detected via satellite or ground level readingsinareasthatseealargerdensityoftraffic.
Otherpollutantsofnoteareonessuchasblackcarbonand volatile organic compounds (VOCs), both of which are formed from the incomplete combustion of fossil fuels (as well as organic material); thus, they find their origins in factories, cars as well as open burning of refuse. Some VOCs include dangerous chemicals such as benzene and formaldehyde. Others would include carbon monoxide (CO), ozone (O3), and dioxins, with many more being released,evenfromtheburningofplasticsalone.
5.3.5 What can Kerala do to improve its pollution levels?
Some initiatives that could be taken to see a marked improvementinpollutionlevelswouldbetofinda wayto reduce vehicle movement, as the state and many others throughout India saw marked improvements with the movement control orders that took place in 2020 due to thecovid-19pandemic.
Realistic ways of getting this done without causing problemswouldbetheintroductionoflowemissionzones, as well as incentives to get people to use their cars less, investment into public transport infrastructure as well as the issuing of fines and charges to vehicles that exceed unsafepollutionlevels,withthisinitiativeeventuallybeing astepintherightdirectiontogettingdiesel-basedengines aswellasancientoroutdatedvehiclesofftheroad.
Others would be to impose similar sanctions and fines on factories that cause pollution in the surrounding air to exceed a certain level, which would lead to a better structure of industrial management by individual companiesandbusinessowners.
ANALYSIS AND DESIGN
6.1 LOAD CALCULATION
6.1.1 Load Calculation of Components of Structure

1. Floorplates:
Materialused:Mildsteel
Weight=31.40Kg/m2
Areaoffloor=25m2
WeightinkN/m2 =0.31kN/m2
2. Steelplatefortower:
Weight=31.4Kg/m2
Area=2πrh=2*3.14*0.5*5=15.71m2
WeightinkN/m2 =0.31kN/m2
3. Handrail:
Materialused:Mildsteel
Weight=13.73Kg/m
Length=19.4m
WeightinkN/m=0.13kN/m
4. Cabinwall:
Materialused:V-Board
Weight=8.9Kg/m2
Area=12m2
Totalareaof5layersofV-board=12*5=60m2
WeightinkN/m2 =0.0873kN/m2
5. Glass:
Dimension=1.7*0.5
Weight=25.5Kg
Areaofsingleglasspanel=1.7*0.5=0.85m2
Weightofglassfor1m2 =25.5/0.85=30Kg
Totalareaforglasspanels=19.68m2
Weightofglassfor19.68m2 =30*19.68=590.4Kg =5.79kN
WeightinkN/m2=0.294kN/m2
6. Trusswork:
Material used: Pre-fabricated aluminium truss work
Weight=3.75kN
Area=25m2
WeightinkN/m2 =0.150kN/m2
7. Stair:
Materialused:Pre-fabricatedaluminium
Height=3m
Width=1m
Weight=349.26Kg=3.43kN
6.1.2 Dead Load
1. ForRoofMembers:
Weightoftruss=0.150kN/m2

Load1=(0.150*0.5*5)/5=0.075kN/m
Load2=(0.150*(0.5+0.5)*1)/1=0.150kN/m
Load3=(0.150*(0.5+0.5)*3)/3=0.150kN/m
2. ForFirstFloorMembers:
Weightoffloorplate=0.31kN/m2
Load1=(0.31*0.5*5)/5=0.155kN/m
Load2=(0.31*(0.5+0.5)*5)/5=0.31kN/m
WeightofV-board=0.0873kN/m2
Weightofglass=0.294kN/m2
Weightofwall=0.0873+0.294=1.167kN/m2
Load3=(1.167*(0.5+0.5)*3)/3=1.167kN/m
Weightoftowerplate=0.31kN/m2
Load4=(0.31*(0.5+0.5)*1)/1=0.31kN/m
Weightoffan=0.44kN
Load5=0.44/4=0.11kN
6.1.3
Live Load
AccordingtoIS:875part2imposedfloorloadforbusiness andofficebuilding
a) Roomforgeneralusewithseparatestorage: UDL=2.5kN/m2
Load=(2.5*(0.5+0.5)*3)/3=2.5kN/m
b) Corridors,passages,lobbies,staircases,balconies: UDL=4kN/m2
Load=(4*0.5*5)/5=2kN/m
6.2 ANALYSIS
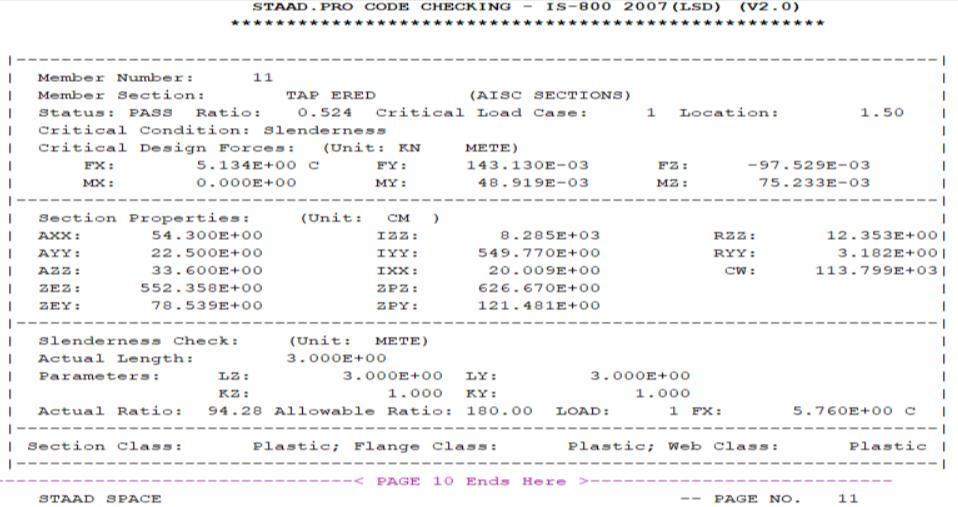
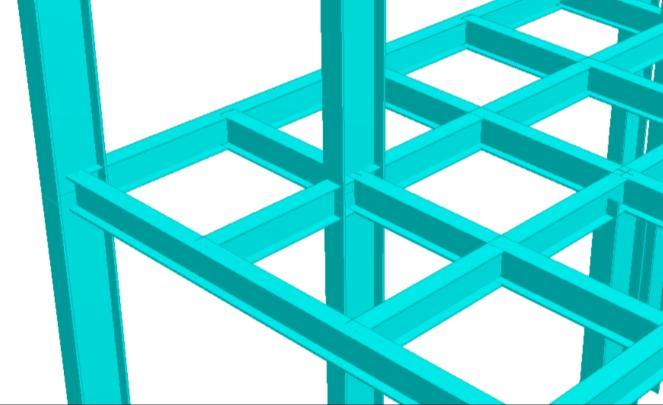
ThestructuralanalysisofthetowerwasdoneusingSTAAD Pro software. Various loading conditions were used to analyse the tower which is acting on it. The analysis resultedtobesafeandthemaximumshearforce, bending moment and deflection are used to design the beams and columnsofthetower.
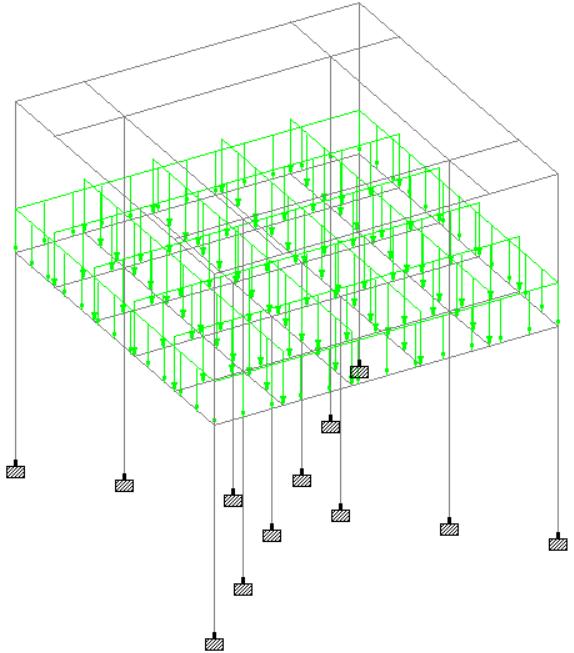


Thevariousloadsactingon thebeamsandcolumnsofthe toweris:
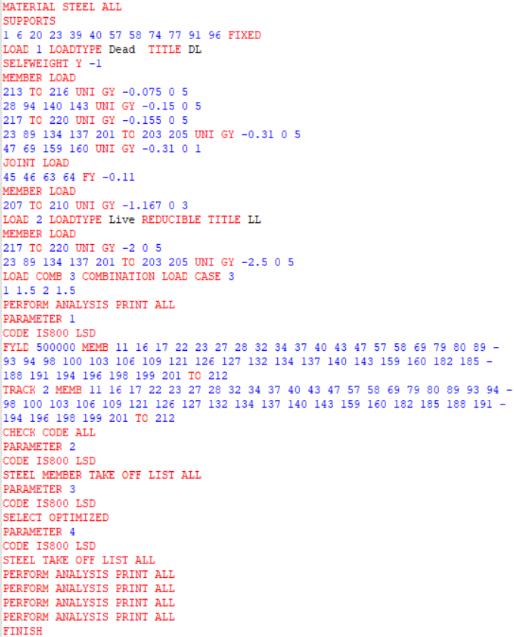
Deadloads
Liveloads
1.5*(Deadload+Liveload)
Table6.1Totalappliedloadandsummationofmoments aroundtheoriginduetodeadload
Table6.2Totalreactionloadandsummationofmoment aroundtheoriginduetodeadload
Table6.3Totalappliedloadandsummationofmoments aroundtheoriginduetoliveload
Table6.4Totalreactionloadandsummationofmoment aroundtheoriginduetoliveload

The Shear Force Diagram, Bending Moment Diagram and DeflectionDiagramofthetowerisshowninfigure6.4,6.5 and6.6respectively.


The maximum bending moment values and maximum shear Force values after the analysis of the tower are shownintable6.5and6.6respectively.
Intensityofudl=3.75/5=0.75kN/m

Assumeself-weight=0.8kN/m
Totalload=0.75+0.8=1.55kN/m
Totalfactoredload=1.55*1.5=2.325kN/m
Max.BM=(Wl2)/8=(2.325*52)/8 =7.26kNm
(Zp)req=M/fy *γmo =(7.26*106)/250*1.1
=31944mm2=31.944cm2
• ForFirstFloor:
Totaludl=5.762kN/m
Weightoftower=4.84kN
Factoredudl=5.762*1.5=8.642kN/m
Factoredpointload=4.84*1.5=7.26kN
Max.BM=(Wl2)/8+(Wl/4) =(8.642*52)/8+(7.26*5)/4 =36.085kNm
(Zp)req=M/fy *γmo =(36.085*106)/250*1.1 =158774mm2=158.774cm2
As per IS:875 part 2 and SP 6, we choose the section according to the calculation above. The selected section hasa greaterZp value.ISMB300@44.2kg/mforcolumns andISMB200@25.4kg/mforbeams.
6.3.2 Properties of The Selected Section

ISMB300
WeightperMeter(w)=44.20Kg/m
SectionalArea(a)=56.26cm2
DepthofSection(h)=300mm
WidthofFlange(b)=140mm
ThicknessofFlange(tf)=12.40mm
ThicknessofWeb(tw)=7.50mm
MomentofInertia(lxx)=8603.60cm4
MomentofInertia(lyy)=453.90cm4
RadiusofGyration(rxx)=12.37cm
RadiusofGyration(ryy)=2.84cm
ISMB200
WeightperMeter(w)=25.40Kg/m
SectionalArea(a)=32.33cm2
DepthofSection(h)=200mm
WidthofFlange(b)=100mm
ThicknessofFlange(tf)=10.80mm
ThicknessofWeb(tw)=5.70mm
MomentofInertia(lxx)=2235.40cm4
MomentofInertia(lyy)=150.00cm4
RadiusofGyration(rxx)=8.32cm
RadiusofGyration(ryy)=2.15cm
•
Roof:
6.3.3
Connection design is done for a critical member having high shear force. ISMB 200 beam is connected to the web ofISMB300column.
Strength of M20 bolts in double shear = (fub*(1+0.78)* π * 2)/(√3*γmb*4)
=(400*(1+0.078)*π*202)/√3*1.25*4
=103314N=103.314kN
StrengthinbearingoverflangeofISMB200
Providing an edge distance mm amd pitch mm,find
b is the minimum of 40/3*22, (60/3*22)-0.25, 400/410, 1.0
b=0.606,and = f=10.8mm
Strengthinbearing=(2.5* b * u)/γmb

=(2.5*0.606*20*10.8*410)/1.25
=10733472N=107.33kN

Boltvalue=103.314kN
Factoredreaction=300kN
Thenumberofboltsrequired=300/103.31=2.90
Provide4boltsontwosides
Step2:ConnectionofangelwithwebofISMB300.
ThicknessofwebofISMB300, w=7.5mm
Strength of bolt in single shear = (fub*0.78* π * 2)/(√3*γmb*4)
=(400*0.078*π*202)/√3*1.25*4=45272N=45.272kN
Strengthinbearingismorethanit.
Theboltvalue=45.272kN
Thenumberofboltsrequired=300/45.27=6.6
Provide4boltsineachanglein2rowsat50mmspacing.
Step3:Designofcleatangle.
To keep the bearing strength on cleat angle greater than the strength in single shear, the thickness of cleat angle is givenby,
(2.5* b * u)/γmb=(fub*0.78*π* 2)/(√3*γmb*4)
Step 1: Connection of cleat angle with the web of secondarybeam.
(2.5*0.606*20* *410)/1.25 = (400*0.078* π*202)/√3*1.25*4 4.56mm
Use6mmthickangle.
Provide ISA 10075,6mm angle with 100mm leg on ISMB 200
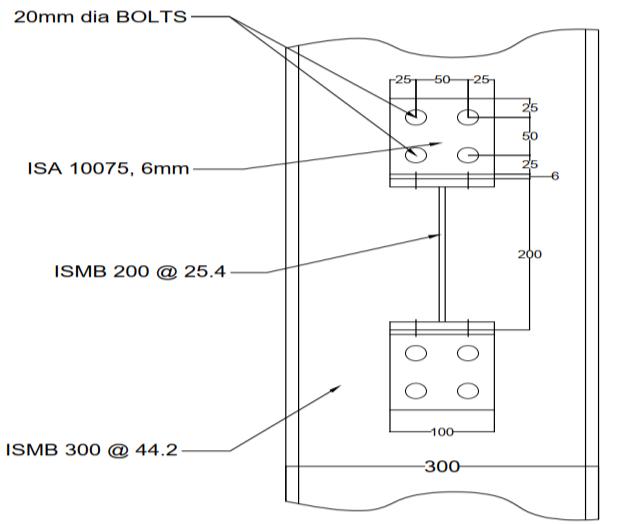

Depth of angle required on ISMB 200 = 25 + 50 + 25 = 100mm
Depth of angle required on ISMB 300 = 25 + 50 + 25 = 100mm
Column base design is done for a critical column member having high axial force. ISMB 300 column is connected to M20concretefoundation.
Step1:Sizeofbaseplate
Bearingstrengthofconcrete=0.45fck =0.45*20=9N/mm2

Factoredload,Pu=590.5kN
Areaofbaseplaterequired=590.5*103/9=65611.11mm2
Let ‘L’ and ‘B’ be the length and width of base plate and takeprojectiona=b
(L+2a)*(B+2b)=A
(300+2a)*(140+2a)=65611.11
4a2+880a-23611.11=0
a=24.17mm~30mm
a=b=30mm
Widthofplate=140+(2*30)=200mm
Lengthofplate=300+(2*30)=360
Therefore,provide360*200sizeplate
Areaprovided=360*200=72000mm2
Step2:Thicknessofbaseplate
Intensityofpressure,ω=Pu/Area
ω=590.5*103/72000=8.201N/mm2
8.201N/mm2 <9N/mm2 ,henceitissafe
Minimum
(2.5*8.201*(302-0.3*302)*1.1)>12.4
7.538mm>12.4mm
Henceprovide12mmthickplate
Step3:Designofconnection
Use 4 bolts of 20mm diameter 300mm long to anchor the plate to foundation. Let us provide a welded connection betweencolumnandbaseplate.
Total length available for welding = 2*((140+1407.5)+(300-2*12.4))=1095.4mm
AsperIS800,cl.10.5.7
Strengthofweldrequired=(fu/√3γmw)*(Lw*tt)
Assumethicknessofweld,s=6mm
tt =0.7s=4.2mm
590.5*103 =(410/√3*1.25)*(Lw*4.2)
Lw =742.433mm
Lengthofweldrequired<Lengthofweldavailable
Henceitissafe
So,letusprovide6mmsizeofweldforconnectingcolumn tobase.
6.3.5 Volume of Air Purified
Inthistower,centrifugalfansareusedtopurifytheair.
Maximum air flow rate of the fan = 34300 m3/hour

Minimumairflowrateofthefan=5600m3/hour
Themaximumairflowrateperday=34300*24= 823200m3
The minimum air flow rate per day = 5600*24 = 134400m3
The HEPA filter traps 99.97% airborne particles above0.3micronsfromtheairpassesthroughit.
CONCLUSION
PollutioncausedbyPM2.5 cancause600prematuredeaths and economic losses of about 500 crores. To control this, an air purification tower is very necessary in the high pollutant emitting zones of the country. As studied the pollution in our state Kerala throughout, and the highest pollution is among three cities, which is Ernakulam, Trivandrum and Kollam. In Ernakulam the most polluted areaisVyttila.Thepollutionindexinthisplaceisfoundto bePM10 andPM2.5 Therefore,toimprovetheairqualityof this place, designed a structure called air purification tower Thepurificationtowerwasinspiredbyairpurifying tower in Xian China. HEPA filter and centrifugal fan is the air purification components used. The tower will be designed to incorporate with traffic watch tower. This structure has the ability to purify the air from 134400 m3 to823200m3 perday.
In addition to this air purification is also helpful for reducing global warming, and acid rain. Some other benefits are also provided to the government in other highly polluted areas that will help in the strengthening human health. All together by reducing pollution we can achieve a balanced ecosystem and develop a great vision forfuturegenerations
REFERENCES
1 Dewidar., K. M. R., & Guirguis M. N., (2020), ‘Air Purification Towers: A Modern Concept in Architectural Sustainability’.
2 Jayakantha D.R., Bandara H.M.N., Gunawardana N.M., Rajapakse R.J., Thilakarathne D.S., Comini E., & Karunarathne S.M.M.L., (2022), ‘Designandconstruction of a low-cost air purifier for killing harmful airborne microorganisms’, HardwareX, 11, e00279.

3. Jumlongkul A., (2022), ‘Low-Cost Air Purifier PrototypeUsinga VentilatingFanandPumpAgainstHaze Pollution’, Aerosol Science and Engineering, 6(4),391-399.
4. Jyothi S. N., Kartha K., Mohan A., Pai J., & Prasad G., (2019, November), ‘Analysis of Air Pollution in Three Cities of Kerala by Using Air Quality Index’, In Journal of Physics: Conference Series (Vol.1362,No.1,p.012110), IOP Publishing.
5 Kapoor A., & Nuangjamnong C., (2021), ‘Factors affecting purchase intention of air purifier as green product among consumers during the air pollution crisis’, AU-GSB e-JOURNAL, 14(2),3-14.
6 Paddy Robertson., (2022), ‘What Is a HEPA Filter and How Does they Work?’, ISO-Aire Elite Commercial Air Purifiers
7 Rusowicz A., Grzebielec A., Ruciński A., Niewiński G., Laskowski R., Jaworski M., & Całun-Nadulski K., (2019), ‘Reviewofairpurificationmethodsinurbanopen spaces’, Modern Engineering,3.
8 Sheraz M., Mir K A., Anus A., Kim S., & Lee W R., (2022), ‘SARS-CoV-2 airborne transmission: a review of risk factors and possible preventative measures using air purifiers’, Environmental Science: Processes & Impacts.
9 Xie D., Wang C., Yu C W., & Wang H., (2021), ‘Numerical investigation of radon dispersion and dose assessment for typical ventilation schemes with an air purifier’, Indoor and Built Environment, 30(1),114-128

