STOCK PRICE PREDICTION USING MACHINE LEARNING [RANDOM FOREST REGRESSION MODEL]
Abstract - The process of stock price prediction has gained significant attention in recent years due to the potential benefits it can offer to investors. This paper discusses the use of machine learning in stock price prediction by leveraging historical data to identify trends and make predictions. The application of machine learning can automate the trading process by providing insights and predictions based on statistical models. By collecting and analyzing large amounts of structured and unstructured data, suitable algorithms can be applied to identify patterns and make informed decisions. However, the volatile nature of the financial stock market poses a significant challenge in accurately predicting stock prices. Factors such as current trends, politics, and the economy can have a profound impact on stock prices, making it difficult to decide when to buy, sell, or hold. Despite these risks, machine learning can help reduce them by providing valuable insights to investors.
Key Words: Stock, Price, Prediction, Machine Learning, Random Forest, Regression, Artificial Intelligence, future, market.
1. INTRODUCTION
The act of predicting stock prices based on past data is known as stock price prediction. To identify trends and comprehend the current market, we employed machine learning on previous data. Through the use of statistical models to generate predictions and draw inferences, machine learning automates the trading process. Both structured and unstructured data can be gathered and tested by machine learning. It can use the new data to apply appropriate algorithms, transform, look for trends, and make judgements. Because of the nature of the financial stock market, which involves current trends, politics,andtheeconomy,itisdifficulttopredictthevalue of stocks with a high degree of accuracy. They have a significantimpactonpricesbymakingitdifficulttodecide whether to purchase, sell, or hold thestock. Risks must therefore be managed due to the fact that they cannot be eliminated.
This study demonstrates the numerous approaches used toincorporatemachinelearning intostock forecastingfor the NSE nifty 50 index. It was built by us using Python andopen-source libraries. We used pre-processing techniquestomakethestockdatarelevantafterobtaining itfromYahooFinance.Additionally,atuningprocedureto validate the model for building, fitting, and training for
***
prediction is used along with randomised grid search cross-validation. Following prediction, error analysis is essential for evaluating the model's effectiveness and the precisionoftheanticipatedvalues.
Prediction is performed using the random forest regression model. This will forecast the low and high prices for the forthcoming trading days, along with the NSE nifty 50 index's predicted prices for the following month. Based on the expected values, decisions regarding thepurchase,sale, orholdingofa stock can bemade. The gathering, processing, and creation of the trading algorithmforpredictionarethemaingoalsofthisstudy.
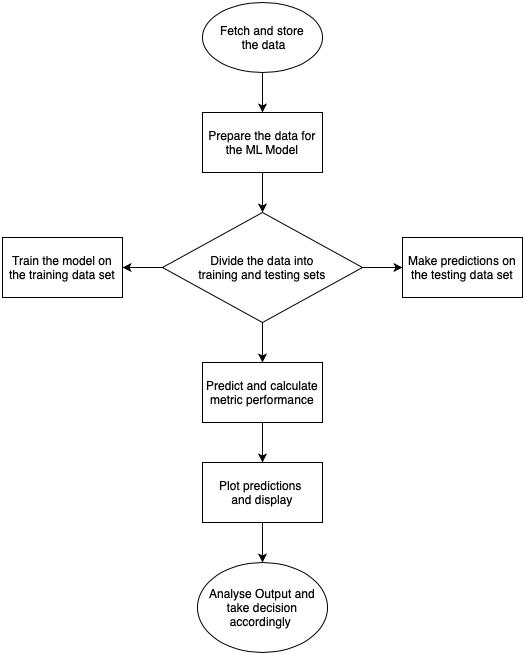
2. FLOWCHART
3. IMPLEMENTATION

3.1 Import libraries:
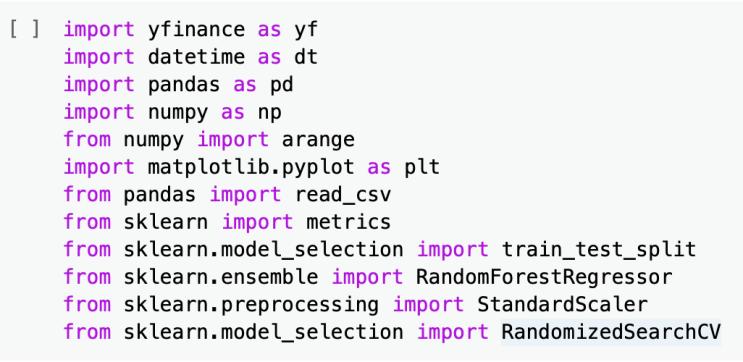
Thefollowinglibrariesareused:
Pandas a Python module for data analysis that loads thedatafileasapandasdataframe.
Matplotlib apythonmoduleforplottinggraphs.
Scikit-learn an open-source python module used in dataanalysisthatsupportsmachinelearningmodels,preprocessing, model evaluation,and training utilities.Italso acts as a sub-module for train_test_split, RandomForestRegressor, StandardScaler, RandomizedSearchCV,andmetrics.
Numpy apythonmodulethatworkswitharrays.
Yfinance a python open-source module used to access financialdata.
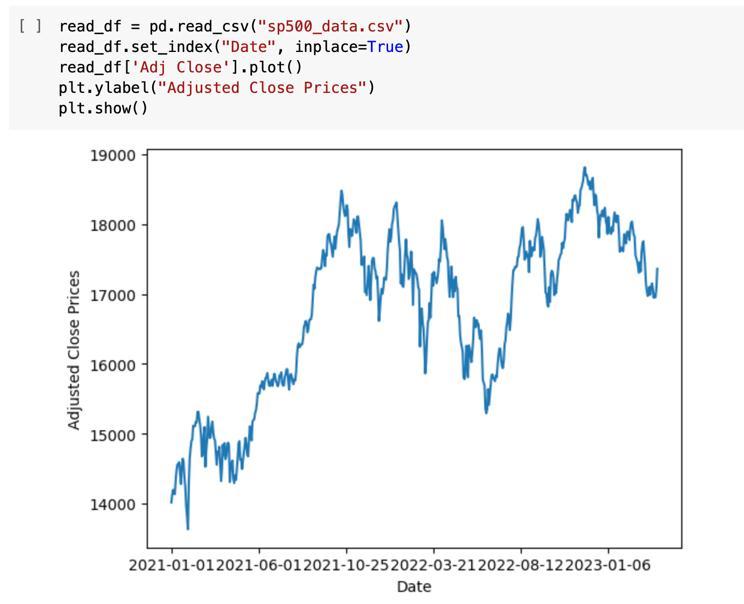
3.3 Visualize the Data:
Fig -2:ImportingLibraries

3.2 Import Dataset:


The historical data of the market is the information required for this study. For each trading day, it includes the date, prices, highest and lowest price, and amount of trades. These numbers are used by traders to gauge a stock'svolatility.
3.3 Data pre-processing:
Preparing the data for the machine learning model involves a number of processes. Pre-processing involves transforming the raw data's format so that the model can use it and work with it. The purpose of this processis to produceadatasetthatthemodelandalgorithmcanuse.A datasetmayhavemissingvalues,redundantandpointless information, or noisy data. Data cleaning is a type of preprocessing that involves updating the index and eliminating values that are missing or incorrect. Additionally, feature selection, hyperparameter tuning, anddatastandardisationisalsodone.
3.3.1
A Python script is used to obtain the data. The data is obtainedusingyfinance.ItwillretrieveNSEIstockdatafor the period of January 1, 2021, to April 1, 2023. In a data frame, the downloaded stock data is loaded before being transformed into a CSV file. so that we can easily feed it into the algorithm after storing it locally. The data set is savedassp500_data.csv.
3.3.2 Feature selection:
The x and y characteristics are chosen at this point in order to create the model's data set. The training and testingdatasetseachhaveXandYfeaturesdefined.
The dataset's columns are called features. One of the fundamental ideas in machine learning applications, feature selection greatly affects the performance of the model.Itwon'tberequiredtouseeverycolumninfeature selection. These chosen features have a bearing and contribute to the outcome of the prediction. The test set performs worse overall because of unnecessary features.
Discovering the most important elements of features is one approach of choosing futures. Feature selector and feature importance modules are available in Sklearn and can be used. Each feature in the data is assigned a score using the feature significance module. The most pertinent features are those with the highest scores, and reliable output variables are always present. Using feature selection can increase accuracy, decrease overfitting, shorten training times, and enhance data visualisation. Thelikelihoodofoverfitting increaseswiththenumberof features.
Valuesfortheopen,high,low,close,andadjclosecolumns are stored in the variable x. Y is where the adj-close columnvaluesarestored. Becausetheywon'tberequired, the other columns, including the one for volume, weren't chosenfortheprocedure.Fivefeaturesareutilized.
Fig
:Scalingthetrainandtestsets
Using the standard scaler, we are scaling the x_train and x_test.
3.4 Apply model and predict:
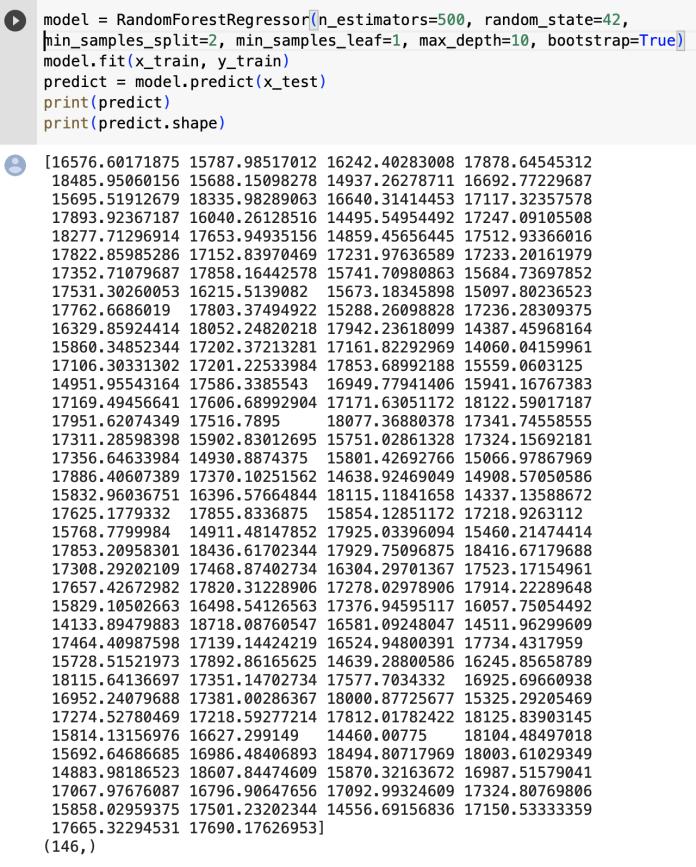
The model may use the dataset now. Selecting a value fortherandomstateistheinitialstep,andthenthetreeis constructed using the number of random states. By randomlyselectingsubsetsofthecharacteristicsandusing these subsets to create smaller trees, random forest eliminatesoverfitting.Thetrainingofthedataisnecessary to construct the random forest. The parameters from the hyperparametertuningarealsousedhere.
-6:Selectingfeatures
3.3.3 Divide into train and test datasets:

Before modelling, the dataset must be divided into a trainingandtestingdataset.
Asubsetofthedatasetusedtocreateandfitprediction models is called the "training set." Building a training dataset script produces a training set by generating the featuresofthetrainingsetusingtheinputoptionsandthe raw stock price data. The model is trained using the data. Themodelrunsonthetrainsetandgainsknowledgefrom thedata.
A testing set is a subset of the dataset used to gauge how well a model will perform in the future. It is a useful benchmark for assessing the model. The trained model is tested using the testing set with regard to the predicted dataset. Thissubsetofthe sethas not been viewed by the model.Itservesasanevaluationtool.
Fig -7:Dividingthedatasetintotrainingandtestingsets
3.3.4 Scaling the features:

We refer to this as data standardisation. The standard scaler function in Sklearn is used to standardise the dataset. Standardisation has been proven to speed up trainingandincreasethemodel'snumericalstability.
Fig
:Theprojectedvaluesaregenerated
This generates the projected values for the coming 314 tradingdays.
3.5 Statistical metrics and performance evaluation:
Risks are calculated using statistical metrics, which are error metrics for regression. In order to lower risks and

improve model performance, model evaluation is essential.
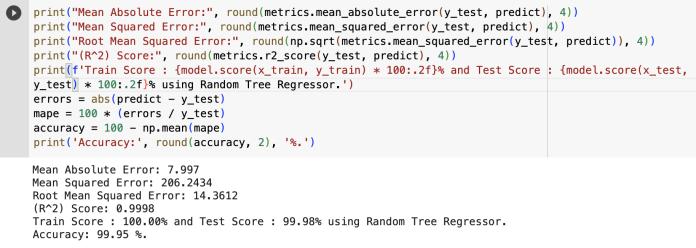
actual values match the regression line. The highest number is 1.0. So, the better the model fits the data, the higherthevalues.Whenther-squaredvaluesfallbetween 0.6 and 1.0, the regression line adequately matches the data, and the model performs well. Values over 65% are regardedasfavorable.
3.5 Statistical metrics and performance evaluation:
-10:Performanceevaluationontesting

The standard deviation of the prediction mistakes is known as root mean square error (RMSE). The residuals estimate the deviation of the data points from the regression line. The distribution of these residuals is gaugedbytheRMSE.Itdescribeshowthedataisclustered around the line of greatest fit, to put it another way. Additionally, it is MSE's square root. The performance improves with decreasing RMSE values. Given that it measuresmoreerrorsthantheothermetrics,itshouldbe low.ARMSEscorelargerthan0.5indicatesthatthemodel hasapoorcapacitytoreliablyforecastthedata.Whenthe RMSEscoreisbetween0.5and0.3,themodelwillforecast datawithahigherdegreeofaccuracy.
Mean absolute error (MEA) quantifies the average size of errors in a series of predictions without taking into account their directional component. It is the average absolute difference between the predicted and the observed value, where all individual variations are given equalweight.Mostsignificantly,itcalculatesthedifference between the actual and projected values. Assume that the MEAvalueis5.Thetruevalueis20,whereasthepredicted value is 25. However, MAE does not penalize prediction errors. If errors are to be examined, they should be the meansquareerrorortherootmeansquarederror.Lower valuesarepreferable.
Theabsolutevalueofeacherrorisaddedtodeterminethe meansquarederror(MSE).Themodelperformanceisalso determined by the mean squared error. Larger mistakes than those found in the MAE are clearly present in this instance.TheaccuracyoftheforecastincreasesastheMSE valuedecreases.
In machine learning, performance evaluation is essential for understanding how well the prediction and model are performing. R-squared and accuracy were employed in this study to assess the model. If a model has to be improved,itwillbedeterminedbytheoutputvalueofthe model evaluation. To test an alternative algorithm, finetune the parameters, add new data, or use feature engineering,amongotheroptions.
R squared is a measure of how well a model fits a certain dataset. It shows how closely the plotted expected and
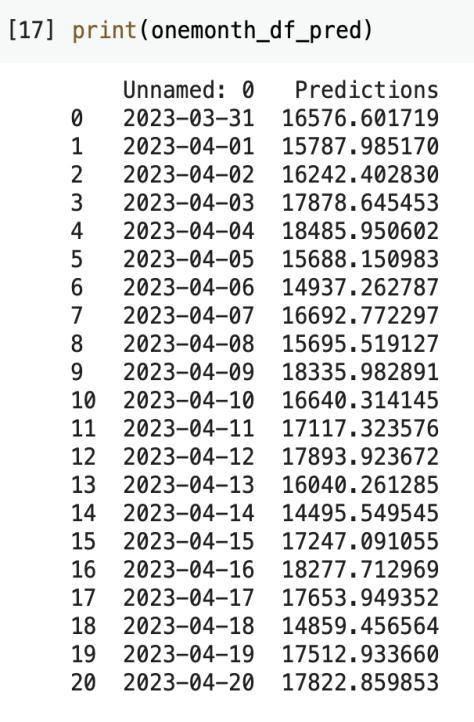
With the expected values for the following year, month, andfivedays,wegenerateddataframes.Ayearoftrading has 252 days, a month has 21, and a week has 5 trading days. From the expected 341 trade days that actually occurred, we took the necessary future days. Dates and prices are converted to CSV files for these subsequent days.
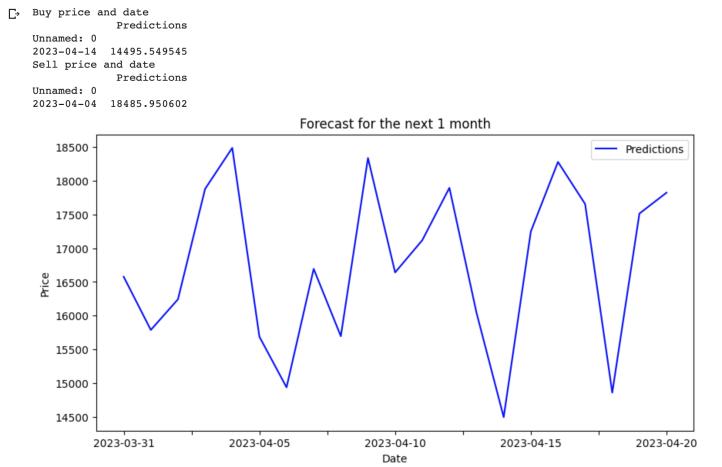
Investors look to profit by selling at the highest price, buying at the lowest price, and holding price if neither takes place in order to determine the buy, sell, and hold prices. The selling price is therefore the highest price in thissituation,whereasthebuypriceistheminimum.
3. RESULTS
Onemonthpredictionresult:
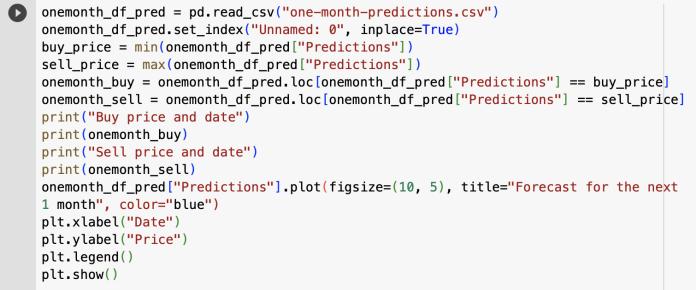

Fig -12:Codetodisplayingthehighestandlowestprices intheupcomingmonthalongwithagraphshowingthe predictedvalues
3. CONCLUSIONS
Inordertosolvethischallenge,variousmethodscanbe used.Fromsentimentanalysis,financialnewsstories,and expert reviews to quantitative analysis for prediction, theirperformancecanvary.However,therearenoperfect or reliable prediction techniques due to how unpredictable the stock market is. If you need to create a modelrapidly,thealgorithmisafantasticoption.Itgivesa reasonably accurate indication of how much weight your attributes are given. The majority of the time, random forestisquick,easy,andadaptable.
REFERENCES
[1] A comparative study of machine learning algorithms for stock price prediction" by Anirudh Kumar and Arnav Kumar Jain (2021):
https://www.sciencedirect.com/science/article/pii/S 2405452620311239
[2] Stock Price Prediction using LSTM and Machine Learning Techniques" by Xiaoyu Liu and Lei Wang (2021):
https://ieeexplore.ieee.org/abstract/document/9418 18

[3] Stock price prediction using machine learning algorithms: A case study on the Australian stock market" by Minh Triet Tran, Hien T. Nguyen, and Thanh Duc Nguyen (2020): https://www.sciencedirect.com/science/article/pii/S 0957417420300561
[4] A Deep Learning Approach to Predict Stock Prices from Financial News" by Md. Rafiqul Islam, Muhammad Masudur Rahman, and Khandaker Tabin Hasan (2021): https://www.mdpi.com/20763417/11/9/3959
