
International Research Journal of Engineering and Technology (IRJET) e-ISSN: 2395-0056
Volume: 12 Issue: 03 | Mar 2025 www.irjet.net p-ISSN: 2395-0072


International Research Journal of Engineering and Technology (IRJET) e-ISSN: 2395-0056
Volume: 12 Issue: 03 | Mar 2025 www.irjet.net p-ISSN: 2395-0072
Ridham Jasani1 , Jasmit Bajaria2 , Vedant Deshmukh3, Dolas Keche4
1,2,3,4
Student, Computer Engineering, Rajiv Gandhi Institute of Technology, Maharashtra, India
Abstract - iDairy is a system designed to optimize dairy retail operations through accurate demand forecasting. It utilizes advanced algorithms to analyze historical sales data and market trends, enabling precise inventory management and reducing wastage. The system is integrated with Google Sheets for real-time data storage, with each product having its own sub-sheet for efficient tracking. A Seasonal Autoregressive Integrated Moving Average (SARIMA) model is employed for forecasting, considering seasonal variations in demand. iDairy provides retailers with actionable insights to streamline stock replenishment and enhance operational efficiency. The project focuses on data-driven decision-making in dairy supply management.
Key Words: Machine Learning, Demand Forecasting, InventoryManagement,SARIMAModel,DairyRetail,DataDrivenDecisionMaking,SalesAnalysis.
Thedairyindustryfacessignificantchallengesinmanaging inventory efficiently due to fluctuating demand patterns, seasonal variations, and perishable product constraints. Traditional inventory management methods often lead to overstockingorshortages,resultinginfinanciallossesand operationalinefficiencies.Toaddresstheseissues,iDairyis developedasanAI-poweredsystemthatleveragesMachine Learning (ML) for accurate demand forecasting and optimizedinventorymanagement.
iDairy integrates a Seasonal Autoregressive Integrated MovingAverage(SARIMA)modeltoanalysehistoricalsales data,identifytrends,andpredictfuturedemandwithhigh precision. This approach helps retailers make data-driven decisions, reducing wastage while ensuring optimal stock levels. The system is designed to work seamlessly with GoogleSheets,whereeachproducthasadedicatedsub-sheet for real-time data storage and tracking. This structured format enhances accessibility and allows businesses to monitorsalespatternsefficiently.
By implementing AI-driven analytics, iDairy aims to streamlinesupplychainprocesses,improveprofitability,and support sustainable dairy retail operations. The project focuses on transforming traditional dairy management through automation, ensuring retailers can maintain a balanced inventory, minimize losses, and enhance overall operationalefficiency.
TheiDairysystemisdesignedtoimprovedemandforecasting and inventory management in dairy retail operations. The systemutilizeshistoricalsalesdatatopredictfuturedemand, helpingretailersoptimizestocklevelsandreducewastage. The Seasonal Autoregressive Integrated Moving Average (SARIMA) model is used for forecasting, as it captures seasonaltrendsandvariationsinsales.
Keyfeaturesoftheproposedsysteminclude:
Data Collection & Storage: Historical sales data is recorded in Google Sheets for easy tracking and analysis.
DemandForecastingModel:SARIMA-basedmodel predicts future sales based on past trends and seasonalvariations.
InventoryOptimization:Forecasteddemandhelps maintainbalancedstocklevels,reducingtheriskof overstockingorshortages.
ByimplementingiDairy,retailerscanstreamlinesupplychain management,minimizeproductwastage,andensureefficient operations,ultimatelyimprovingprofitabilityandresource utilization.
Demand forecasting has been widely studied using both traditionalstatisticalmethodsanddeeplearningtechniques. ARIMA is effective for forecasting in stable environments with low variability, providing reliable predictions for stationarytime-seriesdata.However,itstruggleswithhighly seasonal or complex datasets. On the other hand, LSTM models excel at capturing non-linear relationships, trends, and seasonality, making them ideal for more complex demandforecastingtasks.Studiesshowthattrainingmodels on monthly data rather than weekly improves accuracy. Future research may focus on integrating attention mechanisms and global models to further enhance forecastingcapabilitiesandoptimizeinventorymanagement, particularlyinindustrieslikedairyproduction[1] .
Demand forecasting using Business Intelligence (BI) and machinelearninghasgainedsignificantattentioninrecent years. Various methods like time series analysis and rulebased forecasting models, such as Deep AR, have been explored for accurate predictions. Research shows that

International Research Journal of Engineering and Technology (IRJET) e-ISSN: 2395-0056
Volume: 12 Issue: 03 | Mar 2025 www.irjet.net p-ISSN: 2395-0072
machinelearningmodels,especiallyDeepAR,providehigh forecasting accuracy, reduce losses, optimize stock, and enhanceoperationalefficiencyasdatasizeincreases[2] .
Recent studies have focused on using time series models, particularly Seasonal ARIMA, topredictcommodityprices, especiallyforessentialgoodslikefruitsandvegetables.These modelsaccountforseasonalvariationsandexternalfactors suchasweatherconditions,transportationcosts,andseed quality. While not always 100% accurate, they provide valuable insights for forecasting price trends and implementingstrategiestomaintainaffordability[3]
Demand forecasting has gained significantattention in the research community for its role in improving inventory management, production planning, and market strategies. Several statistical models, particularly ARIMA (Auto Regressive Integrated Moving Average), have been widely usedfortimeseriesforecasting.StudiesindicatethatARIMA models, both seasonal and non-seasonal, are effective in predictingfuturedemandbyanalyzinghistoricalsalesdata. Researchers have explored various improvements to the model, incorporating factors like seasonality, external variables,andmarkettrendstoenhanceaccuracy.ARIMA's adaptabilitytodifferentdatasetsandforecastingneedshas made it a valuable tool in diverse industries, providing actionableinsightsforinformeddecision-making[4] .
Stockpricepredictionhasbeenachallengingtaskduetothe volatilenatureofthemarket,influencedbyvariousfactors such as economic conditions, market psychology, and external events. Several studies have explored predictive models,withARIMAbeingwidelyusedforitssimplicityand efficiencyinshort-termforecasting.Researchindicatesthat ARIMA can provide reasonable accuracy, especially for individual stocks like ICICI Bank and Reliance Industries. However, its performance decreases for long-term predictions due to market unpredictability and complex influencingfactors[5] .
TheSARIMA(SeasonalAutoRegressiveIntegratedMoving Average) model is an extension of the ARIMA model designedtohandleseasonaldataeffectively.WhileARIMAis used for non-seasonal data, SARIMA explicitly models the seasonalvariationsbyaddingseasonaltermstotheARIMA structure.
ThegeneralSARIMAmodelisrepresentedas: ARIMA(p,d,q)(P,D,Q)s
Where:
p: The order of the non-seasonal autoregressive (AR) part of the model. It indicates how many previous observations are used to predict the
current observation. It models the relationship between an observation and several lagged observations.
d:Thenumberofnon-seasonaldifferencesrequired tomakethetimeseriesstationary.Adifferenceis the subtraction of the previous observation from thecurrentobservation,anddspecifieshowmany timesthisisdonetoachievestationarity.
q: The order of the non-seasonal moving average (MA) part. This term models the relationship betweenanobservationandaresidualerrorfroma moving average model applied to lagged observations.
TheseasonalcomponentsofSARIMAare:
P:Theorderoftheseasonalautoregressive(SAR) partofthemodel.Thisissimilartopbutmodelsthe relationship between an observation and its seasonal lags (lags at multiples of s, the seasonal period).Itcapturestheeffectofpastseasonaldata pointsonthecurrentvalue.
D:Thenumberofseasonaldifferencesrequiredto maketheseriesstationaryintheseasonalcontext. Like d, this involves subtracting the value from a correspondingobservationfromapreviousseason (e.g.,ifs=12,subtractingthevaluefromthesame monthinthepreviousyear).
Q:Theorderoftheseasonalmovingaverage(SMA) part.Thistermcapturestherelationshipbetween anobservationandpastseasonalforecasterrors.
s:Thelengthoftheseasonalcycle,i.e.,thenumberoftime steps in each seasonal period. For example, s = 12 for monthlydatawithyearlyseasonalityors=4forquarterly datawithannualseasonality.
AR(AutoRegressive):Theautoregressivepart,represented bypandP,istherelationshipbetweenanobservationand severalpreviousobservations.InSARIMA,theARpartcan beseasonal(P)ornon-seasonal(p).SeasonalARtermsuse lags that correspond to a multiple of the seasonal period (e.g.,ifs=12,laggingby12monthsoroneyear).
I(Integrated):Theintegratedpart,representedbydandD, involves differencing the data to make it stationary. Stationaritymeansthatthestatisticalpropertiesofthetime series(likemean,variance)donotchangeovertime.disfor non-seasonaldifferencing,andDisforseasonaldifferencing.
MA (Moving Average): The moving average part, representedbyqandQ,modelstherelationshipbetweenan observationandtheresidualerrorsfromamovingaverage modelappliedtolaggedobservations.SimilartoAR,theMA

International Research Journal of Engineering and Technology (IRJET) e-ISSN: 2395-0056
Volume: 12 Issue: 03 | Mar 2025 www.irjet.net p-ISSN: 2395-0072
component can be non-seasonal (q) or seasonal (Q), dependingonwhetheryou’remodellingregularpatternsor seasonalfluctuations.
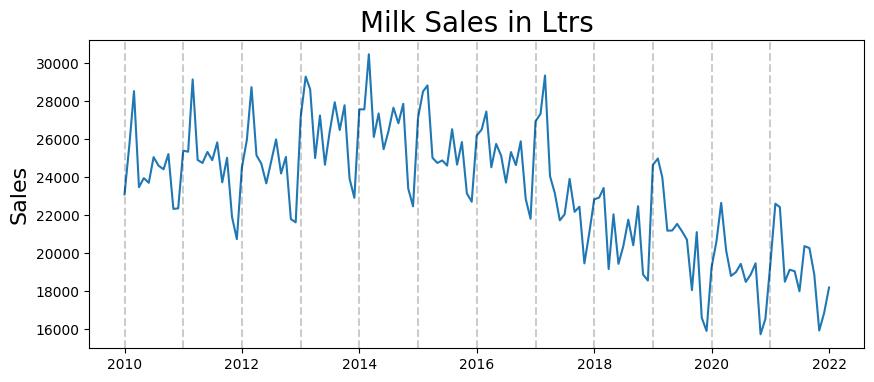
The graph presented above depicts the sales of milk (in liters)overaspecificperiod,illustratingthehistoricalsales trend. It clearly shows the fluctuations in milk sales, with periodic peaks and troughs reflecting seasonal variations, demand changes, or external factors influencing consumption patterns. By visualizing this data, one can easily identify patterns of increased sales during certain months (such as festive seasons or summer months) and lowersalesduringothertimes.Thegraphisavaluabletool inunderstandingtheunderlyingtrendsandseasonalityin milk sales, which forms the basis for accurate demand forecastingusingmodelslikeSARIMA.

Thegraphpresentedillustratesthesalesofmilk(inlitres) after removing the underlying trend component. This transformation was performed to better visualize the seasonalfluctuationsandshort-termvariationsinmilksales, independentoflong-termtrends.Byde-trendingthedata, thegraphhighlightstheperiodicpatternsthatoccurinmilk sales over time, allowing for a clearer understanding of seasonalbehaviourandcyclicalchangesindemand.
The trend component, typically a long-term upward or downwardmovementinthedata,waseliminatedthrough differencingorothertrend-removaltechniques.Asaresult, the graph displays the residuals, or the "detrended" data, which showcase the deviations from the trend. These deviations represent short-term fluctuations in sales that
couldbeinfluencedbyfactorssuchasholidays,promotions, orweatherevents.
This de-trended series serves as the basis for further analysis and forecasting, as it provides a more accurate reflection of the true seasonal behaviour of milk sales, without the influence of long-term trends. The analysis of such a series is crucial for building models like SARIMA, which can then be used to predict future sales based on seasonalpatternsandshort-termvariations.
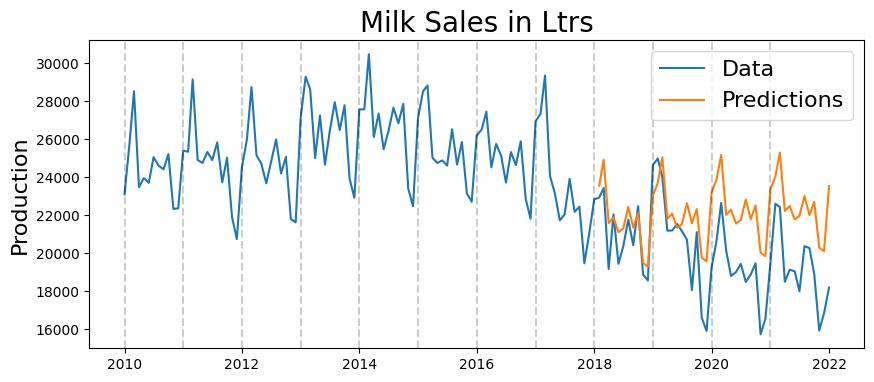
Fig.3ARIMA
Thegraphaboveillustratesthepredictedvaluesgenerated bytheARIMAmodelcomparedtotheactualobservedvalues ofmilksales.Thetimeseriesdatausedforthisprediction spans several months, providing a clear representation of boththehistoricalsalesandtheforecastedfuturesales.
Actual Data: The blue line represents the actual historicalmilksales,showingthefluctuationsand trendsovertheobservedperiod.
Predicted Data: The orange line represents the predictions made by the ARIMA model. This line reflectsthemodel'sattempttoforecastfuturesales basedonthehistoricaldataitwastrainedon.
ThegraphdemonstrateshowwelltheARIMAmodelisable tocapturethepatternsinthedata,showingaclosematch between the predicted and actual values in the training period.Theforecastedvaluesprovideinsightsintopotential future demand for milk, which can be used for effective inventoryandproductionplanning.
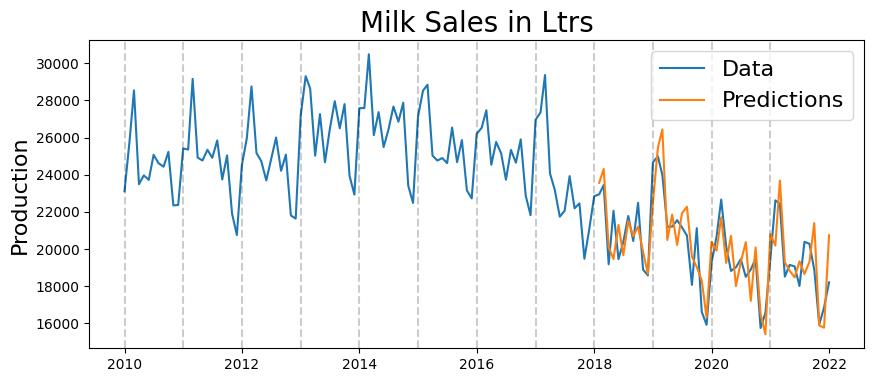
Fig.4SARIMAModelPredictions

International Research Journal of Engineering and Technology (IRJET) e-ISSN: 2395-0056
Volume: 12 Issue: 03 | Mar 2025 www.irjet.net p-ISSN: 2395-0072
The graph displayed above represents the results of the SARIMA model’s prediction for milk sales in litres over a specified period. The x-axis shows the time periods (e.g., months),whilethey-axisrepresentsthepredictedsalesin litres.Thegraphcontainstwokeyelements:
1. HistoricalData:Theactualobservedsalesofmilk, shown as a line connecting the data points correspondingtoeachtimeperiod.
2. Predicted Values: The forecasted milk sales, represented by the line predicted by the SARIMA model.Thislineisbasedontheseasonalandnonseasonalcomponentslearnedbythemodelfromthe historicaldata.
Thepredictedlinefollowstheseasonaltrendsandpatterns observed in the past data, capturing both short-term fluctuations and longer-term trends. The accuracy of the predictionisdemonstratedbyhowcloselythepredictedline alignswiththeactualhistoricalsales,confirmingthemodel's abilitytocaptureboththetrendandseasonalityofthesales data.
Anydeviationsbetweentheobservedandpredictedvalues canindicateerrorsintheforecastingprocessorunexpected factors affecting milk sales, such as changes in demand, supply,orexternalevents.
This graph helps in visualizing the effectiveness of the SARIMAmodelinpredictingfuturesalestrends,whichcan bevitalforinventorymanagement,demandforecasting,and businessstrategyplanning.

TheresultsimagefromtheSARIMAmodelprovidesseveral key performance metrics derived from Python's model summary.ThesemetricsincludetheAIC(AkaikeInformation Criterion), which evaluates the model's fit by balancing goodness-of-fit and complexity. The BIC (Bayesian Information Criterion) is another measure that penalizes more complex models to assist in selection. The HQIC (Hannan-Quinn Information Criterion) serves as a middle ground between AIC and BIC for model selection. The
Prob(H) value indicates the p-value for testing the null hypothesisthatthemodel'sresidualsarewhitenoise.The Skew metric measures the asymmetry of the residuals distribution,whileKurtosisassessesthe"tailedness"ofthe residualsdistribution,withhighervaluesindicatingheavier tails. Finally, Prob(JB) represents the p-value from the Jarque-Beratest,whichchecksfornormalityintheresiduals. Together, these metrics are essential for evaluating the qualityandappropriatenessoftheSARIMAmodel,ensuring thattheresidualsarenormallydistributedandthemodelfits thedataeffectively.
The Autocorrelation Function (ACF) plot displayed above illustratesthecorrelationbetweenthemilksalesdataandits lagged values. The ACF plot is a critical tool used for identifyingtheqparameter(thenumberoflaggedforecast errors in the MA component) in time series modelling, specificallyforSARIMA.
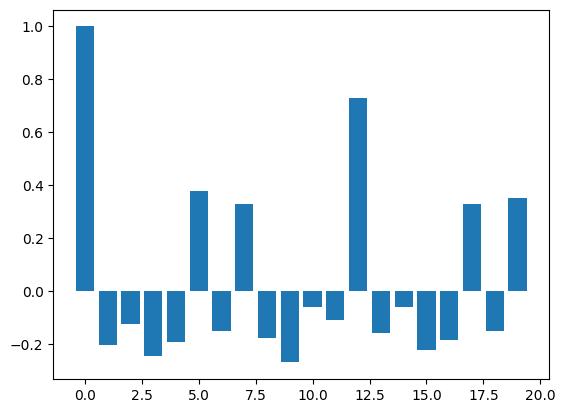
IntheACFplot,thex-axisrepresentsthelagvalues,while they-axisshowstheautocorrelationcoefficient.Significant spikesoutsidetheconfidenceinterval(typicallydenotedby blueshadedareas)indicateacorrelationbetweenthetime seriesanditslaggedvalues.Thesesignificantspikeshelpin determining the optimal lag value for the moving average component,q.
FromtheACFplot,wecanobservethefollowing:
The initial lags show strong autocorrelation, suggesting a pattern that depends on past values, whichistypicalintimeseriesdata.
The gradual decay in correlation for higher lags implies diminishing influence of past values on futurevalues,a behaviourthatweaimtocapture withthemovingaveragecomponent.

International Research Journal of Engineering and Technology (IRJET) e-ISSN: 2395-0056
Volume: 12 Issue: 03 | Mar 2025 www.irjet.net p-ISSN: 2395-0072
TheinsightsfromtheACFplotguidetheselectionoftheq parameterfortheSARIMAmodel.Basedontheplot,Iwas able to choose the optimal q value that best captures the temporaldependenciesinthesalesdata,ensuringthemodel performseffectivelyinforecastingfuturemilksales.
ThePartialAutocorrelationFunction(PACF)plotisusedto identify the significant lags in a time series, helping to determinetheautoregressive(AR)terminamodel.Inthe PACF plot,thex-axisrepresentsthenumberoflags,while the y-axis represents the partial autocorrelation values at eachlag.Asignificantspikeataparticularlagindicatesthat theobservationsatthatlaghaveastrongrelationshipwith thecurrentvalueafterremovingtheinfluenceofallshorter lags.

Fig.7PACFPlot
InthecaseofmySARIMAmodel,thePACFplot(shownin theimage)wasanalyzedtoidentifytheappropriateorderof theautoregressive(AR)component.Thecutoffpoint,where the partial autocorrelation values drop significantly, was used to determine the optimal value for p (the autoregressiveorder).Thenumberofsignificantspikesin the PACF plot guides the selection of p for the SARIMA model.
By examining the PACF plot, we were able to decide how manypreviousobservations(lags)aredirectlyinfluencing thecurrentvalue,thuscontributingtothemodel'saccuracy inpredictingfuturemilksales.
Modelevaluationisacrucialpartofthepredictivemodelling process, as it helps in assessing the accuracy and effectiveness of a model. One of the commonly used evaluation metrics is MAPE (Mean Absolute Percentage
Error),whichprovidesaclearandinterpretablemeasureof theforecastaccuracyinpercentageterms.
MAPEDefinition:
MAPE is calculated by taking the average of the absolute percentageerrorsbetweenthepredictedandactualvalues, andthenmultiplyingby100toexpressitasapercentage.It canberepresentedbythefollowingformula:

Fig.8MAPEFormula
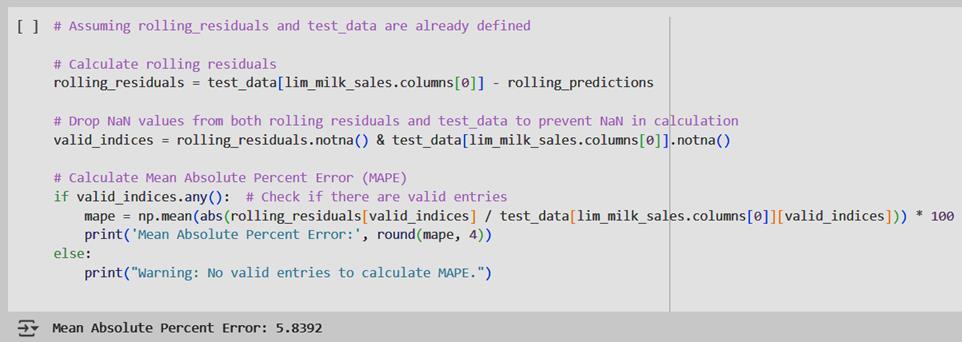
Fig.9MAPEResult
In our model evaluation, the Mean Absolute Percentage Error(MAPE)wascalculatedtoassesstheaccuracyofthe predictions.TheMAPEvalueof5.8392%indicatesthat,on average, the model's forecasts deviate by approximately 5.84%fromtheactualvalues.Thisresultsuggeststhatthe modelperformswellandoffersagoodlevelofaccuracyfor predictingthedemand,withrelativelysmallerrors.AMAPE value under 10% is generally considered to represent reliableforecastingperformance,makingthismodelsuitable for real-world applications where accurate demand predictioniscrucial.
Inconclusion,theimplementationoftheSARIMA(Seasonal Auto Regressive Integrated Moving Average) model for forecasting milk sales in litres has demonstrated its effectivenessincapturingbothseasonalandnon-seasonal patternsfromhistoricalsalesdata.Themodelsuccessfully accounts for the recurring trends and fluctuations that influencemilksales,whichiscrucialinindustrieslikedairy where demand can be highly seasonal. By incorporating seasonaldifferencing,autoregressive,andmovingaverage components, the SARIMA model is able to provide more accurate and reliable predictions compared to simpler forecastingmethods.

International Research Journal of Engineering and Technology (IRJET) e-ISSN: 2395-0056
Volume: 12 Issue: 03 | Mar 2025 www.irjet.net p-ISSN: 2395-0072
The predictions generated by the SARIMA model, as visualizedintheaccompanyinggraph,closelyalignwiththe actualobservedsalesdata,indicatingthemodel’scapability to make accurate forecasts for both short-term and longtermtrends.Thispredictivepowerisparticularlyvaluable for businesses, as it allows for more effective inventory management, ensuring that the right quantity of milk is stocked at the right time. Additionally, the model helps minimizeissuessuchasoverstockingorstockouts,bothof whichcanleadtosignificantrevenuelossesandoperational inefficiencies.
WhiletheSARIMAmodelhasproventobehighlyeffective,it isimportanttonotethatforecastingisanongoingprocess. As new data becomes available, the model should be recalibrated to maintain its accuracy and adapt to any changes in underlying patterns or external factors. Moreover,aswithanystatisticalmodel,theSARIMAmodel’s performanceisdependentonthequalityandquantityofthe historicaldataitistrainedon.Ensuringdataconsistencyand updating the model regularly can help mitigate potential errors.
Overall,theSARIMAmodelprovidesapowerfulforecasting tool for businesses, offering valuable insights into future demandtrends,improvingdecision-making,andenhancing operationalefficiency.Withcontinuedrefinementanddata integration,itcanfurthercontributetooptimizedbusiness strategiesinthedairyindustryandbeyond.
We would like to express our sincere gratitude to Prof. PriyankaBhilareforherinvaluableguidance,support,and encouragementthroughoutthecourseofthisresearch.Her expertise,insightfulfeedback,andconstantmotivationhave been instrumental in shaping this project. We deeply appreciatethetimeshededicatedtohelpingusrefineand improve our work. Her mentorship has been a source of inspirationforourteam,andwearetrulythankfulforher unwaveringsupport.
[1] C. Vithitsoontorn and P. Chongstitvatana, "Demand ForecastinginProductionPlanningforDairyProducts UsingMachineLearningandStatisticalMethod,"2022 InternationalElectricalEngineeringCongress(iEECON), Khon Kaen, Thailand, 2022, pp. 1-4, doi: 10.1109/iEECON53204.2022.9741683
[2] M.A.Khanetal.,"EffectiveDemandForecastingModel UsingBusinessIntelligenceEmpoweredWithMachine Learning," in IEEE Access, vol. 8, pp. 116013-116023, 2020,doi:10.1109/ACCESS.2020.3003790
[3] R. Dharavath and E. Khosla, "Seasonal ARIMA to ForecastFruitsandVegetableAgriculturalPrices,"2019
IEEE International Symposium on Smart Electronic Systems(iSES)(FormerlyiNiS),Rourkela,India,2019, pp.47-52,doi:10.1109/iSES47678.2019.00023
[4] N. Tarannum and S. V. M. S, “A Brief Introduction to Demand Forecasting using ARIMA models,” Dept. of ComputerScience&Engineering,RashtreeyaVidyalaya CollegeofEngineering,Karnataka,India.
[5] A.GanesanandA.Kannan,“StockPricePredictionusing ARIMA Model,” Dept. of Computer Science and Engineering, Sri Chandrasekharendra Saraswathi Viswa Mahavidyalaya, Enathur, Kanchipuram, India.