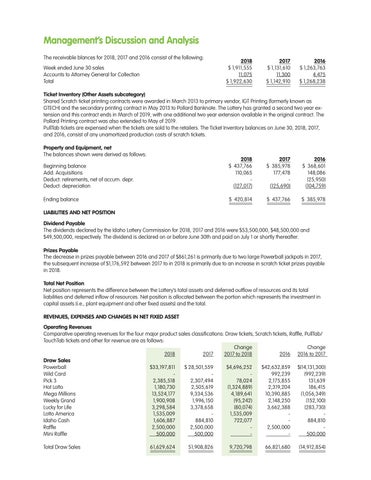
Management’s Discussion and Analysis The receivable blances for 2018, 2017 and 2016 consist of the following: Week ended June 30 sales Accounts to Attorney General for Collection Total
2018 $ 1,911,555 11,075 $ 1,922,630
2017 $ 1,131,610 11,300 $ 1,142,910
2016 $ 1,263,763 4,475 $ 1,268,238
Ticket Inventory (Other Assets subcategory) Shared Scratch ticket printing contracts were awarded in March 2013 to primary vendor, IGT Printing (formerly known as GTECH) and the secondary printing contract in May 2013 to Pollard Banknote. The Lottery has granted a second two year extension and this contract ends in March of 2019, with one additional two year extension available in the original contract. The Pollard Printing contract was also extended to May of 2019. PullTab tickets are expensed when the tickets are sold to the retailers. The Ticket Inventory balances on June 30, 2018, 2017, and 2016, consist of any unamortized production costs of scratch tickets. Property and Equipment, net The balances shown were derived as follows: Beginning balance Add: Acquisitions Deduct: retirements, net of accum. depr. Deduct: depreciation
2018 $ 437,766 110,065 (127,017)
2017 $ 385,978 177,478 (125,690)
2016 $ 368,601 148,086 (25,950) (104,759)
Ending balance
$ 420,814
$ 437,766
$ 385,978
LIABILITIES AND NET POSITION Dividend Payable The dividends declared by the Idaho Lottery Commission for 2018, 2017 and 2016 were $53,500,000, $48,500,000 and $49,500,000, respectively. The dividend is declared on or before June 30th and paid on July 1 or shortly thereafter. Prizes Payable The decrease in prizes payable between 2016 and 2017 of $861,261 is primarily due to two large Powerball jackpots in 2017, the subsequent increase of $1,176,592 between 2017 to in 2018 is primarily due to an increase in scratch ticket prizes payable in 2018. Total Net Position Net position represents the difference between the Lottery’s total assets and deferred outflow of resources and its total liabilities and deferred inflow of resources. Net position is allocated between the portion which represents the investment in capital assets (i.e., plant equipment and other fixed assets) and the total. REVENUES, EXPENSES AND CHANGES IN NET FIXED ASSET Operating Revenues Comparative operating revenues for the four major product sales classifications: Draw tickets, Scratch tickets, Raffle, PullTab/ TouchTab tickets and other for revenue are as follows: Change Change 2018 2017 2017 to 2018 2016 2016 to 2017 Draw Sales Powerball $33,197,811 $ 28,501,559 $4,696,252 $42,632,859 $(14,131,300) Wild Card 992,239 (992,239) Pick 3 2,385,518 2,307,494 78,024 2,175,855 131,639 Hot Lotto 1,180,730 2,505,619 (1,324,889) 2,319,204 186,415 Mega Millions 13,524,177 9,334,536 4,189,641 10,390,885 (1,056,349) Weekly Grand 1,900,908 1,996,150 (95,242) 2,148,250 (152,100) Lucky for Life 3,298,584 3,378,658 (80,074) 3,662,388 (283,730) Lotto America 1,535,009 1,535,009 Idaho Cash 1,606,887 884,810 722,077 884,810 Raffle 2,500,000 2,500,000 2,500,000 Mini Raffle 500,000 500,000 500,000 Total Draw Sales
61,629,624
51,908,826
9,720,798
66,821,680
(14,912,854)