

Early cancer detection in dogs is critical when evaluating dermal and subcutaneous masses, which make up roughly one third of the tumors veterinarians encounter in routine practice. Yet due to the cost, invasiveness, or inconclusive results of traditional diagnostics, more than half of malignant masses go undiagnosed.
HT Vista reduces the delay between cancer detection and intervention by o ering a fast, non-invasive, and a ordable point-of-care tool that rules out non-malignant masses, while flagging suspicious masses for further investigation.
The HT Vista scanner is placed over a mass and gently heats it and the surrounding tissue by 42°F / 6-7°C for 10 seconds before allowing it to cool for an additional 30 seconds. Benign and malignant tissues display di erent heat transfer rates due to di erences in composition, metabolism, tissue morphology, and vascular network, which a ect their thermophysical properties. HT Vista’s algorithms are designed to recognize these distinctions as the mass is heated and left to cool down.
HT Vista was originally developed as a non-invasive cancer screening tool that quickly assesses whether a dermal or subcutaneous mass is likely benign or requires further diagnostic testing (1). Advancements in AI and HT Vista’s extensive and continuously expanding dataset have allowed it to also detect specific cancer types as well.
This article explains the technical details of HT Vista’s key features and highlights the performance of the screening tool (primary classifier), in addition to Lipoma and MCT detection subclassifiers.


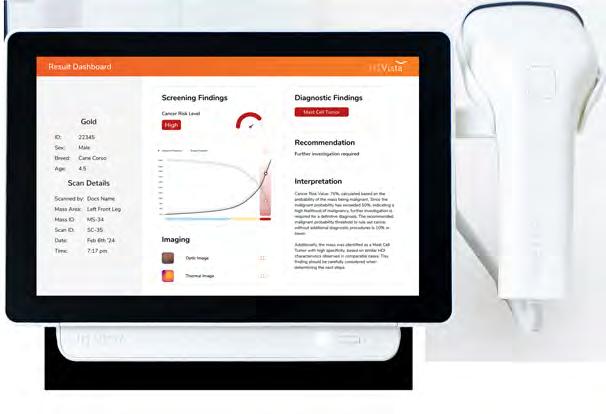
Diagnostic Findings: Subclassifier algorithms detect specific tumor types of both benign (e.g., Lipomas, Sebaceous Adenomas, and Benign Epithelial tumors) and malignant (e.g., Mast Cell Tumors) origin. With a specificity of 90% or higher, subclassifiers give additional ‘rule-in’ confidence, which can help guide treatment decisions right away, especially when additional diagnostics are contraindicated or not financially feasible.
The primary classifier was trained on a dataset of 1,163 canine masses, with tumor types distributed as in table 1.
Benign Cases (n = 743) Malignant Cases (n = 349)
Benign Lipoma (453) MCT (229)
Benign Adnexal / Epidermal Cyst / Tumor (204)
Sebaceous Adenoma (42)
Under sample (44)
Tumor Specific
Soft Tissue Sarcoma (89)
Under sample (31)
Inflammatory Process (71)
Only high-confidence cases from the primary classifier were used to train the subclassification models.
The Lipoma subclassifier was trained with very low Cancer Risk Level cases confirmed to be Lipomas. 249 of 453 Lipomas in the dataset met these criteria (table 2).
Benign Tumors
Malignant Tumors
(FN of primary
(FN of primary classifier)
The Mast Cell Tumor subclassifier was trained with very high Cancer Risk Level cases confirmed to be Mast Cell Tumors. 111 of 229 MCTs in the dataset met these criteria (table 3).
Cancer Risk Levels: HT Vista’s Low, Moderate or High cancer risk levels o er a visual framework to make decision-making more straightforward. Low-risk cases are confidently ruled out - based on an average negative predictive value (NPV) of 98%, suggesting the mass is highly likely benign. Moderate- and high-risk cases indicate a higher risk of malignancy and are guided toward further diagnosis and treatment.
3.
After training the classifier, a validation study was performed, utilizing cases where a diagnostic “ground truth” could be obtained from either histopathology and / or cytology. For each validated scan, the model outputs a discrete score, and the diagnostic “ground truth” is charted. Image 2 shows the distribution of diagnoses across scores, from which HT Vista's overall Sensitivity and Specificity is derived.
To ensure clinically relevant results, primary classifier scorestrained on a 70:30 benign-to-malignant ratio (table 1) - were adjusted to a real-world veterinary prevalence ratio of 85:15 (2).
How Does HT Vista Help You?
Science-Based Decision-Making Cancer Risk Levels and Diagnostic Findings help prioritize cases, support clearer client communication, and proactive diagnostic and treatment strategies.
Earlier Cancer Detection HT Vista increases the chances of catching malignancies like MCTs earlier, improving treatment outcomes and long-term prognosis by minimizing delay between detection and intervention.
HT Vista represents a breakthrough in non-invasive cancer screening, o ering veterinary teams a fast, accurate, painless and a ordable way to assess dermal and subcutaneous masses. Its AI-powered Heat Di usion Imaging technology combines high sensitivity and NPV for ruling out malignancy with tumor-specific subclassifiers that provide high specificity and PPV for ruling in cancer, transforming it from a screening tool into a powerful diagnostic aid.
(Tumor Specific Subclassifiers)
The Lipoma subclassifier validation revealed a 90% specificity, and 99% PPV. Sensitivity was 69%, indicating not every Lipoma is flagged (table 4). This suggests a Lipoma flag is highly accurate, and while not every Lipoma is flagged, a Low Cancer Risk Level still rules out malignancy with high confidence.
The Mast Cell Tumor subclassifier validation revealed a 90% specificity, and 77% PPV. Sensitivity was 44% indicating many MCTs are not flagged (table 4). This suggests a MCT flag is highly accurate, and while not flagging every MCT, a High Cancer Risk Level leads to detection upon further investigation.
With its non-invasive, highly sensitive approach, HT Vista meets the performance standards of top human screening methods aimed at early detection and is pioneering this approach in veterinary medicine.
References
1.Dank G, Buber T, Rice A, Kraicer N, Hanael E, Shasha T, Aviram G, Yehudayo A, Kent MS. (2013) Training and validation of a novel non-invasive imaging system for ruling out malignancy in canine subcutaneous and cutaneous masses using machine learning in 664 masses. Front Vet Sci.
2.Webb MPK, Sidebotham D. (2020) Bayes' formula: a powerful but counterintuitive tool for medical decision-making. BJA Educ.
3.Lee, J. K., Liles, E. G., Bent, S., Levin, T. R., & Corley, D. A. (2014). Accuracy of fecal immunochemical tests for colorectal cancer: Systematic review and meta-analysis. Annals of Internal Medicine, 160(3), 171-181.
4.E Duijm, G L Guit, J O Zaat, A R Koomen, D Willebrand. (1997) Sensitivity, specificity and predictive values of breast imaging in the detection of cancer. Br J Cancer. 1997;76(3):377–381
5.Liao, C.-Y., & Tyan, Y.-S. (2019). Study on Papanicolaou smear images for classification of squamous cell carcinoma. Journal of Cancer Research and Practice, 6(2), 66-71.
*In tables 2 and 3, you will find the following initials with the following meanings: TN - True Negative; FN - False Negative; TP - True Positive; FP - False Positive.