
SubtitleHere


OnbehalfofWoolpert,wewouldliketoextendourappreciationtotheHoward- SuamicoSchool DistrictfortheopportunitytoassistthemindevelopingthisEnrollmentProjectionsReportwhich includesprojectionsbyschoolofattendance.Asaplanningteam,wehopethatthisdocumentwill servetheHoward-SuamicoSchoolDistrictforyearstocome.
AnnHoffsis,REFP,Vice-President,Director|ManagementConsulting
KarenJackson,ConsultantII
GalinaLyogky,ProjectCoordinatorII
CynthiaCasarez,ProjectCoordinatorI
StephanieFrank,ProjectCoordinatorI

TheenrollmentprojectionsbyschoolofattendancefortheHoward-SuamicoSchool Districtincludedinthisreportweredevelopedusingthecohortsurvivalmethodology andWoolpert’scustomenrollmentprojectionsoftware,S.T.E.P.[StudentTrends& EnrollmentProjections].Thiscustomsoftwarewasdevelopedincollaborationwith TheOhioStateUniversityandisbasedonindustrybestpracticesaswellasthenational experienceWoolperthaswithschools,schooldistricts,andstateagencies.

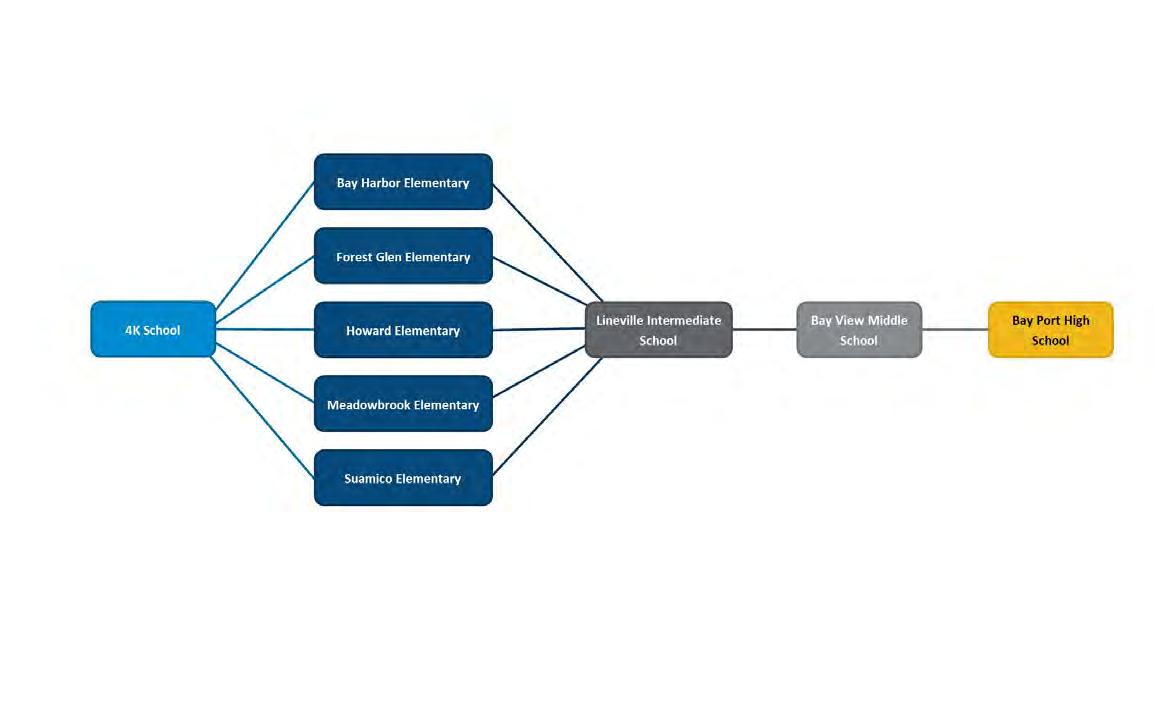
TheHoward-SuamicoSchoolDistrictserves5,654studentsinHowardandSuamico4K,BayHarbor,Forest Glen,Howard,MeadowbrookandSuamicoelementaries,LinevilleIntermediate,BayViewMiddleSchool,and BayPortHighSchoolinthe2024-25schoolyear.
Theprojectionspresentedinthisreportaremeanttoserveasaplanningtoolforthefuture, representingthemostlikelydirectionoftheDistrict .Enrollmentprojectionsweredevelopedusingthe cohortsurvivalmethodologyandbyanalyzingthefollowingdataoutlinedinthisreport:
• Historicalenrollmentbyschool,bygrade,by year
• Residentlivebirthdata
• Censusdata
• Buildingpermits
EnrollmentintheHoward-SuamicoSchoolDistricthasdecreasedby395studentsfromthe2015 - 16tothe 2024 -25schoolyear.Basedonthecohortsurvivalmethodology,enrollmentisprojectedtodecreaseoverthe nexttenyears.

Aswithanyprojection,theDistrictshouldpaycloseattentiontothevariablesassociatedwith determiningenrollmentprojectionsdiscussedinthisdocument .Anyoneormoreofthesefactors canincreaseordecreaseenrollmentwithintheHoward-SuamicoSchoolDistrict.Whenprojectingfuture enrollments,itisvitaltotrackthenumberoflivebirths,theamountofnewhousingactivity,andthe changeinhouseholdcomposition.Itisrecommendedthatthedatacontainedinthisreportshould bereviewedonanannualbasistodeterminehowmorerecenttrendsandanynewhousing developmentwillimpacttheenrollment.Inaddition,anyofthefollowingfactorscouldcausea significantchangeinprojectedstudentenrollment:
• Boundaryadjustments
• Newschoolopenings
• Schoolclosures
• Changes/additionsinprogramofferings
• Preschoolprograms
• PolicyChanges
• Changesingradeconfiguration
• Interestrates/unemploymentshifts
• Intra-andinter-Districttransfers
• Magnet/charter/privateschoolopeningsor closures
• Zoningchanges
• Annexations
• Unplannednewhousingactivity
• Planned,butnotbuilt,housing
• Schoolvoucherprograms
• Transportationpolicychanges
• Pandemics
Obviously,certainfactorscanbegaugedandplannedforfarbetterthanothers.Forinstance,itmay berelativelystraightforwardtogatherhousingdatafromlocalbuildersregardingthetotalnumber oflotsinaplannedsubdivisionandcalculatethepotentialstudentyield.However,planningforchanges intheunemploymentrate,andhowthesemayeitherboostorreducepublicschoolenrollment, provestobemoredifficult .Inanycase,itisessentialtogatherawidevarietyofinformationin preparationforproducingenrollmentprojections.
Whenlookingaheadataschooldistrict’senrollmentoverthenexttwo,five,ortenyears,itis helpfultoapproachtheprocessfromaglobalperspective.Forexample:Howmanynewhomes havebeenconstructedeachyear?Howmanybirthshaveoccurredeachyearinrelationtothe residentpopulation?Ishousingexperiencingaturnoverifso,whatisthecompositionoffamilies movingin/out?Aremoreorlessstudentsattendingprivateschoolorbeinghome-schooled?Whathas theunemploymentratetrendbeenoverthepasttenyears?Whatneweducationalpoliciesarein placethatcouldaffectstudentenrollmentfigures?
Thecohortsurvivalmethodologyisastandardmethodologyusedthroughouttheeducationalplanning industrytoprojectenrollmentTheenrollmentprojectionsdevelopedfortheHoward-SuamicoSchool Districtweredevelopedusingthecohortsurvivalmethod.

Introduction
Tracingthelandscapeofthecountry’spublic schoolenrollmentbackoverthepastfiftyyears revealsdemographic,economic,andsocialchanges. TheUnitedStatesasawholecontinuestoundergo majorshiftsinpublicstudentenrollment,dueinlarge parttopasteventsincludingthebabyboom,the availabilityanduseofbirthcontrol,andthe developmentofsuburbs.Thebabyboomofthelate 1940sand50swasfollowedbythebabybustof the1960sand70s.Thisgaverisetotheechobaby boomofthe1980s.


Nationwide,districtshaveexperiencedtheeffectsof theechobabybustofthe1990s.Fromthe1950s tothe1970s,adramaticdownsizingofthefamily unitoccurred.Adirectresultwasthedeclining schoolenrollmentofthe1970sand1980s.Asof the2010Census,thesizeofafamilywasatan all-timelowof3.14persons.Thelivebirthrate increasedforthefirsttimeinseveralyearsin1998 andincreasedagainin2000and2006However, thebirthrateresumedadescendingpatternin2008 andreachedanall-timelowof10 .9(per1,000 )in 2020andremainedat11.0through2022

Thecohortsurvivalmethodology(sometimesreferredtoasthegrade progressionratiomethod)isawidelyusedenrollmentprojectionmodelthatis usedbymanyschooldistrictsandstateandfederalagenciestoprojectK-12 enrollment
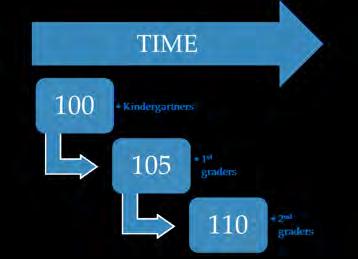
Acohortisagroupofpersons[inthiscase,students].Thecohortsurvival enrollmentprojectionmethodologyuseshistoriclivebirthdataandhistoric studentenrollmentto“age”aknownpopulationorcohortthroughoutthe schoolgrades.Forinstance,acohortbeginswhenagroupofkindergarteners enrollsingradeKandmovestofirstgradethefollowingyear,secondgradethe nextyear,andsoon.
A“survivalratio”isdevelopedtotrackhowthisgroupofstudentsincreasedordecreasedinnumberasthey movedthroughthegradelevels.Bydevelopingsurvivalratiosforeachgradetransition[i.e.2ndto3rdgrade] overaten-yearperiod,patternsemerge.Aprojectionratioforeachgradetransitionisdevelopedbasedon analysisofthesurvivalratiosTheprojectionratiosareusedasamultiplierindeterminingfutureenrollment
Forexample,ifstudentenrollmenthasconsistentlyincreasedfromthe8thtothe9thgradeoverthepastten years,thesurvivalratiowouldbegreaterthan100%andcouldbemultipliedbythecurrent8thgrade enrollmenttodevelopaprojectionfornextyear’s9thgrade.Thismethodologycanbecarriedthroughto developtenyearsofprojectionfiguresBecausethereisnotagradecohorttofollowforstudentscominginto kindergarten,residentlivebirthcountsareusedtodevelopabirth-to-kindergartensurvivalratio.Babiesborn fiveyearsprevioustothekindergartenclassarecomparedinnumber,andaratiocanbedevelopedtoproject futurekindergartenenrollments
Thecohortsurvivalmethodisusefulinareaswherepopulationisstable[relativelyflat,growingsteadily,or decliningsteadily],andwheretherehavebeennosignificantfluctuationsinenrollment,births,andhousing patternsfromyeartoyear.Thecohortsurvivalmethodologyinherentlyconsiderstheneteffectsoffactorssuch asmigration,housing,dropouts,transferstoandfromcharterschools,openenrollment,anddeaths.This methodologydoesnotassumechangesinpolicies,programofferings,orfuturechangesinhousingand migrationpatterns.

ThissectionpresentsdatafromtheUnitedStatesCensusBureauandestimatesfromtheAmerican CommunitySurvey(ACS)todemonstratethedemographiccharacteristicsandhistorictrendsofthe populationwithintheDistrictboundary.WhiletheCensusisconductedevery10years,the AmericanCommunitySurveycollectssocial,housing,educational,occupational,financial,andother demographicdatafromover3.5millionhouseholdsthroughoutthenationmonthlyandiscompiled yearly,asmandatedbytheU.S.Constitution.Thisdatahelpspublicofficials,federal/state/local agencies,schooldistricts,etcassesshistorictrendsandplanforthefuture
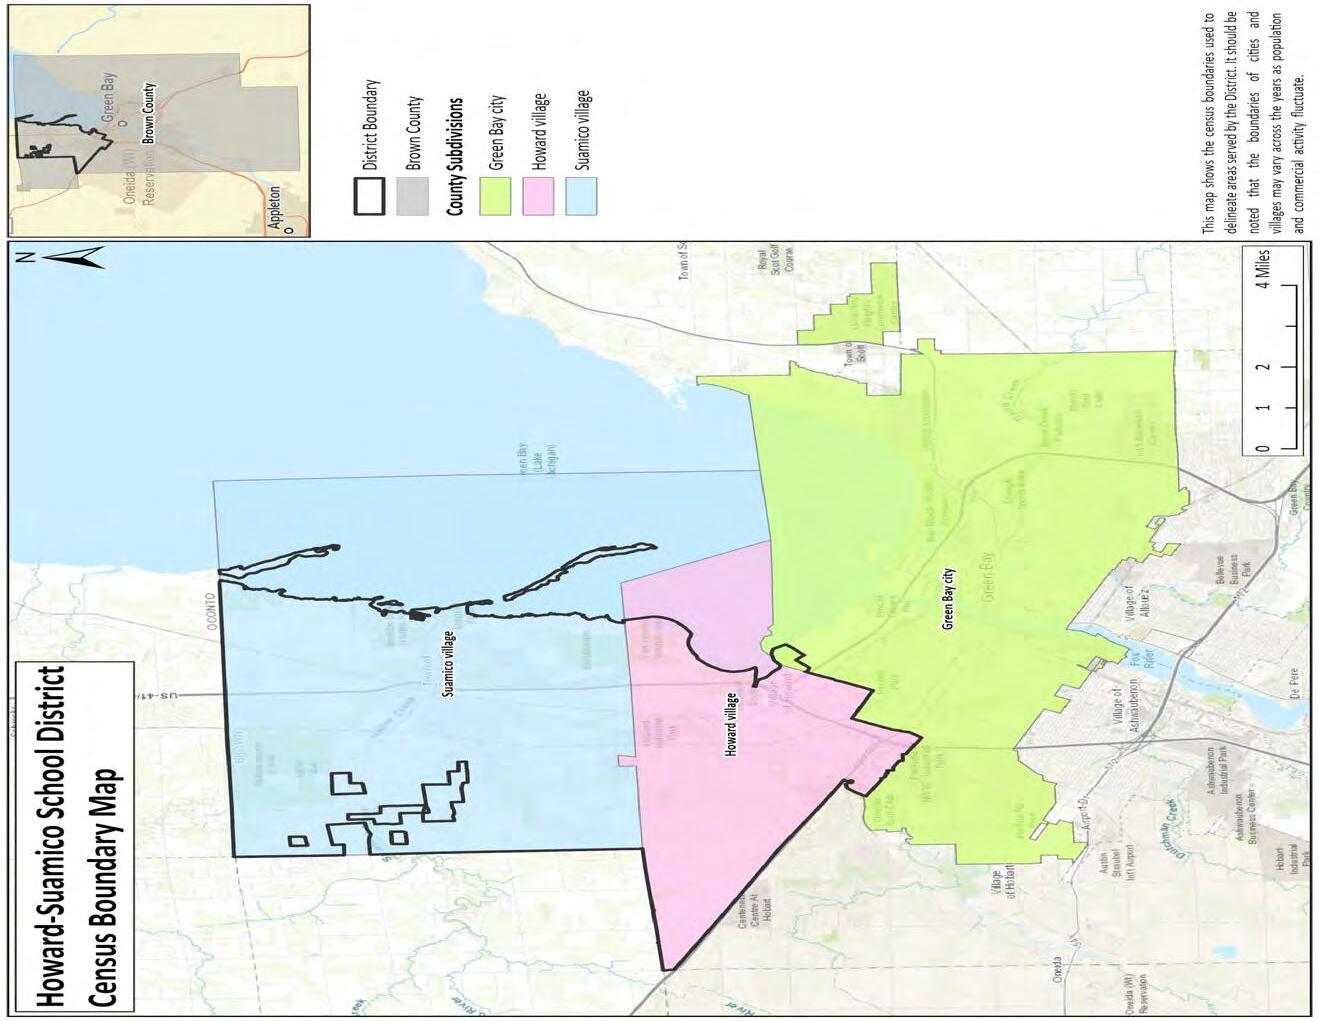
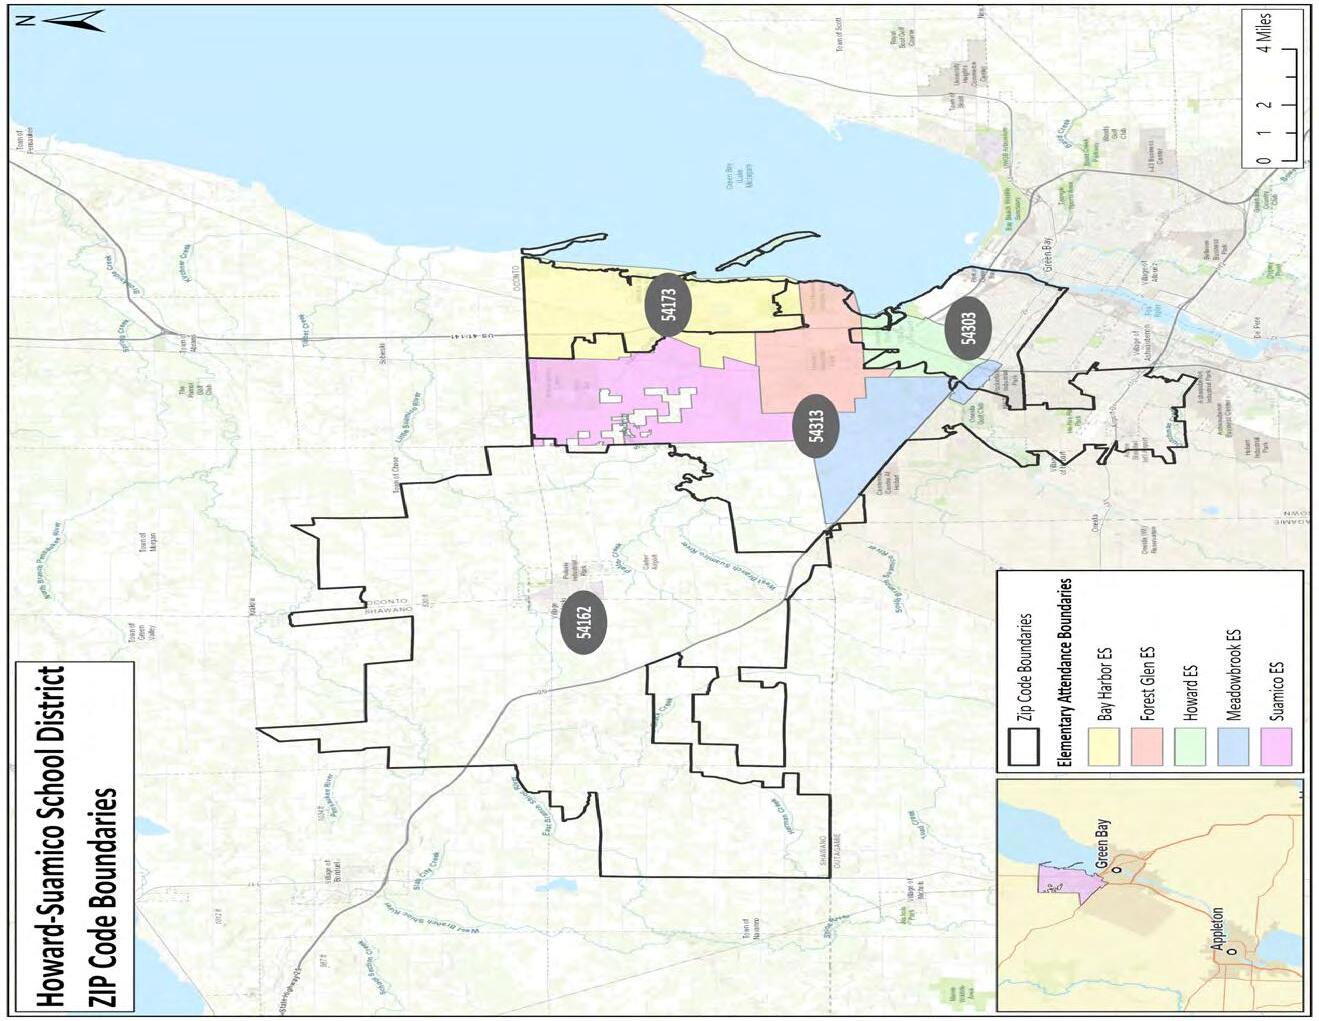
TheHoward-SuamicoSchoolDistrictislocatedinBrownCounty,WisconsinItservespartsorallofthe followinglocalities:GreenBayCity,Howardvillage,andSuamicovillage.Thedataonthefollowingpagesis aggregatedandcolor-coordinatedbytheboundariesshowninthemaponthefollowingpage
ItshouldbenotedthattheDistrictdoesnotnecessarilyservewholelocalitiesbutdatapresentedby localityisforthewholelocality.


ThetableandpiechartbelowshowhowmanyHoward-SuamicoSchoolDistrictstudentsliveinthe DistrictboundaryandeachlocalityservedbytheDistrict,byyear,accordingto2024-25student data.^ThepercentagesforeachlocalityarebasedonthetotalstudentsintheHoward-SuamicoSchool DistrictThetotalatthebottomofthetableindicatesthetotalnumberofstudentsintheDistrict, notthesumofthevaluesinthetable.
Source: Howard-Suamico School District Student Data
*This total reflects the amount of District students, not a total of the values in the table.
^Studentdataand officialenrollment may be taken at different points in the year, so studentdatacountsdo not necessarily match official enrollment counts.
**Other includes students livingoutside of the District boundaryand inlocalities not shown in the map on the previous pageandtable above

Accordingtothe2020Census,sincethe2010Census,thetotalpopulationandmedianageincreasedinthe Districtboundary.Basedonthe2020Census,sincethe2010Census,thenumberofchildrenundertheageof5 hasdecreasedby3percent,thenumberofchildrenages5-19hasincreasedby3percent,thenumberof adultsages20-64hasincreasedby6percent,andthenumberofadultsages65andoverhasincreasedby96 percentintheDistrictboundaryThe2000,2010,and2020populationcountsareshowninthetablebelow


ThetablebelowshowsraceandethnicdistributionthroughouttheHoward-SuamicoSchoolDistrictboundary andthelocalitiesthatareservedbytheDistrict. Accordingtothe2023ACSestimates,mostofthepopulationintheDistrictboundaryspeaksonlyEnglish.The tablebelowshowsthelanguagesspokenathome
Source:
LanguagesSpokenatHome
Population5yearsandover31,277253,60299,63119,16712,385
SpeakonlyEnglish97.45%89.89%83.86%97.15%97.99%
SpeakalanguageotherthanEnglish2.55%10.11%16.14%2.85%2.01% Spanish37116,93911,724215156 5-17yearsold494,6972,9642128
18-64yearsold30811,4508,110194114
65yearsoldandover14792650014
OtherIndo-Europeanlanguages2652,85196617491 5-17yearsold39381652019 18-64yearsold1161,9227558234 65yearsoldandover1105481467238
AsianandPacificIslandlanguages1354,4302,3871332 5-17yearsold054131800 18-64yearsold1353,4961,8201332 65yearsoldandover039324900 Otherlanguages251,4271,008250 5-17yearsold028925600 18-64yearsold251,115746250 65yearsoldandover023600
Source: American Community Survey 5-Year Estimates (2023)

Accordingtothe2023ACSestimates,approximately76%ofthehomesintheHoward-SuamicoSchoolDistrict boundaryaresingle-unitstructureswhile23%ofthehomesare2-or-more-unitstructures.Nearly30%ofthe Districtboundary’shouseholdshaveatleastoneschool-aged(oryounger)childinthem.
TotalHouseholds13,129110,24844,0928,5064,707
Source: American Community Survey 5-Year Estimates (2023)

AccordingtotheU.S.CensusBureau,“Afamilyisagroupoftwopeopleormore(oneofwhomisthe householder)relatedbybirth,marriage,oradoptionandresidingtogether.”
Ahouseholdconsistsofallpersons(relatedandunrelated)livingwithinahousingunit.
Ahousingunitisasingleroom,house,apartment,orothergroupofresidentialroomsthathavedirectoutside access;groupquartersareexcluded.
Accordingtothe2023ACSEstimates,theaveragefamilysizehasincreasedintheDistrictboundarywhilethe averagehouseholdsizehasdecreased.
Fromthe2010Censustothe2020Census,thenumberoftotalandoccupiedhousingunitsintheDistrict boundaryhasincreasedwhilethenumberofvacantunitshasdecreased.


ThetablebelowillustratesthetypesofindustryandoccupationcategoriesintheHoward-SuamicoSchool Districtboundaryandthelocalitiesitserves.2023estimatesarecalculatedforthecivilianemployedpopulation 16yearsandover.
Industry&OccupationCategoriesfortheCivilian EmployedPopulation16YearsandOver,
Totalpopulation32,925269,425106,58520,26113,003 Civilianemployedpopulation,16yearsandover17,775142,22354,54811,3126,625 Agriculture,forestry,fishingandhunting,and
Source: American Community Survey 5-Year Estimates (2023)

AccordingtotheU.S.CensusBureau,earningscomefromajob(salary/wages)whileincomealsoincludes paymentssuchas“SocialSecurity,pensions,childsupport,publicassistance,annuities,moneyderivedfrom rentalproperties,interestanddividends.”Thetablebelowshowsincome,earnings,povertystatus,and unemploymentrateintheACS2023estimates
Population16yearsandover withearnings18,934153,89859,81811,9647,132 Full-time,year-roundworkers withearnings13,18399,69037,5098,3344,972
$1to$9,999orloss0.92%1.38%1.69%1.28%0.28% $10,000to$14,9991.03%1.69%1.90%1.63%0.00%
$15,000to$24,9994.35%4.70%6.60%5.68%2.03%
$25,000to$34,9997.52%9.86%11.85%9.16%4.73%
$35,000to$49,99913.81%21.37%26.91%13.73%13.62%
$50,000to$64,99917.83%19.81%20.08%18.26%17.66%
$65,000to$74,99910.56%10.61%9.52%10.21%11.42%
$75,000to$99,99922.93%15.30%10.94%21.05%25.78%
$100,000ormore21.03%15.29%10.51%19.01%24.48%
MeanEarningsforfull-time, year-roundworkers$81,387$72,405$64,241$74,609$92,602
TotalHouseholds13,129110,24844,0928,5064,707 Lessthan$10,0002.10%3.70%5.00%2.80%0.70%
$10,000to$14,9991.80%3.00%4.50%2.00%1.50%
$15,000to$24,9992.90%5.80%8.60%3.10%2.50%
$25,000to$34,9995.80%6.90%7.40%5.40%6.30%
$35,000to$49,9999.20%11.10%13.60%11.40%5.00%
$50,000to$74,99915.30%17.70%19.70%19.10%8.50%
$75,000to$99,99914.80%14.60%14.60%14.10%15.80%
$100,000to$149,99922.90%20.80%16.20%19.30%29.70%
$150,000to$199,99912.00%8.20%5.70%11.10%13.80%
$200,000ormore13.20%8.20%4.70%11.70%16.10% Medianincome(dollars)$96,669$77,490$62,546$84,896$113,614

Thetablebelowshowsthepresenceofacomputerand/orinternetsubscriptioninhouseholdsinthelocalities servedbytheDistrict,accordingthe2023ACSestimates.Percentagesshownarebasedontotalhouseholds.
Source: American Community Survey 5-Year Estimates (2023)

ThetablesbelowsummarizethepercentageofthepopulationlivingwithintheHoward-SuamicoSchoolDistrict boundary,byagegroup,enrolledinschool;enrolledinschoolandattendingpublicschool;andenrolledin schoolandattendingprivateschool,basedonU.S.CensusAmericanCommunitySurvey(ACS)5–YearEstimates. Home-schooledchildrenarecountedintheprivateschooldata;theACSdoesnotdistinguishbetweencharter andnon-charterschoolsIfanyoneintheseagegroupshadnotattendedanyschoolinthe3monthsbeforethe surveywasconducted,theywereconsideredtonotbeenrolledinanyschool. ItshouldbenotedthatthisdataisnotasurveyofthestudentsattendingschoolsintheDistrict;rather,itis basedonmonthlysurveyssentoutbytheACStohouseholdsintheDistrictboundary.Thissurveydataisthen usedtocreatetheestimatesshowninthetablesbelow AgeGroup201520162017201820192020202120222023Trend


HOWARD-SUAMICOSCHOOLDISTRICTBOUNDARY %OFAGEGROUPENROLLEDINSCHOOLATTENDINGPUBLICSCHOOL


Source: U.S. Census

ThefollowinginformationrepresentsblockgroupestimatescreatedfrommarketresearchandU.S.Censusdata obtainedfromtheEnvironmentalSystemsResearchInstitute[ESRI].ESRIprovidesayearlyupdatetotheir demographicdatainincrementsoffiveyears.Tomakeupdatestotheirdemographicdataset,theyuse AmericanCommunitySurvey[ACS]datathattakesaseriesofmonthlysamplesurveysbutonlyfromareaswith populationsof65,000ormore.OneyearofACSdataisaperiodestimateasatwelve-monthaverage,rather thanasinglepointintime
AccordingtotheESRIestimates,thetotalpopulationofBrownCountyisestimatedtoincreaseoverthenext fiveyearsAsillustratedinthetablebelow,thenumberofchildren,ages5-18,isestimatedtodecreaseby 2,246children,orapproximately5percent.

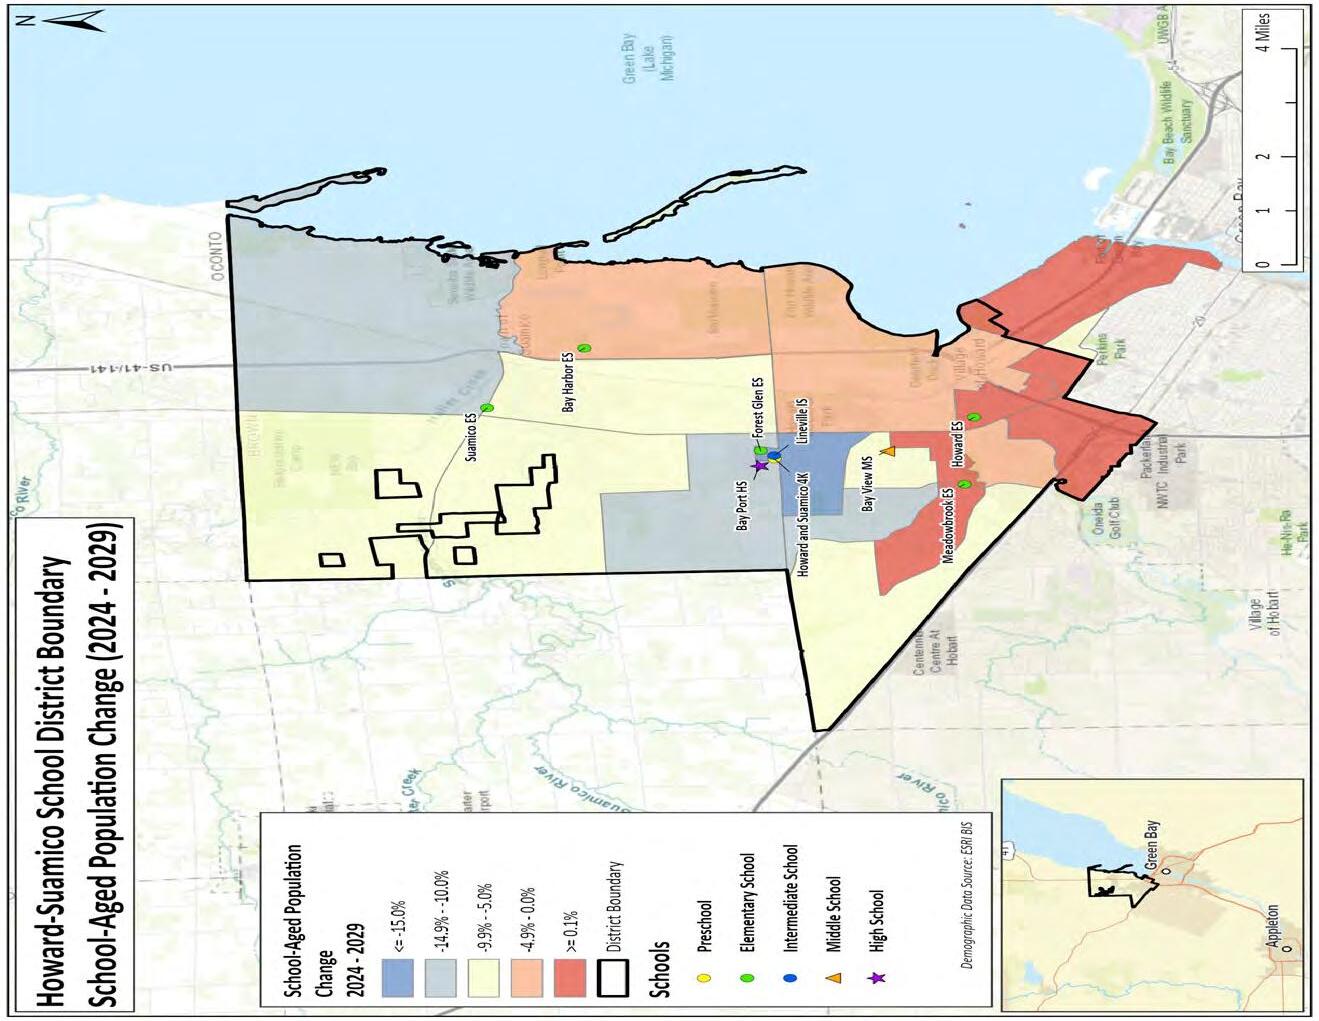
Themaponthefollowingpageshowsschool-agedpopulationchangeintheU.S.Censusblockgroupswithin/ aroundtheHoward-SuamicoSchoolDistrictboundary.Populationchangesarebasedon2024and2029 estimates.
AblockgroupisdefinedbytheU.S.CensusBureauas,“astatisticaldistrictofacensustract,generallydefined tocontainbetween600and3,000peopleand240and1,200housingunits,andthesmallestgeographicunit forwhichtheCensusBureautabulatessampledata.”


Housingdevelopmentandbuildingpermitsaretrackedtodeterminetheireffectonstudentenrollment.The tablebelowandgraphsonthefollowingpageillustratethenumberofsingle-andmulti-familybuildingpermits issuedinBrownCounty,GreenBayCity,SuamicoVillage,andthevillageofHowardsince2000.
MoredetailedhousingdatacanbefoundintheStudentPotentialAnalysisreport
20001,130429187161688 20011,2059692131821580 20021,2598781972621320 20031,4461,0952531461156 20041,27480622443511730 20051,058664166888884 20067505887996780 200781131980746010 2008409255570524 2009480228890390 201047551339186474 20113473624016264 20125002754826400 201354255171105614 2014506361701104471 2015520362712753103 201662020211105142 20176413109804547 20185724351010344 2019506405630400 2020611599712523090 20216005765825034 2022447612370304 2023419397370320 20245301,05542434522 2025*1249011098 Source: SOCDS Building Permits Database ( *preliminary through March 2025)


Utilizationofresidentlivebirthdataisrecommendedwhenprojectingfuturekindergartenenrollments.This dataprovidesahelpfuloveralltrendLargebubblesinbirthcounts,eitherupordown,canalsobeplannedfor oranticipatedbytheDistrict.
Inaddition,thelivebirthcountsareusedindeterminingabirth-to-kindergartenandbirth-to-firstgradesurvival ratio.Thisratioidentifiesthepercentageofchildrenborninarepresentativeareawhoattendkindergartenand firstgradeintheDistrictfiveandsixyearslaterThesurvivalratiosforbirth-to-kindergarten,birth-to-firstgrade, aswellasgrades1-12canbefoundonpage24ofthisreport.
DataisarrangedbytheresidenceofthemotherForexample,ifamotherlivesinHowardbutdeliversherbaby inSuperior,thebirthiscountedinHoward.Livebirthcountsaredifferentfromlivebirthrates.Thelivebirth countissimplytheactualnumberoflivebirths.Abirthrateisthenumberofbirthsper1,000womenina specifiedpopulationgroup.
ThetableandgraphincludetheresidentlivebirthcountsforZIPcodes54162,54173,54303,and54313Upon analysisofthemaponthefollowingpage,onlylivebirthcountsforZIPcodes54173,54303,and54313were usedinthedevelopmentoftheenrollmentprojections.
Source: Wisconsin Department of Health Services, Division of Public Health, Office of Health Informatics *Data from 2024 is provisional and subject to change. Data extracted 05/22/2025 from Vital Records Reporting & Analytic Database.


Thechartbelowdemonstratestheten-yearchanges,bygradelevel,inenrollmentasstudentsmovethrough thesystemPercentagesgreaterthan100indicatethattherearemorestudentsthantherewereintheprevious gradethepreviousyear.Inotherwords,therewasanincreaseinstudentpopulationwherenewstudentswere addedtothesystem.Percentageslessthan100indicatethattherewasdeclineorstudentsleftthesystem.If theexactnumberofstudentsin1stgradeduringthe2015-16schoolyearwerepresentin2ndgradeforthe 2016-17schoolyear,thesurvivalratiowouldbe100percent.
Birth-to-KindergartenandBirth-to-FirstGrade:Thisratioindicatesthenumberofchildrenbornintheareawho attendkindergartenandfirstgradeinthedistrictfiveandsixyearslater.Whatisimportanttonoteisthetrend insurvivalratios,notnecessarilytheactualnumber
Grades8to9:Thehigherthanusualpercentagemaybearesultofschooldistrictpromotionpolicies.Oftenin schooldistricts,studentsarepromotedfrom8thto9thgradeandafteroneyearin9thgradedonothave sufficientcreditstobeclassifiedasa10thgraderandarecountedagainas9thgradersthefollowingyear.There mayalsobestudentswhoareattendingprivateorcharterschoolsorarehomeschooledthroughgrade8and thenattendpublicschoolsforhighschooleducation.
TheCOVID-19pandemicintroducedanunforeseenlevelofvolatility,nationwide,asseeninthesurvivalratios forthe2019-20to2020-21and2020-21to2021-22schoolyears.Theseratioswillneedtobemonitored closelyoverthenextfewyearsasnewtrendsareestablished
2018-192019-2045.79%101.81%43.67%101.28%99.23%101.76%104.42%102.75%100.21%99.34%106.35%100.00%98.43%100.63% 2019-202020-2138.93%96.89%44.37%100.51%99.24%101.03%101.23%98.94%98.66%99.36%102.42%100.00%99.78%102.39% 2020-212021-2237.05%104.51%40.68%106.68%99.75%100.00%97.96%102.44%98.72%100.45%105.15%100.22%101.71%104.42% 2021-222022-2342.28%97.26%36.04%100.81%95.74%101.02%102.03%100.00%100.95%101.95%108.78%100.41%98.50%100.84%
meansimpleallyears
std.dev.simpleallyears
meansimple5years
std.dev.simple5years
meansimple3years
std.dev.simple3years
meansimple2years
std.dev.simple2years
meanweightedallyears
std.dev.weightedallyears
meanweighted5years
std.dev.weighted5years
meanweighted3years
std.dev.weighted3years
meanweighted2years
std.dev.weighted2years


Asindicatedinthetablebelow,overthepasttenyears,studentenrollmentintheHoward


BayHarborElementary388410394398412384383364334327

BayPortHigh1,8201,8661,8861,8931,9021,9021,9061,9151,9421,951 BayViewMiddle904928893898923908905894841817
ForestGlenElementary514521513495480471459445454448


HowardElementary289291306295277273258275257262

HowardandSuamico4K379374363344331276330295233280

LinevilleIntermediate845882914904920877805787811812

MeadowbrookElementary560520513510492471479478484477

PupilServices14171814151313101315

SuamicoElementary336335319327318316316298277265

GrandTotal6,0496,1446,1196,0786,0705,8915,8545,7615,6465,654

Source: Howard-Suamico School District Enrollment Data, September Count

Thetableandgraphsbelowshowopenenrollment-in,openenrollment-out,openenrollment-inbygradeand openenrollment-outbygradeintheDistrict,accordingtodataprovidedbytheHoward-SuamicoSchool District
Thevaryingshades ofcolorin thetable


Woolpertdevelopedlow,moderate,high,andrecommendedenrollmentprojectionsfortheHoward-Suamico SchoolDistrict.Themoderateenrollmentprojectionsarebasedonaselectedaverageorweightedaverageof survivalratios(inthiscase,a5-yearweightedaverage,byschool).Thelowandhighenrollmentprojectionsare developedusingstatisticaldistributionaltheory,providingtheDistrictwithamoreconservative(low)andmore liberal(high)enrollmentprojection.Therecommendedenrollmentprojectionisbasedonadetailedanalysisof historicalenrollmentandresultingsurvivalratiosoverthepast10years,byschoolSignificantshiftsinsurvival ratiopatternsarerealizedandaccountedforindeterminingprojectionratiosindependentlyforeachgrade level.TherecommendedillustratesthemostlikelydirectionoftheDistrictbasedonmorerecenttrends.
Therangeofenrollmentprojectionsfromlow(conservative)tohigh(liberal)areofferedduetothelimitations ofthecohortsurvivalmethodinfactoringchangestopolicies,programofferings,andfuturechangesinhousing andmigrationpatterns.Forexample,thelowenrollmentprojectionmightbeusedifhousingdeclines significantlymorethananticipated;thehighenrollmentprojectionmightbeusedifhousinggrowthincreasesat amorerapidratethanseeninrecentyears.
Itshouldbenotedthattheactuallivebirthcountsareavailablethrough2024andprojectkindergarten enrollmentthrough2028-29Toprojectkindergartenthrough2034-35,asimpleaverageofthelast3yearsof livebirthcountswasused.
ProjectedPK(S/L)and4Kenrollmentdoesnotfollowthecohortsurvivalmethodbutisbasedonthecurrent 2024-25enrollmentof16and306,PK(S/L)and4Kstudents,respectively

Source:

School2025-26*2026-272027-282028-292029-302030-312031-322032-332033-342034-35Trend
BayHarborElementary315322314307323325324326326324

BayPortHigh1,8941,8531,8141,7881,8021,7501,7471,7281,6251,620

BayViewMiddle849841829780788821718680722721

ForestGlenElementary460443427414439442445448449445

HowardElementary273245225212213213212213213213

HowardandSuamico4K280280280280280280280280280280

LinevilleIntermediate809754761792693658698696701721

MeadowbrookElementary498463453455463462466469470466

PupilServices15151515151515151515

SuamicoElementary268251251245254255259260261259

GrandTotal5,6615,4675,3695,2885,2705,2215,1645,1155,0625,064


5,000
3,000


School2025-26*2026-272027-282028-292029-302030-312031-322032-332033-342034-35Trend
BayHarborElementary315313301289300302302303303301

BayPortHigh1,8941,8491,8091,7841,7971,7491,7541,7441,6531,644

BayViewMiddle849841829784800836737690718717

ForestGlenElementary460435414395413417419422424420

HowardElementary273256240231232232233233232233

HowardandSuamico4K280280280280280280280280280280

LinevilleIntermediate809757772807712667694692698716

MeadowbrookElementary498466456459466463466470471467

PupilServices15151515151515151515
SuamicoElementary268252249240248249252254255253 GrandTotal5,6615,4645,3655,2845,2635,2105,1525,1035,0495,046


School2025-26*2026-272027-282028-292029-302030-312031-322032-332033-342034-35Trend
BayHarborElementary315299280265271271271273273271

BayPortHigh1,8941,8311,7821,7461,7491,6901,6761,6431,5311,484

BayViewMiddle849831816763765787680613623620

ForestGlenElementary460416386362372373379380381378

HowardElementary273236214201200200199199200200

HowardandSuamico4K280280280280280280280280280280

LinevilleIntermediate809746748769664600609605610626

MeadowbrookElementary498453440439445443448450451448

PupilServices15151515151515151515

SuamicoElementary268240234223229230232232234232

GrandTotal5,6615,3475,1955,0634,9904,8894,7894,6904,5984,554


School2025-26*2026-272027-282028-292029-302030-312031-322032-332033-342034-35Trend
BayHarborElementary315328324317332334333336336334
BayPortHigh1,8941,8671,8371,8231,8451,8111,8351,8501,7841,818
BayViewMiddle849851842805836888798775827828
ForestGlenElementary460455440432456460464466468464
HowardElementary273274268264268270270269268269
HowardandSuamico4K280280280280280280280280280280
LinevilleIntermediate809768798847762740790790796816
MeadowbrookElementary498477471475485484488490493488
PupilServices15151515151515151515
SuamicoElementary268265264259271272275276277275 GrandTotal5,6615,5805,5395,5175,5505,5545,5485,5475,5445,587
Source: Woolpert


1,000 2,000 3,000 4,000 5,000 6,000


Source:
ProjectedEnrollment-Recommended-BayPortHigh
Source:
Thevaryingshades ofcolorin thetable represent

Source: Howard-Suamico School District Enrollment Data, September Count ProjectedEnrollment-Recommended-BayViewMiddle
Source: Woolpert ProjectedEnrollment-Moderate-BayViewMiddle


Source: Howard-Suamico School District Enrollment Data, September Count
ProjectedEnrollment-Recommended-HowardandSuamico4K Grade2025-262026-272027-282028-292029-302030-312031-322032-332033-342034-35
Source: Woolpert
ProjectedEnrollment-Moderate-HowardandSuamico4K Grade2025-262026-272027-282028-292029-302030-312031-322032-332033-342034-35
Source: Woolpert
ProjectedEnrollment-Low-HowardandSuamico4K Grade2025-262026-272027-282028-292029-302030-312031-322032-332033-342034-35
Source: Woolpert
ProjectedEnrollment-High-HowardandSuamico4K Grade2025-262026-272027-282028-292029-302030-312031-322032-332033-342034-35
Source: Woolpert
Thevaryingshades ofcolorin thetable represent statisticallysignificant cohort sizes. Thedarkerblue represents smalle r
while thedarker redrepresents largercohorts, comparatively.

Source: Howard-Suamico School District Enrollment Data, September Count
Source: Woolpert

Thevaryingshades
Source: Howard-Suamico

Source: Howard-Suamico School District Enrollment Data, September Count
ProjectedEnrollment-Recommended-PupilServices
Grade2025-262026-272027-282028-292029-302030-312031-322032-332033-342034-35
Source: Woolpert
ProjectedEnrollment-Moderate-PupilServices
Grade2025-262026-272027-282028-292029-302030-312031-322032-332033-342034-35 PK(S/L)15151515151515151515 GrandTotal15151515151515151515
Source: Woolpert
ProjectedEnrollment-Low-PupilServices
Source: Woolpert
ProjectedEnrollment-High-PupilServices
Grade2025-262026-272027-282028-292029-302030-312031-322032-332033-342034-35 PK(S/L)15151515151515151515
Source: Woolpert
Thevaryingshades ofcolorin thetable represent statisticallysignificant cohort sizes. Thedarkerblue represents smalle r cohorts, while thedarker redrepresents largercohorts, comparatively.


Aswithanyprojection,theDistrictshouldpaycloseattentiontolivebirthcounts,enrollmentinelementary schools,openenrollment,non-publicenrollment,in/outmigrationpatterns,andanyhousinggrowth.Itis recommendedthatthisdocumentbereviewedonanannualbasistodeterminehowmorerecentgrowthand enrollmenttrendswillimpacttheenrollmentprojections.
WoolpertispleasedtohavehadtheopportunitytoprovidetheDistrictwiththisdemographicstudyWehope thisdocumentwillprovidethenecessaryinformationtomakeinformeddecisionsaboutthefutureofthe Howard-SuamicoSchoolDistrict.

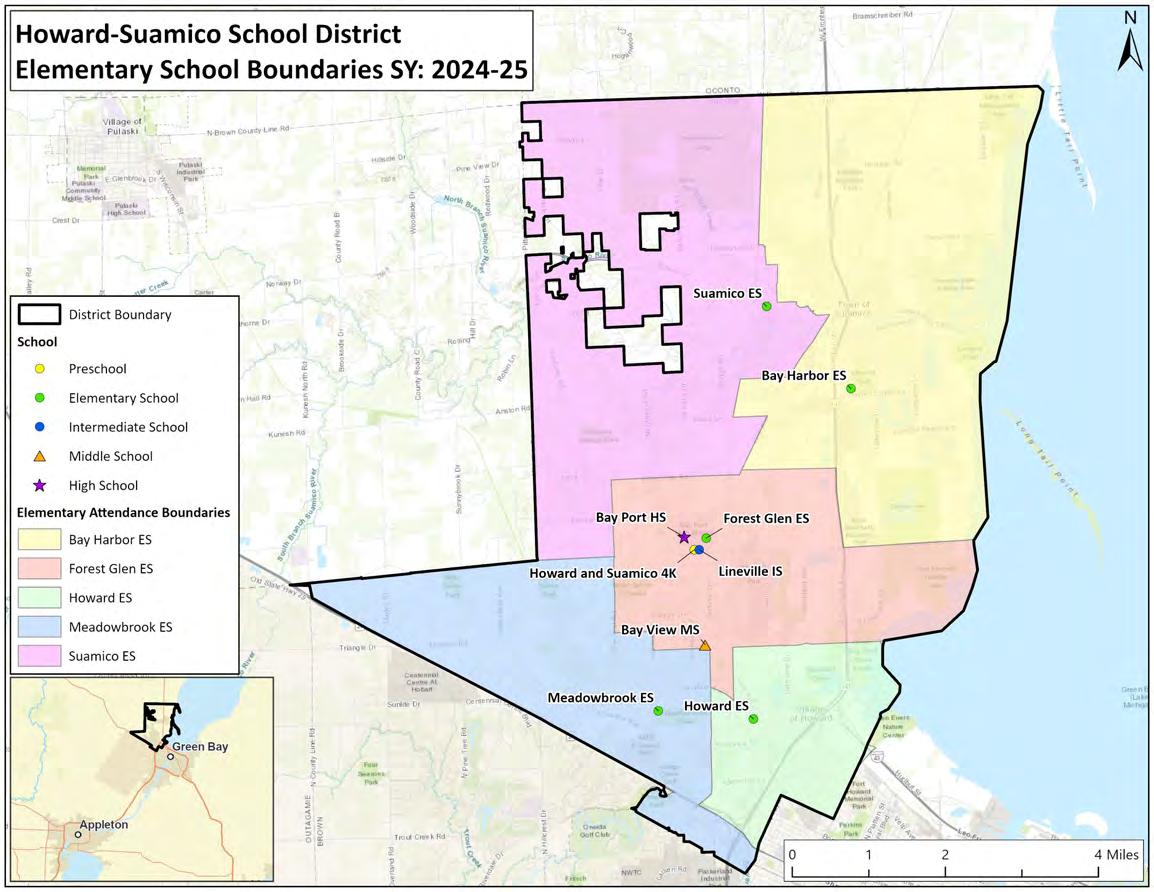
Thefollowingmapillustratesthe2024-25schoolboundariesintheHoward-SuamicoSchoolDistrict.


Thetablesbelowandonthefollowingpageillustratealive/attendanalysisfortheHoward-SuamicoSchool District.Thistablecross-references2024-25studentenrollment*andthecurrentattendancezonein whichstudentsreside.Thenumbersinbolddenotestudentswholiveintheboundaryofandattendtheir zonedschool.Transfer-indenotesthenumberofstudentswhotransferintoaschoolfromoutsideofthe attendancezone.Transfer-outdenotesthenumberofstudentsthatleavetheirzonedschooltoattendanother school.OutofDistrictindicatesstudentswhoresideoutsideoftheDistrictandUnmatchedindicates studentswhowereunabletobegeocoded(matchedtoapointonamap).
SchoolofAttendance
Note:Studentdataandofficial


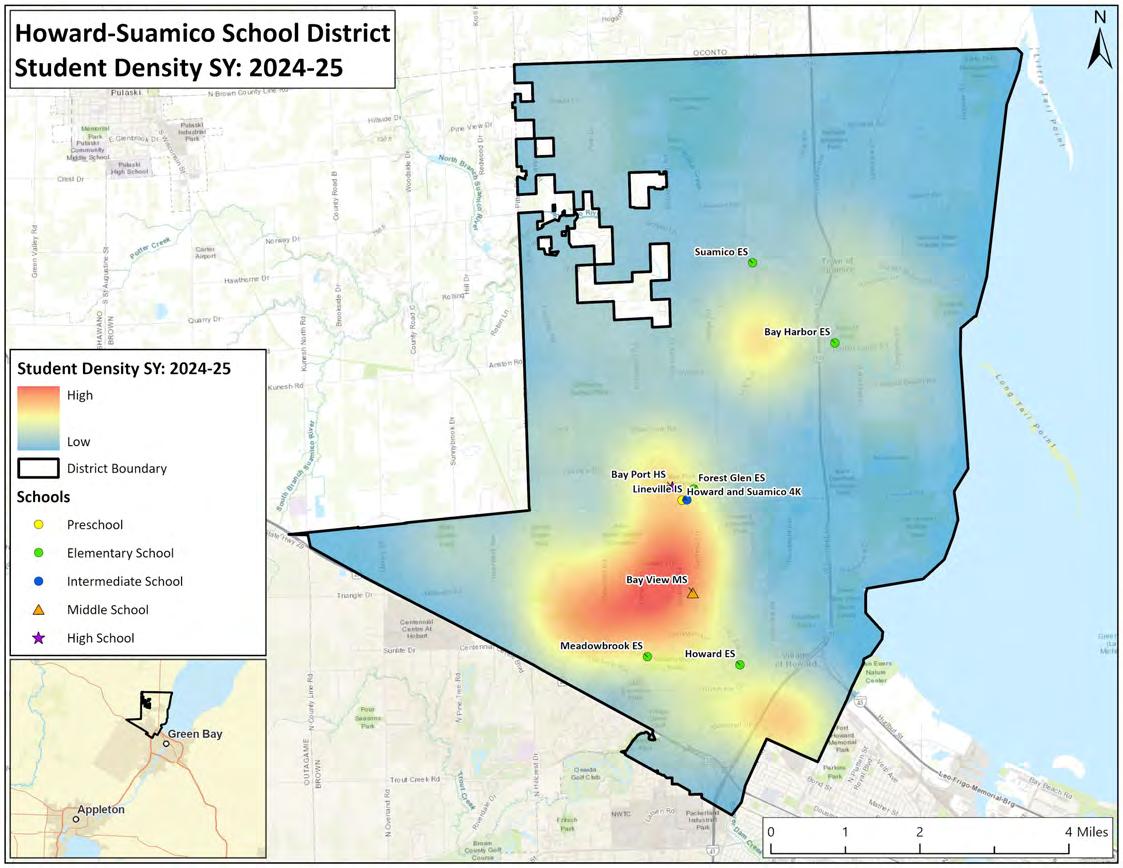
ThemapbelowshowsstudentdensityintheHoward-SuamicoSchoolDistrict.Thedarkerblueareasindicate lowerstudentdensitywhilethedarkerredareasindicatehigherstudentdensity.
