
Identifying Predictors of Atmospheric Nitrogen Deposition in Long Island, NY
Taran Parmar, Dr. Steve M. Raciti Department of Biology, Hofstra University
Introduction
Nitrogen pollution is a major environmental issue on Long Island that affects drinking water and coastal ecosystems. One important source is atmospheric nitrogen deposition, which results from emissions by vehicles, powerplants, and urban development. Excess nitrogen can lead to harmful algal blooms, low oxygen levels in the water, and fish deaths. These impacts threaten the economic stability of coastal communities. National monitoring sites for atmospheric nitrogen deposition are located in rural areas and may underestimate deposition in suburban regions. To better understand this, nitrogen deposition data were collected from 26 sites across Long Island. This study tests whether population density, traffic emissions, impervious surface area, or powerplant emissions can predict patterns of nitrogen deposition.
Methods
- Ion exchange resin (IER) columns were installed at 26 sites across Long Island, which absorbed atmospheric nitrogen deposition over 6-8 weeks.
- Resin columns were later analyzed to determine total nitrogen deposition.
- ArcGIS was used to map monitoring sites and create buffer zones around each one.
- Four predictors were evaluated: on road CO2 emissions (within 1km), impervious surface area (within 1km), NOx emissions from power plants (within 10km), and population density (within 3km).
- Linear and multiple linear regression models.
Results

Conclusions
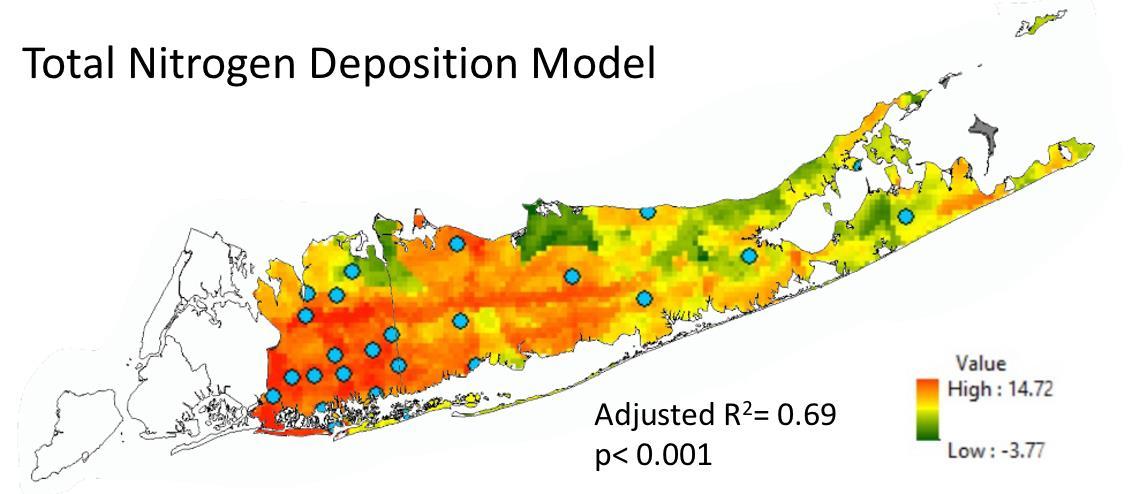
We found that nitrogen deposition varied across Long Island and could be successfully predicted. On road vehicle emissions were the strongest individual predictor (R2 = 0.52), followed by nitrous oxide emissions from power plants (R2 = 0.52) and impervious surfaces (R2 = 0.42). Population density was only a weak predictor (non-significant). A multiple linear regression model that combined vehicle emissions, point source emissions, and impervious surface area produced the most accurate predictions of nitrogen deposition across Long Island (R2 = 0.69, p < 0.001). The highest nitrogen deposition levels were observed in areas with heavy traffic, dense development, and nearby emissions from powerplants and industrial sites. Deposition was higher at most of the study sites than at the National Atmospheric Deposition monitoring station, indicating that measurements from rural areas do not adequately reflect atmospheric nitrogen deposition across densely developed suburban areas.
Next Steps
- Collect additional data from underrepresented areas, such as agricultural regions and eastern Long Island, to improve model accuracy.
- Test the model’s predictive power in new locations between existing sampling sites.
- Explore seasonal trends in nitrogen deposition by using longer term monitoring.
Acknowledgements
I would like to thank my research advisor, Dr. Raciti, for his guidance and support throughout this project. I also thank Harper McDowell, Brigid Lamaze, and other students in the Raciti lab for their assistance with data collection and fieldwork.
References
- Rao, P., Hutyra, L. R., Raciti, S. M., & Templer, P. H. (2014). Atmospheric nitrogen inputs and losses along an urbanization gradient from Boston to Harvard Forest, MA. Biogeochemistry, 121(1), 229 – 245.
- Decina, S. M., Hutyra, L. R., & Templer, P. H. (2019). Hotspots of nitrogen deposition in the world’s urban areas: A global data synthesis. Frontiers in Ecology and the Environment, 18(2), 92-100.
- Wang, H., Bouwman, A. F., Van Gils, J., Vilmin, L., Beusen, A. H. W., Wang, J., Liu, X., Yu, Z., & Ran, X. (2023). Hindcasting harmful algal bloom risk due to land-based
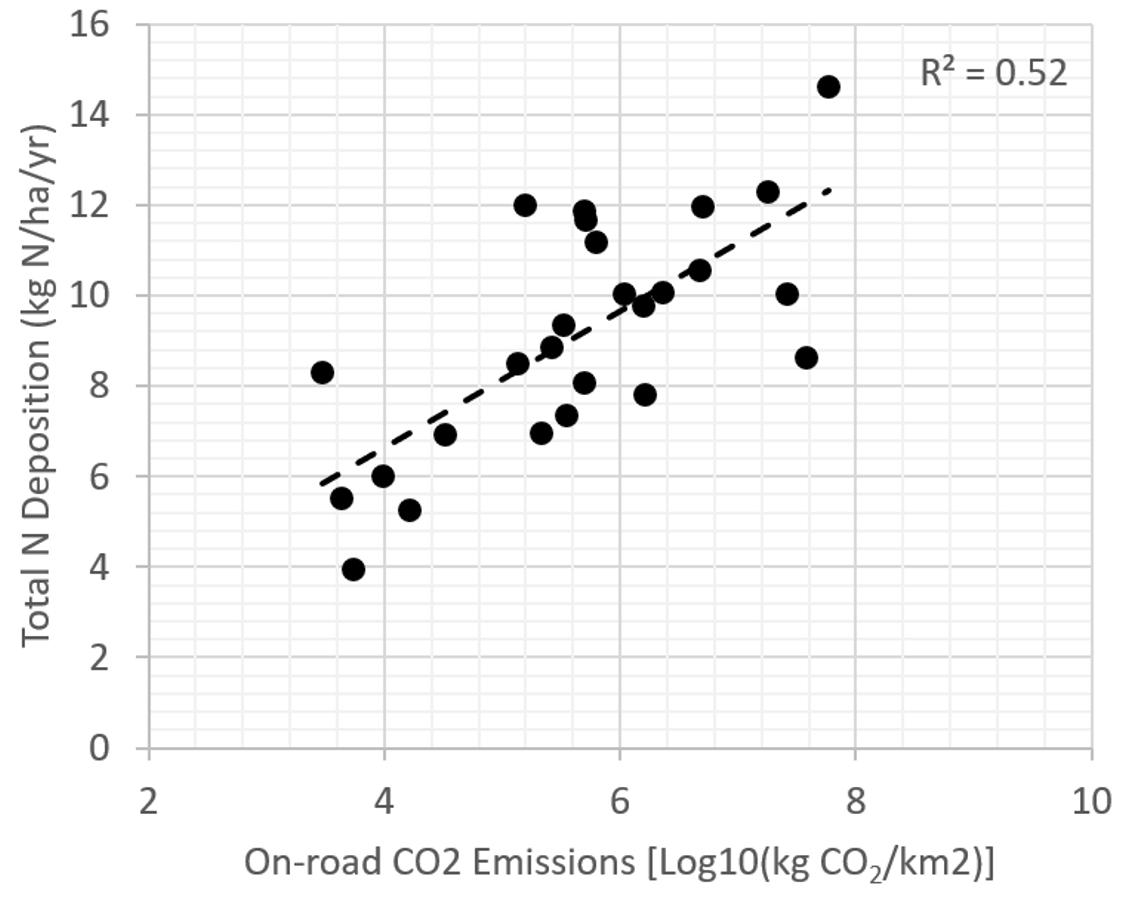
Figure 2. Total nitrogen deposition increases with on road CO2 emissions within a 1 km radius. This variable showed the strongest individual relationship with nitrogen deposition (R2 = 0.52).
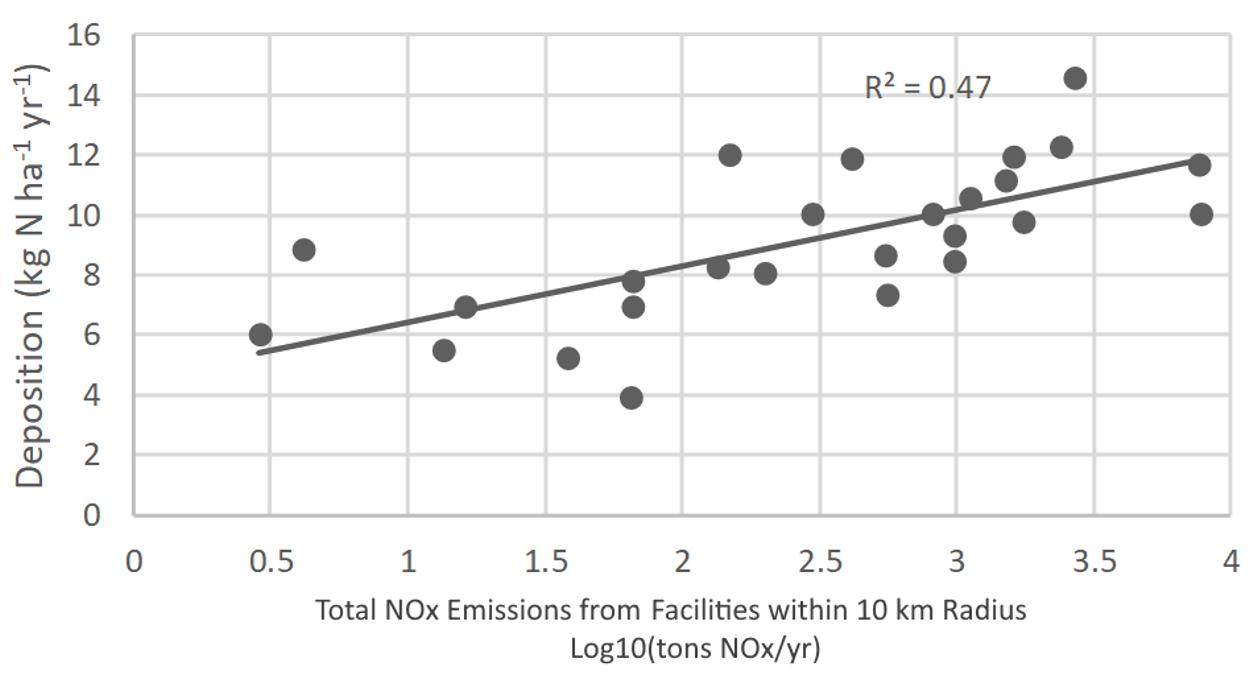
Figure 3. Nitrogen Deposition Increases with NOx emissions from power plants within a 10 km radius. This was the second strongest predictor (R2 = 0.47). Figure
nutrient pollution in the Eastern Chinese coastal seas. Water Research, 231, 119669.
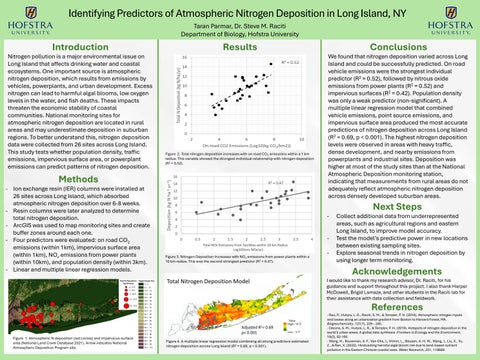
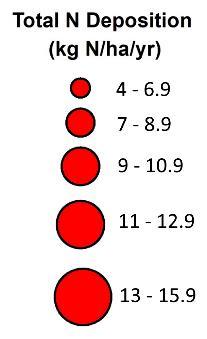
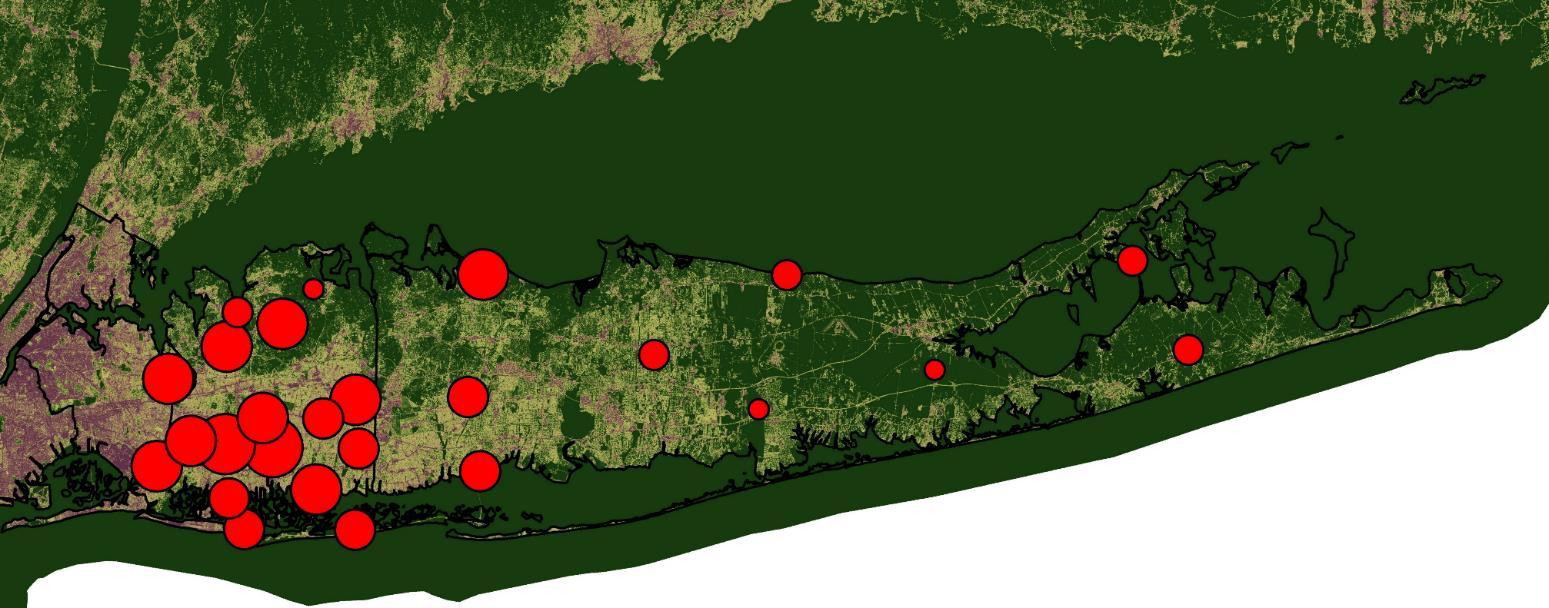
Figure 1. Atmospheric N deposition (red circles) and impervious surface area (National Land Cover Database 2021). Arrow indicates National Atmospheric Deposition Program site.