Results of the Community Survey for The Hempfield Park Master Plan
Community Survey Results | Hempfield Park Master Plan
The Community Survey was conducted from August 11, 2022 through November 7, 2022.


Community members could take the survey online, using either a smart phone or a computer.
Paper surveys were available at three public meetings on October 20, 26, and 27.
Community Survey Results | Hempfield Park Master Plan
Who took the survey?
454 responses
448 online surveys


6 paper surveys
Community Survey Results | Hempfield Park Master Plan
Who took the survey?
Most respondents live in 15601 (Greensburg), 15644 (Jeannette), or 15642 (Irwin).
No responses were received from ZIP codes 15616, 15625, 15637, 15679, or 15688.
About 4% of respondents did not live in Hempfield.
1,009
Community Survey Results | Hempfield Park Master Plan
Q1
15601 15611 15619 15624 15633 15634 15635 15639 15642 15644 15662 15665 15672 1567515691 15697 Not from Hempfield Township What
your ZIP code?
is
Q2
Who took the survey?
Most respondents were over age 35. The least represented groups were youth and young adults
18‐24.
1,009
Community Survey Results | Hempfield Park Master Plan
Under 1818‐2425‐3435‐4445‐5455‐6465+ 0.00% 5.00% 10.00% 15.00% 20.00% 25.00% 30.00% In what age range do you fall?
Q3 Value of Recreation


Recreation is important to 96% of respondents; only one thought recreation was not at all important.
Not so important 3.09%
1,009


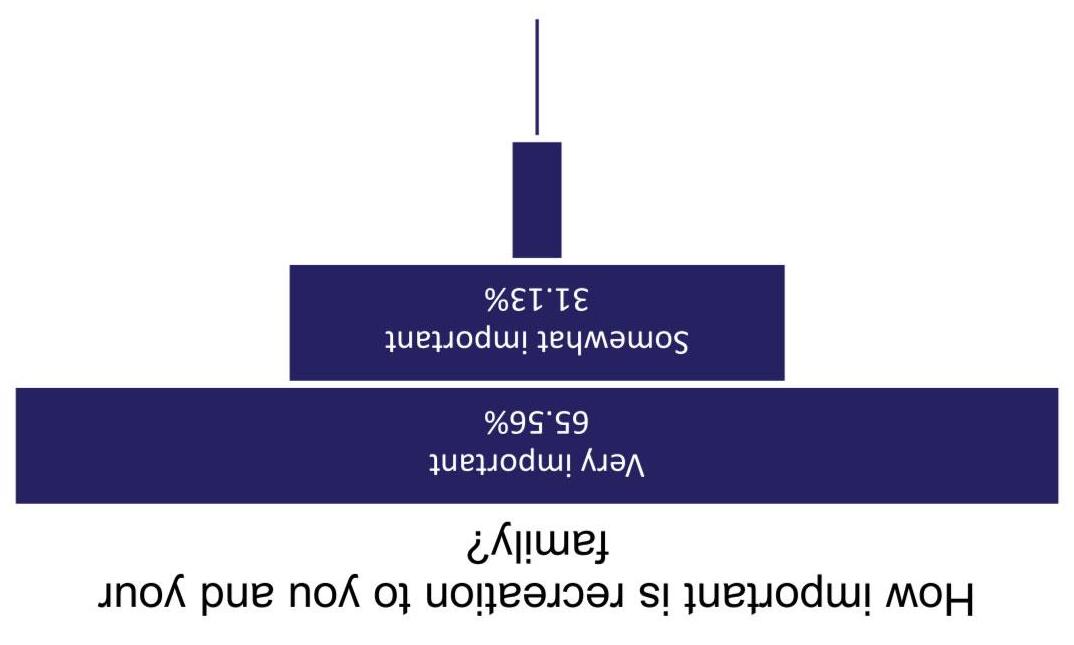
Not at all important 0.22%
Community Survey Results | Hempfield Park Master Plan
Q5
Underserved groups
Which groups do you feel are underserved?
The top answers to this question reflect the top demographic groups taking the survey.
Write‐in answers
• Active seniors
• People who live too far from the park
1,009
0.00% 5.00% 10.00% 15.00% 20.00% 25.00% 30.00% 35.00% 40.00%
Community Survey Results | Hempfield Park Master Plan
How often do you visit Hempfield Park?
Q 6 & 7
Visiting Hempfield Park
What are your top three reasons for visiting?
Exercise and athletics were top reasons for visiting Events & programs were also a big reason people make the trip to Hempfield Park!
Never 4% A few times a year 33% Once a month or more 28% Once a week or more 29% Daily 5%
you
Park? Never 4%
often do
visit Hempfield
242 –Exercise 193 –Athletics/Sports 160 –Events 147 –Playground 105 –Open Spaces 92 –Relaxation 88 –Picnics/Pavilion Rental 29 –Other top
Dog walking Camp Pickleball
reasons:
Q9 & 10 Condition & Maintenance
How would you rate the condition of Hempfield Park?
“Excellent! 3.35/4 Stars”


What priority do you feel Township officials should place on maintaining the park?
Respondents are most satisfied with access to major highways, ambulance responsiveness, and access to reliable sewer services and development
High Priority 2.7/3
Community Survey Results | Hempfield Park Master Plan
Q4 Facilities –Most important
These are the top three facilities respondents value (but may already be provided or not needed at Hempfield Park): 77% Walking & Jogging Trails
72% Restrooms
57% Bike Trails
55% Nature Trails
52% Picnic Shelters
Which are mostimportant to your household?
Disc golf
Volleyball
Softball
Batting cage
Tennis
Baseball Golf
Concession stand
Cornhole Track
Garden area
Pickleball
Community center
Basketball
Indoor athletics
Open space
Multipurpose field
Dog park
Splash park
Indoor fitness
Sledding hill
Outdoor fitness
General picnic area/tables
Swimming pool
Playground
Picnic shelter
Nature trails
Bike trails
Restrooms
Walking/jogging trails
1,009
0.00%10.00%20.00%30.00%40.00%50.00%60.00%70.00%80.00%90.00%
Q11 Top requested facilities at Hempfield Park
At Hempfield Park, top requested/enhanced facilities are:
38% Splash Park
18% Pickleball
16% Restrooms
12% Pedestrian Walkways
12% Shade Trees
Select your top three facilitiesto be added or enhanced at Hempfield Park.
Lighting, 5.04%
Bocce, 5.28%
Basketball, 5.76%
Artificial turf fields, 6.00%
Multipurpose field (football/soccer/lacrosse), 6.00%
Environment/sustainability features, 6.47%
Playgrounds, 7.91%
Community center, 8.15%
Putting or chipping green, 8.15%
Open space/natural area, 9.11%
Indoor recreation, 9.59%
Disc golf, 10.07%
Fitness area, 10.55%
Shade/trees, 11.51%
Pedestrian walkways, 12.23%
Other, 13.19%
Restrooms, 16.31%
Pickleball, 17.99%
Splash park, 37.65%
Community Survey Results | Hempfield Park Master Plan
0.00%5.00%10.00%15.00%20.00%25.00%30.00%35.00%40.00%
Q11

Top requested facilities at Hempfield Park
Respondents had a wide variety of ideas to increase use of Hempfield Park
• Tennis/maintenance
• Volleyball
• Dekhockey
• Soccer
• Picnic shelters
• Parking/shade for parking/parking at soccer fields
• Community event grounds
• Skateboard park
• Amphitheater
• Pool
• Baseball
• Softball
• Signage/Wayfinding from parking
• Football
• Hiking Trail
• Bike/Mountain bike trail
• Horseshoes
• Cornhole
• Pond for fishing/canoeing/loop trail
• Walking Path
• Indoor fitness/walking track
• Fitness trail
• Benches on paths
• A/C in HTAC
facilities
• Cricket/separate cricket from path

• Archery
• Badminton
• Bike skills park
• Access to park by walking or biking
• Enhance concessions
• Equine trails
• Outdoor basketball
• Small playground
• Restrooms
• Transportation for Seniors
• Water for dogs
What methods do you feel most effectively provide residents with information regarding park facilities and recreation programs?
While the Township magazine was the top information source for most respondents, some checked “Other” to specify the newspaper or flyers placed in the newspaper

Communication Township website (www.hempfieldtwp.com) Township magazine ‐Headlining Hempfield Emails/Texts from the Township Social media (Facebook, Instagram, Twitter, etc.) Hempfield Area School District Bulletin boards/information posted in the Athletic Complex Word of mouth Other (please specify) 0.00% 10.00% 20.00% 30.00% 40.00% 50.00% 60.00% 70.00%
Q12
Community Survey Results | Hempfield Park Master Plan
Do you participate in programs or events offered by the Township's Recreation Department?
Q13 & 14
Programming
Many respondents were unaware of events or programs offered
If you do not participate, why not?
The top reason given for “other” was that Hempfield Park is too far away.

Yes 54% No 46%
Not enough time Cost Lack of knowledge of events/programs Lack of events Type of events held Timing of events/programs Other (please specify) 0.00% 5.00% 10.00% 15.00% 20.00% 25.00% 30.00% 35.00% 40.00%
“Other” programming was a combination of these options, as well as: fishing, all‐ages water activities, library services, and nature/garden education.
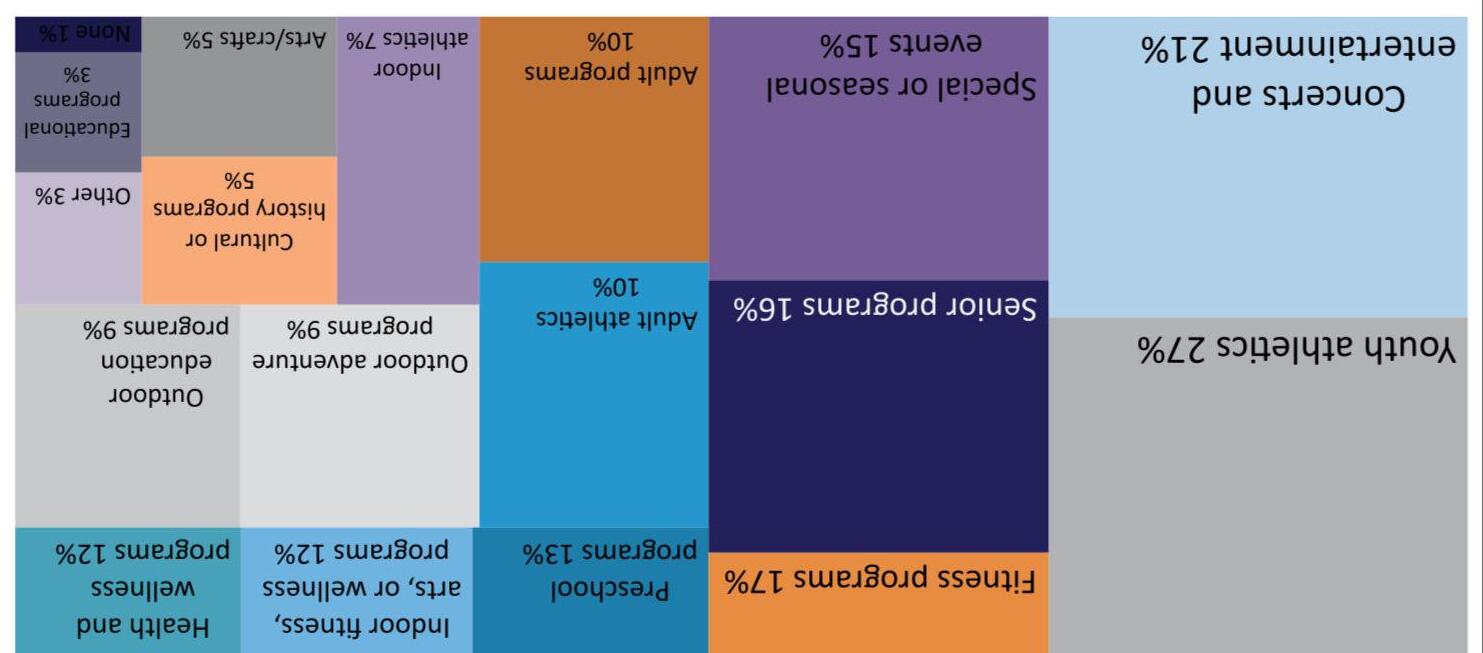
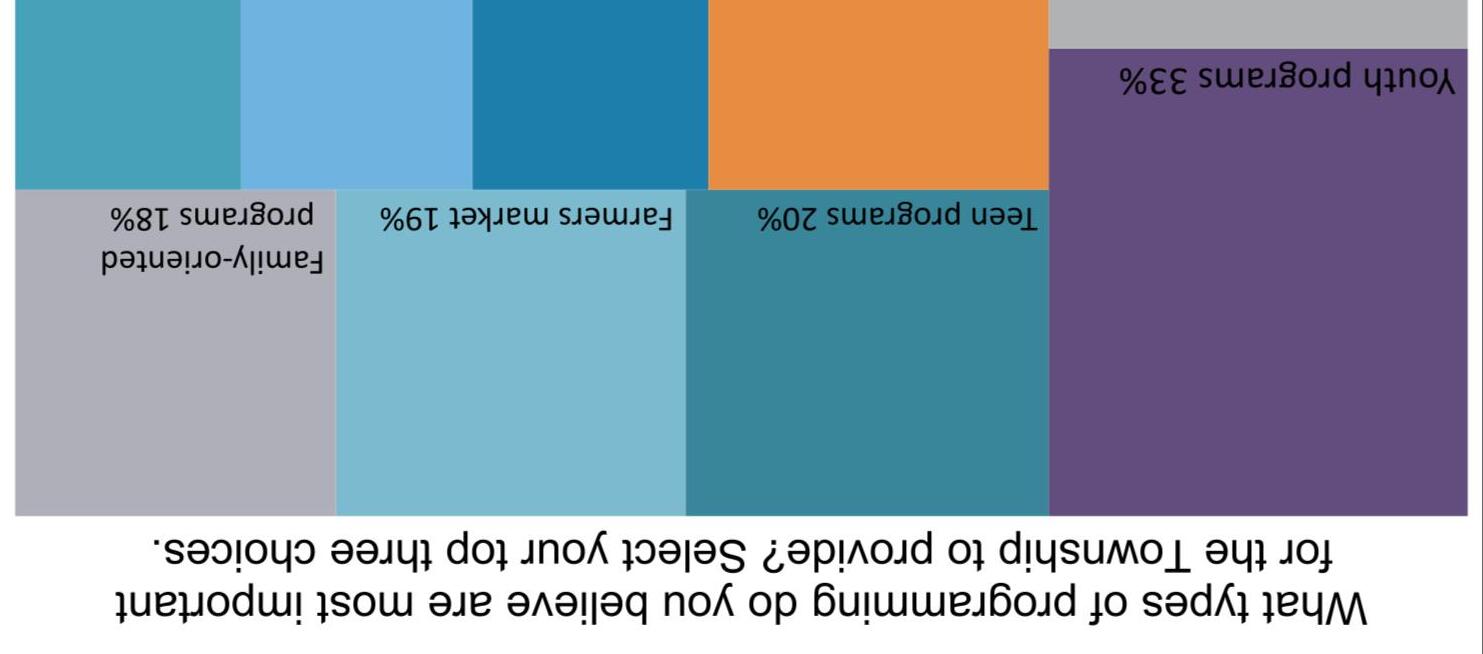
Q16
Programming None
Q15 Fees

Very expensive
Somewhat expensive
Reasonable
It is important to balance affordability ‐ to allow the most people access to Park programs and amenities –with sustainable income.
Most respondents thought Hempfield’s pricing was reasonable!
Somewhat inexpensive
Very inexpensive
How would you rate the fees assessed for the following:


Community Survey Results | Hempfield Park Master Plan

rentals ProgramsEventsAthletic
1 1.5 2 2.5 3 3.5 4 4.5 5
Facility
Complex membership
Q17 Trails
Would you or members of your household support the development of trails within the Township and surrounding areas?
The vast majority of respondents support trail development of all types!

Yes, walking trailsYes, bike trailsYes, multi‐use trails connecting parks, schools, and neigborhoods


No, we should not develop trails I don't know
Community Survey Results | Hempfield Park Master Plan
0.00% 10.00% 20.00% 30.00% 40.00% 50.00% 60.00% 70.00%