2021 SUSTAINABILITY REPORT


6 Appendix Acronym List and Glossary Indexes & Data › Performance Data › TCFD Disclosures Table › SASB Table › GRI Index › Independent Accountants’ Review Report › Forward-looking Statements and Website References 74 76 78 78 86 87 88 93 97 INTRODUCTION ENVIRONMENT SOCIAL GOVERNANCE APPENDIX TABLE OF CONTENTS About Helmerich & Payne Sustainability Highlights at a Glance Letter From Our CEO The H&P Way About This Report Sustainability Oversight 4 6 8 10 12 12 1 Environment Environmental Management Environmental Governance, Risks & Opportunities, and Strategy 14 16 27 2 Customers Delivering Outcomes Customer Spotlight 3 Employees Health & Safety Diversity, Equity, & Inclusion Workforce Development 4 Communities Corporate Giving Efforts & Programs Employee Community Responsibility to Each Other 32 35 39 40 42 48 51 56 59 62 62 5 Governance Corporate Governance Ethics & Compliance Risk Management 64 66 71 72
ABOUT HELMERICH & PAYNE
For over 100 years, H&P has been a trusted partner in the industry. The Company’s longevity results from our commitments to our shareholders, business partners, employees, and the communities in which we operate. We lead the drilling industry through our innovation, the value we bring to customers, and our support of sustainability across our operations. Our customer-centric approach will continue to underpin our offerings as we evolve and deliver on a wider array of drilling and digital technology solutions.

› American Association of Drilling Engineers (“AADE”)
› American Institute of Steel Construction (“AISC”)
› American Petroleum Institute (“API”)
› American Society of Civil Engineers (“ASCE”)
› American Welding Society (“AWS”)
› International Association of Business Communicators (“IABC”)
› International Association of Drilling Contractors (“IADC”) › Society of Petroleum Engineers
› The Petroleum Alliance of Oklahoma
H&P 2021 Sustainability Report 5
24% 32% APPROXIMATELY APPROXIMATELY of the total horizontal market share in U.S. land drilling of the super-spec market share in
land drilling LARGEST ONSHORE DRILLER IN THE UNITED STATES: OPERATING SINCE 1920 H&P OPERATES IN 3 SEGMENTS North America Solutions: 84% market leader Offshore Gulf of Mexico: 10% cash flow generator International Solutions: 5% opportunistic growth
COMPANY PROFILE
U.S.
MEMBERSHIPS 1 :
INDUSTRY ASSOCIATION
5,444 488 employees within the US employees in international operations % OF REVENUE 1. Industry association memberships are representative of either H&P membership or individual H&P employee memberships INTRODUCTION ENVIRONMENT CUSTOMERS EMPLOYEES COMMUNITIES GOVERNANCE APPENDIX * As of September 30, 2021
SUSTAINABILITY HIGHLIGHTS AT A GLANCE
ENVIRONMENT
› Formal Health, Safety, and Environment (“HSE ”) Policy statement
› Committed to certifying our Environmental Management System against ISO 14001 in 2022
› Achieved four of five key results within the 2021 Environmental Actively C.A.R.E. goal framework
› Established a new 2022 Environmental Actively C.A.R.E. goal
› Identified eight climate-related risks and opportunities
ENVIRONMENTAL PERFORMANCE:
› Reduction in Scope 1 emissions on a normalized basis by approximately 23% since 2018
› Since 2018, we have installed LED lights on our rigs which provide approximately 30 to 70% reduced power draw compared to legacy less energy efficient lights
› During fiscal 2021, we had only two reportable spills consisting of 0.19 liters per kilometer drilled or 1.3 cups per mile drilled
› Reduced North America Solutions real estate footprint by over 30% since 2017
RISKS
› Transition to Low-Carbon Economy
› Regulatory Risks
› Operational and Incident-Based Risks
› Physical Risks
OPPORTUNITIES
› Commercial-Venture New Energies Businesses
› Operational Efficiency Improvements
› Research and Development
› Supporting Business Partners and Customers
in Meeting Environmental Sustainability Goals
SOCIAL › CUSTOMERS
› Formal Quality Policy Statement demonstrating our commitment to safety, customer satisfaction, efficiency, productivity, and innovation
› Partner with customers with a focus on delivering efficiency and sustainable outcomes
SOCIAL › EMPLOYEES
› Serious Injury and Fatality (“SIF”) & Actively C.A.R.E. programs have reduced serious injuries:
› SIF Actual Rates have decreased since 2018 with zero SIF Actual Incidents in fiscal 2021
› Achieved successes in all three Safety Actively C.A.R.E. goals
› Set three new 2022 Safety Actively C.A.R.E. goals
SOCIAL › COMMUNITIES
› Supported over 50 philanthropic organizations during fiscal 2021
› Adopted a Human Rights policy
GOVERNANCE INDEXES & DATA
› Board diversity & composition – four out of five recently added Board Members considered gender or ethnically diverse
› ISS Governance QualityScore: 2 of 10 (1 being best)
› Maintained our Whistleblower Policy
› The Board of Directors conducted overall oversight of corporate sustainability and oversaw the identification of climate-related risks & opportunities
› Aligned with three leading reporting standards: (TCFD, GRI, SASB)
› Ernst & Young provided limited assurance for select metrics contained in this report
H&P 2021 Sustainability Report 7
INTRODUCTION ENVIRONMENT CUSTOMERS EMPLOYEES COMMUNITIES GOVERNANCE APPENDIX
LETTER FROM OUR CEO

I am pleased to share H&P’s inaugural Sustainability Report highlighting our efforts to maintain impactful corporate stewardship. Helmerich & Payne has long recognized the importance of promoting sustainability across the organization and the broader oil and gas value chain. It is something that is important for me personally, and it is reflected in how we interact with our stakeholders. This report provides greater transparency into how we operate as a Company and we believe such transparency is important to our investors.
We believe access to energy is fundamental to sustaining and improving the quality of all lives. At the same time, we are fortunate that our role in the energy value chain positions us to meaningfully impact the efficiency, safety, and environmental responsibility with which energy is sourced. This is particularly important as the world grapples with the effects of climate change. As such, we are wholeheartedly committed to driving positive change, and we will continue to do so with the various levers at our disposal.
H&P is a company built on values – what we refer to as “The H&P Way”. Our values complement our purpose, guide our behavior, enhance our culture, drive corporate stewardship, and unite our people with a common purpose. They also allow us to continuously support our customers’ operations and goals, while prioritizing the health and safety of all who come in contact with H&P’s operations. These values cast the vision beyond “good enough,” and point towards something greater. At H&P, we endeavor to filter every decision through our values and to uphold the highest standards in everything we do.
As I reflect on our sustainability efforts over time, I am proud of the work we have accomplished, including some more recent achievements:
› Reduced our Scope 1 emissions normalized by distance drilled by approximately 23% since 2018;
› Filled four out of the last five Board of Director positions during the last five years with qualified individuals who are gender or ethnically diverse;
› Decreased our SIF Actual rates on the job since 2018 with zero in fiscal 2021; and
› Supported over 50 philanthropic organizations.
Also, I am confident we will continue to demonstrate progress moving forward as well as continue to recognize that these achievements would not be possible without our employees who embody our culture, live our values, and remain committed to always Do The Right Thing.
On behalf of everyone at H&P, we are steadfast in our commitment to providing increasingly efficient and responsible energy to the world.
Sincerely,
OUR PURPOSE:
WHAT WE DO: We safely provide performance-
OUR VALUES: Our values reflect who we are and the way we interact with one another, our customers, partners, and shareholders
• Actively C.A.R.E.
• Service Attitude
• Innovative Spirit
• Teamwork
• Do the Right Thing
JOHN LINDSAY President and
H&P 2021 Sustainability Report 9
Chief Executive Officer
“We believe access to energy is fundamental to sustaining and improving the quality of all lives.”
Improving lives through efficient and responsible energy
driven drilling solutions
INTRODUCTION ENVIRONMENT CUSTOMERS EMPLOYEES COMMUNITIES GOVERNANCE APPENDIX
“The U.S. is the world’s leading natural gas and oil producer, which is critically important given new projections that global energy consumption will increase nearly 50% by 2050. Though reliable access to energy often is taken for granted in this country, people in other parts of the world struggle to obtain the energy needed for sustainable development and to empower basic human progress.
According to the International Energy Agency (IEA), nearly one in eight people around the world lives without electricity, and 2.7 billion people currently are without access to clean cooking facilities. Without power for heating, lighting and advanced technologies, human potential is severely limited. And in the absence of cleaner fuels, people must use coal, kerosene, biomass and other energy sources to prepare food, which contributes to harmful and unnecessary indoor air pollution.”
THE H&P WAY
OUR PURPOSE:
Improving lives through efficient and responsible
energy
Almost every aspect of modern life depends on energy – its availability and access to it. Society’s general wellbeing relies on the energy industry to supply the power that sustains and drives our lives. Industries supplying our food, heat, clothing, shelter, medical care, transportation, and technology rely on this access to energy. Additionally, oil and gas products are central to our lives in less obvious ways and are useful in manufacturing goods such as medicines, medical devices, computers, and phones. All of these modern conveniences rely on byproducts from oil and gas.
H&P has helped its customers supply energy for more than a century, and we continue to innovate and improve the ways in which we can provide energy safely, reliably, and efficiently. Through our work and the work of our customers, we have used our unique position and expertise to advance energy production, reliability, and affordability to people across the globe.
Ensuring this availability of affordable energy requires planning for the future. By anticipating future needs, we not only prepare for the future, but we can lead the way. Out of our commitment to innovation, we have developed technology to deliver industry-leading efficiency and value. This same philosophy around innovation has helped us improve safety and reduce the environmental impact of
our solutions. Going forward, we believe we are poised to address some of the toughest questions facing the energy sector. Our continued innovations are aimed at increasing efficiency, lowering cost, reducing environmental impact, and reducing risk for our customers, as well as improving overall economics.
WHAT WE DO: We safely provide performance-driven drilling solutions
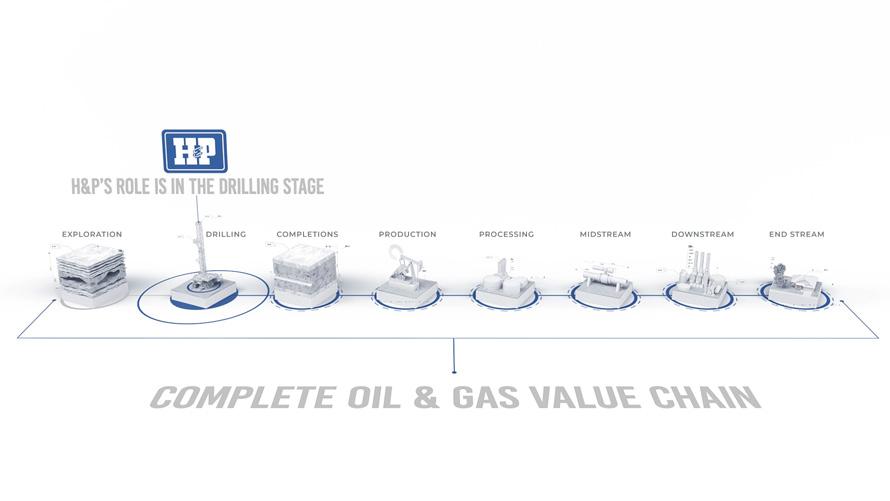
H&P has a reputation for reliability, operational excellence, and financial discipline as well as industry leadership in technological innovation. We provide performance-driven drilling solutions that are intended to make oil and gas recovery safer and more economical for our customers. We have a customer-centric focus and operate in the drilling segment of the oil and gas production value chain. Our FlexRig® fleet combined with our software solutions help us to provide expertise and advanced technology and equipment to drill oil and gas wells for companies in the exploration and production (“E&P”) segment.
Our unique business model spans design, construction, fleet operation, and maintenance, technology development, and implementation allowing us to maximize the value created through our integrated drilling solutions.
OUR VALUES:
Our values reflect who we are and the way we interact with one another, our customers, partners, our shareholders, and the community
Our values inform every aspect of our business and help us drive our commitment
to continuous improvement. In a competitive industry and changing energy landscape, our values inspire our efforts to deliver industry-leading services and offer innovation to preserve safety and reduce our environmental impact while making energy accessible globally.
OUR VALUES
Actively C.A.R.E. – We treat one another with respect. We care about each other. We are committed to Controlling and Removing Exposures for ourselves and others.
SERVICE ATTITUDE – We do our part and more for those around us. We consider the needs of others and provide solutions to meet their needs.
INNOVATIVE SPIRIT – We constantly work to improve and try new approaches. We make decisions based on our customers’ challenges and goals with a long-term view in mind.
TEAMWORK – We listen to one another and work across teams toward a common goal. We collaborate to achieve results and focus on success with our customers and shareholders.
DO THE RIGHT THING – We are honest and transparent. We tackle tough situations, make decisions, and speak up when needed.
H&P 2021 Sustainability Report 11
INTRODUCTION ENVIRONMENT CUSTOMERS EMPLOYEES COMMUNITIES GOVERNANCE APPENDIX
API BLOG
For questions or feedback regarding H&P’s sustainability efforts, please contact: Sustainability@hpinc.com
ABOUT THIS REPORT
Helmerich & Payne (“H&P”, “we”, “our”, or “Company”) is pleased to present the Company’s inaugural annual Sustainability Report, which outlines our sustainability efforts and performance during our fiscal year ending September 30, 2021.
Our approach to sustainability is grounded in ‘Doing the Right Thing’ and our ongoing engagement with employees across the organization, our customers, suppliers, and our shareholders. To further demonstrate our ongoing commitment to our employees, customers, environment, and communities, we have taken into account and aligned the report to leading sustainability reporting frameworks, including the Sustainability Accounting Standards Board (“SASB”), the Global Reporting Initiative (“GRI”), and the Task Force on Climate-related Financial Disclosures (“TCFD”) and have reported our results against these frameworks.

Furthermore, contained in this report is our assessment of risks, opportunities, and related strategies after completing preliminary analyses focused on H&P’s resilience under various climate change scenarios. Additionally, we have committed to completing a more robust quantitative climate scenario analysis in 2022.
SUSTAINABILITY OVERSIGHT
Corporate sustainability is a priority at H&P that intersects across the functions of our Board committees and is addressed cross-functionally throughout our organization. Board committees oversee sustainability risks and opportunities pertinent to their responsibilities.
› The Audit Committee has direct oversight of the Company’s guidelines and policies with respect to risk assessment and risk management, including significant financial and other business risk disclosures, including risks related to sustainability;
› The Human Resource Committee oversees certain sustainability performance-based executive compensation metrics, including those related to safety and annually reviews a compensation risk analysis prepared by management; and
› The Nominating and Corporate Governance Committee reviews the composition of the Board as a whole and recommends to the Board, if necessary, measures to be taken so that the Board reflects the appropriate balance of knowledge, experience, skills, and expertise and periodically reviews the Code of Business Conduct and Ethics and our corporate governance principles.
While the Board’s committees focus on certain aspects of sustainability related to their functions and regularly report out to the entire Board, the overall oversight of corporate sustainability is conducted at the Board level, aspects of which are formally integrated into every Board meeting. Due to its importance, the oversight of the risks and opportunities associated with climate change is conducted by the full Board.
As the Board maintains oversight representing the Company’s stakeholders, management is responsible for planning, monitoring, and leading the implementation of several of our sustainability initiatives. Notably, our management oversaw the development of this report, which is our inaugural Sustainability Report.
One of the purposes of this report is to provide transparent and reliable data to our stakeholders. Though not required, we engaged Ernst & Young, LLP to provide limited assurance over select sustainability indicators included in this Sustainability Report. The scope of the third-party assurance includes: Scope 1 emissions; Scope 2 emissions; Total Fuel Consumed, percentage renewable, percentage used in on-road equipment and vehicles and off-road equipment; select gender diversity metrics; select ethnic diversity metrics; Full-Time Equivalent (“FTE”) fatality rate; FTE Total Recordable Incident Rate; FTE Lost Time Incident Rate.
H&P 2021 Sustainability Report 13
INTRODUCTION ENVIRONMENT CUSTOMERS EMPLOYEES COMMUNITIES GOVERNANCE APPENDIX
ENVIRONMENT

1 ENVIRONMENT
ENVIRONMENT
At H&P, our environmental management and sustainability strategy focuses on environmental risks related to our operations. H&P recognizes environmental risks are business risks, and continued efforts to reduce exposure to these factors will help H&P preserve value over the long-term. Minimizing risks to the environment while maximizing benefits to our customers and society at large is at the heart of our values and exemplifies the H&P Way.
We use our Environmental Management System (“EMS”) combined with an understanding of our environmental risks and opportunities to play the right role in helping our industry reduce its environmental impact. At the same time, we leverage our mechanical and digital capabilities to adapt to the evolving demand for energy resources, such as geothermal energy. We believe continued innovation and environmental management efforts can improve the sustainability of drilling operations and the oil and gas value chain overall.
ENVIRONMENTAL MANAGEMENT
H&P’s technical capabilities, along with our unique position in the oil and gas value chain, inform our approach to environmental management and oversight. Our most pressing environmental risks, include but are not limited to, the risks associated with the transition to a low-carbon economy, regulatory risks, operational and incident risks, and physical risks from changing climate and severe weather events. These risks are outlined in greater detail in the Environmental Governance, Risks & Opportunities, and Strategy section of this report.
Our EMS, and Crisis and Emergency Management Plan (“CEMP”) reinforce our commitment to preventing environmental harm and reducing environmental impact. Our Environmental Governance Team (“EGT”), with members from
multiple departments and business units, monitors data, government regulations, customer feedback, and industry standards to refine our sustainability strategy and related objectives.
ENVIROMENTAL OVERSIGHT
Our Board provides environmental management oversight with the input from senior management. As part of its larger sustainability and risk oversight functions, the Board reviews many topics, including environment and climate change matters. We have programs in place to manage climate and environmental risks as well as contingency planning and emergency response planning. We also have a newly appointed Environmental Specialist – who plays an active role in the environmental management associated with our operations, as well as a Corporate Sustainability lead to cross-functionally coordinate our sustainability efforts across the organization.
A detailed graphic and corresponding definitions outlining oversight is to the right.
Together, the CMT, CST, IMT, and SERTs, utilize our CEMP to prepare H&P for incidents that could introduce potential risks to our employees, facilities, operations, or the environment. Quarterly, our Global Security Director provides an update related to physical safety and emergency management to the Audit Committee of our Board of Directors.
Board of Directors
Board Committee
Team / Individual who is reported to by operational support and oversight teams.
Operational oversight team
Operational support team
BOARD OF DIRECTORS AUDIT COMMITTEE
› Audit Committee – oversees the ERM Team.
› Corporate Support Team (“CST”); Incident Management Team (“IMT”); Site Emergency Response Teams (“SERTs”) – work together with the CMT to respond to significant events or crises.
› Crisis Management Team (“CMT”) – oversees responses to any significant events or crises. The team includes members of the executive and senior management teams. In coordination with the CMT, our Global Security Director oversees and updates H&P’s Crisis and Emergency Management Plan.
› Enterprise Risk Management Team (“ERM”) – supports Board-level risk management initiatives.
› Environmental Governance Team (“EGT”) – manages climate and environmental risks through data collection and strategy enhancements.
H&P 2021 Sustainability Report 17
ENVIRONMENTAL GOVERNANCE TEAM
HEALTH, SAFETY, ENVIRONMENT TEAM
SVP OF OPERATIONS CRISIS MANAGEMENT TEAM
GLOBAL SECURITY DIRECTOR
CHIEF EXECUTIVE OFFICER
CORPORATE SUPPORT TEAM INCIDENT MANAGEMENT TEAM
INTRODUCTION ENVIRONMENT CUSTOMERS EMPLOYEES COMMUNITIES GOVERNANCE APPENDIX
SITE EMERGENCY RESPONSE TEAMS ENTERPRISE RISK MANAGEMENT TEAM
PROCESSES AND HEALTH, SAFETY, ENVIRONMENTAL POLICY
In addition to the teams and systems dedicated to environmental management and emergency response, we have integrated policies, plans, and processes into the way we operate to help us minimize our environmental impact, prevent incidents, and monitor our progress.
Our EMS is in place to provide guidance, trainings for employees, and formalize practices to reduce environmental exposures. This system reflects our environmental commitments to uphold and advance environmental practices in our industry, which are often more robust than relevant legislation, regulations, and/or our customer would require. Additionally, we are pursuing ISO 14001 certification for our EMS and are committed to obtaining that certification in 2022.
As noted in our Health, Safety, & Environmental Policy (“HSE Policy”), we conduct our business as an environmentally responsible corporate citizen and make efforts to minimize our impact on the natural environment. In our HSE Policy, we define the environment as the physical assets and equipment that make-up our workplace; as well as the earth, air, waterways, and communities that surround them. The policy contains specific commitments outlining the importance of environmental stewardship:
› Meeting or exceeding applicable health, safety, environmental, legal, and customer requirements;
› Complying with industry accepted health, safety, and environmental practices;
› Implementing practical processes that assist in eliminating or reducing our impacts on the natural environment; and
› Continually improving the effectiveness of our EMS and our performance.
Aligned with our commitments we:
› Provide appropriate and adequate resources to implement the Company’s EMS;
› Set annual environmental objectives and key results;
› Monitor performance towards accomplishment of our objectives and key results;
› Manage our processes, monitor our materials, and train our people in the Company’s incident prevention and response plans;

› Report environmental incidents and share lessons learned to prevent recurrence elsewhere in the Company;
› Implement corrective actions and preventive measures as appropriate;
› Perform environmental audits to ensure compliance with legal requirements and conformance with client requirements and the elements of our EMS;
› Recognize individual employees and/or operations that demonstrate environmentally responsible behaviors, exceptional performance, and environmental leadership; and
› Review the HSE Policy annually and revise as needed.
H&P’s CEMP helps us to prepare for potential and realized incidents and crises. H&P’s CEMP aligns with the following third parties:
› National Incident Management System –Incident Command System
› Federal Emergency Management Agency’s Comprehensive Preparedness Guide
› The National Fire Protection Association 1600 Standard on Disaster – Emergency Management and Business Continuity Programs Research
The CEMP also outlines the structure for managing a severe incident and works in collaboration with more specific H&P response plans tailored to different incident types and locations. By providing a structured framework and preparing, we believe our risk management programs enable us to deliver our services safely while safeguarding our personnel and the environment. In addition to crisis response training for employees, H&P also has a confidential hotline for employees or non-employees to report compliance concerns that, if are emergencies, are reported immediately to the relevant incident and crisis management teams.
TRAINING & RECOGNITION
Proper oversight and processes for risk management and environmental management are reinforced by our training efforts. Our CMT develops and implements H&P’s emergency preparedness and response training program, while the CST, IMT, and SERT work together to plan and conduct trainings. Our trainings include new team member and role specific training, fire-life safety training, and tabletop exercises.
Our employees are engaged in training programs related to our Actively C.A.R.E. principles that help advance our environmental goals. Employees receive training related to our emissions reduction and spill prevention efforts, while our Recognition and Rewards (“R&R”) program – which rewards employees for their management and removal of HSE risks – helps to incentivize employees to improve environmental performance and reduce emissions.
H&P 2021 Sustainability Report 19
During fiscal 2021, we recognized individual employees 7,312 different times through the R&R program. 2 2. R&R awards include all HSE recognitions not just environmental-related recognitions. INTRODUCTION ENVIRONMENT CUSTOMERS EMPLOYEES COMMUNITIES GOVERNANCE APPENDIX
Our efforts to reduce the excess runtime within these groups has represented a reduction in year-over-year carbon dioxide equivalent (CO 2e) emissions of approximately 715 metric tons.
ENVIRONMENTAL GOALS
Our commitment to environmental management is reflected in our environmental goals. Every year, we introduce Actively C.A.R.E. goals (“ACGs”) to help us quantify and monitor our efforts to Actively control and remove exposures. Trainings and initiatives to achieve the targets accompany our ACGs.
At the beginning of calendar year 2021, we introduced an environmentally geared ACG to “Reduce Our Environmental Impact”, which included addressing our greenhouse gas emissions.
In order to achieve this goal, we set a series of key results, that if achieved would result in successfully achieving the overall ACGs. During 2021, we focused on key results around reducing excess engine runtime from our two main emissions sources: rig engines and fleet vehicles. Our efforts to reduce the excess runtime within these groups has represented a reduction in year-over-year carbon dioxide equivalent (CO2e) emissions of approximately 715 metric tons.
Training, technology advancements, partnerships with our customers, and incentives through our R&R Program all contribute to achieving our environmental goals. Our data
tracking capabilities help us monitor performance, while strong relationships with our customers help us to manage energy use on our rigs. Engine use and efficiency is central to our emission reduction efforts. Collaborative planning and strong communication with our customers around emissions from the drilling stage of operations will be an important opportunity for us as we seek to achieve beneficial outcomes for our customers and the environment.
Our EGT resets our Environmental ACGs on an annual basis based on previous year data and information collected and reviewed by the team. The determination of these goals takes place every year in September (our fiscal year-end) by the EGT and are approved by our Senior VPs of Operations before they are formalized and introduced to employees. We also align executive compensation to internal and external communicated environmental performance and goals to align our improvement initiatives across the organization.
To date, we have accomplished four of the five original key results within our calendar year 2021 Environmental ACG. Our progress in the remaining key results demonstrate our continued commitment to environmental management. Intrinsic in our values to go beyond “good enough” and strive for something better means that once key results are achieved, we continued to push and expand by creating new key results to help further advance our overall goal of reducing our environmental impact.
2021 ENVIRONMENTAL ACTIVELY C.A.R.E. GOAL
REDUCE OUR ENVIRONMENTAL IMPACT
Some of the key results that were part of our 2021 Environmental Actively C.A.R.E. goal include:
1
› QUANTIFY ALL SCOPE 1 & 2 EMISSIONS
COMPLETE
Purpose: Demonstrates a milestone in our data collection process and transparency-oriented process. Scoped emissions data allows us to have insight into our operational impact and assess future improvement opportunities.
Progress: We have quantified our Scope 1 & 2 emissions for our fiscal years since 2018.
2 › ESTABLISH AN ENVIRONMENTAL REWARDS & RECOGNITION PROGRAM
COMPLETE
Purpose: An incentive-based program aligning our employees with our culture to promote climate stewardship.
Progress: We have completed the formalization of an Environmental Rewards & Recognition Program.
3 › ACHIEVE 100% COMPLETION RATE FOR ENVIRONMENTAL TRAINING ANNUALLY COMPLETE
Purpose: Helps our employees recognize and manage climate risks in their day-to-day tasks supporting our broader climate strategy.
Progress: Employees completed the assigned environmental training.
4 › REDUCE EXCESS RIG ENGINE RUNTIME BY 10% 3
ONGOING
Purpose: Specific emissions reduction target that helps drive positive behavioral and economic decisions. Current efforts to reduce excessive engine runtime include the development and implementation of technology advancements as well as more efficient on-site management.
Progress: Continued focus into 2022
5 › REDUCE FLEET VEHICLE IDLE TIME BY 33% 4
Purpose: Sets emission reduction target that helps drive positive behavioral decisions.
Progress: Through September 30th, 2021, fleet vehicle idle times have been reduced by 34% which exceeded our target.
3. Excess engine runtime is defined as any time engines are running for more than two hours when fewer engines could run and not exceed 100% load.
4. Fleet vehicle idle time is measured as any time a vehicle is on and has not moved for more than five minutes.
H&P 2021 Sustainability Report 21
INTRODUCTION ENVIRONMENT CUSTOMERS EMPLOYEES COMMUNITIES GOVERNANCE APPENDIX
COMPLETE
2022 ENVIRONMENTAL A CTIVELY C.A.R.E. GOAL GREENHOUSE GAS EMISSIONS MANAGEMENT
REDUCE THE AMOUNT OF GHG EMISSIONS PER 1,000 FEET DRILLED BY 5%
Building upon our 2021 ACG to reduce our environmental impact, our 2022 environmental ACG focuses on driving real Greenhouse Gas (“GHG”) emissions improvement through a 5% reduction target. Some of the key results that are part of our 2022 Environmental Actively C.A.R.E. goal include:
1
› REDUCE EXCESS ENGINE RUNTIME PER 1,000 FEET DRILLED BY 10%
Purpose: Specific emissions reduction target that helps drive positive behavioral and economic decisions. Current efforts to reduce excessive engine runtime include the development and implementation of technology advancements as well as more efficient on-site management.
Progress: Continuation of 2021 rig engine reduction goal
2
› IMPLEMENT ENGINE ROADMAPS AND ACHIEVE 80% OF UTILIZATION ON H&P RIGS
Purpose: Creates and implements engine management plans specific to a rig and customer to allow the engines to be run at maximum efficiencies.
Progress: New goal
3
›
IMPLEMENT NEW TECHNOLOGY TO IMPROVE RIG EFFICIENCY
Purpose: Develop and implement technologies that build on existing programs to help automate, reduce, or change rig engines to improve efficiencies and reduce emissions.
Progress: New goal
4 › ACHIEVE A COMPLETION RATE OF 100% FOR QUARTERLY ENVIRONMENTAL TRAININGS
Purpose: Elevated 2021 goal from annual to quarterly basis to help our employees recognize and manage climate risks in their day-to-day tasks supporting our broader climate strategy.
Progress: New goal
H&P tracks the emissions associated with our operations. Given our position in the oil and gas value chain and the nature of our operations, emissions from our equipment can also be counted by our customers. Accordingly, we have potential to improve the sustainability attributable to both our operations and those of our customers’ operations. Our biggest opportunity to reduce emissions lies in working with our customers to optimize the use of our rigs as part of their operations. Over the past four years, our efficiency efforts have helped us reduce Scope 1 emissions per kilometer drilled by approximately 23%.
TOTAL SCOPE 1 GHG EMISSIONS NORMALIZED BY DRILLING ACTIVITY
Note: The emissions from our rig operations account for approximately 96% of our total emissions for our North American Solutions, Offshore Gulf of Mexico, and International Solutions. These emissions are likely included in our customers’ Scope 1 calculations as well. In a vast majority of contracts, our customers provide the fuel needed to operate the rigs and thus include the emissions as direct result of producing their hydrocarbon products.
Distance drilled for North America Solutions only; North America Solutions revenue accounted for 84% of the total in fiscal 2021.
Emissions are measured, calculated, or estimated utilizing methods that are in conformance with the GHG Protocol Corporate Reporting and Accounting Standard; Emissions factors and global warming potentials are derived from the EPA and other sources; The reporting boundary for emissions is defined utilizing an operational control approach; Rig engine CO2e emissions calculated using Original Equipment Manufacturer (OEM) emissions specifications from engine load and/or amount of fuel consumed; Fleet vehicle emissions calculated from fuel purchase data and/or fuel economy estimates for mileage driven.
Note, the boundaries for our Scope 1 emissions are as follows: Sources we own, rent for on-site operations, and/or control operationally which are directly related to domestic and internal (land and offshore) drilling solutions.
We also track our Scope 2 emissions, and, in fiscal 2021, we have decreased our Scope 2 footprint by 17% from 2018.
H&P 2021 Sustainability Report 23
50 55 60 65 70 75 FY 2019 66 FY 2018 71 FY 2020 62 2021 55 Metric tons CO 2 e per kilometer drilled -7%
INTRODUCTION ENVIRONMENT CUSTOMERS EMPLOYEES COMMUNITIES GOVERNANCE APPENDIX
-6% -11%
In addition to our ongoing efficiency efforts, we have the capability to power some of our rigs with other sources besides diesel, using natural gas supplementation – dual fuel or natural gas engines, or electrical power – high-line or battery. We recognize there are benefits and drawbacks to using the various types of fuel configurations to power our rigs. For example, the use of natural gas can reduce regulated emissions such as nitrogen dioxide and sulfur dioxide; however, this same fuel type may increase GHG emissions from methane slippage, a problem resulting from varying load requirements
and incomplete combustion of natural gas. Another example is considering what type of fuel was used to generate the high-line electrical power. By working with our customers to understand their needs and identifying their desired outcomes, our alternative fuels and power sources provide opportunities to further serve our customers and the environment in the future. We substituted diesel engines with three natural gas engines and an energy storage solution for a customer. Our solutions are spotlighted further in the Customers section.
ENERGY CONSUMPTION MANAGEMENT
H&P seeks to lower our energy consumption on our rigs and by installing LED lights and developing more efficient engine power management systems, we will be better able to manage our energy consumption in the future.
H&P HAS HISTORICALLY DEMONSTRATED AN ENVIRONMENTAL FOCUS
Since 2018, we have installed LED lights on our rigs which provide approximately 30 to 70% reduced power draw compared to legacy less energy efficient lights.
SPILL MANAGEMENT
Our approach to spill management focuses on prevention, and if needed, mitigation. Spill Prevention, Control, and Countermeasure (“SPCC”) plans, trained crews, and emergency response kits are part of our overall spill management strategy. SPCC plans contain both proactive measures to prevent spills as well as measures to reduce
environmental impacts if a spill does occur. Spill prevention and emergency response trainings help rig crews manage incidents effectively. Finally, full emergency response kits are required on every site to address any spills that occur and to help prevent those spills from reaching waterways or other environmentally sensitive areas.
Our prevention- and training-based approach has contributed to a low incident rate including only two reportable onsite spills consisting of 2.6 m3 or 0.00019 m3 per kilometer drilled (1.3 cups per mile drilled) in fiscal 2021.6,7
H&P 2021 Sustainability Report 25
efficiency
led
a decrease
emissions
energy
We substituted diesel engines with
natural gas engines
energy
Our
TOTAL ENERGY CONSUMPTION NORMALIZED BY DRILLING ACTIVITY FY 2019 945 FY 2018 1,016 FY 2020 884 2021 785 750 800 850 900 950 1,000 1,050 -7% -6% -11% Gigajopules per kilometer drilled In
2021 SPILL INCIDENT RATE: Only Incidents per 200,000 Hours Worked 0.03 Energy consumption for electricity and fuels derived from same methods used to calculate Scope 1 and 2 GHG emissions. 5. Average employee attendance is represented by average number of trainings completed for HAZCOM, HAZWOPER, SPCC and Emergency Response Trainings. 6. Spills listed are those which H&P was required to report to the necessary government agencies in each state. 7. Recordable spill incidents per 200,000 hours worked.
service
“…
fewer
The same
efforts that have
to
in our Scope 1
per kilometer drilled also result in improvements in our total
consumption normalized by drilling activity, which has declined by approximately 23% since 2018.
three
and an
storage solution for a customer.
solutions are spotlighted further in the Customers section.
fiscal 2021, 2,727 H&P employees completed Environmental and Emergency Response Trainings.5
› First FlexRig put into
in 2002 was powered using highline power. › THE DENVER POST | MAY 23, 2006: Oil patch evolves
125-foot high derrick can be skidded in four directions so that as many as 22 wells can be drilled from one pad … that means up to 75 percent fewer pads, not as many roads
days spent drilling each well … two diesel engines that power an electrical system, so it is quieter than conventional rigs that might have as many as eight diesel engines’ … ‘The rig uses less fuel and cut emissions by about 35 percent’ … ‘It’s a lot safer and cleaner’… Inside the drilling cabin, the automation is even more pronounced” › NEWS ON 6 | APRIL 11, 2006: Two longtime Tulsa titans are teaming up to drill for natural gas in the Rockies “… it [FlexRig®] works faster, cheaper, and safer than any rig in the world. Part of the secret is automation advanced computer controls that save wear-and-tear on drill bits and save the precious time of replacing drill bits … It [FlexRig] makes your operation a much more efficient operation …”
INTRODUCTION ENVIRONMENT CUSTOMERS EMPLOYEES COMMUNITIES GOVERNANCE APPENDIX
WASTE MANAGEMENT
H&P has employed a variety of initiatives to manage waste as part of its environmental strategy. Recycling plays an important role in our waste management efforts. Some of the common practices around waste management and recycling include:
› Lubricants and hydraulic fluids – we take steps to reclaim used hydraulic fluids and lubricants through various filtration technologies to extend the lifespan of these products;
› Steel – whenever we have excess steel from a rig upgrade/repair or when we scrap decommissioned rigs, we contract with local scrap dealers to cut-up and recycle the steel;
› E-waste – we contract with outside vendors that specialize in e-waste disposal; and
› Drilling fluids and oil-based drilling muds –when a rig has completed drilling at a location, before it is moved back to our rig yard or another customer’s wellsite, it is thoroughly cleaned of any drilling fluids or oil-based drilling muds.
WATER MANAGEMENT
H&P acknowledges the importance of responsible water use within the oil and gas value chain.
Water use on well sites is largely controlled by our customers and as such we have limited scope in what we are able to manage at the well site. However, H&P is dedicated to helping its customers improve water use to meet their own environmental goals. We train our employees to properly handle water for our customers, and we are committed to managing water in an environmentally conscious way. Because we do not directly control water use, we have outlined our role in the use of it at well sites:
› Customers supply water for our freshwater tanks that we use for cleaning, drilling fluids, and other general needs.
› H&P typically provides tanks used to house drilling fluids that can utilize freshwater as a base. We work with our customers to monitor, measure, and maintain the drilling fluids.
› Finally, we service the removal of fluids through customer supplied means.
BIODIVERSITY MANAGEMENT
H&P’s customers largely control the oversight of biodiversity initiatives in the places where we operate. We understand the value of broader biodiversity protection and we support those efforts where we are able. Advancements in H&P’s drilling technology have helped to reduce environmental impacts while continuing to serve our customers. Investing in mechanical and digital improvements has improved our drilling efficiency and helped our customers to produce more energy with less impact on the land used by our customers. Increased drilling efficiency leads to a reduction of the direct impact on local habitats and communities by having a smaller overall environmental footprint, a reduction of the impacts of local infrastructure at well sites, and a reduction of the number of persons require per site.
Beginning in 2018, we have consolidated some geographic locations into more centralized operations and due to the ongoing COVID-19 pandemic that process was accelerated. Additionally, in 2020 due to the COVID-19 pandemic, we created more flexible work arrangements for office employees, so they could work in a traditional sense from the office, work remotely, or a hybrid of both. Accordingly, we have reduced our U.S. real estate footprint by over 33% and improved our ecological impact footprint.

ENVIRONMENTAL GOVERNANCE, RISKS & OPPORTUNITIES, AND STRATEGY
H&P’s current initiatives and strategy reflect our current considerations around our role in climate change – the impact of our operations on the climate and the impact of the climate on our operations. We review both the risks of climate change and the opportunities, such as disruptive technologies mitigating our industry’s impacts. We have proactive oversight mechanisms in place and have disclosed environmental footprint data with the intention to improve our climate stewardship. Our climate disclosures contained herein are informed by the TCFD recommendations.
GOVERNANCE
While sustainability matters have been a longstanding item of discussion at the Board level, the Board believes that climate change and related oversight of risks and opportunities are a corporate priority and therefore should be regularly reviewed and assessed by the entire Board with input from management. At the September 2021 Board of Directors meeting, the Board oversaw the review of climate-related risks and opportunities leveraging internal stakeholder feedback from members across the organization, including those who directly oversee environmental management.
Since 2018, we have reduced our U.S. real estate footprint by over 33% improving our ecological impact footprint.
In calendar year 2020, we drilled more kilometers than in 2011, but used half the number of rigs as we did in 2011.
H&P 2021 Sustainability Report 27
INTRODUCTION ENVIRONMENT CUSTOMERS EMPLOYEES COMMUNITIES GOVERNANCE APPENDIX
CLIMATE-RELATED RISKS AND OPPORTUNITIES
The current climate-related risks and opportunities are:
RISKS
TRANSITION TO LOW-CARBON ECONOMY: H&P’s ability to adapt its operations to support the shift to a low-carbon economy. Additionally, this risk includes the evolving perception of the industry due to the climate change dialogue and the financial risks to the organization associated with climate related impacts.
REGULATORY RISKS: Risks that arise from the constantly changing environmental regulatory landscape causing public and private sector perception to shift and possible limitations to capital access in forms of investment or lending.
OPERATIONAL AND INCIDENT-BASED RISKS: The Company’s operational footprint and incident risk and/or occurrence can significantly impact the Company and increase perceived and realized risk exposure and reputational harm.

PHYSICAL RISKS: The Company’s exposure to and management of climate-related physical risks, such as inclement weather, could impact the Company’s ability to operate.
OPPORTUNITIES
COMMERCIAL-VENTURE NEW ENERGIES BUSINESSES: Any commercial activities in which the Company partakes including potential or realized investments and business ventures in alternative energy businesses.
OPERATIONAL EFFICIENCY IMPROVEMENTS: Efforts taken to improve operational efficiency that benefit cost reduction and minimizes environmental impact.
RESEARCH AND DEVELOPMENT: The amount of money, time, and resources invested into developing increased efficiency and clean-tech technologies which may drive revenue and H&P’s sustainable product offering.
SUPPORTING BUSINESS
IN
PARTNERS AND CUSTOMERS
MEETING ENVIRONMENTAL SUSTAINABILITY
GOALS: The ability of the Company’s current and future drilling solutions to support business partners and customers’ environmental sustainability goals through increased operational efficiency and continued innovation.
STRATEGY
We are well positioned to assist our customers in advancing their sustainability efforts, which in turn will allow our industry to act as a better climate steward. By utilizing the talents of our employees, combined with our FlexRig® fleet and our innovative technologies, we have demonstrated our commitment to and success with augmenting well site efficiency, reducing costs for our customers, and increasing production. These benefits also accrued to simultaneously reduce environmental impacts and risks.
We understand climate change presents challenges for society, our industry, and our Company, but it also presents new opportunities for H&P.
Specific details on our current strategies to capitalize on these opportunities are outlined below:
1. COMMERCIAL-VENTURE NEW ENERGIES BUSINESSES
Existing and new investments in alternative energy businesses represent an opportunity for H&P to explore the alternative energy space. H&P possesses expertise and assets that could be utilized to capitalize on investments related to clean sources of energy.
Geothermal energy is particularly promising because it utilizes our existing rig assets and drilling expertise while targeting an alternative energy source with great potential. Specific expertise includes our autonomous drilling and digital technology, which deliver wellbore quality and placement and are required by modern geothermal drilling applications.
In fiscal 2021, we invested in unconventional geothermal companies that are targeting the ambitious goal of affordable, reliable, and clean baseload energy on a global scale, in short –“geothermal anywhere.” To achieve the goal of “geothermal anywhere,” we are strategically
partnering with companies developing enhanced geothermal systems (“EGS”) and closed-loop systems. EGSs work by introducing permeability and working fluid to hot dry rock or hot sedimentary aquifers to create geothermal reservoirs that geothermal heat is extracted from. Closedloop systems work when sealed pipe systems are placed in hot dry rock to extract geothermal heat without creating a reservoir.
Investment in these companies continues and we also have a robust set of additional geothermal investment opportunities across a diverse technological and drilling spectrum where we could make additional investments. These opportunities not only include providing our drilling and technology solutions, but also direct investments into companies, which support their goals of accessing geothermal heat to create carbon-free and scalable baseload power generation.
The strategic partnerships we have forged and connections we have made in the geothermal
sector comprise the beginnings of a strong network of partners. H&P is becoming known as a pioneer in unconventional geothermal drilling.
2. OPERATIONAL EFFICIENCY IMPROVEMENTS
Operational efficiencies can reduce costs and the environmental impacts of our business. Accordingly, the Company stands to benefit from additional opportunities for increased efficiency in the future. We see near-term opportunities related to new technologies around engine power management and battery power.
H&P is exploring opportunities in engine power management systems to assist in optimizing power loads and the levels at which our rigs engines operate. We are employing our technological prowess to optimize fuel consumption through software and automation. By automating rigs and harnessing the power of predictive technologies, we can optimize engine load requirements and other technical factors. We are investing in
H&P 2021 Sustainability Report 29
INTRODUCTION ENVIRONMENT CUSTOMERS EMPLOYEES COMMUNITIES GOVERNANCE APPENDIX
the development of engine power management software that monitors engine loads and controls the number of generators and levels of output they operate at to optimally match power requirements. In turn, this reduces unnecessary fuel consumption and related emissions and in certain instances, helps avoid methane slippage from natural gas engines.
Continued developments in our predictive capabilities may present opportunities to further improve energy efficiency through load balancing to reduce the generator power necessary to cover unexpected energy peaks. We are investigating in ways to convert the energy from the braking systems on our land rigs into electricity to be stored in batteries and reused during peak demand. Additionally, the utilization of battery power can lead to the reduction of well site combustion, while still maintaining the ability to drill effectively and meet power demands.
Further automation in drilling and analytics are two additional opportunities that could materialize in the near-term due to the Company’s advanced drilling platform and computing capabilities. Automated drilling helps ensure that H&P is drilling as efficiently and effectively as possible. H&P’s automation solution turns the art of directional drilling into a science with more consistent and repeatable outcomes. The accuracy of the drilling through automation also helps to minimizes errors and helps to reduce overall environmental impacts. H&P utilizes data and internal analytics to monitor energy usage during drilling and thus identify areas for greater efficiency.

3. RESEARCH AND DEVELOPMENT
H&P aims to be at the forefront of innovation in our industry and we know that research and development is at the heart of that process. During the 2017-2019 timeframe we acquired four technology companies and related talent that served as the foundation of our digital technology offerings. Our current autonomous technology solutions not only benefit our customers’ well economics, but also assist in them in achieving a better environmental footprint profile as well. From this foundation we continue to innovate and develop additional technologies that will continue to help our customers address challenges they face.
4. SUPPORTING BUSINESS PARTNERS AND CUSTOMERS IN MEETING ENVIRONMENTAL SUSTAINABILITY GOALS
We put our customers first and our aim is to meet their objectives. Increasingly, these objectives revolve around ESG performance and reducing environmental impacts. H&P customers can pursue customized solutions based on their unique situation and objectives. For example, we already offer solutions that employ different fuels to power our rigs including dual fuel, natural gas, and the ability to utilize grid electricity for customers. These alternative fuel offerings are built to deliver desired environmental outcomes such as reduced emissions from value chain operations. As opportunities arise, we will continue to explore and pursue the usage of alternative fuels and power sources, such as batteries, to capture environmental opportunities and reduce the environmental impact of operations.
ENVIRONMENTAL METRICS AND TARGETS
Our proactive data tracking and environmental footprint reporting and transparency is reflected in detail in our Performance Data tables where we report over 40 environmental impact metrics. Additionally, our commitment towards continued improvement is demonstrated by our environmental Actively C.A.R.E. goals and key results, which are updated annually and are described in detail in our Environmental Management section and Performance Data tables.
H&P 2021 Sustainability Report 31
INTRODUCTION ENVIRONMENT CUSTOMERS EMPLOYEES COMMUNITIES GOVERNANCE APPENDIX
SOCIAL

CUSTOMERS 2
CUSTOMERS
Within the oil and gas industry, we are a trusted drilling partner for our customers. Increasingly, our customers are looking specifically to our expertise and technologies to help them minimize their environmental impact, reduce risks, and achieve their ESG performance targets. While we consider the sustainability impacts of our operations, many of the environmental and safety risks associated with the oil and gas industry are not in our direct control as they fall outside of our operations and practical realm of responsibility. Therefore, our strongest impact is realized through the responsible environmental approach incorporated into the drilling solutions we provide to our customers.
In order to provide a clearer picture of our role in the oil and gas value chain, we illustrate a simple summary of what we at H&P do followed by a separate summary of areas of focus within other sectors in the oil and gas industry.
OTHER SECTORS OF THE OIL AND
Makes drilling for oil and gas safer and more efficient;
Builds and renovates drilling rigs at two industrial facilities in Texas and Oklahoma;
Oversees drilling operations on its rigs on customer sites;
Drills predominantly onshore in the United States (86% of available rigs are U.S. onshore); and
Makes significant investments in research and development and new technologies.
GAS INDUSTRY
Buy, lease, prepare, manage or restore land or are responsible for the protection of wildlife on or biodiversity of property;
Engage in hydraulic fracturing;
Pump oil or gas from the ground;
Procure, transport or pump water underground, or treat or remove wastewater from the site, or arrange for its disposal;
Assume responsibility for the prevention of fugitive releases or emissions associated with the oil and gas production process;
Engage in midstream operations, such as oil and gas transport or storage; and
Engage in downstream operations, such as refining.
SHELL CEO AWARD
“H&P is proud to be recognized by Shell as a Chief Executive Officer HSSE and SP Areas Award winner for our offshore team’s dedication to the Job By Design (“JBD”) process. The award highlights our team’s commitment to creating a safe work environment as part of our core value to Actively Control and Remove Exposures (C.A.R.E.). Thank you, Shell, for your continued partnership! #ActivelyCARE”
DELIVERING OUTCOMES
As the largest onshore driller in the United States, H&P recognizes the importance of partnering with our customers, understanding their challenges, and employing our suite of solutions to safely provide our customers with the outcomes they desire. In a competitive industry, we strive to differentiate our services through the quality and specificity of our FlexRig® fleet, engineering design expertise, operational efficiency, software technologies, safety, strong partnerships, and environmental performance.
H&P’s commitment to safely provide performance-driven drilling solutions is demonstrated publicly in its Quality Policy. Our Quality Management System (“QMS”) was developed in alignment with ISO 9001:2015 standards and is certified as such. The transparent and systematic controls provided by the QMS allows H&P to listen to customer needs and consistently provide effective and reliable solutions for those needs.
TOP RANKING IN CUSTOMER SATISFACTION FROM ENERGYPOINT RESEARCH FOR 12 YEARS IN A ROW
“Helmerich & Payne has been named the No. 1 Land Driller in the EnergyPoint Research Customer Satisfaction Survey for the 12th year in a row. In addition to capturing the top spot overall, H&P was also ranked first in job quality, technology, HSE, Interior Texas and Mid-Continent, the Gulf Coast and three additional onshore categories.”
The QMS is utilized to:
› Assess the overall context of the organization in order to establish clear objectives;
› Put customers first by consistently meeting their needs and enhancing customer satisfaction;
› Work in efficient ways by having processes aligned with organizational activities;
› Meet statutory and regulatory requirements; and
› Identify and address risks.
The H&P Quality Management System is certified to ISO 9001:2015 by a third-party certifying body. This certification is a signal to our customers and other stakeholders that we have implemented the ISO 9001 standard correctly. Our QMS Policy and corresponding quality product offering results in benefits such as repeat customers, new clients, increased business, increased productivity, improved efficiency and expansion into international markets.usiness, increased productivity, improved efficiency and REDUCED FUEL AND EMISSIONS
H&P 2021 Sustainability Report 35 INTRODUCTION ENVIRONMENT CUSTOMERS EMPLOYEES COMMUNITIES GOVERNANCE APPENDIX
Our desire to reliably serve our customers and our organizational commitment to quality and safety has manifested in our industry leading position. Through the continued improvement of our drilling solutions, we have built a state-of-the-art fleet and developed industry-leading software. Our FlexRig® fleet and automated software solutions enable us to deliver reliability, value, and innovation to our customers.
FLEXRIG ® FLEET
Our Super Spec FlexRig® fleet was built with employee safety and overall efficiency in mind:
› The FlexRig® drilling rig is designed and packaged to reduce hazards for our employees, third parties, and customers. The safety by design concept limits exposure of our personnel creating a safer work environment.
› The FlexRig® AC-driven equipment enables greater control and less failures of drilling and downhole equipment. Preventing failures reduces tripping and the associated emissions and possible safety incidents.

› The innovative design of the FlexRig® drilling rig reduces the need for multiple cranes to assemble and disassemble the rig. The packaging of the load reduces truck traffic, which in turn reduces emissions from rig moving equipment.
H&P’s strategic commitment to pursuing uniformity and innovation within our fleet has resulted in the development of the largest fleet of super-spec land rigs in the U.S. These rigs can be used to drill in the conventional and unconventional wells of varying depths including in long, lateral wells on multiple well pads. The combination of our super-spec fleet, our in-house experts, as well as our suite of software solutions help to create consistency, improve drilling efficiency, and improve wellbore quality.
TECHNOLOGY AND SOFTWARE SOLUTIONS

The Company’s digital technologies and the deployment of those into H&P’s FlexRig® fleet are an integral part of our performance-driven solutions and are intended to deliver the desired outcomes for our customers by making drilling safer and more economical.
Our technology aids in removing human variability by automating aspects of the process to assist operators or replace the need for human directional drillers, which not only helps to improve wellbore spacing, improve safety and efficiency of our drilling operations, and can increase investment returns, but also helps reduce the overall environmental impact of the drilling process. From our customers’ perspective, these attributes translate to value in three primary ways:
REDUCED FUEL AND EMISSIONS
› By reducing human error, downhole tool failures and the related repair costs, we help reduce the number of trips, which in-turn reduces fuel and emission impact for our customers.
› We reduce manual inefficiencies that lead to flat time and delay time to target. Delays add more days to the well and in turn increases fuel consumption and associated emissions.
› By proactively mitigating wellbore challenges, we help reduce backoffs and sidetrack frequency to deliver a more reliable wellbore with less downtime and risk. These reduced risks lend to more repeatable and consistent execution, requiring less fuel and thus emissions.
INCREASED LIKELIHOOD OF HIGHER PRODUCTION PER EMISSIONS INVOLVED IN EXTRACTING HYDROCARBONS FROM THE GROUND
› Our automated and geological technologies help deliver a tighter curve at an orientation that helps maximize the completable lateral length of the asset.
› By optimizing wellbore placement, we can provide more control and precision to maximize contact with the reservoir in turn increasing efficiency in reaching the target zone and then maximizing production by reliably staying on target.
› Wellbore positioning comes with high levels of uncertainty due to error sources inherent in the surveying process. If not accounted for, these errors can result in loss of production, equipment failure, and non-productive time, leading to potential exposures and/or costly situations. By reducing this uncertainty with better data, we can positively impact the overall performance for optimal outcomes.
THROUGH AUTOMATED TECHNOLOGY WE ARE ABLE TO PROVIDE EXPERTS WITH THE ABILITY TO BE IN MORE PLACES AT ONCE
› Utilizing automated technology reduces the possibility of human error, increases drilling accuracy, both of which drive efficiency optimize operations from beginning to end.
› Our experts can remotely monitor several wells at once from one central location at the same time compared to only one well at time and requirement to be at the well site location.
H&P 2021 Sustainability Report
1 2 3 37 INTRODUCTION ENVIRONMENT CUSTOMERS EMPLOYEES COMMUNITIES GOVERNANCE APPENDIX
H&P also provides remote maintenance and support for our drilling operations. Our Rig Systems Monitoring and Support Center and Remote Operations Centers are staffed around the clock every day of the year to monitor our rigs and provide feedback to our crews to optimize operations.

PERFORMANCE BASED CONTRACTS
By working with customers to identify their desired outcomes, we can serve our customers’ unique goals and help them overcome challenges through a focused approach that combines the FlexRig® drilling rig, our employees, and the suite of software solutions. This approach is captured by performance-based contracts, which have been a key development to our strategy and service provision, especially as our technology increasingly supports the operations and outcomes of our drilling solutions. With a performance-based contract model, we are not paid for our time—we are compensated for the results we produce, the KPIs we achieve, and the value we add. Along with minimizing risk for our customers, this model is designed to compensate us for the solutions we provide and ultimately, our performance. Adopting performance-based contracts represents an additional step toward serving our customers and linking value creation to our operational outcomes.
CUSTOMER SPOTLIGHT Providing Solutions, Delivering Outcomes
One of H&P’s four identified environmental opportunities is supporting business partners and customers in meeting environmental sustainability goals. H&P is partnering with customers and other business partners to improve the environmental footprint at the well site.
We continue to investigate technology and efficiency improvements for power management on rigs. Currently, we offer solutions to help achieve customers’ sustainability goals such as high-line power and alternative fuel engines. One such solution utilizes lean-burn natural gas engines with energy storage systems (“ESS”), that also offer engine management systems to help increase efficiencies.
In one particular instance with a customer, we utilized lean-burn natural gas and ESS that provided tangible environmental improvements and real efficiency results, such as: reduced fuel cost and greenhouse gas emissions.
CAPITALIZING ON OUR ENVIRONMENTAL OPPORTUNITIES
Operational Efficiency Improvements
Supporting Business Partners and Customer in Meeting Environmental Sustainability Goals
For more information on other successful drilling outcomes, please visit our website at https://www.helmerichpayne.com/drilling-outcomes.
H&P 2021 Sustainability Report 39
INTRODUCTION ENVIRONMENT CUSTOMERS EMPLOYEES COMMUNITIES GOVERNANCE APPENDIX
SOCIAL
“Honesty. Commitment. Integrity. Our pledge is to approach the next 75 years with these time-tested values etched clearly in our minds, remaining forever indebted to the thousands of loyal Helmerich & Payne, Inc., co-workers who have gone before us and kept the faith.”
 – HANS HELMERICH, DECEMBER 1994
EMPLOYEES
3
EMPLOYEES
Our employees are the driving force that differentiates our business. The importance of a diverse, engaged, healthy, and safe workforce is key to our ongoing success.
HEALTH & SAFETY
SAFETY CULTURE
At H&P, we foster a culture of Actively C.A.R.E. and seek to improve our work practices to safeguard the health and safety of our employees, customers, and third parties. Our culture of immediate and open feedback regarding safety allows us to better identify exposures. All employees are encouraged to recognize and report unsafe working conditions and to reinforce this value, we employ coaching on safety and accountability. H&P provides education through Actively C.A.R.E. training and coaching on the negative consequences of health, safety, and environmental exposures encouraging every individual to control and remove exposures in their purview.
“Everybody claims they are safety-conscious. Yet in all the places I’ve ever served — in three companies, on multiple corporate boards, on large not-for-profit hospital and university boards where safety is all-important — I have experienced only TWO deep, full-fledged, all-consuming safety cultures. One was the old Bell System (that one ended in 1984). The other was and is Helmerich & Payne for all the 30+ years I’ve watched.”
- JOHN ZEGLIS, H&P BOARD MEMBER
We have a public HSE Policy that formalizes our safety approach and leadership, serious injury or fatality (“SIF”) strategy, as well as our commitment to continuous improvement. We discuss this in greater detail here in the Environment section of this report.
SAFETY OVERSIGHT
Oversight is key to our continued improvement on health and safety. Our Safety Leadership Team (“SLT”), with members from multiple departments and all business units, monitors data – on a weekly basis at minimum – along with employee feedback to refine our strategy and objectives related to safety.
Our SLT has established cross functional teams to address key objectives and monitor progress. These cross-functional teams help promote an inclusive safety culture in which everyone’s input is valued. The SLT reports monthly to the ELT, including the Company’s Chief Executive Officer, through a formal progress report. Members of the ELT provide support to the SLT including participating in a weekly review of SIF incident investigations and corrective actions for those incidents. H&P’s ELT manages health and safety under the active oversight of our Board of Directors and provides health and safety reports to the Board on a quarterly basis. ELT reports incorporate data on safety efforts including but not limited to safety trainings and our health and safety goals.
A detailed graphic and corresponding definitions outlining oversight is as follows:
BOARD OF DIRECTORS
CHIEF EXECUTIVE OFFICER
EXECUTIVE LEADERSHIP TEAM
SAFETY LEADERSHIP TEAM
Board of Directors
Leadership teams, ELT, and Chief Executive Officer
Operational oversight team
Operational support team
STRATEGIC SAFETY PILLAR TACTICAL SAFETY PILLAR SAFETY TRAINING PILLAR
Strategic Safety Pillar – sets the strategic direction for the planning and implementation of the core Health, Safety and Environmental (HSE) processes known as C.A.R.E. (Controlling and Reducing Exposures) across the organization and oversees the suitability, adequacy, and effectiveness of the HSE processes to control exposure for all H&P at the rigs and related worksites.
› Actively C.A.R.E. Goal Team – represents the cross functional teams that are responsible for establishing and executing on the ACG key results to achieve the overarching ACGs.
› Action Teams – represents the cross functional teams that are formed to address an exposure that needs immediate attention.
› Steering Teams – represents the cross functional teams that are responsible for overseeing H&P’s core HSE processes.
Tactical Safety Pillar – assists operations in the day-to-day execution of the core HSE processes in the business units, regions, and rigs.
› Regional Safety Director – responsible for overseeing the execution of H&P’s safety program in their particular business unit.
› HSE Specialist – responsible for overseeing the execution of H&P’s safety program in their particular region or facility.
› HSE Representatives – responsible for assisting assigned rigs in following HSE procedures and processes.
› HSE Lead Investigators – responsible for conducting SIF investigations and assisting operations in creating effective corrective actions.
Safety Training Pillar – provides education and training to employees that reduces exposures and improves safety performance.
› Human Resources (Organizational Development Department) – creates and delivers training content for employees.
› Safety Leadership Coaches – assists in creating and delivering content for leadership training.
H&P 2021 Sustainability Report 43 INTRODUCTION ENVIRONMENT CUSTOMERS EMPLOYEES COMMUNITIES GOVERNANCE APPENDIX
HSE SPECIALIST
REGIONAL SAFETY DIRECTOR HSE REPRESENTATIVES HSE LEAD INVESTIGATORS
SAFETY LEADERSHIP COACHES
HUMAN RESOURCES (ORGANIZATION DEVELOPMENT DEPARTMENT)
ACTION TEAMS STEERING TEAMS
ACTIVELY C.A.R.E. GOAL TEAM
SAFETY RESULTS
H&P has a history of safety excellence. The safety of our employees and customers is paramount to our values and is ingrained in our business strategy and culture. As reflected by The H&P Way, we are committed to nurturing a culture highlighted by an Actively Caring workforce. We strive to Actively C.A.R.E. for:
we have enhanced our safety efforts using a prevention-based methodology called C.A.R.E. (Control and Removal of Exposures).
OUR OWN SAFETY AND HEALTH
THE SAFETY AND HEALTH OF OTHERS
Our employee safety program now focuses on SIFs, which places more emphasis on near misses and injury exposures, especially those with SIF potential. We believe it is important to take a more holistic and proactive approach to identify safety issues. By focusing on both actual and potential safety events, we use our SIF system to prevent serious injuries and fatalities as opposed to relying purely on incidents reported after they happen. In addition, we have a program, called FlexCheck, that focuses on pre-job planning and risk mitigation around SIFs.
THE PROTECTION OF OUR ENVIRONMENT
Safety performance in the drilling industry is typically measured based on Occupational Safety and Health Administration (“OSHA”) recordable injuries and the active rig years worked without an OSHA recordable injury, lost-time, or disabling injury. We view these metrics as lagging indicators to safety concerns, which can encourage the wrong behavior such as under reporting incidents. While we still track these metrics for regulatory purposes,
Our data has identified that approximately 10% to 15% of all OSHA recordable injuries are events in which valuable lessons learned are produced and inform mitigation efforts to reduce potential serious injury in the future. The remaining recordable cases may not provide the necessary learning opportunities to prevent future serious injury. Similarly, the data also indicates that SIF Potential incidents, all of which provide information to help prevent future serious injury or fatality, occur approximately 1.5x more than the traditional Total Recordable Incident Rate (“TRIR”).
SIF OVERVIEW
SIF ACTUAL – An incident in which there was an actual life-altering, life-threatening, or fatal injury.
SIF POTENTIAL – An incident in which the potential was there for a life-altering, life-threatening or fatal injury.
SIF MITIGATED – An incident in which the potential was there for a life-altering, life-threatening or fatal injury but the potential was mitigated due to an intended barrier or control being in place.
SIF INCIDENTS – Collectively SIF Actual, SIF Potential, and SIF Mitigated
Our SIF Actual rates have decreased to zero from fiscal 2018 to fiscal 2021. Given the lower SIF Actual rate decrease, SIF Potential rates have also seen decreases due to our improved safety results from further identification and removal of exposures. We also recognize that our SIF Mitigated rates have seen variation in year-over-year change; however, SIF Mitigated rates ultimately indicate that SIF Actual events did not occur, indicating mitigation efforts are having a positive impact.
Note, while rig count increased by approximately 45%, there were zero SIF Actuals to H&P employees in fiscal 2021, which is the first time H&P has received zero SIF Actuals in a 12-month period since we began tracking SIFs in 2015.
While we do track TRIR and Lost Time Incident Rate (“LTIR”), we focus primarily on tracking data associated with our SIF program to report and prevent injuries and fatalities. Since H&P has implemented its SIF prevention strategy in 2016, we have achieved a 62% decline in potentially serious injury incidents and a 9% reduction in TRIR.
Our SIF Actual rates have decreased to ZERO from fiscal 2018 to fiscal 2021.
H&P 2021 Sustainability Report 45
SIF RATES FY 2019 FY 2018 FY 2020 2021 0 .5 1 1.5 2 2.5 3 3.5 0.43 2.55 SIF Incidents per 200,000 Hours Worked SIF
SIF
SIF
0.06 0.34 1.82 0.01 0.46 1.17 0.03 0.52 1.10 0.00
Potential
Mitigated
Actual
INTRODUCTION ENVIRONMENT CUSTOMERS EMPLOYEES COMMUNITIES GOVERNANCE APPENDIX
SAFETY TRAINING
We maintain an emphasis on safety through our mandated trainings for all employees. We require that all employees complete a minimum of 26 hours of safety training each year. New field employees are required to complete 41 hours of training during their first year (26 RSMT sessions and 15 hours of New Employee Safety Training), and the training is focused on safety. We believe our continuous safety training efforts have contributed to our decrease in SIF Actual rates.
Compliance with multiple third-party safety programs also helps to ensure our efforts track industry benchmarks and take advantage of available resources. Third party certifications add value to the ways in which we manage our health and safety.

Our third-party compliance includes:
› HSE training is International Association of Drilling Contractors (“IADC”) Rig Pass accredited
› Quality control vetting of HSE policies and procedures by customer-selected third parties
› ISO 9001 certification for the provision of management support for certain oil and gas contract drilling services, including (but not limited to) the following processes:
– Health, safety, and environmental
– Preventative maintenance
– Supply chain management
– Offshore training
HEALTH AND SAFETY GOALS
Executive compensation is tied to internal safety performance goals to align organizational incentives around our safety values. Through SLT reporting and coaching for all levels of employees, H&P incorporates a commitment to safety throughout the organization.
We reset our Health and Safety ACGs on an annual basis which are based on H&P’s SIF data and field input. The determination of these goals takes place every year in September (our fiscal year-end) by the SLT and are approved by the ELT before they are formalized and introduced to employees. Our goals are aspirational in nature and help our
teams to stretch to achieve targets that go beyond status quo.
Our 2020 Health and Safety ACGs focused on SIFs in tubular handling and dropped objects. In line with these goals, we decreased SIF rates by 37% in tubular handling and 16% in dropped objects as well as observed a 42% increase in the mitigation of SIF dropped object as compared to 2019. Since implementing the program, we have reduced SIF incidents through a culture and dedicated workstream devoted to pre-job planning. Our 2021 Health and Safety ACGs continued to build and expand upon our 2020 goals pushing for continual improvement.
2021 HEALTH AND SAFETY ACTIVELY C.A.R.E. GOALS
1 › REDUCE SIF INCIDENTS
IN RIG MOVE ACTIVITIES BY
50% COMPARED TO 2020
Purpose: This is an overarching testament to focusing on safety during critical processes, such as rig moves.
Progress: As of 2021 fiscal year end, SIF incidents in rig move activities decreased 28%.
2 › REDUCE SIF INCIDENTS INVOLVING DROPPED OBJECTS BY 33% COMPARED TO 2020
Purpose: Critical statistic that showcases that equipment is properly handled and inspected for potential issues, like overhead exposures, that could turn into dropped objects.
Progress: As of 2021 fiscal year end, SIF incidents involving dropped objects decreased 20%.
3 › REDUCE SIF INCIDENTS IN TUBULAR HANDLING OPERATIONS BY 33% COMPARED TO 2020
Purpose: Identified exposure of tubular handling and the necessary target to remove the exposure.
Progress: As of 2021 fiscal year end, SIF incidents in tubular handing operations increased 5% compared to 2020, even as rig count increased by approximately 45%.
H&P 2021 Sustainability Report 47
WE DECREASED SIF RATES BY 37% in tubular handling 16% in dropped objects 42% increase in the mitigation of SIF dropped objects. AS WELL AS OBSERVED A INTRODUCTION ENVIRONMENT CUSTOMERS EMPLOYEES COMMUNITIES GOVERNANCE APPENDIX
Given the aspirational nature of the 2021 ACGS, our 2022 Health and Safety ACGs build upon our 2021 goals key performance indicators and focus on reducing unmitigated incidents to drive down SIF Actual events.
2022 HEALTH AND SAFETY ACTIVELY C.A.R.E. GOALS
1
› REDUCE UNMITIGATED SIF INCIDENTS ON RIGS WITHIN THE FIRST 90 DAYS OF BEING RECOMMISSIONED BY 10%
Purpose: The reduction of unmitigated SIF incidents drives us to tangibly minimize actual safety incidents.
Progress: New goal
2 ›
REDUCE THE RATE OF UNMITIGATED SIF INCIDENTS INVOLVING TUBULAR HANDLING BY 10%
Purpose: Building upon our 2021 tubular handling goal, we are focusing on reduction of unmitigated SIF incidents to reduce actual safety incidents and protect our employees.
Progress: New goal
3 ›
REDUCE THE RATE OF UNMITIGATED SIF INCIDENTS INVOLVING DROPPED OBJECTS BY 10%
Purpose: Building upon our 2021 dropped objects goal, we are focusing on reduction of unmitigated SIF incidents to reduce actual safety incidents and protect our employees.
Progress: New goal
DIVERSITY, EQUITY, & INCLUSION
H&P’s Diversity, Equity & Inclusion (“DE&I”) strategy is reflective of our values and strengthens our Company. We believe that creating an environment where our employees feel valued and respected drives engagement, better leverages the unique talents and perspectives of our people to innovate, and enhances our ability to attract and retain a diverse workforce.
To advance our DE&I strategy, H&P has employed a DE&I specialist, implemented a thriving Women of H&P Employee Resource Group, and
established a DE&I Advisory Council with global employee representation. Additionally, our stance on non-discrimination is included in our Code of Business Conduct and Ethics and we are Actively tracking diversity data to better understand demographics within the organization. Over time, our goal is to continually build a more diverse and equitable workplace where inclusion and respect promote strong relationships and more effective teams.
While H&P has employed specialists and created a council to advance our DE&I strategy, we also have managerial oversight of the strategy and all initiatives associated with our strategy. This starts with
DIVERSITY, EQUITY, & INCLUSION OVERSIGHT
DE&I SPECIALIST
Board of Directors
Leadership teams, ELT, and Chief Executive Officer
Operational oversight team
Operational support team
our DE&I team reporting to our human resources department and the ELT, through to our CEO, and finally, findings and measures are presented to our Board.
DIVERSITY, EQUITY, & INCLUSION POLICIES
Formalized policies support our commitments to equal opportunities and a discrimination-free workplace, which are necessary for our business to grow and thrive. Our employees are expected to understand the policies and uphold our values and polices to help create a diverse and inclusive environment. The policies that support these efforts, and are publicly available, include our Code of Business Conduct and Ethics and Equal Employment Opportunity and Prohibition Against Discrimination and Harassment policies.
DE&I ADVISORY COUNCIL
H&P’s DE&I Advisory Council consists of employees with diverse backgrounds and experiences tasked
with championing DE&I within the organization, gathering input from employees and stakeholders, and advising senior management on the impact to employees regarding Company policies, people, practices, and communications. Our DE&I Advisory Council meets regularly to discharge its duties and develop new strategies to further advance H&P’s commitment to embedding DE&I in all levels of the organization.
EMPLOYEE RESOURCE GROUPS (“ERG”)
H&P has developed a framework to support the establishment of Employee Resource Groups, which are employee-driven groups that maintain and grow diversity, inclusion, and equity throughout the organization. These employee identity groups provide an opportunity for employees to build a community, support one another, and develop future leaders within the organization.
H&P 2021 Sustainability Report 49
CHIEF EXECUTIVE OFFICER
EXECUTIVE LEADERSHIP TEAM
DE&I ADVISORY COUNCIL
BOARD OF DIRECTORS
HUMAN RESOURCES (ORGANIZATIONAL DEVELOPMENT DEPARTMENT)
INTRODUCTION ENVIRONMENT CUSTOMERS EMPLOYEES COMMUNITIES GOVERNANCE APPENDIX
EMPLOYEE RESOURCE GROUP: WOMEN OF H&P EMPLOYEE SPOTLIGHT
The first ERG that has been formed at H&P is Women of H&P which has 146 global members. Women of H&P’s core mission is to:
› Empower women professionals within the organization to advocate for themselves, their team members, and the business;
› Promote the interests of women employees in driving business objectives, strategy, and culture;
› Retain and develop women at H&P by providing exposure, networking communities, and development opportunities; and
› Bring cultural awareness within H&P in alignment with business objectives.
On September 30, 2021, H&P employees attended the Greater Oklahoma Chapter of the Women’s Energy Network (“WEN”) five-year anniversary event. There to celebrate WEN were members of Women of H&P’s Cori Nell, Senior Product Manager, Kayla Rike, Senior Financial Analyst, and Ashley Okotoghaide, Manager of Internal Reporting.
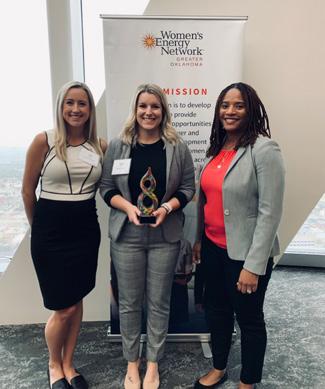
KAYLA RIKE:
“Women of H&P creates a community, this community has provided a place for women to come together, a place where they can empower each other, and a place where they can champion each other. I’ve noticed women feeling more empowered to speak up and to be more vulnerable. I think Women of H&P has opened the door for more communication, and more active listening within the organization.”
CORI NELL: “2021 has been an impactful year for the employee resource group, as we have gained members and participation from all genders within the organization and everyone is eager to learn how to better support one another through allyship.”
USING DATA TO ADVANCE DIVERSITY & INCLUSION
A critical part of advancing our DE&I efforts is understanding our current workforce including a complete picture of employee demographics, which has helped us identify areas of opportunity and change, if necessary.
DIVERSITY TREND
Women Representation in Senior Management Positions
Total U.S. Employees Represented by Minority Groups
Total U.S. workforce unless indicated otherwise Management level definitions were standardized in 2020; Best equivalent positions including Director, Vice President and President were used for 2018-2019 data
WORKFORCE DEVELOPMENT
We believe workforce development is essential to employee engagement and growth. Our Organizational Development Team takes an integrated approach to talent management and training and development programs, where we can help our employees grow and develop new skills as well as foster future managers and leaders from within our organization. Training and development
programs begin with onboarding and orientation and continue throughout our employees’ careers both in corporate positions and in the field. H&P offers a variety of programs ranging from job specific programs to leadership and span topics such as safety, ethics, teamwork, cybersecurity, leadership, problem solving, change, organizational health, compliance, and environmental training. Some of our prominent training programs are:
H&P 2021 Sustainability Report 51
FY
35% 30% 25% 20% 15% 10% 5% 0%
2019 FY 2018 FY 2020 FY 2021
15.7% 31.5% 15.4% 32.7% 13.2% 30.5% 19.6% 33.6%
INTRODUCTION ENVIRONMENT CUSTOMERS EMPLOYEES COMMUNITIES GOVERNANCE APPENDIX
76 CHANGE CHAMPIONS
graduated through the 52-hour program during fiscal 2021
› Change Champions – Teaches employees to solve complex problems using structured processes, tools and data to drive results while emphasizing leadership and public speaking.
› Leadership Series – Online training accessible to all leaders and covers a variety of topics related to leading The H&P Way.
Since the inception of Change Champions, we have graduated 673 employees.
› New Employee Safety Training –Onboarding program for new hires in safety sensitive positions. The purpose of the program is to prepare employees to work safely on our rigs and provide necessary certifications to do so; including all OSHA and IADC training, as well as Company culture education.
› Specialized Short Service Employee Program – The specialized training program is a continuation of New Employee Safety Training basics and is intended to provide the technical on-the-job training guided by a mentor. Mentorship is important for our new employees as it affords H&P employees the ability to teach and learn from one another. The goal of the program is to reduce SIF related events, increase skills and knowledge, and retain talent at H&P.
› H&P 101 – For new headquarter office employees involving the immersion into H&P’s culture, values, Company knowledge and industry foundations.
› Rig Safety Management Training (“RSMT”) – The program is developed and implemented by internal training and safety experts for all field employees to learn, discuss, and understand various safety topics including OSHA and International Suppliers Network (“ISN”) compliance, Actively C.A.R.E.and environmental topics, SIF reviews, leadership development, as well as well personal and positional skills.
› Field Employee Trainings – Position specific trainings for rig managers and drillers which includes Driller Training, Motorman Training, and Well Control Certification which is required bi-yearly.
› Ethics and Compliance Training –Comprised of several specific training programs including Code of Conduct, Insider Trading, Anti-Discrimination & Harassment, Data Privacy, Trade Compliance, and Anti-Corruption.
While all of these programs are used to enhance overall employee development, these trainings are also vital mechanisms for embedding our H&P Way values and Actively C.A.R.E. goals. Additionally, we understand that employees may want to receive, and the importance of receiving, training outside of H&P. Therefore, we reimburse employees for professional
certifications and continuing education and offer an Educational Assistance Plan for eligible employees pursuing an undergraduate degree and, in some cases, post-graduate degrees.
An outline for our comprehensive training programs by sections covered in this report can be seen below.
Training data on our employee participation on a variety of development training programs and performance on specific programs is available in the Performance Data section.
RSMT BREAKDOWN
REPORT SECTION TRAINING OVERVIEW
General Training › Workforce Development
Inclusive of general training programs focused on employee and career development. General training items also cover and emphasize safety and environmental procedures and learnings.
Environmental Training › Environmental Management
Inclusive of environmental training programs focused on improving operational environmental management.
Safety Training › Health & Safety
Ethics & Compliance Training › Ethics & Compliance
Inclusive of safety training programs focused on improving operational health & safety.
Inclusive of ethics & compliance training programs focused on improving employee compliance and ethical behavior.
Cybersecurity Training › Risk Management
Inclusive of cybersecurity training programs focused on mitigating operational IT risks.
Note, the RSMT program touches trainings within the designated General Training, Environmental Training, and Safety Training as outlined in the Performance Data table.
Safety Compliance Actively Care Leadership Position Specific SIF Review
HOURS 100% COMPLETION RATE
length of New Employee Safety Training for SSEs
for Ethics & Compliance trainings among targeted employees
H&P 2021 Sustainability Report 53
15
30% 20% 15% 20% 15% INTRODUCTION ENVIRONMENT CUSTOMERS EMPLOYEES COMMUNITIES GOVERNANCE APPENDIX
TALENT ATTRACTION
Our recruiting and hiring practices are among some of our most important activities. H&P’s Workforce Staffing Team provides full staffing services to our North America Solutions and Offshore Gulf of Mexico operations to ensure consistent staffing levels on our rigs. This team sources, hires, onboards, trains, assigns, and reassigns rig-based employees. H&P maintains a bench of talent to place in entry level rig positions and in downturn years, we maintain relationships with former employees and prioritize recalling our most experienced people for field positions. In addition, we utilize social media, local job fairs, employee referral bonuses, and educational organizations across the U.S. to find diverse, motivated, and responsible employees.
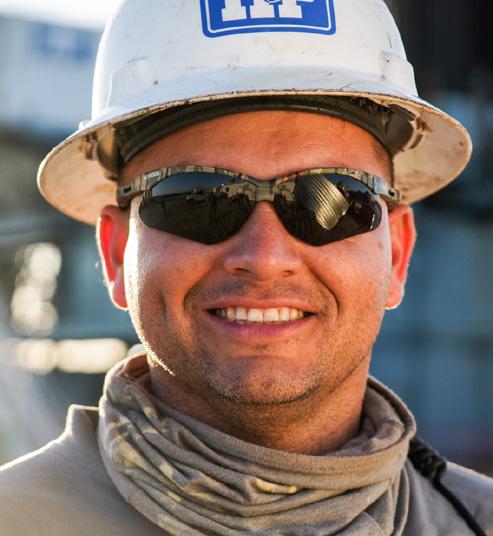
Local hiring is a priority for H&P. In the U.S., H&P prioritizes hiring U.S. citizens, while internationally, H&P strives to develop local talent to create a stronger global workforce. In 2020, H&P transitioned senior leadership positions in Argentina and Colombia from long term expatriates to local leaders. H&P complies with different country requirements for percent of its citizens hired.
Additionally, summer interns at H&P can provide great assistance and bring innovation to our processes. Our primary purpose in this program is to give college and university students an opportunity to gain real-world experience, develop a network, and create a pipeline of talent for future opportunity at H&P.
EMPLOYEE BENEFITS, HEALTH AND WELLNESS
H&P values its employees and believes benefits packages are essential to prioritizing the wellbeing of its staff and offering competitive compensation. Select highlights of our benefits programs include:
› Medical, dental and vision insurance for all fulltime employees, and all part-time; employees working more than 20 hours per week, and their dependents;
› A 401(k) plan with Company match incentive for all full-time employees, and all part-time employees working more than 20 hours per week;
› Employer paid life insurance benefits, which include a life assistance program, identity theft protection, and travel assistance plan;
› The Employee Assistance Program which offers wellness support with counseling, legal assistance, financial coaching, and identity theft resolution;
› The H&P Way Fund which provides financial assistance to US H&P employees during emergencies;
› Employee discounts for phone, computer, personal vehicle, car rental, and hotel purchases; and
› An Educational Assistance Plan, which offers reimbursement of tuition fees for any employee.
H&P recognizes the importance of the mental health of our employees and as such launched a mental health leadership series and incorporated mental health awareness into our monthly focus on organizational health.
H&P’s Flexible Work Policy allows for eligible employees to work flexible schedules and from various locations – mainly the employees’ homes. Eligible roles have the option to work fully remote, traditionally in a H&P office, or a hybrid combination of the two. We believe this policy improves employee morale, increases access to top-tier talent, reduces our real estate footprint, and reduces overall employee commuting time.
H&P 2021 Sustainability Report 55
“I’ve never been more confident in the Company’s future. That assurance is rooted in the conviction that we have the right people in the right place to drive our future success. ”
INTRODUCTION ENVIRONMENT CUSTOMERS EMPLOYEES COMMUNITIES GOVERNANCE APPENDIX
– HANS HELMERICH
SOCIAL
COMMUNITIES
4
COMMUNITIES
As an organization, H&P makes contributions and recruits volunteers to non-profit and professional organizations realizing that philanthropic and charitable activities create positive and long-term impacts in our communities. These values are shared by our employees who are dedicated to the communities where we live and work. The Company continues to advance its community relations program even further with a mission to invest in programs that align with H&P values and enhance quality of life and economic wellbeing in the communities where we operate.
STEM education
Health & Human Services
In addition to corporate philanthropy and employee volunteering, we recognize local hiring and procurement practices as important forms of social investment, which supports communities and strengthens local economies. H&P hires locally in the countries where we do business and seeks to form strong relationships through procurement with local suppliers. We believe a strong focus on our communities and employees is critical in the development of a resilient business model and strong service delivery.
CORPORATE GIVING EFFORTS & PROGRAMS
and facilitates employee volunteerism through our Day of Caring to build value in our communities through our time, resources, and financial support. In our communities, and particularly in Tulsa, Oklahoma, where we are headquartered, we have proudly played a part in a variety of philanthropic initiatives. Our track record of serving our communities is a source of great pride throughout the organization.
DURING FISCAL 2021, H&P HAS SUPPORTED MORE THAN
50 PHILANTHROPIC ORGANIZATIONS
across our local, employee, and environmental communities.
Disaster relief
Environmental sustainability
Charitable activities and fundraising extend and deepen our connection to the communities where we do business. H&P donates to charities
H&P 2021 Sustainability Report 59
INTRODUCTION ENVIRONMENT CUSTOMERS EMPLOYEES COMMUNITIES GOVERNANCE APPENDIX
OUR CORPORATE CONTRIBUTIONS FOCUS ON FOUR KEY AREAS:
1921 TULSA RACE MASSACRE CENTENNIAL COMMISSION
H&P acknowledges the value of history and storytelling. By contributing to the financial mission of the 1921 Tulsa Race Massacre Centennial Commission and the historic Greenwood District of downtown Tulsa, which is popularly known as the “Black Wall Street”, H&P is helping to sustain institutions that preserve the historical and cultural significance of Tulsa. This creates a rich opportunity to honor the past, learn from the city’s history, and foster diversity, equity, and inclusion in our local community.
� LEARN MORE HERE
LOCAL EDUCATION
In fiscal 2021 H&P donated to The Foundation for Tulsa Schools, which is a 501(c)(3) community-based nonprofit committed to carrying out its “mission of building a better community through the support of Tulsa Public Schools”. The Foundation is made up of engaged community members who enlist support for public schools and provide academic resources and financial support.
� LEARN MORE HERE
Additionally, in fiscal 2021 H&P donated to STEM programs in a number of local schools and we also donate directly to schools in Tulsa and broader Oklahoma including:
› The University of Tulsa
› Oklahoma State University
› University of Oklahoma
HELMERICH CENTER FOR AMERICAN RESEARCH
H&P makes financial contributions to the Helmerich Center for American Research at Gilcrease Museum. The Helmerich Center for American Research is dedicated to “enhancing our understanding of human society and culture”. The center seeks to do this through research, institutional collaborations, publications, educational programming, digital services, visiting scholars’ programs, and research fellowships leveraging the museum’s archives.
� LEARN MORE HERE
MEALS ON WHEELS CAPITAL CAMPAIGN
In fiscal 2021, H&P committed to a financial contribution over the next five years to Meal on Wheels which aims to support “more than 5,000 community-based programs across the country that are dedicated to addressing senior isolation and hunger”. � LEARN MORE HERE
THE UNITED WAY
The United Way is an international network that connects members in fundraising efforts to “advance the common good in communities across the world”. The organization’s primary focus is on community-based and community-led solutions to address education, income inequality, and health. H&P joins close to 1,800 communities by engaging in common goals and providing financial support to United Way initiatives. As part of its corporate level contribution, H&P matches employee contributions as part of its yearly fundraiser.
� LEARN MORE HERE
THE NATURE CONSERVANCY
H&P supports The Nature Conservancy, a global environmental nonprofit impacting conservation in 72 countries. As a “Corporate Conservator,” our philanthropic giving helps fund the Nature Conservancy’s work to “conserve the lands and waters on which all life depends.” We recognize the important role biodiversity and natural capital plays in the health of the environment and in our communities. H&P stands behind organizations like the Nature Conservancy to steward the planet’s resources to ensure humans and nature can continue to thrive.
�
LEARN MORE HERE ONE TREE PLANTED
In 2020, as part of our centennial celebration, we partnered with One Tree Planted to plant 100 trees a day for the first 100 days of the year. One Tree Planted is a 501(C)(3) non-profit organization that works to have one tree planted for every dollar it receives in donations to address global reforestation, which will reduce CO2 in the atmosphere. The organization has planted over 2.5 million trees around the world since its inception in 2014.
� LEARN MORE HERE
Our corporate contributions also extend to our field locations. Some of these contributions include:
Texas Adaptive Aquatics: “non-profit sports training program for children and adults with disabilities”
Children’s Advocacy Project in Wyoming: “community response to the broad & devastating impact that child maltreatment has on individuals & the community”
Faces of Freedom in Colorado: “unleash[ing] the potential of dogs by transforming them into custom-trained, life-changing assistance dogs for people in need”
North Dakota Fishing Piers: “install[ing] floating fishing piers at many waters throughout the state to provide more public fishing opportunities”, especially for people with disabilities
H&P 2021 Sustainability Report 61
INTRODUCTION ENVIRONMENT CUSTOMERS EMPLOYEES COMMUNITIES GOVERNANCE APPENDIX
EMPLOYEE COMMUNITY
H&P values employees and recognizes their talent and energy has been a key driver of the Company’s growth over the past 100 years. We are all responsible for executing The H&P Way and philanthropic efforts aimed at our employees allow us to exemplify and reciprocate these values.
THE H&P WAY FUND
The H&P Way Fund was designed to provide short-term assistance to US employees experiencing severe financial need due to unexpected and unavoidable emergencies and is funded by the current employees and matched by H&P. The program focuses on assisting employees facing the following hardships:
› Home Catastrophe/Natural Disaster
› Funeral of Immediate Family
› Emergency Travel for Immediate Family
› Medical Emergency (emergency hospitalization, injury, etc.)
› Personal Emergency (theft, partner laid off, acts of violence)
The H&P Way Fund has provided critical aid to support the resilience of our employees and in doing so, has enhanced our culture of caring, which is core to our business. Employee assistance distributed through The H&P Way Fund helps to reinforce the importance of the wellbeing of our workforce in serving the needs of our customers.
The H&P Way Fund relies on the specialized expertise of the Tulsa Community Foundation, an organization devoted to creating and administering emergency assistance and disaster relief funds for employees. As administrator, the Tulsa Community Foundation fields requests for aid and guarantees applications are confidential.

Information specific to crises and hardships are never shared with H&P.
For more information, please go to https://tulsacf.org/hpwayfund/
PHYLLIS DOTSON SCHOLARSHIP PROGRAM
Promoting access to education and research opportunities is central to our industry and the future of our communities. The Phyllis Dotson Scholarship Program offers children of H&P employees an opportunity to continue to learn and grow through higher education. The Phyllis Dotson Scholarship program was named to honor the legacy of a long-time, and now retired H&P executive, George Dotson, and his wife, Phyllis, and connect their work to our ongoing efforts in the community to provide greater access to education. Scholarships through the program are open to all children of our employees both domestic and abroad. Since 1999, more than 100 scholarships have been awarded.
RESPONSIBILITY TO EACH OTHER HUMAN RIGHTS
We are committed to protecting human rights and preserving human dignity throughout our business activities. Our focus on preserving human rights is reinforced through our Code of Business Conduct and Ethics, Vendor Code of Conduct, and Employee Handbook, as well as within our values and ethical employment practices. Additionally, H&P complies with all employment laws relevant to the countries in which we operate including, but not limited to, laws around child labor, forced labor, human trafficking, any form of modern slavery as well as data security and privacy regulations. We have a Human Rights Policy that defines the Company’s
standards and principles with respect to human rights and it provides guidance to our employees regarding their responsibilities related to the protection of human rights and explains how the policy will be enforced. It contains separate provisions for child labor and forced labor.
Care is also given to protect the rights of our employees and customers by striving to provide a safe working environment free from any type of harassment. We do not discriminate on the grounds of race, color, sex, sexual orientation, religion, national origin, citizenship status, age, genetic information, physical or mental disability, veteran status, pregnancy, or any other legally protected status, in hiring or any other business practice. For more information please see our Equal Employment Opportunity and Prohibition Against Discrimination and Harassment policies.
Our ongoing commitment to human rights means we continue to evaluate ways in which we can improve and strengthen internal policies and outcomes to protect the rights of all people touched by our business.
WORKPLACE VIOLENCE
H&P’s Workplace Violence Policy is contained within the Code of Business Conduct and Ethics and explicitly states the Company does not tolerate threats, potential or actual violence while on any worksite or premises or conducting Company business (including, without limitation, corporate and field offices, drilling rigs, vehicles, lease locations, testing facilities, and crew camps, quarters, trailers or other housing furnished by Company as well as parking lots and common areas associated therewith, collectively “Company Installation”).
H&P 2021 Sustainability Report 63
INTRODUCTION ENVIRONMENT CUSTOMERS EMPLOYEES COMMUNITIES GOVERNANCE APPENDIX
GOVERNANCE 5 GOVERNANCE

GOVERNANCE
Our corporate governance is rooted in the values of the H&P Way. These values are core to the organization and are adopted by the Board and ELT and permeate throughout the entire organization. Corporate governance is foundational to the Company’s broader sustainability strategy as proper oversight mechanisms help mitigate risk and facilitate the prioritization of environmental, social, and governance matters. Additionally, the policies and procedures we have in place support H&P’s goal of achieving long-term value creation for all stakeholders in an ethical and sustainable manner.
CORPORATE GOVERNANCE
BOARD COMPOSITION
Strong corporate governance starts with the Board. We believe the composition and structure of our Board should both reflect and foster independence and diversity. This allows for unique and fresh perspectives based on a variety of experiences to be heard and considered.
The Board’s oversight on sustainability matters is supported by related experience. As corporate officers, members of our Board have been responsible for: corporate governance, efficient use of natural resources, management of personnel, and DE&I initiatives. Additionally, Board members have experience as investors in private and public sustainability focused investments. We believe that this experience and expertise makes our Board well suited to oversee ESG performance and sustainability initiatives at H&P.
From an independence perspective, 83% of directors on our Board qualify as independent under the rules of the New York Stock Exchange (“NYSE”). Furthermore, our independent directors annually elect a lead independent director. Our current lead independent director is Randy
Foutch, who is also a member of the Human Resources Committee (“HR Committee”) and the Chairman of the Nominating and Corporate Governance Committee (“NCG Committee”).
We also believe that diversity – not just in demographics – encourages more robust discussions, new ideas, and ultimately better decision-making. The unique backgrounds of our Board members’ – age, experience, gender, ethnicity, and expertise – helps to facilitate new and innovative ways of thinking and problem-solving to address new and/or complex challenges the Company may face.
On an annual basis we evaluate Board composition to ensure we meet the evolving needs of our business. During the past five years we have added five new directors, four of which are considered diverse by either gender or ethnicity. Each of the five new directors brings a plethora of skillsets and experiences to the Board. Our Board’s expertise is represented by its combined institutional knowledge, and combination of diversity and independence which provides a distinctive set of perspectives and solutions to all of the risks we face, including those related to our sustainability program.
H&P 2021 Sustainability Report 67 INTRODUCTION ENVIRONMENT CUSTOMERS EMPLOYEES COMMUNITIES GOVERNANCE APPENDIX
GENDER AND ETHNIC DIVERSITY BOARD DIVERSITY BREAKDOWN BOARD TENURE BREAKDOWN 80% 80% of directors added over past five years are considered gender or ethnically diverse LENGTH OF TENURE IN YEARS 42% 33% 25% 34% Diverse 17% Women 17% Ethnically Diverse AVERAGE DIRECTOR TENURE: 12 YRS. 0-5 Years 6-10 Years 11+ Years
BOARD COMMITTEES
The Board is responsible for overseeing the Company’s operations and strategy, providing guidance and insight to the Company’s management and effectively stewarding the long-term interests of the Company and its stakeholders. There are three standing committees within H&P’s Board, the Nominating and Corporate Governance Committee (the “NCG Committee”), the Human Resources Committee (the “HR Committee”), and the Audit Committee.
COMMITTEE MEMBERSHIPS
These committees generally conduct meetings at least quarterly or more frequently as needed to discharge their duties and receive comprehensive materials in advance of Board and committee meetings; Committee members are expected to review these materials before each meeting. A copy of the charters for all three committees of the Board are available on our Investor Relations website
NOMINATING AND CORPORATE GOVERNANCE COMMITTEE
H&P’s NCG Committee, which is entirely composed of independent directors, regularly reviews the Board's leadership structure to ensure that it fulfills its responsibility to provide independent oversight of the Company. The primary responsibilities of the NCG Committee as outlined in our proxy statement (available on our Investor Relations website) include, but are not limited to:
› Assisting the Board in fulfilling its independent and objective oversight responsibilities of financial reporting and internal financial and accounting controls of the Company;
› Monitoring the qualifications, independence, and performance of our independent registered public accounting firm; and
› Providing an avenue of communication among the independent auditors, management, the internal auditing department and the Board.
⚫ MEMBER
★ CHAIR
› Identifying and recommending to the Board the selection of Director nominees for each Annual Meeting of Stockholders or for any vacancies on the Board, including consideration of diversity in professional background, experience, expertise, perspective, age, gender, and ethnicity with respect to Board composition as a whole;
› Making recommendations to the Board regarding the adoption or amendment of corporate governance principles applicable to the Company; and
› Assisting the Board in developing and evaluating potential candidates for executive positions and generally overseeing management succession planning.
HUMAN RESOURCES COMMITTEE
H&P’s HR Committee, which is entirely composed of independent directors, functions as a compensation committee and has the responsibility for establishing, implementing, and monitoring our executive compensation program. The primary responsibilities of the HR Committee as outlined in our proxy statement (available on our Investor Relations website) include, but are not limited to:
› Evaluating the performance of our executive officers;
› Reviewing and recommending decisions to the Board regarding compensation of our executive officers;
AUDIT COMMITTEE
H&P’s Audit Committee, which is composed entirely of independent directors, plays a significant role in oversight of risks associated with the Company’s financial performance, internal and external audit functions, legal and tax contingencies, compliance, cybersecurity, physical security and other exposures. Primary responsibilities of the Audit Committee as outlined in our proxy statement (available on our Investor Relations website) include, but are not limited to:
› Making recommendations regarding compensation of non-employee members of our Board; and
› Reviewing and making recommendations or decisions regarding incentive compensation and equity-based compensation plans.
SHAREHOLDER RIGHTS
H&P 2021 Sustainability Report 69
DIRECTOR INDEPENDENCE AUDIT HUMAN RESOURCES NOMINATING & CORPORATE GOVERNANCE
⚫ ⚫ ⚫
⚫ ⚫ SEC DESIGNATED FINANCIAL EXPERT ⚫
LEAD
⚫ ★
⚫ ⚫ ⚫
⚫ ★ ⚫
⚫ ★ SEC DESIGNATED FINANCIAL EXPERT ⚫
Rust ⚫ ⚫ SEC DESIGNATED FINANCIAL EXPERT ⚫
⚫ ⚫ ⚫ John
⚫ ⚫ ⚫ Belgacem Chariag ⚫ ⚫ ⚫
Hans Helmerich
Chairman of the Board John Lindsay Chief Executive Officer Delaney Bellinger
Kevin Cramton
Randy Foutch
DIRECTOR
José Mas
Thomas Petrie
Donald Robillard
Edward
Mary VanDeWeghe
Zeglis
Shareholder input is a key priority of H&P and we regularly engage with our shareholders to understand and address their needs and questions as well as to solicit their input on our corporate practices. INTRODUCTION ENVIRONMENT CUSTOMERS EMPLOYEES COMMUNITIES GOVERNANCE APPENDIX
The target for performance-based compensation for fiscal year 2021 was 86% and 79% of total direct compensation for our CEO and the average of our other named executive officers, respectively.8
We listen to shareholders and have governance practices in place such that shareholders have a voice at H&P. These practices, as outlined in our proxy include:
› Our proxy access by-law permits a stockholder (or a group of up to 20 stockholders) owning 3% or more of the Company’s outstanding common stock continuously for at least three years to nominate and include in the Company’s proxy materials director candidates constituting up to the greater of two individuals or 20% of the Board, if the nominating stockholder(s) and the nominee(s) satisfy the requirements specified in our By-laws.
› In accordance with our By-laws, candidates for director who are properly recommended by our stockholders will be evaluated in the same manner as any other candidate for director.
› Our stockholders vote on a say-on-pay proposal each year and the Board and the HR Committee carefully review the voting results from the advisory vote on executive compensation (commonly known as a say-on-pay proposal) and other stockholder input.
› We have a declassified Board, which helps to promote accountability and counters any potential stagnation or complacency within the Board.
› We have a majority vote standard for uncontested elections with a director resignation policy.
COMPENSATION
Our compensation program not only aligns the interests of our executives and shareholders, but also provides the necessary incentives to attract, retain, and
motivate our people to meet or exceed our Company’s financial and operational goals.
Our performance-based compensation philosophy directly supports our business’ success as measured by both the Company’s share price performance and our executives’ achievement of short- and long-term corporate goals to enhance shareholder value. In order to strike a balance, both individual and Company performance objectives are included in the compensation process. This balance helps create accountability for our executive officers and provides incentives that are aligned not only with long-term value creation for our shareholders and Company, but also all other stakeholders through the integration of sustainability performance objectives. Specifically, for fiscal 2021, some of the performance objectives were tied to Health and Safety and Environmental Actively C.A.R.E. goals, with the recognition that keeping employees and customers safe and reducing our environmental footprint are important to generating long-term value.
The target for performance-based compensation for fiscal year 2021 was 86% and 79% of total direct compensation for our CEO and the average of our other named executive officers, respectively.7
In addition to our performance objective targets, we also use long-term equity incentives and caps on potential payments, clawback provisions, double trigger change in control provisions, and reasonable retention strategies.
The HR Committee maintains oversight of executive compensation and evaluates the performance of our CEO. As part of its oversight, the HR Committee also
considers executive compensation plan performance objectives for the following fiscal year.
We recognize the importance of aligning our compensation against market practices and our peers. Therefore, we review market and survey data sourced from our peer group of companies, the oil and gas industry, and the market overall. Additionally, Willis Tower Watson, a compensation consulting firm, provides expert, independent advice to the HR Committee on our executive compensation practices. It advises the HR Committee on all aspects of executive compensation and provides research, survey information, market data, trends, and developments in executive compensation. The independent consultant assists in the annual evaluation of H&P’s compensation peer group to align with best practices in the industry. The independence of Willis Tower Watson was assessed in accordance with NYSE listing standards.
ETHICS & COMPLIANCE
Employees at each level of the organization are expected to apply the H&P Way core values and act ethically in all work settings. We promote honesty and transparency in everything that we do and create an environment where employees prioritize the responsibility to act ethically. Simply put, ethics and compliance is a part of H&P’s DNA, a corporate value, and a key factor in our success over the past 100+ years.
Our commitment to ethical behavior is formalized and evidenced through our policies. The Code of Business Conduct and Ethics (the “Code of Conduct”) provides
employees with tools that enable them to make consistent, ethical decisions and emphasizes the duty to report any concerns or violations. The Code of Conduct also reflects every employee’s responsibility and commitment to each other, our customers, our suppliers, our shareholders, and the community. It is how we preserve our culture and guide our employees in acting consistent with the H&P Way, which builds upon our reputation of integrity, excellence, and ethical conduct. The Code of Conduct applies to all who work in any capacity for the Company and each employee has the responsibility to know and apply the standards set within. Our Code of Conduct is available on our Corporate Governance Information webpage
While all employees have the responsibility for acting responsibly themselves, employees are also responsible for holding others accountable, which includes reporting any violations for potential concerns, as well as helping to detect or prevent violations of the Code of Conduct.
The Company’s Whistleblower policy prohibits the Company or any of its employees from retaliating or taking any adverse action against whistleblowers. Concerns may be submitted anonymously to the Company through the Ethics Hotline. The Company’s legal department carefully monitors, tracks, and delegates the investigation of allegations of violations of the Code of Conduct to the appropriate department. All ethics hotline complaints are shared with the chair of the Audit Committee in real time and significant complaints are reported to the Audit Committee at least on a quarterly basis. The following is a link to H&P’s confidential ethics hotline: Ethics Hotline Webpage
Per our latest annual proxy statement filing, our CEO to median employee pay ratio for fiscal year 2020 was approximately 65 to 1. In fiscal year 2019, that ratio was 97.9 to 1, representing a 26% decrease year-over-year.9
H&P 2021 Sustainability Report 71
8. FY 2022 performance-based
compensation percentages will be available in our upcoming proxy filing.
9. FY 2021 CEO to median pay ratio will be available in our upcoming proxy filing. INTRODUCTION ENVIRONMENT CUSTOMERS EMPLOYEES COMMUNITIES GOVERNANCE APPENDIX
Our updated Code of Conduct was posted and shared with all employees during fiscal 2021. Periodically, all U.S. based employees are required to re-certify that they have read, understand and will abide by the Code of Conduct.
We seek to provide every employee with the necessary support to uphold ethical standards on an ongoing basis, and therefore provide periodic Code of Conduct training. Additionally, subject matter training, such as anti-corruption training, is provided on an annual basis to applicable employees. Updated and periodic training provides greater awareness into our ethics and compliance program and ensures that all employees are made aware of our current policies.
H&P’s Political Activity Policy, encourages employees to participate in the political process and be active members of their community. However, such participation can only be done on the employee’s own time and with their own personal resources. Employees may not use their roles at H&P to explicitly or implicitly suggest the Company shares the same political views. More details about our Political Activity Policy can be found on our Corporate Governance Information webpage.
In order to maintain accountability for our Code of Business Conduct and Ethics and the ethical conduct of H&P, the Company has active compliance and internal audit departments. Our compliance department is responsible for maintaining corporate policies including the Code of Conduct, training, high-risk vendor management, and high-risk transaction monitoring. The activities of, and audits conducted by the internal audit department serve to monitor and strengthen our corporate governance practices, as well as our internal controls and business and accounting processes — which ultimately results in increased compliance and higher accountability. Both our compliance department and internal audit functions have direct reporting lines to the Audit Committee
to ensure transparency, oversight, and communication of these matters with our Board.
Our Vendor Code of Conduct, which is accessible on our Corporate Governance Information webpage outlines expectations and associated relevant information for our suppliers. All suppliers engaged in providing goods or services to the Company are expected to act in accordance with our Vendor Code of Conduct and at a minimum comply with all applicable laws, rules, regulations, and standards within the jurisdictions in which they operate. We take a pragmatic, risk-based approach to evaluating suppliers, which allows us to dedicate the appropriate amount of due diligence for each supplier.
RISK MANAGEMENT
The Board and its committees have direct oversight of the risk management functions at H&P and regularly receive, at least quarterly, information from management concerning any material risks in operations, safety, legal, regulatory, insurance, finance, and other strategic matters. We maintain an ERM program designed to identify significant risks facing the Company. Our ELT along with the Company’s Risk Management and Insurance Department is responsible for administering the program, including identifying and monitoring risks to the Company, assessing the Company’s risk mitigation plans, and consulting on further measures that can be taken to address new and existing risks.
Through our risk management processes, our Board has provided oversight to the review and identification of climate change-related risks that apply to H&P.This practice is in alignment with the framework established by the TCFD. These risks
are taken into consideration when developing the broader business strategy as well as will underpin our quantitative scenario analysis in 2022.
As previously mentioned in the Environmental section of the report, these climate-related risks include:
› Result in injury to our reputation, downtime, loss of revenue, and increased costs to prevent, respond to or mitigate cybersecurity events.
During 2021, an average of 699 employees completed the 12 assigned IT training modules.
Transition
Regulatory Risks Operational and IncidentBased Risks
Physical Risks
In addition to risks stemming from climate change and the ever-changing regulatory landscape, another risk identified is cybersecurity and the threats related to cyberattacks and cyber incidents, which continue to escalate globally. As outlined in our annual report on Form 10-K, we believe a cyberattack could:
› Disrupt our rig operations including operational technologies as well as our corporate information technology systems;
› Negatively impact our ability to compete;
› Enable the theft or misappropriation of funds;
› Cause the loss, corruption or misappropriation of proprietary or confidential information;
› Expose us to litigation; and
H&P has two dedicated teams to address cybersecurity matters. The Cybersecurity Incident and Response Team (“CIRT”) is responsible for defense and response of incidents such as phishing, ongoing cybersecurity threat analysis, and security breach attempts. The Security Operations Team manages the tools and systems the CIRT team requires. Additionally, our Cybersecurity Architect is responsible for the overall cybersecurity strategy. Therefore, we are not only working on mitigating day-to-day risks, but also making sure our information technology architecture can handle the cybersecurity challenges of the future.
H&P also has a dedicated team that proActively scans for system and application vulnerabilities identified by our threat analysis. If detected, the vulnerabilities are referred to our operations group for correction.
As the threats associated with cybersecurity have escalated, we continue to have programs and employee trainings in place that serve to counter these threats. We also hire outside consultants periodically to perform simulated cyberattacks on the Company to gauge our response strength and identify areas of improvement.
H&P 2021 Sustainability Report 73
to Low-Carbon Economy
INTRODUCTION ENVIRONMENT CUSTOMERS EMPLOYEES COMMUNITIES GOVERNANCE APPENDIX
APPENDIX 6

ACRONYM LIST AND GLOSSARY
TERM DEFINITION
ACG Actively C.A.R.E. Goals
Actively C.A.R.E. Actively Control and Remove Exposures
API American Petroleum Institute
Backoffs or Sidetracks
Occurs when the wellbore being drilled is off target or encounters unexpected geological formation and the drill bit is retracted to start an offset drill path
CEM Crisis and Emergency Management
CEMP Crisis and Emergency Management Plan
CIRT Cybersecurity Incident and Response Team
CMT Crisis Management Team
CO2e Carbon Dioxide Equivalent (includes all greenhouse gases listed calculated by utilizing equivalency factors as defined by the EPA)
CST Corporate Support Team
Curve The degree of which and the turn in the wellbore from vertical to lateral
DE&I Diversity, Equity, and Inclusion
E&P Exploration & Production
EGS Enhanced Geothermal Systems
EGT Environmental Governance Team
ELT Executive Leadership Team
EMS Environmental Management System
ERG Employee Resource Group
ERM Enterprise Risk Management
ESG Environmental, Social, and Governance
FTE Full-Time Equivalent
GHG Greenhouse Gas
GJ Gigajoules
GRI Global Reporting Initiative
TERM DEFINITION
HAZCOM Hazard Communication
HAZWOPER Hazardous Waste Operations and Emergency Response
High-line Refers to electrical power obtained from the installed electricity grid
HSE Health, Safety, and Environmental
IADC International Association of Drilling Contractors
IMT Incident Management Team
LTIR Lost Time Incident Rate
Oil and Gas Refers to crude oil and natural gas, collectively called hydrocarbons
OSHA Occupational Safety and Health Administration
QMS Quality Management System
R&R Rewards & Recognition
ROP Rate of Penetration
RSMT Rig Safety Management Training
SASB Sustainability Accounting Standards Board
SERTs Site Emergency Response Teams
SIF Serious Injury or Fatality
Slide Drilling the curve of the well
SLT Safety Leadership Team
SPCC Plans Spill Prevention, Control and Countermeasure Plans
TCFD Taskforce on Climate-Related Financial Disclosures
TCO e Total Carbon Dioxide Equivalent
Tortuosity Measure of curving and bending in a wellbore
Trip or Tripping The removal and re-insertion of several pieces of drill pipe into a wellbore while drilling a well
TRIR Total Recordable Incident Rate
H&P 2021 Sustainability Report 77 INTRODUCTION ENVIRONMENT CUSTOMERS EMPOYEES COMMUNITIES GOVERNANCE APPENDIX
PERFORMANCE DATA
GENERAL DATA
METRIC
GENERAL
Drilled Distance Kilometers 17,259 21,040 13,606 13,340
Total FTE2 Number 9,701 8,421 3,890 5,932
Total Contract Employees3 Number 58 108 434 328
Total Short-service Employees4 Number 1,875 628 57 901
Number of Wells Drilled Number 3,768 4,125 2,667 2,336
Total Hours Worked6 Number 21,761,421 22,415,984 14,754,461 11,450,065
Revenue Thousands USD 2,487,268 2,798,490 1,773,927 1,218,568
Amount of net revenue in countries that have the 20 lowest rankings in Transparency International’s Corruption Perception Index USD 0 0 0 0
1. Drilled distance is calculated based on hole depth change in streaming rig data; The data reflect only North America Solutions (“NAS”); Note, NAS accounted for 84% of the total revenue in 2021.
2. 2018 - 2020 as published in the corresponding year’s proxy; 2021 employee data is as of 9/30/21 as published the Annual Report on Form 10-K.
3. Accounted for on 9/30 of each fiscal year; includes employee type of consultant or contractor in Workday; Excludes temp agency worker.
4. Floormen with six months or less of service, employed on date of 9/30, and primary work address in United States; Excludes casing floorman or stack crew floorman.
5. Number of wells drilled disclosed to represent SASB activity metric of ‘Number of Active Rig Sites’ (EM-SV-000.A).
6. Represents total hours worked for all employees.
ENVIRONMENTAL DATA
Y-o-Y Change Scope 2 GHG Emissions Percentage (%) - 4.3% -14.0% -7.6%
Y-o-Y Change Scope 1 & 2 GHG Emissions1,2 Percentage (%) - 13.3% -39.5% -13.0%
Total Scope 1 GHG Emissions Normalized by Drilling Activity1,2,3 Metric Tons CO e per Kilometer Drilled 71.5 66.5 62.1 55.1
North America Solutions Scope 1 GHG Emissions Normalized by Drilling Activity1,2,3
Metric Tons CO2e per Kilometer Drilled 65.3 62.8 58.0 52.2
Y-o-Y Change Scope 1 GHG Emissions Normalized by Drilling Activity1,2,3 Percentage (%) - -7.0% -6.6% -11.3%
Scope 1 GHG Emissions from Greatest Sources Normalized by Drilling Activity1,2,4 Metric Tons CO e per Kilometer Drilled 70.1 65.3 61.6 54.2
North America Solutions Scope 1 GHG Emissions from Greatest Sources Normalized by Drilling Activity1,2,4 Metric Tons CO e per Kilometer Drilled 63.9 61.6 57.5 51.3
Scope 1 Emissions intensity1,2 TCO2e/$1K Revenue 0.50 0.50 0.48 0.60
Scope 1 Emissions intensity1,2 TCO e/Employee 127 166 217 124
Scope 2 Emissions intensity TCO2e/$1K Revenue 0.003 0.003 0.004 0.005
Scope 2 Emissions intensity TCO e/Employee 0.78 0.94 1.74 1.05
Scope 1+2 Emissions intensity1,2 TCO2e/$1K Revenue 0.50 0.50 0.48 0.61
Scope 1+2 Emissions intensity1,2 TCO e/Employee 128 167 219 125
ENERGY CONSUMPTION 5
Total Fuel Consumed Used in Off-road Equipment Gigajoules (GJ) 17,090,139 19,412,064 11,673,391 10,148,137
% of Total Fuel Consumed Used in Off-road Equipment Percentage (%) 97.9% 98.1% 97.7% 97.6%
% of Renewable Fuel Consumed Used In Off-road Equipment Percentage (%) 0% 0% 0% 0%
% Renewable of Total Fuel Consumed Used in Off-road Equipment Percentage (%) 0% 0% 0% 0%
Total Fuel Consumed Used in On-road, Mobile Equipment, and Vehicles Gigajoules (GJ) 363,247 375,369 276,302 247,070
% of Total Fuel Consumed Used in On-road, Mobile Equipment, and Vehicles Percentage (%) 2.1% 1.9% 2.3% 2.4%
% of Renewable Fuel Consumed Used in On-road, Mobile Equipment, and Vehicles Percentage (%) 5.8% 5.7% 5.5% 5.2%
% Renewable of Total Fuel Consumed Used in On-road, Mobile Equipment, and Vehicles Percentage (%) 0.1% 0.1% 0.1% 0.1%
Total Diesel Consumption Gigajoules (GJ) 17,141,190 19,470,773 11,728,597 10,209,507
Total Gasoline Consumption Gigajoules (GJ) 271,711 277,556 197,654 167,040
Total Ethanol Consumption Gigajoules (GJ) 21,100 21,500 15,289 12,889
Total Natural Gas Consumption Gigajoules (GJ) 22,913 23,929 24,611 27,352
Total Other Gas Consumption Gigajoules (GJ) 835 658 168 109
Total Biomass Woodchip Consumption Gigajoules (GJ) - 38 31 26
Total Jet Fuel Consumption Gigajoules (GJ) 18,550 16,946 7,984 5,661
Total Electricity Consumption Gigajoules (GJ) 59,993 62,037 51,967 45,560
% Renewable of Total Fuel Consumed Percentage (%) 0.1% 0.1% 0.1% 0.1%
Total Fuel Consumption
Gigajoules (GJ) 17,453,386 19,787,433 11,949,692 10,395,207
H&P 2021 Sustainability Report 79
INDEXES & DATA
UNIT
PERIOD
TIME
FY 2018 FY 2019 FY
FY 2021
2020
METRIC UNIT TIME PERIOD GREENHOUSE GAS EMISSIONS FY 2018 FY 2019 FY 2020 FY 2021
Scope 1 GHG Emissions1,2 Thousands Metric Tons CO2e 1,235 1,400 845 735 Total Scope 2 GHG Emissions Thousands Metric Tons CO2e 7.6 7.9 6.8 6.3
Scope 1 & 2 GHG Emissions1,2 Thousands Metric Tons CO2e 1,242 1,408 852 741
Total
Total
Scope GHG
Thousands Metric Tons CO2e
697
North America Solutions
Emissions1,2
1,127 1,320 789
Y-o-Y Change Scope 1 GHG Emissions1,2 Percentage (%) - 13.4% -39.6% -13.0%
FY 2018 FY 2019 FY 2020 FY 2021
INTRODUCTION ENVIRONMENT CUSTOMERS EMPOYEES COMMUNITIES GOVERNANCE APPENDIX
Total Energy Consumption Gigajoules (GJ) 17,536,292 19,873,438 12,026,301 10,468,145
Total Energy Consumption Normalized by Drilling Activity Gigajoules (GJ) per Kilometer Drilled 1,016 945 884 785
Y-o-Y Change in Total Energy Consumption Normalized by Drilling Activity Percentage (%) - -7.0% -6.4% -11.2%
Percentage of engines in service that meet Tier 4 compliance for non-road diesel engine emissions Percentage (%) - - - 25%
WATER
FY 2018 FY 2019 FY 2020 FY 2021
Percentage water recycled Percentage (%) 0% 0% 0% 0%
SPILLS
FY 2018 FY 2019 FY 2020 FY 2021
Total Number of Spills6 Number - - - 2
Spill Incident Rate7 Incidents per 200,000 Hours Worked - - - 0.03
Volume of Spills m^3 - - - 2.6
BIODIVERSITY
FY 2018 FY 2019 FY 2020 FY 2021
Average disturbed acreage per (1) oil and (2) gas well site8 Number NA NA NA NA
Y-o-Y Change in North America Solutions Operations Real Estate Footprint9 Percentage (%) -1.1% -3.7% -2.4% -28.5%
1. Emissions measured, calculated, or estimated utilizing methods from the GHG Protocol Corporate Standard with emissions factors as defined by the EPA and other sources; Includes all emissions associated with H&P operations as listed by the operational control boundary definition2; CO2e includes all greenhouse gases listed by the EPA and calculated by utilizing equivalency factors as defined by the EPA; Rig engine CO e emissions calculated using Original Equipment Manufacturer (OEM) emissions specifications from engine load and/or amount of fuel consumed; Fleet vehicle emissions calculated from fuel purchase data and/or fuel economy estimates for mileage driven.
2. Note, the boundaries for our Scope 1 emission are follows: Sources we own, rent for on-site operations, and /or control operationally which are directly related to domestic and international (land and offshore) drilling solutions.
3. Distance drilled for NAS only; NAS revenue accounted for 84% of the total in fiscal 2021.
4. Greatest sources considered are rig engines and fleet vehicles.
5. Energy consumption for electricity and fuels derived from same methods used to account for Scope 1 and 2 GHG emissions; total fuel consumption excludes fuel used in Scope 2 emissions inventory.
6. Spills listed are those which H&P was required to report to the necessary government agencies in each state.
7. Reportable spill incidents per 200,000 hours worked.
8. As a contractor, H&P does not manage the disturbance of land associated with drilling an oil or gas well site.
9. Reduction of building space by square footage for NAS based properties.
SOCIAL DATA
METRIC
HEALTH & SAFETY
SIF Potential Incidents per 200,000 Hours Worked 2.55 1.82 1.17 1.10
SIF Mitigated Incidents per 200,000 Hours Worked 0.43 0.34 0.46 0.52
SIF Actual Incidents per 200,000 Hours Worked 0.06 0.01 0.03 0.00
Y-o-Y Change in SIF Actual Safety Incidents Incidents per 200,000 Hours Worked - -83.3% 200% -100%
FTE Total Recordable Incident Rate (TRIR) Incidents per 200,000 Hours Worked 1.89 1.75 1.10 1.50
FTE Lost-Time Incident Rate (LTIR) Incidents per 200,000 Hours Worked 0.50 0.39 0.22 0.61
FTE Fatality rate Incidents per 200,000 Hours Worked 0.00 0.02 0.00 0.00
FTE Near miss frequency rate (NMFR) Incidents per 200,000 Hours Worked 3.16 2.47 3.36 2.76
FTE Total vehicle incident rate (TVIR) Incidents per 200,000 Hours Worked 1.38 1.06 1.46 1.33
Percentage of all employees and contractors who are covered by health and safety management system Percentage (%) 100% 100% 100% 100%
TRAINING & DEVELOPMENT
GENERAL TRAINING
UNIT FY 2018 FY 2019 FY 2020 FY 2021
New Employee Safety Training for Short Service (SSE) Employees Hours 15 15 15 15
Driller Training Participants Number - - 105 278
Motorman Training Participants Number 60 466 136 241
Well Control Certification Training Hours 24 24 24 24
Well Control Certification Participants Number 1,124 953 573 638
Coach Training Participants Number 3,489 600 914 2,637
Change Champion Training Hours 68 68 68 52
Change Champion Graduates Number 134 269 68 76
HSE Recognition & Rewards Granted 2 Number 4,864 14,901 10,163 7,312
ENVIRONMENTAL TRAINING
Average Employees in Attendance for Environmental and Emergency Response Trainings3 Number 9,100 8,420 4,906 2,727
SAFETY TRAINING
Minimum Safety Training for Field Employees4 Hours 26 26 26 26
Minimum Safety Training for Short Service Field Employees (SSE)4,5 Hours 28 28 28 28
ETHICS & COMPLIANCE TRAINING
Average Hours of Ethics & Compliance Training for FTE6 Number 2.25 2 2.25 1.5
% of FTE Ethics & Compliance Training Compliance Percentage (%) 100% 100% 100% 100%
% of Required Employees who Complete Anti-Corruption Training
Percentage (%) 100% 100% 100% 100%
% of Required Employees who Complete Trade Compliance Training Percentage (%) 100% 100% 100% 100%
% of Required Employees who Complete Data Privacy Training7 Percentage (%) 100% 100% 100% 100%
% of Required Employees who Complete Anti-Discrimination & Harassment Training Percentage (%) 100% 100% 100% 100%
% of Required Employees who Complete Insider Trading7 Percentage (%) 100% 100% 100% 100%
H&P 2021 Sustainability Report 81
TIME
UNIT
PERIOD
FY 2018 FY 2019 FY 2020 FY 2021
INTRODUCTION ENVIRONMENT CUSTOMERS EMPOYEES COMMUNITIES GOVERNANCE APPENDIX
% of Required Employees who Complete Code of Conduct Training7
CYBERSECURITY TRAINING
Percentage (%) 100% 100% 100% 100%
Average Number of Employees who Completed Each IT Compliance Training Module8 Number - 1,234 874 699
RETENTION & RECRUITMENT (DOMESTIC ONLY) UNIT FY 2018 FY 2019 FY 2020 FY 2021
Total New Hires Number 5,209 2,294 2,139 1,355
Total New Hires Percentage (%) of Workforce 53.7% 27.2% 55.0% 27.7%
DIVERSITY & INCLUSION 9 UNIT FY 2018 FY 2019 FY 2020 FY 2021
GENDER
Women Representation of Employees10 Percentage (%) 4.2% 4.4% 6.2% 5.4%
Men Representation of Employees10 Percentage (%) 95.8% 95.6% 93.8% 94.3%
Women Representation in Corporate Office Percentage (%) 35.2% 35.1% 33.7% 31.1%
Men Representation in Corporate Office Percentage (%) 64.8% 65.0% 66.3% 68.9%
Women Representation in Senior Management Positions11 Percentage (%) 15.7% 15.4% 13.2% 19.6%
Men Representation in Senior Management Positions11 Percentage (%) 84.3% 84.6% 86.8% 80.4%
Women Representation in All Management Positions11 Percentage (%) 4.0% 4.3% 5.7% 6.3%
Men Representation in All Management Positions11 Percentage (%) 96.0% 95.7% 94.3% 93.7%
RACE/ETHNICITY
REPRESENTATION OF ALL EMPLOYEES (%)
Total U.S. Employees Represented by Minority Groups Percentage (%) 31.5% 32.7% 30.5% 33.6%
White Percentage (%) 68.2% 67.1% 69.5% 66.2%
Asian Percentage (%) 0.6% 0.7% 1.0% 0.8%
Hispanic/Latino
Black or African American
Other Ethnicities12
REPRESENTATION IN FIELD POSITIONS (%)
Percentage (%) 21.4% 21.9% 20.5% 23.8%
Percentage (%) 6.2% 6.7% 5.6% 5.4%
Percentage (%) 3.3% 3.4% 3.4% 3.5%
Total Field Employees Represented by Minority Groups Percentage (%) 32.4% 33.6% 31.5% 35.2%
White Percentage (%) 67.5% 66.4% 68.4% 64.6%
Asian Percentage (%) 0.3% 0.2% 0.2% 0.1%
Hispanic/Latino
Percentage (%) 22.8% 23.4% 22.8% 26.4%
Black or African American
Other Ethnicities12
REPRESENTATION IN CORPORATE OFFICE (%)
Total Corporate Office Employees Represented by Minority Groups
Percentage (%) 6.3% 7.0% 5.9% 5.8%
Percentage (%) 3.0% 3.0% 2.7% 2.9%
Percentage (%) 22.0% 24.1% 23.0% 22.3%
White Percentage (%) 77.9% 75.9% 76.9% 77.5%
Asian Percentage (%) 4.6% 6.7% 6.2% 5.7%
Hispanic/Latino
Percentage (%) 6.2% 5.7% 5.2% 5.6%
Black or African American Percentage (%) 4.4% 4.6% 3.9% 3.1%
Other Ethnicities12
REPRESENTATION IN SENIOR MANAGEMENT POSITIONS (%)
Total Senior Management Employees Represented by Minority Groups
Percentage (%) 6.8% 7.1% 7.7% 7.9%
Percentage (%) 11.4% 9.3% 10.2% 12.5%
White Percentage (%) 87.6% 90.7% 89.8% 86.1%
Asian Percentage (%) 3.7% 2.4% 2.6% 1.9% Hispanic/Latino Percentage (%) 2.4% 1.2% 0.0% 2.3%
Black or African American
Other Ethnicities12
REPRESENTATION IN ALL MANAGEMENT POSITIONS (%)
Percentage (%) 0.0% 0.0% 0.0% 0.0%
Percentage (%) 5.3% 5.7% 7.7% 8.3%
Total All Management Employees Represented by Minority Groups Percentage (%) 23.0% 22.6% 21.1% 20.2%
White Percentage (%) 76.7% 77.2% 78.8% 79.4%
Asian Percentage (%) 0.9% 0.7% 0.6% 0.4%
Hispanic/Latino
Percentage (%) 17.2% 17.0% 15.5% 13.8%
Black or African American Percentage (%) 2.4% 2.3% 2.1% 2.5%
Other Ethnicities12
1. For rig managers and drillers required bi-yearly.
Percentage (%) 2.5% 2.5% 2.9% 3.4%
2. All employees are eligible to receive HSE R&R awards and can be recognized multiple times in a year.
3. Average employee attendance is represented by average number trainings completed for HAZCOM, HAZWOPER, SPCC and Emergency Response Trainings.
4. North America Solutions and South America field employees only; Weekly Rig Management Safety Training (RSMT) provided for all field employees which includes various safety and development topics.
5. SSE defined as less than six months experience; training includes RSMT and New Employee Safety Training.
6. Training on odd ending years is typically digital and thus overall time is less than in-person.
7. Training for this topic was assigned to specific employees who work in positions that require it.
8. IT training completion represents the average number of training modules completed by selected employees across the required annual IT modules; The following breakdowns the module offering count by year - 2019: seven modules 2020: 12 modules 2021: 12 modules.
9. Total U.S. workforce unless indicated otherwise.
10. Data may not add up exactly to 100% due to nonrespondents and may show more than 100% due to the use of monthly averages throughout the year. 11. Management level definitions were standardized in 2020; best equivalent positions including Director, Vice President and President were used for 2018-2019 data.
12. Includes two or more races, American Indian or Alaska Native, and Native Hawaiian or Pacific Islander.
H&P 2021 Sustainability Report 83
INTRODUCTION ENVIRONMENT CUSTOMERS EMPOYEES COMMUNITIES GOVERNANCE APPENDIX
GOVERNANCE DATA
METRIC UNIT TIME PERIOD
BOARD COMPOSITION
Board of Directors Average Age Number 63 63.6 64.6 65
Board of Directors Average Tenure Number 12.2 12.1 13.1 12
Board of Director Gender Representation Percentage (%) 10% 18% 18% 17%
Board of Director Ethnically Diversity Representation2 Percentage (%) 10% 9% 9% 17%
Number of Independent Directors Number 8 9 9 10
EXECUTIVE INCENTIVES
Annual Total Compensation Ratio3 Ratio 101.6:1 87.9:1 64.99:1 1
Percent change in Annual Total Compensation Ratio Percentage (%) - -13% -26% 1
Performance Based Compensation (CEO)4 Percentage (%) 86% 84% 80% 1
Performance Based Compensation (NEO)4,5 Percentage (%) 78%4 75% 68%4 1
1. Data based on figure as of proxy date. In some cases, the FY 2021 data will not be available until the 2022 proxy is published
2. Based on ethnic and racial categories used in Institutional Shareholder Services’ (ISS) database. See ISS Procedures and Policies (Non-Compensation), Frequently Asked Questions, updated April 21, 2021.
3. Ratio of CEO compensation to median employee in accordance with Item 402 of SEC Regulation S-K as set forth in the Company’s proxy statements for its annual meetings of shareholders (Proxy Statements).
4. Percent of salary to sum of bonus, stock awards, and non-equity incentive plan compensation as set forth in the “Summary Compensation Table” of the Proxy Statements. Excludes changes in pension value and non-qualified deferred compensation and other compensation.
5. Excludes NEOs who were not employees for full fiscal year to facilitate comparability between periods.
2022 Actively C.A.R.E. Goal: Reduce the Amount of GHG Emissions per 1,000 Feet drilled by 5% 2021 GHG Emissions per 1,000 feet Drilled Reduction (%) New Goal
2022 Key Result: Reduce excess engine runtime per 1,000 feet drilled by 10% over 2021 2021 Excess Rig Engine Runtime Reduction (%) Continuation of 2021 key result
2022 Key Result: Implement engine roadmaps and achieve 80% of utilization on H&P rigs 2021 Implementation of engine roadmaps and rig utilization (%) New Goal
2022 Key Result: Implement new technology to improve rig efficiency 2021 Not quantified New Goal
2022 Key Result: Achieve a completion rate of 100% for quarterly environmental trainings 2021 Quarterly Training Rate New Goal
2021 Actively C.A.R.E. Goal: Reduce SIF Incidents In Rig Move Activities by 50% Compared to 2020 2020 Rig move activity SIF incident (%) 28% reduction
2021 Actively C.A.R.E. Goal: Reduce SIF Incidents Involving Dropped Objects by 33% Compared to 2020 2020 Dropped Object SIF incident (%) 20% reduction
2021 Actively C.A.R.E. Goal: Reduce SIF Incidents in Tubular Handling Operations by 33% Compared to 2020 2020 Tubular Handling SIF incident (%) 5% increase
2022 Actively C.A.R.E. Goal: Reduce Unmitigated SIF Incidents On Rigs Within The First 90 Days Of Being Recommissioned By 10% 2021 Unmitigated SIF Incidents On Rigs (%) New Goal
2022 Actively C.A.R.E Goal: Reduce The Rate Of Unmitigated SIF Incidents Involving Tubular Handling By 10% 2021 Tubular Handling Rate of Unmitigated SIF Incidents (%) New Goal
2022 Actively C.A.R.E. Goal: Reduce The Rate Of Unmitigated SIF Incidents Involving Dropped Object By 10% 2021 Dropped Object Rate of Unmitigated SIF Incidents (%) New Goal
1. Excess engine run time is defined as any time engines are running for more than two hours when fewer engines could run and not exceed 100% load.
2. Fleet idle time is measure as any time a vehicle is on and has not moved for more than five minutes.
3. As of September 30, 2021
H&P 2021 Sustainability Report 85
FY 2018 FY 20191 FY 2020 Sept. 30, 2021
FY 2018 FY 2019 FY 2020 FY 2021
GOAL PERFORMANCE DATA H&P GOALS YEAR METRIC PROGRESS 2021 Actively C.A.R.E. Goal: Reduce Our Environmental Impact 2020 Not quantified Ongoing Commitment 2021 Key Result: Quantify All Scope 1 & 2 Emissions 2020 Not quantified Complete 2021 Key Result: Establish an Environmental Rewards & Recognition Program 2020 Not established Complete 2021 Key Result: Achieve 100% Completion Rate for Environmental Training Annually 2020 Annual Training Rate Complete (99.8%) 2021 Key Result: Reduce Fleet Vehicle Idle Time by 33%2 2020 Fleet Vehicle Idle Time Reduction (%) Exceeded (34%)3 2021 Key Result: Reduce Excess Rig Engine Runtime by 10% 2020 Excess Rig Engine Runtime Reduction (%) Ongoing
INTRODUCTION ENVIRONMENT CUSTOMERS EMPOYEES COMMUNITIES GOVERNANCE APPENDIX
TASK FORCE ON CLIMATE-RELATED FINANCIAL DISCLOSURES
TASK FORCE ON CLIMATE-RELATED FINANCIAL DISCLOSURES
TCFD CORE ELEMENTS RECOMMENDED DISCLOSURES DISCLOSURES
Sustainability Oversight (pg. 12)
Environment > Environmental Management (pgs. 16-17 )
Governance
a. Describe the organization’s governance around climate-related risks and opportunities.
Environment > Environmental Governance, Risks & Opportunities, and Strategy (pgs. 27-30)
Governance > Risk Management (pgs. 72-73)
Sustainability Oversight (pg. 12)
Environment > Environmental Management (pgs. 16-17 )
SUSTAINABLE ACCOUNTING STANDARDS BOARD: OIL & GAS – SERVICES
SUSTAINABILITY ACCOUNTING STANDARDS BOARD (SASB) - ACCOUNTING METRICS
SASB CODE ACCOUNTING METRIC DISCLOSURE TYPE REQUIRED DISCLOSURE
EM-SV-110a.1 Total fuel consumed, percentage renewable, percentage used in: (1) on-road equipment and vehicles and (2) off-road equipment Quantitative
EM-SV-110a.2 Discussion of strategy or plans to address air emissions-related risks, opportunities, and impacts Discussion & Analysis
Indexes & Data > Performance Table > Environmental Data > Energy Consumption (pgs. 79-80)
Environment > Environmental Management (pgs. 23-24) Environment > Environmental Governance, Risks & Opportunities, and Strategy (pgs. 27-30)
b. Describe management’s role in assessing and managing climate-related risks and opportunities.
a. Describe the climate-related risks and opportunities the organization has identified over the short, medium, and long term.
Environment > Environmental Governance, Risks & Opportunities, and Strategy (pgs. 27-30)
Governance > Risk Management (pgs. 72-73)
Environment > Environmental Governance, Risks & Opportunities, and Strategy (pgs. 27-30)
10-K > Page 36
Strategy
b. Describe the impact of climate-related risks and opportunities on the organization’s businesses, strategy, and financial planning.
c. Describe the resilience of the organization’s strategy, taking into consideration different climate-related scenarios, including a 2°C or lower scenario.
a. Describe the organization’s processes for identifying and assessing climate-related risks.
Environment > Environmental Governance, Risks & Opportunities, and Strategy (pgs. 27-30)
Environment > Environmental Governance, Risks & Opportunities, and Strategy (pgs. 27-30)
Sustainability Oversight (pg. 12)
Environment > Environmental Management (pgs. 16-17 )
Environment > Environmental Governance, Risks & Opportunities, and Strategy (pgs. 27-30)
Governance > Risk Management (pgs. 72-73)
Sustainability Oversight (pg. 12)
Environment > Environmental Management (pgs. 16-17 )
EM-SV-110a.3 Percentage of engines in service that meet Tier 4 compliance for non-road diesel engine emissions Quantitative
EM-SV-140.1 (1) Total volume of fresh water handled in operations, (2) percentage recycled Quantitative
Indexes & Data > Performance Table > Environmental Data > Energy Consumption (pgs. 79-80)
Environment > Environmental Management (pg. 26) Indexes & Data > Performance Table > Environmental Data > Water (pg. 80)
EM-SV-140.2 Discussion of strategy or plans to address water consumption and disposal-related risks, opportunities, and impacts Discussion & Analysis Environment > Environmental Management (pg. 26)
EM-SV-150a.1 Discussion of strategy or plans to address chemical-related risks, opportunities, and impacts Discussion & Analysis Environment > Environmental Management (pgs. 25-26)
EM-SV-150a.2 Volume of hydraulic fracturing fluid used, percentage hazardous Quantitative N/A: H&P’s operations do not include hydraulic fracturing, and therefore H&P does not use hydraulic fracturing fluid.
EM-SV-160a.1 Average disturbed acreage per (1) oil and (2) gas well site Quantitative N/A: Management of disturbed acreage per oil and gas well site is outside of H&P’s operational control.
EM-SV-160a.2 Discussion of strategy or plan to address risks and opportunities related to ecological impacts from core activities Discussion & Analysis
Risk Management
b. Describe the organization’s processes for managing climate-related risks.
c. Describe how processes for identifying, assessing, and managing climate-related risks are integrated into the organization’s overall risk management.
Environment > Environmental Governance, Risks & Opportunities, and Strategy (pgs. 27-30)
Governance > Risk Management (pgs. 72-73)
Sustainability Oversight (pg. 12)
Environment > Environmental Management (pgs. 16-17 )
Environment > Environmental Governance, Risks & Opportunities, and Strategy (pgs. 27-30)
Governance > Risk Management (pgs. 72-73)
EM-SV-320a.1
(1) Total recordable incident rate (TRIR), (2) fatality rate, (3) near miss frequency rate (NMFR), (4) total vehicle incident rate (TVIR), and (5) average hours of health, safety, and emergency response training for (a) full-time employees, (b) contract employees, and (c) short-service employees
Environment > Environmental Management (pgs. 25-26) Environment > Environmental Governance, Risks & Opportunities, and Strategy (pgs. 27-30)
Quantitative Indexes & Data > Performance Table > Social Data > Health & Safety (pgs. 80-81)
EM-SV-320a.2
a. Disclose the metrics used by the organization to assess climate-related risks and opportunities in line with its strategy and risk management process.
Metrics & Targets
b. Disclose Scope 1, Scope 2 and, if appropriate, Scope 3 greenhouse gas (GHG) emissions and the related risks.
c. Describe the targets used by the organization to manage climate-related risks and opportunities and performance against targets.
Environment > Environmental Governance, Risks & Opportunities, and Strategy (pgs. 27-30)
Indexes & Data > Performance Tables > Environmental Data (pgs. 78-80)
Indexes & Data > Performance Tables > Goals (pgs. 84-85)
Indexes & Data > Performance Tables > Environmental Data (pgs. 78-80)
Indexes & Data > Performance Tables > Goals (pgs. 84-85)
Description of management systems used to integrate a culture of safety throughout the value chain and project lifecycle Discussion & Analysis Employees > Health and Safety (pgs. 42-48) Environment > Environmental Management (pgs. 18-19)
EM-SV-510a.1 Amount of net revenue in countries that have the 20 lowest rankings in Transparency International’s Corruption Perception Index Quantitative Indexes & Data > Performance Table > General Data (pg. 78)
EM-SV-510a.2
Description of the management system for prevention of corruption and bribery throughout the value chain Discussion & Analysis
EM-SV-530a.1
Governance > Ethics & Compliance (pgs. 71-72 Employees > Workforce Development (pgs. 51-56)
Discussion of corporate positions related to government regulations and/or policy proposals that address environmental and social factors affecting the industry Discussion & Analysis 10K > Business > Regulations (pgs. 15-16)
EM-SV-540a.1 Description of management systems used to identify and mitigate catastrophic and tail-end risks Discussion & Analysis
Governance > Risk Management (pgs. 72-73) Employees > Workforce Development (pgs. 51-56) Environment > Environmental Management (pgs. 16-19)
H&P 2021 Sustainability Report 87
INTRODUCTION ENVIRONMENT CUSTOMERS EMPOYEES COMMUNITIES GOVERNANCE APPENDIX
SUSTAINABILITY
102-6 Organizational Profile Markets Served
102-7 Organizational Profile Scale of the Organization
Intro > About Helmerich & Payne (pg. 12) 10-K > Page 5
Intro > About Helmerich & Payne (pg. 12) 10-K > Pages 12, 98
EM-SV-000.A
EM-SV-000.B
EM-SV-000.C
GLOBAL REPORTING INITIATIVE CONTENT INDEX – GENERAL DISCLOSURE 2016
Certain materials throughout this ESG report and the below table reference GRI 2016 Standards including 102-1 – Name of the organization, 102-2 – Activities, brands, products, and services, 102-3 – Location of Headquarters, 102-4 – Location of Operations, 102-5 – Ownership and Legal Form, 102-6 – Markets Served, 102-7 – Scale of the Organization, 102-8 – Information on Employees and Other Workers, 102-9 – Supply Chain, 102-10 – Significant Changes To The Organization And Its Supply Chain, 102-11 – Precautionary Principle or Approach, 102-12 – External Initiatives, 102-13 – Membership of Associations, 102-14 – Statement from Senior Decision Maker, 102-15 – Key impacts, risks, and opportunities, 102-16 – Values, principles, standards, and norms of behavior, 102-17 – Mechanisms for advice and concerns about ethics, 102-18 – Governance structure, 102-19 – Delegating authority, 102-20 – Executive-level responsibility for economic, environmental, and social topics, 102-21 – Consulting stakeholders on economic, environmental, and social topics, 102-22 – Composition of the highest governance body and its committees, 102-23 – Chair of the highest governance body, 102-24 – Nominating and selecting the highest governance body, 102-25 – Conflicts of interest, 102-26 – Role of highest governance body in setting purpose, values, and strategy, 102-27 – Collective knowledge of highest governance body, 102-28 – Evaluating the highest governance body’s performance, 102-29 – Identifying and managing economic, environmental, and social impacts, 102-30 – Effectiveness of risk management processes, 102-31 – Review of economic, environmental, and social topics, 102-32 – Highest governance body’s role in sustainability reporting, 102-33 – Communicating critical concerns ,102-35 – Remuneration policies, 102-36 – Process for determining remuneration, 102-37 – Stakeholders’ involvement in remuneration, 102-38 – Annual total compensation ratio, 102-39 – Percentage increase in annual total compensation ratio, 102-56 – External assurance, 103-2 – The management approach and its components, 201-2 – Financial implications and other risks and opportunities due to climate change, 201-3 – Defined benefit plan obligations and other retirement plans, 207-1 – Approach to Tax, 205-2 – Communication and training about policies and procedures, 302-1 – Energy Consumption within the Organization, 302-4 – Energy Reduction of energy consumption, 303-1 – Interactions with water as a shared resource, 304-1 – Significant impacts of activities, products, and services on biodiversity, 305-1 – Direct (Scope 1) GHG emissions, 305-2 – Energy indirect (Scope 2) GHG emissions, 305-4 – GHG emissions intensity, 305-5 – Reduction of GHG emissions, 403-2 – Hazard identification, risk assessment, and incident investigation, 403-3 – Occupational health services, 403-4 – Worker participation, consultation, and communication on occupational health and safety, 403-5 – Worker training on occupational health and safety, 403-6 – Promotion of worker health, 403-7 – Prevention and mitigation of occupational health and safety impacts directly linked by business relationships, 403-8 – Workers covered by an occupational health and safety management system, 403-9 –Work-related injuries, 404-2 – Training and Education Programs for upgrading employee skills and transition assistance programs, 405-1 – Diversity of governance bodies and employees, 408-1 – Operations and suppliers at significant risk for incidents of child labor, 409-1 – Operations and suppliers at significant risk for incidents of forced or compulsory labor, 415-1 – Political contributions.
102-8 Organizational Profile Information on Employees and Other Workers
102-9 Organizational Profile Supply Chain
Intro > About Helmerich & Payne (pg. 12) Indexes & Data > Performance Table > General Data (pg. 78)
Governance > Ethics & Compliance (pgs. 71-72) 10-K > Page 26
102-10 Organizational Profile Significant Changes To The Organization And Its Supply Chain Governance > Ethics & Compliance (pgs. 71-72)’ 10-K > Page 26
102-11 Organizational Profile Precautionary Principle or Approach
Environment > Environmental Management (pgs. 16-27 )
Governance > Risk Management (pgs. 72-73)
102-12 Organizational Profile External Initiatives Intro > H&P Way (pgs. 10-11)
102-13 Organizational Profile Membership of Associations Intro > About Helmerich & Payne (pg. 12)
STRATEGY
METRIC / DISCUSSION ITEM
DISCLOSURE
102-14 Strategy Statement from Senior Decision Maker Letter from Our CEO (pgs. 8-9) 102-15 Strategy Key impacts, risks, and opportunities Environment > Environmental Governance, Risks & Opportunities, and Strategy (pgs. 27-30)
ETHICS AND INTEGRITY
METRIC / DISCUSSION ITEM DISCLOSURE
102-16 Ethics and Integrity Values, principles, standards, and norms of behavior Intro > H&P Way (pgs. 10-11) 102-17 Ethics and Integrity Mechanisms for advice and concerns about ethics Governance > Ethics & Compliance (pgs. 71-72)
Governance > Corporate Governance (pgs. 66-71) 102-19 Governance Delegating authority
Environment > Environmental Governance, Risks & Opportunities, and Strategy (pgs. 27-30) Governance > Risk Management (pgs. 72-73) 102-20 Governance
Executive-level responsibility for economic, environmental, and social topics
Sustainability Oversight (pg. 12) Environment > Environmental Management (pgs. 16-17 )
Environment > Environmental Governance, Risks & Opportunities, and Strategy (pgs. 27-30)
Employees > Diversity, Equity, & Inclusion (pgs. 49-51)
Governance > Risk Management (pgs. 72-73) 102-21 Governance Consulting stakeholders on economic, environmental, and social topics
Environment > Environmental Governance, Risks & Opportunities, and Strategy (pgs. 27-30) Governance > Risk Management (pgs. 72-73) Proxy > Page 28
H&P 2021 Sustainability Report 89
REPORTING INITIATIVE (GRI) INDEX
ACTIVITY
TYPE
ACCOUNTING STANDARDS BOARD (SASB) - ACTIVITY METRICS GLOBAL
SASB CODE
METRIC DISCLOSURE
REQUIRED DISCLOSURE
Number of active rig sites Quantitative 10-K > Pages 6, 39
Quantitative
Number of active well sites
N/A: The number of active well sites is not relevant to H&P’s operational control.
Quantitative
Total amount of drilling performed
Indexes & Data > Performance Table > General Data (pg. 78)
employees Quantitative Indexes
ORGANIZATIONAL PROFILE AND RELATED DISCLOSURES METRIC / DISCUSSION ITEM DISCLOSURE 102-1 Organizational Profile Name of the organization 10-K 102-2 Organizational Profile Activities, brands, products, and services 10-K > Pages 5, 15 102-3 Organizational Profile Location of Headquarters 10-K 102-4 Organizational Profile Location of Operations 10-K 102-5 Organizational Profile Ownership and Legal Form 10-K > Page 5 GOVERNANCE METRIC / DISCUSSION ITEM DISCLOSURE
Governance
structure
EM-SV-000.D Total number of hours worked by all
& Data > Performance Table > General Data (pg. 78)
102-18
Governance
INTRODUCTION ENVIRONMENT CUSTOMERS EMPOYEES COMMUNITIES GOVERNANCE APPENDIX
102-22 Governance
102-23 Governance
Composition of the highest governance body and its committees Governance > Corporate Governance (pgs. 66-71)
Chair of the highest governance body
Governance > Corporate Governance (pgs. 66-71) Proxy > Page 11
102-24 Governance Nominating and selecting the highest governance body Governance > Corporate Governance (pgs. 66-71) Proxy > Page 11
102-25 Governance Conflicts of interest Code of Conduct > Page 11
102-26 Governance
Role of highest governance body in setting purpose, values, and strategy
102-27 Governance
Collective knowledge of highest governance body
Sustainability Oversight (pg. 12)
Environment > Environmental Governance, Risks & Opportunities, and Strategy (pgs. 27-30)
Sustainability Oversight (pg. 12)
Environment > Environmental Governance, Risks & Opportunities, and Strategy (pgs. 27-30) Governance > Corporate Governance (pgs. 66-71) Proxy > Page 24
102-28 Governance Evaluating the highest governance body’s performance Governance > Corporate Governance (pgs. 66-71)
Sustainability Oversight (pg. 12)
MANAGEMENT APPROACH
METRIC / DISCUSSION ITEM DISCLOSURE
103-2 Management Approach The management approach and its components Governance > Risk Management (pgs. 72-73)
ECONOMIC PERFORMANCE
METRIC / DISCUSSION ITEM DISCLOSURE
201-2 Economic Performance Financial implications and other risks and opportunities due to climate change Environment > Environmental Governance, Risks & Opportunities, and Strategy (pgs. 27-30)
201-3 Economic Performance Defined benefit plan obligations and other retirement plans Employees > Workforce Development (pgs. 51-56)
TAX
METRIC / DISCUSSION ITEM DISCLOSURE
207-1 Tax Approach to Tax 10-K > Pages 52, 70, 84 Proxy > Page 29
ANTI-CORRUPTION
102-29 Governance Identifying and managing economic, environmental, and social impacts
Environment > Environmental Governance, Risks & Opportunities, and Strategy (pgs. 27-30) Governance > Risk Management (pgs. 72-73) Governance > Corporate Governance (pgs. 66-71)
102-30 Governance Effectiveness of risk management processes Governance > Risk Management (pgs. 72-73)
Sustainability Oversight (pg. 12)
102-31 Governance Review of economic, environmental, and social topics
102-32 Governance
Highest governance body’s role in sustainability reporting
Environment > Environmental Governance, Risks & Opportunities, and Strategy (pgs. 27-30) Governance > Risk Management (pgs. 72-73)
Sustainability Oversight (pg. 12)
Environment > Environmental Governance, Risks & Opportunities, and Strategy (pgs. 27-30)
102-33 Governance Communicating critical concerns Governance > Ethics & Compliance (pgs. 71-72)
102-35 Governance Remuneration policies
Governance > Corporate Governance (pgs. 66-71) Proxy > Page 41
102-36 Governance Process for determining remuneration Governance > Corporate Governance (pgs. 66-71)
102-37 Governance Stakeholders’ involvement in remuneration Governance > Corporate Governance (pgs. 66-71)
102-38 Governance Annual total compensation ratio
102-39 Governance
REPORTING PRACTICE
Percentage increase in annual total compensation ratio
Governance > Corporate Governance (pgs. 66-71) Indexes > Governance Data (pg. 84) Proxy > Page 68
Governance > Corporate Governance (pgs. 66-71) Indexes > Governance Data (pg. 84) Proxy > Page 68
METRIC / DISCUSSION ITEM DISCLOSURE
102-56 Reporting Practice External assurance Sustainability Oversight (pg. 12)
METRIC / DISCUSSION ITEM DISCLOSURE
205-2 Anti-Corruption Communication and training about policies and procedures Governance > Ethics & Compliance (pgs. 71-72)
ENVIRONMENT
METRIC / DISCUSSION ITEM DISCLOSURE
302-1 Energy Energy Consumption within the Organization
302-4 Energy Reduction of energy consumption
Indexes & Data > Performance Tables > Environmental Data (pgs. 78-80)
Environment > Environmental Management (pgs. 23-25)
Indexes & Data > Performance Tables > Environmental Data (pgs. 78-80)
303-1 Water and Effluents Interactions with water as a shared resource Environment > Environmental Management (pg. 26)
304-1 Biodiversity Significant impacts of activities, products, and services on biodiversity Environment > Environmental Management (pg. 27 )
305-1 Emissions Direct (Scope 1) GHG emissions
305-2 Emissions Energy indirect (Scope 2) GHG emissions
305-4 Emissions GHG emissions intensity
Indexes & Data > Performance Tables > Environmental Data > Greenhouse Gas Emissions (pgs. 78-79)
Indexes & Data > Performance Tables > Environmental Data > Greenhouse Gas Emissions (pgs. 78-79)
Indexes & Data > Performance Tables > Environmental Data > Greenhouse Gas Emissions (pgs. 78-79)
305-5 Emissions Reduction of GHG emissions Environment > Environmental Management (pgs. 23-25)
H&P 2021 Sustainability Report 91
INTRODUCTION ENVIRONMENT CUSTOMERS EMPOYEES COMMUNITIES GOVERNANCE APPENDIX
SOCIAL METRIC / DISCUSSION ITEM DISCLOSURE
403-2 Occupational Health and Safety Hazard identification, risk assessment, and incident investigation Employees > Health and Safety (pgs. 42-48)
403-3 Occupational Health and Safety Occupational health services Employees > Workforce Development (pgs. 51-56)
403-4 Occupational Health and Safety Worker participation, consultation, and communication on occupational health and safety Employees > Health and Safety (pgs. 42-48)
403-5 Occupational Health and Safety Worker training on occupational health and safety Employees > Health and Safety (pgs. 42-48)
403-6 Occupational Health and Safety Promotion of worker health Employees > Workforce Development (pg. 51-56)
403-7 Occupational Health and Safety Prevention and mitigation of occupational health and safety impacts directly linked by business relationships Employees > Health and Safety (pgs. 42-48)
403-8 Occupational Health and Safety Workers covered by an occupational health and safety management system Employees > Health and Safety (pgs. 42-48)
403-9 Occupational Health and Safety Work-related injuries
Indexes > Performance Data > Safety Data (pgs. 80-81)
404-2 Training and Education Programs for upgrading employee skills and transition assistance programs Employees > Workforce Development (pg. 51-56)
405-1 Diversity and Equal Opportunity Diversity of governance bodies and employees
Governance > Corporate Governance (pgs. 66-71) Indexes > Governance Data (pg. 68) Indexes > Diversity & Inclusion Data (pgs. 66-67)
408-1 Child Labor Operations and suppliers at significant risk for incidents of child labor Communities > Responsibility to Each Other (pgs. 62-63)
409-1 Forced or Compulsory Labor Operations and suppliers at significant risk for incidents of forced or compulsory labor Communities > Responsibility to Each Other (pgs. 62-63)
415-1 Public Policy Political contributions Governance > Ethics & Compliance (pgs. 71-72)
Ernst & Young LLP 1700 One Williams Ctr. Tulsa, OK 74172
Tel: +1 918 560 3600
Fax: +1 918 560 3691 ey.com
INDEPENDENT ACCOUNTANTS’ REVIEW REPORT
Independent Accountants’ Review Report
Ernst & Young LLP 1700 One Williams Ctr. Tulsa, OK 74172
To the Management of Helmerich & Payne, Inc.
Tel: +1 918 560 3600 Fax: +1 918 560 3691 ey.com
TO THE MANAGEMENT OF HELMERICH & PAYNE, INC.
Independent Accountants’ Review Report
We have reviewed Helmerich & Payne, Inc.’s accompanying schedules of selected sustainability indicators included in Appendix A (the “Subject Matter”) for the year ended September 30, 2021, in accordance with the criteria also set forth in Appendix A (the “Criteria”). Helmerich & Payne, Inc.’s management is responsible for the Subject Matter in accordance with the Criteria. Our responsibility is to express a conclusion on the Subject Matter based on our review.
To the Management of Helmerich & Payne, Inc.
We have reviewed Helmerich & Payne, Inc.’s accompanying schedules of selected sustainability indicators included in Appendix A (the “Subject Matter”) for the year ended September 30, 2021, in accordance with the criteria also set forth in Appendix A (the “Criteria”). Helmerich & Payne, Inc.’s management is responsible for the Subject Matter in accordance with the Criteria. Our responsibility is to express a conclusion on the Subject Matter based on our review.
Our review was conducted in accordance with attestation standards established by the American Institute of Certified Public Accountants (AICPA) AT -C section 105, Concepts Common to All Attestation Engagements, and AT-C section 210 , Review Engagements. Those standards require that we plan and perform our review to obtain limited assuran ce about whether any material modifications should be made to the Subject Matter in order for it to be in accordance with the Criteria. A review consists principally of applying analytical procedures, making inquiries of persons responsible for the subject matter, obtaining an understanding of the data management systems and processes used to generate, aggregate and report the Subject Matter and performing such other procedures as we considered necessary in the circumstances. A review is substantially less in scope than an examination, the objective of which is to obtain reasonable assurance about whether the Subject Matter is in accordance with the Criteria, in all material respects, in order to express an opinion. Accordingly, we do not express such an opi nion. A review also does not provide assurance that we became aware of all significant matters that would be disclosed in an examination. We believe that our review provides a reasonable basis for our conclusion.
We have reviewed Helmerich & Payne, Inc.’s accompanying schedules of selected sustainability indicators included in Appendix A (the “Subject Matter”) for the year ended September 30, 2021, in accordance with the criteria also set forth in Appendix A (the “Criteria”). Helmerich & Payne, Inc.’s management is responsible for the Subject Matter in accordance with the Criteria. Our responsibility is to express a conclusion on the Subject Matter based on our review.
Our review was conducted in accordance with attestation standards established by the American Institute of Certified Public Accountants (AICPA) AT-C section 105, Concepts Common to All Attestation Engagements, and AT-C section 210, Review Engagements. Those standards require that we plan and perform our review to obtain limited assurance about whether any material modifications should be made to the Subject Matter in order for it to be in accordance with the Criteria. A review consists principally of applying analytical procedures, making inquiries of persons responsible for the subject matter, obtaining an understanding of the data management systems and processes used to generate, aggregate and report the Subject Matter and performing such other procedures as we considered necessary in the circumstances. A review is substantially less in scope than an examination, the objective of which is to obtain reasonable assurance about whether the Subject Matter is in accordance with the Criteria, in all material respects, in order to express an opinion. Accordingly, we do not express such an opinion. A review also does not provide assurance that we became aware of all significant matters that would be disclosed in an examination. We believe that our review provides a reasonable basis for our conclusion.
In performing our review, we have also c omplied with the independence and other ethical requirements set forth in the Code of Professional Conduct and applied the Statem ents on Quality Control Standards established by the AICPA.
In performing our review, we have also complied with the independence and other ethical requirements set forth in the Code of Professional Conduct and applied the Statements on Quality Control Standards established by the AICPA.
Our review was conducted in accordance with attestation standards established by the American Institute of Certified Public Accountants (AICPA) AT -C section 105, Concepts Common to All Attestation Engagements, and AT-C section 210 , Review Engagements. Those standards require that we plan and perform our review to obtain limited assuran ce about whether any material modifications should be made to the Subject Matter in order for it to be in accordance with the Criteria. A review consists principally of applying analytical procedures, making inquiries of persons responsible for the subject matter, obtaining an understanding of the data management systems and processes used to generate, aggregate and report the Subject Matter and performing such other procedures as we considered necessary in the circumstances. A review is substantially less in scope than an examination, the objective of which is to obtain reasonable assurance about whether the Subject Matter is in accordance with the Criteria, in all material respects, in order to express an opinion. Accordingly, we do not express such an opi nion. A review also does not provide assurance that we became aware of all significant matters that would be disclosed in an examination. We believe that our review provides a reasonable basis for our conclusion.
As described in Appendix A , the Subject Matter is subject to measurement uncertainties resulting from limitations inherent in the nature and the methods used for determining such data. The selection of different but acceptable measurement techniques can result in materially differen t measurements. The precision of different measurement techniques may also vary.
As described in Appendix A, the Subject Matter is subject to measurement uncertainties resulting from limitations inherent in the nature and the methods used for determining such data. The selection of different but acceptable measurement techniques can result in materially different measurements. The precision of different measurement techniques may also vary.
In performing our review, we have also c omplied with the independence and other ethical requirements set forth in the Code of Professional Conduct and applied the Statem ents on Quality Control Standards established by the AICPA.
The information included in the Helmerich & Payne, Inc. 2021 Sustainability Report and the Helmerich & Payne, Inc. 2021 Sustainability Performance Data Sheet, other than the Subject Matter, has not been subjected to the procedures applied in our review and, accordingly, we express no conclusion on it.
The information included in the Helmerich & Payne, Inc. 2021 Sustainability Report and the Helmerich & Payne, Inc. 2021 Sustainability Performance Data Sheet, other than the Subject Matter, has not been subjected to the procedures applied in our review and, accordingly, we express no conclusion on it.
As described in Appendix A , the Subject Matter is subject to measurement uncertainties resulting from limitations inherent in the nature and the methods used for determining such data. The selection of different but acceptable measurement techniques can result in materially differen t measurements. The precision of different measurement techniques may also vary.
Based on our review, we are not awa re of any material modifications that should be made to the accompanying schedules of selected sustainability indicators included in Appendix A for the year ended September 30, 2021, in order for the schedules to be in accordance with the Criteria.
Based on our review, we are not aware of any material modifications that should be made to the accompanying schedules of selected sustainability indicators included in Appendix A for the year ended September 30, 2021, in order for the schedules to be in accordance with the Criteria.
The information included in the Helmerich & Payne, Inc. 2021 Sustainability Report and the Helmerich & Payne, Inc. 2021 Sustainability Performance Data Sheet, other than the Subject Matter, has not been subjected to the procedures applied in our review and, accordingly, we express no conclusion on it.
Based on our review, we are not awa re of any material modifications that should be made to the accompanying schedules of selected sustainability indicators included in Appendix A for the year ended September 30, 2021, in order for the schedules to be in accordance with the Criteria.
H&P 2021 Sustainability Report 93
December 13, 2021 INTRODUCTION ENVIRONMENT CUSTOMERS EMPOYEES COMMUNITIES GOVERNANCE APPENDIX A member firm of Ernst & Young Global Limited
December 13, 2021
APPENDIX A – HELMERICH & PAYNE, INC.’S SCHEDULES OF SELECTED
SUSTAINABILITY INDICATORS
SCHEDULE OF SELECT SAFETY METRICS FOR THE
YEAR ENDED SEPTEMBER 30, 2021
INDICATOR NAME REPORTED VALUE UNITS OF MEASURE CRITERIA
Full-time equivalent (FTE) fatality rate 0.00 Fatalities per 100 employees
Global Reporting Initiative (GRI) Standard 403-9 (a)(i): Work-related injuries
FTE total recordable incident rate (TRIR) 2,3 1.504 Recordable incidents per 100 employees GRI Standard 403-9 (a)(iii): Work-related injuries
FTE lost-time incident rate (LTIR)5 0.616 Lost-time incidents per 100 employees
FTE lost-time incident rate is defined as the number of lost-time incidents multiplied by 200,000 and divided by the number of employee hours worked.
Reporting boundary: H&P includes employees (salaried and hourly) and contractors that H&P directly supervises in its calculation.
1. H&P calculates its fatality rate by dividing the number of work-related fatalities by the number of total hours worked and multiplying the quotient by 200,000.
2. H&P calculates its TRIR by dividing the number of recordable work-related incidents by the number of total hours worked and multiplying the quotient by 200,000.
3. H&P defines a “recordable incident” as any occupational injury or illness that results in the following: Fatalities, regardless of the time between the injury and death, or the length of the illness; or Days away from work cases, other than fatalities; or Non-fatal cases without days away from work that:
– Result in transfer to another job or termination of employment
– Require medical treatment (other than first aid)
– Involve loss of consciousness
– Result in restriction of work or motion
4. The TRIR was determined as of November 15, 2021 for the fiscal year ended September 30, 2021. The number of recordable incidents is based upon employees self-reporting work-related injuries or illnesses which may be affected by culture, societal norms, and/or regulations. To the extent a recordable incident is not self-reported, it would not be included in the TRIR calculation.
5. H&P calculates its LTIR by dividing the number of work-related lost-time incidents by the number of total hours worked and multiplying the quotient by 200,000.
6. The LTIR was determined as of November 15, 2021 for the fiscal year ended September 30, 2021. The number of lost-time incidents is based upon employees self-reporting work-related injuries or illnesses which may be affected by culture, societal norms, and/or regulations. To the extent a recordable incident is not self-reported, it would not be included in the recordable incident rate calculation.
7. H&P defines a “lost-time incident” as a work-related injury or illness that results in an attending physician or other licensed health care professional recommending that the employee stay at home for a period of one or more days due to the work-related illness or injury, or that restricts work for a period of one or more days and the Company is unable to accommodate the restriction. Note that injuries and illnesses are not considered lost time incidents unless they affect the employee beyond the day of injury or onset of illness.
8. H&P records employee hours worked using two methods. For US Land and Offshore personnel, actual hours worked are captured through the Company’s Employee Management System. For international employees, hours are manually calculated based on the number of people assigned per work location and the expected number of hours worked per shift. Hours worked by international employees represent approximately 7% of total hours worked for the Company in the fiscal year ended September 30, 2021.
SCHEDULE OF SELECT DIVERSITY METRICS FOR THE
INDICATOR NAME
YEAR ENDED SEPTEMBER 30, 2021 9
REPORTED VALUE
Diversity Metrics by Gender Male Female
All Employees10 94.3% 5.4%
Employees in Corporate Office11 68.9% 31.1%
All Management Positions12 93.7% 6.3%
Senior Management Positions13 80.4% 19.6%
Diversity Metrics by Ethnicity White Asian Hispanic / Latino Black / African American Other Ethnicities14
All Employees 66.2% 0.8% 23.8% 5.4% 3.5%
Employees in Field Positions15 64.6% 0.1% 26.4% 5.8% 2.9%
Employees in Corporate Office11 77.5% 5.7% 5.6% 3.1% 7.9%
All Management Positions12 79.4% 0.4% 13.8% 2.5% 3.4%
Senior Management Positions13 86.1% 1.9% 2.3% 0.0% 8.3%
CRITERIA
GRI Standard 405-1 (b)(i): Diversity of governance bodies and employees
GRI Standard 405-1 (b)(iii): Diversity of governance bodies and employees
Reporting boundary: Diversity metrics are reported for United States (U.S.) employees (excluding contingent workers16), except where otherwise noted. This includes U.S.-based employees on international rotation or assignment.
9. Diversity metrics are calculated by averaging the demographic data as of each month-end within the fiscal year, in order to reflect the changes in workforce throughout the year. The metrics are calculated using self-reported data by the employees. Certain metrics do not sum to 100.0% based on employees who did not disclose their demographic data.
10. This metric includes all employees globally (excluding contingent workers).
11. Includes employees working in corporate and technology offices as well as employees in professional positions (as defined by H&P’s human resources structure) who work from home.
12. Includes employees with a job level of M1 or above as defined by H&P’s human resources structure, which includes supervisors, managers, senior managers, directors, vice presidents, senior vice presidents, and president.
13. Includes employees with a job level of M3 or above as defined by H&P’s human resources structure, which includes senior managers, directors, vice presidents, senior vice presidents, and president.
14. Includes two or more races, American Indian or Alaska Native, and Native Hawaiian or Pacific Islander.
15. Includes employees working on rigs, in field and district offices, yards, or remotely as part of field operations.
16. H&P defines contingent workers as non-H&P employees who work within the organization as contractors, consultants, managed service providers, or international third-country nationals (TCNs).
H&P 2021 Sustainability Report 95
INTRODUCTION ENVIRONMENT CUSTOMERS EMPOYEES COMMUNITIES GOVERNANCE APPENDIX
SCHEDULE OF SELECT ENVIRONMENTAL METRICS FOR THE YEAR ENDED SEPTEMBER 30, 2021
INDICATOR NAME REPORTED VALUE UNITS OF MEASURE CRITERIA
Scope 1 greenhouse gas (GHG) emissions17 735
Thousands Metric tonnes carbon dioxide equivalents (tMT CO2e)
Scope 2 GHG emissions, location-based method (LBM)18 6.3 tMT CO2e
Total fuel consumed19 10,395,207 Gigajoules (GJ)
Percentage of fuel consumed that is renewable20 0.1% Percentage
Percentage of fuel consumed used in on-road, mobile equipment and vehicles21 2.4% Percentage
Percentage of fuel consumed used in off-road equipment22 97.6% Percentage
The GHG Protocol: A Corporate Accounting and Reporting Standard
The GHG Protocol: A Corporate Accounting and Reporting Standard, GHG Protocol Scope 2 Guidance
NOTES TO SCHEDULES
NOTE ON SOURCES OF EMISSIONS FACTORS AND GLOBAL WARMING POTENTIALS:
INDICATOR NAME EMISSIONS FACTORS GLOBAL WARMING POTENTIALS
Environmental Protection Agency (EPA) Center for Corporate Climate Leadership
GHG emissions – Scope 1
GHG Emission Factors Hub
The Climate Registry 2020 Default Emission Factors
The Emissions & Generation Resource Integrated Database (eGRID) 2019 Climate Transparency 2019 Report
2007 IPCC Fourth Assessment Report
Sustainability Accounting Standards Board (SASB) EM-SV-110a.1
GHG emissions – Scope 2 (location-based)
Dubai Electricity and Water Authority 2019 Emission Factors
2019 CO2 Emission Factors of the Interconnected System of Ecuador
The Climate Registry 2020 Default Emission Factors
NOTE ON NON-FINANCIAL REPORTING:
Reporting boundary: H&P uses the operational control approach to define its boundary for Scope 1 emissions, Scope 2 LBM emissions, and total fuel consumed, consistent with the approaches outlined by the GHG Protocol Corporate Standard, the GHG Protocol Scope 2 Guidance, and SASB EM-SV-110a.1.
17. H&P applies the GHG Protocol: A Corporate Accounting and Reporting Standard for Scope 1 emissions by multiplying fuel consumption by the emissions factors indicated in the table in the notes to schedules section titled “Sources of emissions factors and global warming potentials.” Scope 1 GHG emissions are primarily generated from the consumption of diesel fuel by US Land, Offshore, and International rig engines during drilling activities. Additional Scope 1 emission generating activities include the consumption of diesel and gasoline by the US and international vehicle fleet.
18. H&P applies the GHG Protocol Scope 2 Guidance for location-based emissions by multiplying purchased electricity and heating fuels by the emissions factors indicated in the table in the notes to schedules section titled “Sources of emissions factors and global warming potentials.” Scope 2 emissions generating activities include the consumption of electricity and heating fuels at facilities under H&Ps operational control.
19. Total fuel consumed is comprised of the fuel streams that fall within H&P’s operational control, including diesel, gasoline, ethanol, corporate jet fuel, propane, and acetylene. Fuel consumption data is captured from fuel purchases made during the reporting period, daily fuel tank readings on offshore rigs, and one-second engine activity and fuel consumption data captured by digital transmitters installed on US Land rig engines.
20. H&P measures the percentage of fuel consumed that is renewable based on the ethanol content of gasoline purchased for US-based light-duty trucks. Ethanol meets the SASB standard for a renewable fuel as it is produced from renewable biomass, replaces the quantity of fossil fuel present in fuel, and has lifecycle GHG emissions that are at least 20% less than baseline gasoline lifecycle emissions.
21. H&P considers all light duty vehicles (i.e., gasoline and diesel power light duty vehicles) as being “on-road.”
22. H&P considers any fuel consumed that does not fall into the “on-road” category as “off-road.”
Non-financial information is subject to measurement uncertainties resulting from limitations inherent in the nature and the methods used for determining such data. The selection of different but acceptable measurement techniques can result in materially different measurements. The precision of different measurements techniques may also vary.
FORWARD-LOOKING STATEMENTS AND WEBSITE REFERENCES
The information and opinions contained in this report are provided as of the date of this report and are subject to change without notice. We do not undertake to update or revise any such statements. This report represents our current policy and intent and is not intended to create legal rights or obligations. This report may contain or incorporate by reference public information not separately reviewed, approved, or endorsed by us and no representation, warranty, or undertaking is made by us as to the accuracy, reasonableness, or completeness of such information. Inclusion of information in this report is not an indication that the subject or information is material to our business, results of operations, or financial position.
Statements contained in this report, as well as materials or websites that are cross-references, that are not historical facts are forward-looking statements within the meaning of the Private Securities Litigation Reform Act of 1995. Forward-looking statements generally can be identified by the use of forward-looking terminology such as “may,” “will,” “expect,” “intend,” “estimate,” “anticipate,” “believe,” “predict”, “project,” “target,” “continue,” “commits,” or the negative thereof or similar terminology. Forward-looking statements are based upon current plans, strategies, estimates, and expectations, plans, or goals related to corporate responsibility, sustainability and environmental matters, employees, policy, business, procurement and other risks and opportunities. Such statements are based on currently available information and assumptions, as well as standards for measuring progress that are still in development, and are subject to numerous risks, uncertainties, and assumptions that may cause actual results to vary materially from those indicated. The inclusion of such statements should not be regarded as a representation that such plans, estimates, or expectations will be achieved.
Website references are provided for convenience only. The content on the referenced websites is not incorporated by reference into this report, nor does it constitute a part of this report. We assume no liability for any third-party content contained on the referenced websites.
H&P 2021 Sustainability Report 97
INTRODUCTION ENVIRONMENT CUSTOMERS EMPOYEES COMMUNITIES GOVERNANCE APPENDIX
Note Regarding Trademarks
Helmerich & Payne, FlexRig, and other trademarks, service marks, and/or trade names used in this report are registered with the United States and Patent Office and are the property of H&P. This report also may use unregistered marks considered proprietary to H&P.
© Helmerich & Payne, Inc. 2021, All Rights Reserved NYSE : HP | helmerichpayne.com

Direct Inquiries To David T. Wilson Vice President, Investor Relations Helmerich & Payne, Inc. 1437 South Boulder Avenue Tulsa, Oklahoma 74119 918.742.5531 sustainability@hpinc.com
