Journal of Nutr ient Management
8
Where is biogas heading?

12 Feed the soil bacteria
14 Digesting their way
Published by W.D. Hoard & Sons Co. May | 2021
EAST Jim Dewitt
1-630-750-3482
j.dewitt@bauer-at.com
MIDWEST Trey Poteat 1-219-561-3837

t.poteat@bauer-at.com
WEST Jeff Moeggenberg
1-630-334-1913
j.moeggenberg@bauer-at.com
SALES DIRECTOR Ray Francis 1-219-229-2066
r.francis@bauer-at.com
PARTS/OPERATIONS Rob Hultgren 1-800-922-8375


r.hultgren@bauer-at.com

WASTE WATER TREATMENT TURNING MANURE INTO HIGH QUALITY BEDDING TURNING LIQUID GOLD INTO ENRICHED BEDDING 90 YEARS OF WORLD WIDE IRRIGATION AND SLURRY TECHNOLOGY YEARS PORTABLE IRRIGATION Fan produces bedding material with a dry matter content of up to 38% in solids. New Dealership Inquiries Welcome BAUER North America Inc. 107 Eastwood Road, Michigan City, IN 46360 • 1-800-922-8375 • bnasales@bauer-at.com Call the FAN/ BAUER boys: GREEN BEDDING® SEPARATOR, MIXER, SLURRY & WATER PUMPS
There is a buzz of activity around the manure lagoon at this California dairy as agitators stir the contents prior to application. The manure is produced by a herd of Holsteins and Jerseys housed in a combination of freestall barns and dry open lots. Proper agitation of the lagoon breaks up surface crusts and suspends solids that have settled at the bottom.


MANAGING EDITOR Abby Bauer
ART DIRECTOR Todd Garrett
EDITORIAL COORDINATOR
Jennifer Yurs
DIRECTOR OF MARKETING
John Mansavage
ADVERTISING SALES
Andy Dellava adellava@hoards.com
Jane Griswold jgriswold@hoards.com
Jenna Zilverberg jzilverberg@hayandforage.com
Kim Zilverberg kzilverberg@hayandforage.com
ADVERTISING COORDINATOR
Patti Kressin pkressin@hoards.com
W.D. HOARD & SONS
PRESIDENT Brian V. Knox
EDITORIAL OFFICE
28 Milwaukee Ave. West Fort Atkinson, WI 53538
WEBSITE www.jofnm.com
EMAIL info@jofnm.com
PHONE (920) 563-5551
Journal of Nutrient Management (ISSN# 26902516) is published four times annually in February, May, August, and November by W.D. Hoard & Sons Company, 28 Milwaukee Ave. West, Fort Atkinson, Wisconsin 53538 Tel: (920) 563-5551. Email: info@ jofnm.com Website: www.jofnm.com. Postmaster: Send address corrections to: Journal of Nutrient Management, PO Box 801, Fort Atkinson, Wisconsin 53538-0801. Tel: (920) 563-5551. Email: info@ jofnm.com. Subscription Rates: Free and controlled circulation to qualified subscribers. For Subscriber Services contact: Journal of Nutrient Management, PO Box 801, Fort Atkinson, Wisconsin 53538, call (920) 563-5551, Email:info@jofnm.com.
Copyright © 2021 W.D. Hoard & Sons Company. ALL RIGHTS RESERVED. Content may not be reproduced or used for any commercial activity without express written consent from W. D. Hoard & Sons Company.
jofnm.com May 2021 | Journal of Nutrient Management | 3
Find us online at: www.jofnm.com twitter.com/JournalofNM facebook.com/JournalofNM ON THE COVER
Journal of Nutrient Management CONTENTS
First Thoughts 4 Policy Watch . . . . . . . . . . . . . 5 In the Field . . . . . . . . . . . . . . 6 Manure Minute 17 On the Move 22 Fresh Paint . . . . . . . . . . . . . 24 Places to Be . . . . . . . . . . . . 25 Nutrient Insights 26 DEPARTMENTS Volume 2 | No. 2 Digesting their way 14 4 6 8 10 12 18 19 22 26 Investing in the future Know your flow Where is biogas heading? Nutrient mass balances help weigh farm options Feed the soil bacteria Account for the nutrients in milk Don’t underestimate manure from open lots If manure spills, how will you respond? The fuss over phosphorus
Photo by Ryan Ebert, Fort Atkinson, Wis
Abby Bauer Managing Editor

INVESTING IN THE FUTURE
During a visit with my grandfather in the farmhouse where he has lived nearly his entire life, we talked about what the homestead looked like when he was young. Besides dairy cows, his family also raised sheep, chickens, pigs, and horses used to do field work.
My grandpa recalled the time that a neighboring farm went up for sale, and his father purchased it to expand their land base. All these years later, my grandpa remembers that when his dad told his mom they were going to buy that farm, she cried.
I am sure it seemed like a tremendous expense at a time when they were living off a farming income and raising a family of eight children. No doubt, in her mind, there were many other ways that money could have been spent.
Fortunately, that purchase by my great-grandfather turned out to be a wise investment. Those additional fields provided enough land for my grandfather and then later my uncles to carry on the family business, with enough acres to apply manure and grow feed needed for the dairy herd.
I had a similar conversation with a college classmate of mine a few years back. Like me, he grew up on a dairy, and both he and his brother returned to the farm after graduation. My friend said he felt his dad bought land they didn’t seem to need when he was in high school. However, once he and his brother joined the operation, they were so glad to have that additional asset as part of the farm that now supports three families.
In both of these situations, the family’s patriarch took a chance and bet on the future of the farm and the next generation of farmers. Of course, not all bets produce fruitful results, but in these two cases, the investments proved worthwhile.
In other scenarios, a large purchase and more debt may not be best for the future of the business, and a decision to not invest may make more financial sense. That was the case for dairyman Nick Dallmann, whose farm is featured on page 14. Dallmann had a strong desire to add an anaerobic digester to their dairy, but the family
was hesitant to make that capital investment. By exploring other options, they were able to find the right partnership that allowed them to install a methane digester without owning it. Today, their farm reaps the benefits of anaerobic digestion in several ways, including less stored manure and a bedding source for the cows. Meanwhile, the owners of the digester are able to harness and sell the energy produced, and the local environment benefits from this process of turning waste (manure) into renewable energy. It’s a win for all.
And then, there are some investments that cost little or nothing at all. As individuals and as farmers, one of the most valuable traits we can invest in is our reputation. Although the cost is minimal, a reputation isn’t gained overnight. It takes years of careful planning, thoughtful actions, and an investment in relationships.
One way to protect yourself and your reputation is to have plans in place for an unexpected event. When it comes to nutrient management, this could include a manure spill incident on your land or an equipment malfunction. Knowing what you would do before it happens could save valuable time and protect your image. Read about some steps to consider on page 22.
Perhaps the most important investment you can make is in the people around you. Show appreciation for your family and your employees, and invest in their health and well-being. If they aren’t running on a full tank of gas, neither is your farm. And as you work hard day in and day out, please make the time to be safe, and take a few moments to enjoy your life. Investing in your own health and happiness is certainly a worthy cause, too.
Until next time,
 Abby
Abby
4 | Journal of Nutrient Management | May 2021 jofnm.com Let us know your thoughts. Write Managing Editor Abby Bauer, 28 Milwaukee Ave. West, P.O. Box 801, Fort Atkinson, WI 53538; call: 920-563-5551; or email: abauer@jofnm.com. FIRST THOUGHTS
UTAH
A new bill, SB 130, was signed into law by Utah Governor Spencer Cox. The bill requires counties to identify at least one area where new concentrated agricultural feeding operations (CAFOs) could be located, unless the county demonstrates that this is not feasible due to population density or population density relative to the amount of private land within the county.
pollution regulations on farms and ranches.


The second, HB 51, removed the expiration date on a dual standard for phosphorus released by dairies that has been in place since 2012 and was set to end on July 1, 2023. The dual standard will now be permanent and allow dairy producers to choose between a phosphorus threshold standard or a phosphorus indexing standard when monitoring the land application of manure.

The bills were backed by the Idaho Dairymen’s Association, the Idaho Cattle Association, J.R. Simplot Co., and other agricultural groups. Both bills take effect on July 1.
As a rancher himself, Little noted that the state should govern with the lightest hand possible. However, he expressed some concern that this legislation may raise the likelihood of agency rules being challenged in court.
MARYLAND
The Manure Transport Program will raise the cost-share rate for Maryland farmers and manure brokers handling poultry manure to $28 per ton. This change will further assist farmers in making the switch to using poultry manure as a fertilizer. The overall goal is to move poultry litter away from farms with high phosphorus levels and apply it to fields in other parts of the state that need the nutrients.
This program plays a role in helping the state meet its goals to restore the health of waterways and the Chesapeake Bay. To participate, farmers must be in good standing with the Maryland Agricultural Water Quality Cost Share Program and in compliance with the state’s nutrient management regulations.
ALABAMA

There is a new streamlined permit registration process for owners of concentrated animal feeding operations (CAFOs) in Alabama. The permit regulations, which are issued by the Alabama Department of Environmental Management, require an inspection by a qualified and credentialed professional once every five years. Previously, inspections were mandated annually. Technical requirements, including buffers, land manure application, record keeping, and best management practices, remain the same.
MINNESOTA

The Minnesota Agricultural Water Quality Certification Program has reached a new milestone, enrolling 1,000 farmers and landowners into the program. These owners represent more than 715,000 acres. The goal is to enroll one million acres by the end of 2022.
The program puts farmers in touch with their local conservation district experts to identify and mitigate water quality risks. Certified producers have priority when it comes to receiving financial assistance for projects, and certified farms are considered in compliance with new water quality laws and regulations for 10 years.
IDAHO
Idaho’s governor, Brad Little, signed into law two bills that ease the state’s regulations on manure management. The first, HB 167, requires state officials to consider the economic ramifications when imposing jofnm.com
Since the certification program began, more than 2,050 new conservation practices were added; 38,500 tons of sediment stayed out of the state’s rivers; 110,000 tons of soil and 48,500 pounds of phosphorus were saved; nitrogen losses were cut by 49%; and the equivalent of 39,000 metric tons of carbon emissions were reduced each year.
POLICY WATCH
May 2021 | Journal of Nutrient Management | 5 Introducing US Screen Co. Fond du Lac, WI 54937 • MADE IN USA • Dry matter to 38% • Easy maintenance • Returns quality water for flushing • Flexible screen design ... allows for maximum quality bedding • Mega-durable auger design • Bearing mount at outlet to increase life of screens/auger • Heavy duty stainless steel frame structure for the corrosive environment • 15 Horse power motor Contact us: 1-920-238-5460 www.al-ins.com Aaron.Kuhls@al-ins.com
KNOW YOUR FLOW
A monitoring project revealed differences in drain tile flow trends in Wisconsin and Minnesota.
by Eric Cooley, Aaron Wunderlin, and Tim Radatz
It is important to understand drainage tile flow trends in agricultural production systems to effectively manage tile-drained land. Tile flow is an indicator of elevated soil moisture content and water percolating through the soil profile. This excess water can transport essential plant nutrients, mainly nitrogen, out of the root zone. Once nutrients reach the drain tile, they can be transported to surface waters.
Considerations for tiled land
Drainage tile adds extra considerations when managing agricultural fields to maximize nutrient use efficiency and minimize the risk of nutrient loss to surface waters. Nutrient distribution must be carefully timed to minimize applications when tile flow is high and crop uptake is low. Proper timing of manure and fertilizer applications on tile-drained land will minimize nutrient loss.
Drainage tile flow trends can vary significantly between geographic regions or even fields on a farm based on several variables:
• Precipitation: timing, volume, and level of intensity
• Physical setting: slope, position in the watershed (headlands versus lowlands), and water table depth
• Soil properties: texture, restrictive layers, sand lenses, and textural changes from glacial deposits
• La nd management: tillage type and crop rotation
• Drain tile: depth, spacing, type, and age of the tile system
Comparing the flow
Surface water run trends are similar in Wisconsin and Minnesota, with peak flow in March during snowmelt and in June with late spring rain on wet soils. The tile flow trends, however, are differ-

ent between the two states (Figure 1). In Wisconsin, peak tile flow coincides with snowmelt in March, then steadily declines until September. Then it intensifies with late fall/early winter rain and snowmelt. In Minnesota, peak tile flows match the secondary surface runoff peak in June, rapidly falling in August and then climbing with snowmelt in March.
A multistate project
To gain more knowledge of tile flow patterns and nutrient loss dynamics in Wisconsin and Minnesota, Discovery Farms applied for and successfully received a USDA-NRCS Conservation Innovation Grant to evaluate 48 tile systems, evenly split between the two states. Tile flow and water quality data were collected for the project from October 1, 2017, to September 30, 2020.
A combination of intensive, intermediate, and basic tile monitoring strategies were used in four regions in each state to determine if lower cost monitoring methods could be combined with intensive monitoring to provide valuable information. At intensive tile monitoring sites, continuous flow data were collected and water samples were taken throughout flow events proportional to flow volume.
At intermediate tile sites, continuous flow data were collected and biweekly water samples were taken. For the basic sites, both an instantaneous flow measurement and water sample were collected biweekly.
In this new tile monitoring project, tile flow trends in Wisconsin and Minnesota were similar to those observed in previous tile monitoring. In Wisconsin, 23 out of 24 monitored sites were flowing greater than 50% of the time during biweekly site visits. Meanwhile, in Minnesota, eight out of 23 monitored sites were flowing greater than 50% of the biweekly site visits (Figure 2). Three of the sites in Wisconsin had continuous flow and many other near continuous, but Minnesota had no sites that were continuous.
The differences in flow periods between Wisconsin and Minnesota are
6 | Journal of Nutrient Management | May 2021 jofnm.com IN THE FIELD
influenced by many of the previously stated variables, but in Wisconsin, many of the tile systems evaluated were likely intercepting groundwater or perched water tables. This is evidenced by both the continuous flow and flow volumes that exceed the actual precipitation volume for the surface topography defined basin for the tile system.
In addition, nutrient concentrations were extremely low and consistent as compared to sites with more intermittent flow. The upwelling groundwater into these tile systems likely diluted percolating water coming through the soil profile above the tile and made soil and nutrient concentration trend analysis in the tile difficult.
Evaluation of tile flow patterns
The flow information collected in this and previous Discovery Farms projects in Wisconsin and Minnesota help identify regional tile flow patterns. These patterns can be used to predict peak periods for tile flow when nutrients have the greatest potential to be leached from the crop root zone.
Fertilizer and manure applications should be timed to avoid these greater loss periods. Or, application could be combined with nutrient retention strategies like cover crops or controlled drainage to retain nutrients in the soil until they can be utilized by a subsequent crop. It is still important for farmers and consultants to evaluate tile systems they manage to determine individual flow patterns and yearly precipitation trends that can fluctuate annual flow trends in a tile system.
Additional analysis is being conducted to evaluate nutrient loss comparisons between cropping systems, tillage systems, manure and fertilizer timing, and cover crop retention. If you are interested in more information on nutrient retention practices such as cover crops, controlled drainage or other options, contact your local NRCS or Land Conservation Department representative. ■
The authors are with Discovery Farms in Wisconsin and Minnesota.
jofnm.com May 2021 | Journal of Nutrient Management | 7
1.6 1.4 1.2 1.0 0.8 0.6 0.4 0.2 0.0 Average monthly flow (in) Month Jan Feb Mar Apr May Jun Jul Aug SepOct Nov Dec ■ Surface runoff ■ MN Tile ■ WI Tile
Figure 1. Surface runoff and tile flow in Wisconsin and Minnesota (2004 to 2017)
100% 90% 80% 70% 60% 50% 40% 30% 20% 10% 0% ■ Yes ■ No DK6 BR2 MA2 DK2 SH5 DK5 DK4 SH3 DK1 MA4 SH4 DK3 BR5 SH8 SH9 DK7 BR4 BR1 MA3 SH2 MA1 SH6 BR3 SH1 Wisconsin 100% 90% 80% 70% 60% 50% 40% 30% 20% 10% 0% ■ Yes ■ No ST1-TA ST1-TE DO1-TA ST1-TC DO1-TD ST1-TB ST1-TD DO1-TF DO1-TC DO1-TB ST1-TF NO1-TE DO1-TE RE1-TA RE1-TB RE1-TD NO1-TA RE1-TE RE1-TF NO1-TD NO1-TB RE1-TC NO1-TC Minnesota
Figure 2. Biweekly flow frequency in Wisconsin and Minnesota (2017 to 2020)
Where is biogas heading?

The Biden administration has made climate change mitigation a priority, and digesters are part of the equation.
by Rich Schell
U.S. agriculture faces what could be a pivotal moment for biogas and methane digesters with the election of Joe Biden as president and the appointment and confirmation of Tom Vilsack as secretary of agriculture. Prior to the election, when Biden was asked about regulation and agriculture, he responded with a description about how methane could be processed out of the manure. As the Biogas Council noted, it was not a technical answer, but he got the concept of the process.
Generally, U.S. presidents don’t mention this topic. Combined with that knowledge is his appointment of Secretary Vilsack, who supported greater use of digester technology during his time working for the Obama administration. It would seem there will be a clear agreement moving forward on the benefits of anaerobic digesters as well as other green initiatives such as carbon credits and cover crops.
Signs of the times
Several big policy directives give very clear signposts to the directions that the Biden administration will proceed. First, there was a presidential directive making the U.S. part of the Paris Agreement again. Second, there was Biden’s executive order titled “Tackling the Climate Crisis at Home and Abroad.” Third, there was the executive order to estab-
lish the President’s Council of Advisors on Science and Technology (PCAST).
The Paris Agreement is a “big picture” document that sets very high level targets for countries. It does not assign specific requirements for the farm sectors of the countries that sign it. However, it does call for a country to determine what contribution it can make to lowering global temperatures. This requires countries to “pursue domestic mitigation measures.” The Biden administration will look to the farm sectors to help achieve these domestic mitigation measures.
President Biden signed a very broad climate change executive order covering a wide range of topics, from international agreements to a Civilian Climate Conservation Corps to the federal government buying sustainable products. One of the key points, as noted above, is the president directing his administration to set a nationally determined contribution under the Paris Agreement.
As part of the efforts to cope with climate change, the administration identified possible contributions from the agricultural sector. Biden said, “America’s farmers, ranchers, and forest landowners have an important role to play in combating the climate crisis and reducing greenhouse gas emissions by sequestering carbon in soils, grasses, trees, and other vegetation and sourcing sustainable bioproducts
With climate change mitigation on the minds of many government leaders, farms will be part of the solution in the coming years, with an emphasis placed on the use of anaerobic digesters.
and fuels.” Livestock operations that adopt and use methane digesters would presumably be part of that contribution by the farm sector.
Policy will shape action
In addition, the executive order calls upon the secretary of agriculture to take specific steps to get input from farmers and ranchers and other stakeholders on how the Department of Agriculture can encourage voluntary adoption of climate smart agricultural practices. These practices would result in additional carbon reduction and sequestration and source sustainable bioproducts and fuels. It would seem that the fuel and other by-products anaerobic digesters produce would fit within sustainable bioproducts and fuels.
8 | Journal of Nutrient Management | May 2021 jofnm.com
As part of the executive order, President Biden reaffirmed that the U.S. government will follow scientific thinking on climate change. This order calls for using scientific knowledge on climate, including research, systematic observation of the climate system, and early warning systems. This commitment to science-based policy also appears in the executive order on the President’s Council of Advisors on Science and Technology. The discussions of this group will shape policy, and policy will shape action. A key indicator to watch will be whom gets appointed to this council.
More on digesters
There are several proposals on how support for methane digesters might be accomplished. The Climate 21 Project calls for methane generators to enhance electric use from digesters, and it points to USDA’s Rural Development program to promote methane digesters. USDA, it suggests, should target the livestock industry and provide budget resources to help farmers install digesters.
The Food and Agriculture Climate Alliance presents joint policy recommendations and includes technical assistance from the Natural Resources Conservation Service (NRCS). In addition, they recommend speeding up digester approval. They also propose tax credits and an investment tax credit. Finally, they favor moving the Agstar program, which supports digesters, from the Environmental Protection Agency (EPA) to USDA.
Looking ahead
Time and political developments will determine specifics of how the administration will go forward. As has been noted, the best predictor of what people will do in the future is what they have done in the past. In 2009, under the Obama administration, Vilsack signed a memorandum of understanding with the dairy industry.
According to USDA, they agreed that “USDA and U.S. dairy producers will work together to reach a 25% reduction in greenhouse gas emissions by the year 2020. USDA will do so by undertaking research initiatives, allowing implementation flexibility, and enhancing marketing efforts of anaerobic

digesters to dairy producers.”
It seems very likely that in some ways, the future will resemble the past, but with more money and urgency. There are voices calling for more vigorous action for small farms, and it is reasonable to assume people will also be asking for more action on environmental topics, including methane and water

issues. It seems likely the Biden administration will have to respond with more money and sooner rather than later. ■
With equipment built to last and engineered to use less energy, we’ve been helping you get the most out of your land and herds for over three decades. When you partner with Daritech and our local dealers, you benefit from the knowledge and experience of designing milking and manure management systems used world-wide in small and large herd farms.
We have innovative, easy to maintain, fully automated solutions that will increase your efficiency without adding labour and save you money. Call us, or a dealer near you to discover the many ways Daritech can help you focus on the future of your farm.
jofnm.com May 2021 | Journal of Nutrient Management | 9
• 800-701-3632 Contact us today for a dealer near you!
www.daritech.com
Greenline E-Series Agitators
DT360 Manure Separators
Daritech Centrifuge
Greenline 250 AutoPrime Pumps
The author is an attorney based in Des Plaines, Ill.
Nutrient mass balances help weigh farm options
Precision
by Eric Young
nutrient management is a must — guessing is not good enough.
Making the most of on-farm nutrients always makes economic and environmental sense. A good working knowledge of nutrient management and farm nutrient mass balances can help producers improve efficiency and farm profitability.

Both animals and crops require specific amounts and combinations of nutrients to support optimal productivity. Making the most of crop
growing conditions while minimizing the likelihood of nutrient loss to the environment is a main goal of nutrient management. Nutrients fed or applied above biological optima is lost farm income and poses a potential water quality risk.
Find a balance
A field nutrient balance is an annual estimate of the amount of a given nutrient remaining after accounting for
all sources (such as fertilizer, manure, soil, and the previous crop) and crop uptake. Field nutrient balances are routinely calculated for nitrogen (N), phosphorus (P), and potassium (K) and help gauge purchased fertilizer needs, develop cropping enterprise budgets, and justify nutrient application rates. Like crop yield, field nutrient balances vary annually depending on weather, soils, and agronomic practices.
Similar to a field nutrient balance,
10 | Journal of Nutrient Management | May 2021 jofnm.com
Measuring the flow of nutrients on to and off of the farm can uncover animal feeding or cropping inefficiencies.
a whole farm nutrient mass balance is the difference between all nutrient inputs (purchased forage, fertilizer, and/or feedstuffs) and outputs (milk, meat, and crops or commodities sold off farm) scaled up to the whole farm. Purchased fertilizers and animal feedstuffs (including grains and other protein/ energy sources) are often two of the largest nutrient imports and are the most expensive on dairy farms.
Nutrient mass balances reflect broad scale farm nutrient flows and are useful for highlighting potential animal feeding or cropping based nutrient inefficiencies.
Convert nutrients into milk
Quirine Kettering’s group at Cornell University has done extensive research on dairy farm nutrient mass balances in New York aimed at sustainable N, P, and K balances. Targets are designed with the goal of supporting high milk production but discourage nutrient enrichment that can lead to inefficiencies and environmental risk.
Combining milk production data with nutrient mass balance information provides an efficiency index for converting purchased farm nutrients into milk. Based on cropping and milk production data from well over 100 New York farms, the researchers developed “feasible” mass balance estimates for N, P, and K.
The feasible nutrient mass balance calculations were based on 75th percentile mass balance values across farms in addition to farm data and sustainable P balance calculations. Assuming 70% of forage crop nutrients are produced on the farm, no manure is exported off farm, and a total mixed ration P content of 4 grams per kilogram (0.4%) of dry matter, P excreted by animals is balanced by crop P removal at an animal density of 1,000 pounds per acre.
The data were used to establish N, P, and K nutrient balance thresholds on a per acre of tillable cropland and

per hundredweight (cwt.) of milk (100 pounds of milk) basis to help farms evaluate their individual measures in relation to other farms’ milk production and nutrient balance data (see table).
It is suggested that farms maintain positive nutrient balances to offset inevitable losses. Long-term negative balances indicate nutrient limitation, whereas larger, positive balances indicate excessive nutrient importation and an opportunity to cut back on fertilizer and/or feedstuff purchases.

In addition, farms that have consistently large positive N and P balances may be more at risk of nutrient enrichment, particularly in the case of P. It is well-known that P accumulates in surface soils with repeated manure and fertilizer applications, particu larly when P application rates exceed crop P removal.
Farms that are Concentrated Animal Feeding Operations (CAFOs) and farms receiving state or federal funding must assess P loss potential on all fields using a P site index. Fields with high soil test P and/or other features that elevate P loss potential (such as high erosion or flooding) and increase P site index scores can eventually limit the amount and timing of the manure application these fields can receive. In many states, manure application or P of any kind is not permitted once a certain P site index threshold value is exceeded, thus limiting the amount of crop acreage that can receive manure.
An important aspect of this Cornell research was that farms with larger positive balances were able to reduce nutrient balances without compromis ing milk production or crop yields. It was also clear that producing a larger amount of feed on-farm tended to help maintain feasible balances.
Must be measured
Precision feed management is a term used by nutritionists to convey the idea of meeting the animal’s nutritive needs based on physiology and different
growth or lactational stages without overfeeding to optimize production. Similarly, precision nutrient management aims to provide nutrients to crops when needed most to minimize losses and increase efficiency.
Precision nutrient approaches require routine and repeated forage, manure, and soil testing in addition to accurate crop and farm records. Guessing is not good enough given the tight profit margins and uncertain prices these days. Good management requires measurements. Nutrient mass balances are another tool available to help producers evaluate options for increasing farm efficiency and reducing their potential environmental footprint. ■
The author is a research soil scientist for the Institute for
jofnm.com May 2021 | Journal of Nutrient Management | 11
Recommended maximum nutrient mass balances for N.Y. dairy farms Nutrient mass balance measureN P K Per acre (lbs./acre) <105 <12 <37 Per cwt. milk (lbs./cwt.) <0.88 <0.11 <0.30 Keith
SILAGE
FOUNDATION
Safe practices
Educational Resources Safe Silage silagesafety.org
Bolsen
SAFETY
4
4
Feed the soil bacteria
Manure and compost improve soil health by supporting the bacterial and fungal populations underground.
by Linda Schott
ccording to the Food and Agriculture Organization (FAO), soil health is defined as the continued capacity of soil to function as a vital living system, within ecosystem and land-use boundaries, to sustain biological productivity, promote the quality of air and water environments, and maintain plant, animal, and human health. For cropland, this definition can be interpreted as the continued capacity of soil to function as a vital living system to sustain healthy crop production.
One proven way to improve soil health is to elevate soil carbon and soil organic matter. The reason no-tillage practices and cover crops improve soil health is by reducing carbon loss or increasing it through photosynthesis, respectively. Manure and compost application can also boost soil carbon because these products are high in organic carbon.
Manure and compost have long been critical components of crop fertility plans worldwide. The high concentration of organic carbon and plant-essential nutrients in manure and compost make them excellent fertilizers. However, manure is greatly underutilized; only about 22% of the manure produced worldwide is applied as fertilizer.
This underutilization can yield regional nutrient imbalances when inorganic fertilizers are imported to meet crop nutrient needs that locally produced fertilizers (such as manure and compost) could supply. However, with this challenge comes opportunity.
An important contributor to overall soil health is soil biology, and it makes
up part of the “living ecosystem” piece of the definition. Fauna inhabiting soil affect and are related to many physical and chemical characteristics critical to crop production.
Soil bacteria and fungi form the base of the soil ecosystem. These organisms both create soil organic matter and are part of soil organic matter. Thus, they are a critical component of healthy soil.
Soil bacteria and fungi consume organic matter as well as animal and plant residues (including manure, compost, crop stubble, and so forth), which helps to cycle nutrients in soil. Manure and compost applications have been shown to increase bacterial and fungal populations in soils when compared with inorganic fertilizers.
Some manure or compost is better
than none. When only half of required crop nitrogen is supplied by manure, with the other half supplied by inorganic fertilizer, fungal and bacterial populations continue to grow.
Applications make “cents”
For crop producers, fertilizer costs generally encompass a relatively large proportion of input costs. In modern crop production, virtually all crops receive fertilizer to ensure ample yields.
In several studies comparing manure and/or compost with inorganic fertilizers where the same rates of nutrients were applied, more nitrogen, phosphorous, and potassium were available to crops with manure and compost. This improved availability can generally be linked to extra microbial activity.

12 | Journal of Nutrient Management | May 2021 jofnm.com
Manure and compost applications benefit soil structure, including aggregate stability and improved infiltration of water from irrigation and rainfall.
When abundant populations of soil biology are present, like in soils receiving compost and manure, nutrient cycling tends to rise because microbes are feeding on each other, soil organic matter, and animal and plant residues. More microbes necessitate more feeding, and thus, more nutrient cycling. This means that growers can potentially reduce fertilizer applications by leveraging the free work done by microbes when better food sources (those containing carbon) are provided. Larger biological populations also improve soil physical properties. Some soil organisms help “glue” soil mineral particles together through by-product production, while other soil organisms “tie” particles together with hyphae. Both processes help improve soil structure by creating more space for water and air exchange because, just like humans and other living things, soil microbiology
needs air and water to survive. This leads to further growth in soil microbial populations due to a better habitat. Manure and compost application have also been shown to improve soil structural properties, like aggregate stability and infiltration, when compared to inorganic fertilizer. This is likely due to both enhanced soil biology and more in soil organic carbon. Regardless of the cause, as soil structure improves, water from irrigation and rainfall can better infiltrate into the soil, and soil and nutrients are also less likely to run off.
Incorporate manure and compost


Just like care should be taken when first deciding to implement cover crops and no-tillage, care should be taken when utilizing manure and compost. Improvement in soil health metrics has been shown with any species of manure and compost. However, farms

must ensure that manure and compost are applied at agronomically appropriate rates. This means that growers need to know what nutrients they are applying through laboratory testing as well as what their soil nutrient status is and what nutrients the crop needs.
Application of manure and/or compost creates a win-win-win situation by enhancing soil health, growing a similarly yielding crop, and reducing regional nutrient imbalances. If you’re in an area where manure and/or compost is available, I urge you to determine whether these products would fit into your system. They are not waste products and, in fact, have a lot of worth. ■
The author is an assistant professor and extension specialist in nutrient and waste management at the University of Idaho.

jofnm.com May 2021 | Journal of Nutrient Management | 13
4103 DNMS
5105 LNMS
4103 LNMS DRAGHOSE SYSTEM
5105 DNMS
Applying Innovation. Delivering Customer Service. BETTER PRODUCTS. BETTER RESULTS. 800.628.6196 OXBO.COM
Equipped with All-Wheel Drive and choice of 3 or 5 wheels, we can help you spread your valuable nutrients in even the toughest conditions.
DIGESTING THEIR WAY
For one Midwest dairy, partnerships with private companies allowed them to successfully run an anaerobic digester on their farm for most of the last decade.

14 | Journal of Nutrient Management | May 2021 jofnm.com
by Abby Bauer, Managing Editor
For several years, Nick Dallmann was interested in adding an anaerobic digester to his family’s dairy farm. “I knew some other people who had one, and I saw the benefits from having a digester,” he explained. Still, they weren’t sure they wanted to undertake the capital required to build one on their dairy.
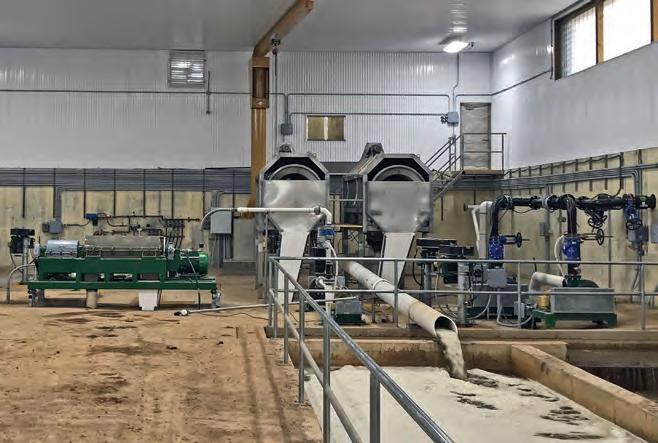
After some conversations with Steve Dvorak, a physical engineer and president of DVO Inc., Dvorak decided to build a digester at Dallmann East River Dairy LLC to utilize the manure produced and use it as a research facility. At the same time, the family added a freestall barn and expanded their herd size to maximize their parlor.
Dallmann farms in Brillion, Wis., with his grandparents, Terry and Darlene; parents, Daniel and Shirley; and his sister and brother-in-law, Travis and Lindsay Hansen. They milk 2,900 cows and farm around 3,300 acres of cropland. He spoke about their farm and digester during a Between the Lakes Demonstration Farms Network field day.
The plug flow digester, which began operating in 2012, was designed by DVO, who also operated the digester and sold the electricity to Wisconsin Public Service. The Dallmanns had a 10-year contract with DVO, but with markets changing on the electrical and utility side, Dallmann said they knew the original agreement wasn’t likely to last the full decade.

Initially, a combustion engine was used to make electricity from the methane that is produced, but that changed when DVO sold the digester to U.S. Gain, who now owns the digester and gas cleanup equipment. DVO continues to do maintenance on the digester.
Their manure is now being turned into natural compressed gas that is injected into a pipeline. Dallmann explained that raw biogas only contains 60% methane, and it has to be 99% methane to be injected into the pipeline.
“One big challenge with compressed natural gas projects is getting impurities out of biogas,” Dallmann said. Before, they were able to put the biogas through the combustion engine as it was. Now, once the biogas leaves the digester, it goes through more equipment to remove the hydrogen sulfide, carbon dioxide, and other impurities.
Every day, Dallmann said their dairy is producing 1,200 gallons of diesel equivalents. The natural gas is compressed and stored in a trailer, and every three days that trailer is hauled to another dairy about 20 minutes away where the gas is injected into the pipeline.
Bedding is a major benefit
All manure from the farm goes through the digester. This includes manure from the freestall barns and the heifers’ outdoor open lots, alley flush water, and parlor wash water.
With a capacity of 1.5 million gallons, manure enters the digester on one side and makes a big “U.” As new manure comes in, digested manure is pushed out.
The anaerobic digester must stay at 101°F year round. “That’s where the bugs operate most efficiently,” he said. Its location in the ground provides natural insulation, and then it is covered with spray foam insulation.
The digester is 16 feet deep, with 14 feet of manure and 2 feet of gas storage. Manure is retained in the digester for 16 to 18 days before being released out the other end. Dallmann explained that retention time is critical to fully complete the digestion process.
From there, some of the manure is sent through a screw press separator so that the solids can be removed and used for bedding. The Dallmanns also sell this bedding to two other farms.
“The solids have been a major benefit for us and a major cost savings, and the other two farms enjoy it, too,” Dallmann said. “It prevents us from buying sand, and it makes manure handling and manure storage cleanouts easier.”
In the past, they had been using wheat straw and mattresses. Since switching to the manure solids, they have been able to maintain the same herd somatic cell count.
“As long as the digester is operating the way it is supposed
jofnm.com May 2021 | Journal of Nutrient Management | 15 Contact us with product questions or to receive a FREE estimate. (920) 948-9661 • www.pippingconcrete.com dennis@pippingconcrete.com • www.facebook.com/pippingconcrete Serving the AmericanNationwideFarmer THE TANK BUILDER! AGRICULTURAL CONCRETE The Nation’s Leader in Agricultural Concrete The most versatile option when choosing a waste storage facility! Our NRCS pre-approved tanks can be placed in or out of the ground.
All photos: Abby Bauer
to, we are getting the retention time in the digester we need, and the bugs are working the way they are supposed to, ideally you should have clean solids at the end,” Dallmann shared. Occasionally, they send in samples of solids coming out of the separator to be cultured to ensure everything is being digested properly.
They also run their screw presses as tight as they can, Dallmann noted, to create a drier product at the end. He said the solids used for bedding have 60% to 65% moisture content.
They only separate the solids they need; the rest bypass the separators and go into the manure storage pit, eliminating the need for another waste stream. “We like to keep things as simple as possible,” Dallmann said.
Every last drop
While the digester allows them to recycle manure on their farm, the Dallmanns also reuse water, too. They divert most of the “clean” water collected from roof tops into a ditch that wraps around the farm to keep it out of their manure storage structure.
Meanwhile, “dirty” water from their bunkers, feeding area, and outdoor cattle lot is directed toward an 8 million-gallon storage pit. It was originally built with a 4 million-gallon capacity, but they doubled it two years later. “That gives you an idea of how much water we are collecting,” Dallmann said. This water is utilized through their
irrigation pivots when needed. The year before last, when more than 40 inches of rain fell, they only turned on the pivot once. The rest of the water was irrigated on top of fourth-crop alfalfa. In 2020, he said they were able to use the system more frequently as it was intended.

Dallmann estimated that the pivot system paid for itself in two or three years. He said the pivots aren’t all that expensive; there is more cost involved in getting the liquid out to the pivots through a buried pipeline system.

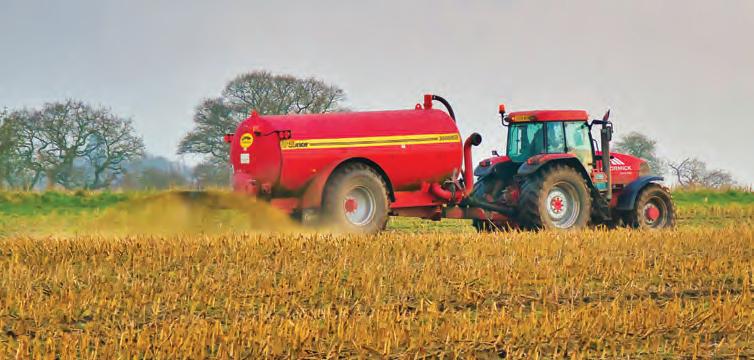
The farm also has 3 miles of buried pipeline used for manure application, which Dallmann considers a positive aspect of their manure management. The pipeline takes the manure under a river, preventing up to 1,500 truckloads of manure from traveling over a local bridge each year. It also reduces soil compaction in the fields.
“This is a major, major benefit for us and our neighbors,” Dallmann said. “Last fall, we didn’t run a single manure truck. It was all applied using draglines.”
When manure is surface applied, odor can be a concern. However, Dallmann feels the digested manure creates less of a smell problem.
“It’s a totally different odor, in my opinion,” he said. “It’s not nearly as potent as raw manure.”
Dallmann also believes the digestion process makes the nutrients more
available for the crops. “It changes the manure nutrients from organic to inorganic, and they are ready to be absorbed,” he explained.
Partners in production
While they are not receiving income from the biogas generated on their farm, Dallmann feels there are many other positive impacts from having an anaerobic digester. In addition to the agronomic benefits, he again pointed to the ability to use recycled solids as bedding.
“Using solids for bedding is a major cost saver for us, and selling some to other farms generates income,” he said.
Dallmann is pleased with the partnerships with DVO and U.S. Gain that have allowed them to operate a digester on their dairy for nearly a decade. They are able to capture some of the benefits provided by a digester without the capital investment or the challenges that can come with operation. In addition, it allows them to improve overall efficiency of their dairy, from crops to feed and milk to manure.
“The digester is utilizing what the cow did not. We’re making gas from what’s left over,” he said. “We are trying to capture every bit of energy from that feed.”
With the help of an anaerobic digester and other conservation practices, the Dallmanns are able to achieve their goal of recycling as much of their manure and water as possible. ■
16 | Journal of Nutrient Management | May 2021 jofnm.com
Nick Dallmann, who farms with his family at Dallmann East River Dairy LLC, spoke about their anaerobic digester and manure management practices at a Between the Lakes Demonstration Farms Network field day held near Brillion, Wis.
Water runoff from the bunkers, feeding areas, and open lots is collected and then travels through a pipeline system to be land applied using irrigation pivots.
INHIBITORS HELP WHEN THE TIMING IS RIGHT
In a University of Minnesota Extension Crop News e-newsletter, Melissa Wilson and Jeff Vetsch posed the question, “Nitrification inhibitors and manure: Do they work?”

Their answer was, “Yes, sometimes, but not always,” and they pointed to some Minnesota research to explain.
Nitrification inhibitors prevent soil bacteria from converting the ammonium portion of manure nitrogen into nitrate. This cuts the risk of nitrate leaching and denitrification.
Two studies used a nitrification inhibitor called nitrapyrin. In the first study, liquid dairy or swine manure was applied in mid-September, mid-October, and mid-April the following year. Nitrapyrin was added to half of the plots. Corn was planted in May, and soil samples were collected when plants were at the V4 state.
In the second study, liquid swine manure was applied in mid-October or mid-November, some with nitrapyrin and some without. Soil samples and yield data were collected after corn was planted the following spring.
In the first study, nitrate concentrations were elevated by nitrapyrin. Yield only improved at two of the seven sites, though. Corn yields were highest when manure was applied in April, with or without a nitrification inhibitor.
In the second study, which took place over four years, corn grain yields were improved in three of the years when manure was applied with nitrapyrin in October. It only improved two of the years when manure was applied in November. Fields that had manure applied with nitrapyrin in October yielded the same as those that received manure in November, whether or not a nitrification inhibitor was used.
The authors indicated that nitrapyrin helped conserve soil nitrogen from fall-applied manure. As for yields, inhibitors seem to help in October. Application may not be as useful in September, as the inhibitors likely
don’t last long enough for soil temperatures to drop. They also seem less effective in November, as soil tempera-
tures in more Northern climates are typically below 50°F and nitrification is dramatically reduced naturally.
jofnm.com May 2021 | Journal of Nutrient Management | 17 MANURE MINUTE
Account for the nutrients in milk
When milk is land applied, the nutrient value must be considered.
by Deanne Meyer
No dairy producer wants to dispose of saleable milk, but there have been times in the past year, due to COVID-19 ramifications and other reasons, where some farms were asked to reduce production or dump milk. Some of this milk ended up being land applied to fields.
It’s important to consider the ramifications of the nutrients in milk from an agronomic perspective. Milk is nutritious. It’s also going to contribute to the nutrient load when applied to land.
The table summarizes the nutrient composition of various sized tankers of milk based on bulk tank analyses from 34 Central Valley dairies in California. Every 5,000 gallons of milk contained 217 pounds of nitrogen and 35 pounds of phosphorus. When diets are formulated to the National Research Council’s recommendations for dairy cattle, a cow producing 88 pounds of milk is expected to excrete 0.99 pound of nitrogen and 0.17 pound of phosphorus daily.
On a phosphorus basis, 5,000 gallons of milk is equivalent to 205 milking cows’ worth of manure for one day. On a nitrogen basis, 5,000 gallons of milk is equivalent to 220 cows’ daily manure.
From a nutrient uptake perspective, an acre of corn silage yielding 30 tons at 27% dry matter (DM) removes 243 pounds of nitrogen (1.5% nitrogen on a DM basis) and 43 pounds of phosphorus (0.27% phosphorus on a DM basis). In the example above, another 0.8 acre of land is needed to grow corn silage to utilize the phosphorus from 5,000 gallons of milk. If
your corn yields or phosphorus concentrations are lower, you’ll need more land.

Know your fields
Your geographic location and the amount of milk dumped will determine if you should have no concern, great concern, or if you’re somewhere in between. Remember to do your due diligence with your regulatory authority and notify them of milk disposals if this is a requirement. Also remember to include appropriate reporting.
Climate, watershed sensitivity, regulatory requirements, and other local specific conditions impact the potential challenges associated with dumping milk. In addition to the nutrient content, the fat composition of milk makes
it quite a challenge to manage. Minimizing undesirable mineral buildup in pipelines and odors, flies, and nutrient hot spots in fields is important. Uniform distribution of milk is key. In many states, a dairy association or cooperative extension service can provide guidelines for milk disposal.
I sincerely hope your future tanks go directly to your processor! But if you find yourself in a situation where milk must be land applied, please keep these values in mind. ■
18 | Journal of Nutrient Management | May 2021 jofnm.com
Pounds of nutrient applied per load of milk by different load sizes Load size in gallons Nutrient Concentration 1,0005,00010,000 Pounds per load Fat 3.62%3111,5573,113 Protein 3.15% 271 1,355 2,709 Nitrogen 0.504% 43 217 433 Calcium 1,011 mg/L 9 43 87 Phosphorus 811 mg/L 7 35 70 Magnesium 100 mg/L 1 4 9 Potassium 1,434 mg/L 12 62123 Sodium 377 mg/L 3 16 32 Sulfur 271 mg/L 2 12 23 Chloride 896 mg/L 8 39 77 Source: Robinson,
The author is a livestock waste management specialist in the department of animal sciences at University of California, Davis.
Beaucaire, and Meyer. Milk levels in bulk milk of California dairy cows.
Don’t underestimate manure from open lots
On-farm observations help better predict the flow of nitrogen and phosphorus from beef cattle open lots.
by Megan Homolka, Galen Erickson, and Richard Koelsch
Manure collected from open lot animal housing systems varies due to weather conditions, management of cattle and pens, and other factors resulting in substantial changes in manure characteristics. Understanding variability is important for planning nutrient management systems.
Planning often relies upon standard values published by the USDA Natural Resource Conservation Service (NRCS) and American Society of Agricultural and Biological Engineers (ASABE) for open lot beef cattle manure quantities and characteristics. However, results from a University of Nebraska study suggest significant challenges associated with planning based upon standard values for estimating manure characteristics. This means estimates using site and time specific manure analysis are critical for open lot beef systems.
A look at open lots
Defining the characteristics of manure and runoff from open, earthen lots creates unique challenges compared to animals housed under a roof. Some variables include:
• Impact of climatic conditions
• Distinguishing between compacted soil and manure
• Management practices (such as frequency of manure collection)
• Diets fed due to the ability of ruminant animals to utilize a variety of by-products, forages, and crop residues
To quantify the differences of open lot systems, data was collected from cattle finishing trials conducted at the Eastern Nebraska Research and Extension Center (ENREC) beef feedlot facility. Over a 15-year period, 416 unique pen observations were evaluated for the impacts of a broad range of weather conditions, dietary treatments, feedlot management practices, and nitrogen and phosphorous conservation practices (for animal performance data, see the 2021 Nebraska Beef Report at http://bit.ly/ JNM-NEBeefReport). A pooled analysis of manure and nutrient characteristics from the pen data was performed.
Trial methods followed common procedures for estimating animal perfor-
mance, nutrient intake and excretion, as-removed manure, and runoff quantities. Losses of nitrogen (N) and phosphorus (P) were estimated using a mass balance comparison of nutrient inputs and known outputs with the difference representing losses or unaccounted P (P remaining in the lot after cleaning). Standard methods were followed for harvesting manure and determining mass. Representative samples were collected and frozen at minus 4°C until analysis. When rainfall occurred, runoff was collected, sampled, and quantified.
The nitrogen balance
Nitrogen entering a pen as feed will exit the pen in one of four ways: in
jofnm.com May 2021 | Journal of Nutrient Management | 19
Percentage of feed nutrients captured
0% 20% 40% 60% 80% 100% 120% Phosphorus: Nitrogen: Winter Runoff Excess Recovered Runoff Summer Manure Manure Retained Retained Not Recovered Winter Runoff Runoff Summer Manure Manure Retained Retained Loss Loss
Figure 1: End points for dietary nitrogen and phosphorus consumed by beef for summer and winter feeding periods.
the marketed animal (retained); as runoff holding pond water; as removed manure; or as N loss, occurring predominantly as ammonia volatilization (Figure 1). The evaluation of the independent pen measurements at ENREC suggests that N retained by the marketed animal (approximately 13% of N in feed) are consistent between winter and summer feeding periods. On the other hand, nitrogen retained in the manure and runoff and the amount that is lost is significantly different for winter and summer periods.
Nitrogen loss ranged from 65% to 44% of fed N for summer and winter, respectively. As a result of changes in loss during these feeding periods, the manure retained 0.11 pound per head per day for summer periods and 0.20 pound per head per day for winter periods (of the 0.54 and 0.50 pound per head per day of N intake as feed). Season (summer versus winter) is an important factor influencing N recovered from open lot systems.
Intake provides some explanation for observed variability of as-removed manure N and N loss for manure harvested following a summer feeding period, but it offers less explanation for the winter feeding period. (See the 2021 Nebraska Beef Report for a summary of statistically significant variables.) The data set suggests that an increase of dietary intake of 1 pound results in approximately a 0.30-pound bump in as-removed manure N during the summer. There was no relationship during the winter.
This review also showed an increase of dietary intake of 1 pound is responsible for a 0.61-pound and 0.84-pound rise in N loss for summer and winter feeding periods, respectively. A better correlation was observed between N intake and N lost for the summer months [R2 = 0.54 (P < 0.01)] and for the winter feeding period [R2 = 0.37 (P < 0.01)].
The correlation between organic matter and N in the manure (Table 1) suggests a strong relationship (R 2 = 0.85 for summer and 0.70 for winter, P < 0.01 for both). Improving manure’s organic matter also appears to reduce N losses. Management practices that elevate manure organic matter will impact planning for as-removed
Table 1: Nitrogen, phosphorus, and dry matter characteristics of manure from open feedlot pens
1 Summer = cattle fed from April to October, Winter = cattle fed from November to May.
2 Calculated using NRC (1996) net protein and net energy equations.
3 Calculated as N or P intake minus N or P retention.
4 Calculated as N intake minus N retained minus N manure minus N runoff.
5 ASABE: American Society of Agricultural Engineers Standard D384.2, Manure Production and Characteristics.
manure N and may moderately reduce N emissions as well.
Measuring phosphorus
Phosphorus entering a feedlot pen as feed will exit the pen in the marketed animal (retained), as runoff holding pond water, or as manure (Figure 1). Again, the fraction of P retained by the animal remained relatively constant for summer and winter periods.
The as-removed manure P was substantially greater in the winter than summer, exceeding the winter estimate of excreted P. The manure P for summer and winter represented 47% and 95% of fed P, respectively. The runoff P during the summer was double that observed during the winter feeding period (6% versus 3% of fed P).
These results suggest that a P balance based upon these four inputs and outputs left some P unaccounted, approximately 0.02 pound per head per day in the summer (likely left on the lot surface or mixed in the soil) and minus 0.01 pound per head per day in the winter. Pen cleaning practices in fall following a summer feeding period (lot
surfaces are drier and the soil-manure interface is more easily maintained) resulted in some excreted P not being removed from the pens.
Spring pen cleaning following the winter feeding period more likely involves muddy conditions (and less easily defined soil-manure interface) with more soil and additional P being removed beyond what is excreted. Differences in ash content appear to support this conclusion. These findings suggest that pen cleaning following the winter feeding period was removing P left behind during the cleaning at the end of summer.
Efforts to explain variability in manure P recovery based upon feed P intake demonstrated weak correlations (Table 1). However, planning procedures for managing manure P should recognize the significant differences between winter and summer feeding periods for as-removed manure P.
Evaluating the manure solids
Significant seasonal and individual feeding period variability in the amount of manure harvested was also observed. Variability in the amount
20 | Journal of Nutrient Management | May 2021 jofnm.com
N Characteristics Summer1 Winter1 ASABE 5 N intake, lb./head/d 0.54 a 0.50 0.42 N retain, lb./head/d2 0.068 a 0.066 0.063 N excreted, lb./head/d 3 0.48 0.43 0.36 N runoff, lb./head/d 0.014 0.008 N manure, lb./head/d 0.11 0.20 0.20 N loss, lb./head/d4 0.35 0.22 P Characteristics Summer Winter ASABE 5 P intake, lb./head/d 0.083 0.071 0.062 P excreted, lb./head/d 3 0.067 0.056 0.049 P retain, lb./head/d 0.016 0.015 0.013 P runoff, lb./head/d 0.0050 0.0023 P manure, lb./head/d 0.039 0.067 0.082 Unaccounted 0.023 -0.014 DM Characteristics Summer Winter ASABE 5 As-is, lb./head/d 20.5 28.9 16.5 DM, lb./head/d 11.9 17.6 11.0 OM, lb./head/d 2.2 4.1 3.3 Ash, lb./head/d 9.2 13.4 7.7
of as-removed manure quantity occurs even when following predefined protocols for managing pen surfaces, as are used at the ENREC feedlot.


Total manure, total solids, total organic matter, and total ash were all significantly greater for the winter versus summer feeding period when expressed on a unit mass per head per day basis. For example, cleaning following the winter feeding period removed 47% more ash (most likely soil), 87% more organic matter, and 56% more total manure.
These observations of variation in manure solid characteristics between the winter and summer feeding period (and similar previous observations for N and P) suggest the need for characterizing and managing manure independently based upon the feeding period. Differences at the ENREC feedlot are due, in part, to a summer feeding period, which included higher N and P feed intake, a shorter feeding period, and larger animals entering the lot. Differences in weather conditions and pen surface conditions are likely important contributors to variability, commonly impacting the amount of soil contamination that occurs.
Compared to the standards
As animal performance, feeding program options, and other management practices evolve, standard methods for predicting feedlot manure characteristics and quantities are prone to greater errors. When ASABE assumptions and estimates are compared with field measures in this study, the following observations were made:
1. Greater total feed intake, higher average daily gains, and greater finishing weights were observed for the animals finished at the ENREC feedlot than the assumed values in the ASABE standard (originally published in 2004), better reflecting industry trends.

2. ASABE underestimates the dietary N intake and excreted N observed for the ENREC feedlot. Our observed P dietary intake and excretion was also greater than estimated by ASABE.
3. ASABE substantially underestimates total manure, dry matter, organic matter, and ash for winter feeding periods. For example, total as-removed manure averages for both winter (28.9 pounds per head per day) and summer feeding periods (20.5 pounds per head per day) were greater than that of ASABE standards at 16.5 pounds per head per day. The ENREC data set also suggests more ash in the manure than anticipated by ASABE.
4. As-removed manure N following the winter feeding period for the ENREC feedlot was similar to the ASABE estimate but substantially less after the summer feeding period. Manure P levels were substantially less than reported by ASABE (more than 50% less in the summer-feeding period).
In addition, ammonia volatilization from open lots is substantial. For every 1,000 head finished at the ENREC feedlot, the nitrogen loss is approximately 46,000 pounds and 38,000 pounds of N for the summer and winter feeding periods, respectively. This loss is an environmental risk and represents an annual economic loss of roughly $35,000 per 1,000 head for the ENREC feedlot. Experience would suggest that by doubling organic matter in the manure, one might expect to retain


approximately two-thirds more nitrogen in the manure. Standard values for estimating excreted and as-removed manure have historically been used for many planning and design procedures, including the development of nutrient management plans. These standard values have little to no validity in earthen, open-lot animal housing based upon these observations for the ENREC feedlot.
In commercial yards that harvest manure following each feeding period (or possibly more often), separately monitoring and managing manure for unique feeding periods is important. Base nutrient planning processes on manure sampling protocols that establish a history of feedlot-specific manure characteristics, including separate histories for manure removed following winter and summer feeding periods. Due to the high degree of variability in manure characteristics, individual year adjustments for manure and fertilizer rates are essential and should be based upon a current manure sample analysis. ■
Financial support for this research came from the Robert and Karla Baltzell Student Innovation Award at the University of NebraskaLincoln. This information was originally published in the 2021 Nebraska Beef Cattle Report.
Homolka is a student, and Erickson and Koelsh are professors, all at the University of Nebraska, Lincoln.
jofnm.com May 2021 | Journal of Nutrient Management | 21
IF MANURE SPILLS, HOW WILL YOU RESPOND?
Proper clean up after a manure spill incident can protect the environment and a farm’s reputation.
by Abby Bauer, Managing Editor
When it comes to accidents that lead to manure spilling where it doesn’t belong, University of Wisconsin-Madison Division of Extension specialist Kevin Erb asks farmers to remember this Warren Buffet quote:
“It takes 20 years to build a reputation and five minutes to ruin it. If you think about that, you’ll do things differently.”
Erb, extension’s conservation professional training program director, addressed manure spills and clean up during a Professional Dairy Producers of Wisconsin (PDPW) Dairy Signal webinar.
“Your dairy has a reputation, and your neighbors and renters look at your operation through a certain lens,” he said. “If they look at you like an environmental steward, you are much more likely to get forgiveness if something goes wrong. You really think about things differently if you keep that in mind.”
Accidents happen
Erb explained that the definition of a spill varies by situation and by state. In some parts of the country, a certain number of gallons lost is considered a spill. Other states, like Wisconsin, take a more pragmatic approach, he said, considering the potential a spill has to impact humans or the environment.
He emphasized that accidental
manure spills happen; tankers tip over and hoses break. Where a farm can get into trouble is when no action is taken to report the spill, document the steps taken, clean up the manure, and restore the area.
“Knowing what you are going to do in this situation is essential,” Erb said. “You have a responsibility to report a spill.”
Erb’s co-presenter, Isaac Ross from the Wisconsin Department of Natural Resources (DNR), agreed.
“Spills do happen,” said the state’s Spills Team Leader. “What we want you to do is have a spill plan in place.”
Assess the scene
Erb and Ross reminded the audience that medical attention takes precedence
if someone was injured in the incident.
“It’s really critical that the safety of employees, and getting medical attention if needed, takes priority,” Erb said. “Once that is addressed, then you are asking how do I control this, and how do I keep the spill from getting bigger?”
Ross agreed with that priority list, sharing his team’s 5 C’s of a manure spill response:
• Caution
• Control
• Contain
• Contact
• Clean up
As part of a spill response plan, Erb said to have necessary contact information handy so that the incident can be properly reported.
22 | Journal of Nutrient Management | May 2021 jofnm.com ON THE MOVE
The best way to deal with a manure spill is to anticipate what could go wrong before it happens and make adjustments to avoid an incident altogether.
“When an accident happens, we don’t think straight,” said Erb. “Have the spill hotline phone number programmed into your cellphone.”
Ross said that most states have some sort of spill response program in place. In Wisconsin, for example, there is a hotline that is staffed 24 hours a day. When someone calls that number, information is gathered and a report is created. That report is sent to the region’s spill coordinator, who will take the next steps as necessary.
Who should make that call? Ross said in Wisconsin, the law reads that the causer, owner, or possessor of the manure needs to report the accident. Erb added that just because a sheriff arrived at the scene does not mean the spill was reported to DNR yet, so be sure to make that call.
Some farms may avoid contacting the DNR or other officials, but the speakers said to not be afraid to report an incident. Erb shared that most farmers who cooperate in reporting and clean up don’t face a financial penalty as long as there isn’t environmental damage.
Ross added, “We (spill response coordinators) exist not to get you in trouble; we exist because accidents happen and we want to help you.”
If you have a spill and take all necessary precautions, he said, that will be saved in your file and help build your reputation. “Spills happen, and it’s not illegal,” he said. “It’s going to be in your favor to work with us.”
Erb agreed, saying, “Being proactive is really key.”
Ross said to err on the side of caution in terms of reporting. Oftentimes, the responsible party may clean up the area and think it is okay, but without calling the DNR or another agency to do an assessment, problems could be revealed down the road.
“Avoiding impacts to the environment, that is going to be our main concern,” Ross said. “Our goal is to make sure that the area is restored to its intended use.”
All manure spills are not created equally. “It’s really important to realize that 5 gallons of manure spilled right next to a trout stream is a much different situation than 500 gallons in the middle of a flat cornfield,” Erb said.
Still, Ross shared that manure is defined as a hazardous substance that has the potential to impact human health or the environment. “All spills need to be cleaned up, no matter how large or how small,” he said.
Use your best judgment
To avoid spills and run off, Erb offered the following pieces of advice.
“You as the farmer know your fields and know the soil. You need to use your best professional judgment,” he said. Sometimes that means applying a lower rate of manure than is stated in the nutrient management plan if there is the potential of runoff due to poor soil conditions or impending rain, for example. “Using your best judgment before
you enter that field is critical,” he said. Again, he encouraged farms to have a spill response plan in place and the spill hotline programmed into a cellphone. Also, be certain employees know what is expected of them in the case of a spill.


“We know accidents will happen. Do your best to prevent that,” he said. Walk around equipment before you load to confirm there aren’t any problems. Make sure employees are empowered to make decisions about application.
In addition, look for risk factors. Erb said 40% to 45% of spills are transportation related. One way to minimize these issues is to lay drag lines out properly so they won’t scrape against a metal culvert or anything sharp that could cause a hole.
Erb said he can often predict when problems with transportation are going to happen. For example, if rain is in the forecast, he said people are more likely to hurry and take mental shortcuts.
“Step back and make sure you are taking the time to do things properly, that you’re not rushing yourself, and that will prevent a lot of these accidental spills,” he said.
“Be prepared when a spill happens, clean it up, and document what you did,” he concluded. Erb said that dairy and livestock farmers have learned that it is better to be proactive in these types of scenarios to aid in clean up and maintain the farm’s reputation as stewards of the environment. ■
jofnm.com May 2021 | Journal of Nutrient Management | 23
intel Sign up for our free e-newsletter at www.hoards.com/intel Breaking news. Industry insight. On-farm stories. sss SUPPLIER FORUM
SUNOVAWORX OFFERS A REMOTE ENGINE CONTROLLER


Broadcaster 1+ was designed with the key features and flexible options of both the Broadcaster 1 and Broadcaster 2, including multiple built-in safety features. The Broadcaster 1+ remote engine controller is a userfriendly, economical system that will simplify and improve your liquid pumping operations.
The Broadcaster 1+ uses cellular communication and supports control and monitoring from around the world. It is designed for use in many applications, including agriculture, irrigation, water transfer, de-watering, series or parallel pump set-ups, and municipal pumping.
One operator can stay in control of single or multi-pump systems, simultaneously, from inside the tractor cab. Cellular towers provide reliable signal around

obstacles between controlled pumps, 24 hours a day and seven days a week, from anywhere in the world. In real-time, the coordinates of each pump can be viewed using GPS tracking. Review and analyze pump performance using the activity log, including inlet/outlet pressure, engine vitals, and more.
If you are pumping in a zone where cellular reception is unavailable, radio communications will keep you connected. Broadcaster radios operate on mesh networking, allowing every radio in the operation to act as a repeater for added redundancy.

The Broadcaster 1+ can improve labor efficiency by reducing the number of people who need to be involved in the pumping operation. It can also be safer,
with better ability to monitor and control the entire pumping operation. For more information, please visit www.sunovaworx. com or call 1-855-386-9679.
FRESH PAINT
eHay WEEKLY Cutting edge, research-based information for livestock producers, custom operators, commercial hay growers, forage consultants, and educators. • Headline news and field reports • Original features • Market insight and crop updates • Event coverage • Direct to your inbox every Tuesday morning Our magazine and e-newsletter are FREE to qualified subscribers! Sign-up is fast and easy at hayandforage.com
PROFESSIONAL DIRECTORY
ANAEROBIC DIGESTER SERVICES
Future Enviroassets LLC
513-349-3844
LF@futureenviroassets.com
www.futureenviroassts.com
ENVIRONMENTAL SOLUTIONS
Agricultural Digesters LLC
88 Holland Lane #302
Williston, VT 05495
802-876-7877
info@AgriculturalDigesters.com
www.AgriculturalDigesters.com
Hall Associates
23 Evergreen Dr. Georgetown, DE 19947-9484 302-855-0723
hallassociates@mediacombb.net
Tomorrow Water
1225 N. Patt St. Anaheim, CA 92801 714-578-0676
info@bkt21.com
tomorrowwater.com
Trident Processes Inc.
1-800-799-3740
frank.engel@tridentprocesses.com www.tridentprocesses.com
COATINGS
Industrial Solutions
5115 S. Rolling Green Ave. Ste. 211 Sioux Falls, SD 57108 605-254-6059
www.isusananoclear.com
PLACES TO BE
WASTE HANDLING EQUIPMENT
R Braun Inc. 209 N. 4th Ave. St. Nazianz, WI 54232 920-773-2143

www.RBrauninc.com
R
Braun Inc.
209 N. 4th Ave. St. Nazianz, WI 54232
920-773-2143
www.RBrauninc.com
Don’t see your company listed? Send your company name, key contact, mailing address, telephone number, email, and website to marketing@jofnm.com with Professional Directory in the subject line.
Due to the COVID-19 health situation, many meetings and events are being rescheduled or canceled. Please visit the listed websites frequently for updates.
World Pork Expo
June 9 to 11, 2021
Des Moines, Iowa
Details: worldpork.org
Iowa Swine Day
June 24, 2021
Ames, Iowa
Details: www.aep.iastate.edu/ iowaswineday
National Pork Industry Conference
July 11 to 14, 2021
Wisconsin Dells, Wis.
Details: porkconference.com
Wisconsin Farm Technology Days
July 20 to 22, 2021
Eau Claire, Wis.
Details: www.wifarmtechdays.org
Empire Farm Days
August 3 to 5, 2021
Pompey, N.Y.
Details: empirefarmdays. leetradeshows.com
Cattle Industry Convention and National Cattlemen’s Beef Association (NCBA) Trade Show

August 10 to 12, 2021
Nashville, Tenn.
Details: convention.ncba.org
U.S. Poultry & Egg Association’s Environmental Management Seminar
September 16 and 17, 2021 Destin, Florida
Details: www.uspoultry.org/ educationprograms
World Dairy Expo
September 28 to October 2, 2021
Madison, Wis.
Details: worlddairyexpo.com
If you would like us to include your event on our list, please send details to info@jofnm.com.
jofnm.com May 2021 | Journal of Nutrient Management | 25 Journal of Nutr ient Management Visit us online at : WWW.JOFNM.COM
THE FUSS OVER PHOSPHORUS
 by Thomas Menke
There was a period of time when phosphorus was rarely a consideration with manure applications — it was all about nitrogen. Now nitrogen is a secondary consideration and phosphorus is paramount.
The Environmental Protection Agency (EPA) was concerned about nitrates in drinking water, so nitrogen rates from manure and biosolids were what controlled application rates. Yes, phosphorus created nuisance issues in lakes because it was typically a first-limiting factor to algal growth. A little in the water caused a bloom and interfered with boating and fishing. With a crack down on phosphorus being discharged through National Pollutant Discharge Elimination System (NPDES) permits and the arrival of no-till farming over 30 years ago, we thought we saved the lake!
Our victory was short-lived, though. No-till greatly reduced soil erosion, and as a result, phosphorus attached to soil particles. Now a new form of phosphorus emerged as the real problem: soluble phosphorus. Along with that came the HABs — toxic harmful algal blooms. This took place just when we thought it was safe to go back into the water.
Setting an upper limit
Apparently, algae like soluble nutrients, just like corn does. And since nitrogen and potassium are very soluble, they are found in most agricultural stream and lake waters. Since phosphorus is generally not very soluble, a
little makes a big difference. Based on studies done on Michigan soils, it was determined many years ago that soil test levels of 150 parts per million (ppm) or higher (Bray P1 test method) provided a critical level of soluble phosphorus in runoff water.
The race was on for each state to get in line to adopt this nice, round number as their upper limit for soil test phosphorus that would impact water quality. Some states approached it more thoughtfully and came up with different numbers and even more scientific ways to predict soluble phosphorus leaking from fields.
But, at the end of the day, governments like to think and express regulations in simple terms, so having a “number” won out. Most agronomists and water quality specialists know it is not that simple.
There are many variables
Now it is our job to help farmers navigate the phosphorus issue. And it couldn’t be more confusing: What’s the difference between phosphorus (P) and phosphate (P 2O5)? Or parts per million and pounds per acre?
Are my phosphorus levels too high — and by whose standards? When am I allowed to put manure on this field? What do these Bray P1 results mean, or what is the Mehlich III test method? Or what about Morgan or Olsen phosphorus tests? Is manure phosphorus as available as fertilizer phosphorus?
There is not enough space to answer these questions here, but just know
that it is critical to understand how phosphorus is being reported (units and form) on your soil test report and the test method used. In addition, you need to know if the actual test method is reported, or if it is a calculated “equivalent.” For example, some soil test laboratories will run the Mehlich III extraction method, multiply it by 0.7, and report it as a Bray P1 value.
As I mentioned in my previous article in the February 2021 issue, phosphorus in manure is much less soluble than that in fertilizers. Yet, it is very available to the plant due to the organic matrix that is broken down by soil microbes to release phosphorus when plants need it. So, I’ll go on record by saying that replacing chemical phosphorus with manure phosphorus will be a benefit to water quality.
Unfortunately, there appear to be larger forces at work that are frustrating our efforts to limit phosphorus from entering surface waters. Some of those being implicated are from the techniques that worked to our benefit not that many years ago.
Multiple studies document the surface accumulation of phosphorus under longterm no-till conditions. This environment is created from surface fertilizer (or manure) applications and from the residue itself that breaks down and releases soluble phosphorus. The same is being seen from killed cover crops releasing the nutrient.
The other situation that came with the no-till farming boom was the broad use of glyphosate herbicides. Suffice it to say, there are interesting research articles concerning glyphosate’s impact on populations of harmful algae species. By understanding these phosphorus relationships, methods, and terminologies, we can manage them. At the same time, we will become better stewards of the environment. ■
26 | Journal of Nutrient Management | May 2021 jofnm.com
NUTRIENT INSIGHTS
The author is the president of Menke Consulting LLC, an agronomic and environmental consulting firm in Greenville, Ohio.
REGISTER NOW AT WORLDPORK.ORG #WPX21 Home of the industry’s best innovation, education and networking. Brought to you by June 9-11 DES MOINES, IA where old friends and the next best thing


INVEST IN QUALITY ® www.kuhn.com Visit our website today to locate a Dealer near you! Reliable flow to discharge provides more consistent, even spreading Exclusive twin-auger design eliminates material bridging Versatile to handle the widest variety of wet and dry materials Heavy-duty drive extends service intervals to save time and money 1,000 - 2,400 gallon capacities • trailer models • side-discharge SL 100 SERIES PROTWIN® SLINGER® Adjustable hammer shroud for faster and more consistent spreading Proven, twin-auger design eliminates material bridging Optional scales for precise monitoring and nutrient tracking Fully enclosed, heavy-duty oil bath drive for low maintenance and long life 2,600 - 5,000 gallon capacities • side-discharge • truck & trailer models Commercial Manure Spreaders SLC 100 SERIES PROTWIN® SLINGER® Manure Spreaders
IN
SPREADERS Over 30 Years Experience From solids to slurry, spread the widest variety of materials. VERSATILE. EFFICIENT. RELIABLE.
LEADER
SIDE-DISCHARGE
