Journal of Nutrient Management (ISSN# 2690-2516) is published four times annually in February, May, August, and November by W.D. Hoard & Sons Company, 28 Milwaukee Ave. West, Fort Atkinson, Wisconsin 53538 Tel: (920) 563-5551. Email: info@jofnm.com Website: www.jofnm.com. Postmaster: Send address corrections to: Journal of Nutrient Management, PO Box 801, Fort Atkinson, Wisconsin 53538-0801. Tel: (920) 563-5551. Email: info@jofnm.com. Subscription Rates: Free and controlled circulation to qualified subscribers. For Subscriber Services contact: Journal of Nutrient Management, PO Box 801, Fort Atkinson, Wisconsin 53538, call (920) 5635551, Email: info@jofnm.com.
Ihad the privilege of writing a story about a man who lived through an experience that nearly killed him. After an out-patient surgical procedure on his knee, John was discharged from the hospital late that night. He was only home about an hour when his femoral artery burst. When that happens, it is only a matter of minutes before a person loses too much blood to survive.
That same evening, close to midnight, a local police officer’s shift had technically ended, but he was still out wrapping up an assignment. As he drove back to the police station, he heard a 9-1-1 call come in for someone who was bleeding. By sheer luck, Officer Jay was just blocks away, so he rushed over to the house and found a dire situation. With the help of John’s wife, Judy, he was able to apply a tourniquet and use pressure to stop the bleeding. An ambulance arrived a few minutes later and transported John to the hospital. When it was all said and done, he had lost about 22% of his blood, and if the bleeding had continued much longer, John would not be here to tell this story.
Officer Jay was off duty and didn’t have to respond that night, but he did — and his actions saved another person’s life. I got to speak with Officer Jay as well, and while he was relieved he was there to help John, he humbly said he was just doing his job.
John also had a career focused on helping others as a therapist. Now in retirement, he volunteers his time with a hospice care program, visiting patients and their families in their most vulnerable moments.
I wrapped up this conversation in awe, of both Officer Jay’s quick thinking and selfless commitment to helping others and of John’s career dedicated to serving people, and his spirit for volunteerism. It made me wonder if I would ever have such a profound impact on people’s lives, and I said something to that effect to John as I thanked him for his commitment to others. He reminded me that there are opportunities to make big impacts in people’s lives, but they don’t have to be big moments or big gestures. Every interaction
we have with people — from our family members to co-workers to that stranger in the checkout line — can change their day, their week, or even more. How we treat people matters. The little things matter, he said.
That got me thinking about careers in agriculture. All of you who are farming, doing research for farmers, or supporting farmers in some way — you are working in a career that sustains life. You are producing the food that people need to live. That’s a big job and a big responsibility with a big impact.
But feeding the world does not happen overnight. It is a combination of steps, actions, and decisions that are made day after day and year after year. Big or small — they all matter in some way.
Looking more specifically at manure, improving the way we handle this valuable by-product and manage other nutrients on the farm is another long-term commitment. Every positive change made is a step in the right direction, from using cover crops to adding processing technology, to protecting biosecurity when transporting manure, as discussed on page 24. When added together, we can make the most of manure and our stewardship of the land, but each piece is an important part of the bigger puzzle.
John was filled with gratitude for Officer Jay being in the right place at the right time that terrifying night, and he was thankful I put his experience down on paper to share with others. His message is one of service, timing, appreciation, and a reminder that little actions can have a big impact. I was grateful for the opportunity to meet John and Jay and hear this story firsthand. And now I am pleased I can share it with you. This is your reminder that even the smallest of actions, on the farm or in your personal life, have the potential to positively impact others.
Until next time, Abby
Let us know your thoughts. Write Managing Editor Abby Bauer, 28 Milwaukee Ave. West, P.O. Box 801, Fort Atkinson, WI 53538; call: 920-563-5551; or email: info@jofnm.com.
POLICY WATCH
TEXAS
A law recently signed by Texas Governor Greg Abbott prohibits the siting of commercial composting facilities in any county that does not have a commercial organics diversion ordinance. Such facilities include those that accept sourceseparated yard trimmings, clean wood material, vegetative material, paper, manure, meat, fish, dead animal carcasses, dairy materials, or meat and vegetable oils and greases from a municipal, commercial, or institutional source.
The bill comes after months of public backlash against a proposed compost facility in Lee County The law does not apply to agricultural operations or composting facilities approved by the Texas Commission on Environmental Quality before January 1, 2025. It goes into effect in September.
NORTH CAROLINA
North Carolina Governor Josh Stein vetoed legislation that aimed to eliminate an interim greenhouse gas reduction mandate set in a 2021 law. He argued the bill would have discouraged diverse energy sources and negatively impacted consumers.
The law requires that electric regulators take all reasonable steps to reduce carbon dioxide output 70% from 2005 levels by 2030. A directive in the 2021 law to meet a carbon neutrality standard by 2050 remains in place. Critics of the legislation who want cleaner energy sources sooner encouraged the governor to veto the bill.
NEW YORK
A proposed bill in New York would prohibit the Department of Environmental Conservation from issuing permits for new or expanding concentrated animal feeding operations (CAFOs). New York is currently home to around 500 CAFOs, most of which are dairy operations.
Opponents of the bill say it will stifle growth and development in the state’s dairy industry, which ranks fifth in the nation in terms of milk production. The bill is currently being discussed in the Assembly and Senate Environmental Conservation committees.
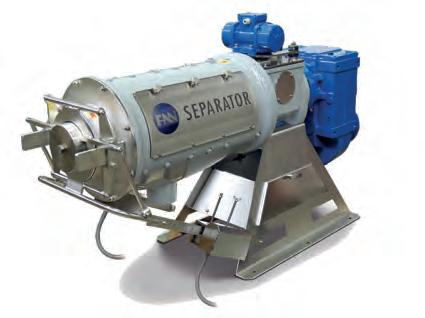
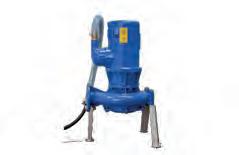
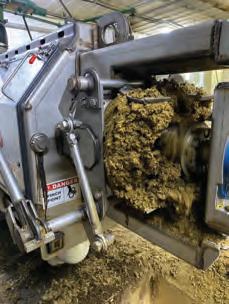
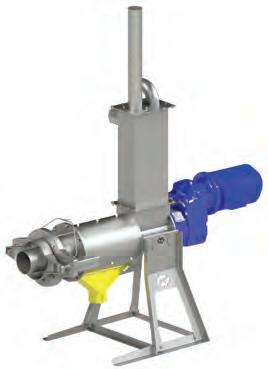
THE INNOVATIVE BIOSELECT FOR EFFICIENT MANURE SEPARATION.
UNITED STATES
President Donald Trump signed into law the “One Big Beautiful Bill” on July 4. The bill included several agricultural aspects, such as the extension of the Clean Fuel Production Credit (45Z) through 2029. The credit supports the production of low-emission transportation fuels, such as ethanol, biodiesel, renewable diesel, and sustainable aviation fuel.
Originally created by the Inflation Reduction Act in 2022, the provision prevents the credit from being used for fuels produced by feedstock sources outside of North America. The changes support agricultural feedstocks, including corn and soybeans, while reducing the nation’s reliance on fossil fuels.
FEATURES:
+ Low Life-Cycle Costs
+ Turnkey from a Single Source: Separator Pump(s)
Control Unit
Stationary or Mobile Skids
+ Large Capacities
+ Patented Profile Auger with Counter Bearing for No Auger Screen Contact
+ Continuously Variable Dry Matter Content
844-647-7867 | www.boerger.com
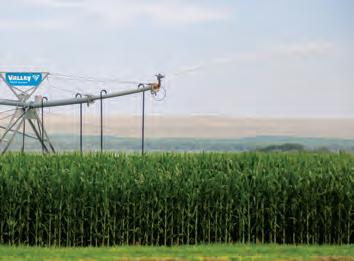
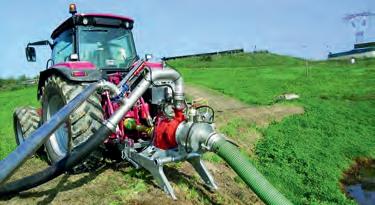
HOW MUCH NITROGEN IS IN IRRIGATION WATER?
Accounting for nitrogen in irrigation water offers an opportunity to optimize nitrogen use to crop needs and minimize nitrogen leaching to groundwater, particularly in well-drained soils.
by Guolong Liang
Have you ever wondered if there is nitrate in your irrigation water?
Irrigation is used to grow specialty crops as well as commodity crops such as field corn, soybeans, and alfalfa. Yet, nitrogen in irrigation is often overlooked as a nitrogen input. In this article, we will discuss the presence of nitrate in irrigation water and opportunities to budget for nitrogen in irrigation to improve nitrogen use efficiency.
Consider what’s available
Nitrogen is present in groundwater mostly as nitrate (NO3). Nitrate-N in groundwater re-enters the nitrogen cycle in irrigated fields through irrigation. In Figure 1, irrigation nitrogen, like other nitrogen inputs (nitrogen from fertilizer and manure), can add nitrogen to the soil nitrogen pool.
In 2020, a survey of six farms in the Wisconsin Central Sands region conducted by Chris Kucharik and Tracy Campbell from the Department of Agronomy at the University of Wisconsin-Madison found NO3-N levels ranging from 4 to 45 mg/L in irrigation wells. The level of nitrogen from the same wells was relatively stable year to year, even though it can vary from well to well. To determine nitrogen levels in your irrigation water, test different wells annually.
Crunch the numbers
You can calculate the amount of nitrogen from irrigation through the following formula:
Irrigation N (lb. N/acre) = Irrigation amount (inches) * Irrigation water NO3-N concentration * 0.23 (mg/L)
For every inch of irrigation water containing 10 mg per liter of NO3 -N, 2.3 pounds of nitrogen per acre is added through irrigation. The amount of irrigation nitrogen varies across wells with different nitrate-N levels and crops with different water needs. The table presents nitrogen applied through irrigation from various rates on irrigated corn.
Consider that nitrogen from irrigation can enhance crop uptake efficiency. In
a dry year, close to 80 pounds of nitrogen may be applied through high-nitrate irrigation water on cornfields in this scenario. Ignoring this nitrogen source when estimating total nutrient supply can lead to over-fertilization, increasing the risk of groundwater contamination and reducing profitability as excess nitrogen is likely to leach into the groundwater.
Look for opportunities to credit The following example highlights corn production on coarse-textured
Figure 1. The nitrogen cycle in an irrigated cropping system
Adapted from “The nitrogen cycle for general cropping systems” by the Nutrient and Pest Management Program at the University of Wisconsin-Madison.
soils in Wisconsin, where irrigation water contains elevated levels of NO3 -nitrogen. It demonstrates how to account for nitrogen from irrigation and use that information to adjust nutrient applications effectively.
Figure 2 presents the irrigation amount and the corresponding nitrogen applied through irrigation on a sandy cornfield. In this case, the field received irrigation every three to four days from mid-June through harvest, averaging 1.7 pounds of nitrogen per acre per application. Over the season, 78 pounds of nitrogen were applied through 17 inches of irrigation water, with a nitrate concentration of 20 mg per liter.
Keep in mind that irrigation nitrogen can vary significantly with weather. In
of irrigation nitrogen. In drier years, when irrigation ramps up, it’s critical to account for the nitrogen it contributes. Adjusting in-season fertilizer rates based on nitrogen already applied through irrigation helps crops reach optimal growth with fewer inputs. This not
Incorporating irrigation-derived nitrogen into nutrient management plans requires further research. We need to better understand how much credit irrigation nitrogen provides across different crops and soil types, such as potatoes and corn in the Wisconsin Central Sands region. Still, the approach outlined here offers two practical applications:
1. In-season: Adjust fertilizer rates based on nitrogen already supplied through irrigation.
2. Off-season: Use irrigation nitrogen data as a hindcasting tool to evaluate total nitrogen use.
For many growers, considering nitrogen addition from irrigation is a new concept. It’s important to be aware that fertility doesn’t just come from fertilizer bags. It may also come from the water
continued on following page >>>
SIDE-SHOOTER BUCKET
Spreads sand or sawdust into freestalls.
FEED ALLEY SCRAPER
Keeps feed close to the cows. Rubber blade outlasts steel blades. Less vibration.
FLUFFER
Aerates and levels bedding for maximum cow comfort and safety.
EXPANDABLE SCRAPER
Adjusts to the full alley width, reducing the number of passes needed to clean the alley.
TIRE SCRAPER
Cleans like a squeegee in just one pass. These rubber tire scrapers are built to last!
Figure 2. Nitrogen supplied via irrigation throughout the growing season
Irrigation (in)
Cumulative irrigation N input (lb. N/acre)
Irrigation and rainfall amount on a cornfield in 2023 in central Wisconsin (loamy sand soil). The orange line shows cumulative nitrogen from irrigation, while the blue bars represent irrigation amount applied throughout the season.
TAKEAWAYS:
• Test nitrate concentration in water from each irrigation well: To accurately quantify
Learn more about nitrogen in irrigation water at the Ag Water Program’s website: bit.ly/Ninirrigationwater.
TARIFFS MAY IMPACT FERTILIZERS
When the dust settles and final tariff rates are announced for various trade partners, prices could rise for imported products. For farmers, one area to watch is fertilizer.
The U.S. is not particularly reliant on imports of nitrogen and phosphorus. A University of Illinois farmdoc Daily article indicated that 6% to 13% of nitrogen needs and 6% to 20% of phosphorus needs have been imported since 2020.
Potassium is a different story. According to the National Minerals Information Center of the United States Geological Survey, potassium imports accounted for more than 90% of the nation’s needs by volume since 2020. Canada is the global leader in potash production, and over the last five years, the U.S. sourced more than 80% of its potash from Canada.
Restrictions are not always setbacks
Restriction maps serve several purposes.
Nby Scott Fleming
utrient management planning takes place on every farm — whether owners and managers specifically cite it as such or not. Like most things in this world, restrictions are a key component of the process. Specific protocols vary from state to state or even across counties due to locality-based needs and concerns, but the basic tenet of planning remains the same: limit the risk of nutrient delivery into water. One of the best ways to do this is with help from restriction maps.
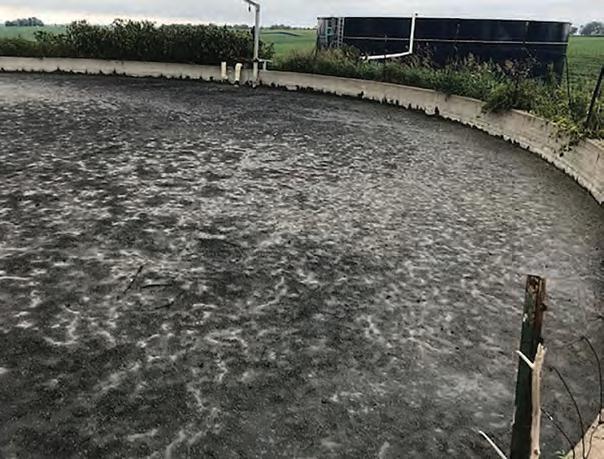
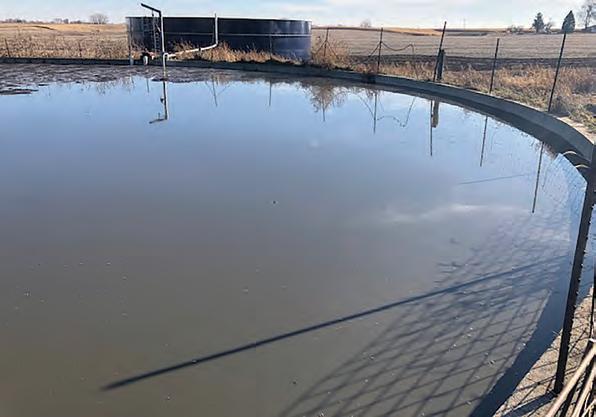
The most straightforward of all nutrient management planning constraints are those you can see. In a brief survey of U.S.-based restrictions, some sort of surface water setback was present in all regulations. Surface waters that clearly demand restrictions include lakes, ponds, rivers, and streams. But some states have enacted restrictions for surface waters not typically categorized as such. These may include drainage and irrigation ditches, intermittent streams, or grassed waterways. After all, these waterways may not always contain water, but they are the first point of entry for any precipitation into a navigable waterway.
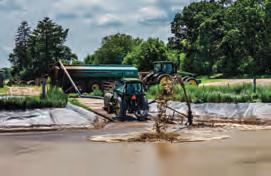
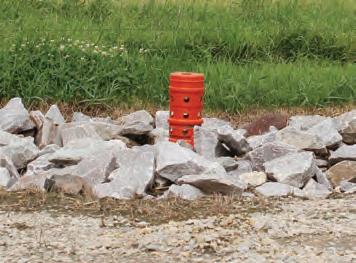
The next landscape restriction class is visible but with features often hiding in plain sight. These direct conduits to groundwater give contaminants a shorter path into the groundwater aquifer. Many of these paths are man-made, including drinking water wells, irrigation wells, oil or gas wells, and gravel pits. One that may slip under the radar is drain tile surface inlets. These inlets are designed to quickly remove ponded water from a low area and drain it underground through the tile drainage system. This water drainage shortcut may remove standing water quickly, but it also acts as an alternate route for nutrients and pathogens into ground or surface water.
Sinkholes are not common in the U.S., but they pose major challenges for some producers as a direct route to groundwa-
ter. Sinkholes are generally formed when limestone bedrock is dissolved by water. Since rainwater is slightly acidic, the water will slowly dissolve the bedrock, leaving a void beneath the soil surface. If the roof of the resulting cave is not strong enough, it will slowly or suddenly collapse, resulting in a sinkhole.
Out of sight
The next restriction category is one we cannot see: soil. Soil is one of the most limiting and restrictive features on a farm. Soil has three restrictions that can cause nutrient application challenges — all of which are in place to limit the risk of nutrients, namely nitrogen, to groundwater.
First up is bedrock. If bedrock is located too close to the soil surface, manure may not be applied. As with all nutrient management-related restrictions, the subtle nuances of the rule vary from state to state. In the case of Wisconsin, this restriction even varies depending on the type of bedrock. Generally, application is greatly restricted or prohibited if soil is less than 2 feet deep. Depth of groundwater is the distance from the soil surface to the water table. In the eastern U.S., the depth to groundwater parameter is more likely to be called “frequently flooded soils,” but the outcome is the same. The soil is likely wet too close to the point of application. When manure is applied near a
shallow water table, nitrates are more likely to reach groundwater.
Soil permeability can also complicate application. A measure of how fast water moves through soil, permeability causes groundwater issues when water flows through soil before the growing crop has a chance to capture the nutrients. When manure is applied in the fall on permeable soil, the water captures and transports the dissolved nitrate on its way to the water table — before the plants ever have a chance to use it. Finer-textured soils like silt loams would have a slower infiltration rate than coarser-textured
soils such as sandy loams. Heavy soils are generally not subject to any fall permeability-related restrictions, whereas light soils almost always face regulation.
Know the rules
Understanding the restrictions for your locality is the first step to compliant and environmentally-sound nutrient applications. Generally, application restraints are broken into three categories:
1. Spreading prohibited
2. Rate or incorporation restrictions
3. Seasonal restrictions
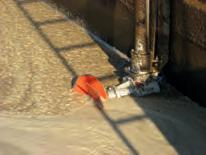
While spreading prohibited seems
A drain tile surface inlet to remove ponded water from fields quickly.
obvious, the others have some bumpers to help guide manure applications. Rate restrictions curb applications to a specific gallons-per-acre rate, while incorporation restrictions stipulate that you can apply, but they require injection or incorporation. Seasonal restraints allow you to apply manure, but only after a specific date or below a specific soil temperature. Nutrient management restrictions are very state-specific, so always look up your state’s guidelines. Surface water regulations are similar, yet diverse, throughout the world. There is generally a form of mandatory setback. For instance, in Nebraska, manure may not be applied within 100 feet of surface water. If a permanent vegetative buffer is used, manure can be applied up to 35 feet from surface water. Maryland has a 10-foot setback if injecting manure but a 35-foot setback when broadcasting manure. Heading up the coast to Vermont, rules change. All fields must have
a 25-foot buffer from adjoining surface waters, but only a 10-foot buffer from ditches. In Wisconsin, there is a 50-foot prohibition from any surface water, but there are incorporation and rate-related restrictions within 300 feet of a stream and 1,000 feet of a lake or pond.
Direct conduits have similar constraints to surface water. In fact, the Nebraska regulations call for the same setbacks from almost all surface and groundwater resources. In Pennsylvania, the private drinking water well setback is 100 feet. Municipal wells have a greater risk of contamination and tend to have a greater setback requirement, almost universally.
Generally, permeable or wet soil types have a rate restriction, if not prohibition, when it comes to fall manure application. There could be additional timing or soil temperature requirements. All these rules and guides are in place to reduce the risk of nitrates moving through the
soil. When soil temperatures are low, nitrate is bound more tightly to soil, limiting the risk of nitrate moving through the rooting zone and into the groundwater. As previously stated, when depth to bedrock is involved, there is generally a moratorium on nutrient application if the bedrock is found within a certain depth.
Restriction maps are a vital part of safely spreading manure. While the finer details may fluctuate state to state, the heart of these tools remains the same. These maps exist to help locate the areas that may lose manure nutrients to the environment. After all, manure is a valuable commodity, and using these maps above and beyond their intended purpose will help extend fertilizer dollars.
The author is a nutrient management specialist and sampling director at Rock River Laboratory in Watertown, Wis.
Less leaching with covers
Cover crops have benefited soils for generations, and in today’s world, they can play an important role in minimizing nutrient losses.
by Rhonda Miller
Cover crops have been around for millennia. Many ancient civilizations, including those in Greece, Rome, and China, recognized that cover crops and crop rotations with legumes could improve soil fertility and prevent erosion.
In the U.S., cover crops were common until the 1950s. Nutrients were often limited, and leguminous cover crops were one of the primary ways to add nitrogen to the soil. Cover crops were also used to help prevent erosion
and suppress weed growth. In addition, cover crops improved the soil structure and organic matter content of the soil.
Before the development of synthetic fertilizers, cover crops and crop rotations were critical components of main-
taining soil health and a productive cropping system. The development of synthetic fertilizers, partnered with the advent of the Green Revolution in the late 1950s, shifted the focus toward monoculture farming and away from crop rotations. This ultimately led to a decline in cover crop use.
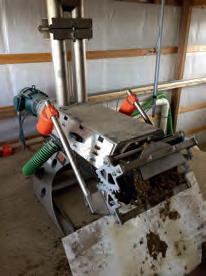
We are now beginning to realize that the organic matter content of the soil and soil health often decline when only syn-
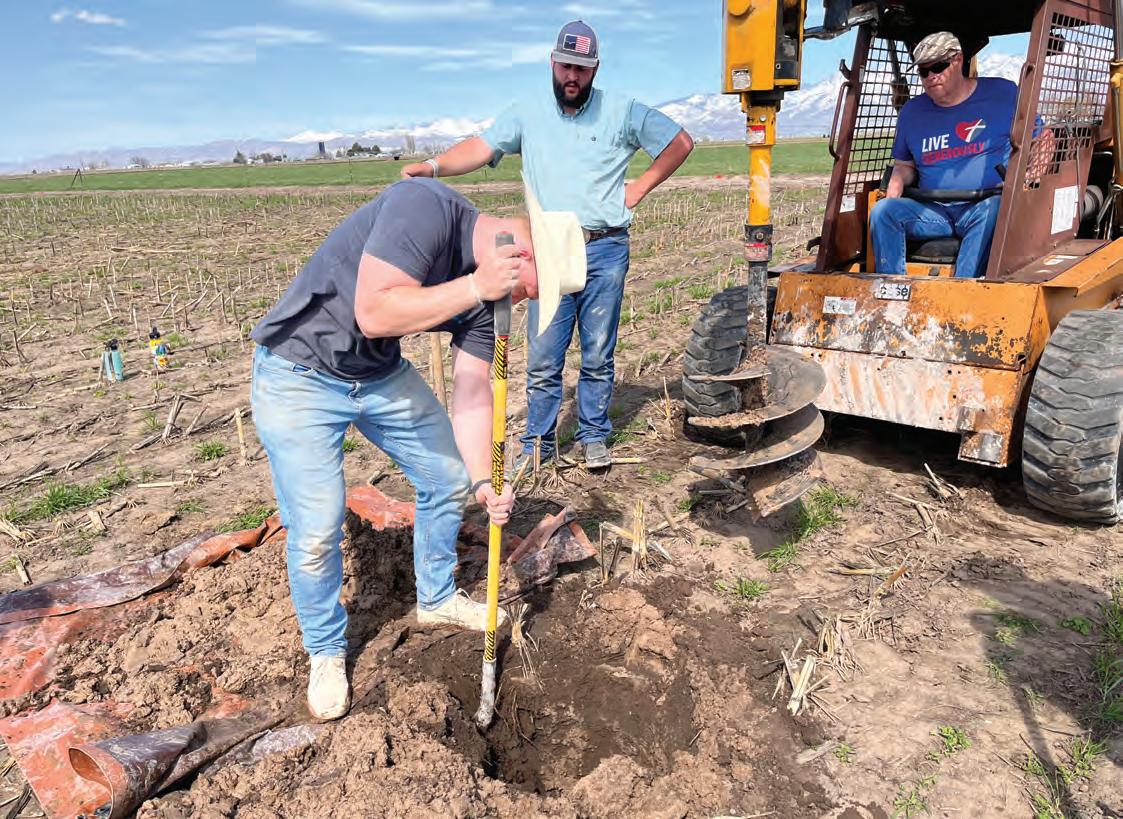
Installing a mini zero-tension lysimeter.
thetic fertilizers are used. Cover crops can address some of these limitations. The value of a cover
Cover crops offer numerous benefits such as reducing runoff, preventing erosion, increasing soil organic carbon (SOC) content, and contributing organic matter to the soil. By improving the water and nutrient holding capacity of the soil, cover crops can help make plants more resilient, which will help improve yields. Additionally, cover crops can be a good forage source for livestock. The use of cover crops in crop production has also been shown to reduce nutrient leaching. By boosting the water and nutrient holding capacity of the soil, more nutrients can be retained, giving plants a chance to intercept and utilize the nutrients. The additional roots and microbes present from a cover crop can also capture nutrients, retain them, and then release them later. Cover crops that are mixtures of several plant types will support multiple types of microbes, which can further help reduce nutrient loss.
Reducing nutrient loss helps improve yields, reduce fertilizer costs, and minimize off-target effects to the environment.
Consider the elements
Recent Utah State University surveys reported that although nearly 50% of Utah producers think cover crops can be beneficial, and they may use them at some point in the future, current adoption rates are modest. Much of that is likely due to skepticism as to whether or not cover crops will actually work in Utah. A relatively short growing season, limited water quantities, timing of when water is available, and a lack of local studies showing applicability in the Intermountain West create uncertainties.
Most of the information on cover crops comes from other regions in the U.S. where there is more precipitation, a longer growing season, and different cropping systems than what is found in Utah. A common crop rotation utilized in Utah is alfalfa for five to seven years, followed by corn silage, and then wheat before the new alfalfa crop is planted.
This crop rotation returns little residue to the soil, so the addition of cover crops would be beneficial.
One of the biggest issues in the Intermountain West is the lack of water. Rainfall is limited with most precipitation falling during the winter months. Our irrigation water primarily comes from snow melt that is captured in reservoirs. Canal companies release water during the main portion of the growing season, but irrigation water is often not available early in the spring and much of the fall. Both the relatively short growing season and the limited water availability in the fall pose a problem when trying to establish cover crops.
One way to address some of these limitations is to interseed the cover crop while the corn is at the V3 to V5 stage. The goal is to minimize the ability of the cover crop to negatively impact corn establishment and growth while also getting the cover crop established before the corn canopies over and blocks direct sunlight. By interseeding early in the season,
the cover crop is established when water is available, and it gives the cover crop a jump start for growth once the corn crop is harvested.
The biggest drawback to interseeding at the V3 to V5 stage is that there is a narrow window for getting the cover crop planted. Interseeding past the V5 stage can result in severe damage to the corn crop.
Select cover crops for interseeding based on their ability to grow underneath a corn canopy. In Utah, we are typically using a cover crop that is a mixture of a cereal crop or annual ryegrass, a vetch or legume, and a brassica such as radish. There is typically no yield loss when a cover crop is interseeded.
Aiming to minimize losses
Nitrogen (N) is of greatest concern when it comes to nutrient losses from
fertilizer and manure, although phosphorus can also create problems. Nutrients lost through leaching and volatilization are an economic loss for producers and an environmental concern.
Nutrients that get into our surface water sources often result in eutrophication and fish kills. Harmful algal blooms (HABs) are becoming a bigger issue, impacting recreational areas, human health, pets, and livestock.
Nutrient leaching of fertilizers can contribute to groundwater contamination. More and more wells now exceed the U.S. drinking water standard of 10 parts per million (ppm) nitrate-N. High nitrates in drinking water can impact human and animal health, resulting in blue baby syndrome and spontaneous livestock abortions. Even more concerning is the strong correlation between high nitrate levels in the drinking
water and the occurrence of multiple pediatric cancers, including brain and central nervous system cancers.
To improve the adoption of soil health practices in Utah, a study funded by a Natural Resource Conservation Service (NRCS) Conservation Innovation Grant (CIG) is underway. This statewide study examines soil health at 17 farms that are incorporating various soil health practices and comparing them to the standard practices used on their farms.
At two of the locations in northern Utah, mini zero-tension lysimeters (12-inch diameter) were installed below the root zone to collect leachate (see photo). PEX tubing was buried from the lysimeter to an access point at the edge of the field. Planting and tillage can take place over the lysimeters. Both farms have a sandy loam
Figure 2. Nutrient leaching on Farm GS in 2023 and 2024
soil, apply manure, and are incorporating cover crops as their soil health treatment. The water table is only 3 to 5 feet below the soil surface.
Leachate is collected bi-weekly throughout the growing season, and as late as possible in the winter. Leachate samples are analyzed for available nitrogen and dissolved phosphorus. Deep soil cores are also being collected to a depth of 5 feet and will be analyzed for available nitrogen and phosphorus. Other scientists are examining various soil health metrics, such as bulk density, soil carbon tests, and water infiltration.
In 2023, both farms, which we will refer to as Farm GS and Farm JC, planted silage corn and interseeded a cover crop (a rye, vetch, and brassica mix) at the V5 stage. Due to the short growing season, cover crop establishment early in the season is needed to get adequate cover crop growth in the fall. Both Farm GS and Farm JC exhibited similar results, producing less leachate with a lower nitrate
concentration under the cover crop. The total nitrate lost due to leaching under the cover crop treatment was about half that compared to the conventional (no cover crop) treatment for both farms (Figure 1).
In 2024, Farm GS began transitioning to alfalfa. Oats were planted in the spring and terminated for a late summer or early fall alfalfa planting. No cover crop was planted into the oats as there was plenty of volunteer cover crop. A three-way grass mixture will be interseeded into alfalfa in 2025 for the soil health treatment. Nutrient leaching was less overall than in 2023, but the results were similar in that leaching was reduced significantly (about 40%) when a cover crop was used (Figure 2). Farm JC planted silage corn in 2024 but missed the window for getting the cover crop planted so there was no cover crop treatment, and no differences were found between the two treatments.
On both farms, the leachate (on average) exceeded the drinking water
standard for nitrate concentration even with the cover crop. The application of manure in the spring on a sandy loam soil likely contributed to this result.
In both 2023 and 2024, when a cover crop was utilized, the total nitrate lost due to leaching was approximately half that of the conventional (no cover crop) treatment with no reduction in yield. This indicates that the cover crop was able to use excess nitrate and possibly improve fertilizer nitrogen use efficiency in silage corn production, without harming silage corn yield.
This study will continue for three more years. The goal is to verify and demonstrate practices that improve soil health and minimize environmental impacts. ■
A CERTIFICATION COOKIE CUTTER DOESN’T EXIST
The who, what, when, and where of manure handler certification varies widely from state to state.
by Robert Meinen
Proper handling of manure nutrients is essential to help maximize its agronomic and economic value. To safeguard against nutrient losses, many states have implemented certification programs for manure handlers, which are aimed at teaching principles that minimize environmental risks associated with nitrogen and phosphorus loss.
A research team recently developed a survey that was distributed to agency and university employees across the United States. The survey gathered information on manure handling certification programs and was completed by professionals in all 50 states.
Breaking it down
Upon review of information obtained from survey responses, state-level certification was characterized for three levels of manure handlers:
1. Producers (farmers) that land apply their own manure.
2. Professional manure applicators and transporters that perform manure handling and application services on a for-hire basis.
3. Manure brokers who assume ownership of the manure exported from a farm and determine the end use of that manure.
Certification for all three levels was categorized as mandatory or voluntary depending on state requirements.
Certification of producers, professional manure haulers, and manure brokers was available in 26 states; however, program parameters varied widely
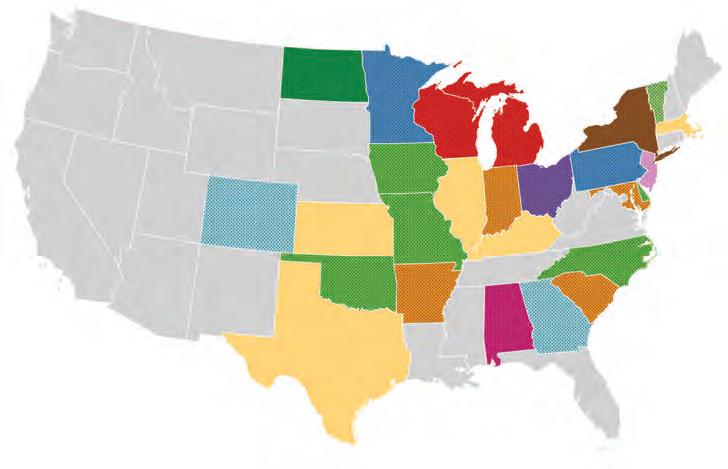
Color of the state corresponds to rows in Table 1 where certification levels and categories are described. Gray states do not have certification programs.
among states. Twenty-one states had certification programs for producers, with 15 of those having mandatory producer certification. Twenty states had professional applicator programs, with 13 of those being mandatory. Ten states had broker certification, and seven of those were mandatory programs. All states with manure broker certification also provided professional applicator certification, with three of them having volunteer producer certification programs as well.
Table 1 provides level and category
information for the 26 states where certification programs were found. Row colors in Table 1 correspond to the coloring of states in Figure 1, which maps the 26 states that have certification programs.
Variation all around
While states initiate manure certification programs to assist with water quality goals, Table 1 and Figure 1 demonstrate the wide range of approaches among states. States with certification programs have advanced animal industries, and many of the
Figure 1. Manure handler certification programs by state
leading poultry and swine producing states have certification programs.
Certification is generally lacking in Western states. Another group of states without certification appears as an arc from Louisiana to Virginia. No apparent geographic pattern emerges in state-level approach between certification levels and categories of state-level certification programs, as evident by only occasional colors that share a border in the figure.
Inconsistencies in certification requirements highlights that states develop certification program policies, levels, and categories on an individual basis. These programs are most likely in response to regional animal density, nutrient imbalances, and water quality concerns.
While focusing programs on state needs has benefits, states should work together to ensure certification reciprocity and minimize paperwork to encourage manure nutrient movement across borders. Moving manure across state lines can assist in watershed goals by transporting surplus nutrients to areas where manure nutrients can replace fertilizers. Stripping down transfer barriers can encourage concepts of manureshed management and bolster nutrient use efficiencies while still allowing for certification programs that meet each state’s needs. ■
The author is director of the Pennsylvania Nutrient Management Education Program and a Penn State extension specialist in nutrient and manure management.
■ The research team consisted of K. Colton Flynn, Jenifer L. Yost, and Sheri Spiegal, USDA Agriculture Research Service; Kevin Erb, University of Wisconsin; Mirai Inaoka, University of Illinois Urbana-Champaign; and Robert J. Meinen, Penn State University.
Table 1. Manure handler certification level and category for states with
certification programs
Survey results of manure handler certification level (farmers, applicators, and brokers) and category (volunteer and mandatory) for states with certification programs. States reporting no certification programs were omitted from the table. Columns were sorted by level and category before sorting alphabetically by state. Rows with same coloring have the same certification level and category. Row color corresponds to like colors of states in Figure 1.
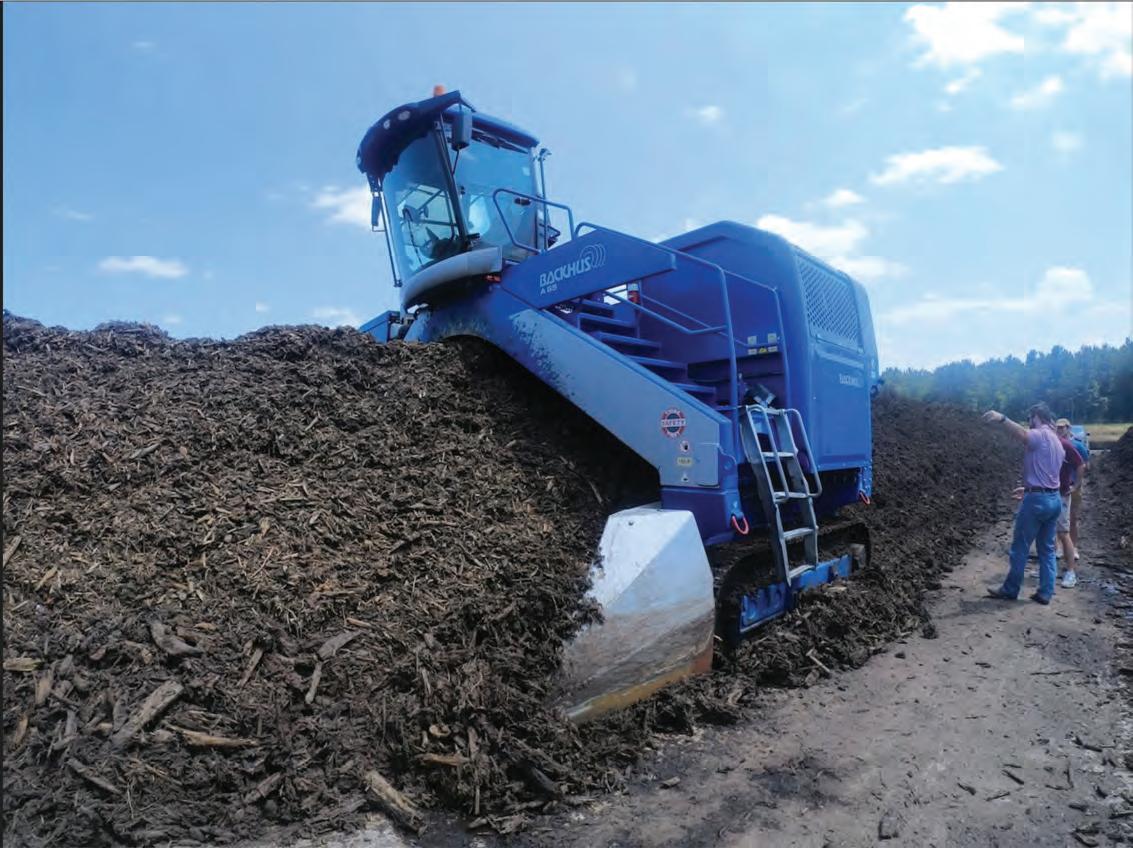
Puzzle pieces of the compost supply chain
This analysis looked at factors that influence dairy manure compost in one region of the United States.
by Pat Hatzenbuehler, Srijan Budhathoki, Mario de Haro-Martí, and Anthony Simerlink
The dairy industries in the Pacific Northwest (PNW) states of Idaho, Oregon, and Washington have similarities and differences that allow for comparison of characteristics. Data from the U.S. Department of Agriculture (USDA) on cash receipts from dairy product sales show that the dairy industries in each state experienced growth between 2008 and 2023. However, Idaho has the largest dairy industry among the states and experienced the most growth over this period.
Common crops in dairy rations such as alfalfa and corn silage are grown in
all PNW states, but there are differences regarding where such cropland is located and its proximity to dairy operations. While there are regions, especially near state border lines, with similar climates and ecosystems, there are substantial differences across and within PNW states regarding land composition, including characteristics such as elevation and the presence of forests. Because of these similarities and differences in cropland and other natural resource characteristics, there is opportunity to learn from experiences in each of the three PNW states regarding how challenges are being managed.
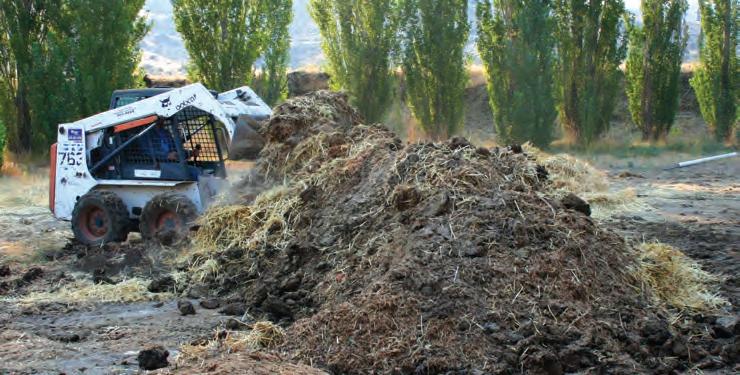
A common hurdle
A key issue facing the dairy industry in all PNW states is the management of dairy manure. A common practice employed by dairies and other farms to help facilitate the use of manure for crop nutrients and soil amendments is to compost. Composting transforms the raw manure by removing water, allowing microbes to kill pathogens that can impact crop growth, and stabilizing nutrients. Typically, compost makers add different feedstocks to raw manure to improve the carbon (C) to nitrogen (N) ratio to an ideal of 30:1, raising it from a base value of 5:1 to 25:1 that is common
for “as collected” dairy manure.
The table shows several common feedstocks used in dairy composting in the PNW and their associated C:N ratio. Hay, cornstalks, and straw are relatively low in their C:N compared to wood chips and sawdust. This implies that adding wood chips or sawdust to raw manure can more easily raise the C:N ratio than adding hay, cornstalks, or straw.
Since the natural resources and land composition impact the availability of potential compost feedstocks, our primary goals for this study were to characterize the participants in the dairy manure compost supply chains in the PNW states and to describe how such differences have implications for compost quality and usability.
Supply chain links
Based on a review of extension bulletins and consultation with dairy and compost industry stakeholders, we identified typical participants in the PNW
Cornstalks 60 to 70:1
Straw 40 to 150:1
Brush, wood chips100 to 500:1
Sawdust 200 to 700:1
dairy manure compost supply chains (Figure 1). The arrows represent how they may interact with each other. A one-way arrow implies a sale or purchase of a good or service from one participant to another, which is typically not reciprocated. A two-way arrow represents relationships in which the participants commonly both buy and/or sell with each other.
It is expected that the compost supply chains in the dairy-producing
regions in Idaho, Oregon, and Washington have at least some of the main components represented in the figure, but not all components may be relevant for all regions. For example, a logging business may not participate in a dairy compost supply chain in dairy producing areas for which forest areas are not close by. Additionally, the relative extent of participation would vary across regions. For instance, there may be more corn silage farms than grain farms depending on the common crop rotations and robustness of the linkages between crop farms and dairies.
What we learned
The previous section provided insights on how the economic structure of an agricultural region can influence how a dairy compost supply chain functions. One structurally important aspect that we highlight is the spatial concentration of the dairy industry. The spatial concentration is an important factor for
explaining composting patterns because a highly spatially-concentrated dairy industry implies there is more incentive to implement the composting process than is the case for a less concentrated industry. This is because composted manure can be transported further distances than raw manure. Another important economic structure aspect is the availability of compost feedstocks, which is related to how forests and cropland are spatially distributed.
Given the idea that spatial concentration of the dairy industry is an important factor for incentivizing dairy manure composting, we identified two measures that can help describe the relative spatial concentration of the dairy industries in Idaho, Oregon, and Washington. The first is the Herfindal-Hirschman Index (HHI), which is often used to measure the extent of industry concentration (such as a monopoly versus many businesses participating).
For our context, we adapted the HHI to examine the percentage of total milk cows in the state that are in each county. An HHI measure of about 100 would imply an even distribution of the dairy industry across counties, while a value of 10,000 implies that all cows are in one county.
The second measure we examined was the ratio of dairy cows to cropland in each county. This provides a measure of the availability of cropland to distribute the manure produced.
We used county level data from USDA National Agricultural Statistics Service 2022 Census of Agriculture on dairy cow inventories and cropland to calculate each of these measures. Our calculated HHI measures were 1,378 for Idaho, 2,082 for Washington, and 2,307 for Oregon. This implies that the dairy industries are relatively more evenly distributed in Idaho than in Washington and Oregon.
Regarding the ratio of dairy cows to cropland acres, the average for each state was 0.11 cows per acre in Idaho and 0.07 cows per acre in Oregon and Washington. However, each state had counties with ratios of cows to cropland that were far greater than the average, including 1.18 cows per acre in Gooding County, Idaho; 1.64 cows per acre in Tillamook, Ore.; and 0.52 cows per acre in Whatcom, Wash.
A main takeaway message of this
analysis is that the dairy industries in Oregon and Washington are more spatially concentrated than in Idaho. This implies that there may be greater incentive to compost in Oregon and Washington than in Idaho to facilitate transportation of raw manure to further distances. Indeed, data from the ESRI ArcGIS Business Analyst for 2025 show that there were 19 compost businesses in Oregon and 25 in Washington, but only five in Idaho. Maps of these business locations reveal that the compost businesses are commonly located in areas with high dairy production presence in each state, as we would expect.
We also examined the relative presence of potential compost feedstock suppliers using data from the U.S. Census Bureau. These data show that, as of 2022, there are the following number of logging businesses in each state: 222 in Idaho; 578 in Oregon; and 380 in Washington. A spatial examination of such data showed that it is more common to have both dairy cows and logging busi-
nesses in Oregon and Washington than in Idaho. Thus, there is more potential for using wood-based amendments with higher C:N ratios in the composting process in Oregon and Washington.
Our study provides insights into the factors that influence how dairy manure compost supply chains operate in the PNW states and how the economic structure is important for describing how and why we expect variation in dairy manure compost quality in the different regions. While this study was conducted at the state level and provides a larger scale overview of conditions, we intend to implement the analysis for localized multi-county dairy-producing regions to provide more precise insights into the types and quality of the compost in the regions. ■
Hatzenbuehler is a University of Idaho extension specialist, Budhathoki is a Washington State University graduate student, and de Haro-Martí and Simerlink are University of Idaho extension educators.
Figure 1. PNW dairy compost supply chain linkages
Silage farmer
Laboratory tester
Dairy
Logging business
Cereals farm
Composting business
MANURE MINUTE
DO THE RIGHT RESEARCH
Manure management is necessary on any livestock or poultry operation. When it comes time to invest in new structures, equipment, or technology, that is a decision that can’t be taken lightly. In a recent California Dairy Quality Assurance Program newsletter, University of California-Davis Livestock Waste Management Specialist Deanne Meyer gave advice on what to consider before investing in new manure-handling technology.
Will this work on my farm? Meyer recommended asking questions to people who have experience using the technology you are considering. Weigh their answers with your own situation, taking into account your species, housing situation, manure collection system, and climate. “Just because it did or didn’t work in Wisconsin or Florida doesn’t mean it’ll work or not work in California,” she noted.
Look for unbiased research results. If talking to a company, ask them about costs, timing of installation, and details about operation and maintenance. Nutri ent and waste management plans will likely need to be updated, so talk to your advisers in those areas to get their opinion. You may need an engineer to evaluate how this technology would work with your farm’s layout. Your lawyer should also review all contracts and discuss areas of concern.
Will this solve your current manure challenges? Think about what improvements you are trying to make and if this technology addresses them without creating new or different challenges. Meyer said to include your environmental or nutrient management specialist in this process as they can help identify potential red flags related to nutrient management.
Read the fine print. Meyer emphasized the need to carefully read all statements and contracts to be sure you understand the impacts the technology could have on ani mal and manure management options. Have conversations with all members of your team involved in manure han dling to ensure you have the information you need to make a solid decision.
Consider current and future needs. analysis of your physical layout, including current and future manure management, is essential to avoid ugly outcomes,” Meyer wrote. If more operational responsibil ity will be required of farm staff, think about training needs. If there is a way to monetize the system someday, understand what paperwork or data is needed to make that happen. Finally, think about what would happen if the equipment would break or malfunction. Identify clean-up procedures and a back-up plan in case some thing goes wrong.
Genomic testing is a sustainability tool
For these two dairy producers, a focus on genetics has helped move their herds toward a more sustainable future.
by Abby Bauer, Managing Editor
When we talk about sustainable practices that protect the environment and preserve our natural resources, we often focus on reducing emissions and managing nutrients. For livestock farmers, sustainability also includes how they raise animals and make changes to improve efficiency of the herd or flock.
At the California Dairy Sustainability Summit, two producers shared insights on a genetic tool that has made a big difference for their herds: genomic testing.
Genomic testing analyzes an animal’s DNA to predict its genetic merit for various traits, including milk production, fertility, and health. Since genomic technology was made available to the industry in 2009, more than 10 million dairy cattle have been genomically tested.
Making informed decisions
Simon Vander Woude was one of the early adopters and has been genomic testing his herd since 2012. He and his wife, Chris, started their farming career with 150 cows on a farm near San Diego, Calif. Today, they milk 6,000 cows at three locations in Merced County and are working to bring some of their children into the operation.
“Genomics is a tool in our tool bag,” he said of the technology.
Vander Woude used genomic testing first to help them determine which animals they wanted to produce more
heifers from. After growing their herd size aggressively for years, they got to a point where they did not need to raise as many heifers as replacements. They were then able to use genetic data to determine which animals to breed to beef.
“It was very common for us to raise one heifer per cow when we were growing our herd,” he explained. “Now we are raising 0.6 to 0.7 heifers per cow, and that is the most efficient way to run our operations.”
Marketing dairy-beef calves has also been a valuable aspect of their business. “We’ve become an integral part of the beef chain by raising Holstein-Angus crosses for more than a decade,” he added. Vander Woude explained that the carbon footprint of a dairy-beef calf is 20% that of a beef calf, since the beef cow is just growing a calf while the
dairy cow is also producing milk. “We have a good story to tell there as well.”
Better from top to bottom
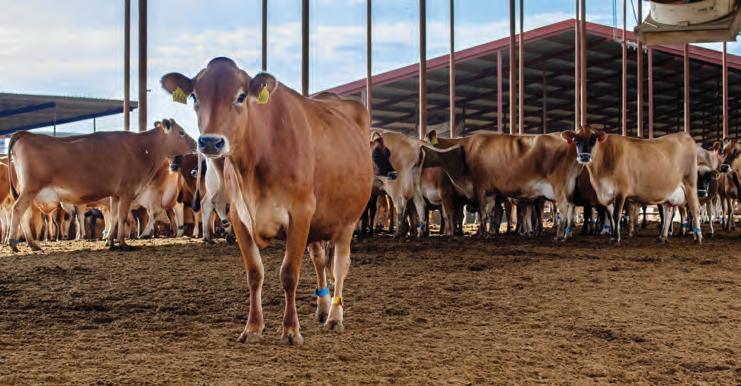
Wiebren Jonkman is a first-generation farmer milking 1,100 Jerseys in Merced, Calif. He credits genomic testing for part of their success.
“I am passionate about farming practices that ensure the health of the herd and the environment,” he noted.
Jonkman said his herd is healthier and more productive today, top to bottom, than it was when they bought the cows nearly a decade ago. When he and his wife, Luciana, took over the dairy, Jonkman said there were no records on the cows. They decided to breed 100% to sexed semen and use genomic testing to find their top-tier cows. After a few years, they established those top-level cows to breed
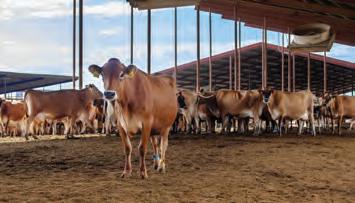
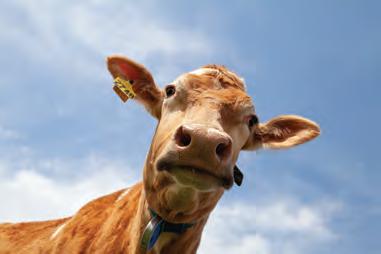
At Diamond J Farms, Wiebren Jonkman uses genomic testing to identify the top animals in their herd.
Simon Vander Woude and Wiebren Jonkman discussed genomic testing’s role in sustainable farming during the California Dairy Sustainability Summit.
from, and then they started incorporating beef-on-dairy genetics.
“It never stops. You will always have a top and a bottom in the herd,” he said. “With genomic testing, you try to boost the top and take out the bottom.”
As they got farther along on their genetic journey, they focused more on health traits. Their animals today are stronger and stay in the herd longer.
“It takes a while to see it, but it’s a fun journey once you see the results,” Jonkman shared. Underscoring the progress Jonkman has made, his herd achieved an impressive feat: In the same year, it was recognized for its reproductive efficiency by the Dairy Cattle Reproduc tive Council and for milk quality by the National Mastitis Council.
Wisdom from experience
The dairymen offered advice to others looking to use genomic testing. Vander Woude emphasized the importance of having a strategy for genomic testing.
“Have a plan for what you are going to do with your genomic data,” he said. “You have to think about the fact that every breeding decision you make today is three years away from being real ized.” This includes the time it takes to order the semen and breed the cow to when the calf is born and then raised.
“You have to have a long-range plan,” he said. “Either you are in or out — don’t dabble.”
Jonkman agreed about the impor tance of consistency. “Find a protocol that works for you and stick to it. Don’t defer from it.”
For both of these dairies, genomic testing has advanced the animals and the overall efficiency of the operation.
“We are doing more with less, and
genomic data has allowed us to do that,” Vander Woude explained. “We are getting more milk from fewer cows, and more components with fewer cows. We have fewer heifers in inventory, so we are feeding fewer mouths those maintenance calories.”
Vander Woude continued, “A lot of
things in our business are about efficiency. As a business owner and a data manager, efficiency is what we strive for. It is what we enjoy.” For Vander Woude and Jonkman, genomic testing has elevated the efficiency and quality of the cows milked on their dairies each and every day.
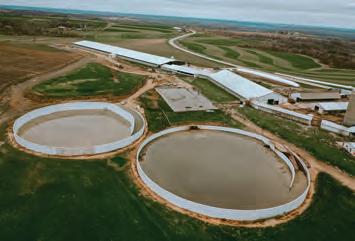
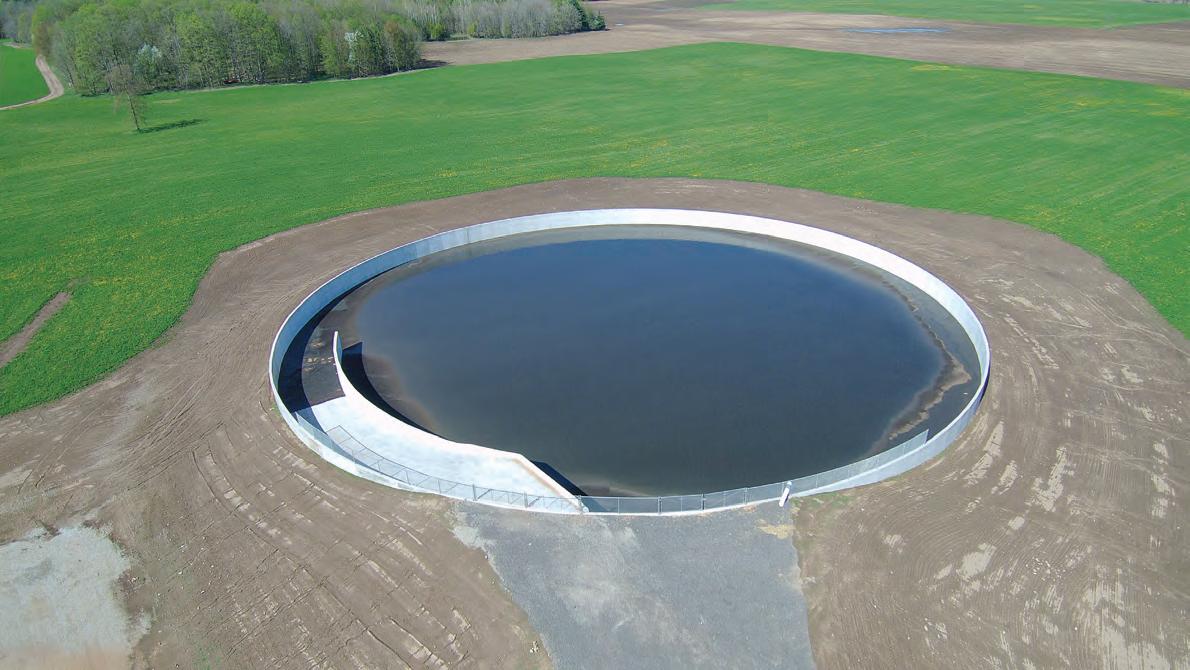
WE BUILD TANKS
Stop the spread
Manure haulers play a role in food safety by implementing biosecurity practices.
by Megan Dresbach
Biosecurity involves procedures intended to protect humans and animals against disease or harmful biological agents. When protocols are thorough and followed — and the key word is followed — they protect both people and livestock.
Biosecurity is food security, and food security is national security. In today’s world, this concept is even more crucial for producers and consumers.
In June, two Chinese students were arrested for bringing a foreign material, Fusarium graminearum, into the United States in a plastic bag within some pages of a book. This disease is already present in the United States and can be devastating to certain crops. It’s terrifying that something so small can be detrimental on a large scale. Their destination was the University of Michigan, and living in Ohio, that was too close to home for my comfort. This is one extreme example of violation of biosecurity, but opportunities for disease risk are all around us. Let’s look at a situation that could happen to a manure hauler.
A manure example
There was a biosecurity case involving manure that made its way to the Nebraska Supreme Court. The case, Ronnfeldt Farms v. Arp, was between two manure haulers and a sow facility. One manure hauler hired another to help complete the job in a timely manner. The sow facility later had a disease outbreak and sued the manure hauling companies, claiming proper biosecurity protocols were not followed, which in turn caused the outbreak. The case focused on who was responsible for communicating what details to which party.
The sow facility sought damages
We as an industry play a key role in keeping our customers, their livestock, and our country safe.
totaling $1.5 million. Could you or your company afford to pay that amount?
Keep it clean
What biosecurity practices should manure haulers implement? Each operation should have its protocols clearly outlined because it minimizes their risk. These practices can vary greatly, but here are some basics that every hauler should follow.
Respect the clean/dirty line. The “clean” side of the property is where anyone who is authorized to go into the barn parks their vehicle and follows a specified path to and from the vehicle to the barn. The “dirty” side is where a manure hauler should be working. This side contains all personnel, equipment, and walkways pertaining to the removal of manure. The line needs to be respected by all personnel at all times. This strategy is simple, effective, and key to a good biosecurity program. Keep equipment clean. After manure application is finished, clean the equipment. It may not be realistic to carry around a pressure washer to thoroughly wash the equipment, but at the bare minimum, knock off the clumps of manure. If there is access to a water source, use a garden hose to remove the next layer of grime. Then, use a disinfectant on at least the tires. These are suggestions for the bare minimum.
The better option is to use a pressure washer after every job to completely
remove every bit and piece of dirt and manure. Then, once the equipment is thoroughly cleaned, spray everything with a disinfectant. Pay attention to the disinfectant labels; some need to be washed off after they dry.
Here are few other biosecurity questions to consider:
• Is it possible to schedule jobs so that you are working at farms with alternating species?
• Can you carry a can of disinfectant in every vehicle so boots can be sprayed when the employee arrives for the day?
• Should the drivers be allowed to stop at the convenience store or restaurants during the day?
Protecting the food supply
This is your business; you choose the practices to implement. You are responsible for the decisions that address biosecurity concerns.
Biosecurity is not something that can be out of sight, out of mind. We as an industry play a key role in keeping our customers, their livestock, and our country safe. We must take that role seriously. America has the most cost-effective and safest food supply in the world. Let’s keep it that way. ■
The author is the vice president of W.D. Farms LLC in Circleville, Ohio, and blogs as the Ohio Manure Gal.
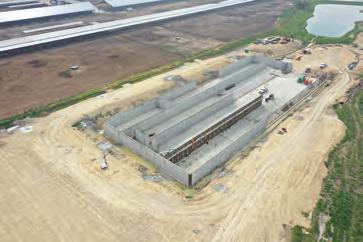
AGRICULTURAL CONCRETE
JP Tank
317 Kohlman Rd. Fond du Lac, WI 54937 920-948-2286
jptankconcrete@gmail.com jptank.com
Pipping Concrete N6106 County Rd. C Rosendale, WI 54974 920-948-9661
If you would like your event included on our list, please send details to info@jofnm.com
MANURE MINUTE
NOT YOUR AVERAGE FLY
n old pest made new headlines when a case of New World screwworm was identified in southern Mexico. Efforts to keep the pest south of Panama had been mostly effective, but the recent discovery of screwworms as far north as Mexico led U.S. Secretary of Agriculture Brooke Rollins to close the border to cattle, bison, and horses from Mexico in early May. A plan to reopen the border was announced this summer, but when a case of New World screwworm was identified farther north in July, 370 miles south of the U.S.-Mexico border, Rollins announced the border would remain closed.
New World screwworm is an economic threat to livestock and wildlife. The parasitic fly used to be common in the southern U.S. but has been eradicated in the country since 1966, with the exception of an outbreak in the deer population in the Florida Keys in 2016. Eradication was declared again in March 2017.
New World screwworm eradication was achieved by breeding and raising millions of sterilized screwworm flies and releasing them across the southern U.S. Once a female mates with a sterile male, the female will not mate again and can only lay sterile eggs, reducing the population over time. This same control strategy has been used to keep New World screwworms south of Panama. It is not easy to keep the New World screwworm population contained, though. It requires the frequent release of sterile flies, animal movement restrictions, and strict monitoring for signs of infection.
Most adult flies lay eggs in manure, decaying plant material, or decaying animal flesh. That is why one control strategy for more common flies is to regularly remove manure piles from around barns. The New World screwworm is different, though. It will lay eggs in an opening on otherwise healthy skin and the larvae, or maggots, feed on healthy tissue. According to a Kansas State Research and Extension fact sheet, wounds as small as a tick bite or a thorn prick can serve as an infestation site. The area around the naval is a common infection site in young animals. Wounds from dehorning and castration are also at risk.
Infested animals may exhibit symptoms such as pain, depression, lethargy, and reduced appetite. The maggots feed aggressively and can cause severe damage or even death in their victims. This pest can have a detrimental impact on livestock, wildlife, and pets, so USDA is working with Mexico to ensure proactive measures are taken to maintain a New World screwworm-free border.
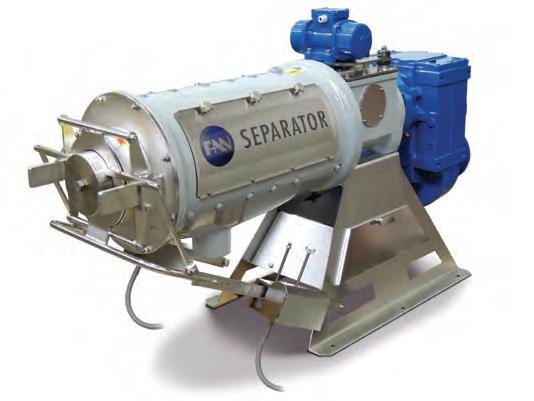
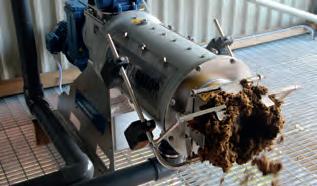
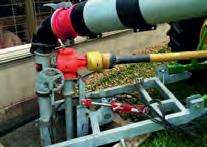
MANURE SEPARATORS ARE NOT CREATED EQUAL.
Every dairy farm has one. Every dairy farm needs one. And you have options. But when it comes to the most efficient, highest performance, greatest cost-to-value, there’s only one option. SAVECO products are designed to be the very best. You deliver the milk. We’ll deliver you one of the best business decisions you’ll ever make. Call us at 224.441.4204, and start turning a problem into a better dry solids solution.
FOLLOW THE FLOW OF MANURE PROCESSING
SMARTER MANURE MANAGEMENT STARTS WITH THE RIGHT PATH
To find success, your manure system must be thoughtfully planned and designed. Whether you’re updating your current manure system or planning a new one, consider the solutions and technology that fit your goals today and tomorrow. Use this guide to help follow the flow of manure throughout a dairy and get a better understanding of the role each component plays in achieving your manure processing goals.
1 MANURE CONVEYANCE SYSTEMS
Smart manure movement. Vacuums, tire scrapers, augers, flumes and flush systems
efficiently move manure from the barn for further processing.
Quick manure collection and removal
Low maintenance and reduced downtime
Consistent and reliable
*If bedding with sand, go to 2A If bedding with other materials, jump to 2B
4
MANURE AND BEDDING DRYERS
Drier bedding. Healthier cows. Happier outcomes. Whether you use manure solids, digester solids or sand, drying boosts bedding quality. Dryers reduce moisture, odor and pathogens.
Increase bedding dry matter
Improve cow comfort
Reuse solids effectively
DESIGN A MANURE MANAGEMENT SYSTEM THAT WORKS FOR YOUR DAIRY
Scan the QR code or visit mclanahan.com to start a conversation with our team and learn more about complete manure system design and management. We help grow your dairy because we know your dairy.
2A
SAND SEPARATION SYSTEMS
Clean sand. Comfortable cows. Lower costs. Sand separation systems recover high percentages of sand and clean it for reuse, reducing costs and improving cow health. These systems are designed for all types of manure conveyance.
Reuse sand within days
Reduce bedding costs by up to 95%
Keep sand out of downstream processes, tanks and storage
5
STORAGE AND APPLICATION
Store smarter. Apply efficiently. Maximize value. Proper storage and timely application are key to unlocking the full value of manure.
2
ANAEROBIC DIGESTER
Digest efficiently. Manage cleaner. Reduce impact. Untreated manure can create odor issues, raise environmental concerns and complicate nutrient planning. Anaerobic digesters break down the organic matter of manure, reducing odor, stabilizing nutrients and shrinking the volume of material.
More predictable nutrient value
Lower hauling and treatment cost
Reduced nutrient loss and runoff
Better timing for crop uptake
Fewer trips, lower fuel and labor costs
3
SOLID SEPARATION TECHNOLOGY
Separate smart. Handle easier. Store better. Fine solids clog systems and increase hauling cost while reducing manure value. Solid separators, hydroclones and washboxes remove solids for smoother handling and a smaller environmental footprint.