Journal of Nutrient Management (ISSN# 26902516) is published four times annually in February, May, August, and November by W.D. Hoard & Sons Company, 28 Milwaukee Ave. West, Fort Atkinson, Wisconsin 53538 Tel: (920) 563-5551. Email: info@ jofnm.com Website: www.jofnm.com. Postmaster: Send address corrections to: Journal of Nutrient Management, PO Box 801, Fort Atkinson, Wisconsin 53538-0801. Tel: (920) 563-5551. Email: info@jofnm. com. Subscription Rates: Free and controlled circulation to qualified subscribers. For Subscriber Services contact: Journal of Nutrient Management, PO Box 801, Fort Atkinson, Wisconsin 53538, call (920) 563-5551, Email: info@jofnm.com.
I’ve been lucky to attend countless agricultural conferences and meetings as an editor. An agenda full of intriguing sessions is key to gathering magazine content, but interactions during the less structured parts of the day are when the most enriching conversations often take place.
Mealtimes are a prime time for dialogue. After visiting the buffet line, your next move includes a scan of the banquet hall with your lunch plate in hand, searching for a seat. This decision can set the stage for the next 60 minutes and mean the difference between polite chitchat or an invigorating conversation. Both can be nice, but the latter makes the hour pass much more quickly.
I hit the jackpot when I sat down at a table with a few wonderful people at a conference last fall. One of the women worked in the aquaculture industry in Asheville, N.C. Soon we were deep in conversation about the devastation experienced in that area after Hurricane Helene. Houses were literally washed away, along with roads. Small business owners were forced to shutter their stores with no opening in sight. Schools were closed and left parents scrambling for childcare so they could still work. Hurricane Helene battered the area in late September, and at the time of this conference in mid-November, the city was still under a water boiling advisory. Residents could not drink, cook, or even bathe with the water in their homes.
We were just enthralled by her every word. The destruction. The misinformation being shared in the media. The heartwarming way people came together. Hurricane coverage was on the news, of course, but this firsthand account was unforgettable. It was not a conversation directly tied to agriculture, but I am very glad I chose that seat on that day.
A few months later, I was at a workshop with the intent of gathering information for an article. The workshop was interactive and informative, but it did not provide the content I hoped for. However, my table mates more than made up for that. As members of a farm team, I enjoyed their viewpoints throughout the day, and afterward, we had
a good conversation about their farm, their custom manure application business, and their goal of making their business the best it could be. I left this meeting thankful for the opportunities I’ve had to meet interesting and inspiring farmers. Most “seats” we choose in life are a longer term commitment than the lunch hour. This includes the place we work and the people we work with, the organizations we join, and the leadership positions we embrace. These decisions influence our personal happiness and fulfillment, but they also impact the difference we can make in the world around us. No one can be everything or do everything at once. We must choose our lane carefully and find the best places to invest ourselves during each stage of life.
In terms of environmental impact, farming is often placed in the hot seat. But from our frontrow seat of agriculture, we see the many ways farmers and food processors are already working to protect the environment. In this issue alone, several articles feature sustainable farming practices, from cover crops to anaerobic digestion. A farm can’t implement every single recommendation thrown its way, but each owner can choose the ideas that fit best. I’d advise putting more thought into this than one would when selecting their lunch seat, but sometimes it’s difficult to know how a practice is going to work — or not work — on your farm until you try it.
As for those more temporary day-to-day decisions, like picking a seat in the lunchroom, on a plane, or in the doctor’s office waiting room, you can certainly keep to yourself. Sometimes, though, a simple hello can launch into an engaging conversation that warms your heart, makes you laugh, or motivates you to try something new. That’s when you know you picked the best seat in the house that day.
Until next time, Abby
Let us know your thoughts. Write Managing Editor Abby Bauer, 28 Milwaukee Ave. West, P.O. Box 801, Fort Atkinson, WI 53538; call: 920-563-5551; or email: info@jofnm.com.
POLICY WATCH
WASHINGTON
The Washington State Pollution Control Hearings Board ordered the Department of Ecology to rewrite pollution discharge permits for concentrated animal feeding operations (CAFOs) to better protect water resources and public health. A unanimous Washington Court of Appeals decision in 2021 required the Department of Ecology to rewrite these permits because they violated state and federal law, and the court order detailed ways to bring these permits into compliance. However, provisions created did not meet expectations.
In the new order, the Department of Ecology must allow the public to review and comment on CAFO pollution control plans, require groundwater monitoring for every permitted facility, and set a standard to ensure leachate from manure storage will not pollute groundwater.
NEW JERSEY
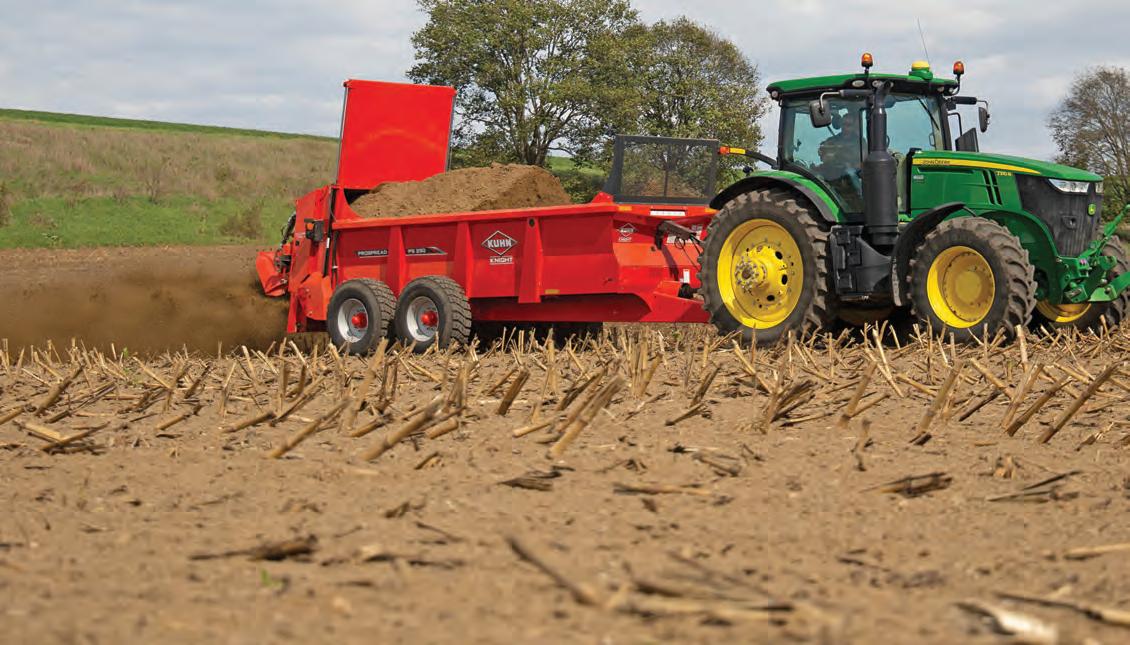
The New Jersey Department of Agriculture announced funding to support the purchase and maintenance of manure spreaders and the establishment of a community use program for manure spreaders. Eligible applicants are New Jersey-based individuals, agricultural cooperatives, notfor-profit organizations, and government agencies. Applicants must be committed to supporting nutrient management in their communities. Grants up to $25,000 will be awarded. More details are available at bit.ly/3YddeO1. The application deadline is June 16, 2025.
IOWA
A bill regulating anaerobic digesters advanced from the Iowa House of Representatives and moved on the Senate. The proposed bill would task the Iowa Department of Natural Resources with regulating the construction, expansion, placement, and operation of anaerobic digesters and associated structures.
The bill would draw a distinct line between farms and anaerobic digesters. Under current regulations, any compliance issues that occur with an anaerobic digester are placed on the livestock operation because the digesters aren’t licensed with the state.
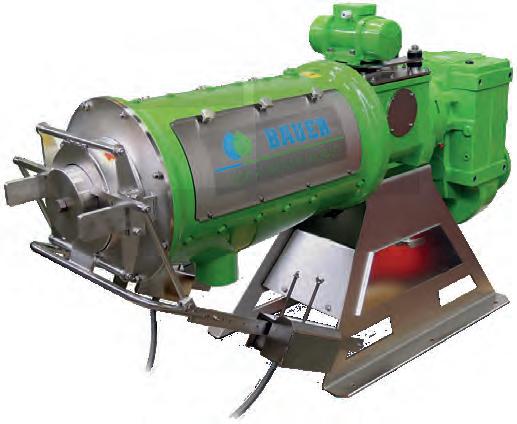
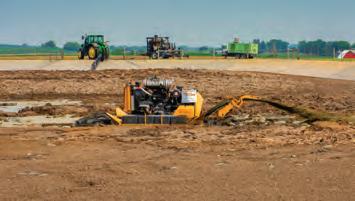
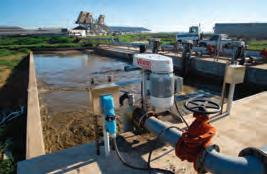
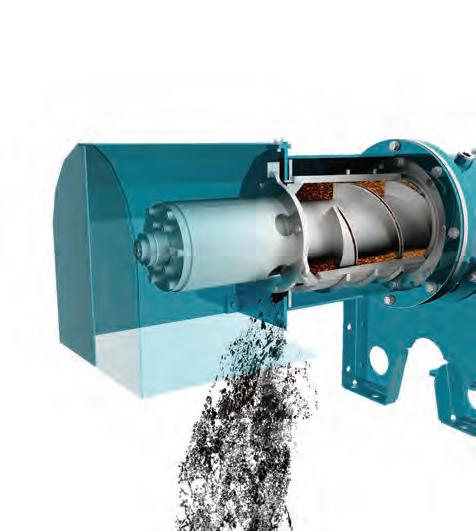
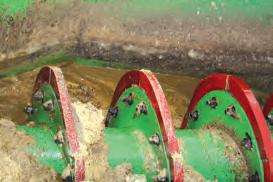
THE INNOVATIVE BIOSELECT FOR EFFICIENT MANURE SEPARATION.
UNITED STATES
The U.S. Department of Agriculture (USDA) announced an investment of $537 million in 543 biofuel projects across 29 states with funding from the Higher Blends Infrastructure Incentive Program (HBIIP). The investment includes projects approved by the Trump administration and supports an executive order to boost energy production.
The funding will support gas station upgrades for storage tanks and fuel pumps, making higher ethanol and biodiesel blends more available. Greater biofuel use could raise demand for corn and soybeans. It may also support growing biofuel exports. According to USDA, the U.S. exported 585,324 metric tons of ethanol worth $5.11 billion in 2024. Key buyers were Canada, South Korea, and the European Union.
FEATURES:
+ Low Life-Cycle Costs
+ Turnkey from a Single Source: Separator Pump(s)
Control Unit
Stationary or Mobile Skids
+ Large Capacities
+ Patented Profile Auger with Counter Bearing for No Auger Screen Contact
+ Continuously Variable Dry Matter Content
844-647-7867 | www.boerger.com
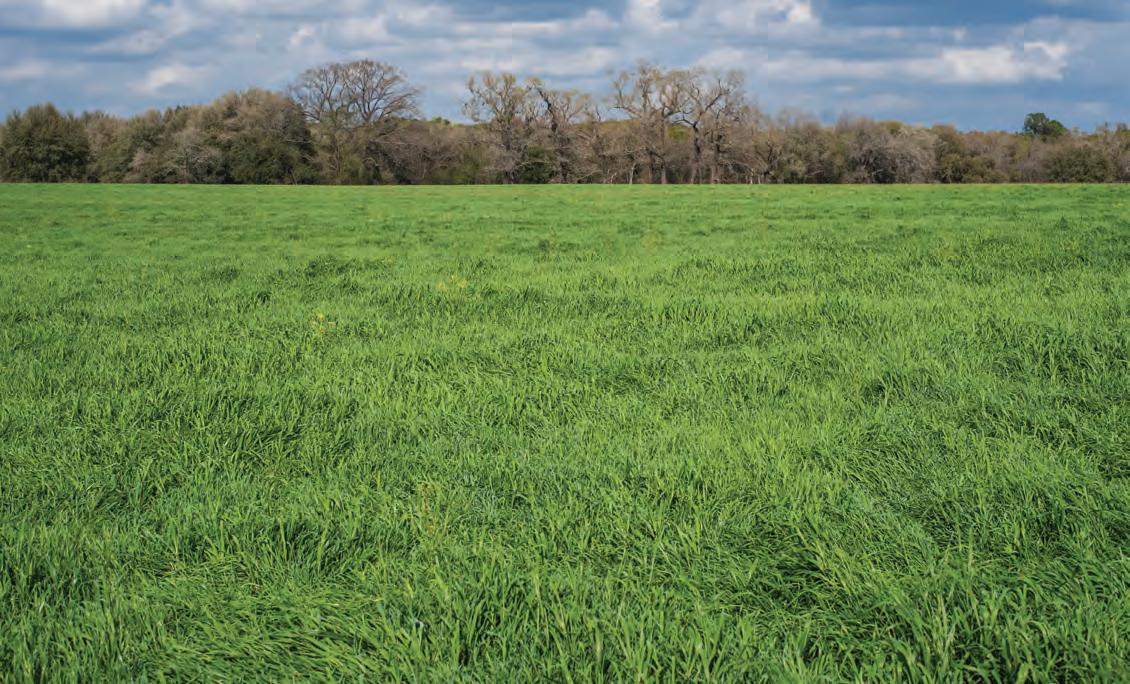
WANTED: FIELDS UNDER COVER
Overwintering cover crops is a proven way to further reduce phosphorus losses from cropland.
by Laura Paletta
In a cropping system, soil and nutrients work together to deliver healthy plants and productive crops. Fine-tuning soil and nutrient management to achieve profitable harvests and water quality protection can seem very complicated. Wisconsin crop consultants and university researchers are working together to define some simple steps to help achieve those goals.
When choosing which management practices best fit into a system, Step 1 is to prioritize those that keep the soil covered as much as possible throughout the year to prevent soil erosion, reduce phosphorus loss, and improve soil health (Figure 1). Practices like no-till, high residue cover, and cover crops have shown reductions in soil erosion and particulate phosphorus loss at Discovery Farms sites.
Next, think about the added nutrient source (fertilizer or manure) rate and timing. For Step 2, determine your phosphorus rate based on recommendations that take into account plant uptake and previous soil fertility. If nutrients added are greater than the recommendation, phosphorus is vulnerable to loss through surface runoff. This is even more critical if the nutrients are added when the risk for
runoff is highest during late winter and early spring.
Keep it covered
Once you have those two pieces in place, Step 3 is adding an overwintering cover crop to the rotation. Cover crops are a great tool to help cover and protect the soil, especially during months when a field is typically bare. Cover crops also impact nutrient levels by recycling nutrients back to the soil surface, which impacts Step 2. However, studies have shown that cover crops and crop residues can create a significant supply of phosphorus on the soil surface that could be of concern during the nongrowing season. In cold climates, the repeated freeze and thaw cycles convert the phosphorus to a readily-available form, which creates a concern for water quality. If a cover crop dies during the winter, it will not be as successful at protecting the soil or relaying nutrients
Figure 1: Three steps to minimize nutrient losses
1
Step 1. Maximize soil coverage
Keep your soil covered as much as possible throughout the year.
2
Step 2. Apply nutrients at the right rate and time
Consider plant uptake needs and when nutrients are most vulnerable to being lost.
to the next crop. A live, green cover crop is a better option for a longer window of soil protection and holding nutrients into the next growing season.
Dead
3
Step 3. Choose an overwintering cover crop
A green, living crop in early spring can better limit losses than a cover crop that winterkills.
or alive?
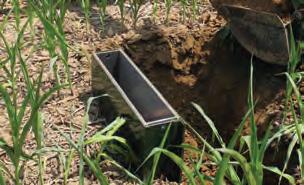
Because he was intrigued by research showing dissolved phosphorus in winter runoff in Wisconsin cropping systems,
Steve Hoffman, agronomist and president of InDepth Agronomy in eastern Wisconsin, began an investigation into potential phosphorus contributions from overwintering or winterkilled cover crops. Hoffman found that water surrounding dead leaf tissues has a higher concentration of phosphorus compared to water by tissues that are still alive.
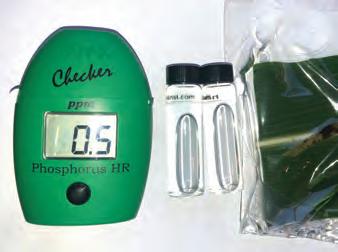
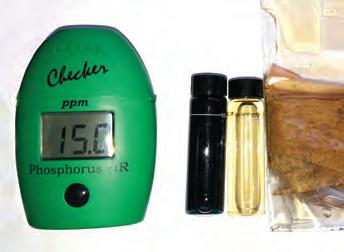
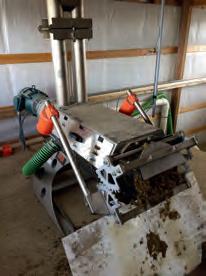
He tested this idea by placing a naturally senesced corn leaf and a live leaf in distilled water for three hours. Using a Hanna HI 706 P HR checker HC to compare the phosphorus levels, he found that the water with the dead leaf contained 15 ppm dissolved phosphorus (DP) versus 0.5 ppm DP from the live leaf sample (Figure 2).
Interested to learn more, Hoffman honed in on cover crops and compared several other live versus dead species (peas, oats, radish, and more). He found that in every case, the dead crop released much higher phosphorus concentrations than the live ones. This idea is supported by a study in Indiana that found in a system with an overwintering cereal rye cover crop, dissolved phosphorus levels were significantly lower compared to a winterkilled oat/radish cover crop.
This evidence suggests that if a cover crop does not survive as green, living tissue through the winter, the dead tissue has the potential to release higher nutrient levels that would be left on the surface and vulnerable to loss during runoff events driven by rain and snow melt. If the cover crop is an overwintering species, those nutrients stay within the plant cells.
Discovery Farms edge-of-field monitoring data in Wisconsin shows that March and April are the months that runoff is the most likely and in the greatest quantity (Figure 3). Early spring has a higher likelihood of snow melt or rain events while soils are still frozen or thawing.
Overwintering species help reach the goal of relaying the nutrients within the cover crops to the following cash crop. If the cover crop nutrients are available for the following cash crop, less additional nutrient inputs are needed, saving time and money. Losing more nutrients negatively impacts water quality, affecting local waterways and aquatic ecosystems. Keeping soil covered is most important to reduce soil and nutrient losses, followed by nutrient management strat-
Figure 2. Corn leaves were tested for dissolved phosphorus content
Leachate from a live corn leaf (left) and a dead corn leaf (right) were tested for dissolved phosphorus. A darker blue sample depicts a higher concentration of dissolved phosphorus (vials on the left). The vials on the right are sample leachate used to normalize the colorimeter.
Data from Discovery Farms edge-of-field network shows that the most runoff is seen in March (25% of annual runoff), followed by April (18% of annual runoff).
egies. Cover crops will provide soil coverage, and careful species and variety selection can have additional benefits in phosphorus movement off a field. In a system where soil loss is of most concern, even winterkilled cover crops provide soil protection through the winter, much like residue from corn harvested for grain.
The benefits of greater soil protection in fields vulnerable to erosion outweigh the possible water quality concern of phosphorus loss from frozen plant tissues. However, as you refine your cropping system, consider choosing an overwintering cover crop that continues to grow in the spring to reduce the move-
ment of phosphorus. An overwintering cover crop provides functional protection during early spring runoff events. These are complicated dynamics, but the combination of water quality research from Discovery Farms and agronomist observation and investigation is one way to continue improving our understanding of agronomic and water quality dynamics in cropping systems. ■
The author is an outreach specialist with the University of Wisconsin Extension’s Agriculture Water Quality Program.
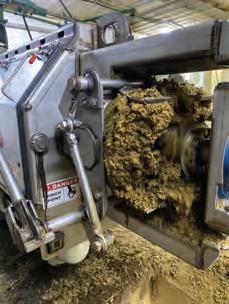
MANURE MINUTE
MICROBES MAKE COMPOST MAGIC
Composting reduces manure volume, cuts down on weed seeds, and kills pathogens. What happens within that compost pile also breathes life into soil. During a Michigan State University Extension “In the Weeds” podcast episode, Eliza Hensel talked about the benefits compost can bring to crop growers.
“Compost is a really good soil amendment,” said Hensel, a compost systems educator for Michigan State University Extension. The addition of organic materials via compost cascades into other effects that reduce soil erosion, improve water absorption, and more.
Hensel noted that compost slowly releases organic matter and nutrients over time. “One application of compost may go a lot longer than one application of synthetic fertilizer,” she explained. Compost is full of microbes, and Hensel said, “Those microbes are the magic of composting.” The heat generated comes from microbial action in the pile. Once composting is complete, its addition to soil boosts the popula tion of beneficial microbes that can help overpower harmful pathogens. Hensel likened compost to probiotics humans use to improve gut health.
For the best outcome, Hensel advised taking a soil test. There are many dif ferent blends of compost and compost products that fit different situations.
Also take time to test the com post before use. Hensel shared that a basic compost analysis will provide details such as pH, bulk density, and the carbon-to-nitrogen ratio. Carbon and nitrogen are the building blocks of compost, Hensel said, and a healthy balance between 20-to-1 and 30-to-1 carbon to nitrogen is ideal.
The most important reason to sub mit a compost test is to make sure the compost is a finished, cured prod uct. “Compost can actually be harmful if it hasn’t had time to cure,” Hen sel warned. The analysis will assess maturity to ensure the chemical microbial process is complete and the compost is ready to use.
“It’s not only a tool that enhances
productivity and sustainability of farms,” Hensel summarized. “It also builds resilience to get through challenges
mate change, and market demands. I recommend it to anyone.”
Sustainable farming makes an impact across the Upper Midwest
by Rachel Malcore Goblisch
Farmers for Sustainable Food (FSF) is helping farmers advance their sustainability efforts through data-driven initiatives and providing them with the tools, resources, and information needed to make well-informed decisions for their individual farms.
For nearly 10 years, FSF has been supporting a growing community of farmer-led watershed conservation groups across Wisconsin and Minnesota. By fostering connections, sharing knowledge, and collaborating, these groups continue to significantly impact the local environment and community.
These efforts are documented through an annual survey administered by FSF. The survey captures conservation practices within these farmer-led groups and demonstrates ongoing improvements to soil and water quality.
What the survey said
In 2024, 257 farmers from seven different farmer-led groups participated in an annual conservation practice survey. This group encompassed 278,329 acres and 378,313 head of livestock.
The sustainable practices measured and recorded in the survey included soil sampling, nutrient management planning, cover cropping, reduced tillage, no-tillage, low disturbance manure application, variable rate fertilizer application, split nitrogen application, nitrogen stabilizer, and planting green.
Results of the survey show potential environmental improvements due to sustainable farming practices. The
following conservation efforts provide valuable benefits to climate health, soil health, and water quality throughout Wisconsin and Minnesota:
• Reduction of greenhouse gas emissions by 30,839 metric tons of carbon dioxide equivalents, which is comparable to the emissions produced by 7,342 cars in a year.
• Prevention of sediment loss from farm fields of 368,948 tons, equivalent to 36,894 dump trucks worth of soil.
• Reduction of phosphorus runoff by 518,898 pounds of phosphorus, potentially preventing 259.5 million pounds of algae growth in local water bodies.
The farmer-led groups participating in the survey included Calumet County Ag Stewardship Alliance, Dodge County Farmers for Healthy Soil Healthy Water, Driftless Area Ag Alliance, Lafayette Ag Stewardship Alliance, Peninsula Pride Farms, Sheboygan River Progressive Farmers, and Western Wisconsin Conservation Council. Data was analyzed by Houston Engineering Inc.
FSF Sustainability Program
Many farmers participating in these farmer-led groups, as well as others in various states, are expanding their
efforts through FSF’s Sustainability Program. This program is part of an initiative that builds off a nationally recognized model, FSF’s Framework for Farm-Level Sustainability Projects. It helps farmers determine what conservation practices are most effective for their farms and provides tools to document the environmental and financial effects. Partial funding for the program comes from the U.S. Department of Agriculture Partnerships for Climate-Smart Commodities award.
“Having the ability to see the impact my farming practices are making on a yearly basis helps me make better decisions,” said Paul Cornette, a dairy farmer and FSF board president. “Through the FSF Sustainability Program, I have been able to track my metrics as well as compare them to the group to see where I can improve or may be ahead of the curve.”
In 2024, the first year of the FSF Sustainability Program, it consisted of five projects, with 53 farms in Wisconsin, Iowa, Minnesota, and South Dakota participating in data collection and analysis regarding their 2023 cropyear information. In total, the program encompassed 100,193 acres of cropland and 71,686 head of cattle.
Farmers enrolled in the FSF Sustainability Program receive individual reports showing key metrics for their farms. The aggregated results demonstrate the broad, positive environmental
impact of sustainable farming practices.
The data captured from those enrolled in the first year of the project showed that the farms reduced 49,161 tons of carbon dioxide equivalents (CO2e) per year from the implementation of cropland best management practices, or, on average, 0.49 tons of CO2e per acre per year. This is equivalent to powering 6,602 U.S. homes for one year or removing 11,467 U.S. passenger vehicles from the road. In comparison, the reduction on the farms is comparable to the amount of CO2e that nearly 49,311 acres of forestland remove each year.
“These farms are making a difference, and when we aggregate the results, we show the important impact they are making,” said Lauren Brey, FSF managing director. “The actionable data and outcomes farmers receive through this program continue to help them improve and make informed management decisions for their own farms.” ■
MANURE SEPARATORS ARE NOT CREATED EQUAL.
Every dairy farm has one. Every dairy farm needs one. And you have options. But when it comes to the most efficient, highest performance, greatest cost-to-value, there’s only one option. SAVECO products are designed to be the very best. You deliver the milk. We’ll deliver you one of the best business decisions you’ll ever make. Call us at 224.441.4204, and start turning a problem into a better dry solids solution.
Another side of nutrient management planning
A plan guides manure application and fertilizer use, but it also plays an important role in sustainable farming.
by Scott Fleming
Sustainability has long been a foundation on farms of all types and sizes. While sustainability may not have always involved carbon sequestration for the carbon market or goals of reduced greenhouse gas emissions, farmers have been conservationists for hundreds of years.
Soil conservation and nutrient management are critical for maintaining land for the next generation. The main components of nutrient management create a factual, model-based story of sustainability that will aid in the preservation of farming far into the future. Key industry stakeholders are already using nutrient management as a measure of sustainability. Where does the nutrient management planning process intersect with the vital
portions of this somewhat new objective of sustainable farming?
It starts with soil
It takes about 500 years to form one inch of topsoil, so any farmer can see the value in protecting the soil while also taking measures to help regenerate it. Tolerable soil loss (T) is the metric used to determine the severity of soil loss. Tolerable soil loss levels range
from as low as 1 ton per acre per year to as high as 5 tons per acre per year. These tolerable losses vary based on a soil’s tolerance to erosion. Soil that is easily eroded will have a very low tolerable soil loss, while soil that resists erosion well will have a higher T value. Additionally, soils that have already experienced erosion will have lower tolerable soil loss values. Without bringing soil loss below tolerable levels, there is no sustainability of a farm’s soil. Soil loss through water erosion is measured in tons per acre per year using the Revised Universal Soil Loss Equation 2 (RUSLE2). RUSLE2 uses
factors such as slope percent and length, as well as soil type, rainfall, and runoff to estimate soil loss throughout the crop rotation. While producers can’t change the soil type or the slope, they can influence the erosion rate by managing the amount of tillage, changing the crop rotation, or adding cover crops.
Water on the surface
When soil is conventionally tilled, the bare soil is exposed to every drop of rainfall on its surface. It is this initial rain drop impact that has the greatest impact on soil erosion. When a raindrop hits the soil surface, it detaches soil particles and suspends them in the water. This suspended soil in the water droplet moves with the runoff across the soil surface and potentially off of the field. When cover crops or reduced tillage are used, the soil is protected from rainfall’s impact by an armor of dead or living plant material.
Beyond soil loss, water’s effect on the land also influences phosphorous loss. Unlike nitrogen, which leaches through the soil, phosphorus nutrients are tightly bound to the soil. When soil is detached from the field, it brings phosphorus along for the ride. Unfortunately, this is the leading cause of eutrophication in freshwater, causing algae blooms in lakes and streams.
The Phosphorus Index is the measure used to estimate the risk of phosphorus delivery to surface water. A unitless measure, the index’s magic number is six — but the lower, the bet ter. Anything above six is considered a high risk.
The best option for farms to reduce their P index value is through the reduction of soil test phosphorus (STP) to optimum levels. When the concentration of phosphorus in soil is high, the amount of phosphorus lost through erosion is also high.
Support from stakeholders
While several sustainability projects, grants, and their sub sequent funding appear to be in limbo, the collective goal and drive toward sustainability have not changed. Industry stake holders will continue their push — especially as consumers drive the food directive.
Currently, there are multiple incentives for farms to adopt management practices that further the sustainability goal. Some dairy food plants offer bonuses for completing a nutrient management plan. Similarly, some ethanol and other grain buying markets provide per-acre or per-bushel incentives on grain grown with a smaller carbon footprint.
Having a nutrient management plan is often a payment enhancer as well as a great way to track field or farm his tory. In addition, some county governments are offering tax incentives for landowners with nutrient management plans on their farms. Soil carbon credits and carbon trad ing for the carbon market are still much easier to broker when nutrient management plans are included to qualify the farm for this opportunity. The state and federal govern ment still require NMPs for concentrated animal feeding operations (CAFOs).
resources. The federal government maintains its core programs of the Environmental Quality Incentives Program (EQIP) and the Conservation Stewardship Program (CSP). Through either program, payments are available for writing a nutrient management plan and participating in sustainability enhancing activities like those previously mentioned. If sustainable practices are already on your radar, explore options for funding that USDA can provide.
With or without a current nutrient management plan, farms can begin incorporating regenerative practices into their management scheme. Whether writing your own plan or hiring a professional adviser, a nutrient management plan can be a giant leap in the right direction. The additional validation and documentation that a plan provides will help a farm ensure compliance with mandatory programs or voluntary incentives that may appear. Even without a program incentive, having a plan will ensure that farmland will sustain and support future generations. ■
The author is a nutrient management specialist and sampling director at Rock River Laboratory in Watertown, Wis.
Seek out resources
Farms of any size can take advantage of a wide array of sustainability, conservation, and nutrient management
Finding value after avian influenza
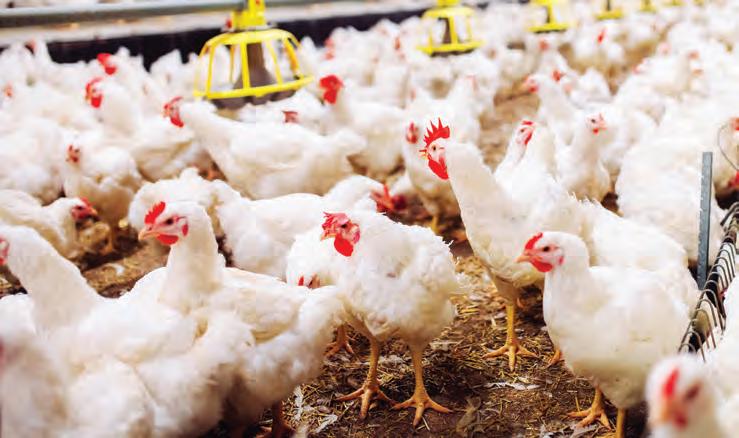
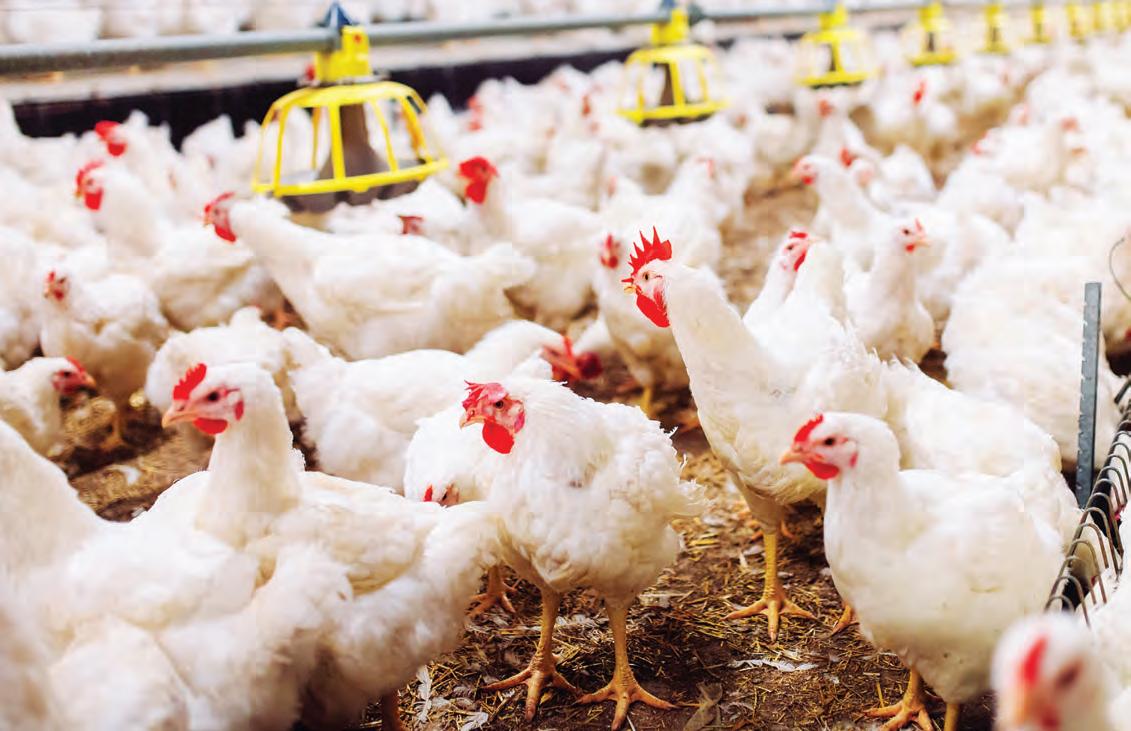
While highly pathogenic avian influenza has devastated many poultry flocks across the country, proper composting creates a nutrient source that can still be used on farms.
by Glen Arnold
Over the past few months, highly pathogenic avian influenza (HPAI) impacted more than 70 poultry farm locations housing 14.668 million birds in four Ohio counties. Nationwide, cases have been detected in flocks in all 50 states since the outbreak began in early 2022. Cases have also been confirmed in dairy herds in 17 states as of late April.
HPAI is considered a foreign animal disease that is thought to be transmitted by migrating wild birds. As such, the Ohio Department of Agriculture (ODA) and United States Department of Agriculture (USDA) carry out initial response and containment activities on affected sites as well as the surrounding area to manage the disease and prevent further spread. Although these poultry producers may
have their Ohio livestock mortality composting certificates, federal livestock and avian mortality disposal laws take precedence when a foreign animal disease is involved.
A time-consuming process
The predominant method of HPAI disposal is composting of infected materials, which may include carcasses, manure, bedding, feed, and eggs, if a
layer operation is involved. A premises must undergo appropriate disposal practices, in addition to many other requirements, prior to having their quarantine released.
Composting is the biological decomposition of organic material under controlled, aerobic conditions that can inactivate pathogens and convert mortalities into a nutrient-rich soil amendment. The compost can be used as a fertilizer.
Dealing with HPAI has been difficult for all involved, especially the livestock producers and the businesses tied to livestock production in affected areas. It has been a mammoth-sized undertaking in western Ohio to sample flocks for the virus and depopulate infected birds. Then farms must secure and transport carbon amendments for compost piles, build the compost piles, sample the compost piles for temperatures, turn the piles, clean and disinfect the premises, and transport and land apply the finished compost.
Ready for application
Once the compost piles have met the time and temperature requirements for virus elimination and are released by the state, the compost can be land applied to fields. In Ohio, producers must follow the state’s requirements for movement, distribution, and land application of mortality compost. Requirements may include sampling and testing of the compost for a variety of parameters.
Poultry compost analysis results may vary for many reasons. These can include sampling error, size and age of the animals composted, newness of the bedding material, quality of the carbon amendments used in the composting process, and the length of the composting period. Some compost piles will need additional grinding, screening, or time for further composting simply due to the size and variability of the wood chips used in the composting process.
A look at the numbers
HPAI struck a large commercial poultry laying farm in Defiance County, Ohio, in the fall of 2022. Table 1 shows the nutrient testing results from the HPAI compost land applied in 2023. In addition to the compost samples, regular poultry litter was sampled and
land applied for this farm at the same time of the layer compost sampling. This manure was from replacement laying hens that had produced manure for more than three months.
Nearly all the HPAI compost piles in western Ohio have met the regulatory requirements release and land application. Table 3 has the nutrient content from most of the turkey compost samples collected and sent for analysis.
Table 4 has the nutrient content of compost samples from layer farms collected and sent for analysis.
Confronting the concerns
There has been some reluctance on the part of landowners to accept poultry compost from turkey and laying hen farms impacted by HPAI. However, the compost has a carbon-nitrogen ratio of about 12 to 1, so there is
little concern about nitrogen being immobilized in the soil while the compost breaks down. Wood chips or sawdust alone might have a carbon-nitrogen ratio of 200 to 1, and that addition to a field would definitely tie up soil nitrogen until the wood chips or sawdust break down.
The compost product has met USDA specifications for land application, so there is little concern about spreading HPAI to additional areas. Therefore, compost from HPAI-infected farms is a nutrient source farmers can use to amend their normal fertility program while adding organic matter to their fields.
The author is a professor and field specialist of manure nutrient management systems with Ohio State University Extension.
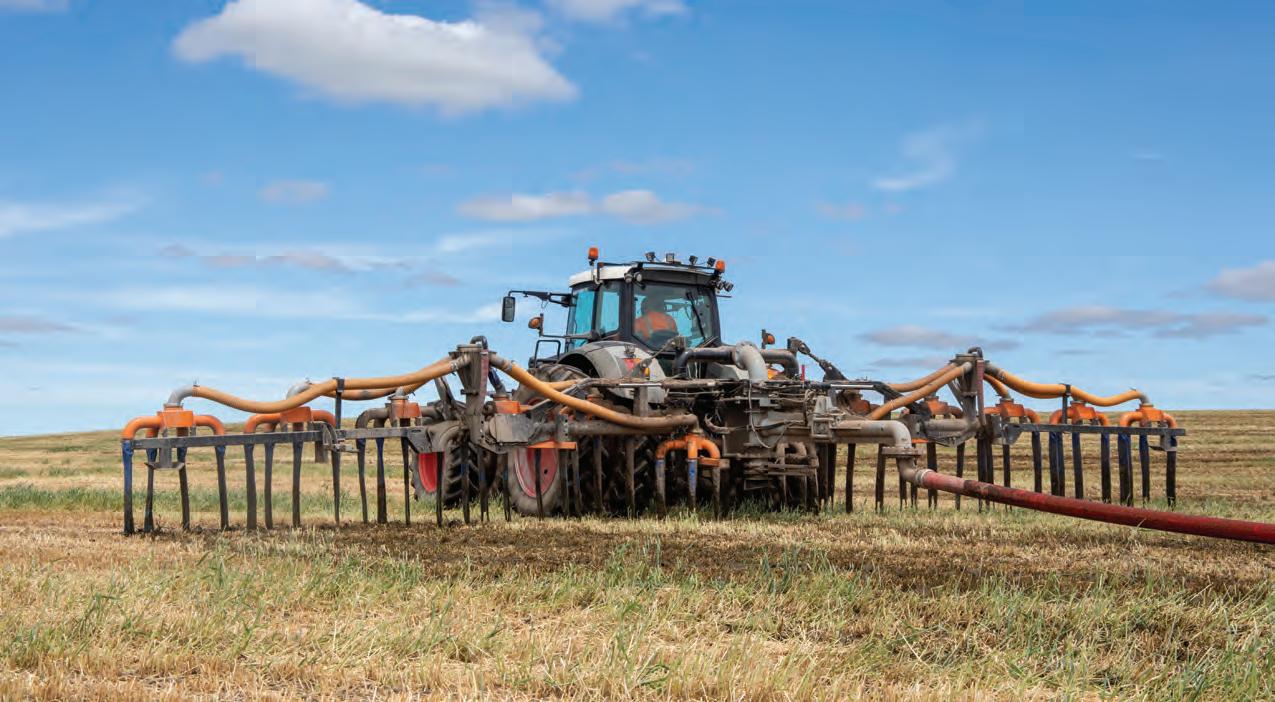
To fine-tune nitrogen application rates, researchers updated the presidedress soil nitrate test and made adjustments to account for injected manure.
by Robb Meinen
Mid-season soil nitrate testing in corn can provide valuable information on expected nitrogen availability to the crop through the remainder of the growing season. Researchers in Pennsylvania developed a soil nitrate sampling protocol for fields where manure injection causes patterned nitrogen distribution in the soil. Additional work provided updates to the state’s presidedress soil nitrate test (PSNT) that reflect contemporary crop and soil management practices.
A tool for tracking
The PSNT is an affordable tool that allows producers to sample soil and have it analyzed at a soil laboratory for nitrate nitrogen (NO 3 -N) concentration during corn’s early growth stage. The NO 3 -N level is indicative of the nitrogen supply available in the soil from manure and other organic sources. The lab results are entered into a simple PSNT formula that provides a recommendation for the amount of sidedress nitrogen expected to provide the economic optimum nitrogen rate (EONR) to the corn in the current growing season.
The test can also indicate if no sidedress nitrogen is needed. Producers can strategically limit manure and fertilizer applications prior to planting and use the PSNT to provide economic and agronomic information on the soil’s resil-
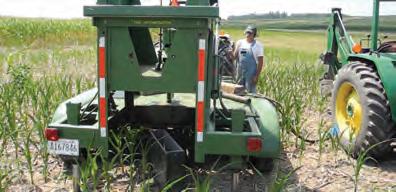
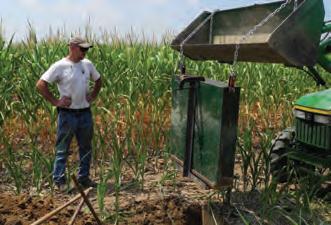
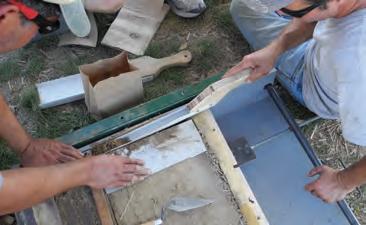
1. Soil collection during monolith soil research
A) The monolith sampler was oriented perpendicular to the direction of manure injection travel. The monolith sampler was pounded into the soil with a special weighted tool. B) The monolith sampler in soil before extraction. C) Removal of the monolith soil sample that is 30 inches wide. D) The full monolith sampler was laid on its side, a single side was removed, and special tools were used to remove 30 side-by-side, 1-inch wide, 12-inch deep soil samples that were each analyzed for nitrate nitrogen content.
iency to supply nitrogen for the remainder of the season. Thus, the PSNT is a tool that provides agronomic, economic, and environmental benefits associated with the 4R practices — right source, right rate, right time, and right place. PSNT soil sampling protocols vary slightly between state land-grant insti-
tutions and extension organizations. In Pennsylvania, the PSNT protocol calls for 10 to 20 random soil core samples, taken 12 inches deep, to be collected when corn is 6 to 12 inches tall. The soil is composited and mixed, with a single subsample sent to the laboratory for analysis. Drying or cooling soil samples
Figure
before shipping is recommended to slow microbial processes and nitrogen transformations. Laboratory analysis results are reported in units of parts per million (ppm) NO3 -N.
Measuring for injected manure
The PSNT was developed in the 1990s and did not provide specific soil collection recommendations for fields where manure was injected. Manure injection deposits manure in parallel banded patterns across a field. This results in higher nitrogen concentrations in a zone around the band. Random soil probe placement could collect cores from areas close to the band or in the middle space between bands, each reducing confidence in PSNT results.
Penn State and USDA-ARS researchers designed an experiment that used a unique monolith soil collection system to capture a soil core for every inch across a two-dimensional plane
oriented perpendicular to the travel of manure injection (Figure 1). The experiment used 30-inch spacing between manure injection bands, so 30 individual adjacent soil NO3 -N levels were known. The work was replicated and repeated over two seasons.
A statistical model was developed to compare NO 3 -N results from different possible soil sampling protocols to the average NO 3 -N of all 30 samples combined. A simple sampling spacing protocol emerged as the top choice. Soil sampling where nutrients are banded is done by collecting a set of five equally spaced sets of soil cores in an orientation perpendicular to the nutrient band from four locations in the field (Figure 2).
To determine the specific, equally spaced distance between soil cores for the field, measure the distance between band locations and divide by five. For example, if manure injection bands are
30 inches apart, then collect five soil cores that are 6 inches apart (30 inches divided by five cores equals 6 inches between cores) as a set.
The set of five adjacent cores are collected at four random locations in the field for a total of 20 soil cores. The 20 cores are combined and prepared for shipment to the laboratory as outlined earlier. The protocol when manure is injected requires no more labor or expense compared to the random protocol where there is no injection. Since development, this sampling protocol has been verified in numerous field trials.
The cores must be collected perpendicular to the direction in which the manure band was applied. By PSNT time, manure band locations can be difficult to locate. The precise location of the band does not need to be known because one of the five cores will be close to the band (one sample would be within 3 inches of the center of the
manure band in the 30-inch spacing above), as illustrated in Figure 2.
Finding the optimum rate
Historically, laboratory PSNT results provide a level of NO3-N from the soil sample that is entered into a formula to determine sidedress nitrogen needs. Most states provide a threshold NO3-N level that indicates there is enough nitrogen stored in the soil to meet corn growth needs. For example, in Pennsylvania, if the results were greater than 21 ppm NO3-N, no additional nitrogen was recommended. If results were below this threshold, the ppm NO3-N result was entered into a formula along with expected corn grain yield, nitrogen supplied from historic manure application, and nitrogen supplied from previous legume crops to derive a nitrogen sidedress recommendation in pounds per acre.
As time, practices, and yields advanced, the Pennsylvania formula became less reliable in its predictive quality. Changes such as widespread adoption of no-till, cover crops, retention of soil organic matter, and a producer focus on soil health improvements provided resilient pools of immobilized nitrogen in the soil, especially in fields that received historic manure applications. Ever-increasing corn yields mean higher nitrogen crop removal occurs more often today than in previous decades. Penn State researchers utilized data from 47 site-years to develop and verify the updated formula to enter PSNT results to find a recommended nitrogen sidedress rate (see Figure 3).
Consider the variation
This formula can account for the wide variety of soil management practices that affect nitrogen fertilizer requirement, such as conservation of manure ammonium with injection and immobilization or mineralization of nitrogen from previous cover crop residues and historical manure application. Research that calibrated nitrogen sidedress recommendations for this formula indicated that the PSNT result is only useful if the field has a long-term manure history of two or more years of manure applied in the last five years prior to the current year.
An additional 50 pounds of nitrogen per acre is added to the sidedress recommendation when a cover crop mixture with different plant families
These are recommended PSNT soil sampling protocols. Field A received surface manure application, and 20 soil cores are collected from random locations. Field B received injected manure. The center of the manure injection band is indicated with a black line, and zones of influence near the manure band where higher nitrate nitrogen levels are expected are indicated by the lighter shading. Twenty total soil cores are still collected as sets of five from four locations in the field. The sets are spaced equally from each other by dividing the distance between injection bands by five. The exact location of the band does not need to be known, but sets must be oriented perpendicular to the direction of injection travel.
Figure 3. Updated Pennsylvania PSNT formula and sample calculation
Economic optimum nitrogen rate (EONR) calculation for fields with manure application history
0.72 X Corn yield goal in bushels/acre - 5.1 X PSNT result in ppm NO3 -N + 50 if cover crop is a mixture of plant families = N sidedress recommendation in pounds N/acre
For example, if a field has expected corn yield of 220 bushels/acre, a PSNT result of 22 ppm NO3 -N, has manure application history of two years out of the five, and a monoculture grass cover crop the calculation would be as follows: (0.72 X 220) – (5.1 X 22) + 0 = 46 pounds N/acre
or functional types (such as a mix of grasses, brassicas, and/or legumes) existed in the field in the prior winter.
Unlike the original PSNT approach, the new formula does not contain a fixed critical soil nitrate threshold where no nitrogen sidedressing is recommended. Growers can determine if low sidedress recommendations are worth pursuing. A formula result of zero indicates that no plant response to nitrogen sidedress is expected. When the new formula provides a negative result, no sidedress nitrogen is recommended. ■
The author is director of the Pennsylvania Nutrient Management Education Program and a Penn State extension specialist in nutrient and manure management.
MANURE MINUTE
CAN CO-DIGESTION WORK ON A SMALLER SCALE?
naerobic digestion not only recovers nutrients and energy from manure, but it also reduces methane. Some farms with anaerobic digesters will bring in other organic materials to help feed the digester and enhance output. Farms may also receive payment or a tip fee for recycling this food waste. This combination of manure and other organic materials is called co-digestion.
While anaerobic digesters are growing in number on livestock operations, they tend to be built on larger farms. While anaerobic digesters can theoretically work for a farm of any size, there are economies of scale that come with these systems, and financial feasibility is often a challenge, especially for smaller operations digesting manure alone.
A Cornell University study looked at the practicality of co-digestion at various dairy herd sizes. Lauren Ray, a senior extension associate and engineer with Cornell University, shared these results during a CALS PRO-DAIRY webinar titled, “How small can co-digestion economically go?”
In New York, there are around 35 anaerobic digesters on dairy farms. Manure from 90,000 dairy cows — 15% of the state’s herd — is being processed through a digester. To evaluate how an anaerobic digester with co-digestion may work on more farms of various herd sizes, Ray shared the model farm and Cornell Manure-based Anaerobic Digester Simulation tool that was used in the study. The food products added to the anaerobic digester in the analysis included cheese whey, confectionery waste, and a small amount of fats, oils, and grease.
In their model, the waste was trucked from the food processor to the farm and loaded into a reception pit, which would then be mixed with dairy manure. This delivery and storage part is very important, especially on smaller farms, Ray noted. That’s because on-farm processes to handle the food waste, such as unpackaging or grinding, all add substantial cost and management requirements.
Co-digestion will also add to the amount of energy or biomethane produced during anaerobic digestion and will create more volume of digestate to be stored after the process. “That is a consideration and a cost,” Ray said.
The analysis looked at dairy farms with 150, 300, 1,000, and 2,000 lactating cow equivalents. Food waste was added at 10%, 25%, or 50% of the total digester feedstock that includes manure. The revenue estimates were based off energy production and possible payment for taking on food waste, but other revenue streams could be available depending on location.
Ray noted that in their model, co-digestion on a dairy with 150 lactating cow equivalents was not economically feasible. With half of the feedstock as food waste, the break-even cost would still be challenging to meet.
On a dairy with 300 lactating cow equivalents (about 225 milking cows plus 175 heifers), the project was feasible, but only when food waste was co-digested in an equal volume to
the manure, tip fees reached $20 per ton, and biomethane was valued at $25 per million BTU (MMBTU) or more.
In comparison, a dairy with 1,000 lactating cow equivalents (725 milking cows plus 600 heifers), achieved economic feasibility with 25% or more of food waste added to manure, as long as both the tip fees and energy revenue were high (more than $40 per ton and more than $35 per MMBTU biomethane, respectively). If food waste was included at 50%, the project penciled out at more moderate tip and biomethane rates.
The economic feasibility improved dramatically when food waste was accepted at higher ratios, Ray noted. This comes from the ability to generate more energy and the extra revenue from taking on food waste. While co-digestion can work at a smaller scale, larger systems more easily achieve economic feasibility, she concluded. Ray encouraged farm owners to work with an experienced developer to explore opportunities for their business.
Going negative on soil nitrous oxide emissions
Soil type, fertility, tillage intensity, manure application, and crop rotation all affect greenhouse gas emissions; modeling methods must account for this variation.
by Eric Young
Greenhouse gas emissions — in the U.S. and globally — are dominated by the energy and transportation sectors. Together, these industries account for greater than 75% of total emissions on a carbon dioxide equivalent basis. Agriculture is still considered an important contributor at 10%. Based on Environmental Protection Agency (EPA) estimates from 2022, carbon dioxide (CO2) accounts for 75% of total greenhouse gas emissions, with methane (CH4) and nitrous oxide (N2O) contributing 18% and 4%, respectively.
While agricultural greenhouse gas emissions are relatively small, the dairy industry is stepping up in a big way to reduce emissions. Practices such as improved crop rotations can help mitigate greenhouse gas emissions
while promoting soil carbon sequestration and greater crop yield potential. Given the importance of CO2 as a greenhouse gas and the large amount of land in agriculture globally, crop and soil management practices that can
sequester carbon and boost yield potential are needed to reduce crop production risk and better withstand weather extremes in general.
Modeling the impact
Simulation models are routinely used to estimate greenhouse gas emissions from agriculture and mitigation potential of various practices. All simulation models require reliable field measurements for calibration and validation of predictions. Calibration and validation are critical parts of any agroecosystem model and particularly for greenhouse
gases, since emissions are often highly variable and closely tied to changes in weather and soil conditions.
Soil type, tillage intensity, fertility, manure application, and crop rotation all affect greenhouse gas emissions. It is important for field scale greenhouse gas models to account for these agronomic factors to make useable predictions and gain the confidence of producers and the industry. Recent and ongoing research at the Marshfield Agricultural Research Station (MARS) in north central Wisconsin has focused on quantifying greenhouse gas emissions from corn silage, hay, and grazed pastures under differing fertility and manure application strategies.
A look at manure
A recent study at MARS measured greenhouse gas emissions from no-till corn silage plots that received a onetime application of solid manure. The study was initiated in a ryegrass field with somewhat poorly drained soil.
A one-time application of solid dairy heifer manure (8.2 dry tons per acre) and separated dairy manure solids (8.7 dry tons per acre) was applied to the soil surface without incorporation in September 2020. Greenhouse gas emissions were monitored in 2020 before and after manure was applied and for three years of no-till corn production from 2021 to 2023. A control of no manure was included for comparison where corn received starter fertilizer and 70 pounds of nitrogen per acre as urea at the V5 to V6 growth stage each season.
Results showed that cumulative CO2 emissions were greater for the manuretreated plots in 2021, and that was not surprising given the greater total carbon inputs from manure application (Figure 1). Interestingly, N2O emissions were low or negative each year, with manure application having little effect on cumulative N2O trends (see figures). There has been considerable emphasis on N2O because it has a 273-
fold greater global warming potential value per molecule compared to CO2 for a 100-year period.
The lack of N2O emission in our study was notable compared to other studies. Recent work has stressed the importance of reporting both positive and negative N2O fluxes from cropland. The term “negative” N2O emission means that soils are consuming N2O at the time of measurement, so not accounting for substantial negative emissions artificially inflates annual N2O totals.
Soil aeration status affects denitrification potential and conversion ratios of nitrate (NO3 -) to N2O and N2. More poorly drained conditions tend to favor greater conversion of NO3 - to N2 and, therefore, low or “negative” N2O emissions. At the same time, poor aeration also favors greater CH4 emission, since methanogenesis can only occur in extremely low oxygen environments and anaerobic conditions.
We hypothesize that the combina-
tion of poorly drained soil and no-tillage limited N2O emission for the reasons outlined above while exacerbating CH4 emission. Other studies have also reported larger CH4 emissions when soils are not tilled, particularly for imperfectly drained fields. Accumulation of residue at the surface under no-till conditions in our study may have further enhanced conditions for CH4 emission by providing a concentrated source of labile organic carbon at the soil surface. Ongoing research at MARS is clarifying the role of tillage, soil drainage, and manure application on greenhouse gas emissions.
Future measurements
Results from our trial and other studies indicate that capturing fieldby-field variation in soil type, drainage, tillage, and nutrient inputs is critical for greenhouse gas models to accurately estimate whole farm GHG emissions and carbon footprints. The Ruminant Farm Systems model (RuFaS) is a whole farm, daily time step model in development led by scientists at the U.S. Dairy Forage Research Center in Madison, Wis., and university and industry partners. The RuFaS model simulates major nutrient biophysical processes underpinning farm production including N2O emissions. A future version will include routines for estimating CO2 and CH4 emissions from animal, manure, and cropping systems.
Field monitoring of greenhouse gas emissions in different cropping systems, soils, and agricultural regions is important for calibrating RuFaS and other field-scale greenhouse gas models. This is a critical step given the multiple differences in climate, cropping systems and management practices on U.S. dairy farms and in other countries. Looking forward, continued and reliable field-based greenhouse gas emission measurements will be important for greenhouse gas inventorying, model validation, and carbon markets in some cases. ■
The author is a research soil scientist for the Institute for Environmentally Integrated Dairy Management, USDA-ARS.
Figure 1, 2, and 3. Annual cumulative totals over the study for carbon dioxide, nitrous oxide, and methane emissions. Note the average net negative N2O emissions in 2021 and 2022 implying soils were consuming more N2O than they were emitting. BP = bedded pack heifer manure; CON = control (no manure); SDS = separated dairy manure solids. Error bars are standard error of the mean.
Figure 2. Annual cumulative totals for nitrous oxide emissions
Figure 3. Annual cumulative totals for methane emissions
Figure 1. Annual cumulative totals for carbon dioxide emissions
CON SDS
MANURE MINUTE
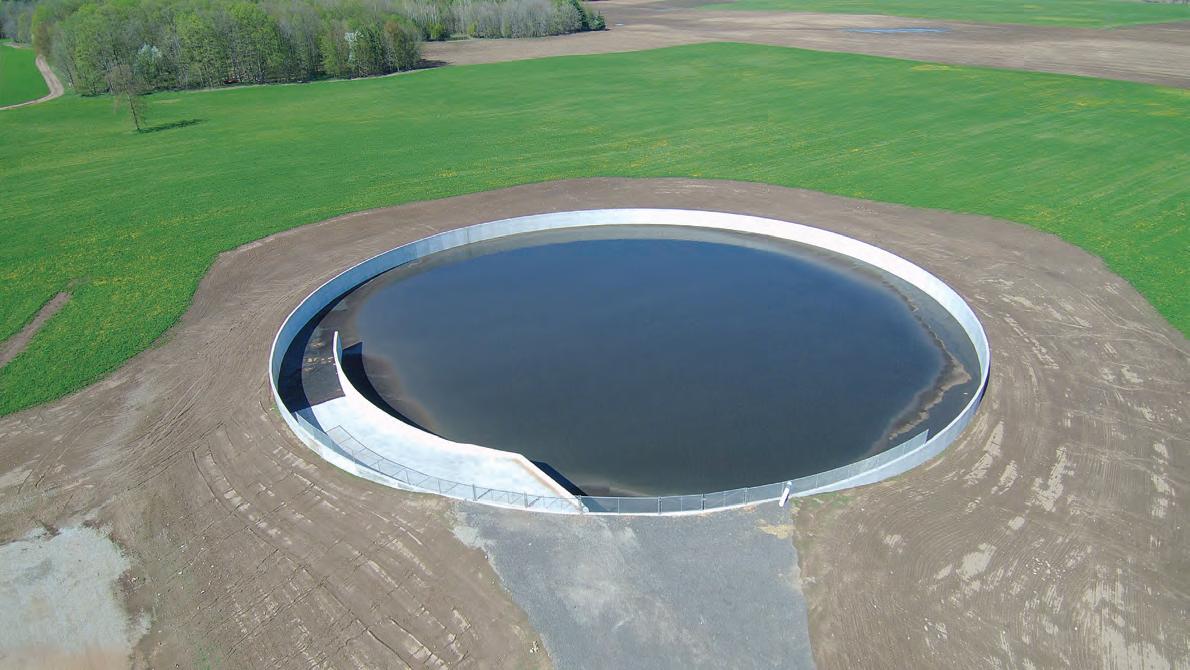
STORE MANURE STRATEGICALLY
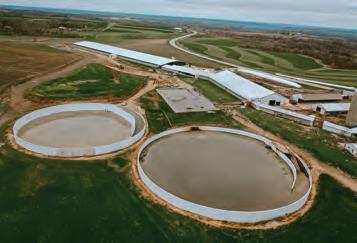
When building a new livestock site or expanding a current one, more manure storage is often needed. Manure storage allows farms to apply manure when plant and soil conditions are best suited for nutrient uptake. Extension specialist Jactone Arogo Ogejo shared guidelines for manure storage placement in a Virginia Cooperative Extension publication.
Ogejo said to think about the location of buildings, wells, surface water, and neighbors. There are also natural aspects such as trees and prevailing winds. Future expansion plans should also be considered. Review state
structure as close to the source as possible but outside of flood plains. If the structure must be located within a flood plain, protect the storage structure from extreme rain events as stipulated in your state’s regulations.
He advised placing manure storage facilities downslope from the well to protect the water supply. “While observing the minimum distance for well separation may help to protect your own well, poorly designed or poorly maintained animal manure storage facilities could still contaminate the groundwater that supplies other local drinking-water wells,” he shared. “Protecting the
sible, cover or contain manure and livestock lots to reduce or eliminate runoff.
Stored manure has an odor, so locate the structure where it will be least disruptive. This is a key component of neighbor relations.
The location, size, and type of storage facility chosen should allow for convenient filling and emptying, Ogejo noted. A push-up wall can be useful when using equipment such as frontend loaders. Make the storage facility accessible by a road or driveway that can handle all weather conditions.
“Manure is stored so that it can be used effectively as a fertilizer for crops, decrease handling costs, and minimize the potential to pollute the environment,” Ogejo wrote. Plan storage structures with these factors in mind.
MENSCH ManufacturinG
QUALITY EQUIPMENT FOR THE DAIRY FARMER
SIDE-SHOOTER BUCKET
Spreads sand or sawdust into freestalls.
FEED ALLEY SCRAPER
Keeps feed close to the cows. Rubber blade outlasts steel blades. Less vibration.
FLUFFER
Aerates and levels bedding for maximum cow comfort and safety.
EXPANDABLE SCRAPER
Adjusts to the full alley width, reducing the number of passes needed to clean the alley.
TIRE SCRAPER
Cleans like a squeegee in just one pass. These rubber tire scrapers are built to last!
Danger lurks in the air
One of the biggest hazards of working with manure can’t be seen, heard, or smelled.
by Megan Dresbach
Safety That word encompasses numerous topics when working in the field of agriculture. In this column, I will focus on factors that must be considered while working with manure and the gases it releases. You’ve read about this before, but this is a hazard that deserves further discussion and improved practices.
We’ve all heard stories about lives lost, both livestock and humans, to gases released from manure. My heart aches for these families. Our nutrient management industry must pay attention to this dangerous side effect of our occupation! Gases are a hazard we can’t see, and therefore, people often don’t take the risk seriously, but this is a serious threat with a fatal impact. Simple interventions can prevent a tragedy.
The main culprits
The four gases we worry about are hydrogen sulfide, carbon dioxide, methane, and ammonia. Carbon dioxide (CO2) is heavier than air, so it displaces oxygen in a confined space. Methane (CH4) is lighter than air and flammable. Ammonia (NH3) is also lighter than air and can cause eye or respiratory irritation. Hydrogen sulfide (H2 S), in my opinion, is the most dangerous. There is a common misconception that H2 S is not as dangerous because it smells like rotten eggs. If that smell is present, a human can leave the area and be okay. Unfortunately, H2 S only smells like rotten eggs at very low concentrations — less than 10 parts per million (ppm). Once levels reach 10 ppm or higher, side effects start to appear. Hydrogen sulfide impairs one’s ability to smell, which means a person can be in danger and not know it. The gas also paralyzes the respiratory system.
Hydrogen sulfide is heavier than air. It can creep out of the manure storage area and concentrate in low-lying areas. Unfortunately, adults and children have perished because they were in these areas.
Beyond closed spaces
It is a myth that gases are only a concern in confined spaces. They are always present when it comes to manure. Gases are released when manure is disturbed, especially during agitation.
An atmospheric inversion occurs when a layer of warm air sits above a layer of cooler air, trapping pollutants near the ground and preventing upward air movement. What does this have to do with manure gases? An inversion can happen on a foggy morning. It is not uncommon for farmers or manure haulers to start agitating early in the morning when it is still foggy. The gases get trapped between the ground and the fog. These gases are then concentrated in the areas where humans and livestock are present. Inversions have caused deaths. Delaying agitation until after the fog has lifted can avoid this situation and possibly save a life.
A slight breeze and a person standing upwind instead of downwind can make
all the difference. We have placed flags on different pieces of our equipment so we can easily tell the wind direction and adjust how we work accordingly.
Protection is inexpensive
Personal gas monitors should be standard on every operation. This technology has evolved in the last few years. The ones I purchase cost around $100. I charge them every day before use, and after two years, they are replaced. There is no bump testing needed to check for functionality, no maintenance required, and they are easy to use. There is no reason anyone working around manure should not have one. A life is worth way more than $100. Everybody needs to take the proper precautions to protect themselves and their fellow workers. If you don’t have a gas monitor, buy one right now. Your family, friends, and community want you to come home safe. Spend that $100 for you and for them! ■
The author is the vice president of W.D. Farms LLC in Circleville, Ohio, and blogs as the Ohio Manure Gal.
AGRICULTURAL CONCRETE
JP Tank
317 Kohlman Rd. Fond du Lac, WI 54937 920-948-2286
jptankconcrete@gmail.com jptank.com
Pipping Concrete N6106 County Rd. C Rosendale, WI 54974 920-948-9661
Sand bedding provides a healthy, comfortable environment for dairy cows. But sand is abrasive, and when mixed with manure, it can become difficult to agitate and pump, expensive to land apply and it is not always the optimal addition to fields.
Choose a manure partner who can help you overcome these challenges and help your herd prosper. Plus, you can REDUCE BEDDING COSTS BY UP TO 95% with efficient sand separation and recovery.
3
ANAEROBIC DIGESTERS
Without separation beforehand, sand-laden manure is incompatible with anaerobic digester systems.
With sand separation, you can:
Achieve greater than 90% sand recovery
Capture an additional 5% of fines
Success begins with capitalizing on physics, gravity and engineering know-how.
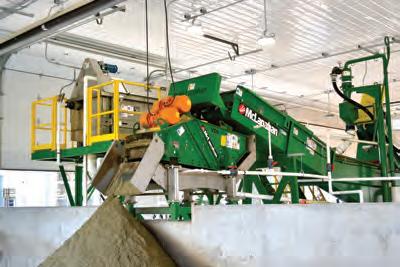
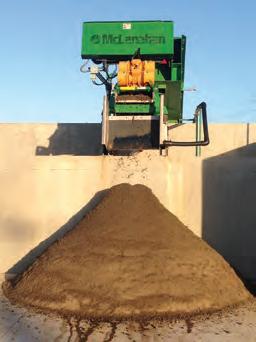
MOVING AND SEPARATING
Sand is tough on equipment, but McLanahan equipment is tougher.
Engineered to outperform standard-duty equipment
Simplifies manure transport and handling
Produces clean, recycled sand suitable for reuse within days
Reduces costly storage cleanouts
Heavy-duty engineered equipment for on-farm conditions for extended life and fewer parts runs.
COW COMFORT
Sand bedding is the gold standard for dairy cows because it’s a forgiving, drier, comfortable deep bed.
Sand bedding:
Increases cow lying time
Decreases lameness
Boosts milk production
Researchers suggest bedding with sand containing less than 3% organic matter and more than 95% dry matter.1
FIELD EFFECTS
Over time, applying sand-laden manure can change the nutrient composition of soils.2
As sand is added to manure, the percentage of N, P, K and sulfur is diminished3
Without sand separation, dairies may add up to 2/3 of a truckload of sand per acre per year
The effects are slow, but cumulative. Research shows adding large amounts of sand to soil can change its texture to include 20% more sand over two decades.3