Contributions Designed and detailed the project, developing a modular street market system for urban reuse. Produced all drawings, diagrams, and visualizations presented in the project.
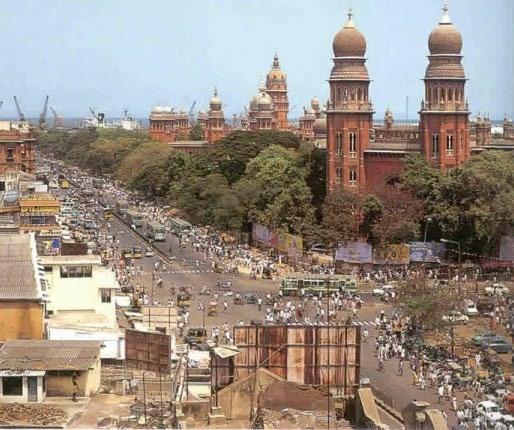
The project proposes the redesign of Vallalar Nagar, a central district in George Town, Chennai, to improve pedestrian mobility and support the local street economy. The area is one of the city’s most active commercial zones, yet lacks basic public infrastructure such as parks, squares, and walkable sidewalks.
A modular system is introduced to organize mobile shops and informal vendors, offering flexible configurations for shelves, tables, and electrical access. This system aims to improve the trading capacity of the street, formalize existing activity, and create safer, more accessible public spaces for vendors and pedestrians.
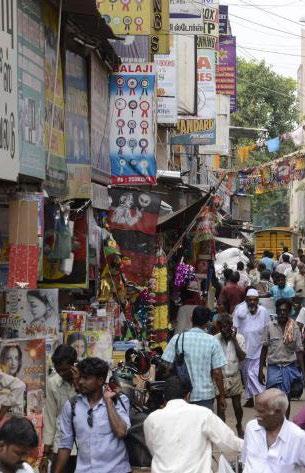
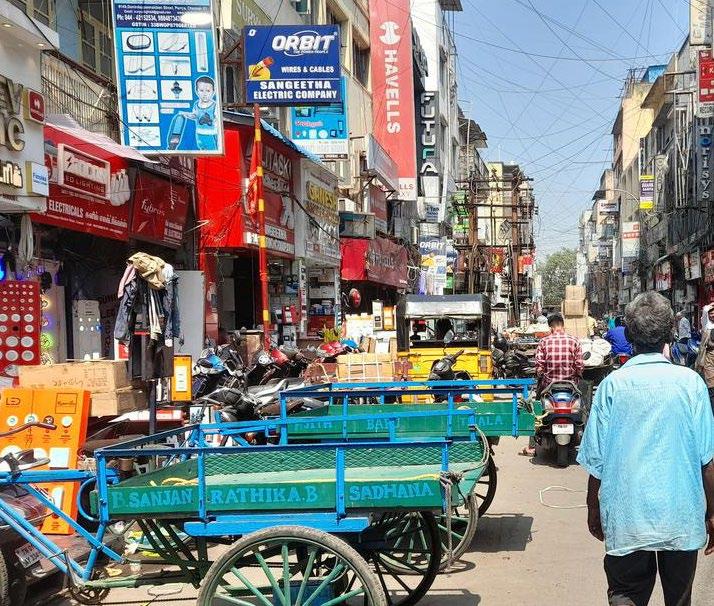
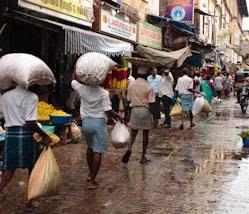
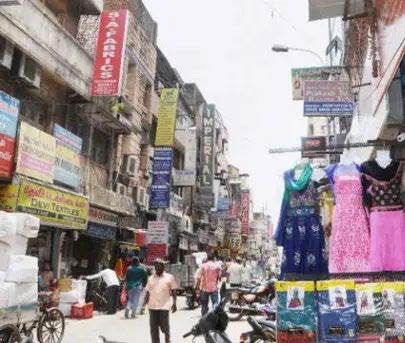
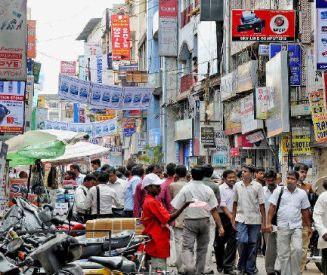
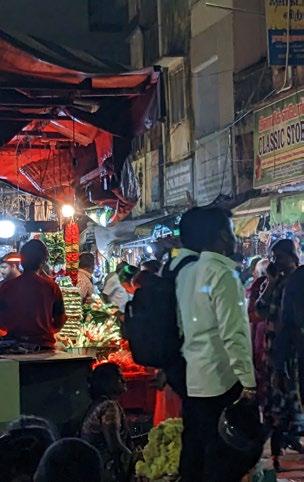
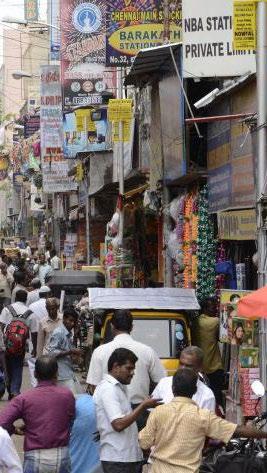
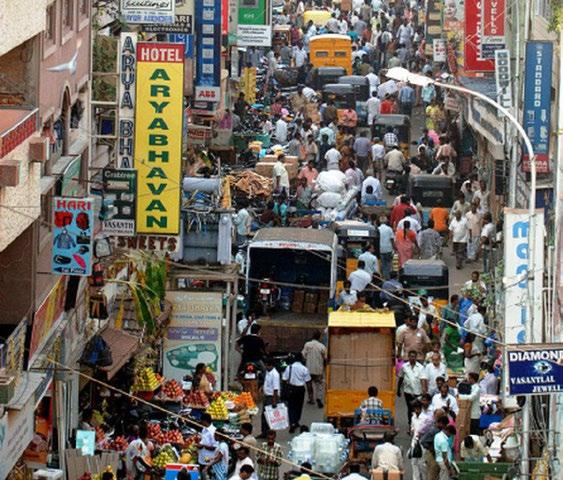
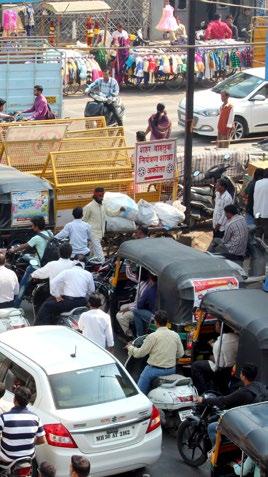
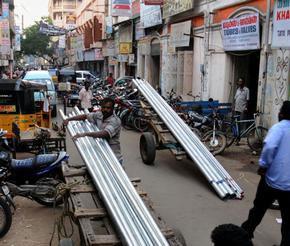
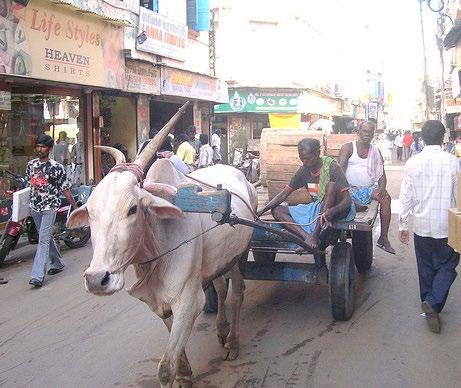
In George Town, streets are often too narrow to accommodate both movement and trade. Sidewalks are nearly absent, and vendors spill into the carriageway, leaving pedestrians to navigate through traffic. The boundary between public circulation and private use is blurred, creating constant friction and little sense of shared space
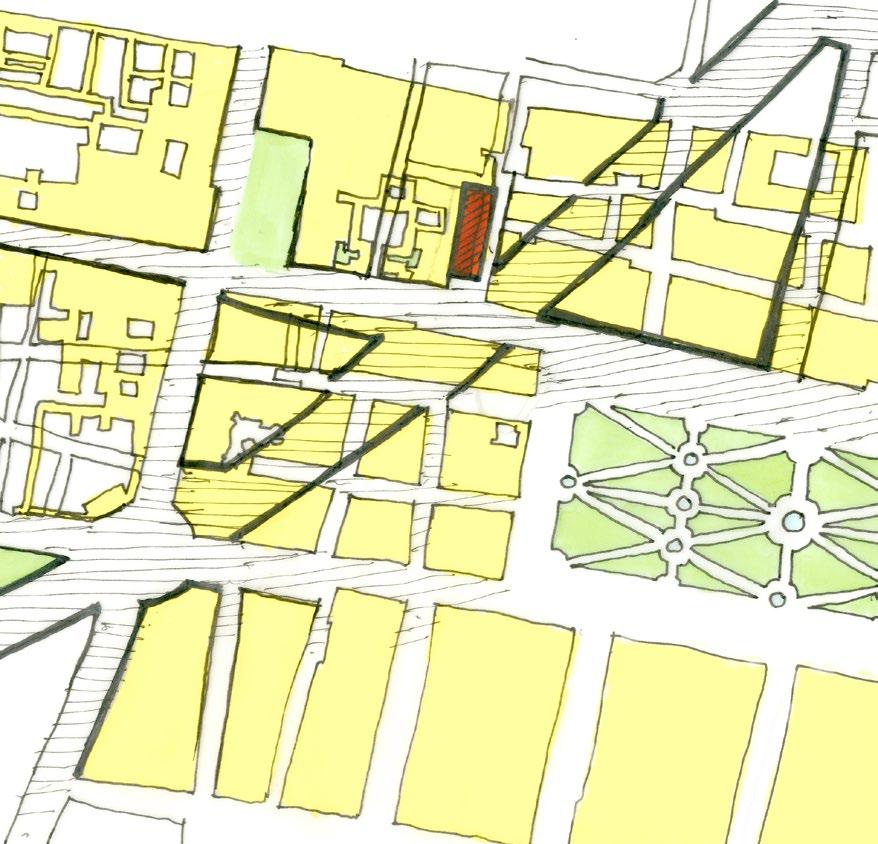
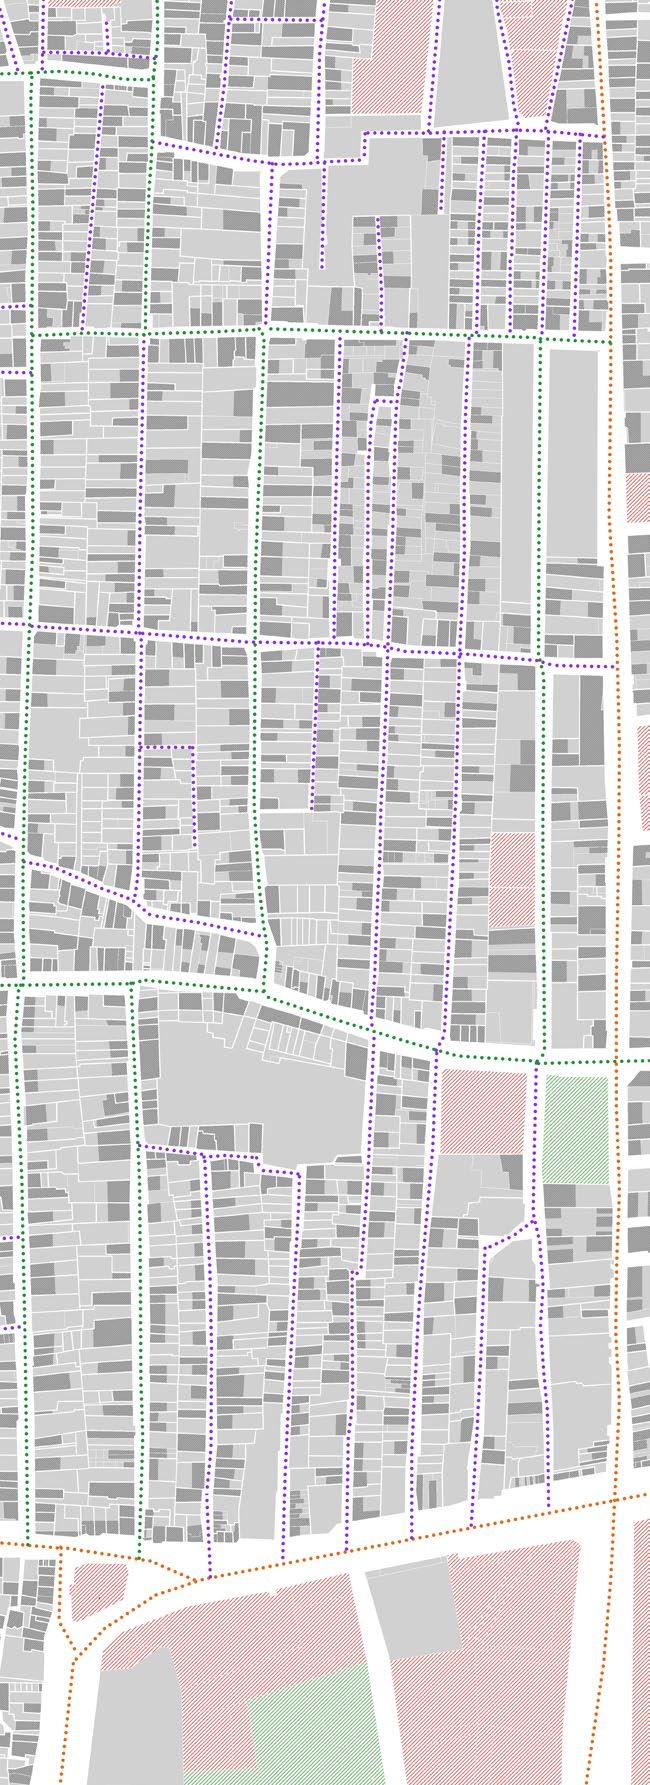
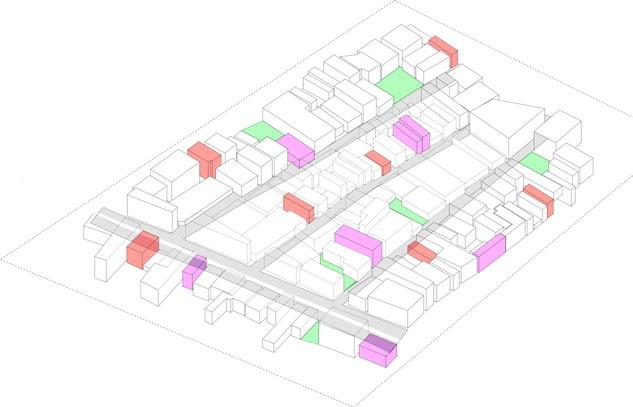
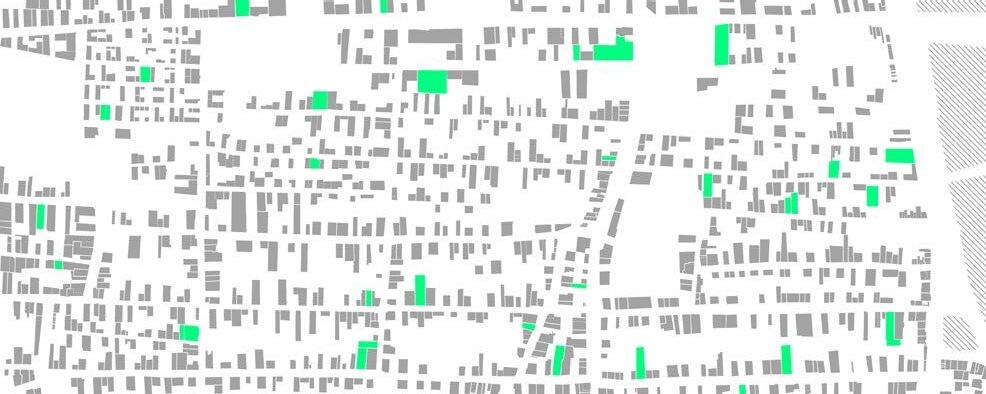
Existing Site Conditions
Residential Building
Retail Building
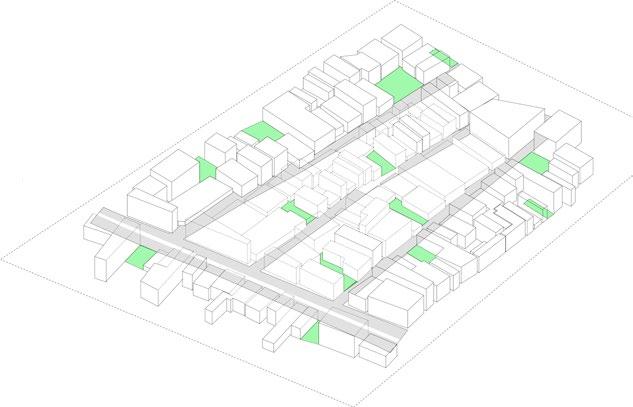
Green Space
Commercial Land
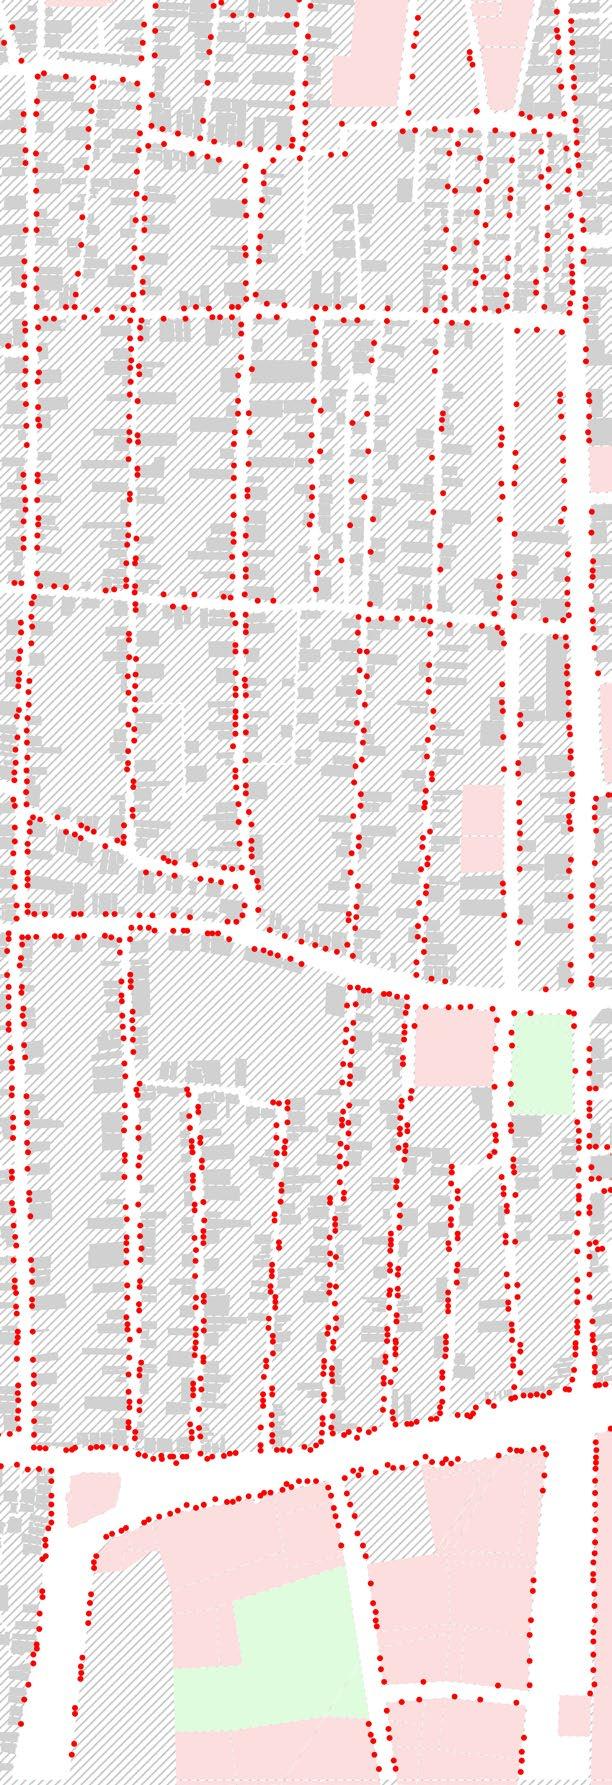
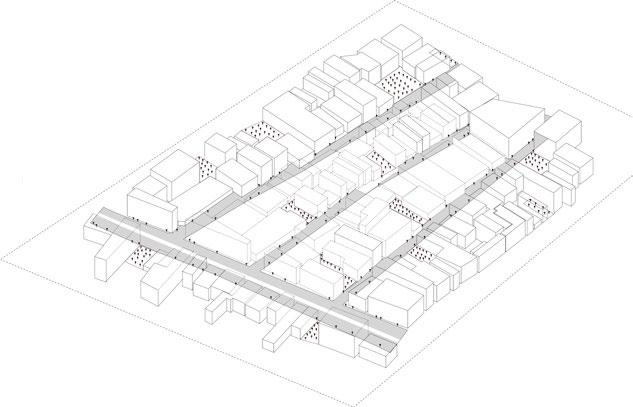
Street Hawkers
Major Road - 30ft
Minor Road - 15ft
Street - 10ft
Master Plan - George Town
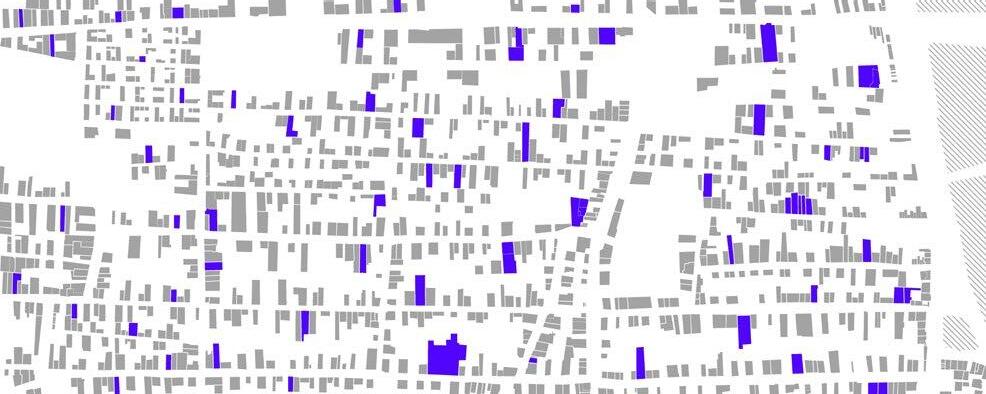
George Town is predominantly composed of residential and mixed-use residential zones. The area is designated as a ‘ Continuous Building Area,’ allowing two-story structures with a maximum Floor Area Ratio (FAR) of 1.5
However, the majority of buildings in the district are non-compliant with current development regulations. Many have been constructed without formal approvals from the city corporation, resulting in widespread regulatory violations and a built fabric that lacks consistency with the intended planning framework.
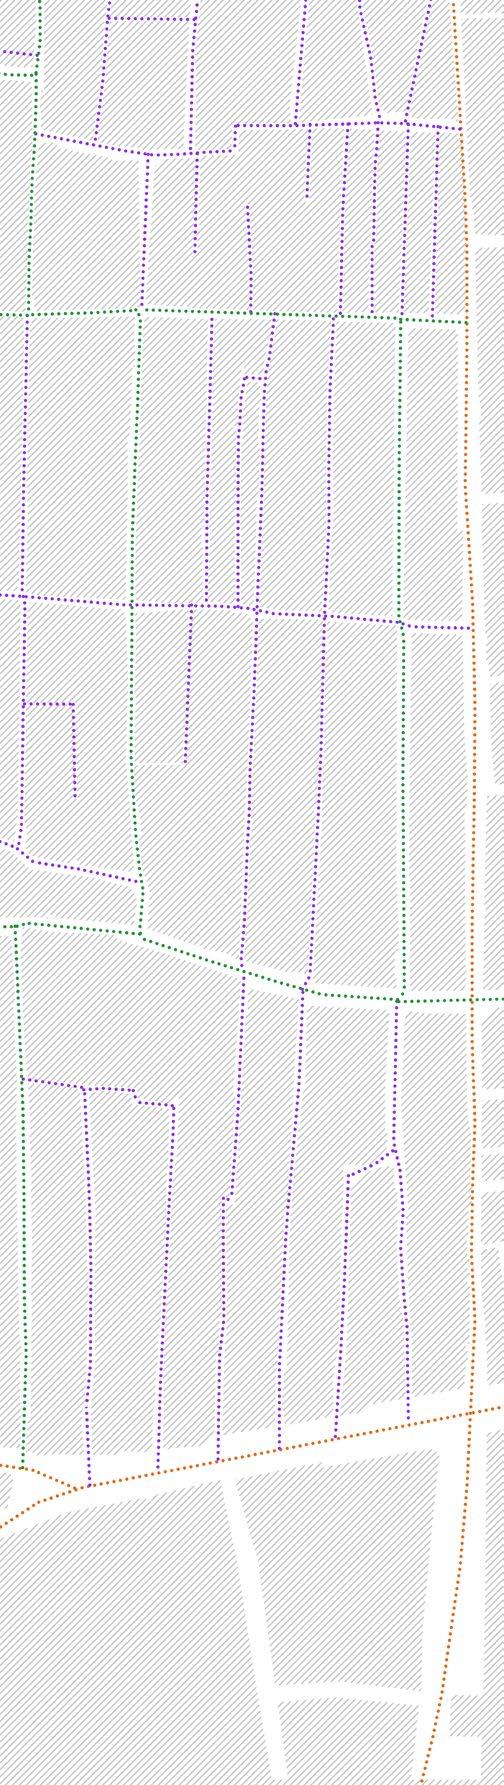
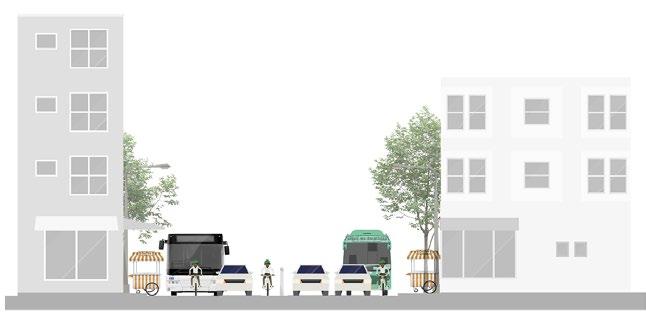
Road width - 10 ft
Road width - 15 ft
Road width - 30 ft
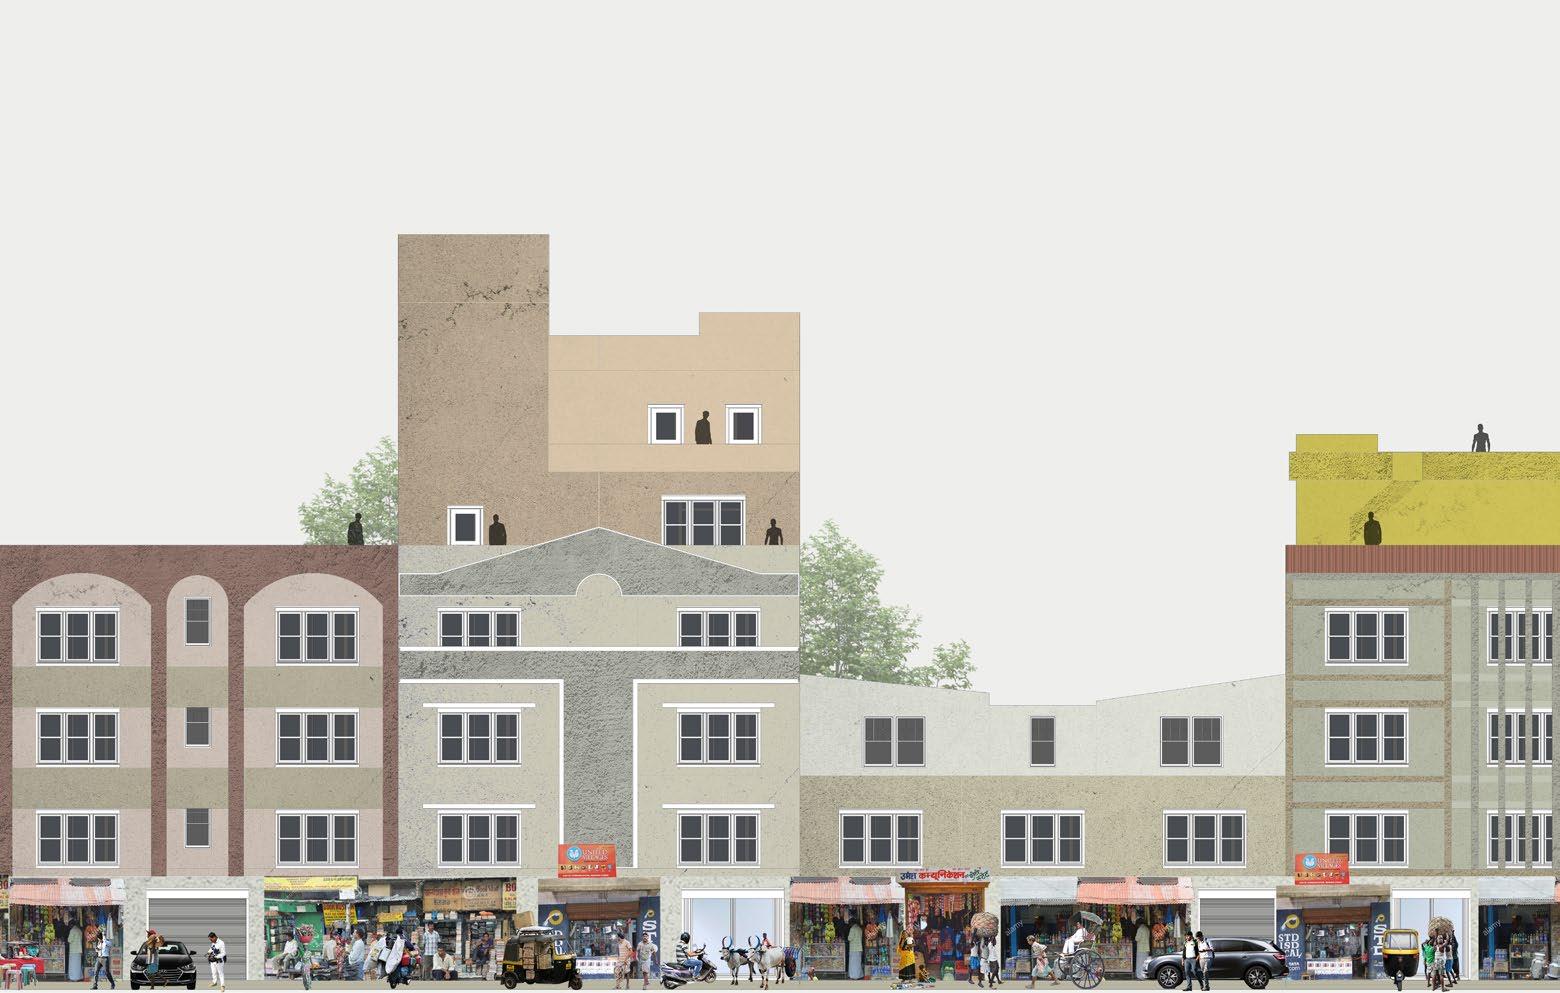
Typical Road Sections
Building Standards
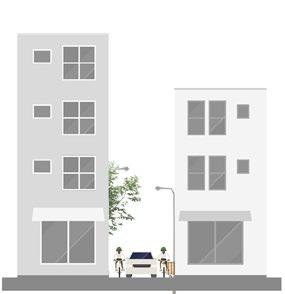
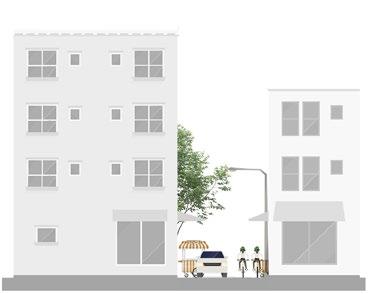
The existing street infrastructure is significantly underdeveloped, with sidewalks that are narrow, inconsistent, and often interrupted. There is minimal spatial definition between the pedestrian zone and adjacent private properties, resulting in blurred boundaries that reduce walkability and hinder safe, accessible movement.
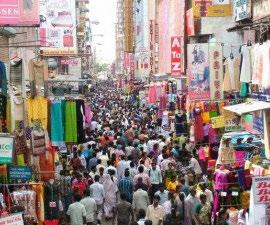
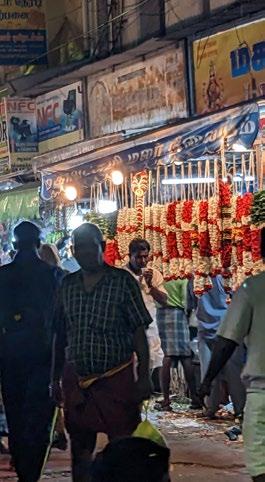
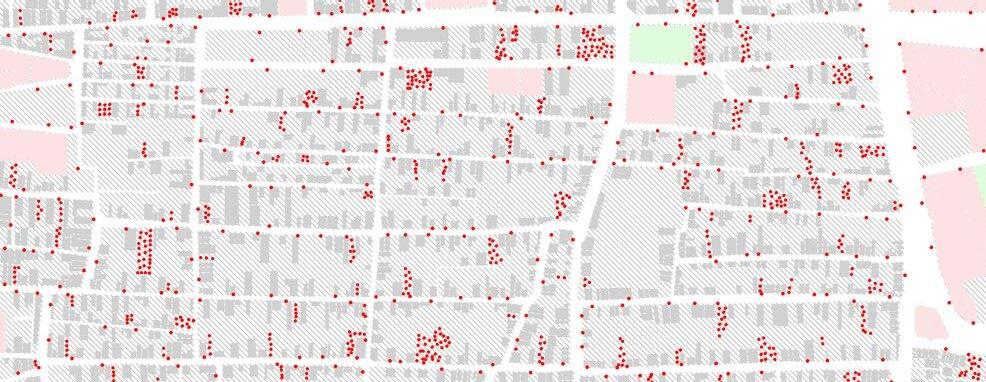
This district serves as a major center of trade, with a high concentration of informal vendors However, the absence of a clear circulation framework and a lack of regulatory enforcement have allowed encroachments into the street. This contributes to intense congestion and creates conflict between pedestrian activity and vehicular flow, making the area difficult to navigate and unsafe for both.
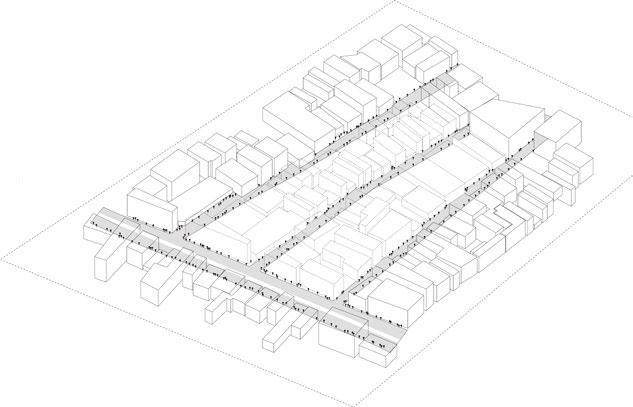
Existing density of street hawkers along the sidewalks of streets and roads
Reclaiming underutilized and vacant lots and demolish underused facilities
Renovating and utilizing available vacant lands
Relocating street hawkers to proposed lands to reduce street congestion
Proposal
Reclaim underused plots
Underutilized and vacant lands
Existing Structures
Demolish underused facilities
Underused facilities
Existing Structures
Renovate existing resources
Renovate facilities
Existing Structures
A new designated area for street hawkers is proposed to accommodate existing market activity while alleviating congestion along primary streets. This relocation strategy aims to formalize informal trade and improve overall circulation within the district.
0’ 250’ 125’
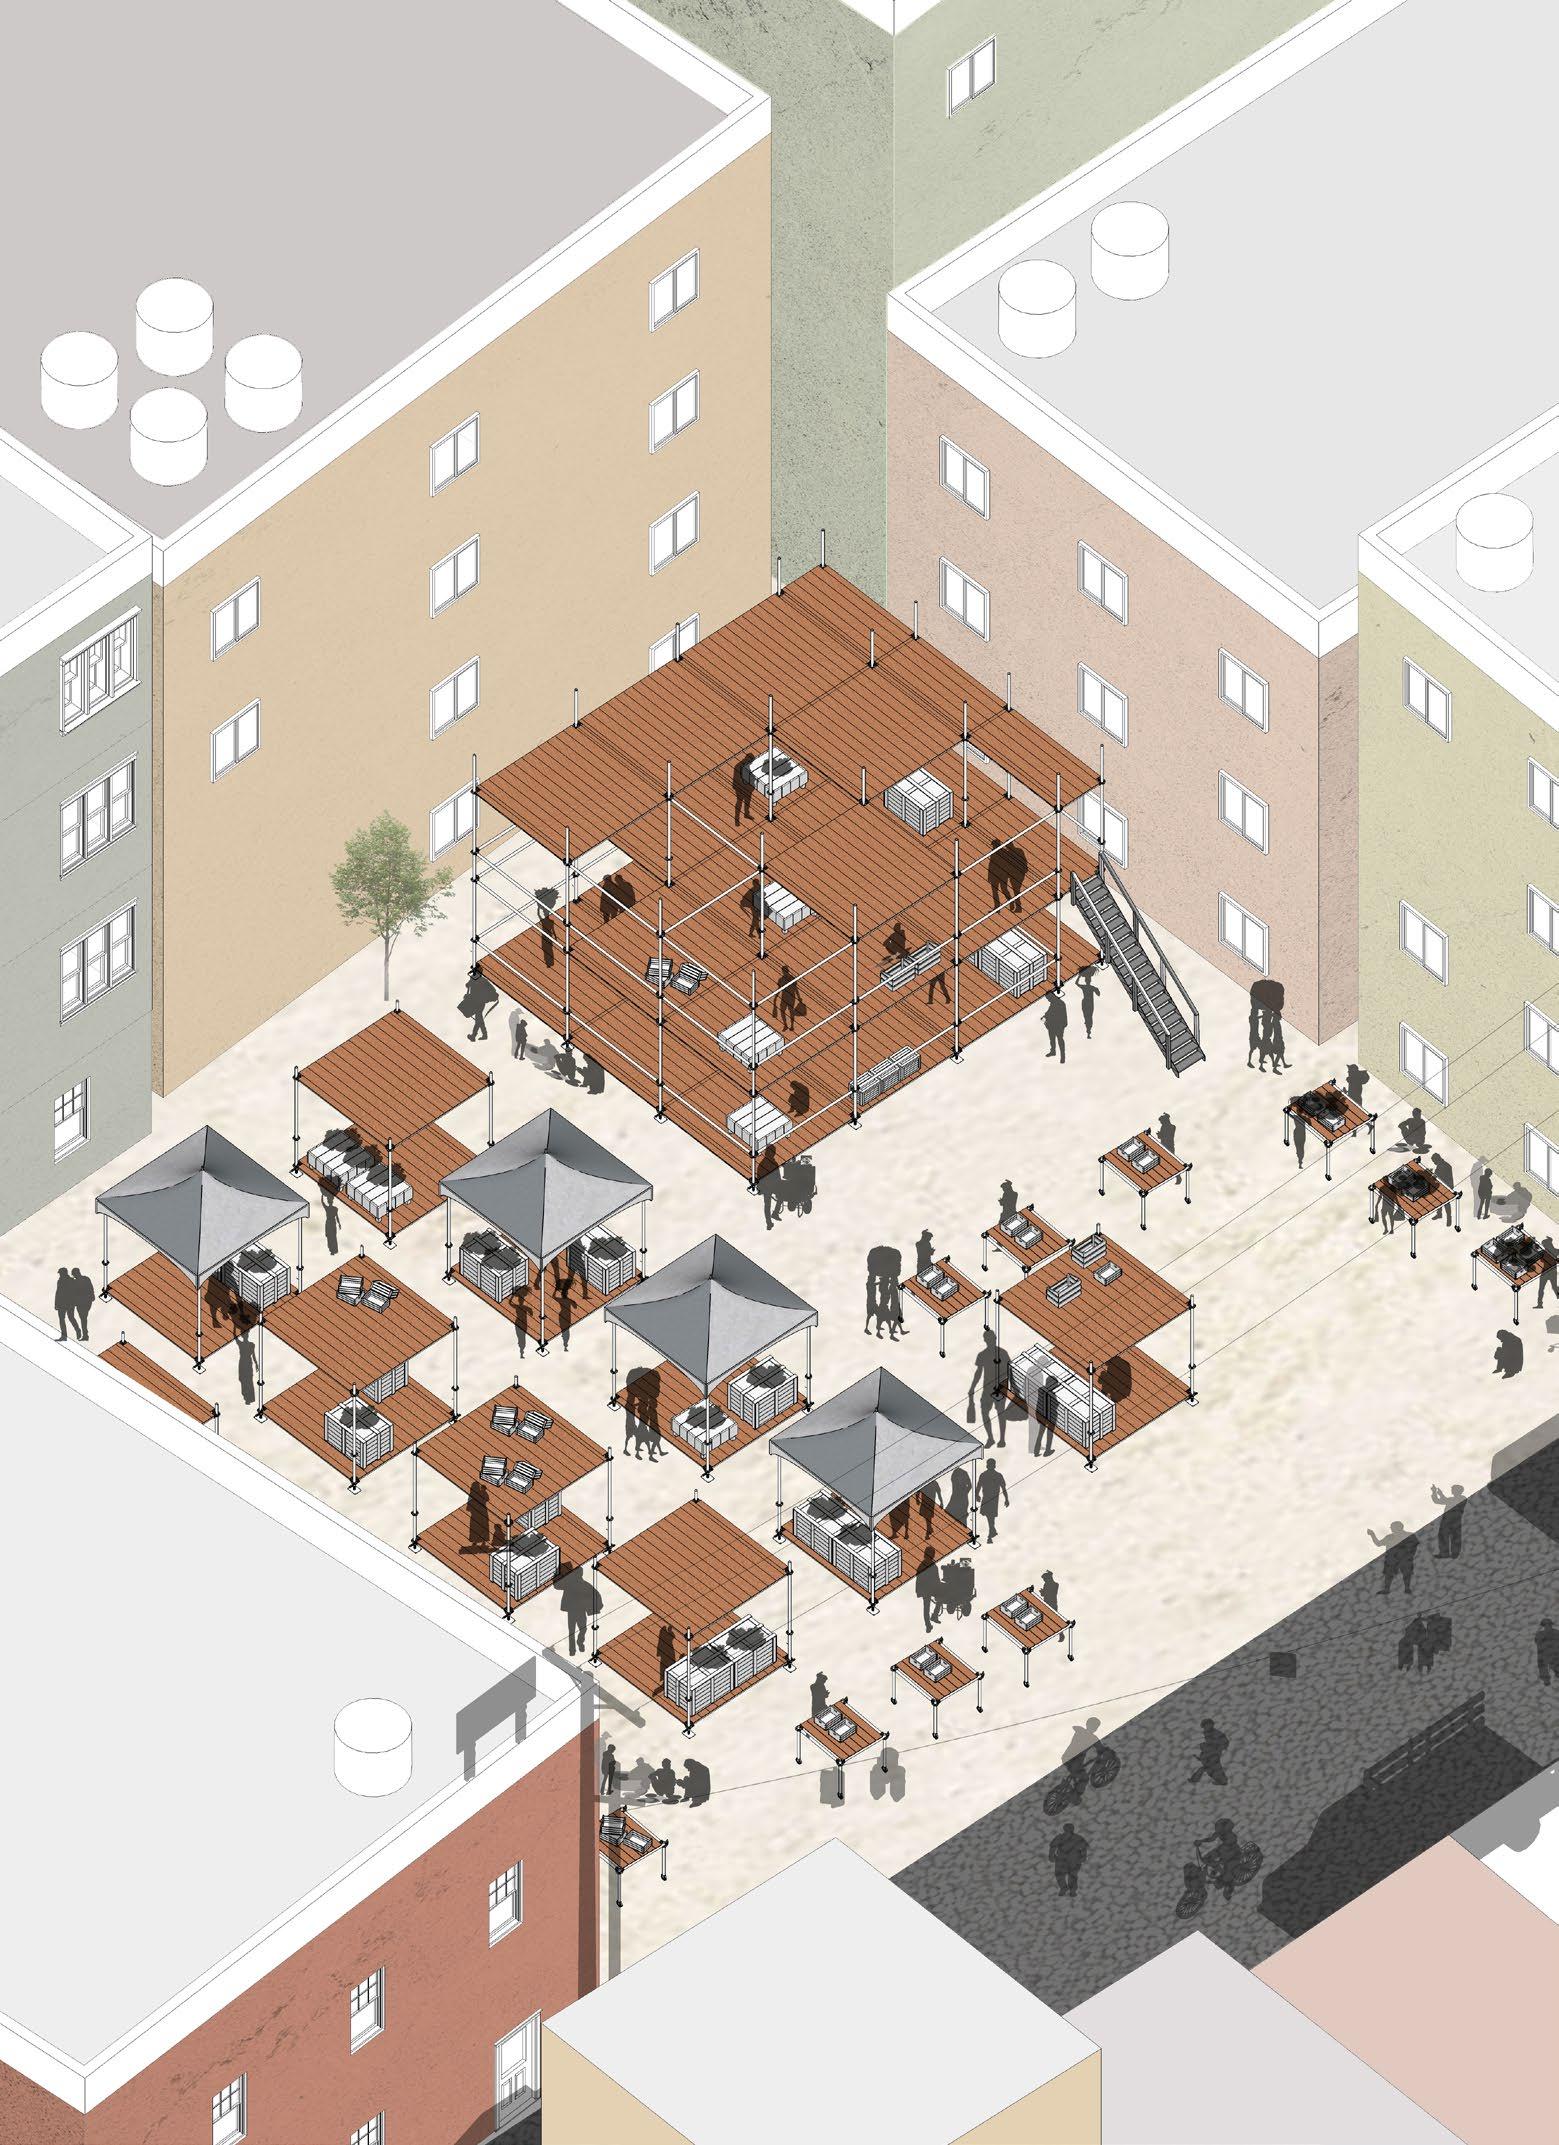
Modular Design
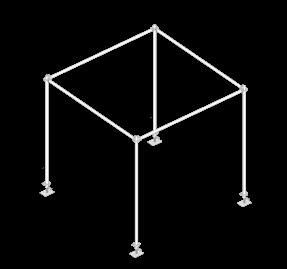
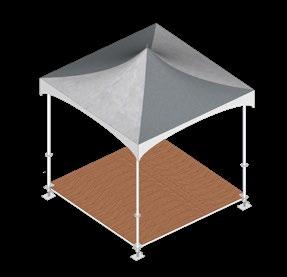
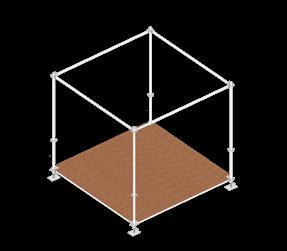
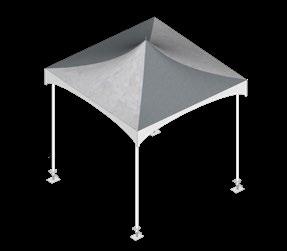
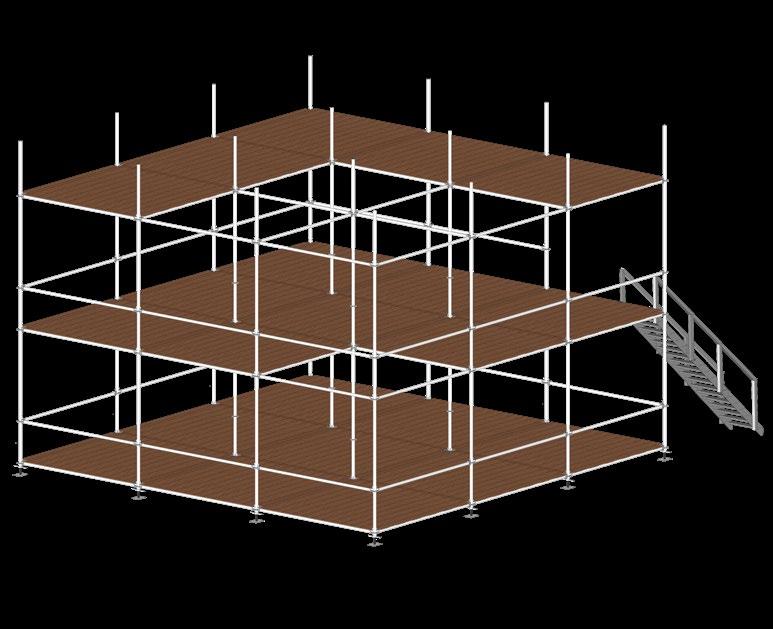
The vendor units are constructed using scaffolding as the primary structural framework, with pallet wood forming the base platform. Roofing is adaptable and can be assembled using either pallet wood or tarpaulin, depending on seasonal or contextual needs.
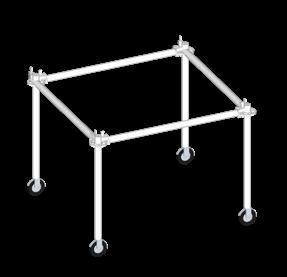
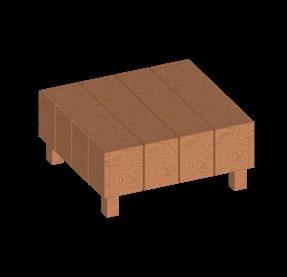
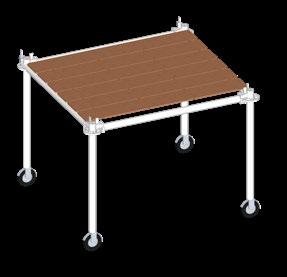
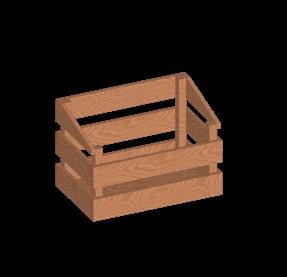
Designed for flexibility, the units are modular and fully demountable. Their components can be reconfigured or scaled based on vendor requirements, allowing for easy relocation or resizing. Storage boxes made from pallet wood add functionality while maintaining material consistency.
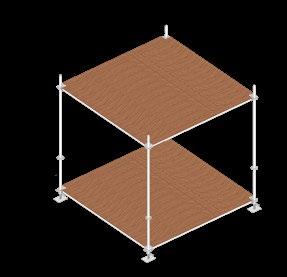
The system emphasizes durability, sustainability, and ease of deployment. During festivals or peak trading seasons, smaller units can be combined to create multi-level stalls, supporting higher vendor capacity within the same footprint.
Creating multi level stalls by merging minor units
Details of scaffolding joints
Base frame Pallet Wood Floor
Support Frame Temporary Shade
Tarpaulin Roof Pallet Wood Roof
Mobile Structure
Pallet Wood Storage Units
Equity Across Raleigh
Location Raleigh, NC
Academic Cartography, Spring 2024
Instructors Sara Queen, Tania Allen
Contributions Researched and visualized socio-economic data using ArcGIS Pro, RawGraphs, and Python. Developed all maps, diagrams, and data visualizations presented in the project.
The research, emphasizing Raleigh, comprises three interconnected map series with seven maps that study socioeconomic disparities in Wake County. It is an exploration of ArcGIS Pro, visualizing various Open Data available on the Raleigh Gov website, along with RawGraphs and a bit of Python
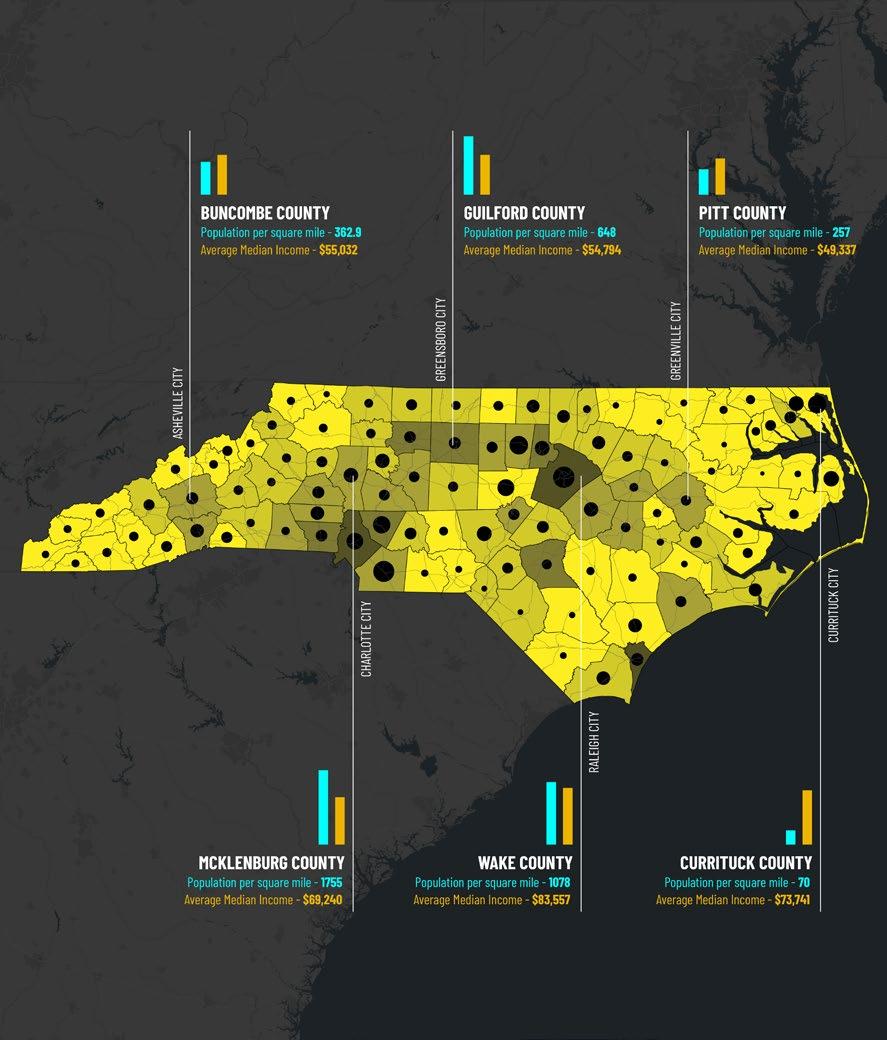
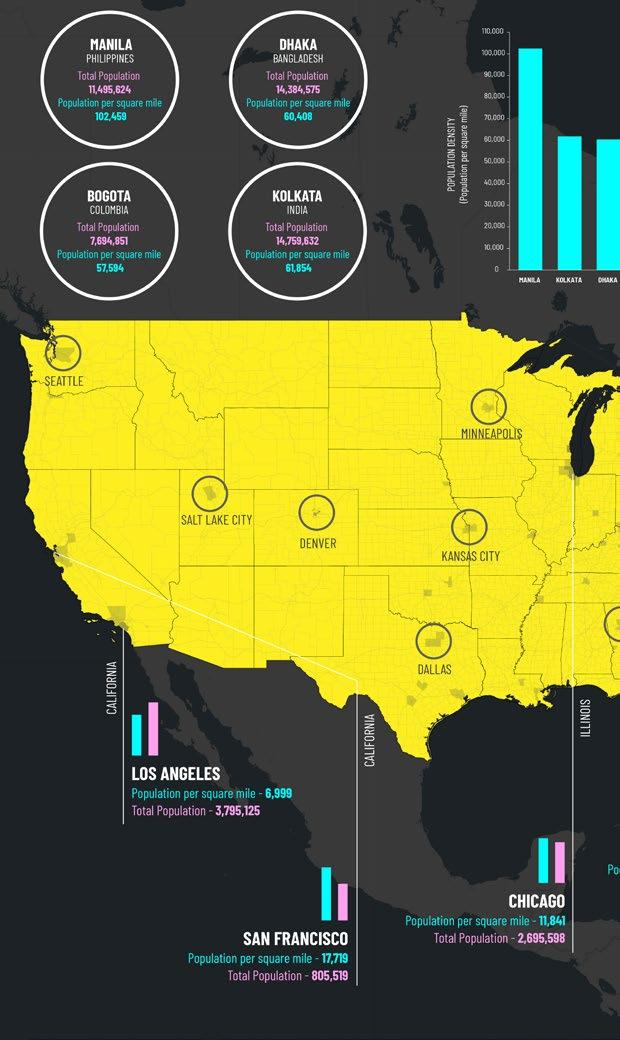
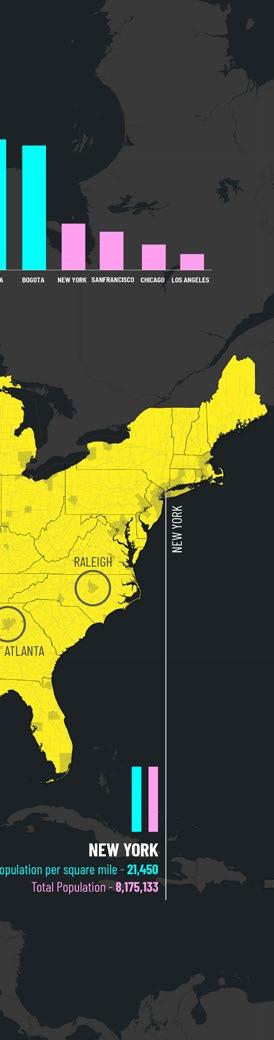
Map Series 01 compares population density and median income across different scales: North Carolina, Wake County, and Raleigh Zooming in from the NC scale, observations reveal a significant income disparity between the northwest and southeast of Raleigh. On the US scale, the map identifies the densely populated cities in the country.
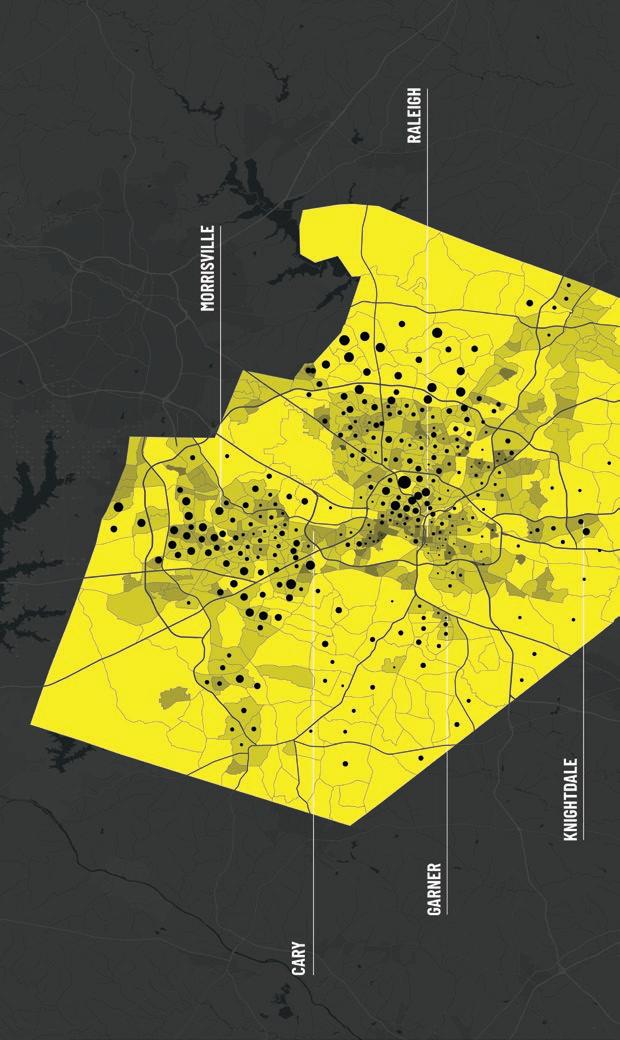
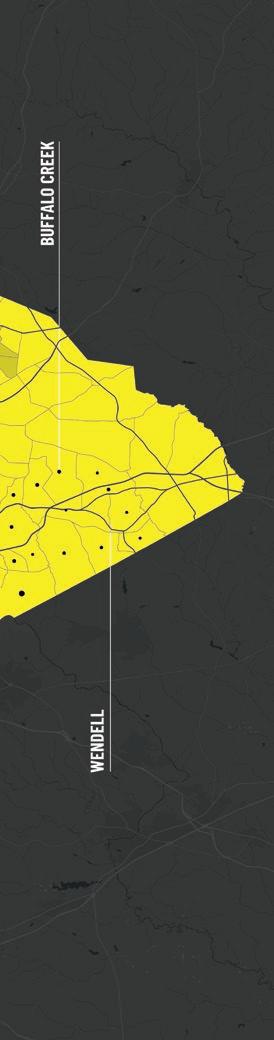
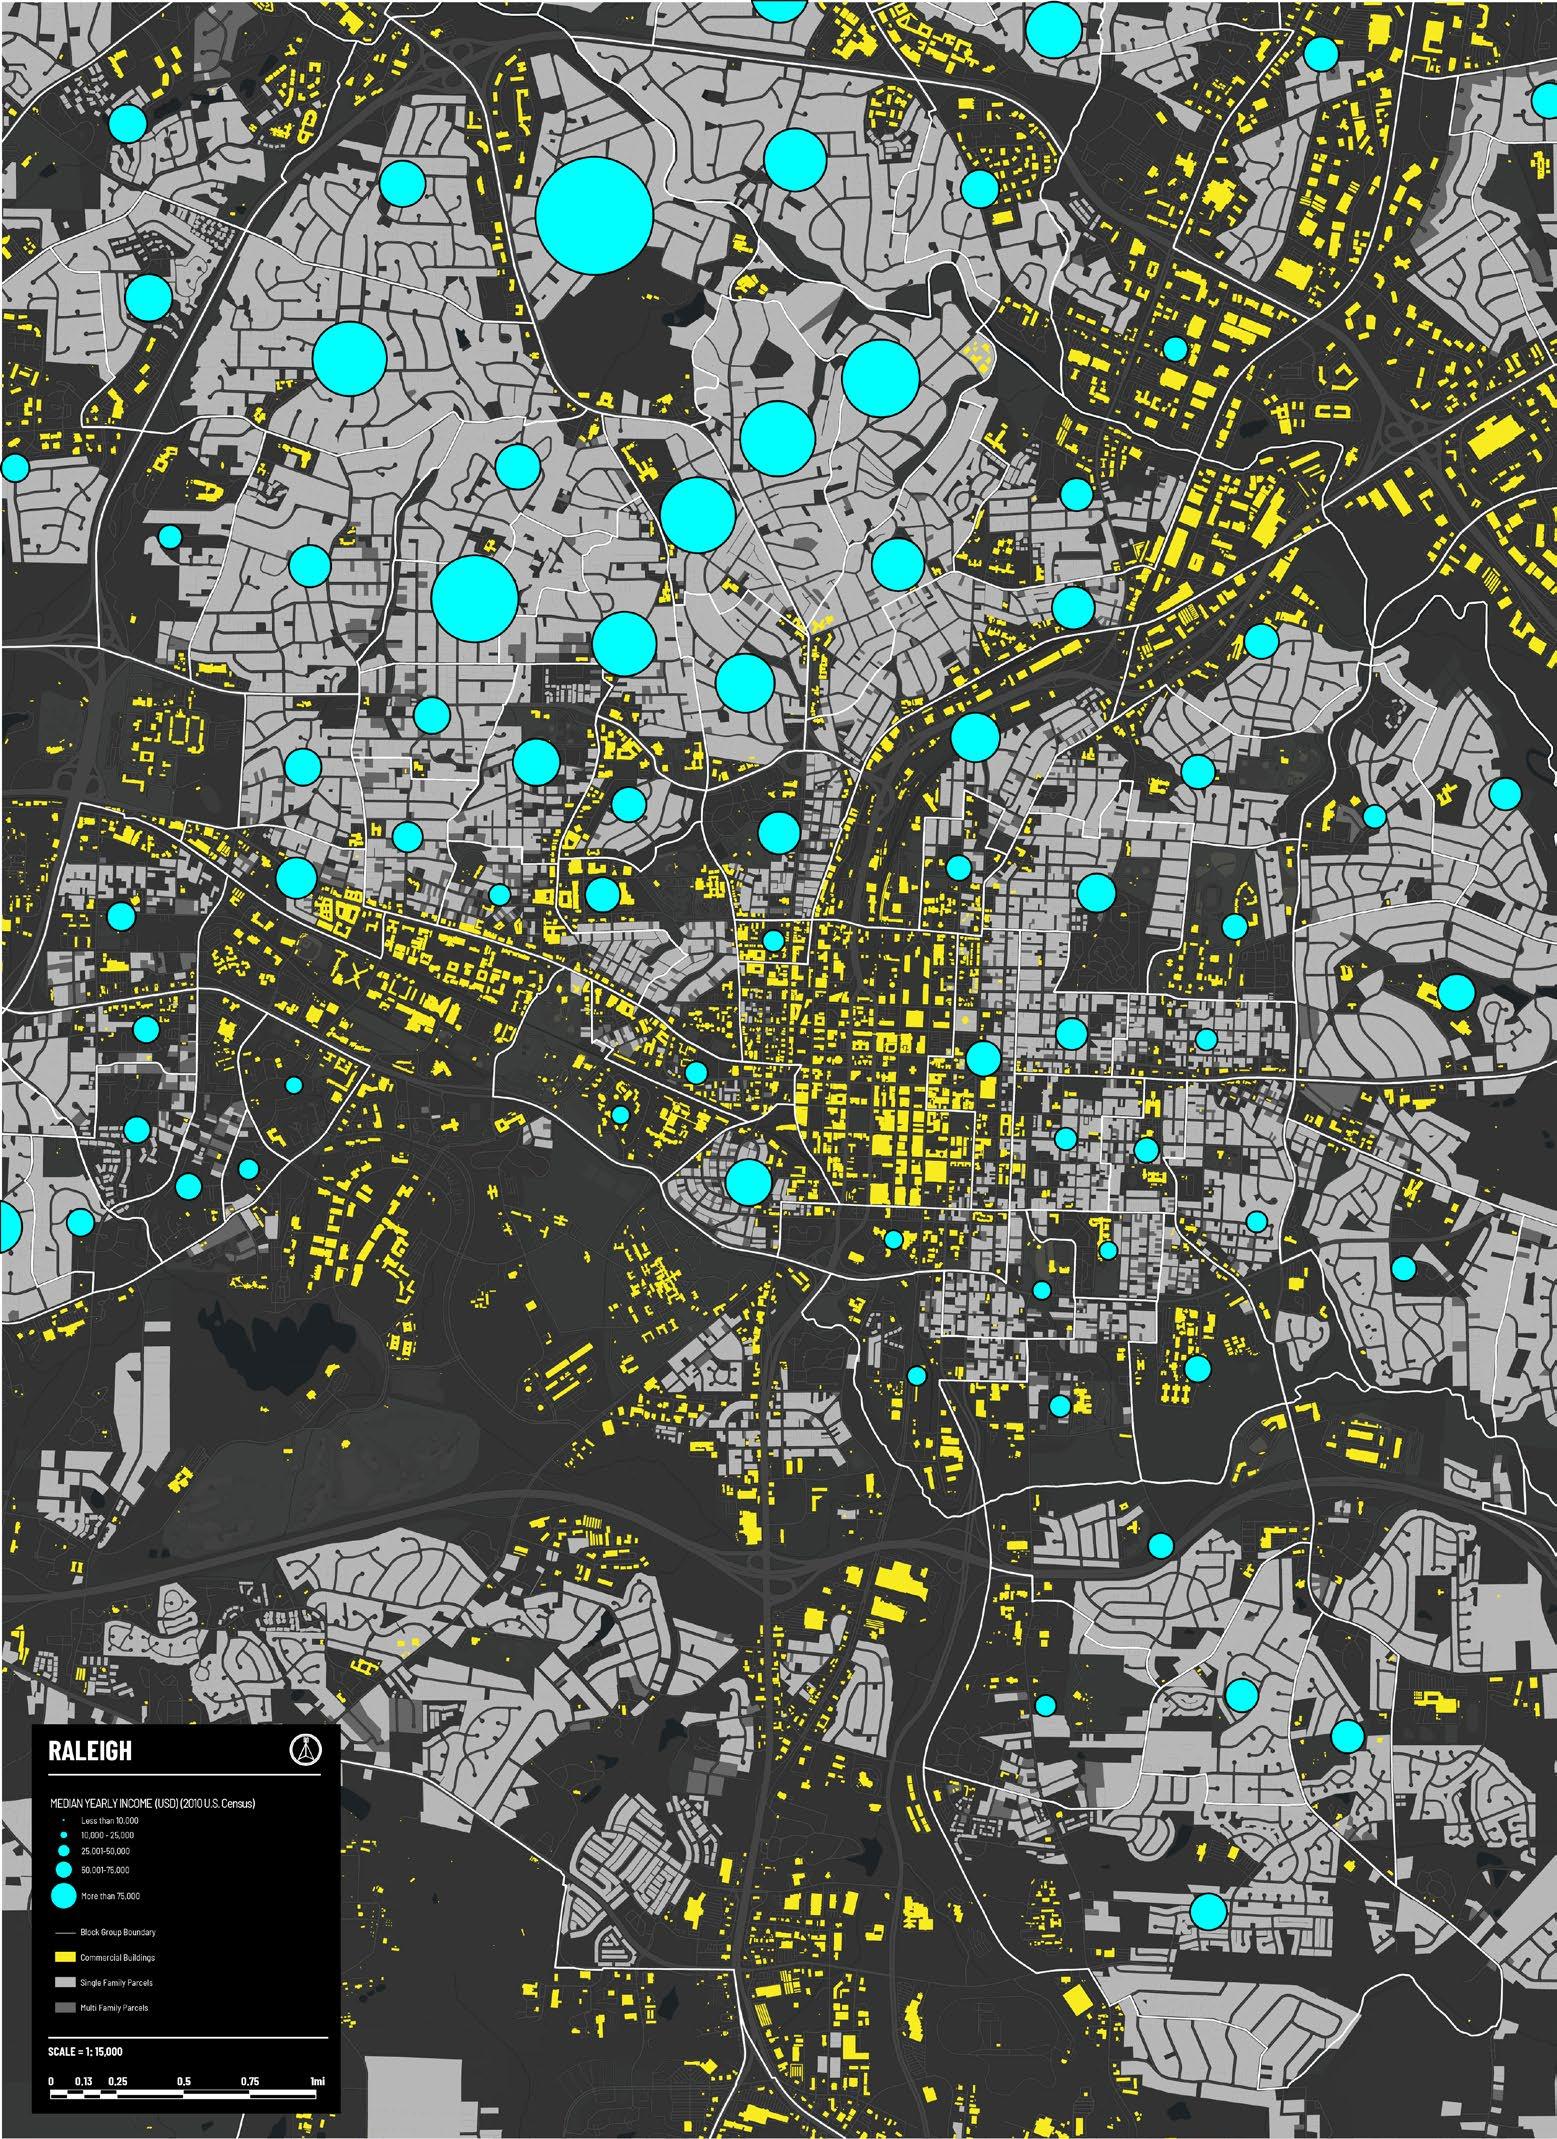
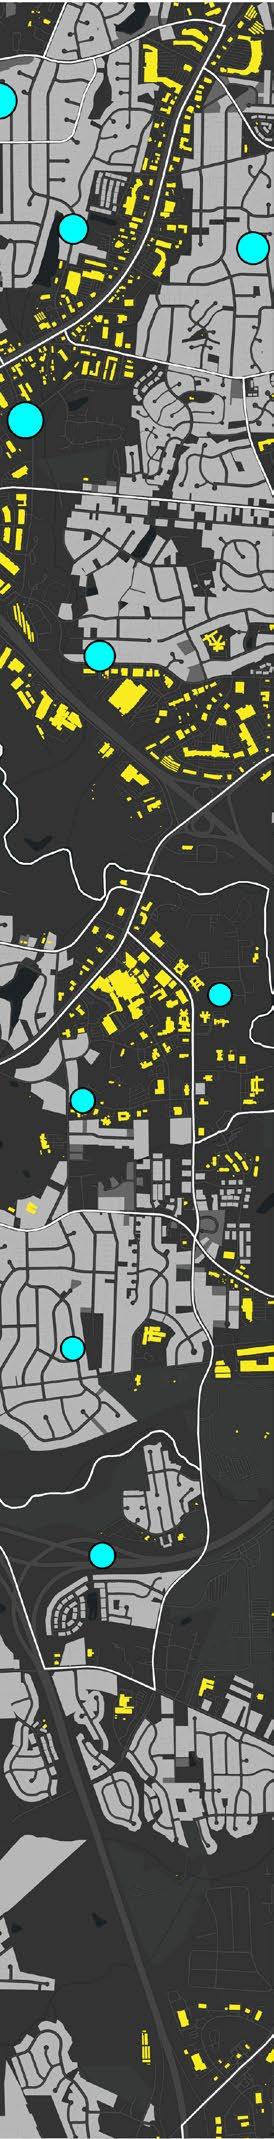
City Scale - Raleigh
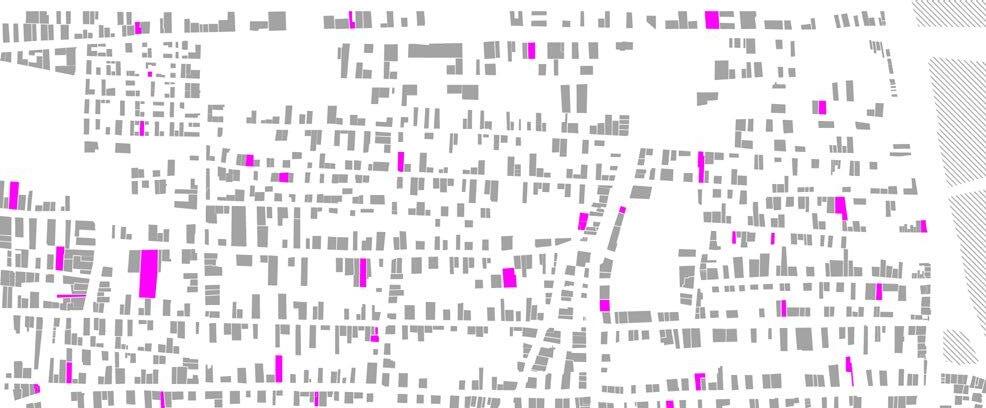
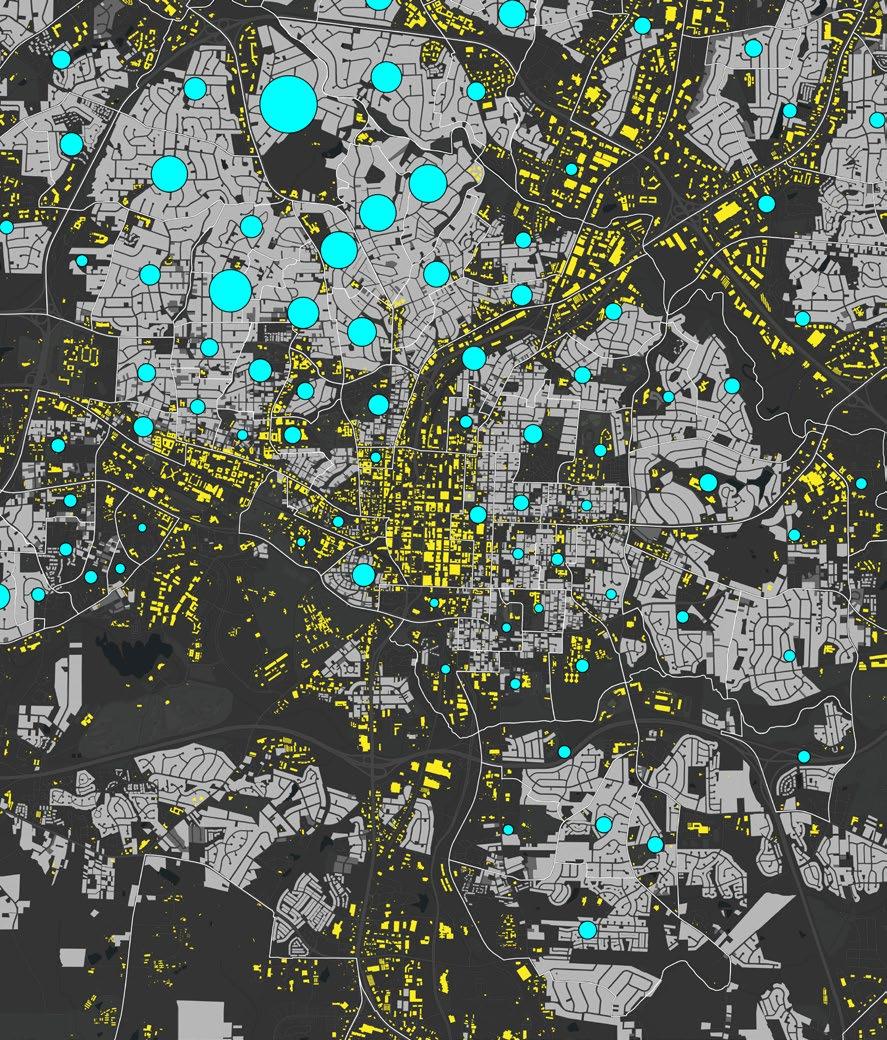
Median Income and Single-family Parcels
This map plots median annual income as blue circles overlaid on single- and multi-family parcels, shown in light and dark grey fills respectively, in Raleigh. Block group boundaries are outlined in white, and commercial buildings are highlighted in bright yellow to help identify downtown Raleigh
The low population density around downtown is explained by the dominance of single-family residential parcels. Notably, single-family parcels in the northwest show significantly higher median income levels compared to those in the southeast.
The map demonstrates that population density primarily reflects the distribution of single-family housing. Median income levels, however, vary independently of density. This analysis continues in Map
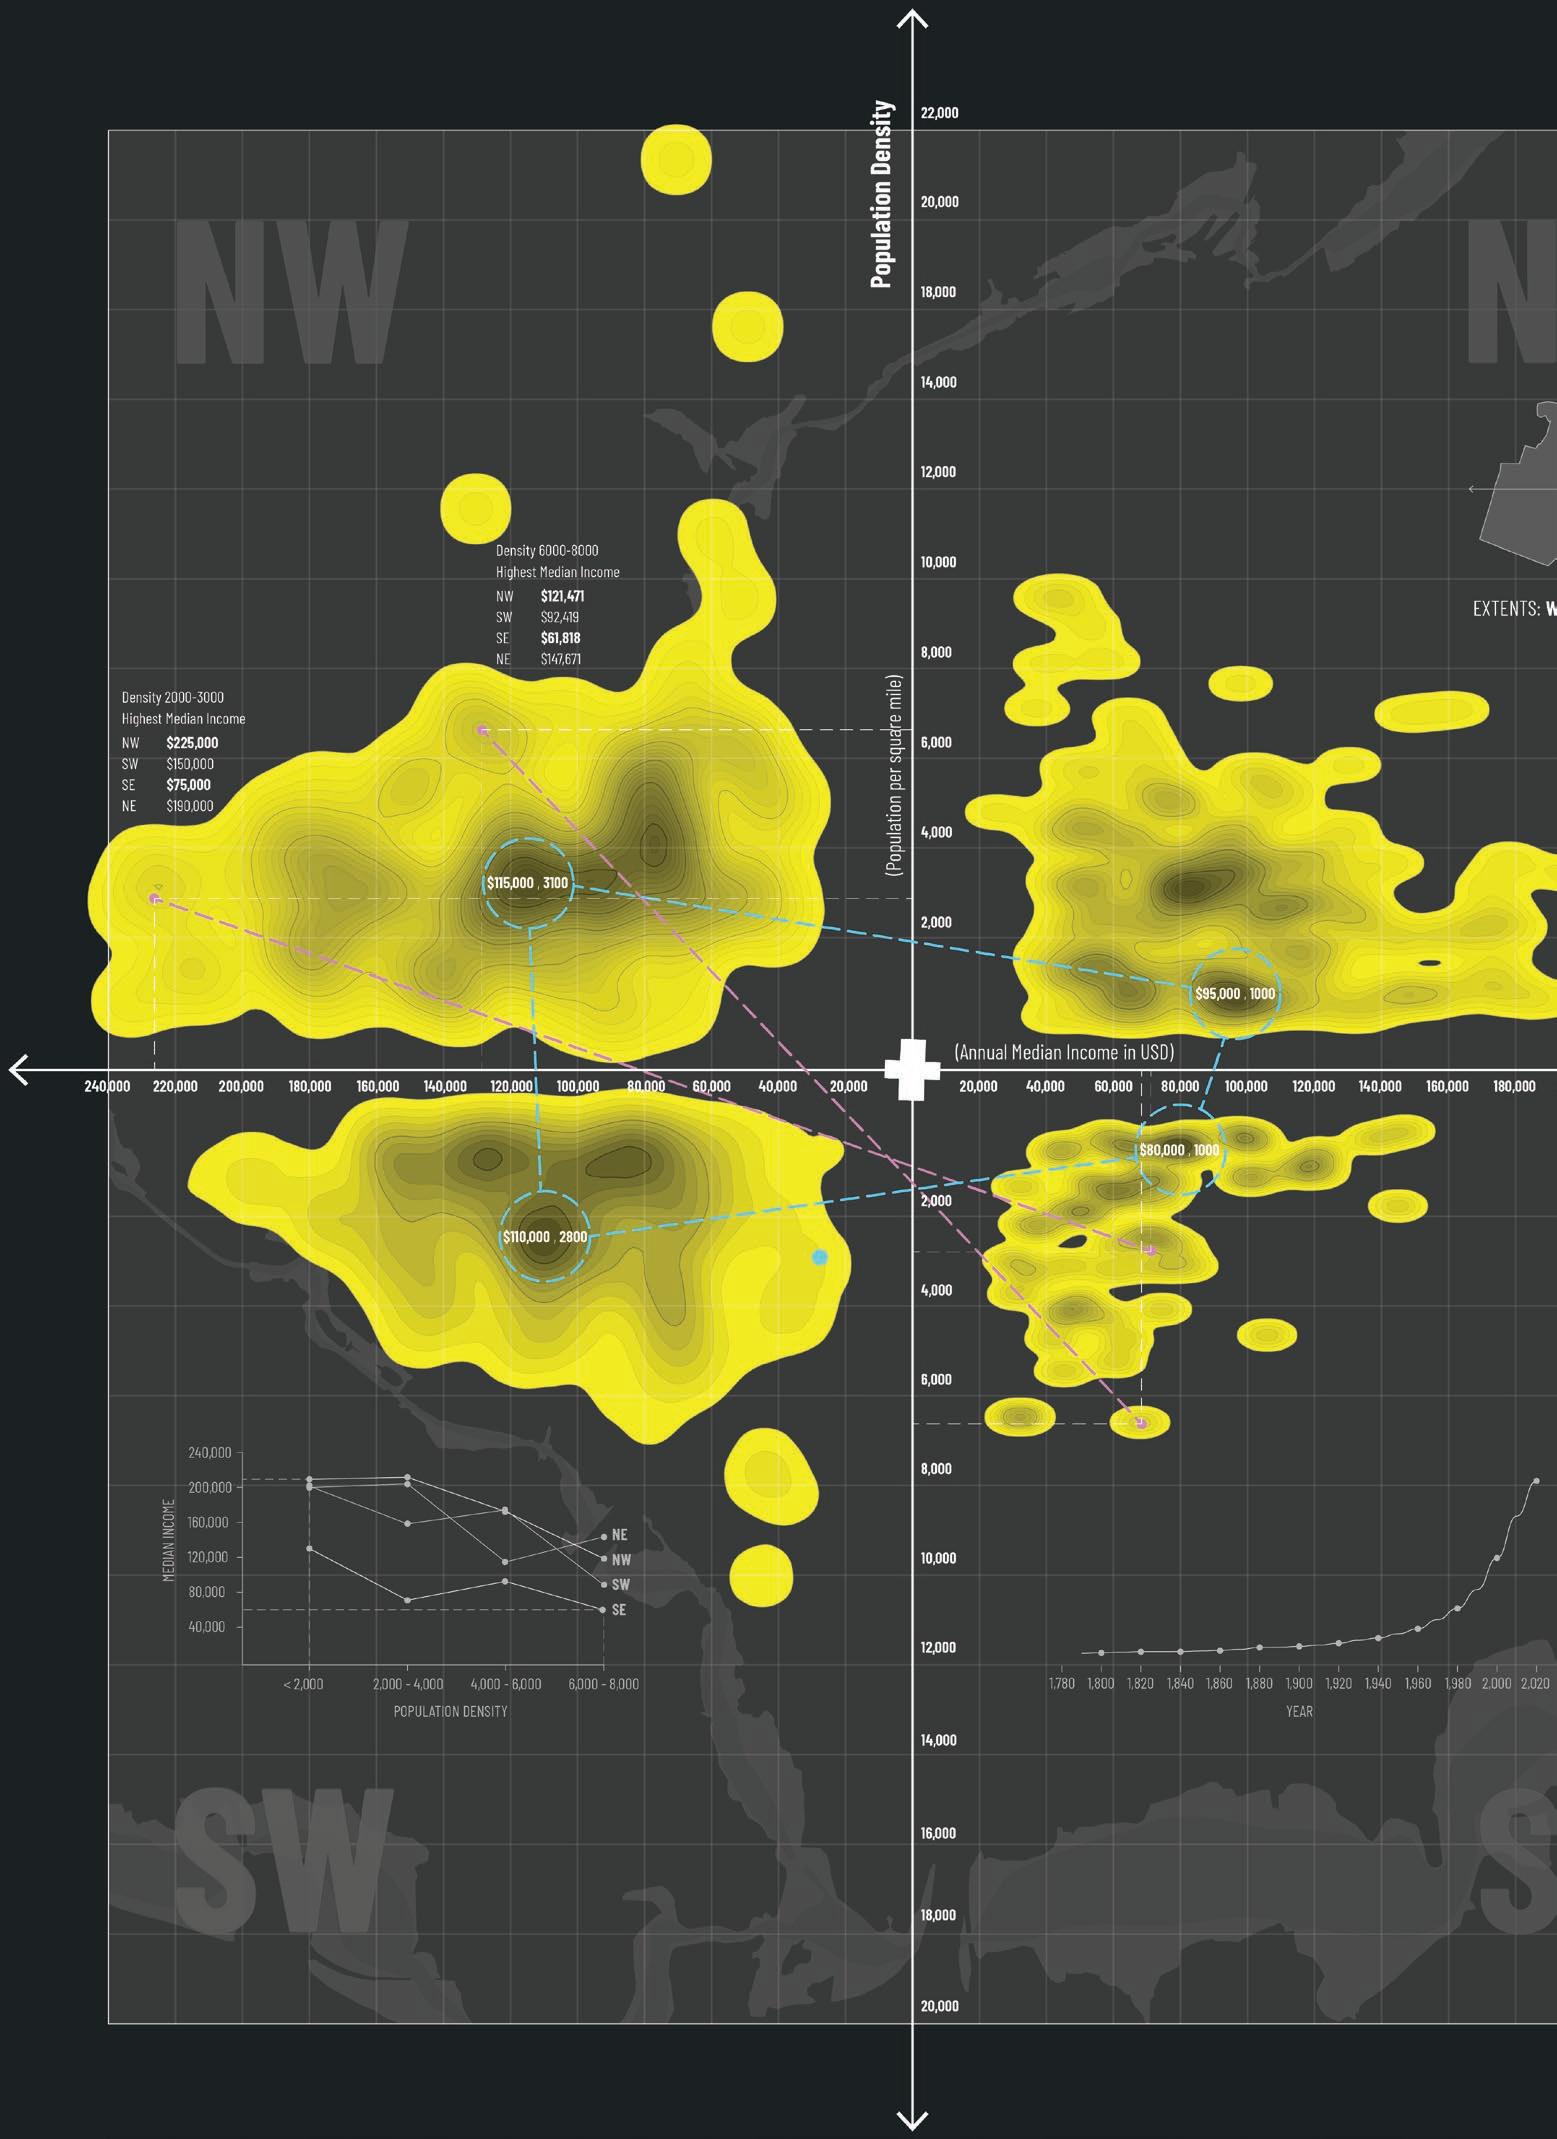
Relational Map
Income Gap in Wake County
This map continues the research from Map Series 01. It presents a contour graph with median annual income on the X-axis and population density on the Y-axis, dividing Wake County into four geographic quadrants. The Raleigh State Capitol serves as the origin point, symbolizing the heart of the county.
Key observations are highlighted with pink dotted lines, which emphasize disparities in income across quadrants with similar population densities. For example, in areas with a density between 2,000 and 3,000 people per square mile, the northwest quadrant shows a median income of $225,000, while the southeast quadrant shows only $75,000
As supplemental information, a line graph in the southwest quadrant compares median income levels across all four quadrants. Another graph in the southeast quadrant illustrates significant population growth over the past six decades. An underlay of floodplain areas further reveals that the southeast quadrant contains more flood-prone zones than the others.
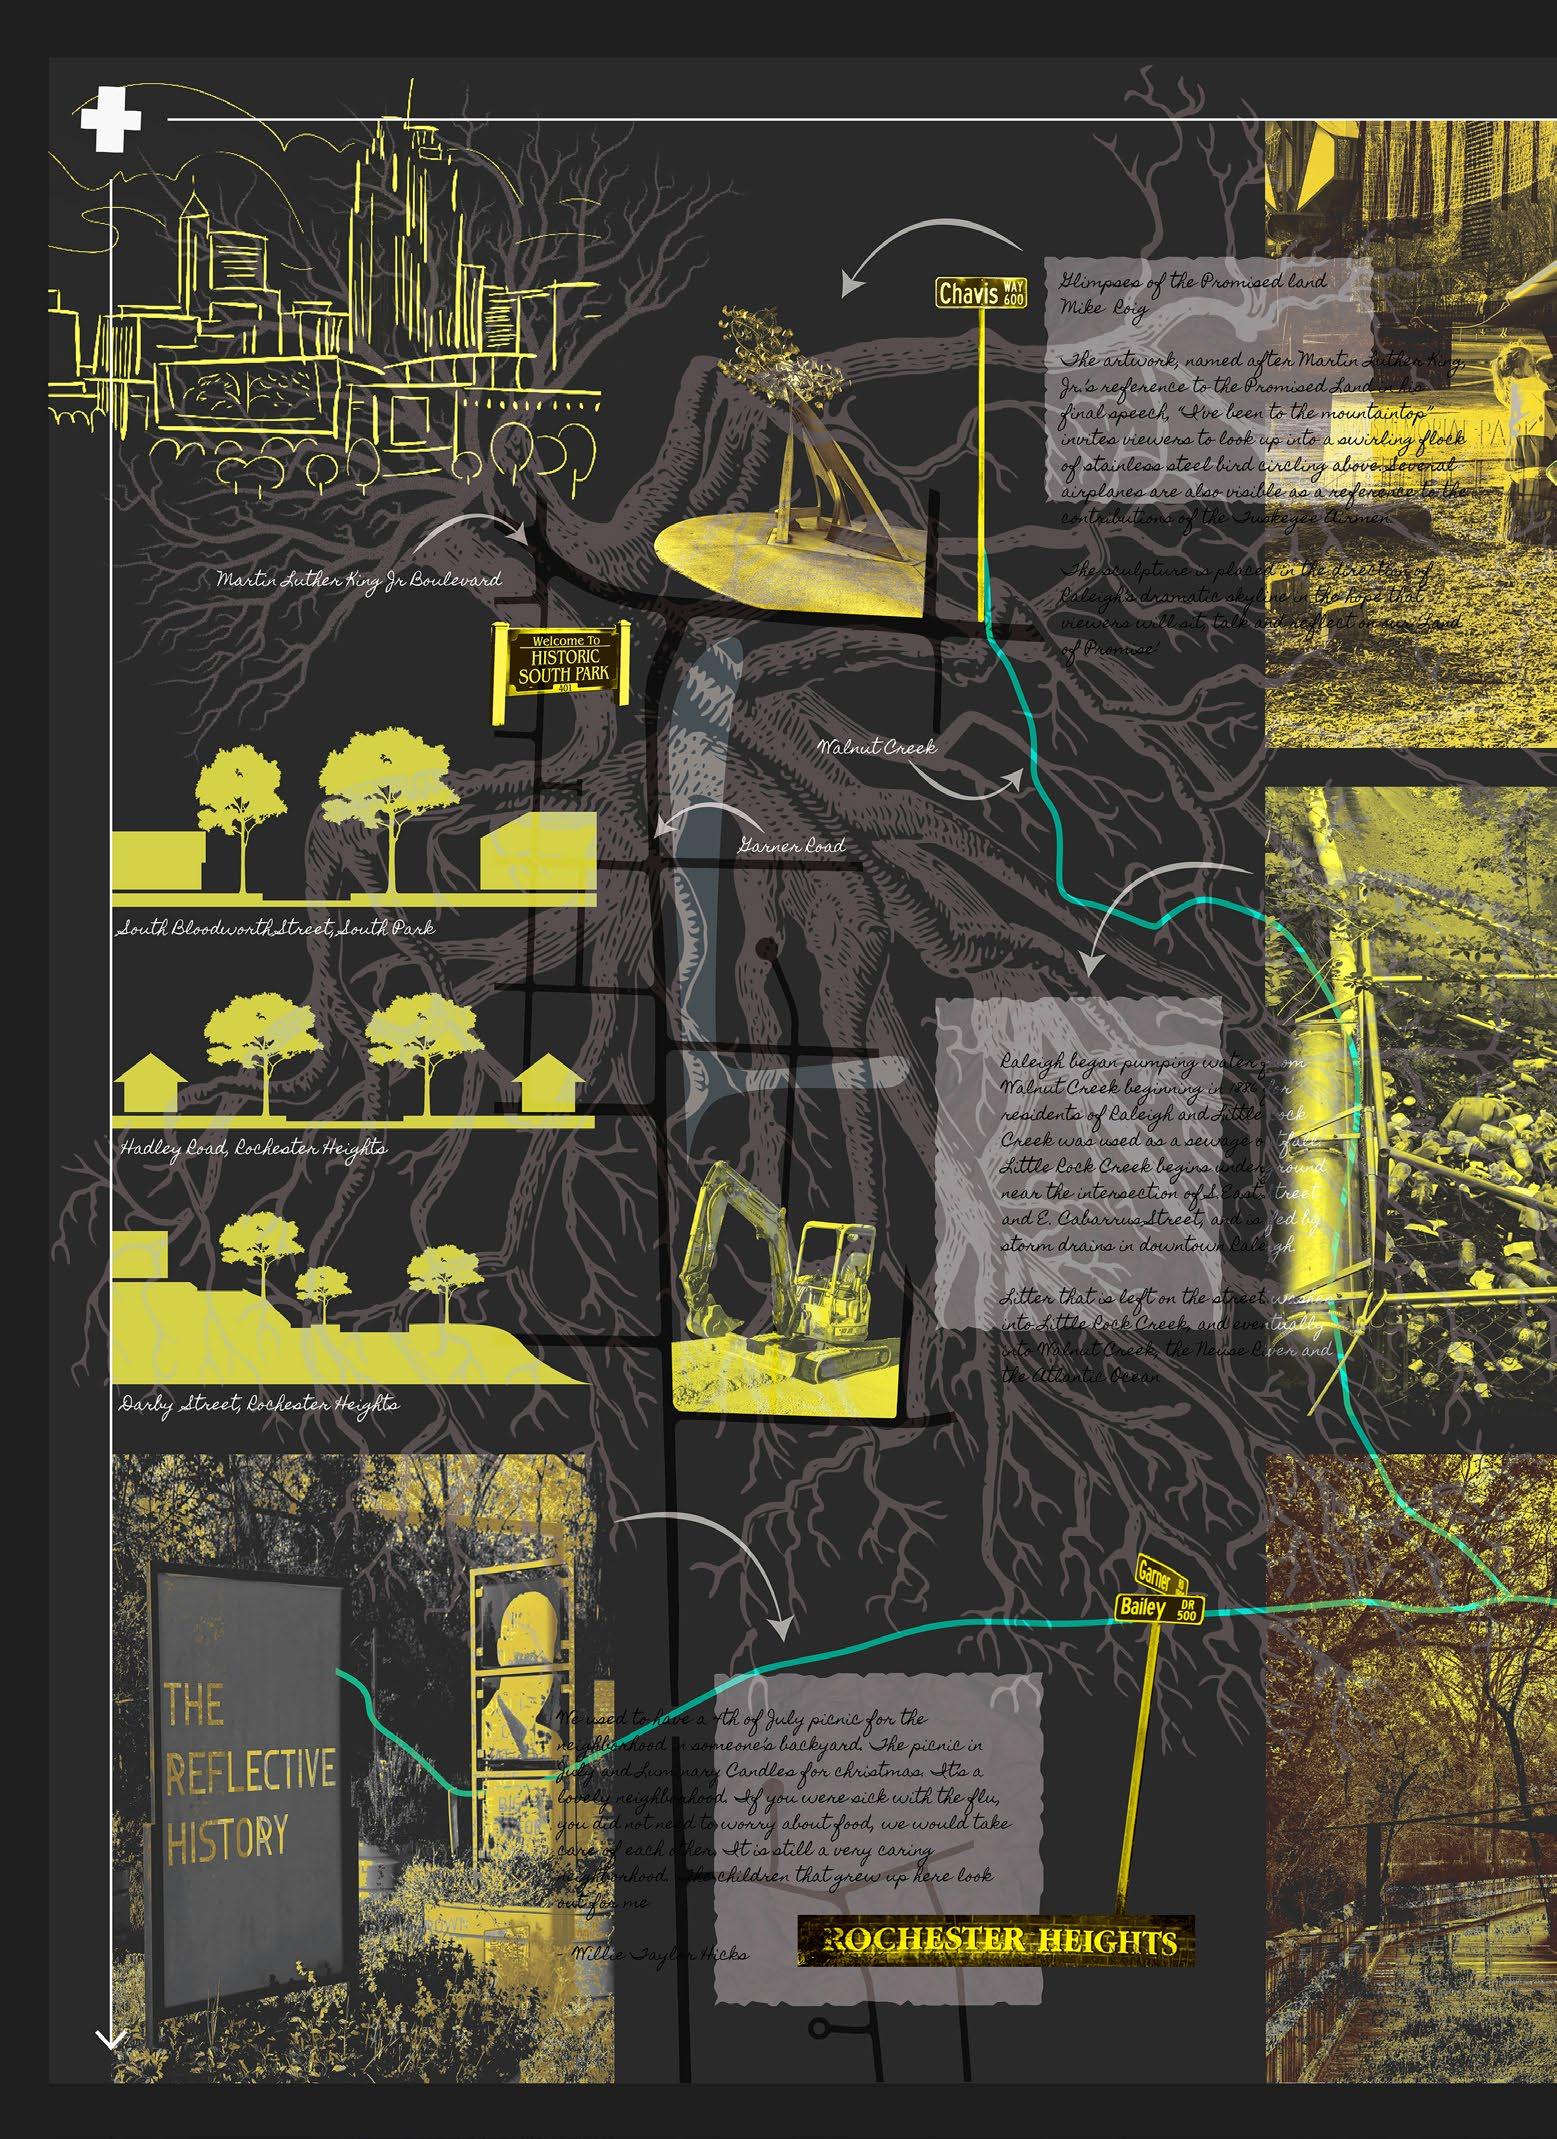
Autographic and Thick Mapping
Experiencing Southeast Raleigh
This experiential map brings together my observations from walks through Chavis Park, South Park, and Rochester Heights. These neighborhoods are located in the southeast quadrant of Map Series 02. An indigenous oak tree forms the backdrop, with its roots beginning at the Raleigh State Capitol in the top left corner. The tree serves as a metaphor for the city’s growth and evolution since its founding in 1792.
The black road network highlights Garner Road, which runs vertically through all three focus areas. Martin Luther King Jr. Boulevard cuts across from downtown. A sketch of the Raleigh skyline, visible from each of the neighborhoods, is placed in the upper left. The skyline reveals itself intermittently and feels like it plays hide-and-seek as one walks through Southeast Raleigh. The blue line represents Walnut Creek, which includes wetlands and walkable greenway trails.
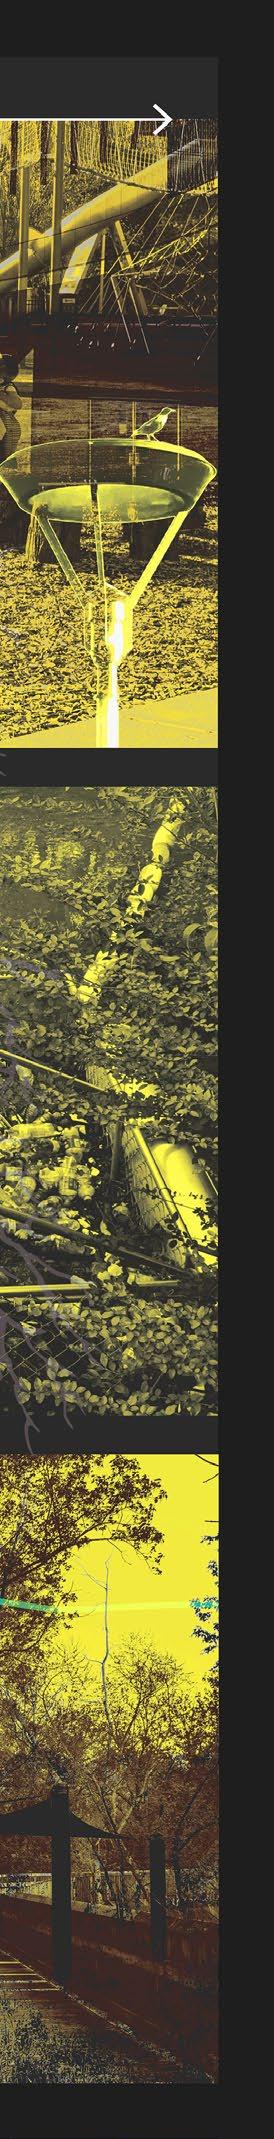
Three collages along the right edge of the map capture distinct moments from each area and reflect their unique character. Wall sections on the left show variations in road widths, housing types, and topography across Southeast Raleigh. The text next to the images is not easily legible, which serves as a reminder that stories are present, but sometimes they require closer attention to be seen.
Pedestrianization of Pondy Bazaar
Location Chennai, India
Academic Urban Design Studio, Fall 2016
Instructor Stanley Clement Daniel
Contributions Developed the site strategy, designed the collaborative sidewalk system, and produced all drawings, diagrams, and visuals presented in the project.
This project focuses on Pondy Bazaar in T. Nagar, one of Chennai’s busiest commercial districts. Thyagaraya Road, the central artery of the area, experiences high pedestrian activity and slow-moving vehicular traffic, creating unsafe and inefficient conditions for both shoppers and vendors.
The proposal reconfigures vehicular circulation to prioritize pedestrian safety and commercial access. A new street layout introduces a collaborative sidewalk system, allowing public space to extend into shops and retail activity to expand into the public realm. The design reimagines the street as an integrated network that supports movement, trade, and shared use of space.
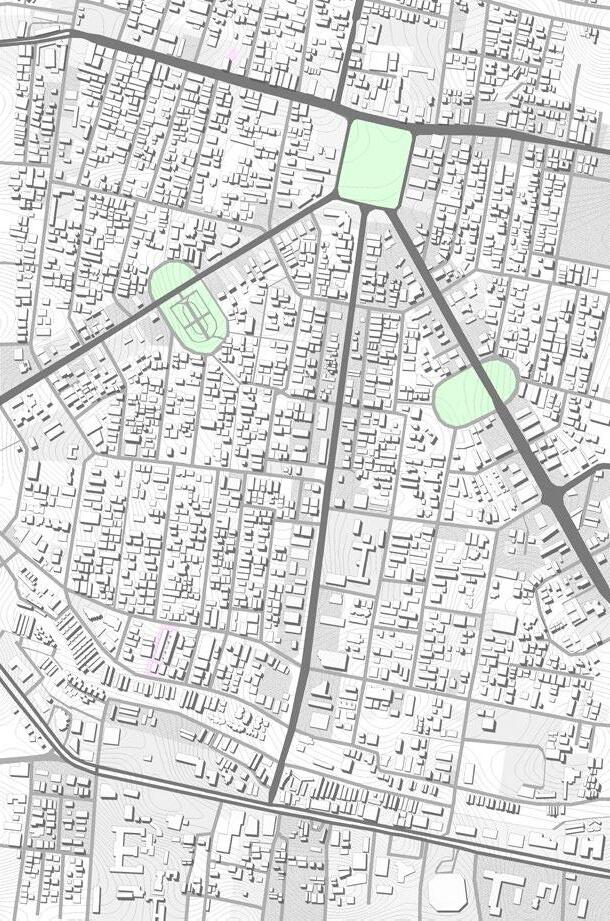
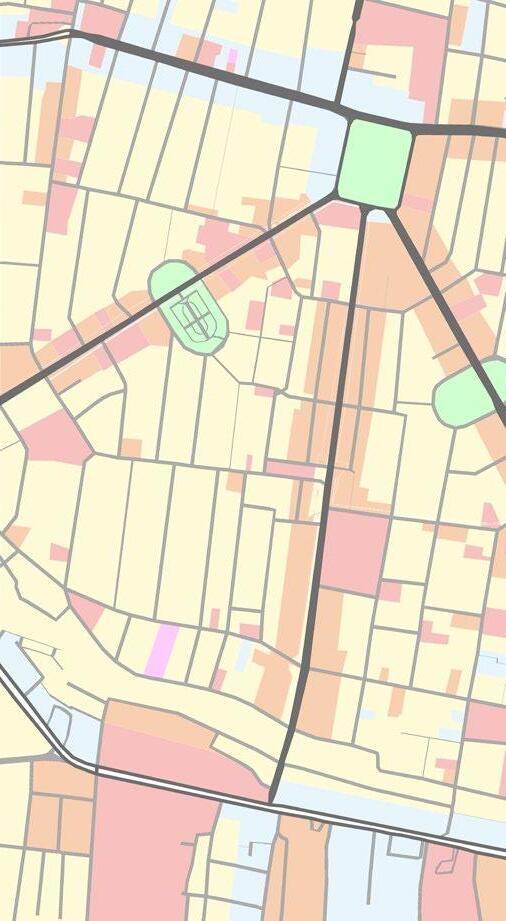
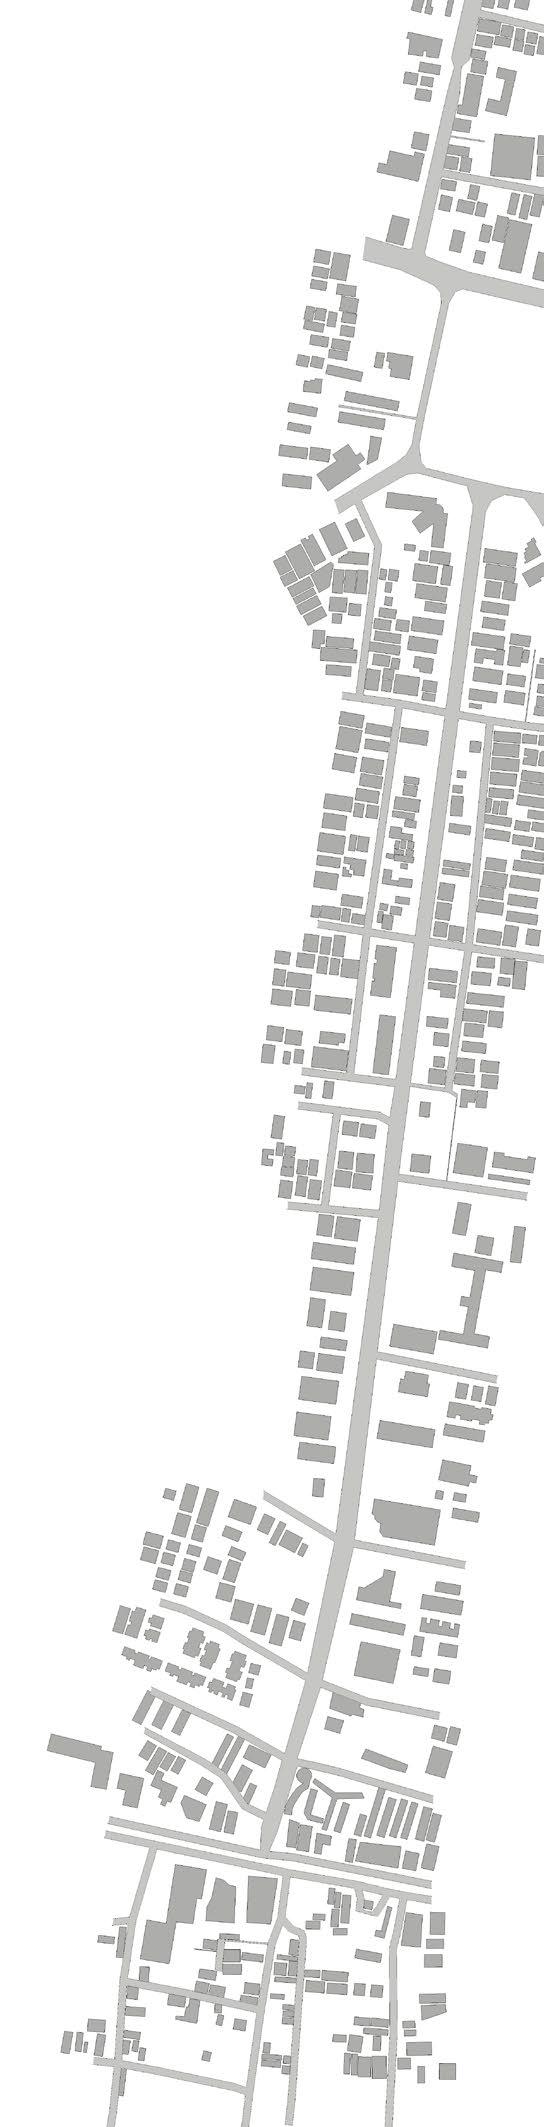
Building Density Map
Primary Residential
Mixed Residential Commercial
Institutional
Open & Recreation
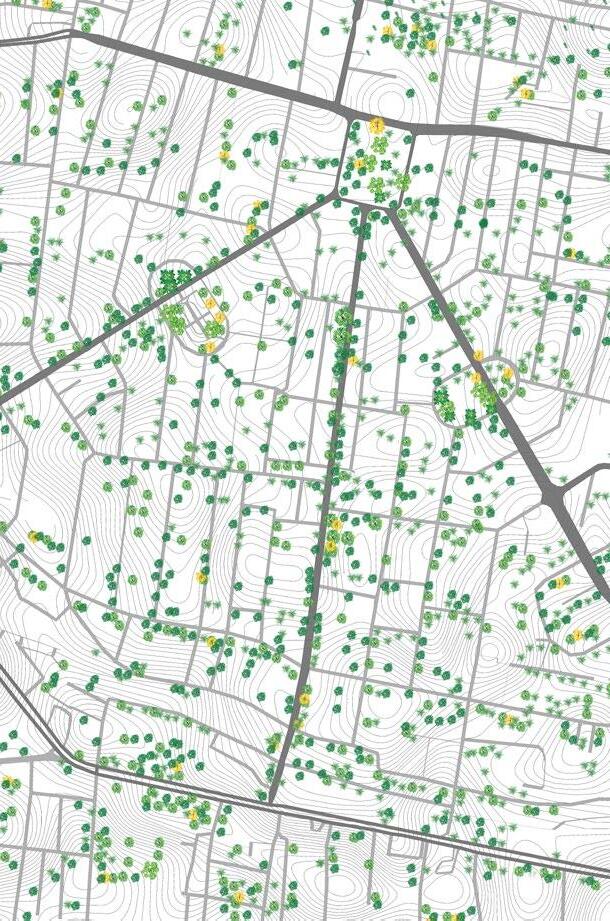
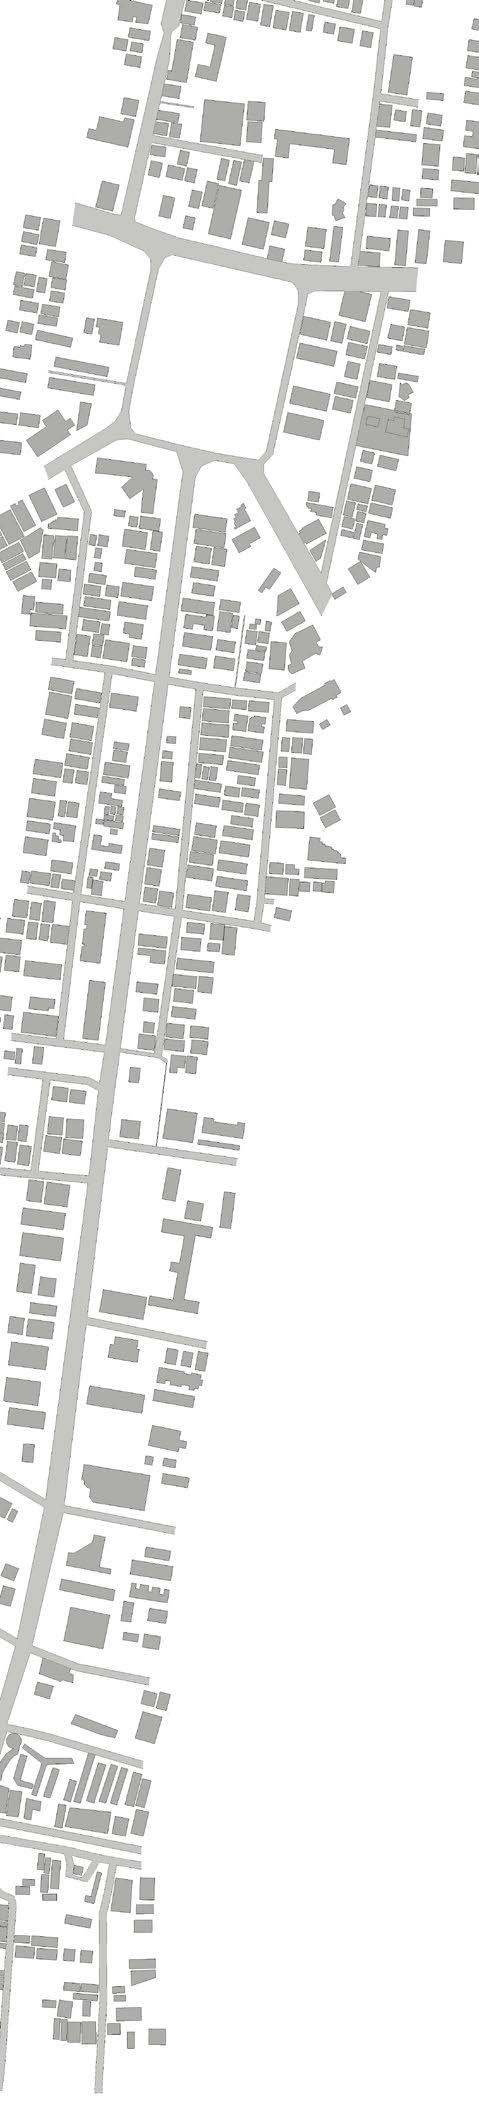
Vegetation Map
Existing Site Conditions
Structures in the Thyagaraya Nagar area occupy the maximum allowable plot coverage Development along the main road has reached a saturation point, leaving limited space for new infrastructure.
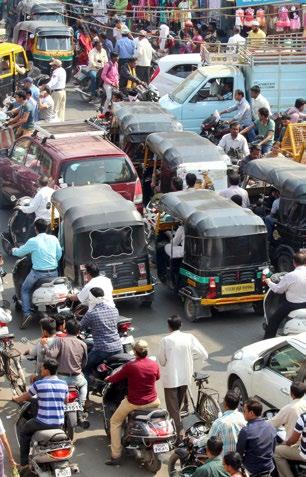
Streets originally designed for pedestrians and carts now accommodate thousands of motor vehicles daily, creating constant modal conflict
The area lacks sufficient parking infrastructure Most vehicles are parked along street edges, causing encroachments and restricting pedestrian movement. Survey data shows that 22% of respondents were unable to access Pondy Bazaar due to obstructions from informal parking
A study indicates that 51.9% of commuters use public transit, while 48.1% rely on cars or motorcycles. Of the latter group, 52% park on side streets, increasing congestion.
Abundant trees around these roads helps in shading the pedestrian walkways and positively influence the local climate
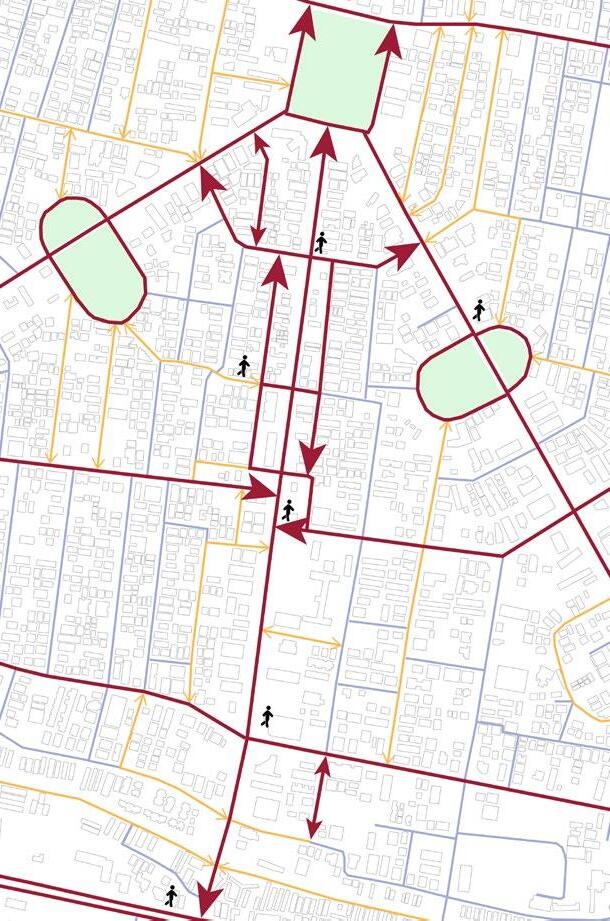
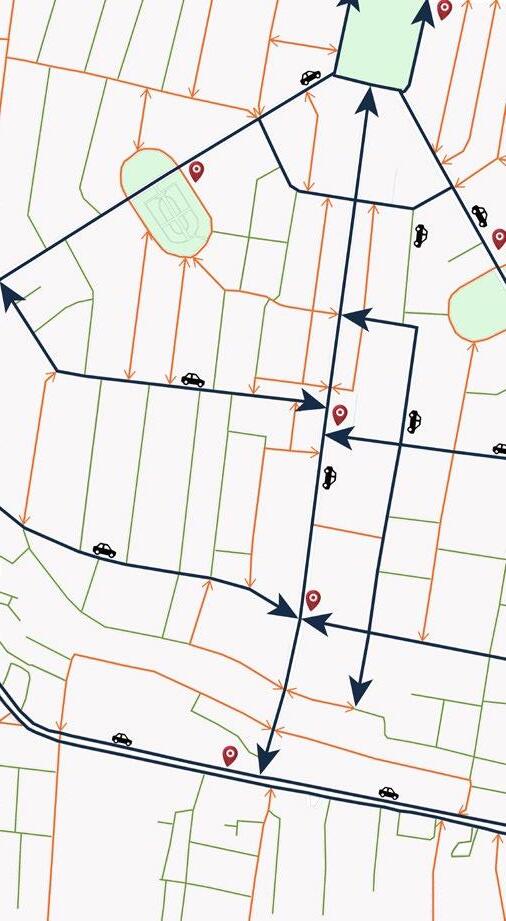
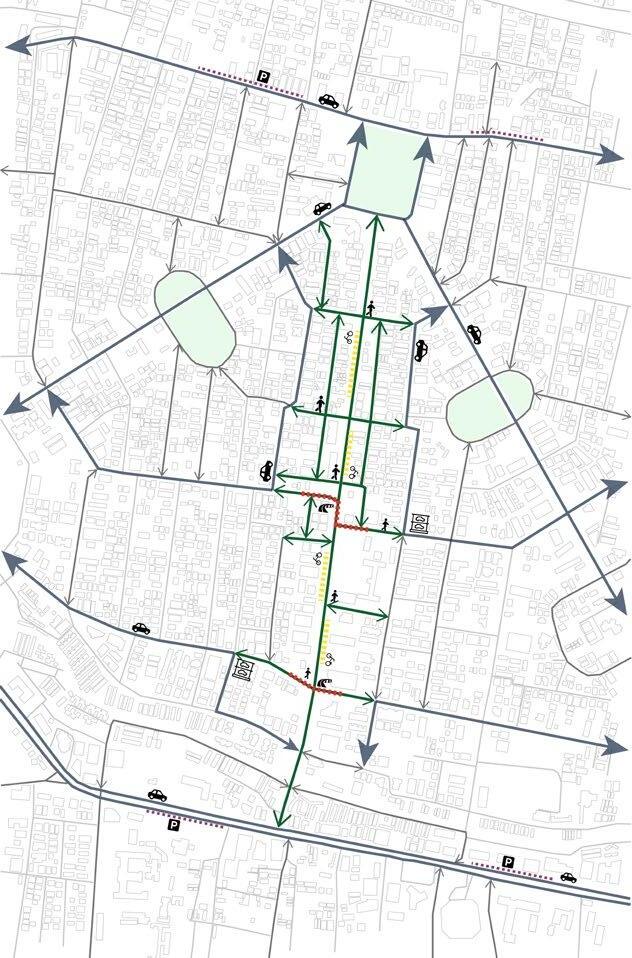
Design Strategy
Redirecting the motor-way
Restricting the access of motor way from the main commercial street to reduce traffic and congestion
Expanding bicycle and pedestrian network
Promoting environmental friendly modes of transportation
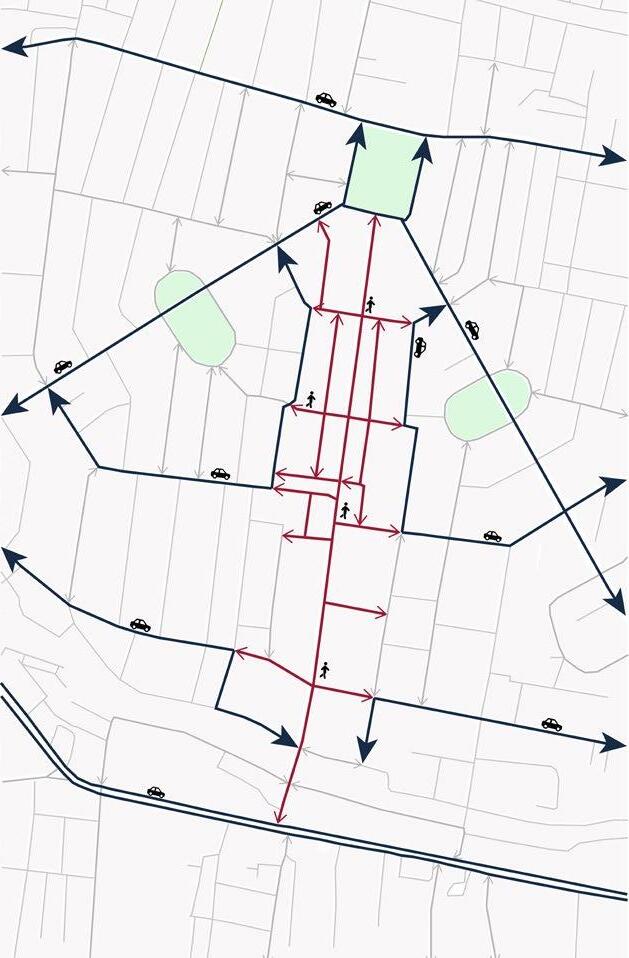
Proposed
Motor way
Pedestrian way
Merging existing and new transit network
Connecting developing modes of transportation, such as a metro service to an existing city transit system
Optimizing transit switch ef fi and link interchange points, to connect with the alternate transport
Proposed
Motor way
Pedestrian way
Cycle corridor
Parking
Overpass
Multi level parking
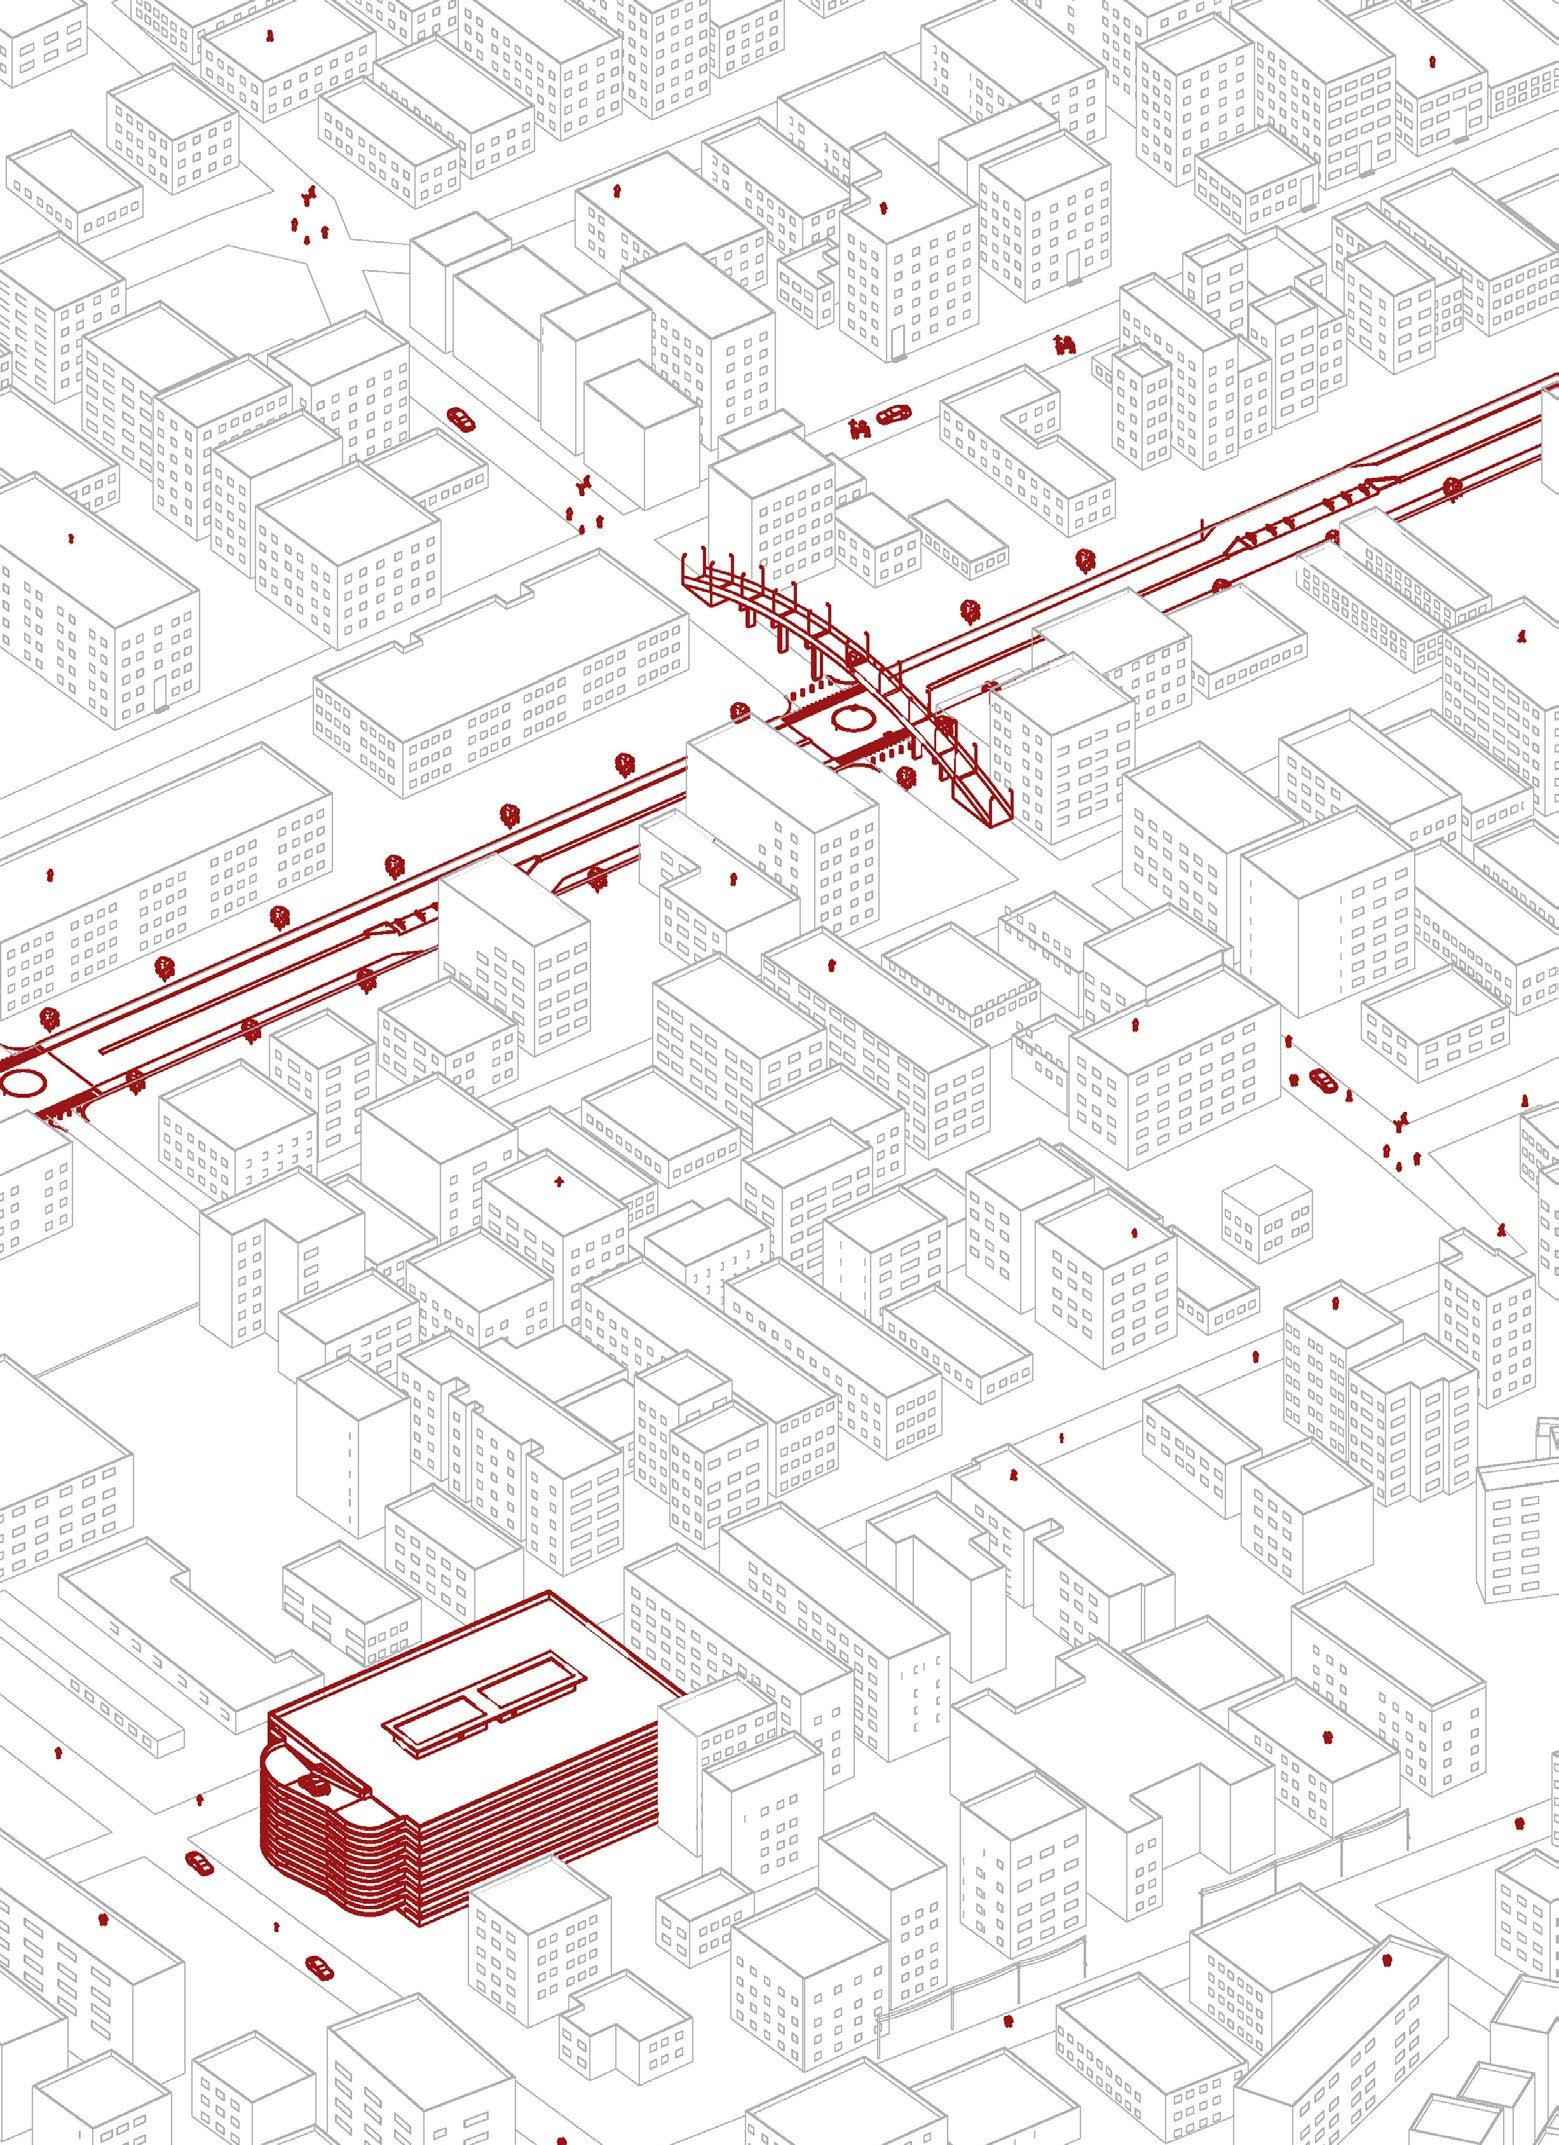
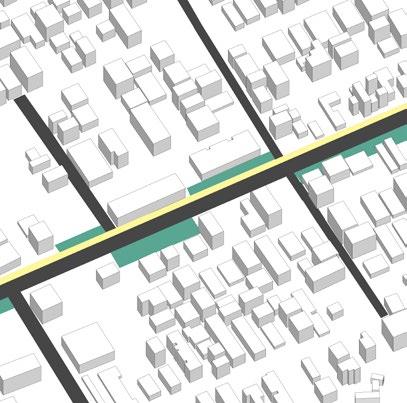
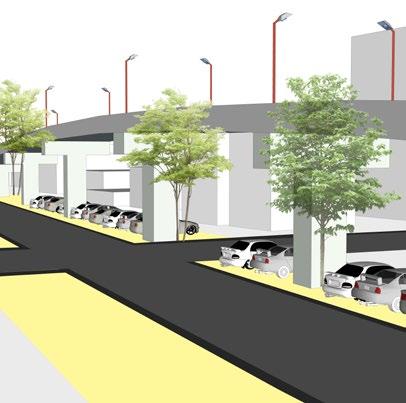
Proposal
Unused space beneath the flyover is repurposed to accommodate vehicle parking and ease demand on nearby streets.
Access for vehicles into Pondy Bazaar is restricted to establish a dedicated pedestrian plaza that prioritizes walkability and safety.
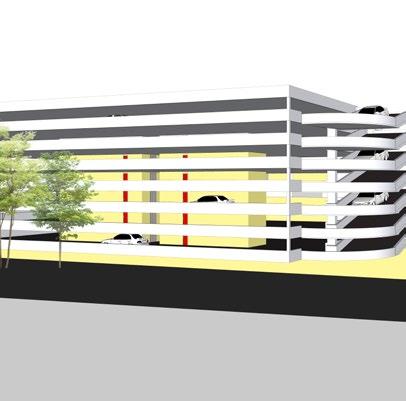
To address parking-related congestion, a multilevel parking facility is proposed nearby to serve commercial visitors.
Vehicular overpasses are introduced at two key junctions to redirect through-traffic and prevent conflict with pedestrian zones.
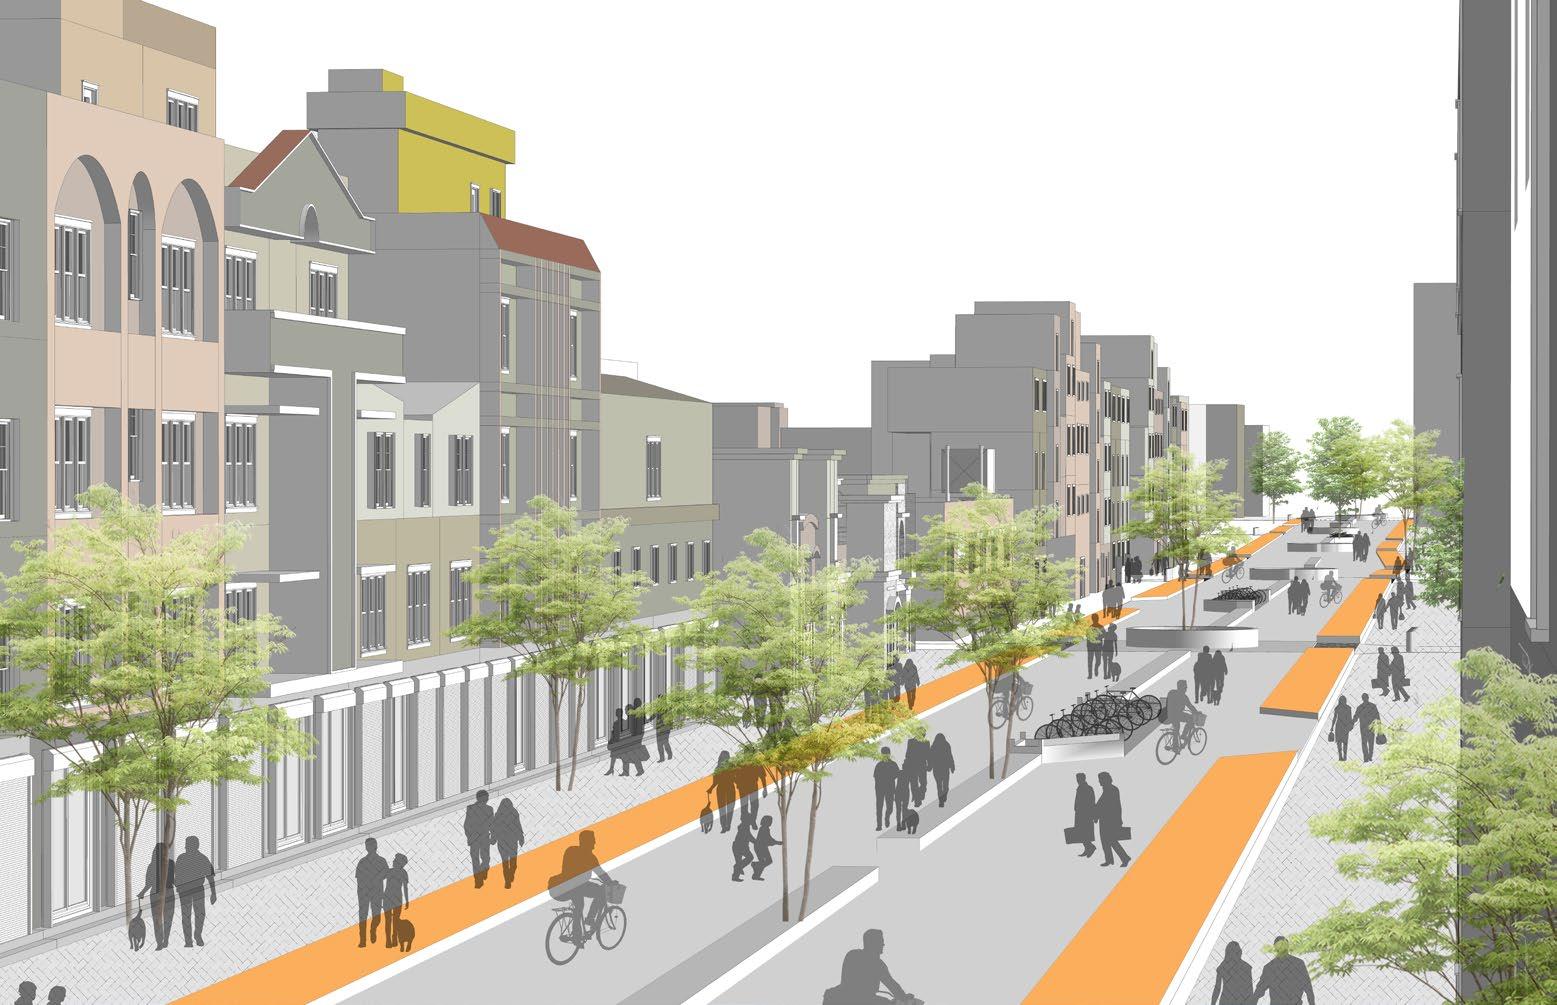
The primary pedestrian corridor is widened and enhanced with a dedicated bicycle lane to support sustainable, non-motorized transportation and reduce vehicular dependency.
Parking under existing overpass
Proposed overpass at the main street junction
Pedestrian plaza street
Multi level parking
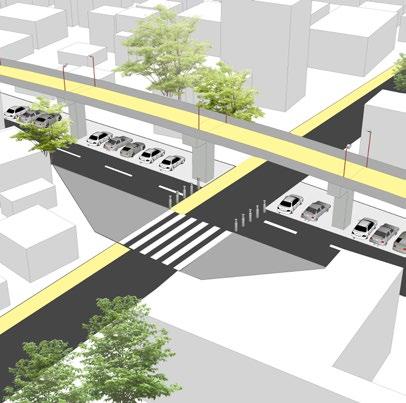
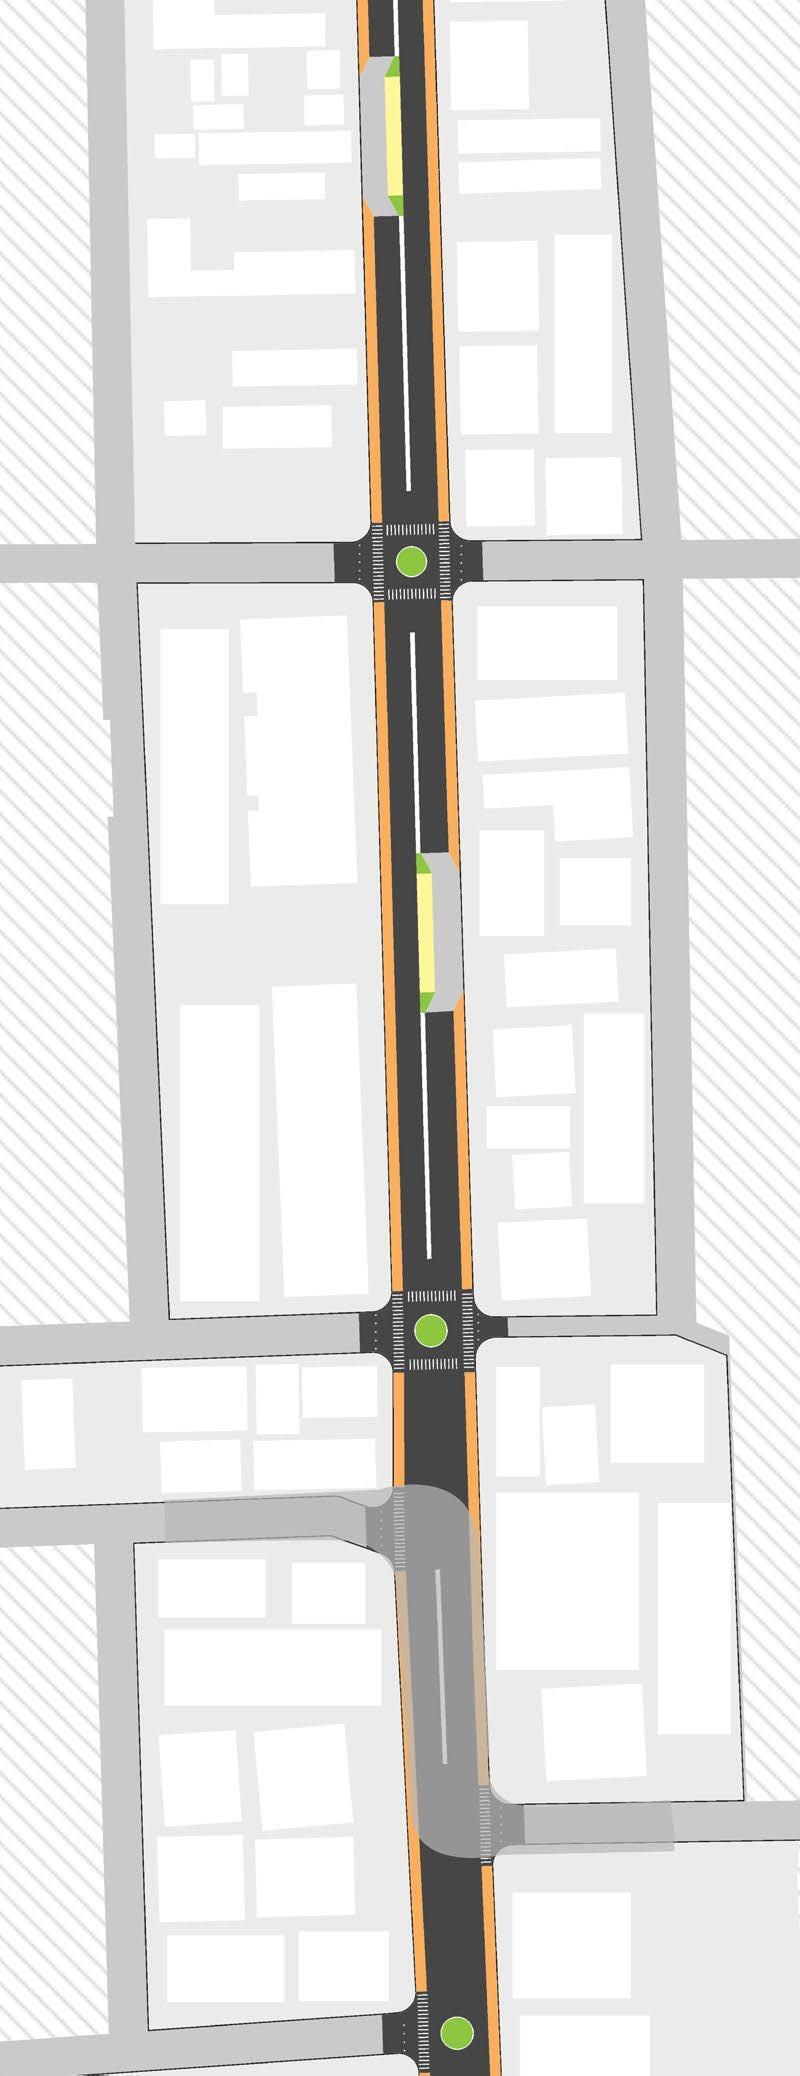
Pedestrian Street Proposal
Bicycle Parking 60 ft x 20 ft
Hybrid Lane (Bicycle & Pedestrian)
Bicycle Lane 13 ft width
Pedestrian pathway 6 ft width
Median
Traffic Island with Pedestrian Crossways
Median
Bicycle Parking 60 ft x 20 ft
Hybrid Lane (Bicycle & Pedestrian)
Pedestrian pathway 6 ft width
Median
Traffic Island with Pedestrian Crossways
Vehicular Overpass connecting the opposite roads
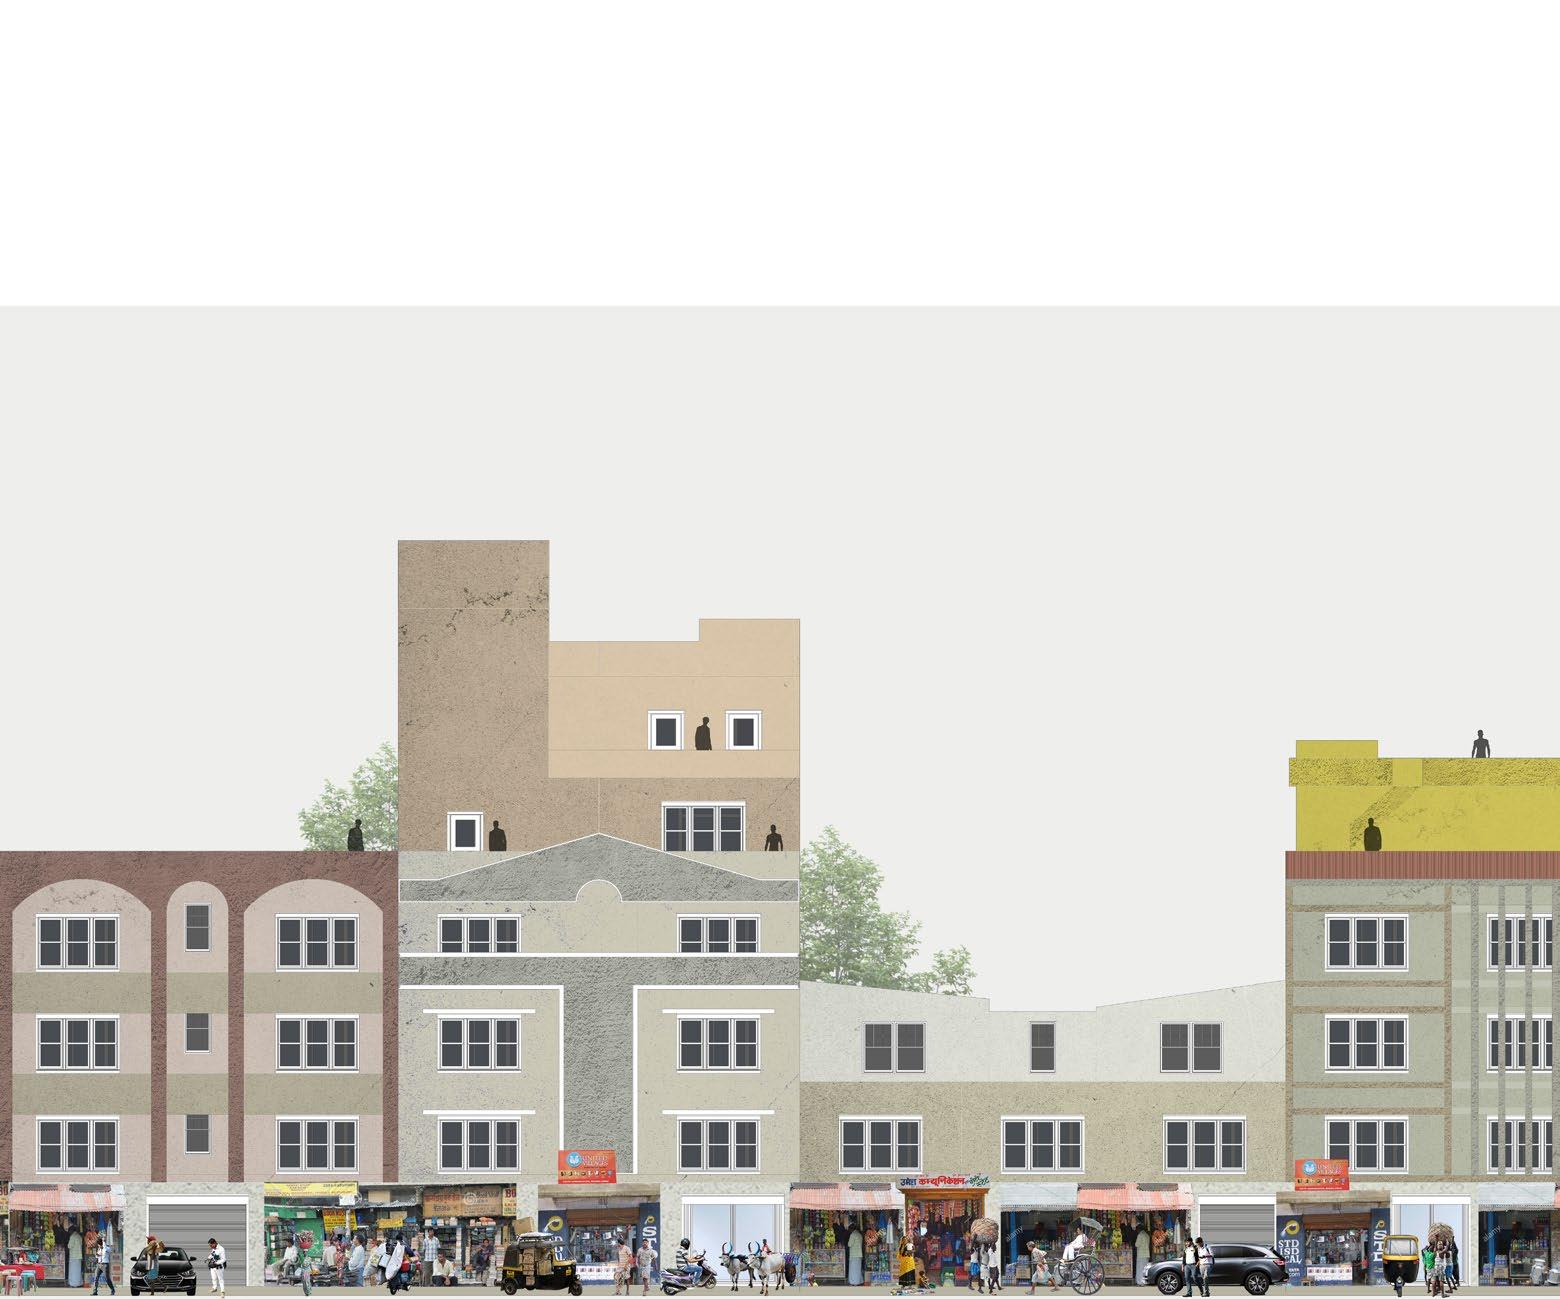
Mixed Residential buildings along the road-side
Vehicular access restricted in the Primary road
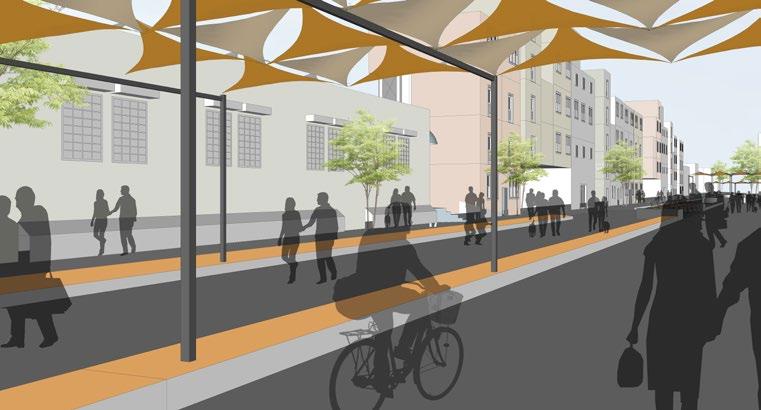
Canopy
Pedestrianization Traffic
Pondy Bazaar is made more sustainable for both pedestrian activity and vehicular movement through a series of strategic design interventions
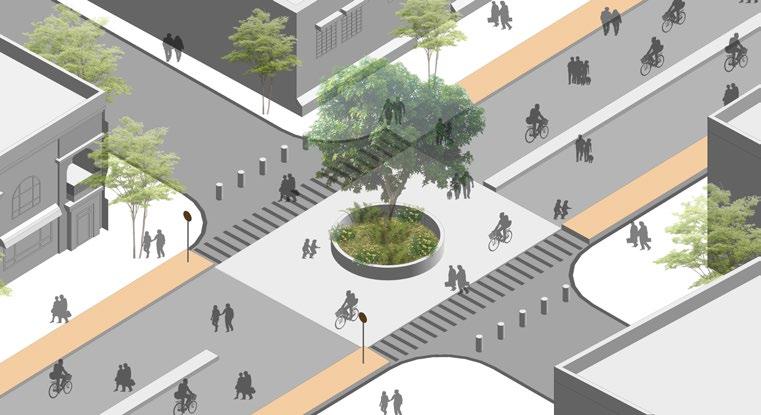
Traffic islands are introduced at key intersections to manage circulation. Shaded canopies are placed at regular intervals along walkways to enhance pedestrian comfort. A multi-level parking structure accommodates high volumes of incoming vehicles. Hybrid lanes are integrated to ease congestion and activate the streetscape, creating a more vibrant public corridor
Canopy at regular intervals
Pedestrianization of Pondy bazaar
Traffic island
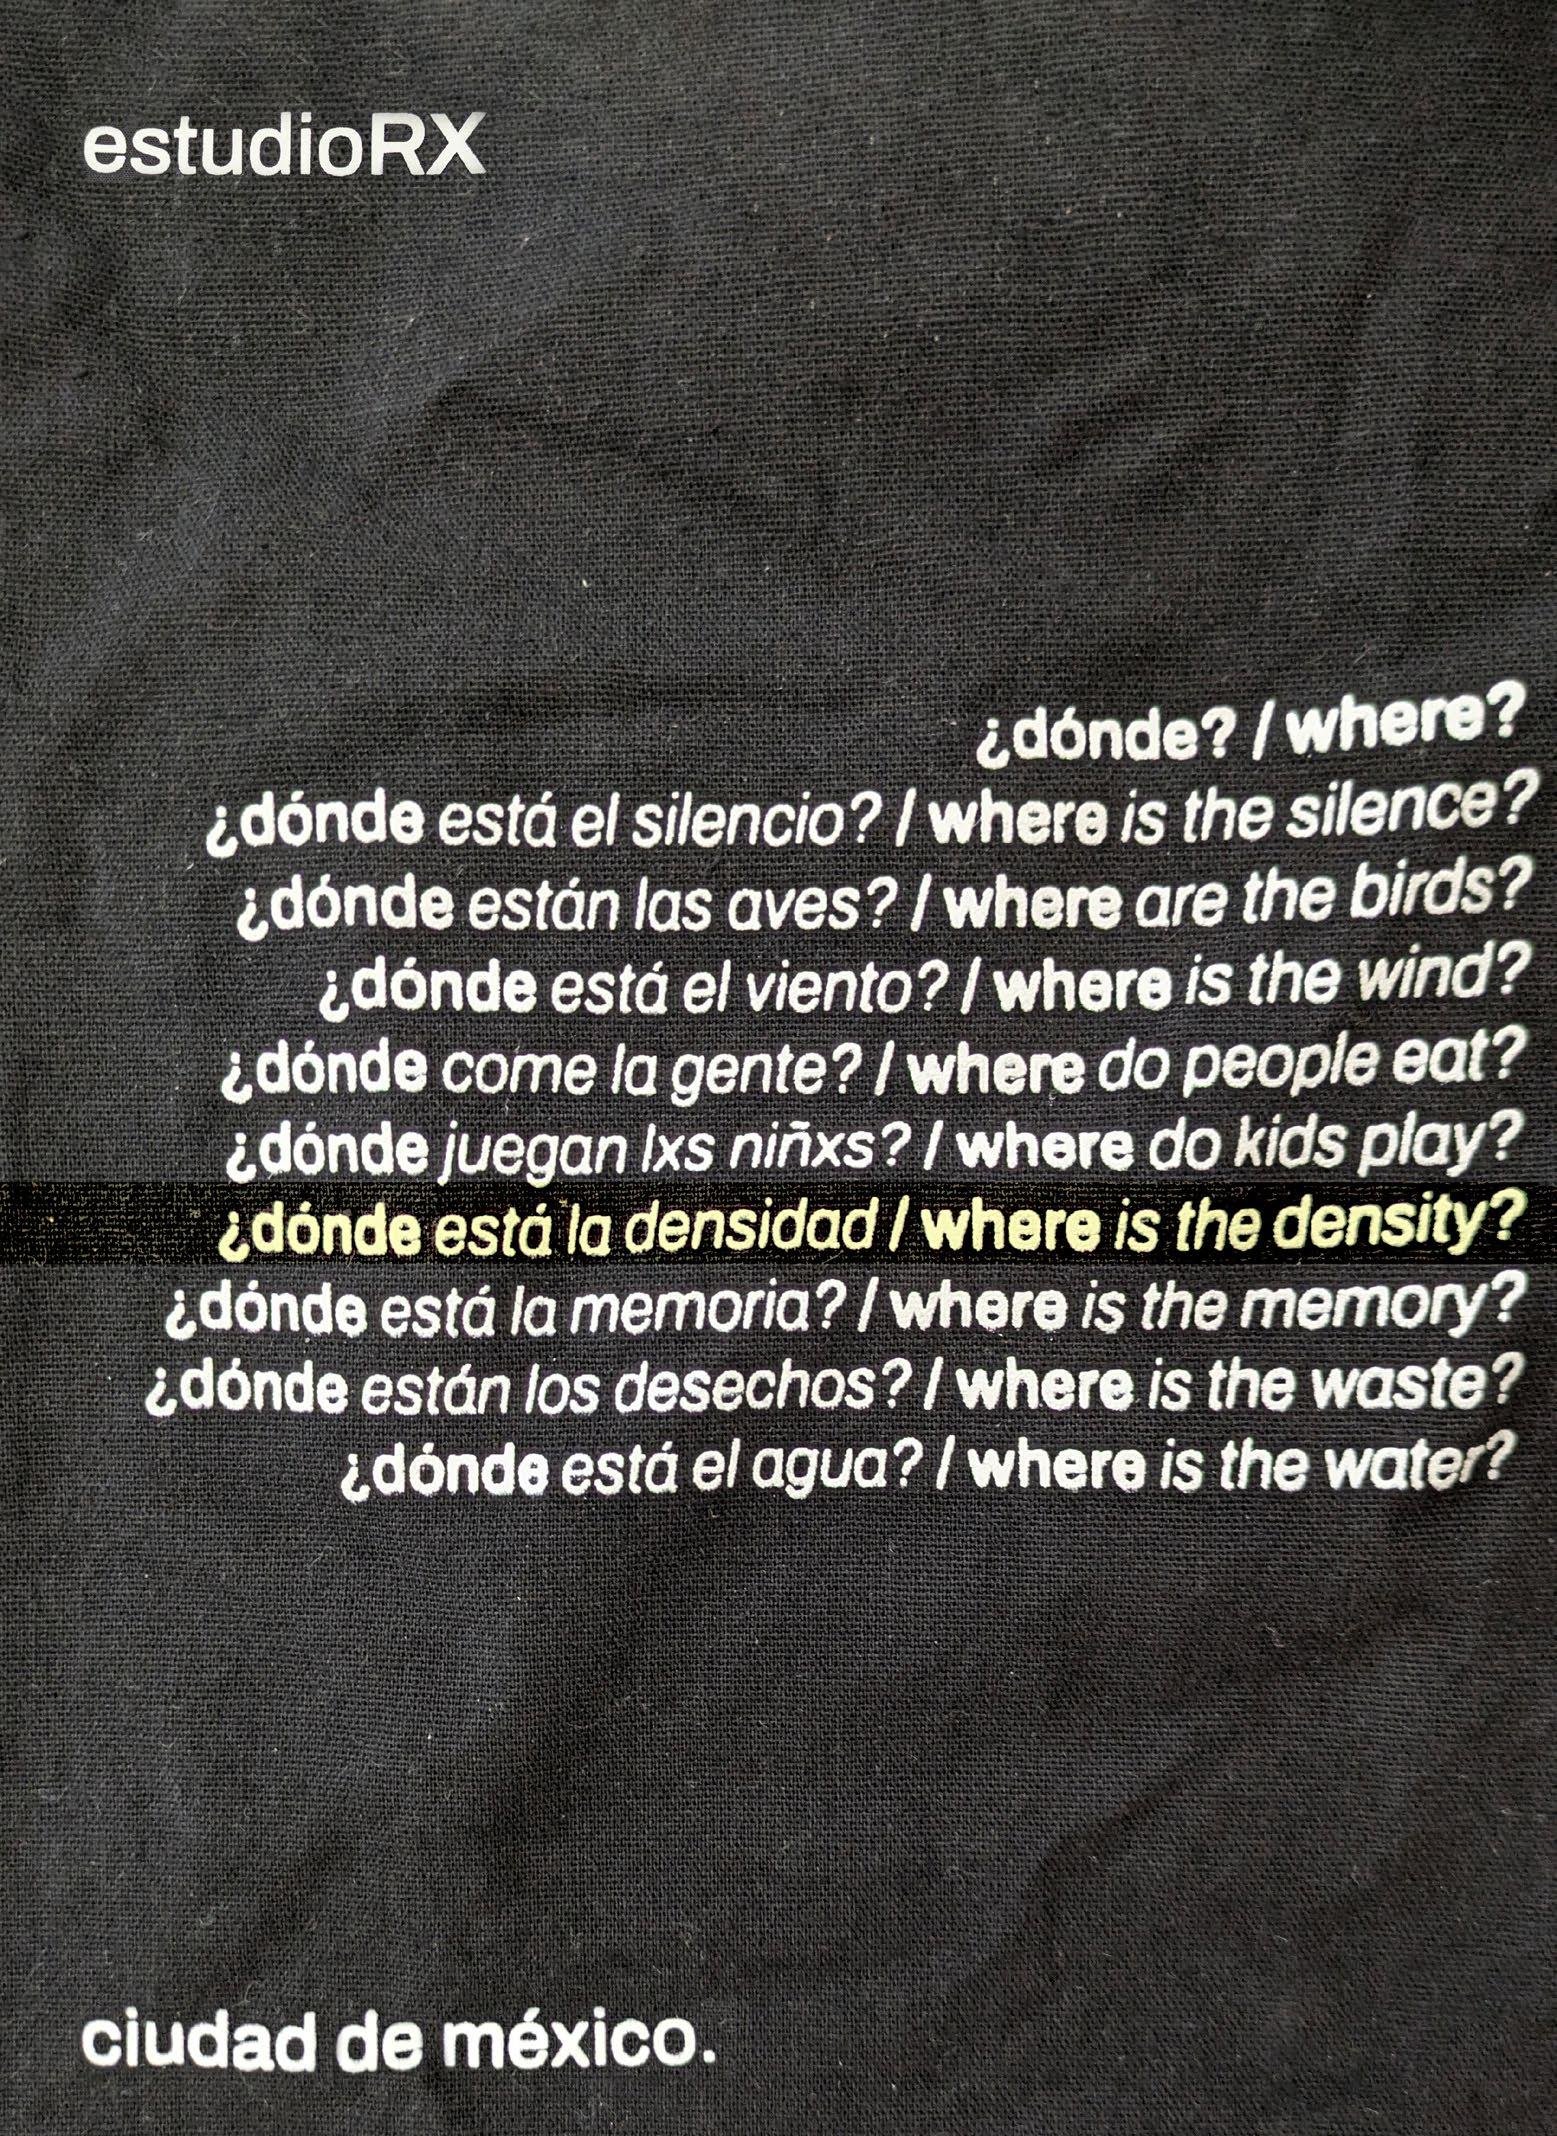
Where is the Density?
Location Mexico City, Mexico
Academic CDMX Studio, Fall 2024 Instructors Gabriela Carrillo, Patricia Morgado
Team Harsha Raju, Bonnie Kadhim (NCLA), Dhamar Sanchez (UNAM), Andres Quiroz (UNAM)
Contributions Documented site conditions through sketches, photographs, and video. Collaboratively developed the video through concept, sequencing, and final editing. Participated in the design charette with a site-specific focus on the intersection of Calzada and Paseo De La Reforma.
The project stems from a week-long travel and design charette in Mexico City with students from NC State Architecture and Landscape and the Universidad Nacional Autónoma de México (UNAM). Guided by architect Gabriela Carrillo, the experience focused on observing public space through walking, sketching, and collaborative documentation.
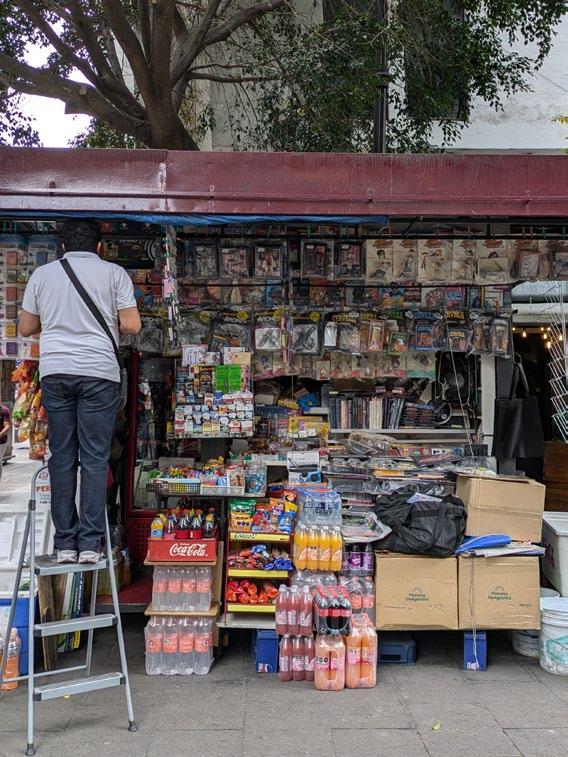
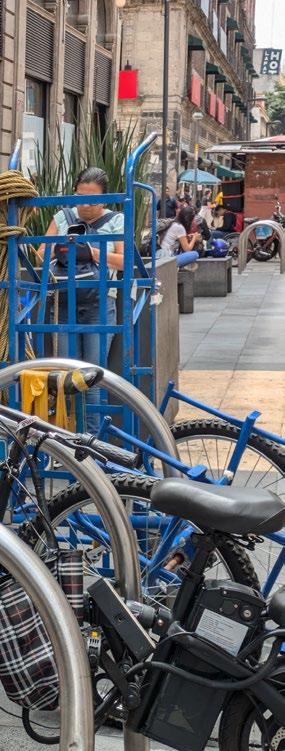
Our team responded to the prompt “Where is the density?” and produced a video capturing the patterns of infrastructure, ritual, and informal activity. The video was developed collaboratively and selected as the best in the final review.
¿Dónde está la densidad?
Link: Video – Where Is the Density?
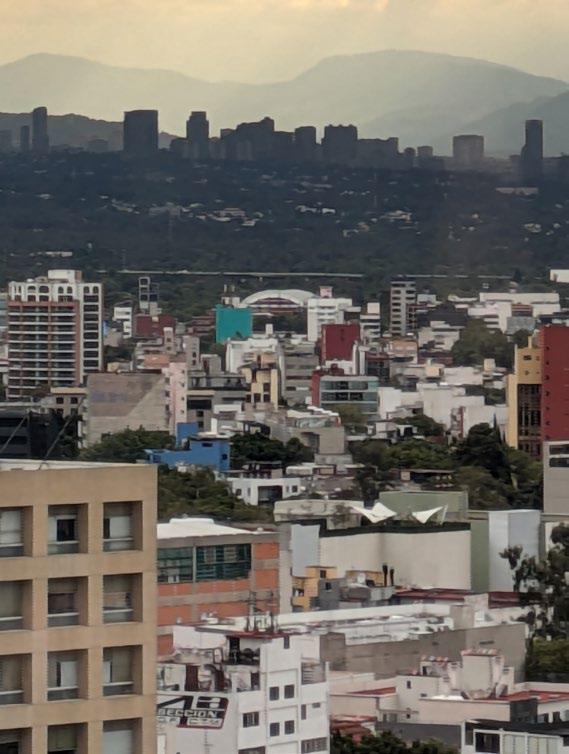
We live in a city, vast and dense Striving to thrive amidst the immense
We flee the traffic, noise, and haste, To laugh and cry in a secret space.
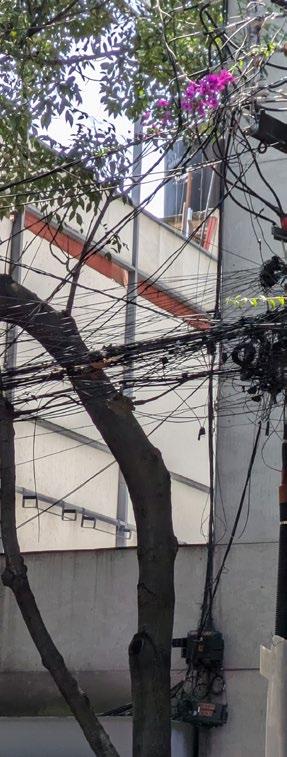
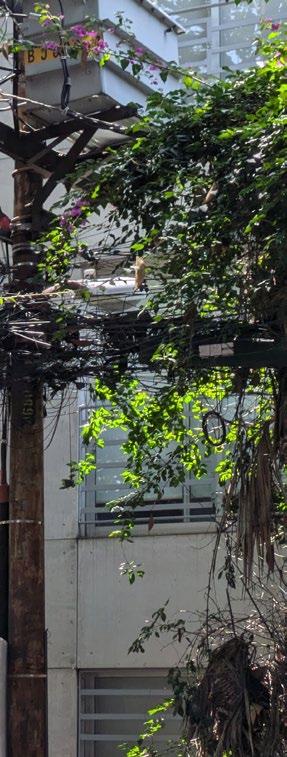
The poles hold more than electric lines Forgotten vows, the political lies
We gather things that catch our eye We hold them close, as years pass by!
We chop, sauté, and stir the stew When flavors fade, we add what’s new.
Amid the chaos, the endless race, We carve out order, a sacred space!
PaseoDeLaReforma
Reforma Meets Calzada: Then and Now
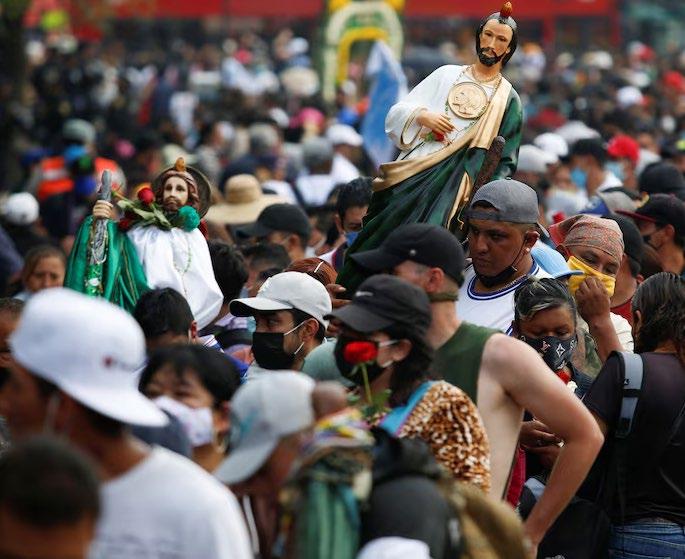
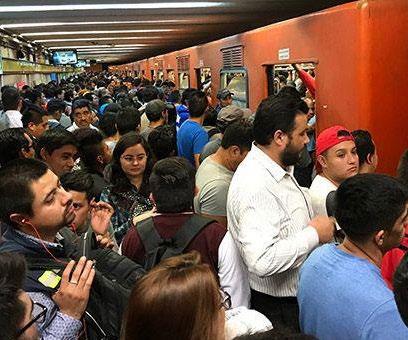
Above and Below: San Hipólito’s Crowds and Metro
Calzada
San Hipolito Church
Central
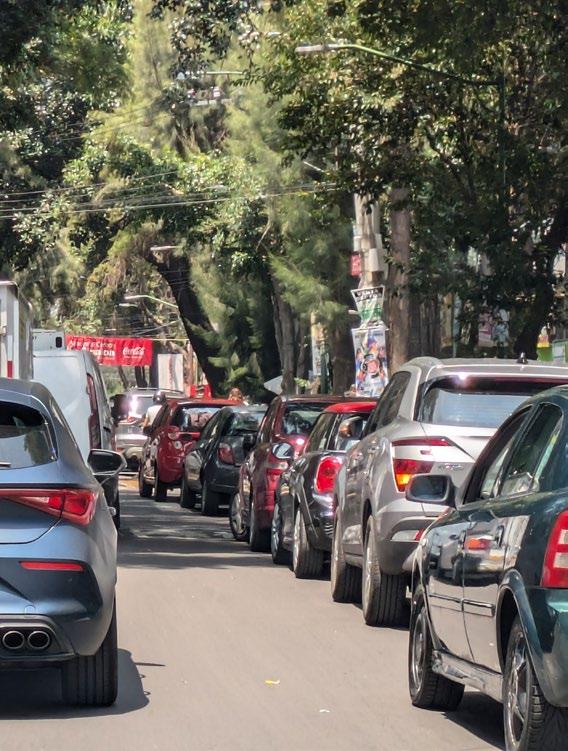
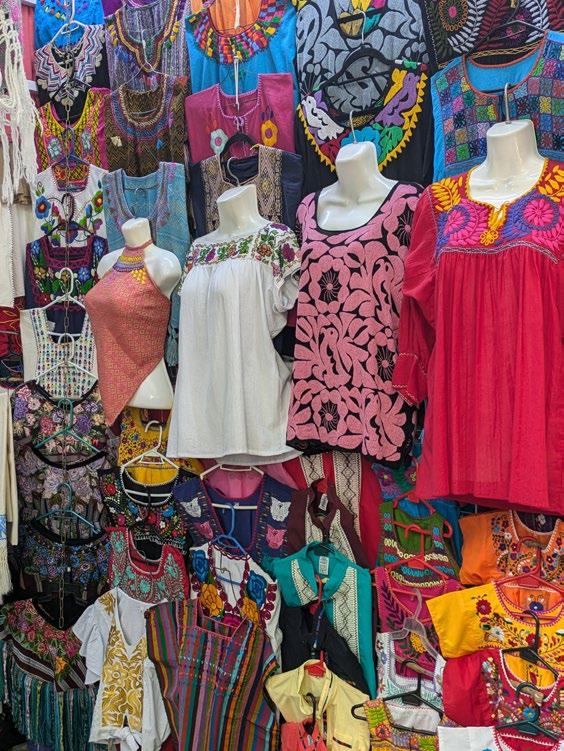
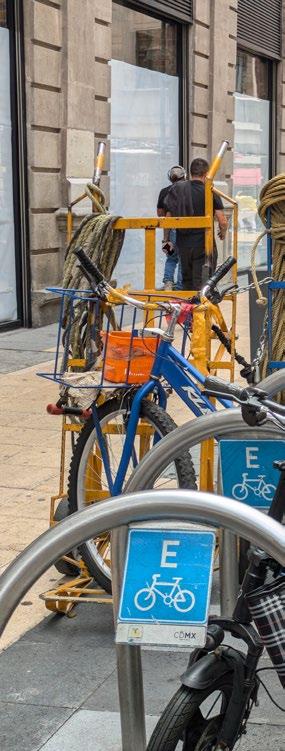
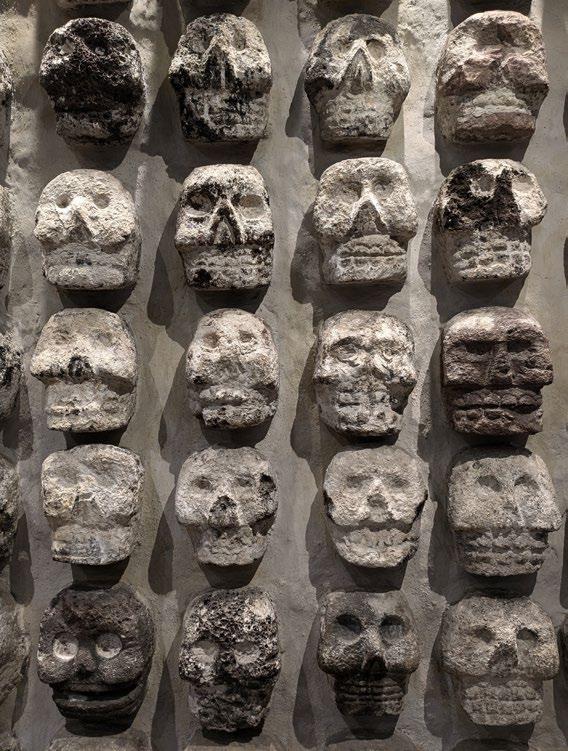
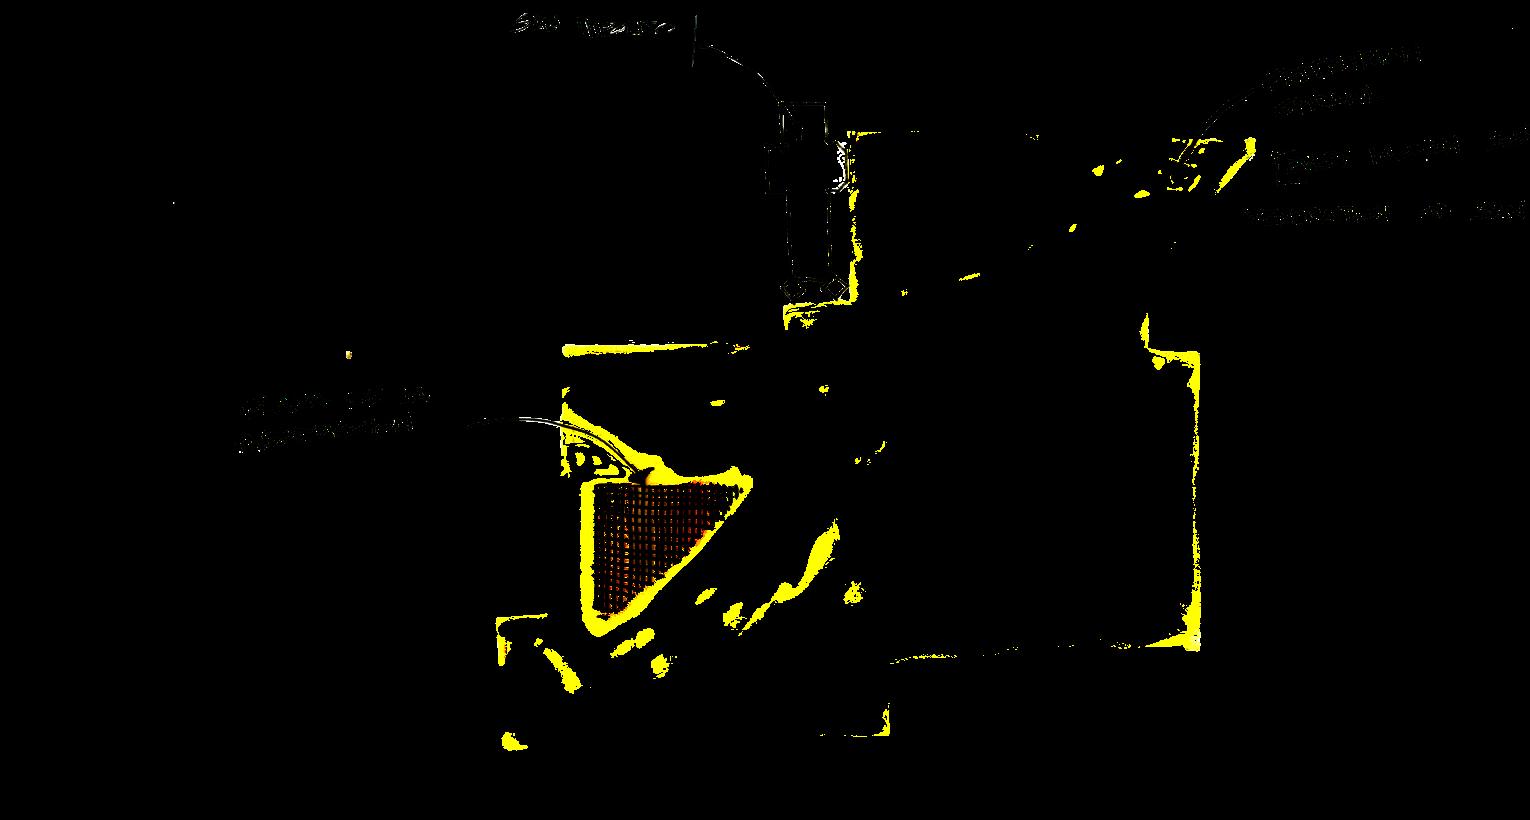
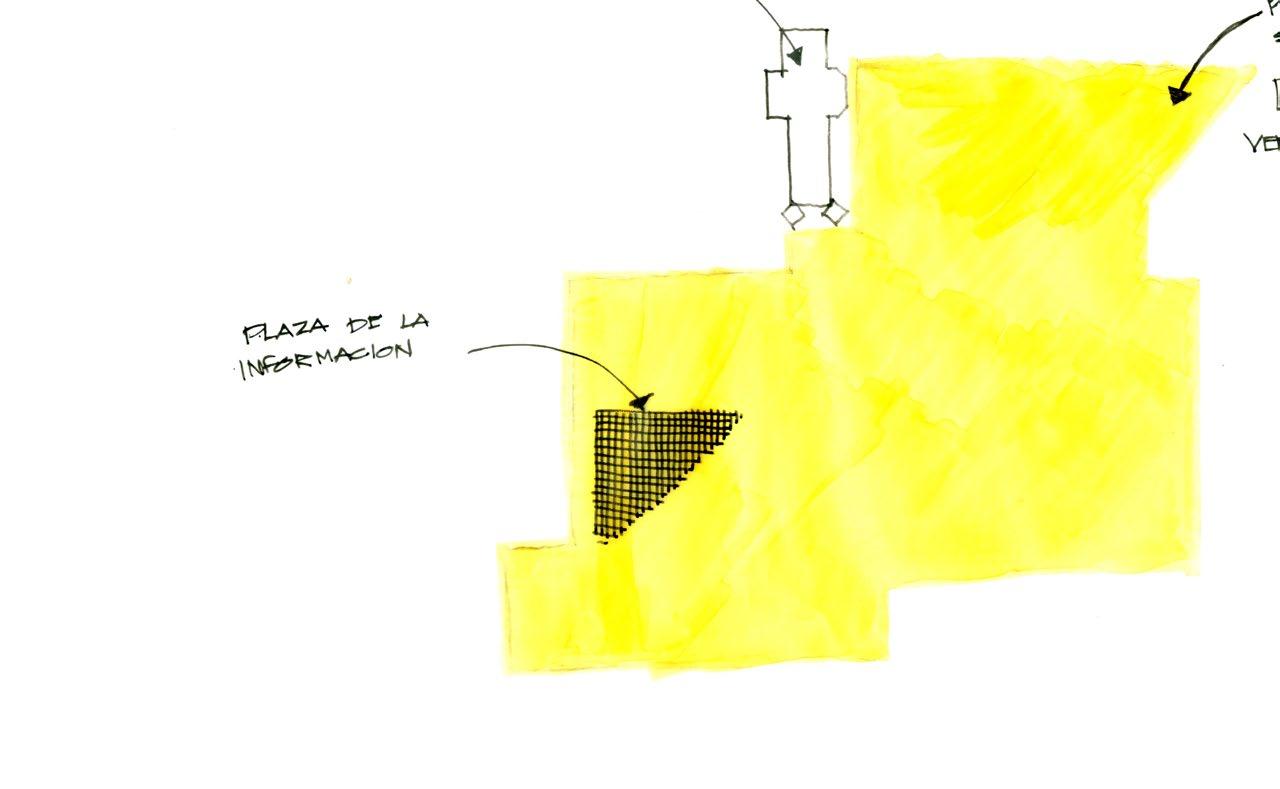
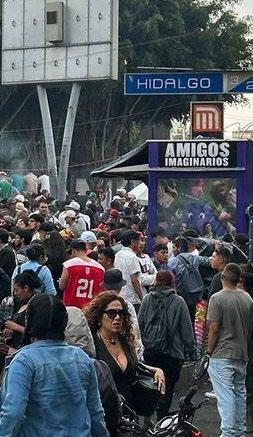
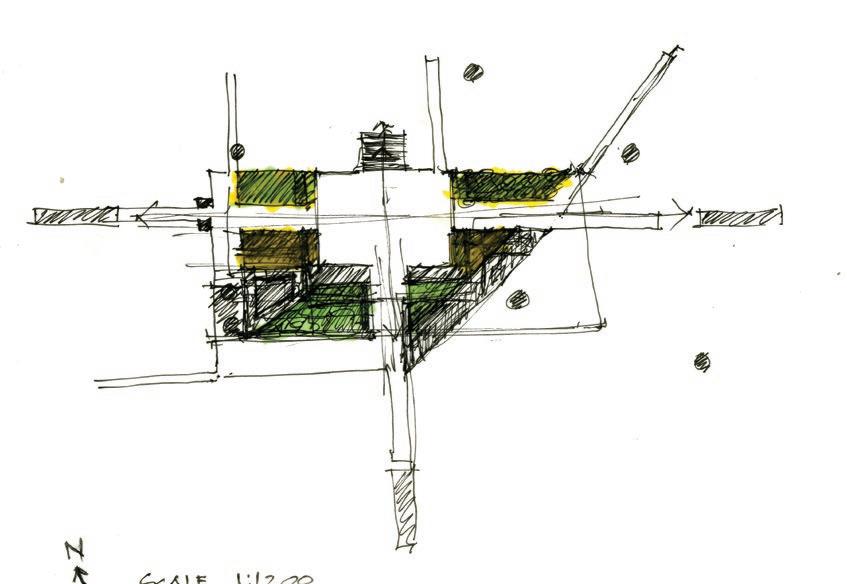
This spread documents how density unfolds at the intersection of Calzada and Paseo de la Reforma, where ritual, transit, and informal use compete for space. The visuals trace competing layers of use at the intersection.
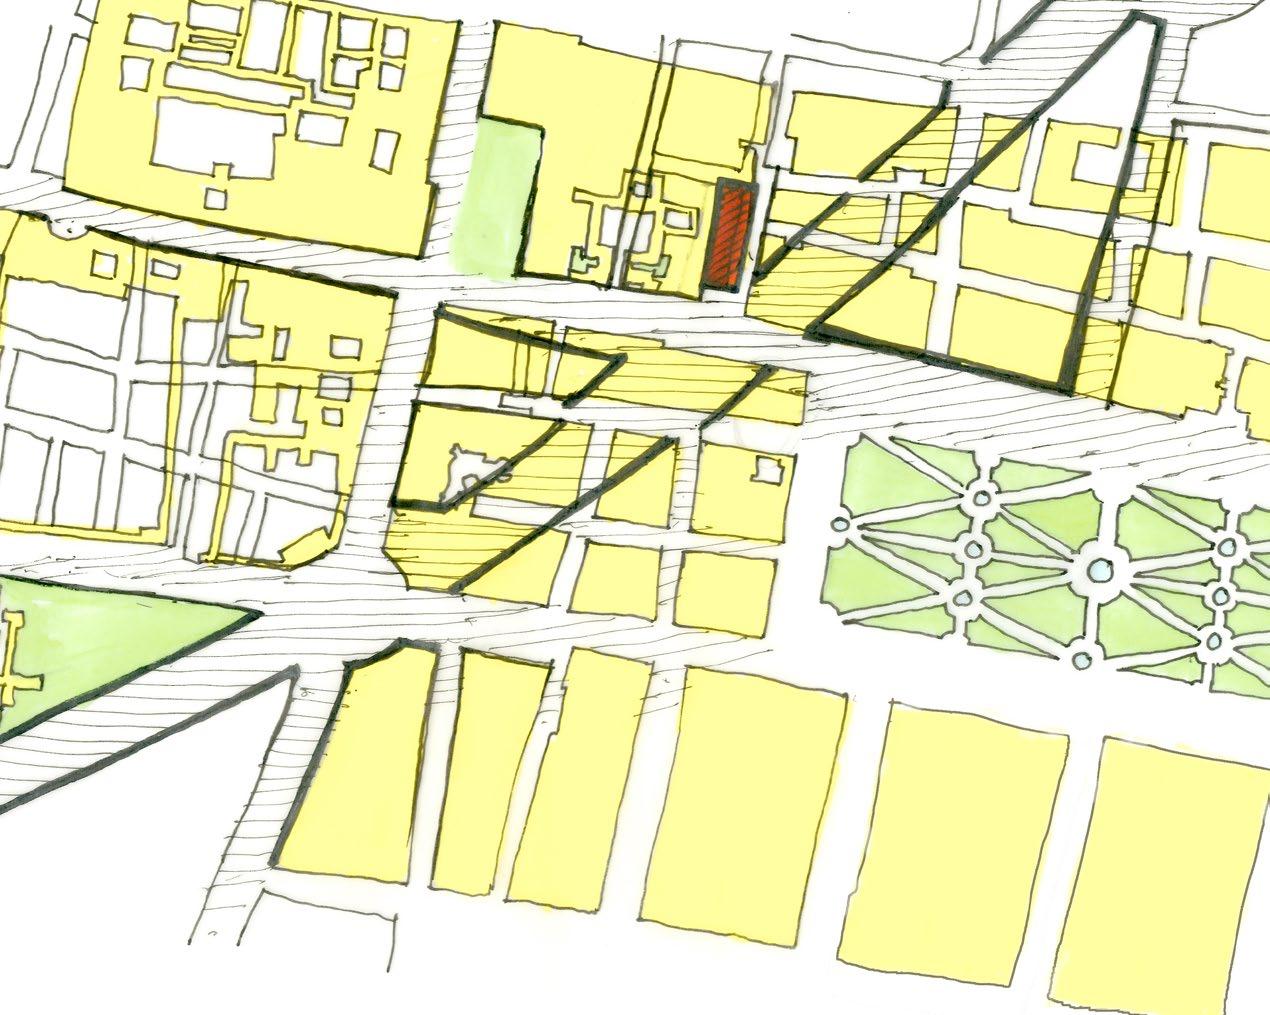
In a 1865 map, Paseo De La Reforma stops well before meeting Calzada, and the San Hipolito Church had a much larger complex. The sketch to the left overlays the current map onto the 1865 map to show how the extension of Paseo De La Reforma cut through existing blocks and created the intersection with Calzada.
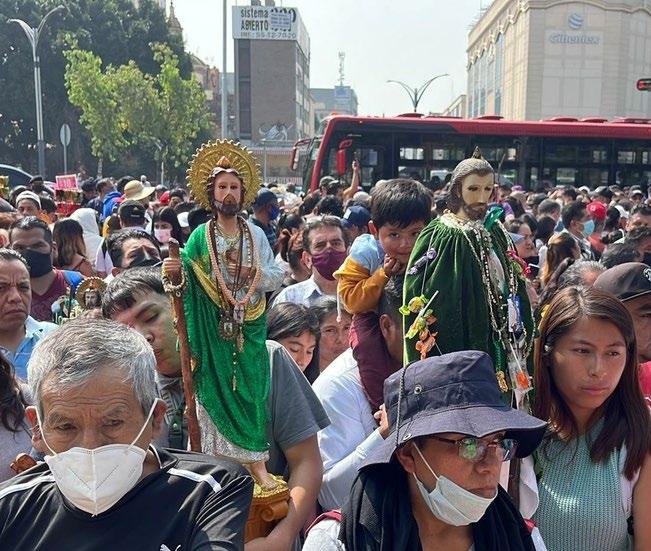
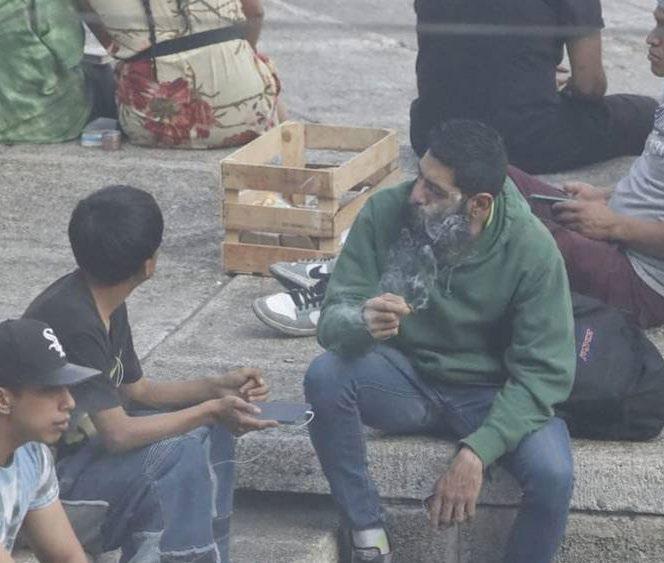
The monthly veneration of Saint Tadeo at San Hipolito Church brings large crowds that spill into the intersection, blocking traffic and creating congestion. Meanwhile, Plaza de la Información, marked on the sketch, is an underutilized corner of the intersection often associated with activities like drug sales and pot smoking, reflecting the fragmented use of the surrounding spaces.
The sketch also highlights the Metro Hidalgo station and its multiple underground routes, which further intensify the area’s density and contribute to surface-level congestion.
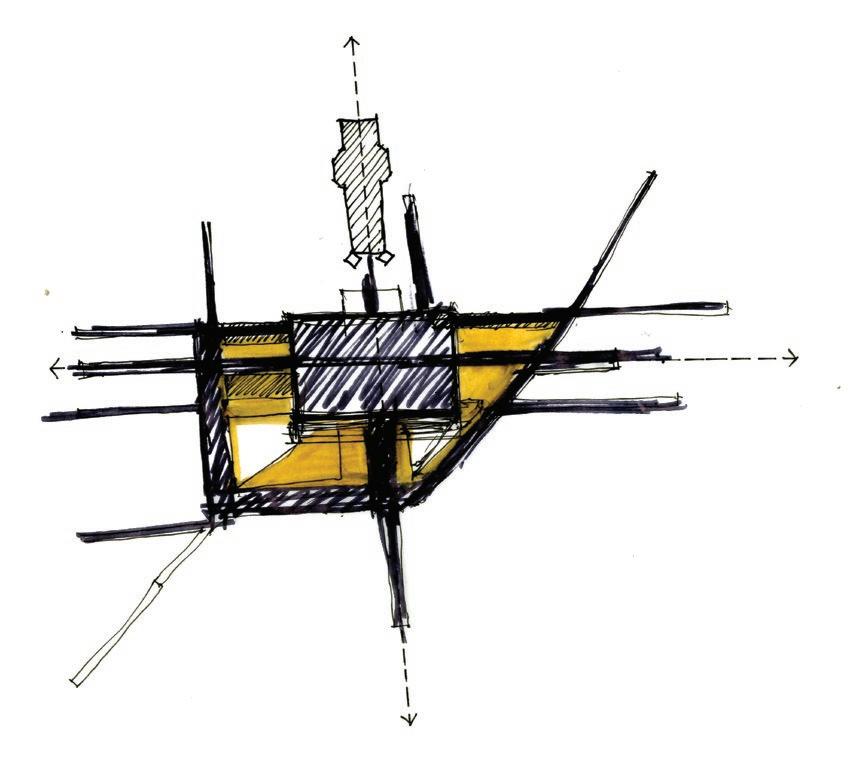
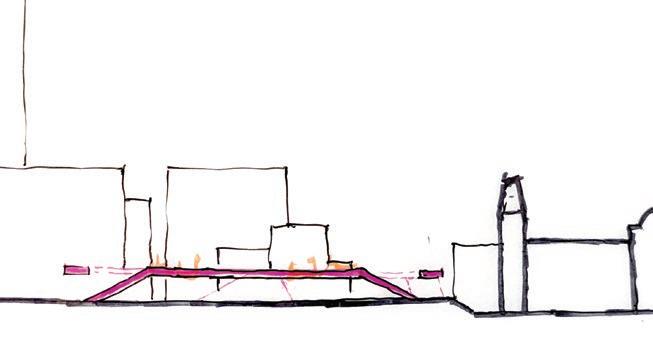
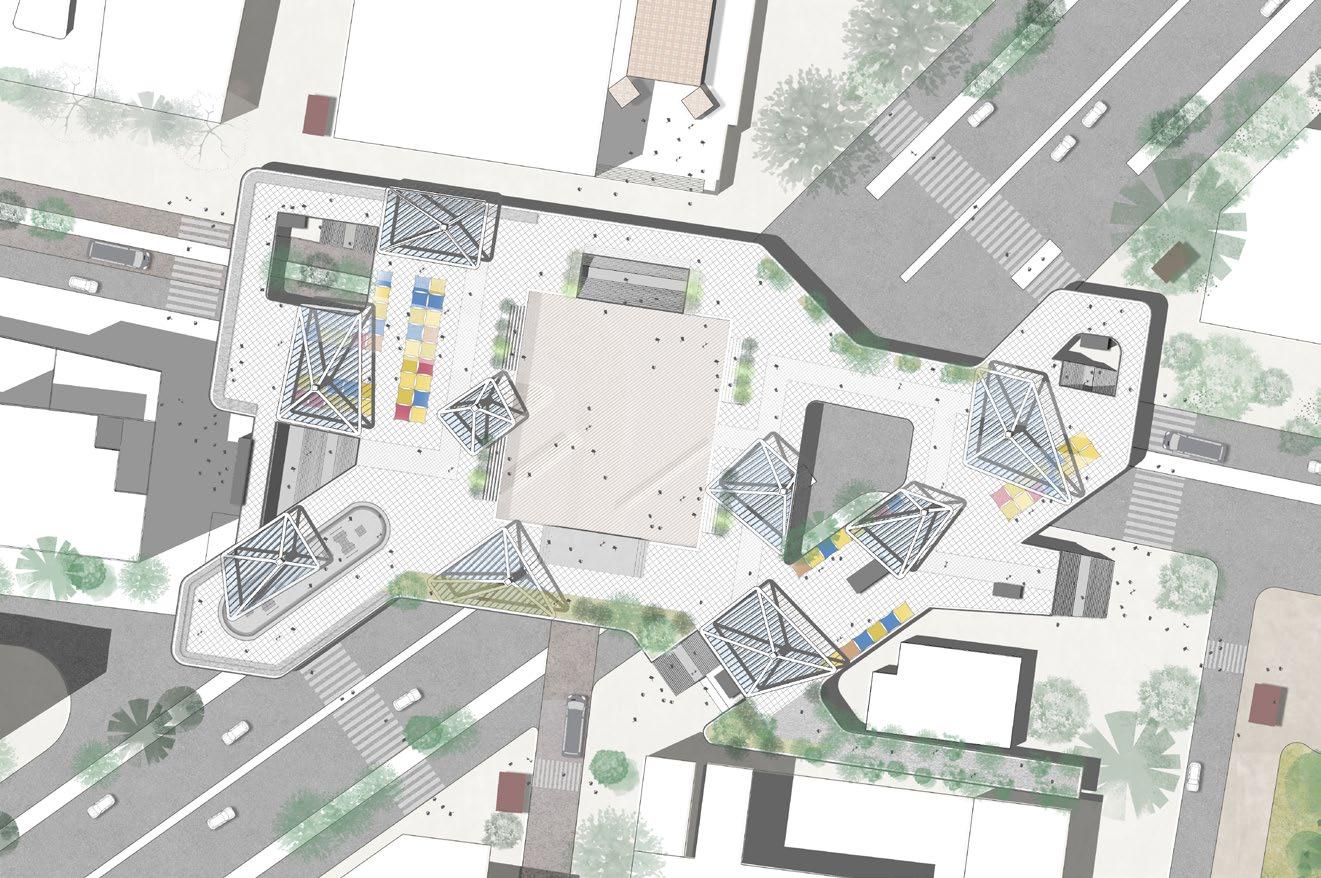
Initial design studies explored an elevated plaza connected to all Metro Hidalgo exit points, allowing pedestrians to bypass surface traffic and move safely across the intersection.
At its center, a flexible square aligns with San Hipolito Church, extending its public space for monthly gatherings, and serving as a venue for concerts, markets, and civic events on other days.
Site Plan - Plaza Intervention
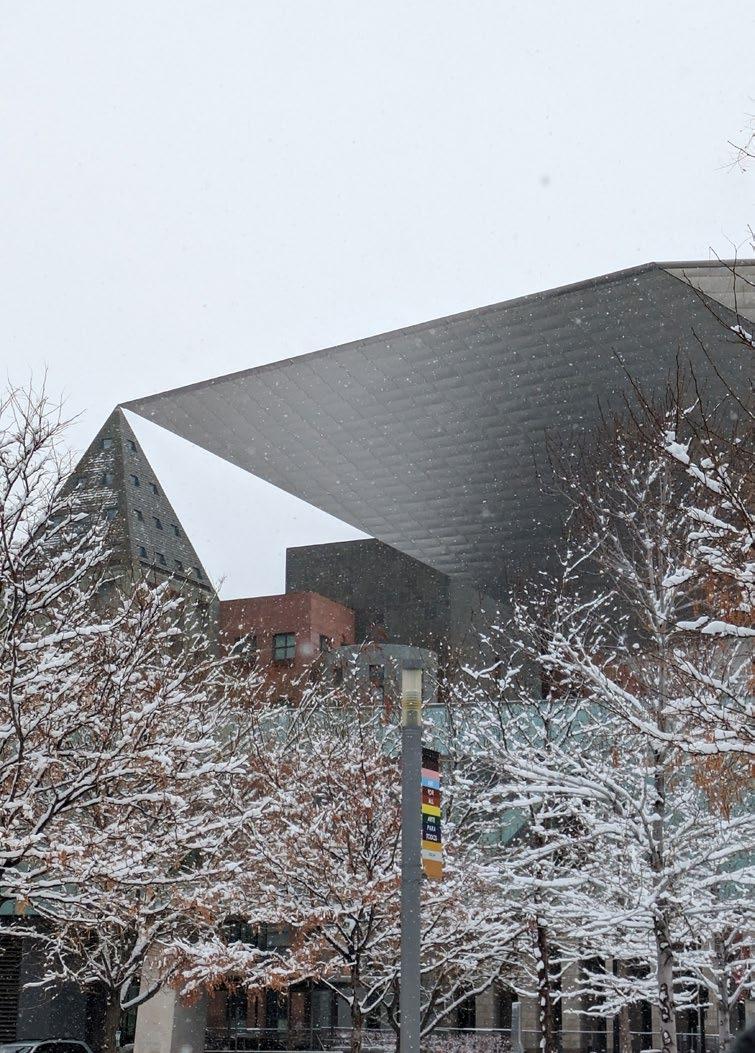
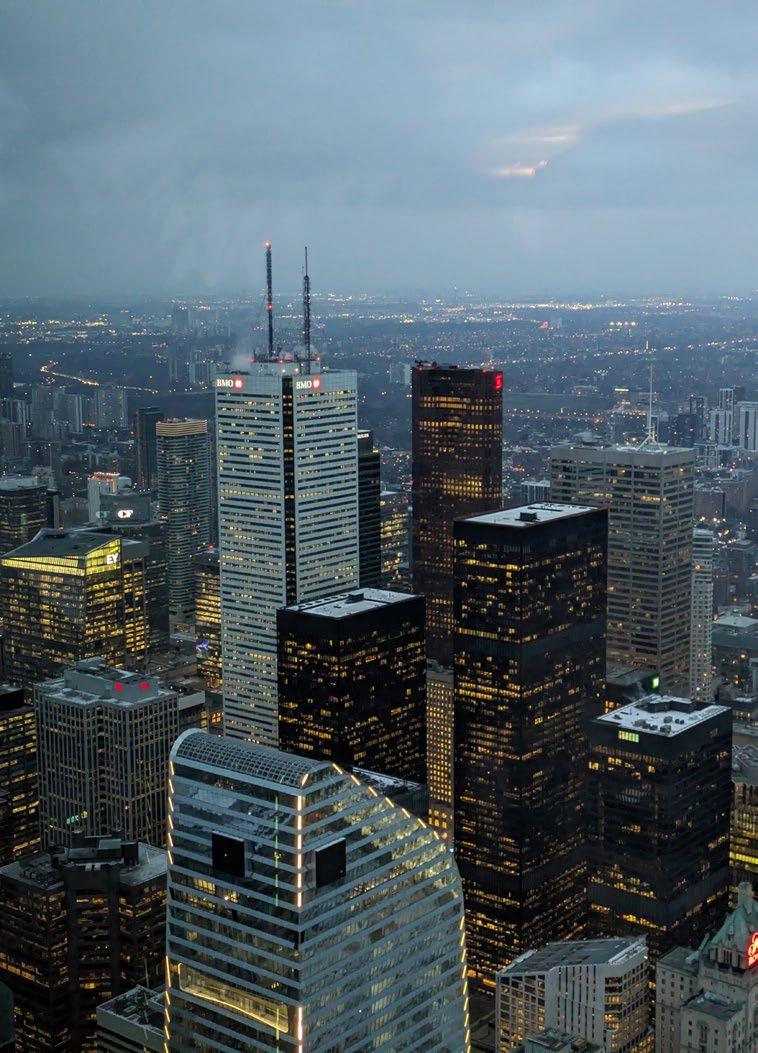
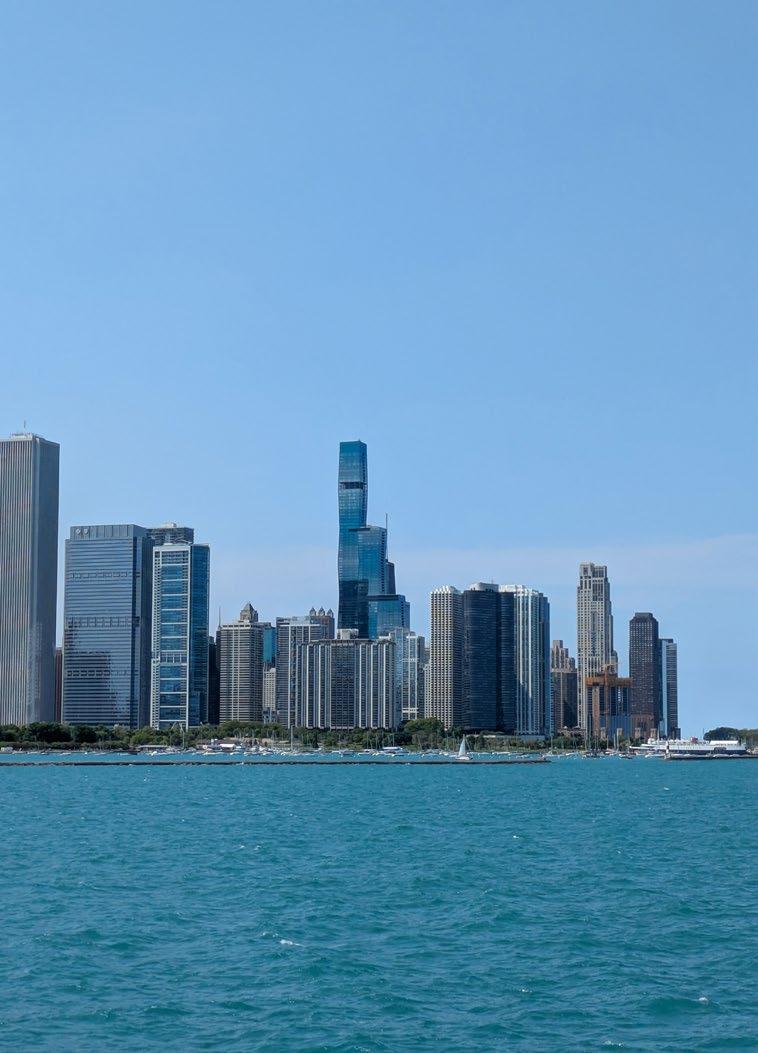
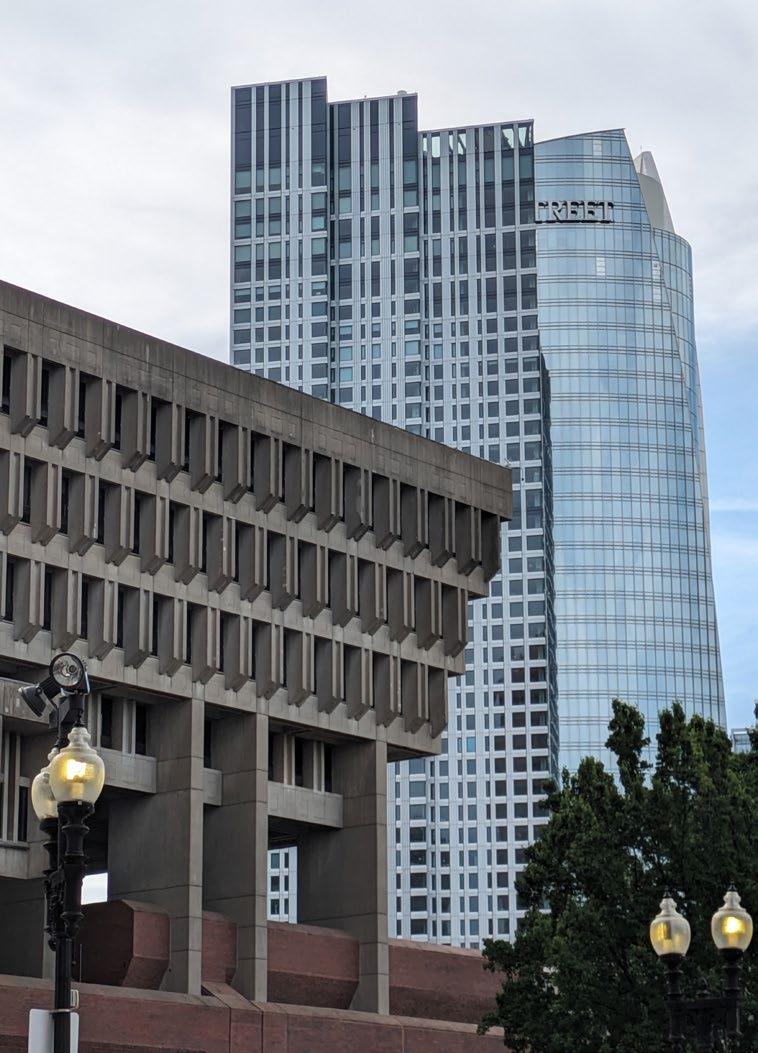
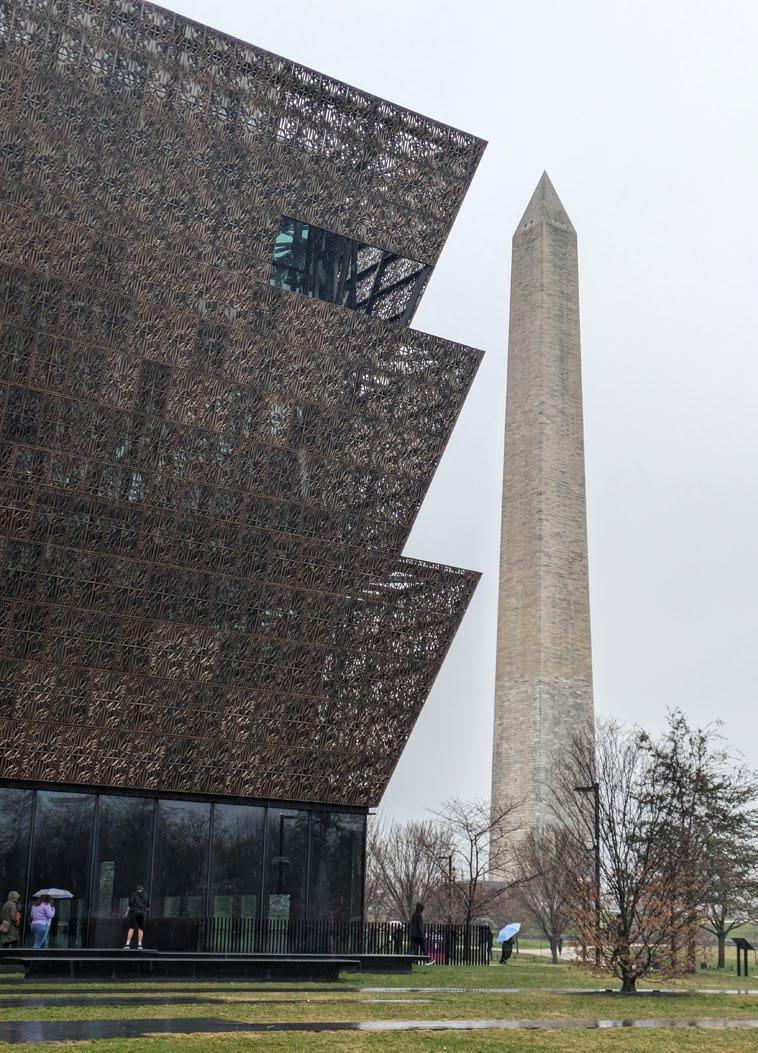
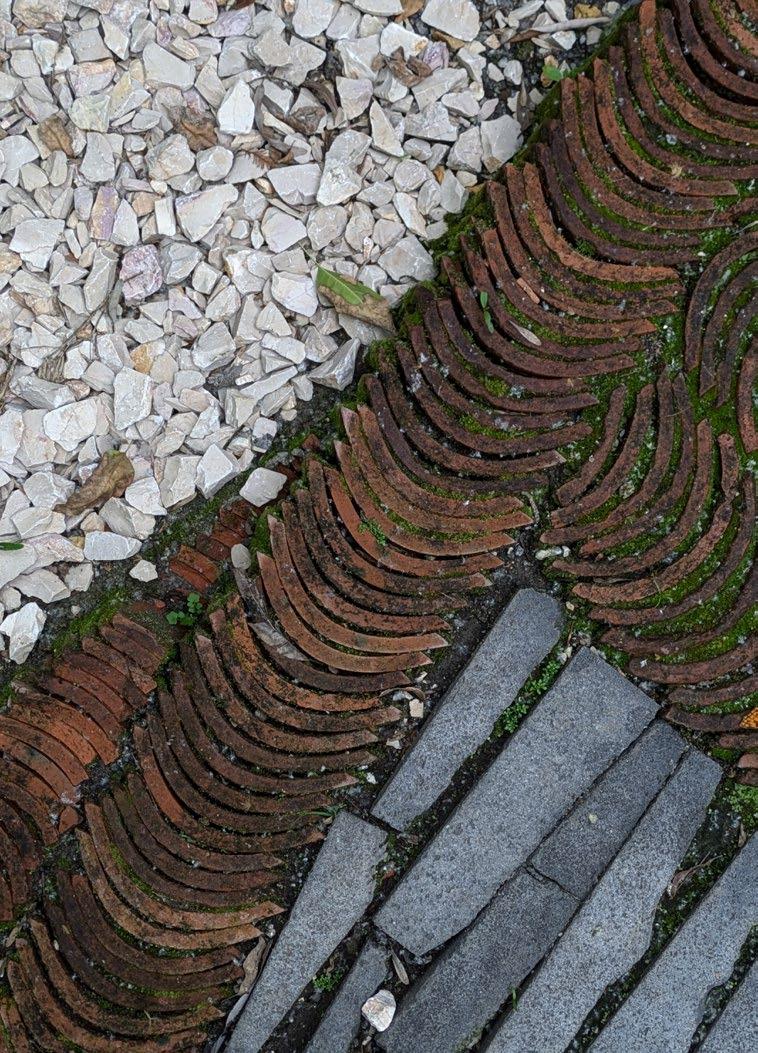
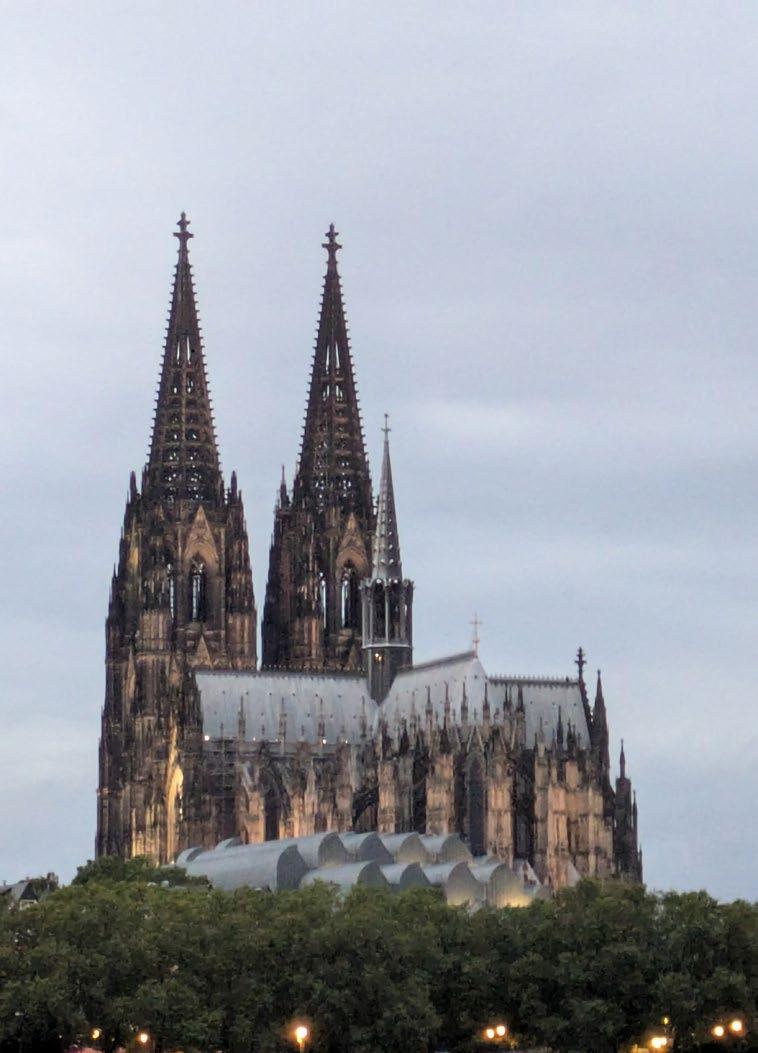
Across Cities
Travel Documentation | 2023-2025
Location Various cities in America and Europe
Contributions Documented spatial observations across cities. Curated images for material contrast, framing, and use of space.
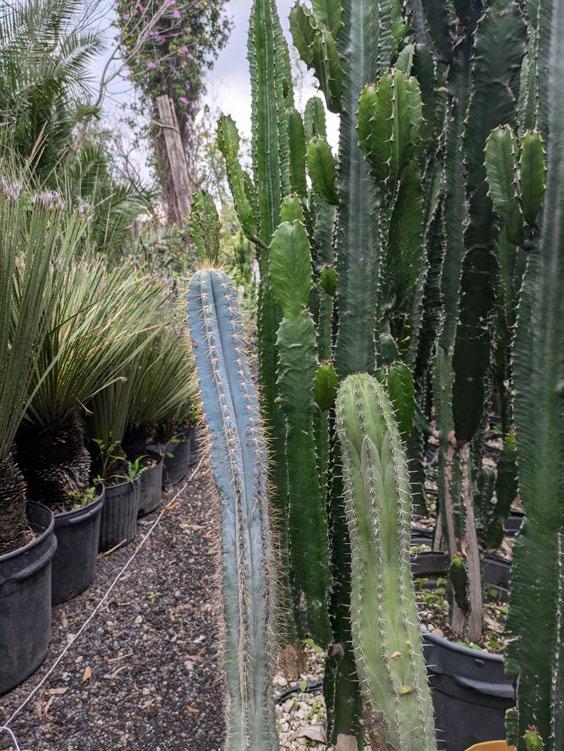
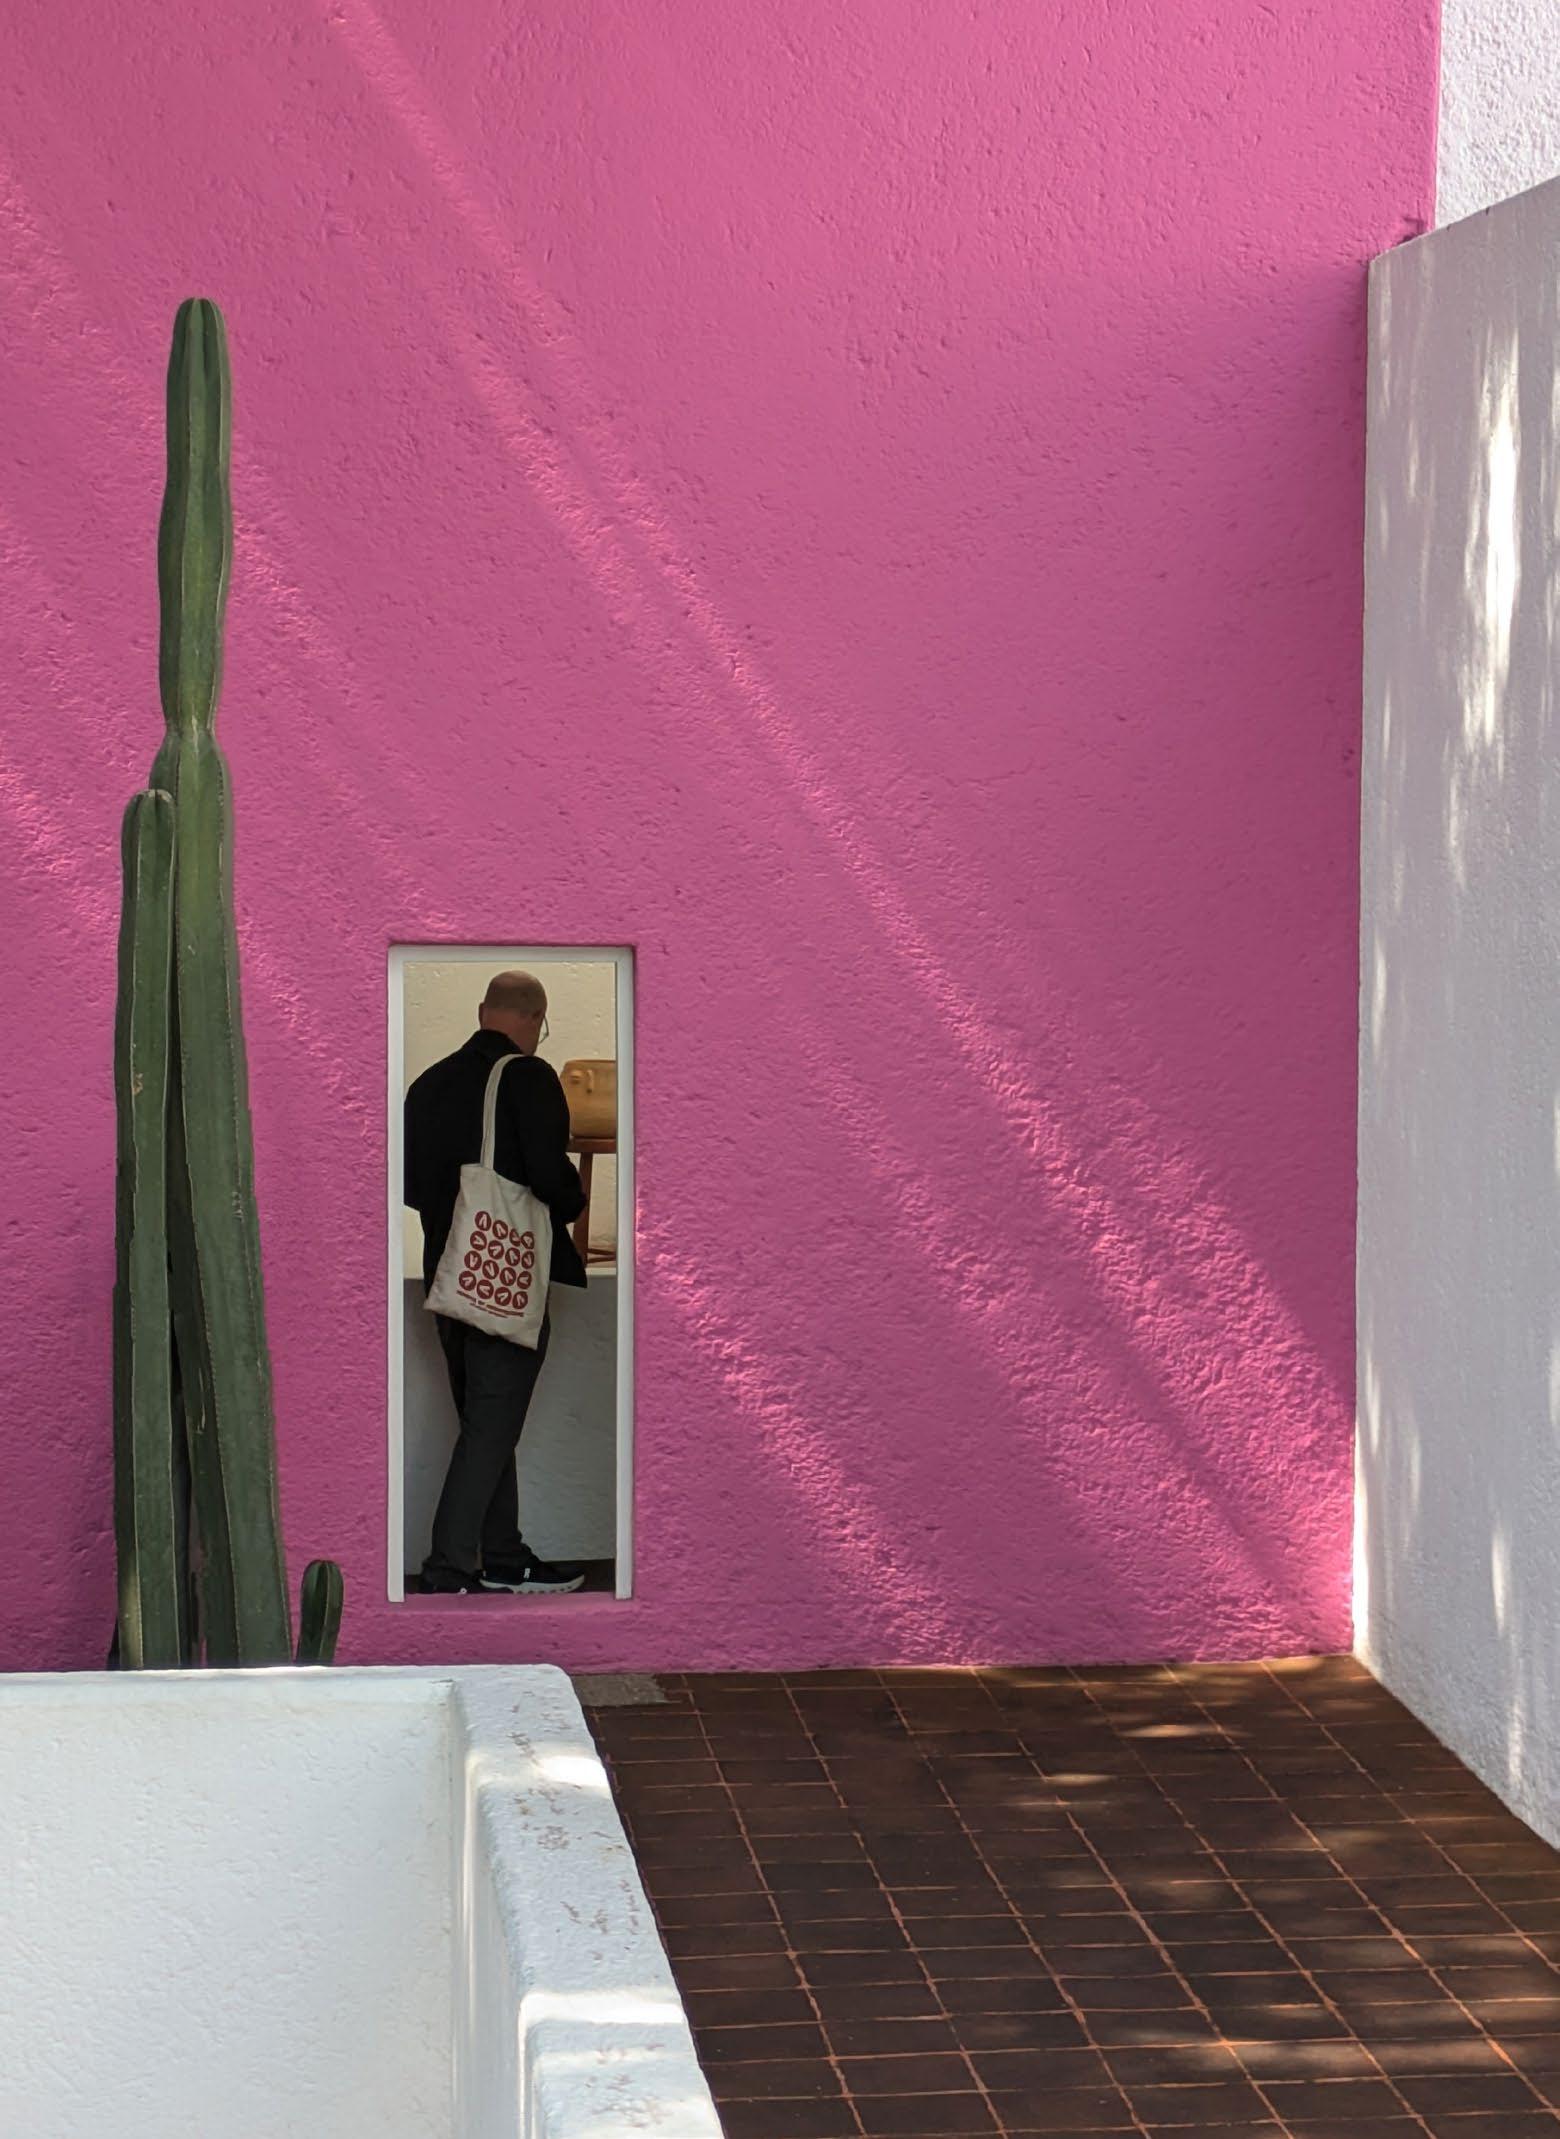
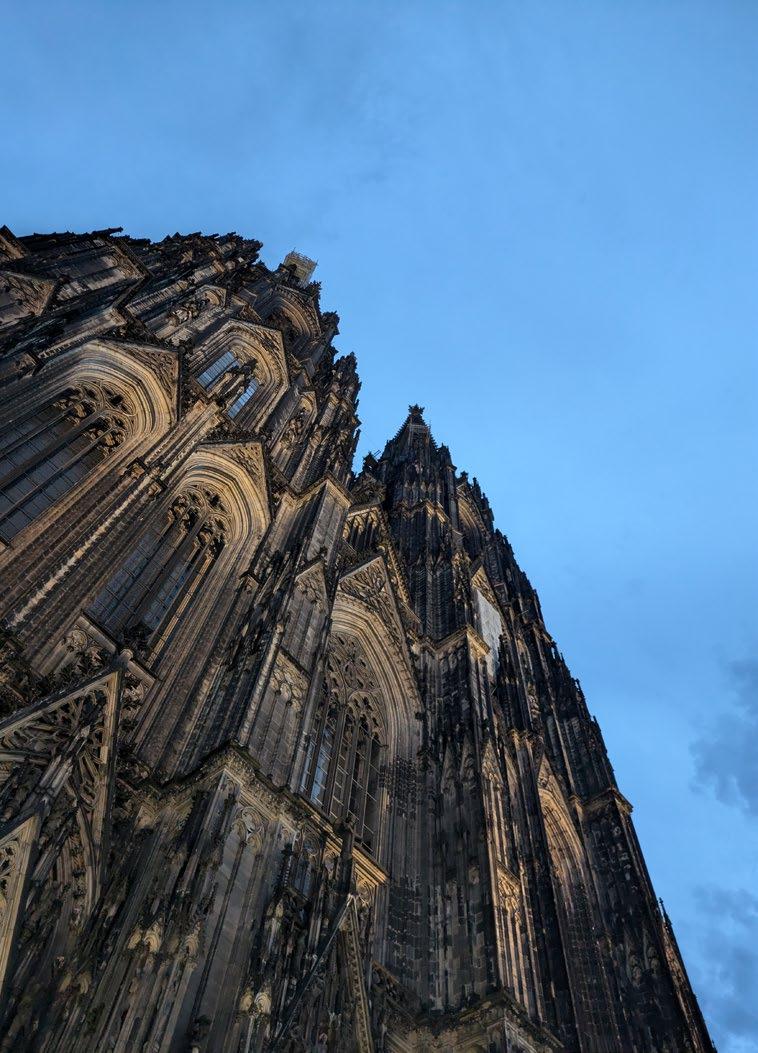
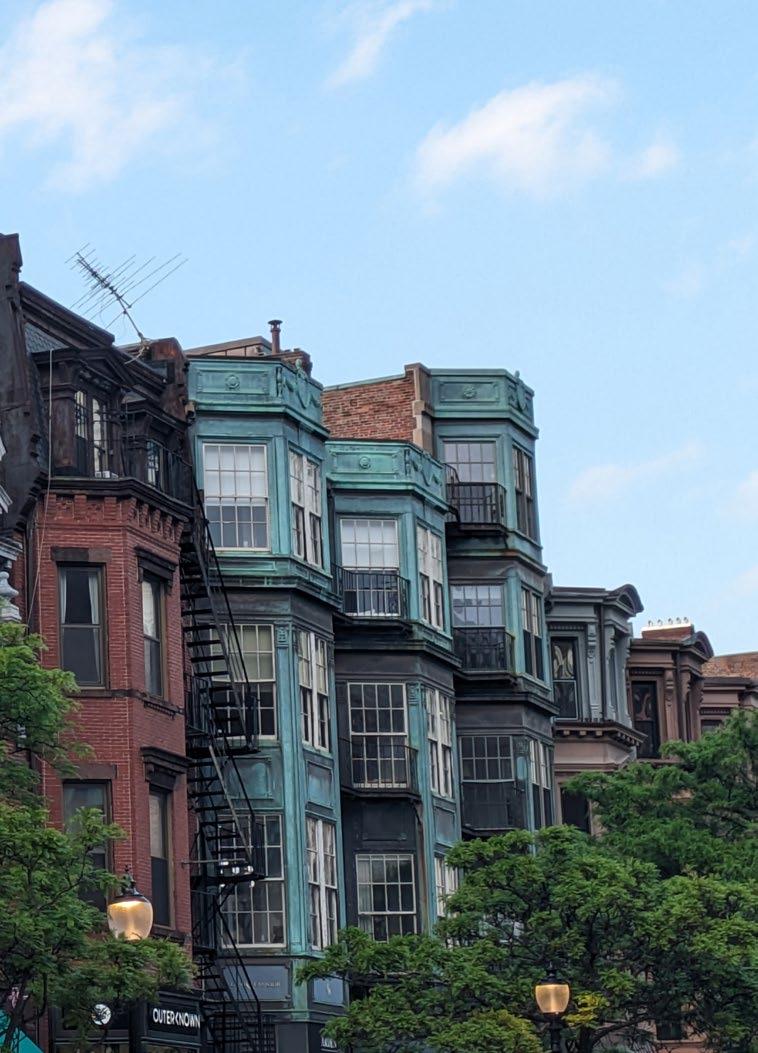
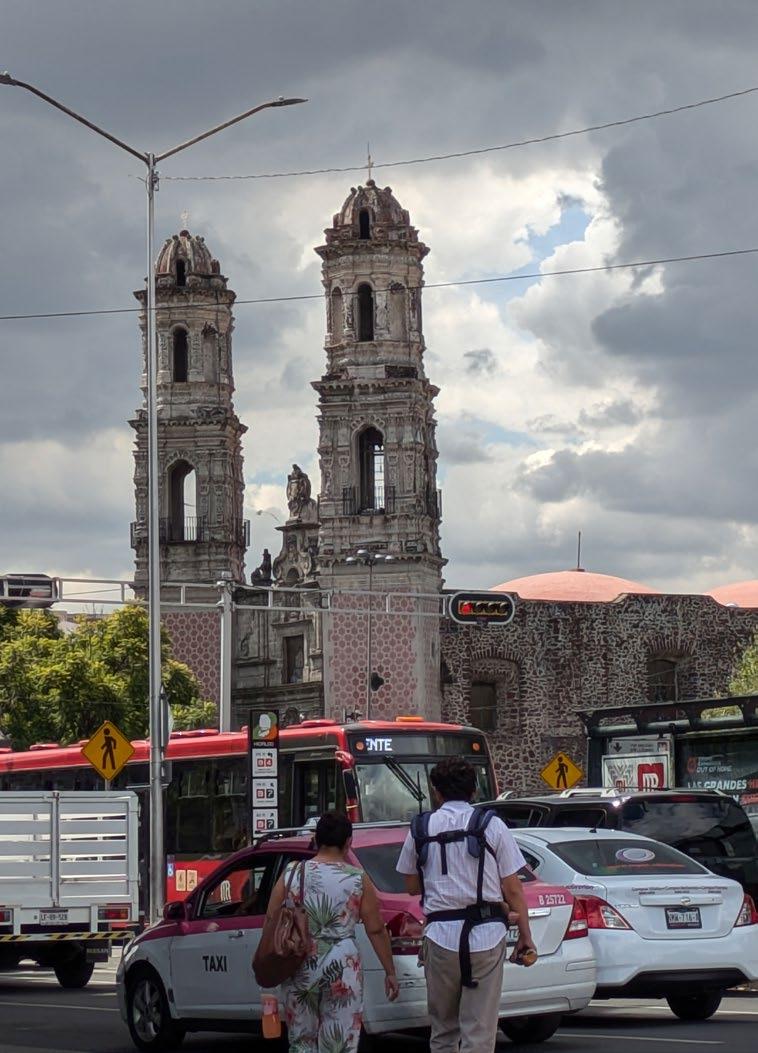
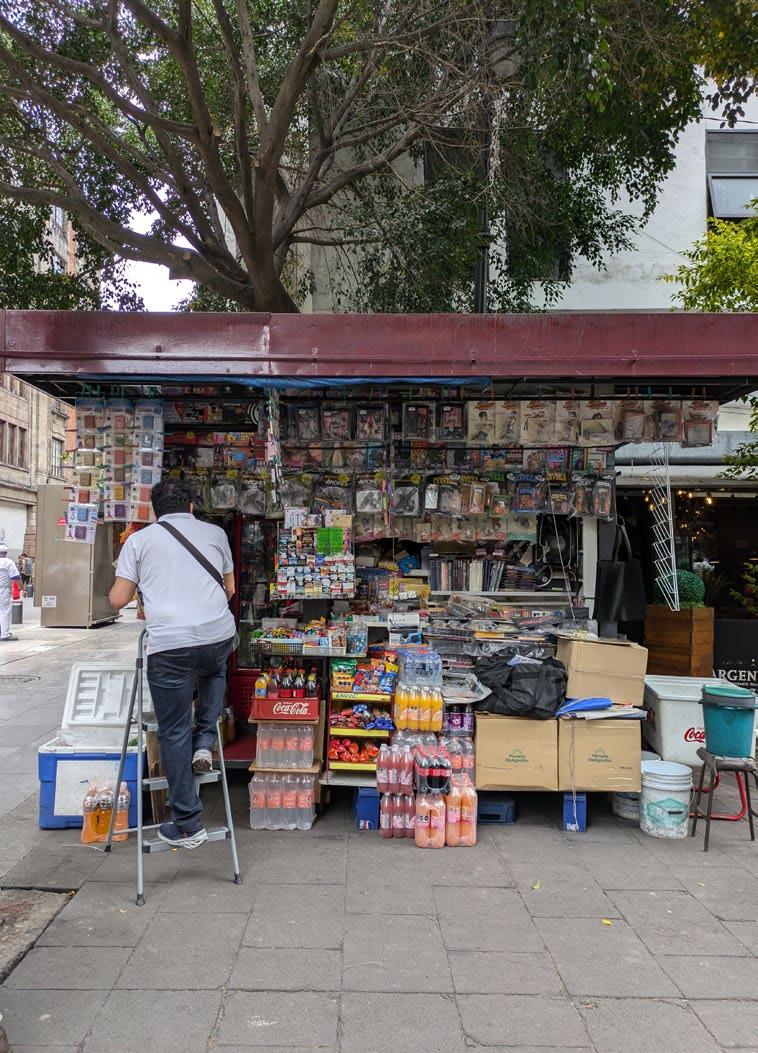
These photographs were taken over the past two years while visiting cities for academic work and personal travel. Each captures a moment where form, material, or public use revealed something about how cities work.
Cities documented: Boston, Denver, Washington D.C., Chicago, Toronto, Mexico City, Cologne