Can quantum answer the questions that Eratosthenes started? by Charles Brain (Second Year, HELP Level 1)
Are the COP conferences a waste of time? by Ollie Scrimshaw (Second Year, HELP Level 1)
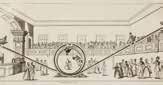
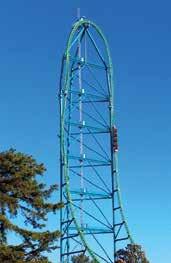
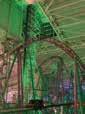
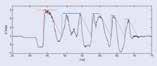
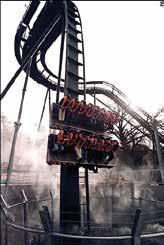
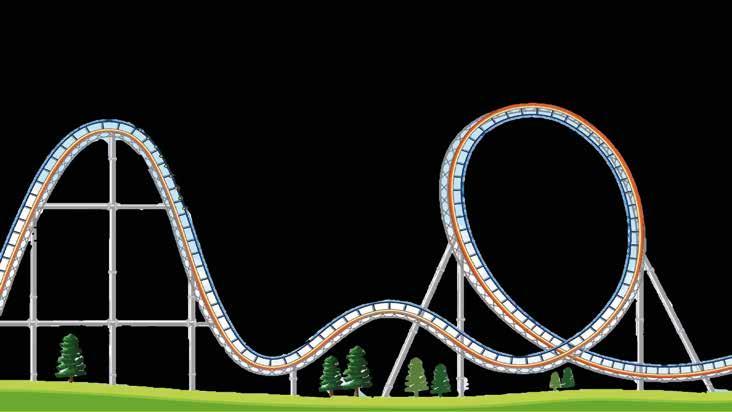
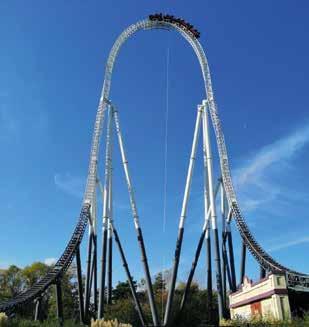
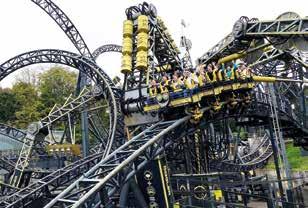
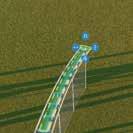
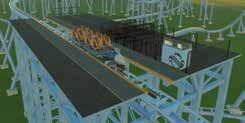
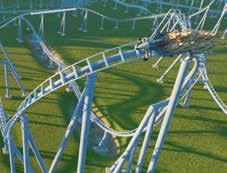
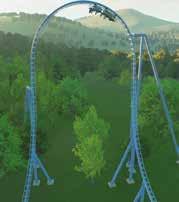
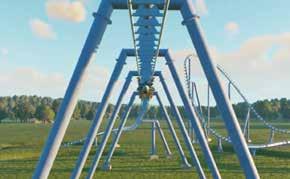
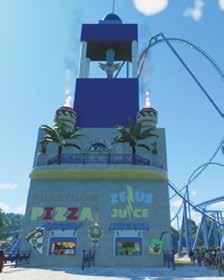
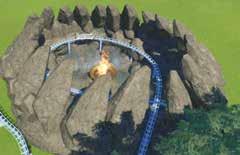
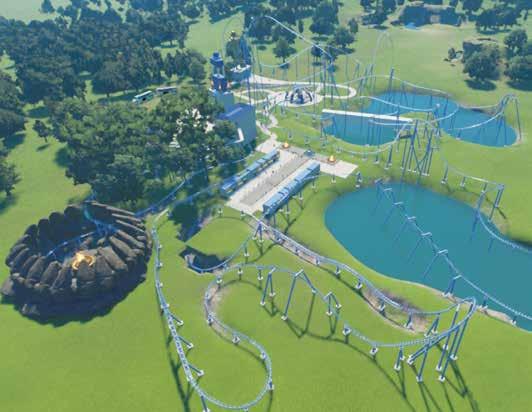
Rollercoaster manufacture and engineering by Leo Syverson (Second Year, HELP Level 1)
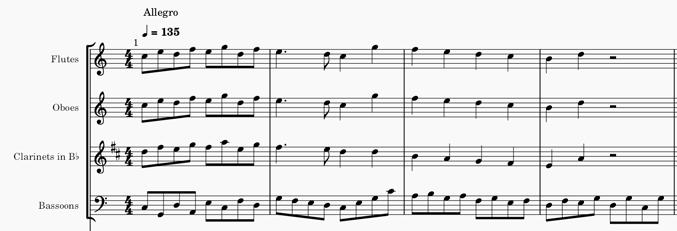
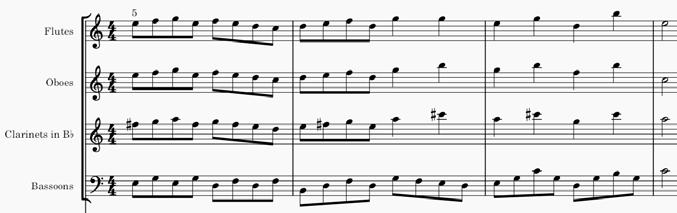
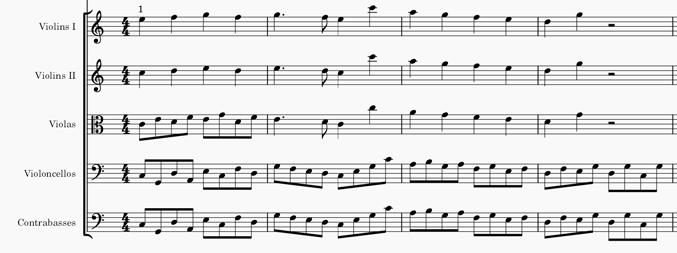
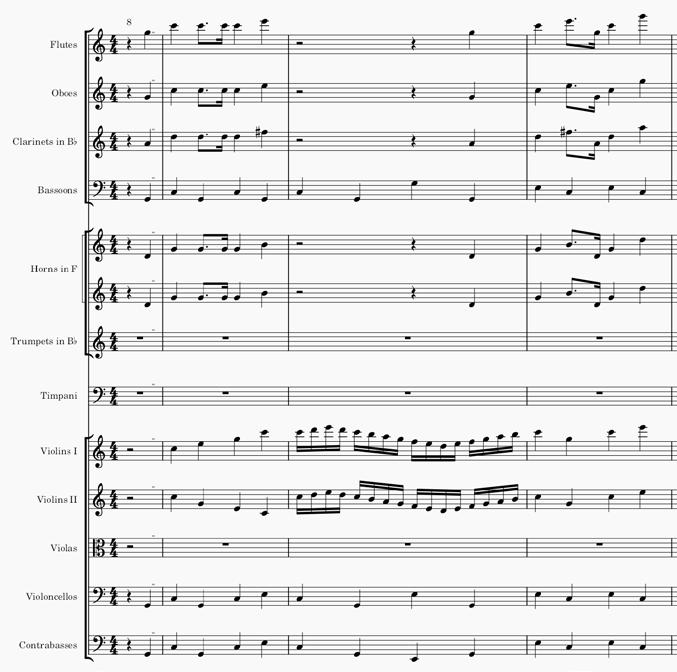
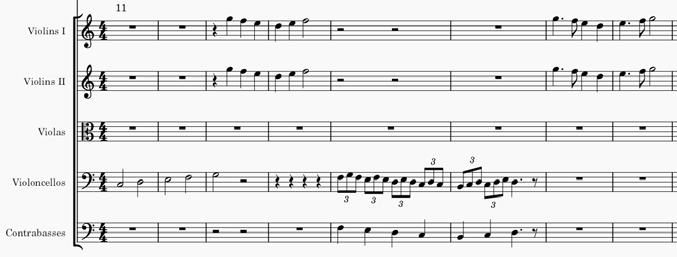
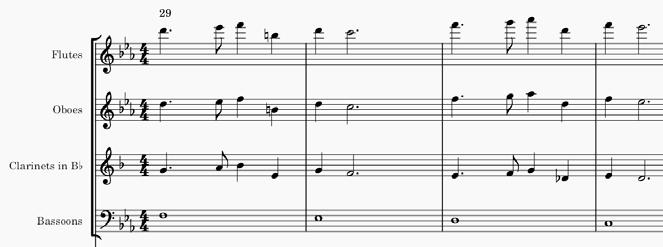
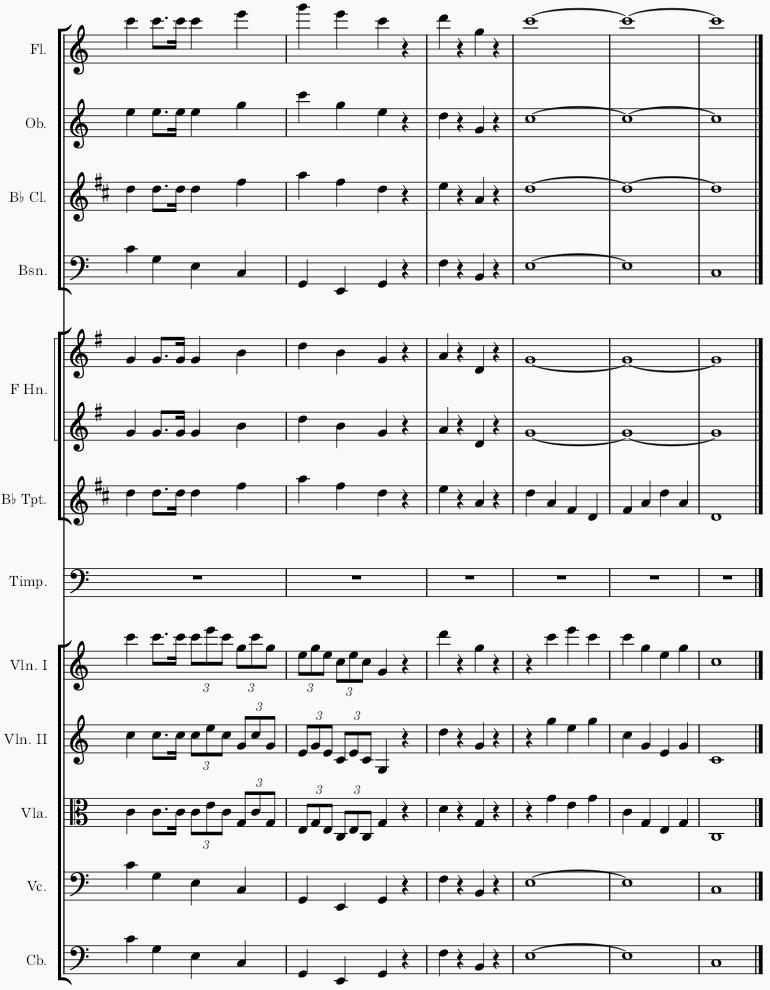
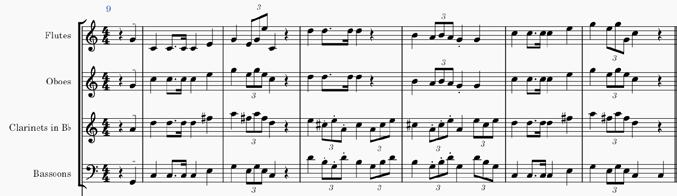
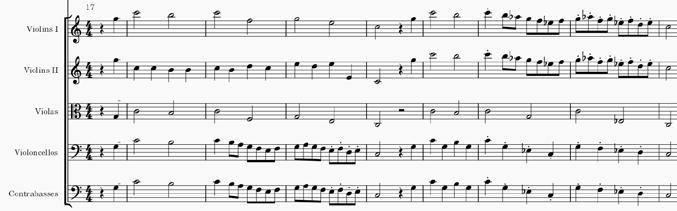
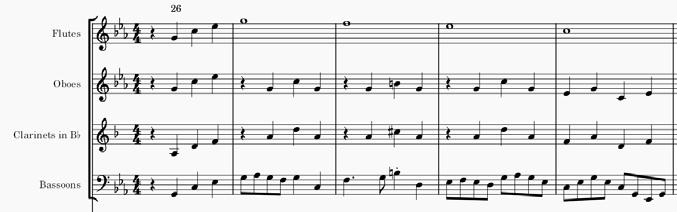
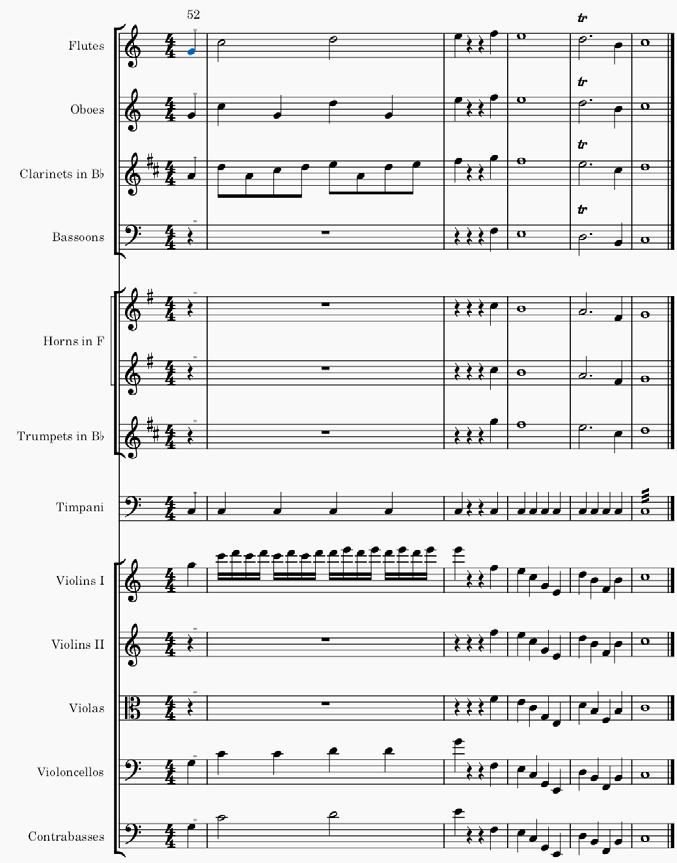
Orchestration in the style of Haydn by David Tam (Second Year, HELP Level 1)
The Geopolitics of AI: the US-China AI Battle by Ruaan Vamadevan (Second Year, HELP Level 1)
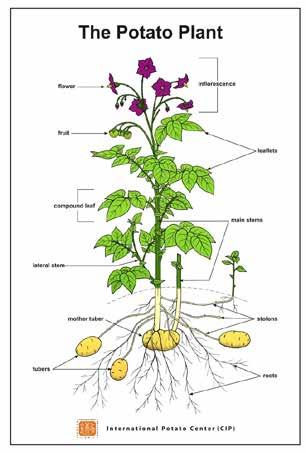
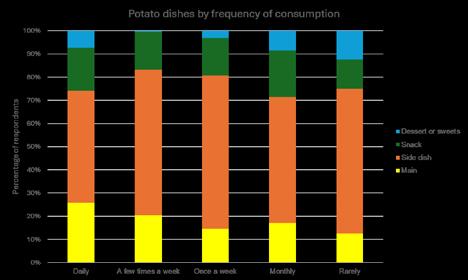
How has the potato evolved into how it is now, and how has it affected the way we are now? by Luis Moreno Yao (Third Year, HELP Level 2)
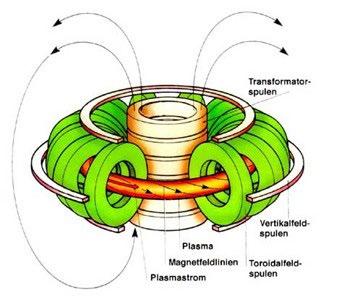
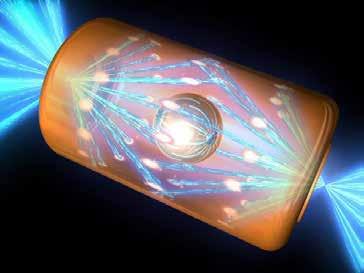
Nuclear Fusion by Kairav Schafermeyer (Third Year, HELP Level 2)
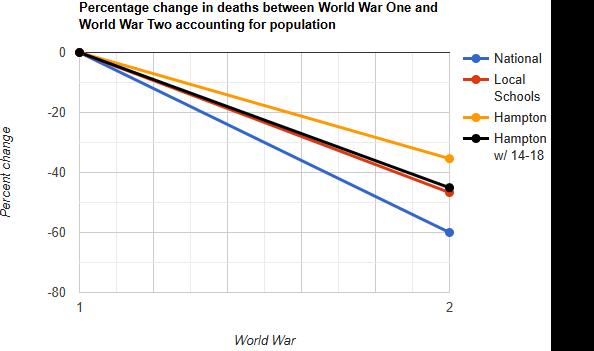
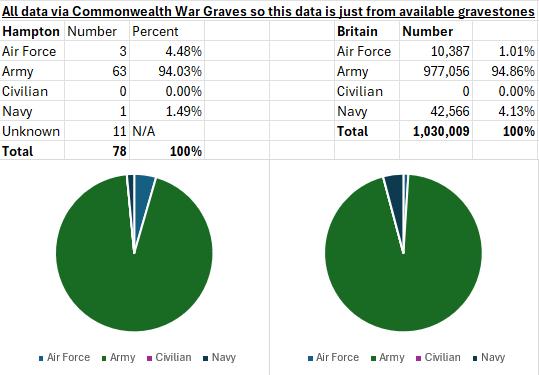
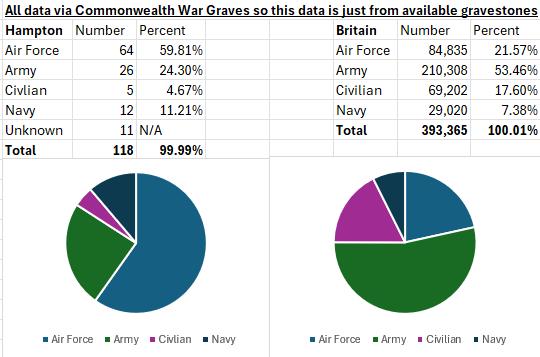
Why was World War II so deadly for Hamptonians? by George Scholes (Third Year, HELP Level 2)
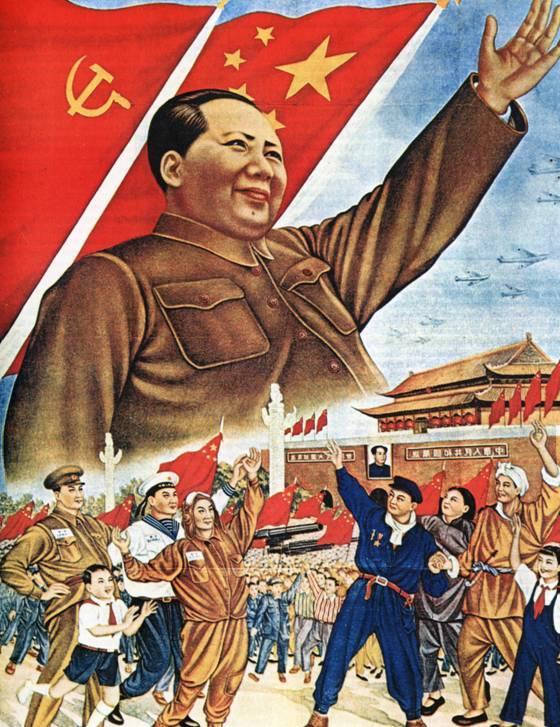
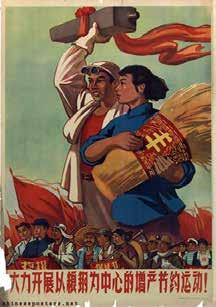
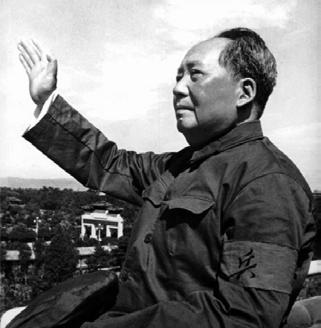
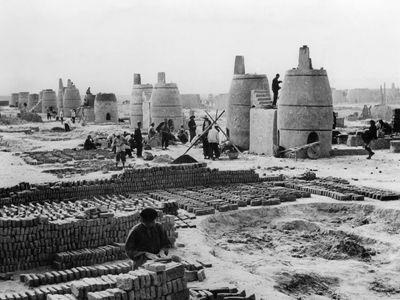
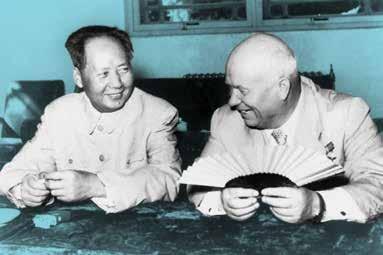
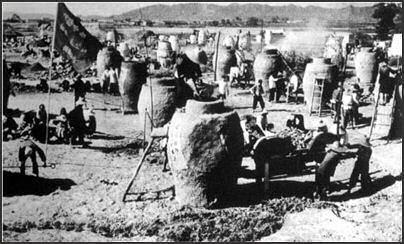
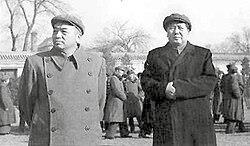
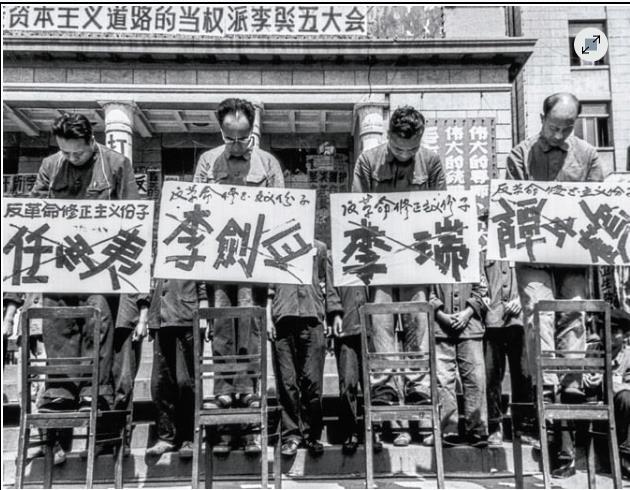
How far was the Great Leap Forward successful? The campaign to industrialise China by Lucas Tao (Third Year, HELP Level 2)
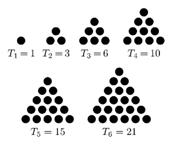
Pascal’s Triangle by Shishir Vaddadi (Third Year, HELP Level 2)
Modern Day 2025: Is anything really private? (Video Project) by David Brown (Third Year, HELP Level 2)
FOREWORD
The Hampton Extended Learning Programme (or HELP for short) is a programme of extended learning open to pupils in the Second Year and above.
HELP provides an opportunity for Hamptonians to extend their learning in an academic area of their choice.
There are four levels of HELP:
• Level 1 – Second Year
• Level 2 – Third Year
• Level 3 – Fourth/Fifth Year
• Level 4 – Sixth Form
A pupil completing a HELP project pairs with a teacher supervisor who guides them through the process, providing useful mentoring throughout the research and projectwriting phases. This gives Hamptonians an invaluable opportunity to develop research, communication, and organisational skills, working one-to-one with their teacher. The only pre-requisite for completing a HELP project is that the topic must be genuinely outside the curriculum.
The 2025 prize-winning projects from Second and Third Year pupils in this collection represent just a small fraction of those submitted. I hope you will agree that Hamptonians’ intellectual curiosity and enthusiasm for their interests shine through in these pieces of work. I thank Mark Cobb for designing this e-publication, as well as the many teachers who have given generously of their time in supervising their HELP mentees. I also thank the scores of pupils who have completed a HELP project this year – it has been a pleasure reading each and every one.
Dr J Flanagan Assistant Head and HELP Coordinator
IDENTIFICATION OF GEMSTONES
BY JAMES AYERS
(Second Year – HELP Level 1 – Supervisor: Mr Doyle)
Identification of gemstones
Introduction
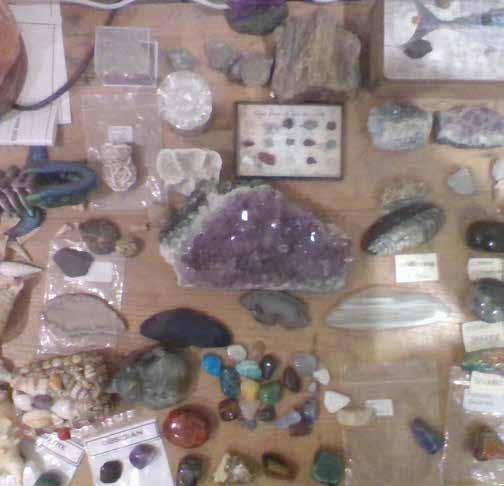
I have been fascinated by gemstones ever since I received my first one, an amethyst, when I was 8 years old in Cornwall and from then my collection has grown to over 150.
I love them for countless reasons, their beauty, their unique qualities and their range of colours. How tiny elements can form these beautiful creations. It interests me that one gemstone quartz can be purple, known as amethyst, pink, referred to as rose quartz, green, named aventurine and lots more.
Have you ever wondered how one element can affect the colour of the gemstone entirely? How can the different characteristics of the gemstone, the cleavage, specific gravity, colour and transparency all contribute to the identification of different minerals?
Well wait no more, the answers to all these questions are below
Gemstones are minerals or organic materials that have many uses and are most prized for their beauty, often being used in jeweller y.
A mineral is a naturally occurring inorganic element or compound which is arranged in an orderly structure. It has lots of different unique properties, such as its hardness, specific gravity, and cleavage. A mineral also has a definite chemical composition. However, a rock is the naturally occurring formation of one or more minerals or fragments of older rocks, fossils or a mixture of these.
Identification of gemstones
There are many different minerals and sometimes it is hard for geologists to identify all the types of gemstones and whether the sample is a mineral or just a rock. It is difficult for them to identify different gemstones because there are over 4000 known minerals, and amazingly 80-100 new ones are discovered each year. Out of all of these, only a few hundred are common making it challenging to identify as most of them are quite rare gemstones.
To help with identification, geologists look at lots of the physical properties of the mineral Some of these properties are mentioned below, their geological formation, the colour, streak, lustre, hardness, specific gravity, transparency, cleavage, fracture, cr ystal form, twinning and their chemical composition.
How are minerals formed?
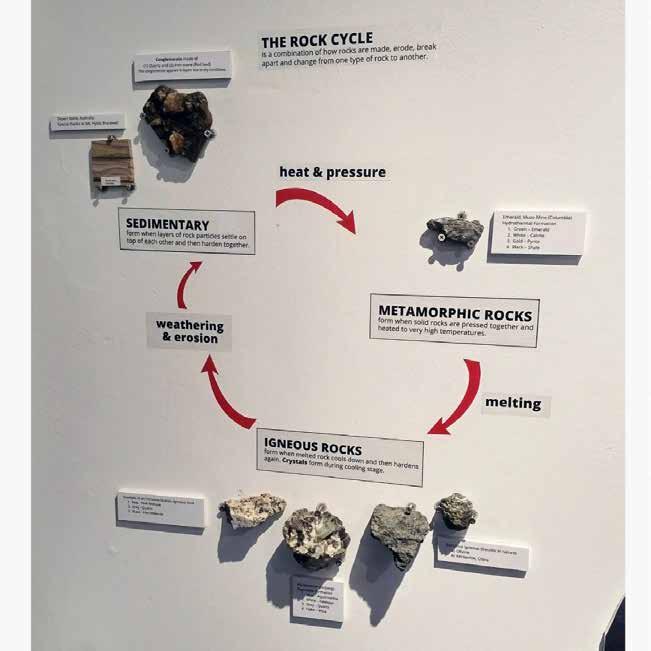
Minerals from through various geological processes over millions of years, including metamorphism, magmatic crystallization, hydrothermal solutions, sedimentary formation, volcanic gases and evaporation of saline solutions. All these processes involve the arrangement of the atoms in a specific shape or structure.
, volcanic gases and evaporation of saline solutions. All these processes involve the arrangement of the atoms in a specific shape or structure. The Gem Museum (https://thegemmuseum.gallery/zh/rock- cycle/rockcycle/)
Existing rocks can be turned into new minerals through extreme pressure or heat acting on the existing rock within the Earth’s crust. They can also be transformed from chemical reactions taking place inside the Earth’s crust They are most commonly
transformed due to the movement of the tectonic plates. This process can lead to the formation of gemstones like garnet and jade.
Magmatic crystallization
Minerals can form from the crystallization and cooling of magma, either within the earth’s mantle or from volcanic eruptions. Factors like the cooling of the magma can affect the size of the mineral - if it cools slowly the mineral will be big, if it takes longer to cool, the mineral will be smaller. The composition of the magma and the elements in magma affect the type of mineral, the order they crystallise in and at what temperature.
The process of sedimentation
This is where minerals are deposited from weathered and eroded rock in the form of rock particles that then settle on top of each other in layers. These sediments are then compacted and cemented together. An example of a sedimentary gemstone is halite.
Hydrothermal solutions
These form when hot solutions, often heated up by nearby magma, circulate within the Earth’s crust. As they cool, dissolved minerals get precipitated out of the solution and sink into nearby cracks and crevices in rocks.
Evaporation of saline solutions
This is when water containing salt, which has dissolved within the water, evaporates and leaves behind salt, which can crystallize and form minerals. The evaporation of saline solutions leads to evaporate minerals for example gypsum which is a common example of a evaporate mineral.
Volcanic gases
When gases are released from volcanic eruptions they can condense and form minerals, like sulfur which was formed from sulphur dioxide.
How does knowing a mineral’s geological formation help identify it?
Knowing the geological formation of the mineral helps provide information about the mineral’s origin, inclusions and other characteristics which can help identify it using different methods explained later.
You can find out the chemical composition of a mineral from its geological formation. For example, if the process was metamorphism, then the original rock’s elements may be incorporated into or rearranged into the new mineral. This would give an understanding of the elements used in the structure of the new mineral and its chemical composition.
From this we could then use different classification systems, such as the Dana Classification System, which uses four numbers each referring to the structure of a mineral to help identify the unknown mineral.
Colour
Diamonds, rubies, emeralds - what’s their most defining feature? For most of us, the answer is the same – their colour. Geologists use colour to identify certain gemstones when out in the field. However, there are some difficulties with colour as it is surprisingly the least reliable characteristic for identifying minerals as the colour is affected by lots of different tiny factors which are mentioned below. However, colour is one of the most important considerations for gemstone quality. Below, I talk about what causes colour in minerals and why colour can vary between different minerals.
191,803 Gemstones And Their Names Stock Photos, Pictures & Royalty-Free ImagesiStock
Firstly, what is the behaviour of light? The sun emits white light which hits an object giving it a range of colours. Different coloured objects absorb and reflect different wavelengths of light resulting in us seeing the wavelength that is reflected. Objects absorb different wavelengths of light due to the atoms they are made of.
Some wavelengths of light excite electrons within the structure, and they jump to higher energy levels. These wavelengths are then absorbed.
The wavelengths we see, the ones that are reflected, do not have the right energy to cause the electrons to rise to higher energy levels and are therefore reflected for us to see
What causes colour in minerals?
The colour of the mineral is primarily due to how they reflect some wavelengths of light and absorb others. But there are lots of reasons why each gemstone is a different colour or hue.
Metal ions
Firstly, metal ions. What is a metal ion? A metal ion is an atom that has lost one or more electrons resulting in a positively charged particle. Metal ions are crucial to the structure of many minerals, playing a key role in many characteristics of the mineral. Now, we know what a metal ion is, how does it help affect the colour of the mineral? As I said before, the metal ions play a key role in the characteristics of the gemstone. The metal ions affect the colour when it interacts with light in a process called “charge transfer”. This is when the light shines on the mineral and certain wavelengths are absorbed by the metal ions, causing the electrons to rise to higher energy levels affecting the colour as the ones that are not absorbed by the metal ions are transmitted. Therefore, the wavelengths that are transmitted are seen by the human eye and we view as the colour of the mineral.
For example, in blue sapphire, the colour is violet blue or blue. But why? This specific colour is due to the charge transfer between iron (Fe2+) and titanium (Ti4+ ). The electrons between Fe2+ and Ti4+ transfer resulting in Fe2+ + Ti4+ → Fe3+ + Ti3+ In the process, a certain amount of energy is required and therefore most wavelengths are absorbed apart from blue or violet. This is why the blue sapphire appears blue or violet-blue.
Below is a table of the main metal ions and the colour of the mineral with that metal ion in its structure.
Metal ion Colour
Cobalt Pink, blue, red
Example in a mineral
Cobaltian calcite (pink-reddish colour)
Chromium Green, red Ruby (red), Emerald (green)
Copper Blue, green Azurite, Malachite
Iron Red, green, yellow Garnets (red), Peridot (green)
Manganese Pink Rhodochrosite
Nickel Green Annabergite
Uranium Yellow Zippetite
Vanadium Green / Colour change Vanadinite
Titanium Blue Sapphire
Tin Yellow-brown Cassiterite
Impurities
Impurity Gemstone colour(s) Example
Chromium (Cr) Red, Green Emerald, Ruby
Iron (Fe) Blue, Yellow, Green, Black, Brown Aquamarine, Sapphire, Topaz, Quartz
Cobalt (Co) Blue Blue Spinel
Nickel (Ni) Green Chrysoprase
Vanadium (V) Green Emerald
Manganese (Mn) Violet, Pink, Red Morganite, Red beryl
Boron (B) Blue Diamond
Titanium (Ti) Blue Blue Sapphire
Nitrogen (N) Yellow, Brown Diamond
Unlike metal ions they are not primarily part of the gemstone’s chemical composition or structure. Impurities are trace elements that affect the colour of the gemstone. Different impurities cause different colours as shown in the table above.
Structure
Finally, we have the structure. The way the atoms are arranged within the mineral affect the colour. The specific wavelengths of light that we perceive to be the mineral’s colour are the result of the atoms and ions within the structure and how they interact with light, absorbing and reflecting different wavelengths. Different crystal structures influence which wavelengths are absorbed and reflected because they have different atom arrangements.
However, there can be imperfections in these atom arrangements that then affect the properties of the mineral, including the colour. These are called lattice imperfections and lattice defects. These change the colour because they create new energy levels within the mineral structure which therefore affects which wavelengths of light are absorbed and which are reflected.
In addition, there are colour centres within the mineral structure. This is when electrons are trapped within the mineral structure and cause the energy levels of the atoms in the structure to vary. Therefore, this affects which wavelengths of light are being absorbed and which are being reflected.
So, the structure, metal ions and impurities all affect the colour of a gemstone. As a result, colour is not a reliable way of identifying different minerals because of the multiple different impurities, metal ions and defects, lattice imperfections that can exist in the mineral structure.
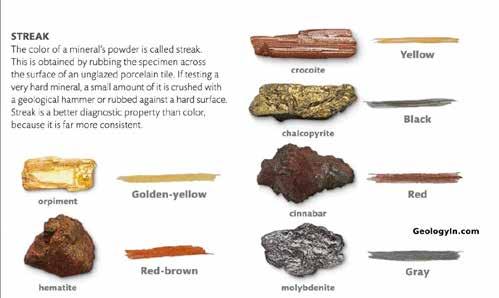
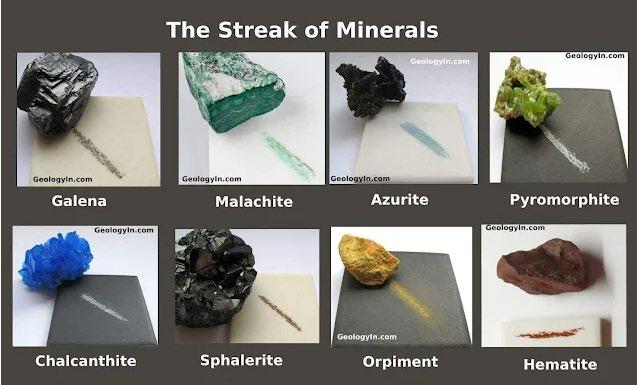
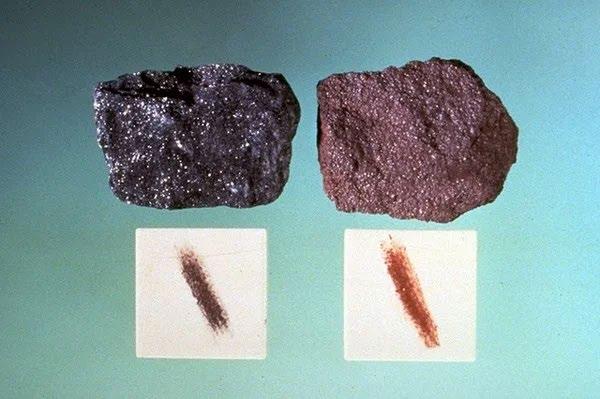
Streak
The streak is the colour of the ground up powder from a mineral. The streak test is done by firmly rubbing the mineral on an unglazed porcelain plate and this produces powder. The rubbing action produces a coloured line or streak. The colour of the streak is used to identify all minerals and is particularly helpful when different minerals have a similar colour. For example, zinc sulfide and lead sulfide look very similar, but zinc sulfide streaks are a brown colour whereas lead sulfide streaks are a dark grey.
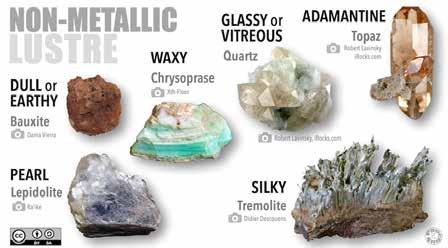
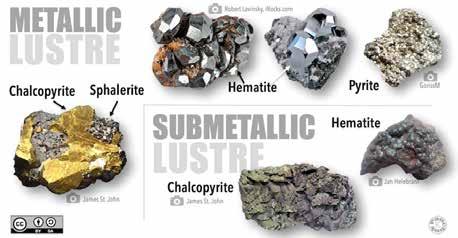
Lustre is the way in which a mineral surface reflects light. The categories of lustre are metallic, vitreous (looks a bit like broken glass), resinous and adamantine (sparkles). You can tell the lustre by the way the light reacts and plays off crystal surfaces.
Physical Properties of Minerals – Laboratory Manual for Earth Science
These images show.different.types.of.lustre.which.can.be.used.to.identify.what.type.of. lustre.the.mineral.has?.which.helps.reduce.the.number.of.potential.minerals.the.object. could.be¡
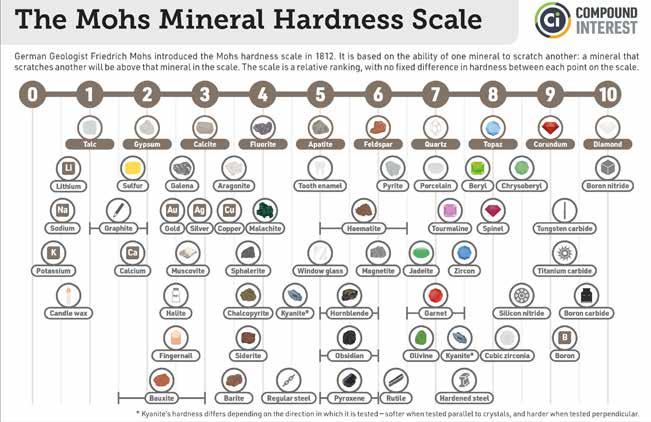
Hardness
The hardness of a gemstone is determined by how well a mineral resists scratching. There is a scale created for working out the hardness - the Mohs’ hardness scale:
A mineral can be scratched by a mineral that is harder than it (i.e. higher in the Mohs’ hardness scale). For example, amethyst would scratch apatite but would get scratched by corundum. Furthermore, if a mineral scratches amethyst but gets scratched by topaz it’s hardness would be marked as between the two - 7.5. Therefore, minerals are either identified as a whole number or half a number on the scale.
However, when a minerologist is in the field, they do not have the other minerals to test hardness using this scale so instead they would use a testing device such as a fingernail, penny, steel knife, steel file or drill bit with the hardness as listed above.
Compound Interest: The Mohs Hardness Scale: Comparing the hardness of minerals
Specific gravity is a way of expressing the relative density of a gemstone. It is measured as the ratio of the mass of the gemstone to the mass of an equal volume of water at 4 degrees centigrade It is usually measured using different density oils. Its numerical value represents how much heavier the gemstone is compared to the equal volume of water. The higher the number, the heavier the gemstone is.
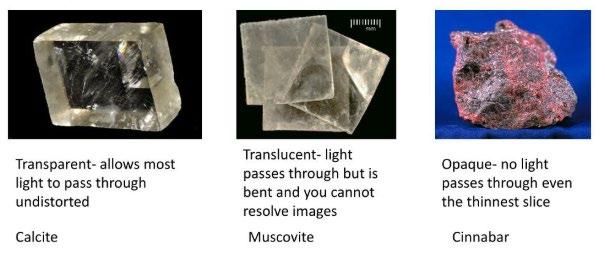
Transparency
Minerals vary in the amount of light that they transmit. This is due to differences within the mineral’s atomic structure and how it interacts with light as differences in the structure cause certain wavelengths of light to be transmitted and others to be reflected.
If light will pass right through the mineral, it is called transparent. If some light passes through it, but no clear image can be seen on the over side it is called translucent. If it does not allow light to pass through but reflects all light reaching the surface, then it is called opaque.
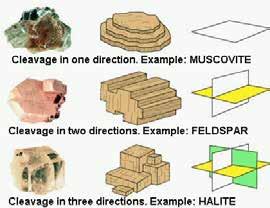
Cleavage is how a mineral breaks along certain lines of weakness. The pattern of the cleavage is related to the structure of the crystal faces, which in turn, is related to the way the atoms are arranged in the mineral.
Cleavages are described on their quality, for example, how smoothy the mineral breaks, and how easy or hard it is to produce the cleavage. From this there are perfect, imperfect, good, distinct, fair and poor cleavages. There are also different cleavages in different directions, some minerals have one direction of cleavage whereas others have two or three directions of cleavage.
Brooklyn College - Earth and Environmental Sciences - Minerals - Cleavage and Fracture
The fracture of a gemstone is how a mineral breaks if it does not cleavage. It is especially relevant to minerals that are glass-like. The descriptive terms for this property are conchoidal (shell like), fibrous or splintery, hackly, and uneven.
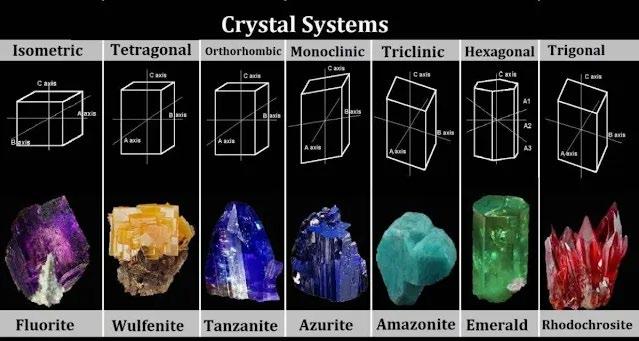
Crystal form
The crystal form is the geometric shape that a mineral normally occupies. There are three types of crystal symmetry.
Axis of symmetry is a line through which the crystal may be rotated such that it presents the same appearance more than once during the 360- degree turn.
Centre of symmetry is defined as an imaginary point within the crystal where lines from different faces of the structure will intersect and be equidistant to one another.
Plane of symmetry is an imaginary plane that divides the crystal into two equal parts such that one is a mirror image to the other.
Crystal Systems and Crystal Structure – Geology In
Cubic / Isometric - All three axes are of equal length and are at right angles.
Tetragonal - Crystals have 3 axes, two of which are of equal length and are in the same plane. The main axis is either longer or shorter and all three intersect at right angles.
Hexagonal - Three out of four of the axes are in one plane and have three axes of symmetry. The fourth axis is of a different length and intersects the others at right angles.
Rhombohedral (trigonal ) - All three axes are of equal length and none of the axes are perpendicular to another, but the crystal faces all have the same size and shape.
Orthorhombic - Three axes, all different lengths and are at right angles to each other.
Monoclinic - Three axes which are all of a different length to one another. Two are at right angles to each other and the third is inclined.
Triclinic - All three axes are of different lengths and inclined towards each other.
Amorphous - No crystal structure. Most of these are either cooled too quickly to crystalise or are organic.
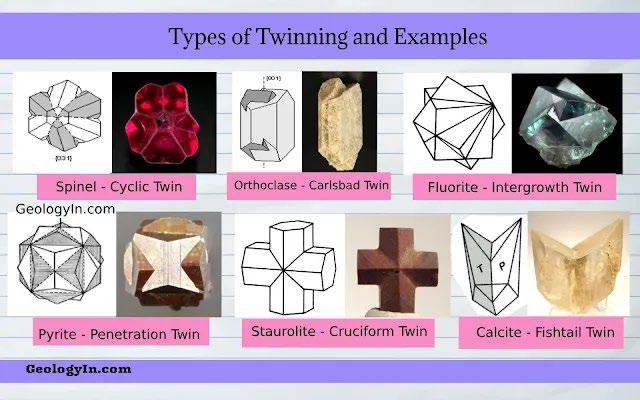
Crystals grow more commonly as composites or in groups rather than by themselves. When one crystal grows against or through another it is called a twin crystal. There are three main types of twin crystals, although there are others Contact twins, repeated twins and penetration twins are the main ones. In contact twins the crystals share a face of the crystal. In repeated twins crystals grow back-to -back in a regular way. In penetration twins crystals grow through one another.
Twinning: Types of Twinning With Photos – Geology In
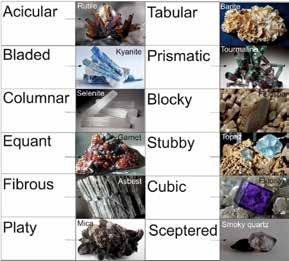
Each mineral takes on a habit. Its habit refers to the external shape and structure of a crystal which can be influenced by growth conditions and can result in surface roughening, skeletal, hollow crystals and morphological instability. Typical habits include bladed (shaped like a blade), which is found in kyanite, tabular (plate-like), an example of which is halloysite, and prismatic (drawn out like a needle), found in amethyst.
Varieties of crystal habit | Download Scientific Diagram
Chemical composition refers to the ‘recipe’ of a substance, which includes the ratio, arrangement and specific types of chemical elements that make up a compound.
The chemical composition impacts the physical properties and how the mineral behaves and interacts with its environment, such as with light. Minerals have a very specific chemical composition that can’t be changed, which can be shown as a chemical formula. Some minerals are made up of a single element, for example diamond or silver, but most are made up of multiple elements, such as quartz or calcite.
The chemical composition of a mineral can greatly help with identification. By working out the chemical composition, and the chemical formula of the mineral, this can identify which elements make up its composition and can then identify the group of minerals it belongs to This is the Dana Classification system, where minerals are classified using a hierarchical system with four numbers used to identify the mineral.
First number- represents the mineral group
Silicates
These are the biggest group, having roughly 1000 silicate minerals, making up 90 percent of the Earth’s crust. Felspar and quartz are the most common silicates. The basic building block for all silicates is the silica tetrahedron To make the wide variety of silicates, this bonds with other elements.
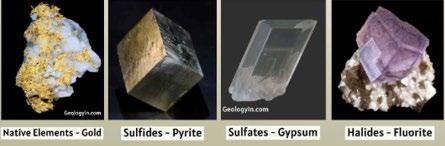
Native elements
These are minerals which only contain atoms from one type of element Most of these are very rare and expensive as only a small number of minerals are found in this group. Examples include diamonds, gold and silver.
Halides
Halide minerals are salts that form when salt water evaporates. Chemical elements known as halogens (fluorine, iodine, bromine, or chlorine) bond with other metallic atoms to also make halides. Examples include halite, fluorite and cryolite.
Carbonates
The structure of a carbonate is one carbon atom bonded to three oxygen atoms, however, they can also incorporate other elements, such as calcium, copper, iron and others, to form different minerals. For example, calcite which is the structure of carbonate with calcium as well.
Oxides
Oxides contain one or two metal elements combined with oxygen. Examples include corundum, hematite, magnetite, and cuprite.
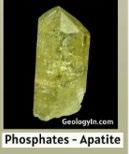
Phosphates
Phosphates are similar to a silicate in atomic structure. In phosphates, phosphorus, arsenic, or vanadium bond to oxygen to form a tetrahedral arrangement. These tetrahedrons are a key unit in the structure of a phosphate mineral. An example of a phosphate mineral is turquoise, a mineral containing copper, aluminium, and phosphorus.
Sulfates
Sulfate minerals contain sulphur atoms bonded to oxygen atoms. They form when salt water evaporates like halides. Gypsum is a common example of a sulfate.
Sulfides
Sulfides are formed when metallic elements combine with sulfur. However, sulfides do not contain oxygen, unlike sulfates which do contain oxygen. A common example of a sulphide is pyrite, more commonly known as ‘fool’s gold’ – or iron pyrites.
The Complete Classification of Minerals – Geology In
The second number in the Dana Classification System represents the type of mineral, including information about the atomic characteristics of the mineral. This number helps distinguish between multiple minerals within the same group depending on variations in their atomic characteristics and structure.
The third number
The third number represents the crystal and structure form of the mineral, based on structural similarities.
The fourth number
The fourth number provides the mineral species of the specific mineral based upon the first three number of the group, atomic characteristics and structural characteristics.
For example, the Dana classification number for amethyst is 75.1.3.1. This identifies it as a tectosilicate (75). The other numbers indicate its position within the silicate class, type, and structural subgroup
Conclusion
Historically, shape and colour were used to identify most gemstones. However, now we use a much more reliable range of characteristics, from the mineral’s chemical composition to its hardness and lustre. Colour is still important but other factors include the crystal form, habit, geological formation, fracture, twinning, streak, specific gravity and transparency.
A more detailed identification system is important because ruby and sapphire are the same mineral, corundum, but have different colours Galena and sphalerite are both black in colour, but galena has a grey streak whereas sphalerite has a brown streak.
In the future there may be a different approach to identifying gemstones perhaps using artificial intelligence (AI) AI may be able to analyse gemmological data and unique features of the gemstone to improve the accuracy of the identification. Overall, there are many ways to identify gemstones and as time goes by, there are likely to be even more.
References
Rocks and minerals by Dr Ronald Louis Bonewitz published 2008.
The following are hyperlinks to the websites used:
Colour And Optical Effects In Gemstones | February 20, 2024
7.12: Causes of Color - Geosciences LibreTexts
Colour And Optical Effects In Gemstones | February 20, 2024
Understanding Color Phenomena in Colored Gemstones, Jewelry - From the Library at M.S. Rau, Since 1912.
Color Center - an overview | ScienceDirect Topics
mineral identification
Minerals and Mineral Groups | Earth Science
New Dana Classification Number
Mineral - Occurrence, Formation, Compound | Britannica
Rock Cycle, Formation of Gemstones - The Gem Museum Singapore
How do minerals form? - The Australian Museum
Diamond cubic - Wikipedia
What are Crystal Systems and Mineral Habits? - International Gem Society
Maths is an ongoing journey of development. Simple theories that originated in ancient times have led us to complex problems, questions and answers in the modern world.
In this study I explore three of the most influential mathematical discoveries from the last 2000 years, chosen from interviews with esteemed mathematicians. I look at the Sieve of Eratosthenes, to Turing’s theory on the Entscheidungsproblem and Halting problem, and quantum computing The link between them? Prime numbers. Often considered some of the most beautiful numbers in the world
For each discovery, I look at how it works, how it links to prime numbers, and the impact it has on our past, present and future. I hope you enjoy reading it as much as I enjoyed writing it.
“I hope that…. I have communicated a certain impression of the immense beauty of the prime numbers and the endless surprises that they have in store for us.” 1
Contents
Chapter 1 Asking the experts
What was your favourite mathematical discovery of ancient times? What is your favourite mathematical discovery of recent times? What will be the most amazing mathematical discovery in the future?
Chapter 2 Primed for success
Walk to Syrene, and I will prove the world is not flat
The Sieve of Eratosthenes
Prime numbers and the world around us
Chapter 3 Decidable or not?
Are all mathematical problems solvable or unsolvable? Turing’s proof, why does it matter
Chapter 4 Qubit, Qubi t
How did quantum come about?
What is quantum mechanics and how does Quantum computing work? Could quantum finish what Eratosthenes started?
1 Zagier (1977)
Chapter 1: Asking the experts
Researching ideas from the experts themselves
In preparation for this HELP Project, I emailed several esteemed mathematicians to ask for their favourite examples of mathematical discoveries by ancient civilisations, in recent years, and of the most exciting potential discoveries of the future. I received replies from:
I also emailed some more incredible mathematicians and mathematical authors but t hey were very busy. I am grateful to John, Junaid and Tim for their ideas. I am also grateful to my supervisor Mr Lee who helped me to spot that prime numbers are a common theme between them.
This chapter presents a summary of the contact I had with the experts. I asked why their suggestions were exciting, why they were such an accomplishment at the time and what they contribute to the development of society.
Spoiler Alert: Chapter in a box
Mathematician name, contacted March 2025
John Amstrong King’s College London
Junaid Mubeen Mathematical Author
Tim Pike Pensions Policy Institute
What is your favourite mathematical discovery of ancient times?
The invention of zero
Eratosthenes circumference of the earth
Eratosthenes circumference of the earth
What is your favourite mathematical discovery of recent years?
What will be the most amazing mathematical discovery of the future?
Turing’s theory of theoretical limits NP complete algorithms
Einstein tiles
Discovering how bumblebees fly
Discovering whether AI can produce original work
Turning quantum computing from theory to actuality
John Armstrong Reader in mathematics at King’s College London
Junaid Mubeen countdown champion, mathematical author and host of Parallel Circles.
Tim Pike Head of Modelling at the Pensions Policy Institute
Chapter 1: Asking the experts
Question 1. What is your favourite mathematical discovery of ancient times?
John Armstrong: The invention of zero, and the use of a symbol for zero in number systems .
Why is it exciting? Because it proves nothing is important! Zero gives practical algorithms like the method of long multiplication to perform computations. These were some of the earliest algorithms, but thanks to computers algorithms are now everywhere. Zero was invented independently across the world: in Babylon, China, India and by the Maya, showing the universality of maths.
Why was it such an accomplishment at the time? Try calculating 865 x 73 just using Roman numerals and let me know how you get on.
What did it contribute to the evolution of society? Everything stored on a computer is stored using zeros and ones. So roughly half of everything that is stored on a computer is zero.
Tim Pike & Junaid Mubeen – Eratosthenes circumference of the earth
Eratosthenes' was around in the 3rd century BC, born in Libya and studied in Athens. He did many things such as find prime numbers, but his calculation of the circumference of the earth is the one I like most. It's an exemplar in mathematical modelling and shows how we can be so audacious in the questions we ask once we have the right tools. And in fact, he managed it with the primitive tools at his disposal (and sound reasoning involving the physics of light ra ys). Why is it exciting? The earth was recognised as spherical, but there was not agreement as to exactly how big it was. The model was important as it contains many good features. It applied a simple approach: it's just about the angle that two parallel lines intercept a circle and calculating what proportion of the circumference is covered by the arc between the intercept points. There are several assumptions (e.g. the earth is a sphere) It required very few inputs (the measuring of an angle and knowing the distance between two carefully selected locations) It gave a remarkably accurate result despite the simplifications and limitations. Why was it such an accomplishment at the time? Only the simplified version of his model is known (his original working is lost, but a simplified description still exists) To get a distance between two cities required paying people to walk the route who pretty much would count their paces. What did it contribute to the evolution of society? A slightly later calculation using a similar approach came up with a less accurate answer (the distance was less accurately measured) but the model for calculating the size of the earth was retained. Inaccurate calculations of the size of the earth persisted and were still evident when Columbus sailed.
Question 2 What is your favourite mathematical discovery of recent years?
Tim Pike – Discovering how bumblebees fly
Understanding how bumblebees can fly. The models showed that they couldn't fly, yet there was evidence they could. Models have moved on, and fluid dynamics and experimentation has demonstrated the contribution of the leading- edge vortex to the fact they ca n fly.
John Armstrong – Turing’s theorem of theoretical limits
Turing’s theorem from 1936 probably counts as recent as its less than 100 years old? He showed that there are some problems a computer can never solve. In fact, Turing’s result is just one of several incredible results proved last century which tell us about the theoretical limits of computers and of knowledge.
Chapter 1: Asking the experts
Junaid Mubeen – Einstein Tiles
In terms of recent accomplishments, the discovery of the Einstein tile was fairly remarkable. It's a bit more abstract, but the idea of an infinite, nonrepeating pattern emanating from a single tile is inspiring. It's also impressive how they discovered one version of it and then, just a few months later, improved on it by removing the need for reflections. That's a rapid rate of progress for maths research!
Question 3: What will be the most amazing mathematical discovery of the future?
John Armstrong – NP complete algorithms
Given a list of whole numbers, find an efficient algorithm to find out if you divide into sets of 3 whole numbers all of which have the same sum. This might not sound very important, but you can show that lots of other much more practically useful questions can be solved efficiently if you can solve this problem efficiently. In fact, there is a class of problems called “NP complete” problems which are all basically equivalent to each other, and I’ve just picked one example. If you can find an efficient way to solve any NP complete problem, you’ve found an efficient way to solve them all. It might well be impossible to find an efficient solution to NP complete problems, but now nobody knows for sure.
Tim Pike – Turning quantum computing from theory to actuality
The set S={20,23,25,30, 49,45,27,30,30,40,22,19} can be partitioned into the four sets {20,25,45},{23,27,40},{49,2 2,19},{30,30,30], each of which sums to T=90.
Quantum computing is progressing from theory to reality. It’s not yet fully practical for real-work tasks, but we are getting closer and what we know is paving the way for breakthroughs in medicine, science, design and so many more worlds. When it arrives, it will bring about some of the most rapid changes that maths has ever seen.
Junaid Mubeen – Whether AI can create original work
In terms of future problems, we're all keeping our eye on AI (the ultimate mathematical application) and whether it can reach the point of creating original work. If that comes to pass, we might expect to see a whole host of mathematical results proven in our lifetimes that were previously thought too challenging. I'm less sceptical on the matter than I was in the past, although there's some way to go for computers to demonstrate that they can think and reason as well (or better than) human mathematicians.
What
did I choose and why?
I need to write a paragraph about what I did with the interview content.
Chapter 2: Primed for success
What is this chapter about?
This chapter presents the first of three fascinating and linked case studies. More specifically, it looks at the power of prime numbers, having taken inspiration from Eratosthenes’ discovery of how to measure the size of the earth in 330 BCE. The work of Eratosthenes was described as a remarkable example of maths in ancient civilisations by two of my experts, Junaid Mubeen and Tim Pike. After some early research, and in consultation with my HELP project supervisor, I quickly realised that another of his most significant works was his discovery of how to find all the prime numbers below a finite point.
Why is it exciting?
While Eratosthenes’ discovery of how to measure the earth was infinitely impressive, his further study of how to calculate prime numbers caught my eye for two reasons. First, because prime numbers are the building blocks of modern and future mathematics and computing. Secondly, because there is still so much that we don’t know about them that there is a one-milliondollar reward available for the person who can prove how they are distributed.
While I’d love to try to answer this question, my HELP project probably isn’t the right place, so let’s start with Eratosthenes.
Spoiler Alert: Chapter in a box
Questions: Answers:
What was the discovery?
Who discovered it?
Where and when was it discovered?
How and why was it discovered?
A way to identify all the prime numbers (numbers that can only be divided by themselves and one), below a given limit but not above it.
Eratosthenes
Eratosthenes discovered how to find prime numbers in Alexandria in around 200BC 2
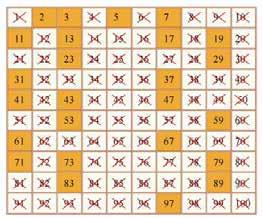
Eratosthenes created an algorithm called the ‘Sieve of Eratosthenes’ which uses the process of eliminating any multiples of a given prime. For example, you would start with two as your given prime, and then cross off four, six, eight… as non-primes. You would then repeat this for the next prime, which would be three. This algorithm gave mathematicians a foundation for understanding prime numbers, as well as a way to illustrate the concepts of prime and composite numbers, factorisation and algorithmic thinking.
Why is this important for today’s world?
2 Britannica (2025)
Prime numbers are a building block of cryptography, which is the study of creating codes to encrypt words, phrases or messages.
Chapter 2: Primed for success
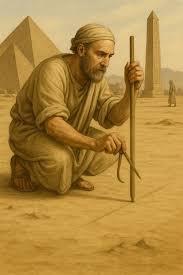
Walk to Syrene and I will prove the world is not flat .
Before we look at prime numbers, let’s find out why our experts led us to Eratosthenes, and his discovery of how to measure the earth
In around 200BC, almost everyone believed that the earth was completely flat, and that water flowed off the side of the planet like a waterfall. There were hundreds of incorrect maps attempting to depict the globe, which were consequentially killing hundreds of people1 .
However, Eratosthenes, who lived in Alexandria, did not believe this and wanted to prove it false. He believed it was wrong because he had noticed that at the same time on the same day, light shone down at different angles in different places across the world. It was using mathematics along with these rays that Eratosthenes not only proved that the earth was truly round, he calculated its circumference for the first time too.
How did he do it? Eratosthenes sent a man to walk from Alexandria to Syrene to find the distance between the two. He knew that at noon, the angle created by a light shining down on to a well in Syrene was 0o and that the angle in Alexandria was about 7.2 o 1 When he divided 360, the total angles in a circle, by 7.2, the difference in angle between Alexandria and Syrene, he got 50. This meant that the distance between Syrene and Alexandria was 1/50 of the entire circumference of the earth 1 When Eratosthenes was informed that the distance from Alexandria to Syrene was roughly 805 kilometres, he multiplied this by 50, to give him an estimation of the circumference of the world at 40,250 kilometres. Shockingly, this was only 175 kilometres off the exact circumference of the earth, and he calculated this hundreds of years before it was finally proven.
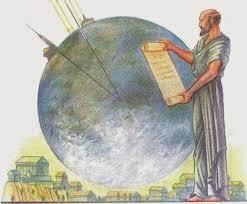
Erastosthenes’ discovery meant two important things.
1. He proved the earth is spherical. If the earth was flat, the angles of the light shining on a well in Syrene would have been equal to that of Alexandria, as it would be on a flat plain. This means that there must be a curvature on the earth. If we did this same process on two different places on earth, we would still get a difference i n angle and would therefore lead to us being able to calculate the same circumference from any point. This proves that there is an equal curve around the planet, as it could have been any shape that isn’t fully flat, but this proves that the earth must be a sphere.
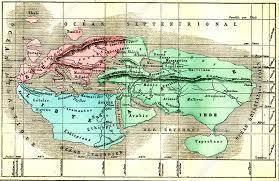
2. His discovery led to much more accurate maps of the planet and seas. As people had previously believed the earth was flat, there was no accurate representations of the land and ocean. This meant that hundreds of sailors perished on their voyages every year. Eratosthenes developed a much more accurate map of the world using his knowledge of a round world. This was laughed at at the time, but people continued dying, it was hundreds of years later that people started to recognise that Eratosthenes was truly correct, and that they had been wrong for years. We now have a perfectly accurate map of the world, and no one is dying due to mistakes on maps anymore.
Chapter 2: Primed for success
The sieve of Eratosthenes
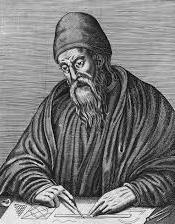
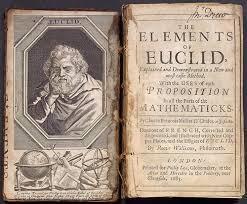
Prime numbers are one of the most important types of numbers in mathematics and are as important to the world today as they were when they were first studied by ancient Greek mathematicians including Euclid in around 300 BCE and Eratosthenes in around 200 BCE.
Prime numbers have fascinated mathematicians for centuries. In this section I am going to look three important questions, the answer for one of which can be found using an infamous algorithm written by Eratosthenes himself.
1. How many prime numbers are there?
2. What is the largest prime number that we know?
3. How can we work out what the next prime number will be?
Prime numbers are numbers that can only be divided by themselves and one.
“Prime numbers are infinitely many” 3
The first notable discovery around how prime numbers work was made by Euclid, who proved that prime numbers are infinite . Euclid did this by taking an equation where he multiplied a finite number (n) of primes (p) together (N) and then added one to the answer. This is shown in the equation N = (p1 x p2 x p3 x … pn) + 1.
By doing this, Euclid knew that N could not be divided by any of the prime integers because he had added one. As a result, he knew that the answer had to be a prime itself, or a composite number with new prime factors.
300 BC
Most importantly, Euclid knew that this equation could be repeated an infinite number of times and therefore lead him to propose that there are an infinite number of primes. This theory has been accepted through all modern mathematics and has also been proven by other mathematicians including Euler (1700 CE) and Fürstenberg (1955 CE).
For example, take: (2 x 5 x 13) + 1 = 131. This is a prime number that wasn’t used in the equation, so it is therefore a new prime. To find a composite which leads to prime factors take: (3 x 7 x 11 x 19) + 1 = 4390. This is a composite number, and its prime factors would be 2, 5 and 439, which are all new primes that weren’t used in the equation.
Are zero and one prime numbers? This has been an ongoing dispute that has recently seemed to be answered. The explanation that proves that 0 isn’t prime is the fact that it can’t be. Primes fall under the category of natural numbers, which are numbers from 1 upwards, and 0 isn’t a part of that category, but sits in the category of whole numbers. Even though if you divided 0 by 17, it would be a whole number, 0, it still can’t be prime because it doesn’t5 fall under the correct category of numbers. Furthermore, the explanation that proves 1 is not prime is the definition of primes. The definition states that a number is prime if it can only be divided by 1 and itself, therefore meaning it must have two factors. Whereas 1 only has 1 factor, which is itself. T his means that 1 can’t be prime
3 Euclid (300 BCE)
Euclid,
Chapter 2: Primed for success
The largest prime number we know is 2136,279,841 – 1 4
According to Euclid’s theory of infinite primes, the answer to the question of what the largest prime number is can never be solved. But that doesn’t stop people searching for the largest number we know. But how do they do that?
Eratosthenes of Cyrene, who lived in Alexandria, Egypt, furthered Euclid’s discovery by finding a way to find all the primes up to a given limit, but not beyond. Using this discovery, we can continue increasing the value of the limit to continue finding ever larger prime numbers. This is a quest which continues to enthral mathematicians to this day.
Eratosthenes did this by making a grid of the numbers up to his chosen limit, and, starting with two, eliminating all the multiples of a prime integer selected. This model was called the ‘Sieve of Eratosthenes’ and underpins the algorithm still used today to calculate the largest prime numbers we know.
The downfall to this discovery was that you couldn’t further predict primes. As far as we know, they appear to be almost completely random. Two thousand, three hundred years later, we still haven’t found a way to find prime numbers going forwards, rather than going backwards as Eratosthenes did.
Today, mathematicians must use computers to find increasingly large primes using the same method as Eratosthenes. The most recent was discovered just six months ago. How long do you think it will be till we find the next?
“Mathematicians have tried and failed to this day to discover some order to the sequence of prime numbers, and we have reason to believe that it is a mystery into which the mind will never penetrate.” 5
To answer the question of what the next prime number will be would need us to solve a $1 million dollar question . How are prime numbers distributed?
Why is the prize for this a million dollars? Because even though we know there are an infinite number of primes, we have never found a regular pattern to their distribution. This means that it is impossible to predict prime numbers beyond those that we can calculate using the Sieve of Eratosthenes.
If we were to be able to find a pattern, we would be able to calculate an infinite number of prime numbers and what could this mean for the future of mathematics as we know it?
4 As of the 23rd of October 2024
5 Euler (1992)
The sieve of Erastothenes
Chapter 2: Primed for success
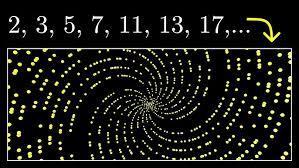
Prime numbers and the world around us
Now, it is all good and well talking about finding large prime numbers, or how they were discovered, or whether 0 and 1 are prime, but the real question is, what can primes do?
When you look beyond the simple definition of a prime number, you can find many examples of the complex use of primes in our lives. The se numbers are utilized in many ways that you wouldn’t expect from simple, natural numbers with a twist. These are my two favourite ways in which they are found:
Cicadas emerge from their underground nests once every 13 or 17 years. 13 and 17 are both prime numbers.
If you put the two primes in separate lists and then add the number in that list on to itself, the only time the two would appear at the same time would be the multiplication of the two, which, in the cicada’s case, is 221.
This makes it extremely difficult for predators to rely on them for food, as it will be a 50/50 guess as to whether the cicadas will be out or not and only guaranteed once every 221 years. This also makes it much easier to prevent interbreeding, as there i s only a 50% chance of two types of cicadas being out at the same time.
The second example of prime numbers being found in real life is a much more practical example. Cryptography. Cryptography is a way of coding and decoding messages that allow only the intended recipients to be able to view it.
This is done by using a public key, which is available to anyone who looks for it, and a private key, which is only usable by the intended recipient.
Prime numbers are a very important part of this, as primes are very unpredictable due to their apparently random distribution. This randomness is an important factor as cryptographers want to make their codes as hard to break as possible.
When a message is sent, cryptography requires that two prime numbers are multiplied to give a very large composite number. We can think of the composite number as the locking mechanism for a message (known as the public key), and we can think of the prime factors as the keys (known as the private keys). A message would then be sent out with the lock on, and this lock is referred to as the ‘public key’ which means it is available to anyone who goes looking for it, but to break it down is near on impossible, even with the incredibly strong power of computers that live around us.
“I hope that…. I have communicated a certain impression of the immense beauty of the prime numbers and the endless surprises that they have in store for us.” 6
6 Zagier (1977)
Chapter 3: Decidable or not?
What is this chapter about?
In Chapter 2, we discovered that one of the greatest unknowns in modern mathematics is how prime numbers are distributed. This led me to uncover yet another remarkable advancement in mathematics as recommended by my experts.
Prime numbers are used in cryptography, which is a form of coding and decoding messages, and are probably the underlying feature of them So, is the fact that we don’t understand the distribution of prime numbers the reason that cryptography works?
Alan Turing came up with a theory that proves there are some problems that can never be solved by a computer, and this discovery has had profound implications for computers and computing as we know it today. When it comes to problems we can’t solve, the million - dollar question is if the distribution of prime numbers is one of them.
Why is it exciting ?
Spoiler Alert: Chapter in a box
Questions: Answers:
What was the discovery?
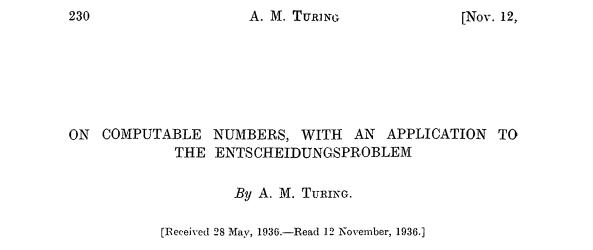
Turing’s theorem of theoretical limits (His paper on it was called “On computable numbers with an application to the Entscheidungsproblem )
Who discovered it? Alan Turing
Where and when was it discovered?
How and why was it discovered?
Why is this important for today’s world
In 1936, during Turing’s post graduate time at King’s College, Cambridge.
Turing did this by using the idea of a ‘universal machine’ that was able to simulate any other Turing Machine, and he used this to prove both the Entscheidungsproblem and the Halting Problem undecidable. Turing wrote this paper to prove both of these problems as undecidable, but also, for the first, time, bring to light his idea of a universal machine.
Turing’s paper has been the cornerstone of computational development for the past 89 years. His paper established the basis for computing and the concept of Turing’s Universal Machine.
Chapter 3: Decidable or not?
“
Turing’s Proof ”
In 1936, Alan Turing, who is most famously known for his influence in the fight against Nazi Germany, wrote an article called “On computable numbers, with an application to the Entscheidungsproblem.” This was one of the most significant computing and mathematics writings at the time and still is
In his article, Turing investigates the Entscheidungsproblem, which asks whether a general algorithm could tell us if a mathematical statement was true or false in a finite amount of time
Turing also looks at the Halting problem, which asks, if we were to build a coding programme with an algorithm, would we be able to know if the programme would ever stop running or if it would continue infinitely.
Are all mathematical problems solvable or unsolvable?
Looking at both the Entscheidungsproblem and Halting questions, Turing ’s goal was to explore whether we would ever be able to solve either of these questions, and most importantly, whether all mathematical problems were infinitely decidable, or undecidable. His answer? There are some mathematical problems that can never be solved .
“ There is no general method which tells whether a given formula U is provable in K ”
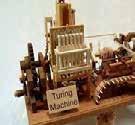
What is the Turing machine? Alan Turing is perhaps best known for his concept of the “automatic machine” The machine was based on a theoretical model of computation, which we can see as an algorithm. It used symbols on a strip of tape and manipulated them according to a set of rules. Even though it was simple it could implement any algorithm. The Turing machine was effectively the world’s first computer.
Chapter 3: Decidable or not?
The Entscheidungsproblem – can an algorithm decide is something is true or false?
What is the Entscheidungsproblem? The Entscheidungsproblem asked whether a computer, or an automatic machine as he called it, could know if a mathematical statement was true or false in a finite amount of time.
First, Turing used his automatic machine to investigate whether the Entscheidungsproblem was decidable or undecidable. This seems like a simple question which should have a simple answer. Most people instinctively think the answer would be yes. But Turing managed to prove that the true answer is no, an automatic machine cannot state if every mathematical statement was true or false.
The way he proved this was by showing that computable numbers could give rise to uncomputable ones, therefore stating that there could be no “mechanical process” for solving all mathematical problems. A number is computable if it differs by an integer from the number computed by a circle-free machine. A machine is circle-free if it writes down more than a finite number of numbers of the first kind.
The Halting problem – does an algorithm ever stop running?
What is the Halting problem? The Halting problem asks whether an automatic machine could tell if a programme, simple or complex, that was written on a computer language would halt after a certain amount of time
In the same article, Turing applied his theory to the Halting problem. An algorithm or programme that would halt would be one with a look that only repeats for a certain amount of time, for example, ten. After ten loops, this programme would halt. The Halting Problem asks whether a n automatic machine can figure out if any programme will halt or not.
Not according to Turing
Turing showed that you can't create a single, general algorithm that can definitively determine whether any program will eventually halt. This has profound implications for the limits of what can be computed. In doing so, Turing managed to prove that the Halting Problem, like the Entscheidungsproblem, is undecidable, meaning that it can’t be solved by a computing device.
Turing’s proof, why does it matter?
Turing’s discovery on the Entscheidungsproblem and the Halting Problem, which became known as Turing’s Proof, answered a problem that had been unsolved for decades. It was a remarkable step forward for computing and was also the start for the development of computers and electronic devices we have today
Chapter 3: Decidable or not?
Having solved these two problems may seem like a minor advancement, with us knowing that we can’t know if every statement is true or false, and that we can’t know if any programme will halt or not. However, the research and theory of the Turing machine behind it has become one of the major building blocks for the development of computers
One of the key reasons why this paper was so important in the development of computers today is because it introduced the idea of the Turing machine, a machine capable of adapting to the instructions that it was given. This theory has laid the foundations for all the developments of devices and computers and is a holy grail for all device designers.
The theory of this machine is still looked upon as a remarkable discovery today, around 90 years after it was written. Whenever we go on to our devices, such as smart phones, laptops and televisions, we have Alan Turing to thank. His article “On computable numbers, with an application to the Entscheidungsproblem” has laid the foundations for decades of previous discovery, and decades more to come.
What are its applications in the real world?
This research performed by Alan Turing has been crucial to the development of devices, computing and coding, as this was the direct consequence of his piece. However, there have been many other indirect applications of great interest that resulted because of Turing’s work. One of the most notable was the extreme development of cryptography
There are two main reasons as to why cryptography has developed so much since Turing’s paper. The first of these reasons is because of Turing’s work on computable and noncomputable numbers, as both involve identifying and characterizing numbers based on their mathematical properties. As shown in my previous case study on primes, these numbers are a large and influential part of cryptography, so it allowed for a lot of development in the area, which is one of the reasons why cryptography developed so much because of Turing’s paper.
The second reason why cryptography developed so much is because of the development of electronic devices. These devices are much more powerful than us and can solve problems a lot quicker. We have taken advantage of this new power and discovered many new primes, which helps with cryptography. Also, the computers have helped us discover new ways to code and decode messages.
Can we find the pattern of primes? One of the biggest questions that originated from Turing’s proof was what problems this could apply to. One of the most exciting of these is the difference of primes, and whether there is a pattern between them. We are still looking for a way to either prove or disprove that we can find a pattern between primes, however Turing’s paper leads most to believe that we won’t be able to.
Chapter 4: Qubit, Qubit
What is this chapter about?
In the previous chapter, we discovered that Alan Turing came up with a theory that proved that computers can’t solve all problems, but can we solve more problems than we realised with the development of quantum computing?
Quantum is still in early days of development, and in this chapter, we will explore the main pioneers in quantum mechanics and computing, as well as how it works and what potential it holds for the future.
We’ll end with looking at how quantum computing could strengthen encryption by finding new prime numbers that we don’t even know about. And asking whether it can tell us if the distribution of prime numbers is a question we will ever be able to solve at all.
Why is it exciting?
Quantum computing has the potential to be exponentially more powerful than classic computing, handle more complex calculations, process
Spoiler Alert: Chapter in a box
Questions: Answers:
What was the discovery?
Who discovered it?
How and why was it discovered?
Quantum computing and mechanics
Quantum computing has evolved over time through the discoveries of Sir Isaac Newton, Max Planck, Albert Einstein, Werner Heisenberg, Erwin Schrodinger and Richard Feyman among others.
Why is this important for today’s world
Chapter 4: Qubit, Qubit
Could quantum computing truly change our life?
This is the question everyone is asking about quantum computing since the connection was made between Max Planck’s theory of quanta in 1900, and Alan Turing’s work on the “universal Turing machine”, which paved the way for modern computing.
GLOSSARY
Quantum mechanics: A field of scientific study that looks at the behaviour of matter and energy at the atomic and subatomic level.
Quantum computing: A field that uses the powers of quantum mechanics to perform computations so powerful that classical computers couldn’t solve
Subatomic level: Something that occurs that is smaller than or inside of an atom.
Qubits: Instead of using binary bits (0 or 1) like on a classic computer, quantum mechanics uses qubits. Qubits occur in a superposition, with both 0 and 1 occurring simultaneously. This allows for a much larger amount of information to be processed at the same speed as a classic computer.
Superposition: Qubits can exist in a superposition of multiple states, 0 and 1, at the same time.
How did quantum come about?
1687 Sir Isaac Newton laws of motion
Sir Isaac Newton’s paper on the laws of motion perfectly explain the relationship between physical matter and the forces that act on it to cause motion. The forces include gravity, mass and acceleration, for example in a game of billiards or pool. Since Ne wton however, there were many discoveries that the simple laws of motion couldn’t explain, leading to the development and exploration of quantum mechanics.
Put simply, the laws of motion behind quantum mechanics are not the same as the laws of motion that Newton developed because scientists realised that energy and matter behave in different ways.
1900 Max Planck proposes the idea that energy isn’t transferred continuously , but instead, comes in small and discrete packages. He called these “quanta”.
According to Planck’s theory, different atoms and molecules can emit or absorb energy in discrete quantities only.
Planck’s concept of this “quanta” sparked the interest of scientists across the world and initiated the development of quantum theory.
Chapter 4: Qubit, Qubit
1905 Albert Einstein proves Planck’s theory of quanta , when he discovered the photoelectric effect in 1905. His light- quantum paper was the only one of his great papers of 1905 that he himself called “very revolutionary”.
Light is one example of something composed of discrete packets of energy, in this case called photons. The effect states that where a photon, as an example of electromagnetic radiation, strikes a metal surface, it ejects a photoelectron from the surface of the metal. The entire photon’s energy is then transferred to the ejected electron as kinetic energy.
Newton’s laws of motion would predict that the energy of these photoelectrons would increase with the intensity of the light. However, Einstein proved that energy released depends on the frequency of light, not the intensity, because the energy of each pho ton is proportional to its frequency. This was the first example of how quantum mechanics works differently to Newton’s laws of motion, as the photons’ energy depends on the frequency and not the light intensity.
1925 Werner Heisenberg attempts to explain quantum mechanics , the study of how matter and energy act at an atomic and sub -atomic level. This study became the cornerstone for the mathematical formulation of quantum mechanics. It focuses not on the theory of electron orbits in atoms, but on observable amounts of atoms by calculating backwards by using the intensities and frequencies of the light photons given out and taken in by the matter.
This development for quantum mechanics has had such a large impact on physicists over the world and allowing people to explain things that don’t follow the classic laws of physics, that it was labelled as one of the two great pillars of modern physics, alo ng with Einstein’s theory of general relativity.
1926 and 1935
Heisenberg was the man who truly started the development of quantum mechanics and how it works in the universe.
Erwin Schrödinger uses “wave-functions” to further develop Heisenberg’s idea of quantum mechanics and explained it in his Schrödinger equation. He also created a machine to calculate the energy levels of electrons in atoms. This greatly increased the understanding of how the quantum mechanics in a physical system evolves over time, especially around atomic structure. It was later proven that if Schrödinger’s equation was squared, it would show the chance of finding an electron in a certain area. This further proves that probabilities are always random.
9 years later, Schrödinger put forward his infamous cat experiment to show the absurdity of quantum mechanics in a life-sized scale. It is difficult to understand that an electron could be in two different states at once, but it is even more strange that t his cat that Schrödinger posed in his problem could be both alive and dead at the same time.
This later raised many more questions around quantum mechanics, including whether there could be more states, which has been answered with qudits. People also asked whether quantum mechanics applies to larger and more complex structures of atoms, which it can, but it is less noticeable.
Chapter 4: Qubit, Qubit
Schrödinger asked that if a cat, radioactive material, a vial of poisonous gas, a hammer and a Geiger counter were all sealed inside of a box, then how would we know if the cat was dead. Schrödinger assumed that after an hour, there was a 50/50 chance of the radioactive material decaying, which would lead to the Geiger counter being set off, releasing the hammer, breaking the vial and therefore killing the cat. This means that the cat can be both alive and dead, so it is in a superposition of alive and dead, like qubits, who are in the state of 0 and 1.
1948 Richard Feynman, Julian Schwinger and Shin’ichirō Tomonaga develop quantum electrodynamics, another field that branches off from quantum mechanics. It looks in to how matter and light interact with each other. This is based around quantum mechanics and Einstein’s theory of special relativity. During this, Richard Feynman created the Feynman diagram, which demonstrates how light and matter interact.
What is quantum mechanics and how does Quantum computing work ?
Quantum mechanics isn’t something that can be made, it is a theory of scientific discovery that it is being developed every day. Quantum Mechanics investigates how energy and matter act at an atomic and sub -atomic level It was first used by Max Planck to explain why certain things didn’t occur according to classic laws of physics, first written by Newton. Scientists have been looking into it for over a hundred years and there is still so much more for us to learn.
No entanglement, no quantum mechanics
Entanglement is when the dynamics of two particles are grouped together, meaning they are linked together. However, this only tells us about the internal state of the system and not the systems (this is like a recording of a guitar being played, but you no t being able to know the shape or colour of that guitar). A result of this is that if something occurs in one particle, it happens almost instantaneously in another particle, if the two are entangled.
Schrodinger’s Cat
Chapter 4: Qubit, Qubit
Quantum mechanics v. classic computing
Quantum mechanics powers the ability for us to develop quantum computing which is more powerful than classic computing. A classic computer such as the one you and I use is a computer with bits, 0 and 1, which occur separately. We know this as binary code and it is used to represent numbers, digits, characters and more. However, quantum computers use qubits, also 0 and 1, which occur simultaneously, in superposition
This allows for much more information to be stored and transferred compared to a classic computer. This leads to quantum computers being able to solve much more complex problems that classic computers couldn’t This is why quantum computing is so exciting, and why development has been so rapid . Quantum computers do exist and can do problems in ways that classic computers can’t. It is like how a Rubik’s cube is solved, where there is the slower and more difficult traditional route, and the easier and much faster route
Quantum computing:
• Calculates with qubits, which represent 0 and 1 at the same time
• Power of quantum increases exponentially in relation to the number of qubits
• Quantum computers need to be kept ultra cold and have high error rates
• Work best for tasks like organisation problems, simulations and data analyais
• Is still in its early days of development and there is no consensus on how powerful it will be. Scientists including Jensen Huang of Nvidia and Sundar Pichai of Google think we will be able to see the benefits in 10-20 years, others think it is over rated
Classic computing:
• Calculates with transistors that can represent either 1 or 0
• Power increases slowly in a 1:1 relationship with the number of transistors
• Can operate at room temperature and have low error rates
• Best at everyday processing
Why all the hype?
So how have quantum mechanics improved the world we live in so far ?
Lasers (1960)
Firstly, the laser was built in 1960 based on Einstein’s quantum mechanical process to emit a focused ray of light on to a single point, called stimulated emission. They do this by using a flash lamp to trigger the electrons on a ruby rod, and this released photons. These photons then bounced back and forth, which stimulated more electrons to release photons, and this process continued to create a visible beam of light, at a singular wavelength frequency. These lasers have many real-life applications. They are used in barcode scanners, surgery and chip manufacturing, which are all important parts of our life. This development is due to the powers of quantum mechanics and how these electrons and photons act.
Chapter 4: Qubit, Qubit
Magnetic Resonance Scanners (MRI)
MRI machines are used for medical procedures, as these machines, with the power of magnetic fields and radio waves, can make detailed images of the human body. The ability to do this is possible because of semiconductor circuitry. These are circuits built to manipulate the flow of electrons in a semiconductor material.
Without MRI, we wouldn’t be able to see where issues in the body are. MRIs lead to a more accurate diagnosis of issues than other scans like CT and decreases the chance of an unnecessary procedure. Annually, 100 to 150 million MRI scans are performed over the world.
Solar cells
Solar cells emerged from Albert Einstein’s work on photoelectrons, which proved that when a photon strikes against a metal surface, it creates a photoelectron which releases energy. This energy is given out by the emission from the metal electrons by the light photons.
Solar cells are essential for solar energy as we look for new and efficient renewable sources of energy to replace fossil fuels. If solar becomse the biggest energy resource in the world in 50 years’ time, then we will have quantum mechanics and Albert Einstein to thank.
And the most important of all - quantum computers
By far most exciting and important development from quantum mechanics is the quantum computer. Quantum is still only in its early days of development, and it still isn’t quite ready for practical use yet, but when it is, it will have the potential to be gr oundbreaking.
But will this create a dangerous gap between the haves and the have nots? Quantum computers won’t be as accessible as modern- day laptops and computers, and not everything will be powered by quantum from the outset. So what happens if the power of quantum falls into the wrong hands before the classic computing work has had time to adapt or catch up? Only time will tell but until then, quantum is already changing our world for the better.
Quantum has the possibility of solving problems such as the millennial problems, and many others that could change maths as we know it. The main areas that quantum can truly impact, other than drastically improving the speed of solving, are medicine discovery, cryptography, and development of artificial intelligence .
Medicine discovery will be greatly impacted by the development of quantum mechanics because of its future ability to simulate molecular interactions. This will help scientists understand complex new biological processes, allowing them to create new medicines to treat patients. This will be a significant advancement as it will allow for us to be able to discover cures for uncurable diseases, such as Alzheimer's diseases. This will help thousands of people and thousands of families who are put through incred ibly painful times when they know that there is no cure for their loved one
Chapter 4: Qubit, Qubit
Artificial intelligence will be greatly improved by quantum computing significantly. We have already seen how classic computers have made AI seem so realistic, and talk like a real human would, so imagine how strong quantum computing would be with much stronger processing power, compared to a classic computer. AI would become even more human-like and would develop human traits and qualities, as it learns every day how to improve.
Cryptography Many people worry that quantum computers, with their stronger processing power, will be able to break current encryption methods, putting much of the world’s critical data at risk. But, quantum computers would also be able to create their own quantum-proof codes that will make it impossible for even quantum computers to decode the messages that are intended to be hidden. It might also be able to find new prime numbers that could make encryption harder to break. Which brings us to our final question:
Could quantum finish what Eratosthenes started?
The potential for quantum to find new prime numbers, one of the building blocks of encryption, first developed by Alan Turing’s work on the Enigma code. But could it help solve the million- dollar question that began with the discovery of Eratosthenes Sieve back in 200BCE?
Can we ever know how prime numbers are distributed, or is it, as Turing proved, a question that we will never be able to answer? will Turing’s theorem be proved right over time?
"Mathematicians have tried in vain to this day to discover some order in the sequence of prime numbers, and we have reason to believe that it is a mystery into which the human mind would never penetrate."
The three case studies we have looked at through this project show that maths is a never- ending journey of discovery,
Referencces s
References
Websites:
Alan Turing’s Paper 1936 - https://www.cs.virginia.edu/~robins/Turing_Paper_1936.pdf
Real World Applications of Prime Numbershttps://math.stackexchange.com/questions/43119/real-world-applications- of-primenumbers
Euclid - https://www.britannica.com/science/number-theory/Euclid Largest Prime Numbers Known - https://www.livescience.com/physicsmathematics/mathematics/what-is -the -largest-known-prime-number Eratosthenes - https://www.britannica.com/biography/Eratosthenes
Google Scholar Paper on why primes are importanthttps://scholar.google.co.uk/scholar?hl=en&as_sdt=0%2C5&q=why+are+prime+numb ers+important&oq=Why+are+prime +
Sieve of Eratosthenes - https://study.com/academy/lesson/the -sieve- of-eratostheneslessonquiz.html#:~:text=At%20some%20point%2C%20he%20was,along%20a%20list%20of %20numbers.
Video explaining Turing’s paper from 1936https://www.youtube.com/watch?v=56HGIcFkej0
Different Types of Atoms - https://cosmosatyourdoorstep.com/2017/10/17/types- ofatoms/
Analysis of Turing’s Paperhttps://people.maths.bris.ac.uk/~mapdw/welch_proc_ems.pdf
Other Resources:
Euclid (300 BCE) Elements, Proposition 20, Book IX
Euler, L. in Simmons, G. (1992). Calculus Gems. McGraw-Hill, New York
Mubeen, J. & Davies, B. (2020). What’s the Point of Maths.DK, Penguin Random House, London.
Zagier, D. (1977). The first 50 million prime numbers. The Mathematical Intelligencer 16. George, S (Editor). (2025) Discover magazine. March/April 2025 Issue
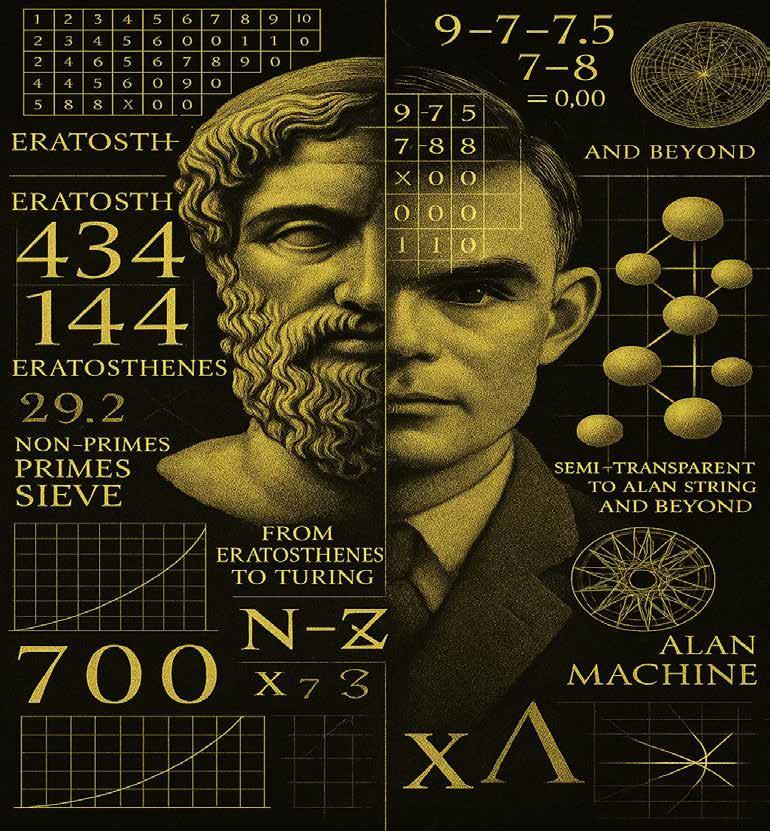
Note: The Front Cover of this Project was designed by ChatGPT.
ARE THE COP CONFERENCES A WASTE OF TIME?
BY OLLIE SCRIMSHAW
(Scond Year, HELP Level 1, Supervisor: Mr Harrison)
Are the COP Conferences a Waste of Time?
Ollie J Scrimshaw
2H HELP project
What are the COP conferences?
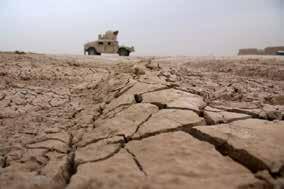
‘COP refers to the United Nations Framework Convention on Climate Change (UNFCCC) and is an international meeting focusing and making progress to end climate change’i . This definition given by the University of Cambridge somewhat summarises what the conference is, but does it glorify the reality of a perilous climate spinning out of our control?
Standing for the ‘Conference of Parties’, COP, is the annual meeting of countries, aimed at creating a plan to tackle climate change in the following year.
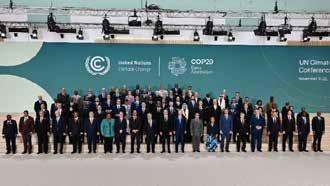
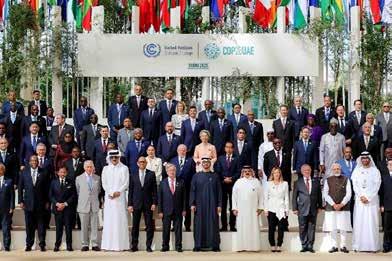
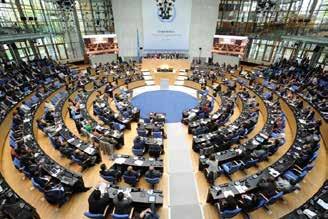
Established in 1992, the United Nations Framework Convention on Climate Change was introduced to help tackle the ‘inevitable rising temperatures’ ii that seemed like an ever-growing problem in the developing modern world The first COP conference was held in 1995 in Germany and discussed how to start tackling the issues. The most recent meeting was COP 29 and was held in 2024 in Baku, Azerbaijan. Over 50,000 delegates attended, ranging from political representatives to climate scientists, highlighting the importance of such a significant event. Two hundred countries were represented, including Palestine, The Cook Islands and the UK itself. More on that later.
Just because the conferences discuss creating new rules to help the environment, it does not mean that there are already hundreds of laws and frameworks across the Planet In the UK, the Climate Change Act of 2008 protects the little remaining wilderness in the UK, among other key rules and targets. To name a few, the UK aims to ‘reduce its greenhouse gas emissions to net-zero by 2050’iiiand created the ‘Climate Change Committee, an advisory body that advises the government about decisions to do with climate change laws’iv These examples show that the UK is on its way to becoming one of the greenest countries in the world, even if it does not look likely now.
However, 30 years on from the first COP conference, not much significant action has emerged. On the contrary, examples of a corrupt environmental system are evident globally. For instance, on March 12 this year, a passage in the Brazilian Amazon Rainforest was felled to make way for a road, leading to the small town of Belem (COP 30 is due to be held there), which at the time was called ‘contradictory’. The BBC stated that ‘the state government touts the highway's "sustainable" credentials, but some locals and conservationists are outraged at the environmental impact’v . The COP conferences aim to stop, or at least slow down, climate change, but by making the meetings so public and widely accessible, is the toll on the environment worth the meeting? Are the conferences creating false hope that the climate will be restored quickly and easily? And, most importantly, are the conferences a waste of time?
COP 29- The controversies and successes
November 2024 saw COP 29 being held in Baku, Azerbaijan The meeting was overall deemed as somewhat successful, due to the spending limit on environmental issues increasing by £300 billion per year. This was, however, a ‘compromise outcome’vi for developing countries, with a previous goal set for at least £10.3 billion annually from every country. This clearly shows that more funding is needed to properly tackle climate change.
The choice of location for the conference did raise a few eyebrows, since Azerbaijan is one of the largest oil and gas producers in the world. It has an authoritarian government which has been ‘extensively linked to climate corruption’vii, with several of the oSicial sponsors of COP29 being directly owned by, or linked to, the President of Azerbaijan, Ilham Aliyev. These were among several other controversies such as the COP President, Elnur Soltanov, being recorded making oil and gas deals during the conference and less important ones such as there not being enough vegan options in the COP food court!
Around the same time a large protest took place, involving climate activist Greta Thunberg, in Tbilisi, the capital of Georgia on 11 November 2024. Thunberg and other activists claimed that ‘the event [i.e. COP] was a poor way of greenwashing the human rights abuses’viii, which have long been an issue in Azerbaijan. She called it “absurd” to hold climate talks in a “petrostate”. In response to these claims, President Aliyev called the protest a “smear campaign”.
1- shows the increase in environmental spending by developed countries
In 2021, the UK pledged to provide £11.6 billion per year towards climate initiatives by 2024, with the aim of shaping a greener future for the country. However, only half of this budget is being spent today. Graph 1 shows how developed countries have changed their environmental spending from 2016 to 2022, with a huge increase in 2022. These figures look promising for our future, but it is estimated that we need to invest four times as much into the climate if the world wants to reach its target of £7.5 trillion by 2030. So, is COP 29 a good example of how more is needed if we want to improve global temperatures?
Graph
Successes of the previous COP conferences
These meetings mark the most significant opportunity to secure global agreements and ‘reign-in the world’s biggest polluters’ix. Some may argue that the COP conferences are a fantastic opportunity to tackle climate change, but others think that they are a waste of valuable time. The fact that these meetings provide a forum for all countries to discuss openly their problems and concerns may potentially outweigh all negative sides to the meetings. In the past, the successes of COP have been few but rewarding, such as the Paris agreement and the Kyoto Protocol. These two incredibly important agreements were huge steps in getting to where we are today, and some of the main reasons that the nations are still fighting climate change Here is what they are:
The Kyoto Protocol is an international agreement that ‘commits state parties to reduce greenhouse gas emissions’x. It was adopted on the 11th of December 1997 in Kyoto but came into force from the 16th of February 2005 The First Commitment lasted from 2005 until 2012, when it was replaced with both the Paris Agreement and the Second Commitment, the Doha Amendment, which lasted until 2020. Currently, 192 parties have pledged to this deal, but some dropped out, such as Canada in 2012 after the First Commitment period expired. Unlike other deals, this Protocol recognises that some countries have a higher capability to tackle climate change than others and therefore states that ‘the obligation to reduce current emissions is dependant on how high the country’s level of released greenhouse gasses is’xi . This also relates to the fact that climate change has been experienced diSerently across the world, such as tsunamis in Indonesia and droughts in the UK. The Kyoto Protocol was – and still is – viewed as one of the most ‘eSicacious environmental treaties’xii to ever be signed, even though critics say it is “vague” with no “binding methods”.
The main diSerence between the two agreements is that the Kyoto Protocol only makes it obligatory for developed nations (even then countries such as America did not feel that it was necessary to take part) whereas the Paris Agreement realises that climate change is a ‘global predicament’xiii and makes it necessary for all countries to put money towards tackling climate change. Established in Paris in 2015, the agreement legally binds all countries that signed the document to help reduce global temperatures to well below 2℃, ‘preferably 1.5℃’xiv The agreement works on a five-year cycle of “ambitious” individual work, and at the end of the five years, the countries meet to discuss what they have done to help reduce global temperatures. To reach this target of 1.5 degrees Celsius by 2030, it is estimated that greenhouse gas emissions must ‘peak before the end of this year [i.e. 2025] and reduce by 43% by the end of this century’xv, which is not an easy target.
Even though these are the two main agreements in the COP history, countless successful documents and deals have been signed to help reduce the burden of climate worries. This shows
Graph 2- shows how much the UK will need to reduce its emissions if it wants to reach its NetZero goal
that the world is on its way to a greener future, but first do we need to focus on the problems with the agreements and meetings? After all, they are the foundation to these agreements.
Criticisms and limitations of COP
Despite the clear sense of success with the Kyoto Protocol and the Paris Agreement, critics have still had their negative say on the key events. Corruption is a huge talking point when it comes to the meetings, not just from the controversial location choices such as the petrostates Azerbaijan and Dubai, but the negotiations that have sparked outrage in the environmental community. From secret oil and gas deals to the host nations being paid vast sums of money for oil companies to sponsor the event, critics have had a lot to condemn. The picture above is of an oil plant, just 300 meters away from where COP 29 was held in Azerbaijan, highlighting how the choice of location was a controversial decision. Azerbaijan relies on oil for 90% of its total exports and 98% of its energy, despite previous claims about becoming a fossil fuel free country by 2030, which does not look likely at the moment.
Moreover, the expectation that the COP conferences must deliver a new climate saving pact are not helpful and not in the least bit realistic, judging from the previous outcomes of the meetings. Thirty conferences have taken place over the course of thirty years, and critics say that only two pacts have been globally successful in aiding the fight to end climate change. The publicity of the event and the growing number of people watching and relying on the conferences to create a plan and solve a problem that is practically impossible to solve, has potentially been the reason for the lack of ideas being put forward.
Linking to a previous point about the publicity of the event, scientist and researcher at Oxford University, Benito Muller gave a clear summary of my point in just one sentence: ‘it’s clear that the annual meetings have grown far too big to be eSective.’xvi This point is backed up by many sets of data, especially in the clear increase in attendees in recent years Less than 5,000 people attended the first few annual conferences, with a spike to about 10,000 in 2007, when the Kyoto Protocol was negotiated in Japan. In 2009, when there were huge expectations for a global climate deal, the conference ultimately led to disappointment. In Copenhagen, attendance surged to about 25,000 but then dropped back to 10,000 or less during the next few years before reaching nearly 30,000 in 2015 in Paris. The next
quantum leap came in 2018 in Dubai, where the UNFCCC tallied more than 85,000 attendees. At the COP last year in Baku, after the ‘disappointing outcome’xvii of COP 28, under 67,000 people attended, showing a clear decline in attendance. This all links back to the limitations of COP, due to the clear point being conveyed by scientists such as Benito Muller: The event is overpublicised.
Alternative approaches
In a world where climate change has taken the spotlight in many countries and at many conferences, are the audience of the COP meetings suggesting that alternative meetings happening elsewhere are the more appropriate way of discussing the dilemma? For example, the United Nations Climate week held every year has had many positive outcomes, such as the US greenhouse gas pledge and many more. Unlike the COP conference, the Climate week boasts of a flexible agenda, meaning that the decisions are not set in stone are able to be changed to create a ‘practical, scalable solution’xviii. However, critics say that this is a downside to the smaller event, because just like the COP conferences, the meeting lacks any binding methods to the deals. This means that the pacts are optional, rather than being compulsory, which surely would improve the eSort being put into the COP conferences.
Moreover, The One Planet Summit, held in France every year embodies all the good things about the COP conference plus more. Being a more popular event for many, the Summit primarily focuses on the financial side of climate change rather than tackling the climate directly. As described by French President, Emanuel Macron, who leads the meet, ‘the vision of the One Planet Summit is to oSer a new, pragmatic and eSective framework for financial action, one that will contribute to broadening and renewing international cooperation for the ecological transition’xix. However, what seems to be the problem for all these events is the lack of compulsory deals, which includes the deals made at this event and as I mentioned earlier, potentially the solution to the problem
Finally, there is the Petersburg Climate Dialogue, held in Germany and involving the minimum number of parties to reduce publicity, in contrast to the COP conferences. The event is invitation only and involves 30-40 countries deciding on the fundamental talking points of the next COP conference. Despite this being a ‘run-up’ event for the COP conference its significance is huge to
keep the COP conferences running. Many deals that seemed to be made at the COP conferences are often pre-negotiated and tested at the Petersburg Climate Dialogue. For instance, the Paris agreement has significantly shaped at the previous Climate Dialogue. However, just like the other alternative approaches, there are no binding methods.
How is geopolitics and wars shaping COP?
Over the past 10 years, the world has seen a huge change in foreign relations, not just politically but environmentally as well. Wars have broken out all over the world, heavily impacting our ability to work together to tackle climate change as one, peaceful group. Wars may not just aSect the relationship between two or more countries, but also have a detrimental eSect on the climate. To name one problem, migration increases the burden on urban areas and leads to overpopulation, linking to the reason why wars may be the reason why the world cannot solve the problem. All the militaries combined produce 5.5% of the world’s greenhouse gas emissions, and the number is potentially much higher, because only 75% of these militaries have admitted to the vast greenhouse gas emissions. To name another crisis, the war in Ukraine has been estimated to have released around 230 million tonnes of carbon dioxide emissions, which is the same as what Austria, Hungary, the Czech Republic and Slovakia produce in one yearxx. This shows that wars may be one of the main reasons as to why the earth is slowly heating up.
Another case of geopolitics driving climate decisions at the COP conferences comes from Europe. Prior to Russia’s invasion of Ukraine, European nations were heavily dependent on Russian-imported fossil fuels. Germany, the continent’s largest economy, relied on Russia for 90% of its gas supply. Russia has also ceased to attend the COP conferences from 2022, hugely aSecting the momentum of the previous agreements. Following the invasion, however, European leaders were quick to reduce dependence on Russian fossil fuels, in large part by replacing them with clean wind and solar power. “In the long run,” the European Commission announced in 2022, “EU energy security will be achieved by replacing imported fossil fuels with domestically produced renewable energy.”xxi This decision had an impact: in 2023, the EU’s fossil fuel use fell by a record 19%, while wind and solar power generation increased hugely.
Geopolitics are reshaping the world’s fight against climate change, both for better and for worse. However, even as geopolitics complicates cooperation between countries, they also oSer new ways to build bridges between diSerent countries.
Conclusion
As the modern world develops, the toll on the climate could potentially lead to major crises in all areas of the world. From icecaps melting, to natural disasters such as tsunamis becoming more frequent as time goes on, are we running out of time to sort these problems out? Luckily, the world knows about these problems, and they are slowly realising that change must happen quickly in order to save the planet.
The COP conferences provide a global forum for countries and scientists to discuss the problem, potentially being the main reason as to why the Paris Agreement and the Kyoto Protocol were introduced back in 2005 and 2015. Whilst these successful attributes have led to some critics praising the events, others say that overall, the summits are a waste of time. The controversial choice of location and lack of binding methods are the main reason for the criticism. Another reason for this could potentially be due to geopolitics involved in the agreements, especially between Ukraine and Russia and their conflict starting in 2022. The war has clearly aSected the tensions at the meetings and could have led to less productive agreements.
Despite the criticisms faced at the COP conferences, I think that these events are one of the main reasons as to why the world is noticing the potential danger and these countries are now forced to acknowledge the fact that we have to sort out the problem before its too late. Even if the lack of successful deals is the worst accusation, the COP conferences are a good starting point for the countries to discuss what they need to achieve in the next century regarding the climate. After all, there is no planet B.
Graph 3- shows which European countries rely on Russian Gas
i What is COP? | Cambridge Institute for Sustainability Leadership (CISL)
ii https://unfccc.int/process/the- convention/history- of-the- convention
iii https://environmentlaw.org.uk/LYE/LYE/Climate- change/CC-Homepage.aspx
iv https://environmentlaw.org.uk/LYE/LYE/Climate- change/CC-Homepage.aspx
v Amazon rainforest cut down to build highway for COP climate summit
vCOP29 Key outcomes and next steps for the UK - Climate Change Committee
vii 2024 United Nations Climate Change Conference - Wikipedia
vii 2024 United Nations Climate Change Conference - Wikipedia
vii What's COP and why does it matter? | Local action
vii Kyoto Protocol - Wikipedia
vii What is the Kyoto Protocol? | UNFCCC
vii Kyoto Protocol: All You Need to Know
vii https://www.cfr.org/backgrounder/paris-global- climate- change-agreements
xiv https://youtu.be/WiGD0OgK2ug
xv The Paris Agreement | UNFCCC
xv The Downsides of a Massive Global Climate Conference
xvii The Downsides of a Massive Global Climate Conference
xviii About us | Climate Week
xix One Planet Summit: Acting together for the planet | One Planet Summit
xx https://svet.charita.cz/en/news/how-wars- destroy-the- environment-and- contribute-to - climatechange/
xxi Geopolitics and the COP - The Council on Strategic Risks
(Second Year – HELP Level 1 – Supervisor: Mr McKitrick)
Glossary
Glossary
• Inversions – When the rider and cart travels upside down.
• Lift hills – A method used to pull a cart up the track on a hill - often includes the use of a chain.
• Hydraulic or electromagnetic launches – Used to launch a cart at high speed on a horizontal track, avoiding the need to raise the cart up a hill to reach speed in the descent.
• Brake runs – A set of brakes on the track used to slow the coaster cart down.
• Elements – Unique parts of a roller coaster ride, e.g. inversions, zero G stalls.
• Outer banks – When the cart faces outwards on the track, forcing riders to the edge of their seat
• Zero G stalls – When a rider enters a 180° inversion with zero G of force, then hangs upside down for a brief period before flipping back 180° again.
• Head choppers – Theming and parts of the ride that appear to get very close the riders head, giving the illusion that riders need to put their arms down if they are in the air.
• Airtime – When the rider is lifted out of their seat when going over a hill or bump.
• Hang time – When a rider feels like they are falling out of their seat, usually during an inversion.
• Valleying – When a roller coaster cart must be removed from the track for maintenance purposes.
• Ride cycle – The entire period of an individual customer’s ride.
Introduction
Introduction
What are roller coasters? Sounds like an easy question, right? But to truly answer, we must look back as early as the 1800s to understand how it all began.
The aim of this project is to find out everything there is to know about roller coasters, then use all that information to design my own roller coaster using the design tool, ‘Planet Coaster 2’.
So, what is the history of roller coasters, how have they developed over time and what is in store for roller coaster enthusiasts as we look to the future?
The History of Roller Coasters
When was the first coaster invented and where was this ingenious idea first considered? Surprisingly, the first resemblance of a coaster was a slide completely made of wood and ice in 18th century Russia (as shown to the right). Willing guests would take turns to be pushed down that slide in sleds or carts, with the carts inspiring the roller coaster designs we see today.
The 19th century would bring a key feature of coasters into play: the track. Railways were developing at a fast pace during the 19th century in more innovative and resourceful countries like England – which inspired early roller coasters. But these were far less advanced coasters than the ones we have now, featuring railroad tracks with carts tightly secured to the tracks to always keep riders inside of the vehicle.
In the early 20th century, it was discovered that with reduced track/wheel friction and advances in the design of coaster carts allowed riders to experience higher speeds and G – forces, adding to the overall thrill and relief many people experienced from their usual busy lives.
Timeline of Roller Coaster History
Early
Coasters:
The first ever roller coaster to feature an inversion (where riders are tilted upsidedown), was built in 1846 and called Centrifugal Railway. It was invented in Paris.
The Promenades Aeriennes in Paris, otherwise known as the Ariel Walk is widely considered the first ever roller coaster and was built in 1817.
1800s to early 1950s
Lap bars, the current key to safety on many roller coasters nowadays, were first used in 1907 on a roller coaster called Drop the Dip. 1 year later, the first ever coaster to feature spinning carts was built in 1908 and named Virginia Reel. Riders would spin inside a Waltzer-like vehicle.
The first ever indoor coaster (a coaster completely enclosed inside of one large structure) was built in 1926. It was called Twister because of its many hills and turns.
To appeal to younger audiences, manufacturers began to design junior coasters in 1952 that would feature a slower overall experience with less drops and sometimes multiple laps of the track. The first junior coaster was Little Dipper at Memphis Kiddie Park.
Gravity Pleasure Road, built in 1885, was the first ever roller coaster to feature a powered chain lift to pull the carts up the track before releasing them back at a very fast speed.
By far, the biggest milestone for coasters in the early 1900s was by far the first ever roller coaster to reach 100 feet called Cyclone at Revere Beach. This recordbreaking coaster was constructed in 1925.
New Designs : 1960s to 1990s
The first mine train, an icon in the roller coaster industry, was built in 1966 when Runaway Mine Train in Six Flags Over Texas opened.
The first suspended coaster, The Bat, was built in 1981. Suspended roller coasters featured riders sitting below the track in carts that would freely swing freely.
The Racer at King’s Island was the first ever coaster to feature a backwards operation where riders would have the same experience facing the opposite way. This coaster, invented in 1982, also featured a duelling element where two identical tracks would have two coaster carts race each other throughout.
Also, in1982, the first ever stand-up coaster was made where riders would of course be standing not sitting. It was called Dangai. 1983 was when the first alpine coaster was made: Ice Mountain Bobsleds.
In 1984 the first ever boomerang coaster was made and named Boomerang showing creativity at its best. Jokes aside, boomerang coasters featured the cart launching forwards and backwards repeatedly.
The first bobsled coaster, Flying Turns was made in 1929 Ohio. Many of the first ever Wild Mouse coasters known for their sharp turns and steep drops began to appear in the US in 1930.
The year 1985 was when the first ever pipeline coaster, Ultra Twister where the coaster was not on the track but inside of it, was made.
The first coaster where riders would be facing down whilst lying on their belly in their seats was called Skytrak and made in 1997. This is an early example of a flying coaster. In 1998, another new roller coaster design was introduced: the dive coaster. Oblivion at Alton Towers was a dive coaster.
The first inverted coaster, much like a suspended coaster where riders were below the track, but the seats are locked in place, was called Batman: The Ride and designed in 1992. In 1995, Space Mountain in Disneyland Paris would be the first coaster to feature audio onboard.
Modern Roller Coasters: late 1990s to present day
Wrapping up the 20th century, the first ever floorless coaster, Medusa, was built in 1999 and featured seats without any floor below, hence the name ‘floorless’. In 2001, Dodonpa was not only the first ever roller coaster to feature a vertical drop, but it also has the fastest ever acceleration, going 112mph in 1.56 seconds!
In the later half of 2002, Gravity Max, the first tilt coaster, was made. A tilt coaster is one that has the riders rotate 90 degrees on a singular piece of track to connect from one part to another before dropping the vertically.
In 2002, the first ever roller coaster featuring a launch was designed and fittingly named Xcelerator as it speeds up from 0 – 82mph in only 2.3 seconds. In this same year, the first ever 4th dimension coaster was made and called X.
Th13teen at Alton Towers, designed in 2010, was the first ever roller coaster to have a vertical drop. Th13teen has riders drop down vertically in the dark before going backwards.
Furius Baco in Spain is the first ever wing coaster, a design where passengers are sat on either side of the coaster at the centre as though held by arms or wings. It was made in 2007.
Finally, this year the first ever ultra surf coaster opened and was called Georgia Gold Rusher, though its layout was rather strange resembling a U –shaped track with either end curved outwards.
Wonder Woman Golden Lasso Coaster introduces one of the stranger types of roller coasters in 2018: single rail coasters. Theses roller coasters only have one thick line of track that the cart goes across.
Incredible Roller Coaster Records
Roller coasters are very cool and thrilling, but to make them even more memorable and iconic the various manufacturers compete to achieve world records such as the fastest or tallest coaster.
These coaster records are so valuable to both theme parks and coaster companies, that the designs often end up being terrifying! For example, roller coasters have already reached above 400ft in height – this not only helps attract more customers to the theme parks but is also key to the success of individual roller coaster companies.
Despite these design battles, the focus on achieving new records provides a more thrilling experience for the rider whilst also allowing riders to share their intense coasters’ stories!
Speed
Name: Falcon’s Flight Opening Year: Still under construction Speed: 155mph Theme Park: Six Flags Qiddiya, Saudi Arabia
Name: Superman: Escape From Krypton Opening Year: 1997 Speed: 100mph Theme Park: Six Flags Magic Mountain, US
Name: Red Force Opening Year: 2017 Speed: 112mph Theme Park: Ferrari Land, Spain
Name: Top Thrill 2 Opening Year: 2024 Speed: 120mph Theme Park: Cedar Point, US
Name: Formula Rossa Opening Year: 2010 Speed: 149mph Theme Park: Ferrari World, Abu Dhabi
Height of Drop
Name: Kingda Kah
Opening Year: 2005 – 2024
Height: 456ft
Theme Park: Six Flags Great Adventure, US
Name: Red Force
Opening Year: 2017
Height: 367ft
Theme Park: Ferrari Land, Spain
Name: Leviathan
Opening Year: 2012
Height: 306ft
Theme Park: Canada’s Wonderland
Name: Hyperion
Opening Year: 2018
Height: 252ft
Theme Park: Energylandia, Poland
Name: Falcon’s Flight
Opening Year: To be opened
Height: 640ft
Theme Park: Six Flags Qiddiya, Saudi Arabia
Name: Top Thrill 2
Opening Year: 2025
Height: 420ft
Theme Park: Cedar Point, US
Name: Millenium Force
Opening Year: 2000
Height: 310ft
Theme Park: Cedar Point, US
Name: Orion
Opening Year: 2020
Height: 287ft
Theme Park: Kings Island, US
Inversions
Name: Centrifugal Railway
Opening Year: 1846
Inversions: 1
Theme Park: No theme park, France
Name: Corkscrew
Opening Year: 1976
Inversions: 3
Theme Park: Cedar Point, US
Name: Vortex
Opening Year: 1987
Inversions: 6
Theme Park: Kings Island, US
Name: Colossus
Opening Year: 2002
Inversions: 10
Theme Park: Thorpe Park, UK
Name: Dragon Khan
Opening Year: 1995
Inversions: 8
Theme Park: Portaventura Park, Spain
Name: The Smiler
Opening Year: 2013
Inversions: 14
Theme Park: Alton Towers, UK
Steepness of Drop
Name: TMNT Shellraiser
Opening Year: 2019
Steepness: 121.5°
Theme Park: Nickelodeon Universe, US
Name: Green Lantern Coaster
Opening Year: 2011
Steepness: 120.5°
Theme Park: Warner Brothers Movie World, Australia
Name: Saw – The Ride
Opening Year: 2009
Steepness: 100°
Theme Park: Thorpe Park, UK
Name: SheiKra
Opening Year: 2005
Steepness: 90°
Theme Park: Busch Gardens Tampa Bay, US
Name: Oblivion
Opening Year: 1998
Steepness: 87.5° Theme Park: Alton Towers, UK
Safety introduction
Safety is extremely import on modern day roller coasters. Early coasters often had no safety restraints or simple lap bar restraints. Fortunately, roller coaster safety has evolved significantly since that time, driven by technology, engineering and stricter regulations.
Basic regulations such as height restrictions are usually visible to the rider, however many other less obvious factors contribute to the overall safety of the roller coasters we know today. In fact, the risks of injury or death are extremely low on a roller coaster with a 1 in 170 million chance of death thanks to the rigorous safety precautions that are taken every day.
To test the safety of rides before opening, test dummies and Gforce recorders are put on the ride to make sure there are no casualties or dangers for the riders. These measurements can also be taken by simulating the ride in a computer software. Some examples of coaster design platforms are No Limits, Planet Coaster 2 and AutoCAD
Safety regulations
Restraints - By the mid 20th century, restraints and seatbelts became standard, reducing the risk of riders being ejected during the ride.
Safety systems - Modern roller coasters use a range of sensors to monitor ride conditions and prevent accidents. Automated braking systems both control the ride speed and make emergency stops when necessary. Modern roller coasters also include redundant safety mechanisms such as backup braking systems and reinforced track supports to ensure rides remain operational and safe, even if one safety system fails.
Structure and design - The transition from wooden to steel coasters made the ride smoother and safer. The use of stronger materials improved the structural safety of the coaster.
Safety regulations
Regulatory standards - Industry safety standards have been introduced by organised organisations like ASTM International. These standards guide the design, maintenance and operation of roller coasters.
Biomechanical assessments - Research into acceleration and the human tolerance for G-forces has helped with coaster design, avoiding causing discomfort or injury to the riders.
Inspections and maintenance - Roller coaster staff conduct regular daily inspections, tests and maintenance checks to identify potential issues and take action where needed to maintain safety.
Seat design - Roller coaster seats can also be designed and shaped to avoid the rider being placed under excessive forces.
Theming / Build Up
The theming and initial build up to the roller coaster ride is an important part of the overall experience. The intent is to create an atmosphere of excitement, fear and intimidation through sound, visuals, physical effects and even smells!
Examples of theming and build-up include:
• Intimidation due to the up-close viewing and noise of the coaster
• Anticipation/fear/anxiety during queueing
• Audio and video recordings, images,
• Observing the ride in action the screaming of riders
• Dark periods during queueing
• Flashing lights
• Storyline, pre-shows
• Images and videos showing riders’ reactions
• Pre-show
Seating & Start of Ride
The concept of falling off a roller coaster is terrifying – that’s why there are numerous ways that a manufacturer can and must ensure safety, one example being the seating and restraints on a ride.
Seats on a ride are ideally comfortable, with a lap bar or over-the-head restraint as well as cushioning to keep the rider safe. However not all rides achieve this, making the experience much more uncomfortable and sometimes even more scary!
As the ride starts, the rider knows that they’ve reached the point of no return. For some, this is quite daunting, but for others it helps them calm down since there is no longer any opportunity to get off the ride. Most riders brace for a launch or a sudden drop at the start of the ride, though most start with a lift hill. The speed of the climb can also be adjusted, with a quicker lift hill usually building less tension than a longer one – you may also get to enjoy the view for longer with a higher lift hill. However, some rides are different - take ‘The Smiler’ coaster for example, which drops straight into a dark section before doing an inversion in the pitch black. Clearly a lot scarier than a lift hill!
On Ride Experience
The best types of roller coasters are the unique and thrilling ones. The only way to truly make them stand out, however, is to make the on-ride experience as intense yet memorable as possible.
This can be done via many techniques and by using many coaster elements such as:
• Launches
• Drops
• Speedy acceleration
• G-Forces
• Hang time, airtime, stalls and outer banks
• Inversions
• Snappy turns
• Head choppers
These features often give the rider adrenaline whilst making their mouth dry from the sheer speed of the ride. They may also feel what is called the drop or stomach feeling, when you drop down and you feel your stomach lift upwards, which counts towards the thrill of the ride.
Post
Ride Experience
Some people say that the best parts of a coaster is when it ends, usually meant in a good way. People believe that the end is the best bit is because most people get the feeling of euphoria since they have overcome their fears.
The only problem with the end of the ride is that the deceleration from brake runs can often be very uncomfortable. Furthermore, if your ride experience was atrocious, you could be left feeling very nauseous and even throw up. Thankfully, most manufacturers try their best to stop that from happening since it doesn’t present the ride with a good reputation if customers see someone throwing up because of it.
After you get off the ride, there is usually a themed path to take to get back to the main park. Along the way, many rides have ride photo stands where you can see your reaction during the ride plastered on a photo. They can be good or bad photos but are usually quite funny like the pictures in the top right. You can even get some merchandise from stores that most parks have, themed to the ride the you just went on.
The Science Behind Roller Coasters
Kinetic Energy (KE):
Kinetic Energy (Joules, J) is the energy of a body in motion. In the case of a roller coaster, the body in motion is the cart (and the people inside). The equation for Kinetic Energy is KE = ½mv2, where m is mass and v is velocity.
Gravitational Potential Energy (GPE):
Gravitational potential energy (J) is the energy stored when a body is at a height above the Earth’s surface. GPE = mgh where m is mass, g is gravitational acceleration and h is height.
Energy conservation or Mechanical Energy (ME):
Mechanical Energy (J), ME=PE+KE+Q where PE is potential energy, KE is kinetic energy, and Q is heat – meaning the heat lost due to friction between the cart and the track.
Centripetal Force:
Centripetal force is the force keeping the coaster on the curved track, usually during a loop which ensures the roller coaster cart does not fly off the track! Fc = ��2 � where m is mass, v is velocity, and r is the radius of curvature of the loop.
G-Forces:
G-Force is the force experienced by the riders at different stages of the roller coaster track. G-forces can be positive where the rider feels heavy, negative where the rider feels weightlessness (or airtime) or lateral where the rider is pushed sideways. G-Force is expressed as a multiple of g, based on the equation G = � � where a is acceleration and g is the gravitational acceleration.
Back
Back
Air Resistance:
Air resistance is the force that air creates against the cart during the ridethis has the effect of slowing the cart down. Air resistance or ‘drag’ is related to the air density, the cross-sectional area of the cart, the velocity and the drag coefficient. The denser the air, the more resistance there will be against the cart.
Friction:
Friction is the resistance between the roller coaster wheels and the track the cart rides on. ‘Rolling’ Friction has the effect of slowing the cart down throughout the whole ride cycle. The amount of friction depends on the material of the track and the wheels and the weight of the roller coaster cart . For example, the smoother the track that the coaster rides on, the less friction the cart would experience.
Inertia:
Inertia is defined by Newton’s first law which states that ‘every object will remain at rest or in uniform motion in a straight line unless acted on by an external force.’ The object in this scenario is the cart, which changes direction based on the track and the forces acting on the cart.
Momentum:
Momentum varies as the velocity of the coaster changes during the ride. Momentum p=mv where p is momentum, m is mass and v is velocity.
Acceleration:
Acceleration is the change in velocity over time. For example, Stealth at Thorpe Park has a very fast acceleration since it goes from 0 – 80mph in 1.8 seconds making its acceleration 19.9m/s2
Back
Back
Features and Problems of Modern Coasters
Stealth at Thorpe Park
Type of coaster
• Intamin hydraulic launch coaster
• Top hat track design as main feature
Opening Date, Age & Cost
• Opened March 2006, 19 years operating
• Cost £12 million
Theming
• Racetrack at Amity Speedway
Thrills & Features
• Launch 0 – 80mph
• Airtime hill (weightlessness) at end of ride
• View on top hat at 62m
Ride Problems
• Ride rolls back due to insufficient speed and friction
• Cost to maintain Solution
• Reduce friction
• More tests before opening
• Ensure hydraulic launch is powerful enough
The Smiler at Alton Towers
Type of coaster
• Gerstlauer Infinity Coaster
Opening Date, Age & Cost
• Opened May 2013, 12 years operating
• Cost £18 million
Theming
• Twisted track in X Sector
Thrills & Features
• 14 inversions (record)
• Vertical lift hill mid-ride
• Two lift hills/halves
Ride Problems
• Accident in June 2015 where queues were extremely high. One cart was added to track without letting staff know. Cart did not have enough speed and was left until another cart crashed into it, causing people to lose legs.
Solution
• Additional safety checks
• Never add a new cart without notice
Hyperia at Thorpe Park
Type of coaster
• Mack Hypercoaster
Opening Date, Age & Cost
• Opened May 2024, 1 year operating
• Cost £18 million
Theming
• Extremely high structure in Fearless Valley
• Theme of ‘find your fearless’ and taking flight
Thrills & Features
• Twisted drop of 72 meters, fastest coaster in UK
• Zero G stalls
• Track and harness designed for weightlessness
Ride Problems
• Rollbacks on outer-bank specifically due to the carts’ wheels creating too much friction. It had to be valleyed multiple times.
Solution
• Replaced rubber wheels with nylon wheels to reduce friction. Ride is noticeably faster than usual, especially around outer bank.
Famous Roller Coaster Manufacturers
Vekoma
Vekoma is the world’s most successful roller coaster manufacturer. They have over 300 in-house specialists forming the world’s largest roller coaster centre of excellence. This enables Vekoma to create innovative roller coaster designs with a focus on safety while also keeping within the budget of their theme park clients. Their purpose is to support theme parks in their journey to become more popular.
Their main headquarters are located in Vlodrop, The Netherlands, but their company supports theme parks all over the world. The company was founded in 1926, evolving over time to create very well known and record-breaking coasters such as Guardians of the Galaxy: Cosmic Rewind at Disneyworld and at a cost of $500M - the world’s most expensive coaster!
Vekoma also built Expedition Everest at Disneyworld - an icon in the coaster industry with its broken track and picturesque theming, F.L.Y - a flying themed coaster in Phantasialand and Big Thunder Mountain - the iconic mine train at Disneyland Paris featuring a tall mountain as its centrepiece, although much smaller in scale compared to the likes of Expedition Everest.
Intamin
Intamin, founded in 1967, are based in Schaan, Liechtenstein and like Vekoma, also serves theme park clients all over the world. Intamin designs and develops reliable, precise coasters and safe roller coasters for the theme park industry. When compared to Vekoma, Intamin focus on coasters with less extreme thrill aspects are more limited in the models of coasters they design and develop.
While more limited in their coaster designs, Intamin have still produced some of the most recognisable and impressive designs ever in the coaster industry. This includes Kingda Kah - once the world’s tallest coaster, but retired by explosion in 2025 due to high maintenance costs!
Intamin also created the Velocicoaster at Universal Islands of Adventure - a double launched coaster with the theme of escape from the Velociraptors in Jurassic Park; Colossus at Thorpe Park - an intense coaster with 10 inversions and Taron - a heavily themed roller coaster at Phantasialand.
My Own Roller Coaster Design
My Roller Coaster Design - ‘Hermes’
To demonstrate the various steps involved in designing a coaster, I have used the design tool ‘Planet Coaster 2’ to create my own coaster using the many different tools available on the platform.
My ride theme is based on ancient Greece, where the riders and the cart represent the messenger god, Hermes, travelling around ancient Greece to deliver a message to Zeus. Though the journey is perilous, the riders eventually make it out safely after succeeding with their mission.
The ride is fittingly named Hermes and I will now show you the process of designing the coaster and the notable elements on the ride. Enjoy!
Design Tools
The utilities tab on the right side of the picture above, by far the most important tab, allows you to change the type of track, going from normal track to launches and brake runs. It also lets you change whether track supports are there or not, and to give the option of catwalks on the side of the coaster. On the right side of the picture above, you can see the construction mode which allows you to angle the train up or down, turn right or left and bank to either side.
The testing tab gives provides you with a set of statistics that are measured on the ride such as G-forces, Excitement, Nausea and Fear levels, and the speed of the ride. These stats are recorded throughout the ride an average is taken, being shown in the results part of the testing tab along with drop measurements and maximum or minimum G-forces experienced on-ride. To the right of the picture above, you can see that during testing, test dummies are used on the ride, not customers.
The ride operations tab provides the designer, me in this case, with many different options for how many carts are running at once, the length of the carts, the times for customers to get on as well as many other buttons to change the coaster’s overall operations. It even lets you affect the amount of friction on the tracks. To add multiple carts, you can select an option from a variety of ways to add more. The most used option, the one I used, is the block section mode where along the ride, block sections (straight pieces of track that slow the cart down slightly) must be used throughout the ride depending on how many carts are wanted on the ride at once.
Launch Design
The launch used in my design is electromagnetic, meaning the ride does not have to stop before speeding up again (versus a hydraulic launch where the cart is dragged along the track). I used six electromagnetic launches in my design, with two of them being very short.
Launches are used to build the momentum and speed of the cart throughout the ride and designed using the Planet Coaster 2 ‘Utilities’ tool. These settings include adjusting the acceleration and target speed but often set to maximum for added thrills with a guarantee that the car travels over any hill. One alternative to launches are lift hills - a slower and less exciting way of gaining speed where the cart is taken upwards before gravity pulls it back down.
As shown above, launches must be straight to ensure safety without riders being tossed around whilst accelerating rapidly. The launch track can also be raised up and down for extra thrills - more on that on the next Slide.
Outer-bank and Inverted Top Hat Design
My outer bank design (top right) builds a sense of weightlessness as riders lean to the side, nearly falling out of their seats. To add even more intensity, the launch speed before the outer bank could have been increased to whip the riders out of their seat, but I decided to make it slower to let this element last longer. In an outer bank, the track faces outwards, not upwards.
My inverted top hat (bottom right) features the cart going over a ‘top hat’ design (one that goes straight up, before curving to go straight back down), but upside down or inverted. This adds more thrill and uniqueness, whilst still being safe for the rider. The shape of the track represents the top of a top hat, hence the name.
Airtime Hill Design
I included two airtime hills in my design, one of which is shown to the right. Both airtime hills are on a launch where the rider is shot over the hill, with the rider thrown out of their seat whilst accelerating to create an insanely thrilling combination of elements!
My design also includes a zero G stall, where riders enter a zero G inversion but remain upside down for a longer period of time before turning the right way up again. This allows riders to feel even longer periods of weightless alongside other ride elements, perceived to be hanging for a longer period than actually experienced.
Theming
Here are some ways that I incorporated Greek theming throughout my coaster design including statues, the entrance, the cart design and even a food stand!
Final ‘Hermes’ Roller Coaster Design
POV OF RIDE
POV of Ride Link
The Future of Roller Coasters
Future Rollercoaster Designs
Roller coasters must continue to be just as thrilling and fun, so the designs need to be future-proof. There are multiple ways to do this, one of which being to add more ways for a rider to experience the ride such as VR headsets being used on the ride, even though that has already become a part of certain modern coasters.
Some possible ideas for future coaster designs include:
• Augmented Reality – slightly more advanced than VR, where a rider feels more immersed in the ride.
• AI-driven engineering – as AI develops, there will soon be a way to design coasters that exceed the limits of human invention. To test this, I asked AI to provide a future roller coaster design. The result was questionable…..a track shaped as the infinity symbol, with glass-floored carts and a range of optical illusions on-ride. Perhaps not the most realistic design!
• New technology/materials – the introduction of new technology and materials allows designers to take advantage of technological advancements to add new thrills to coasters.
• Adaptive rides – adjusting the experience for each guest and ride, so a ride is never the same.
• Interactive ride – in addition to the coaster’s thrills, riders must perform certain tasks or actions under pressure.
• Faster/higher – similar to use of new materials, we can use such advanced materials to create faster, higher and more thrilling rides.
Summary
Summary
Roller coasters have so much to offer. From adrenaline rushes to endless thrills, there is always a coaster to match any person’s preference. As well as being able to express my passion for coasters and explain everything I know, it has also been great to learn about what really happens behind the scenes and gain an understanding of all the effort put into designing each individual coaster.
Roller coaster design has progressed at an incredible rate over the last few years, with hundreds of insane roller coasters around the world, some with records that seem impossible to break but somehow are still being surpassed. The future seems bright for roller coasters since there is just nothing quite like them in terms of thrills, and even though AI might not be the best way to design coasters in years to come, manufacturers will be there to constantly match the public and the theme park industry’s needs.
My highlight of this project was by far making my own design where I could take what I know and what I have discovered and apply that in my own ride, including unique elements and theming. In conclusion, roller coasters are in the top of their league and will continue to thrill for many more years!!!
ORCHESTRATION IN THE STYLE OF HAYDN
BY DAVID TAM
(Second Year – HELP Level 1 – Supervisor: Mr Ferrier)
Orchestration in the style
The Classical Period and Haydn
The Classical Period (1750-1820) contained some of music’s greatest works, ranging from symphonies and string quartets to piano sonatas and concertos. Haydn, also known as the Father of the String Quartet or the oldest of the famous trio of Classical composers (Haydn, Beethoven and Mozart), was, and still is, considered to be one of the greatest composers of all time.
Haydn’s style of music conforms to the norm of the Classical Era. Most of his pieces have simple melodies along with consonant harmonies, with a thinner texture. As for his symphonies and unlike other Classical composers around 1760, he stated, “I prefer a band with three bass instruments – cello, bassoon and double bass – to one with six double basses and three celli, because certain passages stand out better that way.” 1 An example of opposition to this idea was in Mozart’s orchestra, where he requested a surprisingly large amount of instruments – “He wanted: 40 violins, 10 violas, 6 celli, 10 double -basses and double wind on each part.” 1 Later on, however, Haydn did adopt the larger, more sonorous version of the orchestra.
Within his pieces, Haydn placed much emphasis on the sound of the bass line, with the bass instruments almost always playing the same harmony as each other to bring out the richness of the bass. He then used the brass to back up the major chords in the cho rd progressions, sometimes including some chromaticism when the trumpets were designed to later become more lyrical. This is shown in Haydn’s Trumpet Concerto, where “they were relegated to playing tonic-dominant phrases” 2. He usually used the woodwind as the main melodic line, often allowing for solo woodwind phrases in his pieces as well as unique tunes. By using the variety of timbres produced by the woodwind, Haydn was able to add contrasting colours to his pieces. Haydn’s strings were used to thicken texture and create musical effects via their interactions with the other instruments from the different sections of the orchestra.
Symphony
Haydn’s symphonies often opened with the first movement in sonata form –ABA – introducing the symphony with a simple yet effective piece. The entire
symphony was usually composed with a sense of stable tonality, with the key signature only modulating to its dominant key or relative major/minor. However, Haydn’s symphonies would resolve to its original key, creating a sense of closure after the recapitulation.
Haydn used strong cadences to demarcate each phrase, often employing the use of V-I chord progressions to mark the end of the musical thought. As well as this, he used the “Circle of Fifths”, or a chord progression which went up or down by perfect fifths. He used this in many of the developments in his pieces, creating a sense of harmonic movement with the consonant interaction between the harmony and the melody.
He would also borrow elements from the Baroque Era, using sharp and sudden changes in dynamic to generate an element of surprise, like in Symphony No.94, also known as the “Surprise Symphony” 3. The symphony is known as such as after a section of calm, quiet and slow phrases, Haydn suddenly denotes for the orchestra to play a forte G major chord, jolting the audience back to attention.
For Haydn’s third or last movements, he would usually end off with a rondo. This was a relatively fast and joyful piece, following the ABACA form. Here, he used contrasting themes to create a playful atmosphere and incorporated a flexible structure as well. This allowed for h is dance-like rhythms and for multiple variations of the theme of the piece.
Analysis
First Movement
The first movement of my symphony is written in sonata form, drawing inspiration from the early symphonic style of Joseph Haydn. It opens with a predictable, lyrical tune presented in the flutes, oboes, and clarinets. This is accompanied by a harmonic counterpart in the violins and violas, which plays a similar motif a major third above. The bass section functions as a unified voice, reinforcing clarity and warmth a texture characteristic of Haydn’s orchestration.
The chordal progression for the first phrase is I-V-I-V (Fig. 1), or the circle of fifths, with the ending being allowing for the continuation of this idea. The repetition of this musical thought evokes a sense of a dialogue, or an unanswered question, which is then “answered” again by the woodwind. The result of this is an energetic forward -moving phrase.
Fig. 1. The circle of fifths chordal progression in the first phrase.
The strings for the exposition follow a similar pattern (Fig. 2), but have fewer notes to thin the texture of the piece to make sure that it is of accordance with the Classical style. As seen below, the celli and contrabasses play the exact same tune, as in Haydn’s time, they would not have had separate staves and instead would have been grouped into one.
Fig. 2. Strings section with a thinner texture.
Fig.3. Quaver-length notes in major thirds and perfect fourths to establish a strong baseline.
To generate an idea of momentum and to maintain the younger Haydn’s interest in a strong bassline, I have used quaver-length notes (Fig. 3). Haydn has been noted to have used major thirds and perfect fourths to establish the tonality of a section and quavers to create rhythmic interest. This is seen in his Symphony No. 101 “The Clock” 4 , where the pizzicato quavers in the strings were used to mimic the sound of a clock. As my symphony is an adaptation of the well-known nursery rhyme, “The Wheels on the Bus”, I have used the quavers in the bass to establish the movement of a bus, or the rolling of the wheels on the road. The dotted rhythm in the violins and violas has been intended to both make sure that the piece remains interesting and to exemplify the jolt of the vehicle on a bump of the road , showcasing Haydn’s playfulness.
The second section (development) of the first movement hints at the famous tune of the rhyme, yet it does not quite fully manifest, as the first movement is merely the introduction to the symphony, and the full -blown tune should not yet be played – it should only be allowed to escape in small, fragmented allusions to the original. The foreshadowing allows for the manipulation of the tune and to keep the audience engaged.
At this point, the brass finally makes an entrance , but only with the French horns (Fig. 4). Here, they have been used for the reinforcement of the melody.
The trumpets have not been used here, to make sure that the texture was not overpowered by the brass and unintentionally make the melody smother the harmony. The strings have once again been used as an accompaniment, with fast, octave-based passages which bring out the sense of suspense and excitement as the movement progresses through the small melodic hints. The chordal pattern I used here is once again the circle of fifths.
Fig. 4. Brass to reinforce mel ody; semiquavers in violins provide a sense of tension.
For the third part of the piece (recapitulation), we see the return of the quaver motion in the bass (Fig. 5). Meanwhile, there is once again the short ascending major scale in thirds. However, this time round, the French horns play and, much like the middle section, hint at the tune of the nursery rhyme , further solidifying the significance of the fact that the complete tune has been reserved for the later movements.
Fig. 5. Return of the quavers as a recapitulation of the refrain.
In summary, the first movement acts as a musical overture to the symphony, hinting at the familiar nursery rhyme while exploring it through Classical conventions. The faster passages in the piece create tension and draw the audience in, and the repetitive rich bass has generated a strong sense of motion.
Second Movement
The second movement of my symphony is, like the Classical style, much slower than the first movement. Here, it opens with a C major chord, setting the tonality, and then the tune of the first section is released. If one was to strip down the tune to its bare bones, one would find that the t une is in fact just a descending scale. The intro has a particularly thin texture, with the violins only supplementing it with crotchets on beats 2, 3 and 4 and only the cello playing one note.
Then, more notably, comes the call and response between the bass and the treble (Fig. 6). The celli, contrabasses and bassoons slowly ascend from I to V, “asking the question” much like in my first movement. The treble respond to said “question” with another scale which descends then ascends, reversing the “question” on the bass. Here, I add rhythmic differentiation to the second iteration of call and response, with triplets being included in the bass and dotted crotchets in the treble/soprano. Below is an example of what I have done in the strings. The same has been done in the woodwind. (N.B ., I have not included brass for this section)
Fig. 6. Call and response between bass and treble.
Then, I modulate into C minor (Fig. 7) by using a descending scale which slowly incorporates elements of the C minor harmonic scale . As seen in the first movement, the brass has been used to emphasise important points in the downward scale.
Triplets are of importance again here, as they add to rhythmic contrast from the rigid crotchet rhythms of the introduction. After this section, a broken chord of C minor defines the tonality for this section and is a haunted echo of the introduction’s broken chord of C major.
7. Modulation into C minor harmonic.
Fig. 8. Main melodic idea of the second section of the second movement.
Figure 8 shows the main melodic idea of the second section of my second movement. I have rewritten the main melodic idea in the clarinet stave to be a minor third above the original theme to create a consonant harmonical sense. In the violins and viola, the idea of the accompaniment in the first section makes another appearance, but is in a minor key to suit the second section. This idea is generally used to display the sense of a limping forward movement and exemplifies the twistedness of this section. The French horns have again been used to reinforce the main melodic idea, and the fac t that the section is in C
Fig.
minor harmonic is a mirthless reminder of how the major key has been turned to the opposite tonality.
Fig. 9. Application of semiquavers in French horns to break up the monotony
To ward off the boredom of the audience, I have included a faster French horn passage of semiquavers (Fig. 9). These notes have also been written in C minor harmonic and the fast semiquavers have been used to generate a forwardmoving sense in the piece. It also demarcates the ending of the second section of the movement.
At last, I have used all the brass instruments at the third and last section of my piece (Fig. 10 and Fig. 11). I have also finally included the entire musical thought of the nursery rhyme “The Wheels on the Bus”. The loudness and clarity of the trumpets have been used to break the ominous gloom of the second section as the piece returns to the C major key. This has been specifically designed to make it seem like the glorious sunshine after the storm clouds have dissipated. The strings are then played to the same tune as the brass, adding a layer of sonority and richness. After this, all the parts of the orchestra reconvene to play the tune, with triplets once again returning in the violins and viola to a dd rhythmic variation.
Orchestration
Tam
Fig. 10. Triumphant announcement of the melody of the Wheels on the Bus
Fig. 11. In conclusion, in the second movement, I have explored the Classical idea of a slower second movement, with modulation into a minor key from a major and the return of the major key later in the piece.
Third Movement
The third and last movement of my symphony is in the Rondo form – ABACA. It opens with a large, vibrant C major chord, with all instruments playing , to rouse the audience after a slow second movement . Then, I use the circle of fifths to allow the tonality to establish a foothold on the introduction of the piece. As this is a rondo, the piece is played at a fast tempo for the audience to get a feel of the bounciness and forward momentum of the piece ; matching the spirit of the original nursery rhyme “ The Wheels on the Bus”. I have used a steady crotchet harmony interlaced with the quavers to achieve the sense of allegro con brio (Fig. 12).
The introductory phrase’s chord progression is as follows: I-V-I-V-I-V-I. As the phrase has ended, I have ended it on the tonal chord for a sense of closure. I have also denoted for the celli and contrabasses to play staccato for this phrase to lighten the texture and produce the bounciness required for the musicality to show through. Unlike in the previous movements, I have not used the brass in this movement purely for emphasis on specific notes – instead, the brass carries the melody to make sure that the final piece of my symphony pac ks a punch.
This refrain has been intended to generate awaken the audience after the slower, gentler second movement, which may have caused the listener to lose interest. As said before in my analysis, the dotted rhythms mimic the bounces and jolts of the bus on the road, with the staccatos representing small breaths and breaks, while the quavers move the piece forward like the wheels of the bus.
With some variation, this phrase is then played again – this time with less instruments to reduce the texture and not overload the audience. The descending scale in the bass going from I-II creates a sense of unfinished business and suggests that although there may be a new section, our refrain will be heard again sometime later.
Fig. 12. Crotchet harmony interlaced with quavers to move the piece forward at pace.
In the next section (the episode), we again encounter the theme of the nursery rhyme this symphony is based on. This is shown above. I have used triplets here for rhythmic contrast to the regular crotchets and quavers, and have used
dotted rhythms to exemplify the musicality of the piece. Like Haydn, I have placed an emphasis on the melody being played in the woodwind, and for the harmony to be simple and consonant with the melody.
Fig. 13. Reminder of the theme of the symphony.
The refrain comes once again after the tune of the rhyme is played, but this time, I use it to modulate from C major to C minor for the second episode (Fig. 14). To create a sense of familiarity and freshness at the same time, I have employed the same rhythm and scale structure – it descends from I-V-I.
Fig. 14. Modulation of the refrain from C major to C minor.
The next passage is reminiscent of the second movement of the symphony – it has much less movement in the melodic line as it consists entirely of semibreves (Fig. 15).
Fig. 15. Slow moving extract.
Here, I repeat what I have done in the first refrain – I have maintained a regular rhythm with the crotchets intertwined with the quavers and made use of dotted rhythms. The general melodic pattern here is that the melody moves down in a scale. In this section of the piece, the brass section has been silenced entirely to allow for the delicate melancho lily of the woodwind and string to come through without being broken by the brighter, louder brass.
Fig. 16. Semiquavers are added to break up bass and harmony.
As is the general trend of the symphony, I have used rapid semiquavers to indicate movement from a particularly slow or sluggish section into a brighter, faster and more active one. Though the melody’s rhythm remains the same, the bass and harmony have now been broken up by the new rhythmic change (Fig. 16).
To break away from the dark, dreary and gloomy C minor, the refrain returns once again in C major. The melody returns to as it was in the beginning , played in both the woodwind, brass and strings with the circle of fifths to reestablish the major tonality.
The ending of the piece has a chord progression of IV-III-II-I, landing the entire piece in the warm embrace of C major, with a drumroll from the timpani as an extra flourish (Fig. 17).
Orchestration
Fig. 17. The ending of the third movement and of the symphony.
Orchestration
References
1. The Classical Style, Revised Edition, 1976 (P. 143), Charles Rosen, Faber and Faber, ISBN: 0-571-04905-2
2. Classicalexburns; accessed on 14 May 2025 https://classicalexburns.com/2022/03/30/joseph -haydn-trumpet-concerto-anatural-progression/
3. Symphony No.94 in G major, Hob.I:94, Haydn, J.
4. Symphony No.101 in D major, Hob.I:101, Haydn, J.
Appendix
Appendix A – Symphony No. 1 , “March of the Wheels”, 1 st Movement, David A. Tam
Symphony No. 1, Mvt . 1
"March of the W heels"
Flutes
Oboes
Clar inets in B♭
Bassoons
Hor ns in F
T r umpets in B♭
T impani
Violins I
Violins II
Violas
Violoncellos
Contrabasses
Vc.
V la
V ln II
V ln. I T imp B♭ Tpt.
V la
V ln II
ln. I
V la.
V ln. II
ln. I
Appendix B – Symphony No. 1 , “March of the Wheels”, 2 nd Movement, David A. Tam
No. 1, Mvt . 2
"March of the W heels"
Moderato
Flutes
Oboes
Clar inets in B♭
Bassoons
Hor ns in F
T r umpets in B♭
T impani
Violins I
Violins II
Violas
Violoncellos
Contrabasses
V la
V ln. II V ln. I
V la
V ln. II V ln. I
V ln. II V ln. I T imp
V la
V ln II
V ln. I T imp.
V la
V ln II V ln. I T
Appendix C – Symphony No. 1 , “March of the Wheels”, 3 rd Movement, David A. Tam
the
Flutes
Oboes
Clar inets in B♭
Bassoons
Hor ns in F
T r umpets in B♭
T impani
Violins I
Violins II
Violas
Violoncellos
Contrabasses
V la.
V ln II
ln. I
V la.
V ln II
V ln. I T imp. B♭ Tpt.
V la
V ln II
V ln. I
V la
V ln II V ln. I
V la.
V ln. II
V ln. I T imp. B♭ Tpt. F Hn Bsn. B♭ Cl
V la
V ln II
V ln. I T imp B♭ Tpt
V la
V ln II
V ln. I T imp B♭ Tpt
Vc.
V la
V ln II
V ln. I T imp
B♭ Tpt
F Hn
Bsn
B♭ Cl.
Ob. Fl
Vc.
V la
V ln II
V ln. I T imp
B♭ Tpt
F Hn
Bsn
B♭ Cl.
Ob. Fl
II
THE GEOPOLITICS OF AI: THE US-CHINA AI BATTLE
BY RUAAN VAMADEVAN
(Second Year – HELP Level 1 – Supervisor: Dr Flanagan)
The Geopolitics of Artificial Intelligence:
The US-China AI Battle
June 2025
Ruaan Vamadevan
Hampton School (2L)
Introduction
The dawn of artificial intelligence (AI) as a transformative force in global affairs marks a pivotal moment in the 21st century’s geopolitical narrative. No longer relegated to the realm of speculative fiction or confined to isolated technological marvels, AI has become a strategic asset with the power to redefine military might, economic supremacy, and the very architecture of international relations. At the heart of this seismic shift lies the intensifying rivalry between the United States (US) and China - two superpowers locked in a contest that will shape the future global order.
The stakes of this AI battle are existential. The nation that achieves AI supremacy stands to wield unprecedented influence, not only over its own destiny but also over global rules, values, and opportunities available. The US and China are not merely competing for technological breakthroughs; they are vying to set the standards, control the infrastructure, and dictate the ethical and regulatory frameworks that will govern the digital societies of tomorrow. This competition is already manifesting in militar y innovations, economic strategies, and the bifurcation of global technological ecosystems.
This essay explores the far-reaching geopolitical implications of the US -China AI rivalry. It begins by examining the role of AI in reshaping military strategy and security dynamics, then analyses the quest for technological sovereignty and the risks of digital dependency and finally assesses the economic and systemic consequences of the arm-wrestle for AI supremacy, including the emergence of competing global blocs.
The AI battle is not only a contest for technological leadership, but a struggle to define the foundations of the 21st- century world order.
AI as a Force Multiplier in Modern Warfare
The integration of artificial intelligence into military systems has fundamentally altered the strategic calculus of great-power competition. In the past, military dominance was largely a function of manpower, industrial capacity, and conventional firepowe r. Today, AI acts as a force multiplier, enabling nations to enhance their military capabilities exponentially without proportional increases in personnel or expenditure. Advanced AIdriven systems can optimize logistics, analyse vast intelligence datasets in real time, and increase the precision of targeting, allowing less traditionally dominant militaries to challenge established powers through autonomous weapons, cyber operations, and information warfare. E.g., Ukraine, who don’t have significant air-force capability, destroyed Russian strategic bombers with a “Trojan horse” drone attack 3000 miles deep into Russian territory in June 2025
For the US, AI offers a pathway to maintain its technological edge and global military reach. The Pentagon’s investments in AI- enabled command and control (C2) autonomous decision-making systems, autonomous drones, and predictive analytics are designed to ensure rapid decision-making and battlefield superiority. AI-powered surveillance platforms can sift through terabytes of satellite imagery and signals intelligence, identifying threats and opportunities faster than any human analyst. Meanwhile, the integration of AI into missile defence, electronic warfare, and logistics allows for more agile and resilient military operations.
China, recognizing the transformative potential of AI, has made its development a national priority. The Chinese government’s “Next Generation Artificial Intelligence Development Plan” explicitly links AI to national security, calling for the creation of intelligent military systems that can operate autonomously and adaptively in complex environments. The People’s Liberation Army (PLA) is investing heavily, for example, in AIpowered swarm drones, unmanned underwater vehicles, and cyber capabilities designed to disrupt US military networks and infrastructure. By leveraging AI, China aims to offset US advantages in traditional platforms and project power in contested domains such as the South China Sea and the Taiwan Strait.
Military Transformation and Security Dilemmas
The new “Arms Race”: Autonomous Weapons and Deterrence Instability
The AI- driven arms race is defined less by the accumulation of tanks and aircraft and more by the pursuit of speed, autonomy, and data superiority. Autonomous weapons systems (AWS), such as AI-powered drones, unmanned ground vehicles, and robotic swarms, are at the forefront of this new competition. These systems can operate independently, making split-second decisions based on real-time data, and are capable of overwhelming traditional defences through sheer numbers and adaptability.
This shift introduces profound risks for global security. Unlike nuclear weapons, which are relatively easy to monitor and verify, AI systems are opaque, rapidly evolving, and difficult to regulate. The prospect of a surprise AI breakthrough by one side could destabilize deterrence, prompting pre- emptive actions or miscalculations “Flash war” scenarios - where AI- driven military systems respond to perceived threats with such speed that escalation spirals out of human control- are now a genuine concern. The risk of accidental or unintended conflict is heightened by the potential for adversarial attacks on AI decision-support systems, data poisoning, or the misinterpretation of ambiguous signals.
The dual-use nature of AI technology further complicates the picture. Many of the algorithms, sensors, and computational platforms that underpin military AI are developed for civilian purposes, such as self- driving cars or industrial automation – a contrast with the past where many innovations were born in the military and then adopted for civilian use. This makes regulation and non-proliferation efforts exceedingly difficult, as innovations can be rapidly adapted for military use by state and non-state actors alike. The proliferation of AI- enabled weapons, especially to rogue states or terrorist groups, poses a new class of security threats that are harder to contain and predict than the nuclear arms race of the 20th century.
Figure: Automated AI swarm drones in flight (Source: National Defense)
Alliance Dynamics and the Governance Challenge
The AI arms race is not occurring in a vacuum. The United States, China, Russia, the European Union, and other major powers all have differing views on AI ethics, development, and control. Military cooperation among allies - such as within NATOnow hinges on harmonizing AI norms and ensuring interoperability between national systems. Disagreements over data sharing, algorithmic transparency, and the use of lethal autonomous weapons could strain alliances and complicate joint operations. Efforts to establish global treaties or norms for the control of military -grade AI have so far struggled to gain traction. Unlike nuclear non-proliferation, where clear lines can be drawn between civilian and military applications, the dual-use character of AI blurs these boundaries. Controls on AI chips and software are difficult to enforce, and the rapid pace of innovation means that yesterday’s restrictions may be obsolete tomorrow. The absence of robust governance frameworks increases the risk of arms races, proliferation, and unintended escalation.
Nowhere are the military, technological, and geopolitical stakes of the AI battle more evident than in Taiwan. The island’s geopolitical significance stems from its dual role as a democratic flashpoint in US-China relations and as the world’s leading produ cer of advanced semiconductors. Taiwan Semiconductor Manufacturing Company (TSMC) alone produces two -thirds of the global semi- conductors, and over 90% of the world’s cutting- edge AI chips, making it a critical node in the global AI supply chain.
China’s persistent claims over Taiwan, reinforced by military drills, cyberattacks, and economic coercion, clash with Taiwan’s push for international recognition and deepening ties with the United States. A Chinese takeover of Taiwan would not only shift regional power dynamics but also grant Beijing unparalleled leverage over AI
The Taiwan Semiconductor Dilemma
Figure: Taiwan Semiconductors production dominance (Source: Money Morning )
infrastructure, potentially reshaping global security and economic networks. Conversely, heightened US-Taiwan collaboration could further entrench Taiwan’s role as a democratic tech bulwark, albeit at the cost of escalating great-power tensions. The U.S., while reaffirming support for Taiwan’s defence, faces domestic pressures and strategic ambiguity under Trump’s "America First" policies, including demands for Taiwan to self-fund its military and threats of trade penalties. Taiwanese President Lai Ching-te’s efforts to bolster defence spending to over 3% of GDP and deepen U.S. ties reflect Taipei’s strategy to counter Beijing’s pressure, even as China warns that any move toward formal independence could trigger conflict. This uncertainty complicates cross-strait stability, with Taiwan’s location in the first island chain and its leadership in advanced chip production making it a focal point for both superpowers.
In summary, the militarization of AI is transforming conflict, the logic of deterrence, and alliance politics. The US- China rivalry is driving an arms race that is faster, more opaque, and more difficult to regulate than any in history. The consequences for global security are profound, with the risk of accidental escalation, proliferation, and the erosion of established norms.
Technological Sovereignty and Digital Dependency
Digital Dependency
As artificial intelligence becomes embedded in every facet of modern life - from information searches and business operations to healthcare and national security - the question of who controls AI systems has emerged as a critical issue for governments worldwide.
Figure: GenAI usage across multiple industries in the US (Source: Ben Evans “AI eats the world”)
Nations that rely on foreign providers - such as Amazon, Google, or Alibaba - for cloudbased AI services face strategic vulnerabilities, including the risk of surveillance, data exploitation, backdoors, and economic coercion. Their critical information flows and decision-making processes become subject to the influence of foreign powers, echoing the geopolitical dynamics of energy dependency in the 20th century The consequences of digital dependency are not merely technical but deeply political. Governmen ts that cede control over AI systems risk losing the ability to shape public opinion, protect societal values, and safeguard national security. In a world where AI-generated content can subtly reinforce cultural beliefs or suppress inconvenient truths, maintaining sovereignty over AI is seen as essential for protecting national interests.
The Rise of Sovereign AI
The concept of “Sovereign AI” refers to the development and operation of AI systems that are fully controlled by a national entity, designed to comply with local data sovereignty laws and reflect the cultural, ethical, and regulatory priorities of a specifi c country or region – essentially to avoid digital dependency
For the United States, sovereign AI means ensuring that American companies and government agencies retain control over the data, algorithms, and computational infrastructure that underpin AI systems. Models like OpenAI’s ChatGPT and Meta’s Llama are developed using American infrastructure, datasets, and regulatory frameworks, embedding Western perspectives and values into their outputs.
China, for its part, has aggressively pursued its own sovereign AI capabilities. The Chinese government has invested billions in domestic AI research, established strict data localization requirements, and developed indigenous alternatives to Western platforms. Chinese AI models, such as DeepSeek, are designed at training or posttraining to align with government priorities and censorship policies. For example, when prompted about sensitive topics like the Tiananmen Square Massacre, these models are programmed to avoid the subject or provide ‘acceptable’ responses, reinforcing state-approved narratives and insulating citizens from external influence.
Figure: DeepSeek’s reasoning and responses to “sensitive” questions (Source: Digital trends)
The pursuit of sovereign AI is not limited to the US and China. Other nations, such as Saudi Arabia, are making substantial investments - like the recent $100 billion+ allocation for a domestic “AI factory” - to reduce reliance on foreign cloud infrastructure and AI platforms. The European Union is also seeking to establish its own regulatory frameworks and invest in domestic AI capabilities, aiming to balance innovation with privacy and ethical considerations.
The global race for AI sovereignty is exacerbating inequalities, as countries with the resources to invest in domestic AI capabilities pull ahead, while others become increasingly dependent on foreign platforms.
Figure: Global private investment in AI 2013-22 (Source: World Economic Forum)
Data, Infrastructure, and the New Resource Race
In the AI era, the critical resources are not oil or steel but data, algorithms, and the computational infrastructure - such as graphics processing units (GPUs) and supercomputers - required to build and operate advanced AI models. The ability to collect, process, and analyse vast amounts of data has become a key determinant of national power. Countries that can afford to invest in these capabilities are moving rapidly to develop their own sovereign AI stacks, ensuring that they - not foreign corporations or rival governments - dictate the flow of information and the direction of technological innovation within their borders. The high costs and technical complexity of developing sovereign AI present significant challenges for smaller or less wealthy nations lacking the financial or technological resources to build their own AI infrastructure, for whom the risks of digital dependency loom large.
The US and China are both racing to secure access to the world’s most advanced semiconductor manufacturing, high-performance computing, and data storage facilities. The US government has moved to restrict the export of advanced AI chips, manufacturing equipment and cloud computing services to China, citing national security concerns, aiming to slow China’s progress and protect its own technological edge. China, in response, is pouring resources into developing domestic alternatives to US-restricted components, such as Huawei’s Ascend chips as rivals to Nvidia’s GPUs. This competition is leading to the formation of parallel supply chains, standards, and innovation pathways – essentially “decoupling” them.
The Challenge of Regulation and Governance
Efforts to regulate AI at the international level have so far struggled to keep pace with technological change. The dual-use nature of AI, the opacity of algorithms, and the lack of transparency in data collection and processing make it difficult to establish clear rules and enforceable norms. The result is a fragmented landscape, with competing regulatory frameworks, standards, and ethical guidelines.
Sovereign AI and the Future of International Relations
Comparing the rise of sovereign AI to previous technological revolutions highlights both the opportunities and risks at stake. Just as the Industrial Revolution empowered nations that could harness and control their own energy resources, the AI revolution is set to empower those who can master the production, governance, and deployment of AI within their own borders. In both cases, the economic and political stakes are shaping the global balance of power and the future of international relations. The difference now is that the “raw material” is not a physical commodity but the digital infrastructure and data that underpin AI systems.
In summary, the quest for technological sovereignty is rapidly becoming a defining issue in the US-China rivalry. Sovereign AI, therefore, represents not just a technological priority but a fundamental shift in how nations assert their independence and protect their values in an interconnected, AI- driven world. The ability to produce, govern, and deploy AI on national terms will determine economic competitiveness as well as cultural autonomy and political sovereignty. For countries unable to keep pace, the risk is a new form of dependency – a digital one that could prove as consequential as the energy dependencies of the past.
Economic
Power, Global Standards, and Bloc Formation
AI as an Engine of Economic Transformation
Beyond its military and technological dimensions, the US-China AI rivalry is rapidly transforming the global economic landscape. AI is not just a military asset but a driver of economic growth and productivity. Both the US and China are leveraging AI to automate industries, streamline logistics, and create new markets, with the potential to reshape global labour and supply chains.
The nation with AI supremacy stands to lead in critical sectors - such as finance, healthcare, manufacturing, and logistics - reaping outsized economic benefits and setting the rules for international trade and technology transfer. AI- driven innovation is already powering the next wave of digital platforms, from autonomous vehicles and smart cities to personalized medicine and financial technology. The economic stakes are enormous: according to some estimates, AI could add trillions of dollars to global GDP over the next decade, with the lion’s share accruing to the countries that lead in research, development, and deployment.
Figure: Economic potential of AI globally (Source: McKinsey & Company 2023)
The Battle for Global Standards and Digital Ecosystems
As the AI race intensifies, the focus has shifted from individual technological breakthroughs to the architecture of entire digital ecosystems. Both Washington and Beijing are pushing rival regulatory frameworks and technical standards, aiming to lock other countries into their respective digital spheres of influence.
The US, through its dominance of global tech giants and cloud infrastructure, is setting de facto standards for AI development and data privacy. American companies such as Google, Microsoft, and Amazon provide the backbone for much of the world’s AI infrastructure, shaping the rules and practices that govern digital society.
China, meanwhile, is leveraging its massive domestic market and state - driven industrial policy to promote its own standards and platforms. The Chinese government has invested heavily in “Digital Silk Road” initiatives, exporting Chinese-built AI infrastructure, surveillance systems, and smart city technologies to countries across Asia, Africa, and Latin America. By embedding Chinese standards in the digital infrastructure of developing nations, Beijing aims to expand its influence and create a global ecosystem that is interoperable with Chinese platforms, but potentially incompatible with Western systems.
The Emergence of Competing Blocs: The “Digital Iron Curtain”
The result of these efforts is the emergence of distinct geopolitical blocs, with nations aligning their digital infrastructure, regulatory policies, and supply chains with either Washington or Beijing. This “digital iron curtain” is fragmenting the global technology landscape, with export controls, technology bans, and competing standards accelerating the formation of parallel supply chains and innovation pathways.
Recent events have underscored the speed and intensity of this bifurcation. The US has expanded export controls on AI chips and manufacturing equipment, seeking to choke off China’s access to the most advanced technologies. China, in response, has accelerated its push for tech self-sufficiency, investing in domestic semiconductor manufacturing, AI research, and alternative operating systems. The ability to share data, algorithms, and best practices across borders has been a key driver of progress in AI research and development. The emergence of parallel technology stacks - one Western, one Chinese – and competing blocs, each with its own standards and restrictions risks fragmenting global markets, stifling cross-border innovation, and forcing businesses to operate in redundant or incompatible systems, limiting the benefits of AI for the world.
For multinational companies, the bifurcation of the global AI landscape presents significant challenges. Firms must now navigate a complex web of regulations, standards, and supply chain restrictions, often maintaining separate product lines and
infrastructure for different markets. The costs of compliance, duplication, and lost economies of scale are substantial, and the risk of being caught in the crossfire of USChina tensions is ever-present.
The Impact on “Third Bloc” countries: Choices and Consequences
Middle powers and developing nations face difficult choices in this new environment. Some, such as India, Brazil, and Indonesia, are seeking to carve out their own space by investing in domestic AI capabilities and promoting digital sovereignty. Others are aligning more closely with one bloc or the other, attracted by the promise of investment, market access, or security guarantees.
The global AI race could exacerbate existing inequalities, as countries lacking the resources to develop sovereign AI become dependent on foreign providers ; where the rules, values, and opportunities available to a country are determined not by its own citizens but by the interests of distant superpowers.
The Future of the Global Economic Order
The outcome of the US-China AI rivalry will have profound implications for the future of the global economic order. If the current trajectory continues, the world could see the emergence of two competing digital ecosystems, each with its own standards, supply chains, and spheres of influence. The risk is a fragmented and less efficient global economy, with higher costs, slower innovation, and increased barriers to trade and collaboration.
Alternatively, there is the possibility of a more cooperative and integrated approach, where countries work together to establish common standards, share best practices, and promote the responsible and equitable development of AI. Achieving this outcome will require strong leadership, trust-building, and a willingness to compromise on both sides.
In summary, the economic and systemic consequences of the US- China AI rivalry are far-reaching. The battle for AI supremacy is not only a contest for technological leadership but a struggle to define the rules, values, and opportunities of the 21stcentury global economy.
Conclusion
The AI battle between the United States and China is more than a technological rivalry; it is a defining contest for global power, economic leadership, and the future of international norms. From the militarization of AI and the struggle for technological sovereignty to the formation of competing digital blocs, the consequences of this competition will reverberate across every facet of society.
The militarization of AI is transforming the logic of deterrence, alliance politics, and conflict, raising the risk of accidental escalation, proliferation, and the erosion of established norms. The quest for technological sovereignty is reshaping the bala nce of power, as countries race to secure control over the data, algorithms, and infrastructure that underpin AI systems. The economic and systemic consequences of the AI race are driving the emergence of competing blocs, fragmenting the global technology landscape, and creating new forms of digital dependency.
The outcome of the US-China AI rivalry will not only determine which superpower leads in the 21st century but will also shape the rules, values, and opportunities of the emerging global order. The choices made today - by governments, companies, and citizens - will echo for generations to come, influencing the trajectory of technological progress, the distribution of power, and the prospects for peace and prosperity.
In this contest, the world faces a choice: to allow the AI battle to drive division, instability, and inequality, or to seek common ground and build a more inclusive, cooperative, and responsible approach to the development and deployment of artificial intelligence.
The trajectory of this era hinges on the defining geopolitical rivalry of our time.
7. https://www.mckinsey.com/capabilities/mckinsey - digital/our-insights/theeconomic-potential- of-generative-ai-the-next-productivity-frontier General Research
HOW HAS THE POTATO EVOLVED INTO HOW IT IS NOW, AND HOW HAS IT AFFECTED THE WAY WE ARE NOW?
BY LUIS MORENO YAO
(Third Year – HELP Level 2 – Supervisor: Mr Harrison)
How has the potato evolved into how it is now, and how has it affected the way we are now ?
Intr oduction:
Potatoes. You may be reading this, wondering why I have chosen to write about a vegetable instead of a ‘cooler’ topic such as videogames, or fractions, or the history of history. However, potatoes are cool. Cooler than videogames or fractions. When the decision came to do a HELP project, I wanted to do something which reflected my diverse heritage, consisting of Spanish and Chinese parents, and potatoes is the bridge which connects them (other than their flag colours). Furthermore, potatoes can be used in so many ways, it has always fascinated me how they can be mashed, or fried, or turned into a battery for clocks. Additionally, what has intrigued me since I was young is how potatoes form an endless loop, as if you buy a normal potato from your local Tesco’s and just plant it in the ground with a little water, in just a few weeks you will begin to see that a little green plant will begin to sprout through the layers of dirt and grow into sometimes multiple potatoes; this process is called vegetal reproduction and can come with some undesired consequences due to the fact that this causes the new potatoes to be genetically clones of the father potato which means that: if the first potato had an illness or virus, it would get passed onto the next potatoes; furthermore, if one potato was especially bad tasting or ridden with black spots, this would persist with the ‘new’ potatoes.
As you can see from this helpful image from the CIP or the International Potato Center, there is the mother potato or ‘tuber’ which is where the roots, plant and baby tubers come from. Going back to the CIP, they are doing wonderful work in Africa, China and Latin America in order to ‘increase and share the benefits of root and tuber crops and their agrifood systems through equitable partnerships and science-based innovations to address the climate, nutrition, and poverty challenges of the future.’ To summarise this somewhat lengthy quote, potatoes are an incredibly versatile plant which is packed with vitamins, and it is a carbohydrate meaning it can provide long-standing energy release, keeping workers and villagers full of energy and with full bellies. Additionally, in the global south (as in poorer countries which struggle with basic needs such as food, shelter and water), potatoes
can be a new ailment introduced to keep these poorer villages and tribes full, whilst maintaining a stable harvest which can also be used throughout the colder seasons as potatoes can withstand winter cold.
Back to the original idea, potatoes are an incredibly interesting topic with a vast and deep history which we will uncover, which began in 8,000 B.C with the Incas
Origin of potatoes :
Although most of us know and love potatoes as both a source of nutrients and carbohydrates, and the base foundation for many a main dish, side or snack; however, when potatoes were first discovered in the Incan empire in Mezo America, they were used as a method of time measurement through boiling a potato, if a potato had an odd shape, it could mean that a storm was coming and some Incans even used the potato to ease childbirth. The image on the right is how potatoes at the time of the Incans looked like, the potatoes we know look different due to the differing climate and altitude between South America and Europe As time went on, the potato grew to become a revered food that was included in medicine to treat injuries. Another food which we use in a very different way than the Incans is the Cacao bean which, like the potato, was used in various ways including as a form of currency and as an energising drink which was to be drunk before war; recently, scientists investigating the properties of cacao discovere d that consuming it without the addition of sugar can actually give properties strengthening both physical and mental properties. What we can take from this is that the potato might very well also contain some of these presupposed properties such as a mild anaesthetic. Thousands of years later in 50 A.D, farmers in the Andes discovered that potatoes grow better in high altitudes which meant that many civilisations flourished in the valley zone which was where all the potatoes were planted. All this is helpful knowledge, but the question we should be asking is: how has the potato evolved as it has, and taken a form which is so different from any other vegetable we know of?
How the potato is the way it is :
Potatoes were, until recently, one of the vegetables which evolved separately from us humans and which we did not attempt to change or grow. Unlike wheat and rice, potatoes were wild for a very long duration, which made them the way they are; some examples of this are that instead of being a traditional plant with its food stored in its stem, it stores all its food as starch in tubers which is the part we eat. What this means for the plant is that it is resistant to harsh weather conditions, as it can just let the flower
and stem die, whilst keeping a source of food for when the weather gets better. This can also protect against harmful bacteria, viruses or bugs, as if one part of the plant becomes infected or infested, it can sacrifice that part of the plant by cutting the water supply through that petiole. It is common knowledge that a potato is a vegetable; however, it also contains fruit which goes by various colours and sizes as shown in the images below. Although this fruit shares the same class, nightshade, as many other fruits and vegetables such as tomatoes and eggplants, the fruit it produces contains a high amount of solanine, which is harmful to humans. The green skin of a potato also contains small amounts of solanine, which is removed after frying. This is a problem that neither cooks nor the public know about, which is that green potatoes contain between 0.1 to 0.4 grams of solanine per potato. With a diet composed mainly of potatoes, one can find themselves severely poisoned, this, however, is prevented due to the fact that not many people choose to eat green potatoes and prefer to lean towards white potatoes which contain little to no glycoalkaloids. The potato plant made these in self- defence as they are a natural pesticide. As humans realised the greatness of the tuber part of the plant, they did not use the berries to plant more potatoes as they reproduce vegetatively. Furthermore, although they contain 250-500 seeds, the potato fruit take up to 7 months to fully grow, and it is much more efficient to just take another tuber and plant it which takes significantly less time and effort. A key element of any plant is the flower, and the potato plant has exactly that. Flowers are used to pollinate in order to grow fruit, and in this case, it is the potato berry. The flowers of the plant come in a plethora of colours and smells, and the anther, and petals can come in almost any combination of: red, white, and blue. However, pollination is not the only use for these beautiful flowers; regarding harvesting potatoes, farmers have discovered that the emergence and disappearance of the flower correlates with the readiness of the tuber. This means we can currently predict when a potato is ready to be harvested, optimising the harvest.
How potatoes were brought to Europe:
The way that the humble potato entered our lives is a long, and tragic one, and it started over 500 years ago in a lowly wool merchant’s family. His name was Dominico, and his eldest son was none other than the revered Christopher Columbus. However, what many may not know, is that his name was Cristoforo Colombo, and he changed his name to Christopher Columbus to appeal more to the Spanish and Americans. Interestingly enough, the Spanish just had their own name
for him anyway, which was Cristobal Colon. Christopher decided to be like his father (as many children at the time were forced to do) and learned the skills of navigation, cartography as well as many other key qualities when attributed to the navigation of the seas. It was only when he turned 33 years old when he decided to leave for an expedition to India in desire for an adventure into the unknown. By this point he had travelled to most of the known world such as Iceland and the coast of West Africa; he was also married with the daughter of a poor noble family in Portugal Even though Columbus was born and raised in Sicily, Italy, the global superpower at the time was most definitely Spain, and because of this he voyaged to Spain to present the idea of this expedition to the king in hopes that he would give Columbus more men and the funds to lead this voyage to India in return for all of the treasures they would undoubtedly find. This painting on the right depicts a royal hearing or assembly, and in particular, this one shows us what it would have been like for Christopher to inquire about the use of funds for his exploratory needs. However, back in 1484, he decided to ask King John II of Portugal instead, this may have been due to the fact that he was not yet an important enough or famous enough sailor and navigator, it could have also been due to the links he had with his wife being a noblewoman; he was turned down by the king of Portugal, and after just 2 years, he relocated to Spain in the hopes that the king and queen of Spain would fund him for his adventure. Alas, the days passed and Christopher grew hungry for adventure in a new world. After six years of pain and suffering, his appeal was passed and he was scheduled to leave in just 7 months. This sudden acceptance was due to the successful conquest of Granada, meaning that Spain was no longer in a military struggle any longer and could devote money through other means. The conquest of Granada essentially ended Muslim rule from over 800 hundred years ago, so you could say that Spain wanted to ride the wave of victory with Christopher, and that they certainly did.
I really don’t want this to just be another boring historical account of Christopher Columbus’ adventures, so I will just say this: he created the passageway for new food and materials to be brought from the Americas to Europe and beyond.
Although Columbus discovered the Americas in 1492, the first potato was only brought to Europe in the 16th century. This was because it took a very long time for the Europeans to essentially ‘conquer’ America. Once the potato was brought to Spain, its popularity surged as it was a form of cheap sustenance for the poor. Potatoes are incredibly resistant to conditions and because of this, it was much better at growing and being harvested than other vegetables such as cabbages, carrots or turnips.
The Columbian exchange was created from 1492-1800 and saw the taking of food, people and valuables from the Americas to Europe. This included, chilies, peppers, potatoes, cacao, corn, tomatoes and more. As for people, the conquistadors took over
11 million slaves from Africa to work in transporting these goods. This was called the transatlantic slave trade.
Although these new foods were brought to Europe, they were not commonly used as food, and instead the people of Britain especially, thought that these new vegetables such as tomatoes were poisonous, due to the bright red colour. Furthermore, there were rumors that people would die right after eating one. It took nearly 200 years, until someone named Robert Gibbon Johnson ate an entire basket of tomatoes in one sitting. There is lots of controversy to whether tomatoes were actually poisonous and cultivated to remove the poison, or whether the acidity of the tomato combined with the lead coating of the plates, resulted in the deaths of many. However, we are here to talk about potatoes Sir Walter Raleigh first brought potatoes to Ireland in 1589, almost a century after Christopher Columbus discovered America. Now, what text about potatoes would be complete without the Irish Potato famine?
The Irish Potato Famine
It is no secret that the Irish love potatoes. They are used in almost every dish, and for good reason. As said by Lara Hanlon, potatoes can serve as a gateway through the past, present and future. She wrote a fascinating article about the relationship between the Irish and potatoes, highlighting the dependence they had on the calorie- dense carbohydrate. The reason the potato famines of 1740-41 and 1845-49 struck so hard to the poor populations of Ireland was the deep connection and reliance on the spud. Around half of the population ate almost exclusively potatoes, whereas the other half ate them frequently, this meant that when, in 1845, a new strain of water mold which came from North America attacked almost all the potatoes in Ireland, the people had basically nothing to eat. This water mold was called Phytophthora?.and was normally kept in check through the hot, dry conditions in America, but due to the humid, wet climate of Ireland, the Phytophthora flourished. This 4 year long famine caused around 1 million deaths, and the only way some survived was from migrating to other countries such as the US. As illustrated wonderfully in his novel ‘Twist of gold’, Michael Morpurgo tells us the story of two children escaping to the US in hopes of survival. This unforgettable tale shows us the extent to which the potato famine affected the people of Ireland. Interestingly, although the potato caused such distress and disaster, after the events of the famine, the Irish still very much adore the spud, and the national dish of Ireland, Irish stew, contains potatoes, and through my research, I have found out that there are tens upon tens of dishes with the potato in it. All in all, you could say a potato is a double- edged blade, it has great pros, but also great cons; this is due to the asexual reproduction of the potato, and how it essentially clones itself.
Potatoes from around the rest of the world
Instead of doing extensive research on the way potatoes are used in other parts of the world through the posts or blogs of others, I decided to create a Microsoft form with many questions to do with how potatoes serve as an ‘essential’ ingredient compared to what part of the world that person is from. Here I have pictures of all the different questions.
This form got 230 responses, varying with age, gender, religion and culture. I achieved this through sending it to my year group, friends out of school and my parents’ colleagues. I hoped that this form would give me a wide variety of results from which I was able to correlate some evidence and create a conclusion. To my surprise, the quality of results was incredibly high, and I was able to get some concrete data. Let’s go into the results with the first question. Luckily, the Third Year at Hampton is ver y diverse, as well as my parents’ colleagues, this meant that not everyone who answered the form was from Europe, and instead all
around the world. Obviously around 50% answered Europe, but there were also many people from Asia and North A merica. Something I would change if I were to make this form again, would be to allow the person to select more than one option, as many people nowadays are multicultural, and so it may be difficult for them to only choose one place, as it would not fully represent their heritage.
The next question was on the frequency of potato consumption, and much to my surprise, 3 people never eat potatoes, looking into this they came from Europe, Asia and Latin America; however, I believe that the one from Asia wasn’t taking the form seriously, as their other answers were silly and not reasonable. This is the main challenge of using forms: it is up to the people whether or not the data is useful. Moreover, when we look at the people who often eat potatoes, they are actually very evenly spread out, with Africa as the most often consumer, and Oceania as the least often consumer. However, these results are not completely reliable, as only 3 people were from Africa, and so they do not accurately fully represent Africa. Moreover, there were quite a few people from Asia, meaning those results were more accurate, and looking at Graph 1, over 65% of Asians eat potatoes Graph 1 at least a few times a week. This could be because the diet in Asia and Africa is very carb heavy, and they tend to move away from bread and focus on potatoes, rice or grain. There was also a comment from someone from Nigeria, and they said that in Nigeria they only use potatoes in a pastry called meat pie; however, they prefer other starchy alternatives like sweet potatoes or yams. In Oceania, they do not use potatoes that much at all. This could be the effect of colonialism from the British, as the British sent some of their prisoners to Australia, and they were fed potatoes as it was a cheap and filling sustenance; this meant that after Australia secured independence, they did not take a liking to potatoes and only ate chips or used potatoes as an alternative to other carbs.
Question 3 focused on what way potatoes served in a meal, and the results were quite interesting. As one would suspect, French fries were the most common form of potato consumption, but surprisingly, there were many who ate mashed potatoes. This shocked me because you don’t really find mashed potatoes anywhere outside the UK. Looking further into it, the regions which ate the most mashed potatoes, were Europe and North America; I suspect this is due to the British influence on America. Moreover, there were people who ate mashed potatoes in Asia, but I assume that is because they are Asian but live in the UK and because of that, eat mashed potatoes. You may be asking what the responses in the ‘other’ section were, and the short answer is fried or stir-fried potatoes slices or strips. This answer came mostly from Asia, as stir-frying is a very common method of cooking.
Question 4 was, in my opinion, the most interesting. It was a simple question, but the data I was able to retrieve was great. This question was on the role potatoes have on a meal, and obviously side dish was the most prevalent response, but the other responses intrigued me. I created this graph on excel, and it showed the role of potatoes by regions. This showed me that potatoes were part of the main meal in all regions with 20% or more except for North and South America. This surprised me, and I believe this was because in North America, people eat potatoes through fries or chips, and in South America, people eat a heavy corn-based diet, consisting of tortillas and rice. When people selected the ‘snack’ option, I believe it was because of
crisps, but that was not the case in Asia. I have been to various parts of Asia myself, and they do not eat crips at all. Instead, a common snack may be dried sweet potato or puffed rice. Surprisingly, over 20% of the people from Oceania chose the ‘dessert/sweets’ option, however these were backed with no explanation, so I decided to do some research and found out that they commonly eat potato cakes which are deep fried disks of potato mash which can be dipped in sweet condiment like chocolate or whipped cream.
Looking at this other graph, you can see that when people eat potatoes daily, they are commonly in the main dish, compared to eating potatoes at differing frequencies. This means that in some parts of the world, the potato is deeply ingrained as part of the cuisine and culture. When potatoes are in the main dish, they are normally part of a curry or stew, which is very common in Asia. Potatoes came to Asia through the Portuguese and Dutch, and quickly became a loved staple, due to how easy it was to grow and harvest it. However, other than that, the proportions remain quite even, and this definitely surprised me, as I wasn’t expecting the role of the potato to not change as the frequency changes. This could be because of the availability in the market. Since it is very easy to get a pack of crisps or some fries, no matter how often you eat potatoes, those two will be very common.
I will group the final 3 questions together as they were open ended questions, and not all the respondents put something. There were two potatoes that were the most used which were the russet and marris piper. Looking into why, the russet potato is the most popular potato in the world as it is excellent when baked or mashed due to its high starch content. As for the Maris piper, it is very versatile and can be used in almost any form. Another common potato was the Yukon gold, which has a slightly buttery taste which makes it very good in a mashed potato. Moreover, interestingly, some people did not mind what potato they sued and instead chose different colour potatoes to add to the visual aesthetic. Additionally, other potatoes included: new potatoes, dried potatoes and jersey royal potatoes. Looking into the jersey ryal potatoes, they are a special variety only grown on the island of new jersey, and it has a special nutty flavour. One thing I wanted to uncover during this project was how potatoes could be so similar
yet so distinct; it all comes down to the fact that they are an incredibly sturdy vegetable and can survive almost any conditions. This means that in different conditions, they grow differently, causing a plethora of variations such as the jersey royal.
The 6th question was based on the relevance of potatoes for a certain culture. Sadly, even the members of those cultures did not know themselves why potatoes were used, but luckily I could do that myself. The form revealed that India truly respects potatoes, and they are used in dishes for many special occasions. According to one respondent, potato stew is served at weddings in some parts of India, and potato bonda is a muchloved street food staple which makes up the southern Indian diet. Another Indian staple is aloo papdi chaat or just chaat. Rumours are that it was created in the regal kitchen of the great emperor Shah Jahan. Chaat is a fluffy, spicy and well-seasoned dish which has potatoes as one of its crucial components. Moving over to Scandinavia, potatisgrätang is a Swedish dish which is served in festivals such as Swedish Easter. It was created during Easter as a cheap and easy way to have a warm, comforting meal. Many national dishes are centered around potatoes, and the Lithuanian one isn’t different. Kugela, or kugelis, is the national dish of Lithuania and consists of mainly grated potatoes, cheese, eggs and bacon. It is a simple yet delicious treat to eat at every national holiday. It was created with just leftovers of eggs, cheese and scrap meat, and turned into the food we know today. Another way potatoes have made themselves into our most loved dishes and celebrations is through Christmas dinner. Think to yourself: what good would any roast be without a good old tray of roast potatoes. Throughout the world, roasted potatoes have made themselves at home during a Christmas dinner (and in thanksgiving as well). However, roast potatoes are not just eaten in the UK but in other places like Germany, where, on Christmas eve, they have potato salad with sausages, or in some families in Ireland, they have scalloped potatoes or mashed. There are countless other dishes which would take too much time to go through them individually, so I have attached a link to the full excel spreadsheet with all the data here.
Conclusion
I believe that after reading through this entire project, it is evident to what extent the potato has formed the diet that we all have. It has transformed our cuisine to the next level, and we would be missing out on so many things if the potato disappeared off the face of the Earth. If we go back to the beginning of human life on this planet, we will see
that our diet consisted of berries and meat, as we were hunter gatherers; we did not eat starchy foods, but with the discovery of the potato tuber, a magical lump filled with nutrients and energy, we were able to create massive civilisations, as we were actually able to feed everyone. Nowadays, many communities across the globe rely heavily on potatoes and depend on its numerous good qualities. Now, we should not be quick to assume all potatoes are the same, as that would be a dreadful mistake to make; there are thousands upon thousands of varieties of potatoes, and all of them are different in their own ways. Potatoes are the most consumed vegetable in the world, and our love for it reflects this. Our once meat-based diet is now filled with starch: sometimes in China there can be a meal with rice, noodles and potatoes. This goes to show how deeply ingrained this philosophy is and it is safe to say that potatoes are a global staple. I believe I have answered the question well enough, but just to go through it once again, potatoes are the cornerstone of our lives, they have served as our friend for thousands of years, their versatility and durability meant that they would grow in even the harshest of snowstorms, or the driest droughts; they have stuck with us through thick and thin, and I believe we should show the potato some appreciation.
Bibliography
A- Allrecipes.com
B- Britanicca.com
C- Cipotato.org
Garden.eco
Lovepotatoes.co.uk
Medium.com
Wikepedia.com
NUCLEAR FUSION
BY KAIRAV SCHAFERMEYER
(Third Year – HELP Level 2 – Supervisor: Mr Worrall)
Every second, our Sun fuses 600 million tonnes of hydrogen into helium, releasing about 3.78 x 1026 Joules of energy, 650,000 times as much energy as our world uses in a year. The Sun uses nuclear fusion, a reaction in which at least two atomic nuclei combine to form a heavier nucleus under high pressure and heat. In a fusion reaction, the difference in the mass of the reactants and products is then converted into an unfathomable amount of energy, corresponding to Albert Einstein’s most famous equation, E = mc2 This allows nuclear fusion to be four million times more efficient than coal combustion and yet does not produce greenhouse gases or pollutants. Many regard it as the ‘Holy G rail’ of renewable energy. Do not be confused with nuclear fission, the splitting of heavy atoms to release energy, which is already commonly used in nuclear reactors and weapons nowadays. Fusion is actually four times more efficient than fission. In this project, I will explain the particle physics behind fusion’s mass defect, its history and how it inherently links to fission. I will also show how fusion reactors have been developed and which processes occur in order to extract energy from fusion reactions. Once you have read this project, you can imagine a future in which humanity successfully harnesses fusion, mitigating the need for fossil fuels whilst providing an almost limitless energy supply for all.
How does fusion work?
According to the law of conservation of mass, the mass of the reactants of a reaction is equivalent to the mass of the products. This is the same with energy, which cannot be created nor destroyed, only transferred. That is evidently true. For example, in a combustion reaction, the bonds between the atoms in a molecule are broken to release energy. The mass of the reactants and products is still the same, and the energy in the chemical store of the reactants is equivalent to the energy that was transferred to the environment as heat and sound. In fusion, the
difference between the masses of the reactants and the products releases a huge amount of energy. Mass is seemingly ‘destroyed’ and energy is ‘created’, appearing to defy the laws of the conservations of mass and energy. In the 1920s, the British physicist Francis William Aston discovered that the mass of four hydrogen atoms is greater than that of a helium atom (He-4) Hydrogen atoms have one proton each in their nuclei, whereas an He-4 atom has two protons and two neutrons. Surely their masses would be the same. The mass of a proton is equivalent to the mass of a neutron. Alas, there is a mass defect (a difference in mass) which must have been released as energy. Albert Einstein produced an equation, E = mc2, which shows that ‘neither [mass nor energy] may disappear without compensation in the other quantity’. The laws of the conservation of mass and energy are linked, and therefore matter can exchange with energy and vice versa. In a fusion reaction, the energy released is therefore equivalent to the mass defect multiplied by the speed of light (300,000,000m/s) squared, showing that a huge quantity of energy can be produced from a relatively small mass
E = mc 2
So, what actually happens in nuclear fusion and how does the transaction between mass and energy work? When you search up ‘how does fusion make energy ’, you will find that Google tells you that ‘the total mass of the resulting nucleus is less than the mass of the two original nuclei […] leftover mass becomes energy’. That is true, but why is this so?
A fusion reaction involves smashing at least two nuclei to form a heavier atom. The nuclei of atoms consist of protons and neutrons, as you may already know. They are known as nucleons. But did you know that protons and neutrons consist of smaller constituents? These are called quarks, and there are different types including ‘up’ and ‘down’ quarks, which are the most common. This is because other, larger quarks (like ‘charm’, ‘strange’, ‘top’ and ‘bottom’) break down due to a process known as particle decay. Protons are made up of two ‘up’ quarks and one ‘down’ quark, whereas neutrons are made up of one ‘up’ quark and two ‘down quarks. Electrons do not contain quarks, for they are leptons. Quarks have positive and negative electrical charges (for example, ‘up’ quarks have +2/3 and ‘down’ quarks have -1/3) Quarks have other charges, but not binary charges like ‘+’ and ‘’ . These charges are colours. Why colours? Because they form a neutral ‘white’ when combined. Gluons are particles which carry a colour and an anti- colour between quarks. The interactions
between gluons and quarks are as follows. Gluons emitted from quarks will share the same colour as the quark they were cast from. After emitting such a gluon, the quark will change its colour charge. The gluon will then take the anti- colour of this charge as well as the quark’s original colour. Here follows an example of the interactions between quarks and gluons. If a gluon is emitted from a red quark, the gluon’s colour will be red. If the red quark turns into a blue quark, then the gluon will carry blue’s anti- colour: yellow. When this gluon comes into contact with a blue quark, its yellow anti- colour will cancel out the blue and that quark will become red. This phenomenon occurs all the time in nucleons, allowing the charges to be in superposition.
In a nucleon, the quarks are confined into a small volume by the strong force, which is one of the four fundamental forces, which include the electromagnetic force, the weak force and gravity. The energy to keep quarks confined increases with a greater distance between quarks. If the energy is too great, sometimes, a gluon has enough potential energy to split into a quark and anti- quark pair. This is less stable as the nucleon now has five quarks. The pair of quarks either collapses back into a gluon or the pair leaves the nucleon (at least after rearranging to become colour balanced). Nucleons with odd numbers of quarks are called baryons, and those with an even number of quarks are known as mesons. The quark-anti- quark pair that split from the gluon is a meson called a pion (ϖ).
In a proton, if the gluon splits into an up quark and anti-up quark, the original three quarks will be colour imbalanced. Therefore, a quark from the pair will swap with one of the originals to restore colour balance. The pion may come into contact with another nucleon, like a neutron for example. The anti- quark will cancel out the neutron’s up quark and the remaining quark in the pair will take its place, emitting a gluon, which would change the colour of another quark already in the neutron, restoring colour balance. Such a pion is known as a neutral pion. If the gluon splits into two down quarks in a proton, then the down quark in the pion will swap with another in the nucleon to achieve colour balance, turning the original proton into a neutron (because neutrons have two down quarks and one up quark). An up and anti- down quark pion may come into contact with a neutron, in which the anti- down will cancel out a down quark in the neutron and the up quark will take its place, converting the neutron into a proton. This is a positive pion interaction, and a negative exchange occurs when the pion is emitted from the neutron instead, converting itself into a proton and another proton into a neutron. This process is called a weak interaction (also known as the weak force), which only works at short distances and is used to explain atomic decay. Weak interactions involve the release of a positron (beta-plus decay), which are represented by ‘e+’ in fusion. Positrons have the same mass of an electron and yet a positive charge.
When two protons are brought together, you would expect them to repel because of the electromagnetic force. The electromagnetic force causes like- charged particles to repel
and oppositely charged particles to attract. So how does a nucleus stay intact if there is repulsion between the like- charged protons? If they are close enough, the pion interactions bind them together. This is the strong force in action (but more specifically in this case, the strong nuclear force), which is 1038 times stronger than gravity. The distance that a pion travels before decaying is effectively the range of the strong nuclear force of a nucleon. If two light nuclei are brought into a very short range, then they can bind and form a heavier nucleus. In fusion, the strong nuclear force may act upon two hydrogen atoms, forming a deuterium nucleus – a hydrogen isotope that has one proton and one neutron.
1H + 1H → 2H + e+ + v
Subsequent reactions may occur, eventually leading to the formation of the stable He4, which has two protons and two neutrons in its nucleus.
The probability of a pion’s location is proportional to the radius of a nucleon, which is proportional to the mass of the nucleon. This is the radius of localisation. When two nucleons are brought closer together, the likelihood of a pion interacting with the other nucleon increases, and so does the radius of localisation. As mentioned earlier, quarks occupy an exceedingly small volume. We can describe particles as waves in quantum mechanics, which must fit into this volume. When nucleons are brought together, there is a larger volume in which the pion can inhabit. If the volume in which a particle is confined increases, the momentum (mass times velocity) of the wave function decreases, and it therefore has a greater wavelength. A particle’s wavelength is therefore inversely proportional to its momentum. A particles momentum is directly proportional to its mass, so if the nucleon has a greater wavelength, it will have less mass. This can be expressed in De Broglie’s equation: λ = h/mv = h/p, where ‘λ’ is the wavelength, ‘h’ is Planck’s constant, ‘m’ is mass, ‘v’ is velocity and ‘p’ is momentum. This mass defect accounts for the huge amounts of energy produced. But how exactly is this energy released?
p = mv
λ = h/p
Momentum, like energy, is conserved. As previously stated, momentum is equal to the mass multiplied by the velocity. If the mass decreases in a fusion reaction, the momentum also decreases. This extra momentum must be passed off somewhere else. When a hydrogen nucleus (which contains a lonely proton) is fused with a deuterium nucleus, the momentum is transferred as an emitted photon (light particle). When deuterium and He-3 (a helium isotope with two protons and a neutron) fuse, the momentum is transferred into the kinetic energy store of the products, which may collide with other particles and trigger further fusion reactions. The kinetic energy store
of these particles is equivalent to their temperature/thermal energy. Energy is released because the resulting heavy nucleus has more binding energy than the lighter nuclei that fused. The binding energy of a nucleus is the energy needed to separate its nucleons, and also the energy released when these nucleons come together to form a nucleus. The energy released from fusion reactions can be harnessed using magnetic confinement systems (like tokamaks and stellarators), inertial confinement or a hybrid system. These will be discussed to greater depth later on in ‘Applications/Practicalities’.
The Sun is about 333,000 times heavier than our home planet, Earth. Huge levels of gravity compress hydrogen atoms to temperatures of 15 million Celsius and pressures of 26.5 million gigapascals. This fuses hydrogen in the sun’s core to produce helium and energy It is this energy, in the form of sunlight, which has allowed life to flourish across our planet. Since the 1950s we have been intrigued by fusion, but there have been many challenges to overcome. Firstly, in order for a fusion reaction to occur, at least two protons must slam into each other at roughly at least two percent the speed of light to overcome the electromagnetic forces until they are close enough that the strong nuclear force can bind them. It takes a tremendous amount of energy to accelerate nucleons to this speed. There is also a low probability that they will actually collide and fuse. However, because the sun is so large, there is an immense amount of gravity acting upon the sun’s core. This compresses the sun’s hydrogen in the core to remarkably high pressures and therefore extremely high densities, allowing quantum tunnelling to occur. Quantum tunnelling is the process in which particles overcome an energy barrier – in this case, electrostatic repulsion – without sufficient energy due to some of their wave-like properties. Fusion can then take place at relatively low temperatures of 15 million degrees Celsius However, on Earth, we cannot replicate such high pressures. Instead, we can compensate by increasing the temperature of our reactants. On Earth, deuterium and tritium (a hydrogen isotope with one proton and two neutrons) must reach temperatures of 100 million degrees Celsius to fuse to compensate for lower pressures and densities. Even for just two protons – hydrogen nuclei - to fuse, they must reach temperatures of three billion degrees. The probability that two particles will interact is known as the cross section, which compares the particle’s relative velocities in a certain volume. Greater temperatures and densities increase the cross section. However, this can be difficult to achieve on Earth, so why has humanity decided to harness nuclear fusion? Can we make it efficient? A nd how have we done so? More of the practicalities/applications of fusion will be covered as well as its history in the following pages.
History
»I.am.become.death?.destroyer.of.worlds‹
J¡.Robert.Oppenheimer
I present you with yet another rhetorical question: where does the idea of nuclear fusion come from? In the late 1800s, there was much speculation as to what powered our sun. Many thought that if the sun’s energy source were coal-based, the sun would only be a few thousand years old. However, Darwin’s theory of evolution showed that organisms must have evolved for millions, even billions of years. This would mean that the sun would have to be billions of years old, as sunlight has always been crucial factor in nature, forming the basis of food chains and providing a source of energy for respiration by photosynthesis.
In the 1920s, when Francis William Aston discovered a mass defect between four hydrogen atoms and a helium (He-4) atom, more research began upon the nature of energy and mass. Later, Robert Atkinson and Fritz Houtermans would show that copious amounts of energy could be produced from this mass defect. A round this time, no one knew how the stars powered themselves, but Aston’s discovery later proved to be a vital clue. Arthur Stanley Eddington came across both Einstein’s famous equation (E = mc2) and Aston’s research, allowing him to reason that nuclear fusion could be the source of energy in stars - even if they were only composed of 5% hydrogen. Quantum tunnelling, a phenomenon when particles pass an energy barrier with sufficient energy, was discovered by Friedrich Hund in 1929, after mathematical research was taken by George Gamow. Quantum tunnelling occurs under high densities in our Sun, allowing it to maintain steady fusion reactions to release energy. Many more scientists in the 1930’s did experiments involving fusion. John Cockcroft and Ernest Walton built a particle accelerator at Ernest Rutherford’s Cavendish laboratory In 1932, lithium was split into alpha particles by using protons in this particle accelerator – the first fission, not fusion, reaction. Many experiments were conducted with deuterons (the nuclei of deuterium atoms). This eventually led to the first successful synthetic fusion reaction in 1934 by Rutherford and his student, Mark Oliphant, combining deuterium to form helions (He-3 nuclei) and tritons (tritium nuclei) by fusion. This was tied to Hans Bethe’s work on stellar nucleosynthesis, concluding that proton-proton chain reactions fuel the stars Bethe had also proposed the CNO
cycle, which describes the fusion of hydrogen into helium with carbon, nitrogen and oxygen as catalysts.
To understand more about the history of nuclear fusion, we must take a detour into nuclear fission. Fusion occurs when the nuclei of light elements combine to form larger elements, with the release of energy. Fission is the opposite: it is the splitting of a large nucleus into smaller nuclei with the release of energy, particularly as gamma radiation. Research into fission began similarly to fusion: as research into the nature of atoms. After four decades of research on atomic radiation - including alpha, beta and gamma radiation - in 1896, Henri Becquerel discovered that pitchblende (an ore containing uranium and radium) caused a photographic plate to darken. He later showed that this was because alpha particles (helium nuclei) and beta particles (electrons) were being emitted. Gamma rays were soon discovered as well within the pitchblende. Marie Curie gave a name to this phenomenon: radioactivity. Ernest Rutherford, who was credited with the discovery of the nuclear model of the atom, found that radioactivity could lead to the formation of new elements. In 1938, Otto Hahn and Fritz Strassman discovered fission by bombarding uranium with neutrons, forming barium (a much smaller atom) with the release of neutrons and energy Soon, other scientists around the world recognised the potential of a chain reaction (as the omitted neutrons would trigger further fission reactions). Lise Meitner and Otto Robert Frisch then published the theoretical basis of fission in 1939.
During the outbreak of World War II, many feared that Germany would develop nuclear weapons. Albert Einstein raised awareness of the possibility of a nuclear weapon and its potential to the US government. Research into fission continued in various countries such as the USA and Britain, with the aim of achieving nuclear power generation and developing nuclear weapons. Scientists including Leo Szilard and Enrico Fermi began experiments on self-sustaining, controlled chain reactions in the early 1940s. In 1942, the US initiated the Manhattan Project, a top -secret effort with the focus of creating an atomic bomb, led by J. Robert Oppenheimer. The first controlled fission reaction was conducted in the university of Chicago by Fermi. Many more experiments took place in the US and UK using uranium or plutonium until the atomic bomb was fully developed. In New Mexico, the Trinity test took place, involving the first detonation of a nuclear warhead. On the 6th of August 1945, the USA dropped an atomic bomb known as ‘Little Boy’ on Hiroshima, slaughtering 140,000 innocent men, women and children On the 9th of August 1945, another atomic bomb detonated in Nagasaki, killing 40,000 people, thus ending World War II. After the war, more research was focused on military and civilian applications, such as nuclear powerplants.
In the 1950s, work begun on the development of thermonuclear weapons, in which a small fission reaction within the weapon would release X-rays and large temperatures, igniting a fusion reaction between deuterium and tritium. This came to be known as ‘boosted fission’ as the addition of hydrogen isotopes increased the yield of nuclear weapons. In 1952, the thermonuclear fusion-based Ivy Mike, the first full scale fusion weapon, detonated in Elugelab Island in the Marshall Islands and was soon followed by Castle Bravo, the first practical example which detonated in 1954. The amount of energy released was equivalent to 10.4 megatons of TNT, or 44 petajoules (or 4,400,000,000,000,000 joules of energy). To put this figure into perspective, the fission-based ‘Little Boy’ dropped on Hiroshima had a yield of 0.015 megatons of TNT (or 15 kilotons), proving that incorporating fusion into already-powerful nuclear weapons could increase their potential by several magnitudes. The largest ever nuclear warhead, the thermonuclear Tsar Bomba, was estimated to have had a yield of 50 megatons.
After the Second World War, there was also more focus on self-sustaining fission reactions as an energy source, in which uranium nuclei would be bombarded by neutrons to instigate a nuclear fission reaction, releasing thermal energy. This would generate steam, which would then drive a turbine to produce electricity. The first selfsustaining nuclear reactor was built in 1942 by Enrico Fermi and was crucial step of the Manhattan Project. The first commercial fission reactor was opened on 17 October 1956, in the United Kingdomhttps://www.britannica.com/games/victordle/mode2?room=95ec7070-b245-4f2c-a5b4-9da0b02eaa62, and was named Calder Hall. It produced both electricity and plutonium for military use. The town of Workington was the first town in the world to receive electricity from a nuclear energy source. Fission reactors were also employed on military submarines as an efficient power supply, providing increased speed and greater time submerged underwater. Whilst advancements in fission energy have allowed humanity to harness this technology for peaceful means, nuclear fusion is still under development and has yet to be used commercially.
In the 1940s and 1950s, research into controlled fusion began alongside the pursuit of fusion/fission weapons. In August 1955, the Atoms for Peace conference was held in Geneva, highlighting the potential of nuclear energy for peaceful means. In 1950, Soviet scientists Igor Tamm and Andrei Sakharov proposed the design of the tokamak, a type of magnetic confinement fusion device. This would confine the plasma using precise magnetic fields to sustain the fuel for long enough to allow fusion to successfully occur. The first tokamak was the Russian T-1, which was built by the Kurchatov Institute in
Moscow and began operation in 1958. In 1951, Lymen Spitzer developed the concept of a stellarator, which dominated the field of fusion research in the 1950s until Lev Artsimovich proved that the tokamak was a more efficient design.
In the 1970s, many more countries in Europe joined the worldwide collaboration to achieve fusion power The worldwide oil crisis of 1973 prompted more governments to step up research into alternative energy resources, including fusion… This led to JET (Joint European Torus), which was initiated in 1973 and situated in Culham, Oxford. It emerged as the largest magnetic confinement plasma physics experiment, completed in 1983 on time and on budget. In November 1985, General Secretary Mikhail Gorbachev of the former Soviet Union proposed the idea of collaborative international fusion research to US President Ronald Reagan at the Superpowers Summit in Geneva. ITER (International Thermonuclear Experimental Reactor, or Latin for ‘the way’) was set in motion a year later, involving the European Union, the US, the Soviet Union and Japan.
Meanwhile, JET began harnessing a 50-50 mixture of deuterium and tritium to sustain fusion using the tokamak design. As you may recall, deuterium is a hydrogen isotope with one proton and one neutron within its nucleus, whereas tritium is a hydrogen isotope with one proton and two neutrons. JET set a world record for fusion output at 16MW from 24MW of external heating, achieving a Q (efficiency) of 0.67. JET’s explicit goal was to achieve a Q -value of 1, which it breakeven. However, ITER (which was then joined by China, S outh Korea and India in the early 2000s) ambitiously hopes to exceed a Q-value of 10 (i.e. 500MW of fusion power from 50MW of input power). In 2005, ITER members decided that ITER would be constructed in Cadarache, France. Unfortunately, due to costs and overruns, ITER is not expected to begin operations until 2034.
In 2021, a world record was made as JET produced 56MJ of energy from only 170 micrograms of deuterium and tritium. In December 2022, US-based National Ignition Facility (NIF) used inertial confinement to achieve the record for the highest Q-value: 4.3.
In 2018, Commonwealth Fusion Systems (CFS) collaborated with MIT to produce high temperature superconducting magnetics to construct smaller and low- cost fusion systems. CFS has been working towards SPARC together with MIT’s Plasma Science and Fusion Centre (PSFC). ARC stands for ‘affordable’, ‘robust’, ‘compact’, highlighting the CFS’s key aims for a fusion device.
Rosatom, one of Russia’s most prominent fusion research corporations, has recently focused developing the T-15 and designing TRT, a potential future prototype for fusion reactors.
TAE technologies, formerly known as ‘Tri Alpha Energy ’ is another American company, which does not use a tokamak, stellarator or inertial confinement design, but an FRC
(field reversed configuration) With $1.2 billion of funding, TAE plan to use hydrogenboron fuel for commercial fusion.
On 23 January 2025, the Chinese EAST reactor (Experimental Advanced Superconducting Tokamak) set a new world record by maintaining a stable fusion reaction for 17 minutes and 26 seconds at temperatures exceeding 100 million degrees Celsius.
General Fusion is a Canadian Fusion Company based in Richmond, British Columbia which has utilised a variation of the tokamak, successfully developing magnetised target fusion (MTF) within their Lawson Machine 26 (LM26). General Fusion has been recognised as the leader in clean energy and cleantech, receiving $455 million of investment from the Canadian Government and private investors. Helion, an American company, uses a hybrid approach by combining magnetic and inertial confinement to achieve fusion. They have promised to begin supplying Microsoft with electricity by 2028 using Polaris, which is based on their latest reactor Trenta. Although most fusion corporations are pursuing commercialisation, some are solely experimental, like ITER, so they can help us understand fusion’s potential.
Fusion power has received $7.1 billion worldwide in investments, leading significant advancements since Mark Oliphant’s first fusion demonstration, but there are still hurdles humanity must overcome for commercialisation. There are now 50 companies competing in the race to achieve commercial fusion. Will this vision become reality? In the following section, the variety of fusion approaches made by private and government-funded organisations will be explored, alongside an in- depth analysis of their technology and their struggles.
Applications/Practicalities.
» Nature.does.not.give.up.her.secrets.easily¡‹
NIF.Senior.Scientist.John.Lindl
There are two main approaches to achieving fusion: magnetic confinement fusion (MCF) and inertial confinement fusion (ICF). MCF uses strong magnetic fields to confine the hot plasma of fusion fuel, whereas ICF uses powerful laser beams (or beams of particles) to heat and compress the fuel pellet In this section, I shall explain the tokamak and the stellarator designs (examples of MCF,) and laser/particle beam ICF. There are also fission-fusion hybrid reactors and aneutronic fusion prototypes, but these are less common.
Tokamak
The tokamak is a toroidal (donut-shaped) apparatus that controls fusion using magnetic confinement. The toroidal vacuum chamber (torus) holds the fusion fuel – the hydrogen isotopes – which are heated and ionised to create a plasma. A plasma is a state of matter in which electrons are stripped from their atoms. If this plasma is exposed to its environment, it will cool down; so fusion will not occur. This is why magnetic fields are used to confine the plasma, maintaining an elevated temperature. Toroidal coils create a magnetic field around the torus, whereas poloidal coils generated by the central solenoid shape the plasma and external vertical fields control the plasma’s position. The combination of the three sets of coils creates a helical 3D magnetic field, confining the plasma and forcing it to travel along the field lines around a point known as the guiding centre.
Some of the plasma may experience drift, in which particles move away from the magnetic field lines and hit the walls of the tokamak. Fusion reactions produce energetic particles (like alpha particles) which then contribute to further reactions. If drifting occurs, these products are lost, decreasing the overall fusion yield. However, scientists have developed unique magnetic configurations which may cancel out drift motion, ensuring that the fuel is stable. Stellarators are similar to tokamaks but have the potential to sustain longer fusion reactions than tokamaks. This is because the plasma in tokamaks is susceptible to disruptions – breakdowns in the plasma’s flow – which can damage the reactor.
An electric current drives the plasma’s behaviour and refines the magnetic field, whilst also heating up the fuel to extremely high temperatures, typically over 100 million degrees Celsius. This is known as Joule (or Ohmic) heating, one of many ways to initiate fusion within the tokamak. Neutral beam injection can also be used, in which neutral particles are injected into the plasma, transferring their energy into the fuel from their kinetic energy stores. High-frequency electromagnetic radiation is another method, which involves radio waves to heat the plasma. Either way, substantial power input is needed for ignition (the point when fusion becomes self-sustaining). For example, JET consumes 700-800MW of electrical power to maintain fusion. However, with future
advancements, fusion reactors are expected to incorporate more efficient superconducting magnets, thus requiring less energy – around 200-300MW. ITER, ever ambitious, plans to release 500MW of power from only 50MW of input power in the future.
After heating, the hydrogen nuclei begin to fuse at high temperatures and densities, releasing immense energy. In the Sun, protons (hydrogen nuclei) fuse to form helium and release energy. In fusion reactors on Earth, we typically use D-T fusion, in which deuterium and tritium fuse to release Helium-4, one neutron and energy, which is shown as MeV in the following equation. One eV (electron volt) is the amount of energy an electron gains when it moves across a potential difference of one volt. One MeV is a million electron volts. ‘D’ can also be represented by ‘2H’ as it is a hydrogen isotope, and ‘T’, ‘3H’.
D + T → He4 + n + 17.6 MeV ²H + ³H → ⁴He + n + 17.6 MeV
Neutrons, which carry 80% of the energy released in the fusion reaction, are unaffected by the magnetic fields because they have no charge. They then transfer their energy to the walls of the tokamak, transferring their kinetic energy as heat. Water circulating around the tokamak captures this heat and produces steam. This steam drives turbines that connect to generators, producing electricity. Remind you of a traditional power station? The diverter, which is essentially the exhaust-pipe of the reactor, removes intense heat and particles by spreading them over a larger surface area. This minimises damage and therefore the need for subsequent repairs.
So, why do we not have commercial, tokamak-based fusion running the power grids? Firstly, the fuel must reach temperatures over 100 million degrees Celsius in order to fuse. The diverter handles the impact of this intense heat and energy, but obtaining robust, long-lasting materials for the diverter presents another challenge. High heat fluxes, neutron radiation and plasma instability can all damage the vacuum chamber and other major components Plasma instabilities (or turbulence) are caused by gradients in the plasma temperature and density. These can lead to ‘disruptions’, in which particles are hurled towards the vessel wall. In 1975, holes were burnt into the vacuum chamber of the TFT (Tokamak Fusion Test reactor) due to such ‘disruptions. Another challenge is that the magnetic field must also be designed in such a way that the reactor does not consume so much energy.
So, why do we use deuterium and tritium in fusion, when hydrogen/proton nuclei is so abundant (in seawater as H2O)? Proton-proton reactions in the Sun occur in exceptionally large volumes of plasma, which we cannot achieve sufficiently on Earth. Proton-proton reactions are also not very efficient: they have a low power density. But
perhaps most importantly, it has a low cross section: the reaction probability is extremely low. When protons fuse, they form He-2, which immediately splits apart back into two protons as there are no neutrons to hold the nucleus. Deuterium must be formed, so that it can fuse into He-4, which is more stable. Deuterium includes one neutron, so one of the reactant protons must undergo weak interactions (as discussed on page 3) to convert into a neutron to produce deuterium. Even though proton-proton fusion reactions are difficult and ‘rare’, the Sun is large enough to sustain itself on these reactions. Instead, on Earth, fusion involves deuterium and tritium (D-T) due to several key factors. Firstly, D-T reactions have higher reactivity – and cross section - than proton-proton reactions, meaning that it is easier for them to fuse. They also have lower temperature requirements of around 150 million degrees Celsius, whereas protonproton fusion would need temperatures of 1.5 billion degrees. Deuterium is very abundant and readily available too, as 1/6700 of hydrogen isotopes found in seawater are deuterium. Tritium, on the other hand, is quite rare; only 20 kilograms are produced annually. They also have a short half-life, 12.3 years. A half-life is the amount of time it takes for half of the radioactive sample to decay. However, in nuclear reactors, lithium can be installed in the vessel to receive the neutrons received from the fusion and thus produce tritium on-site.
6Li + 1n → 4He + T (3H)
Due to the energy losses in tritium production, beryllium is also present as a ‘neutron multiplier’, so that when struck by neutrons, the beryllium releases two neutrons and an alpha particle (namely He-4). However, beryllium naturally contains uranium and could possibly generate plutonium in the vessel This would make it more difficult to maintain the fusion reactor due to radioactive waste.
However, despite the tokamak’s various issues, it has emerged as the leading fusion device due to its efficient manner in heating and confining the plasma. Research into tokamak-based fusion has brought numerous countries together in the search for commercial fusion, whilst also making significant progress since Gorbachev’s proposed collaboration. But will true commercial fusion rely on tokamaks, or perhaps another method.
Inertial Confinement Fusion
The highest Q-value achieved in MCF was 0.67, which was conducted in JET using D-T fuel. The highest Q-value in ICF (inertial confinement fusion) was 4.13, which was achieved by Nation Ignition Facility (NIF) using lasers to rapidly heat and compress D-T fuel in a small capsule. 8.6MJ of energy of fusion energy was yielded from only 2.08MJ of laser energy.
How does ICF work, and why is it so much more efficient than MCF? At NIF, a weak laser pulse, of about a billionth of a joule, is split and carried along optical fibres to 48 amplifiers. This increases the pulses energy by 10 billion – still only a few j oules. Each of the 48 beams are split into 4, resulting in a total of 192 separate beams. These are passed through two glass amplifiers, the power amplifier and the main amplifier. The beams travel back and forth four times through the main amplifier using a special optical switch called the plasma electrode Pockels cell (PEPC). Then, the beams return for a final pass through the power amplifier. Now the beams’ total energy has grown to 4 million joules. The infrared pulses are then converted into 2 million joules of ultraviolet energy. The 192 laser beams are then concentrated upon a single target, the hohlraum, which contains the D-T fuel within an x-ray ‘oven’. When the laser beams strike the hohlraum, the resulting x-rays ignite an implosion, in which the D-T fuel fuses under extreme temperatures and densities.
Unlike MCF, fusion in ICF is not continuous but is pulsed. ICF holds a greater focus on fusion reactions that occur within a very short timeframe, whereas MCF typically involves sustained fusion, giving rise to more energy losses and instabilities. However, there has been more focus on MCF, especially tokamak-based fusion, as it is more commercially viable: ICF cannot sustain pulsed reactions (yet), thus hindering the potential of long-term power generation. Energy released from ICF cannot be captured easily due to such brief reactions, which is why scientists believe MCF holds more promise. Magneto -inertial Fusion (Helion Energy, Inc.)
Helion Energy is a private fusion company that does not make use of tokamaks or highenergy laser beams. Instead, Helion pursues pulsed, non-ignition fusion using a plasma accelerator, allowing the power output to be adjusted. The term ‘non-ignition’ means that Helion’s fusion is not sustained but pulsed, but unlike fusion in NIF, reactions occur in rapid succession. Another key detail is that Helion’s fusion reactors entirely skip the steam cycle, allowing for greater efficiency. Helion also does not harness tritium but instead uses deuterium and helium-3 (D-He3), removing the need for on-site tritium production – though introducing on-site He-3 production…
So, why does Helion use D-He3 fuel, and how does this link to their fusion apparatus? As previously stated, Helion does not incorporate the steam cycle, in which steam is generated and drives a turbine and so on. This is because the process of turning heat into mechanical energy (i.e. steam driving a turbine) is extraordinarily inefficient: twothirds of thermal output energy is lost. The JET tokamak, which achieved the highest Qvalue of any MCF device, would therefore only have an efficiency of 22.11% (Q = 0.67 * 0.33 = 0.2211), according to my calculations. That is why Helion uses FRCs (FieldReversed Configuration) in their reactors, minimising energy loss by harnessing direct energy capture. Deuterium and He-3 (a helium isotope that has two protons and one neutron within its nucleus) are compressed and heated by magnetic fields on opposite ends of the reactor, forming two separate FRCs consisting of dense, superheated plasmas. Currents create high-beta plasmas, allowing the plasma pressure to push against the magnetic field, meaning that it is essentially more difficult to confine.
However, this shapes FRCs into a familiar donut-shape Magnets accelerate the two FRCs at 1,000,000mph (roughly 1.6 million kph) towards one another, until they collide in the centre. They are further compressed by strong magnetic fields until they reach temperatures of 100 million degrees Celsius. The reactant ions overcome natural electrostatic repulsion and fuse The energy released from fusion causes the plasma to expand outwards. This expansion pushes back on the magnetic field induced by the reactor’s magnets. According to Faraday’s law, the change in field creates a current, therefore increasing the current in the coils of the external magnets. This is known as direct energy conversion, as fusion energy is converted directly into electricity, without any other medium. The costs of building such a reactor are also reduced; they are around the low tens of millions, drastically contrasting to ITER’s costs of upwards of $50 billion.
Helion uses deuterium and He-3 as the reactants, He-4 and a proton, carry a charge, allowing them to exert a change in field against the external magnetic field and thus produce electricity. D-He3 also produces radioactive waste than D-T fusion, making it more sustainable to generate energy. This combination has a higher energy density than
D-T fuel, but it requires much higher temperatures to initiate such a fusion reaction; it will ultimately have a significantly smaller cross section.
D + He3 → He4 + p + 18.3 MeV
2H + 3He → 4He + 1p + 18.3 MeV
Whilst deuterium is relatively common, helium-3 is quite rare. Some even suggest exploiting the Moon’s He-3 stores, as the Moon’s lack of a magnetic field allows solar wind to deposit He-3. However, this isotope can be readily produced in D-D reactions which also occur in Helion’s reactor (as well as a neutron), thus making it a closed system.
D + D → n + He3
2H + 2H → n + 3He + 3.27 MeV
Overall, Helion’s method of energy generation by fusion will be quite successful and promising in the near future: they have already promised to begin supplying Microsoft by 2028 They will use faster and smaller methods for fusion compared to the traditional tokamaks and will completely skip the steam cycle – though D-T fuel is a much more reactive fuel than D-He3. NIF may have quite a Q-value, but it cannot be sustained or used in power generation… yet.
Why is fusion so important?
Fusion would revolutionise energy production, providing an almost limitless supply of energy without greenhouse gas emissions from relatively abundant fuel (i.e. deuterium from seawater, onsite tritium production – using lithium – and Helion’s closed system involving the production of helium-3). There is also little radioactive waste involved, unlike in fission-based nuclear reactors, which require sufficient disposal. Fusion reactions, despite immense heat, are inherently safer than fission reactions as they are not self-sustaining and must be confined to high temperatures and densities in order to fuse the fuel. Large-scale accidents like Chernobyl and Fukushima would never occur; if there was any disturbance, the plasma would cool and the reaction would swiftly end. Fusion is four million times more efficient than coal combustion, and four times more efficient than fission on a mass basis. Due to such high-power output, fusion would easily power desalination plants, providing clean water to those who would not be able to access such necessities otherwise. Fusion would contribute a substantially to the world’s electricity demand, which is already 2TW, replacing much of the existing fossil fuel infrastructure.
Criticisms
Fusion deals with extreme temperatures, so it must require very durable materials. Finding such materials has proved to be a major challenge due to severe degradation. Fusion is also very costly; billions of dollars have been spent pursuing technology that has not even reached our power grids. Another key argument is that scientists have always promised that commercial fusion would be achieved in just a few years since the 1950s… Experts predict we will have fusion around the 2050s or 2060s, though some companies are more optimistic.
These criticisms are very true, but fusion’s potential exceeds its cost. It will provide a cheap, almost limitless supply of energy with no pollutants/greenhouse gases. Unlike fission, it will also produce much less radioactive waste and comes with inherent safety features. Hydropower, the world’s leading renewable energy source, will be dwarfed by fusion’s efficiency and reliable fuel source. If fusion became reality, it would replace most existing energy infrastructure, even providing electricity to those who do not currently have access to it.
Fusion is a reaction in which two light atomic nuclei combine to form a heavier nucleus with the release of energy. Once these nuclei are brought close together, the strong nuclear forces overcome the natural electrostatic repulsion, allowing pion interactions to occur under a larger volume, decreasing the momentum of the particle’s wave function but increasing the particle’s wavelength. Because a particle’s wavelength is inversely proportional to its mass, it will have less mass after fusing. According to Einstein’s equation, E = mc2, this mass must be released as energy – quite a substantial amount. Research into fusion begun as an inquiry into how stars powered themselves and the nature of energy and matter. Hans Bethe, Ernest Rutherford and George Gamow were just few of many scientists who shaped our understanding of fusion in the 20th century. Our knowledge of fusion soon evolved, allowing us to successfully harness its potential in nuclear weapons but yet we are still developing commercial, peaceful fusion after decades of research. To do so, we have developed different methods such as tokamak and stellarators (both magnetic confinement fusion), whilst corporations such as NIF have been pursuing inertial confinement fusion. However, other, non-
mainstream ideas have also been funded and explored, like the FRC-based magnetoinertial fusion approach by Helion, which may show greater potential. Fusion will allow us to replace existing fossil fuel infrastructure, unlike other renewable energy sources, because it is just so efficient, producing no greenhouse gas emissions or long-lived radioactive waste. Will this dream become reality?
(Third Year – HELP Level 2 – Supervisor: Mr Cross)
Why was World War II so deadly for Hamptonians?
Level Two HELP Project
By George Scholes (3D) and supervised by Mr Cross (History Department)
Contents:
Introduction
Initial Theories
Chance
School Size Increase
Roles
The path of an Air Force pilot in World War II Was the Air Force more dangerous than other sectors in the military?
Conclusion
Sources
Data Gathered during Project Calculations
World War I Data
World War II Data
Introduction
I chose to do this project following the Remembrance Day assembly, in which I noticed that significantly more Hamptonians were killed in World War II (118) compared to World War I (78). Not only that, but World War II unexpectantly caused many less total British soldier deaths (384,0001) compared to World War I (880,0001). So, I wondered, what was the reason for this? Why are there such discrepancies in such correlated things?
Hamptonian vs British Soldier Deaths
Figure 0.1 – Graph showing the comparison between Hamptonian and British deaths in the wars (adjusted to the same magnitude)
Although this project focusses solely on numbers, it is necessary to reinforce that the occurrences in these wars are deeply saddening and should be thought about throughout despite the lack of specifics. This project has been sobering to say the least about how lucky we are to live in a world without widespread violence to this scale.
Theories
Chance?
Figure 1.1 – Deaths in the World Wars in Neighbouring Schools2
Hamptonian Deaths British Soldier Deaths (/10,000)
It is immediately clear that Hampton is the only school to have more deaths in World War II. So, could this difference be just down to chance, or was there a difference between these schools? If there is no other reason found by the following data, then this must be the solution.
School Size Increase?
Obviously, these figures tell a large part of the story – an 119% increase4 in the size of the school is startling to say the least – but is this the whole story?
Well, no. The increase in the size of the school was due to the change of location from Upper Sunbury Road to Hanworth Road in 1939, but this should not have changed the amount of students going to war as the influx of new students came predominantly into the 1st year, meaning that by 1945 there would still be no difference in the numbers of those serving as the first joiners of the new school would be in lower 6th, aged 17 and unable to serve. So, to truly express the change in size of the school we must take the data from 7 years prior to both wars, in 1907 and 1932 respectively, to get a full spread of the data which actually influenced the war.
Although there are no available statistics of the number of boys in Hampton in these years, we can find the average percentage increase in pupils per year, then extrapolate these numbers to these desired years.
Using the statistics from Figure 0.1, 1.1 and our predicted data on the number of Hampton boys in certain years, we can graph the change in deaths between the wars overall, for local schools and for Hampton, now accounting the change in population, average school size increase and Hampton’s large increase in size (all data can be found on the excel spreadsheet). Surely this will give a regular outcome now, right?
Figure 2.1.1 – Number of Boys in each Hampton Grammar School form in Easter 19153
Figure 2.1.2 – Number of Boys in Hampton Grammar School in Summer 19393
Figure 2.1.3 – A graph showing the percentage change in deaths between the World Wars accounting for the aforementioned factors.
Nearly. As you may notice, there are two Hampton School lines. The black shows the data if the regular development occurred during the First World War while the yellow shows the data without this included. My first instinct was to not include these years, as, if anything, the school may have shrunk then. However, the trend including this is extraordinarily close to that of the local schools.
Roles
Despite these, perhaps, less interesting factors, my initial theory still stands as I begin to investigate this segment, that the main reason of this disparity is the difference in roles in the wars, and how roles in the Second World War emerged that were both highly specialised and highly dangerous for those doing those jobs. My hypothesis from the start was that the skills of those going to Hampton School translated to more reckless jobs specifically in World War II, causing this staggering difference. This would also explain why the Hamptonian and Local Schools’ lines are both quite similar, as they both represent places which contain more qualified and more intelligent people (in general).
3.1.1 – Data showing the proportions of roles in World War I for Hamptonians and Brits
Figure 3.1.2 – Pie charts showing the proportions of deaths in different roles in World War II for Hamptonians and Brits
This data is striking to say the least. The World War One data is as expected: the different graphs are largely similar; however, it is in the World War Two graph in which we see the staggering contrast.
Figure
There is a far larger proportion of Air Force soldiers in Hampton School than nationally that died, while there were fewer army soldiers in Hampton School compared to nationally.
“In general terms, it was to be expected that […] a large proportion of specialists and of junior officers in the temporary armed forces should come from Grammar Schools.”5
“The Air Force, in particular, had to select educated men who could pass quickly through the complexities of the schooling needed to make them efficient. Any Grammar School, like Hampton Grammar School, which had an Air Training Squadron, made its own direct contribution to the Air Force.”5
As seen by these words by W.D James, a man who documented many experiences of Hamptonians from World War II, it is clear that the reason why there were so many soldiers in the Air Force from Hampton School was that it boasted a large amount of educated men who could learn how to operate in the Air Force quickly and easily. But is the disparity of deaths due to there being more Hamptonians in the Air Force and a direct correlation between population and deaths, or was it that it was more dangerous to them, thus increasing the difference between the different fields? To find this out, we must look at a typical path for an Air Force recruit to make his way to the cockpit.
The Path of an Air Force Pilot in World War II6
The majority of Hamptonians that died in the Air Force were in The Royal Air Force Volunteer Reserve (RAFVR) (92%) as opposed to The Royal Air Force (RAF) (6%) or The Glider Pilot Regiment (1%). This means that only those in the RAF were actually qualified to fly a fighter aircraft before the war began, as the RAFVR, despite being created in 1936, was only designed to support the primary RAF during wartime, and the Glider Pilot Regiment was established in 1942 to transport soldiers via gliders to fight on the frontlines.
All the pilots in World War II were volunteers, some starting before the war and some joining the war effort during the conflict. The large amount of Hamptonians in the Air Force was likely due to the Hanworth Air Park, later renamed to No. 5 Elementary and Reserve Flying Training School (No.5 E&RFTS), which was located in Hanworth, being very close to the school. This meant that due to the rising tensions in the 1930s, many students were encouraged to attend this flying school with the allure of it being so close to their homes.
On the 3rd of September 1939, No.5 E&RFTS dropped its reserve status to be named No. 5 Elementary Flying Training School (No.5 EFTS). Many of the now trained pilots were now required to begin to fight or work for the United Kingdom, while other continued training which was specifically in Miles M.14 Magister aircrafts.
This is the path that most of the Air Force fighters from Hampton went through and this illustrates why there was such a large proportion of them from Hampton: there was a very large flying school just minutes from their school, and it was one of the main non-state schools in the area, meaning that it was preferable for recruitment.
Was the Air Force more dangerous than other sectors in the military?
In short, yes. During World War II, a significant percentage of the Royal Air Force (RAF) aircrew perished. Approximately 72% of the 125,000 aircrew who served were either killed, seriously injured, or taken prisoner of war7 Overall, over the course of the war, 880,000 British forces died, 6% of the adult male population and 12.5% of those serving1. Although it should be noted that the criterion for each statistic is different, this really illustrates the difference in the different sectors in the UK war effort in World War II.
Conclusion
Although the initial figure of the difference between the World War I and World War II deaths, especially due to the inverse correlation of UK deaths, was striking and confusing (especially as it went against the trend of the other schools in the surrounding area), it is now clear that this ratio can be explained as a consequence of many different factors. The large increase in the size of the school between these years was obviously a large reason for this, but the main reason was the large proportion of Hamptonians who served in the Air Force. This was a more dangerous area of fighting, and the reason that so many students became pilots was due to their academic strength and their proximity to the flight training school which was located locally in Hanworth. This meant that there was a large number of War Dead despite a regular number of those who served due to the lethality of the sector that so many of them were in.
Sources
1 – UK Parliament “The Fallen” Document
2 – All statistics in this table originated from the Hampton School website commemorating the fallen in these wars.
3 – “The Lion” Hampton School magazine from various years (found in the Hampton Archives)
4 – (((530+500) / 2) - 235) / 235 = 1.191...
5 – Hamptonians at War, by W.D James (Book)
6- Much of the information here originated from Wikipedia: Royal Air Force Volunteer Reserve, Glider Pilot Regiment, List of Flying Reserve Schools, London Air Park, Miles Magister
7 – International Bomber Command Centre
Data Gathered During the Project
WORLD WAR I DATA:
data via Commonwealth War Graves so this data is just from available gravestones
WORLD WAR II DATA:
HOW FAR WAS THE GREAT LEAP FORWARD SUCCESSFUL?
THE CAMPAIGN TO INDUSTRIALISE CHINA
BY LUCAS TAO
(Third Year – HELP Level 2 – Supervisor: Miss Bellingan)
Preface
In 1958, Mao Zedong launched the Great Leap Forward. It was a campaign intending to transform China into a global superpower, surpassing the leading countries at the time. It aimed to revolutionise agriculture, industry, and society by using the collective power of the people in China to overcome centuries of poverty and underdevelopment. However, this campaign turned into one of the greatest human tragedies in history, with millions of lives lost and lessons that still remains today. China had incredible determination but also devastating consequences during the Great Leap Forward. What drove Mao to push his vision so far, and why did it fail so catastrophically? Understanding this can not only helps realising the challenges faced by a growing nation, but also to see how these events shaped modern China.
In this book, we will explore the origins of the Great Leap Forward, why and how it was implemented, the long-lasting impact it had on China's people and economy, discover China’s history and decide how far it was unsuccessful. We will discover the ideals that inspired the campaign, the hardships endured during its execution, and the lessons the world can learn from it. In this book, we focus on these aspects:
1. Propaganda poster in China “Let’s focus on increasing production and cutting costs, especially in grain and steel.” “ ]
- Political aspects: How the CCP’s policies influenced the direction of the GLF, including Mao’s leadership, propaganda, and political consequences.
- Economic aspects: How effective were the industrial and agricultural policies? We will focus on production targets, collectivization, and the resulting economic impact.
- Social Aspects: What were the consequences on Chinese society (changes in daily life, the impact of the famine, and more)?
By looking at these aspects, we can assess the extent to which the campaign achieved its intended goals and where it failed.
As an author, my interest in the Great Leap Forward is both academic and personal. Although I was born in England, my entire family is from China, and the history of the Great Leap Forward has shaped the lives of millions, including my great-grandparents and grandparents Growing up alongside my grandparents, I often heard accounts to China’s past and Mao Zedong, but I never fully understood the scale of events. This project has given me the opportunity dive deeper into the China’s past and the Great Leap Forward.
Get ready to dive deep into one of history's most ambitious and controversial experiment!
2.1
2.2
2.3
Chapter
3.1
3.2
3.3
3.4
Chapter
4.1
4.2
4.3
4.4
Introduction “超英赶 美 ”
(“Exceeding the UK, catching the USA”)
Mao Zedong – 1950s
The Great Leap Forward was one of the most ambitious and controversial campaigns in history. China planned to rapidly transform its economy and society through mass mobilization. However, it resulted in one of the greatest human tragedies ever recorded.
It was launched in 1958 as part of Mao Zedong's vision to leapfrog China's economy ahead of Western powers and the Soviet Union by rapidly industrializing and increasing agricultural output. Mao set ambitious goals, including the creation of communes and widespread steel production through "backyard furnaces”.
However, the program was ruined by poor planning, overambitious targets, and widespread mismanagement. Millions of people suffered from famine and overworking.
2. Picture showing Mao greeting people
Sino-Soviet Split
China was a key player in the Cold War after the establishment of the People’s Republic of China in 1949. The Korean War secured China’s position as a Communist power. However, the war strained its economy because of the large amounts of money spent on their military and isolation from the world. The war also deepened China’s alignment with the Soviet Union, which later provided important economic and technological aid in the early 1950s.
After decades of war and instability, China faced severe economic challenges. The CCP initially focused on stabilising the economy through land reforms, inflation control and industrialisation in the First Five-Year Plan from 1953 to 1957. This plan followed the Soviet model, emphasising heavy industry funded by a surplus of agricultural goods. However, China’s large population and limited agricultural output made this plan unsustainable.
During the late 1950s, tension between China and the Soviet Union escalated because of ideological differences . Mao Zedong’s revival of Stalinist policies (collectivisation and labour-intensive methods) clashed with Nikita Khrushchev’s de -Stalinization ideals, which deteriorated their relations. This Sino-Soviet split left China deprived of Soviet support during the Great Leap Forward.
The GLF also represented China’s challenge to Soviet leadership in the socialist alliance. By proposing an alternative path to communism made for developing nations, Mao positioned China as a leader distinct from the Soviet model. This further alienated China from the USSR, which then saw the GLF as a threat.
Industrial and Agricultural Growth Goals
Mao Zedong’s goals for the Great Leap Forward was centered on transforming China into a modern industrial and agricultural powerhouse in a short time. For industry, Mao wanted to bypass traditional industrialisation by using China’s vast labour force. His vision emphasised on “walking on two legs,” meaning simultaneous development of urban and rural industries. This led to people using backyard steel furnaces, where rural communities were tasked with producing steel locally in order to increase the national output. Mao Zedong believed that this labour-intensive approach would not only accelerate industrial growth but also show the superiority of Chinese communism over capitalist nations in the West and the Soviet Union’s model of development.
In agriculture, Mao aimed to increase grain production to support industrialisation and feed China’s growing population. He introduced collectivisation by organising rural areas into communes, where land and resources were shared, and produced goods were controlled. Large-scale irrigation projects and experimental farming techniques were used to maximise profit. However, these projects and techniques often ignored experts’ suggestions and relied on ideological and blind passion instead of factual knowledge. This led to failures in crops and famine, proving them to be unsuccessful.
3. A boy gathers dry grass for food in the Great Famine
Introduction of Key Policies & Corrupted Government
People’s communes merged households into massive units, averaging around 5,000 families each. Communes abolished private property, organised collective farming and introduced communal kitchens to free women for labour. They were aiming to be self-sufficient, combining agriculture, light industry and social services. However, the focus on meeting unrealistic production rations led to inefficiencies, negligence and food shortages.
Another key policy was the use of backyard furnaces. They were used to increase steel production. Peasants were mobilised to build small furnaces in villages and urban areas, melting down household items like tools and cookware. This mass mobilisation reflected Mao’s belief in labour over expertise. However, this led to poor-quality steel and diverted resources away from essential agricultural work.
Combined with exaggerated harvest reports, these policies led to famine during the campaign. Politically, local officials were under immense pressure to meet Mao’s very ambitious targets, so they inflated production figures to show progress and success. These false reports created a false view of success in higher levels of government, which led to unrealistic policies that intensified resource misallocation. Economically, inflated grain production figures prompted the government to order massive amounts of grain for urban areas and exports, which left rural communes with insufficient food supplies. This led to widespread famine, leaving millions of peasants suffering from starvation and displacement as the government were unaware of the true scale of the crisis.
Chapter 1: Key Events of the GLF
1.1 Establishment of Communes
Communes were big groups formed during the Great Leap Forward, usually made up of about 5,500 families living together. The idea was to create communities that combined farming, small industries, schools, and healthcare. In communes, people shared everything (e.g., land, tools, and meals) so they could work together to rapidly improve their lives and boost China’s economy.
The Chinese government created communes to accelerate industrialisation by mobilising China’s rural population. They were designed to extract surplus from the countryside to support development and industriali sation in urban areas. Communes were also seen as a means to achieve socialist ideals by eliminating private property and promoting collective effort where everyone contributed to the community’s success.
In communes, work was organised collectively, with labour divided into teams and brigades. Agricultural tasks, industrial production, and infrastructure projects were all managed centrally. People were assigned roles based on the needs of the commune, often disregarding individual skills or preferences. This system aimed to maximise productivity using mass mobilisation but often led to inefficiencies and mismanagement.
Housing in communes was typically basic and uniform, with families living in close quarters. Communal dining halls were a key feature, where meals were prepared and served collectively. This was intended to free up more labour for production by reducing time spent on household chores. However, it disrupted traditional family structures and often resulted in poor nutrition because of resource mismanagement.
Private property in rural China were abolished as communes were made. Peasants were forced to give up their land, livestock, and tools for everyone to share and use. This move aimed to eliminate class distinctions and boost productivity through shared resources. Beyond land and tools, personal possessions, from cooking utensils to furniture, were often shared or repurposed. This policy was driven by the goal of making China a communist society where everything was owned collectively and shared
However, it ignored different cultures of different families and individual attachments to personal property. A negative social impact was that people had resentment or anger to these radical policies, and therefore, had decreased motivation.
The ‘ iron rice bowl’ system, which guaranteed basic amenities regardless of effort, further reduced productivity and motivation. Additionally, centralised planning often ignored local conditions and expertise, leading to unsuccessful projects and poor resource allocation, ultimately hindering economic progress.
The government's expectations during the Great Leap Forward were wildly optimistic The government and Mao anticipated that willpower and mass mobilisation could overcome technological and resource limitations. They believed that spirit could rapidly transform China into an industrial powerhouse, competing with Western nations in just a few years. However, China's economy lacked the infrastructure, expertise, and resources to achieve such growth in such a short amount of time. Mao’s focus on quantity over quality led to the production of goods that were often unusable or inedible. For example, agricultural experiments based on pseudoscience, like
4. Famished peasant families eating at a commune
Lysenkoism, failed to increase crop yields and were unsuccessful as expected. This hindered the progress even more and brought people’s spirits and motivation further down.
Politically, communes gave commune leaders control over people's lives. This disrupted traditional village hierarchies and created new power dynamics. Commune leaders often prioritised pleasing superiors over accurately reporting local conditions , which led to a breakdown between in communication between rural areas and the government.
Communes heavily altered rural life. The collectivisation of daily activities, including eating and childcare, weakened family bonds and social structures. This led to disorientation and families faced a loss of identity in culture among rural populations. There was inequality in communes, creating new forms of social hierarchies based on political loyalty.
Communes aimed to boost productivity through collective effort. However, the communes' focus on self-sufficiency often resulted in the misallocation of resources. For example, areas unsuited for certain types of production were forced to be used anyway, which gave sub-par results. China’s shift from household-based farming to large-scale collective farming ignored centuries of the locals’ knowledge about land management and the rotation of crops, ultimately reducing crop yields. The attempt to rapidly industrialise rural areas through backyard furnaces drew crucial labour and resources away from agriculture, leading to resource shortages
5. People working with newly built small blast furnaces in Chungwei, China
1.2 Backyard Furnaces
The backyard furnaces campaign launched in 1958. Mao’s belief in rapid steel production through backyard furnaces showed his vision of transforming China into an industrial powerhouse through sheer willpower and mass mobilization. Mao aimed to push China’s industrial output to rival the United Kingdom within 15 years. Mao's vision, which was influenced by Soviet leader Nikita Khrushchev's speech of overtaking the U.S. economy, reflected his fundamental misunderstanding of industrial processes. The Communist Party set a very ambitious target to double steel production to 10.7 million tons in 1958. This sudden push led to a breakdown in rational decision-making and devastating consequences. Liu Shaoqi and Deng Xiaoping were initially supportive but became increasingly concerned as the campaign's flaws became clearer and clearer.
Initially, the campaign was a symbol of China's quick progress and independence, which impressed some foreign countries. However, after the true nature of the campaign became clear, it heavily damaged China's credibility. For example, the Soviet Union, who were initially supportive, became critical of the campaign. This contributed to the Sino -Soviet split, with Nikita Khrushchev openly criticizing the ‘backyard’ industrialisation in his visit to China in 1958. The campaign's failure also led to a reassessment of China's economic policies by Western analysts, influencing foreign perceptions of China's development model for years to come.
Collecting the metal for backyard furnaces had many social consequences. Peasants were pressured into contributing their metal possessions, including tools and household items. In Xinyang, over 3
6 Mao and Khrushchev during his 1957 visit to Peking
million kilograms of iron tools were taken in just 3 months. This stripped households of valuable assets, many of which had been passed down through generations. The loss of these items not only impoverished families but also took away family traditions. For example, in some areas, ancestral graves were destroyed to extract metal ornaments, which left scars on rural communities
The poor quality of steel produced by backyard furnaces gave a severe blow to China's economy. By the end of 1958, China claimed to have produced 11 million tons of steel, but much of it was unusable pig iron. The smelting processes, often using temperatures too low for proper steel production, resulted in low-grade metal that failed to meet industrial standards. This massive waste of resources showed a significant opportunity cost. For example, in Sichuan province, 3.9 million tons of steel were reported to be produced in 1958, but only 300,000 tons were usable. Industries that relied on steel, such as machinery manufacturing and construction, suffered from the sub-par materials. As a result, defective goods and infrastructure were produced.
The campaign also had devastating environmental consequences. To fuel the furnaces, around 10% of China's forests were cut down in 1958 alone. In Hubei province, 40 million cubic meters of timber were used to fuel backyard furnaces in 1958. This disrupted ecosystems, leading to soil erosion and loss of plants and animals. The Yangtze River basin was heavily affected, with
7. Backyard furnaces in Xinyang count in 1959
increased flooding in the subsequent years because of the loss of forest cover. The long-term consequences would be felt for decades.
Around 90 million peasants were mobilised to operate with backyard furnaces during the peak of the campaign in late 1958 whilst neglecting the agricultural work that China needed For example, during the autumn harvest in Henan province, 70% of rural labour was moved to non-agricultural work, such as furnace operation. This led to significant drops in crop yields. The food shortages also contributed to the Great Chinese Famine (1959-1961), which led to around 15 to 55 million deaths.
The backyard furnace campaign also had significant health effects for the Chinese people. The smelting processes released toxic fumes and small particles into the air, which led to widespread respiratory issues. Workers at these furnaces usually lacked proper protective equipment to these toxic fumes. They were exposed to dangerous levels of carbon monoxide, sulphur dioxide and other harmful gases. In some areas, the air pollution was so severe that it caused acid rain, damaging crops and leading to food shortages. Years after the campaign ended, the long-term health effects of this exposure would still impact communities.
As steel production increased, many schools in rural areas were temporarily closed or repurposed to support steel production. Students and teachers were mobilised to work at the furnaces, interrupting the education of an entire generation. This had longlasting effects on literacy rates and development in rural China. Furthermore, the campaign's focus on labour over education reinforced anti-intellectual sentiments that would lead up to the Cultural Revolution's attack on educated elites.
8 Chinese red guards during the cultural revolution (1966)
The backyard furnace had unintended consequences for China's traditional industries. As metal items were taken for smelting, many artisanal workshops lost their tools and raw materials. This led to a decline in traditional metalworking skills and the production of culturally significant items. For example, the production of traditional musical instruments, which often required specific metal alloys, was severely impacted. China’s loss of culture and skilled craftsmanship stemmed from Mao’s single-minded focus on steel production.
The campaign had a massive psychological impact on Chinese people as it created trauma in many communities. People worked tirelessly towards unrealistic goals just to see their efforts result in waste and suffering, leading to people being sceptical towards the government.
1.3 The 1953 Lushan Conference
In July 1959 at the Lushan Conference, Peng Dehuai, who was a wellrespected military leader and revolutionary hero, challenged Mao’s Great Leap Forward policies. Peng saw the devastation in rural China firsthand: villagers were starved; fields were abandoned for backyard furnaces and the officials lied about production numbers. In a private letter to Mao, he said that the campaign’s ‘subjective idealism’ and ignorance towards reality had caused massive food shortages. He questioned Mao’s style of leadership. Peng’s intervention was important because it came from within Mao’s inner circle, meaning that the information he gave about Mao would be relatively reliable and a sign that the campaign and the CCP ’s failures could no longer be ignored. Peng’s warning showed a growing fracture within the Communist Party and revealed the dangers of Mao’s plans.
Mao saw Peng’s concerns as an attack on him and told him he was a traitor. At Lushan, Mao accused Peng of leading an ‘right-opportunist clique’, meaning anti-Party clique. More than three million officials came under investigation, and thousands , including intellectuals and local leaders, were labelled as ‘ rightists’ for simply voicing concerns. Mao insisted that the Great Leap’s failures were not the result of flawed policies but the work of saboteurs and counter-revolutionaries. This showed the extent of his power but also had lasting consequences: realistic reformers like Liu Shaoqi and Deng Xiaoping were ignored, while hardcore loyalists that had no clue how to revolutionise China gained influence. Mao sent a clear message: disagreeing with Mao was suicide. He ensured that blind loyalty, rather than logical decision-
9. Peng (left) and Mao (right) in 1953
making, would dominate even if he knew it was not healthy for the growth of China.
The fallout in Lushan left officials to be too terrified to report the truth which created an illusion of success. Despite famine worsening, the government, relying on false harvest reports, increased grain procurement quotas by 15% in 1960. Local leaders staged propaganda displays to show imaginary bumper harvests, while behind the scenes, food shortages deepened. Resources were misallocated ; factories produced useless steel instead of useful farming tools, and crucial irrigation projects were abandoned halfway through. This also silenced experts who could have potentially helped lighten the crisis.
Agronomists and engineers, whose advice clashed with Mao’s vision, were. Instead, unproven farming techniques like deep ploughing and close cropping were used. This resulted in China’s agricultural output collapsing even further. Instead of adapting policies to reality, the government doubled down on their mistakes which pushed the country deeper into economic disaster.
The post-Lushan environment of fear transformed local governance into a theatre of lies. Officials, who were desperate to avoid Peng’s fate, competed to outdo each other. In Henan Province, leaders claimed wheat yields of 7.5 tons per hectare , ten times more than the actual output, whilst confiscating farmers’ last reserves to meet quotas.
Villages that had shortages were labelled as ‘black flags’ and received: fewer food rations or resources, more severe famine conditions, public criticism and humiliation and even more forced labour or quotas, often through long hours or backbreaking work such as building irrigation systems or furnaces. The local leaders could be demoted, punished harshly or arrested. Sometimes, all the people in a village faced stricter government commands. The deceit had important consequences: when the central government exported 4.5 million tons of grain in 1960 (double the levels in 1957), they were unaware that millions of people were already starving. Meanwhile. trust collapsed as neighbours leaked and informed on each other for hoarding food and children denounced parents for ‘counterrevolutionary ’ complaints.
Mao rejected criticism because the Great Leap Forward was inseparable from his political identity. Admitting failure would have permanently damaged his image as China’s ‘Great Helmsman’ and validated people like Peng. Abandoning the campaign would signal weakness during the Sino-Soviet split because it was also tied to Mao’s rivalry with the Soviet Union. Mao blamed failures on local officials rather than his policies and doubled down on mass mobilization. Economically, reforms proposed by moderates (like restoring private plots) threatened Mao’s vision of total collectivisation. By 1961, when cannibalism cases emerged, Mao insisted the Great Leap had “70% achievements, 30% errors.”, which was not true at all.
1.4 The Great Famine (1959-1962)
The Great Famine came from Mao’s insistence on meeting unrealistic agricultural targets and the creation of a culture of exaggeration and lies. Local officials, fearing punishment for underperformance, inflated grain production reports by up to 50% in provinces such as Henan and Anhui. These lies led to excessive state requisitioning. In 1959, the government took over 30% of total grain output, compared to 20% in pre-Leap years. Meanwhile, natural disasters, including droughts in northern China and floods in the Yangtze River basin, reduced harvests by an estimated 15-20% between 1959 and 1961. However, the government blamed ‘class enemies’ and ‘ rightists’ for the shortages and refused to adjust their policies. The government prioritised ideological and opinionative loyalty over adaptive governance, which led to small, manageable challenges transform into large, nationwide catastrophe.
Rural communities endured extreme famine because of systemic extraction. The grain sourcing apparatus took away food from villages even as starvation set in. In Xinyang, Henan, authorities confiscated 90% of harvests in 1959, leaving peasants to survive on tree bark and clay. Families hiding grain faced public struggle sessions and humiliation, whilst informants rewarded with extra rations. Cases emerged of parents abandoning children to reduce mouths to feed, communal kitchens served gruel diluted with sawdust and more. This eroded trust in institutions and broke
10. Peasant children line up for food handouts during the famine of 1959-61
mutual aid, which left rural society fractured for generations after.
Demographic studies show the famine’s huge human cost. Historian Frank Dikötter estimates 45 million deaths between 1958 and 1962, whilst Yang Jisheng’s groundbreaking work states 36 million. Mortality rates peaked in 1960, with Sichuan Province alone losing 10 million people, which was 13% of its population. The crisis also caused 30 million missing births because of malnutrition-induced infertility. Both women and children suffered: female murder spiked as families prioritised sons and orphanages overflowed with abandoned children. This created generational gaps in rural areas and some villages even lost entire group of elders. The state’s refusal to acknowledge the toll allowed the party to escape accountability and responsibility
Desperation drove many people to do unthinkable things. Archives in Anhui reveal over 3,000 cases of cannibalism between 1959 and 1961, often involving the consumption of deceased relatives. In Guangxi, authorities reported families trading children as ‘livestock’ to avoid the prohibition of eating their own children. Survival strategies included boiling leather shoes for protein and scavenging undigested grains from animal faeces. These acts gave people long-lasting psychological damage. Survivors describe enduring guilt and shame, with some communities splitting along lines of ‘eaters’ and ‘ non-eaters’. The cannibalistic behaviour exposed how authoritarian policies could drastically change and dehumanise people and their morals.
China’s household registration system, hukou, made sure cities received preferential treatment. Urban workers received monthly grain rations, 12–15 kg per person, whilst rural allocations dropped to 7 kg in 1960, which were not enough to live properly. Major cities such as Shanghai and Beijing imported grain from Canada and Australia, protecting residents from the worst. On the other hand, rural areas became food prisons: peasants needed permits to travel to prevent migration for sustenance. The urban-rural divide deepened social hierarchies and fostered resentment that later fuelled the Cultural Revolution’s anti- elitism.
The regime weaponised information control to mask the disaster. Internal documents classified famine deaths as ‘ non-natural losses’, whilst propaganda outlets celebrated ‘unprecedented harvests’. Journalists such as Liu Binyan, who reported on Henan’s famine, were purged and sent to labour camps. International observers were restricted to model communes, where the meals were staged and the storehouses were brightly painted to create positive illusions. Locally, grain-summary meetings punished officials who reported shortages, forcing an upward distortion of data. Th e censorship apparatus not only prolonged the famine but also birthed patterns of disinformation that are in China’s crisis management today.
By 1961, the previous catastrophic failures forced limited reforms. Liu Shaoqi and Deng Xiaoping rolled back communal dining halls and allowed private plots which boosted grain yields by 8% in 1962. Mao kept symbolic control but lost economic policymaking power, a change that was formalised at the 1962 Seven Thousand Cadres Conference. However, the reforms were half-measured: land were still collectivised and famine-era leaders such as Li Jingquan kept their posts. The retreat revealed the CCP ’s inability to fully calculate with its failures, which set the stage for Mao’s Cultural Revolution and became a reminder of what can happen when strict beliefs and power take priority over basic human needs.
Chapter 2: Political Factors
2.1 Mao’s Political Motivations for the GLF
Mao launched the Great Leap Forward primarily to have his vision of a communist utopia come to life. He wanted China to go through a shortcut by bypassing capitalist development and jump forward directly. Mao believed that mass mobilisation could overcome material limitations, inspired by the Marxist-Leninist theory. This led to policies such as merging households into communes and smelting steel in backyards. Mao wanted to erase class distinctions and create a society where everyone worked selflessly and for the collective good. However, this cut off ties between labour and reward and caused peasants to lose motivation quickly. Fields were abandoned as peasants were forced into taking part in inefficient projects. Family autonomy was destroyed by things such as communal kitchens and living spaces. The result of this was a catastrophic drop in agricultural productivity. Grain output fell by 15% between 1958 and 1961.
The Great Leap Forward was a way to help Mao reassert control after the Hundred Flowers Campaign, 1956–1957, where critics had expressed dissatisfaction with his leadership. Mao dismissed realistic and practical leaders such as Zhou Enlai and Liu Shaoqi and regained authority and power for himself. Local officials who questioned his unrealistic targets, such as producing 10 million tons of steel in 1958 , were labelled as ‘ rightists’ and purged. This led to officials competing to outdo each other in loyalty displays, leading to inflated production figures to absurdly high levels. For example, some communes claim to have achieved wheat yields of 75 tons per hectare, over 30 times the actual average. Technical experts in agriculture and economics were
ignored by Mao, whilst unworkable policies like deep ploughing were continued.
After Stalin’s death in 1953, Mao wanted to surpass the Soviet Union and the West’s achievements and prove China to be superior. The Great Leap Forward’s slogan, ‘Overtake Britain in 15 years’, reflected this. Industrial targets were set to mimic the Soviet’s style of heavy industry, but Mao added a twist by mobili sing peasants instead of relying on urban workers. This led to farmers smelting steel in homemade furnaces using kitchenware as raw material. Over 600,000 backyard furnaces produced unusable pig iron, which wasted resources and labour. Meanwhile, excessive grain exports to the Soviet Union, peaking at 2.7 million tons in 1959, continued even as famine plagued the countryside. The campaign made food shortages worse and alienated rural communities and peasants.
One of the biggest problems with the Great Leap Forward was how much Mao distrusted experts. He believed that ordinary people, full of the ‘ revolutionary spirit’, could achieve amazing things just by working hard and being creative. This meant that he ignored scientists and engineers who warned him about problems . For example, agronomists said planting crops too close together wouldn’t work, and engineers knew that backyard furnaces wouldn’t be effective. But Mao believed that the passion of the peasants wo uld win over science. Because of this attitude, strange and unscientific farming methods were used, like planting seeds up to three metres deep to supposedly reach ‘ground energy ’. Unsurprisingly, crop yields fell badly, and forests were cut down to fuel furnaces, which led to erosion and environmental damage. Educated city workers were forced to go to the countryside to be ‘ re-educated’ and carry out these unrealistic policies, which pushed intellectuals even further away. By ignoring expert advice, both agriculture and industry were badly affected, and China was left short on resources. Many trained professionals lost hope as their knowledge was ignored. Mao’s focus on ideology over experience meant that the bold ideas behind the Great Leap Forward were never matched by practical results.
Furthermore, it’s also important to understand that the Great Leap Forward was closely tied to Mao’s desire to be remembered as a great, almost god-like, leader and understand how dangerous it is when a leader’s image is put above the truth and the wellbeing of the people. By 1958, he was calling himself the ‘Great Helmsman’ and wanted to be seen as the person who would lead China out of its ‘century of humiliation’. Posters and poems praised him, comparing him to the sun shining down on the country, and this kind of praise made it nearly impossible to admit when things went wrong. Even when millions were dying, Mao claimed the GLF had more achievements than shortcomings. Because his reputation had to be protected, the government delayed reforms that might have saved lives. In the end, over 30 million people died in the famine.
2.2
Sustaining Belief in Mao and the GLF
During the Great Leap Forward, the Chinese Communist Party used powerful propaganda to create the image that everything was going well, even when it wasn’t. Colourful posters showed smiling farmers harvesting huge amounts of grain and workers proudly using backyard furnaces to smelt metal. Slogans like ‘ Three Years of Hard Work, Ten Thousand Years of Happiness ’ promised that a perfect future was just around the corner. However, in reality, communes were starving and the steel being made was mostly useless. The government focused on places like Xushui County, which falsely claimed grain yields 20 times higher than normal, to trick people both in cities and even from other countries into thinking that the Great Leap Forward was a big success. This led to hardly anyone speaking up about what was actually going wrong. Economically, all the effort that went into looking successful, for example, people piling up smelted metal for show, meant real problems like broken tools were ignored, which made production numbers drop even more.
To keep up the illusion, the government made sure that anyone who told the truth was punished. Newspapers such as the People’s Daily printed completely made -up harvest numbers, and loudspeakers in communes played endless songs praising Mao. When a journalist called Liu Binyan revealed the truth about famine in Henan in 1959, he was sent to a labour camp, and his reports were completely erased. The government kept things so secret that even mid -level officials didn’t realise how bad the famine really was. In fact, China was exporting grain while millions were starving at home. People became scared to speak out , as some families even hid the deaths of their loved ones because they didn’t want to be seen as ‘counter-revolutionary.’ This created an atmosphere of fear and made people stop trusting each other. Politically, it strengthened the idea that Mao could never be wrong. because nobody was allowed to say otherwise.
Propaganda didn’t just spread lies; it was used as a weapon to force people to pretend they believed in impossible goals. Slogans like
‘Pessimism is Wrong’ pressured people to act like everything was going fine. If someone said a policy wasn’t working, they could be publicly shamed in something called a ‘struggle session’. This led to a cycle of dishonesty; local officials, afraid of being punished, exaggerated how much food or steel they were producing. These fake numbers were then used by higher-ups to set even bigger targets. In Anhui, villages that claimed massive increases in steel were rewarded, while those that told the truth got less food. Economically, this obsession with appearing successful caused resources to be badly mismanaged, for example, growing wheat where rice would’ve made more sense, making shortages even worse. People also started keeping quiet, because saying the wrong thing could put their lives at stake.
Instead of admitting things were failing, they claimed that the suffering was part of a great revolutionary struggle. Posters showed brave peasants fighting against floods and droughts, and newspapers blamed ‘hidden enemies’ for the food shortages. In 1960, Mao told people to ‘Arm Ourselves with Mao Zedong Thought’, as if hunger was something they could overcome purely by believing harder. Survivors were praised for being ‘steeled revolutionaries’, and starving farmers were told that even chewing on tree bark was helping build socialism. This made people feel like they couldn’t complain or resist. Politically, it meant the government never had to admit its mistakes, instead blaming everything on ‘ natural disasters’. Economically, this meant that dying communes were still expected to hand over grain to prove loyalty, which intensified the famine.
Propaganda was used to cover up the truth during the Great Leap Forward. This left deep scars for China. Even after the worst of the famine, the government kept saying the campaign had been ‘ 70% successful’, and proper changes didn’t arise until 1962. People who lived through it became deeply suspicious of anything the government said. This distrust later exploded during the Cultural Revolution. The obsession with looking loyal rather than being effective meant things like steel production fell way behind. It took
China’s steel industry ten years to recover from all the waste caused by backyard furnaces. Mao’s ability to hide the disaster made him think he could get away with even more extreme campaigns. Propaganda had become a way to control people by pretending everything was fine, even when millions were dying, and this method would be used again to protect the regime no matter the cost to human life.
A CCP propaganda poster from 1959 showing a good vegetable harvest
2.3 Increased Authoritarian Control
As things began to go wrong during the Great Leap Forward, the Chinese Communist Party reacted by cracking down on anyone who dared to speak out. Local officials who tried to report problems like crop failures or famine deaths were labelled as 'rightists' and forced to go through struggle sessions, which were public humiliations where crowds shouted at them and accused them of being traitors. In places like Shizhu County, Sichuan, officials who warned about starvation were beaten and sent to do hard labour ins tead of being listened to. This kind of punishment destroyed important feedback systems. By 1960, grain exports actually rose by 30 percent, even though rural families were eating tree bark to survive, because officials were too scared to admit there were shortages. Without honest reporting, the government had no idea what was really happening, and the crisis grew worse instead of being solved.
Public shaming: People holding up placards showing their alleged crimes
To keep control, the Party sent militias and security forces into villages, turning them into places of fear and constant surveillance. People trying to escape areas hit by famine were caught at checkpoints, and informants spied on neighbours to see if they were hiding food. In Henan, militias would raid homes at night, taking cooking pots and even seeds just to meet steel production targets. These actions broke down traditional village life. Elders lost their roles as leaders, and shared dining halls repla ced normal family meals. Because local people no longer had control, they couldn’t respond to the crisis in ways that might have helped, which made things even worse for rural communities.
The government also took away power from local leaders and gave it all to officials in Beijing. These central committees made all the big decisions, from what crops to grow to how people should work, without understanding local needs. In Guangxi, for examp le, farmers were told to grow sweet potatoes instead of rice, even though the local climate wasn’t right for sweet potatoes. This top -down control led to serious problems. In 1959, Sichuan Province sent 70 percent of its workers to help with steel production, so no one was left to harvest crops, and the food went to waste. Because local knowledge was ignored, grain production dropped by 25 percent across the whole country between 1958 and 1961.
Even basic survival became dangerous. People who tried to gather wild plants to eat were accused of 'stealing from the collective', and families who hid grain could be executed. In Hunan, a man was jailed for 15 years just for picking leftover corn from a state-owned field. At the same time, Mao launched the 'Socialist Education Movement' in 1963, which blamed middle -level officials for the famine. More than 300,000 of them were removed from their jobs, which meant that villages were left without proper leadership. This endless cycle of blame and punishment made people distrust the government more and more, as it seemed more focused on finding enemies than helping its citizens.
By 1961, fear had taken over the government. Officials were too scared to report deaths from starvation because they worried they would be punished. Some even changed population records to hide how bad things really were. This meant help never arrived in t ime. When other countries offered aid in 1962, Mao refused it just to keep up the image that China was strong and self-sufficient. The fear that had been created during the Great Leap Forward didn’t end there. In 1975, when the Banqiao Dam collapsed, which was a dam built during the GLF, local leaders hid the number of deaths at first, again to avoid being blamed. This shows how the damage from the Great Leap Forward lasted for years, even beyond the famine.
Chapter 3: Economic Factors
3.1 Mao’s Political Motivations for the GLF
One of the most damaging results of this system was that resources were pulled away from farming and put into industry. Farmers were told to leave their fields and work in backyard steel furnaces instead, and even farming tools were melted down to make ste el. This meant that both the people and the equipment needed for growing food were taken away, which caused crop production to drop massively. Despite this, the government continued collecting grain from the countryside based on the false harvest numbers t hat had been reported. This left villages with hardly any food, which led to hunger, sickness, and eventually mass starvation. Experts have said that over 60% of the drop in food production during the Great Leap Forward happened because of this focus on industry and the unrealistic amount of food the state took away.
The failure of central planning didn’t just affect farming. A lot of the industrial projects that were quickly started to meet targets ended up wasting time, money, and resources. Many of the steel items made in backyard furnaces couldn’t be used, and buil dings and other projects were rushed and badly made because they had no proper planning. In some places, up to 40% of housing was destroyed. Forests were cut down to keep the furnaces going, which damaged the environment. Because the focus was all on hitting numbers, no one checked whether the things being made were actually useful, and as a result, much of it went to waste, leaving people without the tools or materials they really needed.
The strict way that the country was run also meant local officials couldn’t make changes or try new ideas when problems started. They
were expected to follow orders from above, even if those orders clearly weren’t working. This made things worse, especially after the Soviet Union pulled its support in the early 1960s. China lost access to expert knowledge and important materials, making it even harder to recover. Because the system couldn’t change or adapt, the crisis went on much longer than it should have, until the government finally stopped the Great Leap Forward in 1961.
The human cost of these mistakes was unbelievably high. Tens of millions of people died, not just from starvation, but also from cold and exhaustion. Families and villages were broken apart as people were forced to take part in large group projects. The em otional damage was just as serious: people no longer trusted the government, and a culture of fear and dishonesty took hold. Even though the Great Leap Forward officially ended in 1961, the damage it caused to China’s economy, society, and politics lasted for decades.
3.2 Mao’s Political Motivations for the GLF
The commune system introduced during the Great Leap Forward completely changed how people in the countryside lived and worked, but it ended up doing more harm than good. Private farming was banned. Instead, land, animals, and tools were all shared in big collectives. Families were placed into communes where they worked together, ate together, and even raised their children together. The government hoped this would make farming more efficient and encourage teamwork. However, because everyone got the same amount of food or money no matter how hard they worked, people quickly lost the motivation to put in extra effort.
Things got worse because of how labour was organised. Instead of being paid for how much they did, peasants were given something called work points, which were meant to reflect their effort. But in many cases, these points were handed out equally or based on political loyalty rather than actual hard work. Over time, people realised that there was no point in trying their best, since it didn’t earn them any extra reward. Many began to do the bare minimum. This is often called the ‘free rider problem’, where some people take advantage of others doing the work while not contributing much themselves. As a result, the most hardworking farmers gave up trying, and agricultural productivity began to fall, adding to the food shortages and the famine.
Communal dining halls, which were also part of the commune system, made things worse. Instead of cooking at home, everyone ate meals made in large, shared kitchens. At first, this felt like a luxury, but because food was handed out based on need rather tha n effort, people didn’t feel the need to save or grow more. Food was eaten quickly, waste became common, and soon there wasn’t enough to go around. Without control over their own meals, families lost the ability to manage their food or plan for the future, and their motivation to work harder disappeared completely.
The structure of the communes also damaged traditional village life. Power was taken away from respected elders and local leaders and given to Communist Party officials, who often didn’t know much about farming. These officials focused more on hitting targets than helping people. This top-down way of doing things made many peasants feel ignored and powerless. Because personal ideas and solutions weren’t encouraged, creativity and problem-solving disappeared, and people stopped caring about making improvements or adapting to local conditions.
In the end, the commune system failed to inspire people and caused serious economic and social damage. Farming output collapsed, which played a big role in the Great Famine, and rural communities became divided and hopeless. By the early 1960s, Chinese lea ders realised that people needed a reason to work hard. They began to slowly move away from the commune system and allowed families to have small private plots again. Farmers could now keep part of what they grew, which helped them see a clear link between their effort and their reward. This change helped farming recover quickly and gave rural workers a new sense of purpose.
3.3 Economic Devastation From Backyard Furnaces
As discussed before, the backyard furnaces campaign was one of the key parts of the Great Leap Forward and aimed to turn China into a major industrial country by massively increasing steel production. Millions of ordinary people, including farmers and city workers, were told to build small furnaces in their villages and neighbourhoods. They were encouraged to melt down everyday metal objects, like cooking pots, tools, and even farming equipm ent, to make steel. The idea was that if everyone took part, China could catch up with countries like Britain or the United States, even without proper factories or trained workers. However, in reality, most of the metal produced was poorquality pig iron, which could not actually be used for building or making machines. Instead of helping, this campaign led to the loss of useful tools and personal items, which made life and work even harder for both farmers and city dwellers.
The economic impact was disastrous. As huge numbers of peasants left their farms to work on these furnaces, farming ground to a halt. Crops were left unharvested or even rotted in the fields, and food production dropped sharply. With fewer people working i n agriculture and fewer tools to use, the food shortages got worse, leading to famine. Some local officials, desperate to look good in front of higher authorities, lied about how much steel they were making. This meant that targets kept getting raised, wasting even more time and resources. While leaders focused on steel numbers, they ignored what was really happening; millions of people going hungry and villages falling apart.
The furnaces also caused serious environmental damage. To keep them going, people cut down huge areas of forest . In fact, at least 10 percent of China’s forests were lost during the campaign. When they ran out of wood, people started burning doors, furniture, and even coffins. This caused soil erosion, floods, and long-lasting damage to the
land, which made farming even more difficult. In the end, the environmental destruction made the economic crisis even worse.
The campaign focused more on getting everyone involved and showing loyalty to Mao than on using proper skills or planning. Many of the furnaces were badly built and collapsed after a few heavy rains. The steel that was made couldn’t be used and just piled up in warehouses and train stations. The whole effort was wasteful and took away people and materials from other important jobs. Instead of speeding up industrial growth, it actually damaged the economy and left the country in a worse state than before.
The effects on people’s lives were just as serious. The loss of personal belongings and the pressure to join in created tension and mistrust within communities. Families had to give up items that had been passed down for generations, and people were consta ntly pushed to hit impossible targets. This created fear, stress, and eventually disappointment, as the promised future of wealth and progress never arrived. Instead, people were left to deal with hunger and hardship.
3.4 Long-term Impacts on Agriculture and Industry
The long-term effects of the Great Leap Forward on farming and industry in China were extremely serious, and they shaped the country’s economy and society for many years afterwards. One of the biggest problems was that so many workers were taken away from the fields to work on industrial projects like backyard furnaces. Because of this, food production fell dramatically. Crops were left unharvested, and millions of people went hungry as a result. Traditional farming methods were pushed aside when private farming was banned, and people who disagreed with the changes were often punished. This destroyed village life and the local kn owledge that had helped feed communities in the past. These changes led to one of the deadliest famines in human history. Experts estimate that between 15 and 45 million people died before their time, with the countryside suffering the most.
Industry also struggled under the Great Leap Forward’s policies. At first, there was a lot of construction in areas like steel, mining, and textiles, but most of it didn’t really help in the long run. The backyard furnace campaign, for example, created millions of tons of poor-quality pig iron that couldn’t be used. Many factories and projects were rushed and didn’t work properly. Because the focus was on hitting targets instead of making useful products, there were shortages of materials and huge increases in building costs. By 1962, the government had to cut back on industrial investment by over 80 % to stop the economy from collapsing completely. These setbacks took years to fix.
Farming methods during this time also made things worse. New ideas like close cropping and deep ploughing were meant to increase harvests, but they were based on bad science, especially from the Soviet scientist Trofim Lysenko. These methods caused plants to fight for sunlight and nutrients, which actually lowered the amount of food
that could be grown. Local leaders, scared of getting in trouble, often lied about how much grain had been harvested as they sometimes exaggerated by ten times or more. This meant the government took away more grain than there really was, leaving villages with nothing. These problems showed how dangerous it was to rely on central planning that ignored the real experiences and knowledge of local farmers.
Although most of the results were negative, a few projects from the Great Leap Forward did help later development. For example, the Daqing oil field became a successful model for future campaigns, and some large irrigation projects begun in the late 1950s were useful in later modern farming. However, these successes were small compared to the huge drop in productivity and the long-term damage done to the countryside. Many forests were cut down for furnace fuel, homes were destroyed, and local leadership broke down. It took years for communities to recover from the physical and emotional damage.
After the failure of the Great Leap Forward, China’s leaders had to rethink their approach. In 1962, during the Seven Thousand Cadres Conference, Mao stepped back from day-to-day leadership, and leaders like Liu Shaoqi and Deng Xiaoping began to introduce more practical changes. People were allowed to farm small private plots again, and local areas had more control, which helped food production recover.
Chapter 4: Social Factors
4.1 Impact on Rural Communities
The Great Leap Forward had a devastating effect on rural communities, changing village life across China in ways that would be felt for years. When collective farming was forced on the countryside, families lost the right to work their own land. Private plots were banned, and millions of peasants were placed into huge communes where they had little control over how they worked or what happened to their food. The government set very high grain quotas, and much of the harvest was taken away to feed cities or for export. This left many villagers with barely anything to eat. Even when famine began to spread, local officials, who were worried about being punished for missing targets, still took grain from starving communities. In some areas, people collapsed and died at the gates of full granaries, desperately calling for help from the Communist Party and from Mao Zedong himself. Between 15 and 45 million people died, making it one of the worst humanitarian disasters in history. The provinces hit hardest included Sichuan, Anhui, and Henan.
Forced labour also became a daily part of life during this time. Instead of farming their own crops or spending time with their families, villagers were made to work on massive projects like digging canals or building roads or helping with backyard steel furnaces. This constant hard work, especially while people were starving, led to extreme tiredness, sickness, and many more deaths. Traditional village life broke down. The usual systems of support and leadership were replaced by the state’s strict demands. Communal dining halls, which were meant to bring fairness and equality, became places of
frustration and sadness when food ran out and meals were handed out unfairly.
The psychological effects were just as serious. As people grew more desperate, survival came before everything else. In some areas, neighbours stopped trusting each other. There were reports of people abandoning their children, stealing food, and even turn ing to cannibalism in the most extreme cases. Seeing friends and family die while being unable to do anything left emotional scars that never fully healed. The government made things worse by refusing to admit how bad things were. Propaganda posters and sp eeches still claimed there were record harvests, even when people were starving. For many survivors, this period felt confusing and terrifying. They had trusted the government to improve their lives, but instead they were left feeling betrayed.
The countryside’s economy was completely wrecked. So many workers had been taken away from the fields, and so many tools and animals had been destroyed for steel production, that farming suffered massively. Grain harvests fell sharply, and even the small amounts that were grown were usually taken by the state. Because people weren’t rewarded for working hard in the communes, many gave up trying. Traditional markets disappeared and were replaced by a system of state distribution that simply didn’t meet basic needs. As a result, recovery from the famine was very slow. Some villages took years to get back on their feet.
The Great Leap Forward left a long-lasting legacy of mistrust in rural China. People remembered the suffering, and many were more careful in how they viewed government campaigns after that. When private plots were finally allowed again in the early 1960s, food production and village life slowly began to recover, but the trauma of starvation and forced labour was never forgotten.
4.2 Effects on Family Life
The Great Leap Forward had a huge impact on family life in rural China. One of the biggest changes was the removal of private households and the push for communal living. Families lost control of their homes, land, and even their own meals. Instead of eati ng together in their kitchens, they were forced to eat with their neighbours in communal dining halls, where everyone was given the same basic rations. The government also set up nurseries for children and 'happiness homes' for the elderly to free up adult s for labour. This meant parents were separated from their children, and older family members were taken away from their traditional roles as caregivers and advice-givers. Many rural people felt like the government was stepping into their private lives, an d it created a strong feeling of anger and disconnection. Families could no longer secretly hide food or feed their own children first during shortages, which made surviving the famine even harder.
The role of women also changed a lot during the Great Leap Forward. Women were now expected to work in the fields and help with steel production, instead of staying at home like traditional Confucian values had taught. While some women liked earning work p oints and gaining more independence, many were upset about being separated from their young children. In places like Henan and Shaanxi, mothers reported finding their babies malnourished and covered in sores when they visited overcrowded nurseries. At the same time, propaganda showed off 'Iron Women' who focused more on work than on being mothers, which led to arguments and tension across generations. Daughters-in-law, who had usually been below their mothers -in-law in family hierarchy, gained status through their labour, whil st elderly women lost respect because their traditional domestic skills were no longer valued. All of this caused many extended families to break apart, and older family members were often left alone and vulnerable when the famine hit.
The end of family farming had serious consequences for the countryside’s economy. Families used to rely on private plots to grow vegetables and raise animals, which helped them survive when rations were low. But the government banned these plots, calling t hem 'capitalist remnants'. Without them, people had to depend entirely on the state for food. Things got even worse when tools, cooking pots, and furniture were taken away to be melted down in backyard furnaces. This meant people couldn’t trade or fix thin gs. In provinces like Anhui and Sichuan, some parents who couldn’t feed their children ended up abandoning them or worse, and many teenagers were sent away to labour camps. The state said it could replace the family’s support system with communal welfare, but this failed completely when famine arrived.
These events caused deep emotional damage that lasted for generations. Children who grew up in nurseries missed out on important time with their parents, so they didn’t develop the same strong family bonds. Many learned to focus on survival rather than loyalty. In Guangxi, some survivors later said they remembered fighting their siblings over bowls of porridge. The government even encouraged children to report their parents for hiding food, which created fear and mistrust within families. Older people sent to 'happiness homes' were often neglected, as staff were overworked and more focused on younger labourers. Traditional values like filial piety, respect for parents and elders, began to fade, and some of these changes can still be seen in China’s countryside today.
Overall, the Great Leap Forward had a strange effect on family life. On the one hand, the policies failed and caused great pain. On the other hand, the chaos helped push forward some modern changes. Women’s work during this time helped support later campaigns for gender equality, and smaller nuclear families started to become more common as big extended families broke apart. But the emotional scars and anger over government interference didn’t go away. When private farming was allowed again in the 1960s, many famili es rejected communal systems and went back to working their own land. This
quiet return to independence helped make later reforms like Deng Xiaoping’s Responsibility System successful, in contrast to the failure of Mao’s earlier plans.
4.3 Public Health Crisis
The Great Leap Forward caused one of the worst public health disasters in modern history. As the famine got worse, millions of people suffered from malnutrition and had to survive on things like tree bark, wild plants, and even clay. Many developed swellin g in their bodies, known as edema, because they weren’t getting enough protein. Their immune systems also weakened, making them more likely to catch diseases like tuberculosis and dysentery. In Sichuan Province, which had the highest number of famine deaths, hospitals were overwhelmed with people suffering from illnesses like beriberi and pellagra both caused by not having enough vitamins. Things were made even worse by the coll apse of the healthcare system. Many doctors were sent to work in labour camps, and medical supplies were mainly sent to cities, leaving villages without help.
The effects of this period didn’t just end when the famine did.
Research shows that people who were children during the Great Leap Forward often had health problems for the rest of their lives. Because of extreme stress and hunger, their genes were affected in ways that increased the risk of conditions like high blood pressure, diabetes, and schizophrenia. A study from 2017 found that people born during the famine had a 60% higher risk of developing schizophrenia. These longterm health issues also meant that fewer people were able to work properly, which kept many rural families trapped in poverty. Women who went through the famine were more likely to have underweight babies, starting the same problems all over again.
The spread of disease became even more serious due to malnutrition and overcrowded living in the communes. TB got worse as people’s immune systems couldn’t fight off infection. In Sichuan, studies show that people whose mothers were pregnant during the fam ine were 40% more likely to get TB in the 2000s, and their own children were also at higher risk. Dirty water and lack of hygiene caused outbreaks of cholera and dysentery, especially since many sanitation projects had been stopped so that workers could be sent to steel production. The
government refused to admit there was a crisis, which made things even worse. There were no quarantines, and people were not allowed to report diseases properly, because the authorities didn’t want to ruin the image of progress. As a result, illnesses that could have been stopped turned into full epidemics.
Communal dining halls, which were meant to be fair and equal, ended up spreading disease. Everyone ate the same food in unhygienic conditions, which led to more infections. As food supplies ran low, families had to search for food anywhere they could even if it was unsafe. Traditional healers and midwives were forced to work in labour projects, so local health knowledge disappeared. People stopped trusting one another. In some villages, neighbours competed for food or even hid the deaths of loved ones. Survivors from Anhui tell stories of entire villages where, as they put it, 'no one had the strength to bury the dead', and the unburied bodies made the spread of disease even worse. With trust and social unity breaking down, communities were less able to respond to the health crisis together.
The psychological damage from the famine affected children and grandchildren too. Survivors often developed habits like hoarding food, even when food became more available, which later led to problems like obesity and diabetes. Children raised by famine survivors often picked up these behaviours, continui ng the cycle of poor health. A 2020 study showed that children of famine survivors had higher rates of TB and sexually transmitted infections. This was partly due to inherited changes in their genes, and also because they were less likely to seek help from doctors.
4.4 How
the famine affected different social
groups
The famine caused by the Great Leap Forward didn’t affect everyone in China in the same way. Some groups suffered far more than others, especially those living in the countryside. Rural peasants were hit the hardest, as most of the government’s food collec tion and forced labour efforts were aimed at villages and farms. Even though official figures vary, historians estimate that somewhere between 15 and 45 million people died during the famine, with most of those deaths happening in rural areas. Additionally, many peasants lost their homes and belongings, as up to 40% of rural housing was destroyed to provide fuel for collective projects or backyard furnaces. The communal living system also tore apart the traditional ways families and villages supported each other, which made things even worse during such a difficult time.
People living in cities, on the other hand, were usually more protected from the worst of the famine. The government made sure food was sent to urban areas and to workers in factories, meaning those in cities were more likely to get regular food rations. This created a big divide between the countryside and the cities. While rural families were starving, many urban residents did not experience the same level of suffering. Over time, this difference caused tension between the two groups and helped build long-lasting social divisions in Chinese society. Even while the famine was raging, the government kept focusing on building up cities and industry, which only made things more unfair.
Within rural areas, the most vulnerable people were often the ones who suffered the most. Children and babies died in huge numbers, and some families were so desperate that they had to abandon or sell their children just to survive. Older people were often separated from their families because of commune rules and ended up dying from hunger or illness without anyone to care for them. Women were made to do hard physical labour alongside men, even though they were
already exhausted and trying to care for others. Many women had to watch their loved ones suffer or die, which caused deep emotional trauma.
Whether people survived or not often depended on their local community. Studies have shown that areas where there were strong family clans or where people trusted and helped one another had lower death rates. These communities were more able to hide grain from the state or share food secretly. But in places where trust had already been broken by earlier government campaigns, people were more isolated and less able to cope.
The famine also had a serious impact on education and culture. In rural areas, many schools were shut down or turned into workspaces, which meant a whole generation missed out on their education. Teachers and educated people, who had already been targeted in earlier campaigns, were sometimes blamed for what went wrong or made to do hard labour. At the same time, the government promoted new cultural ideas like the New Folksong and Peasant Painting Movements to try and keep people hopeful and loyal to the par ty. But even with these efforts, many traditional cultural practices and knowledge were lost or damaged by the trauma of what people had been through.
Conclusion
C.1 Summary
The Great Leap Forward is remembered as one of the biggest failures in modern Chinese history. It caused terrible problems across nearly every part of society. The main aim of the campaign was to turn China into a strong industrial and farming country very quickly, but this goal was based on unrealistic targets and poor planning. Leaders ignored the advice of experts, and that led to disaster. Farming was forced into collectives, and huge numbers of villagers were made to stop growing food and instead build things like backyard furnaces. As a result, food production dropped massively. This caused a famine that swept through the countryside, and it is estimated that between 15 and 45 million people died from hunger. Traditional ways of farming were destroyed, families lost their small private plots, and village support systems broke down, making things even worse for rural communities.
In terms of industry, the results were just as bad. The campaign used up huge amounts of resources but didn’t produce anything useful in the long term. The government claimed that steel production was rising quickly, but a lot of it was actually poor-quality pig iron that couldn’t be used. People even melted down their own tools and cooking pots, which made their lives harder and reduced productivity. Big infrastructure projects, like roads and dams, were rushed and often badly planned. This led to shortage s of materials, rising wages for construction workers, and very little improvement in what was actually produced. Between 1960 and 1962, the government had to cut industrial investment by over 80 percent, and the economy shrank as a result. With both farming and industry failing, the country’s income dropped sharply and progress was set back for years.
Socially, the Great Leap Forward caused huge damage too. Families were often split up, with people sent off to different places to do forced
labour. Traditional ways of life in villages disappeared, and the commune system that was meant to provide support ended up doing the opposite. People were starving, cold, and overworked. Many who lived through the campaign experienced deep psychological trauma, and trust in the government was seriously damaged. There were also brutal punishments for those seen as 'counter-revolutionaries', including forced labour and public struggle sessions, which only made people more afraid and divided.
Even though most of the results were tragic, there were a few small successes and lasting changes. Some of the roads, dams, and irrigation systems built at the time were later useful for development. Women were brought into the workforce in large numbers, w hich although it was chaotic helped set the stage for future gender equality efforts. Importantly, the disaster made Chinese leaders realise that their economic approach needed to change. After 1962, private farming plots were allowed again, and the government began to rely more on experts and practical solutions, rather than simply following political slogans. These changes helped shape later reforms under leaders like Liu Shaoqi and Deng Xiaoping, who focused more on realistic goals and improving living conditions.
The Great Leap Forward also left a big mark on Chinese politics. After the failure became clear, leadership in the Communist Party began to shift. Mao Zedong gave up some of his power to more practical leaders for a time. However, he never fully admitted h ow badly the campaign had gone. Instead, he blamed local officials and tried to protect his own image. This attitude helped lead to the Cultural Revolution, where Mao tried to win back full control and punish those he thought had let him down.
C.2 Chinese Communist Party’s Future Policies
The Great Leap Forward completely changed how the Chinese Communist Party made decisions about leadership, the economy, and the way it ran the country. The campaign had disastrous results, including the deaths of tens of millions of people, a collapsing economy, and huge disruption to everyday life. The outcomes forced the Party to think more seriously about the dangers of following extreme ideas without proper planning. After the famine, Party leaders went through a period of reflection and self-criticism, especially at the Seven Thousand Cadres Conference in 1962. At this meeting, Mao Zedong was pressured to hand over some of his control to more practical leaders like Liu Shaoqi and Deng Xiaoping. They believed that China needed to focus on realistic results instead of just political slogans. This was a turning point; instead of pushing for radical collectivism, leaders began to focus on bringing back stability and rebuilding trust, especially in the countryside.
One of the biggest lessons from the Great Leap Forward was that trying to run the entire economy through centralised, top -down control can lead to disaster if local conditions are ignored. In response, the government slowly brought back private farming plo ts and allowed limited market activity in rural areas. This made a big difference and helped farming recover quickly. These changes also set the stage for the much bigger reforms of the 1970s and 1980s, led by Deng Xiaoping. He focused on the idea of 'seek ing truth from facts' and using practical rewards to motivate people, rather than just relying on revolutionary enthusiasm. The failure of the communes and the trauma of the famine made the Party more careful about launching big political experiments without testing them first.
The experience also changed the way the Communist Party handled information and criticism. During the Great Leap Forward, people were scared to speak up, and officials often lied about how much food they
had produced. This made the crisis worse. Afterward, the Party allowed a bit more honest discussion, at least when it came to economic issues. Leaders realised that if mistakes were kept hidden, they would only grow bigger. They also understood that good d ecision-making depends on having accurate data and being willing to change course when things go wrong. However, the painful memory of past purges and mass campaigns meant the Party still wanted to stay fully in control, and it was often cautious about bei ng fully open.
Another area where the Great Leap Forward had a long -lasting impact was food security. The famine showed how dangerous it is to overestimate food production and ignore warning signs. So, in the years that followed, China’s leaders worked on building large grain reserves, finding different sources of food, and making sure rural communities had stable ways to survive. Even today, this thinking continues. Leaders like Xi Jinping have emphasised the importance of being self-sufficient in grain, and this approach comes directly from the hard lessons learned during the Great Leap Forward. It is designed to make sure China never faces the same kind of food crisis again.
In the end, the Great Leap Forward taught the Communist Party how important it is to stay flexible and adapt when things are not working. While the Party didn’t give up on its socialist goals, it became more realistic about how to reach them. Gradual reforms and small-scale trials replaced sudden, extreme changes. The suffering caused by the Leap reminded leaders of the dangers of ignoring local knowledge, silencing criticism, and caring more about looking successful than actually making progress. The failure of the Great Leap Forward helped lead to some of the Party’s later achievements in reducing poverty and modernising the economy.
C.3 The Lessons Learned
The disaster of the Great Leap Forward taught the Chinese Communist Party several harsh lessons that affected the way it led the country afterwards. One of the most important things it realised was how dangerous it is to put political beliefs and mass campaigns above practical knowledge and local experience. During the Leap, the Party believed that pure determination and group work could replace experts and proper planning. As a result, skilled professionals were ignored, and people were forced to use untes ted farming and industrial methods. This caused chaos; irrigation systems failed, communes broke down, and the famous backyard furnaces produced useless metal. It became clear that excitement and hard work were not enough without real planning and technical skills. After seeing the damage, many Party members agreed that future projects had to be based more on facts and science, not just political goals.
Another serious lesson was about the danger of hiding problems and not allowing honest feedback. During the Great Leap Forward, local officials were pressured to report only good news, even when things were going badly. This led to a cycle of lies that sto pped higher-ups from taking action in time. When critics tried to speak up, such as at the Lushan Conference, they were punished or silenced. This meant that no one could warn the government properly about the famine and all the mismanagement going on. After the disaster, the Party slowly began to understand that it needed better information and some level of internal criticism in order to govern properly. This didn’t mean people could openly speak out, but it did open the door to small experiments and local feedback, especially when it came to economic policies.
The famine and the collapse of the economy also showed the limits of strict central planning. The Party saw that setting unrealistic targets without considering what was actually possible in each area could lead to disaster. Collective farming failed, and the forced rush into industry caused even more chaos. In the early 1960s, China brought back
private farming plots and allowed small market activities. These changes led to a quick improvement in food supply and everyday life in rural areas. This step -by-step, practical way of thinking laid the foundation for the big reforms that came later in the 1970s and 1980s, when China began to move toward a mixed economy and gave more freedom to local governments.
The social effects of the Great Leap Forward were also unforgettable. Families were broken apart, millions starved, and people lost trust in the government. This had a deep impact on Party leaders. They realised that future campaigns had to avoid causing t his much pain and disruption. As a result, later policies were often more careful and less likely to ruin people’s lives, even if they still aimed to achieve big changes.
The Great Leap Forward reminded the Communist Party the importance of public trust and government reputation really are. The decision to reject international food aid and to keep exporting grain during the famine, just to avoid looking weak, ended up costing millions of lives. People lost confidence in the leadership, and th e Party knew it had gone too far. In the years that followed, leaders focused more on keeping things stable and avoiding risky decisions. The mistakes of the Great Leap Forward paved a path for China’s future development.
The Great Leap Forward was a failure, and it became one of the worst human and economic disasters of the twentieth century. It was started by Mao Zedong and the Chinese Communist Party in 1958 with the goal of quickly turning China into a powerful industrial nation. However, instead of achieving that, it led to mass starvation, the deaths of between 20 and 45 million people, and the destruction of traditional ways of life. Farming collapsed when peasants were forced into communes and taken away from their land to work on unproductive projects like backyard furnaces. These furnaces mostly made useless pig iron and wasted important resources.
At the same time, food distribution broke down and both agriculture and industry were badly mismanaged. Because criticism was not allowed, a cycle of lies and misinformation formed, which meant the government had no idea how bad things really were until it was too late. Although there were some small improvements in industrial output and early attempts at bringing industry to the countryside, these positives were nowhere near enough to balance out the huge losses. The economic collapse, the millions of deaths, and the longterm suffering left behind had a massive impact on Chinese society.
The Great Leap Forward is a clear example of what can go wrong when ambitious ideas are pushed forward without listening to experts or thinking about the real needs of ordinary people
Table of Figures
0.Propaganda poster, The Great Leap, c.1960………………………………………………………………………………………………………
1.Propaganda poster in China, translation: “Let’s focus on increasing production and cutting costs, especially in grain and steel.”
2.Picture showing Mao greeting people
3.A boy gathers dry grass for food in the Great Famine
4.Famished peasant families eating at a commune
5.People working with newly built small blast furnaces in Chungwei, China
6.Mao and Khrushchev during his 1957 visit to Peking
7.Backyard furnaces in Xinyang count in 1959
8.Chinese red guards during the cultural revolution (1966)
9.Peng (left) and Mao (right) in 1953 …………………………………………………………………………………………………………………………...
Mao's Great Famine by Frank Dikötter (Book) (2010) Tombstone by Yang Jisheng (Book) (2012)
PASCAL’S TRIANGLE
BY SHISHIR VADDADI
(Third Year – HELP Level 2 – Supervisor: Mrs Reyner)
Introduction
What is Pascal’s Triangle?
Pascal’s Triangle is an infinite triangular array used in mathematics. It plays a crucial and extremely useful role in several fields including but not limited to probability, combinatorics and algebra.
(1) (2)
Origins
Although attributed to Blaise Pascal, a Frenchman in the 1600s, the triangle and its properties were discovered far earlier mainly in Asia.
First, in India in the 3rd or 2nd century BCE, the famous mathematician and poet Pingala (िपङ्गल) wrote the Chandahsastra (छ�ःशा�), a book linking mathematics to Sanskrit poetry. During this work with the relations of meters and syllables, he found an algorithm for combinatorics. It is believed that this gave his 10th century commentator Halayudha (हलायुध) through interpretation and elaboration in Mrtasanjivani (मृतस�ीवणी) the ability to form his ‘method of pyramidal expansion,’ Meru-Prastara (मे रुप्र�ार) roughly the Staircase of Mount Meru.
Similarly, in 11th century Persia, mathematician Al-Karaji (یجرکلا) authored a book outlining how to construct the triangle. Although the book is now lost, mathematician, poet and astronomer Omar Khayyam ( رمع مايخ ) recreated it using the binomial theorem giving it the name Khayyam’s Triangle ( ثلثم مايخ )
In China, the triangle was first recorded independently by 11th century mathematician Jia Xian (賈憲), publishing two books that are almost completely lost. Parts of his first book can be understood because of an analysis of the text by Yang Hui in the 14th century which explained Jia Xian's work. This work included a version of Pascal's Triangle and a method for creating the table. As a result, the triangle is named Yang Hui's Triangle in China.
In Europe, Pascal's Triangle appeared for the first time in the Arithmetic of Jordanus de Nemore (13th century). The binomial coefficients were calculated by Gersonides during the early 14th century, using the multiplicative formula for them. The triangle was then put into Petrus Apianus' book on calculations in business in 1527. Mathematician and engineer Niccolo Fontana Tartaglia published the first six rows of the triangle in 1556, giving the name Tartaglia's Triangle in Italy.
Finally, Pascal's Traité du triangle arithmétique (Treatise on Arithmetical Triangle) was published posthumously in 1665. In this, Pascal collected several results then known
about the triangle and employed them to solve problems in probability theory. While, late compared to all his predecessors, his contributions were extremely valuable and are still used to this day, hence giving the current western name of Pascal’s Triangle.
Each row on Pascal’s Triangle is formed by adding the two numbers with imaginary zeros either side of each row as shown below:
By many, including Pascal himself, the triangle is written left aligned seen below. This is useful in some patterns and applications.
The top row with only 1 is considered the ‘0th’ row with the next being the 1st. Moreover, the first entry of each row is considered the ‘0th’ entry.
(2) (3)
Patterns
As mentioned previously, Pascal’s Triangle is a treasure trove of interesting patterns and applications that will be explored here along with some of their simpler proofs. Let the ���� th entry of the ���� th row be �����,� . This notation will be used throughout.
Combinations
One of the mathematical disciplines in which Pascal’s Triangle is the most applicable is combinatorics. This is because of the fundamental link between the triangle and combinations that �����,� = �� � � = ������������ . �� � � or ������������ is pronounced ‘ ���� choose ���� ’ and tells us how many combinations of k items we can get from a list of n items. For instance, ���� =10, because there are 10 ways to select 3 items from a list of 5 items.1
As an example, take the 5th row: 1, 5, 10, 10, 5, 1. ���� =1= �����,� , ���� =5= �����,� , ���� = 10= �����,� , ���� =10= �����,� , ���� =5= �����,� , and ���� =1= �����,�
Proof
This can be proved using proof by induction. This means proving �����,� = �� � � , for ���� = 0 and ���� = ���� , then prove that �����,� = �� � � for any value assuming the same for the two values above. This works by repeating the process of assuming the two values above solve the equation repeatedly until the values reach the known values that solve the equation hence proving that they are correct.
From the triangle’s construction, we can determine the following: �����,� = �����,� = �����,� =1 �����,� = �������,��� + �������,� , where 0< ���� < ���� and ����, ���� ∈ℕ
The latter is the basis for the construction of the triangle. �00� = �����0� = ���������� =1 �����,� = �����,� = �����,� = �00� =
=1
1 For clarification, these are unordered lists. For ordered lists, see permutations.
In order to go further with the proof, the formula �� � � = ������������ = �! �!(��� )! 2 must be used. To understand why this formula holds, first we must use permutations.
Permutations, written as ������������ , tell us how many arrangements ���� items can have in a list of ���� items.
The formula for permutations is ������������ = �! (��� )!, as explained below.
For the 1st item in the arrangement, there are ���� options. This leaves ���� −1 options for the 2nd, and so on with ���� ���� +1 options for ���� th item. By multiplying these together, we find that ������������ can be expressed as ����(���� −1)(���� −2) …(���� ���� +1).
For any given ‘list’ of ���� items, we can determine that there are ���� ! orderings of this. This is because there are ���� options for the 1st item, ���� −1 for the 2nd, and so on until 2 for the (���� −1) th and 1 for the ���� th. Multiplying all of these together gives ���� (���� −1) (2)(1) = ���� ! 3
Hence,
Now, back to the original proof.
Assume �������,� = ���� � � and �������,��� = ��������
2 ����!= ����(���� −1)(���� −2) …(2)(1) , i.e. ����! is the product of all the positive integers until ���� , where ���� ∈ℕ. 3 This relation is because permutations are the same as combinations except ordered.
Applications
Combinations (and permutations) are used all over combinatorics and mathematics as a whole both pure and applied. Its main application is in probability theory, with other notable ones including algebra, topology and geometry, number theory, optimisation, calculus, statistics, (theoretical) physics, graph theory and computer science.
In probability, combinations are used in binomial distributions to find the likelihood of a certain success rate. 5 Specifically, they are used through the binomial expansion.6
Even in day-to-day life, combinations can be used to find how many full outfits you have or how many ice cream flavour combinations you can make. For example, if you need to choose 11 players from 20 options for a football team you have ������ = ������,�� possibilities.
Perhaps the most well-known and widely applicable usage of Pascal’s Triangle is in the coefficients of binomial expansions (binomial theorem).
4 This is derived from the original formula: �����,� = �������,��� + �������,� .
5 See binomial distributions.
6 See binomial theorem.
The binomial expansion is the expansion of (���� + ����)� .
The ���� th row of the triangle provides the coefficients of the expansion of (���� + ����)� , as shown below:
+ ����)� =
Take (���� + ����)� . This could be written as (���� + ����)(���� + ����)(���� + ����)(���� + ����)(���� + ����) and be manually expanded or you could look at the 5th row to find the coefficients and get
Proof
Instead of using Pascal’s Triangle, we can manually do a binomial expansion, such as (���� + ����)� (���� + ����)� = (���� + ����)(���� + ����)(���� + ����)(���� + ����) = (����������������) + (���������������� + ���������������� + ���������������� +
As can be seen, the coefficient of each term is dependent on how many ways we can arrange the power of ���� ���� s and the power of ���� ���� s.
In general, for the ���� th term in the expansion of (���� + ����)� has the coefficient of how many ever ways you can arrange ���� ���� ���� s and ���� ���� s. This means that the coefficient is equal to ������������ or �� � �.
Hence, (���� + ����)�
As ��
Hence,
, binomial coefficients match the rows of Pascal’s Triangle.
This is the binomial theorem.
Applications
Binomial theorem is again used in mathematics including probability theory 7 , algebra, calculus, statistics and number theory, avoiding lengthy calculations. However, the theorem is also used in the real-world including weather predictions, economics, game theory, algorithms and the distribution of IP addresses.
Pascal’s Triangle is used to find the coefficients of the binomial distribution.
The binomial distribution is a way of finding the probability of ���� successes of probability ���� from ���� trials, written as ����(����, ����) ����(����, ����) expands to form (���� +(1− ����))� with each successive term of ����� representing the probability of ���� successes. This follows the binomial expansion, which has coefficients that can be derived from the Pascal’s Triangle, showing that the triangle can also be used to determine the coefficients for the binomial distribution.
For example, the probability of rolling a 6 (probability � �) on a dice ���� times from 5 trials can be found by using the binomial distribution ���� (5, � �) which returns �����,� (��)� (��)� +
, with each term meaning 1 more 6 (e.g. the 1st term is the probability of 0 6s, the second term is that of 1 6, and so on until the last term which is the probability of 5 6s.
Applications
The binomial distribution is of course used extensively in probability theory, statistics and actuarial science. However, it is also extremely important in engineering, economics, medicine, physics, chemistry, psychology, quality control and more. For instance, in physics, it can be used to calculate the probability of an unstable nucleus’ decay and in lots of fields, it is used in Monte Carlo simulations to simulate random outcomes like reaction probabilities and modelling gene expression.
7 See binomial theorem.
In everyday life, it can be used to calculate the probability of certain random events in games, like getting doubles three times in a row in Monopoly, or to predict the likelihood of getting marks in a multiple-choice test by guessing.
(2) (3) (24) (25) (29)
Diagonals (and Hyperpyramidal Numbers)
The diagonals form important sequences, shown (as columns) in the diagram (leftaligned) below.
1s
1 Natural Numbers
1 1 Triangular Numbers
1 2 1 Tetrahedral Numbers
1 3 3 1 Pentatope Numbers
1 4 6 4 1 5-simplex Numbers
1 5 10 10 5 1 6-simplex Numbers
1 6 15 20 15 6 1 etc.
Proof
The 0th diagonal (column when left-aligned) is all 1s.
The 1st diagonal is the natural numbers (whole numbers above 0);
The 2nd diagonal is the triangular numbers.
Triangular numbers are formed by summing natural numbers. The first is 1 �� 1, the second is 1+2 �� 3, the third is 1+2+ 3 �� 6 and so on. This can be represented as circles in an equilateral triangle (hence the name).
More formally, this can be written as
The 3rd diagonal forms the tetrahedral numbers.
Tetrahedral numbers are formed similarly to triangular numbers but in 3D with tetrahedra (triangular pyramids). Each layer, however, seen in the diagram, is a triangle made of a triangular number. We can hence see that the tetrahedral numbers are formed by summing the triangular numbers. This is written as ��������� = ∑
Moreover, it means that �����������
This can be proved by induction.
Pentatope numbers work similarly using the 4th diagonal, but in 4D, hence adding tetrahedral numbers together. The pattern shown with natural numbers, triangular numbers and tetrahedral numbers continues.
This then continues with more dimensions with the ���� th
-simplex number (
) being written as follows.
These number sequences are called hyperpyramidal numbers and are hence all found by the (���� −1)th diagonal of Pascal’s Triangle.
For instance, the 8-simplex numbers are found with the 8th diagonal giving us 1, 9, 45, 165, etc. Or if we wanted the 8th 9-simplex number, we could look at the 8th element of the 9th diagonal to get 11, 400.
(2) (3) (30) (31) (32) (33) (34) (35) (36)
Fibonacci Sequence
The Fibonacci Sequence is a sequence of numbers where each successive term is given by the sum of the previous two, starting 1, 1. The first 10 terms are as follows: 1, 1, 2, 3, 5, 8, 13, 21, 34, 55.
The ‘shallow diagonals’ seen below of Pascal’s Triangle sum to form the Fibonacci sequence.
Hence, through induction, ����� = ∑ ���������,� ���� � � ��� , meaning the ‘shallow diagonals’ of Pascal’s Triangle sum to form the Fibonacci sequence.
Applications
The Fibonacci sequence is used all over mathematics and computer science. For instance, Fibonacci numbers are commonly used in number theory for their connection to the golden ratio 9 , irrational numbers and other mathematical concepts and frequently appear in important fractals. They are also used to design algorithms, especially optimisation algorithms and certain encryption algorithms.
9 The ratio between consecutive Fibonacci numbers converges to the golden ratio or ���� ≈1.618…
The sequence also shares interesting properties with human anatomy and DNA, hence its common use in neural network mapping. Some theoretical physicists have even explored Fibonacci numbers’ appearance in quantum mechanics, chaos theory and cosmology and they have been linked to certain types of particle behaviour, molecular structures and energy levels.
Fibonacci in Nature
The Fibonacci numbers are famous for their regular appearance in the natural world.
In flowers’, like lilies, roses and sunflowers’, petals, the number of petals is often a Fibonacci number. Similarly, the arrangement of leaves around a plant stem, otherwise known as phyllotaxy, often follows the Fibonacci sequence. Even the spirals in pineapples and acorns have Fibonacci numbers of bracts. This is because Fibonacci numbers maximise the light they can receive while growing.
The golden spiral is formed by using squares of side length Fibonacci numbers seen in the diagram above. 10 This also crops up all over nature, including in galaxy spirals, the proportions of nautilus shells and the expansion of seashells.
Fibonacci in the Arts
The golden spiral has fascinated artists for years with many artists believing that artwork in the ratio ���� is most appealing and aesthetically pleasing and that in order to highlight objects, they should be placed on the spiral itself. Leonardo da Vinci himself used the spiral in describing human anatomy to use in his paintings.
An octave in music consists of 13 notes, with each scale having 8 notes, with them 1st, 3rd and 5th being most prominent, all Fibonacci numbers. Mozart reportedly even used the golden ratio in deciding the ratio of the length of parts A and B in his sonatas, a style replicated by the likes of Beethoven, Bartók, Debussy, Schubert, Bach and Satie.
However, much of the use of the Fibonacci sequence in the arts has been criticised as pseudoscientific nonsense with no real truth.
(2) (19) (36) (37) (38) (39) (40) (41) (42) (43)
10 Because of the convergence to ���� , the ratio of the edges of the sides of the rectangle around the spiral also approaches ����
The Sierpiński Triangle
The Sierpiński Triangle is a fractal (a geometric figure or pattern that displays selfsimilarity at different scales, meaning its structure looks similar no matter how much you zoom in or out) constructed by repeated removal of triangular subsets from an equilateral triangle:
1. Start with an equilateral triangle.
2. Subdivide it into four smaller congruent equilateral triangles and remove the central triangle.
3. Repeat step 2 with each of the remaining smaller triangles infinitely.
(2) (3) (36) (44)
Row Sums
The Sierpiński Triangle can also be found in Pascal’s Triangle. Pascal's Triangle until the (2� 1)th row can be coloured with the even numbers white, and the odd numbers black, resulting in an approximation to the Sierpiński triangle. More precisely, the limit as ���� approaches infinity of this parity-coloured (2� −1) -row Pascal triangle is the Sierpiński triangle. To the left is an approximation of the Sierpiński Triangle using the first 31 rows.
The sum of elements in each row is 2� , written as ∑ �����,� � ��� =2� , as seen below.
1=1=2�
1+1=2=2�
1+2+1=4=2�
1+3+3+1=8=2�
1+4+6+4+1=16=2�
1+5+10+10+5+1=32=2�
1+6+15+20+15+6+1=64=2�
1+7+21+35+35+21+7+1=128=2�
Proof
The proof for this is quite simple.
When ���� =0,
�����,� � ��� = �����,� =1=2�
Each element is summed into the next row twice, in the element to the bottom-left and the bottom-right meaning the sum of each row is double the sum of the previous row.
Hence, ∑ �����,� � ��� =2� (2) (3) (45)
Row Products
The ratio of the ratio of the products of successive rows approaches ���� as the triangle goes on.11
The ratio of the ratio of the products of successive rows approaches ���� as the triangle goes on.12 1=1 1×1=1
As can be seen above, the value is getting higher and closer to ���� . However, it does not actually reach close to ���� until much higher rows, with astronomically large products. However, this ratio between the ratios of successive rows can be written as (1+ � �)� as seen before, making it much easier to find the value for higher rows.
Now, the value has approached much closer to ���� , and at row 100 000, it is correct to 5 significant figures.
Proof
Let the product of the ���� th row be �����
Then, to find the ratio of the products of consecutive rows,
The ratio of these ratios is then found as follows,
Polytopes
Polytopes are the generalization of two-dimensional polygons and threedimensional polyhedra to any number of dimensions.
The rows of Pascal’s Triangle give the number of elements of each dimension in a corresponding simplex triangle polytope. Specifically, �����,� gives the number of (���� ���� −1)-dimensional elements in a (���� −1)-dimensional simplex triangle polytope.13
For example, the 3-dimensional triangle polytope is a tetrahedron, with its elements found by the 4th row: 1, 4, 6, 4, 1. This means that a tetrahedron has 1 3-dimensional element (itself), 4 2-dimensional elements (faces), 6 1-dimensional elements (edges) and 4 0-dimensional elements (vertices).
A variation of Pascal’s Triangle can be used to find the same for square polytopes, where an element is the sum of double the top-left element and the top-right
13 Ignore the last element in a row (always 1) as it will always represent the non-existent -1dimensional element.
element (i.e. �����,� =2�������,��� + �������,� ), seen below. However, �����,� gives the number of (���� ���� )-dimensional elements in a ���� -dimensional simplex triangle polytope.
1
1 2
1 4 4
1 6 12 1
1 8 24 32 16
1 10 40 80 80 32
1 12 60 160 240 192 64
For example, the 4-dimensional square polytope is a 4-simplex-hypercube, with its elements found by the 4th row: 1, 8, 24, 32, 16. This means that a cube has 1 4dimensional element (itself), 8 3-dimensional elements, 24 2-dimensional elements (faces), 32 1-dimensional elements (edges) and 16 0-dimensional elements (vertices).
(2) (46)
Other Patterns
The number of odd numbers in a row of Pascal’s Triangle is equal 2� , where ���� is the number of 1s in the binary form of the row number. For example, 7 in binary is 0111. That has 3 1s, meaning there are 23 or 8 odd numbers in the row and row 7 is 1, 7, 21, 35, 35, 21, 7, 1.
In a given row, where the row number is prime, all terms except the 1s are divisible by the row number. For instance, in the 7th row, 7, 21 and 35 are all divisible by 7. This is because no numbers less than the row number can have that number in their prime factors, so ���� ! (���� ���� )! cannot have the row number as a factor, meaning the row number stays in the numerator of �! �!(��� )! and is hence a factor of �����,�
Where ���� is an integer, all the elements in row 2� are odd. For instance, in row 7 or 23-1, 1, 7, 21 and 35 are all odd.
When the elements of a row of Pascal's Triangle are alternately added and subtracted together, the result is 0.14 For example, row 6 is 1, 6, 15, 20, 15, 6, 1, so the formula is 1 6 + 15 20 + 15 6 + 1 = 0.
14 Ignore row 0.
In a triangular portion of a grid (as in the image on the left), the number of shortest grid paths from a given node to the top node of the triangle is the corresponding entry in Pascal's Triangle.
For any row, multiplying each term by successive powers of 10 and adding all the values together will give 11� , where ���� is the row number. For instance, for row 6 (1, 6, 15, 20, 15, 6, 1) returns 1∙10� +6∙10� +15∙10� +20∙10� +15∙10� +6∙10� +1∙ 10� =1771561=11�
(2) (13)
Extensions
Pascal’s Triangle has been extended in several ways to use it for other, greater purposes, for example to higher dimensions, complex numbers and arbitrary bases.
To Higher Dimensions
Pascal’s Triangle can be expanded to higher dimensions. The 3-dimensional expansion is called Pascal’s Pyramid, but further expansions are just collectively known as Pascal’s Simplices.
Pascal’s Pyramid is constructed exactly the same as Pascal’s Triangle, but using the three entries above, with extra imaginary 0s.
The pyramid up to layer 5 is as follows.
Similarly, Pascal’s Triangle can be expanded to further arbitrary dimensions to form simplices.
Applications
Pascal’s Triangle maintains many of its properties when entering higher dimensions. For instance, it can then be used for the trinomial expansion with (���� + ���� + ���� )� with each corner of layer ���� representing 1 variable and going inner to combine them. For example, (����
This can then go even further with higher simplices into multinomial expansion.
This also means that Pascal’s Pyramid can be used for the trinomial distribution where there are 3 possible outcomes of a trial (e.g. win, lose, draw) and Pascal’s Simplices can be used for multinomial distributions, where there are multiple possible outcomes per trial.
(2) (33) (47) (48) (49) (50)
Conclusion
In conclusion, Pascal’s Triangle, while it may appear simple with its formation of just simple addition, has patterns and can be extended so that it is able to be an extremely useful tool not only in mathematical fields, like probability, statistics, combinatorics, algebra, geometry and number theory, but also in scientific fields like theoretical physics, quantum physics, chemistry and computer science as well as simple day-to-day life.
Bibliography
1. Hosch, William L. Pascal's Triangle. Britannica. [Online] 21 March 2025. https://www.britannica.com/science/Pascals-triangle.
3. Ratemi, Wajdi Mohamed. The mathematical secrets of Pascal's Triangle. [Video]. s.l. : Ted-Ed, Youtube, 2015.
4. Humes, Emily. The History of Pascal's Triangle. Mathed at Utah State University. [Online] 2022. http://5010.mathed.usu.edu/Fall2022/EHumes/patterns.html.
13. Jared, J. R. Why does Pascal's Triangle give the Binomial Coefficients? s.l. : Mathematics Stack Exchange.
14. Andrew Lin, Daniel McLaury. Why does Pascal's Triangle work for combinations? s.l. : Quora.
15. Taylor, Courtney. How to Derive the Formula for Combinations. ThoughtCo. [Online] 26 December 2018. https://www.thoughtco.com/derive-the-formula-forcombinations-3126262.
20. CalculusNguyenfly. Proof of Pascal's Triangle. s.l. : Youtube, 2020.
21. Math, Mu Prime. My favorite proof of the n choose k formula! s.l. : Youtube, 2022.
22. Greg Attwood, Jack Barraclough, Ian Bettison, Lee Cope, Charles Garnet Cox, Daniel Goldberg, Alistair Macpherson, Bronwen Moran, Su Nicholson, Laurence Pateman, Joe Petran, Keith Pledger, Harry Smith, Geoff Staley, Dave Wilkins. Edexcel AS and A Level Further Mathematics, Core Pure Mathematics, Book 1/AS. London : Pearson Education Limited, 2017.
23. Greg Attwood, Jack Barraclough, Ian Bettison, Alistair Macpherson, Bronwen Moran, Su Nicholson, Diane Oliver, Joe Petran, Keith Pledger, Harry Smith, Geoff Staley, Robert Ward-PennyDave Wilkins. Edexcel AS and A Level Mathematics, Pure Mathematics, Year 1/AS. London : Pearson Education Limited, 2017.
24. Gill Dyer, Jane Dyer, Kathryn Hipkiss, David Kent, Navtej Marwaha, Katherine Pate, Keith Pledger, Brian Roadnight, Gordon Skipworth, Brian Speed. Edexcel GCSE (9-1) Statistics. London : Pearson Edexcel Limited, 2017.
38. Liu, Katie. Are These 10 Natural Occurrences Examples of the Fibonacci Sequence? Discover Magazine. 2024.
39. Chu, Hw. Relation between Pascal's triangle and fibonacci series. s.l. : Mathematics Stack Exchange.
40. Johnson, Cheryl. Golden Spiral -Rule of Thirds in Art and Photography. Medium.com. [Online] 2018. https://medium.com/@cherinow/golden-spiral-ruleof-thirds-in-art-and-photography-bf4285dff59a.
41. Adobe. An introduction to the golden ratio. Adobe. [Online] https://www.adobe.com/creativecloud/design/discover/golden-ratio.html.
42. Rizzi, Sofia. What is the Fibonacci Sequence – and why is it the secret to musical greatness? Classic FM. [Online] 2022. https://www.classicfm.com/discovermusic/fibonacci-sequence-in-music/.
50. Pascal's Triangle, Pascal's Pyramid, and the Trinomial Triangle. Jr., Antonio Saucedo. s.l. : California State University, San Bernardino, 2019.
Credits
Special thanks to the Ted-Ed video The mathematical secrets of Pascal’s Triangle - Wajdi Mohamed Ratemi as the inspiration for this project and to Mrs C Reyner for supervising this project.
VIDEO PROJECT
MODERN DAY 2025: IS ANYTHING REALLY PRIVATE?
BY DAVID BROWN
(Third Year – HELP Level 2 – Supervisor: Dr Flanagan)