

VOL. 108 SEPTEMBER 2023 Journal of the Ferrata Storti Foundation ISSN 0390 - 6078 haematologica.org
haematologica


Editor-in-Chief
Jacob M. Rowe (Jerusalem)
Deputy Editors
Carlo Balduini (Pavia), Jerry Radich (Seattle)
Associate Editors
Shai Izraeli (Tel Aviv), Steve Lane (Brisbane), Pier Mannuccio Mannucci (Milan), Pavan Reddy (Houston), David C. Rees (London), Paul G. Richardson (Boston), Francesco Rodeghiero (Vicenza), Gilles Salles (New York), Kerry Savage (Vancouver), Aaron Schimmer (Toronto), Richard F. Schlenk (Heidelberg), Sonali Smith (Chicago)
Statistical Consultant
Catherine Klersy (Pavia)
Editorial Board
Walter Ageno (Varese), Sarit Assouline (Montreal), Andrea Bacigalupo (Roma), Taman Bakchoul (Tübingen), Pablo Bartolucci (Créteil), Katherine Borden (Montreal), Marco Cattaneo (Milan), Corey Cutler (Boston), Kate Cwynarski (London), Ahmet Dogan (New York), Mary Eapen (Milwaukee), Francesca Gay (Torino), Ajay Gopal (Seattle), Alex Herrera (Duarte), Martin Kaiser (London), Marina Konopleva (Houston), Johanna A. Kremer Hovinga (Bern), Nicolaus Kröger (Hamburg), Austin Kulasekararaj (London), Shaji Kumar (Rochester), Ann LaCasce (Boston), Anthony R. Mato (New York), Matthew J. Mauer (Rochester) Neha Mehta-Shah (St. Louis), Moshe Mittelman (Tel Aviv), Alison Moskowitz (New York), Yishai Ofran (Haifa), Farhad Ravandi (Houston), John W. Semple (Lund), Liran Shlush (Toronto), Sarah K. Tasian (Philadelphia), Pieter van Vlieberghe (Ghent), Ofir Wolach (Haifa), Loic Ysebaert (Toulouse)
Managing Director
Antonio Majocchi (Pavia)
Editorial Office
Lorella Ripari (Office & Peer Review Manager), Simona Giri (Production & Marketing Manager), Paola Cariati (Graphic Designer), Giulia Carlini (Graphic Designer), Debora Moscatelli (Graphic Designer), Igor Poletti (Graphic Designer), Marta Fossati (Peer Review), Diana Serena Ravera (Peer Review), Laura Sterza (Account Administrator)
Assistant Editors
Britta Dost (English Editor), Rachel Stenner (English Editor), Anne Freckleton (English Editor), Rosangela Invernizzi (Scientific Consultant), Marianna Rossi (Scientific Consultant), Massimo Senna (Information Technology), Luk Cox (Graphic Artist)
Haematologica (print edition, pISSN 0390-6078, eISSN 1592-8721) publishes peer-reviewed papers on all areas of experimental and clinical hematology. The journal is owned by a non-profit organization, the Ferrata Storti Foundation, and serves the scientific community following the recommendations of the World Association of Medical Editors (www.wame.org) and the International Committee of Medical Journal Editors (www.icmje.org).
Haematologica publishes Editorials, Original articles, Review articles, Perspective articles, Editorials, Guideline articles, Letters to the Editor, Case reports & Case series and Comments. Manuscripts should be prepared according to our guidelines (www.haematologica.org/information-for-authors), and the Uniform Requirements for Manuscripts Submitted to Biomedical Journals, prepared by the International Committee of Medical Journal Editors (www.icmje.org).
Manuscripts should be submitted online at http://www.haematologica.org/.
Conflict of interests. According to the International Committee of Medical Journal Editors (http://www.icmje.org/#conflicts), “Public trust in the peer review process and the credibility of published articles depend in part on how well conflict of interest is handled during writing, peer review, and editorial decision making”. The ad hoc journal’s policy is reported in detail at www.haematologica.org/content/policies.
Transfer of Copyright and Permission to Reproduce Parts of Published Papers. Authors will grant copyright of their articles to the Ferrata Storti Foundation. No formal permission will be required to reproduce parts (tables or illustrations) of published papers, provided the source is quoted appropriately and reproduction has no commercial intent. Reproductions with commercial intent will require written permission and payment of royalties.
Subscription. Detailed information about subscriptions is available at www.haematologica.org. Haematologica is an open access journal and access to the online journal is free. For subscriptions to the printed issue of the journal, please contact: Haematologica Office, via Giuseppe Belli 4, 27100 Pavia, Italy (phone +39.0382.27129, fax +39.0382.394705, E-mail: info@haematologica.org).
Rates of the printed edition for the year 2022 are as following:
Institutional: Euro 700
Personal: Euro 170
Advertisements. Contact the Advertising Manager, Haematologica Office, via Giuseppe Belli 4, 27100 Pavia, Italy (phone +39.0382.27129, fax +39.0382.394705, e-mail: marketing@haematologica.org).
Disclaimer. Whilst every effort is made by the publishers and the editorial board to see that no inaccurate or misleading data, opinion or statement appears in this journal, they wish to make it clear that the data and opinions appearing in the articles or advertisements herein are the responsibility of the contributor or advisor concerned. Accordingly, the publisher, the editorial board and their respective employees, officers and agents accept no liability whatsoever for the consequences of any inaccurate or misleading data, opinion or statement. Whilst all due care is taken to ensure that drug doses and other quantities are presented accurately, readers are advised that new methods and techniques involving drug usage, and described within this journal, should only be followed in conjunction with the drug manufacturer’s own published literature.
Direttore responsabile: Prof. Carlo Balduini; Autorizzazione del Tribunale di Pavia n. 63 del 5 marzo 1955. Printing: Press Up, zona Via Cassia Km 36, 300 Zona Ind.le Settevene - 01036 Nepi (VT)

Volume 108, Issue 9: September 2023
Image taken from the Review by Grace Egan and Sarah K. Tasian in this issue.
2265 When more is just more, not better: a recurring lesson
Sonali M. Smith
https://doi.org/10.3324/haematol.2023.283786
2267 Follicular lymphoma grade 3B: low grade, high grade or should we skip the grade?
Erin Mulvey and John P. Leonard
https://doi.org/10.3324/haematol.2023.282893
2269 Prognostic tools for older patients with diffuse large B-cell lymphoma: complex patients require complex solutions and a personal touch
Stefano Luminari
https://doi.org/10.3324/haematol.2023.283000
2271 Challenging the status flow: how artificial intelligence is advancing diagnosis of myelodysplastic neoplasms
Carolien Duetz et al.
https://doi.org/10.3324/haematol.2023.282998
2273 New patterns of genetic instability in chronic myeloid leukemia: interesting, but not ready for clinical use
Charles A. Schiffer
https://doi.org/10.3324/haematol.2023.283059
2275 Relapsed pediatric acute myeloid leukemia: state-of-the-art in 2023
Grace Egan and Sarah K. Tasian
https://doi.org/10.3324/haematol.2022.281106
2289 Maintenance therapy in acute myeloid leukaemia: advances and controversies
Jayastu Senapati et al
https://doi.org/10.3324/haematol.2022.281810
2305 Aplastic Anemia
Graft-versus-host disease and relapse/rejection-free survival after allogeneic transplantation for idiopathic severe aplastic anemia: a comprehensive analysis from the SAAWP of the EBMT
Raynier Devillier et al
https://doi.org/10.3324/haematol.2022.281876
Haematologica
2316 Acute Myeloid Leukemia
Cellular and metabolic characteristics of pre-leukemic hematopoietic progenitors with GATA2 haploinsufficiency
Avigail Rein et al
https://doi.org/10.3324/haematol.2022.279437
2331 Acute Myeloid Leukemia
Characteristics and clinical outcomes of patients with acute myeloid leukemia with inv(3)(q21q26.2) or t(3;3)(q21;q26.2)
Guillaume Richard-Carpentier et al
https://doi.org/10.3324/haematol.2022.282030
2343 Acute Myeloid Leukemia
Simultaneous inhibition of Sirtuin 3 and cholesterol homeostasis targets acute myeloid leukemia stem cells by perturbing fatty acid β-oxidation and inducing lipotoxicity
Cristiana O’Brien et al
https://doi.org/10.3324/haematol.2022.281894
2358
Bone Marrow Transplant
Gonadal function in pediatric Fanconi anemia patients treated with hematopoietic stem cell transplant
Jane Koo et al
https://doi.org/10.3324/haematol.2022.282094
2369
Bone Marrow Transplant
Allogeneic transplantation in acute myelogenous leukemia: a comprehensive single institution's experience
Gerard Socie et al
https://doi.org/10.3324/haematol.2023.282729
2380 Chronic Myeloid Leukemia
Impact of additional genetic abnormalities at diagnosis of chronic myeloid leukemia for first-line imatinib-treated patients receiving proactive treatment intervention
Naranie Shanmuganathan et al
https://doi.org/10.3324/haematol.2022.282184
2396 Chronic Myeloid Leukemia
IL-18 and VEGF-A trigger type 2 innate lymphoid cell accumulation and pro-tumoral function in chronic myeloid leukemia
Benedetta Fiordi et al
https://doi.org/10.3324/haematol.2022.282140
2410 Hematopoiesis
Pax transactivation domain-interacting protein is required for preserving hematopoietic stem cell quiescence via regulating lysosomal activity
Tong Zhang et al
https://doi.org/10.3324/haematol.2022.282224
2422 Hematopoiesis
Myeloid cells from Langerhans cell histiocytosis patients exhibit increased vesicle trafficking and an altered secretome capable of activating NK cells
Daniel W. Hagey et al
https://doi.org/10.3324/haematol.2022.282638
2435 Myelodysplastic Syndromes
Artificial intelligence to empower diagnosis of myelodysplastic syndromes by multiparametric flow cytometry
Valentin Clichet et al
https://doi.org/10.3324/haematol.2022.282370
2444 Non-Hodgkin Lymphoma
Outcomes in grade 3B follicular lymphoma: an international study led by the Australasian Lymphoma Alliance
Allison Barraclough et al
https://doi.org/10.3324/haematol.2022.281375
Haematologica | 108 - September 2023
2454 Non-Hodgkin Lymphoma
The Geriatric Prognostic Index: a clinical prediction model for survival of older diffuse large B-cell lymphoma patients treated with standard immunochemotherapy
Kathrine T. Isaksen et al.
https://doi.org/10.3324/haematol.2022.282289
2467 Non-Hodgkin Lymphoma
Evidence of cure for extranodal nasal-type natural killer/T-cell lymphoma with current treatment: an analysis of the CLCG database
Xin Liu et al.
https://doi.org/10.3324/haematol.2022.281847
2476 Red Cell Biology & its Disorders
Severity and burden of sickle cell disease in France: a nationwide real-world study
Valentine Brousse et al
https://doi.org/10.3324/haematol.2022.282098
2487 Red Cell Biology & its Disorders
Stage-specific dual function: EZH2 regulates human erythropoiesis by eliciting histone and non-histone methylation
Mengjia Li et al
https://doi.org/10.3324/haematol.2022.282016
2503 COVID-19 thromboembolism is reduced in ambulatory, but not hospitalized patients, following COVID-19 vaccination
Hannah Stevens et al
https://doi.org/10.3324/haematol.2022.282262
2507
Combination therapy of a PSEN1-selective γ-secretase inhibitor with dexamethasone and an XPO1 inhibitor to target T-cell acute lymphoblastic leukemia
Charlien Vandersmissen et al
https://doi.org/10.3324/haematol.2022.282144
2513
Inhibition of menin, BCL-2, and FLT3 combined with a hypomethylating agent cures NPM1/FLT3-ITD/ -TKD mutant acute myeloid leukemia in a patient-derived xenograft model
Bing Z. Carter et al
https://doi.org/10.3324/haematol.2022.281927
2520
Midostaurin in addition to intensive chemotherapy in acute myeloid leukemia with t(8;21) and KIT and/or FLT3-ITD mutations: results of the SAL MIDOKIT trial
Leo Ruhnke et al
https://doi.org/10.3324/haematol.2022.281636
2526
Specific O-glycans in the mechanosensory domain of glycoprotein Ib a are important for its stability and function
Yingchun Wang and Renhao Li
https://doi.org/10.3324/haematol.2022.281979
2531
Favorable pharmacokinetic and pharmacodynamic properties of gilteritinib in cerebrospinal fluid: a potential effective treatment in relapsing meningeal acute myeloid leukemia FLT3-ITD patients
Nicolas Vignal et al
https://doi.org/10.3324/haematol.2022.282596
2535 Mitapivat, a pyruvate kinase activator, improves transfusion burden and reduces iron overload in β-thalassemic mice
Alessandro Mattè et al
https://doi.org/10.3324/haematol.2022.282614
Haematologica | 108 - September 2023
2542 Blast phase myeloproliferative neoplasm with prior exposure to ruxolitinib: comparative analysis of mutations and survival
Maymona G. Abdelmagid et al.
https://doi.org/10.3324/haematol.2022.282627
2546 Long-term reduction in the incidence of aplastic anemia and immune thrombocytopenia during the COVID-19 pandemic
Masatoshi Sakurai et al
https://doi.org/10.3324/haematol.2022.282351
2551 Epigenome profiling reveals aberrant DNA methylation signature in GATA2 deficiency
Oskar Marin-Bejar et al.
https://doi.org/10.3324/haematol.2022.282305
2558 Individualized dosing guidelines for PEGasparaginase and factors influencing the clearance: a population pharmacokinetic model
Robin Q.H. Kloos et al
https://doi.org/10.3324/haematol.2023.283685

Section of Hematology / Oncology, Department of Medicine, University of Chicago, Chicago, IL, USA
E-mail: smsmith@bsd.uchicago.edu
https://doi.org/10.3324/haematol.2023.283786
©2023 Ferrata Storti Foundation
Published under a CC BY-NC license
TITLE
AUTHORS Fisher RI, Gaynor ER, Dahlberg S, et al.The advent of combination chemotherapy in the 1970s ushered in a new era of combating cancer, and the observation that CHOP (cyclophosphamide, doxorubicin, vincristine, prednisone) could lead to cures in advanced stage aggressive lymphomas was revolutionary at the time. The subsequent decade reflected a flurry of single arm, and sometimes single institution, trials adding the latest cytotoxic agents to this backbone with phase II trials of MACOP-B, m-BACOD, and ProMACE-CytaBOM, suggesting superior efficacy compared to CHOP. The historical background was that CHOP offered complete remission rates of roughly 50% and cure rates of around 30%, whereas the second-generation regimens were said to double the cure rate. Investigators argued heavily for intensification as a way to improve the cure rate even though these “second-generation” regimens were significantly more toxic, particularly in the era prior to routine anti-emetics, antimicrobial prophylaxis, and growth factor support.
SWOG-8516 (Intergroup 0067), also called the National High-Priority Lymphoma Study, was an ambitious fourarmed trial that sought to resolve the issue by comparing these augmented regimens against CHOP.1 Among 1,138 registered patients, 899 eligible patients were randomized. There were five stratification factors: bone marrow infiltration, bulky disease, age (65 years as cutoff), LDH elevation, and Working Group Formulation histologic group (D or E vs. F, G, H vs. J). It is notable that this was a young patient population, and included pediatric patients. Efficacy outcomes were strikingly similar; with a median follow up of 35 months, the 3-year progressionfree survival was 41-46% and 3-year overall survival 5054% with no statistically significant differences between any of the arms (Figure 1). There were, however, significant differences in terms of fatal toxicity/non-relapse
mortality: 1% CHOP, 3% ProMACE-CytaBOM, 5% mBACOD, and 6% MACOP-B. This trial established CHOP as a formidable therapeutic backbone that has proved difficult to supplant. With the exception of adding rituximab, and perhaps now polatuzumab vedotin (for B-cell histologies) and brentuximab vedotin (for CD30 + T-cell histologies), CHOP is still considered the standard chemotherapy regimen for both B- and T-cell aggressive lymphomas.
Through a modern lens, there are many aspects of this paper that now seem outdated: this was a mixture of Band T-cell histologies based on a now-obsolete classification system, over 20% of patients were ineligible after pathology review, no transformed lymphomas were included, and this was a pre-PET (and pre-gallium) era whereby responses were more difficult to determine. It is provocative to consider whether CHOP would have remained the “winner” if we had had modern histopathologic classification to assess genomic and biologic features, and institution of full supportive care.
Nevertheless, there are many important lessons to be learned from this iconic trial. The first is that “more” is not always “better”, and several subsequent trials evaluating dose density, increasing chemotherapy intensity or even high-dose chemotherapy with autologous stem cell rescue were all negative trials (reviewed by Sehn and Salles2). Furthermore, despite an excellent rationale and impressive single arm data, there are many trials of R-CHOP + X that are negative. This may be due to biologic heterogeneity and an unselected patient population, but also because prolonged time from diagnosis to treatment is an inadvertent selection factor. In S8516/0067, the control arm fared better than expected, perhaps due to these factors.
Despite all these caveats, the National High-Priority Lymphoma Study set a bar for future trials. It is noteworthy
that this trial was a product of the United States Intergroup mechanism, and it is far from likely that a four-arm trial comparing regimens would be feasible if only forprofit entities were involved. As we move to an increasingly targeted (and more expensive) era, this is a critical point to consider if CHOP is to be dethroned. Overall, S8516/0067 definitively showed that “more is not better”,
provided a backbone that remains firmly entrenched in the therapeutic armamentarium, and was one of the first combination regimens to show curability of advanced stage lymphomas.
Disclosure
No relevant conflicts of interest to disclose.
National High-Priority Lymphoma Study. Ann Oncol. 1994;5(Suppl 2):91-95.
2. Sehn LH, Salles G. Diffuse large B-cell lymphoma. N Engl J Med. 2021;384(9):842-858.
 1. Fisher RI, Gaynor ER, Dahlberg S, et al. A phase III comparison of CHOP vs. m-BACOD vs. ProMACE-CytaBOM vs. MACOP-B in patients with intermediate- or high-grade non-Hodgkin's lymphoma: results of SWOG-8516 (Intergroup 0067), the
Received: March 23, 2023.
Accepted: May 9, 2023.
Early view: May 18, 2023.
https://doi.org/10.3324/haematol.2023.282893
©2023 Ferrata Storti Foundation
Published under a CC BY-NC license
Grade 3B follicular lymphoma (G3BFL) is an infrequent subtype of follicular lymphoma (FL) accounting for approximately 5-10% of all FL cases.1 G3BFL has been historically defined visually by the presence of solid sheets of centroblasts with at least a partial follicular pattern identified by morphology or immunohistochemistry, in contrast to diffuse large B-cell lymphoma (DLBCL), which has lost its follicular architecture, and grade 3A FL (G3AFL) which has admixed centrocytes and centroblasts.2 G3BFL is comprised of nearly 50% composite forms with concurrently identified lower-grade FL or DLBCL in biopsy specimens.2 Due to questionable reproducibility in grading and the overall rarity of cases, G3BFL cases have often been excluded from both FL and DLCBL clinical trials. While controversial, the subdivision between G3AFL and G3BFL has been proposed to have biological and clinical relevance, with G3BFL believed to behave more similarly to DLBCL than to indolent FL.1,3 Current clinical approaches are derived largely from historical perspectives and have focused on treatment with cyclophosphamide, doxorubicin, vincristine, and prednisone (CHOP) plus rituximab, without good prospective evidence. Therefore, precise prognostication and optimal therapeutic strategies for G3BFL remain undetermined.
Barraclough and colleagues have now conducted the largest international analysis of G3BFL in the rituximab era, evaluating the outcomes of 157 patients with G3BFL at a median follow-up of 5 years.4 They included cases of composite G3A/3BFL, pure G3BFL, and G3BFL/DLBCL along with large G3AFL and DLBCL comparator groups. In line with current treatment paradigms, patients with G3BFL received rituximab or obinutuzumab combined with CHOP or CHOP-like chemotherapy. Notably, 37% of patients also received maintenance anti-CD20 therapy (with rituximab or obinutuzumab). G3AFL cases were treated with either rituximab- or obinutuzumab-CHOP-like chemotherapy (74%) or bendamustine plus rituximab (26%) with rituximab or obinutuzumab maintenance therapy in 68% of cases. DLBCL cases received rituximab- or obinutuzumab-CHOP-
like chemotherapy. In this analysis, both the 5-year progression-free survival and 5-year overall survival of patients with G3BFL were found to be equivalent to those of patients with G3AFL and were statistically significantly longer than the 5-year progression-free survival and 5-year overall survival of patients with DLBCL.
Prognostic factors in G3BFL identifi ed in this study included CD10 negativity and stage III/IV (inferior progression-free survival), as well as elevated lactate dehydrogenase, poor performance status, and age >60 years old (inferior overall survival). The Follicular Lymphoma International Prognostic Index5 showed poor discrimination of risk groups in G3BFL, while the Revised International Prognostic Index (R-IPI)6 showed a statistically significant difference between risk groups with low, intermediate, and high risk 5-year overall survival rates of 100%, 85%, and 64%, respectively (P<0.001). The performance of these scales in G3BFL has not been previously evaluated and the findings presented here are important. A key caveat (and potential criticism) of this study is the inclusion of a significantly high risk DLBCL cohort used as a comparison group. As compared to either the G3AFL or G3BFL subgroup, DLBCL cases were more likely to be older, with worse performance status, elevated lactate dehydrogenase, more frequent extranodal involvement, and higher IPI scores. DLBCL cases had an atypically poor 5-year progression-free survival (54%), and a high proportion of high-risk R-IPI scores (51%). The disparate outcomes observed between G3BFL and DLBCL are likely influenced at least in part by these differences, which may have a biological origin, however comparisons between risk subgroups in each disease cohort would be more informative in evaluating potential differences. A major challenge in studying G3BFL is the poor reproducibility of grading, influenced by sampling (as transformation is not a uniform event), definition and morphological identification of centroblasts, and methods of enumeration. Central pathology review was not conducted in this analysis. This issue is relevant given that grading discrepancies have
been reported in up to 40-60% of FL cases.2,3,7,8 CD10 negativity in G3BFL was associated with inferior progression-free survival, a feature that has been previously suggested to indicate a closer relationship to DLBCL rather than to low-grade FL.2 Inclusion of MUM1 and BCL6 immunohistochemical analysis as well as fluorescence in situ hybridization analysis for BCL2, BCL6, and MYC would strengthen the authors’ findings as important discrepancies in immunophenotype have been previously observed between low grade FL, G3A/3B FL, and DLBCL.1,9,10 When treated with rituximab-CHOP-like chemotherapy, outcomes appear to be similar between patients with G3BFL and G3AFL, with less similarity between those with G3BFL and DLBCL. Advances in genetic characterization and revisions in classification systems may influence our understanding and identification of G3BFL in the future, and further prospective studies that include this rare subtype are needed. The R-IPI score appears to perform well in identifying patients with G3BFL at higher risk of poor
1. Ott G, Katzenberger T, Lohr A, et al. Cytomorphologic, immunohistochemical, and cytogenetic profiles of follicular lymphoma: 2 types of follicular lymphoma grade 3. Blood. 2002;99(10):3806-3812.
2. Barraclough A, Bishton M, Cheah CY, et al. The diagnostic and therapeutic challenges of grade 3B follicular lymphoma. Br J Haematol. 2021;195(1):15-24.
3. Koch K, Hoster E, Ziepert M, et al. Clinical, pathological and genetic features of follicular lymphoma grade 3A: a joint analysis of the German low-grade and high-grade lymphoma study groups GLSG and DSHNHL. Ann Oncol. 2016;27(7):1323-1329.
4. Barraclough A, England J, Villa D. Outcomes in grade 3B follicular lymphoma: an international study led by the Australasian Lymphoma Alliance. Haematologica. 2023.108(9):2444-2453.
5. Solal-Céligny P, Roy P, Colombat P, et al. Follicular Lymphoma International Prognostic Index. Blood. 2004;104(5):1258-1265.
outcomes when treated with chemoimmunotherapy and may be a useful tool when considering treatment approaches for G3BFL. CD10 negativity also appears to identify higher risk cases. It seems reasonable to consider including patients with G3BFL with low- or intermediaterisk R-IPI scores in FL studies while excluding them from DLBCL studies, provided that they received rituximabCHOP-like chemoimmunotherapy in the frontline setting.
Disclosures
JPL has provided consultancy services for Abbvie, Astellas, AstraZeneca, Bayer, Beigene, BMS, Calithera, Constellation, Caribou Biosciences, Eisai, Lilly, Epizyme, Genmab, Grail, Incyte, Jansssen, MEI Pharma, Merck, Mustang Bio, Novartis, Pfizer, Roche/Genentech, Seagen, Second Genome, and Sutro. EM has no conflicts of interest to disclose.
EM was the primary author with a contribution from JPL.
6. Sehn LH, Berry B, Chhanabhai M, et al. The Revised International Prognostic Index (R-IPI) is a better predictor of outcome than the standard IPI for patients with diffuse large B-cell lymphoma treated with R-CHOP. Blood. 2007;109(5):1857-1861.
7. A clinical evaluation of the International Lymphoma Study Group classification of non-Hodgkin's lymphoma. The Non-Hodgkin's Lymphoma Classification Project. Blood. 1997;89(11):3909-3918.
8. Rimsza LM, Li H, Braziel RM, et al. Impact of histological grading on survival in the SWOG S0016 follicular lymphoma cohort. Haematologica. 2018;103(4):e151-e153.
9. Horn H, Kohler C, Witzig R, et al. Gene expression profiling reveals a close relationship between follicular lymphoma grade 3A and 3B, but distinct profiles of follicular lymphoma grade 1 and 2. Haematologica. 2018;103(7):1182-1190.
10. Horn H, Schmelter C, Leich E, et al. Follicular lymphoma grade 3B is a distinct neoplasm according to cytogenetic and immunohistochemical profiles. Haematologica. 2011;96(9):1327-1334.
In this volume of Haematologica, Isaksen et al. describe a new prognostic index that has been developed and validated to estimate the survival of those older patients with diffuse large B-cell lymphoma (DLBCL) who are treated with standard immunochemotherapy. This new index combines the Activities of Daily Living (ADL) scale and the Charlson Comorbidity Index (CCI), along with age, sex, albumin, stage, Eastern Cooperative Oncology Group (ECOG) score, and lactate dehydrogenase (LDH) level. There are three distinct prognostic groups, which differ significantly in terms of overall survival (OS). The authors demonstrated that the new index performed better than conventional prognostic indices like the International Prognostic Index (IPI), the Revised (R)-IPI, and the National Comprehensive Cancer Network (NCCN)-IPI.1
The authors should be commended for their efforts in carrying out such a study in a difficult-to-treat population, combining lymphoma-related parameters with patientspecific features, which are not well accounted for in the conventional approach to DLBCL prognostic assessment. For many years, the IPI was the only prognostic tool available to estimate survival in patients with aggressive lymphomas. However, this tool oversimplified the complex characteristics of older subjects, assuming a categorical role for age, and limiting patient description to a simple assessment of performance status. It has become clear over time that lymphoma does not get more aggressive with age per se, and that, with the improvement in both prevention measures and living conditions, the consensus on the definition of “old” has shifted upwards, to 75-80 years of age. No matter the age cutoffs, the ECOG performance status (PS) measure is just another ineffective effort to describe patients’ problems. Typically, PS understates or completely ignores the presence of geriatric impairments, which have been proven to be determinants for the patient's geriatric evaluation. Moreover, PS describes a condition that can frequently be reversed by treatment. Over time, geriatric assessment has gained an
Correspondence: S. Luminari stefano.luminari@unimore.it
Received: March 10, 2023.
Accepted: March 17, 2023.
Early view: March 30, 2023.
https://doi.org/10.3324/haematol.2023.283000
©2023 Ferrata Storti Foundation
Published under a CC BY-NC license
important role in describing patient status, allowing the reporting of multiple domains of a patient, ranging from the assessment of the ability to perform simple daily activities to the description of the emotional status or of cognitive functioning. Several now-validated scales have been proposed to describe the fitness of an older patient in an attempt to provide valuable objective and reproducible clinical tools. After several retrospective and prospective studies, Merli et al.2 were able to build and validate the first prognostic index (Elderly Prognostic Index, EPI) designed for the older patient with DLBCL which combines disease-related features with an objective, reproducible, validated tool to define patient frailty (simplified geriatric assessment, sGA). Isaksen et al.’s Geriatric Prognostic Index (GPI) follows in the same vein, but, unlike the EPI, it calculates a score for patients who are eligible for immunochemotherapy with curative intent. This new tool contributes to the ongoing search for accurate prognostic models to support clinical or therapeutic decisions for the management of older DLBCL patients. Additional tools are expected in the future which will explore different scales or proxies of patient status, including patient domains that remain unexplored or for which there is little evidence (i.e., sarcopenia, senescence biomarkers, etc.).
To advance clinical research on older patients with lymphoma, it is critical to remember that one of the primary goals of prognostic studies is to provide actionable features or predictive factors that can be used to support clinical decisions. In this setting, prognostic evaluation in older DLBCL patients requires a slightly different strategy than that in younger individuals. Firstly, an older patient cannot be treated using the same guidelines as those for a younger one. In other words, older patients may benefit more from risk-adapted treatments that take an inverted approach rather than the linear association between rising risk and treatment intensity used for younger patients. A palliative approach that protects the patient from needless toxicity and from further loss of quality of life may
Hematology Unit, Azienda USL–IRCCS di Reggio Emilia and CHIMOMO Department, University of Modena and Reggio Emilia, Reggio Emilia, ItalyPrognostic tools for older patients with diffuse large B-cell lymphoma: complex patients require complex solutions and a personal touch
be a more acceptable goal of therapy in a high-risk patient than it would be in a low-risk older patient with cancer. The second significant difference between younger and older DLBCL patients regards the varied nature of risk in older patients as well as the individual patient’s therapeutic aims. The effectiveness and worth of a treatment are established by a number of factors that are added to the simple risk of mortality or disease progression. The risk of being hospitalized, the loss of independence and of physical or social functioning, or simply the loss of quality of life are some of the pertinent endpoints for a frail patient. Thirdly, compared to younger individuals, the risk variables for older patients with DLBCL are much more diverse and the relationships between these variables are complicated.
1. Isaksen KT, Galleberg R, Mastroianni MA, et al. The Geriatric Prognostic Index: a clinical prediction model for survival of older diffuse large B-cell lymphoma patients treated with standard immunochemotherapy. Haematologica. 2023;108(9):2454-2466.
In conclusion, older patients with DLBCL pose a clinical and therapeutic challenge for physicians, and prognostic tools capable of describing the high complexity of these subjects are eagerly awaited. We must be prepared to manage a complex problem with tools that are, by definition, difficult to manage and use. However, no tool will be able to replace the fundamental role of a dedicated physician, whose experience, compassion, and personal touch are invaluable in determining a patient's outcomes.
SL has received support unrelated to this manuscript as a member of advisory boards for Roche, Jansen, Novartis, Gilead, BMS, Incite, and Beigene.
2. Merli F, Luminari S, Tucci A, et al. Simplified geriatric assessment in older patients with diffuse large B-cell lymphoma: the Prospective Elderly Project of the Fondazione Italiana Linfomi. J Clin Oncol. 2021;39(11):1214-1222.
1Department of Hematology, Amsterdam UMC, location VUmc and 2Cancer Center Amsterdam, Amsterdam, The Netherlands
Correspondence: A.A. van de Loosdrecht
a.vandeloosdrecht@amsterdamumc.nl
Received: March 30, 2023.
Accepted: April 7, 2023.
Early view: April 20, 2023.
https://doi.org/10.3324/haematol.2023.282998
©2023 Ferrata Storti Foundation
Published under a CC BY-NC license
Over the past few years, arti fi cial intelligence (AI) has begun to fulfill its promise of revolutionizing healthcare. In this issue of Haematologica , Clichet and colleagues describe how applying AI to flow cytometry parameters improves diagnostic accuracy in patients suspected for myelodysplastic neoplasms (MDS).1
Since MDS can be challenging to distinguish from benign cytopenias based on standard diagnostic parameters, multiparametric flow cytometry (MFC) has emerged as an additional diagnostic tool.2 However, extensive MFC panels with complex analysis strategies are required to achieve adequate diagnostic accuracy. Employing AI may address this issue, given its potential to detect patterns in complex data.3 While the use of AI in the diagnosis of medical conditions has been a topic of debate, recent advancements demonstrate its benefi ts in different illnesses such as diabetic retinopathy and breast cancer.3,4 For both diseases, diagnostic AI tools are currently commercially available and approved for clinical use by regulatory bodies.3,4
In the current research, Clichet and colleagues employed an AI model to parameters derived from the MFC data needed for the Ogata score. The Ogata score is the most used MFC score for MDS diagnostics and requires the assessment of only two cell surface proteins: CD34 and CD45.5 Although the Ogata score is useful and easy to implement, it has limited sensitivity, ranging from 34 to 76%. Clichet and colleagues illustrate that the use of an elastic net AI model resulted in a simple but accurate diagnostic model that only requires four parameters. This model obtained a sensitivity of 91.8% and a speci ficity of 92.5%, and was validated in an external cohort of 89 patients, illustrating its multi-center potential. One of the explanations for the increase of sensitivity compared with the Ogata score is presumably that this model uses continuous parameters (instead of a fi xed cut-off like in the Ogata score) and assigns a weight to each parameter based on its relevance for MDS diagnosis.
A major challenge for AI in healthcare is translating a suc-
cessful AI model into widespread clinical implementation. Before implementing the model developed by Clichet and colleagues, two initial steps must be taken: extensive multi-center validation and harmonization. Even though most data will be readily available at many locations, such as those collaborating within the European LeukemiaNet working group, harmonization of data acquisition and manual gating strategies of MFC data is crucial. Alternatively, manual gating could be completely replaced by automated analyses, which removes inter-operator variation but requires higher levels of harmonization of data acquisition.6,7
Implementing AI-based diagnostics is also challenging in itself, and lack of technical expertise and funding are commonly reported as major obstacles.8 However, there are examples of innovative solutions that can help facilitate the adoption of AI models in healthcare. One such example is the recently introduced Molecular International Prognostic Scoring System for Myelodysplastic Syndromes (IPSS-M) risk strati fi cation model for MDS, which can be easily employed using a web-based tool that is accessible to all.9 The availability of a similar tool for the model developed by Clichet and colleagues would make it easier to use and facilitate widespread adoption in clinical settings.
Future development and implementation of AI-based tools for the diagnosis of MDS will largely depend on the availability of high-quality data.8 The previously mentioned successful studies on AI in diabetic retinopathy and breast cancer cover thousands of patients, spread over multiple centers and continents.3,4 To fully harness the potential of AI in the diagnosis of MDS, it is crucial that the MDS community joins forces to continue to build comprehensive and diverse databases, such as those managed by the European LeukemiaNet MDS (EUMDS) registry and the MDSRight Consortium. To further improve diagnostic accuracy, these databases should be expanded with data offering high diagnostic potential when applying AI, such as morphological images, mutational
data, and data from novel tools such as label-free cytometry.10,11
Overall, we commend Clichet and colleagues for developing an elegant diagnostic model for MDS. By establishing high-quality databases and clear guidelines on how to implement AI-based diagnostic tools effectively, we can further advance the diagnosis of MDS through AI.
1. Clichet V, Lebon D, Chapuis N, et al. Artificial intelligence to empower diagnosis of myelodysplastic syndromes by multiparametric flow cytometry. Haematologica. 2023;108(9):2435-2443.
2. Brunner AM, Leitch HA, van de Loosdrecht AA, Bonadies N. Management of patients with lower-risk myelodysplastic syndromes. Blood Cancer J. 2022;12(12):166.
3. Kann BH, Hosny A, Aerts HJWL. Artificial intelligence for clinical oncology. Cancer Cell. 2021;39(7):916-927.
4. Grauslund J. Diabetic retinopathy screening in the emerging era of artificial intelligence. Diabetologia. 2022;65(9):1415-1423.
5. Ogata K, Della Porta MG, Malcovati L, et al. Diagnostic utility of flow cytometry in low-grade myelodysplastic syndromes: a prospective validation study. Haematologica. 2009;94(8):1066.
6. Duetz C, Bachas C, Westers TM, van de Loosdrecht AA. Computational analysis of flow cytometry data in hematological malignancies: future clinical practice? Curr Opin Oncol.
Disclosures No
Contributions
All authors contributed equally to the content of this editorial and approved the final submitted manuscript.
2020;32(2):162-169.
7. Duetz C, Van Gassen S, Westers TM, et al. Computational flow cytometry as a diagnostic tool in suspected-myelodysplastic syndromes. Cytometry A. 2021;99(8):814-824.
8. He J, Baxter SL, Xu J, Xu J, Zhou X, Zhang K. The practical implementation of artificial intelligence technologies in medicine. Nat Med. 2019;25(1):30-36.
9. Bernard E, Tuechler H, Greenberg PL, et al. Molecular International Prognostic Scoring System for Myelodysplastic Syndromes. NEJM Evidence. 2022;1(7):EVIDoa2200008.
10. Kimura K, Tabe Y, Ai T, et al. A novel automated image analysis system using deep convolutional neural networks can assist to differentiate MDS and AA. Sci Rep. 2019;9(1):13385.
11. Brück OE, Lallukka-Brück SE, Hohtari HR, et al. Machine learning of bone marrow histopathology identifies genetic and clinical determinants in patients with MDS. Blood Cancer Discov. 2021;2(3):238-249.
Department of Oncology, Karmanos Cancer Institute, Wayne State University School of Medicine, Detroit, MI, USA
Correspondence: C.A. Schiffer
schiffer@karmanos.org
Received: April 7, 2023.
Accepted: April 13, 2023.
Early view: April 20, 2023.
https://doi.org/10.3324/haematol.2023.283059
©2023 Ferrata Storti Foundation
Published under a CC BY-NC license
The impact of tyrosine kinase inhibitors (TKI) on the treatment of chronic myeloid leukemia (CML) has been extraordinary, with overall survival of patients treated in chronic phase now approximating that of the normal population and the elimination of the need for allogeneic transplantation to produce functional cure. However, occasional patients do not respond adequately to standard TKI therapy. I was taught by Dr. Emil Freireich that one frequently develops new insights into the biology of diseases by studying exceptions to the “average” patient, avoiding what he termed “median disease”.1
And indeed, there have been many attempts to identify mechanisms of TKI failure, including studies of pharmacokinetic variability, overexpression of the multidrug resistance phenotype,2 the involvement of other signaling pathways including those associated with immune regulation,3 the presence of RNA expression signatures more consistent with blast phase (BP),4 amongst others. However, none have resulted in changes in the standard treatment approach.
In this issue of Haematologica, Shanmuganathan and colleagues,5 expanding their earlier observations,6 used data from the Australian TIDEL trial to explore the effects of additional genomic changes on response to TKI. The TIDEL trial used a somewhat more aggressive regimen, administering a higher (600 mg) dose of imatinib as initial therapy, with a rapid switch to nilotinib if molecular responses were not satisfactory.7 The overall outcomes of this wellconducted and thoughtfully analyzed study were excellent, although similar to results from large randomized trials comparing imatinib with other TKI.
The authors used an RNA-based capture technique and/or whole genome or transcriptome sequencing to identify changes in addition to the expected BCR::ABL1 in samples from newly diagnosed chronic phase patients. Cancer-associated abnormalities were found in approximately 16% of 200 patients, most commonly “AML-associated” mutations such as ASXL1 (found in 9% of patients), RUNX1, BCORL1, IDH2, DNMT3A, and TET2. In addition, what was
termed “Ph-associated rearrangements” were detected in 36 (18%) patients, defined by the authors as “aberrant fusions formed at the time of the Ph translocation, involving genes or sequences on the translocated chromosomes”. These variants contained material from multiple chromosomes other than 9 and 22, linked to either BCR or ABL1. The Online Supplementary Appendix to the paper provides elegant descriptions of these findings. These two patient groups were combined and termed “additional genetic abnormalities” (AGA), with their outcomes compared to patients without these additional changes. Overall survival was 94% at four years of follow-up, of which 6 of 11 deaths were not related to CML. Eight patients progressed to BP with no apparent association with the presence of AGA. However, after some somewhat complex statistical gymnastics, it was concluded that imatinib-treated patients with AGA had inferior failurefree survival (FFS), most commonly due to failure to reach molecular milestones, but also including accelerated phase (AP) / BP, detection of BCR::ABL1 kinase mutations or death. A host of comparisons between those with or without AGA were made, some incorporating consideration of the EUTOS long-term survival (ELTS) risk score, all of which numerically and sometimes statistically “significantly” (if P=0.04 is considered “proof”) suggested poorer outcomes in those with AGA.
The legitimacy of combining Ph-associated arrangements with other molecular rearrangements is an important issue. To use a baseball analogy, singles and home runs are both classified as ‘hits’, but the latter are much more impactful (and home run hitters get paid much more!). Given the paucity of information about the biology of Phassociated rearrangements, a further rationale is needed to justify giving both equal statistical weight and analyzing them as a homogeneous group. All the Ph-associated arrangements were molecularly unique, suggesting that the specific arrangement was not the culprit, but rather that this finding could hypothetically be a marker of “genetic instability” and/or deficiencies in DNA repair. That said, it
has been known for decades that BCR::ABL1 is permissive of the accumulation of as yet poorly characterized additional mutations contributing to disease progression. It is also important to acknowledge that the correlation of discrete genotypes with outcome does not necessarily provide insights into mechanisms of treatment failure or generate hypotheses about how to address this therapeutically. A humbling example is the recognition, known since the early 1980s, of the favorable influence of Core Binding Factor mutations, initially identified cytogenetically by t(8;21) or inv(16), on the outcome of AML treatment with chemotherapy. Despite the explosion of technology and increased dissection of the biology of AML in the last 40 years or more, the mechanism(s) by which these mutations seem to confer sensitivity to cytotoxic chemotherapy are still not known. Furthermore, there is little understanding of the mechanisms by which additional Ph chromosomes, isochromosome 17 and other aneuploid karyotypes contribute to the block in differentiation leading to blast crisis. The multiple non-discrete “partners” described within the Ph-associated rearrangements would make it even less likely to be able to identify specific pathways to study and target in the future.
Mutated ASXL1 was the most common cancer-associated finding, and while FFS was somewhat lower in ASXL1-mutated patients (P=0.045), only one of these 18 evolved to blast crisis and in this patient the ASXL1 had not been present at the time of deterioration, raising questions as to its relationship to disease progression. These results, and similar observations in an additional small series of CML patients, 8 raise the question of whether all newly diagnosed patients be screened molecularly for changes other than BCR::ABL1. Certainly, the technology used to detect the Ph-associated arrange -
1. Schiffer CA. Commentary on the prescient observations made by Emil J Freireich in Effectiveness of platelet transfusion in leukemia and aplastic anemia (Transfusion 1966;6:50-54). Transfusion. 2022;62(2):267-272.
2. Angelini S, Soverini S, Ravegnini G, et al. Association between imatinib transporters and metabolizing enzymes genotype and response in newly diagnosed chronic myeloid leukemia patients receiving imatinib therapy. Haematologica. 2013;98(2):193-200.
3. Radich JP, Wall M, Branford S, et al. Molecular response in newly diagnosed chronic-phase chronic myeloid leukemia: prediction modeling and pathway analysis. Haematologica. 2023;108(6):1567-1578.
4. Radich JP, Dai H, Mao M, et al. Gene expression changes associated with progression and response in chronic myeloid leukemia. Proc Natl Acad Sci U S A. 2006;103(8):2794-2799.
ments is quite complex, not standardized and, as mentioned, they are not clearly associated by themselves with outcome. It is, however, now routine to search for molecular changes in patients with AML, particularly those with normal karyotypes. Nonetheless, there is no evidence that these additional changes alone are prognostic or contribute to CML progression, and ASXL1 , known to be a poor prognostic finding in AML, is not “targetable”. Hence, more information is needed before such additional molecular screening should be done routinely at diagnosis.
Lastly, there is the question of whether initial treatment with second generation TKI might be more successful in patients with AGA. Randomized trials have not shown a survival advantage using second generation TKI compared to 400 mg of imatinib, although many clinicians opt for the more potent TKI in patients with other poor-risk features. This is a clinically relevant question, and it should be possible to reanalyze material stored from the completed randomized trials rather than waiting the many years that it would take to evaluate this prospectively. In summary, this interesting paper raises more questions than it answers. We still have a poor understanding of how “genetic instability” results in progression and treatment resistance in CML and other cancers. Although a relatively uncommon problem overall in CML, patients in less economically developed countries more often present with more advanced disease, and further studies building on these observations could be important to develop hypothesis-driven new treatment approaches for such individuals.
Disclosures
No conflicts of interest to disclose.
5. Shanmuganathan N, Wadham C, Shahrin N, et al. Impact of additional genetic abnormalities at diagnosis of chronic myeloid leukemia for first-line imatinib-treated patients receiving proactive treatment intervention. Haematologica. 2023;108(9)2380-2395.
6. Branford S, Wang P, Yeung DT, et al. Integrative genomic analysis reveals cancer-associated mutations at diagnosis of CML in patients with high-risk disease. Blood. 2018;132(9):948-961.
7. Yeung DT, Osborn MP, White DL, et al. TIDEL-II: first-line use of imatinib in CML with early switch to nilotinib for failure to achieve time-dependent molecular targets. Blood. 2015;125(6):915-923.
8. Adnan Awad S, Kankainen M, Ojala T, et al. Mutation accumulation in cancer genes relates to nonoptimal outcome in chronic myeloid leukemia. Blood Adv. 2020;4(3):546-559.
1Division of Hematology/Oncology, The Hospital for Sick Children, Department of Pediatrics, University of Toronto, Toronto, Ontario, Canada; 2Division of Oncology and Center for Childhood Cancer Research, Children’s Hospital of Philadelphia, Philadelphia, PA, USA and 3University of Pennsylvania Perelman School of Medicine and Abramson Cancer Center, Philadelphia, PA, USA
Correspondence:
S.K. Tasian tasians@chop.eduReceived: December 24, 2022. Accepted: February 23, 2023. Early view: March 2, 2023.
https://doi.org/10.3324/haematol.2022.281106
©2023 Ferrata Storti Foundation
Published under a CC BY-NC license

Although outcomes of children and adolescents with newly diagnosed acute myeloid leukemia (AML) have improved significantly over the past two decades, more than one-third of patients continue to relapse and experience suboptimal long-term outcomes. Given the small numbers of patients with relapsed AML and historical logistical barriers to international collaboration including poor trial funding and drug availability, the management of AML relapse has varied among pediatric oncology cooperative groups with several salvage regimens utilized and a lack of universally defined response criteria. The landscape of relapsed pediatric AML treatment is changing rapidly, however, as the international AML community harnesses collective knowledge and resources to characterize the genetic and immunophenotypic heterogeneity of relapsed disease, identify biological targets of interest within specific AML subtypes, develop new precision medicine approaches for collaborative investigation in early-phase clinical trials, and tackle challenges of universal drug access across the globe. This review provides a comprehensive overview of progress achieved to date in the treatment of pediatric patients with relapsed AML and highlights modern, state-of-the-art therapeutic approaches under active and emerging clinical investigation that have been facilitated by international collaboration among academic pediatric oncologists, laboratory scientists, regulatory agencies, pharmaceutical partners, cancer research sponsors, and patient advocates.
Outcomes of children and adolescents/young adults with newly-diagnosed acute myeloid leukemia (AML) have improved over the past 20 years with overall survival (OS) rates now approaching 65-70%.1-4 These survival gains have been attributed largely to advances in biological and genetic characterization of heterogeneous pediatric AML subtypes via next-generation sequencing with clinical outcome correlation, and to enhanced supportive care measures focused on reducing toxicities from intensive multi-agent chemotherapy regimens required for cure. Recent advances in flow cytometric and molecular measurable residual disease detection have further enhanced modern risk-stratified approaches to chemotherapy and allocation to allogeneic hematopoietic stem cell transplantation (HSCT) in first complete remission (CR1) when indicated. While these measures have improved event-free survival (EFS) for children and adolescents/young adults with de novo AML, 30-40% of patients ultimately relapse. Manage-
ment of patients in first relapse has varied among pediatric oncology consortia with no universally agreed-upon standard of care at this time. Accordingly, a wide range of second complete remission (CR2) rates from 23% to 81%5,6 and 5-year OS rates from 21% to 42%7-11 has been reported across the spectrum of AML salvage regimens. A standardized approach to relapse has been difficult to achieve for several reasons. The Berlin-Frankfurt-Münster (BFM) group in Europe has historically used relapsed disease as an opportunity to conduct large randomized trials. The Children’s Oncology Group (COG) in North America, Ireland, New Zealand, and Australia and other cooperative groups have viewed relapse as an opportunity to test novel therapeutic agents efficiently in smaller cohorts of patients via early-phase clinical trials. However, access to new drugs of biological interest in pediatric AML is not equal among countries and continents, which has further affected the ability to investigate promising approaches and to standardize treatment more globally in the relapsed setting. Response criteria for pediatric patients
with relapsed AML have also not yet been standardized across study groups, although efforts to do this are currently underway. Finally, patients with a first relapse of AML (without or with prior HSCT) clearly represent a different disease population from patients with primary chemorefractory disease or from those in second or greater relapse who collectively experience highly different outcomes. These populations are frequently grouped together in relapse trials given the relatively small numbers of pediatric patients with AML, which further contributes to heterogeneity of CR achievement and EFS and OS response metrics described above.
Despite these challenges, significant achievements have been made in understanding and treating relapsed AML in pediatric patients during the past decade. This review highlights recent advances in prognostic factors and reinduction regimens for children and adolescents/young adults with relapsed AML and discusses emerging treatment approaches under current and near-future clinical investigation.
Despite heterogeneity of salvage regimens and response assessment metrics for relapsed AML, some consistent predictors of the achievement of second remission have been identified. During the past two decades, several consortia have demonstrated improved survival of children with first relapse, often without introduction of new agents. This metric has been attributed to improved supportive care over time and increased utilization of HSCT with a greater pool of stem cell sources, including haploidentical donors.11 Among COG cohorts, the 5-year OS was 29% for children with relapsed AML between 2007 and 2009 and 40% between 2013 and 2017. BFM studies also reported an improvement in 5-year OS from 39% in 2009-2013 to 49% in 2013-2017 in children with relapsed AML treated with optimized salvage chemotherapy and HSCT.11
Risk stratification at initial AML diagnosis has been associated with outcomes at relapse. Children treated on the COG AAML1031 phase III trial who were initially classified as high risk by leukemia-associated genetics or end-induction MRD and subsequently relapsed had a 5-year OS of 15% versus 44% for initially low-risk patients who relapsed (P<0.001).11 Variables that have prognostic significance in childhood acute lymphoblastic leukemia, such as age and white blood cell count, have not proven predictive of clinical outcomes in children with AML.7 In adult studies, AML patients with full hematologic recovery (complete remission [CR]) have better outcomes compared to those with complete remission with incomplete
platelet count recovery (CRp) or incomplete blood count recovery (CRi).12-14 The negative prognostic outcome of a CRp/CRi has not been demonstrated in pediatric studies, as children with relapsed AML who achieve CRi/CRp do as well as those in CR.5,11 In certain contexts, count recovery could be a surrogate for residual disease, rather than toxicity to normal progenitors.13 The difference in prognostic outcomes for those achieving CRp/CRi between adults and pediatric patients may also be related to fundamental biological differences in AML biology with dysplastic marrow being more predominant in the former. The planned intercalation of MRD-based remission criteria into response assessment may further refine (or complicate) these measures.
Response to therapy at initial AML diagnosis is also predictive of survival in patients with relapse.15 In the BFM cohort, those classified as non-responders (≥10% marrow involvement after first or ≥5% after second induction) had a 5year OS of 0% compared to 45% for those who responded to initial therapy (P=0.031). In the COG cohort, outcomes after relapse were also dependent upon detection of MRD after initial induction therapy with 5-year OS of 24% and 41% (P<0.001) for those with and without MRD, respectively. Finally, resistance to salvage chemotherapy after relapse also expectedly contributes to differential outcomes.
Within a prior Therapeutic Advances in Childhood Leukaemia (TACL) consortium cohort in North America and Australia, 56% of patients with residual disease after reinduction obtained CR after a second treatment attempt, 25% after a third attempt, and 17% after any subsequent attempts.7
Well-known predictors of response are the duration of the initial AML remission and time to relapse.7,10,16-18 Relapse within 1 year of CR1 is consistently associated with poor long-term survival. In BFM studies, 5-year OS was 29% for patients relapsing within 12 months of initial AML diagnosis (early relapse) versus 55% when relapse occurred after more than 12 months (late relapse; P<0.0001).11 COG studies have similarly reported 25% and 51% 5-year OS (P<0.001) in patients with early and late relapse, respectively.11 Those relapsing in less than 6 months after the initial AML diagnosis had comparably poor outcomes to those relapsing at 6 to 12 months after the initial diagnosis (37% vs. 27%, P=0.55). However, the ability to achieve CR2 after reinduction even in patients with early relapse has contributed to superior outcomes, as evidenced by a 4year OS of 41% for responders versus 8% in non-responders in recent BFM studies.15
In comparison to survival of children after a first relapse of AML, survival following a second relapse has not improved over time with a stable 5-year OS of approximately 15%.19 Intensive reinduction regimens have generally not improved outcomes,19 highlighting the need to study novel targeted agents that may better attack the ‘Achilles’s heels’ of the
AML cells for these patients. Encouragingly, if third complete remission (CR3) after second relapse can be achieved, use of HSCT has improved survival. One study demonstrated 5-year OS of 40% for patients receiving chemotherapy and HSCT as third-line therapy.20 Time to relapse also remains prognostic in second relapse with a 5-year OS of 2% and 33% for those who relapsed before and after 1 year, respectively.19 Leukemia-associated high-risk genetic alterations, particularly FLT3 internal tandem duplication (ITD; either alone or with WT1 co-mutations), have also been associated with worse outcomes for patients at second relapse, as described below. Other variables, including age, receiving prior HSCT, white cell count at initial AML diagnosis, and poor treatment response at initial diagnosis, have not proven to be prognostic at second relapse.19,20
Demonstrated improvements in survival of pediatric patients with first relapse of AML warrant an aggressive reinduction attempt with HSCT consolidation in most cases. A number of reinduction regimens have demonstrated efficacy. Factors to consider when choosing a reinduction regimen include time to relapse, initial response to induction therapy, cumulative anthracycline chemotherapy dose, availability of chemotherapeutic agents, and presence of specific mutations that may be amenable to targeted therapies. Recent data have demonstrated that haploidentical transplantation outcomes using post-transplant cyclophosphamide are similar to those obtained with matched sibling donors.21 While direct comparisons between cooperative group trials have not been possible due to differing response criteria, inclusion criteria, and study designs, careful consideration of the data for various evidencebased salvage regimens remains important (Table 1).
The fludarabine and cytarabine with granulocyte colonystimulating factor (g-csf, filgrastim) support (FLAG) regimen is frequently used for children with first relapse of AML in an attempt to provide effective reinduction therapy while reducing infectious and cardiac morbidity, particularly in patients with prior cumulative anthracycline exposure ≥450 mg/m2. CR2 rates after FLAG reinduction as high as 70% in patients with relapsed/refractory AML or ALL have been reported with many patients able to proceed to HSCT after a second cycle of FLAG to consolidate deep remission.22 Anthracycline addition to a FLAG backbone can be considered in patients who have not received maximal prior cumulative dosing or in those with high-risk disease (e.g., early relapse). In one study, a combination of FLAG with idarubicin resulted in CR rates of 81% after one cycle in heavily pre-treated pa-
tients with relapsed AML.23 However, two courses of FLAG with idarubicin have been associated with excessive toxicity,23 so a second induction cycle of FLAG without idarubicin is generally recommended instead.
To decrease treatment-related morbidity associated with cumulative anthracycline usage, the BFM group previously investigated the use of FLAG reinduction combined with a liposomal preparation of daunomycin (DaunoXome) versus FLAG in the largest pediatric first relapse AML randomized study reported to date (n=394 patients).24 All patients received FLAG for cycle 2. DaunoXome has potential benefi ts of decreased toxicity, 25 increased halflife,26 and decreased drug resistance.27 The CR2 rate after two cycles was 69% with FLAG/DaunoXome versus 59% with FLAG ( P =0.07), although OS was similar (40% vs 36%, P =0.54). Interestingly, FLAG/DaunoXome was particularly beneficial for patients with core-binding factor AML (RUNX1::RUNX1T1 or CBFB::MYH11 fusions) with 5-year OS being 82% with FLAG/DaunoXome and 58% with FLAG (P=0.04). While results of this study were very promising, DaunoXome was never made available in the USA and is no longer manufactured.
The COG recently reported its analogous experience using CPX-351, a liposomal preparation of cytarabine and daunorubicin in a fixed 5:1 molar ratio, in the non-randomized AAML1421 phase I/II study in pediatric patients with first relapse of AML.5 Administration of CPX-351 in cycle 1 and FLAG in cycle 2 resulted in an overall response rate (comprising CR, CRp, and CRi) of 81% among 37 treated patients. All 14 patients with AML in late relapse (CR1 ≥12 months) achieved CR2, while 67% of patients with early relapse (CR1 <12 months) achieved CR2. Among the 30 responding patients, 29 (96.7%) were able to proceed to allogeneic HSCT. Twoyear OS remained encouraging at 52.7%, demonstrating long-term benefit of this salvage approach.5 Unfortunately, CPX-351 is not available or is difficult to procure in many countries, including Canada and in Europe.
Additional reinduction methods for patients with relapsed disease have included the investigation of alternate purine analogs or proteasome inhibitors. An Innovative Therapies for Children with Cancer (ITCC) Consortium/BFM trial investigated whether replacing fludarabine with clofarabine in conjunction with cytarabine and liposomal daunorubicin would improve outcomes in patients with early first relapse, chemotherapy-refractory first relapse, or second relapse of AML.28 Among 31 evaluable patients, 64% achieved CR or CRi. The 2-year EFS and OS in this high-risk group were 27% and 32%, respectively. At the recommended phase II dosing of this regimen, the 2-year EFS was 50% and OS 60%.28 In the COG AAML0523 phase II study, clofarabine and cytarabine administered without an anthracycline resulted in a CR + CRp rate of 46%.29 In the COG AALL07P1 phase II/pilot trial, addition of bortezomib to reinduction with either high-dose cytarabine and etoposide
or low-dose cytarabine and idarubicin was also deemed safe with excellent composite complete remission rates (CR + Cri + CRp) of 57% in the idarubicin-containing arm.30 The inclusion of the BCL-2 inhibitor venetoclax in intensive induction regimens has proven effective in adults with relapsed AML,31 and various other venetoclax-based therapy regimens have been investigated in both relapse and de novo settings. In the pediatric domain, the VENAML phase I/II study from St Jude Children’s Research Hospital performed dose-finding and assessed preliminary efficacy of a cytarabine and venetoclax reinduction regimen in 38 pediatric patients with relapsed/refractory AML.32 Four patients had primary chemorefractory AML, 14 of 21 patients in first relapse had received previous salvage therapy, 11 enrolled after second relapse, and two patients enrolled
after third relapse. A CR rate of 57% (CR, CRp, and CRi) was achieved after cycle 1. At the recommended phase II dosing of venetoclax, 70% of patients achieved composite CR with 71% of the CR also being MRD-negative,32 which was very encouraging in a highly treatment-resistant patient population. Of note, the VENAML regimen may not be equally suitable for all AML subtypes. In this study, no patient with FLT3-ITD or FLT3-point mutations responded to therapy,32 possibly due to the lack of FLT3 inhibitor use. Children with high allelic ratio FLT3-ITD AML have an increased risk of relapse.33,34 Survival benefit has been clearly demonstrated with addition of targeted FLT3 kinase inhibitors at relapse and, more recently, to front-line chemotherapy.35,36 Initial trials studied first-generation multi-tyrosine kinase inhibitors with anti-FLT3 properties,
SJCRH VENAML I 2017-2019 38 R/R AML or AUL Venetoclax, cytarabine
CI: 67-89%)
57% CR + CRp + CRi after cycle 1, 70% at RP2D (95% CI: 46-88%)
53% ± 21% Cooper et al. 20205
NR Karol et al. 202032
EFS: event-free survival; OS: overall survival; R/R: relapsed/refractory; AML: acute myeloid leukemia; tAML: therapy-associated/secondary AML; FLAG: fludarabine/cytarabine + granulocyte colony-stimulating factor; CR: complete remission; NR: not reported; BFM: Berlin-Frankfurt-Münster study group; 95% CI: 95% confidence interval; COG: Children's Oncology Group; CRp: complete remission with incomplete platelet count recovery; RP2D: recommended phase II dose; CRi: complete remission with incomplete blood count recovery; ITCC: Innovative Therapies for Children with Cancer; SJCRH: St Jude Children's Research Hospital; AUL: acute undifferentiated leukemia.
such as midostaurin and sorafenib.37,38 Subsequent trials have investigated more selective second-generation inhibitors, including quizartinib, crenolanib, and gilteritinib, after demonstration of promising results in adult patients.39,40 A current phase I/II study is examining the safety and efficacy of quizartinib with fludarabine, cytarabine, and etoposide in pediatric patients with relapsed/refractory AML (NCT03793478). Another phase I/II study is investigating the safety and efficacy of gilteritinib with fludarabine and cytarabine in children with relapsed/refractory AML (NCT04240002). Based upon successful data in adult patients with FLT3-ITD AML that led to its approval by the US Food and Drug Administration (FDA), gilteritinib in combination with multi-agent chemotherapy is also under investigation in the COG AAML1831 phase III trial in children, adolescents, and young adults with newly-diagnosed FLT3ITD or FLT3-mutant AML (NCT04293562). Recent studies have also demonstrated benefit of post-HSCT FLT3 inhibitor maintenance therapy, although desired anti-AML activity must be carefully balanced with risk of toxicity.37,41 The above studies highlight current evidence-based reinduction options for treatment of children with relapsed AML. Ideally, all patients should be enrolled on a clinical trial, and several early-phase studies of precision medicine therapeutics for children with relapsed/refractory AML are now available or will soon open (Table 2). However, if such options are not possible or clinically relevant, a pragmatic approach to salvage therapy is recommended
in Figure 1. For patients with high-risk relapse, incorporation of anthracyclines where possible may offer the best chance of obtaining CR2, but should be carefully weighed against the risk of long-term cumulative cardiotoxicity. While liposomal daunomycin formulations have clearly demonstrated efficacy in AML salvage regimens (and with CPX-351 now under front-line investigation via the COG AAML1831 phase III trial), it is not yet known whether or not this agent is associated with less cardiotoxicity than co-usage of the cardioprotectant dexrazoxane with conventional anthracycline drugs, as was recently shown to be beneficial in children treated on the COG AAML1031 phase III trial.42 For patients with low-risk cytomolecular alterations and late relapse of AML or who have received maximal cumulative dosing of anthracycline chemotherapy, FLAG is a safe and generally very effective reinduction option. In recent years, addition of the CD33-targeting antibody-drug conjugate gemtuzumab ozogamicin (GO) to FLAG cycle 1 for patients with CD33+ AML has been anecdotally used with a goal of improving CR rates while maintaining tolerable side effects. More formal evaluation of FLAG with GO with or without venetoclax for children with relapsed AML is now occurring in clinical trials, such as the international Leukaemia & Lymphoma Society PedAL/EUpAL consortium APAL2020D phase III study (NCT05183035, EudraCT 2021-003212-11), and may shed additional light. If curative treatment is intended, consolidative HSCT when in CR2 or later remission should be pur-
Figure 1. Proposed approach to therapeutic decision-making for children with relapsed acute myeloid leukemia. Additional targeted therapies may be considered depending upon underlying cytomolecular genetic alterations or immunophenotypic characteristics. AML: acute myeloid leukemia; FLAG: fludarabine/cytarabine + granulocyte colony-stimulating factor; ida: idarubicin; FLT3i: FLT3 inhibitor; GO: gemtuzumab ozogamicin; CR: complete remission; CRi: complete remission with incomplete blood count recovery; CRp: complete remission with incomplete platelet count recovery; HSCT: hematopoietic stem cell transplantation.

Table 2. Current and soon-to-open clinical trials for children with relapsed/refractory acute myeloid leukemia.
SJCRH: St Jude Children's Research Hospital; ALAL: acute leukemia of ambiguous lineage; FLA: fludarabine/cytarabine; GO: gemtuzumab ozogamicin; LLS PedAL/EUpAL: Leukemia & Lymphoma Society Pediatric Acute Leukemia and European Pediatric Acute Leukemia consortium; FLAG: fludarabine/cytarabine + granulocyte colony-stimulating factor; ITD: internal tandem duplication; ITCC: Innovative Therapies for Childhood Cancer consortium; COG: Children's Oncology Group; NCI: National Cancer Institute; ALL: acute lymphoblastic leukemia; MPAL: mixed phenotypic acute leukemia; PEP-CTN: Pediatric Early Phase Clinical Trials Network; DFCI: Dana-Farber Cancer Institute; CNS: central nervous system; CREB: cAMP response element binding protein; MDACC: MD Anderson Cancer Center; LD: lymphodepleting chemotherapy; CIBMTR: Center for International Blood and Marrow Transplant Research; DARIC: dimerizing agent-regulated immune-receptor complex; SCH: Seattle Children's Hospital; MDS: myelodysplastic syndromes; BPDCN: blastic plasmacytoid dendritic cell neoplasm; CHOP: Children's Hospital of Philadelphia; CIML: cytokine-induced memory-like; NK: natural killer; HSCT: hematopoietic stem cell transplant.
sued as clinically appropriate. In patients who remain refractory to reinduction attempts, there is surprisingly some evidence to support a role for HSCT even in the absence of CR. In a BFM study cohort, children with AML who had no response after relapse ( ≥5% residual AML after second reinduction therapy) had a poor, but not zero, OS rate of 27% at 5 years.11
Children with trisomy 21-associated AML who relapse represent another high-risk subgroup who require special attention. While outcomes for most young children with myeloid leukemia of Down syndrome (ML-DS) are excellent,43 the subset of patients with relapsed/refractory disease have very poor outcomes with 3-year OS of 17-26%,44-46 even with use of consolidative HSCT. Initial treatment failure in children with ML-DS is frequently secondary to disease progression, rather than due to excess toxicity.45,47 In the recent COG AAML1531 phase III trial, patients were stratified as standard- or high-risk based upon negative or positive end-induction 1 MRD, respectively, with attempted therapy de-escalation via anthracycline reduction to decrease cardiotoxicity for children with standard-risk ML-DS. However, an interim study analysis demonstrated the futility of decreased anthracycline dosing in this population with higher relapse rates than in the prior COG AAML0431 trial. Importantly, very poor salvage of children with initially standardrisk ML-DS who subsequently relapsed was achieved with a 1-year OS of 16.7%, demonstrating the importance of appropriately intensive up-front therapy for these patients to prevent relapse.46 Successful intercalation of more targeted, less toxic agents for children with ML-DS remains an important therapeutic goal.
Historically, AML in children has been treated similarly to AML in adults, and novel agents that have demonstrated
activity in relapsed adult AML have been applied to relapsed pediatric disease. Although there have been some successes with this approach, many agents do not translate well into the pediatric context given fundamental biological differences in AML across the age spectrum. For example, RAS pathway mutations occur frequently in children with AML, but are uncommon in adults. Similarly, mutations in the epigenetic modifier genes DNMT3A, IDH1, and IDH2 are common in adult AML, but rare in pediatrics.48 Specific mutations may also be present at a subclonal level, but targeting these mutations may not fully eradicate disease if they are not major oncogenic drivers.
Given the poor clinical outcomes of children with relapsed/refractory AML, early-phase clinical trials of new agents may be considered for patients with persistent residual disease after a reinduction attempt, particularly if an anthracycline agent was included in reinduction. Alternative strategies include venetoclax-based regimens as described above and immunotherapeutic approaches, such as antibody-drug conjugates, bispecific antibodies, and cell therapies.49 Patients with particularly high-risk AML-associated genetics, including CBFA2T3::GLIS2 fusion, NUP98 rearrangements, and some KMT2A rearrangements, may also be considered for experimental therapy at the time of first relapse if available given their known very poor salvage rates. Some of these ‘boutique’ subtypes of high-risk AML occur exclusively in younger children and may be amenable to novel targeted approaches, including menin inhibition for KMT2A-rearranged and NUP98-rearranged AML and anti-CD56 and FOL1R immunotherapies for CBFA2T3::GLIS2 acute megakaryoblastic leukemia discussed in more detail below (Figure 2).
Hypomethylating agents, such as azacytidine and decitabine, have demonstrated activity in adult AML, initially in elderly patients not fit for intensive chemotherapy.50 The TACL consortium recently investigated reinduction with azacytidine and fludarabine/cytarabine in 12 children with relapsed/refractory leukemia in a phase I study; 58% (7 of 12) achieved CR/CRi after one cycle with four of these responses being MRD-negative.51 The use of hypomethylating chemotherapy for ‘epigenetic priming’ prior to induction chemotherapy is now under evaluation in children and adolescents/young adults with newly-diagnosed AML in a USA-based multi-site randomized phase
II trial (NCT03164057). A subsequent TACL2016-002 phase I trial also studied combining decitabine with the checkpoint inhibitor nivolumab (NCT03825367), but the study closed early due to lack of activity and poor accrual (A Verma, personal communication, 2022). Another class of epigenetic drugs are histone deacetylase (HDAC) inhibitors, such as pabinostat and vorinostat, which remodel chromatin and alter gene expression which can lead to AML cell differentiation and apoptosis.52 A recent St Jude Children’s Research Hospital phase I trial examined the use of panobinostat before and in combination with fludarabine/cytarabine in 17 pediatric patients with relapsed/refractory AML (NCT02676323), which demonstrated the safety of the combination therapy and CR in five of six (83.3%) patients treated at dose level 3, but closed early due to poor accrual.53 The TACL consortium also studied decitabine and vorinostat with fludarabine/cytarabine in a phase I trial in pediatric and adolescent/young adult patients with relapsed/refractory AML or ML-DS (NCT02412475, NCT03263936) and recently reported 19 of 35 (54%) treated patients had achieved CR or CRi.54
In addition to the aforementioned FLT3 and BCL-2 inhibitors, several new targets and associated small molecule inhibitors are of particular interest in childhood AML.
KMT2A rearrangements with a variety of fusion partners occur in 15-20% of pediatric AML cases, many of which are associated with high relapse risk and poor outcomes. The intracellular cofactor menin interacts with the KMT2A protein complex to activate HOXA-cluster genes and MEIS1, which drive leukemia progression.55 Targeted menin inhibitors have demonstrated remarkable activity in preclinical models of KMT2A-rearranged AML and ALL,56 as well as in NPM1-mutant and NUP98-rearranged AML.57,58 Revumenib (SNDX-5613) and ziftomenib (KO-539) have demonstrated safety, tolerability, and preliminary activity in adults with relapsed/refractory KMT2A-rearranged or NPM1-mutant leukemias (NCT04065399, NCT04067336).59,60 Pediatricspecific investigation of menin inhibitors is occurring via industry-supported trials and soon-to-open LLS PedAL/EUpAL phase I trials (SK Tasian, personal communication, 2022).
Selective inhibitors of nuclear export, particularly XPO1 inhibitors, include selinexor and eltanexor, and have demonstrated clinical efficacy in adults and children with relapsed/refractory AML.61,62 A pediatric phase I study of selinexor with fludarabine and cytarabine reported a 47% CR/CRi rate in children with multiply relapsed AML. Singleagent activity of selinexor has also been observed in a small number of pediatric patients with relapsed AML harboring nucleoporin genes (e.g., NUP214, NUP98) and other fusions.61 A phase I/expansion cohort study is now exam-
Figure 2. Therapeutic targets in acute myeloid leukemia under current or planned pediatric-specific clinical investigation. CAR T cells: chimeric antigen receptor T-cell immunotherapy; ADC: antibody-drug conjugates; HMA: hypomethylating agents; HDACi: histone deacetylase inhibitors; NK: natural killer. Created with BioRender.com.
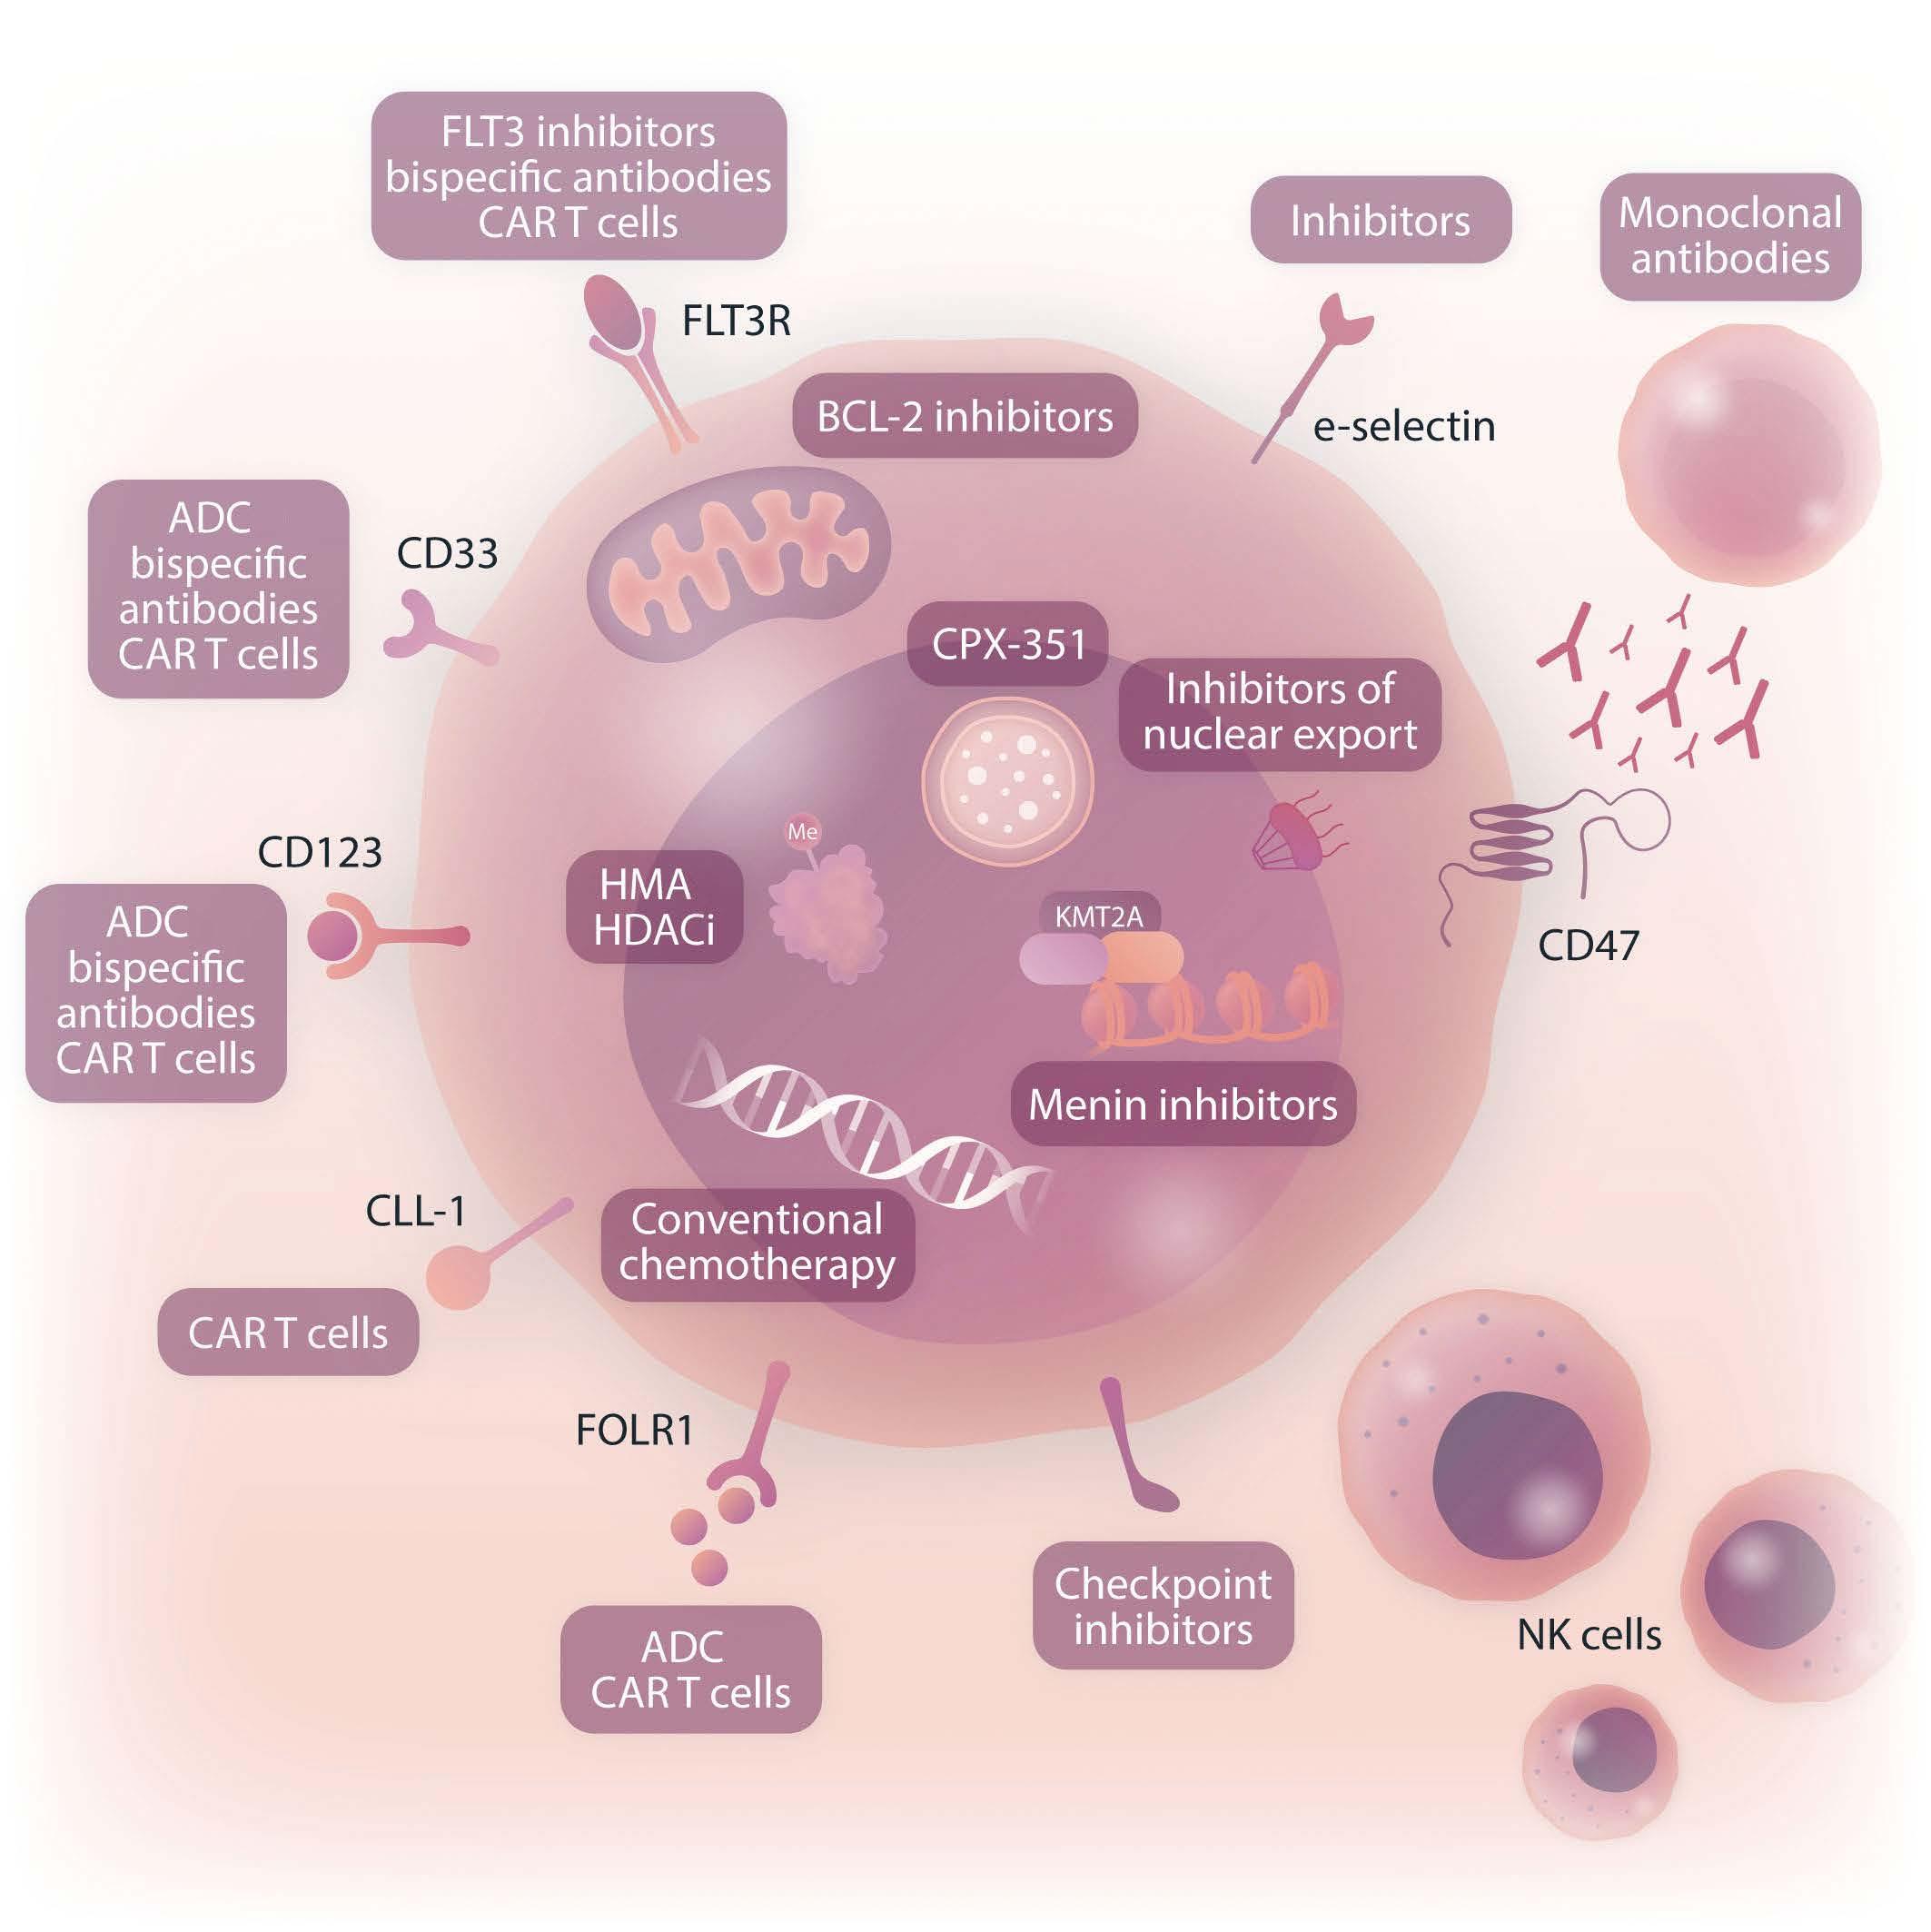
ining the activity of selinexor and venetoclax with chemotherapy in children and adolescents/young adults with relapsed/refractory AML (NCT04898894).
Another pediatric phase I trial is studying the safety and tolerability of ALRN-6294, a targeted inhibitor of MDM2 and MDMX proteins, in children with relapsed/refractory TP53 wild-type solid tumors, lymphoma, or AML (NCT03654716) based upon promising preclinical and early clinical data in adults with AML.63,64
Successful development of immunotherapy targeting cell surface antigens is of particular interest in relapsed/refractory pediatric AML. Analysis of AML specimens from the COG AAML0531 phase III clinical trial demonstrated inferior EFS and OS of children with the highest CD33 protein expression.65 Importantly, the AAML0531 study also demonstrated the safety of combining the CD33-targeting antibody-drug conjugate GO with multi-agent chemotherapy and improved disease-free survival in specific highrisk subgroups.66-68 GO is now approved by the FDA and European Medicines Agency (EMA) for pediatric patients with relapsed or de novo AML based upon favorable clinical trial data from AAML0531 and other European studies. A first-in-child, multi-site phase I trial in the USA is investigating the safety and preliminary activity of CD33 chimeric antigen receptor T cells (CD33CART) in children with multiply relapsed/refractory AML (NCT03971799) based upon promising preclinical data.69 The recently opened international first-in-child COG ADVL2111 phase I trial is also studying the safety and tolerability of a CD33xCD3 bispecific antibody in children with second or greater relapsed/refractory AML (NCT05077423).
CD123 (interleukin receptor-3 alpha chain) is another cell surface antigen of particular interest in pediatric AML given a recent similar demonstration of inferior EFS and OS and increased relapse risk in patients with highest expression.70 Several CD123-directed immunotherapies are under pediatric-specific investigation in phase I clinical trials. The COG PEPN1812 study investigated the safety and tolerability of the CD123xCD3 bispecific antibody flotetuzumab in 15 children with second or greater relapsed AML, identifying a recommended phase II dose and detecting a 20% overall response rate (NCT04158739) that was concordant with data from an adult study.71-73 Phase I trials of CD123 CAR T-cell immunotherapies in children with relapsed/refractory AML are ongoing at the Children’s Hospital of Philadelphia (NCT04678336) and St Jude Children’s Research Hospital (NCT04318678) based upon promising preclinical data and early clinical experience of similar products in adults with relapsed/refractory AML.74-77 Other antigen targets of interest in pediatric AML include mesothelin, CLEC12A (CLL-1, CD371), FLT3, FOL1R, and eselectin ligand.78-84 Early-phase pediatric studies of anti-
body-based or cellular immunotherapies against these targets are planned.
Finally, remarkable anti-leukemia activity has been reported with cytokine-induced memory-like natural killer (NK) cells in adults and children with relapsed/refractory AML with additional trials underway (NCT03068819, NCT04024761).85-87
Additional potential for CAR-modified T cells against NKG2D/NKG2D ligands and CAR-NK cells in patients with relapsed/refractory AML is being explored.88 Accrual is also ongoing in studies of HA-1 T-cell receptor T cells in children with relapsed/refractory AML (NCT03326921).89
Next-generation sequencing approaches in acute myeloid leukemia
While the genomic landscape of newly diagnosed pediatric AML has recently been relatively well-described,48 the cytomolecular characteristics of relapsed AML and their potential evolution from diagnosis are less well understood. More widespread use of RNA- and DNA-based next-generation sequencing will continue to increase our understanding of relapsed pediatric AML and enable further fine-tuning of risk stratification and therapeutic decision-making. A recent study comprehensively sequenced the genome and transcriptome of 136 relapsed AML cases and identified over-representation of WT1, KMT2A, and NUP98 alterations at relapse compared to other subtypes also detected at diagnosis.90 Interestingly, tandem duplications in upstream binding transcription factor (UBTF) were identified as a previously unknown recurrent alteration in 9% of relapsed pediatric AML cases compared to a frequency of 0.9% in relapsed adult AML. These duplications occurred in AML with normal karyotype or trisomy 8 and frequently in the setting of FLT3-ITD and WT1 mutations. This alteration was also noted to be common in young adolescent patients and was associated with higher rates of end-induction MRD positivity and poor long-term survival,90 but remains incompletely understood. Recent integrated genetic and transcriptomic analyses have been posited to be superior in prediction of biological subtypes and outcomes in pediatric AML than conventional immunophenotyping and genetic mutation analyses.91 Future studies that prospectively integrate gene expression profiling, including stemness scores,92,93 into risk stratification are likely to refine further pediatric AML risk stratification and therapeutic selection.
While genomic profiling provides prognostic information regarding disease heterogeneity and clonal evolution, the
identification of novel therapeutic targets to match specific genetic mutations occurs in only a fraction of cases. Because the molecular complexity of AML can be influenced by metabolic and epigenetic perturbations, targeting genomic perturbations does not always translate into meaningful clinical responses. Ex vivo drug testing can provide informative targetable results that complement genomic approaches. The Beat AML (NCT03013998) and other screening studies (NCT02551718) have demonstrated the feasibility of combining functional precision medicine and ex vivo high-throughput drug sensitivity profiling with genomic and transcriptional data,94,95 although prospective data remain lacking. The recent Paediatric LEAP consortium Matched Targeted Therapy study intercalated detailed DNA-based next-generation sequencing and similar drug sensitivity profiling of a subset of relapsed or de novo high-risk pediatric leukemia specimens using the Beat AML platform and identified a high percentage of patients with potential targeted therapy recommendations.96
The EXALT study (NCT03096821) used an image-based single-cell functional precision medicine approach to evaluate the effects of 139 drugs on leukemia specimens from adults with multiply relapsed/refractory hematologic malignancies,97 including 14 patients with AML. Each patient’s progression-free survival was compared with progression-free survival from their prior therapy regimens. Progression-free survival was significantly increased with a single-cell functional precision medicine approach, and OS was also increased with this approach compared to the survival of a cohort treated with physicians’ choice of therapy. Fifty-four percent of patients had progressionfree survival of at least 1.3 times the duration of that from prior therapy, and 21% had an exceptional response (defined as tripled progression-free survival duration compared with expected response duration of the respective disease entity).97 In comparison to classical sequencing approaches, results on this trial were available within a median of 5 days of sample procurement, making it a feasible, relatively real-time approach in the relapsed context. The EXALT 2 study (NCT04470947) is now randomizing patients with relapsed/refractory leukemias to therapy directed by either comprehensive genomic profiling, next generation drug screening, or physicians’ choice.
In another study, Malani and colleagues tested the utility of a functional precision medicine tumor board, integrating functional data with clinical and molecular data to guide treatment decisions.98 Ex vivo drug sensitivity and resistance testing of relapsed AML specimens were performed, and an actionable drug target was identified in 97% of patients with a median timeframe of 4 days. Thirty-seven patients with relapsed/refractory AML were treated according to the result of drug sensitivity and resistance testing with 59% demonstrating a response, including 13 CR. Importantly, achievement of these precision medicine-
induced CR was transplant-enabling in five patients, who achieved long-term survival.98 While difficult to implement for every patient given access, cost, and logistic feasibility, such approaches may offer effective tools for relatively real-time clinical decision making in the relapsed setting, including in childhood AML.
At this time, fewer than half of pediatric patients survive relapsed AML. While outcomes have increased modestly over time, such advances have largely been attributed to improved supportive care rather than to development of more effective treatment approaches. Historically, fewer than 20% of children with relapsed AML have been treated on clinical trials,99 which has limited identification of optimal salvage regimens. Despite significant regulatory burdens, coordinated international efforts and joint relapse trials of new agents are now finally underway to rectify this major knowledge gap.
The outlook for novel therapeutics in pediatric AML has improved with the development of the LLS PedAL/EUpAL consortium. 99 The concept for this joint North American/European initiative is the development of a master screening protocol with a common genetic and immunophenotypic screening platform and a robust data dictionary that identifies critical biological characteristics within relapsed acute leukemia specimens and helps to match patients with specific early-phase precision medicine clinical trials. This innovative international cooperative infrastructure has successfully engaged regulatory agencies, academic pediatric oncologists, and pharmaceutical companies to: (i) standardize relapse definitions, response criteria, and outcomes reporting, (ii) hasten pediatric-specific drug development and investigation of novel agents, and (iii) increase enrollment efficiency of less common ‘boutique’ subtypes of childhood acute leukemias within specific trials. 99
Via recent advances in sophisticated genomic and extended immunophenotypic characterization of childhood AML and correlation with clinical outcomes via comprehensive clinical trial databases, the pediatric oncology community is harnessing its collective power to design clinical trials that increase global patient numbers in rare biological/genetic subgroups predicted to be amenable to specific targeted therapies and to incite collaboration from industry and regulatory partners for timely pediatricspecific investigation of novel agents. Additional efforts at genetic and biological characterization remain necessary to delineate further the complex and heterogeneous landscape of AML in children and adolescents/young adults, as well as to elucidate clinical outcomes of newly ident-
ed high-risk subgroups. As the pediatric AML community investigates new therapies in the relapsed/refractory domain, further work will also be needed to identify predictive biomarkers of treatment response versus failure and to determine which drugs should be prioritized for frontline investigation in patients with de novo disease in the future. Despite many existing challenges, the future of pediatric AML therapy looks promising, and the next decade will undoubtedly bring exciting discoveries that improve the outlook for children and adolescents/young adults with relapsed/refractory AML.
GE declares no conflicts of interest. SKT has received research funding for unrelated studies from Beam Therapeutics, Incyte Corporation, and Kura Oncology, has consulted for bluebird bio©, has received travel support from Amgen, and has served on scientific advisory boards of Aleta Biotherapeutics, Kura Oncology, and Syndax Pharmaceuticals.
Contributions
GE and SKT conceived and directed the study, reviewed
1. Abrahamsson J, Forestier E, Heldrup J, et al. Response-guided induction therapy in pediatric acute myeloid leukemia with excellent remission rate. J Clin Oncol. 2011;29(3):310-315.
2. Pession A, Masetti R, Rizzari C, et al. Results of the AIEOP AML 2002/01 multicenter prospective trial for the treatment of children with acute myeloid leukemia. Blood. 2013;122(2):170178.
3. Rubnitz JE, Inaba H, Dahl G, et al. Minimal residual diseasedirected therapy for childhood acute myeloid leukaemia: results of the AML02 multicentre trial. Lancet Oncol. 2010;11(6):543-552.
4. Aplenc R, Meshinchi S, Sung L, et al. Bortezomib with standard chemotherapy for children with acute myeloid leukemia does not improve treatment outcomes: a report from the Children's Oncology Group. Haematologica. 2020;105(7):1879-1886.
5. Cooper TM, Absalon MJ, Alonzo TA, et al. Phase I/II study of CPX-351 followed by fludarabine, cytarabine, and granulocytecolony stimulating factor for children with relapsed acute myeloid leukemia: a report from the Children's Oncology Group. J Clin Oncol. 2020;38(19):2170-2177.
6. Cooper TM, Sison EAR, Baker SD, et al. A phase 1 study of the CXCR4 antagonist plerixafor in combination with high-dose cytarabine and etoposide in children with relapsed or refractory acute leukemias or myelodysplastic syndrome: a Pediatric Oncology Experimental Therapeutics Investigators' Consortium study (POE 10-03). Pediatr Blood Cancer. 2017;64(8):10.
7. Gorman MF, Ji L, Ko RH, et al. Outcome for children treated for relapsed or refractory acute myelogenous leukemia (rAML): a Therapeutic Advances in Childhood Leukemia (TACL) Consortium study. Pediatr Blood Cancer. 2010;55(3):421-429.
8. Rubnitz JE, Razzouk BI, Lensing S, Pounds S, Pui CH, Ribeiro RC. Prognostic factors and outcome of recurrence in childhood acute myeloid leukemia. Cancer. 2007;109(1):157-163.
9. Stahnke K, Boos J, Bender-Götze C, Ritter J, Zimmermann M,
scientific literature, and wrote and edited the manuscript. Both authors reviewed and approved the manuscript prior to submission.
Our thanks to Luk Cox for his excellent collaboration in producing Figure 2.
GE is supported by an Ontario Institute of Cancer Research (OICR) Investigator Award. SKT is supported by the National Institutes of Health/National Cancer Institute 1U01CA232486 and 1U01CA243072, Department of Defense Translational Team Science Award CA180683P1, and the V Foundation for Cancer Research. SKT is a Scholar of the Leukemia and Lymphoma Society and holds the Joshua Kahan Endowed Chair in Pediatric Leukemia Research at the Children’s Hospital of Philadelphia.
Relevant primary source scientific publications are cited at the end of this manuscript.
Creutzig U. Duration of first remission predicts remission rates and long-term survival in children with relapsed acute myelogenous leukemia. Leukemia. 1998;12(10):1534-1538.
10. Aladjidi N, Auvrignon A, Leblanc T, et al. Outcome in children with relapsed acute myeloid leukemia after initial treatment with the French Leucemie Aique Myeloide Enfant (LAME) 89/91 protocol of the French Society of Pediatric Hematology and Immunology. J Clin Oncol. 2003;21(23):4377-4385.
11. Rasche M, Zimmermann M, Steidel E, et al. Survival following relapse in children with acute myeloid leukemia: a report from AML-BFM and COG. Cancers (Basel). 2021;13(10):2336.
12. Walter RB, Kantarjian HM, Huang X, et al. Effect of complete remission and responses less than complete remission on survival in acute myeloid leukemia: a combined Eastern Cooperative Oncology Group, Southwest Oncology Group, and M. D. Anderson Cancer Center Study. J Clin Oncol. 2010;28(10):1766-1771.
13. Chen X, Xie H, Wood BL, et al. Relation of clinical response and minimal residual disease and their prognostic impact on outcome in acute myeloid leukemia. J Clin Oncol. 2015;33(11):1258-1264.
14. Norsworthy KJ, Gao X, Ko CW, et al. Response rate, event-free survival, and overall survival in newly diagnosed acute myeloid leukemia: US Food and Drug Administration trial-level and patient-level analyses. J Clin Oncol. 2022;40(8):847-854.
15. Creutzig U, Zimmermann M, Dworzak MN, et al. The prognostic significance of early treatment response in pediatric relapsed acute myeloid leukemia: results of the international study Relapsed AML 2001/01. Haematologica. 2014;99(9):1472-1478.
16. Wells RJ, Adams MT, Alonzo TA, et al. Mitoxantrone and cytarabine induction, high-dose cytarabine, and etoposide intensification for pediatric patients with relapsed or refractory acute myeloid leukemia: Children’s Cancer Group study 2951. J
Clin Oncol. 2003;21(15):2940-2947.
17. Webb DK, Wheatley K, Harrison G, Stevens RF, Hann IM. Outcome for children with relapsed acute myeloid leukaemia following initial therapy in the Medical Research Council (MRC) AML 10 trial. MRC Childhood Leukaemia Working Party. Leukemia. 1999;13(1):25-31.
18. Moritake H, Tanaka S, Miyamura T, et al. The outcomes of relapsed acute myeloid leukemia in children: results from the Japanese Pediatric Leukemia/Lymphoma Study Group AML-05R study. Pediatr Blood Cancer. 2021;68(1):e28736.
19. Rasche M, Steidel E, Zimmermann M, et al. Second relapse of pediatric patients with acute myeloid leukemia: a report on current treatment strategies and outcome of the AML-BFM study group. Cancers (Basel). 2021;13(4):789.
20. White T, Kaspers G, Abrahamsson J, et al. Clinical outcomes of second relapsed and refractory first relapsed paediatric AML: a retrospective study within the NOPHO-DB SHIP consortium. Br J Haematol. 2022;197(6):755-765.
21. Ciurea SO, Zhang MJ, Bacigalupo AA, et al. Haploidentical transplant with posttransplant cyclophosphamide vs matched unrelated donor transplant for acute myeloid leukemia. Blood. 2015;126(8):1033-1040.
22. McCarthy AJ, Pitcher LA, Hann IM, Oakhill A. FLAG (fludarabine, high-dose cytarabine, and G-CSF) for refractory and high-risk relapsed acute leukemia in children. Med Pediatr Oncol. 1999;32(6):411-415.
23. Fleischhack G, Hasan C, Graf N, Mann G, Bode U. IDA-FLAG (idarubicin, fludarabine, cytarabine, G-CSF), an effective remission-induction therapy for poor-prognosis AML of childhood prior to allogeneic or autologous bone marrow transplantation: experiences of a phase II trial. Br J Haematol. 1998;102(3):647-655.
24. Kaspers GJ, Zimmermann M, Reinhardt D, et al. Improved outcome in pediatric relapsed acute myeloid leukemia: results of a randomized trial on liposomal daunorubicin by the International BFM study group. J Clin Oncol. 2013;31(5):599-607.
25. Ewer MS, Martin FJ, Henderson C, Shapiro CL, Benjamin RS, Gabizon AA. Cardiac safety of liposomal anthracyclines. Semin Oncol. 2004;31(6 Suppl 13):161-181.
26. Gabizon A, Goren D, Cohen R, Barenholz Y. Development of liposomal anthracyclines: from basics to clinical applications. J Control Release. 1998;53(1-3):275-279.
27. Rahman A, Husain SR, Siddiqui J, et al. Liposome-mediated modulation of multidrug resistance in human HL-60 leukemia cells. J Natl Cancer Inst. 1992;84(24):1909-1915.
28. van Eijkelenburg NKA, Rasche M, Ghazaly E, et al. Clofarabine, high-dose cytarabine and liposomal daunorubicin in pediatric relapsed/refractory acute myeloid leukemia: a phase IB study. Haematologica. 2018;103(9):1484-1492.
29. Cooper TM, Alonzo TA, Gerbing RB, et al. AAML0523: a report from the Children's Oncology Group on the efficacy of clofarabine in combination with cytarabine in pediatric patients with recurrent acute myeloid leukemia. Cancer. 2014;120(16):2482-2489.
30. Horton TM, Perentesis JP, Gamis AS, et al. A phase 2 study of bortezomib combined with either idarubicin/cytarabine or cytarabine/etoposide in children with relapsed, refractory or secondary acute myeloid leukemia: a report from the Children's Oncology Group. Pediatr Blood Cancer. 2014;61(10):1754-1760.
31. DiNardo CD, Lachowiez CA, Takahashi K, et al. Venetoclax combined with FLAG-IDA induction and consolidation in newly diagnosed and relapsed or refractory acute myeloid leukemia. J Clin Oncol. 2021;39(25):2768-2778.
32. Karol SE, Alexander TB, Budhraja A, et al. Venetoclax in
combination with cytarabine with or without idarubicin in children with relapsed or refractory acute myeloid leukaemia: a phase 1, dose-escalation study. Lancet Oncol. 2020;21(4):551-560.
33. Meshinchi S, Alonzo TA, Stirewalt DL, et al. Clinical implications of FLT3 mutations in pediatric AML. Blood. 2006;108(12):3654-3661.
34. Cucchi DGJ, Denys B, Kaspers GJL, et al. RNA-based FLT3-ITD allelic ratio is associated with outcome and ex vivo response to FLT3 inhibitors in pediatric AML. Blood. 2018;131(22):2485-2489.
35. Sexauer AN, Tasian SK. Targeting FLT3 signaling in childhood acute myeloid leukemia. Front Pediatr. 2017;5:248.
36. Knight TE, Edwards H, Meshinchi S, Taub JW, Ge Y. "FLipping" the story: FLT3-mutated acute myeloid leukemia and the evolving role of FLT3 inhibitors. Cancers (Basel). 2022;14(14):3398.
37. Pollard JA, Alonzo TA, Gerbing R, et al. Sorafenib in combination with standard chemotherapy for children with high allelic ratio FLT3/ITD+ acute myeloid leukemia: a report from the Children's Oncology Group protocol AAML1031. J Clin Oncol. 2022;40(18):2023-2035.
38. Zwaan CM, Söderhäll S, Brethon B, et al. A phase 1/2, openlabel, dose-escalation study of midostaurin in children with relapsed or refractory acute leukaemia. Br J Haematol. 2019;185(3):623-627.
39. Inaba H, van Oosterwijk JG, Panetta JC, et al. Preclinical and pilot study of type I FLT3 tyrosine kinase inhibitor, crenolanib, with sorafenib in acute myeloid leukemia and FLT3-internal tandem duplication. Clin Cancer Res. 2022;28(12):2536-2546.
40. Cooper TM, Cassar J, Eckroth E, et al. A phase I study of quizartinib combined with chemotherapy in relapsed childhood leukemia: a Therapeutic Advances in Childhood Leukemia & Lymphoma (TACL) study. Clin Cancer Res. 2016;22(16):4014-4022.
41. Schlenk RF, Weber D, Fiedler W, et al. Midostaurin added to chemotherapy and continued single-agent maintenance therapy in acute myeloid leukemia with FLT3-ITD. Blood. 2019;133(8):840-851.
42. Getz KD, Sung L, Alonzo TA, et al. Effect of dexrazoxane on left ventricular systolic function and treatment outcomes in patients with acute myeloid leukemia: a report from the Children's Oncology Group. J Clin Oncol. 2020;38(21):2398-2406.
43. Ravindranath Y, Abella E, Krischer JP, et al. Acute myeloid leukemia (AML) in Down's syndrome is highly responsive to chemotherapy: experience on Pediatric Oncology Group AML study 8498. Blood. 1992;80(9):2210-2214.
44. Taga T, Saito AM, Kudo K, et al. Clinical characteristics and outcome of refractory/relapsed myeloid leukemia in children with Down syndrome. Blood. 2012;120(9):1810-1815.
45. Hitzler JK, He W, Doyle J, et al. Outcome of transplantation for acute myelogenous leukemia in children with Down syndrome. Biol Blood Marrow Transplant. 2013;19(6):893-897.
46. Hitzler J, Alonzo T, Gerbing R, et al. High-dose AraC is essential for the treatment of ML-DS independent of postinduction MRD: results of the COG AAML1531 trial. Blood. 2021;138(23):2337-2346.
47. Meissner B, Borkhardt A, Dilloo D, et al. Relapse, not regimenrelated toxicity, was the major cause of treatment failure in 11 children with Down syndrome undergoing haematopoietic stem cell transplantation for acute leukaemia. Bone Marrow Transplant. 2007;40(10):945-949.
48. Bolouri H, Farrar JE, Triche T Jr, et al. The molecular landscape of pediatric acute myeloid leukemia reveals recurrent structural alterations and age-specific mutational interactions. Nat Med.
2018;24(1):103-112.
49. Lamble AJ, Tasian SK. Opportunities for immunotherapy in childhood acute myeloid leukemia. Blood Adv. 2019;3(22):3750-3758.
50. Santini V, Ossenkoppele GJ. Hypomethylating agents in the treatment of acute myeloid leukemia: a guide to optimal use. Crit Rev Oncol Hematol. 2019;140:1-7.
51. Sun W, Triche T Jr, Malvar J, et al. A phase 1 study of azacitidine combined with chemotherapy in childhood leukemia: a report from the TACL consortium. Blood. 2018;131(10):1145-1148.
52. San José-Enériz E, Gimenez-Camino N, Agirre X, Prosper F. HDAC inhibitors in acute myeloid leukemia. Cancers (Basel). 2019;11(11):1794.
53. Karol SE, Cooper TM, Mead PE, et al. Safety, pharmacokinetics, and pharmacodynamics of panobinostat in children, adolescents, and young adults with relapsed acute myeloid leukemia. Cancer. 2020;126(21):4800-4805.
54. Pommert L, Schafer ES, Malvar J, et al. Decitabine and vorinostat with FLAG chemotherapy in pediatric relapsed/refractory AML: report from the therapeutic advances in childhood leukemia and lymphoma (TACL) consortium. Am J Hematol. 2022;97(5):613-622.
55. Yokoyama A, Somervaille TC, Smith KS, Rozenblatt-Rosen O, Meyerson M, Cleary ML. The menin tumor suppressor protein is an essential oncogenic cofactor for MLL-associated leukemogenesis. Cell. 2005;123(2):207-218.
56. Borkin D, He S, Miao H, et al. Pharmacologic inhibition of the menin-MLL interaction blocks progression of MLL leukemia in vivo. Cancer Cell. 2015;27(4):589-602.
57. Kühn MW, Song E, Feng Z, et al. Targeting chromatin regulators inhibits leukemogenic gene expression in NPM1 mutant leukemia. Cancer Discov. 2016;6(10):1166-1181.
58. Heikamp EB, Henrich JA, Perner F, et al. The menin-MLL1 interaction is a molecular dependency in NUP98-rearranged AML. Blood. 2022;139(6):894-906.
59. Erba HP, Fathi AT, Issa GC, et al. Update on a phase 1/2 first-inhuman study of the menin-KMT2A (MLL) inhibitor ziftomenib (KO-539) in patients with relapsed or refractory acute myeloid leukemia. Blood. 2022;140(Suppl 1):153-156.
60. Issa GC, Aldoss I, DiPersio JF, et al. The menin inhibitor SNDX5613 (revumenib) leads to durable responses in patients (Pts) with KMT2A-rearranged or NPM1 mutant AML: updated results of a phase (Ph) 1 study. Blood. 2022;140(Suppl 1):150-152.
61. Alexander TB, Lacayo NJ, Choi JK, Ribeiro RC, Pui CH, Rubnitz JE. Phase I study of selinexor, a selective inhibitor of nuclear export, in combination with fludarabine and cytarabine, in pediatric relapsed or refractory acute leukemia. J Clin Oncol. 2016;34(34):4094-4101.
62. Etchin J, Berezovskaya A, Conway AS, et al. KPT-8602, a second-generation inhibitor of XPO1-mediated nuclear export, is well tolerated and highly active against AML blasts and leukemia-initiating cells. Leukemia. 2017;31(1):143-150.
63. Carvajal LA, Neriah DB, Senecal A, et al. Dual inhibition of MDMX and MDM2 as a therapeutic strategy in leukemia. Sci Transl Med. 2018;10(436):eaao3003.
64. Sallman DA, Borate U, Cull EH, et al. Phase 1/1b study of the stapled peptide ALRN-6924, a dual inhibitor of MDMX and MDM2, as monotherapy or in combination with cytarabine for the treatment of relapsed/refractory AML and advanced MDS with TP53 wild-type. Blood. 2018;132(Suppl 1):4066-4066.
65. Pollard JA, Alonzo TA, Loken M, et al. Correlation of CD33 expression level with disease characteristics and response to gemtuzumab ozogamicin containing chemotherapy in childhood AML. Blood. 2012;119(16):3705-3711.
66. Gamis AS, Alonzo TA, Meshinchi S, et al. Gemtuzumab ozogamicin in children and adolescents with de novo acute myeloid leukemia improves event-free survival by reducing relapse risk: results from the randomized phase III Children's Oncology Group trial AAML0531. J Clin Oncol. 2014;32(27):30213032.
67. Pollard JA, Loken M, Gerbing RB, et al. CD33 expression and its association with gemtuzumab ozogamicin response: results from the randomized phase III Children's Oncology Group trial AAML0531. J Clin Oncol. 2016;34(7):747-755.
68. Pollard JA, Guest E, Alonzo TA, et al. Gemtuzumab ozogamicin improves event-free survival and reduces relapse in pediatric KMT2A-rearranged AML: results from the phase III Children's Oncology Group trial AAML0531. J Clin Oncol. 2021;39(28):31493160.
69. Qin H, Yang L, Chukinas JA, et al. Systematic preclinical evaluation of CD33-directed chimeric antigen receptor T cell immunotherapy for acute myeloid leukemia defines optimized construct design. J Immunother Cancer. 2021;9(9):e003149.
70. Lamble AJ, Eidenschink Brodersen L, Alonzo TA, et al. CD123 expression is associated with high-risk disease characteristics in childhood acute myeloid leukemia: a report from the Children's Oncology Group. J Clin Oncol. 2022;40(3):252-261.
71. Lamble AJ, Liu X, Minard C, et al. Safety and activity of flotetuzumab in pediatric and young adult patients with relapsed/refractory acute myeloid leukemia: results from the COG PEPN1812 phase 1 trial. Blood. 2022;140(Suppl 1):6209-6210.
72. Uy GL, Aldoss I, Foster MC, et al. Flotetuzumab as salvage immunotherapy for refractory acute myeloid leukemia. Blood. 2021;137(6):751-762.
73. Vadakekolathu J, Lai C, Reeder S, et al. TP53 abnormalities correlate with immune infiltration and associate with response to flotetuzumab immunotherapy in AML. Blood Adv. 2020;4(20):5011-5024.
74. Gill S, Tasian SK, Ruella M, et al. Preclinical targeting of human acute myeloid leukemia and myeloablation using chimeric antigen receptor-modified T cells. Blood. 2014;123(15):2343-2354.
75. Tasian SK, Kenderian SS, Shen F, et al. Optimized depletion of chimeric antigen receptor T cells in murine xenograft models of human acute myeloid leukemia. Blood. 2017;129(17):2395-2407.
76. Bonifant CL, Szoor A, Torres D, et al. CD123-engager T cells as a novel immunotherapeutic for acute myeloid leukemia. Mol Ther. 2016;24(9):1615-1626.
77. Vaidya A, Doherty E, Wu X, et al. Improving the anti-acute myeloid leukemia activity of CD123-specific engager T cells by MyD88 and CD40 costimulation. Haematologica. 2023,108(4):1039-1052.
78. Leonti AR, Pardo L, Alonzo TA, et al. Transcriptome profiling of glycosylation genes defines correlation with E-selectin ligand expression and clinical outcome in AML. Blood. 2019;134(Suppl1):3772.
79. Le Q, Castro S, Tang T, et al. Therapeutic targeting of mesothelin with chimeric antigen receptor T cells in acute myeloid leukemia. Clin Cancer Res. 2021;27(20):5718-5730.
80. Le Q, Hadland B, Smith JL, et al. CBFA2T3-GLIS2 model of pediatric acute megakaryoblastic leukemia identifies FOLR1 as a CAR T cell target. J Clin Invest. 2022;132(22):e157101.
81. Kaeding AJ, Barwe SP, Gopalakrishnapillai A, et al. Mesothelin is a novel cell surface disease marker and potential therapeutic target in acute myeloid leukemia. Blood Adv. 2021;5(9):23502361.
82. Krawczyk E, Zolov SN, Huang K, Bonifant CL. T-cell activity against AML improved by dual-targeted T cells stimulated
through T-cell and IL7 receptors. Cancer Immunol Res. 2019;7(4):683-692.
83. Willier S, Rothämel P, Hastreiter M, et al. CLEC12A and CD33 coexpression as a preferential target for pediatric AML combinatorial immunotherapy. Blood. 2021;137(8):1037-1049.
84. Niswander LM, Graff ZT, Chien CD, et al. Potent preclinical activity of FLT3-directed chimeric antigen receptor T cell immunotherapy against FLT3-mutant acute myeloid leukemia and KMT2A-rearranged acute lymphoblastic leukemia. Haematologica. 2023;108(2):457-471.
85. Berrien-Elliott MM, Cashen AF, Cubitt CC, et al. Multidimensional analyses of donor memory-like NK cells reveal new associations with response after adoptive immunotherapy for leukemia. Cancer Discov. 2020;10(12):1854-1871.
86. Berrien-Elliott MM, Foltz JA, Russler-Germain DA, et al. Hematopoietic cell transplantation donor-derived memory-like NK cells functionally persist after transfer into patients with leukemia. Sci Transl Med. 2022;14(633):eabm1375.
87. Bednarski JJ, Zimmerman C, Berrien-Elliott MM, et al. Donor memory-like NK cells persist and induce remissions in pediatric patients with relapsed AML after transplant. Blood. 2022;139(11):1670-1683.
88. Rezvani K, Rouce R, Liu E, Shpall E. Engineering natural killer cells for cancer immunotherapy. Mol Ther. 2017;25(8):1769-1781.
89. Krakow EF, Summers C, Dahlberg A, et al. Phase I study of adoptive immunotherapy with HA-1-specific CD8+ and CD4+ memory T cells for children and adults with relapsed acute leukemia after allogeneic hematopoietic stem cell transplantation (HCT): trial in progress. Blood. 2020;136(Suppl 1):45-46.
90. Umeda M, Ma J, Huang BJ, et al. Integrated genomic analysis identifies UBTF tandem duplications as a recurrent lesion in pediatric acute myeloid leukemia. Blood Cancer Discov. 2022;3(3):194-207.
91. Fornerod M, Ma J, Noort S, et al. Integrative genomic analysis of pediatric myeloid-related acute leukemias identifies novel subtypes and prognostic indicators. Blood Cancer Discov. 2021;2(6):586-599.
92. Elsayed AH, Rafiee R, Cao X, et al. A six-gene leukemic stem cell score identifies high risk pediatric acute myeloid leukemia. Leukemia. 2020;34(3):735-745.
93. Huang BJ, Smith JL, Farrar JE, et al. Integrated stem cell signature and cytomolecular risk determination in pediatric acute myeloid leukemia. Nat Commun. 2022;13(1):5487.
94. Tyner JW, Tognon CE, Bottomly D, et al. Functional genomic landscape of acute myeloid leukaemia. Nature. 2018;562(7728):526-531.
95. Kongtim P, Percival M-EM, Martins TJ, et al. Long-term outcomes of a clinical trial of molecular and functional drug screening for individualized therapy in relapsed and refractory (R/R) acute leukemia (AL). Blood. 2022;140(Suppl 1):1200-1202.
96. Pikman Y, Tasian SK, Sulis ML, et al. Matched targeted therapy for pediatric patients with relapsed, refractory, or high-risk leukemias: a report from the LEAP consortium. Cancer Discov. 2021;11(6):1424-1439.
97. Kornauth C, Pemovska T, Vladimer GI, et al. Functional precision medicine provides clinical benefit in advanced aggressive hematologic cancers and identifies exceptional responders. Cancer Discov. 2022;12(2):372-387.
98. Malani D, Kumar A, Brück O, et al. Implementing a functional precision medicine tumor board for acute myeloid leukemia. Cancer Discov. 2022;12(2):388-401.
99. Pearson ADJ, Zwaan CM, Kolb EA, et al. Paediatric Strategy Forum for medicinal product development for acute myeloid leukaemia in children and adolescents: ACCELERATE in collaboration with the European Medicines Agency with participation of the Food and Drug Administration. Eur J Cancer. 2020;136:116-129.
Department of Leukemia, The University of Texas, MD Anderson Cancer Center, Houston, TX, USA
Correspondence: F. Ravandi fravandi@mdanderson.org
Received: January 31, 2023. Accepted: April 24, 2023. Early view: May 4, 2023.
https://doi.org/10.3324/haematol.2022.281810
©2023 Ferrata Storti Foundation
Published under a CC BY-NC license
The last decade has seen steadfast progress in drug development in acute myeloid leukemia (AML) which has moved progressively towards genomic-based therapy. With these advances, outcomes in AML have improved but remains far from satisfactory. One approach towards preventing relapse in AML is to use maintenance therapy in patients, after attaining remission. Allogeneic hematopoietic stem cell transplantation (HSCT) is an effective post-remission therapy that has been proven to reduce the risk of relapse. However, in patients who are ineligible for HSCT or have a high risk of relapse, other effective measures to prevent relapse are needed. There is also a need for post-HSCT maintenance to reduce relapse in high-risk subsets. Over the last 3 decades maintenance therapy in AML has evolved from the use of chemotherapeutic agents to more targeted therapies and better modulation of the immune system. Unfortunately, improvements in survival outcomes as a result of using these agents have not been consistently demonstrated in clinical trials. To derive the optimum benefit from maintenance therapy the time points of therapy initiation need to be defined and therapy must be selected precisely with respect to the AML genetics and risk stratification, prior treatment exposure, transplant eligibility, expected toxicity and the patient’s clinical profile and desires. The far-reaching goal is to facilitate patients with AML in remission to achieve a normal quality of life while improving remission duration and overall survival. The QUAZAR trial was a welcome step towards a safe maintenance drug that is easy to administer and showed survival benefit but leaves many open issues for discussion. In this review we will discuss these issues, highlighting the development of AML maintenance therapies over the last 3 decades.
The recent evolution of targeted therapeutics in acute myeloid leukemia (AML) along with better understanding of disease biology and deeper assessment of post-treatment measurable residual disease (MRD) have improved outcomes of patients with this disease.1 However, despite the attainment of deep remission in AML, i.e. a MRD-negative state, a majority of patients with non-acute promyelocytic leukemia AML relapse over time, with approximately 40% of MRD-negative patients relapsing within 5 years.2-4 Thus, in the absence of ongoing therapy or active immune surveillance, despite attaining significant disease control, patients with AML are prone to relapse. Traditionally, allogeneic hematopoietic stem-cell transplantation (HSCT) has been the default approach to potentiate immune surveillance in AML through a graft-versus-leukemia effect. In transplant-eligible patients with adverse-risk and inter-
mediate-risk AML, HSCT has led to improved disease-free survival (DFS).5 However not all patients are eligible for HSCT, and even for those transplanted, relapses occur and remain challenging to treat. An alternative option for controlling the undetectable yet residual burden of leukemic cells could be through maintenance therapy.
Maintenance therapy, or administration of a less intensive, prolonged therapy after initial intensive induction-consolidation (I-C) chemotherapy has been the standard of care in acute lymphoblastic leukemia6 and acute promyelocytic leukemia.7 Multiple studies have explored the utility of this approach in patients with AML, and with the recent approval of an agent for the first time in this setting, the field is continuing to evolve. With further refinement of maintenance therapy concepts, including the appropriate settings and timing of maintenance therapy, the development of well-tolerated and effective agents and/or combinations and better definition of the endpoints such
as MRD eradication, we are likely to witness more interest in incorporating maintenance strategies into treating patients with AML. The phase III QUAZAR trial comparing CC486 (an oral formulation of azacitidine not bioequivalent to the parenteral form) to placebo in adult patients (≥ 55 years) with AML in remission and not candidates for immediate HSCT, demonstrated a significantly improved overall survival (OS) in the treatment arm, leading to the approval of the drug in this setting.8 However, despite the initial advantage for median survival in the treatment arm, with further follow-up, the desired plateau of sustained OS and relapse-free survival (RFS) was not achieved.9 Several questions do, therefore, remain unanswered, primary among which are eliciting the true benefit of maintenance strategy in patients who complete all planned courses of I-C therapy, have MRD-negative remission and the impact of subsequent salvage therapies.10 In this review we discuss the advances and controversies surrounding maintenance therapy in AML by exploring its need, available results from clinical trials over the last 3 decades and implications in modern AML therapy.
With progressive refinement of AML therapy, it is important that maintenance therapy be defined with respect to its intensity, timepoint of use in the treatment schema, and status of disease control. Conventionally, maintenance therapy has been denoted as low-intensity therapy given over a relatively long duration after attainment of at least morphological disease control.
Over the past several years, treatment strategies, particularly in older patients with AML, have progressively evolved to several effective, low-intensity regimens.11-13 As data with these approaches are gaining traction, they will likely be evaluated in relatively younger patients for remission induction and consolidation. Thus, therapy intensity alone cannot be used to define a maintenance regimen. In patients who receive recurrent cycles of a low-intensity regimen, the same regimen is usually continued after attaining remission, frequently at progressively reduced doses, until disease progression or toxicity. At what point are these treatment cycles considered to transition from ‘consolidation’ to ‘maintenance’ while using the same drugs? Historically maintenance therapy trials in AML included agents that were different from those used for the initial AML therapy, which were commonly conventional chemotherapeutic agents. Thus, the differentiation was clear. Recent trials and maintenance concepts, especially with low-intensity therapy in AML, often use the same regimens in attenuated doses, which make this differentiation less distinct.
As assessment of MRD in AML has become commonplace, do we consider maintenance therapy as treatment received after attainment of MRD-negative remission or in the setting of persistent MRD – so-called ‘MRD eradication’? However, with increasingly effective intensive and non-intensive regimens, pre-maintenance consolidation treatment after remission induction is very often preceded by an MRDnegative state. Thus, therapy following an MRD-negative state cannot be universally deemed to be a maintenance regimen. The European LeukemiaNet 2021 consensus statement recommends that assessment of MRD (in the bone marrow) be ideally done after consolidation therapy and cutoffs for different assays (flow cytometry or molecular methods using polymerase chain reaction or next-generation sequencing) for both MRD negativity and MRD relapse have also been defined.14 Such harmonization of MRD timepoints is important in order to choose subsequent treatment strategies; however, most of these recommendations are geared towards the need for consolidative HSCT while the use of maintenance therapy for MRD eradication in patients with persistent low-level MRD or MRD recurrence remains an unresolved issue. The concept of maintenance therapy in patients in MRD-positive remission could possibly include MRD eradication or ‘conversion’ from an MRD-positive to negative state. Hence, in the absence of defined timepoints for maintenance therapy initiation, as used in clinical trials, the definition of maintenance therapy in clinical practice is variable, often contextual and physician-derived. It depends largely on the baseline AML genomics, the depth of remission attained and the possibility of proceeding to a subsequent HSCT. Better definition of these time points is important for improved understanding of the true benefit of maintenance therapy in clinical trials as well as in retrospective data curation. Possible considerations towards this are:
• In the context of intensive therapy, maintenance therapy may include therapy that is administered as a repetitive, low-intensity treatment after consolidation therapy and with undetectable/stable low-level MRD (e.g., decitabine maintenance after fludarabine, cytarabine, granulocyte colony-stimulating factor-based therapy in core-binding factor [CBF] AML)
• For low-intensity remission induction approaches, maintenance therapy may include therapy administered after attainment of an MRD-negative state or with stable lowlevel MRD with at least 50% dose (dose/duration) reduction of the drugs from the initial therapy, if the same agents are used, or at any dose if the therapy is altered/reduced to a more targeted regimen (e.g., reduced dose azacitidine-venetoclax maintenance after azacitidine-venetoclax induction; gilteritinib maintenance after azacitidine-venetoclax-gilteritinib induction)
• Therapy initiated after HSCT irrespective of MRD status (e.g., sorafenib or azacitidine maintenance after HSCT)
All patients with AML are prone to relapse. Although it is now possible, using more sophisticated assays, to test for the achievement of deeper responses, deleterious residual disease below the level of detection (Figure 1), often at the leukemic stem cell level, fuels disease relapse. The aim of maintenance therapy is to prevent clonal evolution and growth while the immune system is able to overcome the burden of residual leukemia cells. In the era of conventional chemotherapy, further intensification in IC cycles often failed to show any linear improvement in survival.15-18 HSCT was associated with better long-term survival after such intensive therapy in patients with non-

favorable-risk AML. Most maintenance trials from this period failed to show any improvement in OS and often fell short of demonstrating benefit in relapse-/leukemia/disease-free survival. This is likely due to the lack of availability of highly effective, well-tolerated agents with different mechanisms of action compared to standard cytotoxic chemotherapy.
Through rational combination regimens with the addition of novel drugs, such as venetoclax, we are now able to achieve both higher response rates and deeper responses. Could the true benefit of maintenance therapy be evident at this depth of response? Results from the UK NCRI AML 16 trial showed that in older patients with AML (>60 years) in complete remission (CR) after intensive chemotherapy, maintenance with azacitidine led to improvement in 5-
Figure 1. Finding the biological niche for maintenance therapy in acute myeloid leukemia. Finding the right depth of disease control for initiating maintenance therapy in acute myeloid leukemia (AML) is important to garner the greatest benefit from this approach. In patients with significant measurable residual disease (MRD), maintenance therapy might not lead to durable morphological relapse-free survival. The exact cutoff of this MRD is not known but would largely vary based on the AML genomics and type of maintenance therapy used. In patients with very low disease burden, often below the level of detection by modern MRD assays and thus not quantifiable, the use of maintenance therapy might not lead to significant benefit but add to toxicity. In high-risk AML, deep remissions are often difficult with therapy, and short of a hematopoietic stem cell transplantation, maintenance therapy with low-level stable MRD can still be beneficial to improve morphological relapse-free survival. Dynamic monitoring of MRD to guide the duration and intensity of maintenance therapy in conjunction with the extent of toxicity is relevant in clinical practice. MRD: measurable residual disease; PCR: polymerase chain reaction; NGS: nextgeneration sequencing. Figure made on BioRender.com
year OS only in those who were MRD-negative at 10-4 (40% vs. 13%) but not in those who were MRD-positive (20% vs. 23%).19 In the randomized HOVON97 trial comparing azacitidine maintenance to observation in older patients (≥60 years) with newly diagnosed AML after intensive chemotherapy, 12-month DFS was superior in the therapy arm than in the observation arm (64% vs. 42%), however on a multivariate time-to-event regression analysis using baseline disease risk, CR or CR with incomplete count (CRi) recovery etc. as variables, only the presence of a platelet count ≥100x109/L (equated to CR) at initiation of maintenance therapy stood out as a significant factor for improved DFS.20 Although MRD data were not available from this trial, CR could reflect a superior disease control state over that indicated by CRi; this again highlights that the real benefit of maintenance therapy with parenteral azacitidine may be accrued in those who have prior better disease control. In the landmark QUAZAR trial, patients in the treatment (CC-486) arm showed a statistically significant improvement in OS (24.7 vs. 14.8 months) in the whole population.8 However, in an exploratory analysis, the 2year OS benefit of CC-486 over observation was significant in the MRD-positive subgroups rather than in the negative group, although again the improvement was more significant for patients in CR than CRi. Randomized trials stratifying patients based on their disease status at the time of AML maintenance, genomics and prior therapy exposure are needed to understand the population in which maintenance therapy is expected to work best. Lastly, whether maintenance therapy reduces the effectiveness of salvage at relapse is unknown and might
possibly depend on the type of regimens used. If so, improving first remission duration with maintenance therapy might not lead to an OS benefit (Figure 2). This needs to be explored through clinical trials by assessing the response to salvage regimens in patients who relapse after a significant duration of maintenance therapy.

Though an ideal maintenance regimen should suppress the evolution of the relapse-prone residual leukemic cells, this should not lead to additional therapy-related genomic instability. Secondly, the regimen should not lead to a significant additional toxicity burden to the patient through an increased risk of infections, need for recurrent transfusions and overall poor quality of life. This is supremely important because these regimens are being advocated in patients who are already in remission (often with good blood counts). Despite the general safety of hypomethylating agents (HMA) as maintenance therapy, these drugs can still cause cytopenia, which can increase risks of infection and need for transfusions, especially when they are combined with agents such as venetoclax. When used as maintenance therapy after HSCT, immunomodulatory drugs such as lenalidomide have been shown to increase risks of graft-versus-host disease (GvHD), significantly, while immune checkpoint inhibitors can also lead to immune toxicities such as autoimmune hepatitis and colitis. Thirdly, the regimen should be easy to administer and require less frequent monitoring and hospital visits. In reference to
Figure 2. Impact of maintenance therapy on survival in acute myeloid leukemia. Several clinical trials with maintenance therapy in acute myeloid leukemia (AML) have shown benefits in relapse-free survival (RFS), but overall survival (OS) benefits have been reported exceedingly rarely. Maintenance therapy by virtue of suppressing the residual disease clone can improve the duration of morphological RFS. However, the effectiveness of salvage regimens in post-maintenance therapy relapse settings needs to be studied. Prolonged exposure to maintenance regimens in some patients can make the AML more resistant through increased subclonal heterogeneity under therapy pressure, especially if the maintenance therapy is not able to diminish the residual leukemia clones to significant depths. This might make the likelihood of response to subsequent salvage therapy low. Thus, OS might not increase proportionally to RFS with maintenance therapy. In randomized clinical trials with maintenance therapy, response to salvage therapy and survival outcomes of patients after relapse in both maintenance therapy arms, and observation arms should be detailed for better understanding of these dynamics. CR1: first complete remission; RFS: relapse-free survival; OS: overall survival. Figure made on BioRender.com
maintenance regimens advocated after HSCT, they should not increase risks of GvHD, counter the important graft-versus-leukemia effect, cause graft suppression, or interfere with post-transplant immunosuppressive medications. Although monotherapy against targetable mutations (especially if they are persistent at the time of starting maintenance therapy) would appear as the most suitable option (e.g., FLT3/IDH inhibitors), they can fuel the risk of clonal escape and relapse under treatment pressure. Considering the subclonal heterogeneity of AML, combinations such as HMA plus venetoclax or other targeted agents may be better maintenance options given their broader mechanism of action. There are no available comparative data, but it will be important to evaluate and compare the potency and toxicity of these regimens as maintenance therapy. The choice could be made easier in patients without targetable mutations or in those in whom the mutations by themselves are known to drive relapse (e.g., FLT3-ITD).
The clinical development of maintenance therapy in AML has traversed from harnessing the immune system through the use of interleukins, interferon (and donor lymphocyte infusion in the post-HSCT setting), immunomodulatory agents such as lenalidomide to low-intensity chemotherapy, HMA, and now to the present use of targeted therapies or adoptive cellular therapy (Table 1).
The earliest studies of maintenance therapy in AML used low-intensity chemotherapy in different combinations after intensive I-C regimens, without much success. In 1984, Sauter and colleagues were the first to report on the lack of efficacy of adding relatively low doses of cytarabine (100 mg/m2 for 5 days per cycle repeated every 8 weeks) to 6-thioguanine alternating with prednisone and vincristine for 2 years in patients in remission after intensive chemotherapy (vs. observation). Both groups had a median remission period of 18 months and survival of 30 months.21 Shortly after, the German AML Cooperative Group published the results of their frontline AML study (2 clinical trials) showing improved continuous remission duration but not OS in the cohort randomized to maintenance (alternating low-dose cytarabine + daunorubicin, low-dose cytarabine + 6-thioguanine, and low-dose cytarabine + cyclophosphamide) over observation after intensive
chemotherapy.22 The Eastern Cooperative Oncology Group study, in which patients with AML in second relapse or later, or with refractory disease and attaining remission with intensive salvage chemotherapy were randomized to treatment with low-dose cytarabine (10 mg/m2 twice a day for 21 days each cycle repeated every 2 months until disease relapse) or observation showed that patients in the therapy arm had statistically improved DFS (7.7 vs. 3.3 months) but not OS.23
A few other trials also using a chemotherapy-based maintenance approach failed to show any meaningful improvement in survival outcomes. The Southwest Leukemia Group, in a small study, failed to show improvements in RFS and OS with 6-thioguanine, etoposide and CCNU-based maintenance.24 The EORTC-HOVON trial showed an improvement in DFS but not OS with low-dose cytarabine maintenance compared to observation at remission after intensive therapy but the actual figures were still dismal (4year DFS: 13% vs. 7%).25 In the LAME 89/91 study of pediatric patients with AML, DFS was similar in the maintenance (18 months of monthly low-dose cytarabine 25 mg/m2 twice a day for 4 days and continuous 6-methylprednisone) and observation groups while OS was inferior in the maintenance arm.26 Given the long-term poor OS (with or without maintenance therapy) with such chemotherapy-based approaches in non-HSCT patients from an era without MRD assessment in AML, the applicability of these data to modern day AML therapy is low and thus chemotherapy-based maintenance in AML is not routinely practised.
HSCT led to improvements in RFS and OS in patients with AML transplanted in remission, underpinning the importance of potent immune surveillance in preventing relapse. Interleukin-2 was the forerunner in this aspect with several studies looking into its potential utility as a maintenance agent. Biologically, interleukin-2 is a potent activator of cytotoxic T cells and natural killer cells;27-33 however, multiple well-designed clinical trials from the late 1990s to 2010 failed to show a benefit in leukemiafree survival (LFS) or OS with interleukin-2 as maintenance therapy in children, adults or older patients with AML.34-39 The last in this series was the relatively recently published report of the ELAM02 randomized controlled trial in childhood AML in which patients in remission and not undergoing HSCT after intensive I-C therapy were randomized to receive interleukin-2 or remain under observation; there was no improvement in DFS or OS with the use of interleukin-2.40 Two separate meta-analyses showed the futility of interleukin maintenance over observation on DFS and OS; one was an analysis of patientlevel data from adults with AML in five randomized controlled trials (905 patients)41 while the other analysis concerned 1,426 pediatric and adult patients.42
Table 1. The different maintenance therapy approaches, and their clinical utility based on the MD Anderson experience.
Only post- HSCT
IDH mut AML, post-HSCT
High-risk AML, No targetable mutations, NPM1 mut AML FLT3 mut AML, Sorafenib postHSCT
Post-HSCT
High-risk AML No targetable mutation, CBFAML, Post- HSCT
Benefit in special settings
The table shows the clinical utility (safety, ef fi cacy, ease of administration) of the commonly used approaches in acute myeloid leukemia maintenance and summarizes their curren t relevance considering the available data. The respective rows are graded from absent/poor (-) to high/good (++++). This scoring is a rough estimate based on available data and our institution’s practice and experience. *Among FLT3 inhibitors, sorafenib and midostaurin have been speci fi call y studied from the aspect of maintenance therapy and both in the posttransplant setting (SORMAIN and RADIUS trial, respectively). A phase III randomized controlled trial with gilteritinib in the main tenance setting is underway, while other trials of midostaurin (RATIFY), gilteritinib (ADMIRAL) and quizartinib (Quantum R and QuANTUM First) did not speci fi call y study the drug in the maintenance setting. IL2: interleukin 2; HDC: histamine dihydrochloride; FLT3 : FMS-like tyrosine kinase 3; IDH : isocitrate dehydrogenase; DLI: donor lymphocyte infusion; RCT: randomized controlled trial; Y: yes; N: no; CBF-AML: core-binding factor acute myeloid leukemia; HSCT: hematopoietic stem cell transplantation; NPM1 : nucleophosmin 1.
To develop this concept further, histamine di-hydrochloride was added to interleukin-2, in an attempt to reduce the paracrine effect of leukemic cell-derived reactive oxygen species (through the action of the histamine dihydrochloride on leukemic cells),43 which inhibit the activity of T and natural killer cells.44,45 In the first large trial, reported by Brune and colleagues, comparing this combination as a maintenance regimen to observation in 320 adult patients with AML, interleukin-2 + histamine dihydrochloride was associated with improved LFS (2-year LFS: 41% vs. 29%) but no difference in OS (leading to European Medicines Agency approval of this combination for maintenance in AML).46 Further mature data with this combination as a maintenance regimen in AML are lacking. Not surprisingly, Interferon-α has also been studied as a maintenance drug in AML; two randomized clinical trials, one from Finland by Palva and colleagues and the other from the UK (MRC AML11 trial), failed to show a beneficial effect of interferon-α maintenance on DFS or OS.47 In a more recent report from China, the use of interferon- α maintenance for 12-18 months led to improved 4-year RFS (87% vs. 56%) and OS (94% vs. 76%) when compared to a retrospective cohort who had received similar I-C therapy but no interferon- α maintenance.48 Interferon- α is not, however, a well-tolerated drug and has not been further investigated in this setting.
Lenalidomide is a potent immunomodulatory drug and is a widely established maintenance agent in multiple myeloma.49 A single-arm study from the MD Anderson Cancer Center (MDACC), studied lenalidomide maintenance for up to 24 months in patients with high-risk AML in first or subsequent CR and not eligible for HSCT.50 Over a third of patients were able to complete all 24 cycles and the 2-year RFS and OS were 50% and 63%. Of note, 25% of patients had an adverse-risk mutational profile, 21% had adverse cytogenetics and 54% had MRD at the time of starting lenalidomide. In a study by the HOVON-SAKK group lenalidomide as maintenance did not improve RFS; however, the initial therapy was variable including some patients who had received an autologous SCT and the numbers of patients at the time of randomization to maintenance versus observation were small.51 In a small, phase I study of 16 patients, six cycles of maintenance lenalidomide, given for 21 days of each of the 28-day cycles, started 6-10 months after HSCT for high-risk myelodysplastic syndrome (MDS) or AML, resulted in a 2-year RFS of 80%; seven patients developed GvHD (dose-limiting in 2 cases).52 The LENAMAINT trial (NCT00720850) that was designed to test lenalidomide as maintenance therapy after HSCT in patients with del5q or monosomy 5 AML/MDS was terminated due to slow recruitment and possible increased GvHD. Thus, unlike in multiple myeloma, lenalidomide has failed to be a prominent maintenance agent in AML. However, in view of the initial promising data as a
single agent, revisiting lenalidomide in combinations or other strategies may be considered.
In the realm of immune activation, immune checkpoint inhibitors have shown promising results in Hodgkin lymphoma,53,54 Richter syndrome55 and in several non-hematologic malignancies.56,57 Immune checkpoint inhibitors, by blocking PD1, PDL1, and CTLA4 (the immune checkpoints), are able to reverse immune cell exhaustion in malignancy and lead to death of cancer cells.58
In a single-arm phase II study of nivolumab maintenance in patients with high-risk AML in CR/CRi not eligible for HSCT, 15 patients were treated with nivolumab at a dose of 3 mg/kg every 2 weeks (every 4 weeks after cycle 6 and every 3 months after cycle 12) until disease relapse.59 At a median follow-up of 30 months, the median RFS was 8.5 months and the median OS had not been reached. In the recent update of the REMAIN trial, nivolumab (3 mg/kg IV every 2 weeks for 46 doses), when compared to observation in 79 patients with AML not eligible for HSCT, did not lead to improved RFS (2-year RFS 30% in both arms) or OS (2-year OS 60% vs. 53%), but caused a significantly higher burden of adverse events.60
Significant post-HSCT immune toxicities have been reported in patients who have proceeded to transplant after nivolumab maintenance/therapy for AML.61,62 In the frontline trial of nivolumab added to high-dose cytarabine and idarubicin in 44 patients with AML, serious acute GvHD was seen in 5/19 patients who proceeded to HSCT.63
Despite significant insights into harnessing the immune system to treat and maintain remission in cancer, apart from HSCT, immune-based therapy has been largely disappointing in AML. Better understanding of the immune milieu, and further insights into immune function, for example through quantification of PD1-expressing cells in the bone marrow,63 might help to identify patients who could benefit from an immune checkpoint inhibitor approach. Recent data have shown quite conclusively that a higher ratio of baseline T cells to myeloid leukemia cells is fundamental for subsequent response to immune checkpoint inhibitor-based therapy.64 Thus, adequate clearance of leukemic cells before administering immune checkpoint inhibitors is essential for improving the activity of these inhibitors as a maintenance therapy. Furthermore, unlike the situation in solid organ malignancies, in which the PD1/PDL1 axis is more pertinent, immune cell exhaustion in AML could be mediated through upregulation of other proteins such as TIM3 on CD4 and CD8 T cells and CD47 on AML cells (preventing macrophage activity), which are being actively studied as therapeutic targets in AML.65,66
Epigenetic modifiers: hypomethylating agents
HMA (azacitidine and decitabine) alone or in combination with other agents have been the cornerstone of modern
maintenance strategies in AML. The safety and tolerability of HMA, as well as the wide experience of physicians with them, have made them well suited as potential agents for maintenance in AML.
The first in the series of randomized controlled trials with HMA maintenance was reported by the MDACC in 2012. Decitabine at a dose of 20 mg/m2 for 5 days every 4-8 weeks for 12 cycles (n=20) was compared to observation (n=6)/low-dose cytarabine (n=9)/intensive chemotherapy (n=10) in adult patients with AML in remission; at a median follow-up of 45 months, no difference in event-free survival (EFS) (32% vs. 35%) or OS (36% vs. 45%) was found between the two groups.67 The single-arm CALGB 10503 study using decitabine maintenance in patients <60 years who were in first CR but were not proceeding to HSCT did not show any improvement in EFS or OS compared to their historical controls.68
The UK NCRI reported on the data of their AML16 trial in 2015 (described earlier) and for the first time showed an OS benefit with HMA in an exploratory cohort of MRDnegative patients randomized to the azacitidine maintenance arm (75 mg/m2/day for 5 days every 6 weeks for 9 cycles) compared to observation (5-year OS: 40% vs. 13%), but not in the whole cohort (5-year OS vs. 24% vs. 20%).19 In 2019, the HOVON group reported the findings of another phase III randomized controlled trial of azacitidine (50 mg/m2 for 5 days, every 4 weeks for a maximum of 12 cycles) compared to observation in 112 patients ≥60 years with AML/MDS-excess blasts in CR/CRi after intensive therapy. The study showed that DFS was significantly improved in the therapy arm (12-month DFS: 64% vs. 42%; P=0.04) with no difference in OS (12-month OS: 84% vs. 70%; P=0.69).20 The ECOG-ACRIN E2906 study randomized 120 patients ≥60 years with AML in remission to decitabine (20 mg/m2 for 3 days each 4-week cycle for 1 year) or observation after intensive therapy. At a median follow-up of 50 months after the start of induction therapy, patients in the decitabine arm had better DFS (15.3 vs. 8.2 months; P=0.12) and OS (25.8 vs. 19.5 months; P=0.06) but the difference failed to reach statistical significance; notably, in the subgroup of patients with FLT3-ITD-negative disease (88% of tested patients, n=84/96), the median OS was significantly better in the decitabine arm (38.2 vs. 25.2 months; P=0.039).69 Importantly, in all the above studies HMA maintenance was well-tolerated. Possibly, the most important trial with HMA maintenance is the QUAZAR AML-001 trial.8 Administration of CC-486 at a dose of 300 mg/day for 14 days every 28-day cycle until progression produced an improvement in OS compared to that achieved with observation (24.7 vs. 14.8 months) at around 12 months of follow-up. However, some issues arose from analysis of the trial: (i) site-wise data assessment showed that the benefit was insignificant in North American study sites compared to European ones; (ii) pa-
tients who had received consolidation therapy had statistically inferior reduction in hazards of death compared to those who did not receive any consolidation; (iii) the majority of the patients (68%) had received no or only one cycle of consolidation therapy prior to CC-486 maintenance therapy; (iv) the study included a small proportion of patients with active disease who are not poised to benefit from a maintenance therapy approach; and (v) the duration of maintenance therapy was not defined and some patients with morphological progression on trial had a dose increment of the drug. Nonetheless, the trial did show a statistically significant improvement in OS in the overall population with CC-486 maintenance, which had not occurred in the majority of prior maintenance studies with other agents.
Despite the relatively favorable outcomes in CBF-AML, long-term LFS still remains at 50-60%.70 However, through precise disease-specific quantitative polymerase chain reaction transcript-based MRD assessment, pre-emptive therapy can be given to prevent morphological relapse.71
In the CALGB 10503 trial described above, a sizeable percentage of patients (34%) had CBF-AML, and even in them, non-MRD-directed decitabine maintenance did not seem to improve DFS or OS.68 In a single-arm study from the MDACC of 31 patients with CBF-AML treated with fludarabine-high-dose cytarabine-based intensive I-C regimens, decitabine was administered as a maintenance agent in those who had persistent MRD positivity by polymerase chain reaction analysis and/or had failed to receive all the planned cycles of consolidation therapy. Among 23 patients with MRD at the initiation of maintenance, 12 (52%) attained complete molecular response with a median molecular RFS of 93 months; for all the patients who attained or maintained a complete molecular response (n=20) the median molecular RFS was 94 months.72 Further trials with MRD-based HMA maintenance in CBFAML are required to better understand the benefit of this strategy.
Venetoclax combined with azacitidine is being studied for maintenance of remission in non-HSCT and post-HSCT settings. In the first-of-its-kind trial from the MDACC, the venetoclax (400 mg on days 1-14) - azacitidine (50 mg/m2 on days 1-5) regimen given every 28 days for up to 24 cycles was studied in patients ≥18 years of age not immediately eligible for HSCT and in CR/CRi following two or more cycles of intensive chemotherapy or following lowintensity therapy.73 In the last updated report of this single-arm trial (median follow-up: 13 months), among 34 patients, 25 after intensive therapy and nine after low-intensity therapy, 12-month RFS rates were 70% and 58%, respectively, and there were no deaths in remission. The VIALE-M (NCT04102020) is a phase III randomized
controlled trial designed to compare the maintenance combination of CC-486 and venetoclax to observation in adult patients with AML in CR/CRi after intensive therapy and ineligible for HSCT with a primary aim of RFS benefit.74 The randomization will be stratified based on age, cytogenetic risk and MRD at maintenance therapy initiation, which will likely add to the existing knowledge of efficacy of maintenance therapy in different settings. In the post-HSCT setting venetoclax (100 mg days 1-7, later amended to 50 mg with concomitant posaconazole)azacitidine (32 mg/m2 days 1-5) every 28 days as maintenance was studied in 30 patients (27 with AML and 3 with T-cell acute lymphoblastic leukemia) from an ongoing phase II trial. At a median follow-up of 9 months, 12month RFS and OS were 69% and 90%, respectively. Separate data for the AML cohort were not reported.75 Cytopenia was significant with 30% of patients requiring venetoclax dose modifications; however, there was only one graft failure. In another study from China in patients with high-risk MDS/AML, low-dose decitabine (15 mg/m2 for 3 days) and venetoclax (200 mg for 21 days) repeated every 2 months for ten cycles from day +100 after HSCT resulted in a 2-year EFS and OS of 85%. The regimen was reasonably well tolerated with no greater than grade 3 adverse events.76
An azacitidine plus lenalidomide combination has been studied as maintenance therapy in high-risk AML patients and showed acceptable tolerability but not efficacy.77-79 In the GOELAMS group trial that included 117 high-risk AML patients, azacitidine was alternated with lenalidomide for a total of 12 cycles; 65 patients who reached CR after intensive chemotherapy received the combination which led to a median remission duration of 7 months and 2-year OS of 21% for the whole group.78 In another study from Australia, the drugs were given in combination to 60 patients with high-risk AML in first or second CR; the median RFS was approximately 12 months.79
With more widespread incorporation of venetoclax into frontline intensive and low-intensity therapy algorithms for AML it remains to be studied whether further maintenance therapy containing venetoclax beyond remission induction is of potential benefit to prolong LFS. Another question is whether venetoclax should be used as part of maintenance or reserved for salvage therapy at relapse. However, considering the relatively lower efficacy of venetoclax in the relapse setting, the former approach may be more desirable.
The first in the sequence of trials on targeted therapy was the SWOG S0106 trial, reported in 2013, which failed to show any benefit from post-consolidation gemtuzumab ozogamicin (an anti-CD33 antibody-drug conjugate) as maintenance therapy versus observation.80
The SORAML study, conducted in adult patients with AML irrespective of FLT3 status, was the first to compare the addition of sorafenib (400 mg twice daily) to intensive I-C chemotherapy or the same therapy plus placebo followed by maintenance sorafenib or placebo for 12 months. The trial showed an improvement in EFS in the sorafenib arm (3-year EFS: 40% vs. 22%) but no difference in OS.81 However, the trial was not powered to study specifically the impact of sorafenib maintenance.
The landmark phase III RATIFY trial evaluated the addition of midostaurin or placebo to intensive I-C therapy followed by maintenance (50 mg twice a day for 12 cycles of 28 days each) in 717 adult patients with FLT3-mutated, newly diagnosed AML.82 Patients in the midostaurin arm had a superior 4-year EFS (28.2% vs. 20.6%) and OS (51.4% vs. 44.3%), when not censored for SCT, leading to approval of the drug as an add-on to intensive I-C therapy by the US Food and Drug Administration, but not for maintenance. Indeed, the trial was not powered to assess the efficacy of the drug as a maintenance agent and no randomization was done at the time of maintenance. In a post-hoc landmark analysis to understand the impact on survival, both during maintenance and at 1 year after the end of maintenance, DFS (75% vs. 91%) was not different between the midostaurin and placebo arms.83 In a concurrent phase II trial in adult patients with FLT3-ITD AML, conducted by Schlenk and colleagues from the GermanAustrian AML group, midostaurin was added during intensive I-C and continued as maintenance (50 mg twice daily for 1 year) after chemotherapy or HSCT. Overall, 34% of the 284 patients proceeded to midostaurin maintenance; the 2-year EFS and OS were 34-39% and 46-53% in the older and younger patients, respectively. Among the patients who proceeded to HSCT in first remission and were eventfree by day 100, a landmark analysis showed superior EFS and OS in those who started midostaurin within 100 days of transplant (n=71) than in those who did not receive maintenance (n=45).84
The phase III ADMIRAL trial led to the approval of gilteritinib as monotherapy in adult patients with relapsed or refractory FLT3-ITD/tyrosine kinase domain-mutated AML.85 In a long-term follow-up (37 months) of the trial, continued gilteritinib therapy preserved the superior OS (2year OS: 20.6% vs. 14.2%).86 In the QuANTUM First trial, the addition of quizartinib to intensive chemotherapy followed by maintenance in patients with FLT3-ITD AML improved RFS and OS; detailed reporting of the maintenance data is awaited but the strategy could provide an additional option for FLT3-ITD AML.87 The use of FLT3 inhibitors after HSCT will be discussed separately.
Although data on the continued use of IDH inhibitors as
maintenance in the non-HSCT setting are not yet mature, these agents hold tremendous promise given their potency in IDH-mutated leukemia (with azacitidine), tolerability, and ease of administration.88,89 In a phase I study, ivosidenib (n=60) or enasidenib (n=91) was added to intensive I-C chemotherapy and continued as a maintenance agent until relapse, toxicity or HSCT.90 The trial showed the feasibility of such an approach and led to a 12-month OS of 75% in the two cohorts, although the DFS or OS benefit from the maintenance standpoint cannot be commented upon.
Dasatinib has been studied as add-on to intensive chemotherapy followed by maintenance (usually at 100 mg/day for 1 year) in CBF-AML, primarily aiming to ameliorate the negative impact of kinase mutations in these patients. With this approach the AMLSG 11-08 trial documented a 4-year cumulative incidence of relapse of 33% and OS of 75% in 89 patients with CBF-AML.91 The CALGB 10801 trial showed 3-year DFS and OS rates of 75% and 77%, respectively, in 61 patients with CBF-AML with the addition of dasatinib.92 Neither of these trials used gemtuzumab ozogamicin during the I-C; the negative impact of kinase mutations in CBF-AML with fludarabine – high-dose cytarabine-based therapy along with gemtuzumab ozogamicin may be diminished and thus additional benefit/toxicity of dasatinib maintenance in these patients needs to be studied in randomized trials.93
Several other agents have been evaluated in maintenance for AML in the non-HSCT setting, including pembrolizumab,94 androgens,95,96 and panobinostat.97 None of these has led to practice-changing improvements in outcomes. Only in the phase III GOELAMS randomized controlled trial, which included elderly patients with AML, did the use of norethandrolone (an anabolic steroid) lead to improved 5year DFS (31% vs. 16%) and OS (26% vs. 17%), with the benefits being maintained even when adjusting for most baseline patient- and disease-related factors.96
Though there has been significant overlap in the discussion of maintenance regimens in the non-HSCT and post-HSCT settings, here we will focus on some of the more important studies conducted purely in the posttransplant setting.
With regard to FLT3 inhibitors, data on sorafenib maintenance in the post-HSCT maintenance setting are the most robust. The foremost trial in this setting is the phase II SORMAIN trial that randomized 83 patients with FLT3-ITD AML in CR after HSCT to sorafenib maintenance (n=43) or
placebo (n=40) for 2 years. The drug was well tolerated with no increased GvHD and led to improved RFS (not reached vs. 30.9 months) and 24-month OS (90% vs. 66%) at a median follow-up of 42 months.98 A phase III randomized controlled trial from China also documented a reduced incidence of relapse (7% vs. 25%) with sorafenib maintenance after HSCT in FLT3-ITD-mutated AML without increased risks of GvHD.99 The phase II randomized RADIUS trial failed to show any clear benefit from midostaurin maintenance (50 mg twice daily in 12 cycles each of 4 weeks) after HSCT in FLT3-ITD AML.100 There are no reported randomized data as of yet with other FLT3 inhibitors as maintenance in the post-HSCT setting but trials are ongoing. A small retrospective analysis from Japan recently described an improved LFS (100% vs. 36%) and OS (100% vs. 46%) at 1 year with gilteritinib maintenance; this improvement was greatest in those patients who had a higher disease burden at HSCT.101 A recent press release about the phase III MORPHO trial (NCT02997202) by BMT-CTN declared that gilteritinib maintenance versus placebo for 2 years in AML patients with FLT3-ITD following HSCT failed to meet the primary endpoint of RFS benefit in the gilteritinib arm.102,103 The full data from this trial are pending. With respect to quizartinib, the detailed data on post-HSCT maintenance from the QuANTUM First trial are pending; in the QuANTUM-R trial the patients in the quizartinib arm who underwent HSCT in composite CR and received quizartinib maintenance thereafter had a better OS than those who did not (n=31 vs. 11; median OS: 27 vs. 5.4 months).104 Data from a posthoc trial analysis and retrospective analysis with FLT3 inhibitor maintenance or with any other maintenance approach need to be studied carefully because often those patients with the highest risk disease (GvHD, cytopenia) are not able to receive the maintenance agent after HSCT and are already destined to poorer outcomes than those of the patients who are better placed to tolerate maintenance agent.105 This might lead to false overstating of the benefit of any post-HSCT maintenance therapy.
IDH inhibitors are being studied actively as post-HSCT maintenance; in a phase I trial in which enasidenib (planned for 1 year) was administered to 19 IDH2-mutated patients (17 AML, 2 MDS) after transplant, 2-year PFS and OS were 69% and 74%, respectively, with no significant safety concerns.106 The results of a similar study with ivosidenib in IDH1-mutated AML/MDS are awaited (NCT03564821).
A phase III randomized study by Oran et al. failed to show any RFS (median RFS: <2 vs. 1.3 years) or OS (median OS: 2.5 vs. 2.6 years) benefit of azacitidine maintenance (32
mg/m2 for 5 days every 28 days, 12 cycles) over placebo after HSCT in AML.107 Other than the reported data, the phase III randomized AMADEUS trial is comparing the efficacy and tolerability of CC-486 to placebo after HSCT in patients with AML/MDS (NCT04173533). Phase I data on this agent after HSCT showed favorable trends in GvHD incidence and relapse risks.108 Overall, the use of parenteral azacitidine or decitabine at doses lower than recommended for MDS/AML initial therapy, administered over a fixed duration after HSCT, is feasible, does not lead to increased risks of GvHD, and is associated with reduced risks of relapse. A meta-analysis including 14 studies (not limited to randomized controlled trials) showed favorable benefits of post-HSCT HMA maintenance with regard to RFS and OS as well as reduction in rates of chronic GvHD.109
An important development was the recently reported, encouraging result on the use of eprenetapopt in combination with azacitidine as maintenance therapy in TP53-mutated MDS/AML patients after HSCT. The combination, planned to be given for 12 cycles administered every 4 weeks, led to a median RFS of 12.5 months and OS of 20.6 months (at a median follow-up of 17 months) in 33 patients (79% previously exposed to HMA, 36% with active disease at the time of HSCT, 83% with persistent TP53 mutation at HSCT) who received this maintenance.110 The combination was well tolerated, even from the points of view of GvHD and central nervous system toxicity.
Donor lymphocyte infusion (DLI) has been one of the most successful methods of boosting post-transplant immune surveillance.111 Prophylactic DLI that is administered before any evidence of disease recurrence can be considered as maintenance; however, in clinical practice DLI is often a pre-emptive therapy that is used for molecular relapse or loss of donor chimerism after HSCT.112 The lower the disease burden at DLI, the greater the extent of benefit. In multiple studies in high-risk AML, prophylactic DLI led to encouraging survival rates.113-116 In a study by Jedlickova and colleagues, in which high-risk AML patients who received prophylactic DLI (n=46) were compared to a matched group of patients not treated with DLI (n=34), patients in the DLI arm had a superior 7-year OS of 67% compared to 31% in the latter.115 It is important to understand that, in the absence of active GvHD, rapid tapering of immunosuppression is warranted for a better graft-versus-leukemia effect in patients who show any evidence of disease relapse and before DLI infusion.116
Multiple developments in post-HSCT adoptive cellular therapy have occurred over the last two decades, in the form of cytokine activated DLI, unmodified or chimeric antigen receptor modified natural-killer cells, chimeric antigen receptor T cells, etc. with the aim of refining the anti-leukemia activity and potentiating the graft-versus-leukemia effect.111
Vaccines against specific antigens expressed by tumors have also been tried in both the non-HSCT and post-HSCT settings,117,118 primary among which have been those against the WT1 protein in patients with WT1-mutated AML.119 There have been some positive results, but randomized data are lacking.120-123
Continued post-remission therapy beyond consolidation is becoming more relevant in patients with AML. Unlike in acute lymphoblastic leukemia and acute promyelocytic leukemia, these approaches in AML have been associated with varying success. Given the biological heterogeneity of AML, the choice of maintenance therapy will likely be guided by the patient’s AML genomics, remission status and transplant eligibility. Designing any maintenance therapy in AML should be considered with respect to burdens of additional toxicity, hospital visits and the patient’s quality of life.
An ongoing trial at the MDACC is engaging some of the above-mentioned contexts and using a genomically inspired approach to study different combinations of oral maintenance therapy in AML (NCT 05010772). In this five parallel-arm study, adult patients with AML in first remission after intensive remission induction therapy and at least one cycle of intensive consolidation therapy (intensive induction cohort) or after at least two cycles of lowintensity therapy (lower intensity induction cohort) and not candidates for immediate HSCT will receive either oral decitabine alone, or oral decitabine with venetoclax or with a genomics-determined add-on drug (gilteritinib, enasidenib or ivosidenib) to oral decitabine as a maintenance regimen for up to 24 cycles. The trial started enrollment around a year ago.
At the MDACC, maintenance therapy is now advocated to all patients with AML as part of ongoing clinical trials. Parenteral decitabine is suggested for patients with CBF-AML when they are unable to complete designated cycles of fludarabine, cytarabine, granulocyte colony-stimulating factor and gemtuzumab ozogamicin I-C regimens or have persistent molecular MRD after adequate consolidation therapy. For patients with intermediate- and adverse-risk AML, HSCT is the preferred consolidation, followed by maintenance as considered appropriate. In patients who are not able to proceed to HSCT a combination of HMA with or without venetoclax is advocated in the absence of a targetable myeloid mutation. For patients with targetable mutations, such as FLT3 or IDH, the corresponding inhibitors are continued (as monotherapy or with HMA) as a maintenance therapy after remission induction through intensive/low-intensity regimens. The duration of such maintenance therapy is variable and determined by the patient’s
tolerance and blood count recovery, baseline AML genomics, MRD dynamics and possibility of subsequent HSCT. The approaches to AML maintenance have evolved over the last 25 years from low-intensity chemotherapy to the use of more targeted therapies as well as immunotherapy. Whether any such approach truly improves OS in patients who have received adequate frontline therapy and are in a state of deep response needs to be studied better. In patients with high-risk disease (complex karyotype, TP53 mutation, relapsed/refractory disease, MRD-positive at/after HSCT), there is little debate that most physicians would prefer a maintenance therapy. However, whether such maintenance therapy in less adverse-risk AML is beneficial will likely be determined in ongoing trials. The possibility of aggravating genomic instability and clonal escape under maintenance therapy pressure must be kept in mind when designing such regimens.
1. Cooperrider JH, Shukla N, Nawas MT, Patel AA. The cup runneth over: treatment strategies for newly diagnosed acute myeloid leukemia. JCO Oncol Pract. 2022;19(2):74-85.
2. Short NJ, Zhou S, Fu C, et al. Association of measurable residual disease with survival outcomes in patients with acute myeloid leukemia: a systematic review and meta-analysis. JAMA Oncol. 2020;6(12):1890-1899.
3. Kantarjian H, Kadia T, DiNardo C, et al. Acute myeloid leukemia: current progress and future directions. Blood Cancer J. 2021;11(2):41.
4. Burnett AK, Russell NH, Hills RK, et al. Optimization of chemotherapy for younger patients with acute myeloid leukemia: results of the Medical Research Council AML15 trial. J Clin Oncol. 2013;31(27):3360-3368.
5. Koreth J, Schlenk R, Kopecky KJ, et al. Allogeneic stem cell transplantation for acute myeloid leukemia in first complete remission: systematic review and meta-analysis of prospective clinical trials. JAMA. 2009;301(22):2349-2361.
6. Toksvang LN, Lee SHR, Yang JJ, Schmiegelow K. Maintenance therapy for acute lymphoblastic leukemia: basic science and clinical translations. Leukemia. 2022;36(7):1749-1758.
7. Sanz MA, Fenaux P, Tallman MS, et al. Management of acute promyelocytic leukemia: updated recommendations from an expert panel of the European LeukemiaNet. Blood. 2019;133(15):1630-1643.
8. Wei AH, Döhner H, Pocock C, et al. Oral azacitidine maintenance therapy for acute myeloid leukemia in first remission. N Engl J Med. 2020;383(26):2526-2537.
9. Jen EY, Wang X, Li M, et al. FDA approval summary: oral azacitidine for continued treatment of adults with acute myeloid leukemia unable to complete intensive curative therapy. Clin Cancer Res. 2022;28(14):2989-2993.
10. Perissinotti AJ, Benitez LL, Marini BL. Oral azacitidine maintenance for acute myeloid leukemia. N Engl J Med. 2021;384(13):e51.
11. Kadia TM, Reville PK, Wang X, et al. Phase II study of venetoclax added to cladribine plus low-dose cytarabine alternating with 5-azacitidine in older patients with newly diagnosed acute
Disclosures
JS has no relevant conflicts of interest to disclose. TMK reports having received research funding from AbbVie, Amgen, BioLine Rx, Bristol-Myers Squibb, Celgene, Jazz, and Pfizer, and personal fees from AbbVie, Amgen, Genentech, Jazz, Pfizer, Pharmacyclics, and Takeda, all outside the submitted work. FR reports having received research funding from Amgen, Cyclacel, Ltd, Macrogenix, Menarini Ricerche, Selvita, and Xencor, and personal fees from Amgen, Macrogenix, and Xencor, all outside the submitted work.
Contributions JS and FR designed the manuscript. JS made the tables and figures. JS wrote the first draft of the manuscript. TMK and FR reviewed and edited the manuscript. All authors approved the final version of the manuscript.
myeloid leukemia. J Clin Oncol. 2022;40(33):3848-3857.
12. DiNardo CD, Jonas BA, Pullarkat V, et al. Azacitidine and venetoclax in previously untreated acute myeloid leukemia. N Engl J Med. 2020;383(7):617-629.
13. Wei AH, Panayiotidis P, Montesinos P, et al. Long-term follow-up of VIALE-C in patients with untreated AML ineligible for intensive chemotherapy. Blood. 2022;140(25):2754-2756.
14. Heuser M, Freeman SD, Ossenkoppele GJ, et al. 2021 Update on MRD in acute myeloid leukemia: a consensus document from the European LeukemiaNet MRD Working Party. Blood. 2021;138(26):2753-2767.
15. Burnett AK, Russell NH, Hills RK, et al. A randomized comparison of daunorubicin 90 mg/m2 vs 60 mg/m2 in AML induction: results from the UK NCRI AML17 trial in 1206 patients. Blood. 2015;125(25):3878-3885.
16. Löwenberg B, Ossenkoppele GJ, van Putten W, et al. High-dose daunorubicin in older patients with acute myeloid leukemia. N Engl J Med. 2009;361(13):1235-1248.
17. Röllig C, Steffen B, Schliemann C, et al. Single versus double induction with "7+3" containing 60 versus 90 mg daunorubicin for newly diagnosed AML: results from the randomized controlled SAL dauno-double trial. Blood. 2022;140(Suppl 1):523-525.
18. Krug U, Berdel WE, Gale RP, et al. Increasing intensity of therapies assigned at diagnosis does not improve survival of adults with acute myeloid leukemia. Leukemia. 2016;30(6):1230-1236.
19. Burnett A, Russell N, Freeman S, et al. A comparison of limited consolidation chemotherapy therapy or not, and demethylation maintenance or not in older patients with AML and high risk MDS: long term results of the UK NCRI AML16 trial. Haematologica. 2015;100(Suppl 1):194.
20. Huls G, Chitu DA, Havelange V, et al. Azacitidine maintenance after intensive chemotherapy improves DFS in older AML patients. Blood. 2019;133(13):1457-1464.
21. Sauter C, Fopp M, Imbach P, et al. Acute myelogenous leukaemia: maintenance chemotherapy after early consolidation treatment does not prolong survival. Lancet.
1984;323(8373):379-382.
22. Büchner T, Urbanitz D, Hiddemann W, et al. Intensified induction and consolidation with or without maintenance chemotherapy for acute myeloid leukemia (AML): two multicenter studies of the German AML Cooperative Group. J Clin Oncol. 1985;3(12):1583-1589.
23. Robles C, Kim KM, Oken MM, et al. Low-dose cytarabine maintenance therapy vs observation after remission induction in advanced acute myeloid leukemia: an Eastern Cooperative Oncology Group trial (E5483). Leukemia. 2000;14(8):1349-1353.
24. Johnson SA, Prentice AG, Phillips MJ. Treatment of acute myeloid leukaemia with early intensive induction therapy. Acta Oncol. 1988;27(5):527-529.
25. Löwenberg B, Suciu S, Archimbaud E, et al. Mitoxantrone versus daunorubicin in induction-consolidation chemotherapy--the value of low-dose cytarabine for maintenance of remission, and an assessment of prognostic factors in acute myeloid leukemia in the elderly: final report. European Organization for the Research and Treatment of Cancer and the Dutch-Belgian Hemato-Oncology Cooperative Hovon Group. J Clin Oncol. 1998;16(3):872-881.
26. Perel Y, Auvrignon A, Leblanc T, et al. Impact of addition of maintenance therapy to intensive induction and consolidation chemotherapy for childhood acute myeloblastic leukemia: results of a prospective randomized trial, LAME 89/91. J Clin Oncol. 2002;20(12):2774-2782.
27. Malkovský M, Sondel PM. Interleukin 2 and its receptor: structure, function and therapeutic potential. Blood Rev. 1987;1(4):254-266.
28. Maraninchi D, Blaise D, Viens P, et al. High-dose recombinant interleukin-2 and acute myeloid leukemias in relapse. Blood. 1991;78(9):2182-2187.
29. Kolb HJ, Schattenberg A, Goldman JM, et al. Graft-versusleukemia effect of donor lymphocyte transfusions in marrow grafted patients. Blood. 1995;86(5):2041-2050.
30. Speletas M, Ritis K, Bourikas G. Achievement and maintenance of complete remission in a patient with acute myelogenous leukemia after weekly administration of interleukin-2. Haematologica. 1996;81(4):346-348.
31. Tajima F, Kawatani T, Endo A, Kawasaki H. Natural killer cell activity and cytokine production as prognostic factors in adult acute leukemia. Leukemia. 1996;10(3):478-482.
32. Schliemann C, Gutbrodt KL, Kerkhoff A, et al. Targeting interleukin-2 to the bone marrow stroma for therapy of acute myeloid leukemia relapsing after allogeneic hematopoietic stem cell transplantation. Cancer Immunol Res. 2015;3(5):547-556.
33. Decot V, Voillard L, Latger-Cannard V, et al. Natural-killer cell amplification for adoptive leukemia relapse immunotherapy: comparison of three cytokines, IL-2, IL-15, or IL-7 and impact on NKG2D, KIR2DL1, and KIR2DL2 expression. Exp Hematol. 2010;38(5):351-362.
34. Sievers EL, Lange BJ, Sondel PM, et al. Feasibility, toxicity, and biologic response of interleukin-2 after consolidation chemotherapy for acute myelogenous leukemia: a report from the Children's Cancer Group. J Clin Oncol. 1998;16(3):914-919.
35. Blaise D, Attal M, Reiffers J, et al. Randomized study of recombinant interleukin-2 after autologous bone marrow transplantation for acute leukemia in first complete remission. Eur Cytokine Netw. 2000;11(1):91-98.
36. Kolitz JE, Hars V, DeAngelo DJ, et al. Phase III trial of immunotherapy with recombinant interleukin-2 (rIL-2) versus observation in patients < 60 years with acute myeloid leukemia (AML) in first remission (CR1): preliminary results from Cancer and Leukemia Group B (CALGB) 19808. Blood. 2007;110(11):157.
37. Baer MR, George SL, Caligiuri MA, et al. Low-dose interleukin-2 immunotherapy does not improve outcome of patients age 60 years and older with acute myeloid leukemia in first complete remission: Cancer and Leukemia Group B Study 9720. J Clin Oncol. 2008;26(30):4934-4939.
38. Lange BJ, Smith FO, Feusner J, et al. Outcomes in CCG-2961, a Children's Oncology Group phase 3 trial for untreated pediatric acute myeloid leukemia: a report from the Children's Oncology Group. Blood. 2008;111(3):1044-1053.
39. Pautas C, Merabet F, Thomas X, et al. Randomized study of intensified anthracycline doses for induction and recombinant interleukin-2 for maintenance in patients with acute myeloid leukemia age 50 to 70 years: results of the ALFA-9801 study. J Clin Oncol. 2010;28(5):808-814.
40. Petit A, Ducassou S, Leblanc T, et al. Maintenance therapy with interleukin-2 for childhood AML: results of ELAM02 phase III randomized trial. Hemasphere. 2018;2(6):e159.
41. Buyse M, Squifflet P, Lange BJ, et al. Individual patient data meta-analysis of randomized trials evaluating IL-2 monotherapy as remission maintenance therapy in acute myeloid leukemia. Blood. 2011;117(26):7007-7013.
42. Mao C, Fu XH, Yuan JQ, et al. Interleukin‐2 as maintenance therapy for children and adults with acute myeloid leukaemia in first complete remission. Cochrane Database Syst Rev. 2015(11):CD010248.
43. Aurelius J, Martner A, Brune M, et al. Remission maintenance in acute myeloid leukemia: impact of functional histamine H2 receptors expressed by leukemic cells. Haematologica. 2012;97(12):1904-1908.
44. Brune M, Hansson M, Mellqvist UH, Hermodsson S, Hellstrand K. NK cell-mediated killing of AML blasts: role of histamine, monocytes and reactive oxygen metabolites. Eur J Haematol. 1996;57(4):312-319.
45. Mellqvist UH, Hansson M, Brune M, Dahlgren C, Hermodsson S, Hellstrand K. Natural killer cell dysfunction and apoptosis induced by chronic myelogenous leukemia cells: role of reactive oxygen species and regulation by histamine. Blood. 2000;96(5):1961-1968.
46. Brune M, Castaigne S, Catalano J, et al. Improved leukemia-free survival after postconsolidation immunotherapy with histamine dihydrochloride and interleukin-2 in acute myeloid leukemia: results of a randomized phase 3 trial. Blood. 2006;108(1):88-96.
47. Palva IP, Almqvist A, Elonen E, et al. Value of maintenance therapy with chemotherapy or interferon during remission of acute myeloid leukaemia. Eur J Haematol. 1991;47(3):229-233.
48. Jiang H, Liu X-H, Kong J, et al. Interferon-α as maintenance therapy can significantly reduce relapse in patients with favorable-risk acute myeloid leukemia. Leuk Lymphoma. 2021;62(12):2949-2956.
49. Jackson GH, Davies FE, Pawlyn C, et al. Lenalidomide maintenance versus observation for patients with newly diagnosed multiple myeloma (Myeloma XI): a multicentre, openlabel, randomised, phase 3 trial. Lancet Oncol. 2019;20(1):57-73.
50. Abou Dalle I, Kantarjian HM, Ravandi F, et al. Phase 2 study of lenalidomide maintenance for patients with high-risk acute myeloid leukemia in remission. Cancer. 2021;127(11):1894-1900.
51. Löwenberg B, Pabst T, Maertens J, et al. Addition of lenalidomide to intensive treatment in younger and middleaged adults with newly diagnosed AML: the HOVON-SAKK-132 trial. Blood Adv. 2021;5(4):1110-1121.
52. Pham B, Hoeg R, Krishnan R, Richman C, Tuscano J, Abedi M. Safety and tolerability of lenalidomide maintenance in posttransplant acute myeloid leukemia and high-risk myelodysplastic syndrome. Bone Marrow Transplant.
2021;56(12):2975-2980.
53. Ansell SM, Lesokhin AM, Borrello I, et al. PD-1 blockade with nivolumab in relapsed or refractory Hodgkin's lymphoma. N Engl J Med. 2014;372(4):311-319.
54. Kuruvilla J, Ramchandren R, Santoro A, et al. Pembrolizumab versus brentuximab vedotin in relapsed or refractory classical Hodgkin lymphoma (KEYNOTE-204): an interim analysis of a multicentre, randomised, open-label, phase 3 study. Lancet Oncol. 2021;22(4):512-524.
55. Jain N, Senapati J, Thakral B, et al. A phase 2 study of nivolumab combined with ibrutinib in patients with diffuse large B-cell Richter transformation of CLL. Blood Adv. 2023;7(10):1958-1966.
56. Robert C, Schachter J, Long GV, et al. Pembrolizumab versus ipilimumab in advanced melanoma. N Engl J Med. 2015;372(26):2521-2532.
57. Robert C. A decade of immune-checkpoint inhibitors in cancer therapy. Nat Commun. 2020;11(1):3801.
58. Wei SC, Duffy CR, Allison JP. Fundamental mechanisms of immune checkpoint blockade therapy. Cancer Discov. 2018;8(9):1069-1086.
59. Reville PK, Kantarjian HM, Ravandi F, et al. Nivolumab maintenance in high-risk acute myeloid leukemia patients: a single-arm, open-label, phase II study. Blood Cancer J. 2021;11(3):60.
60. Liu H, Sharon E, Karrison TG, et al. Randomized phase II study to assess the role of nivolumab as single agent to eliminate minimal residual disease and maintain remission in acute myelogenous leukemia (AML) patients after chemotherapy (NCI9706 protocol; REMAIN trial). Blood. 2022;140(Suppl 1):1716-1719.
61. Davids MS, Kim HT, Costello C, et al. A multicenter phase 1 study of nivolumab for relapsed hematologic malignancies after allogeneic transplantation. Blood. 2020;135(24):2182-2191.
62. Wang AY, Kline J, Stock W, et al. Unexpected toxicities when nivolumab was given as maintenance therapy following allogeneic stem cell transplantation. Biol Blood Marrow Transplant. 2020;26(5):1025-1027.
63. Ravandi F, Assi R, Daver N, et al. Idarubicin, cytarabine, and nivolumab in patients with newly diagnosed acute myeloid leukaemia or high-risk myelodysplastic syndrome: a single-arm, phase 2 study. Lancet Haematol. 2019;6(9):e480-e488.
64. Penter L, Liu Y, Wolff JO, et al. Mechanisms of response and resistance to combined decitabine and ipilimumab for advanced myeloid disease. Blood. 2023;141(15):1817-1830.
65. Wolf Y, Anderson AC, Kuchroo VK. TIM3 comes of age as an inhibitory receptor. Nat Rev Immunol. 2020;20(3):173-185.
66. Majeti R, Chao MP, Alizadeh AA, et al. CD47 is an adverse prognostic factor and therapeutic antibody target on human acute myeloid leukemia stem cells. Cell. 2009;138(2):286-299.
67. Boumber Y, Kantarjian H, Jorgensen J, et al. A randomized study of decitabine versus conventional care for maintenance therapy in patients with acute myeloid leukemia in complete remission. Leukemia. 2012;26(11):2428-2431.
68. Blum W, Sanford BL, Klisovic R, et al. Maintenance therapy with decitabine in younger adults with acute myeloid leukemia in first remission: a phase 2 Cancer and Leukemia Group B study (CALGB 10503). Leukemia. 2017;31(1):34-39.
69. Foran JM, Sun Z, Claxton DF, et al. Maintenance decitabine (DAC) improves disease-free (DFS) and overall survival (OS) after intensive therapy for acute myeloid leukemia (AML) in older adults, particularly in FLT3-ITD-negative patients: ECOG-ACRIN (E-A) E2906 randomized study. Blood. 2019;134(Suppl_1):115.
70. Borthakur G, Ravandi F, Patel K, et al. Retrospective comparison
of survival and responses to fludarabine, cytarabine, GCSF (FLAG) in combination with gemtuzumab ozogamicin (GO) or idarubicin (IDA) in patients with newly diagnosed core binding factor (CBF) acute myelogenous leukemia: MD Anderson experience in 174 patients. Am J Hematol. 2022;97(11):1427-1434.
71. Yin JAL, O'Brien MA, Hills RK, Daly SB, Wheatley K, Burnett AK. Minimal residual disease monitoring by quantitative RT-PCR in core binding factor AML allows risk stratification and predicts relapse: results of the United Kingdom MRC AML-15 trial. Blood. 2012;120(14):2826-2835.
72. Senapati J, Shoukier M, Garcia-Manero G, et al. Activity of decitabine as maintenance therapy in core binding factor acute myeloid leukemia. Am J Hematol. 2022;97(5):574-582.
73. Bazinet A, Kantarjian H, Borthakur G, et al. A phase II study of azacitidine plus venetoclax as maintenance therapy in acute myeloid leukemia: durable responses with longer term followup. Blood. 2022;140(Suppl 1):9005-9007.
74. Ivanov V, Yeh S-P, Mayer J, et al. Design of the VIALE-M phase III trial of venetoclax and oral azacitidine maintenance therapy in acute myeloid leukemia. Future Oncol. 2022;18(26):2879-2889.
75. Oran B, Champlin RE, Thall PF, et al. Phase II trial of venetoclax (Ven) in combination with azacitidine (AZA) as maintenance therapy for high-risk acute leukemia following allogeneic stem cell transplantation (SCT). Blood. 2022;140(Suppl 1):10561-10562.
76. Wei Y, Xiong X, Li X, et al. Low-dose decitabine plus venetoclax is safe and effective as post-transplant maintenance therapy for high-risk acute myeloid leukemia and myelodysplastic syndrome. Cancer Sci. 2021;112(9):3636-3644.
77. Ramsingh G, Westervelt P, Cashen AF, et al. A phase 1 study of concomitant high-dose lenalidomide and 5-azacitidine induction in the treatment of AML. Leukemia. 2013;27(3):725-728.
78. Hunault M, Maillard N, Tanguy-Schmidt A, et al. Safety and longterm efficacy of maintenance therapy with alternating azacytidine (AZA) and lenalidomide (Len) cycles in elderly (≥ 60) fit patients (Pts) with poor prognosis AML in first complete remission (CR) after LIA induction. A phase II multicentric GOELAMS trial. Blood. 2015;126(23):3787.
79. Wei A, Tan P, Perruzza S, et al. Maintenance lenalidomide in combination with 5-azacitidine as post-remission therapy for acute myeloid leukaemia. Br J Haematol. 2015;169(2):199-210.
80. Petersdorf SH, Kopecky KJ, Slovak M, et al. A phase 3 study of gemtuzumab ozogamicin during induction and postconsolidation therapy in younger patients with acute myeloid leukemia. Blood. 2013;121(24):4854-4860.
81. Röllig C, Serve H, Hüttmann A, et al. Addition of sorafenib versus placebo to standard therapy in patients aged 60 years or younger with newly diagnosed acute myeloid leukaemia (SORAML): a multicentre, phase 2, randomised controlled trial. Lancet Oncol. 2015;16(16):1691-1699.
82. Stone RM, Mandrekar SJ, Sanford BL, et al. Midostaurin plus chemotherapy for acute myeloid leukemia with a FLT3 mutation. N Engl J Med. 2017;377(5):454-464.
83. Larson RA, Mandrekar SJ, Sanford BL, et al. An analysis of maintenance therapy and post-midostaurin outcomes in the international prospective randomized, placebo-controlled, double-blind trial (CALGB 10603/RATIFY [Alliance]) for newly diagnosed acute myeloid leukemia (AML) patients with FLT3 mutations. Blood. 2017;130(Suppl 1):145.
84. Schlenk RF, Weber D, Fiedler W, et al. Midostaurin added to chemotherapy and continued single-agent maintenance therapy in acute myeloid leukemia with FLT3-ITD. Blood. 2019;133(8):840-851.
85. Perl AE, Martinelli G, Cortes JE, et al. Gilteritinib or
chemotherapy for relapsed or refractory FLT3-mutated AML. N Engl J Med. 2019;381(18):1728-1740.
86. Perl AE, Larson RA, Podoltsev NA, et al. Follow-up of patients with R/R FLT3-mutation–positive AML treated with gilteritinib in the phase 3 ADMIRAL trial. Blood. 2022;139(23):3366-3375.
87. Erba H, Montesinos P, Vrhovac R, et al. AML-029 quizartinib prolonged overall survival (OS) vs placebo plus intensive induction and consolidation therapy followed by single-agent continuation in patients aged 18-75 years with newly diagnosed FLT3-internal tandem duplication positive (FLT3-ITD+) acute myeloid leukemia (AML). Clin Lymphoma, Myeloma Leuk. 2022;22:S208-S209.
88. Montesinos P, Recher C, Vives S, et al. Ivosidenib and azacitidine in IDH1-mutated acute myeloid leukemia. N Engl J Med. 2022;386(16):1519-1531.
89. DiNardo CD, Schuh AC, Stein EM, et al. Enasidenib plus azacitidine versus azacitidine alone in patients with newly diagnosed, mutant-IDH2 acute myeloid leukaemia (AG221-AML005): a single-arm, phase 1b and randomised, phase 2 trial. Lancet Oncol. 2021;22(11):1597-1608.
90. Stein EM, DiNardo CD, Fathi AT, et al. Ivosidenib or enasidenib combined with intensive chemotherapy in patients with newly diagnosed AML: a phase 1 study. Blood. 2021;137(13):1792-1803.
91. Paschka P, Schlenk RF, Weber D, et al. Adding dasatinib to intensive treatment in core-binding factor acute myeloid leukemia - results of the AMLSG 11-08 trial. Leukemia. 2018;32(7):1621-1630.
92. Marcucci G, Geyer S, Laumann K, et al. Combination of dasatinib with chemotherapy in previously untreated core binding factor acute myeloid leukemia: CALGB 10801. Blood Adv. 2020;4(4):696-705.
93. Senapati J, Abuasab T, Haddad FG, et al. Common kinase mutations do not impact optimal molecular responses in core binding factor acute myeloid leukemia treated with fludarabine, cytarabine, and G-CSF based regimens. Am J Hematol. 2023;98(3):E53-E56.
94. Zeidner JF, Vincent BG, Ivanova A, et al. Phase II trial of pembrolizumab after high-dose cytarabine in relapsed/refractory acute myeloid leukemia. Blood Cancer Discov. 2021;2(6):616-629.
95. Zheng F, Li Q, Yang S, et al. Maintenance therapy with combination of azacitidine, danazol and thalidomide after intensive chemotherapy in acute myeloid leukemia patients. Blood. 2022;140(Suppl 1):11720-11722.
96. Pigneux A, Béné MC, Guardiola P, et al. Addition of androgens improves survival in elderly patients with acute myeloid leukemia: a GOELAMS study. J Clin Oncol. 2017;35(4):387-393.
97. Ocio EM, Herrera P, Olave MT, et al. Panobinostat as part of induction and maintenance for elderly patients with newly diagnosed acute myeloid leukemia: phase Ib/II panobidara study. Haematologica. 2015;100(10):1294-1300.
98. Burchert A, Bug G, Fritz LV, et al. Sorafenib maintenance after allogeneic hematopoietic stem cell transplantation for acute myeloid leukemia with FLT3-internal tandem duplication mutation (SORMAIN). J Clin Oncol. 2020;38(26):2993-3002.
99. Xuan L, Wang Y, Huang F, et al. Sorafenib maintenance in patients with FLT3-ITD acute myeloid leukaemia undergoing allogeneic haematopoietic stem-cell transplantation: an openlabel, multicentre, randomised phase 3 trial. Lancet Oncol. 2020;21(9):1201-1212.
100. Maziarz RT, Levis M, Patnaik MM, et al. Midostaurin after allogeneic stem cell transplant in patients with FLT3-internal tandem duplication-positive acute myeloid leukemia. Bone Marrow Transplant. 2021;56(5):1180-1189.
101. Terao T, Matsuoka K-i, Ueda H, et al. Gilteritinib maintenance therapy post-allogenic stem-cell transplantation improves the prognosis of patients with FLT3-mutated AML. Blood. 2022;140(Suppl 1):3290-3291.
102. Levis MJ, Hamadani M, Logan BR, et al. BMT CTN protocol 1506: a phase 3 trial of gilteritinib as maintenance therapy after allogeneic hematopoietic stem cell transplantation in patients with FLT3-ITD+ AML. Blood. 2019;134(Suppl_1):4602.
103. Astellas and BMT CTN Announce Topline Results from Phase 3 MORPHO Trial of Gilteritinib [press release]. Tokyo and Rockville, Maryland: Astellas Pharma Inc. and BMT CTN March 9, 2023.
104. Cortes JE, Khaled S, Martinelli G, et al. Quizartinib versus salvage chemotherapy in relapsed or refractory FLT3-ITD acute myeloid leukaemia (QuANTUM-R): a multicentre, randomised, controlled, open-label, phase 3 trial. Lancet Oncol. 2019;20(7):984-997.
105. Senapati J, Kadia TM. Which FLT3 inhibitor for treatment of AML? Curr Treat Options Oncol. 2022;23(3):359-380.
106. Fathi AT, Kim HT, Soiffer RJ, et al. Enasidenib as maintenance following allogeneic hematopoietic cell transplantation for IDH2-mutated myeloid malignancies. Blood Adv. 2022;6(22):5857-5865.
107. Oran B, de Lima M, Garcia-Manero G, et al. A phase 3 randomized study of 5-azacitidine maintenance vs observation after transplant in high-risk AML and MDS patients. Blood Adv. 2020;4(21):5580-5588.
108. de Lima M, Oran B, Papadopoulos EB, et al. CC-486 (oral azacitidine) maintenance therapy is well tolerated after allogeneic hematopoietic stem cell transplantation (alloHSCT) in patients with myelodysplastic syndromes (MDS) or acute myeloid leukemia (AML). Biology Blood Marrow Transplant. 2016;22(3):S312-S313.
109. Kungwankiattichai S, Ponvilawan B, Roy C, Tunsing P, Kuchenbauer F, Owattanapanich W. Maintenance with hypomethylating agents after allogeneic stem cell transplantation in acute myeloid leukemia and myelodysplastic syndrome: a systematic review and meta-analysis. Front Med (Lausanne). 2022;9:801632.
110. Mishra A, Tamari R, DeZern AE, et al. Eprenetapopt plus azacitidine after allogeneic hematopoietic stem-cell transplantation for TP53-mutant acute myeloid leukemia and myelodysplastic syndromes. J Clin Oncol. 2022;40(34):3985-3993.
111. Biederstädt A, Rezvani K. How I treat high-risk acute myeloid leukemia using preemptive adoptive cellular immunotherapy. Blood. 2023;141(1):22-38.
112. Schmid C, Labopin M, Schaap N, et al. Long-term results and GvHD after prophylactic and preemptive donor lymphocyte infusion after allogeneic stem cell transplantation for acute leukemia. Bone Marrow Transplant. 2022;57(2):215-223.
113. Schmid C, Schleuning M, Tischer J, et al. Early allo-SCT for AML with a complex aberrant karyotype - results from a prospective pilot study. Bone Marrow Transplant. 2012;47(1):46-53.
114. Schmid C, Schleuning M, Ledderose G, Tischer J, Kolb H-J. Sequential regimen of chemotherapy, reduced-intensity conditioning for allogeneic stem-cell transplantation, and prophylactic donor lymphocyte transfusion in high-risk acute myeloid leukemia and myelodysplastic syndrome. J Clin Oncol. 2005;23(24):5675-5687.
115. Jedlickova Z, Schmid C, Koenecke C, et al. Long-term results of adjuvant donor lymphocyte transfusion in AML after allogeneic stem cell transplantation. Bone Marrow Transplant. 2016;51(5):663-667.
116. Tsirigotis P, Byrne M, Schmid C, et al. Relapse of AML after
hematopoietic stem cell transplantation: methods of monitoring and preventive strategies. A review from the ALWP of the EBMT. Bone Marrow Transplant. 2016;51(11):1431-1438.
117. Vago L, Gojo I. Immune escape and immunotherapy of acute myeloid leukemia. J Clin Invest. 2020;130(4):1552-1564.
118. Barbullushi K, Rampi N, Serpenti F, et al. Vaccination therapy for acute myeloid leukemia: where do we stand? Cancers (Basel). 2022;14(12):2994.
119. Fujii S-i, Kawamata T, Shimizu K, et al. Reinvigoration of innate and adaptive immunity via therapeutic cellular vaccine for patients with AML. Mol Ther Oncolytics. 2022;27:315-332.
120. Di Stasi A, Jimenez AM, Minagawa K, Al-Obaidi M, Rezvani K. Review of the results of WT1 peptide vaccination strategies for
myelodysplastic syndromes and acute myeloid leukemia from nine different studies. Front Immunol. 2015;6:36.
121. Anguille S, Van de Velde AL, Smits EL, et al. Dendritic cell vaccination as postremission treatment to prevent or delay relapse in acute myeloid leukemia. Blood. 2017;130(15):1713-1721.
122. Maslak PG, Dao T, Bernal Y, et al. Phase 2 trial of a multivalent WT1 peptide vaccine (galinpepimut-S) in acute myeloid leukemia. Blood Adv. 2018;2(3):224-234.
123. Kreutmair S, Pfeifer D, Waterhouse M, et al. First-in-human study of WT1 recombinant protein vaccination in elderly patients with AML in remission: a single-center experience. Cancer Immunol Immunother. 2022;71(12):2913-2928.
Raynier Devillier,1 Dirk-Jan Eikema,2 Carlo Dufour,3 Mahmoud Aljurf,4 Depei Wu,5 Alexei Maschan,6 Alexander Kulagin,7 Constantijn J. M. Halkes,8 Matthew Collin,9 John Snowden,10 Cécile Renard,11 Arnold Ganser,12 Karl-Walter Sykora,12 Brenda E. Gibson,13 Johan Maertens,14 Maija Itäla-Remes,15 Paola Corti,16 Jan Cornelissen,17 Martin Bornhäuser,18 Mercedes Colorado Araujo,19 Hakan Ozdogu,20 Antonio Risitano,21 Gerard Socie22 and Regis Peffault de Latour22
1Paoli Calmettes Institute, Marseille, France; 2EBMT Statistical Unit, Leiden, the Netherlands; 3IRCCS Gaslini Children’s Research Hospital, Genova, Italy; 4King Faisal Specialist Hospital and Research Center, Riyadh, Saudi Arabia; 5First Affiliated Hospital of Soochow University, Suzhou, China; 6Federal Research Center for Pediatric Hematology, Moscow, Russia; 7RM Gorbacheva Research Institute, Pavlov University, St Petersburg, Russia; 8Leiden University Hospital, Leiden, the Netherlands; 9Adult HSCT Unit, Newcastle, UK; 10Sheffield Teaching Hospitals, NHS Trust, Sheffield, UK; 11Institut d`Hematologie et d’Oncologie Pediatrique, Lyon, France; 12Hannover Medical School, Hematology Department, Hemostasis, Oncology and Stem Cell Transplantation, Hannover, Germany; 13Royal Hospital for Children, Glasgow, UK; 14University Hospital Gasthuisberg, Leuven, Belgium; 15Turku University Hospital, Turku, Finland; 16Centro Trapianti di Midollo Osseo, Monza, Italy; 17Erasmus MC, Cancer Institute, Rotterdam, the Netherlands; 18Universitaetsklinikum Dresden, Dresden, Germany; 19Hospital U. Marqués de Valdecilla, Santander, Spain; 20Baskent University Hospital, Adana, Turkey; 21Federico II University of Naples, Napoli, Italy and 22Hopital St. Louis, Paris, France
Correspondence: R. Devillier devillierr@ipc.unicancer.fr
Received: August 1, 2022.
Accepted: March 15, 2023.
Early view: March 23, 2023.
https://doi.org/10.3324/haematol.2022.281876
©2023 Ferrata Storti Foundation
Published under a CC BY-NC license
Survival after allogeneic hematopoietic stem cell transplantation (allo-HSCT) for severe idiopathic aplastic anemia (SAA) has improved in recent years, approaching 75% at 5 years. However, an SAA-adapted composite endpoint, graft-versus-host disease (GvHD) and relapse/rejection-free survival (GRFS), may more accurately assess patient outcomes beyond survival. We analyzed GRFS to identify risk factors and specific causes of GRFS failure. Our retrospective analysis from the Severe Aplastic Anemia Working Party of the European Society for Blood and Marrow Transplantation included 479 patients with idiopathic SAA who underwent allo-HSCT in two conventional situations: i) upfront allo-HSCT from a matched related donor (MRD) (upfront cohort), and ii) allo-HSCT for relapsed or refractory SAA (rel/ref cohort). Relevant events for GRFS calculation included graft failure, grade 3-4 acute GvHD, extensive chronic GvHD, and death. In the upfront cohort (n=209), 5-year GRFS was 77%. Late allo-HSCT (i.e., >6 months after SAA diagnosis) was the main poor prognostic factor, specifically increasing the risk of death as the cause of GRFS failure (hazard ratio [HR]=4.08; 95% confidence interval [CI]: 1.41-11.83; P=0.010). In the rel/ref cohort (n=270), 5-year GRFS was 61%. Age was the main factor significantly increasing the risk of death (HR=1.04; 95% CI: 1.02-1.06; P<0.001), acute GvHD (HR=1.03; 95% CI: 1.00-1.07; P=0.041), and chronic GvHD (HR=1.04; 95% CI: 1.01-1.08; P=0.032) as the cause of GRFS failure. GRFS after upfront MRD allo-HSCT was very good, notably with early allo-HSCT, confirming that younger patients with an MRD should be transplanted immediately. GRFS was worse in cases of salvage allo-HSCT, most notably in older patients, questioning the utility of allo-HSCT earlier in the disease course.
Due to major developments in transplantation modalities over the past 20 years (graft-versus-host disease [GvHD] prophylaxis, HLA typing, conditioning regimens, optimiza-
tion of alternative donor transplantation), overall survival (OS) after allogeneic hematopoietic stem cell transplantation (allo-HSCT) for severe idiopathic aplastic anemia (SAA) has largely improved, approaching 80% at 5 years.1–6 In contrast to allo-HSCT in hematological malignancies, the challenges in allo-HSCT for SAA remain the achievement
of sustained engraftment without significant clinical alloreactivity since no graft-versus-tumor effect is required to achieve long-term survival. Long-term follow-up studies repeatedly reported that GvHD strongly impairs quality of life and plays a pivotal role in the occurrence of late complications, including secondary cancers. Consequently, avoiding GvHD is of particular importance in allo-HSCT for SAA.7–9 Furthermore, when considering beyond simple OS, the use of the SAA-adapted composite endpoint of GvHD and rejection-free survival (GRFS) may be a more meaningful clinical study endpoint by allowing for greater accuracy in assessing patient outcomes. Although some retrospective studies have assessed GRFS in this context, there is no published report including large numbers of patients with the goal of identifying risk factors and causes of GRFS failure.10–12 Based on the Data Quality Initiative program of the Severe Aplastic Anemia Working Party (SAAWP) of the European Society for Blood and Marrow Transplantation (EBMT), we performed a comprehensive analysis of GRFS and causes of failure in, separately, both those previously untreated and of relapsed/refractory SAA.
Data were collected from the SAAWP database of the EBMT. Patients prospectively provided signed informed consent for both data collection through the ProMISe system and any subsequent a posteriori analyses. The study was conducted in accordance with the Declaration of Helsinki and was approved by the scientific committee of the SAAWP of the EBMT.
At the time of analysis, the Data Quality Initiative registry database included 779 patients who first underwent alloHSCT for idiopathic SAA. We applied the following selection criteria: i) allo-HSCT between 2005 and 2016, ii) matched related donor (MRD) or unrelated donor (UD) allo-HSCT, and iii) absence of ex vivo graft manipulation. From there, we specifically focused our analysis on patients who had standard indications for performing alloHSCT and thus created two cohorts: i) patients who underwent upfront allo-HSCT with an MRD (upfront cohort), and ii) patients who underwent allo-HSCT with either an MRD or a UD for post immunosuppressive therapy relapsed or refractory SAA (rel/ref cohort). A detailed patient selection flowchart is provided in the Online Supplementary Figure S1.
The upfront and rel/ref cohorts were analyzed separately with no aim towards comparison. Relevant events for Kaplan-Meier13 GRFS calculation included graft failure (GF,
including primary and secondary graft failure), grade 3-4 acute GvHD (aGvHD), extensive chronic GvHD (cGvHD), and death. Patients were censored in the absence of events prior to last contact. The median follow-up was estimated using the reverse Kaplan-Meier method. The log-rank test was used for univariate comparisons of stratified survival outcomes. Cumulative incidence rates for the initial causes of GRFS failure were calculated, with each event considered as competing with other GRFS causes of failure.14 Gray’s test was used for univariate comparisons. Multivariable competing risks analyses were performed through the multistate modeling framework to compute the predicted probabilities of the cause of GRFS failure over time.15 Briefly, the four causes of GRFS failure (i.e., GF, aGvHD, cGvHD, and death) were set as distinct absorbing states to which patients can transit to from the initial state. The corresponding cause-specific Cox hazard models for the different causes of failure included the following transition-specific covariates: age (continuous), time from diagnosis to allo-HSCT (6-month cutoff), Cytomegalovirus (CMV) serostatus (donor negative [D-]/recipient negative [R-] vs. other), graft source (bone marrow [BM] vs. peripheral blood stem cells [PBSC]), in vivo T-cell depletion with ATG or alemtuzumab (yes vs. no), low-dose total-body irradiation (TBI) (yes vs. no, only for the rel/ref cohort), and donor type (MRD vs. UD, only for the rel/ref cohort). Based on the aforementioned multivariable models, dynamic prediction by landmarking was used to provide predicted probabilities of individual causes of GRFS failure within the 2 years immediately following selected landmark times (each month from 0 to 12 months post allo-HSCT), provided that patients are event-free at the given landmark.16 This enables reassessment of the risks of GRFS failures and the impact of covariates over time.
Continuous variables are presented in the text as median and interquartile range (IQR), with categorical variables as percentages within the group of patients with available data. All survival estimates and hazard ratios (HR) are reported with corresponding 95% confidence intervals (CI). All P values were unadjusted, two-sided, and P<0.05 was considered significant. Statistical analyses were performed using R software 4.0.3 (survival, cmprsk and mstate package17). Additional details on the modeling are provided in the Online Supplementary Figure S2
We analyzed 479 patients, separated into two different cohorts: upfront (n=209) and rel/ref (n=270). Median time from diagnosis to allo-HSCT was 2.7 (IQR, 1.4-5.3) and 9.1 (IQR, 4.3-17.8) months in the upfront and the rel/ref co-
horts, respectively. In the upfront cohort, 188 (90%) patients were 40 years or younger and 162 (72%) underwent early allo-HSCT (i.e., within the 6 months following diagnosis). In the rel/ref cohort, 83 (31%) patients were older than 40 years and 142 (53%) received allo-HSCT from a UD. Median follow-up was 65 months (95% CI: 58-71). Patient and transplantation characteristics are detailed in Table 1.
Upfront matched related donor allogeneic hematopoietic stem cell transplantation cohort: factors influencing graft-versus-host disease and relapse/rejection-free survival as a composite endpoint in univariate analysis
At 5 years after allo-HSCT, OS was 88% (Online Supplementary Figure S3). GRFS probability at 5 years was 77% while the causes of GRFS failure were 5%, 2%, 6% and 9%, for GF, aGvHD, cGvHD, and death, respectively (Figure 1A). According to univariate analysis, age did not significantly influence 5-year GRFS (≤20 years [y] vs. 21-40 y vs. >40 y: 81% vs. 76% vs. 64%; P=0.114). By contrast, CMV serostatus (D-/R- vs. other: 85% vs. 74%; P=0.026) and particularly time from diagnosis to allo-HSCT (≤6 vs. >6 months: 82% vs. 61%; P<0.001; Figure 1B) significantly influenced GRFS. We observed that age (≤20 y vs. 21-40 y vs. >40 y: 8% vs. 5% vs. 31%; P<0.001) and time from diagnosis to allo-HSCT (≤6 vs. >6 months: 7% vs. 18%; P=0.005; Figure 1C, D) significantly increased the risk of death without other prior GRFS events, while only a trend was observed for CMV serostatus (D-/R- vs. other: 2% vs. 10%; P=0.052). In vivo Tcell depletion with ATG or alemtuzumab was associated with a significantly lower risk of graft failure (yes vs. no: 3% vs. 13%; P=0.048). No significant difference in GRFS and causes of GRFS failure was observed according to graft source. We were unable to evaluate the impact of lowdose total body irradiation (TBI) in the upfront cohort since only four patients received irradiation-based conditioning. The full table for univariate comparisons is provided in the Online Supplementary Table S1.
Relapsed or refractory cohort: factors influencing graftversus-host disease and relapse/rejection-free survival as a composite endpoint in univariate analysis
Among the 270 patients who underwent allo-HSCT for rel/ref SAA, 5-year OS (Online Supplementary Figure S3) and GRFS were 73% and 61%, respectively. Cumulative incidences of initial causes of GRFS failure were 9%, 6%, 5%, and 18% for GF, aGvHD, cGvHD, and death prior to other events, respectively (Figure 2A). In this cohort, only age was significantly associated with GRFS (≤20 y vs. 2140 y vs. >40 y: 72% vs. 64% vs. 46%; P=0.003; Figure 2B).
The lower 5-year GRFS probability was due to a significantly higher incidence of death without a prior event in patients older than 40 years (≤20 y vs. 21-40 y vs. >40 y:
12% vs. 14% vs. 30%; P=0.007; Figure 2C), while other causes of GRFS failure (GF, aGvHD, and cGvHD) were not significantly different across age groups. We did not observe any difference in GRFS according to donor type (MRD vs. UD: 62% vs. 61%; P=0.566; Figure 2D). In addition, CMV serostatus other than D-/R- was significantly associated with a higher incidence of GF (D-/R- vs. other: 1% vs. 12%; P=0.021). However, this difference did not significantly influence 5-year GRFS (D-/R- vs. other: 69% vs. 59%; P=0.298). The use of ATG/alemtuzumab and TBI was sig-
Allo-HSCT: allogeneic hematopoietic stem cell transplant; MRD: matched sibling donor; SAA: severe aplastic anemia; IQR: interquartile range; PBSC: peripheral blood stem cell; BM: bone marrow; TBI: total body irradiation: ATG: antithymocyte globulin; ALG: antilymphocyte globulin; CMV: Cytomegalovirus; D-/R-: seronegative for both donor and recipient.
Figure 1. Univariate analysis of graft-versus-host disease and relapse/rejection-free survival (GRFS) and causes of GRFS failure in the upfront allogeneic hematopoietic stem cell transplantation cohort. (A) Stacked cumulative incidences of causes of GRFS failure in the entire upfront cohort (N=209). (B) Kaplan-Meier curves for GRFS according to time from diagnosis to upfront allogeneic stem cell transplantation (allo-SCT). (C) Stacked cumulative incidences of causes of GRFS failure in patients undergoing early upfront allo-HSCT (within 6 months after diagnosis, N=162). (D) Stacked cumulative incidences of causes of GRFS failure in patients undergoing late allo-HSCT (after 6 months following diagnosis, N=47). MRD: matched related donor; GF: graft failure; allo: allogeneic; aGvHD: acute graft-versus-host disease; cGvHD: chronic GvHD.
nificantly associated with reduced risk of aGvHD (yes vs. no: 4% vs. 16%; P=0.006) and GF (yes vs. no: 4% vs. 11%; P=0.039), respectively. No significant difference in GRFS and in causes of GRFS failure was observed according to graft source, donor type, or time from diagnosis to alloHSCT. The full table for univariate comparison is provided in the Online Supplementary Table S2
Predicted probabilities of causes of graft-versus-host disease and relapse/rejection-free survival failure as competing risks in multivariate model
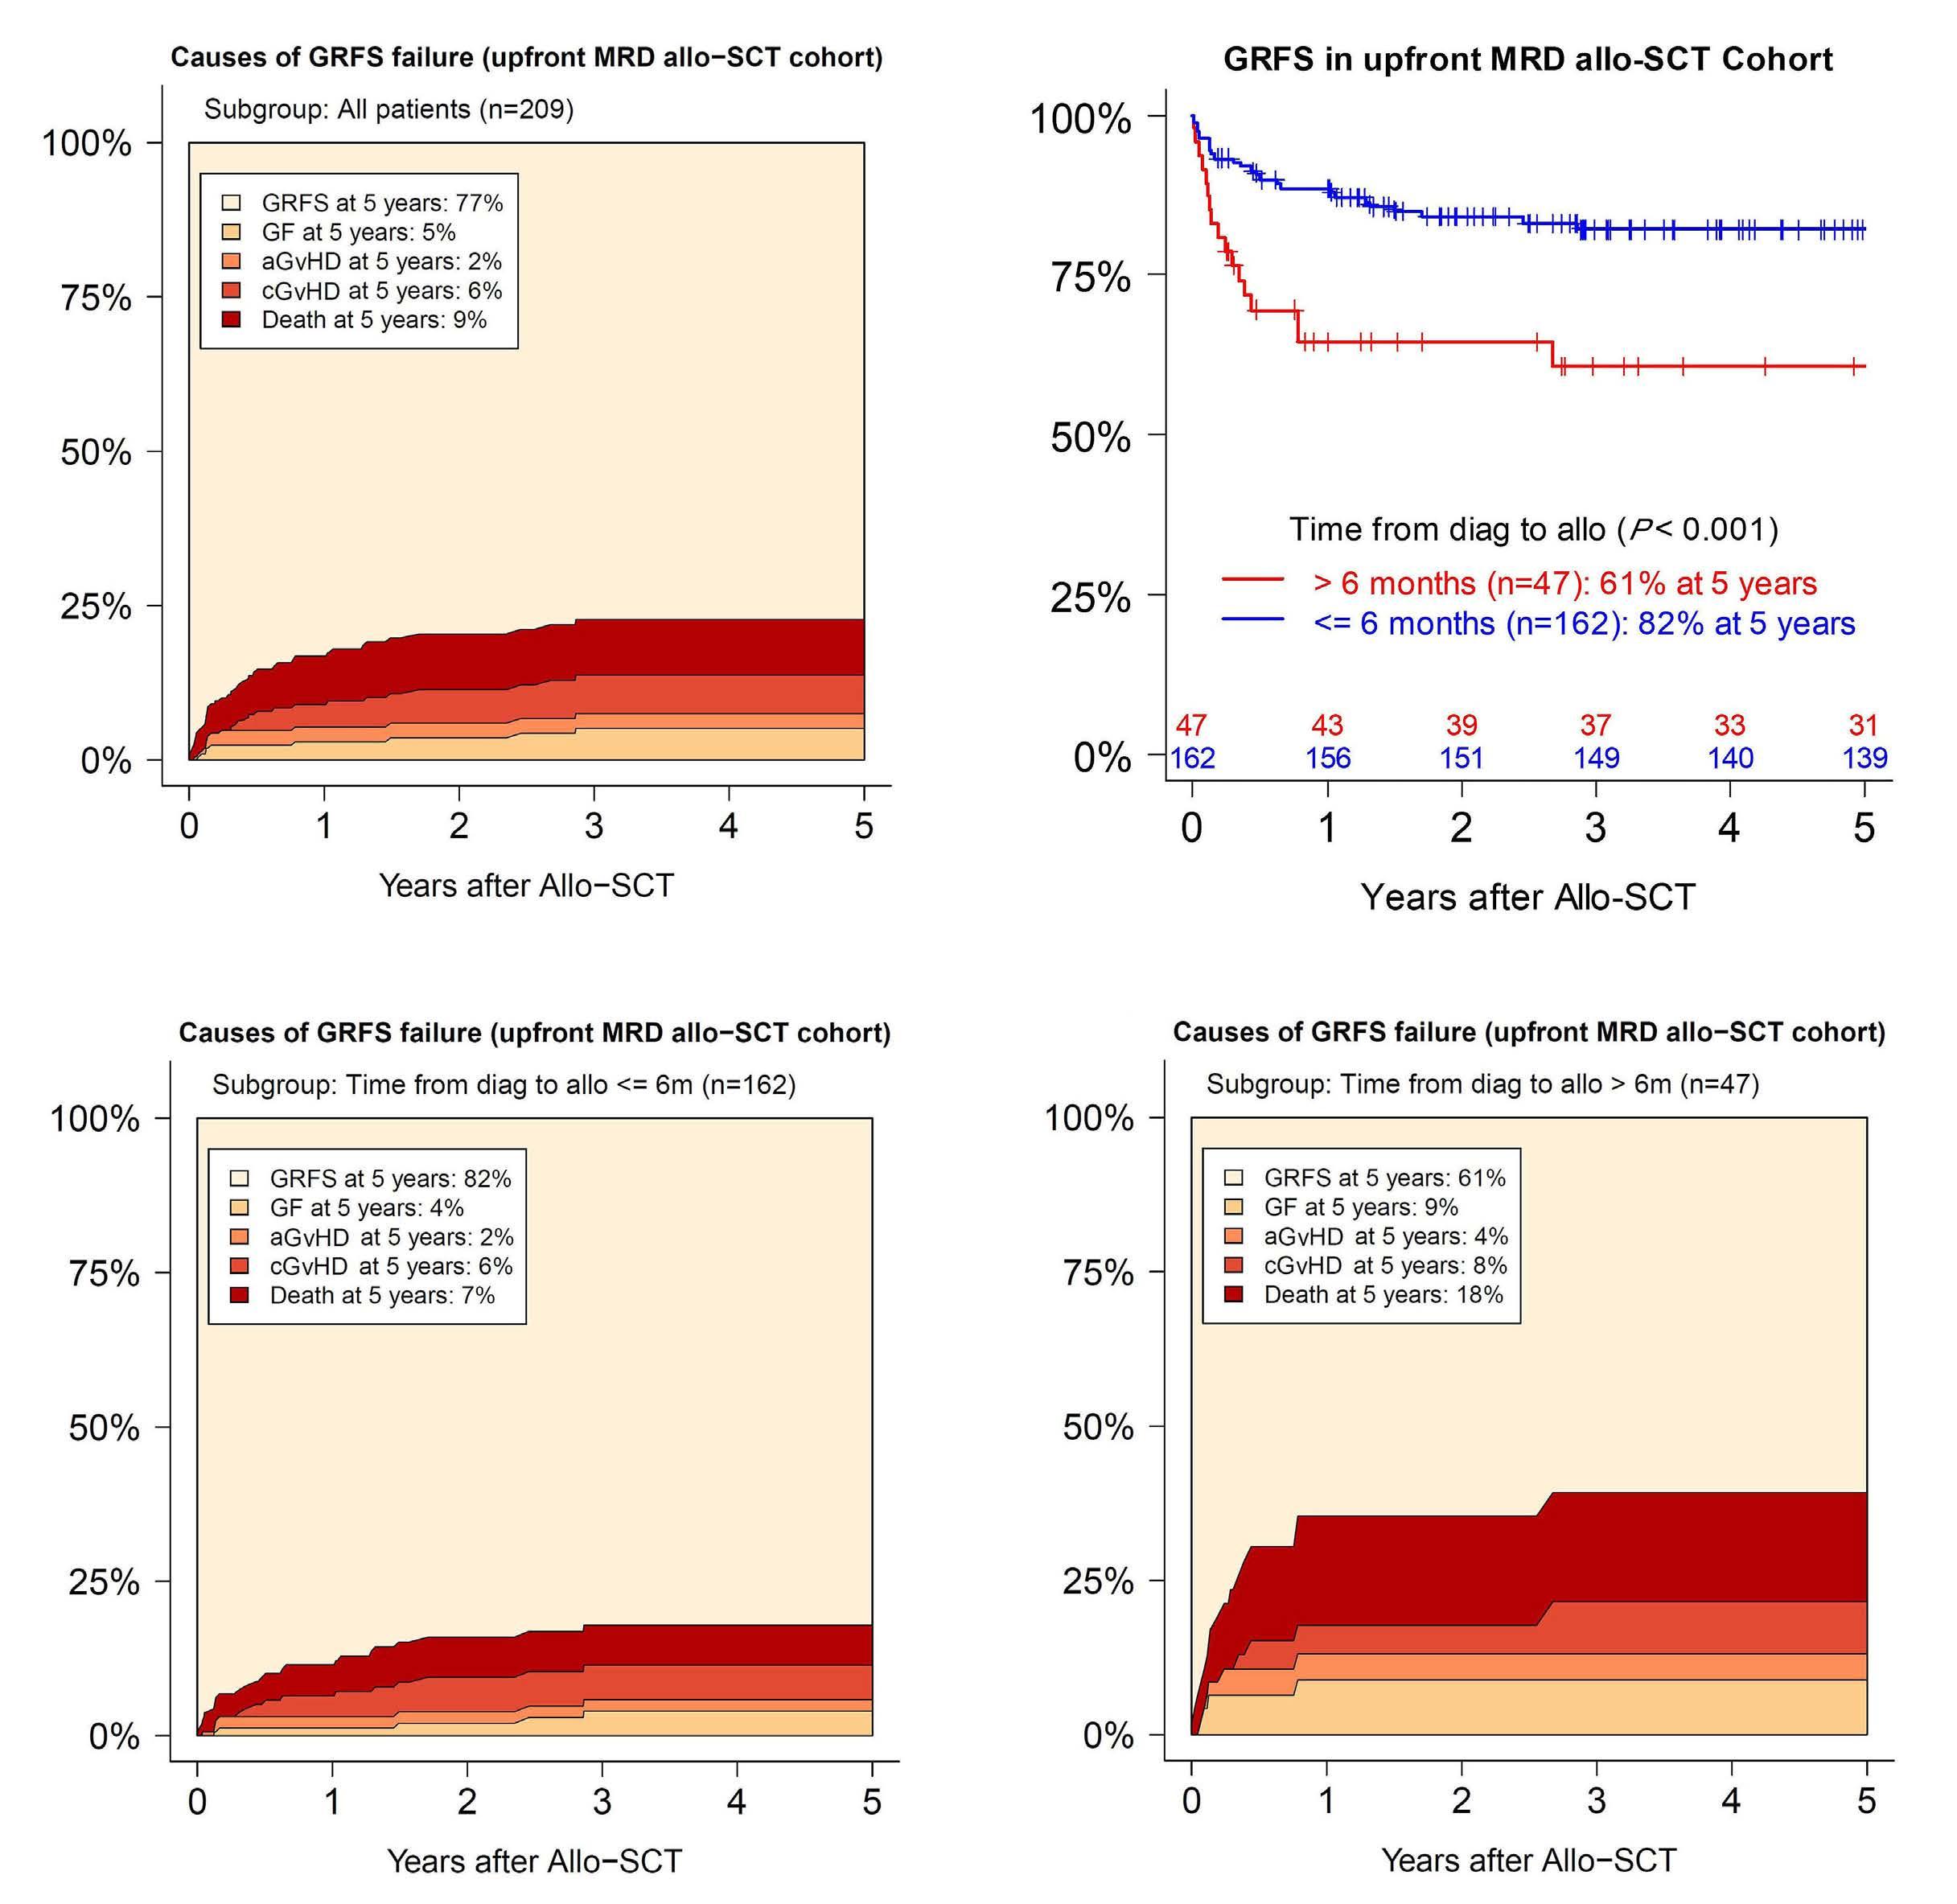
In the upfront cohort, late allo-HSCT (>6 months) was associated with a significant increase in the risk of death as
the first cause of GRFS failure (HR=4.08; 95% CI: 1.41-11.83; P=0.010; Table 2) and with a significantly higher risk of GF (HR=3.84; 95% CI: 1.02-14.41; P=0.046; Table 2). In addition, age was significantly associated with a higher risk of death as the cause of GRFS failure (HR=1.05; 95% CI: 1.01-1.09; P=0.011; Table 2). Furthermore, ATG/alemtuzumab reduced the risk of GF as the initial cause of GRFS failure (HR=0.24; 95% CI: 0.06-0.96; P=0.044; Table 2). No other covariates were found to be significantly associated with the risk of any cause of GRFS failure (Table 2).
In the rel/ref cohort, age was the major determinant of outcome. Age was significantly associated with not only the risk of death as the cause of GRFS failure (HR=1.04;
95% CI: 1.02-1.06; P<0.001) but also with the risk of both aGvHD (HR=1.03; 95% CI: 1.00-1.07; P =0.041) and cGvHD (HR=1.04; 95% CI: 1.01-1.08; P=0.032), without influencing the risk of GF (Table 2). In addition, CMV serostatus other than D-/R- was specifically associated with an increased risk of GF (HR=4.30; 95% CI: 1.01-18.36; P=0.049), without significantly influencing other causes of GRFS failure (Table 2). The use of ATG/alemtuzumab was significantly associated with a reduced risk of aGvHD as the cause of GRFS failure (HR=0.11; 95% CI: 0.03-0.41; P=0.011), while a trend was observed towards a reduced risk of GF using
low-dose TBI (HR=0.29; 95% CI: 0.08-1.05; P= 0.059; Table 2). In addition, the use of a UD was associated with a higher risk of aGVHD (HR= 7.77; 95% CI: 1.54-39.23; P=0.013) and a trend of an increased risk of death (HR=1.89; 95% CI: 0.95-3.73; P=0.059) as the initial cause of GRFS failure.
Based on transition-specific HR provided by the Cox model, computing the 5-year predicted probabilities of GRFS and causes of GRFS failure with different covariate combination settings resulted in the predictions of 5-year GRFS probabilities of 86% and 64% for a 20-year-old pa-
The specific impact of covariates on the different causes of GRFS failure are provided separately for the upfront and relapsed or refractory (rel/ref) cohort. GvHD: graft-versus-host disease; GF: graft failure; aGvHD: acute GvHD; cGvHD: chronic GvHD; allo-HSCT: allogeneic hematopoietic stem cell transplant; ref: reference; MRD: matched sibling donor; PBSC: peripheral blood stem cell; BM: bone marrow; TBI: total body irradiation: D-/R-: seronegative for both donor and recipient; MRD: matched related donor; UD: unrelated donor.
tient who underwent early and late upfront MRD alloHSCT, respectively (Figure 3A). This low GRFS probability after late allo-HSCT is mainly explained by the high risk of both death (13%) and GF (10%) as cause of GRFS failure, while corresponding predicted probabilities of death and GF at 5 years after early allo-HSCT were 4% and 3%, respectively. For virtual 50-year-old patients undergoing late upfront MRD allo-HSCT, the 5-year predicted probability of GRFS was 27% with a high risk of death as the first and only cause of GRFS failure (42%), while similar patients receiving early allo-HSCT reached a GRFS approaching that observed in younger patients (64%) (Figure 3A).
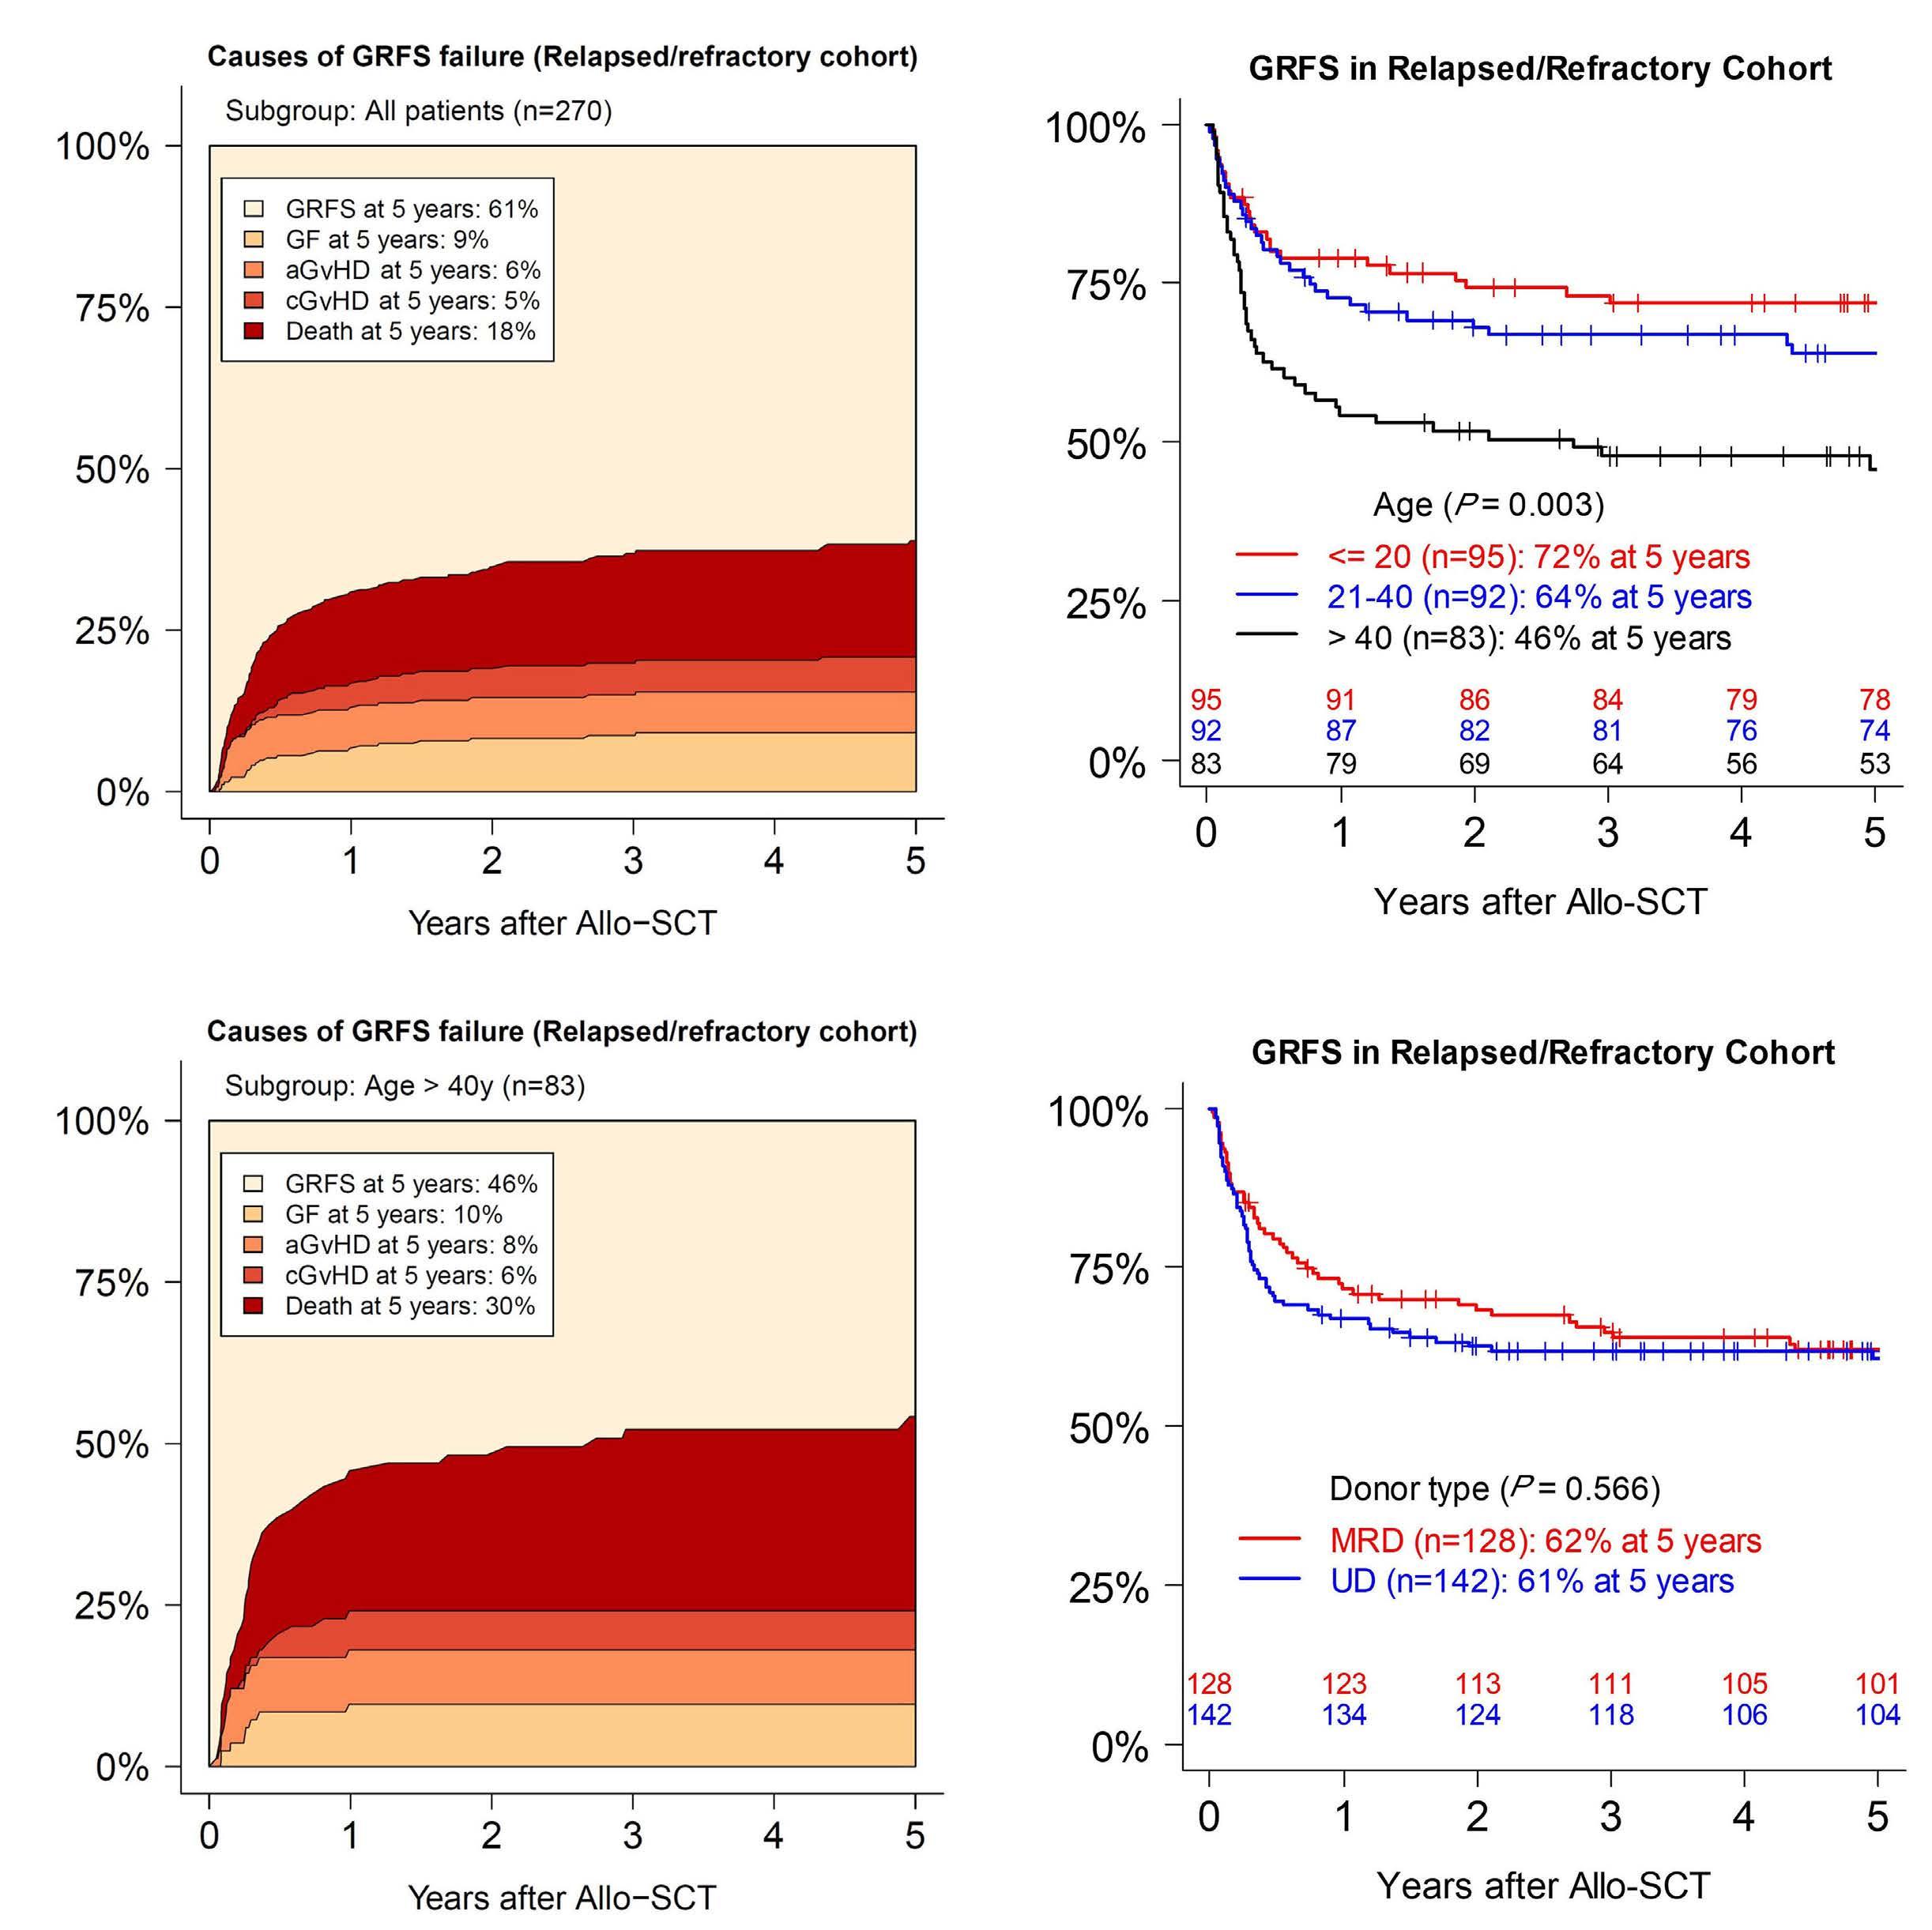
In the rel/ref cohort, the 5-year GRFS probabilities were 86%, 76%, and 59% after MRD allo-HSCT for patients 10, 30, and 50 years old, respectively. In cases of UD alloHSCT the corresponding 5-year GRFS predicted probabilities were 80%, 65%, and 43%, respectively. The main cause of GRFS failure in older patients was death before any other event, with 5-year predicted probabilities of 23% and 37% for a 50-year-old patient undergoing MRD and UD allo-HSCT, respectively (Figure 3B). The complete tables of 5-year probabilities for all covariate combinations are provided in the Online Supplementary Tables S3 and S4 for the upfront and rel/ref cohorts, respectively.
Figure 2. Univariate analysis of graft-versus-host disease and relapse/rejection-free survival (GRFS) and causes of GRFS failure in the relapsed or refractory allogeneic hematopoietic stem cell transplantation cohort. (A) Stacked cumulative incidences of causes of GRFS failure in the whole relapsed or refractory (rel/ref) cohort (N=270). (B) Kaplan-Meier curves for GRFS according to age group. (C) Stacked cumulative incidences of causes of GRFS failure in rel/ref patients with age >40 years old (N=83). (D) Kaplan-Meier curves for GRFS according to donor type in the rel/ref cohort. MRD: matched related donor; GF: graft failure; alloSCT: allogeneic stem cell transplantation; aGvHD: acute graft-versus-host disease; cGvHD: chronic GvHD; UD: unrelated donor.
In order to add a dynamic perspective to the risk of GRFS failure over time, GRFS probabilities and causes of failure within the next 2 years were predicted from successive landmark times (every month from 0 to 12 months post allo-HSCT) for different covariate combinations. In the upfront cohort, 30-year-old patients undergoing early alloHSCT had a GRFS probability of 83% at 2 years after

transplantation. At later landmark times (after 5 months post allo-HSCT), the risk of GRFS failure within the next 2 years was ≤10%, with ≤3% risk of death as the cause of GRFS failure (Figure 4A, B; red solid lines). A patient with the same covariates but an age of 50 years had a GRFS probability of 67% at 2 years after allo-HSCT, approaching the risks observed in younger patients at later landmark times (after 5 months post allo-HSCT the risk of GRFS failure was lower than 20% and the risk of death as the cause of failure was below 7%, Figure 4A, B; red dotted lines). By
Figure 3. Five-year predicted probabilities of graft-versus-host disease and relapse/rejection-free survival (GRFS) and causes of GRFS failure in the upfront and relapsed or refractory cohorts. Predictions are provided by the Cox model shown in Table 2 and are given for some combinations of selected covariates: (A) age and timing of allogeneic hematopoietic stem cell transplantation (allo-HSCT) for the upfront cohort. Other covariates were arbitrarily set as follows: Cytomegalovirus (CMV): “other than seronegative for both donor and recipient (D-/R-)”; graft source: “bone marrow [BM]”; in vivo T-cell depletion: “yes”. (B) Age and donor type for the relapsed or refractory (rel/ref) cohort. Other covariates were arbitrarily set as follows: CMV: “other than D-/R-”; graft source: “BM”; timing of allo-HSCT: “>6 months”; total body irradiation (TBI): “yes”; in vivo T-cell depletion: “yes”. The complete tables of 5-year predicted probabilities for all covariate combinations are provided in the Online Supplementary Tables S3 and S4. MRD: matched related donor; GF: graft failure; allo: allogeneic; aGvHD: acute graft-versus-host disease; cGvHD: chronic GvHD; UD: unrelated donor.
contrast, late allo-HSCT (i.e., >6 months following diagnosis) remained associated with a lower probability of GRFS, most notably in older patients for whom even at later landmark times (after 5 months post allo-HSCT), the risk of GRFS failure within the next 2 years was >40%, including a 20% risk of death as the cause of failure (Figure 4A, B; blue dotted lines).
In the rel/ref cohort, similar analyses showed that age was the major determinant of outcome, with persistent risk of GRFS failure and high risk of death over time, no matter the

donor type (Figure 4C, D). The full tables of dynamic prediction of GRFS and GRFS failures for all covariate combinations are provided in the Online Supplementary Tables S5 and S6 for the upfront and rel/ref cohorts, respectively.
In patients with idiopathic SAA, long-term survival can be achieved with both immunosuppressive therapy (IST) and
Figure 4. Dynamic prediction of outcome in the upfront and relapsed or refractory cohorts. Curves showing the probabilities of graft-versus-host (GvHD) disease and relapse/rejection-free survival (GRFS) (A, C) or death as first cause of GRFS (B, D) within the next 2 years according to landmark times (from 0 to 12 months after allogeneic hematopoietic stem cell transplantation [alloHSCT]). Predictions are shown for different relevant covariate combinations from the Cox model. (A, B) Age and timing of alloHSCT in the upfront cohort. Other covariates were arbitrarily set as follows: Cytomegalovirus (CMV): “other than sero-negative for both donor and recipient (D-/R-)”; graft source: “bone marrow [BM]”; in vivo T-cell depletion: “yes”. (C and D) Age and donor type in the relapsed or refractory (rel/ref) cohort. Other covariates were arbitrarily set as follows: CMV: “other than D-/R-”; graft source: BM”; timing of allo-HSCT: “>6 months”; total body irradiation (TBI): “yes”; in vivo T-cell depletion: “yes”. The full tables of dynamic predictions of GRFS and GRFS failures for all covariate combinations are provided in the Online Supplementary Tables S5 and S6. UD: unrelated donor; MRD: matched related donor.
allo-HSCT. Improvements in supportive care and IST modalities, such as horse ATG and the recent addition of eltrombopag, have now increased OS after IST to approximately 90% at 2 years. However, a third of patients have no response at 6 months, and 10% to 20% of responsive patients will relapse within 2 years after IST, thus becoming candidates for allo-HSCT.18,19 Allo-HSCT has advantages over IST regarding better remission rates and duration, as well as the prevention of clonal evolution but is limited by higher morbidity and the availability of a suitable donor. Thus, first-line treatment algorithms usually consider upfront allo-HSCT as the standard of care only in younger patients (<40-50 years) with an available MRD.1,20,21 However, improvements in transplantation procedures (HLA typing, conditioning regimens, GvHD prophylaxis, alternative donors) have significantly improved OS to nearly 80% at 5 years. Thus, a SAA-adapted GRFS composite endpoint may be more accurate to assess post-transplantation outcomes.
Our study is the first large report evaluating GRFS and its risk factors. In addition, we performed a comprehensive analysis to uncover the effects of covariates on the different causes of GRFS failure. We focused our analyses on two different patient cohorts, where patients were selected because they had received allo-HSCT with the most common indications: upfront allo-HSCT from a MRD (upfront cohort) and allo-HSCT for relapse and/or refractory SAA from a MRD or a UD (rel/ref cohort). By using this method we reduce the impact of confounding factors and their interactions, making it a point of strength in our study.
In the upfront cohort, 5-year GRFS was 77%, which further supports the use of allo-HSCT especially in younger patients. In this situation, our results indicated that the time between diagnosis and allo-HSCT was the most critical predictive factor and confirms that transplantation should occur immediately in younger patients if an MRD is available. If an MRD is not rapidly available, conservative or prompt upfront allo-HSCT from an alternative donor is currently under debate even though recent reports have disclosed promising outcomes in this situation.22–25 Furthermore, the recent results of IST plus eltrombopag in previously untreated SAA also appear encouraging and must be taken into account when considering upfront transplant with an alternative donor (especially in adults).19 Interestingly, although age was still associated with poor outcomes, 5-year GRFS in patients older than 40 years was promising (64%) after upfront MRD allo-HSCT. This observation, although limited by the low number of older patients in the upfront cohort, suggests that some older patients may benefit from upfront MRD allo-HSCT. Indeed, a remission rate of only 47% was reported after conventional IST for older patients with SAA (32% CR + 15% PR)26 and thus many patients will still require salvage therapy for relapse or refractory SAA, a situation that is associated with a worse outcome. Furthermore,
in patients over 40 years old with rel/ref SAA, we observed a 5-year GRFS of only 46%, notably due to a high risk of death as the cause of GRFS failure (30%) no matter the donor type. Rather than just performing a basic analysis of GRFS, we also dynamically evaluated the risks of GRFS failure over time. Although older patients undergoing upfront MRD allo-HSCT initially have a higher risk of death, their risk rapidly approaches that of younger patients a few months after Allo-HSCT, most notably in cases of early transplantation. By contrast, patients in the rel/ref cohort continue to experience GRFS failure over time, even at late landmark times. Our analysis, described for the first time in SAA, adds a dynamic point of view to the impact of risk factors. Initially, it is recommended to treat patients older than 40 years with frontline IST1,20,21 since the debate is still ongoing concerning the use of upfront MRD allo-HSCT in this situation, notably when considering that age >40 years is also associated with IST failure.19 Different studies have demonstrated the feasibility of allo-HSCT in older patients, but did not specifically analyze outcomes after upfront alloHSCT.11,27,28 As such, the recommendations from the Fred Hutchinson Cancer Research Center suggest that allo-HSCT should be the first curative option for SAA in fit patients until 70 years of age, no matter the donor type.29 The recommendation may be further supported by a recent development of a conditioning regimen using both ATG and post-transplantation cyclophosphamide with a haploidentical and unrelated donor in treatment naive and refractory SAA patients.25,30 However, prospective evaluations are necessary to determine whether IST or allo-HSCT will result in better long-term outcomes in older SAA patients. Therefore, the identification and validation of predictive biomarkers of frontline IST failure may help in the decision-making algorithm.
We acknowledge that our model is incomplete, both lacking an assessment of comorbidity and neglecting posttransplantation time-dependent covariates like hematological recovery, organ dysfunction, and/or infections. However, data such as these are not routinely collected in the DaVita quality index DQI (data qualitative initiative) which makes it impossible to create a more complex model. In addition, an external validation cohort would have been useful in confirming our findings.
We conclude that GRFS significantly increases after upfront MRD allo-HSCT, though this can be strongly influenced by the delay between diagnosis and transplantation. Our results not only confirm that younger patients should undergo upfront MRD allo-HSCT without delay, but also suggest the potential benefit of the same strategy in certain patients >40 years old, most notably in the presence of a rapidly available MRD. In the poor prognostic setting of rel/ref SAA, GRFS is obviously worse due to an increased risk of death, with donor type having a marginal effect. In this situation, advanced age is the
major poor prognostic factor for GRFS failure, calling into question the utility of allo-HSCT earlier in the disease course.
No conflicts of interest to disclose.
RD and DJE performed statistical analyses. RD, DJE, GS and RP analyzed the results and wrote the manuscript. RP su-
1. Young NS. Aplastic Anemia. N Engl J Med. 2018;379(17):1643-1656.
2. Dufour C, Pillon M, Sociè G, et al. Outcome of aplastic anaemia in children. A study by the severe aplastic anaemia and paediatric disease working parties of the European group blood and bone marrow transplant. Br J Haematol. 2015;169(4):565-573.
3. Bacigalupo A, Socié G, Hamladji RM, et al. Current outcome of HLA identical sibling versus unrelated donor transplants in severe aplastic anemia: an EBMT analysis. Haematologica. 2015;100(5):696-702.
4. Devillier R, Dalle J-H, Kulasekararaj A, et al. Unrelated alternative donor transplantation for severe acquired aplastic anemia: a study from the French Society of Bone Marrow Transplantation and Cell Therapies and the EBMT Severe Aplastic Anemia Working Party. Haematologica. 2016;101(7):884-890.
5. Peffault de Latour R, Chevret S, Jubert C, et al. Unrelated cord blood transplantation in patients with idiopathic refractory severe aplastic anemia: a nationwide phase 2 study. Blood. 2018;132(7):750-754.
6. Marsh JC, Pearce RM, Koh MBC, et al. Retrospective study of alemtuzumab vs ATG-based conditioning without irradiation for unrelated and matched sibling donor transplants in acquired severe aplastic anemia: a study from the British Society for Blood and Marrow Transplantation. Bone Marrow Transplant. 2014;49(1):42-48.
7. Deeg HJ, Socié G, Schoch G, et al. Malignancies after marrow transplantation for aplastic anemia and fanconi anemia: a joint Seattle and Paris analysis of results in 700 patients. Blood. 1996;87(1):386-392.
8. Deeg HJ, Leisenring W, Storb R, et al. Long-term outcome after marrow transplantation for severe aplastic anemia. Blood. 1998;91(10):3637-3645.
9. Vo P, Onstad L, Flowers ME, Storb R. Cancers after HLAmatched related bone marrow transplantation for aplastic anemia. Bone Marrow Transplant. 2022;57(1):83-88.
10. Vaht K, Göransson M, Carlson K, et al. High graft-versus-host disease-free, relapse/rejection-free survival and similar outcome of related and unrelated allogeneic stem cell transplantation for aplastic anemia: a Nationwide Swedish Cohort Study. Biol Blood Marrow Transplant. 2019;25(10):1970-1974.
11. Sheth VS, Potter V, Gandhi SA, et al. Similar outcomes of alemtuzumab-based hematopoietic cell transplantation for SAA patients older or younger than 50 years. Blood Adv. 2019;3(20):3070-3079.
12. Park S-S, Kwak DH, Jeon Y-W, et al. Beneficial role of low-dose
pervised the study. All authors included patients, read, edited and approved the manuscript
We would like to thank patients and their family and Anne Lippinkhof and Paul Bosman as SAAWP study coordinators.
Data are available upon specific request to the SAAWP of the EBMT.
antithymocyte globulin in unrelated stem cell transplantation for adult patients with acquired severe aplastic anemia: reduction of graft-versus-host disease and improvement of graft-versus-host disease-free, failure-free survival rate. Biol Blood Marrow Transplant. 2017;23(9):1498-1508.
13. Kaplan E, Meier P. Nonparametric estimation from incomplete observations. J Am Stat Assoc. 1958;53(282):457-481.
14. Prentice RL, Kalbfleisch JD, Peterson AV, Flournoy N, Farewell VT, Breslow NE. The analysis of failure times in the presence of competing risks. Biometrics. 1978;34(4):541-554.
15. Putter H, Fiocco M, Geskus RB. Tutorial in biostatistics: competing risks and multi-state models. Stat Med. 2007;26(11):2389-2430.
16. Nicolaie MA, van Houwelingen JC, de Witte TM, Putter H. Dynamic prediction by landmarking in competing risks. Stat Med. 2013;32(12):2031-2047.
17. de Wreede LC, Fiocco M, Putter H. The mstate package for estimation and prediction in non- and semi-parametric multistate and competing risks models. Comput Methods Programs Biomed. 2010;99(3):261-274.
18. Scheinberg P, Nunez O, Weinstein B, et al. Horse versus rabbit antithymocyte globulin in acquired aplastic anemia. N Engl J Med. 2011;365(5):430-438.
19. Peffault de Latour R, Kulasekararaj A, Iacobelli S, et al. Eltrombopag added to immunosuppression in severe aplastic anemia. N Engl J Med. 2022;386(1):11-23.
20. Bacigalupo A. How I treat acquired aplastic anemia. Blood. 2017;129(11):1428-1436.
21. Killick SB, Bown N, Cavenagh J, et al. Guidelines for the diagnosis and management of adult aplastic anaemia. Br J Haematol. 2016;172(2):187-207.
22. Dufour C, Veys P, Carraro E, et al. Similar outcome of upfrontunrelated and matched sibling stem cell transplantation in idiopathic paediatric aplastic anaemia. A study on behalf of the UK Paediatric BMT Working Party, Paediatric Diseases Working Party and Severe Aplastic Anaemia Working Party of EBMT. Br J Haematol. 2015;171(4):585-594.
23. Petit AF, Kulasekararaj AG, Eikema D-J, et al. Upfront unrelated donor hematopoietic stem cell transplantation in patients with idiopathic aplastic anemia: a retrospective study of the Severe Aplastic Anemia Working Party of European Bone Marrow Transplantation. Am J Hematol. 2022;97(1):E1-E3.
24. Xu L-P, Jin S, Wang S-Q, et al. Upfront haploidentical transplant for acquired severe aplastic anemia: registry-based comparison with matched related transplant. J Hematol Oncol. 2017;10(1):25.
25. DeZern AE, Zahurak ML, Symons HJ, et al. Haploidentical BMT for severe aplastic anemia with intensive GVHD prophylaxis
including posttransplant cyclophosphamide. Blood Adv. 2020;4(8):1770-1779.
26. Contejean A, Resche-Rigon M, Tamburini J, et al. Aplastic anemia in the elderly: a nationwide survey on behalf of the French Reference Center for Aplastic Anemia. Haematologica. 2019;104(2):256-262.
27. Rice C, Eikema D-J, Marsh JCW, et al. Allogeneic hematopoietic cell transplantation in patients aged 50 years or older with severe aplastic anemia. Biol Blood Marrow Transplant. 2019;25(3):488-495.
28. Shin SH, Jeon YW, Yoon JH, et al. Comparable outcomes
between younger (⩽40 years) and older (>40 years) adult patients with severe aplastic anemia after HLA-matched sibling stem cell transplantation using fludarabine-based conditioning. Bone Marrow Transplant. 2016;51(11):1456-1463.
29. Georges GE, Doney K, Storb R. Severe aplastic anemia: allogeneic bone marrow transplantation as first-line treatment. Blood Adv. 2018;2(15):2020-2028.
30. Arcuri LJ, Nabhan SK, Loth G, et al. A case series of posttransplantation cyclophosphamide in unrelated donor hematopoietic cell transplantation for aplastic anemia. Biol Blood Marrow Transplant. 2020;26(9):e222-e226.
Avigail Rein,1,2,3 Ifat Geron,1,2,3,4 Eitan Kugler,1,2,3 Hila Fishman,1,2,3 Eyal Gottlieb,5 Ifat Abramovich,5 Amir Giladi,6 Ido Amit,6 Roger Mulet-Lazaro,7 Ruud Delwel,7,8 Stefan Gröschel,7,9,10 Smadar LevinZaidman,11 Nili Dezorella,11 Vered Holdengreber,12 Tata Nageswara Rao,13 Joanne Yacobovich,2 Orna Steinberg-Shemer,2,4 Qiu-Hua Huang,14 Yun Tan,14,15 Sai-Juan Chen,14,15 Shai Izraeli1,2,3,4 and Yehudit Birger1,2,3,4
1Department of Human Molecular Genetics and Biochemistry, Sackler Medical School, Tel Aviv University, Tel Aviv, Israel; 2The Rina Zaizov Division of Pediatric Hematology-Oncology, Schneider Children’s Medical Center, Petah Tikva, Israel; 3Functional Genomics and Childhood Leukaemia Research, Sheba Medical Centre, Tel-Hashomer, Israel; 4Felsenstein Medical Research Center, Sackler School of Medicine, Tel Aviv University, Petah Tikva, Israel; 5Technion Integrated Cancer Center, Faculty of Medicine, Technion Israel Institute of Technology, Haifa, Israel; 6Department of Immunology, Weizmann Institute of Science, Rehovot, Israel; 7Department of Hematology, Erasmus University Medical Center, Rotterdam, The Netherlands; 8Oncode Institute, Erasmus University Medical Center, Rotterdam, The Netherlands; 9Molecular Leukemogenesis, Deutsches Krebsforschungszentrum, Heidelberg, Germany; 10Department of Internal Medicine V, Heidelberg University Hospital, Heidelberg, Germany; 11Electron Microscopy Unit, Weizmann Institute of Science, Rehovot, Israel; 12Electron Microscopy Unit, IDRFU, Faculty of Life Sciences, Tel Aviv University, Israel; 13Stem Cells and Leukemia Laboratory, University Clinic of Hematology and Central Hematology, Department of Biomedical Research (DBMR), Inselspital Bern, University of Bern, Bern, Switzerland; 14State Key Laboratory of Medical Genomics, Shanghai Institute of Hematology, Rui Jin Hospital Shanghai, China and 15Jiao Tong University School of Medicine, Shanghai, China
Correspondence:
S. Izraeli sizraeli@gmail.com
Y. Birger Yehudit.Birger@gmail.com
Received: June 21, 2021.
Accepted: December 1, 2022. Early view: December 7, 2022.
https://doi.org/10.3324/haematol.2022.279437
©2023 Ferrata Storti Foundation
Published under a CC BY-NC license
Mono-allelic germline disruptions of the transcription factor GATA2 result in a propensity for developing myelodysplastic syndrome (MDS) and acute myeloid leukemia (AML), affecting more than 85% of carriers. How a partial loss of GATA2 functionality enables leukemic transformation years later is unclear. This question has remained unsolved mainly due to the lack of informative models, as Gata2 heterozygote mice do not develop hematologic malignancies. Here we show that two different germline Gata2 mutations (TgErg/Gata2het and TgErg/Gata2L359V) accelerate AML in mice expressing the human hematopoietic stem cell regulator ERG. Analysis of Erg/Gata2het fetal liver and bone marrow-derived hematopoietic cells revealed a distinct pre-leukemic phenotype. This was characterized by enhanced transition from stem to progenitor state, increased proliferation, and a striking mitochondrial phenotype, consisting of highly expressed oxidative-phosphorylation-related gene sets, elevated oxygen consumption rates, and notably, markedly distorted mitochondrial morphology. Importantly, the same mitochondrial gene-expression signature was observed in human AML harboring GATA2 aberrations. Similar to the observations in mice, non-leukemic bone marrows from children with germline GATA2 mutation demonstrated marked mitochondrial abnormalities. Thus, we observed the tumor suppressive effects of GATA2 in two germline Gata2 genetic mouse models. As oncogenic mutations often accumulate with age, GATA2 deficiency-mediated priming of hematopoietic cells for oncogenic transformation may explain the earlier occurrence of MDS/AML in patients with GATA2 germline mutation. The mitochondrial phenotype is a potential therapeutic opportunity for the prevention of leukemic transformation in these patients.
Introduction
The hematopoietic transcriptional machinery is a network of highly tuned feedback circuits. Dysfunction of a pivotal regulator might, therefore, hinder its entire performance. GATA2 is a cardinal hematopoietic transcription factor critical for initiation of fetal hematopoiesis and for main-
taining the hematopoietic stem cell pool throughout life by restricting stem cell differentiation.1-3
Abnormal regulation of GATA2 expression and somatic mutations in GATA2 have been associated with both tumor promotion and tumor inhibition.4,5 Yet germline heterozygous mutations in GATA2 , most of which are loss-of-function, are uniformly associated with increased
risk of myeloid malignancies.6,7 GATA2 germline haploinsuffi ciency syndrome is a multisystem disorder with a highly variable clinical presentation.8,9 The most common and most serious consequence of the disorder is the propensity to develop myelodysplastic syndrome (MDS) or acute myeloid leukemia (AML), which affect more than 80% of diagnosed carriers before the age of 40.8,10,11 More than 150 unique mutations have been associated with GATA2 haploinsufficiency,8,11,12 including missense-substitutions, nonsense-truncations, and small indels. Additional secondary oncogenic changes often contribute to leukemic transformation. Hence, the optimal timing for bone marrow (BM) transplantation, currently the sole therapeutic strategy for GATA2 defi ciency, is unclear. There is, therefore, an unmet need to decipher cellular events that precede malignancy in carriers of germline GATA2 mutations.
One of the problems is the scarsity of pre-clinical models. While total ablation of murine Gata2 confers embryonic lethality,2,13 heterozygous mice display only a mild phenotype and do not develop MDS or leukemia.13,14 As hematopoietic malignancies in patients with germline GATA2 abnormalities are characterized by additional somatic oncogenic mutations, it is reasonable to hypothesize that the tumor suppressive effect of Gata2 deficiency will be revealed in mice expressing a hematopoietic oncogene. Interestingly, germline Gata2 haploinsufficiency delayed the occurrence of leukemia in mice carrying CbfbMYH11 fusion,15 while it accelerated leukemogenesis in mice expressing Evi116 or loss of C/Ebp alpha,17 respectively. These later studies focused on a detailed analysis of the mouse leukemias but not on the pre-leukemic phenotype. Here we report a detailed analysis of the impact of Gata2 deficiency on hematopoietic stem and progenitor cells (HSPC) at the pre-leukemic phase. We examined the hypothesis that the implication of dysfunctional Gata2 in mice would be maximized on expression of a stem cell oncogene. ERG, a hematopoietic Ets transcription factor that is an up-stream regulator of GATA2,18 is a potent regulator of normal and leukemic stem cells.19,20 ERG has recently been shown to be the main driver of AML caused by haploinsufficiency of GATA2 with increased expression of EVI-1.21 In line with this, we traced the trajectories of HSPC with heterozygous germline Gata2 deficiency from gestation to leukemia in ERG transgenic mice. We show that the loss of Gata2 caused early expansion of proliferative hematopoietic progenitor cells that had already been detected at the fetal liver stage, long before overt leukemic transformation. We also observed that haploinsufficiency of Gata2 induced a mitochondrial phenotype in these pre-leukemic cells. Significantly, this was confirmed in children with germline GATA2 haploinsufficiency and in human AML with GATA2 mutations.
Double transgenic mice were generated by crossing TgERG18 mice (from two different TgERG F1 mice) with Gata2het mice (provided by Stuart Orkin) or with Gata2+/L359V knockin mice (provided by Sai-Juan Chen). (See detailed description of the mouse model in the Online Supplementary Methods.) The studies were approved by the institutional animal care and use committee (1149/18/ANIM).
Bone marrow cells were washed in 2% FBS in PBS and resuspended in 100 mL staining media (STM) containing fluorochrome conjugated antibodies for 30 minutes. Following staining, cells were washed, re-suspended to a final volume of 100 mL STM, and analyzed with a Gallios 3 laser/10 color flow cytometer (Beckman Coulter, Brea, CA, USA). Leukemia panels are detailed in the Online Supplementary Methods.
Femurs and spleens were fixed in 4% neutral buffered formalin, paraffin-embedded, and stained with hematoxylin and eosin using standard protocols.
Methylcellulose re-plating assays
E14.5 fetal liver (FL) cells were harvested and forced through a 70 m m cell strainer into 2% fetal calf serum in PBS at 4°C. Lineage negative cell enrichment was performed using MACS magnetic columns (MACS Miltenyi Biotec, Bergisch Gladbach, Germany). 2x10 4 cells were plated in methylcellulose supplemented with IL6, IL3, and SCF (MethoCult GF M3534, Stem Cell Technologies, Vancouver, Canada) in duplicates. After seven days, colonies (>50 cells) were counted and re-suspended, and cells were counted and re-plated in the same manner until colonies no longer formed. Three independent experiments were performed, each with 2-3 FL from each genotype.
A BM-derived single-cell suspension was prepared from each mouse femur, diluted to a concentration of aproximately 1,000 cells/mL, and loaded into the 10x chromium microfluidic system, aiming for 5,000 single cells/sample. An RNA-seq library was prepared for each sample according to the manufacturer’s protocol. Final libraries were sequenced using the Nextseq 75 cycles high output kit (Illumina) for a coverage of 50,000 reads/cell. Single cell RNA-seq data analysis is detailed in the Online Supplementary Methods. Raw data are available on the Gene Expression Omnibus (GEO) (accession n. GSE143308).
Cells were sliced, fixed and mounted on carbon-coated Formvar grids. (Details of the protocol are available in the Online Supplementary Methods.) Samples were then stained with uranyl acetate and lead citrate, and examined under a Jeol 1400 Plus transmission electron microscope (Jeol, Tokyo, Japan). Images were captured using SIS Megaview III and the iTEM imaging platform (Olympus, Tokyo, Japan). All mice and human measurements, and calculations in electron microscopy captures were performed using the Fiji open source platform for biological image analysis. Analysis of patients' BM was approved by the institutional review board committee of Rabin Medical Center (approval n. 0840-18-RMC).
Oxygen consumption rates (OCR) were measured using the Seahorse XF96 analyzer (Agilent Technologies, Santa Clara, CA, USA). Cells were treated and cultured with XF assay medium in a Seahorse XF96 cell culture plate (30 mL) before being transferred to the Seahorse XF96 analyzer, as detailed in the Online Supplementary Methods.
RNAseq
Total RNA was extracted and purified using the TRIzolTM Plus RNA purification kit (Invitrogen, Carlsbad, CA, USA). Library preparation, sequencing data and expression analysis are all detailed in the Online Supplementary Methods.
Gata2 heterozygosity accelerates leukemia in transgenic ERG mice
We crossed mice transgenic to human ERG (TgERG; previously shown to develop AML18,20) with Gata2 het mice. There was a significant reduction in time to leukemia and time to survival (log rank Mantel-Cox test, P<0.0001) in TgERG/Gata2het compound mice, compared with TgERG littermates with a Gata2WT background (Figure 1A). To examine the reproducibility of the model, we then crossed a Gata2 +/L359V knockin mice (provided by Sai-Juan Chen) with TgERG mice. GATA2 L359V had previously been identi fi ed in chronic myeloid leukemia. 22 As with Tg ERG/Gata2 het , Tg ERG/Gata2 +/L359V had an accelerated leukemia and a shorter survival time (Online Supplementary Figure S1A and B).
Examination of histopathological sections revealed marked BM infiltration and enlargement of spleens with loss of normal architecture in both TgERG/Gata2het and TgERG/Gata2wt leukemic mice (Online Supplementary Figure S1C). Leukemic cells resided within the CD45dim gate, and was made up of lineage negative; CD150high; cKitlow-pos;
Sca1neg cells consistent with mega-erythroid progenitors (MEP) (Figure 1B and C).23 Similar findings were documented within the Gata2+/L359V progeny (Online Supplementary Figure S1D). Taken together, the accelerated leukemogenesis on the loss of a Gata2 allele confirms its role as a tumor suppressor.
Transition of hematopoietic stem cell to proliferating progenitor cell in TgERG/Gata2het pre-leukemic cells Having established the earlier leukemia development in TgERG mice on the background of Gata2 mutation, we were interested in deciphering the pre-leukemic phenotype. We further analyzed differentiation markers on TgERG/Gata2het and TgERG/Gata2wt HSPC, isolated from 46-week non-leukemic BM. We used two panels to distinguish between stem cells and early progenitor cells: the first included CD150 and CD48 (Slam molecules), and the second included cKit (CD117) and Sca1.24 Flow cytometry analysis revealed a significantly higher CD48pos /CD48neg ratio within the CD150+ population of TgERG/Gata2het cells (Figure 2A and B). CD48 is an early marker of non-quiescence25 suggesting increased non-stem progenitors in TgERG/Gata2het mice. There was a lower fraction of LinSca1+cKit+ cells in the TgERG/Gata2het HSPC compartment consistent with a greater transition from stem to progenitor cells (Figure 2A and C).
We then checked whether associated morphological features can be detected to distinguish TgERG/Gata2het from TgERG/Gata2wt HSPC. BM of four pre-leukemic siblings and two leukemic mice were harvested. Hematopoietic lineage negative (lin-) progenitor cells were selected using magnetic beads and subjected to transmission electron microscopy (TEM). A significant decrease in nuclear to cytoplasmic ratio (NCR) was found in TgERG/Gata2het cells compared with TgERG/Gata2wt (P<0.0001) (Figure 2D). Decreasing NCR during hematopoiesis typically accompanies the gradual transition of pluripotency to lineage commitment and differentiation,26 and is, therefore, consistent with the dominance of progenitor cells of the TgERG/Gata2het HSPC compartment.
Early progenitor cells have a greater proliferative capacity than quiescent hematopoietic stem cells.26 Therefore, we next examined the proliferative potential of TgERG/Gata2het pre-leukemic HSPC. A clear advantage in colony formation capacity in re-plating methylcellulose assays was observed in TgERG/Gata2het fetal liver HSPC compared with their counterparts (one-way ANOVA, P<0.05) (Figure 3A).
We then studied pre-leukemic HSPC derived from BM of age-matched 4-7-week-old mice. Cell trace proliferation assay demonstrated a significantly higher proliferation index of TgERG/Gata2het HSPC compared to TgERG/Gata2wt (Figure 3B).
To further identify pre-leukemic HSPC sub-populations in TgERG/Gata2het, we conducted 10x single cell RNA se-
Figure 1. Accelerated leukemia and reduced survival in Gata2-haploinsufficient TgERG mice. (A) Survival curve showing reduced survival (log rank Mantel-Cox test, ****P<0.0001) in TgERG/Gata2het (blue: n=43) mice compared to TgERG/Gata2wt (herein TgERG, red: n=59) littermates. (B) Flow cytometry plot depicting immune phenotyping of Lin (-) leukemia cells. (Top) Cell scatter. (Bottom) Lin (-) hematopoietic stem and progenitor cells residing in a CD45dim gate, expressing CD150high and cKitlow/+. Leukemic population is circled. (C) Dot plots of CD45dim, CD150, and cKit showing no differences in proportions of expressed membranal markers between the two leukemias (lines represent mean values; P<0.05, Student t test). BM: bone marrow; ns: not significant.


Figure 2. Progenitor expansion within TgERG/Gata2het pre-leukemic hematopoietic stem and progenitor cell compartment. (A) Different stages of progenitors by CD150 and CD48 (slam1, slam2, respectively) combined expression and classical LSK differentiation. Lin- cells were immunophenotyped for progenitor compartments according to SLAM (B) and classical LSK (C) markers. (B) (Left) Representative flow cytometry graphs demonstrating CD48 and CD150 gating approach. (Right) Dot graph summarizing six experiments (n=6; Student t test, *P<0.05). (C) (Left) Representative cytometry plots of two experiments. (Right) Dot graph depicting comparison of LSK proportions (n=7; Student t test, *P<0.05). (D) Transmission electron microscopy images were used to calculate nuclear to cytoplasmic (Nuc/cyto) ratio of leukemic and pre-leukemic cells. (Left) Demarcation of cytoplasm (light blue) and nuclei (dark blue). Cells were derived from two pre-leukemic mice, and one leukemic mouse for either TgERG (left grid) or TgERG/Gata2het (right grid). 1:12,000 magnification scale, calibrated by Fiji tool (1 mm=124 pixel). (Right) A decreased nuclear to cytoplasmic ratio was found in TgERG/Gata2het cells (Student t test, ****P<0.0001). HPC: hematopoietic progenitor cells; HS: hematopoietic stem cells; MPP: multipotential progenitors; BM: bone marrow; ERG: TgERG/Gata2wt; EG2: TgERG/Gata2het
quencing analysis on stem and progenitor cells derived from BM of 4-week-old mice littermates representing the entire genotypic repertoire (WT, Gata2het, TgERG/Gata2wt , TgERG/Gata2het). TgERG/Gata2het cells harbored a discrete expression pattern, clustering distinctively apart from TgERG/Gata2wt cells, and from the remaining two control groups (Figure 3C, left). Consistent with the role of ERG and GATA2 in megakaryocytic and erythroid development,3 a functional annotation map, corresponding to expressed key lineage markers, showed that Early erythroid and Mid erythroid were the main lineage modules to contribute to the distinctive TgERG/Gata2het expression profile (Figure 3C, right, and Online Supplementary Figure S2A). K-means clustering within groups yielded a cluster of differentially expressed genes, up-regulated in the TgERG/Gata2 het sample (Online Supplementary Figure S2B). This gene set corresponded to cell proliferation and cell division GO terms. For example, TgERG/Gata2het cells within the erythroid cluster displayed higher expression of Ki67 proliferation marker as well as the mitotic genes Cenpe and Cenpf (Figure 3D and Online Supplementary Figure S2C). Taken together, immunophenotypic, functional and single cell genomic analysis demonstrate that loss of the WTGata2 allele gave TgERG pre-leukemic cells an enhanced proliferative and self-renewing hematopoietic progenitor phenotype.
A mitochondrial phenotype in Gata2 mutated mouse and human hematopoietic cells
To identify potential mechanistic leads that could link GATA2 loss to the HSPC developmental and proliferative phenotypes, we conducted bulk RNA sequencing experiments in pre-leukemic and leukemic cells. Gene set enrichment analysis (GSEA)27 showed enrichment of oxidative phosphorylation and mitochondrial metabolism in TgERG/Gata2het. This signature was consistently found in fetal liver, in pre-leukemia BM, as well as in leukemic cells (Figure 4A and Online Supplementary Figure S3). Importantly, oxidative phosphorylation is also a leading gene set expression signature in TgERG/Gata2+/L359V leukemic cells (Online Supplementary Figure S4A) and in a Gata2+/L359V mouse model.28 To clarify whether the metabolic signature observed in TgERG/Gata2het mice is relevant in humans, we subsequently analyzed expression profiles of AML patients
who harbor chromosome 3q26 inversion Inv(3q26)/t(3;3), causing activation of the EVI1 oncogene.29,30 Intriguingly, oxidative phosphorylation was among the highest ranked pathways to be enriched in Evi1/GATA2MUT patients (Figure 4B). Moreover, top ranked gene sets in a ERG/Gata2het mouse model and Evi1/GATA2MUT (GSEA, Hallmark cluster) shared common modules, including MYC, and mTOR signaling (Online Supplementary Figure S4B). The common expression signatures seen in our mouse models and the human leukemias suggest that these models are of a general significance to oncogenic driven AML on the background of GATA2 insufficiency status.
To test the functional signifi cance of the mitochondrial gene expression signature, we conducted a metabolic analysis. HSPC from BM of three pairs of pre-leukemic TgERG/Gata2het and TgERG/Gata2wt mouse siblings were analyzed (Seahorse XF96 analyzer). Basal oxygen consumption rate (OCR) was significantly higher in TgERG/Gata2het HSPC (Figure 4C and Online Supplementary Figure S5), and a trend toward higher adenosine triphosphate (ATP) productivity was also found (Online Supplementary Figure S5). Interestingly, proton leak was significantly higher in TgERG/Gata2het cells (Online Supplementary Figure S5). The proton leak represents ATP-dissociated influx of H+ ions into the mitochondria and can reflect mitochondrial damage.31
To estimate cellular mitochondrial content, we calculated mtDNA to nuclear DNA (nDNA) copy number ratio using ND1 and r16s as mitochondrial genes and HK2 as a nuclear gene (Figure 4D, left). Both ND1/HK2 and r16s/HK2 ratios were significantly higher in TgERG/Gata2het cells (Figure 4D, middle and right). Together these findings suggest TgERG/Gata2het HSPC harbor both enhanced oxidative metabolism and mitochondrial abundancy in line with their RNA expression signature.
We investigated whether TgERG/Gata2het cells undergo mitochondrial morphological alteration. Lin- HSPC of 4-weekold pre-leukemic, and two leukemic, age- and sex-matched TgERG/Gata2wt and TgERG/Gata2het mice were analyzed by TEM. Cell captures revealed prominent morphological alterations in TgERG/Gata2het mitochondria

Figure 3. Proliferative phenotype in TgERG/Gata2het pre-leukemia progenitor cells. (A) Enhanced proliferation and re-plating capacity of TgERG/Gata2het fetal liver hematopoietic stem and progenitor cells (HSPC). (Top) Replanting scheme. (Bottom) Bar graph of 3 independent re-plating assays of E14.5 fetal livers (n=6-8 / genotypic group; oneway ANOVA and unpaired Student t test: *P<0.05, **P<0.01, ***P<0.0001). (B) TgERG/Gata2het bone marrow HSPC have a higher proliferation index in CFSE assay. (Left) Representative histograms of two CFSE dilutional courses. TgERG/Gata2wt and TgERG/Gata2het at 0, 72, and 96 hours (hr) from staining. (Right) Six independent experiments (paired Student t test, *P<0.05). (C) Two-dimensional projection plot of Metacell model on 10x single cell analysis of pre-leukemic lineage negative progenitors showing (top) TgERG/Gata2het cells clustered distinctively (green zone) from TgERG/Gata2wt (red zone), and from Gata2het (light blue), and WT (purple). Light blue line delineates the area were TgERG/Gata2wt and TgERG/Gata2het clustered differentially. (Bottom) Functional annotation plot of Metacells by expression of key lineage markers, depicting Early erythroid (pink) and Mid erythroid (red) modules, are dominantly expressed in both TgERG/Gata2het and TgERG/Gata2wt expression profiles shown by projecting the genotype expression map (top) over the lineage expression map (bottom). Differences in expression between TgERG/Gata2wt and TgERG/Gata2het mostly occur in Early and Mid erythroid. An additional line provides an approximate separation of Early from Mid erythroid program zones. (D) Ki67, Cenpf and Cenpe (mitosis-related genes) expression projections on metacell plot are illustrated together with the global expression scheme of TgERG/Gata2het (upper left). The genes are highly expressed in TgERG/Gata2het territory. Dark blue: high expression; yellow-white: low expression; ERG: TgERG: TgERG/Gata2wt; ERG_GATA2:TgERG/Gata2het; GATA2: Gata2het .
showing swelling, circular contour, and co-localization in clusters. Conversely, TgERG/Gata2wt mitochondria were small, thread-shaped, and spread evenly within the cytoplasm (Figure 5A). In addition, the ratio of cumulative mitochondrial area to the cytoplasm of a cell was significantly higher in TgERG/Gata2het (P<0.0001) (Figure 5B), indicating a higher mitochondrial content (Figure 5B), consistent with the genomic quantification (Figure 4D).
Ultra-structural characterization of the mitochondrial morphology revealed ill-defined disrupted cristae in TgERG/Gata2het. Some mitochondria were enclosed in a double membraned vacuole, suggesting mitophagy. Conversely, TgERG/Gata2wt mitochondria were elongated and convoluted, with clear electron-dense crista (Figure 5C, left). Analysis of individual mitochondrion features documented a larger mean area of an individual TgERG/Gata2het mitochondrion. (Student t test, P<0.0001) (Figure 5C, middle). In addition, the aspect ratio (obtained by dividing the mitochondrial longest axis by the shortest axis), ranging from elongated to round, was significantly lower in TgERG/Gata2het mitochondria (Student t test, P<0.0001) (Figure 5C, right). This feature can be related to differences in mitochondrial dynamics, such as fission preference over fusion, associated with cell division32 or to increased degradation due to mitochondrial damage. The unique mitochondrial morphology detected in TgERG/Gata2het HSPC is consistent with the metabolic phenotype. Interestingly, TEM analysis of cells from GATA2 heterozygous mice did not show the same aberrant mitochondrial morphological phenotype as that seen in the TgERG/Gata2het mouse cells (Online Supplementary Figure S7), although gene expression analysis of progenitor cells from GATA2het demonstrated an upregulation in oxidative phosphorylation gene expression (Online Supplementary Figure S8), in agreement with the minimal hematologic phenotype observed in GATA2het mice.
Abnormal mitochondria in hematopoietic progenitors from bone marrow of children with germline GATA2+/R396W mutation
To test whether humans with germline mutated GATA2
present mitochondrial aberrancy, we examined CD34+ BM cells derived from two siblings of one family harboring the GATA2+/R396W mutation (Figure 6A). A 13-year-old male was diagnosed with a germline GATA2 R396W mutation after presenting with aplastic anemia. A genetic analysis of the family revealed the mutation to be transmitted from the asymptomatic father to three of his children: the proband 13-year-old symptomatic son, a 15-year-old asymptomatic daughter, and a 7-year-old asymptomatic son. A fourth male sibling (11 years old) did not inherit the mutation (Figure 6B).
Complete blood count of the proband patient at presentation demonstrated pancytopenia with severe neutropenia (200 cells/ m L), monocytopenia (10 cells/ m L), and thrombocytopenia (24*103/mL). Both asymptomatic carrier siblings displayed normal blood counts with normal cellular indexes. Cytogenetic and somatic gene panel sequencing analysis7 was normal for both proband and carriers. BM biopsy of the proband revealed remarkable hypocellularity (20% of normal) with myelodysplastic changes. Importantly, although her blood count was normal, the sister’s BM demonstrated minimal myelodysplastic changes. No BM examinations were performed for the youngest male carrier or the father.
More than 25 CD34+ BM cells from the patient and the carrier sister were captured using TEM (FEI Tecnai SPIRIT, FEI, Eidhoven, The Netherlands), analyzed, and compared with CD34+ BM cells of a healthy donor. There was a clear difference in general cell morphology: normal control CD34+ cells had a homogenous cytoplasm, and well-defined, electron dense mitochondria, while the mitochondria of GATA2+/R396W cells of both sister and the patient had an abnormal appearance with fragmentation, polymorphism, and disrupted cristae (Figure 6C and D). While quantitative analysis of the mitochondrial morphometrics of the patient's CD34+ cells was difficult to establish due to pronounced cellular disruption and vacuolization, we found the sister’s cells to have a significantly decreased mitochondrial aspect ratio, as in the TgERG/Gata2het mice, but average size of the mitochondria was also reduced,

Figure 4. Enhanced oxidative phosphorylation in GATA2 mutated leukemias. (A) Gene Set Enrichment Analysis (GSEA) plots depicting oxidative phosphorylation pathway enrichment in Tg ERG/Gata2 het RNAseq expression profiles compared with Tg ERG/Gata2 wt. (B) GSEA plot showing oxidative phosphorylation signature is enriched in human Inv(3)/GATA2-mutated acute myeloid leukemia cell expression profiles. (C) Basal oxygen consumption rate (OCR) is significantly higher in Tg ERG/Gata2 het hematopoietic stem and progenitor pre-leukemia cells (HSPC); SeaHorse XF assay. One of 3 independent experiments. Arrows show time of intervention. min: minutes. Student t test, * P <0.05. (D) (Left) Mouse mitochondrial DNA with ND1 and r16s genes marked. (Right) qPCR quantitation of mitochondrial to nuclear DNA ratio calculated using ND1 and r16s. Tg ERG/Gata2 het HSPC harbor a higher ratio of mitochondrial/nuclear DNA copy number. N=3-4. HK2: nuclear reference gene. Student t test, * P <0.05. ERG: Tg ERG : Tg ERG/Gata2 wt; ERG/GATA2het: Tg ERG/Gata2 het .
reflecting the ongoing fragmentation (Figure 6E). Compared with normal BM, GATA2+/R396W cells of both the patient and the sister showed a decrease in nuclear cytoplasmic ratio (P<0.0001) (Online Supplementary Figure S9), similar to that observed in TgERG/Gata2het mouse progenitors. Therefore, disrupted mitochondria and reduced NCR characterize human GATA2 deficiency HSPC, as observed in the TgERG/Gata2het mouse.
Disruptive germline mutations in GATA2 represent a significant risk of developing MDS/AML. Current research has described a variety of effects of GATA2 loss on increasing the virulence of myeloid and erythroid leukemias.12,15-17 Here we investigated the effect of GATA2 haploinsufficiency on the pre-leukemic phenotype. The tumor suppressive function of GATA2 was uncovered by accelerated ERG-driven leukemias in mice with germline Gata2 mutations. We identified enhanced transition of pre-leukemic HSC into proliferating early progenitors. These pre-leukemic progenitors had increased mitochondrial oxidative phosphorylation and increased mitochondrial content with prominent mitochondrial structural aberrations. Strikingly, abnormal mitochondria were detected also in pre-leukemic BM of patients with germline GATA2 mutation, including an asymptomatic carrier.
Several attempts have been made to unravel the tumor suppressive effect of GATA2 in mouse models by crossing Gata2 mutated mice with mice expressing oncogenic leukemic mutations. Some of these models displayed either complex phenotype or no malignant transformation,33 while others accelerated the acute leukemic occurrence16 or altered the leukemic phenotype.17 For example, Liu at al.15 reported enhanced leukemic stem cell phenotype in leukemias arising in a Cbfb-MYH11 knockin/Gata2 heterozygous mouse; however, paradoxically, latency time to leukemia was longer. Thus, oncogenes themselves may enable the tumor suppressive effect of GATA2. Here we exploited TgERG mice to uncover the GATA2 tumor suppressive effect in the pre-leukemic phenotype. ERG is a hematopoietic transcription factor regulating stemness in both normal and leukemic stem cells.34-39 Indeed, ERG co-regulate HSPC together with GATA2 as part
of a heptad of transcription factors.39 ERG, GATA2 and TAL1, three of the Heptad’s factors, act in a loop to regulate erythropoiesis.3 Strikingly, ERG has recently been shown to be the main driver of leukemias characterized by haploinsufficiency of GATA2 and EVI-1 overexpression.21 These EVI-1 AML are highly similar to our mouse model. Interestingly, ERG and GATA2 also co-operate in other types of cancers, particularly prostate cancer.40 Thus, our mouse model is highly relevant, as ERG is a likely oncogene-mediating leukemia progression of GATA2 germline haploinsuffiency.
The main observation in our study is the presence of marked mitochondrial abnormalities associated with increased expression of oxidative phosphorylation genes and elevated oxygen consumption rates in pre-leukemic Gata2 deficient cells. Interestingly, enhanced expression of genes mediating oxidative phosphorylation were also reported by Yamamoto et al.16 in murine AML driven by EVi-1 and Gata2 deficiency. Similar to ERG, Evi-1 is also a hematopoietic stem cell transcription factor and an upstream activator of GATA2.41 Here we show that this mitochondrial gene expression signature exists also in human EVI-1 leukemias with somatic GATA2 mutations. Similarly, activation of oxidative phosphorylation was demonstrated in progression of myeloproliferative neoplasms following loss of LK1/STK11.42 However, here we demonstrate, for the first time in both the mouse model and in children carrying a GATA2 mutation, that the mitochondrial aberrations occur very early, long before progression to frank MDS or leukemia.
These findings may be of general relevance to AML/MDS, as prior reports suggested mitochondrial dysfunction and impaired elimination of defective mitochondria (e.g., mitophagy) in MDS/AML.43 An increased number of mitochondria-containing autophagosomes and enlarged abnormal mitochondria were also shown in early erythroblasts of MDS patients.44,45 The described mitochondria phenotype of structural double membrane vacuoles in conjugation with abnormal mitochondrial structure (Figure 5) in GATA2het (Figure 6) and TgERG/Gata2het may suggest mitophagy involvement in both the pre-leukemia state generated by GATA2het and in the leukemia. MDS patients were reported to have mitophagy involvement in progression to leukemia. Houwerzijl et al. showed that erythroid precursors from high-risk MDS patients have lower mi-
Figure 5. Mitochondrial structural aberrations in TgERG/Gata2het pre-leukemic hematopoietic progenitors. (A) TgERG/Gata2het hematopoietic lineage negative progenitors exhibit mitochondrial disruptions, as shown in transmission electron microscopy which captures imaging both in pre-leukemia and leukemia cells. (Left) TgERG/Gata2wt hematopoietic stem and progenitor cell (HSPC) mitochondria are spread within cytoplasm. (Right) TgERG/Gata2het mitochondria are swollen, rounded, and tend to group in clusters. (Top) Unprocessed capture. (Bottom) ImageJ processed view. Light-blue: mitochondria; beige: nuclei. Scale 1:12,000. (B) Total mitochondrial surface per cell is increased in TgERG/Gata2het hematopoietic progenitors. Representative illustration by ImageJ (left), and dot bar graph (right). N=25-31 cells per genotype; unpaired Student t test, ****P<0.0001. (C) (Left) Mitochondria ultra structures of TgERG/Gata2wt progenitors (TgERG) are elongated, torturous, and display electron dense, clearly defined cristae (vertical frame). TgERG/Gata2het progenitors display spherical, swollen mitochondria and distorted, blurred cristae (horizontal frame). Scale 1: 20,000 ; 1:50,000, respectively; yellow quadrangles show magnified view of mitochondrial structure. (Center) Dot plot showing mean surface area of an individual mitochondrion is higher in TgERG/Gata2het progenitors. Unpaired Student t test, ****P<0.0001. (Right) Dot plot showing mitochondrial aspect ratio, representing longest to shortest axis ratio, is lower in TgERG/Gata2het . Unpaired Student t test, P<0.0001. Note the spherical contour rather than a thread shape. (Calculated by Fiji NIH program.50); TgERG: TgERG/Gata2wt


Figure 6. Mitochondrial aberrations in human GATA2+/R396W mutated hematopoietic progenitors. (A) Schematic illustration of the GATA2 germline R396W substitution mutation switching Arginine to Tryptophan. (B) Family pedigree of the 13-year-old GATA2+/R396W patient (arrow) diagnosed and treated in our hospital. Circle: female; quadrangle; male; y: age in years. (C) Transmission electron microscopy captures of CD34+ bone marrow (BM) cells show fragmented mitochondria (top quadrangles: original capture) designated by pseudocolor light green (large quadrangles). Fragmentation is shown in carrier sister and the patient (left and middle, respectively) compared to normal sized and normal contour mitochondria of donor CD34+ BM cells (right). (Scale 1:4,800 to 1:6,800, Fiji NIH program.50) (D) Mitochondria ultrastructure. Fragmentation and disruption of cristae in carrier and sister (left and middle captures, respectively), and organized well-defined and electron-dense cristae in mitochondria of the control cells (right capture) (FEI Tecnai SPIRIT, Eindhoven, The Netherlands). Scale 1:6,800-1:9,300. (E) Mean surface area of an individual mitochondrion is lower (left) in GATA2+/R396W carrier (sister) CD34+ hematopoietic stem and progenitor cells compared with normal control (unpaired Student t test, ****P<0.0001). Mitochondrial aspect ratio (right), representing longest to shortest axis ratio, is lower in GATA2+/R396W carrier, which reflects fragmented formation instead of thread shape. (Calculated by Fiji NIH program.50] Unpaired Student t test, ****P<0.0001.
tophagy levels compared with low-risk MDS patients. In addition, an MDS mouse model that was generated by deletion of the autophagy protein Atg7, (Vav-Atg7 / ) resulted in a decreased LSK CD150+CD48 HSC compartment (which is the population that we describe) and upregulation of the myeloid leukemia marker CD47.46
Analysis of pre-leukemic cells by single cell RNA sequencing revealed that erythroid committed progenitors are the main population that contribute to the differences in expression patterns between TgERG/Gata2wt and TgERG/Gata2het. Our observation is similar to recently published findings by Nerlov et al.17 There, the authors show that Gata2 mutation synergized with CEBPa double mutation to generate a permissive erythroid chromatin state that promotes leukemogenesis of bilineage acute erythroid /myeloid leukemia. The expansion of highly proliferating erythroid precursors in the TgERG/Gata2het mice was also associated with monocytopenia (Online Supplementary Figure S6), which is often observed in human carriers of germline GATA2 mutations.47
The transition to highly proliferating hematopoietic progenitors was also confirmed by immunophenotyping, in vitro self-renewal proliferation assays, TEM analysis of nuclear to cytoplasmic ratio, and single cell gene expression analysis. Interestingly, our observation of expanded progenitor compartment (cKit+ lin- and sca1-) and reduced fraction of KLS cells in BM of Tg ERG/Gata2 het pre-leukemic mice, is also supported by Nerlov et al. ; in their study, GATA2 loss led to expanded progenitors but not an expanded KLS compartment.17 Our observations are reinforced by developmental studies of Gata2 heterozygous mice that provide qualitative and quantitative evidence that diminished hematopoietic stem cells are accompanied by expansion of hematopoietic progenitors.1,13 Thus, GATA2 haploinsufficiency may create a premature aging phenotype of HSPC characterized by increased transition to progenitors coupled with increased susceptibility to oncogenic transformation.
The transition from quiescence to proliferative pre-leukemic progenitors may also partially explain the mitochondrial phenotype in Tg ERG/Gata2 het . This transition
generates a steep increase in energetic demands, and hence, oxidative phosphorylation preference over glycolysis, mitochondrial fission/ fragmentation, and a flux of reactive oxygen species. 48 The loss of GATA2 as a stem cell gate keeper may result in the transition from quiescence into a proliferative state associated with increased mitochondrial mass and activity. If unrestricted cycling is ongoing, the cellular scavenging machinery may fail to sufficiently neutralize genotoxic molecules. Abnormal mitochondrial dynamics may have a genuine effect on GATA2-deficiency leukemogenic evolvement, a vulnerability that could be exploited therapeutically to prevent and treat these leukemias. While several drugs have been suggested to lower leukemia mitochondrial activity (reviewed by Egan et al. 49), replacing BM transplantation by chronic drug therapy suppressing the preleukemic phenotype is a major challenge and represents one of the leading “unmet needs” in the management of cancer predisposition syndrome. The question remains as to whether a pharmacological approach can alter its course.
Disclosures
No conflicts of interest to disclose.
Contributions
SI, YB and AR designed the research; AR, YB, IG, EK, HF and IA carried out the research; S-JC, RD, SG, RM-L, SLZ, ND, VH, IA, JY, OS-S, Q-HH, YT and EG contributed new reagents and/or analytic tools; AR, AG, IG, YB, EG, RD, IA, RM-L, TNR, S-JC, Q-HH, YT and SI analyzed the data; AR, YB and SI wrote the paper.
We thank Professor Atan Gross for his invaluable advice regarding mitochondrial metabolism and analysis, Jonatan Barel for RNAseq analysis, and to Hadas KerenShaul for 10X RNA sequencing services. We are indebted to Itzhak Ben Moshe and Erez Shtosel for mouse care, and past and present members of Shai Izraeli's research group for fruitful discussion and advice. This research was carried out in partial fulfilment of the requirements for
Avigail Rein's PhD degree at the Sackler Faculty of Medicine, Tel Aviv University, Israel.
This study was supported by the Israel Science Foundation and the National Science Foundation China (to SI and S-JC), the Israeli Ministry of Science and DKFZ (to SI and SG), the Waxman Cancer Research Foundation (to SI), the Ministry of Health (to SI), the Larger Than Life Foundation (to SI and AR), Hans Neufeld Stiftung (to SI) and ICCF (to SI), The Dotan Center of
1. Rodrigues NP, Janzen V, Forkert R, et al. Haploinsufficiency of GATA-2 perturbs adult hematopoietic stem-cell homeostasis. Blood. 2005;106(2):477-484.
2. Tsai FY, Keller G, Kuo FC, et al. An early haematopoietic defect in mice lacking the transcription factor GATA-2. Nature. 1994;371(6494):221-226.
3. Thoms JAI, Truong P, Subramanian S, et al. Disruption of a GATA2-TAL1-ERG regulatory circuit promotes erythroid transition in healthy and leukemic stem cells. Blood. 2021;138(16):1441-1455.
4. Menendez-Gonzalez JB, Vukovic M, Abdelfattah A, et al. Gata2 as a crucial regulator of stem cells in adult hematopoiesis and acute myeloid leukemia. Stem Cell Reports. 2019;13(2):291-306.
5. Chaytor L, Simcock M, Nakjang S, et al. The pioneering role of GATA2 in androgen receptor variant regulation is controlled by bromodomain and extraterminal proteins in castrate-resistant prostate cancer. Mol Cancer Res. 2019;17(6):1264-1278.
6. Kennedy JA, Ebert BL. Clinical implications of genetic mutations in myelodysplastic syndrome. J Clin Oncol. 2017;35(9):968-974.
7. Noy-Lotan S, Krasnov T, Dgany O, et al. Incorporation of somatic panels for the detection of haematopoietic transformation in children and young adults with leukaemia predisposition syndromes and with acquired cytopenias. Br J Haematol. 2021;193(3):570-580.
8. Donadieu J, Lamant M, Fieschi C, et al. Natural history of GATA2 deficiency in a survey of 79 French and Belgian patients. Haematologica. 2018;103(8):1278-1287.
9. Al Seraihi AF, Rio-Machin A, Tawana K, et al. GATA2 monoallelic expression underlies reduced penetrance in inherited GATA2mutated MDS/AML. Leukemia. 2018;32(11):2502-2507.
10. Wlodarski MW, Hirabayashi S, Pastor V, et al. Prevalence, clinical characteristics, and prognosis of GATA2-related myelodysplastic syndromes in children and adolescents. Blood. 2016;127(11):1387-1397; quiz 1518.
11. Churpek JE, Bresnick EH. Transcription factor mutations as a cause of familial myeloid neoplasms. J Clin Invest. 2019;129(2):476-488.
12. Sahoo SS, Kozyra EJ, Wlodarski MW. Germline predisposition in myeloid neoplasms: unique genetic and clinical features of GATA2 deficiency and SAMD9/SAMD9L syndromes. Best Pract Res Clin Haematol. 2020;33(3):101197.
13. de Pater E, Kaimakis P, Vink CS, et al. Gata2 is required for HSC generation and survival. J Exp Med. 2013;210(13):2843-2850.
14. Dzierzak E, Bigas A. Blood development: hematopoietic stem cell dependence and independence. Cell Stem Cell. 2018;22(5):639-651.
15. Saida S, Zhen T, Kim E, et al. Gata2 deficiency delays
Hematological Malignancies, Tel Aviv University (to SI), the ICRF Professorship grant (to SI) and the Nevzlin Foundation (to SI).
Raw data are available in GEO through accession GSE143238 at:
https://www.ncbi.nlm.nih.gov/geo/query/acc.cgi?acc=GSE1 43238 and accession GSE143308 at:
https://www.ncbi.nlm.nih.gov/geo/query/acc.cgi?acc=GSE1 43308
leukemogenesis while contributing to aggressive leukemia phenotype in Cbfb-MYH11 knockin mice. Leukemia. 2020;34(3):759-770.
16. Katayama S, Suzuki M, Yamaoka A, et al. GATA2 haploinsufficiency accelerates EVI1-driven leukemogenesis. Blood. 2017;130(7):908-919.
17. Di Genua C, Valletta S, Buono M, et al. C/EBPalpha and GATA-2 mutations induce bilineage acute erythroid leukemia through transformation of a neomorphic neutrophil-erythroid progenitor. Cancer Cell. 2020;37(5):690-704.e8.
18. Goldberg L, Tijssen MR, Birger Y, et al. Genome-scale expression and transcription factor binding profiles reveal therapeutic targets in transgenic ERG myeloid leukemia. Blood. 2013;122(15):2694-2703
19. Taoudi S, Bee T, Hilton A, et al. ERG dependence distinguishes developmental control of hematopoietic stem cell maintenance from hematopoietic specification. Genes Dev. 2011;25(3):251-262.
20. Birger Y, Goldberg L, Chlon TM, et al. Perturbation of fetal hematopoiesis in a mouse model of Down syndrome's transient myeloproliferative disorder. Blood. 2013;122(6):988-998.
21. Schmoellerl J, Barbosa IAM, Minnich M, et al. EVI1 drives leukemogenesis through aberrant ERG activation. Blood. 2023;141(5):453-466.
22. Zhang SJ, Ma LY, Huang QH, et al. Gain-of-function mutation of GATA-2 in acute myeloid transformation of chronic myeloid leukemia. Proc Natl Acad Sci U S A. 2008;105(6):2076-2081.
23. Pronk CJ, Rossi DJ, Mansson R, et al. Elucidation of the phenotypic, functional, and molecular topography of a myeloerythroid progenitor cell hierarchy. Cell Stem Cell. 2007;1(4):428-442.
24. Boles KS, Nakajima H, Colonna M, et al. Molecular characterization of a novel human natural killer cell receptor homologous to mouse 2B4. Tissue Antigens. 1999;54(1):27-34.
25. Oguro H, Ding L, Morrison SJ. SLAM family markers resolve functionally distinct subpopulations of hematopoietic stem cells and multipotent progenitors. Cell Stem Cell. 2013;13(1):102-116.
26. Passegue E, Wagers AJ, Giuriato S, Anderson WC, Weissman IL. Global analysis of proliferation and cell cycle gene expression in the regulation of hematopoietic stem and progenitor cell fates. J Exp Med. 2005;202(11):1599-1611.
27. Subramanian A, Tamayo P, Mootha VK, et al. Gene set enrichment analysis: a knowledge-based approach for interpreting genome-wide expression profiles. Proc Natl Acad Sci U S A. 2005;102(43):15545-15550.
28. Fu YK, Tan Y, Wu B, et al. Gata2-L359V impairs primitive and
definitive hematopoiesis and blocks cell differentiation in murine chronic myelogenous leukemia model. Cell Death Dis. 2021;12(6):568.
29. Groschel S, Sanders MA, Hoogenboezem R, et al. A single oncogenic enhancer rearrangement causes concomitant EVI1 and GATA2 deregulation in leukemia. Cell. 2014;157(2):369-381.
30. Yamazaki H, Suzuki M, Otsuki A, et al. A remote GATA2 hematopoietic enhancer drives leukemogenesis in inv(3)(q21;q26) by activating EVI1 expression. Cancer Cell. 2014;25(4):415-427.
31. Divakaruni AS, Paradyse A, Ferrick DA, Murphy AN, Jastroch M. Analysis and interpretation of microplate-based oxygen consumption and pH data. Methods Enzymol. 2014;547:309-354.
32. Khacho M, Clark A, Svoboda DS, et al. Mitochondrial dynamics impacts stem cell identity and fate decisions by regulating a nuclear transcriptional program. Cell Stem Cell. 2016;19(2):232-247.
33. Shimizu R, Yamamoto M. Quantitative and qualitative impairments in GATA2 and myeloid neoplasms. IUBMB Life. 2020;72(1):142-150.
34. Loughran SJ, Kruse EA, Hacking DF, et al. The transcription factor Erg is essential for definitive hematopoiesis and the function of adult hematopoietic stem cells. Nat Immunol. 2008;9(7):810-819.
35. Lacadie SA, Zon LI. The ERGonomics of hematopoietic stem cell self-renewal. Genes Dev. 2011;25(4):289-293.
36. Knudsen KJ, Rehn M, Hasemann MS, et al. ERG promotes the maintenance of hematopoietic stem cells by restricting their differentiation. Genes Dev. 2015;29(18):1915-1929.
37. Salek-Ardakani S, Smooha G, de Boer J, et al. ERG is a megakaryocytic oncogene. Cancer Res. 2009;69(11):4665-4673.
38. Yassin M, Aqaqe N, Yassin AA, et al. A novel method for detecting the cellular stemness state in normal and leukemic human hematopoietic cells can predict disease outcome and drug sensitivity. Leukemia. 2019;33(8):2061-2077.
39. Diffner E, Beck D, Gudgin E, et al. Activity of a heptad of transcription factors is associated with stem cell programs and clinical outcome in acute myeloid leukemia. Blood. 2013;121(12):2289-2300.
40. Buscheck F, Zub M, Heumann A, et al. The independent prognostic impact of the GATA2 pioneering factor is restricted to ERG-negative prostate cancer. Tumour Biol. 2019;41(7):1010428318824815.
41. Sato T, Goyama S, Nitta E, et al. Evi-1 promotes para-aortic splanchnopleural hematopoiesis through up-regulation of GATA2 and repression of TGF-b signaling. Cancer Sci. 2008;99(7):1407-1413.
42. Marinaccio C, Suraneni P, Celik H, et al. LKB1/STK11 is a tumor suppressor in the progression of myeloproliferative neoplasms. Cancer Discov. 2021;11(6):1398-1410.
43. Joshi A, Kundu M. Mitophagy in hematopoietic stem cells: the case for exploration. Autophagy. 2013;9(11):1737-1749.
44. Watson AS, Mortensen M, Simon AK. Autophagy in the pathogenesis of myelodysplastic syndrome and acute myeloid leukemia. Cell Cycle. 2011;10(11):1719-1725.
45. Houwerzijl EJ, Pol HW, Blom NR, van der Want JJ, de Wolf JT, Vellenga E. Erythroid precursors from patients with low-risk myelodysplasia demonstrate ultrastructural features of enhanced autophagy of mitochondria. Leukemia. 2009;23(5):886-891.
46. Mortensen M, Soilleux EJ, Djordjevic G, et al. The autophagy protein Atg7 is essential for hematopoietic stem cell maintenance. J Exp Med. 2011;208(3):455-467.
47. Bigley V, Collin M. Dendritic cell, monocyte, B and NK lymphoid deficiency defines the lost lineages of a new GATA-2 dependent myelodysplastic syndrome. Haematologica. 2011;96(8):1081-1083.
48. Filippi MD, Ghaffari S. Mitochondria in the maintenance of hematopoietic stem cells: new perspectives and opportunities. Blood. 2019;133(18):1943-1952.
49. Egan G, Khan DH, Lee JB, Mirali S, Zhang L, Schimmer AD. Mitochondrial and metabolic pathways regulate nuclear gene expression to control differentiation, stem cell function, and immune response in leukemia. Cancer Discov. 2021;11(5):1052-1066.
50. Valente AJ, Maddalena LA, Robb EL, Moradi F, Stuart JA. A simple ImageJ macro tool for analyzing mitochondrial network morphology in mammalian cell culture. Acta Histochem. 2017;119(3):315-326.
Correspondence: T. M. Kadia tkadia@mdanderson.org
G. Richard-Carpentier guillaume.richard-carpentier@uhn.ca
Received: October 18, 2022.
1Department of Medicine, Division of Medical Oncology and Hematology, University of Toronto, Princess Margaret Cancer Center, Toronto, Ontario, Canada; 2Department of Leukemia, Division of Cancer Medicine, University of Texas, MD Anderson Cancer Center, Houston, TX, USA; 3Division of Pharmacy, University of Texas, MD Anderson Cancer Center, Houston, TX, USA; 4Department of Hematopathology, Division of Pathology and Laboratory Medicine, University of Texas, MD Anderson Cancer Center, Houston, TX, USA and 5Department of Stem Cell Transplantation and Cellular Therapy, Division of Cancer Medicine, University of Texas, MD Anderson Cancer Center, Houston, Texas, USA
Accepted: March 13, 2023.
Early view: March 23, 2023.
https://doi.org/10.3324/haematol.2022.282030
©2023 Ferrata Storti Foundation
Published under a CC BY-NC license
Acute myeloid leukemia (AML) with inv(3)(q21q26.2)/t(3;3)(q21;q26.2) has a very poor prognosis. Determinants of clinical outcomes and optimal treatment remain uncertain. We retrospectively reviewed 108 cases of AML with inv(3)/t(3;3) and evaluated clinicopathological characteristics and clinical outcomes: 53 newly diagnosed (ND) AML and 55 relapsed/refractory (R/R) AML. Median age was 55 years. White blood cell (WBC) count ≥20x109/L and platelet count ≥140x109/L was observed in 25% and 32% of ND patients, respectively. Anomalies involving chromosome 7 were identified in 56% of patients. The most frequently mutated genes were SF3B1, PTPN11, NRAS, KRAS and ASXL1. In ND patients, the composite complete remission (CRc) rate was 46% overall; 46% with high-intensity treatments and 47% with lowintensity treatments. The 30-day mortality was 14% and 0%, with high- and low-intensity treatment, respectively. In R/R patients, the CRc rate was 14%. Venetoclax based-regimens were associated with a CRc rate of 33%. The 3-year overall survival (OS) was 8.8% and 7.1% in ND and R/R patients, respectively. The 3-year cumulative incidence of relapse was 81.7% overall. Older age, high WBC, high peripheral blast count, secondary AML and KRAS, ASXL1, DNMT3A mutations were associated with worse OS in univariable analyses. The 5-year OS rates were 44% and 6% with or without hematopoietic stem cell transplantation in CR1, respectively. AML with inv(3)/t(3;3) is associated with low CR rates, very high risk of relapse and dismal long-term survival. Intensive chemotherapy and hypomethylating agents provide similar rates of remission and patients achieving CR benefit from hematopoietic stem cell transplantation in first CR.
Acute myeloid leukemia (AML) is a heterogeneous malignancy of the hematopoietic stem and progenitor cells (HPSC) for which genetic alterations define distinct diagnostic entities with specific phenotypical and clinical characteristics.1-3 Cytogenetic abnormalities are associated with clinical outcomes and inform treatment decisions, including the indication for allogeneic hematopoietic stem cell transplantation (HSCT) in first complete remission (CR1).4,5 AML with inv(3)(q21q26.2)/t(3;3)(q21;q26.2) is a rare subtype identified in about 1% of patients with newly diagnosed AML. These chromosomal rearrangements cause the repo-
sitioning of a GATA2-distal hematopoietic enhancer (G2DHE) located on chromosome 3q21 to activate the expression of EVI1 located on chromosome 3q26.2 in the MDS1-EVI1 complex locus (MECOM).6,7 EVI1 is a transcriptional regulator involved in self-renewal, proliferation, cell differentiation and maintenance of long-term hematopoietic stem cells.8,9 The overexpression of EVI1 suppresses erythropoiesis and lymphopoiesis and expands myeloid cells and HPSC leading to AML.10 The repositioning of G2DHE also causes haploinsufficiency of GATA2, a transcription factor regulating many genes involved in self-renewal and maintenance of HPSC, hence cooperating in the leukemogenesis and aggressiveness of AML with inv(3)/t(3;3).11
Guillaume Richard-Carpentier,1,2 Caitlin R. Rausch,3 Koji Sasaki,2 Danielle Hammond,2 Kiyomi Morita,2 Koichi Takahashi,2 Guilin Tang,4 Rashmi Kanagal-Shamanna,4 Kapil Bhalla,2 Courtney D. Dinardo,2 Gautam Borthakur,2 Naveen Pemmaraju,2 Elizabeth J. Shpall,5 Amin Alousi,5 Naval G. Daver,2 Guillermo Garcia-Manero,2 Marina Y. Konopleva,2 Farhad Ravandi,2 Hagop M. Kantarjian2 and Tapan M. Kadia2Patients with AML with inv(3)/t(3;3) typically have normal or elevated platelets, increased small hypolobated megakaryocytes, and multilineage dysplasia.12 Additional chromosomal abnormalities (ACA) are often identified with inv(3)/t(3;3), most commonly monosomy 7.13,14 In patients with myelodysplastic syndromes (MDS) or AML with inv(3)/t(3;3), frequent mutations in the RAS/MAPK signaling pathways (NRAS, KRAS, PTPN11, NF1) have been identified.15,16 Our knowledge of the prognostic and therapeutic relevance of clinicopathological characteristics of AML with inv(3)/t(3;3) remains limited. Furthermore, the benefit of HSCT in this subgroup of patients is questionable given the dismal prognosis observed with current treatments. We report herein on the baseline clinicopathological characteristics, including mutation analyses, and its association with clinical outcomes in a large cohort of patients with AML with inv(3)/t(3;3).
We retrospectively reviewed all cases of AML diagnosed at or referred to the MD Anderson Cancer Center between January 1, 2000 and September 4, 2020 to identify patients with inv(3)(q21q26.2) or t(3;3)(q21;q26.2). All investigations were conducted under approval of the Institutional Review Committee and in accordance with the Declaration of Helsinki. Patients with chromosome 3q26.2 rearrangements other than MECOM::GATA2 were excluded. Patients had either newly diagnosed (ND) untreated AML or relapsed or refractory (R/R) AML following prior therapy and patients were included in only one of these two cohorts based on their initial status at our institution. The outcomes of patients with ND or R/R AML were analyzed separately. Baseline patient characteristics were collected at the time of diagnosis in patients with ND AML or at the time of their first visit at our institution in patients with R/R AML. The type of treatment administered to patients was classified into low- or high-intensity treatment, with the latter defined as regimens including anthracyclines and/or high-dose cytarabine (≥1 g/m2). While patients with targetable mutations could have received available small molecular inhibitors as part of their therapy, few patients fell into this category: one patient with FLT3-internal tandem duplication each received midostaurin or sorafenib in the frontline and one patient in the R/R cohort received midostaurin. No patients received an IDH inhibitor.
The presence of inv(3)(q21q26.2) or t(3;3)(q21;q26.2) was detected by conventional chromosomal analysis of Gbanding metaphase cells. MECOM rearrangement was
confirmed by fluorescence in situ hybridization (FISH) using MECOM dual-color break-apart FISH probes. ACA were considered relevant when identified in ≥2 metaphases. Complex karyotype (CK) was defined as the presence of ≥3 unrelated clonal chromosomal abnormalities (i.e., ≥2 ACA accompanying inv(3)/t(3;3)). Monosomal karyotype (MK) was defined as the presence of ≥2 autosomal monosomies or ≥ 1 autosomal monosomy in combination with at least one structural chromosomal abnormality (i.e., ≥1 monosomy accompanying inv(3)/t(3;3)).17 Somatic gene mutation data was obtained from amplicon-based targeted next-generation sequencing (NGS) from 2013 onwards and single-gene assays targeting nine genes prior to 2013. Testing was performed on the initial patients’ bone marrow aspirate specimens in our CLIA-certified molecular diagnostics laboratory (additional details in the Online Supplementary Appendix).
Baseline characteristics were compared between ND and R/R patients with Wilcoxon rank sum test for continuous variables and with Fisher’s exact test for categorical variables. Composite complete remission rates (CRc) included complete remission (CR) and CR with incomplete hematological recovery (CRi). Overall remission rate (ORR) included CR, CRi and morphologic leukemia-free state (MLFS).1 Predictors of ORR were evaluated with univariate logistic regression models. Survival estimates were calculated using the Kaplan-Meier method and differences between groups were evaluated with the log-rank test. Univariable Cox proportional hazards (CPH) models were used to estimate hazard ratios (HR) for associations between predictors and overall survival (OS) or relapse-free survival (RFS). OS was defined as the time from diagnosis (ND AML) or first visit at the MD Anderson Cancer Center (R/R AML) until death or last follow-up. RFS was defined as the time from remission to relapse, death, or last follow-up. Cumulative incidence of relapse (CIR) was defined as the time from remission to relapse, considering death in remission as a competing event with the Fine and Gray method. In order to evaluate the impact of HSCT in CR1, we performed a 4-month landmark analysis for HSCT among patients who achieved clinical remission (ORR) and performed another analysis using HSCT in CR1 as a timedependent variable in an extension of the CPH model.18
Between January 1, 2000 and September 4, 2020, we identified 108 patients with AML with inv(3)/t(3;3); 53 with ND AML (53/4248, 1.2%) and 55 with R/R AML (55/2968, 1.9%). The baseline patient characteristics are presented
in Table 1. The median age among patients with ND AML was 63 years versus 48 years in patients with R/R AML (P<0.01). There was a trend for higher median white blood cell count (WBC) among patients with ND versus R/R AML (median WBC 4.1 vs. 3.4x10⁹/L; P= 0.06), but no significant difference in the frequency of WBC ≥20x109/L. The median platelet count was 80x109/L versus 50x109/L in patients with ND and R/R AML, respectively, with a higher proportion of patients with platelets within or above the normal range in the ND group (32% vs. 15%; P=0.05). Thrombocytosis (>400x109/L) was observed in four (8%) patients with ND AML. The bone marrow blast percentage was higher in patients with R/R AML (54% vs. 35%; P=0.02). The frequency of t-AML was 32% in patients with ND AML and 5% in R/R AML (P<0.01). Altogether, 27% of patients had secondary AML, primarily with a preceding diagnosis of MDS. Among patients with R/R AML, the median number of prior lines of treatment was 2 (range, 1–6) and 12 of 55 (22%) patients had previously undergone HSCT.
Genetic characteristics of acute myeloid leukemia with inv(3)(q21q26.2) or t(3;3)(q21;q26.2)
Most patients (87/108, 81%) had inv(3)(q21q26.2). Intriguingly, WBC ≥20x109/L was only observed in patients with
inv(3)(q26.2;q21) (25% vs. 0%; P=0.02). There was no other difference in clinicopathologic characteristics between the two MECOM::GATA2 rearrangements. ACA were identified in 38 of 53 (72%) patients with ND AML and 45 of 55 (82%) patients with R/R AML (P=0.31, Table 1). Monosomy 7 was the most frequent ACA identified in 44% of patients, followed by del(5q) and del(7q) in 16% and 11% of patients, respectively, without differences between groups. CK was observed in 25% and 35% of ND and R/R patients, respectively (P=0.35) and MK was observed in 47% and 51% of ND and R/R patients, respectively (P=0.84) (Table 1). The frequency of somatic gene mutations identified in ≥1% of patients with inv(3)/t(3;3) AML is represented in Figure 1 (also Online Supplementary Table S1). The most frequent gene mutation was in SF3B1, identified in 14 of 28 (50%) tested patients. Mutations in at least one of the genes in signaling pathways (PTPN11, NRAS, KRAS, FLT3, KIT, CBL, NF1, JAK2), were identified in 38 of 51 (75%) patients, most commonly in genes of the RAS-MAPK signaling pathway (36/51, 71%). In total, 14 of 51 (27%) patients had PTPN11 mutation, 23 of 94 (24%) had NRAS mutation, 13 of 94 (14%) had KRAS mutation, three of 94 (3%) had both NRAS and KRAS mutations, two of 51 (4%) had NF1 mutation and one of 51 (2%) had CBL mutation. Splicing factors genes
yrs: years; WBC: white blood cell; Hb: hemoglobin; Plt: platelets; PB: peripheral blood; BM: bone marrow; AML: acute myeloid leukemia; t-AML: therapy-related AML; ACA: additional chromosomal abnormalities; CK: complex karyotype; MK: monosomal karyotype. *CK was defined as the presence of ≥3 unrelated clonal chromosomal abnormalities (i.e., ≥2 ACA accompanying the inv(3)/t(3;3)). †MK was defined as the presence of ≥ 2 monosomies or ≥ 1 monosomy in the presence of a structural chromosomal abnormality (i.e., ≥1 monosomy accompanying inv(3)/t(3;3))
(SF3B1, SRSF2, U2AF1) were mutated in 17 of 28 (61%) patients and myeloid transcription factor genes (GATA2, RUNX1, CEBPA) were mutated in 14 of 51 (27%) patients. Tumor suppressors genes (TP53, WT1), DNA methylation genes (DNMT3A, IDH1, IDH2, TET2) and chromatin modifier genes (ASXL1, NPM1) were each mutated in eight of 51 (16%) patients (Online Supplementary Table S1). WBC ≥20x109/L was more frequent in patients with NRAS mutation (39% vs. 14%; P=0.02), and peripheral blood blast percentage was higher in patients with KRAS mutations (median, 52% vs 16%; P<0.01). No other significant association between WBC, peripheral blood percentage and mutations was identified. NRAS mutations were more frequent in R/R AML (14% ND vs. 33% R/R; P=0.03) and TP53 were more frequent in ND AML (16% ND vs. 0% R/R; P=0.04). RUNX1 mutations were identified in four of 15 (27%) patients with ND AML versus two of 34 (6%) patients with R/R AML (P=0.06). No patient with ND AML had GATA2 mutation versus seven of 34 (21%) patients with R/R AML (P=0.17). ASXL1 and NRAS mutations were more frequent in patients with secondary AML (ASXL1, 33% vs. 6%; P=0.046; NRAS, 46% vs. 16%; P<0.01)
Twelve patients (1 ND, 11 R/R) did not receive treatment at our institution. Therefore, 96 patients were evaluable for treatment response (52 ND, 44 R/R). Intensive treatment was administered in 35 of 52 (67%) ND patients and 20 of 44 (45%) R/R patients (Table 2). CRc was achieved in 24 of 52 (46%) patients with ND AML and six of 44 (14%) patients with R/R AML (P<0.01). Two additional ND pa-
tients achieved MLFS for an ORR of 50% (26 of 52) in ND AML. Among patients who achieved CRc, the rate of measurable residual disease (MRD) negativity by flow cytometry was 38% (5/13 evaluable patients) for ND AML and 0% (0/6 evaluable patients) for R/R AML. In patients with ND AML, CRc was 46% and 47% with high and lowintensity treatments, respectively (P=1.00) and the 30-day mortality rates were 14% and 0%, respectively (P=0.16). Among the six patients with R/R AML who achieved remission, all had received only one or two prior lines of therapy. Among patients with R/R AML, CRc rate was 20% and 8% with high- and low-intensity treatments, respectively (P=0.39) and the 30-day mortality rates were 5% and 8%, respectively (P=1.00). In univariable logistic regression analysis for CRc in patients with ND AML (Online Supplementary Table S2), higher peripheral blood blasts percentage was significantly associated with lower CRc (odds ratio [OR]=0.98; 95% confidence interval [CI]: 0.96–1.00; P=0.02). Patients with secondary AML had a lower CRc of 9% (2/20) versus 38% (28/74) for de novo AML (P=0.02). Patients with ACA had a CRc rate of 27% (20/74) compared to 40% (10/22) in those with inv(3)/t(3;3) as their sole cytogenetic abnormality (P=0.17). CRc rates were numerically lower in patients with monosomy 7 (10/43, 23% vs 20/53, 38%; P=0.19), CK (6/28, 21% vs. 24/68, 35%; P=0.28) and MK (11/48, 23% vs. 19/48, 40%; P=0.12), although none of these differences were statistically significant. Patients whose karyotype met both definitions for CK and MK had a remission rate of 10% (2/20) compared to 38% (15/40) in those with neither CK or MK. Patients with NRAS mutations had remission rates of 22% (4/18) versus 38% (24/64)

in patients without (P=0.35). No other association between ORR and mutational status was observed.
Venetoclax-based regimens have been administered to patients with AML with inv(3)/t(3;3) in our cohort; five with ND AML and seven with R/R AML. Of these patients two (40%) with ND and four (57%) with R/R AML had pretreatment NRAS or KRAS mutations. In patients with ND AML, four patients received venetoclax in combination with hypomethylating agents (HMA) and one patient in combination with intensive chemotherapy. Among these patients, two of five (40%) had a response (1 CRi, 1 MLFS); both with HMA plus venetoclax (therefore 2/4, ORR=50% with HMA plus venetoclax among patients ineligible for intensive chemotherapy) (Table 2). One relapsed after six cycles and died of progressive disease and one remains alive in remission with a follow-up of 3 months. Among patients with R/R AML after one to two prior lines of therapy, four patients received venetoclax in combination with HMA and three patients in combination with intensive chemotherapy (Table 2). Of these, three of seven (43%) patients achieved CRi: one with decitabine plus venetoclax and two with FLAG-Ida plus venetoclax.19 One patient who had relapsed post-transplant died of transplant-related complications after achieving remission with FLAG-Ida plus venetoclax. The two other patients achieving CRi proceeded to HSCT, but both relapsed at 3 and 4 months post-transplant and eventually died of progressive disease. Altogether, venetoclax-based regimens were associated
with a CRc rate of 33% (4/12) and ORR of 42% (5/12) in patients with AML with inv(3)/t(3;3) (Table 2). In comparison, the CRc rate was 31% (26/84) in patients who received regimens without venetoclax (49% in ND AML and 8% in R/R AML). Remissions with venetoclax-based regimens were short-lived (median CR duration 5.4 months) and no sustained remission beyond 6 months have been observed with these regimens in our cohort.
With a median follow-up of 83 months, the median OS was 7.9 months and 5.9 months in patients with ND and R/R AML, respectively. The 3-year OS was 8.8% (95% CI: 3.3–22.4) in ND patients and 7.1% (95% CI: 2.2–22.6) in R/R patients (Figure 2A). Among patients who achieved remission, the median RFS was 4.1 months, the 3-year RFS was 8.6% (95% CI: 2.4–31.0) and the 3-year CIR was 81.7% (95% CI: 65.7–97.6) (Figure 2B, C). Most relapses (62.5%) occurred within 6 months after achieving remission. Six patients (6%) were alive in remission at last follow-up or had RFS beyond 5 years: four after undergoing HSCT in CR1, one after undergoing HSCT with refractory disease, and one in remission with 3-month follow-up. In univariable analyses (UVA), older age (HR=1.01; 95% CI: 1.00–1.03; P=0.04), higher WBC at diagnosis (HR=1.02; 95% CI: 1.01–1.02; P<0.01), higher peripheral blood blasts percentage (HR=1.01; 95% CI: 1.00–1.02; P<0.01) and secondary AML (HR=1.81; 95% CI:1.31-2.91; P=0.01) were significantly associated with inferior OS (Online Supplementary Table S3). Baseline platelet count was not prognostic for OS. Pa-
CRc: composite complete remission; CR: complete remission; CRi: incomplete hematological recovery; ORR: overall remission rates; N: number; HMA: hypomethylating agents; NA: not applicable. *An additional patient treated with a low-intensive venetoclax-based regimen achieved morphologic leukemia-free state (MLFS) and is not included in the CRc rates.
tients with WBC ≥20x109/L had a significantly worse survival than patients with lower WBC (HR=2.19; 95% CI: 1.34–3.59; P<0.01; Figure 3A, B). Clinical outcomes were not different depending on the type of MECOM rearrangement (Figure 3C, D), the presence of monosomy 7 (Figure 3E, F) or the presence of CK or MK (Online Supplementary Figure S2). ND patients with NRAS mutation had a trend towards worse OS (HR=2.39; 95% CI: 0.97–5.85; P=0.06) (Figure 4A, B) and patients with KRAS mutation had a worse OS (HR=2.37; 95% CI: 1.20–4.68; P=0.01), most significantly among patients with R/R disease (Figure 4C, D). Mutations in ASXL1 and DNMT3A were also associated with an adverse outcome (ASXL1: HR=2.62; 95% CI: 1.07–6.42; P=0.04; DNMT3A: HR=3.09; 95% CI: 1.17–8.16; P=0.02). In multivariable analyses (MVA) including significant variables in UVA, WBC ≥20x109/L (HR=5.67; 95% CI: 1.70–18.86; P<0.01), secondary disease (HR=4.14; 95% CI:1.66 –10.28; P<0.01) and ASXL1 mutation (HR=2.83; 95% CI: 1.01–7.94; P=0.049) were independent factors associated with inferior OS.

Among patients who achieved CRc or MLFS, ten of 32 (31%) have undergone HSCT in CR1: five with ND AML and five with R/R AML. Transplant-related characteristics and outcomes are summarized in Table 3. The median time from CRc/MLFS to HSCT was 56 days and 39 days in patients with ND and R/R AML, respectively. The median duration of follow-up for patients who received an allogeneic HSCT in CR1 was 36.6 months (range, 11.1–94.8). Among the ten patients proceeding to HSCT in CR1, four remain alive in remission, one remains alive with relapse post-HSCT and five patients have died from AML (n=4) or post-transplant complications (n=1). The median time from CRc/MLFS to HSCT was 24.5 days in patients with long-term remission versus 60.5 days in patients with subsequent relapse or death. With a 4-month landmark analysis, HSCT in CR1 was signifi cantly associated with improved OS (HR=0.33; 95% CI: 0.12–0.91; P=0.03) (Figure 5A). The 5-year OS among patients who have undergone
dence interval.
Figure 3. Overall survival according to baseline characteristics. Overall survival (OS) according to white blood cell (WBC) count in (A) newly diagnosed (ND) patients and (B) relapsed/refractory (R/R) patients. OS according to type of chromosomal rearrangement in (C) ND patients and D) R/R patients. OS according to presence of monosomy 7 in (E) ND patients and (F) R/R patients. HR: hazard ratio; CI: confidence interval.

HSCT in CR1 was 44% (95% CI: 20 –96) versus 6% (95% CI: 1–38) among patients who have not and the 2-year CIR was 57% (95% CI: 16–97) and 86% (95% CI: 68–100), respectively (P=0.03) (Figure 5B). Importantly, four of six patients alive in remission at last follow-up have undergone HSCT in CR1. When using HSCT in CR1 as a time-dependent variable, HSCT in CR1 was significantly associated with improved RFS (HR=0.39; 95% CI: 0.15–0.98; P=0.046) and trended to be associated with improved OS (HR=0.41; 95% CI: 0.15–1.12; P=0.08). Four patients have undergone HSCT in second remission of whom none maintained long-term remission. Five patients have undergone HSCT with active disease on their previous bone marrow aspiration of whom one achieved sustained remission of more than 7 years and one was alive with R/R AML at last follow-up.
Others died from relapsed disease (n=2) or transplant-related complications (n=1).
AML with inv(3)(q21q26.2) or t(3;3)(q21;q26.2) is a rare subtype of AML with dismal clinical outcomes. The optimal treatment for this aggressive leukemia remains unknown and the prognostic implications of its genetic and clinical features had previously not been fully characterized. In this study, we confirmed the markedly adverse prognosis associated with AML with inv(3)/t(3;3). CRc rates were 46% in ND AML and 14% in R/R AML, attesting to the chemo-resistant nature of this aggressive leukemia. The

3-year OS was 8.8% and 7.1% in ND patients and R/R patients, respectively. Previous reports of AML with inv(3)/t(3;3) have reported CR rates of 31-36% and longterm OS rate below 5%.4,13 Interestingly, among ND patients, the CRc rates were similar between high- and low-intensity treatments (46% vs. 47%), but a higher rate of early mortality was observed with higher-intensity treatment (14% vs. 0%). Patients with early death after intensive chemotherapy had secondary or t-AML, or were older, which may explain the higher induction mortality in these patients.20 Among low-intensity treatments, HMAbased regimens specifically were associated with CRc of 50% in ND AML. Since MECOM overexpression is associated with an aberrant hypermethylation signature via interactions with DNA methyltransferases (DNMT), there may be a biological rationale for using HMA (DNMT inhibitors) in AML with inv(3)/t(3;3).21 Similar to our data, other studies evaluating the outcomes of patients with MDS/AML with inv(3)/t(3;3) treated with azacitidine reported an ORR of 42-50% and a CR rate of 24-29%, which compares favorably to unselected cohorts of patients treated with HMA.22-26 In contrast, patients with AML with inv(3)/t(3;3) treated with intensive chemotherapy definitively have worse prognosis compared to other cytogenetics subgroups.4,13,27 Although the addition of venetoclax
to HMA or low-dose cytarabine (LDAC) have been shown to improve remission rates and survival in patients with AML ineligible for intensive chemotherapy, data specifically in patients with AML with inv(3)/t(3;3) has been lacking.28,29 In patients treated with venetoclax-based regimens in our cohort, one of five (20%) patients with ND AML and three of seven (43%) patients with R/R AML achieved CRc. Although limited by small numbers of patients, these rates are lower than general response rates observed with venetoclax plus HMA, LDAC, or intensive chemotherapy in ND or R/R AML.19,28-30 Altogether, our study suggests that HMAbased regimens for patients with ND AML with inv(3)/t(3;3) offer similar remission rates remission compared to intensive therapy and lower rates of treatment-related mortality. Based on our data, there is no clear signal of benefit to the addition of venetoclax to chemotherapy in ND AML with inv(3)/t(3;3), but further data in this subset is needed. We described the largest cohort of AML with inv(3)/t(3;3) with clinicopathologic characteristics and mutational data in relation to clinical outcomes. AML with inv(3)/t(3;3) was frequently associated with normal platelet counts or thrombocytosis as previously reported.12 Nearly half of the patients had a secondary or therapy-related AML which is more frequent than in unselected cohorts of patients with AML.31,32 Current diagnostic classifications of myeloid neo-
†Persistent cytogenetic aberrations. ^Received post-transplant cyclophosphamide; HSCT: hematopoietic stem cell transplant; yrs: years; F: female, M: male; CR: complete remission; HCT-CI: hematopoietic stem cell comorbidity index; GvHD: graft-versus-host disease; ND: newly diagnosed; R/R: relapsed or refractory; MRD: measurable residual disease by flow cytometry; Flu: fludarabine; Mel: melphalan; TT: thiotepa; Bu: busulfan; ATG: antithymocyte globulin; Clofa: clofarabine; TBI: total body irradiation; RIC: reduced-intensity conditioning; MAC: myeloablative conditioning; MUD: matched unrelated donor; AUC: area-under-the-curve; MSD: matched sibling donor; AML: acute myeloid leukemia; NRM: non-relapse mortality.
plasms now include inv(3)/t(3;3) as a genetic lesion defining a single entity (AML or MDS/AML) because of similar disease characteristics and dismal outcome irrespective of blast percentage.2,3,14,33,34 In our cohort, bone marrow blast count percentage was not associated with survival, indirectly supporting these new classifications, although patients with <20% blasts were not included. However, high WBC count and peripheral blast percentage, typically associated with AML, were associated with NRAS or KRAS mutations and worse outcomes in our cohort. Mutations in the RAS-MAPK pathway might be associated with a more proliferative and aggressive disease, historically classified as AML with ≥20% blasts, but further studies with larger number of patients are required to compare the frequencies of gene mutations in patients with inv(3)/t(3;3) according to WBC count and peripheral blast percentage.16
Age, high WBC count and secondary disease were clinical predictors of survival in UVA in our cohort consistent with previous reports,35 however age was not signifi cant in MVA. This could be explained by the greater proportion of older patients receiving HMA-based treatment which has comparable efficacy to intensive chemotherapy for AML with inv(3)/t(3;3). ACA were observed in about 75% of patients, most commonly involving chromosome 7, yet these abnormalities were not associated with OS in contrast to some published series, but consistent with others.4,13,14,27 In our cohort, CK and MK were observed in 30% and 49% of patients, respectively and were also not associated with outcomes adding to conflicting data in the literature.14,27 We showed that NRAS, KRAS, ASXL1 and DNMT3A mutations were associated with inferior survival in UVA. Interestingly, ASXL1 mutations was the only independent
genetic factor associated with poor OS in MVA despite its strong association with secondary AML.
The benefit of HSCT in CR1 has been questioned in very high-risk genetic subgroups of AML, such as in patients with AML with anomaly of chromosome 17p and remains uncertain in patients with inv(3)/t(3;3) given conflicting data in previous series.14,22,27,36 While the numbers are small, our data suggest that HSCT in CR1 is beneficial in patients with AML with inv(3)/t(3;3) and is seemingly the only hope for a cure, albeit low, with our currently available treatment options. Donor search should start as soon as possible in potentially eligible patients diagnosed with AML with inv(3)/t(3;3). These patients should proceed to HSCT as soon as possible after achieving remission to seize the narrow window of opportunity before an almost certain relapse. Achieving a second CR is rarely possible with AML with inv(3)/t(3;3) and HSCT in CR2 is likely futile based on our data. Our study indirectly supports the use of transplantation in patients with myeloid neoplasms with inv(3)/t(3;3) at an earlier stage of disease when WBC are low and blasts are below 20%. Only one patient with secondary AML proceeded to HSCT in CR1. Once patients have progressive disease with blasts ≥20%, they are less likely to achieve remission and subsequently be amenable to HSCT. Although HSCT is the only curative option for patients with AML with inv(3)/t(3;3), only 10% of patients in our study were able to proceed to HSCT because of a high rate of refractory disease and rapid relapse in those achieving remission. Our study underscores the urgent unmet need for more effective therapeutic approaches to treat AML with inv(3)/t(3;3). Potential therapeutic approaches including bromodomain and extra-terminal motif (BET) inhibitors, PARP inhibitors, MEK or ERK inhibitors in presence of RAS-

MAPK pathway gene mutations or targeting LSC with monoclonal antibodies have shown promising results as reviewed by Birdwell and colleagues.37 Otherwise, our data suggests that the addition of venetoclax might not be particularly beneficial. Targeting other BCL2 family members might be a more effective strategy since EVI1 induces BCLxl expression.37,38 Given their good tolerability, HMA likely represent the preferred backbone to combine drugs to improve upon its efficacy.
In conclusion, we confirm that AML with inv(3)/t(3;3) is associated with dismal outcomes, especially in patients with prior hematological malignancy, high WBC count and mutations in ASXL1. The best approach with currently available treatment option appears to be HMA-based regimens to achieve remission followed by HSCT in CR1 to prevent relapse. Development of novel effective therapies are urgently needed for this aggressive subtype of AML.
Disclosures
GRC discloses advisory board participation from Astellas, AbbVie, BMS, Pfizer and Taiho and honoraria from Astellas, AbbVie and Pfizer. NGD discloses consulting fees from Daichii-Sankyo, BMS, Pfizer, Gilead, Servier, Genentech, Astellas, AbbVie, ImmunoGen, Amgen, Trillium, Arog, Novartis, Jass, Celgene, Syndax, Shattuck Labs, Agios; and research grants from Daichii-Sankyo, BMS, Pfizer, Gilead, Servier, Genentech, Astellas, AbbVie, ImmunoGen, Amgen, Trillium, Hanmi, Trovagene, FATE Therapeutics, Novimmune and Glycomimetics.
HMK discloses honoraria, advisory board participation and/or consultancy from AbbVie, Amgen, Amphista, Ascentage, Astellas, Biologix, Curis, Ipsen Biopharmaceuticals, KAHR Medical, Novartis, Pfizer, Precision Biosciences, Shenzhen Target Rx, Takeda; and research grants from AbbVie, Amgen, Ascentage, BMS, Daiichi-Sankyo, Immunogen, Jazz, Novartis. TMK
1. Dohner H, Estey E, Grimwade D, et al. Diagnosis and management of AML in adults: 2017 ELN recommendations from an international expert panel. Blood. 2017;129(4):424-447.
2. Arber DA, Orazi A, Hasserjian RP, et al. International consensus classification of myeloid neoplasms and ncute leukemia: integrating morphological, clinical, and genomic data. Blood. 2022;140(11):1200-1228.
3. Khoury JD, Solary E, Abla O, et al. The 5th edition of the World Health Organization Classification of haematolymphoid tumours: myeloid and histiocytic/dendritic neoplasms. Leukemia. 2022;36(7):1703-1719.
4. Grimwade D, Hills RK, Moorman AV, et al. Refinement of cytogenetic classification in acute myeloid leukemia: determination of prognostic significance of rare recurring chromosomal abnormalities among 5876 younger adult patients treated in the United Kingdom Medical Research Council trials. Blood. 2010;116(3):354-365.
5. Cornelissen JJ, Gratwohl A, Schlenk RF, et al. The European LeukemiaNet AML Working Party consensus statement on
discloses consulting or advisory role for Novartis, Jazz Pharmaceuticals, Pfizer, AbbVie/Genentech, Agios, Daiichi Sankyo/UCB Japan, Liberum, Sanofi, Servier, Pinot Bio and research funding from Bristol Myers Squibb, Celgene, Amgen, BiolineRx, Incyte, Genentech/AbbVie, Pfizer, Jazz Pharmaceuticals, AstraZeneca, Astellas Pharma, Ascentage Pharma, Genfleet Therapeutics, Cyclacel, Pulmotech, Cellenkos, Glycomimetics, Astex Pharmaceuticals, Iterion Therapeutics, Delta-Fly Pharma. All other authors have no conflicts of interest to disclose.
GRC collected and analyzed the data. GRC and TMK wrote the manuscript. CRR, KS, DH, KM collected data and reviewed the manuscript. KT and RKS provided genomic data and reviewed the manuscript. GT provided and reviewed cytogenetic data and reviewed the manuscript. EJS and AA provided transplant data and reviewed the manuscript. KB, CDD, GB, NP, NGD, GGM, MYK, FR, HMK, and TMK have treated patients included in this study, generated clinical data and reviewed the manuscript.
The authors are grateful to the patients who were treated at the MD Anderson Cancer Center and have been included in this study.
Qualified researchers may request access to individual patient-level data reported in this article after print publication of the current article. No identifying data will be provided. All requests for data must include a description of the research proposal and be submitted to the corresponding author.
allogeneic HSCT for patients with AML in remission: an integrated-risk adapted approach. Nat Rev Clin Oncol. 2012;9(10):579-590.
6. Groschel S, Sanders MA, Hoogenboezem R, et al. A single oncogenic enhancer rearrangement causes concomitant EVI1 and GATA2 deregulation in leukemia. Cell. 2014;157(2):369-381.
7. Yamazaki H, Suzuki M, Otsuki A, et al. A remote GATA2 hematopoietic enhancer drives leukemogenesis in inv(3)(q21;q26) by activating EVI1 expression. Cancer Cell. 2014;25(4):415-427.
8. Goyama S, Yamamoto G, Shimabe M, et al. Evi-1 is a critical regulator for hematopoietic stem cells and transformed leukemic cells. Cell Stem Cell. 2008;3(2):207-220.
9. Zhang Y, Stehling-Sun S, Lezon-Geyda K, et al. PR-domaincontaining Mds1-Evi1 is critical for long-term hematopoietic stem cell function. Blood. 2011;118(14):3853-3861.
10. Ayoub E, Wilson MP, McGrath KE, et al. EVI1 overexpression reprograms hematopoiesis via upregulation of Spi1 transcription. Nat Commun. 2018;9(1):4239.
11. Katayama S, Suzuki M, Yamaoka A, et al. GATA2 haploinsufficiency accelerates EVI1-driven leukemogenesis. Blood. 2017;130(7):908-919.
12. Sun J, Konoplev SN, Wang X, et al. De novo acute myeloid leukemia with inv(3)(q21q26.2) or t(3;3)(q21;q26.2): a clinicopathologic and cytogenetic study of an entity recently added to the WHO classification. Mod Pathol. 2011;24(3):384-389.
13. Lugthart S, Groschel S, Beverloo HB, et al. Clinical, molecular, and prognostic significance of WHO type inv(3)(q21q26.2)/t(3;3)(q21;q26.2) and various other 3q abnormalities in acute myeloid leukemia. J Clin Oncol. 2010;28(24):3890-3898.
14. Rogers HJ, Vardiman JW, Anastasi J, et al. Complex or monosomal karyotype and not blast percentage is associated with poor survival in acute myeloid leukemia and myelodysplastic syndrome patients with inv(3)(q21q26.2)/t(3;3)(q21;q26.2): a Bone Marrow Pathology Group study. Haematologica. 2014;99(5):821-829.
15. Lavallee VP, Gendron P, Lemieux S, D'Angelo G, Hebert J, Sauvageau G. EVI1-rearranged acute myeloid leukemias are characterized by distinct molecular alterations. Blood. 2015;125(1):140-143.
16. Groschel S, Sanders MA, Hoogenboezem R, et al. Mutational spectrum of myeloid malignancies with inv(3)/t(3;3) reveals a predominant involvement of RAS/RTK signaling pathways. Blood. 2015;125(1):133-139.
17. Breems DA, Van Putten WL, De Greef GE, et al. Monosomal karyotype in acute myeloid leukemia: a better indicator of poor prognosis than a complex karyotype. J Clin Oncol. 2008;26(29):4791-4797.
18. Kleinbaum DG, Klein M. Survival Analysis: a Self-Learning Text, Third Edition. New York, NY: Springerx. 2012.
19. DiNardo CD, Lachowiez CA, Takahashi K, et al. Venetoclax combined with FLAG-IDA induction and consolidation in newly diagnosed and relapsed or refractory acute myeloid leukemia. J Clin Oncol. 2021;39(25):2768-2778.
20. Walter RB, Othus M, Borthakur G, et al. Prediction of early death after induction therapy for newly diagnosed acute myeloid leukemia with pretreatment risk scores: a novel paradigm for treatment assignment. J Clin Oncol. 2011;29(33):4417-4423.
21. Lugthart S, Figueroa ME, Bindels E, et al. Aberrant DNA hypermethylation signature in acute myeloid leukemia directed by EVI1. Blood. 2011;117(1):234-241.
22. Wanquet A, Prebet T, Berthon C, et al. Azacitidine treatment for patients with myelodysplastic syndrome and acute myeloid leukemia with chromosome 3q abnormalities. Am J Hematol. 2015;90(10):859-863.
23. Sallman DA, Barnard J, Al Ali NH, et al. Hypomethylating agent therapy in myelodysplastic syndromes with chromosome 3 abnormalities. Clin Lymphoma Myeloma Leuk. 2020;20(9):e597-e605.
24. Fenaux P, Mufti GJ, Hellstrom-Lindberg E, et al. Efficacy of azacitidine compared with that of conventional care regimens in the treatment of higher-risk myelodysplastic syndromes: a randomised, open-label, phase III study. Lancet Oncol. 2009;10(3):223-232.
25. Kantarjian HM, Thomas XG, Dmoszynska A, et al. Multicenter, randomized, open-label, phase III trial of decitabine versus patient choice, with physician advice, of either supportive care or low-dose cytarabine for the treatment of older patients with newly diagnosed acute myeloid leukemia. J Clin Oncol. 2012;30(21):2670-2677.
26. Dombret H, Seymour JF, Butrym A, et al. International phase 3 study of azacitidine vs conventional care regimens in older patients with newly diagnosed AML with >30% blasts. Blood. 2015;126(3):291-299.
27. Sitges M, Boluda B, Garrido A, et al. Acute myeloid leukemia with inv(3)(q21.3q26.2)/t(3;3)(q21.3;q26.2): study of 61 patients treated with intensive protocols. Eur J Haematol. 2020;105(2):138-147.
28. DiNardo CD, Jonas BA, Pullarkat V, et al. Azacitidine and venetoclax in previously untreated acute myeloid leukemia. N Engl J Med. 2020;383(7):617-629.
29. Wei AH, Montesinos P, Ivanov V, et al. Venetoclax plus LDAC for newly diagnosed AML ineligible for intensive chemotherapy: a phase 3 randomized placebo-controlled trial. Blood. 2020;135(24):2137-2145.
30. Kadia TM, Reville PK, Borthakur G, et al. Venetoclax plus intensive chemotherapy with cladribine, idarubicin, and cytarabine in patients with newly diagnosed acute myeloid leukaemia or high-risk myelodysplastic syndrome: a cohort from a single-centre, single-arm, phase 2 trial. Lancet Haematol. 2021;8(8):e552-e561.
31. Granfeldt Ostgard LS, Medeiros BC, Sengelov H, et al. Epidemiology and clinical significance of secondary and therapy-related acute myeloid leukemia: a national populationbased cohort study. J Clin Oncol. 2015;33(31):3641-3649.
32. Hulegardh E, Nilsson C, Lazarevic V, et al. Characterization and prognostic features of secondary acute myeloid leukemia in a population-based setting: a report from the Swedish Acute Leukemia Registry. Am J Hematol. 2015;90(3):208-214.
33. Sasaki K, Montalban-Bravo G, Kanagal-Shamanna R, et al. Natural history of newly diagnosed myelodysplastic syndrome with isolated inv(3)/t(3;3). Am J Hematol. 2020;95(12):E326-E329.
34. Rogers HJ, Hsi ED. Myeloid neoplasms with inv(3)(q21q26.2) or t(3;3)(q21;q26.2). Surg Pathol Clin. 2013;6(4):677-692.
35. Weisser M, Haferlach C, Haferlach T, Schnittger S. Advanced age and high initial WBC influence the outcome of inv(3) (q21q26)/t(3;3) (q21;q26) positive AML. Leuk Lymphoma. 2007;48(11):2145-2151.
36. Mohr B, Schetelig J, Schafer-Eckart K, et al. Impact of allogeneic haematopoietic stem cell transplantation in patients with abnl(17p) acute myeloid leukaemia. Br J Haematol. 2013;161(2):237-244.
37. Birdwell C, Fiskus W, Kadia TM, DiNardo CD, Mill CP, Bhalla KN. EVI1 dysregulation: impact on biology and therapy of myeloid malignancies. Blood Cancer J. 2021;11(3):64.
38. Pradhan AK, Mohapatra AD, Nayak KB, Chakraborty S. Acetylation of the proto-oncogene EVI1 abrogates Bcl-xL promoter binding and induces apoptosis. PLoS One. 2011;6(9):e25370.
Cristiana O’Brien,1 Tianyi Ling,1 Jacob M. Berman,2 Rachel Culp-Hill,3 Julie A. Reisz,3 Vincent Rondeau,2 Soheil Jahangiri,1,2 Jonathan St-Germain,2 Vinitha Macwan,2 Audrey Astori,2 Andy Zeng,2 Jun Young Hong,4 Meng Li,5 Min Yang,4 Sadhan Jana,4 Fabia Gamboni,3 Emily Tsao,1 Weiyi Liu,2 John E. Dick,2 Hening Lin,6 Ari Melnick,5 Anastasia Tikhonova,1,2 Andrea Arruda,1 Mark D. Minden,1,2 Brian Raught,1,2 Angelo D'Alessandro3 and Courtney L. Jones1,2
1Department of Medical Biophysics, University of Toronto, Toronto, Ontario, Canada;
2Princess Margaret Cancer Center, University Health Network, Toronto, Ontario, Canada; 3Biochemistry and Molecular Genetics, University of Colorado Anschutz Medical Campus, Aurora, CO, USA; 4Department of Chemistry and Chemical Biology, Cornell University, Ithaca, NY, USA; 5Department of Medicine, Division of Hematology & Medical Oncology, Weill Cornell Medical College, New York, NY, USA and 6Howard Hughes Medical Institute; Department of Chemistry and Chemical Biology, Cornell University, Ithaca, NY, USA
Correspondence: C.L. Jones
Courtney.jones@uhnresearch.ca
Received: August 5, 2022.
Accepted: March 30, 2023.
Early view: April 6, 2023.
https://doi.org/10.3324/haematol.2022.281894
©2023 Ferrata Storti Foundation
Published under a CC BY-NC license
Outcomes for patients with acute myeloid leukemia (AML) remain poor due to the inability of current therapeutic regimens to fully eradicate disease-initiating leukemia stem cells (LSC). Previous studies have demonstrated that oxidative phosphorylation (OXPHOS) is an essential process that is targetable in LSC. Sirtuin 3 (SIRT3), a mitochondrial deacetylase with a multi-faceted role in metabolic regulation, has been shown to regulate OXPHOS in cancer models; however, it has not yet been studied in the context of LSC. Thus, we sought to identify if SIRT3 is important for LSC function. Using RNAi and a SIRT3 inhibitor (YC8-02), we demonstrate that SIRT3 is a critical target for the survival of primary human LSC but is not essential for normal human hematopoietic stem and progenitor cell function. In order to elucidate the molecular mechanisms by which SIRT3 is essential in LSC we combined transcriptomic, proteomic, and lipidomic approaches, showing that SIRT3 is important for LSC function through the regulation of fatty acid oxidation (FAO) which is required to support OXPHOS and ATP production in human LSC. Further, we discovered two approaches to further sensitize LSC to SIRT3 inhibition. First, we found that LSC tolerate the toxic effects of fatty acid accumulation induced by SIRT3 inhibition by upregulating cholesterol esterification. Disruption of cholesterol homeostasis sensitizes LSC to YC8-02 and potentiates LSC death. Second, SIRT3 inhibition sensitizes LSC to the BCL-2 inhibitor venetoclax. Together, these findings establish SIRT3 as a regulator of lipid metabolism and potential therapeutic target in primitive AML cells.
Acute myeloid leukemia (AML) is a devastating disease with a high rate of relapse and poor survival outcomes.1 In many patients, disease relapse is caused by the persistence of the disease-initiating leukemic stem cells (LSC),2 necessitating the development of LSC-directed therapies. LSC uniquely rely on oxidative phosphorylation (OXPHOS) for ATP production and ultimately their survival.3
One family of proteins which have been shown to regulate energy metabolism in cancer are sirtuins (SIRT). The SIRT family of proteins are responsible for removing multiple
post-translational modifications including acetylation, ribosylation, succinylation, and malonylation. Although SIRT are highly studied in the context of aging and cancer,4 less is known about the role of SIRT in cancer stem cells (CSC).
Sirtuins 1,5-7 28 and 69 have been associated with CSC in solid tumors. In AML, sirtuins 1,10,11 2,12,13 3,14,15 5,16 6,17 and 717 have been shown to play important roles in leukemic survival, however only SIRT1 has been reported to regulate LSC function.10,11
SIRT3 is one of three SIRT which localize to the mitochondria where it plays a key role in orchestrating several critical metabolic pathways through deacetylation of
mitochondrial proteins on lysine residues.18 In cancer cells, SIRT3 has been shown to suppress reactive oxygen species (ROS) levels, promote glutamine metabolism, regulate fatty acid synthesis, inhibit and promote glycolysis, regulate iron metabolism, decrease HIF1α activity, and increase the activity of the citric acid cycle.15,19-21 However, the function of SIRT3 in LSC has not been elucidated. In this study we show that SIRT3 is critical for LSC function in part by promoting fatty acid oxidation (FAO). Inhibition of SIRT3 results in the loss of energy production and fatty acid accumulation in LSC. Further, we demonstrate that LSC are uniquely protected from fatty acid-induced cell death by upregulating protective cholesterol metabolism pathways, which can be targeted to further sensitize LSC to SIRT3 inhibition. Finally, we demonstrate that SIRT3 inhibition sensitizes LSC to the BCL-2 inhibitor venetoclax which is commonly used to treat chemotherapy ineligible AML patients.
Primary acute myeloid leukemia and cell culture
Primary cells obtained were obtained from donors who gave informed consent for sample procurement under the Princess Margaret Leukemia Tissue Bank protocol and analyzed with University Health Network Research Ethics Board approval (20-5031). Cells were cultured in X-Vivo10 media (Lonza; 04-380Q), supplemented with 20% BIT (StemCell; 09500) and cytokines (IL-3, IL-6, SCF, FLT3 ligand). Patient details are available in the Online Supplementary Table S1. Additional culture information is available in the Online Supplementary Appendix
BODIPY staining
BODIPY 581/591 C11 was prepared in media at 2-4 mM. Cells were incubated for 20-45 minutes at 37°C.
Inhibitors/chemicals
YC8-02 was synthesized as previously described.19 Dipyridamole was obtained from Selleck Chemicals (S1895-10 mM/1 mL). Dimethyl 2-oxogluterate (349631-5G) was obtained from Sigma-Aldrich. Linoleic acid (L8134), palmitic acid 13C16 (605573), and palmitic acid 16-13C (605646) were obtained from Sigma-Aldrich. Venetoclax was obtained from Cedarlane (HY-15531-500 mg).
Cord blood (CB) samples were CD34+ enriched using the Miltenyi Biotec’s CD34 microbead magnetic separation kit (130-046-702) following product specifications.
Animal studies were performed in accordance with UHN’s
Animal Resource Center, under animal use protocol 6366 as previously described.22 Detailed methods are available in the Online Supplementary Appendix.
Primary AML samples were sorted for enriched LSC and blast populations as previously described.23 Additional information is available in the Online Supplementary Appendix
Primary samples enriched for LSC, were treated with YC802 inhibitor at 10 mM and 25 mM for 4 hours. RNA was isolated using Qiagen’s RNeasy micro kit (74004). Sample quality was assessed using Agilent Bioanalyzer prior to library preparation and sequencing. RNA sequencing was performed using Illumina Novaseq 6000 using a 100-cycle paired-read protocol with multiplexing resulting in ~40 million reads/sample. Detailed data analysis available in the Online Supplementary Appendix. SIRT3 network analysis is also available in the Online Supplementary Appendix.
Proximity-dependent biotinylation
BioID was performed as previously described.24 Detailed methods are available in the Online Supplementary Appendix
Cell lysates were loaded on 4-15% precast gels (Bio-Rad) and transferred to PVDF membrane (Bio-RAD). Blots were probed with primary anti-FLAG antibody (Sigma-Aldrich, 8146S), GAPDH antibody (SantaCruz; sc-32233), or SIRT3 antibody (Cell Signaling; 5490S) overnight at 4°C, followed by 1-hour incubation with secondary antibody (LI-COR Biosciences, IRDye® 680RD). Blots were imaged using Odyssey® DLx system (LI-COR Biosciences).
Quantitative real-time polymerase chain reaction
RNA was isolated as described above, cDNA was synthesized using the iScript cDNA Synthesis Kit (Bio-Rad; 1708891) and quantitative real-time polymerase chain reaction (RT-qPCR) was performed using Itaq Universal SYBR (BioRad; 1725122).
Enzyme activity and ATP quantification assays
ATP levels were quantified using a kit Roche (11699709001) following the manufacture’s protocol.
Colony-forming unit (CFU) assays,22 small interfering RNA (siRNA) transfection,25 seahorse analysis,22 and metabolic analysis26 were performed as previously described. Additional information is available in the Online Supplementary Appendix
SIRT3 is essential for acute myeloid leukemia survival
In order to establish whether SIRT were essential in LSC, we used siRNA to knockdown each sirtuin in four primary AML specimens (Online Supplementary Figure S1A), then measured cell viability (Online Supplementary Figure S1B) and colony-forming potential (Figure 1A). These data revealed that knockdown of SIRT3 and SIRT4 consistently decreased the viability and colony-forming potential of AML specimens. We chose to focus our subsequent analysis on SIRT3 because of its well characterized role in mitochondrial energy metabolism, an Achilles heel of LSC. 3 Knockdown of SIRT3 in three additional primary AML specimens ( Online Supplementary Figure S1C) and the Molm13 AML cell line confi rmed that SIRT3 knockdown decreased AML viability and colony-forming potential (Figure 1B, C; Online Supplementary Figure S1D, E). Importantly, knockdown of SIRT3 in CD34 + enriched human CB, did not alter colony-forming ability (Figure 1D; Online Supplementary Figure S1F). In order to understand the impact of SIRT3 on stemness, we evaluated the colony-forming ability of primary AML specimens and normal bone marrow upon secondary replating of colonies. In four primary AML specimens, colony-forming potential was signi fi cantly decreased upon replating of SIRT3 knockdown cells compared to the non-targeting control (Online Supplementary Figure S1G, H). In contrast, there was no effect on the serial colony-forming ability of normal bone marrow samples upon knockdown (Online Supplementary Figure S1I, J ) demonstrating a potential therapeutic window to target SIRT3 in AML while minimally affecting normal hematopoietic stem and progenitor cells (HSPC).
In order to assess the impact of SIRT3 on LSC specifically, we knocked down SIRT3 in enriched LSC and AML blast populations from primary AML patient specimens. LSC and AML blasts were enriched using relative reactive oxygen species (ROS) level as previously described.23 LSC enrichment was validated by measuring colony-forming potential ( Online Supplementary Figure S1K ) which revealed that cells with relatively low levels of ROS (enriched LSC) had increased colony-forming potential compared to cells with high levels of ROS (enriched AML blasts). We also confi rmed that ROS low cells are enriched for CD34+, a well-established marker of LSC,27 (Online Supplementary Figure S1L) as previously shown.22 When SIRT3 was knocked down in enriched LSC populations, colony-forming potential was signi fi cantly decreased (Online Supplementary Figure S1M, N). Next, we used the gold-standard assay for assessing LSC and HSC function, engraftment into immune de fi cient mice28 upon SIRT3 knockdown. SIRT3 was knocked down by siRNA in a primary human AML and a normal bone
marrow sample, then transplanted into NSG-SGM3 mice ( Online Supplementary Figure S1O ). SIRT3 knockdown (Online Supplementary Figure S1P) resulted in a significant decrease in AML engraftment (Figure 1E) but did not impair the engraftment or lineage output of normal bone marrow (Figure 1F; Online Supplementary Figure S1Q, R).
In order to further evaluate SIRT3 in AML, we assessed viability and colony-forming potential upon treatment with a SIRT3 inhibitor, YC8-02 19,29 which has previously been shown to target mitochondrial SIRT3 with minor effects on other class one sirtuin proteins, SIRT1 and SIRT2. Importantly, knockdown of SIRT1 and SIRT2 did not affect AML viability or colony-forming potential (Figure 1A; Online Supplementary Figure S1B ) suggesting that any effects of YC8-02 in AML would be SIRT3-mediated. In line with our SIRT3-knockdown experiments, cell viability and colony-forming potential of AML cell lines was signi ficantly decreased upon YC8-02 treatment (Online Supplementary Figure S2A, B ), which correlated with a dose-dependent increase in apoptosis ( Online Supplementary Figure S2C). We then determined the effect of YC8-02 on LSC and blasts enriched from primary AML. Enriched populations were cultured for 48 hours with or without YC8-02 before assessing viability and colonyforming ability. YC8-02 treatment resulted in a significant decrease in LSC and AML blast viability (Online Supplementary Figure S2D ) and a decrease in colony-forming potential of LSC compared to vehicle treatment (Figure 2A). SIRT3 inhibition upon YC8-02 treatment did not decrease the CD34+ cell frequency or colony-forming potential of HSPC isolated from MPBC ( Online Supplementary Figure S2B, E). In order to evaluate the effect of YC8-02 on stemness, secondary colony-forming potential was assessed in AML and normal bone marrow. Upon secondary replating of colonies, the colony-forming potential was signi fi cantly decreased in AML and unaffected in normal bone marrow when treated with YC8-02 (Figure 2C, D).
Finally, to assess the effect of SIRT3 inhibition on LSC and HSPC function, we used the gold-standard assay, engraftment into immune de fi cient mice. Three primary human AML samples and two normal bone marrow specimens were treated with YC8-02 for 24 hours, then transplanted into NSG-SGM3 mice. YC8-02 treatment resulted in a significant decrease in AML engraftment for each AML specimen (Figure 2E) but did not significantly impair the engraftment or lineage output of normal bone marrow (Figure 2F; Online Supplementary Figure S2F). These findings demonstrate that inhibiting SIRT3 significantly impairs LSC function and demonstrate a potential therapeutic window in which LSC can be targeted with minimal effects on normal bone marrow.
Figure 1. SIRT3 knockdown targets acute myeloid leukemia but not hematopoietic stem and progenitor cells. (A) Colony-forming ability of four primary acute myeloid leukemia (AML) specimens (AML1-4) post scrambled and sirturin (SIRT) targeting small interfering RNA (siRNA) transfection. Colony-forming unit (CFU) assay was prepared immediately after electroporation. Statistical significance was determined by one-way ANOVA analysis. Each dot represents a primary AML specimen. (B) Viability of bulk AML 48 hours post scrambled or SIRT3 targeting siRNA transfection in 7 primary AML specimens (AML 1-5, 14 and 15). Statistical significance was determined using a paired t-test. Each dot represents a primary AML specimen. (C) Colony-forming potential of bulk AML post scrambled or SIRT3 targeting siRNA transfection in 7 primary AML specimens (AML. 1-5, 14, and 15). CFU assay was prepared immediately after electroporation. Statistical significance was determined using a paired t-test. Each dot represents a primary AML specimen. (D) Colony-forming potential of 2 CD34-enriched cord blood samples post scrambled or SIRT3 targeting siRNA transfection. CFU assay was prepared immediately after electroporation. Statistical significance was determined using a paired t-test. (E) Engraftment of AML24 post scrambled or SIRT3 targeting siRNA transfection. Each point represents a single mouse. Statistical significance was determined using an unpaired t-test. (F) Engraftment of normal bone marrow post scrambled or SIRT3 targeting siRNA transfection. Each point represents a single mouse. Statistical significance was determined using an unpaired t-test. All error bars represent standard deviation. *P<0.05, **P<0.01, ***P<0.005, ****P<0.001; ns: not significant.

In order to determine the molecular mechanisms by which SIRT3 is important in LSC and AML, we performed
proximity-dependent biotin labeling (BioID) to map the SIRT3 interactome. SIRT3 was expressed in 293 Flp-In cells (Online Supplementary Figure S3A), with an in-frame
Figure 2. SIRT3 inhibition perturbs leukemia stem cell function and spares normal hematopoietic stem and progenitor cells. (A) Colony-forming ability of reactive-oxygen species (ROS) low leukemia stem cells (LSC) was assessed from 6 primary acute myeloid leukemia (AML) (AML 4, 5, 7, 8, 9, 14) and treated with YC8-02 for 24 hours at increasing doses, when possible, prior to performing the colony-forming unit (CFU) assay. Each dot represents a unique AML. Statistical significance was determined using ordinary one-way ANOVA. (B) Colonyforming ability of representative mobilized peripheral blood cells (MPBC) following treatment with YC8-02 for 24 hours at increasing doses prior to performing the CFU assay. Statistical significance was determined using two-way ANOVA. (C) Serial colony-forming ability of primary AML 7, 9, 10, and 24 treated with 10 µM YC8-02 for 24 hours. Each dot represents a unique AML. Statistical significance was determined using an unpaired t-test. (D) Serial colony-forming ability of normal bone marrow treated with 10 µM YC8-02 for 24 hours. Statistical significance was determined using an unpaired t-test. (E) Engraftment of 3 primary AML treated with YC8-02. Each point represents a single mouse. Statistical significance was determined using an unpaired t-test. (F) Engraftment of 2 normal bone marrow specimens in NSG-SGM3 mice following treatment with YC8-02. Each point represents a single mouse. Statistical significance was determined using an unpaired t-test. All error bars represent standard deviation. *P<0.05, **P<0.01, ***P<0.005, ****P<0.001; ns: not significant.

C-terminal BirA*-Flag tag, and BioID was conducted as previously described.30 SIRT3 interactors identified by mass spectrometry were compared to those interacting with the Flag-BirA* tag alone, and with the interactomes of two other mitochondrial matrix proteins, NLN31 and ClpP.32 After subtraction of interactors detected with all three mitochondrial proteins, 316 high confidence SIRT3specific proximity interactors were identified (Online Supplementary Table S2). Three-hundred and one of these hits (95%) are annotated as mitochondrial proteins (Online Supplementary Table S2), linked to lipid, amino acid, and carbohydrate metabolism as well as tricarboxylic acid (TCA) cycle, and respiratory electron transport functions (Online Supplementary Figure S3B). We next compared our BioID analysis to two previously published SIRT3 proteomic analyses: one which interrogated SIRT3 interactors by SIRT3 immunoprecipitation followed by mass spectrometry (IP-MS) and another identified differentially acetylated proteins differentially acetylated upon SIRT3 knockout. SIRT3 IP-MS studies identified 84 interactors, 44 of which were also identified in our BioID analysis (Online Supplementary Figure S3B, red outlines33). We also identified 54 previously reported SIRT3 de-acetylation substrates (Online Supplementary Figure S3B in rectangular nodes34). Overall, these data suggest that SIRT3 may have an important function in regulating mitochondrial energy metabolism, but which metabolic pathway(s) are essential for LSC function were unclear.
While BioID has been previously used to interrogate the functions of proteins in AML,31,32 one limitation of these studies is that it is not currently feasible to perform this analysis in rare cell populations like LSC. In order to interrogate SIRT3 biology specifically in enriched LSC and AML blasts, we performed a global transcriptomic analysis on LSC and blasts upon YC8-02 treatment. LSC and AML blasts from three primary AML specimens were treated with vehicle or YC8-02 for 4 hours. Eight hundred and sixty-nine and 57 genes were significantly altered in LSC and AML blasts upon SIRT3 inhibition, respectively. Gene set enrichment analysis demonstrated significant alterations in several biological functions including pathways pertaining to mitochondrial metabolism (Online Supplementary Figure S3C). Intriguingly, OXPHOS and FAO were amongst the most highly enriched gene sets in LSC (Online Supplementary Figure S3D, E). Notably, proteins involved in each step of FAO were identifi ed as SIRT3 proximity interactors (Figure 3A). Next, we integrated the BioID and gene expression data with the goal of identifying genes most likely to be regulated by SIRT3 in LSC. Specifically, we identified transcripts that were significantly altered in LSC or AML blasts upon YC8-02 treatment, and which encode SIRT3 proximity interactors, to generate SIRT3 LSC and SIRT3 AML blast networks comprising 45 and nine genes, respectively (Online Supplementary Figure
S3F; Online Supplementary Table S3). Utilizing published datasets (details available in the Online Supplementary Appendix), we observed that the SIRT3 LSC network but not the SIRT3 AML blast network was enriched in functional LSC compared to non-LSC. It is also notable that SIRT3 itself was also enriched in LSC populations but to a lesser extent (Figure 3B). Finally, to interrogate the biological significance of these SIRT3 networks, we correlated the GSVA enrichment scores of each SIRT3 network against enrichment scores of biological pathways across 812 primary AML samples. This analysis revealed correlations with several fatty acid metabolism and OXPHOS processes that were strongest with the SIRT3 LSC network compared to the SIRT3 blast network or SIRT3 itself (Figure 3C). Together, the integration of our proteomic and transcriptomic data suggests a role of SIRT3 in the regulation of OXPHOS and fatty acid metabolism in LSC.
In order to functionally demonstrate a link between SIRT3 and OXPHOS in LSC we measured OXPHOS in AML cell lines, primary AML specimens and LSC upon SIRT3 perturbation using a seahorse assay. OXPHOS was decreased in Molm13, MV4;11, and TEX cells, after 24 hours of SIRT3 knockdown (Online Supplementary Figure S4A, B) and upon 4, 8, and 24 hours of YC8-02 treatment at increasing doses (Online Supplementary Figure S4C-E). These changes were evident as early as 4 hours post treatment, and the effects were further increased at later time points (8 and 24 hours) in a dose-dependent manner. Next, we examined the effect of SIRT3 knockdown (Figure 4A) and YC8-02 treatment (Figure 4B) in primary AML specimens. SIRT3 perturbation significantly decreased basal respiration in AML specimens (Figure 4A) and primary human LSC (Figure 4B). Importantly, decreased OXPHOS corresponded with a decrease in cellular ATP in LSC (Figure 4C) indicating that SIRT3 perturbation disrupted mitochondrial energy metabolism. In contrast, SIRT3 knockdown and YC8-02 treatment of normal bone marrow and MPBC respectively did not result in decreased OXPHOS (Figure 4D, E). We observed no compensatory effect of glycolysis in the cell lines or the primary AML specimens (Online Supplementary Figure S4F-I), consistent with findings that show LSC are uniquely reliant on OXPHOS and cannot compensate with upregulation of glycolysis.35 In normal HSPC, we observed a minimal increase in glycolysis upon SIRT3 knockdown (Online Supplementary Figure S4J) and no change in glycolysis upon YC8-02 treatment (Online Supplemental Figure S4K). Overall, these data demonstrate that SIRT3 perturbation results in decreased OXPHOS in both primary LSC and cell lines, resulting in reduced cellular ATP, the likely cause of SIRT3 mediated cell death.

In order to determine if SIRT3 decreases OXPHOS by perturbing fatty acid metabolism in LSC, we performed mass spectrometry-mediated metabolomic analyses. In AML cell lines treated with YC8-02 for 4 hours, there was a significant elevation of fatty acid levels (Online Supplementary Figure S5A). We next examined fatty acid levels in four primary AML specimens upon SIRT3 knockdown for 24 hours, as well as LSC enriched from three primary AML specimens treated with YC8-02 for 0, 4, 8, or 12 hours. Upon SIRT3 perturbation, fatty acids levels were significantly increased in the AML samples (Figure 5A) and LSC (Figure 5B) as early as 4 hours post YC8-02 treatment. No other
Figure 3. SIRT3 regulates mitochondrial energy metabolism in acute myeloid leukemia. (A) Fatty acid oxidation proteins identified as proximity interactors of SIRT3 (dark blue) or not identified as interactors (light blue). (B) Expression of SIRT3 leukemia stem cells (LSC) network, SIRT3 blast network and SIRT3 individually in functional LSC and non-LSC based using GSVA on quantile normalized microarray data (for the networks) or quantile normalized microarray (for SIRT3 alone). Data derived from 220 sorted fractions.33 (C) Correlation of metabolic pathways with SIRT3 LSC network, SIRT3 blast network and SIRT3 individually. Bars represent the Pearson correlation across 812 diagnostic acute myeloid leukemia (AML) patients from TCGA, Beat-AML and Leucegene databases. Network data was generated by using GSVA on transcript per million (TPM) normalized RNA sequencing (RNA-seq) data and the SIRT3 data was generated using variance stabilizing transformation (VST) normalized RNA-seq data and COMBAT batch corrected. *P<0.05, **P<0.01, ***P<0.005, ****P<0.001; ns: not significant.
metabolites previously associated with SIRT3 function such as glutamate19 or succinate36 were significantly altered at 4 hours post YC8-02 treatment (data not shown).
Based on our data above, we hypothesized that fatty acid levels are increased upon SIRT3 perturbation due to a reduction in FAO. In order to test this, we performed a stable isotope labeled (SIL) tracing analysis using 13C16palmitate (Online Supplementary Figure S5B) and examined the incorporation of 13C carbons into TCA cycle intermediates. First, 13C16-palmitate tracing analysis was performed on Molm13 cells 24 hours after electroporation
Figure 4. SIRT3 regulates oxidative phosphorylation. (A) Basal respiration of 3 bulk primary acute myeloid leukemia (AML) transfected with small interfering RNA (siRNA) targeting SIRT3 or a non-targeting scrambled siRNA. Measurements taken 24 hours post electroporation. Statistical significance was determined using an unpaired t-test. (B) Basal respiration of leukemia stem cells (LSC) enriched from 3 primary AML treated with YC8-02 for 12 hours prior to read out. Statistical significance was determined using an unpaired t-test. (C) Total cellular ATP quantified from bulk AML (AML 4, 5, and 14) treated with 10 µM of YC8-02 for 4, 8, or 12 hours. ATP quantities are normalized to the baseline measurement. Each dot represents an AML specimen. Statistical significance was determined using RM one-way ANOVA. (D) Basal respiration of normal bone marrow samples transfected with siRNA targeting SIRT3 or a non-targeting scrambled siRNA. Measurements taken 24 hours post electroporation. Statistical significance was determined using an unpaired t-test. (E) Basal respiration of three mobilized peripheral blood cell (MPBC) samples treated with YC8-02 for 12 hours prior to readout. Statistical significance was determined using an unpaired t-test. All error bars represent standard deviation. *P<0.05, **P<0.01, ***P<0.005, ****P<0.001; ns: not significant. OCR: oxygen consumption rate; KD: knockout.
with control or SIRT3 targeting siRNA (Online Supplementary Figure S5C). SIRT3 knockdown resulted in a loss of TCA cycle intermediates including citrate, succinate, and fumarate derived from 13C16-palmitate, demonstrating that SIRT3 perturbation in AML decreases FAO. We then treated the Molm13 cell line with 10 mM YC8-02 for 4 hours followed by a 4- or 16-hour treatment with SIL palmitic acid (Online Supplementary Figure S5D). SIRT3 inhibition also resulted in a significant decrease of 13C enrichment in TCA cycle intermediates.
Next, we confirmed our findings in primary AML specimens. We performed SIL tracing using three primary AML cells treated for 4 hours with 10 mM YC8-02 followed by introduction of SIL palmitic acid for an additional 16 hours. Compared to control, treatment with YC8-02 resulted in a decrease of TCA cycle intermediates in bulk primary AML specimens (Online Supplementary Figure S5E), enriched LSC (Figure 5C), and to a lesser extent, in enriched AML blasts (Online Supplementary Figure S5F). In order to
demonstrate that decreased FAO is essential to the mechanism by which SIRT3 mediated LSC death, we performed a rescue experiment by adding back the TCA cycle intermediate α-ketoglutarate analog dimethyl-2-oxogluterate (DMKG). The addition of DMKG partially rescued loss of viability upon YC8-02 treatment in primary AML but not AML cell lines (Figure 5D; Online Supplementary Figure S5G). It is important to note that recent studies highlight that DMKG affects metabolic processes outside of TCA metabolism.37 Overall, these data indicate that decreased FAO is one essential part of the mechanism by which SIRT3 inhibition targets LSC.

We hypothesized that lipid accumulation may also be resulting in AML cell death through lipotoxicity38 which is why we observed a partial and lack of rescue by DMKG treatment in LSC and AML cell lines respectively. Further,
Figure 5. SIRT3 inhibition results in fatty acid accumulation in leukemia stem cells. (A) Fatty acids measured by steady state mass spectrometry lipidomics on 4 bulk acute myeloid leukemia (AML) transfected with small interfering RNA (siRNA) targeting SIRT3 or a non-targeting scrambled siRNA. Samples were collected 24 hours post transfection. Significance was determined using a paired t-test. (B) Fatty acids in leukemia stem cells (LSC) enriched from three primary AML and treated with 10 µM YC802 for 4, 8 or 12 hours. Significance was determined using a paired t-test. (C) Stable isotope tracing analysis of LSC enriched from 3 primary AML specimens (AML 8, 10 and 12) treated with vehicle or 10 µM YC8-02 prior to introduction of 13C16-palmitate. Three TCA intermediates were detected in these analyses. Each point represents a unique AML specimen. Statistical significance was determined using an unpaired t-test. (D) Result of tricarboxylic acid cycle (TCA) cycle rescue on viability using bulk AML (AML 11). Cells were treated with dimethyl-2-oxoglutarate (DMKG) at 0 mM or 2.5 mM for 1 hour prior to introduction of 25 µM of YC8-02. Cells were incubated for 48 hours prior to analysis. Statistical significance was determined using ordinary one-way ANOVA. All error bars represent standard deviation. *P<0.05, **P<0.01, ***P<0.005, ****P<0.001; ns: not significant.

we postulated that LSC may be protected from lipid-mediated death due to metabolic compensatory pathways. In order to test this hypothesis, we phenocopied conditions for lipotoxicity by treating cell lines, primary human LSC, and AML blasts with linoleic acid.39,40 Strikingly different responses were observed between the primary cells (Figure 6A) and the cell lines (Figure 6B). While the cell lines, and to a lesser extent, AML blasts, have reduced viability when exposed to linoleic acid, LSC displayed no reduction in cell viability, indicating that LSC have intrinsic mechanisms to protect them from lipotoxicity. Further, primary AML specimens, both CD34+ and CD34- cells, did not display a significant increase in lipid ROS upon SIRT3 inhibition (Figure 6C). In contrast, cell lines treated with YC8-02 showed a significant accumulation lipid ROS staining (Figure 6D) in a manner corresponding to the sensitivity of each cell line to lipotoxic cell death (Figure 6B). These results show that lipid peroxidation likely plays a role in cell line-mediated cell death upon YC8-02 treatment in AML cell lines. In addition, these data suggest that the loss of LSC viability

upon SIRT3 inhibition, could be further enhanced by targeting protective mechanisms to lipotoxicity.
Cholesterol homeostasis is a potential mechanism that protects cells from lipotoxicity through cholesteryl-ester formation.41 Speci fi cally, the carboxylate group of fatty acids can form an ester bond with the hydroxyl group of cholesterols to form cholesteryl-esters which are less toxic to cells. In order to determine if LSC were protected from fatty acid accumulation through altered cholesterol metabolism, we measured both cholesterols and cholesteryl-esters accumulated in the primary LSC following 4, 8, and 12 hours of YC8-02 treatment (Figure 7A, B). Cholesterol and cholesteryl-ester levels were signi fi cantly elevated as early as 4 hours post drug treatment, consistent with the time point we observed an increase in fatty acid levels. In contrast, the AML cells lines, Molm13, OCI-AML-3, and MV4;11 did not display any changes in cholesterol or cholesteryl-ester levels in response to YC8-02 treatment (Online Supplementary Figure S6A, B). We hypothesized that primary AML cells were able to protect themselves against lipid accumulation by induc-
Figure 6. Leukemia stem cells are resistant to cell death induced by lipid accumulation. (A) Viability of leukemia stem cells (LSC) and acute myeloid leukemia (AML) blasts enriched from three primary AML (AML 6, 9, and 10) treated with linoleic acid for 48 hours. Statistical significance was determined using two-way ANOVA. (B) Viability of 3 AML cell lines (OCI-AML-3, Molm13, and MV4;11) treated with linoleic acid for 48 hours. Statistical significance was determined using ordinary one-way ANOVA. (C) BODIPY C11 mean florescence intensity (MFI) of primary AML 20, AML 21, AML 22, and AML 23 treated with 10 µM of YC8-02 for 8 hours. Statistical significance was determined using two-way ANOVA. (D) BODIPY C11 MFI of primary AML cell lines treated with 10 µM of YC8-02 for 8 hours. Statistical significance was determined using an unpaired t-test. All error bars represent standard deviation. *P<0.05, **P<0.01, ***P<0.005, ****P<0.001; ns: not significant.
ing cholesterol esterification. In order to test this hypothesis, we targeted the master regulators of cholesterol homeostasis sterol regulatory-element binding protein 1 and 2 (SREBP1 and SREBP2) which have been proposed to protect cells from lipotoxicity. 38,42-44 We used the SREBP1 and 2 inhibitor dipyridamole 42,45,46 alone or in combination with YC8-02 and measured LSC and blast viability. The effect of YC8-02 was potentiated by dipyri-
damole treatment in LSC isolated from two of the three AML specimens examined (Figure 7C). Further, the combination of SIRT3 knockdown with dipyridamole treatment resulted in significantly more cell death than single treatments ( Online Supplementary Figure S6C, D). In contrast, YC8-02 and dipyridamole treatment did not affect normal CD34+ cells isolated from cord blood (Online
Supplementary Figure S6E).
Figure 7. Combined inhibition of SIRT3 and cholesterol metabolism increases cell death. (A) Cholesterol levels detected by steady state mass-spectrometry lipidomic analysis in leukemia stem cells (LSC) enriched from 3 primary acute myeloid leukemia (AML) specimens and treated with 10 µM YC8-02 for 4, 8 or 12 hours. Statistical significance was determined using ordinary one-way ANOVA. (B) Cholesteryl-ester levels detected by steady state mass-spectrometry lipidomic analysis in LSC enriched from 3 primary AML specimens and treated with 10 µM YC8-02 for 4, 8 or 12 hours. Quantities are normalized to baseline control. Statistical significance was determined using ordinary one-way ANOVA. (C) Viability of LSC and AML blasts enriched from 3 primary AML specimens and treated with 10 µM YC8-02 alone or in combination with 0.5 µM dipyridamole. Statistical significance was determined using two-way ANOVA. All error bars represent standard deviation. *P<0.05, **P<0.01, ***P<0.005, ****P<0.001; ns: not significant.

It is highly likely that effective AML therapies will be delivered using combination treatment approaches. Therefore, we sought to determine if SIRT3 inhibition could sensitize AML cells to approved AML therapies including cytarabine, anthracyclines, and venetoclax. YC8-02 treatment sensitized AML cell lines to venetoclax treatment but not cytarabine or doxorubicin (data not shown). Recent research has identified fatty acid metabolism as a mode of resistance for AML cells to venetoclax.22,25,47 Since SIRT3 targets LSC in part through decreasing FAO it is unsurprising that YC8-02 sensitized AML cells to venetoclax. Next, we treated primary AML samples with venetoclax, YC8-02, or a combination of the two and assessed colony-forming ability (Figure 8A). Specimens treated with the combination of YC8-02 and venetoclax had a significantly decreased colony-forming ability compared to the individual treatments alone. We then used the gold-stan-
dard engraftment assay on AML samples treated with venetoclax, YC8-02, or a combination to assess their effect on functional LSC (Figure 8B). Strikingly, in a patient sample with no response to YC8-02 or venetoclax, the combination treatment resulted in almost undetectable levels of engraftment. These data suggest that targeting SIRT3 sensitizes LSC to venetoclax.
Disease relapse, which originates from residual LSC, remains a major hurdle in AML.2 Thus, it is essential to understand and target the unique properties of LSC to develop new therapies and improve patient outcomes. LSCdirected therapies such as venetoclax paired with hypomethylating agents, have shown tremendous progress in treating a subset of AML patients.48 Here, our results reveal SIRT3 as a novel target to eradicate LSC.
Figure 8. SIRT3 inhibition improves response to venetoclax. (A) Colony-forming ability of 4 primary acute myeloid leukemia (AML) specimens treated with 10 µM YC8-02, 100 nM of venetoclax or a combination of the two, treated for 72 hours prior to performing colony-forming unit (CFU) assay. Statistical significance was determined using an ordinary one-way ANOVA. (B) Engraftment of AML 7 treated with with 10 µM YC8-02, 100 nM of venetoclax, or a combination of the two for 24 hours prior to engraftment. Each point represents a single mouse. Statistical significance was determined using ordinary one-way ANOVA. All error bars represent standard deviation. *P<0.05, **P<0.01, ***P<0.005, ****P<0.001; ns: not significant.

In this study, we found that knockdown and pharmacologic inhibition of SIRT3 had a significant impact on LSC colony-forming potential and cell viability without significantly impacting normal HSPC function. These results highlight SIRT3 as a promising target for treating AML and demonstrate, for the first time, SIRT3’s roles in CSC. SIRT3 has been found to promote disease progression in a number of cancers including B-cell lymphoma.18,19 However, SIRT3’s role in cancer is not fully elucidated as SIRT3 is considered both a tumor suppressor and oncogene.49 The loss of LSC function upon SIRT3 inhibition was due to decreased OXPHOS, a well-established LSC vulnerability.3,35 Importantly, we demonstrate that reduced OXPHOS levels upon SIRT3 perturbation result in a decrease in ATP indicating that we are indeed decreasing overall energy production. Our findings represent a novel method to target a key metabolic pathway in LSC. Our data demonstrate that SIRT3 contributes to energy metabolism through regulation of fatty acid metabolism, which has been established as critical for AML function and response to therapy.3 As SIRT3 is a known regulator of many metabolic pathways, we sought to determine which pathways were significantly impacted by SIRT3 inhibition using a multi-omics approach, combining transcriptomic, metabolomic, and proteomic analyses. By combining these analyses and assessing several time points, we were able to focus our mechanistic studies on the earliest metabolic changes observed upon SIRT3 perturbation, which revealed FAO as a key metabolic pathway regulated by SIRT3 in LSC. FAO has previously been shown to be a metabolic vulnerability of LSC and represents a mechanism by which LSC become resistant to the BCL-2 inhibitor venetoclax.22,25,47 However, FAO had not been shown to be regulated by SIRT3 in CSC. Our work highlights the importance of examining the role of metabolic regulating proteins in various cancer types and cell types, as the essential metabolic pathways regulated by enzymes like SIRT3 vary depending on cellular context.
Lipid homeostasis and toxicity is an area of much interest in cancer biology and has been implicated in cancer development.38 When we phenocopied lipid accumulation in primary LSC we did not observe any changes in cell viability, unlike AML cell lines. Interestingly, the increase in fatty acids levels correlated with elevated cholesterol and cholesteryl-esters in LSC, but not cell lines. Cholesterol and cholesterol esterification have been proposed to be responsible for preventing lipotoxicity.50 Therefore, to obtain the full benefit of inhibiting fatty acid metabolism, we used dipyridamole to block the compensatory effect of cholesterol homeostasis and thereby enhance the effects of YC8-02 treatment. This finding was unique to LSC, demonstrating that interrogating LSC-specific biology is essential to elucidate novel targetable pathways and resistance mechanisms in AML.
SIRT3 has previously been shown to mediate treatment resistance15 through regulation of OXPHOS. In order to understand how SIRT3 inhibition may be beneficial as part of current patient therapy, we tested our SIRT3 inhibitor in combination with chemotherapy and venetoclax. We show that SIRT3 inhibition sensitizes AML cells to venetoclax. These findings are consistent with previous studies that identified that venetoclax resistance is in part driven by elevation of fatty acid metabolism, and that strategies designed to target fatty acid metabolism can sensitize AML cells to venetoclax.22,25,47 In our study, the combination of SIRT3 inhibition and venetoclax outperformed single agent treatments in primary AML specimens. Overall, we demonstrate that SIRT3 is a key regulator of FAO in LSC. Loss of FAO upon SIRT3 inhibition results in reduced OXPHOS and ATP levels ultimately leading to LSC cell death. We highlight the flexibility of primary AML in revealing the compensatory mechanism to evade fatty acid accumulation by cholesterol biosynthesis and esterification. Further, we demonstrate that SIRT3 inhibition improves response to venetoclax by inhibiting fatty acid metabolism, a mode of venetoclax resistance.
HL reports grants from Falk Medical Research Foundation during the conduct of the study, as well as other support from Sedec Therapeutics outside the submitted work. AMM reports grants from Falk Foundation during the conduct of the study; grants from Janssen, Epizyme, Sanofi, and Daiichi Sankyo and personal fees from Janssen, Epizyme, AstraZeneca, Bristol Myers Squibb, Daiichi Sankyo, and Exo Therapeutics outside the submitted work; and a patent for 8635-01-US issued. JED receives royalties from Trillium Therapeutics Inc, a commercial research grant from Celgene/BMS, and institutional licensing fees for AML models. All other authors have no conflicts of interest to disclose.
COB and TL designed and performed the research; collected, analyzed, and interpreted the data; performed the statistical analysis; and wrote the manuscript. JMB and VR designed and performed the experiments; collected and analyzed data, performed statistical analysis and wrote the manuscript. JAR, RC-H and FG performed metabolomics experiments; collected, analyzed, and interpreted metabolomics data; and wrote the manuscript. ET and WL performed experiments, collected, and analyzed data. AD designed the research, analyzed, and interpreted metabolic data, and wrote the manuscript. AZ and JED conceptualized and performed SIRT3 network analysis. JS-G, VM and AA performed proteomic analysis. BR designed the research, analyzed, and interpreted proteomic data, and wrote the manuscript. SJ and AT analyzed and interpreted transcriptomic data and wrote the manuscript. HL, JYH, MY
and SJ synthesized and provided YC8-02, advised on its use for all studies and wrote the manuscript. ML and AM helped conceptualize the research study, advised on the use of YC8-02, and wrote the manuscript. AA and MDM provided AML specimens, advised on the design on the research study and wrote the manuscript. CLJ designed and directed the research, analyzed, and interpreted data, and wrote the manuscript.
The authors thank the Leukemia Tissue Bank (Princess Margaret Cancer Center) for providing the primary AML samples. We thank Drs. Aaron Schimmer and Kristin Hope, for thoughtful suggestions regarding this manuscript and Jill Flewelling (Princess Margaret Cancer Center) for administrative assistance.
Funding
This work was supported by Medical Biophysics Excellence OSOTF, Sona Noran Pancha Graduate Award, David Rae Graduate Student Scholarship (to COB), Medical Biophysics Excellence OSOTF (to TL), NIH 1F31CA250361-01 (to RCH),
1. Pollyea DA, Jordan CT. Therapeutic targeting of acute myeloid leukemia stem cells. Blood. 2017;129(12):1627-1635.
2. Shlush LI, Mitchell A, Heisler L, et al. Tracing the origins of relapse in acute myeloid leukaemia to stem cells. Nature. 2017;547(7661):104-108.
3. Jones CL, Inguva A, Jordan CT. Targeting energy metabolism in cancer stem cells: progress and challenges in leukemia and solid tumors. Cell Stem Cell. 2021;28(3):378-393.
4. Imai S, Guarente L. NAD+ and sirtuins in aging and disease. Trends Cell Biol. 2014;24(8):464-471.
5. Chen X, Sun K, Jiao S, et al. High levels of SIRT1 expression enhance tumorigenesis and associate with a poor prognosis of colorectal carcinoma patients. Sci Rep. 2014;4:7481.
6. Lee JS, Park JR, Kwon OS, et al. SIRT1 is required for oncogenic transformation of neural stem cells and for the survival of "cancer cells with neural stemness" in a p53-dependent manner. Neuro Oncol. 2015;17(1):95-106.
7. An Y, Wang B, Wang X, Dong G, Jia J, Yang Q. SIRT1 inhibits chemoresistance and cancer stemness of gastric cancer by initiating an AMPK/FOXO3 positive feedback loop. Cell Death Dis. 2020;11(2):115.
8. Zhao D, Mo Y, Li MT, et al. NOTCH-induced aldehyde dehydrogenase 1A1 deacetylation promotes breast cancer stem cells. J Clin Invest. 2014;124(12):5453-5465.
9. Ioris RM, Galié M, Ramadori G, et al. SIRT6 suppresses cancer stem-like capacity in tumors with PI3K activation independently of its deacetylase activity. Cell Rep. 2017;18(8):1858-1868.
10. Abraham A, Qiu S, Chacko BK, et al. SIRT1 regulates metabolism and leukemogenic potential in CML stem cells. J Clin Invest. 2019;129(7):2685-2701.
11. Li L, Osdal T, Ho Y, et al. SIRT1 activation by a c-MYC oncogenic network promotes the maintenance and drug resistance of human FLT3-ITD acute myeloid leukemia stem cells. Cell Stem
the Princess Margaret Cancer Center, the Princess Margaret Cancer Foundation, and the Ontario Ministry of Health (to AT, MM, AA, BR, JED and CLJ), the Princess Margaret Cancer Center Foundation, Ontario Institute for Cancer Research through funding provided by the Government of Ontario, Canadian Institutes for Health Research (RN380110409786), Canadian Cancer Society (grant #703212 [end date 2019], #706662 [end date 2025]), Terry Fox New Frontiers Program Project Grant (project# 1106), a Canada Research Chair (to JED), the University of Colorado Cancer Center Support Grant (P30CA046934) (to AD), the Leukemia and Lymphoma Society, American Society of Hematology, the Canadian Institutes of Health Research, University of Toronto Medicine by Design Initiative which receives funding from the Canada First Research Excellence Fund, and the Ontario Institute of Cancer Research (to CLJ).
Data-sharing statement
RNA-sequencing data have been deposited on GEO (GSE224745). Proteomic mass spectrometry data have been deposited to the MassIVE repository (massive.ucsd.edu) under accession MSV000089096.
Cell. 2014;15(4):431-446.
12. Dan L, Klimenkova O, Klimiankou M, et al. The role of sirtuin 2 activation by nicotinamide phosphoribosyltransferase in the aberrant proliferation and survival of myeloid leukemia cells. Haematologica. 2012;97(4):551-559.
13. Xu SN, Wang TS, Li X, Wang YP. SIRT2 activates G6PD to enhance NADPH production and promote leukaemia cell proliferation. Sci Rep. 2016;6:32734.
14. Mitchell S, Zhang P, Cannon M, et al. Anti-tumor NAMPT inhibitor, KPT-9274, mediates gender-dependent murine anemia and nephrotoxicity by regulating SIRT3-mediated SOD deacetylation. J Hematol Oncol. 2021;14(1):101.
15. Ma J, Liu B, Yu D, et al. SIRT3 deacetylase activity confers chemoresistance in AML via regulation of mitochondrial oxidative phosphorylation. Br J Haematol. 2019;187(1):49-64.
16. Yan D, Franzini A, Pomicter AD, et al. SIRT5 is a druggable metabolic vulnerabilty in acute myeloid leukemia. Blood Cancer Discov. 2021;2(3):266-287.
17. Shi X, Jiang Y, Kitano A, et al. Nuclear NAD(+) homeostasis governed by NMNAT1 prevents apoptosis of acute myeloid leukemia stem cells. Sci Adv. 2021;7(30):eabf3895.
18. Jaiswal A, Xudong Z, Zhenyu J, Saretzki G. Mitochondrial sirtuins in stem cells and cancer. Febs J. 2022;289(12):3393-3415.
19. Li M, Chiang YL, Lyssiotis CA, et al. Non-oncogene addiction to SIRT3 plays a critical role in lymphomagenesis. Cancer Cell. 2019;35(6):916-931.
20. Xu LX, Hao LJ, Ma JQ, Liu JK, Hasim A. SIRT3 promotes the invasion and metastasis of cervical cancer cells by regulating fatty acid synthase. Mol Cell Biochem. 2020;464(1-2):11-20.
21. Zhao Q, Zhou J, Li F, et al. The role and therapeutic perspectives of Sirtuin 3 in cancer metabolism reprogramming, metastasis, and chemoresistance. Front Oncol. 2022;12:910963.
22. Jones CL, Stevens BM, D'Alessandro A, et al. Inhibition of amino acid metabolism selectively targets human leukemia stem cells. Cancer Cell. 2018;34(5):724-740.
23. Stevens BM, O'Brien C, Jordan CT, Jones CL. Enriching for human acute myeloid leukemia stem cells using reactive oxygen species-based cell sorting. STAR Protoc. 2021;2(1):100248.
24. Coyaud E, Mis M, Laurent EM, et al. BioID-based identification of Skp Cullin F-box (SCF)β-TrCP1/2 E3 ligase substrates. Mol Cell Proteomics. 2015;14(7):1781-1795.
25. Jones CL, Stevens BM, Pollyea DA, et al. Nicotinamide metabolism mediates resistance to venetoclax in relapsed acute myeloid leukemia stem cells. Cell Stem Cell. 2020;27(5):748-764.
26. Reisz JA, Zheng C, D'Alessandro A, Nemkov T. Untargeted and semi-targeted lipid analysis of biological samples using mass spectrometry-based metabolomics. methods Mol Biol. 2019;1978:121-135.
27. Bonnet D, Dick JE. Human acute myeloid leukemia is organized as a hierarchy that originates from a primitive hematopoietic cell. Nat Med. 1997;3(7):730-737.
28. Lapidot T, Sirard C, Vormoor J, et al. A cell initiating human acute myeloid leukaemia after transplantation into SCID mice. Nature. 1994;367(6464):645-648.
29. Li M, Teater MR, Hong JY, et al. Translational activation of ATF4 through mitochondrial anaplerotic metabolic pathways is required for DLBCL growth and survival. Blood Cancer Discov. 2022;3(1):50-65.
30. Gupta GD, Coyaud É, Gonçalves J, et al. A dynamic protein interaction landscape of the human centrosome-cilium interface. Cell. 2015;163(6):1484-1499.
31. Mirali S, Botham A, Voisin V, et al. The mitochondrial peptidase, neurolysin, regulates respiratory chain supercomplex formation and is necessary for AML viability. Sci Transl Med. 2020;12(538):eaaz8264.
32. Ishizawa J, Zarabi SF, Davis RE, et al. Mitochondrial ClpPmediated proteolysis induces selective cancer cell lethality. Cancer Cell. 2019;35(5):721-737.
33. Yang W, Nagasawa K, Münch C, et al. Mitochondrial sirtuin network reveals dynamic SIRT3-dependent deacetylation in response to membrane depolarization. Cell. 2016;167(4):985-1000.
34. Rardin MJ, Newman JC, Held JM, et al. Label-free quantitative proteomics of the lysine acetylome in mitochondria identifies substrates of SIRT3 in metabolic pathways. Proc Natl Acad Sci U S A. 2013;110(16):6601-6606.
35. Lagadinou ED, Sach A, Callahan K, et al. BCL-2 inhibition targets oxidative phosphorylation and selectively eradicates quiescent
human leukemia stem cells. Cell Stem Cell. 2013;12(3):329-341.
36. Finley LW, Haas W, Desquiret-Dumas V, et al. Succinate dehydrogenase is a direct target of sirtuin 3 deacetylase activity. PLoS One. 2011;6(8):e23295.
37. Parker SJ, Encarnación-Rosado J, Hollinshead KER, et al. Spontaneous hydrolysis and spurious metabolic properties of α-ketoglutarate esters. Nat Commun. 2021;12(1):4905.
38. Broadfield LA, Pane AA, Talebi A, Swinnen JV, Fendt SM. Lipid metabolism in cancer: New perspectives and emerging mechanisms. Dev Cell. 2021;56(10):1363-1393.
39. Han J, Kaufman RJ. The role of ER stress in lipid metabolism and lipotoxicity. J Lipid Res. 2016;57(8):1329-1338.
40. Miglietta A, Bozzo F, Bocca C, et al. Conjugated linoleic acid induces apoptosis in MDA-MB-231 breast cancer cells through ERK/MAPK signalling and mitochondrial pathway. Cancer Lett. 2006;234(2):149-157.
41. Williams KJ, Argus JP, Zhu Y, et al. An essential requirement for the SCAP/SREBP signaling axis to protect cancer cells from lipotoxicity. Cancer Res. 2013;73(9):2850-2862.
42. Longo J, Mullen PJ, Yu R, et al. An actionable sterol-regulated feedback loop modulates statin sensitivity in prostate cancer. Mol Metab. 2019;25:119-130.
43. Shimano H, Sato R. SREBP-regulated lipid metabolism: convergent physiology - divergent pathophysiology. Nat Rev Endocrinol. 2017;13(12):710-730.
44. Navarro-Imaz H, Chico Y, Rueda Y, Fresnedo O. Channeling of newly synthesized fatty acids to cholesterol esterification limits triglyceride synthesis in SND1-overexpressing hepatoma cells. Biochim Biophys Acta Mol Cell Biol Lipids. 2019;1864(2):137-146.
45. Pandyra A, Mullen PJ, Kalkat M, et al. Immediate utility of two approved agents to target both the metabolic mevalonate pathway and its restorative feedback loop. Cancer Res. 2014;74(17):4772-4782.
46. Kim HH, Liao JK. Translational therapeutics of dipyridamole. Arterioscler Thromb Vasc Biol. 2008;28(3):s39-42.
47. Stevens BM, Jones CL, Pollyea DA, et al. Fatty acid metabolism underlies venetoclax resistance in acute myeloid leukemia stem cells. Nat Cancer. 2020;1(12):1176-1187.
48. Pollyea DA, Stevens BM, Jones CL, et al. Venetoclax with azacitidine disrupts energy metabolism and targets leukemia stem cells in patients with acute myeloid leukemia. Nat Med. 2018;24(12):1859-1866.
49. Torrens-Mas M, Oliver J, Roca P, Sastre-Serra J. SIRT3: oncogene and tumor suppressor in cancer. Cancers (Basel). 2017;9(7):90.
50. Huang B, Song BL, Xu C. Cholesterol metabolism in cancer: mechanisms and therapeutic opportunities. Nat Metab. 2020;2(2):132-141.
1Division of Bone Marrow Transplantation and Immune Deficiency, Cincinnati Children’s Hospital Medical Center, Cincinnati, OH; 2Department of Pediatrics, University of Cincinnati College of Medicine, Cincinnati, OH; 3Brandeis University, Watham, MA; 4Division of Endocrinology, Cincinnati Children’s Hospital Medical Center, Cincinnati, OH and 5Division of Reproductive Endocrinology and Infertility, University of Pittsburgh, Pittsburgh, PA, USA
Correspondence: J. Koo jane.koo@cchmc.org
Received: September 14, 2022. Accepted: February 24, 2023.
Early view: March 9, 2023.
https://doi.org/10.3324/haematol.2022.282094
©2023 Ferrata Storti Foundation
Published under a CC BY-NC license
Gonadal dysfunction and reduced fertility are clinical manifestations well described in patients with Fanconi anemia (FA) and following hematopoietic stem cell transplantation (HSCT). It is difficult to differentiate gonadal dysfunction from the primary disease itself or from HSCT procedures. Therefore, it is important to manage expectations about gonadal failure and infertility for all patients with FA, regardless of the HSCT status. We performed a retrospective analysis of 98 pediatric patients with FA who were transplanted between July 1990 and June 2020 to evaluate the incidence of gonadal dysfunction in female and male patients with FA. New-onset premature ovarian insufficiency (POI) was diagnosed in a total of 30 (52.6%) patients. Follicle-stimulating hormone and luteinizing hormone levels were increased in patients diagnosed with POI. AntiMullerian hormone levels declined in POI patients after HSCT (r2=0.21; P=0.001). Twenty (48.8%) male patients were diagnosed with testicular failure. Follicle-stimulating hormone levels increased after HSCT even in patients without testicular failure (r2=0.17; P=0.005). Inhibin B levels decreased over time after HSCT in patients with testicular failure (r2=0.14; P=0.001). These data indicate brisk decline in already impaired gonadal function in transplanted children with FA.
Fanconi anemia (FA) is an inherited DNA repair disorder with heterogeneous clinical manifestations including bone marrow failure, cancer predisposition and other congenital anomalies. Gonadal dysfunction with infertility is commonly described in patients with FA.1-3 Previous reports estimate that up to 65% of patients with FA have gonadal dysfunction.1,2 Cytopenias and progressive bone marrow failure occur early in life during childhood in patients with FA.4 Allogeneic hematopoietic stem cell transplantation (HSCT) is the only curative option for bone marrow failure in patients with FA and is typically required during the first two decades of life. Gonadal dysfunction, manifest as premature ovarian insuffi ciency (POI) or testicular failure, is also a frequent endocrinologic complication in long-term survivors after HSCT.5-10 Few studies have evaluated gonadal dysfunction and fertility outcomes in both females and males with FA who have completed HSCT.11-14 Here, we report our observations of pubertal development, POI and testicular failure
in female and male patients with FA who were treated with HSCT.
We performed a retrospective cohort analysis of all female and male patients with FA who completed HSCT between July 1990 and June 2020 either at Cincinnati Children’s Hospital Medical Center (CCHMC) or at outside centers who had longitudinal pubertal and reproductive hormonal data from follow-up visits conducted at CCHMC. Patients with at least 1 year of follow-up data and were evaluated at CCHMC at our Fanconi Anemia Comprehensive Care Center within the last 5 years at the time of data analysis were included. This study was approved by our Institutional Review Board. Patients with more than one transplant episode were included. Patients were evaluated by physical exam and laboratory evaluation at each visit by a medical provider, including at least one annual assess-
ment by an endocrinologist. Records for each patient were reviewed for demographic and transplant-related clinical information.
Transplant procedures were chosen according to the treating physician per institution practices. Prior to 2009, CCHMC used a low-dose radiation (450 cGy) based HSCT preparative regimen for all patients with FA. Starting in 2009, CCHMC eliminated radiation and transitioned to a busulfan-based preparative regimen for patients with FA. Further information on fertility preservation service practices are outlined in the Online Supplementary Appendix .
Puberty stage was defined by clinical examination and pubertal hormone lab values for females and males. Puberty onset was described as either spontaneous or induced by exogenous estrogen and testosterone supplementation. Patients were classified as prepubertal if there were no secondary sexual features (breast buds for girls and testis volume ≤3 mL for boys), nor evidence of luteinizing hormone (LH) activation, which is characterized by pulsatile LH secretion at the onset of puberty. Delayed puberty was defined as the absence of any evidence of LH activation nor secondary sexual features after the age of 13 years for girls and 14 years for boys. Patients with missing data and patients who were also already pubescent at the time of transplantation were excluded from the analysis to determine if HSCT affected progression into puberty.
serum hormone levels and time from HSCT. Differences were considered significant when P value was <0.05.
Cohort description
Demographic and transplant data for all patients are shown in Table 1. Data in the electronic medical record were available for a total of 98 female (n=57) and male (n=41) patients with FA. We excluded patients who had no clinical or hormonal data available for analysis (n=7). All patients had a diagnosis of FA confirmed by increased chromosomal breakage following exposure to DNA crosslinking agents such as mitomycin C or diepoxybutane (DEB). Sequencing of FA complementation group (FANC) genes was available in 42.9% (n=42) of patients. Median age at time of HSCT was 8.2 years (range, 4.8-24.9 years) in female patients and 8.8 years (range, 3.7-18.7 years) in male patients. Two female patients were diagnosed with congenital urogenital anomalies including obliteration of the clitoral hood (n=1) and vulvar lesions with anorectal malformation (n=1). Six male patients were diagnosed with cryoptorchidism (n=4), hypospadias (n=1) and microphallus (n=1).
Female patients with Fanconi anemia and premature ovarian insufficiency
of premature ovarian insufficiency and testicular failure
POI in prepubertal females was defined as those with undetectable anti-Mullerian hormone (AMH) and in pubertal females as those with follicle-stimulating hormone (FSH) >20 mIU/L, or undetectable serum AMH with absent menstrual periods. Testicular failure was defined in pubertal males as serum FSH >20 mIU/L and/or serum LH >10 mIU/L. The diagnosis of POI or testicular failure was made for each patient at the first instance any patient met these diagnostic criteria. Further details on reproductive hormone assessments are outlined in the Online Supplementary Appendix
Statistical analysis
Median and range, or number (n) and percentage are reported for continuous or categorical patient characteristic variables. Median and range are reported for numerical parametric data. Differences in frequencies between groups were determined using the Χ2 test or Fisher’s exact tests when the sample size was small. A simple regression model was used to quantify the relationship between
The majority of data was collected at the first visit to CCHMC before HSCT (n=91). The entire cohort of patients were followed for a median of 7.9 years (range, 0.11-31.1 years). The median follow-up time for female patients was 7.7 years (range, 0.1-24.7 years). The median follow-up time for male patients was 9.0 years (range, 0.6-31.3 years). Hormonal data after HSCT were available for a median of 5.8 years after HSCT (range, 0.1-20.0 years). New onset POI was diagnosed in 30 (52.6%) female patients during the course of the study (Table 2). Three patients (10%) were diagnosed with POI prior to HSCT and 27 (90%) after HSCT. Median age at POI diagnosis pre-HSCT was 10.6 years old (range, 5.8-12.6 years, n=3). Complementation group data were available only for 14 (46.7%) of patients diagnosed with POI. Eight (57.1%) of these patients had mutations in the FANCA complementation group. The remaining patients had mutations in the FANCC (n=1), FANCF (n=1), FANCG (n=1), FANCI (n=1), FANCL (n=1) and FANCP (n=1). For the three patients diagnosed with POI prior to HSCT, all were transplanted between the age of 8 and 11 years old after the year 2013. Additionally, only two patients had known FANC complementation data and were confirmed to have mutations in the FANCA complementation group. None of these patients had any congenital urogenital abnormalities. The diagnosis of POI was made at a median of 1 year (range, -4.4 to -0.2 years) prior to HSCT. Median
age at POI diagnosis after HSCT was 13.6 years (range, 8.226.9 years), at a median of 4.6 years (range, 0.6-15.4 years) after HSCT. Eight (26.7%) of patients diagnosed with POI had radiation as part of their conditioning regimen, while six (22.2%) of the patients who were not diagnosed with POI received radiation as part of their conditioning regimen. Additionally, only two (6.7%) patients diagnosed with POI were diagnosed with graft-versus-host disease (GvHD) at day 100 from HSCT. Nineteen female patients (33.3%) required HRT with estrogen, four of whom were already on estrogen replace-
ment therapy prior to HSCT. Nine patients with POI started HRT with estrogen at a median of 7.2 years (range, 0.3-15.9 years) after HSCT. Fertility preservation was offered to 28 female patients in this cohort. Serum AMH levels are measured in each patient at the time of consultation to determine ovarian reserve for potential ovarian tissue cryopreservation. Ovarian tissue cryopreservation services were accepted by 14 female patients (50%). There have been no attempts to use any cryopreserved ovarian tissue for pregnancy at the time of data analysis.
Male patients with Fanconi anemia and testicular failure New-onset testicular failure was diagnosed in 20 (48.8.%) male patients during the course of the study (Table 2). Complementation group data were available only for ten (50%) of patients diagnosed with testicular failure. Four (40%) of these patients had mutations in the FANCA complementation group. The remaining patients had mutations in the FANCB (n=1), FANCC (n=3), FANCD2 (n=1) and one patient had homozygous mutations in the FANCE complementation group and a heterozygous mutation in the FANCF complementation group. Three patients (15%) were diagnosed with testicular failure a median of -0.1 years (range, -0.13 to -0.7 years) before HSCT at a median age of 17.8 years old (range, 7.3-18.5 years). These three patients were transplanted at 7 years (n=1) and 18 years (n=2) of age. We only had complementation group data available for two of the patients. One patient had a muta-
tion in the FANCB complementation group, the other had homozygous mutations in the FANCE complementation group and a heterozygous mutation in the FANCF complementation group. None of these patients had any congenital urogenital anomalies. Seventeen patients (85%) were diagnosed with testicular failure after HSCT at a median age of 15.5 years (range, 9.5-34.6 years), a median of 5.4 years (range, 0.7-30.4 years) after HSCT. While no statistical significance or direct correlation can be provided, four (20%) of the patients diagnosed with testicular failure received radiation therapy as part of their conditioning regimen. Six (28.6%) of the patients who were not diagnosed with testicular failure received radiation therapy as part of their conditioning regimen. Additionally, two (10%) of patients diagnosed with testicular failure were diagnosed with GvHD at day 100 from HSCT.
Three patients required HRT with testosterone. One patient
Time from HSCT that HRT was started in years, median (range)
Fertility preservation services accepted, N (%)
Pre-HSCT: before HSCT; Post-HSCT: after HSCT; POI: premature ovarian insufficiency; HSCT: hematopoietic stem cell transplantation; TBI: total body irradiation; HRT: hormone replacement therapy.
was started on hormone replacement therapy (HRT) with testosterone -5.6 year prior to HSCT. The other two patients were started on testosterone 0.3 and 11 years after HSCT. Fertility preservation services were offered to 14 patients. Testicular tissue (n=1) and sperm cryopreservation (n=1) were accepted by only two patients (14.2%). The quality of the sperm are unknown. There was no report of a pregnancy in the partners of the male FA patients.
Hormonal data in female Fanconi anemia patients with and without premature ovarian insufficiency
Female reproductive hormone levels (FSH, LH, oestradiol and AMH) in patients diagnosed with POI and without POI are presented in Figure 1. As expected, serum FSH and LH levels were increased in patients with POI compared to patients without POI (Figures 1A, B). Median FSH levels in patients with POI were 12.6 mIU/L (range, 0.2-136.1 mIU/L)
Figure 1. Hormonal data analysis for female Fanconi anemia patients with premature ovarian insufficiency and without premature ovarian insufficiency. Hormonal data analysis of female Fanconi anemia (FA) patients with premature ovarian insufficiency (POI) or no POI. These hormone levels were measured pre- and post-hematopoietic stem cell transplantation (HSCT) (A) The median serum follicle-stimulating hormone (FSH) hormone level is 12.6 mIU/L in POI patients and 6.8 mIU/L in patients without POI; P<0.0001. (B) The median serum luteinizing hormone (LH) hormone level is 7.4 mIU/L in POI patients compared to 4.1 mIU/L in patients without POI; P=0.0002. (C) The median serum oestradiol level is 11.1 pg/mL in POI patients compared to 29.95 pg/mL in patients without POI; P<0.0001. (D) The median anti-Mullerian hormone (AMH) is 0.0155 ng/mL in POI patients compared to 0.16 ng/mL in patients without POI; P=0.39.

compared to 6.8 mIU/L (range, 0.4-61.3 mIU/L) in patients without POI (P<0.0001). Median LH levels were 7.4 mIU/L (range, 0.02-74.3 mIU/L) in patients with POI which was significantly higher compared to patients without POI (4.1 mIU/L; range, 0.1-50.6; P=0.0002). Seven female patients with FA had FSH >20 mIU/L but were prepubertal at the time of hormone analysis. Estradiol and AMH levels were higher in patients without POI (Figures 1C, D). Median estradiol levels were lower in patients with POI, 11.1 pg/mL (range, 0.15-116 pg/mL) compared to patients without POI (30 pg/mL; range 1-296 pg/mL; P<0.0001). AMH levels were not significantly different in patients diagnosed with POI (median 0.0156 ng/mL; range, 0.003-6.057 ng/mL) and patients without POI (median 0.16 ng/mL; range, 0.003-2.182 ng/mL; P=0.39). Simple regression analysis showed rising FSH levels in patients with POI after HSCT (r2=0.01; P=26). There was no correlation of FSH levels in patients without POI (r2=0.0001; P=0.92) after HSCT (Figure 2A). AMH levels decreased significantly over time from HSCT in patients diagnosed with POI (r2=0.21; P=0.001). AMH levels did not decrease significantly in those without POI (r2=0.02; P=0.27) (Figure 2B).
Data on male reproductive hormone levels (FSH, LH, testosterone and inhibin B) in patients diagnosed with and
without testicular failure are presented in Figure 3. Levels of serum FSH and LH were significantly higher in patients with testicular failure compared to patients without (Figures 3A, B). FSH levels in patients with testicular failure were 20.5 mIU/L (range, 0.2-243 mIU/L) compared to 4.1 mIU/L (range, 0.5-16.9 mIU/L) in patients without testicular failure (P<0.0001). Median LH levels were 6.1 mIU/L (range, 0.2-60.3 mIU/L) in patients with testicular failure which was significantly higher compared to patients without testicular failure (1.4 mIU/L; range, 0.2-15.4 mIU/L; P<0.0001). One patient had LH >10 mIU/L but was pre-pubertal at the time of hormone analysis and was not diagnosed with testicular failure. Interestingly, testosterone levels were higher in patients with testicular failure compared to patients without testicular failure (Figure 3C). Inhibin B levels were significantly decreased in patients with testicular failure (Figure 3D). FSH levels increased with time after HSCT (r2=0.17; P=0.005; Figure 4A). Median testosterone levels were higher in patients with testicular failure, 348.4 ng/dL (range, 0.1-951.2 ng/dL) compared to patients without testicular failure (58.8 ng/mL; range 1-652 ng/dL; P<0.0001). Inhibin B levels were significantly lower in patients with testicular failure (median 44 pg/mL; range, 3-304 pg/mL) and patients without testicular failure (median 111 pg/mL; range 59-304 pg/mL; P=0.003). Inhibin B levels declined significantly after HSCT in patients diagnosed with testicular failure (r2=0.14; P=0.001) (Figure 4B).
Figure 2. Longitudinal analysis of follicle stimulating hormone and anti-Mullerian hormone levels in transplanted female Fanconi anemia patients. Simple linear regression analysis of serum (A) follicle-stimulating hormone (FSH) and (B) anti-Mullerian hormone (AMH) levels in patients with primary ovarian insufficiency (POI) compared to female patients without POI over time in years from hematopoietic stem cell transplant (HSCT). The overall regression was not statistically significant for serum FSH levels in patients diagnosed with POI (r2=0.01; P=0.26). The overall regression was statistically significant for serum AMH levels in patients with POI (r2= 0.21; P=0.001).

Figure
Reproductive
analysis for male
patients with testicular failure and without testicular failure. Hormonal data analysis of male Fanconi anemia (FA) patients with testicular failure or no testicular failure. (A) The median serum follicle-stimulating hormone (FSH) hormone level is 20.45 mIU/L in testicular failure patients and 4.1 mIU/L in patients without gonadal insufficiency; P<0.0001. (B) The median serum luteinizing hormone (LH) hormone level is 6.1 mIU/L in testicular failure patients compared to 1.4 mIU/L in patients without testicular failure; P<0.0001. (C) The median serum testosterone level is 348.4 ng/mL testicular failure patients compared to 58.8 ng/dL in patients without testicular failure; P<0.0001. (D) The median inhibin B 44 pg/mL in testicular failure patients compared to 111 pg/mL in patients without testicular failure; P=0.003.

Pubertal outcomes in female and male patients
Pubertal data were available for a total of 45 female and male patients with FA. Twenty-four female patients (88.9%) entered spontaneous puberty as defined in the methods. Puberty was delayed in five (20.8%) female patients. Three female patients (11.1%) required estrogen replacement therapy to induce pubertal onset. Spontaneous puberty was achieved in 21 (95.5%) male patients, and was delayed in six patients (27.3%).
In this retrospective single-center study, we evaluated longitudinal reproductive and pubertal outcomes of 98 female and male patients with FA treated with HSCT. To our knowledge, this is the largest retrospective study evaluating reproductive outcomes in both pediatric and young adult female and male patients with FA after HSCT. Overall, we observed a high proportion of patients with POI or testicular failure. Prior studies have analyzed fertility and pregnancy outcomes in transplanted patients with FA but focused only on adolescent or adult female patients, excluding a large proportion of this population.12,15-17 In addition, available data include only very small number of male patients with FA,3,18 or only a focus on patients with a primary malignancy diagnosis and include little semen data.19,20
We initially anticipated that HSCT overall would contribute to a higher incidence of POI and testicular failure because chemotherapy and radiation administered prior to HSCT are known to lead to gonadal failure.15 However, our rates of POI and testicular failure were lower than previously reported incidences in smaller cohorts.21 Furthermore, patients who have not yet been diagnosed with POI or testicular failure completed HSCT at much younger ages and had shorter follow-up times at the time of analysis compared to the rest of the cohort. These patients may represent patients who have yet to be diagnosed with POI or testicular failure, and in fact our rates of POI and testicular failure may be underrepresented. Additionally, in our both female and male patients, there were clear differences in serum FSH and LH levels with POI or testicular failure. FSH and LH levels are typically used to diagnose POI or testicular failure.22,23 However, our data show FSH levels do not significantly increase with time after HSCT in patients diagnosed with POI or testicular failure. This suggests FSH levels may not be the best hormone to follow longitudinally in patients diagnosed with POI or testicular failure after HSCT. We also expected that the majority of patients with testicular failure would have lower levels of testosterone compared to patients without testicular failure. A majority of these patients with higher testosterone levels were pubertal at the time of analysis. This is normal physiologically, based on known mechanisms of pubertal
Figure 4. Longitudinal analysis of follicle stimulating hormone and inhibin B levels in transplanted male Fanconi anemia patients. Simple linear regression analysis of serum (A) follicle-stimulating hormone (FSH) and (B) inhibin B levels in patients with testicular failure compared to male patients without testicular failure over time in years from hematopoietic stem cell transplantation (HSCT). The overall regression was not statistically significant for serum FSH levels (r2=0.01; P=0.29) in patients diagnosed with testicular failure. The overall regression was statistically significant for serum inhibin B levels (r2=0.14; P=0.001) in patients diagnosed with testicular failure.

changes that occur where increases in gonadotropin releasing hormone (GnRH) cause changes in testosterone levels. No patients on HRT were included in this analysis. Additionally, testosterone can be created in the peripheral tissue from dehydroepiandrosterone and andreostenedione precursors, which may contribute to higher levels of testosterone in the testicular failure cohort. 24 These data indicate that testosterone may not be the best marker to use to diagnose testicular failure in male patients with FA.
Previous reports have shown AMH levels tend to be low in women with FA, regardless of the HSCT status.12,25 Our data support this trend as we observed decreased AMH levels in female patients with FA after HSCT. However, there was no statistically significant difference between AMH levels in patients with POI compared to patients without POI. Levels of AMH were measured longitudinally before and after HSCT. Interestingly, our data demonstrate that AMH levels continue to decline many years after HSCT in patients with POI. Conversely, AMH levels are largely unchanged after HSCT in patients without POI. We add to the evidence that AMH levels may be a more suitable longitudinal hormonal marker to follow after HSCT in patients diagnosed with POI. In addition, AMH levels should be followed for extended periods of time after HSCT as these levels continue to decline without a plateau.
Inhibin B levels are reported to be lower in male patients with FA.12,26 We also observed lower inhibin B levels in patients diagnosed with testicular failure. FSH levels did not reliably increase after HSCT in patients with testicular failure. Conversely, serum inhibin B levels did decline after HSCT in patients with testicular failure. This decline continued for decades after HSCT. If patients are being followed for testicular failure after HSCT, they should have regular inhibin B levels checked long-term as this is a more reliable marker for testicular function after HSCT.
We saw only a few cases of pubertal delay in this study. The actual incidence of pubertal delay in patients with FA is unknown. Chemotherapy and radiation regimens administered prior to HSCT are known to cause reproductive disturbances leading to incomplete or absent puberty and gonadal failure in other clinical settings. 27 However, the vast majority of patients who had complete pubertal clinical and laboratory data entered spontaneous puberty.
Fertility is often impaired in female patients with FA due to premature menopause and shortened fertility windows. Similarly, poor or absent spermatogenesis in male patients with FA leads to impaired fertility.1,15 It is our institution’s policy to offer fertility preservation services to all HSCT recipients. In order to preserve patient autonomy, the patient and their families ultimately decide
whether they choose to pursue and accept fertility preservation prior to HSCT. Each family and patient receives an individualized consultation with extensive counseling by our fertility preservation team before HSCT procedures begin. A modest proportion of patients with FA consented to fertility preservation services prior to HSCT. The rates of fertility preservation in female patients was higher, although significantly lower in males, when both were compared to previously reported rates of fertility preservation services being accepted.28,29 Fertility preservation in prepubertal males is currently in preclinical experimental stages and may be an explanation for decreased uptake in male patients.
Our work has strengths and limitations. The strengths include the large number of patients with FA treated with HSCT at a single institution. An additional strength of our study includes the length of follow-up we had for patients compared to prior studies.15 The retrospective nature of the study is a limitation and data are necessarily incomplete. We are unable to make a direct comparison of gonadal dysfunction outcomes in patients who were transplanted using a radiation-based or busulfan-based preparative regimen because this data is confounded by changes in institutional transplant-related practices over time. And while outside the scope of this paper, we were not able to make the connection between gonadal failure and disease severity of FA. This information may be important for prompting earlier and timely assessment of fertility function before and after transplant in patients with certain physical manifestations of FA.
Also, serum AMH levels are not a widely accepted marker for POI diagnosis, however, they serve as a better option in prepubertal patients. However, these data highlight the importance that prolonged, consistent, regular follow-up with experienced endocrinologists are needed to make sure these complications are being identified appropriately. Complications after HSCT that may perplex the diagnosis of POI include GvHD that affects the genitourinary tract, especially in female patients. This makes it especially important for patients with POI to be followed closely by an experienced endocrinologist who is astute in diagnosing and monitoring these endocrinologic complications after HSCT. These patients would need to be followed through time with regular, annual visits with an endocrinologist to closely monitor pubertal transitions and to make the diagnoses of POI or testicular failure. Additionally, AMH levels may be affected by unilateral oophorectomy. This analysis would be deeply confounded by differences in the time period HSCT was completed for the patient and that our institution changed our way of practice to eliminate radiation in place of busulfan. Our data show that long-term followup of patients with FA who have completed HSCT should always include regular physical exams and hormonal as-
sessments. Prospective studies in this area would be of value.
Disclosures
No conflicts of interest to disclose.
Contributions
JK is the principal investigator and KCM the senior author. JK, JCH, JMR, PAM, PAM, SMD and KCM developed the Concept and designed the study. JK and IGM collected and assembled data. JK, JCH, JMR and KCM analyzed and interpreted data. JK, IGM, JCH, JMR, PAM, SMD and KCM
1. Alter BP, Frissora CL, Halperin DS, et al. Fanconi's anaemia and pregnancy. Br J Haematol. 1991;77(3):410-418.
2. Auerbach AD. Fanconi anemia and its diagnosis. Mutat Res. 2009;668(1-2):4-10.
3. Giri N, Batista DL, Alter BP, Stratakis CA. Endocrine abnormalities in patients with Fanconi anemia. J Clin Endocrinol Metab. 2007;92(7):2624-2631.
4. Butturini A, Gale RP, Verlander PC, Adler-Brecher B, Gillio AP, Auerbach AD. Hematologic abnormalities in Fanconi anemia: an International Fanconi Anemia Registry study. Blood.1994;84(5):1650-1655.
5. Mathiesen S, Sorensen K, Nielsen MM, et al. Male gonadal function after allogeneic hematopoietic stem cell transplantation in childhood: a cross-sectional, populationbased study. Biol Blood Marrow Transplant. 2020;26(9):1635-1645.
6. Sutani A, Miyakawa Y, Tsuji-Hosokawa A, et al. Gonadal failure among female patients after hematopoietic stem cell transplantation for non-malignant diseases. Clin Pediatr Endocrinol. 2019;28(4):105-112.
7. Vatanen A, Wilhelmsson M, Borgstrom B, et al. Ovarian function after allogeneic hematopoietic stem cell transplantation in childhood and adolescence. Eur J Endocrinol. 2014;170(2):211-218.
8. Rovo A, Aljurf M, Chiodi S, et al. Ongoing graft-versus-host disease is a risk factor for azoospermia after allogeneic hematopoietic stem cell transplantation: a survey of the Late Effects Working Party of the European Group for Blood and Marrow Transplantation. Haematologica. 2013;98(3):339-345.
9. Savani BN, Kozanas E, Shenoy A, Barrett AJ. Recovery of spermatogenesis after total-body irradiation. Blood. 2006;108(13):4292-4293; author’s reply 4293-4294.
10. Anserini P, Chiodi S, Spinelli S, et al. Semen analysis following allogeneic bone marrow transplantation. Additional data for evidence-based counseling. Bone Marrow Transplant. 2002;30(7):447-451.
11. Morse H, Elfving M, Lindgren A, Wolner-Hanssen P, Andersen CY, Ora I. Acute onset of ovarian dysfunction in young females after start of cancer treatment. Pediatr Blood Cancer. 2013;60(4):676-681.
12. Laporte S, Couto-Silva AC, Trabado S, et al. Inhibin B and antiMullerian hormone as markers of gonadal function after hematopoietic cell transplantation during childhood. BMC Pediatr. 2011;11:20.
13. Jadoul P, Anckaert E, Dewandeleer A, et al. Clinical and biologic evaluation of ovarian function in women treated by bone
prepared and wrote the manuscript. All authors gave their final approval of the manuscript.
The authors thank Erica Miller, Leann Mount, Michelle Harris, Kaitlin Brooks, Melissa Hunter, Allison O’Conner and their team for their contribution and dedication toward the patient’s care.
All data presented in this manuscript will be shared upon e-mail request.
marrow transplantation for various indications during childhood or adolescence. Fertil Steril. 2011;96(1):126-133.
14. Mathiesen S, Sorensen K, Ifversen M, et al. Childhood reproductive hormone levels after pediatric hematopoietic stem cell transplantation in relation to adult testicular function. Endocr Connect. 2021;10(10):1352-1365.
15. Nabhan SK, Bitencourt MA, Duval M, et al. Fertility recovery and pregnancy after allogeneic hematopoietic stem cell transplantation in Fanconi anemia patients. Haematologica. 2010;95(10):1783-1787.
16. Sorbi F, Mecacci F, Di Filippo A, Fambrini M. Pregnancy in fanconi anaemia with bone marrow failure: a case report and review of the literature. BMC Pregnancy Childbirth. 2017;17(1):53.
17. Atashkhoei S, Fakhari S, Bilehjani E, Farzin H. Pregnancy after allogeneic hematopoietic stem cell transplantation in a Fanconi anemia patient. Int Med Case Rep J. 2017;10:11-14.
18. Yabe H, Koike T, Shimizu T, et al. Natural pregnancy and delivery after unrelated bone marrow transplantation using fludarabinebased regimen in a Fanconi anemia patient. Int J Hematol. 2010;91(2):350-351.
19. Borgmann-Staudt A, Rendtorff R, Reinmuth S, et al. Fertility after allogeneic haematopoietic stem cell transplantation in childhood and adolescence. Bone Marrow Transplant. 2012;47(2):271-276.
20. Rovo A, Tichelli A, Passweg JR, et al. Spermatogenesis in longterm survivors after allogeneic hematopoietic stem cell transplantation is associated with age, time interval since transplantation, and apparently absence of chronic GvHD. Blood. 2006;108(3):1100-1105.
21. Rose SR, Myers KC, Rutter MM, et al. Endocrine phenotype of children and adults with Fanconi anemia. Pediatr Blood Cancer. 2012;59(4):690-696.
22. Nelson LM. Clinical practice. Primary ovarian insufficiency. N Engl J Med. 2009;360(6):606-614.
23. Watson AR, Rance CP, Bain J. Long term effects of cyclophosphamide on testicular function. Br Med J (Clin Res Ed). 1985;291(6507):1457-1460.
24. Nassar GN, Leslie SW. Physiology, testosterone. StatPearls Publishing. https://www.ncbi.nlm.nih.gov/books/NBK526128/. Published 2022. Accessed October 31, 2022.
25. Sklavos MM, Giri N, Stratton P, Alter BP, Pinto LA. Anti-Mullerian hormone deficiency in females with Fanconi anemia. J Clin Endocrinol Metab. 2014;99(5):1608-1614.
26. Trivin C, Gluckman E, Leblanc T, Cousin MN, Soulier J, Brauner R. Factors and markers of growth hormone secretion and
gonadal function in Fanconi anemia. Growth Horm IGF Res. 2007;17(2):122-129.
27. Muller J. Disturbance of pubertal development after cancer treatment. Best Pract Res Clin Endocrinol Metab. 2002;16(1):91-103.
28. Wikander I, Lundberg FE, Nilsson H, Borgstrom B, RodriguezWallberg KA. A Prospective study on fertility preservation in
prepubertal and adolescent girls undergoing hematological stem cell transplantation. Front Oncol. 2021;11:692834.
29. Diesch T, Rovo A, von der Weid N, et al. Fertility preservation practices in pediatric and adolescent cancer patients undergoing HSCT in Europe: a population-based survey. Bone Marrow Transplant. 2017;52(7):1022-1028.
Correspondence: G. Socie gerard.socie@aphp.fr
Received: January 11, 2023.
Accepted: March 14, 2023.
Early view: March 23, 2023.
1UFR de Médecine, Université Paris Cité; 2APHP, Hématologie Greffe, Hôpital Saint Louis; 3INSERM UMR 976, Hôpital Saint Louis; 4EBMT, Statistical Unit; 5APHP, Hématologie Adultes, Hôpital Saint Louis; 6APHP, Hématologie Séniors, Hôpital Saint Louis; 7APHP, Hématologie Adolescents Jeunes Adultes,
#RpdL and LA contributed equally as senior authors.
https://doi.org/10.3324/haematol.2023.282729
©2023 Ferrata Storti Foundation
Published under a CC BY-NC license
Debates on the role and timing of allogeneic hemtopoietic stem cell transplantation (HSCT) in acute myelogenous leukemia (AML) have persisted for decades. Time to transplant introduces an immortal time and current treatment algorithm mainly relies on the European LeukemiaNet disease risk classification. Previous studies are also limited to age groups, remission status and other ill-defined parameters. We studied all patients at diagnosis irrespective of age and comorbidities to estimate the cumulative incidence and potential benefit or disadvantage of HSCT in a single center. As a time-dependent covariate, HSCT improved overall survival in intermediate- and poor-risk patients (hazard ratio =0.51; P=0.004). In goodrisk patients only eight were transplanted in first complete remission. Overall, the 4-year cumulative incidence of HSCT was only 21.9% but was higher (52.1%) for patients in the first age quartile (16-57 years old) and 26.4% in older patients (57-70 years old) (P<0.001). It was negligible in patients older than 70 years reflecting our own transplant policy but also barriers to transplantation (comorbidities and remission status). However, HSCT patients need to survive, be considered eligible both by the referring and the HSCT physicians and have a suitable donor to get transplantation. We, thus, comprehensively analyzed the complete decision-making and outcome of all our AML patients from diagnosis to last followup to decipher how patient allocation and therapy inform the value of HSCT. The role of HSCT in AML is shifting with broad access to different donors including haploidentical ones. Thus, it may (or may not) lead to increased numbers of allogeneic HSCT in AML in adults.
Although acute myelogenous leukemia (AML) is one of the main indications for allogeneic hematopoietic stem cell transplantation (HSCT) worldwide,1–6 its place and timing in the course of the disease remains controversial.7–10 In the 1980’s large studies compared autologous and allogeneic HSCT versus chemotherapy as consolidation therapies for AML in first complete remission (CR1).11–13 Progress in disease-risk classification using cytogenetics and molecular tools allowed better risk/benefit assessment of the appropriateness of HSCT.14 Statistical tools
were also developed which addressed the survival time bias for those surviving long enough to get to transplant.13 While earlier studies involved only younger patients (receiving myeloablative conditioning regimen) the picture of HSCT changed with the use of reduced intensity conditioning (RIC), expanded donors availability (HLA allelematched unrelated donors [MUD] and haploidentical donors), and progressive decrease of transplant related mortality (TRM).15–18 Similarly, novel induction, targeted and maintenance therapies plus improved supportive care have limited non-relapse mortality following non-HSCT treatments.
Gerard Socie,1,2,3 Jacques-Emmanuel Galimard,4 Emmanuel Raffoux,1,5 Raphael Itzykson,1,5 Pierre Edouard Debureaux,5 David Michonneau,1,2,3 Etienne Lengliné,5 Marie Robin,2 Flore Sicre de Fontbrune,2 Marie Sébert,6 Aliénor Xhaard,2 Rathana Kim,6 Anne Couprie,6 Nathalie Dhedin,7 Matteo Dragani,6 Pierre Lemaire,8 Lise Larcher,1,8 Emmanuelle Clappier,1,8 Nicolas Boissel,1,7 Jean Soulier,1,8 Hervé Dombret,1,5 Pierre Fenaux,1,6 Régis Peffault de Latour1,2# and Lionel Adès1,6# Hôpital Saint Louis and 8APHP, Laboratoire d’Hématologie, Hôpital Saint Louis, Paris, FranceHowever, there are also inherent analytical biases in the chemotherapy-oriented literature.7–9 Chemotherapy reports generally exclude older or unfit patients from clinical trials along with patients with therapy-related AML (tAML) (after previous chemotherapies for malignant or non-malignant diseases) or secondary AML (sAML) evolving from myelodysplastic syndrome (MDS) or myeloproliferative disorders (MPN). More recently, cytogenetic and molecular risk phenotype was used to identify patients who might not need HSCT.19,20
As discussed by Gale and Estey,9 most if not all, previous studies which assessed the value of HSCT lack the denominator: i.e., how many patients with AML from an unselected population (irrespective of age, disease-type [de novo or sAML/tAML]), actually receive HSCT therapy? Some clinical trials or retrospective analyses claimed, especially in good-risk AML, that HSCT can safely be postponed to CR2. This second point has also been challenged (the “myth of allogeneic HSCT in CR2” due to deaths, complications or treatment failures during reinduction),10,12 and has not been properly analyzed in an unselected AML population.
Observational studies of patients are considered important for the development of clinical trials and represent a true figure of patients actually treated.21 Herein, we studied recent and consecutive AML patients using cytogenetic- and molecular-risk characterization to assess the cumulative incidence of HSCT and the impact of treatment choices after formal review of all patients' charts.
Four hundred and ninety-one consecutive adult (over 16 years old) patients with AML were included. All consecutive AML cases between 11, 2015 and 6, 2019 were retrospectively identified through the Leukemia Tumor Board and the diagnostic lab. Patients were diagnosed with AML according to the World Health Organization classi fication.22 All had cytogenetic and molecular evaluation, as previously described.23 Most patients were transplanted in CR1 from HLA identical siblings or matched (10/10) unrelated donors (UD), but few patients underwent HSCT from alternative donors (haploidentical or 1 antigen mismatched [MM] UD in the recent years [13/22 and 2/7 high risk patients were transplanted in CR1 from an haploidentical or a MM UD, respectively]). Additional details are provided in the Online Supplementary Appendix.
Starting from AML diagnosis, overall survival (OS) was the primary endpoint. OS was defined as time to death from any cause. Leukemia-free survival (LFS) was defined as time to first event of relapse, progression, or death. Re-
lapse incidence (RI) was defined as time to primary induction failure or leukemia recurrence after remission; death without relapse or progression was the competing risk. Non-relapse mortality (NRM) was defined as time to death from any cause without relapse or progression; relapse and progression were competing events. Incidence of HSCT was defined as time to first allogeneic HSCT with death as competing event. Incidence of patient review (PtRv) was defined as time to PtRv with death as competing event. Incidence of CR1 was defined as time to CR1, or CRi with death and HSCT as competing events. All the outcomes were censored at last follow-up. Additionally, outcomes were calculated from first relapse. Incidence of CR2 was defined as time to CR2 with death and HSCT as competing events. Finally, OS, LFS, RI and NRM were calculated from first allogeneic HSCT.
Additional details are provided in the Online Supplementary Appendix . Multivariable analyses were performed using Cox proportional hazards models for OS and LFS, and cause-specific outcomes with competing events. Covariates included in Cox multivariable models were European LeukemiaNet (ELN) 2017, secondary AML and age at diagnosis. For OS, impact of the first allogeneic HSCT was included as a time-dependent covariate. Due to an interaction between the HSCT and the ELN2017, the impact of the HSCT on OS was evaluated separately in the goodrisk and intermediate/poor-risk populations. Outcomes were presented with their 95% confidence interval (CI). Impact of covariates on outcomes were presented as hazard ratios (HR) with their 95% CI. The significance level was fixed at 0.05 and all P values were 2-sided. All analyses were done using R software version 4.2.0.
The overall flow and allocations of the patients with AML in the different risk categories was also analyzed in good, intermediate, and poor since timing of transplant may be different in each group. For patients with poor-risk AML, eligible patients (treatment responsive, without excluding comorbidities or acquired complications and with an eligible donor), HSCT is considered in CR1. However, patients with good risk are generally not transplanted in CR1 (even if evaluated in PtRv) and HSCT is generally delayed until CR2 (if they achieve CR2 with suitable clinical status and a suitable donor). Indication for transplant is used as consolidation therapy during CR1 for intermediate/highrisk AML but is limited by age, comorbidity, and suitable donor availability for a patient with intermediate- or highrisk AML in CR1. An HLA-identical sibling and allele HLAmatched unrelated donor was accepted in CR1 but partially matched or haploidentical alternative donors were not always considered acceptable, even if suitable in CR1.
This study has been accepted by 21-799 IRB 00003888
Median age at diagnosis was 68.9 years (range, 16.3-95), and 491 patients were included. Three hundred and eighteen had de novo AML (64.8%) and 173 had s/t-AML as detailed in the Online Supplementary Table S1. According to the ELN 2017 classification,14 145 (29.7%), 117 (24%), and 226 (46.3%) were classified as good, intermediate, and poor risk, respectively. Three patients (0.7% of the population could not be classified) (Table 1) (Figure 1 summarizes main the overall flow chart of the study and patient groupings in the ELN and the MRC24 classifications, cytogenetics, and molecular characteristics). Patients’ first line therapies are summarized in the Online Supplementary Table S2. Even though 70% had either intermediate- or poor-risk AML, only 105 patients underwent allogeneic HSCT at a median of 6.8 months from diagnosis (range, 3.3-57.3). Their median age at diagnosis was 54.2 years (range, 16.3-71.7). Donors were most often HLA-identical siblings (24.8%) or fully matched unrelated donors (MUD, 47.6%) following RIC in 69.5%. Patient, disease and transplant characteristics are shown in the Online Supplementary Table S3.
With a median follow-up of 4.3 years (95% CI: 4.0-4.5), the 4-year OS of the overall cohort is 30.2% (95% CI: 26-34.5) and the 4-year cumulative incidence of HSCT 21.9% (95% CI: 18.3-25.7). Other outcomes for the overall cohort are shown in the Online Supplementary Table S4 and include the cumulative incidence (CI) of CR1 (54.8%); 4-year LFS (21.7%); relapse-incidence (RI) (4-year RI 63.3%) and nonrelapse mortality (NRM). The 1-year incidence of CR1 for the 244 patients who received first line intensive chemotherapy was 83.6% (interquartile range [IQR], 78.3-87.7). Four-year OS by age quartiles at diagnosis ranged from 58.9% (IQR, 49.2-67.4) in patients less than 57 years to 6.9% (IQR, 2.8-13.4) for patients older than 77 years. Similarly, the 4-year CI of proceeding to HSCT dropped significantly per quartile: 52.1% (IQR, 42.3-60.99); 29.3%; (IQR, 21.5-37.5); 5.6% (IQR, 2.5-10.7) and 0%. The CI of achieving CR1 is also shown in Figure 2. The CI of HSCT declined with age as very few in the third quartile and none in the oldest group underwent HSCT. Other outcomes including the CI of CR1, HSCT, estimates of LFS, and incidence of NRM are shown in the Online Supplementary Table S4.
Continued on following page.
Three patients cannot be classified according to European LeukemiaNet 2017. AML: acute myeloid leukemia; PtRv: patient review meeting; IQR: interquartile range; ITD: internal tandem duplication; ND: not determined; HSCT: hematopoietic stem cell transplantation; CR1: 1st complete remission; PR1: 1st partial remission; MDS: myelodysplastic syndrome; MPN: myeloproliferative neoplasm.
ELN2017 good risk had, 4-year OS of 48.7 (IQR; 39.9-56.9); intermediate risk 40 (IQR, 30.7-49.2); and poor risk 13.6 (IQR, 9.3-18.7). The 4-year CI of HSCT for good risk was 19.5 (IQR, 13.3-26.6); intermediate risk 34 (IQR, 25.4-42.8) and poor risk 17.5 (IQR, 12.8-22.7). The CI of CR1 and that of HSCT are illustrated in Figure 2. From Figure 2E it can easily be seen that CI of HSCT logically varied with age and none of the patients in the older quartile (77-96 years) and very few in the third quartile (range, 69-77) underwent HSCT. We then performed two different multivariable analyses (see statistical section) to assess OS. In good-risk AML, older age (HR=1.33; range, 1.20-1.48 per 5 years; P<0.001), secondary AML (HR=1.84; range, 1.03-3.30; P=0.04) and allogeneic HSCT (HR=2.42; range, 1.08-5.45; P=0.03) were each independently associated with poorer survival (Table 2A). However, in intermediate- and poor-risk AML, multivariable analysis showed that older age (HR=1.15; range, 1.09-1.22; P<0.001) and poor versus intermediate risk (HR=1.98; range, 1.49-2.62; P=<0.001) were independently associated with poorer survival. OS of de novo and secondary AML were similar (HR=1.01; range, 0.78-1.29; P=0.96). Allogeneic HSCT in the intermediate- and high-risk category
was associated with better OS (HR=0.51; range, 0.32-0.80; P=0.004) (Table 2B).
Restricted to analysis of patients younger than 70 years at diagnosis, the CI of CR1, CI of HSCT, NRM, RI as well as OS and LFS were close to those of the overall population (Online Supplementary Figure S1). As expected, the overall CR1 rate was higher 72.1 (IQR, 66.2-77.1), as well as the rate of HSCT 38.2 (IQR, 32.2-44.2), overall. For patients in the first age quartile (range, 16-57) the rate of HSCT was 52.1 (IQR, 42.3-60.9) as compared to 26.4 (IQR, 19.4-34) in patients older than 57 (26.4; IQR,19.4-34; P<0.001). However, when studying the qualitative interaction of HSCT effect with ELN2017 groups, results were unchanged. When HSCT was considered as a time-dependent covariate HSCT was associated with borderline decreased survival rate in goodrisk patients (HR=2.34; IQR, 0.99-5.51; P=0.052) but increased survival in intermediate/high-risk patients (HR=0.52; IQR, 0.31-0.87; P=0.01).
Although limited by patient or transplant numbers (especially in good-risk patients), the corresponding feature for LFS for patients transplanted in CR1 was: 0.53 (range, 0.16-1.77) in good-risk patients (8/121; P
0.24
0.08-0.72) in intermediate-risk (24/76; P=0.01), and 0.54 (range, 0.25-1.15) in poor-risk (N=28/78; P=0.11).
After relapse the 1-year incidence of CR2 was 32.3% (range, 24.6-40.2) being 47% (range, 34.8-85.2), 28.6% (range, 13.745.4) and 7.9% (range, 2-19.3) for good, intermediate, and poor risk, respectively. One year incidence of HSCT was 23.4% (IQR, 14-34), 30.4% (IQR, 14.5-48) and 7.9% (IQR, 1.919.5) for good-, intermediate-, and poor-risk AML, respectively. Most importantly, 1 year OS was 39.2 (IQR, 31-47.3) for all patients, and 48.4 (IQR, 36.2-59.6), 31.3 (IQR, 15.8-48.1) and 28.5 (IQR, 15.2-43.3) for good, intermediate, and poor risk, respectively.
Outcomes after HSCT (irrespective of disease status before transplantation) are summarized in the Online Supplementary Figures S2 and S3 and Online Supplementary Table S5 OS was not statistically different with differing donor types, ELN classification, de novo versus sAML or tAML, but in univariate analyses, both younger age at HSCT and myeloablative conditioning were associated with significantly better
Figure 1. Flow chart and main disease characteristics. (A) Flow chart of the study. (B) Molecular and cytogenetic subtypes of acute myleoid leukemia (AML). Color legend: European LeukemiaNet 2017; good risk in blue; intermediate risk in orange; high risk in red. NPM1+/FLT3- or low in blue; NPM1+/FLT3 high in orange. NPM1-/FLT3 high in dark red. K: karyotype. HSCT: hematopoietic stem cell transplantation, diag: diagnosis.

outcome. Other endpoints including 2-year LFS, RI and NRM are summarized in Online Supplementary Figures S2 and S3 and Online Supplementary Table S5
However, success in proceeding to HSCT does not fully reflect the overall process of evaluation for HSCT. Transplant patients need to survive, be considered eligible by the referring physician (based on age, comorbidities, and disease risk), have an available donor, and be accepted by the transplant physicians. These parameters are included in the time dependent cumulative incidence of PtRv. All AML cases are discussed in our institutional PtRv, but only selected cases are discussed in the transplant PtRv. As shown in Figure 3, the CI the incidence of PtRv was slightly but not significantly different from the CI of HSCT. The 100day CI of transplant PtRv was 36.1 (IQR, 31.8-40.5) but statistically varied according to age (P<0.001). Similarly, PtRv was less frequent in ELN poor prognosis AML. The 100-day
Figure 2. Outcomes from diagnosis. (A) Overall survival (OS) according to age at diagnosis (per quartile); age <57; 58-69; 70-77; and >77; (B) OS according to European LeukemiaNet (ELN) 2017; (C) cumulative incidence (CI) of first complete remission (CR1); (D) CI of hematopoietic stem cell transplantation (HSCT); (E) CI of HSCT according to age (per quartile); (F) overall CI of HSCT.

CI of PtRv for de novo AML was 43.1 (IQR, 37.6-48.5), but only 21.9% (IQR, 15.7-28.7 for secondary AML; P<0.001) (Figure 3A, D). Overall, 77 (53.1%), 53 (48.2%) and 144 (65.5%) of good-, intermediate-, and poor-prognosis AML were never discussed in the PtRv for HSCT.
Among all these 287 patients who were never discussed, main factors associated with their exclusion were older age (n=152, 53%, median age at diagnosis of 79 years; range, 65-95) and comorbidities (n=83, 29%). Intensive induction chemotherapy versus HMA-based treatment were delivered in 20% and 55% of those discussed or those excluded from PtRv. Additionally, even after excluding age and comorbidities 31 patients (10.8%) of good-risk patients were also excluded from PtRv.
Among 204 patients who were considered at HSCT PtRv, still 99 (48.5%) did not received HSCT (median age 53 years; range, 18-72); 76 of 99 received intensive induction and 22 of 99 were good-risk AML. Among the 22 good-risk patients, all reached CR1 yet three had no donor (Online Supplementary Table S6). Among all patients with PtRv for transplant: 40 (19.9%) survived at last follow-up without HSCT, 59 (29%) died without HSCT and 105 (52.2%) underwent transplantation. After PtRv, the decision was to not proceed with transplantation in 36 patients (1 due to age, 13 due to comorbidities, 22 being good-risk). For the remaining 62 patients who were considered for HSCT but were not transplanted the flow chart is provided in in Online Supplementary Figure S4
The flowchart of good-risk AML is displayed in the Online Supplementary Figure S5. Patients with good-risk AML (n=145) had a median age of 64.4 years (range, 16.3-95) and 114 (78.5%) received intensive induction chemotherapy (Table 1; Online Supplementary Table S2). The 1-year CI of CR1 was 82.8% (IQR, 75.4-88.1); 4-year CI of HSCT was 19.5%, and 4-year OS was 48.7% (Figure 2). Only few transplants were performed in the first year post diagnosis (Figure 2). After achieving CR1, 72 relapsed and of these 35 (49%) reached CR2 (1-year CI of CR2; 47%; IQR, 34.8-58.2) and only 15 of 35 (43%) received allogeneic HSCT in CR2 (only 20.8% of all who relapsed); 1-year CI of HSCT 23.4 (IQR, 14-34). Of note, among the 31 patients who died post relapse, 24 were never reviewed for transplantation mostly due to their age and comorbidities (n=16, 66.7%). Donor availability and exclusions from PtRv are shown in the Online Supplementary Figure S5
Intermediate-risk AML (n=117) patients are shown in the Online Supplementary Figure S6. They had a median age of 68.9 years (IQR, 57.3-76.1) and 71 (60.7%) received intensive induction chemotherapy (Table 1; Online Supplementary Table 2S). The 1-year CI of CR1 was 61.5% (IQR, 52-69.79), the 4-year CI of HSCT 34% (IQR, 25.4-42.8), and the 4-year OS was 40% (IQR, 30.7-49.2) (Figure 2). From the 117 intermediate-risk patients, 76 reached CR1. Their median age was 66 years (range, 17-86) and 59 (78%) had received in-
dence interval; ELN: European LeukemiaNet.
overall survival; AML: acute myeloid leukemia; HSCT: hematopoietic stem cell transplantation; HR: hazard ratio; CI: con
by clinical characteristics. (A)
incidence (CI) of transplant candidate patient review (PtRv) by age quartile. Consideration of transplant was significantly lower in older patients (100-day cumulative incidence [CI] of PtRv was 81.8 (interquartile range [IQR], 73.3-87.7), 55.7 (IQR, 46-64.2), 8.8 (IQR, 4.7-14.7) and 0%. (B) CI of transplant PtRv by European LeukemiaNet (ELN) 2017. 100-day CI of PtRv: 42.8 (IQR, 34.650.7), 44.4 (IQR, 35-53.4) and 27.8 (IQR, 21.9-33.9) for good, intermediate, and poor risk, respectively; P<0.001. (C) CI of transplant PtRv by according to the Medical Research Council (MRC) classification. (D) CI of transplant ground round (PtRv) according to de novo vs. secondary acute myloid leukemia. (E) Overall CI of PtRv. AML: acute myeloid leukemia.

tensive chemotherapy. After reaching CR1, 33 patients relapsed (median age was 71 years (range, 37-83) and 24 (73%) had received intensive chemotherapy. Among these 33 relapsing patients, ten (30%) reached CR2 (1-year CI of CR2; 28.6%, IQR, 13.7-45.4) while only seven of ten (70%) received allogeneic HSCT in CR2. Most of them were not considered for HSCT because of age and/or comorbidities. Their donor availability and other exclusions criteria are shown in the Online Supplementary Figure S6 Poor-risk AML patients (n=226) are shown in the Online Supplementary Figure S7. They had a median age of 71 years (range, 16-92) and 59 (26%) received intensive induction chemotherapy (Table 1; Online Supplementary Table S2). Their 1-year CI of CR1 was 34% (IQR, 27.8-40.2), 4-year CI of HSCT was only 17.5% (IQR, 12.8-22.7), and 4-year OS was 13.6% (IQR, 9.3-18.7) (Figure 2). Of these 226 poor-risk patients, 78 (35%) reached CR1. Their median age was 65 (range, 16-89) and 39 (50%) had received intensive chemotherapy. Yet after reaching CR1 (28; 36%), 35 relapsed (median age was 70; range, 16-84) and 17 (49%) had received intensive chemotherapy. Among these 35 relapsing patients, three (8.6%) reached CR2 (1-year CI of CR2; 7.9%; IQR, 2-19.3) and only one patient then received allogeneic HSCT in CR2 (3% of those who relapsed). Among the 29 patients who died post relapse, 17 did not have PtRv because of age and comorbidities.
Four decades of debate considered the role of allogeneic HSCT as post remission treatment of AML.2,3,18,25,26 Most analyses did not consider how many patients achieved remission but did not proceed to a transplant whether due to patient or disease characteristics, suitable donor availability or from physicians’ or patients’ choice. In the present study we included all recent adult patients fully characterized at the clinical, cytogenetic, molecular, and therapeutic levels. The main endpoint was OS. The main factors affecting OS were older age and ELN disease risk.2,3,25,27,28 The patient and disease characteristics were as expected29 and their management of patients met recent standards of care.27
We first assessed concordance of our findings with recent evidence-based reviews and recommendations.3,25 Indeed, considering HSCT as a time-dependent covariate and age, patients with intermediate- and poor-risk AML had improved survival with HSCT while patients with good-risk did not. Overall, the 4-year CI of HSCT in the whole population was 22%. Only one review by Appelbaum provided a crude estimate of HSCT of 25% comparing transplants reported to the CIBMTR versus the expected incidence of AML by SEER in 2015.18 In a prior cohort from the Fred Hutchinson Cancer Research Center 78 of 287 patients with newly
diagnosed AML (median age 57 years) received a transplant in CR130 and another study at the MD Anderson testing RIC HSCT in older patients with AML or MDS, reported that only 14 of 259 (5%) patients were transplanted.31 In a national, population-based cohort, Ostgard reported that 19% of all patients (crude estimate) underwent HSCT for AML while in CR1.32 Finally, one recent study reported a CI of HSCT with competing risk in a propensity score-matched design evaluating the value of venetoclax in patients with newly diagnosed AML.33
Increasing numbers of studies report the outcome of older patients who underwent allogeneic HSCT in AML (reviewed in34 and16–18,35,36). Yet, how many older patients are transplanted is unknown. These papers only report the feasibility of HSCT in selected older patients. In our inclusive cohort, the CI of HSCT varied with age with none of the patients in the oldest quartile and very few in the third quartile who underwent HSCT. Restricting the analyses to patients aged <70 years demonstrated only slightly different results from the overall population with similar trends in HSCT use and outcomes. Although the current study reflects only our own practice and, thus, there is bias of physicians being pro or con in discussing HSCT in older patients, it is likely that the number of such transplants will increase in our team but will be limited to a minority of patients fit enough to undergo HSCT (based more on physiological well-being than on calendar age).
A recent prospective study by the NRCI (AML 16 protocol) studied the value of RIC HSCT in patients aged 60-70 years.16 Only 15.4% of the patients underwent HSCT and patients selected for transplantation were more likely to be <65 years old and have a better performance score. The 4year CI of HSCT also varied according to the ELN classification with 27.9% in good-risk; 58% intermediate- and 37% in poor-risk leukemia. This possibly reflects hesitance to use HSCT in good-risk patients and treatment failures preventing HSCT in the poor-risk group. Here again, current data reports the outcome of transplanted patients according to the ELN classification28 or provide recommendations for HSCT according to ELN.3 In our good-risk ELN patients all but eight patients with high-risk feature were transplanted in CR2 (or beyond) but data reported herein, not only show that the shape of the CI curve varied according to ELN (reflecting transplant in CR1 vs. beyond CR1) but also provide new results showing notably that at 4 years the CI of HSCT in patients with good-risk AML reach that of poor-risk. Most recently Sorror et al. evaluated the benefits of allogeneic HSCT in older (or comorbid) patients with AML and provided no evidence for a benefit of allogeneic HSCT after adjustment for geriatric evaluation. Of note, only 77% of the patients had newly diagnosed AML in this cohort.37 Altogether, our own results and current literature point out the fact that although HSCT is “feasible” in elderly patients it can only be performed in a minority of fit pa-
tients in remission.
Variation in the CI of HSCT according to ELN led to the questions: how many patients in each category were considered for transplantation; and what is the eventual allocation of patients from diagnosis until transplant, no transplant, or death? More than half of the patients were not considered for HSCT. Older age and / or comorbidities in 80% of these patients precluded HSCT consideration. Yet another 20% of patients were not discussed mainly because they had good-risk leukemia. Of 201 patients considered for HSCT, 37 (18%) did not receive HSCT as most of them (65%) had good-risk AML. Finally, we analyzed the allocation of all patients in the three ELN categories from diagnosis. In good-risk patients (n=145), 72 relapsed. The 1-year CI of CR2 was 47.0% and only one in four underwent transplantation. However, since only 35 relapsed good-risk patients achieved CR2 and of those only 15 of 35 (20.8% of those who relapsed) received an allograft in CR2, this may misrepresent the utility of HCT for good-risk AML since few could actually receive it. While the NRCI in 201312 suggested a rationale to postpone transplantation to CR2 because good-risk patients could be salvaged by transplant in CR2 - yet only a net 12-15% of relapsed patients went on to allografting.
Molecular monitoring of measurable residual disease (MRD) in CBF, CEBPα, and NPM1-mutated good-risk leukemias38-36 or with multicolor flow cytometry may recognize an increasing level of MRD. Earlier re-induction may possibly improve the rate of CR2 yet needs to be demonstrated. For intermediate risk the CI of CR2 was 28.6% and only seven of ten finally underwent allogeneic HSCT. For poor risk, the 1-year CI of CR2 was low (7.9%). Altogether, these data for intermediate- and poor-risk patients, reinforce the indication for transplantation in CR1 (reviewed in3,34), whatever the donor type is.
While this study provides comprehensive estimates on the CI of transplantation and a detailed description of out-
1. Estey E, Döhner H. Acute myeloid leukaemia. Lancet. 2006;368(9550):1894-1907.
2. Cornelissen JJ, Blaise D. Hematopoietic stem cell transplantation for patients with AML in first complete remission. Blood. 2016;127(1):62-70.
3. Cornelissen JJ, Gratwohl A, Schlenk RF, et al. The European LeukemiaNet AML Working Party consensus statement on allogeneic HSCT for patients with AML in remission: an integrated-risk adapted approach. Nat Rev Clin Oncol. 2012;9(10):579-590.
4. Short NJ, Rytting ME, Cortes JE. Acute myeloid leukaemia. Lancet. 2018;392(10147):593-606.
5. Ferrara JLM, Levine JE, Reddy P, Holler E. Graft-versus-host disease. Lancet. 2009;373(9674):1550-1561.
6. Döhner H, Weisdorf DJ, Bloomfield CD. Acute myeloid leukemia.
comes, it has some limitations. Our overall approach in the transplantation decision only reflects that of the Hospital Saint Louis in the given period. Other centers are prone to perform HSCT in older patients or to use alternative donors more frequently than we do. Confirming these findings in a larger multi-institutional cohort would help to verify our conclusions. Modern advances in molecular sub setting, ongoing improvements in supportive care and targeted post HSCT therapy may yield continuing advances. The ultimate goal is to better identify patients who most likely benefit from early HSCT and need intensified and more effective anti-leukemia measures in order to cure more patients.
No conflicts of interest to disclose.
GS, ER and LA designed the study. JEG performed all statistical analyses. GS, JEG, and LA wrote the manuscript. All authors reviewed and approved the final version.
This article is dedicated to our friend Elihu Estey who sadly died during the collection and analyses of our data. His deep understanding of AML and his major impact in dissecting biases in the literature on the treatment of AML served as a major driver in the design of this study.
Data-sharing statement
This is a not an intervention study and there is no datasharing plan for this study since the requirements by the International Committee of Medical Journal Editors are not applicable for this study. Individual participant data will not be shared. However, reasonable requests for data-sharing can be addressed to GS.
N Engl J Med. 2015;373(12):1136-1152.
7. Gale RP, Wiernik PH, Lazarus HM. Should persons with acute myeloid leukemia have a transplant in first remission? Leukemia. 2014;28(10):1949-1952.
8. Gale RP, Lazarus HM. Correcting 2 more myths regarding transplants for AML in second remission. Blood. 2014;123(5):794.
9. Estey E, Gale RP. How good are we at predicting the fate of someone with acute myeloid leukaemia? Leukemia. 2017;31(6):1255-1258.
10. Forman SJ, Rowe JM. The myth of the second remission of acute leukemia in the adult. Blood. 2013;121(7):1077-1082.
11. Zittoun RA, Mandelli F, Willemze R, et al. Autologous or allogeneic bone marrow transplantation compared with intensive chemotherapy in acute myelogenous leukemia. European Organization for Research and Treatment of Cancer
(EORTC) and the Gruppo Italiano Malattie Ematologiche Maligne dell’Adulto (GIMEMA) Leukemia Cooperative Groups. N Engl J Med. 1995;332(4):217-223.
12. Burnett AK, Goldstone A, Hills RK, et al. Curability of patients with acute myeloid leukemia who did not undergo transplantation in first remission. J Clin Oncol. 2013;31(10):1293-1301.
13. Burnett AK, Hills RK, Russell N. Twenty five years of UK trials in acute myeloid leukaemia: what have we learned? Br J Haematol. 2020;188(1):86-100.
14. Döhner H, Estey E, Grimwade D, et al. Diagnosis and management of AML in adults: 2017 ELN recommendations from an international expert panel. Blood. 2017;129(4):424-447.
15. Del Galy AS, Marouf A, Raffoux E, et al. Allogeneic hematopoietic stem cell transplantation in elderly patients with acute myeloid leukemia or myelodysplastic syndromes: myth and reality. Leukemia. 2021;35(1):225-228.
16. Russell NH, Hills RK, Thomas A, et al. Outcomes of older patients aged 60 to 70 years undergoing reduced intensity transplant for acute myeloblastic leukemia: results of the NCRI acute myeloid leukemia 16 trial. Haematologica. 2022;107(7):1518-1527.
17. Ustun C, Le-Rademacher J, Wang H-L, et al. Allogeneic hematopoietic cell transplantation compared to chemotherapy consolidation in older acute myeloid leukemia (AML) patients 60-75 years in first complete remission (CR1): an alliance (A151509), SWOG, ECOG-ACRIN, and CIBMTR study. Leukemia. 2019;33(11):2599-2609.
18. Appelbaum FR. Impact of allogeneic hematopoietic cell transplantation on the outcome of older patients with acute myeloid leukemia. Best Pract Res Clin Haematol. 2017;30(4):320-326.
19. Papaemmanuil E, Gerstung M, Bullinger L, et al. Genomic classification and prognosis in acute myeloid leukemia. N Engl J Med. 2016;374(23):2209-2221.
20. Gerstung M, Papaemmanuil E, Martincorena I, et al. Precision oncology for acute myeloid leukemia using a knowledge bank approach. Nat Genet. 2017;49(3):332-340.
21. Sherman RE, Anderson SA, Dal Pan GJ, et al. Real-world evidence - what is it and what can it tell us? N Engl J Med. 2016;375(23):2293-2297.
22. Khoury JD, Solary E, Abla O, et al. The 5th edition of the World Health Organization classification of haematolymphoid tumours: myeloid and histiocytic/dendritic neoplasms. Leukemia. 2022;36(7):1703-1719.
23. Fenwarth L, Thomas X, de Botton S, et al. A personalized approach to guide allogeneic stem cell transplantation in younger adults with acute myeloid leukemia. Blood. 2021;137(4):524-532.
24. Grimwade D, Hills RK, Moorman AV, et al. Refinement of cytogenetic classification in acute myeloid leukemia: determination of prognostic significance of rare recurring chromosomal abnormalities among 5876 younger adult patients treated in the United Kingdom Medical Research Council trials. Blood. 2010;116(3):354-365.
25. Koreth J, Schlenk R, Kopecky KJ, et al. Allogeneic stem cell transplantation for acute myeloid leukemia in first complete remission: systematic review and meta-analysis of prospective clinical trials. JAMA. 2009;301(22):2349-2361.
26. Cornelissen JJ, van Putten WLJ, Verdonck LF, et al. Results of a
HOVON/SAKK donor versus no-donor analysis of myeloablative HLA-identical sibling stem cell transplantation in first remission acute myeloid leukemia in young and middle-aged adults: benefits for whom? Blood. 2007;109(9):3658-3666.
27. Estey EH. Acute myeloid leukemia: 2019 update on riskstratification and management. Am J Hematol. 2018;93(10):1267-1291.
28. Grimm J, Jentzsch M, Bill M, et al. Prognostic impact of the ELN2017 risk classification in patients with AML receiving allogeneic transplantation. Blood Adv. 2020;4(16):3864-3874.
29. Shallis RM, Wang R, Davidoff A, Ma X, Zeidan AM. Epidemiology of acute myeloid leukemia: recent progress and enduring challenges. Blood Rev. 2019;36:70-87.
30. Mawad R, Gooley TA, Sandhu V, et al. Frequency of allogeneic hematopoietic cell transplantation among patients with highor intermediate-risk acute myeloid leukemia in first complete remission. J Clin Oncol. 2013;31(31):3883-3888.
31. Estey E, de Lima M, Tibes R, et al. Prospective feasibility analysis of reduced-intensity conditioning (RIC) regimens for hematopoietic stem cell transplantation (HSCT) in elderly patients with acute myeloid leukemia (AML) and high-risk myelodysplastic syndrome (MDS). Blood. 2007;109(4):1395-1400.
32. Østgård LSG, Lund JL, Nørgaard JM, et al. Impact of allogeneic stem cell transplantation in first complete remission in acute myeloid leukemia: a national population-based cohort study. Biol Blood Marrow Transplant. 2018;24(2):314-323.
33. Lachowiez CA, Reville PK, Kantarjian H, et al. Venetoclax combined with induction chemotherapy in patients with newly diagnosed acute myeloid leukaemia: a post-hoc, propensity score-matched, cohort study. Lancet Haematol. 2022;9(5):e350-e360.
34. Dholaria B, Savani BN, Hamilton BK, et al. Hematopoietic cell transplantation in the treatment of newly diagnosed adult acute myeloid leukemia: an evidence-based review from the American Society of Transplantation and Cellular Therapy. Transplant Cell Ther. 2021;27(1):6-20.
35. McSweeney PA, Niederwieser D, Shizuru JA, et al. Hematopoietic cell transplantation in older patients with hematologic malignancies: replacing high-dose cytotoxic therapy with graft-versus-tumor effects. Blood. 2001;97(11):3390-3400.
36. Devillier R, Forcade E, Garnier A, et al. In-depth time-dependent analysis of the benefit of allo-HSCT for elderly patients with CR1 AML: a FILO study. Blood Adv. 2022;6(6):1804-1812.
37. Sorror ML, Gooley TA, Storer BE, et al. An 8-year pragmatic observation evaluation of the benefits of allogeneic HCT in older and medically infirm AML patients. Blood. 2023;141(3):295-308.
38. Jentzsch M, Bischof L, Backhaus D, et al. Impact of MRD status in patients with AML undergoing allogeneic stem cell transplantation in the first vs the second remission. Blood Adv. 2022;6(15):4570-4580.
39. Balsat M, Renneville A, Thomas X, et al. Postinduction minimal residual disease predicts outcome and benefit from allogeneic stem cell transplantation in acute myeloid leukemia with NPM1 mutation: a study by the Acute Leukemia French Association Group. J Clin Oncol. 2017;35(2):185-193.
40. Ivey A, Hills RK, Simpson MA, et al. Assessment of minimal residual disease in standard-risk AML. N Engl J Med. 2016;374(5):422-433.
Naranie Shanmuganathan,1,2,3,4,5,6,7 Carol Wadham,2,3,5 NurHezrin Shahrin,2,3 Jinghua Feng,5,8 Daniel Thomson,2,3 Paul Wang,3,8 Verity Saunders,4 Chung Hoow Kok,4,5,6 Rob M. King,8 Rosalie R. Kenyon,8 Ming Lin,8 Ilaria S. Pagani,4,6,7 David M. Ross,1,2,3,4,7,9 Agnes S.M. Yong,4,6,7,10 Andrew P. Grigg,7,11 Anthony K. Mills,7,12 Anthony P. Schwarer,7,13 Jodi Braley,2 Haley Altamura,2 David T. Yeung,1,4,5,6,7 Hamish S. Scott,2,3,5,6,8 Andreas W. Schreiber,3,8,14 Timothy P. Hughes1,4,6,7 and Susan Branford2,3,4,5,6
1Department of Hematology, Royal Adelaide Hospital and SA Pathology, Adelaide; 2Department of Genetics and Molecular Pathology, SA Pathology, Adelaide; 3Centre for Cancer Biology, SA Pathology and University of South Australia, Adelaide; 4Precision Cancer Medicine Theme, South Australian Health & Medical Research Institute (SAHMRI), Adelaide; 5Clinical and Health Sciences, University of South Australia, Adelaide; 6Adelaide Medical School, University of Adelaide, Adelaide; 7Australasian Leukemia and Lymphoma Group (ALLG); 8Australian Cancer Research Foundation Genomics Facility, Centre for Cancer Biology, SA Pathology, Adelaide; 9Department of Hematology, Flinders University and Medical Centre, Adelaide; 10The University of Western Australia Medical School, Western Australia; 11Department of Clinical Hematology, Austin Hospital and University of Melbourne, Melbourne; 12Department of Hematology, Princess Alexandra Hospital, Brisbane; 13Department of Hematology, Box Hill Hospital, Melbourne and 14School of Biological Sciences, University of Adelaide, Adelaide, Australia
Correspondence: N. Shanmuganathan naranie.shanmuganathan@sa.gov.au
Received: October 6, 2022.
Accepted: March 16, 2023.
Early view: March 23, 2023.
https://doi.org/10.3324/haematol.2022.282184
©2023 Ferrata Storti Foundation
Published under a CC BY-NC license
The BCR::ABL1 gene fusion initiates chronic myeloid leukemia (CML); however, evidence has accumulated from studies of highly selected cohorts that variants in other cancer-related genes are associated with treatment failure. Nevertheless, the true incidence and impact of additional genetic abnormalities (AGA) at diagnosis of chronic phase (CP)-CML is unknown. We sought to determine whether AGA at diagnosis in a consecutive imatinib-treated cohort of 210 patients enrolled in the TIDEL-II trial influenced outcome despite a highly proactive treatment intervention strategy. Survival outcomes including overall survival, progression-free survival, failure-free survival, and BCR::ABL1 kinase domain mutation acquisition were evaluated. Molecular outcomes were measured at a central laboratory and included major molecular response (MMR, BCR::ABL1 ≤0.1%IS), MR4 (BCR::ABL1 ≤0.01%IS), and MR4.5 (BCR::ABL1 ≤0.0032%IS). AGA included variants in known cancer genes and novel rearrangements involving the formation of the Philadelphia chromosome. Clinical outcomes and molecular response were assessed based on the patient's genetic profile and other baseline factors. AGA were identified in 31% of patients. Potentially pathogenic variants in cancer-related genes were detected in 16% of patients at diagnosis (including gene fusions and deletions) and structural rearrangements involving the Philadelphia chromosome (Ph-associated rearrangements) were detected in 18%. Multivariable analysis demonstrated that the combined genetic abnormalities plus the EUTOS long-term survival clinical risk score were independent predictors of lower molecular response rates and higher treatment failure. Despite a highly proactive treatment intervention strategy, first-line imatinib-treated patients with AGA had poorer response rates. These data provide evidence for the incorporation of genomically-based risk assessment for CML.
Chronic myeloid leukemia (CML) is characterized by the translocation that forms the Philadelphia (Ph) chromosome and the BCR::ABL1 gene fusion. Targeted therapy
with tyrosine kinase inhibitors (TKI)1-5 inhibits the activated BCR::ABL1 enzyme and, while generally very effective,6 treatment outcomes remain heterogenous. Up to 15% of patients are resistant to one or more TKI and progression to blast phase (BP) still occurs in approximately
5% of patients.7 While BCR::ABL1 kinase domain point mutations remain the primary known mechanism of acquired resistance and direct sequential therapy selection,7-9 these mutations are identified in only approximately 50% of cases of TKI resistance.10,11 Kinase domain mutations are not detected at diagnosis in chronic phase (CP) CML and are not the cause of primary resistance, which remains poorly understood. This suggests the existence of alternative resistance pathways.
Unrestrained BCR::ABL1 activity promotes genetic instability and can trigger the development of single nucleotide variants, insertions and deletions.12-16 We previously performed an integrative genomic analysis in a discovery cohort of CP-CML patients at diagnosis who were specifically selected based on optimal or very poor outcomes, and found that patients who subsequently progressed to BP had a signifi cantly higher frequency of cancer-related gene variants at diagnosis compared with patients who achieved an optimal molecular response (54% vs. 16%).17 Furthermore, all patients tested at BP had one or more cancer gene variants in addition to BCR::ABL1, which included gene fusions and gene deletions.17,18
Genomic profiling also uncovered novel genomic rearrangements associated with the formation of the Ph chromosome, termed Ph-associated rearrangements.17 These were structural variants defined as aberrant fusions formed at the time of the Ph translocation, involving rearrangement of genes or sequences on the translocated chromosomes. It is likely that many such variants constitute near-simultaneous genomic rearrangements due to repair of additional double strand breaks related to the formation of the Ph chromosome. They were characterized by sequence fragmentation, non-contiguous deletion, inversion, and imperfect reassembly, likely resulting from genomic ‘shattering’ and attempted realignment into a mosaic patchwork of genomic fragments.17,19 These chromoplexy-like rearrangements20 were highly complex in some patients and have been described in other malignancies to correlate with accelerated cancer evolution.21 In our discovery cohort, Ph-associated rearrangements were more frequently observed in patients with poor outcomes (33%) compared with those achieving optimal molecular targets (11%).17 These genomic findings notwithstanding, the true clinical implications of cancer gene variants and Ph-associated rearrangements at the time of CP-CML diagnosis is unknown. Multiple studies have linked cancer gene variants at diagnosis and poor outcome for imatinib-treated patients,17,22,23 but there has been no systematic evaluation of unselected cohorts to establish the true incidence and clinical risk conferred by genetic abnormalities at diagnosis.
In this study, we investigated the clinical relevance of variants in cancer-related genes that were classified as pathogenic or potentially pathogenic (including gene fusions
and deletions), and Ph-associated rearrangements detected at the time of diagnosis in a consecutive cohort of imatinib-treated patients who received rapid treatment intervention that was largely based on time-dependent molecular milestone response values. We show that these genetic abnormalities when detected at the time of diagnosis have a significant impact on treatment response and outcome. The prognostic effect of the genetic abnormalities was independent of the EUTOS long-term survival (ELTS) score, which has already been demonstrated to be discriminative of survival in the TKI era.24 Our data validate and expand the findings from previous discovery cohort studies where the results suffered from selection bias since patients were selected for sequencing based on their known outcome.17,22,23
Ethics approval was obtained from the local Institutional Review Board and the study was performed in accordance with the Declaration of Helsinki.
The total cohort of 210 adult CP-CML patients enrolled in the Australasian Leukemia and Lymphoma Group CML9 study (TIDEL-II, ACTRN12607000325404) were investigated.25 Patients were treated with first-line imatinib 600 mg daily with active intervention: either dose escalation or nilotinib switch for lack of achievement of time-dependent molecular milestones. Imatinib was also dose escalated for subtherapeutic trough levels (<1000 ng/mL) at day 22. The molecular milestones were BCR::ABL1 transcript ratios of ≤10%, ≤1%, and ≤0.1%IS at 3, 6 and 12 months, respectively, similar to those subsequently adopted by the European LeukemiaNet (ELN) as optimal time-dependent responses to TKI therapy.26 Patients were also switched to nilotinib for imatinib intolerance or loss of response, defined as at least one of the following: loss of confirmed complete hematologic response or major cytogenetic response, cytogenetic clonal evolution, a confirmed >5-fold increase in BCR::ABL1 ratio from nadir to a level >0.1% resulting in loss of MMR, a greater than 2-fold increase from nadir in BCR::ABL1 ratio to a level of >10%, detection of >50% mutant BCR::ABL1, or disease transformation to accelerated phase (AP) or BP.25 The method of TKI compliance assessment is included in the Patient Compliance Assessment available in the Online Supplementary Appendix.
Following appropriate approval from the local institutional review board, diagnostic blood samples were sequenced using a customized RNA-based capture panel of 126 genes27 (Online Supplementary Table S1), or whole exome and/or
whole transcriptome sequencing, as previously described.17 We previously demonstrated that total RNA is suitable for detecting multiple different types of variants, including single nucleotide variants (SNV), small insertions and deletions (indels), fusions (genomic and transcripts), and gene deletions and their corresponding genomic breakpoints from pre-spliced RNA.17,27 Identified variants were reviewed using strict criteria, as detailed previously.17 Of the variants that met our criteria for damaging, we only included those considered as likely pathogenic or pathogenic using the criteria set out in joint consensus standards for the classification of somatic variants.28,29 Further details on sequencing methods are provided in the Online Supplementary Methods.
We assessed the association between specific baseline variables and molecular response and outcome by four years, including additional genetic abnormalities (AGA), ELTS clinical risk scores, age, sex, and BCR::ABL1 transcript type. AGA were assessed both in aggregate and in separate categories (cancer gene variants and Ph-associated rearrangements). Variables with P values <0.05 using univariate analysis were assessed in bi/multivariable analysis for the relevant outcome. Confounding variables that were significant using univariate testing required separate assessment on bi/multivariable analysis, such as age and ELTS. The Bayesian information criterion indicated the best multivariable model for selection. Variables that emerged as significant on univariate analysis were assessed for independence utilizing the variance inflation factor to test for multicollinearity. Multiple comparison correction was performed using the Benjamini-Hochberg Method.30 Overall survival (OS) and failure-free survival (FFS) were calculated through Kaplan-Meier estimates and log-rank tests. Patients were censored at study withdrawal or completion of follow-up visits. Independent predictors of OS and FFS were tested using Cox regression analysis. Failure events were as currently defined by the ELN,7 which included failure to achieve time-dependent molecular milestones, acquisition of BCR::ABL1 kinase domain mutations, AP/BP and death by any cause. The cumulative incidence of BCR::ABL1 kinase domain mutation acquisition and disease progression to AP or BP were assessed through Fine-Gray modeling, as were the molecular outcomes of major molecular response (MMR, BCR::ABL1 ≤0.1%IS), MR4 (BCR::ABL1 ≤0.01%IS), and MR4.5 (BCR::ABL1 ≤0.0032%IS). Schoenfeld residuals were used to test the assumption of proportional hazards. Death not related to AP/BP and progression to AP/BP were considered competing risks. Statistical analysis was performed using GraphPad Prism 8.0.0 and R version 4.1.2.
This trial was registered on www.anzctr.org.au with the identifier ACTRN12607000325404.
Diagnostic samples were successfully sequenced for 200 of the 210 patients (95%) with characteristics of these patients summarized in Table 1. The median follow-up of patients was 37 months (range 2.5-48 months). RNA capture panel sequencing was available for 188 patients, and 12 patient samples were sequenced using whole-exome sequencing and/or whole transcriptome RNA-Seq.17 Data for 17 samples have been previously reported.17 Six samples were sequenced using RNA-seq and repeated using the RNA capture panel to demonstrate concordance, and have been reported previously.27 Results were not available for nine patients due to RNA degradation or inadequate sample. BCR::ABL1 fusion transcripts were detected in all samples and the genomic breakpoints that generated the BCR::ABL1 transcript were detected in 85% of patients (Online Supplementary Table S2).
At the time of diagnosis, 40 SNV and indels in cancer genes were detected in 33 patients (16%) across ten genes (Figure 1A). One of these patients also had a gene fusion involving IKZF1 and a deletion involving RUNX1, and rapidly progressed to BP (see Figure 2). Ph-associated rearrangements were identified in 36 patients (18%). The complexity of these rearrangements is detailed in Figure 1B, Online Supplementary Figure S1, and in the Online Supplementary Results. There was no significant difference in the age of patients without AGA (median age 50 years, range 17-81 years) compared to those with cancer gene variants (median age 51 years, range 23-71 years) or Ph-associated rearrangements (median age 45 years, range 17-79 years). Overall, 121/200 patients (61%) expressed the reciprocal ABL1::BCR transcript. Ph-rearrangements were strongly associated with the absence of ABL1::BCR. Of 36 patients with Ph-associated rearrangements, only one expressed ABL1::BCR. The rearrangement for this patient comprised a genomic inversion between BCR and ABL1 that was immediately adjacent to the standard BCR::ABL1 genomic breakpoint. Lack of a reciprocal transcript in 97% of patients with a Ph-associated rearrangement is consistent with deletion or rearrangement of sequence adjacent to the ABL1 and/or BCR breakpoints in many cases. Online Supplementary Table S2 details the predicted size of deletions based on the genomic location of the fusion partners of patients with Ph-associated rearrangements. Eight patients had both cancer gene variants and Ph-associated rearrangements, accounting for 4.5% of the sequenced population. Collectively, 61 patients (31%) harbored AGA. The data for individual patients are detailed in Online Supplementary Table S2.
ASXL1 was the most frequently mutated gene at diagnosis (Figure 1A) with 20 variants observed in 18 of 200 patients
AGA: additional genetic abnormalities; Ph-associated: Philadelphia chromosome-associated; yrs: years; ELTS: EUTOS long-term survival score; BP: blast phase; N/A: not available. *Included one patient with e1a2 and one patient with e13a3 BCR::ABL1 transcripts.
(9.0%). Further details of patients with mutated ASXL1 are provided below. Other genes mutated in multiple patients were RUNX1, DNMT3A and TET2. Two patients had BCORL1 variants at diagnosis and both progressed to BP (see Figure 2). Four patients had evidence of clonal hematopoiesis of indeterminate potential with somatic variants affecting DNMT3A, ASXL1 or TET2 that were detected in both the diagnosis and remission samples, and therefore likely predated the acquisition of the Ph chromosome. Three of these four patients achieved an optimal response while one failed therapy and acquired a BCR::ABL1 kinase domain mutation; this patient also had a distinct somatic ASXL1 variant exclusively within the leukemic clone at diagnosis. Variants that affected RNA splicing were also identified by this methodology (Online Supplementary Figure S2A, B).
We investigated the clinical impact of the AGA on response and outcome. The presence of any genetic abnormality (cancer gene variant or Ph-associated rearrangement) predicted inferior FFS and molecular responses.
There were eleven deaths by the end of the 4-year follow-up period with an OS of 94% (95% CI: 87.9-97.9%)
(Online Supplementary Figure S3A). Six patients succumbed to non-CML-related causes of death (4 cardiacrelated deaths, one cerebrovascular accident, one secondary to infection, and one unknown cause of death). Eight patients progressed to BP (5 myeloid and 3 lymphoid BP) and no patient progressed to AP, with a cumulative incidence of progression of 6% (95% CI: 2.3-12.0%) (Online Supplementary Figure S3B). Of the eight patients that progressed to BP, five died. No variable predicted for progression to BP or OS by Cox regression analysis.
The 4-year estimate of FFS, as defined by the ELN, was 77% (95% CI: 70.2-82.3%) (Online Supplementary Figure S3C). Univariate analysis confirmed that AGA at diagnosis predicted for inferior FFS (69% vs. 80%, P=0.03) (Figure 3A). The ELTS score was also a predictor of FFS (Online Supplementary Figure S4A). No other baseline variable predicted FFS. Multivariable analysis using Cox regression analysis confirmed that the only independent predictors of FFS were the presence of AGA at diagnosis (P=0.04) and the ELTS score (P=0.001) (Table 2).

Figure 1. The genomic findings of the TIDEL-II cohort at diagnosis. (A) Oncoplot of additional genetic abnormalities identified at diagnosis. (B) The predominant Philadelphia chromosome (Ph)-associated rearrangements for individual patients based on the fusion read counts are shown. The diversity of the partner genes (outer circle) involved in the Ph-associated rearrangements is illustrated. Color of the inner circle corresponds to the chromosome location of the involved gene. Width of the ribbon correlates with the frequency of co-occurrence of the fusion partner. All events were in addition to the primary BCR::ABL1 transcript. The complete list of Ph-associated rearrangements is documented in Online Supplementary Table S2. Fusions between BCR and ABL1 in the Circos plot represent inversions.
tions with a cumulative incidence of 6% by four years (95% CI: 3.3-10.2%) (Online Supplementary Table S2 and Online Supplementary Figure S3D). The kinase domain mutations were acquired at a median of 323 days (range 85-722 days) from TKI commencement. By univariate analysis, having an AGA at diagnosis predicted for the acquisition of BCR::ABL1 kinase domain mutations by four years (15% vs. 2%, P<0.001) (Figure 3B). Notably, Ph-associated rearrangements were strongly associated with the acquisition of kinase domain mutations (P<0.001) (Online Supplementary Table S3). While the ELTS score was a significant predictor of the acquisition of kinase domain mutations on univariate analysis (Table 2), the false discovery rate corrected for this. AGA at diagnosis remained the only predictor for the acquisition of BCR::ABL1 kinase domain mutations.
Molecular responses by four years
Inferior achievement of MMR, MR4 and MR4.5 was associated with the presence of AGA at diagnosis. MMR at 12 months of TKI therapy is an optimal response7 and lack of MMR at the 12-month milestone was a trigger for treatment intervention for the study cohort. By 12 months, the cumulative rate of MMR was 61% (95% CI: 54-67%) for the study population (Online Supplementary Figure S3E). The rate of MMR by 12 months in patients with AGA was significantly lower than those without these events (46% vs. 67%, P=0.005) (Figure 3C). The overall cumulative rate of MMR by four years was 82% (95% CI: 76-87%). Univariate analysis (Table 2) demonstrated that AGA at diagnosis predicted for an inferior cumulative incidence of MMR by four years compared with patients without these events (72% vs. 86%, P=0.007) (Figure 3C). ELTS was a predictor for MMR by four years: 87%, 73% and 68% for low-, intermediate- and high-risk groups, respectively (P<0.001) (Online Supplementary Figure S4B). To avoid collinearity, age and ELTS were assessed separately with AGA at diagnosis using bivariable analysis. The strongest model contained both AGA (P=0.025) and the ELTS score (P<0.001) (Table 2).
By four years, 59% (95% CI: 51-65%) and 43% (95% CI: 3550%) of evaluated patients achieved MR4 and MR4.5, respectively, by Fine-Gray modeling (Online Supplementary
Figure S3F, G). AGA were associated with a significantly lower incidence of MR4 (37% vs. 67%, P=0.001) and MR4.5 (27% vs. 49%, P=0.03) (Figure 3D, E). The strongest multivariable analysis demonstrated that AGA and the ELTS
score were the only independent predictors of MR4 (AGA P=0.004 and ELTS P<0.001) and MR4.5 (AGA P=0.03 and ELTS P=0.02) (Table 2).
Combining additional genetic abnormalities and EUTOS long-term survival clinical risk score to predict molecular outcomes
As AGA and ELTS were the only independent predictors of FFS, MMR, MR4 and MR4.5, the impact of combining the two variables for the prediction of these outcomes was assessed. The intermediate-risk and high-risk groups tracked together for each of the assessed outcomes, and, as they were not statistically different from each other, the two groups were combined to increase sample size. AGA were detected in 34 of 126 patients (27%) with low ELTS score but did not predict FFS (Figure 4A). For the combined intermediate- (n=46) / high-risk (n=19) patients, 25 of 65 (38%) had AGA. FFS was significantly inferior for intermediate-/high-risk patients with AGA compared with those without (46% vs. 71%, respectively, P=0.04) (Figure 4B). With respect to MMR achievement, the impact of combining AGA and ELTS was evident across the low-risk and intermediate-/high-risk groups (Figure 4C, D). The cumulative incidence of MMR by 12 months for low-risk ELTS patients with AGA was 50% (95% CI: 32-66%) compared with 77% (95% CI: 67-85%) for low-risk patients without AGA (P=0.003) (Figure 4C). For intermediate- / high-risk ELTS patients, the respective values were 20% (95% CI: 7-31%) compared with 43% (95% CI: 32-58%) for those without (P=0.03) (Figure 4D). Notably, none of the 19 patients in the high-risk ELTS group with an AGA achieved MMR by 12 months. The statistical difference observed at 12 months was not observed at 48 months and was likely due to patients with AGA having slower achievement of MMR, but eventually reaching the target milestone.
Inferior MR4 and MR4.5 were predicted by the presence of AGA among the ELTS risk groups. MR4 in low-risk ELTS patients with AGA was lower compared with those without AGA (48% vs. 72% by four years, P=0.025) (Figure 4E). The respective values for intermediate- / high-risk ELTS patients were 17% versus 59% (P=0.011) (Figure 4F). No patient with high-risk ELTS with AGA at diagnosis achieved MR4 by four years. The cumulative incidence of MR4.5 by four years in the low-risk ELTS group with AGA was 36% versus 55% in those without AGA (P=0.053) (Figure 4G). The respective values for intermediate- / high-risk ELTS
Figure 2. The clonal dynamics of two patients with ASXL1 variants at diagnosis illustrated by fishplots. (A) Patient 430 had a Philadelphia chromosome (Ph)-associated rearrangement in addition to the BCR::ABL1 clone (dark blue) at diagnosis. The Ph-associated rearrangement involved an inversion between ABL1 exon 1 and an intergenic region on chromosome 17q12. In addition, two mutant subclones were detected at diagnosis. One clone contained an ASXL1 frameshift variant (light blue) and the second subclone harbored a BCORL1 frameshift variant, a 34 Kb RUNX1 deletion, and an IKZF1::IGKV3-7 fusion (represented in pink). With the decline of BCR::ABL1 in response to imatinib, the subclones were reduced and the ASXL1 clone became undetectable. However, the second clone expanded and evolved to lymphoid blast phase at 4 months of imatinib. Several independent subclones arose from the original BCORL1/RUNX1/IKZF1 subclone, including an SMC3 nonsense variant, an EZH2 missense variant, and six ABL1 kinase domain mutations. The second patient (384) harbored a single ASXL1 nonsense variant at diagnosis. A rapid deep molecular response was achieved and the ASXL1 subclone became undetectable. The optimal response was maintained. (B) Integrative Genomics Viewer (IGV) screenshot of amino acids 252-255 of ABL1 of patient 430, demonstrating that the Q252H, Y253H, E255K and E255V kinase domain mutations were on separate reads, which indicates that these mutations were in separate clones and were not compound mutations. Only a proportion of each of the mutant reads is shown. TKI: tyrosine kinase inhibitor.

patients were 9% versus 24% (P=0.12) (Figure 4H). Again, among the high-risk ELTS patients, none with AGA achieved MR4.5 by four years.
Impact of additional genetic abnormalities on molecular response for patients who switched to nilotinib Trial-specific criteria for imatinib dose escalation or
switch to nilotinib occurred for time-dependent suboptimal molecular response,25 which was more proactive than in current treatment guidelines. Patients also switched to nilotinib for loss of response or imatinib intolerance. Seventeen patients dose escalated imatinib to 800 mg daily due to failure to meet trial-defined targets, which included six patients with AGA. TKI switch to nilotinib due
to failure to reach a subsequent milestone occurred in 14/16 evaluable patients. One patient switched to nilotinib due to intolerance of the higher imatinib dose, whereas two patients with AGA achieved the subsequent molecular milestone. All that can be concluded from these limited data is that dose escalation of imatinib based on failure criteria had limited response, irrespective of the presence of AGA or not. We assessed whether switch to nilotinib for any reason other than imatinib intolerance could rescue the inferior responses associated with AGA at diagnosis. Fifty-three patients switched to nilotinib for reasons other than imatinib intolerance at a median of 189 days (range 85-678 days) (Online Supplementary Table S4), and the switch occurred more often in patients with AGA than patients without (40% vs. 20%, respectively, P=0.004).

The cumulative incidence of MMR by four years for the 53 patients who switched to nilotinib for reasons other than intolerance was numerically lower if AGA were present at diagnosis, although this did not reach significance (59% vs. 74%, P=0.11) (Figure 5A). Fourteen of the 53 patients switched to nilotinib at 12 months for lack of MMR, and 11 of these 14 achieved MMR following nilotinib switch. The cumulative incidence of MR4 by four years was significantly lower if AGA were present at diagnosis (13% vs. 47%,
Figure 3. Additional genetic abnormalities at diagnosis were an independent predictor of specific outcomes and molecular responses. The graphs show the outcomes and responses according to additional genetic abnormalities (AGA) status at diagnosis. (A) Kaplan-Meier estimates of failure-free survival. (B) Cumulative incidence of the acquisition of BCR::ABL1 kinase domain mutations. (C) Cumulative incidence of major molecular response. (D) Cumulative incidence of MR4. (E) Cumulative incidence of MR4.5. The number at risk table is included below the relevant graphs. TKI: tyrosine kinase inhibitor.
P=0.003) (Figure 5B). Likewise, the 4-year cumulative incidence of MR4.5 was only 6% if AGA were present compared with 24% for patients without AGA (P=0.046) (Figure 5C). There was no significant difference in the cumulative incidence of 12-month MMR, 4-year MR4 or MR4.5 for the 24 patients who switched to nilotinib for imatinib intolerance, irrespective of the presence of AGA (data not shown).
ASXL1 was the most frequently mutated cancer-associated gene at diagnosis. Eighteen patients had frameshift, nonsense or splice site ASXL1 variants. These 18 patients had an inferior 4-year FFS compared with patients with other AGA or without any AGA (60% vs. 75% vs. 81%, respectively, P=0.045) (Figure 6A). Evolution to BP was only observed for one patient with mutated ASXL1 at diagnosis, although the ASXL1 mutant was noticeably absent at progression (Figure 2). Notably, four of the 18 patients (22%) acquired BCR::ABL1 kinase domain mutations, compared with 12% of patients with other AGA and 2% of patients without any AGA (P<0.001) (Figure 6B). None of the other molecular outcomes were significantly different between patients with mutant ASXL1, other AGA, or those with no AGA. The most frequently detected ASXL1 variant in our
cohort was a nonsense variant at R693, which was identified in six of the 20 patients with ASXL1 variants (Online Supplementary Table S2). This is among the most frequently reported ASXL1 variant. Only two patients had the ASXL1 mutant G646Wfs*12 at the time of diagnosis in our cohort, which is the most frequently reported ASXL1 variant.
Interestingly, not all patients with ASXL1 mutants at diagnosis had an adverse outcome. Figure 2 contrasts the dy-
namics of clonal expansion and disappearance of two patients with responses spanning either end of the therapeutic spectrum. At diagnosis, patient 430 had a Ph-associated rearrangement as part of the BCR::ABL1 clone, plus two mutant subclones; one harbored an ASXL1 frameshift variant and the other harbored a BCORL1 frameshift variant, an IKZF1 fusion and a RUNX1 deletion. The patient rapidly progressed to lymphoid BP at four months after an initial response to imatinib, and additional
Variables with P≤0.05 in univariate analysis following false-discovery correction were included in the multivariable analysis models. CI: Confidence Interval; N: number; AGA: additional genetic abnormalities; FDR: false discovery rate; F: female; M: male; KD: kinase domain; MMR: major molecular response; yrs: years; ELTS: EUTOS long-term survival score. For ELTS clinical risk groups, P values are compared with the low-risk group. *Univariate and multivariable analysis for kinase domain mutation acquisition, MMR, MR4 and MR4.5 were assessed with Fine and Gray modeling. This utilizes sub-distribution hazard ratios, which are reported here.
sequencing was performed.17,27 The ASXL1 subclone became undetectable, whereas the second 3-mutant subclone expanded and evolved at BP. Eight additional variants were detected at BP, including six ABL1 kinase domain mutations. In contrast, patient 384 had a single ASXL1 nonsense variant at diagnosis and an excellent response to imatinib therapy. A deep molecular response was achieved at six months and the ASXL1 variant became undetectable by four months. The epigenetic modifier ASXL1 may not harbor intrinsic transformation potential, and additional genomic events may be necessary for progression.
This study, involving a large unselected cohort of consecutively treated CP-CML patients initiated with first-line imatinib,27 expands the results of our prior genomic analysis
of a highly selected patient cohort.17 A higher frequency of AGA at diagnosis was an independent predictor of treatment failure and inferior molecular responses. The data also expand the findings of other genomic studies where patients were retrospectively selected for sequencing based on their known clinical outcome.22,23 Whether more potent TKI when administered as first-line therapy can abrogate the inferior responses associated with AGA22 needs to be further investigated. However, the results presented in this study suggest a highly proactive approach with TKI switch for failure and sub-optimal molecular response may not completely negate the adverse impact of AGA. In our unselected CML cohort, AGA were detected in 31% of patients at diagnosis, and were associated with inferior FFS and molecular responses, even when patients were treated with a highly proactive intervention strategy involving imatinib dose escalation and/or switch to nilotinib for suboptimal molecular responses. For example, the 4-year rate of MR4 in ENESTnd was 32% in the imatinib-treated cohort
Figure 4. Failure-free survival and molecular response among the EUTOS long-term survival score risk groups according to additional genetic abnormalities at diagnosis. Failure-free survival (FFS) according to (A) low and (B) intermediate-/high-risk EUTOS long-term survival score (ELTS). The 48-month cumulative incidence of major molecular response (MMR) according to (C) low and (D) intermediate-/high-risk ELTS; 12-month values indicated. The 4-year cumulative incidence of MR4 according to (E) low and (F) intermediate/high-risk ELTS, and the 4year cumulative incidence of MR4.5 according to (G) low and (H) intermediate-/highrisk ELTS. TKI: tyrosine kinase inhibitor.

where patients were randomized to receive 400 mg daily of imatinib.3 In comparison, the 4-year rate of MR4 in the TIDEL-II study population was 59%, which is similar to the MR4 rate achieved by the matched timepoint in the nilotinib 300 mg twice daily arm of the ENESTnd study (56%).3 Therefore, conventional dosing of imatinib (i.e., 400 mg daily) will likely produce more marked differences than observed in this study.
The independent predictors of patient outcome (inferior FFS, acquisition of BCR::ABL1 kinase domain mutations, lower rates of MMR, MR4 and MR4.5) were AGA at diagnosis and the ELTS clinical risk score. No variable predicted OS or progression to AP/BP, but progression was uncommon in the study population. Combining AGA and the ELTS risk category further differentiated subgroups with inferior molecular responses. In particular, patients with intermediate/ high-risk ELTS who had AGA at diagnosis had inferior FFS and molecular responses. Notably, none of the eight patients in the high-risk ELTS group with AGA achieved MMR by 12 months or MR4 and MR4.5 by four years. ASXL1 variants have been associated with an inferior outcome in many myeloid malignancies, including CML.31 Fur-

thermore, it is among the most frequently mutated genes at BP of CML.17,23,32,33 Mutated ASXL1 was associated with lower response rates to the third-generation TKI, olverembatinib, and higher risk of progression and death.31 Consistent with other studies,33 ASXL1 was the most frequently mutated cancer gene at diagnosis in our cohort (9%), and ASXL1 variants were associated with inferior FFS and higher risk of BCR::ABL1 kinase domain mutation development compared with other AGA. The most frequently reported ASXL1 variant in myeloid neoplasms is G646Wfs*12.34 The reliable detection of this mutant above background reads using next-generation sequencing requires a simple set of metrics.35 Only two patients in our cohort (1%) had the ASXL1 variant G646Wfs*12 at the time of diagnosis. In contrast, this variant has recently been reported at a high frequency in CP- or AP-CML patients with resistance to imatinib and/or second-generation TKI.31 The frequency of specific ASXL1 variants may vary depending on the disease phase, and characterization of much larger cohorts will be needed to confirm the prognostic effect of variants in individual genes. Ochi et al. assessed clonal evolution of genetic abnormalities in blastic transformation of CML.32
Figure 5.
on molecular response for patients who switched to nilotinib for trial-defined failure criteria. Outcomes and responses according to additional genetic abnormalities (AGA) status at diagnosis in patients who switched to nilotinib for trial-defined nilotinib switch criteria, excluding imatinib intolerance. (A) Cumulative incidence of major molecular response (MMR). (B) Cumulative incidence of MR4 by 4 years. (C) Cumulative incidence of MR4.5 by 4 years. TKI: tyrosine kinase inhibitor.
Almost all patients with mutant ASXL1 gained additional genetic abnormalities during progression to BP, suggesting that mutant ASXL1 clones may gain a more transforming phenotype through clonal evolution. Targeted therapeutic approaches for mutant ASXL1 could be a possible future treatment strategy. Mutant ASXL1 was reported to drive response to the BCL2 inhibitor venetoclax in vitro36 and a small molecule inhibitor of BAP1 inhibited mutant ASXL1driven leukemic gene expression and impaired tumor growth in vivo 37

Ph-associated rearrangements are a novel genomic level event associated with the formation of the Ph chromosome that has only recently been described in CML.17 We found a strong correlation between the presence of Ph-associated rearrangements and the acquisition of BCR::ABL1 kinase domain mutations and significantly inferior molecular responses. Every rearrangement was novel and unique to individual patients. Whether these structural rearrangements directly influence response and outcome or if they are a marker of genomic instability is unknown. Ph-associated rearrangements may be associated with defective DNA double-strand break repair. When DNA repair mechanisms are not properly regulated, genome integrity may not be maintained. Major repair mechanisms of double strand breaks are homologous recombination or the error prone non-homologous end joining. It is not yet known whether homologous recombination repair deficiency plays a role in the generation of Ph-associated rearrangements, which could trigger use of error prone non-homologous end joining repair.38-41 Complexity associated with the formation of the Ph chromosome for some patients was revealed by
using higher resolution next-generation sequencing techniques, demonstrating added layers of genomic intricacies beyond the previously reported derivative 9 deletions. Furthermore, Ph-associated rearrangements were strongly associated with the absence of the ABL1::BCR reciprocal transcript, which is consistent with disruption of sequences adjacent to breakpoints on the derivative chromosomes. It is also consistent with the absence of ABL1::BCR transcripts previously reported for patients with large deletions adjacent to the translocation breakpoints identified by fluorescence in situ hybridization.42,43 Some rearrangements involved genomic inversions, fragmentation, circularization and random reassembly, potentially from genomic ‘shattering’. These have been described in other malignancies and associated with therapy resistance.44 The Ph-associated rearrangements emphasize that the formation of the BCR::ABL1 gene fusion in some patients may result from a multi-step process.45,46 Similar rearrangements have been identified in other fusion-based hematologic malignancies, such as acute promyelocytic leukemia,47,48 characterized by the PML::RARA fusion, and RUNX1::RUNXT1-mutated acute myeloid leukemia,49,50 a subtype generally associated with a favorable prognosis. In both contexts, these genomic findings have been associated with poor outcomes.47,49 The promiscuous KMT2A gene defines a category of aggressive high-risk leukemia with over 100 fusion partners.51,52 A subset of these patients had complex chromosomal rearrangements, internal tandem duplications, focal gene deletions, and 11q chromosomal inversions and insertions.51 While further investigation is required to clarify the clinical and biological significance of
these rearrangements, they may be a hallmark of genomic instability. A customized RNA-capture panel, designed specifically to identify novel genomic rearrangements associated with the expected fusions characterizing the specific leukemias, could illuminate the complexity of these events. Risk stratification in CML in the TKI era has relied upon clinical and laboratory parameters within the Sokal risk score, and more recently has included the ELTS score. The rate of early BCR::ABL1 decline in response to TKI therapy has also been utilized to differentiate patient outcomes, with TKI switch recommended for patients failing to adequately meet the critical molecular milestones recommended within the first 12 months of TKI initiation. However, there is increasing awareness of the influence of cancer-gene variants for risk stratification in other hematologic malignancies, and genetic profiling has been incorporated into diagnostics, prognostication and treatment algorithms.53-56 Our work supports and expands the landscape of AGA and reveals their effect on outcomes for patients with CML. Exploration of the complexities of Ph-associated rearrangements will also be useful as a novel predictor of adverse outcomes in CML, and may pave the way for similar findings in other fusion-based cancers. While the TIDEL-II therapeutic approach does not reflect current treatment practices (where patients are treated with first-line second-generation TKI or imatinib at a standard dose of 400 mg), it highlights the fact that, despite higher dose first-line imatinib, aggressive monitoring and proactive TKI switching, the negative effect of AGA could not be overcome. Whether upfront treatment with more potent second-generation TKI can nullify the inferior outcomes we observed for patients with AGA at diagnosis remains to be established. If this is proven, optimal TKI selection in CML could integrate the genomic landscape into risk stratification, in addition to other factors that influence selection of therapy, such as toxicity profile and patient comorbidity. Early consideration of allogeneic stem cell transplantation or novel therapeutic approaches in patients stratified as very high risk of treatment failure and inferior molecular responses based on their individual genetic and clinical profile may be justified. Very high-risk features may include the detection of multiple AGA at diagnosis, as was observed for patient 430 who had rapid progression at four months of imatinib (Figure 2). Expanded data are required to establish the genomic criteria that define very high risk.
NS received honoraria from Novartis and meeting sponsorship from Novartis, Amgen, and Janssen. SB is a member of the advisory boards of Qiagen, Novartis and Cepheid, and received honoraria from Qiagen, Novartis, Bristol-Myers
Squibb, Incyte and Cepheid, and research funding from Novartis and Cepheid. ASY is a member of the advisory board for Novartis, and received research funding from Novartis, Bristol-Myers Squibb and Celgene, and honoraria from Novartis and Bristol-Myers Squibb. AKM is a member of the advisory boards of Sobi and Novartis, and received speaker fees from Abbvie and meeting sponsorship from MSD and Amgen. DMR has received research funding and honoraria from Novartis and Bristol-Myers Squibb and honoraria from Takeda. APG received honoraria from Roche, MSD, Janssen, Novartis and Amgen while having advisory roles for MSD Oncology, Janssen and Novartis. TPH is a member of the advisory boards and has receiv ed research funding and honoraria from Novartis and Bristol-Myers Squibb. The other authors declare no conflicts of interest.
NS collected and analyzed the data, and wrote the paper. CW designed the probes for the RNA capture panel, prepared samples, and analyzed the data. NHS, VS, RRK, ML, JB and HA prepared samples and completed the required laboratory work. AWS, JF, PW, DT and CHK performed the bioinformatic analysis and pipeline development. IP, ASY, RMK, DMR, AKM, APS, APG, DTY and HS reviewed the manuscript. DTY, APG and TPH designed and conducted the TIDEL II trial and co-ordinated the correlative studies. TPH contributed key concepts and assisted in writing the paper. SB designed the research, analyzed the data, contributed key concepts and methodology, and assisted in writing the manuscript.
NS received scholarship funding from the Royal Adelaide Hospital Research Foundation Dawes Scholarship. SB received support from the National Health and Medical Research Council of Australia (APP1117718, APP1138935, APP1027531), from the Ray and Shirl Norman Research Trust and the Cancer Council SA’s Beat Cancer Project on behalf of its donors, and the State Government of South Australia through the Department of Health. TPH received support from the National Health and Medical Research Council of Australia (APP1135949) and has the financial support of Cancer Council SA’s Beat Cancer Project on behalf of its donors and the State Government of South Australia through the Department of Health. The TIDEL II study was sponsored by the Australasian Leukemia and Lymphoma Group.
De-identified participant data collected for our study can be made available to researchers once appropriate ethical approval and a signed data access agreement is obtained.
1. Hochhaus A, Larson RA, Guilhot F, et al. Long-term outcomes of imatinib treatment for chronic myeloid leukemia. N Engl J Med. 2017;376(10):917-927.
2. Hehlmann R, Lauseker M, Saußele S, et al. Assessment of imatinib as first-line treatment of chronic myeloid leukemia: 10year survival results of the randomized CML study IV and impact of non-CML determinants. Leukemia. 2017;31(11):2398-2406.
3. Hochhaus A, Saglio G, Hughes TP, et al. Long-term benefits and risks of frontline nilotinib vs imatinib for chronic myeloid leukemia in chronic phase: 5-year update of the randomized ENESTnd trial. Leukemia. 2016;30(5):1044-1054.
4. Cortes JE, Saglio G, Kantarjian HM, et al. Final 5-year study results of DASISION: the Dasatinib Versus Imatinib Study in Treatment-Naive Chronic Myeloid Leukemia Patients Trial. J Clin Oncol. 2016;34(20):2333-2340.
5. Cortes JE, Gambacorti-Passerini C, Deininger MW, et al. Bosutinib versus imatinib for newly diagnosed chronic myeloid leukemia: results from the randomized BFORE trial. J Clin Oncol. 2018;36(3):231-237.
6. Bower H, Björkholm M, Dickman PW, Höglund M, Lambert PC, Andersson TML. Life expectancy of patients with chronic myeloid leukemia approaches the life expectancy of the general population. J Clin Oncol. 2016;34(24):2851-2857.
7. Hochhaus A, Baccarani M, Silver RT, et al. European LeukemiaNet 2020 recommendations for treating chronic myeloid leukemia. Leukemia. 2020;34(4):966-984.
8. NCCN Clinical Practice Guidelines in Oncology: Chronic Myelogenous Leukemia (version 3.2022). https://www.nccn.org/professionals/physician_gls/f_guidelines.a sp Accessed January 24, 2023.
9. O'Hare T, Eide CA, Deininger MWN. Bcr-Abl kinase domain mutations, drug resistance, and the road to a cure for chronic myeloid leukemia. Blood. 2007;110(7):2242-2249.
10. Soverini S, Colarossi S, Gnani A, et al. Contribution of ABL kinase domain mutations to imatinib resistance in different subsets of Philadelphia-positive patients: by the GIMEMA Working Party on Chronic Myeloid Leukemia. Clin Cancer Res. 2006;12(24):7374-7379.
11. Jabbour E, Kantarjian H, Jones D, et al. Frequency and clinical significance of BCR-ABL mutations in patients with chronic myeloid leukemia treated with imatinib mesylate. Leukemia. 2006;20(10):1767-1773.
12. Calabretta B, Perrotti D. The biology of CML blast crisis. Blood. 2004;103(11):4010-4022.
13. Radich JP. The biology of CML blast crisis. Hematology Am Soc Hematol Educ Program. 2007;384-391.
14. Koptyra M, Cramer K, Slupianek A, Richardson C, Skorski T. BCR/ABL promotes accumulation of chromosomal aberrations induced by oxidative and genotoxic stress. Leukemia. 2008;22(10):1969-1972.
15. Bolton-Gillespie E, Schemionek M, Klein HU, et al. Genomic instability may originate from imatinib-refractory chronic myeloid leukemia stem cells. Blood. 2013;121(20):4175-4183.
16. Kim T, Tyndel MS, Kim HJ, et al. Spectrum of somatic mutation dynamics in chronic myeloid leukemia following tyrosine kinase inhibitor therapy. Blood. 2017;129(1):38-47.
17. Branford S, Wang P, Yeung DT, et al. Integrative genomic analysis reveals cancer-associated mutations at diagnosis of CML in patients with high-risk disease. Blood. 2018;132(9):948-961.
18. Thomson DW, Shahrin NH, Wang PPS, et al. Aberrant RAG-
mediated recombination contributes to multiple structural rearrangements in lymphoid blast crisis of chronic myeloid leukemia. Leukemia. 2020;34(8):2051-2063.
19. Fernandes A, Shanmuganathan N, Branford S. Genomic mechanisms influencing outcome in chronic myeloid leukemia. Cancers. 2022;14(3):620.
20. Shen MM. Chromoplexy: a new category of complex rearrangements in the cancer genome. Cancer Cell. 2013;23(5):567-569.
21. Baca SC, Prandi D, Lawrence MS, et al. Punctuated evolution of prostate cancer genomes. Cell. 2013;153(3):666-677.
22. Nteliopoulos G, Bazeos A, Claudiani S, et al. Somatic variants in epigenetic modifiers can predict failure of response to imatinib but not to second-generation tyrosine kinase inhibitors. Haematologica. 2019;104(12):2400-2409.
23. Adnan Awad S, Kankainen M, Ojala T, et al. Mutation accumulation in cancer genes relates to nonoptimal outcome in chronic myeloid leukemia. Blood Adv. 2020;4(3):546-559.
24. Pfirrmann M, Clark RE, Prejzner W, et al. The EUTOS long-term survival (ELTS) score is superior to the Sokal score for predicting survival in chronic myeloid leukemia. Leukemia. 2020;34(8):2138-2149.
25. Yeung DT, Osborn MP, White DL, et al. TIDEL-II: first-line use of imatinib in CML with early switch to nilotinib for failure to achieve time-dependent molecular targets. Blood. 2015;125(6):915-923.
26. Baccarani M, Deininger MW, Rosti G, Hochhaus A, Soverini S, Apperley JF. European LeukemiaNet recommendations for the management of chronic myeloid leukemia: 2013. Blood. 2013;122(6):872-884.
27. Shanmuganathan N, Wadham C, Thomson D, et al. RNA-based targeted gene sequencing improves the diagnostic yield of mutant detection in chronic myeloid leukemia. J Mol Diagn. 2022;24(7):802-822.
28. Li MM, Datto M, Duncavage EJ, et al. Standards and guidelines for the interpretation and reporting of sequence variants in cancer: a joint consensus recommendation of the Association for Molecular Pathology, American Society of Clinical Oncology, and College of American Pathologists. J Mol Diagn. 2017;19(1):4-23.
29. Horak P, Griffith M, Danos AM, et al. Standards for the classification of pathogenicity of somatic variants in cancer (oncogenicity): joint recommendations of Clinical Genome Resource (ClinGen), Cancer Genomics Consortium (CGC), and Variant Interpretation for Cancer Consortium (VICC). Genet Med. 2022;24(5):986-998.
30. Benjamini Y, Hochberg Y. Controlling the false discovery rate: a practical and powerful approach to multiple testing. J Royal Stat Soc B (Methodological). 1995;57(1):289-300.
31. Zhang X, Li Z, Qin Y, Gale RP, Huang X, Jiang Q. Correlations between mutations in cancer-related genes, therapy responses and outcomes of the 3rd generation tyrosine kinase-inhibitor (TKI) in persons with chronic myeloid leukemia failing prior TKItherapy. Blood. 2021;138(Suppl 1):308.
32. Ochi Y, Yoshida K, Huang Y-J, et al. Clonal evolution and clinical implications of genetic abnormalities in blastic transformation of chronic myeloid leukaemia. Nat Commun. 2021;12(1):2833.
33. Branford S, Kim DDH, Apperley JF, et al. Laying the foundation for genomically-based risk assessment in chronic myeloid leukemia. Leukemia. 2019;33(8):1835-1850.
34. Johnson SM, Ramkissoon L, Haberberger J, et al.
Comprehensive genomic characterization of ASXL1 C.1934dupG (p.G646fs*12) versus other ASXL1 mutations in myeloid neoplasia. Blood. 2021;138(Suppl 1):3466-3466.
35. Alberti MO, Srivatsan SN, Shao J, et al. Discriminating a common somatic ASXL1 mutation (c.1934dup; p.G646Wfs*12) from artifact in myeloid malignancies using NGS. Leukemia. 2018;32(8):1874-1878.
36. Rahmani NE, Ramachandra N, Sahu S, et al. ASXL1 mutations are associated with distinct epigenomic alterations that lead to sensitivity to venetoclax and azacytidine. Blood Cancer J. 2021;11(9):157.
37. Wang L, Birch NW, Zhao Z, et al. Epigenetic targeted therapy of stabilized BAP1 in ASXL1 gain-of-function mutated leukemia. Nat Cancer. 2021;2(5):515-526.
38. Li X, Heyer W-D. Homologous recombination in DNA repair and DNA damage tolerance. Cell Res. 2008;18(1):99-113.
39. Toh M, Ngeow J. Homologous recombination deficiency: cancer predispositions and treatment implications. Oncologist. 2021;26(9):e1526-e1537.
40. Chakraborty A, Tapryal N, Venkova T, et al. Classical nonhomologous end-joining pathway utilizes nascent RNA for error-free double-strand break repair of transcribed genes. Nat Commun. 2016;7(1):13049.
41. Chang HHY, Pannunzio NR, Adachi N, Lieber MR. Nonhomologous DNA end joining and alternative pathways to double-strand break repair. Nat Rev Mol Cell Biol. 2017;18(8):495-506.
42. Huntly BJ, Bench A, Green AR. Double jeopardy from a single translocation: deletions of the derivative chromosome 9 in chronic myeloid leukemia. Blood. 2003;102(4):1160-1168.
43. Sinclair PB, Nacheva EP, Leversha M, et al. Large deletions at the t(9;22) breakpoint are common and may identify a poorprognosis subgroup of patients with chronic myeloid leukemia. Blood. 2000;95(3):738-744.
44. Graux C, Cools J, Melotte C, et al. Fusion of NUP214 to ABL1 on amplified episomes in T-cell acute lymphoblastic leukemia. Nat Genet. 2004;36(10):1084-1089.
45. Naumann S, Decker HJ. Genesis of variant Philadelphia chromosome translocations in chronic myelocytic leukemia. Cancer Genet Cytogenet. 2003;147(1):18-22.
46. Fitzgerald PH, Morris CM. Complex chromosomal translocations in the Philadelphia chromosome leukemias: serial translocations or a concerted genomic rearrangement? Cancer Genet Cytogenet. 1991;57(2):143-151.
47. Licht JD, Chomienne C, Goy A, et al. Clinical and molecular characterization of a rare syndrome of acute promyelocytic leukemia associated with translocation (11;17). Blood. 1995;85(4):1083-1094.
48. Amare PK, Baisane C, Nair R, et al. Characterization of cryptic rearrangements, deletion, complex variants of PML, RARA in acute promyelocytic leukemia. Indian J Hum Genet. 2011;17(2):54-58.
49. Wilde L, Cooper J, Wang Z-X, Liu J. Clinical, cytogenetic, and molecular findings in two cases of variant t(8;21) acute myeloid leukemia (AML). Front Oncol. 2019;9:1016.
50. Ishii Y, Sashida G, Takaku TI, Sumi M, Nakajima A, Ohyashiki K. Cryptic chromosomal anomaly in a patient with acute myeloid leukemia leading to AML1/ETO fusion with unfavorable prognostic factors. Cancer Genet Cytogenet. 2005;160(1):94-95.
51. Meyer C, Burmeister T, Gröger D, et al. The MLL recombinome of acute leukemias in 2017. Leukemia. 2018;32(2):273-284.
52. Andersson AK, Ma J, Wang J, et al. The landscape of somatic mutations in infant MLL-rearranged acute lymphoblastic leukemias. Nat Genet. 2015;47(4):330-337.
53. Dohner H, Estey E, Grimwade D, et al. Diagnosis and management of AML in adults: 2017 ELN recommendations from an international expert panel. Blood. 2017;129(4):424-447.
54. Guglielmelli P, Lasho TL, Rotunno G, et al. MIPSS70: mutationenhanced International Prognostic Score system for transplantation-age patients with primary myelofibrosis. J Clin Oncol. 2017;36(4):310-318.
55. Khoury JD, Solary E, Abla O, et al. The 5th edition of the World Health Organization Classification of Haematolymphoid Tumours: Myeloid and Histiocytic/Dendritic Neoplasms. Leukemia. 2022;36(7):1703-1719.
56. Arber DA, Orazi A, Hasserjian RP, et al. International Consensus Classification of Myeloid Neoplasms and Acute Leukemia: integrating morphological, clinical, and genomic data. Blood. 2022;140(11):1200-1228.
1Department of Pathology and Immunology, Faculty of Medicine, University of Geneva, Geneva, Switzerland; 2Ludwig Institute for Cancer Research, Lausanne Branch, Lausanne, Switzerland; 3IRCCS Azienda Ospedaliero-Universitaria di Bologna, Institute of Hematology «Seràgnoli», Bologna, Italy; 4Department of Oncology, Lausanne University Hospital (CHUV) and University of Lausanne, Epalinges, Switzerland; 5Department of Experimental Medicine (DIMES), University of Genova, Genova, Italy and 6IRCCS Ospedale Policlinico San Martino, Genova, Italy
#CJ and ST contributed equally as senior authors.
Correspondence: S. Trabanelli sara.trabanelli@unige.ch
Received: September 20, 2022.
Accepted: March 29, 2023.
Early view: April 6, 2023.
https://doi.org/10.3324/haematol.2022.282140
©2023 Ferrata Storti Foundation
Published under a CC BY-NC license
Chronic myeloid leukemia (CML) is a hematologic malignancy associated to an unregulated growth of myeloid cells in bone marrow (BM) and peripheral blood (PB), characterized by the BCR-ABL1 translocation. Given the known cytokine impairment in the leukemic niche of CML, we investigated the impact of this microenvironmental dysregulation on innate lymphoid cells (ILC), whose role in cancer has recently emerged. Three ILC subsets are identified based on transcriptional profiles and cytokine secretion. We observed that interleukin 18 (IL-18) and vascular endothelial growth factor A (VEGF-A) are increased in CML patients’ sera and that ILC2 are enriched in CML PB and BM. We found that IL-18 drives ILC2 proliferation and that CML ILC2 highly express CXCR4 and CXCR7 BM-homing receptors, potentially explaining their enrichment in PB and BM, respectively. Next, we showed that ILC2 are hyper-activated through a tumor-derived VEGF-Adependent mechanism, which leads to higher IL-13 secretion. In response to IL-13, leukemic cells increase their clonogenic capacity. Finally, we discovered that the pro-tumoral axis involving VEGF-A, IL-18 and ILC2 was disrupted upon tyrosine kinase inhibitor treatment, normalizing the levels of all these players in CML patients responding to therapy. Overall, our study uncovers the involvement of ILC2 in CML progression, mediated by VEGF-A and IL-18.
Chronic myeloid leukemia (CML) is a rare hematologic malignancy associated to an increased and unregulated growth of myeloid cells in bone marrow (BM) and peripheral blood (PB).1 CML was the first cancer clearly linked to a chromosomal abnormality, namely the translocation between chromosomes 9 and 22, which forms the so-called chimeric “Philadelphia chromosome”. This reciprocal process produces a fusion tyrosine kinase oncoprotein (BCRABL1), leading to additional genomic instabilities and active proliferation of the malignant precursors.2 While the introduction of tyrosine kinase inhibitors (TKI) (e.g., Imatinib, Dasatinib, Nilotinib, Ponatinib) has greatly changed the CML treatment landscape, up to 10% of patients still fail to respond because of resistance onset. The only curative option for these patients remains stem cell transplanta-
tion, bearing complications such as graft-versus-host disease or poor engraftment among others.3 For these reasons, CML needs a better understanding to provide new therapies to TKI-resistant patients. Innate lymphoid cells (ILC) are a recently described group of innate immune cells, which are characterized by the absence of lineage markers (Lin-) but positive expression of CD127. Three different subsets of helper ILC, namely ILC1, ILC2 and ILC3, can be distinguished based on transcriptional regulators and cytokine secretion, which functionally mirror helper CD4+ T cells (i.e., Th1, Th2 and Th17, respectively).4–6 ILC3 are poorly represented in PB, where they are comprised in a cKit+ population of ILC precursors (ILCP).7,8 ILC have been shown to be involved in different biological processes, both physiological, such as antimicrobial responses, tissue homeostasis, lymphoid organ development, and pathological, such as autoimmunity
Benedetta Fiordi,1,2 Valentina Salvestrini,3 Gabriele Gugliotta,3 Fausto Castagnetti,3 Antonio Curti,3 Daniel E. Speiser,4 Emanuela Marcenaro,5,6 Camilla Jandus1,2# and Sara Trabanelli1,2#and cancer.9 Previous evidence showed how ILC are phenotypically or functionally altered in several solid tumors and in hematologic malignancies.10–12 Besides the role of NCR+ ILC3 in graft-versus-host disease13 and ILC1-like cell alterations in acute myeloid leukemia,14 the two subsets most involved in hematologic malignancies are ILC1, which secrete IFN- α and TNF- γ , thus supporting a type-1 response when functionally effective, and ILC2, that produce a type-2 pro-tumor reaction via IL-4, IL-5, IL-9, IL-13 and amphiregulin secretion.15–19 In CML, an important regulator of leukemic stem cell survival and proliferation, and disease progression, is represented by the tumor microenvironment of the leukemic niche.20 Here, immune cells are remodeled in favor of leukemogenesis by the cytokine milieu altered by the blasts.21 Given the relevance of cytokines and growth factors in driving ILC maturation and fulfilling ILC activities, we aimed at dissecting how these actors were affected in the CML microenvironment.
Venous blood was drawn from healthy donors (HD) at the local Blood Transfusion Center, Lausanne, Switzerland and BM samples were obtained from patients undergoing hip joint replacement surgery at the CHUV, Lausanne, Switzerland (EC consents: 2015-00106), under the approval of the Lausanne University Hospital’s Institutional Review Board. CML PB and BM samples were obtained from patients at IRCCS University Hospital of Bologna (EC consents: 94/2016/O/Tess) (Online Supplementary Table S1), under the approval of the IRCCS University Hospital’s Institutional Review Board. Written informed consent was obtained from all subjects and patients, in accordance with the Declaration of Helsinki. Fresh anticoagulated blood diluted at 1:2 ratio in phosphate-buffered saline (PBS) was layered on lymphoprep (ratio diluted blood: lymphoprep 1.5:1). Mononuclear cells were isolated by density gradient centrifugation (1,800 rpm, 20-minute [min] centrifugation without break at room temperature), washed and immediately cryopreserved in 50% RPMI, 40% fetal calf serum (FCS) and 10% dimethyl sulfoxide (DMSO). Serum samples were also collected at the same sampling day after centrifugation of whole blood at 3,000 rpm for 10 min, at room temperature, and immediately frozen.
After gating for lymphocytes and singlets, total ILC were identi fi ed as living Lineage-CD127+ lymphocytes. Helper ILC were defined by excluding CD56 and CD94 doublepositive cells. ILC subsets were identified using CRTH2 and cKit. Dead cells were excluded using the viability dye Live/Dead Zombie Green (Invitrogen). Representative gat-
ing strategy is included in the Online Supplementary Figure S1. Receptors on cell surfaces were stained with the following antibodies: CD309, CXCR7, CD218a, CXCR4 and NKp30.
Cell culture
For ILC2 expansion, freshly sorted ILC2 were cultured for 2 weeks in supplemented StemSpan SFEM II (Stemcell) with human recombinant IL-2 (200 U/mL, Proleukin Roche) and IL-7 (10 ng/mL, Peprotech). Medium was replaced every 2–3 days and phenotype was checked after 2 weeks of culture. Dasatinib, Imatinib and Nilotinib (Sigma-Aldrich) were resuspended in dimethyl sulfoxide (DMSO) and, where indicated, used at the time and concentration reported in the figure legends.
Quantitative real-time polymerase chain reaction
Transcript levels of AREG, NKp30 (NCR3), IL5RA, IL13RA1, IL13RA2, IL4R1, EGFR and VEGFA were quanti fi ed using KAPA SYBR® FAST quantitative polymerase chain reaction (qPCR) Kits (Roche).
Clonogenic assay
K562 cell line (1,000 cells/well) or CD34+ CML sorted cells (10,000 cells/well) were seeded in 6-well plates in 1.5 mL MethoCult Matrix (H4100, StemCell) after treatment for 48 hours with human recombinant IL-13 (50 ng/mL, Peprotech) or medium only. Cells were cultured for 12-14 days to allow the colonies to form. Formed colonies were then scored after incubation at 37°C in a fully humidified 5% CO2 atmosphere. Counting was performed manually by using an inverted brightfield microscope (Leica) at 10x magnification.
Statistical analysis
Statistical analysis was performed using GraphPad Prism software version 9. According to the Shapiro-Wilk test for normality distribution, we used t-tests or Mann-Whitney tests for comparison of two groups and one-way ANOVA for comparison of multiple groups/multiple variables. The data are shown by plotting individual data points and the mean ± standard error of the mean (SEM). A P value less than 0.05 (two-tailed) was considered as statistically significant and labeled with ∗ P values less than 0.01, 0.001 or 0.0001 were labeled respectively with ∗∗, ∗∗∗ or ∗∗∗∗
ILC2 are significantly enriched in chronic myeloid leukemia patients at diagnosis and express bone marrow-homing receptors
Given the presence of cytokine alterations in leukemia, and particularly in CML,22 we investigated whether this
microenvironmental dysregulation was affecting cytokine-responsive cells, such as ILC.23 In order to do so, we analyzed the total frequency and the prevalence of the different ILC subsets applying our previously established

gating strategy24 (Online Supplementary Figure S1A-F) in the PB of CML patients at diagnosis and healthy donors (HD) (Figure 1A-C). Although the overall frequency of ILC was similar in the two groups (Figure 1D), ILC1 were re-
Figure 1. The frequency of innate lymphoid cell subsets in healthy donor and chronic myeloid leukemia peripheral blood at diagnosis, and clinical correlations. (A-C) Representative example of the gating strategy to determine total innate lymphoid cells (ILC) (Lin-CD127+ lymphocytes) and ILC subsets ILC1, ILC2 and ILCP in healthy donor (HD) and CML patients according to CRTH2 vs. cKit expression. (D-G) Total ILC and ILC subsets’ frequency identified in HD and chronic myeloid leukemia (CML) samples (N=15). (H-L) Clinical correlations in CML patients between ILC2 frequency and splenomegaly, ELTS and SOKAL stratification scoring systems (low, intermediate, and high risk). Statistical analysis: Mann-Whitney test and unpaired t-test; *P=<0.05; **P=<0.01; ***P=<0.001; ****P=<0.0001.
duced in CML patients (Figure 1E) and ILC2 significantly increased (Figure 1F), while no difference was observed for ILCP (Figure 1G). In order to investigate whether the ILC2 increase could be linked with clinical manifestations, we correlated ILC2 frequencies with different clinical parameters ( Online Supplementary Table S1) and found that ILC2 frequency positively correlates with the presence of splenomegaly (Figure 1H), with the EUTOS long-term survival (ELTS) survival stratification score, and showed a correlation trend with the SOKAL score (Figure 1I-L). Then, since CML arises in the BM, we wondered if the accumulation of ILC2 was present only in the periphery or if this subset could be also recruited/retained into the BM. Thus, we studied the surface expression of the two major BM-homing receptors (i.e., CXCR4 and CXCR7) in all ILC subsets. We found that the expression of these molecules was significantly higher in CML ILC2 (Figure 2B; Online Supplementary Figure S1G, H), but neither in ILC1, where only CXCR4 was upregulated, nor in ILCP (Figure 2A-C). Since these chemokine receptors are essential for the recirculation and retention of immune and tumor cells in the BM niche where CXCL12 is enriched, we first measured CXCL12 levels in both BM and PB of CML and HD samples, and then we assessed whether ILC2 could migrate along its gradient. In CML, we found a trend for higher CXCL12 levels in BM compared to the PB, as observed in HD (Figure 2D). By performing a chemotaxis assay (transwell assay) we demonstrated the functionality of CXCR4 and/or CXCR7, since ILC2 were chemoattracted along the CXCL12 gradient (Figure 2E, F). Therefore, these results confirm that in ILC2, the CXCR4 and CXCR7 receptors are functional allowing the migration along a CXCL12 gradient and suggest the possibility of ILC2 retention/recruitment into the BM where CXCL12 is enriched.
In line with our hypothesis, ILC2 were increased in the BM of leukemic patients (Figure 2I), while no difference was detected for ILC1 and ILCP (Figure 2G-L). Lastly, we analyzed cKit expression on ILC2 to discriminate cKithigh and cKitlow subsets, the latter being a hallmark of fully lineage committed ILC225,26. In both PB and BM of HD cKitlow ILC2 were enriched, while in CML, the cKit low population was prevalent only in the PB. When comparing BM of CML and HD, we found an opposite distribution of these two subpopulations, since in CML the cKithigh ILC2 were increased and the cKit low ILC2 were decreased in comparison to HD, suggesting reduced differentiation in the BM of CML patients ( Online Supplementary Figure S2A, B). This finding is in line with the pathogenesis of the disease, in which immature cells can accumulate in the BM. These findings suggest that in CML patients the increased frequency of ILC2 in the circulation and in the BM might contribute to supporting leukemic cell persistence and/or progression.
Vascular endothelial growth factor A and interleukin 18 concentrations are elevated in chronic myeloid leukemia patients’ sera at diagnosis
In order to determine the soluble effectors altered in the CML landscape, we measured the concentrations of different cytokines and growth factors in the sera of CML patients at diagnosis as compared to HD. Among the factors under investigation, IL-18 and vascular endothelial growth factor A (VEGF-A) were significantly increased in CML patients (Figure 3A, B), in line with what has been previously reported in CML. 27,28 In order to test whether IL-18 and VEGF-A could be considered as prognostic factors and knowing that the b2a2 transcript has an impact on treatment response to tyrosine kinase inhibitors,29–31 we correlated the concentration of IL-18 and VEGF-A with the presence of two BCR-ABL1 transcripts. We found a trend, though not significant, between higher levels of IL-18 and VEGF-A and the presence of the b2a2 transcript (Figure 3C, D), suggesting that both IL-18 and VEGF-A might be involved in the progression and resistance to therapy of CML. In order to understand whether these effectors could have a role in ILC regulation in CML patients, we first assessed their receptors’ expression on ILC1, ILC2 and ILCP by analyzing the CD218a (IL-18R α ) and CD309 (VEGFR2) expression. We found low expression of CD218a in ILC1 and ILCP, with no significant difference when comparing CML and HD. Instead, ILC2 expressed high levels of IL-18R1 in HD, and intermediate ones in CML (Figure 3E; Online Supplementary Figure S1I ). Therefore, we hypothesized that the high concentration of circulating IL-18 in patients, and the subsequent binding to its receptor, were resulting in CD218a downregulation in CML. In order to test this hypothesis, we stimulated short-term-expanded ILC2 with IL-18 and analyzed the expression of its receptor. As shown in the Online Supplementary Figure S3A, B, upon IL-18 binding, CD218a was downregulated from the cell surface, suggesting that the downregulation observed in patients was likely due to the binding to the circulating IL-18 in CML. With regards to CD309 expression, while no statistical difference could be found in ILC1 and ILCP, we could see a significant upregulation of VEGFR2 on ILC2 from CML patients (Figure 3F; Online Supplementary Figure S1L ). These results suggest that in CML ILC2 could preferentially respond to IL-18 and VEGF-A.
In order to understand whether the increase of circulating IL-18 in CML (Figure 3A) had a functional impact on ILC2, we generated in vitro short-term-expanded ILC2, that maintained CD218a expression at steady state ( Online Supplementary Figure S3C, D). Activation of ILC2 is characterized by secretion of several cytokines. We
thus hypothesized that IL-18 could stimulate ILC2, resulting in the release of type-2 mediators. We stimulated ILC2 for 48 hours with IL-18 and then analyzed the

supernatants for IL-5, IL-13, IL-9, IL-10 and IL-4, but we could not find a relevant difference to medium only (Figure 4A). We then analyzed by CellTrace Far Red staining
Figure 2. Bone marrow-homing receptor frequencies and function on innate lymphoid cells. (A-C) Frequency of innate lymphoid cell (ILC) subsets ILC1, ILC2 and ILCP positive for the bone marrow (BM)-homing receptors CXCR4 and CXCR7 (N=15). (D) CXCL12 levels (pg/mL) measured in the peripheral blood (PB) and BM of chronic myeloid leukemia (CML) patients and healthy donors (HD) (PB CML N=17; PB HD N=18; BM CML N=3; BM HD N=8). (E, F) Chemotaxis assay of ILC2 toward medium only or with CXCL12 (N=3). (G-L) Total ILC and ILC subsets’ frequency in BM samples (N=3 for both HD and CML patients). Statistical analysis: MannWhitney test, paired or unpaired t-test; *P=<0.05; **P=<0.01; ***P=<0.001; ****P=<0.0001.
the proliferation capacity of ILC2 when stimulated with IL-18. We found that IL-18 promotes the proliferation of ILC2, which was previously reported during allergic responses, 32 but not in cancer (Figure 4B, C). Considering IL-18 increase in CML onset, we assessed its level in patients’ sera after different TKI therapies at early (early FU) or late follow-ups (late F-U). Interestingly, IL-18 levels significantly dropped in the first year of therapy irrespectively of the treatment (Figure 4D). Given the observed IL-18 promotion of ILC2 proliferation, we assessed the frequency of ILC in CML patients after therapy. We found that ILC1 and ILC2 were restored to HD levels ( Online Supplementary Figure S3E; Figure 4E ), while no significant changes were found in ILCP ( Online Supplementary Figure S3F ). Interestingly, CD218a levels on ILC1 and ILCP were constant in the follow-ups (Online Supplementary Figure S3G, H ), while the receptor was
recovered on ILC2 after treatment in parallel to the normalization of the IL-18 serology (Figure 4F). These data strongly support the role of IL-18 in promoting ILC2 proliferation in CML.
Tumor-derived VEGF-A stimulates innate lymphoid cell subset 2 effector functions
Given the increased VEGF-A levels in CML patients’ sera (Figure 3B) and its relevance in ILC2 regulation in allergy and asthma,33,34 we analyzed whether this factor could also have a role in the interaction between ILC2 and cancer cells. We first confirmed VEGF-A receptor (CD309) protein expression in in vitro short-term expanded ILC2 (Online Supplementary Figure S4A, B).

The main in vitro model to study CML is the K562 cell line 35 that is often compared to the CD34 + cells of CML patients, given the fact that the malignant blast orig -
Figure 3. Vascular endothelial growth factor A and interleukin 18 levels are higher in chronic myeloid leukemia at diagnosis compared to healthy donor and innate lymphoid cells express their receptors. (A, B) Interleukin 18 (IL-18) and vascular endothelial growth factor A (VEGF-A) concentrations (pg/mL) in chronic myeloid leukemia (CML) patients’ sera at diagnosis (N=21) vs. healthy donors (HD) (N=15). (C, D) Correlation between patients’ BCR-ABL1 transcripts and IL-18 and VEGF-A levels. (E, F)
Frequency of IL-18R α (CD218a) and VEGF-A (CD309) receptors on innate lymphoid cell (ILC) subsets ILC1, ILC2 and ILCP in HD and CML patients (N=15). Statistical analysis: Mann-Whitney test or unpaired t -test; * P =<0.05; ** P =<0.01; *** P =<0.001; ****P=<0.0001.
inates from stem cell progenitors. In line with that, to define the source of VEGF-A, we analyzed its transcript levels in primary CD34 + cells sorted from both patients and HD and compared them to the ones in the K562 cell line. Interestingly, CML CD34 + cells expressed higher VEGFA transcripts compared to HD and the results were similar with the expression levels in K562 (Figure 5A).
Also, we analyzed the secreted VEGF-A in K562 supernatant and detected high levels of protein ( Online Supplementary Figure S4C ). Thus, we confirmed that the K562 cell line was a good model also in our setting and used it for further analysis. We then hypothesized that the VEGF-A secreted by the leukemic cells in CML patients was contributing to ILC2 activation. In order to in-
Figure 4. Interleukin 18 stimulates innate lymphoid cell subset 2 proliferation. (A) Type-2 cytokine secretion (pg/mL) by interleukin 18 (IL-18) stimulated innate lymphoid cell subset 2 (ILC2) (N=5). (B, C) Proliferation analysis after 5 days in culture of shortterm in vitro expanded ILC2 stimulated with IL-18 (N=5). (D) IL-18 levels in chronic myeloid leukemia (CML) sera after different treatments at early (<12 months) (N=15) or late (>12 months) (N=11) follow-ups (F-U). (E) ILC2 in CML peripheral blood (PB) at late (>12 months) (N=5) follow-ups (F-U). (F) CD218a expression on ILC2 in CML PB at late (>12 months) (N=5) follow-ups (F-U). Statistical analysis: Mann-Whitney test, unpaired t-test and two-way ANOVA; *P=<0.05; **P=<0.01; ***P=<0.001; ****P=<0.0001.

vestigate this, we co-cultured ILC2 with K562 cell line for 48 hours and analyzed type-2 cytokine secretion. IL5 and IL-13 were significantly increased in the co-culture condition (Figure 5B). In order to confirm the role of VEGF-A in the interplay between K562 cell line and ILC2, we pre-treated ILC2 with an inhibitor of the VEGF-A receptor 2 (VEGFR2) and measured IL-5 and IL-13 secretion upon co-culture with the K562 cell line or the K562

conditioned medium (CM). Interestingly, IL-13 levels dropped in the presence of the VEGFR2 inhibitor (Figure 5C), while a trend of reduction was found for IL-5 (Figure 5D), suggesting that tumor-secreted VEGF-A stimulated ILC2 secretion of both IL-13 and IL-5. ILC2 activation is not only characterized by the secretion of type-2 cytokines and IL-10, but also by the specific production of amphiregulin (AREG), a ligand of the epidermal growth
Figure 5. K562 cell line contributes to innate lymphoid cell activation via vascular endothelial growth factor A secretion. (A) Real-time quantitative polymerase chain reaction (RT-qPCR) analysis of vascular endothelial growth factor A (VEGFA) gene expression on CD34+ of both chronic myeloid leukemia (CML) patients and healthy donors (HD) (N=3). (B) Type-2 cytokine secretion (pg/mL) in innate lymphoid cell subset 2 (ILC2) and K562 cell line co-cultures, as compared to each cell type in monoculture (N=5). (C) Interleukin 13 (IL-13) secretion (pg/mL) by ILC2 in co-culture with K562 cell line or K562 conditioned medium (CM) with the VEGFR2 inhibitor (1O mM, SU-1498) (N=5). (D) IL-5 secretion (pg/mL) by ILC2 in co-culture with K562 or K562 CM with or without VEGFR2 inhibitor (10 mM, SU-1498) (N=5). (E) VEGF-A levels in CML sera after different treatments at early (<12 months) (N=15) or late (>12 months) (N=11) follow-ups (F-U). (F) CD309 expression on ILC2 in CML PB at late (>12 months) (N=5) follow-ups (F-U). Statistical analysis: Mann-Whitney test, paired and unpaired t-test, ordinary one-way ANOVA and two-way ANOVA; *P=<0.05; **P=<0.01; ***P=<0.001; ****P=<0.0001.
factor receptor (EGFR), which has been shown to have multiple roles in cancer progression and inflammatory responses.36–38 For these reasons, we quantified AREG in CML sera at onset and observed a slight but significant increase in the patients ( Online Supplementary Figure S4D ). Moreover, in CML patients’ sera after TKI therapies at late follow-ups, AREG concentration significantly decreased ( Online Supplementary Figure S4E ) together with VEGF-A levels at both early and late follow-ups (Figure 5E). Even so, AREG transcripts in ILC2 were not increased upon stimulation with the K562 CM and VEGFR2 inhibition did not lead to AREG downregulation ( Online Supplementary Figure S4F ) suggesting that, in CML, tumor-derived factors, including VEGF-A, are not involved in AREG production by ILC2. After TKI therapies, no significant difference was found in CD309 expression on ILC1 ( Online Supplementary Figure S4G ), ILC2 (Figure 5F) or ILCP ( Online Supplementary Figure S4H ). Overall, these observations support a direct effect of tumor-derived VEGF-A on IL-13 and IL-5 secretion by ILC2, that is normalized upon treatment.
In order to understand the relevance of IL-13 and IL-5 in CML, we measured their concentrations in PB sera of HD and of CML patients at disease onset and after TKI treatment. Even though not significant, CML patients showed a trend for increased cytokine levels at diagnosis compared to HD and the levels were normalized upon treatment ( Online Supplementary Figure S5A-D). In order to verify a potential direct effect of the TKI on ILC2 viability, leading to decreased type-2 cytokines, ILC were treated in vitro with different concentrations of Dasatinib, Imatinib and Nilotinib, the drugs used for the treatment of our cohort of patients. Our results showed no major effects of the three drugs on ILC viability (Online Supplementary Figure S5E). In order to decipher whether the ILC2 function was impaired by the different TKI, we stimulated ILC2 with the K562 CM in the absence or the presence of Dasatinib, Imatinib and Nilotinib. ILC2 function was not affected by Dasatinib and Imatinib, while Nilotinib showed a trend in reduced cytokine production (Online Supplementary Figure S5F-G). In parallel, we tested the cytotoxicity of the same TKI on the K562 cell line. As expected, the viability of K562 was impaired when the cells were treated with the drugs (Online Supplementary Figure S5H). Consequently, when ILC2 were cultured in contact with the K562 cell line in the presence of TKI, IL-13 levels dropped, while there was no difference for IL-5 ( Online Supplementary Figure S5I-L ). In order to verify whether the drop in IL-13 production was linked with an impaired K562 stimulation capacity upon TKI treatment, we measured K562 VEGF-A secretion upon TKI treatment and confirmed that the levels were decreased upon administration of the drugs, even though this was only statistically significant with Nilotinib (Online Supplementary
Figure S5M). Together, our results strongly suggest that Dasatinib, Imatinib and Nilotinib, three different TKI used in clinics for the treatment of CML patients, do not act directly on ILC2 viability, but target tumor cells. Only Nilotinib, a second generation TKI, seems to have an effect on ILC2 function.
NKp30-B7H6 axis is not involved in innate lymphoid cell subset 2 activation in chronic myeloid leukemia
As shown above, when treating ILC2-K562 cell line cocultures with a VEGFR2 inhibitor, the ILC2-mediated type-2 response was decreased, but not completely abrogated. This led us to hypothesize that other mechanisms could be involved in ILC2 activation via tumor cells, e.g., the NKp30-B7H6 axis. This axis has been reported to hyper-activate ILC2,39 supporting a tolerogenic pathway involving IL-13 secretion in acute promyelocytic leukemia (APL).17 Thus, we assessed B7H6 expression on K562 cell line and we confirmed its presence on the tumor cell line (Figure 6A). Then, we confirmed NKp30 expression on in vitro short-term-expanded ILC2 (Figure 6B, C). In order to understand whether the binding between NKp30 and its ligand B7H6 on tumor cells could be involved in the K562 cell line-mediated activation of ILC2, we treated the ILC2 with an anti-NKp30 antibody40 (able to mask the receptor) alone or in combination with the VEGFR2 inhibitor. We tested both contact-mediated and soluble factormediated activation of ILC2 by culturing them in direct contact with K562 cell line or with its CM, to analyze the involvement of both membrane-bound and secreted B7H6.41 We found that NKp30 inhibition with the masking antibody did neither hamper ILC2 secretion of IL-13 (Figure 6D) nor the secretion of IL-5 or transcription of AREG and NCR3 (Online Supplementary Figure S6A, B), not in direct contact with K562 cell line nor with the K562 CM. Since in APL the pro-tumoral axis is supported by the combined engagement of B7H6-NKp30 and the binding of the tumor-derived prostaglandin D2 (PGD2) to CRTH2 on ILC2, we analyzed PGD2 levels in CML sera. We found that, in CML, PGD2 is not enriched in PB compared to HD (Figure 6E). Even though ILC2, and not ILC1 and ILCP (Online Supplementary Figure S6C, D), show a trend for higher NKp30 expression in CML patients as compared to HD (Figure 6F), this receptor is not involved in ILC2 activation in CML. This was also supported by the lack of any significant difference on NKp30 expression on patients’ ILC after TKI treatment (Figure 6G; Online Supplementary Figure S6E, F).
Innate lymphoid cell subset 2-derived interleukin 13 enhances chronic myeloid leukemia cell clonogenic capacity
Given the ILC2 activation mediated by the K562 cell line, which led to the secretion of IL-13 and IL-5, we asked how
these effectors could be involved in leukemia progression. First, we assessed the expression of IL-13, IL-5 and AREG receptors (IL-13Rα1, IL-13Rα2, IL-5Rα and EGFR but also IL4R), considering its known interplay with IL-13Rα1 in reacting to IL-13,42 on K562 cell line to understand whether the ILC2 secretion could act directly on the tumor cells. We found that K562 cell line expressed high levels of IL13RA1 transcripts (Figure 7A). Therefore, we focused our next analysis on IL-13 and investigated its effects on the K562 cell line clonogenic capacity. K562 cells were stimulated with IL-13 and then seeded in the matrix. After 2 weeks of incubation, we counted the number of colonies formed per condition. We found that IL-13 stimulation en-
hanced the clonogenic potential of the K562 cell line (Figure 7B, C). We validated these results by checking whether primary CD34+ cells isolated from CML patients at diagnosis had the same property. First, we found that IL13RA1 is expressed in CD34+ cells in CML, with a trend for increased expression as compared to the healthy controls (Figure 7D). Then, we performed the clonogenic assay with the primary cells and confirmed that CML CD34+ cells responded to IL-13 by showing a trend for increased numbers of colonies formed (Figure 7E). All together our data suggest a model in which IL-18 and VEGF-A increase in CML leads to ILC2 accumulation and activation, resulting in IL-13-mediated tumor cell growth (Figure 8).
Figure 6. NKp30 is not sufficient in promoting innate lymphoid cell subset 2 triggering via tumoral B7H6 engagement. (A) Expression of NKp30 ligand B7H6 on K562 cell line. (B, C) Expression of NKp30 on expanded innate lymphoid cell subset 2 (ILC2) from healthy donors (HD) (N=4). (D) Fold change of interleukin 13 (IL-13) expression after NKp30 inhibition alone or in combination with SU-1498 (10 mM, VEGFR2 inhibitor) in ILC2 in co-culture with K562 or K562 conditioned medium (CM). Statistics were calculated compared to fold change =1 (N=5). (E) PGD2 concentrations (pg/mL) in chronic myeloid leukemia (CML) patients’ sera at diagnosis (N=10) vs. HD (N=11). (F) Expression of NKp30 on ILC2 on HD and CML peripheral blood (PB) cells (N=15). (G) NKp30 expression on ILC2 in CML PB at late (>12 months) (N=5) follow-ups (F-U). Statistical analysis: Mann-Whitney test, paired and unpaired t-test; *P=<0.05; **P=<0.01; ***P=<0.001; ****P=<0.0001.

In this study, we report the involvement of IL-18 and VEGF-A in ILC2 activation in CML, which, by secreting IL13, regulate the capacity of the leukemic cells to produce colonies, supporting tumor growth. This is different in APL, another hematologic malignancy characterized by an increase of ILC2, which are hyperactivated through PGD2CRTH2 and B7H6-NKp30 pathways.17 Here, by analyzing the sera of CML patients at diagnosis and excluding the NKp30 involvement, we found that the main ILC2-triggering factors were represented by IL-18 and VEGF-A. It has been shown that ILC can express the IL-18 receptor and thus, can respond to IL-18. In particular, IL-18 was shown to increase the proliferation of ILC2 in patients with allergic rhinitis,32 and to induce ILC3 proliferation and production of IL-22 in human tonsils.43 Here, we show that human circulating ILC2 can respond to IL-18, not by secreting cytokines, but by enhancing their proliferation
rate. This result suggests that in CML patients ILC2 proliferation can be stimulated, at least in part, by the high concentration of IL-18 present in their circulation. Indeed, we found an increase of ILC2 in CML patients compared to HD, expressing lower levels of IL-18 receptor (i.e., CD218a). In fact, we showed that CD218a was reduced upon IL-18 binding. In line with these findings, in CML patients responding to TKI, IL-18 is downregulated and ILC2 frequency is restored, together with the IL-18 receptor expression. In addition, we found that ILC2 are also increased in the BM of CML patients, and we showed that this could be explained by the high expression of the BM-homing receptors CXCR4 and CXCR7 on ILC2, that can mediate ILC2 chemotaxis toward CXCL12. This finding is not surprising, since it has been previously shown that ILC can recirculate between tissues in response to chemokines.44 However, whether IL18 is also enriched in the BM of CML patients and can provide a proliferative stimulus also in the BM is yet to
Figure 7. Interleukin 13 stimulation leads to tumor cell survival and proliferation. (A) Real-time quantitative polymerase chain reaction (RT-qPCR) analysis of IL13RA1, IL13RA2, IL5RA1, IL4RA1 and EGFR gene expression on K562 cell line normalized on B2M (N=3). (B, C) Colony count after performing a clonogenic assay of K562 cell line treated with interleukin 13 (IL-13) (50 ng/mL) compared to controls after 12 days of culture in methylcellulose matrix (MethoCult H4100, StemCell) (N=6). (D) RT-qPCR analysis of IL13RA1, IL13RA2, IL5RA1, IL4RA1 and EGFR gene expression on CD34+ of both chronic myeloid leukemia (CML) patients and healthy donors (HD) (N=3). (E) Colony count after performing a clonogenic assay on CD34+ of CML treated with IL-13 (50 ng/mL) compared to controls after 12 days of culture in methylcellulose matrix (MethoCult H4100, StemCell) (N=6). Statistical analysis: unpaired t-test; *P=<0.05; **P=<0.01; ***P=<0.001; ****P=<0.0001.

be determined. Interestingly, the observed ILC2 enrichment correlates with the ELTS risk score (and shows a positive trend with the SOKAL index) and with splenomegaly, suggesting that ILC2 frequency might be a prognostic parameter, although additional long-term studies in larger patient cohorts are needed to confirm this hypothesis. The fact that ILC2 frequency correlates with disease aggressiveness is in line with what was already shown for other cancer types. In prostate cancer patients, for instance, ILC2 enrichment is stage dependent and is not present in patients with benign prostate hypertrophy.17
The second ILC2 triggering factor we identified was VEGF-A. Angiogenesis plays a major role in both solid tumors and hematologic malignancies, since this process allows malignant cells’ dissemination and metastasis. VEGF-A upregulation has been observed in several tumors and hematologic malignancies, leading to increased angiogenic activity promoting cancer cells.45 In ILC, VEGF-A produc tion has been established for natural killer cells (NK) in hypoxic conditions, moreover it has been found that VEGF-A mediates migration of ILC3, suggesting a pro-angiogenic activity.34,46 On this ground, we confirmed the capacity of the CML tumor cell line K562 to secrete VEGF-A and of primary CD34+ cells isolated from CML patients to have more abundant VEGFA transcripts than their HD counterpart. We found that the major player in the K562 cell line-ILC2 crosstalk is indeed VEGF-A, since upon administration of a VEGFR2 inhibitor the levels of IL-13 and IL5 produced by ILC2 dropped. Interestingly, the blocking of VEGF-A signaling is recapitulated in CML patients after TKI, since in follow-up sera we found a decreased VEGF-A concentration. These results suggest that in CML, tumor-secreted VEGF-A stimulates ILC2 production of IL-13 and that TKI can hamper this crosstalk by either acting directly on tumor cells secretion or on circulating VEGF-A, blocking the access to ILC2.
We also checked whether the accumulation of IL-18 and VEGF-A could correlate with prognostic markers, such as the BCR-ABL1 transcripts.29–31 In particular, the most common forms of BCR-ABL1 transcripts derive from the BCR
break in exons e13 (b2) or e14 (b3) and the ABL1 break in exons a1 or a2, giving rise mainly to e13a2 (b2a2) and e14a2 (b3a2) transcripts. Here, we found an increasing positive trend between IL-18 and VEGF-A upregulation in patients with the b2a2 transcript, suggesting that with a larger cohort of patients it might be possible to confirm the link between IL-18, VEGF-A and CML prognosis.
Given that, besides the conventional type 2 cytokines, ILC2 also specifically produce AREG, a soluble factor linked with tumor cell aggressiveness and chemoresistance, we hypothesize a role of this other ILC2 effector in CML. Indeed, it was shown that cells of CML patient could release exosomes containing AREG that in turn was acting on stromal cells enhancing the expression of annexin A2 and consequently the adhesion of tumor cells to stromal cells.47 However, despite the fact that we found that AREG levels in patients’ sera at disease onset were elevated and restored after long-term follow-up, we could not prove that ILC2 contribute to AREG production in the CML setting.
Lastly, since ILC have been previously shown to support tumorigenesis via cytokine secretion,48–50 we checked whether the IL-13 secreted by ILC2, upon stimulation with VEGF-A-producing tumor cells, could support leukemic cell proliferation. Interestingly, we reported that IL-13 stimulation of the K562 cell line increased tumor cells’ clonogenic ability and showed a positive trend to increase it also in primary CD34+ cells isolated from CML patients, showing that in this disease IL-13 acts directly on tumor cells supporting their survival and proliferation.

We focused our work on understanding why ILC2 are increased in CML and on characterizing their role in this disease. However, we also found a significant drop of ILC1 frequency in CML patients at disease onset that was recovered after TKI treatment. This finding suggests that the partial loss in ILC1 could play a role in the establishment of the pro-tumoral microenvironment and that their recovery could contribute to the favorable outcome of the TKI treatment. Other experiments are needed to verify this hypothesis.
In summary, we show a new mechanism in CML in which
IL-18 and tumor-derived VEGF-A activate ILC2, leading to their increased proliferation and IL-13 secretion, which in turn sustains tumorigenesis.
Disclosures
No conflicts of interest to disclose.
Contributions
BF performed and analyzed the experiments. VS, GG, FC, AC and DES provided patients’ samples and clinical data and critically revised the manuscript. EM provided antibodies and critically revised the manuscript. BF, CJ and ST designed the research, discussed the results and wrote the manuscript.
Acknowledgments
We thank Silvia A. Fuertes Marraco (Department of Oncology, Lausanne University Hospital [CHUV] and University of Lausanne, Epalinges, Switzerland) for providing patients’
1. Cortes J, Pavlovsky C, Saußele S. Chronic myeloid leukaemia. Lancet. 2021;398(10314):1914-1926.
2. Deininger MWN, Goldman JM, Melo JV. The molecular biology of chronic myeloid leukemia. Blood. 2000;96(10):3343-3356.
3. Osman AEG, Deininger MW. Chronic myeloid leukemia: modern therapies, current challenges and future directions. Blood Rev. 2021;49:100825.
4. Spits H, di Santo JP. The expanding family of innate lymphoid cells: Regulators and effectors of immunity and tissue remodeling. Nat Immunol. 2011;12(1):21-27.
5. Ercolano G, Wyss T, Salomé B, Romero P, Trabanelli S, Jandus C. Distinct and shared gene expression for human innate versus adaptive helper lymphoid cells. J Leukoc Biol. 2020;108(2):723-737.
6. Artis D, Spits H. The biology of innate lymphoid cells. Nature. 2015;517(7534):293-301.
7. Lim AI, Li Y, Lopez-Lastra S, et al. Systemic human ILC precursors provide a substrate for tissue ILC differentiation. Cell. 2017;168(6):1086-1100.
8. Ercolano G, Moretti A, Falquet M, et al. Gliadin-reactive vitamin D-sensitive proinflammatory ILCPs are enriched in celiac patients. Cell Rep. 2022;39(11):110956.
9. Chung DC, Jacquelot N, Ghaedi M, Warner K, Ohashi PS. Innate lymphoid cells : role in immune regulation and cancer. Cancers (Basel). 2022;14(9):2071.
10. Ercolano G, Falquet M, Vanoni G, Trabanelli S, Jandus C. ILC2s: new actors in tumor immunity. Front Immunol. 2019;10:2801.
11. Salomé B, Jandus C. Innate lymphoid cells in antitumor immunity. J Leukoc Biol. 2018;103(3):479-483.
12. Jacquelot N, Seillet C, Vivier E, Belz GT. Innate lymphoid cells and cancer. Nat Immunol. 2022:23(3):371-379.
13. Marius Munneke J, Björklund AT, Mjösberg JM, et al. Activated innate lymphoid cells are associated with a reduced susceptibility to graft-versus-host disease. Blood. 2014;124(5):812-821.
14. Salomé B, Gomez-Cadena A, Loyon R, et al. CD56 as a marker of an ILC1-like population with NK cell properties that is functionally impaired in AML. Blood Adv. 2019;3(22):3674-3687.
samples, protocols and suggestions and Federico Simonetta (Division of Hematology, Department of Oncology, Geneva University Hospitals and Faculty of Medicine, University of Geneva, Geneva, Switzerland) for insightful discussion. We thank Daniela Pende (IRCCS Ospedale Policlinico San Martino, Genova, Italy) for providing the masking antibody against NKp30. We are thankful to the patients who accepted to participate in this study.
Funding
This work was supported by the SNSF PRIMA grant (PR00P3_179727) (to CJ), by the Dr Henri Dubois-Ferrière Dinu Lipatti Foundation (to ST), by ISREC PhD Scholarship (to BF), by AIRC IG 2021 – ID. 26037 project (to EM) and by Compagnia di San Paolo (2019.866) (to EM).
Data-sharing statement
All the data are available on request to the first author.
15. Trabanelli S, Curti A, Lecciso M, et al. CD127+ innate lymphoid cells are dysregulated in treatment naïve acute myeloid leukemia patients at diagnosis. Haematologica. 2015;100(7):e257-e260.
16. de Weerdt I, van Hoeven V, Munneke JM, et al. Innate lymphoid cells are expanded and functionally altered in chronic lymphocytic leukemia. Haematologica. 2016;101(11):e461-e464.
17. Trabanelli S, Chevalier MF, Martinez-Usatorre A, et al. Tumourderived PGD2 and NKp30-B7H6 engagement drives an immunosuppressive ILC2-MDSC axis. Nat Commun. 2017;8(1):1-14.
18. Lordo MR, Scoville SD, Goel A, et al. Unraveling the role of innate lymphoid cells in acutemyeloid leukemia. Cancers (Basel). 2021;13(2):1-15.
19. Li Z, Ma R, Ma S, et al. ILC1s control leukemia stem cell fate and limit development of AML. Nat Immunol. 2022;23(5):718-730.
20. Torres-Barrera P, Mayani H, Chávez-González A. Understanding the hematopoietic microenvironment in chronic myeloid leukemia: a concise review. Curr Res Transl Med. 2021;69(3):103295.
21. Camacho V, Kuznetsova V, Welner RS. Inflammatory cytokines shape an altered immune response during myeloid malignancies. Front Immunol. 2021;12:772408.
22. Hoermann G, Greiner G, Valent P. Cytokine regulation of microenvironmental cells in myeloproliferative neoplasms. Mediators Inflamm. 2015;2015:869242.
23. Ducimetière L, Vermeer M, Tugues S. The interplay between innate lymphoid cells and the tumor microenvironment. Front Immunol. 2019;10:2895.
24. Trabanelli S, Gomez-Cadena A, Salomé B, et al. Human innate lymphoid cells (ILCs): toward a uniform immune-phenotyping. Cytometry B Clin Cytom. 2018;94(3):392-399.
25. Hochdörfer T, Winkler C, Pardali K, Mjösberg J. Expression of cKit discriminates between two functionally distinct subsets of human type 2 innate lymphoid cells. Eur J Immunol. 2019;49(6):884-893.
26. Bernink JH, Ohne Y, Teunissen MBM, et al. c-Kit-positive ILC2s exhibit an ILC3-like signature that may contribute to IL-17-
mediated pathologies. Nat Immunol. 2019;20(8):992-1003.
27. Krauth MT, Simonitsch I, Aichberger KJ, et al. Immunohistochemical detection of VEGF in the bone marrow of patients with chronic myeloid leukemia and correlation with the phase of disease. Am J Clin Pathol. 2004;121(4):473-481.
28. Sillaber C, Mayerhofer M, Aichberger KJ, Krauth MT, Valent P. Expression of angiogenic factors in chronic myeloid leukaemia: role of the bcr/abl oncogene, biochemical mechanisms, and potential clinical implications. Eu J Clin Invest. 2004;34(2):2-11.
29. Jain P, Kantarjian H, Patel KP, et al. Impact of BCR-ABL transcript type on outcome in patients with chronic-phase CML treated with tyrosine kinase inhibitors. Blood. 2016;127(10):1269-1275.
30. Castagnetti F, Gugliotta G, Breccia M, et al. The BCR-ABL1 transcript type influences response and outcome in Philadelphia chromosome-positive chronic myeloid leukemia patients treated frontline with imatinib. Am J Hematol. 2017;92(8):797-805.
31. Greenfield G, McMullan R, Robson N, McGimpsey J, Catherwood M, McMullin MF. Response to Imatinib therapy is inferior for e13a2 BCR-ABL1 transcript type in comparison to e14a2 transcript type in chronic myeloid leukaemia. BMC Hematol. 2019;19:7.
32. Li C, Xu Y, Luo X, Chen F. The effect of IL-18 on group 2 innate lymphoid cells in allergic rhinitis. Iran J Immunol. 2021;18(3):188-194.
33. Shen X, Pasha MA, Hidde K, et al. Group-2 innate lymphoid cells promote airway hyperresponsiveness through production of VEGFA. Xiaofei. J Allergy Clin Immunol. 2018;141(5):1929-1931.
34. Shikhagaie MM, Björklund ÅK, Mjösberg J, et al. Neuropilin-1 is expressed on lymphoid tissue residing LTi-like group 3 innate lymphoid cells and associated with ectopic lymphoid aggregates. Cell Rep. 2017;18(7):1761-1773.
35. Lozzio BB, Lozzio CB. Properties of the K562 cell line derived from a patient with chronic myeloid leukemia. Int J Cancer. 1977;19(1):136.
36. Monticelli LA, Sonnenberg GF, Abt MC, et al. Innate lymphoid cells promote lung-tissue homeostasis after infection with influenza virus. Nat Immunol. 2011;12(11):1045-1054.
37. Trabanelli S, Ercolano G, Wyss T, et al. c-Maf enforces cytokine production and promotes memory-like responses in mouse and human type 2 innate lymphoid cells. EMBO J. 2022;41(12):e109300.
38. Howard E, Lewis G, Galle-Treger L, et al. IL-10 production by ILC2s requires Blimp-1 and cMaf, modulates cellular metabolism, and ameliorates airway hyperreactivity. J Allergy Clin Immunol. 2021;147(4):1281-1295.
39. Salimi M, Xue L, Jolin H, et al. Group 2 innate lymphoid cells express functional NKp30 receptor inducing type 2 cytokine production. J Immunol. 2016;196(1):45-54.
40. Pesce S, Tabellini G, Cantoni C, et al. B7-H6-mediated downregulation of NKp30 in NK cells contributes to ovarian carcinoma immune escape. Oncoimmunology. 2015;4(4):e1001224.
41. Gutierrez-Franco J, Hernandez-Gutierrez R, Bueno-Topete MR, et al. Characterization of B7H6, an endogenous ligand for the NK cell activating receptor NKp30, reveals the identity of two different soluble isoforms during normal human pregnancy. Immunobiology. 2018;223(1):57-63.
42. Bhattacharjee A, Shukla M, Yakubenko VP, Mulya A, Kundu S, Cathcart MK. IL-4 and IL-13 employ discrete signaling pathways for target gene expression in alternatively activated. monocytes/macrophages. Free Radic Biol Med. 2013;54:1-16
43. Victor AR, Nalin AP, Dong W, et al. IL-18 Drives ILC3 proliferation and promotes IL-22 production via NF-κB. J Immunol. 2017;199(7):2333-2342.
44. Ricardo-Gonzalez RR, Schneider C, Liao C, Lee J, Liang HE, Locksley RM. Tissue-specific pathways extrude activated ILC2s to disseminate type 2 immunity. J Exp Med. 2020;217(4):e20191172.
45. Aguayo A, Kantarjian H, Manshouri T, et al. Angiogenesis in acute and chronic leukemias and myelodysplastic syndromes. Blood. 2000;96(6):2240-2245.
46. Hawke LG, Whitford MKM, Ormiston ML. The production of proangiogenic VEGF-A isoforms by hypoxic human NK cells is independent of their TGF-β-mediated conversion to an ILC1-like phenotype. Front Immunol. 2020;11:1903.
47. Corrado C, Saieva L, Raimondo S, Santoro A, de Leo G, Alessandro R. Chronic myelogenous leukaemia exosomes modulate bone marrow microenvironment through activation of epidermal growth factor receptor. J Cell Mol Med. 2016;20(10):1829-1839.
48. Han X, Huang T, Han J. Cytokines derived from innate lymphoid cells assist Helicobacter hepaticus to aggravate hepatocellular tumorigenesis in viral transgenic mice. Gut Pathog. 2019;11:23.
49. Kirchberger S, Royston DJ, Boulard O, et al. Innate lymphoid cells sustain colon cancer through production of interleukin-22 in a mouse model. J Exp Med. 2013;210(5):917-931.
50. Bie Q, Zhang P, Su Z, et al. Polarization of ILC2s in peripheral blood might contribute to immunosuppressive microenvironment in patients with gastric cancer. J Immunol Res. 2014;2014:923135.
Tong Zhang,1,2* Manman Cui,1,2* Yashu Li,1,2 Ying Cheng,1,2 Zhuying Gao,1 Jing Wang,1 Tiantian Zhang,1,2 Guoqiang Han,1,2 Rong Yin,3 Peipei Wang,1,2 Wen Tian,1,2 Weidong Liu,1 Jin Hu,1,2 Yuhua Wang,1 Zheming Liu4 and Haojian Zhang1,2,5
1The State Key Laboratory Breeding Base of Basic Science of Stomatology and Key Laboratory of Oral Biomedicine Ministry of Education, School and Hospital of Stomatology, Medical Research Institute, Wuhan University; 2Frontier Science Center for Immunology and Metabolism, Wuhan University; 3Department of Hematology, Zhongnan Hospital, Wuhan University; 4Cancer Center, Renmin Hospital, Wuhan University and 5Taikang Center for Life and Medical Sciences, Wuhan University, Wuhan, China
*TZ and MC contributed equally as first authors.
Correspondence: H. Zhang haojian_zhang@whu.edu.cn
Z. Liu
ZhemingLiu@whu.edu.cn
Received: October 4, 2022.
Accepted: March 3, 2023.
Early view: March 16, 2023.
https://doi.org/10.3324/haematol.2022.282224
©2023 Ferrata Storti Foundation
Published under a CC BY-NC license
Hematopoietic stem cells (HSC) maintain lifetime whole blood hematopoiesis through self-renewal and differentiation. In order to sustain HSC stemness, most HSC reside in a quiescence state, which is affected by diverse cellular stress and intracellular signal transduction. How HSC accommodate those challenges to preserve lifetime capacity remains elusive. Here we show that Pax transactivation domain-interacting protein (PTIP) is required for preserving HSC quiescence via regulating lysosomal activity. Using a genetic knockout mouse model to specifically delete Ptip in HSC, we find that loss of Ptip promotes HSC exiting quiescence, and results in functional exhaustion of HSC. Mechanistically, Ptip loss increases lysosomal degradative activity of HSC. Restraining lysosomal activity restores the quiescence and repopulation potency of Ptip-/- HSC. Additionally, PTIP interacts with SMAD2/3 and mediates transforming growth factor-β signaling-induced HSC quiescence. Overall, our work uncovers a key role of PTIP in sustaining HSC quiescence via regulating lysosomal activity.
Hematopoietic stem cells (HSC) maintain life-long blood homeostasis through self-renewal and differentiation into all lineages of blood cells. In order to sustain their stemness property for a lengthy period of time, HSC need to reside in a quiescent state.1 Under stress or upon perturbations, HSC are activated and exit quiescence to a cycling state. HSC activation is also accompanied by alterations in multiple aspects, such as metabolism and protein synthesis. Thus, a fundamental question in this field is how HSC preserve their quiescence. Recent studies demonstrate that HSC are sensitive to metabolic perturbations.2-10 HSC in quiescence are thought to require the minimal metabolic activity that is met by glycolysis.10, 11 Lysosomes are recognized as centers for degradation and clearance in the cell but also as recycling centers that provide a reservoir of nutrients.12 Lysosomes contain over 60 hydrolases, and macromolecules delivered to lysosomes, such as lipids, carbohydrates, pro-
teins, and nucleic acids as well as defective organelles, are digested by these acid hydrolases into the fundamental units, which can be reused in biosynthesis.12 Recent studies identified that lysosomes are critical in balancing HSC quiescence versus activation by regulating HSC metabolism.13-16 Lysosomes are abundant and large in quiescent HSC, indicating the buildup of undigested materials; conversely, they are few, small and highly active in activated HSC. Repression of lysosomal activity in HSC enlarges lysosomes, suppresses glucose uptake, reverts activated HSC to quiescence, and enhances the competitive repopulation ability of primed HSC by over 90-fold in vivo. 13 These works demonstrate that lysosomal function in quiescent HSC is key to their stem cell capacity.13,14,16,17 However, how the lysosomal function is regulated remains elusive.
The transforming growth factor-β (TGFβ) family of cytokines constitutes a multifunctional signaling circuitry, and plays pivotal functions in regulating cell fate and behavior
transactivation domain-interacting protein is required for preserving hematopoietic stem cell quiescence via regulating lysosomal activity
in all tissues of the body.18 TGFβ signaling maintains a pool of quiescent HSC.19 Neutralization of TGFβ in vitro releases early hematopoietic stem progenitor cells (HSPC) from quiescence,20-22 which is mediated by upregulation of cyclin-dependent kinase inhibitors, such as p57Kip2. Several other mechanisms may also account for TGFβ-mediated HSC quiescence. Our previous study indicates that elevated TGFβ signaling contributes to bone marrow (BM) failure in Fanconi anemia (FA) by impairing HSC function. Inhibition of TGFβ signaling improves the survival of FA cells and rescues the proliferative and functional defects of HSC derived from FA mice and FA patients.23 However, the underlying mechanisms of how TGFβ signaling regulates HSC quiescence still needs to be explored. Pax transactivation domain-interacting protein (PTIP) is a unique subunit for the MLL3 and MLL4 complexes. PTIP is essential for thymocyte development, humoral immunity and class-switch recombination of B lymphocytes.24-26 Our recent work indicates that PTIP governs NAD+ metabolism by regulating CD38 expression to drive macrophage inflammation.27 PTIP is required to maintain the integrity of the BM niche by promoting osteoclast differentiation.28 However, the role of PTIP in HSC is unknown. Here we uncover a key function of PTIP in coordinating TGFβ signaling to regulate lysosomal activity and sustain HSC quiescence.
Mice
C57BL/6J (CD45.2) background Ptipflox/flox mice were obtained from Biocytogen. Scl-CreER mice were a gift provided by Dr. Junke Zheng’s group from Shanghai Jiaotong University. For induction of Cre-ER recombinase, mice were administered tamoxifen by intraperitoneal injection. All experimental mice were a mix of male and female 610-week-old mice. All animal experiments were performed according to protocols approved by the Animal Care and Use Committee of Medical Research Institute, Wuhan University.
Total BM cells were isolated from mice's femur and tibia. HSC were stained with biotin-conjugated lineage markers, then stained with APC-eFlour780-anti-streptavidin, PEanti-c-Kit, APC-anti-Sca-1, PE-Cy5-anti-CD135, PE-Cy7anti-CD48, FITC-CD150, PE-CF594-anti-CD41. BD sorters FACSAria III; BD analyzers FACSCelesta, FACSLSRFortessaX20, and Beckman CytoFlex were used. Experimental details are provided in the Online Supplementary Appendix
Sorted mouse HSC were plated into methylcellulose
medium (M3434) according to the manufacturer’s protocols. Colonies were scored after 10-12 days. Where indicated, media were supplemented with 100 mM leupeptin (Leu) and 5 ng/mL TGFβ1.
Mouse competitive reconstitution analysis
5x10⁵ donor BM cells obtained from 8-12-week-old donor Ptip-/- or wild-type (WT) mice, were mixed with 5x10⁵ competitor cells from CD45.1 mice, and transplanted into lethally irradiated (10 Gy) CD45.1 recipients followed by an analysis of repopulation and multiple lineages of donorderived cells at 4, 8, 12, 16 weeks after transplantation. After 16 weeks, 1x10⁶ donor-derived BM cells obtained from the primary recipient mice along with the same number of competitor cells were transplanted into lethally irradiated (10 Gy) secondary CD45.1 recipient mice.
Immunofluorescence
Sorted Lineage Sca1+c-Kit+ (LSK) cells were fixed with 4% paraformaldehyde (PFA), washed with phosphate-buffered saline (PBS), then permeabilized in PBS + 0.5% Triton X100 for 15 minutes, and blocked for 1 hour (h) in 1% bovine serum albumin (BSA). Fixed and permeabilized cells were then incubated with primary antibodies in PBS + 1% BSA overnight at 4°C; washed and stained with fluorescenceconjugated secondary antibodies for 1 h at room temperature (RT); washed slides were sealed with a mounting medium with DAPI; single cell images were captured by a Zeiss LMS880 Airyscan confocal microscope using a 63/100 X objective and analyzed with ImageJ/Fiji.
Western blotting
Cells were lysed in RIPA and loaded per lane onto SDS PAGE gels. After transfer, nitrocellulose membranes were blocked and incubated overnight at 4°C with the primary antibody. After washes in Tris-buffered saline with Tween 20, membranes were incubated for 1 h at RT with horseradish peroxidase (HRP)-conjugated secondary antibodies, then washed and subsequently incubated with ECL Western Blotting Substrate (Bio-Rad), exposure with X-Ray Super RX Films (Fujifilm).
The experiment data were analyzed using two-way Student's t-test. For the comparison of different specimens, the unpaired t-test was used. Asterisks indicate *P<0.05, **P<0.01, ***P<0.001 and ****P<0.0001.
We first examined the expression level of PTIP in different hematopoietic hierarchy cells from normal human single-
cell RNA-sequencing data.29 Interestingly, we observed a higher expression of PTIP mRNA in HSC when compared with HSPC and GMP (Online Supplementary Figure S1A). Next, we sorted different HSC and HSPC populations from mouse BM to confirm the expression level of PTIP at different hematopoietic stratum. Through quantitative realtime polymerase chain reaction (qRT-PCR), we found that Ptip displayed a higher expression level in HSC populations including long-term and short-term HSC (LT-HSC and STHSC), compared to those in HSPC populations (Figure 1A). This data drove us to investigate the role of PTIP in HSC. We first generated a loss-of-function model by crossing Mx1-Cre transgenic mice with Ptipflox/flox mice (Online Supplementary Figure S1B). The Cre recombinase is under the control of the Mx1 promoter, which is expressed both in hematopoietic cells and BM endothelium. Flow cytometry analysis showed that deletion of Ptip caused a dramatic decrease in frequency and total number of different HSPC (Online Supplementary Figure S1C-F), implying that PTIP is required for stem cell maintenance. Moreover, Mx1-Cre; Ptipflox/flox mice presented with enlarged spleens and whitish limb bones compared to Ptipflox/flox mice, which means that deletion of PTIP in the Mx1 system induced strong extramedullary hematopoiesis (Online Supplementary Figure S1C), consistent with a previous report.28
As previous study indicates that PTIP is required for the integrity of the BM niche to sustain normal hematopoiesis,28 we attempted to specifically delete Ptip in HSC in order to avoid the perturbation from the BM niche. We introduced the Scl-CreER transgenic mice and crossed with Ptipflox/flox mice (Online Supplementary Figure S2A). The expression of tamoxifen-inducible recombinase is under the control of the stem cell leukemia (Scl) stem-cell enhancer, and tamoxifen-dependent recombination specifically occurs in more than 90% of HSC.30 The resultant Scl-CreER;Ptipflox/flox mice and control mice Ptipflox/flox (WT) were treated with tamoxifen for 4 weeks to induce Ptip knockout in HSC (Figure 1B). By performing qRT-PCR and western blotting (WB), we confirmed the deletion of Ptip in BM-derived HSPC (Lin-cKit+ cells) and LT-HSC, respectively (Figure 1C; Online Supplementary Figure S2B). Hereafter, for simplicity, tamoxifen-treated Scl-CreER;Ptipflox/flox mice will be referred to as Ptip-/- mice and tamoxifen-treated Ptipflox/flox control mice as WT mice.
Interestingly, we found that the total cell numbers of spleen and BM in Ptip-/- mice were not significantly changed compared to WT control mice (Online Supplementary Figure S2C). Unlike to the splenomegaly upon Ptip deletion observed in Mx1-Cre; Ptipflox/flox mice, the spleen size from Ptip-/- mice did not change (data not show), suggesting that specific deletion of PTIP in LT-HSC does not induce extramedullary hematopoiesis. Intriguingly, Ptip deficiency did not clearly affect the total numbers of different lineage cells in peripheral blood (PB), including white
blood cells, lymphcytes, granulocytes, monocytes, platelets and red blood cells (Online Supplementary Figure S2C). Following further analysis of these mature cells in PB by flow cytometry, we found that, myeloid cells and lymphocytes were not significantly affected upon Ptip deletion, except for CD8+ T cells showing a statistically obvious decrease in Ptip-/- mice (Online Supplementary Figure S2D). Ptip deletion also did not significantly change the frequencies of these lineage cells in the spleen and BM, except a modest decrease of B cells and CD8+ T cell in the BM (Online Supplementary Figure S2D), which might be related with the role of PTIP in lymphocyte development.24-26
In order to explore the effect of Ptip loss in HSC, we further investigated HSPC populations in the BM from WT and Ptip-/- mice. Interestingly, we found that the frequency and total number of LT-HSC (Lin-Sca-1+c-Kit+CD48-CD150+ cells) were clearly increased (about 2.3-fold) in Ptip-/- mice at 4 weeks after tamoxifen treatment, when compared with WT control (Figure 1D; Online Supplementary Figure S2E, F). An increase of MPP2 population was also observed in Ptip-/- mice, but Ptip loss did not affect other stem progenitor populations (Figure 1D; Online Supplementary Figure S2E, F). Next, we attempted to explore why these phenotypic LT-HSC are increased upon Ptip deletion. We analyzed the cell cycle of HSC, and found that the percentage of Ptip-/- LT-HSC in G0 phase was markedly lower than that of WT control (37.2% vs. 68.5%), while the percentage of Ptip-/- LT-HSC in G1 phase was increased compared to WT LT-HSC (56.3% vs. 24%) (Figure 1E), indicating that PTIP loss promotes HSC exiting quiescence. Interestingly, there was no obvious difference in cycling cells between WT and Ptip-/- groups, suggesting a retention of Ptip-/- HSC in the G1 phase. Moreover, we did not observe a significant difference in apoptotic HSC from WT and Ptip-/- mice (Figure 1F). Taken together, our data indicate that PTIP is required for preserving the quiescence state of HSC.
In order to illuminate whether the function of HSC is affected with Ptip deletion, we first performed a colony forming unit (CFU) assay by sorting HSC from the BM of WT and Ptip-/- mice and seeded them into an M3434 semisolid medium. As expected, loss of Ptip clearly impaired the clonogenic ability of HSC, as Ptip-/- HSC showed less colony numbers when compared with WT HSC (Figure 2A). We next conducted a competitive repopulation assay to determine whether Ptip affects the self-renewal capacity of HSC. The same numbers of total BM cells from WT and Ptip-/- mice with an equal number of CD45.1 helper cells were transplanted into lethally irradiated CD45.1 recipients, and these chimeric mice were analyzed using flow
Figure 1. Loss of Ptip leads to hematopoietic stem cell expansion and activation. (A) Quantitative real-time polymerase chain reaction analysis showing the mRNA expression of Ptip in normal hematopoietic stem cell (HSC) and hematopoietic stem progenitor cell (HSPC) populations (B) experimental scheme for (C-F). (C) Immunoblotting showing PTIP expression in c-kit+ cells after tamoxifen induction. (D) Percentages and total numbers of different stem cell populations in bone marrow (BM) at 4 weeks after tamoxifen treatment. The upper panel shows the representative flow cytometry (FACS) plots. The lower panel plots percentages of wild-type (WT) and Ptip-/- cells in each stem cell population (N=10). (E) Flow cytometry analysis of cell cycle phase of longterm HSC (LT-HSC) from WT and Ptip-/- mice BM harvested at 4 weeks after tamoxifen treatment. The left pa7nel shows the representative flow cytometry plots. Right panel plots percentages of WT and Ptip-/- cells in each stage of the cell cycle (N=6). (F) Flow cytometry analysis of apoptosis of LT-HSC from WT and Ptip-/- mice BM harvested at 4 weeks after tamoxifen treatment. The left panel shows the representative flow cytometry plots. Right panel plots percentages of WT and Ptip-/- LT-HSC (N=4). ns: not significant; *P<0.05, **P<0.01, ***P<0.001 (t-test). Error bars denote mean ± standard error of the mean. BMT: BM transplant.
cytometry over 4-16 weeks after BM transplantation (Figure 2B, C). We found that the percentages of Ptip-/- donorderived total cells (CD45.2+), myeloid cells (Gr-1+, Mac1+),
T cells (CD3e+), and B cells (B220+) were dramatically lower than those of WT group (Figure 2C; Online Supplementary S3A), suggesting the impaired reconstitution abil-

ity of Ptip-/- HSC. At 16 weeks, we directly compared the fractions of WT and Ptip-/- donor-derived stem and progenitor populations, including LT-HSC, ST-HSC, MPP2, MPP3, MPP4, LSK, LMPP, CMP, GMP, MEP, and CLP. As expected, the frequencies and numbers of all the populations were significantly lower in Ptip-/- group (Online Supplementary Figure S3B, C). In order to test the long-term function of HSC, we performed a secondary transplantation (Figure 2B, D). This defect was further exacerbated upon secondary transplantation, as shown by almost undetectable donor-derived cells in the Ptip-/- group (Figure 2D). In order to assess whether Ptip loss affects BM homing, we performed a BM homing assay. BM cells from WT and Ptip-/- mice were transplanted into lethally irradiated CD45.1 mice, and CD45.2 donor-derived cells in the BM were detected 24 hours post transplantation. Interestingly, we did not observe a significant difference between the WT and Ptip-/- groups (\), suggesting that loss of Ptip does not impair BM homing of donor cells. Together, these results indicate that PTIP is critical for maintaining HSC function.
In order to comprehensively understand the regulatory role of PTIP in HSC maintenance, we conducted RNA-sequencing assays to compare gene expression profiles of HSC from WT and Ptip-/- mice. A total of 1,128 genes were found to be differentially expressed by at least 2-fold (P<0.01) (Online Supplementary Figure S4A). Gene Ontology enrichment analysis showed that the upregulated genes in Ptip-/- HSC were related to nucleic acid metabolic processes, regulation of RNA metabolic processes, the Wnt sigaling pathway, and kinase activity (Online Supplementary Figure S4B). The downregulated genes in Ptip-/HSC were genes enriched in the regulation of inflammatory response, reactive oxygen species metabolic processes, apoptotic cell clearance, lysosome, and autophagy (Online Supplementary Figure S4B). Gene Set Enrichment Analysis (GSEA) also showed that genes related to lysosome, TGF β pathways, and hematopoietic cell lineage were significantly downregulated in Ptip-/- HSC (Figure 3A;

Figure 2. Loss of Ptip impairs hematopoietic stem cell long-term competitive repopulation ability in vivo. (A) Colony-forming unit (CFU) assay of long-term hematopoietic stem cells (LT-HSC) cells from wild-type (WT) and Ptip-/- mice bone marrow (BM) at 4 weeks after tamoxifen treatment (N=3). (B) Competitive repopulation assay. (B) The experimental set up. (C) Flow cytometry analysis for different donor-derived lineage cells in peripheral blood (PB) of recipient mice at 4, 8, 12, and 16 weeks after BM transplant (BMT) (N=9-10). (D) Secondary BMT showing impaired long-term self-renewal of WT and Ptip-/- HSC. Flow cytometry analysis for different donor-derived lineage cells in PB of recipient mice at 4, 8, 12, and 16 weeks after BMT (N = 5-6). ns: not significant; *P<0.05, **P<0.01, ***P<0.001, ****P<0.00001, *****P<0.000001 (t-test). Error bars denote mean ± standard error of the mean.
Online Supplementary Figure S4C). In contrast, GSEA showed an enrichment of genes involved in the cell cycle pathway in Ptip-/- HSC (Online Supplementary Figure S4C). As shown in the Online Supplementary Figure S4D, we observed an obvious upregulation of Mycn, Myc and Cdk6, and downregulation of cell cycle inhibitors including p21, p27 and p57.
Previous studies have shown that biological processes involving lysosomes are critical for HSC quiescence and activation.14,15,31 Given the enrichment of gene sets of lysosomal-related pathways in Ptip-/- HSC, we next sought to assess whether Ptip affects lysosome function. Interestingly, Ptip-/- HSC exhibited an obvious decrease of Tfeb, a master transcriptional regulator of lysosomal biogenesis. Downregulation of genes encoding lysosomal enzymes, such as Smpd1, Gns, Ctsh, and Ctsb was also observed in Ptip-/- HSC (Figure 3B), suggesting that lysosomal biogenesis is less efficient in Ptip-/- HSC compared to WT HSC. We further assessed the lysosomes in HSC by staining the lysosomal marker lysosome membrane protein 1 (LAMP1).

As shown in Figure 3C, we observed fewer lysosomes in Ptip-/- HSC compared to WT HSC, which is in line with a previous study showing that lysosomes are relatively scarce in activated HSC.13 We further assessed the density of lysosomes in HSC. Consistently, we found that Ptip-/HSC showed fewer lysosomes in HSC when compared to WT control (Figure 3D).
Lysosomes are acidic organelles, and their activity is often closely related to acidification. While quiescent HSC show slow lysosomal-degradative potential, activated HSC exhibit rapid lysosomal degradation with a higher activity.13 Also, a previous study indicates that phosphorylation-activated mTORC1 translocation to the lysosome directly regulates H+ transport of the vATPase proton pump.32 Therefore, we assessed lysosomal activity in Ptip-/- HSC. First, we measured lysosomal activity directly by co-staining lysosomal biomarker LAMP2 with mTOR. We found that, when compared to WT HSC, the puncta of LAMP in Ptip-/- HSC was decreased, while the puncta of mTOR was increased and the co-localization of mTOR and Lamp2 was also increased (Figure 3E), indicating higher lysosomal proton influx. Next, we detected the potential activity of lysosomes in HSC using LysoSensor, a more pH-sensitive probe to characterize lysosomal activity. As expected, we found that deletion of Ptip increased lysosomal proton influx and leads to higher lysosomal acidification (Figure 3F). Taken together, our data suggest that PTIP affects lysosomal activity of HSC.
We further investigated the effect of increased lysosomal activity on HSC function. Leu is known as a protease in-
Figure 3. PTIP regulates lysosomal activity. (A) Gene sets enrichment analysis (GSEA) plot showing enrichment of gene sets of the lysosome. (B) Quantitative real-time polymerase chain reaction analysis validation of the effect of Ptip on the expression levels of lysosome targets: Ankrd27, Tfeb, Smpd1, Gns, Dram2, Ctsh, and Ctsb. (C) Representative immunofluorescent confocal images of LAMP1 and DAPI (left; bar, 10mm) and quantification (right; N=3). (D) Flow cytometry analysis of LysoTracker green of long-term hematopoietic stem cells (LT-HSC) from wild-type (WT) and Ptip-/- mice bone marrow (BM) harvested at 4 weeks after tamoxifen treatment. The left panel shows the representative flow cytometry plots. Right panel plots mean fluorescence intensity (MFI) of WT and Ptip-/- cells (N=3). (E) Representative immunofluorescent confocal images of LAMP2, mTOR and DAPI (left; bar, 10mm; arrow shows co-localization) and quantification (right; N=3). (F) Flow cytometry analysis of LysoSensor green of LT-HSC from WT and Ptip-/- mice BM harvested at 4 weeks after tamoxifen treatment. The left panel shows the representative flow cytometry plots. Right panel plots MFI of WT and Ptip-/- cells (N=3). ns: not significant; *P<0.05, **P<0.01, ***P<0.001, ****P<0.00001, (t-test). Error bars denote mean ± standard error of the mean.
hibitor that can inhibit enzymatic activity within lysosomes.33 We first treated HSC from WT mice with Leu, and observed the increased size of lysosomes, indicating a buildup of undigested material (Online Supplementary Fig-
ure S4E). This data is in line with previous work,13 confirming the specificity and efficacy of Leu in inhibiting lysosomal degradation. We next inhibited the lysosomal activity with Leu in sorted HSC from Ptip-/- mice. Interestingly, we

found that Leu treatment clearly increased the in vitro clonogenic potential of Ptip-/- HSC (Figure 4A). Next, we assessed whether inhibition of lysosomal activity rescues the cell cycle state and reconstitution ability of Ptip-/- HSC in vivo. We treated WT and Ptip-/- mice with Leu by intraperitoneal injection,34,35 and then analyzed HSC, cell cycle and the in vivo repopulation ability (Figure 4B). As expected, we found that Leu treatment markedly decreased the proportion and numbers of LT-HSC in Ptip-/- mice (Fig-
ure 4C). Further, we found that the percentage of quiescent LT-HSC in Ptip-/- mice was significantly increased by approximately 24% after Leu treatment (Figure 4D). Thus, these data suggest that inhibition of lysosomal activity can effectively block the activation of HSC caused by Ptip loss.
In order to further explore the effect of lysosomal activity on HSC function, we performed a competitive repopulation assay using whole BM cells from WT and Ptip-/- mice
Figure 4. Restraining lysosomal activity restores hematopoietic stem cell competitive repopulation capacity. (A) Colony-forming unit (CFU) assay showing the rescue of phenotype by leupeptin (Leu) or phosphate-buffered saline (PBS) control on long-term hematopoietic stem cells (LT-HSC) (N=4-6). (B) Schematic of lysosomal inhibition by intraperitoneal injection with Leu or PBS control. (C) Percentages and total numbers of different stem cell populations in bone marrow (BM) after lysosomal inhibition by Leu or PBS control. The upper panel shows the representative flow cytometry plots. The lower panel plots percentages and total numbers of wild-type (WT) and Ptip-/- cells in each stem cell population (N=4). (D) Flow cytometry analysis of cell cycle phase of LT-HSC from WT and Ptip-/- mice in BM after lysosomal inhibition by Leu or PBS control. The left panel shows the representative flow cytometry plots. Right panel plots percentages of WT and Ptip-/- cells in each stage of the cell cycle (N=3-4). (E) Competitive repopulation assay. Whole BM of WT and Ptip-/- mice (CD45.2) were treated in vivo with Leu or PBS control, after which cells from each group were injected into lethally irradiated recipient (CD45.1) mice along with 3x10⁵ CD45.1 helper cells (N=5-6). ns: not significant; **P<0.01, ***P<0.001, ****P<0.00001 (t-test). Error bars denote mean ± standard error of the mean.

with or without Leu treatment WT, Ptip-/- mice (Figure 4B, E). Donor-derived CD45.2 cells in PB were detected at 4, 8, 12, and 16 weeks. Interestingly, the percentages of donor-derived cells in PB were significantly higher in Leutreated relative to untreated Ptip-/- groups (Figure 4E). About a 3.57-fold higher percentage of donor-derived cells in PB was observed in Leu-treated relative to untreated Ptip-/- groups at 16 weeks (Figure 4E). Taken together, our results show that inhibition of lysosomal activity effectively restores the quiescence and function of Ptip-/- HSC.
Ptip coordinates TGF β signaling in regulating hematopoietic stem cell quiescence
TGFβ signaling pathway is known as a key regulator of HSC quiescence and function.19 Given that the findings that Ptip deletion leads to the alteration of the TGFβ signaling pathway in HSC (Online Supplementary Figure S4C, D), we hypothesized that PTIP may mediate the function of TGFβ signaling in HSC maintenance. We first employed singlecell RNA-sequencing data36 for correlation analysis of PTIP. Interestingly, correlation analysis showed that PTIP was highly correlated with the TGFβ signaling pathway, lysosomes and cell cycle (Figure 5A). Especially, PTIP expression exhibited a positive correlation with the expression of SMAD3 and TFEB, and a negative correlation with CDK6 (Online Supplementary Figure S5A). In addition, we found that PTIP interacted with SMAD2/3 under endogenous and exogenous conditions (Figure 5B; Online Supplementary Figure S5B). Thus, these data suggest that PTIP may cooperate with the TGFβ signaling pathway to maintain the quiescent state of HSC.
We next investigated whether PTIP cooperates with TGFβ signaling in regulating HSC maintenance. As expected, we observed an obvious increase and decrease in the phosphorylation level of p-Smad2/3 in BM cells upon TGFβ-1 and LY364947 treatment, respectively (Online Supplementary Figure S5C), indicating its efficiency in activating and inhibiting TGFβ signaling. In addition, co-immunoprecipitation assays showed that the interaction of PTIP with SMAD3 was promoted by TGFb-1 treatment, but was blocked by inhibition of TGFβ with LY364947 (Online Supplementary Figure S5D), which suggests that TGFβ signaling regulates the interaction of PTIP with SMAD3. We then investigated whether PTIP participates in TGFβ-regulated HSC proliferation in WT and Ptip-/- mice treated with LY364947 (Figure 5C). Interestingly, inhibition of TGFβ signaling by LY364947 significantly increased the total number of HSC in the WT control group, but did not clearly affect HSC in Ptip-/- mice (Figure 5C). We also found that TGFβ signaling inhibition promotes the transition of quiescent HSC to activated HSC in WT mice, but not in Ptip-/- mice (Online Supplementary Figure S5E). Thus, these data prompted us to further assess whether TGFβ signaling activation could rescue the defects of HSC due
to PTIP deletion. We performed serial CFU assays using LT-HSC treated with active TGFβ1 in vitro (Figure 5D). As expected, when comparing to WT HSC, Ptip-/- HSC displayed impaired clonogenic ability in first-round CFU plating, which was partially rescued by TGFβ1 treatment in the second and third CFU replating (Figure 5D). Thus, this data suggests that TGF β signaling could partially rescue the function of Ptip-/- HSC. In addition, we also found that TGFβ1 treatment downregulated the expression levels of Cdk6, Myc, and Mycn, and upregulated the expression of p21, p27 and p57 in HSPC (Online Supplementary Figure S5F). We further examined lysosomal activity and the expression of lysosomal-associated genes. Interestingly, we found that TGFβ1 treatment reversed the increased lysosomal activity caused by Ptip deletion (Figure 5E). Meanwhile, TGFb1 treatment also restored the expression levels of lysosome-related genes, including Dram2, Ctsd, Ctsb, and Gm2a (Online Supplementary Figure S5G), which suggests that TGFβ signaling is involved in regulating lysosomal activity of HSC. Taken together, these results indicate that PTIP cooperates with TGF β signaling pathway in maintaining HSC quiescence.
HSC need to reside in a quiescent state in order to maintain their function during the whole lifetime. Therefore, how HSC preserve their quiescence is a fundamental scientific question in this field. Here, we uncover a crucial role of the histone methylation regulator PTIP in regulating lysosomal activity and coordinating TGFβ signaling to sustain HSC quiescence and function.
Our findings clarify the intrinsic and key role of PTIP in regulating HSC function and normal hematopoiesis. Previous study showed that deletion of PTIP in HSC and HSPC disrupts the microenvironment in the BM by blocking osteoclast differentiation, leading to a reduction of the BM HSPC pool and extramedullary hematopoiesis.28 In our study, we generated Scl-CreER;Ptipflox/flox mice. In this strain, the expression of tamoxifen-inducible Cre-ER recombinase is under the control of the stem cell leukemia (Scl) stem-cell enhancer.30 It is known that tamoxifen-dependent recombination occurs in more than 90% of adult long-term HSC, whereas the targeted proportion within mature progenitor populations is significantly lower.30 Thus, this HSC-SCL-Cre-ER mice provides us with a valuable tool to investigate the role of PTIP in HSC avoiding the interruption from an altered BM niche due to PTIP deletion. Interestingly, our findings suggest that PTIP is required for preserving HSC in quiescence, and PTIP loss promotes quiescent HSC entry into G1 phase. However, the lack of an obvious difference in cycling cells upon PTIP deletion suggests a retention of Ptip-/- HSC in the G1
Figure 5.
in regulating hematopoietic stem cell quiescence. (A) Pearson’s correlation between PTIP and TGFβ signaling, Lysosome and cell cycle targets from single-cell RNA-sequencing data (GSE157591). (B) Co-immunoprecipitation (CoIP) of SMAD2/3 and PTIP from OCI-AML3 cell line extract following incubation with SMAD2/3 or rabbit IgG antibodies. Immunoprecipitated immunoblotted with the indicated antibodies. (C) The effect of TGFβ signaling inhibition on hematopoietic stem cells (HSC). Upper panel: scheme for LY364947 injection to wild-type (WT) and Ptip-/- mice after tamoxifen administration; Lower panel: total cell numbers of long-term HSC (LT-HSC) in WT and Ptip-/- mice with or without LY364947 treatment. (D) Serial colony-formation unit (CFU) assay using LT-HSC from WT and Ptip-/- mice. Cells were treated with phosphate-buffered saline (PBS) and TGFβ1 at 1st plating separately (N=7); 2,000-3,000 cells from last colony formation were used for 2nd and 3rd plating (N=3). (E) Lysosomal activity assay for TGFβ1 treatment on hematopoietic stem progenitor cells (HSPC). Scheme for TGFβ1 treatment (upper). Bone marrow-derived Lin-c-Kit+ cells from WT and Ptip-/- mice were treated with or without 5 ng/ml TGFβ1 in an ex vivo SFEM medium. The lower panel shows the representative flow cytometry plots and mean fluorescence intensity (MFI) of WT and Ptip-/- cells (N=3). ns: not significant; *P<0.05 **P<0.01, ***P<0.001 (t-test). Error bars denote mean ± standard error of the mean.

phase. Cell cycle progression is regulated by cyclin-CDK complex, and G1-S phase transition is associated with CDK4/6 and Cyclin D and the related inhibitors p21 and p27.37 Thus, G1 arrest of Ptip-/- HSC might correlate with the upregulation of p21 and p27. Together, our work here clearly reveals a critical role of PTIP in HSC maintenance. Our study identifies PTIP as a key factor for regulating lysosomal activity in HSC. Recent studies indicate that lysosomes play an important role in balancing HSC quiescence versus activation.13-16 Quiescent HSC display more and larger lysosomes with slower degradative potential, while activated HSC have fewer and smaller lysosomes with relative higher activity. However, how the lysosomal function is regulated in HSC remains elusive. Interestingly, we find that PTIP loss causes increased lysosomal activity, and subsequently results in activation of
HSC. Repression of lysosomal activity enhances the competitive repopulation ability of Ptip-/- HSC. Our data indicate that PTIP is involved in regulating lysosomal activity in HSC. As the expression of TFEB, the master transcriptional regulator of lysosome biogenesis, is altered by PTIP, it is necessary to further investigate how PTIP regulates the expression of TFEB in the future. Interestingly, we find that PTIP interacts with SMAD2/3, and mediates the function of TGFβ signaling in HSC quiescence. Previous studies showed that interplay between TGF β signaling and cell metabolism is thought to be instrumental in maintaining homeostasis.38 TGFβ signaling regulates lysosome function and involves in lysosome-associated physiological processes.39-41 Therefore, it would be of great interest to uncover whether TGFβ signaling is involved in PTIP-mediated lysosomal activity regulation in HSC.
Disclosures
No conflicts of interest to disclose.
Contributions
TZ and HZ conceived the project. TZ, MC, and HZ designed the experiments and analyzed the data. TZ, MC, YL, YC performed the experiments with the help of JW, TZ, WT and YW. TZ, YL and YC performed bioinformatic analyses with the help of TZ, GH, WL. TZ, MC, and YL performed mouse experiments with the help of GH, RY, and ZG. YL, JW and TZ constructed the RNA-sequencing library. Other researchers in the lab (PW, JH, JW, YW) helped with experiments. YC, ZG, and TZ performed the statistical analysis, and TZ, ZL, and HZ wrote the manuscript. HZ supervised the study.
Acknowledgments
We acknowledge the members of our laboratory for helpful discussion. We also thank all the staff in the core facility of Medical Research Institute at Wuhan University for their tech-
1. Wilson A, Laurenti E, Oser G, et al. Hematopoietic stem cells reversibly switch from dormancy to self-renewal during homeostasis and repair. Cell. 2008;135(6):1118-1129.
2. Nakamura-Ishizu A, Ito K, Suda T. Hematopoietic stem cell metabolism during development and aging. Dev Cell. 2020;54(2):239-255.
3. Takubo K, Nagamatsu G, Kobayashi CI, et al. Regulation of glycolysis by Pdk functions as a metabolic checkpoint for cell cycle quiescence in hematopoietic stem cells. Cell Stem Cell. 2013;12(1):49-61.
4. Sommerkamp P, Altamura S, Renders S, et al. Differential alternative polyadenylation landscapes mediate hematopoietic stem cell activation and regulate glutamine metabolism. Cell Stem Cell. 2020;26(5):722-738.
5. Garcia-Prat L, Kaufmann KB, Schneiter F, et al. TFEB-mediated endolysosomal activity controls human hematopoietic stem cell fate. Cell Stem Cell. 2021;28(10):1838-1850.
6. Guo B, Huang X, Lee MR, Lee SA, Broxmeyer HE. Antagonism of PPAR-gamma signaling expands human hematopoietic stem and progenitor cells by enhancing glycolysis. Nat Med. 2018;24(3):360-367.
7. Vannini N, Girotra M, Naveiras O, et al. Specification of haematopoietic stem cell fate via modulation of mitochondrial activity. Nat Commun. 2016;7:13125.
8. Vannini N, Campos V, Girotra M, et al. The NAD-booster nicotinamide riboside potently stimulates hematopoiesis through increased mitochondrial clearance. Cell Stem Cell. 2019;24(3):405-418.
9. Chandel NS, Jasper H, Ho TT, Passegue E. Metabolic regulation of stem cell function in tissue homeostasis and organismal ageing. Nat Cell Biol. 2016;18(8):823-832.
10. Ito K, Suda T. Metabolic requirements for the maintenance of self-renewing stem cells. Nat Rev Mol Cell Biol. 2014;15(4):243-256.
11. Filippi MD, Ghaffari S. Mitochondria in the maintenance of hematopoietic stem cells: new perspectives and opportunities.
nical support.
This work is supported by the grants to HZ from the National Key R&D Program of China (2022YFA1103200), the National Natural Science Foundation of China (82230007), and the Hubei Provincial Natural Science Fund for Creative Research Groups (2021CFA003). This work is also supported by the grants to RY from the National Natural Science Foundation of China (82200188), and the Special Fund of China Postdoctoral Science Foundation (2022TQ0238). This work is also supported by the Medical Science Advancement Program (Basic Medical Sciences) of Wuhan University (TFJC2018005 to HZ), and by the Fundamental Research Funds for the Central Universities (2042021kf0225 to HZ).
Data-sharing statement
RNA-sequencing data are available from the corresponding author upon request.
Blood. 2019;133(18):1943-1952.
12. Ballabio A, Bonifacino JS. Lysosomes as dynamic regulators of cell and organismal homeostasis. Nat Rev Mol Cell Biol. 2020;21(2):101-118.
13. Liang R, Arif T, Kalmykova S, et al. Restraining lysosomal activity preserves hematopoietic stem cell quiescence and potency. Cell Stem Cell. 2020;26(3):359-376.
14. Dong S, Wang Q, Kao YR, et al. Chaperone-mediated autophagy sustains haematopoietic stem-cell function. Nature. 2021;591(7848):117-123.
15. Ho TT, Warr MR, Adelman ER, et al. Autophagy maintains the metabolism and function of young and old stem cells. Nature. 2017;543(7644):205-210.
16. Loeffler D, Wehling A, Schneiter F, et al. Asymmetric lysosome inheritance predicts activation of haematopoietic stem cells. Nature. 2019;573(7774):426-429.
17. Ghaffari S. Lysosomal regulation of metabolism in quiescent hematopoietic stem cells: more than just autophagy. Cell Stem Cell. 2021;28(3):374-377.
18. Massague J. TGFbeta signalling in context. Nat Rev Mol Cell Biol. 2012;13(10):616-630.
19. Blank U, Karlsson S. TGF-beta signaling in the control of hematopoietic stem cells. Blood. 2015;125(23):3542-3550.
20. Scandura JM, Boccuni P, Massague J, Nimer SD. Transforming growth factor beta-induced cell cycle arrest of human hematopoietic cells requires p57KIP2 up-regulation. Proc Natl Acad Sci U S A. 2004;101(42):15231-15236.
21. Cheng T, Shen H, Rodrigues N, Stier S, Scadden DT. Transforming growth factor beta 1 mediates cell-cycle arrest of primitive hematopoietic cells independent of p21(Cip1/Waf1) or p27(Kip1). Blood. 2001;98(13):3643-3649.
22. Yamazaki S, Iwama A, Takayanagi S, Eto K, Ema H, Nakauchi H. TGF-beta as a candidate bone marrow niche signal to induce hematopoietic stem cell hibernation. Blood. 2009;113(6):1250-1256.
23. Zhang H, Kozono DE, O'Connor KW, et al. TGF-beta inhibition
rescues hematopoietic stem cell defects and bone marrow failure in Fanconi anemia. Cell Stem Cell. 2016;18(5):668-681.
24. Callen E, Faryabi RB, Luckey M, et al. The DNA damage- and transcription-associated protein paxip1 controls thymocyte development and emigration. Immunity. 2012;37(6):971-985.
25. Daniel JA, Santos MA, Wang Z, et al. PTIP promotes chromatin changes critical for immunoglobulin class switch recombination. Science. 2010;329(5994):917-923.
26. Su D, Vanhee S, Soria R, et al. PTIP chromatin regulator controls development and activation of B cell subsets to license humoral immunity in mice. Proc Natl Acad Sci U S A. 2017;114(44):E9328-E9337.
27. Wang Q, Hu J, Han G, et al. PTIP governs NAD(+) metabolism by regulating CD38 expression to drive macrophage inflammation. Cell Rep. 2022;38(13):110603.
28. Das P, Veazey KJ, Van HT, et al. Histone methylation regulator PTIP is required to maintain normal and leukemic bone marrow niches. Proc Natl Acad Sci U S A. 2018;115(43):E10137-E10146.
29. van Galen P, Hovestadt V, Wadsworth Ii MH, et al. Single-cell RNA-seq reveals AML hierarchies relevant to disease progression and immunity. Cell. 2019;176(6):1265-1281.
30. Gothert JR, Gustin SE, Hall MA, et al. In vivo fate-tracing studies using the Scl stem cell enhancer: embryonic hematopoietic stem cells significantly contribute to adult hematopoiesis. Blood. 2005;105(7):2724-2732.
31. Warr MR, Binnewies M, Flach J, et al. FOXO3A directs a protective autophagy program in haematopoietic stem cells. Nature. 2013;494(7437):323-327.
32. Zoncu R, Bar-Peled L, Efeyan A, Wang S, Sancak Y, Sabatini DM.
mTORC1 senses lysosomal amino acids through an inside-out mechanism that requires the vacuolar H(+)-ATPase. Science. 2011;334(6056):678-683.
33. Libby P, Goldberg AL. Leupeptin, a protease inhibitor, decreases protein degradation in normal and diseased muscles. Science. 1978;199(4328):534-536.
34. Moulis M, Vindis C. Methods for measuring autophagy in mice. Cells. 2017;6(2):14.
35. Haspel J, Shaik RS, Ifedigbo E, et al. Characterization of macroautophagic flux in vivo using a leupeptin-based assay. Autophagy. 2011;7(6):629-642.
36. Rodriguez A, Zhang K, Farkkila A, et al. MYC promotes bone marrow stem cell dysfunction in Fanconi Anemia. Cell Stem Cell. 2021;28(1):33-47.
37. Bertoli C, Skotheim JM, de Bruin RA. Control of cell cycle transcription during G1 and S phases. Nat Rev Mol Cell Biol. 2013;14(8):518-528.
38. Liu H, Chen YG. The interplay between TGF-beta signaling and cell metabolism. Front Cell Dev Biol. 2022;10:846723.
39. Chen YG. Endocytic regulation of TGF-beta signaling. Cell Res. 2009;19(1):58-70.
40. Gao G, Chen J, Wang D, et al. TGF-beta1 Facilitates TAp63alpha protein lysosomal degradation to promote pancreatic cancer cell migration. Biology (Basel). 2021;10(7):597.
41. Mitchell H, Choudhury A, Pagano RE, Leof EB. Liganddependent and -independent transforming growth factor-beta receptor recycling regulated by clathrin-mediated endocytosis and Rab11. Mol Biol Cell. 2004;15(9):4166-4178.
Daniel W. Hagey,1,2 Egle Kvedaraite,2-4+ Mira Akber,3+ André Görgens,1,5 Joman Javadi,1 Tatiana von Bahr Greenwood,2,6 Caroline Björklund,7 Selma Olsson Åkefeldt,2,8 Tova HannegårdHamrin,9,10 Henrik Arnell,11,12 Katalin Dobra,1 Nikolas Herold,2,6 Mattias Svensson,3 Samir El Andaloussi,1 Jan-Inge Henter2,6 and Magda Lourda2,3
1Department of Laboratory Medicine, Karolinska Institutet, Stockholm, Sweden; 2Childhood Cancer Research Unit, Department of Women’s and Children’s Health, Karolinska Institutet, Stockholm, Sweden; 3Center for Infectious Medicine, Department of Medicine Huddinge, Karolinska Institutet, Karolinska University Hospital, Stockholm, Sweden; 4Department of Clinical Pathology and Cancer Diagnostics, Karolinska University Hospital, Stockholm, Sweden; 5Institute for Transfusion Medicine, University Hospital Essen, Essen, Germany; 6Pediatric Oncology, Astrid Lindgren Children’s Hospital, Karolinska University Hospital, Stockholm, Sweden; 7Department of Pediatric Hematology and Oncology, Umeå University Hospital, Umeå, Sweden; 8Theme of Children’s Health, Karolinska University Hospital, Stockholm, Sweden; 9Department of Physiology and Pharmacology, Karolinska Institutet, Stockholm, Sweden; 10Department of Pediatric Anesthesia and Intensive Care, Karolinska University Hospital, Stockholm, Sweden; 11Pediatric Gastroenterology, Hepatology and Nutrition, Astrid Lindgren Children's Hospital, Karolinska University Hospital, Stockholm, Sweden and 12Department of Women's and Children's Health, Karolinska Institutet, Stockholm, Sweden
+EK and MA contributed equally to this work.
Correspondence: D. Hagey daniel.hagey@ki.se
M. Lourda magdalini.lourda@ki.se
Received: January 4, 2023.
Accepted: March 9, 2023.
Early view: March 16, 2023.
https://doi.org/10.3324/haematol.2022.282638
©2023 Ferrata Storti Foundation
Published under a CC BY-NC license
Langerhans cell histiocytosis (LCH) is a potentially life-threatening inflammatory myeloid neoplasia linked to pediatric neurodegeneration, whereby transformed LCH cells form agglomerated lesions in various organs. Although MAP-kinase pathway mutations have been identified in LCH cells, the functional consequences of these mutations and the mechanisms that cause the pathogenic behavior of LCH cells are not well understood. In our study, we used an in vitro differentiation system and RNA-sequencing to compare monocyte-derived dendritic cells from LCH patients to those derived from healthy controls or patients with Crohn’s disease, a non-histiocytic inflammatory disease. We observed that interferon-γ treatment exacerbated intrinsic differences between LCH patient and control cells, including strikingly increased endo- and exocytosis gene activity in LCH patients. We validated these transcriptional patterns in lesions and functionally confirmed that LCH cells exhibited increased endo- and exocytosis. Furthermore, RNA-sequencing of extracellular vesicles revealed the enrichment of pathological transcripts involved in cell adhesion, MAP-kinase pathway, vesicle trafficking and T-cell activation in LCH patients. Thus, we tested the effect of the LCH secretome on lymphocyte activity and found significant activation of NK cells. These findings implicate extracellular vesicles in the pathology of LCH for the first time, in line with their established roles in the formation of various other tumor niches. Thus, we describe novel traits of LCH patient cells and suggest a pathogenic mechanism of potential therapeutic and diagnostic importance.
Langerhans cell histiocytosis (LCH) is characterized by the accumulation of langerin+CD1a+ myeloid cells (LCH cells) together with other immune cell populations in inflammatory lesions, which can be fatal or result in a diversity of long-term consequences, including neurodegeneration.1
The molecular characteristics of LCH began to be understood when it was discovered that most lesions are affected by constitutively activated extracellular signal-regulated kinases (ERK) due to somatic mutations in proteins of the mitogen-activated protein kinase (MAPK) pathway.1-3 In addition, BRAF V600E mutation in LCH patients was found to correlate with a suppressive tumor im-
exhibit increased vesicle trafficking and an altered secretome capable of activating NK cells
mune microenvironment and reduced disease-free survival.4 However, the underlying causes of LCH and the behavior of lesional cells remain elusive.
While research on immune stimulation has previously focused on soluble protein factors, such as cytokines,5-10 the role of extracellular vesicles (EV) in intercellular communication has only recently been described. EV are 30 nm to 1 mm in size and are secreted in a programmed fashion from the cell surface and endosomal system of all cells.11 They have been demonstrated to transport lipids, proteins and nucleic acids between cells to influence various processes, including tumor growth.12 EV can promote phenotypic changes in recipient cells by transferring oncoproteins that activate downstream signaling pathways, such as the MAPK or PI3K–AKT–mTOR, which makes them potential mediators of LCH pathology.13 However, neither abnormal vesicle trafficking nor EV have previously been investigated in LCH.
In this work, we have utilized an in vitro differentiation system14 to generate mature monocyte-derived dendritic cells (moDC) from blood monocytes of LCH patients and compare them to healthy controls or patients with Crohn’s disease (CD), a non-histiocytic inflammatory disease often presenting with granulomas. RNA-sequencing (RNA-seq) of these cells confirmed previously described aspects of LCH and revealed starkly increased levels of various membrane trafficking genes in LCH. We confirmed these expression profiles in lesions and performed functional analyses demonstrating that LCH cells displayed increased endocytosis, reacted specifically to interferon-γ (INFγ) treatment and secreted higher numbers of EV. Interestingly, LCH EV were associated with an enrichment of transcripts involved in cell adhesion, MAPK signaling, Tcell activation and vesicle trafficking, particularly in patients with active LCH. By treating lymphocytes with LCH secretome, a marked increase in the frequency of activated NK cells was observed. Together, these results point to novel mechanisms of LCH pathogenesis that may help to better understand the disease and provide potential therapeutic and diagnostic targets.
The study cohort includes nine children with a definitive LCH diagnosis (2 sampled twice) that had been cared for in the Karolinska University Hospital (n=8) or Umeå University Hospital (n=1) in Sweden ( Online Supplementary Table S1) and three children with a definitive CD diagnosis (2 sampled at diagnosis and 1 at follow-up) that had been cared for in the Karolinska University Hospital. Blood samples from healthy controls (n=16) were received from the Clinical immunology and transfusion medicine lab-
oratory (n=11, adults) or the Department of Pediatric Anesthesia and Intensive Care in Karolinska University Hospital (n=5, children). All samples were received after signed informed consent. The study was performed in accordance with the Declaration of Helsinki and approved by the Ethical Review Board in Stockholm.
Isolation of peripheral blood mononuclear cells and purification of monocytes
Peripheral blood mononuclear cells (PBMC) were retrieved after separation of the blood components with Lymphoprep (Axis-Shield PoC AS, Oslo, Norway) and the monocytes were negatively selected using the EasySep™ Human Monocyte Enrichment Kit without CD16 Depletion (STEMCELL Technologies, UK) according to the manufacturer’s instructions. The purity of the enriched monocytes was evaluated with flow cytometry5 and was >90%.
Monocyte differentiation to monocyte-derived dendritic cells
Purified monocytes were seeded at a concentration of 1 million cells/mL in RPMI 1640 medium (Thermo Fischer Scientific, South Logan, US), supplemented with 10% heat-inactivated fetal calf serum (FCS; Sigma-Aldrich, St. Louis, USA), 2 mM L-glutamine (Thermo Fischer Scientific), 10 mM Hepes (N-2-hydroxyethylpiperazine-N-2ethanesulfonic acid; Thermo Fischer Scientific), 50 ng/mL GM-CSF (PeproTech, New Jersey, USA) and 10 ng/mL IL-4 (PeproTech) for 6 days to achieve differentiation to moDC.
Monocyte-derived dendritic cell stimulation
moDC on day 6 were counted and replated in 6-well plates (1 million cells/mL) in RPMI 1640 medium, supplemented with 10% heat-inactivated FCS, 2 mM L-glutamine, 10 mM Hepes, 50 ng/mL GM-CSF and 10 ng/mL IL-4 ± 2 ng/mL INFγ (PeproTech) for 7 additional days. Mature moDC and culture medium were collected on day 13 and further processed for RNA-seq or transmission electron microscopy (EM) imaging.
RNA-sequencing
RNA from cells or EV was extracted15 and precipitated as previously described16 and further explained in the Online
Supplementary Appendix
GraphPad Prism version 9, Excel, R prcomp and DESeq2 were used to analyze the data as described in the Figure legends. The statistical tests used in each graph and the P values are indicated in the figures: *P<0.05, **P<0.01, ***P<0.001 or ****P<0.0001. All violin plots were generated in R using ggplot2, with sample mean shown as a large solid dot, standard error as a vertical line and individual data points as rings.
Additional methods used are available in the Online Supplementary Appendix.
RNA-sequencing of monocyte-derived dendritic cells

In order to better understand the functional characteristics of the myeloid compartment in LCH, we sought to characterize the intrinsic differences between moDC from LCH patients and healthy controls. In order to accomplish
this, we isolated circulating monocytes from three LCH patients (Online Supplementary Table S1) and three healthy controls and differentiated them towards immature moDC using a well-established protocol14,17,18 (Figure 1A). After 7 additional days in culture, the morphology of the cells was studied with EM (Figure 1B) and RNA was extracted for sequencing.
In agreement with previous work,19 EM visualization of the moDC revealed no substantial differences in their morphological phenotype (Figure 1B). Analysis of RNA-seq data confirmed the purity of the analyzed cells, as the cultures
Figure 1. In vitro differentiation of monocytes. (A) Schematic diagram of the differentiation protocol applied to monocytes isolated from healthy controls or Langerhans cell histiocytosis (LCH) patients. (B) Electron microscopy (EM) images of control and patient monocyte-derived dendritic cells (moDC). Scale bars are inset. (C) Expression of marker genes for different immune cell populations in all moDC transcriptome data sets. (D) Comparison between control and patient moDC expression of monocyte and moDC genes. ***DESeq2 adjusted P<0.001. (E) Principal component analysis of control and patient transcriptomes. (F) Gene expression comparison between control and patient moDC. Illustrative genes found differentially expressed in Allen et al. 20 are highlighted. (G) Gene ontology term fold enrichments for genes differentially expressed between control and patient moDC. P values for significantly enriched terms are inset. GM-CSF: granulocyte-macrophage colony-stimulating factor. Haematologica | 108 September 2023
were enriched in markers of monocytes and DC over those of other immune cells (Figure 1C). In order to see if this pattern was equally true in patient and control cells, we investigated the levels of monocyte and DC markers separately in each group. Interestingly, this revealed that the expression of monocyte genes (e.g., CD14, PECAM1) was significantly higher in patients, while the expression of DC markers (e.g., CXCR4, CCR7) was significantly lower (Figure 1D).
In order to assess the differences between patients and controls in an unbiased and genome-wide fashion, we performed principal component analysis (PCA) and hierarchical clustering based on the most variable genes in the data set. This demonstrated that patient and control samples robustly separated from each other (Figure 1E; Online Supplementary Figure S1A) and this separation was driven, at least in part, by the expression of monocyte and moDC genes (Online Supplementary Figure S1B). Furthermore, the moDC from the youngest (18 months old) and oldest (12 years old) patients with active and non-active disease respectively, clustered closer together compared to the third patient (6 years old, non-active disease). Moreover, none of the three patients was on treatment at sampling, indicating that the separation of patients from controls was not affected by age, disease status or treatment of the patients. Additionally, differential expression analysis on the entire transcriptome revealed thousands of genes to be significantly dysregulated in LCH patient cells (Figure 1F; Online Supplementary Tables S2 and S3). Importantly, the genes differentially expressed in our experiments matched well with those previously described in arrays of lesion-derived LCH cells20 (Online Supplementary Figure S1C). In order to characterize the differentially expressed and top PCA-loaded genes, we analyzed their gene ontology enrichments for processes known to be affected in LCH. This revealed that while immune system processes were both up- and downregulated in LCH-derived versus control-derived cells, genes regulating cell-cell adhesion were downregulated and cell cycle genes were upregulated in LCH cells (Figure 1G; Online Supplementary Figure S1D).
γ
Recent single-cell sequencing efforts have identified INFγ signaling in LCH cells.21 Thus, we introduced INFγ stimulation into our moDC differentiation protocol to evaluate its relative effects on the transcriptomes of our patient and control cells (Figure 2A). Confirming the effects of INFγ treatment, hierarchical clustering demonstrated that treated samples generally clustered together when compared to untreated cells from the same individual (Online Supplementary Figure S2A). Gene ontology analysis of genes affected by INFγ showed that treated cells down-
regulated proliferation genes and upregulated those involved in INFγ response and immune cell activation (Online Supplementary Figure S2B, C). However, this transcriptional response did not affect the clear separation observed between patient-derived and control-derived moDC by hierarchical clustering (Figure 2B).
Comparison of control and patient moDC treated with INFγ revealed a similar number of differentially expressed genes to that of untreated cells (Figures 1F and 2C; Online Supplementary Tables S2 and S3). However, cells from patients showed a more pronounced response to INFγ compared to controls (Figure 2D, E). In order to characterize the biological processes that are differentially affected by INFγ, we performed gene ontology analysis. Like in the case without INFγ treatment, patient cells both up- and downregulated genes involved in immune system processes. In contrast, INFγ increased the enrichment of genes involved in cell migration in control cells over patient cells. In patient cells, INFγ treatment exacerbated the differential expression of genes involved in the MAPK pathway, receptor-mediated endocytosis and regulated exocytosis (Figure 2E, F). Notably, exocytosis terms were found within the top ten most significant gene ontologies upregulated in patient cells (Online Supplementary Table S3).
As vesicle trafficking was affected on multiple levels in our RNA-seq data, we looked specifically at the various pathways involved in endocytosis, endosomal sorting and exocytosis.22,23 This revealed that while caveolin and clathrin were downregulated in patient cells, most scavenger receptors and structural components of endocytosis were upregulated (Online Supplementary Figure S3). Moreover, although markers of early endosomes and lysosomes were downregulated in patients, various markers of COPII-mediated anterograde trafficking, late and recycling endosomes, as well as multivesicular bodies were upregulated in patient cells.24-26 This was mirrored by an increase in specific syntaxin, synaptogamin and SNARE genes, as well as markers of vesicle fusion and lysosomal exocytosis,27 which together illustrated the complexity of the LCH exocytosis phenotype (Online Supplementary Figure S3).
In order to confirm that the biological processes identified by gene ontology analysis in our in vitro system were also active in vivo in LCH cells within patient lesions, we turned to a recently published single-cell RNA-seq data set.21 We used CD1A and CD14 to map where LCH cells and monocytes were located within the cell dispersion maps from each of the seven patient lesions analyzed. In this way, we observed that the MAPK, endocytosis and, particularly, exocytosis genes we found enriched in our patient cells were primarily expressed by monocytes and LCH cells, within patient lesions (Figure 2G; Online Supplementary Figure S4).
As our patient samples were limited and heterogeneous,
Figure 2. Interferon-γ enhances abnormal Langerhans cell histiocytosis patient monocyte-derived dendritic cell membrane trafficking. (A) Schematic diagram of the differentiation and stimulation protocol applied to monocytes isolated from healthy controls or patients. (B) Hierarchical clustering of sample-sample Pearson correlations for all control and patient monocyte-derived dendritic cells (moDC) ± interferon-γ (INFγ) treatment. (C) Gene expression comparison between control and patient moDC treated with INFγ. Red dots represent genes with significantly different expression. (D) Magnitude of differential gene expression between Continued on following page.

control and patient moDC when untreated or treated with INFγ. (E) Normalized count data in control and patient moDC ± INFγ treatment for genes exemplifying the gene ontology pathways regulated in (F). (F) Gene ontology term fold enrichments for genes differentially expressed between control and patient moDC ± INFγ treatment. P values for significantly enriched terms are inset. (G) Single cell RNA-sequencing data from Halbritter et al.21 showing the expression of markers for Langerhans cell histiocytosis (LCH) cells (CD1A, pink circle) and monocytes (CD14, black circle), as well as the genes we found differentially expressed within the gene ontology terms listed. Statistics for (D) performed using a two-tailed, unpaired t-test and for (E) using the adjusted P value from DESeq2. **P<0.01 and ***P<0.001. GM-CSF: granulocyte-macrophage colony-stimulating factor.
we wished to confirm the biological processes dysregulated in LCH moDC by comparing these samples with additional age-matched control groups. Thus, we sequenced moDC from five healthy pediatric controls and three pediatric CD patients (Figure 3A; Online Supplementary Table S4). Clustering these samples together with our previous data showed distinct clusters of CD and LCH samples separated from one CD and all control samples (initial and additional pediatric, n=8) (Figure 3B). Performing differential expression analysis between all control samples and either LCH or CD samples revealed more differences between controls and LCH cells (Figures 3C, D). Importantly, the differences in gene expression levels were as significant between LCH moDC and each of the three other sample groups (Figure 3E). Finally, we assessed the potential enrichment of gene ontology terms related to those we found upregulated in our previous analysis. In contrast to their upregulation in LCH moDC, CD moDC downregulated genes involved in MAPK cascade, proliferation, endocytosis and exocytosis, while chemotaxis was instead a feature of these cells (Figure 3F).
Since gene ontology and pathway analysis suggested that receptor-mediated endocytosis genes were upregulated in LCH cells, we wished to functionally confirm this phenotype in moDC cells from a larger and more homogeneous cohort. To this end, EM analysis of moDC from seven LCH patients and seven control samples revealed dense structures within moDC, which were significantly enriched in LCH cultures (Figure 4A, B). Interestingly, these structures were not observed at all when monocytes were isolated with a different protocol that did not involve incubation with magnetic beads (Online Supplementary Figure S5). This suggested that antibody-coated magnetic beads were aberrantly endocytosed during patient monocyte isolation, reflecting the transcriptional changes detected by RNAseq.
As genes regulating exocytosis pathways were particularly upregulated in LCH cells, it was important to understand how this phenotype manifested itself in LCH. In order to study this, we analyzed the vesicles and soluble proteins present in conditioned media from patient and control moDC cultures. Characterization by EM and nanoparticle tracking analysis revealed an abundance of EV 50-200 nm in size in culture media from both patients and controls (Figure 5A, B). In order to separate and quantify the EV
and soluble proteins present in the media, we performed size exclusion chromatography (Figure 5C). This analysis revealed no difference in the amount of soluble proteins present in media from healthy controls and LCH patients, though patient cells treated with INF γ secreted higher protein amounts than untreated patient cells (Figure 5D). Importantly, LCH cells secreted significantly more EV than control cells regardless of their exposure to INF γ , as quantified by nanoparticle tracking. Interestingly, while control cells secreted significantly less EV in the presence of INFγ, LCH patient cells increased the quantity of secreted EV (Figure 5E).
Since we consumed all our primary moDC media performing size exclusion, we turned our analysis to moDC derived from an expanded cohort of LCH patients (Online Supplementary Table S1) and healthy controls to explore the differences between control and patient secretomes. Analysis of moDC conditioned media using a Luminex panel of selected cytokines known to be secreted by monocytes and DC revealed a significant decrease in the levels of CCL2 released by patients, while all other factors were found at similar levels in the media from patients and controls (Online Supplementary Figure S6A). In a parallel attempt to understand the differences between EV secreted by LCH and control moDC, we utilized the MACSplex EV surface protein profiling assay. These experiments revealed lower levels of CD81 and a trend towards higher levels of HLA-DRDPDQ on patient EV, while most other markers were found at similar levels (Online Supplementary Figure S6B).
Even though vesicle quantities were clearly increased in patients, the MACSplex assay did not demonstrate clear pathogenic differences between patient and control EV. Therefore, we sought to better understand their functional distinctions. EV are known to carry and deliver diverse protein-, lipid- and nucleic acid cargo between cells and mRNA has attracted particular attention recently due to its role in directly regulating cellular activity.12 RNA-seq followed by PCA of the most variable genes in the data set showed LCH patient-derived EV transcriptomes to cluster close together, in contrast to control-derived EV, which were more heterogenous (Figure 6A). Furthermore, differential expression analysis revealed hundreds of genes to be specifically enriched in either control or pa-
tient EV (Figure 6B; Online Supplementary Tables S5 and S6). Although it might have been expected that these transcripts simply represented the most highly expressed genes in control and patient cells, this was not the case (Online Supplementary Figure S7A). Instead, only LCH-de-

rived EV were specifically enriched for the genes found to be upregulated in the original cohort of patient cells (Figure 6C).
In order to further understand which cellular transcripts were sorted into EV, we performed differential expression
Figure 3. Vesicle trafficking phenotypes are robust and unique to Langerhans cell histiocytosis samples. (A) Schematic diagram of the differentiation and stimulation protocol applied to monocytes isolated from healthy (adult) controls, healthy pediatric controls, Crohn’s disease (CD) or Langerhans cell histiocytosis (LCH) patients. (B) Hierarchical clustering of sample-sample Pearson correlations for monocyte-derived dendritic cells (moDC) from the initial cohort of healthy controls and LCH patients and the additional cohort of healthy pediatric controls and CD patients. (C, D) Gene expression comparison between all healthy controls and LCH (C) or CD (D) patient moDC. Red dots represent genes with significantly different expression. (E) Batch corrected normalized count data in original and pediatric controls, as well as CD and LCH patient moDC for genes exemplifying the gene ontology pathways regulated in (F). Statistics performed using unpaired, two-tailed t-tests **P<0.01 and ***P<0.001. (F) Gene ontology term fold enrichments for genes differentially expressed between all healthy controls and LCH patient moDC. P values for significantly enriched terms are inset. GM-CSF: granulocyte-macrophage colony-stimulating factor.
cells (Online Supplementary Figure S7B-E). Moreover, the difference between control and patient EV-enriched transcripts was larger than that between the cells themselves (Online Supplementary Figure S7F).
Figure 4. Patient monocyte-derived dendritic cells display abnormal endocytosis. (A) Representative electron micrographs showing beads used in the isolation protocol to be taken up by patient, but not control, monocyte-derived dendritic cells (moDC). Scale bars are inset. (B) Quantification of beads found in moDC from controls (N=7) and patients (N=7). Statistics performed using Mann-Whitney test. **P<0.01.

A B C E D Haematologica | 108 September 2023 2429 ARTICLE - Increased vesicle trafficking in LCH myeloid cells D.W. Hagey et al.

In order to characterize the potential function of patientenriched EV-born transcripts on cells in the lesion, we subjected these to gene ontology analysis. This revealed an enrichment of metabolic genes in both patient and
control EV. In contrast, each was enriched in transcripts with opposing effects on cell motility, such that control and patient EV were associated with positive regulators of cell motility and cell-cell adhesion, respectively (Figure
Figure 6. Langerhans cell histiocytosis extracellular vesicles carry transcripts promoting Langerhans cell histiocytosis lesion properties. (A) Principal component analysis of control and patient extracellular vesicle (EV) transcriptomes. (B) Gene expression comparison between EV secreted from INFγ-treated control and patient monocyte-derived dendritic cells (moDC). Red dots are genes with significantly different expression. (C) Overlap enrichment of genes differentially expressed in control and patient moDC cells and EV. Statistics performed using R prcomp. **P<0.01. (D) Gene ontology term fold enrichments for genes differentially expressed between INFγ-treated control and patient moDC EV. P values for enriched terms are inset. (E) Normalized count data in INFγ-treated patient and control moDC EV for genes exemplifying the gene ontology pathways regulated in (D). (F) Gene ontology term fold enrichments for genes differentially expressed between EV derived from patients with non-active or active Langerhans cell histiocytosis (LCH). P values for enriched terms are inset. (G) Normalized count data in EV derived from patients with non-active or active disease for genes exemplifying the gene ontology pathways regulated in (F). *DESeq2 adjusted P value <0.05 and **DESeq2 adjusted P value <0.01.

6D). Furthermore, a strong enrichment of genes with wellcharacterized roles in T-cell activation and MAPK cascade was observed specifically in patient cells (Figures 6D, E). Interestingly, patient EV transcriptomes could be clearly separated into two subclusters based on PCA: one derived from patients with active disease and one from patients with non-active disease (Figure 6A; Online Supplementary Table S1). By performing differential expression analysis on these two groups (Online Supplementary Figure S7G), EV derived from patients with active disease were more enriched in transcripts involved in T-cell differentiation, MAPK signaling and vesicle trafficking than those from patients with non-active disease (Figures 6F, G; Online Supplementary Table S7).
Since gene ontology analysis revealed upregulation of various terms related to lymphocyte function in EV secreted from LCH patient moDC, we sought to investigate how these would affect lymphocytes in vitro. For this, we isolated PBMC from buffy coats from three healthy donors and cultured them in the presence of either LCH or control moDC supernatants for 18 hours. Cells were then stained with a 22-color flow cytometry panel (Online Supplementary Table S8) to phenotypically characterize the lymphocyte subpopulations in the stimulated PBMC. Single alive lymphocytes from each donor for each stimulation were analyzed with uniform manifold approximation and projection (UMAP) to achieve dimensionality reduction. UMAP analysis (Figure 7A; Online Supplementary Figure S8A) showed that the same lymphocyte subsets could be detected in both LCH- and control-treated PBMC. These were CD4+ and CD8+ T cells (including MAIT cells), NK cells and ILC (Figure 7B; Online Supplementary Figure S8B). Unsupervised clustering with phenograph subdivided the main lymphocyte subsets into 20 distinct subpopulations based on the median fluorescence intensity of cell markers (Figures 7C, D). Investigation of the frequency of each subset in each donor when treated with LCH or control medium (Figure 7E) revealed that LCH medium significantly decreased the frequencies of Treg (C2), CD8+ activated/regulatory cells (C11) and non-activated NK cells (C1, C5). Moreover, LCH media also resulted in a relative increase in the frequencies of naïve CD4+ T cells (C8), effector memory CD4+ T cells with a naïve phenotype (C7) and mature activated NK cells (C4), while no significant difference was observed in other lymphocyte subsets.
One challenge in understanding LCH pathology is that the lesion creates a unique niche of immune cells with complex
phenotypes and interactions that cannot be accurately recapitulated in healthy individuals. However, as LCH cells are a type of CD1a+ DC, and monocytes/monocyte-like cells were proposed to contribute to the LCH cell pool,21,28,29 we felt it would be informative to derive these in vitro and apply an unbiased RNA-seq-based approach to study their nicheindependent differences. Although the cells analyzed were not bona fide LCH cells, this analysis uncovered novel vesicle trafficking phenotypes and confirmed a previously described increase in MAPK activity, impaired DC differentiation and cell migration defects.20,30,31 These phenotypes agree with previous studies reporting low CCR7 protein levels in LCH cells in lesions and an overall semi-mature mixed monocyte-macrophage-DC phenotype.20,31-33 This data demonstrated that our differentiation system adequately recapitulated characteristics of bona fide LCH cells in vitro INFγ expression has been previously documented in LCH lesions34,35 and LCH cells are known to express IFNγR1.35 However, little is known about the impact of INFγ on LCH pathology. Thus, we treated moDC with INFγ and compared their transcriptional profiles with those of unstimulated cells. We found that INFγ treatment exacerbated the increased expression of genes involved in MAPK signaling, endocytosis and exocytosis in LCH patient moDC. Functionally, we found that control moDC decreased their release of EV upon INFγ stimulation, while patient cells increased the secretion of both proteins and EV under these conditions. This supports the interpretation that patient cells are inherently vulnerable to immunological stimuli, possibly explaining the hypercytokinemia detected in patient lesions, blood and CSF.5-8,36,37
Our results indicated that increased proliferation, endocytosis and exocytosis are amongst the most pronounced phenotypes in LCH cells, though these have not been previously described in LCH. The finding of multiple exocytosis terms within the top ten most enriched gene ontology terms describing patient moDC demonstrated this importance (Online Supplementary Table S3). EV are recognized as having a key role in tumor growth through the reprogramming of tissue resident cells and formation of the tumor niche. Their ability to stimulate angiogenesis, drive matrix remodeling and enable immune escape are well documented in several cancers and thus it is possible that EV have a similar role in LCH pathogenesis. Moreover, their unique capability to cross the blood brain barrier provides a potential lead in the link between LCH and pediatric neurodegeneration.38-40 Unfortunately, the small size of our cohort constitutes a limitation of our study and the modest number of moDC obtained prevented us from performing all experiments on the same samples. Regardless, we confirmed the LCH transcriptional phenotypes that we discovered by comparing to three different control groups, including another inflammatory granuloma disease, and functionally verified them using EM, nanoparticle tracking and lymphocyte stimulation assays.
Moreover, the biological relevance of our findings was supported by our ability to map the expression of the dysregulated gene sets in LCH moDC to the CD1A and CD14 expressing cells in LCH lesions.21 Although the mechanisms that underpin LCH have remained elusive, our understanding of the intrinsic pathways dysregulated in LCH cells was improved by the discovery of MAPK pathway mutations in LCH cells. Interestingly, MAPK signaling influences vesicle trafficking, which may lead to the increased exocytosis we observed. As EV can deliver a broad range of biological cargo to influence neighboring cells,12,13 they represent both a novel pathological mechanism and a potential source of disease biomarkers. Indeed, the
analysis of EV contents in plasma and other biofluids have been proposed as tumor biomarkers in various cancers.13 Thus, EV secreted by cells found in LCH granulomas could possibly be used both as early LCH diagnostic markers and as markers for disease state and therapy evaluation. The upregulation of genes such as LAMTOR2 and components of the ESCRT machinery in LCH moDC hinted at previously underappreciated pathological mechanisms. LAMTOR2 resides mainly in late endosomes, where it regulates vesicle sorting and has been shown to be necessary for Langerhans cell proliferation and survival by regulating ERK and mTORC signaling.25 Interestingly, inhibition of mTOR was sufficient to reduce production of inflammatory cyto-
Figure 7. Langerhans cell histiocytosis secretome reprograms lymphocyte function. (A) Uniform manifold approximation and projection (UMAP) on concatenated files of 114,000 lymphocytes from 3 healthy donors (38,000 cells each) treated either with control conditioned culture medium (light blue) or 114,000 lymphocytes from the same 3 healthy donors (38,000 cells each) treated with Langerhans cell histiocytosis (LCH) conditioned culture medium (red). (B) UMAP displaying the median fluorescence intensity (MFI) of the indicated markers. (C) Distribution of the 20 identified phenograph clusters overlaid on the UMAP projection. (D) MFI of each marker in the phenograph clusters. (E) Frequency of each cluster in each donor when treated with CN medium (first point) or LCH medium (second point), linked with a line. Statistics in (E) performed using Multiple paired t-tests. *P<0.05, **P<0.01, ***P<0.001 and ****P <0.0001.

kines by BRAF V600E+ hematopoietic progenitors and improve outcomes in treated mice.41 Moreover, the ESCRT machinery plays a vital role in the cellular processes essential for exosome release and its activation would contribute to the increased exocytosis characterizing LCH cells.42 The perturbed vesicle trafficking resulting from the dysregulation of these genes may explain why we found patient moDC EV to be particularly enriched in transcripts involved in T-cell activation, cell adhesion and MAPK signaling. Importantly, the lateral transfer of these phenotypes would help justify the behavior of lesional cells, including the observation of activated T cells in the absence of stimulatory cytokines.43 In order to assay this directly, we tested the effects of patient and control moDC conditioned media on lymphocyte activity. Interestingly, this revealed a reduction in the frequency of activated T cells and inactive NK cells, and a striking increase in the frequency of naïve T cells and activated NK cells. However, given that the activation markers in these cell types overlap extensively, and NK terms are very limited in the gene ontology database, it is not surprising that T-cell regulation was highlighted in our data. Regardless, this constitutes the first example of histiocytosis cells reprograming other cells in their niche, which is a common function of EV in other neoplastic diseases.41
Together, our findings indicate that LCH patient cells are intrinsically sensitive to immune insult, reveal important mechanisms of disease pathology, and suggest EV as potentially valuable target in LCH patient diagnostics and therapy. For example, a prospective study of LCH patient EV in liquid biopsies has the potential to reveal biomarkers such as mutational status, which could improve the sensitivity of LCH diagnosis and treatment monitoring. Moreover, if EV are confirmed as a pathogenic mechanism of LCH, then sequestering them in lesions or inhibiting their production may prove a potent therapeutic approach, as has been recently demonstrated in systemic inflammation and melanoma.44-46
Disclosures
AG and SEA are consultants for and have equity interests in Evox Therapeutics Ltd., Oxford, UK. JIH served as consultant
1. Allen CE, Merad M, McClain KL. Langerhans-cell histiocytosis. N Engl J Med. 2018;379(9):856-868.
2. Badalian-Very G, Vergilio JA, Degar BA, et al. Recurrent BRAF mutations in Langerhans cell histiocytosis. Blood. 2010;116(11):1919-1923.
3. Sahm F, Capper D, Preusser M, et al. BRAFV600E mutant protein is expressed in cells of variable maturation in Langerhans cell histiocytosis. Blood. 2012;120(12):e28-34.
4. Zeng K, Wang Z, Ohshima K, et al. BRAF V600E mutation correlates with suppressive tumor immune microenvironment and reduced disease-free survival in Langerhans cell histiocytosis. Oncoimmunology. 2016;5(7):e1185582.
for SOBI. All the other authors have no conflicts of interest to disclose.
DWH and ML developed the concept and methodology of the study. DWH, MA, AG, JJ, NH and ML performed the investigation. DWH, EK, AG and ML analyzed data. TvBG, CB, SOÅ, THH, HA and J-IH recruited patients and provided clinical information. DWH, KD, MS, SEA, J-IH and ML provided resources. ML supervised the study. DWH and ML prepared the figures and wrote the manuscript. All authors reviewed and approved the final version of the manuscript.
The authors would like to thank all patients and unrelated volunteers (controls) who agreed to participate in the study, all clinicians and nurses involved in collection of blood samples and the Single Cell Core Facility in Karolinska Institute Flemingsberg. We would also like to thank Kjell Hultenby and Eva Blomén from the electron microscopy unit (EMil) at Karolinska Institute Flemingsberg for their valuable assistance with the EM experiments.
The study was supported by grants to DWH from the Swedish Childhood Cancer Fund, Ishizu Matsumurais Donation and OEE Johanssons Foundation, to JIH from the Swedish Childhood Cancer Fund, the Swedish Cancer Society, the Swedish Cancer and Allergy Fund, and Region Stockholm (ALF-project) and to ML from the Swedish Childhood Cancer Fund, Karolinska Institute, Dr Åke Olsson Foundation for hematological research, Fredrik O Ingrid Thurings Foundation, Mary Béve Foundation for pediatric cancer research and Märta and Gunnar V Philipsons Foundation.
All data needed to evaluate the conclusions of the paper are presented in the paper or in the Online Supplementary Appendix without providing personally identifiable information.
5. Lourda M, Olsson-Akefeldt S, Gavhed D, et al. Detection of IL-17Aproducing peripheral blood monocytes in Langerhans cell histiocytosis patients. Clin Immunol. 2014;153(1):112-122.
6. Oh Y, Morimoto A, Shioda Y, et al. High serum osteopontin levels in pediatric patients with high risk Langerhans cell histiocytosis. Cytokine. 2014;70(2):194-197.
7. Lourda M, Olsson-Akefeldt S, Gavhed D, et al. Adsorptive depletion of blood monocytes reduces the levels of circulating interleukin-17A in Langerhans cell histiocytosis. Blood. 2016;128(9):1302-1305.
8. Morimoto A, Oh Y, Nakamura S, et al. Inflammatory serum cytokines and chemokines increase associated with the disease
extent in pediatric Langerhans cell histiocytosis. Cytokine. 2017;97:73-79.
9. Andersson By U, Tani E, Andersson U, Henter JI. Tumor necrosis factor, interleukin 11, and leukemia inhibitory factor produced by Langerhans cells in Langerhans cell histiocytosis. J Pediatr Hematol Oncol. 2004;26(11):706-711.
10. Kannourakis G, Abbas A. The role of cytokines in the pathogenesis of Langerhans cell histiocytosis. Br J Cancer Suppl. 1994;23:S37-40.
11. van Niel G, D'Angelo G, Raposo G. Shedding light on the cell biology of extracellular vesicles. Nat Rev Mol Cell Biol.2018;19(4):213-228.
12. Elsharkasy OM, Nordin JZ, Hagey DW, et al. Extracellular vesicles as drug delivery systems: why and how? Adv Drug Deliv Rev. 2020;159:332-343.
13. Xu R, Rai A, Chen M, et al. Extracellular vesicles in cancerimplications for future improvements in cancer care. Nat Rev Clin Oncol. 2018;15(10):617-638.
14. Coury F, Annels N, Rivollier A, et al. Langerhans cell histiocytosis reveals a new IL-17A-dependent pathway of dendritic cell fusion. Nat Med. 2008;14(1):81-87.
15. Bost JP, Saher O, Hagey D, et al. Growth media conditions influence the secretion route and release levels of engineered extracellular vesicles. Adv Healthc Mater. 2022;11(5):e2101658.
16. Hagey DW, Kordes M, Gorgens A, et al. Extracellular vesicles are the primary source of blood-borne tumour-derived mutant KRAS DNA early in pancreatic cancer. J Extracell Vesicles. 2021;10(12):e12142.
17. Olsson Akefeldt S, Maisse C, Belot A, et al. Chemoresistance of human monocyte-derived dendritic cells is regulated by IL-17A. PLoS One. 2013;8(2):e56865.
18. Tang-Huau TL, Segura E. Human in vivo-differentiated monocytederived dendritic cells. Semin Cell Dev Biol. 2019;86:44-49.
19. Holter W, Ressmann G, Grois N, et al. Normal monocyte-derived dendritic cell function in patients with Langerhans-cellhistiocytosis. Med Pediatr Oncol. 2002;39(3):181-186.
20. Allen CE, Li L, Peters TL, et al. Cell-specific gene expression in Langerhans cell histiocytosis lesions reveals a distinct profile compared with epidermal Langerhans cells. J Immunol. 2010;184(8):4557-4567.
21. Halbritter F, Farlik M, Schwentner R, et al. Epigenomics and single-cell sequencing define a developmental hierarchy in Langerhans cell histiocytosis. Cancer Discov. 2019;9(10):1406-1421.
22. Kaksonen M, Roux A. Mechanisms of clathrin-mediated endocytosis. Nat Rev Mol Cell Biol. 2018;19(5):313-326.
23. Johansen J, Alfaro G, Beh CT. Polarized exocytosis induces compensatory endocytosis by Sec4p-regulated cortical actin polymerization. PLoS Biol. 2016;14(8):e1002534.
24. Jensen D, Schekman R. COPII-mediated vesicle formation at a glance. J Cell Sci. 2011;124(Pt 1):1-4.
25. Sparber F, Scheffler JM, Amberg N, et al. The late endosomal adaptor molecule p14 (LAMTOR2) represents a novel regulator of Langerhans cell homeostasis. Blood. 2014;123(2):217-227.
26. Villasenor R, Kalaidzidis Y, Zerial M. Signal processing by the endosomal system. Curr Opin Cell Biol. 2016;39:53-60.
27. Bonifacino JS, Glick BS. The mechanisms of vesicle budding and fusion. Cell. 2004;116(2):153-166.
28. Hutter C, Kauer M, Simonitsch-Klupp I, et al. Notch is active in Langerhans cell histiocytosis and confers pathognomonic features on dendritic cells. Blood. 2012;120(26):5199-5208.
29. Milne P, Bigley V, Bacon CM, et al. Hematopoietic origin of Langerhans cell histiocytosis and Erdheim-Chester disease in
adults. Blood. 2017;130(2):167-175.
30. Shi H, He H, Cui L, et al. Transcriptomic landscape of circulating mononuclear phagocytes in Langerhans cell histiocytosis at the single-cell level. Blood. 2021;138(14):1237-1248.
31. Hogstad B, Berres ML, Chakraborty R, et al. RAF/MEK/extracellular signal-related kinase pathway suppresses dendritic cell migration and traps dendritic cells in Langerhans cell histiocytosis lesions. J Exp Med. 2018;215(1):319-336.
32. Annels NE, Da Costa CE, Prins FA, et al. Aberrant chemokine receptor expression and chemokine production by Langerhans cells underlies the pathogenesis of Langerhans cell histiocytosis. J Exp Med. 2003;197(10):1385-1390.
33. Senechal B, Elain G, Jeziorski E, et al. Expansion of regulatory T cells in patients with Langerhans cell histiocytosis. PLoS Med. 2007;4(8):e253.
34. Egeler RM, Favara BE, van Meurs M, Laman JD, Claassen E. Differential In situ cytokine profiles of Langerhans-like cells and T cells in Langerhans cell histiocytosis: abundant expression of cytokines relevant to disease and treatment. Blood. 1999;94(12):4195-4201.
35. Quispel WT, Stegehuis-Kamp JA, Santos SJ, et al. Intact IFNgammaR1 expression and function distinguishes Langerhans cell histiocytosis from mendelian susceptibility to mycobacterial disease. J Clin Immunol. 2014;34(1):84-93.
36. Ismail MB, Akefeldt SO, Lourda M, et al. High levels of plasma interleukin-17A are associated with severe neurological sequelae in Langerhans cell histiocytosis. Cytokine. 2020;126:154877.
37. McClain KL, Picarsic J, Chakraborty R, et al. CNS Langerhans cell histiocytosis: common hematopoietic origin for LCH-associated neurodegeneration and mass lesions. Cancer. 2018;124(12):2607-2620.
38. Javadi J, Gorgens A, Vanky H, et al. Diagnostic and prognostic utility of the extracellular vesicles subpopulations present in pleural effusion. Biomolecules. 2021;11(11):1606.
39. Peinado H, Zhang H, Matei IR, et al. Pre-metastatic niches: organspecific homes for metastases. Nat Rev Cancer. 2017;17(5):302-317.
40. El-Andaloussi S, Mager I, Breakefield XO, Wood MJ. Extracellular vesicles: biology and emerging therapeutic opportunities. Nat Rev Drug Discov. 2013;12(5):347-357.
41. Bigenwald C, Le Berichel J, Wilk CM, et al. BRAF(V600E)-induced senescence drives Langerhans cell histiocytosis pathophysiology. Nat Med. 2021;27(5):851-861.
42. Kim SW, Kim DH, Park KS, et al. Palmitoylation controls trafficking of the intracellular Ca(2+) channel MCOLN3/TRPML3 to regulate autophagy. Autophagy. 2019;15(2):327-340.
43. Quispel WT, Stegehuis-Kamp JA, Santos SJ, Egeler RM, van Halteren AG. Activated conventional T-cells are present in Langerhans cell histiocytosis lesions despite the presence of immune suppressive cytokines. J Interferon Cytokine Res. 2015;35(10):831-839.
44. Gupta D, Wiklander OPB, Gorgens A, et al. Amelioration of systemic inflammation via the display of two different decoy protein receptors on extracellular vesicles. Nat Biomed Eng. 2021;5(9):1084-1098.
45. Chen G, Huang AC, Zhang W, et al. Exosomal PD-L1 contributes to immunosuppression and is associated with anti-PD-1 response. Nature. 2018;560(7718):382-386.
46. Serrati S, Guida M, Di Fonte R, et al. Circulating extracellular vesicles expressing PD1 and PD-L1 predict response and mediate resistance to checkpoint inhibitors immunotherapy in metastatic melanoma. Mol Cancer. 2022;21(1):20.
Valentin Clichet,1 Delphine Lebon,2,3 Nicolas Chapuis,4 Jaja Zhu,5 Valérie Bardet,5 Jean-Pierre Marolleau,2,3 Loïc Garçon,1,3 Alexis Caulier2,3,6,7 and Thomas Boyer1,3
1Service d’Hématologie Biologique, CHU Amiens-Picardie, Amiens, France; 2Service d’Hématologie Clinique et de Thérapie Cellulaire, CHU Amiens-Picardie, Amiens, France; 3HEMATIM, EA 4666, Université Picardie Jules Verne, Amiens, France; 4Assistance PubliqueHôpitaux de Paris, Centre-Université Paris Cité, Service d’Hématologie Biologique, Hôpital Cochin, Paris, France; 5Service d’Hématologie-Immunologie-Transfusion, CHU Ambroise Paré, INSERM UMR 1184, AP-HP, Université Paris Saclay, 92100 Boulogne Billancourt, France; 6Broad Institute of MIT and Harvard, Cambridge, MA, USA and 7Division of Hematology/Oncology, Boston Children’s Hospital, Harvard Medical School, Cambridge, MA, USA
Correspondence: T. Boyer
boyer.thomas@chu-amiens.fr
Received: November 3, 2022.
Accepted: March 7, 2023.
Early view: March 16, 2023.
https://doi.org/10.3324/haematol.2022.282370
©2023 Ferrata Storti Foundation
Published under a CC BY-NC license
The diagnosis of myelodysplastic syndromes (MDS) might be challenging and relies on the convergence of cytological, cytogenetic, and molecular factors. Multiparametric flow cytometry (MFC) helps diagnose MDS, especially when other features do not contribute to the decision-making process, but its usefulness remains underestimated, mostly due to a lack of standardization of cytometers. We present here an innovative model integrating artificial intelligence (AI) with MFC to improve the diagnosis and the classification of MDS. We develop a machine learning model through an elasticnet algorithm directed on a cohort of 191 patients, only based on flow cytometry parameters selected by the Boruta algorithm, to build a simple but reliable prediction score with five parameters. Our AI-assisted MDS prediction score greatly improves the sensitivity of the Ogata score while keeping an excellent specificity validated on an external cohort of 89 patients with an Area Under the Curve of 0.935. This model allows the diagnosis of both high- and low-risk MDS with 91.8% sensitivity and 92.5% specificity. Interestingly, it highlights a progressive evolution of the score from clonal hematopoiesis of indeterminate potential (CHIP) to highrisk MDS, suggesting a linear evolution between these different stages. By significantly decreasing the overall misclassification of 52% for patients with MDS and of 31.3% for those without MDS (P=0.02), our AI-assisted prediction score outperforms the Ogata score and positions itself as a reliable tool to help diagnose MDS.
Myelodysplastic syndromes (MDS) are a heterogeneous group of myeloid neoplasms the incidence of which increases with age, with a median age at diagnosis of 75 years.1 MDS are characterized by ineffective hematopoiesis leading to peripheral cytopenia, and dysplastic features in the erythroid, myeloid, monocytic and megakaryocytic cell lineages in bone marrow (BM) and peripheral blood (PB). Besides the symptoms and complications associated with cytopenia, MDS have a time-dependent heterogeneous but life-threatening potential for malignant transformation into acute myeloid leukemia (AML).2
According to the World Health Organization (WHO) 2016 classification, cytomorphology and cytogenetics are the gold standard for MDS diagnosis.3 However, cytomorphological analysis of BM smears may be challenging and identification of myelodysplastic features requires a well-
trained cytologist. It is especially important when cytogenetic analysis does not reveal any chromosomal abnormality, which happens in 50% of patients. Thus, additional diagnostic procedures such as next generation sequencing (NGS) and multiparametric flow cytometry (MFC) need to be performed to facilitate the diagnosis. Several MDS MFC-scores have already been reported, like the Ogata score4 focusing on progenitor cells, the RED-score5 analyzing nucleated red blood cells, or the integrated flow score (iFS)6 that includes aspects of most of the MFC scores. However, the widespread use of these diagnostic tools is severely limited by a lack of standardization of the procedure among the centers performing flow cytometry, especially when using different flow cytometry machines and different brands of antibodies.
Over the past few years, due to the increased sensitivity of molecular biology techniques, several definitions and classifications of pre-MDS conditions have been pro-
posed.7 Among these pre-MDS conditions are ICUS (idiopathic cytopenia of unknown significance), CHIP (clonal hematopoiesis of indeterminate potential), and CCUS (clonal cytopenia of unknown significance). They have relied either on the presence (ICUS and CCUS) or the absence (CHIP) of cytopenia, or on the detection (CHIP and CCUS) or not (ICUS) of clonal hematopoiesis in molecular biology or cytogenetic analyses. These stages do not require any treatment and CHIP is associated with a 1% risk of transformation to MDS per year. The differential diagnosis between these pre-MDS stages may be challenging and have implications on the patient’s follow-up. Besides, it is often difficult to distinguish pre-MDS stages from low-risk MDS in the absence of marked BM dysplasia, whereas there is a huge difference in the risk of ultimate malignant transformation.8
Recently, artificial intelligence (AI) has begun to play an important role in numerous areas of medicine. Several methods (machine learning, convolutional neural networks) have been developed in hematology to address these specific problems. Interestingly, more and more feature selection algorithms are being developed, which allow us to select and focus on the most important parameters of a given pathology.
In this study, using a 10-color single-tube, we sought to discriminate patients with MDS from patients without MDS based on the profile obtained with MFC in a wellcharacterized and multicentric cohort from hematology departments of three different centers. After features selection using the Boruta algorithm, we established a diagnostic score to accurately distinguish between patients without MDS and patients with or without excess blasts.
Between 2019 and 2021, patients with suspected MDS who had undergone MFC evaluation at initial diagnosis were retrospectively identified in the hematology departments of 3 different centers (Amiens, Ambroise Paré and Cochin hospitals). Peripheral blood (PB) cytopenia were defined as platelets below 150x109/L (thrombocytopenia), neutrophils below 1.8x10⁹/L (neutropenia), and hemoglobin concentration below 12 g/dL or 13 g/dL (anemia) for women and men, respectively. All MDS diagnoses were made according to the 2016 World Health Organization (WHO) classification. Clinical, morphologic, immunophenotypic, molecular, and cytogenetic data were reviewed. The Revised International Prognostic Scoring System (IPSS-R) was calculated as previously described.9 We divided the total cohort into two; first, we designed a learning cohort with patients from two hospitals (Ambroise Paré and Cochin), and then we used an external validation
cohort with patients from the Amiens hospital. This process is the gold standard of development and medical application on a machine learning algorithm. This method, associated with crossvalidation on a learning cohort, allows generalized performances which can be applied to other hospitals, as well as algorithms with less overfitting to be obtained.10
One center used a Navios™ instrument (Beckman Coulter, Miami, FL, USA) and the two others used FACSCanto™ and FACSLyric™ instruments (Beckton Dickinson, Franklin Lakes, NJ, USA). Before each series, the settings of the photomultipliers were checked with fluorescent calibration beads.
Direct immunolabeling was performed on 50 mL of whole BM. After 20 minutes incubation, red blood cells were lysed with VersalyseTM solution (Beckman Coulter) according to the manufacturer’s instructions, and the samples were washed once in phosphate-buffered saline (PBS). At least 50,000 events were acquired. All the antibodies used are listed in Online Supplementary Tables S1-S3. As described by Della Porta et al.11 regarding the Ogata score, four parameters (1 point each when outside the normal ranges) were analyzed: 1) the percentage of CD34+ myeloid progenitors among all acquired cells (threshold for normal <2%); 2) the percentage of B-cell progenitors, defined as CD34+CD38+CD19+ cells, among all CD34+ cells (threshold for normal >5%); 3) the lymphocyte/myeloid progenitor CD45 ratio (normal range 4-7.5); and 4) the granulocyte/lymphocyte SSC peak channel ratio (threshold for normal >6). The Ogata score was positive if ≥2. Expression of CD7, CD56 and HLA-DR on blast cells was also assessed, as well as the total hematogone ratio (number of hematogones/number of CD34+ cells).
R software 4.0.5 was used for the statistical analysis: χ2 test for categorical variables, non-parametric Kruskall Wallis test and Pearson correlation for quantitative parameters. We performed features selection using the Boruta algorithm with 150 random forest iterations and obtained a predictive model by logistic regression penalized by an elasticnet algorithm on previously selected features.12 We used an α coefficient of penalization of 0.6 and a 10-fold crossvalidation on training and test cohorts to reduce bias and optimize threshold category; an algorithm performance with a matrix of prediction on the Amiens Hospital validation cohort was obtained. A Receiver Operating Characteristic (ROC) curve analysis was performed on this validation cohort. Finally, we used a Cochran-MantelHaenszel χ2 test to analyze differences between the different matrices of prediction obtained by the Ogata and the elasticnet score on each group.
Machine learning was performed on MDS and no MDS patients without CHIP (n=280). CHIP was added to the figures a posteriori to observe the behavior of the model on this pathology. Two-tailed P<0.05 was considered statistically significant.
A total of 105 (34.65%) patients without MDS (no MDS), 23 with pre-MDS (7.59%), 112 (36.96%) with MDS without excess blasts, and 63 patients (20.79%) with MDS with excess blasts (MDS-EB) were enrolled in the total cohort (Table 1). All patients with pre-MDS stages listed in the introduction were combined in the pre-MDS group because of the small number of patients in each category. Among the 105 no MDS cases, there are patients with drug toxicity (n=15, 14.28%), autoimmune disease (n=10, 9.52%), liver insuffiency (n=12, 11.43%), bone marrow metastasis (n=8, 7.61%), idiopathic thrombocytopenia (ITP) (n=12, 11.43%), infections (n=12, 11.43%), vitamin B9 or B12 deficiency (n=7, 6.67%), non-Hodgkin lymphoma (n=12, 11.43%), aplastic anemia (n=7, 6.67%), kidney failure (n=6, 5.71%), and multiple myeloma (n=4, 3.81%).
In the total cohort, there was a significant difference in
median age at diagnosis between these groups (72 years for patients without malignancy, 75 for pre-MDS, 78 for MDS, and 80 for MDS-EB; P=0.016). We did not found any significant difference between MCV values, probably due to the high values in some no MDS patients (vitamin deficiency). A positive-Ogata score classified 71% of MDS patients in the MDS group, and accurately classified 81.10% of no MDS patients. It performed better for patients with MDS-EB, accurately classifying 95% of them in the MDS group, whereas it performed less well for the diagnosis of MDS without excess of blasts, both for MDS-MLD and MDSSLD, only identifying 57.10% and 47.13% of them, respectively. Thus, the sensitivity of the Ogata score was 69.80% with 93.80% specificity, with a 95% positive predictive value (PPV) and a 63% negative predictive value (NPV). As expected, the percentage of CD34+ myeloid progenitors was significantly higher in the MDS-EB group (2.76%) than in the patients with no MDS (0.71%), pre-MDS (0.63%), and MDS without excess of blasts (0.92%) (P<0.001). We found no significant immunophenotypic aberrations, with a similar median value of CD7+ blasts (P=0.942), CD56+ blasts (P=0.551), and HLA-DR negative blasts (P=0.658) across the different groups. On the other hand, the percentage of CD7+ blast cells was significantly higher in the MDS groups (P<0.001).
MDS: myelodysplastic syndromes; CHIP: clonal hematopoiesis of indeterminate potential; MDS-EB: MDS with excess blasts; MCV: mean corpuscular volume; WBC: white blood cells; ANC: absolute neutrophil count; CD34+CD38- : percentage of CD34+ CD38- blast cells; CD7+ blasts: median value of CD7+ blast cells; CD56+ blasts: median value of CD56+ blast cells; HLA-DR- blasts: median value of HLA-DR- blast cells; Total Hg: ratio Hg/CD34+; Hg Ogata: hematogone parameter of the Ogata Score; CD45 Ogata score: CD45 lymphocytes/ myeloid progenitor CD45 ratio of the Ogata score; SSC Ogata: granulocytes/lymphocytes side scatter parameter of the Ogata score.
To help distinguish patients with MDS from those with no MDS, we applied a Boruta feature selection algorithm on flow cytometry parameters. The qualitative granulocyte/lymphocyte SSC peak channel ratio (SSC Ogata score <6), the total hematogone ratio (number of hematogones/number of CD34+ cells), the percentage of CD34+ B-cell progenitors among all CD34+ cells (hematogone Ogata score), and the percentage of CD34+ myeloid progenitors were informative features to predict the diagnosis of MDS by MFC. On the contrary, the percentage of CD34+CD38- blast cells and the lymphocyte/myeloid progenitor CD45 ratio were found to be the least relevant features (Figure 1).
We then used an elasticnet model to evaluate the probability of MDS (with or without excess blasts) on the learning and the test cohorts (plus pre-MDS patients; Figure 2A), allowing us to propose this mathematical formula: MDS prediction score = -1.58 + 2.928*SSC Ogata score + 0.965*hematogone Ogata score + 0.8907*%CD34+ myeloid progenitors – 0.0032*Total hematogone ratio
In our learning cohort, a threshold of 0 with this formula proved ideal to distinguish patients with MDS from preMDS or no MDS patients using crossvalidation. We then validated this model with a threshold of 0 on the Amiens Hospital validation cohort, and we obtained a ma-
Figure 1. Features selection by Boruta algorithm. Features in green are validated as useful, features in red are useless to predict myelodysplastic syndromes, control in blue are hazard permuted features that allow us to confront predictive potential of our variables with these randomness features. y-axis represents difference between each Z-score accuracy on feature and control, associated with standard deviation obtained on 100 iterations. Horizontal threshold represented significant different threshold between features and control. SS Ogata score: granulocyte/lymphocyte SSC peak channel ratio; Ogata final: numerical value of the Ogata score between 0 and 4; SS Ogata: numerical value of the granulocyte/lymphocyte SSC peak channel ratio; Total Hg: number of hematogones/number of CD34+ cells; Hg Ogata score: percentage of CD34+ B-cell progenitors among all CD34+ cells; % of MFC blasts: percentage of CD34+ myeloid progenitors; quantitative Ogata Hg: numerical value of the percentage of CD34+ B-cell progenitors among all CD34+ cells; Ogata Mb score: percentage of CD34+ myeloid progenitors; Ratio CD45: numerical value of the lymphocyte/myeloid progenitor CD45 ratio; Ogata CD45 score: out of 4-7.8 range; min: minimum; max: maximum.

trix prediction with sensitivity of 91.84%, a specificity of 92.48%, and positive and negative predictive values of 93.75% and 90.03%, respectively. The prognostic values of our AI-assisted MDS prediction score strikingly outperforms the Ogata score, particularly by significantly improving the sensitivity and the NPV (Table 2).
To validate our diagnosis threshold with normalized data, we built a cumulative proportion plot for all pathologies on the total cohort that shows representativeness of this cohort without imbalanced data (Figure 2B).

With a cut off of 0, ROC curve analysis performed on the same validation cohort showed an Area Under the Curve of 0.935, highlighting the excellent performance of the MDS prediction score by which only 6.47% of the patients were misclassified (Figure 2C).
In the total cohort (191 patients on learning and test cohorts plus 89 patients on external validation cohort: total n=280), our elasticnet MDS prediction score allowed for a clear distribution of MDS, MDS-EB and no MDS groups (Figure 2D). To improve the accuracy of diagnosis for these three subgroups, we refined the thresholds of our model
and identified three groups: group A with an elasticnet MDS prediction score between -3 and 0, group B higher than 0 and less than 3, and group C higher than 3 (Figure 3). Group A included many patients without MDS (87.88% with no MDS; 90.90% of the no MDS patients in the global cohort were in this group: n=132). Group B had more MDS patients without EB (88.17% with MDS in this group: n=93), and group C had more MDS-EB patients or MDS without EB but with multiple abnormalities like multi-lineage dysplasia or genetic abnormalities (100% of MDS in this group: n=78) (Table 3). Patients with pre-MDS stages were equally distributed in group A and group B. Strikingly, our AI-assisted model shows a progressive evolution of the MDS prediction score from a pre-MDS condition (CHIP) to highrisk MDS, suggesting a linear evolution between these different stages (Figure 2C and Figure 4).
We then tested the accuracy of the model to classify patients according to the IPSS-R categories. In the whole cohort, IPSS-R was available for 150 MDS patients. Only 18 MDS patients (9.42% of total MDS; 13.63% of group A) were classified in group A, all others being classified in groups
Figure 2. Probability of myelodysplastic syndrome (MDS) diagnosis according to the elasticnet MDS score. Development of an elasticnet model to predict the probability of MDS in the training and test cohorts. (A) Density plot of pathology repartition according to the MDS score. (B) Cumulative proportion of the cases in the global cohort according to the MDS score. (C) Receiver Operating Characteristic curves of the MDS score on the external validation cohort for MDS and no MDS patients (without preMDS patients). (D) Cumulative proportion of the MDS score according to different pathologies. Pre-MDS: pre-myelodysplastic syndrome conditions; MDS-EB: MDS with excess blasts.
MDS: myelodysplastic syndromes; ER: error rate based on the misclassified rate; PPV: positive predictive value; NPV: negative predictive value.
B and C of our model. Of these 18 patients, only one was of intermediate risk according to the IPSS-R, whereas nine were in the low-risk group and eight in the very low-risk group. Importantly, no high-risk patients were classified in group A (Table 4).
Overall, our newly developed AI-assisted MDS prediction score improved the accuracy of MDS diagnosis, by reducing the risk of misclassification of MDS without excess blasts by 52.07% (P=0.004) and an absence of MDS by 31.33% (P=0.022) compared to the Ogata score (Figure 4). Therefore, the sensitivity of this score for the subgroup of

patients without excess blasts was 78.27%. These different subtypes could not be diagnosed by flow cytometry (using cytology alone) but were informative as to the ability of the algorithm to predict MDS.
In this study, we developed an innovative model combining artificial intelligence and machine learning with flow cytometry to improve the performance of MFC in diagnosing MDS.
MDS: myelodysplastic syndromes; MCV: mean corpuscular volume; WBC: white blood cells; ANC: absolute neutrophil count; CD34+CD38-: percentage of CD34+ CD38- blast cells; CD7+ blasts: median value of CD7+ blast cells; CD56+ blasts: median value of CD56+ blast cells; HLA-DRblasts: median value of HLA-DR- blast cells; Total Hg: ratio Hg/CD34+ ; Hg Ogata: hematogone parameter of the Ogata score; CD45 Ogata: CD45 lymphocytes/myeloid progenitor CD45 ratio of the Ogata score; SSC Ogata: granulocytes/lymphocytes side-scatter parameter of the Ogata score.
Here, we propose an original AI-assisted prediction score for MDS to directly investigate the value of combining AI and MFC for the diagnosis of MDS. A few studies have used convolutional neural networks with gradient boosting to assess dysplasia13,14 or to distinguish aplastic anemia from MDS with very good sensitivity and specificity;15 but, up till now, AI has remained underused in the diagnosis of MDS, particularly in combination with MFC. Two other studies demonstrated a link between morphology, mutational status and prognosis in MDS using machine learning techniques.16,17 Recent studies used unsupervised cluster analysis of flow cytometry to identify new subsets in pathological erythropoiesis or facilitate the diagnosis of MDS.18,19
The aim of this study was to distinguish patients with actual MDS from patients without MDS. Our AI-assisted MDS prediction score following an elasticnet model identified that most of the MDS patients have a score >0. By setting the cut-off value to 0, our diagnostic model shows high predictive value and strikingly outperforms the Ogata score by significantly increasing the sensitivity and the specificity of this test. If the original Ogata score performs well to discriminate MDS-EB (that are also usually easier to diagnose on BM smears), the great value of our score is in improving the accuracy of diagnosing MDS without excess blasts, whether they show single or multi-lineage
dysplasia. With an error rate of 8% for both false positive and negative results, our MDS prediction score will increase user confidence for biologists and clinicians involved in the diagnostic procedure, especially when the presence of dysplastic features is not clear. In addition to its performances in the diagnosis of MDS, our model allowed for risk prediction, as we identifi ed three risk groups (A, B and C) that correlate with the evolution of the disease. Nevertheless, one MDS-EB patient was classified in group A (see Figure 3.) This patient had bicytopenia, 6% blasts on the bone marrow aspiration with no cytogenetic abnormalities and no mutations found, and was classified in the IPSS-R category. The patient is currently being monitored and is not receiving treatment. This is an unusual case, and the excess of blasts on bone marrow smears could be reactive (this excess was not found on MFC analysis with an Ogata score = 0). The follow-up of this patient could help us to understand his classification in group A.
In our model, patients with pre-MDS cluster equally with patients without MDS. This specific distribution argues for a continuity between the occurrence of clonal hematopoiesis and the onset of MDS, as previously suggested by several teams.7,20-25
Our prediction score included a few patients diagnosed with ICUS and CCUS; these had to be combined with CHIP
patients to preserve the score’s performance. It would be interesting to further explore their behavior in our model. Furthermore, we could not discriminate between the different categories of MDS (e.g., 5q- syndrome, MDS with ring sideroblasts), and this could be the subject of further tests. It would also be interesting to know whether a positive score increases the risk of developing an overt MDS. Unfortunately, the cohort was not designed to answer this question, and more patients and a longer follow-up are required.
The model has been built using the 2016 MDS WHO classification. As the recent release of the new classification might change the performances values, we aimed to reclassify our patients according to the new WHO classifi-
Figure 4. Distribution of myelodysplastic syndrome (MDS) prediction on the different groups with the elasticnet MDS score and Ogata score. Distribution of the different subtypes of pathologies according to the Ogata score and according to the penalized logistic score group. Diagnosis of myelodysplastic syndrome with single lineage dysplasia (MDSSLD) and myelodysplastic syndrome with multilineage dysplasia (MDSMLD) was made in cytology. (A) Classification according to the Ogata score. (B) Classification according to the elasticnet score. MDS-EB2: myelodysplastic syndrome with excess blasts between 10% and 19%; MDSEB1: myelodysplastic syndrome with excess blasts between 5% and 9%; pre-MDS: pre-myelodysplastic syndrome conditions.

cation. As no patient was diagnosed with MDS-EB2 with AML-defining cytogenetics, this update did not change the initial classification of the patients.
Another potential limitation of the generalizability of the model is the lack of standardization between the different centers when assessing the Ogata score. Despite published recommendations,26 centers either use different fluorochromes or different clones of antibodies. However, when using data with artificial intelligence, this variability is a real asset in helping to build the algorithm. Moreover, all of the three centers involved in the study passed the external quality controls for this panel of antibodies on normal BM samples through the Acute Leukemia French Association / French Innovative Leukemia Organization
(ALFA-FILO) network. Despite using different antibodies and dyes, the MDS prediction score yielded excellent results in the validation cohort, suggesting our model could be widely used.
Flow cytometry provides faster results than most cytogenetics or molecular biology techniques and is widely available worldwide; its standardization between laboratories is, therefore, of crucial importance. It relies on the same panel as that used in the Ogata score, which is already carried out in most laboratories. At a time when cost-effectiveness is becoming increasingly important, this AI-assisted MDS prediction score enables rapid patient diagnosis and stratification to help clinicians in their quest for the best patient care.
1. Zeidan AM, Shallis RM, Wang R, Davidoff A, Ma X. Epidemiology of myelodysplastic syndromes: why characterizing the beast is a prerequisite to taming it. Blood Rev. 2019;34:1-15.
2. Menssen AJ, Walter MJ. Genetics of progression from MDS to secondary leukemia. Blood. 2020;136(1):50-60.
3. Arber DA, Orazi A, Hasserjian R, et al. The 2016 revision to the World Health Organization classification of myeloid neoplasms and acute leukemia. Blood. 2016;127(20):2391-2405.
4. Ogata K, Della Porta MG, Malcovati L, et al. Diagnostic utility of flow cytometry in low-grade myelodysplastic syndromes: a prospective validation study. Haematologica. 2009;94(8):1066-1074.
5. Mathis S, Chapuis N, Debord C, et al. Flow cytometric detection of dyserythropoiesis: a sensitive and powerful diagnostic tool for myelodysplastic syndromes. Leukemia. 2013;27(10):1981-1987.
6. Cremers HR, Wager TD, Yarkoni T. The relation between statistical power and inference in fMRI. Gilbert S, ed. PLoS One. 2017;12(11):e0184923.
7. Steensma DP, Bejar R, Jaiswal S, et al. Clonal hematopoiesis of indeterminate potential and its distinction from myelodysplastic syndromes. Blood. 2015;126(1):9-16.
8. Sekeres MA, Taylor J. Diagnosis and treatment of myelodysplastic syndromes: a review. JAMA. 2022;328(9):872-880.
9. Greenberg PL, Tuechler H, Schanz J, et al. Revised international prognostic scoring system for myelodysplastic syndromes. Blood. 2012;120(12):2454-2465.
10. Andaur Navarro CL, Damen JAA, Takada T, et al. Risk of bias in studies on prediction models developed using supervised machine learning techniques: systematic review. BMJ. 2021;375:n2281.
11. Della Porta MG, Picone C, Pascutto C, et al. Multicenter validation of a reproducible flow cytometric score for the diagnosis of lowgrade myelodysplastic syndromes: results of a European LeukemiaNET study. Haematologica. 2012;97(8):1209-1217.
12. Kursa MB, Jankowski A, Rudnicki WR. Boruta – a system for feature selection. Fundam Inform. 2010;101(4):271-285.
13. Mori J, Kaji S, Kawai H, et al. Assessment of dysplasia in bone marrow smear with convolutional neural network. Sci Rep. 2020;10(1):14734.
14. Acevedo A, Merino A, Boldú L, Molina Á, Alférez S, Rodellar J. A new convolutional neural network predictive model for the
No conflicts of interest to disclose.
TB and VC designed the research study. TB, NC, JZ, VB and LG collected and analyzed the data. DL, AC and JPM managed patients and provided clinical data. TB, VC, VB, NC, LG and AC wrote the paper. All authors approved the final version of the manuscript for publication.
The authors confirm that the data supporting the findings of this study are available within the article and its Online Supplementary Appendix.
automatic recognition of hypogranulated neutrophils in myelodysplastic syndromes. Comput Biol Med. 2021;134:104479.
15. Kimura K, Tabe Y, Ai T, et al. A novel automated image analysis system using deep convolutional neural networks can assist to differentiate MDS and AA. Sci Rep. 2019;9(1):13385.
16. Nagata Y, Zhao R, Awada H, et al. Machine learning demonstrates that somatic mutations imprint invariant morphologic features in myelodysplastic syndromes. Blood. 2020;136(20):2249-2262.
17. Nazha A, Komrokji R, Meggendorfer M, et al. Personalized prediction model to risk stratify patients with myelodysplastic syndromes. J Clin Oncol. 2021;39(33):3737-3746.
18. Porwit A, Violidaki D, Axler O, Lacombe F, Ehinger M, Béné MC. Unsupervised cluster analysis and subset characterization of abnormal erythropoiesis using the bioinformatic FLOW‐SELF Organizing Maps algorithm. Cytometry B Clin Cytom. 2022;102(2):134-142.
19. Duetz C, Van Gassen S, Westers TM, et al. Computational flow cytometry as a diagnostic tool in suspected‐myelodysplastic syndromes. Cytometry A. 2021;99(8):814-824.
20. Genovese G, Kähler AK, Handsaker RE, et al. Clonal hematopoiesis and blood-cancer risk inferred from blood DNA sequence. N Engl J Med. 2014;371(26):2477-2487.
21. Jaiswal S, Fontanillas P, Flannick J, et al. Age-related clonal hematopoiesis associated with adverse outcomes. N Engl J Med. 2014;371(26):2488-2498.
22. Desai P, Mencia-Trinchant N, Savenkov O, et al. Somatic mutations precede acute myeloid leukemia years before diagnosis. Nat Med. 2018;24(7):1015-1023.
23. Abelson S, Collord G, Ng SWK, et al. Prediction of acute myeloid leukaemia risk in healthy individuals. Nature. 2018;559(7714):400-404.
24. Takahashi K, Wang F, Kantarjian H, et al. Preleukaemic clonal haemopoiesis and risk of therapy-related myeloid neoplasms: a case-control study. Lancet Oncol. 2017;18(1):100-111.
25. Gondek LP, DeZern AE. Assessing clonal haematopoiesis: clinical burdens and benefits of diagnosing myelodysplastic syndrome precursor states. Lancet Haematol. 2020;7(1):e73-e81.
26. Westers TW, Ireland R, Kern W, et al. Standardization of flow cytometry in myelodysplastic syndromes: a report from an international consortium and the European LeukemiaNet Working Group. Leukemia, 2012;26(7):1730-1741.
Allison Barraclough,1,2 James T. England,3,4 Diego Villa,3 Joel Wight,2,5 Greg Hapgood,6 Jason Conn,6 Nicole Wong Doo,7 Eric Wenlong Li,7 Michael Gilbertson,8,9 Briony Shaw,8 Mark J. Bishton,10 Malik Saeed,10 Sumita Ratnasingam,11 Chathuri Abeyakoon,11 Geoff Chong,2,12,13 Shin Hnin Wai,13,14 Matthew Ku,2,15 Hui-Peng Lee,16 Kathryn Fleming,16 Constantine Tam,2,17 Genevieve Douglas,13 Chan Y. Cheah,18,19 Zi Yun Ng,18 Tukten Rolfe,20 Anthony K. Mills,20 Nada Hamad,21,22,23 Helen Cashman,21 Mary Gleeson,24 Manjunath Narayana25 and Eliza A. Hawkes13,26
1Department of Haematology, Fiona Stanley Hospital, Perth, Australia; 2University of Melbourne, Melbourne, Australia; 3University of British Columbia and BC Cancer Centre for Lymphoid Cancer, Vancouver, British Columbia, Canada; 4Princess Margaret Cancer Centre, Toronto, Ontario, Canada; 5Department of Haematology, Townsville University Hospital, Townsville, Australia; 6Department of Haematology, Princess Alexandra Hospital, Brisbane, Australia; 7Concord Clinical School, University of Sydney, Sydney, Australia; 8Department of Haematology, Monash Health, Melbourne, Australia; 9School of Clinical Sciences, Monash University, Melbourne, Australia; 10Department of Haematology, Nottingham City Hospital, Nottingham, UK; 11Department of Haematology, University Hospital Geelong, Geelong, Australia; 12Ballarat Regional Integrated Cancer Centre, Ballarat Health Services, Melbourne, Australia; 13Department of Medical Oncology and Haematology, Olivia Newton-John Cancer Research and Wellness Centre, Austin Health, Melbourne, Australia; 14Department of Haematology, The Northern Hospital, Melbourne, Australia; 15Department of Haematology, St Vincent’s Hospital Melbourne, Melbourne, Australia; 16Department of Haematology, Flinders Medical Centre, Adelaide, Australia; 17Department of Haematology, Peter MacCallum Cancer Centre and Royal Melbourne Hospital, Melbourne, Australia; 18Department of Haematology, Sir Charles Gairdner Hospital, Perth, Australia; 19University of Western Australia, Medical School, Perth, Australia; 20Greenslopes Private Hospital, Brisbane, Australia; 21Department of Haematology, St Vincent’s Hospital Sydney, Sydney, Australia; 22School of Clinical Medicine, University of New South Wales, Sydney, Australia; 23School of Medicine, University of Notre Dame, Sydney, Australia; 24Department of Haematology, Guy’s and St. Thomas’ NHS Foundation Trust, London, UK; 25Department of Haematology, Sunshine Coast University Hospital, Birtinya, Australia and 26Transfusion Research Unit, Monash University, Melbourne, Australia
Correspondence: E. Hawkes
eliza.hawkes@onjcri.org.au
Received: May 9, 2022.
Accepted: February 16, 2023.
Early view: February 23, 2023.
https://doi.org/10.3324/haematol.2022.281375
©2023 Ferrata Storti Foundation
Published under a CC BY-NC license
Grade (G) 3B follicular lymphoma (FL) is a rare FL subtype which exists on a histological continuum between ‘lowgrade’ (Grade 1, 2 and 3A FL) and diffuse large B-cell lymphoma (DLBCL) appearing to share features with each. Clinical characteristics and outcomes are poorly understood due to lack of adequate representation in prospective trials and large-scale analyses. We analyzed 157 G3BFL cases from 18 international centers, and two comparator groups; G3AFL (n=302) and DLBCL (n=548). Composite histology with DLBCL or low-grade FL occurred in approximately half of the G3BFL cases. With a median of 5 years follow-up, the overall survival and progression-free survival of G3BFL patients was better than that of DLBCL patients ( P <0.001 and P <0.001, respectively); however, G3BFL patients were younger (P<0.001) with better performance status ( P<0.001), less extranodal disease ( P<0.001) and more frequently had normal lactate dehydrogenase (P<0.001) at baseline. The overall and progression-free survival of patients with G3BFL and G3AFL were similar (P=0.83 and P=0.80, respectively). After frontline immunochemotherapy, 24% of G3BFL relapsed; relapse rates were 63% in the DLBCL cohort and 19% in the low-grade FL cohort. Eight percent of relapses occurred beyond 5 years. In this G3BFL cohort, the revised International Prognostic Index successfully delineated risk groups, but the Follicular Lymphoma International Prognostic Index did not. We conclude that patients with immunochemotherapy-treated G3BFL have similar survival outcomes to those with G3AFL, yet a favorable baseline profile and distinctly superior prognosis compared to patients with DLBCL.
Follicular lymphoma (FL) is the most frequent indolent nonHodgkin lymphoma, constituting 20-30% of all cases.1 World Health Organization (WHO) morphological grading is according to the relative proportion of centrocytes to centroblasts.2 WHO grade 3B follicular lymphoma (G3BFL), the highest grade, accounts for only 5-10% of cases1,3-6 and is differentiated from its lower grade counterpart, grade 3A FL (G3AFL), by the presence of follicles comprised exclusively of centroblasts.7 While the 2022 revision of the International Consensus Classification of Mature Lymphoid Neoplasms has retained this grading strategy,8 the recent 5th edition of the WHO diagnostic criteria has revised FL nomenclature, with G1-3FL now being referred to as classic FL and G3BFL as follicular large cell lymphoma.9
Low-grade FL (grade 1, 2 and 3AFL) typically follows a relapsing-remitting disease course potentially spanning decades, whereas G3BFL is thought to follow a more aggressive clinical course. Published data, however, conflict with some G3BFL reports describing an indolent, incurable natural history while others describe rapid initial progression followed by long remissions and potential cure from combination chemotherapy, more akin to diffuse large B-cell lymphoma (DLBCL).3,4,6,10-15
Despite histological similarities between G1-G3AFL and G3BFL, treatment guidelines largely recommend rituximab and anthracycline-containing regimens for G3BFL,16 analogous to the clinical management for DLBCL. In contrast, low-grade FL management predominantly utilizes therapy to control symptomatic disease and achieve durable remission as opposed to cure.17,18 While historical variation exists for G3AFL therapeutic paradigms,19,20 G3AFL is currently considered an indolent lymphoma and regularly included in modern-era low-grade FL trials.17,21,22 Yet exclusion of G3BFL from both DLBCL and low-grade FL clinical trials and the small heterogeneous cohorts in published retrospective series have limited our understanding of this highgrade FL subgroup and the optimal treatment approach. Here we describe outcomes in the first large international G3BFL study from the rituximab era. We utilized contemporaneous comparator G3AFL and DLBCL cohorts to establish prognostic information, survival outcomes and relapse patterns of this rare FL subtype.
We developed a database of consecutively treated adult G3BFL patients diagnosed between 2002 and 2019 from 18 expert lymphoma centers in Australia, UK and Canada. Composite G3AFL/G3BFL and G3BFL/DLBCL were included in the G3B group. Treatment consisted of rituximab/obinutuzumab, cyclophosphamide, doxorubicin, vincristine and predniso-
lone (R/O-CHOP)-like chemotherapy with or without radiotherapy. Those receiving radiotherapy alone (n=2) or alternate chemotherapy regimens (n=6) were excluded. In this study, FL grading was according to the 4th edition WHO criteria.7
Consecutive G3AFL and DLBCL cases from participating institutions were collected for comparison because of the close histological relationships and to establish clinical similarities and differences between these and G3BFL. The G3AFL comparator cases were collected consecutively in the same time-frame and by the same contributing sites as the G3BFL group. Treatment was with R-CHOP-like chemotherapy with or without radiotherapy or bendamustine-rituximab. The DLBCL cohort were treated with R-CHOP, with or without radiotherapy, from 2008-2018 (inclusive), and were identified from three of the Australian sites. The majority of participating sites follow the standard international recommendation of 5 years’ follow-up in aggressive lymphoma, after which time patients were discharged back to their primary care physician and at which point no further outcome data could be extracted from external sources. Retrospective data including baseline characteristics, treatment details and outcomes were obtained from registries and tertiary institution medical records. Cases were sourced from centers with established expert lymphoma multidisciplinary meeting histopathology review, as central histological review of all archived cases from the large number of international participating sites was not feasible. Additionally, in order to ensure homogeneity of diagnosis and grading between contributing countries, we analyzed progression-free survival (PFS) according to regions (Australia vs. Canada vs. UK) for G3AFL and G3BFL, and demonstrated no statistical difference between regions (G3AFL P=0.78, G3BFL P=0.58). Furthermore, the proportions of G3AFL and G3BFL in our series are similar to those reported elsewhere.4,6,15
Overall survival (OS) was defined as the time from the date of diagnosis until death from any cause, and PFS as the time from diagnosis until relapse/progression (to any B-cell lymphoma subtype) or death from any cause, both calculated using the Kaplan-Meier method with patients censored at last known follow-up if no date of death or progression was recorded.23 Differences in patient and disease-related characteristics among groups (G3AFL, G3BFL and DLBCL) were analyzed using the Fisher exact test for discrete variables and the Kruskal-Wallis H test for continuous variables. Differences in OS and PFS were compared using log-rank tests, and associations between prognostic factors, histological subgroup and outcomes were analyzed using Cox proportional hazard models. Variables with P<0.1 on univariable analysis were included in the multivariable analysis, with two-tailed P values ≤0.05 considered statistically significant. This study was conducted in accordance with the ethical standards of the responsible committee on human experi-
mentation and with the Declaration of Helsinki of 1975, as revised in 2008 and was approved by institutional review boards at all participating institutions.
A total of 157 G3BFL cases were eligible including 85 cases of pure G3BFL, 24 of composite G3A/G3BFL, and 48 of composite G3B/DLBCL, collectively termed the “G3BFL” group. The comparator groups consisted of 302 G3AFL and 548 DLBCL consecutive cases. Baseline clinical and tumor characteristics, treatment and relapse data are summarized in Table 1.
For G3BFL, all patients received R- or O-CHOP-like chemotherapy with 17% receiving consolidative radiotherapy. Fiftynine patients (37%) received maintenance rituximab or obinutuzumab for a median of 8 cycles (range 1-24). Of the G3AFL patients, 74% received R- or O-CHOP-like chemotherapy with or without radiotherapy and 26% received bendamustine-rituximab, with 68% receiving maintenance therapy for a median of eight cycles (range, 1-24).
The median follow-up of the entire cohort was 5 years (range, 0.03-16.11 years). The 5-year survival rates of patients with pure G3BFL, composite G3A/3BFL or G3BFL/DLBCL were not significantly different (PFS: G3BFL 60% [95% CI: 46-71%], G3AFL/G3BFL 79% [95% CI: 5492%], and G3BFL/DLBCL 70% [95% CI: 51-83%] P=0.51; OS: G3BFL 80% [95% CI: 67-88%], G3AFL/G3BFL 86% [95% CI: 54-96%], G3BFL/DLBCL 87% [95% CI: 71-95%] P=0.37) and therefore this group was analyzed together. The 5-year PFS of the G3BFL group was 66% (95% CI: 57-75%) and the OS was 84% (95% CI: 76-89%). While outcomes were similar in the G3AFL and G3BFL groups (OS: HR=1.04 [95% CI: 0.67-1.65] P=0.84; PFS: HR=1.04 [95% CI: 0.75-1.46] P=0.81), the G3BFL group had superior PFS and OS compared to those of the DLBCL group (OS: HR=2.19 [95% CI 1.45-3.29] P<0.001; PFS: HR=1.73 [95% CI: 1.27-2.63] P=0.001). No plateau was observed on the G3BFL PFS curve (Figure 1A, B). No difference in survival was demonstrated between R-CHOP-treated G3AFL and G3BFL (OS: HR=0.98 [95% CI: 0.60-1.60] P=0.93; PFS HR 0.98 [95% CI 0.68-1.40] P=0.89) (Figure 2A, B).
On univariate analysis of the entire cohort, candidate factors that were statistically significant for PFS and OS were age >60 years, male gender, elevated baseline lactate dehydrogenase, stage III/IV disease, Eastern Cooperative Oncology Group (ECOG) performance status 3-4 and extranodal involvement. Stage III/IV disease and extranodal involvement did not retain significance on multivariable analysis. DLBCL was associated with inferior PFS and OS on both univariate and multivariate analyses, whereas G3AFL and G3BFL did not display a difference in outcome. The DLBCL cohort PFS and OS HR were 1.27 (95% CI: 1.00-1.62; P=0.05) and 1.53 (95%
CI: 1.12-2.08; P=0.007) respectively, whereas the G3AFL PFS and OS HR were 0.97 (95% CI: 0.69-1.35; P=0.84), and 0.96 (95% CI: 0.61-1.51; P=0.86) respectively. The G3BFL PFS HR was 0.81 (95% CI: 0.54-1.2; P=0.30) and the OS HR was 0.86 (95% CI: 0.51-1.47; P=0.59) (Table 2).
The proportions of relapses and those progressing within 24 months of diagnosis (POD24)24 were similar in the G3AFL and G3BFL groups with total relapse proportions and POD24 as follows: G3AFL 29% and 18%, G3BFL 25% and 19%. The median time to relapse was 19 months (range, 1-155) for G3AFL and 13 months (range, 4-138) for G3BFL. In those who relapsed, no difference in outcomes was seen according to baseline histological grade: PFS HR=1.04 (95% CI: 0.71-1.54) P=0.81; OS: HR=1.10 (95% CI: 0.62-1.95) P=0.75. At 2 years, G3BFL patients experiencing POD24, had an inferior OS compared with G3AFL patients: 2-year OS G3AFL 66% (95% CI: 51-78%), G3BFL 34% (95 CI: 14-57%) P=0.05.
Of the 39 relapses in the G3BFL group, 27 had biopsy confirmation. Histology at relapse was G1FL or G2FL in two (7%), G3AFL in three (11%), G3BFL in five (18%) and DLBCL in 17 (63%). Of those who relapsed/transformed to DLBCL, diagnostic histology was composite G3AFL/G3BFL in two patients (12%), G3BFL in ten patients (59%) and G3BFL/DLBCL in five patients (29%). The median time to relapse with FL histology was 28 months (range, 5-138) and with DLBCL 18 months (range, 4-59). Patterns of relapse according to histological subtype are presented in Figure 3. Three of 39 relapses in G3BFL occurred beyond 5 years at 6, 7.5 and 11.5 years and histology was G1FL/G2FL, G3AFL and G3BFL. Twenty-seven deaths were reported in the G3BFL group. Of these, 15 were attributable to lymphoma. Six deaths occurred beyond 5 years from the initial G3BFL diagnosis, all due to non-lymphomatous causes. In the G3AFL cohort, 62 deaths were recorded, of which 38 were due to lymphoma. Nineteen deaths occurred more than 5 years after the initial diagnosis of lymphoma, of which six were caused by lymphoma. In the DLBCL cohort, 179 deaths occurred. Lymphoma was the cause of death in 118 cases with 19 deaths occurring beyond 5 years, nine of which were caused by lymphoma.
The univariable analysis of candidate prognostic factors in G3BFL for PFS and OS is presented in Table 3. CD10 immunohistochemical negativity and Ann Arbor stage III/IV disease were associated with inferior PFS, while elevated lactate dehydrogenase, ECOG performance status 3-4 and age >60 years were associated with inferior OS. Factors that retained significance on multivariable analysis were ECOG performance status 3-4 for PFS and OS and stage III/IV disease for PFS. Of note, our series did not show an OS or PFS advantage with the addition of maintenance rituximab or obinutuzumab to front-line immunochemotherapy in G3BFL (OS HR=0.32 [95% CI: 0.07-1.59] P=0.17; PFS HR=0.91 [95% CI: 0.38-2.18] P=0.84), with the caveat
of non-uniform administration and treatment cycle length (Table 3).
The prognostic utility of the Follicular Lymphoma International Prognostic Index (FLIPI)25 and the revised International Prognostic Index (R-IPI)26 for G3BFL were assessed. The FLIPI showed poor discrimination of risk groups with low, intermediate and high-risk 5-year OS of 100%, 80% and 81%, respectively (P=0.19). The R-IPI showed a statistically
significant difference between risk groups with low, intermediate and high-risk 5-year OS of 100%, 85% and 64% respectively (P<0.001) (Figure 4A, B).
This international analysis of G3BFL patients, uniformly
NA: not available. G3AFL: grade 3A follicular lymphoma; G3BFL: grade 3B follicular lymphoma; DLBCL: diffuse large B-cell lymphoma; ECOG Eastern Cooperative Oncology Group; LDH: lactate dehydrogenase; ULN: upper limit of normal; IHC: immunohistochemistry; FLIPI: Follicular Lymphoma International Prognostic Index; R-IPI: Revised International Prognostic Index, R/O-CHOP, rituximab or obinutuzumab with cyclophosphamide, doxorubicin, vincristine and prednisolone; RT: radiotherapy; POD24: progression of disease within 2 years.
treated with R-CHOP-like chemotherapy, is the largest and most comprehensive of its kind. By comparisons with contemporaneous G3AFL and DLBCL cohorts, of which the vast majority were also treated with R-CHOP-like therapy, we found that patients with G3BFL have a better prognosis than those with DLBCL. Moreover, G3AFL and G3BFL had very similar PFS and OS outcomes. These key findings indicate that G3BFL behaves similarly to G3AFL, but is distinct from DLBCL.
The historically described aggressive behavior of G3BFL is based on small (n<25), retrospective cohorts predominantly treated in the pre-rituximab era.5,11,13,14 However, in our dataset, both PFS and OS for G3BFL were markedly superior to those for DLBCL. Interestingly, patients with composite G3BFL and
DLBCL histology experienced similar survival outcomes to patients with pure G3BFL, rather than DLBCL. This was not due to treatment, as both cohorts uniformly received R/OCHOP. This contrasts with the series reported by Yuen et al.27 showing that outcomes of 17 G3BFL and DLBCL patients were similar (OS P=0.42; event-free survival, P=1.0). Our results may in part be due to the more favorable baseline clinical prognostic profile of G3BFL compared to DLBCL. G3BFL patients were found to be younger with a better performance status, less frequent extranodal involvement and/or baseline elevated lactate dehydrogenase. However, our multivariable analysis, accounting for these differences, demonstrated that only DLBCL patients had inferior outcomes.
In addition to the similar survival outcomes of patients with

G3AFL or G3BFL, the POD24 rate and continuous pattern of relapse were also similar for the follicular histologies. This was despite the use of bendamustine for around 25% of G3AFL patients, compared to nearly all G3BFL patients receiving R/O-CHOP. The proportion of relapses with DLBCL histology was similar for G3AFL and G3BFL. Baseline clinical characteristics were well balanced, as were FLIPI and R-IPI profiles. While outcomes of G3BFL and G3AFL were equivalent with R-CHOP, it is not known if bendamustine-based therapy for G3BFL would have yielded equivalent outcomes.
Unlike previous small series,4,15 our data suggest that G3BFL may not consistently be curable as evidenced by the continuous pattern of relapse.
Previous studies comparing G3AFL and G3BFL have yielded
conflicting results. In a study of 345 FL patients, patients with G3BFL (n=23) had a higher mortality compared with G13AFL patients, independently of clinical factors (P<0.01).4

However, only 9% of G3BFL patients received front-line rituximab, although anthracycline was used in 70% compared with 30% of G1-2FL and 43% of G3AFL cases. Another small study (17 G3BFL) displayed inferior outcomes for these patients compared to those with G3AFL using rituximab and anthracycline therapy (P=0.043).27 In contrast, Shustik et al.6 found equivalent outcomes in G3AFL and G3BFL (n=22); again, not all received rituximab. Interpretation of these three studies is hampered by small numbers of G3BFL cases and non-uniform rituximab use.
In our study the proportion of G3BFL patients expressing
CD10 and BCL2, as assessed by immunohistochemistry, was significantly lower than the proportion of G3AFL. This is corroborated by prior studies, demonstrating that pure G3BFL and composite G3B/DLBCL can lack CD10 and BCL2 contrasting with G1-3AFL, which typically has uniform CD10, BCL2 and BCL6 expression.28,29 Additionally, our data and others have shown that the median Ki-67 proliferation index increases proportionally with FL grade28 but is lower than that seen with DLBCL. To further characterize these laboratory-based differences, two recent studies utilized gene expression profiling techniques with differing results. Horn et al. failed to observe a significant difference in the gene expression patterns between G3AFL and G3BFL, while in a supervised analysis approach30, Piccaluga et al. demon-

strated G3BFL formed a single cluster, distinct from FLG1/2 and G3AFL31. Low case numbers (6 and 4, respectively) and differing gene sets likely contributed to this discrepancy. Further molecular studies are needed to examine the biological differences between these FL subgroups. The original FLIPI25 and R-IPI26 score studies did not include G3BFL in their primary analyses, hence their utility is not clear in this group. For the first time, we have shown that the R-IPI retains prognostic significance with G3BFL, while the FLIPI score does not. Given the excellent delineation between risk groups using the R-IPI, our results support the use of the RIPI as an accurate baseline prognostication tool for G3BFL. Our study shows a higher rate of R-IPI high-risk patients in the DLBCL cohort than in the G3AFL and G3BFL cohorts. Ad-
PFS: progression-free survival; OS: overall survival; HR: hazard ratio; 95% CI: 95% confidence interval; LDH: lactate dehydrogenase; ECOG Eastern Cooperative Oncology performance status; FL: follicular lymphoma; DLBCL: diffuse large B-cell lymphoma.
PFS: progression-free survival; OS: overall survival; HR: hazard ratio; 95% CI: 95% confidence interval; LDH: lactate dehydrogenase; ECOG Eastern Cooperative Oncology performance status; IHC: immunohistochemistry.
Figure 4. Survival of patients with grade 3B follicular lymphoma according to prognostic risk scores. (A) Overall survival according to Follicular Lymphoma International Prognostic Index (FLIPI) risk score. (B) Overall survival according to Revised International Prognostic Index (R-IPI).

ditionally, compared to DLBCL patients, G3BFL patients presented more commonly with lactate dehydrogenase within the normal range, a lower median ki67 and less frequently with extranodal site involvement, reflecting a more favorable disease “signature”. These factors likely contribute to the favorable outcomes of G3AFL and G3BFL described in our study compared to DLBCL. There are a number of limitations to this study. We acknowledge the inherent limitations of retrospective data collection and analyses. The practice of discharging patients with aggressive lymphoma after 5 years of follow-up and the inability to collect ongoing outcome data after this time-point may contribute to survivorship bias. While it is recognized that relapses after 5 years are rare for DLBCL, this may not be the case with G3BFL, so longer-term conclusions should be made with caution. Another problem is that central pathology review of the entire cohort by a single pathologist was not possible; however, we limited study participation to institutions with local lymphoma pathological expertise and routine lymphoma multidisciplinary meeting case reviews. Even with the harmonization of criteria for FL grading we acknowledge concordance and reproducibility challenges in grading of G3FL.1,29 Nonetheless, with global central review not feasible in routine care, our international collaboration, with designated expert centers presents a large, real-world international cohort. Furthermore, while relapse proportions were reported, follow-up was not uniform between patients and not all cases had biopsy information available, so these results should be interpreted with caution. Additionally, limited immunohistochemistry and fluorescent in situ hybridization diagnostic data were available/provided and this precluded a detailed analysis in this regard. We also acknowledge that the DLBCL cases were collected from 2008 onwards from a limited number of representative centers, while the indolent cases were from 2002 onwards. This decision was due to feasibility of collecting thousands of DLBCL cases as DLBCL is far more common, and due to the stable outcomes of DLBCL seen in both trials and retrospective cohorts across the rituximab era. The similar outcomes from our cohort compared to other large DLBCL real-world studies are reassuring.26,32,33
On the basis of this analysis, G3BFL should be considered to have a prognosis similar to that of G3AFL, and distinct from that of DLBCL. Because our G3BFL cohort was uniformly treated with R/O-CHOP, we cannot currently recommend alternative regimens used for lower grade FL. Nevertheless, we suggest that upfront clinical trials for FL that incorporate anti-CD20 monoclonal antibody and CHOP include both G3AFL and G3BFL cases. Due to the marked difference in outcomes compared to those of DLBCL, it seems appropriate to exclude G3BFL from front-line DLBCL clinical trials. Further research to improve the molecular classification of G3BFL may assist in developing specific treatments for this rare subgroup.
HC, MG, MN, JTE, GH, JC, MG, BS, MS, SR, CA, SHW, KF, GD, ZN and TR have no conflicts of interest to disclose. AB has received speakers fees from Roche and sat on an advisory board for Gilead. DV has received honoraria from and sat on advisory boards for Roche, Kite/Gilead, BMS/Celgene, BeiGene, Janssen, Abbvie, AstraZeneca, and Kyowa Kirin; and had received research funding* from Roche and AstraZeneca; JW has received honoraria, travel support, and speakers fees from and sat on advisory boards for Abbvie; has received honoraria and travel support from Janssen; and sat on advisory boards for Alexion. MJB has received honoraria from Celltrion, Tevapharma, Gilead, and F. Hoffmann-La Roche; has sat on advisory boards for F. Hoffmann-La Roche; and has received travel expenses from BMS. GC has sat on advisory boards for BMS; and has received research funding from BMS, HutchMed, Pharmacyclics, Merck Serono, AstraZeneca, MorphoSys, Incyte, SeaGen, Isofol, Bayer, and Amgen. MK has sat on advisory boards for Roche and Antengene. H-PL has sat on advisory boards for Roche; and has received honoraria from BeiGene. CT has received honoraria and research funding from Abbvie, Janssen, and BeiGene. CYC has provided consulting services for, has sat on advisory boards for, and has received honoraria from Roche, Janssen, MSD, Gilead, AstraZeneca, Lilly, TG therapeutics, Beigene, Novartis, and BMS; and has received research funding from BMS, Roche, Abbvie, and MSD. AKM has received speaker’s fees from Abbvie; has sat on advisory boards for SOBI and Novartis; and had meeting sponsorship from Amgen and MSD. NH has sat on advisory boards for Roche, Gilead, Abbvie, Novartis, Janssen, and Jazz pharma. EAH has received research funding* from Bristol Myers Squibb/Celgene, Merck KgA, AstraZeneca, and Roche; has sat on advisory boards for Roche*, Antigene*, Bristol Myers Squibb, AstraZeneca, Novartis*, Merck Sharpe Dohme*, Gilead*, and Beigene*; has received speaker’s fees from Roche*, AstraZeneca*, Abbvie*, Janssen, and Regeneron; and provided consultancy services to Specialised therapeutics. (*Paid to institution).
AB designed the research study, contributed and analyzed the data and wrote the paper. EAH designed and supervised the research study, analyzed the data and wrote the paper. JTE, JW, GH, JC, MG, BS, MJB, MS, SR, CA, GC, SHW, MK, H-PL, KF, CT, GD, CYC, ZN, TR, AKM, NH, HC, MG, MN and DV contributed data and wrote the paper.
This study was supported by a Royal Australasian College of Physicians Research Entry Scholarship to Allison Barraclough.
The authors will willingly share the original data on request made by e-mail to the corresponding author.
1. The Non-Hodgkins Lymphoma Classification Project. A clinical evaluation of the International Lymphoma Study Group classification of non-Hodgkin's lymphoma. Blood. 1997;89(11):3909-3918.
2. Swerdlow SH, Campo E, Pileri SA, et al. The 2016 revision of the World Health Organization classification of lymphoid neoplasms. Blood. 2016;127(20):2375-2390.
3. Chau I, Jones R, Cunningham D, et al. Outcome of follicular lymphoma grade 3: is anthracycline necessary as front-line therapy? Br J Cancer. 2003;89(1):36-42.
4. Wahlin BE, Yri OE, Kimby E, et al. Clinical significance of the WHO grades of follicular lymphoma in a population-based cohort of 505 patients with long follow-up times. Br J Haematol. 2012;156(2):225-233.
5. Martin A, Weisenburger D, Chan W, et al. Prognostic value of cellular proliferation and histologic grade in follicular lymphoma. Blood. 1995;85(12):3671-3678.
6. Shustik J, Quinn M, Connors JM, Gascoyne RD, Skinnider B, Sehn LH. Follicular non-Hodgkin lymphoma grades 3A and 3B have a similar outcome and appear incurable with anthracycline-based therapy. Ann Oncol. 2011;22(5):1164-1169.
7. Swerdlow SH, Campo E, Harris NL, et al. WHO Classification of Tumours of Haematopoietic and Lymphoid Tissues. Lyon, France: IARC Press; 2008.
8. Campo E, Jaffe ES, Cook JR, et al. The International Consensus Classification of Mature Lymphoid Neoplasms: a report from the Clinical Advisory Committee. Blood. 2022;140(11):1229-1253.
9. Alaggio R, Amador C, Anagnostopoulos I, et al. The 5th edition of the World Health Organization classification of haematolymphoid tumours: lymphoid neoplasms. Leukemia. 2022;36(7):1720-1748.
10. Martin AR, Weisenburger DD, Chan WC, et al. Prognostic value of cellular proliferation and histologic grade in follicular lymphoma. Blood. 1995;85(12):3671-3678.
11. Rodriguez J, McLaughlin P, Hagemeister FB, et al. Follicular large cell lymphoma: an aggressive lymphoma that often presents with favorable prognostic features. Blood. 1999;93(7):2202-2207.
12. Strati P, Fowler N, Pina-Oviedo S, et al. Long-term remissions of patients with follicular lymphoma grade 3 treated with R-CHOP. Clin Lymphoma Myeloma Leuk. 2018;18(1):e103-e108.
13. Bartlett NL, Rizeq M, Dorfman RF, Halpern J, Horning SJ. Follicular large-cell lymphoma: intermediate or low grade? J Clin Oncol. 1994;12(7):1349-1357.
14. Wendum D, Sebban C, Gaulard P, et al. Follicular large-cell lymphoma treated with intensive chemotherapy: an analysis of 89 cases included in the LNH87 trial and comparison with the outcome of diffuse large B-cell lymphoma. Groupe d'Etude des Lymphomes de l'Adulte. J Clin Oncol. 1997;15(4):1654-1663.
15. Mustafa Ali M, Rybicki L, Nomani L, et al. Grade 3 follicular lymphoma: outcomes in the rituximab era. Clin Lymphoma Myeloma Leuk. 2017;17(12):797-803.
16. Barraclough A, Bishton M, Cheah CY, Villa D, Hawkes EA. The diagnostic and therapeutic challenges of grade 3B follicular lymphoma. Br J Haematol. 2021;195(1):15-24.
17. Dreyling M, Ghielmini M, Rule S, Salles G, Vitolo U, Ladetto M. Newly diagnosed and relapsed follicular lymphoma: ESMO Clinical Practice Guidelines for diagnosis, treatment and followup. Ann Oncol. 2016;27(suppl 5):v83-v90.
18. National Comprehensive Cancer Network. NCCN Guidelines
Version 2.2023 Follicular Lymphoma (grade 1-2). https://www.nccn.org/professionals/physician_gls/pdf/bcell.pdf. Accessed 09/02/2023.
19. Rummel MJ, Niederle N, Maschmeyer G, et al. Bendamustine plus rituximab versus CHOP plus rituximab as first-line treatment for patients with indolent and mantle-cell lymphomas: an open-label, multicentre, randomised, phase 3 non-inferiority trial. Lancet. 2013;381(9873):1203-1210.
20. Flinn IW, van der Jagt R, Kahl BS, et al. Randomized trial of bendamustine-rituximab or R-CHOP/R-CVP in first-line treatment of indolent NHL or MCL: the BRIGHT study. Blood. 2014;123(19):2944-2952.
21. Marcus R, Davies A, Ando K, et al. Obinutuzumab for the firstline treatment of follicular lymphoma. N Engl J Med. 2017;377(14):1331-1344.
22. Barraclough A, Chong G, Gilbertson M, et al. Immune priming with single-agent nivolumab followed by combined nivolumab & rituximab is safe and efficacious for first-line treatment of follicular lymphoma; interim analysis of the '1st FLOR' Study. Blood. 2019;134(Suppl_1):1523.
23. Kaplan EL, Meier P. Nonparametric estimation from incomplete observations. J Am Stat Assoc. 1958;53(282):457-481.
24. Casulo C, Byrtek M, Dawson KL, et al. Early relapse of follicular lymphoma after rituximab plus cyclophosphamide, doxorubicin, vincristine, and prednisone defines patients at high risk for death: an analysis from the National LymphoCare Study. J Clin Oncol. 2015;33(23):2516-2522.
25. Solal-Céligny P, Roy P, Colombat P, et al. Follicular Lymphoma International Prognostic Index. Blood. 2004;104(5):1258-1265.
26. Sehn LH, Berry B, Chhanabhai M, et al. The Revised International Prognostic Index (R-IPI) is a better predictor of outcome than the standard IPI for patients with diffuse large B-cell lymphoma treated with R-CHOP. Blood. 2007;109(5):1857-1861.
27. Yuan J, Greiner TC, Fu K, et al. Rituximab improves the outcome of patients with grade 3 follicular lymphoma receiving anthracycline-based therapy. Clin Lymphoma Myeloma Leuk. 2017;17(8):488-497.e2.
28. Ott G, Katzenberger T, Lohr A, et al. Cytomorphologic, immunohistochemical, and cytogenetic profiles of follicular lymphoma: 2 types of follicular lymphoma grade 3. Blood. 2002;99(10):3806-3812.
29. Koch K, Hoster E, Ziepert M, et al. Clinical, pathological and genetic features of follicular lymphoma grade 3A: a joint analysis of the German low-grade and high-grade lymphoma study groups GLSG and DSHNHL. Ann Oncol. 2016;27(7):1323-1329.
30. Horn H, Kohler C, Witzig R, et al. Gene expression profiling reveals a close relationship between follicular lymphoma grade 3A and 3B, but distinct profiles of follicular lymphoma grade 1 and 2. Haematologica. 2018;103(7):1182-1190.
31. Piccaluga PP, Califano A, Klein U, et al. Gene expression analysis provides a potential rationale for revising the histological grading of follicular lymphomas. Haematologica. 2008;93(7):1033-1038.
32. Reddy A, Zhang J, Davis NS, et al. Genetic and functional drivers of diffuse large B cell lymphoma. Cell. 2017;171(2):481-494.
33. Maurer MJ, Ghesquières H, Link BK, et al. Diagnosis-totreatment interval is an important clinical factor in newly diagnosed diffuse large B-cell lymphoma and has implication for bias in clinical trials. J Clin Oncol. 2018;36(16):1603-1610.
Correspondence: M. Brodtkorb meide@ous-hf.no
Received: December 13, 2022.
Accepted: February 23, 2023. Ealy view: March 2, 2023.
1Department of Cancer Immunology, Institute for Cancer Research, Oslo University Hospital, Oslo; 2KG Jebsen Center for B Cell Malignancies, Institute of Clinical Medicine, Faculty of Medicine, University of Oslo, Oslo; 3Department of Oncology and Medical Physics, Haukeland University Hospital, Bergen; 4Department of Hematology, Akershus University Hospital, Lørenskog; 5Department of Hematology, Vestfold Hospital Trust, Tønsberg; 6Department of Surgery, Section of Oncology, Drammen Hospital, Vestre Viken Hospital Trust, Drammen; 7Department of Oncology, Østfold Hospital Trust, Kalnes; 8Department of Hematology, Telemark Hospital Trust, Skien; 9Department of Clinical Science, University of Bergen, Bergen; 10Institute of Clinical Medicine, Faculty of Medicine, University of Oslo, Oslo; 11The Research Center for Age Related Functional Decline and Diseases, Innlandet Hospital Trust, Ottestad; 12Stavanger University Hospital–Rogaland, Stavanger; 13Department of Informatics, University of Oslo, Oslo; 14Institute for Cancer Genetics and Informatics, Oslo University Hospital, Oslo; 15Department of Cancer Genetics, Institute for Cancer Research, Oslo University Hospital, Oslo and 16Department of Oncology, Oslo University Hospital, Oslo, Norway
https://doi.org/10.3324/haematol.2022.282289
©2023 Ferrata Storti Foundation
Published under a CC BY-NC license
The International prognostic Index (IPI) is the most widely used clinical prediction model for diffuse large B-cell lymphoma (DLBCL) patients treated with rituximab, cyclophosphamide, doxorubicin, vincristine and prednisone (R-CHOP), but may be suboptimal in older patients. We aimed to develop and externally validate a clinical prediction model for older, RCHOP-treated DLBCL patients by examining geriatric assessment and lymphoma-related parameters in real-world cohorts. A population-based training set of 365 R-CHOP-treated DLBCL patients ≥70 years was identified through the Cancer Registry of Norway. The external test set consisted of a population-based cohort of 193 patients. Data on candidate predictors were retrieved from the Cancer Registry and through review of clinical records. Cox regression models for 2-year overall survival were used for model selection. Activities of daily living, the Charlson Comorbidity Index, age, sex, albumin, stage, Eastern Cooperative Oncology Group performance status and lactate dehydrogenase level were identified as independent predictors and combined into a Geriatric Prognostic Index (GPI). The GPI demonstrated good discrimination (optimismcorrected C-index 0.752), and identified low-, intermediate- and high-risk groups with significantly different survivals (2year overall survival, 94%, 65%, and 25%, respectively). At external validation, the continuous and grouped GPI demonstrated good discrimination (C-index 0.727 and 0.710, respectively) and the GPI groups had significantly different survivals (2-year overall survival 95%, 65%, and 44%, respectively). Both the continuous and grouped GPI showed better discrimination than the IPI, revised-IPI and National Comprehensive Cancer Network (NCCN)-IPI (C-index 0.621, 0.583, and 0.670, respectively). In conclusion, we have developed and externally validated a GPI for older DLBCL patients treated with R-CHOP that outperformed the IPI, revised-IPI and NCCN-IPI. A web-based calculator is available at https://wide.shinyapps.io/GPIcalculator/.
Diffuse large B-cell lymphoma (DLBCL) is the most common lymphoid malignancy with almost half the patients being 70 years or older at diagnosis.1 R-CHOP (rituximab, cyclophos-
phamide, doxorubicin, vincristine and prednisone) has remained standard treatment for over two decades, curing about 60% of patients. Although survival improved for all age groups after the introduction of rituximab, relative- and disease-specific survival is still markedly poorer for older
Kathrine T. Isaksen,1,2 Renate Galleberg,3 Maria Adele Mastroianni,4 Marit Rinde,5 Leiv Sindre Rusten,6 Dlawer Barzenje,7 Frode Ramslien,8 Øystein Fluge,3,9 Marit Slaaen,10,11 Peter Meyer,12 Knut Liestøl,13,14 Erlend B. Smeland,1,2 Ole Christian Lingjærde,13,15 Harald Holte2,16 and Marianne Brodtkorb1,16patients.2-4 This is mainly due to comorbidity and age-related organ changes compromising delivery of standard, curative treatment and increasing the risk of adverse events. However, there is a large heterogeneity in fitness among older patients and the evidence base for guiding treatment decisions is limited as clinical trials often exclude older patients or select only the fittest older patients.5,6 Based on phase II trials, an attenuated R-miniCHOP regimen has been suggested as standard treatment for patients over 80 years to balance efficacy and risk of treatment toxicity.7,8 Treatment stratification based on age alone is inaccurate and to optimize treatment outcome for older DLBCL patients it is crucial to improve the selection of patients for R-CHOP or R-miniCHOP. This is especially relevant in older patients who have few curative options at progression or relapse. More precise prognostic tools are also crucial for improving the design of clinical trials in older DLBCL patients.
The International Prognostic Index (IPI), its revised version (R-IPI) and the National Comprehensive Cancer Network (NCCN)-IPI are the most widely used clinical prediction models for DLBCL patients treated with R-CHOP.9-11 However, the IPI was developed and refined in cohorts including all age groups, not focusing on domains of special importance in older patients, and agnostic to the increasing agerelated heterogeneity above the age of 60 years. Accumulating evidence shows that prognostic factors change with older age, with non-lymphoma-related factors gaining increased importance.12
A geriatric assessment (GA) is a systematic and multidimensional evaluation of older patients which has emerged as an important tool to assess older patients’ fitness for cancer treatment and to predict survival and toxicity.13-18 A full GA is resource-demanding and we and others have shown that a simplified GA can readily and precisely predict survival in older DLBCL patients.19-21 Here, we aimed to develop and externally validate a clinical prediction model especially suited for older (≥ 70 years) DLBCL patients who are considered candidates for curative treatment. For this purpose, we used a population-based, R-CHOP-treated cohort to examine candidate predictors of special importance in older patients, including GA variables, in addition to established lymphoma predictors and routine tumor markers. We aimed to create a predictive model with easy accessible parameters that can be applied in a routine oncology practice, and to compare the model with the IPI, R-IPI and NCCN-IPI.
We used the Cancer Registry of Norway to identify a population-based training set of DLBCL patients aged ≥70
years and treated with R-CHOP during 2006-2016 in the administrative region of South-Eastern Norway. The patients included in the training set were treated at seven independent hospitals. For the external test set, DLBCL patients aged ≥70 years treated with R-CHOP during 20032016 at two independent hospitals in South-Eastern and two in Western Norway were included (Figure 1). The study was approved by the Norwegian Regional Health Research Ethics Committee (REK 2017/1861) and Data Protection Officers at all participating hospitals.
Data on candidate predictors were retrieved from data prospectively reported to the Cancer Registry of Norway and through review of clinical records. Parameters of the GA were registered retrospectively by review of clinical records and included a modified Katz Activities of Daily Living (ADL) scale,22 Charlson Comorbidity Index (CCI)23, Geriatric Nutritional Risk Index (GNRI)24, albumin, body mass index and polypharmacy (≥ 5 regular medications). These parameters were chosen as they could be scored from data routinely collected in clinical practice, they cover key domains of a GA and have been validated in cancer patients.14,25 ADL was scored as “dependent” if the patient had impairments in any of the six categories (bathing, dressing, toileting, transferring, continence, and eating), lived in an institution or received help from home nursing.
Additional candidate predictors examined for association with survival were age, sex, disease stage, Eastern Cooperative Oncology Group performance status (ECOG PS), extranodal sites, B-symptoms, bulky disease (>7 cm), heart disease, heart failure, hypertension, coronary artery disease, lactate dehydrogenase (LDH) level, hemoglobin concentration, lymphocytes, monocytes, neutrophils, lymphocyte/monocyte ratio (LMR), monocyte/lymphocyte ratio (MLR), neutrophil/lymphocyte ratio (NLR), C-reactive protein (CRP), estimated glomerular filtration rate (eGFR), alanine aminotransferase, as well as cell-of-origin (COO),26 Ki67, BCL2 expression and CD5 expression (all determined by immunohistochemistry).
Two-year overall survival (OS) was chosen as the primary endpoint to limit dilution of non-lymphoma-related deaths, while 5-year OS and 2-year progression-free survival (PFS) were secondary endpoints.
For the training set, OS was calculated from the date of diagnosis to death from any cause or censored at the end of follow-up on 30 June, 2020. PFS was calculated from the date of diagnosis to progression, relapse or death from any cause or censored after 2 years of follow-up. OS and PFS were estimated using the Kaplan-Meier method and the log-rank test was used to compare curves. The
median follow-up for OS was estimated with the reverse Kaplan-Meier method.27
In the training set, missing values were imputed with multivariate imputation by chained equations to preserve representativeness and statistical power.28,29 Continuous values were primarily analyzed as continuous, as recommended in guidelines,30 but were (log) transformed if deemed necessary to avoid an overly large impact of outliers. For categorical variables, subgroups were collapsed based on clinical reasoning and to create sufficiently large groups. Univariate and multivariable Cox proportional hazard models for 2-year OS were used for model development. Model performance was assessed with discrimination and calibration. Discrimination was quantified using the Harrell C-index and calibration was assessed with a calibration slope and calibration plots.31,32 In the training set, model
performance was corrected for optimism with 200 bootstrap resamples.30
All statistical analyses were performed using R version 4.1.3. Further details are provided in the Online Supplementary Material.
Characteristics of the patients in the training set
A total of 365 patients were included in the training set (Figure 1). Their median age was 76 years (range, 70-91), 56% had stage III/IV disease and 33% an ECOG PS ≥2 (Table 1). Ten percent were ADL dependent, 30% had a CCI ≥2, 32% regularly used ≥5 medications and 29% had moderate to severe nutritional risk according to the GNRI. The majority
Figure 1. Flow chart of patients included in the training and test sets. All hospitals are from the administrative regions of SouthEastern (hospitals 1-9) or Western (hospitals 10-11) Norway and include hospitals at both the local and university hospital levels. Patients from hospitals 1-9 were identified through the Cancer Registry of Norway and include all patients diagnosed with diffuse large B-cell lymphoma in the period 2006-2016 who were ≥70 years of age at diagnosis and had received rituximab, cyclophosphamide, doxorubicin, vincristine and prednisone as first-line treatment. Patients from hospitals 10 and 11 were diagnosed in the period 2003-2008 and identified locally. Number of events is the number of deaths at 2 years of follow-up (2-year overall survival). DLBCL: diffuse large B-cell lymphoma; R-CHOP: received rituximab, cyclophosphamide, doxorubicin, vincristine and prednisone.

(64%) received full-dose R-CHOP (initial dosage >80%), while the remainder received attenuated R-CHOP (initial dosage ≤80%). For patients receiving attenuated R-CHOP, the median initial dose was 75% (interquartile range [IQR], 50-75%). The median follow-up time was 104 months (IQR, 72-136) and 2-year OS was 65% (95% confidence interval [95% CI]: 60-70%). At the 2-year follow-up 129 patients had died; the causes of death included lymphoma (53%), treatment-related toxicity (32%), other non-lymphoma-related causes (12%) and unknown cause (3%).
Candidate predictors that showed a significant association with 2-year OS (cutoff P<0.10) in the training set were age, sex, ADL, CCI, GNRI, albumin, ECOG PS, disease stage, specific extranodal sites (bone marrow, liver, lung), bulky tumor, B-symptoms, LDH, hemoglobin, lymphocytes, monocytes, neutrophils, LMR, MLR, NLR, eGFR and CRP (Table 2; Online Supplementary Table S1, Online Supplementary Figure S1). Extranodal sites >1 were not per se predictive of reduced survival; however bone marrow, liver and lung infiltration did have a negative impact on survival both independently and when merged into one common parameter. Albumin and GNRI were the predictors with the lowest P values in univariate analyses, followed by ECOG PS, LDH, inflammatory markers (CRP, NLR, LMR and MLR), ADL and CCI. Of note, none of the biological immunhistochemical markers from the pathology reports, including COO, was significantly associated with 2-year OS. Significant candidate predictors from univariate analyses were included in Cox multivariable models for 2-year OS. Further variable selection was performed using stepwise backward elimination with the Akaike information criterion as the stopping criterion and age forced to stay in the model due to its biological relevance. With this strategy a model with the following nine variables was identified: age (continuous), sex, ADL dependent, CCI ≥2, GNRI (absent, low, moderate/severe), stage III-IV, ECOG PS ≥2, LDH (log) and NLR (log) (Online Supplementary Table S2). The same model was also identified when using forward selection or a combination of forward and backward selection. Likewise, when applying backward elimination to 200 bootstrap resamples of the training set, the nine variables were included in the final model in over 60% of the bootstrap resamples. The nine-variable model was then critically examined for
*Frailty status assessed with our previously published frailty calculator: Isaksen et al., Blood Advances 2021, https://wide.shinyapps.io/appfrailty/. **Treatment intensity defined by the initial dosage of R-CHOP. Further details are provided in the Online Supplementary Material. ADL: activities of daily living; CCI: Charlson Comorbidity Index; GNRI: Geriatric Nutritional Risk Index; ECOG PS: Eastern Cooperative Oncology Group performance status; LDH: lactate dehydrogenase; ULN: upper limit of normal; IPI: International Prognostic Index; R-IPI: revised IPI; NCCN-IPI: National Comprehensive Cancer Network IPI; R-CHOP: rituximab, cyclophosphamide, doxorubicin, vincristine and prednisone; OS: overall survival; 95% CI: 95% confidence interval.
clinical robustness and potential simplification while retaining predictive power. NLR was associated with some uncertainties because of significant differences in lymphocyte counts between hospitals and a risk of neutrophil counts being affected by steroid treatment initiated prior to the registered blood sample analysis. Including NLR in the model would also make it less suitable to apply after pre-phase treatment with steroids commonly
given to older patients. We therefore examined a model without NLR, which showed only a marginal loss in discrimination (C-index 0.764 vs. 0.765), thus NLR was removed from the final model. When running stepwise selection again without the NLR, the same eight variables were identified with no other candidate predictor chosen as a replacement for NLR.
As albumin and GNRI (as a continuous score) showed a
*Polypharmacy: ≥ 5 regular medications vs. <5 regular medications. **See Online Supplementary Figure S1 for details on Cox univariate analyses for specific extranodal sites. ***Includes heart failure, coronary artery disease, cardiac arrhythmia, operated valve disease or an implanted pacemaker. Further details are provided in the Online Supplementary Material and Online Supplementary Table S1. HR: hazard ratio; 95% CI: 95% confidence interval; ADL: activities of daily living; CCI: Charlson Comorbidity Index; GNRI: Geriatric Nutritional Risk Index; ECOG PS: Eastern Cooperative Oncology Group performance status; GCB: germinal center B-cell like; IHC: immunohistochemistry; ULN: upper limit of normal; LMR: lymphocyte/monocyte ratio; MLR: monocyte/lymphocyte ratio; NLR: neutrophil/lymphocyte ratio; eGFR, estimated glomerular filtration rate; CRP: C-reactive protein; ALAT: alanine aminotransferase.
high degree of correlation (Spearman correlation >0.90), a simpler model with albumin (as a continuous or categorical variable [<36 g/L or <38 g/L]) was compared to the model with GNRI. LDH as a continuous variable was also compared to LDH as a categorical variable with two cutoffs as defined in the NCCN-IPI (elevated 1-3 x upper reference level of normal [ULN] and elevated >3 x ULN). Age as a continuous variable was compared to age as a categorical variable with a cutoff at 80 years. A simplified model with age as a continuous variable, albumin as a categorical variable (<36 g/L) and LDH with two cutoffs showed the best discrimination (optimism-corrected Cindex 0.752) and acceptable calibration (optimism-corrected calibration slope 0.89) ( Online Supplementary Figure S2 ), and was selected as the final model (Table 3A). Further details are provided in the Online Supplementary Material.
A Geriatric Prognostic Index (GPI) was then constructed from the weighted sum of regression coefficients for the eight variables in the final model (the linear predictor) (Table 3A). Age was counted as years over 70 to create a score starting at zero. As we planned for an online calculator for the GPI, regression coefficients with five decimals were used to preserve prognostic information. Accordingly, the GPI was calculated as follows:
GPI = (years >70 years x 0.04103) + 0.48169 (if ADL dependent)
+ 0.74504 (if CCI ≥2) + 0.90446 (if albumin <36 g/L) + 0.45541 (if ECOG PS ≥2) + 0.52298 (if stage III-IV) + 0.33396 (if male) + 0.12446 (if LDH 1-3 x ULN) + 0.65823 (if LDH >3 x ULN) This resulted in a GPI ranging from 0 to 3.9893 (median, 1.5156) in 355 patients in the training set with available data for the selected variables.
For division into three risk groups, objective cutoffs at the 30 th and 80 th percentiles (cutoff GPI 0.98003 and 2.39963) were chosen. With these cutoffs, low-, intermediate- and high-risk groups with significantly different 2-year OS (94%, 65%, and 25%, respectively; P <0.001) were identified, and the model with the three GPI groups demonstrated good discrimination with a C-index of 0.726 (Figure 2; Table 3B). The GPI groups also showed significantly different 5-year OS (84% [95% CI: 77-91%], 49% [95% CI: 42-57%] and 18% [95% CI: 11-30%]) and 2year PFS (92% [95% CI: 87-97%], 60% [95% CI: 53-68%] and 23% [95% CI: 15-35%]) (Online Supplementary Figure S3). Survival was similar when analyses were limited to patients receiving full-dose R-CHOP (2-year OS 95%, 69%, and 30%; P<0.001), and slightly poorer for patients receiving attenuated R-CHOP (2-year OS 88%, 58%, and 18%; P <0.001) ( Online Supplementary Figure S4 ; Online Supplementary Table S3). The GPI groups were also predictive for survival when restricted to patients over and under 80 years of age (Online Supplementary Figure S5). The predictive value of the GPI groups also exceeded that of our previously developed frailty classification 19 (Cindex frailty grouping: 0.697).
Table 3. (A) Multivariable Cox regression model for 2-year overall survival in the training set and (B) the Geriatric Prognostic Index risk groups in the training set (N=355, number of events =122)
(A) Performance of the multivariable Cox model in the training set: optimism-corrected C-index after applying the final Cox model to 200 bootstrap resamples of the training set: 0.752. (B) C-index of the model with three Geriatric Prognostic Index risk groups: 0.726. Survival estimated from Kaplan-Meier curves. β: regression coefficient; SE: standard error; HR: hazard ratio; 95% CI: 95% confidence interval; ADL: activities of daily living; CCI: Charlson Comorbidity Index; ECOG PS: Eastern Cooperative Oncology Group performance status; ULN: upper limit of normal; GPI: Geriatric Prognostic Index; OS: overall survival.
External validation of the Geriatric Prognostic Index and comparison with the International Prognostic Index and its modifications
A total of 193 patients were included in the test set (Figure 1). Their median age was similar to that of the training set (77 years; range, 70-95) (Table 1). The test set had a lower frequency of patients with >1 extranodal sites, fewer patients with IPI 3 and more with IPI 2. There was also a trend towards fewer patients with CCI ≥2 and more patients with albumin <36 g/L in the test set, otherwise the distribution of baseline characteristics was similar in the training and test sets. The proportion of patients receiving full-dose R-CHOP (64%) and the median dose for attenuated R-CHOP (75% of full-dose; IQR, 53-75) was the same as in the training set. The median follow-up time was 127 months (IQR, 83-163) and 2-year OS was similar to that in the training set (68% vs 65%).
In the test set, the median GPI was 1.43900 (range, 0.04103 to 4.47104) in 174 patients with complete data for the eight included variables. Applying the fixed cutoffs for the GPI groups from the training set, 33% (n=57), 41% (n=71) and 26% (n=46) of patients were assigned to the low-, intermediateand high-risk group, respectively. Both the continuous GPI and GPI groups showed good discrimination for 2-year OS with a C-index of 0.727 and 0.710, respectively, and the GPI groups showed significantly different 2-year OS (95%, 65%, and 44%; P<0.001) (Figure 3A; Table 4). The GPI groups were also predictive for 5-year OS (75% [95% CI: 65-87%], 49% [95% CI: 38-62%] and 32% [95% CI: 21-49%]) and 2-year PFS (91% [95% CI: 84-99%], 59% [95% CI: 49-72%] and 41% [95% CI: 29-58%]).
A calibration slope of 0.73 for the GPI indicates some overestimation of risk for the high-risk patients in the test set. When comparing observed and predicted survival for the GPI groups, mean predictions for the low- and intermediate-risk groups were in line with estimated survival, while the highrisk group had a slightly better survival than predicted (Online Supplementary Figure S6).

The GPI and GPI groups outperformed IPI, R-IPI and NCCNIPI in terms of model discrimination in both the training set (C-index: IPI 0.665, R-IPI 0.628, and NCCN-IPI 0.671) and test set (C-index: IPI 0.621, R-IPI 0.583, and NCCN-IPI 0.670) (Figure 3; Table 4), and reallocated a substantial proportion of patients into different risk groups (Figure 4). In particular, the GPI identified a large low-risk group with a very favorable prognosis (GPI low-risk group: 33% of patients, 95% 2-year OS vs. IPI low-risk group: 24% of patients, 85% 2-year OS) (Table 4). The predictive value of the GPI also exceeded that of our previously developed frailty score19 (C-index 0.64).
The characteristics of the patients in the GPI risk groups were similar in the training and test sets (Online Supplementary Tables S4 and S5). In the test set, the majority of patients in the low-risk group had stage I/II disease (n=43, 75%), were 70-79 years old (n=43, 75%) and fit (n=48, 91%) according to our previously published frailty calculator.19 The majority had also received full-dose R-CHOP (n=50, 88%) (Online Supplementary Table S4). Patients in the GPI low-risk group were reallocated from all four IPI groups (Figure 4). In the intermediate-risk group the majority of patients had stage III/IV disease (n= 38, 54%), were 70-79 years old (n=51, 72%), were either fit (n=29, 45%) or unfit (n=28, 44%), and had received full-dose R-CHOP (n=47, 68%) (Online Supplementary Table S4). Also here, patients were reallocated from all four IPI groups.
In the high-risk group, 61% of patients (n=28) were 70-79 years old, 87% (n=40) had stage III/IV disease, all patients were either unfit (n=29, 64%) or frail (n=16, 36%), and 64% had received attenuated R-CHOP (n=27) (Online Supplementary Table S4). The majority of patients were IPI high-risk, but patients from the remaining IPI groups were also reallocated to the GPI high-risk group. When comparing the high-risk group in the training and test sets, the high-risk group in the test set had a lower proportion of patients who were classified as frail (36% vs. 48%), and a lower median GPI score (2.74 vs. 2.94) (Online Supplementary Tables S4 and S5).
We have developed, and externally validated, the GPI based on large, population-based Norwegian cohorts. This index is especially suited for predicting survival of older
(≥70 years) DLBCL patients who are candidates for curative intent treatment with R-CHOP. The GPI combines known prognostic factors in DLBCL with impairments in GA parameters to integrate a patient’s fitness into the prognostication. The GPI showed good discrimination and outperformed the IPI, R-IPI and NCCN-IPI in both the training and test sets.

The GPI identified three risk groups with significantly different survival in the test set, in contrast to the IPI, R-IPI
and NCCN-IPI that only identified two groups with significantly different survival. Importantly, the GPI was superior in identifying a substantial proportion of older patients (~1/3) with a very favorable prognosis following R-CHOP treatment. Patients in the GPI low-risk group were reallocated from all IPI groups, including the high-intermediate and high-risk groups. The GPI is more complex than the IPI, but our results underline the importance of a broader assessment of older lymphoma patients. The ADL and CCI
Table 4. External validation. Performance of the Geriatric Prognostic Index in the test set and comparison with the International Prognostic Index and its modifications.
Survival estimated from Kaplan-Meier curves and hazard ratios estimated from Cox regression in the test set. OS: overall survival; 95% CI: 95% confidence interval; HR: hazard ratio; GPI: Geriatric Prognostic Index; IPI: International Prognostic Index;
National Comprehensive Cancer Network IPI.
are relatively simple parameters that are easily assessed in routine oncology practice, and with the use of an online calculator, the GPI is quickly available.
The GPI low- and intermediate-risk groups had similar survival in the training and test sets, but the high-risk group had better survival in the test set than in the training set. This is likely due to differences in selection of patients for R-CHOP and treatment management at different hospitals. As the high-risk group includes the majority of frail patients, the composition of this group may differ between hospitals. The heterogeneity of the high-risk group, together with this group being the smallest risk group (n=46 in the test set), makes the survival estimates for the high-risk group subject to variation within the group. This is reflected in the wider confidence interval for 2-year OS for the high-risk group (Table 4).
An Elderly Prognostic Index (EPI) that combines a simplified GA with IPI and hemoglobin has been proposed by the Italian Lymphoma Foundation.21 The EPI was developed for patients treated with both palliative and curative regimens and not restricted to R-CHOP. The GPI is also slightly easier and faster to perform than the EPI. The EPI includes the Cumulative Illness Rating Scale for Geriatrics (CIRS-G), which is more comprehensive than the CCI, and also includes instrumental activities of daily living (IADL) in addition to ADL. Their prospective study design is a strength, but also increases the risk of selection bias in this older patient population. A direct com-
revised IPI;
parison between the GPI and EPI was not possible in our study as we did not have data on CIRS-G and IADL. An Elderly IPI (E-IPI) for patients over 60 years has also been suggested. 33 However, the only modification from the standard IPI is an age cutoff at 70 years, and no GA parameters were included.
Four of the prognostic factors from the IPI were included in our GPI (age, stage, ECOG PS and LDH), while extranodal sites were not. Bone marrow, liver and/or lung infiltration were associated with adverse survival in univariate analyses, but lost significance when combined with the other IPI variables in multivariable analysis. Decreased prognostic value of extranodal sites in older DLBCL patients has also been demonstrated by others.7,34 Age was forcibly maintained in the model due to its biological relevance, but was not highly significant. This may partly be due to selection bias whereby only the fitter among the oldest patients receive R-CHOP. On the other hand, chronological age may also be of less importance among older patients in whom fitness evaluation may better reflect a patient’s biological age. Age was not dichotomized in the GPI as a continuous variable is more likely to reflect the biological effect of increased age. However, a commonly used cutoff at 80 years was also tested in the final model, but resulted in poorer model performance.
GNRI and albumin showed a high degree of correlation and gave similar results when included in the final model. Albumin was thus chosen for a simpler model. Several studies
have identified albumin as a strong prognostic marker for survival in older DLBCL patients.7,34,35 Decreased albumin could be part of a general dysregulation of protein synthesis and metabolism linked to frailty.36 Albumin is also likely linked to other aspects, including poor nutritional status, inflammation and lymphoma aggressiveness.37
CCI was highly significant in the model. The prognostic value of comorbidity in older DLBCL patients has been demonstrated in several studies.15,34 However, some prospective studies on older patients have not shown this association.8,38 This is likely caused by selection bias for fit patients, and highlights the importance of a representative cohort when identifying prognostic factors in an older age group. ADL dependence was, as expected, not as high in this older patient population selected for receiving R-CHOP treatment, compared to an unselected older population.19 Nevertheless, ADL showed prognostic value independent of ECOG PS, a finding that has also been demonstrated by others.15,20,21,38 Poorer prognosis for male sex has also been shown in several studies.34,39-41
Chronic, low-grade, systemic inflammation has been linked to frailty, and several serum markers linked to inflammation have been suggested as potential biomarkers for frailty.36 Inflammatory markers were also highly significant in univariate analyses in our data. However, after removal of NLR, no other inflammatory marker contributed significantly to the model. This may partly be due to a strong correlation
with albumin and other variables in the model linked to inflammation, frailty and tumor aggressiveness. None of the examined tumor-related parameters from the routine pathology report was significant, including COO. Other studies have also demonstrated the lack of prognostic value of COO in older DLBCL patients.8,34 Our results indicate that factors linked to frailty override known tumor biological variations in older DLBCL patients treated with R-CHOP. However, the lack of prognostic significance of COO in our cohort may also be due to the fact that COO was determined by immunohistochemistry, not by gene expression.38
Inclusion of other biological markers, such as double-hit or double-expression of MYC and BCL2, might improve the model. However, genetic complexity is associated with increasing age and biological markers may have less prognostic value among older patients.42 An aggressive tumor biology could also partly be reflected in clinical parameters. Inclusion of newly identified molecular subtypes43,44 could add prognostic information, but may be of less prognostic relevance in older patients and makes the model less feasible to apply in routine clinical practice.
Limitations of our study include the retrospective study design with a restricted number of GA parameters. However, prospective studies and meta-studies have identified the GA domains included in the GPI (functional status, comorbidity and nutrition) as key domains in a GA for capturing

frailty and predicting survival in older hematology patients.14,15 The retrospective study design also increases the risk of registration bias. In particular, the retrospective collection of ADL could be subjected to underreporting. Biological features such as double-hit status could also not be tested in the model because of the high number of missing observations. The selection of patients for R-CHOP treatment and the dosage of R-CHOP administered may also vary between doctors and hospitals, which could affect the accuracy of the GPI. Furthermore, the 2-year OS predicted by the GPI may have improved in the current era with increasing approval of novel therapies in later-line settings. In a constantly moving treatment landscape, prognostic scores such as the GPI need to be continuously validated or revised, and survival predictions may need to be re-calibrated. Strengths include the population-based study design with quality-checked and few missing data, enabling identification of a representative, “real-world” older DLBCL population. This is difficult to achieve in a prospective setting, as many older patients are treated at smaller, local hospitals not involved in prospective trials. Limiting the analysis to patients treated with R-CHOP allowed testing of known disease- and treatment-related predictors. This, in combination with predictors of special importance in older patients, including GA variables, makes the study well suited for modeling a robust prognostic index in older DLBCL patients treated with R-CHOP. The GPI was also externally validated and its performance compared to that of IPI, R-IPI and NCCN-IPI.
Before the start of treatment, we and others suggest assessing frailty status by using an objective GA to help evaluate patients’ fitness for R-CHOP treatment.16-19,21 Alternatives for frailty assessment include our previously proposed frailty score that is easily accessible together with the GPI in an online calculator.19 Of note, frailty status should be re-evaluated after pre-phase treatment to allow for improvement in frailty status for patients with reduced fitness mainly caused by their lymphoma. A comprehensive GA also includes non-oncological interventions for identified impairments to optimize patients’ fitness prior to oncological treatment.45
For possible R-CHOP candidates, according to our data the GPI provides a more accurate estimation of prognosis following R-CHOP than the IPI, R-IPI and NCCN-IPI. The prognostic information from the GPI also exceeded that of a simplified frailty assessment alone, and can thus together with frailty status provide a more solid ground for dose adaptions in individual patients. It can also form a basis for shared decision-making conversations with patients and their families. Importantly, the GPI could provide a platform for risk-adapted treatment approaches in clinical trials in older DLBCL patients. The very favorable outcome for the
low-risk patients reinforces R-CHOP as the gold standard for this group. For the intermediate- and high-risk patients, chemotherapy-free agents that have shown potential in DLBCL, including bi-specific antibodies, immunomodulatory agents, targeted agents and chimeric antigen receptor Tcell-based therapy could be considered in a clinical trial setting, either alone or in combination with R-CHOP.46-50 In conclusion, we have developed and externally validated the GPI suited for older (≥70 years) DLBCL patients who are considered candidates for curative treatment with R-CHOP. The GPI combines GA variables with well-established prognostic factors in DLBCL. The model outperformed the IPI, R-IPI and NCCN-IPI and could be a tool for informed treatment decisions and for stratifying older DLBCL patients for clinical trials. The GPI consists of easy accessible parameters that can be obtained in routine oncology practice, and can be calculated with an online calculator available at https://wide.shinyapps.io/GPIcalculator/. Although the GPI has been externally validated, validation in a prospective setting is warranted.
Disclosures
No conflicts of interest to disclose.
Contributions
MB, HH, EBS and KTI designed the research study. KTI, HH, MAM, MR, LSR, DB, FR, MS, ØF, RG and PM participated in collection of clinical data. KTI, MB, HH, EBS, OCL and KL analyzed and interpreted the data. KTI generated all the tables and figures and drafted the manuscript. All authors critically reviewed and approved the final manuscript.
The authors would like to thank Astrid Bergrem at Lovisenberg Hospital, Abdulkarim Hilli at Diakonhjemmet Hospital, Martin Ruppert and Sameer Bhargava at Bærum Hospital, and Janicke Nilsson and Øyvind Øverli who assisted in assembling data from local hospitals.
Funding
This work was supported by grants to HH from the SouthEastern Norway Regional Health Authority (grant reference number 2017050) and The KG Jebsen Foundation (grant reference number SKGJ-MED-016), and grants to EBS from the Norwegian Cancer Society (grant reference number 182694).
The original data included in this study cannot be shared publicly due to Norwegian regulations, but can be shared upon reasonable request to the corresponding author if this divulgation is accepted by the Norwegian Regional Committees for Medical and Health Research Ethics and Data Protection Officers at participating hospitals.
1. Smith A, Howell D, Patmore R, Jack A, Roman E. Incidence of haematological malignancy by sub-type: a report from the Haematological Malignancy Research Network. Br J Cancer. 2011;105(11):1684-1692.
2. Coiffier B, Lepage E, Briere J, et al. CHOP chemotherapy plus rituximab compared with CHOP alone in elderly patients with diffuse large-B-cell lymphoma. N Engl J Med. 2002;346(4):235-242.
3. Pfreundschuh M, Schubert J, Ziepert M, et al. Six versus eight cycles of bi-weekly CHOP-14 with or without rituximab in elderly patients with aggressive CD20+ B-cell lymphomas: a randomised controlled trial (RICOVER-60). Lancet Oncol. 2008;9(2):105-116.
4. Sant M, Minicozzi P, Mounier M, et al. Survival for haematological malignancies in Europe between 1997 and 2008 by region and age: results of EUROCARE-5, a population-based study. Lancet Oncol. 2014;15(9):931-942.
5. Scher KS, Hurria A. Under-representation of older adults in cancer registration trials: known problem, little progress. J Clin Oncol. 2012;30(17):2036-2038.
6. Hamaker ME, Stauder R, van Munster BC. Exclusion of older patients from ongoing clinical trials for hematological malignancies: an evaluation of the National Institutes of Health Clinical Trial Registry. Oncologist. 2014;19(10):1069-1075.
7. Peyrade F, Jardin F, Thieblemont C, et al. Attenuated immunochemotherapy regimen (R-miniCHOP) in elderly patients older than 80 years with diffuse large B-cell lymphoma: a multicentre, single-arm, phase 2 trial. Lancet Oncol. 2011;12(5):460-468.
8. Peyrade F, Bologna S, Delwail V, et al. Combination of ofatumumab and reduced-dose CHOP for diffuse large B-cell lymphomas in patients aged 80 years or older: an open-label, multicentre, single-arm, phase 2 trial from the LYSA group. Lancet Haematol. 2017;4(1):e46-e55.
9. International Non-Hodgkin's Lymphoma Prognostic Factors Project. A predictive model for aggressive non-Hodgkin's lymphoma. N Engl J Med. 1993;329(14):987-994.
10. Sehn LH, Berry B, Chhanabhai M, et al. The revised International Prognostic Index (R-IPI) is a better predictor of outcome than the standard IPI for patients with diffuse large B-cell lymphoma treated with R-CHOP. Blood. 2007;109(5):1857-1861.
11. Zhou Z, Sehn LH, Rademaker AW, et al. An enhanced International Prognostic Index (NCCN-IPI) for patients with diffuse large B-cell lymphoma treated in the rituximab era. Blood. 2014;123(6):837-842.
12. Soubeyran PL, Cordoba R. Approaches for vulnerable and frail older patients with diffuse large B-cell lymphomas. Curr Opin Oncol. 2019;31(5):369-373.
13. Lin RJ, Behera M, Diefenbach CS, Flowers CR. Role of anthracycline and comprehensive geriatric assessment for elderly patients with diffuse large B-cell lymphoma. Blood. 2017;130(20):2180-2185.
14. Hamaker ME, Prins MC, Stauder R. The relevance of a geriatric assessment for elderly patients with a haematological malignancy--a systematic review. Leuk Res. 2014;38(3):275-283.
15. Scheepers ERM, Vondeling AM, Thielen N, van der Griend R, Stauder R, Hamaker ME. Geriatric assessment in older patients with a hematologic malignancy: a systematic review. Haematologica. 2020;105(6):1484-1493.
16. Morrison VA, Hamlin P, Soubeyran P, et al. Diffuse large B-cell lymphoma in the elderly: impact of prognosis, comorbidities,
geriatric assessment, and supportive care on clinical practice. An International Society of Geriatric Oncology (SIOG) expert position paper. J Geriatr Oncol. 2015;6(2):141-152.
17. Wildiers H, Heeren P, Puts M, et al. International Society of Geriatric Oncology consensus on geriatric assessment in older patients with cancer. J Clin Oncol. 2014;32(24):2595-2603.
18. Mohile SG, Dale W, Somerfield MR, et al. Practical assessment and management of vulnerabilities in older patients receiving chemotherapy: ASCO Guideline for Geriatric Oncology. J Clin Oncol. 2018;36(22):2326-2347.
19. Isaksen KT, Mastroianni MA, Rinde M, et al. A simplified frailty score predicts survival and can aid treatment-intensity decisions in older patients with DLBCL. Blood Adv. 2021;5(22):4771-4782.
20. Tucci A, Ferrari S, Bottelli C, Borlenghi E, Drera M, Rossi G. A comprehensive geriatric assessment is more effective than clinical judgment to identify elderly diffuse large cell lymphoma patients who benefit from aggressive therapy. Cancer. 2009;115(19):4547-4553.
21. Merli F, Luminari S, Tucci A, et al. Simplified geriatric assessment in older patients with diffuse large B-cell lymphoma: the Prospective Elderly Project of the Fondazione Italiana Linfomi. J Clin Oncol. 2021;39(11):1214-1222.
22. Katz S. Assessing self-maintenance: activities of daily living, mobility, and instrumental activities of daily living. J Am Geriatr Soc. 1983;31(12):721-727.
23. Charlson ME, Pompei P, Ales KL, MacKenzie CR. A new method of classifying prognostic comorbidity in longitudinal studies: development and validation. J Chronic Dis. 1987;40(5):373-383.
24. Bouillanne O, Morineau G, Dupont C, et al. Geriatric Nutritional Risk Index: a new index for evaluating at-risk elderly medical patients. Am J Clin Nutr. 2005;82(4):777-783.
25. Lidoriki I, Schizas D, Frountzas M, et al. GNRI as a prognostic factor for outcomes in cancer patients: a systematic review of the literature. Nutr Cancer. 2021;73(3):391-403.
26. Hans CP, Weisenburger DD, Greiner TC, et al. Confirmation of the molecular classification of diffuse large B-cell lymphoma by immunohistochemistry using a tissue microarray. Blood. 2004;103(1):275-282.
27. Shuster JJ. Median follow-up in clinical trials. J Clin Oncol. 1991;9(1):191-192.
28. White IR, Royston P, Wood AM. Multiple imputation using chained equations: issues and guidance for practice. Stat Med. 2011;30(4):377-399.
29. Steyerberg EW. Clinical Prediction Models. 2nd ed. Cham: Springer International Publishing. 2019:127-155.
30. Moons KG, Altman DG, Reitsma JB, et al. Transparent Reporting of a multivariable prediction model for Individual Prognosis or Diagnosis (TRIPOD): explanation and elaboration. Ann Intern Med. 2015;162(1):W1-73.
31. Harrell FE Jr, Califf RM, Pryor DB, Lee KL, Rosati RA. Evaluating the yield of medical tests. JAMA. 1982;247(18):2543-2546.
32. Royston P, Altman DG. External validation of a Cox prognostic model: principles and methods. BMC Med Res Methodol. 2013;13:33.
33. Advani RH, Chen H, Habermann TM, et al. Comparison of conventional prognostic indices in patients older than 60 years with diffuse large B-cell lymphoma treated with R-CHOP in the US Intergroup Study (ECOG 4494, CALGB 9793): consideration of age greater than 70 years in an elderly prognostic index (E-IPI). Br J Haematol. 2010;151(2):143-151.
34. Chihara D, Westin JR, Oki Y, et al. Management strategies and outcomes for very elderly patients with diffuse large B-cell lymphoma. Cancer. 2016;122(20):3145-3151.
35. Melchardt T, Troppan K, Weiss L, et al. A modified scoring of the NCCN-IPI is more accurate in the elderly and is improved by albumin and beta2-microglobulin. Br J Haematol. 2015;168(2):239-245.
36. Saedi AA, Feehan J, Phu S, Duque G. Current and emerging biomarkers of frailty in the elderly. Clin Interv Aging. 2019;14:389-398.
37. Gupta D, Lis CG. Pretreatment serum albumin as a predictor of cancer survival: a systematic review of the epidemiological literature. Nutr J. 2010;9:69.
38. Oberic L, Peyrade F, Puyade M, et al. Subcutaneous rituximabminiCHOP compared with subcutaneous rituximab-miniCHOP plus lenalidomide in diffuse large B-cell lymphoma for patients age 80 years or older. J Clin Oncol. 2021;39(11):1203-1213.
39. Riihijärvi S, Taskinen M, Jerkeman M, Leppä S. Male gender is an adverse prognostic factor in B‐cell lymphoma patients treated with immunochemotherapy. Eur J Haematol. 2011;86(2):124-128.
40. Pfreundschuh M, Muller C, Zeynalova S, et al. Suboptimal dosing of rituximab in male and female patients with DLBCL. Blood. 2014;123(5):640-646.
41. Eyre TA, Martinez-Calle N, Hildyard C, et al. Male gender is an independent predictor for worse survival and relapse in a large, consecutive cohort of elderly DLBCL patients treated with RCHOP. Br J Haematol. 2019;186(4):e94-e98.
42. Klapper W, Kreuz M, Kohler CW, et al. Patient age at diagnosis is associated with the molecular characteristics of diffuse large Bcell lymphoma. Blood. 2012;119(8):1882-1887.
43. Chapuy B, Stewart C, Dunford AJ, et al. Molecular subtypes of diffuse large B cell lymphoma are associated with distinct pathogenic mechanisms and outcomes. Nat Med. 2018;24(5):679-690.
44. Schmitz R, Wright GW, Huang DW, et al. Genetics and pathogenesis of diffuse large B-cell lymphoma. N Engl J Med. 2018;378(15):1396-1407.
45. Rostoft S, O'Donovan A, Soubeyran P, Alibhai SMH, Hamaker ME. Geriatric assessment and management in cancer. J Clin Oncol. 2021;39(19):2058-2067.
46. Westin JR, Nastoupil LJ, Fayad L, et al. Smart start: rituximab, lenalidomide, and ibrutinib alone and in combination with standard chemotherapy for patients with newly diagnosed diffuse large B-cell lymphoma: final phase II results. Blood. 2019;134(Suppl_1):1581.
47. Olszewski AJ, Avigdor A, Babu S, et al. Single-agent mosunetuzumab is a promising safe and efficacious chemotherapy-free regimen for elderly/unfit patients with previously untreated diffuse large B-cell lymphoma. Blood. 2020;136(Suppl 1):43-45.
48. Neelapu SS, Jacobson CA, Oluwole OO, et al. Outcomes of older patients in ZUMA-1, a pivotal study of axicabtagene ciloleucel in refractory large B-cell lymphoma. Blood. 2020;135(23):2106-2109.
49. Bishop MR. The benefit of CAR T cells in older patients. Blood. 2020;135(23):2020-2021.
50. Xu PP, Shi ZY, Qian Y, et al. Ibrutinib, rituximab, and lenalidomide in unfit or frail patients aged 75 years or older with de novo diffuse large B-cell lymphoma: a phase 2, single-arm study. Lancet Healthy Longev. 2022;3(7):e481-e490.
Xin Liu,1* Li-Ling Zhang,2* Bao-Lin Qu,3 Qiu-Zi Zhong,4 Li-Ting Qian,5 Yong Yang,6 Xiao-Rong Hou,7 Xue-Ying Qiao,8 Hua Wang,9 Yuan Zhu,10 Jian-Zhong Cao,11 Jun-Xin Wu,12 Tao Wu,13 Su-Yu Zhu,14 Mei Shi,15 Hui-Lai Zhang,16 Xi-Mei Zhang,16 Hang Su,17 Yu-Qin Song,18 Jun Zhu,18 Yu-Jing Zhang,19 Hui-Qiang Huang,19 Ying Wang,20 Fan Chen,21 Lin Yin,21 Xia He,22 Shang Cai,23 Ye-Xiong Li1 and Shu-Nan Qi1
1National Cancer Center/National Clinical Research Center for Cancer/Cancer Hospital, Chinese Academy of Medical Sciences and Peking Union Medical College, Beijing; 2Union Hospital, Tongji Medical College, Huazhong University of Science and Technology, Wuhan, Hubei; 3The General Hospital of Chinese People's Liberation Army, Beijing; 4Beijing Hospital, National Geriatric Medical Center, Beijing; 5The Affiliated Provincial Hospital of Anhui Medical University, Hefei, Anhui; 6Department of Radiation Oncology, Fujian Medical University Union Hospital, Fuzhou, Fujian; 7Peking Union Medical College Hospital, Chinese Academy of Medical Sciences (CAMS) and Peking Union Medical College (PUMC), Beijing; 8The Fourth Hospital of Hebei Medical University, Shijiazhuang; 9Second Affiliated Hospital of Nanchang University, Nanchang; 10Cancer Hospital of the University of Chinese Academy of Sciences (Zhejiang Cancer Hospital), Institute of Cancer and Basic Medicine (IBMC), Chinese Academy of Sciences, Zhejiang; 11Shanxi Cancer Hospital and the Affiliated Cancer Hospital of Shanxi Medical University, Taiyuan, Shanxi; 12Fujian Provincial Cancer Hospital, Fuzhou, Fujian; 13Affiliated Hospital of Guizhou Medical University, Guizhou Cancer Hospital, Guiyang, Guizhou; 14Hunan Cancer Hospital and the Affiliated Cancer Hospital of Xiangya School of Medicine, Changsha, Hunan; 15Xijing Hospital of Fourth Military Medical University, Xi'an; 16Tianjin Medical University Cancer Institute and Hospital, Key Laboratory of Cancer Prevention and Therapy, National Clinical Research Center for Cancer, Tianjin; 17The Fifth Medical Center of PLA General Hospital, Beijing; 18Key Laboratory of Carcinogenesis and Translational Research (Ministry of Education), Peking University Cancer Hospital and Institute, Beijing; 19Sun Yat-sen University Cancer Center, State Key Laboratory of Oncology in South China, Collaborative Innovation Center for Cancer Medicine, Guangzhou, Guangdong; 20Chongqing University Cancer Hospital and Chongqing Cancer Hospital, Chongqing; 21Affiliated Hospital of Qinghai University, Qinghai; 22Jiangsu Cancer Hospital and Jiangsu Institute of Cancer Research, Nanjing, Jiangsu and 23Department of Radiation Oncology, the Second Affiliated Hospital of Soochow University, Suzhou, China
*XL and LLZ contributed equally as first authors.
Correspondence: S.-N. Qi medata@163.com
Y.-X. Li yexiong12@163.com, yexiong@yahoo.com
Received: July 27, 2022.
Accepted: March 13, 2023. Early view: March 23, 2023.
https://doi.org/10.3324/haematol.2022.281847
©2023 Ferrata Storti Foundation
Published under a CC BY-NC license
Survival from extranodal nasal-type NK/T-cell lymphoma (ENKTCL) has substantially improved over the last decade. However, there is little consensus as to whether a population of patients with ENKTCL can be considered “cured” of the disease. We aimed to evaluate the statistical “cure” of ENKTCL in the modern treatment era. This retrospective multicentric study reviewed the clinical data of 1,955 patients with ENKTCL treated with non-anthracycline-based chemotherapy and/or radiotherapy in the China Lymphoma Collaborative Group multicenter database between 2008 and 2016. A non-mixture cure model with incorporation of background mortality was fitted to estimate cure fractions, median survival times and cure time points. The relative survival curves attained plateau for the entire cohort and most subsets, indicating that the notion of cure was robust The overall cure fraction was 71.9%. The median survival was 1.1 years in uncured patients. The cure time was 4.5 years, indicating that beyond this time, mortality in ENKTCL patients was statistically equivalent to that in the general population. Cure probability was associated with B symptoms, stage, performance status, lactate dehydrogenase, primary tumor invasion, and primary upper aerodigestive tract site. Elderly patients (>60 years) had a similar cure fraction to that of younger patients. The 5-year overall survival rate correlated well with the cure fraction across risk-stratified groups. Thus, statistical cure is possible in ENKTCL patients receiving current treatment strategies. Overall probability of cure is favorable, though it is affected by the presence of risk factors. These findings have a high potential impact on clinical practice and patients’ perspective.
Extranodal nasal-type NK/T-cell lymphoma (ENKTCL) is an aggressive and heterogeneous disease with variable prognosis. It is globally rare but relatively more common in East Asia and South America.1 ENKTCL frequently originates from the upper aerodigestive tract (UADT), and most patients (70-90%) present with early-stage disease.2,3 Survival outcomes for ENKTCL have substantially improved over the last decade, owing to the use of upfront modern radiotherapy48 and non-anthracycline (ANT)-based chemotherapy,9-13 establishment of novel prognostic models,14-16 and risk-adapted treatment strategy.7,17 The 5-year overall survival (OS) rates range from 55% to 90% for low- and intermediate- to high-risk early-stage disease,12-15 but remains <40% for advanced-stage or very high–risk disease.10,15 Recently, we demonstrated that the survival probability increased over time after radiotherapy in a risk-dependent manner among early-stage ENKTCL patients.18 Annual hazard of death decreased to 5-6% at 3 years after completion of radiotherapy, irrespective of patient’s initial risk category. Patients achieving progression-free disease within 24 months (PFS24) after current treatments had a 5-year OS rate of 92.2%, which was only slightly lower than the 94.3% in a matched general Chinese population.19 In addition, despite the generally poor prognosis of elderly patients with early-stage ENKTCL,20,21 elderly low-risk patients and a subgroup of high-risk patients who achieved PFS24 after radiotherapy have survival equivalent to that of the age- and sex-matched general population.22 Given the variety of primary sites and the heterogeneity of clinical features and prognoses, it is necessary to know whether ENKTCL can be considered a curable disease in the modern treatment era. Although cure at the individual level is difficult to determine, statistical cure at the population level - i.e., no excess disease-related death from the primary disease or secondary complications—can be demonstrated by showing plateauing of the relative survival (RS) function.23 By this method, colon cancer,24 liver cancer,25 and Hodgkin lymphoma,26,27 have all been shown to be curable, but diffuse large B-cell lymphoma (DLBCL) might not be curable.28,29,30 The curability of ENKTCL in the modern treatment era has not been investigated yet. In this study, we used the data of a large cohort of ENKTCL patients from the China Lymphoma Collaborative Group (CLCG) database to estimate the cure fraction and the survival of uncured patents in the entire cohort and in risk-stratified subgroups, and evaluate the association between OS and cure fraction.
We performed a retrospective analysis of the data of pa-
tients with newly diagnosed ENKTCL registered in the CLCG database between 2008 and 2016. Patients were eligible for inclusion in this study if they had received nonANT-based chemotherapy and/or radiotherapy. Patients treated with unknown or ANT-based chemotherapy regimens were excluded. A total of 1,955 patients who met these criteria constituted the study population. This study was approved by the Institutional Review Boards; the need for informed consent was waived because only deidentified patient data were used.
Pretreatment staging evaluations included physical examination; endoscopy of the upper aerodigestive tract; computed tomography (CT) scans of the chest, abdomen and pelvis, magnetic resonance imaging (MRI) of the head and neck; bone marrow examination. Positron emission tomography (PET)/CT with 2-deoxy-2-[18F] fluoro-D-glucose (18F-FDG) has been routinely used for staging since 2010. Patients were staged using the Ann Arbor staging system and were classified into low-, intermediate/low-, intermediate/high-, high-, and very high-risk groups according to the nomogram-revised risk index (NRI).15 Definitions of primary site and primary tumor invasion (PTI) are provided in the Online Supplementary Appendix
Of the 1,123 patients with stage I disease, 691 (61.5%) received combined-modality therapy (CMT) of radiotherapy and chemotherapy, 305 (27.2%) received radiotherapy (RT) alone, and 127 (11.3%) received chemotherapy alone; Of the 599 stage II patients, 465 (77.6%) received CMT, 57 (9.5%) received RT alone, and 77 (12.9%) received chemotherapy alone; of the 233 stage III-IV patients, 146 (62.7%) received chemotherapy alone, and 87 (37.3%) received CMT. Details on chemotherapy regimens (Online Supplementary Table S1) and radiotherapy are provided in the Online Supplementary Appendix.
OS was calculated from the date of initial treatment to the date of death or last contact and analyzed using the Kaplan–Meier method. RS was calculated as the ratio of the actual survival to the expected survival in an age-, sex-, and calendar year–matched general Chinese population (Online Supplementary Appendix) using the Ederer II method.31 If visual examination showed plateauing of the RS curve, then cure was hypothesized to be plausible.
Statistical cure is assumed to be achieved when surviving patients experience the same mortality as the general population. This concept applies at the group level and is
distinct from “medical cure” at the individual level. Cure fraction was defined as the level at which the RS curve reached a plateau.32 Using a non-mixture cure model, the cure fraction was modeled with a logit link, whereas the RS of the uncured (fatal) group was assumed to follow a Weibull distribution. Details are provided in the Online Supplementary Appendix
All statistical tests were two-sided, with type I error set at 5%. The OS rates were estimated and compared using the log-rank test in R 4.1.0 (http://www.r-project.org/). The cure models were fitted using the algorithms strsmix and strsnmix in STATA/SE 13.0 (STATA, College Station, TX, USA).32 Linear regression analysis was used to assess the relationship between OS and cure fraction.
Baseline clinical characteristics, initial response and overall survival
Table 1 lists the baseline clinical characteristics of the patients. The median age was 43 years (range, 1-87 years). Most patients had early-stage disease (88.1%), good performance status (PS; Eastern Cooperative Oncology Group [ECOG] score 0-1, 93.5%), and primary UADT site (93.6%).
Elevated lactate dehydrogenase (LDH) was present in 533 (27.3%) patients, and PTI in 1,087 (55.6%) patients. There were 1,833 patients who completed the response evaluation after the initial treatment. The complete response (CR), partial response (PR), stable disease (SD),
ECOG: Eastern Cooperative Oncology Group; Int: intermediate; LDH: lactate dehydrogenase; NRI: nomogram-revised risk index; UADT: upper aerodigestive tract; PTI: primary tumor invasion; Int-low: intermediate-low; Int-high: intermediate-high.
and progression disease (PD) rates after initial treatment were 70.1%, 18.6%, 1.9%, and 9.4% for the whole cohort, with 73.3%, 18.4%, 1.6% and 6.7% for early-stage disease, and 45.1%, 19.9%, 3.9% and 31.1% for advanced-stage disease, respectively.
The 5-year and 10-year OS rates for the entire cohort were 71.2% (95% CI: 68.9-73.5) and 63.8% (95% CI: 56.9-68.3), respectively.
The 5-year and 10-year RS rates for the entire cohort were 73.5% (95% CI: 71.1-75.9) and 69.0% (95% CI: 64.5-73.8), respectively (Online Supplementary Figure S1A). In the whole cohort, as well as in most subgroups stratified by clinical factors and NRI, the RS curves reached a clear plateau within 5 years of diagnosis (Online Supplementary Figure S2A-H), indicating the statistical plausibility of cure for ENKTCL.
The cure model converged and fitted well for ENKTCL in the entire cohort and in each subgroup. The cure fraction of the entire cohort was 71.9% (95% CI: 69.3-74.5), but the predicted RS of uncured patients was poor, with the median survival of only 1.1 years (95% CI: 1.0-1.3) (Figure 1A). The excess hazard rate in the entire cohort was 15.6% in the first year and then decreased continuously. The cure time, which was defined as the time at which 95% of the “uncured" patients would have died, was 4.5 (95% CI: 3.7-5.5) years after treatment. Thus, beyond 4.5 years, excess mortality attributed to ENKTCL became statistically negligible; that is, mortality of ENKTCL patients approximated that of the general population. In contrast, the excess hazard of death for uncured patients increased steeply in the first year to ap-
proximately 66% and then progressively increased over time (Figure 1B). In order to assess the potential influence of the inclusion of children and adolescent patients (whole cohort vs. cohort of patients ≥20 years old) on cure fraction, additional sensitivity analysis was conducted. The cure fraction of 72.1% (95% CI: 69.5-74.7) for patients ≥20 years old (n=1,855) was very close to that of 71.9% (95% CI: 69.3-74.5) for all patients with inclusion of children and adolescent (Online Supplementary Figure S3). As shown in Online Supplementary Figure S3, the relative survival curves for the two cohorts almost overlapped.
Cure fractions stratified by clinical features are presented in Table 1. In univariate analysis, the factors significantly associated with high cure probability were no B symptoms, stage I disease, ECOG score 0-1, normal LDH, absent PTI, and primary UADT site (all P<0.05 by the cure model test; Figure 2A-F). Although patients over 60 years had significantly worse OS than patients younger than 60 years (P=0.002 by log-rank test; data not shown), there was no significant difference in the cure fraction between the two age-groups after adjusting for background mortality (P= 0.518 by the cure model test).
The median survival time of uncured patients ranged from 0.6 to 2.1 years in different subgroups (Online Supplementary Table S5). Cure time was attained within 5 years in almost all subgroups, except for the subgroup of extra-UADT disease. These results indicated that patients achieving a 5-year survival could be considered statistically cured.
We examined whether the NRI could discriminate the cure fractions. According to the NRI, the cure fractions for the
Figure 1. Cure model results. (A) Predicted relative survival curves of the whole cohort of patients (blue line) and the uncured patients (red line) using the non-mixture cure model. In the entire group, from 4.5 years after treatment onward, the survival plateaued at approximately 72%, which represents the cure fraction (dashed line). (B) Excess hazard rate of the whole cohort (blue line) and the uncured patients (red line). In the whole cohort, the excess hazard continued to decrease until it approached zero at 4.5 years after treatment. Conversely, in uncured patients, the excess hazard progressively increased over time.

time of uncured patients decreased as NRI risk factors increased, ranging from 1.6 years for low-risk patients to 0.6 years for very high–risk patients (Figure 3B). Cure time was attained within 5 years across all risk groups (Online Supplementary Table S5).
Haematologica | 108 September 2023 2471 ARTICLE - Curability of ENKTCL with current treatment X. Liu et al.

As cure time was attained within 5 years across almost all subgroups, we explored whether the 5-year OS rate could be a good proxy for cure fraction. The 2- to 5-year OS correlated well with cure fraction across subgroups stratified by clinical factors and NRI-defined risk groups (Figure 4; all P<0.001). Moreover, the OS rates at 4 years (determination coefficient, R2=0.96; P<0.001) and 5 years (R2=0.94; P<0.001) were very close to the estimated cure fraction (Figure 4C, D). Thus, the 5-year OS rate can be proposed as a surrogate for cure fraction in ENKTCL patients.

In this large comprehensive study, we established that despite the aggressive and heterogeneous clinical behavior of ENKTCL, the notion of cure is applicable and robust, irrespective of clinical features and risk stratification. Across subgroups of ENKTCL patients, statistical cure is achievable with current treatment strategies. Cure fractions were associated with clinical prognostic factors (e.g., B symptoms, stage, PS, PTI, LDH, and primary UADT site). However, old age was not significantly associated with cure fraction after adjusting for background mortality. Moreover, the 5-year OS rate was found to be a valid surrogate for cure fraction in ENKTCL patients. The findings of this study can help in improving clinical practice and in designing clinical trials on this particular lymphoma. To the best of our knowledge, this is the first study to quantitatively evaluate the statistical curability of ENKTCL treated with current methods. In contrast to traditional survival analysis, where the assumption is that all patients are at risk of disease-related death, the cure model allows
for characterization of the heterogeneity in the plateau areas of survival plots by splitting patients into those who are cured (i.e., those with the same mortality hazard as the general population) and those who are not (i.e., those with higher mortality hazard than the general population). Using the non-mixture cure model with incorporation of background mortality, we demonstrated that the overall probability of statistical cure was approximetely 72% in ENKTCL patients treated with current methods. Despite the heterogeneity of the disease and its aggressive clinical behavior, the RS curves plateaued and the cure model converged and fitted well across most subsets. Thus, from a statistical standpoint, a population-based cure is plausible and robust for ENKTCL. This phenomenon is consistent with our previous findings and those of others that, despite an aggressive disease course in the first few years, late relapse is rare in ENKTCL beyond 5 years.12,18,19,33 Cure fraction is also high and stable for young and middle-aged Hodgkin lymphoma patients treated primarily with chemotherapy.26,27 However, similar cure is not attained for DLBCL in the modern immunochemotherapy era; some DLBCL patients manifest a pattern of continued late relapse, without flattening of survival curves.28,29,30 These distinct disease courses may be attributed to underlying differences in biological behavior and treatment principles.
Interestingly, the signi ficant determinants of chance of cure (PS, PTI, LDH, and stage) that were identified in this study mirrored covariates in the previously established NRI: PTI, LDH, and stage reflect tumor burden; stage and PTI reflect invasive potential; and PS reflects the patient’s ability to tolerate treatment.14,15 Meanwhile, despite being a proven independent adverse factor for OS in ENKTCL1416 and DLBCL,34 age >60 years was not significantly associated with cure fraction after adjusting for background
mortality in ENKTCL. In our previous study, elderly lowrisk ENKTCL patients and a subgroup of high-risk patients who achieved PFS24 had survival equivalent to that of the matched general population.22 In this study, we further show that elderly ENKTCL patients have as good a chance of cure as young patients. In contrast, in other hematologic malignancies, such as acute myeloid leukemia,35 Hodgkin lymphoma,26,27 and DLBCL,28 where intensified chemotherapy is used with the aim of achieving cure, elderly patients usually have lower cure fractions than younger patients. One possible explanation is that elderly patients are less able to complete first-line intensified systemic treatment due to comorbidities and greater susceptibility to treatment side effects. However, radiotherapy, which is well tolerated by the elderly,22 is the
backbone of first-line treatment for early-stage ENKTCL patients.4-8,21
Although the NRI system was derived from the Cox proportional hazards model with the primary endpoint of OS,15 it performed well in predicting and discriminating the cure fraction. The NRI system stratified ENKTCL patients into five subgroups, ranging from a low-risk subset (with highly curability of 87%) to a very high–risk subset (with poor curability of 44%). The NRI system can be used for classifying patients according to possibility of cure and selecting first-line treatment and follow-up strategy.7,17,18 Use of the NRI system by researchers across countries would facilitate international multicenter clinical trial design and comparison of results.
The uncured (fatal) ENKTCL patients had notably poor
Figure 4. Association of overall survival and cure fraction by prognostic factors and nomogram-revised risk index-defined risk groups. The (A) 2-year, (B) 3-year, (C) 4-year, and (D) 5-year overall survival (OS) by subgroups were linearly associated with the corresponding cure fraction. The 3-year, 4-year, and 5-year OS estimations were very close to the cure fraction estimation. R-square: determination coefficient.

prognosis, with median survival time of 1.1 years (0.6 to 1.6 years in very high–risk to low-risk groups). This is consistent with the aggressive disease course of the uncured DLBCL patients, with median survival times from 0.6 to 1.9 years in high- to low-risk groups.28 In contrast, the uncured young and middle-aged Hodgkin lymphoma patients had a relatively favorable survival (median, 4.6 years).26 Therefore, the uncured patients with different types of lymphomas manifested apparently heterogeneous clinical courses. Cure time is an important factor to be considered during follow-up of patients. Traditionally, achievement of 5-year survival has been the surrogate for “cure” in many cancers, but this is only based on experience and not on evidence. In this study, we show that survival for 5 years establishes cure for ENKTCL patients from a statistical standpoint; the mortality of survivors approximated that of the general population at 4.5 years after current treatment. The 5-year OS estimates were very close to the corresponding cure fractions across subgroups, indicating that 5-year OS was a good surrogate for the cure fraction. This finding provides patient, clinicians, and statisticians with a valuable time point. For patients, once they reach the 5-year mark, they can be reassured that their risk of death is very close to that of the general population. For clinicians, the 5-year mark is a milestone after which further reduction of follow-up frequency might be appropriate. For statisticians, during prospective trials design, there might be little value in defining late recurrence or disease-related death as endpoints beyond 5 years; instead, quality of life, treatment-related adverse effects, or secondary cancers, might be more relevant during further follow-up.
Strengths of this study included that our study was based on a large multicenter cohort, with high-quality data and sufficiently long follow-up. Data based on patients treated outside of clinical trials provide real-world benchmark estimates of prognosis for extrapolation to the general population. Moreover, the cure model based on RS data is suited for quantifying long-term survival and has the advantage of not relying on accurate reporting of causes of death. However, there were several limitations in this study. Firstly, as patients with extra-UADT disease have more aggressive clinical course and lower cure fraction, it remains unclear whether these patients should be treated differently than patients with UADT disease. Secondly, we recognize that patients from the endemic area (China) in the current study
1. Vose J, Armitage J, Weisenburger D, et al. International peripheral T-cell and natural killer/T-cell lymphoma study: pathology findings and clinical outcomes. J Clin Oncol. 2008;26(25):4124-4130.
2. Li YX, Liu QF, Fang H, et al. Variable clinical presentations of nasal and Waldeyer ring natural killer/T-cell lymphoma. Clin
tended to have favorable prognostic features (e.g., younger ages and early stages) than those in non-endemic areas (Europe and North America). In order to justify this skewing, the cure fractions were assessed according to stage and age. Despite of this, additional studies are still required to investigate the cure fraction in patients from non-endemic areas. Thirdly, we acknowledge that the imaging modality information (patients who underwent PET/CT scan) was not available for each patient in the CLCG database. Fifteen percent of patients in this study were diagnosed before 2010 when PET/CT scan was not routinely used for staging. PET/CT scan might upstage some cases, as it is more sensitive than CT in identifying small distant extranodal disease in lymphoma.
In conclusion, this study establishes the robustness of the notion of cure and the varied cure probability in ENKTCL from a population-based standpoint in the modern treatment era. Patients who succumb to ENKTCL within 5 years comprise a very special subset of patients with properties that are yet to be described. The use of biological markers of cure at the individual level needs to be examined in future studies.
Disclosure
No conflicts of interest to disclose.
Contributions
S-NQ and YXL designed the research. YXL, SNQ, XL, and LLZ collected and analyzed data. XL, LLZ, SNQ, and YXL wrote the paper. All authors provided patients data and approved the paper.
Funding
The present work was supported by grants from the National Natural Science Foundation of China (81970185), the National Key Research and Development of China (2020AAA0109504), the Beijing Hope Run Special Fund of Cancer Foundation of China (LC2020B07), and the training project of “National Tutor System” for Young Health Talents in Suzhou.
The datasets used and/or analyzed during the current study are available from the corresponding authors (S-NQ) on reasonable request.
Cancer Res. 2009;15(8):2905-2912.
3. Kim TM, Lee SY, Jeon YK, et al. Clinical heterogeneity of extranodal NK/T-cell lymphoma, nasal type: a national survey of the Korean Cancer Study Group. Ann Oncol. 2008;19(8):1477-1484.
4. Qi SN, Li YX, Specht L, et al. Modern radiation therapy for extranodal nasal-type NK/T-cell lymphoma: risk-adapted
therapy, target volume, and dose guidelines from the International Lymphoma Radiation Oncology Group. Int J Radiat Oncol Biol Phys. 2021;110(4):1064-1081.
5. Wu T, Yang Y, Zhu SY, et al. Risk-adapted survival benefit of IMRT in early-stage NKTCL: a multicenter study from the China Lymphoma Collaborative Group. Blood Adv. 2018;2(18):2369-2377.
6. Yang Y, Cao JZ, Lan SM, et al. Association of improved locoregional control with prolonged survival in early-stage extranodal nasal-type natural killer/T-cell lymphoma. JAMA Oncol. 2017;3(1):83-91.
7. Qi SN, Yang Y, Zhang YJ, et al. Risk-based, response-adapted therapy for early-stage extranodal nasal-type NK/T-cell lymphoma in the modern chemotherapy era: a China Lymphoma Collaborative Group study. Am J Hematol. 2020;95(9):1047-1056.
8. Li YX, Yao B, Jin J, et al. Radiotherapy as primary treatment for stage IE and IIE nasal natural killer/T-cell lymphoma. J Clin Oncol. 2006;24(1):181-189.
9. Yamaguchi M, Suzuki R, Oguchi M, et al. Treatments and outcomes of patients with extranodal natural killer/T-Cell lymphoma diagnosed between 2000 and 2013: a cooperative study in Japan. J Clin Oncol. 2017;35(1):32-39.
10. Qi SN, Yang Y, Song YQ, et al. First-line non-anthracycline-based chemotherapy for extranodal nasal-type NK/T-cell lymphoma: a retrospective analysis from the CLCG. Blood Adv. 2020;4(13):3141-3153.
11. Kwong YL, Kim WS, Lim ST, et al. SMILE for natural killer/T-cell lymphoma: analysis of safety and efficacy from the Asia Lymphoma Study Group. Blood. 2012;120(15):2973-2980.
12. Zhang Y, Ma S, Cai J, et al. Sequential P-GEMOX and radiotherapy for early-stage extranodal natural killer/T-cell lymphoma: A multicenter study. Am J Hematol. 2021;96(11):1481-1490.
13. Zheng X, He X, Yang Y, et al. Association of improved overall survival with decreased distant metastasis following asparaginase-based chemotherapy and radiotherapy for intermediate- and high-risk early-stage extranodal nasal-type NK/T-cell lymphoma: a CLCG study. ESMO Open. 2021;6(4):100206.
14. Yang Y, Zhang YJ, Zhu Y, et al. Prognostic nomogram for overall survival in previously untreated patients with extranodal NK/Tcell lymphoma, nasal-type: a multicenter study. Leukemia. 2015;29(7):1571-1577.
15. Chen SY, Yang Y, Qi SN, et al. Validation of nomogram-revised risk index and comparison with other models for extranodal nasal-type NK/T-cell lymphoma in the modern chemotherapy era: indication for prognostication and clinical decision-making. Leukemia. 2021;35(1):130-142.
16. Kim SJ, Yoon DH, Jaccard A, et al. A prognostic index for natural killer cell lymphoma after non-anthracycline-based treatment: a multicentre, retrospective analysis. Lancet Oncol. 2016;17(3):389-400.
17. Yang Y, Zhu Y, Cao JZ, et al. Risk-adapted therapy for early-stage extranodal nasal-type NK/T-cell lymphoma: analysis from a multicenter study. Blood. 2015;126(12):1424-1432.
18. Liu X, Wu T, Zhu SY, et al. Risk-dependent conditional survival and failure hazard after radiotherapy for early-stage extranodal natural killer/T-cell lymphoma. JAMA Netw Open. 2019;2(3):e190194.
19. Yang Y, Wang Y, Liu X, et al. Progression-free survival at 24 months and subsequent survival of patients with extranodal
NK/T-cell lymphoma: a China Lymphoma Collaborative Group (CLCG) study. Leukemia. 2021;35(6):1671-1682.
20. Wang ZY, Li YX, Wang H, et al. Unfavorable prognosis of elderly patients with early-stage extranodal nasal-type NK/T-cell lymphoma. Ann Oncol. 2011;22(2):390-396.
21. Liu WX, Shi M, Su H, et al. Effect of age as a continuous variable on survival outcomes and treatment selection in patients with extranodal nasal-type NK/T-cell lymphoma from the China Lymphoma Collaborative Group (CLCG). Aging (Albany NY). 2019;11(19):8463-8473.
22. Chen B, Zhu SY, Shi M, et al. Risk-dependent curability of radiotherapy for elderly patients with early-stage extranodal nasal-type NK/T-cell lymphoma: a multicenter study from the China Lymphoma Collaborative Group (CLCG). Cancer Med. 2018;7(12):5952-5961.
23. Lambert PC, Thompson JR, Weston CL, et al. Estimating and modeling the cure fraction in population-based cancer survival analysis. Biostatistics. 2007;8(3):576-594.
24. Lambert PC, Dickman PW, Osterlund P, et al. Temporal trends in the proportion cured for cancer of the colon and rectum: a population-based study using data from the Finnish Cancer Registry. Int J Cancer. 2007;121(9):2052-2059.
25. Spolverato G, Vitale A, Cucchetti A, et al. Can hepatic resection provide a long-term cure for patients with intrahepatic cholangiocarcinoma? Cancer. 2015;121(22):3998-4006.
26. Glimelius I, Ekberg S, Jerkeman M, et al. Long-term survival in young and middle-aged Hodgkin lymphoma patients in Sweden 1992-2009-trends in cure proportions by clinical characteristics. Am J Hematol. 2015;90(12):1128-1134.
27. Driessen J, Visser O, Zijlstra JM, et al. Primary therapy and relative survival in classical Hodgkin lymphoma: a nationwide population-based study in the Netherlands, 1989-2017. Leukemia. 2021;35(2):494-505.
28. Howlader N, Mariotto AB, Besson C, et al. Cancer-specific mortality, cure fraction, and noncancer causes of death among diffuse large B-cell lymphoma patients in the immunochemotherapy era. Cancer. 2017;123(17):3326-3334.
29. Bobillo S, Joffe E, Lavery JA, et al. Clinical characteristics and outcomes of extranodal stage I diffuse large B-cell lymphoma in the rituximab era. Blood. 2021;137(1):39-48.
30. Lugtenburg PJ, de Nully Brown P, van der Holt B, et al. Rituximab-CHOP with early rituximab intensification for diffuse large B-cell lymphoma: a randomized phase III trial of the HOVON and the Nordic Lymphoma Group (HOVON-84). J Clin Oncol. 2020;38(29):3377-3387.
31. Ederer F, Axtell LM, Cutler SJ. The relative survival rate: a statistical methodology. Natl Cancer Inst Monogr. 1961;6:101-121.
32. Lambert PC. Modeling of the cure fraction in survival studies. Stata J. 2007;7(3):351-375.
33. Fox CP, Civallero M, Ko Y-H, et al. Survival outcomes of patients with extranodal natural-killer T-cell lymphoma: a prospective cohort study from the international T-cell Project. Lancet Haematol. 2020;7(4):e284-e294.
34. Sehn LH, Berry B, Chhanabhai M, et al. The revised international prognostic index (R-IPI) is a better predictor of outcome than the standard IPI for patients with diffuse large B-cell lymphoma treated with R-CHOP. Blood. 2007;109(5):1857-1861.
35. Shah A, Andersson TM, Rachet B, et al. Survival and cure of acute myeloid leukaemia in England, 1971-2006: a populationbased study. Br J Haematol. 2013;162(4):509-516.
1Centre de Référence MCGRE, Service d’Hématologie-Immunologie, AP-HP, Hôpital Robert Debré, Université Paris Cité and Université des Antilles, INSERM, BIGR, Paris, France; 2French Referral Center for Sickle Cell Disease, SFGM-TC (Société Française de Greffe de Moelle et de Thérapie Cellulaire), DrepaGreffe Association, Nogent sur Marne, France; 3Stève Consultants, Oullins, France; 4bluebird bio, Inc., Somerville, MA, USA and 5Sickle Cell Referral Center, Henri Mondor Hospital, AP-HP, UPEC, Laboratory of Excellence GR-Ex, INSERM Unit 955, Mondor Institute of Biomedical Research, Paris-Est Creteil University, Creteil, France
*VB and FB contributed equally as first authors.
Correspondence: S. Benard sbenard@steve-consultants.com
Received: September 30, 2022.
Accepted: March 6, 2023.
Early view: March 16, 2023.
https://doi.org/10.3324/haematol.2022.282098
©2023 Ferrata Storti Foundation
Published under a CC BY-NC license
The burden of sickle cell disease (SCD) in France has been difficult to apprehend due to the paucity of reliable nationwide epidemiological data. We aimed to describe the epidemiology of SCD and evaluate its burden and costs. Patients with SCD and most severely affected patients were identified between 2012 and 2018 from the French National Health Data System database (SNDS, Système national des données de santé). Outcomes of interest included rates of acute and chronic complications, healthcare resource utilization and associated costs, and were compared in subpopulations of patients before and after hematopoietic stem cell transplantation, initiating hydroxyurea or a chronic transfusion program. Between 2012 and 2018, 22,619 patients with SCD were identified, among which 4,270 patients were defined as most severely affected. Rates of vaso-occlusion episodes and acute chest syndrome were 86.29 (95% confidence interval [CI]: 85.75-86.83] and 12.90 (95% CI: 12.69-13.11) per 100 person years in the study population and 166.9 (95% CI: 165.4168.4) and 22.71 (95% CI: 22.16-23.27) per 100 person years in most severely affected patients. Median (Q1-Q3) annualized total costs were €5,073.63 (range, €1,633.74-14,000.94) and €13,295.67 (range, €5,754.67-26,385.23) in the study population and most severely affected patients. Median annualized costs were ten times lower after treatment intensification for hematopoietic stem cell transplantation (€29,011.75 vs. €2,465.98; P<0.001), they slightly decreased after hydroxyurea initiation (€13,057.79 vs. €12,752.44; P=0.003) and were five times higher after chronic transfusion program initiation (€4,643.11 vs. €22,715.85; P<0.001). SCD still places a significant demand on health resources, even after therapeutic intensification.
Sickle cell disease (SCD) is the most frequent genetic disease in the world1 and is considered a major public health topic. It is caused by a single mutation in the β -globin gene, resulting in an abnormal hemoglobin S (HbS).2 The most common and impactful form of SCD is the homozygous (SS) HbSS genotype. Other forms of SCD include the association of hemoglobin S (HbS) and other genetic βglobin variants, including hemoglobin C (HbSC) or β-thalassemia (S/ β 0-thalassemia and S/ β +-thalassemia). The expression of the SCD phenotype varies greatly and can range from moderate to severe across genotypes, but also within the same genotype. Sickle carriers (HbAS), also known as patients with sickle cell trait, do not have path-
ological manifestations. In contrast, patients with SCD experience a myriad of acute and chronic events ranging from painful vaso-occlusive crises (VOC) and acute chest syndrome (ACS) to chronic complications, including organ failure, life-threatening infections and stroke.
The management of SCD relies on the prevention and treatment of SCD complications and is mainly supportive. Disease-modifying therapies for patients with SCD include chronic transfusion programs (CTP), hydroxyurea (HU), and more recently, L-glutamin, crizanlizumab in 2021, and voxelotor in 2022. Potentially curative therapy includes hematopoietic stem cell transplantation (HSCT) and gene therapies.3
SCD has a significant negative impact on the quality of life of patients and requires high levels of healthcare resource utilization, resulting in a significant economic burden.4,5
As there is limited data on the epidemiology and the burden of SCD in France, the purpose of this study was to collect up-to-date epidemiological data on SCD on a nationwide basis, to evaluate the clinical burden as well as the annual healthcare resource use and costs in patients with SCD, with a specific focus on most severely affected patients and a comparison before and after disease-modifying treatment initiation.
The French healthcare system offers universal coverage for nearly 99% of French residents in mainland France and overseas territories.6 Reimbursed medical services are captured in an exhaustive pseudonymized patient-level collection of claims data: the French National Health Data
System database (SNDS, Système national des données de santé). SNDS is a suitable tool for epidemiological and population-based medical resource utilization research.6,7 The study population consisted of patients identified in SNIIRAM (Système national d'information inter-régimes de l'Assurance maladie) from the French general healthcare insurance system, alive on or born after January 1st, 2012, with at least one SCD-related record between 2009 and 2018 (Figure 1):
-hospitalization for SCD (ICD-10 code D57 excluding D57.3sickle-cell trait);
-long duration diseases (LDD) for SCD (ICD-10 code D57);
-dispensation of phenoxymethylpenicillin for at least 6 months, initiated before 1 year of age.
CIM-10 coding theoretically allows to differentiate SCD phenotypes, but the absence of clinical data and imprecise coding led us to include all patients with SCD with no ge-

notype/phenotype distinction. In order to limit the inclusion of patients miscoded for SCD, patients susceptible to being sickle carriers were excluded (Online Supplementary Figure S2). Patients with temporary health insurance coverage, missing data for age, and twins were excluded.
Index date was the date of the first SCD-related record during the study period, or January 1st, 2012, for patients with SCD-related records prior to 2012. Patients were followed from the index date till death or December 31st, 2018.
A subgroup of most severely affected patients was defined at index date as patients meeting at least one of the following criteria:
- two VOE in the year preceding the index date or four VOE in the 2 years preceding the index date. VOE corresponded to inpatient hospitalizations (excluding daycare hospitalizations) for VOC, hepatic sequestration, splenic sequestration, severe priapism or ACS;
- six HU reimbursements with ≥6 months between the earliest and the latest HU reimbursement in the 2 years preceding the index date and with at least one VOE after the first HU reimbursement;
- six transfusion procedures within 12 months prior to the index date.
Subpopulations of patients with therapeutic intensification (defined as disease-modifying therapy treatment initiation [CPT or HU] or curative treatment [HSCT]) were defined (Figure 2). In order to ensure ensure 4 years of follow-up after the treatment intensification date (date of the first record of therapeutic intensification), patients with at least 6 months of medical history were selected between 2012 and 2014 and followed-up for 4 years or until death (Online Supplementary Figure S1). Outcomes were compared considering a 3-year period before and 4 years after the intensi fication date. In order to exclude HSCT procedure costs for HSCT patients, outcomes were compared on a period of 3 years before HSCT versus a period of 1 and 4 years after HSCT.
Quantitative values will notably de described as median,
first (Q1) and third (Q3). Quartiles correspond to value superior to that of 25% (Q1) or 75% (Q3) of the population. Rates per person years were calculated by dividing the number of events by the sum of person years. Quantitative variables were compared using paired Student’s ttest or Wilcoxon signed-rank test, depending on data distribution. Analyses were performed using SAS® 9.4 (SAS Institute Inc. Cary, NC, USA).
The prevalence of SCD was 15,203 patients in 2012 and slightly increased over the years to 21,668 patients alive in 2018 (Online Supplementary Figure S2). Overall, between 2012 and 2018, a total of 22,619 patients with SCD were identified in the national database. Among these, 2,207 patients were not covered by the general health insurance system and were excluded, resulting in a study population of 20,412 patients with SCD. A subpopulation of 4,270 most severely affected patients was identified at the index date.

Male/female sex ratio was 0.74, with 8,702 (42.6%) male and 11,710 (57.4%) female patients. Mean (standard deviation [SD]) age at the index date was 24.0 (21.0) years, and 45% of patients were younger than 18 years old. Most severely affected patients tended to be younger, with a mean age at the index date of 21.8 years (15.7) and had a men/women sex ratio of 0.89 (Table 1). Median (Q1–Q3) follow-up duration was 7.0 (4.2-7.0) years. During followup, 5.2% (n=1,062) of patients with SCD died, among whom 23.4% (n=248) were most severely affected. The median (Q1–Q3) age at death of patients with SCD was 58 (range, 39-73) years old, contrasting sharply with the age at death of 44 (range, 28-57) years in most severely affected patients.
VOC and ACS were the most frequent causes of hospitalization (Table 2), with a rate of 86.29 (95% CI: 85.75-86.83)
and 12.90 (95% CI: 12.69-13.11) per 100 person years, respectively, and a 30-day readmission rate of 19.9% and 8.7%, respectively. These events were more frequent in most severely affected patients, with 166.9 (95% CI: 165.4168.4) per 100 person years for hospitalizations for VOC and 22.71 (95% CI: 22.16-23.27) per 100 person years for
ACS, and a 30-day readmission rate of 28.9% and 9.9%, respectively.
Chronic SCD-related events prevalence increased with age (Table 3) and were more important in most severely affected patients than in the whole SCD population, with respectively 15.4% (n=656) versus 8.1% (n=1,651) for car-
Cerebrovascular symptoms include transient cerebral ischemic attacks along with intracerebral and intracranial hemorrhage. CI: confidence interval.
diovascular disease, 15.5% (n=662) versus 6.6% (n=1,351) for osteonecrosis, 13.9% (n=593) versus 4.0% (n=819) for iron overload, 7.9% (n=338) versus 6.6% (n=1,350) for kidney disease and 9.3% (n=399) versus 4.7% (n=961) for pulmonary thrombotic events.
Patients with SCD had a median of 2.0 (range, 0.3-4.4) ambulatory medical visits per year and 1.3 general practitioner visits (range, 0.0-3.3), but 21.3% and 27.9% of the total population as well as the most severely affected patients had no visits, respectively (Table 4). However, there was a median of 0.4 (range, 0.0-1.3) outpatient hospital visits per year, with 36.9% of patients not having any outpatient visits. These numbers were similar in most severely affected patients. Regarding emergency room (ER) visits, 71.4% of patients had at least one ER visit followed by a hospitalization (n=14,571) and 87.4% for most severely affected patients (n=3,733), with a median of 0.9 (range, 0.3-1.9) ER visit per year that were almost all followed by hospitalization.
Overall, 93% of patients (n=18,988) and 97.9% of most severely affected patients (n=4,179) had at least one hospitalization during follow-up, including day-care unit hospitalizations, with a median of 1.3 (range, 0.6-2.9) hospitalization per year for a cumulative duration of 3.3 (range, 2.0-5.0) days per year. This number doubled in the most severely affected patients, with 2.9 (range, 1.4-6.4) hospitalizations per year with a similar cumulative duration.
The dispensation of pain medication concerned 63.6% (n=12,992) and 81.3% of the most severely affected patients (n=3,470). HU dispensation (Siklos® and/or Hydrea®) concerned 24.8% (n=5,061) of patients and more than half of the most severely affected patients (56,0%, n=2,390). Regarding sick leaves in patients aged between 15-64 years (n=2,528), 37.9% (n=4,189) of patients had at least
one sick leave during follow-up, with a median duration of 9.1 (range, 2.8-27.4) days per year. Results were similar for most severely affected patients. The use of reimbursed medical transport concerned 39.7% (n=8,110) of patients with a median of 0.6 (range, 0.2-2.0) per year annually. Results were similar for most severely affected patients. In the study population, the median annualized total health care costs per patient were €5,073.63 (range, €1,633.74-14,000.94) and were driven at 90% by hospitalization costs with €4,140.66 (range, €1,145.06-12,114.41) (Table 5; Figure 3). Medication costs accounted for €115.19 (range, €23.30-419.36), and medical consultation costs accounted for €81.94 (range, €23.83-162.85). Total health care costs tended to be twice higher in most severely affected patients with a median of €13,295.67 (range, €5,754.67-26,385.23), similarly driven by hospitalization costs €10,983.70 (range, €4,414.01-22,403.95).
Among HSCT patients (n=70), healthcare resource utilization (HCRU) was significantly lower between 1 and 4 years after HSCT compared to 3 years before HSCT. The median number and duration of hospitalizations significantly decreased from 9.0 (range, 5.7-13.0) to 1.0 (range, 0.3-3.0) hospitalizations per year (P<0.001) and from 2.3 (range, 1.5-4.8) to 1.2 (range, 1.0-2.7) days per hospitalization (P<0.001) (Table 6). The number of ER visits followed by hospitalization decreased from 0.7 (range, 0.0-1.4) to 0.0 (range, 0.0-0.3) (P<0.001) and concerned fewer patients (73.3%, n=55 vs. 37.3%, n=28; P<0.001). Patients with pain medication dispensation decreased from 44.0% (n=33) to 24.0% (n=18) (P=0.002). The median annualized costs were ten times lower after HSCT (€29,011.75 vs. €2,465.98; P<0.001; Figure 3), mostly represented by a decrease in hospitalization costs that accounted for 96% of total costs (€26,576.97 vs. €1,915.70; P<0.001). Medication costs also decreased significantly (€216.62 vs. €132.66; P=0.035).
Among patients initiating HU (n=1,124), there were fewer ambulatory medical visits per year in the 3 years before HU initiation compared to 4 years after, with a median of 2.3 versus 3.0 (P=0.003), including general practitioner visits (1.7 vs. 2.2; P=0.004), while the number of outpatient hospital visits did not differ. Patients with a dispensation of pain medication increased from 76.2% (n=856) to 91.6% (n=1,030) (P<0.001). The proportion of patients using medical transport significantly increased after HU initiation from 40.0% (n=450) to 52.9% (n=595) (P<0.001), but the median annual number of medical transport and duration of sick leaves did not differ. Median annualized costs slightly decreased after HU initiation (€13,057.79 vs. €12,752.44; P=0.003), while median medication costs significantly increased after HU initiation (€156.68 vs €2,180.05; P<0.001).
Among patients initiating a CTP (n=210), the median
number of hospitalizations per year, including day care unit hospitalizations, significantly increased from 1.3 (range, 0.7-2.7) in the 3 years before CTP initiation to 9.0 (range, 5.7-12.7) in the 4 years following CTP initiation (P<0.001), but the hospitalizations were twice as short with a reduction from 4.0 (range, 2.5-5.5) to 2.1 (range, 1.33.5) days (P<0.001). Other HCRU significantly increased were hospitalizations after an ER visit (63.3%, n=140 vs 82.4%, n=182; P<0.001), the number of patients using pain medication (45.7%, n=101 vs. 64.3%, n=142; P<0.001) and the number of patients using medical transport that doubled (21.7%, n=48 vs 49.8%, n=110; P<0.001). The median annualized costs for patients initiating CTP were more than five times higher after CTP initiation (€4,643.11 vs. €22,715.85; P<0.001), with a significant increase in hospitalization costs (€3,054.45 vs. €19,934.54; P<0.001) and medication costs (€113.43 vs. €798.28; P<0.001).
Study population aged between 15 and 64 years (N=11,053)
Most severely affected patients aged between 15 and 64 years (N=2,505)
Q: quartile; MCO: médecine, chirurgie, obstetrique; SCD: sickle cell disease. *Opioid medication excluding morphine.
To the best of our knowledge, this is the first real-world study in France describing and comparing nationwide epidemiology, HCRU, overall costs, before and after diseasemodifying therapy and HSCT initiation. Our study highlights the progressive increase of SCD prevalence over the years, from 15,203 patients in 2012 to 21,668 in 2018, with figures in line with recent literature data reporting a prevalence between 19,800 and 32,400 patients in 2016.5 The increasing number of patients can be explained by the implementation of newborn screening for SCD, which has allowed the identification of 9,260 children with SCD since 1989,8 by the inclusion of new adults due to emigration and overall better survival of patients. Early diagnosis, followed by prophylactic measures, has allowed for better prevention of disease complications and improved quality
of care, delaying the median age of death from 35.1 years for the 1995-2010 period9,10 to 58.0 years for the 2012-2018 period. These results are in line with the global trends of improved survival in SCD,11,12 although mortality estimates for the most severely affected patients remain dramatically unimproved at 43.5 years.
Results from our study stratified by age and sex are consistent with the literature.13 The most severely affected patients were younger and had a more pronounced clinical burden, reflected by high frequencies of acute complications, including hospitalizations for VOE, ACS, and ER visits, followed by hospitalizations and pain symptoms that were captured through pain medication dispensation that concerned two-thirds of the study population and almost all of the most severely affected patients. Of note, pain medication dispensation did not include morphine treatment as the latter is not prescribed outside hospital
settings in France, in line with national guidelines that do not recommend ambulatory prescription of morphine. We confirm in this study that severe outcomes are more frequent in younger patients,5,13 with rates of complications consistent with previously reported data on VOC rates ranging between 53.91 and 142.20 VOC events per 100 person years and ACS rates between 8.8 events and 25.3 events per 100 patient years.14,15 More than half of the most severely affected required disease-modifying treatment by HU, in line with the substantial disease severity in this subgroup.

Our findings are also consistent with existing data on chronic SCD-related complications that report a prevalence of around 6% of pulmonary hypertension in adult patients, between 8% and 22% for osteonecrosis and 12% for end-stage chronic kidney disease.16,17 Expectedly, organ damage increased across age groups, notably for chronic kidney disease, pulmonary hypertension, cardiac complications, sequels of cerebrovascular events, and osteonecrosis. With 99% of children who now reach adulthood8 and around half of the patients in the study population aged under 18 years, an increasing proportion of children treated for SCD are expected to transition from pediatric to adult care, with, expectedly, an increasing burden re-
lated to chronic organ complications such as kidney or heart failure.
In addition to the important morbidity highlighted through acute and chronic complications, healthcare resource utilization was high and increased in most severely affected patients, with a median of 2.9 hospital stays per patient per year and 3.3 days per stay, corresponding to an average of 9.5 total days per year, including same-day discharge hospitalizations. These results are inferior to those from previous studies of SCD-related healthcare utilization, reporting a mean of 2.83 hospitalizations and 14.69 total days during a 12-month follow-up period,4,18 a discrepancy possibly attributable to the differing inclusion/exclusion criteria, which favored in our study specificity over sensitivity. This study also offers a perspective on the importance of ambulatory settings in the clinical follow-up of patients with 0.4 outpatient hospital visits per year and 2.0 ambulatory medical visits per year, among which 1.3 general practitioner visits, meeting the French recommendations of quarterly follow-up for optimal patient treatment pathways.19,20
The median annualized costs estimated for SCD was €5,073.63 and was coherent with reported costs in previous retrospective studies.5 Mean costs were estimated
to be €16,025.18, highlighting a wide variability of HCRU among patients with SCD, with a small fraction of patients driving a significant increase in HCRU and costs as previously observed in pediatric patients,21 notably for most severely affected patients with a median annualized total cost of €12,562.34, mainly driven by hospitalization costs. On a national scale and considering the prevalence of SCD in France, this cost per patient remains higher than cystic fibrosis, another rare genetic disease with a prevalence of 7,000 patients in France,22 which is associated with an average annual cost of €29,746,23 highlighting the significant economic burden of SCD in France. It should be noted that SNDS allows for the exact cost of medications calculation so that the figures include real-life costs, allowing to take into consideration both Siklos® and Hydrea® for the study of HU and treatment costs overall. Regarding non-transplant intensive therapeutic strategies, CTP is mainly indicated in patients with neurological complications and severely symptomatic patients despite HU, as well as acute splenic sequestration prevention in children.24,25 HU prescription practices have been described in the European, multi-centered non-interventional ESCORT-HU cohort, conducted over a 10-year period, including 1,906 participants, among which 74% were prescribed HU for VOC or ACS while 26% were treated for other nonVOC complications, including severe chronic anemia and conditional transcranial Doppler velocities.26 While the decrease in hospitalization duration after CTP initiation suggests a benefit in preventing SCD-related complications, total costs were, however, multiplied by five highlighting the burden of CTP on the healthcare system and on patients who require regular hospital attendance for same-day discharge care. Similarly, our study underlined a minor impact of HU in decreasing costs and did not capture the positive disease-modifying effects of HU therapy in reducing the overall HCRU.27–29 In line with results from real-world studies, a high economic burden was still associated with patients treated by HU.4 This burden could be partly explained by low treatment adherence since important rates of treatment discontinuation have been reported in previous studies ranging from 58.9% to 87.8%.4,30 Another explanation could pertain to the increasing severity of the disease with time, requiring more follow-up and more hospitalizations and limiting the effect of non-curative treatments, as highlighted by the ESCORT-HU cohort where initial HU dose was progressively increased in 44% of patients during follow-up because of recurrent VOC events.26 Altogether, these findings corroborate the persisting economic burden on the healthcare system following non-transplant intensive therapy initiation, with remaining acute and chronic disease-related complications and potential adverse effects such as iron overload, allo-immunization, and delayed hemolytic transfusion reactions.25
Post-HSCT median costs were ten times lower starting from the 2nd year post-HSCT (€2,465.98); however, HSCT is only available for a small subgroup of patients. Important improvements have been obtained over time with HSCT from a matched-sibling donor (MSD), reaching 98% of disease-free survival in SCD patients younger than 30 years following myeloablative conditioning regimen31 and have expanded the indications to less severe patients. Non-myeloablative conditioning regimens have allowed for an increased frequency of adult transplants, even in the presence of organ dysfunction, offering 87% chances of cure with no graft-versus-host disease (GvHD) risk.32,33 However, such transplants are still limited by the lack of matched sibling donors. Recently, haplo-identical HSCT using post-transplant cyclophosphamide has allowed to strongly increase the pool of donors.34–36 Recent results with gene therapy are also promising, giving access to a potentially curative treatment to patients with no available donor and without the risk of GvHD.
It should be noted that for all of the above-mentioned treatments, cost comparison was restricted to a few years after treatment intensification and does not reflect the lifetime cost of patients undergoing HSCT or initiating HU and CTP. Cost distribution was skewed, with a small number of patients with very high costs, driving mean costs to €23,347.75 after HSCT, €45,075.85 after CTP initiation and €20,752.06 after HU initiation. Even though the median gives a better indication of cost distribution among patients, this difference between the two measures highlights a high variability in HCRU within these subpopulations, notably among HSCT patients. Mean costs might be considered a better measure of the economic burden since the costs of these outliers are also presented for reimbursement
The use of the SNDS database allowed to include a majority of patients with SCD in France and enabled adequate power for analysis of this population, but our study has some limitations inherent to secondary database analysis. Because of the absence of genotype data, a conservative selection algorithm was used to minimize the risk of including sickle carriers miscoded for SCD, resulting in a possible underestimation of the prevalence of SCD in France. Although the general scheme of health insurance covers more than 80% of the French population,37 the overall prevalence of the disease might be underestimated regarding patients covered by other health insurance schemes. Furthermore, patients with SCD under temporary health insurance coverage (i.e., for patients who recently emigrated) were not included because of identification difficulties. The non-inclusion of this population in the study might further underestimate the population size and overall HCRU and costs. The most frequent and severe SCD genotype (SS/S β 0-thalassemia) accounts for approximately 70% of patients in France,38 while the most se-
verely affected patients in our study accounted for only 21% of the study population. This difference results from the lack of clinical and biological data in SNDS that allows to precisely estimate disease severity in clinical practice. Consequently, the definition of most severely affected patients relied on acute events and treatment utilization in a reallife setting rather than chronic comorbidities. Altogether, this resulted in a possible inclusion of non-severe patients in the most severely affected patients subgroup. The availability of both genotype data and biological variables would have allowed a more precise identification of severity profiles and assessment of the burden related to severe SCD and provided additional insights into the therapeutic management of the disease and overall burden reported in this study. Our results nevertheless confirm the severity subgroup definition and are coherent with existing literature that highlights that the most severely affected patients share characteristics that are associated with more acute and chronic pain, more hospital re-admissions and an accumulation of organ damage.39,40 Because this study is descriptive, the relationship between the severity and outcomes is yet to be demonstrated. Results for the age at death are challenged by the study design that does not allow the longitudinal follow-up of patients, causing a possible overestimation of life expectancy. Furthermore, severity status was defined on index date only, resulting in a potential underestimation of the number of most severely affected patients by not including patients whose severity status appeared during follow-up. Finally, French medicaladministrative databases do not allow to control the data validity and quality. Some studies have reported some unreliability in the ICD-10 diagnoses coded in the PMSI database.6,41 There is a risk of information bias related to coding errors in hospitalization diagnosis; however, considering the important number of patients included, this bias is expected to have a limited impact.
Despite the limitations and biases identified, this study gives a reliable overview of the current prevalence and the continuous life-long management of patients with SCD in
1. Mattioni S, Stojanovic KS, Girot R, Lionnet F. La drépanocytose en France. Rev Francoph Lab. 2016;2016(481):61-66.
2. Sundd P, Gladwin MT, Novelli EM. Pathophysiology of sickle cell disease. Annu Rev Pathol. 2019;14:263-292.
3. Carden MA, Little J. Emerging disease-modifying therapies for sickle cell disease. Haematologica. 2019;104(9):1710-1719.
4. Shah N, Bhor M, Xie L, et al. Treatment patterns and economic burden of sickle-cell disease patients prescribed hydroxyurea: a retrospective claims-based study. Health Qual Life Outcomes. 2019;17(1):155.
5. Leleu H, Arlet JB, Habibi A, et al. Epidemiology and disease burden of sickle cell disease in France: A descriptive study based on a French nationwide claim database. PLoS One.
France. The mainstay of SCD treatment remains blood transfusion or HU therapy, but SCD still places a significant demand on health resources, even more importantly in the most severely affected patients and over time. Treatment advances that address underlying disease pathogenesis and can halt acute and chronic disease manifestation are needed to improve the lives of those affected and to alleviate the associated healthcare system burden.
FB is a consultant of bluebirdbio, Pfizer and Vertex; is part of the advisory board of GBT; has received honorary from AddMedica, Anoosha Habibi; has received ASH congress funding from Addmedica; is a consultant and trainer of their team of Novartis; is a consultant of GBT and has received congress funding from GTB, was a consultant of bluebirdbio up to 2000. VB was an advisory committee member up to 2018 of Addmedica, is a consultant for Beam Therapeutics; is an advisory committee member of Forma therapeutics and GBT; was a consultant of bluebirdbio up to 2020. SB is the executive director of Steve consultants and does contract work with bluebirdbio. MG is employed by Steve consultants and does contract work with bluebirdbi. AM is employed by Steve consultants and does contract work with bluebirdbio. MG is employed by bluebirdbio.
VB and FB equally contributed to the manuscript development. VB, FB and AH drafted the manuscript. MG performed statistical analysis . All authors developed the concept and design of the research and supervised the study. All authors acquired, analyzed and interpreted data. All authors participated in the interpretation of the data, provided critical feedback and final approval for submission, and took responsibility for the accuracy, completeness, and protocol adherence of data and analyses.
All original data are included in the manuscript.
2021;16(7):e0253986.
6. Bezin J, Duong M, Lassalle R, et al. The national healthcare system claims databases in France, SNIIRAM and EGB: powerful tools for pharmacoepidemiology. Pharmacoepidemiol Drug Saf 2017;26(8):954-962.
7. Tuppin P, Rudant J, Constantinou P, et al. Value of a national administrative database to guide public decisions: From the système national d’information interrégimes de l’Assurance Maladie (SNIIRAM) to the système national des données de santé (SNDS) in France. Rev Epidemiol Sante Publique. 2017;65(Suppl 4):S149-S167.
8. Brousse V, Allaf B, Benkerrou M. Dépistage néonatal de la drépanocytose en France. médecine/sciences.
2021;37(5):482-490.
9. Gomes E, Castetbon K, Goulet V. Mortalité liée à la drépanocytose en France: Âge de décès et causes associées (1979-2010). Bull Épidémiologique Hebd. 2015;2015(8):142-150.
10. Lanzkron S, Carroll CP, Haywood C. Mortality rates and age at death from sickle cell disease: U.S., 1979–2005. Public Health Rep. 2013;128(2):110-116.
11. Quinn CT, Rogers ZR, McCavit TL, Buchanan GR. Improved survival of children and adolescents with sickle cell disease. Blood. 2010;115(17):3447-3452.
12. Platt OS, Brambilla DJ, Rosse WF, et al. Mortality in sickle cell disease. Life expectancy and risk factors for early death. N Engl J Med. 1994;330(23):1639-1644.
13. Masson E. Sévérité des patients drépanocytaires à travers la prise en charge hospitalière en France: résultats rapportés du Programme de médicalisation des systèmes d’information (PMSI). EM-Consulte. https://www.emconsulte.com/article/1292574/severite-des-patients-drepanocyt aires-a-travers-la. Accessed December 8, 2021.
14. Sysol JR, Machado R. Sickle cell disease and acute chest syndrome: epidemiology, diagnosis, management, outcomes. In: Lee JS, Donahoe MP, editors. Hematologic abnormalities and acute lung syndromes. Cham: Springer International Publishing. p67-87.
15. Shah N, Bhor M, Xie L, et al. Evaluation of vaso-occlusive crises in United States sickle cell disease patients: a retrospective claims-based study. J Health Econ Outcomes Res. 2019;6(3):106-117.
16. Powars DR, Chan LS, Hiti A, Ramicone E, Johnson C. Outcome of sickle cell anemia: a 4-decade observational study of 1056 Patients. Medicine (Baltimore). 2005;84(6):363-376.
17. Akgül F, Yalçin F, Seyfeli E, et al. Pulmonary hypertension in sickle-cell disease: comorbidities and echocardiographic findings. Acta Haematol. 2007;118(1):53-60.
18. Kauf TL, Coates TD, Huazhi L, Mody-Patel N, Hartzema AG. The cost of health care for children and adults with sickle cell disease. Am J Hematol. 2009;84(6):323-327.
19. Haute Autorité de Santé. 2006 - Prise en charge de la drépanocytose chez l’enfant .pdf. https://www.hassante.fr/jcms/c_272479/fr/prise-en-charge-de-la-drepanocytos e-chez-l-enfant-et-l-adolescent. Accessed January 12, 2022.
20. Haute Autorité de Santé. ald_10_guide_drepano_adulte_web.pdf. https://www.hassante.fr/upload/docs/application/pdf/2010-04/ald_10_guide_dre pano_adulte_web.pdf. Accessed January 25, 2022.
21. Thielen FW, Houwing ME, Cnossen MH, et al. Cost of health care for paediatric patients with sickle cell disease: an analysis of resource use and costs in a European country. Pediatr Blood Cancer. 2020;67(9):e28588.
22. Burgel P-R. Epidemiological trends of cystic fibrosis in France: 10-year perspective. Arch Pediatr Organe Off Soc Francaise Pediatr. 2016;23(Suppl 12):12S4-12S8.
23. Chevreul K, Berg Brigham K, Michel M, Rault G. Costs and health-related quality of life of patients with cystic fibrosis and their carers in France. J Cyst Fibros. 2015;14(3):384-391.
24. Howard J. Sickle cell disease: when and how to transfuse. Hematol Am Soc Hematol Educ Program. 2016;2016(1):625-631.
25. Chou ST. Transfusion therapy for sickle cell disease: a balancing act. Hematol Am Soc Hematol Educ Program. 2013;2013:439-446.
26. de Montalembert M, Voskaridou E, Oevermann L, et al. Real-Life
experience with hydroxyurea in patients with sickle cell disease: results from the prospective ESCORT-HU cohort study. Am J Hematol. 2021;96(10):1223-1231.
27. Charache S, Terrin ML, Moore RD, et al. Effect of hydroxyurea on the frequency of painful crises in sickle cell anemia. Investigators of the multicenter study of hydroxyurea in sickle cell anemia. N Engl J Med. 1995;332(20):1317-1322.
28. Rodgers GP, Dover GJ, Noguchi CT, Schechter AN, Nienhuis AW. Hematologic responses of patients with sickle cell disease to treatment with hydroxyurea. N Engl J Med. 1990;322(15):1037–1045.
29. Yawn BP, John-Sowah J. Management of sickle cell disease: recommendations from the 2014 expert panel report. Am Fam Physician. 2015;92(12):1069-1076.
30. Candrilli SD, O’Brien SH, Ware RE, Nahata MC, Seiber EE, Balkrishnan R. Hydroxyurea adherence and associated outcomes among Medicaid enrollees with sickle cell disease. Am J Hematol. 2011;86(3):273-277.
31. Bernaudin F, Dalle J-H, Bories D, et al. Long-term event-free survival, chimerism and fertility outcomes in 234 patients with sickle-cell anemia younger than 30 years after myeloablative conditioning and matched-sibling transplantation in France. Haematologica. 2020;105(1):91-101.
32. Hsieh MM, Kang EM, Fitzhugh CD, et al. Allogeneic hematopoietic stem-cell transplantation for sickle cell disease. N Engl J Med. 2009;361(24):2309-2317.
33. Hsieh MM, Fitzhugh CD, Weitzel RP, et al. Nonmyeloablative HLAmatched sibling allogeneic hematopoietic stem cell transplantation for severe sickle cell phenotype. JAMA. 2014;312(1):48-56.
34. de la Fuente J, Dhedin N, Koyama T, et al. Haploidentical bone marrow transplantation with post-transplantation cyclophosphamide plus thiotepa improves donor engraftment in patients with sickle cell anemia: results of an international learning collaborative. Biol Blood Marrow Transplant. 2019;25(6):1197-1209.
35. Bolaños-Meade J, Fuchs EJ, Luznik L, et al. HLA-haploidentical bone marrow transplantation with posttransplant cyclophosphamide expands the donor pool for patients with sickle cell disease. Blood. 2012;120(22):4285-4291.
36. Bolaños-Meade J, Cooke KR, Gamper CJ, et al. Effect of increased dose of total body irradiation on graft failure associated with HLA-haploidentical transplantation in patients with severe haemoglobinopathies: a prospective clinical trial. Lancet Haematol. 2019;6(4):e183-e193.
37. Direction de la Sécurité Sociale. Les chiffres clés de la Sécurité sociale 2019.pdf. https://www.securitesociale.fr/files/live/sites/SSFR/files/medias/DSS/2019/CHIFFRES% 20CLES%202019.pdf. Accessed December 08, 2021.
38. Brousse V, Arnaud C, Lesprit E, et al. Evaluation of outcomes and quality of care in children with sickle cell disease diagnosed by newborn screening: a real-world nation-wide study in France. J Clin Med. 2019;8(10):1594.
39. Ballas SK, Lusardi M. Hospital readmission for adult acute sickle cell painful episodes: frequency, etiology, and prognostic significance. Am J Hematol. 2005;79(1):17-25.
40. Ballas SK, Lieff S, Benjamin LJ, et al. Definitions of the phenotypic manifestations of sickle cell disease. Am J Hematol. 2010;85(1):6-13.
41. Misset B, Nakache D, Vesin A, et al. Reliability of diagnostic coding in intensive care patients. Crit Care. 2008;12(4):R95.
1School of Life Sciences, Zhengzhou University, Zhengzhou, China; 2Department of Gastroenterology, Children's Hospital affiliated to Zhengzhou University, Zhengzhou, China; 3Molecular Biology Research Center and Center for Medical Genetics, School of Life Sciences, Central South University, Changsha, China and 4Laboratory of Membrane Biology, New York Blood Center, New York, NY, USA
*ML, DL and FX contributed equally as first authors. #XA and LC contributed equally as senior authors.
Correspondence: L. Chen lxchen@zzu.edu.cn
X. An xan@nybc.org
Received: September 5, 2022.
Accepted: March 28, 2023.
Early view: April 6, 2023.
https://doi.org/10.3324/haematol.2022.282016
©2023 Ferrata Storti Foundation
Published under a CC BY-NC license
Enhancer of zeste homolog 2 (EZH2) is the lysine methyltransferase of polycomb repressive complex 2 (PRC2) that catalyzes H3K27 tri-methylation. Aberrant expression and loss-of-function mutations of EZH2 have been demonstrated to be tightly associated with the pathogenesis of various myeloid malignancies characterized by ineffective erythropoiesis, such as myelodysplastic syndrome (MDS). However, the function and mechanism of EZH2 in human erythropoiesis still remains largely unknown. Here, we demonstrated that EZH2 regulates human erythropoiesis in a stage-specific, dual-function manner by catalyzing histone and non-histone methylation. During the early erythropoiesis, EZH2 deficiency caused cell cycle arrest in the G1 phase, which impaired cell growth and differentiation. Chromatin immunoprecipitation sequencing and RNA sequencing discovered that EZH2 knockdown caused a reduction of H3K27me3 and upregulation of cell cycle proteindependent kinase inhibitors. In contrast, EZH2 deficiency led to the generation of abnormal nuclear cells and impaired enucleation during the terminal erythropoiesis. Interestingly, EZH2 deficiency downregulated the methylation of HSP70 by directly interacting with HSP70. RNA-sequencing analysis revealed that the expression of AURKB was significantly downregulated in response to EZH2 deficiency. Furthermore, treatment with an AURKB inhibitor and small hairpin RNAmediated AURKB knockdown also led to nuclear malformation and decreased enucleation efficiency. These findings strongly suggest that EZH2 regulates terminal erythropoiesis through a HSP70 methylation-AURKB axis. Our findings have implications for improved understanding of ineffective erythropoiesis with EZH2 dysfunction.
Erythropoiesis is a complex and tightly controlled cellular process that consists of early erythropoiesis, terminal erythroid differentiation, and reticulocyte maturation. During early erythropoiesis, multipotent hematopoietic stem cells proliferate and differentiate into burst-forming unit-erythroid (BFU-E) cells and colony-forming unit-erythroid (CFU-E) cells. During terminal erythroid differentiation, CFU-E cells differentiate into morphologically recognizable proerythroblasts (Pro), basophilic erythroblasts (Baso), polychromatic erythroblasts (Poly), and orthochromatic erythroblasts (Ortho).1,2 Over the last few
decades, a growing body of evidence has revealed the critical roles of epigenetic regulators in the modulation of erythropoiesis. 3 Epigenetic dysregulation has been found to be tightly associated with the onset and progression of many hematological malignancies characterized by dyserythropoiesis.4
Enhancer of zeste homolog 2 (EZH2) is the core component of polycomb repressive complex 2 (PRC2), a protein complex that catalyzes the trimethylation of histone H3 lysine 27 (H3K27me3), which regulates the expression of downstream target genes.10 In contrast to extensive studies on the function of Ezh2 in maintaining the selfrenewal of hematopoietic stem progenitor cells by sta-
Mengjia Li,1* Donghao Liu,1* Fumin Xue,2* Hengchao Zhang,1 Qianqian Yang,1 Lei Sun,1 Xiaoli Qu,1 Xiuyun Wu,1 Huizhi Zhao,1 Jing Liu,3 Qiaozhen Kang,1 Ting Wang,1 Xiuli An4# and Lixiang Chen1#bilizing the chromatin structure5,6 and the roles in regulating the quiescent hematopoietic stem cell pool by supporting their proliferation and exhaustion,7-11 only few studies have been conducted to explore the role of Ezh2 during erythropoiesis. Previous studies have shown that deletion of EZH2 results in erythroblast impairment accompanied by enhanced apoptosis.12,13 It was shown that the stable expression of EZH2 prevents erythroid precursor cell apoptosis by silencing the expression of Bim1 during the in vitro-induced differentiation of human fetal liver CD34 + hematopoietic stem cells.14 Furthermore, it has been reported that EZH2 abnormalities are associated with abnormal erythropoiesis in primary myelofibrosis (PMF), which is a hematopoietic stem cell (HSC) disease characterized by aberrant differentiation of all myeloid lineages and profound disruption of the bone marrow niche.15 Additionally, numerous recent studies have demonstrated that aberrant expression and lossof-function mutations of EZH2 are tightly associated with the pathogenesis and evolution of various myeloid malignancies characterized by dyserythropoiesis, such as MDS,16 AML,17 and MPN.18 These findings strongly suggest that EZH2 plays critical roles in the regulation of human erythropoiesis. However, the mechanism by which EZH2 modulates human erythropoiesis still remains largely unknown.
In this study, we explored the roles and mechanism of EZH2 in the regulation of human erythropoiesis by combining a short hairpin RNA (shRNA)-based knockdown strategy and treatment with a specific inhibitor to defunctionalize EZH2. We showed that EZH2 deficiency impaired cell growth and delayed differentiation during the early stage of erythropoiesis and induced the generation of cells with abnormal nuclei and decreased enucleation rates during the terminal stage. Integrated analysis of RNA sequencing (RNA-seq) and chromatin immunoprecipitation sequencing (ChIP-seq) revealed that EZH2 catalyzes histone and non-histone methylation in a stage-specific manner. During the early stage, EZH2 deficiency reduced the abundance of H3K27me3, which in turn, upregulated the expression of various cyclin-dependent kinase inhibitors (CDKI). However, during the terminal stage when histones are released from the nucleus and are degraded, EZH2 deficiency led to decreased methylation of HSP70 accompanied by decrease of aurora kinase B (AURKB). Notably, similar to EZH2 deficiency, AURKB knockdown also caused the generation of cells with aberrant nuclei and a significant decrease of enucleation rate, strongly suggesting EZH2 regulates terminal erythropoiesis via HSP70-AURKB axis. Our findings provide novel insights into the role of EZH2 in regulating human erythropoiesis and have implications in understanding ineffective erythropoiesis associated with EZH2 dysfunction.
The details of antibody usage are described in the Online Supplementary Appendix.
Erythroid differentiation of CD34+ cells and small hairpin RNA-mediated knockdown
Primary human cord blood CD34+ cells were isolated from mononuclear cells (MNC) obtained using standard density gradient centrifugation, followed by positive selection using CD34+ magnetic selective beads system (Miltenyi Biotechnology, Bergisch Gladbach, Germany) according to the manufacturer’s protocol.1 The cell culture details are described in the Online Supplementary Appendix. The detailed preparation of lentivirus, and transduction in CD34+ cells have been described previously.19
For flow cytometry analysis of H3 Lys27 trimethylation, we collected normal erythroid cells cultured on days 7, 11 and 15. Then the cells were fixed with 4% paraformaldehyde at 25°C for 10 minutes (min) and permeabilized with 0.1% Triton X-100 for 10 min. Cells were washed twice in phosphate-buffered saline (PBS) and stained with anti-Lys27Me3 antibody (Cell Signaling Technology, 9733S) for 20 min, then incubated with anti-rabbit IgG Alexa fluor 488 (Cell Signaling Technology, 2975) for 20 min, followed by fluorescence-activated cell sorting (FACS) analysis using a BD LSRFortessa™ flow cytometry.20
Drug treatment
The drugs for cell treatment were as follows. Tazemetostat (EPZ-6438, S7128) was purchased from Selleck and was added into cell culture at a final concentration of 0.5 mM and 5 mM. Barasertib (AZD1152-HQPA, AZD2811, S1147) was purchased from Selleck Chemicals dissolved in dimethyl sulfoxide (DMSO), and was used at a final concentration of 2 n Mand 10 nM. Adenosine periodate oxidized (AdOx, A7154) was purchased from Sigma-Aldrich and was used at final concentrations of 10 mM and 20 mM.
Protein immunoprecipitation and immunoblotting Cells (20×106) were collected and lysed with RIPA buffer (#89900, Thermo Fisher Scientific) supplemented with the proteinase inhibitor PMSF (#36978, Thermo Fisher Scientific) for 1 hour. Cell lysates were precleared with magnetic protein A/G beads (#1614833, Bio-Rad) for 1 hour, followed by incubation with protein A/G beads for 2 hours and finally with antibodies (EZH2, HSP70, HSP90, methylated lysine antibody, or isotype control antibody) for 12 hours at 4°C and then washed 5 times with wash buffer (same as lysis buffer). The immunoprecipitation mixture was boiled in SDS sample buffer and separated by 10% SDS-
PAGE, transferred onto a nitrocellulose membrane (#1620177, Bio-Rad), and western blotting was performed following standard protocols.
The protein bands were shown by Coomassie staining. The blue staining was removed from the SDS-PAGE gel and digested for 12 hours at 37°C with 200 ng of modified sequencing grade trypsin (Promega) in 50 mM ammonium bicarbonate buffer containing RapiGest (Waters Corporation). Digested samples were analyzed by high sensitivity liquid chromatography tandem mass spectrometry and Orbitrap fusion Lumos mass spectrometer (Thermo Fisher Scientific). The mass spectrometry proteomics data have been deposited to the ProteomeXchange Consortium via the PRIDE21 partner repository with the dataset identifier PXD039069 and PXD039198.
We performed ChIP-seq and RNA-seq and a detailed description of the data analysis is provided in the Online Supplementary Appendix.
Expression and subcellular location of EZH2 and H3K27me3 dynamically changed during erythropoiesis
We differentiated cord blood-derived CD34+ cells to erythroid cells using a three-step culture erythroid system, as shown in Figure 1A. Although erythropoiesis is a continuous process, it can be divided into two stages: early erythroid development and terminal erythroid differentiation. The cell composition of each cell category and cytoplasm were shown in the Online Supplementary Figure S1A, B. In order to investigate the function of EZH2 during human erythropoiesis, we first analyzed the expression level of EZH2 from the transcriptomics data of highly purified populations of erythroid cells from cord blood and peripheral blood at distinct stages of erythropoiesis.22 The expression of EZH2 was increased in late basophilic and polychromatic erythroblasts, but was decreased in orthochromatic erythroblasts during erythropoiesis (Online Supplementary Figure S2A, B). It is well known that EZH2 acts as a histone methyltransferase that catalyzes the modification of H3K27me3.10 We collected cells at days 7, 9, 11, 13, and 15 during the process of erythroid differentiation and detected the protein level of EZH2 and the abundance of H3K27me3 by western blot. As shown in Figure 1B, EZH2 was consistently expressed at all stages of erythroid development, while the abundance of H3K27me3 was gradually decreased. We also used flow cytometry based strategy to check the level of H3K27me3 according to previous works.20 As shown in the Figure 1C, H3K27me3 was
significantly decreased from day 7 to day 15. We further examined the location of EZH2 and H3K27me3 by immunofluorescence and western blotting on days 7, 11, and 15 (Figure 1D, E). Notably, we found that EZH2 was constantly located in the nucleus, but H3K27me3 was gradually released from the nucleus to the cytoplasm. Given that both EZH2 and H3K27me3 are located in the nucleus in early stage erythroid cells, and that H3K27me3 are predominantly present in the cytoplasm, we hypothesize that EZH2 played a critical role in modulating H3K27me3 during the early erythroid development, while EZH2 regulates cellular function in a H3K27me3-independent manner during the terminal erythroid development.
In order to test our hypotheses, we used two methods to achieve EZH2 dysfunction during early and terminal erythroid development. One strategy used a shRNA-mediated approach using a tetracycline-inducible-GFP expression system that is induced by adding doxycycline (DOX) at specific stages, and the second approach was to treat cells with EPZ6438, a specific inhibitor of EZH2 (Figure 2A). We first determined the knockdown efficiency of EZH2 in the erythroid progenitors using real-time polymerase chain reaction and western blot analysis, which was shown to be nearly 80% (Online Supplementary Figure S3A–C). EZH2 deficiency reduced the cell number of the erythroid progenitor cells by 4-fold as compared to that of the control group (Figure 2B). In order to address the causes for impaired cell growth, we examined cell apoptosis using 7-AAD and Annexin V double staining and found that the cell apoptosis rate of the control group and EZH2 knockdown group were approximately 7.29% and 7.51%, respectively. For the DMSO control, the apoptosis rate was 4.91%, while the apoptosis rate of the EPZ6438 0.5 mM and EPZ6438-5mM groups was 5.98% and 6.0%, respectively (Online Supplementary Figure S4A). There was no significant difference in the cell apoptosis rate between the control and EZH2 dysfunction groups (Online Supplementary Figure S4B). We then checked cell cycle using an EdU flow cytometry assay and we found that knockdown of EZH2 led to G1 phase cell cycle arrest of erythroid progenitors (Figure 2C). Aside from the impairment of cell growth, we further found that EZH2 knockdown also delayed the differentiation of erythroid progenitor cells with an increase in BFU-E and decreased in CFU-E (Figure 2D). We then checked the colony-forming ability of erythroid progenitors and found that the number and size of BFU-E and CFU-E clones in the control groups were significantly greater than that of EZH2-defunctionalized groups (Figure 2E). In summary, dysfunction of EZH2 impaired cell growth by arresting the cell cycle in G1 phase and delayed differentiation during early erythroid development.
Figure 1. The abundance and localization of EZH2 and H3K27me3 during erythropoiesis. (A) Schematic diagram of erythroid cell differentiation from CD34+ cells. The day of getting CD34+ cells was recorded as day 0. Early erythroid development was the first phase (day 0 to day 7), terminal erythroid development was the second and third phase (day 7 to day 15). (B) Representative western blot showing the level of EZH2 and H3K27me3 in whole cell lysates prepared from cultured erythroid cells on days 7, 9, 11, 13, and 15. Quantitative analysis of EZH2 and H3K27me3 from 3 independent experiments. The H3K27me3 signals were normalized to H3 using densitometric analysis with ImageJ software. (C) Flow cytometry analysis of H3K27me3 in normal erythroid cells cultured on days 7, 11 and 15. Quantitative analysis from 3 independent experiments showing the abundance of H3K27me3. (D) Immunofluorescence images showing the location of EZH2 and H3K27me3 (green) on days 7, 9, 11, 13, and 15. Hoechst 33342 (blue) was used to stain the nucleus. GPA (red) was used to stain the membrane of terminal erythroid cells. (E) Western blot analysis showing the location of EZH2 and H3K27me3 by extracting nuclear and cytoplasm protein. RCC1 and tubulin were used as nuclear and cytoplasmic markers, respectively. Quantitative analysis of EZH2 and H3K27me3 protein level in the nucleus and cytoplasm from 3 independent experiments. Statistical analysis is from 3 independent experiments, and the bar plot represents mean ± standard deviation of triplicate samples. ns: not significant; *P<0.05, **P<0.01, ***P<0.001.

Figure 2. Deficiency of EZH2 impaired cell growth and delayed differentiation during early stage of human erythropoiesis. (A) Schematic diagram of experiment method. The day of getting CD34+ cells was recorded as day 0. Lentivirus human CD34+ transduction at day 2. During the early stage erythroid development, small hairpin RNA (shRNA)-mediated knockdown was performed by using a tetracycline-inducible-GFP expression system, which can be induced by adding doxycycline (DOX) at day 3 or defunctionized EZH2 by treating cells with EPZ6438 at day 3. (B) Growth curves of cells, including scramble-shRNA, EZH2-shRNA, dimethyl sulfoxide (DMSO) control, EPZ6438-0.5 mM, and EPZ6438-5 mM. (C) Representative flow cytometry profiles of the cell cycle as assessed by EdU and 7-AAD staining of day 7 erythroid cells. Quantitative analysis of the cell cycle from 3 independent experiments. (D) Flow cytometry analysis of erythroid progenitor cells at day 7. The fold change of absolute progenitor cells (burst-forming unit-erythroid [BFU-E] and colony-forming unit-erythroid [CFU-E]) number. (E) Colony-forming ability of erythroid cells derived from scramble-shRNA, EZH2-shRNA, DMSO control, EPZ6438 0.5 mM, and EPZ6438 5 mM in BFU-E colony medium or CFU-E colony medium on day 6; scale bar, 200 mm. Quantitative analysis the number of BFU-E and CFU-E colonies from 3 independent experiments. Statistical analysis is from 3 independent experiments, and the bar plot represents mean ± standard deviation of triplicate samples. ns: not significant; *P<0.05, **P<0.01, ***P<0.001.

Integrated chromatin immunoprecipitation sequencing and RNA sequencing analyses of the effect of EZH2 on the early stage of erythropoiesis
In order to further confirm our conjecture and explore the mechanism of EZH2 regulating early erythropoiesis via catalyzing the formation of H3K27me3, we performed ChIP-seq and RNA-seq analyses of control and EZH2-knockdown erythroblasts cultured for 7 days (Online Supplementary Figure S5). Heat maps and corresponding profile plots of ChIP-seq displayed a significant decrease in the abundance of H3K27me3 in response to EZH2 knockdown (Figure 3A, B). We further conducted genomic feature analysis of the distribution of H3K27me3, and found that 23.57% of decreased peaks in EZH2-shRNA group had presence in the promoter regions (Online Supplementary Figure S6A). Volcano plot and heat map analysis of the RNA-seq data showed that there were approximately 696 differentially expressed genes (DEG) between the scramble-shRNA and EZH2-shRNA groups (adjusted P value <0.1), and the number of upregulated and downregulated genes in EZH2-deficient cells was 570 and 126, respectively (Online Supplementary Figure S6B, C). Gene ontology (GO) pathway enrichment analysis for DEG revealed that the upregulated genes were mainly enriched in the hemostasis and functional activation of hematopoietic cells, while the down-regulated genes predominantly enriched in metabolic pathways (Online Supplementary Figure SA, B). Box plot of integrated ChIP-seq and RNA-seq analysis showed that the upregulated expression of genes was tightly associated with the reduction of H3K27me3 in EZH2-shRNA group (Figure 3C). Further GO terms analysis showed that the upregulated genes were significantly enriched in the cell growth-associated biological processes, such as negative regulation of growth, negative regulation of cell growth, and cell growth (Figure 3D). Heat maps showed that decreased H3K27me3 signal around transcription start site (TSS) and upregulated CDK gene expression in EZH2-shRNA group (Online Supplementary Figure S8A). Furthermore, the integrated analysis also revealed enrichment peaks of H3K27me3 at the promoter region of CDKN1A and CDKN1C (Figure 3E), together with significantly upregulated mRNA expression of CDKN1A and CDKN1C (approximately 8 times) in EZH2-shRNA group (Online Supplementary Figure S8B, C). Taken together, our data show that EZH2 regulates the expression of CDK-related genes by modulating the modification of H3K27me3 and plays critical roles in the regulation of erythroid progenitor cell growth and differentiation of erythroid progenitors during early erythroid development.
of EZH2
We then further explored the roles and mechanisms through which EZH2 regulates terminal erythroid devel-
opment (Figure 4A). We first determined the knockdown efficiency of EZH2 of erythroblasts during the terminal stage of erythropoiesis using real-time polymerase chain reaction (PCR) and western blotting. We found that the knockdown efficiency of EZH2 was approximately 85% on days 11 and 15 (Figure 4B-D). By counting cell numbers from day 7 to day 15, we found that the number of cells in the control and EZH2-knockdown groups increased from approximately 1×10⁶ to about 100×106, whereas for the control and EPZ6438-treated groups, the cell numbers increased from approximately 1×10⁶ to about 130×106 (Online Supplementary Figure S9A). Then we detected cell apoptosis in the erythroblasts at days 11 and 13 using 7-AAD and Annexin V double-staining, which were analyzed by flow cytometry. The ratio of apoptotic cells in the ScrambleshRNA group increased from approximately 6.7% to 8.9%, as compared to approximately 8.9% to 10.1% in the EZH2knockdown group. For the control and EPZ6438-treated groups, the ratio of apoptotic cells increased from approximately 5.7% to 8.8% and from approximately 6.4% to 9.4%, respectively. Taken together, we found that dysfunction of EZH2 had no effect on either the cell growth or cell apoptosis (Online Supplementary Figure S9B, D). We also monitored changes in the cell cycle by an EdU incorporation assay, and we found no significant difference between the control and experimental groups (Online Supplementary Figure S9C, E). The differentiation of CFU-E cells into erythroid precursors is characterized by the surface expression of glycoprotein A (GPA), a specific marker of erythroid cells. The results showed that there was no difference in the ratio of GPA-positive cells on days 9, 11, 13, and 15 (Online Supplementary Figure S10A, B). Using α4-integrin and Band 3 as surface markers, differentiation of pro-erythroblasts to late-stage erythroblasts was detected by flow cytometry. The results showed that dysfunction of EZH2 does not affect terminal erythroid differentiation (Online Supplementary Figure S10D, E). Notably, the morphological observations indicated that both EZH2 knockdown and EPZ6438 treatment significantly increased the generation of cells with abnormal nuclei, with approximately 22% and 28% on days 13 and 15, respectively (Figure 4E; Online Supplementary Figure S10C). In addition, by using flow cytometry to check the extruded nuclei that were stained with Hoechst 33342, we found that EZH2 dysfunction also caused a dramatic decrease in the enucleation rate to approximately 15% and 20% on days 13 and 15, respectively. However, enucleation rates were approximately 30% and 50% on days 13 and 15, respectively, for the control group (Figure 4F). In conclusion, although dysfunction of EZH2 did not affect cell growth and differentiation, both knockdown of EZH2 and treatment with EPZ6438 led to significant impairment of the terminal stage of erythropoiesis by inducing the generation of erythroblasts with abnormal nuclei, which caused a reduction in the enucleation rate.
Figure 3. EZH2 regulated the CDK-related genes by modulating H3K27me3 during early stage erythropoiesis. (A) The heat maps showing the chromatin immunoprecipitation sequencing (ChIP-seq) signals of EZH2-small hairpin RNA (shRNA) (left) and scramble-shRNA (right) around TSS. (B) Representative peaks chart image showing the ChIP signals of EZH2-shRNA (blue) and scramble-shRNA (green) around TSS. (C) Box chart analysis showing downregulation of H3K27me3 gene expression. (D) Go analysis showing the functional classification of upregulation DEG by regulated of H3K27me3 after knockdown EZH2. (E) Methylation and gene expression level at CDKN1A and CDKN1C locus in scramble-shRNA and EZH2-shRNA.

Figure 4. Knockdown of EZH2 induced abnormal nuclear cells and impaired enucleation during terminal erythropoiesis. (A) Schematic diagram of experiment method. The day of getting CD34+ cells was recorded as day 0. Lentivirus transduction human CD34+ at day 2. Doxycycline (DOX) or EPZ6438 was added at day 7. (B) Quantitative real-time polymerase chan reaction (qRTPCR) results showing EZH2 expression in erythroblasts infected with lentivirus containing scramble-small hairpin RNA (shRNA) and EZH2-shRNA on days 11 and 15. (C) Representative western blot images showing the knockdown efficiency of scrambleshRNA and EZH2-shRNA on days 11 and 15. (D) Quantitative analysis the knockdown efficiency of EZH2 from 3 independent experiments. (E) Representative images of scramble-shRNA, EZH2-shRNA, diemthyl sulfoxide (DMSO) control, EPZ6438-0.5 mM, and EPZ6438-5 mM on day 15. Red arrow pointed to cells with abnormal nuclear morphology; scale bar, 5 mm. Statistical analysis of abnormal nuclear cells from 3 independent experiments. (F) Flow cytometry analysis showing the enucleation efficiency of scramble-shRNA, EZH2-shRNA, DMSO control, EPZ6438 0.5 mM, and EPZ6438 5 mM on days 11 and 15. Statistical analysis of the enucleation efficiency from 3 independent experiments. Statistical analysis is from 3 independent experiments, and the bar plot represents mean ± standard deviation of triplicate samples. ns: not significant; *P<0.05, **P<0.01, ***P<0.001.

EZH2 interacted with HSP70 and catalyzed HSP70 methylation

In order to understand the molecular mechanisms underlying EZH2 regulation of terminal erythropoiesis, we carried out a co-immunoprecipitation coupled with mass spectrometry (CoIP-MS) assay to identify proteins that interact with EZH2. As shown in Figure 5A, various non-histone proteins were found to possess the capability to bind with
EZH2, among which HSPA8, HSP90AB1, HSP90AA1, and HSPA1B were identified to have the highest binging capability. Previous studies have reported that HSPA8 and HSPA1B are members of the HSP70 family, which is an evolutionarily conserved family of ATP-dependent chaperones involved in a variety of biological processes.23-25 Both HSP90AB1 and HSP90AA1 belong to the HSP90 protein family, which are highly conserved ubiquitous molecule.26,27
Figure 5. EZH2 interacted with HSP70 and catalyzed HSP70 methylation. (A, B) Mass spectrometry analysis of proteins pulled-down by an anti-EZH2 antibody. Immunoprecipitation (IP) was performed using cell lysates collected from cultured cells on day 15 using control IgG, anti-EZH2 antibody, or anti-HSP70 and anti-HSP90 followed by immunoblotting (IB) with anti-HSP70 antibody or anti-EZH2 antibody, followed by IB with anti-HSP90 antibody or anti-EZH2 antibody. (C) Immunofluorescence images showing the co-localization of EZH2 (green) and HSP70 (red). Hoechst 33342 (blue) was used to stain the nucleus. (D) Representative western blot showing the protein level of HSP70 in cells transfected with scramble-small hairpin RNA (shRNA) or EZH2-shRNA and treated with or without EPZ6438 (0.5 mM, 5 mM). H3, and Tubulin were used as loading control. Quantitative analysis of the relative protein level of HSP70 from 3 independent experiments. (E, F) IP analysis of anti-HSP70 or anti-Methyl-K was performed followed by IB with antiMethyl-K or HSP70 in cells were transfected with scramble-shRNA and EZH2-shRNA. Statistical analysis is from 3 independent experiments, and the bar plot represents mean ± standard deviation of triplicate samples. ns: not significant; *P<0.05, **P<0.01, ***P<0.001. IgG: immunoglobulin G.
In order to verify the mass spectrometric results, we performed immunoprecipitation with an anti-EZH2 antibody followed by immunoblotting using anti-HSP70 antibody and anti-HSP90 antibodies. The results further confirmed that EZH2 can interact with both HSP70 and HSP90 proteins (Figure 5B). In order to further confirm the interaction between EZH2 and HSP70, we performed immunofluorescence staining to check the location of EZH2 and HSP70. We found that they were co-localized together in the nucleus (Figure 5C). In addition, by checking the expression of HSP70 after knockdown of EZH2, we found that the protein level of HSP70 remained unchanged in the EZH2 dysfunction group as compared to the control group (Figure 5D). Recently, it was reported that EZH2 performs a non-canonical enzymatic role by which EZH2 catalyzes the methylation of specific lysine residues of various non-histones.28,29 Thus, we speculated that, by direct binding to HSP70 and HSP90, EZH2 might exert regulatory roles by mediating the methylation of HSP70 or HSP90. By performing immunoprecipitation with a HSP70 or HSP90 antibody followed by immunoblotting using a pan-methyl lysine antibody, we found that dysfunction of EZH2 actually affected the methylation of HSP70, but not HSP90. We performed western blot analysis combined with co-immunoprecipitation to assess the function of EZH2 in HSP70 and HSP90 methylation. We found that HSP70 methylation was attenuated after EZH2 deficiency (Figure 5E, F). However, no methylation of HSP90 was detected (data not shown), suggesting that HSP90 methylation was not involved in mediating EZH2 function. In order to gain further evidence that EZH2 catalyzes HSP70 methylation, we sought to identify the potential methylation sites in HSP70 protein by mass spectrometry. As shown in Online Supplementary Figure S11, we found that in the control group there were four methylated sites of HSP70, which were Lys7, Lys9, Lys10, and Lys33, while there were no methylated sites observed on HSP70 in the EZH2-knockdown groups. All of these results strongly indicate that EZH2 can bind to HSP70, which thus, modulates the terminal stage of erythropoiesis by catalyzing methylation of HSP70.
Knockdown of EZH2 resulted in downregulation of AURKB at the transcriptional level
In order to further explore the molecular mechanisms underlying the roles of EZH2 in the regulation of terminal erythroid development, we performed RNA-seq analysis on cells in the control and EZH2-knockdown groups on day 15 (Figure 6A). Volcano and heat map analysis showed that the number of DEG were approximately 419, with approximately 166 and 253 genes upregulated and downregulated in EZH2-knockdown cells, respectively (Figure 6B, C). Downregulated genes were enriched with GO terms involved in various biological processes reported to be tightly associated with nuclear condensation and enucle-
ation, which occur specifically during the terminal stage of erythropoiesis,30-32 including chromosome segregation, organelle fission and spindle organization. Gene set enrichment analysis (GSEA) revealed that the AURKB gene, a subunit of the chromosome guest protein complex, which ensures accurate chromosome segregation and cell division, was present in most of these key pathways (Figure 6D, E). Based on the occurrence of methylation on nonhistone protein HSP70, we speculated that HSP70 methylation was tightly associated with the regulation of the expression of AURKB at the transcriptional level. In order to test this, we treated day 14 cells with or without the methyltransferase inhibitor adenosine-2 , 3 -dialdehyde (AdOx) (2 nM and 10 nM)33 and then determined the abundance of HSP70 methylation and expression of AURKB. Western blot analysis showed that global lysine methylation decreased while the protein expression of HSP70 was unchanged (Figure 7A-C). We then performed an immunoprecipitation experiment using anti-HSP70 antibody or anti-methyl-lysine antibody followed by immonblotting using an anti-methyl-lysine or anti-HSP70 antibody. As shown in Figure 7D and E, the results showed that HSP70 methylation dramatically decreased in the presence of AdOx. We further found that the transcript level of AURKB was also significantly downregulated, which was accompanied with a decrease in the methylation of HSP70 (Figure 7F). In conclusion, the decreased of AURKB transcription could be attributed to a reduction of HSP70 methylation.
Dysfunction of AURKB led to the generation of abnormal nucleus and impairment in enucleation efficiency
We then conducted experiments to examine the effects of AURKB deficiency on terminal erythropoiesis. We treated day 11 cultured normal cells with AZD2811,34 an AURKB inhibitor used at 2 nM and 10 nM or knockdown AURKB using shRNA-mediated approach on day 11. Flow cytometry analysis showed that the addition of AZD2811 had no effect on cell apoptosis at days 13 and 15 (Online Supplementary Figure S12A, B). Furthermore, there were no difference in terminal erythroid differentiation after adding AZD2811 (Online Supplementary Figure S12C, D). However, we found that addition of AZD2811 impaired the enucleation efficiency in cells on days 13 and 15. The enucleation efficiency with AZD2811 treatment was decreased nearly 15% and 28% on days 13 and 15 (Figure 8A, B), respectively. Similarly, knockdown of AURKB also decreased enucleation efficiency. Upon morphology observation, approximately 20% of the cells in the AZD2811 groups and AURKB-shRNA groups had abnormal nuclei (Figure 8C, D). These results suggested that inhibiting the function of AURKB can also cause abnormal nuclei and decreased enucleation efficiency. In summary, these findings suggested that EZH2 may regulated AURKB expression by mediating HSP70 methylation during terminal erythroid development.
Figure 6. EZH2 deficiency resulted in the downregulation of AURKB at transcriptional level. (A) Principal component analysis of samples representing 3 biologic replicates from D15 cells transfected with scramble-small hairpin RNA (shRNA) and EZH2-shRNA. (B) Volcano map showing genes with significant difference between scramble-shRNA and EZH2-shRNA group. (C) Heat map showing expression values of differentially expressed genes (DEG) between scramble-shRNA and EZH2-shRNA group. (D) The top 15 downregulated pathways revealed by gene ontology gene ontology (GO) analysis of the differentially expressed genes between scramble-shRNA and EZH2-shRNA. (E) Rank-based gene set enrichment pathways by EZH2 significantly regulated. The images of gene set enrichment analysis demonstrated the key pathways which all involved in the AURKB gene.

In this study, we are surprised to find that EZH2 regulates human erythropoiesis in a stage-specific dual function manner, by regulating early erythroid development via catalyzing H3K27me3 and modulating terminal stage development by eliciting non-histone methylation. It is important to note that terminal erythroid differentiation is a complex and highly regulated process that includes decreased nuclear size, chromatin condensation, and culminates in enucleation.31,32 Previous studies have shown that some nuclear proteins, such as histones, are exported from the erythroid precursor nucleus into the cytoplasm and ultimately degraded during terminal erythroid development.35 Our results demonstrated that H3K27me3 was exported into the cytoplasm of normal erythroblasts during maturation, whereas EZH2 was constantly localized in the nucleus during normal erythropoiesis. This finding provides a useful model to study the non-canonical roles of EZH2, such as non-histone

methylation, without interference from the classical substrate H3K27me3.
It has been reported that EZH2 deletion can affect cell proliferation through cell cycle arrest in lung cancer cells,36 mouse osteogenesis,37 breast cancer,37 and human glioma cells.37 Triviai et al. also reported that EZH2 abnormalities can promote clonal proliferation of tumorigenic hematopoietic stem cells, block the hematopoietic progenitor cell cycle, and impair erythropoiesis in PMF15. In our study, on early erythroid development, we found deficiency of EZH2 impaired cell proliferation due to cell cycle arrest in the G1 phase and delayed the differentiation of progenitor erythroid cells. Furthermore, we found that EZH2 function was dependent on H3K27me3 during early erythroid development. A previous study reported that in acute myeloid leukemia, EZH2 deletion leads to a significant reduction in the level of H3K27me3 and affects CDKI and genes related to the development and differentiation process.38 Consistent with the previous findings, our current study demonstrated that knockdown of EZH2 led to
Figure 7. Methylated HSP70 regulates the transcription of AURKB. (A) Representative western blot showing the protein level of HSP70 in cells treated with or without adenosine-2 , 3 -dialdehyde (AdOx). H3 and tubulin were used as loading control. (B) Quantitative analysis of the relative protein level of Methyl-K from 3 independent experiments. (C) Quantitative analysis of the relative protein level of HSP70 from 3 independent experiments. (D, E) Cells were treated with or without AdOx (2 nM, 10 nM) and then used in an immunoprecipitation with anti-HSP70 or anti-Methyl-K followed by immunoblotting with anti-Methyl-K or HSP70. (F) Quantitative analysis the relative mRNA expression level of AURKB from 3 independent experiments. Statistical analysis is from 3 independent experiments, and the bar plot represents mean ± standard deviation of triplicate samples. ns: not significant; *P<0.05, **P<0.01, ***P<0.001. IB: imminoblotting; IP: immunoprecipitation; IgG: immunoglublin G; DMSO: dimethyl sulf-
Figure 8. Deficiency of AURKB led to the generation of abnormal nucleus and decreased enucleation efficiency. (A) Flow cytometry analysis showing the enucleation efficiency of dimethyl sulfoxide (DMSO) control, AZD2811 2 nM, and AZD2811 10 nM on days 13 and 15. Statistical analysis of the enucleation efficiency from 3 independent experiments. (B) Flow cytometry analysis showing the enucleation efficiency of scramble-small hairpin RNA (shRNA), AURKB-shRNA1, and AURKB-shRNA2 on days 13 and 15. Statistical analysis of the enucleation efficiency from 3 independent experiments. (C) Representative cytospin images of DMSO control, AZD2811 2 nM, and AZD2811 10 nM on day 15. Red arrow pointed to cells with abnormal nuclear morphology; scale bar, 5 mm. Statistical analysis of abnormal nuclear cells from 3 independent experiments. (D) Representative cytospin images of scramble-shRNA, AURKB-shRNA1, and AURKB-shRNA2 on day 15. Red arrow pointed to cells with abnormal nuclear morphology; scale bar, 5 mm. Statistical analysis of abnormal nuclear cells from 3 independent experiments. Statistical analysis is from 3 independent experiments, and the bar plot represents mean ± standard deviation of triplicate samples. ns: not significant; *P<0.05, **P<0.01, ***P<0.001.

upregulation of cell cycle-related gene expression, including CDKN1A and CDKN1C.
In recent years, it has been shown that EZH2 not only regulates biological processes via catalyzing H3K27me3, but also modulates the transcriptional expression of genes independent of H3K27me3. Numerous studies have shown that EZH2 can modulate non-histone protein methylation in an H3K27me3-independent manner, and most of them are transcription factors (TF) and chromatin-associated proteins,29 such as STAT3,39 GATA4,29 and AR.40 Interestingly, during terminal erythroid development, we found in the present study that EZH2 knockdown had no significant effect on the proliferation, apoptosis, and differentiation, but it rather increased abnormal nuclear cells and decreased enucleation efficiency in an H3K27me3-independent manner. We found that H3K27me3 was released into the cytoplasm, while EZH2 was still in the nucleus in the late erythroid cells. Moreover, EZH2 can interact with non-histone HSP70 and HSP90. It is worth mentioning that EZH2 can only regulate HSP70 methylation. Based on these results, we conclude that the dysfunction of the late-stage cells induced by EZH2 knockdown is caused by decreasing non-histone HSP70 methylation independent of the effects of H3K27me3 on terminal erythropoiesis.
HSP70 proteins are well-known molecular chaperones involved in protein folding.41,42 Several studies have demonstrated that HSP70 can play an important regulatory role in human erythroblasts by stabilizing GATA1, a core transcription factor in the differentiation and maturation of erythroblasts.24 In our study, the result showed that although knockdown EZH2 significantly affected the methylation of HSP70, but did not affect the protein expression level of HSP70. Based on this finding, we speculated that it is very likely GATA1 is not changed in EZH2-knockdown cells. This hypothesis is supported by our western blot as well as RNA-seq analysis (Online Supplementary Figure S13A-C). It has also been reported that abnormal expression or function of HSP70 can promote ineffective erythropoiesis in β-thalassemia,43,44, MDS,23,45, and Diamond-Blackfan anemia.24,46 In addition, an increasing number of studies have revealed other functions of HSP70 chaperone proteins and linked the methylation of non-histone proteins to the regulation of gene transcription.33,47 More importantly, a previous study reported that nuclear HSP70 can directly interact with AURKB, and enhanced HSP70 lysine methylation can promote its activity.48 In the present study, we provide evidence showing that dysregulation of HSP70 methylation led to repression of AURKB expression during terminal erythroid development.
AURKB has been identified as a key component of chro-
mosome passenger complex (CPC), and inhibition of AURKB leads to impaired CPC function.49 The highly dynamic CPC is critical for various cell processes, such as chromatin condensation, chromosome orientation at the mitotic spindle and spindle assembly checkpoints, and cytoplasmic division.50 Most of these cell processes have been shown to play critical roles during the unique cell events of the terminal stage of erythropoiesis, including nuclear condensation and enucleation.
In summary, we uncovered a previously unknown mechanistic roles for EZH2 in the regulation of human erythropoiesis. We demonstrated that EZH2 can modulate normal erythropoiesis via catalyzing methylation of both non-histone and histone proteins in a stage-dependent manner. Our findings provide novel insights into understanding of the roles of EZH2 in the regulation of normal and ineffective erythropoiesis.
Disclosures
No conflicts of interest to disclose.
Contributions
XA and LC designed the overall project, analyzed the results and prepared the manuscript, with input from all coauthors. ML, DL and FX performed the experiments with assistance from QY, LS, XW and TW. HCZ performed the integrated bioinformatics analysis with assistance from XQ, JL, HZZ and QK.
Acknowledgments
The authors would like to thank LetPub (www.letpub.com) for linguistic assistance and presubmission expert review.
This work was supported, in part, by grants from the Natural Science Foundation of China (82170116, 81870094, 81870093, 81900112 and 82000121), the Program for Science & Technology Innovation Talents in Universities of Henan Province (20HASTIT039), the Key Scientific and Technological Research Projects in Henan Province (222102310012) and 2021 science and technology development plan of the Henan Province (212102310037).
Data and materials supporting the findings are available from the corresponding authors upon request. All datasets analyzed in this study are available in the GEO repository at NCBI. The accession number is GSE222115. All other relevant data supporting the key findings of this study are available within the article and its Online Supplementary Appendix.
1. Hu J, Liu J, Xue F, et al. Isolation and functional characterization of human erythroblasts at distinct stages: implications for understanding of normal and disordered erythropoiesis in vivo. Blood. 2013;121(16):3246-3253.
2. Chen K, Liu J, Heck S, Chasis JA, An X, Mohandas N. Resolving the distinct stages in erythroid differentiation based on dynamic changes in membrane protein expression during erythropoiesis. Proc Natl Acad Sci U S A. 2009;106(41):17413-17418.
3. Hewitt KJ, Sanalkumar R, Johnson KD, Keles S, Bresnick EH. Epigenetic and genetic mechanisms in red cell biology. Curr Opin Hematol. 2014;21(3):155-164.
4. Morgan MAJ, Shilatifard A. Reevaluating the roles of histonemodifying enzymes and their associated chromatin modifications in transcriptional regulation. Nat Genet. 2020;52(12):1271-1281.
5. Kamminga LM, Bystrykh LV, de Boer A, et al. The Polycomb group gene Ezh2 prevents hematopoietic stem cell exhaustion. Blood. 2006;107(5):2170-2179.
6. Ezhkova E, Pasolli HA, Parker JS, et al. Ezh2 orchestrates gene expression for the stepwise differentiation of tissue-specific stem cells. Cell. 2009;136(6):1122-1135.
7. Mochizuki-Kashio M, Mishima Y, Miyagi S, et al. Dependency on the polycomb gene Ezh2 distinguishes fetal from adult hematopoietic stem cells. Blood. 2011;118(25):6553-6561.
8. Herrera-Merchan A, Arranz L, Ligos JM, de Molina A, Dominguez O, Gonzalez S. Ectopic expression of the histone methyltransferase Ezh2 in haematopoietic stem cells causes myeloproliferative disease. Nat Commun. 2011;3:623.
9. Xie H, Xu J, Hsu JH, et al. Polycomb repressive complex 2 regulates normal hematopoietic stem cell function in a developmental-stage-specific manner. Cell Stem Cell. 2014;14(1):68-80.
10. Kheradmand Kia S, Solaimani Kartalaei P, Farahbakhshian E, Pourfarzad F, von Lindern M, Verrijzer CP. EZH2-dependent chromatin looping controls INK4a and INK4b, but not ARF, during human progenitor cell differentiation and cellular senescence. Epigenetics Chromatin. 2009;2(1):16.
11. Kamminga LM, Bystrykh LV, de Boer A, et al. The Polycomb group gene Ezh2 prevents hematopoietic stem cell exhaustion. Blood. 2006;107(5):2170-2179.
12. Mochizuki-Kashio M, Aoyama K SG, Oshima M, et al. Ezh2 loss in hematopoietic stem cells predisposes mice to develop heterogeneous malignancies in an Ezh1-dependent manner. Blood. 2015;126(10):1172-1183.
13. Aoyama K, Shinoda D, Suzuki E, et al. PRC2 insufficiency causes p53-dependent dyserythropoiesis in myelodysplastic syndrome. Leukemia. 2021;35(4):1156-1165.
14. Hu P, Nebreda AR, Hanenberg H, et al. P38alpha/JNK signaling restrains erythropoiesis by suppressing Ezh2-mediated epigenetic silencing of Bim. Nat Commun. 2018;9(1):3518.
15. Triviai I, Zeschke S, Rentel J, et al. ASXL1/EZH2 mutations promote clonal expansion of neoplastic HSC and impair erythropoiesis in PMF. Leukemia. 2019;31(1):99-109.
16. Ernst T, Chase AJ, Score J, et al. Inactivating mutations of the histone methyltransferase gene EZH2 in myeloid disorders. Nat Genet. 2010;42(8):722-726.
17. Stasik S, Middeke JM, Kramer M, et al. EZH2 mutations and impact on clinical outcome: an analysis in 1,604 patients with newly diagnosed acute myeloid leukemia. Haematologica. 2020;105(5):e228-e231.
18. Vardiman JW, Thiele J, Arber DA, et al. The 2008 revision of the
World Health Organization (WHO) classification of myeloid neoplasms and acute leukemia: rationale and important changes. Blood. 2009;114(5):937-951.
19. Yan H, Wang Y, Qu X, et al. Distinct roles for TET family proteins in regulating human erythropoiesis. Blood. 2017;129(14):2002-2012.
20. Kim W, Bird GH, Neff T, et al. Targeted disruption of the EZH2EED complex inhibits EZH2-dependent cancer. Nat Chem Biol. 2013;9(10):643-650.
21. Perez-Riverol Y, Bai J, Bandla C, et al. The PRIDE database resources in 2022: a hub for mass spectrometry-based proteomics evidences. Nucleic Acids Res. 2022;50(D1):D543-D552.
22. An X, Schulz VP, Li J, et al. Global transcriptome analyses of human and murine terminal erythroid differentiation. Blood. 2014;123(22):3466-3477.
23. Frisan E, Vandekerckhove J, de Thonel A, et al. Defective nuclear localization of Hsp70 is associated with dyserythropoiesis and GATA-1 cleavage in myelodysplastic syndromes. Blood. 2012;119(6):1532-1542.
24. Rio S, Gastou M, Karboul N, et al. Regulation of globin-heme balance in Diamond-Blackfan anemia by HSP70/GATA1. Blood. 2019;133(12):1358-1370.
25. Kampinga HH, Craig EA. The HSP70 chaperone machinery: J proteins as drivers of functional specificity. Nat Rev Mol Cell Biol. 2010;11(8):579-592.
26. Schopf FH, Biebl MM, Buchner J. The HSP90 chaperone machinery. Nat Rev Mol Cell Biol. 2017;18(6):345-360.
27. Hahn JS. The Hsp90 chaperone machinery: from structure to drug development. BMB Rep. 2009;42(10):623-630.
28. Lee JM, Lee JS, Kim H, et al. EZH2 generates a methyl degron that is recognized by the DCAF1/DDB1/CUL4 E3 ubiquitin ligase complex. Mol Cell. 2012;48(4):572-586.
29. He A, Shen X, Ma Q, et al. PRC2 directly methylates GATA4 and represses its transcriptional activity. Gen Dev. 2012;26(1):37-42.
30. Zhao B, Liu H, Mei Y, et al. Disruption of erythroid nuclear opening and histone release in myelodysplastic syndromes. Cancer Med. 2019;8(3):1169-1174.
31. Ji P, Murata-Hori M, Lodish HF. Formation of mammalian erythrocytes: chromatin condensation and enucleation. Trend Cell Biol 2011;21(7):409-415.
32. An C, Huang Y, Li M, et al. Vesicular formation regulated by ERK/MAPK pathway mediates human erythroblast enucleation. Blood Adv. 2021;5(22):4648-4661.
33. Gao WW, Xiao RQ, Peng BL, et al. Arginine methylation of HSP70 regulates retinoid acid-mediated RARβ2 gene activation. Proc Natl Acad Sci U S A. 2015;112(26):E3327-3336.
34. Harding SM, Benci JL, Irianto J, Discher DE, Minn AJ, Greenberg RA. Mitotic progression following DNA damage enables pattern recognition within micronuclei. Nature. 2017;548(7668):466-470.
35. Zhao B, Mei Y, Schipma MJ, et al. Nuclear condensation during mouse erythropoiesis requires Caspase-3-mediated nuclear opening. Dev Cell. 2016;36(5):498-510.
36. Li HS, Xu Y. Inhibition of EZH2 via the STAT3/HOTAIR signalling axis contributes to cell cycle arrest and apoptosis induced by polyphyllin I in human non-small cell lung cancer cells. Steroids. 2020;164:108729.
37. Dudakovic A, Camilleri ET, Paradise CR, et al. Enhancer of zeste homolog 2 (Ezh2) controls bone formation and cell cycle progression during osteogenesis in mice. J Biol Chem. 2018;293(33):12894-12907.
38. Tanaka S, Miyagi S, Sashida G, et al. Ezh2 augments leukemogenicity by reinforcing differentiation blockage in acute
myeloid leukemia. Blood. 2012;120(5):1107-1117.
39. Kim E, Kim M, Woo DH, et al. Phosphorylation of EZH2 activates STAT3 signaling via STAT3 methylation and promotes tumorigenicity of glioblastoma stem-like cells. Cancer Cell. 2013;23(6):839-852.
40. Xu K, Wu ZJ, Groner AC, et al. EZH2 oncogenic activity in castration-resistant prostate cancer cells is Polycombindependent. Science. 2012;338(6113):1465-1469.
41. Imamoglu R, Balchin D, Hayer-Hartl M, Hartl FU. Bacterial Hsp70 resolves misfolded states and accelerates productive folding of a multi-domain protein. Nat Commun. 2020;11(1):365.
42. Polier S, Dragovic Z, Hartl FU, Bracher A. Structural basis for the cooperation of Hsp70 and Hsp110 chaperones in protein folding. Cell. 2008;133(6):1068-1079.
43. Arlet JB, Ribeil JA, Guillem F, Hermine O, Courtois G. HSP70 regulates ineffective erythropoiesis in beta-thalassaemia. Med Sci (Paris). 2015;31(1):9-11.
44. Hermine O, Arlet JB, Ribeil JA, Guillerm F, Vandekerkhove J, Courtois G. HSP70, an erythropoiesis regulator that determines the fate of erythroblasts between death and differentiation.
Transfus Clin Biol. 2013;20(2):144-147.
45. Dong XM, Zhao K, Zheng WW, et al. EDAG mediates Hsp70 nuclear localization in erythroblasts and rescues dyserythropoiesis in myelodysplastic syndrome. FASEB J. 2020;34(6):8416-8427.
46. Gastou M, Rio S, Dussiot M, et al. The severe phenotype of Diamond-Blackfan anemia is modulated by heat shock protein 70. Blood Adv. 2017;1(22):1959-1976.
47. Wang J, Wang GG. No easy oay Out for EZH2: its pleiotropic, noncanonical effects on gene regulation and cellular function. Int J Mol Sci. 2020;21(24):9501.
48. Cho HS, Shimazu T, Toyokawa G, et al. Enhanced HSP70 lysine methylation promotes proliferation of cancer cells through activation of Aurora kinase B. Nat Commun. 2012;3:1072.
49. Adams RR, Carmena M, Earnshaw WC. Chromosomal passengers and the (aurora) ABCs of mitosis. Trends Cell Biol. 2001;11(2):49-54.
50. Petsalaki E, Zachos G. The abscission checkpoint: a guardian of chromosomal stability. Cells. 2021;10(12):3350.
The risk of venous thromboembolism (VTE) is increased in patients with severe acute respiratory syndrome coronavirus 2 (SARS-CoV-2) infection and is associated with higher mortality.1-3 Despite changes to thromboprophylaxis regimens in patients hospitalized with coronavirus disease 2019 (COVID-19), high rates of VTE have been reported in the second and third waves of COVID-19.1,3 With widespread COVID-19 vaccine availability, whether vaccination influences the risk of COVID-19-associated thromboembolism (COVID-19 TE) in ambulatory and hospitalized patients remains an important question. Here, we use data from the large UK Biobank and perform a cohort study to investigate the association between COVID-19 vaccination and COVID-19 TE. The UK Biobank is a prospective population-based study with comprehensive health and genetic data for over 500,000 participants who were recruited to the Biobank between 2006 and 2010.4 Data collection occurred from February 1, 2020 until September 30, 2021. We defined an early-pandemic, unvaccinated cohort (February 1, 2020 to December 31, 2020) and compared to patients who received a first or second dose of any COVID-19 vaccination, between January 1, 2021 and June 30, 2021 (Figure 1). Patients were characterized by age, sex, body mass index and smoking status. Participants were

excluded if demographic or health data was incomplete. Patients were evaluated for the development of COVID-19 infection, defined by a positive SARS-CoV-2 test more than 14 days after COVID-19 vaccination. COVID-19 test result data was provided to UK Biobank by Public Health England, Public Health Scotland and Secure Anonymized Information Linkage for England, Scotland and Wales, respectively. Participants were defined as hospitalized, if the SARS-CoV2 test was ordered as a hospital inpatient (which includes Accident and Emergency, hospital ward inpatients and patients in Intensive Care Units), or if the test was flagged as a hospital acquired infection. Ambulatory participants were defined as anyone receiving a positive SARS-CoV-2 test that did not meet the criteria for hospitalization.
COVID-19 TE was defined as an International Classification of Diseases (ICD)-10 code for deep vein thrombosis (i.e., I801, I802, and I822) or pulmonary embolism (i.e., I260 and I269) occurring within 90 days of COVID-19 infection.
Statistical analysis was performed using R version 4.0.3. Data is available from researchers upon request. We performed logistic regression and calculated odds ratios (OR) with 95% confidence intervals (CI) for the outcome of COVID-19 TE, adjusted by the variables of age, sex and body mass index.
The UK Biobank received ethical approval from the North West Multicenter Research Ethics Committee (11/NW/0382). All participants gave written informed consent. This research has been conducted using the UK Biobank Resource under application number 55469.
Overall, 218,915 individuals were included in the analysis, with 152,401 individuals in the early-pandemic unvaccinated cohort, 39,495 individuals in the first dose cohort, and 27,019 individuals in the second dose cohort. Demographic information is shown in Table 1. Within the unvaccinated cohort, COVID-19 was diagnosed in 13,028 patients (8.5%), compared with 3,593 (9.1%) individuals following first dose of COVID-19 vaccination, and 1,904 (7.0%) individuals following the second dose of vaccination (Table 1).
COVID-19 infection resulting in hospitalization occurred in 2,703 (20.7%) of the unvaccinated cohort, 54 (1.5%) of the first dose cohort and 39 (2%) patients of the second dose cohort. Death from COVID-19 occurred in 1.1% of the unvaccinated cohort, and 0.1% patients of both the first and second dose cohorts (Table 1).
The incidence of COVID-19 TE in the unvaccinated cohort was 1.4%, which decreased to 0.2% following the first dose of COVID-19 vaccination (OR: 0.18, 95% CI: 0.09-0.36; P<0.001) and to 0.1% after the second dose of vaccination (OR: 0.06, 95% CI: 0.02-0.26; P<0.001) (Table 1). Across the three cohorts, PE rather than DVT was the predominant type of venous thrombotic event diagnosed, and accounted for 80.1%, 87.5% and 100% of all events in the unvaccinated,
first dose and second dose cohorts, respectively. Despite the marked reduction in overall COVID-19 TE, the incidence of COVID-19 TE in hospitalized patients remained elevated. In the unvaccinated cohort, the incidence of COVID-19 TE following hospitalization for COVID-19 infection was 163 of 2,703 (6%), compared with six of 54 (11.1%) in the first dose cohort and two of 39 (5.1%) in the second dose cohort. By contrast, COVID-19 TE rates in ambulatory patients remained low across all cohorts, being diagnosed in 0.2% of the unvaccinated cohort, 0.1% of the first dose cohort, with no events diagnosed in the second dose cohort (Table 1). Our study demonstrates a marked reduction in the rate of COVID-19 TE following one or two doses of COVID-19 vaccination compared to an unvaccinated cohort. However, this reduction in COVID-19 TE appears to be largely driven by a reduction in severe COVID-19 infection requiring hospitalization. Indeed, although the number of patients requiring hospitalization for COVID-19 was markedly reduced, the incidence of COVID-19 TE in hospitalized patients remained relatively stable and was diagnosed in 6% of the early pandemic cohort, 11.1% of the first dose cohort and 5.1% of the second dose cohort. Conversely, we demonstrate that the incidence of COVID-19 TE in the first 90 days after COVID19 infection in ambulatory patients is low.
To our knowledge, this is the first study to evaluate COVID-19 TE in vaccinated individuals in both ambulatory and hospitalized patients. Recently, Xie and colleagues demonstrated that COVID-19 vaccination attenuates the
vein thrombosis COVID-19 TE by hospitalization status for COVID-19 infection, N
CI), P value
*Odds ratio adjusted by age, sex and body mass index. BMI: body mass index; CI: confidence interval; COVID-19: coronavirus disease
COVID-19 TE: COVID-19-associated thromboembolism; OR: odds ratio; SD: standard deviation; TE: thromboembolism.
risk of COVID-19 TE in the first 30 days following infection in ambulatory patients, but no hospitalized individuals were included.5 Our study, which evaluated patients until 90 days post COVID-19 infection, supports that COVID-19 vaccination is associated with a reduced risk of COVID-19 TE, which appears to be predominantly due the lower rate of hospitalization with COVID-19 infection. These findings also support the recently published randomized clinical trials evaluating the use of thromboprophylaxis in outpatients with COVID-19, that demonstrated low rates of VTE regardless of thromboprophylaxis or vaccination status.6,7
Whether COVID-19 vaccination mitigates the risk of COVID19 TE in hospitalized patients remains to be fully elucidated. Although the majority of VTE events in our study across all cohorts were diagnosed in patients who were hospitalized for COVID-19 infection, the absolute event rate was low due to a reduction in severe COVID-19 infection. Currently, several international professional society guidelines recommend therapeutic anti-coagulation for non-intensive care unit patients hospitalized with COVID-19 acute illness to prevent major thromboembolism and reduce mortality.8,9 Our results suggest that patients hospitalized with COVID19 have an elevated risk of VTE independent of vaccination status, and, thus are supportive of these guidelines. However, it will be important to prospectively validate the benefit of such anticoagulant strategies in populations with high vaccine coverage.
The strengths of this study include the large study size with access to free universal healthcare through the UK National Health Service, increasing the likelihood that COVID-19 therapies were consistent between cohorts. Limitations include the lack of available data regarding vaccination type, COVID19-specific therapeutics and anticoagulation regimens prescribed to COVID-19 cases. Due to the retrospective nature of the study and the use of ICD-10 codes, the study did not capture several patient factors, such as medical comorbidities and current medical therapies, or further information regarding VTE, which includes the type of diagnostic imaging used for VTE, the specific location of DVT, or whether the events were symptomatic in nature. Moreover, our definition of hospitalization for COVID-19 may include cases where COVID-19 was an incidental finding on routine hospital testing, and not the cause for hospitalization. Whether vaccine-induced immune thrombotic thrombocytopenia (VITT) or other vaccine-related thrombotic events were captured in the vaccinated population in this study is not known. However, the mean time from COVID-19 vaccination to COVID-19 infection was 176.4 days and 140.8 days in the first and second dose cohorts, respectively, and COVID-19 TE was diagnosed up to 90 days post infection. Given that VITT is extremely rare (reported incidence ranging from 1 in 26,000 to 2.1 in 100,000 individuals following 1 dose of ChAdOx1 nCov-19 [AstraZeneca, Sydney, NSW, Australia]), and
vaccine-related thrombotic events and VITT typically present within 30 days of vaccination, the likelihood of capturing these events is extremely low.10-12 Finally, the inclusion of a contemporaneous unvaccinated cohort is unable to be included due to the high vaccine coverage in the UK.
In summary, these findings demonstrate that the rate of COVID-19 TE is low in a large population with high vaccination rates and access to COVID-19 therapeutics. Moreover, this reduction in COVID-19 TE appears to be driven by significantly lower rates of hospitalization with COVID-19 infection. Our findings suggest that the rate of COVID-19 TE is very low in ambulatory patients, but that the risk of COVID-19 TE persists in individuals requiring hospitalization with COVID-19, regardless of vaccination status. Further clinical trials should address optimal anticoagulation strategies in the era of widespread COVID-19 vaccination.
1Department of Hematology, Alfred Hospital; 2Australian Center for Blood Diseases, Monash University; 3Atherothrombosis and Vascular Biology Program, Baker Heart and Diabetes Institute; 4Cambridge Baker Systems Genomics Initiative, Baker Heart and Diabetes Institute; 5Department of Cardiology, Alfred Hospital and 6Baker Department of Cardiometabolic Health, The University of Melbourne, Melbourne, Victoria, Australia
*HS and SRC contributed equally as first authors. #KP and JM contributed equally as senior authors.
Correspondence: J. McFadyen - james.mcfadyen@monash.edu
https://doi.org/10.3324/haematol.2022.282262
Received: October 11, 2022.
Accepted: January 17, 2023. Early view: January 26, 2023.
©2023 Ferrata Storti Foundation
Published under a CC BY-NC license
Disclosures
No conflicts of interest to disclose.
Contributions
HS contributed to the study design, analysis and interpretation of data, drafting and revision of the manuscript. SRC contributed to the study design, acquisition and analysis of data, and drafting and
Hannah Stevens,1,2,3* Sergio Ruiz-Carmona,4* Karlheinz Peter3,5,6# and James D. McFadyen1,2,3,6#revision of the manuscript. JDM contributed to the study design, interpretation of data, and drafting and revision of the manuscript. KP contributed to the study design, interpretation of data, and drafting and revision of the manuscript.
Acknowledgments
HS is supported by the Monash University Research Training
1. Katsoularis I, Fonseca-Rodriguez O, Farrington P, et al. Risks of deep vein thrombosis, pulmonary embolism, and bleeding after covid-19: nationwide self-controlled cases series and matched cohort study. BMJ. 2022;377:e069590.
2. McFadyen JD, Stevens H, Peter K. The emerging threat of (micro)thrombosis in COVID-19 and its therapeutic implications. Circ Res. 2020;127(4):571-587.
3. Dutch Covid Thrombosis Coalition, Kaptein FHJ, Stals MAM, et al. Incidence of thrombotic complications and overall survival in hospitalized patients with COVID-19 in the second and first wave. Thromb Res. 2021;199:143-148.
4. Bycroft C, Freeman C, Petkova D, et al. The UK Biobank resource with deep phenotyping and genomic data. Nature. 2018;562(7726):203-209.
5. Xie J, Prats-Uribe A, Feng Q, et al. Clinical and genetic risk factors for acute incident venous thromboembolism in ambulatory patients with COVID-19. JAMA Intern Med. 2022;182(10):1063-1070.
6. Cools F, Virdone S, Sawhney J, et al. Thromboprophylactic lowmolecular-weight heparin versus standard of care in unvaccinated, at-risk outpatients with COVID-19 (ETHIC): an open-label, multicentre, randomised, controlled, phase 3b trial. Lancet Haematol. 2022;9(8):e594-e604.
7. Barco S, Voci D, Held U, et al. Enoxaparin for primary
Program Scholarship and Wheaton Family PhD Scholarship. KP is supported by a National Health and Medical Research Council (NHMRC) L3 Investigator Research Fellowship. JDM is supported by a NHMRC and Heart Foundation Future Leader Fellowship.
Data-sharing statement
Data is available from researchers upon request.
thromboprophylaxis in symptomatic outpatients with COVID-19 (OVID): a randomised, open-label, parallel-group, multicentre, phase 3 trial. Lancet Haematol. 2022;9(8):e585-e593.
8. Spyropoulos AC, Goldin M, Giannis D, et al. Efficacy and safety of therapeutic-dose heparin vs standard prophylactic or intermediate-dose heparins for thromboprophylaxis in high-risk hospitalized patients with COVID-19: the HEP-COVID randomized clinical trial. JAMA Intern Med. 2021;181(12):1612-1620.
9. REMAP-CAP Investigators, ACTIV-4a investigators, ATTACC nvestigators, et al. Therapeutic anticoagulation with heparin in critically Ill patients with Covid-19. N Engl J Med. 2021;385(9):777-789.
10. Dix C, McFadyen J, Huang A, Chunilal S, Chen V, Tran H. Understanding vaccine-induced thrombotic thrombocytopenia (VITT). Intern Med J. 2022;52(5):717-723.
11. Greinacher A, Langer F, Makris M, et al. Vaccine-induced immune thrombotic thrombocytopenia (VITT): update on diagnosis and management considering different resources. J Thromb Haemost. 2022;20(1):149-156.
12. Hippisley-Cox J, Patone M, Mei XW, et al. Risk of thrombocytopenia and thromboembolism after Covid-19 vaccination and SARS-CoV-2 positive testing: self-controlled case series study. BMJ. 2021;374:n1931.
Ɣ-secretase inhibitors (GSI) are a potential therapeutic option for T-cell acute lymphoblastic leukemia (T-ALL) cases with a NOTCH1 mutation, but broad spectrum GSI cause severe gastro-intestinal toxicity.1 We recently demonstrated that MRK-560, a PSEN1-selective GSI, is still active against leukemia cells and does not induce gastro-intestinal toxicity.1 Here, we show that MRK-560 is synergistic with dexamethasone in T-ALL cell lines and that combination treatment prolongs survival in T-ALL patient-derived xenograft (PDX) mouse models. Moreover, we were able to further reduce leukemia development and prolong survival of T-ALL PDX mice by adding KPT8602, an XPO1 inhibitor previously shown to have antileukemia activity in T-ALL.2,3 T-ALL is an aggressive hematological cancer, which arises from the accumulation of multiple genomic lesions in hematopoietic precursor cells.4 Over the past years, the long-term survival of pediatric T-ALL has increased to almost 90% due to improved supportive care, optimization and intensification of multi-agent chemotherapy based on risk group stratification of patients.5 Although this optimized therapy also improved the outcomes of adults, the long-term survival rate in this group hovers around 50%.6 Moreover, the outcome remains poor for relapsed/refractory T-ALL and the side effects of chemotherapy, such as infections or cardiovascular impairment, also affect patients’ health.1,2,7 Therefore, there is a need for other targeted therapies, which are more efficient and less toxic compared to chemotherapy. One important therapeutic target for T-ALL is the NOTCH1 signaling pathway, since gain-of-function mutations in the NOTCH1 receptor are present in the majority of the patients.4,8
The transmembrane NOTCH1 receptor has to be cleaved by the γ-secretase complex in order to become active and to regulate gene expression of NOTCH1 downstream targets, such as HES1 9 Broad-spectrum GSI effectively inhibit NOTCH1 cleavage by the γ -secretase complex and have been tested in clinical trials for the treatment of Alzheimer and T-ALL, showing on-target dose-limiting gastro-intestinal toxicities.10,11 However, Habets et al. showed that T-ALL cells only contain PSEN1-containing γsecretase complexes, while other cell types, such as intestinal cells, express both PSEN1 and PSEN2.1 This explains the gastro-intestinal toxicity of broad-spectrum GSI and we recently demonstrated that MRK-560, a PSEN1-selective GSI, can be used to safely inhibit T-ALL
cell growth in PDX, without severe gastro-intestinal toxicities.1,2
One important remaining aspect before using PSEN1-selective GSI in clinical trials is to investigate their combinatorial effect with currently used drugs, such as dexamethasone, doxorubicin and vincristine. In the current work, we tested the combination of the PSEN1-selective GSI, MRK-560, with currently used chemotherapeutic drugs in T-ALL cell lines and PDX models. After we obtained clear synergy between MRK-560 and dexamethasone, we also tested the triplet combination MRK-560, dexamethasone and KPT-8602. KPT-8602 is a second-generation XPO1 inhibitor, which showed potent activity against ALL and is currently tested in a clinical trial for multiple myeloma (clinicaltrials gov. Identifier: NCT02649790).2,3,12
First, we determined the effect on cell viability of MRK-560 in combination with commonly used drugs by performing dose response curves in two T-ALL cell lines, DND-41 and SUPT-1 (Figure 1A; Online Supplementary Figure S1B, C). Both cell lines are sensitive to currently used drugs (dexamethasone, vincristine, doxorubicin) and are dependent on NOTCH1 signaling for survival and proliferation. DND-41 cells have a mutation in the heterodimerization and PEST domains of NOTCH1,2 while SUPT-1 cells have a NOTCH1 translocation (t7;9)(q34;q34), resulting in a truncated NOTCH1 receptor, and both still require γ-secretase cleavage to activate the NOTCH1 mutants. The majority of T-ALL cell lines are not sensitive to dexamethasone and could therefore not be used in this study.
Treatment with MRK-560 increased the sensitivity of both NOTCH1-dependent cell lines to dexamethasone, with the largest effect observed in SUPT-1 cells (Figure 1A). In order to determine if MRK-560 and dexamethasone act synergistically, we calculated the synergy or δ score for each drug combination (Figure 1B). The average synergy score for SUPT-1 cells was higher compared to DND-41, which is in line with the dose response curves (Figure 1A). As control, we included a NOTCH1-independent dexamethasone-sensitive B-ALL cell line (697 cells) for which no major difference in dexamethasone sensitivity was observed between dimethyl sulfoxide (DMSO)- and MRK560-treated cells (Online Supplementary Figure S1A), confirming the specificity of MRK-560 to NOTCH1. The same dose response curves and synergy plots were obtained for the combination between MRK-560 and other chemotherapeutic drugs (Online Supplementary Figure

Figure 1. MRK-560 synergizes with dexamethasone in T-cell acute lymphoblastic leukemia cell lines via HES1. The effect of MRK560 treatment was visible after 5-7 days and therefore, cells were always pretreated with dimethyl sulfoxide (DMSO)/MRK-560 for 5 days, followed by 24 hours (h) (quantitative polymerase chain reaction, western blot) or 48 h treatment (dose response, apoptosis) with DMSO/MRK-560 alone or in combination with dexamethasone. (A) Dose response curves for 2 NOTCH1-dependent T-cell acute lymphoblastic leukemia (T-ALL) cell lines (DND-41 and SUPT-1). The relative viability was calculated based on the DMSO condition of each pretreatment group (DMSO/MRK-560). (B) Synergy plots representing the synergy or δ-score for each combination of MRK-560 and dexamethasone in DND-41 and SUPT-1 cells. (C) Synergy mechanism between MRK-560 and dexamethasone via HES1. Dexamethasone binds to and upregulates the glucocorticoid receptor (GR). Subsequently, BIM expression increases and results in apoptosis. Besides, HES1 is a suppressor of the GR auto-upregulation and is down regulated by γ-secretase inhibitors, such as MRK-560, which further increases the expression of BIM and apoptosis. (D) Annexin-V-positive cells for DND-41 and SUPT-1 cells after treatment of 48 h with/without highly synergistic concentration of dexamethasone (DND-41: 2.5 nM dexamethasone and 1 mM MRK-560, SUPT-1: 50 nM dexamethasone and 1 mM MRK-560). (E) mRNA expression levels of the glucocorticoid receptor (NR3C1), HES1 and BIM after treatment of 24 h with/without highly synergistic concentration of dexamethasone. mRNA expression levels were normalized to housekeeping genes and the DMSO control. (F) Protein expression levels of glucocorticoid receptor (NR3C1), HES1 and BIM after treatment of 24 h with/without highly synergistic concentration of dexamethasone (DND-41: 2.5nM dexamethasone and 1 mM MRK-560, SUPT-1: 50 nM dexamethasone and 1 mM MRK-560). A loading control (β-actin) is included for all samples. All figures contain mean and standard deviation (error bars) of 3 replicates. Statistical differences were obtained after Sidak’s multiple comparisons test (one-way ANOVA). MSS: maximum synergy score for a specific drug combination; ASS: average synergy score for all drug combinations. DEXA: dexamethasone.
S1B, C). For doxorubicin and vincristine, the overall synergy score suggested an additive effect between both drugs, rather than a synergistic effect. We also noticed that higher concentrations of doxorubicin and vincristine resulted in lower synergy scores. In agreement with this, another research group has found that HES1 is necessary for doxorubicin-driven apoptosis, which could explain the antagonistic effects at higher concentrations of doxorubicin.13
A potential synergy mechanism between NOTCH1 inhibition via broad spectrum GSI and glucocorticoids was already investigated previously (Figure 1C).14,15 In order to evaluate if the same mechanism is valid for the combination between PSEN1-selective GSI MRK-560 and dexamethasone, we performed an apoptosis assay with annexin-V/PI staining (Figure 1D). Combination treatment significantly increased apoptosis by approximately 2.5fold compared to dexamethasone-only treatment in both cell lines. We further investigated the synergy mechanism from Figure 1C by measuring gene expression and corresponding protein levels of glucocorticoid receptor (NR3C1), HES1 and BIM (Figure 1E, F). Combination treatment downregulated HES1 and increased NR3C1 and BIM mRNA and protein levels in both cell lines, which further confirmed the synergy mechanism from Figure 1C. In order to study whether the observed synergy between MRK-560 and dexamethasone in vitro could also prolong survival in mice, we set up an in vivo experiment with the T-ALL PDX X10, which we engineered to express luciferase (Figure 2A; Online Supplementary Table S1).12 Drug toxicity was evaluated based on weight changes during treatment and no significant differences were observed between vehicle and treated mice (Figure 2B). In addition, the increase in human CD45+ cells in peripheral blood after treatment was delayed in mice treated with the combination, compared to single treated mice (Figure 2B). Moreover, the bioluminescent images and the corresponding
total fluxes of the different treatment groups also showed significant reduction in leukemia progression of combination versus single treatment (Figure 2C, D). These results indicate that combining MRK-560 and dexamethasone in vivo delay leukemia progression compared to MRK-560 or dexamethasone alone. This prolonged suppression of leukemia in combination-treated mice also resulted in a significant increase in survival compared to MRK-560 or dexamethasone alone (Figure 2E).
After showing synergy between MRK-560 and dexamethasone, we tested the triple combination of MRK-560, dexamethasone and the XPO1 inhibitor KPT-8602 in a second in vivo experiment (Figure 3A). The percentage of human CD45+ cells in spleen and bone marrow was significantly lower in the triple-combination treatment (Figure 3B), indicating that the triple-combination treatment is more effective for T-ALL patients. Here, we did not observe significant weight changes between double- and triple-combination treatment (Online Supplementary Figure S2A). Furthermore, we did not observe increased goblet cell counts in the gastro-intestinal tract or macroscopic skin lesions for any of the treatments, but there was a significant decrease in skin thickness after drug treatment compared to vehicle (Figure 3C, D). Overall, these results confirm a low toxicity of MRK-560 in combination with dexamethasone or KPT-8602.
Since we did not detect severe toxicity with double- or triple-combination treatment, we next performed more in vivo experiments to obtain preclinical data in five T-ALL PDX models (XB41, X12, X14, X09, XC63) with different NOTCH1 and/or FBXW7 mutations (Figure 3E; Online Supplementary Table S1). In placebo-treated mice, human leukemia cells (detected by anti-human CD45) represented >50% of peripheral white blood cells in less than 20 days, while dual combination of drugs delayed this to over 40 days and the triple combination to about 70 days (Online Supplementary Figure S2B). These effects were
Figure 2. Combination treatment with MRK-560 and dexamethasone results in a survival benefit in T-cell acute lymphoblastic leukemia patient-derived xenograft mice. (A) Schematic representation of the set-up of the in vivo experiment with patient-derived xenograft (PDX) X10-luciferase (X10-luc) sample. Twenty female immunodeficient mice (8-10 weeks old) were injected with X10-luc cells and treatment with vehicle (n=5), MRK-560 (15 mg/kg, intraperitoneally [IP], n=5), dexamethasone (5 mg/kg, IP, n=5) or the combination (n=5) was started after engraftment (0.5-1% human CD45 in blood). After treatment, mice were subjected to survival analysis and were marked as ‘death to leukemia’ when they reached 50% human CD45 in blood. (B) Percentage of weight changes compared to initial weight at start of treatment and percentage of human CD45+ cells in peripheral blood (PB) of all treatment groups at different time points. (C) Normalized bioluminescent images of each treatment group at different time points during treatment (day 7, 14 and 21) and after treatment (day 35). In order to obtain bioluminescent imaging (BLI) images, mice were anesthetized with 2% isoflurane, injected subcutaneously with D-luciferin (126 mg/kg) and imaged with the IVIS Spectrum. (D) Maximum total flux (photons/second) of the BLI figures. Statistical analysis of the maximum total flux at day 35 was performed with one-way ANOVA Sidak’s multiple comparison test. (E) Kaplan-Meier survival plots for the different treatment groups with X10-luc. The data were analyzed using log-rank Mantel-Cox statistical test. The grey color in all figures represents the treatment period. All figures show mean and standard deviation (error bars) of 5 mice (5 mice/treatment group).DEXA: dexamethasone; DMSO: dimethyl sulfoxide.

obtained with only 3 weeks of treatment. Data for MRK560 plus KPT-8602 were re-used from a previous study using the same PDX models.2 Separate graphs for each PDX sample are presented in the Online Supplementary Figure S2C. We also have to point out here that toxicity monitoring by weight of the mice did indicate significant weight loss associated with the triple-combination treatment, which requires further monitoring of possible toxicity with this treatment (Online Supplementary Figure S2B). Overall, we conclude that treatment with MRK-560 and
dexamethasone prolongs survival with 7 days compared to dexamethasone only, while the triple-treatment combination significantly increased survival with 45 or 28 days compared to vehicle or dexamethasone-only treatment, respectively (Figure 3F).
In conclusion, we demonstrate that the combination between MRK-560 and dexamethasone, a cornerstone in the current treatment of T-ALL, is synergistic and that the underlying mechanism between both drugs is comparable to previously described between broad-spectrum GSI and
Figure 3. Treatment with MRK-560/dexamethasone/KPT-8602 combination further prolongs T-cell acute lymphoblastic leukemia survival. (A) Schematic representation of the set-up of the in vivo experiment with X12 patient-derived xenograf (PDX). Twelve female immunodeficient mice (8-10 weeks old) were injected with X12 cells and treated with vehicle (n=4), double combination (MRK-560: 15 mg/kg, intraperitoneally [IP] – dexamethasone: 5 mg/kg, IP) (n=4) or the triple combination (KPT-8602: 5 mg/kg, oral gavage) (n=4) after engraftment. After 3-week treatment (5 days on – 2 days off), all mice were sacrificed. (B) Percentage of human CD45+ cells in spleen and bone marrow (BM) after 3-week treatment. (C) Images of periodic Acid-Schiff staining on intestines together with the amount of goblet cells per millimeter of villus after 3-week treatment. Scale bar, 100 mM. (D) Images of hematoxylin and eosin staining of skin section of the back of mice together with skin thickness after 3-week treatment. For each mouse, the skin thickness was measured at 5 different locations and all data points are given in this figure. Scale bar, 400 mM. (E) Schematic representation of the set-up of the in vivo experiment with different PDX models: X12, X14, XB41, X09, XC63. For each PDX sample, 5 mice were injected and divided into the 5 treatment groups after engraftment. After 3 weeks of treatment (5 days on – 2 days off) with vehicle, MRK-560 (15 mg/kg, IP), dexamethasone (5 mg/kg, IP), MRK-560 + dexamethasone or MRK560 + dexamethasone + KPT-9602 (KPT-8602: 5 mg/kg, oral gavage) mice were subjected to survival analysis and were marked as ‘death to leukemia’ when blood human CD45 levels reached 50%. (F) Kaplan-Meier survival plots, normalized to death of vehicle. This graph also include data from Govaerts et al. since the same PDX samples were used:2 vehicle and MRK-560 survival values are the average of this experiment and the ones obtained in Govaerts et al., MRK-560 and KPT-8602 combination curve was copied from Govaerts et al. The data were analyzed using log-rank Mantel-Cox statistical test. *XC63 mouse was treated with 2.5 mg/kg KPT-8602 instead of 5 mg/kg. The experiment was stopped after 98 days, the last triplet combination mouse was sacrificed and leukemia was detected in bone marrow. The grey color in all figures represent the treatment period. All graphs show mean and standard deviation (error bars). DEXA: dexamethasone; T-ALL: T-cell acute lymphoblastic leukemia; NSG: immune deficient mice (NSG strain), ns: not significant.

dexamethasone.14 Furthermore, other studies showed that co-treatment between broad-spectrum GSI and glucocorticoids can reverse the gastro-intestinal toxicity observed with these GSI and can even reverse glucocorticoid resistance.14,15 All these data suggest that MRK-560 can be safely combined with dexamethasone for the treatment for T-ALL by increasing apoptosis in leukemia cells and by
restoring dexamethasone sensitivity in resistant patients. We also showed that we can further increase survival in PDX models with different NOTCH1/FBXW7 mutations after treatment with the triple-combination therapy with MRK560, dexamethasone and the XPO1 inhibitor KPT-8602. Importantly, we observed that treatment with double- or triple-combination did not show severe toxicity on the
gastro-intestinal system. Future clinical trials are needed to determine if such drug combinations are beneficial to T-ALL patients with sub-optimal responses to chemotherapy, or if the inclusion of these targeted drugs can reduce the dose of the chemotherapeutic compounds and limit their side effects. Additionally, relapse or dexamethasone-resistant patients can benefit from this combination treatment since MRK-560 can increase the sensitivity of leukemia cells to dexamethasone.
Charlien Vandersmissen,1,2,3 Cristina Prieto,1,2,3 Olga Gielen,1,2,3 Kris Jacobs,1,2,3 David Nittner,2 Johan Maertens,3,4,5 Heidi Segers3,6,7 and Jan Cools1,2,3
1Center for Human Genetics, KU Leuven; 2Center for Cancer Biology, VIB; 3Leuvens Kanker Instituut (LKI), KU Leuven – UZ Leuven; 4Department of Hematology, UZ Leuven; 5Department of Microbiology, Immunology and Transplantation, KU Leuven; 6Department of Oncology, KU Leuven and 7Department of Pediatric Oncology, UZ Leuven, Leuven, Belgium
Correspondence:
J. COOLS - jan.cools@kuleuven.be
1. Habets RA, De Bock CE, Serneels L, et al. Safe targeting of T cell acute lymphoblastic leukemia by pathology-specific NOTCH inhibition. Sci Transl Med. 2019;11(494):1-13.
2. Govaerts I, Prieto C, Vandersmissen C, et al. PSEN1-selective gamma-secretase inhibition in combination with kinase or XPO1 inhibitors effectively targets T-cell acute lymphoblastic leukemia. J Hematol Oncol. 2021;14(1):97.
3. Vercruysse T, De Bie J, Neggers JE, et al. The second-generation exportin-1 inhibitor KPT-8602 demonstrates potent activity against acute lymphoblastic leukemia. Clin Cancer Res. 2017;23(10):2528-2541.
4. Girardi T, Vicente C, Cools J, De Keersmaecker K. The genetics and molecular biology of T-ALL. Blood. 2017;129(9):1113-1123.
5. Teachey DT, Pui CH. Comparative features and outcomes between paediatric T-cell and B-cell acute lymphoblastic leukaemia. Lancet Oncol. 2019;20(3):e142-e154.
6. Jabbour E, O’Brien S, Konopleva M, Kantarjian H. New insights into the pathophysiology and therapy of adult acute lymphoblastic leukemia. Cancer. 2015;121(15):2517-2528.
7. Trinquand A, Plesa A, Abdo C, et al. Toward pediatric T lymphoblastic lymphoma stratification based on minimal disseminated disease and NOTCH1/FBXW7 status. Hemasphere. 2021;5(10):e641.
8. Albertí-Servera L, Demeyer S, Govaerts I, et al. Single-cell DNA amplicon sequencing reveals clonal heterogeneity and evolution
https://doi.org/10.3324/haematol.2022.282144
Received: September 23, 2022.
Accepted: January 19, 2023.
Early view: January 26, 2023.
©2023 Ferrata Storti Foundation
Published under a CC BY-NC license
Disclosures
No conflicts of interest to disclose.
Contributions
CV designed the study and developed the methodology, performed experiments, analyzed data and wrote the original draft. CP developed the methodology, supervised the study and wrote the original draft. OG, KJ and DN performed experiments. JM and HS collected human T-ALL samples. JC designed the study and methodology, supervised the study and wrote the original draft.
Funding
This project was funded by the Belgian Foundation Against Cancer (2020-100 to JC) and KU Leuven (grant C14/18/104 to JC, HS and JM). CP was supported by the Flanders research foundation (FWO).
Data-sharing statement
The data is available by contacting the corresponding author.
in T-cell acute lymphoblastic leukemia. Blood. 2021;137(6):801-811.
9. Tosello V, Ferrando AA. The NOTCH signaling pathway: role in the pathogenesis of T-cell acute lymphoblastic leukemia and implication for therapy. Ther Adv Hematol. 2013;4(3):199-210.
10. Coric V, Salloway S, Van Dyck CH, et al. Targeting prodromal Alzheimer disease with avagacestat: a randomized clinical trial. JAMA Neurol. 2015;72(11):1324-1333.
11. Deangelo D, Stone R, Silverman L, et al. A phase I clinical trial of the notch inhibitor MK-0752 in patients with T-cell acute lymphoblastic leukemia/lymphoma (T-ALL) and other leukemias. J Clin Oncol. 2006;24(Suppl 18):S685.
12. Verbeke D, Demeyer S, Prieto C, et al. The XPO1 inhibitor KPT8602 synergizes with dexamethasone in acute lymphoblastic leukemia. Clin Cancer Res. 2020;26(21):5747-5758.
13. Huang Z, Lin S, Long C, et al. Notch signaling pathway mediates Doxorubicin-driven apoptosis in cancers. Cancer Manag Res. 2018;10:1439-1448.
14. Real PJ, Tosello V, Palomero T, et al. Gamma-secretase inhibitors reverse glucocorticoid resistance in T-ALL. Nat Med. 2009;15(1):50-58.
15. Samon JB, Castillo-Martin M, Hadler M, et al. Preclinical analysis of the γ-secretase inhibitor PF-03084014 in combination with glucocorticoids in T-cell acute lymphoblastic leukemia. Mol Cancer Ther. 2012;11(7):1565-1575.
Menin inhibition has antileukemia activity in both, mixedlineage leukemia-rearranged (MLL-r) and nucleophosmin (NPM1)-mutant (NPM1c) acute myleoid leukemia (AML)1-5 by suppressing the menin-dependent HOX/MEIS gene signature.6 Menin inhibitors are in clinical development in hematological malignancies with these genomic alterations. While initial clinical results indicate efficacy in MLL-r and NPM1c AML, menin inhibition combined with other targeted agents has potential to enhance efficacy. FLT3 is frequently mutated in MLL-r and NPM1c AML. Coinhibition of menin and FLT3 preclinically showed enhanced activity in MLL-r/FLT3- and NPM1/FLT3-mutant AML.7,8 We recently reported that menin inhibition by SNDX-50469 synergized with BCL-2 inhibition by venetoclax in vitro in NPM1/FLT3-mutant primary AML cells and in vivo in a patient-derived xenograft (PDX) model of AML with NPM1/FLT3-ITD/FLT3-TKD mutations, resulting in significant survival extension.9 Others have since reported that menin and BCL-2 inhibitor combinations synergize against MLL-r and NPM1c AML.10 In agreement with reports that menin inhibition targets FLT3 in NPM1/FLT3-mutated AML, we previously showed that SNDX-50469 reduces pFLT3 and that the combination of SNDX-50469 and venetoclax enhances this reduction in NPM1/FLT3-mutant patient cells in vitro. Interestingly, we observed that cells surviving the SNDX-50469/venetoclax combination at the end of treatment had increased p-FLT3 signaling in vivo in a NPM1c/FLT3-ITD/FLT3-TKD PDX model.9 This increase in p-FLT3 likely increased MCL-1 and contributed to leukemia outgrowth. We therefore investigated whether adding FLT3 inhibitor gilteritinib could enhance the activity of SNDX-50469 and venetoclax combination. We here report that combined inhibition of menin, BCL-2, and FLT3 has superior antileukemia activities in NPM1/FLT3-mutated AML in vitro and in vivo and that the combination effectively reduces BCL-2 and HOX9/MEIS expression and is potentially curative in a NPM1/FLT3-mutated AML model, in which efficacy is further enhanced in combination with 5-azacitidine.
Mononuclear cells from NPM1-/FLT3-mutant AML patients (all had additional co-mutations and 3/4 were resistant to venetoclax and FLT3 inhibitors; Online Supplementary Table S1) co-cultured with bone marrow (BM)-derived stromal cells were treated with two doses of SNDX-50469,
gilteritinib, venetoclax, or combinations. SNDX-50469/gilteritinib/venetoclax combination at one- or two-dose levels significantly increased apoptosis (Figure 1A) and decreased viable cell numbers (Figure 1B) compared to control, single-drug, or two-drug combinations in blasts and CD34+ AML stem/progenitor cells. SNDX-50469/gilteritinib/venetoclax/5-azacitidine was equally and possibly more effective than the triple-drug combination (Figure 1). The experiment in mice was conducted using the same PDX model (NPM1c/FLT3-ITD/FLT3-TKD) employed in our prior SNDX-50469/venetoclax combination study.9 When circulating human (hu) CD45+ cells reached 2.6%, the PDXbearing NSG mice were treated: i) vehicle, ii) SNDX-50469 (0.1% in chow), iii) gilteritinib (35 mg/kg), iv) SNDX50469/gilteritinib, v) gilteritinib/venetoclax (50 mg/kg), vi) SNDX-50469/gilteritinib/venetoclax, or vii) SNDX-50469/gilteritinib/venetoclax/5-azacytidine (2.5 mg/kg) (Figure 2A). Due to weight loss in mice treated with the triple-drug (1 died on treatment day 8) and quadruple-drug combinations (2 died on treatment day 7) (excluded in subsequent analysis), gilteritinib was reduced from 35 to 25 mg/kg and venetoclax was reduced from 50 to 35 mg/kg in these two groups beginning on treatment day 10, which prevented further weight loss (Online Supplementary Figure S1). Disease progression and treatment response were assessed by flow cytometric measurement and/or immunohistochemical staining of huCD45+ cells in peripheral blood or tissues collected at the end of the treatment (31 days) or at the moribund stage. In order to assess the treatment effects on leukemia blasts and phenotypicallydefined leukemia stem/progenitor cells and proteins in BM leukemia cell populations, we performed cytometry by time of flight (CyTOF) single-cell proteomic analysis11 using an antibody panel described previously9 with additional antibodies against HOXA9, MEIS1, and PBX3. At 2 weeks, all treatment arms significantly lowered the circulating huCD45+ cells compared to vehicle controls, and gilteritinib and gilteritinib/venetoclax greatly enhanced the activity of SNDX-50469 (Figure 2B). At 4 weeks, all treatment groups had significantly reduced circulating blasts compared to controls; no significant differences between treatment groups were observed (Figure 2C). Post-treatment assessments showed that all treatment groups had significantly lower splenic leukemia
Figure 1. The combined inhibition of menin, BCL-2, and FLT3 exerts strong antileukemia activity in acute myeloid leukemia cells and stem/progenitor cells from patients with NPM1-/FLT3-mutant acute myeloid leukemia. Peripheral blood cells from patients with NPM1-/FLT3-mutant acute myeloid leukemia (AML) were co-cultured with bone marrow (BM)-derived stromal cells and treated with venetoclax (VEN), SNDX-50469 (SNDX), gilteritinib (GTN), 5-azacytidine (5-Aza), or various combinations for 24 hours (h). Apoptosis (Annexin V+) (A) and viable cells (B) in CD45+ and CD34+ cell populations were determined by flow cytometry.11 Samples were obtained after acquiring written informed consent following MD Anderson Cancer Center Institutional Review Board approved protocol and in accordance with the Declaration of Helsinki. CON: control.

burdens than controls; SNDX-50469, SNDX-50469/gilteritinib, and SNDX-50469/gilteritinib/venetoclax were significantly more active than gilteritinib; and SNDX50469/gilteritinib/venetoclax was more effective than SNDX-50469 and SNDX-50469/gilteritinib but did not reach statistical significance (Figure 2D). These results were consistent with the observed reduction in spleen sizes. All treatment groups had significantly lower BM leukemia burden than controls; of these treatment groups, gilteritinib was least effective and did not enhance the activity of SNDX-50469, which was significantly more active than gilteritinib. The percentage of BM leukemia cells in the SNDX-50469/gilteritinib/venetoclax group was significantly lower than those in all other treatment groups (Figure 2E).
All treatments significantly extended survival (Figure 2F) compared with controls (median survival duration 62 days). SNDX-50469 (survival duration 128 days) was significantly more effective than gilteritinib (survival duration 90.5 days).
Control and SNDX-50469–treated mice had survival durations similar to those observed in our previous study.9 The

survival duration of the gilteritinib/venetoclax (121 days) and SNDX-50469/gilteritinib groups did not differ in this model. Even with reduced gilteritinib and venetoclax doses, the SNDX-50469/gilteritinib/venetoclax combination extended survival (survival duration >235 days) significantly longer than SNDX-50469, gilteritinib, SNDX-50469/gilteritinib, or venetoclax/gilteritinib, which was also superior than survival benefit achieved with the SNDX-50469/venetoclax combination (survival duration 143 days).9 The survival benefit is closely reflected in reductions observed in the BM leukemia burden, which supports the importance of BM blast reduction/elimination in this model.
Venetoclax as a single agent has limited clinical activity in resistant/relapsed AML.12 Elderly AML patients have high response rates to venetoclax/hypomethylating agent combinations.13 In order to determine if hypomethylating agents further improve survival, we also treated mice with SNDX50469/gilteritinib/venetoclax plus 5-azacytidine. The median survival duration had not been reached when the experiment was terminated on day 414. One mouse treated with the quadruple-drug combination (*, Figure 2F) survived
Figure 2. The combined inhibition of menin, BCL-2, and FLT3 exerts strong antileukemia activity and prolongs survival in an NPM1c/FLT3-ITD/TKD acute myeloid leukemia patient-derived xenograft model . Experiments in mice were conducted in accordance with Institutional Animal Care and Use Committee approved protocols. (A) The experimental scheme. (B-E) Percentages of human (hu) CD45+ in the peripheral blood at 2 weeks (B) and 4 weeks (C) and in the spleen (D) and bone marrow (BM) (E) at the end of treatment, as determined by flow cytometry. Spleens harvested at the end of the treatment are also shown in (D). (F) Survival by treatment type. Mouse survival was estimated using the Kaplan-Meier method, and survival data were analyzed using the log-rank test. (G) Immunohistochemical staining for huCD45. Left, immunohistochemical staining for huCD45 in BM cells from a patient-derived xenograft (PDX)-bearing NSG mouse (positive control) and BM cells from a non–PDX-bearing NSG mouse (negative control). Right, immunohistochemical staining for huCD45 in lung, liver, and heart tissues from a mouse treated with the quadruple-drug combination (marked * in [F]). Differences between groups were determined using the Student t-text. P values ≤0.05 were considered statistically significant. *P≤0.05; **P≤0.01; ***P≤0.001; ****P≤0.0001. M: million; d: day; wk: week; PB: peripheral blood; SNDX: SNDX-50469; Gil: gilteritinib; VEN: venetoclax; 5-AZA: 5-azacitidine.
258 days with a minimal leukemia burden in the BM (0.06%) and spleen (0.15%) and no huCD45+ cells were detected in the lungs, liver, or heart (Figure 2G). Importantly, two of six mice in the triple- and three of five mice in the quadrupledrug treatment groups lived close to the life expectancy of normal NSG mice with no detectable leukemia cells in the spleen or BM (Online Supplementary Table S2) when the experiment was terminated suggesting that these combinations eliminated all leukemia cells resulting in cure. CyTOF analysis clustered BM leukemia cells at the end of therapy based on cell surface antigen expression patterns (Figure 3A). The percentages of viable leukemia blasts and phenotypic stem/progenitor cells in the treatment groups and the cell populations in representative mice from each group are shown in Figure 3B, C, respectively. As we reported previously,9 SNDX-50469 is more active in CD34+CD38+ and CD34+CD38+CD123+ cell populations, except for CD34+CD38+CD123+Tim3+ cells, than CD34+CD38-, CD34+CD38-CD123+, or CD34+CD38-CD123+Tim3+ populations, which are more sensitive to gilteritinib. The SNDX50469/gilteritinib combination did not exhibit enhanced activity compared to either agent alone, but the triple-drug combination greatly reduced the number of leukemia blasts and stem/progenitor cells.
Protein expression data of BM leukemia cells at the end of treatment are shown in Figure 3D. Consistent with studies showing the effects of SNDX-50469 on RNA levels in Molm13 cells,5 CyTOF analysis revealed that cells treated with SNDX-50469 and SNDX-50469/gilteritinib exhibited reduced expression of MEIS1 and PBX3 proteins and to a lesser degree of HOXA9, in vivo. Cells treated with SNDX50469/gilteritinib/venetoclax showed markedly reduced expression of HOXA9, and more profound reductions of MEIS1, PBX3, BCL-2, BCL-2A1, and BCL-XL than cells treated only with SNDX-50469, consistent with the efficacy of the triple-drug combination. As expected, SNDX-50469 increased CD11b expression, indicative of differentiation. Enhanced in vivo efficacy of combining menin and FLT3 inhibitors was observed in MLL-r/FLT3 mutant AML7,8 and to a lesser degree in NPM1/FLT3 mutant AML.8 SNDX50469/gilteritinib was more effective than SNDX-50469 in reducing circulating blast numbers at week 2, but it neither reduced the BM leukemia burden nor did it improve survival compared to SNDX-50469. It is unclear whether this discrepancy is due to different models. One possibility is that cells became less sensitive to SNDX-50469/gilteritinib over time. Indeed, at the end of treatments, SNDX50469/gilteritinib-treated cells showed increased β-cate-


Figure 3. Menin, FLT3, and/or BCL-2 inhibition targets leukemia cells and stem/progenitor cells and modulates HOX/MEIS/PBX3 and BCL-2 protein levels. PhenoGraph was used to cluster cell populations according to cell surface marker expression. Cisplatin-low viable single cells were gated with FlowJo software (version 10.7, FlowJo LLC) and exported as flow cytometry standard (FCS) data for subsequent analysis in Cytofkit.14 Cell populations identified and embedded by PhenoGraph in the “Cytofkit_analyzedFCS” files were gated in FlowJo to quantify marker expression. ArcSinh-transformed counts for each protein expression in desired cell populations were visualized with heat maps. (A) Clusters of leukemia cells and leukemia stem/progenitor cells. (B) Percentages of viable leukemia cells and leukemia stem/progenitor cells in each treatment group. (C) Human (hu) CD45 cells in the treatment groups. (D) Protein expression in huCD45+ cells in the treatment groups. Antibodies against PBX3, MEIS1, or HOXA9 were obtained from Proteintech (12571-1-AP), Origene (CF809622, clone OTl1B4), and Abcam (ab191178), respectively. The other antibodies are as previously described.9 Cells were collected at the end of treatment from mouse BM. CON: control; SNDX: SNDX50469; Gil: gilteritinib; VEN: venetoclax.
nin and BCL-XL expression compared to SNDX-50469 or gilteritinib, which were largely eliminated in the tripledrug-treated group (Figure 3). Our findings demonstrate that co-inhibition of menin, BCL-2, and FLT3 has profound activity against AML and AML stem progenitor cells with NPM1c/FLT3-ITD/-TKD mutations in vitro and in vivo. This combination reduces the HOX/MEIS signature and antiapoptotic BCL-2 proteins, resulting in major survival benefit. The quadruple combination of SNDX-50469/gilteritinib/ venetoclax/5-azacytidine resulted in cures of >50% of mice carrying triple-mutant human AML cells. Note, the tripledrug and quadruple-drug combination groups were treated with decreased doses of gilteritinib and venetoclax compared to single- or double-agent treatment groups. These combinations were well tolerated for extended time periods, after dose reductions, attesting to their tolerability and efficacy.
In the triple-drug combination group, residual leukemia cells were still characterized by increased p-FLT3/MCL-1 levels, although total FLT3 levels were decreased. Whether p-FLT3/MCL-1 was inhibited in the quadruple-drug combination group was not determined. Nevertheless, three of five mice in the quadruple-, and two of six mice in the triple-drug combination group lived close to the life expectancy of normal NSG mice with no detectable leukemia cells at termination of the experiment after >400 days suggesting, but not fully establishing a potential benefit of added 5-azacitidine to the triple-drug combination. Results warrant the clinical development of concomitant inhibition of menin, BCL-2, and FLT3 combined with or without a hypomethylating agent in NPM1-/FLT3-mutated AML.
Bing Z. Carter,1 Po Yee Mak,1+ Wenjing Tao,1+ Lauren B. Ostermann,1 Duncan H. Mak,1 Baozhen Ke,1 Peter Ordentlich,2 Gerard M. McGeehan,2 and Michael Andreeff1
1Section of Molecular Hematology and Therapy, Department of Leukemia, The University of Texas MD Anderson Cancer Center, Houston, TX and 2Syndax, Waltham, MA, USA
+PYM and WT contributed equally as second authors.
Correspondence:
B.Z. CARTER - bicarter@mdanderson.org
M. ANDREEFF -mandreef@mdanderson.org
https://doi.org/10.3324/haematol.2022.281927
Received: August 10, 2022.
Accepted: January 20, 2023.
Early view: February 2, 2023
©2023 Ferrata Storti Foundation
Published under a CC BY-NC license
Disclosures
BZC received research funding from Syndax. GM and PO are employees of Syndax. MA is a consultant for Syndax.
Contributions
BZC conceptualized the study, analyzed data, and wrote the manuscript. PYM, WT and LBO performed experiments and analyzed data. DHM and BK performed experiments. GMM and PO discussed the study concept, provided materials, and edited the manuscript. MA conceptualized the study, interpreted the data, and edited the manuscript.
Acknowledgments
We thank Joe Munch in the MD Anderson’s Research Medical Library for editing the manuscript and Deanna Alexander for assisting with the manuscript submission.
Funding
This work was supported in part by research funding from Syndax (to BZC); by the National Institutes of Health through MD Anderson’s Cancer Center Support Grant (P30CA016672) of Flow Cytometry/Image Core; and by the Paul and Mary Haas Chair in Genetics (to MA).
Materials described in the manuscript, including all relevant raw data, is freely available to any researcher wishing to use them for noncommercial purposes, without breaching participant confidentiality.
1. Borkin D, He S, Miao H, et al. Pharmacologic inhibition of the Menin-MLL interaction blocks progression of MLL leukemia in vivo. Cancer Cell. 2015;27(4):589-602.
2. Grembecka J, He S, Shi A, et al. Menin-MLL inhibitors reverse oncogenic activity of MLL fusion proteins in leukemia. Nat Chem Biol. 2012;8(3):277-284.
3. Klossowski S, Miao H, Kempinska K, et al. Menin inhibitor MI3454 induces remission in MLL1-rearranged and NPM1-mutated models of leukemia. J Clin Invest. 2020;130(2):981-997.
4. Uckelmann HJ, Kim SM, Wong EM, et al. Therapeutic targeting of preleukemia cells in a mouse model of NPM1 mutant acute myeloid leukemia. Science. 2020;367(6477):586-590.
5. Krivtsov AV, Evans K, Gadrey JY, et al. A Menin-MLL Inhibitor induces specific chromatin changes and eradicates disease in models of MLL-rearranged leukemia. Cancer Cell. 2019;36(6):660-673.
6. Kühn MW, Song E, Feng Z, et al. Targeting chromatin regulators inhibits leukemogenic gene expression in NPM1 mutant leukemia. Cancer Discov. 2016;6(10):1166-1181.
7. Dzama MM, Steiner M, Rausch J, et al. Synergistic targeting of FLT3 mutations in AML via combined menin-MLL and FLT3 inhibition. Blood. 2020;136(21):2442-2456.
8. Miao H, Kim E, Chen D, et al. Combinatorial treatment with menin and FLT3 inhibitors induces complete remission in AML
models with activating FLT3 mutations. Blood. 2020;136(25):2958-2963.
9. Carter BZ, Tao W, Mak PY, et al. Menin inhibition decreases Bcl-2 and synergizes with venetoclax in NPM1/FLT3-mutated AML. Blood. 2021;138(17):1637-1641.
10. Fiskus W, Boettcher S, Daver N, et al. Effective Menin inhibitorbased combinations against AML with MLL rearrangement or NPM1 mutation (NPM1c). Blood Cancer J. 2022;12(1):5.
11. Carter BZ, Mak PY, Tao W, et al. Targeting MCL-1 dysregulates cell metabolism and leukemia-stroma interactions and resensitizes acute myeloid leukemia to BCL-2 inhibition. Haematologica. 2020;23(10):260331.
12. Konopleva M, Pollyea DA, Potluri J, et al. Efficacy and biological correlates of response in a phase II study of venetoclax monotherapy in patients with acute myelogenous leukemia. Cancer Discov. 2016;6(10):1106-1117.
13. DiNardo CD, Pratz K, Pullarkat V, et al. Venetoclax combined with decitabine or azacitidine in treatment-naive, elderly patients with acute myeloid leukemia. Blood. 2019;133(1):7-17.
14. Chen H, Lau MC, Wong MT, Newell EW, Poidinger M, Chen J. Cytofkit: a bioconductor package for an integrated mass cytometry data analysis pipeline. PLoS Comput Biol. 2016;12(9):e1005112.
Acute myeloid leukemia (AML) with t(8;21)(q22;q22.1); RUNX1::RUNX1T1, along with AML with inv(16)(p13.1q22)/t(16;16) (p13.1;q22);CBFB::MYH11 considered as core binding factor (CBF)-AML, is known to confer a favorable prognosis.1-3 However, a considerable proportion of patients with CBF-AML, especially those with t(8;21) AML, still experience relapse, emphasizing the need of novel therapeutic approaches.4,5 Several studies have identified additional molecular alterations, such as KIT or FLT3 mutations, as risk factors for relapse and impaired survival in CBF-AML. Here, in particular the prognosis of patients with t(8;21) AML seems to be negatively impacted by these additional mutations.6-9 Thus, there is a molecular rationale to implement KIT/FLT3 inhibitors into treatment of patients with AML with t(8;21). Accordingly, we conducted a prospective, single-arm, multi-center, phase II trial MIDOKIT (clinicaltrials gov. Identifier: NCT01830361) to evaluate the molecular guided addition of midostaurin, an oral multi-kinase inhibitor with activity on KIT and FLT3, to standard daunorubicin/cytarabine (DA)-based intensive chemotherapy (IC) in adult patients with newly diagnosed AML with t(8;21) with evidence of KIT and/or FLT3 internal tandem duplication (FLT3-ITD) mutations. Patients aged 18-65 years with previously untreated AML according to the World Health Organization (WHO) classification were eligible for molecular prescreening. Those with evidence of t(8;21)(q22;q22.1); RUNX1::RUNX1T1 with additional KIT and/or FLT3-ITD mutations and response to one course of DA induction chemotherapy (IT) performed outside the trial could be enrolled. Inclusion and exclusion criteria are summarized in the Online Supplementary Table S1
The trial design and treatment algorithm is shown in Figure 1A. Enrolled patients were scheduled to receive a second course of DA induction chemotherapy (cytarabine 100 mg/m2/day continuously intravenously, days 1-7 and daunorubicin 60 mg/m2/day intravenously, days 3-5) and three courses of high-dose cytarabine consolidation (cytarabine 3000 mg/m2/ intravenously twice daily, days 1, 3, 5) each followed by midostaurin 50 mg orally twice daily on days 8-21, and subsequent midostaurin maintenance for 12 months.
The primary endpoint of the study was 2-year event-free survival (EFS). The primary objective was to improve 2-year EFS from a historical benchmark of 50% to 80%. The historical benchmark was based on data of 103 patients with AML with t(8;21) treated within the AML96 trial (clinicaltrials gov. Identifier: NCT00180115), the AML2003 trial (clinicaltrials
gov. Identifier: NCT00180102) and the AML60+ trial (clinicaltrials gov. Identifier: NCT00180167), hereof 32 patientsmatched for sex, age and number of courses of induction and consolidation chemotherapy - with evidence of KIT and/or FLT3-ITD mutations (28.1% of patients harboring FLT3-ITD mutations) showing chemo-responsiveness after IT1. Secondary endpoints included composite complete remission (CR) rate, relapse-free survival (RFS), overall survival (OS), incidence of treatment-emergent adverse events (AE) and measurable residual disease (MRD) kinetics. For prospective molecular screening the presence of AML with t(8;21)(q22;q22.1); RUNX1::RUNX1T1 was assessed via reverse transcription polymerase chain reaction (RT-PCR) (evidence of RUNX1::RUNX1T1) and fluorescence in situ hybridization (FISH) (evidence of t(8;21)(q22;q22.1)), results were validated in one of the SAL reference laboratories. Patients were evaluated for FLT3-ITD and KIT mutations via fragment length analysis (limit of detection [LOD] 0.05 allelic ratio) and Sanger sequencing (LOD 10% variant allele frequency [VAF]), respectively.10 In addition, patients with available samples were retrospectively assessed via amplicon-based next-generation sequencing (NGS; MiSeq, Illumina, Inc; DHS-003Z human myeloid neoplasms panel + custom AML panel, Qiagen N.V.; LOD 1% VAF). Quantitative bone-marrow RUNX1::RUNX1T1 MRD was assessed via RT-PCR according to the Europe Against Cancer (EAC) initiative guidelines.11
The trial was conducted in accordance with the principles of the Declaration of Helsinki; the trial protocol was approved by the Ethics Committee of the TU Dresden. Written informed consent was provided by all patients before screening.
Between Mar 13, 2013 and Dec 15, 2017 a total of 53 patients were diagnosed with t(8;21) AML at 11 participating centers, of those, 23 patients were screened and 18 patients with AML with t(8;21) and evidence of KIT and/or FLT3-ITD mutations were enrolled. All 18 patients had received DA for IT1 outside the trial (most patients received daunorubicin at a dose of 60 mg/m2) and had shown chemo-responsiveness. Table 1 and Figure 1B, C show the baseline characteristics, molecular features, and clinical course of the enrolled patients. Patient disposition is provided in the Online Supplementary Figure S1A. The median age was 50 years (range, 27-65 years), ten patients (55.6%) were male. Sixteen patients were diagnosed with de novo AML. A total of 24 KIT mutations were found in 16 patients (88.9%), some patients harbored several (subclonal) vari-

Figure 1. Trial design, treatment algorithm, patient characteristics, molecular features, outcome and RUNX1::RUNX1T1 measurable residual disease kinetics. (A) MIDOKIT trial design and treatment algorithm. (B) Patient clinical characteristics and molecular features, each row represents 1 unique patient, columns represent clinical features or molecular alterations (only recurring variants/variants of special interest [ASXL2] considered pathogenic/likely pathogenic are shown). (C) Swimmer plot showing individual patient outcomes. (D) KIT variant alle frequency (VAF) according to KIT variants. (E) FLT3-ITD AR and FLT3-TKD VAF. (F-H) Eventfree survival, relapse-free survival and overall survival in MIDOKIT patients as compared to historical controls (patients with acute myeloid leukemia [AML] with t(8;21) with KIT and/or FLT3-ITD mutations treated with intensive chemotherapy (IC) without midostaurin within the AML96 trial (clinicaltrails gov. Identifier: NCT00180115), the AML2003 trial (clinicaltrails gov. Identifier: NCT00180102) and the AML60+ trial (clinicaltrails gov. Identifier: NCT00180167). (I and J) Quantitative bone-marrow RUNX1::RUNX1T1 measurable residual disease (MRD), 11 patients achieved persistent hematologic complete remission (CR) (left panel), 7 patients experienced subsequent molecular and/or hematologic relapse (right panel). AE: adverse event; AR: allelic ratio; CI: confidence interval; DNR: daunorubicin; EOT: end of treatment; F: female; HCT: hematopoietic cell transplantation; HC: historical control; IT1: induction therapy 1; M: male; MRD: minimal residual disease; N: no/mutation absent; NA: not assessed ; RT-PCR: reverse transcription polymerase chain reaction; Y: yes/mutation present.
ants, median KIT VAF was 11.94% (range, 1.13-44.47%), and most patients had exon 17 mutations (Figure 1B, D). Four patients had evidence of an FLT3-ITD mutation, the median FLT3-ITD allelic ratio was 0.16 (range, 0.05-0.36); three patients harbored FLT3-TKD mutations. (Figure 1B, E). Two patients were positive for both, KIT and FLT3-ITD. The mutational landscape was in line with previous reports, none of the patients harbored CEPBA or NPM1 mutations. Sixteen patients (88.8%) completed IT2, 12 patients (66.6%) completed consolidation therapy and started midostaurin maintenance and four patients (22.2%) completed midostaurin maintenance (Figure 1C; Online Supplementary Figure S1A). Allogeneic hematopoietic cell transplantation (HCT) was performed in seven patients (38.9%), of whom three patients were in first CR and four patients received salvage HCT after relapse. Of note, one patient was diagnosed with colorectal cancer (CRC) AJCC stage IVC after IT2, he was withdrawn from the trial and died 5 months later (UPN 003-06). Another patient was withdrawn from the trial due to non-compliance (UPN 010-02) and one patient was lost to follow-up during consolidation (UPN 014-18) (Figure 1C).
After IT2 CR rate was 100%, 16 patients (88.9%) achieved CR and two patients achieved CR with incomplete neutrophil recovery (11.1%). After a minimum follow-up of 2 years, seven patients suffered from relapse (of which 2 were molecular and 5 were hematologic relapses) and two patients died after preceding relapse. Here, patients with low KIT VAF seem to more frequently experience relapse. Detailed information on salvage therapies for patients experiencing relapse is provided in the Online Supplementary Table S2. One patient was lost to follow-up (Figure 1C). In the intention-to-treat analysis, this results in eight events and a 2-year EFS of 55.6% (95% confidence interval [CI]: 30.8-78.5), accordingly the alternate hypothesis of a 2-year EFS ≥80% was not met (Figure 1F). The median EFS, RFS and OS were not reached. At 2 years, rates of RFS and OS were 58.8% (95% CI: 39.5-87.6) and 88.2% (95% CI: 74.2-100), respectively (Figure 1G, H). No differences in EFS and RFS between patients treated within MIDOKIT and historic controls were seen. However, we ob-
BM: bone marrow; CBC: complete blood count; WBC: white blood cell count; ECOG: Eastern Cooperative Oncology Group performance status; FISH: fluorescence in situ hybridization; ITD: internal tandem duplication; IT1: induction therapy 1; PB: peripheral blood; RT-PCR: reverse transcription polymerase chain reaction; VAF: variant allele fre-
Table 2. Non-hematologic adverse events of any grade reported in >10% of patients and the corresponding frequencies of grade ≥3 events, regardless of attribution, according to CTCAE 4.03.
includes preferred terms
served a trend for an improved OS in patients treated within the MIDOKIT trial as compared to the historical controls (2-year OS 88.2%, 95% CI: 74.2-100 vs . 65.6%, 95% CI: 51.1–84.3; P=0.05), which was stable during longterm follow-up (5-year OS 73.5%%, 95% CI: 43.4-89.3 vs. 49.3%, 95% CI: 31.0-65.2; P=0.08) (Figure 1H; Online Supplementary Figure S1B).
Sixteen patients (88.9%) achieved complete molecular remission (CR MRD -) after IT2 ( ≥ 3-log reduction of RUNX1::RUNX1T1 ). Of these, five patients experienced subsequent molecular and/or hematologic relapse, 11 patients showed persistent CRMRD- (Figure 1I, J).
Overall, 315 non-hematologic AE - hereof 55 AE ≥ CTCAE grade 3 - and 13 serious AE (SAE) were observed (Table 2). SAE observed included sepsis, pneumonia, sinusitis and pneumonitis; no cardiac SAE were observed. Overall,
four patients had an AE entailing premature end of treatment: pneumonitis and biliary tract infection in UPN 036-05, left ventricular systolic dysfunction in UPN 07217, tremor in UPN 010-11, and diagnosis of CRC in UPN 003-06. Two patients died; deaths were not considered to be related to midostaurin. Interruptions of midostaurin administration and dose reductions were observed in five (27.7%) and eight (44.4%) patients, respectively. AE commonly associated with dose modifications were nausea, vomiting, diarrhea, and electrocardiogram QTc interval prolongation. The median number of days with midostaurin administration was 148.5 (range, 14-416 days). The median ratio of administered/scheduled cumulative dose of midostaurin was 0.34 (range, 0.04-1.06), 13 patients (72.2%) received <80% of the scheduled cumulative dose of midostaurin.
The MIDOKIT trial was the first prospective clinical trial evaluating the molecular-guided implementation of the multi-kinase inhibitor midostaurin in combination with IC in patients with newly diagnosed AML with t(8;21)(q22;q22.1); RUNX1::RUNX1T1 with evidence of KIT and/or FLT3-ITD mutations. The addition of midostaurin to IC and single-agent maintenance therapy was tolerable and feasible, and no unexpected excess in toxicity was observed. Unfortunately, the MIDOKIT trial failed to reach the assumed primary endpoint of 80% 2-year EFS, due to - among others - early relapses in 44% of patients. However, with a composite CR rate of 100% and an improved 2-year OS of 88.2% as compared to patients with AML with t(8;21) and KIT and/or FLT3-ITD mutations treated within historic AML trials without midostaurin, the results of our trial are still promising. Our findings are comparable with two similar trials conducted by the German-Austrian AML Study Group (AMLSG) and the Cancer and Leukemia Group B (CALGB) evaluating the multi-kinase inhibitor dasatinib in a non-biomarker guided fashion in combination with IC in patients with CBF-AML (4-year OS 75%, 3-year OS 77%, and 5-year OS 73% in the AMLSG, the CALGB, and the MIDOKIT trial, respectively), arguing for further evaluation of tyrosine kinase inhibitors in combination with IC in patients with CBF-AML.12,13 Moreover, a subgroup-analysis of the RATIFY trial found CBF rearrangements to be an independent predictor for favorable OS and EFS, again supporting the evaluation of midostaurin in a larger cohort of patients with CBF-AML.14,15
Of note, the MIDOKIT trial has some limitations in order to draw conclusions applicable to a larger cohort of patients, e.g., the small number of patients and the singlearm trial design. Further, non-adherence, mostly due to intolerance as well as individual protocol deviations such as allogeneic HCT in first CR, limited the time and dose of midostaurin exposure and might have contributed to the non-achievement of the primary endpoint (only 27.8% of patients received >80% of the scheduled dose of midostaurin). Moreover, the implementation of midostaurin not before IT2 might have reduced its antileukemic potential since a post hoc analysis of the RATIFY trial indicates the early use of midostaurin from IT1 on to be essential for its antileukemic effect.14 Thus, our results suggest re-evaluation of molecular informed implementation of midostaurin (or novel FLT3/KIT inhibitors) in patients with CBF-AML through a larger, redesigned, randomized, controlled trial.
In conclusion, the MIDOKIT trial was the first prospective clinical trial assessing midostaurin in patients with AML with t(8;21) in a molecular guided fashion. Although MIDOKIT failed to reach the assumed primary endpoint of 80% 2-year EFS, the promising OS supports further biomarker-driven evaluation of TKI in combination with IC in CBF-AML.
Leo Ruhnke,1 Christoph Röllig,1 Sylvia Herold, 2 Tim Sauer, 3,4 Christian H. Brandts, 5 Björn Steffen, 5 Kerstin Schäfer-Eckart,6 Stefan W. Krause,7 Mathias Hänel, 8 Albrecht Reichle, 9 Sebastian Scholl,10 Andreas Neubauer,11 Jan-Henrik Mikesch,12 Johannes Schetelig,1,13 Friedrich Stölzel,1 Michael Kramer,1 Annett Haake,1 Julia Frimmel,1 Alwin Krämer, 3,4 Richard Schlenk, 3,4 Uwe Platzbecker,14 Hubert Serve, 5 Claudia D. Baldus,15 Carsten MüllerTidow, 3 Daniela Aust, 2 Martin Bornhäuser,1,4,16 Gerhard Ehninger 1 and Christian Thiede 1,17 on behalf of the Study Alliance Leukemia (SAL)
1 Department of Internal Medicine I, University Hospital Dresden, TU Dresden, Dresden; 2 Institute of Pathology, University Hospital Dresden, Dresden; 3 Department of Internal Medicine V, University of Heidelberg, Heidelberg; 4 German Cancer Consortium (DKTK) partner site Dresden, Dresden, and German Cancer Research Center (DKFZ), Heidelberg; 5 Department of Internal Medicine II, University Hospital Frankfurt, Frankfurt; 6 Department of Internal Medicine V, Nuremberg Hospital North, Paracelsus Medical University, Nuremberg; 7 Department of Internal Medicine V, University Hospital Erlangen, Erlangen; 8 Department of Internal Medicine III, Chemnitz Hospital, Chemnitz; 9 Department of Internal Medicine III, Hematology and Internal Oncology, University Hospital Regensburg, Regensburg; 10 Department of Internal Medicine II, Hematology and Internal Oncology, University Hospital Jena, Jena; 11 Department of Internal Medicine, Hematology, Oncology and Immunology, University Hospital Marburg, Marburg; 12 Department of Internal Medicine A, University Hospital Münster, Münster; 13 DKMS Clinical Trials Unit, Dresden; 14 Department of Internal Medicine I, Hematology and Cellular Therapy, University Hospital Leipzig, Leipzig; 15 Department of Hematology and Oncology, University Hospital SchleswigHolstein, Campus Kiel, Kiel; 16 National Center for Tumor Diseases (NCT) Dresden, Dresden and 17Agendix GmbH, Dresden, Germany
Correspondence:
L. RUHNKE - leo.ruhnke@ukdd.de
https://doi.org/10.3324/haematol.2022.281636
Received: July 4, 2022.
Accepted: January 30, 2023.
Early view: February 9, 2023.
©2023 Ferrata Storti Foundation
Published under a CC BY-NC license
Disclosures
Novartis provided the investigational medicinal product and financial support to conduct the trial. The authors have no conflicts of interest to disclose.
CR, GE and CT were responsible for study conception and design. CT, SH, DA and LR carried out/interpreted molecular studies. MK and LR performed statistical analyses. AH provided administrative support. LR, CR, TS, CHB, BS, KSE, SWK, MH, AR, SS, AN, JHM, JS, FS, JF, AK, RS, UP, HS, CDB, CMT, MB, GE and CT were involved in care of patients, sample procurement and/or contributed to in the data collection and interpretation. LR drafted the manuscript; and all authors agreed on the final version.
1. Döhner H, Estey E, Grimwade D, et al. Diagnosis and management of AML in adults: 2017 ELN recommendations from an international expert panel. Blood. 2017;129(4):424-447.
2. Grimwade D, Ivey A, Huntly BJP. Molecular landscape of acute myeloid leukemia in younger adults and its clinical relevance. Blood. 2016;127(1):29-41.
3. Arber DA, Orazi A, Hasserjian R, et al. The 2016 revision to the World Health Organization classification of myeloid neoplasms and acute leukemia. Blood. 2016;127(20):2391-2405.
4. Schlenk RF, Benner A, Krauter J, et al. Individual patient databased meta-analysis of patients aged 16 to 60 years with core binding factor acute myeloid leukemia: a survey of the German Acute Myeloid Leukemia Intergroup. J Clin Oncol. 2004;22(18):3741-3750.
5 Marcucci G, Mrózek K, Ruppert AS, et al. Prognostic factors and outcome of core binding factor acute myeloid leukemia patients with t(8;21) differ from those of patients with inv(16): a Cancer and Leukemia Group B study. J Clin Oncol. 2005;23(24):5705-5717.
6. Paschka P, Marcucci G, Ruppert AS, et al. Adverse prognostic significance of KIT mutations in adult acute myeloid leukemia with inv(16) and t(8;21): a Cancer and Leukemia Group B Study. J Clin Oncol. 2006;24(24):3904-3911.
7. Duployez N, Marceau-Renaut A, Boissel N, et al. Comprehensive mutational profiling of core binding factor acute myeloid leukemia. Blood. 2016;127(20):2451-2459.
8. Jahn N, Terzer T, Sträng E, et al. Genomic heterogeneity in core-
We thank all patients and their families as well as all the members of the Study Alliance Leukemia for their participation in the MIDOKIT trial. Also, the excellent support of Katrin Peschel, Juliane Beyer and Verena Otto is gratefully acknowledged.
Original data and protocols are available upon reasonable request.
binding factor acute myeloid leukemia and its clinical implication. Blood Adv. 2020;4(24):6342-6352.
9. Cairoli R, Beghini A, Grillo G, et al. Prognostic impact of c-KIT mutations in core binding factor leukemias: an Italian retrospective study. Blood. 2006;107(9):3463-3468.
10. Thiede C, Steudel C, Mohr B, et al. Analysis of FLT3-activating mutations in 979 patients with acute myelogenous leukemia: association with FAB subtypes and identification of subgroups with poor prognosis. Blood. 2002;99(12):4326-4335.
11. Schuurhuis GJ, Heuser M, Freeman S, et al. Minimal/measurable residual disease in AML: a consensus document from the European LeukemiaNet MRD Working Party. Blood. 2018;131(12):1275-1291.
12. Marcucci G, Geyer S, Laumann K, et al. Combination of dasatinib with chemotherapy in previously untreated core binding factor acute myeloid leukemia: CALGB 10801. Blood Adv. 2020;4(4):696-705.
13. Paschka P, Schlenk RF, Weber D, et al. Adding dasatinib to intensive treatment in core-binding factor acute myeloid leukemia-results of the AMLSG 11-08 trial. Leukemia. 2018;32(7):1621-1630.
14. Stone RM, Mandrekar SJ, Sanford BL, et al. Midostaurin plus chemotherapy for acute myeloid leukemia with a FLT3 Mutation.N Engl J Med 2017; 377:454-464.
15. Voso MT, Larson RA, Jones D, et al. Midostaurin in patients with acute myeloid leukemia and FLT3-TKD mutations: a subanalysis from the RATIFY trial. Blood Adv. 2020;4(19):4945-4954.
Platelets lacking O-glycans exhibit a reduced lifespan and increased clearance in the liver due to defective sialylation.1,2 Variations in O-glycosylation affect platelet functions and abolish surface expression of glycoproteins, particularly glycoprotein (GP)Ibα that contains the vast majority of sialic acids on the platelet and is implicated in fast clearance of desialylated platelets.1,3 GPIbα is a major subunit in the GPIb-IX complex that also contains GPIbβ and GPIX.4 Ligand-mediated unfolding of the mechanosensory domain (MSD) in GPIbα, and consequently the exposure of the Trigger sequence, is the key step in activating GPIb-IX signaling and inducing platelet clearance.3-5 The isolated MSD is not stable.4,6 Desialylation of O-glycans could induce spontaneous MSD unfolding.3 It is not clear which of the 18 serine (Ser) and threonine (Thr) residues in the MSD are actually O-glycosylated (Figure 1A). Here, we characterize GPIbα mutants with altered O-glycosylated MSD in transfected Chinese hamster ovary (CHO) cells, and report evidence for specific MSD O-glycans being important for the stability and signaling function of GPIbα GPIb α expressed on transfected CHO cells exhibits a lower molecular weight than that on platelets,7 indicating that GPIbα O-glycans on platelets are larger and more complex than those in CHO cells. Nevertheless, surface expression and functions of GPIb α , including its expression level affected by the glycosylated MSD, have been faithfully recapitulated in transfected CHO cells,4,6 suggesting that the CHO cell is an appropriate model system for the study of GPIbα conformation and stability. In order to investigate how O-glycosylation in the MSD affects GPIbα, we arbitrarily divided the MSD into three regions: N-terminal (residues Ala417-Pro442), C-terminal (Val443-Glu471), and the Trigger (Ser472-Phe483). All Ser and Thr residues in each region were mutated to Ala to generate three GPIbα variants, named N∆O, C∆O, and T∆O, respectively. Expression vectors encoding these variants and the wild-type (WT) were transfected into CHO cells that stably expressed human GPIb β and GPIX (CHO- β IX cells) and characterized as previously described6,7 (Figure 1; Online Supplementary Figure S1).
Compared to that of WT, surface expression of the N∆O variant, but neither C∆O nor T∆O, was significantly reduced (Figure 1B, C; Online Supplementary Figure S1). Consistently, the N∆O protein in transfected cells was much less than the WT, and it had a lower molecular weight (Online Supplementary Figure S1C, D). In comparison, C∆O had a WTlike molecular weight, and two glycosylated bands were present in CHO-T∆O cells expressing T∆O, one of which
even had higher molecular weight than WT (Online Supplementary Figure S1C, G). GPIbβ expression was significantly reduced in N∆O and T∆O cells than WT, and GPIX expression was reduced in all three variant cells (Figure 1D, E; Online Supplementary Figure S2). Moreover, C∆O formed a non-GPIb complex8 in addition to the native GPIb complex (Online Supplementary Figure S2D). These results indicate that i) the majority of MSD O-glycans are in the N-terminal region, ii) O-glycans in the N-terminal region are critical to GPIbα expression, and iii) O-glycans in the C-terminal region are important for proper GPIb-IX assembly. Like in circulating platelets, GPIbα is continuously proteolyzed or shed from transfected CHO cells, with its extracellular domain, known as glycocalicin (GC), released into the culture media. The shedding cleavage site is located in the MSD (Figure 1A).9 CHO cells expressing N∆O (CHON∆O cells) produced more GC than WT and two other mutants. Adding GM6001, a broad-spectrum metalloprotease inhibitor, to culture markedly increased GPIbα surface expression in CHO-WT and other mutant cells and reduced GC generation (Online Supplementary Figure S3A; Figure 1F, H). However, a significant level of GC was still present in CHO-N∆O cells, suggesting that N∆O could be cleaved by proteases other than metalloproteases. This is consistent with an earlier report that GPIbα variants lacking residues 461-483 could express GC on the surface of transfected CHO cells at a high level without GPIbβ and GPIX.6 In comparison, the level of GC produced by shedding of the C∆O variant was significantly lower than that from WT GPIbα In CHO-T∆O cells, both glycosylated variants were shed, although it was difficult to quantitate their extent of shedding separately (Figure 1G, H).
We reported previously that unfolding of the MSD helps expose the shedding cleavage site and could increase shedding of GPIbα. 3,5 Monoclonal antibody (MAb) WM23 recognizes a sequence in the sialomucin region of GPIbα, and MAb 5G6 binds a linear epitope containing the ADAM17 shedding cleavage site in the MSD.10,11 The ratio of 5G6 binding to WM23 binding has been utilized as a proxy for the extent of MSD unfolding.3-5 In order to understand the mechanism for the increased shedding of the N∆O variant, fluorescently labeled WM23 and 5G6 were incubated with aforementioned CHO cells, and it was observed that binding of WM23 to CHO-N∆O cells was about 50% of those to CHO-WT and other mutant cells (Figure 2A, B). Binding of 5G6 to CHO-N∆O cells was significantly increased compared to WT and others (Figure 2C, E), suggesting that the MSD in the N∆O variant on transfected CHO cells is more
unfolded than that in WT and is therefore more readily cleaved or shed. On the other hand, the MSD is well folded in the C∆O and T∆O variants. Therefore, O-glycans in the Nterminal region of the MSD are important to GPIbα expression and stability.
After transfected CHO cells adhere to immobilized VWF, binding of von Willebrand factor (VWF) in turn could induce signaling into CHO cells and result in filopodia formation.4,5,12,13 The extent of filopodia formation correlates with GPIb-IX-mediated cellular signaling.3,5,12,13 In order to assess
the effects of O-glycosylation in the MSD on binding and signaling functions of GPIbα, CHO cells expressing WT GPIbα, N∆O, C∆O, and T∆O variants were placed on a VWFcoated slide in the presence of botrocetin and EDTA, cell adhesion and filopodia formation therein were visualized by fluorescence microscopy and quantitated for comparison.12,13

The number of adherent CHO-C∆O and CHO-T∆O cells was indistinguishable from that of CHO-WT cells, consistent with the observation that they did not affect binding of GPIbα to VWF (Figure 3A, B; Online Supplementary Figure
Figure 1. O-glycans in the N-terminal region of the mechanosensory domain are important to GPIbα expression and shedding. (A) The sequence of human GPIbα mechanosensory domain (MSD) includes residues A417-F483. Putative O-glycosylation sites, serine or threonine residues, are colored red. The N-terminal region (A417 to P442), the C-terminal region (V443 to E471), and the Trigger region (S472 to F483) are marked. The ADAM17 cleavage site is denoted by the arrowhead. (B) Overlaid flow cytometry histograms showing surface expression of GPIbα variants in stably transfected CHO cells that expressed wild-type GPIbβ and GPIX. βIX: cells transfected with an empty vector. N∆O, C∆O, and T∆O denote the GPIbα constructs that have mutations of Oglycosylation sites. GPIbα expression was detected by flow cytometry with anti-GPIbα WM23 antibody.6 (C-E) Bar plots of (C) GPIbα variant, (D) GPIbβ, and (E) GPIX surface expression in noted stably transfected CHO cells. GPIbβ and GPIX was detected with monoclonal antibodies RAM.1 and FMC25, respectively. The mean fluorescence intensity (MFI) was quantified and plotted (mean ± standard deviation, n=3). Comparison of result was performed by one-way ANOVA. *P<0.05; ***P<0.001. (F) Bar plots of GPIbα expression level in each transfected CHO cell treated with vehicle (unfilled bar graph) or GM6001 (color-filled bar graph), quantified by MFI. (G) Representative western blots showing cellular expression of GPIbα in noted stably transfected CHO cells and glycocalicin (GC) released from these cells into the culture media. Cell lysates of denoted cells were resolved in SDS gels and transferred to the PVDF membrane, which was blotted by WM23 or anti-β-actin antibody. Molecular weight markers are labeled on the right. (H) Bar plot of relative GC levels from noted cells after treatment of vehicle (open bar) or GM6001 (filled bar). The GC band was quantitated by densitometry and normalized against that from CHO-WT cells before GM6001 treatment. Data are shown as mean ± standard deviation, n=3. Comparison of results was performed by one-way ANOVA with post hoc tukey test *P<0.05; ***P<0.001.
S3B). With little GPIbα expression on the surface, very few CHO-N∆O cells adhered to the VWF surface. Consequently, only filopodia in CHO-C∆O and CHO-T∆O cells were counted (Figure 3A, C, D). Compared to CHO-WT cells, fewer filopodia and smaller area coverage per cell was observed in CHO-C∆O cells, indicating less robust signaling activity in the C∆O mutant. These results suggest that the C∆O variant, while retaining its ability to bind VWF, is largely devoid of its ability to transmit signals into the cell. The underlying mechanism remains to be defined. A possible explanation could be that removing O-glycans in the C-terminal region stabilizes the MSD and increases the unfolding force threshold such that VWF tether-mediated tension cannot adequately pull open the MSD and induce signaling. Since part of C∆O existed in the cell as non-GPIb complex,8 it also suggests that the non-GPIb complex may not have the signaling ability. In comparison, adherent CHO-T∆O cells produced more filopodia than CHO-WT cells (Figure 3), suggesting that the GPIbα signaling function may be enhanced by mutations in the T∆O variant. However, it was not clear which T∆O form, or both, may alter the signaling function of GPIbα.
Overall, our results demonstrate that O-glycans at different locations in the MSD exhibit different, or even opposite, ef-
fects on GPIbα expression and function. A recent study comparing donor platelets from different ABO blood groups reported that type O platelets form less stable interactions with VWF at arterial shear than non-O platelets.14 From our results, it is conceivable that a type O blood group in the C-terminal region may reduce GPIb-IX signaling and thereby affect platelet interaction or adhesion with VWF under shear, although a solid link between MSD dynamics and VWF-mediated platelet translocation remains to be established. In addition, a patient diagnosed with the platelettype von Willebrand disease was reported to miss nine residues (PTILVSATS) in the N-terminal region of the MSD.15 The GPIbα expression level on platelets is normal in this patient, suggesting that this sequence, including any O-glycans therein, may not significantly affect the stability of the MSD. It remains unclear how missing this 9-residue sequence affects the VWF-binding activity.
Our results indicate that not all Ser/Thr residues in the MSD are glycosylated. The exact O-glycosylation sites in this domain remain to be defined. A striking feature of the T∆O variant is its two distinct glycosylated forms (Figure 1D; Online Supplementary Figure S1C). One of them had a WT-like molecular weight, and the other had a higher molecular weight, suggesting different glycosylation pattern.
Figure 2. Absence of O-glycans in the N-terminal region increased unfolding of the mechanosensory domain. (A, B) Overlaid flow cytometry histograms showing binding of (A) WM23 antibody and (B) 5G6 antibody in noted stably transfected CHO cells. Each antibody binding level was quantitated by mean fluorescence intensity as described3, 5 and in the Online Supplementary Appendix (C-E) Bar plots showing (C) quantitated WM23 binding level, (D) 5G6 binding level, and (E) ratio of 5G6/WM23 binding in noted variant CHO cells. Data are shown as mean ± standard deviation, n=3. Comparison of results was performed by one-way ANOVA with post hoc tukey test. *P<0.05; ***P<0.001.

Figure 3. Differential effects of specific O-glycans in the mechanosensory domain on filopodia formation of transfected CHO cells. (A) Representative confocal microscopy images of noted transfected CHO cells that are adhered to von Willebrand factor (VWF) in the presence of botrocetin and ethylenediaminetetraacetic acid (EDTA). Briefly, a glass slide was coated with human VWF at 10 mg/mL in phosphate-buffered saline (PBS) at 4 °C overnight and blocked with 1% bovine serum albumin in PBS for 1 hour at 22°C. CHO cells stably expressing wild-type and mutant GPIb-IX were resuspended in modified Tyrode’s buffer (134 mM NaCl, 0.34 mM Na2HPO4, 2.9 mM KCl, 1 mM MgCl2, 5 mM glucose, 12 mM NaHCO3, 20 mM HEPES, pH 7.35) containing 5 mM EDTA at the concentration of 1×10⁶ cells/mL. The cells were placed on VWF-coated slides in the presence or absence of 1 mg/mL botrocetin for 30 minutes (min) at 37 °C. The adherent cells on the slide were washed with PBS buffer, fixed with 4% paraformaldehyde for 10 min, and stained with TRITC-conjugated phalloidin in PBS containing 0.1% Triton X-100 for 30 min. Images were collected on an Olympus Fluo View FV1000 confocal microscope. Images collected in 10-12 viewfields from 2 independent experiments were analyzed using Fiji (ImageJ) and a macro written for quantitative analysis of filopodia.13 (B-D) Bar plots of (B) number, (C) average surface area, and (D) number of filopodia of adhered CHO cells. Error bars represent mean ± standard deviation. Significance determined by one-way ANOVA with post hoc Tukey test. ***P<0.001.
In other words, one or both of these Ser residues may not be O-glycosylated. They are important for proper folding of the MSD. Mutating them to alanine may alter the MSD conformation and expose an otherwise shielded Ser/Thr residue or residues for new O-glycosylation. It may also alter GPIbα interaction with GPIbβ/GPIX and form nonGPIb complex that does not contain GPIX (Figure 1D, E; Online Supplementary Figure S2D). Also, such an effect may not be the same in transfected CHO cells as in platelets. This complication makes it difficult for the approach of Ser/Thr-scanning mutagenesis, since it cannot be assumed that the effect on O-glycosylation induced by a site-specific mutation in the MSD is limited to that specific site.

Yingchun Wang and Renhao Li
Aflac Cancer and Blood Disorders Center, Children’s Healthcare of Atlanta, Department of Pediatrics, Emory University School of Medicine, Atlanta, GA, USA
Correspondence:
R. LI - renhao.li@emory.edu
https://doi.org/10.3324/haematol.2022.281979
Received: August 20, 2022.
Accepted: January 30, 2023.
Early view: February 9, 2023.
©2023 Ferrata Storti Foundation
Published under a CC BY-NC license
Disclosures
No conflicts of interest to disclose.
Contributions
YW designed and performed research, analyzed results, prepared figures and wrote the manuscript. RL designed research, analyzed results, prepared figures and wrote the manuscript.
Acknowledgments
We thank the Emory Children's Pediatric Research Center Flow Cytometry Core and Emory Integrated Cellular Imaging Core for technical support, and Michael Berndt for sharing the WM23 antibody.
Funding
This investigation was supported in part by NIH grants HL082808.
Data-sharing statement
For the original data set, please contact the corresponding author.
1. Wang Y, Jobe SM, Ding X, et al. Platelet biogenesis and functions require correct protein O-glycosylation. Proc Natl Acad Sci U S A. 2012;109(40):16143-16148.
2. Li Y, Fu J, Ling Y, et al. Sialylation on O-glycans protects platelets from clearance by liver Kupffer cells. Proc Natl Acad Sci U S A. 2017;114(31):8360-8365.
3. Wang Y, Chen W, Zhang W, et al. Desialylation of O-glycans on glycoprotein Ibα drives receptor signaling and platelet clearance. Haematologica. 2021;106(1):220-229.
4. Quach ME, Li R. Structure-function of platelet glycoprotein IbIX. J Thromb Haemost. 2020;18(12):3131-3141.
5. Deng W, Xu Y, Chen W, et al. Platelet clearance via shearinduced unfolding of a membrane mechanoreceptor. Nat Commun. 2016;7:12863.
6. Tao Y, Gan C, Zhang X, et al. Unaccompanied mechanosensory domain mediates low expression of glycoprotein Ibα: implications for Bernard-Soulier syndrome. J Thromb Haemost. 2020;18(2):510-517.
7. Luo SZ, Mo X, Afshar-Kharghan V, Srinivasan S, Lopez JA, Li R. Glycoprotein Ib α forms disulfide bonds with 2 glycoprotein Ib β subunits in the resting platelet. Blood. 2007;109(2):603-609.
8. Luo S-Z, Mo X, López JA, Li R. Role of the transmembrane domain of glycoprotein IX in assembly of the glycoprotein Ib-IX complex. J Thromb Haemost. 2007;5(12):2494-2502.
9. Gardiner EE, Karunakaran D, Shen Y, Arthur JF, Andrews RK,
Berndt MC. Controlled shedding of platelet glycoprotein (GP)VI and GPIb-IX-V by ADAM family metalloproteinases. J Thromb Haemost. 2007;5(7):1530-1537.
10. Liang X, Russell SR, Estelle S, et al. Specific inhibition of ectodomain shedding of glycoprotein Ibα by targeting its juxtamembrane shedding cleavage site. J Thromb Haemost. 2013;11(12):2155-2162.
11. Berndt MC, Du XP, Booth WJ. Ristocetin-dependent reconstitution of binding of von Willebrand factor to purified human platelet membrane glycoprotein Ib-IX complex. Biochemistry. 1988;27(2):633-640.
12. Maurer E, Tang C, Schaff M, et al. Targeting platelet GPIbβ reduces platelet adhesion, GPIb signaling and thrombin generation and prevents arterial thrombosis. Arterioscler Thromb Vasc Biol. 2013;33(6):1221-1229.
13. Quach ME, Chen W, Wang Y, et al. Differential regulation of the platelet GPIb-IX complex by anti-GPIbβ antibodies. J Thromb Haemost. 2021;19(8):2044-2055.
14. Dunne E, Qi QM, Shaqfeh ES, et al. Blood group alters platelet binding kinetics to von Willebrand factor and consequently platelet function. Blood. 2019;133(12):1371-1377.
15. Othman M, Notley C, Lavender FL, et al. Identification and functional characterization of a novel 27-bp deletion in the macroglycopeptide-coding region of the GPIbα gene resulting in platelet-type von Willebrand disease. Blood. 2005;105(11):4330-4336.
Patients diagnosed with acute myeloid leukemia (AML) harboring internal tandem duplication (ITD) mutations in the FLT3 gene present a higher risk of early relapses and shorter overall survival after chemotherapy.1 Gilteritinib, a highly selective oral FLT3 inhibitor has demonstrated significant therapeutic effect in patients with relapsed or refractory FLT3-mutated AML with higher complete remission (CR) rates (21.1% vs. 10.5%) and longer median overall survival (9.3 months vs. 5.6 months) compared to salvage chemotherapy.2 Gilteritinib, metabolized by CYP3A4 into inactive metabolites, has been identified in vitro as a P-gp substrate.3 Gilteritinib inhibits FLT3 kinase activity and viability of cells expressing FLT3 with a halfmaximal inhibitory concentration (IC50) of 0.291 nM (0.16 ng/mL)3 and 0.92-2.1 nM (0.51-1.16 ng/mL), respectively in BA/F3 cells exogenously expressing wild-type FLT3 or FLT3 mutants (FLT3-ITD, FLT3-D835Y, and FLT3-ITD-D835Y).4 In a meta-analysis of 11 ECOG-ACRIN trials, central nervous system (CNS) involvement was detected in 1.1% and CNS infiltration at diagnosis was not associated with a lower rate of CR or a shorter overall survival.5 Nevertheless, Del Principe et al. reported higher incidence of meningeal involvement reaching 32% at AML diagnosis, associated with a poorer outcome.6 CNS relapses occur in 2.6-4.1% and confer a poor prognosis.7 However, patients with CNS relapses were excluded from the gilteritinib pivotal trial.2 Perrone et al. reported a relapsing medullar and meningeal AML FLT3-ITD patient responding to gilteritinib monotherapy,8 however, gilteritinib CNS distribution was not assessed.
We aimed to explore the distribution and in vitro efficacy of gilteritinib in cerebrospinal fluid (CSF) in AML patients with CNS relapse. We report here four patients, from four French institutions treated for concomitant CNS and medullary FLT3- ITD AML relapse with gilteritinib and intrathecal injections of chemotherapy (IT). All patients provided informed consent to participate to this study.
A 63-year-old woman, was diagnosed in February 2020 with French-American-British (FAB)9, 10 M1-AML. Cytogenetic analysis showed a normal karyotype and next-generation sequencing (NGS) analysis showed mutations of NPM1, FLT3-ITD, DNMT3A, SMC3 and KMT2D/MLL2. CR was
obtained after intensive chemotherapy (7+3 regimen) plus Midostaurin, then consolidation with intermediate dose of Cytarabine (IDAC) and Midostaurin and maintenance with Midostaurin. Fifteen months after CR, headache and radicular pain revealed a simultaneous bone marrow and CNS relapse with 2,960/mm3 blast cells in the CSF with normal karyotype and NGS identical to February 2020 without FLT3-TKD mutation. Intrathecal triple therapy (ITT) (corticosteroid, Methotrexate and Cytarabine) was given with CSF blast cell clearance, followed by IDAC plus gilteritinib 120 mg once daily (QD) as consolidations in July 2021 (6 IT in all) followed by gilteritinib 120 mg QD as longterm maintenance and in toto encephalic irradiation. CR was obtained 4 months after CR2 and maintained at 1 year.
Patient 2
A 62-year-old woman, was diagnosed in July 2021 with an hyperleukocytic FAB M5-AML, with a normal karyotype, NPM1 type A mutation and FLT3-ITD. Due to initial hyperleukocytosis, lumbar puncture (LP) with ITT was performed during induction and revealed a CNS involvement with 24 blasts/mm3 in CSF. CR was achieved after induction chemotherapy with Daunorubicin and Cytarabin plus Midostaurin (HOVON AML 156), and two courses of consolidation with IDAC and Midostaurin. CSF examination after induction was negative. Two months after CR, she presented with delirium, psychomotor retardation and an erythematous maculopapular rash, revealing a combined dermal and CNS relapse with 5 blasts/mm3 in CSF. IT (corticosteroid and methotrexate) injections (3 IT) and gilteritinib 120 mg QD monotherapy was started, further decreased to 80 mg QD for hepatic toxicity. In June 2022 bone marrow was positive for NPM1 and gilteritinib was increased to 120 mg twice daily (QD) as maintenance therapy with seven IT. One year after gilteritinib initiation, no blasts were detected in CSF.
Patient 3
A 50-year-old woman, was diagnosed in March 2021 with a normal karyotype FAB M5-AML, NGS analysis of blast cells showed mutations of NPM1 (mutant D), FLT3- ITD , KRAS and TET2 exon 3 and 9. CR was achieved after intensive chemotherapy (7+3 regimen) plus gilteritinib (HOVON AML 156). The patient received IDAC combined
with Clofarabine in consolidation. One month after CR, a neuromeningeal relapse occurred with blast cells in CSF. ITT were started (4 IT in all) and followed by gilteritinib 120 mg QD in October 2021. In November 2021, Venetoclax 400 mg QD was added.11 Two months later, MRD on NPM1 was undetectable with few blasts in CSF. In September 2022, a cerebral computed tomography scan showed a thalamic mass linked to the AML. The patient deceased in October 2022.
A 64-year-old man, was diagnosed in May 2019 with a normal karyotype FAB M5-AML, NGS analysis of blast cells displayed mutations of NPM1 (mutant A), DNMT3A, TET2 splice exon 5, ASXL1 and IDH1. CR was achieved after induction-consolidation chemotherapy with Daunorubicin and Cytarabin followed by non-myeloablative phenoidentical bone marrow allograft. MRD NPM1 was undetectable after 1 month. In November 2020, he presented an extramedullar and CNS relapse with NPM1 (mutant A) and FLT3-ITD mutations. ITT were given with CSF blast cell clearance (4 IT). Consolidation with Azacytidine plus Venetoclax 400 mg QD, achieving incomplete cytologic response with undetectable MRD phenotype and NMP1 mutation, was stopped after eight cycles due to hematologic toxicity. In April 2022, he was admitted for cauda equina syndrome and LP revealed a second CNS progression with 980/mm3 blast cells in the CSF harboring FLT3ITD mutation. ITT were given (6 IT) associated to gilteritinib 120 mg QD with CSF blast cell clearance. MRD NPM1 was undetectable 1 month after gilteritinib initiation and CR maintained after 1 year.
Gilteritinib trough concentration in plasma and CSF at steady state were quantified using liquid chromatography coupled to tandem mass spectrometry methods (TSQAltis Thermo-Fisher Scientifics, Massachusetts, USA). Protein levels in CSF were quantified by turbidimetric method (TPUC3, Cobas c703, Roche, Meylan, France). Flt-3 ligand (Flt-3L) was quantified in CSF and plasma using an enzyme-linked immunosorbant assay (Human Flt-3 Ligand Quantikine ELISA Kit, R&D Systems, Minnesota, USA). All available gilteritinib and Flt-3L levels in plasma and CSF are presented in Table 1. Plasma concentrations of the four patients were consistent with pharmacokinetics data previously described.12 No drug-drug interaction was found here excluding patient 1 concomitantly treated with the weak CYP34A inhibitor Isavuconazole, possibly contributing to higher plasma concentrations.12 Median CSF/ plasma ratio of 2.81% was consistent in the four patients regardless of the plasma concentration and protein level in CSF, suggesting a linear correlation within the plasma concentration range observed (range, 148-763 ng/mL) and a lack of saturation phenomenon involving a weak impact of P-gp. Furthermore, in patient 3, association to Venetoclax, a known P-gp inhibitor, did not enhance gilteritinib CSF distribution.13 This low ratio is partly explained by the low unbound fraction, in healthy subjects of 5.7%,4 the only fraction able to cross the blood-brain barrier. Nevertheless, gilteritinib CSF concentration exceeded IC50 for FLT3 kinase activity in all samples.3 Restoration of Flt-3L level in serum after starting chemotherapy has been associated with higher overall survival in AML FLT3-ITD patients14 and further investigation is needed to explore Flt-3L in CSF as a prognostic biomarker. Interestingly Flt-
Figure 1. Response of FLT3-ITD-mutated (MV4-11) cells and FLT3-ITD wild-type cells (U937) to patient cerebrospinal fluid. (A) Response of U937 (FLT-3 negative) and MV4-11 (FLT-3 positive) cell lines treated with increasing concentrations of gilteritinib (day 3; N=7). (B) U937 cells treated in vitro with control cerebrospinal fluid (CSF) compared to the CSF of 4 acute myeloid leukemia (AML) patients with central nervous system (CNS) and medullary FLT3 internal tandem duplication (FLT3-ITD) relapse (day 5; N=4). (C) MV4-11 cells treated in vitro with control CSF compared to the CSF of 2 AML patients with CNS and medullary FLT3-ITD relapse (day 5; N=4). (D) Distribution of the area under the curve (AUC) for FLT3 wild-type (WT) U937 cells with control CSF or CSF of 4 AML patients with CNS and medullary FLT3-ITD relapse for 5 days. (E) Distribution of AUC for FLT3-ITD MV4-11 cells with control CSF or CSF of 4 AML patients with CNS and medullary FLT3-ITD relapse for 5 days. Error bars represent the mean ± standard deviation of 4 technical replicates (day 5; N=4; *P<0.05; **P<0.005; ***P<0.0005).
3L level in CSF was not correlated to Flt-3L level in plasma.
MV4-11 is a cell line established from the monocytes of a 10-year-old male with AML harboring a FLT3-ITD mutation. U937 was obtained from a 37-year-old male with histiocytic lymphoma without a FLT3-ITD mutation. Both cell lines were purchased from ATCC and maintained in RPMI-1640 (Sigma-Aldrich #R8758) supplemented with 1% penicillin–streptomycin and 10% fetal bovine serum (Sigma-Aldrich) at 37°C with 5% CO2.
In order to determine the activity of gilteritinib in the CSF of AML patients with CNS and medullary FLT3-ITD relapse, FLT3-ITD mutated (MV411) and FLT3 wild-type (U937) AML cell lines were plated in quadruplicate and treated with increasing concentrations of patient or control CSF up to 2.2 ng/mL and normalized to MV4-11 or U937 cells with a CSFmimicking control solution (plasma diluted 1/200th in water).
Response to CSF treatment was measured using CellTiterGlo (Promega #G7573) to determine normalized intensity of luminescence to infer cell proliferation and viability after 5 days of treatment with control CSF or gilteritinib -containing CSF samples from patients 1 to 4. The FLT3-ITD AML cell line, MV4-11, demonstrated a significant reduction in the area under curve (AUC) in response to increasing volume of CSF with an IC50 of 3.86 nM (2.13 ng/mL), in comparison with its FLT3 WT U937 counterpart which did not show sensitivity to patient-derived CSF (Figure 1). These results confirmed that the CSF of patients 1 and 4 contains an active unbound fraction of gilteritinib which exhibited anti-leukemic properties. For patients 2 and 3, MV4-11 did not demonstrate a significant reduction in the AUC in response to an increasing volume of CSF despite the quantifiable gilteritinib concentration in the CSF.
Due to its use in combination with other therapies, gilte-

ritinib efficacy as a single agent was not assessable. Nevertheless, this report describes objective sustainable responses and pharmacodynamic proofs of gilteritinib CSF penetration in AML patients with CNS involvement. With such favorable pharmacokinetic and pharmacodynamic properties, and given the paucity of drugs active on CNS relapse of AML, our reports provide rationale for further evaluations of the use of gilteritinib in CNS involvement of AML patients.
Nicolas Vignal,1,2 Loïs Kelly,3 Etienne Lengline,4 Aurélie CabannesHamy,5 Justine Siavellis,6 David Ghez,7 Hélène Sauvageon,1,2
Thorsten Braun,6 Evelyne Jacqz-Aigrain,1 Milena Kohn,5 Philippe Rousselot,5 Alexandre Puissant,3 Emmanuel Raffoux,4 Samia Mourah1,2 and Lauriane Goldwirt1,2
1AP-HP, Hôpital Saint-Louis, Department of Pharmacology, Paris; 2INSERM U976, Université Paris Cité, Paris; 3INSERM U944, Université Paris-Cité, Paris; 4AP-HP, Hôpital Saint-Louis, Department of Hematology, Paris; 5CH Versailles, Department of Hemato-Oncology, Versailles; 6AP-HP, Hôpital Avicenne, Department of Hematology, Paris and 7IGR, Department of Hematology, Villejuif, France
Correspondence:
L. GOLDWIRT - lauriane.goldwirt@aphp.fr
1. Perl AE, Altman JK, Cortes J, et al. Selective inhibition of FLT3 by gilteritinib in relapsed or refractory acute myeloid leukaemia: a multicentre, first-in-human, open-label, phase 1-2 study. Lancet Oncol. 2017;18(8):1061-1075.
2. Perl AE, Martinelli G, Cortes JE, et al. Gilteritinib or chemotherapy for relapsed or refractory FLT3-mutated AML. N Engl J Med. 2019;381(18):1728-1740.
3. Mori M, Kaneko N, Ueno Y, et al. Gilteritinib, a FLT3/AXL inhibitor, shows antileukemic activity in mouse models of FLT3 mutated acute myeloid leukemia. Invest New Drugs. 2017;35(5):556-565.
4. FDA. Gilteritinib FDA multi-discipline review. https://www.accessdata.fda.gov/drugsatfda_docs/nda/2018/21134 9Orig1s000Approv.pdf Accessed December 2022.
5. Ganzel C, Lee JW, Fernandez HF, et al. CNS involvement in AML at diagnosis is rare and does not affect response or survival: data from 11 ECOG-ACRIN trials. Blood Adv. 2021;5(22):4560-4568.
6. Del Principe MI, Buccisano F, Soddu S, et al. Involvement of central nervous system in adult patients with acute myeloid leukemia: incidence and impact on outcome. Semin Hematol. 2018;55(4):209-214.
7. Siegal T, Benouaich-Amiel A, Bairey O. Neurologic complications of acute myeloid leukemia. Diagnostic approach and
https://doi.org/10.3324/haematol.2022.282596
Received: December 16, 2022.
Accepted: February 3, 2023.
Early view: February 16, 2023.
©2023 Ferrata Storti Foundation
Published under a CC BY-NC license
Disclosures
ER acts as a consultant for Astellas. All other authors have no conflicts of interest to disclose.
Contributions
LG developed the concept, supervised the research, reviewed and edited the article. NV, EL, ACH, JS, DG, TB, MK, PR, ER and LG analyzed data. NV, LK, EL, ACH, JS, DG, HS, TB, EJ-A, MK, PR, AP, ER, SM and LG performed the formal analysis, developed the methodology and software, visualized and validated data and wrote the original draft. NV, LK, EL, AC-H, JS, DG, HS, TB, EJ-A, MK, PR, AP, ER, SM and LG provided resources.
We thank Patricia Maslanka, Aïcha Laghzal and Aude Loiseau for their technical contribution.
Data-sharing statement
The data that support the findings of this study are available from the corresponding author upon reasonable request.
therapeutic modalities. Blood Rev. 2022;53:100910.
8. Perrone S, Ortu La Barbera E, Viola F, et al. A relapsing meningeal acute myeloid leukaemia FLT3-ITD+ responding to Gilteritinib. Chemotherapy. 2021;66(4):134-138.
9. Bennett JM, Catovsky D, Daniel MT, et al. Proposals for the classification of the acute leukaemias. French-American-British (FAB) co-operative group. Br J Haematol. 1976;33(4):451-458.
10. Arber DA, Orazi A, Hasserjian R, et al. The 2016 revision to the World Health Organization classification of myeloid neoplasms and acute leukemia. Blood. 2016;128(3):462-463.
11. Daver N, Perl AE, Maly J, et al. Venetoclax plus Gilteritinib for FLT3-mutated relapsed/refractory acute myeloid leukemia. J Clin Oncol. 2022;40(35):4048-4059.
12. James AJ, Smith CC, Litzow M, et al. Pharmacokinetic profile of Gilteritinib: a novel FLT-3 tyrosine kinase inhibitor. Clin Pharmacokinet. 2020;59(10):1273-1290.
13. Chiney MS, Menon RM, Bueno OF, Tong B, Salem AH. Clinical evaluation of P-glycoprotein inhibition by venetoclax: a drug interaction study with digoxin. Xenobiotica. 2018;48(9):904-910.
14. Milne P, Wilhelm-Benartzi C, Grunwald MR, et al. Serum Flt3 ligand is a biomarker of progenitor cell mass and prognosis in acute myeloid leukemia. Blood Adv. 2019;3(20):3052-3061.
β-thalassemia (β-thal) is a genetic red cell disorder characterized by chronic hemolytic anemia due to ineffective erythropoiesis and reduced red cell survival.1-3 Chronic transfusion and intensive iron chelation are standard treatments for β-thalassemic syndromes,1 but new therapeutic options are being developed, including gene therapy4 and novel pharmacologic approaches. We have shown that mitapivat, a pyruvate kinase activator, improves anemia and ineffective erythropoiesis in Hbbth3/+ mice, a widely used model for β-thal.5 The effects of mitapivat are not limited to the erythroid compartment: mitapivat also modulates DMT1 expression, controlling iron absorption in the duodenum in Hbbth3/+ mice, with an increase of hepcidin related to the improvement in ineffective β-thalassemic erythropoiesis.5 Results from a phase II trial of mitapivat in non–transfusion-dependent β-thal patients previously demonstrated a sustained long-term increase in hemoglobin (Hb ≥1 g/dL) with improvement of hemolysis and ineffective erythropoiesis.6 Here, we asked whether mitapivat might be a potential therapeutic option also for β-thal patients under chronic transfusion regimen. In order to address this question, we exposed female Hbbth3/+ mice (3-4 months of age) to chronic transfusion with or without mitapivat (50 mg/kg twice daily [BID]). Hbbth3/+ mice were treated by oral gavage with mitapivat (50 mg/kg BID) or vehicle for 10 days, and then transfused with 400 µL washed red blood cells at 40-45% hematocrit (Hct)7 (Figure 1A). We defined Hb values ≤10.5 g/dL as the transfusion threshold, corresponding to the reduction of ~50% of post-transfusion Hb values. Normality of data was assessed with the Shapiro-Wilk test. Two-tailed unpaired Student t-test or two-way analysis of variance with Tukey’s multiple comparisons were used for data analyses. Data show values from individual mice and are presented with mean ± standard error of the mean (differences with P<0.05 were considered significant).
As shown in Figure 1B, mitapivat-treated β-thal mice exposed to chronic transfusion displayed a greater sustained rise in Hb from baseline compared to vehicle-treated transfused β-thal mice. This resulted in a longer interval between transfusions (13.8±1.0 days in mitapivat-treated β-thal mice vs. 10.5±1.0 days in vehicletreated β -thal mice; Figure 1C). Chronic transfusion resulted in a significant reduction of splenomegaly in both mitapivat- and vehicle-treated β-thal mice (Online Supplementary Figure 1SA) compared to untreated β -thal mice, but spleen iron accumulation was significantly lower in mitapivat-treated β-thal mice when compared to
vehicle-treated β-thal mice (Figure 1D). A significant reduction of both bone marrow and spleen ineffective erythropoiesis was observed in all transfused β -thal mice (Figure 1E; Online Supplementary Figure S1B). Of note, mitapivat-treated transfused β-thal mice showed a slight increase of bone marrow erythropoiesis with a trend towards an improvement of maturation index compared to vehicle-treated transfused β-thal mice evaluated at the end of the study.5 This is most likely related to a protective effect of mitapivat on residual bone marrow and spleen erythropoiesis (Figure 1F). Indeed, plasma erythropoietin was lower in mitapivat-treated transfused β-thal mice than in vehicle-treated transfused β-thal mice (Online Supplementary Figure S1C). Since splenic macrophages contribute to both erythrophagocytosis and iron recycling, we evaluated the functional profile of spleen macrophages in the different mouse groups.8 As shown in Figure 1G, flow cytometric analysis of the surface expression of the M1 marker CD80 and the M2 marker CD206 on spleen macrophages (MΦ) revealed that mitapivat promoted a proresolving profile of splenic macrophages in transfused β-thal mice when compared to vehicle-treated transfused β-thal mice (Online Supplementary Figure S2A). This effect was still observed in non-transfused mitapivat-treated mice compared to vehicle-treated β-thal mice (Figure 1G; Online Supplementary Figure S2A). Collectively, these data support the role of mitapivat in reprograming macrophages from proinflammatory to proresolving and repairing the phenotype in β-thal mice with or without chronic transfusion.9
We then evaluated the impact of mitapivat on iron metabolism in transfused β -thal mice. Mitapivat-treated transfused β-thal mice showed lower liver iron accumulation when compared to vehicle-treated transfused βthal mice (Figure 2A). This might be due in part to the reduction of the transfusion burden but also to the multimodal action of mitapivat, which we previously showed to modulate hepcidin indirectly by the reduction of ineffective erythropoiesis and downregulation of DMT1 expression in the duodenum.5 Indeed, in mitapivat-treated transfused β-thal, we found a significant increase in liver hepcidin/LIC ratio (Figure 2B) and a marked reduction in the percentage of serum transferrin saturation when compared to vehicle-treated transfused β-thal mice (Figure 2C). The reduced transfusion burden observed in mitapivat treated β-thal mice might favorably contribute to the general reduction of iron-overload in β-thal mice exposed to chronic transfusion. Our preclinical results in combination with clinical data from non-transfusion-de-

Figure 1. Mitapivat reduces transfusion burden in β-thalassemia mice exposed to chronic transfusion with associated reprogramming of splenic macrophage phenotype. (A) Experimental study design to assess the effects of mitapivat on hematologic phenotype of β-thalassemia (β-thal) mice exposed to chronic transfusion. (B) Hemoglobin (Hb) changes over time in transfused (Tr.) β-thal (Hbbth3/+) mice treated with either vehicle or mitapivat (50 mg/kg twice daily [BID]) shown as single animals (n=3 vehicle-treated mice; n=4 mitapivat-treated mice). Grey dotted line shows the transfusion threshold (10.5 g/dL). (C) Transfusion time intervals in β-thal (Hbbth3/+) mice treated with either vehicle or mitapivat (50 mg/kg BID). Data are presented as means ± standard error of the mean (SEM) (n=3 vehicle-treated mice; n=4 mitapivat-treated mice); #P<0.05 compared to vehicle-treated transfused β-thal mice. (D) Iron staining (Perl’s Prussian blue is a semi-quantitative method to assess organ iron accumulation) in spleen from Hbbth3/+ mice treated with either vehicle or transfusion plus vehicle or transfusion plus mitapivat. One representative image from 3 with similar results. Left panel: quantification of iron staining in spleen. Data are mean ± SEM (n=3). *P<0.05 compared with vehicle Hbbth3/+ mice and #P<0.05 compared with vehicle-treated transfused Hbbth3/+ mice. (E) Flow cytometric analysis (CD44+Ter119+ and cell size markers, see also the Online Supplementary Figure S2) of bone marrow and spleen from Hbbth3/+ mice exposed to either vehicle or to chronic transfusion with and without mitapivat treatment (see also Matte et al 5). Data are mean ± SEM (n=3-4). *P<0.05 compared with vehicle Hbbth3/+ mice and #P<0.05 compared with vehicle-treated transfused Hbbth3/+ mice. (F) Maturation index as ratio between pop II (Baso E.) and pop IV (Ortho E.) in bone marrow and spleen from Hbbth3/+ mice treated with either vehicle or exposed to chronic transfusion with or without mitapivat, analyzed by flow cytometry. Data are mean ± SEM (n=3-4). (G) Flow cytometric quantification of M1 (CD80) and M2 (CD206) expression on spleen macrophage cell surface from wild-type (WT) or Hbbth3/+ mice exposed to either vehicle or mitapivat or to chronic transfusion with and without mitapivat treatment. Spleen macrophages (MΦ) were isolated with the GentleMACS cell dissociator (Miltenyi Biotech, Germany). MΦ were identified and gated as CD45+/F4/80+ cells. Anti-CD45 PE-Cy5.5, F4/80 PE, CD206 PerCP-Cy5.5 and CD80 were from BioLegend, USA. Data are mean ± SEM (n=3-4). MFI: mean fluorescence intensity; RBC: red blood cells.
pendent β-thal patients treated with mitapivat6 suggest that the increase in the length of time between transfusions with mitapivat treatment may be associated with improvement in the quality of life in patients as well as a decrease in iron-overload-related organ damage. Recent reports in transfusion-dependent β-thal patients have highlighted a correlation between ferritin levels and kidney iron accumulation assessed by magnetic resonance T2* imaging, or in sample analysis from kidney biopsies or autopsy series.10 Kidney iron overload mainly involved the tubular compartment which has been related to chronic anemia and might be reversed by iron chelation.10 In vehicle-treated transfused β-thal mice, we found tubular accumulation of iron, which was significantly reduced in mitapivat-treated transfused animals (Figure 3A). No major difference in creatinine was observed in both β-thal mouse groups exposed to chronic transfusion (Online Supplementary Figure S2B). Previous studies suggest that kidney iron accumulation promotes local oxidative stress, contributing to profibrotic signaling in addition to hypoxia.10,11 MicroRNA (miRNA) let-7b, -c, and -d have been shown to be linked to renal fibrosis throughout the transforming growth factor-β cascade (TGF-β).12 In this study, miRNA let-7b and -d were upregulated in vehicle-treated β-thal mice with or without chronic transfusion (Figure 3B; Online Supplementary Figure S2C), while mitapivat downregulated miRNA let-7b and -d in β-thal mice with or without chronic transfusion (Figure 3B; Online Supplementary Figure S2C). miRNA let-7 have been reported to reduce ATP production by deactivating pyruvate dehydrogenase kinase (PDK).13 Here, we found normalization of the amount of the active form of the TGF-β receptor in β-thal mice treated with mitapivat when compared to vehicle-treated β -thal mice with or without transfusion (Figure 3C). Previously, in βthal mice, the activation of TGF-β receptor was reduced by chronic transfusion, hypoxia being a trigger of activa-
tion of TGF-β receptor.14 Taken together, our data indicate that mitapivat might play a pivotal role in kidney protection by reducing the transfusion burden and iron overload as well as by preserving energy cell metabolism. This might represent an added value of mitapivat as a therapeutic option for patients with β-thal taking iron chelators who develop renal toxicity or chronic kidney disease. Finally, we explored the effects of the co-administration of mitapivat and deferiprone (DFP) on β-thal mice, since iron chelation is part of the gold standard treatment of βthal patients.1 DFP was administered to Hbbth3/+ mice treated with mitapivat in drinking water at the dosage of either 1.25 or 0.75 mg/mL15 (Online Supplementary Figure S3A). Previously, Casu et al. reported that DFP alone has no effect on hematologic parameters and red cell features in murine β-thal.15 The beneficial effects of mitapivat on murine β-thal anemia was maintained when mitapivat was co-administered with DFP at both dosages, as supported by the stable and sustained increase in Hb and the reduction in circulating erythroblasts compared to baseline values (Online Supplementary Figure S3B, C). In agreement with Matte et al., 5 we found a significant reduction in α-globin membrane precipitates in red blood cells from mitapivat DFP-treated Hbbth3/+ mice compared with vehicle-treated animals (Online Supplementary Figure S3D). Of note, DFP iron chelation efficacy represented by a change in LIC was preserved in β-thal mice treated with both DFP and mitapivat (Online Supplementary Figure S3E).
In conclusion, our study shows for the first time that mitapivat improves the transfusion burden and reduces organ iron overload in β-thal mice exposed to a chronic transfusion regimen. We also observed that mitapivat might protect the kidney against profibrotic stimuli related to local iron accumulation by two different mechanisms: the reduction in transfusion requirement and the local modulation of miRNA involved in profibrotic signal-
Figure 2. Mitapivat-treated transfused β-thalassemia mice show reduced liver iron accumulation and improved iron homeostasis. (A) Left and central panels: iron staining (Perl’s Prussian blue is a semi-quantitative method to assess organ iron accumulation) in liver from wild-type (WT) and Hbbth3/+ mice treated with either vehicle or transfusion (Tr.) or transfusion plus mitapivat. One representative image from 5 with similar results. Right panel: quantification of iron staining in liver. Data are mean ± standard error of the mean (SEM) (n=5). °P<0.05 compared to WT, *P<0.05 compared with vehicle Hbbth3/+ mice and #P<0.05 compared with vehicle-treated transfused (Tr.) Hbbth3/+ mice. (B) Liver mRNA expression normalized over liver iron concentration (LIC) as determined using the bathophenanthroline method. Data are presented as means ± SEM (n=3). #P<0.05 compared with vehicletreated transfused Hbbth3/+ mice. (C) Transferrin saturation in Hbbth3/+ mice treated with either vehicle or transfusion or transfusion plus mitapivat. Transferrin saturation was calculated as the ratio between serum iron and total iron binding capacity, using the Total Iron Binding Capacity Kit (Randox Laboratories, UK) and 50 mL of serum, according to the manufacturer’s instructions. Data are presented as means ± SEM (n=3). *P<0.05 compared with vehicle Hbbth3/+ mice and #P<0.05 compared with vehicle-treated transfused Hbbth3/+ mice. RBC: red blood cells.

Figure 3. In transfused β-thalassemia mice, mitapivat reduces kidney iron accumulation and downregulates profibrotic kidney miRNA let-7 expression. (A) Upper panels: iron staining (Perl’s Prussian blue is a semi-quantitative method to assess organ iron accumulation) in kidney from wild-type (WT) and Hbbth3/+ mice treated with either vehicle or transfusion (Tr.) or transfusion plus mitapivat. One representative image from 3-6 with similar results. Lower panels: quantification of iron staining in kidney. Data
Continued on following page.

are mean ± standard error of the mean (SEM) (n=3-6). *P<0.05 compared with vehicle Hbbth3/+ mice and #P<0.05 compared with vehicle-treated transfused (Tr.) Hbbth3/+ mice. (B) Relative expression of miRNA let-7b and -7d in kidneys from WT or Hbbth3/+ mice exposed to either vehicle or mitapivat or to chronic transfusion with and without mitapivat treatment. Small RNA was isolated from frozen kidneys using a silica spin column-based Quick-RNA kit (Zymo Research), quantified with a UV NanoPhotometer (Implen), and reverse transcribed with the qScript microRNA cDNA Synthesis for RT-PCR (QuantaBio). For real time polymerase chain reaction (RT-PCR) analysis of let-7b and let-7d miRNA, 3 ng of cDNA were used as a template in reaction mixtures (10 mL final volume) including a PowerUp SYBR Green Master Mix (5 mL, Applied Biosystems), miRNA-specific forward and universal reverse primers (1 mL each, miRCURY assays, Qiagen), and PCR-grade water. The expression of the indicated mRNA was quantitated by the comparative ΔCt method. RNU6-1 was used as control for normalization. Data are mean ± SEM (n=3-4). *P<0.05. **P<0.01. ***P<0.001. (C ) Phospho-tyrosine immunoprecipitation of kidneys from WT or Hbbth3/+ mice exposed to either vehicle or mitapivat or to chronic transfusion with and without mitapivat treatment, using anti-phospho-tyrosine specific antibodies (IP: PY, clone PY99 from SCBT, Santa Cruz, CA and clone 4G10 from Merck KGaA, Darmstadt, Germany), revealed with anti-TGF-β receptor (Rec) specific antibody. GAPDH in whole-cell lysate (WCL) is used as loading control. One representative gel from 4 others with similar results is presented. Blots were developed using the Luminata Forte Chemiluminescent HRP Substrate from Merck Millipore (Armstadt, Germany), and images were acquired with the Alliance Q9 Advanced imaging system (Uvitec, UK). Densitometric analysis of immunoblots is shown on the right. Data are mean ± SEM (n=4). °P<0.05 compared to WT; *P<0.05 compared with vehicle Hbbth3/+ mice, #P<0.05 compared with vehicle-treated transfused Hbbth3/+ mice. RBC: red blood cells.
ing. Finally, the observed reprograming of spleen macrophages toward a proresolving phenotype might represent an added value to the known improvement of ineffective erythropoiesis induced by mitapivat in β-thal mice.5 Thus, the beneficial effects of mitapivat in β-thal mice exposed to chronic transfusion support its use as a potential new therapeutic tool in clinical management of thalassemic patients under chronic transfusion regimen.
Alessandro Mattè,1 Penelope A. Kosinski,2 Enrica Federti,1 Lenny Dang,2 Antonio Recchiuti,3 Roberta Russo,4 Angela Siciliano,1 Veronica Riccardi,1 Anne Janin,5 Matteo Mucci,3 Christophe Leboeuf,5 Achille Iolascon,6 Carlo Brugnara7 and Lucia De Franceschi1
1University of Verona and AOUI Verona, Verona, Italy; 2Agios Pharmaceuticals, Inc., Cambridge, MA, USA; 3Deptartment of Medical, Oral and Biotechnology Science, “G. d’Annunzio” University of Chieti, Chieti, Italy; 4Dipartmento di Medicina Molecolare e Biotecnologie Mediche, Università degli Studi di Napoli Federico II, Naples, Italy; 5University Diderot of Paris, Paris, France; 6CEINGEBiotecnologie Avanzate Franco Salvatore, Naples, Italy and 7Department of Laboratory Medicine, Harvard Medical School, Boston Children's Hospital, Boston, MA, USA
Correspondence:
L. DE FRANCESCHI - lucia.defranceschi@univr.it
https://doi.org/10.3324/haematol.2022.282614
1. Taher AT, Musallam KM, Cappellini MD. Beta-Thalassemias. N Engl J Med. 2021;384(8):727-743.
2. De Franceschi L, Bertoldi M, Matte A, et al. Oxidative stress and
Received: December 20, 2022.
Accepted: February 7, 2023.
Early view: February 16, 2023.
©2023 Ferrata Storti Foundation
Published under a CC BY-NC license
Disclosures
LDF received research funding from Agios during 2015-2022. LD and PAK are Agios employees and stockholders. All other authors have no conflicts of interest to disclose.
Contributions
LDF, CB, AM and AI designed and carried out research and wrote the paper. PAK, LD and CB critically revised data and wrote the paper. AM, EF, AS and VR carried out cytokine FACS analysis, immunoprecipitation assays and ELISA analysis. RB carried out molecular analysis. EF revised the paper. MM and AR carried out miRNA analysis, analyzed the data and wrote the paper. CL and AJ performed pathology analysis and analyzed data.
This study was supported by an Agios Pharmaceuticals, Inc. research collaborative grant to LDF. Editorial assistance was provided by Avant Healthcare, LLC and Excel Medical Affairs, Horsham, UK, supported by Agios.
All the data and protocols are stored in the Nas Synology DS216se Hard Disk, located at the University of Verona, Verona, Italy and will be made available on request. Please direct requests for original data to the corresponding author.
β-thalassemic erythroid cells behind the molecular defect. Oxid Med Cell Longev. 2013;2013:985210.
3. Rivella S. β-thalassemias: paradigmatic diseases for scientific
Haematologica | 108 September 2023 2540
discoveries and development of innovative therapies. Haematologica. 2015;100(4):418-430.
4. Locatelli F, Thompson AA, Kwiatkowski JL, et al. Betibeglogene autotemcel gene therapy for non-beta(0)/beta(0) genotype beta-Thalassemia. N Engl J Med. 2022;386(5):415-427.
5. Matte A, Federti E, Kung C, et al. The pyruvate kinase activator mitapivat reduces hemolysis and improves anemia in a betathalassemia mouse model. J Clin Invest. 2021;131(10):e144206.
6. Kuo KHM, Layton DM, Lal A, et al. Safety and efficacy of mitapivat, an oral pyruvate kinase activator, in adults with nontransfusion dependent alpha-thalassaemia or beta-thalassaemia: an open-label, multicentre, phase 2 study. Lancet. 2022;400(10351):493-501.
7. Park SY, Matte A, Jung Y, et al. Pathologic angiogenesis in the bone marrow of humanized sickle cell mice is reversed by blood transfusion. Blood. 2020;135(23):2071-2084.
8. Ramos P, Casu C, Gardenghi S, et al. Macrophages support pathological erythropoiesis in polycythemia vera and betathalassemia. Nat Med. 2013;19(4):437-445.
9. Galvan-Pena S, O'Neill LA. Metabolic reprograming in
macrophage polarization. Front Immunol. 2014;5:420.
10. Demosthenous C, Vlachaki E, Apostolou C, et al. Betathalassemia: renal complications and mechanisms: a narrative review. Hematology. 2019;24(1):426-438.
11. Musallam KM, Taher AT. Mechanisms of renal disease in betathalassemia. J Am Soc Nephrol. 2012;23(8):1299-1302.
12. Hong S, Lu Y. Omega-3 fatty acid-derived resolvins and protectins in inflammation resolution and leukocyte functions: targeting novel lipid mediator pathways in mitigation of acute kidney injury. Front Immunol. 2013;4:13.
13. Ma X, Li C, Sun L, et al. Lin28/let-7 axis regulates aerobic glycolysis and cancer progression via PDK1. Nat Commun. 2014;5:5212.
14. Chou YH, Pan SY, Shao YH, et al. Methylation in pericytes after acute injury promotes chronic kidney disease. J Clin Invest. 2020;130(9):4845-4857.
15. Casu C, Aghajan M, Oikonomidou PR, et al. Combination of Tmprss6- ASO and the iron chelator deferiprone improves erythropoiesis and reduces iron overload in a mouse model of beta-thalassemia intermedia. Haematologica. 2016;101(1):e8-e11.
The International Consensus Classification (ICC) recognizes a JAK2 mutation-prevalent category of myeloproliferative neoplasms (MPN), which includes polycythemia vera (PV), essential thrombocythemia (ET), primary myelofibrosis (PMF), and MPN, unclassifiable (MPN-U).1,2 Each one of these MPN subcategories is at risk of progressing into acute myeloid leukemia (AML) with reported rates (median follow-up) of 3.9% (8.2 years) for PV, 2.6% (9.9 years) for ET and 9.3% (3.2 years) for PMF.3 There is limited information regarding the risk of leukemic transformation in MPN-U.4 MPN progression into AML is operationally designated as blast-phase disease (MPN-BP) and requires the presence of ≥20% circulating or bone marrow (BM) blasts while a blast count of 10-19% constitutes “accelerated phase” disease.2
In a previous study of 410 patients with MPN-BP, including 248 from the Mayo Clinic, we reported a median survival of 3.6 months and 3-year survival rate of 6%.5 Among the Mayo Clinic cases, 121 (49%) received supportive care, 103 (42%) chemotherapy with (n=24) or without (n=79) achieving response, and 24 (10%) allogeneic stem cell transplant
(ASCT);5 the 1/3-year survival rates were 66%/32% for ASCT, 37%/19% for patients achieving chemotherapy-induced response but were not transplanted, and 8%/1% in the absence of both ASCT and response to chemotherapy.5 The particular study preceded the advent of Janus kinase 2 inhibitors (JAKi), which are now part of the expanding therapeutic armamentarium for MPN.6 In this regard, ruxolitinib has paved the way with its Food and Drug Administration (FDA) approval in 2011.7 There is currently general agreement on the efficacy of ruxolitinib and other JAKi in controlling splenomegaly and constitutional symptoms of patients with MPN whereas there is limited evidence for value in modifying disease natural history, including impact on progression into MPN-BP.6 The current retrospective study details our more recent experience in patients with MPN-BP who were diagnosed after the approval date for ruxolitinib (2011); our main objective was to examine the impact of prior exposure to ruxolitinib, on genetic composition and survival.
The current study was conducted under an Institutional Review Board-approved minimum risk protocol that
Table 1. Cytogenetic and mutation information on 103 patients with myeloproliferative neoplasms with transformation into acute myeloid leukemia (blast phase disease): variables collected at the time of leukemic transformation, stratified by prior exposure to ruxolitinib or other Janus kinase 2 inhibitors.
Somatic mutations, N evaluable =96, N (%) (seen in 7 or more patients)
JAKi:
allowed retrospective collection and analysis of data from patients seen at the Mayo Clinic Rochester, MN, USA, after the FDA approval date for ruxolitinib (2011); diagnosis dates spanned from 12/16/2011 to 5/27/2021. Diagnoses of specific MPN variants and MPN-BP were according to ICC criteria.2 For the purposes of comparative analysis, patients were classified into those with or without prior exposure to ruxolitinib (Tables 1 and 2). Responses were recorded according to European LeukemiaNet criteria.8 Clinical and laboratory data, including cytogenetic and molecular information, were collected from patients at the time of leukemic transformation. Survival analysis was calculated from the time of leukemic transformation to death or last follow-up. Conventional statistical methods were applied using JMP Pro 16.0.0 software (SAS Institute, Cary, NC, USA). A total of 103 patients (median age 70 years, range 37-89; 52% males) were considered; MPN variant prior to AML transformation was PMF in 35% and post-PV/ET MF in 65% (Table 1). MPN treatment prior to leukemic transformation included ruxolitinib ± other JAKi in 32 (31%) patients while the remaining 71 cases received other cytoreductive drugs, mostly in the form of hydroxyurea and not including JAKi (n=60; 58%) or neither (n=11; 10%). Median duration of treatment for the ruxolitinib and non-ruxolitinib groups were 47 and 66 months, respectively (P=0.06), and median time from MPN diagnosis to leukemic transformation was 6 and 8 years (P=0.47). At the time of leukemic transformation, karyotype was available in 97 patients and revealed monosomal karyotype or monosomy 7 in 35 (36%), complex karyotype, non-monosomal in 18 (19%), normal karyotype in 17 (18%) and other abnormalities in 27 (28%); karyotype profile was similar between the ruxolitinib and non-ruxolitinib groups (P=0.34). Driver mutation distribution (“N”
evaluable =83) was also similar in the two groups (P=0.65): JAK2 67%, CALR 7%, MPL 6% and triple-negative 1%. The frequency of other mutations is outlined in Table 1 with the most frequent being ASXL1 (40%), TP53 (33%), TET2 (18%), FLT3 (18%), SRSF2 (16%), EZH2 (16%), DNMT3A (16%), IDH1 (16%), RUNX1 (11%) and NRAS (9%); frequency of SRSF2 mutation was significantly higher in the ruxolitinib group (P=0.02; 16% vs. 3%; Table 1); other mutations of similar distribution, not listed in Table 1 and occurring in less than seven patients each, included DNMT3A, IDH1, IDH2, RUNX1, NRAS, STAG2, ZRSR2, GATA2, U2AF1, CEBPA, NPM1, KIT, WT1, SF3B1, BCOR, FGFR3. Red cell transfusion need (P<0.01), antecedent PMF history (P<0.01) and marked splenomegaly (P<0.01) were also more likely to be seen in the ruxolitinib group (Table 1).
First-line MPN-BP therapy included intensive chemotherapy (n=35; 35%), hypomethylating agents (HMA) with (n=12; 12%) or without (n=21; 21%) venetoclax, other drugs (n=6; 6%) or supportive care (n=25; 25%) (Table 2; P=0.72 for ruxolitinib vs. non-ruxolitinib groups). Seventy-one patients were evaluable for response to chemotherapy with only 11 (15%) achieving complete remission/complete remission with incomplete count recovery (CR/CRi) (Table 2). At the time of this writing, 96 (93%) deaths and 11 (11%) ASCT were documented, without significant differences between ruxolitinib versus non-ruxolitinib groups (Table 2). Among the seven patients censored alive, five had received ASCT, four of whom had persistent bone marrow blasts (8-16%) at time of transplant. Univariate survival analysis disclosed favorable impact from ASCT (P<0.01) and achievement of CR/CRi (P<0.01) while inferior survival was associated with age >65 years (P=0.02), complex/monosomal karyotype (P<0.01), platelet count <100x109/L (P=0.01), and previous
Table 2. Treatment approaches and clinical course of 103 patients with myeloproliferative neoplasms with transformation into acute myeloid leukemia (blast phase disease), stratified by exposure to ruxolitinib or other Janus kinase 2 inhibitors.
MPN: myeloproliferative neoplasms; AML: acute myeloid leukemia; JAKi: Janus kinase 2 inhibitor; CR/Cri: complete remission/complete remission with incomplete count recovery; ASCT: allogeneic stem cell transplant.
exposure to ruxolitinib (P=0.047). Multivariable analysis confirmed the favorable impact of ASCT (P<0.01; hazard ratio [HR]=0.18; 95% confidence interval [CI]: 0.08-0.41) and the adverse impact of complex/monosomal karyotype (P<0.01; HR=2.2; 95% CI: 1.4-3.5), platelet count <100x109/L (P<0.01; HR=2.3; 95% CI: 1.4-3.6) and previous exposure to ruxolitinib (P=0.04; HR=1.7; 95% CI: 1.02-2.7; Figure 1A); the latter was most apparent in the absence of ASCT (Figure 1B). Figure 1C depicts survival data stratified by ASCT versus intensive chemotherapy without ASCT versus less intensive chemotherapy including HMA alone or in combination with venetoclax. Among the 32 ruxolitinib-exposed patients with MPN-BP, 31 had died and causes of death included progressive leukemia in 26 patients, pneumonia/infections in three and subarachnoid hemorrhage and granulocytic sarcoma in one patient each.
In the current contemporary series of patients with MPNBP, there was no evidence to suggest improved outcome in the last decade while the value of ASCT in securing long-term survival and the detrimental impact of high-risk karyotype and thrombocytopenia were confirmed.5 The favorable impact of ASCT in MPN-BP was recently asserted by a large European Bone Marrow Transplant (EBMT) registry data involving 663 informative cases, with 3-year
survival rate of 36%.9 In the particular study, the absence of active disease at time of transplant was associated with a higher 3-year survival rate (43% vs. 30%) and, therefore, supportive of current practice of using hypomethylating agent-based combination therapy, as a bridge towards ASCT.10,11 The novel observation in the current study was the identification of prior exposure to ruxolitinib as an independent risk factor for inferior survival, independent of its observed association with SRSF2 mutation. However, this does not prove cause and effect and our observations should be interpreted with caution, considering the retrospective nature of the study. In this regard, we acknowledge missing information on details of ruxolitinib therapy, including indications and pretreatment risk score, although such information might be more relevant for post-ruxolitinib treatment survival as opposed to post-MPN-BP survival. Possible explanations outside of drug effect include the enrichment of biologically more aggressive disease in patients needing treatment with ruxolitinib, which might not have been accounted for by risk factors considered in our multivariate model, which, however, did account for the preponderance of pre-PMF and transfusiondependent cases in the ruxolitinib-exposed patients. The potential value of ASCT in mitigating adversity from known
Figure 1. Survival data among 103 patients with blast phase myeloproliferative neoplasms (MPN-BP). (A) Patients stratified by prior exposure to ruxolitinib. (B) Survival data limited to 92 patients with blast phase myeloproliferative neoplasms (MPN-BP) who did not receive allogeneic stem cell transplant (ASCT) and were stratified by prior exposure to ruxolitinib. (C) Patients stratified by treatment received for MPN-BP.

or unknown risk factors for survival in MPN-BP requires validation from a larger study.
Maymona G. Abdelmagid,1 Aref Al-Kali,1 Kebede H. Begna,1 William J. Hogan,1 Mark R. Litzow,1 Farah Fleti,1 Abhishek A. Mangaonkar,1 Mrinal S. Patnaik,1 Michelle A. Elliott,1 Hassan Alkhateeb,1 Min Shi,2 Matthew T. Howard,2 Kaaren K. Reichard,2 Rhett P. Ketterling,2 Mithun Shah,1 Animesh Pardanani,1 Naseema Gangat1 and Ayalew Tefferi1
1Division of Hematology, Department of Medicine, Mayo Clinic and 2Division of Hematopathology, Department of Laboratory Medicine, Mayo Clinic, Rochester, MN, USA
Correspondence:
A. TEFFERI - tefferi.ayalew@mayo.edu
https://doi.org/10.3324/haematol.2022.282627
1. Thiele J, Kvasnicka HM, Orazi A, et al. The international consensus classification of myeloid neoplasms and acute leukemias: myeloproliferative neoplasms. Am J Hematol. 2023;98(3):544-545.
2. Arber DA, Orazi A, Hasserjian RP, et al. International Consensus Classification of Myeloid Neoplasms and Acute Leukemias: integrating morphologic, clinical, and genomic data. Blood. 2022;140(11):1200-1228.
3. Szuber N, Mudireddy M, Nicolosi M, et al. 3023 Mayo Clinic Patients with myeloproliferative neoplasms: risk-stratified comparison of survival and outcomes data among disease subgroups. Mayo Clin Proc. 2019;94(4):599-610.
4. Deschamps P, Moonim M, Radia D, et al. Clinicopathological characterisation of myeloproliferative neoplasm-unclassifiable (MPN-U): a retrospective analysis from a large UK tertiary referral centre. Br J Haematol. 2021;193(4):792-797.
5. Tefferi A, Mudireddy M, Mannelli F, et al. Blast phase myeloproliferative neoplasm: Mayo-AGIMM study of 410 patients from two separate cohorts. Leukemia. 2018;32(5):1200-1210.
6. Tefferi A, Gangat N, Pardanani A, et al. Myelofibrosis: genetic
Received: December 21, 2022.
Accepted: February 7, 2023.
Early view: February 16, 2023.
©2023 Ferrata Storti Foundation
Published under a CC BY-NC license
Disclosures
No conflicts of interest to disclose.
Contributions
All authors reviewed and approved the manuscript. MGA, AT and NG designed the study, abstracted clinical and laboratory data, performed statistical analysis, and wrote the paper. AT, AAK, KHB, WJH, MRL, AAM, MSP, MAE, HA, AP and NG contributed patients. MS, MTH, and KKR participated in pathology review. RPK participated in cytogenetic review.
Data-sharing statement
Data will be shared upon reasonable request to the corresponding author.
characteristics and the emerging therapeutic landscape. Cancer Res. 2022;82(5):749-763.
7. Verstovsek S, Kantarjian H, Mesa RA, et al. Safety and efficacy of INCB018424, a JAK1 and JAK2 inhibitor, in myelofibrosis. N Engl J Med. 2010;363(12):1117-1127.
8. Dohner H, Estey E, Grimwade D, et al. Diagnosis and management of AML in adults: 2017 ELN recommendations from an international expert panel. Blood. 2017;129(4):424-447.
9. Orti G, Gras L, Zinger N, et al. Allogeneic hematopoietic cell transplant for blast phase of philadelphia-chromosome negative myeloproliferative neoplasms: a retrospective study from the Chronic Malignancies Working Party of the EBMT. Bone Marrow Transpl. 2022;57(Suppl 1):S69.
10. Gangat N, Guglielmelli P, Szuber N, et al. Venetoclax with azacitidine or decitabine in blast-phase myeloproliferative neoplasm: A multicenter series of 32 consecutive cases. Am J Hematol. 2021;96(7):781-789.
11. Odenike O. How I treat the blast phase of Philadelphia chromosome-negative myeloproliferative neoplasms. Blood. 2018;132(22):2339-2350.
Although the coronavirus disease 2019 (COVID-19) pandemic has exerted collateral effects on various diseases, little is known about its impact on the incidence of hematologic diseases. This retrospective study evaluated the incidence of hematologic diseases during the COVID-19 pandemic using the Japanese nationwide database. The overall incidence of hematologic diseases decreased temporarily in April-May 2020 during the first COVID-19 wave, but gradually recovered to baseline over 6 months. The decrease was prominent in slowly progressing malignant and premalignant diseases, while rapidly progressive malignant diseases showed no significant decrease. On the other hand, immune thrombocytopenia (ITP) and idiopathic aplastic anemia (AA) showed a sustained decrease over 6 months, unlike other anemic and cytopenic diseases. Particularly, severe ITP and AA cases showed a more significant decrease. These results suggest community-acquired infectious agents as the leading cause of these diseases. During the COVID-19 pandemic, the government has implemented social restrictions aimed at controlling community severe acute respiratory syndrome coronavirus 2 (SARS-CoV-2) transmission. Such restrictions have had widespread collateral effects on diseases other than COVID-19, due to changes in both health care system performance and public behavior including canceling or postponing medical visits.1 During the first COVID-19 wave, the number of diagnoses of various diseases, including cancers and cardiovascular diseases, declined temporarily,2-4 but returned to the expected levels by the second half of 2020.2-4 On the other hand, the public have maintained selfrestraint behaviors, such as social distancing and wearing masks, to minimize SARS-CoV-2 transmission through person-to-person contact. Accordingly, many common infectious diseases, such as influenza, substantially decreased and remained low throughout 2020.5 These observations suggest that the extent and duration of the collateral effect may provide insights into disease etiology and related pathogenesis, particularly in association with infection. Hematologic diseases include various conditions ranging from rapidly progressing malignancies to disorders that are often asymptomatic and diagnosed incidentally as well as those triggered by infection. However, little is known about the collateral effect of the COVID-19 pandemic on the incidence of various hematologic diseases. Therefore, we conducted a retrospective study using the Blood Disease Registration managed by the Japanese So-
ciety of Hematology (JSH)6,7 to evaluate the short-term and long-term impact of the COVID-19 pandemic on the number of newly diagnosed hematologic diseases. This study was approved by the committee of academic and statistical investigation of the JSH and the Ethics Committee of Keio University School of Medicine.
The registered diseases consisted of 267 hematologic diseases, and we focused on nine disease categories representing major hematologic diseases: four malignant (acute leukemias, aggressive lymphomas, indolent lymphomas, and plasma cell disorders), three premalignant (myelodysplastic syndromes [MDS], myeloproliferative neoplasms [MPN], and premalignant monoclonal B-cell disorders) and two non-malignant categories (ITP and idiopathic AA) (Online Supplementary Table S1).
In order to evaluate the collateral effect of the COVID-19 pandemic, we compared the number of newly diagnosed cases in 2020, when the COVID-19 pandemic began in Japan, with that in 2019. The weekly number of newly diagnosed cases was counted in 4-week segments, and the number in 2020 was corrected by dividing by the ratio of the number of each disease category during January-February in 2020, which was before the COVID-19 pandemic, to that in 2019. The relative incidence was calculated as the difference between the actual number in 2019 and corrected number in 2020 divided by the actual number in 2019, for each disease category per each month, and presented as a 2-month moving average.
We evaluated 85,827 cases, consisting of 43,397 and 42,430 cases diagnosed in 2019 and 2020, respectively. Patient characteristics were similar between 2019 and 2020 (Table 1). The relative incidence for all registered cases and the weekly counts of newly confirmed COVID19 cases in Japan are shown in Figure 1. There were three COVID-19 waves in 2020 in Japan. During the first wave, when the infection spread and a state of emergency was declared from April to May, the overall incidence of hematologic diseases significantly decreased by 15% (P=0.003). During the second and third waves starting from June and October, the overall incidence declined by 10% and 7% (P=0.04 and P=0.048), respectively. Therefore, the COVID19 pandemic influenced the incidence of hematologic diseases, but its extent became smaller over time.
Among malignant diseases, the number of cases diagnosed with acute leukemias, aggressive lymphomas, and plasma cell disorders showed a slight but not statistically
Figure 1. Relative incidence for all registered cases with hematologic diseases and the number of new COVID-19 cases in Japan. Two-month moving average of the decrease rate for all registered cases with hematologic diseases in 2020 compared to 2019 is shown on the left, together with the weekly counts of newly confirmed COVID-19 cases per 100,000 population in 2020 in Japan13 on the right. Gray boxes indicate the first, second, and third waves of COVID-19, respectively. Vertical dotted lines in the right panel indicate the duration of a state of emergency: it was declared by the Japanese government for Tokyo, Osaka, Kanagawa, Saitama, Chiba, Hyogo, and Fukuoka on April 7 2020, and for remaining prefectures on April 16. It was terminated for all prefectures except Hokkaido, Saitama, Chiba, Tokyo, Kanagawa, Kyoto, Osaka, and Hyogo on May 14, for Kyoto, Osaka, and Hyogo on May 21 and for Hokkaido, Saitama, Chiba, Tokyo, and Kanagawa on May 25. Two-tailed Student's t-test was used to compare the actual weekly numbers in 2019 and the corrected weekly numbers in 2020 for 2 months. *P<0.05; **P< 0.01.
Comparisons between groups were based on the Wilcoxon rank-sum test for continuous data, and the Fisher’s exact test for categorical data.
significant decrease by at most 16% during the three COVID-19 waves (Figure 2A, B and D). In contrast, the number of cases with indolent lymphomas slowly decreased and reached a significantly lower level of 15% (P=0.007) in June-July, and gradually recovered to the baseline level (Figure 2C).

In premalignant diseases, the number of MDS and MPN cases significantly dropped by 26% and 17% (P=0.001 and P=0.03) respectively, in April-May, and these numbers gradually recovered to the baseline level in August-September (Figure 2E, F). Meanwhile, the number of cases with premalignant monoclonal B-cell disorders (mainly consisting of monoclonal gammopathy of unknown sig-
nificance) significantly decreased since March-April, with the largest decline of 41% (P=0.003) in April-May among disease categories (Figure 2G). The number continued to be significantly lower for 6 months and gradually recovered to a non-significant level by the end of 2020. Interestingly, the incidence of non-malignant disease showed a different time course: the number of ITP cases rapidly decreased by 23% (P=0.02) in April-May, and continued to be significantly lower (17 25% reduction) over 8 months until the end of 2020 (Figure 2H). On the other hand, the number of idiopathic AA cases did not show a statistically significant decline in April-May (Figure 2I). However, it gradually decreased thereafter, with a statis-
Figure 2. Relative incidences for cases with each disease category. Two-month moving average of the decrease rates for cases with acute leukemias (A), aggressive lymphomas (B), indolent lymphomas (C), plasma cell disorders (D), myelodysplastic syndromes (MDS) (E), myeloproliferative neoplasms (F), premalignant monoclonal B-cell disorders (G), immune thrombocytopenia (ITP) (H) and idiopathic aplastic anemia (AA) (I) in 2020 compared to 2019. Gray vertical indicate the weekly counts of newly confirmed COVID-19 cases per 100,000 population in 2020 in Japan.13 Vertical dotted lines in the panels indicate the duration of a state of emergency. Two-tailed Student's t-test was used to compare the actual weekly numbers in 2019 and the corrected weekly numbers in 2020 for 2 months. *P<0.05; **P<0.01; ***P<0.001; ****P<0.0001.

tically significant decline in July-August, and further decreased after September-October, reaching 36% in October-November.
Next, we evaluated differences according to disease severity in ITP, idiopathic AA and MDS, which show similar symptoms and laboratory findings at diagnosis. In ITP, the decrease rate of mild diseases did not reach statistical significance throughout the year ( Online Supplementary Figure S1A). In contrast, severe diseases showed a significant decrease of 24% (P=0.03) in April-May, remained significantly lower, with a maximum decrease of 37% ( P =0.004) in August-September, and did not show signs of recovery until the end of 2020. Similarly, in idiopathic AA, mild to moderate diseases showed a sustained decreasing trend of up to 28% in July-August, but which were insignificant throughout the year ( Online Supplementary Figure S1B ). Severe diseases showed a similar decreasing trend of 27% ( P =0.12) in April-May, continued to decrease after July-August, reached a maximal reduction of 49% (P=0.001) in October-November, and did not recover until the end of 2020. On the other hand, in MDS, the low-risk group showed a significant decrease of 32% in April-May during the first wave and recovered rapidly. The high-risk group showed a slight but mostly insignificant decrease during the first and second waves (by at most 15%) and then recovered (Online Supplementary Figure S1C). Therefore, the collateral effect is more robust and persistent in severe forms of ITP and idiopathic AA. Here we comprehensively investigated the changes in the incidences of various hematologic diseases during the COVID-19 pandemic, and revealed that the extent and timing of such collateral effects depend on the nature and aggressiveness of the disease. We revealed that the incidence of ITP and idiopathic AA continued to decline until the end of 2020. Although limited medical access caused under-reporting of disease incidence, particularly during the first wave, this cannot explain the long-term reduction of ITP and idiopathic AA incidences, as other anemic and cytopenic diseases showed a contrasting trend. While the individual etiology is unknown in many cases, it is widely accepted that infection can trigger the development and/or acute exacerbation of ITP.8,9 Thus, it is reasonable to postulate that reduced person-to-person contact due to social restrictions imposed during the COVID-19 pandemic contribute to the rapid and sustained decrease (by approximately 20%) of ITP incidence especially in severe cases, suggesting a critical role of community-acquired infectious pathogens in ITP pathogenesis regardless of age.
Idiopathic AA also showed distinctive longitudinal changes in incidence, which suggests a crucial role of infectious etiology in AA pathogenesis. Immune destruction is considered the main cause of idiopathic AA, especially when
severe.10,11 Although AA can present as a rare sequela of certain viral infections, such as Epstein-Barr virus (called acquired or secondary AA), in most cases, no apparent causes are identified, leading to the diagnosis of idiopathic AA.10,11 However, our results suggest that a substantial proportion (at least one-third) of idiopathic AA, particularly severe one, is caused by infectious pathogens. This unique longitudinal change suggests a possible interval between the triggering infection and the development of AA. This finding supports the pathological hypothesis that viral infection provokes an aberrant immune response, triggering an oligoclonal expansion of cytotoxic T cells that destroy hematopoietic stem cells.10,12 Given that Helicobacter pylori eradication is a standard treatment of ITP8,9, identifying such pathogens can lead to the development of novel anti-infective treatments and biomarkers for immunosuppressive therapies against these diseases.
1Division of Hematology, Department of Medicine, Keio University School of Medicine and 2Division of Molecular Oncology, National Cancer Center Research Institute, Tokyo, Japan
Correspondence: K. KATOKA - kkataoka-tky@umin.ac.jp
https://doi.org/10.3324/haematol.2022.282351
Received: November 23, 2022.
Accepted: February 9, 2023.
Early view: February 16, 2023.
©2023 Ferrata Storti Foundation
Published under a CC BY-NC license
Disclosures
MS received research funding from Nippon Shinyaku Co. LTD. KK has received research funding from Otsuka Pharmaceutical Co., Chugai Pharmaceutical Co. LTD., Takeda Pharmaceutical Co. LTD., and Chordia Therapeutics Inc., has received scholarship endowments from Eisai Co. LTD., Otsuka Pharmaceutical Co. LTD., Ono Pharmaceutical Co. LTD., Kyowa Hakko Kirin Co. LTD., Takeda Pharmaceutical Co. LTD., Chugai Pharmaceutical Co. LTD., Mochida Pharmaceutical Co. LTD., JCR Pharmaceuticals Co. LTD., and Asahi Kasei Pharma Corp., and has accepted researchers from Otsuka pharmaceutical Co. LTD. All other authors have no conflicts of interest to disclose.
Masatoshi Sakurai,1 Yasunori Kogure,1,2 Kota Mizuno,1,2 Eri Matsuki1 and Keisuke Kataoka1,2
MS designed the research; analyzed and interpreted the data; and wrote the first draft of the manuscript. YK and KM analyzed and interpreted the data and wrote the first draft of the manuscript. EM interpreted the data and wrote the first draft of the manuscript. KK designed the research; analyzed and interpreted the data; and revised the draft of the manuscript. MS, YK, KM and KK had full access to all data and interpreted and reviewed the data. All authors critically reviewed and approved the manuscript. All authors took final responsibility for the decision to submit for publication.
1. The Collateral Damage of COVID-19. J Public Health (Oxf). 2020;42(4):659.
2. Morris EJA, Goldacre R, Spata E, et al. Impact of the COVID-19 pandemic on the detection and management of colorectal cancer in England: a population-based study. Lancet Gastroenterol Hepatol. 2021;6(3):199-208.
3. Carr MJ, Wright AK, Leelarathna L, et al. Impact of COVID-19 on diagnoses, monitoring, and mortality in people with type 2 diabetes in the UK. Lancet Diabetes Endocrinol. 2021;9(7):413-415.
4. Cannatà A, Bromage DI, Rind IA, et al. Temporal trends in decompensated heart failure and outcomes during COVID-19: a multisite report from heart failure referral centres in London. Eur J Heart Fail. 2020;22(12):2219-2224.
5. Groves HE, Piche-Renaud PP, Peci A, et al. The impact of the COVID-19 pandemic on influenza, respiratory syncytial virus, and other seasonal respiratory virus circulation in Canada: A population-based study. Lancet Reg Health Am. 2021;1:100015.
6. Nakazawa H, Sakai K, Ohta A, et al. Incidence of acquired pure red cell aplasia: a nationwide epidemiologic analysis with 2
The authors would like to thank the committee of academic and statistical investigation of the Japanese Society of Hematology.
The datasets used in the study can be requested for use in research studies, subject to obtaining necessary permissions from the committee of academic and statistical investigation of the Japanese Society of Hematology.
registry databases in Japan. Blood Adv. 2022;6(24):6282-6290.
7. Hagiwara S, Nagai H, Tanaka J, Okada S. The current state of human immunodeficiency virus-associated lymphoma in Japan: a nationwide retrospective study of the Japanese Society of Hematology Blood Disease Registry. Int J Hematol. 2019;110(2):244-249.
8. Cooper N, Ghanima W. Immune thrombocytopenia. N Engl J Med. 2019;381(10):945-955.
9. Neunert C, Terrell DR, Arnold DM, et al. American Society of Hematology 2019 guidelines for immune thrombocytopenia. Blood Adv. 2019;3(23):3829-3866.
10. Young NS. Aplastic anemia. N Engl J Med. 2018;379(17):1643-1656.
11. Bacigalupo A. How I treat acquired aplastic anemia. Blood. 2017;129(11):1428-1436.
12. Luzzatto L, Risitano AM. Advances in understanding the pathogenesis of acquired aplastic anaemia. Br J Haematol. 2018;182(6):758-776.
13. Ministry of Health LaW. Visualizing the data: information on COVID-19 infections. Vol. 2022.
GATA2 deficiency is a complex multi-system disorder with high risk of developing myelodysplastic syndromes (MDS) and acute myeloid leukemia (AML) with a nearly complete lifetime penetrance.1,2 GATA2 carriers show a highly variable expressivity, with some individuals developing earlyonset MDS, while others remain asymptomatic throughout life. Although no prognostic biomarkers exist, it is likely that both cooperating genetic and epigenetic drivers shape the course of the disease.3 Despite advances in the identification of recurrent somatic mutations in a set of leukemia driver genes (i.e., STAG2, SETBP1, ASXL1 and ETV6), there are major gaps in understanding the molecular mechanisms associated with leukemic progression in GATA2 carriers.4 Moreover, DNA methylation alterations contribute to the initiation and expansion of leukemic clones and aberrant hypermethylation occurs in adult patients with MDS and AML.5,6 However, to date, a genomewide DNA methylome analysis in GATA2 patients has not been performed.
For this study, 20 clinically annotated GATA2 carriers from seven Spanish hospitals were enrolled (Table 1; Online Supplementary Figure S1). Median age at diagnosis was 36 (range, 6–75) years. The primary initial manifestation was MDS (n=12, 55%), followed by immunodeficiency (n=3, 15%), and AML (n=2, 10%). On cytogenetics, trisomy 8 was detected in three patients, complex karyotype in two patients, while 11 patients had normal karyotype (Online Supplementary Figure S1A-F). Based on DNA availability, somatic mutation profiling was performed in total peripheral blood (PB) or bone marrow (BM) of 17 GATA2 carriers. Somatic mutations in myeloid malignancy genes were identified in 71% (12/17) tested patients (Online Supplementary Figure S1F). This analysis confirmed the heterogeneity of acquired somatic mutations in GATA2 deficiency, with STAG2, ASXL1 and SETBP1 as recurrently affected genes. We obtained global DNA methylation profiles of patients who underwent complete genetic characterization by using the Infinium Human Methylation EPIC 850 K platform (Illumina). We profiled DNA of eight BM (P1, P3, P5, P6, P10, P11, P12, P13) and eight PB samples (P1, P4, P7, P8, P9, P13, P16 and P17) and compared them with a cohort of 12 (5 PB and 7 BM) age-matched healthy donor (HD) controls.
High-dimensional data visualization showed that the majority of GATA2 patients cluster tightly together and separately from HD. Asymptomatic carriers P1, P16 and P17 (at age 6, 40 and 75 years old, respectively) belonging to the same family, were encompassed to the HD group (Figure 1A). Additionally, we compared HD with asymptomatic
GATA2 carriers alone, and we still observed intermixed samples (data not shown ). Next, the DNA methylation changes were calculated between the GATA2 group and HD pairwise, revealing a DNA methylation pattern specific to GATA2 carriers. In detail, 2,834 differentially methylated positions (DMP) were identified in GATA2 BM samples and 1,406 DMP in PB samples (Online Supplementary Figure S2A). A descriptive analysis of the DMP distribution was performed using as a reference the probe distribution of the Infinium MethylEPIC array from distal to proximal CpG island regions (open sea, CpG shelf, CpG shore and CpG island) (Online Supplementary Figure 2B). Although previous studies showed that promoter-proximal methylation is negatively correlated with active gene expression;7 our analysis revealed that the majority of DMP are promoterdistant in both, BM (open sea: 60% hypomethylated DMP and 72.5% hypermethylated DMP) and PB samples (open sea: 52% hypomethylated and 82.3% hypermethylated) (Figure 1B; Online Supplementary Figure 2C).
Additionally, the DMP distribution using the neighboring gene as reference showed an enrichment in intergenic and intronic regions (Figure 1C; Online Supplementary Figure S2D-E). This observation was corroborated by a correlation analysis comparing the DMP distribution of GATA2 patients with the reference array (Online Supplementary Figure S2F). Overall, we observed that DNA methylation changes are enriched in gene-distant and intronic regions in GATA2 patients. Whether this discrepancy is a consequence of GATA2 deficiency, or arising solely from the MDS evolution, needs to be further investigated. Previous studies showed that endogenous GATA2 preferentially occupies sites distant to promoters in hematopoietic stem cells,8 hence the loss of DNA binding capacity of GATA2 mutant protein might result in aberrant DNA methylation of these loci.
Interestingly, unsupervised analysis of hypermethylated DMP highlighted the presence of a hypermethylated DMP subcluster across all the GATA2 BM samples (hereinafter subcluster A), including P1, the asymptomatic GATA2 carrier (Figure 1D). The matching PB of P1 revealed a subcluster of hypermethylated DMP (hereinafter subcluster B) as affected GATA2 patients (Figure 1E). Importantly, the 2-year longitudinal follow-up of P1 showed the evolution to MDS with multilineage dysplasia (MDS-MLD) and monosomy 7 without secondary mutations. In contrast, the two asymptomatic GATA2 carriers P16 and P17 (father and grandfather of P1) had a DNA methylation profile comparable with the HD group (Figure 1E). This observation suggests the presence of a likely early aberrant DNA
Patients were diagnosed in the following hospitals: University Hospital of Gran Canaria Dr. Negrin, Hospital de la Santa Creu i Sant Pau, Hospital Universitari Vall d'Hebron, Hospital La Paz, Hospital Clínico Universitario de Salamanca, Hospital General Universitario Gregorio Marañón and Dr. Balmis General University Hospital. M: male; F: female; NK: normal karyotype; NA: not available; MDS: myeloid dysplastic syndrome; ID: immunodeficiency; AML: acute myeloid leukemia; HSCT: hematopoietic stem cell transplantation; seq.: sequencing; WES: whole exome sequencing; *: at sample collection.
methylation at specific loci in GATA2 carriers that might have a potential use in early detection of patients at risk for impending myeloid transformation.
After the gene annotation of the 131 DMP of the subcluster A (Online Supplementary Figure S2G), 118 genes were associated to hypermethylated DMP (Online Supplementary Figure S2H), including MECOM, which epigenetic regulation has been reported in AML.9 The top candidate was PROMININ1 (PROM1/CD133) with four hypermethylated DMP upstream of its promoter region (Online Supplementary Figure S2I). Interestingly, the aberrant methylation status of the PROM1 promoter has already been described in various cancers including AML.10
Moreover, 42 of 131 hypermethylated DMP subclusters are classified as gene regulatory elements; and most of them are enriched for H3K27ac, a chromatin mark associated with enhancer activity (Figure 2A).
Because tissue-specific DNA methylation patterns might
alter the methylation results, we overlapped the 118 BMhypermethylated genes with the 1,060 PB-hypermethylated genes. We found 51 commonly hypermethylated common genes, implying that PB samples, at least partially reflect the dysregulated pattern observed in the BM (Figure 2B). Additionally, the 205 PB-hypermethylated subcluster B genes were crossed with 118 BM-hypermethylated subcluster A genes, observing an overlapp of 30 genes, indicating that the aberrant DNA methylation profile is detectable in both BM and PB samples (Online Supplementary Figure S2H). Aberrant epigenetic changes have been associated with alterations of transcription factor (TF) genomic binding capacities.11,12 Therefore, we assessed whether the hypermethylated and hypomethylated DMP identified in PB and BM samples were enriched in specific TF DNA binding motives using Hypergeometric Optimization of Motif EnRichment (HOMER). This analysis revealed in the hypermethylated DMP a signi
cant enrich-
Figure 1. Unsupervised hierarchical clustering and the heat map visualization of differentially methylated CpG sites of GATA2 patients. (A) T-distributed stochastic neighbor embedding (t-SNE) showing the distribution of GATA2 patient (P) data (in red) and healthy donors (HD) (in blue), based on DNA methylation profile. Bone marrow (BM) samples are represented with circles and peripheral blood (PB) samples are represented with triangles. (B) Differentially methylated probes (DMP) distribution of BM samples, hypermethylated (above) and hypomethylated (below). CpG island distance, island (eggplant), shore (lollipop), shelf (mauve) and open sea (fandango). (C) DMP distribution of BM samples, hypermethylated (above) and hypomethylated (below). Promoter (dark blue), intergenic (orange), intronic (grey), exonic (yellow), 5’ UTR (light blue) and 3’ UTR (green). (D) Heatmap of DMP BM vs. HD samples. The DMP in common among all GATA2 patients (subcluster A) are squared in green. Scale β values from -3 (blue/hypomethylated) to +3 (red/hypermethylated). (E) Heatmap of DMP of PB vs. HD samples. The hypermethylated DMP in P1 sample (subcluster B), which are in common with affected GATA2 patients, are squared in fuchsia. Scale β values from -3 (blue/hypomethylated) to +3 (red/hypermethylated).

Figure 2. Regulatory element analysis of hypermethylated genomic regions identify in GATA-mutant patients. (A) Ranked representation of the regulatory function of the hypermethylated position based on GeneHancer (blue) score and H3K27ac enrichment of those genomic positions (green). (B) Venn diagram of the total hypermethylated genes in peripheral blood (PB) (n=1,060) vs. subcluster of hypermethylated genes in bone marrow (BM) (n=118), the genes of the intersection are 51 genes. P value=1.572541e-14 (hypergeometric distribution test). (C) Hypergeometric Optimization of Motif EnRichment (HOMER) analysis using hypermethylated differentially methylated probes in BM samples. Enriched motifs found are predominantly from the ETS family including ETV and PU.1. (D) HOMER analysis using hypermethylated DMP in peripheral blood (PB) samples. Enriched motifs found are predominantly from the ETS family and IRF family. (E) Top row: Venn diagram of the neighboring gene of hypermethylated DMP in the BM samples (n=1,631) compared to the neighboring gene of hypermethylated DMP in the PB samples (n=1,095), intersection 494 genes. Bottom row: GATA2-regulated genes (n=2301) obtained from the intersection of 2 GATA2 chromatin immunoprecipitation sequencing (ChIPseq) data GSE107639.15 The crossed of top intersection (n=494) vs. GATA2-regulated genes (n=2301), the intersection gives 82 GATA2 hypermethylated targets both in PB and BM.

ment in TF motives of the ETS family, such as ETV2, ETV6, ELF5 and PU.1 among others (Figure 2C, D), which are known to play a role in MDS.13 The hypomethylated DMP showed an enrichment in TF of the bZIP family preferentially (Online Supplementary Figure S3A, B). In order to evaluate whether the GATA2 binding sites are linked to DNA methylation in GATA2 deficiency, we integrated the hypermethylated genes in both PB and BM samples with a GATA2 chromatin immunoprecipitation sequencing (ChiPseq) dataset from our laboratory (GSE107639).14 This analysis revealed the presence of 82 of 494 hypermethylated genes that are also GATA2 targets (Figure 2E). On the contrary, the intersection of GATA2-regulated genes with the hypomethylated genes in BM and PB did not show any relevant gene enrichment (Online Supplementary Figure S3C). Additionally, the common hypermethylated genes of PB and BM were crossed with K562 myeloid leukemia GATA2 ChIPseq dataset (GSE18868),8 observing that 204 of 494 hypermethylated genes are GATA2 targets and 51 of 82 genes are in common between Castaño et al. 14 and Fujiwara et al. 8 datasets (Online Supplementary Figure S3D, E). Gene ontology analysis of the 82 hypermethylated GATA2 target genes showed an enrichment in transcriptional regulation and cell differentiation. In silico analysis of the upstream regulators inferred that ETV6, TCF12, MGA, and SOX5 are cooperative TF of the GATA2 gene regulatory network (Online Supplementary Figure 3F). Together, our data suggest that GATA2 deficiency is associated with aberrant DNA methylation in GATA2 target genes.
Finally, we compared our BM hypermethylation data with publicly available methylation profiles of 184 pediatric AML patients, TARGET 2018.15 Interestingly, 50% (4/8) of our GATA2 patients clustered together with AML samples (which had a known GATA2 mutation-negative status), showing a similar methylation pattern with AML samples (Online Supplementary Figure S3G). This points to the possibility that some aberrant methylation signatures observed in our GATA2 patients might be directly linked to the AML transformation and thus arise independently of the underlying GATA2 germline mutation. Future genomewide association studies are warranted to address this question in depth.
I n conclusion, we identified an aberrant DNA hypermethylated signature in GATA2 deficiency. Specifically, we described the presence of a subset of aberrant hypermethylated genes present in GATA2 carriers at early (and not yet symptomatic) disease stage, which could be potentially used as predictors of disease progression. In this context, the implementation of customized methylation-specific assays might be instrumental to validate our findings in larger cohorts of patients and to test its clinical prognostic utility. Finally, a collaborative effort will be essential to increase the number patients with this rare yet high-risk MDS/AML predisposition syndrome,
allowing for comprehensive genetic and epigenetic analyses to understand the impact of the secondary hits and/or aberrant DNA methylation on the disease progression.
Oskar Marin-Bejar,1 Damia Romero-Moya,1 Javier Rodriguez-Ubreva,2 Maximiliano Distefano,3 Francesca Lessi,4 Paolo Aretini,4 Alessandro Liquori,5,6 Julio Castaño,7 Emilia Kozyra,8 Lili Kotmayer,9 Clara Bueno,10 José Cervera,5,6,11 José Carlos Rodriguez-Gallego,12,13,14 Josep F. Nomdedeu,15 Laura Murillo- Sanjuán,16 Cristina Díaz de Heredia,16 Antonio Pérez-Martinez,17,18,19 Félix López-Cadenas,20,21 Carolina Martínez-Laperche,22 Nieves Dorado-Herrero,22 Francisco M. Marco,23 Felipe Prósper,6,24,25 Pablo Menendez,6,10,26,27 David Valcárcel,28 Esteban Ballestar,2,29 Csaba Bödör,9 Anna Bigas,6,30,31 Albert Catalá,3,32 Marcin W. Wlodarski33 and Alessandra Giorgetti1,4,34
1Regenerative Medicine Program, Bellvitge Institute for Biomedical Research (IDIBELL) and Program for Clinical Translation of Regenerative Medicine in Catalonia (P-CMRC), Barcelona, Spain; 2Epigenetics and Immune Disease Group, Josep Carreras Research Institute (IJC), Barcelona, Spain; 3Department of Hematology and Oncology, Institut de Recerca Sant Joan de Déu, Hospital Sant Joan de Déu, Barcelona, Spain; 4Fondazione Pisana Per la Scienza ONLUS (FPS), San Giuliano Terme, Italy; 5Hematology Research Group, Instituto de Investigación Sanitaria La Fe, Valencia, Spain; 6Centro de Investigación Biomédica en Red de Oncología (CIBERONC), Instituto de Salud Carlos III, Madrid, Spain; 7Advanced and Cell Therapy Services, Banc de Sang i Teixits, Barcelona, Spain; 8Division of Pediatric Hematology and Oncology, Department of Pediatrics and Adolescent Medicine, Medical Center, Faculties of Medicine and Biology, University of Freiburg, Freiburg, Germany; 9HCEMM-SE Molecular Oncohematology Research Group, Department of Pathology and Experimental Cancer Research, Semmelweis University, Budapest, Hungary; 10Josep Carreras Leukemia Research Institute, Department of Biomedicine, School of Medicine, University of Barcelona, Barcelona, Spain; 11Genetics Unit, Hospital Universitario y Politécnico La Fe, Valencia, Spain; 12Department of Immunology, University Hospital of Gran Canaria Dr. Negrin, Canarian Health System, Las Palmas de Gran Canaria, Spain; 13Department of Clinical Sciences, University Fernando Pessoa Canarias, Las Palmas de Gran Canaria, Spain; 14Department of Medical and Surgical Sciences, School of Medicine, University of Las Palmas de Gran Canaria, Las Palmas de Gran Canaria, Spain; 15Servei d´Hematologia Hospital de la Santa Creu i Sant Pau, Universitat Autònoma de Barcelona, IIB Sant Pau/Josep Carreras Leukemia Research Institute (IJC), Barcelona, Spain; 16Pediatric Hematology and Oncology Division, Hospital Universitari Vall d'Hebron, Vall d'Hebron Institut de Recerca, Barcelona, Spain; 17Pediatric Department, Universidad Autonoma de Madrid, Madrid, Spain; 18Hospital La Paz Institute for Health Research, Madrid, Spain;
19Pediatric Hemato-Oncology Department, University Hospital La Paz, Madrid, Spain; 20Servicio de Hematología Hospital Clínico Universitario de Salamanca, Salamanca, Spain; 21Instituto Biosanitario de Salamanca (IBSAL), Salamanca, Spain; 22Servicio de Hematología, Hospital General Universitario Gregorio Marañón, Instituto de Investigación Sanitaria Gregorio Marañón, Madrid, Spain; 23Immunology Department, Dr. Balmis General University Hospital, Institute for Health and Biomedical Research (ISABIAL), Alicante, Spain; 24Area de Hemato-Oncología, CIMA Universidad de Navarra, Instituto de Investigación Sanitaria de Navarra (IDISNA), Pamplona, Spain; 25Servicio de Hematologia, CCUN, Clínica Universidad de Navarra, Universidad de Navarra, Pamplona, Spain; 26Red Española de Terapias Avanzadas (TERAV) - Instituto de Salud Carlos III, Madrid, Spain; 27Institució Catalana de Recerca i Estudis Avançats (ICREA), Barcelona, Spain; 28Hematology Department, Vall d´Hebron University Hospital; Experimental Hematology, Vall d’Hebron Institute of Oncology (VHIO), Department of Medicine, Universitat Autònoma de Barcelona, Barcelona, Spain; 29Epigenetics in Inflammatory and Metabolic Diseases Laboratory, Health Science Center (HSC), East China Normal University (ECNU), Shanghai, China; 30Programa de Investigación en Cáncer, IMIM (Hospital del Mar Medical Research Institute), Barcelona, Spain; 31Josep Carreras Leukemia Research Institute (IJC), Barcelona, Spain; 32Centro de Investigación Biomédica en Red de Enfermedades Raras (CIBERER), Instituto de Salud Carlos III, Madrid, Spain; 33Department of Hematology, St. Jude Children’s Research Hospital, Memphis, TN, USA and 34Department of Pathology and Experimental Therapeutics, Faculty of Medicine and Health Sciences, Barcelona University, Barcelona, Spain
Correspondence:
A. GIORGETTI - agiorgetti@idibell.cat
O. MARIN-BEJAR - omarin@idibell.cat
https://doi.org/10.3324/haematol.2022.282305
Received: November 7, 2022.
Accepted: February 10, 2023. Early view: February 23, 2023.
©2023 Ferrata Storti Foundation
Published under a CC BY-NC license
Disclosures
No conflicts of interest to disclose.
Contributions
OM-B, AG, AC and MWW designed the study and wrote the
1. Kotmayer L, Romero-Moya D, Marin-Bejar O, et al. GATA2 deficiency and MDS/AML: experimental strategies for disease
manuscript. OM-B, DRM, JR, MD, FL, PA, AL, JC, JP, WK, LK, EB, and AB performed genomic and epigenomic studies and data analysis.
JCRG, JFN, CDH, APM, MDC, CML, ND, FM, FP, CB, PM, DV, and AC were involved in patient care, sample collection, testing and reporting. All authors contributed to the manuscript and provided final approval.
We thank Francesca di Giorgio, Loris Mularoni, Chiara Mazzanti, Joan Pera, Dolly Viviana Fiallo-Suárez, Adela Escudero-Lopez, María Díez-Campelo, Teresa González, Montserrat Arnan, Francesc Solé, Amaia Vilas Zornoza, Montse Rovira (Hospital Clinic, Barcelona), Paola Romecin and Laura Palomo, for technical support.
This work was supported by ERA PerMed GATA2-HuMo Funding Mechanism in Spain: Acció instrumental de SLT011/18/00006 of the Department of Health of the Government of Catalonia to AG and AB; in Hungary: ED-18- 1-2019-001 grant from the National Research, Development and Innovation Office to CB; and in Germany: German Federal Ministry of Education and Research (BMBF) 2018123/01KU1904 to MWW.ÚNKP-21-2-I-SE-21 and Hungarian National Academy of Scientist Education grant to KL, TKP2021-NVA-15. TKP2021-EGA-24 and EU's Horizon 2020 research and innovation program under grant agreement no. 739593 and Elixir Hungary to CB. The Spanish Ministry of Economy, Industry, CERCA/Generalitat de Catalunya and Fundació Josep Carreras-Obra Social la Caixa and the Deutsche Josep Carreras Leukämie-Stiftung (DJCLS15R/2021) to PM: Asociación Española contra el cancer (AECC, PRYGN211192BUEN) and Health Institute Carlos III (PI20/00822) to CB. Competitiveness (MINECO PID2020-15591RB-100), La Marató de TV3 (202001-32), FPS Grant 2018 by Fondazione Pisana per la Scienza ONLUS and CERCA Programme/ Generalitat de Catalunya for institutional support to AG, and BMBF MyPred 01GM1911A to MWW. OM-B Is supported by 101029927-scGATA2track (H2020-MSCA-IF-2020) and KOG-20210901162. AL is the recipient of the APOSTD2021/212 fellowship from the Generalitat Valenciana. Funding for this project was provided in part by an EHA Research Grant award granted by the European Hematology Association (KOG-202109-01162). This project has received funding from the European Union’s Horizon 2020 research and innovation programme under the Marie Sklodowska-Curie grant agreement No 101029927. We thank CERCA Programme / Generalitat de Catalunya for institutional support.
The sequencing data has been deposited to EGA European Genome-Phenome Archive, genomic WES data, PRJEB58433 and to GEO, epigenome data, GSE221745.
modelling and future therapeutic prospects. 2022;199(4):482-495.
2. Zhang Y, Wu J, Qin T, et al. Comparison of the revised 4th (2016)
and 5th (2022) editions of the World Health Organization classification of myelodysplastic neoplasms. Leukemia. 2022;36(12):2875-2882.
3. Al Seraihi AF, Rio-Machin A, Tawana K, et al. GATA2 monoallelic expression underlies reduced penetrance in inherited GATA2mutated MDS/AML. Leukemia. 2018;32(11):2502-2507.
4. West RR, Calvo KR, Embree LJ, et al. ASXL1 and STAG2 are common mutations in GATA2 deficiency patients with bone marrow disease and myelodysplastic syndrome. Blood Adv. 2022;6(3):793-807.
5. Figueroa ME, Abdel-Wahab O, Lu C, et al. Leukemic IDH1 and IDH2 mutations result in a hypermethylation phenotype, disrupt TET2 function, and impair hematopoietic differentiation. Cancer Cell. 2010;18(6):553-567.
6. Figueroa ME, Skrabanek L, Li Y, et al. MDS and secondary AML display unique patterns and abundance of aberrant DNA methylation. Blood. 2009;114(16):3448-3458.
7. Futscher BW, Oshiro MM, Wozniak RJ, et al. Role for DNA methylation in the control of cell type specific maspin expression. Nat Genet. 2002;31(2):175-179.
8. Fujiwara T, O'Geen H, Keles S, et al. Discovering hematopoietic mechanisms through genome-wide analysis of GATA factor chromatin occupancy. Mol Cell. 2009;36(4):667-681.
9. Groschel S, Sanders MA, Hoogenboezem R, et al. A single
oncogenic enhancer rearrangement causes concomitant EVI1 and GATA2 deregulation in leukemia. Cell. 2014;157(2):369-381.
10. Gopisetty G, Xu J, Sampath D, Colman H, Puduvalli VK. Epigenetic regulation of CD133/PROM1 expression in glioma stem cells by Sp1/myc and promoter methylation. Oncogene. 2013;32(26):3119-3129.
11. Garcia-Gomez A, Li T, de la Calle-Fabregat C, et al. Targeting aberrant DNA methylation in mesenchymal stromal cells as a treatment for myeloma bone disease. Nat Commun. 2021;12(1):421.
12. Blattler A, Farnham PJ. Cross-talk between site-specific transcription factors and DNA methylation states. J Biol Chem. 2013;288(48):34287-34294.
13. Zhao J, Li D, Seo J, Allen AS, Gordan R. Quantifying the impact of non-coding variants on transcription factor-DNA binding. Res Comput Mol Biol. 2017;10229:336-352.
14. Castano J, Aranda S, Bueno C, et al. GATA2 promotes hematopoietic development and represses cardiac differentiation of human mesoderm. Stem Cell Reports. 2019;13(3):515-529.
15. Bolouri H, Farrar JE, Triche T, Jr., et al. The molecular landscape of pediatric acute myeloid leukemia reveals recurrent structural alterations and age-specific mutational interactions. Nat Med. 2018;24(1):103-112.
Robin Q.H. Kloos,1 Ron Mathôt,2 Rob Pieters3 and Inge M. van der Sluis1,3
1Department of Pediatric Oncology and Hematology, Sophia Children’s Hospital – Erasmus MC, Rotterdam; 2Department of Hospital Pharmacy, Amsterdam University Medical Center, University of Amsterdam, Amsterdam and 3Princess Máxima Center for Pediatric Oncology, Utrecht, The Netherlands
Correspondence: I.M. van der Sluis i.m.vandersluis@prinsesmaximacentrum.nl
Received: June 5, 2023.
Accepted: June 5, 2023.
Early view: June 15, 2023.
https://doi.org/10.3324/haematol.2023.283685
©2023 Ferrata Storti Foundation
Published under a CC-BY-NC license
With reference to our paper published in the May issue 2021 of Haematologica,1 we would like to draw your attention to Table 5 which contains two typing errors. In fact, in the column “Target trough levels: 100-250 IU/L”, the second “Week level” range should be 100-150 IU/L instead of 100-250 IU/L, while in the column “Target trough levels: 250-400 IU/L” the third “Week level” range should be 300-350 IU/L instead of 300-250 IU/L, as shown in the corrected Table 5 below.
Corrected Table 5. Dosing guideline, dose adjustments.
Target trough level: 100-250 IU/L Target trough level: 250-400 IU/L
The dose adjustments apply for biweekly administration of PEGasparaginase during steady state. The doses may be adjusted based on week (7 days) or trough (14 days) after administration targeting at trough asparaginase activity levels of 100-250 IU/L or 250-400 IU/L.
1. Kloos RQH, Mathôt R, Pieters R, van der Sluis IM. Individualized dosing guidelines for PEGasparaginase and factors influencing the clearance: a population pharmacokinetic model. Haematologica. 2021;106(5):1254-1261.
