Journal of the Ferrata Storti Foundation VOL. 109 APRIL 2024 haematologica.org ISSN 0390 - 6078


Much cited Journal

Impact Factor 2022: 10.1
CiteScore 2022: 13.3
Fast review process

Submission ® 1st decision (submit to peer review or quick rejection): 3 days
Submission ® 2nd decision for peer-reviewed papers (accept, reject or make changes): 24 days
Low publication cost
The publisher is a non-profit Foundation that keeps the cost for authors as low as possible
Editor-in-Chief
Jacob M. Rowe (Jerusalem)
Deputy Editors
Carlo Balduini (Pavia), Jerry Radich (Seattle)
Associate Editors
Michael Deininger (Milwaukee), Shai Izraeli (Tel Aviv), Pier Mannuccio Mannucci (Milan), Jessica Okosun (London), Pavan Reddy (Ann Arbor), David C. Rees (London), Paul G. Richardson (Boston), Francesco Rodeghiero (Vicenza), Gilles Salles (New York), Kerry Savage (Vancouver), Aaron Schimmer (Toronto), Richard F. Schlenk (Heidelberg)
Statistical Consultant
Catherine Klersy (Pavia)
AI Consultant
Jean Louis Raisaro (Lausanne)
Editorial Board
Walter Ageno (Varese), Sarit Assouline (Montreal), Andrea Bacigalupo (Roma), Taman Bakchoul (Tübingen), Pablo Bartolucci (Créteil), Katherine Borden (Montreal), Marco Cattaneo (Milan), Corey Cutler (Boston), Kate Cwynarski (London), Ahmet Dogan (New York), Mary Eapen (Milwaukee), Francesca Gay (Torino), Ajay Gopal (Seattle), Alex Herrera (Duarte), Martin Kaiser (London), Marina Konopleva (Houston), Nicolaus Kröger (Hamburg), Austin Kulasekararaj (London), Shaji Kumar (Rochester), Ann LaCasce (Boston), Matthew J. Mauer (Rochester) Neha Mehta-Shah (St. Louis), Moshe Mittelman (Tel Aviv), Alison Moskowitz (New York), Yishai Ofran (Haifa), Farhad Ravandi (Houston), John W. Semple (Lund), Liran Shlush (Toronto), Sarah K. Tasian (Philadelphia), Pieter van Vlieberghe (Ghent), Ofir Wolach (Haifa), Loic Ysebaert (Toulouse)
Managing Director
Antonio Majocchi (Pavia)
Editorial Office
Lorella Ripari (Office & Peer Review Manager), Simona Giri (Production & Marketing Manager), Paola Cariati (Graphic Designer), Giulia Carlini (Graphic Designer), Debora Moscatelli (Graphic Designer), Igor Poletti (Graphic Designer), Diana Serena Ravera (Peer Review), Laura Sterza (Account Administrator), Andrew Sturgeon (Peer Review)
Assistant Editors
Luca Arcaini (Scientific Consultant), Luk Cox (Graphic Artist), Britta Dost (English Editor), Anne Freckleton (English Editor), Rosangela Invernizzi (Scientific Consultant), Marianna Rossi (Scientific Consultant), Massimo Senna (Information Technology), Rachel Stenner (English Editor)
Haematologica (print edition, pISSN 0390-6078, eISSN 1592-8721) publishes peer-reviewed papers on all areas of experimental and clinical hematology. The journal is owned by a non-profit organization, the Ferrata Storti Foundation, and serves the scientific community following the recommendations of the World Association of Medical Editors (www. wame.org) and the International Committee of Medical Journal Editors (www.icmje.org).
Haematologica publishes Editorials, Original articles, Review articles, Perspective articles, Editorials, Guideline articles, Letters to the Editor, Case reports & Case series and Comments. Manuscripts should be prepared according to our guidelines (www.haematologica.org/information-for-authors), and the Uniform Requirements for Manuscripts Submitted to Biomedical Journals, prepared by the International Committee of Medical Journal Editors (www.icmje.org).
Manuscripts should be submitted online at http://www.haematologica.org/.
Conflict of interests. According to the International Committee of Medical Journal Editors (http://www.icmje. org/#conflicts), “Public trust in the peer review process and the credibility of published articles depend in part on how well conflict of interest is handled during writing, peer review, and editorial decision making”. The ad hoc journal’s policy is reported in detail at www.haematologica.org/content/policies.
Transfer of Copyright and Permission to Reproduce Parts of Published Papers. Authors will grant copyright of their articles to the Ferrata Storti Foundation. No formal permission will be required to reproduce parts (tables or illustrations) of published papers, provided the source is quoted appropriately and reproduction has no commercial intent. Reproductions with commercial intent will require written permission and payment of royalties.
Subscription. Detailed information about subscriptions is available at www.haematologica.org. Haematologica is an open access journal and access to the online journal is free. For subscriptions to the printed issue of the journal, please contact: Haematologica Office, via Giuseppe Belli 4, 27100 Pavia, Italy (phone +39.0382.27129, fax +39.0382.394705, E-mail: info@haematologica.org).
Rates of the printed edition for the year 2022 are as following:
Institutional: Euro 700
Personal: Euro 170
Advertisements. Contact the Advertising Manager, Haematologica Office, via Giuseppe Belli 4, 27100 Pavia, Italy (phone +39.0382.27129, fax +39.0382.394705, e-mail: marketing@haematologica.org).
Disclaimer. Whilst every effort is made by the publishers and the editorial board to see that no inaccurate or misleading data, opinion or statement appears in this journal, they wish to make it clear that the data and opinions appearing in the articles or advertisements herein are the responsibility of the contributor or advisor concerned. Accordingly, the publisher, the editorial board and their respective employees, officers and agents accept no liability whatsoever for the consequences of any inaccurate or misleading data, opinion or statement. Whilst all due care is taken to ensure that drug doses and other quantities are presented accurately, readers are advised that new methods and techniques involving drug usage, and described within this journal, should only be followed in conjunction with the drug manufacturer’s own published literature.
Direttore responsabile: Prof. Carlo Balduini; Autorizzazione del Tribunale di Pavia n. 63 del 5 marzo 1955.
Printing: Press Up, zona Via Cassia Km 36, 300 Zona Ind.le Settevene - 01036 Nepi (VT)
Image taken from the editorial by Y. Masamoto and M. Kurokawa in this issue.
1019 Anti-CD19 chimeric antigen receptor T-cell therapy for B-cell acute lymphoid leukemia
A.P. Rapoport
https://doi:10.3324/haematol.2024.285155
1021 Eligibility criteria: too big, too small or just right?
E.Atallah
https://doi.org/10.3324/haematol.2023.283972
1022
More than a lonca-shot: beating the odds in relapsed/refractory diffuse large B-cell lymphoma
C.Ho and S.D. Smith
https://doi.org/10.3324/haematol.2023.284056
1025 Using machine learning to unravel the intricacy of acute myeloid leukemia
L.Guarnera and V. Visconte
https://doi.org/10.3324/haematol.2023.284085
1027 MYC overexpression: adding another piece to the puzzle of high-risk mantle cell lymphoma
A.Kumar
https://doi.org/10.3324/haematol.2023.284105
1029 First-line MAPK inhibition in pediatric histiocytosis: are we ready?
O.Abla
https://doi.org/10.3324/haematol.2023.284188
1032 A key to engineering natural killer cells to attack acute myeloid leukemia
Y.Masamoto and M. Kurokawa
https://doi.org/10.3324/haematol.2023.284272
1035 How we manage a high D-dimer
M.Franchini et al.
https://doi.org/10.3324/haematol.2023.283966
Acute Leukemia
1046 Use, variability, and justification of eligibility criteria for phase II and III clinical trials in acute leukemia
A.Hantel et al.
https://doi.org/10.3324/haematol.2023.283723
Acute Lymphoblastic Leukemia
1053 Association of NUDT15 gene polymorphism with adverse reaction, treatment efficacy, and dose of 6-mercaptopurine in patients with acute lymphoblastic leukemia: a systematic review and metaanalysis
S. Du et al.
https://doi.org/10.3324/haematol.2023.282761
Acute Lymphoblastic Leukemia
1069 Susceptibility of pediatric acute lymphoblastic leukemia to STAT3 inhibition depends on p53 induction L. Gasparoli et al.
https://doi.org/10.3324/haematol.2023.283613
Acute Myeloid Leukemia
1082 Extended exposure to low doses of azacytidine induces differentiation of leukemic stem cells through activation of myeloperoxidase
D.V. Jeyaraju et al.
https://doi.org/10.3324/haematol.2023.283437
Acute Myeloid Leukemia
1095 Prognostic value of European LeukemiaNet 2022 criteria and genomic clusters using machine learning in older adults with acute myeloid leukemia
S. Park et al.
https://doi.org/10.3324/haematol.2023.283606
Acute Myeloid Leukemia
1107 Immune checkpoint molecule DNAM-1/CD112 axis is a novel target for natural killer-cell therapy in acute myeloid leukemia
Y. Kaito et al.
https://doi.org/10.3324/haematol.2023.282915
Cell Therapy & Immunotherapy
1121
HLA-C*04:09N is expressed at the cell surface and triggers peptide-specific T-cell activation
C. Welters et al.
https://doi.org/10.3324/haematol.2023.283812
Hemostasis
1128 Tissue factor pathway inhibitor is associated with risk of venous thromboembolism and all-cause mortality in patients with cancer
C. Englisch et al.
https://doi.org/10.3324/haematol.2023.283581
Histiocytic Disorder
1137 Dabrafenib and trametinib in Langerhans cell histiocytosis and other histiocytic disorders
E. Cournoyer et al.
https://doi.org/10.3324/haematol.2023.283295
Non-Hodgkin Lymphoma
1149
Immunochemotherapy plus lenalidomide for high-risk mantle cell lymphoma with measurable residual disease evaluation
Z.D. Epstein-Peterson et al.
https://doi.org/10.3324/haematol.2023.282898
Non-Hodgkin Lymphoma
1163 Outcome of combined modality treatment in first-line for stage I(E) peripheral T-cell lymphoma; a nationwide population-based cohort study from the Netherlands
F.O. Meeuwes et al.
https://doi.org/10.3324/haematol.2023.283174
Non-Hodgkin Lymphoma
1171 MYC protein is a high-risk factor in mantle cell lymphoma and identifies cases beyond morphology, proliferation and TP53/p53 – a Nordic Lymphoma Group study
J.M. Rodrigues et al.
https://doi.org/10.3324/haematol.2023.283352
1184
Non-Hodgkin Lymphoma
Loncastuximab tesirine in relapsed/refractory diffuse large B-cell lymphoma: long-term efficacy and safety from the phase II LOTIS-2 study
P.F. Caimi et al.
https://doi.org/10.3324/haematol.2023.283459
Non-Hodgkin Lymphoma
1194 Polatuzumab vedotin plus bendamustine and rituximab or obinutuzumab in relapsed/refractory follicular lymphoma: a phase Ib/II study
C.R. Flowers et al.
https://doi.org/10.3324/haematol.2023.283557
Plasma Cell Disorders
1206 Ribosomal protein S3 mediates drug resistance of proteasome inhibitor: potential therapeutic application in multiple myeloma
G. Chen et al.
https://doi.org/10.3324/haematol.2023.282789
Plasma Cell Disorders
1220 Single cell analysis of the CD8+ T-cell compartment in multiple myeloma reveals disease specific changes are chiefly restricted to a CD69- subset suggesting potent cytotoxic effectors exist within the tumor bed
J. Favaloro et al.
https://doi.org/10.3324/haematol.2023.283062
Stem Cell Transplantation
1233 Targeting TFH cells is a novel approach for donor-specific antibody desensitization of allograft candidates: an in vitro and in vivo study
N. Ma et al.
https://doi.org/10.3324/haematol.2023.283698
1247
Genome-wide assessment of genetic risk loci for childhood acute lymphoblastic leukemia in Japanese patients
M. Hangai et al.
https://doi.org/10.3324/haematol.2023.282914
1253 BH3 profiling as pharmacodynamic biomarker for the activity of BH3 mimetics
R.A. Pan et al.
https://doi.org/10.3324/haematol.2023.283060
1259
1264
1269
Subcutaneous injection of IHP-102 prevents lung vaso-occlusion in sickle cell disease mice
R.K. Dubey et al.
https://doi.org/10.3324/haematol.2023.283716
Long-term outcome after autologous BCR::ABL1-negative peripheral blood stem cell transplantation in adults with Philadelphia-positive acute lymphoblastic leukemia: a comparative study
L. Caillot et al.
https://doi.org/10.3324/haematol.2023.283742
Glofitamab monotherapy induces high complete response rates and manageable safety in Chinese patients with heavily pretreated relapsed or refractory diffuse large B-cell lymphoma
Y. Song et al.
https://doi.org/10.3324/haematol.2023.283802
1274
Low-dose azacitidine, pioglitazone and all-trans retinoic acid is safe in patients aged ≥60 years with acute myeloid leukemia refractory to standard induction chemotherapy (AMLSG 26-16/AML-ViVA): results of the safety run-in phase
D. Heudobler et al.
https://doi.org/10.3324/haematol.2023.283864
1279 Comorbidity indices for prognostic evaluation in multiple myeloma: a comprehensive evaluation of the Revised Myeloma Comorbidity Index and other comorbidity indices with pro- and retrospective applications
K.Schoeller et al.
https://doi.org/10.3324/haematol.2023.283884
1285 Catheter-related thrombosis in stem cell recipients: comparison of different types of catheter
S.Milczarek et al.
https://doi.org/10.3324/haematol.2023.283924
1289 Small myeloid subclones are present at diagnosis of multiple myeloma in patients who develop secondary myelodysplastic syndromes
G.Escure et al.
https://doi.org/10.3324/haematol.2023.284050
1293 Factor VIII genotype and the risk of developing high-responding or low-responding inhibitors in severe hemophilia A: data from the PedNet Hemophilia Cohort of 1,202 children
N.G. Andersson et al.
https://doi.org/10.3324/haematol.2023.284095
1297 CD38 expression by plasma cells in extramedullary multiple myeloma
L.Notarfranchi et al.
https://doi.org/10.3324/haematol.2023.284169
1301 A patient with minimal myeloma treatment who survived for 20 years
A.Djarmila Behsen et al.
https://doi.org/10.3324/haematol.2023.283563
1306 Emergence of TP53 mutation during lenalidomide therapy of myelodysplastic syndrome with del(5q) and its subsequent disappearance following salvage therapy with decitabine
N.Gangat et al.
https://doi.org/10.3324/haematol.2023.284547
1310 Erratum to: Retrospective analysis of pacritinib in patients with myelofibrosis and severe thrombocytopenia
S.Verstovsek et al.
https://doi.org/10.3324/haematol.2023.284815
1311 Erratum to: Utility of clinical comprehensive genomic characterization for diagnostic categorization in patients presenting with hypocellular bone marrow failure syndromes
P.Blombery et al.
https://doi.org/10.3324/haematol.2023.284760
Aaron P. Rapoport
University of Maryland School of Medicine and Marlene and Stewart Greenebaum Cancer Center, Baltimore, MD, USA
E-mail: arapoport@umm.edu
https://doi.org/10.3324/haematol.2024.285155
©2024 Ferrata Storti Foundation
Published under a CC BY-NC license
TITLE Chimeric antigen receptor-modified T cells for acute lymphoid leukemia.
AUTHORS
JOURNAL

Grupp SA, Kalos M, Barrett D, et al.
The New England Journal of Medicine. 2013;368(16):1509-1518. doi: 10.1056/NEJMoa1215134.
Historically the long-term survival of patients with relapsed and refractory B-cell acute lymphoblastic leukemia (ALL) has been poor despite the application of allogeneic stem
cell transplants and especially after such transplants fail.1
In the landmark paper by the group led by Stephan A. Grupp, Michael Kalos and Carl H. June at the University of

Pennsylvania and the Children’s Hospital of Philadelphia, two children received infusions of CD19-directed chimeric antigen receptor (CAR)-modified T cells (CTL019) for refractory pre-B-cell ALL (Figure 1).2
Both children experienced more than a 1,000-fold increase in CTL019 cells during the first 2 weeks after infusion, which comprised up to 72% and 34% of the total circulating T cells. Both children experienced high fevers starting a few days after the CTL019 infusion and lasting about 1 week; one of the children required blood pressure and ventilatory support while the other patient later developed encephalopathy. Both children had B-cell aplasia and total clearance of leukemia from their marrow by 1 month after treatment. One of the two children remained in remission for more than 12 years and recent studies suggest that anti-CD19 CAR T cells may persist, evolve into a CD4+ predominant phenotype and remain functional for 10 years or more in long-surviving leukemia patients.3
In addition to first demonstrating that patients with advanced and refractory ALL could achieve complete and durable remissions after CAR T-cell therapy, this landmark paper highlighted several principles which have become
1. Barrett AJ, Horowitz MM, Pollock BH, et al. Bone marrow transplants from HLA-identical siblings as compared with chemotherapy for children with acute lymphoblastic leukemia in a second remission. N Engl J Med. 1994;331(19):1253-1258.
2. Grupp SA, Kalos M, Barrett D, et al. Chimeric antigen receptor-
integral to the care of all patients with aggressive B-cell (and other hematologic) malignancies who receive CAR T-cell therapies. These include: (i) the importance of prompt recognition of life-threatening cytokine-release syndrome with features of macrophage activation due to marked elevation of interleukin-6, interferon- g and other cytokines and its successful management using the interleukin-6 receptor blocking antibody tocilizumab; (ii) potential trafficking of CAR T cells to the central nervous system and prolonged persistence leading to tumor clearance and perhaps contributing to neurological toxicity; and (iii) the risk of CAR T-cell target antigen loss (CD19) as a mechanism for treatment failure as one of the patients developed a CD19-negative relapse 2 months after treatment.
It is remarkable that so much was learned from a clinical research experience involving just two small patients. But, as Dr. Carl June and other wise clinical investigators have humbly said, “Every single patient can teach us important lessons”.
No conflicts of interest to disclose.
modified T cells for acute lymphoid leukemia. N Engl J Med. 2013;368(16):1509-1518.
3. Melenhorst JJ, Chen GM, Wang M, et al. Decade-long leukaemia remissions with persistence of CD4+ CAR T cells. Nature. 2022;602(7897):503-509.
Correspondence: E. Atallah eatallah@mcw.edu
Received: September 25, 2023.
Accepted: October 2, 2023.
Early view: October 12, 2023.
https://doi.org/10.3324/haematol.2023.283972
©2024 Ferrata Storti Foundation
Published under a CC BY-NC license
In this issue of Haematologica, Hantel and colleagues1 review an important topic that is not commonly discussed: how do eligibility criteria affect the patient population enrolled and, in turn, affect the outcomes and interpretation of studies? On the one hand, eligibility criteria can be too restrictive, thereby reducing the number of eligible patients and decreasing the applicability of the findings to the general population or ‘real world’. On the other hand, eligibility criteria can be too liberal, thereby placing patients at an unnecessary risk. Finding the right balance is always a hard task. When writing a protocol, considerable thought and time should be given to the eligibility criteria. Despite that, we do not always get it right. In this study, the researchers reviewed the eligibility criteria in front-line phase II/III leukemia trials listed on clinicaltrials.gov from 2010 to 2019 and analyzed how often do we get it right. They sought to identify two concepts. The first is the consistency (concordance) between the trial eligibility criteria and known drug safety at the time of study initiation, and the second is the difference between the eligibility criteria and the drug safety-based limits.
Overall, the concordance between known toxicity and eligibility criteria was approximately 50%. So we got it right (No safety signal/No limit and Safety signal/Limit) in only half the studies. Surprisingly, approximately 30% of the studies had eligibility criteria that were too liberal (Safety signal/No limit) and approximately 10% were too restrictive (No safety signal/Limit).
Looking then at the difference between eligibility criteria and drug safety limits, we did not do any better. From 50% to 75% of studies had criteria that were more restrictive than the known drug safety limits.
Take bilirubin, for example. In 250 studies, 1.2%, 66.8%, 1.6%, and 30% of studies had no safety signal/no limit, safety signal/
1. Hantel A, Luskin MR, Khan I, et al. Use, variability, and justification of eligibility criteria for phase II and III clinical trials in acute leukemia. Haematologica. 2024;109(4):1046-1052.
limit, no safety signal/limit and safety signal/no limit included in the eligibility criteria, respectively. Of the studies that had a safety signal with limit, that limit was too restrictive in 75% of the studies.
So, in summary, eligibility criteria that were supposed to be included were missed 30% of the time. When they were appropriately included, they were more restrictive 50-75% of the time. This inaccuracy can lead to biases both ways: putting patients on studies and exposing them to unnecessary risk because we as researchers want to enroll more patients on studies, or excluding others that have missed the eligibility criteria by an unjustified 0.1 criteria limit. In addition, this affects the generalizability of findings to the general population, and may affect the efficacy and outcomes of these studies. The authors of the study acknowledge several weaknesses, mainly that the limits or known safety may not have been fully known at the time of protocol writing. Also, we do not know how many more patients may have been enrolled on those studies had the criteria been ‘just right’. Nevertheless, this study highlights the need for careful review of eligibility criteria and the criteria limits included in each study. This can be done by minimizing the use of eligibility criteria ‘templates’, careful review of the literature, and including only those eligibility criteria that will impact patient safety. The proper use of eligibility criteria has led several groups, including the Food and Drug Administration, to issue specific guidance for including organ dysfunction or infectious disease criteria in studies.2,3 I acknowledge that, after reading this paper, I for one will pay even more attention to the eligibility criteria of my studies and will continue to aim to get them ‘just right’.
No conflicts of interest to disclose.
2. Kim ES, Bruinooge SS, Roberts S, et al. Broadening eligibility criteria to make clinical trials more representative: American Society of Clinical Oncology and Friends of Cancer Research Joint Research Statement. J Clin Oncol. 2017;35(33):3737-3744.
3. Gerber DE, Singh H, Larkins E, et al. A new approach to simplifying and harmonizing cancer clinical trials-standardizing eligibility criteria. JAMA Oncol. 2022;8(9):1333-1339.
1Division of Hematology and Oncology, Department of Internal Medicine, University of Washington and 2Fred Hutchinson Cancer Center, Seattle, WA, USA
Correspondence: S.D. Smith ssmith50@fredhutch.org
Received: September 11, 2023.
Accepted: September 26, 2023.
Early view: October 5, 2023.
https://doi.org/10.3324/haematol.2023.284056
©2024 Ferrata Storti Foundation
Published under a CC BY-NC license
Recent randomized trials have yielded major advances in management of diffuse large B-cell lymphoma (DLBCL), integrating antibody-drug conjugate (ADC) and CD19-directed chimeric antigen receptor T-cell (CAR T) therapies into modern standards of care. However, relapsed/refractory (R/R) DLBCL becomes successively less curable with each recurrence—and patient comorbidities, residual drug toxicities, logistical requirements, and disease biology become increasingly complex. While single-arm studies have yielded several accelerated drug approvals by the US Food and Drug Administration (FDA), these trials are markedly heterogenous with regard to design, eligibility criteria, duration of follow-up, and logistical requirements.1-5 In this context, selecting the therapy for R/R DLBCL with the best long-term odds of success—balancing efficacy and risk of toxicity—has emerged a formidable challenge.
Among key therapies approved for 3+ line treatment of DLBCL is loncastuximab tesirine-lpyl (lonca), an anti-CD19 antibody conjugated to a pyrrolobenzodiazepine dimer (PBD) DNA-alkylating cytotoxic payload. Lonca was granted US FDA approval in April 2021, for patients with R/R DLBCL, transformed lymphoma, and high-grade B-cell lymphoma, after two or more prior systemic therapies. This approval was based on findings from the single-arm LOTIS-2 trial, which demonstrated an overall response rate (ORR) of 48% and complete response (CR) rate of 24% with lonca administered intravenously every 3 weeks, for up to 1 year.1 A number of other PBD-based antibody-drug conjugates have been tested in hematologic malignancies but have met the fate of termination by trial sponsors, or unacceptable myelotoxicity and infection risks.6 Lonca succeeded in DLBCL where many others failed, as the LOTIS-2 trial exceeded its efficacy primary goal (targeting a 40% ORR) while demonstrating acceptable toxicity, in a highly refractory population (58% refractory to their most recent line of treatment). Nonetheless, follow-up of this study was short and toxicities were significant, including
cytopenias, photosensitivity, GGT elevation, and volume overload/pleural effusions; median number of treatment cycles was three, and 6% died of treatment-emergent adverse events. Given the stakes involved in selecting lonca for clinical use, longer-term follow-up and a higher level of detail are warranted from the LOTIS-2 study. In this issue of Haematologica , Caimi et al. present longer-term follow-up (now median 7.8 months) of the LOTIS-2 study, reporting a median overall survival of 9.6 months and a median progression-free survival (PFS) of 4.9 months.7 The study primarily focuses on subsets of patients with CR (n=36 [24.8%]) and those who achieved a long-term CR—that is, were alive in CR without disease progression for ≥1 year (n=16 [11%]) or ≥2 years (n=11 [7.6%]). This long-term report finds many ways to describe and parse the 36-patient CR subgroup, whose median follow-up is 35 months and who received a median of eight cycles of lonca treatment. Neither median PFS nor duration or response were reached, and 2-year relapse-free survival is 72.8%. Baseline characteristics of the CR subgroup, and the long-term CR, are also described in depth. However, given small sample sizes, findings (such as a higher median age, percentage female, and high-grade morphology in long-term CR) are hard to interpret. Notably, no patients with primary refractory disease achieved a CR for 2 years or more, casting doubt on any potential for lonca to cure truly chemorefractory DLBCL. In addition, the high level of detail of the CR subgroup is counterbalanced by lack of new detail on treatment exposure or toxicity with lonca, though reassuringly, neither secondary malignancy (including myelodysplasia) nor late liver toxicity (related to GGT elevations observed on therapy) were observed. These results underscore the potential for lonca to provide durable responses and extended treatment-free periods, without imparting significant long-term toxicity risk, for a select subset of patients. However, identifying pretreatment

patient or tumor characteristics that may predict long-term benefit from lonca remains challenging. Specifically, there are no tissue-based biomarkers for predicting response to lonca. In vitro data suggests that CD19 expression, as measured by cell surface protein and RNA level, is associated with the cytotoxic activity of lonca.8 However, exploratory analyses of CD19 expression by immunohistochemistry on tumor tissue from patients in the LOTIS-2 trial did not reveal any significant correlation with clinical response to lonca.9 Other DLBCL studies (e.g., brentuximab vedotin in DLBCL) have also failed to note a clear relationship with antigen expression and clinical efficacy, and much work is needed to define biomarkers predicting response to therapy with this agent.10
Within the landscape of treatments for R/R DLBCL, and based on LOTIS-2 eligibility, lonca distinguishes itself as a valuable therapeutic option that encompasses high-risk patient populations, including those with high-grade B-cell lymphoma, refractory disease, transformed lymphoma, and those with prior anti-CD19 CAR T-cell therapy. As evidenced in this report, subgroups of these patients with high-risk R/R DLBCL will still achieve durable CR and time off therapy. However, even after reassurance that lonca can help beat long odds, selection of therapy requires nuanced consideration of patient features, toxicities, and logistics (Figure 1). This is particularly relevant in light of
two new US FDA approvals of bispecific antibodies with high efficacy (39% CR) but specific toxicity concerns including cytokine-release syndrome and a need for inpatient monitoring.4,5 The present report by Caimi and colleagues provides a high-resolution look at a small number of durable CR, but no definitive answers. Postmarketing data with lonca, and long-term reports of other agents in the 3+ line setting, are needed to help guide therapeutic choices to beat the odds in R/R DLBCL.
Disclosures
SDS reports consultancy from AstraZeneca, Karyopharm Therapeutics, Kite, Incyte, ADC Therapeutics, BeiGene, AbbVie, Coherus Biosciences (immediate family member), Epizyme, and Numab; research funding from Acerta Pharma/AstraZeneca, Ayala Pharmaceuticals (immediate family member), Bristol-Myers Squibb (immediate family member), Bayer, Denovo Biopharma, Genentech, Ignyta (immediate family member), Incyte, Merck, Portola Pharmaceuticals, BeiGene, ADC Therapeutics, Enterome, Kymera, MorphoSys/Incyte, Nanjing, Portola Pharmaceuticals/Alexion Pharmaceuticals, and Viracta Therapeutics. CH has no conflicts of interest to disclose.
Contributions
CH and SDS wrote the manuscript.
1. Caimi PF, Ai W, Alderuccio JP, et al. Loncastuximab tesirine in relapsed or refractory diffuse large B-cell lymphoma (LOTIS-2): a multicentre, open-label, single-arm, phase 2 trial. Lancet Oncol. 2021;22(6):790-800.
2. Salles G, Duell J, González Barca E, et al. Tafasitamab plus lenalidomide in relapsed or refractory diffuse large B-cell lymphoma (L-MIND): a multicentre, prospective, single-arm, phase 2 study. Lancet Oncol. 2020;21(7):978-988.
3. Kalakonda N, Maerevoet M, Cavallo F, et al. Selinexor in patients with relapsed or refractory diffuse large B-cell lymphoma (SADAL): a single-arm, multinational, multicentre, open-label, phase 2 trial. Lancet Haematol. 2020;7(7):e511-e522.
4 Thieblemont C, Phillips T, Ghesquieres H, et al. Epcoritamab, a novel, subcutaneous CD3xCD20 bispecific T-cell-engaging antibody, in relapsed or refractory large B-cell lymphoma: dose expansion in a phase I/II trial. J Clin Oncol. 2023;41(12):2238-2247.
5. Dickinson MJ, Carlo-Stella C, Morschhauser F, et al. Glofitamab for relapsed or refractory diffuse large B-cell lymphoma. N Engl J Med. 2022;387(24):2220-2231.
6. Hartley JA. Antibody-drug conjugates (ADCs) delivering
pyrrolobenzodiazepine (PBD) dimers for cancer therapy. Expert Opin Biol Ther. 2021;21(7):931-943.
7 Caimi PF, Ai WZ, Alderuccio JP, et al. Loncastuximab tesirine in relapsed/refractory diffuse large B-cell lymphoma: long-term efficacy and safety from the phase 2 LOTIS-2 study. Haematologica. 2024;109(4):1184-1193.
8. Tarantelli C, Wald D, Munz N, et al. Targeting CD19-positive lymphomas with the antibody-drug conjugate (ADC) loncastuximab tesirine: preclinical evidence as single agent and as combinatorial approach. bioRxiv. 2023:2023.08.17.553668. doi:10.1101/2023.08.17.553668 [pre-print, not peer-reviewed].
9. Caimi PF, Hamadani M, Carlo-Stella C, et al. CD19 expression by IHC alone is not a predictor of response to loncastuximab tesirine: results from the LOTIS-2 Cclinical trial and quantitative systems pharmacology modeling. Blood. 2022;140(Suppl 1):S9548-9550.
10 Jacobsen ED, Sharman JP, Oki Y, et al. Brentuximab vedotin demonstrates objective responses in a phase 2 study of relapsed/refractory DLBCL with variable CD30 expression. Blood. 2015;125(9):1394-1402.
1Department of Translational Hematology & Oncology Research, Taussig Cancer Institute, Cleveland Clinic, Cleveland, OH, USA and 2Department of Biomedicine and Prevention, University of Rome Tor Vergata, Rome, Italy
Correspondence: V. Visconte visconv@ccf.org
Received: September 25, 2023.
Accepted: October 2, 2023.
Early view: October 12, 2023.
https://doi.org/10.3324/haematol.2023.284085
©2024 Ferrata Storti Foundation
Published under a CC BY license

The paper by Park et al.1 published in this issue of Haematologica proposes the application of machine learning (ML) algorithms to refine cluster signatures characterized by cytogenetic and mutational features common to patients with acute myeloid leukemia (AML). Such effort is inspired by the goal of defining similar clusters possibly informing on survival outcomes and response or refractoriness to conventional therapies (intensive chemotherapy [IC], hypomethylating agents [HMA], and HMA plus venetoclax [VEN]). The study cohort comprised 279 patients who underwent IC (n=131), HMA (n=76), and HMA/VEN (n=72) in a time span of almost four years. The focus of the study is to validate European LeukemiaNet (ELN) 2022 classification in older patients, and for this, a cohort of patients ≥60 years was analyzed. The study also expands on the investigation of ELN 2022 in patients for whom IC is not appropriate. Using unsupervised hierarchical clustering, the authors were able to merge features according to similarities, pointing out the heterogeneity of the disease with the identification of 9 genomic clusters characterized by diverse survival outcomes based on treatment. Some clusters were associated with better outcomes in one or another treatment group. For instance, cluster 4 was enriched in core-binding factor-AML (96% CBF-AML) and associated with better prognosis in the IC group, which reflected the choice of IC in older patients with CBF-AML. One of the major additions of this study to the generalized concept of using ML to measure the effects of combinatorial gene mutations was the incorporation of treatment data. However, although ML was able to distinguish cluster types associated with treatment, given the small sample size per treatment group, it is difficult to reach a definitive conclusion.
Having said that, this study complements other key results achieved through ML in the field of AML in recent years. The interconnection of several variables in large cohorts of patients has allowed researchers to explore, through ML, different patient stratifications2,3 and integrated prog-
nostic algorithms,4 to identify biomarkers,5 and support cytomorphological diagnosis.6 This huge amount of data has offered insights into different aspects of AML management, respecting the granularities of disease features, and suggesting the possibilities of adding new factors or classifiers to consider in the tailoring of treatment strategy. Thus, in the near future, one could envision a role for ML in the refinement of the disease classifications and as a useful guide to a proper integration of emerging strategies such as immunotherapies, results from clinical trials, and maintenance treatments. Furthermore, the paper by Park et al.1 offers the opportunity to reflect on the discrepancies among the studies using ML clustering in AML. In 2021, Awada et al.2 applied standard and ML-driven analysis to 6,788 AML cases and defined a genomic 4-tiered model, challenging the conventional dichotomy between de novo and secondary AML. Recently, 4 clusters were also identified in a large European cohort analyzed by Eckardt et al.7 by re-stratifying patients in comparison to ELN 2017 criteria. Ultimately, the current study identified 9 genomic clusters by incorporating treatment data. These differences can be attributed to several biases determined by unavailable / different choice of data, small sample sizes (a limitation also pointed out by Park et al.1 with regards to their study), short patient follow-up, exclusion / inclusion of clinical data, and misclassifications. Of note, the comparison among studies can be challenging and misleading, especially when using unsupervised learning approaches in which lack of prediction inputs might be applicable only to a specific context. In fact, the context-dependent interpretation of the data underpins one of the most important pitfalls and concerns of ML: the restriction of an algorithm to a single specific use. In summary, this article contributes to the literature demonstrating the utility of ML algorithms in resolving intricate molecular relationships and their impact on clinical outcomes. More importantly, the future holds the promise of
dissecting genomic interplay guiding precision medicine. In line with several new tools being tested, large studies, standardization, validation cohorts, and uniformity of pipelines across studies could be the keys to unlock the full potential of ML.
1. Park S, Kim TY, Cho B-S, et al. Prognostic value of European Leukemia Net 2022 criteria and genomic clusters using machine learning in older adults with acute myeloid leukemia. Haematologica. 2024;109(4):1095-1106.
2. Awada H, Durmaz A, Gurnari C, et al. Machine learning integrates genomic signatures for subclassification beyond primary and secondary acute myeloid leukemia. Blood. 2021;138(19):1885-1895.
3. Kewan T, Durmaz A, Bahaj W, et al. Molecular patterns identify distinct subclasses of myeloid neoplasia. Nat Commun. 2023;14(1):3136.
4. Eckardt JN, Röllig C, Metzeler K, et al. Prediction of complete
No conflicts of interest to disclose.
Both authors contributed equally.
remission and survival in acute myeloid leukemia using supervised machine learning. Haematologica. 2023;108(3):690-704.
5. Zhang Y, Liu D, Li F, et al. Identification of biomarkers for acute leukemia via machine learning-based stemness index. Gene. 2021;804:145903.
6. Eckardt JN, Schmittmann T, Riechert S, et al. Deep learning identifies acute promyelocytic leukemia in bone marrow smears. BMC Cancer. 2022;22(1):201.
7. Eckardt JN, Röllig C, Metzeler K, et al. Unsupervised metaclustering identifies risk clusters in acute myeloid leukemia based on clinical and genetic profiles. Commun Med (Lond). 2023;3(1):68.
Lymphoma Service, Division of Hematologic Malignancies, Department of Medicine, Memorial Sloan Kettering Cancer Center, New York, NY, USA
Correspondence: A. Kumar
kumara2@mskcc.org
Received: October 4, 2023.
Accepted: October 12, 2023.
Early view: October 19, 2023.
https://doi.org/10.3324/haematol.2023.284105
©2024 Ferrata Storti Foundation
Published under a CC BY-NC license
Although mantle cell lymphoma (MCL) has a common genetic hallmark t(11;14), juxtaposing IGH and CCND1 gene loci, which leads to cyclin D1 overexpression, MCL is markedly clinically and biologically heterogeneous, ranging from an indolent to highly aggressive disease. Characterizing highrisk MCL is an area of ongoing interest not only in order to refine prognostication in this disease, but also to identify subgroups of patients who may benefit from novel therapeutic approaches beyond standard chemoimmunotherapy.
The MCL International Prognostic Index (MIPI), high proliferation (estimated by Ki-67 in routine clinical practice), blastoid/pleomorphic morphology, complex cytogenetics, and TP53 aberrations are clinical and pathobiological risk factors associated with poor prognosis in MCL.1 There are ongoing efforts to identify additional factors that underlie the diversity of MCL and measures of increased genomic and epigenomic complexity as well as TP53 and C-MYC alterations have been associated with more aggressive clinical behavior and poor survival outcomes.2
In a paper published in this issue of Haematologica, Rodrigues and colleagues add to the evolving story of highrisk MCL by demonstrating that MYC protein overexpression is an independent prognostic factor associated with inferior progression-free and overall survival outcomes.3
In their retrospective analysis of 252 MCL patients (154 from the Swedish Lymphoma Register and 98 from the Nordic Lymphoma Group clinical trials MCL2 and MCL3), MYC overexpression assessed by immunohistochemistry (defined as >20% positive cells with nuclear staining using an anti-MYC antibody) was identified in 14% of samples (35/252). The MYC overexpression correlated with increased MYC mRNA expression levels by RNAscope®. Interestingly, C-MYC translocation (identified by fluorescence in situ hybridization [FISH]), C-MYC copy number gains, or C-MYC genetic mutation were rarely observed in this cohort and did not correlate with MYC protein overexpression. MYC
rearrangements and mutations have been rarely reported in previously published retrospective series and case reports, and thus have not become a routine part of the cytogenetic/ molecular evaluation of MCL cases.4-11 MYC overexpression, assessed by immunohistochemistry, in contrast, appears more prevalent based on this study and, thus, a potentially more robust prognostic marker.
In the study by Rodrigues et al., MYC overexpression correlated with inferior progression-free survival and overall survival and remained an independent prognostic factor in multivariable Cox proportional hazards models when adjusting for other high-risk features. Of interest, a subgroup of patients (n=13) with evidence of MYC overexpression and TP53 alteration (TP53 overexpression and/or mutation) had a particularly poor prognosis with an increased risk of progression (hazard ratio=16.9, 95% confidence interval: 7.438.3) and death (hazard ratio=7.8, 95% confidence interval: 4.4-14.1). TP53 aberrancy is widely recognized as one of the strongest prognostic factors in MCL and, despite optimal intensive chemoimmunotherapy, this subset of patients has markedly inferior survival outcomes compared to patients with wild-type TP53 status.12 However, molecular clustering data (incorporating whole exome sequencing and RNA-sequencing analyses) suggest that TP53 mutations can be seen in both non-nodal leukemic patients with an overall favorable prognosis (cluster 1) and also in patients with dismal survival outcomes enriched for highly proliferative and non-classical histology MCL (cluster 4), suggesting that the prognostic relevance of TP53 is context-dependent and that not all mutations are created equal.13 Interestingly, cluster 4 also had gene signatures of an active MYC pathway. Thus, as suggested in the work by Rodrigues et al., the combination of alterations in both TP53 and C-MYC may have an additive negative prognostic effect.3
C-MYC is an essential transcription factor that regulates various cellular functions, including proliferation, growth,
and apoptosis, and has been implicated in the pathogenesis of a number of B-cell lymphomas. Although C-MYC gene rearrangements (assessed by FISH) are commonly seen in Burkitt lymphoma and high-grade B-cell lymphoma (“double-hit diffuse large B-cell lymphoma [DLBCL]”), MYC overexpression assessed by immunohistochemistry in the absence of the C-MYC gene rearrangement has been shown to be prognostically relevant in the so-called “double expressor” DLBCL.14 In MCL, the acquisition of a C-MYC translocation 8q24 has been referred by some as “double-hit” MCL and has been associated with blastic transformation and an aggressive disease course in various case reports.4-11 From the study by Rodrigues et al., we learn that MYC overexpression in MCL, without evidence of C-MYC translocation or mutation, is more common than previously recognized, prognostically relevant, and is likely driven by transcriptional dysregulation.
High-risk MCL patients, defined by TP53 mutation and other factors, remain a challenging population to treat and ongoing clinical trials are investigating integration of targeted
1. Jain P, Dreyling M, Seymour JF, Wang M. High-risk mantle cell lymphoma: definition, current challenges, and management. J Clin Oncol. 2020;38(36):4302-4316.
2. Nadeu F, Martin-Garcia D, Clot G, et al. Genomic and epigenomic insights into the origin, pathogenesis, and clinical behavior of mantle cell lymphoma subtypes. Blood. 2020;136(12):1419-1432.
3. Rodrigues J, Hollander P, Schmidt L. MYC protein is a high-risk factor in mantle cell lymphoma and identifies cases beyond morphology, proliferation and TP53/p53 – a Nordic Lymphoma Group study. Haematologica. 2024;109(4):1171-1183.
4 Au WY, Horsman DE, Viswanatha DS, Connors JM, Klasa RJ, Gascoyne RD. 8q24 translocations in blastic transformation of mantle cell lymphoma. Haematologica. 2000;85(11):1225-1227.
5. Felten CL, Stephenson CF, Ortiz RO, Hertzberg L. Burkitt transformation of mantle cell lymphoma. Leuk Lymphoma. 2004;45(10):2143-2147.
6. Hao S, Sanger W, Onciu M, Lai R, Schlette EJ, Medeiros LJ. Mantle cell lymphoma with 8q24 chromosomal abnormalities: a report of 5 cases with blastoid features. Mod Pathol. 2002;15(12):1266-1272.
7 Hu Z, Medeiros LJ, Chen Z, et al. Mantle cell lymphoma with MYC rearrangement: a report of 17 patients. Am J Surg Pathol. 2017;41(2):216-224.
8. Michaux L, Wlodarska I, Theate I, et al. Coexistence of BCL1/ CCND1 and CMYC aberrations in blastoid mantle cell
therapies and novel immunotherapeutics. Although it is recognized that standard chemoimmunotherapy is likely inadequate for TP53 aberrant MCL, the optimal alternative therapeutic approach remains unclear. Given the heterogeneous chemotherapies applied in the retrospective series described in the study by Rodrigues et al., this study does not provide any insights into optimal treatment pathways for the high-risk subsets with MYChigh or MYChigh with TP53 alterations, but emphasizes the need for a broader assessment of MYC expression in MCL to validate these findings and perhaps to facilitate future development of individualized therapies for high-risk MCL.
AK has received research support from AbbVie, Adaptive Biotechnologies, Celgene, Pharmacyclics, Loxo/Lily Pharmaceuticals, and Seattle Genetics; has received honoraria from Astra Zeneca, Kite Pharmaceuticals, Janssen, Genentech, and Loxo/Lily Pharmaceuticals; and has a consulting role with Genentech.
lymphoma: a rare finding associated with very poor outcome. Ann Hematol. 2004;83(9):578-583.
9 Reddy K, Ansari-Lari M, Dipasquale B. Blastic mantle cell lymphoma with a Burkitt translocation. Leuk Lymphoma. 2008;49(4):740-750.
10 Tirier C, Zhang Y, Plendl H, et al. Simultaneous presence of t(11;14) and a variant Burkitt’s translocation in the terminal phase of a mantle cell lymphoma. Leukemia. 1996;10(2):346-350.
11. Vaishampayan UN, Mohamed AN, Dugan MC, Bloom RE, Palutke M. Blastic mantle cell lymphoma associated with Burkitt-type translocation and hypodiploidy: short report. Br J Haematol. 2001;115(1):66-68.
12. Eskelund CW, Dahl C, Hansen JW, et al. TP53 mutations identify younger mantle cell lymphoma patients who do not benefit from intensive chemoimmunotherapy. Blood. 2017;130(17):1903-1910.
13. Yi S, Yan Y, Jin M, et al. Genomic and transcriptomic profiling reveals distinct molecular subsets associated with outcomes in mantle cell lymphoma. J Clin Invest. 2022;132(3):e153283.
14 Green TM, Young KH, Visco C, et al. Immunohistochemical double-hit score is a strong predictor of outcome in patients with diffuse large B-cell lymphoma treated with rituximab plus cyclophosphamide, doxorubicin, vincristine, and prednisone. J Clin Oncol. 2012;30(28):3460-3467.
Correspondence: O. Abla
oussama.abla@sickkids.ca
Received: September 29, 2023.
Accepted: November 7, 2023.
Early view: Novembet 16, 2023.
https://doi.org/10.3324/haematol.2023.284188
©2024 Ferrata Storti Foundation
Published under a CC BY-NC license
In this issue of Haematologica, Cournoyer et al. discuss their experience using first-line mitogen-activated protein kinase (MAPK) inhibitors in childhood Langerhans cell histiocytosis (LCH) and other histiocytic disorders.1
LCH, a rare myeloid neoplasm affecting mostly children, is driven by activating mutations in the MAPK pathway, mostly BRAF-V600E.2 It has heterogeneous clinical presentations ranging from limited single-system involvement to severe multisystem or neurodegenerative forms. LCH is defined by the accumulation of CD1a+/CD207+ cells in organs such as bone and skin, and the so-called risk organs (liver, spleen and hematopoietic system); patients with involvement of these organs have a higher risk of mortality.2 Multisystem LCH is treated with risk-adapted therapy, but many patients require myelosuppressive salvage regimens. MAPK inhibitors, such as dabrafenib, a BRAF inhibitor, and trametinib, a MEK inhibitor, are being used to treat refractory LCH and other histiocytic disorders, but most patients relapse after therapy discontinuation.3,4
Cournoyer et al. treated 14 young patients with relapsed/ refractory LCH (13 with proven multisystem disease, one with possible neurodegeneration and diabetes insipidus) and two with relapsed/refractory systemic Rosai-Dorfman-Destomebs disease with dabrafenib, trametinib or inhibitor combination, achieving a 94% favorable response rate; the patient with possible central nervous system (CNS)-LCH had improved neurological symptoms. Eighteen patients received inhibitors first-line, 13 with proven LCH (6 with multisystem and 7 with single-system disease), three with possible CNS-LCH (1 positive for BRAF-V600E according to droplet digital polymerase chain reaction [ddPCR]) and two with multisystem juvenile xanthogranuloma. All had sustained favorable responses with a median treatment duration of 2.5 years. The three patients with isolated possible CNS-LCH had improved or stabilized disease. Five LCH patients with single-system disease discontinued therapy and remain well, while four with multisystem LCH
who discontinued therapy relapsed and were restarted on inhibitors with rapid response.
Albeit retrospective, the report by Cournoyer et al. is important for many reasons. LCH can be almost universally cured with chemotherapy but high rates of treatment failure in patients with multisystem involvement, high toxicity of salvage therapies and long-term morbidity for all relapsed/refractory LCH patients represent major challenges. Therefore, more effective and safer treatment options are warranted. Treatment with MAPK inhibitors is promising due to its ease of administration, less toxicity, the better quality of life it provides and the possibility of it preventing reactivations.
A few studies have shown the effectiveness of MAPK inhibitors in children with relapsed/refractory LCH or neurodegenerative disease.3,4 However, the efficacy of first-line MAPK inhibitor monotherapy has been unknown, and the paper by Cournoyer et al. is the first report of such a strategy in children with LCH or juvenile xanthogranuloma. A few caveats need discussion. First, not all LCH patients are candidates for first-line inhibitor therapy, which is reasonable in clinical neurodegeneration or infants with risk organ-positive multisystem disease who are at high risk of early treatment failure. In contrast, low-risk patients with relapsed/refractory multifocal bone involvement or risk organ-negative multisystem disease routinely respond to mild chemotherapy and may not need inhibitors, unless they are resistant. This is due to the unknown optimal duration of inhibitor therapy and risk of indefinite and unnecessary treatments for mild disease. Furthermore, these inhibitors are not indicated for unifocal bone LCH, which can resolve spontaneously. Cournoyer et al. treated seven patients with single-system LCH (3 multifocal and 4 unifocal bone onvolvement) with inhibitors as first-line therapy with favorable response; however, as they state, it is unknown whether these responses were due to inhibitors or spontaneous LCH remission.

Second, it is controversial whether patients with isolated diabetes insipidus should be treated for LCH. Indeed, in a few pediatric studies on pituitary stalk thickening, only 8-19% were diagnosed with LCH.5 It is unknown whether peripheral blood ddPCR anaysis might improve the detection rate of LCH diagnosis. Furthermore, a review from Vienna showed that only 25% of patients with LCH and radiological signs of neurodegeneration progressed to clinical neuordegeneration.6 Therefore, BRAF inhibitors are reasonable only in patients with presumed LCH, isolated diabetes insipidus and progressive radiological neurodegeneration who have
neurological symptoms and are positive by ddPCR for the BRAF-V600E mutation. Another issue is the ability of MAPK inhibitors to penetrate the CNS adequately. BRAF/MEK inhibitors are substrates of P-glycoproteins, and their efflux by the blood-brain barrier leads to limited drug levels within the CNS.7 Day101 (tovorafenib) is a type II pan-RAF inhibitor with greater CNS penetration, and less dermatological, cardiac and ocular toxicities than other MAPK inhibitors. Nevertheless, the authors showed significant improvement in their CNS-positive patients treated with MEK inhibition. Third, although MAPK inhibitors are better tolerated than
chemotherapy, they are not harmless. However, the authors showed that inhibitors were well tolerated, and that three patients had sustained responses at smaller doses. Leukemia and cutaneous basal cell carcinoma have been seen in adults with histiocytosis following treatment with MAPK inhibitors.8 No pediatric reports of second malignancies after MAPK inhibitors exist, and the long-term toxicities of these drugs in this population is unknown. Fourth, the most important question is when to stop these inhibitors? A study of adult patients with histiocytosis whose MAPK inhibitors were discontinued after complete or partial response had been obtained, showed that 77% relapsed after treatment interruption.9 In the study by Cournoyer et al., 11 patients stopped inhibitors: 36% relapsed at a median time of 5 months and all responded after restarting inhibitors. Therefore, in some patients, such as those with relapsed/refractory, multisystem risk organ-positive disease or neurodegeneration, it may not be safe to stop inhibitors, whereas in others, with relapsed/refractory skin/ bone involvement, it might be reasonable to stop inhibitors after 2 years of remission while using ddPCR to monitor for the presence of circulating BRAF-V600E. This question should be answered in a prospective clinical trial. Additionally, targeted inhibitor therapy does not eradicate the LCH clone, whereas chemotherapy does; thus, it is possible that combining chemotherapy with inhibitors might help in MAPK inhibitor discontinuation. Evseev et al.
1. Cournoyer E, Ferrell J, Sharp S, et al. Dabrafenib and trametinib in Langerhans cell histiocytosis and other histiocytic disorders. Haematologica. 2024;109(4):1137-1148.
2. Khoury JD, Solary E, Abla O, et al. The 5th edition of the World Health Organization Classification of Haematolymphoid Tumours: Myeloid and Histiocytic/Dendritic Neoplasms. Leukemia. 2022;36(7):1703-1719.
3. Donadieu J, Larabi IA, Tardieu M, et al. Vemurafenib for refractory multisystem Langerhans cell histiocytosis in children: an international observational study. J Clin Oncol. 2019;37(31):2857-2865.
4 Whitlock JA, Geoerger B, Dunkel IJ, et al. Dabrafenib, alone or in combination with trametinib, in BRAF V600-mutated pediatric Langerhans cell histiocytosis. Blood Adv. 2023;7(15):3806-3815.
5. Robison NJ, Prabhu SP, Sun P, et al. Predictors of neoplastic disease in children with isolated pituitary stalk thickening. Pediatr Blood Cancer. 2013;60(10):1630-1635.
reported on nine infants who received vemurafenib and chemotherapy (cytarabine, cladribine) simultaneously as salvage therapy; eight of them showed response without toxicity. Nevertheless, this combination did not eradicate the clone as five of the eight patients relapsed soon after discontinuing vemurafenib and required vemurafenib maintenance therapy.10 The long-term safety and efficacy of such a combination will need to be validated in prospective trials. Lastly, although effective, MAPK inhibitors carry a high price tag and may not be affordable in countries with limited resources.
In summary, Cournoyer et al. have presented a promising study of patients with histiocytic disorders receiving first-line and second-line MAPK inhibitor therapy. These inhibitors are well tolerated and the rate of response to them is high, but they do not prevent relapses after their discontinuation. Prospective trials are needed to determine the long-term efficacy and safety of inhibitors as first-line therapy and optimal therapy duration in children. Validating the sensitivity of minimal disease markers (monitored by ddPCR) will help in the identification of patients in whom inhibitor discontinuation can be safe. Figure 1 shows a possible algorithm for the treatment of LCH, including the potential role of MEK inhibition.
Disclosures
OA is a consultant for Spring Works.
6. Wnorowski M, Prosch H, Prayer D, et al. Pattern and course of neurodegeneration in Langerhans cell histiocytosis. J Pediatr. 2008;153(1):127-132.
7. Sakji-Dupré L, Le Rhun E, Templier C, et al. Cerebrospinal fluid concentrations of vemurafenib in patients treated for brain metastatic BRAF-V600 mutated melanoma. Melanoma Res. 2015;25(4):302-305.
8. Cohen Aubart F, Emile JF, Carrat F, et al. Targeted therapies in 54 patients with Erdheim-Chester disease, including follow-up after interruption (the LOVE study). Blood. 2017;130(11):1377-1380.
9 Reiner AS, Durham BH, Yabe M, et al. Outcomes after interruption of targeted therapy in patients with histiocytic neoplasms. Br J Haematol. 2023;203(3):389-394.
10 Evseev D, Osipova D, Kalinina I, et al. Vemurafenib combined with cladribine and cytarabine results in durable remission of pediatric BRAF V600E-positive LCH. Blood Adv. 2023;7(18):5246-5257.
1Department of Cell Therapy and Transplantation Medicine and 2Department of Hematology and Oncology, Graduate School of Medicine, The University of Tokyo Hospital, Tokyo, Japan
Correspondence: M. Kurokawa kurokawa@m.u-tokyo.ac.jp
Received: October 23, 2023.
Accepted: October 26, 2023.
Early view: November 2, 2023.
https://doi.org/10.3324/haematol.2023.284272
©2024 Ferrata Storti Foundation
Published under a CC BY-NC license
In this issue of Hematologica, Kaito and colleagues report on a way to switch on natural killer (NK) cells so that the activity of these cells against acute myeloid leukemia (AML) is increased.1 AML is caused by the accumulation of multiple genetic abnormalities in hematopoietic stem and progenitor cells. Despite the development of novel therapies for AML, relapse remains a major problem. Immunotherapy is a promising approach to target diverse clones of AML, but the mechanisms of immune dysregulation in AML and methods to overcome them need to be elucidated. NK cells are characterized by their cytotoxic capacity against virally infected cells and cancer cells without prior activation or past exposure. Many studies have shown the fundamental role of NK cells in cancer immune surveillance. NK cells are also considered important for disease control in AML based on several observations, including that the anti-leukemic activity of NK cells is inversely correlated with disease progression,2 and NK-cell function is correlated with prognosis.
As detailed in a recent review,3 when used as cellular therapy, NK cells are generally safe because of the low risk of allogeneic reactions and cytokine release syndrome. A patient’s peripheral blood NK cells are usually infused after ex vivo expansion, but the proliferation and functional capacity of autologous cells from previously treated patients are often inadequate, limiting their therapeutic efficacy. While allogeneic NK cells harvested from healthy donors have shown clinical efficacy,4 various challenges to this strategy remain, including low persistence, lack of optimal protocols for ex vivo expansion, and risk of graft-versus-host disease mainly due to contaminating T cells. Other sources of NK cells include umbilical cord blood, induced pluripotent stem cells, and the patient-derived NK cell line NK-92, available as an off-the-shelf product. In a phase I clinical trial, NK-92 cells provided responses, without severe toxicity, in some patients.5 Since the introduction of chimeric antigen receptor (CAR)-T cells, much attention has been focused on the
cytolytic potency of chimeric-based technologies. CAR-NK cells are considered a promising option due to their favorable cytotoxicity profile and low manufacturing cost. NK-92 cells have also been modified with CAR and used in clinical trials.6 However, NK-cell therapies, including CAR-NK cells, still have problems to solve, such as loss of target antigen, a hostile tumor microenvironment, and tumor heterogeneity. One of the biggest problems is the short-term persistence of these cells in vivo and, despite many efforts, including cytokine activation and genetic modification,7 objective responses remain transient.
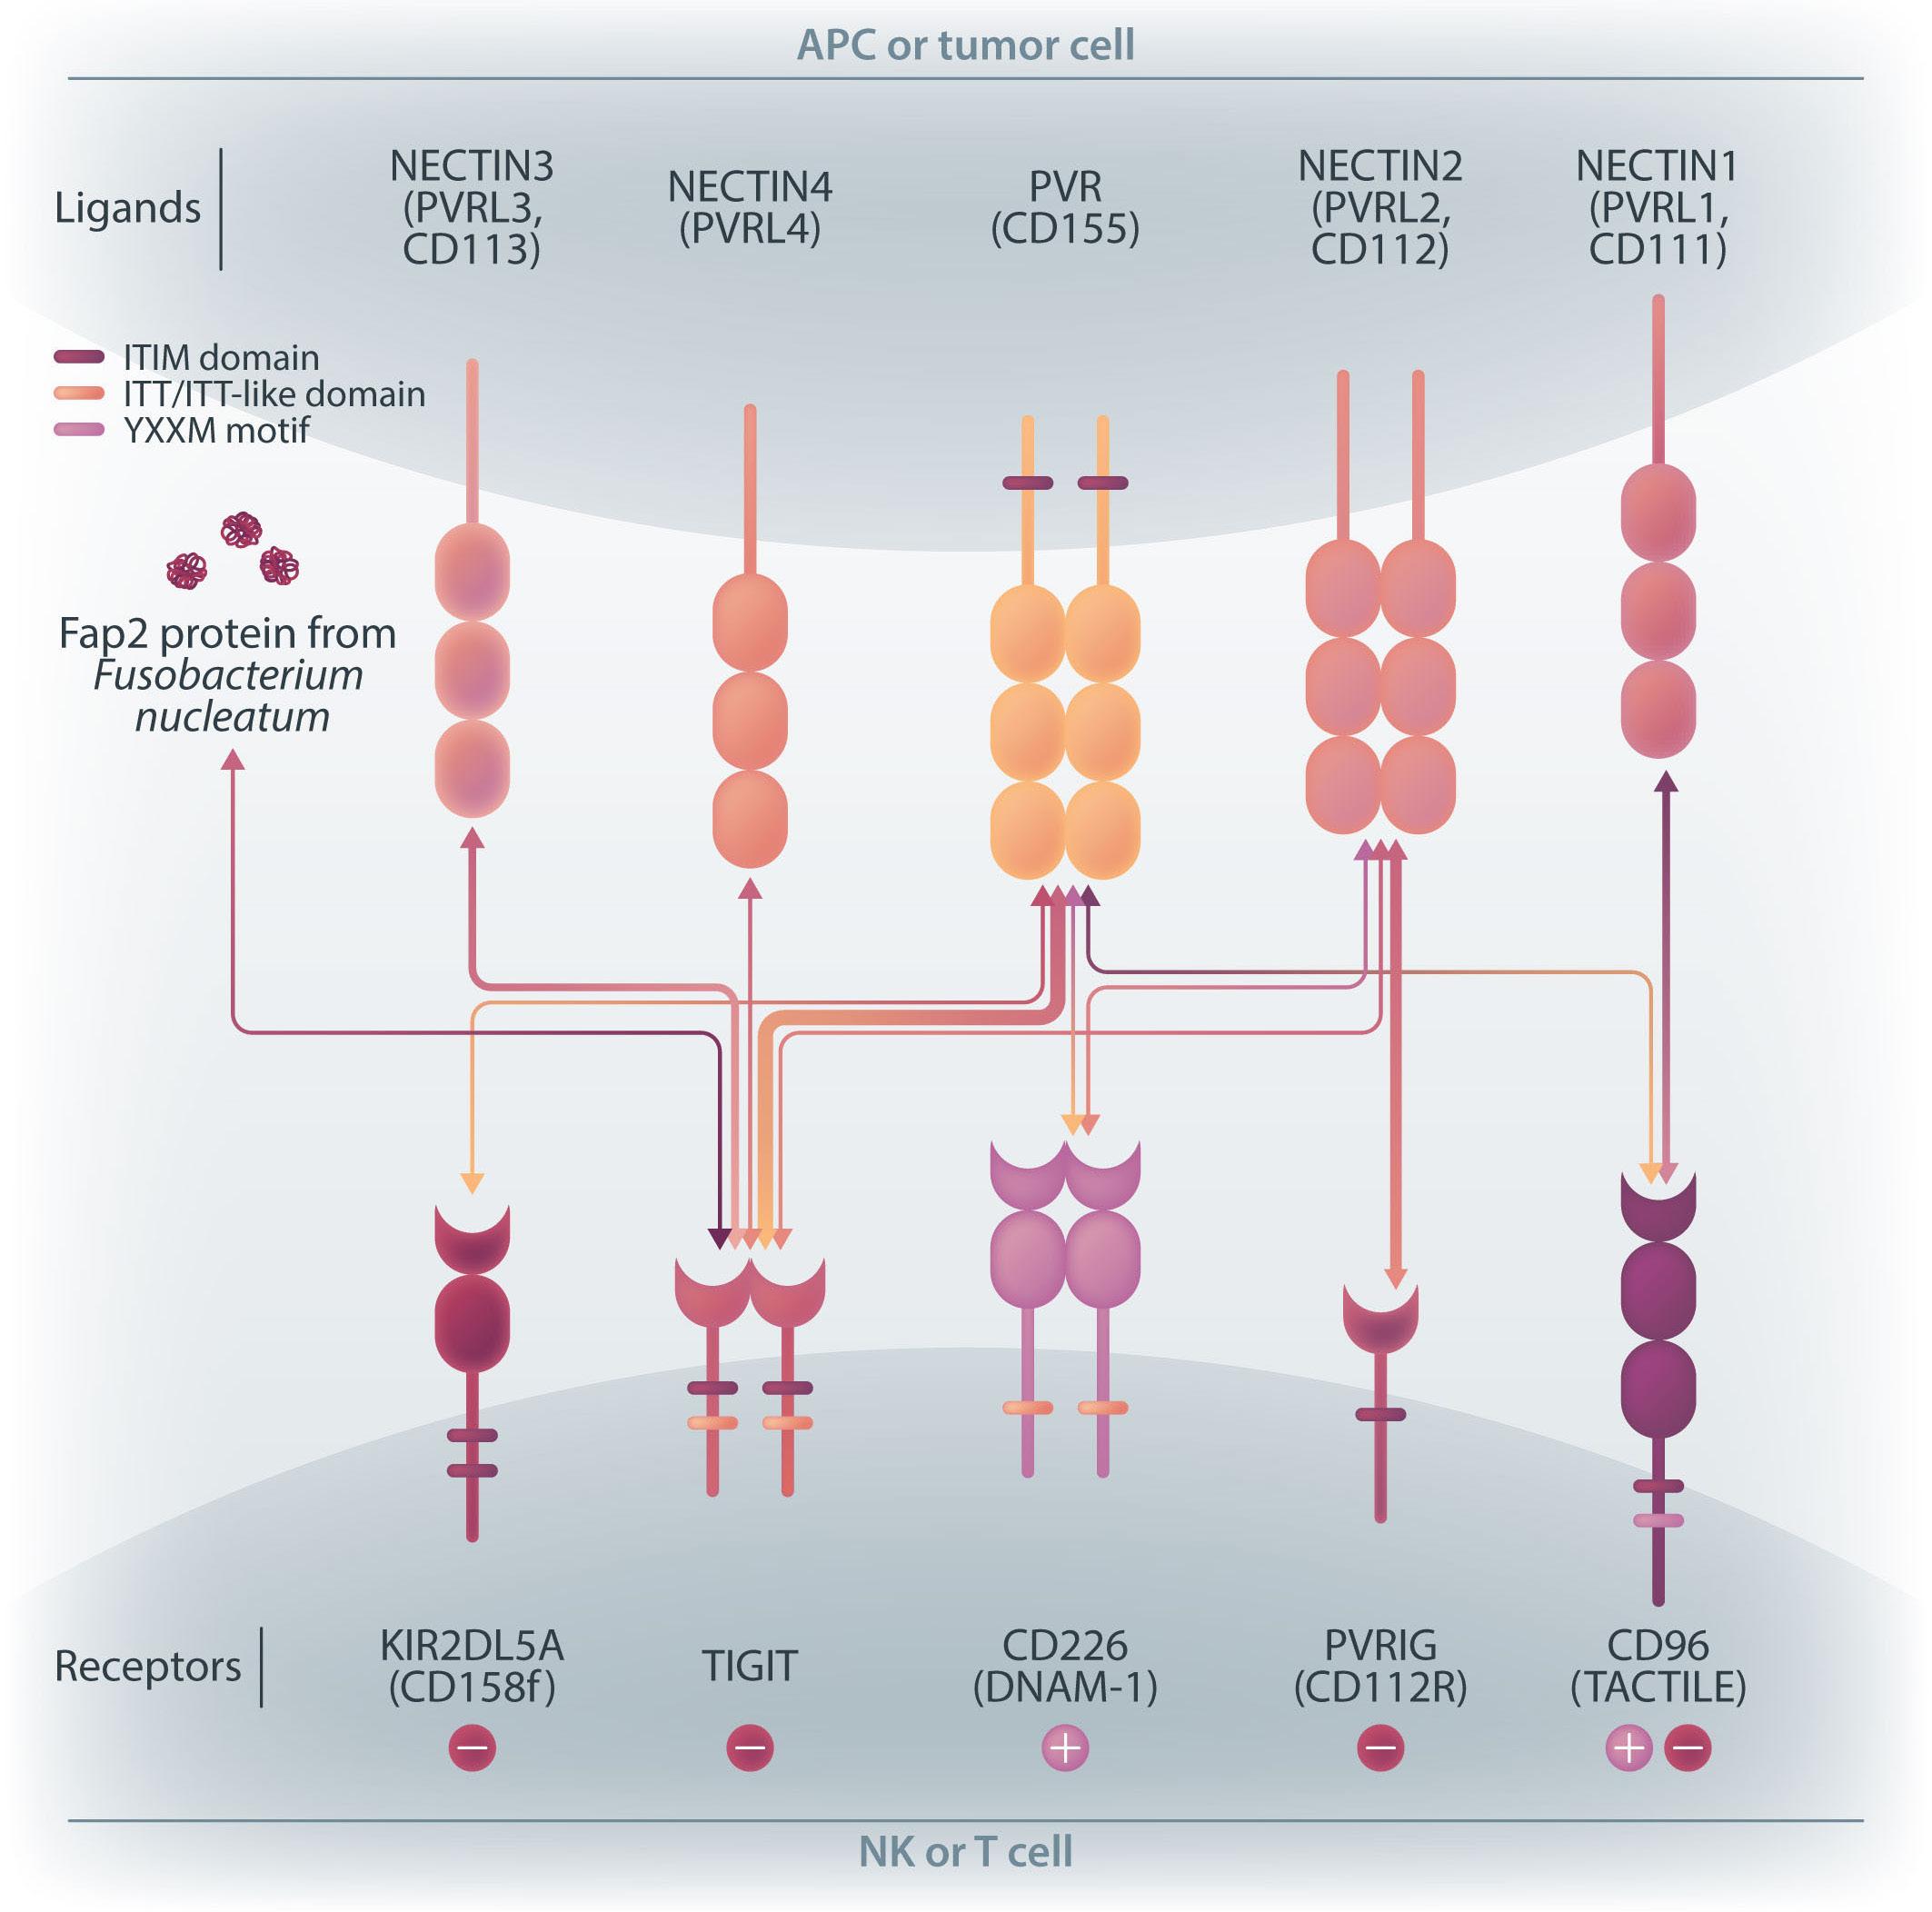
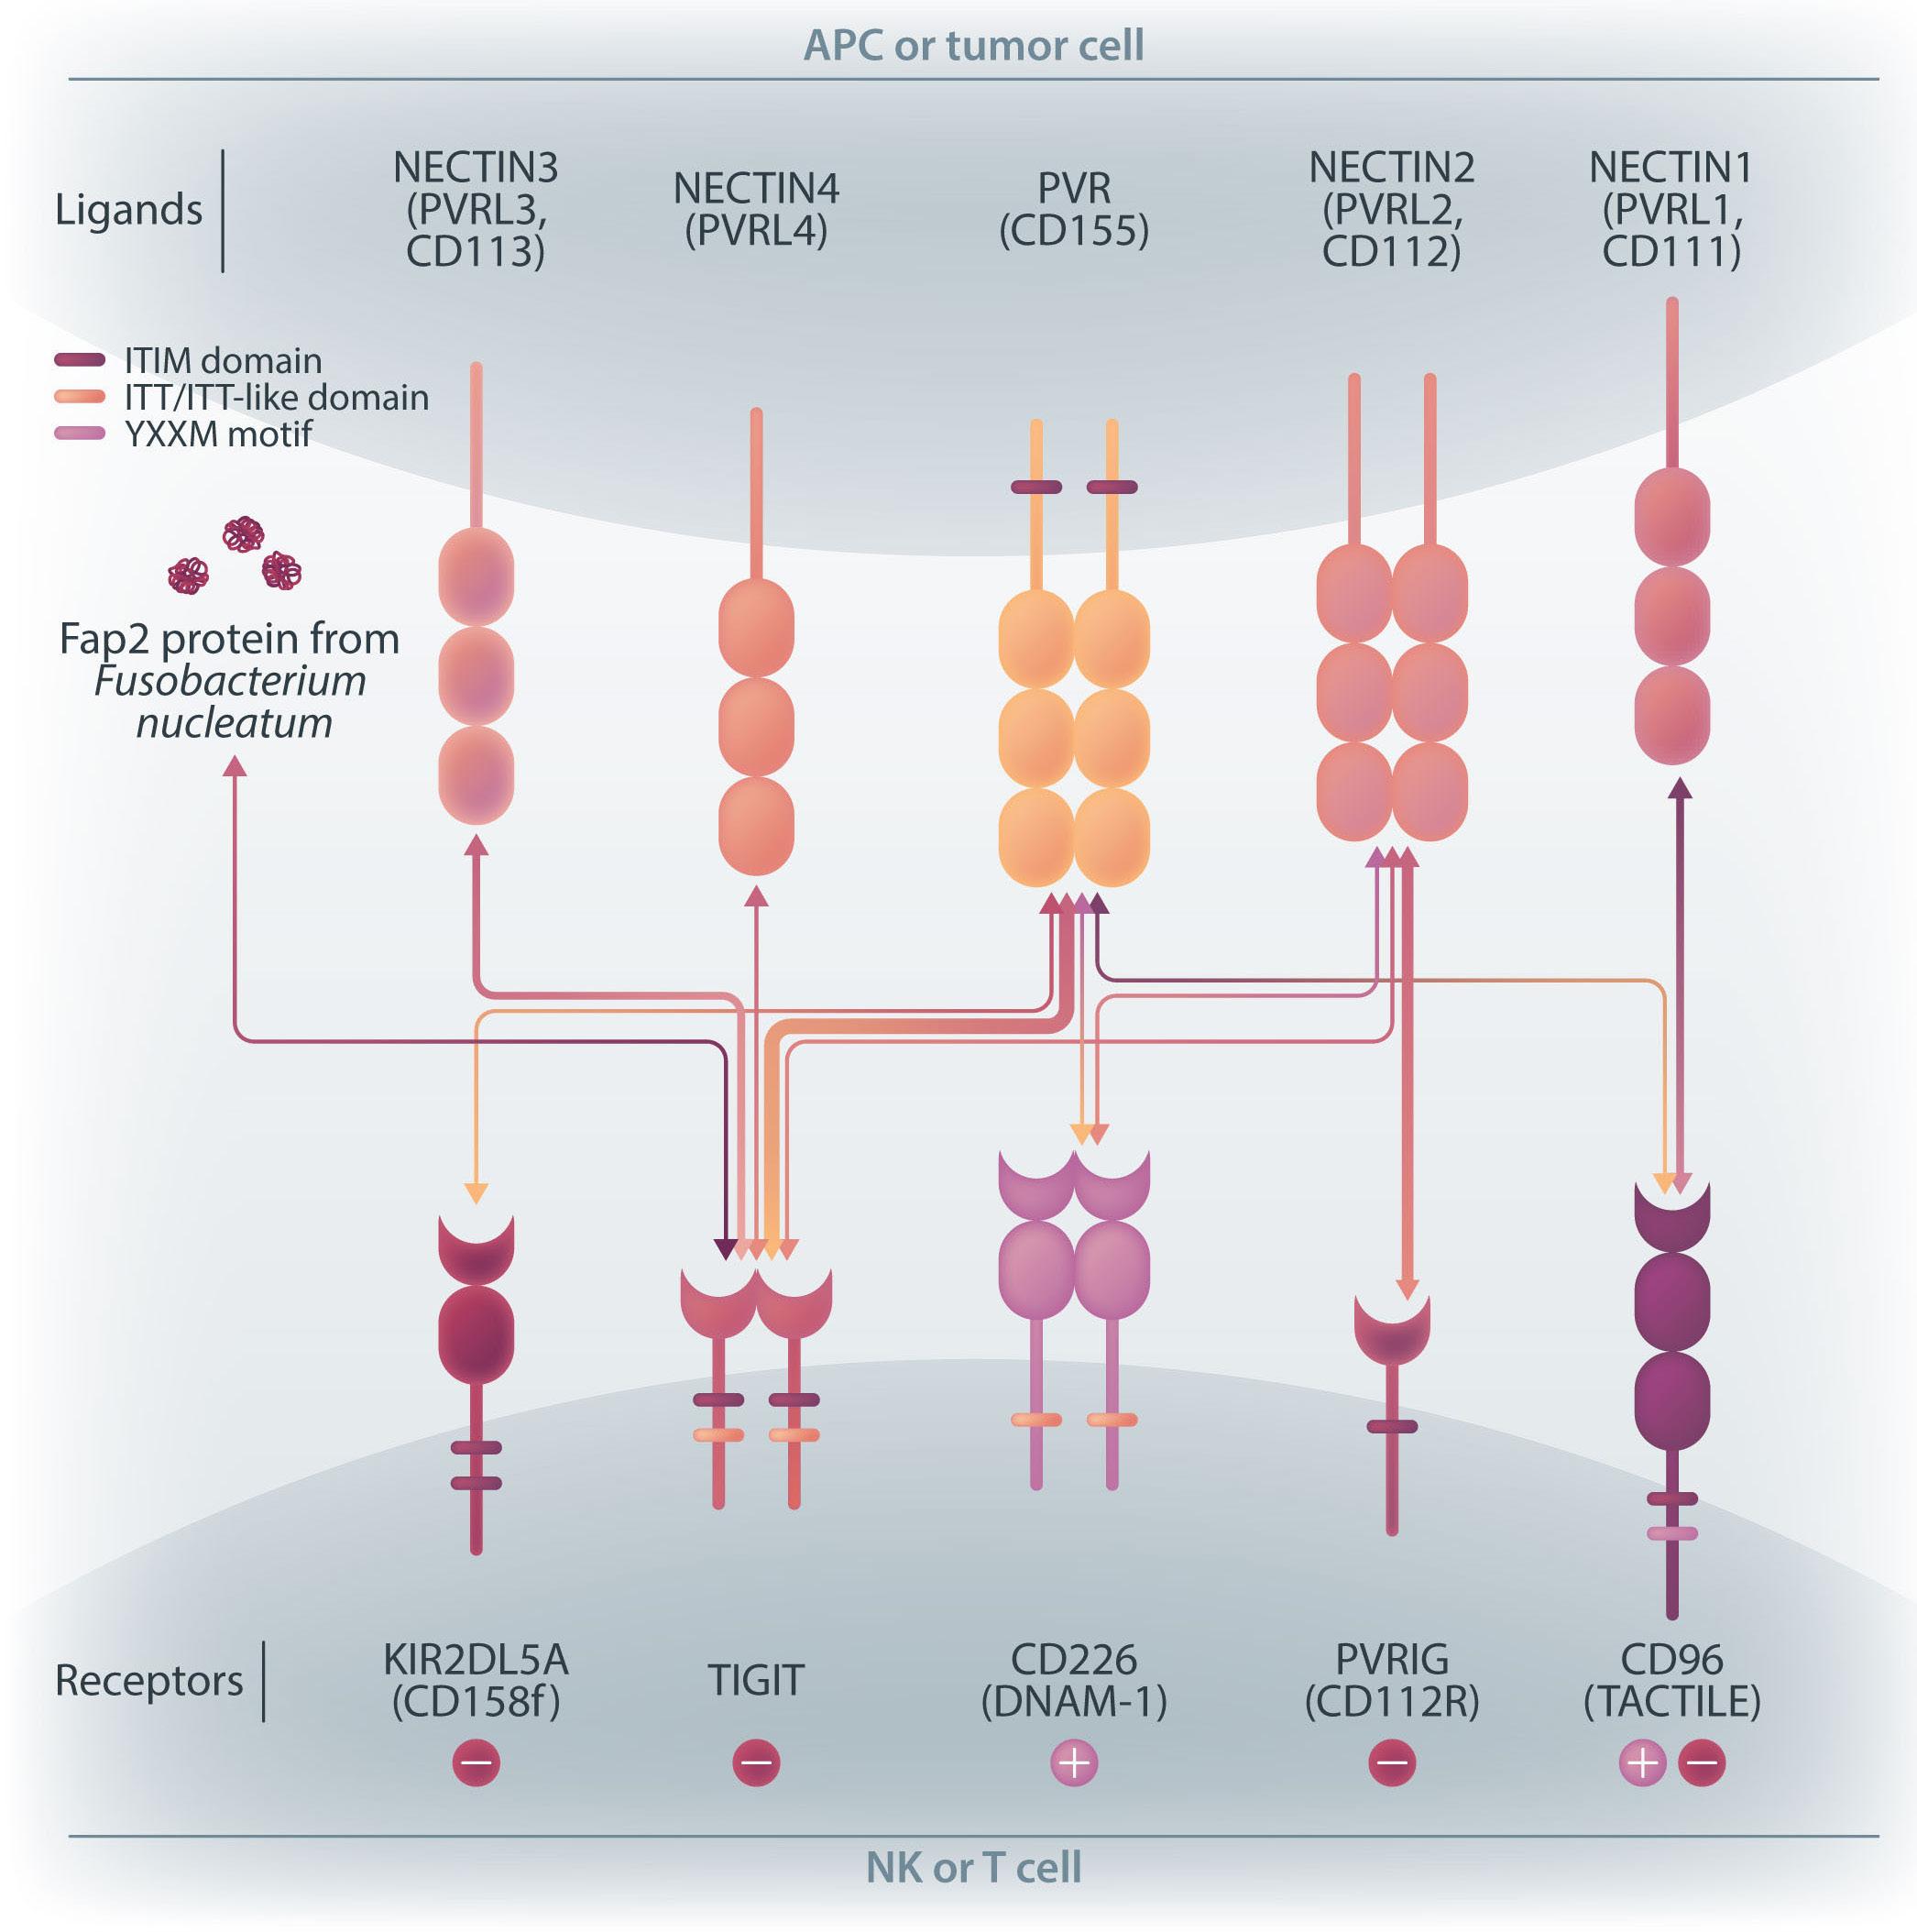
NK cells express a variety of activating and inhibitory receptors to recognize host cell changes such as malignant transformation or viral infection. In addition to downregulation of major histocompatibility complex class I ligands, the balance of signals from these receptors regulates the cytotoxic function of NK cells. In NK cells from AML patients, downregulation of activating receptors, such as natural cytotoxicity receptors and DNAX accessory molecule-1 (DNAM-1, CD226), and upregulation of inhibitory receptors including CD94 and TIGIT, lead to dysfunction.8 In AML cells, loss of activating ligands or increased expression of inhibitory ligands has been reported. Among them, the Nectin/ Nectin-like family plays an important role in the regulation of NK cells as well as T cells. DNAM-1 is a representative co-stimulatory receptor, while TIGIT, CD96, and PVRIG are inhibitory receptors. Several ligands, including CD155 and NECTIN2 (CD112), interact with these receptors.9 Ligands and receptors in this family have various binding affinities for each other rather than a one-to-one correspondence (Figure 1). The signaling network mediated by these complex ligand-receptor relationships regulates NK-cell activation precisely in a context-dependent manner. The ratio of CD112 to CD155 expression varies between tumors, and the CD155-TIGIT and CD112-PVRIG axes may play different roles in NK-cell regulation in different tumors. In AML, CD155 and CD112 are reportedly negative prognostic markers,10 but
their functional significance is not yet clear. NK cells from AML patients also show high TIGIT expression as well as reduced DNAM-1 expression, associated with poor prognosis. However, it has not been clearly understood what kinds of ligand-receptor relationships are important in the pathogenesis of NK-cell abnormalities in AML in terms of therapeutic implications.
In the abovementioned study, Kaito et al. showed that
CD112 and CD155 are highly expressed in primary AML samples.1 As was reported previously,10 cases with high CD112 expression had a poor prognosis. In contrast, DNAM-1 and TIGIT were highly expressed in NK and T cells, but there was no correlation between their expression and clinical characteristics or therapeutic responses. After showing that more than 80% of NK-92 cells expressed TIGIT and 8% expressed DNAM-1, the authors generated NK-92 cells

family. The receptors are expressed on natural killer (NK) cells and T
while
ligands
present on either antigen-presenting cells or tumor cells. DNAM-1 activates NK cells via interactions with CD155 or CD112, but DNAM-1 has a higher affinity for CD155 than for CD112. The affinity between TIGIT and CD155 is significantly higher than that between DNAM-1 and CD155, so the activating receptor DNAM-1 is competed against the CD155 ligand by the inhibitory receptor TIGIT. The CD112 ligand mediates the co-stimulatory effect via DNAM-1 and the inhibitory effects via interactions with CD112R and TIGIT. CD96 is primarily bound by CD155 and acts as an inhibitory receptor, although it can act as an activating receptor in certain circumstances. In this way, ligands and receptors have various binding affinities for each other rather than a one-to-one correspondence. TIGIT also interacts with Fap2, produced by bacteria in the tumor microenvironment, to suppress NK-cell activity. Activating and inhibitory signals induced by the receptor are represented by + and -. Ligand-receptor interactions are illustrated by arrows, with arrow thickness indicating relative affinity. However, a model has recently been reported in which differences in surface expression, rather than differences in intrinsic affinity, are important. APC: antigen-presenting cell; PVRL: poliovirus receptor-related; CD: cluster of differentiation; PVR: poliovirus receptor; ITIM: immunoreceptor tyrosine-based inhibition motif; ITT: immunoglobulin tail tyrosine; Fap2: fibroblast activation protein-2; KIR2DL5A: killer cell immunoglobulin-like receptor, two Ig domains and long cytoplasmic tail 5A; TIGIT: T-cell immunoglobulin and ITIM domain; DNAM-1: DNAX accessory molecule-1; PVRIG: poliovirus receptor-related immunoglobulin domain containing; TACTILE: T cell-activated increased late expression; NK: natural killer.
transfected with DNAM-1 (NK-92 DNAM-1) or lacking TIGIT. In cytotoxicity assays, NK-92 DNAM-1 cells showed enhanced cytotoxicity against AML cells, with increased expression of degranulation markers and intracellular cytokines. In contrast, cells with knockout (KO) of TIGIT did not show these changes nor additive effects with DNAM-1 transfection. NK-92 DNAM-1 cells showed better cytotoxicity than NK-92 cells against CD155 KO AML cells. However, this enhancement was lost against CD112 KO AML cells and, interestingly, the cytotoxicity was rather less against double KO AML cells. When co-cultured with double KO AML cells, the index of activation of NK-92 DNAM-1 cells was attenuated compared to that following co-culture with wild-type AML cells, accompanied by upregulation of inhibitory receptors and signaling molecules, suggesting that the enhanced cytotoxicity of NK-92 DNAM-1 cells is ligand-dependent. These findings were replicated in primary AML blasts and in xenograft models, in which AML cells expressing CD155 and CD112 were subject to enhanced
1. Kaito Y, Sugimoto E, Nakamura F, et al. Immune checkpoint molecule DNAM-1/CD112 axis is a novel target for natural killercell therapy in acute myeloid leukemia. Haematologica. 2024;109(4):1107-1120.
2. Rey J, Fauriat C, Kochbati E, et al. Kinetics of cytotoxic lymphocytes reconstitution after induction chemotherapy in elderly AML patients reveals progressive recovery of normal phenotypic and functional features in NK cells. Front Immunol. 2017;8:64.
3. Myers JA, Miller JS. Exploring the NK cell platform for cancer immunotherapy. Nat Rev Clin Oncol. 2021;18(2):85-100.
4 Bachanova V, Cooley S, Defor TE, et al. Clearance of acute myeloid leukemia by haploidentical natural killer cells is improved using IL-2 diphtheria toxin fusion protein. Blood. 2014;123(25):3855-3863.
5. Boyiadzis M, Agha M, Redner RL, et al. Phase 1 clinical trial of adoptive immunotherapy using “off-the-shelf” activated natural killer cells in patients with refractory and relapsed acute
cytotoxicity by NK-92 DNAM-1 cells. While the fact that NK-92 DNAM-1 cells can be suppressed in the absence of an appropriate ligand on AML cells necessitates further analysis of the ligand-receptor relationships before clinical applications, this study demonstrates that DNAM-1 transfection in NK-92 cells enhances cytotoxic activity against AML in a CD112- and CD155-dependent manner. Further improvements are clearly needed to realize effective NK-cell therapy, including improved tumor targeting, more effective CAR design, and combination with other immunotherapies. Nevertheless, the results presented by Kaito and collleagues are important findings that may cooperate with such improvements.
No conflicts of interest to disclose.
Both authors contributed equally.
myeloid leukemia. Cytotherapy. 2017;19(10):1225-1232.
6. Tang X, Yang L, Li Z, et al. First-in-man clinical trial of CAR NK-92 cells: safety test of CD33-CAR NK-92 cells in patients with relapsed and refractory acute myeloid leukemia. Am J Cancer Res. 2018;8(6):1083-1089.
7 Shimasaki N, Jain A, Campana D. NK cells for cancer immunotherapy. Nat Rev Drug Discov. 2020;19(3):200-218.
8. Valhondo I, Hassouneh F, Lopez-Sejas N, et al. Characterization of the DNAM-1, TIGIT and TACTILE axis on circulating NK, NKTlike and T cell subsets in patients with acute myeloid leukemia. Cancers (Basel). 2020;12(8):2171.
9 Wu B, Zhong C, Lang Q, et al. Poliovirus receptor (PVR)-like protein cosignaling network: new opportunities for cancer immunotherapy. J Exp Clin Cancer Res. 2021;40(1):267.
10 Stamm H, Klingler F, Grossjohann EM, et al. Immune checkpoints PVR and PVRL2 are prognostic markers in AML and their blockade represents a new therapeutic option. Oncogene. 2018;37(39):5269-5280.
Massimo Franchini,1 Daniele Focosi,2 Mario Piergiulio Pezzo1 and Pier Mannuccio
Mannucci31Department of Transfusion Medicine and Hematology, Carlo Poma Hospital, Mantova; 2North-Western Tuscany Blood Bank, Pisa University Hospital, Pisa and 3Fondazione IRCCS Ca’ Granda-Ospedale Maggiore Policlinico and University of Milan, Angelo Bianchi Bonomi Hemophilia and Thrombosis Center, Milan, Italy
Correspondence: P.M. Mannucci
piermannuccio.mannucci@policlinico.mi.it
Received: July 26, 2023.
Accepted: October 18, 2023.
Early view: October 26, 2023.
https://doi.org/10.3324/haematol.2023.283966
©2024 Ferrata Storti Foundation
Published under a CC BY-NC license
Abstract
D-dimer, a soluble fibrin degradation product that originates from plasmin-induced degradation of cross-linked fibrin, is an important biomarker of coagulation activation and secondary fibrinolysis that is routinely used to rule out venous thromboembolism (VTE), and to evaluate the risk of VTE recurrence, as well as the optimal duration of anticoagulant therapy. Besides VTE, D-dimer may be high due to physiologic conditions, including aging, pregnancy, and strenuous physical activity. In addition, several disorders have been associated with increased D-dimer levels, ranging from disseminated intravascular coagulation to infectious diseases and cancers. Thus, it is far from unusual for hematologists to have to deal with ambulatory individuals with increased D-dimer without signs or symptoms of thrombus formation. This narrative review is dedicated to the management of these cases by the hematologist.
Hemostasis can be schematically represented as a constant, delicate equilibrium between anticoagulant and procoagulant strengths in order to maintain the blood in physiological conditions of fluidity. The primary function of hemostasis is the generation of a stable clot in the event of vascular injury, thereby preventing excessive blood loss.1 While the formation of a clot, composed essentially of fibrin and blood cells (i.e., erythrocytes, leukocytes, and platelets), is essential to stop bleeding, its timely removal by the fibrinolytic system is also needed to restore blood flow within the repaired blood vessel.2 Clot lysis, made by plasmin and other proteases, is accompanied by the generation of fibrin degradation products. Among the laboratory biomarkers of fibrinolysis, D-dimer is currently considered the gold standard, not only because of its high sensitivity, but also rapid results, widespread availability, and relatively low cost of the assays.3-5 Besides thromboembolic diseases, several physiological and pathological conditions (i.e., aging, pregnancy, cancer, inflammation, infection), not necessarily characterized by thrombus formation, have been associated with increased D-dimer.6
In this narrative review aimed at the hematologist, we first present a typical clinical case and describe the physiology and physiopathology of D-dimer formation. This is followed
by a summary of the main conditions associated with increased D-dimer and we propose an approach to their management, based on evidence in the literature and personal experiences. COVID-19-associated increased D-dimer levels will be not discussed here, since they have already been extensively addressed elsewhere.7-9 It is, however, undeniable that during the 3-year pandemic, an overuse of D-dimer testing was performed in many patients infected by (or recovering from) SARS-CoV-2 infection, thereby creating a generalized and often unjustified alarm among patients and medical teams.10 Accordingly, hematologists have frequently met cases of isolated increased D-dimer levels with no apparent thrombotic process, and have thus been called upon to make important decisions as to their management.
For this narrative review, we examined the medical literature for complete published studies on the management of patients with increased D-dimer. A literature search of the PubMed (through Medline) electronic database was carried out without time limits. Only studies published in English were considered. The Medical Subject Heading (MeSH) and keywords used were: “D-dimer”, “thrombosis”,
“venous thromboembolism”, “pulmonary embolism”, “deep vein thrombosis”, “cancer”, “management”, “treatment”, “inflammation”, “disseminated intravascular coagulation”, “trauma”, “surgery”, “infection”, “sepsis”, “pregnancy”, “joint arthroplasty”, “cardiovascular disease”, “acute aortic dissection”, and “coronary artery disease”. We also screened the reference lists of the most relevant articles for further studies not captured in the initial literature search.
In order to show that D-dimer testing is often misused (which can lead to inappropriate diagnosis and therapies), we present here a typical case involving a 76-year old woman referred to us three years after an unprovoked deep vein thrombosis (DVT) of the popliteal vein of the left leg. All the screenings for thrombophilia or para-neoplastic syndrome were negative. After six months of antithrombotic therapy with a direct oral anticoagulant (DOAC) and negative venous ultrasonography she started a risk stratification protocol measuring D-dimer twice: first, at the time of stopping anticoagulant therapy and then one month later. Since both results were negative (below the fixed cutoff value of 500 µg/L), it was decided to stop the anticoagulation therapy. After a few months, her general practitioner, prompted by non-specific complaints of a “swollen and heavy leg”, prescribed D-dimer testing. This showed increased levels (1,350 µg/L) so that the patient was instructed to resume anticoagulation with a DOAC. During the last two years, anticoagulation has been stopped and started again several times due to the patient’s concerns about a possible hemorrhage and the fluctuation of her D-dimer levels. Finally, the general practitioner referred the case to us. Medical history and physical examination revealed that in the last five years she had been suffering from severe coxarthrosis and gonarthrosis of the left leg. Surgery had been postponed and the patient made frequent use of anti-inflammatory drugs when pain was unbearable (the cause of her fear of a possible hemorrhage if she received anticoagulants). A recent venous ultrasonography was negative. Because we observed that D-dimer levels fluctuated according to the degree of pain and inflammation, she has been instructed not to resume the anticoagulant therapy, to stop random D-dimer measurement, and to refer to an orthopedic surgeon to tackle her joint problems.
Coagulation is the physiological process that leads to blood “solidification” through the conversion of soluble fibrinogen into insoluble fibrin through the enzymatic action of the thrombin, derived from conversion from its zymogen prothrombin. Once the coagulation mechanisms have
started, there is the secondary activation of fibrinolysis meant to prevent the uncontrolled propagation of fibrin formation and facilitate the repair of the lesion.1 However, to better understand D-dimer formation, we need to examine more deeply the molecular mechanisms underlying the physiological coagulation process. Circulating fibrinogen is made of three paired protein chains: A α , B b and g . When needed at the vascular injury site, thrombin cleaves fibrinopeptides A and B from fibrinogen to form fibrin monomers that polymerize in the frame of a non-enzymatic process. Finally, Factor XIII provides monomer stabilization through covalent binding involving the g chains, so that the insoluble fibrin net is ready to act as the main backbone of the coagulation process and related repair of the vascular lesion. Then the fibrinolytic process begins locally and converts insoluble fibrin to soluble products that can be cleared from the bloodstream by the liver. This process depends on the enzyme plasmin, derived from activation from its zymogen plasminogen that circulates in the blood and is localized inside the forming clot together with fibrinogen.1 The plasminogen to plasmin activation and its progressive action upon the fibrin net produces a number of soluble products among which there are the D-dimer fragments (Figure 1) which are present only if there is a stabilized fibrin net but are not formed with fibrinogen alone.11,12
The presence of D-dimer in the bloodstream is physiological, representing the continuous balance between coagulation and fibrinolysis. Only when D-dimer exceeds the cutoff value is it considered pathologic. Cutoff values, earlier considered fixed and universal, are now considered variable and age-dependent, perhaps reflecting the physiological changes of the homeostatic system with the increased prevalence with aging of inflammatory –coagulative – reparative processes. From the time of its formation, D-dimer begins to be detectable in blood within approximately two hours, with a half-life of approximately six hours. After surgery, D-dimer increases, peaking at about one week and then decreasing by 5-10% daily; it is detectable for at least one month.13-15
Numerous assays are commercially available for the laboratory measurement of D-dimer. Most of them rely on monoclonal antibodies and are typically enzyme-linked immunosorbent assays (ELISA). But other methods use microparticles covered with monoclonal antibodies that bind D-dimer and cause agglutination, detected and quantified by nephelometry or turbidometry. There are point of care (POC) assays that produce both qualitative and quantitative results, and provide faster results in emergency care settings. Quantitative ELISA have a high sensitivity (>95%) but a low specificity for VTE and thus are principally used for exclusion purposes. For this reason, establishing a cutoff value is very important; but these values differ greatly among the various assays used, perhaps due to the different specificity and epitope affinity of the

fibrin monomers by cleaving fibrinopeptides A and B.
fibrin polymers.
Factor XIII (activated by thrombin) into an insoluble cross-linked fibrin
to plasmin, which releases soluble D-dimers and other fragments,
products are cleared from the bloodstream by the liver.
different monoclonal antibodies. Thus, it is of paramount importance to use an assay method for which the cutoff value has been determined by association of the D-dimer results with the clinical and instrumental diagnostic findings of VTE.3-5 D-dimer results can be expressed in two different units: FEU (Fibrinogen Equivalent Units) that correlate the mass of the D-dimer to that of fibrinogen, or DDU (D-dimer Units) that relate to the mass of the D-dimer itself. It is important not to switch or confuse a result expressed in FEU with one expressed in DDU, because they differ by a factor of 1.75.5
As mentioned above, D-dimer is used to guide the diagnos-
tic procedure of VTE, which includes DVT and pulmonary embolism. However, while patients with pulmonary embolism or DVT in the acute phase usually have high D-dimer levels, individuals with high D-dimer do not necessarily have an underlying thromboembolic disease, but they may have several other pathological and non-pathological conditions (Table 1).
To begin, we provide a concise description of the D-dimer-based diagnostic workup of this thrombotic disorder. VTE affects nearly 10 million people every year worldwide, with an annual incidence of 1-2 cases per 1,000 population. It is the third most frequent cardiovascular disease.16,17 Although its incidence increases with age both in men and women, women have a higher risk of developing VTE at the young age of 20-40 years due to hormonal-related
factors (i.e., pregnancy or oral contraceptive use).16,17 Owing to the substantial global burden of VTE, suspected VTE requires a timely and preferably non-invasive diagnostic tool. In this context, thanks to the high sensitivity (almost 100%) of quantitative ELISA, D-dimer measurement plays a key role in the diagnostic workup. However, due to its low specificity (high negative and low positive predictive value), the test should only be used to exclude VTE.18-20 This means that a D-dimer negative result (i.e., <500 µg/L) categorizes patients as having a low to moderate clinical pre-test probability of VTE.
Several scores have been developed in order to assess the clinical probability of VTE. The most used are the Wells and Geneva scores.21,22 In addition, a simplified and validated version of the Geneva score has been developed to widen its adoption in clinical practice.23,24 The combination of negative D-dimer ELISA and low-intermediate pre-test clinical probability excludes DVT or pulmonary embolism in approximately 30% of the cases with suspected VTE with no need for imaging (i.e., venous ultrasonography for a suspected DVT and computed tomography [CT] pulmonary angiogram for a suspected pulmonary embolism).25
Conversely, D-dimer is not recommended in patients with a high clinical probability, because a normal result does not exclude VTE, even when a highly sensitive assay is used; these cases should directly undergo imaging without D-dimer testing (Figure 2).26 Notably, as D-dimer levels increase with age, an age-adjusted (age x 10 µg/L in patients aged >50 years) rather than a fixed cutoff (< 500 µg/L) is warranted to exclude VTE in patients with low or intermediate pre-test clinical probability.27 Although impaired renal function has been suggested to affect D-dimer levels in individuals suspected of having VTE,28 its influence seems to be less important than that of age.29
D-dimer testing in combination with a clinical pre-test probability assessment (YEARS criteria or revised GENEVA score) has also been used for the exclusion of pulmonary embolism in pregnant women with the aim of avoiding unnecessary imaging.30,31 In addition, D-dimer testing provides important information not only for the diagnosis of VTE, but also for the anticoagulant management of VTE. Current evidence indicates that a positive D-dimer after completion of three months of anticoagulant therapy in patients with a first unprovoked VTE is associated with a 2-fold higher risk of VTE recurrence than a negative test.4 Thus, following the demonstration of the strong association between D-dimer and VTE recurrence,32 D-dimer testing is often included in the prediction models designed to guide decisions for stopping anticoagulant therapy.33,34 On the other hand, persistently high D-dimer after stopping a 3-month anticoagulant treatment argues in favor of therapy prolongation in cases with unprovoked VTE.35
The role of D-dimer for the diagnosis of cerebral vein thrombosis (CVT) has been the object of research in the last 20 years. A systematic review and meta-analysis by
Table 1. Pathological and non-pathological conditions associated with high D-dimer levels.
Physiological
Aging
Pregnancy
Physical exercise
Pathological
Venous thromboembolism1
Cancer1
Disseminated intravascular coagulation1
Cardiovascular diseases (atrial fibrillation, coronary artery disease, acute aortic dissection1)
HELLP syndrome
Diabetes
Hemorrhages
Infections (peri-prosthetic hip and knee infections1)/sepsis
Inflammation
Cirrhosis
Renal disease
Trauma/surgery
1Conditions for which the usefulness of D-dimer testing is supported by clinical studies. HELLP: hemolysis, elevated liver enzymes, and low platelets.
Dentali and colleagues (14 studies including 1,134 patients) found high sensitivity and specificity for D-dimer (93.9% and 89.7%, respectively) in patients with suspected CVT. 36 Another meta-analysis performed by Alons et al. (8 studies including 636 patients) showed that D-dimer had a high negative predictive value for CVT in low-risk patients (defined as those with normal neurological examination, normal standard head CT scan, and absence of such risk factors as puerperium and pregnancy) with isolated headache.37 A recent prospective study proposed a new score that, combining clinical data with normal D-dimer (i.e., < 500 µ g/L), was very effective in predicting CVT, thus reducing unnecessary neuroimaging.38 Finally, the current view is that D-dimer testing should not be recommended as a first-line diagnostic tool for the diagnosis of venous thrombosis in unusual sites (upper limbs, retinal veins, abdominal veins).39
It has previously been pointed out that the detection of increased D-dimer does not necessarily imply the presence of an underlying disease because there are a number of physiological conditions that are accompanied by abnormal values (Table 1).40 D-dimer increases with age, thus leading to a greater proportion of older patients (> 50%) with values higher than the conventional cutoff of 500 µg/L.41 The lower specificity of D-dimer for VTE in older compared to younger people implies that the former are unlikely to have negative D-dimer results even when VTE is absent, with a related high rate of unnecessary use of imaging tests.42 For
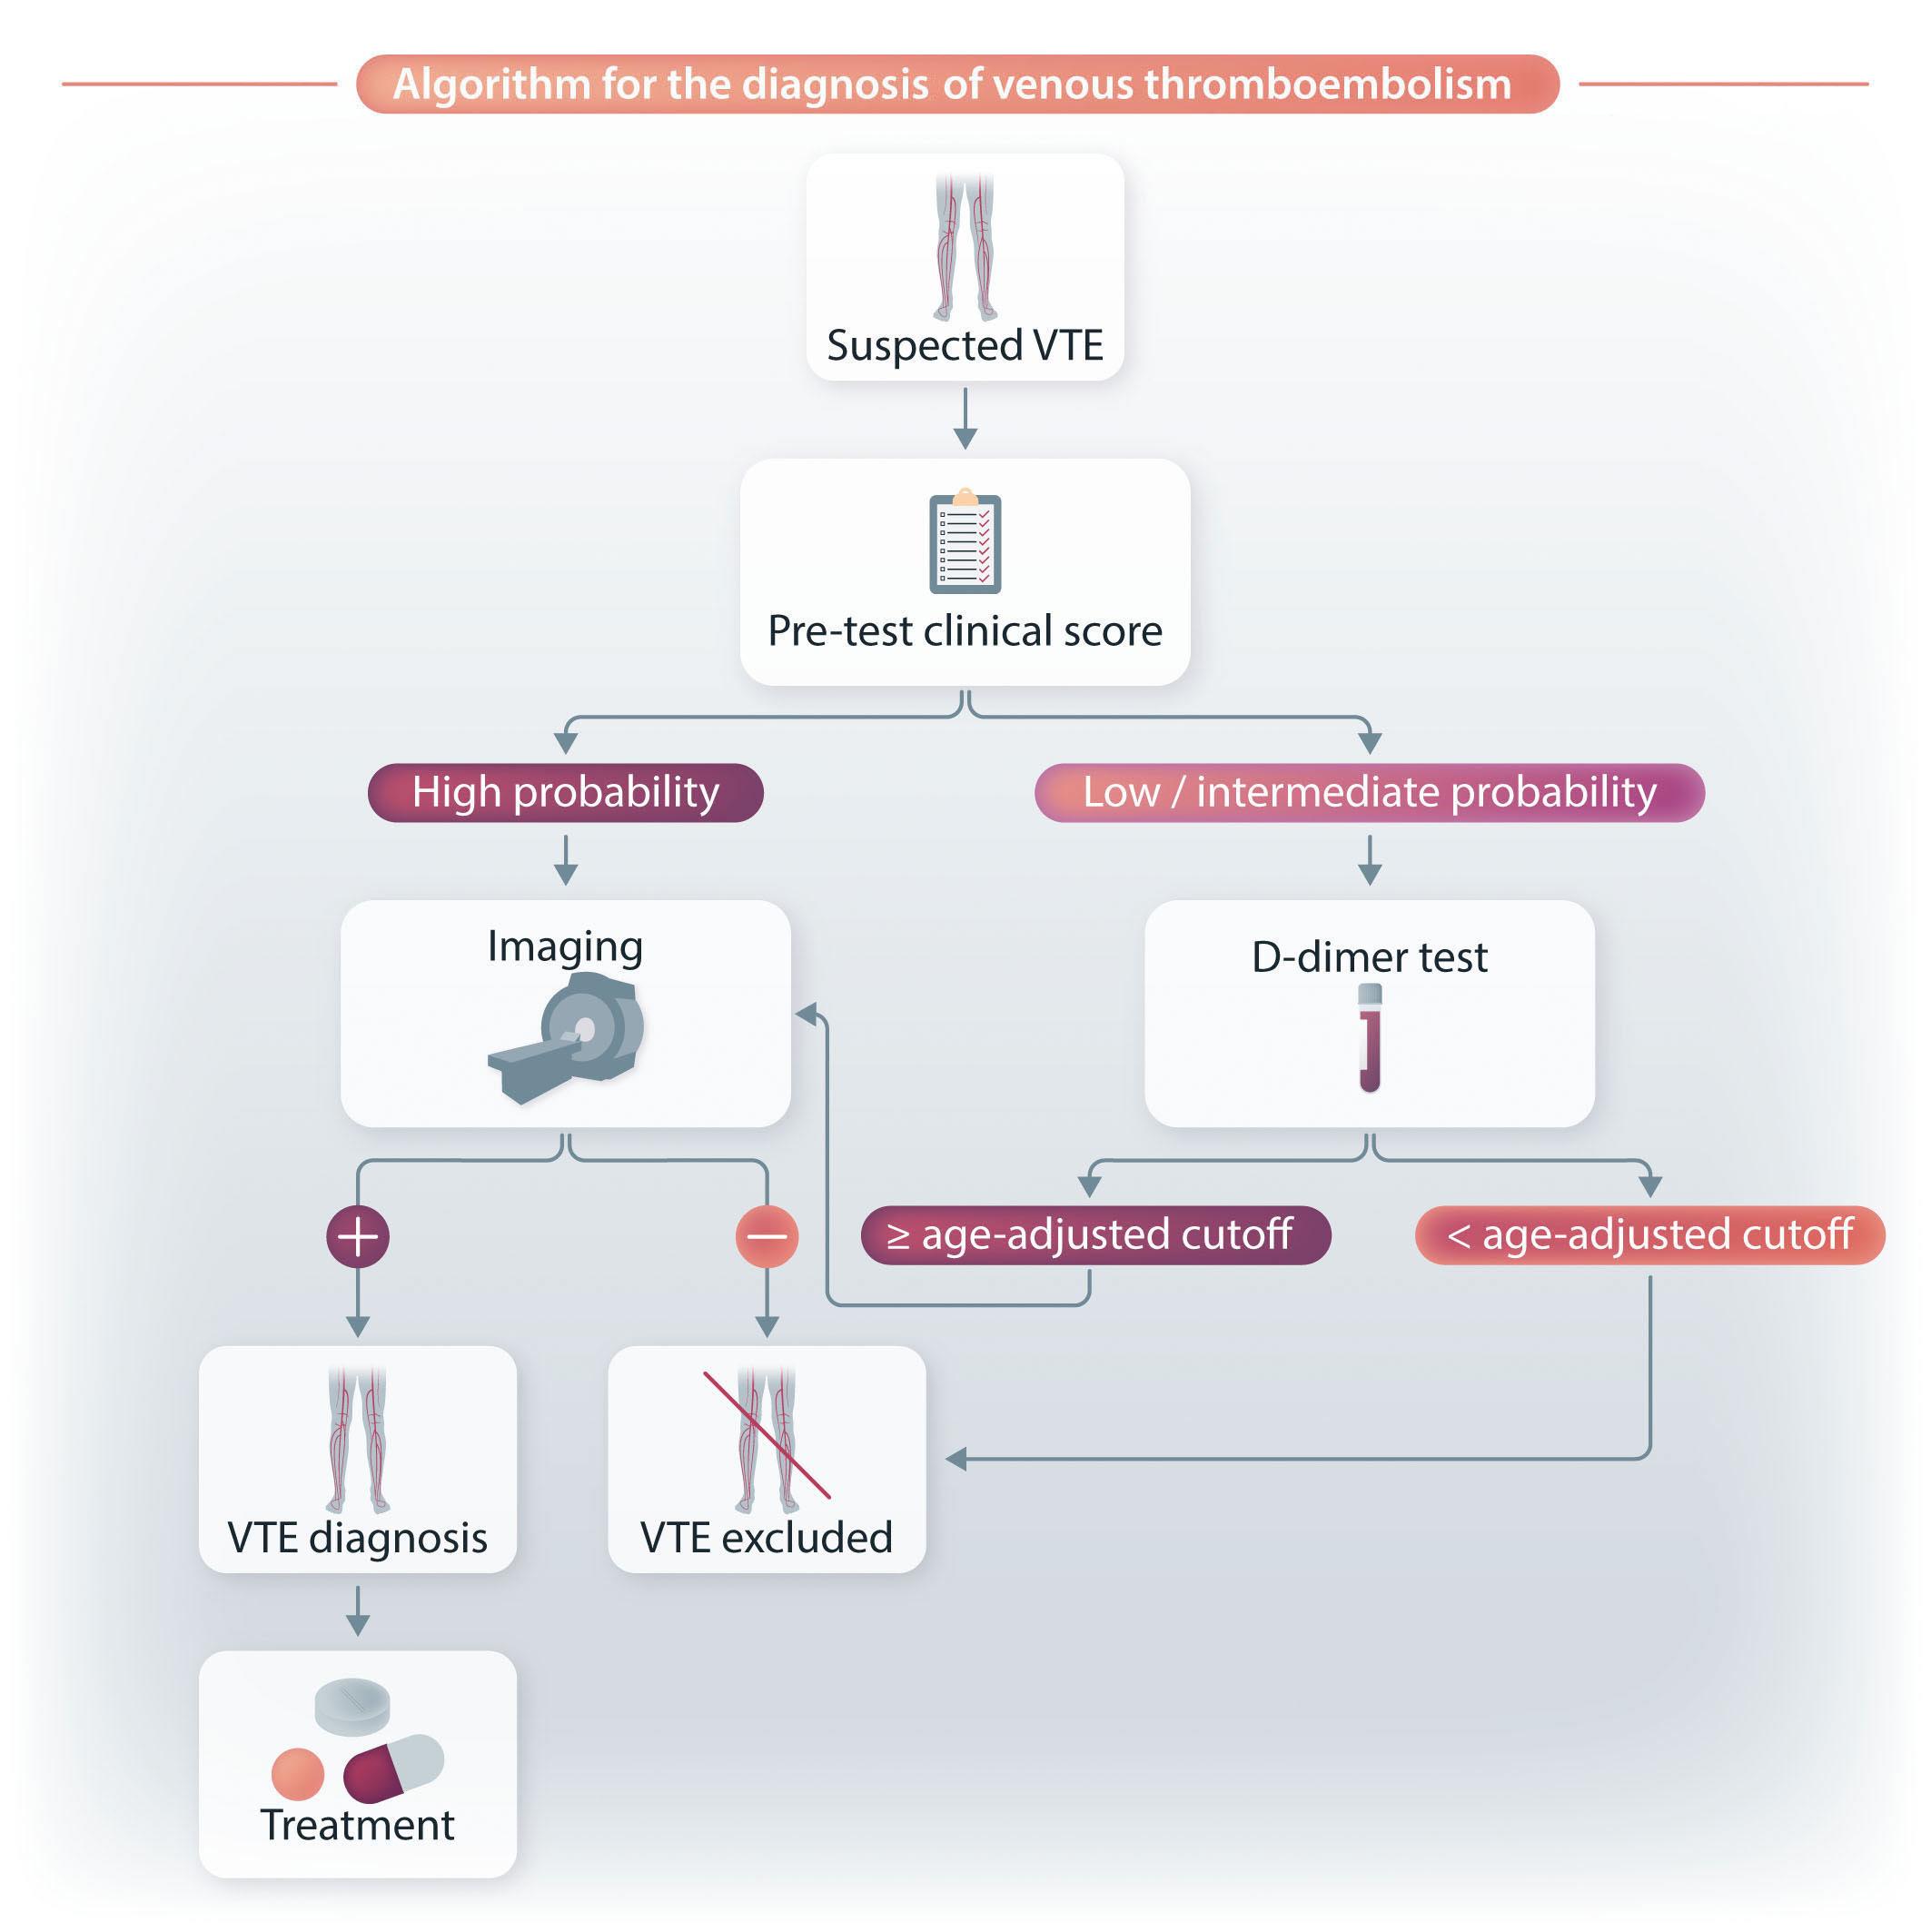
this reason, an age-adjusted cutoff has been validated and recommended in the diagnostic workup of VTE.43 However, in patients >80 years of age, the use of D-dimer measurement is not recommended for the exclusion of VTE, because high baseline levels lead to unacceptably high false positive results in cases with no VTE.44
Similarly, D-dimer levels increase physiologically during pregnancy and in the post-partum period.45,46 D-dimer levels are also higher in women taking oral contraceptives than in non-users, perhaps reflecting their hypercoagulable state.47
Exercise has effects on hemostasis that are dependent on the duration and intensity of the physical activity.48 D-dimer levels significantly increase following short-duration strenuous exercise,49 and exercise-induced fibrinolytic activity in healthy subjects is proportional to the amount of exercise taken.10 Changes in cardiac and hemostatic biomarkers (including D-dimer) after strenuous endurance exercise can mimic pulmonary embolism and myocardial injury in individuals who are not actually at risk.50
Disseminated intravascular coagulation
Disseminated intravascular coagulation (DIC) is a severe, often life-threatening, syndrome characterized by diffuse and persistent activation of the hemostatic system with intravascular thrombin generation, and fibrin formation and degradation.51 Early recognition of DIC is crucial to allow prompt treatment, the primary aim of which is to eliminate the underlying condition (i.e., sepsis, malignancy, trauma, obstetric diseases).48 D-dimer has become a cornerstone in the diagnosis of DIC because, thanks to its excellent negative predictive value, the use of D-dimer measurement in this context has been endorsed by all national and international guidelines.52 For example, the International Society of Thrombosis and Hemostasis (ISTH) not only validated a scoring system (including prothrombin time, platelet count, fibrinogen and D-dimer levels) for its diagnostic and prognostic value, but also recommended sequential D-dimer measurements to monitor DIC evolution, and to guide clinical and therapeutic management.53,54
The activation of coagulation is a common finding in malignant tumors, being associated with growth and progression.55 As a consequence, up to 20% of cancer patients develop VTE, which is the second leading cause of death.56 D-dimer is over-produced in the presence of active malignancy and levels are increased in a variety of tumors.57 However, the common finding of high D-dimer in cancer even in the absence of thrombosis limits the diagnostic usefulness of this test. Nevertheless, incorporating D-dimer measurement in appropriate scoring systems including other biomarkers may help to identify cancer patients at increased risk of developing VTE who are thus candidates for primary thromboprophylaxis.58-62 In addition, although the value of screening patients with increased D-dimer for occult cancer is still a subject of debate, an occult cancer may be considered as the potential source of a substantial rise in D-dimer levels when other physiological or pathological causes have been ruled out.48 The usefulness of this approach has been highlighted in a clinical study in patients with unprovoked VTE, demonstrating that extremely high D-dimer (>4,000 µg/L) is independently associated with the likelihood of an occult cancer.63
There is a close link between fibrinogen, thrombus formation, fibrinolysis and the inflammatory process.10 Fibrinogen, an acute phase reactant, leaks out of the vasculature contributing to the inflammatory process.64 The involvement of clotting factors (i.e., FVIII and others) helps to form fibrin in the extravascular space, which functions as a scaffold for the inflammatory cells of the immune system to exert their functions.64 As a result of fibrin formation, secondary fibrinolysis occurs and this generates D-dimer, with levels paralleling the degree of inflammation.65 Several diseases are characterized by low-grade chronic inflammation and thus high D-dimer; the most common are autoimmune diseases and diabetes. Although D-dimer is considered a marker of inflammation (the so call “D-dimeritis”), high values do not necessarily imply the presence of an increased thrombotic risk10 because D-dimer increases exponentially in parallel with C-reactive protein.66
Inflammation also provides the molecular basis to explain the detection of high D-dimer during infections. The best example is sepsis, a life-threatening systemic infection-related condition associated with defects in hemostasis and, as mentioned above, with DIC.67 Marked elevations of D-dimer have been observed in sepsis, demonstrating the prognostic importance of D-dimer in relation to the severity of the patient’s condition.68,69 Besides SARS-CoV-2 infection, several viral infections (i.e., Ebola virus, influenza A virus, human immunodeficiency virus [HIV], hepatitis C virus, Coxsackievirus, herpes simplex virus and parvovirus B19) are characterized by a marked rise in plasma levels of hypercoagulability markers, such as D-dimer and thrombin-antithrombin complex.70 The endothelial dysfunction and the inflammatory state associated with infections
drive patients towards a hypercoagulable condition, that translates into an increased thromboembolic and cardiovascular risk.66 This is particularly evident in HIV-infected patients.71 In addition to chronic, low-grade inflammation (an important mechanism for their enhanced risk of cardiovascular disease), people living with HIV have increased D-dimer that correlate with VTE and mortality risks.72 The role of D-dimer in the diagnosis of peri-prosthetic infections merits special mention.73,74 A systematic review and meta-analysis based on 12 studies including a total of 1,818 patients concluded that D-dimer has sufficient diagnostic accuracy to exclude peri-prosthetic joint infection.75 In addition, the updated 2018 Musculoskeletal Infection Society criteria validated a score for the diagnosis of peri-prosthetic hip and knee infections which included D-dimer levels >860 µg/L.76
Several other disorders have been associated with abnormal D-dimer.77 Among cardiovascular diseases, atrial fibrillation is accompanied by high D-dimer levels, which decrease during anticoagulant treatment or after successful cardioversion.78,79 Because D-dimer is higher in atrial fibrillation patients with such additional risk factors for stroke as hypertension, diabetes or heart failure, its measurement has been proposed as a biomarker for predicting the risk of stroke.80 Notably, a recent study demonstrated the efficacy of an age-adjusted D-dimer cutoff to exclude the presence of left atrial thrombi in patients with atrial fibrillation.81 However, predictive value is less powerful than that of other biomarkers (i.e., troponin, N-terminal pro-B-type natriuretic peptide), which are preferentially incorporated into the available risk prediction models.82 Prospective studies have also evaluated the utility of D-dimer measurement to predict other cardiovascular adverse events (i.e., myocardial infarction and cardiovascular death), but with conflicting results.77 Likewise, in patients with pre-existing coronary artery disease, D-dimer is of uncertain value for the prediction of incident cardiovascular events.82 A separate mention should be made of acute aortic dissection, an extremely severe condition for which a rapid diagnosis is essential. As D-dimer levels are high in the presence of acute aortic dissection and low in its absence, a normal D-dimer helps to exclude this diagnosis.83 The diagnostic value of this measurement was recently assessed by a systematic review and meta-analysis including 16 clinical studies and 1,135 patients. This concluded that a D-dimer <500 µg/L had excellent exclusion diagnostic sensitivity (96%), thus playing a crucial role in the differential diagnosis of acute aortic dissection.84
The role of D-dimer for the diagnosis of acute intestinal ischemia has also been acknowledged in the literature.85 A systematic review and meta-analysis including 12 studies with 1,300 patients calculated a sensitivity of 94%, suggesting a potential diagnostic role for this biomarker.86
Beside these thrombotic or pre-thrombotic conditions, the clinical usefulness of D-dimer has also been studied in hemorrhagic conditions, including intracerebral and subarachnoid hemorrhages. A retrospective study of 1,332 consecutive cases with spontaneous intracerebral hemorrhage found that high D-dimer (>550 µg/L) was an independent predictor of poor functional outcome and mortality.87 Similar results were obtained by a retrospective study of 2,056 patients with aneurysmal subarachnoid hemorrhage.88 High D-dimer have also been reported in HELLP (hemolysis, elevated liver enzymes, low platelets) syndrome, a rare complication of pregnancy considered a variant of pre-eclampsia.48 This biomarker has, therefore, been proposed for the early identification of patients with pre-eclampsia at risk of developing a severe HELLP syndrome, although its clinical utility is questionable due to increased D-dimer during physiological pregnancy (see above). D-dimer is also increased in liver cirrhosis, and since it has been positively associated with the severity of liver dysfunction and the presence of portal vein thrombosis, it has been proposed as a predictor of adverse outcomes in these patients.89 Finally, inflammation-related increased D-dimer levels have been reported in other conditions, including pancreatitis and diabetes.5 For example, the marker has been recently proposed for cardiovascular risk stratification in patients with type 2 diabetes.90
While there is little doubt of the role of D-dimer in the diagnostic workup of patients affected by acute illnesses such as VTE, DIC and sepsis (Table 1), a challenge is represented by the management of ambulatory individuals characterized by the detection of high D-dimer levels but no evidence of thrombosis. This issue has received greater attention given the generalized and indiscriminate dispensation of D-dimer testing during and following the COVID-19 pandemic. When an ostensibly healthy and asymptomatic person is referred for persistently high D-dimer, they should first be reassured by explaining all the possible reasons other than disease that may underly this abnormality. On the other hand, an abnormal D-dimer should not be overlooked in otherwise asymptomatic subjects. Thus, they should have access to differential diagnostic procedures, and all possible conditions associated with increased D-dimer should be taken into consideration in the process.
Figure 3 shows a flow chart with a summary of the evaluation processes to be carried out by hematologists in ambulatory cases with increased D-dimer levels following age adjustment. This flow-chart is based mostly on our
personal experience rather than on the scarse data available in the literature. First, and most importantly, physical examination is crucial for excluding the presence of signs and/or symptoms related to VTE. It is also essential to rule out not only current symptoms, but also those that arose in the previous few days. For example, we recently observed an asymptomatic patient with increased D-dimer who reported that in the previous few days he had had some respiratory symptoms that had gradually disappeared. A precautionary CT pulmonary angiogram was performed and a pulmonary embolism was diagnosed.
In cases with clinical signs/symptoms potentially suggestive of VTE, we suggest performing a leg venous ultrasonography for the detection of occult DVT, plus, when pulmonary embolism is suspected, a CT angiogram (see the flow chart in Figure 3). If negative, the individual should then undergo blood screening to identify conditions possibly associated with increased D-dimer. Again, it is essential to check the individual’s case history and carry out a physical examination to restrict the range of blood tests to be performed. The individual should also be asked about the presence of autoimmune or rheumatic disorders, diabetes, chronic inflammatory disorders, renal disease, active or previous cancer, chronic infection, liver disease, and cardiovascular disorders. All physiological causes of high D-dimer (ongoing or recent pregnancies, strenuous physical exercise) should also be ruled out. Blood tests should, therefore, be focused on those able to confirm or diagnose an underlying disorder. In case of identification of a pathological condition, the patient should be referred to the specialist for the most appropriate care. In addition to physical examination, we suggest performing an abdominal ultrasound in order to exclude aortic dissection. If no underlying condition is identified, the individual should be reassured about their health status and a clinical follow-up set in place.
D-dimer testing is unequivocally a useful tool for the diagnosis of VTE. However, owing to its intrinsic poor positive predictive value, D-dimer is not specific for thromboembolic disease because increased levels are also observed in many other conditions, ranging from DIC to infections and malignant neoplasms. In other words, increased D-dimer levels may be encountered as part of an inflammatory state or cancer without being the sign of intravascular thrombus formation. Thus, while D-dimer measurement must be incorporated in multi-test algorithms for the evaluation of patients with suspected VTE, this measurement has limited clinical utility in unselected ambulatory cases and should, therefore, only be performed in specified clinical situations. However, the detection of increased D-dimer cannot be ignored and warrants a series of diagnostic procedures aimed at the proper management of these

cases. This means, on the one hand, the exclusion of any associated thromboembolic complication and, on the other hand, the identification or exclusion of conditions associated with increased D-dimer. When the latter remains the only abnormality, individuals should be reassured about their health status and encouraged to avoid the repeated, obsessive measurement of D-dimer.
1. Lippi G, Favaloro EJ. Laboratory hemostasis: from biology to the bench. Clin Chem Lab Med. 2018;56(7):1035-1045.
2. Franchini M, Mannucci PM. Primary hyperfibrinolysis: facts and fancies. Thromb Res. 2018;166:71-75.
3. Riley RS, Gilbert AR, Dalton JB, Pai S, McPherson RA. Widely used types and clinical applications of D-dimer assay. Lab Med. 2016;47(2):90-102.
4 Linkins LA , Takach Lapner S. Review of D-dimer testing: good, bad, and ugly. Int J Lab Hematol. 2017;39(Suppl 1):98-103.
5. Johnson ED, Schell JC, Rodgers GM. The D-dimer assay. Am J Hematol. 2019;94(7):833-839.
PMM has received honoraria from Roche, Takeda, and Werfen for lectures at educational symposia. MF, MPP and DF have no conflicts of interest to disclose.
All the authors wrote, read and approved the manuscript.
6. Lippi G, Mullier F, Favaloro EJ. D-dimer: old dogmas, new (COVID-19) tricks. Clin Chem Lab Med. 2022;61(5):841-850.
7 Semiz S. COVID19 biomarkers: what did we learn from systematic reviews? Front Cell Infect Microbiol. 2022;12:1038908.
8. Iba T, Levy JH, Levi M, Thachil J. Coagulopathy in COVID-19. J Thromb Haemost. 2020;18(9):2103-2109.
9 Franchini M, Marano G, Cruciani M, et al. COVID-19-associated coagulopathy. Diagnosis (Berl). 2020;7(4):357-363.
10. Thachil J, Favaloro EJ, Lippi G. D-dimers-”normal” levels versus elevated levels due to a range of conditions, including
“D-dimeritis”, inflammation, thromboembolism, disseminated intravascular coagulation, and COVID-19. Semin Thromb Hemost. 2022;48(6):672-679.
11. Doolittle RE. Structural aspects of the fibrinogen to fibrin conversion. Adv Protein Chem. 1973;27:1-109.
12. McKee PA, Rogers LA, Marler E, et al. The subunit polypeptides of human fibrinogen. Arch Biochem Biophys. 1966;116(1):271.
13. Mager JJ, Schutgens RE, Haas FJ, et al. The early course of D-dimer concentration following pulmonary artery embolisation, Thromb Haemost. 2001;86(6):1578-1579.
14. Chandler WL, Velan T. Plasmin generation and D-dimer formation during cardiopulmonary bypass. Blood Coagul Fibrinolysis. 2004;15(7):583-591.
15. Dindo D, Breitenstein S, Hahnloser D, et al. Kinetics of D-dimer after general surgery. Blood Coagul Fibrinolysis. 2009;20(5):347-352.
16. Khan F, Tritschler T, Kahn SR, Rodger MA. Venous thromboembolism. Lancet. 2021;398(10294):64-77.
17 Freund Y, Cohen-Aubart F, Bloom B. Acute pulmonary embolism. JAMA. 2022;328(13):1336-1345.
18. Di Nisio M, Squizzato A, Rutjes AW, Büller HR, Zwinderman AH, Bossuyt PM. Diagnostic accuracy of D-dimer test for exclusion of venous thromboembolism: a systematic review. J Thromb Haemost. 2007;5(2):296-304.
19 Konstantinides SV, Meyer G, Becattini C, et al. ESC Scientific Document Group. 2019 ESC Guidelines for the diagnosis and management of acute pulmonary embolism developed in collaboration with the European Respiratory Society (ERS). Eur Heart J. 2020;41(4):543-603.
20. Crawford F, Andras A, Welch K, Sheares K, Keeling D, Chappell FM. D-dimer test for excluding the diagnosis of pulmonary embolism. Cochrane Database Syst Rev. 2016;2016(8):CD010864.
21. Wells PS, Anderson DR, Rodger M, et al. Evaluation of D-dimer in the diagnosis of suspected deep-vein thrombosis. N Engl J Med. 2003;349(13):1227-1235.
22. Le Gal G, Righini M, Roy PM, et al. Prediction of pulmonary embolism in the emergency department: the revised Geneva score. Ann Intern Med. 2006;144(3):165-171.
23. Wells PS, Anderson DR, Rodger M, et al. Derivation of a simple clinical model to categorize patients probability of pulmonary embolism: increasing the models utility with the SimpliRED D-dimer. Thromb Haemost. 2000;83(3):416-420.
24. Klok FA, Mos IC, Nijkeuter M, et al. Simplification of the revised Geneva score for assessing clinical probability of pulmonary embolism. Arch Intern Med. 2008;168(19):2131-2136.
25. Wells PS, Anderson DR, Rodger M, et al. Excluding pulmonary embolism at the bedside without diagnostic imaging: management of patients with suspected pulmonary embolism presenting to the emergency department by using a simple clinical model and D-dimer. Ann Intern Med. 2001;135(2):98-107.
26. Duffett L, Castellucci LA, Forgie MA. Pulmonary embolism: update on management and controversies. BMJ. 2020;370:m2177.
27. Righini M, Van Es J, Den Exter PL, et al. Age-adjusted D-dimer cutoff levels to rule out pulmonary embolism: the ADJUST-PE study. JAMA. 2014;311(11):1117-1124.
28. Robert-Ebadi H, Bertoletti L, Combescure C, Le Gal G, Bounameaux H, Righini M. Effects of impaired renal function on levels and performance of D-dimer in patients with
suspected pulmonary embolism. Thromb Haemost. 2014;112(3):614-620.
29 Ten Cate V, Nagler M, Panova-Noeva M, et al. The diagnostic performance of renal function-adjusted testing in individuals suspected of having venous thromboembolism. Haematologica. 2019;104(9):e424-e427.
30 Righini M, Robert-Ebadi H, Elias A, et al. CT-PE-Pregnancy Group. Diagnosis of pulmonary embolism during pregnancy: a multicenter prospective management outcome study. Ann Intern Med. 2018;169(11):766-773.
31. van der Pol LM, Tromeur C, Bistervels IM, et al. Artemis Study Investigators. Pregnancy-adapted YEARS algorithm for diagnosis of suspected pulmonary embolism. N Engl J Med. 2019;380(12):1139-1149.
32. Legnani C, Palareti G, Cosmi B, Cini M, Tosetto A, Tripodi A. Different cut-off values of quantitative D-dimer methods to predict the risk of venous thromboembolism recurrence: a post-hoc analysis of the PROLONG study. Haematologica. 2008;93(6):900-907.
33. Rodger MA, Le Gal G, Langlois NJ, et al. REVERSE II investigators. “HERDOO2” clinical decision rule to guide duration of anticoagulation in women with unprovoked venous thromboembolism. Can I use any D-dimer? Thromb Res. 2018;169:82-86.
34 Eichinger S, Heinze G, Kyrle PA. D-dimer levels over time and the risk of recurrent venous thromboembolism: an update of the Vienna prediction model. J Am Heart Assoc. 2014;3(1):e000467.
35. Stevens SM, Woller SC, Kreuziger LB, et al. Antithrombotic therapy for VTE disease: second update of the CHEST Guideline and Expert Panel Report. Chest. 2021;160(6):e545-e608.
36. Dentali F, Squizzato A, Marchesi C, Bonzini M, Ferro JM, Ageno W. D-dimer testing in the diagnosis of cerebral vein thrombosis: a systematic review and a meta-analysis of the literature. J Thromb Haemost. 2012;10(4):582-589.
37. Alons IM, Jellema K, Wermer MJ, et al. D-dimer for the exclusion of cerebral venous thrombosis: a meta-analysis of low risk patients with isolated headache. BMC Neurol. 2015;15:118.
38. Heldner MR, Zuurbier SM, Li B, et al. Prediction of cerebral venous thrombosis with a new clinical score and D-dimer levels. Neurology. 2020;95(7):e898-e909.
39 Ordieres-Ortega L, Demelo-Rodríguez P, Galeano-Valle F, Kremers BMM, ten Cate-Hoek AJ, ten Cate H. Predictive value of D-dimer testing for the diagnosis of venous thrombosis in unusual locations: a systematic review. Thromb Res. 2020;189:5-12.
40 Favresse J, Lippi G, Roy PM, et al. D-dimer: preanalytical, analytical, postanalytical variables, and clinical applications. Crit Rev Clin Lab Sci. 2018;55(8):548-577.
41. Haase C, Joergensen M, Ellervik C, Joergensen MK, Bathum L. Age- and sex-dependent reference intervals for D-dimer: evidence for a marked increase by age. Thromb Res. 2013;132(6):676-680.
42. Schouten HJ, Geersing GJ, Koek HL, et al. Diagnostic accuracy of conventional or age adjusted D-dimer cut-off values in older patients with suspected venous thromboembolism: systematic review and meta-analysis. BMJ. 2013;346:f2492.
43. De Pooter N, Brionne-François M, Smahi M, Abecassis L, Toulon P. Age-adjusted D-dimer cut-off levels to rule out venous thromboembolism in patients with non-high pre-test probability: clinical performance and cost-effectiveness
analysis. J Thromb Haemost. 2021;19(5):1271-1282.
44 Olson JD. D-dimer: an overview of hemostasis and fibrinolysis, assays, and clinical applications. Adv Clin Chem. 2015;69:1-46.
45. Eichinger S. D-dimer testing in pregnancy. Pathophysiol Haemost Thromb. 2003;33(5-6):327-329.
46. Chabloz P, Reber G, Boehlen F, Hohlfeld P, de Moerloose P. TAFI antigen and D-dimer levels during normal pregnancy and at delivery. Br J Haematol. 2001;115(1):150-152.
47. Tekle E, Gelaw Y, Asrie F. Hematological profile changes among oral contraceptive users: a narrative review. J Blood Med. 2022;13:525-536.
48. Lippi G, Franchini M, Targher G, Favaloro EJ. Help me, Doctor! My D-dimer is raised. Ann Med. 2008;40(8):594-605.
49. Zadow EK, Kitic CM, Wu SSX, Fell JW, Adams MJ. Time of day and short-duration high-intensity exercise influences on coagulation and fibrinolysis. Eur J Sport Sci. 2018;18(3):367-375.
50 Sedaghat-Hamedani F, Kayvanpour E, Frankenstein L, et al. Biomarker changes after strenuous exercise can mimic pulmonary embolism and cardiac injury-a meta-analysis of 45 studies. Clin Chem. 2015;61(10):1246-1255.
51. Favaloro EJ. Laboratory testing in disseminated intravascular coagulation. Semin Thromb Hemost. 2010;36(4):458-467.
52. Wada H, Matsumoto T, Yamashita Y. Diagnosis and treatment of disseminated intravascular coagulation (DIC) according to four DIC guidelines. J Intensive Care. 2014;2(1):15.
53. Toh CH, Hoots WK. SSC on disseminated intravascular coagulation of the ISTH. The scoring system of the Scientific and Standardisation Committee on Disseminated Intravascular Coagulation of the International Society on Thrombosis and Haemostasis: a 5-year overview. J Thromb Haemost. 2007;5(3):604-606.
54. Suzuki K, Wada H, Imai H, et al. Subcommittee on Disseminated Intravascular Coagulation. A re-evaluation of the D-dimer cut-off value for making a diagnosis according to the ISTH overt-DIC diagnostic criteria: communication from the SSC of the ISTH. J Thromb Haemost. 2018;16(7):1442-1444.
55. Franchini M, Montagnana M, Targher G, Manzato F, Lippi G. Pathogenesis, clinical and laboratory aspects of thrombosis in cancer. J Thromb Thrombolysis. 2007;24(1):29-38.
56. Khorana AA, Francis CW, Culakova E, Kuderer NM, Lyman GH. Thromboembolism is a leading cause of death in cancer patients receiving outpatient chemotherapy. J Thromb Haemost. 2007;5(3):632-634.
57 Ma M, Cao R, Wang W, et al. The D-dimer level predicts the prognosis in patients with lung cancer: a systematic review and meta-analysis. J Cardiothorac Surg. 2021;16(1):243.
58. Ay C, Dunkler D, Marosi C, et al. Prediction of venous thromboembolism in cancer patients. Blood. 2010;116(24):5377-5382.
59. Pabinger I, van Es N, Heinze G, et al. A clinical prediction model for cancer-associated venous thromboembolism: a development and validation study in two independent prospective cohorts. Lancet Haematol. 2018;5(7):e289-e298.
60 Kumar V, Shaw JR, Key NS, et al. D-Dimer enhances risktargeted thromboprophylaxis in ambulatory patients with cancer. Oncologist. 2020;25(12):1075-1083.
61. Falanga A, Ay C, Di Nisio M, et al; ESMO Guidelines Committee. Venous thromboembolism in cancer patients: ESMO Clinical Practice Guideline. Ann Oncol. 2023;34(5):452-467.
62. Verzeroli C, Giaccherini C, Russo L, et al. HYPERCAN
Investigators. Utility of the Khorana and the new-Vienna CATS prediction scores in cancer patients of the HYPERCAN cohort. J Thromb Haemost. 2023;21(7):1869-1881.
63. Han D, Hartaigh B, Lee JH, et al. Impact of D-Dimer for prediction of incident occult cancer in patients with unprovoked venous thromboembolism. PLoS One. 2016;11(4):e0153514.
64 Clemmensen I, Andersen RB. The fibrinolytic system and its relation to inflammatory diseases. Semin Arthritis Rheum. 1982;11(4):390-398.
65. Shorr AF, Thomas SJ, Alkins SA, Fitzpatrick TM, Ling GS. D-dimer correlates with proinflammatory cytokine levels and outcomes in critically ill patients. Chest. 2002;121(4):1262-1268.
66. Steeghs N, Goekoop RJ, Niessen RW, Jonkers GJ, Dik H, Huisman MV. C-reactive protein and D-dimer with clinical probability score in the exclusion of pulmonary embolism. Br J Haematol. 2005;130(4):614-619.
67. Prucha M, Bellingan G, Zazula R. Sepsis biomarkers. Clin Chim Acta. 2015;440:97-103.
68. Kinasewitz GT, Yan SB, Basson B, et al. Universal changes in biomarkers of coagulation and inflammation occur in patients with severe sepsis, regardless of causative micro-organism. Crit Care. 2004;8(2):R82-90.
69 Iba T, Gando S, Murata A, et al. Predicting the severity of systemic inflammatory response syndrome (SIRS)-associated coagulopathy with hemostatic molecular markers and vascular endothelial injury markers. J Trauma. 2007;63(5):1093-1098.
70. Subramaniam S, Scharrer I. Procoagulant activity during viral infections. Front Biosci (Landmark Ed). 2018;23(6):1060-1081.
71. Vos AG, Idris NS, Barth RE, Klipstein-Grobusch K, Grobbee DE. Pro-inflammatory markers in relation to cardiovascular disease in HIV infection. A systematic review. PLoS One. 2016;11(1):e0147484.
72. Perkins MV, Joseph SB, Dittmer DP, Mackman N. Cardiovascular disease and thrombosis in HIV infection. Arterioscler Thromb Vasc Biol. 2023;43(2):175-191.
73. Wang R, Zhang H, Ding P, Jiao Q. The accuracy of D-dimer in the diagnosis of periprosthetic infections: a systematic review and meta-analysis. J Orthop Surg Res. 2022;17(1):99.
74. Cutter B, Lum ZC, Giordani M, Meehan JP. Utility of D-dimer in total joint arthroplasty. World J Orthop. 2023;14(3):90-102.
75. Balato G, De Franco C, Balboni F, et al The role of D-dimer in periprosthetic joint infection: a systematic review and metaanalysis. Diagnosis (Berl). 2021;9(1):3-10.
76. Parvizi J, Tan TL, Goswami K, et al. The 2018 definition of periprosthetic hip and knee infection: an evidence-based and validated criteria. J Arthroplasty. 2018;33(5):1309-1314.e2.
77 Weitz JI, Fredenburgh JC, Eikelboom JW. A test in context: D-dimer. J Am Coll Cardiol. 2017;70(19):2411-2420.
78. Hijazi Z, Oldgren J, Siegbahn A, Wallentin L. Application of biomarkers for risk stratification in patients with atrial fibrillation. Clin Chem. 2017;63(1):152-164.
79 Pezzo MP, Tufano A, Franchini M. Role of new potential biomarkers in the risk of thromboembolism in atrial fibrillation. J Clin Med. 2022;11(4):915.
80 Danese E, Montagnana M, Cervellin G, Lippi G. Hypercoagulability, D-dimer and atrial fibrillation: an overview of biological and clinical evidence. Ann Med. 2014;46(6):364-371.
81. Almorad A, Ohanyan A, Pintea Bentea G, et al. D-dimer blood concentrations to exclude left atrial thrombus in patients
REVIEW ARTICLE - High D-dimer management
with atrial fibrillation. Heart. 2021;107(3):195-200.
82. Danesh J, Whincup P, Walker M, et al. Fibrin D-dimer and coronary heart disease: prospective study and meta-analysis. Circulation. 2001;103(19):2323-2327.
83. Cui JS, Jing ZP, Zhuang SJ, et al. D-dimer as a biomarker for acute aortic dissection: a systematic review and metaanalysis. Medicine (Baltimore). 2015;94(4):e471.
84 Yao J, Bai T, Yang B, Sun L. The diagnostic value of D-dimer in acute aortic dissection: a meta-analysis. J Cardiothorac Surg. 2021;16(1):343.
85. Derikx JP, Schellekens DH, Acosta S. Serological markers for human intestinal ischemia: a systematic review. Best Pract Res Clin Gastroenterol. 2017;31(1):69-74.
86. Sun DL, Li SM, Cen YY, et al. Accuracy of using serum D-dimer
for diagnosis of acute intestinal ischemia: a meta-analysis. Medicine (Baltimore). 2017;96(13):e6380.
87. Zhou Q, Zhang D, Chen X, et al. Plasma D-dimer predicts poor outcome and mortality after spontaneous intracerebral hemorrhage. Brain Behav. 2021;11(1):462-468.
88. Fang F, Wang P, Yao W, et al. Association between D-dimer levels and long-term mortality in patients with aneurysmal subarachnoid hemorrhage. Neurosurg Focus. 2022;52(3):E8.
89. Li Y, Qi X, Li H, et al. D-dimer level for predicting the inhospital mortality in liver cirrhosis: a retrospective study. Exp Ther Med. 2017;13(1):285-289.
90. Cheng L, Fu Q, Zhou L, et al. D-dimer as a predictor of cardiovascular outcomes in patients with diabetes mellitus. BMC Cardiovasc Disord. 2022;22(1):82.
Andrew Hantel,1,2,3 Marlise R. Luskin,3 Irum Khan,4 Elizabeth Warner,2 Anand A. Patel,5 Thomas P. Walsh,1 Daniel J. DeAngelo,3 Christopher S. Lathan1,6 and Gregory A. Abel1,2,3
1Division of Population Sciences, Dana-Farber Cancer Institute, Boston, MA; 2Center for Bioethics, Harvard Medical School, Boston, MA; 3Division of Hematologic Malignancies, Dana-Farber Cancer Institute, Boston, MA; 4Division of Hematology/Oncology, Department of Medicine, Robert H. Lurie Comprehensive Cancer Center, Northwestern University, Chicago, IL; 5Section of Hematology-Oncology, Department of Medicine, The University of Chicago, Chicago, IL and 6Lowe Center for Thoracic Oncology, Dana-Farber Cancer Institute, Boston, MA, USA
Correspondence: A. Hantel
andrew_hantel@dfci.harvard.edu
Received: June 13, 2023.
Accepted: August 4, 2023.
Early view: August 10, 2023.
https://doi.org/10.3324/haematol.2023.283723
©2024 Ferrata Storti Foundation
Published under a CC BY-NC license
Clinical trial eligibility criteria can unfairly exclude patients or unnecessarily expose them to known risks if criteria are not concordant with drug safety. There are few data evaluating the extent to which acute leukemia eligibility criteria are justified. We analyzed criteria and drug safety data for front-line phase II and/or III acute leukemia trials with start dates 1/1/2010-12/31/2019 registered on clinicaltrials.gov. Multivariable analyses assessed concordance between criteria use and safety data (presence of criteria with a safety signal, or absence of criteria without a signal), and differences between criteria and safety-based limits. Of 250 eligible trials, concordant use of ejection fraction criteria was seen in 34.8%, corrected QT level (QTc) in 22.4%, bilirubin in 68.4%, aspartate transaminase/alanine aminotransferase (AST/ALT) in 58.8%, renal function in 68.4%, human immunodeficiency virus (HIV) in 54.8%, and hepatitis B and C in 42.0% and 41.2%. HIV and hepatitis B and C criteria use was concordant with safety data (adjusted Odds Ratios 2.04 [95%CI: 1.13, 3.66], 2.64 [95%CI: 1.38, 5.04], 2.27 [95%CI: 1.20, 4.32]) but organ function criteria were not (all P>0.05); phase III trials were not more concordant. Bilirubin criteria limits were the same as safety-based limits in 16.0% of trials, AST/ALT in 18.1%, and renal function in 13.9%; in 75.7%, 51.4%, and 56.5% of trials, criteria were more restrictive, respectively, by median differences of 0.2, 0.5, and 0.5 times the upper limits of normal. We found limited drug safety justifications for acute leukemia eligibility criteria. These data define criteria use and limits that can be rationally modified to increase patient inclusion and welfare.
Clinical research is ethical when there is fair subject selection and a favorable risk-benefit ratio.1 Recent analyses of solid tumor clinical trials found that eligibility criteria can disproportionately exclude potential participants from historically marginalized groups.2,3 Unless there is a safety-based justification for these criteria, such exclusions are discriminatory and reduce the number of eligible patients, slowing recruitment and inhibiting trial completion. For instance, eliminating exclusions for manageable medical conditions not thought to be justified by drug safety (e.g., coronary stenting, diabetes mellitus) in pancreatic cancer trials increased overall eligibility and reduced disparities for Black compared to White patients (with exclusions, ineligibility rates were 42.4% vs. 33.2%, P=0.02; without exclusions 26.8% vs. 24.8%, P>0.05).2 In this and other examples in non-small cell lung cancer,3 such modifications
enhance generalizability and arguably the scientific value necessary for ethical research.1 At the same time, criteria must be used to protect participants from unnecessary risk when safety signals are known. In late 2022, the United States (US) Food and Drug Administration (FDA) was empowered by passage of the Food and Drug Omnibus Reform Act (FDORA) to promote rational revision of criteria to reduce exclusion and enhance safety.4-6 Like unjustified criteria, unjustified variability in the limits assigned to criteria (e.g., the value that defines minimum acceptable renal function) also represents unfair exclusion or risk unless differences are drug safety-based.1 Data on the variability of eligibility criteria limits and their justification in drug safety are few. The use and variability of criteria across phase II and III trials in acute myeloid and lymphoblastic leukemia have also not been well described. Without similar data in leukemia, the blood cancer research community cannot assess where better alignment of crite-
ria and drug-associated risks is needed, and unnecessary exclusion and risk will continue. In this context, we sought to characterize the use, variability, and drug safety-based justification of eligibility criteria, as well as the extent to which they could be rationally modified to promote inclusion and safety.
Design and objectives
This was a retrospective analysis of phase II and III acute leukemia clinical trial eligibility criteria and their basis in drug safety. Objectives were to assess concordance between trial eligibility criteria and drug safety profiles (with concordance defined as the presence of an eligibility criterion with a drug safety signal or absence of a criterion without a signal), and to determine differences between criteria-based and drug safety-based limits and their variability. We also examined whether concordance and differences improved in later phase studies. Manuscript reporting followed PRISMA guidelines, as applicable. Ethical approval for the study was provided by the Dana-Farber Cancer Institute Office for Human Research Studies as protocol 22-267.
Trial, criteria, and drug safety selection, abstraction, and coding
To assess potential changes in criteria that could be made under the aegis of a single regulatory standard, the search focused on trials registered with the US FDA. As US law FDAAA 801 requires all therapeutic clinical trials in the US to be registered on clinicaltrials.gov,7 this database was selected for review and queried on 10/6/2022. The study period (2010-2019) was defined to allow sufficient time after enactment of FDAAA 801 (circa 2008) for all new studies to be registered. The search terms and filters are described in the Online Supplementary Appendix. The results were reviewed to exclude trials that did not meet the above criteria, did not test therapies to treat acute leukemia, tested cellular therapies, only tested therapies in relapsed/ refractory disease, and/or only recruited patients outside the US. Searches, result screening, and eligibility criteria coding were independently performed by two trained team members, and consensus arbitration with a third was used to resolve discrepancies.8
An initial list of eligibility criteria was developed collaboratively by the study team based on FDA guidance.4,5 Criteria were coded into binary, categorical, or continuous variables based on FDA guidance when possible and common categories when not. The drug safety review sought to identify safety signals known at the time of study initiation that would justify the use of enrollment criteria. All anti-cancer therapies tested were compiled and reviewed to identify safety data available at the time of the study start date.
Details on criteria and drug safety identification and coding, and the lists of variables used, are shown in the Online Supplementary Methods, Online Supplementary Tables S1, S2.
Criteria use and limit differences were reported using descriptive statistics with frequencies and percentages. Criteria limit dispersion was reported as medians with interquartile ranges (IQR) and robust coefficients of variation (rCV; the IQR divided by the median).9 Univariable assessments of concordance between laboratory criteria and drug safety signals, and odds of concordance between phase III and phase II studies, were assessed using χ2 or Fisher’s exact testing with Odds Ratios and 95% Confidence Intervals. Adjusted Odds Ratios (aOR) of concordance were calculated using multivariable logistic regression models with criteria use as the dependent variable and presence of a relevant drug safety signal as the independent variable (e.g., known association with QT interval prolongation for corrected QT [QTc] criteria), adjusted for phase, year, size, and trial sponsor type(s).10,11 Improvement in alignment of criteria and safety-based limits from phase II to phase III was assessed by the absolute reduction in the median difference between criteria- and safety based-limits, with significance assessed using the two-sample Mann-Whitney U test, and the corresponding IQR difference, with significance assessed using the Brown-Forsythe equality of variances test.12 Statistical testing was performed using STATA Version 16.1 (StataCorp; College Station, TX, US). The significance level was pre-specified as alpha=0.05.
The search resulted in 848 acute myeloid leukemia (AML) and 459 acute lymphocytic leukemia (ALL) trials, of which 250 (19.1%) were eligible for analysis: 190 AML (22.4%) and 60 ALL (13.1%). A flow diagram of exclusions is shown in Online Supplementary Figure S1. Most trials were phase II (203; 81.2%); 47 trials (18.8%) were phase III. Eighty (32.0%) trials were sponsored by the National Institutes of Health, 151 (60.4%) by academic investigators, and 136 (54.4%) by industry. A total of 74 (29.6%) trials had participating sites outside the US. Across all trials there were 162 unique anti-cancer therapies tested ( Online Supplementary Table S3), of which 83 (51.2%) were not FDA-approved at the study start date. Approximately half of the trials (135; 54.0%) tested at least one drug that was investigational at study start.
Variability in the use of common eligibility criteria with associated limits is shown in Table 1. Limit variability, measured as rCV, was >10% for the age demarcation of an older adult (12.5%) and for renal function (35.0%), bilirubin (22.5%), drug washout period (75.0%), and prior malignancy washout period (75.0%) limits. Violin plots of these
measures’ variability are shown in Online Supplementary Figure S2. Common exclusion criteria without associated limits included diagnosis of human immunodeficiency virus (HIV) (137 trials; 54.8%), hepatitis B (105; 42.0%) and C (103; 41.2%) infection, and central nervous system (CNS) disease (117; 46.8%). Cytoreduction was specifically allowed in 122 (48.8%) trials.
Concordance between criteria with limits and relevant drug safety signals is shown in Figure 1. There was concordance between the presence of ejection fraction limits and chemotherapy associated with congestive heart failure
risk in 115 (46.0%) trials. Criteria concordance with other relevant risks was seen for QTc limits in 146 (58.4%) trials, bilirubin in 170 (68.0%) trials, aspartate transaminase/ alanine aminotransferase (AST/ALT) in 148 (59.2%) trials, and renal function in 159 (63.6%) trials. Exclusion criteria for HIV, hepatitis B, and hepatitis C were concordant with drug safety in 145 (58.0%), 135 (54.0%), and 131 (52.4%) of trials, respectively.
Unadjusted OR and aOR of concordance are shown in Table 2: HIV and hepatitis B and C criteria use was concordant with drug safety data (aOR 2.04 [95%CI: 1.13, 3.66]; 2.64
*Robust coefficient of variation = (interquartile range)/(median). ^Restricted to trials enrolling fit patients. N: number; CV: coefficient of variation; ECOG: Eastern Cooperative Oncology Group; N/A: not available; AST/ALT: aspartate transaminase/alanine aminotransferase; QTc: corrected QT; ULN: upper limit of normal; ms: milliseconds.
[95%CI: 1.38, 5.04]; 2.27 [95%CI: 1.20, 4.32]) but organ function criteria were not (all aOR P>0.05). Sponsor type was associated with eligibility criteria use in several instances. Industry sponsorship was associated with increased odds of hepatitis B and C exclusions (aOR 2.45 [95%CI: 1.13, 5.30] and 2.59 [95%CI: 1.19, 5.64]) and academic sponsorship with increased odds of bilirubin and renal function exclusions (aOR 3.14 [95%CI: 1.62, 6.07] and 2.84 [95%CI: 1.50, 5.36]). There were no significant differences in what limits were placed according to the presence or absence of a drug safety signal (all Mann-Whitney U test P>0.05) (Figure 2). Odds of concordance between criteria use and drug safety data were numerically lower for phase III studies compared to phase II studies (Online Supplementary Table S4, Online Supplementary Figure S3); odds were less concordant for bilirubin (OR 0.41 [95%CI: 0.21, 0.78]), AST/ALT (OR 0.43 [95%CI: 0.23, 0.83]), and renal function limits (OR 0.53 [95%CI: 0.28, 0.99]). We next assessed the limits that were used when there was concordance between the presence of a criterion and drug safety data. Drug safety-based and criteria-based lim-
its for bilirubin were the same in 16.0% of these trials, for AST/ALT in 18.1%, and for renal function in 13.9%; in 75.7%, 51.4%, and 56.5% of trials the criteria were more restrictive, respectively. Specific drug safety limits for left ventricular ejection fraction (LVEF) and QTc were too few for comparison. Differences in renal and hepatic function limits from eligibility criteria and drug safety data are shown in Figure 3. The median absolute differences between eligibility criteria and drug safety-based limits were 0.5 times the upper limit of normal (ULN) for renal function, 0.5 ULN for AST/ ALT, and 0.2 ULN for bilirubin; the respective IQR were 0.9, 2.5, and 1.3.
Limit differences between phase II and phase III studies are shown in Online Supplementary Figure S4. Differences in median renal function limit in phase III trials were significantly different and closer to zero (Mann Whitney U test P=0.03); bilirubin and AST/ALT limits were not significantly different in phase III. The variability of these differences was similar between phase II and III trials for renal function (IQR 0.81 and 0.50), AST/ALT (2.50 and 2.50), and bilirubin (1.30 and
*Adjustments were for trial phase, size, year of study start, leukemia subtype, and sponsor type(s). OR: odds ratio; CI: confidence interval; QTc: corrected QT; AST/ALT: aspartate transaminase/alanine aminotransferase; HIV: human immunodeficiency virus.
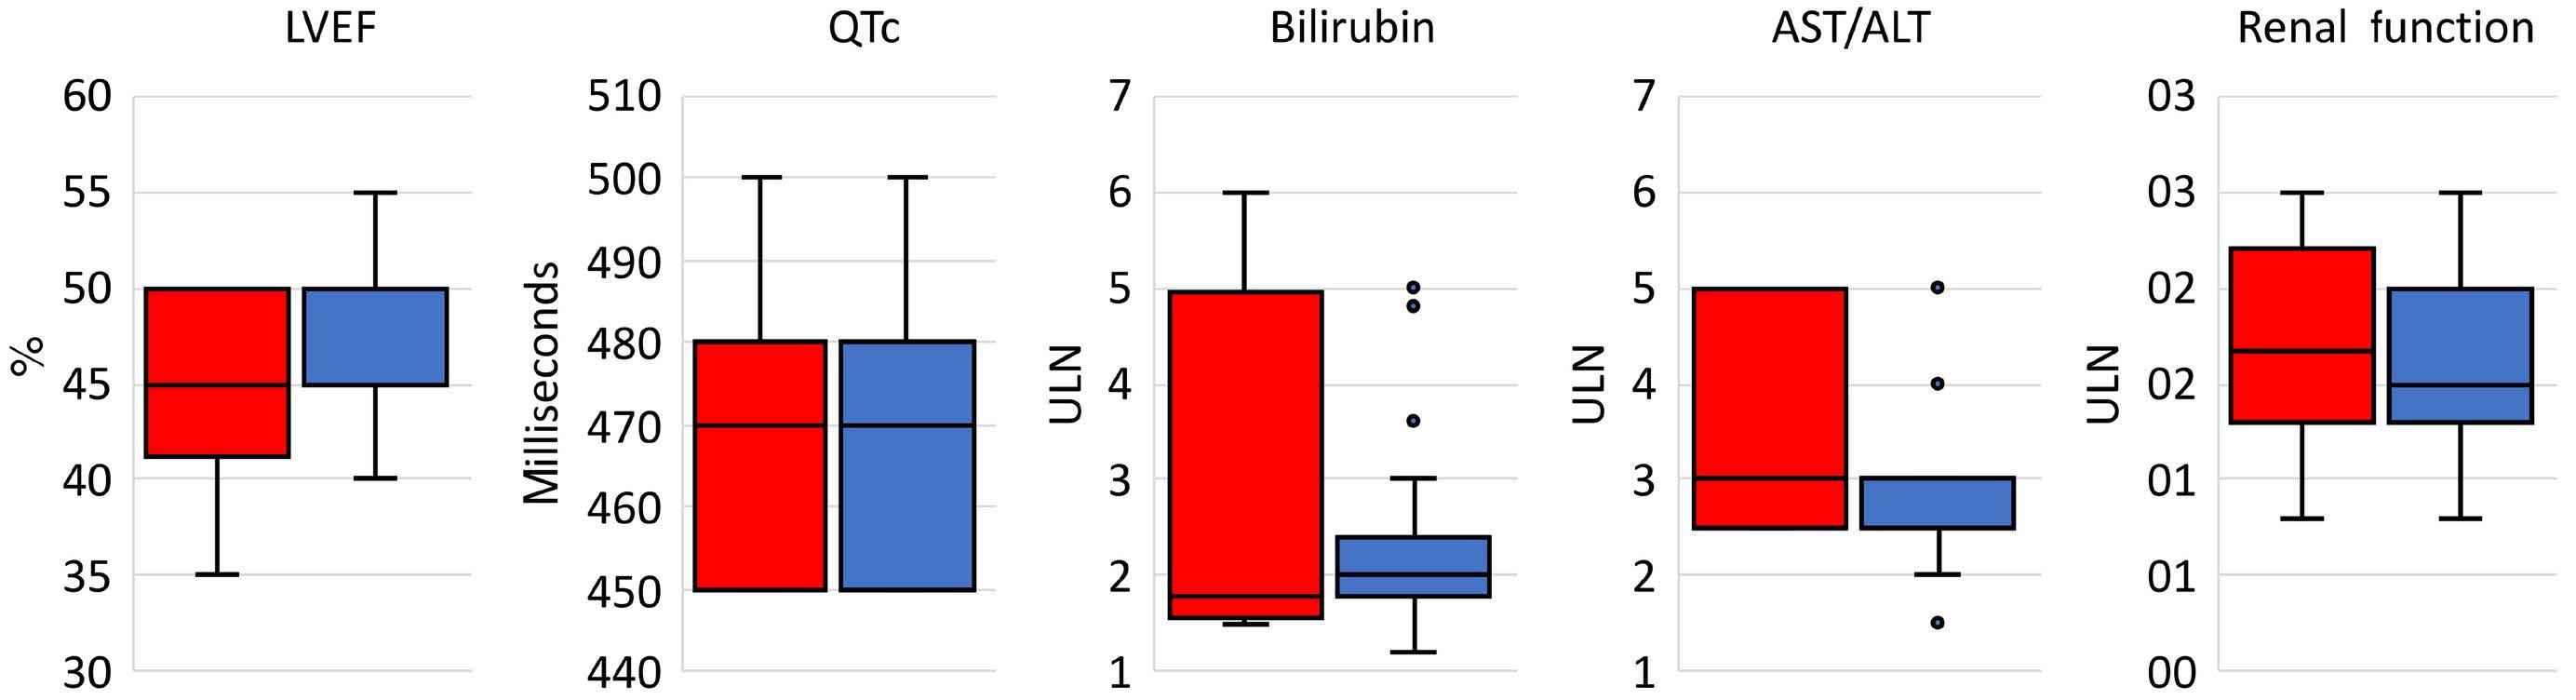
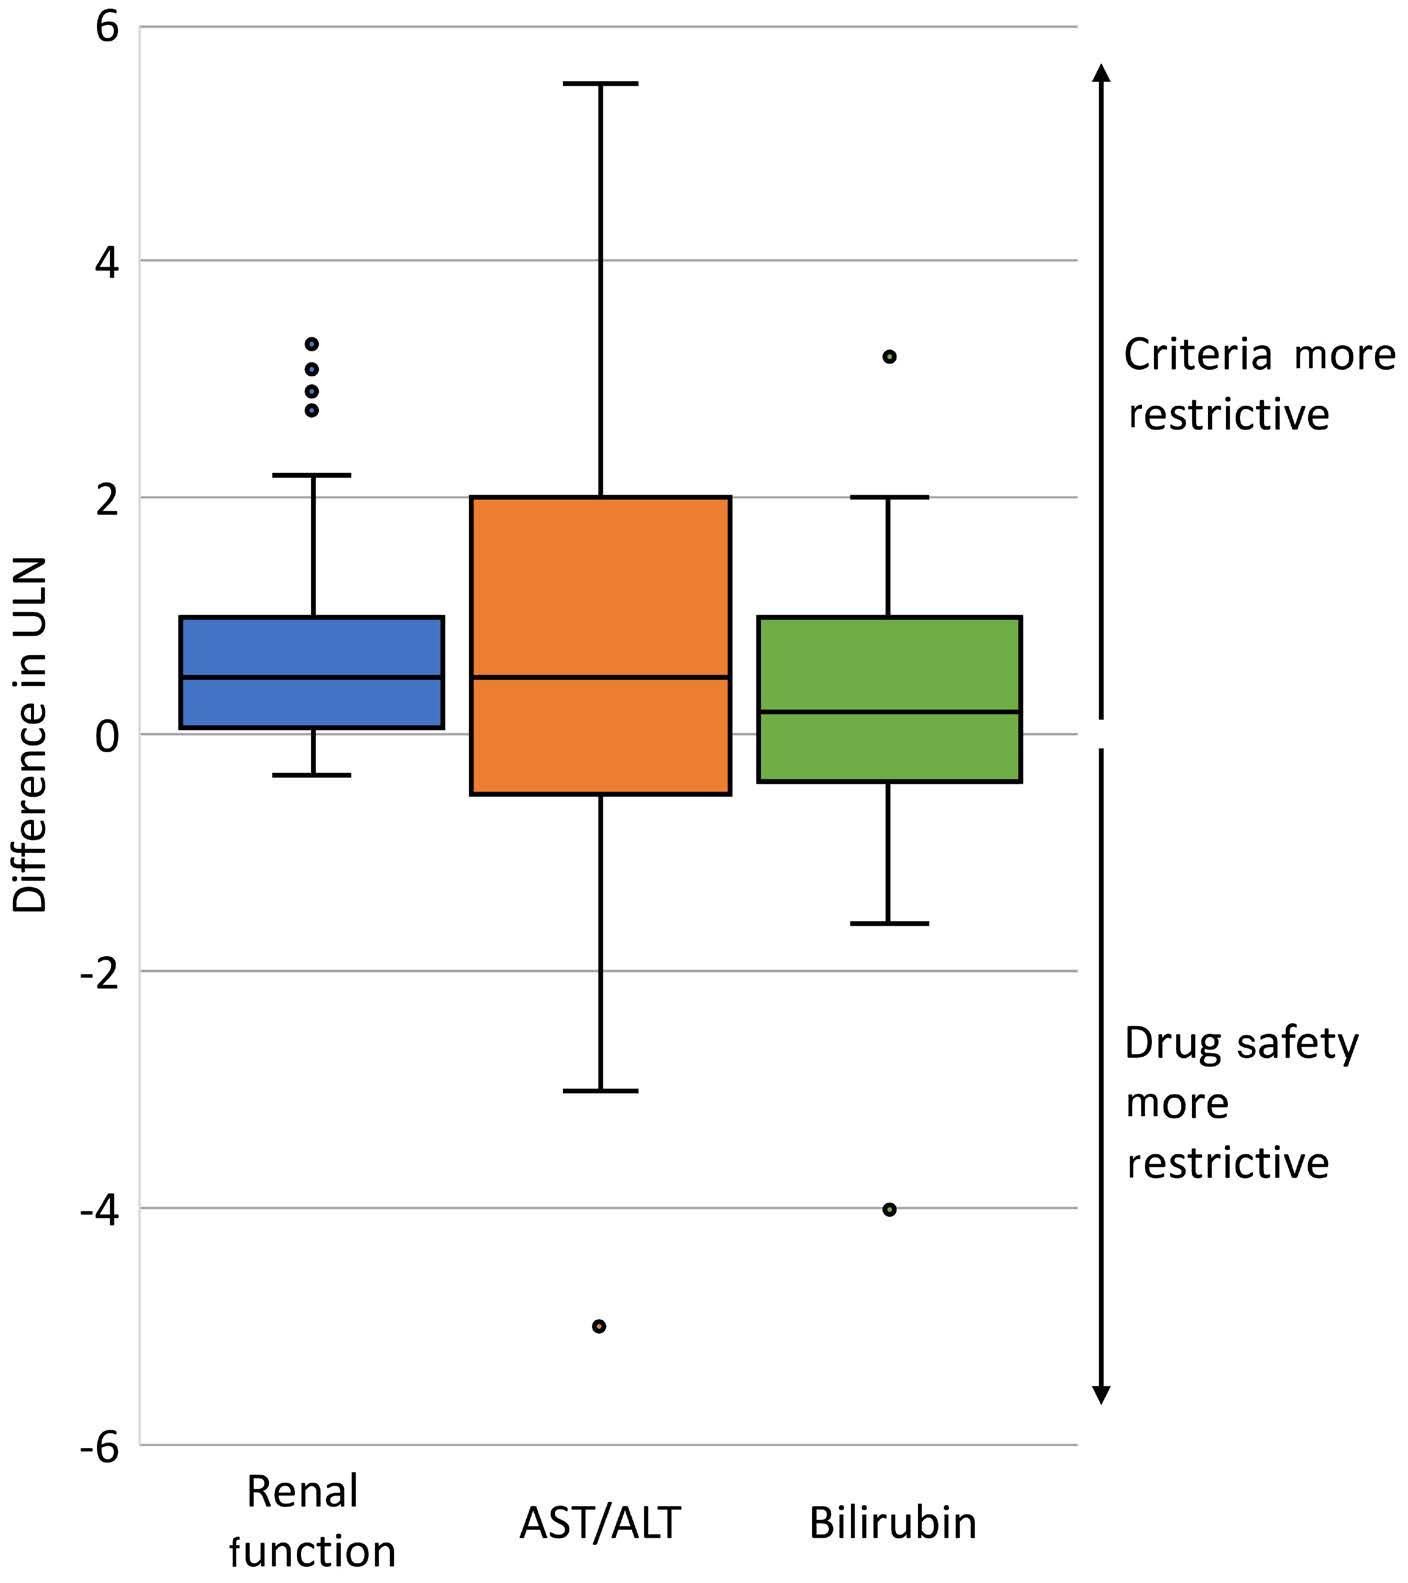
and liberalization in order to improve representativeness and accrual, limit the implicit biases that can occur when criteria are not explicit, and improve patient safety.13 These data are consistent with solid tumor studies that demonstrate the presence of unjustified criteria and their potential impact on demographic inequities in participation.2,3 One such study used the Flatiron real-world database and found that if several enrollment criteria for non-small cell lung cancer immunotherapy trials were removed (e.g., neutrophil counts, CNS metastasis), the eligible population would be doubled and would only decrease the projected Hazard Ratio of overall survival by 0.05.3 A study in pancreatic cancer found that Black patients would have been less likely to participate owing to hepatitis and HIV status.2 The lack of justification for infectious disease exclusions in some of the trials in this analysis suggests this inequity may also be present in acute leukemia.
0.97) (all Brown-Forsythe test P>0.05).
In this analysis assessing the use, variability, and justification of acute leukemia clinical trial eligibility criteria, there was a substantial discordance between criteria and drug safety data. The use or absence of many criteria were related to anticipated risk, but large proportions were not. There was concordance between infectious disease criteria and risk, but this was not the case for organ function criteria, and the imposed criteria limits were similarly restrictive irrespective of anticipated risk. Despite the presumption that additional safety data would become available later in drug development, criteria use in phase III studies was not more concordant. When trial criteria use was concordant with safety data, the imposed criteria limits were generally more restrictive than drug safety data and were variable in their degree of restriction. Among these studies, phase III limits were somewhat more aligned with drug safety data than phase II, but their limits were no less variable. Together, these data identify specific criteria that sponsors and investigators should assess for inclusion, removal,
To our knowledge, prior studies regarding acute leukemia enrollment criteria are aligned but distinct and do not address the question of use, variability, or justification across phase II and III studies. A trial published in 2017 enrolled patients with comorbid conditions, organ dysfunction, and poor performance status to show that a trial of low-intensity therapy was possible in this traditionally ineligible population.14 This is important in that it shows trials, rather than just post-approval real-world analyses, are possible for most patient populations. At the same time, it did not assess heterogeneity in trial criteria and when criteria are justified or unjustified. A separate study from the FDA analyzed disparities in ineligibility of screened patients on 13 trials from 2016 to 2019 (N=3192), finding that 27% were ineligible. These data also showed that Black and Hispanic patients with AML were less likely to meet study eligibility requirements due to cardiac function and/or a lack of specific mutations.15 Notably, there was significant selection bias as the analysis was restricted to those who consented to participate, meaning that data on those who were known to be ineligible, and thus not approached, were not included.
The present study adds significantly to this literature because it not only assesses criteria use but their variability and justification in drug safety. We found that there was wide variability within criteria with associated measures. Some criteria such as time since prior cancer diagnosis have limited justification, and others like bilirubin limits were not present despite known drug-related hepatotoxicity. We also saw that if a criterion was used, it was generally more restrictive than suggested by drug safety data. Criteria used were also similarly restrictive independent of if there were known drug-related risks. Taken together, these data identify criteria that should be specified and others that can be liberalized to promote a rational approach to maximizing the eligible pool of patients without compromising safety.
The systematic approach used to catalog study drug safety
profiles relative to enrollment criteria also minimizes the bias of prior studies, which did not account for the more limited knowledge of drug safety known during investigational drug development. Though much of the previously published literature focuses on criteria expansion, our study also identifies areas where known safety signals exist, but explicit criteria are missing. This can put enrollees at unnecessary risk, limit the identification of efficacious drugs, and may increase enrollment bias by leaving related eligibility decisions to individual investigators.
Applying these points to a study included in the analysis, we can see how trial eligibility may be modified in practice. This study tested the combination of nivolumab, cytarabine, and idarubicin in AML, and used exclusion criteria based on hepatic and renal lab values. The labels for the antineoplastic therapies used collectively identify hepatic and renal toxicity (among other side effects), justifying the trial’s use of exclusion criteria related to liver and kidney function. The study’s hepatic and renal criteria limits were bilirubin ≤1.5, AST/ALT ≤2.5, and creatinine ≤1.3 times the ULN, and the conservative limits from drug labels were ≤2, ≤3, ≤2.2 times the ULN, respectively. In this case, expansion of renal and hepatic criteria by 0.5, 0.5, and 1.1 times the ULN could be justified and potentially increase the eligible population while maintaining safety. A similar process, applied systematically across new trials, would align eligibility with drug safety, expanding criteria limits in some trials, contracting limits in others, and making criteria explicit instead of inexact in the rest.
Limitations of this study include the potential for bias due to safety data that were unpublished at the time of study start, which we attempted to minimize through multi-modal searches and use of trial protocols. This mirrors the investigational drug safety data and eligibility requirements that enrolling physicians use during recruitment. While we focused on drug-safety profiles from individual drugs, we could not capture safety justifications based on emerging issues related to the overall intensity of a regimen, where general eligibility restrictions for organ dysfunction or comorbidities may be used. Nonetheless, there were a number of criteria not included where safety signal(s) were identified which would not have been ameliorated. The generalizability of the analysis is limited to clinical trials conducted under FDA regulation, which was done to assess changes in criteria that could be made under a single regulatory standard. Cellular therapy trials were also excluded as the population eligible for cellular therapy treatment, even outside the research context, is much more restricted than the broader acute leukemia population. Other limitations include biases due to the necessary aggregation of unstructured data into analytic variables, which limited our ability to capture vague or inexact criteria, and required us to assume a uniform normal range of laboratory values, and the moderate sample size, which was limited by the availability of trials.
In summary, a substantial proportion of acute leukemia clinical trial enrollment criteria do not appear justified by drug safety. Both the FDA and the American Society of Clinical Oncology have recognized this issue and adopted positions requiring justification of criteria;16-18 these data identify where potentially unjustified criteria and limits exist for acute leukemia and a rational approach to meeting this goal while ensuring patient wellbeing. Judicious minimization of criteria based on drug safety profiles and standardization are key to enhancing research representativeness, efficacy, and safety.
AH has received personal fees (advisory boards) from AstraZeneca and AbbVie. MRL reports receiving personal fees (advisory boards) from Novartis and AbbVie. AAP has received institutional research funding from Kronos Bio, Pfizer, and Sumitumo, and personal fees from AbbVie (educational curriculum development) and Bristol Myers Squibb (advisory board). DJDeA has received research funding from Abbvie, Novartis, Blueprint, and Glycomimetrics, and personal fees from Amgen, Autolus, Blueprint, Gilead, Incyte, Jazz, Kite, Novartis, Pfizer, Servier, and Takeda (consulting). GAA has received personal fees (consulting) from Novartis. The other authors have no conflict of interests to disclose.
AH, CSL, GAA, IK and AAP are responsible for the study concept. AH, EQ, TPW and GAA designed the methodology. AH, EW and TPW collected the data. AH, EW, TPW and GAA analyzed the data. AH, EW, TPW and GAA wrote the manuscript. MRL, IK, AAP, DJDeA, CSL and GAA critically reviewed the manuscript. All authors revised the manuscript for publication.
The authors would like to acknowledge the work of Dillon Clancy in assisting with data collection and preparing the figures.
AH is supported by grants from the National Cancer Institute of the National Institutes of Health (K08 CA273043), the American Society of Clinical Oncology (Career Development Award), the Alliance in Clinical Trials for Oncology (Special Projects Fund), and the Rieder Family Fellowship in Acute Lymphoblastic Lymphoma. IK is supported by a grant from the American Cancer Society (CSDG-21-088-01-ET). The sponsors had no role in gathering, analyzing, or interpreting the data. The content of this publication does not necessarily reflect the views or policies of the Department of Health and Human Services, nor does mention of trade names, commercial products, or organizations imply endorsement by the US government.
The data in this study are publicly available, as outlined in
1. Emanuel EJ, Wendler D, Grady C. What makes clinical research ethical? JAMA. 2000;283(20):2701-2711.
2. Riner AN, Girma S, Vudatha V, et al. Eligibility criteria perpetuate disparities in enrollment and participation of black patients in pancreatic cancer clinical trials. J Clin Oncol. 2022;40(20):2193-2202.
3. Liu R, Rizzo S, Whipple S, et al. Evaluating eligibility criteria of oncology trials using real-world data and AI. Nature. 2021;592(7855):629-633.
4 Duggal M, Sacks L, Vasisht KP. Eligibility criteria and clinical trials: an FDA perspective. Contemp Clin Trials. 2021;109:106515.
5. Cancer clinical trial eligibility criteria: available therapy in non-curative settings. 2022. https://www.fda.gov/media/150244/ download Accessed 18 March 2023.
6. Food and Drug Omnibus Reform Act of 2022. Washington (DC): 117th United States Congress; 2022.
7. National Library of Medicine. ClinicalTrials.gov. 2022. https:// clinicaltrials.gov Accessed 6 October 2022.
8. Flick U. The SAGE handbook of qualitative data analysis. Los Angeles (CA): Sage Publications Inc; 2014. xxiii.
9 Arachchige C, Prendergast LA, Staudte RG. Robust analogs to the coefficient of variation. J Appl Stat. 2022;49(2):268-290.
10. Altman DG. Practical statistics for medical research. 3rd ed. Chapman & Hall/CRC; 1999. xii. p. 611.
11. Fleiss JL, Levin B, Paik MC. Statistical methods for rates and proportions. Wiley series in probability and statistics. 3rd ed. J. Wiley; 2003. xxvii. p. 760.
12. Brown MB, Forsythe AB. Robust tests for the equality of
the manuscript. Datasets used in the analysis can be made available on reasonable request to the corresponding author.
variances. J Am Stat Assoc. 1974;69(346):364-367.
13. Barrett NJ, Boehmer L, Schrag J, et al. An assessment of the feasibility and utility of an ACCC-ASCO implicit bias training program to enhance racial and ethnic diversity in cancer clinical trials. JCO Oncol Pract. 2023;19(4):e570-e580.
14 Montalban-Bravo G, Huang X, Naqvi K, et al. A clinical trial for patients with acute myeloid leukemia or myelodysplastic syndromes not eligible for standard clinical trials. Leukemia. 2017;31(2):318-324.
15. Pulte D, Fernandes L, Wei G, et al. FDA analysis of ineligibility for acute myeloid leukemia clinical trials by race and ethnicity. Clin Lymphoma Myeloma Leuk. 2023;23(6):463-470.
16. Food and Drug Administration Oncology Center of Excellence: Center for Drug Evaluation and Research and Center for Biologics Evaluation and Research. Cancer clinical trial eligibility criteria: patients with organ dysfunction or prior or concurrent malignancies; guidance for industry. 2020. https://www.fda.gov/ media/123745/download Accessed 18 March 2023.
17 Food and Drug Administration Oncology Center of Excellence: Center for Drug Evaluation and Research and Center for Biologics Evaluation and Research. Cancer clinical trial eligibility criteria: patients with HIV, hepatitis B virus, or hepatitis C virus infections; guidance for industry. 2020. https://www.fda.gov/ media/121319/download Accessed 18 March 2023.
18. Kim ES, Bruinooge SS, Roberts S, et al. Broadening eligibility criteria to make clinical trials more representative: American Society of Clinical Oncology and Friends of Cancer Research Joint Research Statement. J Clin Oncol. 2017;35(33):3737-3744.
Association of NUDT15 gene polymorphism with adverse reaction, treatment efficacy, and dose of 6-mercaptopurine in patients with acute lymphoblastic leukemia: a systematic
Shan Du,1,2* Xuefei Huang,1,2* Xia He,1,2 Mian Mao,3 Min Chen,1,2 Rong Zhang,4 Huikai Shao,1,2 Ziyan Lv,1,2 Xinxia Liu1,2# and Junlan Chuan1,2#
1Department of Pharmacy, Sichuan Academy of Medical Sciences and Sichuan Provincial People’s Hospital; 2Personalized Drug Therapy Key Laboratory of Sichuan Province, School of Medicine, University of Electronic Science and Technology of China; 3Department of Pharmacy, Sichuan Cancer Hospital and 4Department of Pediatrics, Sichuan Academy of Medical Sciences and Sichuan Provincial People’s Hospital, Chengdu, China
*SD and XFH contributed equally as first authors.
#XXL and JLC contributed equally as senior authors.
Abstract
Correspondence: J. Chuan chuanjunlan@foxmail.com
X. Liu cupflysea@163.com
Received: January 18, 2023.
Accepted: September 26, 2023. Early view: October 5, 2023.
https://doi.org/10.3324/haematol.2023.282761
©2024 Ferrata Storti Foundation
Published under a CC BY-NC license
6-mercaptopurine (6-MP) serves as the backbone in the maintenance regimens of acute lymphoblastic leukemia (ALL). We aimed to evaluate the influence of NUDT15 gene polymorphism on the risk of myelosupression, hepatotoxicity and interruption of 6-MP, as well as treatment efficacy and dose of 6-MP in ALL patients. A total of 24 studies with 3,374 patients were included in this meta-analysis. We found 9-fold higher risk of 6-MP induced leukopenia (odds ratio [OR] =9.00, 95% confidence interval [CI]: 3.73-21.74) and 2.5-fold higher risk of 6-MP-induced neutropenia (OR=2.52, 95% CI: 1.72-3.69) for NUDT15 c.415C>T variant carriers in the dominant model. Moreover, we found that the dose intensity of 6-MP in ALL patients with one NUDT15 c.415C>T variant alleles (CT) was 19% less than that in wild-type patients (CC) (mean differences: 19.43%, 95% CI: -25.36 to -13.51). The tolerable dose intensity of 6-MP in NUDT15 c.415C>T homozygote variant (TT) and heterozygote variant (CT) carriers was 49% and 15% less than that in wild-type patients, respectively. The NUDT15 c.415C>T variant group (CT+TT) had seven times (OR=6.98, 95% CI: 2.83-17.22) higher risk of developing 6-MP intolerance than the CC group. However, NUDT15 c.415C>T polymorphism did not appear significantly associated with hepatotoxicity, treatment interruption or relapse incidence. We concluded that NUDT15 c.415C>T was a good predictor for 6-MP-induced myelosuppression in ALL patients. The dose intensity of 6-MP in ALL patients with NUDT15 c.415C>T variants was significantly lower than that in wild-type patients. This research provided a basis for further investigation into relations between NUDT15 gene and adverse reaction, treatment efficacy and dose intensity of 6-MP.
Acute lymphoblastic leukemia (ALL) is a malignant and heterogeneous condition in which uncontrolled proliferation of lymphoblasts (of B- or T-cell origin) occurs in the bone marrow, peripheral blood, and/or other organs. It affects both children and adults.1,2 The overall survival (OS) of ALL has improved tremendously over the past few decades, and the 5-year OS exceeds 90% in children who receive contemporary therapy.3,4 The thio-substituted purine analogue 6-mercaptopurine (6-MP), which can inhibit ALL cell
DNA synthesis along with weekly methotrexate (MTX), is the backbone in the maintenance regimens of ALL.5,6 However, due to the narrow therapeutic index, 6-MP can bring about dose-dependent toxicities such as myelosuppression and hepatotoxicity in ALL patient. These adverse effects can result in 6-MP dose reduction or therapy interruption, and even increase the risk of life-threatening infections and relapse.7,8
It was reported that 6-MP can be converted into active metabolites 6-thioguanine nucleotides (6-TGN) via a series of enzymes. 6-TGN consist of 6-thio(d)-GMP, 6-thio(d)-GDP,
and 6-thio(d)-GTP. 6-thio(d)-GTP are incorporated into DNA and RNA, which can cause inhibition of nucleotide and protein synthesis and lead to cytotoxicity typified by leukopenia.9-11 Meanwhile, 6-MP and its metabolites can be methylated into inactive 6-methyl mercaptopurine (6MMP) by thiopurine methyltransferase (TPMT). Therefore, TPMT activity is negatively related to 6-TGN content. Furthermore, TPMT deficiency caused by genetic variants is likely to increase the level of 6-TGN and therefore result in myelosuppression.12-14 Given the formerly observed association between TPMT polymorphisms and thiopurines-induced leukopenia, US Food and Drug Administration has suggested preemptive TPMT testing for individualizing thiopurines dose and reducing the risk of drug-related adverse events.15,16 However, compared with their Caucasians (10%) counterparts, Asians (3%) have lower frequency of TPMT variants and are more likely to be subject to 6-MP-induced leukopenia, dose intolerance, and dose reduction.17 It was observed that hematotoxicity occurred in some patients with wild-type TPMT, which indicates that some other genetic variants are probably associated with 6-MP tolerance and related adverse reactions.17-19 Recently, a series of studies reported that genotype of nucleoside diphosphate-linked moiety X-type motif 15 (NUDT15), particularly NUDT15 c.415C>T (rs116855232), had a strong association with 6-MP-induced myelosuppression and 6-MP intolerance in ALL.20-22 Indeed, NUDT15 is hypothesized to dephosphorylate the 6-MP active metabolites 6-thio(d)-GTP to 6-thio(d)-GDP, which can prevent their incorporation into DNA and decrease the 6-MP cytotoxicity.23 In other words, NUDT15 variants are supposed to result in excessive levels of 6-thio(d)-GTP and increase host toxicity. Although the association between NUDT15 c.415C>T variants and 6-MP-induced myelotoxicity is widely recognized, the pooled increased risk, by involving more newly published research, of myelosuppression in ALL patients with NUDT15 c.415C>T variants has not been reported.24-27 Moreover, the correlation between NUDT15 polymorphism and risk for hepatotoxicity, treatment interruption, dose intensity of 6-MP or relapse of ALL were not evaluated in previous meta-analysis.28-31 In order to fill this gap, we conducted a systematic review and meta-analysis aiming to assess the association between NUDT15 gene polymorphism and adverse reaction, treatment efficacy and dose of 6-MP particularly in patients with ALL.
This systematic review was conducted according to the Preferred Reporting Items for Systematic Reviews and Meta-analyses (PRISMA) Statement principles.32 The protocol for this systematic review was registered on PROSPERO (registration number: CRD42022384698). PubMed, Web
of Science, Embase, Cochrane Library, CNKI, China Biology Medicine, Wanfang and VIP databases were searched from their inception up to November 25, 2022 using the following key terms: (NUDT15 OR MTH2 protein OR Nudix Hydrolase 15 OR nucleoside diphosphate-linked moiety X-type motif 15) AND (leukaemia OR leukemia). Eligible studies were included if they met the following inclusion criteria: i) investigating the association between at least one NUDT15 gene polymorphism and adverse reactions (e.g., leukopenia, neutropenia, hepatotoxicity, treatment interruption), treatment efficacy of 6-MP or 6-MP dose (e.g., dose intensity, intolerant incidence, tolerable dose et al.); ii) patients are limited to those diagnosed with acute lymphoblastic leukemia; iii) the study type is a cohort study or case control; iv) literature language is English or Chinese. Exclusion criteria were as follows: i) review articles, editorials and comments; ii) duplicated studies; iii) case reports; iv) not an outcome of interest or not available. Two reviewers (SD, XFH) independently undertook the study selection according to prespecified inclusion and exclusion criteria, and any disagreement was resolved by discussion or by consulting a third author.
For each study included, two reviewers independently extracted and collected general information and outcome data in a standardized data extraction form. General information contained the first author’s name, year of publication, ethnicity, study design, age, female/male, total sample size, 6-MP initial dose, phase of treatment, the outcome of study, SNP, the genotyping method, timing of follow-up and Hardy-Weinberg equilibrium. Outcome data included any available information about leukopenia, neutropenia, hepatotoxicity, relapse, treatment interruption, dose intensity, intolerant incidence, as well as tolerable dose. In addition, we e-mailed the corresponding author for detailed information when data from a study was unextractable and any discrepancies were resolved by consensus.
Two researchers independently assessed the quality of eligible studies based on the Newcastle-Ottawa Scale (NOS). The NOS contains eight items, categorized in three domains: selection, comparability, and outcome (cohort studies) or exposure (case-control studies). The quality score of each study was rated from zero to nine.33
All outcomes were pooled using Review Manager (RevMan) version 5.4. We calculated odds ratios (OR) and their 95% confidence intervals (CI) to evaluate the association of NUDT15 gene polymorphism and with the occurrence of 6-MP-induced adverse drug reactions, which include leukopenia, neutropenia, hepatotoxicity, treatment interruption along with relapse and intolerant incidence. Meanwhile,
we also analyzed mean differences (MD) and their 95% CI which presented potential influence of NUDT15 gene polymorphism on 6-MP dose intensity and tolerable dose. Heterogeneity between studies was estimated by the χ2 test and the I2 statistic. If I2 <50%, the fixed-effects model with the Mantel-Haenszel method was employed; otherwise, the random-effects model was adopted. It is noteworthy that sensitivity analysis by sequentially excluding each study and subgroup analysis were conducted according to specific circumstances.
Retrieved results
Nine hundred and seven articles were retrieved among which 530 duplicates were removed. Through reading the titles and abstracts, 256 irrelevant studies were excluded, so a total of 121 studies qualified for full text screening. After screening, we further dropped eight reviews or comments, two editorial or letters, 36 conference abstracts, two studies written in neither English nor Chinese, three other gene or other disease studies, four potential duplicates, 19 without extractable data, as well as 23 without outcome of interest. So, 24 studies were finally included. The process of literature retrieval and study screening process are illustrated in Figure 1.
Study characteristics and quality assessment
Table 1 summarizes the characteristics of the included studies. They were published between 2015 and 2022. Ten of them came from China (including Hongkong and Taiwan),25,26,34-41 three from Japan,42-44 three from Korea,45-47 three from Thailand,48-50 two from India,27,51 one from Colombia,24 Lebanon,52 and Kurdistan52 respectively, as well as one multiracial study.21 Their sample size ranged from 51 to 404. One of them was case control study37 and 23 were cohort studies. The NOS score ranged from 6 to 8.
Association between NUDT15 gene polymorphism and adverse reactions of 6-MP
Association between NUDT15 c.415C>T or NUDT15 c.52G>A polymorphism and 6-MP induced leukopenia
In total, eight studies were included to compare the occurrence of leukopenia between 256 NUDT15 c.415C>T variant (CT+TT) carriers and 820 wild-type patients (CC).26,34,35,37,40,41,44,45 Five studies used white blood cell count (WBC) <2×10³/µL as the definition of leukopenia,26,35,37,40,44 Choi et al 45 defined WBC <1.5×10³/µL as leukopenia and the other two studies did not define it (Online Supplementary Table S1).34,41 The result demonstrated that the CT+TT group had a nine times higher risk of leukopenia incidence than the CC group (OR=9.00, 95% CI: 3.73-21.74; P<0.00001) (Figure 2A). Sensitivity analysis with sequential omission of each study suggested that this effect was stable. The
Continued on following page.
Study Ethnicity Age in years* Sample size N (F/M)
6-MP initial dose (mg/m2/d) Outcome of study NUDT15 variant Genotyping method Follow-up time (range) HWE NOS score
Moradveisi 201952
Lebanese Kurdistani Lebanese (6.63±4.93); Kurdistani (6.25±3.07)
Pai 202127 Indian
cohort 1: 16.5 (2-56) cohort 2: 17 (1-63)
Lebanese: 136 (59/77); Kurdistani: 74 (31/43) maint (75) HT c.415C>T TaqMan SNP genotyping F:120 weeks M:143 weeks YES 8
cohort 1: 42 (7/35) cohort 2: 133 (45/88) maint
*Age in years was described as median (range) or mean ± standard deviation (SD) or range according to the original study. †Age at diagnosis. #Study Tanaka 2018 involved all of the patients in study Tanaka 2015 with 3 more patients, and both were included for they had different outcomes. Furthermore, as for the same outcomes from 2 studies, we only used the data with larger patient size in Tanaka 2018. 6-MP: 6-mercaptopurine; ASPCR: allele-specific polymerase chain reaction; cons: consolidation; DI: dose intensity; F: female; FISH: fluorescence in situ hybridization; d: day; HT: hepatotoxicity; HWE: Hardy–Weinberg equilibrium; init: initiation; int inc: intolerant incidence; leuk: leukopenia; M: male; maint: maintenance; NA: not available; neutr: neutropenia; NOS: Newcastle–Ottawa Scale; PCR: polymerase chain reaction; rel: relapse; RI: remission induction; TD: tolerable dose; TI: treatment interruption; SNP: single nucleotide polymorphism; CC: wild-type patients; CT: heterozygote variant carriers; TT: homozygote variant carriers.
study of Cao 202034 and Zhu 2018 41 contributed the biggest heterogeneity, probably due to involving the remission induction phase of treatment with the highest dose of 6-MP (60 mg/m/2/d) among all the studies. The subgroup analysis using the same standard of leukopenia suggested that the CT+TT group developed a 3.9 times higher risk of leukopenia than the CC group (OR=3.89, 95% CI: 2.62-5.76; P<0.00001)
with I2 decreased from 83% to 0% (Figure 2B). Moreover, 927 patients in seven studies were included to evaluate the association of NUDT15 c.415C>T gene polymorphism with leukopenia incidence in the recessive model (TT vs CT+CC) 34,35,37,40,41,44,45 and the TT group had a significantly 15.9 times higher risk of leukopenia incidence than the CT+CC group (OR= 15.88, 95% CI: 5.80-43.48; P<0.00001) (Figure
2C). In the subgroup analysis using the same standard of leukopenia, the TT group had a 8.5 times higher risk of leukopenia incidence than the CT+CC group (OR=8.50, 95% CI: 2.38-30.32; P=0.0010) (Figure 2D).
Other than the correlation of NUDT15 c.415C>T polymorphism with leukopenia being well investigated, some studies also focused on the association of NUDT15 c.52G>A polymorphism with leukopenia in ALL patients. Two studies with 283 ALL patients in total were included to compare the events of leukopenia in NUDT15 c.52G>A variant group (GA+AA) with the wild-type group (GG).41,44 The difference between the two groups in the incidence of leukopenia was not statistically significant (OR=3.60, 95% CI: 0.79-16.38; P=0.10) (Figure 2E).
Association between NUDT15 c.415C>T polymorphism and 6-MP-induced neutropenia
We compared the events of neutropenia in NUDT15 c.415C>T variant group and wild-type group based on ten studies comprising 1,082 patients with ALL.24,27,35,38,45,46,48-51 Correa-Jimenez et al.24 did not describe the definition of neutropenia, while three studies defined neutropenia as absolute neutrophil count (ANC) <1,500/µL, ANC <1,000/µL, and ANC <750/µL,27,35,51 respectively, and the remaining six studies shared the same standard of neutropenia as ANC <500/µL (Online Supplementary Table S1).38,45,46,48-50 The variant group (CT+TT) was proven to be significantly associated with a 2.5-fold higher risk of neutropenia in comparison to the wild-type group (OR=2.52, 95% CI: 1.72-3.69; P<0.00001) (Figure 3A). The subgroup analysis that defined ANC <500/ µL as neutropenia showed that the CT+TT group had a 2.3 times higher risk of neutropenia incidence than the CC group (OR=2.28, 95% CI: 1.42-3.67; P=0.0007) (Figure 3B). In addition, five studies with 552 patients were included to investigate the role of NUDT15 c.415C>T gene polymorphism on the risk of neutropenia in the recessive model.35,38,45,46,49 No significant difference between the two groups was found (OR=2.93, 95% CI: 0.92-9.37; P=0.07) (Figure 3C). However, the sensitivity analysis suggested that after excluding Li et al. 2021,35 the homozygote variant of NUDT15 c.415C>T (TT group) had a significantly 4.8 times higher risk of neutropenia incidence compared with the CT+CC group (OR=4.84, 95% CI: 1.21-19.35; P=0.03) (Figure 3D). A potential explanation was that only one patient with TT was in Li’s analysis,35 who did not even develop neutropenia at all, so the sample was too small to be representative.
Association between NUDT15 c.415C>T or NUDT15 c.52G>A polymorphism and 6-MP-induced hepatotoxicity
A total of 1,012 patients from seven studies were included for comparing the incidence of hepatotoxicity in NUDT15 c.415C>T variant group with the wild-type group.25,26,39-41,44,52
Two of the studies shared the same standard of hepatotoxicity as alanine aminotransferase (ALT) or aspartate aminotransferase (AST) >5-fold of normal.26,41 Three studies
defined hepatotoxicity as ALT >500 U/L, ALT >700 U/L, and ALT or AST >500 U/L, respectively.25,40,44 The remaining two defined hepatotoxicity as the highest direct bilirubin values ≥1.5 mg/dL, and as either ALT, AST, alkaline phosphatase or total bilirubin above 2-fold upper limit of normal, respectively.39,52 All above-mentioned information are listed in Online Supplementary Table S1. The results revealed that NUDT15 c.415C>T variants did not increase the incidence of hepatotoxicity (OR=1.27, 95% CI: 0.84-1.91; P=0.26) and the sensitivity analysis verified the stability of the results (Figure 4A). In addition, subgroup analysis of the two studies which defined ALT or AST >5-fold of normal as hepatotoxicity, did not show that the NUDT15 c.415C>T variant group had an increased incidence of hepatotoxicity compared to the wild-type group (OR=1.06, 95% CI: 0.56-2.00; P=0.85) (Figure 4B). Moreover, no significant difference in the incidence of hepatotoxicity (OR=2.43, 95% CI: 0.95-6.20; P=0.06) (Figure 4C) was observed in the recessive model either.25,39-41,44 Three studies comprising 426 ALL patients were included to compare the events of hepatotoxicity in NUDT15 c.52 G>A variant carriers (GA+AA) versus wild-type patients (GG) and the result indicated that there was no significant difference in hepatotoxicity incidence in either (OR=1.09, 95% CI: 0.22-5.31; P=0.91) (Figure 4D).25,41,44
Association between NUDT15 c.415C>T polymorphism and 6-MP treatment interruption
Five studies with 537 ALL patients were included to compare the events of treatment interruption in the NUDT15 c.415C>T variant group (CT+TT) and the wild-type group (CC).24,27,40,43,45 The definition of treatment interruption of these included studies is listed in Online Supplementary Table S1. Specifically, treatment interruption was defined as the cessation of medicine administration caused by adverse events such as cytopenia, infections or hepatotoxicity. The result suggested that there was no significant difference in the incidence of treatment interruption between two groups (OR=1.36, 95% CI: 0.41-4.46; P=0.62) (Figure 5A). However, the sensitivity analysis did not support the result - with one study excluded,40 the NUDT15 c.415C>T variant carriers developed a 2.5-fold higher risk of treatment interruption than wild-type patients (OR=2.51, 95% CI: 1.23-5.15; P=0.01) (Online Supplementary Figure S1). Considering that patients with high-risk ALL were excluded in this study, and it defined interruption as the cessation of 6-MP resulting from infections or hepatotoxicity, this study had a lower interruption incidence than other studies. This might be a reason for its unstable results. Although there is a difference in the initial dose of 6-MP in these studies, the subgroup analysis of the four studies with the same initial dose still did not confirm a significant difference in the treatment interruption incidence between NUDT15 c.415C>T variant group and the wild-type group (OR=1.48, 95% CI: 0.23-9.32; P=0.68) (Online Supplementary Figure S2). Nor did a significant difference exist between the
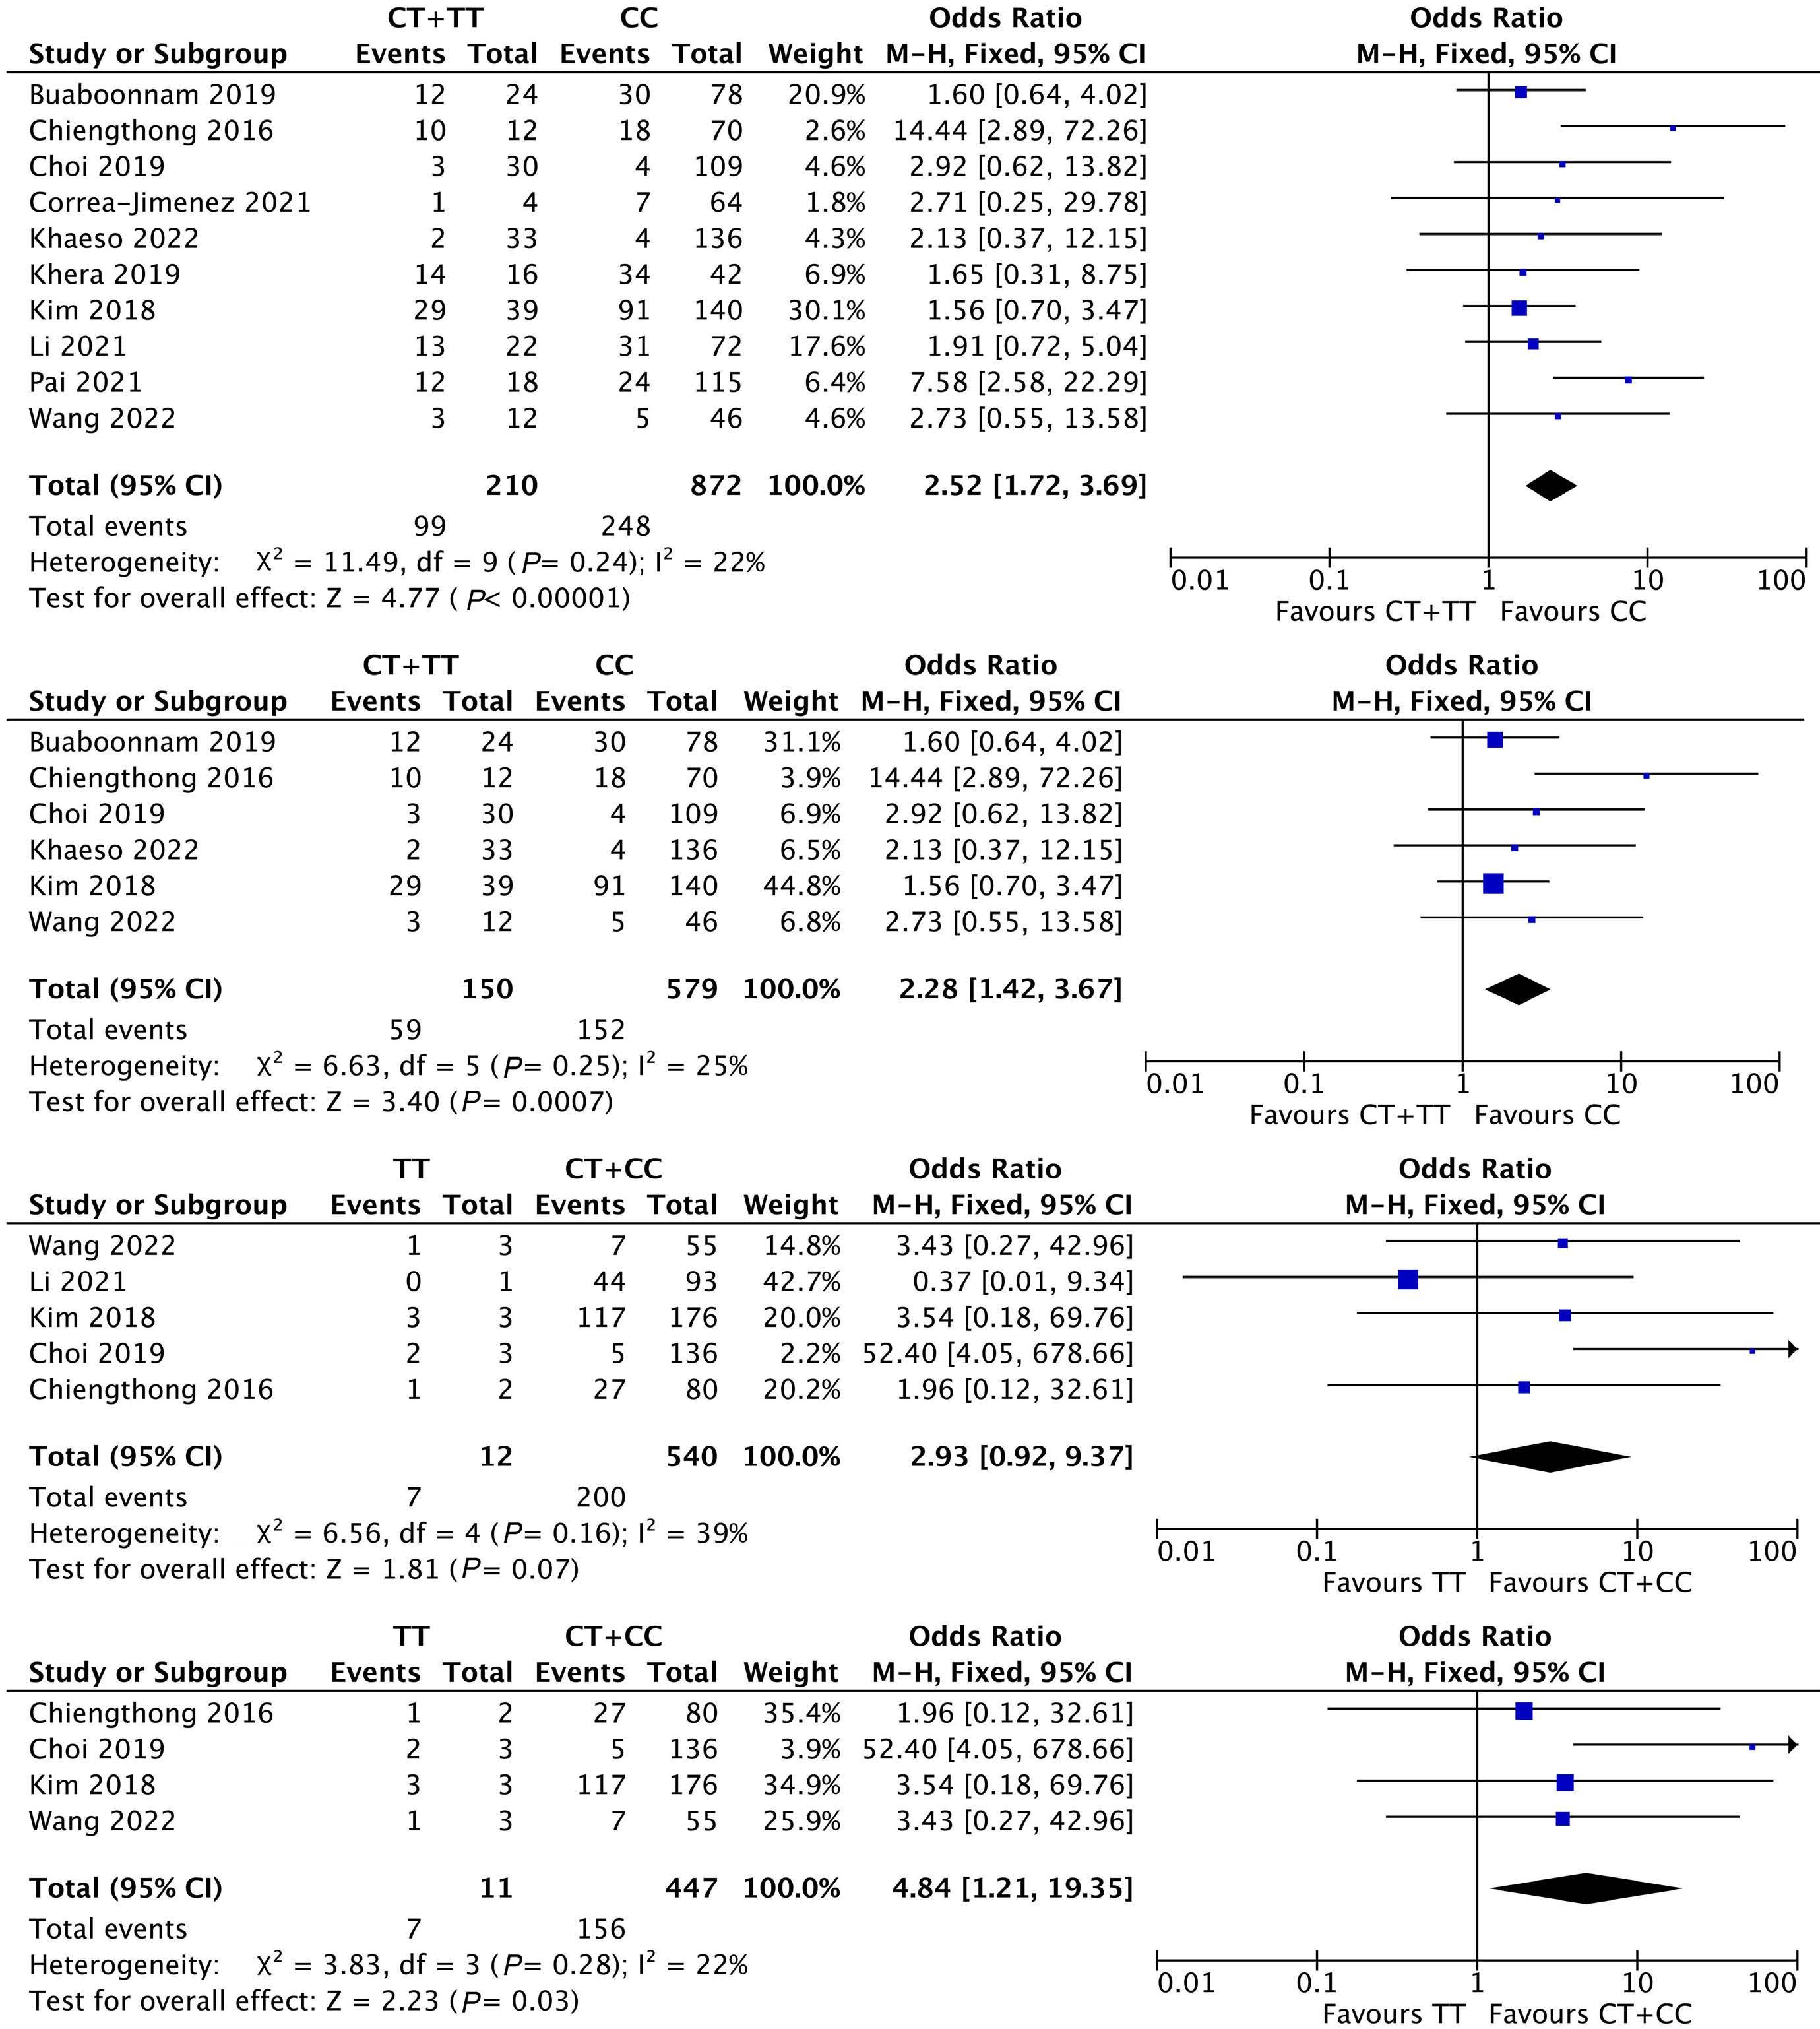
association of NUDT15 c.415C>T polymorphism with occurrence of treatment interruption in the recessive model (OR=1.47, 95% CI: 0.39-5.52; P=0.57) (Figure 5B),40,43,45 which was supported by sensitivity analysis.
Association between NUDT15 gene polymorphism and efficacy of 6-MP
In addition to the above-listed adverse events, we were also concerned about whether the efficacy of 6-MP was
influenced by NUDT15 gene polymorphism. The reported outcomes related to 6-MP’s efficacy included event-free survival (EFS), overall survival (OS), relapse, and death. However, due to the limited studies and unavailable data, we could not evaluate EFS or OS using quantitative meta-analysis. Therefore our meta-analysis was limited to relapse of ALL patients after treatment with 6-MP as an efficacy outcome.
We did not find a pre-existing meta-analysis about the
influence of gene polymorphism on the relapse of ALL patients after treatment with 6-MP. In order to fill this gap, in our research, 603 patients in five studies were involved to compare the events of relapse in NUDT15 c.415C>T variant carriers with wild-type patients.24,36,42,43,49 No significant difference was found in the relapse incidence between two groups (OR=1.20, 95% CI: 0.63-2.27; P =0.58) (Figure 6A), and the sensitivity analysis supported this finding. In addition, two studies with 402 patients
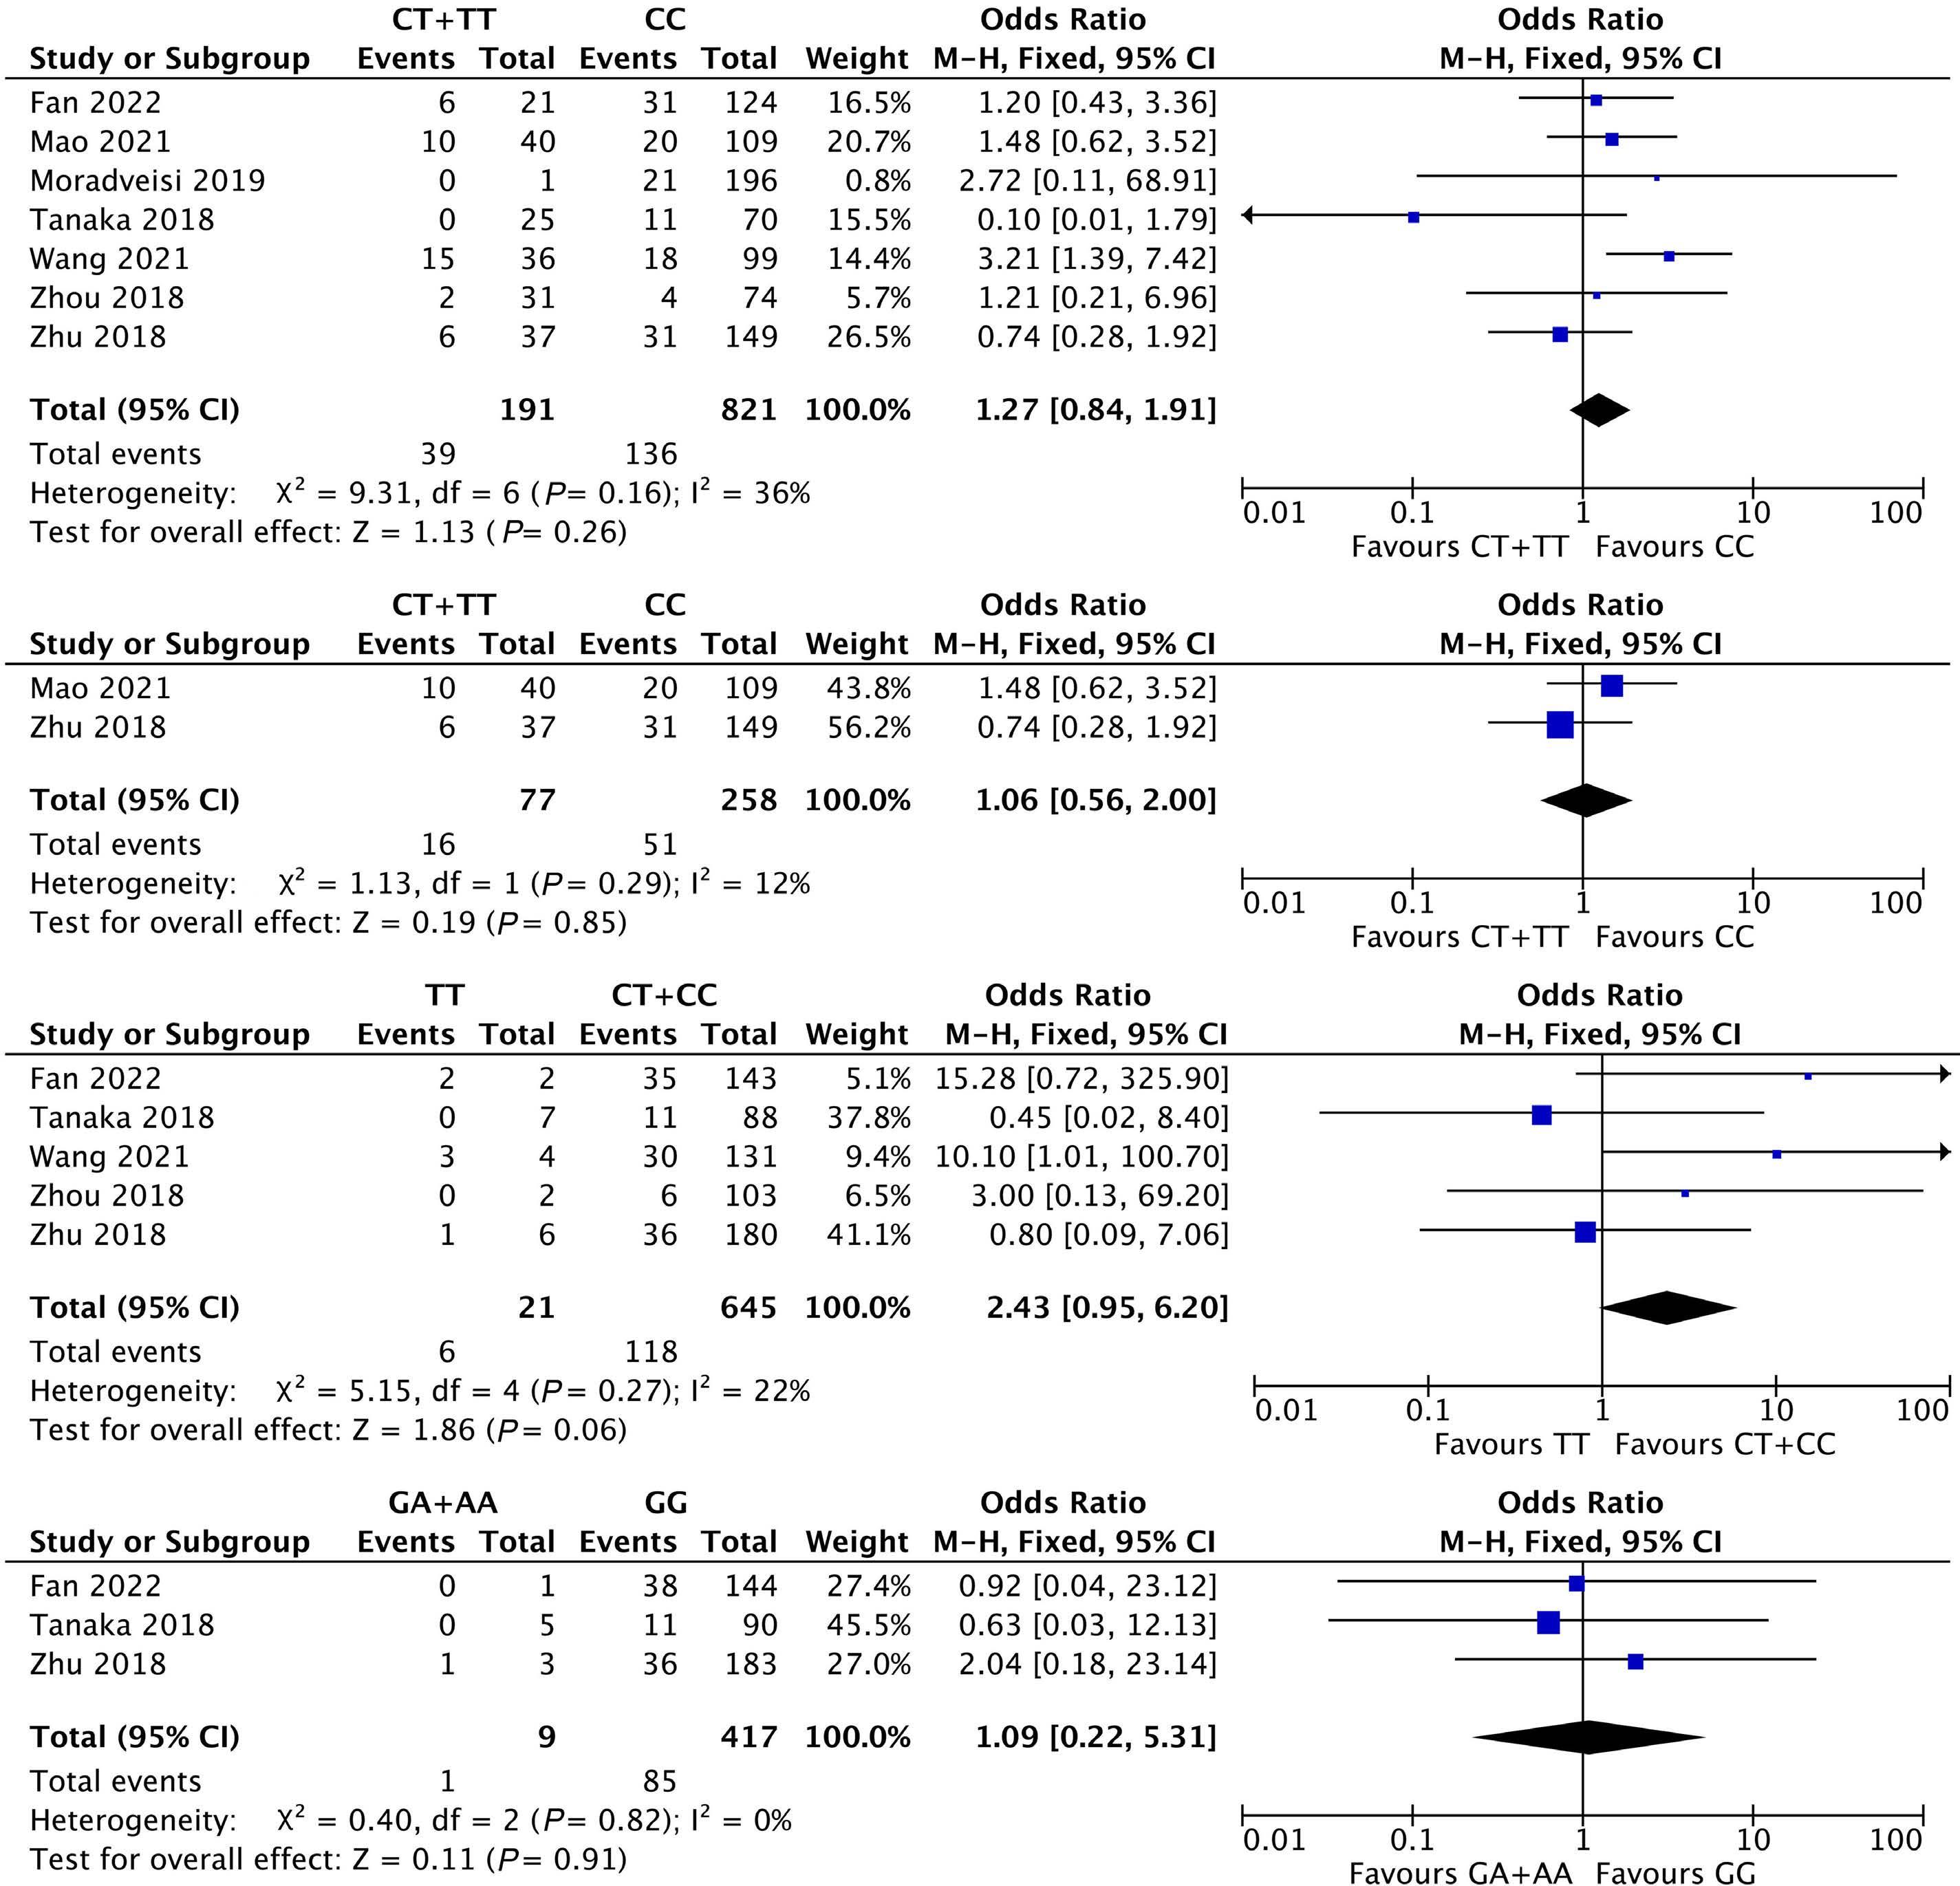
were available for comparing the incidence of relapse in NUDT15 c.415C>T recessive model, and similarly, no significant difference was observed (OR=2.29, 95% CI: 0.44-11.84; P =0.32) (Figure 6B). 36,43
Association between NUDT15 c.415C>T polymorphism and dose of 6-MP
The variants in NUDT15 that can influence 6-MP tolerance in ALL patients have been identified. Nevertheless, there
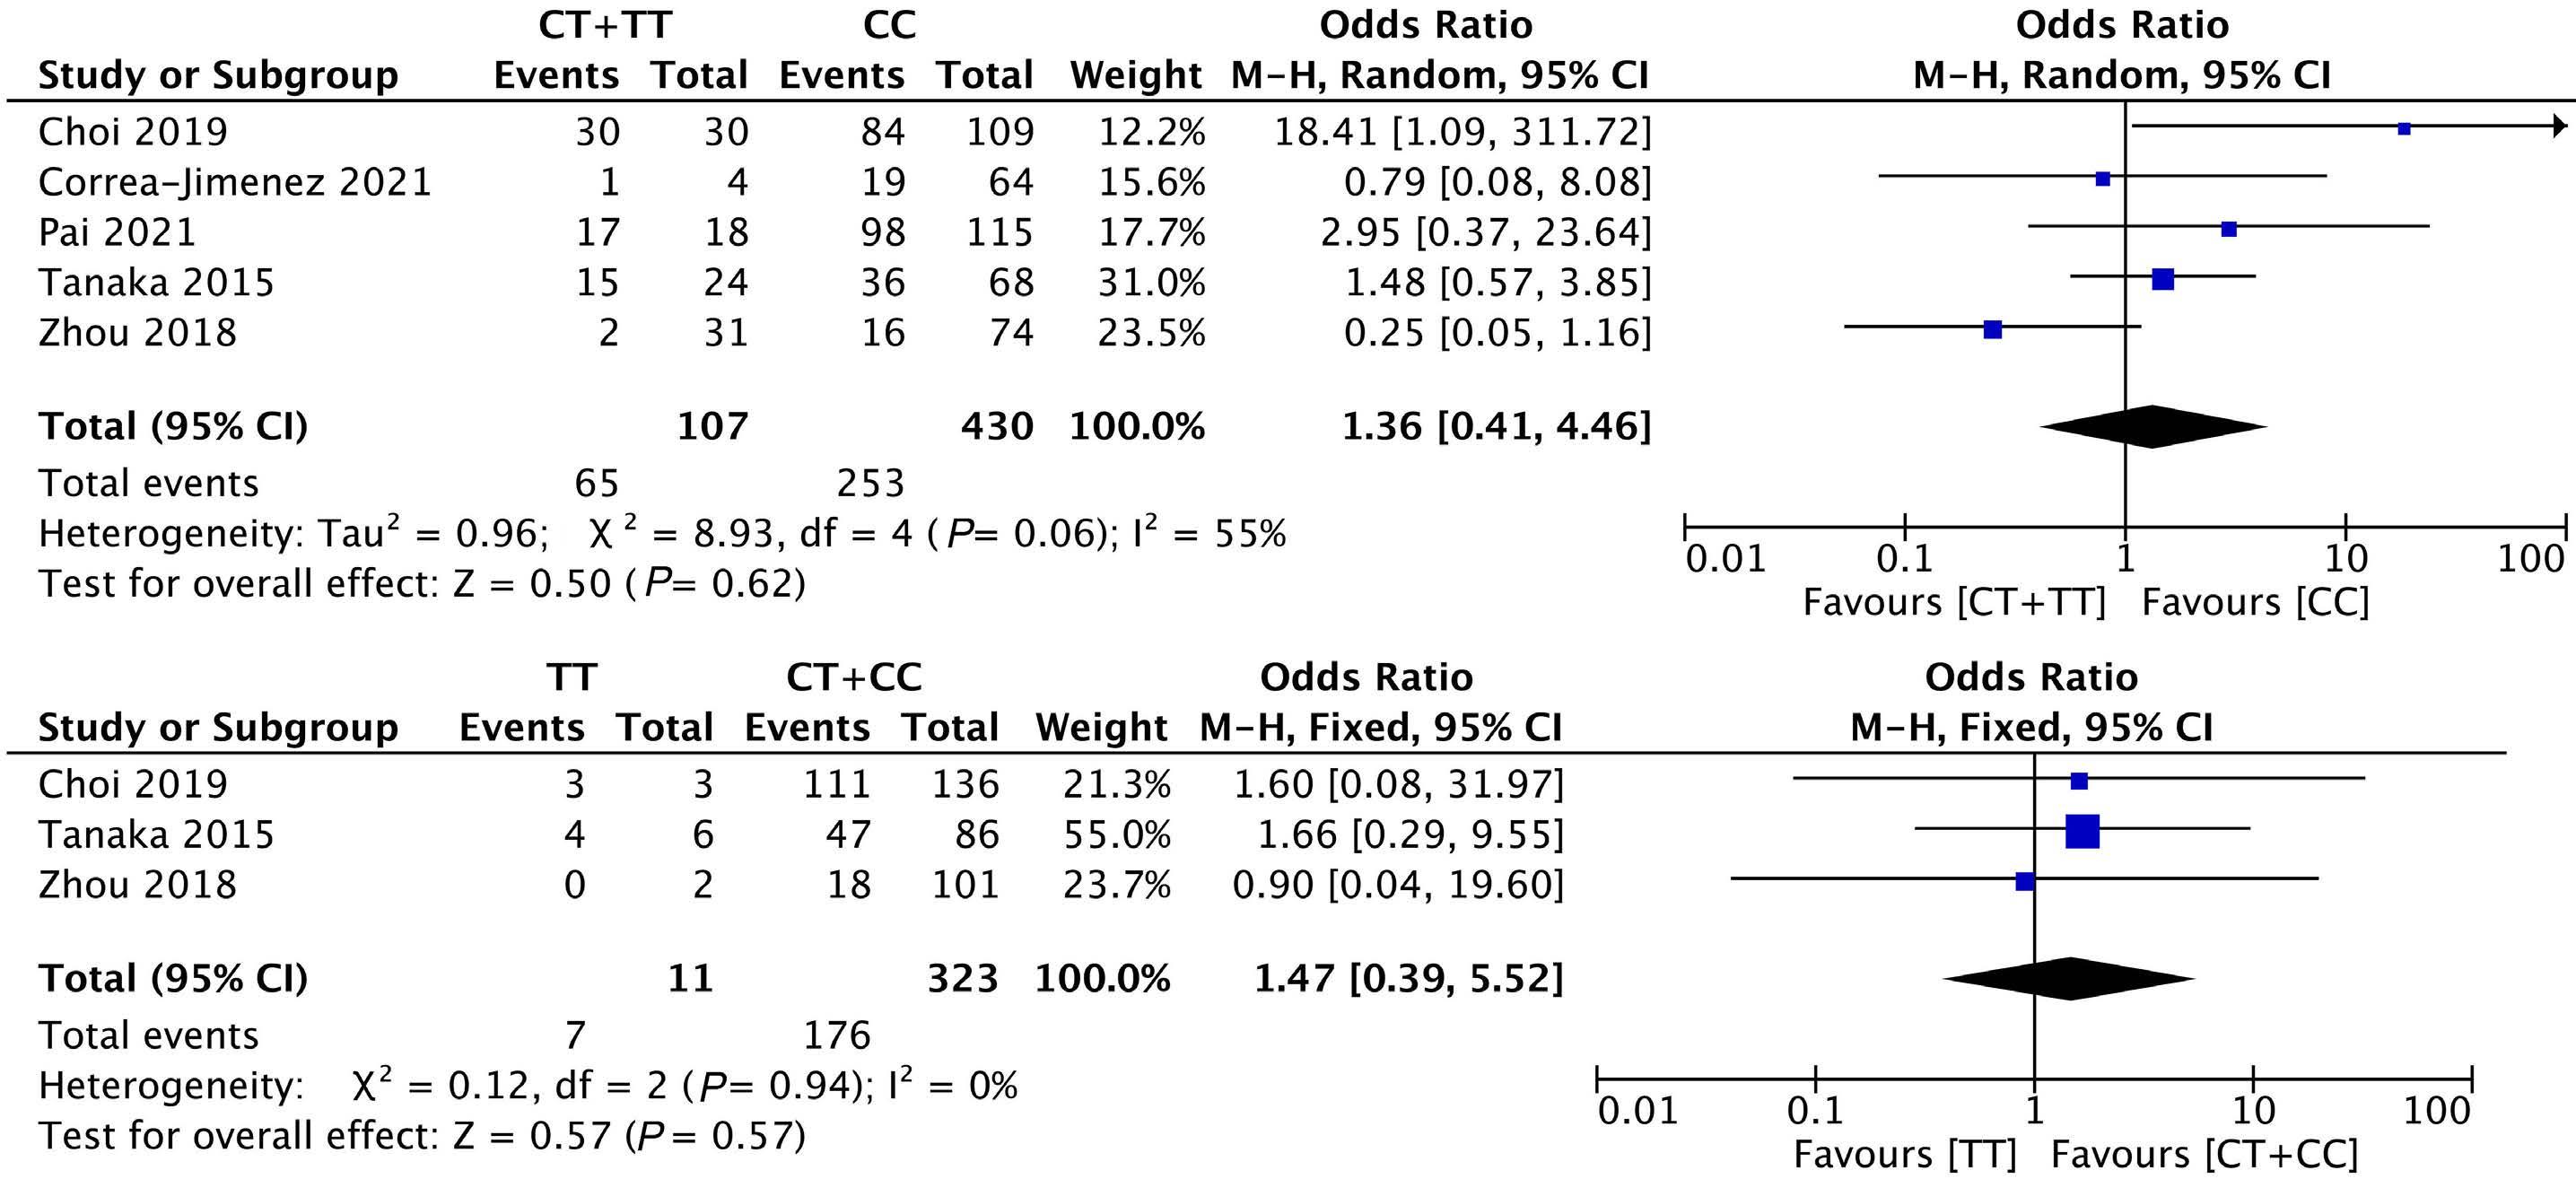
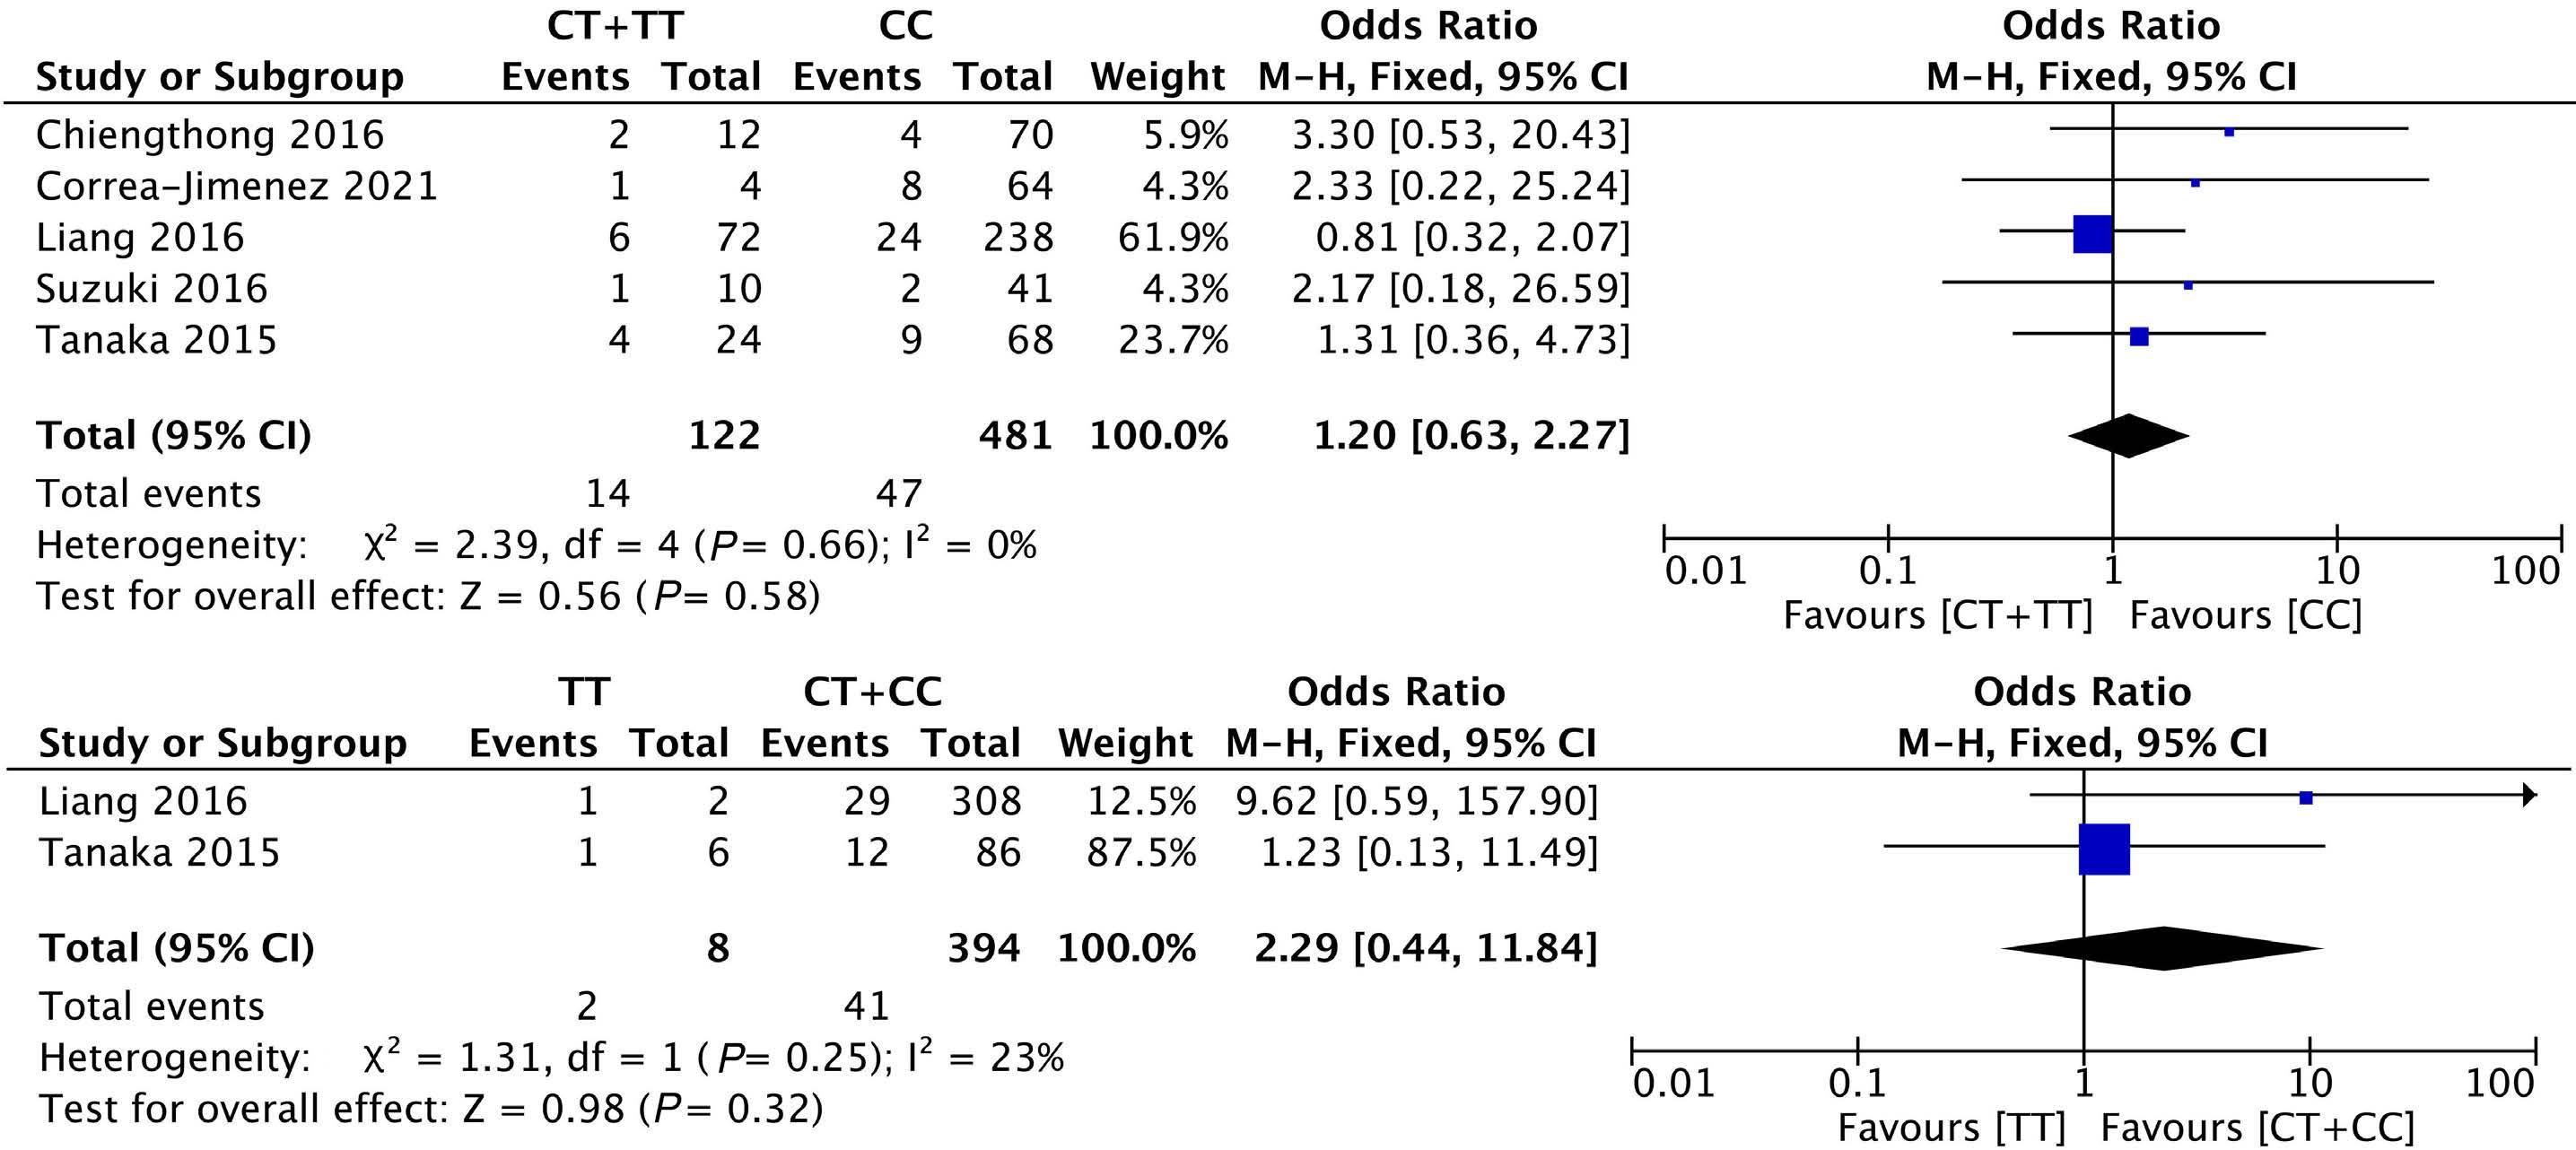
has been no meta-analysis concerning the influence of gene polymorphism on the dosing of 6-MP in ALL. We did a quantitative analysis of the outcome regarding dosing of 6-MP (e.g., dose intensity, tolerable dose) in ALL to make a recommendation for the individualized therapy of 6-MP in ALL in the future.
Dose intensity and intolerant incidence of 6-MP
Dose intensity refers to the ratio of the actual prescribed 6-MP dose by physician to the protocol dose, for the dose of 6-MP would be adjusted because of adverse events or not achieving the target. We assessed potential effects of gene polymorphism on the dose adjustment of 6-MP in ALL. Two articles with 1,109 patients qualified for a meta-analysis about the association between NUDT15 c.415C>T gene polymorphism and dose intensity of 6-MP in ALL,21,47 and one provided two groups of data (1 represents AALL03N1 cohort, another 1 represents St Jude cohorts).21 The dose intensity of 6-MP in ALL patients with one NUDT15 c.415C>T variant
alleles (CT) was 19% less than wild-type patients (CC) (MD: 19.43%, 95% CI: -25.36 to -13.51; P<0.00001) (Figure 7A). Only one study included the dose intensity of patients with two NUDT15 c.415C>T variant alleles (TT) (8.3±7%, N=2),21 so a quantitative meta-analysis of the model (TT vs. CC) was not feasible. Additionally, given that some studies defined 6-MP intolerance as dose intensity <50%, two studies were utilized to compare the risk of 6-MP intolerance between NUDT15 c.415C>T variant carriers and wild-type patients.27,44 We found that the NUDT15 c.415C>T variant group (CT+TT) had a seven-times higher risk of developing 6-MP intolerance compared with the wild-type group (CC) (OR=6.98, 95% CI: 2.83-17.22; P<0.0001) (Figure 7B).
Two studies were included in the meta-analysis to compare the tolerable dose of 6-MP in 112 NUDT15 c.415C>T variant carriers (5 homozygotes and 107 heterozygotes) with 347 wild-type patients.26,36 The initial dose of 6-MP in these
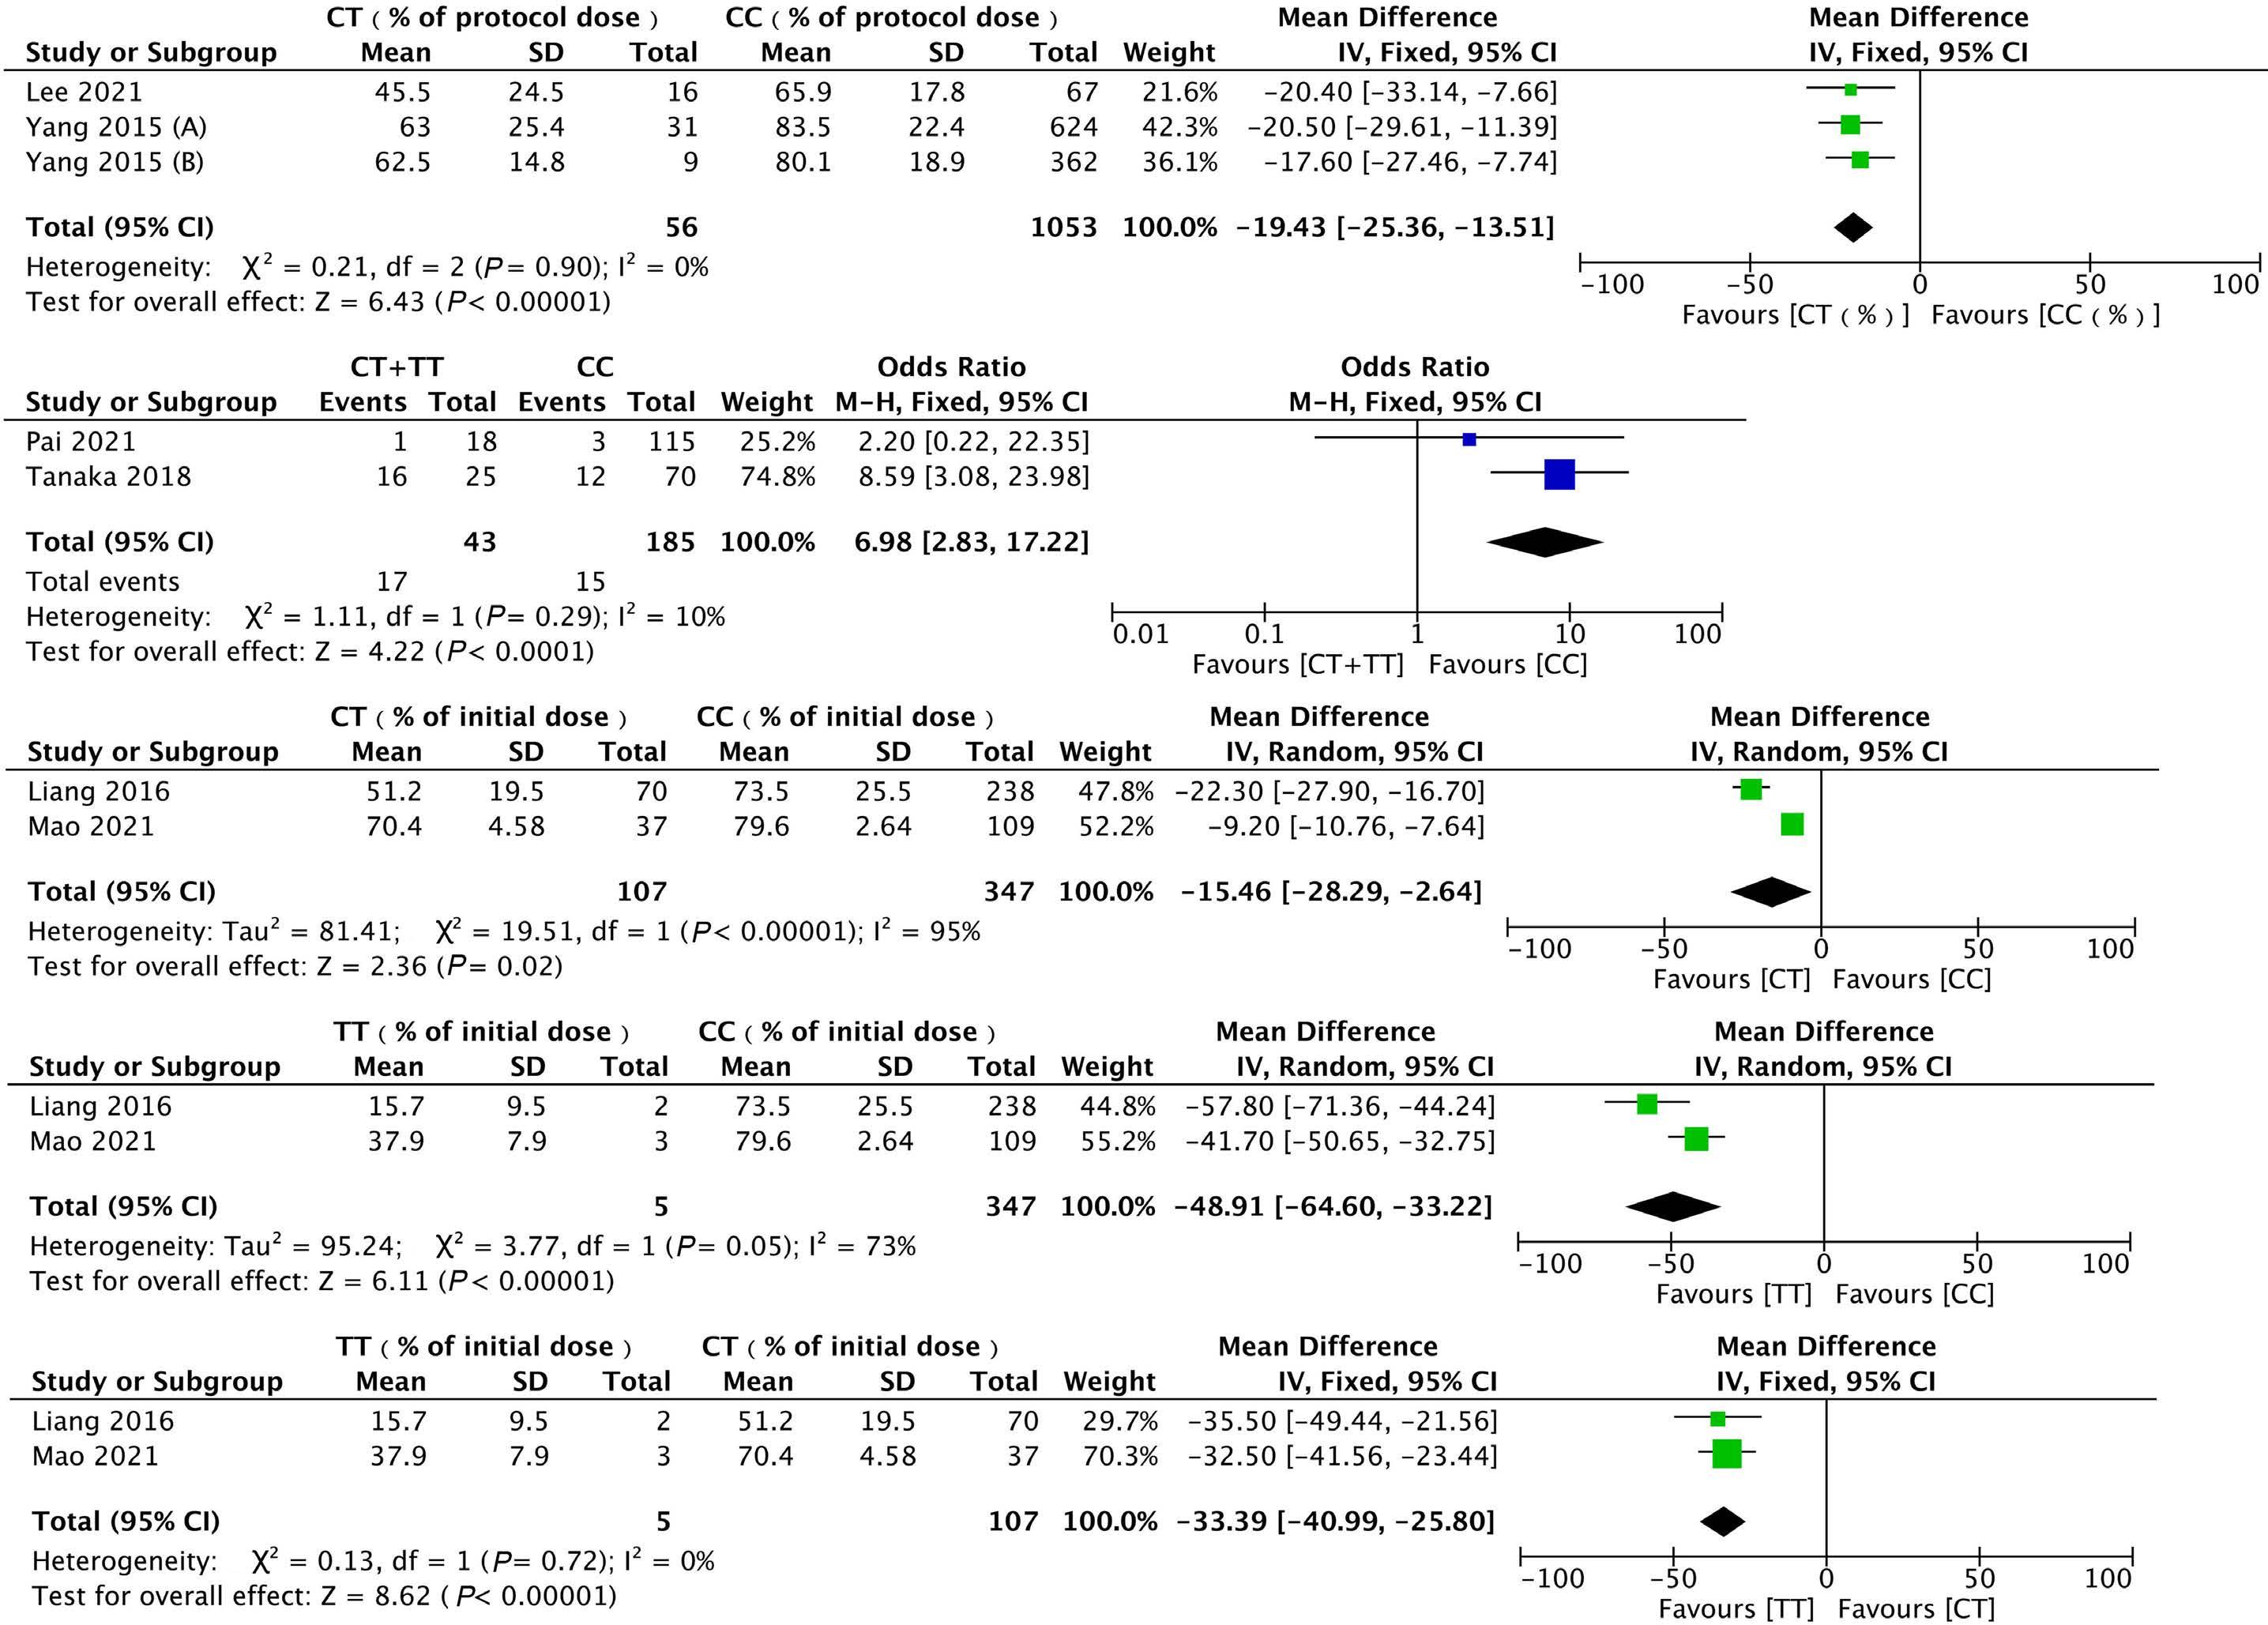
two studies were 50 mg/m2/d and 60 mg/m2/d, respectively. We calculated the ratio of tolerable dose by initial dose as tolerable dose intensity for the purpose of avoiding the influence of the variation in initial dose between the two studies on the pooled results. The tolerable dose intensity of 6-MP in the NUDT15 c.415C>T CC, CT and TT group was 80%, 70% and 38% respectively in Mao’s research,26 while in Liang’s,36 the tolerable dose intensity of 6-MP in the NUDT15 c.415C>T CC, CT and TT group was 74%, 51%, 16% respectively. The meta-analysis suggested that the pooled tolerable dose intensity of 6-MP in the CT group was 15% less than that in the CC group (MD: -15.46%, 95% CI: -28.29 to -2.64; P=0.02) (Figure 7C). Furthermore, the tolerable dose intensity of 6-MP in the TT group was 49% less than the CC group (MD: -48.91%, 95% CI: -64.60 to -33.22; P<0.00001) (Figure 7D). Additionally, we found the tolerable dose intensity of 6-MP in the TT group was 33% less than that in the CT group (MD: -33.39%, 95% CI: -40.99 to -25.80; P<0.00001) (Figure 7E).
6-MP is a commonly used drug for the treatment of ALL, especially in the maintenance phase.53 As known to us, the typical adverse reactions of thiopurines include myelosuppression, hepatotoxicity, hair loss and pancreatitis et al. 54 Variants in TPMT gene, as the most well-known genetic predictor for myelosuppression of thiopurine, can be responsible for merely 25% of the leukopenia cases.55 NUDT15 was identified through a genome-wide association study (GWAS) as a predictor for thiopurine intolerance in children with ALL21 and patients with IBD.22
Our systematic review suggested that NUDT15 c.415C>T polymorphism had a strong relationship with 6-MP induced leukopenia and neutropenia in ALL patients but not with 6-MP induced hepatotoxicity. No strong correlation between NUDT15 c.52G>A polymorphism and 6-MP induced leukopenia or hepatotoxicity was observed. It was demonstrated that NUDT15 c.415C>T was less likely to be a good predictor for the relapse of ALL patients who were treated with 6-MP. Moreover, it was found that the dose intensity and tolerable dose of 6-MP in ALL patients with NUDT15 c.415C>T variant were greatly reduced.
NUDT15 c.415C>T was demonstrated to be a genetic predictor for thiopurine-induced myelosuppression in a variety of diseases such as IBD,56 ALL,21 rheumatoid arthritis,57 neurological diseases,58 and autoimmune hepatitis,59 which was supported by our study as well in ALL patients through meta-analysis. In our review, NUDT15 c.415C>T variant carriers resulted in a 9-fold and 2.5-fold higher risk for leukopenia and neutropenia, respectively. In addition to NUDT15 c.415C>T, 20 variants of NUDT15 gene such as c.52G>A, c.36_37insGGAGTC et al have been reported so far. However, the correlation between NUDT15*5 and NUDT15*6 with thiopurine-related myelosuppression remain contested.50 Our study suggested that the
difference in the risk for 6-MP-associated leukopenia in NUDT15 c.52G>A variant carriers and wild-type patients was not statistically significant. The influence of NUDT15 c.52G>A gene polymorphism on 6-MP-associated leukopenia was less than NUDT15 c.415C>T in our study. This is consistent with the analysis of IBD patients,60 and substantiates NUDT15*5 being classified as uncertain function alleles in the Clinical Implementation Consortium (CPIC) Guidelines.61 Associations of other variants of the NUDT15 gene with 6-MP-induced hematotoxicity were not evaluated in the meta-analysis due to lack of enough studies (N<2).
Hepatotoxicity is another common adverse reaction which always leads to the reduction or interruption of thiopurine. Different studies have inconsistent findings regarding association of NUDT15 polymorphism with 6-MP-induced hepatotoxicity,25,26,39-41,44,52 and the majority of studies fail to find NUDT15 c.415C>T to be a predictor for hepatotoxicity of 6-MP. Some researchers explain that NUDT15 might not affect 6MMPN (6-methyl mercaptopurine nucleotide), which is known as a metabolite of thiopurine associated with hepatotoxicity.62 Other than NUDT15, TPMT*3C rs1142345,63 COMT rs4680,34 and MTHFR rs1801133 variants et al. 64 are identified as genetic predictors of thiopurine-associated hepatoxicity. Possible varying effect magnitudes of these genes in inducing hepatotoxicity leave room for future’s research. The influence of combinational drug, methotrexate (MTX), which is also hepatoxic, should be considered as a confounding factor as well. Though interruption of 6-MP is supposed to be an indication of incidence of serious adverse reaction, our meta-analysis failed to find a significant relationship between NUDT15 c.415C>T polymorphism and interruption of 6-MP. Nevertheless, the high heterogeneity between included studies and the significant greater risk for therapy interruption in NUDT15 c.415C>T variant carriers after excluding Zhou’s research40 showed that the pooled results are subject to change by adding high quality studies in future. We speculated that the cause of this situation may be exclusion of high-risk ALL individuals and different definition of “interruption” in Zhou’s research. Bhatia et al.65 once demonstrated that 6-MP non-adherence led to a high risk of relapse, and variability in TGN levels also contributed to the relapse incidence. The interruption of 6-MP should be avoided to minimize the relapse of ALL, and using NUDT15 genetic testing-guided 6-MP dosing to avoid the treatment interruption of 6-MP is worthy of research.
In addition to investigating the influence of NUDT15 polymorphism on 6-MP-associated adverse reaction, we also wonder if gene polymorphism plays a role on the efficacy of 6-MP in ALL patients. The reported efficacy outcomes of 6-MP in ALL include EFS, OS, relapse, and death.26,27,36,43,48 The rate of relapse in ALL patients appears high in developing countries,66 which relates to a poor prognosis and acts as one of major causes for death.67 Therefore, elucidating the predictor for relapse and preventing its occurrence is important. The higher level of DNA-TG, the downstream metabolite of
MTX/6-MP combination chemotherapy, is found to be correlated with a lower relapse hazard.6,68 As a pharmacogenetic predictor for relapse of ALL, phosphoribosyl pyrophosphate synthetase 1 gene (PRPS1)67,69 and cytosolic 5’-nucleotidase II gene (NT5C2)70,71 are identified as relapse-specific mutations in recent research. In our meta-analysis, no association between NUDT15 c.415C>T polymorphism with relapse risk of ALL was observed. Nishii et al.72 found that DNA-TG was positively correlated with 6-MP dosage regardless of NUDT15 genotype. In their research, 6-MP dose was reduced in NUDT15-deficient patients to achieve a level of DNA-TG comparable to that in wild-type patients and thereby mitigate NUDT15 deficiency-mediated toxicity. Many studies have reported that patients with NUDT15 variants receive lower dose of 6-MP than those harboring wild-type NUDT15 during ALL treatment, and this was supported by our meta-analysis.21,40,43 In conclusion, the similar relapse rate in the NUDT15 group in this study was probably because the 6-MP dose during treatment was adjusted to optimize the exposure of DNA-TG in expectation of preventing 6-MP toxicity. However, this study is limited by the relatively small sample size and short follow-up period, so research with large samples and long follow-up is expected in the future to confirm the effect of NUDT15 on relapse risk. Because of the limited number of relevant studies and some unavailable data, we did not perform a meta-analysis about the association of NUDT15 polymorphism with EFS and OS in the present review. Although all of the above-mentioned studies found no significant difference for OS or EFS among NUDT15 c.415C>T genotypes,26,27,36,43,48 Tanaka et al.43 pointed out a tendency for a worse EFS rate in their study in carriers of NUDT15 c.415C>T variant allele, though explanations were not given. Therefore, further investigating this potential correlation is recommended. Death cases were reported only in two studies, and no significant difference in the incidence of death between the NUDT15 c.415C>T variant group and the wild-type group was observed (Online Supplementary Figure S3).
Pharmacogenomics studies can not only help us identify pharmacogenetic predictors for efficacy and safety of medical treatment, but also aim to provide references for individualizing therapy. NUDT15 variants carriers have a greater risk for developing leukopenia than wild-type patients, and accordingly, dosing of 6-MP based on NUDT15 genotype to avoid the severe adverse reaction and maintain the efficacy is a critical issue. Although CPIC Guidelines gave a recommendation for thiopurine dosing based on TPMT and NUDT15 genotypes, the dosing of 6-MP is not always adjusted according to the guideline in the current clinical practice.73 In addition, the efficacy and safety of 6-MP regimen adjustment also have not yet been verified in clinical use. In this article, we conducted a meta-analysis to compare the pooled dose intensity, tolerable dose of 6-MP in the clinical study of ALL patients who carry NUDT15 variants with wildtype patients, providing a reference for dose adjustment
for NUDT15 variants carriers in clinical practice. Due to the variance in the initial dose of 6-MP in the included studies, it would be preferable to use dose intensity for the dose adjustment of 6-MP, that will give a better idea on how much the dose was reduced. The tolerable dose intensity of 6-MP in ALL patients with NUDT15 c.415C>T homozygote variant (TT) and heterozygote variant (CT) was 49% and 15% less than that of wild-type patients, reminding us patients with NUDT15 c.415C>T homozygote variant (TT) should be much more carefully monitored and 6-MP dose should be greatly reduced.
Former reported meta-analyses seldomly evaluated the association of NUDT15 polymorphism with 6-MP-induced leukopenia in a specific disease,28,29,31,74 except for one which found increased risk for thiopurine-induced leukopenia in IBD patients for NUDT15 c.415C>T (OR=6.90, 95% CI: 5.2-9.1),30 and another one which conducted a subgroup analysis in different diseases and reported a significant association between NUDT15 c.415C>T and leukopenia in ALL patients with only four studies included (OR=13.13, 95% CI:3.43-50.23 for the dominant model).75 The increased risk for 6-MP-induced leukopenia in ALL patients with NUDT15 c.415C>T variants was 9-fold higher than wild-type ones according to our meta-analysis of eight studies with large sample sizes. This increases the reliability of the results in ALL patients. Furthermore, association between NUDT15 polymorphism with neutropenia, hepatotoxicity, treatment interruption, treatment efficacy and dose of 6-MP in ALL patients were also for the first time reported in our meta-analysis. However, there are some limitations in our systematic review. First of all, the majority of included studies are retrospective and the studies regarding dose intensity of 6-MP and tolerable dose of 6-MP are few. Secondly, there is a high heterogeneity between different studies concerning incidence of leukopenia and interruption. This is probably ascribed to inconsistent definition of the outcome such as leukopenia or the difference in the baseline such as the initial dose of 6-MP. Moreover, low representation of a small sample for patients with NUDT15 variants in several studies also contributes to the heterogeneity. Thus, more studies with a larger sample size are expected to further confirm the reliability of the present results. Thirdly, some outcomes were presented in different forms, further limiting the number of comparable studies. For example, a study reported 5-year EFS,48 while another one provided 3-year progression-free survival.27
In conclusion, our meta-analysis showed that NUDT15 c.415C>T was a good predictor for 6-MP-induced myelosuppression in ALL patients, and the dose intensity of 6-MP in ALL patients with NUDT15 c.415C>T variants was much less than in wild-type patients. Although NUDT15 c.415C>T variants carriers might have a higher risk of experiencing treatment interruption and relapse of ALL than wild-type patients, the correlation is not significant in this meta-analysis. Further large prospective studies, which can better evaluate
the association between NUDT15 gene, efficacy, adverse reaction and dose of 6-MP in ALL patients, are encouraged. Additionally, the influence of confounding factors such as other genes (TPMT, inosine triphosphatase [ITPA] et al.) or the combinational drug on efficacy and adverse reactions of 6-MP requires further investigation. The economic stake of pretreatment genetic testing is an important clinical concern. So far, only a few studies have reported cost effectiveness analysis of pretreatment screening for NUDT15-defective alleles when using thiopurines in ALL or IBD patients.73,76 Further prospective studies of genotype-guided dosing of 6-MP with large sample size are needed to assess the efficacy, safety and economic benefits of pretreatment NUDT15 gene testing. It is also of great significance to compare the cost effectiveness of pretreatment NUDT15 c.415C>T testing alone or in combination with other NUDT15 risk alleles or with other genes such as TPMT and ITPA.
Through this systematic review, we provided the following revelations for the clinical practice. Firstly, NUDT15 c.415C>T variants are likely to increase the risk of toxicity of 6-MP in ALL patients. Secondly, the dose intensity and tolerable dose of 6-MP in NUDT15 c.415C>T variant carriers were significantly less than that in wild-type patients, so the dose adjustment of 6-MP during the treatment should be individualized among different NUDT15 genotypes. Thirdly, NUDT15 genotype did not affect the relapse of ALL based on the current research.
No conflicts of interest to disclose.
1. Al Ustwani O, Gupta N, Bakhribah H, Griffiths E, Wang E, Wetzler M. Clinical updates in adult acute lymphoblastic leukemia. Crit Rev Oncol Hematol. 2016;99:189-199.
2. Pui CH, Robison LL, Look AT. Acute lymphoblastic leukaemia. Lancet. 2008;371(9617):1030-1043.
3. Inaba H, Mullighan CG. Pediatric acute lymphoblastic leukemia. Haematologica. 2020;105(11):2524-2539.
4 Ma H, Sun H, Sun X. Survival improvement by decade of patients aged 0-14 years with acutelymphoblastic leukemia: a SEER analysis. Sci Rep. 2014;4:4227.
5. Teachey DT, Hunger SP, Loh ML. Optimizing therapy in the modern age: differences in length of maintenance therapy in acute lymphoblastic leukemia. Blood. 2021;137(2):168-177.
6. Toksvang LN, Lee SHR, Yang JJ, Schmiegelow K. Maintenance therapy for acute lymphoblastic leukemia: basic science and clinical translations. Leukemia. 2022;36(7):1749-1758.
7 Mei L, Ontiveros EP, Griffiths EA, Thompson JE, Wang ES, Wetzler M. Pharmacogenetics predictive of response and toxicity in acute lymphoblastic leukemia therapy. Blood Rev. 2015;29(4):243-249.
8. Schmiegelow K, Nielsen SN, Frandsen TL, Nersting J. Mercaptopurine/Methotrexate maintenance therapy of childhood
SD and JLC conceived the study. SD, XFH and XH performed literature search. SD, XFH, XXL and JLC performed article selection, data extraction and analysis. SD and XFH wrote the manuscript draft. JLC, XXL, MM, MC, XH and HKS provided guidance on the methodology. SD, XFH, JLC, XXL, XH, MM, MC, RZ and ZYL edited the manuscript. SD, JLC and XXL funded the study. All authors approved final version of the article.
Dr. Tianjing Liao offered us valuable help with manuscript editing.
This study was supported by Talent Youth Fund of Sichuan Provincial People’s Hospital (2022QN22), Personalized Drug Therapy Key Laboratory of Sichuan Province (2021YB04), Research Fund for the Doctoral Program of Sichuan Academy of Medical Sciences and Sichuan Provincial People’s Hospital (2015BS04), the Science and Technology Project of Health and Family Planning Commission of Sichuan Province (19PJ269), National Natural Science Foundation of China (82101163), Department of Science and Technology of Sichuan Province of China (2021YFS0387,2021YFS0388) and Clinical Research Foundation of Sichuan Provincial People’s Hospital (2021LY23).
All original data of our study are included in the manuscript and Online Supplementary Material. The Online Supplementary Material can be found with the online version of this article. The protocol for this systematic review was registered on PROSPERO.
acute lymphoblastic leukemia: clinical facts and fiction. J Pediatr Hematol Oncol. 2014;36(7):503-517.
9 Ebbesen MS, Nersting J, Jacobsen JH, et al. Incorporation of 6-thioguanine nucleotides into DNA during maintenance therapy of childhood acute lymphoblastic leukemia-the influence of thiopurine methyltransferase genotypes. J Clin Pharmacol. 2013;53(6):670-674.
10 Fotoohi AK, Coulthard SA, Albertioni F. Thiopurines: factors influencing toxicity and response. Biochem Pharmacol. 2010;79(9):1211-1220.
11. Kakuta Y, Kinouchi Y, Shimosegawa T. Pharmacogenetics of thiopurines for inflammatory bowel disease in East Asia: prospects for clinical application of NUDT15 genotyping. J Gastroenterol. 2018;53(2):172-180.
12. Evans WE, Hon YY, Bomgaars L, et al. Preponderance of thiopurine S-methyltransferase deficiency and heterozygosity among patients intolerant to mercaptopurine or azathioprine. J Clin Oncol. 2001;19(8):2293-2301.
13. Lennard L, Lilleyman JS, Van Loon J, Weinshilboum RM. Genetic variation in response to 6-mercaptopurine for childhood acute lymphoblastic leukaemia. Lancet. 1990;336(8709):225-229.
14 Relling MV, Hancock ML, Rivera GK, et al. Mercaptopurine therapy intolerance and heterozygosity at the thiopurine S-methyltransferase gene locus. J Natl Cancer Inst. 1999;91(23):2001-2008.
15. Relling MV, Gardner EE, Sandborn WJ, et al. Clinical pharmacogenetics implementation consortium guidelines for thiopurine methyltransferase genotype and thiopurine dosing: 2013 update. Clin Pharmacol Ther. 2013;93(4):324-325.
16. Schmiegelow K, Forestier E, Kristinsson J, et al. Thiopurine methyltransferase activity is related to the risk of relapse of childhood acute lymphoblastic leukemia: results from the NOPHO ALL-92 study. Leukemia. 2009;23(3):557-564.
17 Collie-Duguid ES, Pritchard SC, Powrie RH, et al. The frequency and distribution of thiopurine methyltransferase alleles in Caucasian and Asian populations. Pharmacogenetics. 1999;9(1):37-42
18. Bhatia S, Landier W, Hageman L, et al. 6MP adherence in a multiracial cohort of children with acute lymphoblastic leukemia: a Children’s Oncology Group study. Blood. 2014;124(15):2345-2353.
19 Takatsu N, Matsui T, Murakami Y, et al. Adverse reactions to azathioprine cannot be predicted by thiopurine S-methyltransferase genotype in Japanese patients with inflammatory bowel disease. J Gastroenterol Hepatol. 2009;24(7):1258-1264.
20 Moriyama T, Nishii R, Perez-Andreu V, et al. NUDT15 polymorphisms alter thiopurine metabolism and hematopoietic toxicity. Nat Genet. 2016;48(4):367-373.
21. Yang JJ, Landier W, Yang W, et al. Inherited NUDT15 variant is a genetic determinant of mercaptopurine intolerance in children with acute lymphoblastic leukemia. J Clin Oncol. 2015;33(11):1235-1242.
22. Yang SK, Hong M, Baek J, et al. A common missense variant in NUDT15 confers susceptibility to thiopurine-induced leukopenia. Nature Genet. 2014;46(9):1017-1020.
23. Singh M, Bhatia P, Khera S, Trehan A. Emerging role of NUDT15 polymorphisms in 6-mercaptopurine metabolism and dose related toxicity in acute lymphoblastic leukaemia. Leuk Res. 2017;62:17-22.
24. Correa-Jimenez O, Yunis JJ, Linares-Ballesteros A, SarmientoUrbina I. Susceptibility to thiopurine toxicity by TPMT and NUDT15 variants in Colombian children with acute lymphoblastic leukemia. Colomb Med (Cali). 2021;52(3):e2074569.
25. Fan POL, Leung KT, Chan KYY, et al. ABCC4, ITPA, NUDT15, TPMT and their interaction as genetic predictors of 6-mercaptopurine intolerance in chinese patients with acute lymphoblastic leukemia. Pediatr Hematol Oncol. 2022;39(3):254-266.
26. Mao XY, Yin RX, Sun GY, et al. Effects of TPMT, NUDT15, and ITPA genetic variants on 6-mercaptopurine toxicity for pediatric patients with acute lymphoblastic leukemia in Yunnan of China. Front Pediatr. 2021;9:719803.
27. Pai AA, Mohan A, Benjamin ESB, et al. NUDT15 c.415C>T polymorphism predicts 6-MP induced early myelotoxicity in patients with acute lymphoblastic leukemia undergoing maintenance therapy. Pharmgenomics Pers Med. 2021;14:1303-1313.
28. Cargnin S, Genazzani AA, Canonico PL, Terrazzin S. Diagnostic accuracy of NUDT15 gene variants for thiopurine-induced leukopenia: a systematic review and meta-analysis. Pharmacol Res. 2018;135:102-111.
29. Khaeso K, Udayachalerm S, Komvilaisak P, et al. Meta-analysis of NUDT15 genetic polymorphism on thiopurine-induced myelosuppression in Asian populations. Front Pharmacol.
2021;12:784712.
30. van Gennep S, Konté K, Meijer B, et al. Systematic review with meta-analysis: risk factors for thiopurine-induced leukopenia in IBD. Aliment Pharmacol Ther. 2019;50(5):484-506.
31. Wang R, Liu B, Li J, et al. Association between the c.415C>T, c.52G>A, and 36_37insGGAGTC polymorphisms of NUDT 15 and thiopurine-induced leukopenia, thiopurine intolerance, and severe hair loss: an updated meta-analysis. Drug Des Devel Ther. 2019;13:2729-2744.
32. Moher D, Liberati A, Tetzlaff J, Altman DG, Group P. Preferred reporting items for systematic reviews and meta-analyses: the PRISMA statement. PLoS Med. 2009;6(7):e1000097.
33. Wells GA, Shea B, O’Connell D, et al. The Newcastle-Ottawa Scale (NOS) for assessing the quality of nonrandomized studies in meta-analyses. 2009. https://www.ohri.ca/programs/clinical_ epidemiology/oxford.asp. Accessed on Jan 15, 2023.
34. Cao M, Yin D, Qin Y, et al. Screening of novel pharmacogenetic candidates for mercaptopurine-induced toxicity in patients with acute lymphoblastic leukemia. Front Pharmacol. 2020;11:267.
35. Li H, Shen J, Ru Y, Tu C, Li Y, Ren D. Association between rs116855232 gene polymorphisms and mercaptopurine-induced adverse reactions in children with acute lymphoblastic leukemia. Chin J Pharmacoepidemiol. 2021;30(9):596-600.
36. Liang DC, Yang CP, Liu HC, et al. NUDT15 gene polymorphism related to mercaptopurine intolerance in Taiwan Chinese children with acute lymphoblastic leukemia. Pharmacogenomics J. 2016;16(6):536-539.
37. Liu JW, X. Association between polymorphism of NDUT15 gene and leucopenia induced by 6-mercaptopurine in children with acute lymphoblastic leukemia. J Clin Pediatr. 2018;36(2):113-116.
38. Wang J, Wang X, Hao G, Cheng Y, Lu H, Suo T. Relationship between NUDT15 gene polymorphism and tolerance to treatment with 6-mercaptopurinein children with acute lymphoblastic leukemia. J Leuk Lymphoma. 2022;31(5):286-289.
39 Wang X, Wang W. Association between polymorphism of NUDT15 gene and hepatotoxicity induced by 6-MP in children with acute lymphoblastic leukemia. Chin J Med Genet. 2021;38(12):1258-1261.
40. Zhou H, Li L, Yang P, et al. Optimal predictor for 6-mercaptopurine intolerance in Chinese children with acute lymphoblastic leukemia: NUDT15, TPMT, or ITPA genetic variants? BMC Cancer. 2018;18(1):516.
41. Zhu Y, Yin D, Su Y, et al. Combination of common and novel rare NUDT15 variants improves predictive sensitivity of thiopurineinduced leukopenia in children with acute lymphoblastic leukemia. Haematologica. 2018;103(7):e293-e295.
42. Suzuki H, Fukushima H, Suzuki R, et al. Genotyping NUDT15 can predict the dose reduction of 6-MP for children with acute lymphoblastic leukemia especially at a preschool age. J Hum Genet. 2016;61(9):797-801.
43. Tanaka Y, Kato M, Hasegawa D, et al. Susceptibility to 6-MP toxicity conferred by a NUDT15 variant in Japanese children with acute lymphoblastic leukaemia. Br J Haematol. 2015;171(1):109-115.
44. Tanaka Y, Nakadate H, Kondoh K, Nakamura K, Koh K, Manabe A. Interaction between NUDT15 and ABCC4 variants enhances intolerability of 6-mercaptopurine in Japanese patients with childhood acute lymphoblastic leukemia. Pharmacogenomics J. 2018;18(2):275-280.
45. Choi R, Sohn I, Kim MJ, et al. Pathway genes and metabolites in thiopurine therapy in Korean children with acute lymphoblastic leukaemia. Br J Clin Pharmacol. 2019;85(7):1585-1597.
46. Kim H, Seo H, Park Y, et al. APEX1 polymorphism and
mercaptopurine-related early onset neutropenia in pediatric acute lymphoblastic leukemia. Cancer Res Treat. 2018;50(3):823-834.
47. Lee JM, Shim YJ, Kim DH, Jung N, Ha JS. The effect of NUDT15, TPMT, APEX1, and ITPA genetic variations on mercaptopurine treatment of pediatric acute lymphoblastic leukemia. Children (Basel). 2021;8(3):224.
48. Buaboonnam J, Sripatanatadasakul P, Treesucon A, et al. Effect of NUDT15 on incidence of neutropenia in children with acute lymphoblastic leukemia. Pediatr Int. 2019;61(8):754-758.
49. Chiengthong K, Ittiwut C, Muensri S, et al. NUDT15 c.415C>T increases risk of 6-mercaptopurine induced myelosuppression during maintenance therapy in children with acute lymphoblastic leukemia. Haematologica. 2016;101(1):e24-26.
50 Khaeso K, Komvilaisak P, Chainansamit SO, et al. NUDT15 is a key genetic factor for prediction of hematotoxicity in pediatric patients who received a standard low dosage regimen of 6-mercaptopurine. Drug Metab Pharmacokinet. 2022;43:100436.
51. Khera S, Trehan A, Bhatia P, Singh M, Bansal D, Varma N. Prevalence of TPMT, ITPA and NUDT 15 genetic polymorphisms and their relation to 6MP toxicity in north Indian children with acute lymphoblastic leukemia. Cancer Chemother Pharmacol. 2019;83(2):341-348.
52. Moradveisi B, Muwakkit S, Zamani F, Ghaderi E, Mohammadi E, Zgheib NK. ITPA, TPMT, and NUDT15 genetic polymorphisms predict 6-mercaptopurine toxicity in Middle Eastern children with acute lymphoblastic leukemia. Front Pharmacol. 2019;10:916.
53. Brown PA, Shah B, Advani A, et al. Acute lymphoblastic leukemia, Version 2.2021, NCCN clinical practice guidelines in oncology. J Natl Compr Canc Netw. 2021;19(9):1079-1109.
54 Tanaka Y, Saito Y. Importance of NUDT15 polymorphisms in thiopurine treatments. J Pers Med. 2021;11(8):778.
55. Broekman M, Coenen MJH, Wanten GJ, et al. Risk factors for thiopurine-induced myelosuppression and infections in inflammatory bowel disease patients with a normal TPMT genotype. Aliment Pharmacol Ther. 2017;46(10):953-963.
56. Kojima Y, Hirotsu Y, Omata W, et al. Influence of NUDT15 variants on hematological pictures of patients with inflammatory bowel disease treated with thiopurines. World J Gastroenterol. 2018;24(4):511-518.
57 Tsuchiya A, Aomori T, Sakamoto M, et al. Effect of genetic polymorphisms of azathioprine-metabolizing enzymes on response to rheumatoid arthritis treatment. Pharmazie. 2017;72(1):22-28.
58. Kim SY, Shin JH, Park JS, et al. NUDT15 p.R139C variant is common and strongly associated with azathioprine-induced early leukopenia and severe alopecia in Korean patients with various neurological diseases. J Neurol Sci. 2017;378:64-68.
59 Fan X, Yin D, Men R, Xu H, Yang L. NUDT15 polymorphism confer increased susceptibility to thiopurine-induced leukopenia in patients with autoimmune hepatitis and related cirrhosis. Front Pharmacol. 2019;10:346.
60 Sato T, Takagawa T, Kakuta Y, et al. NUDT15, FTO, and RUNX1 genetic variants and thiopurine intolerance among Japanese patients with inflammatory bowel diseases. Intest Res. 2017;15(3):328-337.
61. Relling MV, Schwab M, Whirl-Carrillo M, et al. Clinical
pharmacogenetics implementation consortium guideline for thiopurine dosing based on TPMT and NUDT15 genotypes: 2018 update. Clin Pharmacol Ther. 2019;105(5):1095-1105.
62. Nygaard U, Toft N, Schmiegelow K. Methylated metabolites of 6-mercaptopurine are associated with hepatotoxicity. Clin Pharmacol Ther. 2004;75(4):274-281.
63. Hao QS, Wang Z, Fang QY, et al. Effect of genetic polymorphism of TPMT and NUDT15 on the tolerance of 6-mercaptopurine therapy in adult acute lymphoblastic leukemia. Chin J Hematol. 2021;42(11):911-916.
64. Zhou Y, Wang L, Zhai XY, et al. Precision therapy of 6-mercaptopurine in Chinese children with acute lymphoblastic leukaemia. Br J Clin Pharmacol. 2020;86(8):1519-1527.
65. Bhatia S, Landier W, Hageman L, et al. Systemic exposure to thiopurines and risk of relapse in children with acute lymphoblastic leukemia: a children’s oncology group study. JAMA Oncol. 2015;1(3):287-295.
66. Li B, Brady SW, Ma X, et al. Therapy-induced mutations drive the genomic landscape of relapsed acute lymphoblastic leukemia. Blood. 2020;135(1):41-55.
67. Li B, Li H, Bai Y, et al. Negative feedback-defective PRPS1 mutants drive thiopurine resistance in relapsed childhood ALL. Nat Med. 2015;21(6):563-571.
68. Nielsen SN, Toksvang LN, Grell K, et al. No association between relapse hazard and thiopurine methyltransferase geno- or phenotypes in non-high risk acute lymphoblastic leukemia: a NOPHO ALL2008 sub-study. Cancer Chemother Pharmacol. 2021;88(2):271-279.
69 Mullighan CG. Mutant PRPS1: a new therapeutic target in relapsed acute lymphoblastic leukemia. Nat Med. 2015;21(6):553-554.
70. Dieck CL, Tzoneva G, Forouhar F, et al. Structure and mechanisms of NT5C2 mutations driving thiopurine resistance in relapsed lymphoblastic leukemia. Cancer Cell. 2018;34(1):136-147.e6.
71. Somazu S, Tanaka Y, Tamai M, et al. NUDT15 polymorphism and NT5C2 and PRPS1 mutations influence thiopurine sensitivity in acute lymphoblastic leukaemia cells. J Cell Mol Med. 2021;25(22):10521-10533.
72. Nishii R, Moriyama T, Janke LJ, et al. Preclinical evaluation of NUDT15-guided thiopurine therapy and its effects on toxicity and antileukemic efficacy. Blood. 2018;131(22):2466-2474.
73. Wei X, Zhuang J, Li N, et al. NUDT15 genetic testing-guided 6-mercaptopurine dosing in children with ALL likely to be costsaving in China. Int J Hematol. 2022;115(2):278-286.
74. Jena A, Jha DK, Kumar-M P, et al. Prevalence of polymorphisms in thiopurine metabolism and association with adverse outcomes: a South Asian region-specific systematic review and meta-analysis. Expert Rev Clin Pharmacol. 2021;14(4):491-501.
75. Liu Y, Meng Y, Wang L, Liu Z, Li J, Dong W. Associations between the NUDT15 R139C polymorphism and susceptibility to thiopurine-induced leukopenia in Asians: a meta-analysis. Onco Targets Ther. 2018;11:8309-8317.
76. Chang JY, Park SJ, Jung ES, et al. Genotype-based treatment with thiopurine reduces incidence of myelosuppression in patients with inflammatory bowel diseases. Clin Gastroenterol Hepatol. 2020;18(9):2010-2018.
Luca Gasparoli,1 Clemence Virely,1 Alexia Tsakaneli,1 Noelia Che,1 Darren Edwards,2 Jack Bartram,2 Michael Hubank,3 Deepali Pal,4 Olaf Heidenreich,5 Joost H.A. Martens,6 Jasper de Boer1 and Owen Williams1
1Cancer Section, Developmental Biology and Cancer Department, UCL Great Ormond Street Institute of Child Health, London, UK; 2Department of Pediatric Hematology, Great Ormond Street Hospital for Children, London, UK; 3Center for Molecular Pathology, The Royal Marsden, Sutton, UK; 4Department of Applied Sciences, Northumbria University, Newcastle upon Tyne, UK; 5Princess Maxima Center for Pediatric Oncology, Utrecht, the Netherlands and 6Department of Molecular Biology, Faculty of Science, Radboud Institute for Molecular Life Sciences, Radboud University, Nijmegen, the Netherlands
Correspondence: O. Williams
owen.williams@ucl.ac.uk
Received: May 25, 2023.
Accepted: September 27, 2023.
Early view: October 5, 2023.
https://doi.org/10.3324/haematol.2023.283613
Published under a CC BY license
Advances in the clinical management of pediatric B-cell acute lymphoblastic leukemia (B-ALL) have dramatically improved outcomes for this disease. However, relapsed and high-risk disease still contribute to significant numbers of treatment failures. Development of new, broad range therapies is urgently needed for these cases. We previously reported the susceptibility of ETV6-RUNX1+ pediatric B-ALL to inhibition of signal transducer and activator of transcription 3 (STAT3) activity. In the present study, we demonstrate that pharmacological or genetic inhibition of STAT3 results in p53 induction and that CRISPR-mediated TP53 knockout substantially reverses susceptibility to STAT3 inhibition. Furthermore, we demonstrate that sensitivity to STAT3 inhibition in patient-derived xenograft (PDX) B-ALL samples is not restricted to any particular disease subtype, but rather depends on TP53 status, the only resistant samples being TP53 mutant. Induction of p53 following STAT3 inhibition is not directly dependent on MDM2 but correlates with degradation of MDM4. As such, STAT3 inhibition exhibits synergistic in vitro and in vivo anti-leukemia activity when combined with MDM2 inhibition. Taken together with the relatively low frequency of TP53 mutations in this disease, these data support the future development of combined STAT3/ MDM2 inhibition in the therapy of refractory and relapsed pediatric B-ALL.
Pediatric leukemia accounts for up to a fifth of all cancer deaths in children. Acute lymphoblastic leukemia (ALL) comprises half of these cases, despite the success of modern chemotherapy and risk stratification. Failure of therapy in pediatric ALL is due to refractory and relapsed disease, as well as the toxicity of the chemotherapy itself.1 There is, therefore, an unmet clinical need that may be addressed by focusing on inhibition of oncogenic pathways required for leukemia maintenance across a broad range of disease subtypes. Targeting susceptibilities retained in relapsed leukemia is particularly relevant in this context.
Cancer cells often exhibit an exaggerated dependence upon normal cellular signaling pathways. Identification of such pathways deregulated in B-cell precursor ALL (B-ALL) and essential for leukemia survival is crucial for the development of novel therapies. For example, aberrant activation of STAT3 has been linked with transformation and tumor growth in multiple
tissues.2 Indeed, the importance of STAT3 in hematopoietic malignancies is well documented, particularly for subtypes of lymphoma3 and acute myeloid leukemia.4 Although STAT3 is required for the normal reconstitution activity of hematopoietic stem cells5,6 its pharmacological targeting does not appear to elicit short-term toxicity,7 providing a rationale for development of STAT3-targeting drugs.8 STAT3 is also required for normal B-cell development, deficiency resulting in reduced numbers of early B-cell progenitors.9 STAT3-deficient pro-B cells exhibit elevated levels of apoptosis, suggesting that impaired B-cell development is caused by loss of B-cell progenitor viability in the absence of STAT3.9
We previously demonstrated that STAT3 signaling plays an essential role in the most common form of pediatric leukemia, t(12;21) B-ALL. Thus, B-ALL cell lines containing the t(12;21) chromosomal translocation, which encodes the ETV6-RUNX1 fusion protein, are highly dependent on STAT3 signaling for leukemia growth, survival, clonogenicity and progression in vivo. 10 Furthermore, patient primary ETV6-RUNX1+ B-ALL cells
were also found to be sensitive to STAT3 inhibition. Activation of STAT3 was mediated by an intracellular mechanism downstream of the ETV6-RUNX1 fusion protein, involving guanine nucleotide exchange factor induction.11 Other B-ALL subtypes, with a much poorer prognosis, were also found to be dependent upon sustained STAT3 activity.10 More recently, STAT3 dependence has also been demonstrated in poor-risk pediatric B-ALL subtypes, with high STAT3 expression being associated with inferior survival.12 Although it is likely that there are distinct mechanisms responsible for STAT3 activation in the different B-ALL subtypes, dependency renders them susceptible to pharmacological inhibition of STAT3. In this study, we used global gene expression analysis to demonstrate that STAT3 inhibition leads to induction of the p53 response in B-ALL cells. Pharmacological inhibition, small hairpin RNA (shRNA)-mediated knockdown and CRISPR/ Cas9-mediated ablation of STAT3 all result in elevated p53 protein and p53-target gene expression. B-ALL apoptosis in response to STAT3 inhibition can be reversed by deletion of TP53. In contrast to the subtype-specific STAT3 dependence we observed previously in B-ALL cell lines,10 patient-derived xenograft (PDX) B-ALL samples exhibited broad susceptibility to STAT3 inhibition across different subtypes, with resistance only apparent in two TP53 mutant samples. These data suggest that requirement for STAT3 activity may be a general characteristic of the pediatric B-ALL lineage, perhaps associated with signaling pathways operating in the cells of origin. Enhanced elimination of B-ALL cells was achieved by combining STAT3 inhibition with p53 induction through inhibition of MDM2, indicating a novel potential therapeutic opportunity. Indeed, since only a minority of pediatric B-ALL cases are associated with TP53 mutations,13 even in high-risk and relapsed disease,14-16 induction of p53 may be an attractive therapeutic approach to leukemias that are refractive to conventional therapy.
Mice
Mice were maintained in UCL GOSICH animal facilities and experiments were performed according to and approved by United Kingdom Home Office regulations and followed UCL GOSICH institutional guidelines.
B-cell acute lymphoblastic leukemia patient-derived xenograft acute lymphoblastic leukemia cells
Ethical approval was given (Research Ethics Committee reference 14/EM/0134) for use of appropriately consented material from patients with B-ALL at Great Ormond Street Hospital for Children (London, UK). Non-irradiated 6- to 12-week-old NOD-SCID-g-/- (NSG; The Jackson Laboratory, Bar Harbor, ME, USA) mice were intra-bone injected with 1-2x10⁶ mononuclear cells (Online Supplementary Table S1). Recipient mice were sacrificed upon developing clinical signs of disease. Human
PDX ALL cells were harvested and purified from spleens using the mouse cell depletion kit (Miltenyi Biotec, Surrey, UK).
For co-culture experiments with Luciferase-expressing B-ALL PDX samples, 3x10⁴/cm2 mesenchymal stem cells (MSC) were plated in 96-well tissue culture plates and 2x10⁴ B-ALL PDX cells were added in StemSpan Serum-Free Expansion Medium II (SFEM II, STEMCELL Technologies, Cambridge, UK).17,18 Cells were treated for 5 days with indicated drugs and luminescence analyzed with the Steady-Glo Luciferase Assay System (Promega, Southampton, UK), according to manufacturer’s instruction, and detected with Infinite m200 Pro microplate reader (Tecan, Reading, UK). The following reagents and inhibitors were used, S3I-201 (Cayman Chemical, MI, USA), Napabucasin (BBI608; MedChemExpress, NJ, USA), C188-9 (MedChemExpress and Adooq Biosciences, CA, USA), Nutlin-3a (Merck Life Science, Dorset, UK) and Idasanutlin (Bio-Techne, Abingdon, UK).
Non-irradiated NSG mice were intravenously transplanted with 2x10⁵ luciferase-expressing B-ALL PDX cells. Recipient mice were imaged using the IVIS® Lumina Series III (PerkinElmer, Beaconsfield, UK) and randomly allocated to control or drug-treated groups, by flipping a coin. Recipient mice were treated with vehicle (7% dimtehyl sulfoxide [DMSO], 56% Labrasol, 37% polyethylene glycol 400), C188-9 (100 mg/kg), Idasanutlin (30 mg/kg) or C188-9 + Idasanutlin by 5-7 daily oral gavages. No blinding was used.
Quantitative real-time polymerase chain reaction analysis
Quantitative real-time polymerase chain recation (qRT-PCR) was performed on mRNA using TaqMan probe-based chemistry, as previously described,19 using a StepOnePlus Real-Time PCR System (Thermo Fisher Scientific). Primer/probe sets were from Applied Biosystems, Life Technologies.
Western blot and immunoprecipitation analysis
Western blot and immunoprecipitation (IP) analyses were performed as previously described10,20 (detailed in the Online Supplementary Appendix).
RNA sequencing and chromatin immunoprecipitation sequencing
RNA sequencing (RNA-seq), chromatin immunoprecipitation sequencing (ChIP-seq), ChIP-qPCR and gene set enrichment analysis (GSEA) was performed as detailed in the Online Supplementary Appendix
Statistics
Statistical significance was determined using Prism (GraphPad) software. Statistical analysis of means was performed using the one sample t test or unpaired Student’s t test, twotailed P values <0.05 being considered statistically significant.
Variance was similar between groups. Statistical analysis of survival curves was performed using the log-rank test.
The data generated in this study are available within the article and its Online Supplementary Appendix. The RNA-seq data generated in this study are publicly available in the Gene Expression Omnibus at GSE179333 (S3I-201) and GSE179332 (shSTAT3) and the ChIP-seq data at GSE213766. More details are provided in the Online Supplementary Appendix
In order to further investigate the mechanism responsible for STAT3 dependency in ETV6-RUNX1+ B-ALL, we performed RNA-seq in REH cells to examine global gene expression changes 6 hours after pharmacological inhibition of STAT3, via the STAT3 inhibitor S3I-20121 (Figure 1A). Inhibition of STAT3 resulted in a total of 1,085 significantly upregulated and 820 downregulated genes, of which 156 and 22 were changed more than 2-fold, respectively. We performed GSEA with the MSigDB hallmark gene set collection to identify cellular pathways perturbed in this RNA-seq data in an unbiased manner. The hallmark p53 pathway (M5939) gene set was the most upregulated gene set in this analysis (Online Supplementary Figure S1A). Enrichment of high-confidence p53 target genes, assembled in a recent meta-analysis,22 confirmed that gene expression changes resulting from acute STAT3 inhibition are consistent with p53 induction (Figure 1B). Analysis of TP53 RNA sequences from the RNA-seq data confirmed that the REH cells were TP53 wild-type. Next, we performed RNA-seq in REH cells after shRNA-mediated STAT3 silencing (Figure 1A; Online Supplementary Figure S1B). The hallmark p53 pathway was once more the most upregulated gene set (Online Supplementary Figure S1A) and high-confidence p53 target genes were significantly enriched in these gene expression changes (Figure 1B). Furthermore, 240 of the 1,085 genes induced by S3I-201 were also significantly upregulated following STAT3 silencing, 45 of which were high-confidence p53 target genes.22 Taken together, these data suggest that STAT3 functions in these cells to repress p53 induction. Direct repression of TP53 by STAT3 has so far only been demonstrated in transformed fibroblast cells, where STAT3 binds to the promoter of TP53 and inhibits its transcription.23 However, we did not observe a significant change in TP53 expression in either of the RNA-seq data sets (fold change [FC] =1.01, P adj =0.96 and FC=0.99, P adj=0.83 for TP53 in the S3I-201 and shSTAT3 data sets, respectively). This indicates that p53 induction resulting from STAT3 inhibition was not due to transcriptional activation of TP53
In order to examine whether p53 induction following inhibition of STAT3 occurred at the protein level, we examined p53 protein expression after pharmacological or genetic inhibition of STAT3 (Figure 1C-E). Total p53 protein levels
increased significantly in REH cells after 6-hour exposure to S3I-201 and an independent STAT3 inhibitor, Napabucasin (BBI608) (Figure 1C).24 Moreover, this resulted in increased expression of CDKN1A (Figure 1F) and other selected p53 target genes (Online Supplementary Figure S1C). shRNA-mediated silencing of STAT3 (Online Supplementary Figure S1B) also resulted in increased total p53 protein and target gene expression (Figure 1D, G). In order to confirm these data using an independent approach, we then targeted STAT3 in REH cells by CRISPR/Cas9 knockout using two independent gRNA against the regions encoding the SH2 (g1_STAT3) and DNA-binding (g2_STAT3) domains. Tracking of insertions and deletions (Indel) by DEcomposition (TIDE) analysis in the bulk population of STAT3-/- REH cells confirmed the specific and efficient editing of the targeted regions in STAT3 (Online Supplementary Figure S2A) and consequent reduction of total STAT3 protein expression in REH cells (Figure 1E). Loss of STAT3 expression led to selective depletion of STAT3-/REH cells (Online Supplementary Figure S2B, C), in line with the anti-proliferative and apoptotic consequences of STAT3 inhibition we described previously.10 Knockout of STAT3 also resulted in a significant increase in p53 protein (Figure 1E) and target gene (Figure 1H; Online Supplementary Figure S2D) expression. Conversely, expression of a constitutively active form of STAT3 (CASTAT3) (Online Supplementary Figure S3A) we observed a small but significant decrease in p53 target gene expression (Online Supplementary Figure S3B). Protein levels of p53 are tightly regulated by the E3 ubiquitin ligase MDM2, which targets p53 for ubiquitination and subsequent degradation.25-27 In order to evaluate the role of MDM2 in controlling p53 protein levels in the context of STAT3 inhibition, we performed immunoprecipitation experiments with a specific MDM2 antibody following a short 6-hour exposure to S3I-201. We observed no changes in MDM2 association with p53 (Online Supplementary Figure S4A), an interaction important for MDM2 regulation of p53 protein expression levels.28 Furthermore, 6 hours after exposure, no changes in total MDM2 protein expression were detected following STAT3 inhibition with either S3I-201 or Napabucasin (Online Supplementary Figure S4B). In contrast, MDM2 gene expression increased significantly following STAT3 inhibition (Online Supplementary Figure S4C), most likely as a consequence of p53 induction, since MDM2 is a well-described p53 target.29,30 In summary, no changes in MDM2:p53 interaction or total MDM2 protein expression could be detected at a time point in which p53 induction was evident. Taken together, these data indicate that p53 induction following STAT3 inhibition is not directly dependent on MDM2. Ubiquitination of p53 by MDM2 has also been shown to be positively regulated by MDM4,31 suggesting an alternative mechanism through which STAT3 could influence p53 protein levels. Although the association of p53 with MDM4 was not affected by 6-hour exposure to S3I-201 (Figure 2A), S3I-201 treatment (Figure 2B) or shRNA-mediated STAT3 silencing (Figure 2C) resulted in decreased total MDM4 protein expression. Moreover, S3I-201
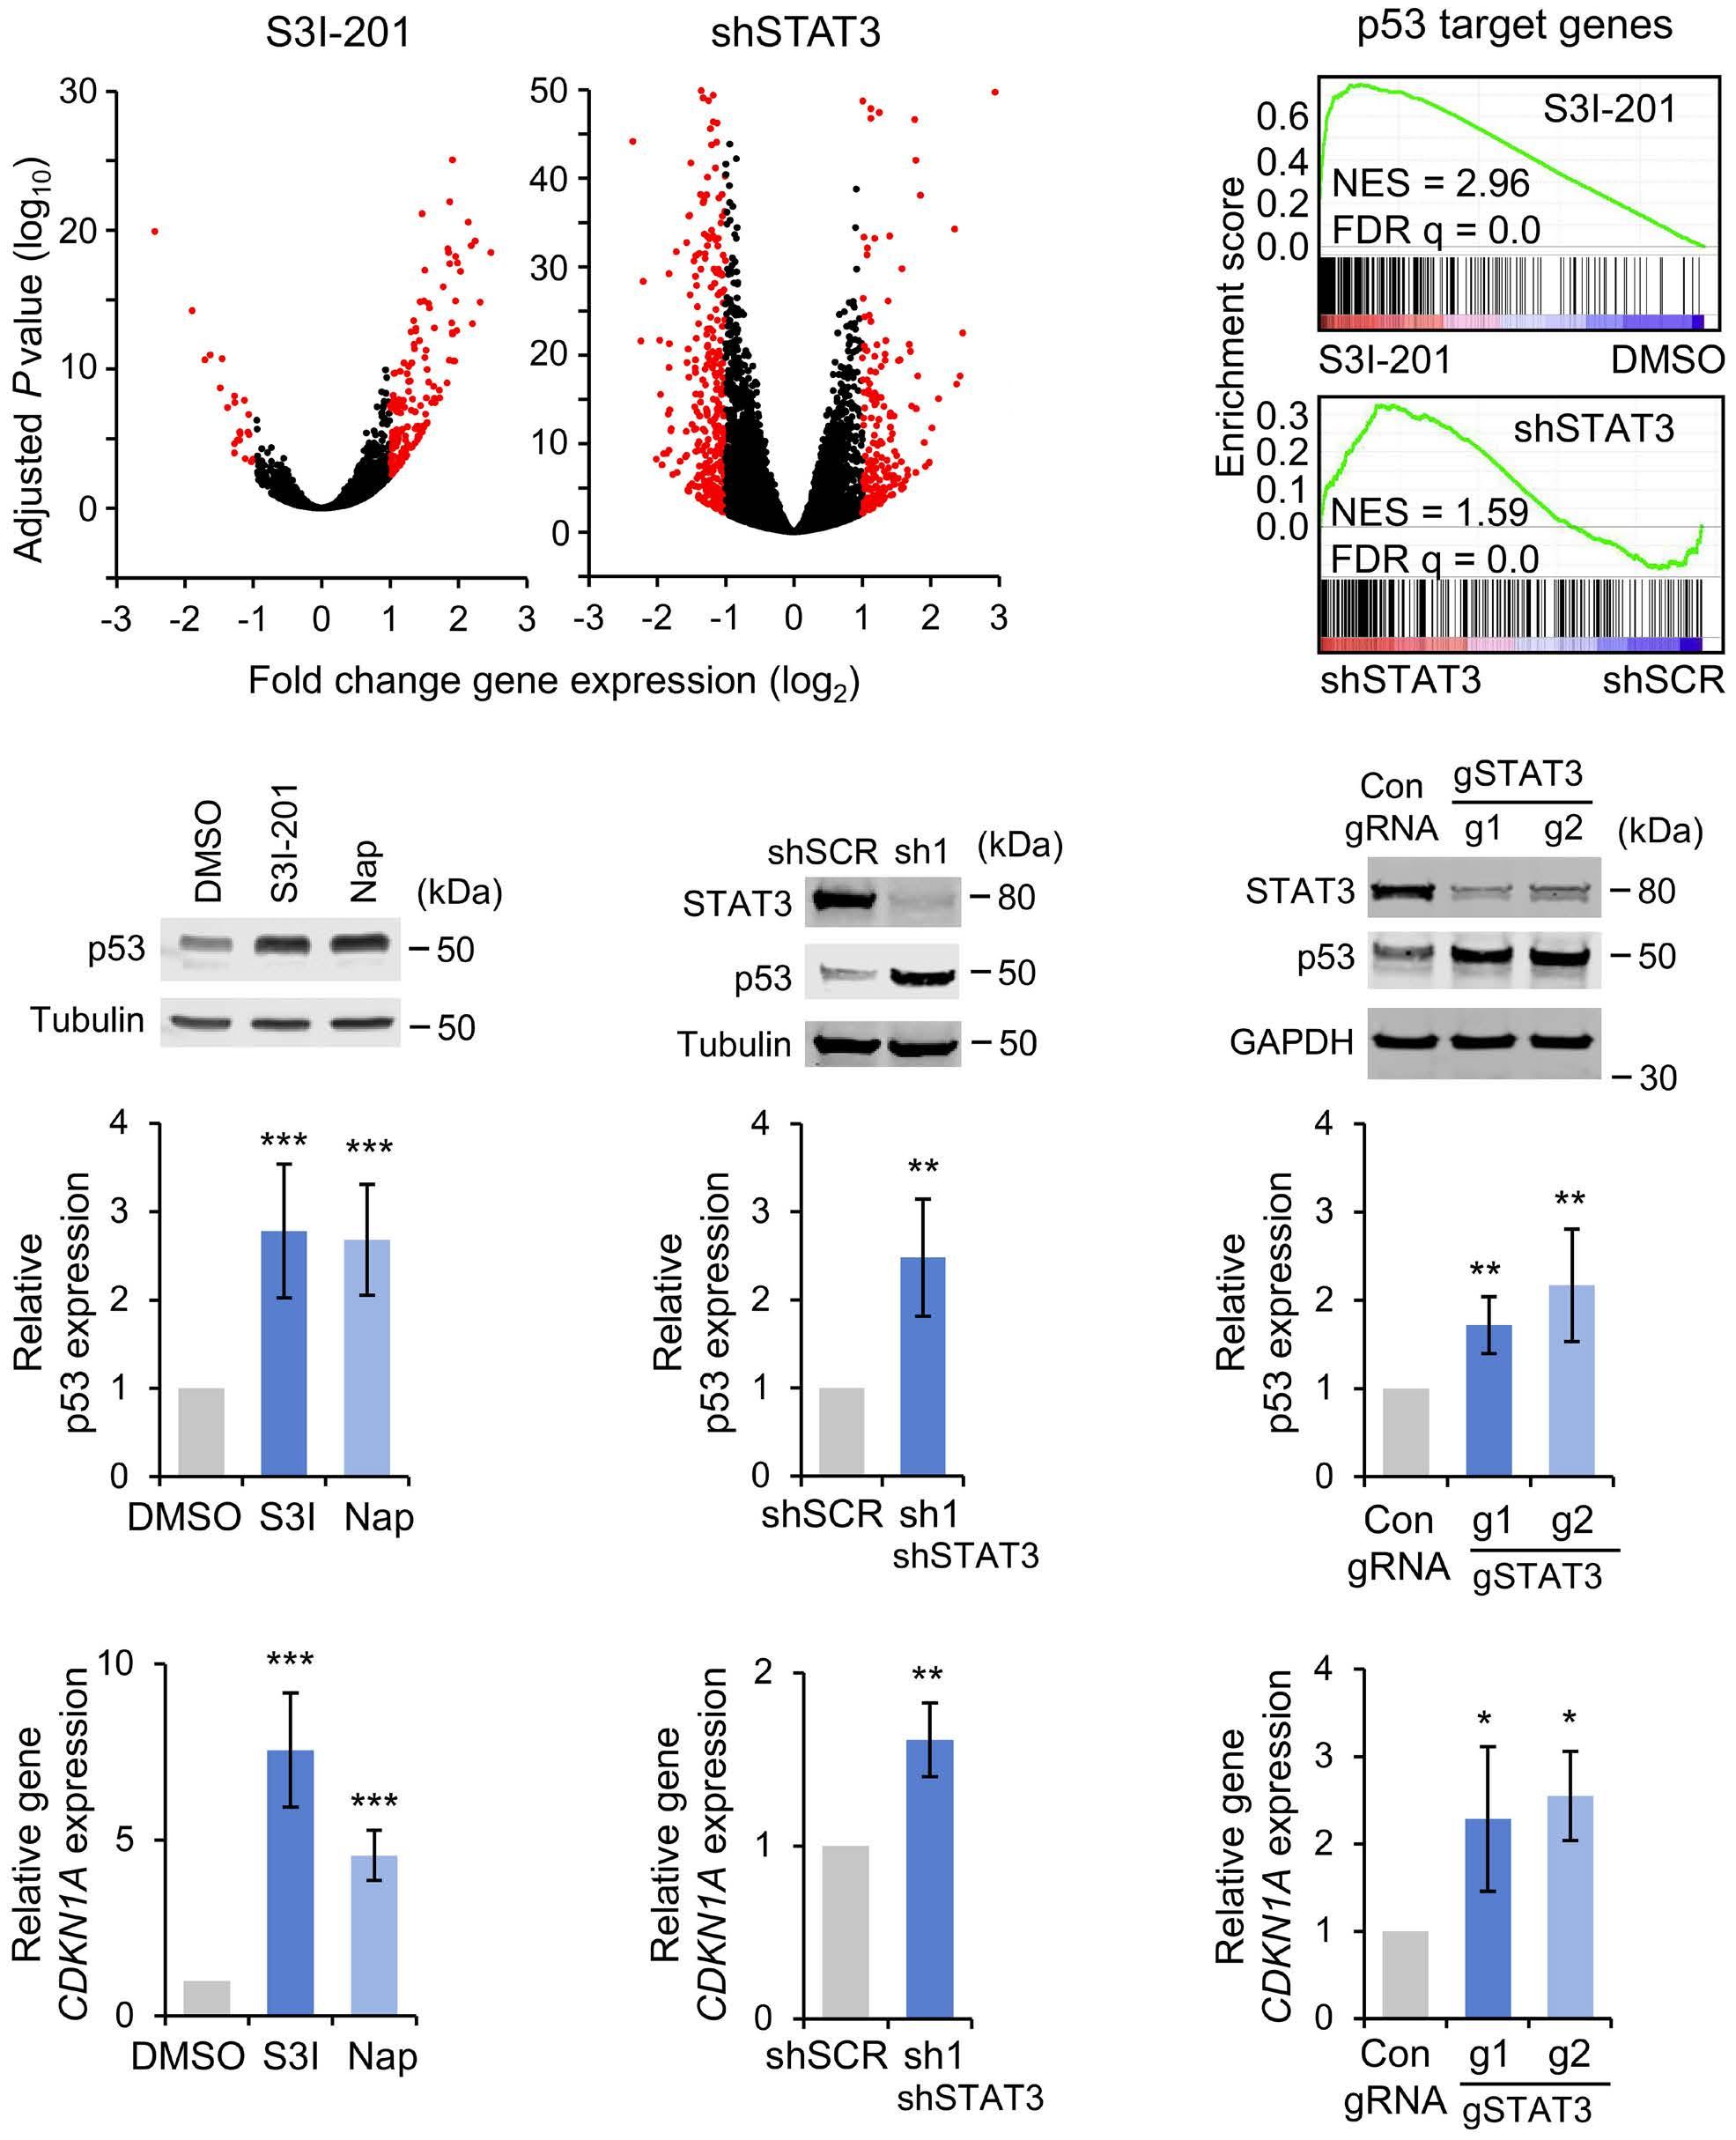
Figure 1. STAT3 inhibition results in p53 induction in B-cell acute lymphoblastic leukemia cells. (A) Volcano plots of RNA-sequencing (RNA-seq) analysis showing fold gene expression changes in REH cells following treatment with S3I-201 (50 µM, 6 hours [hrs], N=3) or 5 days after small hairpin RNA (shRNA)-mediated STAT3 (sh1, N=3) silencing. Expression changes greater than 2-fold and P<0.05 are shown in red, Wald test. (B) Gene set enrichment analysis (GSEA) demonstrating enrichment of p53 target genes, as previously defined in,22 in S3I-201 and shSTAT3 induced gene expression changes. (C-E) Western blot examples (top panels) and quantification (lower panels) of p53 protein expression in REH cells (C) 6 hours after exposure to S3I-201 (50 µM) or Napabucasin (10 µM), (D) 5 days after transduction with scrambled control or shSTAT3 (sh1) shRNA or (E) 7 days after transduction with Cas9 and control or gSTAT3 gRNA. Bars and error bars are means and standard deviation (SD) of (C) N=8 and (D), (E) N=4 independent experiments. Data are normalized to (C, D) tubulin and (E) GAPDH loading control and to (C) dimethyl sulfoxide (DMSO)-treated, (D) control shRNA transduced and (E) control gRNA transduced REH cells. *P< 0.05; **P<0.01; ***P<0.001, one sample t test. (F-H) quantitative real-time polymerase chain reaction analysis of CDKN1A gene expression in REH cells (F) 6 hrs after exposure to S3I-201 (50 µM) or Napabucasin (10 µM), (G) 5 days after transduction with scrambled control or shSTAT3 shRNA or (H) 7 days after transduction with Cas9 and control or gSTAT3 gRNA. Bars and error bars are means and SD of (F) N=5, (G) N=4 and (H) N=5 independent experiments. Gene expression data are normalized to (F) DMSO-treated, (G) control shRNA transduced and (H) control gRNA transduced REH cells. *P<0.05; **P<0.01; ***P<0.001, one sample t test.
induced MDM4 loss was rescued by proteasomal inhibition (Figure 2D) suggesting that it was caused by proteasomal degradation. These data indicate that p53 induction correlates with reduced levels of MDM4 protein expression following
STAT3 inhibition.
We speculated that the observed increase in p53 protein expression would translate into increased binding to target gene loci. Indeed, immunoprecipitation experiments following
STAT3 inhibition by S3I-201 revealed a significant increase in the mono-methylation of lysine 372 of p53 (Figure 3A), a post-translational modification of p53 associated with increased DNA binding, resulting from the increase in total p53.32 Increased binding of target loci by p53 was confirmed by ChIP-seq (Figure 3B, C; Online Supplementary Figure S4D) and ChIP-qPCR (Figure 3D) experiments. S3I-201 exposure resulted in more than 2-fold increased binding of p53 at 400 peaks in REH cells (Figure 3B), including well-established p53 target genes CDKN1A, 33 BBC3 (PUMA)34 and ATF335 (Figure 3C, D). GSEA revealed significant enrichment of the genes that were associated with increased p53 binding in gene expression changes following S3I-201 treatment of REH cells (Figure 3E).
In order to determine the contribution of p53 induction to the response of REH cells to STAT3 inhibition, we performed CRISPR/Cas9-mediated knockout of TP53 in REH cells. Loss of p53 protein was confirmed in two independent TP53-/- clones (Figure 4A). TIDE analysis of the TP53-/- clones confirmed specific and efficient editing of the targeted region encoding the N-terminus domain of p53 (Online Supplementary Figure S5A). As expected, loss of TP53 abrogated the induction of p53 target gene expression resulting from STAT3 inhibition (Figure 4B) and significantly attenuated apoptosis induction following STAT3 inhibition with either S3I-201 or Napabucasin (Figure 4C). Similar impairment of apoptosis induction was observed following treatment of TP53-/- REH clones with the
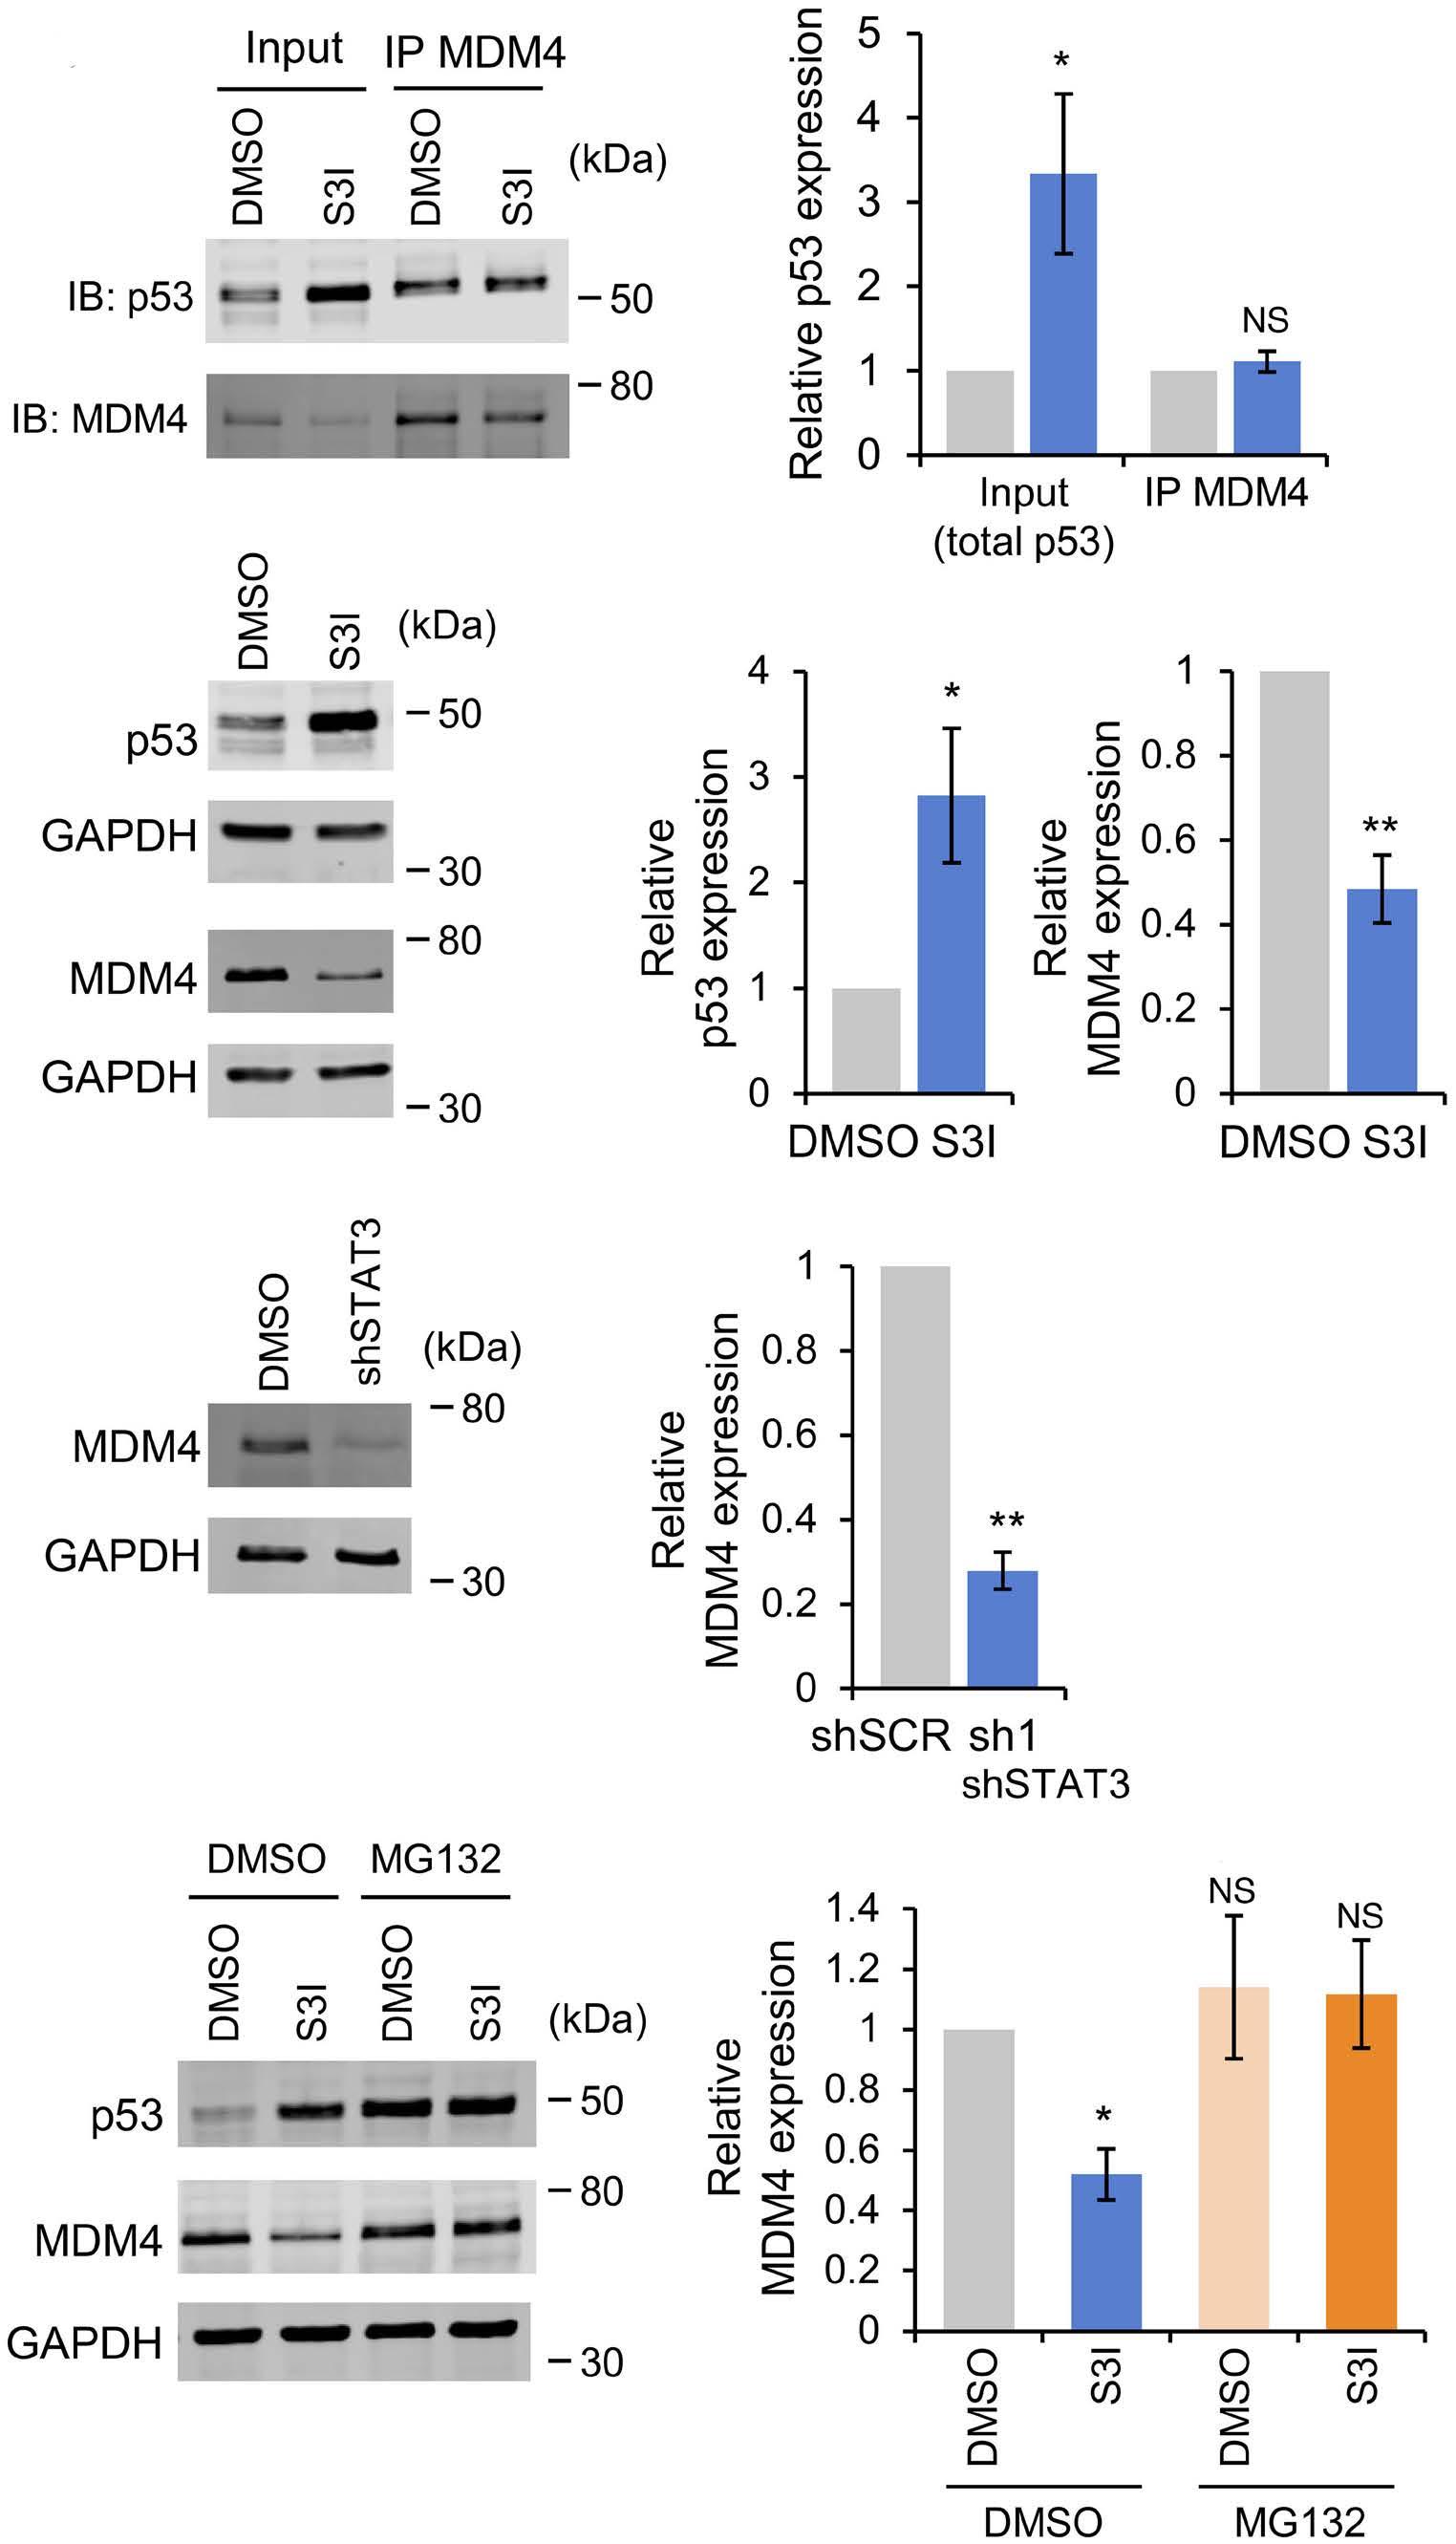
Figure 2. p53 induction following STAT3 inhibition correlates with loss of MDM4. (A) Western blot analysis (left panel) and p53 protein expression quantification (right panel) of input and anti-MDM4 immunoprecipitates from REH cells, following 6-hour treatment with S3I-201 (50 µM). Blots were stained with anti-p53 or anti-MDM4. Data are normalized to dimethyl sulfoxide (DMSO)-treated REH cells. Bars and error bars are means and standard deviation (SD) of N=3 independent experiments. *P<0.05; NS: not significant, one sample t test. (B, C) Western blot analysis (left panels) and quantification (right panels) of MDM4 and p53 protein expression in REH cells following (B) 6-hour treatment with S3I-201 (50 µM) or (C) 5 days after transduction with scrambled control or small hairpin STA3 (shSTAT3) (sh1) shRNA. GAPDH was used as a loading control. Bars and error bars are means and SD of N=3 independent experiments. Data are normalized to GAPDH loading control and to DMSO-treated REH cells. *P<0.05; **P<0.01; NS: not significant, one sample t test. (D) Western blot analysis (left panel) and quantification (right panel) of MDM4 protein expression in REH cells following 6-hour treatment with S3I-201 (50 µM), with and without MG132 (10 µM). GAPDH was used as a loading control. Bars and error bars are means and SD of N=3 independent experiments. Data are normalized to GAPDH loading control and to DMSO-treated REH cells. *P<0.05; NS: not significant, one sample t test.
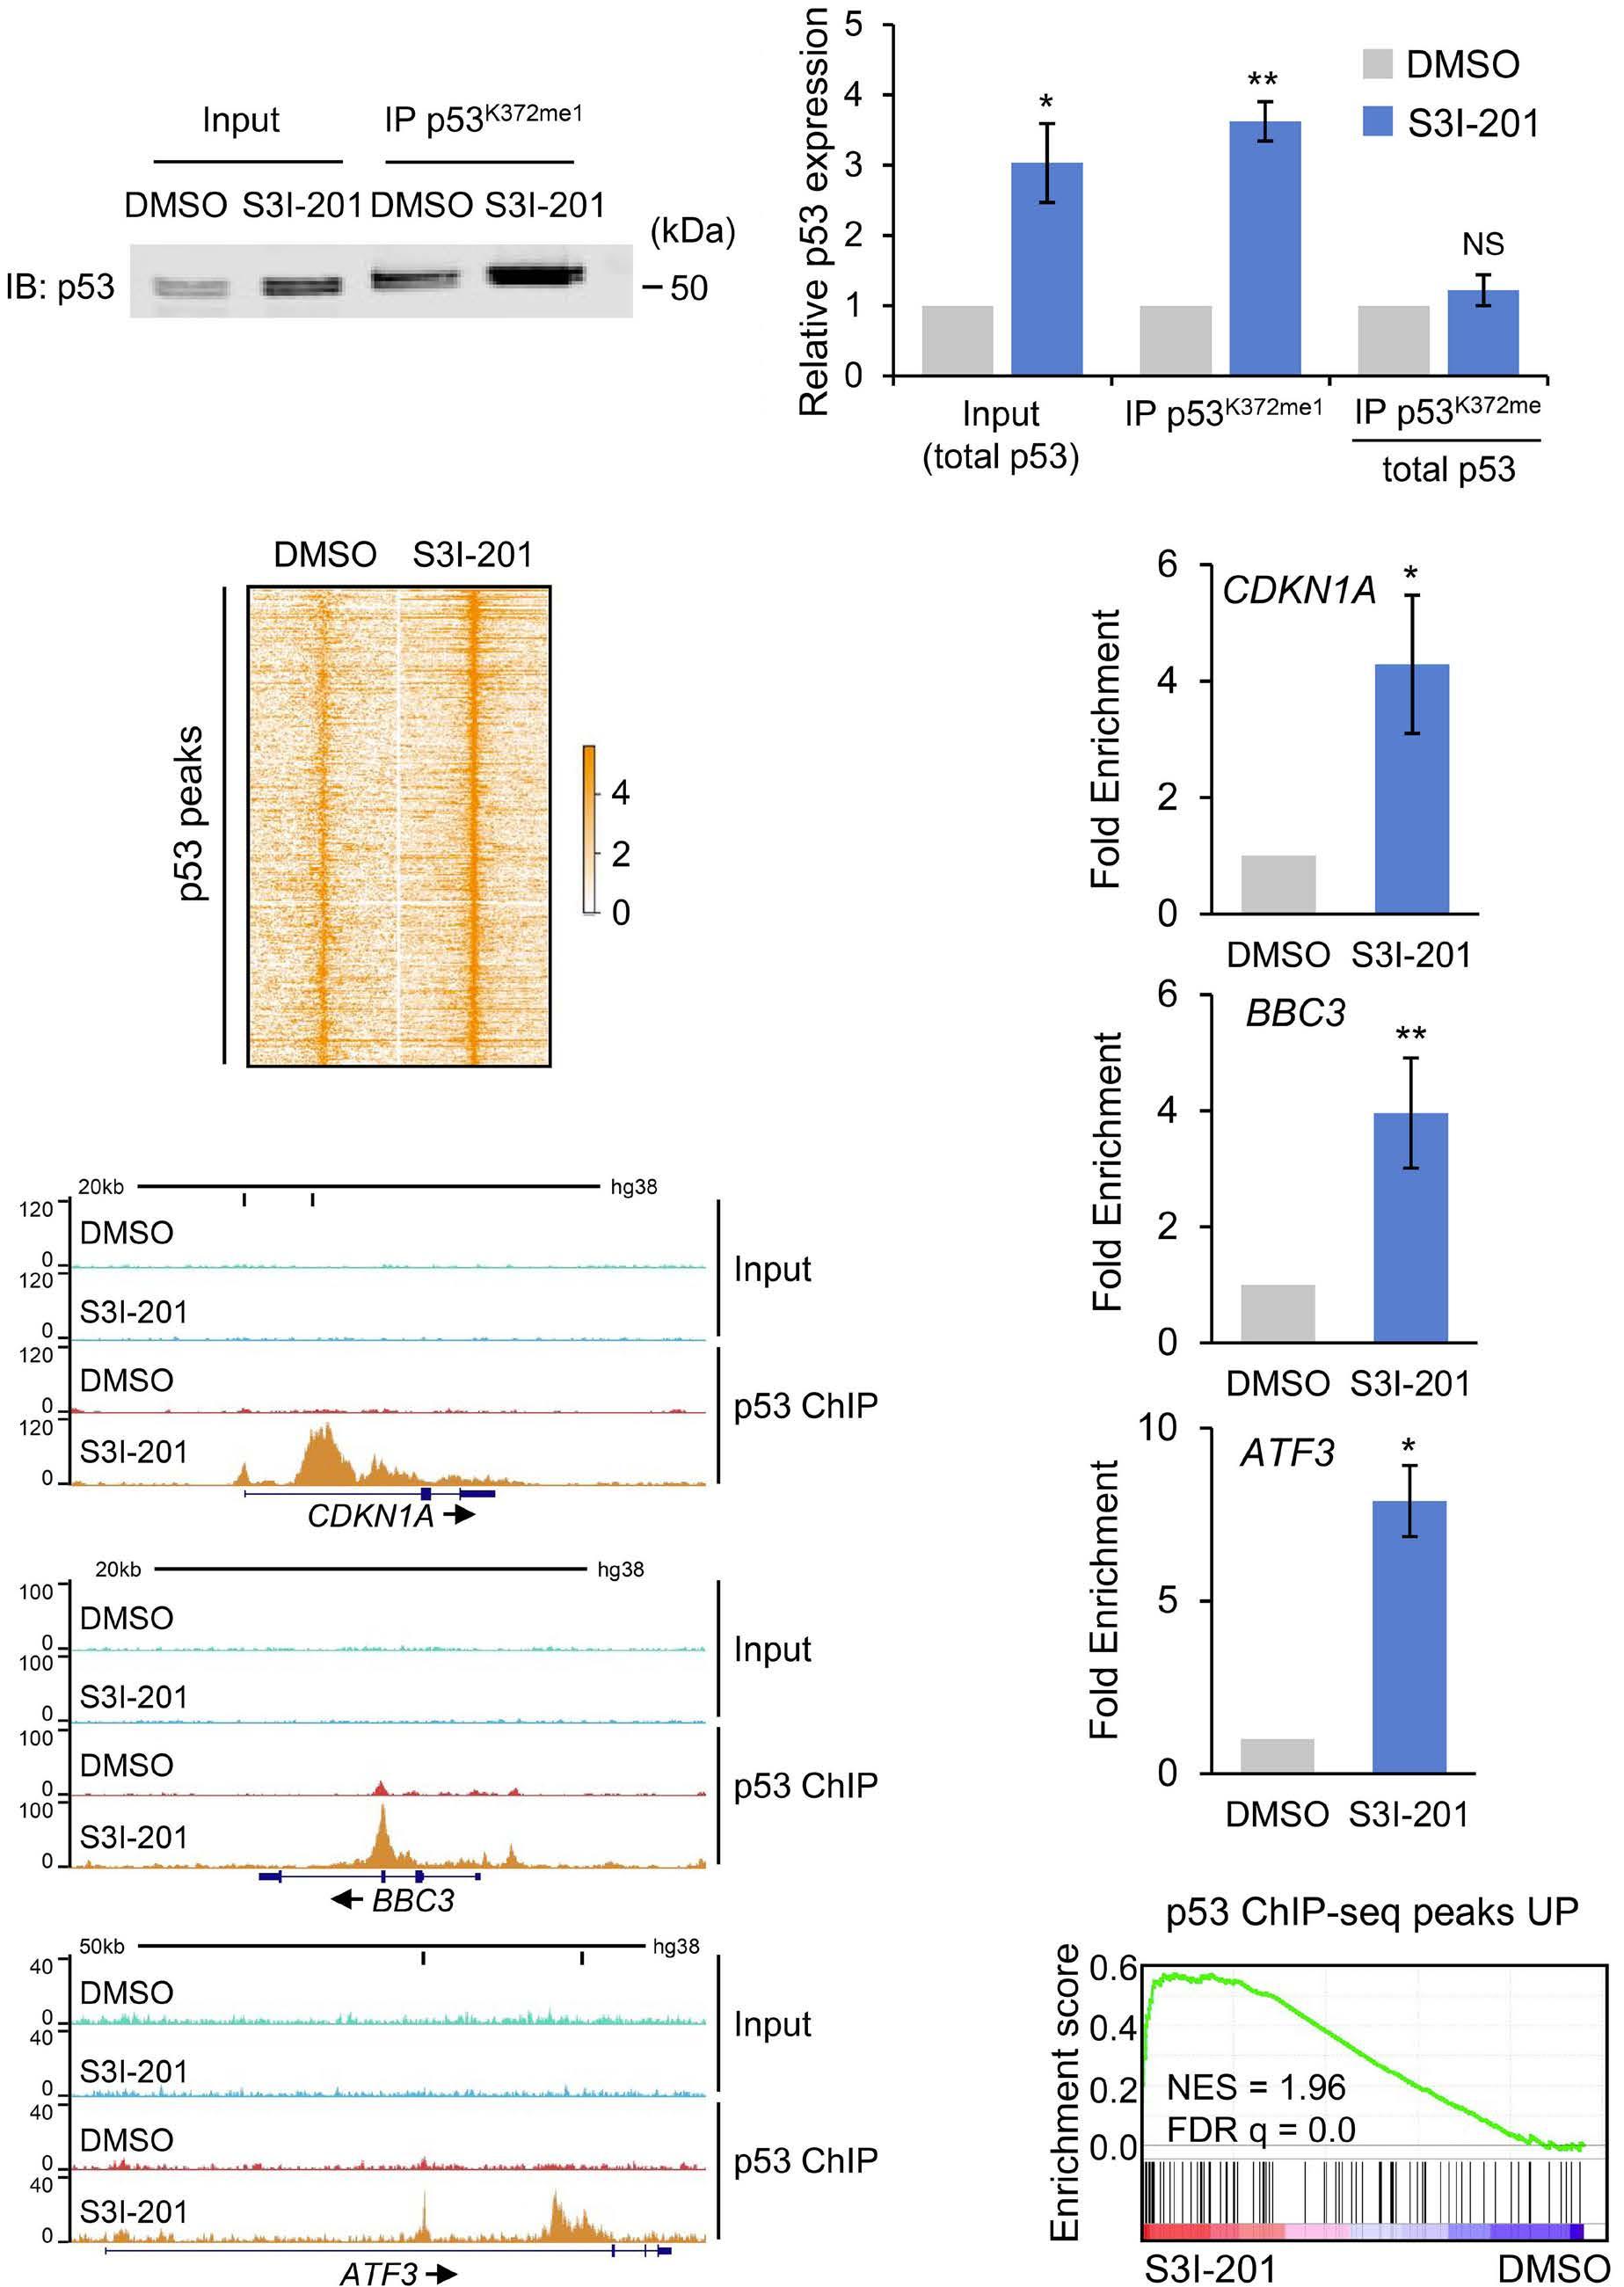
3. STAT3 inhibition results in increased binding of p53 to target genes. (A) Western blot example (left panel) and quantification (right panel) of input and anti-p53K372me1 immunoprecipitates from REH cells, following 6-hour treatment with dimethyl sulfoxide (DMSO) or S3I-201 (50 µM), stained with anti-p53 (DO-1). Bar and error bars are means and standard deviation (SD) of N=3 independent experiments. Data are normalized to DMSO-treated cells. **P<0.01, one sample t test. (B) Heatmap showing chromatin immunoprecipitation (ChIP) signal for the dynamic p53 peaks (>2-fold increased in S3I-201 with over 100 counts per million reads) following 6-hour exposure to DMSO or S3I-201 (50 µM). (C) Exemplar ChIP-sequencing tracks for p53 peaks at target genes in DMSO- and S3I-201-treated REH cells. High-confidence (CDKN1A, ATF3) p53 binding motifs are indicated by vertical black bars below the scale ruler. (D) ChIP quantitative polymerase chain reaction (ChIP-qPCR) validation analysis of p53 binding at CDKN1A (top panel), BBC3 (middle panel) and ATF3 (lower panel) in REH cells following 6-hour treatment with S3I-201 (50 µM). Data are shown as fold increase of enrichment over that from a gene desert region, normalized to DMSO-treated cells. Bars and error bars are means and SD of N=3 independent experiments. *P< 0.05; **P<0.01, one sample t test. (E) Gene set enrichment analysis (GSEA) demonstrating enrichment of 122 genes, with >2-fold increased p53 binding with peaks over 100 cpm reads, in gene expression changes in REH cells following treatment with S3I-201 (Figure 1A).
MDM2 inhibitor Nutlin-3a (Figure 4D). Moreover, TP53 loss also rescued inhibition of REH cell colony formation in methylcellulose following STAT3 inhibition (Online Supplementary Figure
S5B). In contrast, S3I-201-induced loss of MDM4 protein was not affected by TP53 knockout, confirming that although p53 has been shown to repress MDM4 mRNA translation31 this
was not the cause of MDM4 loss following STAT3 inhibition (Online Supplementary Figure S5C).
We demonstrated previously that ETV6-RUNX1+ B-ALL cell lines
and primary patient samples are highly dependent on STAT3 signaling for leukemia growth, survival, clonogenicity and progression in vivo. 10 In order to investigate STAT3 dependence
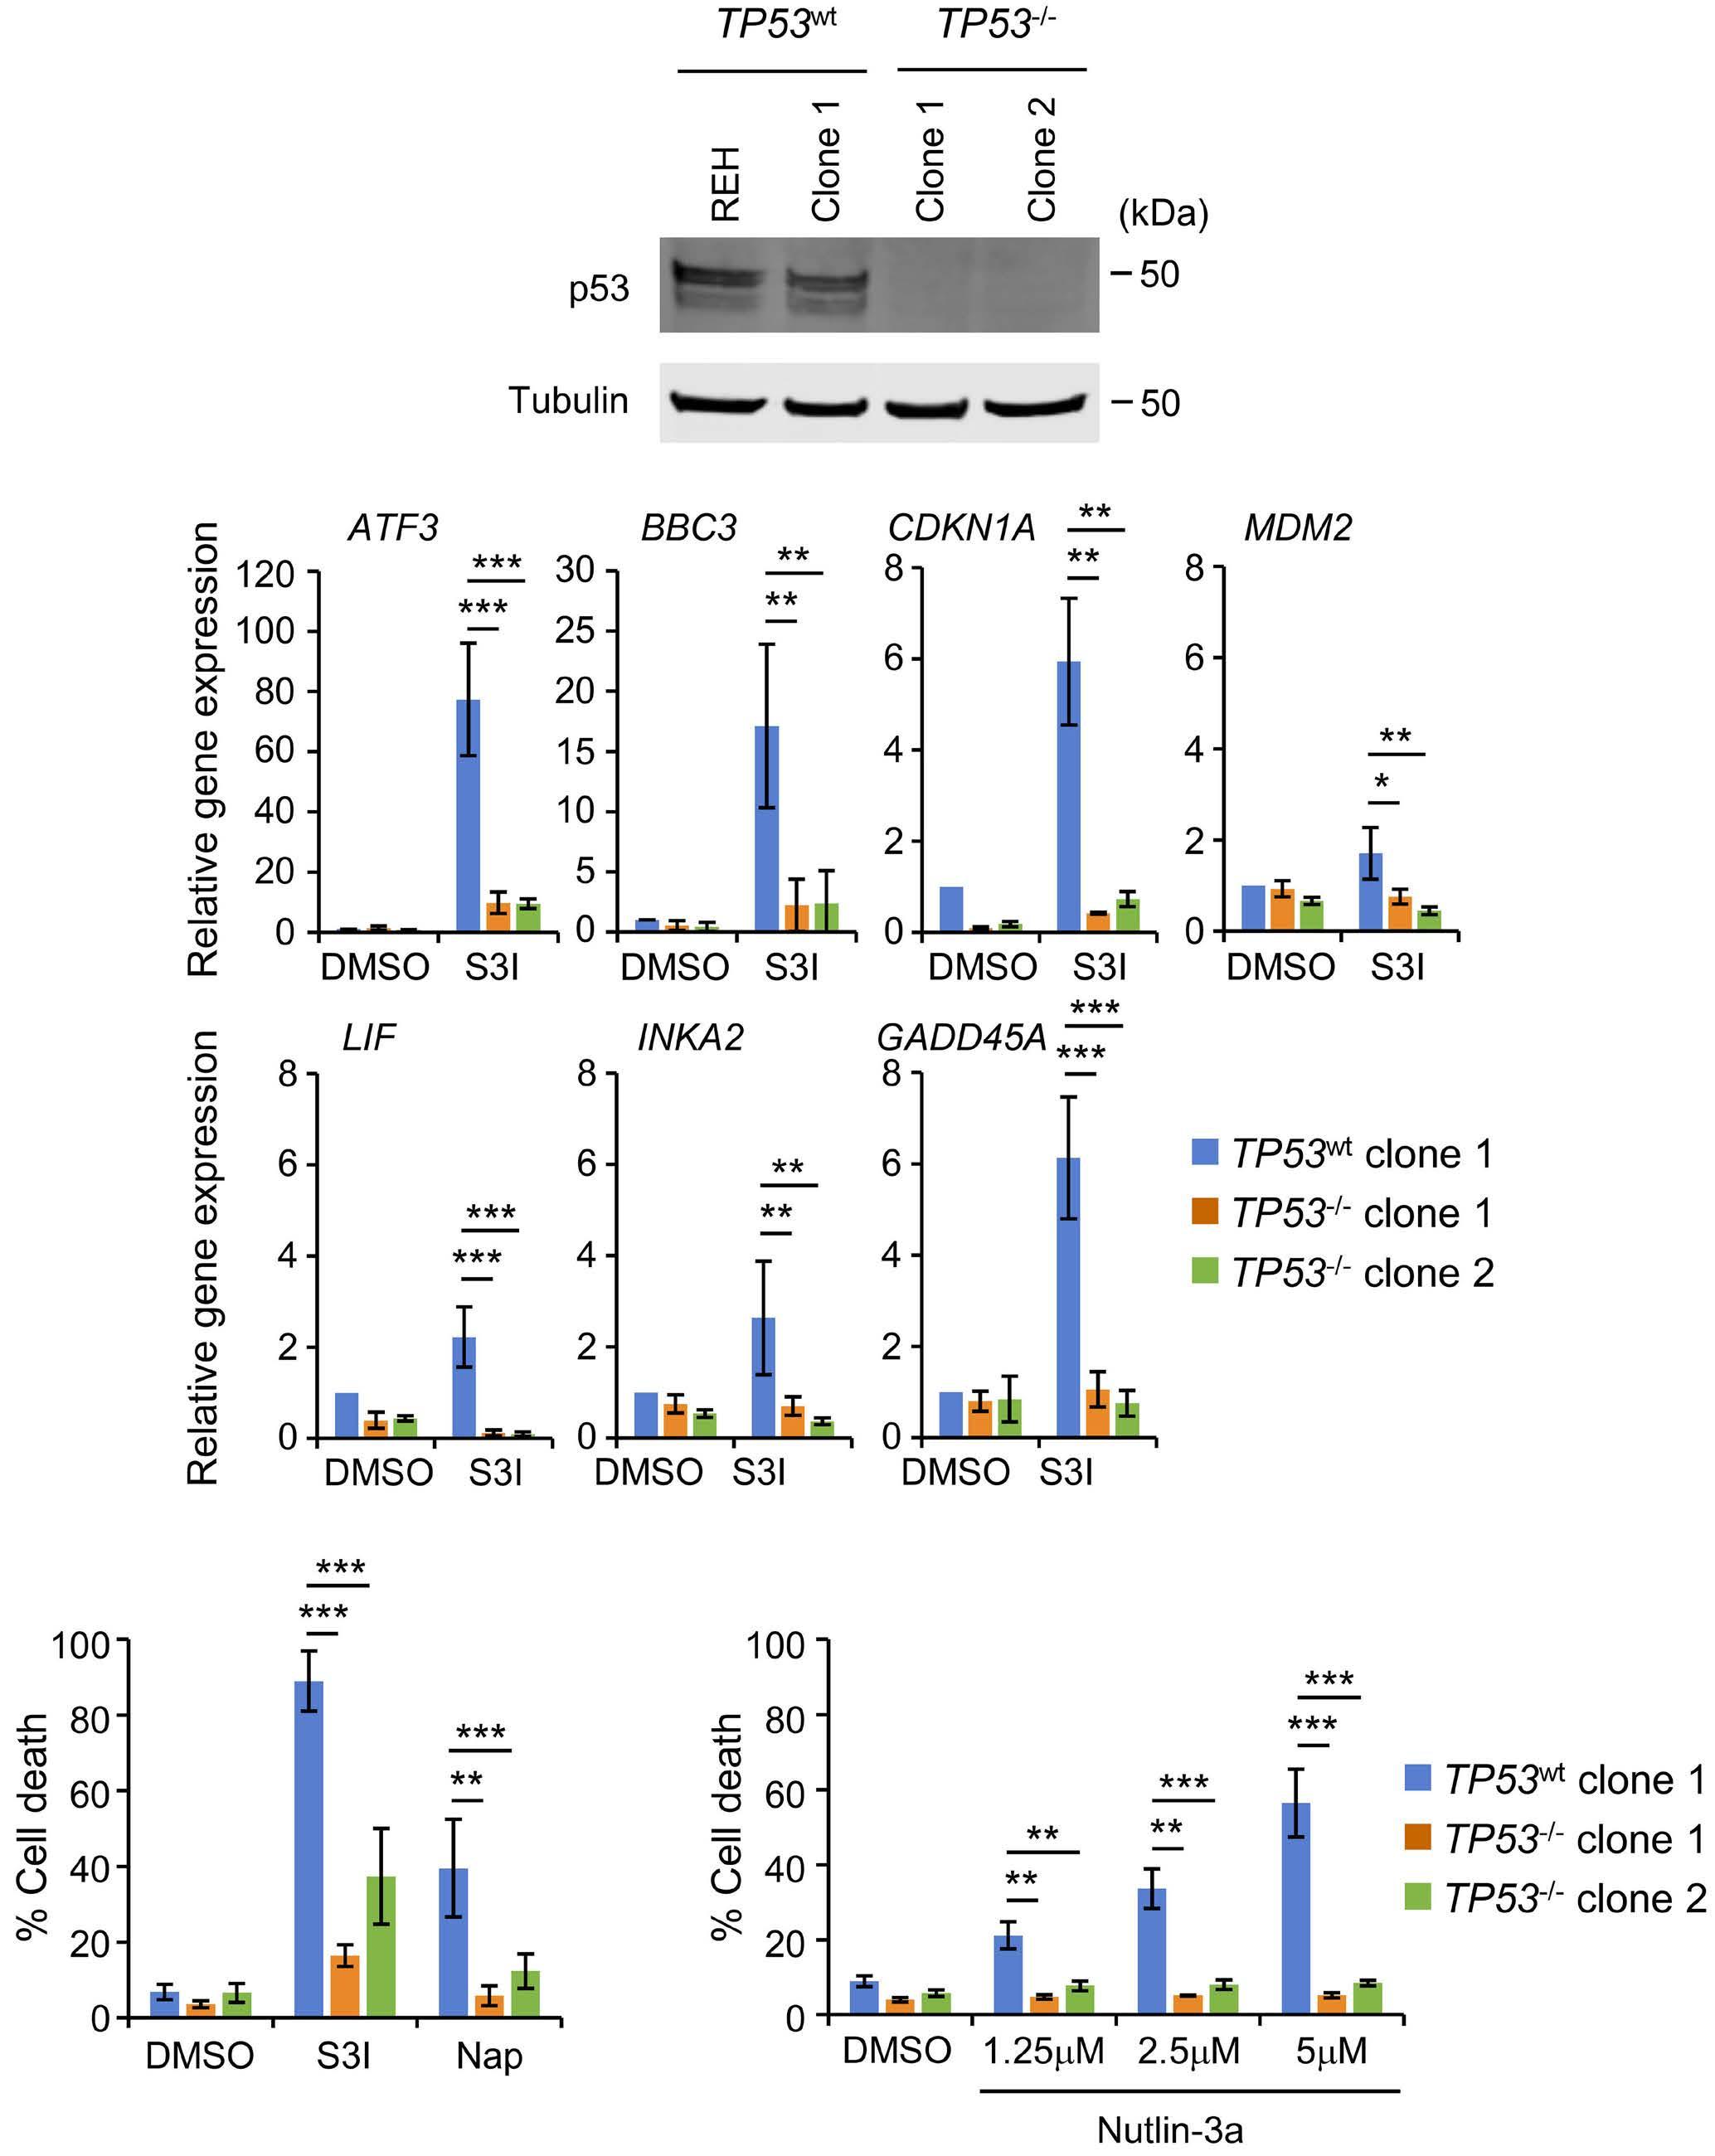
STAT3 inhibition. (A) Western blot analysis of
by transduction of REH cells with Cas9 and control or TP53-specific gRNA,
the latter
for loss of p53 protein expression. (B) Quantitative real-time polymerase chain reaction (qRT-PCR) analysis of selected p53 target gene22 expression in TP53wt and TP53-/- REH clones following 6-hour treatment with S3I-201 (50 µM).
are normalized to gene expression in the dimethyl sulfoxide (DMSO)-treated TP53wt clone. Bars and error bars are means and standard deviation (SD) of N=4 independent experiments. *P<0.05; **P<0.01; ***P<0.001, unpaired Student’s t test between S3I-201-treated TP53wt and TP53-/- clones. (C) Induction of apoptosis (% Annexin V+ cells) in TP53wt and TP53-/- REH clones following 48 hours treatment with S3I-201 (50 µM) or Napabucasin (10 µM). Bars and error bars are means and SD of N=5 independent experiments. **P<0.01; ***P<0.001, unpaired Student’s t test between S3I-201- or Napabucasin-treated TP53wt and TP53-/- clones. (D) Induction of apoptosis (% Annexin V+ cells) in TP53wt and TP53-/REH clones following 48-hour treatment with indicated concentrations of Nutlin-3a. Bars and error bars are means and SD of N=3 independent experiments. **P<0.01; ***P<0.001, unpaired Student’s t test between Nutlin 3a-treated TP53wt and TP53-/clones.
across different pediatric B-ALL subtypes, we expanded our analysis to B-ALL PDX samples, including some generated from relapsed B-ALL cases. Twelve of 14 B-ALL PDX samples exhibited sensitivity to 24-hour S3I-201 exposure (Figure 5A). Interestingly, sensitivity was apparent across a broad range of B-ALL subtypes, including ETV6-RUNX1+ but also TCF3PBX1+, hyperdiploid, KMT2A-rearranged and PAX5-rearranged samples, and samples from relapsed disease. In contrast, an ETV6-RUNX1+ and a hypodiploid B-ALL PDX sample, both from relapsed disease, exhibited resistance to STAT3 inhibition (Figure 5A). Upregulation of CDKN1A and GADD45A gene expression after 6-hour S3I-201 treatment followed the same pattern of response, changes in expression being detected in sensitive but not resistant samples (Figure 5B). Total p53 protein levels increased in all B-ALL PDX samples 6 hours after exposure to S3I-201 (Online Supplementary
Figure S6A-C). The pattern in loss of viability was the same upon exposure of the PDX samples to Nutlin-3a, with the two S3I-201-resistant samples also exhibiting resistance to MDM2 inhibition (p53 induction) (Figure 5C). Sanger sequencing of the diagnostic relapse hypodiploid B-ALL sample from which one of the resistant PDX (sample 14) was generated, revealed the presence of a missense heterozygous TP53 mutation (Online Supplementary Figure S7A). Targeted gene panel sequencing of the other resistant B-ALL PDX (sample 13), derived from relapsed ETV6-RUNX1+ disease, detected three mutations affecting TP53 (Online Supplementary Figure S7B). TP53 missense mutations in both samples affected the region encoding the DNA-binding domain of p53, Y220C and R248Q in the hypodiploid and ETV6-RUNX1+ samples, respectively. In contrast, targeted gene panel sequencing of the 12 sensitive PDX samples confirmed their wild-type
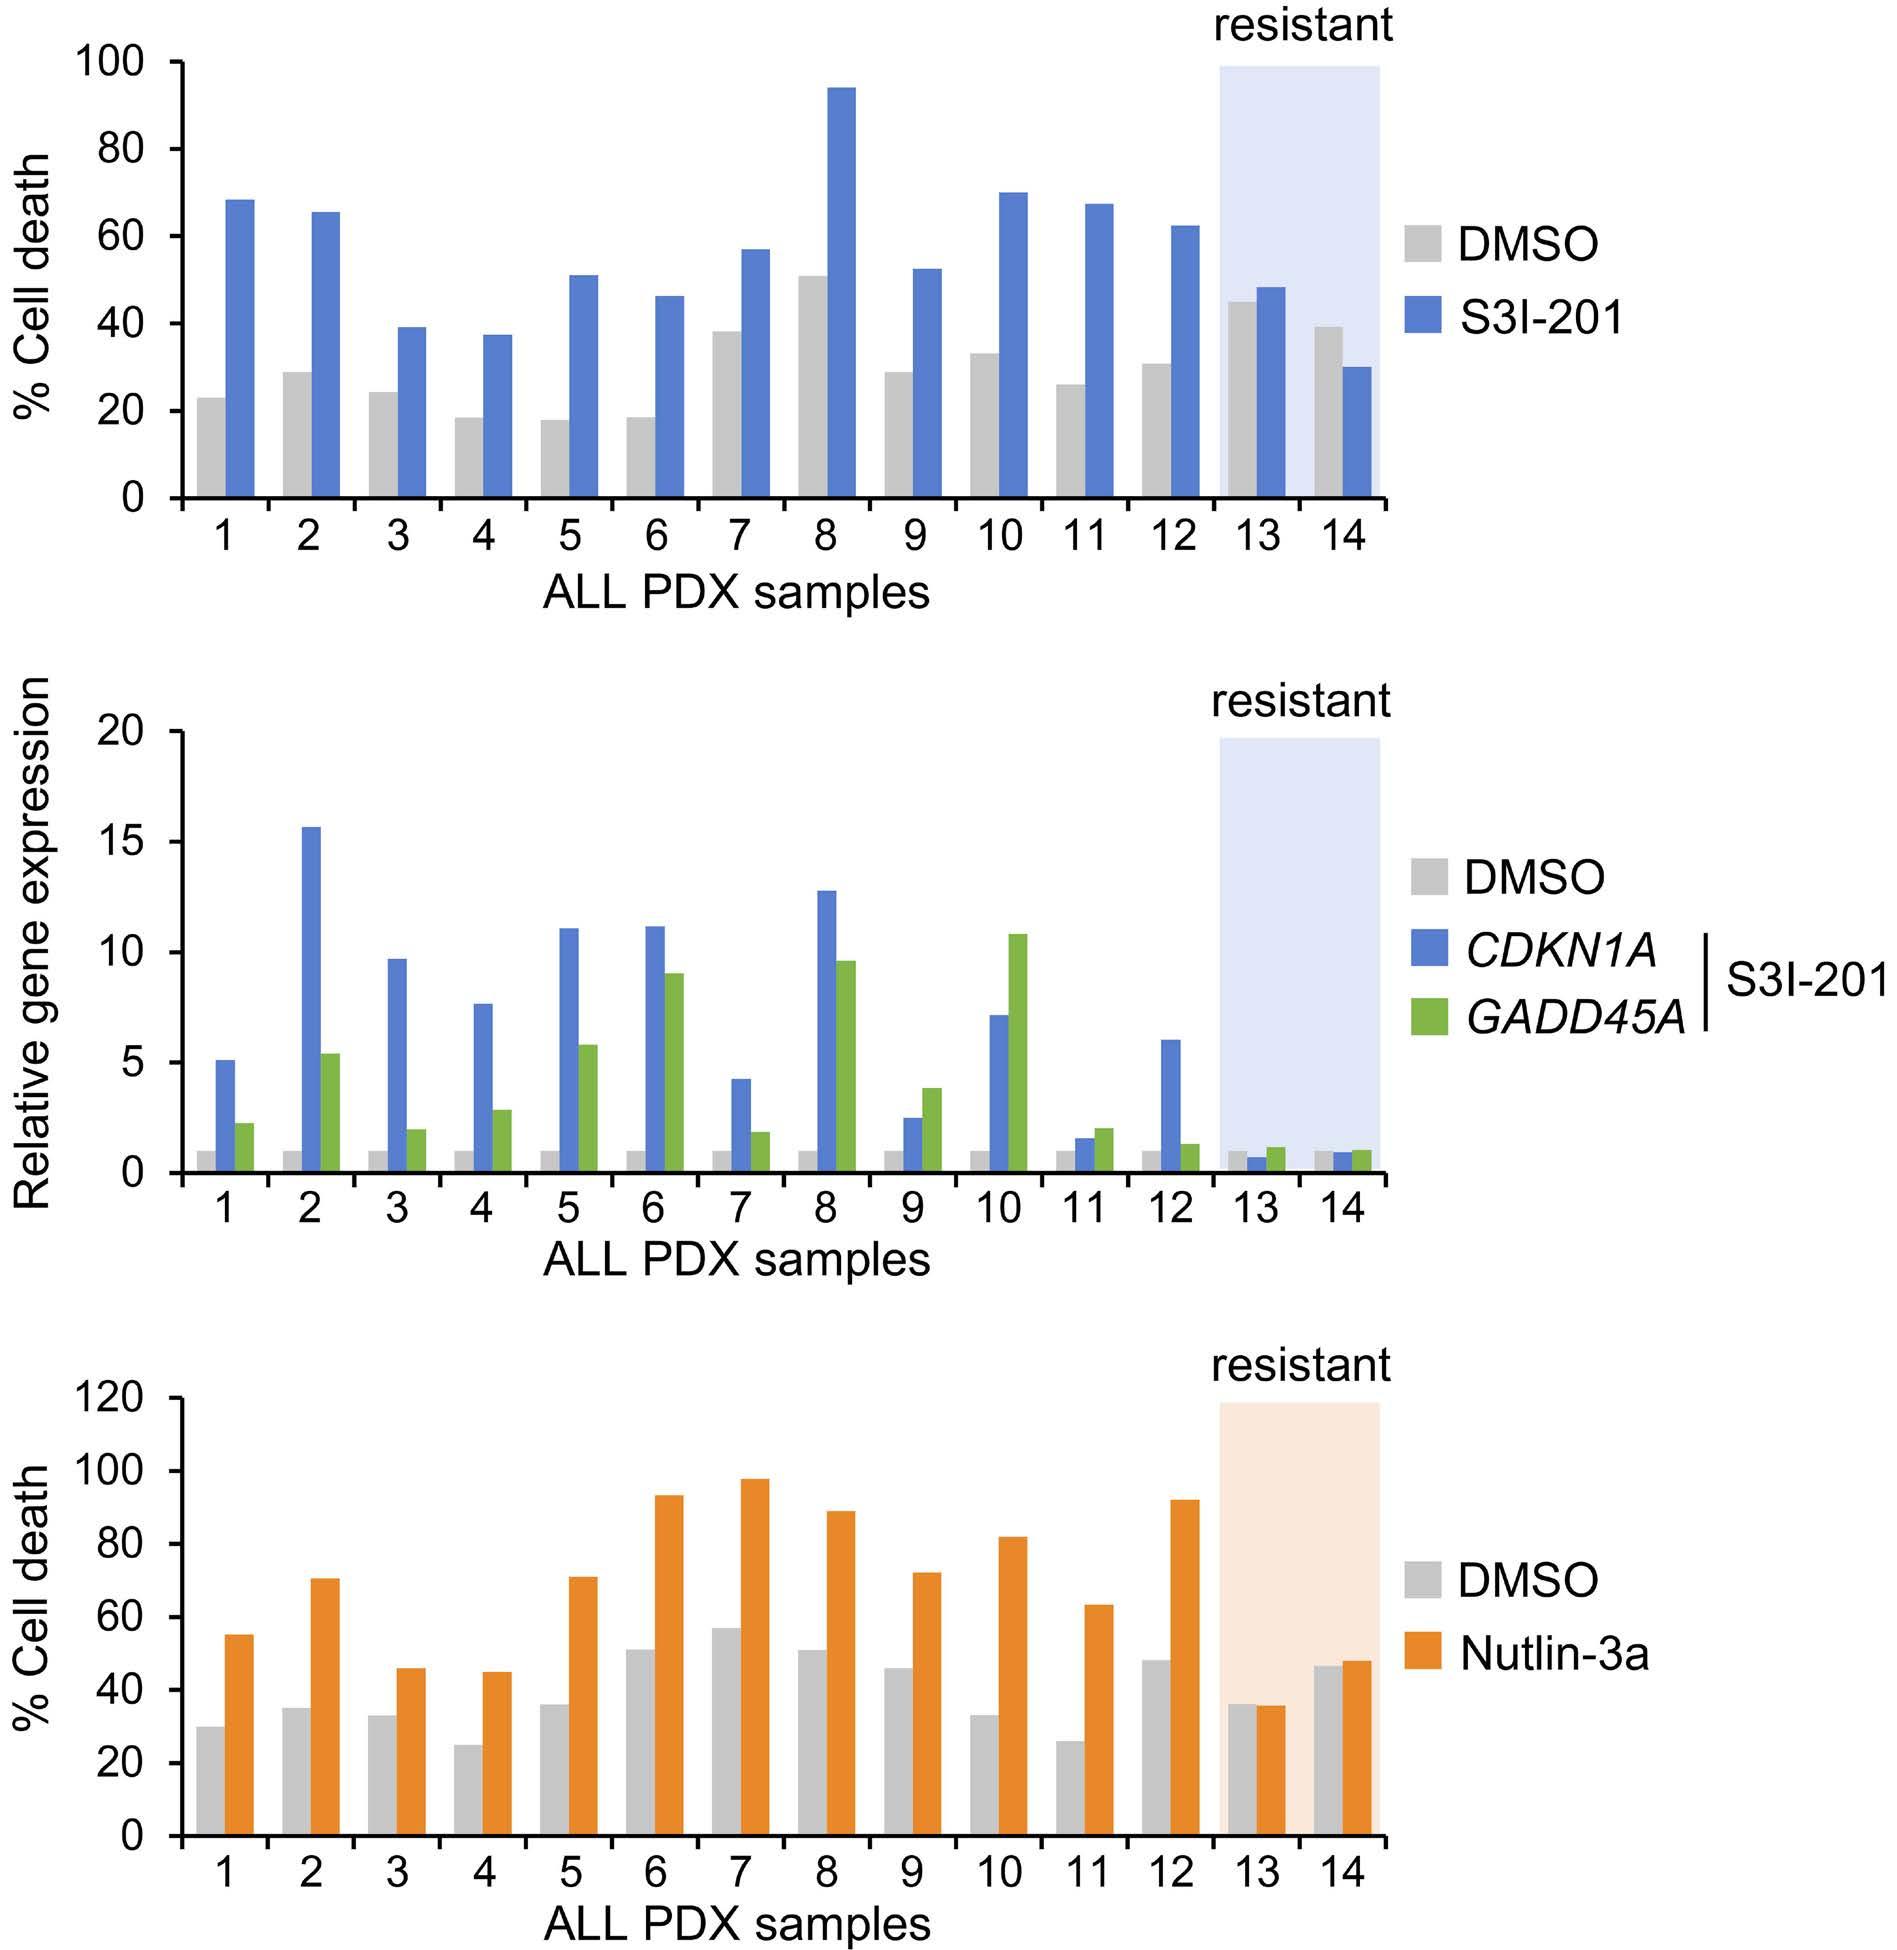
Figure 5. The sensitivity of B-cell acute lymphoblastic leukemia patient-derived xenograft cells to STAT3 inhibition correlates with TP53 status. (A) Induction of apoptosis (% Annexin V+ cells) in B-cell acute lymphoblastic leukemia patient-derived xenograft (B-ALL PDX)
24-hour treatment with S3I-201 (50 µM) in liquid culture. B-ALL PDX samples: ETV6-RUNX1+ (1-5, 12, 13), TCF3-PBX1+ (6), hyperdiploid (7), high-hyperdiploid (8), KMT2A-MLLT3+ (9), KMT2A-AFDN+ (10), PAX5-rearranged (11) and hypodiploid (14). Samples 1-10 were derived from presentation samples and samples 11-14 from relapsed samples. (B) Quantitative real-time polymerase chain reaction (qRT-PCR) analysis of CDKN1A and GADD45A gene expression in B-ALL PDX samples following 6-hour treatment with S3I-201 (50 µM). Gene expression data are normalized to dimethyl sulfoxide (DMSO)-treated cells. (C) Induction of apoptosis (% Annexin V+ cells) in B-ALL PDX samples following 24-hour treatment with Nutlin-3a (5 µM) in liquid culture.
TP53 status, although one of these (sample 11) contained a heterozygous deletion (chr17p11.2-p13.3) encompassing one TP53 allele. Taken together, these data are consistent with a critical role of p53 in mediating B-ALL sensitivity to STAT3 inhibition.
Since p53 induction following STAT3 inhibition did not appear to be mediated via direct MDM2 modulation (Online Supplementary Figure S4A-C), we reasoned that it may synergize with p53 induction resulting from MDM2 inhibition. Indeed, inhibition of STAT3 by either S3I-201 or Napabucasin demonstrated synergistic anti-leukemia activity in REH cells, when combined with MDM2 inhibition by Nutlin-3a (Figure 6A, B), suggesting a rationale for combined targeting of STAT3 and MDM2 in novel B-ALL therapy.
We next used a previously developed co-culture model in which drug susceptibility of luciferase-expressing B-ALL PDX samples is evaluated after seeding onto primary Nestin-positive human MSC.18 Five luciferase-transduced B-ALL PDX samples, two of which came from relapsed disease, proliferated over a 5-day period on human MSC (Online Supplementary Figure S8A). All of these samples exhibited sensitivity to C188-936 (also known as TTI-101), a more potent STAT3 inhibitor than S3I-201, over a similar concentration range to those reported for solid cancer cells37 (Online Supplementary Figure S8B). Increased susceptibility of all five samples to STAT3 inhibition (by S3I-201, Napabucasin or C188-9) was evident on combination with MDM2 inhibition (Figure 6C). The anti-leukemia effect observed in this co-culture model was associated with cell death (Online Supplementary Figure S8C) and was not a consequence of a direct effect of the drugs on primary MSC viability (data not shown). In contrast, these drug combinations had virtually no effect on the luciferase-expressing TP53 mutant hypodiploid B-ALL PDX (sample 14) (Online Supplementary Figure S8D). Similar responses to drug combinations occurred in three additional untransduced PDX samples (Online Supplementary Figure S8E). Longitudinal bioluminescence imaging demonstrated that short-term oral administration of Idasanutlin (MDM2 inhibitor) impaired disease progression in vivo in the PAX5 rearranged (sample 11) relapsed (Figure 7) and the KMT2A-MLLT3+ (sample 9) B-ALL model (Online Supplementary Figure S9A, B), and that in the former efficacy was improved by combining MDM2 with STAT3 inhibition.
In this study we demonstrate that pediatric pre-B ALL exhibits broad sensitivity to STAT3 inhibition. Previously, we demonstrated that ETV6-RUNX1+ B-ALL cell lines and primary patient samples were susceptible to inhibition of STAT3.10,11 However, in contrast to cell lines,10 the present study demonstrates that susceptibility of PDX samples is not restricted to specific subtypes of B-ALL but appears to be a general feature of the disease. Pharmacologic, shRNA- or CRISPR/Cas9-mediated
inhibition of STAT3 resulted in p53 induction and cell death, largely abrogated by CRISPR-Cas9-mediated TP53 knockout. Furthermore, two PDX samples exhibiting resistance to STAT3 inhibition were also resistant to MDM2 inhibition and contained missense TP53 mutations. Taken together, these data indicate that p53 induction underlies the sensitivity of B-ALL cells to STAT3 inhibition.
Combined C188-9 and Idasanutlin treatment was more effective at impairing disease progression in comparison to Idasanutlin alone in the PAX5 rearranged B-ALL PDX sample. These data validate the enhanced sensitivity of B-ALL PDX samples to combined STAT3 and MDM2 inhibition in vitro. However, enhanced drug combination efficacy was not seen in vivo for the KMT2A-MLLT3+ sample and C188-9 alone did not affect disease progression in either sample. The difference in effectiveness of Idasanutlin and C188-9 in vivo is likely to be due to their relative bioavailabilities, further improvements of which will be required for translation of STAT3 inhibition as a therapy in B-ALL.
Evidence in the literature indicates that p53 may be regulated by STAT3 through a variety of different mechanisms. Transcriptional repression of TP53 by STAT3 was demonstrated in Src transformed fibroblasts and melanoma cells,23 and in chronic lymphocytic leukemia B cells.38 More recently, leukemia inhibitory factor (LIF) was also shown to cause STAT3-dependent reduction in p53 protein expression levels in colorectal cancer cells.39 However, in this case STAT3 activation had no effect on TP53 mRNA levels but was rather shown to act via indirect transcriptional activation of MDM2 and consequent p53 protein degradation.39 Similarly, we did not observe any change in TP53 expression in B ALL cells following STAT3 inhibition, but p53 regulation was not directly dependent on MDM2 either. However, STAT3 inhibition resulted in MDM4 protein loss that was rescued by proteasomal inhibition and was not a result of p53 induction. Since MDM4 has been shown to increase ubiquitination of p53 by MDM2, as well as directly inhibiting the transactivation activity of p53,31 it is likely that STAT3 inhibition leads to elevated p53 protein levels by inducing MDM4 degradation. Further experiments are necessary to elucidate exactly how this is achieved. The broad susceptibility of pediatric B-ALL PDX samples to STAT3 inhibition suggests that a requirement for STAT3 activity may be a general characteristic of the pediatric B-ALL lineage, perhaps associated with signaling pathways operating in the cells of origin. In this context it is worth noting that both STAT3 and p53 play important roles in normal B-cell development. Thus, STAT3 was shown to be involved in the positive regulation of B-cell development, deficiency resulting in a partial pre-pro-B-cell differentiation block and increased pro-B-cell apoptosis.9 With respect to p53, regulation of its expression, transcriptionally or otherwise, plays a critical role in pre-B-cell development and selection. For example, apoptosis of pre-B cells that fail to productively rearrange their immunoglobulin heavy chain genes was shown to be mediated by p53 induction.40 In this case, induction was via
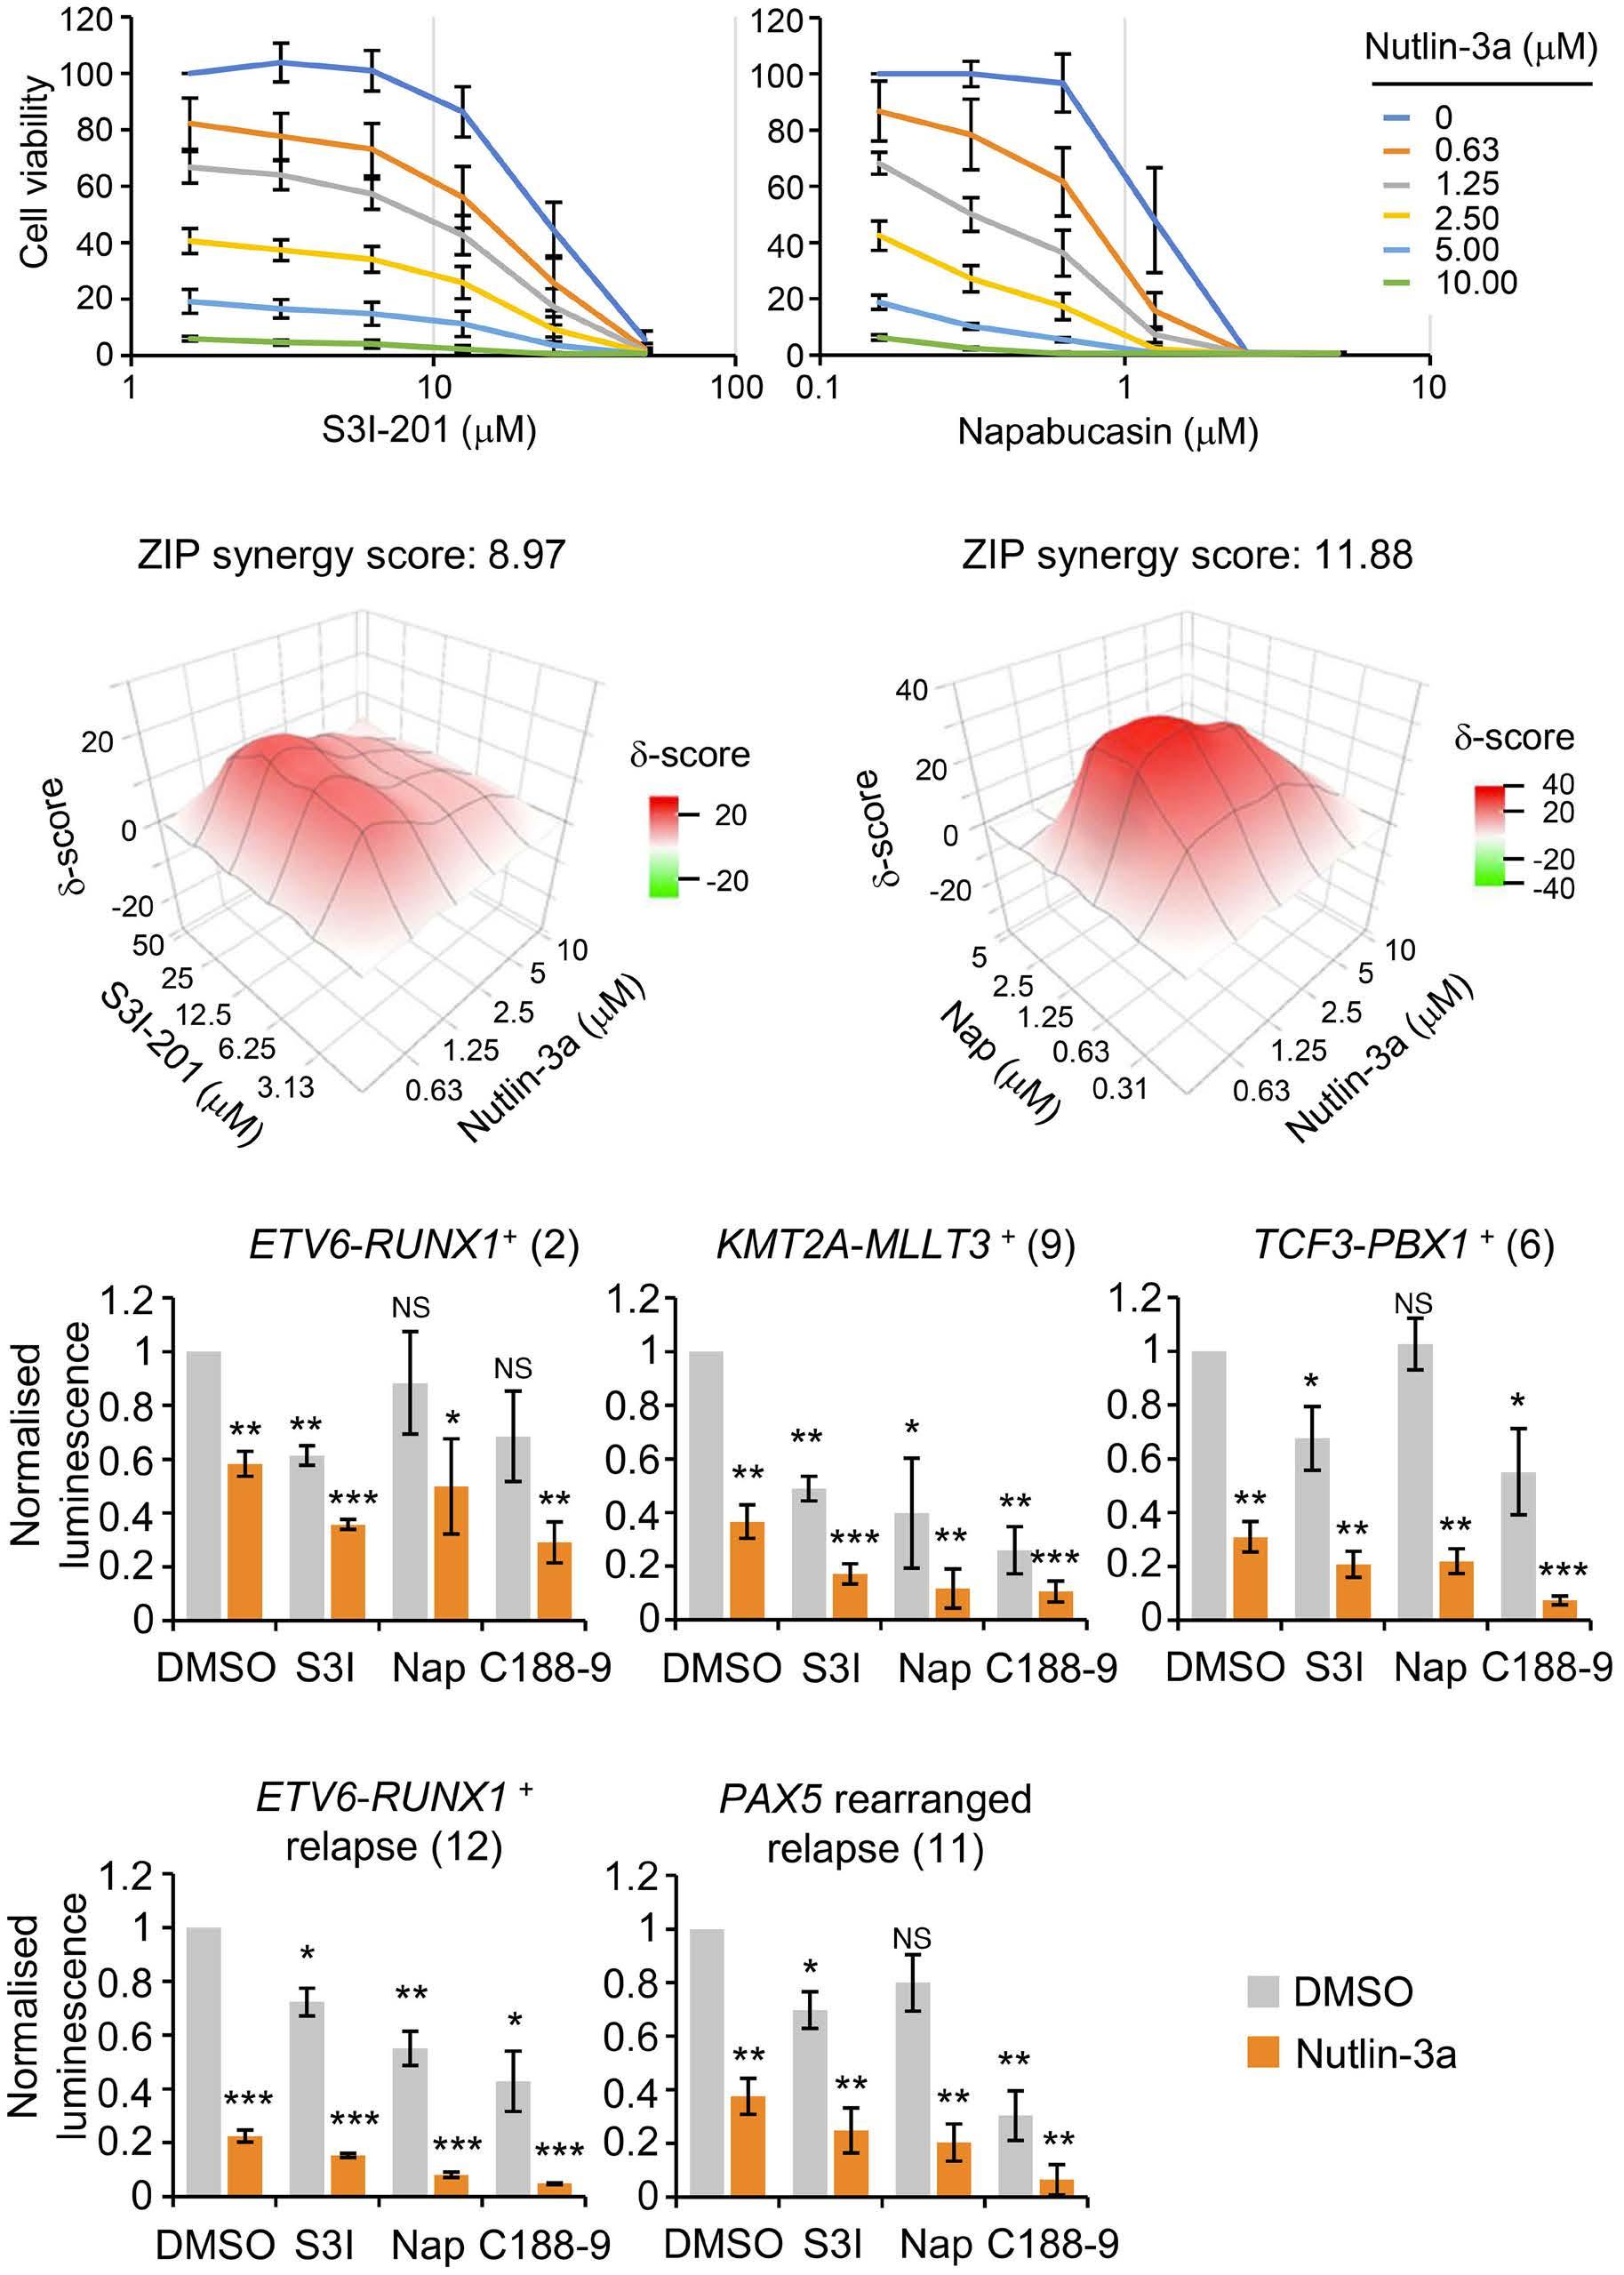
72-hour
(A)
concentrations of either S3I-201 or Napabucasin in combination with Nutlin-3a. Data are normalized to dimethyl sulfoxide (DMSO)-treated cells. Graphs points and error bars are means and standard deviation (SD) of N=4 (S3I-201) and N=3 (Napabucasin) independent experiments. (B) 3D synergy maps and ZIP synergy scores of data shown in (A), calculated with SynergyFinder (version 2.0). (C) Luminescence of luciferase-expressing B-cell acute lymphoblastic leukemia patient-derived xenograft (B-ALL PDX) samples, grown in co-culture with human mesenchymal stem cells (MSC), 5 days after exposure to MDM2 inhibitor Nutlin-3a (5 µM) alone or in combination with STAT3 inhibitors S3I-201 (50 µM), Napabucasin (1.5 µM) and C188-9 (10 µM). Corresponding B-ALL PDX sample number from Figure 4 is indicated in brackets. Data are normalized to DMSO-treated cells. Bars and error bars are means and SD of N=3 independent experiments. *P<0.05; **P<0.01; ***P<0.001; NS: not significant, one sample t test.
transcriptional activation of TP53 by the transcription factor BACH2. Furthermore, BACH2 was shown to act as a tumor suppressor in pre-B ALL, by virtue of its regulation of TP53 expression.40 Signaling pathways regulating p53 activity also appear to control pre-B-cell homeostasis. The Wip1 phosphatase, encoded by the p53 target gene PPM1D, is involved
in the negative feedback regulation of p53 activation.41 Interestingly, deletion of the Ppm1d gene was shown to result in reduced numbers of mature B cells. This defect was found to be due to induction of p53 and apoptosis in the pre-B-cell compartment and could be reversed by deletion of Tp53 42 This suggests that the autoregulatory loop between Wip1 and
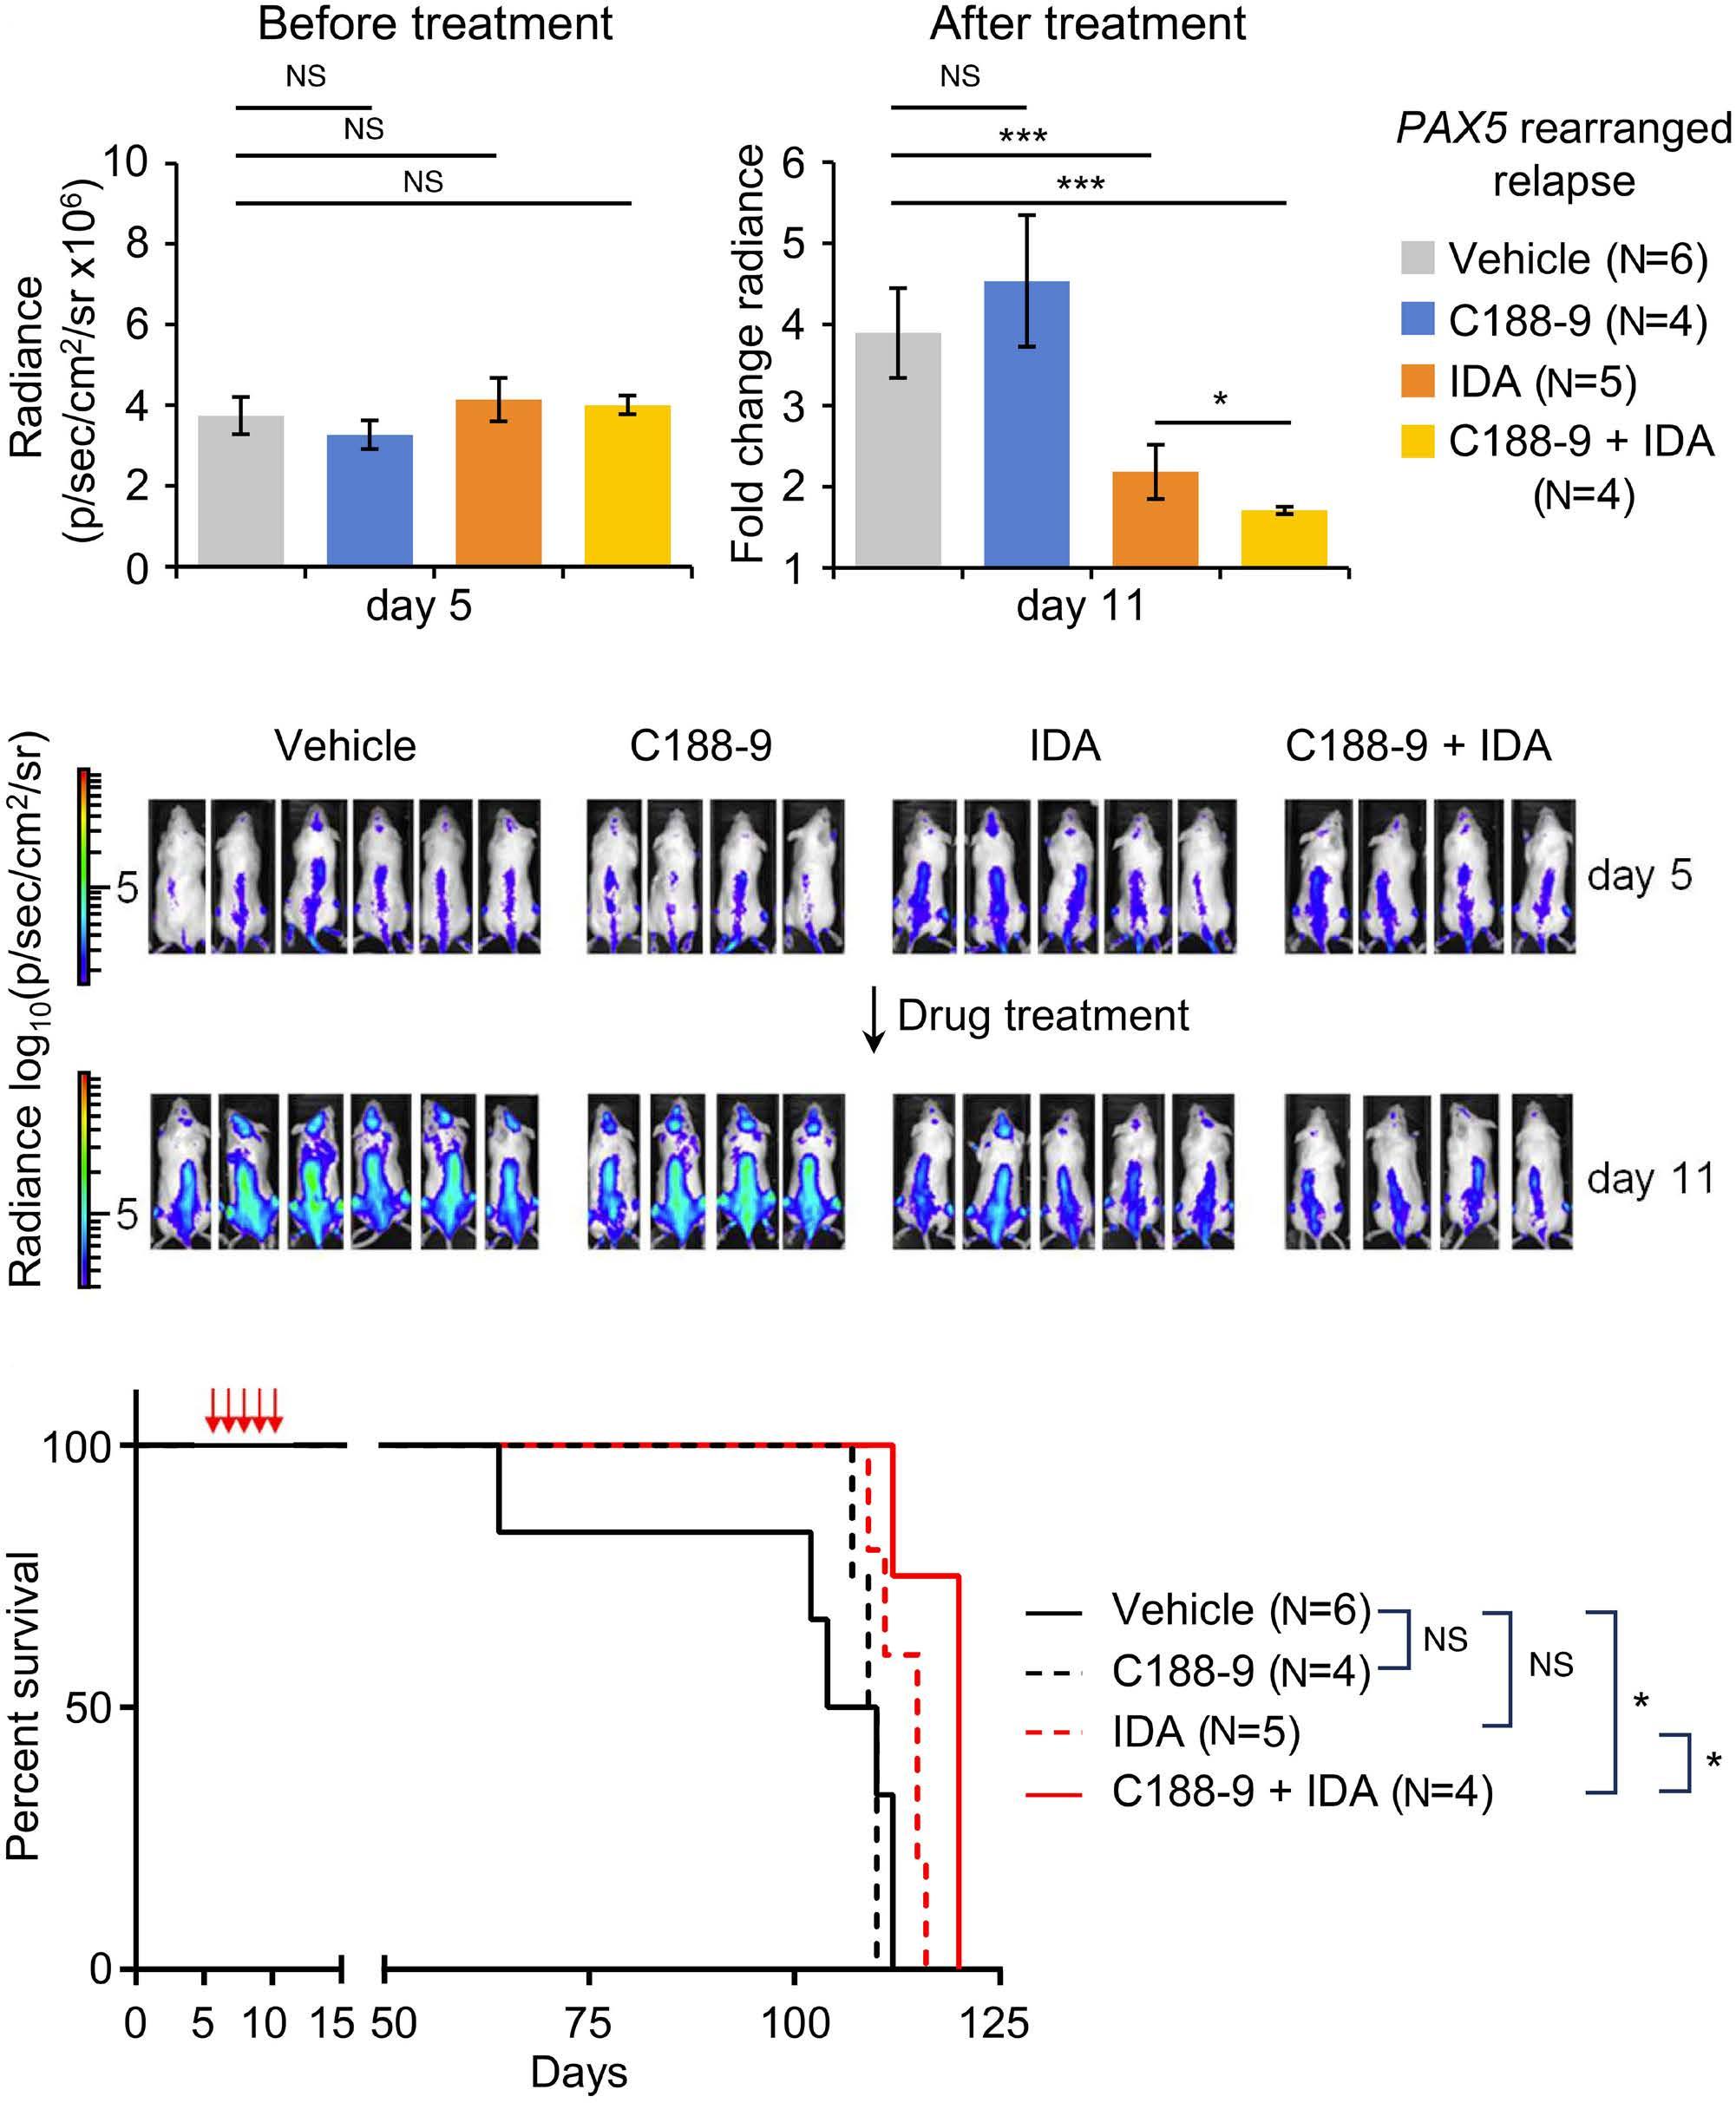
7. STAT3 and MDM2
B-cell acute lymphoblastic leukemia progression in vivo. (A) Bioluminescence signal (radiance = photons/s/cm2/steradian) in NSG recipient mice 5 days after injection of the luciferase-expressing PAX5 rearranged (relapse) B-cell acute lymphoblastic leukemia patient-derived xenograft (B-ALL PDX) sample and before drug treatment (left panel), and fold change in bioluminescence signal 11 days after injection, following 5 daily treatments with vehicle or the indicated drug combinations (right panel). Bars and error bars are means and standard deviation (SD) of values form each treatment group, the number of mice in each group indicated in brackets. *P< 0.05; ***P<0.001; NS: not significant, unpaired Student’s t test between indicated groups. (B) Bioluminescence imaging of NSG recipient mice before (day 5) and after (day 11) drug treatment. Bars for luminescence signal represent photons/s/cm2/steradian. (C) Survival curve for recipient mice in (A, B), treated with vehicle (black solid line), C188-9 (black dashed line), Idasanutlin (IDA, red dashed line) or C188-9 + IDA combination (red solid line). Red arrows indicate drug treatments. P=0.76 (vehicle vs. C188-9); P=0.055 (vehicle vs. IDA); P=0.0131 (vehicle vs. C188-9 + IDA); P
p53 functions to maintain normal pre-B-cell development. In contrast to the evidence for isolated STAT3 and p53 function in normal B-cell development, relatively little is known about the possible connection between STAT3 activity and repression of p53 induction in B-cell progenitors. In this context, it is interesting to note that constitutively active STAT3 was shown to promote resistance to g irradiation-induced
apoptosis in peritoneal B-1 cells.43 Interestingly, STAT3-dependent radioresistance could also be induced in normal B-2 B cells by stimulation with cytokines in the presence of BCR cross-linking.43 Although p53 induction by g irradiation was not directly examined in this study, these data suggest that a link may exist between STAT3 activity and suppression of p53 responses in normal B cells. Further studies will be required
to establish whether the STAT3/p53 pathway we describe in pre-B ALL is associated with leukemogenesis or rather is retained during transformation of pre-B cells.
TP53 mutations are more prevalent in relapsed pediatric B-ALL than primary disease.14-16 Indeed, thiopurine chemotherapy has recently been linked with the emergence of missense TP53 mutations.44 However, the overall incidence of these mutations is still relatively low in comparison to other cancers,13,45 supporting the therapeutic applicability of this approach to p53 induction in primary and relapsed pediatric B-ALL. In conclusion, we demonstrate broad susceptibility of pediatric B ALL to p53 induction following STAT3 and combined STAT3/MDM2 inhibition. p53 induction is not a result of increased TP53 transcription and is not directly dependent on MDM2, but rather is likely to result from MDM4 degradation. Consistent with this, B-ALL cells exhibited increased sensitivity to combined STAT3 and MDM2 inhibition in vitro and in vivo, indicating a novel disease susceptibility amenable to therapeutic exploitation.
Disclosures
No conflicts of interest to disclose.
Contributions
LG, CV, AT, NC and OW performed the experiments and data analysis. JB and DE provided clinical input and patient material. MH performed panel sequencing. JHAM analysed ChIP-sequencing data. DP and OH provided primary human MSC samples and methodology for ex vivo PDX co-culture. OW and JdB provided project leadership and supervised the research. LG and OW wrote the paper. All authors read, pro-
1. Karol SE, Pui CH. Personalized therapy in pediatric high-risk B-cell acute lymphoblastic leukemia. Ther Adv Hematol. 2020;11:2040620720927575.
2. Yu H, Lee H, Herrmann A, Buettner R, Jove R. Revisiting STAT3 signalling in cancer: new and unexpected biological functions. Nat Rev Cancer. 2014;14(11):736-746.
3. Zhu F, Wang KB, Rui L. STAT3 Activation and oncogenesis in lymphoma. Cancers (Basel). 2019;12(1):19.
4 Bar-Natan M, Nelson EA, Xiang M, Frank DA. STAT signaling in the pathogenesis and treatment of myeloid malignancies. JAKSTAT. 2012;1(2):55-64.
5. Oh IH, Eaves CJ. Overexpression of a dominant negative form of STAT3 selectively impairs hematopoietic stem cell activity. Oncogene. 2002;21(31):4778-4787.
6. Chung YJ, Park BB, Kang YJ, Kim TM, Eaves CJ, Oh IH. Unique effects of Stat3 on the early phase of hematopoietic stem cell regeneration. Blood. 2006;108(4):1208-1215.
7 Kortylewski M, Kujawski M, Wang T, et al. Inhibiting Stat3 signaling in the hematopoietic system elicits multicomponent antitumor immunity. Nat Med. 2005;11(12):1314-1321.
8. Frank DA. STAT3 as a central mediator of neoplastic cellular transformation. Cancer Lett. 2007;251(2):199-210.
vided critical comments and approved the manuscript.
The authors thank Ayad Eddaoudi, UCL GOS ICH Flow Cytometry Facility, for providing assistance with flow cytometry, all the staff of the UCL GOS ICH Western Laboratories for excellent animal husbandry, and Tony Brooks and Paola Niola, UCL Genomics, for RNA and ChIP sequencing, and Deborah Hughes, Gregorz Pietka, Reda Stankunaite and Paula Proszek at Royal Marsden Hospital Center for Molecular Pathology for help with TP53 sequencing.
This research was supported by Children with Cancer UK (14169, 17-249 to LG); Action Medical Research (GN2368 to CV); the Medical Research Council (MR/S021000/1 to CV); Children’s Cancer and Leukemia Group Little Princess Trust Project Grant program (CCLGA 2022 21 to CV); SPARKS and Great Ormond Street Hospital Children’s Charity (V4819 to AT); Action Medical Research and Life Arc (GN2820 to Noelia Che); Alternative Hair Charitable Foundation and Great Ormond Street Hospital Children’s Charity (W1073 to JdB); Great Ormond Street Hospital Children’s Charity (V1305, V2617 to OW); Olivia Hodson Cancer Fund (SR16A35 to OW); the NIHR Great Ormond Street Hospital Biomedical Research Center; and an NC3Rs fellowship (NC/ P002412/1 to DP).
The authors will make their original data available to future researchers upon request directed to the corresponding author.
9 Chou WC, Levy DE, Lee CK. STAT3 positively regulates an early step in B-cell development. Blood. 2006;108(9):3005-3011.
10 Mangolini M, de Boer J, Walf-Vorderwulbecke V, Pieters R, den Boer ML, Williams O. STAT3 mediates oncogenic addiction to TEL-AML1 in t(12;21) acute lymphoblastic leukemia. Blood. 2013;122(4):542-549.
11. Virely C, Gasparoli L, Mangolini M, et al. ARHGEF4 regulates an essential oncogenic program in t(12;21)-associated acute lymphoblastic leukemia. Hemasphere. 2020;4(5):e467.
12. Bhansali RS, Rammohan M, Lee P, et al. DYRK1A regulates B cell acute lymphoblastic leukemia through phosphorylation of FOXO1 and STAT3. J Clin Invest. 2021;131(1):e135937.
13. Imamura J, Miyoshi I, Koeffler HP. p53 in hematologic malignancies. Blood. 1994;84(8):2412-2421.
14 Gump J, McGavran L, Wei Q, Hunger SP. Analysis of TP53 mutations in relapsed childhood acute lymphoblastic leukemia. J Pediatr Hematol Oncol. 2001;23(7):416-419.
15. Hof J, Krentz S, van Schewick C, et al. Mutations and deletions of the TP53 gene predict nonresponse to treatment and poor outcome in first relapse of childhood acute lymphoblastic leukemia. J Clin Oncol. 2011;29(23):3185-3193.
16. Krentz S, Hof J, Mendioroz A, et al. Prognostic value of genetic
alterations in children with first bone marrow relapse of childhood B-cell precursor acute lymphoblastic leukemia. Leukemia. 2013;27(2):295-304.
17 Bomken S, Buechler L, Rehe K, et al. Lentiviral marking of patient-derived acute lymphoblastic leukaemic cells allows in vivo tracking of disease progression. Leukemia. 2013;27(3):718-721.
18. Pal D, Blair HJ, Elder A, et al. Long-term in vitro maintenance of clonal abundance and leukaemia-initiating potential in acute lymphoblastic leukaemia. Leukemia. 2016;30(8):1691-1700.
19 Walf-Vorderwulbecke V, Pearce K, Brooks T, et al. Targeting acute myeloid leukemia by drug-induced c-MYB degradation. Leukemia. 2018;32(4):882-889.
20 Clesham K, Walf-Vorderwulbecke V, Gasparoli L, et al. Identification of a c-MYB-directed therapeutic for acute myeloid leukemia. Leukemia. 2022;36(6):1541-1549.
21. Siddiquee K, Zhang S, Guida WC, et al. Selective chemical probe inhibitor of Stat3, identified through structure-based virtual screening, induces antitumor activity. Proc Natl Acad Sci U S A. 2007;104(18):7391-7396.
22. Fischer M. Census and evaluation of p53 target genes. Oncogene. 2017;36(28):3943-3956.
23. Niu G, Wright KL, Ma Y, et al. Role of Stat3 in regulating p53 expression and function. Mol Cell Biol. 2005;25(17):7432-7440.
24. Li Y, Rogoff HA, Keates S, et al. Suppression of cancer relapse and metastasis by inhibiting cancer stemness. Proc Natl Acad Sci U S A. 2015;112(6):1839-1844.
25. Haupt Y, Maya R, Kazaz A, Oren M. Mdm2 promotes the rapid degradation of p53. Nature. 1997;387(6630):296-299.
26. Kubbutat MH, Jones SN, Vousden KH. Regulation of p53 stability by Mdm2. Nature. 1997;387(6630):299-303.
27. Honda R, Tanaka H, Yasuda H. Oncoprotein MDM2 is a ubiquitin ligase E3 for tumor suppressor p53. FEBS Lett. 1997;420(1):25-27.
28. Lane DP, Hall PA. MDM2--arbiter of p53’s destruction. Trends Biochem Sci. 1997;22(10):372-374.
29. Barak Y, Juven T, Haffner R, Oren M. mdm2 expression is induced by wild type p53 activity. EMBO J. 1993;12(2):461-468.
30 Wu X, Bayle JH, Olson D, Levine AJ. The p53-mdm-2 autoregulatory feedback loop. Genes Dev. 1993;7(7A):1126-1132.
31. Haupt S, Mejia-Hernandez JO, Vijayakumaran R, Keam SP, Haupt Y. The long and the short of it: the MDM4 tail so far. J Mol Cell Biol. 2019;11(3):231-244.
32. Chuikov S, Kurash JK, Wilson JR, et al. Regulation of p53 activity through lysine methylation. Nature.
2004;432(7015):353-360.
33. el-Deiry WS, Tokino T, Velculescu VE, et al. WAF1, a potential mediator of p53 tumor suppression. Cell. 1993;75(4):817-825.
34 Nakano K, Vousden KH. PUMA, a novel proapoptotic gene, is induced by p53. Mol Cell. 2001;7(3):683-694.
35. Zhang C, Gao C, Kawauchi J, Hashimoto Y, Tsuchida N, Kitajima S. Transcriptional activation of the human stress-inducible transcriptional repressor ATF3 gene promoter by p53. Biochem Biophys Res Commun. 2002;297(5):1302-1310.
36. Redell MS, Ruiz MJ, Alonzo TA, Gerbing RB, Tweardy DJ. Stat3 signaling in acute myeloid leukemia: ligand-dependent and -independent activation and induction of apoptosis by a novel small-molecule Stat3 inhibitor. Blood. 2011;117(21):5701-5709.
37. Lewis KM, Bharadwaj U, Eckols TK, et al. Small-molecule targeting of signal transducer and activator of transcription (STAT) 3 to treat non-small cell lung cancer. Lung Cancer. 2015;90(2):182-190.
38. Sainz-Perez A, Gary-Gouy H, Gaudin F, et al. IL-24 induces apoptosis of chronic lymphocytic leukemia B cells engaged into the cell cycle through dephosphorylation of STAT3 and stabilization of p53 expression. J Immunol. 2008;181(9):6051-6060.
39 Yu H, Yue X, Zhao Y, et al. LIF negatively regulates tumoursuppressor p53 through Stat3/ID1/MDM2 in colorectal cancers. Nat Commun. 2014;5:5218.
40 Swaminathan S, Huang C, Geng H, et al. BACH2 mediates negative selection and p53-dependent tumor suppression at the pre-B cell receptor checkpoint. Nat Med. 2013;19(8):1014-1022.
41. Takekawa M, Adachi M, Nakahata A, et al. p53-inducible wip1 phosphatase mediates a negative feedback regulation of p38 MAPK-p53 signaling in response to UV radiation. EMBO J. 2000;19(23):6517-6526.
42. Yi W, Hu X, Chen Z, et al. Phosphatase Wip1 controls antigenindependent B-cell development in a p53-dependent manner. Blood. 2015;126(5):620-628.
43. Otero DC, Poli V, David M, Rickert RC. Cutting edge: inherent and acquired resistance to radiation-induced apoptosis in B cells: a pivotal role for STAT3. J Immunol. 2006;177(10):6593-6597.
44. Yang F, Brady SW, Tang C, et al. Chemotherapy and mismatch repair deficiency cooperate to fuel TP53 mutagenesis and ALL relapse. Nat Cancer. 2021;2(8):819-834.
45. Comeaux EQ, Mullighan CG. TP53 Mutations in hypodiploid acute lymphoblastic leukemia. Cold Spring Harb Perspect Med. 2017;7(3):a026286.
Danny V. Jeyaraju,1 Maryam Alapa,1 Ann Polonskaia,1 Alberto Risueño,2 Prakash Subramanyam,3 Amit Anand,3 Kaushik Ghosh,4 Charalampos Kyriakopoulos,2 Daiane Hemerich,1 Rose Hurren,5 Xiaoming Wang,5 Marcela Gronda,5 Aarif Ahsan,1 Hsiling Chiu,1 Geethu Thomas,5 Evan F. Lind,6 Daniel L. Menezes,7 Aaron D. Schimmer,5 Patrick R. Hagner,1 Anita Gandhi1 and Anjan G. Thakurta1°
1Bristol Myers Squibb, Summit, NJ, USA; 2CITRE, Bristol Myers Squibb, Seville, Spain; 3BBRC, Bangalore, India; 4Bristol Myers Squibb, Bangalore, India; 5Princess Margaret Cancer Center, Toronto, Ontario, Canada; 6Department of Molecular Microbiology and the Knight Cancer Institute, Oregon Health & Science University, Portland, OR, USA and 7Bristol Myers Squibb, San Francisco, CA, USA
°Currrent address: Nuffield Orthopedic Center, Department of Rheumatology and Musculoskeletal Sciences, University of Oxford, Headington, UK
Correspondence: A.G. Thakurta anjan.thakurta@ndorms.ox.ac.uk
Received: May 2, 2023.
Accepted: October 30, 2023.
Early view: November 9, 2023.
https://doi.org/10.3324/haematol.2023.283437
©2024 Ferrata Storti Foundation
Published under a CC BY-NC license
Oral azacitidine (oral-Aza) treatment results in longer median overall survival (OS) (24.7 vs. 14.8 months in placebo) in patients with acute myeloid leukemia (AML) in remission after intensive chemotherapy. The dosing schedule of oral-Aza (14 days/28-day cycle) allows for low exposure of Aza for an extended duration thereby facilitating a sustained therapeutic effect. However, the underlying mechanisms supporting the clinical impact of oral-Aza in maintenance therapy remain to be fully understood. In this preclinical work, we explore the mechanistic basis of oral-Aza/extended exposure to Aza through in vitro and in vivo modeling. In cell lines, extended exposure to Aza results in sustained DNMT1 loss, leading to durable hypomethylation, and gene expression changes. In mouse models, extended exposure to Aza, preferentially targets immature leukemic cells. In leukemic stem cell (LSC) models, the extended dose of Aza induces differentiation and depletes CD34+CD38- LSC. Mechanistically, LSC differentiation is driven in part by increased myeloperoxidase (MPO) expression. Inhibition of MPO activity either by using an MPO-specific inhibitor or blocking oxidative stress, a known mechanism of MPO, partly reverses the differentiation of LSC. Overall, our preclinical work reveals novel mechanistic insights into oral-Aza and its ability to target LSC.
Acute myeloid leukemia (AML) is a disease of the elderly with a median age at diagnosis >68 years. Unfavorable cytogenetics and associated comorbidities are among the factors that make elderly patients unfit/ineligible for intensive chemotherapy, known as the 7+3 regimen.1-3 As a result, targeted and less intensive treatments are used as first line therapy for many of these patients. Venetoclax/ azacitidine (Ven/Aza) is one such treatment regimen that has improved outcomes in chemotherapy-ineligible newly diagnosed AML patients.4,5 The backbone of this regimen, Aza, is a hypomethylating agent that incorporates into RNA
and DNA. DNA-incorporated Aza leads to loss of DNMT1 and therefore, genome-wide hypomethylation.6 Through hypomethylation-dependent/independent effects, Aza impacts multiple cellular processes such as apoptosis, DNA damage response, tumor suppressor re-expression, immune modulation, and more.7 Given the genomic and epigenomic dysregulation and heterogeneity in AML, the broad hypomethylating effect and multitude of mechanisms impacted by Aza could be one of the keys to its clinical efficacy. Venetoclax selectively inhibits the anti-apoptotic protein, BCL-2.8 On the other hand, many AML patients eligible for intensive chemotherapy achieve complete remission with the 7+3 regimen.3 However, most of these
patients on chemotherapy as well as Ven/Aza therapy eventually relapse.9-11
A multicenter study identified longer relapse-free survival following first remission as one of the key parameters for better prognosis.12 Thus, better maintenance therapy is critical for AML patients. The QUAZAR AML-001 study demonstrated that maintenance therapy with oral-Aza significantly prolonged overall and relapse-free survival.13,14 Interestingly, single agent injectable-Aza did not provide a significant overall survival benefit in maintenance therapy in a similar patient population.15,16 The key translational question posed by this observation is, what specific mechanisms are associated with the oral formulation that may contribute to the observed clinical benefit in AML maintenance. In order to further explore this, we modeled injectable- and oral-Aza in our preclinical studies and explored the mechanism of action of oral-Aza. Equally important is to identify similarities between the two dosing regimens for potential future investigations of oral-Aza with agents that could combine well with injectable-Aza.
Human and mouse cell lines
AML cell lines were cultured in RPMI1640 (SKM1), Iscove’s Modified Dulbecco’s Medium (IMDM; OCI-AML2, OCI-AML20, MV411) or α-MEM (OP9, OCI-AML3, OCI-AML5) supplemented with 10% or 20% fetal bovine serum, sodium pyruvate, glutamine, and penicillin-streptomycin. OP9 cells were further supplemented with b-mercaptoethanol (b-ME) and OCI-AML20 with b-ME and granulocyte-macrophage colony-stimulating factor (GM-CSF).
Flow cytometry
For OCI-AML20, CD33, and CD45, stains were used to distinguish OP9 cells (mouse) and OCI-AML20 cells (human). OCI-AML20 were then assessed for differentiation and changes in the leukemic stem cell (LSC) population with the following markers: live/dead stain, CD34 and CD38. Flow cytometry was performed in a BD LSRFortessaTM X-20.
Myeloperoxidase inhibition
OCI-AML20 cells were treated with Aza (conventional or extended dose) alone or in combination with 10 µM myeloperoxidase (MPO)-IN-28 (dosed on days 1 and 4). Flow analysis was done on day 7.
Cytokine array
OCI-AML20 cells were seeded at 0.5x10⁶ cells/mL and treated with Aza, conventional or extended dosing. Supernatant from the cells was collected on days 3, 5, and 7. Cytokine array was performed using Proteome Profiler Human XL Cytokine Array Kit (biotechne, ARY022B), according to the manufacturer’s recommendation except that membranes
were incubated with IRDye 800CW Streptavidin (Licor, 92632230) to allow fluorescent detection of the cytokines. Membranes were imaged with Odyssey CLx (Licor).
Primary acute myeloid leukemia cell culture and CD34+ cells enrichment
Frozen primary patient samples (mutations in BCOR, BCORL1, CDKN2A, IKZF1, NOTCH1 RUNX1, SF3B1, STAG2, TET2, TP53) were quickly thawed and followed by CD34+ cells isolation (Stemcell Technologies, 17856) according to the manufacturer’s protocol. Flow cytometry was used to verify enrichment of the CD34+ population before treatment initiation. Cells were resuspended to a concentration of 0.5x10⁶ cells/mL in X-VIVO 10 medium (Lonza, 04-380Q) supplemented with 20% BIT 9500 serum substitute (STEMCELL Technologies, 09500) and cytokines: interleukin-6 (IL-6) (10 ng/mL; PeproTech, 200-06), IL-3 (10 ng/mL; PeproTech, 200-03), stem cell factor (50 ng/mL; Peprotech, 300-07), FLT3-ligand (50 ng/mL; PeproTech, 300-19), granulocyte colony-stimulating factor (10 ng/mL; PeproTech, 300-23), and TPO (25 ng/mL; PeproTech, 300-18). The cells were dosed with Aza (extended or conventional) and flow analysis was performed on day 7 day with live/dead stain, CD34, and CD38 antibodies.
For in vivo intrafemoral engraftment studies, we modeled injectable-Aza and oral-Aza doses with 3 mg/kg once daily for 5 days (QDx5) and 1 mg/kg QDx15, respectively (intraperitonially in both cases, modified from Vu et al.)13 Twelve-week female immunodeficient NOD.CB17-Prkdcscid/J (NOD-SCID)17 mice used for the transplantation of primary AML cells were obtained from the Ontario Cancer Institute (Toronto, Ontario, Canada). All animal studies were performed in accordance with the Ontario Cancer Institute Animal Use Protocol (AUP): # 1251.33 (NOD-SCID).
For the syngenic mouse model: C1498 (ATCC® TIB-49™) murine acute leukemia cells (American Tissue Culture Collection) expressing firefly luciferase and GFP (designated C1498-Luc3-GFP) were developed at Charles River Laboratories. Mice were injected with 1x10⁶ C1498-Luc3GFP tumor cells via the tail vein. Animals were randomized into treatment groups based on body weight on day 1 post-injection. All drug treatments were initiated on day 5 and were administered QD. Vehicle (phosphate-buffered saline [PBS]) and Aza were administered intraperitoneally.
For the chimeric AML model: FLT3-internal tandem duplication (ITD), TET2, and LysM-cre mice were bred to generate a heterologous genotype of FLT3-ITD-/+TET2-/+LysM-cre-/+ . Bone marrow chimeras were generated by irradiating mice in an X-ray irradiator at a lethal dose of 9 Gy. Bone marrow from FLT3-ITD-/+TET2-/+LysM-cre-/+ (CD45.2) was adoptively transferred via intravenous injection into 8-week-old CD45.1 congenic disparate recipient mice. Mice were monitored for chimerism after week 8 post-adoptive transfer. Aza was administered intraperitonially.
Extended-dose Aza leads to durable hypomethylation and sustained gene expression independent of the integrated stress response pathway
While both injectable- and oral-Aza have the same active ingredient, their clinical dose and schedules are different, and they do not have similar bioavailability, pharmacokinetic (PK) or pharmacodynamic (PD) profiles.18,19 In a phase I study, compared with non-responders, patients who achieved clinical response with oral-Aza had greater hypomethylation as measured by global demethylation scores.19 This indicated that the dosing schedule might impact the hypomethylative effect of Aza. In order to test this hypothesis, we modeled injectable- and oralAza based on a recent study by Vu and colleagues.20 They modeled the clinical exposures of injectable- and oral-Aza using a “high exposure, limited duration” (HE-LD) regimen mimicking injectable-Aza and a “low exposure, extended duration” (LE-ED) mimicking oral-Aza hereafter referred to as conventional and extended dose respectively.
In order to understand the mechanistic basis of greater hypomethylation by oral-Aza, we treated three different AML cell lines with the in vitro modeling of the conventional- versus extended-dosing regimens. In these Aza-treated samples, genome-wide methylation was measured by whole-genome bisulfite sequencing and gene expression changes by RNA sequencing (RNA-seq) (Figure 1A) on days 3 and 5. While day 3, showed greater genome-wide hypomethylation in the conventional dose in two of the three cell lines (Figure 1B-D, upper panels), by the end of treatment (day 5), the extended-dose Aza regimen demonstrated durable hypomethylation in all three cell lines relative to the conventional Aza (P<0.001) (Figure 1B-D, lower panels, based on b score greater than 0.7; Online Supplementary Figure S1A; Online Supplementary Table S1). This suggested progressive hypomethylation in the extended dose but not in the conventional dose. Similarly, gene expression changes were greater/progressive in the extended dose at the end of treatment (day 5) (Figure 1E). Intrigued by the sustained effects of the low-dose Aza, we explored the status of DNMT1, which is degraded through entrapment by Aza thereby facilitating hypomethylation.6 Biochemical analysis revealed loss of DNMT1 (90% reduction) at early time points (Figure 1F). On day 7, DNMT1 levels recovered to nearly 90% with the conventional dose (Figure 1F) but not in the extended dose. Thus, the extended dose, albeit at lower exposures of Aza, facilitates prolonged loss of DNMT1 and thereby durable hypomethylation. Of note, while up to day 10, DNMT1 levels continue to be low in extended Aza treatment, there is about 20-50% cell death at these time points raising the possibility that at time points beyond day 7, cell death could contribute to loss of DNMT1 (data not shown).
In order to further understand the sustained hypometh -
ylation of the extended-dose Aza, we analyzed the PD basis in an in vivo study measuring [14C] Aza incorporation in peripheral blood mononucelar cells (PBMC) after intraperitoneal administration to male C57BL/6 mice. These mice were treated with the two dosing regimens to mimic the conventional dose (3 mg/kg, QDx5) and extended dose (1 mg/kg, QDx15) regimens of Aza ( Online Supplementary Figure S1B ) with both regimens receiving the same cumulative dose of Aza. Results showed that the relative incorporation of Aza into DNA was greater in the extended dose based on relative area under the curve (AUC) (Figure 1G). Thus, the continued exposure of Aza resulted in a sustained therapeutic effect through greater nucleic acid incorporation thereby explaining the prolonged loss of DNMT1.
RNA incorporation of Aza is a potential mechanism through which, integrated stress response (ISR), one of the known mechanisms of action of Aza, 21 is activated. In a recent study, this has been postulated as a mechanistic basis for synergy with venetoclax. 22 In order to investigate if the extended dose also activates ISR, we treated MV4-11, SKM-1, and AML-193 cell lines with 0.2 µ M or 1 µ M Aza in short-term (24 hours) experiments (Figure 1H). As expected, 1 µ M Aza, mimicking conventional Aza, resulted in increased levels of eIF2 α phosphorylation as well as ATF4, the core and effector of ISR, respectively. 23 With the 0.2 µ M dose, we observed slightly lower levels of phospho-eIF2 α and ATF4. In addition, treatment with ISRIB, 24 a known inhibitor of ISR, reversed ATF4 expression without impacting DNMT1 loss. In order to investigate if ISR could be activated at later stages of the extended dose, we performed a time-course experiment over a period of 7 days (Figure 1I). While the extended dose was able to induce ATF4 expression, it did not result in activation of C/EBP Homologous Protein (CHOP), a downstream effector of ATF4 that leads to cell death 25 which was observed in the 1 µ M dose at 24 hours. These results indicate that while both the conventional and extended dosing trigger a stress response, the extended dose is not robust enough to mediate cell death through the ISR pathway.
Taken together, the above-stated observations indicate that while conventional-Aza works through activation of stress response and hypomethylation mediated changes, the extended dosing of oral-Aza results in sustained gene expression driven temporal effects that could be a key differentiating factor between injectable- and oral-Aza.
In order to further investigate the therapeutic impact of the above-observed differences, we investigated the effect of the two dosing regimens in an in vivo syngeneic and patient-derived xenograft (PDX) model of AML. C1498-Luc3-GFP cells were injected into the tail vein of
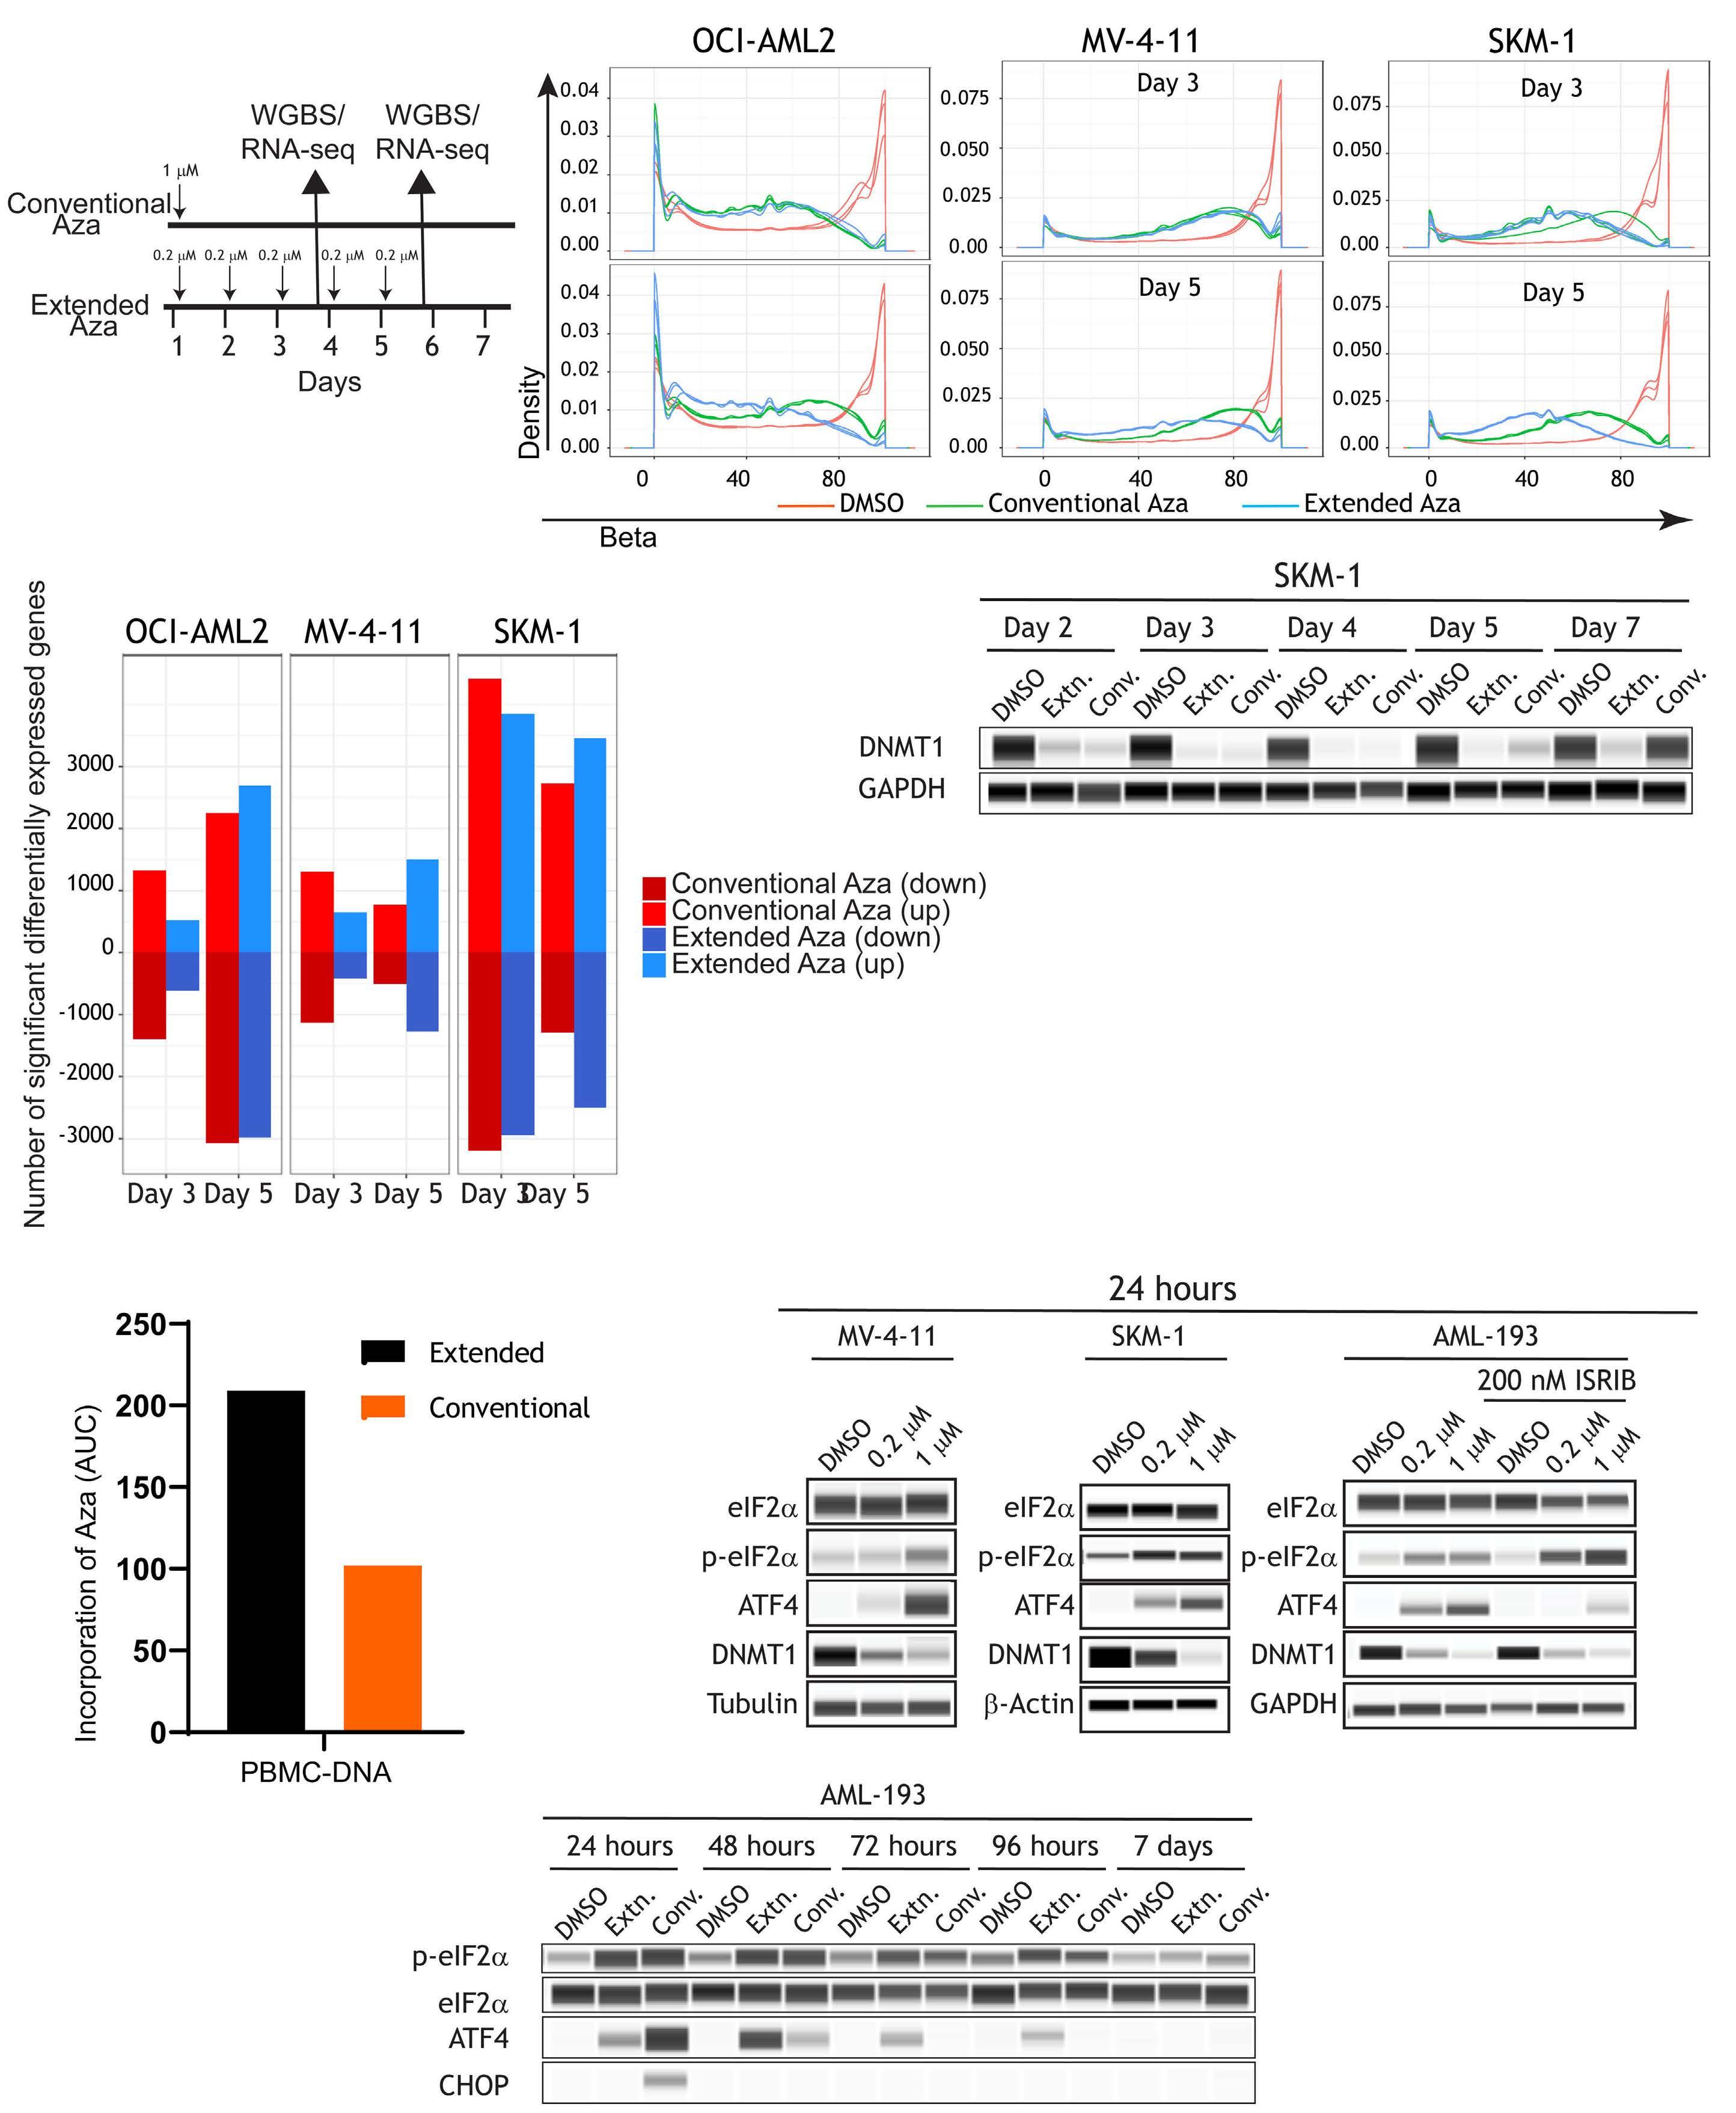
Figure 1. Extended-dose Aza leads to a more sustained hypomethylation and gene expression. (A) Schematic of experimental design of (B) OCI-AML2, (C) MV-4-11, and (D) SKM-1 cell lines DNA methylation profiles as measured by whole-genome bisulfite sequencing (WGBS) in response to the 2 dosing regimens. Compared to day 3, in day 5 extended dose results in a progressing/ sustained hypomethylation. (E) Barplots indicating the total number of significantly differentially expressed genes in all 3 cell lines at the 2 time points (day 3 and day 5). Three replicates per cell line, per time point, per gene was used to generate the barplots using the R limma package. Note the increase in the number of genes in extended dose but not in conventional dose azacitidine (Aza) at the later time point (“down” indicates downregulated and “up” indicates upregulated). (F) DNMT1 levels were measured by protein simple western blotting at the indicated times in SKM-1 cell line. (G) Area under the curve (AUC) barplots representing the amount of Aza incorporation in peripheral blood mononucear cells (PBMC) using the conventional or extended dose of Aza. AUC data was generated from 3 animals and 5 time points for each dosing regimen (H) Biochemical analysis was performed in MV-4-11, SKM-1, and AML-193 cells treated with low (0.2 µM) or high (1 µM) dose of Aza for 24 hours. Protein lysates were prepared and assessed for treatment-mediated activation of ISR and loss of DNMT1. AML-193 experiment was duplicated (right panel) to assess the effect of ISRIB, an ISR inhibitor, in ablating Aza-induced ISR activation. Tubulin or glyceraldehyde-3-phosphate dehydrogenase (GAPDH) was used as a loading control. (I) AML-193 cells were treated with Aza in conventional or extended regimen and protein lysates were prepared from days 1-7 and assessed for DNMT1 expression and ISR activation markers. EIF2α was used as a loading control. RNA-seq: RNA sequencing.
syngeneic mice which were then treated with the two dosing regimens of Aza. Ventral bioluminescence imaging (BLI) of luciferase-expressing tumor cells demonstrated that both regimens of Aza significantly decreased tumor burden at 15, 18 and 21-days post-injection ( Online Supplementary Figure S2A ). At day 25 post-injection, flow cytometry analysis demonstrated that both dosing regimens significantly decreased the percentage of GFP + C1498 tumor cells in peripheral blood ( Online Supplementary Figure S2B ). Both Aza regimens similarly increased survival of tumor-bearing mice, compared to vehicle controls (Figure 2A) suggesting that both regimens are equally effective in reducing disease burden.
In order to further validate these in vivo observations, we used an IDH1R132H PDX AML model, CTG-2227.26 Cells were injected into the tail vein of sublethally irradiated, immunocompromised mice (NOG-EXL) and the animals were treated with the two dosing regimens. Tumor burden was assessed by measuring spleen weight at the end of the study. Similar to the syngenic model, both dosing regimens caused significant and comparable decreases in spleen weight compared to vehicle-treated animals (Figure 2B). Taken together, the syngeneic and PDX models indicate that despite the difference in dosing schedule, both the Aza dosing regimens are equally effective against bulk AML cells and contribute to lowering disease burden.
Given that oral-Aza is effective in maintenance therapy where leukemic stem/progenitor cells are one of the drivers of relapse, we tested the two dosing regimens in a chimeric AML model. Bone marrow from FLT3 -ITD; TET2 ; LysM-cre compound heterozygous mice on a CD 45.2 background was adoptively transferred to CD45.1 wild-type (WT) recipient mice. Again, the extended-Aza dosing was as effective as the conventional dosing at resolving splenomegaly (Figure 2C), a strong indicator of AML progression; However, the extended-Aza dosing significantly decreased blasts in the bone marrow, whereas conventional dosing did not (Figure 2D). These data suggest that the extended dosing regimen more effectively controls bone marrow disease in this model.
Extended-dose Aza induces differentiation/elimination of leukemic stem cells
LSC are primitive hematopoietic cells related to the origin and relapse in AML.27,28 In order to investigate the impact of the oral-Aza/extended dosing on the LSC compartment, we utilized an in vitro LSC model, OCI-AML20.29 Extended-Aza dosing resulted in depletion of LSC (CD34+/CD38- or CD38 low) and concomitant enrichment of CD34+/CD38+ cells at day 7 (Figure 3A, representative flow plot; Online Supplementary Figure S3A, replicate data). While the conventional-Aza dosing also resulted in depletion of CD34+CD38cells, the extended-Aza dosing had greater depletion of LSC in response to the extended-dose Aza. Notably, no overt cell death/apoptosis observed in these cells (Online Supplementary Figure S3B). In order to further validate the differentiation phenotype, we treated a CD34+ cell-enriched primary AML sample (TP53- and TET2-mutated) with both dosing regimens and identified differentiation of CD34+ cells to CD34- cells (Figure 3B; Online Supplementary Figure S3C). In order to further substantiate these observations, we performed single cell RNA-seq in OCI-AML20 cells at different time points (3, 5, and 7 days). Data were analyzed using a previously described classifier to identify leukemic myeloid cell lineages.30 Compared to untreated cells, the extended dosing resulted in an increase of granulocyte-monocyte progenitor (GMP) and myeloid cells indicating induction of differentiation in immature cells. While the conventional dosing also resulted in similar change in cell type composition, the extended-dosing regimen was associated with significantly greater differentiation compared with the conventional regimen (Figure 3C).
In order to test the effects of oral-Aza like dosing on leukemic progenitors in vivo, we leveraged a mouse xenograft model (NOD/SCID). Following injection of AML patient-derived PBMC into the right femur, the mice were treated with Aza regimens mimicking the injectable/conventional dose (3 mg/kg x5 days) or the oral/extended dose (1 mg/ kg x15/21 days) (Figure 4A). At day 42, animals were sacrificed, and primary engraftment was measured in the left femur/distal site. Both conventional and extended dosing
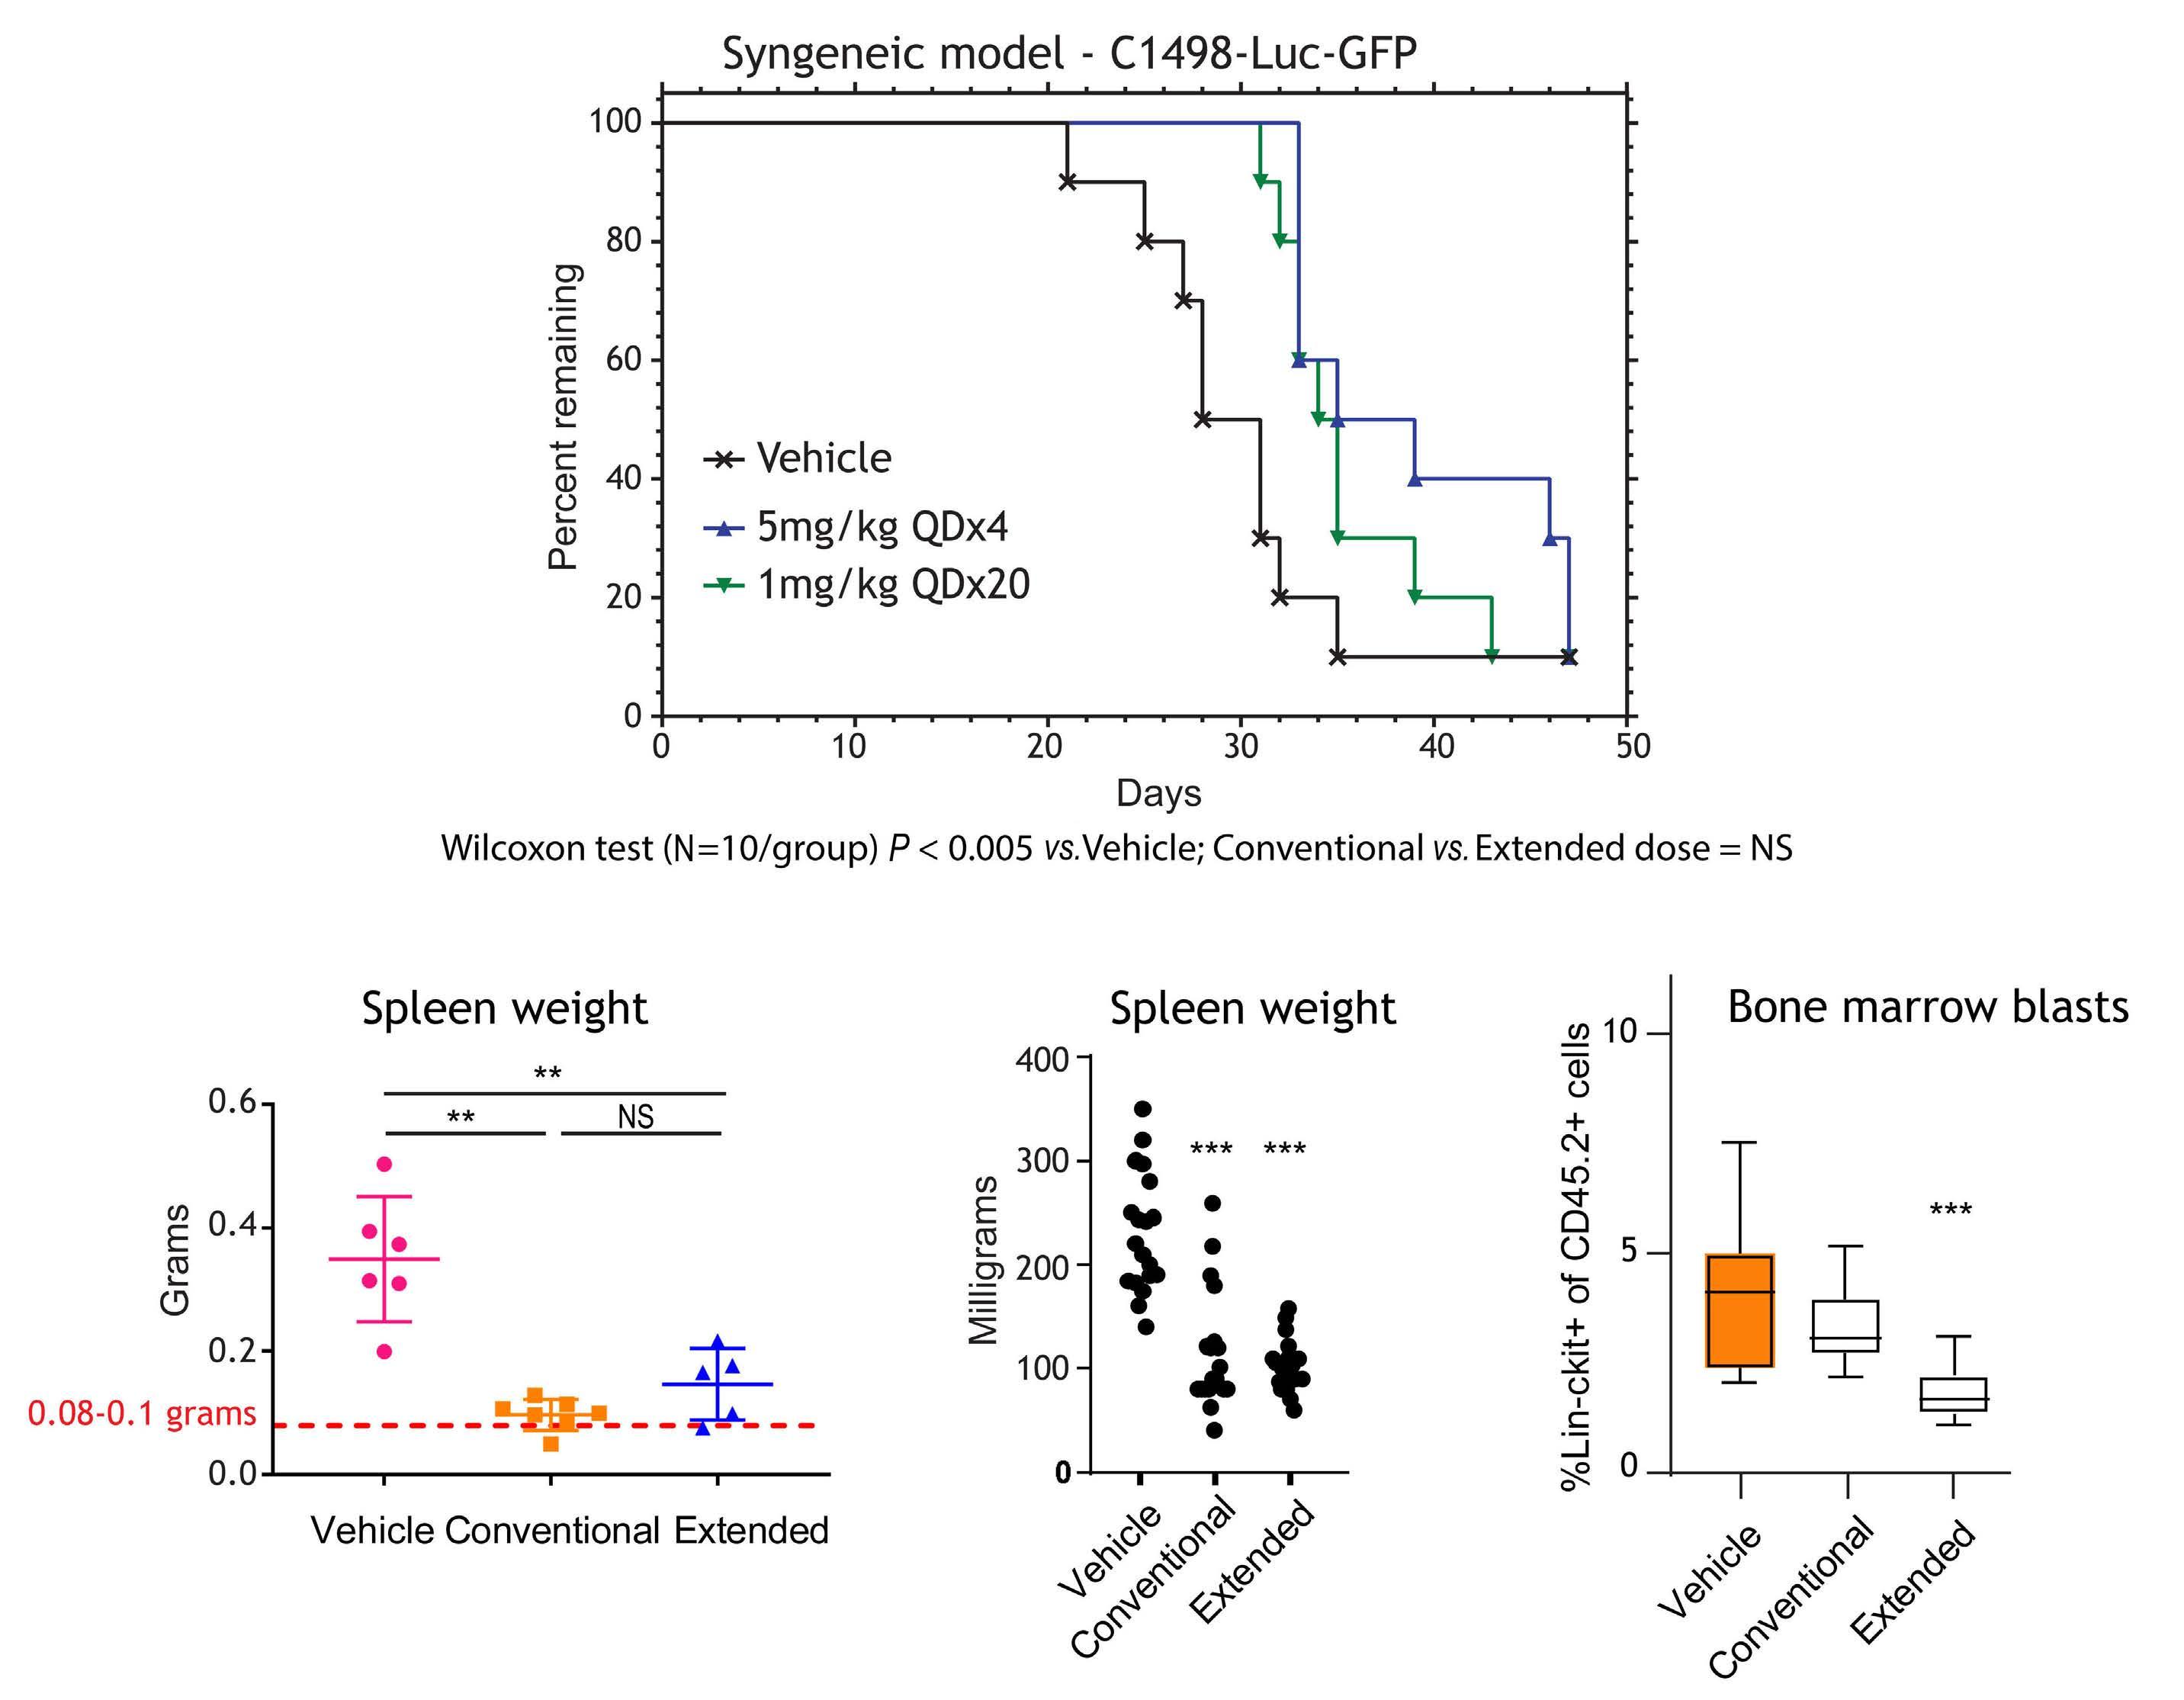
Figure 2. Extended dosing of Aza preferentially targets bone marrow blasts. (A) Survival of B6 albino mice injected with C1498Luc3-GFP+ cells and treated with vehicle, conventional-azacitidine (Aza) (5 mg/kg once daily for 4 days [QDx4]) or extended-Aza (1 mg/kg QDx20); N=10 per group. Representative bioluminescence imaging (right panel) of mice are shown (N=1 representative mouse/group). Blue to red color represents low to high intensity of bioluminescence. (B) Mean spleen weights measured at the end of the study for the patient-derived xenograft (PDX) acute myeloid leukemia (AML) mice treated with vehicle, conventional-Aza (5 mg/kg QDx5) or extended-Aza dosing (1 mg/kg QDx25) are shown as group mean ± standard deviation (N=5 to 7/group). Red dotted line indicates normal C57BL/6J mouse spleen weight. **P≤ 0.01. (C) Median spleen weights from GEM model of AML harboring FLT3-ITD and TET2 loss (N=17-19/group) (normal spleen weight of wild-type mice is 72 milligrams). *P≤0.05; **P≤0.01, ***P≤ 0.001 for Aza relative to vehicle/isotype control using non-parametric one-way ANOVA. (D) Flow cytometry was performed on cells collected at the end of week 4 and cell percentages are presented as group medians (N=12/group). ***P≤0.001 for Aza relative to vehicle/isotype control. P values were calculated using non-parametric one-way ANOVA. NS: not significant.
reduced engraftment by about 10-fold relative to the control treatment (Figure 4B).
In order to further validate the differentiation phenotype observed with the extended dose, we analyzed the human PBMC that remained at the site of injection (right femur) in the primary engraftment experiment. Similar to the engraftment, the degree of differentiation induction on progenitors was similar in both regimens. Most of the cells in the sample tested were arrested in the GMP-like phase and both regimens of Aza induced the differentiation
of >50% of these cells into a common myeloid progenitor (CMP) or megakaryocyte-erythrocyte progenitor (MEP) like phenotype (Figure 4C-E). There was also reduction of CD33+CD123+ stem/progenitor cells at the site of injection (Figure 4F). Notably, there was no overt loss of weight in the animals (Figure 4G).
Taken together, our data based on an in vitro LSC model suggest that the efficacy of oral-Aza in AML maintenance is in part linked to the ability of the extended dosing schedule to target LSC. In addition, the in vivo model demonstrates
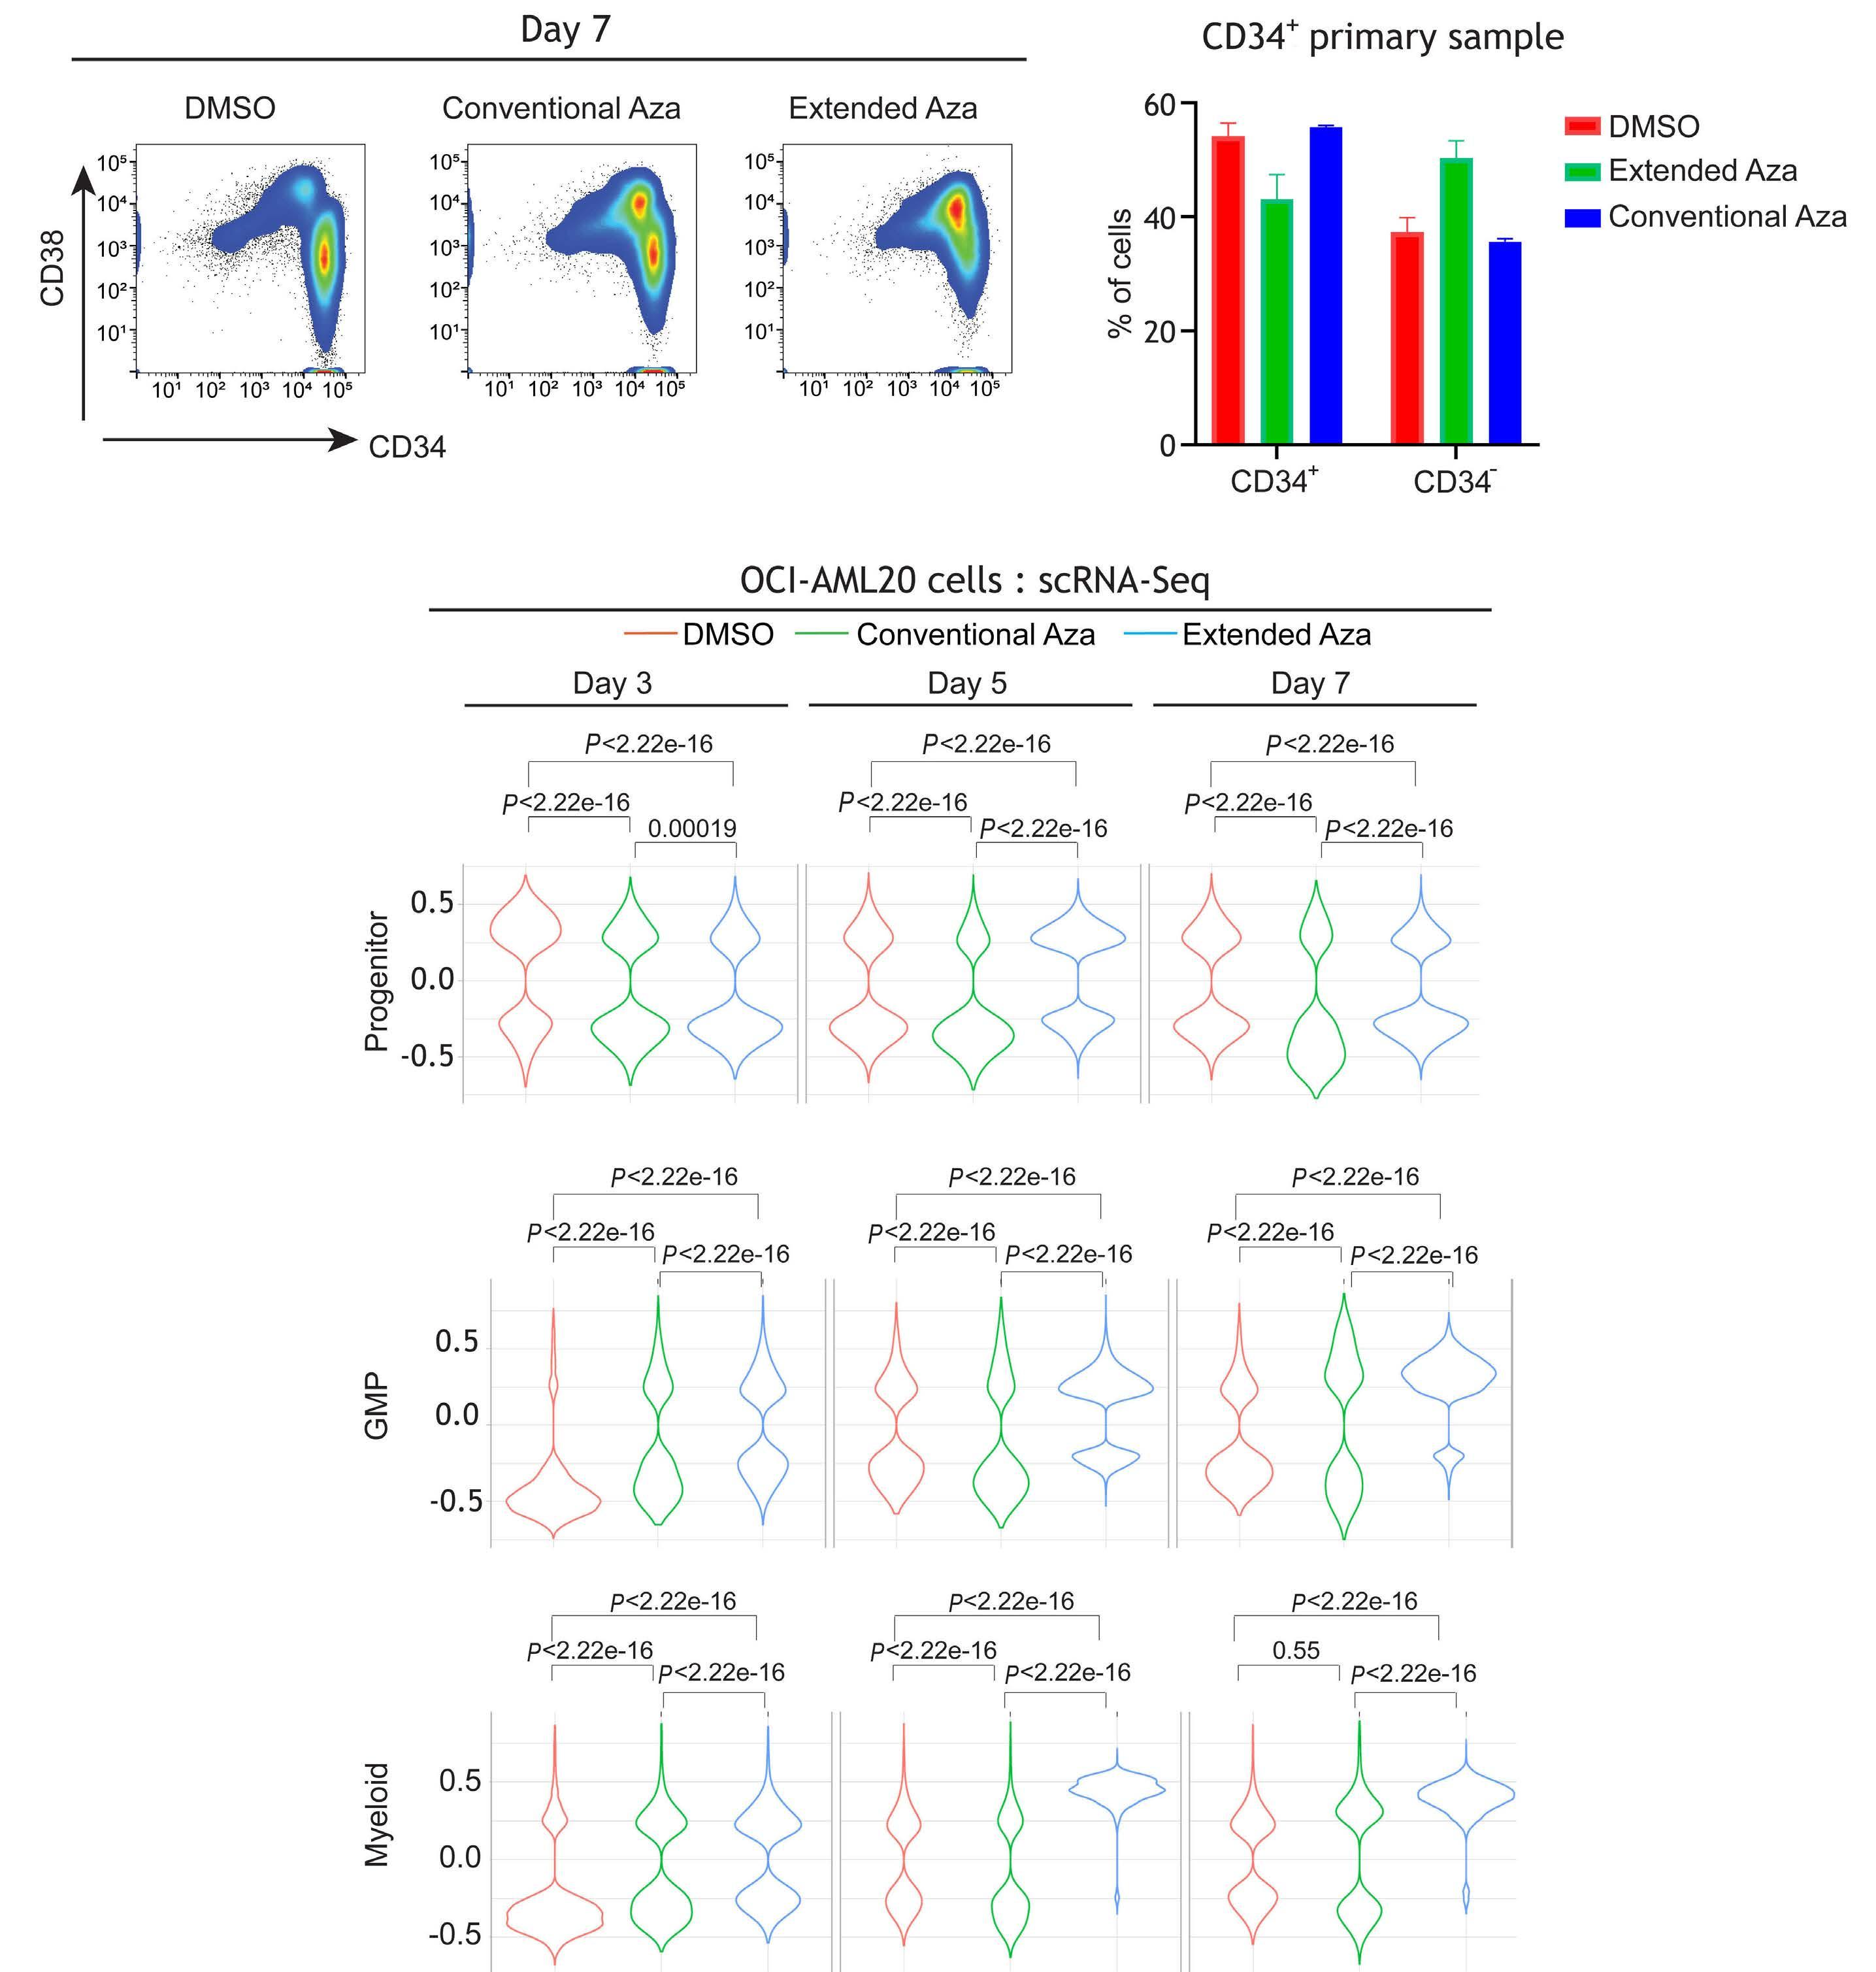
Aza
leukemic stem cells. (A) OCI-AML20 cells were cultured on OP9 feeder layer and the cells were treated with dimethyl sulfoxide (DMSO) or azacitidine (Aza) (extended or conventional dosing). At day 7, all cells were collected and subjected to flow cytometry. After discriminating live/dead cells and singlets, human cells (to differentiate from mouse OP9 cells) were identified by CD33+/CD45+ staining. Within that population the profile of CD34/ CD38 was identified. (B) CD34+-enriched primary acute myeloid leukemia (AML) sample was treated with both dosing regimens. Flow cytometry was performed on day 7 to identify CD34 and CD38 population (C) Samples from the above-described experiment were collected and subjected to single-cell RNA sequencing (scRNA-seq) as described in the methods. Violin plots indicating the treatment-specific distribution and the Wilcoxon P value of the GSVA enrichment on Van Galen signatures at days 3, 5, and 7. GMP: granulocyte-monocyte progenitors.
that oral-Aza induces differentiation of LSC and leukemic progenitor cells.
In order to understand the molecular determinants of the greater degree of differentiation occurring in the LSC compartment in the extended dose, we sorted CD34+CD38- cells from OCI-AML20 cells (Figure 5A) and treated them with the two Aza dosing regimens and performed bulk RNAseq at day 5. As expected, pathway analysis (GO process) revealed that the most significantly upregulated pathway was cellular differentiation in the CD34+CD38- cells upon 5 days of extended dosing but not in the conventional dosing (Figure 5B).
In order to investigate drivers of the upregulated cell differentiation pathway, we analyzed secreted factors from cell culture supernatants of OCI-AML20 cells treated with both the Aza-dosing regimens in a feeder layer-free culture using the Proteome Profiler™ antibody array. Among the differentially secreted factors, MPO, a hallmark enzyme of the myeloid lineage was the secreted factor that was also the most upregulated by gene expression analysis in LSC that were treated with the extended-dose Aza (Online Supplementary Figure S4A). In addition, western blot analysis confirmed that MPO is upregulated in OCI-AML20 cells as well as in CD34+ cells from a primary sample (TP53- and TET2-mutated) in response to the extended dose (Figure 5C). Given MPO’s association to myeloid differentiation, we hypothesized that upregulation of MPO could be implicated in extended Aza-induced LSC differentiation. In order to test this hypothesis, we used an inhibitor of MPO, MPO-IN-2831 and treated OCI-AML20 cells with MPO-IN-28 and the both the Aza doses. Inhibition of MPO countered the differentiation induction by extended-dose Aza (Figure 5D; Online Supplementary Figure S4B) by more than 20% reduction in the non-LSC population (CD34+CD38+ or CD34-). Being a peroxidase, MPO has been shown to induce reactive oxygen species (ROS) generation in myeloid cells,32 a potential mechanism that has been shown to induce differentiation of LSC.33,34 In order to investigate if MPO-induced ROS could facilitate differentiation in LSC, OCI-AML20 cells were concurrently treated with N-acetylcysteine (NAC) and the two Aza dosing regimens. ROS scavenging with NAC, blocked differentiation of LSC with the extended dose but not with the conventional dose further validating our hypothesis (Figure 5E; Online Supplementary Figure S4C). Taken together, our results suggest that extended dose Aza induces differentiation of LSC through upregulation of MPO and ROS.
In AML maintenance therapy, the primary goal is to elim-
inate residual leukemic cells in the bone marrow thereby eliminating minimal residual disease (MRD) and reducing the risk of relapse. However, rare therapy-resistant cells that reside within the MRD, also known as LSC, can drive clonal leukemic repopulation resulting in relapse.28,35 Thus, understanding the biology of these LSC and identifying therapeutic agents that effectively target LSC during induction or maintenance therapy would be important in reducing rates of relapse in AML. While oral-Aza is effective in AML maintenance therapy, the mechanistic basis was not clear. Our preclinical work, for the first time demonstrates oralAza’s ability to target LSC.
Even though both injectable- and oral-Aza have the same active ingredient, the dosing schedule results in varying PK and PD profiles as well as therapeutic effects. Based on the preclinical data presented here, oral-Aza acts primarily through sustained hypomethylation-mediated gene expression changes and injectable-Aza acts through stress response as well as hypomethylation (not as sustained as oral-Aza). Consistent with our observations, a study with low-risk MDS patients reported sustained hypomethylation imparted by oral-Aza over the entire treatment cycle (up to 21 days). In addition, patients administered with oral-Aza and with resultant reduction in DNA methylation had better hematologic response.36 Similarly, sustained hypomethylation with oral-Aza were observed in another independent study.19
Given the biochemical differences observed (Figure 1) between the two dosing regimens, our in vivo studies yielded interesting similarities and differences (Figure 2) highlighting the functional impact of the two dosing regimens based on differentiation state of the cell. Both oral- and injectable-Aza were equally efficacious in targeting bulk AML cells in the syngeneic and the PDX model, both of which used bulk AML cells. However, when we looked at less differentiated bone marrow blast cells in the FLT3-ITD; TET2 model, the extended dose was effective in targeting this less differentiated population. When we applied this finding to an in vitro LSC model (OCI-AML20), we observed similar results and demonstrated that oral-Aza is more effective in eliminating immature myeloid cells and inducing differentiation of leukemic stem cells through upregulation of MPO. MPO, being a ROS generator, in turn likely acts through ROS to induce differentiation of LSC. Inhibition of MPO activity as well as ROS scavenging both rescue/block oral-Aza-mediated differentiation of LSC. Thus, a key understanding from our work is that the impact of oral-Aza is cell type specific.
Aza in combination with other agents has been shown to target LSC and induce differentiation.37,38 However, the specific Aza-associated mechanism was not clear. A key understanding from our work is the differential effect of oral-Aza on LSC versus non-LSC. In the in vitro model (OCIAML20) enriched in LSC, the extended dose was more effective than the conventional dose. In order to recapitulate
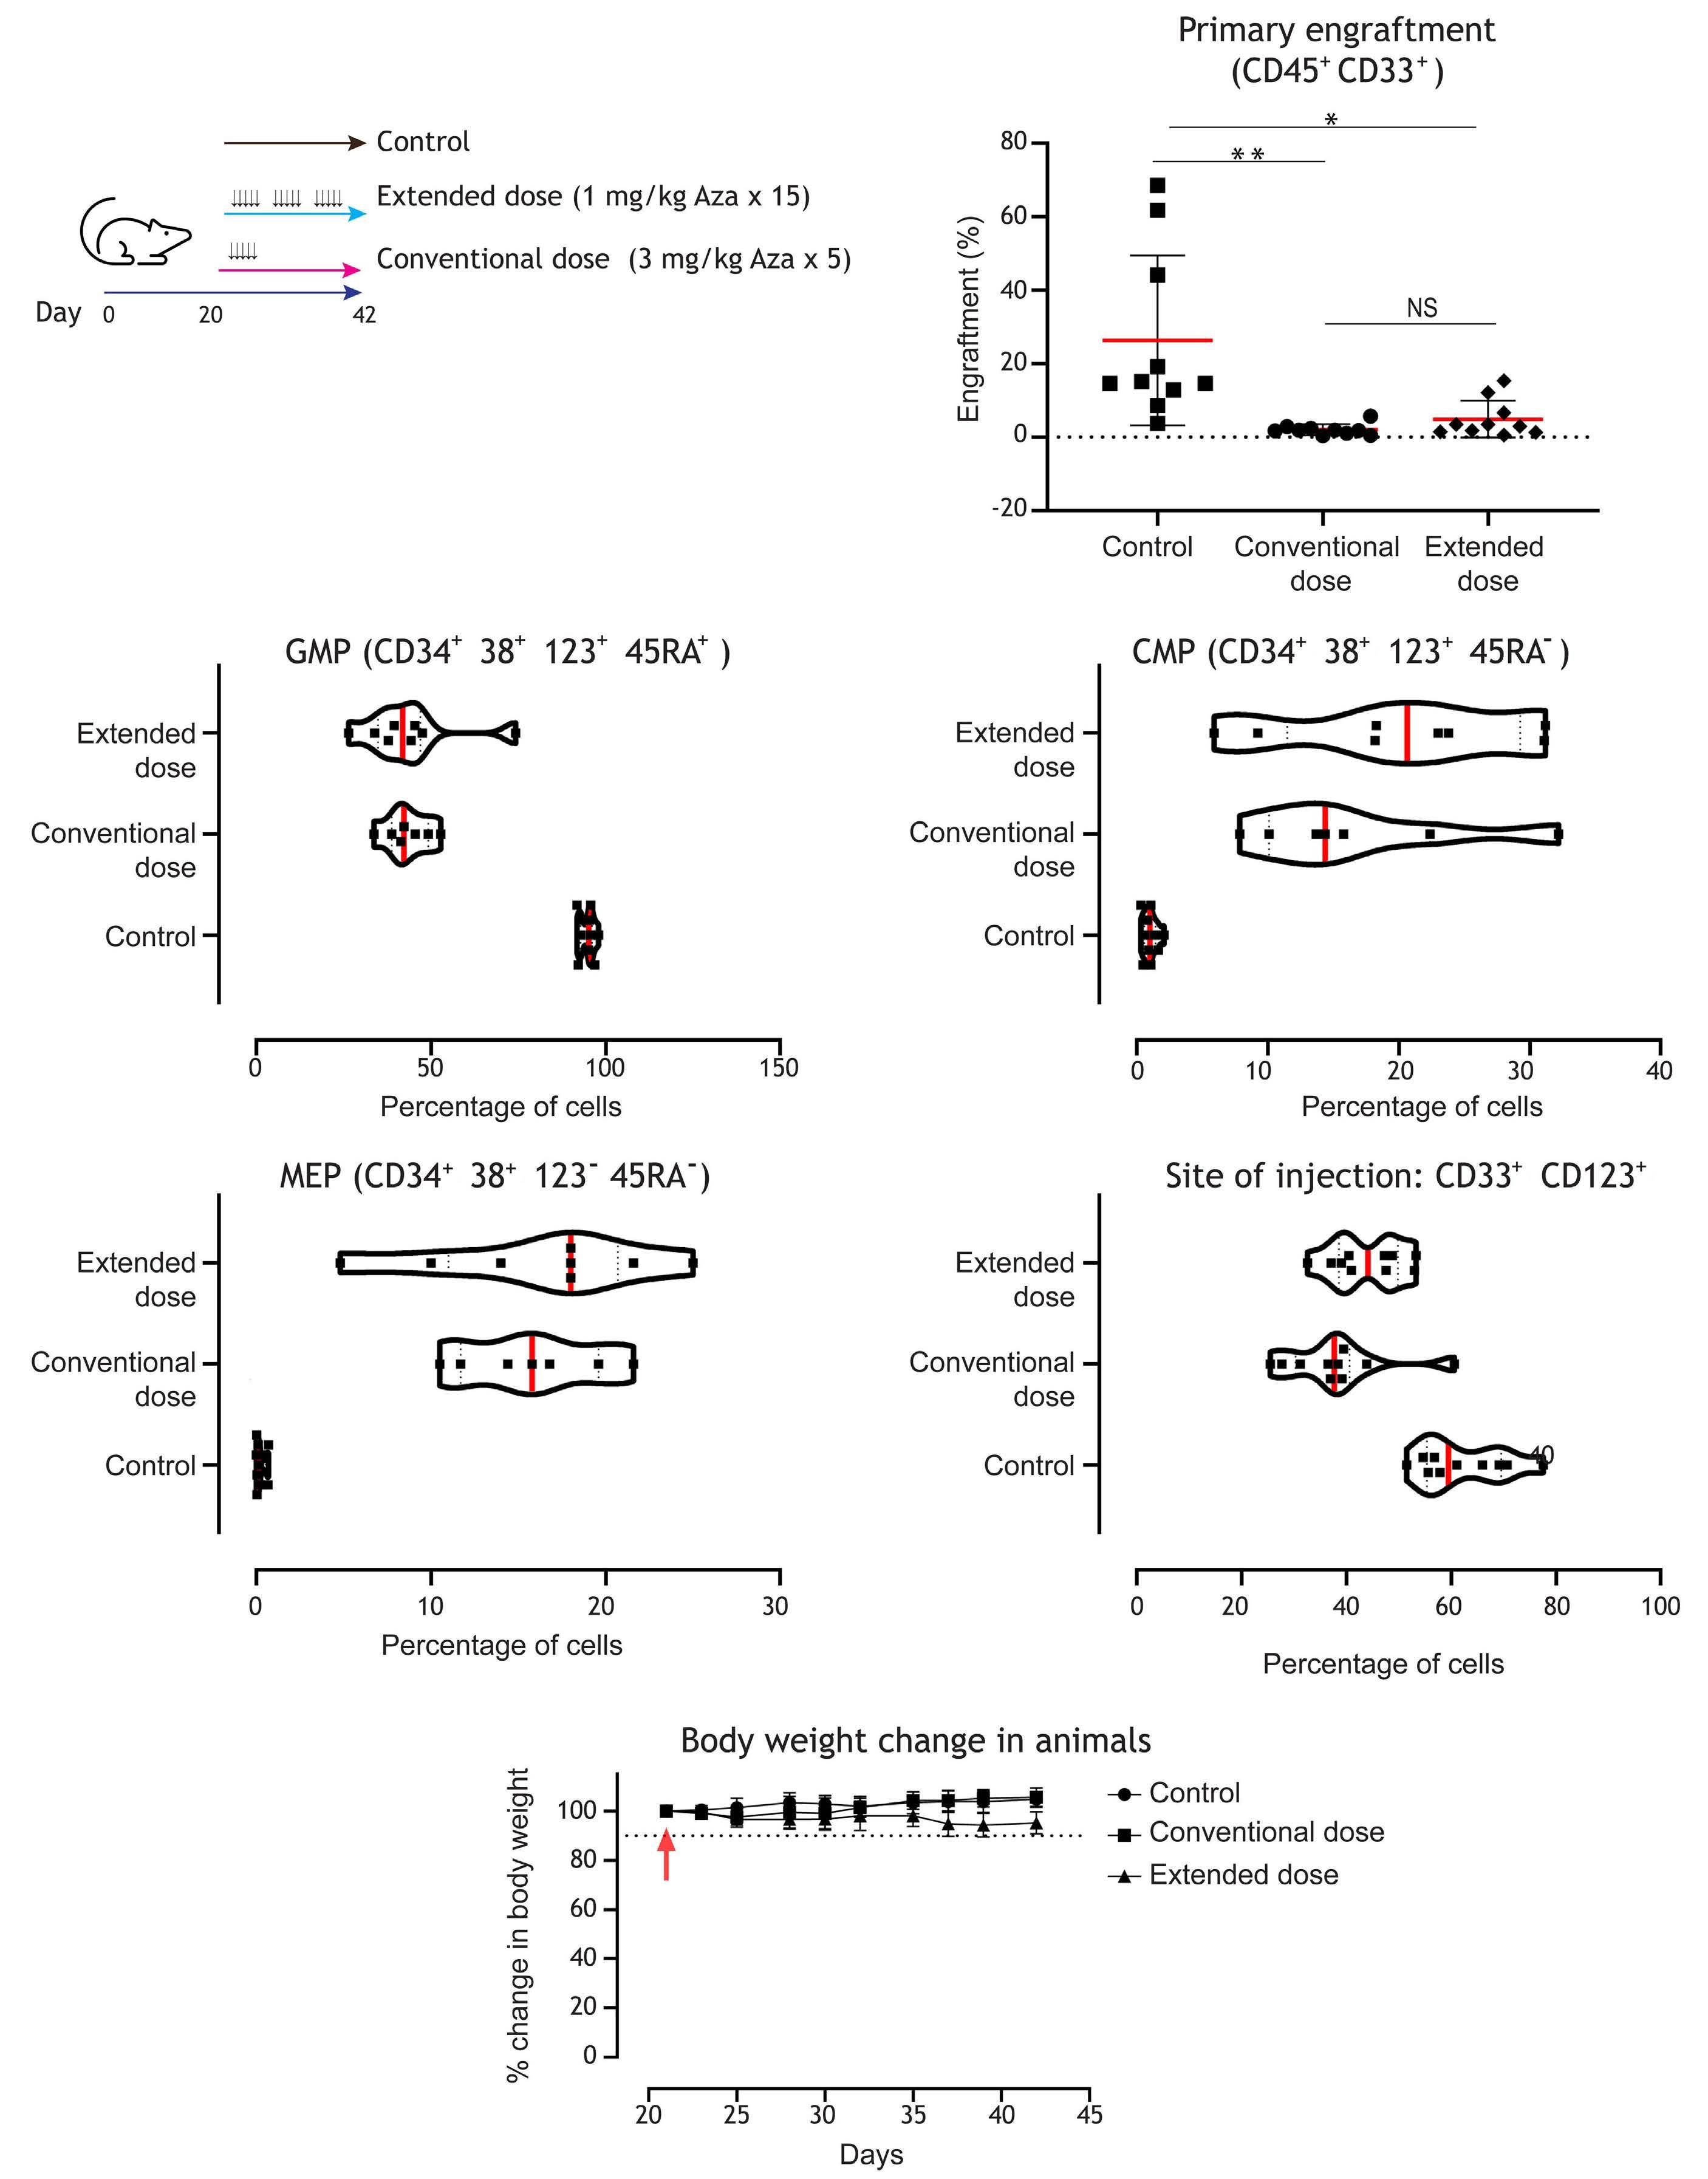
Figure 4. Extended-dose Aza is equally effective as conventional dosing in targeting acute myeloid leukemia cells and stem/ progenitor cells in vivo. (A) Schematic of experiment. Primary acute myeloid leukemia (AML) cells were injected into the right femurs of sub-lethally irradiated NOD/SCID mice. Twenty days after injection, mice (10 animals per group) were treated with vehicle or 2 different doses of azacitidine (Aza) mimicking conventional/injectable dosing (3 mg/kg 5 doses for 5 consecutive days) or extended dosing (1 mg/kg 15 doses over 21 days [5/7 days per week]). At the end of treatment (42 days from day of injection), flow cytometry was performed in both right and left femurs to measure engraftment. (B) Plots indicate the percentage of human cells that engrafted in the left femur (distal site). The red bar indicates the median values, and each data point indicates a mouse. In order to measure the ability of Aza to target the persistence of leukemic cells at the site injection, human cells in the right femur (site of injection) were assessed with the indicated surface markers to identify (C) granulocyte-monocyte progenitors (GMP), (D) common myeloid progenitors (CMP) and (E) megakaryocyte-erythrocyte progenitors (MEP) (F) CD123 (IL-3 receptor α chain), a marker for AML stem and progenitor cells, was also reduced at the site of injection demonstrating equivalent efficacy for the conventional dosing and the extended dosing of Aza. (G) Animal body weight was monitored during treatment as a proxy for animal health. The dotted line indicates 90% (10% change). Data represent median ± standard deviation. *P<0.05 and **P<0.01 by unpaired t test.
the in vitro findings, we performed engraftment studies of primary AML samples using bulk mononuclear cells which predominantly includes progenitors and blasts. The two dosing regimens performed similarly in reducing disease burden. Notably, conventional Aza is administered for 7 days in the clinic while our animal models received Aza only for 5 days based on our modeling. While we attempted to perform secondary engraftment, a measure of the capacity of re-initiation of leukemia by LSC when serially transplanted into mice, we did not achieve any engraftment in the conventional or extended-dose regimens even at the site of injection in the secondary mice likely because of the robust effect of both dosing regimens in the primary engraftment (data not shown). Thus, we could not leverage
our transplant models to interrogate effects on LSC in vivo. Multiple studies have demonstrated that LSC rely on oxidative phosphorylation, a process that could generate more ROS and result in loss of stemness.33,39,40 However, LSC have developed unique mechanisms to maintain stemness by countering increased ROS such as increased antioxidant enzymes, increased levels of mitophagy and others.41-44 Thus, when oxidative stress/damage/signaling increases, stem cells tend to differentiate.45,46,33 MPO is a hallmark enzyme of the myeloid lineage and patients with high MPO have been shown to have superior overall survival47 and has been shown to be expressed at high levels in cells committed to granulomonocytic differentiation and activation of MPO facilitates oxidative damage.48 In
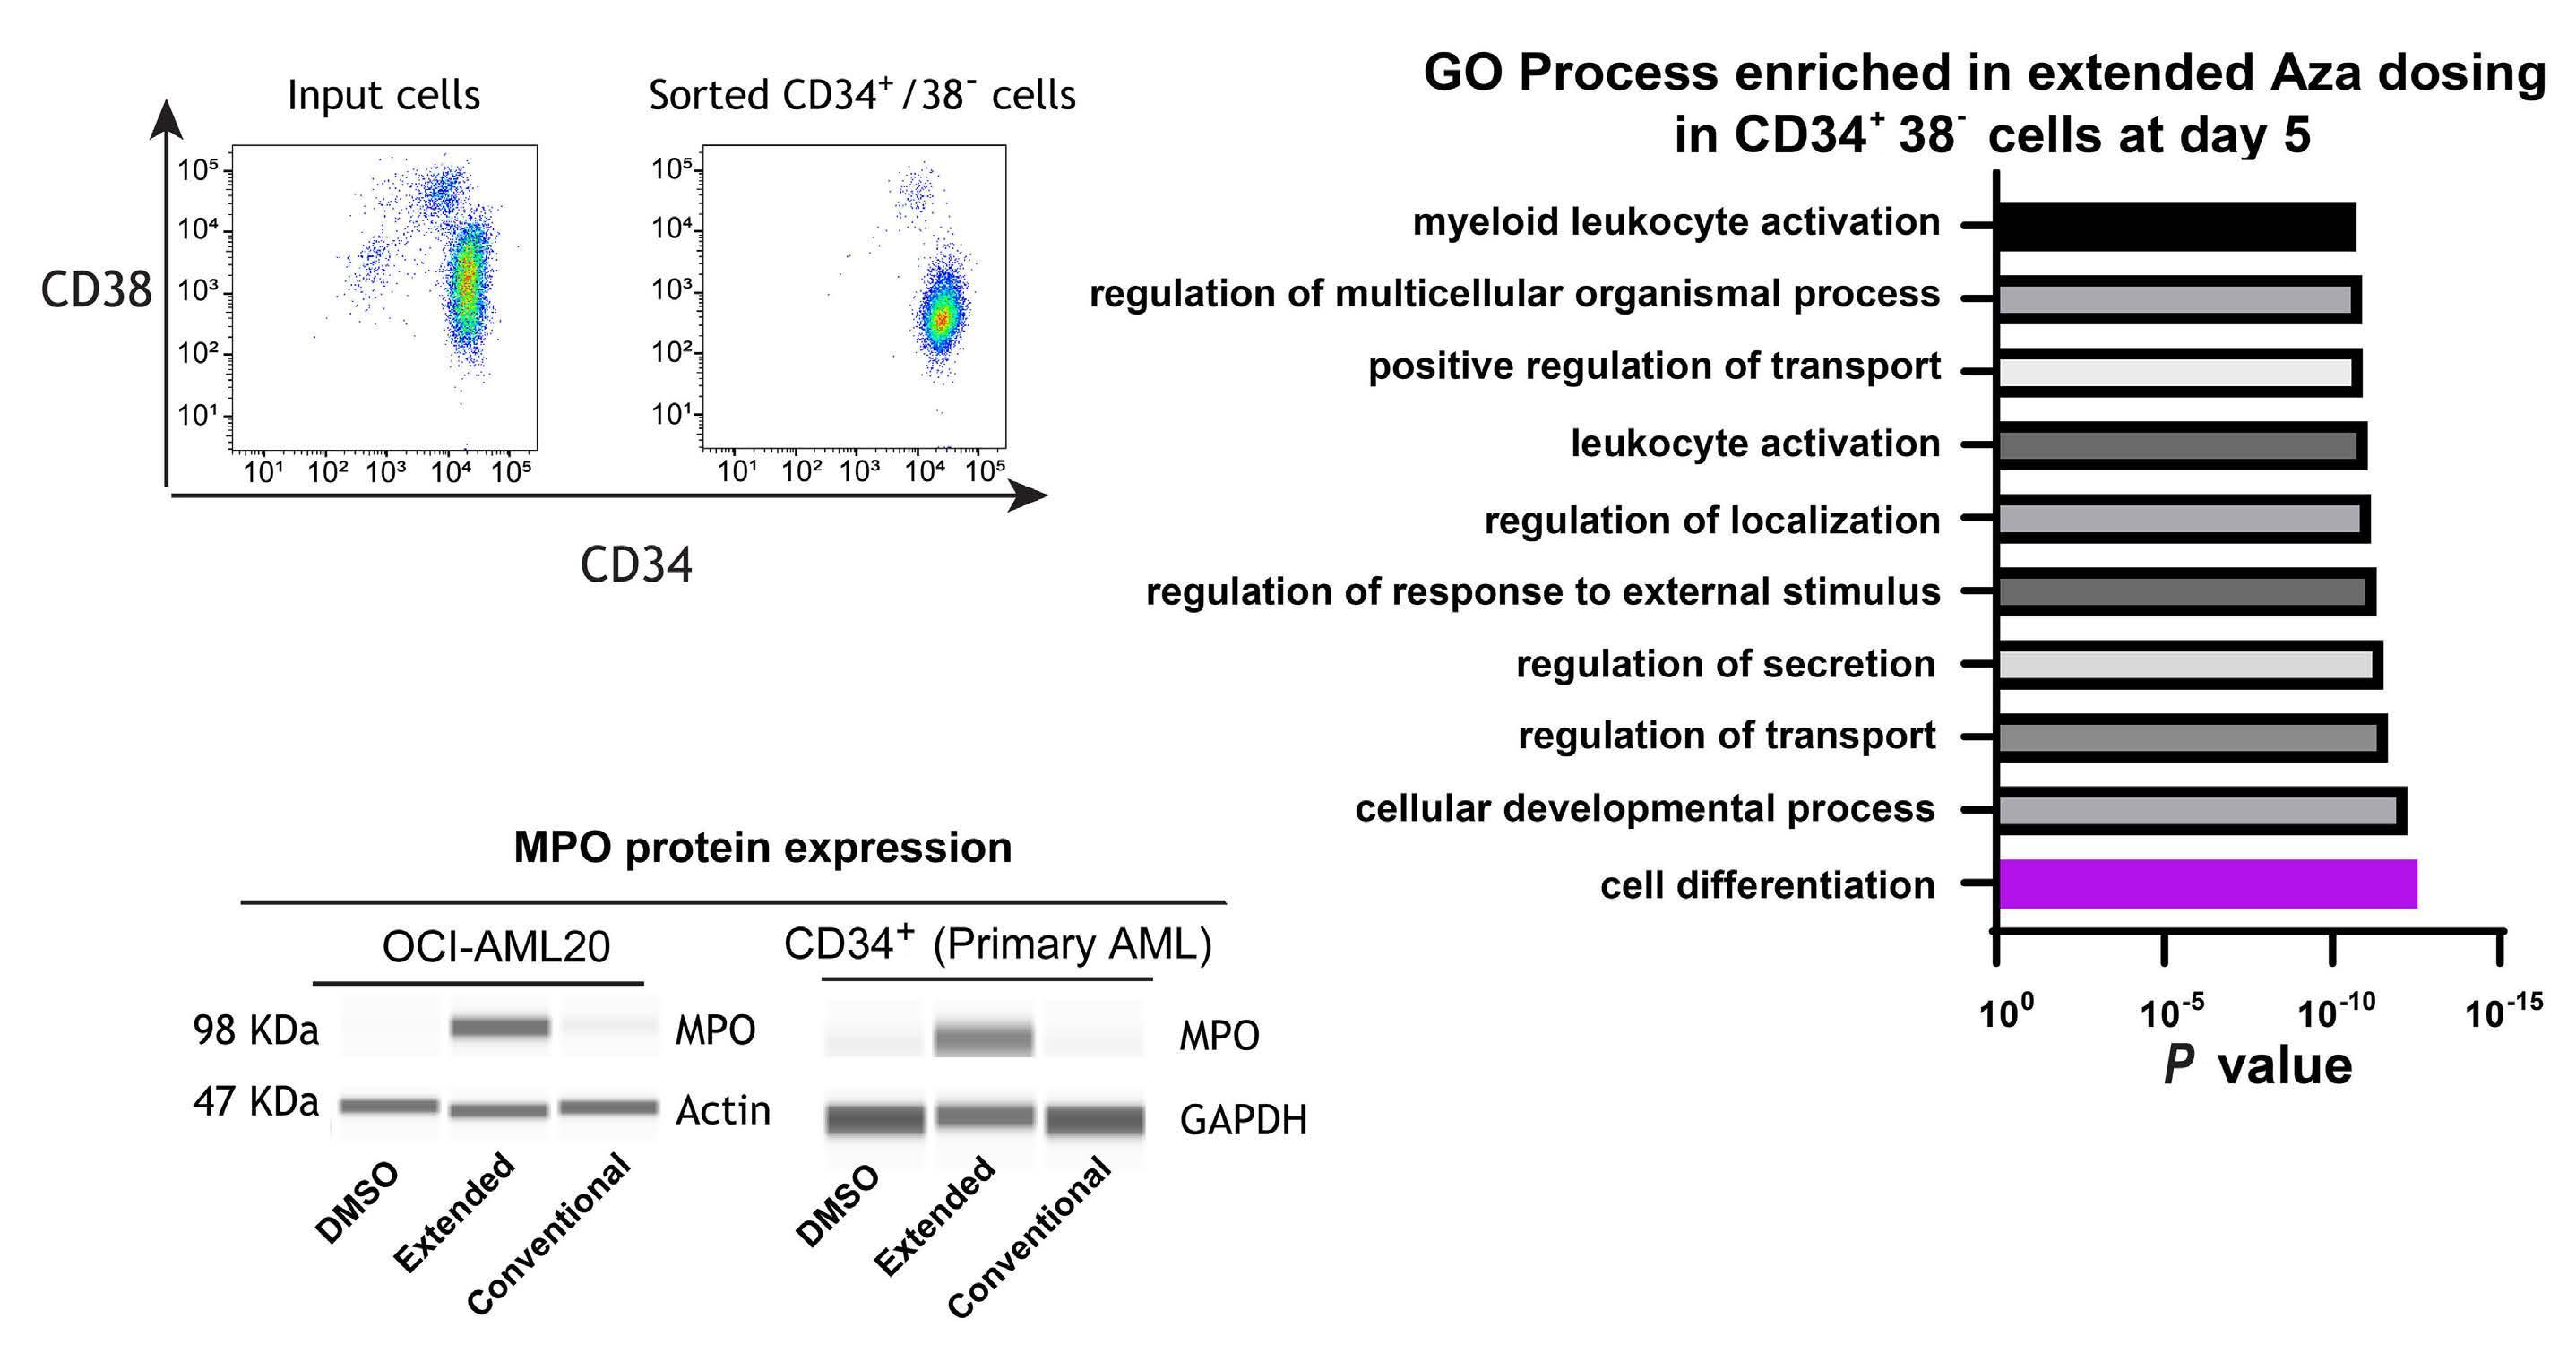
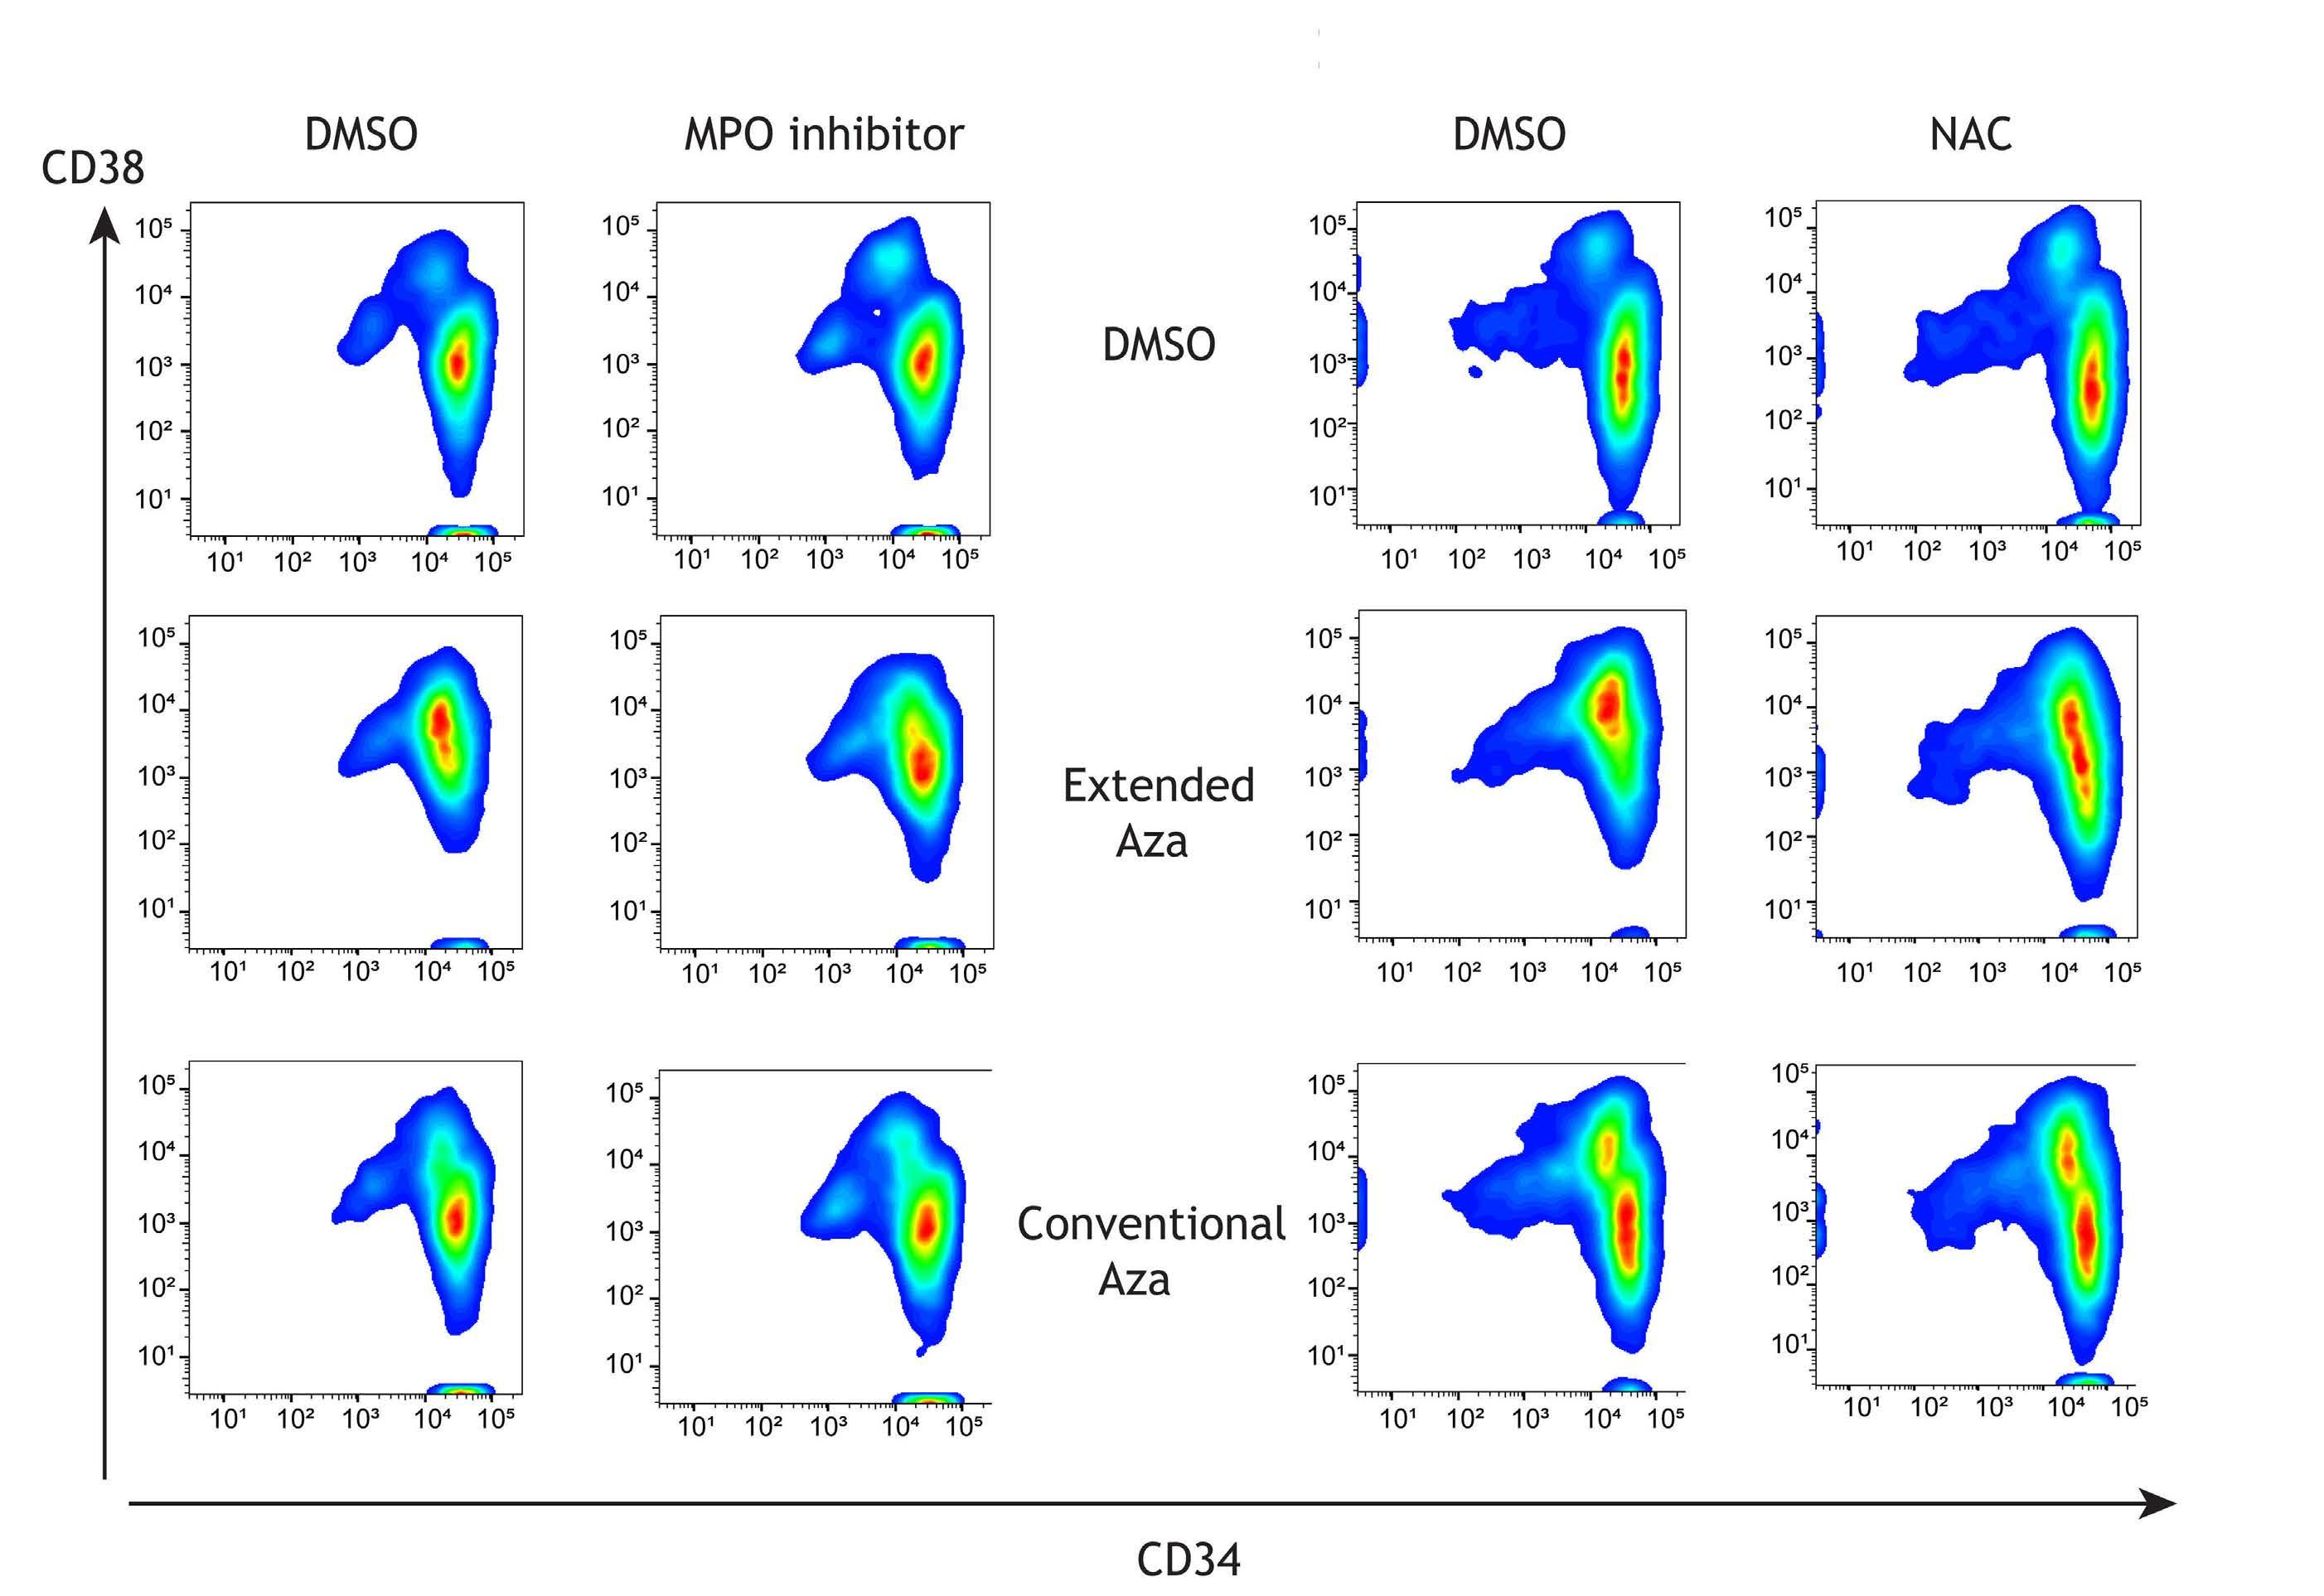
Figure 5. Extended-dose Aza upregulates myeloperoxidase expression to induce leukemic stem cell differentiation, which can be partly rescued by myeloperoxidase inhibition or reactive oxygen species scavenging. (A) OCI-AML20 cells were sorted to retrieve the CD34+38- population. (B) Sorted cells were treated with azacitidine (Aza) (extended or conventional dose) and bulk RNA sequencing was performed at day 5 followed by pathway enrichment analysis (gene ontology [GO] process) to assess Aza-induced pathways. (C) OCI-AML20 cells were treated with Aza (conventional or extended regimen) and myeloperoxidase (MPO) expression was assessed by capillary electrophoresis on day 7, glyceraldehyde-3-phosphate dehydrogenase (GAPDH) was used as a loading control. (D) Representative flow data from 1 experiment with OCI-AML20 cells were treated with extended or conventional regimen of Aza with or without 10 µM MPO-IN-28 or (E) N-acetylcysteine (NAC) on days 2 and 4 and flow cytometry assessment was conducted on day 7 using live/dead, CD45, CD34 and CD38 staining. DMSO: dimethyl sulfoxide.
addition, MPO has been shown to be increased in response to Aza in a few cases through promoter demethylation by DNMT-inhibitors.49,50 Our work uniquely demonstrates MPO upregulation in the LSC compartment upon Aza treatment which induce differentiation through oxidative stress as evidenced by a block in differentiation through ROS scavenging. A limitation of our study is that the cell lines and the LSC model that we have used are not truly representative of de novo AML and do not carry the common molecular mutations observed in elderly AML patients. To this end we attempted to replicate our key findings in commercially available multiple primary AML samples. However, we were successful in culturing CD34+ cells from only one primary sample (TET2- and TP53-mutated and not the commonly observed DNMT3A/NPM1/FLT3-ITD mutation) for 7 days and replicated our key findings.
Overall, we have highlighted mechanistic insights of oralAza that make it an effective maintenance therapy. Aza is known to have additional mechanisms of action beyond the ones described here including immune modulation, viral mimicry, and others. While we have primarily focused on tumor intrinsic mechanisms as part of this work, our data warrant exploring other mechanisms where Aza is implicated and identify further unique properties of oral-Aza.
Disclosures
DVJ, MA, AP, AR, PS, AA, KG, CK, DH, DLM, PRH and AG are current employees of Bristol Myers Squibb and received equity compensation. ADS has received research funding from Takeda Pharmaceuticals, BMS and Medivir AB, and consulting fees/honorarium from Takeda, Novartis, Jazz, and Otsuka Pharmaceuticals; and is named on a patent application for
the use of DNT cells to treat AML. AGT and AA are former employees of BMS and received equity compensation. EFL received research funding from Celgene/BMS.
DVJ, MA, AP, AR, PS, CK, DH, RH, XW, MG, AA, GT and HC designed and performed the research, analyzed data,
1. Appelbaum FR, Gundacker H, Head DR, et al. Age and acute myeloid leukemia. Blood. 2006;107(9):3481-3485.
2. Siegel RL, Miller KD, Jemal A. Cancer statistics, 2020. CA Cancer J Clin. 2020;70(1):7-30.
3. Pollyea DA, Bixby D, Perl A, et al. NCCN guidelines insights: acute myeloid leukemia, Version 2.2021. J Natl Compr Canc Netw. 2021;19(1):16-27.
4 DiNardo CD, Wang J, Pratz KW. Azacitidine and venetoclax in AML. Reply. N Engl J Med. 2020;383(21):2088-2089.
5. Mustafa Ali MK, Corley EM, Alharthy H, et al. Outcomes of newly diagnosed acute myeloid leukemia patients treated with hypomethylating agents with or without venetoclax: a Propensity Score-Adjusted Cohort Study. Front Oncol. 2022;12:858202.
6. Patel K, Dickson J, Din S, et al. Targeting of 5-aza-2’deoxycytidine residues by chromatin-associated DNMT1 induces proteasomal degradation of the free enzyme. Nucleic Acids Res. 2010;38(13):4313-4324.
7 Issa JP, Kantarjian H. Azacitidine. Nat Rev Drug Discov. 2005 May:Suppl:S6-7.
8. Souers AJ, Leverson JD, Boghaert ER, et al. ABT-199, a potent and selective BCL-2 inhibitor, achieves antitumor activity while sparing platelets. Nat Med. 2013;19(2):202-208.
9 Dohner H, Weisdorf DJ, Bloomfield CD. Acute myeloid leukemia. N Engl J Med. 2015;373(12):1136-1152.
10. Lowenberg B, Ossenkoppele GJ, van Putten W, et al. High-dose daunorubicin in older patients with acute myeloid leukemia. N Engl J Med. 2009;361(13):1235-1248.
11. Reville PK, Kadia TM. Maintenance therapy in AML. Front Oncol. 2020;10:619085.
12. Breems DA, Van Putten WL, Huijgens PC, et al. Prognostic index for adult patients with acute myeloid leukemia in first relapse. J Clin Oncol. 2005;23(9):1969-1978.
13. Wei AH, Dohner H, Pocock C, et al. Oral azacitidine maintenance therapy for acute myeloid leukemia in first remission. N Engl J Med. 2020;383(26):2526-2537.
14 Roboz GJ, Montesinos P, Selleslag D, et al. Design of the randomized, phase III, QUAZAR AML Maintenance trial of CC486 (oral azacitidine) maintenance therapy in acute myeloid leukemia. Future Oncol. 2016;12(3):293-302.
15. Burnett A, Russell N, Freeman S, et al. A comparison of limited consolidation chemotherapy therapy or not, and demethylation maintenance or not in older patients with Aml and high risk Mds: long term results of the Uk Ncri Aml16 Trial. EHA Library. 2015;103225:S513.
16. Huls G, Chitu DA, Havelange V, et al. Azacitidine maintenance after intensive chemotherapy improves DFS in older AML patients. Blood. 2019;133(13):1457-1464.
17 Nicolini FE, Cashman JD, Hogge DE, et al. NOD/SCID mice engineered to express human IL-3, GM-CSF and Steel factor
and wrote the paper. AA, EFL, KG, DLM, ADS, PRH, AG and AGT designed the research, analyzed data and wrote the paper.
Original data are available upon request to the first and corresponding authors.
constitutively mobilize engrafted human progenitors and compromise human stem cell regeneration. Leukemia. 2004;18(2):341-347.
18. Garcia-Manero G, Gore SD, Cogle C, et al. Phase I study of oral azacitidine in myelodysplastic syndromes, chronic myelomonocytic leukemia, and acute myeloid leukemia. J Clin Oncol. 2011;29(18):2521-2527.
19 Laille E, Shi T, Garcia-Manero G, et al. Pharmacokinetics and pharmacodynamics with extended dosing of CC-486 in patients with hematologic malignancies. PLoS One. 2015;10(8):e0135520.
20 Vu T, Straube J, Porter AH, et al. Hematopoietic stem and progenitor cell-restricted Cdx2 expression induces transformation to myelodysplasia and acute leukemia. Nat Commun. 2020;11(1):3021.
21. Lee TT, Karon MR. Inhibition of protein synthesis in 5-azacytidine-treated HeLa cells. Biochem Pharmacol. 1976;25(15):1737-1742.
22. Jin S, Cojocari D, Purkal JJ, et al. 5-Azacitidine induces NOXA to prime AML cells for venetoclax-mediated apoptosis. Clin Cancer Res. 2020;26(13):3371-3383.
23. Costa-Mattioli M, Walter P. The integrated stress response: from mechanism to disease. Science. 2020;368(6489):eaat5314.
24. Sidrauski C, Tsai JC, Kampmann M, et al. Pharmacological dimerization and activation of the exchange factor eIF2B antagonizes the integrated stress response. Elife. 2015;4:e07314.
25. Zinszner H, Kuroda M, Wang X, et al. CHOP is implicated in programmed cell death in response to impaired function of the endoplasmic reticulum. Genes Dev. 1998;12(7):982-995.
26. Gruber E, So J, Lewis AC, et al. Inhibition of mutant IDH1 promotes cycling of acute myeloid leukemia stem cells. Cell Rep. 2022;40(7):111182.
27. Bonnet D, Dick JE. Human acute myeloid leukemia is organized as a hierarchy that originates from a primitive hematopoietic cell. Nat Med. 1997;3(7):730-737.
28. Shlush LI, Mitchell A, Heisler L, et al. Tracing the origins of relapse in acute myeloid leukaemia to stem cells. Nature. 2017;547(7661):104-108.
29 Luciani GM, Xie L, Dilworth D, et al. Characterization of inv(3) cell line OCI-AML-20 with stroma-dependent CD34 expression. Exp Hematol. 2019;69:27-36.
30 van Galen P, Hovestadt V, Wadsworth Ii MH, et al. Single-cell RNA-Seq reveals AML hierarchies relevant to disease progression and immunity. Cell. 2019;176(6):1265-1281.
31. Soubhye J, Chikh Alard I, Aldib I, et al. Discovery of novel potent reversible and irreversible myeloperoxidase inhibitors using virtual screening procedure. J Med Chem. 2017;60(15):6563-6586.
32. Nakazato T, Sagawa M, Yamato K, et al. Myeloperoxidase is a key regulator of oxidative stress mediated apoptosis in myeloid
leukemic cells. Clin Cancer Res. 2007;13(18 Pt 1):5436-5445.
33. Lagadinou ED, Sach A, Callahan K, et al. BCL-2 inhibition targets oxidative phosphorylation and selectively eradicates quiescent human leukemia stem cells. Cell Stem Cell. 2013;12(3):329-341.
34 Owusu-Ansah E, Banerjee U. Reactive oxygen species prime Drosophila haematopoietic progenitors for differentiation. Nature. 2009;461(7263):537-541.
35. Ng SW, Mitchell A, Kennedy JA, et al. A 17-gene stemness score for rapid determination of risk in acute leukaemia. Nature. 2016;540(7633):433-437.
36. Garcia-Manero G, Gore SD, Kambhampati S, et al. Efficacy and safety of extended dosing schedules of CC-486 (oral azacitidine) in patients with lower-risk myelodysplastic syndromes. Leukemia. 2016;30(4):889-896.
37. MacBeth KJ, Chopra VS, Tang L, et al. Combination of azacitidine and enasidenib enhances leukemic cell differentiation and cooperatively hypomethylates DNA. Exp Hematol. 2021;98:47-52.
38. Pollyea DA, Stevens BM, Jones CL, et al. Venetoclax with azacitidine disrupts energy metabolism and targets leukemia stem cells in patients with acute myeloid leukemia. Nat Med. 2018;24(12):1859-1866.
39 Sriskanthadevan S, Jeyaraju DV, Chung TE, et al. AML cells have low spare reserve capacity in their respiratory chain that renders them susceptible to oxidative metabolic stress. Blood. 2015;125(13):2120-2130.
40 Culp-Hill R, D’Alessandro A, Pietras EM. Extinguishing the embers: targeting AML metabolism. Trends Mol Med. 2021;27(4):332-344.
41. Pei S, Minhajuddin M, Adane B, et al. AMPK/FIS1-mediated mitophagy is required for self-renewal of human AML stem cells. Cell Stem Cell. 2018;23(1):86-100.
42. Tothova Z, Gilliland DG. FoxO transcription factors and stem cell homeostasis: insights from the hematopoietic system. Cell Stem Cell. 2007;1(2):140-152.
43. Aloum L, Brimson CA, Zhyvoloup A, et al. Coenzyme A and protein CoAlation levels are regulated in response to oxidative stress and during morphogenesis in Dictyostelium discoideum. Biochem Biophys Res Commun. 2019;511(2):294-299.
44. Folkerts H, Hilgendorf S, Wierenga ATJ, et al. Inhibition of autophagy as a treatment strategy for p53 wild-type acute myeloid leukemia. Cell Death Dis. 2017;8(7):e2927.
45. Diehn M, Cho RW, Lobo NA, et al. Association of reactive oxygen species levels and radioresistance in cancer stem cells. Nature. 2009;458(7239):780-783.
46. Kim YS, Kang MJ, Cho YM. Low production of reactive oxygen species and high DNA repair: mechanism of radioresistance of prostate cancer stem cells. Anticancer Res. 2013;33(10):4469-4474.
47. Matsuo T, Kuriyama K, Miyazaki Y, et al. The percentage of myeloperoxidase-positive blast cells is a strong independent prognostic factor in acute myeloid leukemia, even in the patients with normal karyotype. Leukemia. 2003;17(8):1538-1543.
48. Yu G, Liang Y, Zheng S, et al. Inhibition of myeloperoxidase by N-Acetyl lysyltyrosylcysteine amide reduces oxidative stressmediated inflammation, neuronal damage, and neural stem cell injury in a murine model of stroke. J Pharmacol Exp Ther. 2018;364(2):311-322.
49 Aumer T, Gremmelmaier CB, Runtsch LS, et al. Comprehensive comparison between azacytidine and decitabine treatment in an acute myeloid leukemia cell line. Clin Epigenetics. 2022;14(1):113.
50 Leung KK, Nguyen A, Shi T, et al. Multiomics of azacitidinetreated AML cells reveals variable and convergent targets that remodel the cell-surface proteome. Proc Natl Acad Sci U S A. 2019;116(2):695-700.
Correspondence: B.S. Cho cbscho@catholic.ac.kr
1Department of Hematology, Catholic Hematology Hospital, Seoul St. Mary’s Hospital, College of Medicine, The Catholic University of Korea, Seoul, South Korea; 2Leukemia Research Institute, College of Medicine, The Catholic University of Korea, Seoul, South Korea; 3Division of Hematology/Oncology, Department of Medicine, Vanderbilt University Medical Center, Nashville, TN, USA; 4Department of Laboratory Medicine, College of Medicine, The Catholic University of Korea, Seoul, South Korea; 5Department of Chemical Engineering, Hongik University, Seoul, South Korea; 6ImpriMedKorea Inc., Seoul, South Korea and 7Vanderbilt University, Nashville, TN, USA
*SP and TYK contributed equally as first authors.
Abstract
Received: May 25, 2023.
Accepted: September 6, 2023. Early view: September 14, 2023.
https://doi.org/10.3324/haematol.2023.283606
©2024 Ferrata Storti Foundation
Published under a CC BY-NC license
This study aimed to validate the new European Leukemia Net (ELN) 2022 criteria for genetic risk stratification in older adults with acute myeloid leukemia (AML) and to determine the most likely set of clusters of similar cytogenetic and mutation properties correlated with survival outcomes in three treatment groups: intensive chemotherapy (IC), hypomethylating agents (HMA) alone, and HMA plus venetoclax (HMA/VEN). The study included 279 patients (aged ≥60 years) who received IC (N=131), HMA (N=76), and HMA/VEN (N=72) between July 2017 and October 2021. No significant differences were observed in survival among the groups according to ELN 2022 risk stratification. Unsupervised hierarchical clustering analysis identified nine genomic clusters (C1-9) with varying survival outcomes depending on treatment type. For example, C4 (predominant for core binding factor-AML) displayed a favorable prognosis in the IC group, but not in the HMA or HMA/VEN groups. The HMA/VEN group had better outcomes than the HMA group in many clusters (C1, 2, 3, and 5); however, the addition of VEN to HMA or IC did not improve the survival outcomes compared with those of HMA alone in C7 and C9 (predominant for -5, del(5q), -7, -17/abn(17p), complex karyotypes, and mutated TP53). The study highlights the limitations of ELN genetic risk stratification in older adults with AML. It emphasizes the need for a more comprehensive approach that considers co-occurring somatic mutations to guide treatment selection in older adults with AML.
Acute myeloid leukemia (AML) is a heterogeneous group of diseases with variable prognoses,1-3 resulting primarily from the complexity of the clonal architectures due to various chromosomal abnormalities, genetic mutations, or epigenetic changes.1-4 In addition to this biological heterogeneity, age is an important prognostic indicator.5,6 For instance, older adults with AML have been considered a distinct entity representing a vulnerable population characterized by inferior response and lower tolerance to conventional chemotherapy.6,7 Therefore, treating older adults with AML is challenging. Classically, medical fitness is regarded as the major factor in determining candidacy for intensive chemotherapy (IC). Older adults with AML can receive IC if they meet the assessment criteria be-
cause IC is considered the best choice for obtaining a higher chance of remission and longer survival.7-10 However, with the introduction of novel agents in recent years,11 less intensive therapeutics, such as a combination of venetoclax (VEN) and hypomethylating agents (HMA),12-14 have been used more frequently than IC, not only in patients with poor-risk cytogenetics, but also for those with NPM1 and/or IDH mutations known to benefit from VEN-based regimens.15,16 Consequently, fitness cannot be the sole basis for treatment decisions, and clinicians have to consider best-fit treatment options on an individualized basis according to the patient’s disease-specific features, including cytogenetics and the mutational profile.17 As more information about AML genomic landscapes becomes available, the prognostication system for AML has continued to evolve. Until recently, the European LeukemiaNet (ELN)
2017 genetic risk stratification2 (now up-dated to the 2022 version3) was regarded as the gold standard for AML prognostication, and proved to be effective in predicting outcomes in independent validation cohorts of AML patients aged <65 years.18,19 Although it is broadly accepted that the ELN risk model fits well and can serve as a basis for guiding treatment strategies in young patients with AML, the same risk strata are not as informative for older patients.20,21 Therefore, the newly up-dated ELN 2022 guideline should be validated using multiple cohorts, and if outcomes are not predictable, there is an urgent need for appropriate tools to guide physicians in precisely tailoring a treatment strategy for this patient population.
Machine learning (ML) methods are effective for analyzing vast amounts of data and identifying complex relationships between variables. These advantages can promote better understanding of individual heterogeneities within a given disease. They can also delineate diagnostic and prognostic subgroups more precisely, and these can be used to develop individualized therapeutic strategies.22-24 Some studies have classified the genomic landscapes of patients with AML using the unsupervised ML method and attempted to categorize survival outcomes of each cluster.22,25-27 However, these studies focused on relatively young patients with AML. Given the need to validate the ELN 2022 classification in older patients with AML, and the scarcity of genomic classification data for this population, we aimed to investigate the effectiveness of ELN 2022 in this population and attempted to identify distinct genomic subtypes of older patients with AML via unsupervised clustering. In addition, we compared the patient outcomes of three treatment modalities, namely, IC, HMA alone, and HMA plus VEN, within the identified genomic subtypes and evaluated the potential impact of genomic clustering by ML on the care of elderly patients.
The patient selection criteria were: a) older ≥ 60 years patients with AML newly diagnosed at Seoul St. Mary’s Hospital between July 2017 and October 2021; b) having available information on chromosome and gene mutations at diagnosis; and c) having received either IC, HMA alone, or HMA plus VEN (HMA/VEN) as their first-line treatment. Patient consent was not required because of the retrospective nature of the study. Patients who received only the best supportive care were not included in this study, which was approved by the Institutional Review Board and Ethics Committee of the Catholic Medical Center in South Korea (KC21RISI0572).
Bone marrow karyotyping was performed on G-banded metaphase chromosomes using conventional techniques. The karyotypes were interpreted using the International Standing
Committee on Human Cytogenomic Nomenclature (ISCN) 2016.28 For molecular analysis, next-generation sequencing was performed using a customized myeloid panel (SM panel), as described in our previous report.29 The SM panel contains 67 genes that are frequently mutated in patients with AML. (See the Online Supplementary Appendix for details.)
For the detection of the FMS-like tyrosine kinase 3-internal tandem duplication (FLT3-ITD) mutation, polymerase chain reaction (PCR) for fragment analysis was performed using a previously published modified protocol, as detailed in the Online Supplementary Appendix. 30
The baseline clinical and molecular characteristics of the older patients with AML were compared using the χ2 test or Fisher exact test for categorical variables and a two-sample t test or Mann-Whitney U test for continuous variables. The P value was corrected using the Bonferroni method when multiple tests were indicated. Overall survival (OS) was defined as the time from the initiation of treatment to death from any cause. OS was estimated using the Kaplan-Meier method, and the groups were compared using the log-rank test. The Cox proportional hazards model was used for the univariate and multivariate analyses of OS. Variables with P<0.10 by univariate analysis were considered for entry into the multivariate analysis.
Unsupervised techniques were evaluated in our cohort and internally validated without testing external data. The abnormalities in karyotypes and genetic mutations that were used for risk stratification in ELN 2022 and additional mutations found in >3% of all patients in our cohort were used for the analysis. Detailed genomic variables are described in Online Supplementary Table S1. The number of clusters was determined using the parameter NbClust,31 which explored a range of 3-12 clusters. The optimal number of clusters was chosen based on a voting process involving several measures, including the maximum value of the index, the maximum difference between the hierarchy levels of the index, and the minimum value of second differences between levels of the index. This process is further explained in detail in Online Supplementary Table S2 and Online Supplementary Figure S1
The Ward1 algorithm with Euclidean distances were used for hierarchical agglomerative clustering and compared with k-means, clustering with partitioning around medoids (PAM), self-organizing maps (SOM), and the Gaussian mixture model (GMM). (See the Online Supplementary Appendix for details.) For internal validation, the clustering algorithms were compared by the clValid package.32 The correlation network map demonstrated the weight if the correlation coefficient was >0.02. The analysis was performed using R software for statistical computing (v.0.2; R Foundation for Statistical Computing, Vienna, Austria).
Patient characteristics and their comparison between the treatment groups
A total of 279 patients who met the inclusion criteria were selected; median age at diagnosis was 68 years (range 6084 years). As first-line treatment, 131 patients received IC (47.0%), 76 patients received HMA alone (27.2%), and 72 patients received HMA/VEN (25.8%). Median age of patients who received IC, HMA alone, and HMA/VEN was 64, 75, and 70 years, respectively (Table 1). Median age of patients in the HMA group was significantly higher than that of patients in the other groups. Most patients had de novo AML (N=238, 85.3%). There were more patients with secondary AML in the HMA/VEN group (30.6%) than in the other groups (IC: 9.2%;
HMA: 9.2%). Among the genetic mutations at AML diagnosis, the distribution of FLT3-ITD and PTPN11 mutations differed significantly among the three groups. The frequency of mutated FLT3-ITD was the lowest in patients receiving HMA/ VEN (IC: 16%; HMA: 19.7%; HMA/VEN: 2.8%; P=0.018), whereas the PTPN11 mutation was observed the least in the IC group (IC: 2.3%; HMA: 13.2%; HMA/VEN: 8.3%; P=0.03).
Survival outcomes after each treatment in older patients with acute myeloid leukemia according to European Leukemia Net 2022 criteria risk stratification
The clinical outcomes of each treatment are shown in Figure 1. After a median follow-up of 26.3 months, the median OS in the IC, HMA, and HMA/VEN groups was 20 months (95% CI: 14.9-32.5), 8.8 months (95% CI: 6.0-11.3), and 10 months
Karyotype abnormality, N (%) Complex -5 or del(5q);-7;-17/abn(17p)
Mutation, N (%)
IC: intensive chemotherapy; HMA: hypomethylating agent; HMA/VEN: HMA plus venetoclax; N: number; RUNX1-RUNX1T1: t(8;21)(q22;q22) rearrangement; CBFB-MYH11: inv(16)(p13.1q22) or t(16;16)(p13.1;q22) rearrangement; VAF: variant allele frequency.
(95% CI: 6.3-27.0), respectively (P<0.01). We applied the ELN 2022 risk stratification to the three treatment groups. For patients in the IC group, the median OS was estimated to be 44.1, 23.2, and 13.9 months according to the risk groups of favorable (FAV), intermediate (INT), and adverse (ADV) risk by ELN 2022, respectively. Moreover, long-term survival rate has a distinct trend that was not significantly different between the risk groups (P=0.069). As observed in the IC group, there was no significant difference in OS according to the ELN 2022 risk in the HMA (P=0.926) or HMA/VEN (P=0.498) groups. These data suggest that ELN 2022 genetic risk stratification does not impact survival outcome with respect to treatment modalities in older patients with AML.
Genetic factors that are associated with worse overall survival in older patients with acute myeloid leukemia by the treatment groups
To determine which ELN 2022 genetic risk stratification factors are associated the most with OS in each treatment group, we conducted univariate and multivariate analyses of these factors (Table 2). Mutated genes that were found in >3% of the patients and the cut-off age of 75 years were included in this analysis. Among the patients in the IC group, monosomal karyotype, mutated TP53 with at least 10% variant allele frequency (VAF), U2AF1, and SETBP1 result in inferior OS according to the multivariate analysis. In the HMA group, CBFB-MYH11 fusion, mutated SRSF2, and non-biZIP CEBPA were independently associated with worse OS. In the HMA/VEN group, no variables significantly impacted OS in the multivariate analysis. These data suggest that certain genetic mutations are associated with OS in distinct treatment groups of older patients with AML.
Unsupervised clustering with respect to molecular aberrations
Hierarchical clustering with respect to the molecular and cytogenetic analysis results indicates that older patients
with AML can be classified into one of the nine clusters (Figure 2A). The dominant cytogenetic features of each cluster were as follows. Cluster 1 (C1): no dominant genomic alterations; C2: non-bZIP CEBPA and FLT3-ITD mutations; C3: mutated ASXL1 and RUNX1; C4: RUNX1-RUNX1T1 or CBFB-MYH11 fusion; C5: BCOR and IDH2 mutations; C6: mutated NPM1 with FLT3-ITD wild type, IDH1, NRAS, PTPN11, bZIP in-frame CEBPA, and JAK2; C7: abnormal karyotype (-5 or del(5q); -7;-17/abn(17p)); C8: mutated SRSF2 and TET2; and C9: complex karyotype and TP53 mutation at a VAF of at least 10%.
To determine which molecular aberrations are associated with each other in a paired fashion, we mapped their correlation network (Figure 2B). In this data analysis, the following pairs of molecular aberrations were highly correlated: monosomal karyotype and either -5, del(5q), -7 or -17/abn(17p), RUNX1-RUNX1T1 and KIT mutations, and complex karyotype and TP53 mutations with at least 10% VAF. The node with the most concomitant mutation or genetic events (also referred to as the highest betweenness centrality) was mutated SETBP1, followed by NRAS mutation. In contrast, the betweenness centrality was lowest in CBFB-MYH11 fusion, followed by the bZIP in-frame CEBPA mutation, complex karyotype, and SRSF2 mutations. Detailed proportions of the cytogenetic abnormalities and genetic mutations in each cluster are described in Figure 3. (See also Online Supplementary Table S1.) There were some overlaps across the clusters that may be due to the inherent limitations of the clustering method employed and the modest sample size, or they could reflect the characteristics of AML, where mutational overlapping across clusters is unavoidable. In addition, we also compared different cluster methods and found that the hierarchical agglomerative clustering used in this study showed the best score in connectivity and stability (average proportion of non-overlap and the average distance between means) (Online Supplementary Table S3). According to the Meila
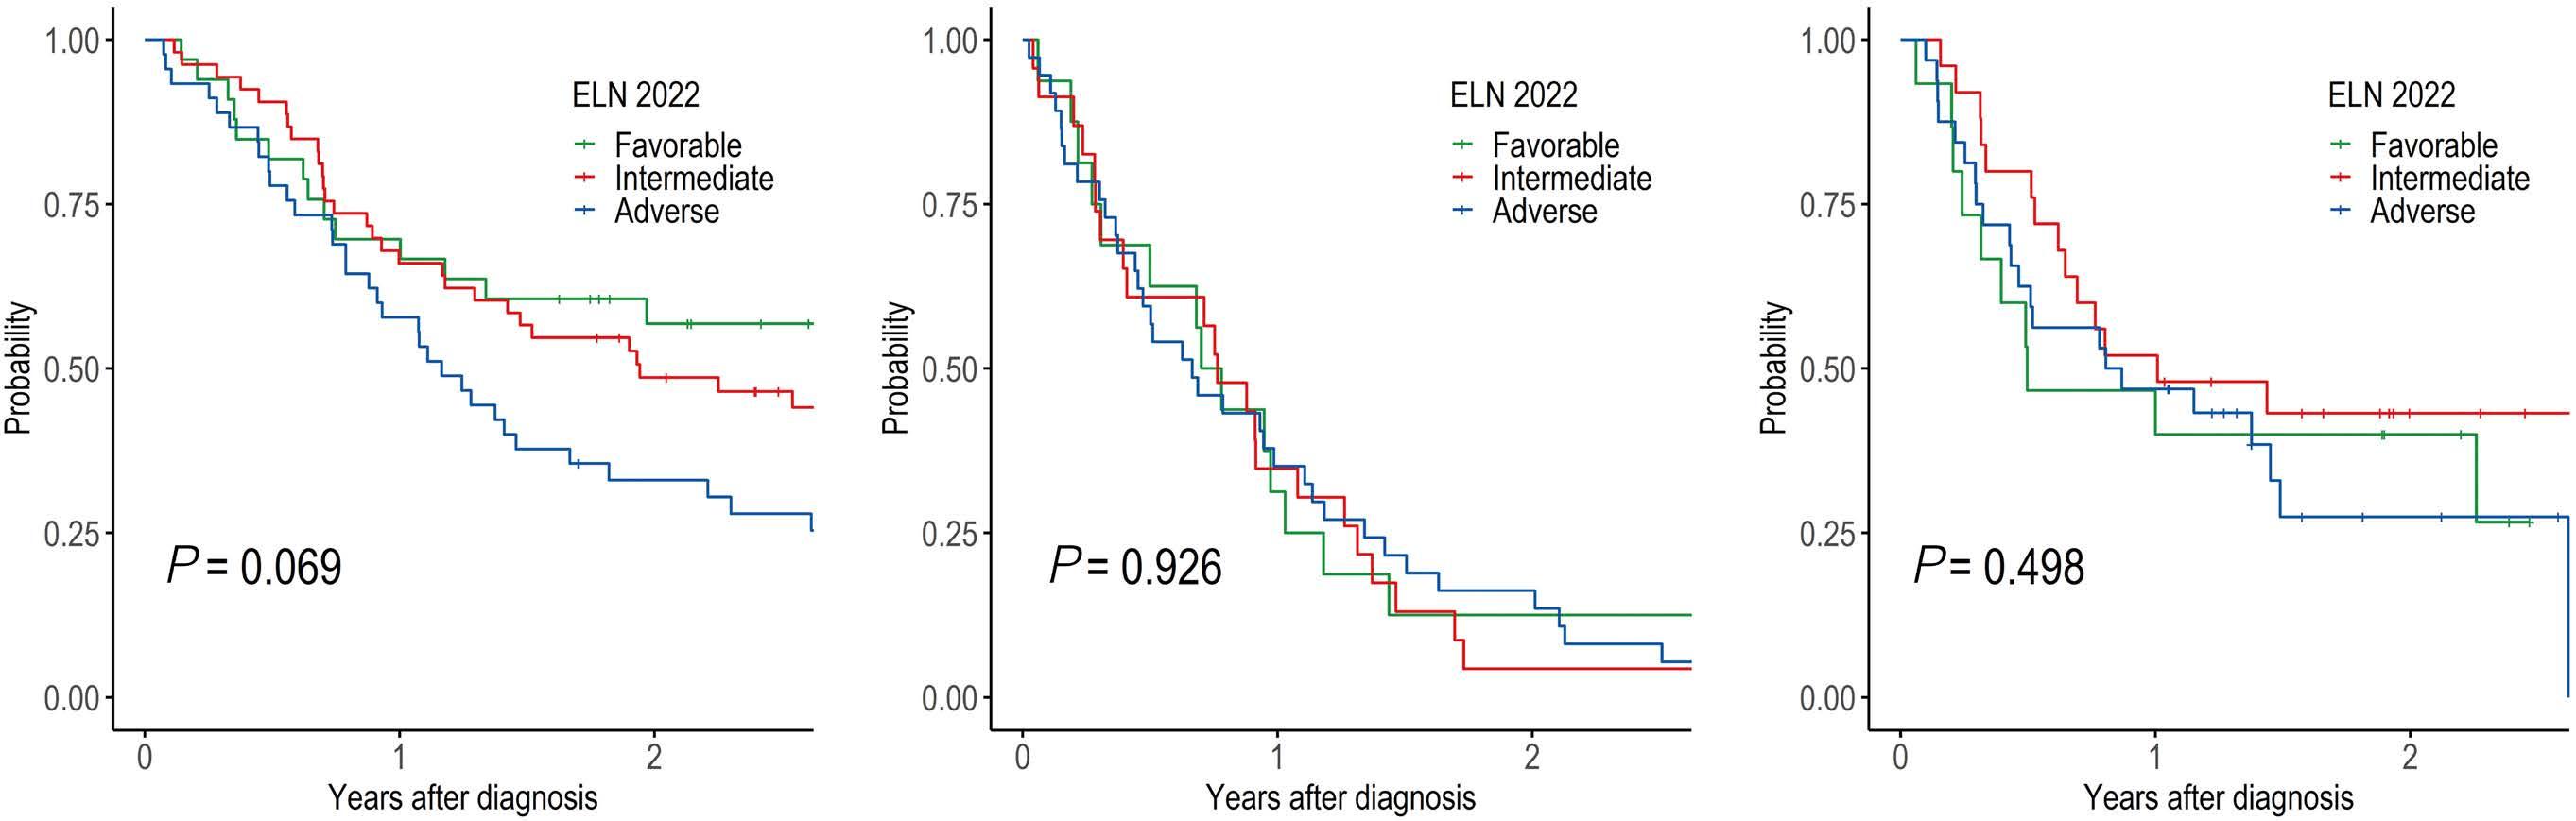
IC: intensive chemotherapy; HMA: hypomethylating agent; HMA/VEN: HMA plus venetoclax; HR: Hazard Ratio; CI: Confidence Interval; RUNX1RUNX1T1: t(8;21)(q22;q22) rearrangement; CBFB-MYH11: inv(16)(p13.1q22) or t(16;16)(p13.1;q22) rearrangement; VAF: variant allele frequency.
variance information, clusters from PAM and SOM were the most similar, and hierarchical agglomerative clustering and GMM were the most different.
Genomic clustering by hierarchical agglomerative clustering and survival outcomes
To determine whether clusters formed with respect to molecular aberrations are associated with survival outcomes in older patients with AML, we compared and analyzed the survival of patients in clusters classified by molecular and cytogenetic aberrations. The median OS of all patients was 12.8 months, and those of C1, C3, C4, and C5 were >13 months. C7 showed the worst OS (median 6.7 months) among the clusters (Online Supplementary Table S4). The OS of each cluster according to
the treatment type (Online Supplementary Figure S2) showed that survival could be significantly different across clusters when subject to the same treatment. Linking the clusters with survival outcomes of each treatment arm (Figure 4A, B, C, Online Supplementary Figure S3) enabled stratification (favorable, intermediate, and adverse) with significant differences in OS. Among the 131 patients in the IC group, the survival of C3 and C4 was superior to those of C2, C7, and C9 (Hazard Ratio [HR]: 2.79; 95% CI: 1.30-5.99; P=0.009). In contrast, C1, C3, and C7 achieved better survival (HR: 2.97; 95% CI: 1.28-6.88; P=0.011) than C2 and C4 when treated with HMA. In the HMA/VEN group, C1, C3, and C5 showed favorable survival outcomes, whereas C6 and C8 showed poorer outcomes (HR: 3.97; 95% CI: 1.60-9.84; P=0.001).
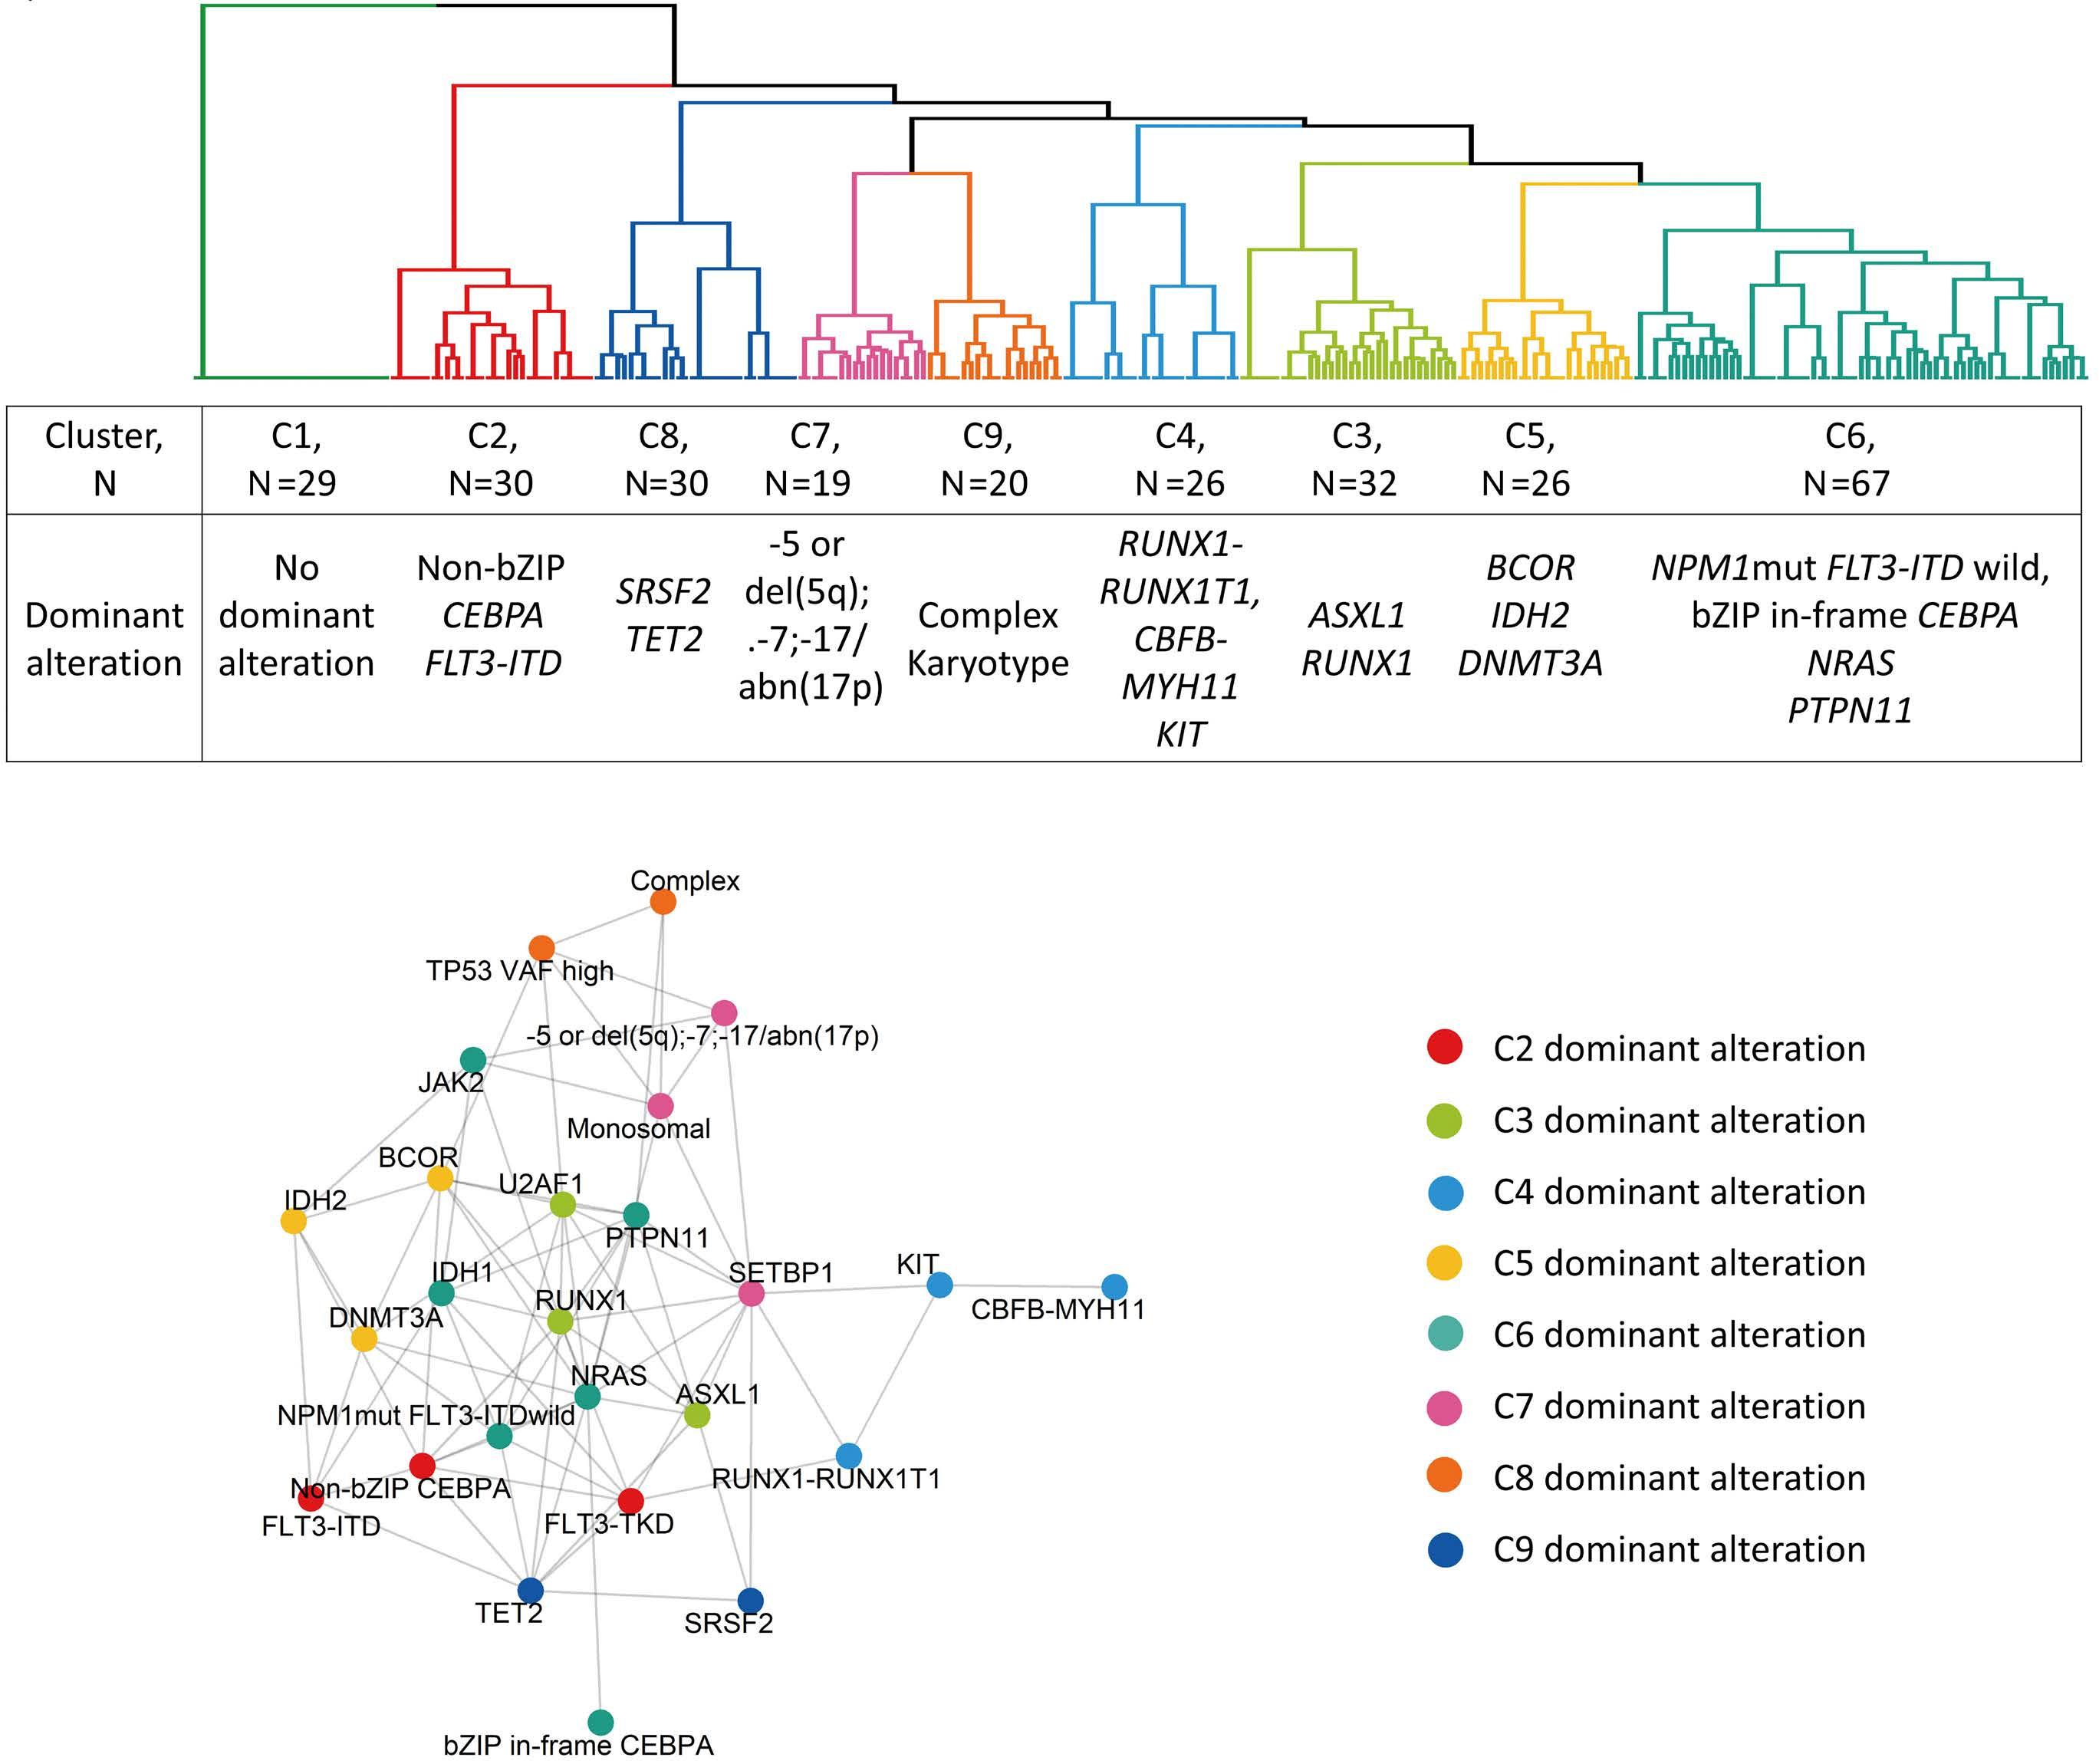
Stratification of the clusters differed depending on the treatment type, and survival outcomes of each cluster were substantially different according to different treatment arms (Figure 4D-F). Among C4, C6, and C8, IC showed better outcomes than HMA/VEN did (7 vs. 23.6 months; P=0.009). The HMA/VEN arm showed better outcomes than HMA only (HMA vs. HMA/VEN: 9.2 vs. 31.4 months; P=0.002) among C1, C2, C3, and C5. C7 and C9 showed no differences in OS among the HMA, HMA/VEN, and IC groups (8.6 vs. 9.5 vs. 9.4 months; P=0.904).
With the recent release of the up-dated version of the ELN risk stratification, several groups have reported real-world prognostic validation results that proved that ELN 2022 performs well in stratifying patients with AML into prognostically different favorable, intermediate, and adverse risk groups.33,34
However, these results were derived only from patients who received IC; consequently, information on the prognostic utility of ELN 2022 in older patients who may or may not be candidates for IC is lacking. In this study, we applied ELN 2022 to verify its prognostic predictability among patients with AML ≥ 60 years of age. We observed that it could not distinguish survival prognosis in these aged populations regardless of the treatments they received. The poor predictive ability of ELN 2022 was particularly noticeable in the patients receiving lower-intensity treatment compared with that of the IC group. Our results are consistent with previous findings that demonstrated the limited value of ELN 2017 in predicting prognosis in older adults with AML.20,21 This highlights the need for a distinct prognostic system from that used for young patients with AML to guide therapeutic approaches in this older population.
Given the lack of prognostic models derived from disease features in older adults with AML, we examined the feasibility of prognostication based on clustering with respect
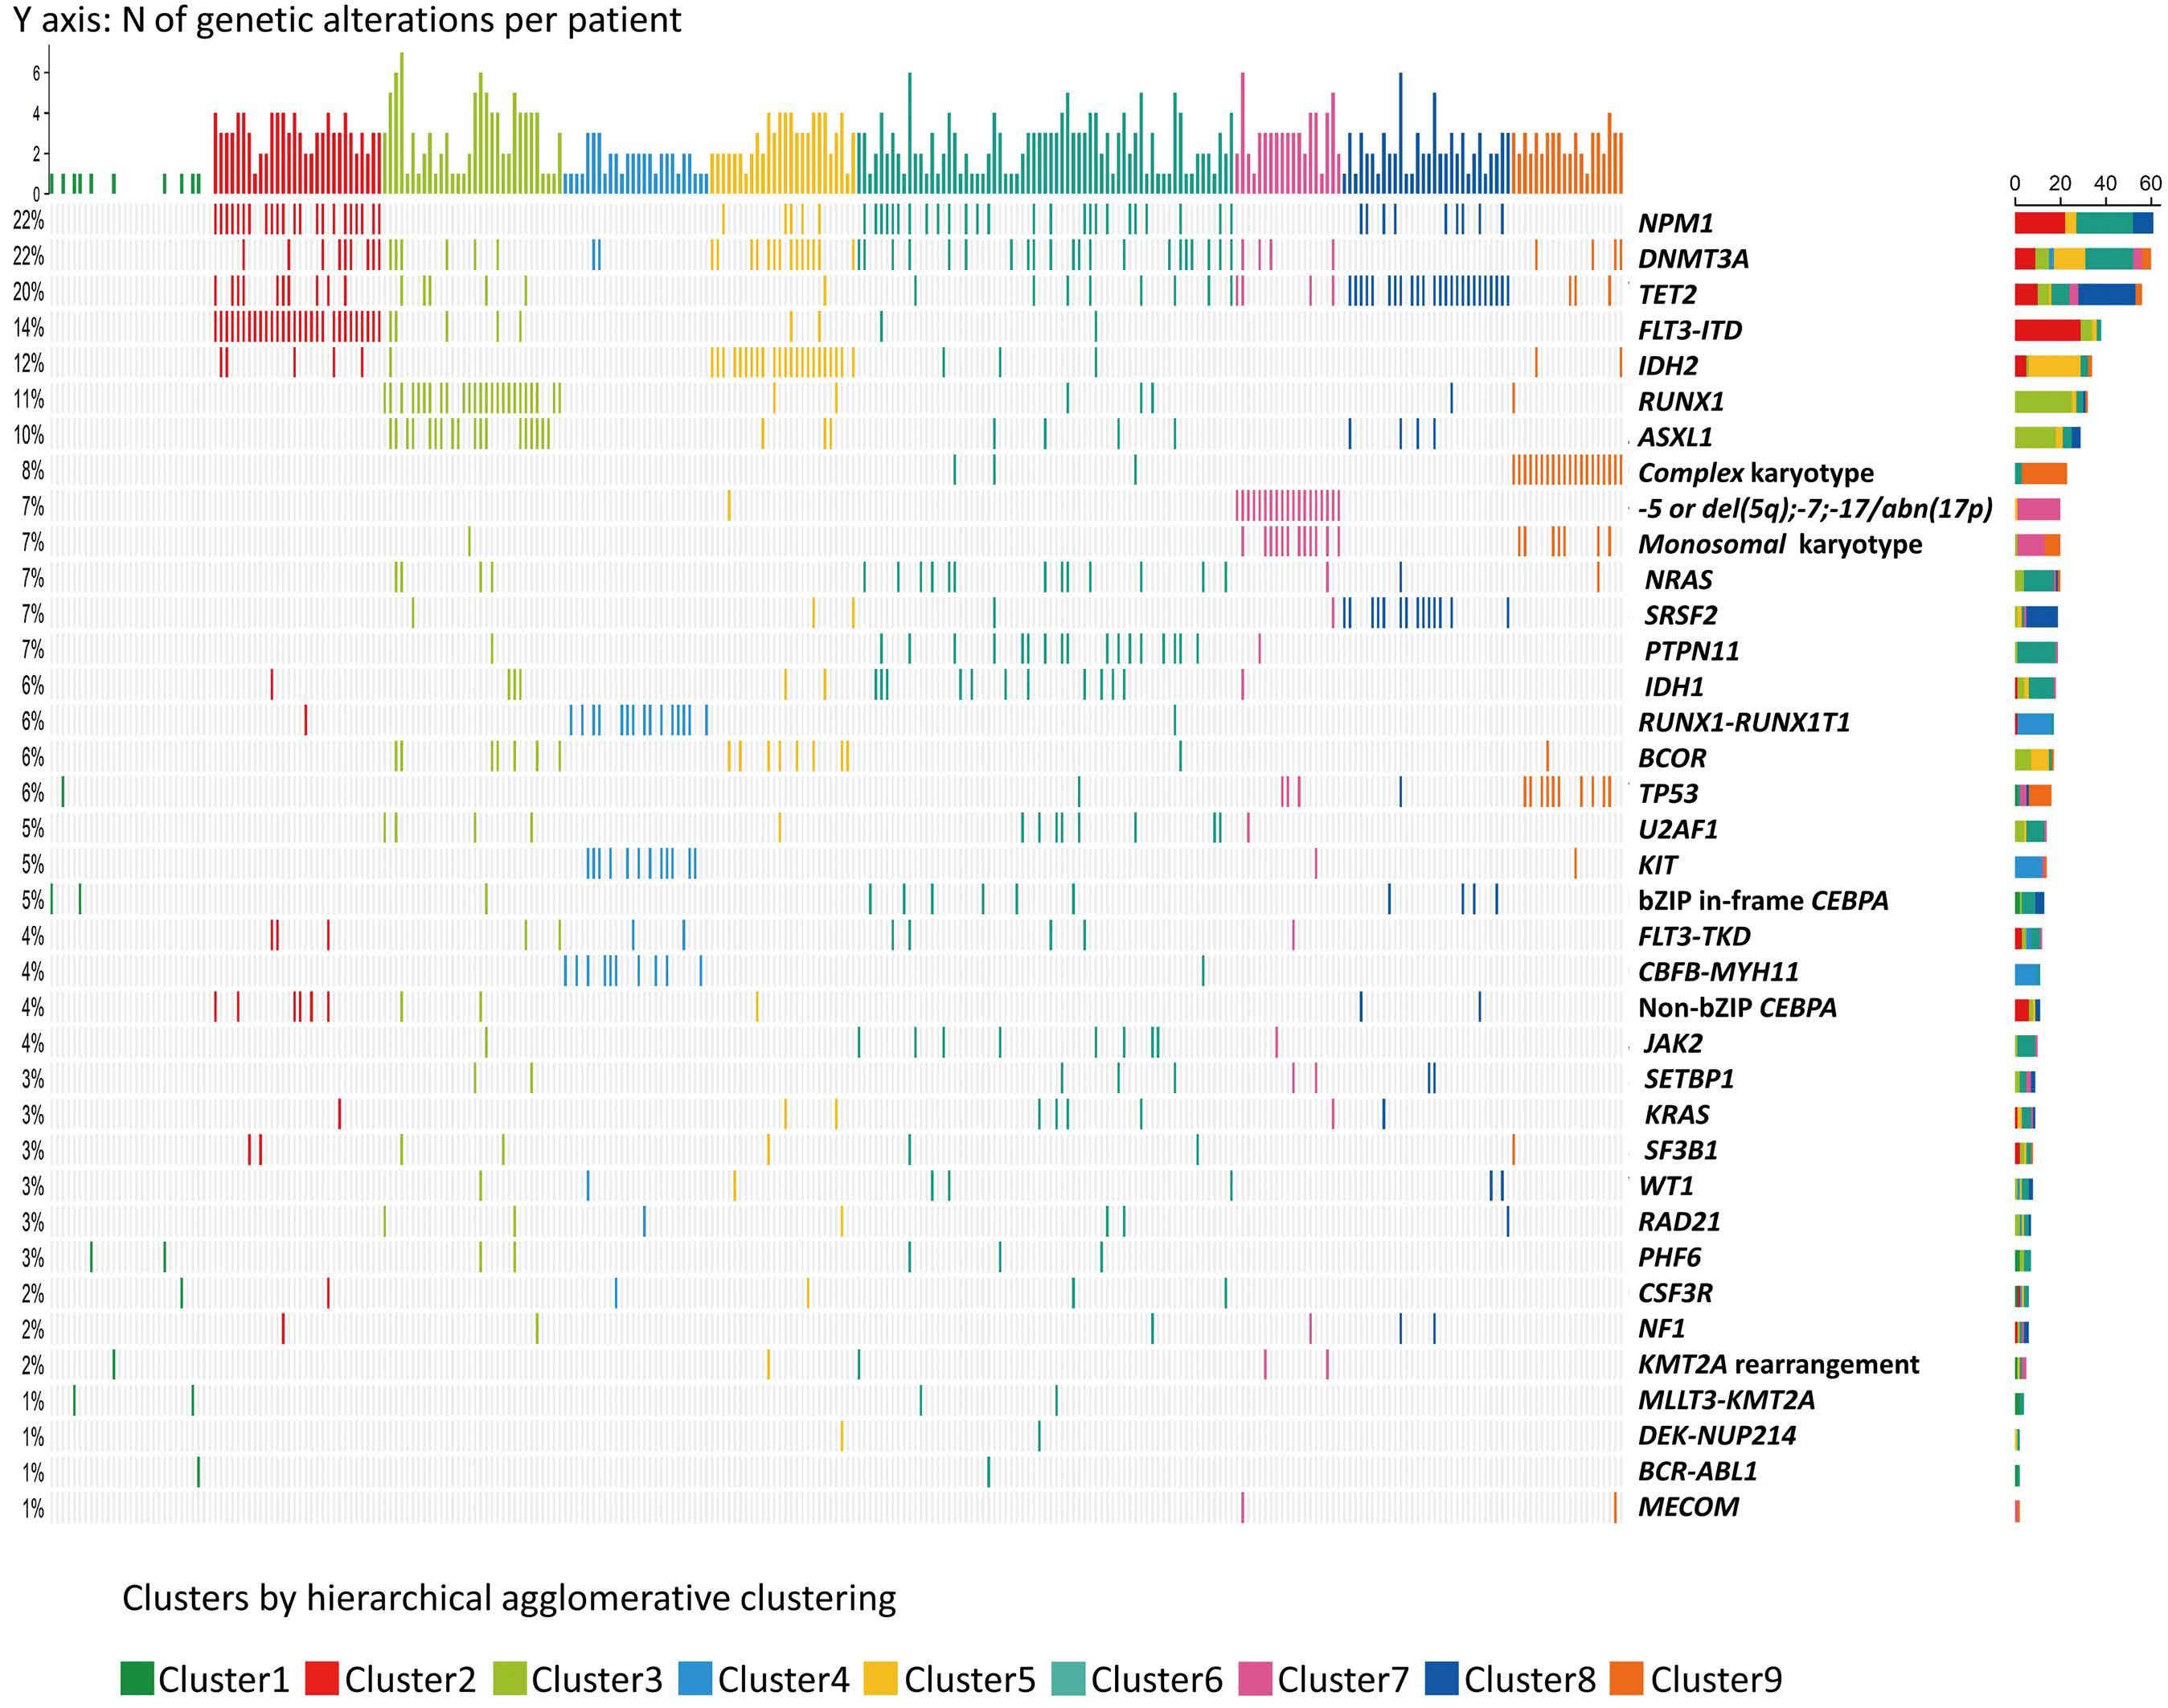
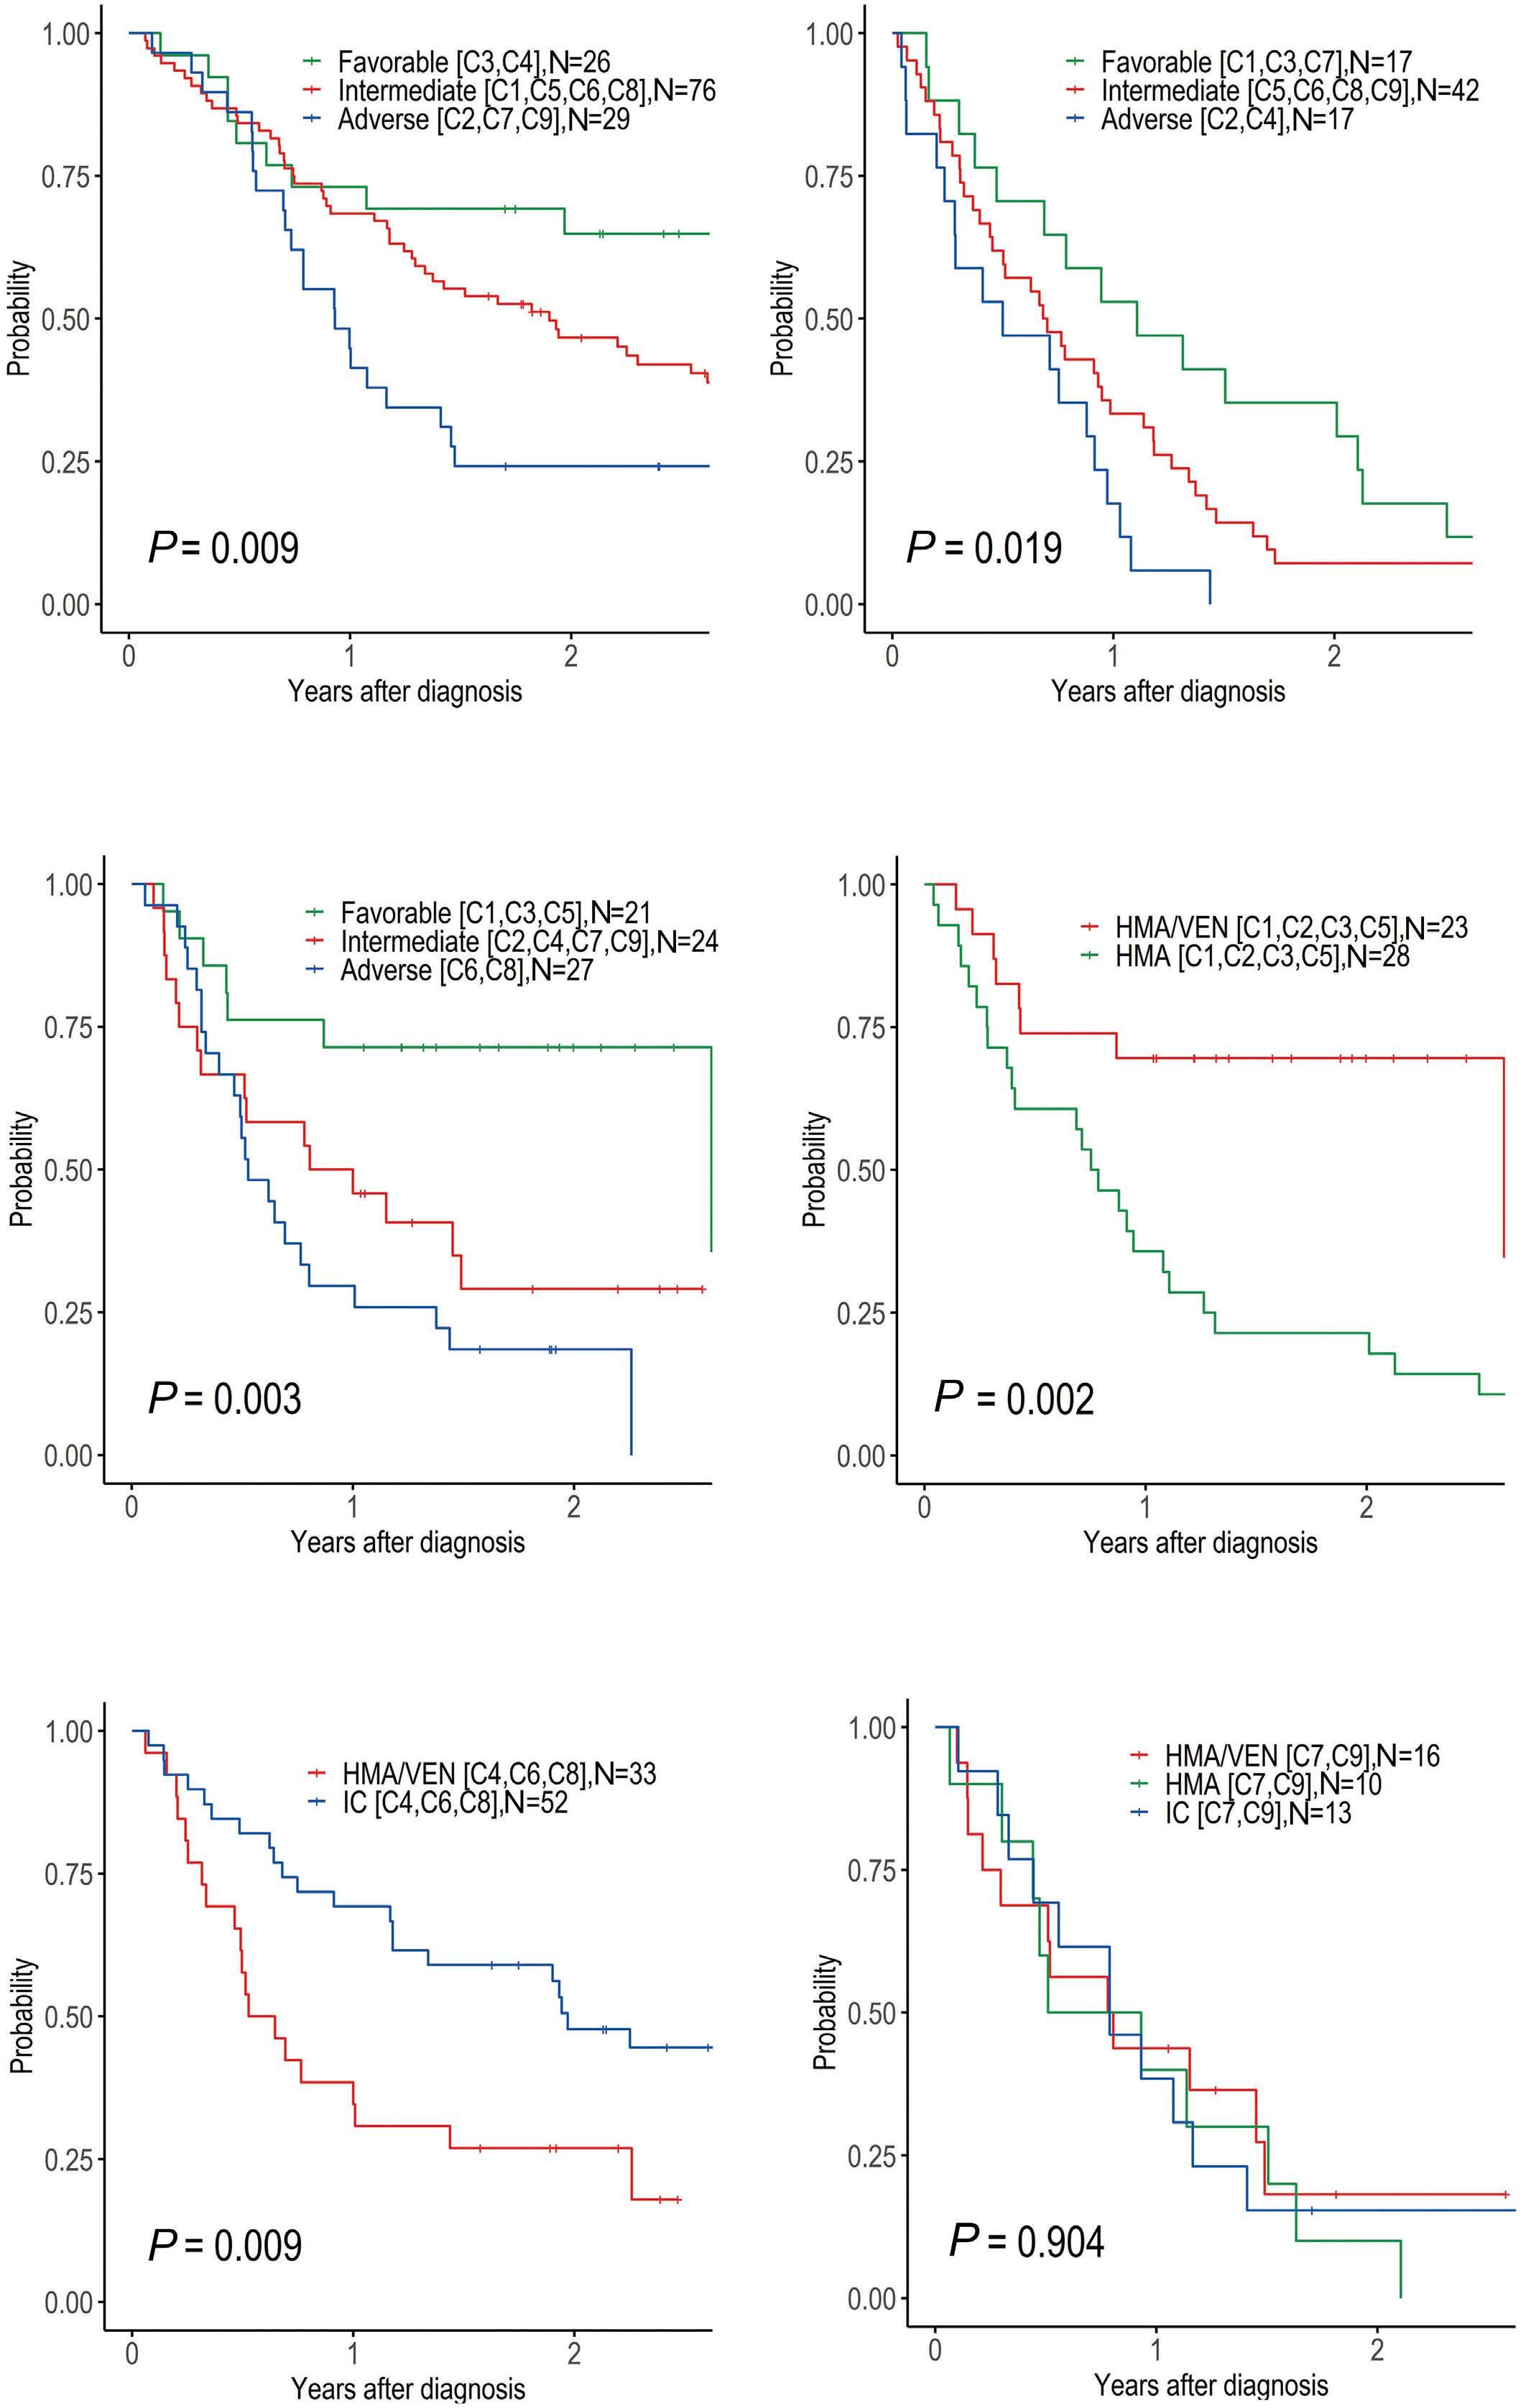
to abnormalities in karyotypes and genetic mutations. Prior to our study, several scoring systems had been proposed to assist in determining which treatment may be beneficial to older adults with AML in terms of OS, early mortality, or comprehensive geriatric quality of life.6-8,35,36 However, these were limited in that the development of such decision models was usually conducted regardless of the treatment type, with the result that they were unable to provide information regarding outcomes according to different treatment types. In addition, previous risk stratification was mainly focused on survival outcomes of exclusive genetic alterations that did not overlap.26,27 As various genes were verified and characterized as affecting each other, subgrouping was needed to promote better interpretation.37 Analyzing the interaction of each gene with several genes was possible via conventional statistical methods; however, because more genes were added, calculating the effect of the gene was impossible without applying an ML method. In particular, the ML method could validate whether these classifications were well-divided. In this study, we conducted an unsupervised hierarchical clustering analysis and classified older adults with AML into nine clusters with different genetic profiles at baseline. Although clustering is not straightforward because of the presence and complexity of co-occurring somatic mutations, each cluster has its own molecular signature based on predominantly mutated genes or karyotype abnormalities. Intriguingly, we observed that each genomic cluster was mapped to different prognostic positions by the changes in treatment modalities; a genomic cluster that showed favorable survival outcomes after IC would not necessarily show favorable outcomes after HMA or HMA/VEN, but could instead be the one that shows a poor prognosis.
In this context, one of the noticeable clusters was C4, in which core-binding factor-AML (CBF-AML) fusion dominance was observed. Among the AML subtypes, CBF-AML is a genetically distinct group of AML associated with chromosomal changes in t(8;21) and inv(16)(p13q22) or t(16;16)(p13;q22). It has several clinically distinctive characteristics compared with other forms of AML, such that it often begins in young adults. Patients aged >60 years with CBF-AML make up only about 5-15% of all adult CBF-AML.38-41 It often presents a good prognosis given its favorable response to cytarabine-based IC. Moreover, it is generally accepted that older adults with CBF-AML should be offered IC if they are considered fit. Accordingly, patients with CBF-AML in our study were primarily offered IC unless deemed ineligible to receive such therapy. However, apart from data concerning IC, there are few data regarding the management of older adults with CBF-AML. Furthermore, phase III studies evaluating the effectiveness of lower-intensity treatments, such as HMA or HMA+VEN, in older adults with AML excluded CBF-AML for study inclusion.13,42,43 In this study, we observed that C4, which mostly consisted of patients with CBF-AML (25/26, 96.2%), had a good prognosis in the IC group but not in the HMA or HMA/ VEN groups. Moreover, the addition of VEN to HMA did not
provide additional survival benefits compared with HMA alone for C4 patients. Our findings are in line with the results of a previous study in which the possibility of VEN resistance in CBF-AML was considered given the unpredictably poor event-free survival or OS in relapsed or refractory CBF-AML patients receiving the VEN-combined intensive regimen.44 However, this conflicts with the findings of another study showing remarkable activity of HMA+VEN in favorable-risk AML, including cases of CBF-AML (10/46, 22%).45 Given the limited data on the activity of HMA or HMA+VEN in patients with CBF alterations, further research with a larger cohort is needed.
Acute myeloid leukemia with higher-risk cytogenetics and mutated TP53 have a dismal prognosis following conventional IC, making these patients candidates for innovative therapies that have the potential to improve prognosis. Our findings also showed that IC has no survival benefit over HMA or HMA+VEN in patients belonging to C7 and C9, where unfavorable cytogenetics, such as -5, del(5q), -7, -17/abn(17p), or complex karyotypes with mutated TP53 were predominant. The median OS was similar between the IC, HMA, and HMAVEN groups (9.4 vs. 8.6 vs. 9.5 months; P=0.904). Moreover, VEN combined with HMA did not improve the survival outcome compared with HMA alone, consistent with the results from the subgroup analysis of the phase III VIALE-A study.13 Similarly, in a phase II study of 10-day decitabine plus VEN,14 the median OS for adverse-risk cytogenetics was reported to be 8.0 months, whereas the median estimates were not reached for newly diagnosed de novo AML. In addition, multivariable analysis in this phase II study indicated that TP53 mutation is associated with inferior survival and higher risk of relapse. Taken together, these data suggest an urgent need for novel therapeutic approaches targeting this group of patients. Based on the evidence that enhanced immune infiltrations are frequently observed in TP53-mutated AML, promising preliminary data with novel immune-based agents such as magrolimab,46 flotetuzumab,47 sabatolimab, and eprenetapopt48 have been reported. In particular, given that TP53 mutation is frequently accompanied by a complex karyotype (as shown in C9), the results of ongoing clinical trials for TP53-mutated AML are awaited with the hope of improving survival.49
With regard to treatment selection for older adults with AML, the current guideline50 recommends azacitidine plus VEN as a preferred category 1 regimen for the majority of elderly patients unless they are suitable for IC. However, we have found that some clusters treated with HMA/VEN did not show any remarkable survival advantage over HMA alone. In addition, in real-world practice, we have observed a more prominent cytopenia or morphologic leukemia-free state with an uncertain response when using the VEN combination compared to HMA alone. This potentially leads to significant morbidity or mortality, highlighting the need for speedy identification of patients who are less likely to respond to the VEN combination. To date, however, beyond current risk factors such as genomics, we cannot be sure of the best way to identify the
best-fit population for specific treatments, including HMA/ VEN. In this way, exploring a model that can reliably predict overall benefit through a summation of potential benefit and toxicity, which could perhaps be complemented with a physical function measure51 or an ex vivo drug sensitivity test,52 would be helpful for older adults with AML who usually consider HMA/VEN as their first choice.
The current study has several limitations. First, its retrospective nature and the relatively modest sample size in each treatment group, sometimes with a very small number of patients receiving specific treatments, make it challenging to draw definitive conclusions. Second, the lack of an independent validation cohort restricts the generalizability of our findings, and further validation of the clustering groups using external data or prospective cohorts is needed. Third, other possible factors affecting survival outcomes, such as fitness at diagnosis, quality of treatment response, and type of post-remission treatment, were not taken into account in the survival model. Fourth, we could not assess the impact of CPX-351, FLT3, or IDH inhibitors on survival outcomes because these agents were not available when the patients included in the study were treated. Fifth, the unsupervised clustering approach employed may have inherent weaknesses as it does not incorporate the physicians’ clinical standpoints. For instance, C6 encompasses diverse genetic subgroups that are clustered together, where the co-assignment of various genetic mutations in the same cluster does not necessarily imply a strong relationship between them. Instead, it appears to reflect a tendency for C6 to possess less distinct genetic characteristics compared to the other clusters within the fixed cluster size (N=9) that was determined by the voting process involving multiple indices. Nevertheless, to the best of our knowledge, this is the first study to validate the new ELN 2022 risk stratification in older adults with AML. Furthermore, this is the first attempt to correlate genomic subtypes of AML revealed by unsupervised ML clustering with treatment-dependent prognostic prediction, which was confined to the setting of older adults with AML. This provides new insights into how therapeutic benefits vary by and depend on an individual genetic signature, which may aid clinicians in determining suitable treatments for older adults with AML. In conclusion, we demonstrate the limits of the new ELN 2022 for predicting outcomes in older adults with AML, highlighting
1. Papaemmanuil E, Gerstung M, Bullinger L, et al. Genomic classification and prognosis in acute myeloid leukemia. N Engl J Med. 2016;374(23):2209-2221.
2. Dohner H, Estey E, Grimwade D, et al. Diagnosis and management of AML in adults: 2017 ELN recommendations from an international expert panel. Blood. 2017;129(4):424-447.
the need for a different prognostic approach in this population. We also show that ML might be used to categorize genetic variables that influence prognosis depending on the type of treatment. When large-scale data analysis is possible, ML technology can allow genomic data to be classified more accurately based on how well different treatments work. This may improve our understanding of the unique clonal architecture of each patient, and enable a heterogeneous group of older adults with AML to receive the most precise and individualized treatment.
No conflicts of interest to disclose.
TYK and SP collected and analyzed the data, and wrote the manuscript. DK, JML, MSK and YK provided patients and materials, and reviewed the manuscript. JK provided the materials and reviewed the manuscript. AR, TKK and HJK reviewed the manuscript and analyzed the data. BSC designed the study, provided patients and materials, analyzed the data, and supervised the writing of the manuscript. All authors read and agreed to the final version of the manuscript for publication.
We thank all patients and their families for their participation in the trial.
This research was supported by the Research Fund of Seoul St. Mary’s Hospital associated with The Catholic University of Korea and by a grant from Catholic Institute of Cell Therapy in 2023; by a grant from the National Research Foundation of Korea funded by the South Korean government (MSIT; 2022R1A2C2004517) and a grant of the Korea Health Technology R&D Project through the Korea Health Industry Development Institute (KHIDI), funded by the Ministry of Health and Welfare, Republic of Korea (HI22C1314).
The data presented in this study are available on request from the corresponding author. The data are not publicly available for privacy and ethical reasons.
3. Dohner H, Wei AH, Appelbaum FR, et al. Diagnosis and management of AML in adults: 2022 recommendations from an international expert panel on behalf of the ELN. Blood. 2022;140(12):1345-1377.
4 Park JH, Kang MG, Kim HR, et al. Changing the frequency and spectra of chromosomal aberrations in Korean patients with acute leukemia in a tertiary care hospital. Blood Res. 2020;55(4):225-245.
5. Appelbaum FR, Gundacker H, Head DR, et al. Age and acute myeloid leukemia. Blood. 2006;107(9):3481-3485.
6. Min GJ, Cho BS, Park SS, et al. Geriatric assessment predicts nonfatal toxicities and survival for intensively treated older
adults with AML. Blood. 2022;139(11):1646-1658.
7 Palmieri R, Paterno G, De Bellis E, et al. Therapeutic choice in older patients with acute myeloid leukemia: a matter of fitness. Cancers (Basel). 2020;12(1):120.
8. Ferrara F, Barosi G, Venditti A, et al. Consensus-based definition of unfitness to intensive and non-intensive chemotherapy in acute myeloid leukemia: a project of SIE, SIES and GITMO group on a new tool for therapy decision making. Leukemia. 2013;27(5):997-999.
9 Cortes JE, Mehta P. Determination of fitness and therapeutic options in older patients with acute myeloid leukemia. Am J Hematol. 2021;96(4):493-507.
10 Juliusson G. Older patients with acute myeloid leukemia benefit from intensive chemotherapy: an update from the Swedish Acute Leukemia Registry. Clin Lymphoma Myeloma Leuk. 2011;11(Suppl 1):S54-59.
11. Park S, Cho BS, Kim HJ. New agents in acute myeloid leukemia (AML). Blood Res. 2020;55(S1):S14-S18.
12. Cherry EM, Abbott D, Amaya M, et al. Venetoclax and azacitidine compared with induction chemotherapy for newly diagnosed patients with acute myeloid leukemia. Blood Adv. 2021;5(24):5565-5573.
13. DiNardo CD, Jonas BA, Pullarkat V, et al. Azacitidine and venetoclax in previously untreated acute myeloid leukemia. N Engl J Med. 2020;383(7):617-629.
14 DiNardo CD, Maiti A, Rausch CR, et al. 10-day decitabine with venetoclax for newly diagnosed intensive chemotherapy ineligible, and relapsed or refractory acute myeloid leukaemia: a single-centre, phase 2 trial. Lancet Haematol. 2020;7(10):e724-e736.
15. Pollyea DA, DiNardo CD, Arellano ML, et al. Impact of venetoclax and azacitidine in treatment-naive patients with acute myeloid leukemia and IDH1/2 mutations. Clin Cancer Res. 2022;28(13):2753-2761.
16. Lachowiez CA, Loghavi S, Kadia TM, et al. Outcomes of older patients with NPM1-mutated AML: current treatments and the promise of venetoclax-based regimens. Blood Adv. 2020;4(7):1311-1320.
17 de Leeuw DC, Ossenkoppele GJ, Janssen J. Older patients with acute myeloid leukemia deserve individualized treatment. Curr Oncol Rep. 2022;24(11):1387-1400.
18. Boddu PC, Kadia TM, Garcia-Manero G, et al. Validation of the 2017 European LeukemiaNet classification for acute myeloid leukemia with NPM1 and FLT3-internal tandem duplication genotypes. Cancer. 2019;125(7):1091-1100.
19. Harada Y, Nagata Y, Kihara R, et al. Prognostic analysis according to the 2017 ELN risk stratification by genetics in adult acute myeloid leukemia patients treated in the Japan Adult Leukemia Study Group (JALSG) AML201 study. Leuk Res. 2018;66:20-27.
20 Pogosova-Agadjanyan EL, Moseley A, Othus M, et al. AML risk stratification models utilizing ELN-2017 guidelines and additional prognostic factors: a SWOG report. Biomark Res. 2020;8:29.
21. Itzykson R, Fournier E, Berthon C, et al. Genetic identification of patients with AML older than 60 years achieving long-term survival with intensive chemotherapy. Blood. 2021;138(7):507-519.
22. Awada H, Durmaz A, Gurnari C, et al. Machine learning integrates genomic signatures for subclassification beyond primary and secondary acute myeloid leukemia. Blood. 2021;138(19):1885-1895.
23. Eckardt JN, Bornhauser M, Wendt K, Middeke JM. Application of machine learning in the management of acute myeloid
leukemia: current practice and future prospects. Blood Adv. 2020;4(23):6077-6085.
24. Lee SI, Celik S, Logsdon BA, et al. A machine learning approach to integrate big data for precision medicine in acute myeloid leukemia. Nat Commun. 2018;9(1):42.
25. Metzeler KH, Herold T, Rothenberg-Thurley M, et al. Spectrum and prognostic relevance of driver gene mutations in acute myeloid leukemia. Blood. 2016;128(5):686-698.
26. Hua X, Hyland Paula L, Huang J, et al. MEGSA: a powerful and flexible framework for analyzing mutual exclusivity of tumor mutations. Am J Human Genet. 2016;98(3):442-455.
27. Shen W, Tokdar ST, Ghosal S. Adaptive Bayesian multivariate density estimation with Dirichlet mixtures. Biometrika. 2013;100:623-640.
28. International Standing Committee on Human Cytogenomic Nomenclature. ISCN: an international system for human cytogenomic nomenclature (2016). Basel: Karger; 2016.
29. Lee J-M, Kim Y-J, Park S-S, Han E, Kim M, Kim Y. Simultaneous monitoring of mutation and chimerism using next-generation sequencing in myelodysplastic syndrome. J Clin Med. 2019;8(12):2077.
30 Kim Y, Lee GD, Park J, et al. Quantitative fragment analysis of FLT3-ITD efficiently identifying poor prognostic group with high mutant allele burden or long ITD length. Blood Cancer J. 2015;5(8):e336.
31. Charrad M, Ghazzali N, Boiteau V, Niknafs A. NbClust: an R package for determining the relevant number of clusters in a data set. J Stat Softw. 2014;61:1-36.
32. Brock G, Pihur V, Datta S, Datta S. clValid: an R package for cluster validation. J Stat Softw. 2008;25:1-22.
33. Lo MY, Tsai C-H, Kuo Y-Y, et al. Prognostic relevance of adult acute myeloid leukemia patients according to the 2022 European LeukemiaNet risk stratification. Blood. 2022;140(Suppl 1):130-131.
34 Song G-Y, Kim T, Ahn S-Y, et al. Prognostic predictability of 2022 European LeukemiaNet (ELN) risk stratification in the real world. Blood. 2022;140(Suppl 1):1018-1019.
35. Deschler B, Ihorst G, Platzbecker U, et al. Parameters detected by geriatric and quality of life assessment in 195 older patients with myelodysplastic syndromes and acute myeloid leukemia are highly predictive for outcome. Haematologica. 2013;98(2):208-216.
36. Walter RB, Othus M, Borthakur G, et al. Prediction of early death after induction therapy for newly diagnosed acute myeloid leukemia with pretreatment risk scores: a novel paradigm for treatment assignment. J Clin Oncol. 2011;29(33):4417-4423.
37. van der Werf I, Wojtuszkiewicz A, Meggendorfer M, et al. Splicing factor gene mutations in acute myeloid leukemia offer additive value if incorporated in current risk classification. Blood Adv. 2021;5(17):3254-3265.
38. Appelbaum FR, Kopecky KJ, Tallman MS, et al. The clinical spectrum of adult acute myeloid leukaemia associated with core binding factor translocations. Br J Haematol. 2006;135(2):165-173.
39 Park S, Choi H, Kim HJ, et al. Genome-wide genotype-based risk model for survival in core binding factor acute myeloid leukemia patients. Ann Hematol. 2018;97(6):955-965.
40 Marcucci G, Mrozek K, Ruppert AS, et al. Prognostic factors and outcome of core binding factor acute myeloid leukemia patients with t(8;21) differ from those of patients with inv(16): a Cancer and Leukemia Group B study. J Clin Oncol. 2005;23(24):5705-5717.
41. Borthakur G, Kantarjian H. Core binding factor acute
myelogenous leukemia-2021 treatment algorithm. Blood Cancer J. 2021;11(6):114.
42. Dombret H, Seymour JF, Butrym A, et al. International phase 3 study of azacitidine vs conventional care regimens in older patients with newly diagnosed AML with >30% blasts. Blood. 2015;126(3):291-299.
43. Kantarjian HM, Thomas XG, Dmoszynska A, et al. Multicenter, randomized, open-label, phase III trial of decitabine versus patient choice, with physician advice, of either supportive care or low-dose cytarabine for the treatment of older patients with newly diagnosed acute myeloid leukemia. J Clin Oncol. 2012;30(21):2670-2677.
44 DiNardo CD, Lachowiez CA, Takahashi K, et al. Venetoclax combined with FLAG-IDA induction and consolidation in newly diagnosed and relapsed or refractory acute myeloid leukemia. J Clin Oncol. 2021;39(25):2768-2778.
45. Arslan S, Zhang J, Dhakal P, et al. Outcomes of therapy with venetoclax combined with a hypomethylating agent in favorable-risk acute myeloid leukemia. Am J Hematol. 2021;96(3):E59-E63.
46. Sallman D, Asch A, Kambhampati S, et al. AML-196: The first-inclass anti-CD47 antibody magrolimab in combination with azacitidine is well tolerated and effective in AML patients: phase 1b results. Clin Lymphoma Myeloma Leuk.
2021;21(Suppl 1):S290.
47. Uy GL, Aldoss I, Foster MC, et al. Flotetuzumab as salvage immunotherapy for refractory acute myeloid leukemia. Blood. 2021;137(6):751-762.
48. Cluzeau T, Sebert M, Rahmé R, et al. Eprenetapopt plus azacitidine in TP53-mutated myelodysplastic syndromes and acute myeloid leukemia: a phase II study by the Groupe Francophone des Myélodysplasies (GFM). J Clin Oncol. 2021;39(14):1575-1583.
49 Vadakekolathu J, Lai C, Reeder S, et al. TP53 abnormalities correlate with immune infiltration and associate with response to flotetuzumab immunotherapy in AML. Blood Adv. 2020;4(20):5011-5024.
50 Pollyea DA, Altman JK, Assi R, et al. Acute Myeloid Leukemia, Version 3.2023, NCCN Clinical Practice Guidelines in Oncology. J Natl Compr Canc Netw. 2023;21(5):503-513.
51. Kwag D, Bang SY, Lee JH, et al. The prognostic value of physical function in older adults with acute myeloid leukemia treated with low intensity treatment. Blood. 2022;140(Suppl 1):1020-1021.
52. Kuusanmäki H, Kytölä S, Vänttinen I, et al. Ex vivo venetoclax sensitivity testing predicts treatment response in acute myeloid leukemia. Haematologica. 2023;108(7):1768-1781.
Yuta Kaito,1 Emi Sugimoto,2 Fumi Nakamura,3 Yutaka Tsukune,4 Makoto Sasaki,4 Shunsuke Yui,5 Hiroki Yamaguchi,5 Susumu Goyama,6 Yasuhito Nannya,1 Kinuko Mitani,3 Hideto Tamura7 and Yoichi Imai3
1Division of Hematopoietic Disease Control, Institute of Medical Science, The University of Tokyo, Tokyo; 2Division of Cellular Therapy, Institute of Medical Science, The University of Tokyo, Tokyo; 3Department of Hematology and Oncology, Dokkyo Medical University, Tochigi; 4Department of Hematology, Juntendo University School of Medicine, Tokyo; 5Department of Hematology, Nippon Medical School, Tokyo; 6Division of Molecular Oncology, Graduate School of Frontier Sciences, The University of Tokyo, Tokyo and 7Division of Diabetes, Endocrinology and Hematology, Department of Internal Medicine, Dokkyo Medical University Saitama Medical Center, Saitama, Japan.
Abstract
Correspondence: Y. Imai imaiyo-tky@umin.ac.jp
Received: February 8, 2023.
Accepted: September 8, 2023.
Early view: September 21, 2023.
https://doi.org/10.3324/haematol.2023.282915
©2024 Ferrata Storti Foundation
Published under a CC BY-NC license
Acute myeloid leukemia (AML) is a hematologic malignancy that frequently relapses, even if remission can be achieved with intensive chemotherapy. One known relapse mechanism is the escape of leukemic cells from immune surveillance. Currently, there is no effective immunotherapy for AML because of the lack of specific antigens. Here, we aimed to elucidate the association between CD155 and CD112 in AML cell lines and primary AML samples and determine the therapeutic response. Briefly, we generated NK-92 cell lines (NK-92) with modified DNAX-associated molecule 1 (DNAM-1) and T-cell immunoglobulin and ITIM domain (TIGIT), which are receptors of CD155 and CD112, respectively. Analysis of 200 cases of AML indicated that the survival of patients with high expression of CD112 was shorter than that of patients with low expression. NK-92 DNAM-1 exhibited enhanced cytotoxic activity against AML cell lines and primary cells derived from patients with AML. DNAM-1 induction in NK-92 cells enhanced the expression of cytotoxicity-related genes, thus overcoming the inhibitory activity of TIGIT. Between CD155 and CD112, CD112 is an especially important target for natural killer (NK)-cell therapy of AML. Using a xenograft model, we confirmed the enhanced antitumor effect of NK-92 DNAM-1 compared with that of NK-92 alone. We also discovered that CD112 (Nectin-2), an immune checkpoint molecule belonging to the Nectin/Nectin-like family, functions as a novel target of immunotherapy. In conclusion, modification of the DNAM-1/CD112 axis in NK cells may be an effective novel immunotherapy for AML. Furthermore, our findings suggest that the levels of expression of these molecules are potential prognostic markers in AML.
Acute myeloid leukemia (AML) is a hematologic malignancy in which hematopoietic stem/progenitor cells accumulate multiple genetic abnormalities associated with differentiation and proliferation, resulting in the autonomous and uncontrolled progression of the disease.1,2 Recently, molecular targeted agents such as venetoclax3 and gilteritinib4 have been approved for use as AML treatment. However, AML relapse remains a major concern and is associated with a poor prognosis.5 Escape of tumor cells from the immune system has piqued interest as an important mechanism of relapse in hematologic malignancies. Previous studies have documented enhanced
expression of inhibitory receptors such as programmed death-1 in T cells derived from patients with AML.6,7 To circumvent escape from the immune system, immune checkpoint inhibitors have been tested for AML treatment, but they have not been effective.8,9 Moreover, the development of chimeric antigen receptor T-cell therapy for AML has stalled because of the lack of specific targetable antigens.10
We focused on natural killer (NK) cells, a type of innate lymphocyte capable of directly killing target cells without antigen presentation.11 The cytotoxic function of NK cells is regulated by the balance of signals from activating and inhibitory receptors.12
NK-cell therapy for AML includes autologous and allogeneic
NK cells. Autologous NK cells are less likely to cause graftversus-host disease, but they do not exhibit substantial therapeutic efficacy because of their own reduced cytotoxicity.13,14 Difficulties with in vitro expansion and activation, and lack of in vivo persistence of allogeneic NK cells contribute to insufficient clinical efficacy.15
The NK-92 cell line (NK-92), which is derived from a patient with non-Hodgkin lymphoma, has been employed in off-theshelf therapy,16,17 as it has just one receptor of the inhibitory killer cell immunoglobulin-like receptor (KIR) family members,18 expresses many activating receptors,19 and is more cytotoxic than primary NK cells. A clinical trial using NK-92 for relapsed/refractory AML was conducted, but the results were not promising.20
Recently, the pathway between immune cell receptors, including DNAX-associated molecule 1 (DNAM-1, CD226), T-cell immunoglobulin and ITIM domain (TIGIT), PVR-related Ig domain (PVRIG, CD112R), T-cell activation, increased late expression (TACTILE, CD96), and their ligands, the Nectin/Nectin-like family molecules CD155 (poliovirus receptor), CD111 (Nectin-1), CD112 (Nectin-2), and CD113 (Nectin-3), have attracted attention as a novel class of immune checkpoint molecules. The major receptors in this pathway are thought to be DNAM-1 (an activating receptor) and TIGIT (an inhibitory receptor).21,22 CD155 and CD112 belong to the immunoglobulin superfamily of adhesion glycoproteins23 and their expression is upregulated in a variety of malignancies, although their association with prognosis varies by the type of malignancy.24-26 There are reports of decreased DNAM-1 expression in NK cells and increased TIGIT expression in exhausted T cells derived from AML.27-30 TIGIT antibodies have been shown to be useful in the treatment of solid tumors and are being tested in clinical trials, but have not been shown to be useful in AML.31,32 In this study, we analyzed the expression of CD155 and CD112 in AML cell lines and primary AML samples to elucidate their association with therapeutic responses. We found that CD112 may be associated with a poor prognosis. Furthermore, we established a DNAM-1-introduced NK-92 assuming that CD112 targeted therapy may be more promising than previous immunotherapies for patients with a poor prognosis.
Analysis using a clinical database
The Cancer Genome Atlas (TCGA) program (https://www. cancer.gov/about-nci/organization/ccg/research/structural-genomics/tcga) was used to analyze data in the cBioPortal for Cancer Genomics (version 5.1.2) (https://www.cbioportal. org/).33 mRNA expression in TCGA dataset was assigned to the group with a threshold Z-score >1.0. Kaplan-Meier overall survival curves were analyzed using the log-rank test.
Cytotoxicity assay
Leukemia cell lines (primary AML cells) were stained with
carboxyfluorescein succinimidyl ester (CellStain-CFSE; Dojindo, Kumamoto, Japan). Tumor cells (target cells) and NK-92/modified NK-92 (effector cells) were co-cultured for 4 h at effector-to-target cell ratios of 1, 5, and 10. Four hours later, the cells were collected and stained with Cellstain-propidium iodide (PI) solution (Dojindo). The percentage of PI-positive leukemia cell lines cultured alone or co-cultured with leukemia cell lines was estimated using flow cytometry. Cytotoxicity of NK-92 and modified-NK-92 was calculated as the percentage of PI-positive co-cultured leukemia cell lines minus that of leukemia cell lines cultured alone.
Primary cells were stained with the antibodies listed in Online Supplementary Table S1. The cells were analyzed and isolated using BD FACS Aria II SORP (BD Biosciences). FlowJo software (version 10.8.0, FlowJo LLC, Ashland, OR, USA) was used to analyze the results. This study was reviewed and approved by the Ethics Review Committee of the Institute of Medical Science, University of Tokyo (2020-16-0623).
Leukemia xenograft models
Female (6- to 8-week-old) NOD.Cg-Prkdcscid Il2rgtm1Wjl/ SzJ (NSG) mice were irradiated with 200 cGy on day -1. Luciferase-introduced MOLM-13 and phosphate-buffered saline (PBS) (FUJIFILM Wako, Japan)/NK-92/NK-92 DNAM-1 cells were injected through the tail vein on day 0. PBS/NK-92/ NK-92 DNAM-1 cells were injected through the tail vein on days 1 and 2. D-luciferin (FUJIFILM Wako Pure Chemicals, Osaka, Japan) was administered intraperitoneally at a dose of 100 µL (150 µg) to each animal twice a week and evaluated using the Spectrum In Vivo Imaging System (IVIS, PerkinElmer, Waltham MA, USA). Living Image Software (version 4.7.4, PerkinElmer) was used to quantify the luminescence. Details on these protocols are included in the Online Supplementary Methods. Additional information on the methods is provided in the Online Supplementary Data
High CD112 expression is associated with a poor prognosis in patients with acute myeloid leukemia
To confirm the association between Nectin/Nectin-like family molecule expression and prognosis in AML patients, we analyzed data from patients with AML using cBioPortal. We analyzed the AML cohort of TCGA program and found no significant difference in survival rate between the groups with high or low CD155 ( P=0.972). However, the CD112 high-expression group had a significantly worse prognosis than the low-expression group (P=0.014) (Figure 1A). Analysis of TCGA clinical data showed an increased frequency of patients with adverse-risk cytogenetics according to the European LeukemiaNet (ELN) risk classification in the
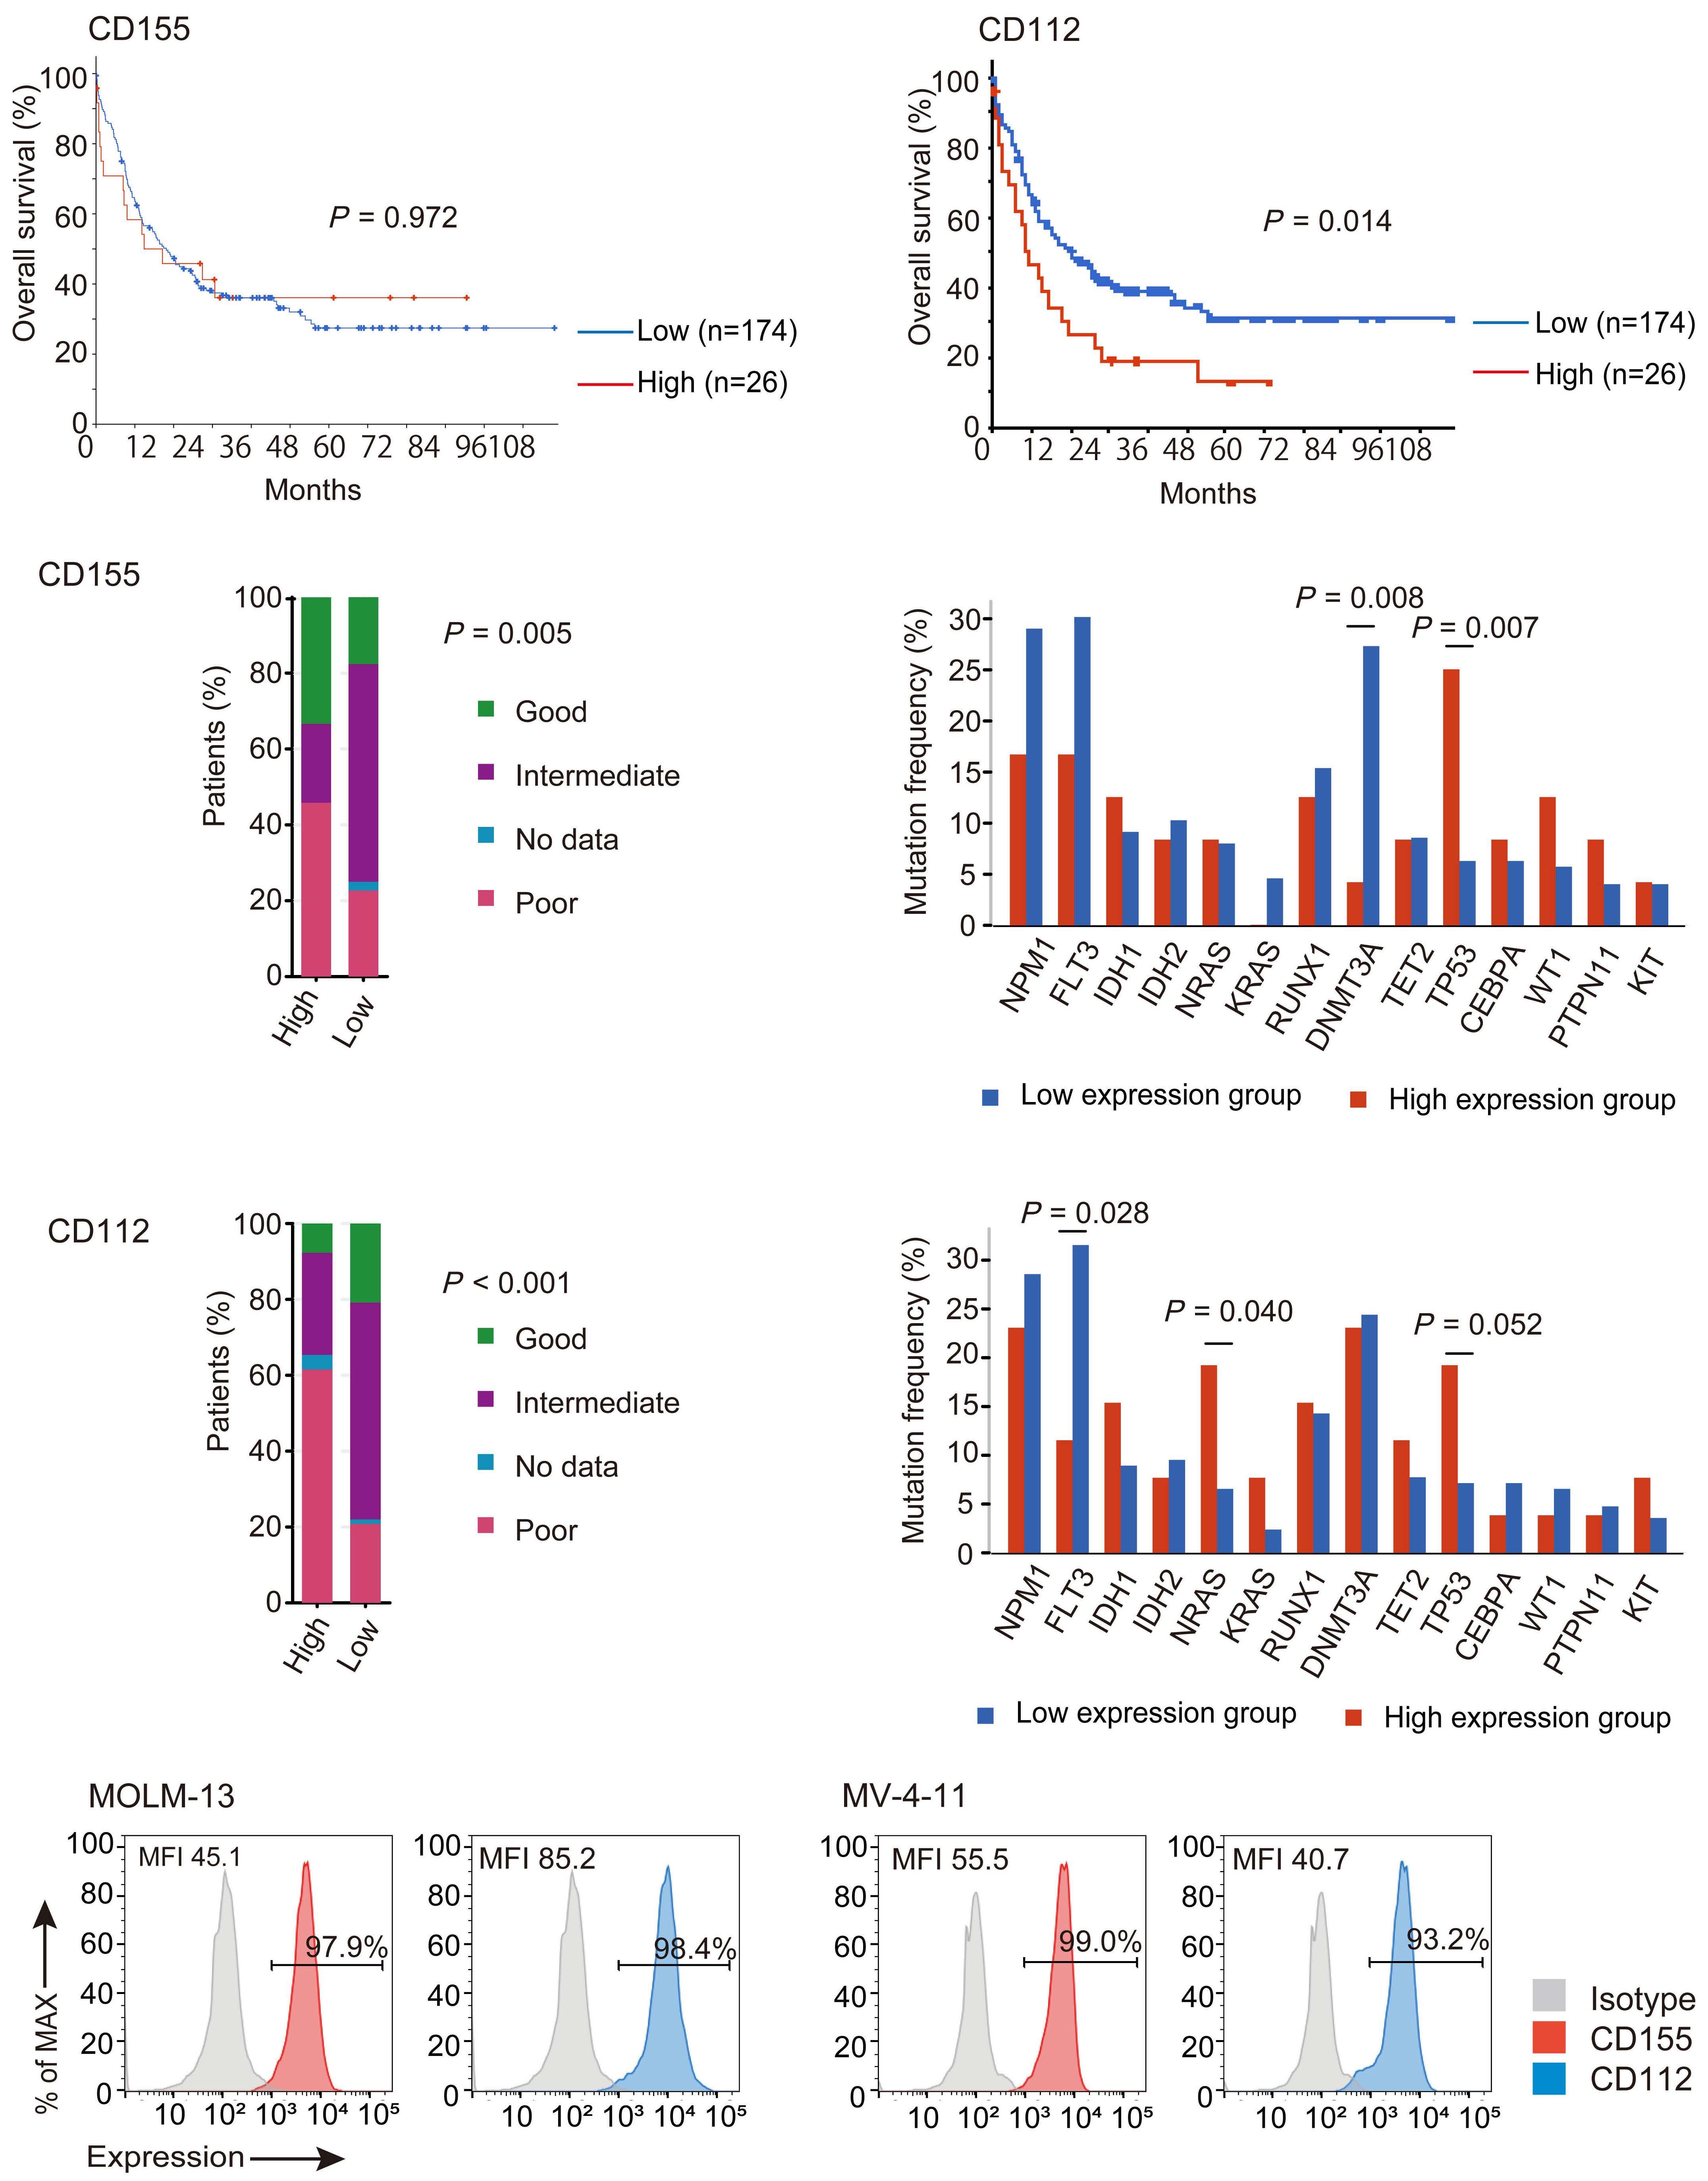
Figure 1. Relationship between CD155 and CD112 expression and prognosis in patients with acute myeloid leukemia. (A) The cBioPortal was used to analyze the association between CD155 and CD112 expression and prognosis in a cohort of patients with acute myeloid leukemia (AML) from The Cancer Genome Atlas (TCGA). A log-rank test was used. The red line indicates the high expression group and the blue line represents the low expression group. (B, C) Left: relationship between CD155/CD112 expression and European LeukemiaNet risk classification in a cohort of patients with AML derived from TCGA. The difference in the distribution of patients with each cytogenetic risk between the high and low expression groups was estimated using the χ2 test. Right: relationship between CD155/CD112 expression and genetic mutation in a cohort of patients with AML derived from TCGA. Red indicates the high expression group and blue indicates the low expression group. (D) Expression of CD155 and CD112 in AML cell lines (MOLM-13 and MV-4-11) was analyzed using flow cytometry. Gray histograms indicate the isotype control, red indicates CD155 and blue indicates CD112 expression. MFI: median fluorescence intensity.
CD112 high-expression group compared with that in the low-expression group (P<0.001). In a multivariate analysis, CD112 was not identified as an independent prognostic factor for overall survival. We could not find any consistent correlation between CD155 expression and ELN risk classification (P=0.005) (Online Supplementary Figure S1A). Regarding somatic mutations, the CD112 high-expression group had a significantly lower frequency of FLT3 mutations and significantly higher frequency of NRAS mutations than the low-expression group. Although the difference was not statistically significant, TP53 mutations were also frequently found in the CD112 high-expression group. Other clinical data did not differ significantly between CD155 or CD112 high- and low-expression groups (Figure 1B, C, Online Supplementary Figure S1A, B).
The expression of CD155 and CD112 in AML cell lines (MOLM-13, MV-4-11, THP-1, KG-1, NB-4, Kasumi-1, TF-1) and a blastic phase of a chronic myeloid leukemia cell line (K562) was analyzed using flow cytometry. Both CD155 and CD112 were expressed in both types of cell line, and more than 90% of the cells expressed these molecules, except for CD112 in NB-4 (Figure 1D, Online Supplementary Figure S2).
CD155 and CD112 are expressed in primary acute myeloid leukemia blasts and their expression is not associated with the initial treatment response
To analyze the expression of Nectin/Nectin-like family molecules and their receptors in leukemia cells from patients with AML, we analyzed the expression of CD155 and CD112 in primary AML blasts from patients with de novo AML using flow cytometry (Online Supplementary Figure S3). The patients’ characteristics are shown in Online Supplementary Table S2. As for primary AML blasts in peripheral blood, 63.0% (17/27 cases) had more than 20% positivity for both CD155 and CD112 expression (Figure 2A).
Next, we analyzed the relationship between the expression of CD155/CD112 in AML blasts and their response to therapy. We divided patients into two groups: those who achieved a complete response with standard induction therapy and those who did not and compared the expression of CD155/CD112 in AML blasts in the two groups. The expression of CD155 and CD112 in primary AML blasts did
not differ significantly between the groups. Although the median CD155 and CD112 values were higher in the group that did not achieve a complete response than in the group that did, the difference in distribution was not statistically significant (Online Supplementary Figure S4).
Thus, AML blasts express CD155 and CD112. Although the mRNA expression of CD112 in AML blasts is related to overall survival, CD155 and CD112 expression in AML blasts was not associated with the achievement of complete response to induction therapy.
No association between DNAM-1 or TIGIT expression on natural killer cells and initial treatment response in patients with acute myeloid leukemia
We analyzed the expression of DNAM-1 and TIGIT in primary NK and T cells from patients with de novo AML using flow cytometry (Online Supplementary Figure S3). More than 90% of NK cells in the peripheral blood and bone marrow were positive for DNAM-1 and TIGIT. No correlation was observed between DNAM-1 and TIGIT expression (Figure 2B). All T cells in peripheral blood and bone marrow were positive for DNAM-1 and TIGIT. There was a significant positive correlation between DNAM-1 and TIGIT expression in peripheral blood T cells (Online Supplementary Figure S5A).
Next, we analyzed the relationship between the expression of DNAM-1 and TIGIT in NK cells and response to therapy. We divided the patients into two groups and compared the expression of DNAM-1/TIGIT in NK cells from the two groups. DNAM-1 and TIGIT expression in NK cells did not differ significantly between the groups. Regarding peripheral blood, the group that did not achieve a complete response had a lower median DNAM-1 and higher median TIGIT expression than the group that did have a complete response (Online Supplementary Figure S5B). In T cells, DNAM-1 and TIGIT expression did not differ significantly between the groups (Online Supplementary Figure S5C). No correlation was found between the clinical test data and expression of Nectin/Nectin-like family molecules or their receptors (Online Supplementary Figure S6).
The expression of receptors for Nectin/Nectin-like family molecules in NK-92 was analyzed using flow cytometry. TIGIT and TACTILE were expressed in more than 80% of the cells, whereas DNAM-1 was expressed in only approximately 8% of the cells, and PVRIG was almost not expressed (Figure 2C).
Figure 2. CD155 and CD112 expression on acute myeloid leukemia cells and receptor expression on natural killer cells from patients with acute myeloid leukemia and on NK-92 cells. (A) Results of flow cytometry analysis of the percentage of CD155/CD112-positive leukemic cells in peripheral blood samples from patients with acute myeloid leukemia (AML) are shown in box and whisker plots. (B) Left: flow cytometric analysis of the percentage of DNAM-1/TIGIT-positive natural killer (NK) cells in peripheral blood and bone marrow fluid samples from patients with AML is shown in box and whisker plots. Right: scatter plots of the percentages of DNAM-1 and TIGIT. Bars indicate regression lines. Linear regression analysis was used to analyze correlations. (C) Expression of receptors for Nectin/Nectin-like family molecules in a NK-cell line (NK-92) was analyzed using flow cytometry. r: correlation coefficient; PB: peripheral blood; BM: bone marrow; MFI: median fluorescence intensity.
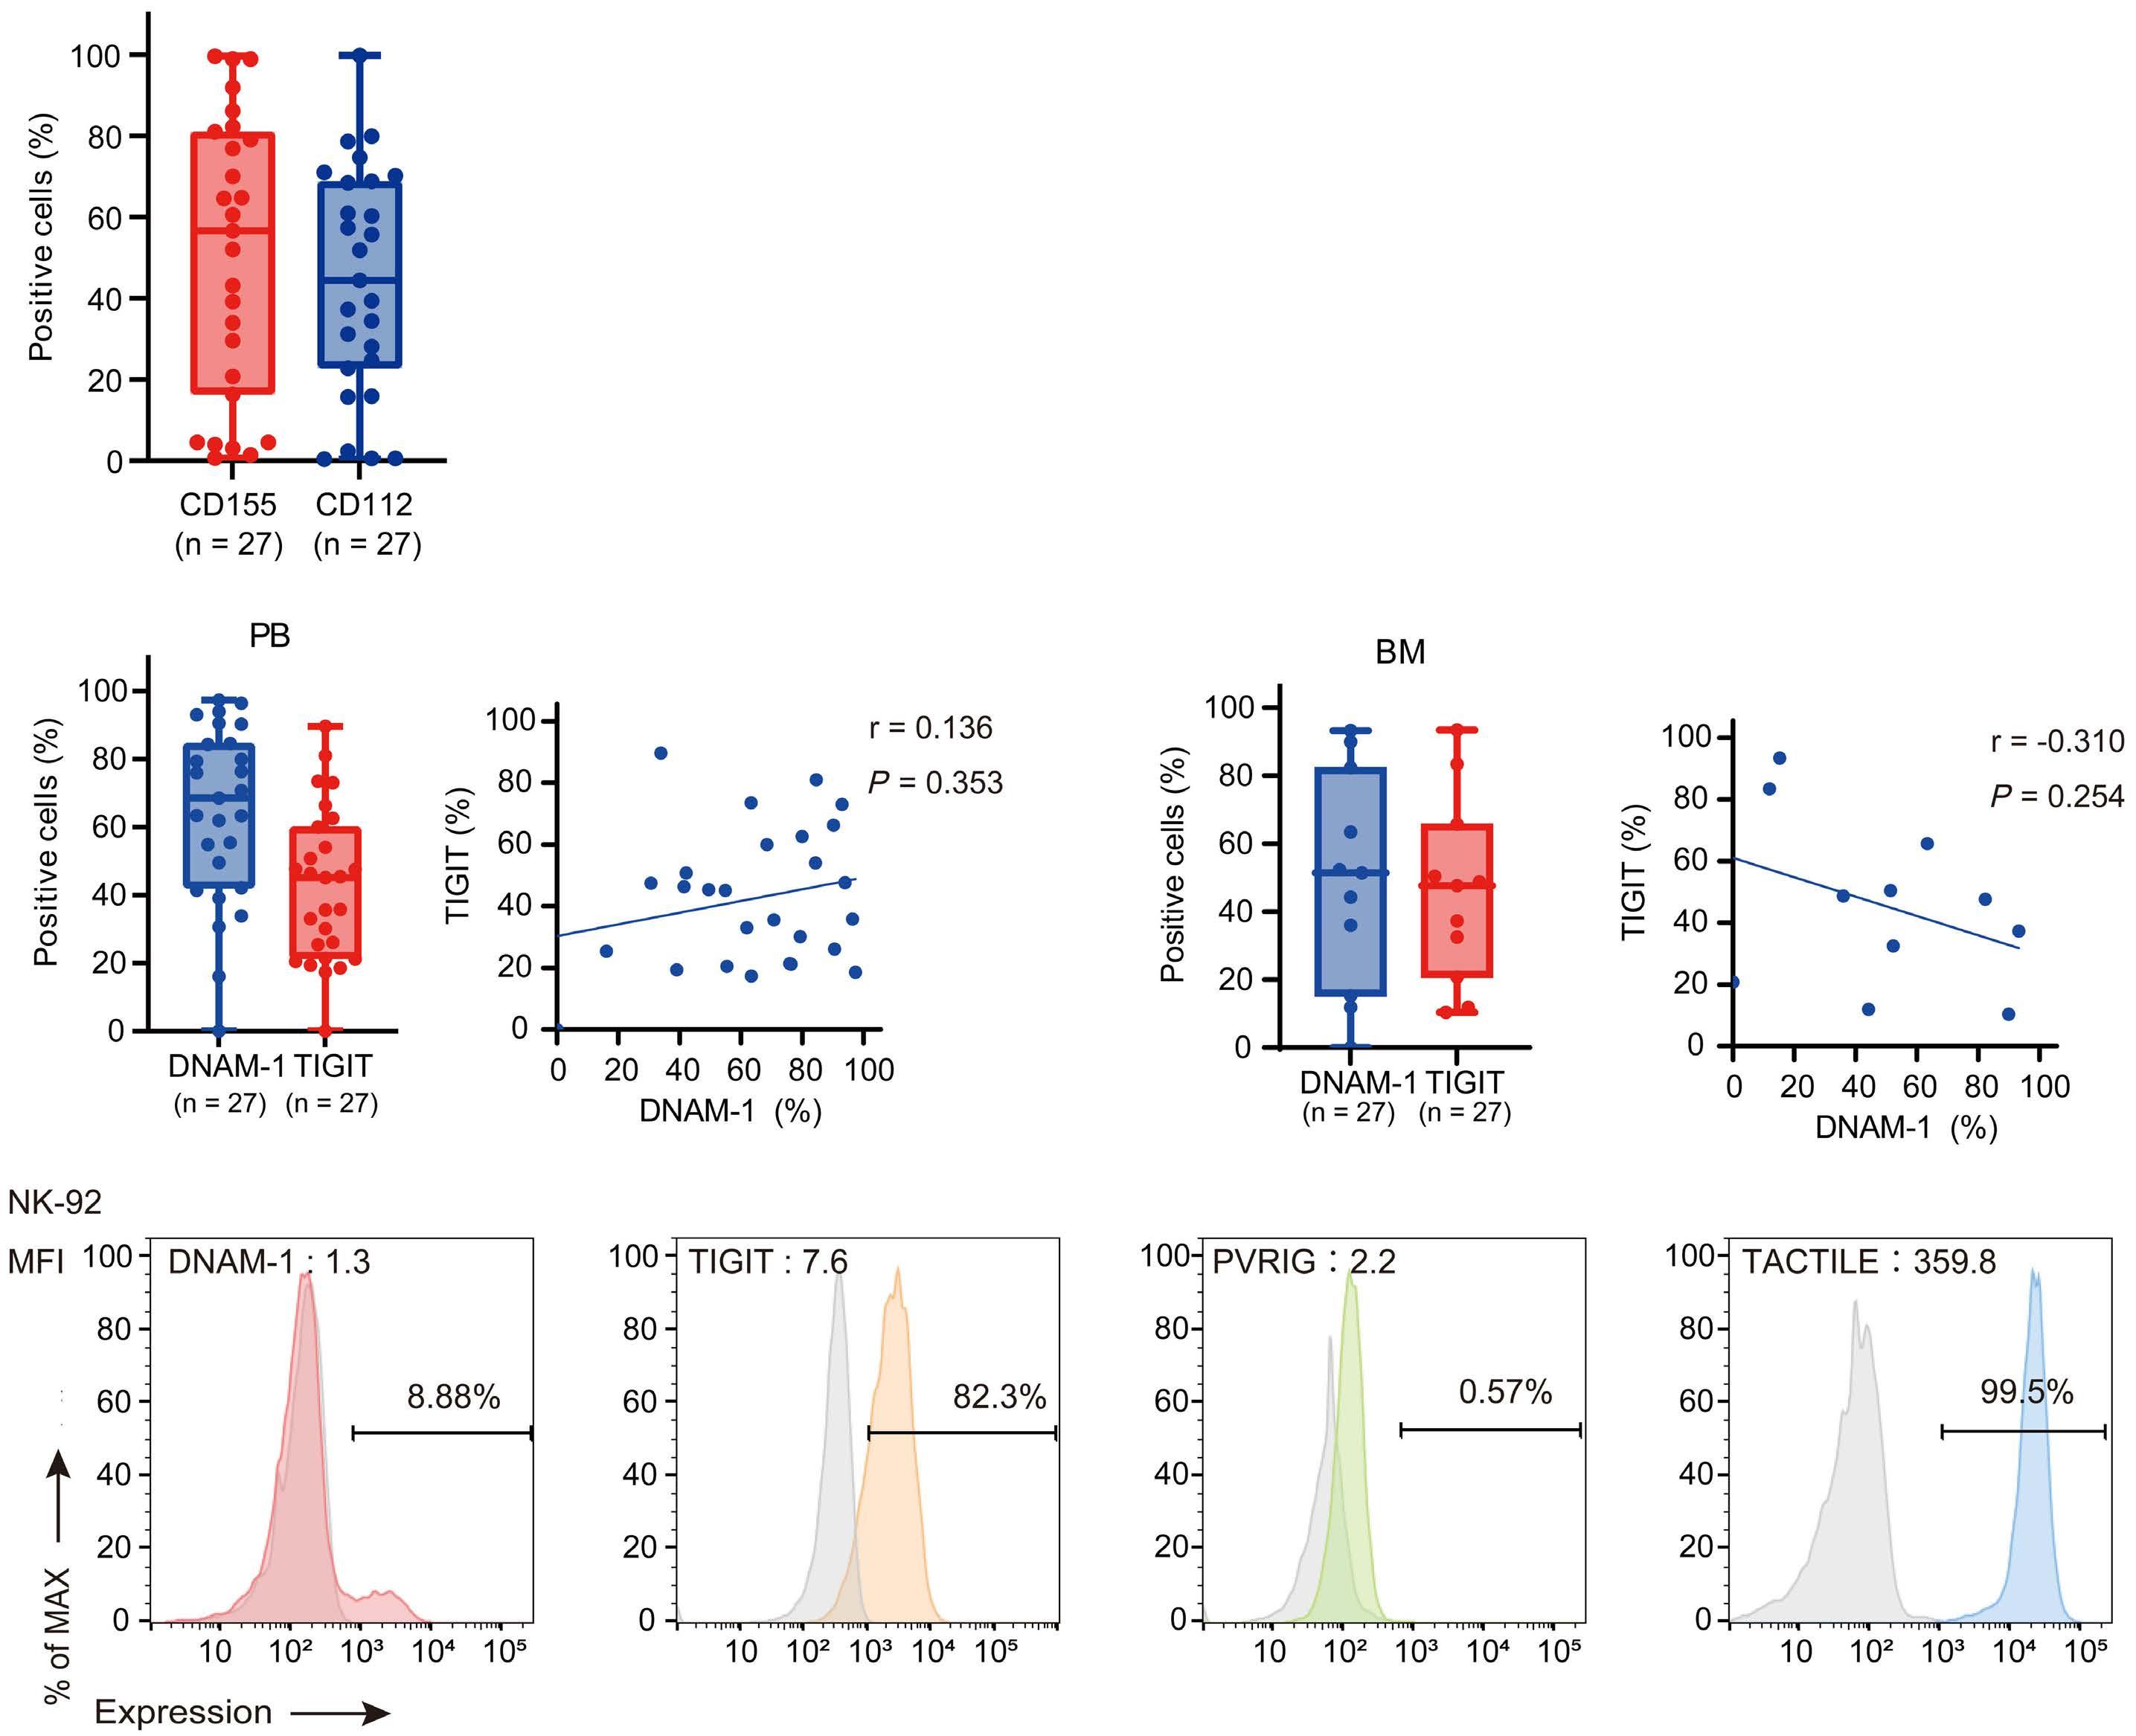
Nectin/Nectin-like family molecule receptor-modified NK-92 showed enhanced cytotoxicity against leukemia cell lines
To analyze the relationship between the receptors of Nectin/ Nectin-like family molecules and NK-92 activity, we generated a receptor-modified NK-92. DNAM-1 complementary DNA was transfected into the cells using lentiviral particles and analyzed using flow cytometry after 1 week. Lentiviral vectors with DsRed as a marker were generated and transfected into NK-92 to create control cells. (Online Supplementary Figure S7A, B). The cells that were strongly positive for DNAM-1 were sorted and expanded for another week, and DNAM-1 expression was analyzed using flow cytometry. DNAM-1induced NK-92 (NK-92 DNAM-1 DsRed) with a significantly higher mean fluorescence intensity and a positivity rate of more than 90% were obtained (Figure 3A). Electroporation was used to introduce sgRNA for knockout (KO) of TIGIT and Cas9 protein into NK-92 and analyzed using flow cy-
tometry after 1 week (Online Supplementary Figure S7C, D). TIGIT-negative cells were sorted and their expression was analyzed using flow cytometry after 1 week. TIGIT-negative NK-92 (NK-92 TIGIT KO) with a significantly lower mean fluorescence intensity and a positivity rate of less than 1% were obtained (Online Supplementary Figure S8).
To analyze the function of DNAM-1-induced and TIGIT KO NK-92, we conducted MTT and cytotoxicity assays. Analysis of cell proliferation at 24 and 48 h indicated no significant changes in either NK-92 DNAM-1 or NK-92 TIGIT KO, compared with that in NK-92 (Online Supplementary Figure S9). Next, we conducted a cytotoxicity assay targeting leukemia cell lines (MOLM-13, MV-4-11, KG-1) and measured the percentage of death (PI positivity) of leukemia cells (CFSE positive) after 4 h of co-culture with NK-92 DsRed or NK-92 DNAM-1 DsRed (Online Supplementary Figure S10A). Both cell lines showed significantly enhanced NK-92 DNAM-1 DsRed cytotoxicity compared to NK-92 DsRed (Figure 3B,
Online Supplementary Figure S10B). Similar effects were confirmed in NK-92 and NK-92 TIGIT KO (Online Supplementary Figure S10C).
Strong expression of DNAM-1 induces NK-92 activation and cytokine production
To evaluate DNAM-1-induced NK-cell activation, the expression of the degranulation marker (CD107a) and intracellular
cytokines (tumor necrosis factor-α [TNFα] and interferon-g [IFNg]) of NK cells co-cultured with leukemia cell lines was analyzed using flow cytometry (Online Supplementary Figure S11A). Both in the absence of target cells and when co-cultured with leukemia cell lines, the expression of CD107a, TNFα, and IFNg was significantly upregulated in NK-92 DNAM-1 DsRed, compared with that in NK-92 DsRed (Figure 3C, Online Supplementary Figure S11B). In contrast,
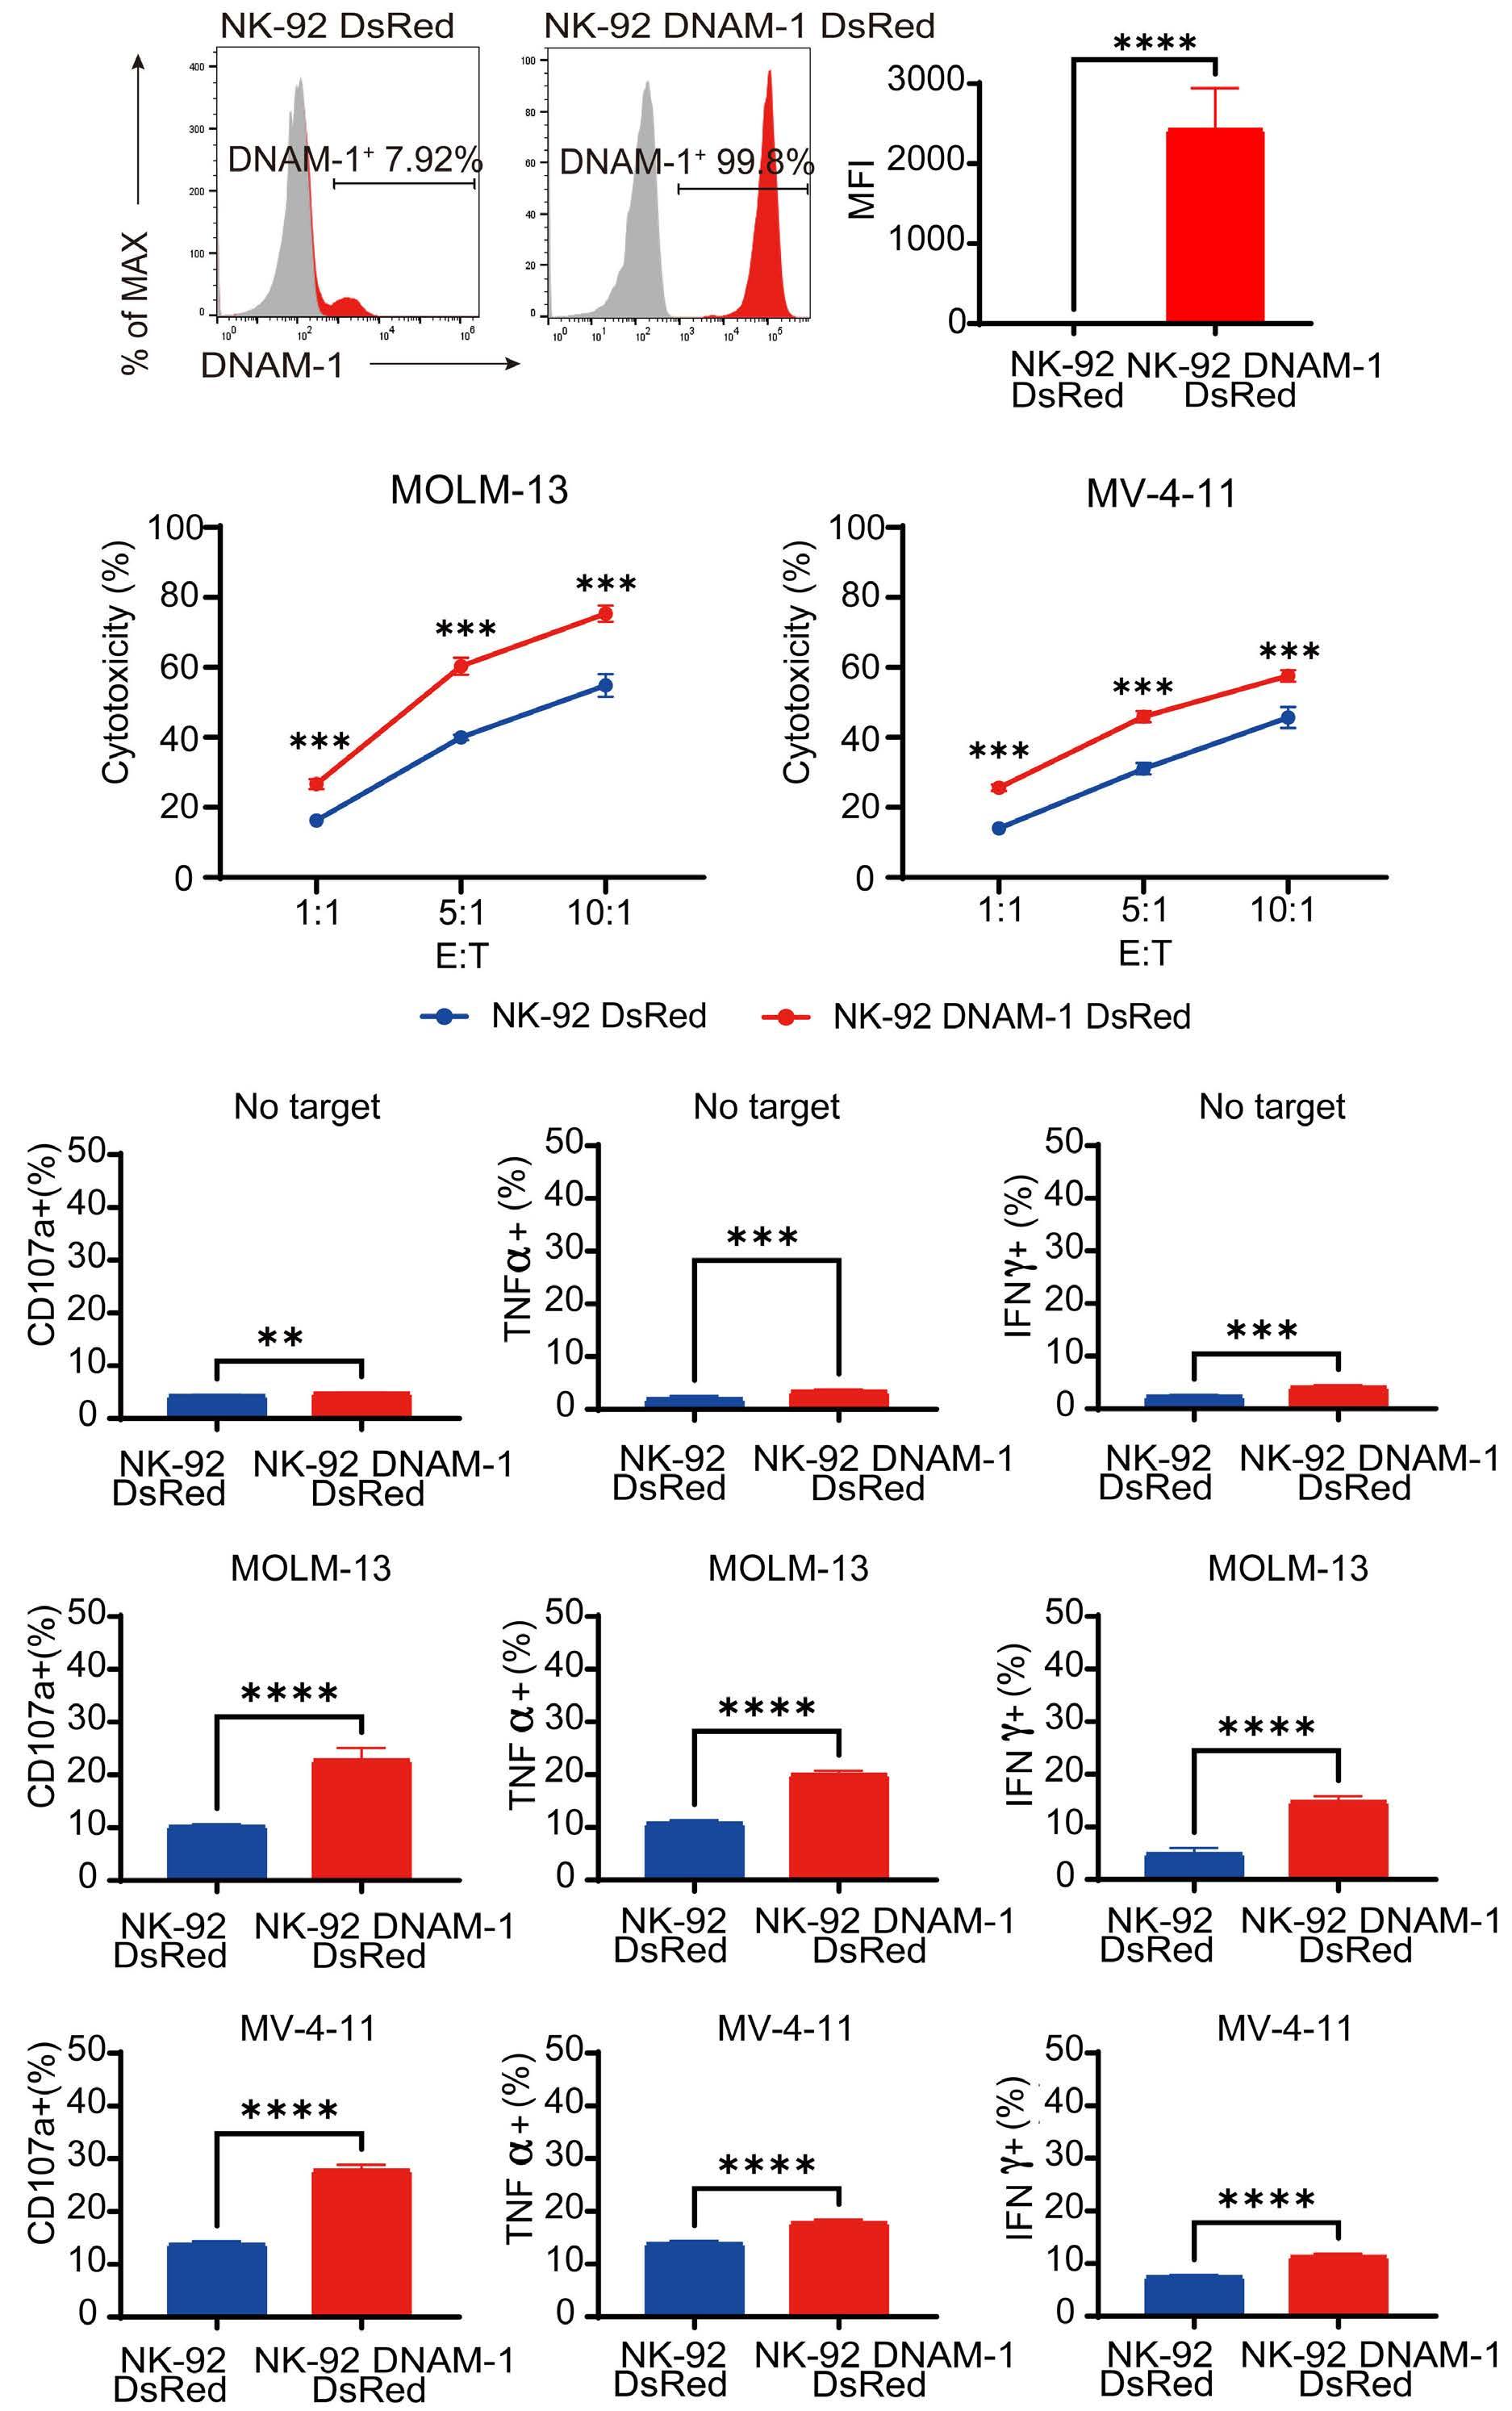
Figure 3. Generation and functional analysis of NK-92 with modified receptors for Nectin/Nectin-like family molecules. (A) DNAM-1 expression in NK-92 DsRed and NK-92 DNAM-1 DsRed. Gray histograms represent the isotype control, while the red histograms represent DNAM-1 expression. (B) Cytotoxicity of NK-92 DsRed and NK-92 DNAM-1 DsRed against leukemia cell lines (MOLM-13, MV-4-11) was analyzed and compared using cytotoxicity assays. Red lines indicate NK-92 DNAM-1 DsRed and blue lines indicate NK-92 DsRed. (C) CD107a expression in NK-92 DsRed/NK-92 DNAM-1 DsRed was analyzed using flow cytometry when NK-92 DsRed and NK-92 DNAM-1 DsRed and leukemia cell lines were co-cultured. Tumor necrosis factor-α and interferon- g expression in NK-92 DsRed and NK-92 DNAM-1 DsRed was analyzed using intracellular flow cytometry. Comparisons between the groups were performed using a two-tailed Student t test. The mean ± standard error are shown. **P<0.01, ***P<0.001, ****P<0.0001, E: effector; T: target; MFI: median fluorescence intensity.
in the absence of target cells, the expression of CD107a, TNFα, and IFNg was not significantly altered in NK-92 TIGIT KO compared with that in NK-92. When NK-92 TIGIT KO or NK-92 were co-cultured with target cells, increases in TNFα or IFNg expression were observed in some cell lines; however, CD107a expression did not change significantly (Online Supplementary Figure S11C).
Upregulation of cytotoxicity-related genes in NK-92 by DNAM-1 induction
RNA sequencing was performed to analyze the genes with changes in expression due to DNAM-1 induction or TIGIT KO. We identified genes that showed significant expression changes (|log2 (fold change)| ≥1 and P<0.05) after DNAM-1 induction. The expression of 128 genes, including those related to heat shock protein (HSP), interleukin and KIR, was upregulated. The expression of 110 genes containing those related to T-cell function was downregulated (Figure 4A, B). Based on previous reports,34,35 we analyzed activating and inhibitory receptor-related genes. The expression of CD244, FCGR3B, HAVCR2, and others was significantly altered, but less than 2-fold (Figure 4C).
Gene set enrichment analysis showed that pathways such as Regulation of NK cell mediated immunity, Positive regulation of cell killing, and Positive regulation of cytokine production involved in immune response were significantly upregulated in the Gene Ontology Biological Process gene set (Figure 4D, Online Supplementary Figure S12). None of the downregulated genes, such as those related to amino acid transport, was associated with cell killing or antitumor effects.
In contrast, among the genes that showed more than 2-fold and significant changes of expression by KO of TIGIT, 135 genes were upregulated and 316 genes were downregulated (Online Supplementary Figure S13A). Several inhibitory receptor-related genes (HAVCR2, IL1RN, KLRD1, and TGFBR1) were significantly downregulated (Online Supplementary Figure S13B). The gene set enrichment analysis showed upregulation of genes related to ribosome biogenesis, mRNA processing, and telomere maintenance in the Gene Ontology Biological Process gene set (Online Supplementary Figure S13C, D).
Thus, strong DNAM-1 expression upregulates the expression of cytotoxicity-related genes in NK-92; however, TIGIT KO did not induce upregulation of cytotoxicity-related genes in NK-92.
NK-92 DNAM-1 does not show any additive effect of the cytotoxicity caused by TIGIT KO.
From previous analyses, the activation of NK-92 was more evident under DNAM-1 induction than under TIGIT KO. To evaluate whether there is an additive effect of TIGIT KO on NK-92 activation by DNAM-1 induction, we generated NK92 transfected with DNAM-1 and TIGIT KO (NK-92 DNAM-1 TIGIT KO) (Figure 5A).
Cytotoxicity assays targeting leukemia cell lines were per-
formed using NK-92 DNAM-1, NK-92 TIGIT KO, and NK-92 DNAM-1 TIGIT KO. NK-92 DNAM-1 showed significantly increased cytotoxicity, compared to NK-92 TIGIT KO, but not when compared to K562 (Figure 5B, Online Supplementary Figure S14A). In K562, the cytotoxicity of NK-92 TIGIT KO was very strong, even at an effector-to-target ratio of 1:1, and there was no significant difference in cytotoxicity between NK-92 DNAM-1 and NK-92 TIGIT KO. Furthermore, no significant difference was observed between NK-92 DNAM-1 and NK-92 DNAM-1 TIGIT KO.
Next, using flow cytometry, we analyzed the expression of CD107a, TNFα, and IFNg in NK-92 co-cultured or not with leukemia cell lines. In NK-92 DNAM-1 or NK-92 DNAM-1 TIGIT KO, CD107a, TNFα, and IFNg expression was significantly upregulated compared with that in NK-92 TIGIT, with or without co-culture with target cells. However, no significant difference was observed between NK-92 DNAM-1 and NK-92 DNAM-1 TIGIT KO (Figure 5C, Online Supplementary Figure S14B).
Enhancement of cytotoxicity by DNAM-1 induction is ligand-dependent
To analyze whether the enhancement of cytotoxicity by DNAM-1 induction was dependent on CD155 and CD112, we generated CD155 and/or CD112 KO cells in some leukemia cell lines (Online Supplementary Figure S15A-C).
Cytotoxicity assays were performed using NK-92 DNAM-1; the cytotoxicity of NK-92 DNAM-1 was compared between wild-type and CD155 KO, CD112 KO, or double KO cell lines. When targeting MOLM-13, single KO of CD155 or CD112 did not reduce cytotoxicity of NK-92 DNAM-1, but double KO significantly reduced its cytotoxicity compared to the wildtype. When targeting MV-4-11, CD155 KO did not reduce cytotoxicity, but CD112 KO as well as double KO significantly reduced cytotoxicity. When targeting KG-1, both CD155 KO and CD112 KO reduced cytotoxicity, with CD112 KO tending to reduce it more, and double KO reducing the cytotoxicity yet further (Figure 6A).
Next, the expression of CD107a, TNFα, and IFNg was analyzed using flow cytometry when NK-92 DNAM-1 was co-cultured with the leukemia cell lines. The expression was significantly lower when co-cultured with double KO cells, compared with that in wild-type cells. In CD155 or CD112 single KO cells, changes in CD107a and cytokine expression differed between the cell lines (Figure 6B).
These results suggest that the enhancement of cytotoxicity by DNAM-1 induction depends on pathways mediated by CD155 and CD112, and that the dependence on CD155 or CD112 differs between each cell line.
NK-92 DNAM-1 exerts cytotoxicity against primary acute myeloid leukemia blasts
Using flow cytometry, we next compared the cytotoxicity of NK-92 and NK-92 DNAM-1 against leukemia cells derived from patients with AML.
Cytotoxicity against primary AML blasts with at least 40%
B
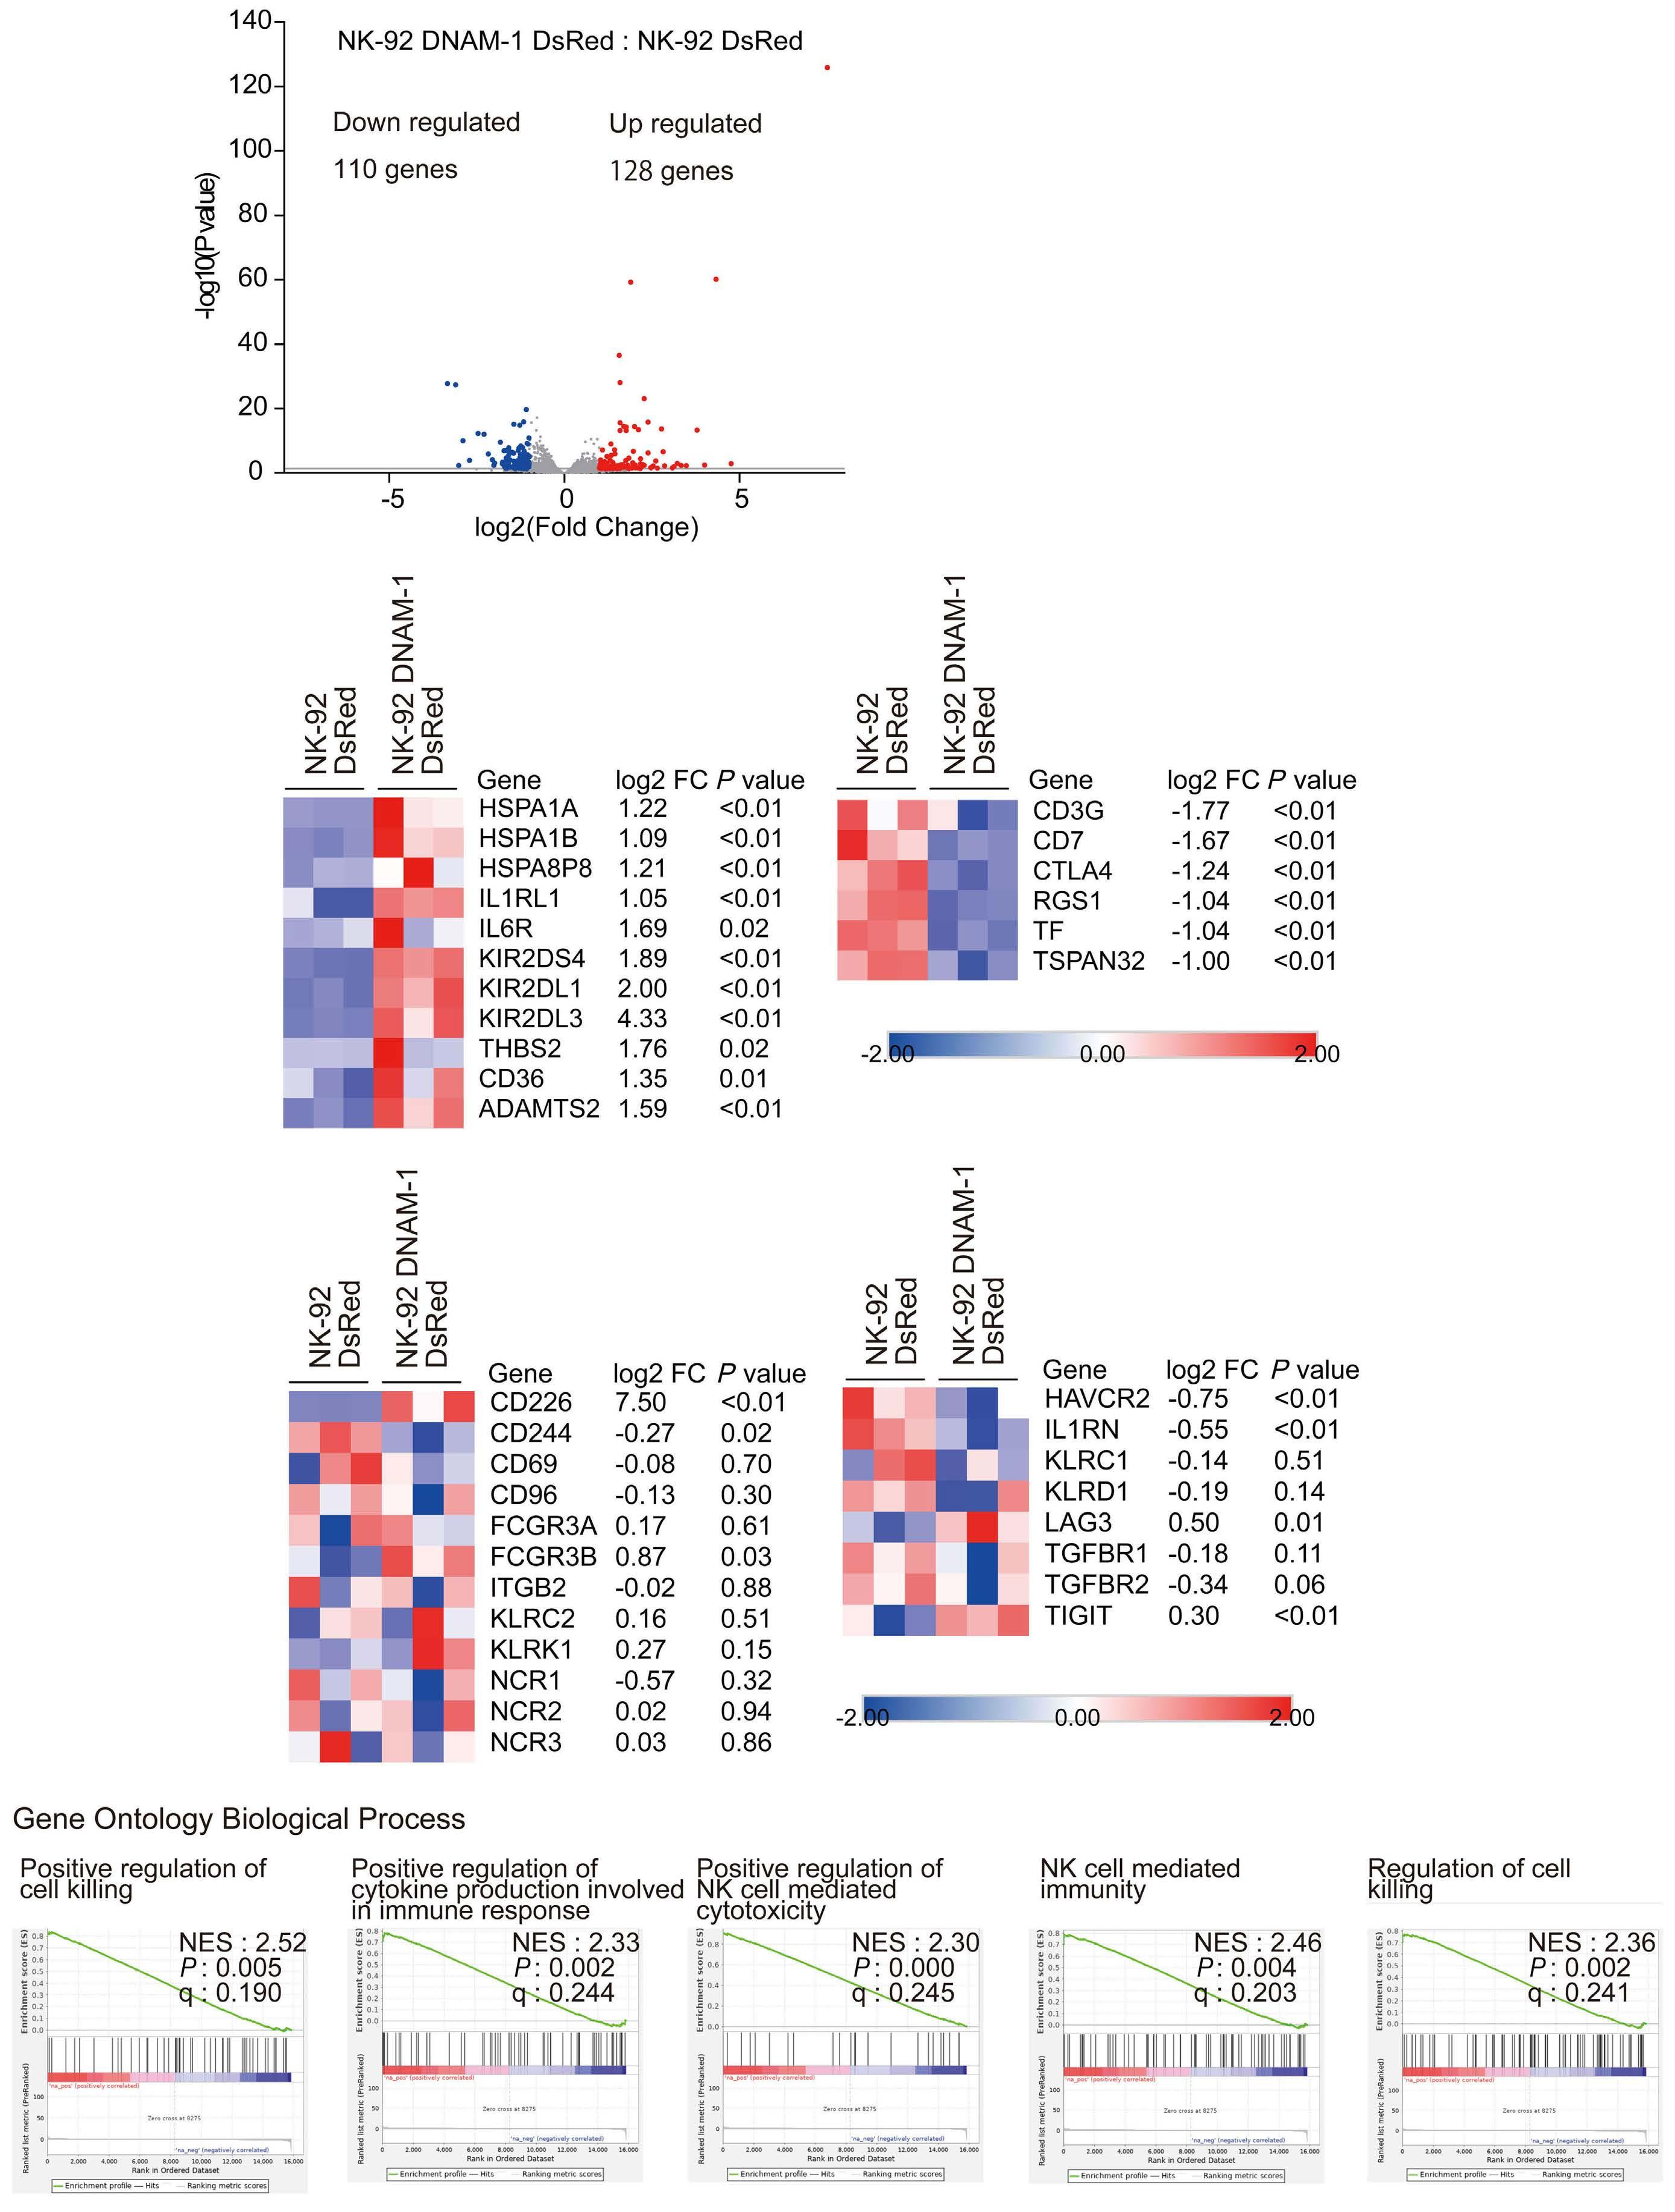
Figure 4. NK-92 DNAM-1 DsRed showed increased expression of cytotoxicity-related genes. (A) Volcano plot of genes with variable expression based on RNA-sequencing. Log2 (fold change [FC]) is plotted on the X axis and -log10 (P value) on the Y axis. Gray points indicate |log2 (FC)| ≤1 and P≥0.05, red points indicate log2 (FC) ≥1 and P<0.05, and blue points indicate log2 (FC) ≤ -1 and P<0.05. (B) Heatmap of upregulated and downregulated genes. (C) Heatmap of natural killer (NK) cell activating receptor-related genes and NK cell inhibitory receptor-related genes. (D) Representative data from a gene set enrichment analysis of a Gene Ontology Biological Process gene set. NES: normalized enrichment score, q: false discovery rate.
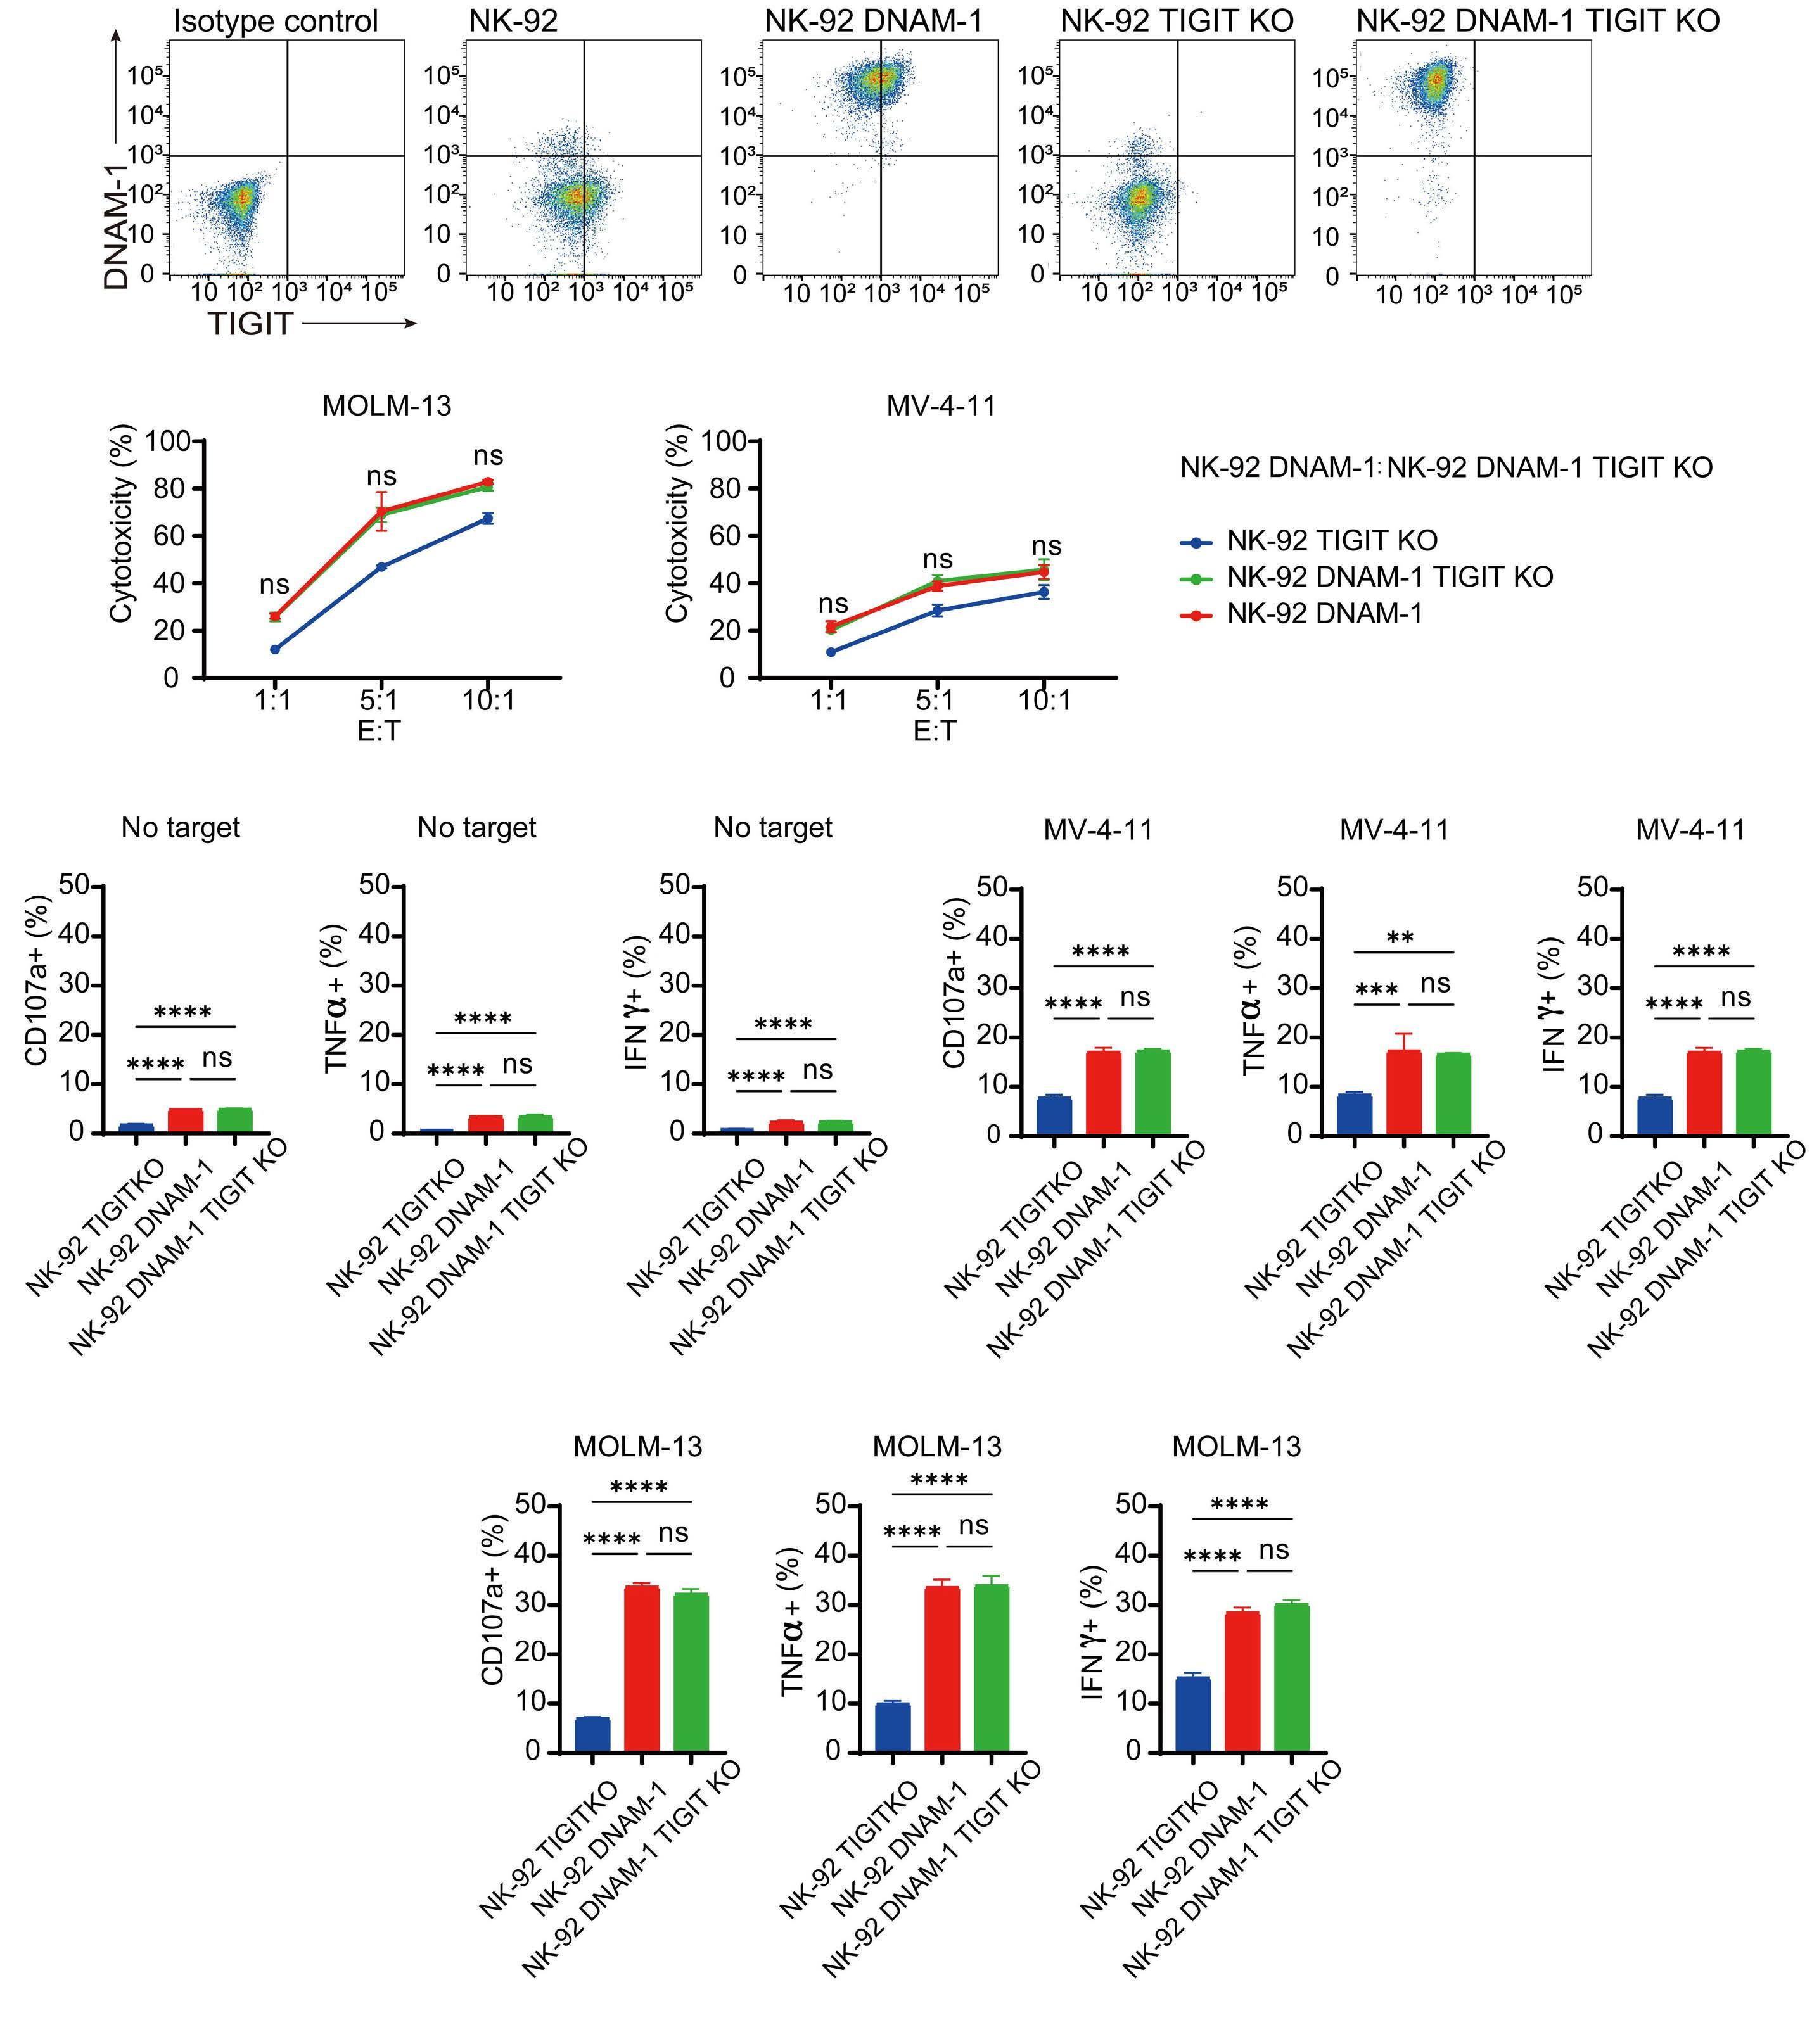
Figure 5. DNAM-1 transduction and TIGIT knockout do not appear to have an additive effect. (A) A NK-92 DNAM-1 TIGIT knockout (KO) cell line was generated and its expression was analyzed using flow cytometry. (B) Cytotoxicity of NK-92 DNAM-1, NK-92 TIGIT KO, and NK-92 DNAM-1 TIGIT KO against leukemia cell lines (MOLM-13 and MV-4-11) was analyzed and compared using cytotoxicity assays. Red lines indicate NK-92 DNAM-1, blue lines indicate NK-92 TIGIT KO, and green lines indicate NK-92 DNAM-1 TIGIT KO. (C) CD107a expression of NK-92 DNAM-1, NK-92 TIGIT KO, and NK-92 DNAM-1 TIGIT KO in co-culture with leukemia cell lines was analyzed using flow cytometry. Tumor necrosis factor-α and interferon-g expression in NK-92 DNAM-1, NK-92 TIGIT KO, and NK-92 DNAM-1 TIGIT KO was analyzed using intracellular flow cytometry. The mean ± standard error are shown. A two-tailed Student t test was used to compare two groups, and one-way analysis of variance was used for comparisons among three groups. Multiple comparisons were made using the Tukey test. ns: no statistically significant difference, **P<0.01, ***P<0.001, ****P<0.0001. TNF-α: tumor necrosis factor-α; IFN-g: interferon-g
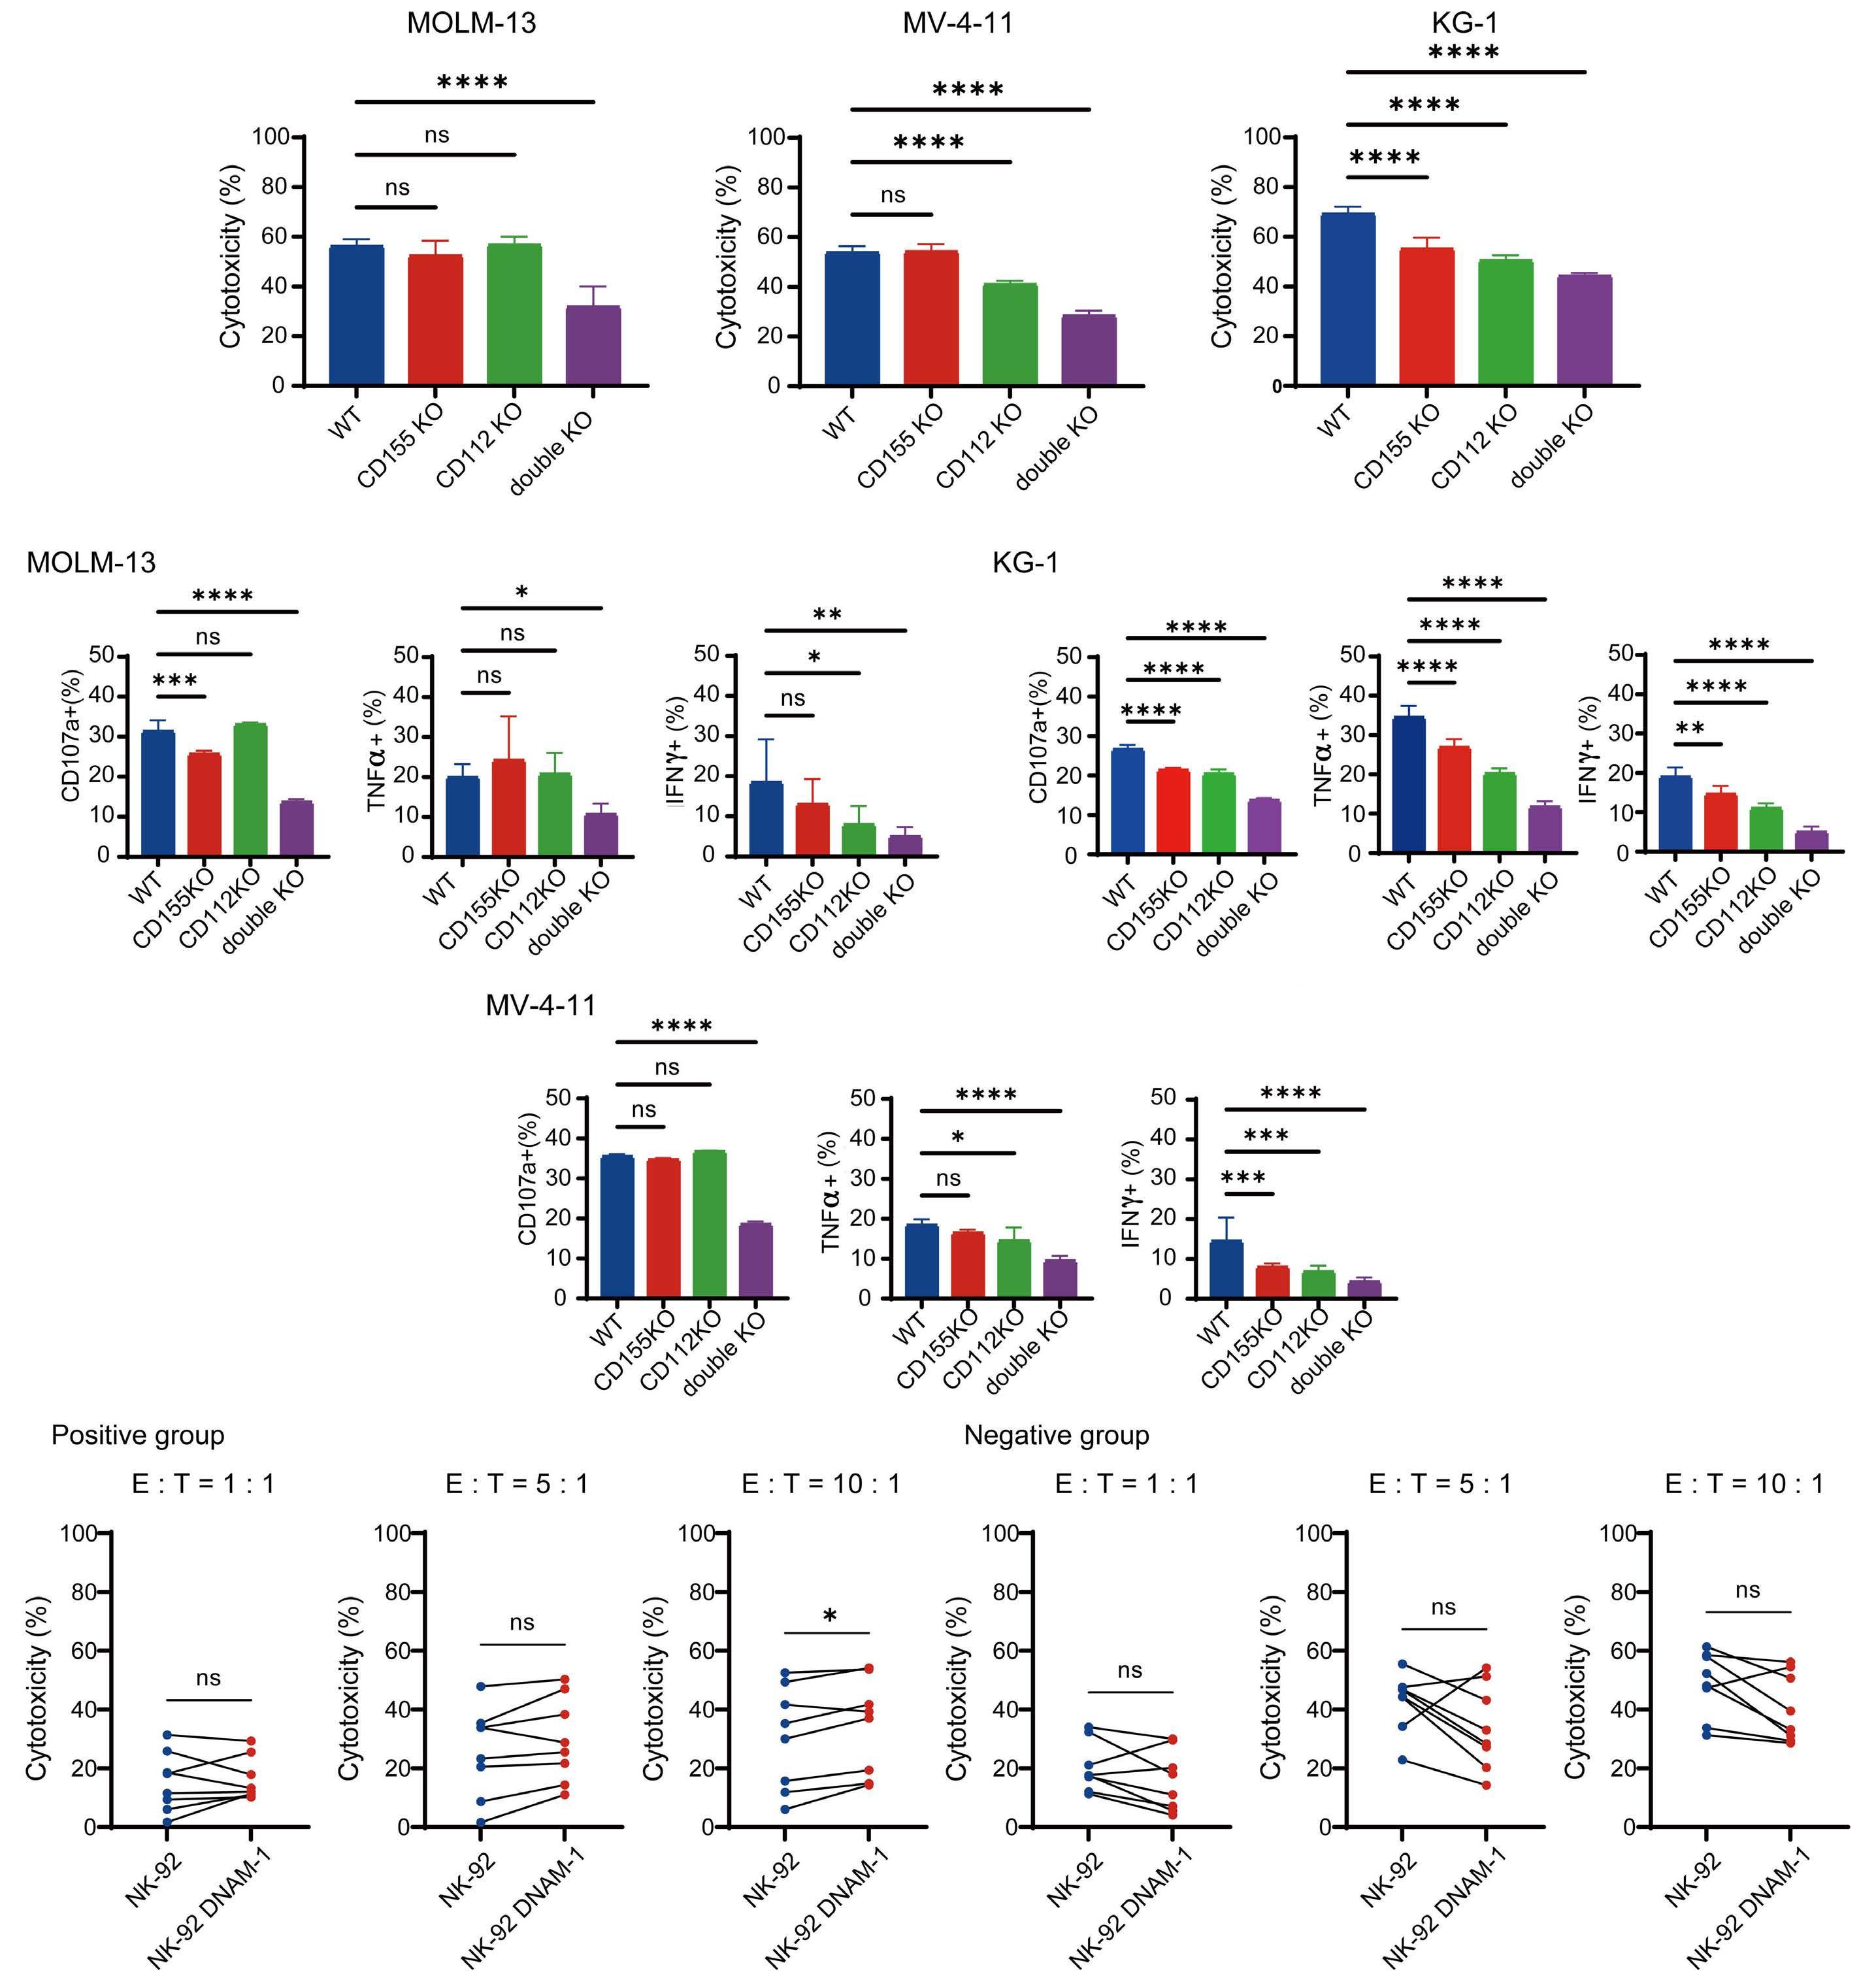
Figure 6. Enhancement of cytotoxicity by DNAM-1 is dependent on Nectin/Nectin-like family molecules. (A) Cytotoxicity of NK-92 DNAM-1 against MOLM-13, MV-4-11, KG-1 and CD155 and/or CD112 knockout (KO) cells was analyzed and compared using cytotoxicity assays. (B) CD107a expression of NK-92 DNAM-1 cells co-cultured with MOLM-13, MV-4-11, KG-1 and CD155 and/or CD112 KO cells was analyzed using flow cytometry. Tumor necrosis factor-α and interferon-g expression of NK-92 DNAM-1 cells was analyzed using intracellular flow cytometry. The mean ± standard error are shown. A two-tailed Student t test was used to compare the two groups. (C) Cytotoxicity of NK-92 and NK-92 DNAM-1 against primary acute myeloid leukemia (AML) blasts that expressed at least 40% positivity for CD155 and CD112 and 70% for either (positive group) was compared with that against primary AML blasts with less CD155 and CD112 positivity (negative group). Each point connected by a line represents a sample from the same patient. The mean ± standard error are shown. The Wilcoxon signed-rank test was used for comparison between the two groups. ns: no statistically significant difference, *P<0.05, **P<0.01, ***P<0.001, ****P<0.0001. WT: wild-type; TNF-α: tumor necrosis factor-α; IFN-g: interferon-g; E:T: effector-to-target cell ratio.
and 70% positivity for CD155 and CD112, respectively (positive group), was compared with that against primary AML blasts with less CD155 and CD112 positivity (negative group). In the positive group, the cytotoxicity of NK-92 DNAM-1 was significantly enhanced compared to that of NK-92 at an effector-to-target cell ratio of 10. No significant difference was observed in the negative control group at any effector-to-target cell ratio (Figure 6C).
Thus, the cytotoxicity of NK-92 DNAM-1 was enhanced compared with that of NK-92 in primary AML blasts with strong expression of CD155 and CD112.
DNAM-1 induced NK-92 displays stronger anti-acute myeloid leukemia effects than NK-92 in a xenograft model
To evaluate the cytotoxicity of NK-92 DNAM-1 in vivo, we generated a xenograft mouse model. NSG mice were irradiated on day -1. Luciferase-introduced MOLM-13 (1×10⁵ cells/100 µL) were injected via the tail vein with 100 µL of PBS, NK-92 (5×10⁶ cells/100 µL), or NK-92 DNAM-1 (5×10⁶ cells/100 µL) on day 0. Then, 200 µL of PBS, NK-92 (5×10⁶ cells), or NK-92 DNAM-1 (5×10⁶ cells) were injected via the tail vein on days 1 and 2. Proliferation of leukemic cells was evaluated using IVIS once or twice a week (Figure 7A).
Representative IVIS images from days 5 and 8 are shown for the three groups: vehicle (PBS), NK-92, and NK-92 DNAM-1. The NK-92 DNAM-1 group showed suppressed AML progression, with this effect being more pronounced than in the PBS or NK-92 groups (Figure 7B).
Regarding average radiance, the NK-92 DNAM-1 group showed significantly suppressed AML progression compared to the vehicle and NK-92 groups on day 15 (Figure 7C). A significant survival benefit was observed (Figure 7D). There was no significant difference in body weight between the three groups (Figure 7E).
This is the first study to analyze the association between the Nectin/Nectin-like family molecules expressed in AML cells and their receptors on NK cells and to demonstrate the utility of treatment with receptor-modified NK cells. The development of immunotherapy for AML has lagged behind that for other hematologic malignancies because of the lack of appropriate therapeutic targets. We, therefore, sought promising targets, which are especially specific to AML patients with a poor prognosis.
NK cells from patients with AML have a suppressive phenotype as shown by the increased expression of TIGIT36 and decreased expression of DNAM-1,37 and that prognosis is poor for patients with such impaired immune cells.36,38 With regard to CD155 and CD112, there have been reports that leukemia cells escape NK-cell attack by decreasing CD155/ CD112 expression,39 and that the expression of multiple NK-
cell receptor ligands, including MICA, ULBP, CD155, and CD112, is associated with prognosis in patients with AML.40 However, there have been no reports on the association of CD155 or CD112 alone with prognosis in patients with AML or on NKcell therapy targeting them.
Here, we found that high expression of CD112 is a poor prognostic marker in AML, which is at least partially explained by a higher frequency of cases with high-risk cytogenetics and trends to a higher frequency of TP53 mutations. In addition, the group with high CD112 expression had fewer FLT3-mutated cases and these cases do not benefit from the practically available treatment of FLT3 inhibition. Thus, adaptive immunotherapy that stimulates NK cells through activation of the DNAM-1-CD112 axis by exploiting the high expression of CD112 could be a sophisticated strategy to take advantage of the feature of this group of AML patients with a poor prognosis. DNAM-1 and TIGIT, the receptors focused on in this study, share some ligands and transmit opposing signals to NK cells.22
Previous reports indicated that TIGIT inhibits DNAM-1 directly,41 suggesting that high TIGIT expression may be associated with low DNAM-1 expression, but no such correlation was observed, at least in the samples in this study. By accumulating more cases, it may be possible to analyze whether the expression of DNAM-1 or TIGIT and the correlation between them are related to the remission rate or the subsequent relapse rate. In the analysis of the antitumor effects of DNAM-1 induction and TIGIT KO, we focused on the DNAM-1 pathway because the effect of DNAM-1 induction was stronger than that of TIGIT KO. Induction of DNAM-1 in NK-92 resulted in increased expression of HSP-related genes, such as HSPA1A and HSPA1B. HSP contributes to increased immune cell cytotoxicity,42,43 which may induce the production of pro-inflammatory cytokines such as IL-1 and IL-6, thereby increasing NK-cell activity. In contrast, as negative feedback to the activation by DNAM-1 induction, increased expression of some inhibitory KIR-related genes was observed. Inhibition of these receptors, rather than TIGIT, may be more effective when combined with NK-92 DNAM-1 cell therapy. No genes and pathways that were downregulated were found to be associated with the suppression of NK-cell function, supporting the usefulness of DNAM-1 induction. The enhanced cytotoxicity induced by DNAM-1 was dependent on binding to CD155 or CD112. The dependence on CD155 and CD112 was cell line-dependent. In some cell lines, CD112 KO reduced the cytotoxicity of NK-92 DNAM-1, suggesting the importance of the DNAM-1/CD112 axis. It is important to analyze the association between known AML risk factors and CD112 to better select patients who will benefit from treatment with NK-92 DNAM-1. CD112 expression may be a marker for predicting the therapeutic response to DNAM-1-induced NK-cell therapy. In vivo, DNAM-1-induced NK-92 was able to inhibit AML growth compared to the vehicle, but administration of NK-92 DNAM-1 after AML progression did not have any suppressive effect (data not shown). In clinical settings, it
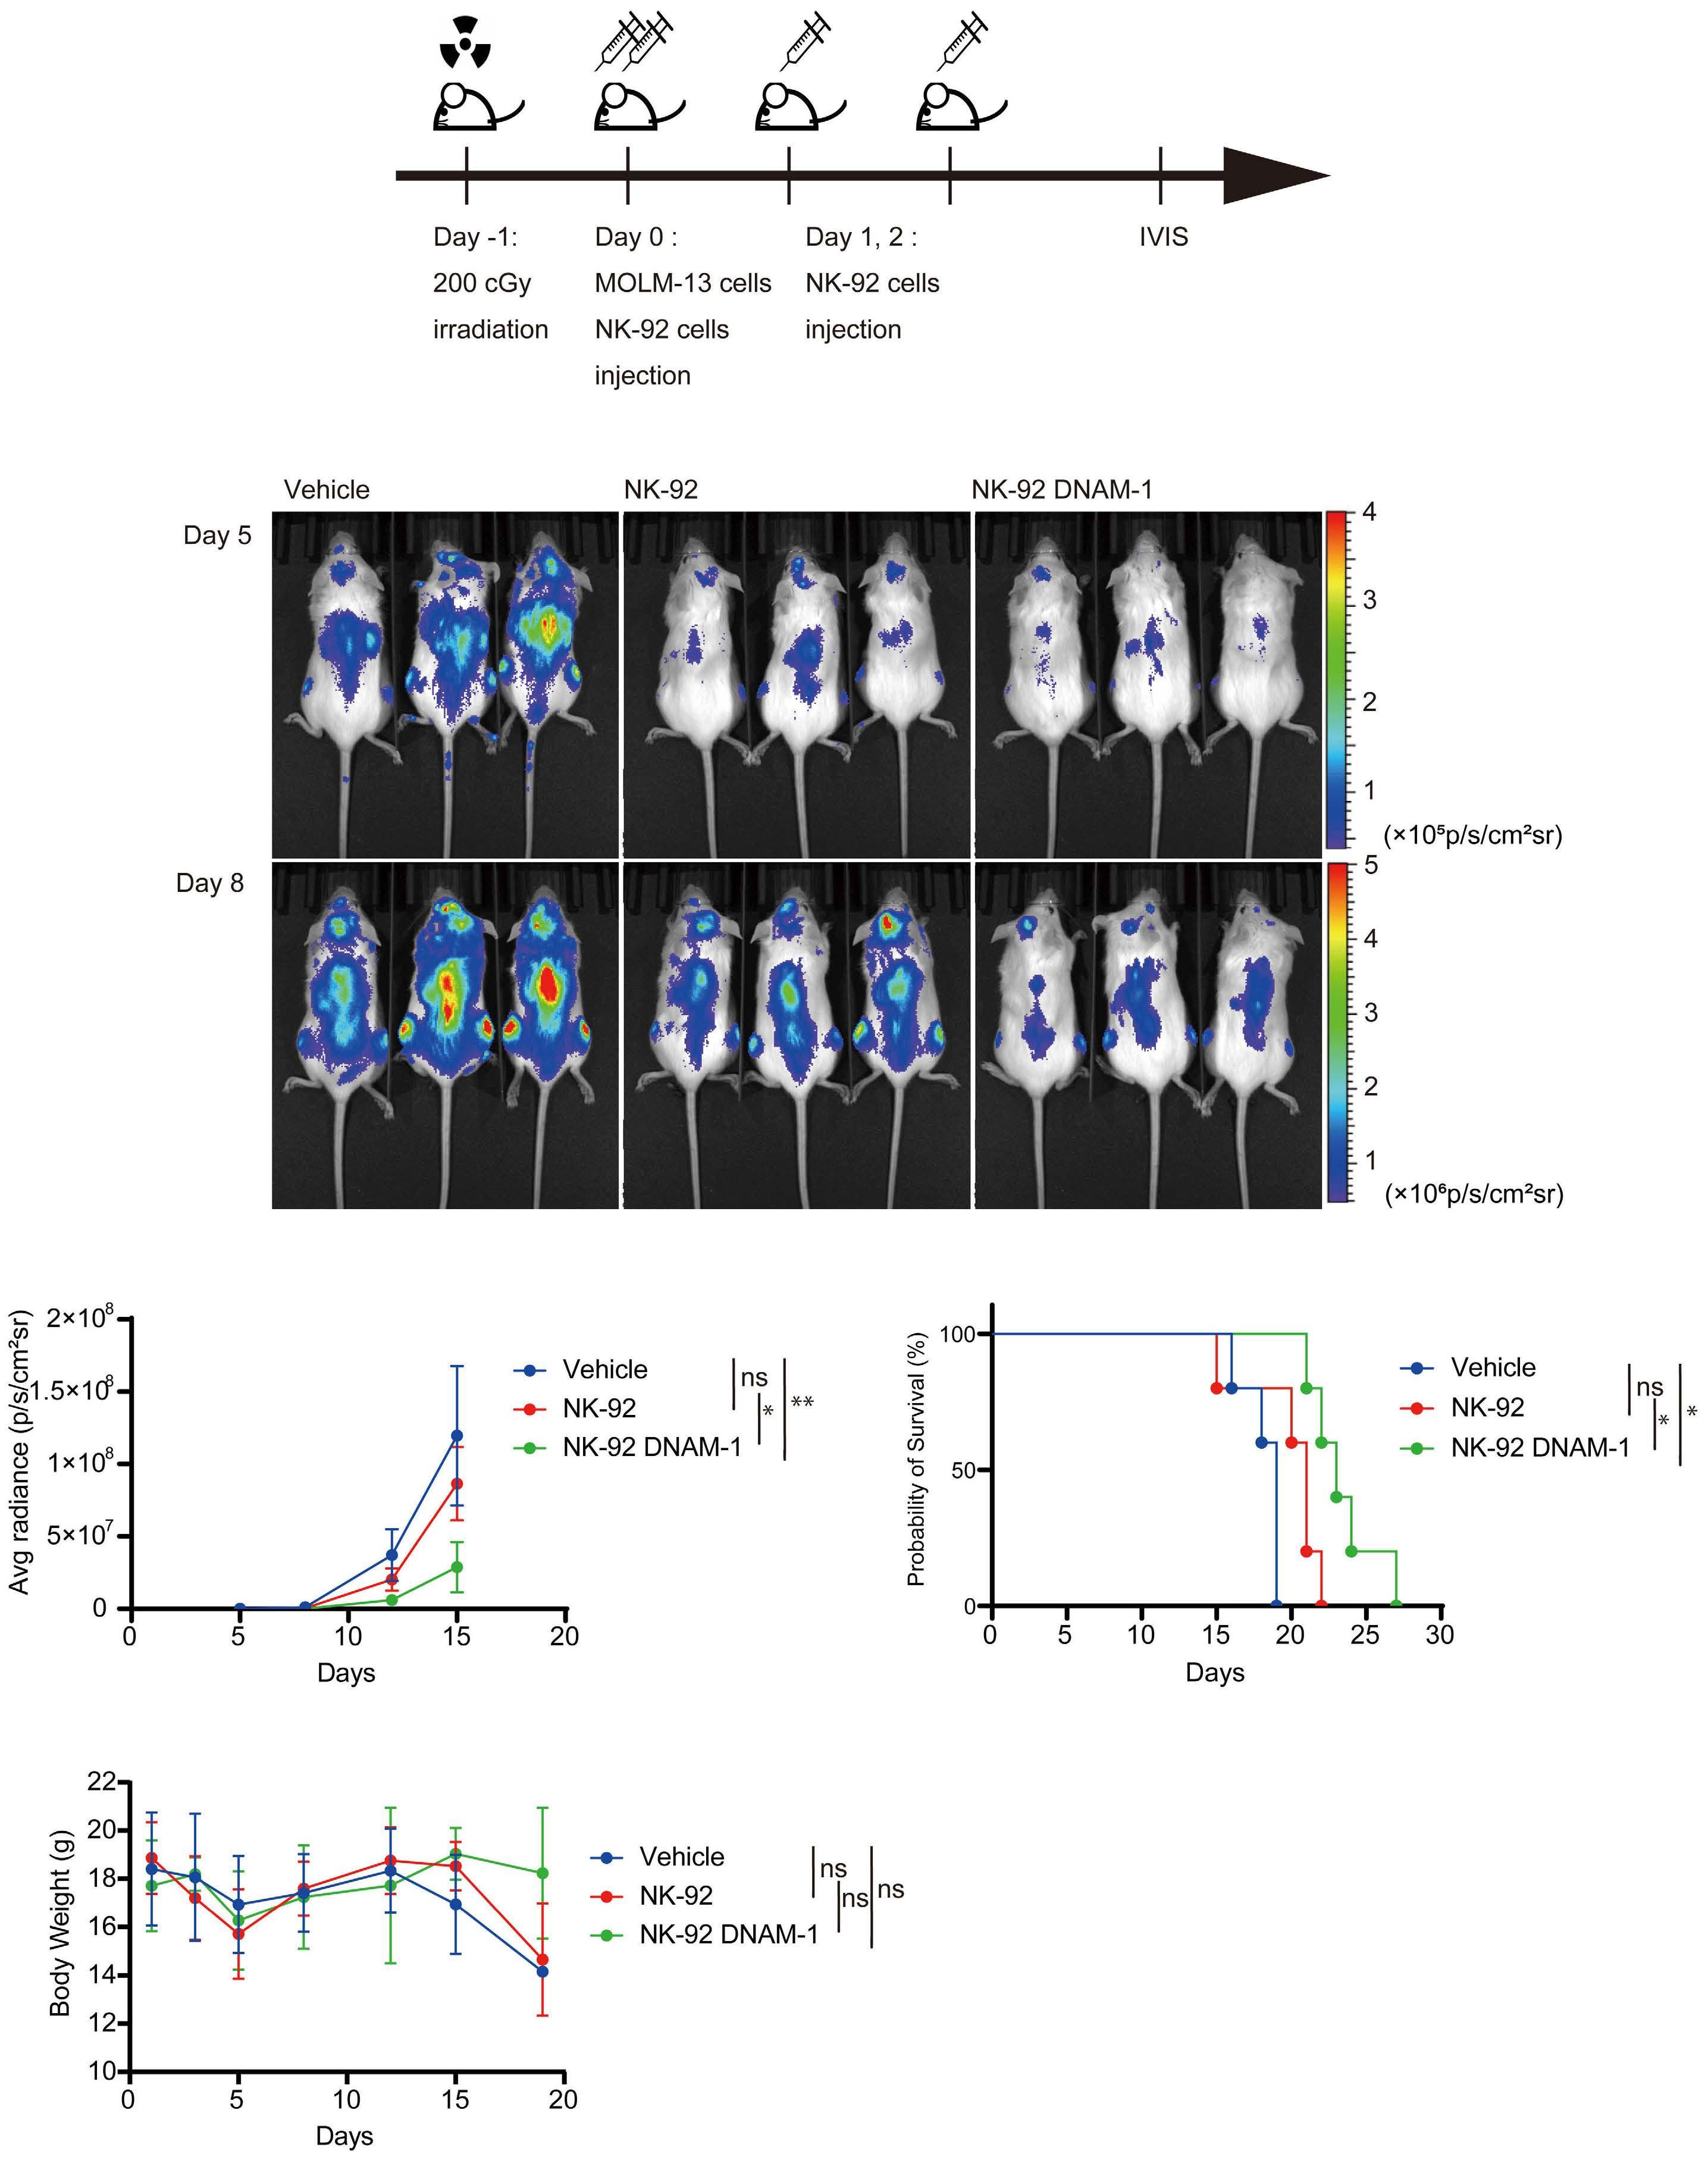
the In Vivo
days 5 and 8. (C) One-way
of variance (ANOVA) was used to compare the three groups. Multiple comparisons were made using the Tukey test. (D) Survival curves of the three groups. A log-rank test was used. Multiple comparisons were performed with the Holm test. (E) Mouse weight curves for the three groups. A one-way ANOVA test was used. Multiple comparisons were made using the Tukey test. The mean ± standard error are shown. ns: no statistically significant difference, *P<0.05, **P<0.01
is realistic to use NK-92 DNAM-1 cell therapy to eliminate minimal residual disease and for maintenance therapy after remission, but not as induction therapy. Enhancement of directivity to the tumor is important for enhancing the efficacy of NK-cell therapy. As a method to increase directivity against tumors, the generation of chimeric antigen receptor-NK cells, a combination of antibodies with antibody-dependent cellular cytotoxicity, and a combination of immunostimulatory drugs is encouraged.44,45 The combination of these drugs may increase the sensitivity of AML cells to NK-92 DNAM-1.46,47 In this study, we showed that the Nectin/Nectin-like family molecule CD112 was expressed in AML blasts and that it may be associated with prognosis and therapeutic response. NK-cell therapy that targets these cells may be effective in suppressing AML progression. We propose that the necessary steps before proceeding to a first-in-human study of NK-92 DNAM-1 must include genetic modifications, such as enabling the autocrine secretion of cytokines that activate NK-92 and maintain their proliferation, and introducing suicide genes that prevent tumorigenesis, as well as experiments with patient-derived xenograft models. Moreover, efficacy and safety analyses, including effects on normal hematopoiesis, are needed. Clinically, NK-92 DNAM-1 cell therapy may contribute to the eradication of minimal residual disease as a maintenance therapy after hematopoietic stem cell transplantation and chemotherapy.
Disclosures
YN received research funding from Daiichi Sankyo and an honorarium from Fuji Pharma. YN is a consultant for Novartis and Otsuka Pharmaceutical. KM has received research
1. Arber DA, Orazi A, Hasserjian R, et al. The 2016 revision to the World Health Organization classification of myeloid neoplasms and acute leukemia. Blood. 2016;127(20):2391-2405.
2. Papaemmanuil E, Gerstung M, Bullinger L, et al. Genomic classification and prognosis in acute myeloid leukemia. N Engl J Med. 2016;374(23):2209-2221.
3. DiNardo CD, Jonas BA, Pullarkat V, et al. Azacitidine and venetoclax in previously untreated acute myeloid leukemia. N Engl J Med. 2020;383(7):617-629.
4 Perl AE, Martinelli G, Cortes JE, et al. Gilteritinib or chemotherapy for relapsed or refractory FLT3-mutated AML. N Engl J Med. 2019;381(18):1728-1740.
5. Jongen-Lavrencic M, Grob T, Hanekamp D, et al. Molecular minimal residual disease in acute myeloid leukemia. N Engl J Med. 2018;378(13):1189-1199.
6. Knaus HA, Berglund S, Hackl H, et al. Signatures of CD8+ T cell dysfunction in AML patients and their reversibility with response to chemotherapy. JCI Insight. 2018;3(21):e120974.
7 Williams P, Basu S, Garcia-Manero G, et al. The distribution of T-cell subsets and the expression of immune checkpoint receptors and ligands in patients with newly diagnosed and
funding from Nippon Shinyaku, Takeda Pharmaceutical, Kyowa Kirin, Chugai Pharmaceutical, Sumitomo Dainippon Pharma, and Daiichi Sankyo. KM is a consultant for Novartis Pharma, Kyowa Kirin, and Bristol-Myers Squibb. YI received research funding from JSPS KAKENHI (grant number 20K08726), Takeda Pharma, and Bristol Myers Squibb. YI has received honoraria from Bristol Myers Squibb, Takeda Pharma, Janssen Pharmaceutical, and Sanofi. The remaining authors have no conflicts of interest to disclose.
Contributions
YK and YI performed the research, analyzed and interpreted the data, and wrote the manuscript. YI designed the study and edited the manuscript. ES, SG, YN, and HT analyzed and interpreted the data and revised the manuscript. FN, YT, MS, SY, HY, and KM provided the samples from AML patients for this study. YI supervised the project. YK and YI confirmed the authenticity of all the raw data. All the authors have read and approved the final manuscript.
The authors thank all patients who participated in this study.
This study was funded by the Japan Society for the Promotion of Science, Kagaku Kenkyu hi (grant n. 20K08726).
The data generated in the current study are available from the corresponding author on reasonable request. RNA sequencing data were deposited in the DNA Data Bank of Japan (accession number DRA 015488).
relapsed acute myeloid leukemia. Cancer. 2019;125(9):1470-1481.
8. Bashey A, Medina B, Corringham S, et al. CTLA4 blockade with ipilimumab to treat relapse of malignancy after allogeneic hematopoietic cell transplantation. Blood. 2009;113(7):1581-1588.
9 Daver N, Garcia-Manero G, Basu S, et al. Efficacy, safety, and biomarkers of response to azacitidine and nivolumab in relapsed/refractory acute myeloid leukemia: a nonrandomized, open-label, phase II study. Cancer Discov. 2019;9(3):370-383.
10. Huang R, Li X, He Y, et al. Recent advances in CAR-T cell engineering. J Hematol Oncol. 2020;13(1):86.
11. Abel AM, Yang C, Thakar MS, Malarkannan S. Natural killer cells: development, maturation, and clinical utilization. Front Immunol. 2018;9:1869.
12. Waldhauer I, Steinle A. NK cells and cancer immunosurveillance. Oncogene. 2008;27(45):5932-5943.
13. Veluchamy JP, Kok N, van der Vliet HJ, Verheul HMW, de Gruijl TD, Spanholtz J. The rise of allogeneic natural killer cells as a platform for cancer immunotherapy: recent innovations and future developments. Front Immunol. 2017;8:631.
14 Parkhurst MR, Riley JP, Dudley ME, Rosenberg SA. Adoptive transfer of autologous natural killer cells leads to high levels of
circulating natural killer cells but does not mediate tumor regression. Clin Cancer Res. 2011;17(19):6287-6297.
15. Franks SE, Wolfson B, Hodge JW. Natural born killers: NK cells in cancer therapy. Cancers (Basel). 2020;12(8):2131.
16. Romanski A, Uherek C, Bug G, et al. CD19-CAR engineered NK-92 cells are sufficient to overcome NK cell resistance in B-cell malignancies. J Cell Mol Med. 2016;20(7):1287-1294.
17 Tam YK, Miyagawa B, Ho VC, Klingemann HG. Immunotherapy of malignant melanoma in a SCID mouse model using the highly cytotoxic natural killer cell line NK-92. J Hematother. 1999;8(3):281-290.
18. Zhang J, Zheng H, Diao Y. Natural killer cells and current applications of chimeric antigen receptor-modified NK-92 cells in tumor immunotherapy. Int J Mol Sci. 2019;20(2):317.
19. Maki G, Klingemann HG, Martinson JA, Tam YK. Factors regulating the cytotoxic activity of the human natural killer cell line, NK-92. J Hematother Stem Cell Res. 2001;10(3):369-383.
20. Boyiadzis M, Agha M, Redner RL, et al. Phase 1 clinical trial of adoptive immunotherapy using “off-the-shelf” activated natural killer cells in patients with refractory and relapsed acute myeloid leukemia. Cytotherapy. 2017;19(10):1225-1232.
21. Blake SJ, Dougall WC, Miles JJ, Teng MW, Smyth MJ. Molecular pathways: targeting CD96 and TIGIT for cancer immunotherapy. Clin Cancer Res. 2016;22(21):5183-5188.
22. Sanchez-Correa B, Valhondo I, Hassouneh F, et al. DNAM-1 and the TIGIT/PVRIG/TACTILE axis: novel immune checkpoints for natural killer cell-based cancer immunotherapy. Cancers (Basel). 2019;11(6):877.
23. Mendelsohn CL, Wimmer E, Racaniello VR. Cellular receptor for poliovirus: molecular cloning, nucleotide sequence, and expression of a new member of the immunoglobulin superfamily. Cell. 1989;56(5):855-865.
24. Stamm H, Klingler F, Grossjohann EM, et al. Immune checkpoints PVR and PVRL2 are prognostic markers in AML and their blockade represents a new therapeutic option. Oncogene. 2018;37(39):5269-5280.
25. Qu P, Huang X, Zhou X, et al. Loss of CD155 expression predicts poor prognosis in hepatocellular carcinoma. Histopathology. 2015;66(5):706-714.
26. Huang X, Qu P, Chen Y, et al. Low expression of CD112 is associated with poor overall survival in patients with hepatocellular carcinoma. Hum Pathol. 2014;45(9):1944-1950.
27. Sanchez-Correa B, Gayoso I, Bergua JM, et al. Decreased expression of DNAM-1 on NK cells from acute myeloid leukemia patients. Immunol Cell Biol. 2012;90(1):109-115.
28. Guillerey C, Harjunpää H, Carrié N, et al. TIGIT immune checkpoint blockade restores CD8(+) T-cell immunity against multiple myeloma. Blood. 2018;132(16):1689-1694.
29 Kong Y, Zhu L, Schell TD, et al. T-cell immunoglobulin and ITIM domain (TIGIT) associates with CD8+ T-cell exhaustion and poor clinical outcome in AML patients. Clin Cancer Res. 2016;22(12):3057-3066.
30. Josefsson SE, Huse K, Kolstad A, et al. T cells expressing checkpoint receptor TIGIT are enriched in follicular lymphoma tumors and characterized by reversible suppression of T-cell receptor signaling. Clin Cancer Res. 2018;24(4):870-881.
31. Mettu NB, Ulahannan SV, Bendell JC, et al. A phase 1a/b openlabel, dose-escalation study of etigilimab alone or in
combination with nivolumab in patients with locally advanced or metastatic solid tumors. Clin Cancer Res. 2022;28(5):882-892.
32. Cho BC, Abreu DR, Hussein M, et al. Tiragolumab plus atezolizumab versus placebo plus atezolizumab as a first-line treatment for PD-L1-selected non-small-cell lung cancer (CITYSCAPE): primary and follow-up analyses of a randomised, double-blind, phase 2 study. Lancet Oncol. 2022;23(6):781-792.
33. Ley TJ, Miller C, Ding L, et al. Genomic and epigenomic landscapes of adult de novo acute myeloid leukemia. N Engl J Med. 2013;368(22):2059-2074.
34 Martinet L, Ferrari De Andrade L, Guillerey C, et al. DNAM-1 expression marks an alternative program of NK cell maturation. Cell Rep. 2015;11(1):85-97.
35. Landolina N, Mariotti FR, Ingegnere T, et al. IL-1R8 silencing improves the anti-tumor function of freshly isolated human NK cells. J Immunother Cancer. 2022;10(3):e003858.
36. Liu G, Zhang Q, Yang J, et al. Increased TIGIT expressing NK cells with dysfunctional phenotype in AML patients correlated with poor prognosis. Cancer Immunol Immunother. 2022;71(2):277-287.
37. Valhondo I, Hassouneh F, Lopez-Sejas N, et al. Characterization of the DNAM-1, TIGIT and TACTILE axis on circulating NK, NKTlike and T cell subsets in patients with acute myeloid leukemia. Cancers (Basel). 2020;12(8):2171.
38. Chretien AS, Devillier R, Granjeaud S, et al. High-dimensional mass cytometry analysis of NK cell alterations in AML identifies a subgroup with adverse clinical outcome. Proc Natl Acad Sci U S A. 2021;118(22):e2020459118.
39 Kearney CJ, Ramsbottom KM, Voskoboinik I, Darcy PK, Oliaro J. Loss of DNAM-1 ligand expression by acute myeloid leukemia cells renders them resistant to NK cell killing. Oncoimmunology. 2016;5(8):e1196308.
40 Mastaglio S, Wong E, Perera T, et al. Natural killer receptor ligand expression on acute myeloid leukemia impacts survival and relapse after chemotherapy. Blood Adv. 2018;2(4):335-346.
41. Ge Z, Peppelenbosch MP, Sprengers D, Kwekkeboom J. TIGIT, the next step towards successful combination immune checkpoint therapy in cancer. Front Immunol. 2021;12:699895.
42. Multhoff G, Mizzen L, Winchester CC, et al. Heat shock protein 70 (Hsp70) stimulates proliferation and cytolytic activity of natural killer cells. Exp Hematol. 1999;27(11):1627-1636.
43. Figueiredo C, Wittmann M, Wang D, et al. Heat shock protein 70 (HSP70) induces cytotoxicity of T-helper cells. Blood. 2009;113(13):3008-3016.
44 Farber M, Chen Y, Arnold L, et al. Targeting CD38 in acute myeloid leukemia interferes with leukemia trafficking and induces phagocytosis. Sci Rep. 2021;11(1):22062.
45. Le Roy A, Prébet T, Castellano R, et al. Immunomodulatory drugs exert anti-leukemia effects in acute myeloid leukemia by direct and immunostimulatory activities. Front Immunol. 2018;9:977.
46. Chen B, Lee JB, Kang H, Minden MD, Zhang L. Targeting chemotherapy-resistant leukemia by combining DNT cellular therapy with conventional chemotherapy. J Exp Clin Cancer Res. 2018;37(1):88.
47. Cany J, Roeven MWH, Hoogstad-van Evert JS, et al. Decitabine enhances targeting of AML cells by CD34(+) progenitor-derived NK cells in NOD/SCID/IL2Rg(null) mice. Blood. 2018;131(2):202-214.
Carlotta Welters,1 Marthe-Lina Welters,1 Serena Stadler,2 Lars Bullinger,1,2 Julian Strobel,3 Holger Hackstein,3 Arunraj Dhamodaran,4 Thomas Blankenstein5 and Leo Hansmann1,2,6
1Department of Hematology, Oncology, and Tumor Immunology, Charité –Universitätsmedizin Berlin (CVK), Berlin, Germany; 2German Cancer Consortium (DKTK), Partner Site Berlin, Berlin, Germany; 3Department of Transfusion Medicine and Hemostaseology, Friedrich-Alexander-University Erlangen-Nuremberg, Erlangen, Germany; 4T-knife Therapeutics Inc., San Francisco, CA, USA; 5Molecular Immunology and Gene Therapy, Max-Delbrück-Center for Molecular Medicine (MDC), Berlin, Germany and 6Department of Internal Medicine III, University Hospital Regensburg, Regensburg, Germany
Correspondence: L. Hansmann leo.hansmann@ukr.de
Received: June 23, 2023.
Accepted: September 18, 2023.
Early view: September 28, 2023.
https://doi.org/10.3324/haematol.2023.283812
©2024 Ferrata Storti Foundation
Published under a CC BY-NC license
The null allele HLA-C *04:09N differs from HLA-C *04:01 in a frameshift mutation within its cytoplasmic domain, resulting in translation of 32 additional amino acids that are assumed to prevent cell surface expression. However, we recently identified a multiple myeloma-reactive T-cell receptor (TCR) that appeared to recognize antigen presented on HLA-C *04:09N and encouraged us to ask whether HLA-C *04:09N, albeit not easily detectable at the cell surface, can present antigen sufficient for T-cell activation. We generated two HLA-class I-deficient cell lines, re-expressed HLAC *04:09N, detected HLA expression by flow cytometry, and tested for T-cell activation using a cytomegalovirus peptide-specific HLA-C *04:01-restricted TCR. In both cell lines, HLA-C *04:09N expression was detectable at the cell surface and could be enhanced by IFN- g exposure. Recombinant HLA-C * 04:09N expression was sufficient for T-cell activation in vitro , which could be blocked by an HLA-class I-specific antibody, suggesting HLA-TCR interaction at the cell surface. Peripheral blood mononuclear cells isolated from an individual who physiologically expressed HLA-C*04:09N triggered peptide-specific T-cell activation, confirming our results with cells with natural HLA expression levels. In conclusion, we present peptide-specific HLA-C *04:09N-restricted T-cell activation and suggest consideration of this allele in the appropriate clinical context, such as allogeneic stem cell transplantation, or in the setting of cellular therapy.
HLA-C*04:09N (C*04:09N) is one of 344 currently reported null alleles at the HLA-C locus (https://hla.alleles.org). Accounting for frequencies between 0.00002 and 0.0189 in cohorts that include more than 1,000 individuals,1,2 C*04:09N is considered one of the most frequent null alleles.3,4 C*04:09N differs from HLA-C*04:01 (C*04:01) in a point deletion within exon seven, which results in a frameshift and extension of the reading frame 97 base pairs beyond the canonical stop codon, translating into a protein 32 amino acids longer than C*04:01.5-7 The additional 32 amino acids do not inhibit intracellular protein expression but were suggested to prevent cell surface expression.5,7 Consequently, C*04:09N expression has been reported to be detectable by intracellular staining but not at the cell surface using the pan HLA-class I-specific antibody, clone W6/32, which resulted in its designation as a null allele.5 The extracellular parts
of C*04:09N and C*04:01 are identical, suggesting potential presentation of identical peptide repertoires.
We recently identified a multiple myeloma-reactive T-cell receptor (TCR) that appeared to recognize antigen presented on C*04:09N,8 calling its status as a null allele into question. Current evidence that defines C*04:09N as a null allele relies on flow cytometry-based detection of HLA-cell surface expression using one HLA-class I-specific antibody clone (W6/32) and lacks functional proof of the biological irrelevance of this allele.
Our observations in multiple myeloma encouraged us to study whether C*04:09N, albeit not detectable at the cell surface in previous studies, can present antigen in a form that enables peptide-specific T-cell activation. We asked experimentally whether C*04:09N expression: i) is detectable at the cell surface with current technologies; ii) can be modulated by the cytokine milieu; and iii) is sufficient for peptide presentation and specific T-cell activation.
Primary cells
The study was approved by the local institutional review board (protocol EA2/096/15 to LH). All participants provided written informed consent, and all research was conducted in accordance with the Declaration of Helsinki.
Cell lines and culture conditions
HEK293T (RRID: CVCL_0063) and U2OS (RRID: CVCL_0042) were cultivated in DMEM with 10% fetal bovine serum (FBS), 10,000 U/mL penicillin, and 10 mg/mL streptomycin (all Thermo Fisher Scientific) at 37°C and 5% CO2. If indicated, 1,000 U/mL IFN-g (PeproTech) were added for 24 hours (h) prior to analysis or co-culture experiments.
T-cell receptor expression on human peripheral blood lymphocytes
Recombinant TCR expression in human lymphocytes was performed as previously described.8-10 Detailed information on the QYD peptide-specific TCR has been reported previously.11
HLA knockout using CRISPR-Cas9
HLA-A, HLA-B, and HLA-C knockout of U2OS was performed as previously described8 and confirmed by flow cytometry.
Recombinant HLA expression
Coding sequences of C*04:09N and C*04:01 (accession numbers HLA01451, HLA00420) were downloaded from IPDIMGT/HLA (https://www.ebi.ac.uk/ipd/imgt/hla/), synthesized (GeneArt, Life Technologies), and cloned into the pHSE3’ vector under control of an H-2Kb promoter, as previously described.12 Cell lines were transfected with FuGENE® HD (Promega). For stable expression, cells were selected with 3 mg/mL G418 (Cayman Chem), and single cell clones were generated by limiting dilution.
Minigene expression
The amino acid sequence of cytomegalovirus (CMV)-derived pp65 was downloaded (https://www.ncbi.nlm.nih.gov, Gene ID: 3077579) and two 38 amino acid long sequences containing QYDPVAALF (QYD, underlined: MGQQIFLEVQAIRETVELRQYDPVAALFFFDIDLLLQRG) and KDVALRHVV (KDV, underlined: MTSAFVFPTKDVALRHVVCAHELVCSMENTRATKMQVIG) were reverse translated using EMBOSS.13 Minigene constructs were synthesized (Integrated DNA Technologies Inc.), cloned into pcDNA6/V5-His A, and transfected with FuGENE® HD (Promega) 36 h before co-culture experiments.
Reagents for determination of HLA expression or T-cell activation upon co-incubation are listed in the Online Supplementary Appendix. For intracellular staining, we used the Cytofix/Cytoperm Fixation/Permeabilization Kit (BD Biosciences). All reagents were used according to the man-
ufacturer’s instructions.
For enrichment of CD8+ T cells before co-culture experiments, we used MojoSort™ Human CD8 Nanobeads (Biolegend) for magnetic-activated cell separation (MACS) with minor modifications: CD8 Nanobeads were diluted 1:5 and cells were separated on MS columns (Miltenyi). Enriched populations were on average 71.7% CD8+, as determined by flow cytometry.
Co-culture experiments of TCR-transduced T cells with HEK293T or U2OS were performed in 250 µL medium (RPMI-1640 supplemented with 10% FBS, 10,000 U/mL penicillin, and 10 mg/mL streptomycin) in 48-well plates for 18 h; co-cultures with PBMC were performed in 150 µL medium in 96-well plates for 24 h at 37°C and 5% CO2. Indicated peptides (Genscript) were added at 5 µM final concentration 1 h before co-culture. For HLA-blocking, Ultra-LEAF Purified Anti-Human HLA-class I (clone W6/32, BioLegend, RRID: AB_2561492) or Ultra-LEAF Purified Mouse IgG2a κ isotype control (clone MOPC-173, BioLegend, RRID: AB_11148947) were added at 50 µg/mL final concentration 1 h before co-culture. Activation of T cells was detected using the Human IFN-g ELISA Set BD OptEIA (BD Biosciences, RRID: AB_2869029), the human granzyme B DuoSet ELISA kit (R&D Systems), and by flow cytometry.
HLA typing of the sample MM160
HLA-typing was performed using Holotype HLA24/7 (Omixon; Budapest, Hungary) in combination with MiSeq (Illumina; San Diego, CA, USA) according to the manufacturer’s instructions. Sequencing data were analyzed using Twin software v.3.1.1 (Omixon) and IMGT/HLA-Database v.3.32. HLA-C*04:09N was confirmed by sequence-specific primer (SSP) PCR (Olerup SSP® HLA-C*04:09N, Olerup SSP AB; Stockholm, Sweden) according to the manufacturer’s instructions.
Statistical analysis
Statistics were calculated using R, v.4.0.3.14 (See figure legends for the tests applied.)
HLA-C*04:09N is expressed at the cell surface
We transfected HEK293T that lack HLA-A, HLA-B and HLA-C expression (HEKHLA-KO)8 with pHSE3’ expression plasmids that encoded C*04:09N or C*04:01 as a positive control. HLA expression was determined by flow cytometry after intracellular or cell surface staining with antibodies specific for HLA-BC (clone B1.23.2) or pan HLA-class I (clone W6/32) (Online Supplementary Table S1). As expected, C*04:09N was detectable by intracellular staining (Figure 1A). How-
ever, we also detected C*04:09N cell surface expression after staining with the HLA-BC-specific antibody (Figure 1A, top). In line with previous observations,5,7 only residual C*04:09N cell surface expression could be observed with the pan HLA-class I antibody (Figure 1A, bottom). C*04:01 expression was detectable by intracellular and cell surface staining (Figure 1A).
Recombinant HLA expression can vary in the context of different cell types and due to transfection efficiency. To confirm our findings, we generated an osteosarcoma cell line deficient in HLA-A, HLA-B and HLA-C (U2OSHLA-KO), of which we established a single cell clone-derived cell line that stably expressed C*04:09N as the only HLA-ABC allele
(U2OS04:09N). In line with our results from transient HLA expression in HEKHLA-KO, surface expression of C*04:09N was weak but detectable with the HLA-BC-specific, but not with the pan HLA-class I-specific antibody (Figure 1B). Microenvironmental influences including, but not limited to the cytokine milieu, can modulate HLA expression. As an example, we determined HLA-cell surface expression of U2OS04:09N after exposure to IFN-g in vitro. While C*04:09N cell surface expression was detectable on an average of 21.4% of U2OS04:09N, expression increased to an average of 81.8% after IFN-g treatment. (See Figure 1C for a representative example). On average, HLA-cell surface expression on U2OS04:09N, determined as allophycocyanin (APC) mean
*04:09N cell surface expression by flow cytometry. (A) HEKHLA-KO were transfected with plasmids encoding C*04:09N (HEK04:09N) or C*04:01 (HEK04:01) and stained with HLA-BC (clone B1.23.2, top) or pan HLA-class I (clone W6/32, bottom) antibody for flow cytometry. The plots show one representative example out of 3 independent experiments. (B) Flow cytometry detection of cell surface C*04:09N expression on U2OS04:09N with HLA-BC (top) or pan HLA-class I antibody (bottom). (C) Effects of in vitro IFN-g exposure on C*04:09N cell surface expression on U2OS04:09N. If indicated, cells were incubated with 1,000 U/mL IFN-g for 24 hours (h) prior to analysis. The flow cytometry plot is representative for 3 independent experiments. (D) HLA cell surface expression of U2OS04:09N after 24-h IFN-g exposure determined as mean fluorescence intensity (MFI) in 3 independent experiments with 3 replicates per experiment. Data points indicate 9 individual replicates. WT: wild type.
fluorescence intensity (MFI), increased 1.9-fold upon IFN-g exposure (Figure 1D). IFN-g exposure did not substantially affect cell surface staining of C*04:09N with the pan HLAclass I-specific antibody (Online Supplementary Figure S1). Taken together, C*04:09N expression was detectable at the cell surface of two different cell lines and increased upon IFN-g exposure in vitro
T cells can be activated by peptides presented on HLAC*04:09N
Identical extracellular domains, including the peptide binding grooves, of C*04:09N and C*04:01 suggest binding of a similar peptide repertoire. To determine potential T-cell activation by peptides presented on C*04:09N, we expressed a C*04:01-restricted TCR specific for the CMV-derived epitope QYDPVAALF (QYD),11 which is presented on C*04:01, in human peripheral blood T cells (TQYD) (Online Supplementary Figure S2). (See Table 1 for HLA-class I alleles of the donor used for TCR expression). IFN-g and granzyme B secretion were measured to detect T-cell activation. For antigen presentation, HEKHLA-KO were co-transfected with expression plasmids encoding C*04:09N and a minigene encoding the target epitope (QYD) or a negative control epitope (KDVALRHVV, called KDV). Only HEKHLA-KO co-transfected with C*04:09N and the target epitope QYD activated TQYD, confirming activation of a C*04:01-restricted TCR by a peptide presented on C*04:09N (Figure 2A). Non-TCR-transduced T cells could not be activated by HEK04:09N confirming TCR-dependent T-cell activation (Online Supplementary Figure S3). T-cell activation was blocked by pan HLA-class I-specific antibody, which suggested that C*04:09N-T-cell interaction occurred at the cell surface (Figure 2B).
To confirm our results in a different cell line, U2OSHLA-KO and U2OS04:09N were transfected with the QYD or KDV minigenes and co-cultured with TQYD. Only U2OS04:09N expressing the QYD minigene activated TQYD (Figure 2C). In line with our results from HEK293T, non- transduced T cells were not activated
Patient/Donor
T-cell donor
MM160
HLA-class I alleles
A*03:01:01; A*34:02:01
B*07:02:01; B*14:01:01
C*07:02:01; C*08:02:01
A*02:01:01G; A*23:01:01
B*44:03:01G; B*51:01:01G
C*04:09N; C*15:02:01
by U2OS04:09N (Online Supplementary Figure S4). TQYD activation by U2OS04:09N could be blocked by the pan HLA-class I antibody (Figure 2D).
Our data functionally confirmed: i) C*04:09N-dependent; and ii) target epitope-specific T-cell activation.
Peripheral blood mononuclear cells of an HLA-C*04:09N+ donor can present QYD and trigger specific T-cell activation
We obtained peripheral blood mononuclear cells (PBMC) of one multiple myeloma patient (MM160) who physiologically expressed C*04:09N (Table 1) and had been part of a previous study of our group.8 PBMC of MM160 were rested or incubated with IFN-g for 24 h, washed, loaded with QYD or the negative control peptide KDV, and incubated with TQYD CD137 expression on TCR-transduced CD8+ T cells (see Online Supplementary Table S2 for antibody panel and Online Supplementary Figure S5 for gating strategy) and granzyme B in cell culture supernatants were measured to detect T-cell activation. TQYD were activated by PBMC of patient MM160 in a QYD-specific manner, and activation could be enhanced by pre-incubation of PBMC with IFN-g (Figure 3A). Accordingly, increased frequencies of dead cells among target peptide-loaded PBMC after co-culture suggested peptide-specific killing in the context of C*04:09N (Figure 3A,
T cells for recombinant T-cell receptor expression were isolated from leftover materials of an allogeneic stem cell graft (T-cell donor). Continued on following page.
*04:09N. (A) TQYD were cultured with HEKHLA-KO which were (co-)transfected with a plasmid encoding C*04:09N and a minigene encoding QYD or KDV. (B) TQYD were incubated with HEKHLA-KO co-transfected with a plasmid encoding C*04:09N and the QYD-minigene in presence of a blocking antibody against pan HLAclass I (clone W6/32) or isotype control (clone MOPC 173). (C) TQYD were incubated with U2OSHLA-KO or U2OS04:09N transfected with the QYD- or KDV-minigene. (D) TQYD were incubated with U2OS04:09N transfected with the QYD-minigene in the presence of a blocking antibody against pan HLA-class I (clone W6/32) or isotype control (clone MOPC 173). Bar charts indicate mean ± standard error of mean. In all charts, IFN-g and granzyme B in cell culture supernatants were measured by ELISA. Data are representative of 3 independent experiments with 3 technical replicates per experiment. Statistical significance was determined by paired Student t test and corrected for multiple testing by Bonferroni correction. ***P<0.001.
B). Non-TCR-transduced T cells were not activated by QYD loaded onto PBMC of MM160, although granzyme B showed higher background after pre-incubation with IFN-g (Figure 3B). To exclude the possibility that QYD could potentially be presented by any of the HLA-alleles of MM160 other than C*04:09N, we expressed all HLA-alleles of MM160 one at a time (Table 1) in HEKHLA-KO, each in combination with the QYD minigene, and tested for activation of TQYD. Only C*04:09N in combination with the QYD minigene activated TQYD (Figure 3C). T cells that were used for TCR transduction did not express either C*04:01 or C*04:09N (Table 1); to experimentally exclude antigen presentation by T cells used for TCR transduction, we demonstrated that incubation of non-transduced T cells and TQYD in presence of QYD peptide did not result in T-cell activation (Figure 3D).
In summary, PBMC of a C*04:09N+ individual can present peptide and trigger T-cell activation in a C*04:09N-restricted manner.
C*04:09N, first described in 2002,5,7 is considered a null allele due to previously non-detectable cell surface expression, and we are not aware of any functional confirmation that C*04:09N could not trigger peptide-specific T-cell activation. Moreover, we recently identified a multiple myeloma-reactive TCR that appeared to recognize antigen in the context of C*04:09N.8 This encouraged us to experimentally address whether C*04:09N expression: i) can be detected at the cell
surface with current technologies; and ii) can trigger peptide-specific T-cell activation in a functional assay.
Accurate detection of C*04:09N cell surface expression requires specific antibodies, which are commercially available against pan HLA-class I (clone W6/32), HLA-BC (clone B1.23.2), and HLA-C (clone DT9). Currently, there is no commercially available antibody specifically against C*04:01, or even C*04:09N. Therefore, we generated two cell lines (HEK293T and U2OS), in which we deleted all endogenous HLA-A, HLA-B, and HLA-C alleles by CRISPR Cas9. In these cell lines, we expressed single HLA-C alleles of choice, which could subsequently be detected by any of the above-mentioned antibodies (pan HLA class I, HLA-BC, or HLA-C). We chose HEK293T and U2OS because they are widely available and easy to transfect with high efficiency by standard methodologies. The HLA-C-specific antibody (DT9) delivers only weak staining for flow cytometry compared to the HLA-BC or pan HLA-class I-specific antibodies; furthermore, DT9 can also recognize HLA E,15 and was, therefore, not used in this study.
Recombinant cell surface expression of C*04:09N was weak and only reliably detectable with the HLA-BC-specific antibody (B1.23.2) confirming results of previous studies that only used the pan HLA-class I-specific antibody (W6/32) for C*04:09N detection.5,7 A possible explanation, among many others, for the observed differences in sensitivity between the B1.23.2 and W6/32 antibodies could be that W6/32 detects HLA in complex with b2-microglobulin, whereas B1.23.2 recognizes an epitope expressed on both b2-microglobulin-associated and free HLA-class I heavy chains.16,17
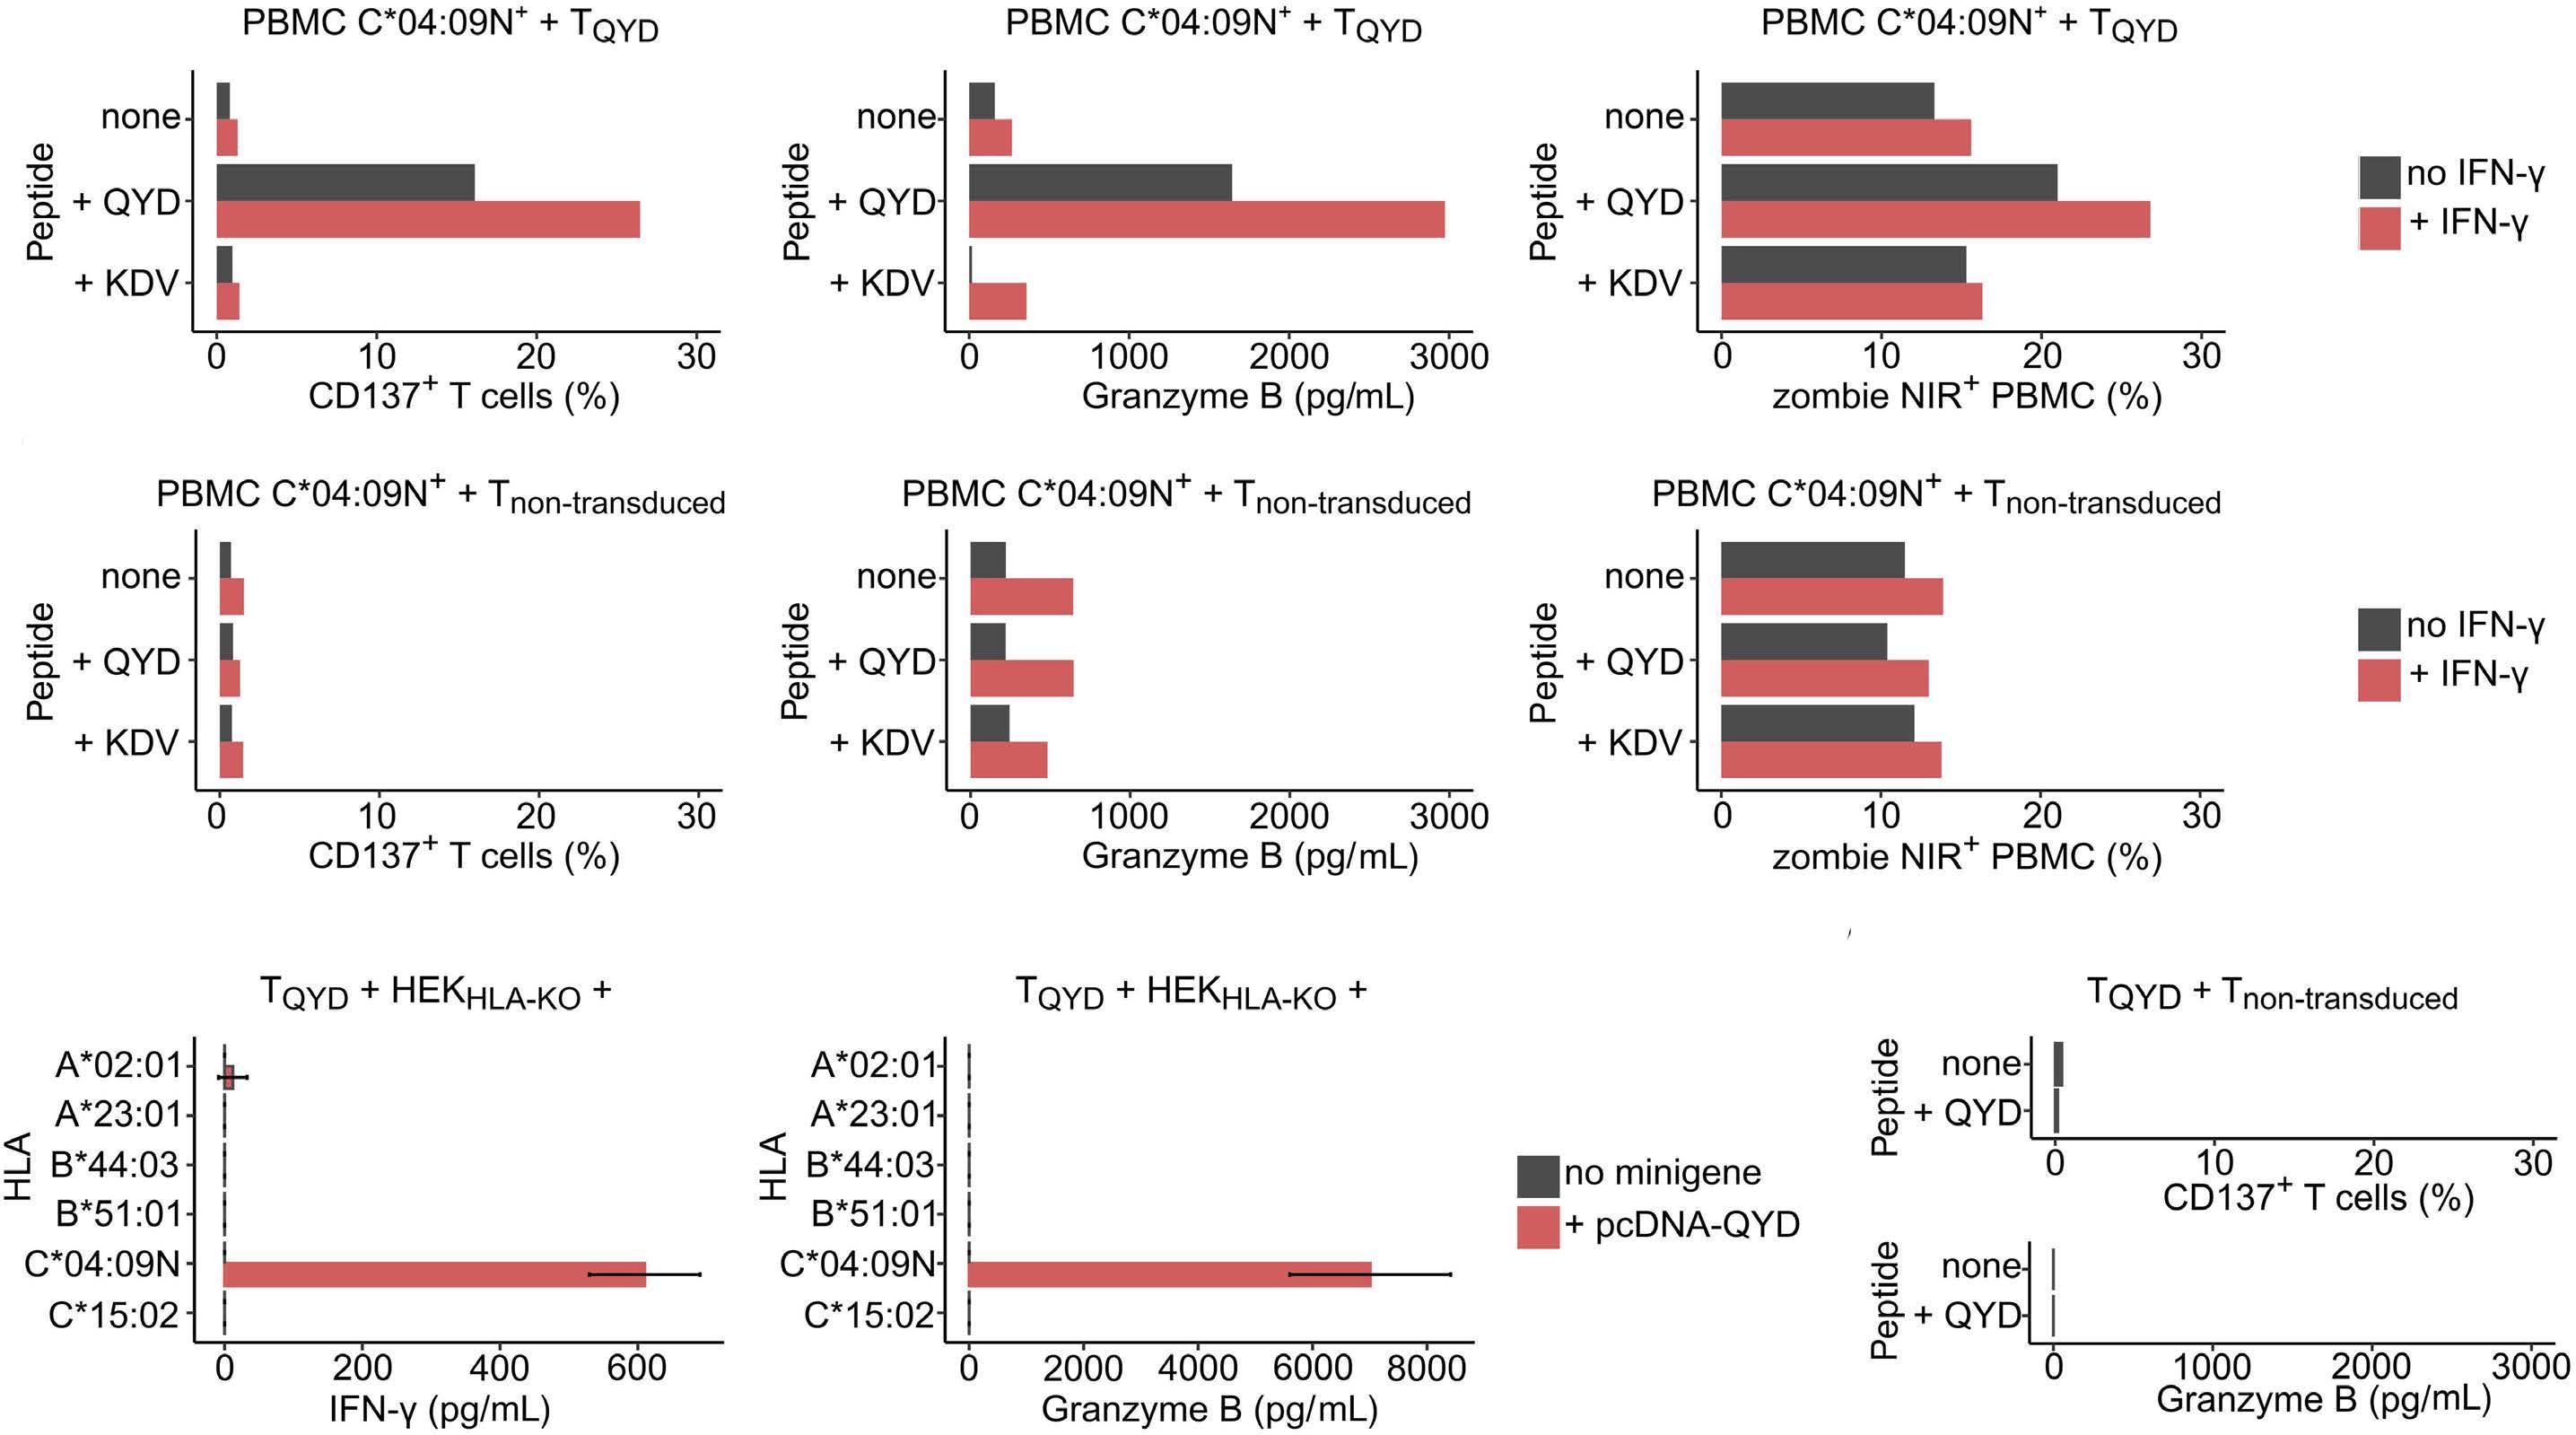
3. QYD peptide-specific T-cell activation in an HLA-C*04:09N+ individual. (A) TQYD were labeled with cell trace violet and cultured with peripheral blood mononuclear cells (PBMC) of an HLA-C*04:09N+ individual loaded with 5 µM QYD- or KDV-peptide; PBMC were incubated with 1,000 U/mL IFN-g for 24 hours (h) before co-culture if indicated. To detect T-cell activation, CD137 expression on TCR-transduced CD8+ T cells was determined by flow cytometry and granzyme B secretion in cell culture supernatants was measured by ELISA. Dead PBMC were determined as zombie NIR+ among all cell trace violet negative cells. (B) Non-TCR-transduced T cells labeled with cell trace violet and incubated with PBMC of the same donor (see panel A) loaded with 5 µM QYD- or KDV-peptide; PBMC were incubated with 1,000 U/mL IFN-g for 24 h before co-culture if indicated. To detect T-cell activation, CD137 expression on CD8+ T cells was determined by flow cytometry and granzyme B secretion in cell culture supernatants was measured by ELISA. Dead PBMC were determined as zombie NIR+ among all cell trace violet negative cells. (C) TQYD were cultured with HEKHLA-KO that recombinantly expressed all HLA alleles of MM160 (one at a time) and the QYD-minigene. IFN-g and granzyme B in cell-culture supernatants were measured by ELISA. Bar charts indicate mean ± standard error of mean. Data are representative of 3 experiments. (D) To confirm that QYD could not be presented by the T cells used for T-cell receptor (TCR) transduction, TQYD were co-cultured with non-TCR-transduced T cells loaded with 5 µM QYD- or KDV-peptide.
C*04:09N surface expression was enhanced by IFN-g exposure. IFN-g is known to regulate gene expression beyond HLA-class I genes.18-20 In vitro application of IFN-g resulted in substantially increased C*04:09N expression and stronger specific T-cell activation. Based on these observations, we assume relevant effects of the cytokine milieu and tissue-associated modulation of C*04:09N expression in vivo. Independently of whether C*04:09N cell surface expression was detectable by flow cytometry, we asked experimentally whether C*04:09N expression was functionally relevant and could mediate peptide-specific T-cell activation. We demonstrated in two unrelated cell lines that transient or stable C*04:09N expression was sufficient for peptide presentation and specific T-cell activation. Inhibition of T-cell activation by addition of pan HLA-class I antibody to the cell culture indicated that TCR-peptide-HLA interaction occurred at the cell surface. Our results were confirmed with PBMC of a C*04:09N+ individual. Our data prove functionally
that C*04:09N expression, albeit challenging to detect by flow cytometry, is biologically relevant for HLA-restricted T-cell activation.
Our study was entirely carried out in vitro; therefore, we cannot draw conclusions on in vivo situations. However, strong modulation of C*04:09N expression by the cytokine milieu (IFN-g), and isolation of a clonally expanded C*04:09-restricted T-cell clone from bone marrow of a multiple myeloma patient8 strongly suggest immunological relevance of this allele in vivo.
We assume our findings to have implications in the fields of hematopoietic stem cell and solid organ transplantation; however, although C*04:09N is considered one of the most abundant null alleles, its overall frequency is relatively low and varies within several orders of magnitude between different populations.2 Comprehensive analyses of larger cohorts along with C*04:09N peptidome data, especially in comparison with C*04:01, are required to determine impli-
cations for allogeneic transplantation and specific disease associations, as well as in the context of other settings, such as cellular therapy.
Disclosures
LB has sat on advisory committees for Abbvie, Amgen, Astellas, Bristol-Myers Squibb, Celgene, Daiichi Sankyo, Gilead, Hexal, Janssen, Jazz Pharmaceuticals, Menarini, Novartis, Pfizer, Sanofi, and Seattle Genetics, and has received research support from Bayer and Jazz Pharmaceuticals. LH has sat on advisory committees for Sanofi, and has received travel support from Amgen. All other authors have no conflicts of interest to disclose.
Contributions
CW and LH conceived the project. CW, MLW, SS, JS, HH, AD, TB and LH designed experiments. AD and TB provided
1. Bors A, Inotai D, Andrikovics H, et al. Low occurrence of the HLA-C*04:09N allele in a large Hungarian cohort. Tissue Antigens. 2015;86(1):32-35.
2. Gonzalez-Galarza FF, McCabe A, Santos E, et al. Allele frequency net database (AFND) 2020 update: gold-standard data classification, open access genotype data and new query tools. Nucleic Acids Res. 2020;48(D1):D783-D788.
3. Pinto C, Smith AG, Larsen CE, et al. HLA-Cw*0409N is associated with HLA-A*2301 and HLA-B*4403-carrying haplotypes. Hum Immunol. 2004;65(2):181-187.
4. Bauer M, Kempenich J, Wadsworth K, Malmberg C, Beduhn B, Dehn J. Frequencies and haplotype associations of nonexpressed HLA alleles in ethnically diverse populations on the National Marrow Donor Program’s Be The Match Registry. Hum Immunol. 2020;81(10-11):580-587.
5. Balas A, Santos S, Aviles MJ, et al. Elongation of the cytoplasmic domain, due to a point deletion at exon 7, results in an HLA-C null allele, Cw*0409 N. Tissue Antigens. 2002;59(2):95-100.
6. Lind C, Ferriola D, Mackiewicz K, Papazoglou A, Sasson A, Monos D. Filling the gaps - the generation of full genomic sequences for 15 common and well-documented HLA class I alleles using next-generation sequencing technology. Hum Immunol. 2013;74(3):325-329.
7 Wang ZC, Smith AG, Yunis EJ, et al. Molecular characterization of the HLA-Cw*0409N allele. Hum Immunol. 2002;63(4):295-300.
8. Welters C, Lammoglia Cobo MF, Stein CA, et al. Immune phenotypes and target antigens of clonally expanded bone marrow T cells in treatment-naive multiple myeloma. Cancer Immunol Res. 2022;10(11):1407-1419.
9 Engels B, Cam H, Schuler T, et al. Retroviral vectors for highlevel transgene expression in T lymphocytes. Hum Gene Ther. 2003;14(12):1155-1168.
10 Lammoglia Cobo MF, Welters C, Rosenberger L, et al. Rapid single-cell identification of Epstein-Barr virus-specific T-cell receptors for cellular therapy. Cytotherapy. 2022;24(8):818-826.
critical material. CW, MLW and SS performed experiments. CW, MLW, SS, LB, JS, HH, AD, TB and LH analyzed data. CW and LH wrote the manuscript with input from all authors. LH co-ordinated and supervised the project.
We thank Matthias Truss for flow cytometry support, and Klaus Dornmair for providing expression vectors.
Funding
This work was supported by Deutsche Krebshilfe e.V. (70113355; to LH), Berliner Krebsgesellschaft e.V. (HAFF202013 MM; to LH), the German Cancer Consortium (DKTK; to LH), and the European Union (ERC Advanced Grant Neo-T, 882963; toTB).
Data-sharing statement
All data are publicly available along with this manuscript.
11. Dhamodaran A. Generation and characterization of ABab.I transgenic mice: a novel tool for the isolation of human T cell receptors selected on a distinct human HLA class I haplotype for adoptive T cell therapy of cancer [Dissertation]. Refubium - Freie Universität Berlin Repository. https://refubium.fu-berlin. de/handle/fub188/32213 Accessed June 2023.
12. Siewert K, Malotka J, Kawakami N, Wekerle H, Hohlfeld R, Dornmair K. Unbiased identification of target antigens of CD8+ T cells with combinatorial libraries coding for short peptides. Nat Med. 2012;18(5):824-828.
13. Rice P, Longden I, Bleasby A. EMBOSS: the European Molecular Biology Open Software Suite. Trends Genet. 2000;16(6):276-277.
14 R Core Team. R: a language and environment for statistical computing. Vienna, Austria: R Foundation for Statistical Computing; 2020.
15. Tremante E, Lo Monaco E, Ingegnere T, Sampaoli C, Fraioli R, Giacomini P. Monoclonal antibodies to HLA-E bind epitopes carried by unfolded beta2 m-free heavy chains. Eur J Immunol. 2015;45(8):2356-2364.
16. Rebai N, Malissen B. Structural and genetic analyses of HLA class I molecules using monoclonal xenoantibodies. Tissue Antigens. 1983;22(2):107-117.
17 Shields MJ, Ribaudo RK. Mapping of the monoclonal antibody W6/32: sensitivity to the amino terminus of beta2microglobulin. Tissue Antigens. 1998;51(5):567-570.
18. Basham TY, Bourgeade MF, Creasey AA, Merigan TC. Interferon increases HLA synthesis in melanoma cells: interferon-resistant and -sensitive cell lines. Proc Natl Acad Sci U S A. 1982;79(10):3265-3269.
19. Campbell IL, Bizilj K, Colman PG, Tuch BE, Harrison LC. Interferon-gamma induces the expression of HLA-A,B,C but not HLA-DR on human pancreatic beta-cells. J Clin Endocrinol Metab. 1986;62(6):1101-1109.
20 Friedman RL, Manly SP, McMahon M, Kerr IM, Stark GR. Transcriptional and posttranscriptional regulation of interferoninduced gene expression in human cells. Cell. 1984;38(3):745-755.
Tissue factor pathway inhibitor is associated with risk of venous thromboembolism and all-cause mortality in patients with cancerCornelia Englisch,1 Florian Moik,1,2 Johannes Thaler,1 Silvia Koder,1 Nigel Mackman,3 Matthias Preusser,4 Ingrid Pabinger1 and Cihan Ay1
1Clinical Division of Hematology and Hemostaseology, Department of Medicine I, Medical University of Vienna, Vienna, Austria; 2Division of Oncology, Department of Internal Medicine, Medical University of Graz, Graz, Austria; 3Division of Hematology, Department of Medicine, UNC Blood Research Center, University of North Carolina at Chapel Hill, Chapel Hill, NC, USA and 4Division of Oncology, Department of Medicine I, Medical University of Vienna, Vienna, Austria
Correspondence: C. Ay cihan.ay@meduniwien.ac.at
Received: May 23, 2023.
Accepted: October 3, 2023.
Early view: October 12, 2023.
https://doi.org/10.3324/haematol.2023.283581
©2024 Ferrata Storti Foundation
Published under a CC BY-NC license
Venous thromboembolism (VTE) is a common complication in patients with cancer. Data on the role of natural inhibitors of coagulation for occurrence of cancer-associated VTE are limited, thus, we investigated the association of tissue factor pathway inhibitor (TFPI) with risk of VTE and all-cause mortality in patients with cancer. Total TFPI antigen levels were measured with a commercially available enzyme-linked immunosorbant assay in patients included in the Vienna Cancer and Thrombosis Study, a prospective observational cohort study with the primary outcome VTE. Competing risk analysis and Cox regression analysis were performed to explore the association of TFPI levels with VTE and all-cause mortality. TFPI was analyzed in 898 patients (median age 62 years; interquartile range [IQR], 53-68; 407 (45%) women). Sixty-seven patients developed VTE and 387 died (24-month cumulative risk 7.5% and 42.1%, respectively). Patients had median TFPI levels at study inclusion of 56.4 ng/mL (IQR, 45.7-70.0), with highest levels in tumor types known to have a high risk of VTE (gastroesophageal, pancreatic and brain cancer: 62.0 ng/mL; IQR, 52.0-75.0). In multivariable analysis adjusting for age, sex, cancer type and stage, TFPI levels were associated with VTE risk (subdistribution hazard ratio per doubling =1.63, 95% confidence interval [CI]: 1.03-2.57). When patients with high and intermediate/low VTE risk were analyzed separately, the association remained independently associated in the high risk group only (subdistribution hazard ratio =2.63, 95% CI: 1.40-4.94). TFPI levels were independently associated with all-cause mortality (hazard ratio =2.36, 95% CI: 1.85-3.00). In cancer patients increased TFPI levels are associated with VTE risk, specifically in patients with high-risk tumor types, and with all-cause mortality.
Venous thromboembolism (VTE) is a common complication in patients with cancer. The risk for VTE in this patient population is about 7-9-fold higher compared to the general population.1-3 VTE is not only a major cause of morbidity but also a negative prognostic factor in patients with cancer.4-7 The mechanisms of cancer-associated thrombosis are not completely understood. However, several hemostatic biomarkers have been found to predict risk of VTE in patients with cancer, for instance, procoagulant factors, such as tissue factor (TF), neutrophil extracellular traps (NETS), and podoplanin, have been implicated in the development of cancer-associated thrombosis.8-11 In contrast, the association of natural inhibitors of hemostasis with cancer-associated thrombosis is currently unclear.
Tissue factor pathway inhibitor (TFPI) is a natural anticoagulant that inhibits complexes of tissue factor (TF) and factor VIIa via its Kunitz-1 domain and factor Xa via its Kunitz-2 domain. The majority (about 80%) of TFPI is bound to the endothelium, with the remaining 20% circulating freely (about 2%) or bound to low-density lipoproteins.12 Furthermore, humans have a heparin-releasable and a platelet pool of TFPI.13
Conflicting results on the association of TFPI with VTE risk have been reported in the general population. Several case-control studies found an association between low levels of TFPI and risk of VTE.14-17 However, these results were not replicated in a longitudinal study.15 Therefore, it is unclear, if low TFPI levels in the case-control studies were the cause or the consequence of a VTE event. Further, it has been speculated that TFPI levels may be increased due
to binding to TF+ extracellular vesicles (EV).18,19 It is known that TF is expressed by cancer cells of various types and is thought to play a significant role in tumor growth and metastasis formation.20,21 Thus, high TF levels are associated with poor overall survival in patients with various tumor types.5,20,22
In comparison to the non-cancer population, higher plasma TFPI levels were reported in patients with cancer and especially in those with metastatic disease.23,24 It has been suggested that TFPI also plays a role in cancer progression in different tumor types.25 Low expression of TFPI on tumor cells was found to be associated with cancer progression and poor overall survival.26-28 However, the association of TFPI with risk of developing VTE and prognosis of the disease has not been studied in a broad population of patients with cancer. Therefore, we measured TFPI levels in a prospective cohort study of patients with cancer for prediction of VTE and risk of all-cause mortality.
This analysis was performed within the framework of the Vienna Cancer and Thrombosis Study (CATS). The study is a single-center, prospective observational cohort study including patients with newly diagnosed or recurrent cancer after full or partial remission. The study has been approved by the local ethics committee (EC no.: 126/2003, ethik-kom@ meduniwien.ac.at) and was performed according to the Declaration of Helsinki and its later amendments. Detailed information about the study, its inclusion and exclusion criteria and the study procedures has been published in previous publications29,30 and can be found in the Online Supplementary Appendix
Laboratory analysis
Blood was drawn at study inclusion and collected in Vacutainer citrate tubes (Vacuette; Greiner-Bio One) by sterile venipuncture. Blood preparation is explained in the Online Supplementary Appendix
Total TFPI antigen levels were measured with a commercial assay in citrate plasma samples according to the manufacturer´s instructions (Imubind total TFPI ELISA kit; American Diagnostica Inc., Stamford, CT, USA). EV-TF activity was measured according to standardized protocols for a chromogenic endpoint assay as reported in detail previously.22,23 D-dimer levels were measured by a quantitative latex assay (STA-LIAtest D-DI; Diagnostica-Stago, Asnieres, France) on an STA-R analyzer (Diagnostica-Stago).32 sP-selectin levels were measured using a human sP-selectin Immunoassay (R&D Systems; Minneapolis, MN) following the manufacturer’s instructions as described previously.30 Fibrinogen was determined according to Clauss (STA Fibrinogen; Diagnostica Stago, Asnieres, France; normal
range: 180-390 mg/dL).33 C-reactive protein (CRP) serum levels were determined by an immuno-nephelometric assay (Olympus Diagnostics; Southall, UK) on an AU 2700 chemistry analyzer.34
Statistical analyses were performed with STATA 17 (Stata Corp., Houston, TX, USA), SPSS 28.0 (IBM SPSS Statistics; Chicago, IL, USA) and R (Version 4.1.0; R Core Team). Standard summary statistics were used to report patient baseline characteristics (absolute frequencies, percentages, median, interquartile range [IQR, indicating the 25 th to 75 th percentile of the distribution of metric variables]). Medians between two groups were compared with a Mann-Whitney U test. Correlations were analyzed with a Spearman correlation coefficient. As death was considered as a competing event during follow-up time, VTE outcomes were studied in a competing risk framework. 35 In order to compare the cumulative VTE incidence between groups, a proportional sub-hazard regression model according to Fine and Gray was conducted. The association of TFPI levels with all-cause mortality was assessed in Cox regression analysis. A multivariable model including age, sex, cancer type and stage (stage 4 vs . stage 1, 2, 3) was conducted as well. For cancer type adjustment patients were stratified according to tumor type VTE risk category. Patients with pancreatic, gastroesophageal and brain tumors were considered to be at very high risk, those with breast and prostate cancer at low risk and all others to be at intermediate risk. 36 Furthermore, a model adjusting for EV-TF activity, D-dimer or sP-selectin levels was used for competing-risk and Cox regression analysis.
For a subgroup analysis patients were divided according to the baseline VTE risk according to the tumor type into high, intermediate, and low risk. 36 A ROC curve analysis with AUC computing was performed for the different VTE multivariable models to obtain the AUC values.
Patient characteristics
TFPI was analyzed in 898 patients with available samples. The median age was 62 years (IQR, 53-68) and 407 (45%) patients were female. Patients were followed for a median follow-up of 22 months (IQR, 7-25). Overall, 67 patients (7.5%) were diagnosed with VTE (6-, 12-, and 24-month cumulative risk: 5.5%, 6.7%, 7.5%) and 387 patients (43.1%) died (6-, 12-, and 24-month cumulative risk: 15.1%, 27%, 42.1%) (Table 1). In detail, 27 patients were diagnosed with PE only, 31 with a DVT only, four with both PE and DVT, one with DVT and portal vein thrombosis, one with portal vein thrombosis, one with sinus vein thrombosis and two with catheter-related thrombosis as index event.
Distribution of tissue factor pathway inhibitor levels
Patients had median TFPI levels of 56.4 ng/mL (IQR, 45.770.0). The distribution of TFPI levels did not significantly differ between cancer types (Figure 1). Patients with metastatic disease had higher levels compared to those with non-metastatic disease (median 61.0 ng/mL; IQR, 50.074.0 vs. 50.4 ng/mL, IQR, 42.0-62.0; P<0.001). TFPI levels showed a weak positive correlation with CRP, fibrinogen, D-dimer, sP-selectin, and platelet counts, but not with EV-TF activity (Table 2).
Baseline levels of TFPI were associated with risk of VTE (subdistribution hazard ratio [SHR] per doubling of TFPI levels: 1.92, 95% confidence interval [CI]: 1.33-2.79). This association remained significant in multivariable analysis adjusting for age, sex, cancer type and stage (adjusted subdistribution hazard ratio [SHR] per doubling =1.62, 95% CI: 1.03-2.57). When comparing the 1-year and 2-year cumulative incidence of patients with TFPI levels above the 75th percentile (>70 ng/mL) to those with levels equal to or below the 75th percentile (≤70 ng/mL) a significant difference was observed (9.7% vs. 5.8%; 10.7% vs. 6.6%; P=0.04 for 12-month cumulative incidence; Figure 2). In a separate analysis adjusting for EV-TF activity, D-dimer, or sP-selectin levels, the association remained significant (EV-TF activity adjusted SHR per doubling of TFPI =2.00, 95% CI: 1.25-3.21; D-dimer
adjusted SHR per doubling of TFPI =1.92, 95% CI: 1.29-2.85; sP-selectin adjusted SHR per doubling of TFPI =1.60, 95% CI: 1.08-2.38). When D-dimer (adjusted SHR per doubling of TFPI =1.62, 95% CI: 0.99-2.63) or sP-selectin (adjusted SHR per doubling of TFPI =1.42, 95% CI: 0.87-2.23) levels were added to the clinical covariates model the association was weakened significantly (Table 3).
In a smaller subgroup (n=291) EV-TF activity was available and the addition of this biomarker to the clinical multivariate model did not lead to a significant weakening of the association (adjusted SHR per doubling of TFPI =2.12, 95% CI: 1.20-3.43; Table 3).
In a subgroup analysis we stratified according to tumor type based VTE risk categories in high risk (brain, pancreas, gastroesophageal) and low/intermediate risk.36 Patients with high VTE risk tumor types had the highest TFPI levels (62.0, IQR, 52.0-75.0). In the high-risk group we found an association between TFPI and risk of VTE (sex, age, and stage adjusted SHR per doubling of TFPI =2.63, 95% CI: 1.40-4.94), also after adding D-dimer to the clinical covariable model (adjusted SHR per doubling of TFPI =2.49, 95% CI: 1.34-4.62). This association was not observed when analyzing patients with low/intermediate-risk tumor types (sex and age adjusted SHR per doubling of TFPI =1.34, 95% CI: 0.68-2.63).
The baseline level of TFPI was associated with risk of all-
IQR: interquartile range; VTE: venous thromboembolism; TFPI: tissue factor pathway inhibitor; EV-TF: extracellular vesicle-associated tissue factor; CRP: C-reactive protein.
cause mortality (hazard ratio [HR] =2.70, 95% CI: 2.21-3.03). In multivariable analysis (adjusting for age, sex, cancer type and stage), the association was weakened in magnitude but remained statistically significant (adjusted HR per doubling of TFPI =2.36, 95% CI: 1. 85-3.00). The 1-year and 2-year cumulative risk of all-cause mortality in patients with TFPI levels above the 75th percentile (>70 ng/ mL) and those equal to or below the 75th percentile (≤70 ng/mL) was significantly higher (47.2% vs. 21.7%; 54.4% vs. 34.7%; P<0.001 for 12-month cumulative incidence; Figure
3). Further, upon adding D-dimer or sP-selectin levels to the clinical multivariable analysis (including sex, age, stage and cancer type) the association was weakened but remained significant (D-dimer adjusted HR per doubling of TFPI =1.56, 95% CI: 1.21-2.01; sP-selectin adjusted HR per doubling of TFPI =2.15, 95% CI: 1.67-2.76, respectively). In the subgroup with EV-TF activity levels available, the addition of this biomarker to the clinical multivariable model led to a weakened but significant association (EV-TF activity adjusted HR per doubling of TFPI =2.08, 95% CI: 1.42-3.04).
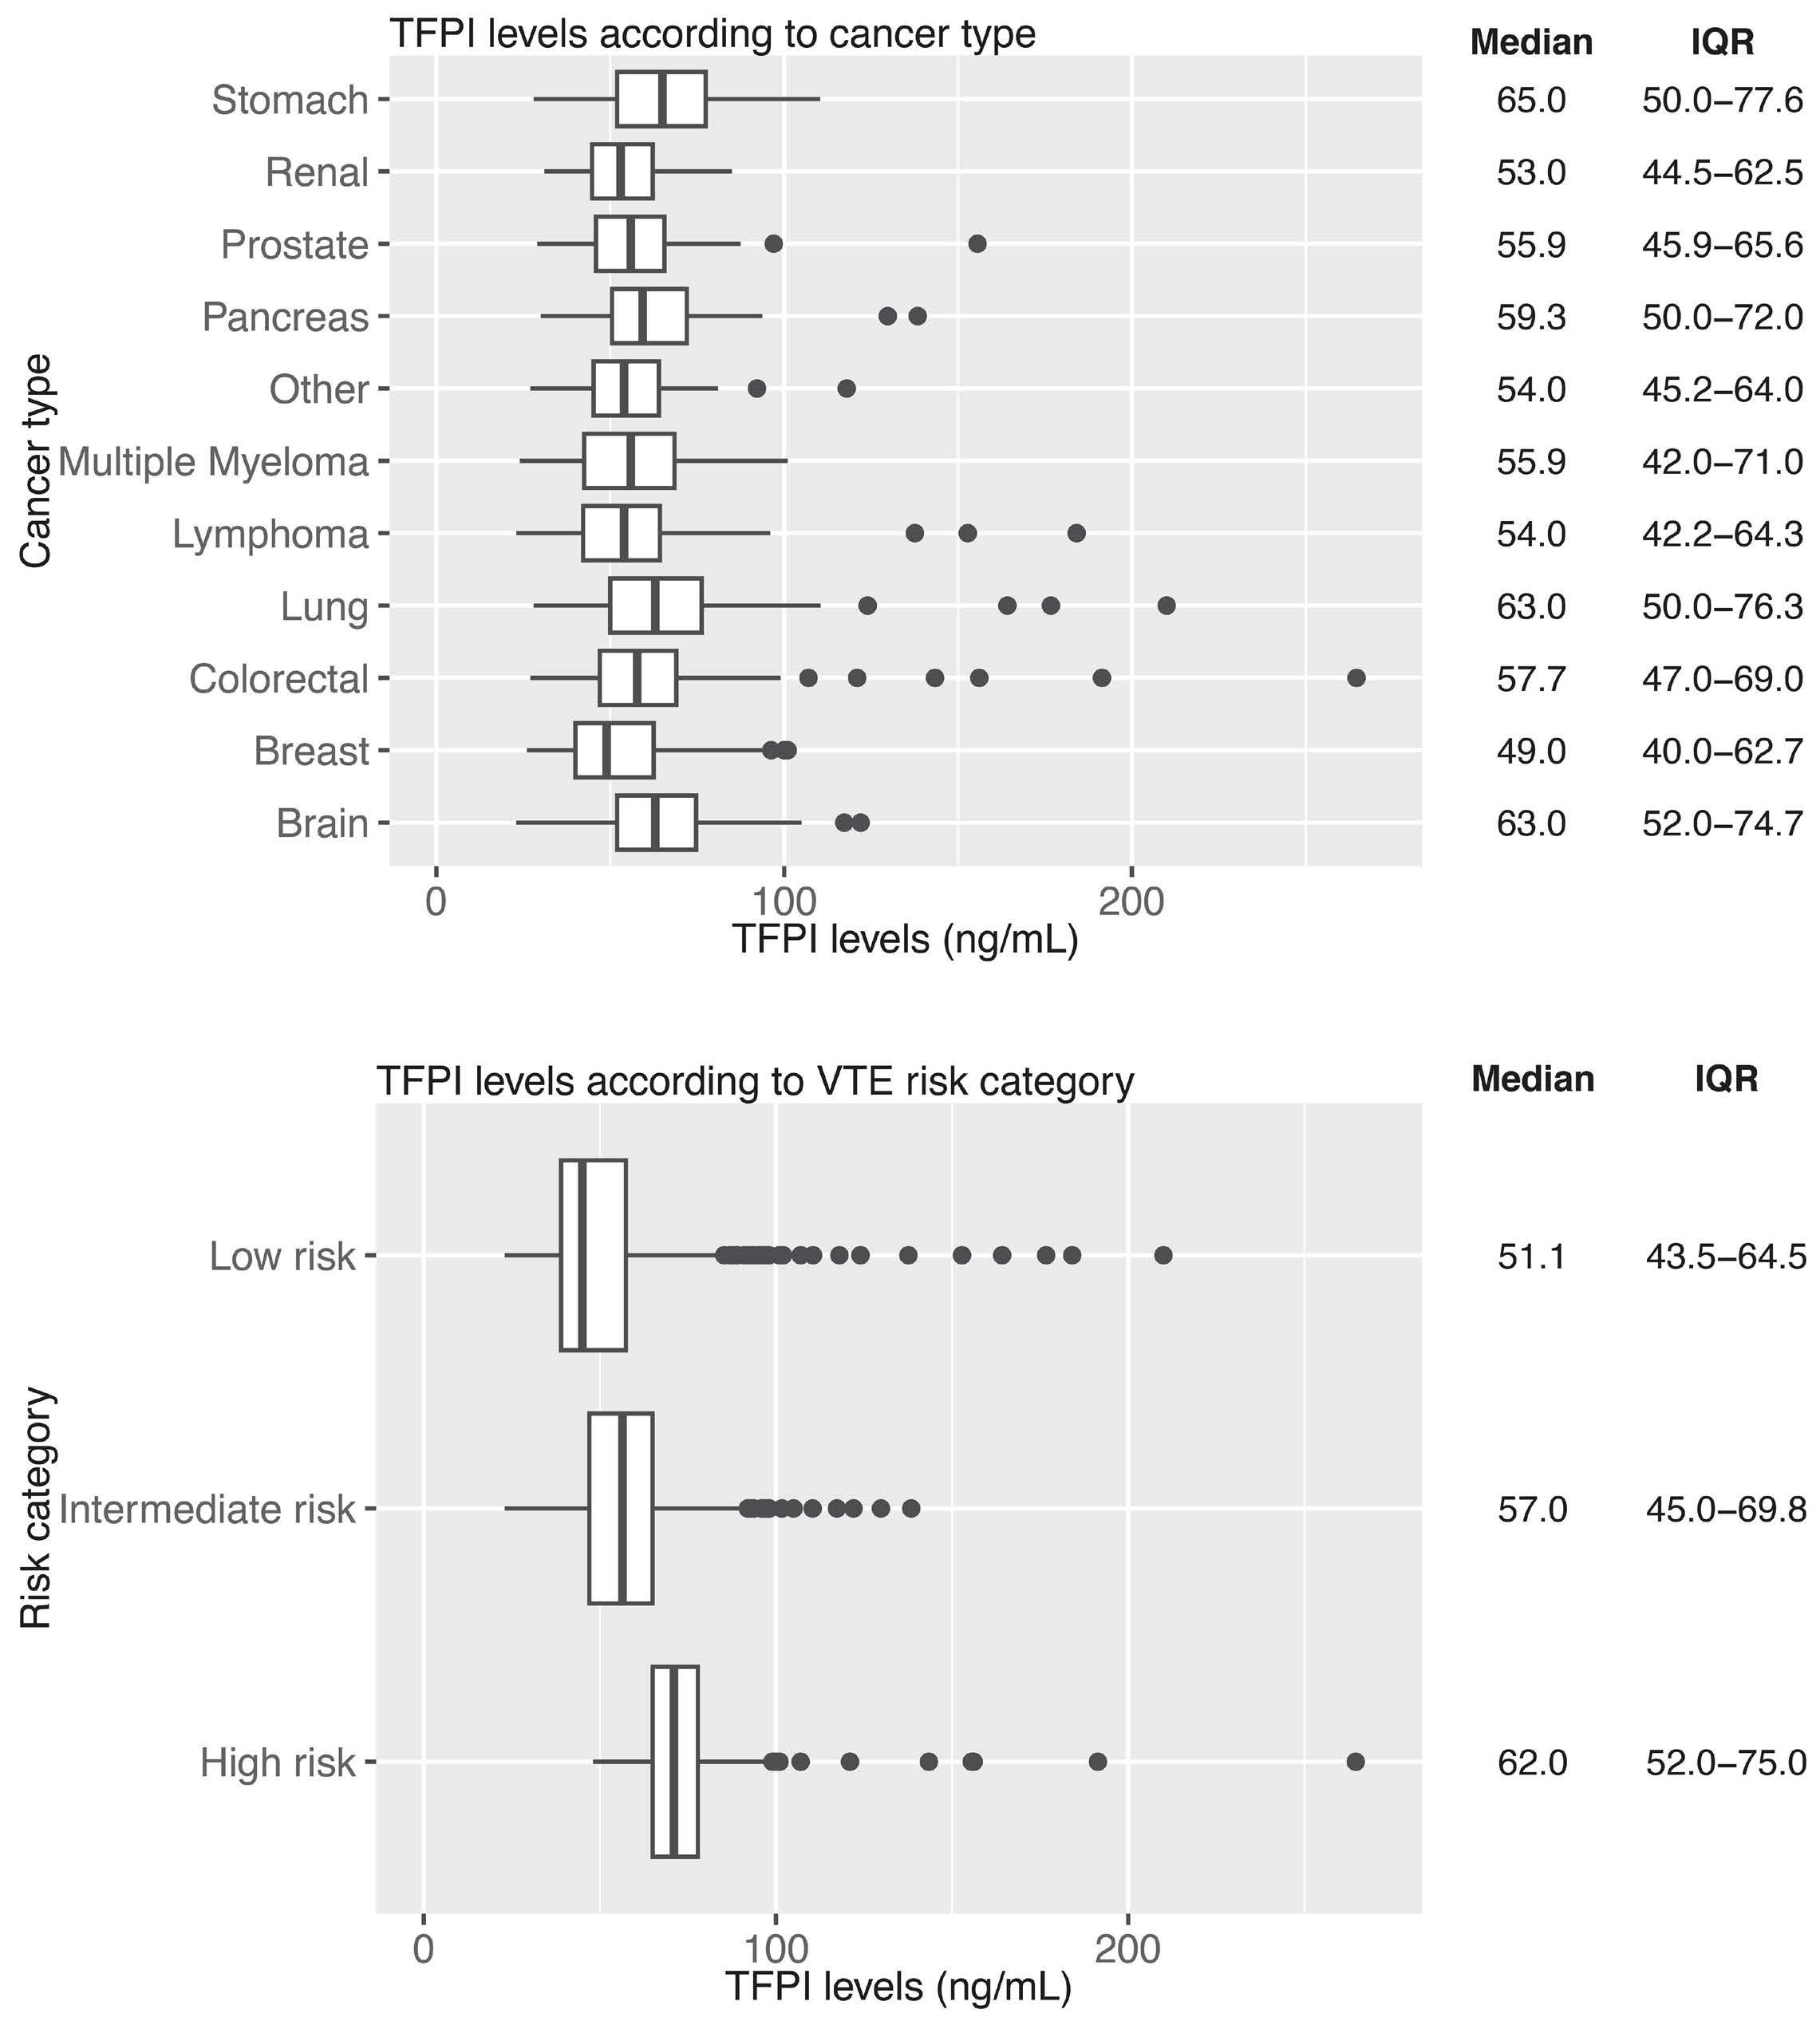
In the present prospective cohort study of patients with cancer, we found an association between TFPI levels and cancer-associated VTE and all-cause mortality. In a subgroup analysis, we identified the association between TFPI levels and risk of VTE to be refined to the population of patients with tumor types at a high risk of VTE, but not in the intermediate/low-risk population.
It is counter intuitive that higher levels of an anticoagulant are associated with cancer-associated thrombosis. However, this may be, in part, due to a change in distribution of TFPI from the endothelium into the circulation during cancer progression. Indeed, we found higher levels of circulating TFPI in patients with metastatic disease compared to patients with non-metastatic disease. This is consistent with two other studies.23,24 Patients with metastatic disease have a higher risk of VTE compared with patients with non-metastatic disease.7,37 Similar findings, i.e., an association between higher levels and adverse outcomes, were reported in the setting of arterial thrombosis and atherosclerosis studies.38
The association remained beyond clinical co-variates such as age, sex, cancer stage, and type. However, upon adding D-dimer to this clinical co-variable analysis, an established predictive biomarker for VTE in patients with cancer,32 the association between total TFPI levels and VTE did not remain statistically significant. A similar observation has been reported in a previous study of patients with acute deep vein thrombosis (DVT).39 It has been suggested that the close interrelation between TFPI and D-dimer could be due to release of fibrin-bound TFPI and D-dimer from a fibrin clot, which could explain why TFPI is higher in patients with VTE.39 However, in our study TFPI levels were not measured during an acute VTE event. Therefore, the
prediction of future VTE events with higher levels cannot be completely explained by this hypothesis. D-dimer levels are elevated in patients with cancer even in the absence of a thrombotic event and indicate a general systemic hypercoagulable state. Higher D-dimer levels have been associated with poor survival and higher risk of all-cause mortality beyond its association with increased risk of VTE in patients with cancer.6,32,40 One possible explanation for our observation could be that TFPI levels measured in our study are reflecting fibrin-bound TFPI that is co-released with D-dimer after activation of hemostasis and fibrinolysis, also in the absence of overt thrombotic manifestations. Interestingly, TFPI levels in our study correlated positively with D-dimer levels, albeit only weakly.
When adding sP-selectin to the clinical covariables, the association between TFPI levels and VTE was significantly weakened. sP-selectin was previously shown to be associated with an increased risk for cancer-associated VTE.30 Thus, some of the circulating TFPI levels might be derived from activated platelets in patients with cancer.41,42 This
CRP: C-reactive protein; EV-TF: extracellular vesicle-associated tissue factor.
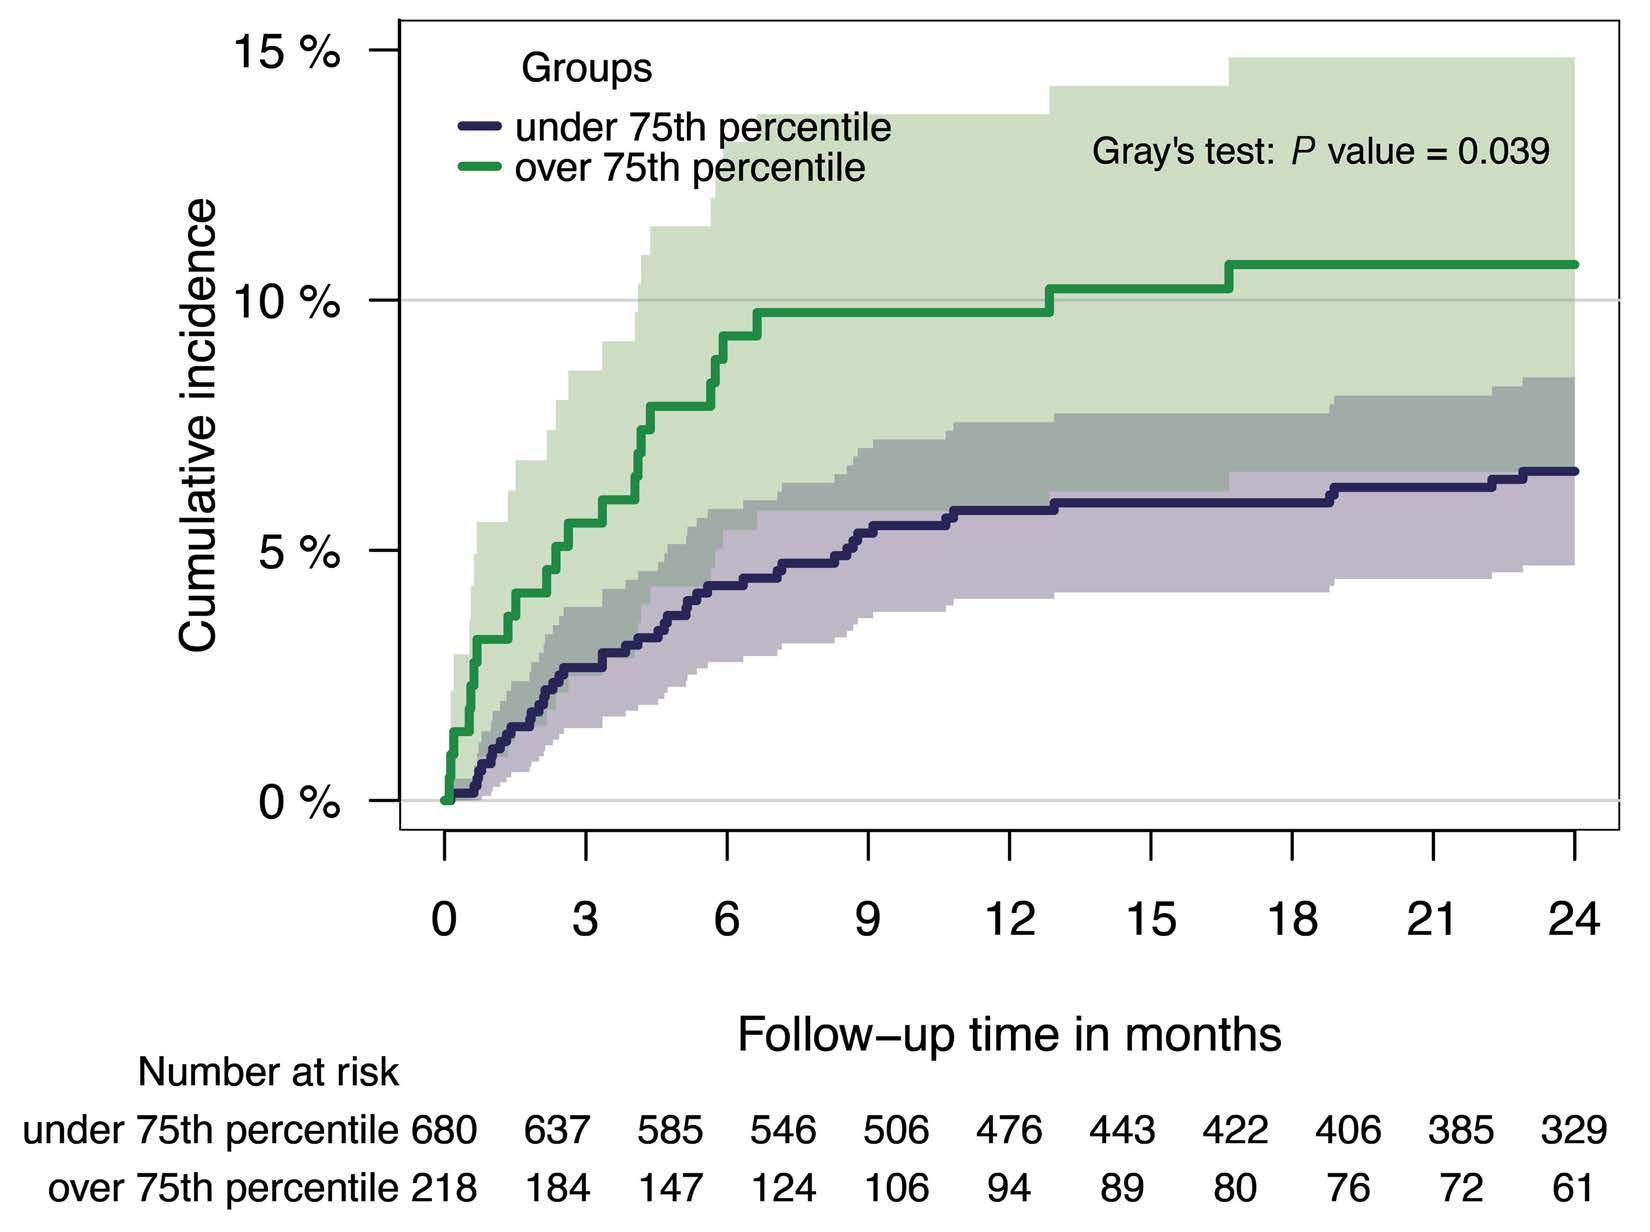
Figure 2. Cumulative venous thromboembolism incidence of patients (N=898) with tissue factor pathway inhibitor levels ≤75th (N=680) (≤70 ng/mL) versus >75th percentile (N=218) (>70 ng/mL). Patients were divided according to their tissue factor pathway inhibitor (TFPI) level and the group with levels equal to or under 70 ng/mL (≤75th percentile) was compared to the group with levels over 70 ng/mL (>75th percentile) within a Fine and Gray subdistribution hazard model, P=0.04.
hypothesis is supported by the fact that we observed a positive correlation between TFPI and sP-selectin levels. The endothelium is another potential source of the increased levels of circulating sP-selectin and TFPI.
Interestingly, the results differed when stratifying the association of TFPI levels with risk of VTE according to tumor site risk categories (i.e., high VTE risk vs. intermediate/low VTE risk tumor type groups). An independent association in the high-risk subgroup was seen, whereas this was not the case in the intermediate/low-risk group. This subgroup also had the highest TFPI levels. One explanation for this finding could be that patients with pancreatic cancer were allocated in the high-risk group. It is known that TF plays a role in VTE development in this tumor type.5,20,43 Thus, it could be speculated that its inhibitor, TPFI, might be of
importance in pancreatic cancer patients as well. Based on the known systemic hypercoagulability and subclinical hemostatic activation in patients with cancer, our study provides a suitable framework to evaluate the interrelation of TFPI in the context of other biomarkers of hemostasis and inflammation. We found a positive and weak correlation between TFPI and CRP, fibrinogen, and sP-selectin. While some studies have reported positive correlations with various coagulation factors and hemostatic biomarkers (including e.g., FVIII and D-dimer), this was not replicated by others.15,23,39,44 A weak positive correlation between TF and TFPI was described previously.45 However, it is important to note that this study used a commercial enzyme-linked immunosorbant assay to measure TF antigen levels that was shown to not reliably detect TF antigen in plasma.46 We did
Model
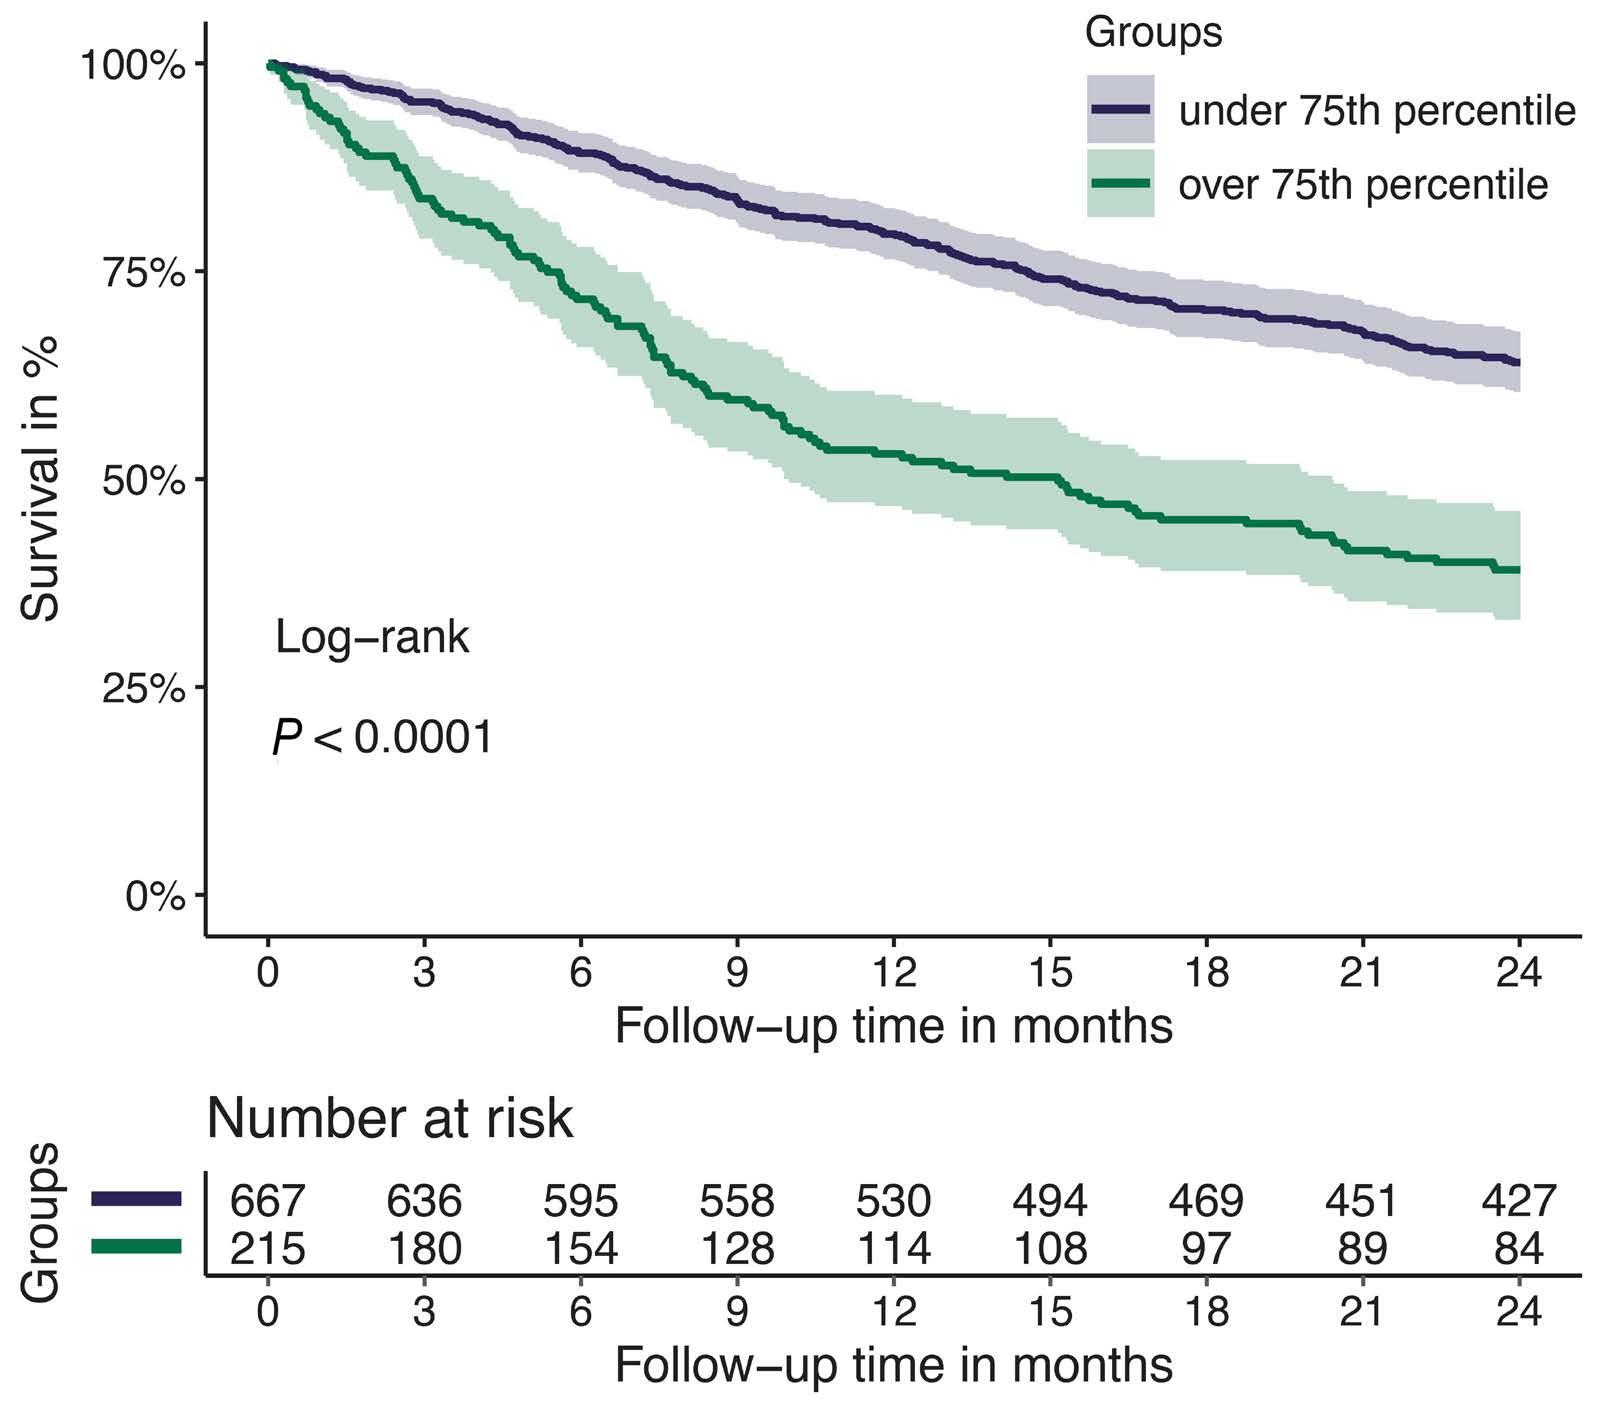
not find an association between TFPI and EV-TF activity. However, our power for this analysis was low as EV-TF was not measured in all patients, leaving us with 34 VTE events in this subgroup. Overall, our results may indicate that TFPI is a marker of disease severity and this could explain the opposing results reported previously due to different time points of measurements and patient populations.
TFPI was reported to play a role in the cancer environment as well.25 High levels were described to have a favorable effect and absence of TFPI may propagate cancer progression in experimental studies.26-28,45 Important to note is that previously no correlation between tumor TFPI and plasma TFPI levels could be established.45 This could explain why divergent results are reported, namely that high plasma TFPI levels were associated with poor overall survival in our cohort of cancer patients.
With respect to the association between TFPI and risk of mortality, we only observed a slightly weakened association when adding D-dimer, EV-TF activity or sP-selectin levels to the clinical co-variable model in multivariate analysis. The association of TFPI and mortality risk might be explained by increased plasma levels of TFPI mediated through pathways involving activation of the hemostatic system, endothelium and/or inflammation, which in return might be involved in cancer-promoting mechanisms or adverse clinical outcomes. Interestingly, we previously found an association between higher levels of antithrombin, another natural anticoagulant, and all-cause mortality in patients with cancer, specifically in those with brain tumors.47
Elevated EV-TF activity levels were reported to be associated with increased VTE risk and in specific cancer types with poor overall survival.5,20,48 Interestingly, in our cohort,
Figure 3.
(N=898)
tissue factor pathway inhibitor levels ≤75th (N=680) (≤70 ng/mL) versus >75th percentile (N=218) (>70 ng/mL). Patients were divided according to their tissue factor pathway inhibitor level and the group with levels equal to or under 70 ng/mL (≤75th percentile) was compared to the group with levels over 70 ng/mL (>75th percentile) within a Kaplan-Meier analysis and with a log-rank test, P<0.001.
TFPI levels were higher in patients with metastatic disease, similarly to higher TF levels that were previously reported.20 Our observation that adding EV-TF activity to the multivariate analysis did not influence the association of TFPI and VTE risk, could indicate that TFPI might have a better predictive capacity than TF in a heterogeneous cohort of cancer patients. Important to note is that this was only a subgroup analysis as EV-TF activity was available in a small group of patients. Furthermore, these patients were mostly the ones with a high VTE risk tumor type, of which especially patients with pancreatic tumors are known to have elevated EV-TF activity.22 Thus, TFPI could act as a surrogate marker, as the physiological response to elevated TF levels could be an increase in TFPI levels to maintain the hemostatic balance as proposed previously.49 In addition, EV captured from plasma using an anti-TF antibody were shown to contain TFPI.18 Further, it was reported that TF activity of EV isolated from plasma is increased in the presence of an anti-TFPI antibody, thus, this data suggests that TFPI is bound to TF+ EV.19
TF is a biomarker that was found to have predictive and prognostic capacity in patients with cancer, most pronounced in patients with pancreatic cancer.5 However, most of the methods purported to measure TF in plasma are not reliable or are highly variable and, therefore, cannot be used in the clinic.50 Thus, TFPI might be more reliable and reproducible to measure in the clinical setting. Generally, hemostatic biomarkers that have a predictive or prognostic potential are of interest in oncological research. Various markers have shown to have this potential and might aid in personalized clinical decision making in oncology.6 The study had some limitations. Firstly, there is no stan-
dardized TFPI measurement. However, we decided to measure total TFPI antigen levels with a widely used commercial enzyme-linked immunsorbant assay in plasma samples. Second, EV-TF activity levels were not available in all patients and there was some missing data. Third, we could not investigate endothelial activation due to the lack of an adequate marker. Furthermore, prophylactic heparin injections were not an exclusion criterion in our study, and heparins were shown to lead to a transient but short increase of TFPI plasma levels. However, only a very small proportion (<5%) of patients received prophylactic heparin injections 12-24 hours before blood sampling. Lastly, our analysis was exploratory in nature. We used a predefined cutoff (75th percentile of TFPI levels of the whole cohort) for elevated levels and thus, in the future validation and further investigations of the causality of our findings are needed.
To conclude, TFPI levels are associated with risk of VTE and all-cause mortality in a prospective cohort of patients with cancer. TFPI levels might represent a surrogate marker for hemostatic activation and thus should be further investigated in independent studies.
1. Mulder FI, Horváth-Puhó E, van Es N, et al. Venous thromboembolism in cancer patients: a population-based cohort study. Blood. 2021;137(14):1959-1969.
2. Grilz E, Posch F, Nopp S, et al. Relative risk of arterial and venous thromboembolism in persons with cancer vs. persons without cancer-a nationwide analysis. Eur Heart J. 2021;42(23):2299-2307.
3. Khorana AA, Mackman N, Falanga A, et al. Cancer-associated venous thromboembolism. Nat Rev Dis Primers. 2022;8(1):11.
4 Moik F, Posch F, Grilz E, et al. Haemostatic biomarkers for prognosis and prediction of therapy response in patients with metastatic colorectal cancer. Thromb Res. 2020;187:9-17.
5. Moik F, Prager G, Thaler J, et al. Hemostatic biomarkers and venous thromboembolism are associated with mortality and response to chemotherapy in patients with pancreatic cancer. Arterioscler Thromb Vasc Biol. 2021;41(11):2837-2847.
6. Moik F, Ay C. Hemostasis and cancer: impact of haemostatic biomarkers for the prediction of clinical outcomes in patients with cancer. J Thromb Haemost. 2022;20(12):2733-2745.
7 Chew HK, Wun T, Harvey D, Zhou H, White RH. Incidence of venous thromboembolism and its effect on survival among patients with common cancers. Arch Intern Med. 2006;166(4):458-464.
8. Ay C, Pabinger I, Cohen AT. Cancer-associated venous thromboembolism: burden, mechanisms, and management. Thromb Haemost. 2017;117(2):219-230.
9 Hisada Y, Grover SP, Maqsood A, et al. Neutrophils and neutrophil extracellular traps enhance venous thrombosis in mice bearing human pancreatic tumors. Haematologica. 2020;105(1):218-225.
10. Hisada Y, Ay C, Auriemma AC, Cooley BC, Mackman N. Human pancreatic tumors grown in mice release tissue factor-positive
Disclosures
MP has received honoraria for lectures, consultation or advisory board participation from the following companies: Bayer, Bristol-Myers Squibb, Novartis, Gerson Lehrman Group (GLG), CMC Contrast, GlaxoSmithKline, Mundipharma, Roche, BMJ Journals, MedMedia, Astra Zeneca, AbbVie, Lilly, Medahead, Daiichi Sankyo, Sanofi, Merck Sharp & Dome, Tocagen, Adastra, Gan & Lee Pharmaceuticals and Servier.
CE and CA developed the concept of the study. SK and JT performed measurements. CE and FM performed data analysis. NM and IP supervised the project. MP, IP and CP recruited patients. All authors drafted and revised the manuscript.
We would like to thank Dr. Daniel Kraemmer for his statistical advice.
The data presented in this study are available on request from the corresponding author.
microvesicles that increase venous clot size. J Thromb Haemost. 2017;15(11):2208-2217.
11. Riedl J, Preusser M, Nazari PM, et al. Podoplanin expression in primary brain tumors induces platelet aggregation and increases risk of venous thromboembolism. Blood. 2017;129(13):1831-1839.
12. Kasthuri RS, Glover SL, Boles J, Mackman N. Tissue factor and tissue factor pathway inhibitor as key regulators of global hemostasis: measurement of their levels in coagulation assays. Semin Thromb Hemost. 2010;36(7):764-771.
13. Lindahl AK, Sandset PM, Abildgaard U. The present status of tissue factor pathway inhibitor. Blood Coagul Fibrinolysis. 1992;3(4):439-449.
14 Dahm A, Van Hylckama Vlieg A, Bendz B, et al. Low levels of tissue factor pathway inhibitor (TFPI) increase the risk of venous thrombosis. Blood. 2003;101(11):4387-4392.
15. Zakai NA, Lutsey PL, Folsom AR, Heckbert SR, Cushman M. Total tissue factor pathway inhibitor and venous thrombosis. The longitudinal investigation of thromboembolism etiology. Thromb Haemost. 2010;104(2):207-212.
16. Amini-Nekoo A, Futers TS, Moia M, et al. Analysis of the tissue factor pathway inhibitor gene and antigen levels in relation to venous thrombosis. Br J Haematol. 2001;113(2):537-543.
17 Ariëns RA, Alberio G, Moia M, Mannucci PM. Low levels of heparin-releasable tissue factor pathway inhibitor in young patients with thrombosis. Thromb Haemost. 1999;81(2):203-207.
18. Franco C, Lacroix R, Vallier L, et al. A new hybrid immunocapture bioassay with improved reproducibility to measure tissue factor-dependent procoagulant activity of microvesicles from body fluids. Thromb Res. 2020;196:414-424.
19. Sachetto ATA, Mackman N. Tissue factor and COVID-19: an update. Curr Drug Targets. 2022;23(17):1573-1577.
20 Hisada Y, Mackman N. Tissue factor and cancer: regulation, tumor growth, and metastasis. Semin Thromb Hemost. 2019;45(4):385-395.
21. Lawaetz M, Christensen A, Juhl K, et al. Potential of uPAR, αvb6 integrin, and tissue factor as targets for molecular imaging of oral squamous cell carcinoma: evaluation of Nine targets in primary tumors and metastases by Immunohistochemistry. Int J Mol Sci. 2023;24(4):3853.
22. Thaler J, Ay C, Mackman N, et al. Microparticle-associated tissue factor activity, venous thromboembolism and mortality in pancreatic, gastric, colorectal and brain cancer patients. J Thromb Haemost. 2012;10(7):1363-1370.
23. Iversen N, Lindahl AK, Abildgaard U. Elevated TFPI in malignant disease: relation to cancer type and hypercoagulation. Br J Haematol. 1998;102(4):889-895.
24. Lindahl AK, Sandset PM, Abildgaard U, Andersson TR, Harbitz TB. High plasma levels of extrinsic pathway inhibitor and low levels of other coagulation inhibitors in advanced cancer. Acta Chir Scand. 1989;155(8):389-393.
25. Sierko E, Wojtukiewicz MZ, Kisiel W. The role of tissue factor pathway inhibitor-2 in cancer biology. Semin Thromb Hemost. 2007;33(7):653-659.
26. Amirkhosravi A, Meyer T, Chang JY, et al. Tissue factor pathway inhibitor reduces experimental lung metastasis of B16 melanoma. Thromb Haemost. 2002;87(6):930-936.
27. Stavik B, Skretting G, Aasheim HC, et al. Downregulation of TFPI in breast cancer cells induces tyrosine phosphorylation signaling and increases metastatic growth by stimulating cell motility. BMC Cancer. 2011;11:357.
28. Williams L, Tucker TA, Koenig K, et al. Tissue factor pathway inhibitor attenuates the progression of malignant pleural mesothelioma in nude mice. Am J Respir Cell Mol Biol. 2012;46(2):173-179.
29. Ay C, Jungbauer LV, Sailer T, et al. High concentrations of soluble P-selectin are associated with risk of venous thromboembolism and the P-selectin Thr715 variant. Clin Chem. 2007;53(7):1235-1243.
30 Ay C, Simanek R, Vormittag R, et al. High plasma levels of soluble P-selectin are predictive of venous thromboembolism in cancer patients: results from the Vienna Cancer and Thrombosis Study (CATS). Blood. 2008;112(7):2703-2708.
31. Hisada Y, Mackman N. Measurement of tissue factor activity in extracellular vesicles from human plasma samples. Res Pract Thromb Haemost. 2019;3(1):44-48.
32. Ay C, Vormittag R, Dunkler D, et al. D-dimer and prothrombin fragment 1 + 2 predict venous thromboembolism in patients with cancer: results from the Vienna Cancer and Thrombosis Study. J Clin Oncol. 2009;27(25):4124-4129.
33. Tiedje V, Dunkler D, Ay C, et al. The role of fibrinogen plasma levels, the -455G>A fibrinogen and the factor XIII A subunit (FXIII-A) Val34Leu polymorphism in cancer-associated venous thrombosis. Thromb Haemost. 2011;106(5):908-913.
34 Kanz R, Vukovich T, Vormittag R, et al. Thrombosis risk and survival in cancer patients with elevated C-reactive protein. J Thromb Haemost. 2011;9(1):57-63.
35. Ay C, Posch F, Kaider A, Zielinski C, Pabinger I. Estimating risk of venous thromboembolism in patients with cancer in the
presence of competing mortality. J Thromb Haemost. 2015;13(3):390-397.
36. Pabinger I, van Es N, Heinze G, et al. A clinical prediction model for cancer-associated venous thromboembolism: a development and validation study in two independent prospective cohorts. Lancet Haematol. 2018;5(7):e289-e298.
37. Dickmann B, Ahlbrecht J, Ay C, et al. Regional lymph node metastases are a strong risk factor for venous thromboembolism: results from the Vienna Cancer and Thrombosis Study. Haematologica. 2013;98(8):1309-1314.
38. Winckers K, ten Cate H, Hackeng TM. The role of tissue factor pathway inhibitor in atherosclerosis and arterial thrombosis. Blood Rev. 2013;27(3):119-132.
39 Sidelmann JJ, Bladbjerg EM, Gram J, Münster AM, Jespersen J. Tissue factor pathway inhibitor relates to fibrin degradation in patients with acute deep venous thrombosis. Blood Coagul Fibrinolysis. 2008;19(5):405-409.
40. Posch F, Riedl J, Reitter EM, et al. Dynamic assessment of venous thromboembolism risk in patients with cancer by longitudinal D-Dimer analysis: a prospective study. J Thromb Haemost. 2020;18(6):1348-1356.
41. Riedl J, Kaider A, Marosi C, et al. Decreased platelet reactivity in patients with cancer is associated with high risk of venous thromboembolism and poor prognosis. Thromb Haemost. 2017;117(1):90-98.
42. Riedl J, Pabinger I, Ay C. Platelets in cancer and thrombosis. Hamostaseologie. 2014;34(1):54-62.
43. Hisada Y, Mackman N. Cancer cell-derived tissue factor-positive extracellular vesicles: biomarkers of thrombosis and survival. Curr Opin Hematol. 2019;26(5):349-356.
44 Yamanaka S, Miyake R, Yamada Y, et al. Tissue factor pathway inhibitor 2: a novel biomarker for predicting asymptomatic venous thromboembolism in patients with epithelial ovarian cancer. Gynecol Obstet Invest. 2022;87(2):133-140.
45. Tinholt M, Vollan HK, Sahlberg KK, et al. Tumor expression, plasma levels and genetic polymorphisms of the coagulation inhibitor TFPI are associated with clinicopathological parameters and survival in breast cancer, in contrast to the coagulation initiator TF. Breast Cancer Res. 2015;17(1):44.
46. Lee RD, Barcel DA, Williams JC, et al. Pre-analytical and analytical variables affecting the measurement of plasmaderived microparticle tissue factor activity. Thromb Res. 2012;129(1):80-85.
47. Englisch C, Königsbrügge O, Nopp S, et al. Antithrombin activity and assocciation with risk of thrombosis and mortality in patients with cancer. Int J Mol Sci. 2022;23(24):15770.
48. van Es N, Hisada Y, Di Nisio M, et al. Extracellular vesicles exposing tissue factor for the prediction of venous thromboembolism in patients with cancer: a prospective cohort study. Thromb Res. 2018;166:54-59.
49 Mann KG, Orfeo T, Butenas S, Undas A, Brummel-Ziedins K. Blood coagulation dynamics in haemostasis. Hamostaseologie. 2009;29(1):7-16.
50 Mackman N, Sachetto ATA, Hisada Y. Measurement of tissue factor-positive extracellular vesicles in plasma: strengths and weaknesses of current methods. Curr Opin Hematol. 2022;29(5):266-274.
Eily Cournoyer,1* Justin Ferrell,1* Susan Sharp,2 Anish Ray,3 Michael Jordan,4 Christopher Dandoy,4 Michael Grimley,4 Somak Roy,5 Robert Lorsbach,5 Arnold C. Merrow,2 Adam Nelson,4 Allison Bartlett,4 Jennifer Picarsic5 and Ashish Kumar4
1Cincinnati Children’s Hospital Medical Center Pediatric Residency Training Program, Cincinnati, OH; 2University of Cincinnati College of Medicine, Division of Radiology, Cincinnati Children’s Hospital Medical Center, Cincinnati, OH; 3Division of Hematology and Oncology, Cook Children’s Hospital, Fort Worth, TX; 4University of Cincinnati College of Medicine, Division of Bone Marrow Transplant and Immune Deficiency, Cincinnati Children’s Hospital Medical Center, Cincinnati, OH and 5University of Cincinnati College of Medicine, Division of Pathology, Cincinnati Children’s Hospital Medical Center, Cincinnati, OH, USA
*EC and JF contributed equally as first authors.
Correspondence: A. Kumar
Ashish.kumar@cchmc.org
Received: April 6, 2023.
Accepted: September 4, 2023.
Early view: September 21, 2023.
https://doi.org/10.3324/haematol.2023.283295
©2024 Ferrata Storti Foundation
Published under a CC BY-NC license
The standard treatment for Langerhans cell histiocytosis (LCH) is chemotherapy, although the failure rates are high. Since MAP-kinase activating mutations are found in most cases, BRAF- and MEK-inhibitors have been used successfully to treat patients with refractory or relapsed disease. However, data on long-term responses in children are limited and there are no data on the use of these inhibitors as first-line therapy. We treated 34 patients (26 with LCH, 2 with juvenile xanthogranuloma, 2 with Rosai-Dorfman disease, and 4 with presumed single site-central nervous system histiocytosis) with dabrafenib and/or trametinib, either as first line or after relapse or failure of chemotherapy. Sixteen patients, aged 1.3-21 years, had disease that was recurrent or refractory to chemotherapy, nine of whom had multisystem LCH with risk-organ involvement. With a median treatment duration of 4.3 years, 15 (94%) patients have sustained favorable responses. Eighteen patients, aged 0.2-45 years, received an inhibitor as first-line treatment. All of these have had sustained favorable responses, with a median treatment duration of 2.5 years. Three patients with presumed isolated central nervous system/pituitary stalk histiocytosis had stabilization or improvement of their disease. Overall, inhibitors were well tolerated. Five patients with single-system LCH discontinued therapy and remain off therapy without recurrence. In contrast, all four patients with multisystem disease who discontinued therapy had to restart treatment. Our data suggest that children suffering from histiocytoses can be treated safely and effectively with dabrafenib or trametinib. Additional studies are, however, needed to determine the long-term safety and optimal duration of therapy.
Histiocytic diseases are rare neoplastic disorders resulting from the aberrant accumulation of cells of the monocyte lineage, namely macrophages or dendritic cells.1 The most common and well-studied histiocytic disease is Langerhans cell histiocytosis (LCH), a condition characterized by accumulation of clonal CD1a+ and CD207+ cells.2 LCH affects approximately one in 200,000 children and is most common in children 1 to 3 years old, but can present at any age.3 Clinical manifestations of LCH are highly variable, ranging from isolated, self-limiting lesions to multi-organ disease that is associated with significant morbidity and mortality. Traditionally, the first-line treatment for LCH has been vinblastine and systemic steroids, based on the
last international randomized controlled study nearly a decade ago (called LCH-III).4 Patients with multisystem (MS) LCH with involvement of liver, spleen, or bone marrow i.e. with so-called risk-organ involvement (RO+), have a variable course, with only about 60% achieving a status of not having active disease after 1 year on standard LCH-III therapy. In MS-LCH without risk organ involvement (MS RO–), the relapse/reactivation rate after 1 year of standard therapy with vinblastine and prednisone is still about 37%.4 Second-line agents have included cytarabine and/ or cladribine, or clofarabine for recurrent disease or for disease that failed to respond to standard of care.5 These chemotherapy treatments carry a high risk of morbidity, require central access for the duration of treatment, and are not always effective in MS RO+ and central nervous
system (CNS) disease.6 These regimens are associated with severe hematologic toxicities, often requiring transfusion support, as well as delayed immune reconstitution and grade IV neutropenia, with associated blood stream infections. These toxicities are a high price to pay given the persistent risk of disease reactivation both during and after therapy.5
The ontology of LCH lesions has been linked to bone marrow-derived myeloid dendritic precursor cells. Activating mutations in the mitogen-activated protein kinase (MAPK) pathway play a central role in the pathogenesis of LCH.7-13 Approximately 50-60% of LCH lesions harbor a recurrent activating mutation in the BRAF gene, specifically BRAF-V600E.14,15 Furthermore, even in cases without the BRAF-V600E mutation, there is ubiquitous activation of downstream phosphorylated kinases, phospho-MEK and phospho-ERK. This suggests that activation of the BRAF-MEK-ERK axis is universal in this disease, regardless of BRAF-V600E mutational status.16 Given these findings, there has been growing interest in BRAF-MEK-ERK pathway inhibitors for the treatment of histiocytic diseases. Several studies have shown that BRAF and MEK inhibitors hold promise as salvage therapy for the treatment of high-risk LCH, particularly for patients with multisystem disease or those with risk organ involvement.17-24 The utility and feasibility of these treatments as first-line therapies have yet to be elucidated.
Herein, we describe our experience using dabrafenib, a BRAF inhibitor, and trametinib, a MEK inhibitor, to treat LCH and other histiocytic disorders. We initially treated several children whose disease was refractory to conventional treatments or who had relapsed after therapy. Based on the observed responses and safety profiles in these patients, we offered targeted, first-line inhibitor therapy to newly diagnosed patients. All patients were treated off-label as described in detail under the methods section.
Several children were referred to us for refractory or relapsed LCH. With consistent positive results of dabrafenib and trametinib in these patients, we proposed a clinical trial of inhibitors in the first-line setting to several companies.17,25 However, none was able to support a trial. We therefore offered newly diagnosed patients the choice of treatment with conventional chemotherapy or an inhibitor. The justifications of this approach were the demonstrable efficacy of inhibitors in patients with refractory disease, and our goals of treatment, namely restoration of health and prevention of disease recurrence. The benefits and risks of conventional and targeted therapies were discussed in detail with the patient/parent, including the
unknown potential for cure and unknown duration of optimal therapy for the latter. Patients and families were informed in detail about the off-label use of the agents and all were given the option of treatment with conventional chemotherapies. Patients receiving inhibitors were monitored for adverse effects with regular complete blood counts, blood chemistry panels, and echocardiograms.
The Institutional Review Board of Cincinnati Children’s Hospital Medical Center certified this retrospective study as exempt from oversight and from requiring informed consent.
The diagnosis was confirmed via histopathology, when tissue samples were attainable (n=28), by expert pediatric pathologists (RL and JP). LCH was classified as single system or multisystem, and being with or without involvement of risk organs (liver, bone marrow, spleen). Mutations were identified by VE1-immunohistochemistry (BRAF-V600E) or next-generation sequencing. Patients with diabetes insipidus and accompanying imaging findings of isolated pituitary stalk infiltration/thickening and/or loss of a posterior pituitary bright spot were classified as having isolated pituitary lesions. Other CNS manifestations (abnormal T2 signal in cerebellar nuclei or white matter, pontine lesions, cerebellar atrophy) were classified as isolated CNS LCH or neurodegenerative LCH. In cases of isolated pituitary or CNS disease, the presumed diagnosis was based on location and radiological characteristics.
Clinical status and radiological changes were used to assess response to therapy following the Histiocyte Society guidelines. Overall responses were classified as no active disease, active disease that was better since starting therapy, active disease that was progressing, or active disease that was stable. For patients with irreversible diabetes insipidus the response was recorded separately from overall disease response. For example, in patients with MS-LCH and diabetes insipidus, complete resolution of non-pituitary disease was recorded as no active disease with diabetes insipidus. Similarly, for patients with irreversible sclerosing cholangitis present at the time of initiating inhibitor treatment, the overall disease response was separated from the liver disease (e.g., no active disease with sclerosing cholangitis).
The imaging modalities used to assess response to treatment included positron emission tomography - computerized tomography scan (PET/CT), magnetic resonance imaging, CT scan, and ultrasound. For PET scans, the initial maximum standardized uptake value (SUVmax) was compared to the SUVmax of the same lesion on the first follow-up PET/CT for patients who had a PET/CT scan on record at the time of starting the inhibitor and at follow-up within 1 year of starting the medication. PET findings were considered to indicate progressive disease, stable disease, improved disease, or complete resolution
based on interval changes in SUVmax values, as well as the number of lesions. There was not an absolute SUV value that was used as a negative cutoff. When looking at the response of LCH lesions to treatment, lesions were compared to the local background. For example, we would determine whether a skeletal lesion continued to have uptake greater than the adjacent uninvolved bone or whether a liver lesion still had uptake above that of the uninvolved liver. This classification was then used in conjunction with clinical status to determine the overall response.
When feasible, patients with a known BRAF-V600E mutation had their peripheral blood analyzed for the presence of circulating mutant cells by real-time polymerase chain reaction (RT-PCR) or by droplet digital polymerase chain reaction (ddPCR) (using DNA derived from peripheral blood mononuclear cells, available at our institution as HistioTrak). The platform for HistioTrak is a standard ddPCR system (BioRad, Inc) that is optimized to maximize signal-to-noise ratio at mutation levels that are below a variant allele frequency of 0.01%. Fractional abundance or a variant allele frequency <0.001% is considered a negative result. The term “significant or not significant” is not used for clinical reporting of HistioTrak results.
This study was a single-center, retrospective chart review of 34 patients with histiocytic disease who were treated with dabrafenib and/or trametinib. The patients’ characteristics and outcomes are tabulated in Tables 1 and 2. Thirty-four patients (12 females, 22 males) aged 0.2 to 45 years old were treated with targeted inhibitor therapy. Sixteen patients had received systemic treatment for their histiocytosis prior to initiation of the inhibitor and 18 received the inhibitor without prior treatment (see details under Methods). The median age of the patients at diagnosis was 2.3 years and the median age at the start of inhibitor therapy was 1.9 years. The patients’ characteristics, average time on inhibitor treatment, risk organ involvement, mutation, site(s) of disease, inhibitor used, histiocytic disease classification, response at last follow-up, and adverse effects are detailed in Table 1 for those with relapsed/refractory disease and in Table 2 for those treated with a targeted inhibitor as first-line therapy.
Details of the 16 patients who received the targeted inhibitor after undergoing earlier histiocytic disease-specific therapy can be viewed in Table 1. Thirteen patients had
biopsy-confirmed LCH; nine patients had MS RO+ disease and four patients had multisystem disease without involvement of risk organs (MS RO–). Of these, one had MS RO+ LCH with CNS involvement and one had MS RO– LCH with pituitary stalk involvement. One patient had isolated CNS involvement (central diabetes insipidus, progressive ataxia and cognitive dysfunction) that could not be biopsied because of the location of disease, however the imaging findings were highly characteristic of LCH (loss of posterior pituitary bright spot, abnormal T2 signal in white matter and cerebellum, and progressive cerebellar volume loss). Two patients had systemic Rosai-Dorfman disease (patient #15: lymph node and CNS disease; patient #16: skin, bone and lymph node disease). Of the 14 patients with tissue samples available for analysis, 13 had mutations in BRAF-MEK-ERK pathway genes (BRAF-V600E, n=12; MAP2K1, n=1). In this cohort, the median age of initiation of inhibitor treatment was 2.4 years (range, 1.3-31). Seven patients received dabrafenib, seven received trametinib, and two patients received both drugs simultaneously. The rationale for the combination therapy for patient #14 was the unknown mutation and the lack of data on the impact of inhibitors in CNS LCH at the time of initiation of treatment, while for patient #15 dabrafenib was added to help to reduce the acneiform rash with trametinib.26 The median length of time that this group has been treated with the inhibitor is 4.3 years (range, 0.3-7.3 years). As shown in Figure 1, in this group, six patients with LCH no longer have active disease, six do not have active disease but have residual organ damage (4 with diabetes insipidus, 1 with sclerosing cholangitis, and 1 with both diabetes insipidus and sclerosing cholangitis). Of the two patients with Rosai-Dorfman disease, one has stable disease, while the other suffered progressive disease. The patient with isolated CNS disease (patient #14) had improvement of neurological symptoms and function.
Patients receiving inhibitor as first-line therapy
Eighteen patients were treated with targeted inhibitors as first-line therapy (Table 2). Thirteen patients had biopsy-confirmed LCH; seven patients had single-system disease, three patients had MS RO– disease (1 with CNS involvement), and three patients had MS RO+ disease. Four patients with single-system LCH had solitary bone lesions and received treatment due to location (CNS risk) and/or rapid growth of the lesion or persistence of pain. There were two patients with isolated CNS or pituitary stalk lesion(s) that could not be biopsied due to the location of the disease, however their imaging findings were highly characteristic of LCH (abnormal T2 signal in white matter and deep cerebellar nuclei). One patient with isolated CNS disease (#32) was found to have circulating BRAF-V600E+ cells via peripheral blood ddPCR, suggesting LCH as the likely diagnosis (Figure 2). Two patients had progressive systemic juvenile xanthogranuloma. In this cohort, four
Table 1. Trametinib and/or dabrafenib treatment for relapsed or refractory disease. Disease classifications, mutations, and response to trametinib and/or dabrafenib in patients who received prior therapy for their histiocytic disorder.
PB
1
2
3
4
5
RO+ BM, bone, skin BRAF V600E
(i) VBL, CS
(ii) EPEG, CS, CTX (iii)
(i) VBL, CS (ii) ARA-C (iii)
(i)
(i)
6
(i)
16
Pt #: patient number; yrs: years; Dx: diagnosis; ITx: inhibitor treatment; FU: follow-up; recur.: recurrence; PB: peripheral blood; RT-PCR: real-time polymerase chain reaction; ddPCR: droplet digital polymerase chain reaction; LCH: Langerhans cell histiocytosis; MS: multisystem; RO+/–: risk organ positive/negative; BM: bone marrow; VBL: vinblastine; CS: corticosteroid; EPEG: etoposide; CTX: cyclophosphamide; CAFdA: clofarabine; DAB: dabrafenib; NAD: no active disease; Y: yes; wks: weeks; LN: lymph node; MTX: methotrexate; MP: mercaptopurine; ARA-C: cytarabine; NAD + DI: no active disease with residual diabetes insipidus; mths: months; NA: not applicable; BM: bone marrow; N: no; ND: not done; CNS: central nervous system; TRA: trametinib; PS: pituitary stalk; DR: dose reduction; ADB: active disease, better; LCH-ND: neurodegenerative LCH; RDD: Rosai-Dorfman disease; ADS: active disease, stable; ADP: active disease, progressing.
**Identified by droplet digital polymerase chain reaction (ddPCR) because no tissue was available due to isolated central nervous system involvement. ***Restarted 18 months after a trial off therapy when noted to be ddPCR-positive in peripheral blood. Pt #: patient number; yrs: years; Dx: diagnosis; ITx: inhibitor treatment; Y: yes; N: no; recur.: recurrence; PB: peripheral blood; RT-PCR: real-time polymerase chain reaction; ddPCR: droplet digital polymerase chain reaction; F: female; LCH: Langerhans cell histiocytosis; MS: multisystem; RO+/–: risk organ positive/negative; LN: lymph node; DAB: dabrafenib; TRA: trametinib; PP: parental preference; NAD: no active disease; BM: bone marrow; NA: not applicable; GI: gastrointestinal; CNS: central nervous system; DI: diabetes insipidus; SS: single system; ND: not done; PS: pituitary stalk; DR: dose reduction; JXG: juvenile xanthogranuloma; NAD + DI: no active disease with residual diabetes insipidus.
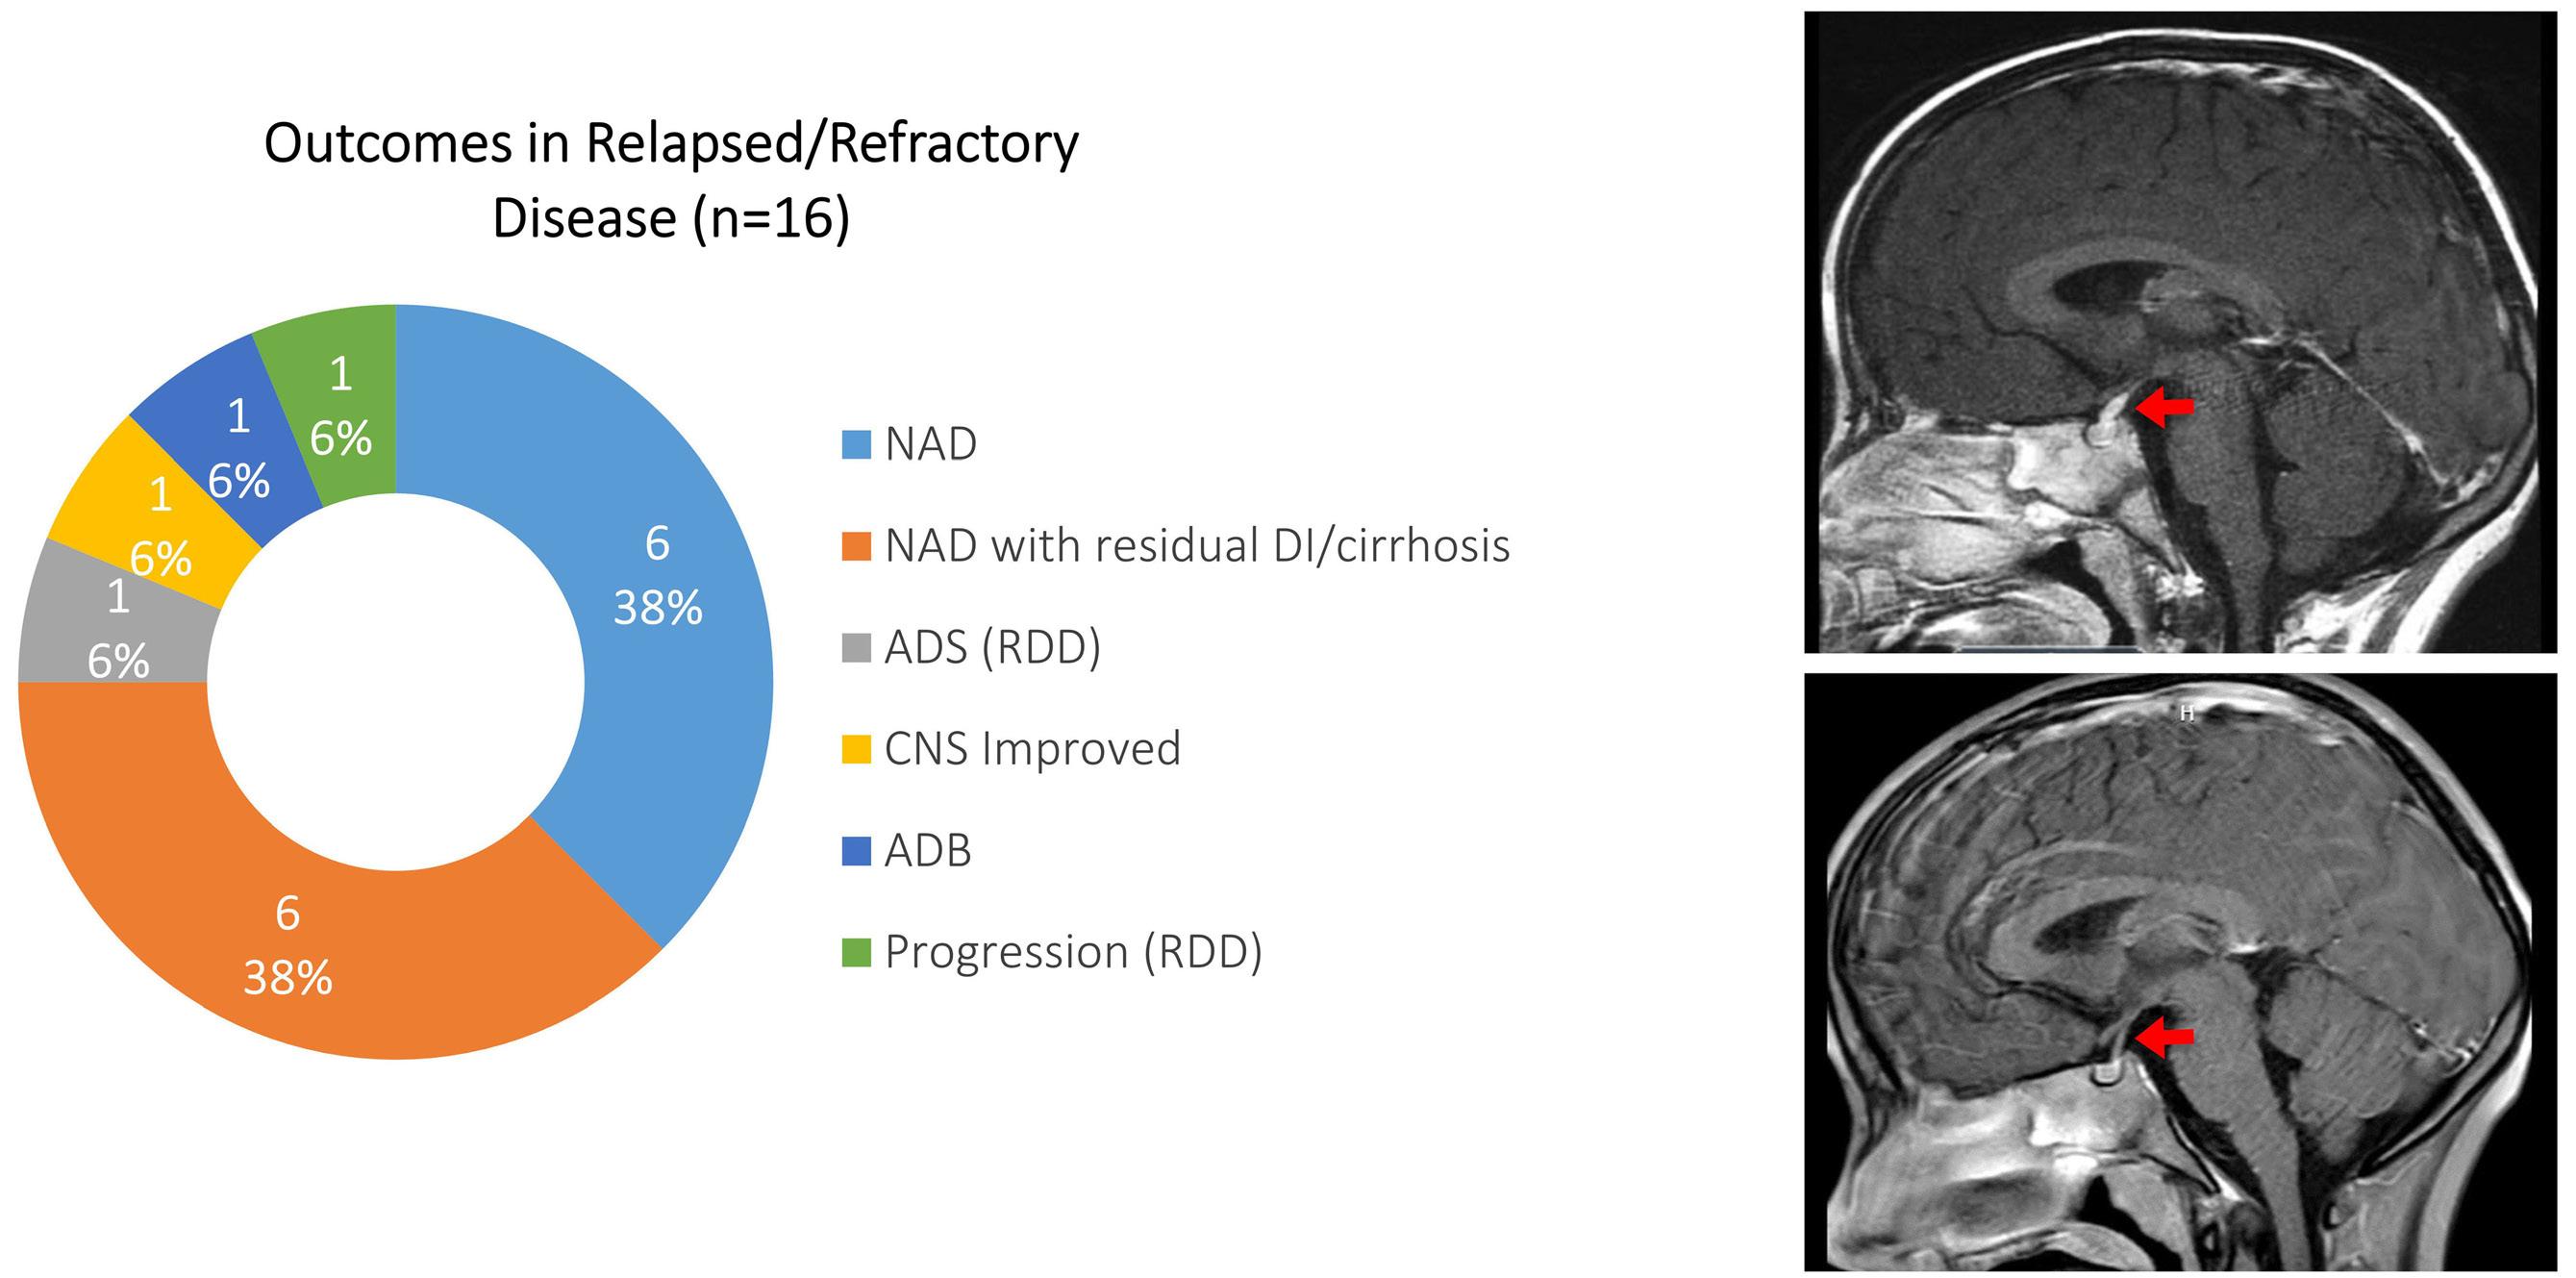
Langerhans cell histiocytosis when he developed sudden onset diabetes insipidus (upper panel). The arrow points to thickened infundibulum. He was treated with trametinib and repeat MRI 6 weeks later (lower panel) showed normal thickness of the enhanced infundibulum (red arrow). NAD: no active
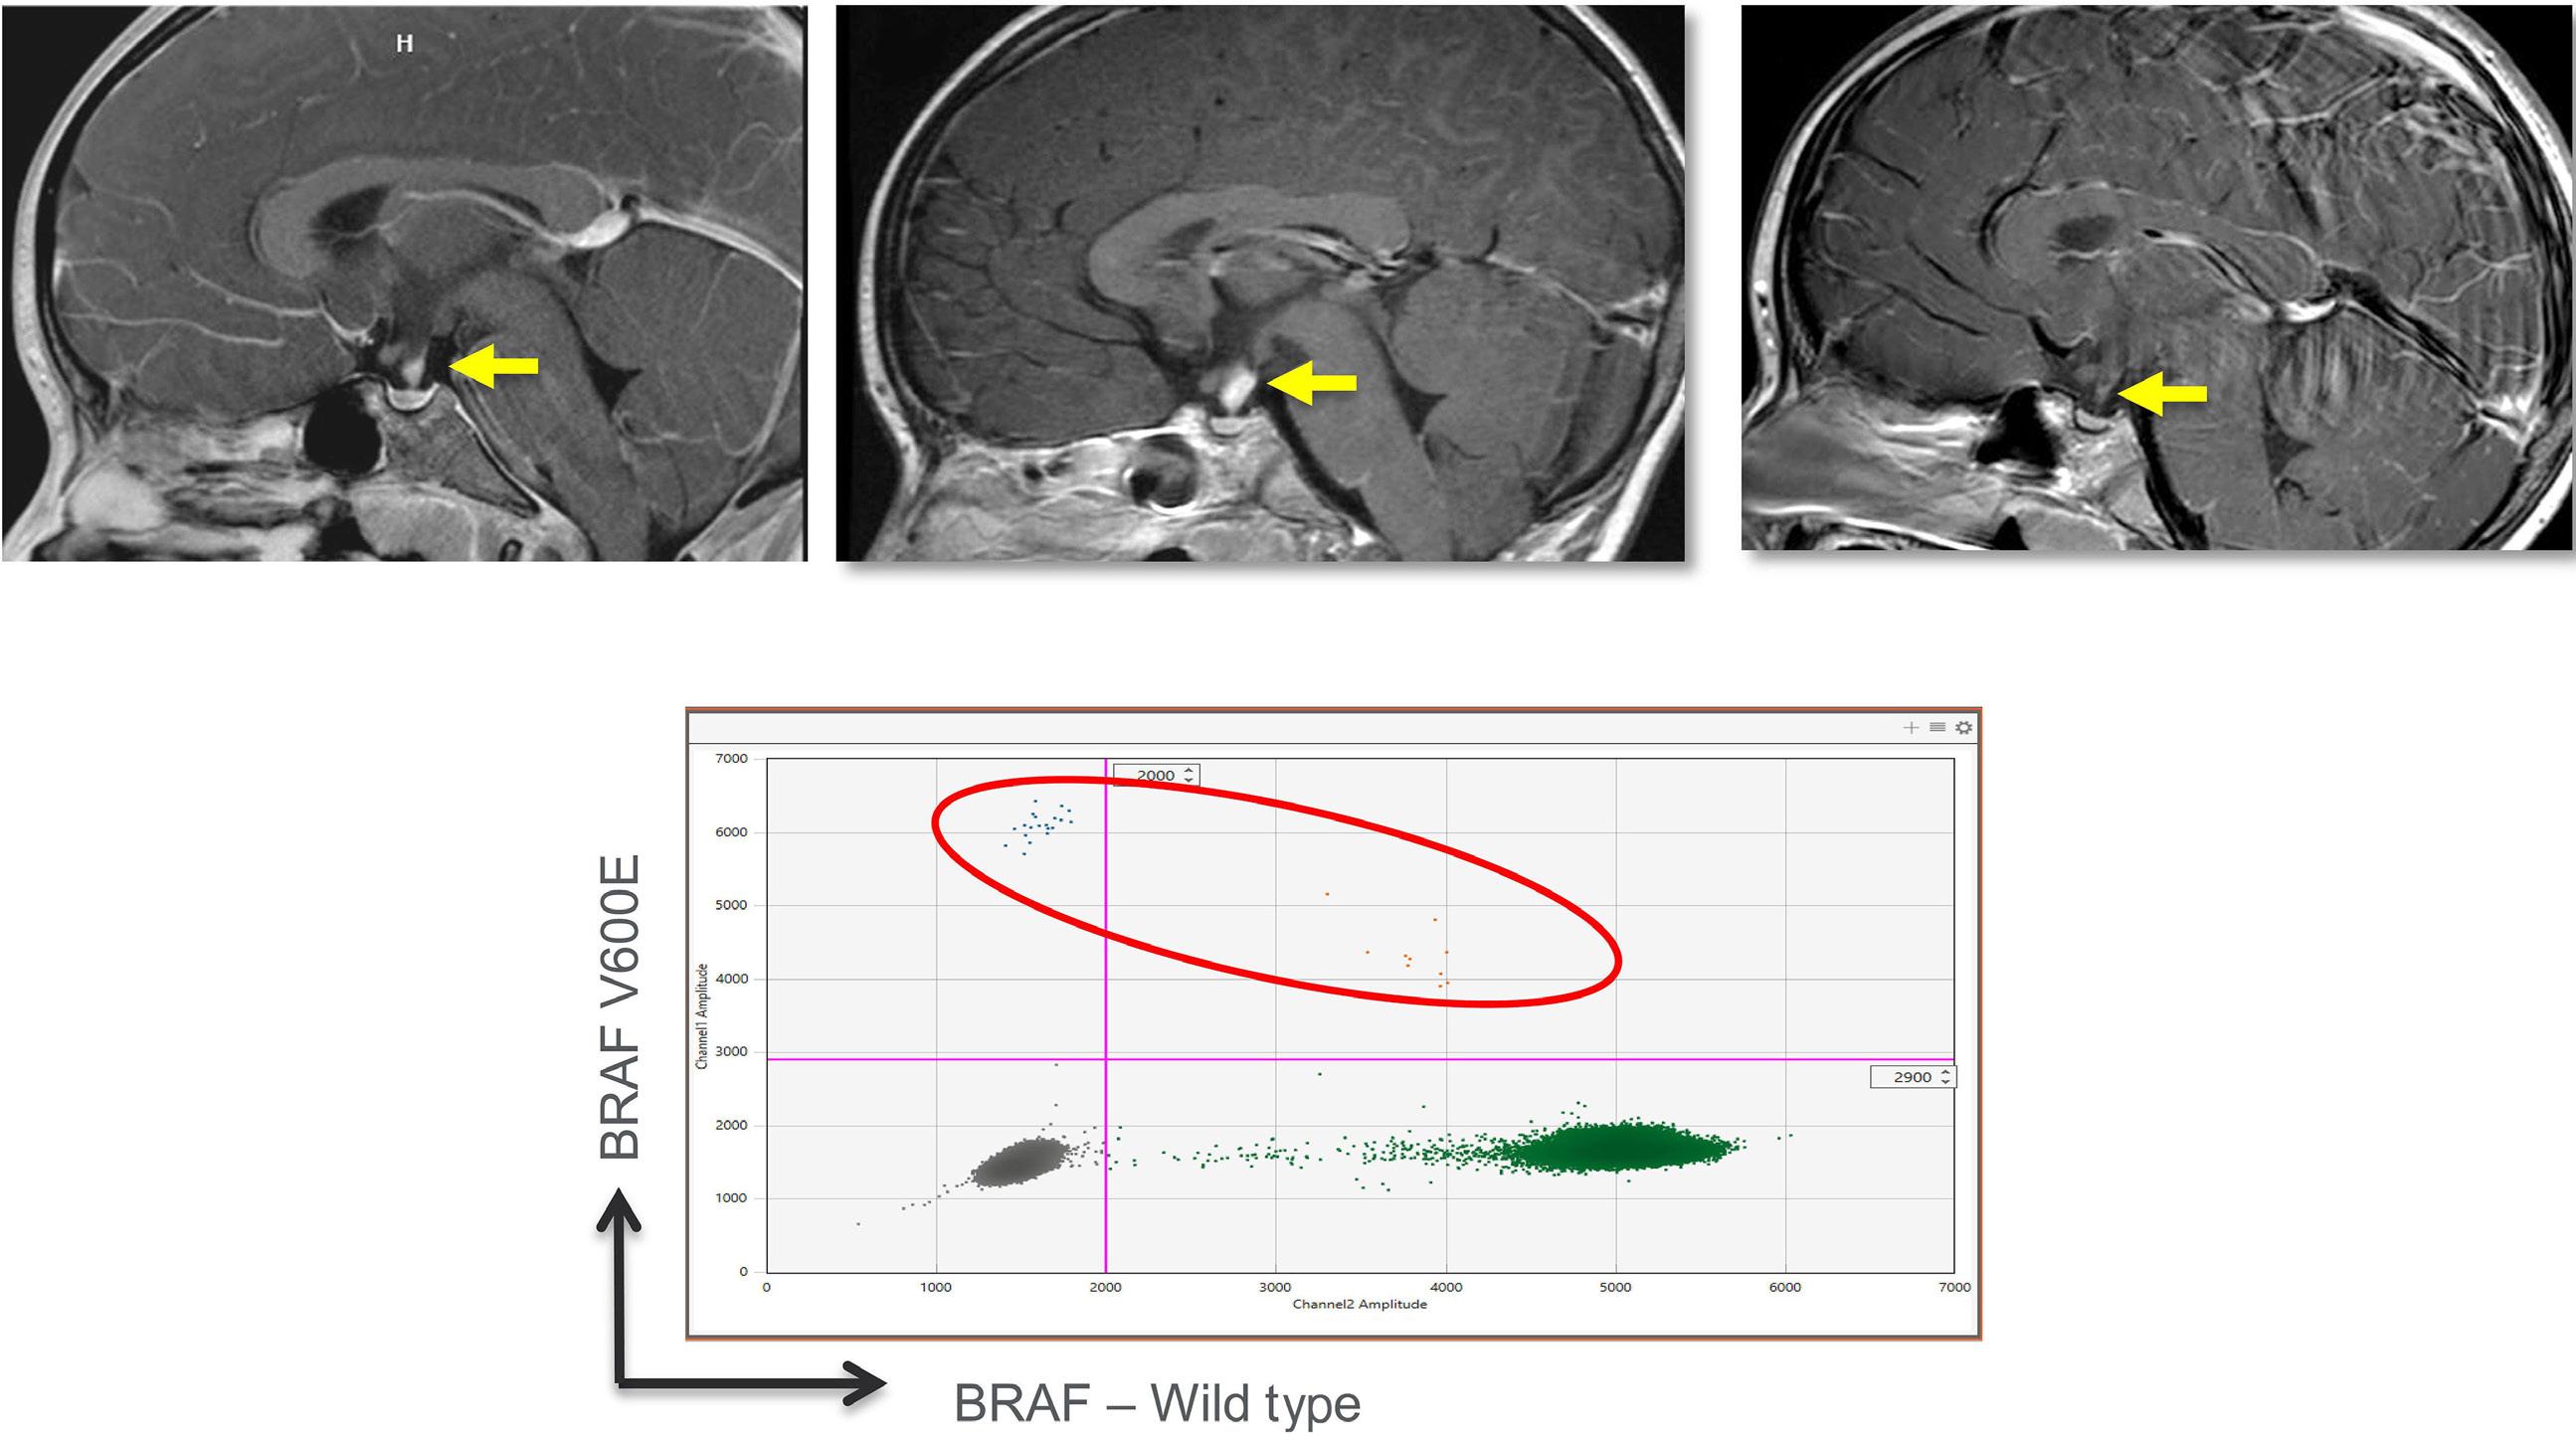
infundibular infiltration (arrow). Extensive evaluation was negative for histiocytosis or a germ cell tumor. A biopsy of the pituitary stalk was deemed unsafe. (B) Follow-up MRI a few months later showed worsening of pituitary stalk thickening (arrow). Treatment was initiated with trametinib. (C) Repeat MRI 3 months after initiation of trametinib showed resolution of the pituitary stalk infiltration (arrow). (D) HistioTrak on peripheral blood mononuclear
patients received dabrafenib, 13 received trametinib, and one patient (#23) was initially treated with trametinib but then switched to dabrafenib due to side effects. Of the 13 patients with tissue samples available for analysis, 12 had mutations in BRAF-MEK-ERK pathway genes (BRAF-V600E, n=9; GAB2-BRAF fusion, n=1; BRAF indel, n=2). One patient with juvenile xanthogranuloma had a TFG-RET fusion that was identified after the patient had experienced a dramatic response to treatment with trametinib. In this group, the median age of treatment initiation was 5.5 years (range, 0.2-45) and the median treatment duration was 2.5 years (range, 0.3-6.4). As depicted in Figure 3, 12 patients with LCH currently do not have active disease, and one patient with MS RO– LCH which included CNS disease now does not have active disease, with resolution of diabetes insipidus and improved clinical neurocognition. Of the two patients with systemic juvenile xanthogranuloma (patient
#33 with skin, liver, spleen, and bone marrow disease and patient #34 with CNS and skin disease), neither has active disease, although one still has diabetes insipidus. Three patients had isolated CNS or pituitary stalk disease, two of whom are currently improved, while one has stable disease.
Overall, no patients in either group experienced progression or worsening of disease on therapy, including notably patients with MS RO+ disease. When available, there was a universal decrease in PET scan activity upon treatment with trametinib and/or dabrafenib ( Online Supplementary Figure S1). Eleven patients (4 with MS RO+ LCH and 7 with single-system LCH) were trialed off inhibitor therapy with four experiencing relapses of disease ranging from 3 weeks to 1 year after discontinuation with a median time of 5 months. Three of the nine relapsed/refractory MS RO+ patients had a pause in treatment. All three had
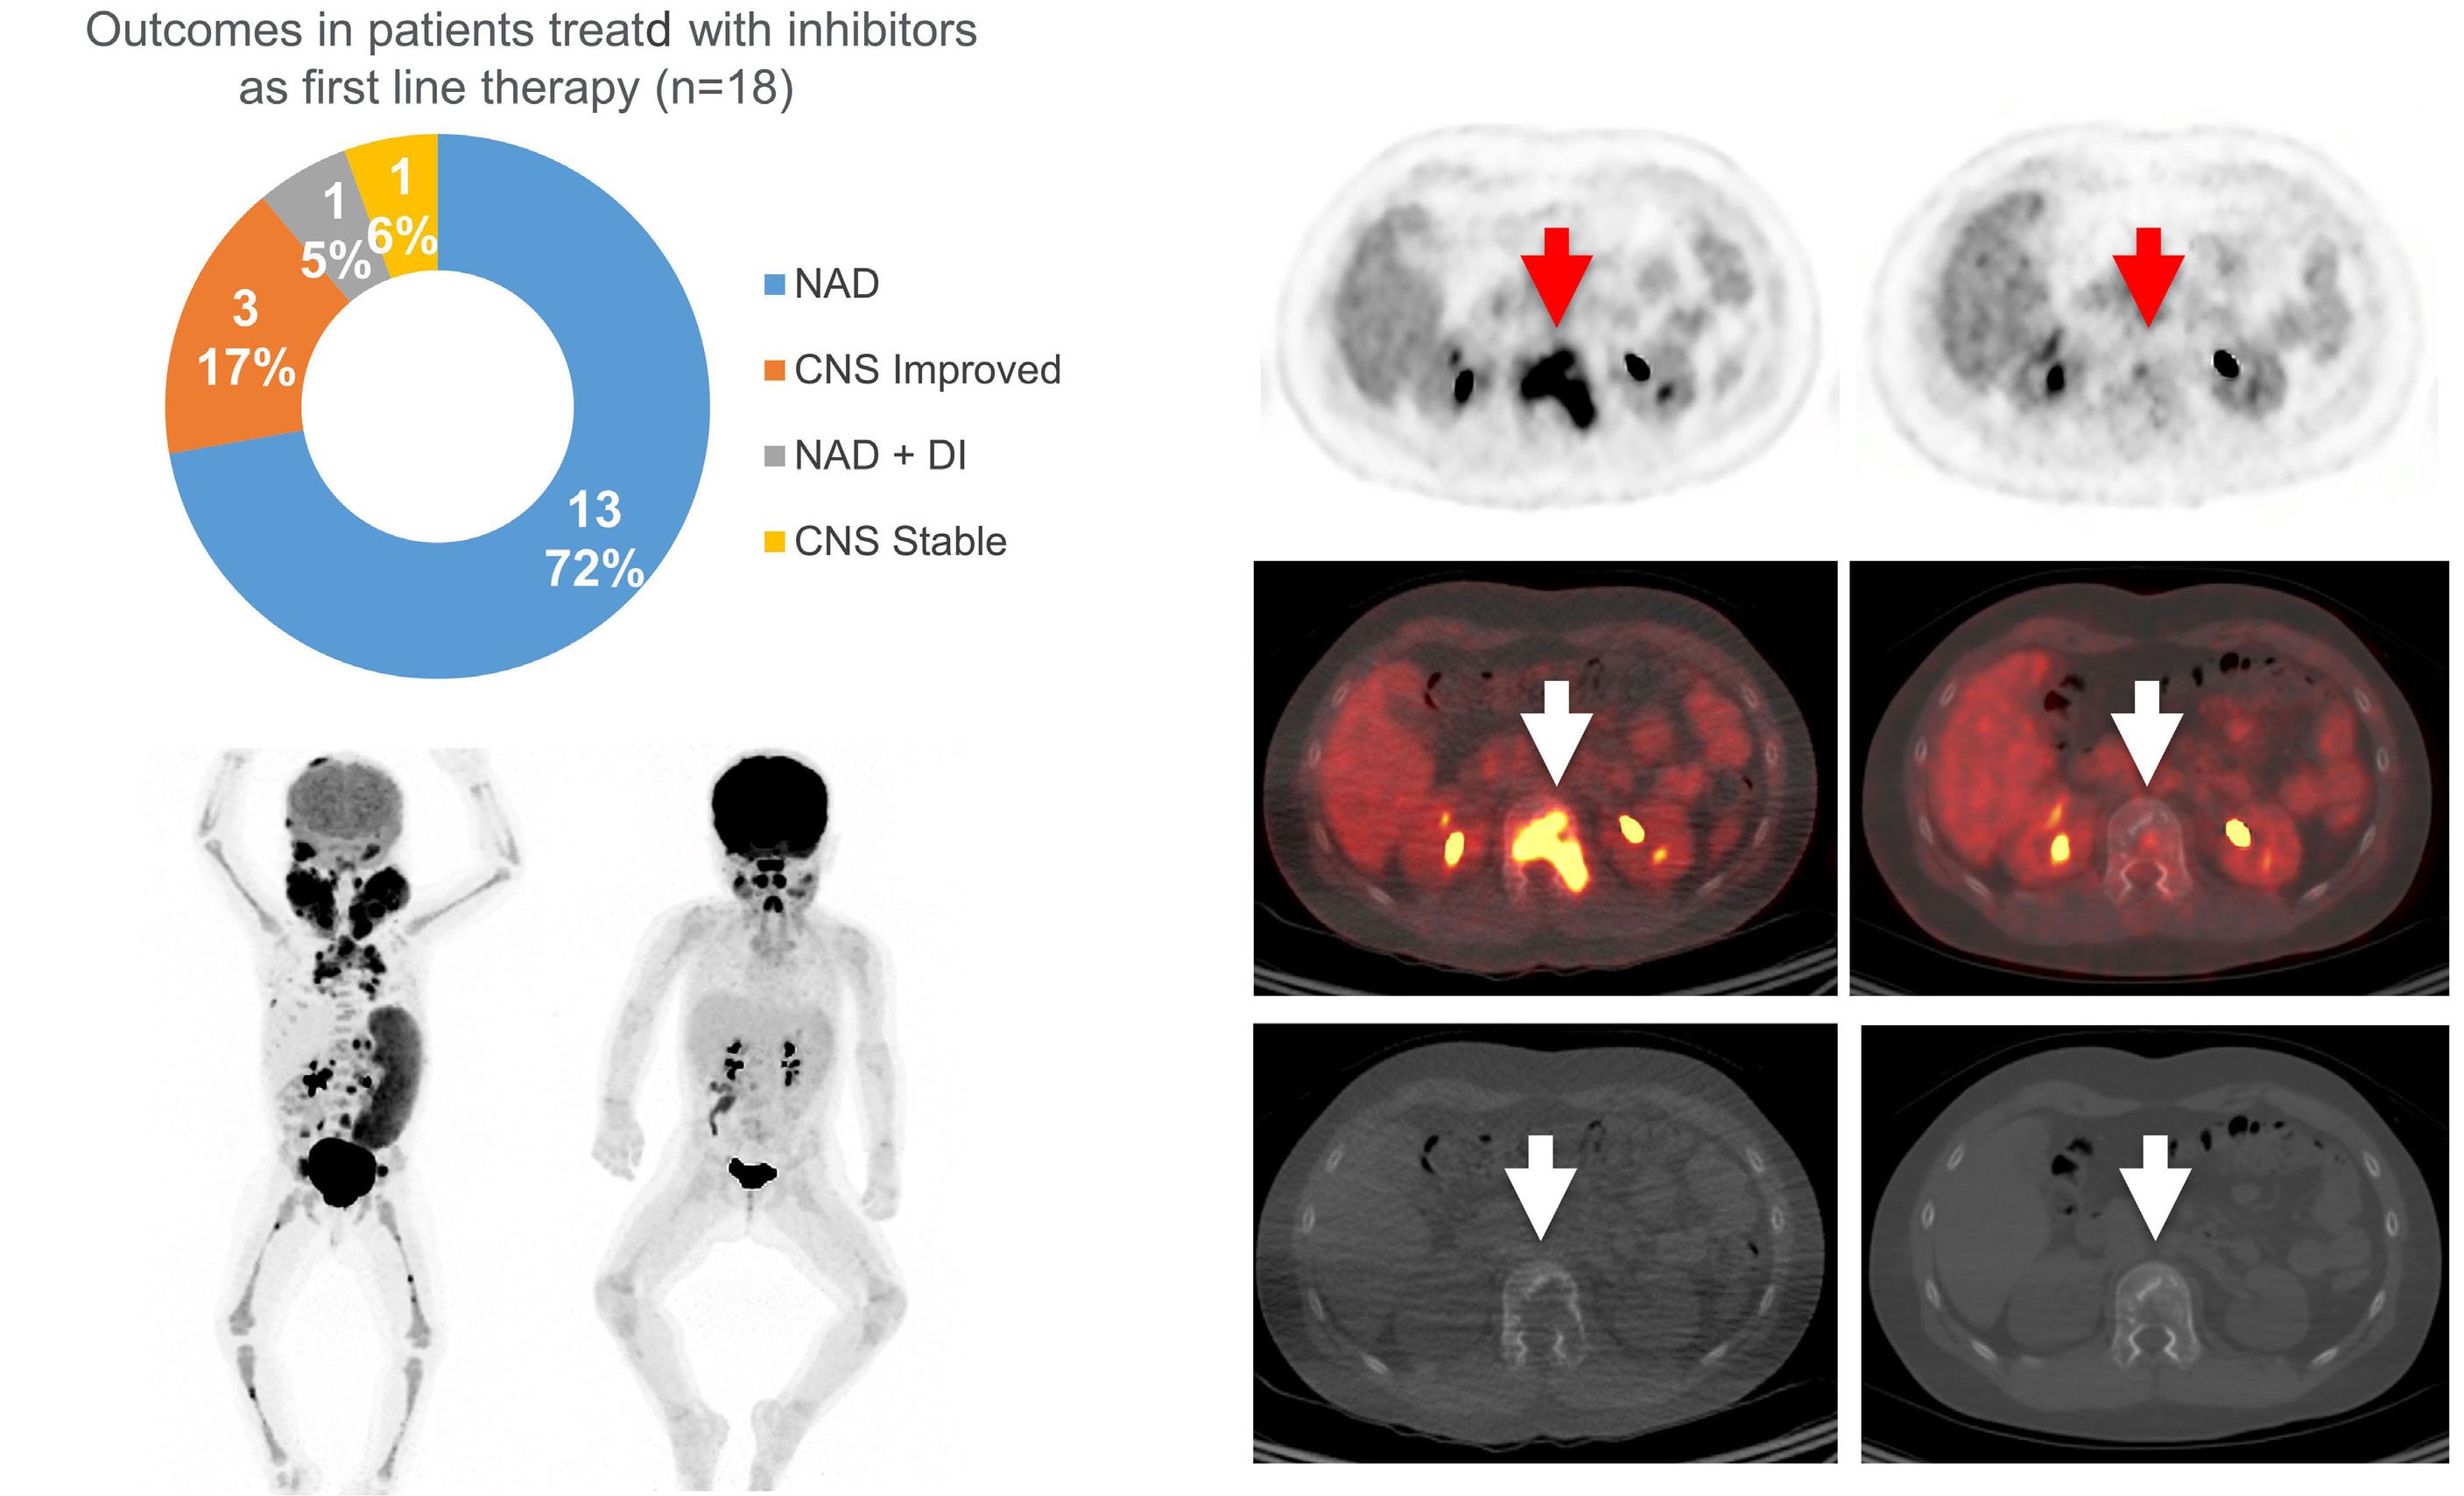
histiocytosis
Langerhans
and juvenile xanthogranuloma,
extensive disease including fluorodeoxyglucose (FDG)-avid lesions of the calvarium, chest wall, vertebrae, pelvis, and lower extremities, as well as splenomegaly and profound lymphadenopathy involving the neck, chest,
and
for BRAF-V600E. Repeat imaging (right
following 8 weeks of therapy with trametinib, with marked interval decrease in size and FDG avidity of bony lesions, decrease in splenomegaly and marked improvement in lymphadenopathy throughout. (C) PET (upper and middle rows) and computed tomography (bottom row) of a 12-year-old male at diagnosis (left frames in each row) of multifocal bone LCH demonstrating a large bony lesion involving the L1 vertebral body, with a SUVmax value of 15. Repeat imaging (right frames) performed following 6 weeks of therapy with trametinib
vertebral lesion. NAD: no active disease; CNS: central nervous
disease recurrence, at 3 weeks, 5 months and 10 months after suspension of the inhibitor, and all achieved a status of no active disease after the inhibitor was resumed. The remaining six patients with RO+ disease were not trialed off therapy and remain without active disease. One patient with single-system multifocal bone disease (no prior chemotherapy) suffered recurrence upon stopping therapy after 1 year and similarly experienced resolution of disease when the inhibitor was resumed. Only one patient receiving an inhibitor as first-line therapy with MS RO+ LCH (patient #17) was taken off therapy in accordance with parental preference and with the knowledge that peripheral blood and bone marrow PCR (real time) were both negative for the BRAF-V600E mutation. This patient remains without active disease; however, therapy was resumed 18 months later once it was discovered that peripheral blood HistioTrak (ddPCR for BRAF-V600E) was positive. Six patients with single-system disease did not experience recurrence following cessation of therapy (4 patients with single-system, unifocal bone disease who were treated because the location of the lesion created a risk to the CNS or due to a rapidly growing lesion or persistent symptoms and 2 patients with single-system, multifocal bone disease). These patients were treated for a median time of 1.8 years (range, 0.3 months to 4 years) and the median time off therapy was 11 months (range, 4 months to 3.2 years).
Patients treated with trametinib were prescribed an oral starting dose of 0.025 mg/kg daily. For young children, the 0.5 mg tablet was dissolved in 5 mL of clear liquid and the appropriate dose calculated for each patient. For patients treated with dabrafenib, the starting dosage was an oral formulation of 3-5 mg/kg daily in two divided doses. The contents of the 50 mg capsule were dissolved in 5 mL of clear liquid and the dose calculated for each child based on weight. Each dose was prepared fresh. Attributable side effects for each inhibitor are listed in Tables 1 and 2. Most of the listed side effects were considered minor. The most common reported side effect was skin rash with trametinib in six of 20 patients. The only reported side effect of dabrafenib was nausea in one of 11 patients. Four out of 20 patients on trametinib required dose adjustment due to side effects of skin rash or abdominal pain, which resolved upon dose reduction. Only one patient stopped trametinib due to side effects. Patient #23 had hair-thinning and was transitioned from trametinib to dabrafenib as per parental preference. No patients on dabrafenib needed dose adjustment.
For patients with BRAF-V600E-associated disease, peripheral blood monitoring was performed either by real-time
Patients’ demographics
N (%)
12 (35)
34 (100)
Male Female Total 22 (65)
Inhibitor treatment
Dabrafenib
Trametinib
Both
Disease classification
Langerhans cell histiocytosis
Single system disease
Multisystem, ROMultisystem, RO+ Isolated CNS or PS
Total
Rosai Dorfman disease
Juvenile xanthogranuloma
Mutation
Langerhans cell histiocytosis
BRAF V600E
BRAF L485
BRAF N486
MAP2K1 Q56P
Unable to biopsy*
Unknown**
Juvenile xanthogranuloma
GAB2-BRAF
TFG-RET fusion
Rosai Dorfman disease
Unknown**
Unknown***
11 (32)
20 (59)
3 (9)
7 (20.5)
7 (20.5)
12 (35)
4 (12)
30 (88)
2 (6)
2 (6)
23 (68) 1 (3) 1 (3) 1 (3) 3 (8) 1 (3)
1 (3) 1 (3)
1 (3) 1 (3)
*Unable to biopsy due to location (e.g., central nervous system, pituitary stalk). **Next-generation sequencing not approved by insurance for patients #15 and #29 (VE1 negative by immunohistochemistry). ***No mutations identifiable by next-generation sequencing (patient #16). RO+/–: risk organ positive/negative; CNS: central nervous system; PS: pituitary stalk.
PCR or more recently by ddPCR. The results of the most recent testing are shown in Tables 1 and 2. In most patients with MS RO+ LCH, circulating BRAF-V600E+ cells were detectable even after their disease had become inactive. Notably, in several patients we did not detect circulating BRAF-V600E by real-time PCR, but did see low level detection by ddPCR, highlighting the importance of using methodologies with greater sensitivity to detect the presence of residual disease cells.
In 2017, we reported dramatic sustained clinical responses in patients with refractory MS LCH treated with inhibitors targeting the BRAF-MEK pathway.25 Although limited by the number of pediatric patients included, several other studies have also shown sustained clinical responses to the
targeted BRAF inhibitors dabrafenib and/or vemurafenib in histiocytosis, most notably in refractory disease.17-19 Moreover, a large pediatric international observational study recently documented that vemurafenib was effective at controlling refractory LCH with the BRAFV-600E mutation, albeit not curing the disease as shown by reactivation after stopping therapy.20 A recently published prospective phase I/II study evaluated single-agent dabrafenib or the combination of dabrafenib and trametinib in pediatric patients with recurrent/refractory LCH. Clinical efficacy and manageable toxicity were seen in both treatment groups, with most responses ongoing at the end of the study.24 Outside of pediatrics, these inhibitors have also shown efficacy in adults with histiocytic disorders.27-29 The efficacy of targeted inhibitors as a first-line monotherapy is largely unknown, as most patients in these studies had been previously treated with conventional therapies and either did not respond or relapsed. Given the dramatic, consistent, and sustained responses seen in patients with refractory high-risk disease, we aimed to treat patients newly diagnosed with histiocytic disorders with inhibitors as first-line therapy to achieve rapid and durable disease control. Ideally, such novel treatments should be administered as part of a prospective clinical trial. Unfortunately, none of the manufacturers of the available BRAF or MEK inhibitors was able to support such a trial. With overall treatment failure rates of approximately 40% with chemotherapy compared to the almost 100% response rate with the targeted inhibitors, we chose to treat patients with the latter Food and Drug Administration-approved drugs off-label, with the goal of restoring the patient’s health and preventing disease recurrence. The secondary benefits were the ease of administration while also sparing patients the potential side effects, toxicity and morbidity of traditional chemotherapeutic agents.
In our study, most of the patients had LCH and, consistent with the existing literature, the majority harbored the BRAF -V600E or another BRAF-MEK-ERK pathway activating mutation. All the patients with LCH or juvenile xanthogranuloma, regardless of the mutation, showed a favorable response to dabrafenib or trametinib, ranging from stabilization of disease (CNS disease, sclerosing cholangitis of liver) to complete clinical and radiographic resolution. The responses were comparable in patients treated with either dabrafenib or trametinib. Trametinib and dabrafenib each led to sustained clinical responses in patients with all classifications of disease, either as first-line therapy or in recurrent/refractory disease (Figures 1 and 3). Dabrafenib is effective only in the case of BRAF-V600E, while trametinib, being a MEK inhibitor, has a wider application. Once we had observed responses to trametinib in patients whose disease was driven by other mutations in BRAF or in MAP2K1, we treated all subsequent patients with trametinib, regardless of the driver mutation. One reasonable approach is to use a BRAF inhibitor
in patients with BRAF-V600E-associated disease, and a MEK inhibitor in all the others. Our data suggest that a MEK inhibitor may be useful in all patients, regardless of the driver mutation. None of the patients in our cohorts had disease associated with RAF-independent mutations in MAP2K1 (Class III), which are known to be resistant to allosteric MEK inhibitors such as trametinib.30 Given their tolerability and efficacy in patients with either BRAF or MAPK21 mutations, MEK inhibitors such as trametinib may be utilized initially in all patients while awaiting identification of the mutation.
It is well known that patients with MS RO+ LCH are at considerable risk of disease progression despite conventional chemotherapy.4 In concordance with previous studies, we saw sustained dramatic clinical and radiological responses, even in MS RO+ patients who were refractory to chemotherapy.18,19,21 Moreover, three patients with MS RO+ LCH treated with the inhibitor as first-line therapy did not have active disease at follow-up, a status that has been sustained, making these inhibitors a potential novel therapeutic option for pediatric patients with highrisk disease. The range of disease response to therapy was largely based on classification of the disease, with the known irreversible effects such as diabetes insipidus or sclerosing cholangitis/liver cirrhosis persisting despite therapy (e.g., patients #4 and #8). The goals of treatment in these situations are to preserve organ function and prevent further progression.31 Unfortunately, by the time these two patients were referred to us for inhibitor therapy, both had already developed extensive fibrosis in the liver, which was irreversible. In patients treated with inhibitors as first-line therapy, we hope to decrease or prevent the development of these permanent consequences. In fact, no patients in our study (in either cohort) developed diabetes insipidus, cirrhosis, or neurodegenerative LCH while on targeted therapy. Although CNS penetration of MEK inhibitors varies, these drugs remain a mainstay of brain tumor therapy for low-grade gliomas, neurofibromatosis type I and metastatic melanoma. 32 We report significant improvements for the patients in our cohort with CNS disease treated with MEK inhibition, including those with isolated CNS disease, in accordance with what was described by McClain et al. in their 2018 report on CNS LCH.33 The only patient whose disease did not respond to a targeted inhibitor was patient #16, who had recurrent/ refractory Rosai-Dorfman disease for 12 years that did not respond to numerous treatments and who did not have an identifiable mutation on multiple biopsies. Trametinib was tried due to persistent, severe knee pain in an area of perceived active disease. However, symptoms persisted, and trametinib was stopped when the disease progressed. The adverse effects of trametinib and dabrafenib in our study were generally mild and well tolerated with only one patient experiencing side effects significant enough to stop therapy (patient #26). It is also notable that re-
sponses were sustained at smaller doses, as seen in patients #11, #30, and #28. The discontinuation rate of the inhibitors used in our study was less than the 11.5-15.7% reported in melanoma treatment.34 Although an increase in the risk of skin cancers has been attributed to BRAF and MEK inhibitors in the adult population, none of our patients developed skin cancer during their treatment.35 As the average duration of treatment in our study was just over 3 years and 3 months, the longer-term tolerability remains to be elucidated.
One of the great medical challenges in treating patients with BRAF and MEK inhibitors has been the question of when to stop therapy. In our study, all patients with single-system solitary bone lesions and two of three patients with single-system multifocal bone disease experienced sustained remissions after treatment was discontinued. It is known that some patients with single-system solitary bone lesions may experience resolution of disease without treatment. As such, these lesions are not always treated and are instead monitored over time. However, in cases in which the lesion involves the cranial bones outside the calvarium, treatment is recommended due to the risk of progression to the CNS. We, therefore, cannot state with certainty whether the responses seen in this cohort were due to therapy or to spontaneous remission. The rapid resolution of symptoms and the accompanying radiographic improvement are consistent with a treatment effect. One patient with single-system multifocal bone disease (patient #28) in whom therapy was stopped at 1 year had a recurrent bone lesion shortly after discontinuation of trametinib. Resumption of treatment resulted in a rapid response that has been sustained. Additionally, all MS-LCH patients who stopped therapy experienced recurrence of disease, but regained a status of no active disease once inhibitor treatment was reinitiated. These data support others’ conclusions that 1 year of inhibitor treatment is potentially insufficient outside of solitary bone lesions. Furthermore, in MS-LCH, inhibitors likely do not eradicate disease cells but rather induce clinical (silent) remission.19,20 We detected very low levels of circulating mutant cells in the blood of many MS-LCH patients, even upon attaining complete clinical remission on inhibitor therapy. This phenomenon is thought to be due to the presence of presumed long-lived, but scantily represented, mutant bone marrow progenitor cells that serve as a reservoir of disease.10,13,17 However, given the clinical and radiological remissions, the inhibitor therapy does effectively inhibit (render static) the mutant cell(s) from causing systemic and tissue-specific inflammatory damage to end-organs, and thus likely prevents permanent, irreversible consequences in some children (i.e., diabetes insipidus, neurodegeneration, liver cirrhosis secondary to sclerosing cholangitis) as well as quickly ameliorating the hyper-inflammatory hemophagocytic lymphohistiocytosis-like cytokine storm in MS RO+ infants which carries a
high risk of mortality.36
A highly sensitive minimal residual disease marker is needed to guide physicians on the duration of therapy based on the molecular detection of occult disease. Unfortunately, testing the blood for the circulating mutant BRAF-V600E cells by RT-PCR has not proven to monitor molecular remission accurately, as clinical relapses have been noted after cessation of therapy despite negative RT-PCR results.17 In fact, when these same samples were re-tested by ddPCR on circulating mononuclear cells (not cell-free DNA), a low level of mutational burden was found. We have now developed this assay as a clinical test, called HistioTrak, to serve as a high-sensitivity biomarker for minimal residual disease. As predicted, the majority of patients with MS LCH had detectable circulating BRAF-V600+ cells by HistioTrak, even years after inhibitor therapy. Remarkably, HistioTrak helped us to diagnose the etiology of isolated diabetes insipidus in a patient whose magnetic resonance imaging showed pituitary stalk infiltration (Figure 2). Although the diabetes insipidus persists, the pituitary stalk infiltration resolved rapidly with trametinib therapy and the child remains otherwise asymptomatic, with no clinical evidence of neurological dysfunction. However, his peripheral blood HistioTrak remains positive in spite of treatment with trametinib for 2 years. Incorporation of molecular assays such as HistioTrak will help to improve the diagnosis, treatment, and monitoring of patients with histiocytic diseases, reducing the risk of long-term complications such as neurodegenerative disease.
Despite the successful clinical remissions reached with targeted therapies in histiocytic disorders, our study is limited by being a retrospective review, not a prospective clinical trial. As such, it is difficult to deduce the efficacy of these therapies directly. We also recognize the inability of these agents to cure MS RO+ LCH. Additionally, since these drugs are relatively new, the long-term safety of treatment, including its impact on fertility, is unknown. The utility of inhibitors in patients with isolated diabetes insipidus is also unknown, so treating these patients with inhibitors is not universally accepted. However, despite these limitations, our experience suggests that targeted therapies are safe and appear more efficacious in controlling disease than conventional chemotherapy, as shown by the consistent responses in both refractory and newly diagnosed disease. Prospective studies are needed in order to demonstrate efficacy rigorously. Given the rarity of this disease, it is our hope that these aggregate results will lead to prospective clinical trials that will help to answer the question of efficacy. In addition, we believe that the inability to completely eradicate mutant cells and achieve cure (defined as absence of disease without therapy) should not be the reason to discard or not utilize these life-preserving targeted therapies. There are tantalizing reports of disease eradication being attained by combining targeted therapy with chemotherapy.37 The utility and safety of such combination approaches will need to be evaluated in larger groups of patients, probably
once a targeted therapy is approved and readily available for use in children.
In summary, patients with histiocytic disorders can be treated safely and effectively with targeted BRAF inhibitors such as dabrafenib (for those with BRAF-V600E mutant disease) or a MEK inhibitor such as trametinib (in disease caused by any BRAF mutation and most MAP2K1 mutations). Although our data suggest that it may be possible to discontinue inhibitor therapy in single-system disease, future prospective studies are needed to determine when and if patients with multisystem disease can safely discontinue therapy. The development of highly sensitive molecular testing for minimal residual disease may help clinicians make this decision and should be incorporated into future studies. The availability of an efficacious, well-tolerated treatment for patients with high-risk disease offers a breakthrough therapeutic choice for a potentially fatal condition. Likewise, it also provides a new therapeutic possibility for patients with neurodegenerative disease for whom no effective therapy is currently available. Prospective studies are warranted to further determine the long-term efficacy and tolerability of inhibitors as first-line therapy as well as the duration of treatment.
1. Hogstad B, Berres ML, Chakraborty R, et al. RAF/MEK/ extracellular signal-related kinase pathway suppresses dendritic cell migration and traps dendritic cells in Langerhans cell histiocytosis lesions. J Exp Med. 2018;215(1):319-336.
2. Baiocchi RA . Driving toward targeted therapy for LCH. Blood. 2014;124(10):1546-1548.
3. Tran G, Huynh TN, Paller AS. Langerhans cell histiocytosis: a neoplastic disorder driven by Ras-ERK pathway mutations. J Am Acad Dermatol. 2018;78(3):579-590.
4 Gadner H, Minkov M, Grois N, et al. Therapy prolongation improves outcome in multisystem Langerhans cell histiocytosis. Blood. 2013;121(25):5006-5014.
5. Simko SJ, Tran HD, Jones J, et al. Clofarabine salvage therapy in refractory multifocal histiocytic disorders, including Langerhans cell histiocytosis, juvenile xanthogranuloma and Rosai-Dorfman disease. Pediatr Blood Cancer. 2014;61(3):479-487.
6. Donadieu J, Bernard F, van Noesel M, et al. Cladribine and cytarabine in refractory multisystem Langerhans cell histiocytosis: results of an international phase 2 study. Blood. 2015;126(12):1415-1423.
7 Allen CE, Merad M, McClain KL. Langerhans-cell histiocytosis. N Engl J Med. 2018;379(9):856-868.
8. Berres ML, Merad M, Allen CE. Progress in understanding the pathogenesis of Langerhans cell histiocytosis: back to histiocytosis X? Br J Haematol. 2015;169(1):3-13.
9. Durham BH, Lopez Rodrigo E, Picarsic J, et al. Activating mutations in CSF1R and additional receptor tyrosine kinases in histiocytic neoplasms. Nat Med. 2019;25(12):1839-1842.
10. Durham BH, Roos-Weil D, Baillou C, et al. Functional evidence for derivation of systemic histiocytic neoplasms from hematopoietic stem/progenitor cells. Blood. 2017;130(2):176-180.
11. Lim KPH, Milne P, Poidinger M, et al. Circulating CD1c+
Disclosures
AK is a consultant for SOBI, Springworks Therapeutics, and OPNA. MJ is a consultant for SOBI. AR has served on an advisory board for SOBI. The other authors have no conflicts of interest to disclose.
Contributions
EC collected and analyzed data and authored the manuscript. JF collected and analyzed data and authored the manuscript. SS and ACM reviewed radiological findings, edited the manuscript and provided the radiological figures. JP analyzed pathology specimens and edited the manuscript. RL analyzed pathology specimens. MJ, MG, AB, and AN provided clinical data. SR performed the ddPCR (HistioTrak) analysis. AK provided clinical data, supervised the entire study, and edited the manuscript.
Funding
The study was supported by Liam’s Lighthouse Foundation.
Data-sharing statement
Additional raw data are available upon request to the corresponding author.
myeloid dendritic cells are potential precursors to LCH lesion CD1a+CD207+ cells. Blood Adv. 2020;4(1):87-99.
12. Milne P, Bigley V, Bacon CM, et al. Hematopoietic origin of Langerhans cell histiocytosis and Erdheim-Chester disease in adults. Blood. 2017;130(2):167-175.
13. Xiao Y, van Halteren AGS, Lei X, et al. Bone marrow-derived myeloid progenitors as driver mutation carriers in high- and low-risk Langerhans cell histiocytosis. Blood. 2020;136(19):2188-2199.
14 Badalian-Very G, Vergilio JA, Degar BA, et al. Recurrent BRAF mutations in Langerhans cell histiocytosis. Blood. 2010;116(11):1919-1923.
15. Chakraborty R, Hampton OA, Shen X, et al. Mutually exclusive recurrent somatic mutations in MAP2K1 and BRAF support a central role for ERK activation in LCH pathogenesis. Blood. 2014;124(19):3007-3015.
16. Brown NA, Furtado LV, Betz BL, et al. High prevalence of somatic MAP2K1 mutations in BRAF V600E-negative Langerhans cell histiocytosis. Blood. 2014;124(10):1655-1658.
17 Lee LH, Krupski C, Clark J, et al. High-risk LCH in infants is serially transplantable in a xenograft model but responds durably to targeted therapy. Blood Adv. 2020;4(4):717-727.
18. Haroche J, Cohen-Aubart F, Emile JF, et al. Dramatic efficacy of vemurafenib in both multisystemic and refractory ErdheimChester disease and Langerhans cell histiocytosis harboring the BRAF V600E mutation. Blood. 2013;121(9):1495-1500.
19. Eckstein OS, Zinn D, Fein Levy C, et al. Clinical outcomes and molecular responses in children with Langerhans cell histiocytosis treated with MAPK pathway inhibitors. Blood. 2018;132(Suppl 1):3684.
20 Donadieu J, Larabi IA, Tardieu M, et al. Vemurafenib for refractory multisystem Langerhans cell histiocytosis in children: an international observational study. J Clin Oncol.
2019;37(31):2857-2865.
21. Diamond EL, Durham BH, Ulaner GA, et al. Efficacy of MEK inhibition in patients with histiocytic neoplasms. Nature. 2019;567(7749):521-524.
22. Evseev D, Kalinina I, Raykina E, et al. Vemurafenib provides a rapid and robust clinical response in pediatric Langerhans cell histiocytosis with the BRAF V600E mutation but does not eliminate low-level minimal residual disease per ddPCR using cell-free circulating DNA. Int J Hematol. 2021;114(6):725-734.
23. Yang Y, Wang D, Cui L, et al. Effectiveness and safety of dabrafenib in the treatment of 20 Chinese children with BRAFV600E-mutated Langerhans cell histiocytosis. Cancer Res Treat. 2021;53(1):261-269.
24. Whitlock JA, Geoerger B, Dunkel IJ, et al. Dabrafenib, alone or in combination with trametinib, in BRAF V600-mutated pediatric Langerhans cell histiocytosis. Blood Adv. 2023;7(15):3806-3815.
25. Lee LH, Gasilina A, Roychoudhury J, et al. Real-time genomic profiling of histiocytoses identifies early-kinase domain BRAF alterations while improving treatment outcomes. JCI Insight. 2017;2(3):e89473.
26. Flaherty KT, Infante JR, Daud A, et al. Combined BRAF and MEK inhibition in melanoma with BRAF V600 mutations. N Engl J Med. 2012;367(18):1694-1703.
27. Diamond EL, Subbiah V, Lockhart AC, et al. Vemurafenib for BRAF V600-mutant Erdheim-Chester disease and Langerhans cell histiocytosis: analysis of data from the histologyindependent, phase 2, open-label VE-BASKET study. JAMA Oncol. 2018;4(3):384-388.
28. Hazim AZ, Ruan GJ, Ravindran A, et al. Efficacy of BRAFinhibitor therapy in BRAF(V600E) -mutated adult Langerhans
cell histiocytosis. Oncologist. 2020;25(12):1001-1004.
29 Abeykoon JP, Rech KL, Young JR, et al. Outcomes after treatment with cobimetinib in patients with Rosai-Dorfman disease based on KRAS and MEK alteration status. JAMA Oncol. 2022;8(12):1816-1820.
30 Gao Y, Chang MT, McKay D, et al. Allele-specific mechanisms of activation of MEK1 mutants determine their properties. Cancer Discov. 2018;8(5):648-661.
31. Braier J, Ciocca M, Latella A, et al. Cholestasis, sclerosing cholangitis, and liver transplantation in Langerhans cell histiocytosis. Med Pediatr Oncol. 2002;38(3):178-182.
32. Schreck KC, Grossman SA, Pratilas CA. BRAF mutations and the utility of RAF and MEK inhibitors in primary brain tumors. Cancers (Basel). 2019;11(9):1262.
33. McClain KL, Picarsic J, Chakraborty R, et al. CNS Langerhans cell histiocytosis: common hematopoietic origin for LCHassociated neurodegeneration and mass lesions. Cancer. 2018;124(12):2607-2620.
34 Heinzerling L, Eigentler TK, Fluck M, et al. Tolerability of BRAF/MEK inhibitor combinations: adverse event evaluation and management. ESMO Open. 2019;4(3):e000491.
35. Gencler B, Gonul M. Cutaneous side effects of BRAF inhibitors in advanced melanoma: review of the literature. Dermatol Res Pract. 2016;2016:5361569.
36. Chellapandian D, Hines MR, Zhang R, et al. A multicenter study of patients with multisystem Langerhans cell histiocytosis who develop secondary hemophagocytic lymphohistiocytosis. Cancer. 2019;125(6):963-971.
37. Eder SK, Schwentner R, Ben Soussia P, et al. Vemurafenib acts as a molecular on-off switch governing systemic inflammation in Langerhans cell histiocytosis. Blood Adv. 2022;6(3):970-975.
Zachary D. Epstein-Peterson,1 Esther Drill,2 Umut Aypar,3 Connie Lee Batlevi,1 Philip Caron,1 Ahmet Dogan,3 Pamela Drullinsky,1 John Gerecitano,1° Paul A. Hamlin,1 Caleb Ho,3° Allison Jacob,4 Ashlee Joseph,1 Leana Laraque,1 Matthew J. Matasar,1 Alison J. Moskowitz,1 Craig H. Moskowitz,1° Chelsea Mullins,4° Colette Owens,1 Gilles Salles,1 Heiko Schöder,5 David J. Straus,1 Anas Younes,1° Andrew D. Zelenetz1 and Anita Kumar1
1Lymphoma Service, Division of Hematologic Malignancies, Department of Medicine, Memorial Sloan Kettering Cancer Center, New York, NY; 2Department of Biostatistics and Epidemiology, Memorial Sloan Kettering Cancer Center, New York, NY; 3Department of Pathology, Memorial Sloan Kettering Cancer Center, New York, NY; 4Adaptive Biotechnologies, Seattle, WA and 5Department of Radiology, Memorial Sloan Kettering Cancer Center, New York, NY, USA
°Current address JG: The Janssen Pharmaceutical Companies of Johnson & Johnson, Raritan, NJ, USA
°Current address CH: Loxo Oncology, Inc., Stamford, CT, USA
°Current address CM: Notch Therapeutics, Seattle, WA, USA
°Current address CHM: Department of Medicine, Division of Hematology, Sylvester Comprehensive Cancer Center, University of Miami Miller School of Medicine, Miami, FL, USA
°Current address AY: AstraZeneca Pharmaceuticals, LP, Wilmington, DE, USA
Correspondence: A. Kumar
kumara2@mskcc.org
Received: February 7, 2023.
Accepted: August 21, 2023.
Early view: August 31, 2023.
https://doi.org/10.3324/haematol.2023.282898
©2024 Ferrata Storti Foundation
Published under a CC BY-NC license
Chemoimmunotherapy followed by consolidative high-dose therapy with autologous stem cell rescue was a standard upfront treatment for fit patients with mantle cell lymphoma (MCL) in first remission; however, treatment paradigms are evolving in the era of novel therapies. Lenalidomide is an immunomodulatory agent with known efficacy in treating MCL. We conducted a single-center, investigator-initiated, phase II study of immunochemotherapy incorporating lenalidomide, without autologous stem cell transplant consolidation, enriching for patients with high-risk MCL (clinicaltrials gov. Identifier: NCT02633137). Patients received four cycles of lenalidomide-R-CHOP, two cycles of R-HiDAC, and six cycles of R-lenalidomide. The primary endpoint was rate of 3-year progression-free survival. We measured measurable residual disease (MRD) using a next-generation sequencing-based assay after each phase of treatment and at 6 months following end-oftreatment. We enrolled 49 patients of which 47 were response evaluable. By intent-to-treat, rates of overall and complete response were equivalent at 88% (43/49), one patient with stable disease, and two patients had disease progression during study; 3-year progression-free survival was 63% (primary endpoint not met) and differed by TP53 status (78% wild-type vs 38% ALT; P=0.043). MRD status was prognostic and predicted long-term outcomes following R-HiDAC and at 6 months following end-of-treatment. In a high-dose therapy-sparing, intensive approach, we achieved favorable outcomes in TP53wild-type MCL, including high-risk cases. We confirmed that sequential MRD assessment is a powerful prognostic tool in patients with MCL.
An established standard of care for younger, fit patients with mantle cell lymphoma (MCL) has been frontline immunochemotherapy (IC) followed by consolidative high-dose
therapy with autologous stem cell rescue (HDT/ASCR) and rituximab maintenance. However, the use of upfront HDT/ ASCR in MCL was established in an era when rituximab and cytarabine were not routinely applied and there were limited treatment options for relapsed or refractory (R/R)
disease. Thus, it has been questioned whether HDT/ASCR should remain incorporated into frontline MCL therapy given the lack of clear overall survival (OS) benefit for this approach,1-3 the rapidly evolving treatment landscape in MCL, and the substantial toxicity and intensive healthcare utilization associated with HDT/ASCR.4 Furthermore, the outcomes among patients with high-risk MCL (e.g., TP53 alteration high proliferation index, blastoid histology) treated with IC followed by HDT/ASCR are poor.5,6 A number of novel therapies have shown promising efficacy for the treatment of MCL (thoroughly reviewed in 7), including bortezomib, lenalidomide (len), Bruton tyrosine kinase inhibitors (BTKi), and venetoclax. Several studies have incorporated these novel agents into established IC regimens to evaluate if they can improve outcomes and potentially facilitate the safe omission of HDT/ASCR consolidation.
Len, an immunomodulatory agent with pleotropic anti-tumor effects, has established efficacy in newly diagnosed8 and R/R MCL.9 We designed a sequential frontline treatment approach for untreated MCL incorporating len to IC (rituximab, cyclophosphamide, doxorubicin, vincristine, and prednisone [R-CHOP] followed by rituximab + high-dose cytarabine [R-HiDAC]) followed by R-len maintenance. We examined whether HDT/ASCR can be spared using this intensive induction treatment regimen in combination with len followed by R-len maintenance in a cohort of patients with MCL enriched for high-risk features (blastoid or pleomorphic histology, Ki67 ≥30%).
In addition to establishing the safety and efficacy of this treatment approach, we sought to investigate measurable residual disease (MRD) testing to augment response assessment and disease monitoring. The presence of MRD has been shown to offer prognostic information in MCL. However, comprehensive, prospective data in uniformly treated cohorts using contemporary, sensitive testing methodologies assays was lacking. MRD testing results do not currently guide treatment selection, intensification, or de-escalation for patients with MCL in clinical practice and
further data are required before it can be incorporated into routine treatment decisions. We concurrently assessed the utility of sequential next-generation sequencing (NGS) for MRD detection using the clonoSEQ® Assay (Adaptive Biotechnologies, Seattle, WA) in the context of our prospective clinical study.
Eligible patients were age ≥18 years with untreated stage II-IV MCL. Eligibility required radiographically measurable disease, absent active infection, absent central nervous system involvement by MCL, and adequate performance status, blood counts, and organ function. Full eligibility requirements are detailed in the Online Supplementary Appendix. We aimed to enroll 2/3 high-risk patients, defined as Ki67 ≥30% or blastoid/pleomorphic histology. Eligibility for HDT/ASCR was not an enrolment criterion; subjects being considered for enrolment who intended to pursue HDT/ASCR were not permitted to enroll given the design of our study. This study was approved by our institutional review board (#15-196) and all trial conduct was in accordance with the Declaration of Helsinki with informed written consent. Our trial was registered with the National Clinical Trials Network ( clinicaltrials gov. Identifier: NCT02633137).
In 43 instances, we performed molecular profiling on baseline tumor samples using a hybrid-capture, NGS panel interrogating >400 genes with the ability to detect mutations and copy number alterations.10
Initial treatment consisted of four cycles of R-CHOP (lenR-CHOP; Figure 1) followed by two cycles of R-HiDAC. At
interim evaluation with 16 patients, the 3,000 mg/m2 dose of cytarabine was removed due to excess hematologic toxicity. Thereafter, patients received 6 months of rituximab-lenalidomide (R-len). We administered standard thromboprophylaxis concurrent with len, growth factor support for len-R-CHOP and R-HiDAC, varicella prophylaxis throughout treatment, and Pneumocystis jirovecii prophylaxis during len-R-CHOP and R-HiDAC.
18FDG positron emission tomography/computed tomography (PET/CT) was performed after each phase of treatment. MRD testing occurred at these same time points and additionally at 6 months following end-of-treatment (EoT, the conclusion of R-len). We assessed radiographic response using the 5-point scale (5PS)11 and classified responses using the Lugano Classification.12 We used CTCAE version 4.0 to grade adverse events.
Measurable residual disease testing
The methodology for peripheral blood-based NGS MRD assay has been described previously.13 Briefly, clonoSEQ® uses multiplex polymerase chain recation (PCR) and NGS to identify and track MCL-associated immunoglobulin receptor gene rearrangements (IgH, IgK, and IgL) with a lower detection limit of 1x10⁻⁶. All MRD analyses were performed centrally (Adaptive Biotechnologies, Seattle, WA); any detectable tumor-associated clonal rearrangement was labeled ‘detectable MRD’ (dMRD) and the absence of detectable rearrangement, ‘uMRD’.
The primary efficacy endpoint was 3-year progression-free survival (PFS) measured from study enrollment, with desirable cutoff 75% and undesirable 60%. The trial was powered at 80% with 47 patients. By protocol, patients who enrolled but did not complete the len-R-CHOP phase were removed and replaced. We report intent-to-treat outcomes including all 49 patients enrolled. Secondary objectives included PFS and OS, each measured from start of treatment. PFS was measured until progression or last follow-up and OS until death or last follow-up. Patients lost to follow-up or withdrawn from study are also counted as events. We conducted a landmark survival analysis to investigate the association between progression status at 24 months post-diagnosis (POD24) and OS and performed this only on those patients who were alive/not lost to follow-up at that time point. We conducted survival analyses using the Kaplan-Meier method. We evaluated prognostic variables using Cox proportional hazards. ED conducted biostatistical analyses using R (Version 4.0) and all authors had access to clinical data.
We enrolled 49 total patients (Table 1) from January 2016 until
*Percentages refer to evaluated patients. **One patient did not have Ki67 assessment at baseline; additionally, 1 patient’s MCL displaying aggressive pathologic features not reaching the threshold for formally labeling as blastic morphology had Ki67 (<10%) only assessed from bone marrow sampling at baseline was classified as high-risk per protocol given these features at diagnosis and that subsequent biopsy specimens showed an elevated (≥30%) Ki67 concurrent with the same aggressive features. †Patients with evaluation via multiple methodologies are listed in each category. IQR: interquartile range; MIPI_b: biologic Mantle Cell Lymphoma International Prognostic Index; LDH: lactate dehydrogenase; GI: gastrointestinal; NGS: next-generation sequencing; WT: wild-type; ALT: altered; SNP: single nucleotide polymorphism.
June 2018. Per protocol, efficacy-evaluable patients completed len-R-CHOP treatment. Two patients did not complete len-R-CHOP, one for progressive disease and one for toxicity. One patient withdrew from the study in remission following R-HiDAC to pursue HDT/ASCR. The median age among all patients was 63 years (range, 30-79) and 22 (45%) were
≥65 years old at enrollment. Thirty-one (65%) patients were high-risk by protocol including four patients with blastoid histology. Forty-one patients (84%) had tumor TP53 mutation and deletion status assessed prior to treatment; of these, 14 were TP53 altered (mutation and/or gene loss) (34%): three harbored mutated TP53, five harbored one copy of TP53, and
2.
TP53 and progression of disease within 24 months status.
(A) Progression-free survival (PFS) in evaluable patients (N=47).
(B) Overall survival (OS) in evaluable patients (N=47). (C) PFS by TP53 status (wild-type [WT] vs. deletion alone vs. mutation (MUT) alone vs. mutated/deleted, N=41). (D) OS by TP53 status (WT vs. deletion (DEL) alone vs. MUT alone vs. mutated/deleted, N=41). (E) PFS by TP53 status (WT/retained vs. altered, N=41). (F) OS by TP53 status (WT/retained vs. altered, N=41). (G) OS by progression of disease within 24 months (POD24) status. LOH: loss of heterozygosity.

six harbored both. High-risk patients were enriched for MCL harboring TP53 alterations (Online Supplementary Table S1).
By intent-to-treat (N=49), as of March 2023, the median follow-up among survivors was 63 months (range, 11-84). At EoT (N=47 patients), the overall response rate was 88% (Online Supplementary Figure S1), all complete responses (CR). Examining the three patients with stable disease or progressive disease on treatment, two had tumor TP53 status assessed and both harbored deletion and mutation. Among 43 patients with CR at EoT, 32 have since relapsed at a median of 40 months (95% confidence interval [CI]: 33-49) from enrollment. The median PFS among all patients was 49 months (95% CI: 38-59; Figure 2A) and the median OS was not reached [NR]; Figure 2B); the rates of 3-year PFS and OS were 63% (95% CI: 50-78) and 85% (95% CI: 76-96), respectively. PFS and OS differed according to TP53 status (Figures 2C-F): 3-year PFS, wild-type [WT] 78% (95% CI: 64-95) versus altered 38% (95% CI: 20-71; logrank P=0.04); 3-year OS WT 96% (95% CI: 89-100) versus
altered 69% (95% CI: 49-96) as well as MIPI-b14 and study risk category (PFS, not OS; Table 2). Median OS differed numerically by CR status (CR vs. <CR) post-len-R-CHOP (22 months vs. NR) but this did not meet the threshold for statistical significance (Online Supplementary Table S5). At relapse/disease progression, all response-evaluable patients but three (with localized MCL amenable to radiation) received BTKi-based therapy (8 single-agent, 18 combination therapy), of which 19 (76% of response-assessed) had disease response. Nine patients had TP53 mutation at relapse and received BTKi, of whom seven (78%) experienced disease response. The median survival among relapsing/ progressing patients was 32 months (95% CI: 19-NR) from time of relapse/progression and 16 patients are deceased, including two patients deceased due to SARS-CoV2 infection coincident with responding MCL. Progression during study/within 1 year of EoT and relapse within 2 years of EoT were each associated with inferior OS (Table 3), as was POD24 (Table 3; Figure 2G). The seven patients who progressed within 2 years of diagnosis had a median OS of 17 months (95% CI: 7-NR) after the 2-year time point
1N;
confidence interval; MIPI_b: biologic Mantle Cell Lymphoma International Prognostic Index;
deletion; LOH: loss of heterozygocity;
not reached.
versus an unreached median for the 38 non-progressing patients (P<0.001).
Treatment-related toxicities of interest are displayed in Table 4. At interim evaluation following 16 total patients, the 3,000 mg/m2 cytarabine dose was removed due to a pattern of excessive hematologic toxicity of grades 3/4 anemia and thrombocytopenia with one or both of these occurring in seven of ten patients who received 3,000 mg/m2. Cycle 2 of cytarabine was dose-reduced or omitted in all but two such patients and no major bleeding events occurred during this period. For cycle 2 cytarabine dosing, one patient received 500 mg/m2, two 750 mg/m2, 13 1,000 mg/m2, 24 2,000 mg/ m2, and two 3,000 mg/m2.
No treatment-related deaths occurred; one patient withdrew during len-R-CHOP due to tumor lysis syndrome. The most common grade ≥3 toxicities were hematologic, most commonly neutropenia (37% of patients undergoing lenR-CHOP, 70% of patients undergoing R-HiDAC, and 42% of patients receiving R-len). The rates of febrile neutropenia were 14%, 21%, and 7% and grade ≥3 thrombocytopenia 22%, 83%, and 9% (one grade 1 bleeding event occurred) in the three treatment phases, respectively.
Treatment-related adverse events frequently led to dose reductions or delays (Table 4): 41% of patients receiving lenR-CHOP, 36% R-HiDAC, and 53% R-len. For the 20 patients requiring dose reduction/delay during len-R-CHOP, reasons included neutropenic fever (N=7), cytopenia (N=7), infection (N=3), rash (N=2), or other causes (N=2); see protocol in the Online Supplementary Appendix for lenalidomide and cytarabine dose reduction guidelines (R-CHOP dosing was not altered).
Rare grade ≥3 infections occurred, including four instances of pneumonia, one skin/soft tissue, and one sepsis. Non-hematologic grade ≥3 toxicities are detailed in the Online Supplementary Table S4; we did not observe malignancies ascribed to treatment. Notably frequent grade ≤2 toxicities across phases of treatment included fatigue (e.g., 35% during len-R-CHOP), peripheral sensory neuropathy (29% during len-R-CHOP), and rash (20% during both len-R-CHOP and R-len).
Measurable residual disease outcomes
Among 46 patients with an available pretreatment tumor sample, clonal rearrangement characterization was successful in 89% of patients; all baseline (pretreatment) blood samples were dMRD. An MRD result at the level of 1x10⁻⁵ sensitivity (1E-5) sensitivity was available at all four post-baseline time points in 28 patients (Figure 3A). At 1E-5, 32% (12/37) of patients remained dMRD following lenR-CHOP, of which 11 converted to uMRD following R-HiDAC thus 3% (1/37) were dMRD following both len-R-CHOP and R-HiDAC consolidation. PFS did not differ by MRD status at 1E-5 following len-R-CHOP and only one patient remained dMRD following R-HiDAC at 1E-5. At the level of 1x10 -6 sensitivity (1E-6; Figure 3B; Online Supplementary Table S2), MRD status did predict median PFS following both len-R-CHOP (39 months [95% CI, 21-46] for dMRD vs. 54 months [95% CI, 28-NR] for uMRD; P=0.03) and R-HiDAC (19 months [95% CI, 11-NR] for dMRD vs. 45 months [95% CI, 27-NR] for uMRD; P=0.005).
Among 37 patients with MRD results at 1E-5 at EoT, four were dMRD, two of which were simultaneous (within 2 weeks of testing) with relapse; the remaining two patients dMRD had median PFS of 5 (95% CI, 4-NR) months versus
General/metabolism
Musculoskeletal/connective
Nervous system
Peripheral
*Data are presented as N patient (%) except for totaled toxicities which are at the toxicity instance (not patient) level. †Toxicities related to a phase of treatment affecting the next phase are ascribed to the preceding therapy; e.g., a patient with grade 3 anemia due to cycle 4 of len-R-CHOP causing delay in cycle 1 of R-HiDAC, this would be attributed to len-R-CHOP. ‡37 patients received only <3,000 mg/m2, seven patients received 1 cycle of 3,000 mg/m2 followed by 2,000 mg/m2 for cycle 2, 2 patients received both cycles at 3,000 mg/m2, and 1 patient received only 1 cycle total at 3,000 mg/m2; toxicities are listed under 3,000 g/m2 if a patient received at least 1 dose at this level. §Instances of febrile neutropenia with an identified infectious source/agent are noted under both Infection and Febrile neutropenia categories. #Instances of dose reduction or delay due to multiple causes are listed under each category. Len-R-CHOP: lenalidomide plus rituximab, cyclophosphamide, doxorubicin, vincristine, and prednisone; R-HiDAC: rituximab plus high-dose cytarabine; R-len: rituximab plus lenalidomide.
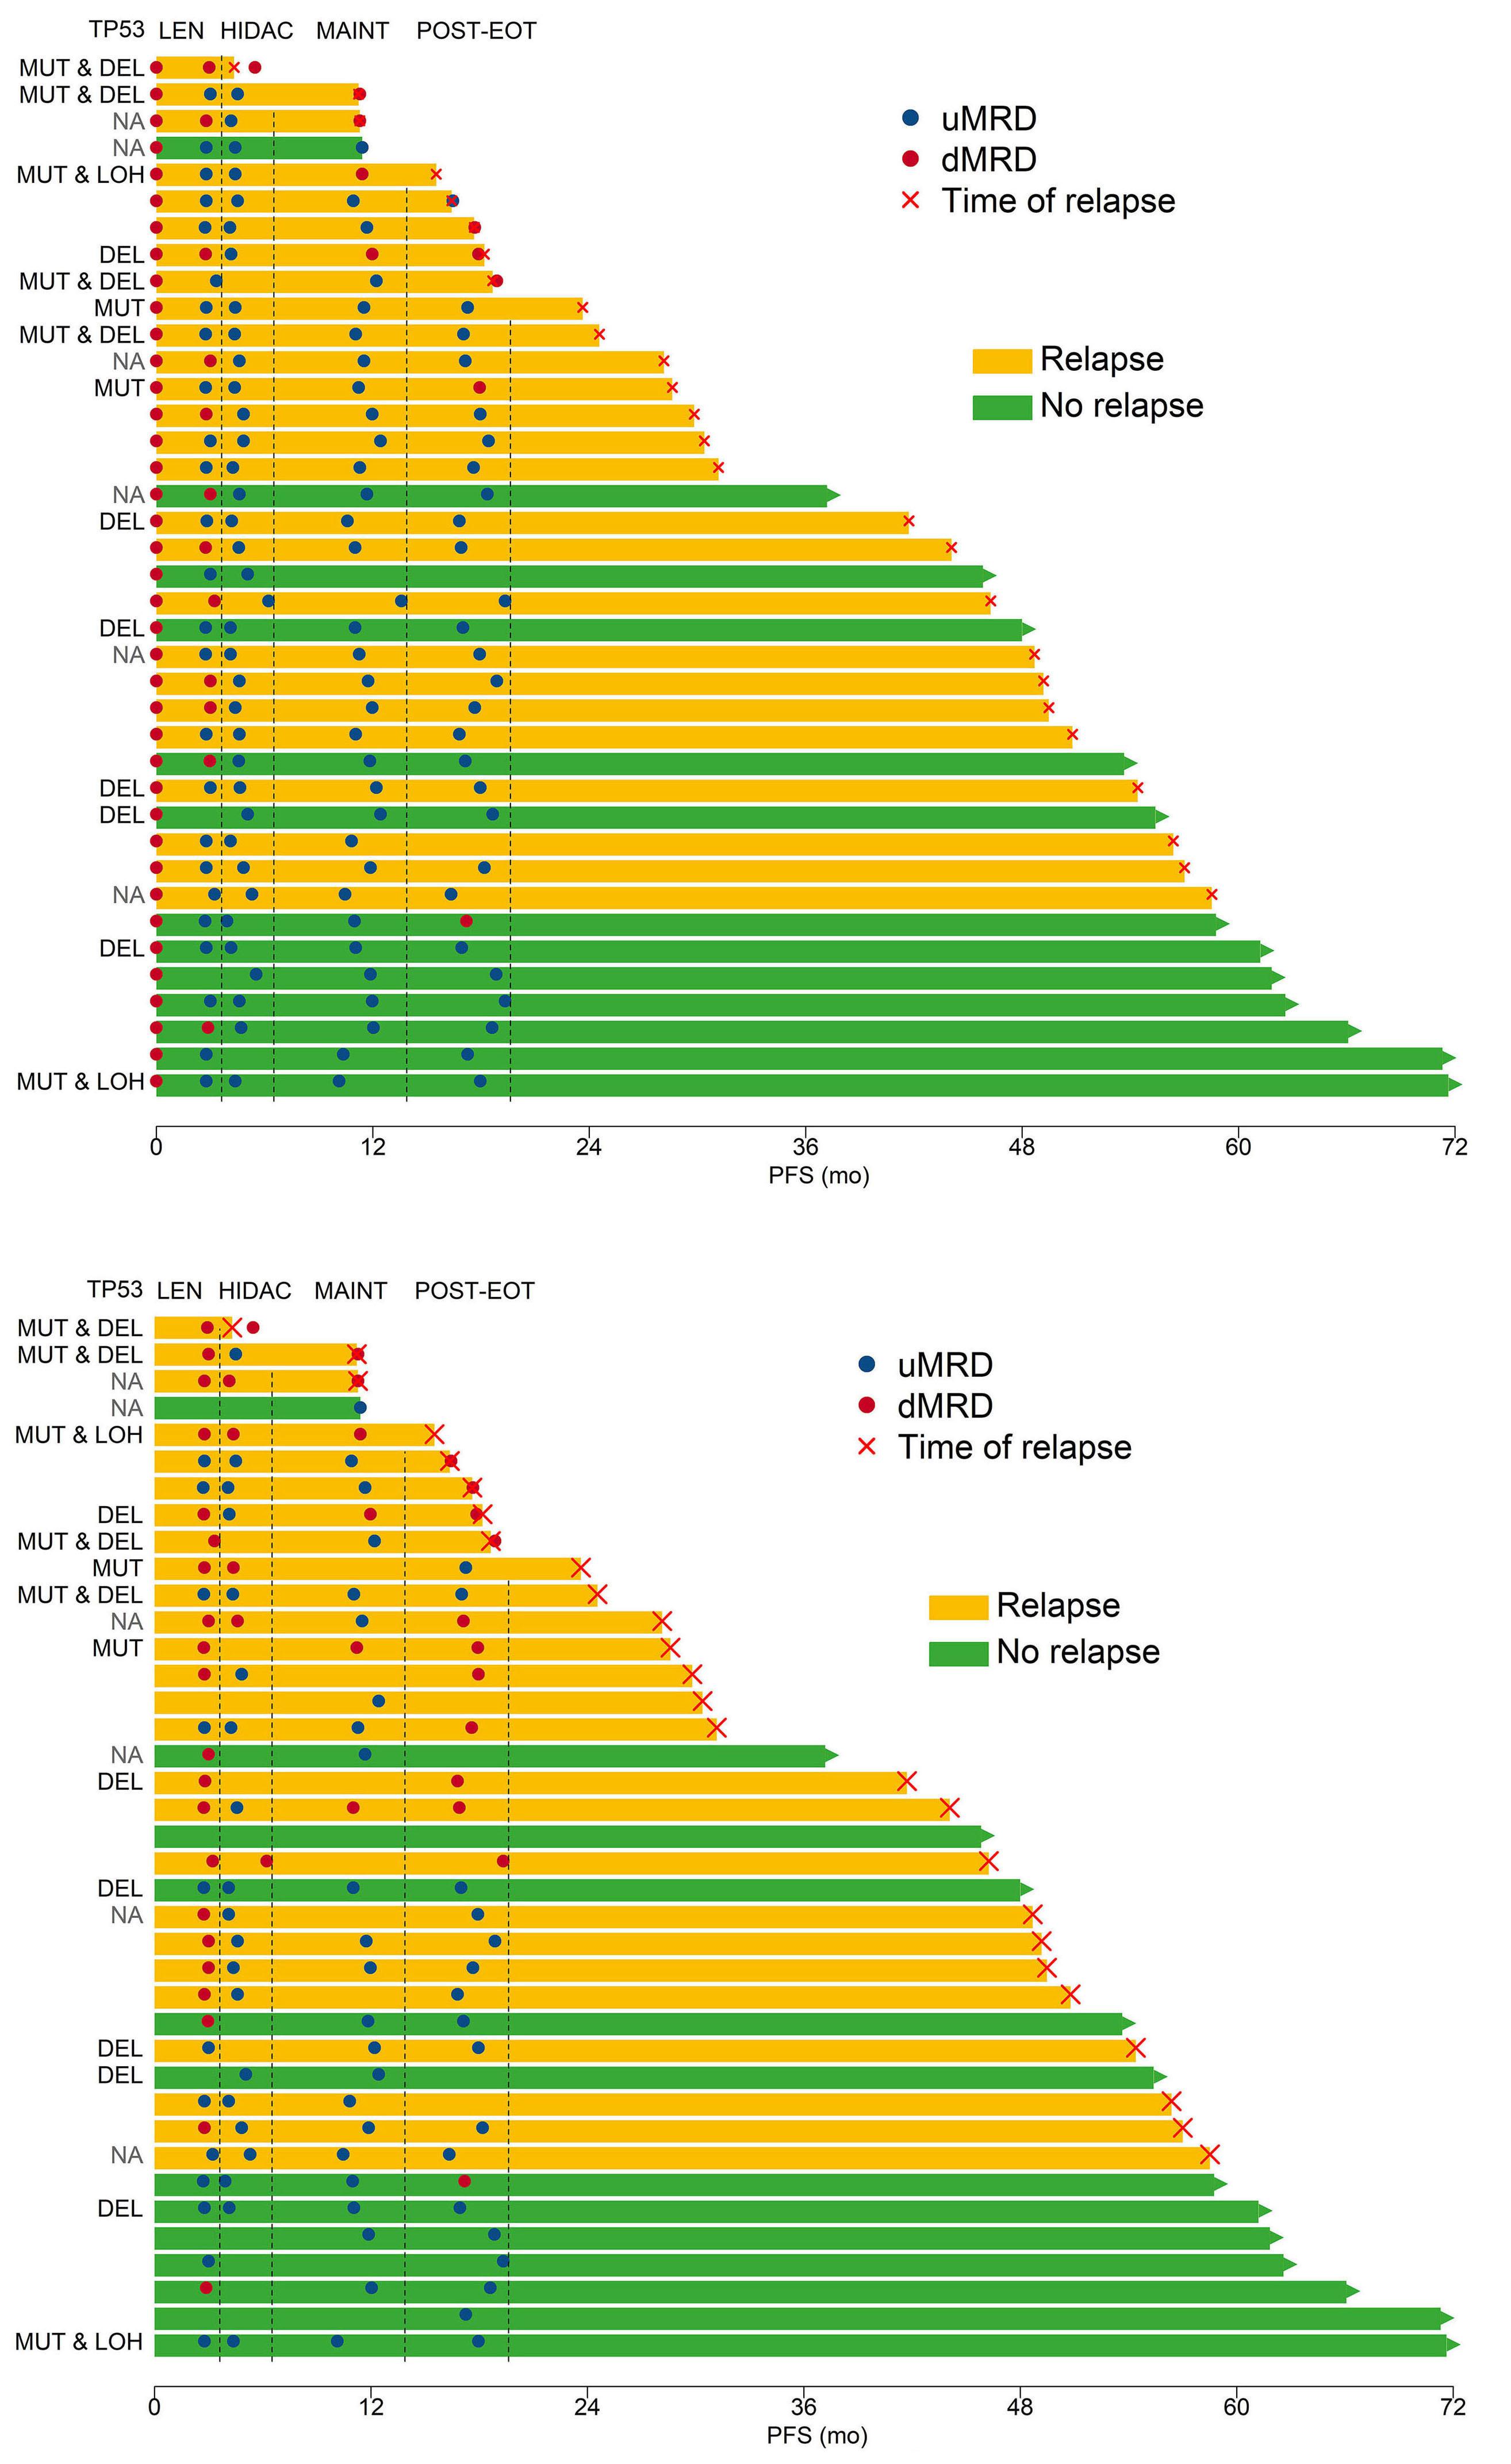
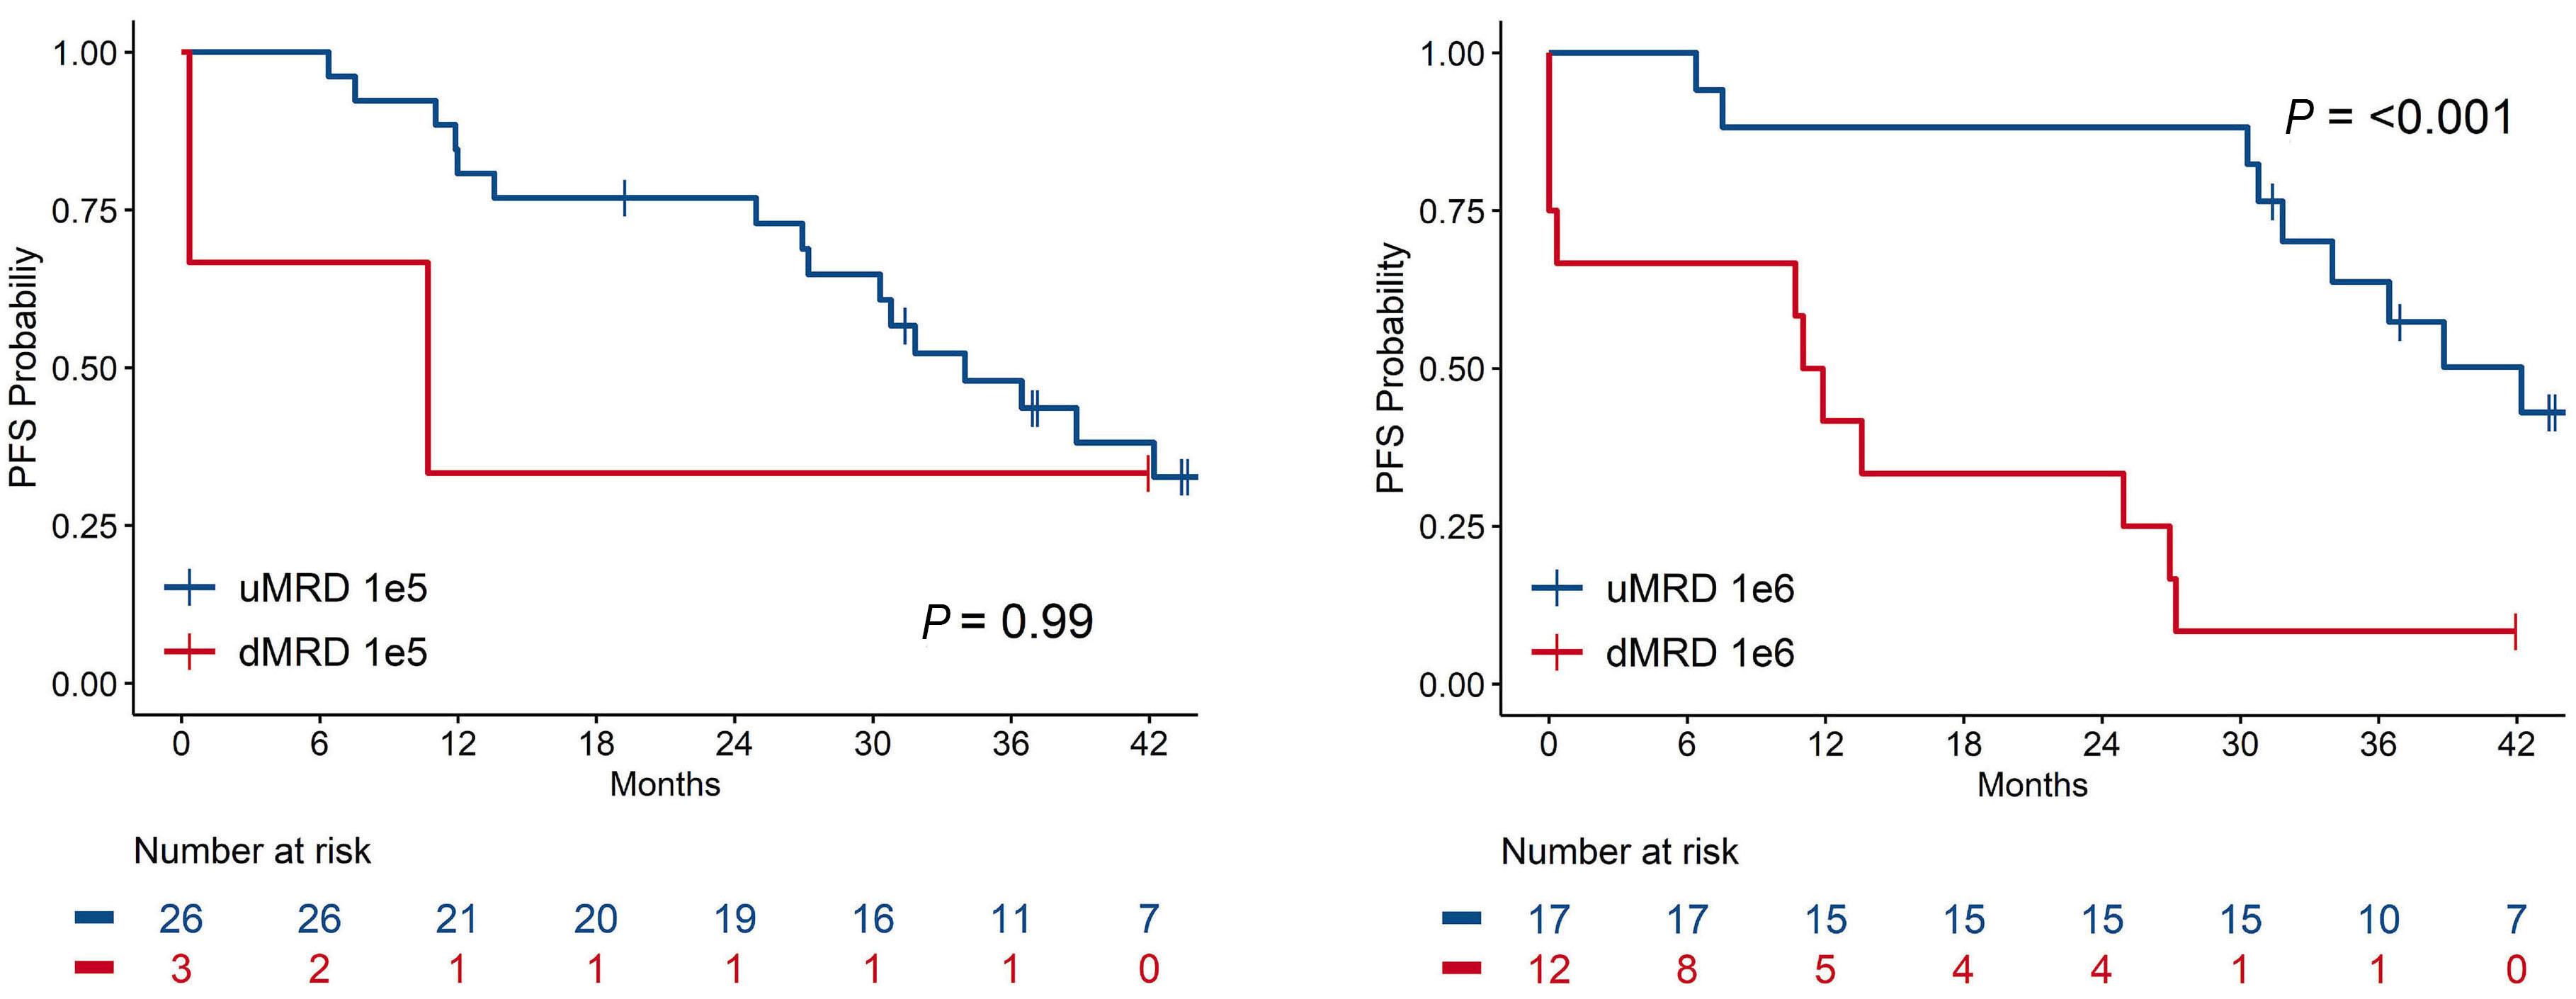
38 (95% CI, 33-NR) months for the 32 patients non-relapsed with uMRD (P<0.001). All six patients whose MCL was uMRD at 1E-6 at EoT and converted to dMRD at 6 months post-EoT eventually experienced disease relapse. MCL MRD status at 1E-6 at 6-months post-EOT was predictive of PFS (Figure 3C; Online Supplementary Table S2; Online Supplementary Figure S2): among the 29 patients with 1E-6 MRD results (12 dMRD, 17 uMRD), median PFS was 42 months (95% CI, 34-NR) for uMRD versus 11 months (95% CI, 0-NR) for dMRD (P<0.001).
Examining concordance between PET/CT results and MRD status at 1E-5 (Online Supplementary Table S3), there were 111 coincident testing instances, of which most (86%) were concordant: six as PET+/dMRD and 89 as PET-/uMRD. Sixteen coincident tests showed discordant results: five PET+/uMRD (all 5PS =4; 3 after len-R-CHOP and 2 after R-HiDAC) and 11 PET-/dMRD. In all three instances of PET+/uMRD discordance following len-R-CHOP, the patients’ subsequent PET eventually was rated as 5PS ≤3. One patient with PET+/uMRD discordance following R-HiDAC converted to PET- followed R-len maintenance whereas the other patient remained PET+ and had conversion to dMRD. Both patients whose disease was PET-/dMRD at EoT have experienced disease relapse.
Tumor genomic and cytogenetic alterations
Forty-five patients underwent NGS-based targeted exome sequencing (Figure 4) and 20 patients therein underwent analysis of paired tumor sequencing at relapse/progression. As shown in Figure 4A, besides TP53 (N=8, 22%), commonly mutated genes at baseline included ATM (53%) and KMT2D (24%). A subset of 11 patients also had expanded cytogenetic testing at baseline (karyotype, N=7; SNP array, N=3; both, N=1) of whom two had complex karyotype (≥3 unrelated cytogenetic abnormalities beyond t(11;14)). Six of 20 patients with
paired sequencing at time of disease relapse/progression demonstrated emerging CDKN2A and CDKN2B homozygous deletions compared to baseline (McNemar test for paired data, P=0.13). No gene besides TP53 was prognostic when altered at baseline (hazard ratio [HR] for PFS =5.91; 95% CI: 2.35-14.84; HR for OS =7.87; 95% CI: 2.21-28.02).
We performed a single-center, investigator-initiated, phase II study examining a frontline intensive IC-based treatment regimen for MCL with the addition of len and omitting consolidative HDT/ASCR. Although the primary study endpoint of 3-year PFS was not met, this was primarily driven by the poor outcomes observed among patients with TP53-altered MCL, further establishing that TP53-altered MCL is associated with poor outcomes when treated with IC and len does not overcome this negative prognostic impact.5 However, among patients with WT TP53, outcomes were more favorable, even among patients whose MCL harbored adverse disease features (elevated Ki67 and/or blastoid/pleomorphic histology). We further demonstrated the prognostic importance of MRD status in MCL within our approach, especially at the level of 1E-6 sensitivity, which can be achieved using the NGSbased MRD assay.
The frequency and severity of toxicities observed with our treatment regimen generally aligned with those expected based on prior studies investigating len-R-CHOP15 and R-len.16 The addition of lenalidomide did impact R-CHOP dosing, as 41% of patients required dose reduction (in len) or delay during len-R-CHOP, primarily due to cytopenias (7 instances) and neutropenic fever (6 instances). This frequency is
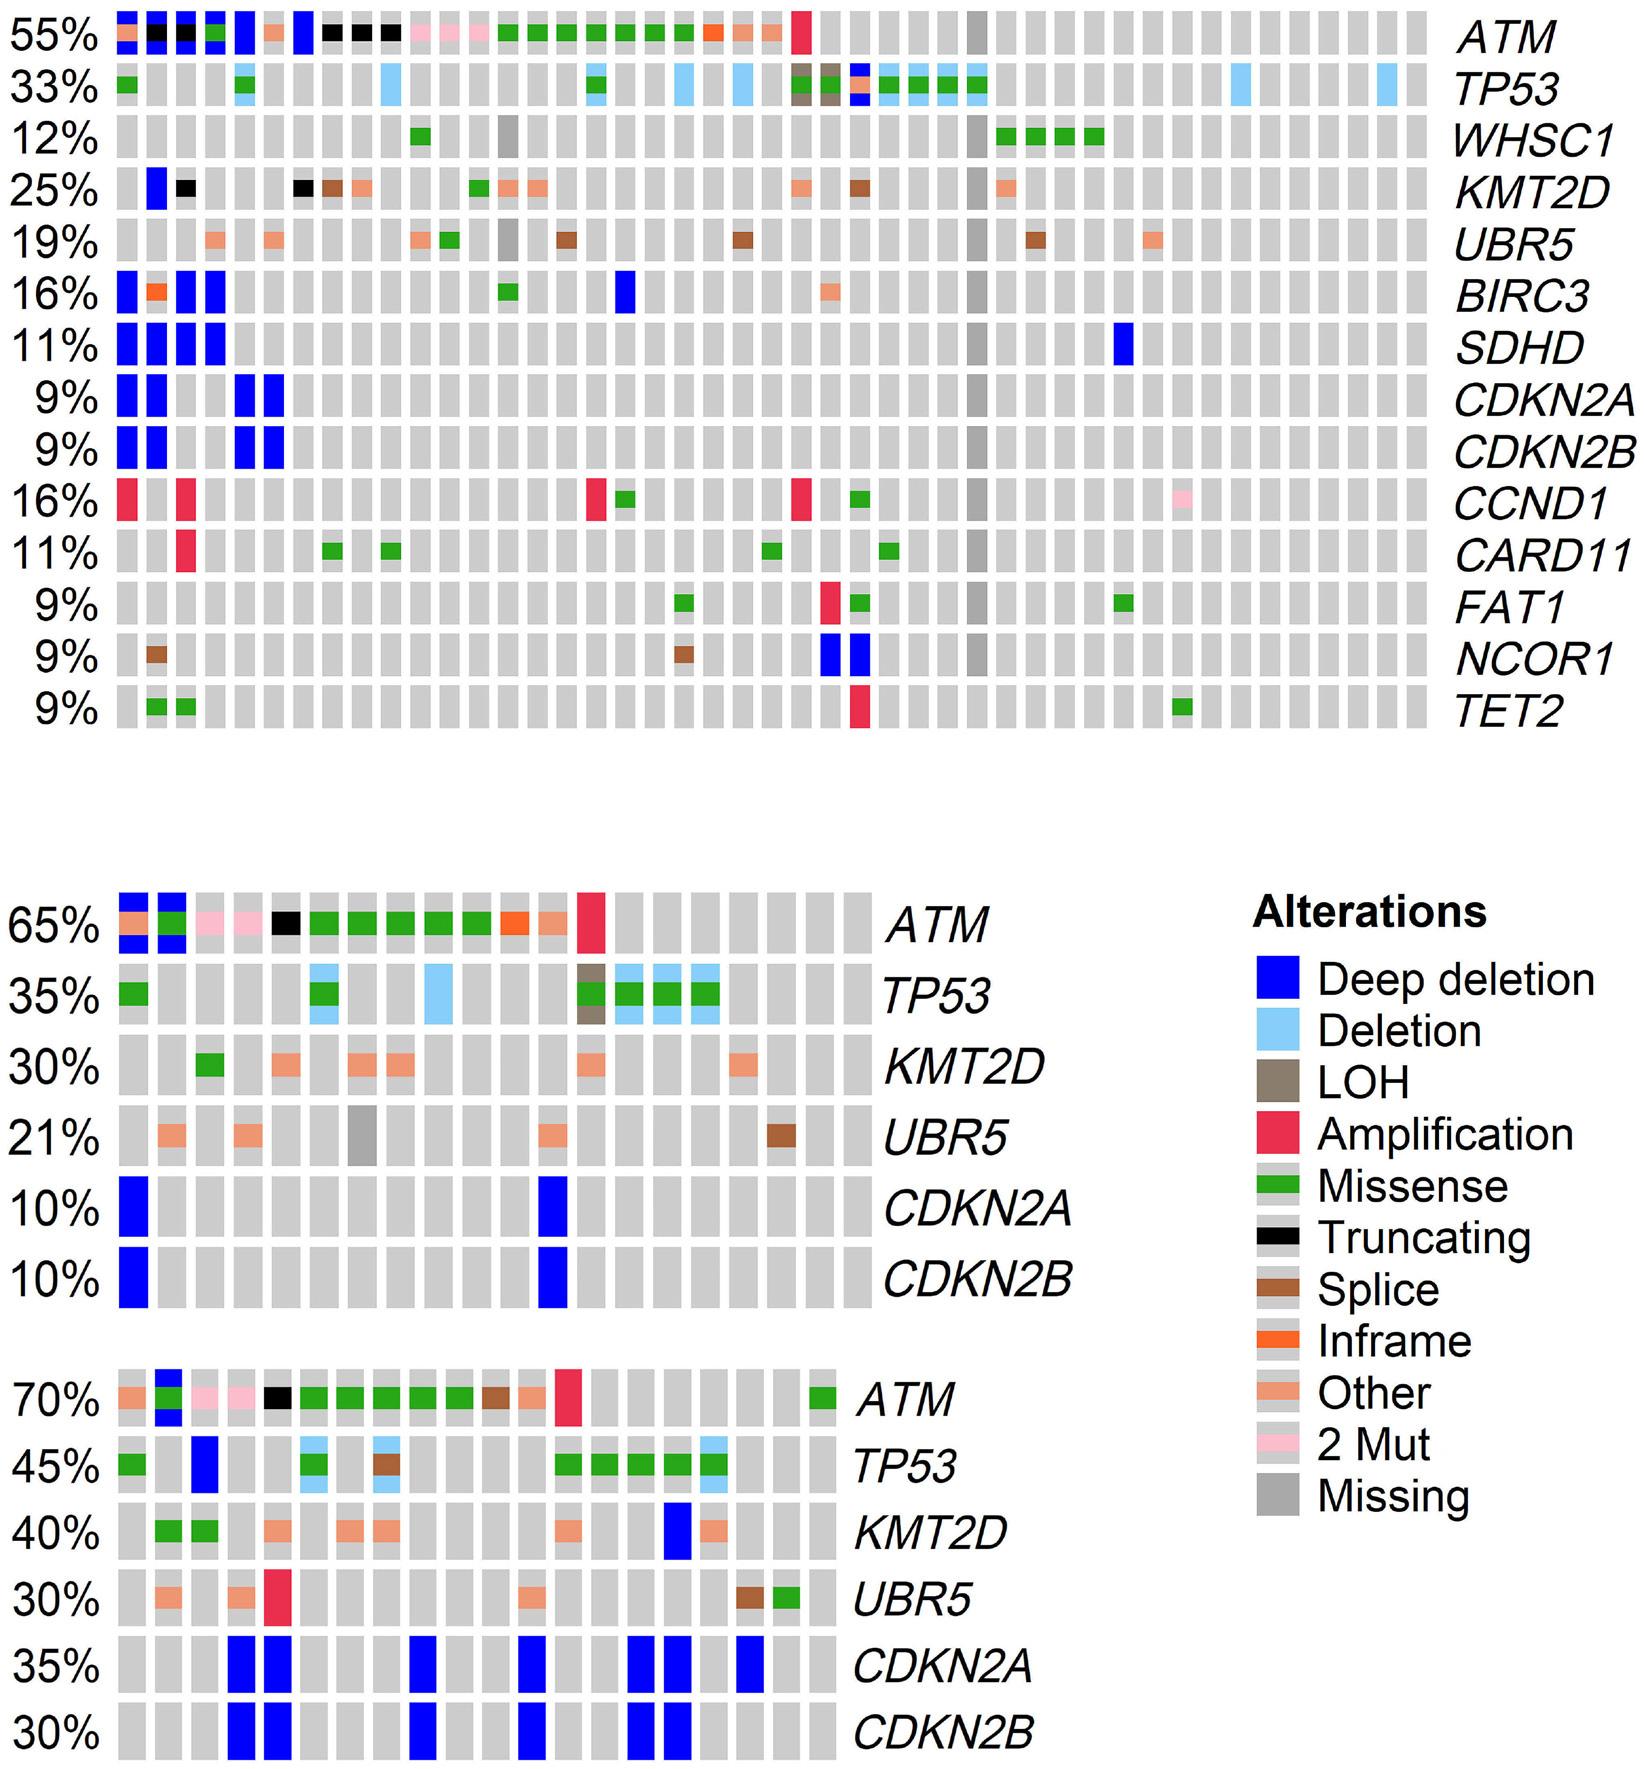
higher than that observed (9%15) in treating diffuse large B-cell lymphoma with len-R-CHOP, which could be due to the higher incidence of bone marrow involvement in MCL predisposing to hematologic toxicity. At interim analysis of 16 patients, we observed excessive hematologic toxicity, primarily grades 3/4 thrombocytopenia without bleeding, with 3,000 mg/m2 of cytarabine. Therefore, this dose level was removed for the remainder of our study. Numerous dose regimens of cytarabine have been utilized in treating MCL, notably: R-BAC - 500-800 mg/m2 for 3 days, R-DHAX - 2,000 mg/m2 every 12 hours for two doses, hyper-CVAD (age-based) - 1,000-3,000 mg/m2 every 12 hours for 2 days, and Nordic (age-based) - 2,000-3,000 mg/m2 every 12 hours for 2 days.
In our study, many patients’ MCL responded to cytarabine radiographically and based on conversion from dMRD to uMRD with cytarabine dosing of <3,000 mg/m2, suggesting that efficacy may be maintained with dose attenuation for advanced age or comorbidity.
The role for consolidative HDT/ASCR in first remission in MCL has been questioned given several retrospective and real-world studies in the modern era which have not demonstrated an OS benefit with this approach.1,3,17 An updated analysis from the European Mantle Cell Lymphoma Network phase 3 clinical trial that established the role of HDT/ASCR show no statistically significant difference in PFS and OS in the rituximab-treated patient subset (N=68) between HDT/
in cohort in at least 4 instances (N=45 patients). Source of TP53 deletion status includes all possible testing modalities, including targeted sequencing and other cytogenetic studies (karyotype, single nucleotide polymorphism array, fluorescence in situ hybridization). (B) Tile plot displaying genomic alterations at progression evaluating the top 6 genes altered in relapsed samples (N=20 patients). LOH:loss of heterozygosity; Mut: mutations.
ASCR and interferon-α maintenance in first remission.3 The rate of referral for HDT/ASCR in real-world datasets of patients in the United States is as low as 17%, suggesting incomplete uptake of this practice.18,19 Although supportive care measures for patients undergoing HDT/ASCR have improved and the incidence of major toxicities or death with its use in contemporary practice is lower,20 it still carries potential for substantial toxicity (especially in older patients in whom MCL is common), deep and lasting immunosuppression with potential infectious sequelae, high cost, and intensive exposure to healthcare facilities, much of which are especially undesirable during the ongoing COVID-19 pandemic. Other notable studies have incorporated novel agents to frontline therapy with IC without HDT/ASCR consolidation.21-24 Results from the WINDOW-1 study were published,22 reporting outcomes from 131 patients treated with ibrutinib-rituximab followed by R-hyper-CVAD/methotrexate-cytarabine: among 97 PET/CT-evaluable patients, the overall response rate was 71% and complete response rate 69% to ibrutinib-rituximab alone; 3-year PFS was 79% (95% CI: 70-85), indicative of high clinical activity for this regimen. The Nordic MCL4 study24 investigated len added to upfront bendamustine-rituximab in a non-transplant-eligible patient population (N=50) and demonstrated a median PFS of 42 months; importantly, patients whose MCL harbored altered TP53 (N=12) had inferior survival outcomes in this
study. Finally, abstract results have been reported for the Triangle study,23 which randomized 870 patients to IC plus HDT/ASCR (‘arm A’) versus IC plus HDT/ASCR plus ibrutinib (‘arm A+I’) versus IC plus ibrutinib omitting HDT/ASCR (‘arm I’). Similar to the WINDOW-1 study, only 15% of patients in Triangle were high-risk by MIPI. Although the 3-year PFS estimates from these studies (especially WINDOW-1 and Triangle) are higher than the 3-year PFS reported in the current study, our study included both younger and older patients and enriched for high-risk patients (59% with MIPI-b high risk and 23% with mutated TP53), thus limiting cross-trial comparison of outcomes. Collectively, these studies and our results show that frontline targeted therapies can build upon IC regimens and spare patients the toxicities associated with HDT/ASCR without a clear decrement in PFS.
Maintenance therapy has a clear role post-HDT/ASCR in prolonging remission duration based on results from the LYSA Group’s randomized study demonstrating prolongation in PFS and OS with 3 years of rituximab maintenance.25 Data from the Randomized European MCL Elderly Trial26 reinforced the benefit to rituximab maintenance for older patients following R-CHOP. Multiple other groups have investigated the role for len-based maintenance with27 or without8 HDT/ ASCR. The MCL R2 Elderly trial8 reported improved PFS but not OS comparing R-len to rituximab alone as maintenance following induction (without HDT/ASCR) at the cost of increased toxicity; thus, along with waited results from the ongoing ECOG-ACRIN E1411 trial,28 the optimal composition of maintenance therapy remains an unanswered question that warrants further inquiry. In our study, the re-emergence of detectable MRD and subsequent relapses that we observed in the 6 months following EoT suggest that a longer duration of maintenance beyond 6 months may have been beneficial to sustain remissions in this high-risk patient population. However, such considerations would have to balance potential benefits with toxicity and further immunosuppression from R-len.
We evaluated MRD status at multiple points and our data comprise one of the largest experiences in MCL using the NGS clonoSEQ platform; most prior studies used ASO PCR. Overall, we have shown that MRD status carried prognostic importance in our sequential treatment regimen, especially at later time points such as 6 months following EoT, and that 1E6 is more strongly predictive of outcomes than 1E5 sensitivity. A key finding from our study is the different implications for MRD results at the level of 1E-5 versus 1E-6 sensitivity levels: a majority of patients’ disease was uMRD at 1E-5 following R-HiDAC and MRD status at this sensitivity level and time point did not carry prognostic significance. However, MRD status at 1E-6 at this same time point did discriminate long-term PFS (median 22 months dMRD vs. 54 months uMRD). This supports the use an of NGS MRD assay which is a highly sensitive assay and can achieve a sensitivity level of 1x10⁻⁶. An additional key finding is that persistent or
recurrent dMRD late in study treatment predicted long-term PFS: at 6 months following EoT, median PFS was 13 months for dMRD versus 39 uMRD at the level of 1E-6 sensitivity. This prompts consideration as to whether additional maintenance could have been beneficial in patients with dMRD. Furthermore, this finding of a later MRD time point carrying prognostic importance is concordant with results from a large, prospective effort using a PCR-based assay.29 Therein, the authors showed that MRD status at 6 months post-HDT/ ASCR was a particularly useful measure for predicting longterm outcome. MRD-based study designs based on these results could continue maintenance for patients with dMRD and/or terminate maintenance for patients with uMRD. We substantiated existing literature correlating abnormalities in TP53 and poor outcomes with IC-treated patients in MCL (this relationship was not firmly established at time of study conception). Our data correlating upfront sequencing results with clinical outcomes is one of the largest and most comprehensive in uniformly treated patients with MCL. We did not identify additional gene signatures predictive of outcomes. Through serial sequencing in 20 patients at baseline and relapse, we demonstrated stability in TP53 alterations (Figure 4B) and identified in CDKN2A and CDKN2B loss at time of relapse, similar to enrichment previously published findings.30 The 3-year PFS rate among patients with TP53-altered MCL approximates data from the Nordic MCL2 study in which patients underwent HDT/ASCR, recognizing the limitations of cross-trial comparisons and differences between these cohorts.5 The addition of len did not appear to abrogate this negative effect. There are ongoing studies without chemotherapy that are investigating the use of targeted therapies, such as BTKi with or without venetoclax, as upfront treatment of TP53-altered MCL (clinicaltrials gov. Identifier: NCT03824483, NCT03112174) and we await results from these studies to inform management for high-risk MCL patients.
Our study carries limitations. First, our study was devised and implemented prior to the extensive body of literature demonstrating the adverse prognostic effect of TP53 abnormalities in MCL. Second, although there are clear patterns among our data from clinical and MRD perspectives, we caution firm conclusions given the relatively small numbers of patients treated at a single center that ultimately warrant confirmation in a multicenter effort.
We designed a non-HDT/ASCR-based frontline treatment approach for MCL and achieved generally favorable clinical outcomes in patients with WT TP53 MCL with expected toxicity for cytarabine-containing induction regimens in treating MCL. Our clinical outcomes roughly align with those from other upfront HDT/ASCR-sparing approaches with novel agents, when accounting for our enriching for patients with high-risk MCL, and further substantiate the validity of this therapeutic approach. Additionally, we have redemonstrated the predictive power of MRD evaluation in defining disease trajectories longitudinally in patients with MCL and highlight
the 1E-6 sensitivity level as particularly useful. Although we are not further developing this treatment regimen, similar future approaches could consider developing a strategy with a longer maintenance treatment phase given the pattern of relapses that we observed post-maintenance. Based on the first formal evaluation in the Triangle study incorporating upfront BTKi, it is unclear whether or not upfront len + chemoimmunotherapy approaches will be further developed. Noteworthy ongoing upfront studies include venetoclax-lenalidomide-rituximab31 and acalabrutinib-lenalidomide-rituximab32 from which we await further results. Given len’s immunomodulatory mechanism of action and the advent of chimeric antiden receptor T cell33 and bi-specific antibodies34 in treating MCL, there may be rational synergistic combinations that can be pursued wherein len augments the efficacy of these immune-based therapies.
Disclosures
ZDE-P discloses education content review for Elsevier. CLB discloses grants/contracts from Epizyme, Autolus, Roche and Vincerx; consulting/advisory boards for BMS, Seattle Genetics, Kite, Karyopharm, TG Therapeutics, ADC Therapeutics, Abbvie and Genentech; stock/options of Dava Oncology; honoraria from TouchIME, Medscape and Moderna. PC discloses stock/options of Bristol-Myers Squibb, Johnson and Johnson, Novartis, Pfizer, Teva and Glaxo Smith Kline. AD discloses grants/contracts from Roche and Takeda; consulting for Incyte and EUSA. JG discloses employment at Janssen Pharmaceuticals. PAH discloses grants/contracts from Molecular Templates, Alexion/Portola and Janssen; consulting for Calithera Pharmaceuticals, AstraZeneca, Juno Therapeutics, Sandoz, Karyopharm and Celgene; data safety monitoring/advisory board of Molecular Templates. CH discloses honoraria from Invivoscribe, Inc. and Maryland Society of Pathologists; support for meetings/travel from Loxo Oncology at Lilly; advisory board membership at Blueprint Medicines; stock options of Eli Lilly and Company; employment at Loxo Oncology at Lilly. AJa discloses employment at Adaptive Biotechnologies. MJM discloses grants/contracts from Astra Zeneca, Bayer, Genentech, IGM Biosciences, Janssen, Pharmacyclics, Roche and Seattle Genetics; consulting/advisory role at ADC Therapeutics, Astra Zeneca, Bayer, Daiichi Sankyo, Epizyme, F. Hoffmann-La Roche Ltd, Genentech Inc., IMV Therapeutics, Juno Therapeutics, Karyopharm, Merck, MEI Pharma, Rocket Medical, Seattle Genetics, TG Therapeutics and Teva; honoraria from ADC Therapeutics, Bayer, Daiichi Sankyo, Epizyme, IMV Therapeutics, Janssen, MEI Pharma, Pharmacyclics, Genentech, Roche and Seattle Genetics; expert testimony for Bayer; stock/options of Merck. AJM discloses honoraria from Seagen, L.P./Purdue, Affimed, Imbrium Therapeutics, Takeda, Seattle Gentics, Janpix Ltd. and Merck; data safety monitoring/advisory board of Lymphoma Hub and Gilead Science Inc. CM discloses stock/options and employment at Adaptive
Biotechnologies. GS discloses consulting for Abbvie, Beigene, BMS/Celgene, Epizyme, Genentech/Roche, Genmab, Incyte, Janssen, Kite/Gilead, Loxo, Milteniy, Molecular Partners, Morphosys, Nordic Nanovector, Novartis, Rapt, Takeda and Debiopharm/Velosbio/Ipsen; honoraria from Abbvie, Bayer, Incyte, Kite/Gilead, Morphosys, Novartis and Regeneron; stock/options of Owkin. DJS disloses grants/contracts and honoraria from Takeda and Seagen. AY discloses employment at AstraZeneca. ADZ discloses grants/contracts from MEI Pharma, Genentech/Roche and Beigene; consulting for Genentech Roche, Beigene, MEI Pharma, AstraZeneca, Abbvie, MorphoSys, Novartis, Adaptive Biotech, Janssen, Gilead, Kite, BMS, Celgene and Juno; honoraria from MEI Pharma, Kyowa Kirin, NCCN, ASCO Post, Curio Science, Kite Pharm and DAVA Oncology; support for meetings/travel from Dava Oncology, NCCN, ER Congressi and UNMC; data safety monitoring/ advisory board of Genentech, Roche, Abbvie, AstraZeneca, Kite, Celgene and Juno; leadership/fiduciary role at NCCN and Lymphoma Research Foundation; DMC membership at BMS, Celgene and Juno. AK discloses research support from Celgene; grants/contracts from Genentech/Abbvie, Pharmacyclics, Adaptive Biotechnologies and Seattle Genetics; honoraria from Astra Zeneca, Kite Pharmaceuticals and Janssen; stock from Bridge Bio. All other authors have no conflicts of interest to disclose.
AK and AZ designed the study. ZDE-P wrote the manuscript. ED conducted biostatistical analyses. UA and CH assisted with genomic and cytogenetic analyses. CLB, PC, PD, JG, PAH, MJM, AJM, CHM, CO, DJS, AY, ADZ, and AK enrolled patients, oversaw treatments, and graded toxicities. LL and AJ assisted with data collection and oversight. AD and CH provided pathology input. APJ and CM performed and provided input on MRD analyses. GS provided critical input on the manuscript. HS interpreted PET/CT scans. All authors read and approved the final manuscript for submission.
We acknowledge the patients and caregivers for participating in our study. We also acknowledge the study staff, medicine steering committee, and protocol development staff at MSKCC for implementation assistance. Formatting assistance at MSK was provided by Hannah Rice.
This work was supported by the institutional P30 grant (P30CA008748) and the American Association for Cancer Research, the Lymphoma Research Foundation, and the AIDS Malignancy Consortium (to ZDE-P).
The data generated in this study are available upon request from the corresponding author.
1. Gerson JN, Handorf E, Villa D, et al. Survival outcomes of younger patients with mantle cell lymphoma treated in the rituximab era. J Clin Oncol. 2019;37(6):471.
2. Karmali R, Switchenko JM, Goyal S, et al. Multi-center analysis of practice patterns and outcomes of younger and older patients with mantle cell lymphoma in the rituximab era. Am J Hematol. 2021;96(11):1374-1384.
3. Zoellner A-K, Unterhalt M, Stilgenbauer S, et al. Long-term survival of patients with mantle cell lymphoma after autologous haematopoietic stem-cell transplantation in first remission: a post-hoc analysis of an open-label, multicentre, randomised, phase 3 trial. Lancet Haematol. 2021;8(9):e648-e657.
4 Shah GL, Mohammadi I, Purdum AG, Wong AC, Schroeder A, Kilgore KM. Cost and healthcare utilization in relapsed/ refractory diffuse large B-cell lymphoma: a real-world analysis of medicare beneficiaries receiving chimeric antigen receptor T-cell vs. autologous and allogeneic hematopoietic cell transplants. Transplant Cell Ther. 2021;27(3):S302.
5. Eskelund CW, Dahl C, Hansen JW, et al. TP53 mutations identify younger mantle cell lymphoma patients who do not benefit from intensive chemoimmunotherapy. Blood. 2017;130(17):1903-1910.
6. Geisler CH, Kolstad A, Laurell A, et al. Long-term progressionfree survival of mantle cell lymphoma after intensive front-line immunochemotherapy with in vivo–purged stem cell rescue: a nonrandomized phase 2 multicenter study by the Nordic Lymphoma Group. Blood. 2008;112(7):2687-2693.
7 Jain P, Dreyling M, Seymour JF, Wang M. High-risk mantle cell lymphoma: definition, current challenges, and management. J Clin Oncol. 2020;38(36):4302-4316.
8. Ribrag V, Safar V, Kluin-Nelemans H, et al. Rituximablenalidomide (R2) maintenance is superior to rituximab maintenance after first line immunochemotherapy in mantle cell lymphoma: results of the MCL R2 Elderly Clinical Trial. Blood. 2021;138(Suppl 1):379.
9 Trněný M, Lamy T, Walewski J, et al. Lenalidomide versus investigator’s choice in relapsed or refractory mantle cell lymphoma (MCL-002; SPRINT): a phase 2, randomised, multicentre trial. Lancet Oncol. 2016;17(3):319-331.
10 Cheng DT, Mitchell TN, Zehir A, et al. Memorial Sloan KetteringIntegrated Mutation Profiling of Actionable Cancer Targets (MSK-IMPACT): a hybridization capture-based next-generation sequencing clinical assay for solid tumor molecular oncology. J Mol Diagn. 2015;17(3):251-264.
11. Barrington SF, Mikhaeel NG, Kostakoglu L, et al. Role of imaging in the staging and response assessment of lymphoma: consensus of the International Conference on Malignant Lymphomas Imaging Working Group. J Clin Oncol. 2014;32(27):3048.
12. Cheson BD, Pfistner B, Juweid ME, Gascoyne RD, Specht L, Horning SJ, Coiffier B, Fisher RI, Hagenbeek A, Zucca E. Revised response criteria for malignant lymphoma. J Clin Oncol. 2007;25(5):579-586.
13. Ching T, Duncan ME, Newman-Eerkes T, et al. Analytical evaluation of the clonoSEQ Assay for establishing measurable (minimal) residual disease in acute lymphoblastic leukemia, chronic lymphocytic leukemia, and multiple myeloma. BMC Cancer. 2020;20(1):1-15.
14 Hoster E, Klapper W, Hermine O, et al. Confirmation of the mantle-cell lymphoma International Prognostic Index in randomized trials of the European Mantle-Cell Lymphoma
Network. J Clin Oncol. 2014;32(13):1338-1346.
15. Nowakowski GS, LaPlant B, Macon WR, et al. Lenalidomide combined with R-CHOP overcomes negative prognostic impact of non–germinal center B-cell phenotype in newly diagnosed diffuse large B-cell lymphoma: a phase II study. J Clin Oncol. 2015;33(3):251-257.
16. Ruan J, Martin P, Shah B, et al. Lenalidomide plus rituximab as initial treatment for mantle-cell lymphoma. N Egnl J Med. 2015;373(19):1835-1844.
17 Dreyling M, Lenz G, Hoster E, et al. Early consolidation by myeloablative radiochemotherapy followed by autologous stem cell transplantation in first remission significantly prolongs progression-free survival in mantle-cell lymphoma: results of a prospective randomized trial of the European MCL Network. Blood. 2005;105(7):2677-2684.
18. Kumar A, Martin P, Wang M, et al. Real-world treatment patterns and outcomes of 3,455 previously untreated mantle cell lymphoma patients in US routine clinical practice. Hematol Oncol. 2021;39(Suppl 2):18-22.
19 Sawalha Y, Radivoyevitch T, Tullio K, et al. The role of upfront autologous hematopoietic cell transplantation in the treatment of mantle cell lymphoma, a population based study using the National Cancer Data Base (NCDB). Blood. 2017;130(Suppl 1):2009.
20 Liu H-W, Seftel MD, Rubinger M, et al. Total body irradiation compared with BEAM: Long-term outcomes of peripheral blood autologous stem cell transplantation for non-Hodgkin’s lymphoma. Int J Radiat Oncol Biol Phys. 2010;78(2):513-520.
21. Chang JE, Li H, Smith MR, et al. Phase 2 study of VcR-CVAD with maintenance rituximab for untreated mantle cell lymphoma: an Eastern Cooperative Oncology Group study (E1405). Blood. 2014;123(11):1665-1673.
22. Wang ML, Jain P, Zhao S, et al. Ibrutinib–rituximab followed by R-HCVAD as frontline treatment for young patients (≤ 65 years) with mantle cell lymphoma (WINDOW-1): a single-arm, phase 2 trial. Lancet Oncol. 2022;23(3):406-415.
23. Dreyling M, Doorduijn JK, Gine E, et al. Efficacy and safety of ibrutinib combined with standard first-line treatment or as substitute for autologous stem cell transplantation in younger patients with mantle cell lymphoma: results from the randomized Triangle Rrial By the European MCL Network. Blood. 2022;140(Suppl 1):1-3.
24. Eskelund CW, Albertsson-Lindblad A, Kolstad A, et al. Lenalidomide plus bendamustine-rituximab does not overcome the adverse impact of TP53 mutations in mantle cell lymphoma. Haematologica. 2018;103(11):e541.
25. Le Gouill S, Thieblemont C, Oberic L, et al. Rituximab after autologous stem-cell transplantation in mantle-cell lymphoma. N Engl J Med. 2017;377(13):1250-1260.
26. Kluin-Nelemans HC, Hoster E, Hermine O, et al. Treatment of older patients with mantle cell lymphoma (MCL): long-term follow-up of the randomized European MCL elderly trial. J Clin Oncol. 2020;38(3):248-256.
27. Ladetto M, Cortelazzo S, Ferrero S, et al. Lenalidomide maintenance after autologous haematopoietic stem-cell transplantation in mantle cell lymphoma: results of a Fondazione Italiana Linfomi (FIL) multicentre, randomised, phase 3 trial. Lancet Haematol. 2021;8(1):e34-e44.
28. Smith MR, Jegede O, Martin P, et al. ECOG-ACRIN E1411 randomized phase 2 trial of bendamustine-rituximab (BR)based induction followed by rituximab (R) ± lenalidomide (L)
consolidation for mantle cell lymphoma: effect of adding bortezomib to front-line BR induction on PFS. J Clin Oncol. 2021;39(Suppl 15):7503.
29 Ferrero S, Grimaldi D, Genuardi E, et al. Punctual and kinetic MRD analysis from the Fondazione Italiana Linfomi MCL0208 phase 3 trial in mantle cell lymphoma. Blood. 2022;140(12):1378-1389.
30 Delfau-Larue M-H, Klapper W, Berger F, et al. High-dose cytarabine does not overcome the adverse prognostic value of CDKN2A and TP53 deletions in mantle cell lymphoma. Blood. 2015;126(5):604-611.
31. Phillips TJ, Danilov AV, Bond D, et al. The combination of venetoclax, lenalidomide and rituximab in patients with newly diagnosed mantle cell lymphoma induces high response rates and MRD undetectability. J Clin Oncol. 2021;39(Suppl 15):7505.
32. Ruan J, Leonard JP, Chen GZ, et al. Phase 2 trial of acalabrutinib-lenalidomide-rituximab (ALR) with real-time monitoring of MRD in patients with treatment-naïve mantle cell lymphoma. Blood. 2022;140(Suppl 1):175-177.
33. Wang M, Siddiqi T, Gordon L, et al. Lisocabtagene maraleucel (liso-cel) in r/r MCL: primary analysis results from the MCL cohort of the single-arm, multicenter, Seamless Design Transcend NHL study. Hematol Oncol. 2023;41(S2):875-877.
34. Phillips T, Dickinson M, Morschhauser F, et al. Glofitamab step-up dosing induces high response rates in patients (pts) with relapsed or refractory (R/R) mantle cell lymphoma (MCL), most of whom had failed prior bruton’s tyrosine kinase inhibitor (BTKi) therapy. Blood. 2021;138(Suppl 1):130.
Frederik O. Meeuwes,1,2 Mirian Brink,3 Wouter Plattel,2 Marjolein W.M. van der Poel,4 Marie José Kersten,5 Mariëlle Wondergem,5 Lara Böhmer,6 F.J. Sherida H. Woei-A-Jin,7 Otto Visser,8 Rimke Oostvogels,9 Patty M. Jansen,10 Karen J. Neelis,11 Anne P.G. Crijns,12 Laurien A. Daniëls,13 Tjeerd J.F. Snijders,14 Joost S.P. Vermaat,15 Gerwin A. Huls2 and Marcel Nijland2
1Department of Hematology, Treant Hospital, Emmen, the Netherlands; 2Department of Hematology, University Medical Center Groningen, Groningen, the Netherlands; 3Department of Research and Development, Netherlands Comprehensive Cancer Organisation (IKNL), Utrecht, the Netherlands; 4Department of Hematology, GROW School for Oncology and Developmental Biology, Maastricht University Medical Center, Maastricht, the Netherlands; 5Department of Hematology, Amsterdam University Medical Centers, Cancer Center Amsterdam, Amsterdam, the Netherlands; 6Department of Hematology, Haga Hospital, The Hague, the Netherlands; 7Department of General Medical Oncology, University Hospitals Leuven, Leuven, Belgium; 8Department of Hematology, Isala Hospital, Zwolle, the Netherlands; 9Department of Hematology, University Medical Center Utrecht, Utrecht, the Netherlands; 10Department of Pathology, Leiden University Medical Center, Leiden, the Netherlands; 11Department of Radiotherapy, Leiden University Medical Center, Leiden, the Netherlands; 12Department of Radiotherapy, University Medical Center Groningen, Groningen, the Netherlands; 13Department of Radiotherapy, Amsterdam University Medical Centers, Cancer Center Amsterdam, Amsterdam, the Netherlands; 14Department of Hematology, Medisch Spectrum Twente, Enschede, the Netherlands and 15Department of Hematology, Leiden University Medical Center, Leiden, the Netherlands
Correspondence: M. Nijland m.nijland@umcg.nl
Received: March 26, 2023.
Accepted: September 27, 2023.
Early view: October 5, 2023.
https://doi.org/10.3324/haematol.2023.283174
©2024 Ferrata Storti Foundation
Published under a CC BY-NC license
Peripheral T-cell lymphomas (PTCL) comprise a heterogeneous group of mature T-cell neoplasms with an unfavorable prognosis; presentation with stage I(E) disease is uncommon. In clinical practice, an abbreviated chemotherapy treatment regimen combined with radiotherapy (combined modality treatment [CMT]) is commonly used, although evidence from clinical trials is lacking. The aim of this nationwide population-based cohort study is to describe first-line treatment and outcome of patients with stage I(E) PTCL. All newly diagnosed patients ≥18 years with stage I(E) anaplastic large cell lymphoma (ALCL), angioimmunoblastic T-cell lymphoma (AITL) and peripheral T-cell lymphoma NOS (PTCL not otherise specified [NOS]) in 1989-2020 were identified in the Netherlands Cancer Registry. Patients were categorized according to treatment regimen, i.e., chemotherapy (CT), radiotherapy (RT), CMT, other therapy and no treatment. The primary endpoint was overall survival (OS). Patients with stage I(E) ALCL, AITL and PTCL NOS (n=576) were most commonly treated with CMT (28%) or CT (29%), 2% underwent SCT. RT only was given in 18%, and 8% received other therapy and 16% no treatment. Overall, the 5-year OS was 59%. According to subtype, 5-year OS was superior for ALCL as compared to PTCL NOS and AITL (68% vs. 55% and 52%, respectively; P=0.03). For patients treated with CMT, 5-year OS was significantly higher (72%) as compared to patients treated with either CT or RT alone (55% and 55%, respectively; P<0.01). In multivariable analysis, age per year increment (hazard ratio [HR] =1.06, 95% confidence interval [CI]: 1.05-1.07), male sex (HR=1.53, 95% CI: 1.23-1.90), and CT, or no treatment (HR=1.64, 95% CI: 1.21-2.21, and HR=1.55, 95% CI: 1.10-2.17, respectively) were associated with a higher risk of mortality. For stage I(E) ALCL, AITL and PTCL NOS, 5-year OS is 59%, comparing favorably to historical outcome in advanced-stage disease. Superior outcome estimates were observed in patients treated with CMT.
Peripheral T-cell lymphomas (PTCL) are mature lymphoproliferative diseases that form a heterogenous group of >20 distinct subtypes. PTCL account for approximately 10% of newly diagnosed lymphomas worldwide. The most prevalent subtypes in Europe and North America are anaplastic large cell lymphoma (ALCL), angioimmunoblastic T-cell lymphoma (AITL) and peripheral T-cell lymphoma not otherwise specified (PTCL NOS), which together account for approximately 80-86% of all PTCL diagnoses.1,2 The prognosis of patients with PTCL is generally poor, with a median 5-year overall survival (OS) of 28-43%, where ALCL anaplastic lymphoma kinase (ALK)+ is a positive exception with a 5-year OS of 72-78%.3-8
The majority of PTCL patients present with advanced-stage disease. These patients are generally treated with six cycles of cyclophosphamide, doxorubicin, vincristine and prednisone - either with or without etoposide (CHO(E)P). More recently brentuximab vedotin + CHP was shown to be superior to CHOP in ALCL, but a direct comparison with CHOEP is lacking.9 In young and fit patients, current data largely support the use of consolidative autologous stem cell transplant (SCT).3,7,8,10-14
A minority of patients present with limited-stage disease whereby the incidence strongly depends on subtype. 3-5
A recent population-based study conducted in Denmark and Sweden indicated that the outcome in patients with limited-stage disease is superior to to those with extensive disease.15 Clinical trials on the optimal treatment of patients with limited stage are lacking. Derived from its use in aggressive B-cell lymphoma, an abbreviated treatment regimen with three cycles of CHO(E)P combined with radiotherapy (combined modality treatment [CMT]) has been adapted in daily practice of stage I(E) PTCL, but only sporadically in stage II.8,16-18
Clinical trials addressing the efficacy of different first-line treatment modalities in stage I(E) PTCL have, to the best of our knowledge, not been performed. Our nationwide population-based cohort study aims to describe the various first-line treatment regimens and the outcome of patients with stage I(E) PTCL in the Netherlands.
The nationwide population-based Netherlands Cancer Registry (NCR) is maintained and hosted by the Netherlands Comprehensive Cancer Organization (IKNL) and has nationwide coverage of at least 95% of all malignancies since 1989.19 The NCR relies on comprehensive case notification through the Nationwide Histopathology and Cytopathology Data Network and the Nationwide Registry of Hospital Discharges (i.e., inpatient and outpatient discharges). In-
formation on dates of birth and diagnosis, sex, topography and morphology, hospital type of diagnosis, and first-line therapy is routinely recorded by trained registrars of the NCR through retrospective medical records review. Information on last known vital status for all patients (i.e., alive, dead, or emigration) is obtained through annual linkage with the Nationwide Population Registries Network that holds vital statistics on all residents of the Netherlands.
All patients ≥18 years with stage I(E) PTCL diagnosed between 1989-2020 were identified in the NCR, using the International Coding system of Disease - Oncology (ICD-O) of the World Health Organization (WHO), morphology codes 9702-9705, 9714 and 9715. Stage I(E) was defined according to the Ann Arbor staging system, determined by physician assessment, in which IE is defined as extranodal localization of the lymphoma.
The PTCL subgroups analyzed included ALCL, AITL and PTCL NOS. Enteropathy associated T-cell lymphoma (EATL), extranodal natural killer-T-cell lymphoma nasal type (ENKTCL), and anaplastic large cell lymphoma, seroma associated - also known as breast-implant associated anaplastic large cell lymphoma (BIA-ALCL) - and several other, rare PTCL subtypes were excluded from analyses as treatment regimens of these disease entities are different from ALCL, AITL and PTCL NOS. Moreover, patients with a defined primary cutaneous T-cell lymphoma, including the primary cutaneous T-cell lymphomas subcutaneous panniculitis-like T-cell lymphoma (ICD-O 9708), mycosis fungoides (ICD-O 9700), primary cutaneous ALCL (ICD-O 9718), primary cutaneous g/δ T-cell lymphoma (ICD-O 9726), CD4+ small/medium T-cell lymphoproliferative disorder (ICD-O 9709) and CD8+ aggressive epidermotropic cytotoxic T-cell lymphomas (ICD-O 2513) were disregarded for this study. Furthermore, PTCL patients with primary involvement of the central nervous system have been excluded. ALK+ and ALK- ALCL were registered as distinct entities in the NCR as of 2008, according to WHO classification of 2008 (4th edition). Patients were categorized according to treatment modality, i.e., chemotherapy (CT; +/- SCT), radiotherapy (RT), CMT, other therapy and no treatment. Anatomical localization of first clinical presentation according to treatment modality is presented in Online Supplementary Figure S1. Information on the exact therapeutic regimen and number of cycles was registered in the NCR for patients diagnosed as of January 1, 2014. Furthermore, patients were categorized in two calendar periods, i.e., 1989-1999, and 2000-2020. The ‘cutoff’ year was based on the implementation of CMT for patients with PTCL in the Netherlands adapted from the pivotal study of Miller et al. in large B-cell lymphoma published in 1998.18
According to the Central Committee on Research involving Human Subjects (CCMO), this type of observational study does not require approval from an ethics committee in the Netherlands. The Privacy Review Board of the NCR approved the use of anonymous data for this study.
Descriptive statistics were used to present patient characteristics across the six treatment modalities. In addition, for 58 patients treated with CT and diagnosed in 20142020, type of chemotherapy, number of cycles and best response, determined by physician assessment using the Lugano classification, were evaluated. The primary endpoint was OS, defined as the time between PTCL diagnosis and all-cause-death with survival follow-up through February 1, 2022 (patients alive were censored on this date). With a median follow-up time of 70 months post-diagnosis, all survival analyses were restricted to 5 years of follow-up. The Kaplan-Meier method served to estimate OS, and the log-rank test to examine differences in survival distributions. OS was calculated for the two calendar periods, three subtypes of PTCL (AITL, PTCL NOS and ALCL) and for the five treatment strategies (CT, CMT, RT, other therapy and no treatment). For ALK+ and ALK- ALCL have been classified as distinct entities as of 2008, OS was calculated for 77 patients with ALK+ ALCL and ALK- ALCL diagnosed as of 2008. Moreover, 2-year progression-free survival (PFS) of patients treated with CT and diagnosed in 2014-2020 was calculated. PFS was defined as the time between diagnosis and tumor progression or all-cause-death, whichever occurred first.
Finally, the impact of age, sex, subtype, period of diagnosis, Ann Arbor stage (meaning stage I vs. stage IE or extranodal vs. nodal disease) and treatment on risk of mortality was evaluated using uni- and multivariable Cox proportional hazard regression analysis. For the latter, co-variates were introduced in the regression models with a backward selection method, and the final model was accomplished when the P value for the covariates was below 0.05. The results from the Cox regression analyses produce hazard ratios (HR) with associated 95% confidence intervals (CI). The proportional hazard assumption was tested based on
the Schoenfeld residuals. Overall, a P value below 0.05 was considered statistically significant. All analyses were performed using STATA/SE 17.1 (StataCorp LP, College Station, Texas, USA).
From 1989 to 2020, among the 4,795 patients with PTCL, 851 (18%) patients were diagnosed with stage I(E) disease. Of the stage I(E) patients, 343 were diagnosed with PTCL-NOS (40%), 205 with ALCL (24%), 28 with AITL (3%), and 275 with other subtypes of PTCL (32%; Figure 1). Patients with PTCL NOS, ALCL and AITL were included, leaving 576 patients with stage I(E) disease for further analyses. Over time, the share of patients with PTCL NOS decreased from 74% to 46%, whilst more patients were diagnosed with ALCL in the latter time period (24% vs. 47%); the percentage of AITL patients remained relatively stable (2% vs. 7%). The majority of the 576 patients were diagnosed between 2000 and 2020 (n=320, 56%), although the incidence of stage I(E) disease among patients with PTCL NOS, ALCL, or AITL decreased over time when compared to patients with stage II-IV (Online Supplementary Figure S2). Overall, the median age was 61 years with a male preponderance (58%). Median age varied between 55 and 67 years for patients treated with CMT versus patients treated with RT only or without therapy. Most patients treated with CMT had ALCL, whereas most patients treated with RT only were diagnosed with PTCL NOS (Table 1). Regarding ALCL, 77 patients were diagnosed after 2007 of whom 29 were ALK+, 47 were ALK- and for one patient the ALK status was unknown.
In total, 331 patients (57%) were treated with CT (Table 1),
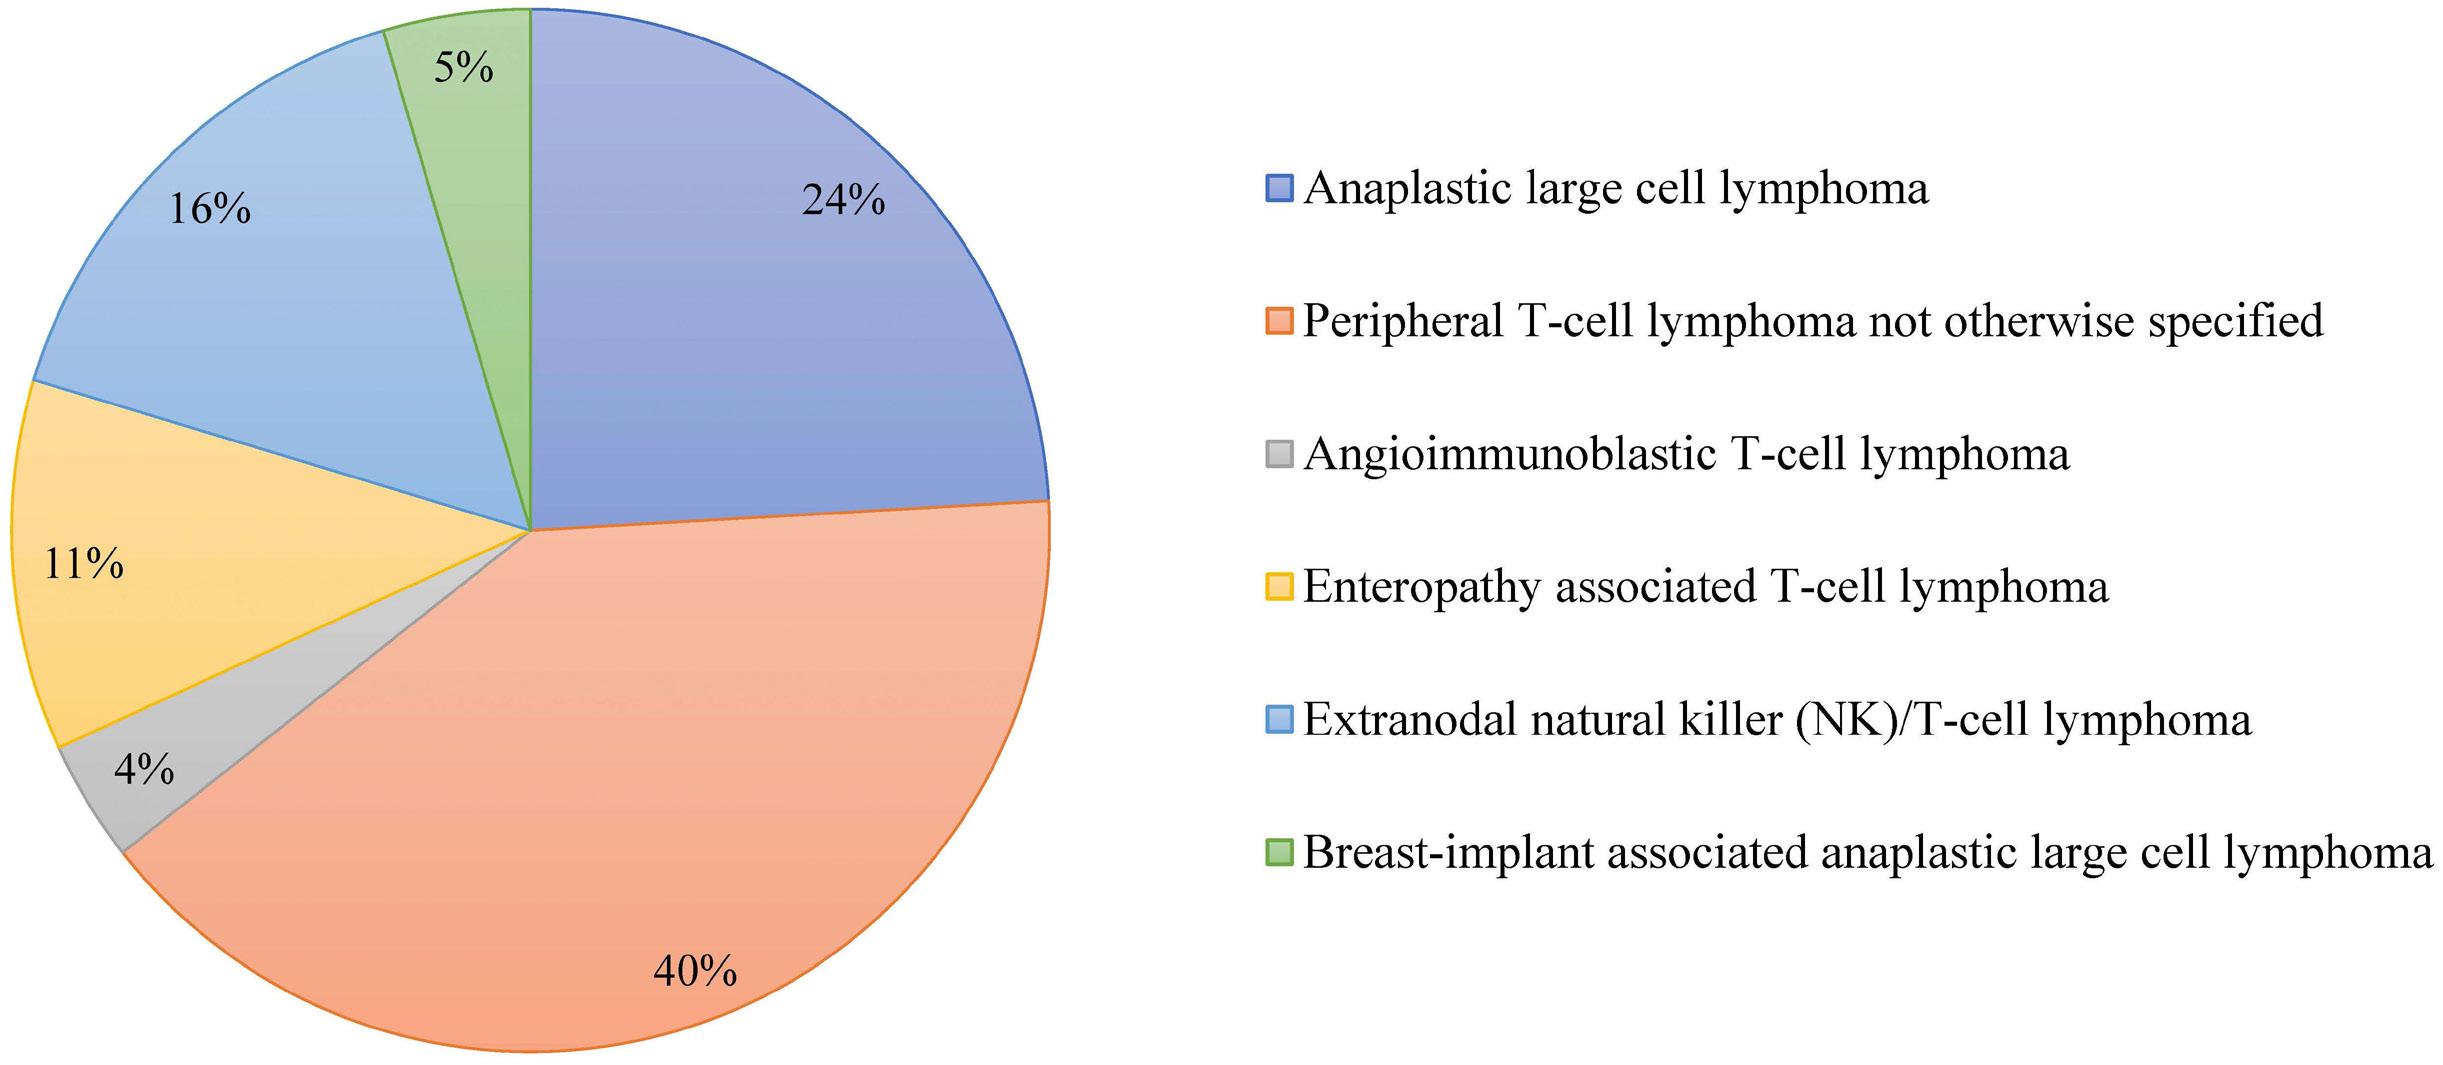
of whom 157 (47%) received CT only, 163 (49%) received CMT and 11 patients (3%) received consolidative SCT. RT was used in 102 patients (18%), 48 patients (8%) were treated otherwise, i.e., by means of surgical resection or with steroids and 95 patients did not receive any treatment at all (16%). From 2000 onwards, more patients were treated with CMT (39% vs. 131%) and less with RT (36% vs. 6%),
as compared to patients diagnosed before 2000 (P<0.01; Figure 2).
Of the 58 patients with stage I(E) disease diagnosed in 2014-2020 that were treated with CT, 39 received CHOP, 17 received CHOEP, one patient received CEOP and one patient brentuximab vedotin. Of the 56 patients with CHO(E)P, 31 patients received CT in combination with RT. The majority
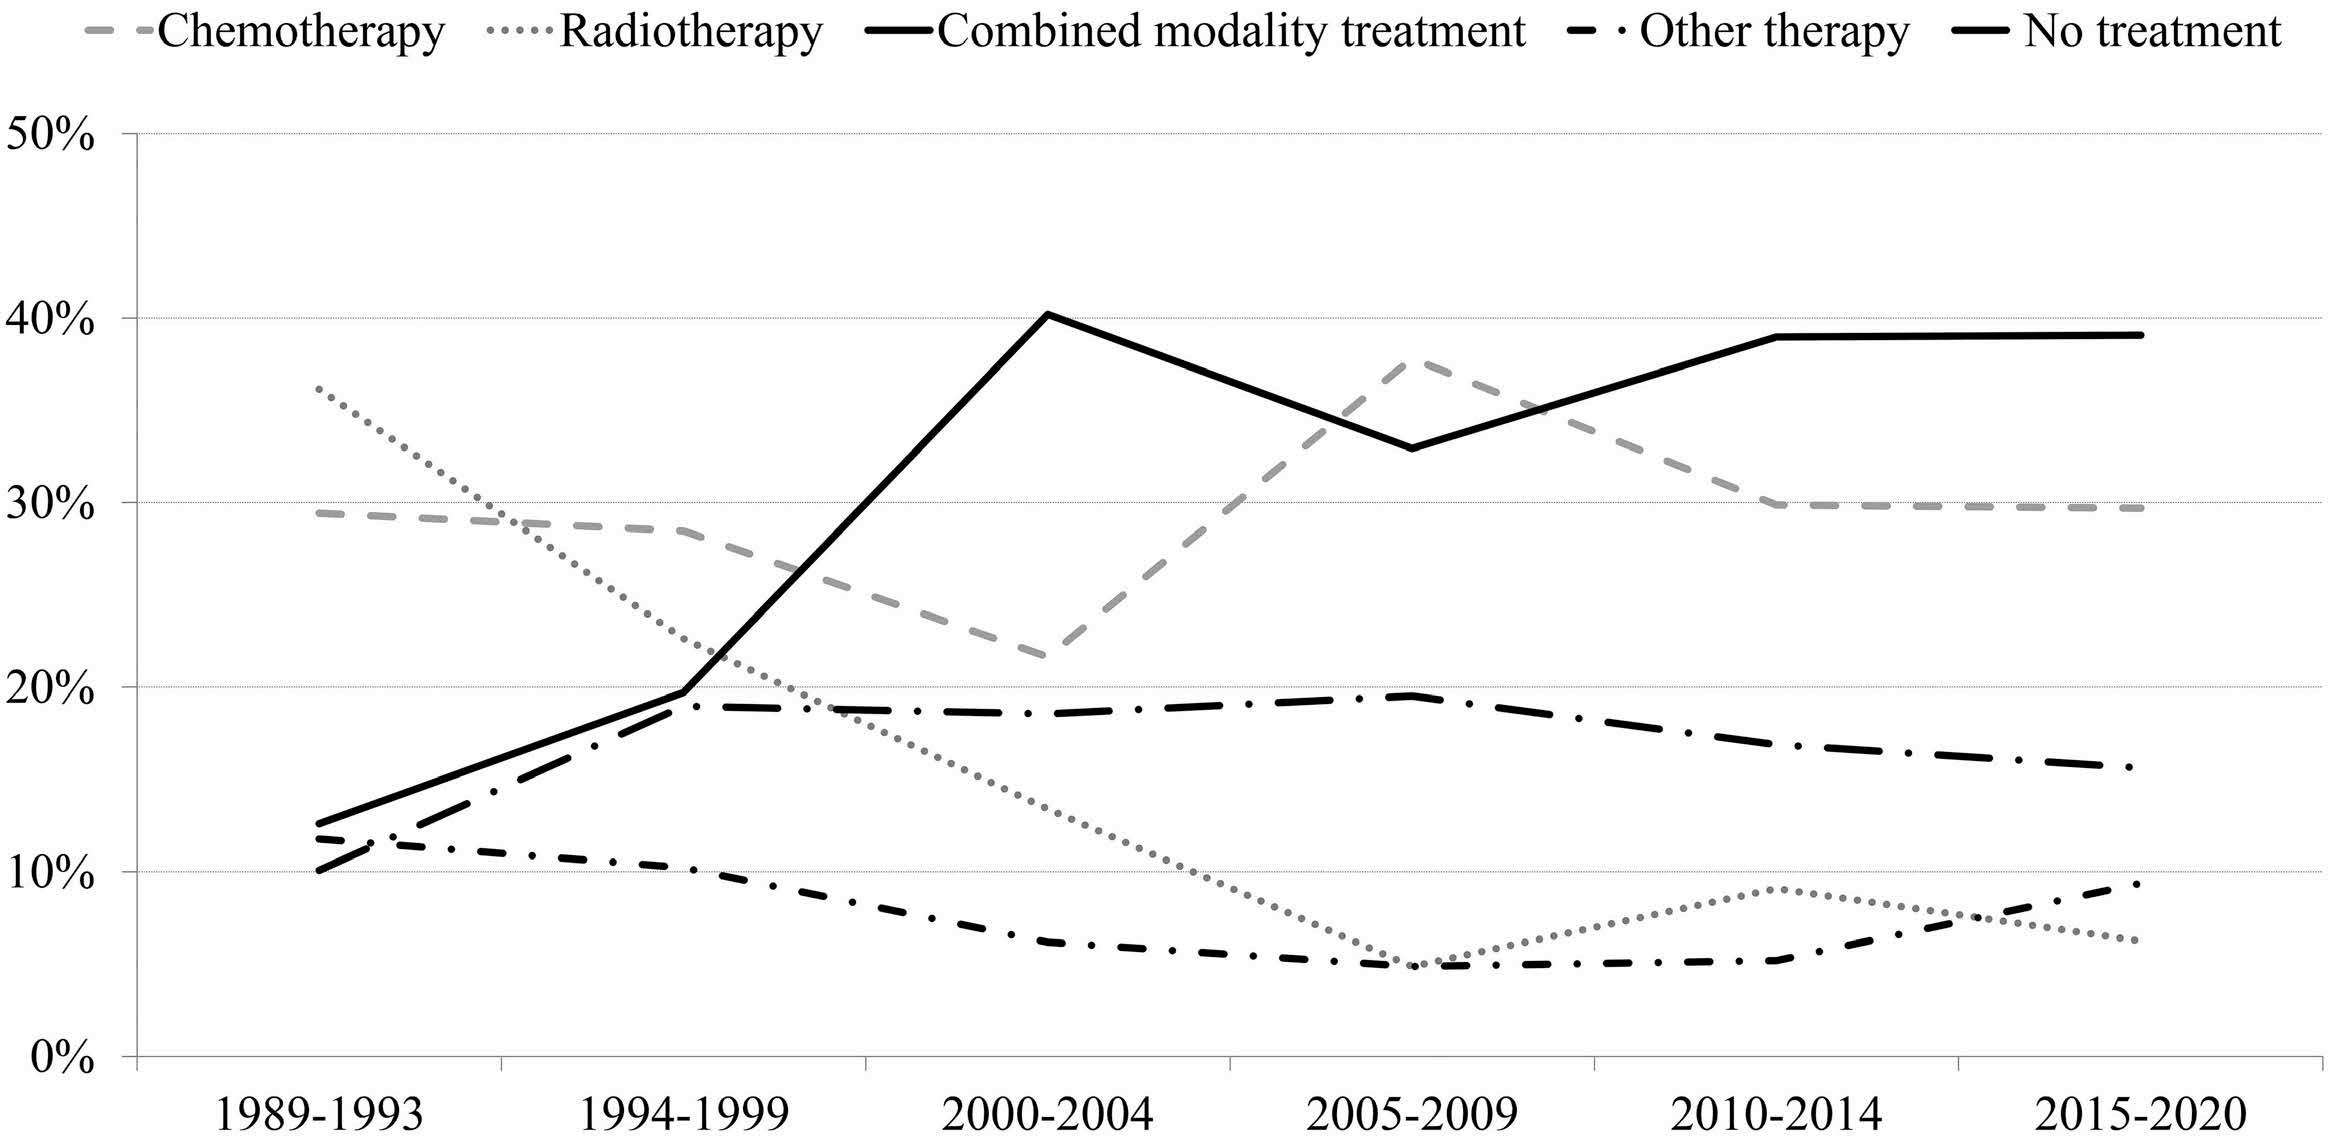
AITL, PTCL NOS). ALCL: anaplastic large cell lymphoma; AITL: angioimmunoblastic T-cell lymphoma; PTCL: peripheral T-cell lymphoma; NOS: not otherwise
CT: chemotherapy; CMT: combined-modality therapy; RT: radiotherapy; ALK: anaplastic lymphoma kinase; NOS: not otherwise specified; N: number; ALCL: anaplastic large cell lymphoma; AITL: angioimmunoblastic T-cell lymphoma; PTCL: peripheral T-cell lymphoma.
(29/31, 94%) of patients treated with CMT received 2-4 cycles of CHO(E)P. Of the 25 patients with CHO(E)P (of whom 5 with SCT), 76% (n=19) received ≥6 cycles.
Overall, the 5-year OS of stage I(E) PTCL was 59%. The 5-year OS estimates for ALCL, PTCL NOS and AITL were 68% (median OS 88 months), 55% (median OS 67 months) and 52% (median OS 44 months), respectively (P=0.03; Figure 3A). For patients with ALCL ALK+, 5-year OS was 80% as compared to 68% for patients with ALCL ALK- (Online Supplementary Figure S3; P=0.28). For patients with ALCL, PTCL NOS and AITL, 5-year OS was significantly higher when treated with CMT (72%) as compared to either chemotherapy or radiotherapy alone (55% 5-year OS for both; P<0.01; Figure 3B). There was no significant difference in the 5-year OS for stage I(E) PTCL over time, e.g., 56% in 1989-1999 and 62% in 2000-2020 (P=0.15).
For the whole cohort, uni- and multivariable analyses were performed (Online Supplementary Table S1). In multivariable analyses, age had a negative impact on outcome (per year increment, HR=1.06, 95% CI: 1.05-1.07) as well as male sex (HR=1.54, 95% CI: 1.24-1.91). Treatment with CT or no treatment were associated with a higher risk of mortality compared to CMT (HR=1.64, 95% CI: 1.211-2.21, and HR=1.55, 95% CI: 1.10-2.17, respectively; Figure 4; Online Supplementary Table S1).
Response and 2-year PFS were calculated for the 55 patients treated in 2014-2019. In this subpopulation, 50 patients received CT and five patients RT only. Of the patients with CT, 17 (34%) received CT only, 29 (58%) with RT (CMT), and four (8%) with SCT. Regarding best response, three patients with CT only had refractory disease, one patient early progression. Refractory disease or early progression was not
observed in patients treated with CMT or RT. Two-year PFS was 67% for patients with CT, and 79% for patients with CMT (Online Supplementary Figure S4; P=0.33).
In this nationwide population-based study, we show that 18% of patients with PTCL present with stage I(E) disease. Although the outcome of stage I(E) patients with ALCL, AITL and PTCL-NOS compares favorably to historical outcomes in patients with stage II-IV, the 5-year OS of 59% remains unsatisfactory.
The reported incidence of patients with PTCL presenting with limited-stage PTCL (stage I and II) varies between 23% and 48%.3,6,20,21 The incidence of stage I(E) disease is reported to be 9.5-11%.15,22 The incidence of stage I(E) PTCL in this cohort as compared to advanced-stage disease varies per subtype, i.e., patients with AITL rarely have limited-stage disease, which is in line with previous studies.23,24 There has been a remarkable shift in diagnoses between the two time periods from predominantly PTCL NOS to a more or less equal divide between PTCL NOS and ALCL. This might be due to better understanding of the disease and therefore more accurate diagnostic classifications like immunohistochemical stainings for better discrimination between the different PTCL subtypes or reflect the actual higher percentage of patients with ALCL presenting with limited-stage disease. Furthermore, the increased use of positron-emission tomography for the staging of aggressive lymphoma helps to more accurately distinguish those patients that truly have stage I(E) disease from those that have low volume advanced-stage disease that might be missed when using the less accurate method of computed
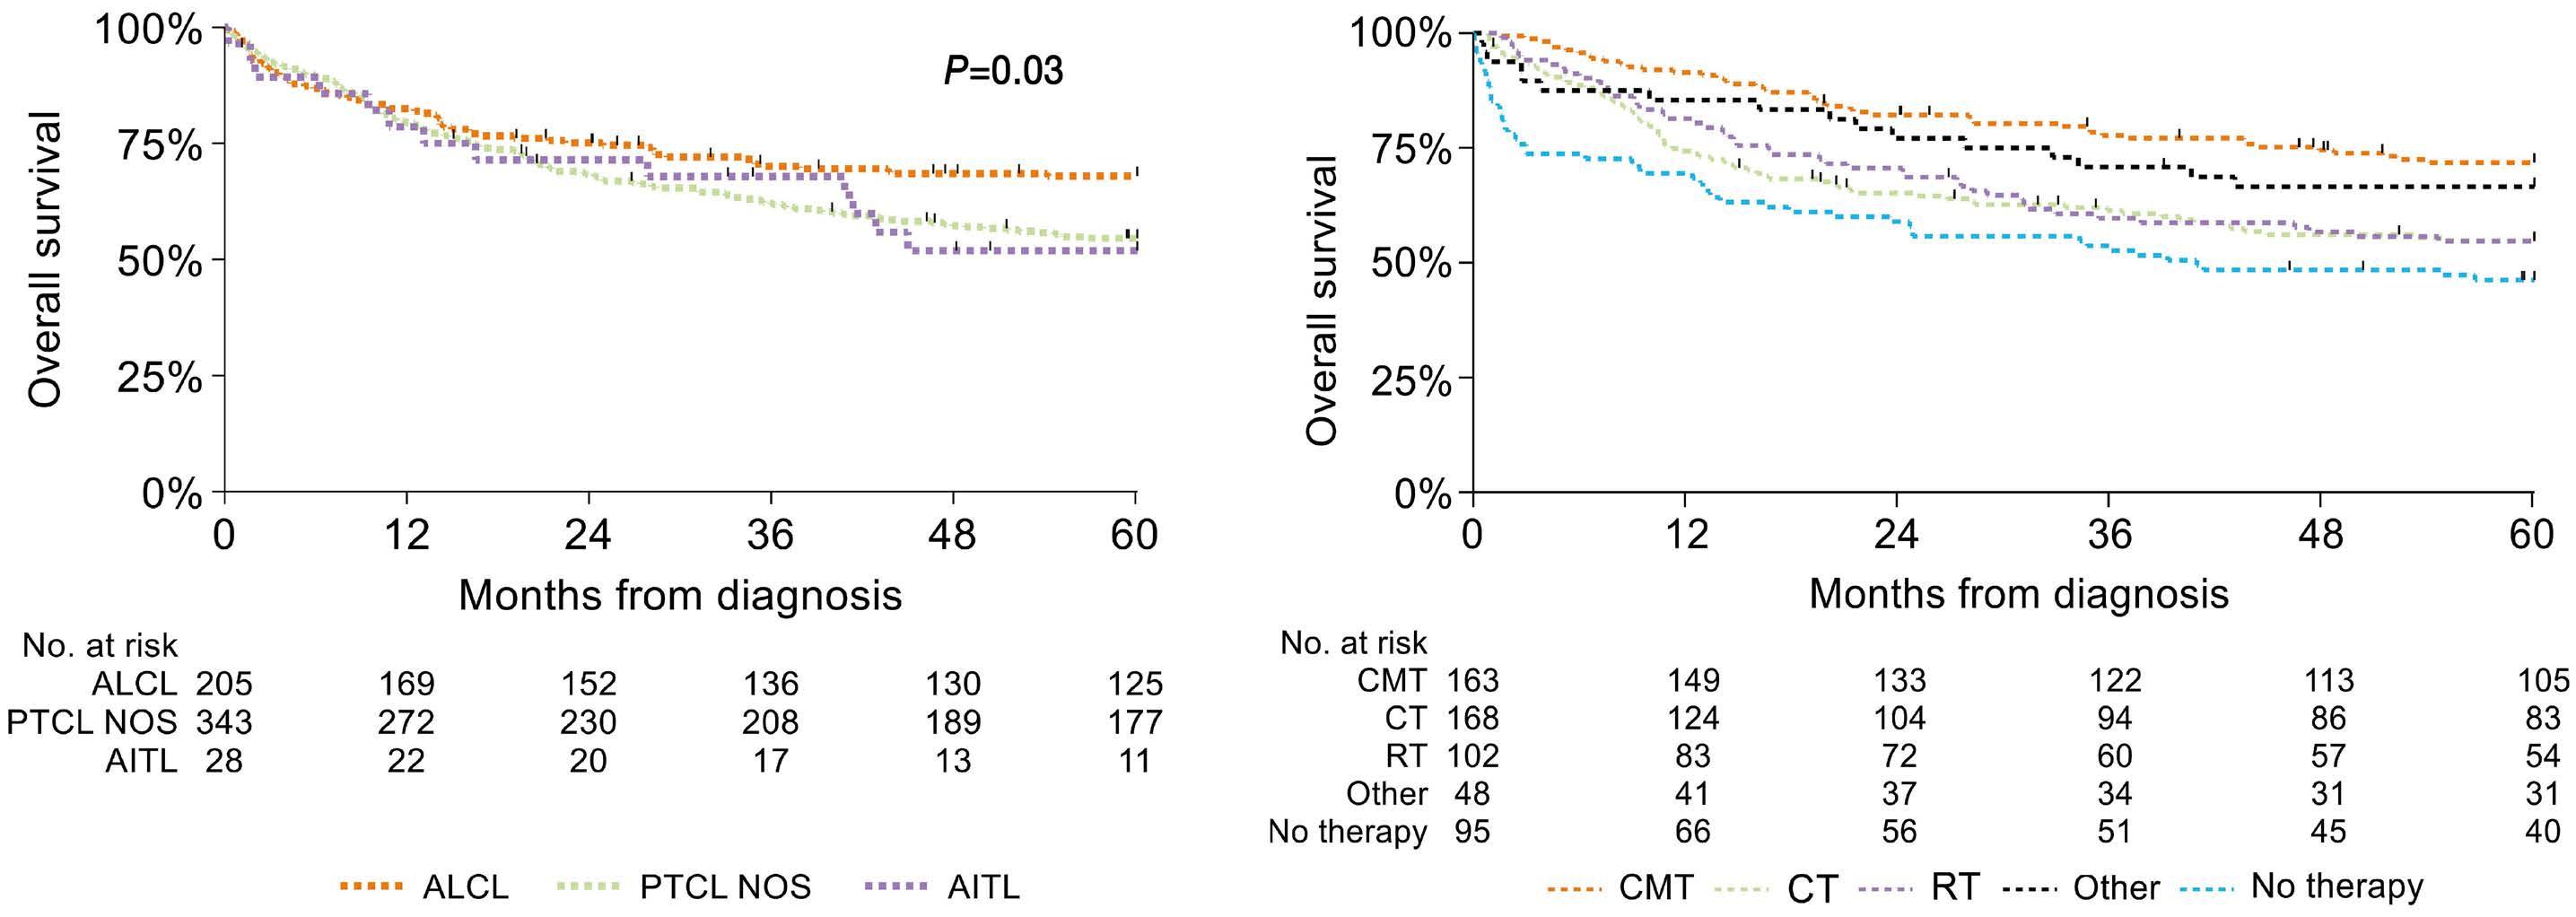
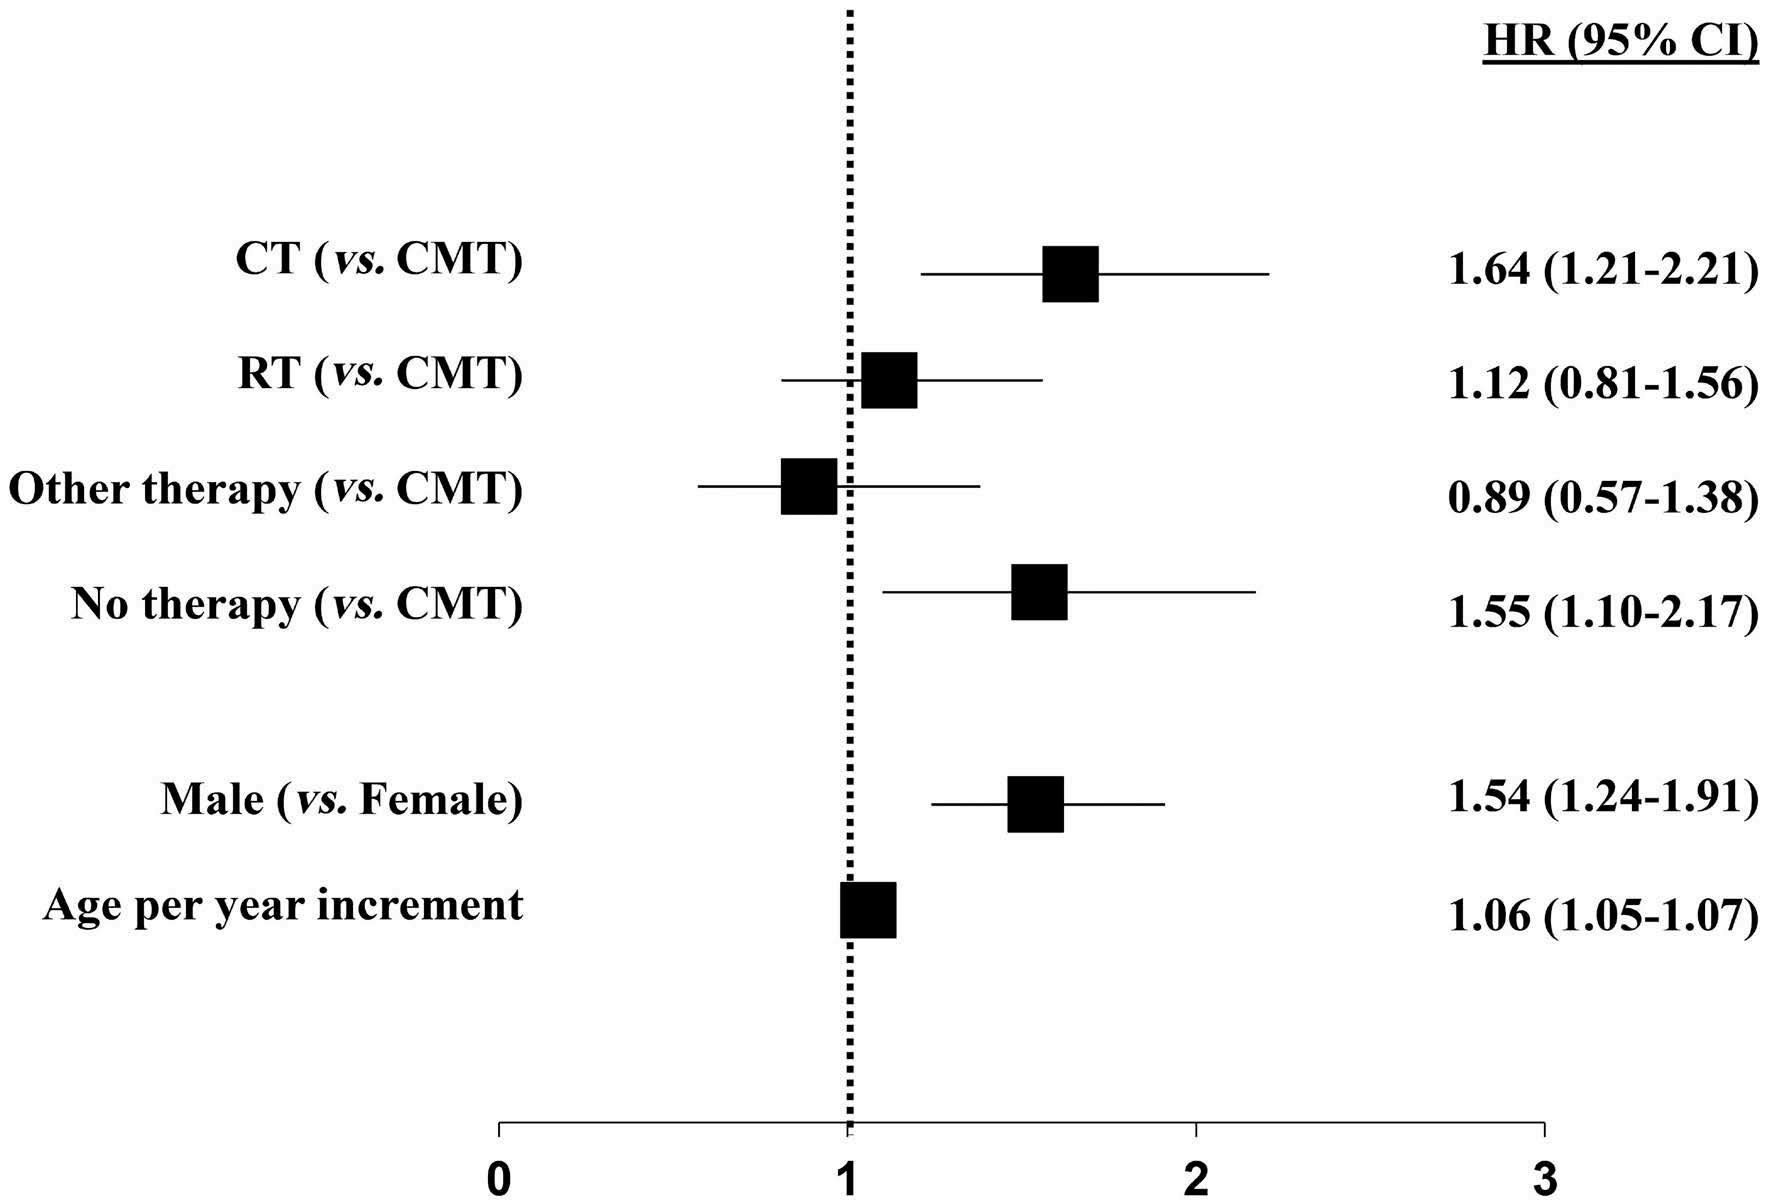
tomography-scanning.
Optimal treatment of patients with limited-stage PTCL remains unknown. Patients with stage II disease can present with quite a variable disease burden and in the Netherlands are generally treated with full course chemotherapy.18 In parallel with the implementation of CMT in patients with limited-stage aggressive B-cell lymphoma, there was an increase in the administration of CMT for stage I(E) PTCL patients, i.e., from 15% to 40% in the most recent time period. While SCT has been widely adopted in patients with advanced-stage PTCL, it was only offered in 2% of stage I(E) patients.
The favorable 5-year OS of patients with stage I(E) PTCL in the current study, as compared to advanced-stage disease previously reported by our group, confirms the results of the Nordic Lymphoma Epidemiology Group that reported on patients with limited-stage (I-II) AITL, ALCL and PTCL NOS (n=239) and found a similar 5-year OS (58%, including stage II patients) compared to 28% for patients with advanced-stage disease in the same time period.8,15 It is unclear whether there was a difference in outcome between stage I and II patients. One might expect a better outcome in our cohort since it only reports on patients with stage I disease, however the Nordic Lymphoma Epidemiology Group only included patients that were treated with at least one cycle of CHOP-like therapy whereas we included all patients with stage I(E) disease. In the Netherlands, CMT is preserved for stage I PTCL patients, whereas in other countries CMT is also offered to patients with stage II disease. In our study, outcome among patients with stage I(E) disease who received CMT was similar as compared to outcomes reported in two retrospective registry studies among patients with limited-stage PTCL comparing CMT with CT.16,17 In these studies, the effect of CMT versus CT on outcome was not reported separately for stage I and stage
Figure 4. Forest plot of multivariable analysis for overall survival among patients with stage I(E) peripheral T-cell lymphoma. HR: hazard ratio; CI: confidence interval; CMT: combined modality therapy; CT: chemotherapy; RT: radiotherapy.
II disease. Therefore, it cannot be ruled out that only in case of stage I disease and not stage II disease, CMT is associated with an improved survival as compared to CT.
Finally, since outcomes are improved in limited-stage aggressive B-cell lymphomas when treated with CMT, we anticipated that, once the use of CMT as a treatment strategy increased, this might lead to improved OS in PTCL patients. While the use of CMT is on the rise, the majority of patients are still treated differently and, therefore the impact of the increase in the use of CMT is not sufficient to have a statistically significant impact on outcome for the whole cohort. In recent years, many new drugs - alemtuzumab, brentuximab vedotin, romidepsin, amongst others - were studied in the first-line treatment of PTCL and most of them failed to show an improvement in outcome.9,25,26 Brentuximab vedotin (BV) was the only positive exception. In the ECHELON-2 study, BV-CHP was superior over CHOP.9 The study population mainly consisted of ALCL patients; only a small number of patients had AITL or PTCL NOS. In a subgroup analysis, in both limited-stage and advanced-stage disease the risk of mortality for patients treated with BV-CHP versus CHOP was similar. Recently, no benefit in ORR, PFS or OS was observed in a randomized clinical trial comparing CHOP to CHOP with romidepsin (Ro-CHOP) in PTCL. Separate results for stage I disease patients (3.8%) were not available in that study.26 In a phase II study, the impact of oral azaciditine added to CHOP was studied as first-line treatment option among 21 patients with PTCL, showing an ORR of 85%. However, only two patients had limited-stage disease.27 Despite the favorable outcome of limited-stage PTCL as compared to advanced-stage disease, these patients should not be overlooked when conducting clinical trials.
The main strength of our study includes the use of a nationwide population-based cancer registry with comprehensive
data available on first-line treatment in a homogeneous patient population. Limitations of our study include selection bias, as we do not know the motivation of the treating physician to choose a certain treatment modality, lack of information on comorbidities, potential misclassification of subtypes of PTCL, and the lack of information on the dose of radiotherapy. Furthermore, detailed information on tumor, treatment characteristics as well as response and progression-free survival were available from 2014 onward. Despite these limitations, cancer registries remain the standard for cancer surveillance activities and for population-based analysis of treatment outcomes and with little data being available on this subject, let alone prospective studies, these data are highly valuable.
Conclusion
For stage I(E) ALCL, AITL and PTCL NOS, 5-year OS is 59%. This compares favorably to the reported outcomes in advanced-stage disease. Superior outcome estimates were observed in patients treated with CMT.
1. Swerdlow SH, Campo E, Harris NL, et al. WHO Classification of Tumours of Haematopoietic and Lymphoid Tissues. Lyon: International Agency for Research on Cancer. 2017.
2. Stewart BW, Wild CP. World Cancer Report 2014. Lyon, France: International Agency for Research on Cancer IARC Press. 2014;482-491.
3. Ellin F, Landström J, Jerkeman M, Relander T. Real-world data on prognostic factors and treatment in peripheral T-cell lymphomas: a study from the Swedish Lymphoma Registry. Blood. 2014;124(10):1570-1577.
4 Vose J, Armitage J, Weisenburger D. International peripheral T-cell and natural killer/T-cell lymphoma study: pathology findings and clinical outcomes. J Clin Oncol. 2008;26(25):4124-4130.
5. Foss FM, Horwitz SM, Civallero M, et al. Incidence and outcomes of rare T cell lymphomas from the T Cell Project: hepatosplenic, enteropathy associated and peripheral gamma delta T cell lymphomas. Am J Hematol. 2020; 95(2):151-155.
6. Petrich AM, Helenowski IB, Bryan LJ, Rozell SA, Galamaga R, Nabhan C. Factors predicting survival in peripheral T-cell lymphoma in the USA: a population-based analysis of 8802 patients in the modern era. Br J Haematol. 2014;168(5):708.
7 Cederleuf H, Hjort Jakobsen L, Ellin F, et al. Outcome of peripheral T-cell lymphoma in first complete remission: a Danish-Swedish population-based study. Leuk Lymphoma. 2017;58(12):2815.
8. Brink M, Meeuwes FO, Van der Poel MWM, et al. Impact of etoposide and ASCT on survival among patients aged <65 years with stage II to IV PTCL: a population-based cohort study. Blood. 2022;140(9):1009-1019.
9. Horwitz S, O’Connor OA, Pro B, et al. Brentuximab vedotin with chemotherapy for CD30-positive peripheral T-cell lymphoma (ECHELON-2): a global, double-blind, randomised phase 3 trial. Lancet. 2019;393(10168):229-240.
10 Pfreundschuh M, Trümper L, Kloess M, et al. Two-weekly or
No conflicts of interest to disclose.
MN and MB designed the study. MB collected the data. MB, MN and FM analyzed the data. FM, MB and MN wrote the paper. All authors revised the manuscript and accepted its final version.
The authors would like to thank the registrars of the Netherlands Cancer Registry (NCR) for their dedicated data collection. The nationwide population-based NCR is maintained and hosted by the Netherlands Comprehensive Cancer Organization (IKNL).
No data sharing other than in the form of this manuscript is possible due to laws and regulations.
3-weekly CHOP chemotherapy with or without etoposide for the treatment of elderly patients with aggressive lymphomas: results of the NHL-B2 trial of the DSHNHL. Blood. 2004;104(3):634-641.
11. Schmitz N, Trümper L, Ziepert M, et al. Treatment and prognosis of mature T-cell and NK-cell lymphoma: an analysis of patients with T-cell lymphoma treated in studies of the German High-Grade Non-Hodgkin Lymphoma Study Group. Blood. 2010;116(18):3418-3425.
12. Reimer P, Rüdiger T, Geissinger E, et al. Autologous stem-cell transplantation as first-line therapy in peripheral T-cell lymphomas: results of a prospective multicenter study. J Clin Oncol. 2009;27(1):106-113.
13. Park SI, Horwitz SM, Foss FM, et al. The role of autologous stem cell transplantation in patients with nodal peripheral T-cell lymphomas in first complete remission: report from COMPLETE, a prospective, multicenter cohort study. Cancer. 2019;125(9):1507-1517.
14. Fossard G, Broussais F, Coelho I, et al. Role of up-front autologous stem-cell transplantation in peripheral T-cell lymphoma for patients in response after induction: an analysis of patients from LYSA centers. Ann Oncol. 2018;29(3):715-723.
15. Ludvigsen Al-Mashhadi A, Cederleuf H, Kuhr Jensen R, et al. Outcome of limited-stage peripheral T-cell lymphoma after CHOP(-like) therapy: a population based study of 239 patients from the Nordic lymphoma epidemiology group. Am J Hematol. 2023;98(3):388-397.
16. Chen Z, Huang H, Li X, et al. Chemotherapy plus radiotherapy versus chemotherapy alone for patients with peripheral T-cell lymphoma, not otherwise specified. Front Oncol. 2021;11:607145.
17. Rodríguez-López JL, Patel AK, Balasubramani GK, Glaser SM, Beriwal S, Vargo JA. Treatment selection and survival outcomes in early-stage peripheral T-cell lymphomas: does anaplastic lymphoma kinase mutation impact the benefit of consolidative radiotherapy? Leuk Lymphoma. 2021;62(3):538-548.
18. Miller TP, Dahlberg S, Cassady JR, et al. Chemotherapy alone compared with chemotherapy plus radiotherapy for localized intermediate- and high-grade non-Hodgkin’s lymphoma. N Engl J Med. 1998;339(1):21-26.
19 Schouten LJ, Höppener P, van den Brandt PA, Knottnerus JA, Jager JJ. Completeness of cancer registration in Limburg, The Netherlands. Int J Epidemiol. 1993;22(3):369-376.
20 Rodriguez-Pinilla SM, Domingo-Domenech E, Climent F, et al. Clinical and pathological characteristics of peripheral T-cell lymphomas in a Spanish population: a retrospective study. Br J Haematol 2021;192(1):82-99.
21. Savage KJ, Chhanabhai M, Gascoyne RD, Connors JM. Characterization of peripheral T-cell lymphomas in a single North American institution by the WHO classification. Ann Oncol. 2004;15(10):1467-1475.
22. Carson KR, Horwitz SM, Pinter-Brown LC, et al. A prospective cohort study of patients with peripheral T-cell lymphoma in the United States. Cancer. 2017;123(7):1174.
23. Kameoka Y, Takahashi N, Itou S, et al. Analysis of clinical
characteristics and prognostic factors for angioimmunoblastic T-cell lymphoma. Int J Hematol. 2015;101(6):536-542.
24. De Leval L, Parrens M, Le Bras F, et al. Angioimmunoblastic T-cell lymphoma is the most common T-cell lymphoma in two distinct French information data sets. Haematologica. 2015;100(9):e361-364.
25. Wulf GG, Altmann B, Ziepert M, et al. Alemtuzumab plus CHOP versus CHOP in elderly patients with peripheral T-cell lymphoma: the DSHNHL2006-1B/ACT-2 trial. Leukemia. 2021;35(1):143-155.
26. Bachy E, Camus V, Thieblemont C, et al. Romidepsin plus CHOP versus CHOP in patients with previously untreated peripheral T-cell lymphoma: results of the Ro-CHOP phase III study (conducted by LYSA). J Clin Oncol. 2021;40(3):242-251.
27. Ruan J, Moskowitz AJ, Metha-Shah N, et al. High rates of remission with the initial treatment of oral azacitidine plus CHOP for peripheral T-cell lymphoma (PTCL): clinical outcomes and biomarker analysis of a multi-center phase II study. Blood. 2021;138(Suppl 1):138.
Joana M. Rodrigues,1 Peter Hollander,2 Lina Schmidt,1 Eirinaios Gkika,1 Masoud Razmara,3 Darshan Kumar,4 Christian Geisler,5 Kirsten Grønbæk,5-7 Christian W. Eskelund,5,6 Riikka Räty,8 Arne Kolstad,9 Christer Sundström,10 Ingrid Glimelius,10 Anna Porwit,11 Mats Jerkeman11 and Sara Ek1
1Department of Immunotechnology, Lund University, Lund, Sweden; 2Cancer Immunotherapy, Department of Immunology, Genetics and Pathology, Uppsala University, Uppsala, Sweden; 3Department of Clinical Pathology, Akademiska University Hospital, Uppsala, Sweden; 4Aiforia Technologies Plc, Helsinki, Finland; 5Department of Hematology, Rigshospitalet, Copenhagen, Denmark; 6Biotech Research and Innovation Center (BRIC), University of Copenhagen, Copenhagen, Denmark; 7Department of Clinical Medicine, Faculty of Health Science, University of Copenhagen, Copenhagen, Denmark; 8Department of Hematology, Helsinki University Hospital, Helsinki, Finland; 9Department of Oncology, Innlandet Hospital Trust, Division Gjøvik-Lillehammer, Gjøvik, Norway; 10Department of Immunology, Genetics and Pathology, Cancer Precision Medicine, Uppsala University, Uppsala, Sweden and 11Division of Oncology, Department of Clinical Sciences, Lund University, Lund, Sweden
Correspondence: S. Ek sara.ek@immun.lth.se
Received: April 14, 2023.
Accepted: August 21, 2023.
Early view: August 31, 2023.
https://doi.org/10.3324/haematol.2023.283352
©2024 Ferrata Storti Foundation
Published under a CC BY-NC license
The transcription factor MYC is a well-described oncogene with an important role in lymphomagenesis, but its significance for clinical outcome in mantle cell lymphoma (MCL) remains to be determined. We performed an investigation of the expression of MYC protein in a cohort of 251 MCL patients complemented by analyses of structural aberrations and mRNA, in a sub-cohort of patients. Fourteen percent (n=35) of patients showed high MYC protein expression with >20% positive cells (MYChigh), among whom only one translocation was identified, and 86% (n=216) of patients showed low MYC protein expression. Low copy number gains of MYC were detected in ten patients, but with no correlation to MYC protein levels. However, MYC mRNA levels correlated significantly to MYC protein levels with a R2 value of 0.76. Patients with a MYChigh tumor had both an independent inferior overall survival and an inferior progression-free survival (hazard ratio [HR]=2.03, 95% confidence interval [95% CI]: 1.2-3.4 and HR=2.2, 95% CI: 1.04-4.6, respectively) when adjusted for additional high-risk features. Patients with MYChigh tumors also tended to have additional high-risk features and to be older at diagnosis. A subgroup of 13 patients had concomitant MYChigh expression and TP53/p53 alterations and a substantially increased risk of progression (HR=16.9, 95% CI: 7.4-38.3) and death (HR=7.8, 95% CI: 4.4-14.1) with an average overall survival of only 0.9 years. In summary, we found that at diagnosis a subset of MCL patients (14%) overexpressed MYC protein, and had a poor prognosis but that MYC rearrangements were rare. Tumors with concurrent MYC overexpression and TP53/p53 alterations pinpointed MCL patients with a dismal prognosis with a median overall survival of less than 3 years. We propose that MYC needs to be assessed beyond the current high-risk factors in MCL in order to identify cases in need of alternative treatment.
MYC is a pleiotropic transcription factor that regulates 10-15% of the genome and can simultaneously affect protein-coding genes and non-coding RNA products.1,2 It is involved in a plethora of essential cellular mechanisms, such as cell growth, metabolism and protein synthesis, cell adhesion, apoptosis, cell cycle, and angiogenesis.1-3 MYC is an important factor in B-cell proliferation known
to be involved in lymphomagenesis,3 and its deregulation is frequently associated with worse outcome.2-4 Translocations involving MYC and immunoglobulin genes are described in other B-cell lymphomas, particularly Burkitt and double-hit lymphomas, and are associated with aggressive behavior of the malignancy.2 Overexpression of MYC without genetic rearrangements also has a negative impact on outcome in B-cell lymphomas in general.5 In mantle cell lymphoma (MCL), mutations of MYC have been shown to
occur in around 20% of cases,6 and MYC-regulated pathways are often affected by genetic alterations in subsets of disease.7 Cytogenetic investigations of MYC were recently recommended as part of clinical routine but are not yet clinically implemented in most hospitals.8 The frequency of translocations involving MYC is reportedly low9-11 and most reports have been case studies describing translocations that juxtapose MYC and CCND1 12-15 In general, consensus on the degree of MYC deregulation in MCL is lacking. Here, we aim to describe the frequency of protein expression, mRNA, translocations, and amplifications of MYC in primary MCL and relate the findings to clinicopathological parameters and outcome.
MCL is a disease with a heterogeneous clinical behavior characterized by the chromosomal t(11;14)(q13;q32) that juxtaposes CCND1 to immunoglobulin genes, leading to constitutive cyclin D1 overexpression.16 An established prognostic tool, the MCL International Prognostic Index (MIPI), integrates information on age, performance status, lactate dehydrogenase levels and white blood cell count and stratifies patients into high, intermediate and low risk.17 Additional biological risk factors include TP53 mutations and/ or p53 overexpression, high proliferation, and non-classic morphology.16 Despite recent improvements in treatment,18 MCL patients often have a poor prognosis and frequently relapse.19 Thus, identification and improved understanding of alterations in MCL lymphomagenesis, beyond the already established risk factors, are critical in order to be able to individualize therapeutic decision-making.
To date, a limited number of studies have focused on MYC in MCL. In 2017, Hu et al. showed that MYC rearrangements were present in less than 1.0% of MCL cases at diagnosis, with these cases having a median overall survival (OS) of 31.3 months.20 When compared with other subtypes of lymphoma, MCL tumors seem to have a lower frequency of structural alterations involving MYC. 21 Nonetheless, in an evaluation of 88 patients, Wang et al. described 27 with tumors with MYC rearrangements and 21 with extra copies of MYC. Both subgroups of patients showed a lower OS when compared to cases with no MYC aberrations.22 However, the study by Wang et al., and other investigations reporting MYC translocations, were selected cohorts enriched for structural alterations involving MYC 9,20,23 An extensive study evaluating 1,214 lymphomas, including 138 cases of MCL, did not find any MYC rearrangements in MCL cases and only 2% had MYC protein overexpression >26%.11 Overall, MYC aberrations in MCL have been associated with a worse prognosis,10,23,24 non-classic morphology20,21,23,24 and, reportedly, enrichment for p53 overexpression among MYC-overexpressing tumors,24-26 but their additive role in MCL prognosis and clinical characteristics has not been determined. A study in diffuse large B-cell lymphoma showed that tumors with dual MYC/TP53 alterations had distinct clinicopathological characteristics with worse survival compared to wild-type cases.27
In the current study, we investigated the frequency of each molecular layer of MYC deregulation in primary diagnostic samples from a cohort of MCL patients and identified its association with both clinical and molecular high-risk factors.
Patients’ material
Two hundred and fifty-two MCL patients were included in this study, and 154 patients were part of a population-based cohort that comprised patients registered in the Swedish Lymphoma Register (SLR) and diagnosed in Uppsala and Southern Sweden between 2000-2017. The additional 98 samples were derived from patients enrolled in the Nordic Lymphoma Group clinical trials MCL2 and MCL3 (N-MCL2/3) (Online Supplementary Figure S1). The N-MCL2 trial was registered with ISRCTN.com ID ISRCTN87866680; the N-MCL3 trial was registered with ClinicalTrials.gov ID NCT00514475. Further details are provided in the Online Supplementary Materials and Methods
This study was approved by the Ethical Regional Committee in Lund (Dnr 2011/593) for part of the SLR cohort (BLISS) and by the Ethical Regional Committee in Uppsala for the N-MCL2/3 samples (Dnr 2009/428) and for part of the SLR cohort (U-CAN) (Dnr 2014/233).
The patients’ tissue microarrays were stained with anti-MYC antibody (clone Y69 1:50, Abcam; Cambridge, UK), as used in the clinical setting and in previous publications.10,24 Tissue samples were considered to overexpress MYC when the percentage of cells with a dark brown nucleus was ≥20%, in agreement with published data.24 Details about the immunohistochemistry investigaions are provided in the Online Supplementary Materials and Methods.
Fluorescent in-situ hybridization (FISH) was performed on 4 µm tissue sections using split-signal DNA probes for MYC with Vysis MYC Break Apart FISH Probe (Abbott Laboratories; Green Oaks, IL, USA) according to instructions from the manufacturer. An Olympus BX-51 microscope (Prior Lumen200 light source) and GenASIs Capture and Analysis Platform software (Applied Spectral Imaging; Carlsbad, CA, USA) were used to capture digital images of tumor areas. Cases without representative tumor material or with no representative signals were excluded. Positive FISH results on tissue microarrays were validated by evaluating whole-tissue sections.
MYC mRNA was evaluated in 85 fresh-frozen, paraffin-embedded samples from the SLR cohort with the RNAscope® assay (Advanced Cell Diagnostics; Newark, CA, USA) following the manufacturer’s instructions. The H-score was calculated
for each sample, and was defined as the dynamic range of MYC expression based on the quantification of the probe signal on a cell-by-cell level. The workflow is described in detail in the Online Supplementary Materials and Methods.
Multiplexed immunofluorescence staining
Tissue microarray slides were stained with anti-CD20 (11.9 µg/mL, clone IGEL/773, Novus Biologicals, Littleton, CO, USA), anti-CD3 (2 µg/mL, clone UM500048CF, OriGene; Rockville, MD, USA) conjugated with AlexaFluor 532 antibody labeling kit (Thermo Fisher Scientific, Waltham, MA, USA), anti-CD163 (1.25 µg/mL, clone EPR14643-36, Abcam; Cambridge, UK) conjugated with AlexaFluor 647 antibody labeling kit (Thermo Fisher Scientific), and Syto13 (500 nM, Nanostring, Seattle, WA, USA).
A software for deep learning artificial intelligence, Aiforia Create Version 5.3 (Aiforia Technologies Plc, Helsinki, Finland), was used for image analyses as further described in the Online Supplementary Materials and Methods
Statistical analysis
A χ2 test, t test or Wilcoxon signed-rank test was used to
evaluate differences between groups. The Pearson correlation coefficient was applied to test correlations between continuous variables. The outcome variables considered in the study were OS and PFS. Maximally selected rank statistics (Max Rank) in R28 was used to determine a cutoff for MYC. Differences were considered statistically significant when the P value was <0.05. A detailed description of the statistical analysis is provided in the Online Supplementary Materials and Methods.
Patients’ clinicopathological characteristics
A total of 252 patients were included in this study (Table 1), with 98 patients belonging to the N-MCL2/3 clinical trials and 154 patients being part of the SLR cohort. Male patients were predominant (75%) and the median age at diagnosis was 63 years. Patients were evenly distributed among the different MIPI risk groups, but this information was only available for 196 of the 252 patients. Thirty-one percent (76/242) of the patients had highly proliferative tumors
p53
TP53/p53, N (%)
Percentages might not add up to 100 due to rounding. *Missing information for only one of the variables studied. **Progression-free survival information was only available for 198 patients. N: number; MIPI: Mantle Cell Lymphoma Prognostic Index; WBC: white blood cell; LDH: lactate dehydrogenase; ULN: upper limit of normal; ECOG: Eastern Cooperative Oncology Group; N-MCL2/3: Nordic-Mantle Cell Lymphoma 2/3 clinical trials; R-CHOP: rituximab, cyclophosphamide, doxorubicin, vincristine, prednisone; OS: overall survival; PFS: progression-free survival.
(Ki67 >30%) and 16% (38/242) had non-classic morphology. A subgroup of patients had tumors with high expression of p53 (12%, 29/240) and/or TP53 mutations (20%, 24/119). Thus, 35/242 cases had either high p53 protein expression or a TP53 mutation. The discrepancy in frequency between the p53 and TP53 evaluation is mostly due to the lower number of samples sequenced, restricted by the availability of high-quality material. Overall, patients had a median OS of 6.2 years and a median PFS of 4.8 years. Of note, OS information was available for all patients included, whereas PFS was calculated based on 200 patients. The patients’ clinicopathological characteristics, divided by cohort, can be found in Online Supplementary Table S1
MYC overexpression
Based on previous studies in which MYC expression was assessed in a cohort of 65 cases of MCL,24 a cutoff of 20% was used to define patients with MYC protein overexpression (MYChigh). Immunohistochemistry was used to determine MYC protein expression. The mean expression was 13.1% (range, 0.14-82.9%) and the median expression was 8.7%. Max Rank statistics showed that OS outcome differences were maximized when groups were dichotomized with a cutoff at 21.4%, supporting the applicability of the 20% cutoff used to define MYC overexpression.24
Using the 20% cutoff, MYC was overexpressed in 14% of all tumor samples studied (35/252) (Table 1). Online Supplementary Figure S2 shows representative immunohistochemistry staining for MYC.
MYC mRNA and immunohistochemistry results are concordant
To evaluate MYC mRNA expression levels, we performed RNAscope®; representative images of the staining are shown in Online Supplementary Figure S3. An H-score for MYC
mRNA expression was calculated, which showed a strong correlation (Pearson) to the frequency of positive cells detected by immunohistochemistry (Online Supplementary Figures S4 and S5) with a R2 value of 0.76 (P<0.001), in the same range as previously reported for MCL.10 Information about the cohort used for RNAscope® can be found in Online Supplementary Table S2
MYChigh is associated with poor outcome
Outcome in patients with MYChigh tumors was inferior compared to that of patients with MYClow tumors (Figure 1). Patients with MYChigh MCL had a median OS of 2.2 years and PFS of 1.8 years, whereas patients with MYClow tumors had a median OS of 7.3 years and PFS of 5.2 years. In concordance, patients with MYChigh tumors also had a significantly higher risk of death (hazard ratio [HR]=2.34, 95% confidence interval [955 CI]: 1.55-3.57) and disease progression (HR=1.73, 95% CI: 1.05-2.86) compared to patients with MYClow tumors. The frequency of MYC-positive cells was also significantly associated with poor outcome as a continuous variable, for both OS and PFS. However, per increased percentage of MYC-positive cells, the risk of death or progression only increased by 3% and 4%, respectively (Table 2). Likewise, for MYC mRNA (as a continuous value), a higher H-score was associated with inferior survival and shorter progression-free survival, albeit with a low hazard ratio per H-score unit increase (Table 2). MYC protein measurements violated the proportional hazards assumption, showing a greater impact on short-term survival (Online Supplementary Figure S6). Of the cases classified as MYChigh, 57% died and 62% progressed within the first 3 years (Figure 1). In a follow-up of 3 years, the proportional hazards assumption for PFS was not violated and a negative impact on survival could be observed (Online Supplementary Table S3). Similar trends were seen when evaluating the effect of MYChigh and MYC frequency
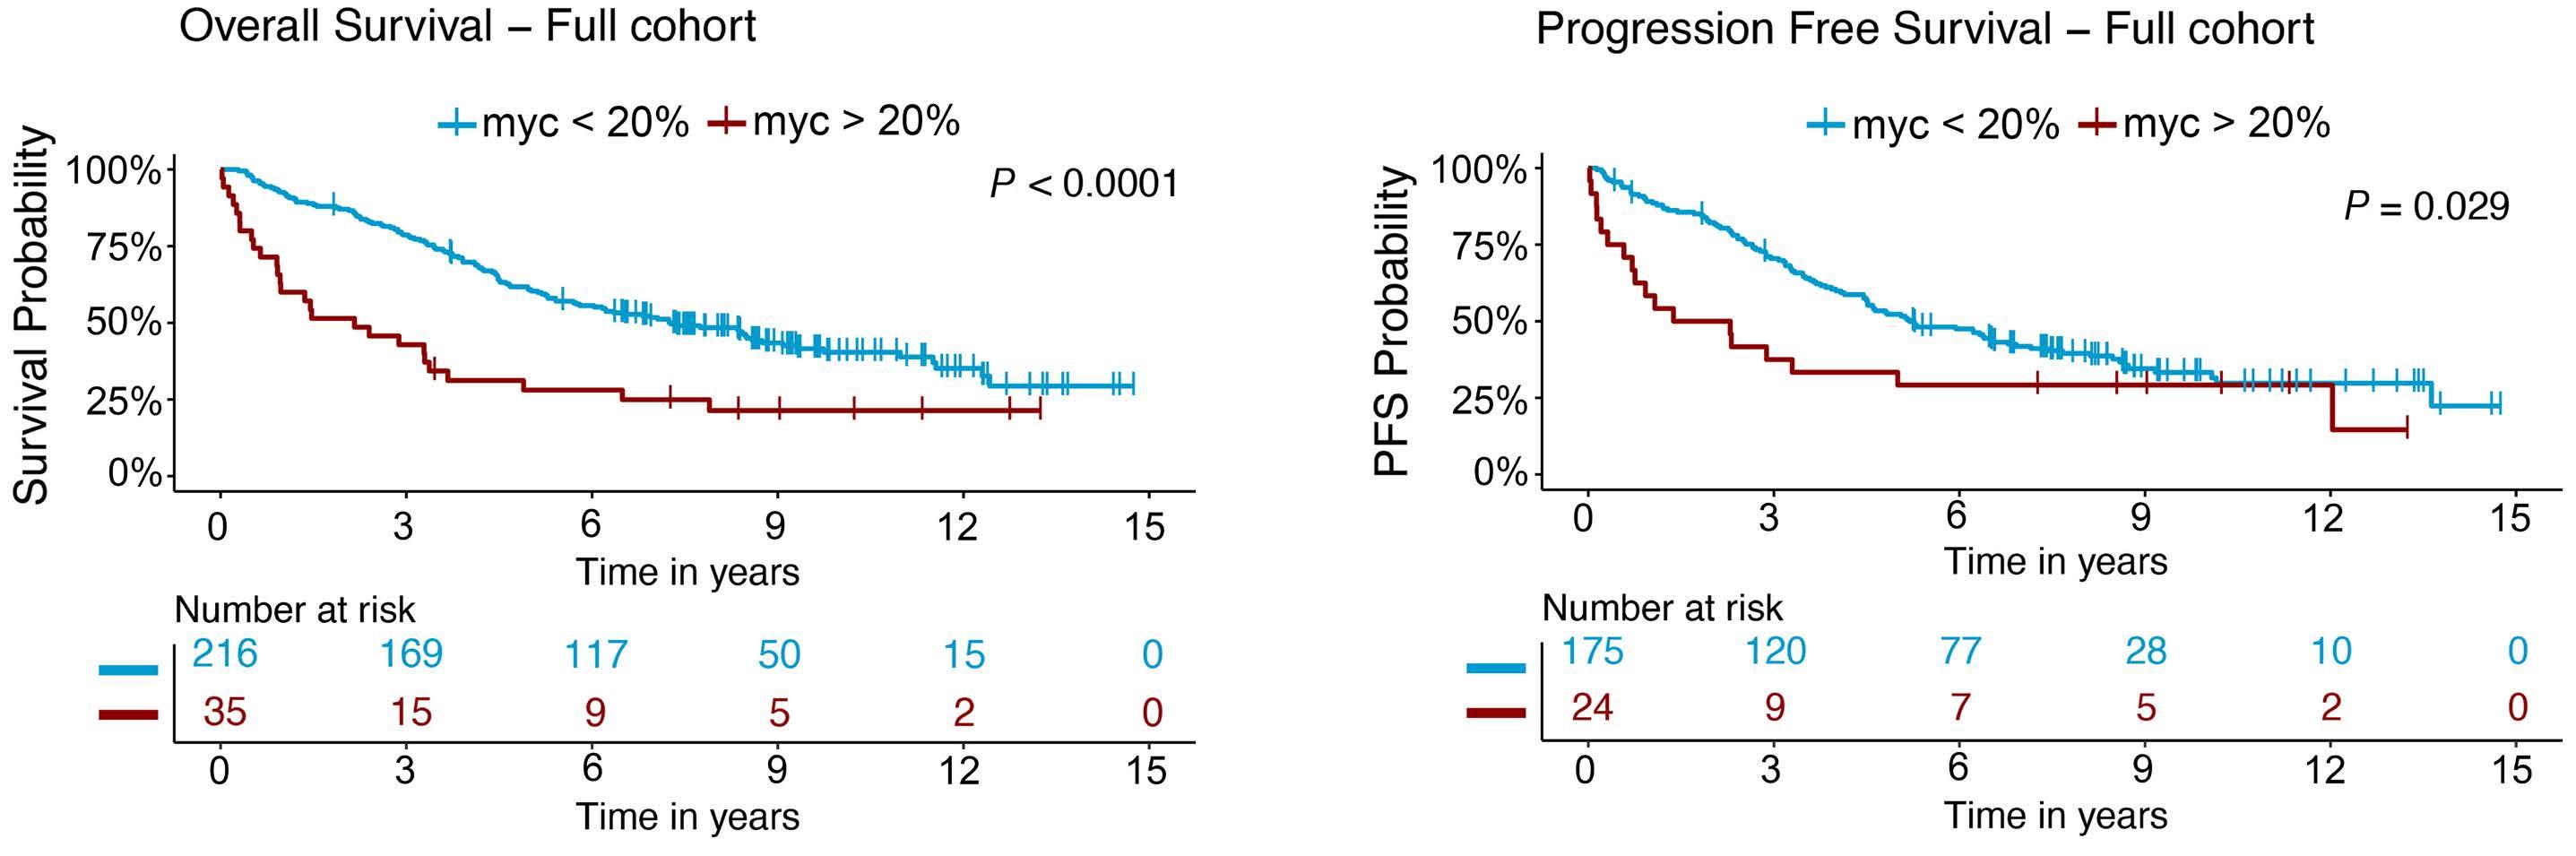
as a continuous value on outcome for the different cohorts separately (Online Supplementary Figure S7, Online Supplementary Table S4 ). However, in the SLR cohort, MYChigh was not statistically prognostic for PFS, probably because of the heterogenous treatment protocols used in this population-based cohort. In the N-MCL2/3 cohort, only six patients were classified as MYChigh and the group reached statistical significance as predictor for PFS, but not OS (Online Supplementary Table S4).
To understand if there were consistent differences among MYChigh cases depending on whether they had an OS shorter or longer than 3 years, we compared the main clinicopathological parameters of these two groups of patients (Online Supplementary Table S5). The patients with an OS less than 3 years had additional high-risk factors, being in a high-risk MIPI group and the majority also with high proliferation and/ or TP53/p53 aberrations. Surprisingly, the male/female ratio showed a major difference, with only one out of nine female MYChigh patients surviving for more than 3 years.
MYChigh tumors remained associated with OS (HR=2.03, 95% CI: 1.22-3.40) and PFS (HR=2.20, 95% CI: 1.04-4.64) when adjusting for gender, age and established high-risk factors (Table 3). MYChigh was not significant when adjusting for MIPI group (Table 3). Of note, evaluation of MYC protein expression on prognosis in MCL remained significant only when considering patients with MIPI information (Online Supplementary Table S6). MYC as a continuous variable was not independent of high-risk factors (data not shown).
MYChigh is associated with high-risk factors
Patients with MYChigh tumors were enriched in other high-risk factors such as age, Ki-67 proliferation index, non-classic morphology, MIPI group and TP53/p53+ aberrations (Figure 2A, Table 4). Patients with MYChigh tumors were on average older at diagnosis (Figure 2B), with a median age at diagnosis of 70.7 years versus 63.6 years for patients with MYClow tumors. MYC protein overexpression (MYChigh) was found to be associated with the presence of TP53 mutations and/or p53 overexpression (hereon referred to as TP53/p53+ tumors, n=35). Dual alterations of MYC and TP53/p53+ (hereon referred to as MYChigh TP53/p53+) were detected in 13 out of 250 patients (Table 4). Tumors with alterations in TP53 had a higher median expression of MYC-positive cells compared
to wild-type tumors (P<0.001) (Figure 2C) and MYChigh TP53/ p53+ cases were more likely to have high proliferation, non-classic morphology and be in a high-risk MIPI group, similar to the MYChigh group (Table 4).
MYChigh TP53/p53+ tumors have a dismal prognosis
A total of 13 patients had tumors classified as MYChigh TP53/ p53+. These patients had a very short median survival (0.9 years) and a shorter median PFS (0.5 years) compared to patients who did not show concomitant alterations in these molecules. The majority died within 3 years of diagnosis (Figure 3A). This was significantly lower compared to either one of the individual high-risk groups (Figure 3B). All patients with PFS information available with MYChigh TP53/p53+ tumors progressed within 2 years (Figure 3C) and had a shorter time to progression than either of the patient groups presenting with only one of the individual risk factors (Figure 3D). Online Supplementary Figure S8 depicts the process for classification of tumors based on MYC and TP53/p53 status. Double aberrations conferred an increased risk of death (HR=7.83, 95% CI: 4.35-14.09) and disease progression (HR=16.87, 95% CI: 7.43-38.31) (Table 2). MYChigh TP53/p53+ aberrations remained prognostic, for both OS and PFS, when adjusting for additional high-risk factors (Table 5). Of note, prognostic analysis considering only TP53 mutation and MYChigh tumors remained significant for both OS and PFS (Online Supplementary Figure S9).
MYC protein expression is not correlated with genomic aberrations
To explore the hypothesis that MYC protein overexpression can be associated with genomic rearrangements of MYC, a total of 85 cases mounted in tissue microarrays were evaluated by FISH with a MYC break-a-part probe. Of those 85 patients, 70 (82%) showed no signs of genomic alterations of MYC. Among the remaining 15 cases, three showed copy gains in less than 20% of the evaluated cells, 11 showed copy gains in more than 20% of the evaluated cells and one case showed the presence of a translocation (Online Supplementary Figure S10).
To validate the FISH findings, whole tissue sections were used. Diagnostic tissue blocks from 14 out of the 15 patients were available for further evaluation (Online Supplementary
*Progression-free survival analysis truncated at 3 years. HR: hazard ratio; 95% CI: 95% confidence interval; P: probability value; N: number; wt: wild-type; MIPI: Mantle Cell Lymphoma International Prognostic Index.
Percentages for some variables do not add up to 100% due to rounding. *A χ2 statistical test was performed to evaluate significant differences between patients with different levels of MYC expression or those double-positive for MYC and TP53/p53 and the clinicopathological characteristics. **A χ2 statistical test was performed with Yates continuity correction to adjust for small values. N: number; P: probability value; MIPI: Mantle Cell Lymphoma International Prognostic Index.
Table S7). Results were consistent between tissue microarrays and full tissue sections. No correlation between copy number gains of MYC and protein overexpression was observed, as most of tumors with MYC copy number gains had a low frequency of cells expressing MYC protein (Online Supplementary Table S7). The presence of copy number gains was not associated with outcome (data not shown).
The single MYC-translocated MCL case had an OS of over 6 years, no other high-risk factors but a classic morphology, low Ki-67 expression, and was TP53/p53 wild-type. In line with the lack of genomic alterations, MYC showed genetic mutations in only one patient, determined by targeted sequencing of part of the SLR cohort as previously published.29 This MYC mutated case only had 4% of cells expressing MYC protein.
MYChigh tumors showed an increase in M2-like macrophage infiltration
In a recent study, we showed that the frequencies of T cells and M2 macrophages are prognostic in MCL30 and hypothesized that the composition of the microenvironment would be different in MYChigh and MYClow cases. T-cell and M2 macrophage frequencies were determined based on multiplexed immunofluorescence staining using machine learning (Aiforia software). The multiplexed immunofluo-
rescence staining included stains for CD3, CD163 and CD20. For a total of 117 patients, information was available for both multiplexed immunofluorescence and MYC status. T-cell infiltration, marked as CD3 positivity, ranged from 1.48% to 52.58% of total cells. The presence of CD163+ cells, as a surrogate marker for M2 macrophages, varied between 0.02% and 23.09% of total cells. The abundance of T cells and M2-like macrophages and the density of tumor cells in the tumor regions in MYChigh and MYClow cases were compared to assess the association with MYC status. MYChigh cases had a higher infiltration of CD163+ macrophages, whereas no difference was seen for T-cell infiltration or density of tumor cells (Online Supplementary Figure S11).
The impact of MYC deregulation on outcome in MCL is consistently reported in the literature,10,22,23 but most studies include limited or selected cohorts. The present study of 252 MCL patients is, to the best of our knowledge, the largest study so far to evaluate clinical impact by exploring MYC protein expression and its association with clinicopathological features including established risk factors. The study is focused on the impact of MYC protein, and the
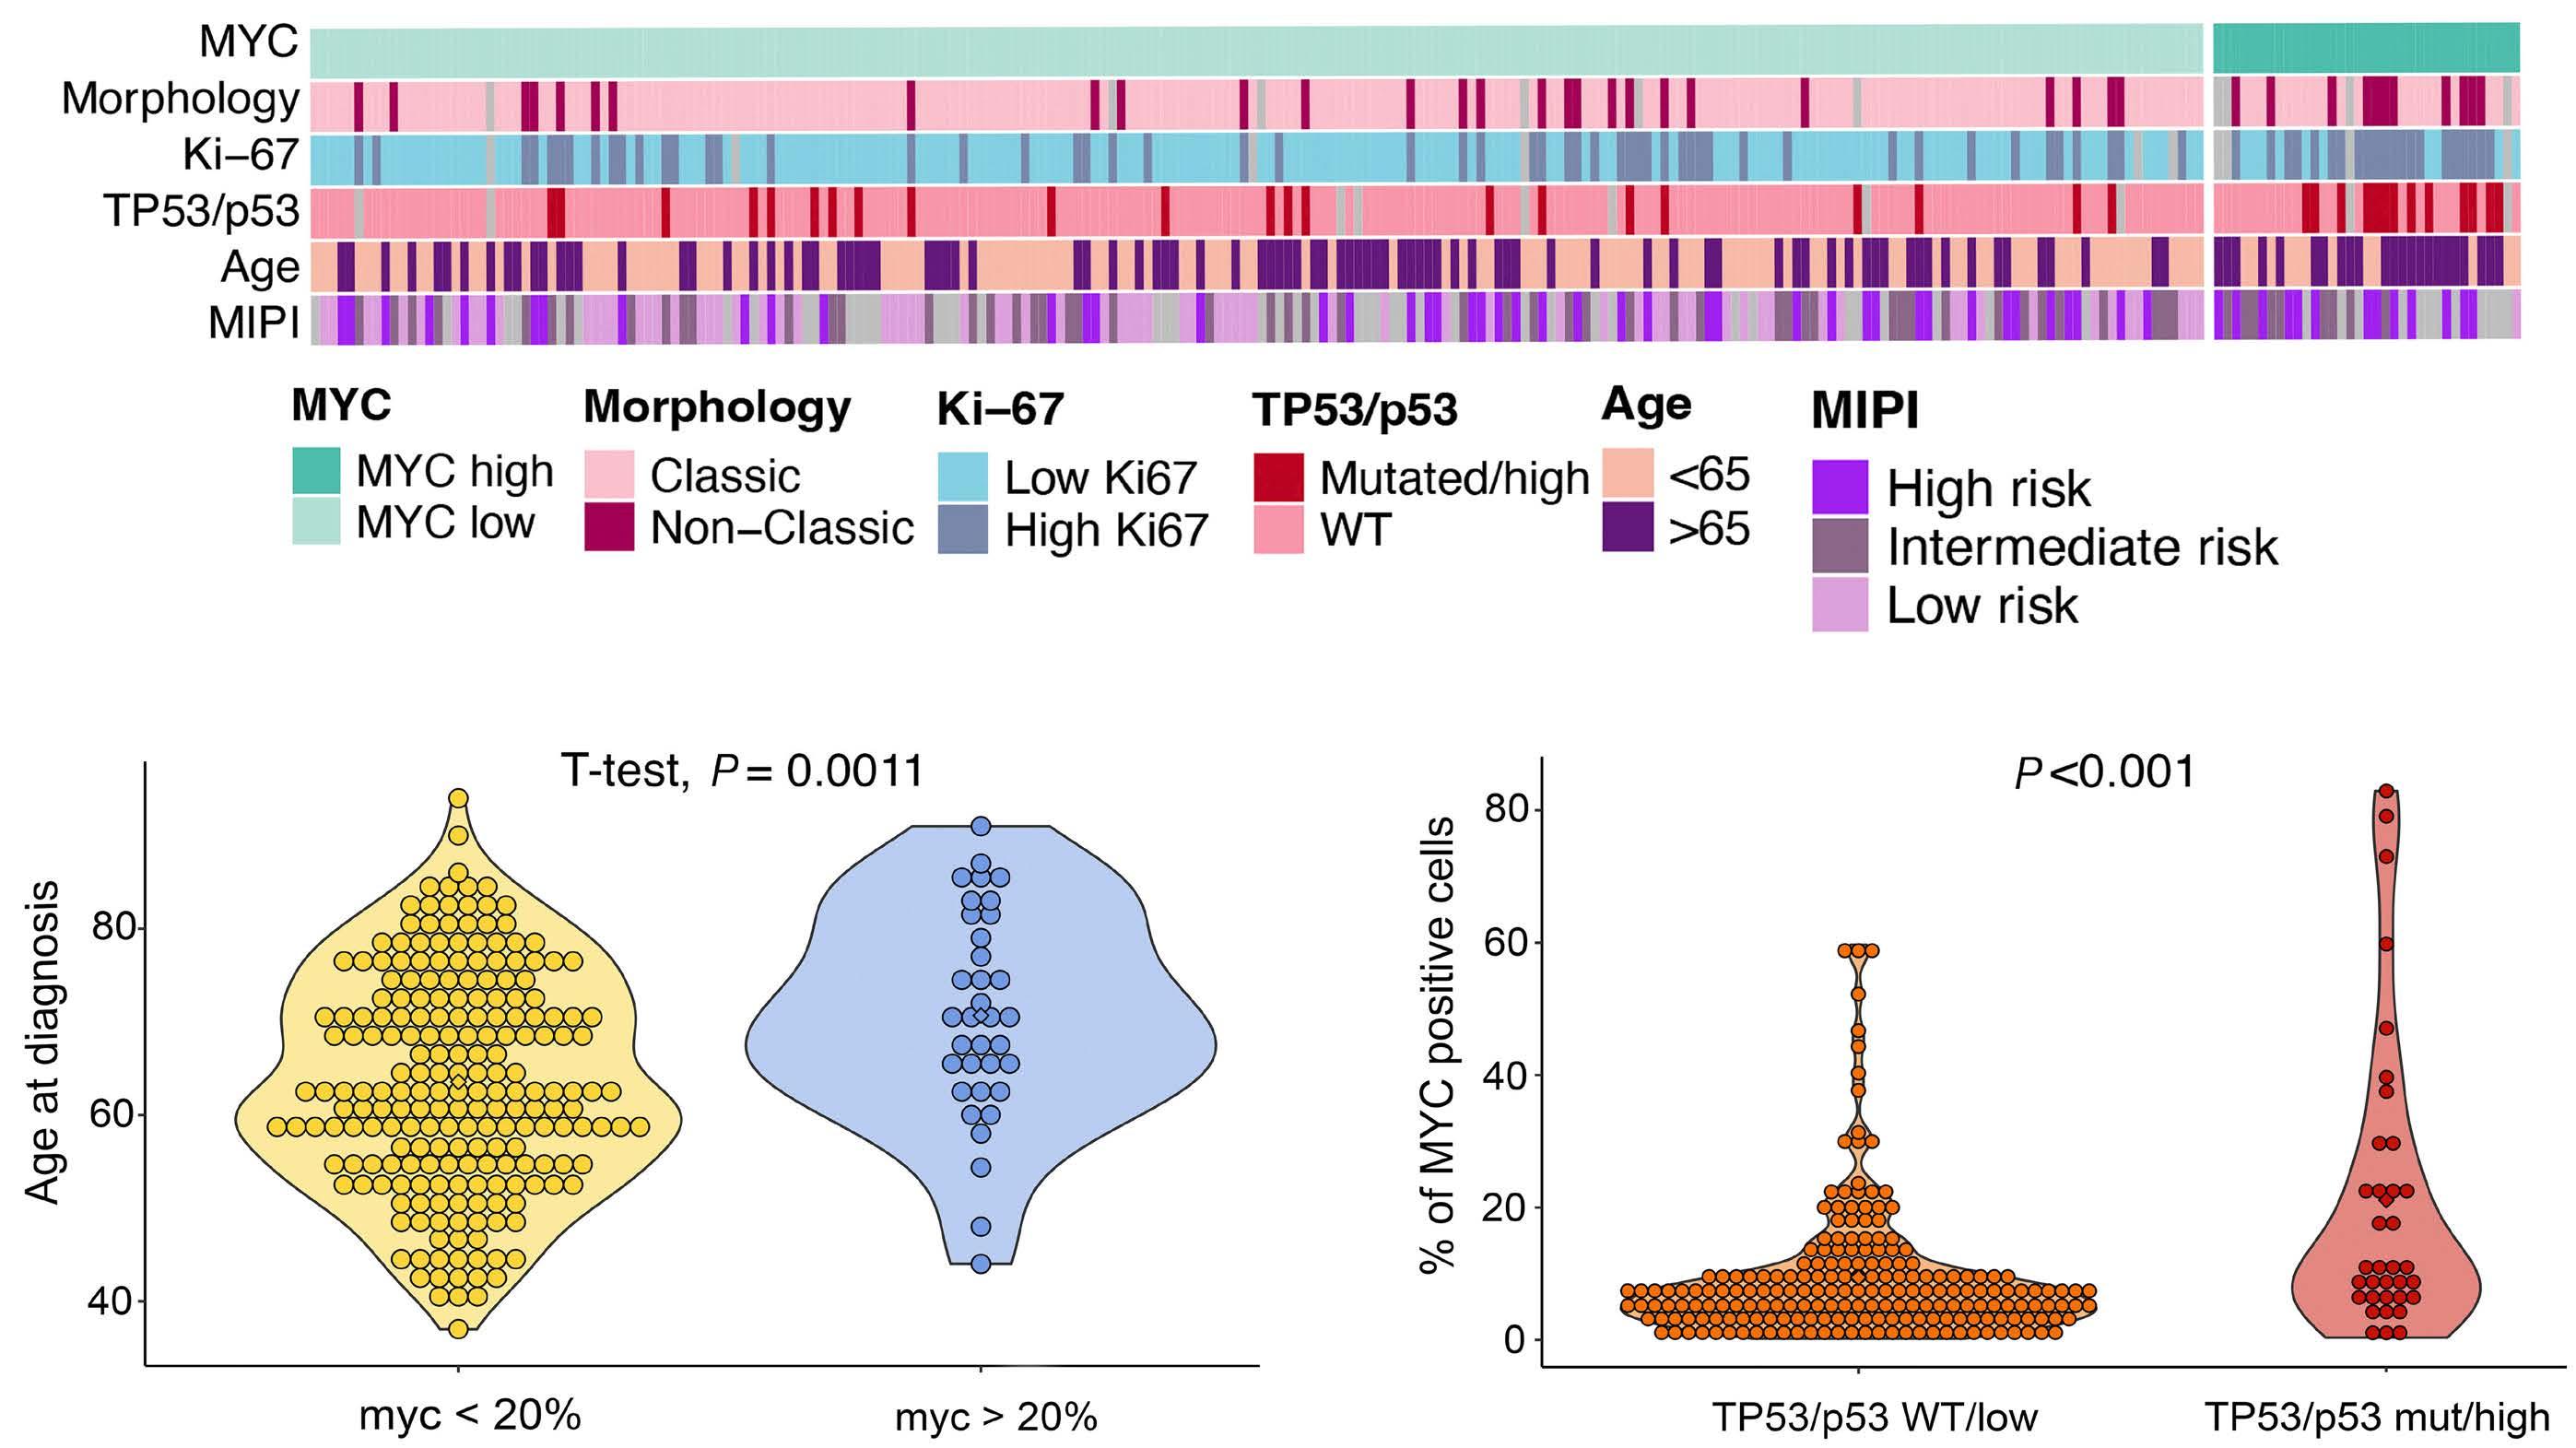
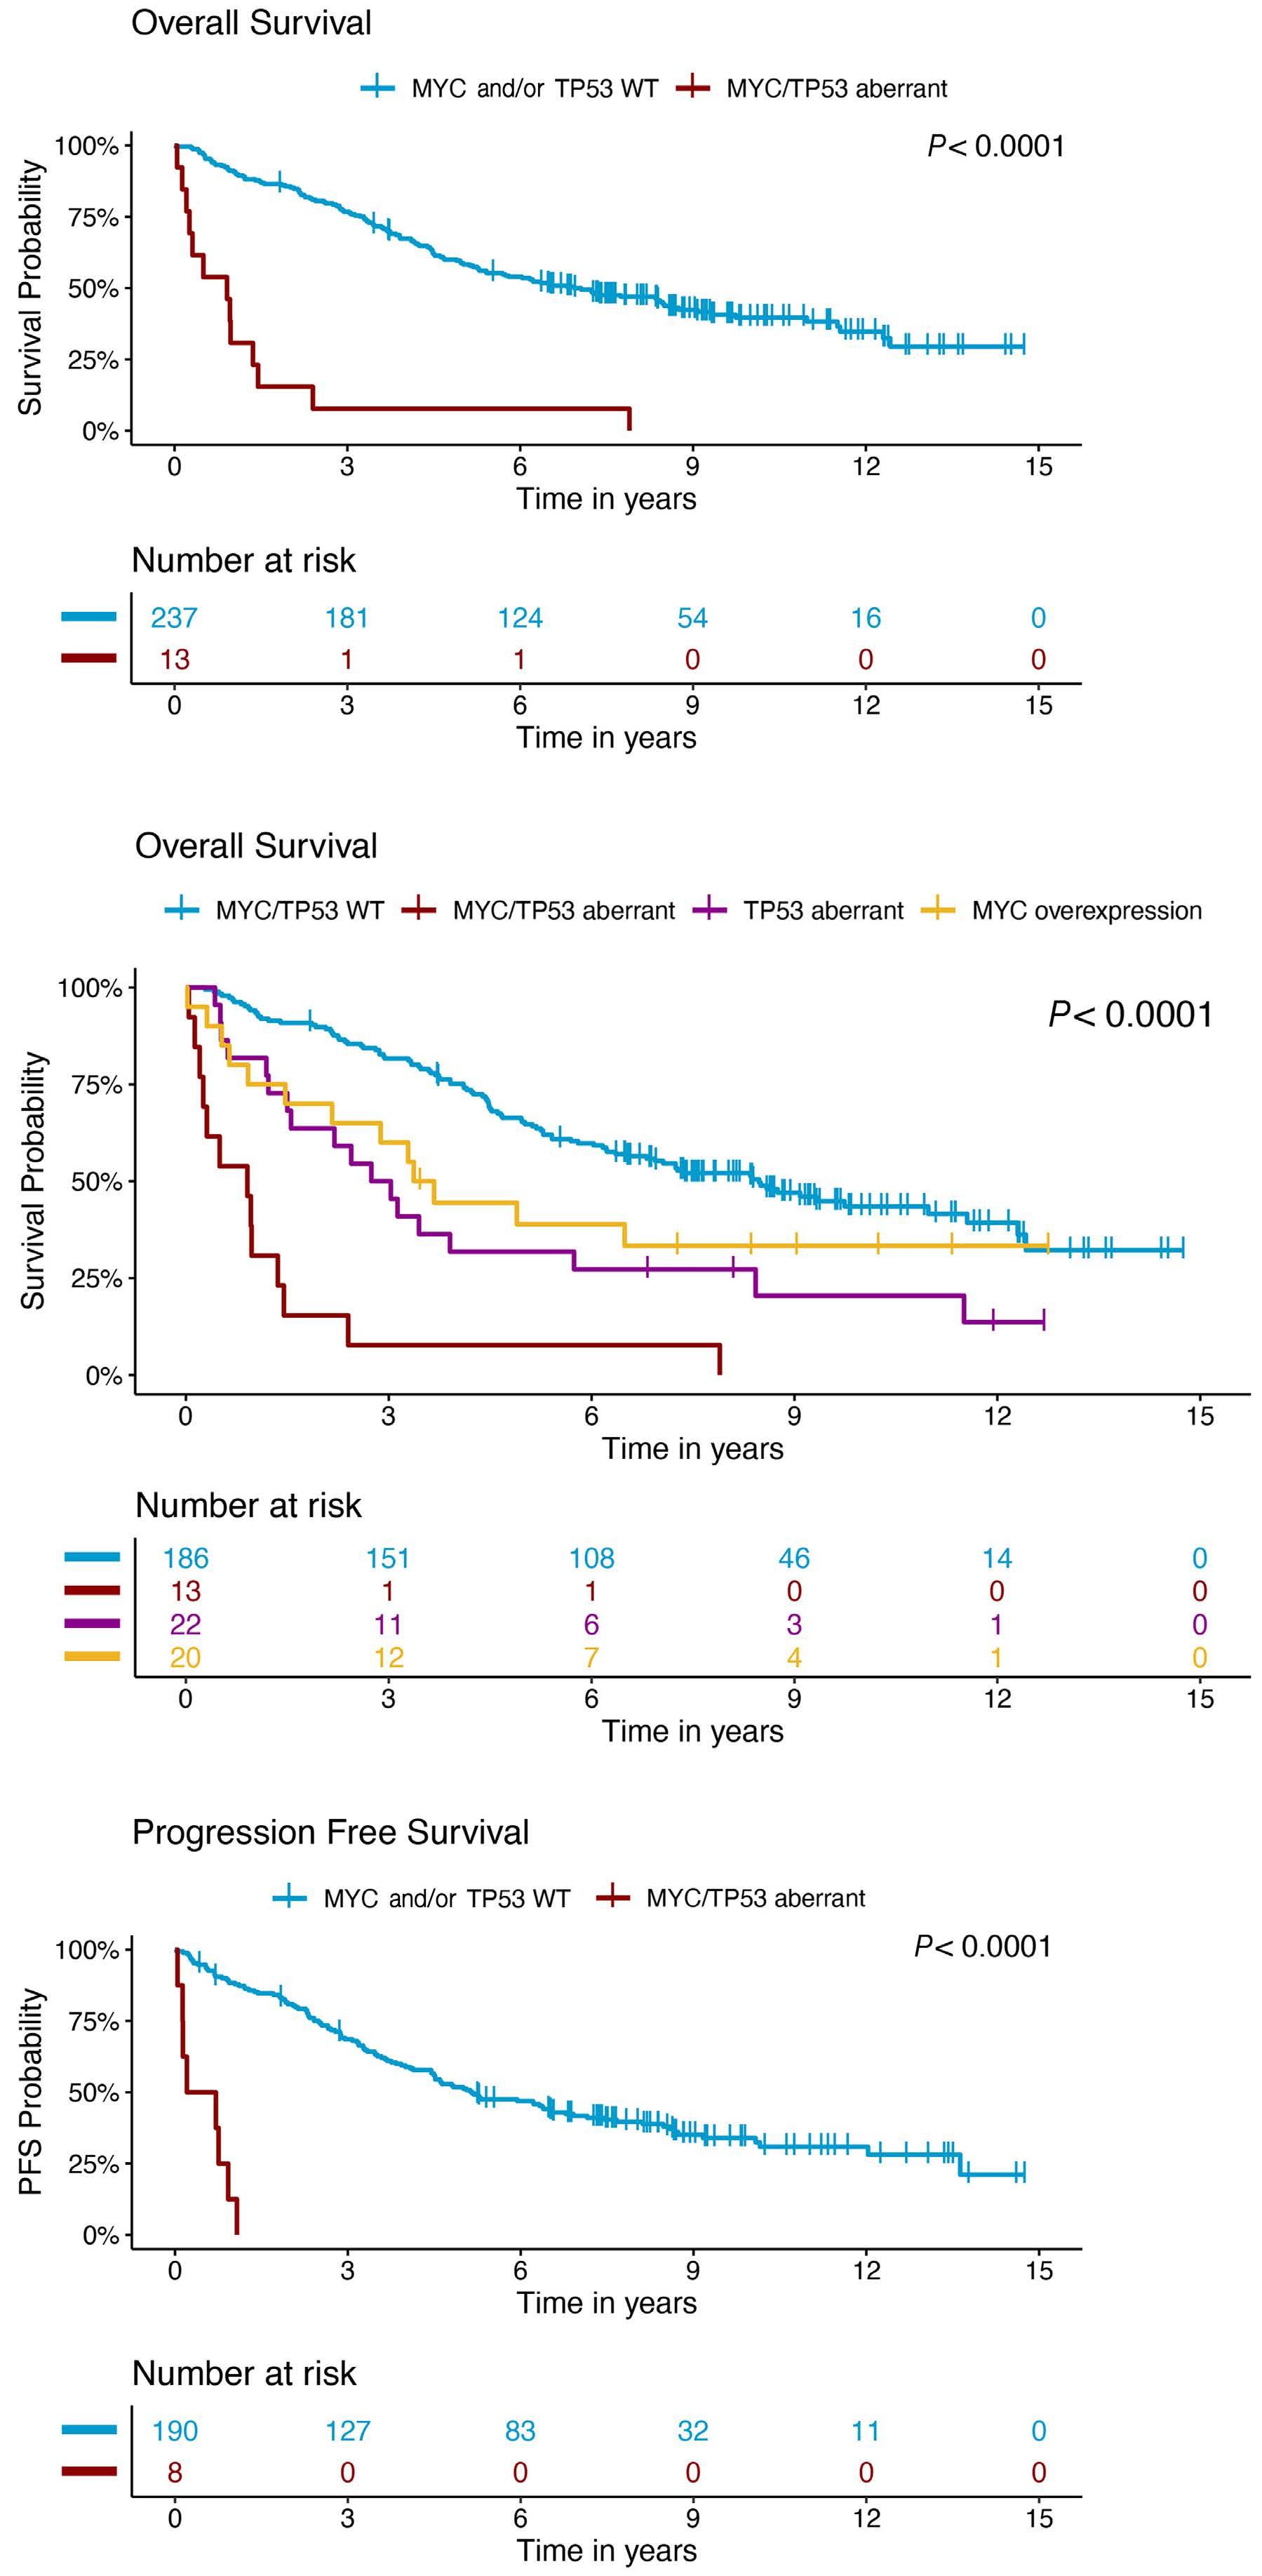
Figure 3. Patients with MYChighTP53/p53+ form a subgroup with adverse prognosis.
(A) Prognostic impact of MYChighTP53/p53+ versus all other states on overall survival. (B) Prognostic impact on overall survival for patients with tumors that were classified only as MYChigh, only TP53/p53+, both MYChighTP53/p53+ or wild-type for both markers. (C) Prognostic impact of MYChighTP53/p53+ versus all other patients on progression-free survival. (D) Prognostic impact on progression-free survival for patients with tumors that were classified only as MYChigh, only TP53/p53+, both MYChighTP53/p53+ or wild-type for both markers. Kaplan-Meier estimates were calculated and are shown. Log-rank statistics were used to evaluate the statistical significance of differences. WT: wild-type; PFS: progression-free survival.
Continued on following page.

HR: hazard ratio; 95% CI: 95% confidence interval; P: probability value; N: number.
association with gene amplifications, and rearrangements, and transcriptional activity.
Current literature on MYC in MCL has not reached a consensus on a cutoff for the definition of MYChigh.10,25,31,32 Previous studies used 10%, 20% or 26%,10,11,24 which hampers direct comparison of the impact of dichotomized groups. We applied a 20% cutoff based on the findings of a previous study on 65 MCL patients by Choe et al 24 To validate the applicability of the applied cutoff in our cohort, we further used Max Rank statistics that identified 21% as the cutoff maximizing the difference in OS in the present cohort.
Most MCL patients had tumors with a low frequency of MYC-positive cells, but 14% (n=35) of the tumors had >20% positive cells and were defined as MYChigh. The patients with
MYChigh tumors had a median OS of 2.2 years and PFS of 1.8 years. These were significantly shorter than the OS of 7.3 years and the PFS of 5.2 years for patients with MYClow tumors. The impact on outcome is similar to that previously reported by Oberley et al.10 Both elevated mRNA and protein MYC levels were associated with poor prognosis. Of interest, MYC levels violated the proportional hazards assumption, indicating that the prognostic effect of MYC protein is time-dependent, with a mainly negative impact in the first 3 years after diagnosis. To understand whether there were other high-risk features that separated MYChigh patients with OS shorter or longer than 3 years, the clinicopathological characteristics were compared and confirmed that additional high-risk factors such as being in a
high-risk MIPI group, having TP53/p53 aberrations and high proliferation were more common in MYChigh patients with an OS shorter than 3 years. Of note, women with MYChigh tumors seemed to do even more poorly than men, with only one out of nine women having an OS longer than 3 years. Although numbers are small, this indicates that there might be a sex-related difference in the adverse effects mediated by MYC.
Comparison of MYChigh and MYClow tumors with clinicopathological parameters showed that there is a positive correlation between high age and MYC overexpression in MCL. This has not been reported before. In the study by Aukema et al 26 most patients with high MYC expression were older than 65 years, although this was not specifically mentioned. High expression of MYC is also associated with older age in patients with anaplastic lymphoma kinase-positive large cell lymphomas33 and diffuse large B-cell lymphoma.34 Besides age, patients with MYChigh tumors were also enriched for other high-risk features such as high-risk MIPI group, non-classic morphology, and high proliferation. However, the negative impact of MYC on outcome was independent of these high-risk factors, with the exception of MIPI group, emphasizing the additive effect between molecular factors, which was explored further. The impact of TP53 mutations and/or p53 overexpression in MCL has been widely documented by us and others35,36 and assessment of TP53 status should be performed in routine clinical diagnostics.16 Wild-type p53-mediated apoptosis can be induced by MYC,37 and as MYC overexpression in cancer is believed to lead to deregulation of its physiological targets,38 altered TP53/p53 could synergize with MYC and lead to a more aggressive variant of the disease. Here we show that simultaneous alterations in MYC and TP53/p53 (MYChighTP53/p53+) did indeed have an additive negative prognostic effect compared to either of the aberrations alone, being associated with a median OS and PFS of only 0.9 and 0.5 years, respectively. The MYChighTP53/p53+ subgroup of patients had unfavorable clinical characteristics, with most having highly proliferative tumors, with non-classic morphology and being in a high-risk MIPI group. The presence of tumors with both aberrations had been noted in other studies,23,26,39,40 but this is the first time that an association with prognostic and clinicopathological parameters in MCL is reported. The negative effect of MYC overexpression combined with TP53 mutations, excluding patients with wild-type TP53 but high levels of p53 protein, was also confirmed. The mechanisms behind MYC and TP53/p53 crosstalk remain to be explored, but these aberrations are known to influence each other by involvement of proteins, such as BMI-1, ARF, and microRNA, including microRNA34a.41 Den et al. studied the synergetic effect of MYC and TP53/p53 abnormalities on outcome in patients with diffuse large B-cell lymphoma, similarly to this study on MCL.
In our cohort we identified only one case with MYC rearrangements, but a few cases (1.3% of the 85 evaluated cases)
showed copy gains of MYC. These results are in line with prior studies in which MYC rearrangements were rare.10,20,42 When genetic alterations have been observed, they have mainly been amplifications/copy gains rather than chromosomal translocations of MYC 31 A high frequency of MYC abnormalities has been found in only one selected cohort.23 Similarly, concurrent translocations of MYC and CCND1 have been reported only as single cases, except in a selected cohort with overrepresentation of leukemic MCL in which 5% of MCL tumors had these dual aberrations.43 Thus, we can conclude that translocations or other rearrangements involving MYC are rare in MCL at diagnosis, corresponding to less than 2% of all cases in most studies. However, in the present study MYC protein overexpression identified 14% of MCL patients with a poor prognosis and added information on high risk beyond TP53/p53, morphology and proliferation.
In other B-cell lymphomas, such as Burkitt lymphoma and diffuse large B-cell lymphoma, structural alterations involving MYC are a predominant mechanism leading to MYC overexpression.25 In MCL, we found that MYC copy number gains were not correlated with outcome or MYC mRNA or protein overexpression. The expression seems to be driven by transcriptional dysregulation and mRNA and protein expression were highly correlated with similar effects on outcome. Investigations of MYC-driven lymphomagenesis in MCL support this notion, by showing that miRNA, such as miR33b, miR96, and miR503, are pivotal in the regulation of MYC44 and that histone deacetylation is involved in the repression of transcription mediated by MYC 45 In addition, MALT1 has also been proposed as an alternative mechanism for MYC protein stabilization in MCL.46 Studies in other lymphomas show that hotspot mutations in regions that can affect protein stability are selected during lymphomagenesis and are associated with a negative impact on outcome.47 It has also been shown by Nadeau et al. that MYC and TP53 are the only genes whose alterations have an impact on outcome beyond that of the total genomic complexity.48 However, mutations of MYC do not seem to drive relapse in MCL as MYC has been shown to be less mutated in relapsed cases compared to cases at diagnosis.6 In other cancers, MYC has a role in shaping the tumor immune microenvironment, through several mechanisms. Indeed, MYC is capable of immune checkpoint regulation, like PD-L1 and MHC class I and II molecules, and promotes cytokine secretion, leading, as an example, to re-programing M1- to M2-like macrophages.49,50 We hypothesized that MYChigh tumors would have an altered immune microenvironment. Image analyses showed no differences in T-cell infiltration but MYChigh tumors were associated with increased infiltration of CD163+ cells. This suggests that M2 macrophages may contribute to an adverse outcome in such tumors and that MYC is associated with both intrinsic and extrinsic high-risk features.
Previous studies in cancer have shown the potential of MYC
inhibition to promote antitumor effects. Nonetheless, due to intrinsically disordered domains and lack of enzymatic sites, MYC has been considered undruggable.51 Several approaches have been proposed to inhibit MYC both directly and indirectly at all its levels of regulation. Recently, the first direct MYC inhibitor, the blocking peptide OMO-103 (Peptomyc), reached clinical phase studies. OMO-103 has been shown to alter the tumor microenvironment, potentiating an antitumor immune response,52 providing hope for future successful clinical use of this agent. MYC has been shown to have a role in ibrutinib resistance.53,54 Thus, also in the ibrutinib era in MCL, we expect that MYC will remain a highrisk marker and that MYC-targeting therapies may play an important role in both the diagnostic and relapsed setting. The current study included 252 MCL patients evaluated at diagnosis; their treatment during the follow-up was not homogenous. As both MYC and p53 aberrations affect a limited group of patients, results need to be validated in independent cohorts of patients, ideally under the same treatment protocol. The analyses are further limited by the fact that no mutational analyses were performed, so no correlation between different mutational sites that may affect protein stability and protein expression could be identified.
In summary, MYC protein is a high-risk marker and, in this study, was overexpressed in a significant subgroup of cases of MCL (14%). Overexpression of MYC (>20% expression) adds prognostic information beyond that of established molecular risk factors, such as TP53/p53, morphology and proliferation, for risk stratification of MCL patients. MCL patients carrying tumors with both MYChigh and TP53/p53 aberrations constitute a subgroup with a dismal prognosis, indicating additive negative effects. Previous efforts at risk stratification have included the presence of upregulation of MYC at the bulk mRNA level together with other markers in a five-gene signature that predicts survival in MCL.55 However, we propose that MYC may be assessed through routine immunohistochemistry, using a cutoff at 20% to separate high from low expression, together with routine assessment of TP53/p53 status, proliferation and MIPI group.
Disclosures
MJ has received research support from Abbvie, AstraZeneca, Janssen, Gilead, BMS and Roche, and honoraria from
1. Meyer N, Penn LZ. Reflecting on 25 years with MYC. Nat Rev Cancer. 2008;8(12):976-990.
2. Cai Q, Medeiros LJ, Xu X, Young KH. MYC-driven aggressive B-cell lymphomas: biology, entity, differential diagnosis and clinical management. Oncotarget. 2015;6(36):38591-38616.
3. Filip D, Mraz M. The role of MYC in the transformation and aggressiveness of ‘indolent’ B-cell malignancies. Leuk Lymphoma. 2020;61(3):510-524.
4 Ziepert M, Lazzi S, Santi R, et al. A 70% cut-off for MYC protein
Abbvie, AstraZeneca, BMS, Genmab, Janssen, Novartis, Incyte, EUSApharma, Gilead, and Roche. IG has participated in educational sessions for Jansen Cilag, and has received research support from Takeda and Lokon Pharma. KG has received research support from Janssen, and has participated in advisory boards for GSK and Nanexa. DK is employed by Aiforia Technologies Plc. The remaining authors do not have any conflicts of interest to disclose.
JMR was involved in the conception and design of the study, performed data and statistical analyses, and wrote the manuscript. PH and MR were involved in the pathology review and FISH evaluation. LS and EG took part in the experimental and data analyses. DK was involved in data generation and technical support. CG, RR, AK, IG, and MJ were involved in the collection of clinical information and responsible for the cohorts used in this study. CWE and KG performed sequencing analysis of the N-MCL2/3 cohort. CS and AP were involved in the pathology review. SE designed the study and wrote the manuscript. All authors approved the final version of the manuscript.
The authors would like to thank the Nordic Lymphoma Group, and specifically the Nordic MCL network, the Department of Laboratory Medicine, Medical Service in Skåne, FoU-department at the Pathology Department, Uppsala University Hospital and Histohub, Division of Oncology, Department of Clinical Sciences, Lund University for assisting in the immunohistochemistry and tissue cuts.
This project has received funding from the European Union’s Horizon 2020 research and innovation programme under Marie Skłodowska-Curie grant agreement N 754299, Cancerfonden (2016/465, 19 0309Pj and 21 1561 Pj), Mats Paulssons Stiftelse för forskning, innovation och samhällsbyggande, Stiftelsen Stefan Paulssons cancerfond, and CREATE Health. All financial support was granted to SE.
Original data and protocols are available upon request.
expression in diffuse large B cell lymphoma identifies a highrisk group of patients. Haematologica. 2020;105(11):2667-2670.
5. Riedell PA, Smith SM. Double hit and double expressors in lymphoma: definition and treatment. Cancer. 2018;124(24):4622-4632.
6. Hill HA, Qi X, Jain P, et al. Genetic mutations and features of mantle cell lymphoma: a systematic review and meta-analysis. Blood Adv. 2020;4(13):2927-2938.
7. Yi S, Yan Y, Jin M, et al. Genomic and transcriptomic profiling reveals distinct molecular subsets associated with outcomes in
mantle cell lymphoma. J Clin Invest. 2022;132(3):e153283.
8. Jain P, Wang ML. Mantle cell lymphoma in 2022 - a comprehensive update on molecular pathogenesis, risk stratification, clinical approach, and current and novel treatments. Am J Hematol. 2022;97(5):638-656.
9 Setoodeh R, Schwartz S, Papenhausen P, et al. Double-hit mantle cell lymphoma with MYC gene rearrangement or amplification: a report of four cases and review of the literature. Int J Clin Exp Pathol. 2013;6(2):155-167.
10 Oberley MJ, Rajguru SA, Zhang C, et al. Immunohistochemical evaluation of MYC expression in mantle cell lymphoma. Histopathology. 2013;63(4):499-508.
11. Chisholm KM, Bangs CD, Bacchi CE, Molina-Kirsch H, Cherry A, Natkunam Y. Expression profiles of MYC protein and MYC gene rearrangement in lymphomas. Am J Surg Pathol. 2015;39(3):294-303.
12. Seok Y, Kim J, Choi JR, et al. CD5-negative blastoid variant mantle cell lymphoma with complex CCND1/IGH and MYC aberrations. Ann Lab Med. 2012;32(1):95-98.
13. Durot E, Patey M, Luquet I, Gaillard B, Kolb B, Delmer A. An aggressive B-cell lymphoma with rearrangements of MYC and CCND1 genes: a rare subtype of double-hit lymphoma. Leuk Lymphoma. 2013;54(3):649-652.
14 Delas A, Sophie D, Brousset P, Laurent C. Unusual concomitant rearrangements of cyclin D1 and MYC genes in blastoid variant of mantle cell lymphoma: case report and review of literature. Pathol Res Pract. 2013;209(2):115-119.
15. Liu W, Chen X, Fan J, et al. Quadruple-hit pleomorphic mantle cell lymphoma with MYC, BCL2, BCL6, and CCND1 gene rearrangements. Br J Haematol. 2021;195(4):634-637.
16. Silkenstedt E, Linton K, Dreyling M. Mantle cell lymphoma - advances in molecular biology, prognostication and treatment approaches. Br J Haematol. 2021;195(2):162-173.
17 Hoster E, Klapper W, Hermine O, et al. Confirmation of the mantle-cell lymphoma International Prognostic Index in randomized trials of the European Mantle-Cell Lymphoma Network. J Clin Oncol. 2014;32(13):1338-1346.
18. Wallace D, Reagan PM. Novel treatments for mantle cell lymphoma: from targeted therapies to CAR T cells. Drugs. 2021;81(6):669-684.
19. Kumar A, Sha F, Toure A, et al. Patterns of survival in patients with recurrent mantle cell lymphoma in the modern era: progressive shortening in response duration and survival after each relapse. Blood Cancer J. 2019;9(6):50.
20 Hu Z, Medeiros LJ, Chen Z, et al. Mantle cell lymphoma with MYC rearrangement: a report of 17 patients. Am J Surg Pathol. 2017;41(2):216-224.
21. Hernandez L, Hernandez S, Bea S, et al. c-myc mRNA expression and genomic alterations in mantle cell lymphomas and other nodal non-Hodgkin’s lymphomas. Leukemia. 1999;13(12):2087-2093.
22. Wang L, Tang G, Medeiros JL, et al. MYC rearrangement but not extra MYC copies is an independent prognostic factor in patients with mantle cell lymphoma. Haematologica. 2021;106(5):1381-1389.
23. Yi S, Zou D, Li C, et al. High incidence of MYC and BCL2 abnormalities in mantle cell lymphoma, although only MYC abnormality predicts poor survival. Oncotarget. 2015;6(39):42362-42371.
24. Choe JY, Yun JY, Na HY, et al. MYC overexpression correlates with MYC amplification or translocation, and is associated with poor prognosis in mantle cell lymphoma. Histopathology. 2016;68(3):442-449.
25. Nguyen L, Papenhausen P, Shao H. The role of c-MYC in B-cell
lymphomas: diagnostic and molecular aspects. Genes (Basel). 2017;8(4):116.
26. Aukema SM, Croci GA, Bens S, et al. Mantle cell lymphomas with concomitant MYC and CCND1 breakpoints are recurrently TdT positive and frequently show high-grade pathological and genetic features. Virchows Arch. 2021;479(1):133-145.
27. Deng M, Xu-Monette ZY, Pham LV, et al. Aggressive B-cell lymphoma with MYC/TP53 dual alterations displays distinct clinicopathobiological features and response to novel targeted agents. Mol Cancer Res. 2021;19(2):249-260.
28. Hothorn T, Zeileis A. Generalized maximally selected statistics. Biometrics. 2008;64(4):1263-1269.
29 Rodrigues JM, Porwit A, Hassan M, Ek S, Jerkeman M. Targeted genomic investigations in a population-based cohort of mantle cell lymphoma reveal novel clinically relevant targets. Leuk Lymphoma. 2021;62(11):2637-2647.
30 Rodrigues JM, Nikkarinen A, Hollander P, et al. Infiltration of CD163-, PD-L1- and FoxP3-positive cells adversely affects outcome in patients with mantle cell lymphoma independent of established risk factors. Br J Haematol. 2021;193(3):520-531.
31. Sander B, Wallblom A, Ekroth A, Porwit A, Kimby E. Characterization of genetic changes in MCL by interphase FISH on tissue sections. Leuk Lymphoma. 2007;48(7):1344-1352.
32. Gong Y, Zhang X, Chen R, Wei Y, Zou Z, Chen X. Cytoplasmic expression of C-MYC protein is associated with risk stratification of mantle cell lymphoma. PeerJ. 2017;5:e3457.
33. Lyapichev KA, Tang G, Li S, et al. MYC expression is associated with older age, common morphology, increased MYC copy number, and poorer prognosis in patients with ALK+ anaplastic large cell lymphoma. Hum Pathol. 2021;108:22-31.
34. Paul U, Richter J, Stuhlmann-Laiesz C, et al. Advanced patient age at diagnosis of diffuse large B-cell lymphoma is associated with molecular characteristics including ABC-subtype and high expression of MYC. Leuk Lymphoma. 2018;59(5):1213-1221.
35. Rodrigues JM, Hassan M, Freiburghaus C, et al. p53 is associated with high-risk and pinpoints TP53 missense mutations in mantle cell lymphoma. Br J Haematol. 2020;191(5):796-805.
36. Ferrero S, Rossi D, Rinaldi A, et al. KMT2D mutations and TP53 disruptions are poor prognostic biomarkers in mantle cell lymphoma receiving high-dose therapy: a FIL study. Haematologica. 2020;105(6):1604-1612.
37. Hoffman B, Liebermann DA. Apoptotic signaling by c-MYC. Oncogene. 2008;27(50):6462-6472.
38. Sabo A, Kress TR, Pelizzola M, et al. Selective transcriptional regulation by Myc in cellular growth control and lymphomagenesis. Nature. 2014;511(7510):488-492.
39 Malarikova D, Berkova A, Obr A, et al. Concurrent TP53 and CDKN2A gene aberrations in newly diagnosed mantle cell lymphoma correlate with chemoresistance and call for innovative upfront therapy. Cancers (Basel). 2020;12(8):2120.
40 Yamashita T, Vollbrecht C, Hirsch B, Kleo K, Anagnostopoulos I, Hummel M. Integrative genomic analysis focused on cell cycle genes for MYC-driven aggressive mature B-cell lymphoma. J Clin Exp Hematop. 2020;60(3):87-96.
41. Yu L, Yu TT, Young KH. Cross-talk between Myc and p53 in B-cell lymphomas. Chronic Dis Transl Med. 2019;5(3):139-154.
42. Michaux L, Wlodarska I, Theate I, et al. Coexistence of BCL1/ CCND1 and CMYC aberrations in blastoid mantle cell lymphoma: a rare finding associated with very poor outcome. Ann Hematol. 2004;83(9):578-583.
43. Aukema SM, Siebert R, Schuuring E, et al. Double-hit B-cell lymphomas. Blood. 2011;117(8):2319-2331.
44 Karkhanis V, Alinari L, Ozer HG, et al. Protein arginine methyltransferase 5 represses tumor suppressor miRNAs that down-regulate CYCLIN D1 and c-MYC expression in aggressive B-cell lymphoma. J Biol Chem. 2020;295(5):1165-1180.
45. Zhang X, Zhao X, Fiskus W, et al. Coordinated silencing of MYC-mediated miR-29 by HDAC3 and EZH2 as a therapeutic target of histone modification in aggressive B-Cell lymphomas. Cancer Cell. 2012;22(4):506-523.
46. Dai B, Grau M, Juilland M, et al. B-cell receptor-driven MALT1 activity regulates MYC signaling in mantle cell lymphoma. Blood. 2017;129(3):333-346.
47. Cucco F, Barrans S, Sha C, et al. Distinct genetic changes reveal evolutionary history and heterogeneous molecular grade of DLBCL with MYC/BCL2 double-hit. Leukemia. 2020;34(5):1329-1341.
48. Nadeu F, Martin-Garcia D, Clot G, et al. Genomic and epigenomic insights into the origin, pathogenesis, and clinical behavior of mantle cell lymphoma subtypes. Blood. 2020;136(12):1419-1432.
49 Dhanasekaran R, Baylot V, Kim M, et al. MYC and Twist1 cooperate to drive metastasis by eliciting crosstalk between
cancer and innate immunity. Elife. 2020;9:e50731.
50 Dhanasekaran R, Deutzmann A, Mahauad-Fernandez WD, Hansen AS, Gouw AM, Felsher DW. The MYC oncogene - the grand orchestrator of cancer growth and immune evasion. Nat Rev Clin Oncol. 2022;19(1):23-36.
51. Dang CV, Reddy EP, Shokat KM, Soucek L. Drugging the ‘undruggable’ cancer targets. Nat Rev Cancer. 2017;17(8):502-508.
52. Soucek L, Whitfield J, Martins CP, et al. Modelling Myc inhibition as a cancer therapy. Nature. 2008;455(7213):679-683.
53. Lee J, Zhang LL, Wu W, et al. Activation of MYC, a bona fide client of HSP90, contributes to intrinsic ibrutinib resistance in mantle cell lymphoma. Blood Adv. 2018;2(16):2039-2051.
54 Scapinello G, Riva M, Branca A, et al. A case of “double hit” mantle cell lymphoma carrying CCND1 and MYC translocations relapsed/refractory to rituximab bendamustine cytarabine (R-BAC) and ibrutinib. Ann Hematol. 2020;99(11):2715-2717.
55. Hartmann E, Fernandez V, Moreno V, et al. Five-gene model to predict survival in mantle-cell lymphoma using frozen or formalin-fixed, paraffin-embedded tissue. J Clin Oncol. 2008;26(30):4966-4972.
Paolo F. Caimi,1 Weiyun Z. Ai,2 Juan Pablo Alderuccio,3 Kirit M. Ardeshna,4 Mehdi Hamadani,5 Brian Hess,6 Brad S. Kahl,7 John Radford,8 Melhem Solh,9 Anastasios Stathis,10 Pier Luigi Zinzani,11,12 Ying Wang,13 Yajuan Qin,13 Luqiang Wang,13 Zhiying Cindy Xu13 and Carmelo CarloStella14
1Cleveland Clinic Taussig Cancer Center, Cleveland, OH, USA; 2Helen Diller Family Comprehensive Cancer Center, University of California, San Francisco, CA, USA; 3Sylvester Comprehensive Cancer Center, University of Miami Miller School of Medicine, Miami, FL, USA; 4University College London Hospitals NHS Foundation Trust, London, UK; 5Division of Hematology and Oncology, Medical College of Wisconsin, Milwaukee, WI, USA; 6Medical University of South Carolina, Charleston, SC, USA; 7Washington University, St. Louis, MO, USA; 8NIHR Clinical Research Facility, University of Manchester and the Christie NHS Foundation Trust, Manchester Academic Health Science Center, Manchester, UK; 9Blood and Marrow Transplant Program at Northside Hospital, Atlanta, GA, USA; 10Oncology Institute of Southern Switzerland, EOC, Bellinzona, Switzerland; 11IRCCS Azienda Ospedaliero-Universitaria di Bologna, Istituto di Ematologia “Seràgnoli,” Bologna, Italy; 12Dipartimento di Scienze Mediche e Chirurgiche, Università di Bologna, Bologna, Italy; 13ADC Therapeutics America, Inc., Murray Hill, NJ, USA and 14Department of Biomedical Sciences, Humanitas University, and Department of Oncology and Hematology, Humanitas Research Hospital−IRCCS, Milano, Italy
Correspondence: P.F. Caimi caimip@ccf.org
Received: May 9, 2023.
Accepted: August 23, 2023.
Early view: August 31, 2023.
https://doi.org/10.3324/haematol.2023.283459
©2024 Ferrata Storti Foundation
Published under a CC BY-NC license
Therapies that demonstrate durable, long-term responses with manageable safety and tolerability are needed for patients with relapsed/refractory diffuse large B-cell lymphoma (R/R DLBCL). Loncastuximab tesirine (loncastuximab tesirine-lpyl [Lonca]), an anti-CD19 antibody conjugated to a potent pyrrolobenzodiazepine dimer, demonstrated single-agent antitumor activity in the pivotal phase II LOTIS-2 study in heavily pretreated patients with R/R DLBCL. Here we present updated efficacy and safety analyses from LOTIS-2, performed for all patients and in subsets of patients with a complete response (CR), including patients with CR who were event-free (no progressive disease or death) for ≥1 year and ≥2 years from cycle 1, day 1 of treatment. Lonca was administered every 3 weeks (0.15 mg/kg for 2 cycles; 0.075 mg/kg for subsequent cycles). As of the final data cutoff (September 15, 2022; median follow-up: 7.8 months [range, 0.3-42.6]), 70 of 145 (48.3%) patients achieved an overall response. Thirty-six (24.8%) patients achieved CR, of which 16 (44%) and 11 (31%) were event-free for ≥1 year and ≥2 years, respectively. In the all-treated population, the median overall survival was 9.5 months; the median progression-free survival was 4.9 months. Among patients with CR, median overall survival and progression-free survival were not reached, with 24-month overall and progression-free survival rates of 68.2% (95% CI: 50.0-81.0) and 72.5% (95% CI: 48.2-86.8), respectively. No new safety concerns were detected. With additional follow-up, Lonca continued to demonstrate durable, long-term responses with manageable safety and tolerability in patients with CR (clinicaltrials gov. Identifier: NCT03589469).
In newly diagnosed diffuse large B-cell lymphoma (DLBCL), frontline therapy is potentially curative for approximately 60% of patients.1 Further, patients with newly diagnosed DLBCL who achieved event-free survival (defined as no disease progression, relapse, new anticancer treatment, or death)
for 24 months after the initial first-line immunochemotherapy were found to have an overall survival (OS) equivalent to that of the age- and sex-matched general population, suggesting that long-term responses can indicate positive outcomes for patients with DLBCL.1 However, up to 40% of patients do not respond to frontline therapy or relapse.1 Patients with relapsed/refractory (R/R) DLBCL after stem cell
transplant (SCT) or chimeric antigen receptor T-cell (CAR T) therapy or who are refractory to second-line therapy have a poor prognosis and limited treatment options.2,3 While the number of treatment options for R/R DLBCL is increasing, not all patients are eligible for, able to access easily, or able to tolerate many of these therapies.4,5 There remains a medical need for effective and accessible therapies with manageable safety and tolerability that have demonstrated the potential for long-term disease control in R/R DLBCL. Loncastuximab tesirine (loncastuximab tesirine-lpyl [Lonca]) is an antibody-drug conjugate comprising a humanized anti-CD19 monoclonal antibody conjugated through a cleavable linker to a potent pyrrolobenzodiazepine (PBD) dimer alkylating cytotoxin, SG3199.6 Upon binding to the CD19 antigen, Lonca is internalized, the linker is cleaved, and PBD dimers are rapidly released.6 The PBD dimer forms persistent DNA crosslinks in the DNA minor groove, leading to tumor cell apoptosis.7 In April 2021, Lonca received accelerated approval from the US Food and Drug Administration as a single agent for the treatment of adult patients with R/R large B-cell lymphoma after two or more lines of systemic therapy, including DLBCL not otherwise specified, DLBCL arising from low-grade lymphoma, and high-grade B-cell lymphoma (HGBCL).8 Subsequently, Lonca received European Medicines Agency conditional approval in December 2022 for the same indication.9
In the primary analysis of the pivotal phase II LOTIS-2 study (data cutoff: April 6, 2020; median follow-up: 7.3 months [range, 0.3-20.2]8), Lonca demonstrated single-agent antitumor activity and had an acceptable safety profile in heavily pretreated patients with R/R DLBCL with an overall response rate (ORR) of 48.3% and a complete response (CR) rate of 24.1%.10 In a previously presented follow-up analysis (data cutoff: March 1, 2021; median follow-up: 7.8 months [range, 0.3-31.0]), the ORR was the same as in the primary analysis, and one patient with a partial response (PR) converted to CR for a final CR rate of 24.8%. Durable responses to Lonca were observed, with a median duration of response (DOR) of 13.4 months and a median DOR in patients with CR not reached; no new safety signals were detected.11
Here we present updated long-term efficacy and safety data in patients with R/R DLBCL treated with Lonca in the phase II LOTIS-2 study, including analyses of subsets of patients with durable CR.
The multicenter, open-label, single-arm phase II LOTIS-2 study (clinicaltrials gov. Identifier: NCT03589469) design and methodology were previously described.10 Briefly, key eligibility criteria included patients aged ≥18 years, investigator-defined R/R DLBCL (including DLBCL not otherwise specified, HGBCL with MYC and BCL2 and/or BCL6 rear-
rangements, and primary mediastinal B-cell lymphoma) after two or more prior systemic therapies, measurable disease (2014 Lugano criteria), and an Eastern Cooperative Oncology Group performance status of 0 to 2.
Lonca was administered on an outpatient basis intravenously over 30 minutes once every 3 weeks on day 1 of each 21day cycle at a dose of 0.15 mg/kg for the first two cycles followed by 0.075 mg/kg for subsequent cycles for up to 1 year or until disease relapse or progression. Patients with clinical benefit could continue treatment beyond 1 year upon sponsor approval. Patients received dexamethasone premedication to reduce the incidence and severity of PBD-related adverse events (AE; i.e., edema, effusion, and skin-related events).
This study was conducted in accordance with the International Council for Harmonization Good Clinical Practice guidelines and ethical principles of the Declaration of Helsinki. All participants provided written informed consent. The study protocol and amendments were approved by all relevant ethics committees.
The primary efficacy endpoint was the ORR (defined as the proportion of patients with a CR or PR according to the 2014 Lugano classification,12 determined by independent central review). Patient disease assessment and follow-up were previously described.10 Secondary efficacy endpoints included the DOR (time from first response [CR or PR] to disease progression or death), CR rate (the proportion of patients with a CR as determined by an independent central review), relapse-free survival (RFS; the time from CR to disease progression or death), progression-free survival (PFS; the time from the start of treatment to disease progression or death), and OS (the time from the start of treatment to death from any cause).
Safety endpoints included frequency and severity of AE and serious AE, graded according to the National Cancer Institute’s Common Terminology Criteria for Adverse Events v4.0.
The primary analysis of the LOTIS-2 study was previously published (data cutoff: April 6, 2020).10 The follow-up efficacy and safety analyses reported here (data cutoff: September 15, 2022) were performed for all patients who received ≥1 dose of Lonca, in a subset of patients who achieved a best response of CR, and in subsets of patients with a best response of CR who were event-free (events defined as progressive disease or death) for ≥1 year or ≥2 years starting from cycle 1, day 1 of Lonca treatment.
Analysis of primary and secondary endpoints was previously described10 (see the Online Supplementary Appendix 1). The duration of time patients remained treatment-free post-Lonca was defined as the interval from the last dose of Lonca until the end of study for patients who did not receive subsequent anticancer therapy or the start of subsequent
anticancer therapy for patients who received subsequent anticancer therapy. All statistical analyses were conducted using SAS, version 9.4.
As of the final data cutoff of September 15, 2022 (median follow-up, all-treated population: 7.8 months [range, 0.342.6]), a total of 145 patients received at least one dose of Lonca and were evaluable for efficacy and safety. Baseline characteristics and demographics are summarized in Table
1. Briefly, the median age was 66.0 years, 58.6% of patients were male, 6.9% of patients had HGBCL, the median number of prior therapies was 3.0, 20.0% of patients had primary refractory disease, 61.4% had disease refractory to the last prior systemic therapy, 9.7% of patients had prior CAR T therapy, and 16.6% had prior SCT.
Patient subsets of interest included patients with CR (36 [24.8%]; median follow-up: 35.0 months) and patients with CR who were event-free for ≥1 year (16 [11.0%]; median follow-up: 37.2 months) and ≥2 years (11 [7.6%]; median follow-up: 37.5 months). Among the subset of patients with CR (n=36), 38.9% were male, 13.9% had HGBCL, 13.9% had double-hit disease, 13.9% had primary refractory disease,
Patients with CR who
aR/R DLBCL was classified according to the 2016 World Health Organization classification. bThe primary analysis reported high-grade B-cell lymphoma (HGBCL) in 11 patients. CAR T: chimeric antigen receptor T cell; CR: complete response; DLBCL: diffuse large B-cell lymphoma; ECOG: Eastern Cooperative Oncology Group; NOS: not otherwise specified; R/R: relapsed/refractory; SCT: stem cell transplant.
and 30.6% had disease refractory to the last prior systemic therapy. In the subset of patients with CR who were eventfree for ≥1 year (n=16), 18.8% were male, 31.3% had HGBCL, 31.3% had double-hit disease, 12.5% had primary refractory disease, and 31.3% had disease refractory to the last prior systemic therapy. In the subset of patients with CR who were event-free for ≥2 years (n=11), 18.2% were male, 27.3% had HGBCL, 27.3% had double-hit disease, 0% had primary refractory disease, and 36.4% had disease refractory to the last prior systemic therapy.
Most baseline characteristics were similar between the all-treated population, the subset of patients with a CR, and the subsets of patients with CR who were event-free for ≥1 year and ≥2 years. The median age, the percentage of female patients, and the percentage of patients with HGBCL were higher in the subsets of patients with CR who were event-free for ≥1 year and ≥2 years than in the all-treated population. The percentage of primary refractory patients was lower among the subset of patients with CR who were event-free for ≥1 year, and substantially lower (0% vs. 20%) in the subset of patients with CR who were event-free for ≥2 years, than in the all-treated population.
Lonca administration and exposure are summarized in the Online Supplementary Table S1. In the all-treated population, the median number of treatment cycles was 3.0 (range, 1-26). Among patients with CR, the median number of treatment cycles was 8.0 (range, 1-26). Among patients with CR who were event-free for ≥1 year and ≥2 years, the median numbers of treatment cycles were 12.5 and 13.0, respectively.
As of the final data cutoff, the ORR was 48.3% (70/145),
with a CR rate of 24.8% (36/145). Among patients with CR, 44% (16/36) and 31% (11/36) were event-free for ≥1 year and ≥2 years, respectively. The median time to response for all responders was 41.0 days (range, 35-247). Among the subset of patients with CR, the median time to response was 42.0 days (range, 36-247).
Efficacy outcomes for the all-treated population and the subset of patients with CR are summarized in Table 2. The median DOR was 13.4 months (95% confidence interval [CI]: 6.9- not estimated [NE]) in the all-treated population and was not reached among patients with CR (Figure 1). Of the 36 patients with CR, it is estimated (Kaplan–Meier approach) that 82.8% (95% CI: 59.9-93.3) of patients would maintain response for 1 year, and 72.4% (95% CI: 48.1-86.8) would maintain the response for 2 years. The median PFS was 4.9 months (95% CI: 2.9-8.3) in the all-treated population and was not reached in patients with CR (Figure 2A). Of the 36 patients with CR, it is estimated (Kaplan–Meier approach) that 82.9% (95% CI: 60.0-93.3) of patients would be progression-free for 1 year, and 72.5% (95% CI: 48.2-86.8) would be progression-free for 2 years. The median OS was 9.5 months (95% CI: 6.7-11.5) in the all-treated population and was not reached in patients with CR. Of the 36 patients with CR, 12 OS events were reported, and it is estimated (Kaplan–Meier approach) that 77.1% (95% CI: 59.4-87.9) of patients would maintain survival for 1 year, and 68.2% (95% CI: 50.0-81.0) of patients would maintain survival for 2 years (Figure 2B). Among the 36 patients with CR, the median RFS was not reached (Figure 2C), and it is estimated (Kaplan–Meier approach) that 83.2% (95% CI: 60.5-93.5) and 72.8% (95% CI: 48.5-87.0) of patients would be relapse-free for 1 and 2 years, respectively.
Among patients with CR, the median duration of time patients remained treatment-free post-Lonca was 6.1 months (range, 1.0-37.5). In the subsets of patients who were event-
free for ≥1 year and ≥2 years, the median duration of time patients remained treatment-free post-Lonca was 24.8 months (range, 3.4-37.5) and 27.7 months (range, 20.7-37.5), respectively (Figure 3). None of the 11 patients with CR who were event-free for ≥2 years received new anticancer therapy; all 11 patients were censored due to patient discontinuation of the study. The most common reason for the censoring of patients with CR was study discontinuation in 15 (41.7%) patients, followed by transplant in ten (27.8%) patients. Five (13.9%) patients were censored for the start of new anticancer therapy other than transplant. Three (8.3%) patients each experienced progressive disease and death. Among the 14 (9.7%) patients in the all-treated population who were previously treated with CAR T therapy, the ORR was 42.9%. Following treatment with Lonca, 16 (11.0%) patients in the all-treated population received CAR T therapy, and 12 (8.3%) received SCT. As assessed by principal investigators, four of the five patients with a record of response achieved CR after SCT.
No new safety signals were identified during the long-term follow-up. All-grade treatment-emergent adverse events (TEAE; occurring in ≥10% of all-treated patients) and grade ≥3 TEAE are summarized in Table 3. All-grade TEAE occurred in 98.6% of patients in the all-treated population. TEAE occurring in ≥30% of the all-treated population were increased g-glutamyl transferase (GGT; 42%), neutropenia (40%), and thrombocytopenia (33%). Grade ≥3 TEAE were reported in 73.8% of patients. Grade ≥3 TEAE in ≥10% of the all-treated population were neutropenia (26%), thrombocytopenia
(18%), increased GGT (17%), and anemia (10%). No cases of secondary malignancy or myelodysplastic syndrome were reported. No deaths due to TEAE were considered to be related to Lonca.
TEAE were similar between the all-treated population and the subset of patients with CR. All-grade TEAE occurred in 100% of patients with CR. TEAE occurring in ≥30% of patients with CR were increased GGT (50%), neutropenia (42%), anemia (36%), thrombocytopenia (36%), peripheral edema (33%), and nausea (31%). Grade ≥3 TEAE were reported in 75% of patients with CR; grade ≥3 TEAE occurring in ≥10% of patients with CR were neutropenia (28%), increased GGT (19%), thrombocytopenia (19%), leukopenia (14%), and hypophosphatemia (11%). All-grade and grade ≥3 TEAE in patients with CR who were event-free for ≥1 year and ≥2 years were generally similar to those of the overall population (Online Supplementary Table S2).
In the all-treated population, 40% of patients had dose withdrawal before cycle 3, meaning that those patients did not reach the scheduled dose reduction before discontinuing treatment with Lonca. TEAE leading to treatment discontinuation occurred in 24.8% of patients in the all-treated population. The most common TEAE leading to treatment discontinuation in the all-treated population were increased GGT (12.4%), peripheral edema (2.8%), localized edema (2.1%), and pleural effusion (2.1%). Among the subset of patients with CR, TEAE leading to treatment discontinuation occurred in 41.7% of patients. The most common TEAE leading to discontinuation in patients with CR were increased GGT (19.4%), peripheral edema (8.3%), localized edema (5.6%), and pericardial effusion (5.6%).
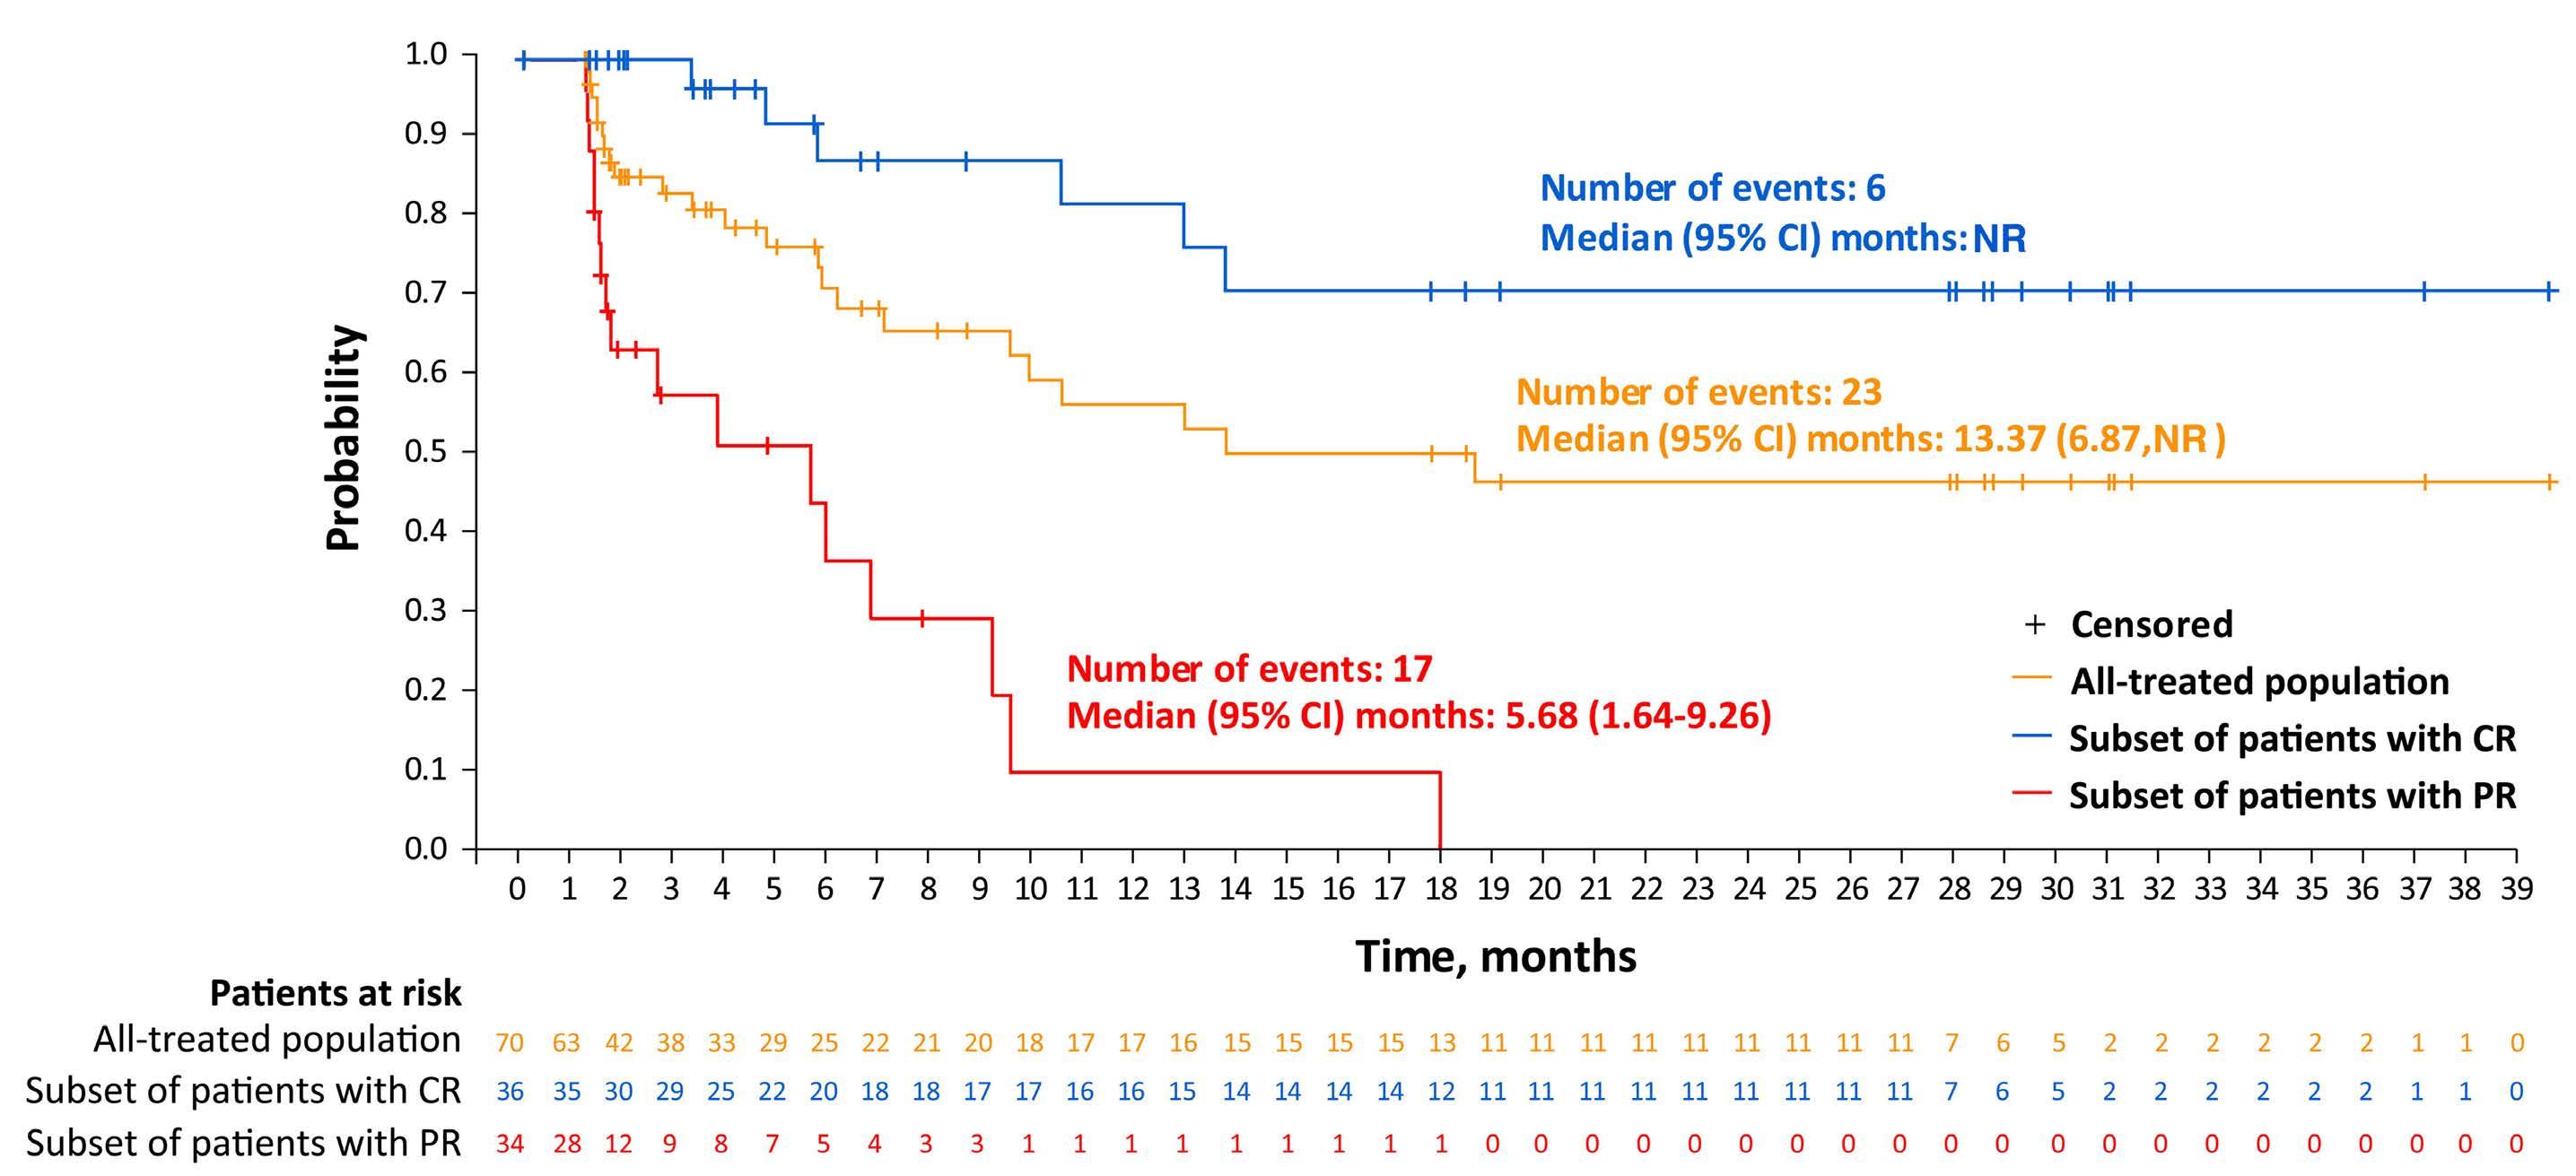
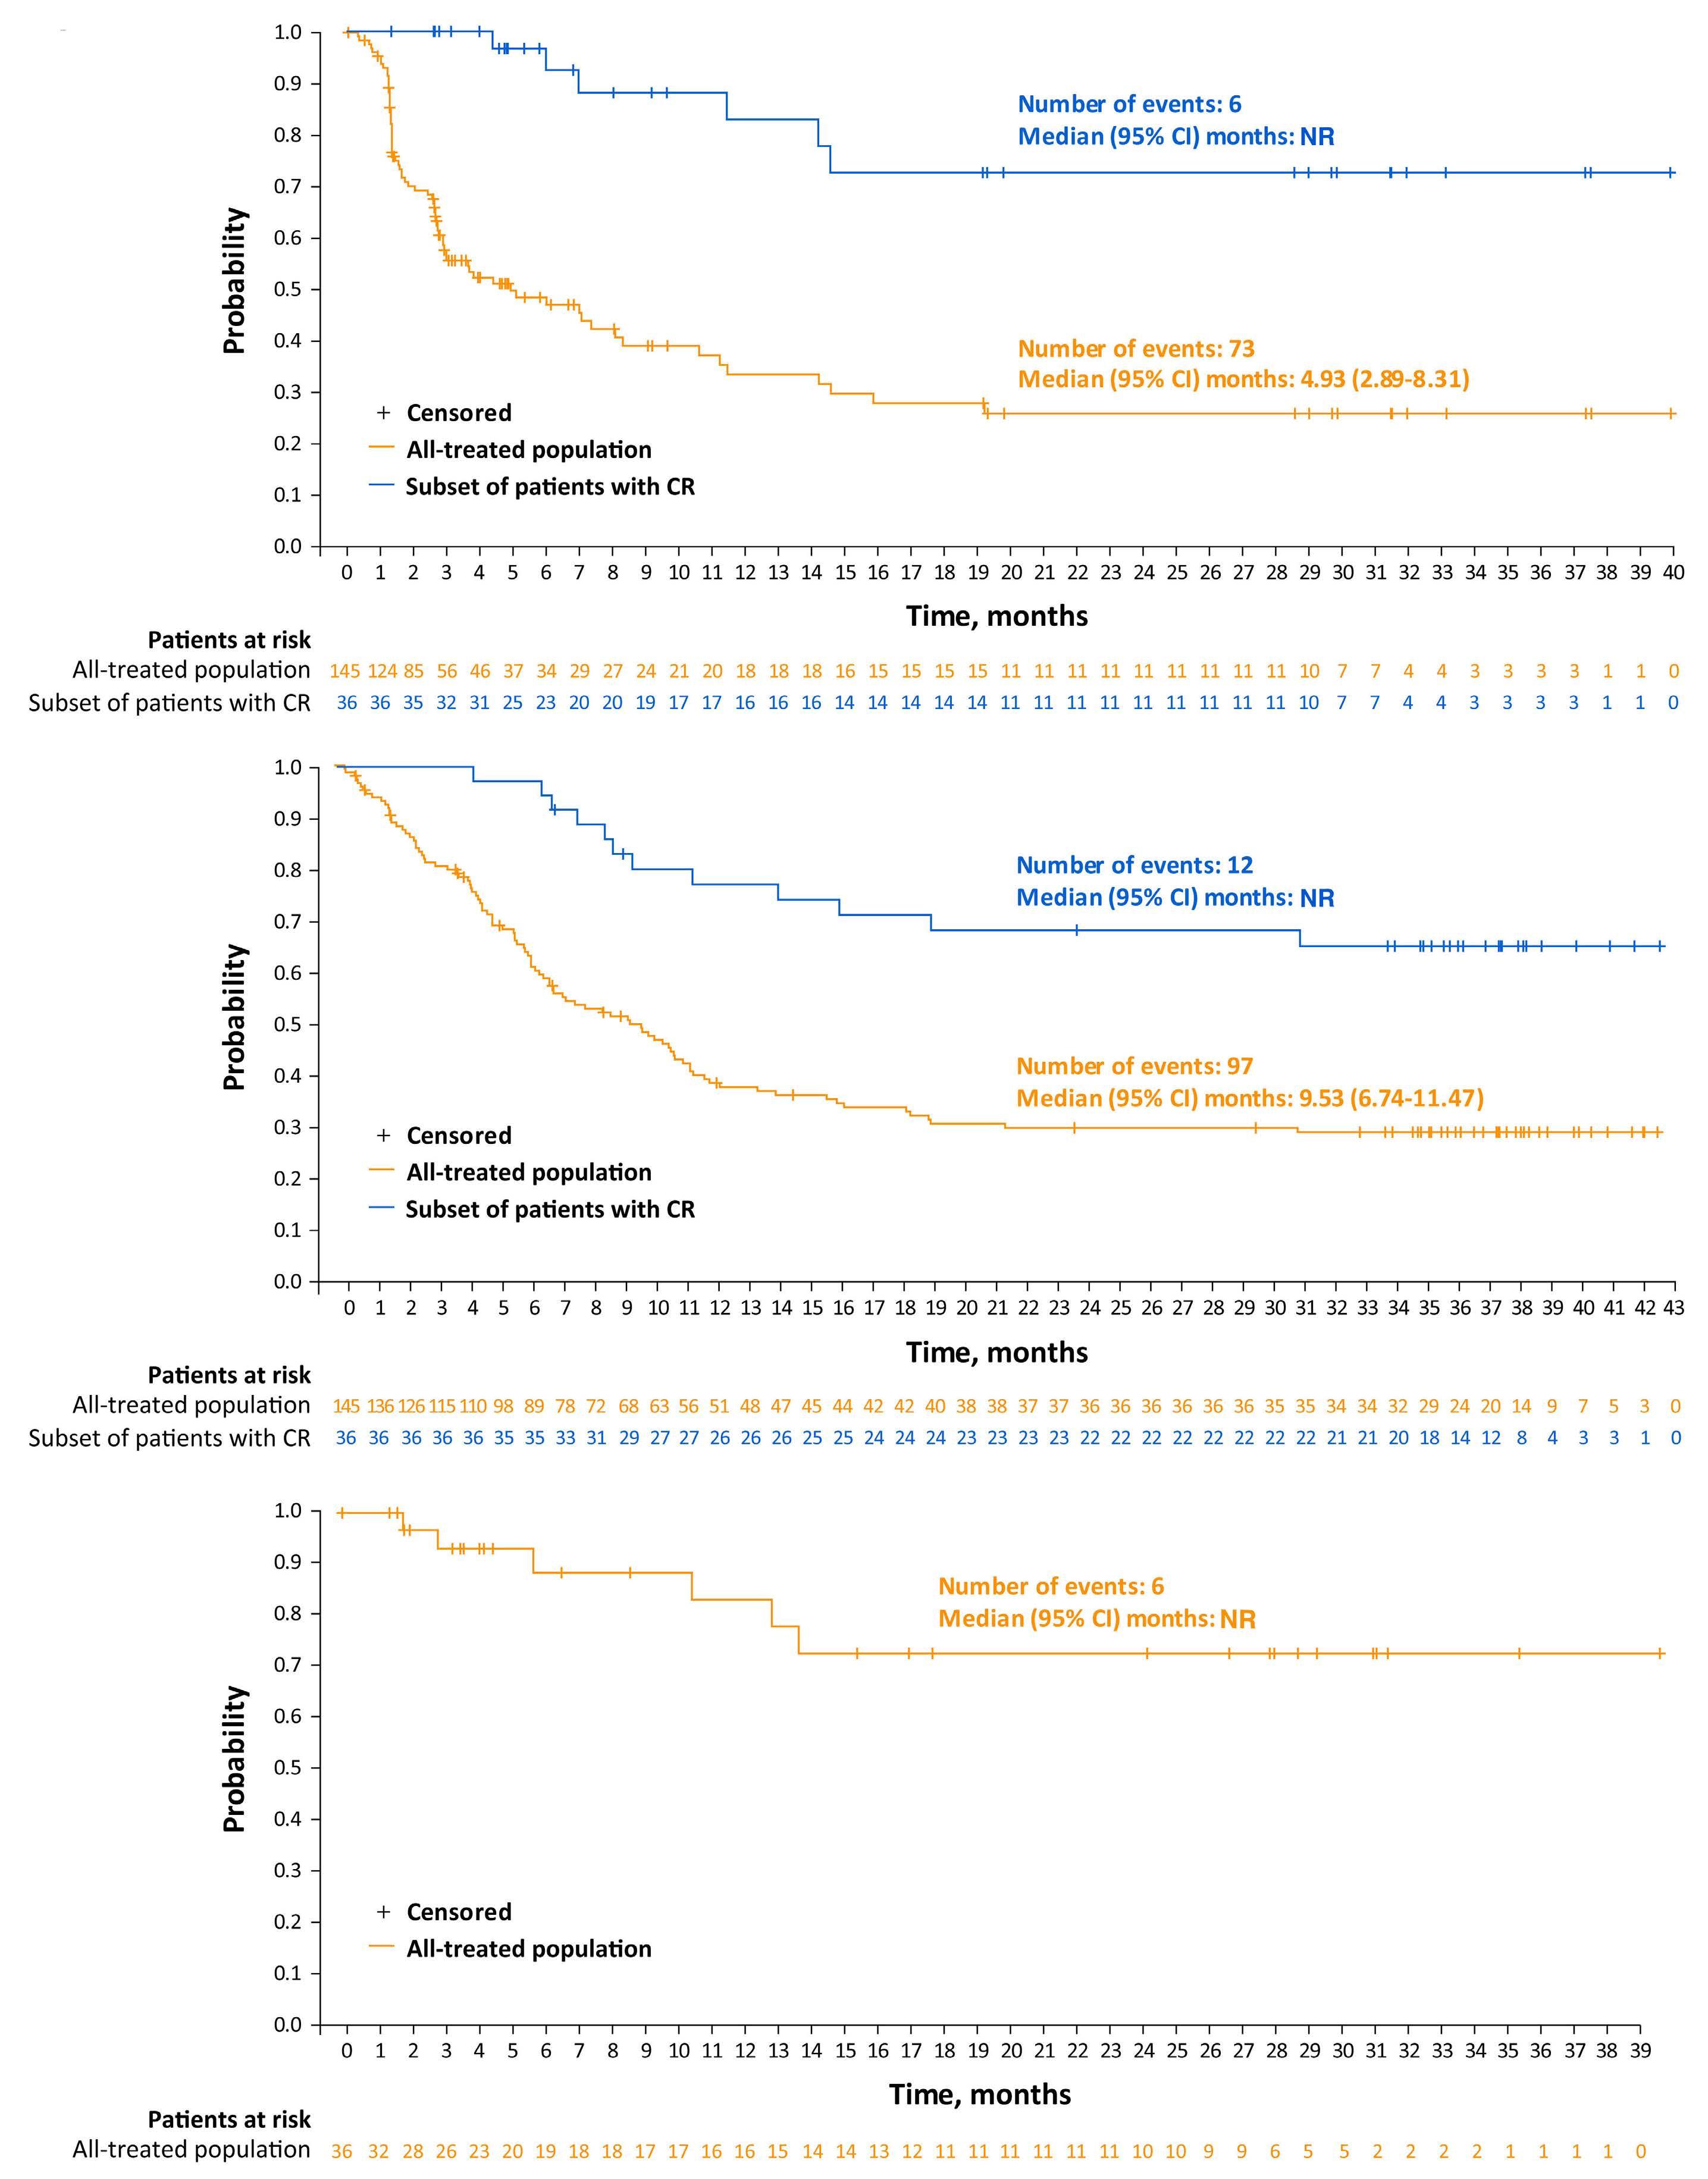
In the primary analysis of the LOTIS-2 study, Lonca demonstrated antitumor activity with an ORR of 48.3%, a CR rate of 24.1%, and durable responses (median DOR, 10.3 months) in patients with heavily pretreated R/R DLBCL.10 In this longer-term follow-up analysis, with a median follow-up of 35.0 months in patients with CR, these durable responses were maintained. The ORR was consistent with the primary analysis at 48.3%, and one PR was converted to a CR for a final CR rate of 24.8%. In the all-treated population, the median DOR extended to 13.4 months. The median OS and median PFS were consistent with the primary analysis at 9.5 months and 4.9 months, respectively. Further, in this LOTIS-2 long-term follow-up analysis, 44% and 31% of the 36 patients with CR were event-free for ≥1 year and ≥2 years, respectively. In a previous study, patients with newly diagnosed DLBCL who achieved event-free survival for ≥2 years after initial therapy were found to have an OS similar to that of an age- and sex-matched general population.1 For patients with R/R DLBCL, it remains to be seen whether achieving event-free survival for ≥2 years may also translate to a comparable effect on OS and disease-specific mortality. Among the subset of patients with CR who were
event-free for ≥1 year or ≥2 years, the median duration of time patients remained treatment-free post-Lonca was greater than 24 months, with one patient remaining treatment-free as long as 37 months. Achievement of these long treatment-free intervals is likely to translate into improved measures of quality of life, as patients with non-Hodgkin lymphoma who are off treatment and disease-free have been shown to have improved quality of life compared with patients with active disease.13
Baseline characteristics were compared between the all-treated patient population and the subsets of patients with durable responses to identify potential factors predictive of long-term response to Lonca. Overall, no trends have emerged, as baseline characteristics were generally similar between the all-treated population and the subsets of patients with durable responses; however, there was a notable difference in the proportion of patients who were primary refractory in the all-treated population (20%) and the subset of patients with CR who were event-free for ≥2 years (0%), as well as a difference between the proportion of patients with HGBCL in the all-treated population (6.9%) and the subsets of patients with CR who were event-free for ≥1 year (31.3%) and ≥2 years (27.3%). Further studies are needed to expand our understanding of subgroups that
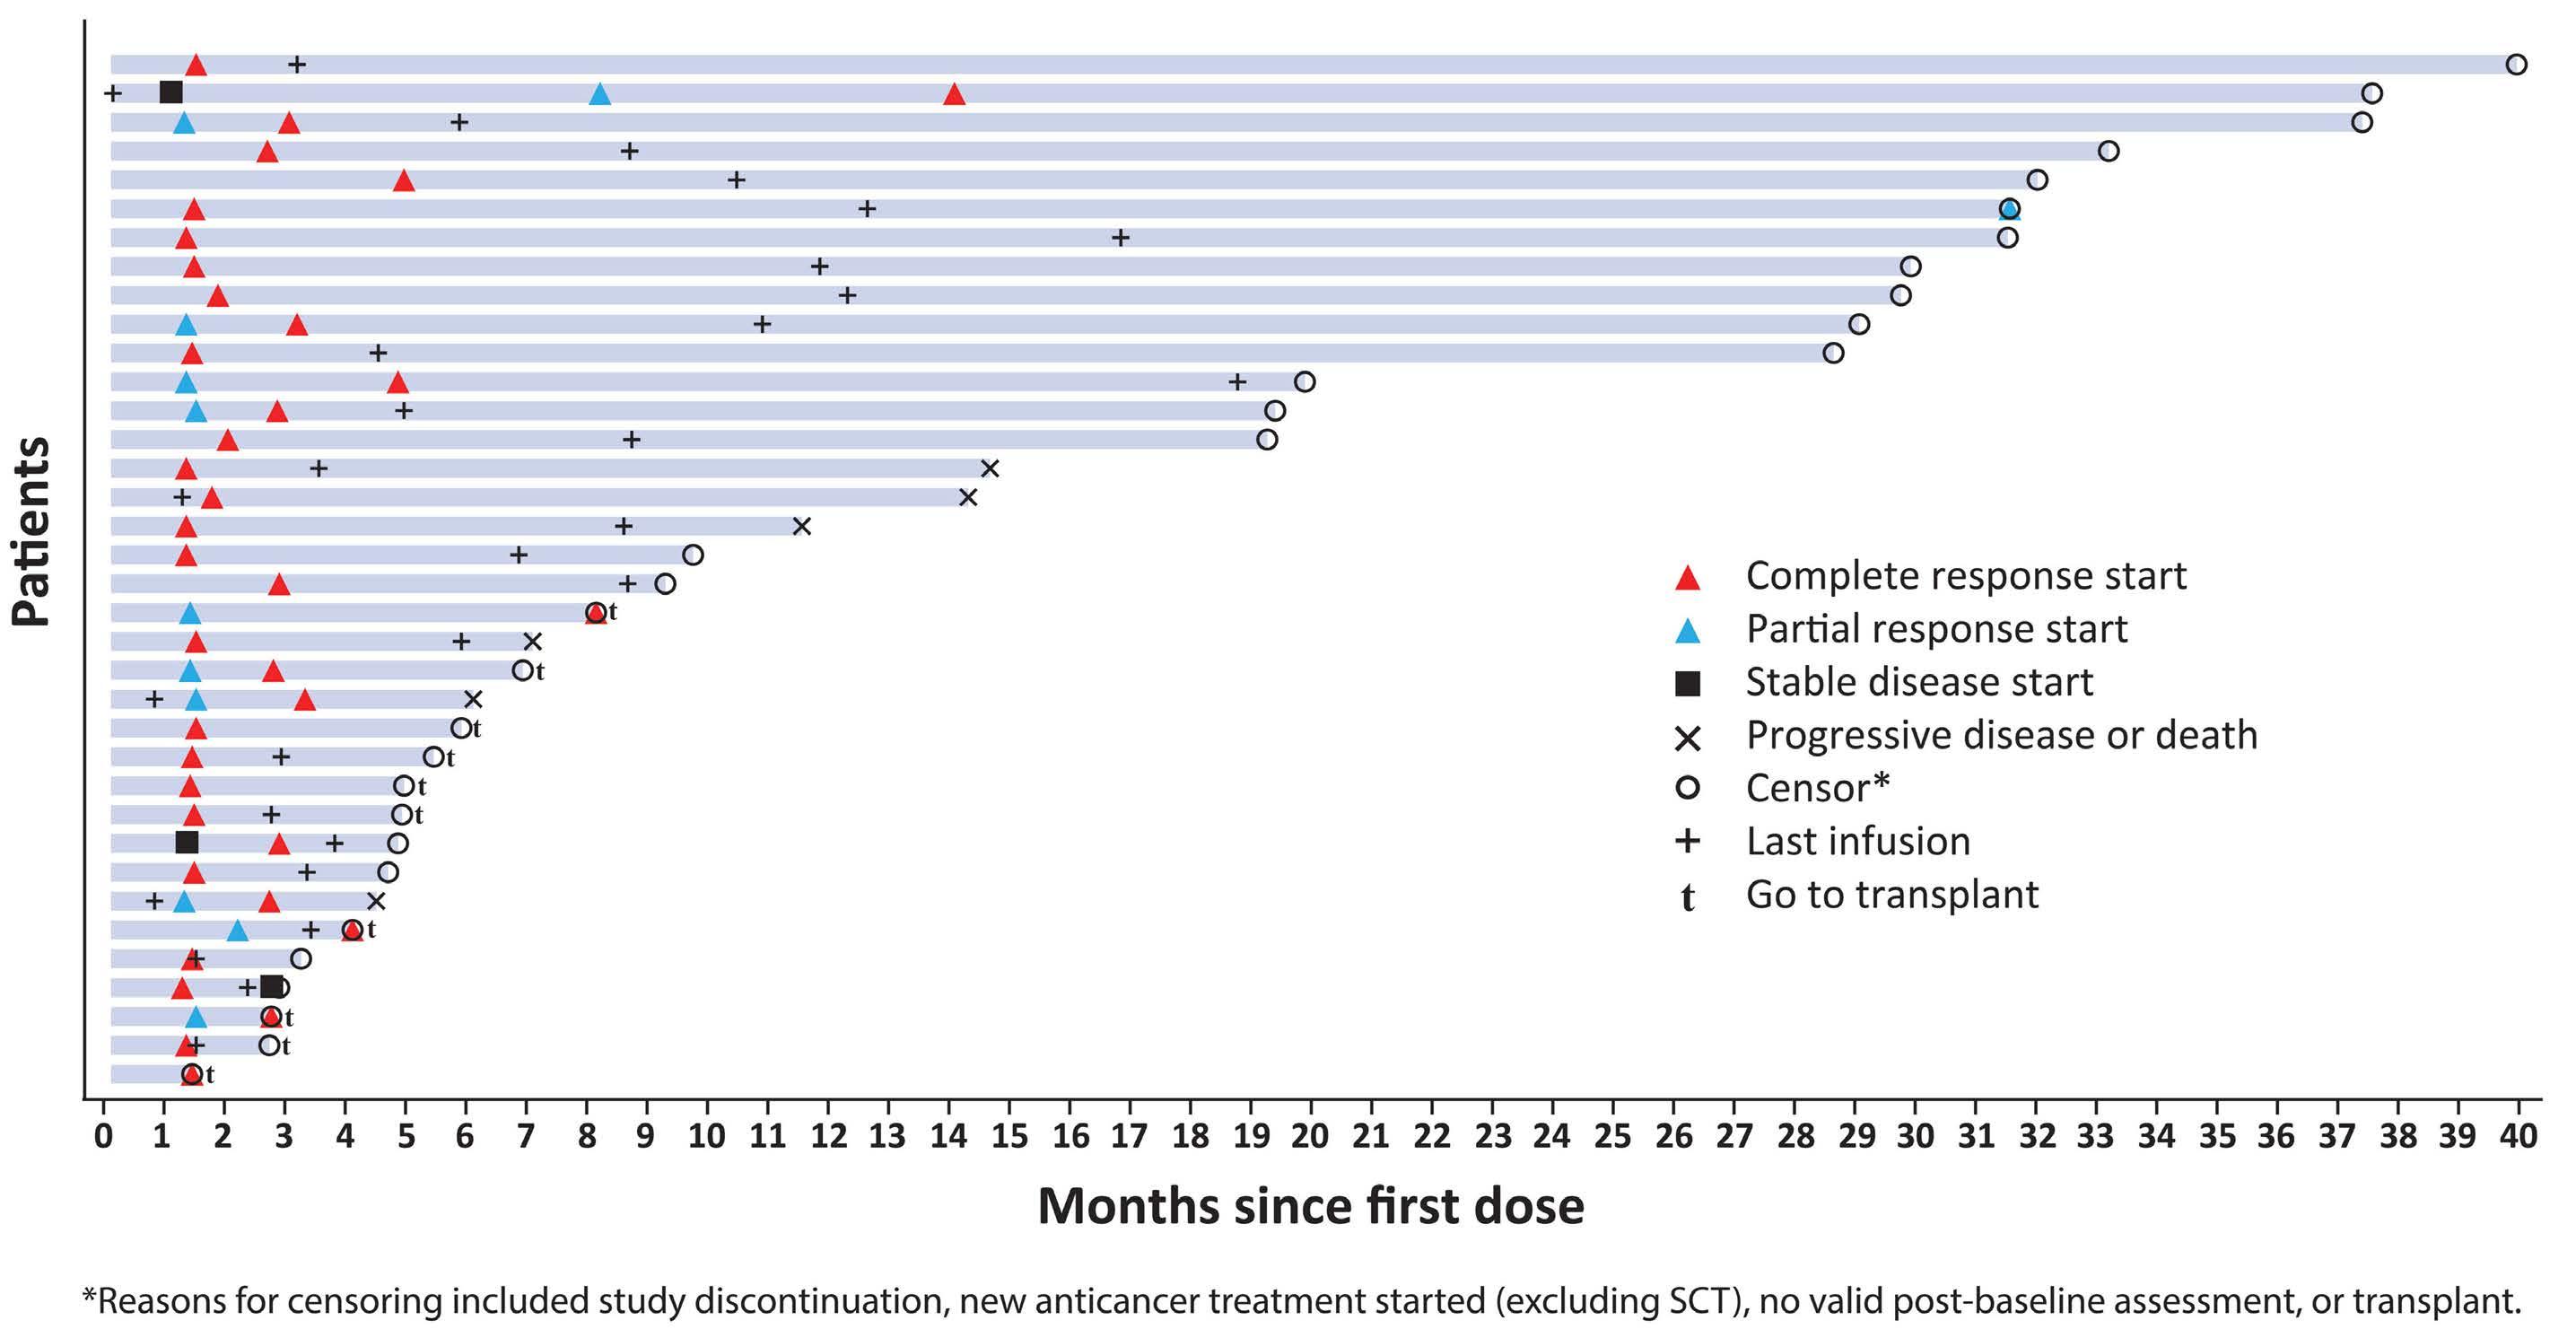
ALP: alkaline phosphatase; ALT: alanine transaminase; AST: aspartate aminotransferase; CR: complete response; GGT: g-glutamyl transferase; TEAE: treatment-emergent adverse event.
are predictive of durable response to Lonca. Preliminary biomarker studies suggest that response to treatment with Lonca is observed across a wide range of CD19 expression levels, including patients with very low levels.14 The role of CD19 expression and response to Lonca is being further explored. Additional studies to investigate methods to overcome resistance to Lonca in subgroups such as chemorefractory patients, possibly through evaluation with combination therapies, are also needed.
One question that arises in practice is how best to sequence multiple CD19-directed therapies. In this study, patients had previously received CAR T therapy and achieved an ORR similar to that of the all-treated population. This finding is consistent with previous analyses and suggests that responses can be achieved with Lonca in patients who progressed after receiving CD19-targeted CAR T therapy.15 In this long-term follow-up analysis, the safety profile of
Lonca remained consistent with previously reported safety data; no new safety concerns were detected.10,11 With the use of dexamethasone premedication, standard spironolactone diuretics, and recommendations to minimize or avoid sun exposure, TEAE considered to be related to the PBD dimer cytotoxin—edema and effusion, skin-related AE, and liver enzyme abnormalities16—were consistent with previously reported safety data. PBD dimer cytotoxin-related AE continued to be manageable, with dose delays and/or modifications.10 Increased GGT was the most common reason for treatment discontinuation, followed by edema and effusions. According to the LOTIS-2 study protocol, patients with recurrent grade ≥2 GGT elevation, after two dose reductions or dose delays >5 weeks due to GGT elevation, were discontinued from treatment with Lonca. However, treatment discontinuation due to elevated GGT does not reflect clinical practice, as elevated GGT
does not typically trigger the discontinuation of therapy in a patient whose disease is responding to anticancer therapy, especially without the presence of other elevated liver enzymes.17 Further, patients with GGT elevations did not present with long-term liver toxicity of any grade. One limitation of this analysis was the small number of patients with long-term responses. Further study in a large patient population is needed to understand better the characteristics of patients with long-term response to treatment with Lonca. A strength of this analysis is that the LOTIS-2 patient population is representative of a real-world population of patients with R/R DLBCL who have received multiple prior lines of therapy, including similar median ages and proportions of sex, race, patients with transformed disease, and patients with double-/triple-hit disease.18,19
In conclusion, among heavily pretreated patients with R/R DLBCL in the pivotal LOTIS-2 study, Lonca continued to demonstrate durable responses with a manageable safety and tolerability profile in this long-term follow-up analysis. Further, a subset of 11 patients with CR remained event-free for ≥2 years with no evidence of disease, no new anticancer treatment, and a median treatment-free duration of 27.7 months post-Lonca treatment.
Disclosures
PFC served as a consultant/advisor for ADC Therapeutics, BMS/Celgene, Genentech, Genmab, Kite Pharma, MEI Pharma, Novartis, and Takeda. WZA participated in advisory boards for Acrotech Biopharma, ADC Therapeutics, BeiGene, Kymera Therapeutics, and Nurix Therapeutics; and received research funding from Nurix Therapeutics. JPA received honoraria from Oncinfo and OncLive; consultant and research funding from ADC Therapeutics and Genentech; and served as consultant for Genentech. An immediate family member of JPA served on the advisory boards for Agios Pharmaceuticals, Forma Therapeutics, Foundation Medicine, Inovio Pharmaceuticals, and Puma Biotechnology. KMA received honoraria from BMS, Gilead, and Novartis. MH served as a consultant for AbGenomics, ADC Therapeutics, Celgene, Incyte, Janssen R&D, Omeros, Pharmacyclics, TeneoBio, and Verastem; participated in speaker bureaus for AstraZeneca, BeiGene, and Sanofi Genzyme; and received research support from Astellas Pharma, Spectrum Pharmaceuticals, and Takeda. BH served as a consultant for ADC Therapeutics, AstraZeneca, and BMS; and participated in a speaker bureau for BMS. BSK served as consultant for AbbVie, ADC Therapeutics, AstraZeneca, BeiGene, Celgene/BMS, Eli Lilly, Epizyme, Genentech, Genmab, Hutchmed, Incyte, Kite, MEI Pharma, Molecular Templates, Pharmacyclics, Takeda, and T G Therapeutics; and received research funding from AbbVie, ADC Therapeutics, AstraZeneca, BeiGene, and Genentech. JR served as consultant/advisor for ADC Therapeutics, BMS, Kite Pharma, Novartis, and Takeda; served as speaker for ADC Therapeutics, Seattle Genetics, and Takeda; owns stock in
ADC Therapeutics and AstraZeneca (spouse); provided expert testimony for and received honoraria from ADC Therapeutics and Takeda; and received research funding from Takeda. MS served as consultant/advisor for ADC Therapeutics and Genentech; and served on speaker bureaus for BMS, GSK, and Sanofi. AS served as a consultant/advisor for AstraZeneca, Bayer, Eli Lilly, Janssen Oncology, Novartis, and Roche; and received research funding from AbbVie, ADC Therapeutics, Amgen, AstraZeneca, Bayer, Cellestia, Debiopharm Group, Eli Lilly, Incyte, Loxo, MEI Pharma, Merck/MSD, Novartis, Pfizer, Philogen, and Roche. PLZ served as a consultant for EUSA Pharma, MSD, Sanofi, and Verastem; participated in advisory committees for ADC Therapeutics and Sandoz; participated in speaker bureaus/advisory committees for BMS, Celltrion, EUSA Pharma, Gilead, Janssen-Cilag, Kyowa Kirin, MSD, Roche, Servier, Takeda, TG Therapeutics, and Verastem. YW is an employee of ADC Therapeutics with equity and stock options in the company; and has an immediate family member employed by/stock ownership in Johnson & Johnson. YQ is an employee of ADC Therapeutics with equity and stock options in the company. LW is an employee of ADC Therapeutics with equity and stock options in the company. ZX is an employee of ADC Therapeutics with equity and stock options in the company. CCS served as a consultant/ advisor for ADC Therapeutics, Celgene/BMS, Karyopharm, MSD, Novartis, Roche, Sanofi, and Scenic Biotech; and received honoraria from AstraZeneca, Celgene, Incyte, Gilead Sciences, Janssen Oncology, MSD, and Roche.
Contributions
PFC, WZA, JPA, KMA, MH, BH, BSK, JR, MS, AS, PLZ, and CCS were principal investigators who contributed as follows: provision of patient care; data analysis and interpretation; development and critical revision of the manuscript; and provision of final approval of the submitted content. YW, YQ, LW, and ZX contributed as follows: data analysis and interpretation; statistical analyses; development and critical revision of the manuscript; and provision of final approval of the submitted content. All authors had full access to all data in the study and approved the decision to submit for publication.
Acknowledgments
Medical writing support was provided by Adrianne Spencer, PhD (CiTRUS Health Group), and was funded by ADC Therapeutics SA, in accordance with Good Publication Practice 2022 (GPP 2022) guidelines.
Funding
This study was funded by ADC Therapeutics SA.
Data-sharing statement
Proposals requesting de-identified participant data collected for the study following publication can be sent to clinical.trials@adctherapeutics.com and will be evaluated on a case-by-case basis.
1. Maurer MJ, Ghesquières H, Jais JP, et al. Event-free survival at 24 months is a robust end point for disease-related outcome in diffuse large B-cell lymphoma treated with immunochemotherapy. J Clin Oncol. 2014;32(10):1066-1073.
2. Crump M, Neelapu SS, Farooq U, et al. Outcomes in refractory diffuse large B-cell lymphoma: results from the international SCHOLAR-1 study. Blood. 2017;130(16):1800-1808.
3. Chow VA, Gopal AK, Maloney DG, et al. Outcomes of patients with large B-cell lymphomas and progressive disease following CD19-specific CAR T-cell therapy. Am J Hematol. 2019;94(8):E209-E213.
4 Westin J, Sehn LH. CAR T cells as a second-line therapy for large B-cell lymphoma: a paradigm shift? Blood. 2022;139(18):2737-2746.
5. Kansagra A, Farnia S, Majhail N. Expanding access to chimeric antigen receptor T-cell therapies: challenges and opportunities. Am Soc Clin Oncol Educ Book. 2020;40:1-8.
6. Zammarchi F, Corbett S, Adams L, et al. ADCT-402, a PBD dimer-containing antibody drug conjugate targeting CD19expressing malignancies. Blood. 2018;131(10):1094-1105.
7 Hartley JA, Flynn MJ, Bingham JP, et al. Pre-clinical pharmacology and mechanism of action of SG3199, the pyrrolobenzodiazepine (PBD) dimer warhead component of antibody-drug conjugate (ADC) payload tesirine. Sci Rep. 2018;8(1):10479.
8. ADC Therapeutics. ZYNLONTA® (loncastuximab tesirine-lpyl) [package insert]. https://www.adctherapeutics.com/wpcontent/uploads/2022/10/ZYLONTA-PI_October-2022_LOCKED. pdf. Accessed June 30, 2023.
9. European Medicines Agency. Zynlonta Product Information. https://www.ema.europa.eu/en/documents/productinformation/zynlonta-epar-product-information_en.pdf. Accessed June 30, 2023.
10 Caimi PF, Ai W, Alderuccio JP, et al. Loncastuximab tesirine in relapsed or refractory diffuse large B-cell lymphoma (LOTIS-2): a multicentre, open-label, single-arm, phase 2 trial. Lancet
Oncol. 2021;22(6):790-800.
11. Zinzani PL, Carlo-Stella C, Ai W, et al. LOTIS-2 follow-up analysis: updated results from a phase 2 study of loncastuximab tesirine in relapsed or refractory diffuse large B-cell lymphoma. Hematol Oncol. 2021;39(S2):252.
12. Cheson BD, Fisher RI, Barrington SF, et al. Recommendations for initial evaluation, staging, and response assessment of Hodgkin and non-Hodgkin lymphoma: the Lugano classification. J Clin Oncol. 2014;32(27):3059-3068.
13. Smith SK, Zimmerman S, Williams CS, Zebrack BJ. Health status and quality of life among non-Hodgkin lymphoma survivors. Cancer. 2009;115(14):3312-3323.
14 Caimi PF, Hamadani M, Carlo-Stella C, et al. CD19 expression by IHC alone is not a predictor of response to loncastuximab tesirine: results from the LOTIS-2 clinical trial and quantitative systems pharmacology modeling. Blood. 2022;140(Supplement 1):9548-9550.
15. Caimi PF, Ardeshna KM, Reid E, et al. The antiCD19 antibody drug immunoconjugate loncastuximab achieves responses in DLBCL relapsing after antiCD19 CAR-T cell therapy. Clin Lymphoma Myeloma Leuk. 2022;22(5):e335-e339.
16. Hartley JA. Antibody-drug conjugates (ADCs) delivering pyrrolobenzodiazepine (PBD) dimers for cancer therapy. Expert Opin Biol Ther. 2021;21(7):931-943.
17 Lee TH, Kim WR, Poterucha JJ. Evaluation of elevated liver enzymes. Clin Liver Dis. 2012;16(2):183-198.
18. Xie J, Wu A, Liao L, et al. Characteristics and treatment patterns of relapsed/refractory diffuse large B-cell lymphoma in patients receiving ≥3 therapy lines in post-CAR-T era. Curr Med Res Opin. 2021;37(10):1789-1798.
19 Hamadani M, Liao L, Yang T, Chen L, Moskowitz C. Characteristics and clinical outcomes of patients with relapsed/refractory diffuse large B-cell lymphoma who received at least 3 lines of therapies. Clin Lymphoma Myeloma Leuk. 2022;22(6):373-381.
Christopher R. Flowers,1° Matthew J. Matasar,2° Alex F. Herrera,3 Mark Hertzberg,4 Sarit Assouline,5 Judit Demeter,6 Andrew McMillan,7 Amitkumar Mehta,8 Stephen Opat,9 Marek Trněný,10 Lisa Musick,11 Jamie Hirata,11 Annie Yang11 and Laurie H. Sehn12
1Winship Cancer Institute of Emory University, Atlanta, GA, USA; 2Memorial Sloan Kettering Cancer Center, New York, NY, USA; 3City of Hope Medical Centre, Duarte, CA, USA; 4Prince of Wales Hospital and University of NSW, Sydney, New South Wales, Australia; 5Jewish General Hospital, Montreal, Quebec, Canada; 6Semmelweiss University, Budapest, Hungary; 7Center for Clinical Haematology, Nottingham University Hospitals NHS Trust, Nottingham, UK; 8University of Alabama at Birmingham, Birmingham, AL, USA; 9Clinical Haematology, Monash Health and Monash University, Clayton, Victoria, Australia; 10Charles University General Hospital, Prague, Czech Republic; 11Genentech Inc., South San Francisco, CA, USA and 12BC Cancer Centre for Lymphoid Cancer and The University of British Columbia, Vancouver, British Columbia, Canada
°Current address of CRF: MD Anderson Cancer Center, Houston, TX, USA
°Current address of MJM: Rutgers Cancer Institute of New Jersey, New Brunswick, NJ, USA
Correspondence: C.R. Flowers
CRFlowers@mdanderson.org
Received: May 25, 2023.
Accepted: September 19, 2023.
Early view: September 28, 2023.
https://doi.org/10.3324/haematol.2023.283557
©2024 Ferrata Storti Foundation
Published under a CC BY-NC license
Follicular lymphoma (FL) is the most common type of indolent non-Hodgkin lymphoma. Despite treatment advances that have improved outcomes for patients with relapsed or refractory (R/R) FL, many patients still die from progressive disease or treatment-related toxicities. In the phase Ib/II GO29365 study (clinicaltrials.gov 02257567), the safety and efficacy of polatuzumab vedotin plus bendamustine and rituximab (Pola-BR) versus bendamustine and rituximab (BR) alone, and polatuzumab vedotin plus bendamustine and obinutuzumab (Pola-BG) as a single-arm cohort were evaluated in patients with R/R FL. Following the phase Ib safety run-in, patients were randomized 1:1 to receive Pola-BR or BR alone in the phase II stage; a separate non-randomized Pola-BG cohort was examined in the phase Ib/II expansion stage. Primary endpoints included safety and tolerability (phase Ib) and positron emission tomography complete response (PET-CR) rate by independent review committee (phase II). Overall, 112 patients were enrolled (phase Ib safety run-in: Pola-BR, N=6; phase II randomized cohort: Pola-BR, N=39; BR, N=41; phase Ib/II expansion cohort: Pola-BG, N=26). PET-CR rates were 66.7% (phase Ib safety run-in, Pola-BR); 69.2% (phase II randomized, Pola-BR); 63.4% (phase II randomized, BR); and 65.4% (phase Ib/II expansion Pola-BG). There was a higher occurrence of cytopenias with Pola-BR and Pola-BG than with BR; serious adverse events were more frequent with Pola-BR (61.4%) and Pola-BG (46.2%) than with BR (29.3%). Overall, this analysis does not demonstrate a benefit of adding Pola to BR or BG regimens for patients with R/R FL.
Follicular lymphoma (FL) is an indolent B-cell lymphoma that accounts for 20% of all non-Hodgkin lymphomas.1
Although improved patient outcomes were observed with the introduction of anti-CD20 monoclonal antibodies, FL remains an incurable disease and patients frequently require multiple lines of treatment.2 Despite the available standard treatment options for relapsed or refractory (R/R)
FL, patients often die due to progressive disease (PD) or treatment-related toxicities.3,4 For these reasons, new therapeutic options are needed.
Polatuzumab vedotin is an antibody-drug conjugate (ADC) that targets CD79b to deliver a microtubule inhibitor, monomethyl auristatin E (MMAE), to malignant B cells.5-7 Once internalized in the cell, MMAE binds to microtubules and prevents cell division, thereby inducing apoptosis.8
Polatuzumab vedotin in combination with bendamustine
and rituximab (Pola-BR) has received approval from the European Medicines Agency and United States Food and Drug Administration for patients with R/R diffuse large B-cell lymphoma (DLBCL) based on data from the pivotal phase Ib/II GO29365 study (clinicaltrials.gov 02257567).9-11 Furthermore, obinutuzumab-chemotherapy combination demonstrated superiority compared with rituximab-chemotherapy in patients with previously untreated FL in the phase III GALLIUM study (clinicaltrials.gov 01332968).12 Improved progression-free survival (PFS) with obinutuzumab versus rituximab has been demonstrated across the most commonly used chemotherapy backbones, including bendamustine.13
Here, we present efficacy and safety data from patients with R/R FL enrolled in the GO29365 study. The cohorts included in this analysis are patients who received Pola-BR versus bendamustine and rituximab (BR) alone, and a single-arm expansion cohort of polatuzumab vedotin in combination with bendamustine and obinutuzumab (Pola-BG).
Trial conduct
This international, multicenter, open-label, phase Ib/II GO29365 study evaluated the safety, tolerability, and efficacy of Pola-BR, BR, and Pola-BG in patients with R/R FL or R/R DLBCL. Safety and efficacy results have been previously reported for the DLBCL cohorts.14,15 This analysis includes the R/R FL cohorts only.
The study protocol was approved by applicable ethics committees and institutional review boards in accordance with the International Conference on Harmonization Guidelines for Good Clinical Practice, and the Declaration of Helsinki.16 All patients provided informed consent. An Independent Review Committee (IRC), including board-certified radiologists and an oncologist experienced in malignant lymphoma, assessed all patients for end-of-treatment (EOT) response based on imaging and bone marrow biopsy
results during the phase II part of the study.
Patient population
Eligible patients were aged ≥18 years with histologically confirmed R/R FL (grade 1, 2 or 3a), and an Eastern Cooperative Oncology Group performance status (ECOG PS) of 0-2. Patients had received ≥1 prior therapy for FL and were considered relapsed or refractory to their last treatment. Patients who had received prior bendamustine were considered eligible if they had a response duration of ≥1 year following treatment. Patients were excluded if they had received treatment with any monoclonal antibodies, radioimmunoconjugate, or ADC within five half-lives or four weeks (whichever was longer) prior to cycle (C) 1, day (D) 1 of the study regimen. Full details of the inclusion and exclusion criteria are shown in Online Supplementary Table S1
The study comprised a phase Ib safety run-in stage of Pola-BR and Pola-BG, followed by a phase II randomized stage to evaluate Pola-BR versus BR, and a phase II expansion stage to evaluate Pola-BG (Figure 1), which was recruited in parallel with the randomized cohort. Patients were randomized 1:1, and stratified by duration of response to prior therapy (≤12 months vs. >12 months) and disease burden (high vs. low, as defined by the Groupe d’Étude des Lymphomes Folliculaires criteria17). Patients were treated for up to six 28-day cycles and received the regimens above with dosing of intravenous (IV) bendamustine 90 mg/m2 on D2 and D3 of C1, and D1 and D2 of subsequent cycles; IV rituximab 375 mg/m2 on D1 of each cycle; IV obinutuzumab 1,000 mg on D1, D8 and D15 of C1 and D1 of subsequent cycles; and IV polatuzumab vedotin 1.8 mg/kg on D2 of C1 and D1 of subsequent cycles.
Primary prophylaxis against neutropenia with granulocyte-colony stimulating factor was required during each cycle of therapy, according to American Society of Clinical Oncology guidelines18 or institutional standards at each site. Also, antiviral and antipneumocystis prophylaxis was
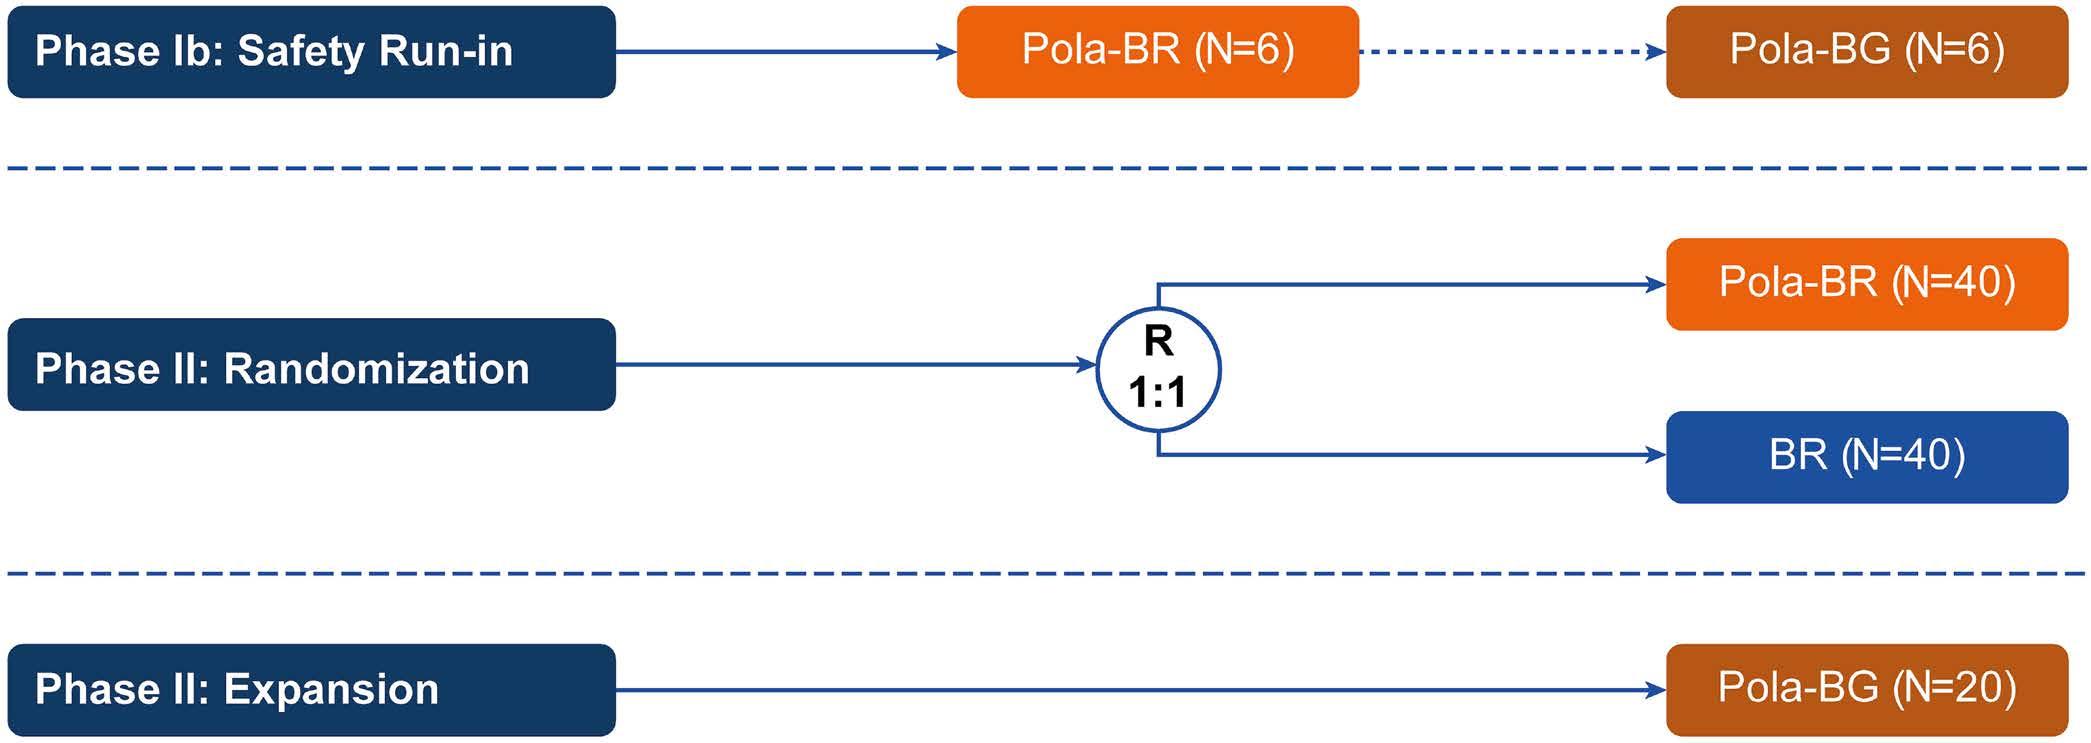
required from initiation of study treatment until ≥6 months after completion of treatment.
The primary endpoints were safety and tolerability (phase Ib), and IRC-assessed [18F]fluorodeoxyglucose-positron emission tomography-computed tomography (PET-CT) complete response (CR) rate using modified Lugano Response Criteria19 6-8 weeks after C6, D1 or last dose of study medication (phase II). Secondary endpoints included objective response at EOT and best objective response. Exploratory endpoints included efficacy outcomes by biomarker status (including CD79b expression, which is presented in this analysis), investigator (INV)-assessed duration of response (DOR), PFS, event-free survival, and overall survival (OS). Responses were assessed by CT or PET-CT after C3 (interim) and at EOT (primary response assessment). Follow-up CT scans were performed every six months until PD or patient withdrawal, or for up to approximately two years after completing study treatment. Patients who were in
remission after two years of scans were not required to continue surveillance imaging in this study.
Between February 3, 2015 and September 20, 2016, 112 patients with R/R FL were enrolled into separate arms of the GO29365 study as follows: phase Ib safety run-in (Pola-BR, N=6), phase II randomized cohort (Pola-BR, N=39; BR, N=41), phase Ib/II expansion cohort (Pola-BG, N=26).
Patients’ demographics and baseline characteristics are described in Table 1. Patients in all treatment groups had received a similar number of lines of prior treatment, with more than half of patients receiving ≥2 lines. Refractory status to last therapy was also similar between treatment groups, although fewer patients in the Pola-BG group had PD within 24 months of initiation of the first anti-lymphoma treatment with chemoimmunotherapy (POD24) (Table 1). High
BR: bendamustine plus rituximab; ECOG PS: Eastern Cooperative Oncology Group performance status; FLIPI: Follicular Lymphoma International Prognostic Index; Pola-BR: polatuzumab vedotin plus bendamustine and rituximab; Pola-BG: polatuzumab vedotin plus bendamustine and obinutuzumab. *No response or progression within 6 months of last treatment.†POD24: progression of disease within 24 months of initial diagnosis. Defined as progression of disease within 24 months of initiation of first anti-lymphoma treatment with chemoimmunotherapy.
levels of CD79b protein expression (H-score ≥200 or ≥2) were observed in 97/100 (97.0%) patients with FL across all cohorts in this analysis.
At the clinical cut-off date (October 21, 2021), median duration of follow up was: phase Ib safety run in (Pola-BR), 74.8 months (95% confidence interval [CI]: 70.3not evaluable [NE]); phase II randomized (Pola-BR), 62.4 months (95% CI: 60.8-64.5), (BR), 60.4 months (95% CI: 59.4-62.4); phase Ib/II expansion (Pola-BG), 65.0 months (95% CI: 61.6-65.4).
Efficacy outcomes in the FL cohorts are summarized in Table 2. Similar IRC-assessed PET-CR rates were observed across treatment arms at the primary response assessment: phase Ib safety run-in (Pola-BR) 66.7% (4/6 patients); phase II randomized (Pola-BR) 69.2% (27/39), (BR) 63.4% (26/41); phase Ib/II expansion (Pola-BG) 65.4% (17/26). Among patients who responded to treatment (CR or partial response), median INV-assessed DOR was 16.4 months in the phase II randomized Pola-BR group versus 18.1 months in the BR group and was not reached in the phase Ib/II expansion Pola-BG group (Online Supplementary Figure S1).
In the phase II randomized cohort, median INV-assessed PFS was 18.5 months (95% CI: 15.9-30.4) in the Pola-BR
arm and 17.8 months (95% CI: 12.5-35.0) in the BR arm (Figure 2A). In the phase Ib/II expansion (Pola-BG) arm, median INV-assessed PFS was 40.5 months (95% CI: 23.1-NE) (Figure 2B). Median OS was not reached in either the phase II randomized Pola-BR or BR arms (Figure 2C) or the phase Ib/II expansion Pola-BG arm (Figure 2D). INV-assessed PFS and OS rates by baseline risk factors are shown in Figure 3A and B. INV-assessed PFS and OS were generally similar between patients receiving Pola-BR or BR across the subgroups included.
Subsequent therapies
New anti-lymphoma therapy (NALT) data in the FL cohorts are shown in Table 3. Patients did not receive maintenance treatment as part of this regimen. One patient proceeded to receive chimeric antigen receptor T-cell therapy in the phase II randomized Pola-BR arm. In total, 9 patients received subsequent stem cell transplants (5 autologous, 4 allogeneic): one in the phase Ib safety run-in Pola-BR arm, one in the phase 1b safety run-in Pola-BG arm, 4 in the phase II randomized BR arm, one in the phase II randomized Pola-BR arm, and 2 in the Pola-BG expansion arm.
Safety
A summary of patient safety across the three treatment
End-of-treatment response,* N (%), 95% CI IRC assessed
ORR (CR/PR)
CR
Investigator-assessed
ORR (CR/PR)
CR
Best overall response† (INV), N (%), 95% CI
ORR (CR/PR)
CR
Duration of response (INV)
Patients with event, N (%)
Median in months (95% CI)
Progression-free
5 (83.3), 35.9-99.6
4 (66.7), 22.3-95.7
5 (83.3), 35.9-99.6
4 (66.7), 22.3-95.7
6 (100.0), 54.1-100.0
5 (83.3), 35.9-99.6
4/6 (66.7)
36.3 (16.1-NE)
30 (76.9), 60.7-88.9
27 (69.2), 52.4-83.0
31 (79.5), 63.5-90.7
25 (64.1), 47.2-78.8
35 (89.7), 75.8-97.1
30 (76.9), 60.7-88.9
28/35 (80.0)
16.4
30 (73.2), 57.1-85.8
26 (63.4), 46.9-77.9
33 (80.5), 5.1-91.2
26 (63.4), 46.9-77.9
37 (90.2), 76.9-97.3
27 (65.9), 49.4-79.9
23 (88.5), 69.9-97.6
17 (65.4), 44.3-82.8
23 (88.5), 69.9-97.6
18 (69.2), 48.2-85.7
24 (92.3), 74.9-99.1
21 (80.8), 60.7-93.5
BG: bendamustine plus obinutuzumab; BR: bendamustine plus rituximab; CI: Confidence Interval; CR: complete response; CT: computed tomography; INV: investigator-assessed; IRC: independent review committee; N: number; NE: not evaluable; ORR: objective response rate; PET: positron emission tomography; Pola-BR: polatuzumab vedotin plus bendamustine and rituximab; Pola-BG: polatuzumab vedotin plus bendamustine and obinutuzumab; PR: partial response. *At primary response assessment by PET. †By PET-CT or CT.
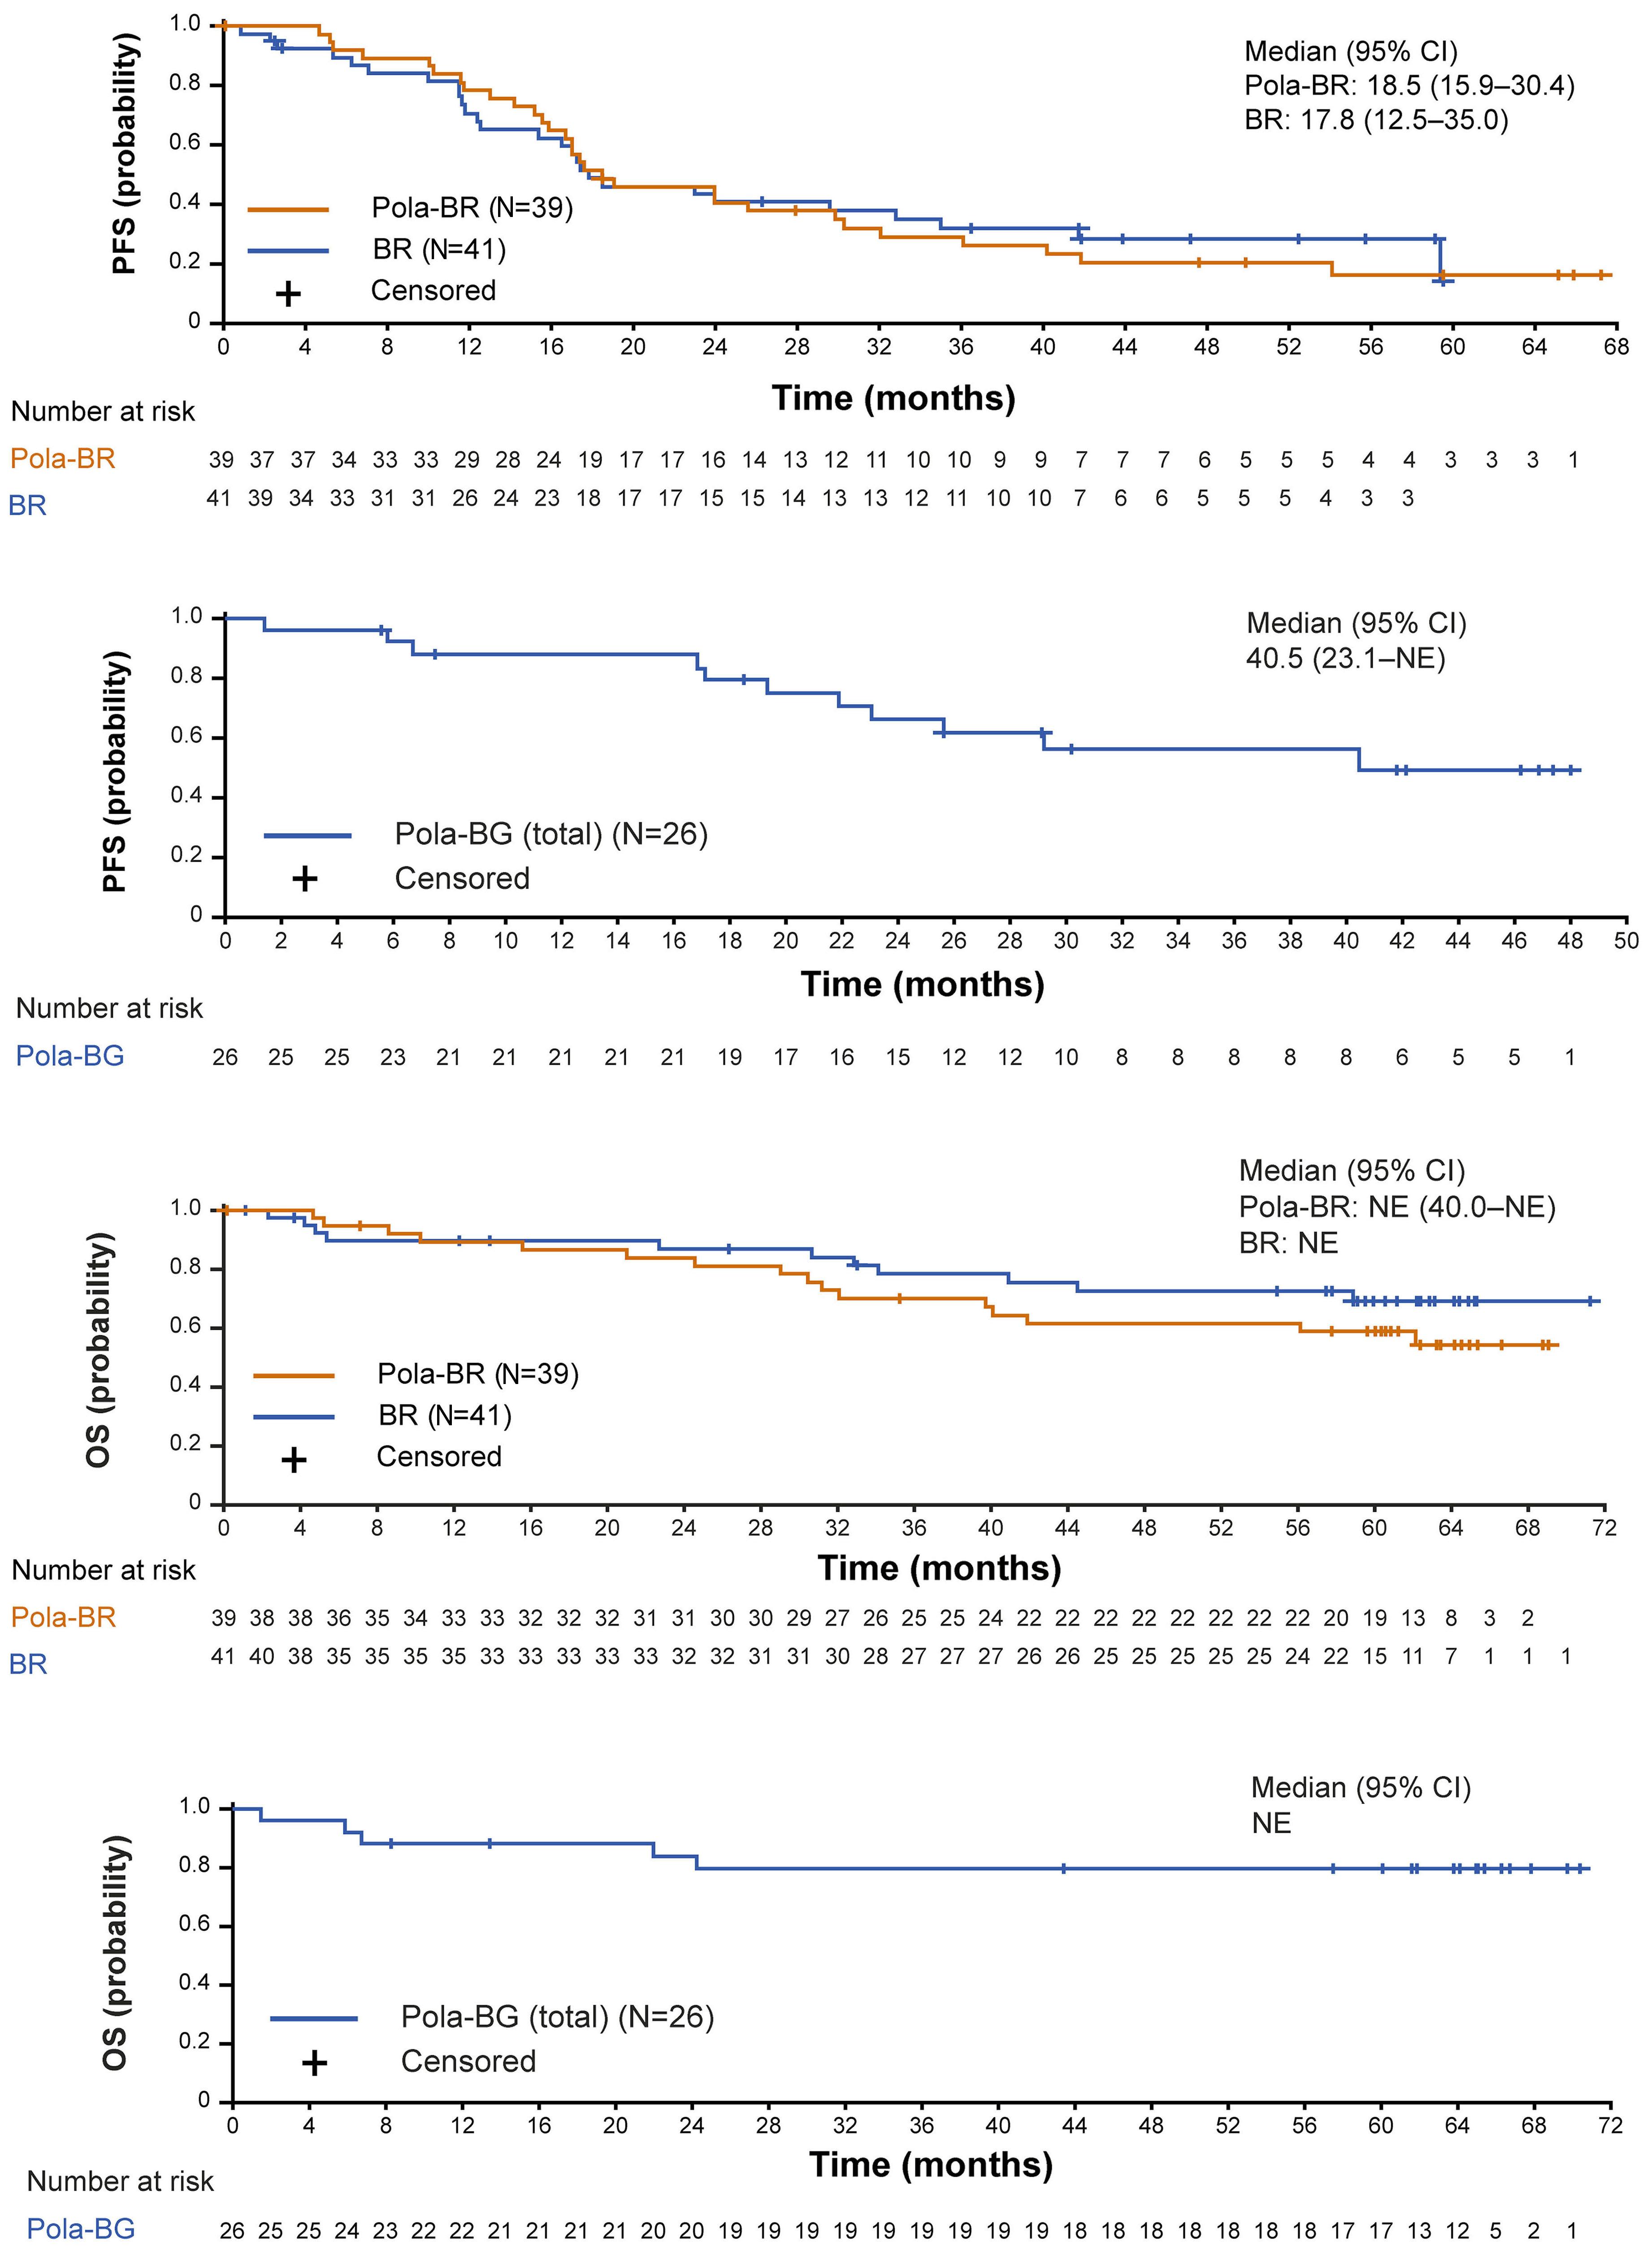
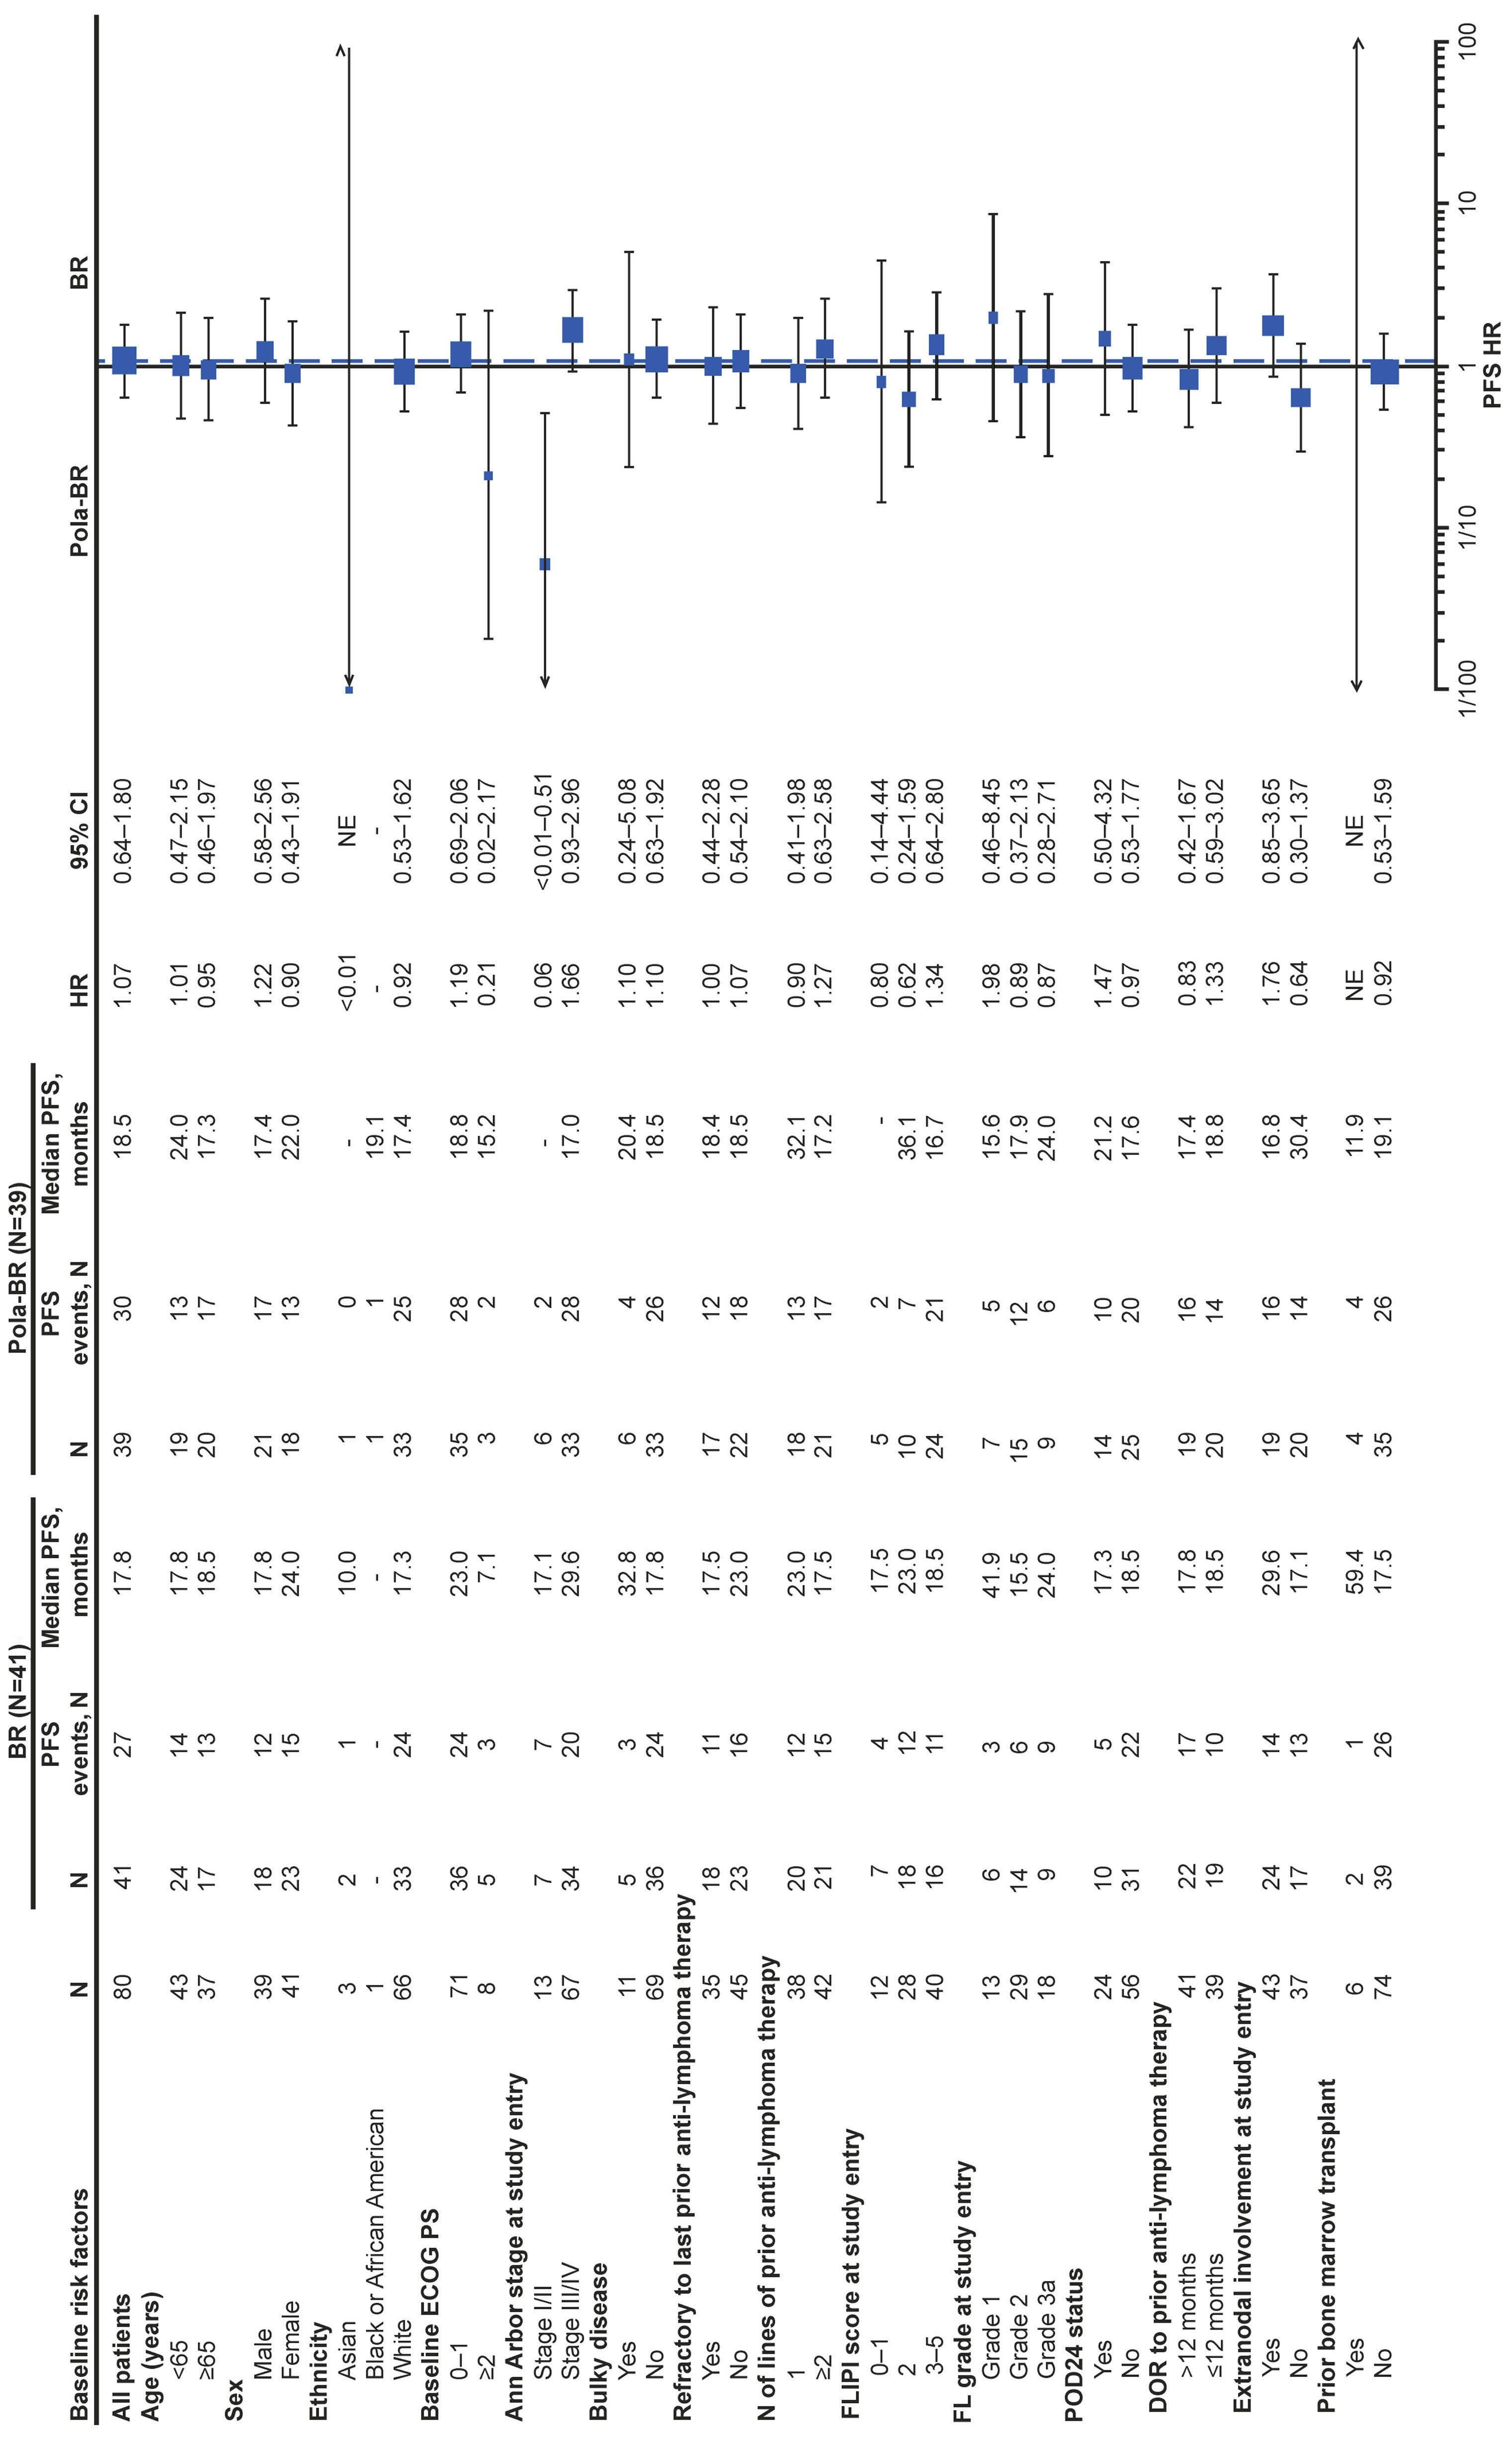
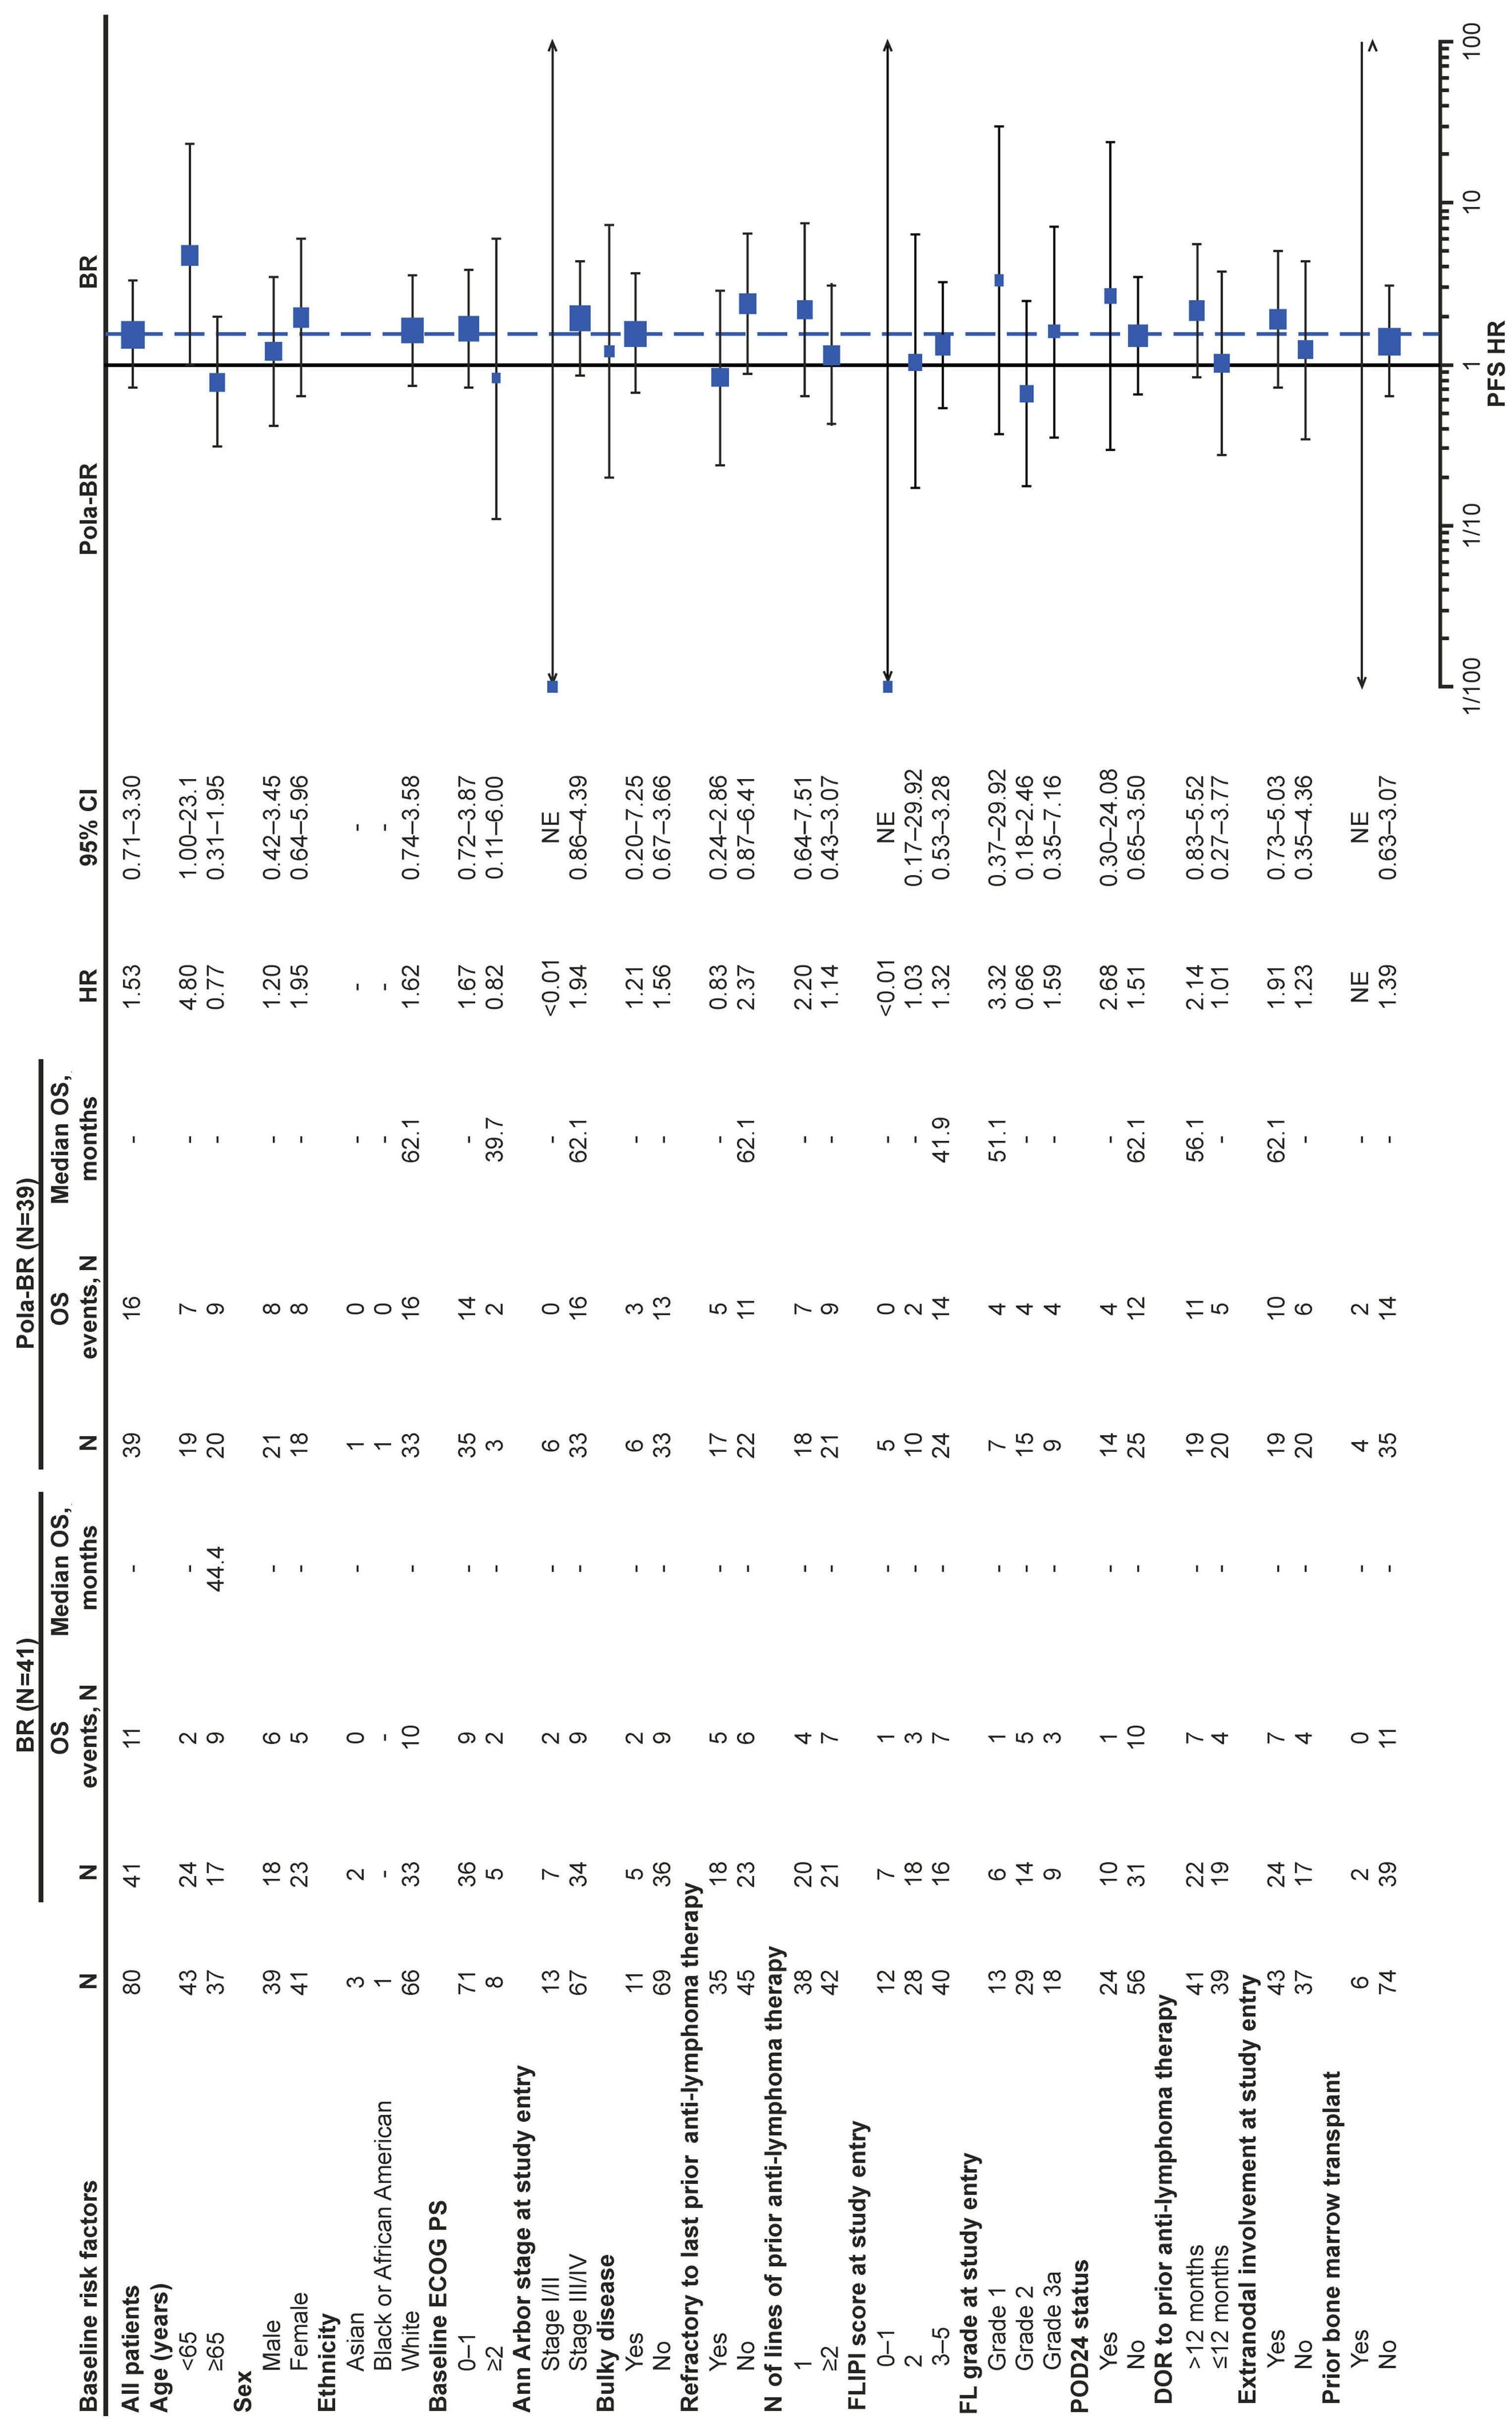
3.
effects of baseline variables on investigator-assessed progression-free and overall survival in patients in the phase II randomized cohort treated with polatuzumab vedotin plus bendamustine and rituximab or bendamustine plus rituximab. (A) Progression-free survival (PFS). (B) Overall survival (OS). BR: bendamustine plus rituximab; CI: Confidence Interval; DOR: duration of response; ECOG PS: Eastern Cooperative Oncology Group performance status; FL: follicular lymphoma; FLIPI: Follicular Lymphoma International Prognostic Index; HR: hazards ratio; N: number; POD24: progression within 24 months of treatment; Pola-BR: polatuzumab vedotin plus bendamustine and rituximab; NE: not evaluable.
arms is presented in Table 4. The median number of treatment cycles completed was 5 (range: 1-6) in the Pola-BR arm, 3 (range: 1-6) with BR, and 6 (range: 1-6) with Pola-BG (Online Supplementary Table S2). Adverse events (AE) were the main cause of treatment discontinuation across all arms. Median duration on treatment was 4.7 months in all treatment arms. The most common all-grade and grade 3-4 AE are summarized in Table 5; infections and cytopenias were the most common. In the randomized groups, rates of all-grade and grade 3-4 neutropenia, febrile neutropenia, and anemia were greater with Pola-BR than with BR, and all-grade and grade 3-4 thrombocytopenia was greater with BR than with Pola-BR. Rates of all-grade non-hematologic AE were generally higher with Pola-BR than with BR (Table 5).
Serious AE (SAE) were observed in 27/44 (61.4%) patients who received Pola-BR, 12/41 (29.3%) patients who received BR, and 12/26 (46.2%) patients who received Pola-BG. SAE were mostly infections and infestations: Pola-BR group N=16 (including pneumonia, N=7); BR group, N=6; Pola-BG group, N=7. In the Pola-BR group, 7 patients had SAE categorized as blood and lymphatic disorders.
Peripheral neuropathy (PN) was reported in 19/44 (43.2%) patients in the Pola-BR group, 11/41 (26.8%) patients in the BR group, and 14/26 (53.8%) patients in the Pola-BG group. PN was mostly grade 1-2 in all treatment groups; grade 3 PN was reported in one patient (gait disturbance; unresolved at time of patient’s death) in the Pola-BR group and one patient (hypoesthesia; resolved 19 days after onset) in the Pola-BG group. PN was mostly resolved by the data cut-off date (PN resolved in 13/19 [68.4%] patients in the Pola-BR group, 8/11 [72.7%] in the BR group, and 10/14 [71.4%] in the Pola-BG group). Dose reductions due to PN were reported in one and 2 patients in the Pola-BR and Pola-BG groups, respectively; dose interruption due to PN was reported in one patient, in the Pola-BG group.
Secondary malignancies were reported in 4/41 (9.8%) patients in the Pola-BR group (endometrial cancer, acute myeloid leukemia, colon cancer, and Hodgkin lymphoma [each N=1]), 7/41 (17%) patients in the BR group (basal cell carcinoma, gastrointestinal adenocarcinoma [each N=2], pancreatic carcinoma, rectal cancer, squamous cell carcinoma of the skin [each N=1]), and 1/26 (4%) patient in the Pola-BG group (endometrial adenocarcinoma).
BR: bendamustine plus rituximab; CAR: chimeric antigen receptor; N: number; NALT: new anti-lymphoma therapy; Pola-BR: polatuzumab vedotin plus bendamustine and rituximab; Pola-BG: polatuzumab vedotin plus bendamustine and obinutuzumab. *Includes any monotherapy, multi-drug, or cell-based regimen.
AE: adverse event; BR: bendamustine plus rituximab; N: number; Pola-BR: polatuzumab vedotin plus bendamustine and rituximab; Pola-BG: polatuzumab vedotin plus bendamustine and obinutuzumab.
Grade 5 AE were observed in 8 (18.2%) patients who received Pola-BR, 4 (9.8%) patients who received BR, and 2 (7.7%) patients who received Pola-BG. Three of the events were considered by the investigator to be related to study treatment, one in each cohort. The majority of the deaths (9/14; 64%) occurred more than 90 days after the last dose of study drug. Eight patients experienced the event following PD or after initiating NALT. Grade 5 infections and infestations included pneumonia (N=1, Pola-BR), sepsis (N=1, BR), SARS-CoV-2 infection-induced pneumonia (N=1, Pola-BR), septic shock (N=1, BR), and progressive multifocal leukoencephalopathy (N=1, Pola-BG). A summary of all deaths in the safety-evaluable population is shown in Online Supplementary Table S3.
In this study, efficacy outcomes were generally consistent across treatment groups. High IRC-assessed PET-CR rates were observed in all treatment arms at EOT (Table 2) and were comparable to results reported in the GADOLIN (bendamustine + obinutuzumab) and AUGMENT (lenalidomide + rituximab) trials.20,21 Furthermore, overall response rate and best overall responses were similar across treatment arms.
In the randomized arms, time-to-event endpoints were similar in patients treated with Pola-BR and BR. Notably, despite five years of follow up, the median DOR was not reached for the Pola-BG arm. The median PFS was twice as long for patients in the Pola-BG group than in the Pola-BR group, although patients were not randomized between these arms and the 95% CI for DOR and PFS overlapped. In this small cohort, there was a lower proportion of patients in the Pola-BG group with POD24, and the median age was lower, compared with patients in the Pola-BR arm, which may explain the longer median PFS with Pola-BG versus Pola-BR. The efficacy benefits previously reported with polatuzumab vedotin in the R/R DLBCL cohorts of this study9 were not observed in this current analysis of patients with R/R FL. As expected, higher objective response and CR rates were observed with the triplet combination of Pola+BR than with the doublet combination of Pola+R reported in the phase II ROMULUS study (clinicaltrials.gov 01691898), in which the objective response rate for patients with FL was 70% (95% CI: 47-88), and the CR rate was 45% (95% CI: 23-68).22 However, differences in study design and patient populations limit the value of cross-trial comparisons. Hematologic toxicities were more frequent in the Pola-BR group than in the BR or Pola-BG groups. For example, higher rates of grade 3/4 neutropenia were observed with
13
19 (73.1)
16 (61.5)
16 (61.5)
14 (53.8)
11 (42.3)
8 (30.8)
4 (15.4)
2 (7.7)
7 (26.9)
0 (0.0)
13 (50.0)
9 (34.6)
6 (23.1)
6 (23.1)
6 (23.1)
AE: adverse event; BR: bendamustine plus rituximab; Pola-BR: polatuzumab vedotin plus bendamustine and rituximab; Pola-BG: polatuzumab vedotin plus bendamustine and obinutuzumab; SOC: system organ class. *Most common blood and lymphatic system disorder AE defined as incidence ≥10% (any grade) in any treatment group. †Most common non-hematologic disorder AE defined as incidence ≥20% (any grade) in any treatment group.
Pola-BR than with BR or Pola-BG, resulting in higher rates of febrile neutropenia and infections. SAE were also higher in the Pola-BR group; febrile neutropenia and pneumonia were the most frequently reported SAE. In this analysis, safety results were found to be consistent with the known safety profiles of polatuzumab vedotin, bendamustine, obinutuzumab, and rituximab.10,11 However, the rate of PN in the BR group (11/41; 26.8%) was surprising, since PN is not typically associated with BR.23,24 PN reported during the study was mostly grade 1-2 in all treatment groups, and in the BR group, nine out of eleven (81.8%) patients with PN experienced grade 1 events. Despite higher rates of AE, there was no difference in rates of treatment discontinuation between the study arms.
Baseline characteristics, including number of prior therapies and refractory status, were generally balanced between treatment arms, except for some characteristics associated with a better prognosis in the Pola-BG arm. These characteristics included younger median age, lower POD24 rate, patients with ECOG PS 0-1, and a longer duration from initial diagnosis and time since last treatment in the Pola-BG group than in the Pola-BR and BR groups. Among baseline variables, Ann Arbor stage I/II disease and prior autologous stem cell transplant appeared to be associated with more favorable outcomes with Pola-BR versus BR alone, although patient numbers in some of the subgroups were too small to draw definitive conclusions.
As most patients with FL experience relapse, and duration of response typically diminishes with subsequent lines of treatment, safer and more effective treatment options are needed.25 Adding polatuzumab vedotin to rituximab results in improved efficacy compared with rituximab monotherapy;22,26 however, a similar add-on benefit was not observed when combining Pola+BR. One potential rationale for the lack of benefit observed when adding polatuzumab vedotin to bendamustine combined with an anti-CD20 agent may be related to the considerable activity of bendamustine in patients with FL.20 In the current study, adding polatuzumab vedotin to BR did not improve on the already high response rates observed with BR/BG alone. The combination of polatuzumab vedotin plus rituximab could be a well-tolerated option in some patients with R/R FL who may not be candidates for bendamustine-based chemotherapy regimens. A limitation of this study was the modest sample size for all three study arms, in particular, the Pola-BG arm, in which only 26 patients were enrolled. Also, inclusion of patients who had previously received bendamustine with a response duration of ≥1 year (~10% of the population) could be considered a limitation, given the known negative impact of bendamustine on bone marrow.27
In conclusion, no difference in efficacy was observed between Pola-BR and BR, although higher rates of cytopenias and SAE were reported in patients who received Pola-BR versus BR alone. This analysis does not demonstrate a benefit of adding Pola to BR regimens for patients with R/R FL.
Disclosures
CRF reports consultancy for AbbVie, Bayer, BeiGene, Celgene, DenovoBiopharma, Foresight Diagnostics, Genentech Inc., F. Hoffmann-La Roche Ltd., Genmab, Gilead, Karyopharm, Pharmacyclics/Janssen, SeaGen, and Spectrum; research funding from 4D, AbbVie, Acerta, Adaptimmune, Allogene, Amgen, Bayer, Celgene, Cellectis, EMD, Gilead, F. Hoffmann-La Roche Ltd., Genentech Inc., Guardant, Iovance, Janssen Pharmaceutical, Kite, Morphosys, Nektar, Novartis, Pfizer, Pharmacyclics, Sanofi, Takeda, TG Therapeutics, Xencor, Ziopharm, Burroughs Wellcome Fund, Eastern Cooperative Oncology Group, National Cancer Institute, and V Foundation, Cancer Prevention and Research Institute of Texas: CPRIT Scholar in Cancer Research; and receives Foresight Diagnostics and NPower stock options. MJM reports consultancy for ADC Therapeutics, AstraZeneca, Bayer, Daiichi Sankyo, Epizyme, F. Hoffmann-La Roche Ltd., Genentech Inc., IMV Therapeutics, Juno Therapeutics, Karyopharm, Merck, MEI Pharma, Rocket Medical, Seattle Genetics, TG Therapeutics, Teva, and Bayer; research funding from AstraZeneca, Bayer, Genentech Inc., IGM Biosciences, Janssen, Pharmacyclics, F. Hoffmann-La Roche Ltd., and Seattle Genetics; honoraria from ADC Therapeutics, Bayer, Daiichi Sankyo, Epizyme, IMV Therapeutics, Janssen, MEI Pharma, Pharmacyclics, Genentech Inc., F. Hoffmann-La Roche Ltd., and Seattle Genetics; and receives Merck stocks. AFH reports consultancy for BMS, Genentech Inc., Merck, Seattle Genetics, AstraZeneca, Karyopharm, ADC Therap, Takeda, Tubulis, Regeneron, Genmab, Pfizer, Caribou, AbbVie and Adicet Bio; and research funding from Bristol Myers Squibb, Genentech Inc., Merck, Seattle Genetics, Kite Pharma, Gilead, AstraZeneca, and ADC Therapeutics. MH reports advisory board participation and honoraria for F. Hoffmann-La Roche Ltd., Takeda, Otsuka, BeiGene, Gilead, Janssen, Novartis, and Mundipharma. SA reports consultancy for Genentech Inc., F. Hoffmann-La Roche Ltd., Astra Zeneca, Novartis, BMS, Jazz, Gilead, Amgen, BeiGene, AbbVie, and Paladin; research funding for Novartis; and honoraria from Genentech Inc., F. Hoffmann-La Roche Ltd., Astra Zeneca, Novartis, BMS, Jazz, Gilead, Amgen, BeiGene, AbbVie, and Paladin. JD reports consultancy for AbbVie, BMS, Janssen-Cilag, Novartis, Pfizer, Takeda; and honoraria for Pfizer. AMc reports honoraria from F. Hoffmann-La Roche Ltd., Takeda, Amgen, and Prosthetics; and has served on speakers’ bureaux for F. Hoffmann-La Roche Ltd. AM reports research funding from Incyte, Takeda, Forty Seven Inc./Gilead, Juno Pharmaceuticals/BMS, Celgene/BMS, Innate Pharmaceuticals, Seattle Genetics, TG Therapeutics, Affimed, Merck, Kite/Gilead, F. Hoffmann La-Roche Ltd., Genentech Inc., I-MAB; consultancy for Gilead, AstraZeneca, Pharmacyclics, Seattle Genetics, Incyte, Morphosys/Incyte, TG Therapeutics, Kyowa Kirin, Novartis, BMS, BeiGene; and has served on speakers’ bureaux for Gilead, AstraZeneca, Pharmacyclics, Seattle Genetics, Incyte, Morphosys/Incyte, Kyowa Kirin, BMS, BeiGene. SO reports consultancy for AbbVie, AstraZeneca, BeiGene, CSL Behring,
Gilead, Jansssen, Merck, F. Hoffmann-La Roche Ltd., and Takeda; research funding for AbbVie, AstraZeneca, BeiGene, CSL Behring, Gilead, Janssen, Pharmacyclics, F. Hoffmann-La Roche Ltd., Sandoz, and Takeda; honoraria from AbbVie, AstraZeneca, BeiGene, CSL Behring, Gilead, Jansssen, Merck, F. Hoffmann-La Roche Ltd., and Takeda; and advisory board participation for AbbVie, AstraZeneca, BeiGene, CSL Behring, Gilead, Janssen, Merck, F. Hoffmann-La Roche Ltd., and Takeda. MT reports consultancy for Takeda, BMS, Incyte, AbbVie, Amgen, F. Hoffmann-La Roche Ltd., Gilead Sciences, Janssen, Morphosys, Novartis, and Zentiva; and research funding from F. Hoffmann-La Roche Ltd., Takeda, and Novartis. LM, JH and AY are employees of Genentech Inc., and hold Genentech Inc. and F. Hoffmann-La Roche Ltd. stocks/stock options. LHS reports consultancy for AbbVie, Acerta, Amgen, Apobiologix, AstraZeneca, BMS/Celgene, Gilead, Incyte, Janssen, Kite, Karyopharm, Lundbeck, Merck, Morphosys, F. Hoffmann-La Roche Ltd., Genentech Inc., Sandoz, Seattle Genetics, Servier, Teva, Takeda, TG Therapeutics, Verastem; research funding from F. Hoffmann-La Roche Ltd., Genentech Inc., Teva; and honoraria from AbbVie, Acerta, Amgen, Apobiologix, AstraZeneca, BMS/Celgene, Gilead, Incyte, Janssen, Kite, Karyopharm, Lundbeck, Merck, Morphosys, F. Hoffmann-La Roche Ltd., Genentech Inc., Sandoz, Seattle Genetics, Servier, Teva, Takeda, TG Therapeutics, and Verastem.
JH, LM, CRF and LHS designed the clinical study and inter-
1. Monga N, Nastoupil L, Garside J, et al. Burden of illness of follicular lymphoma and marginal zone lymphoma. Ann Hematol. 2019;98(1):175-183.
2. Casulo C, Barr PM. How I treat early-relapsing follicular lymphoma. Blood. 2019;133(14):1540-1547.
3. Salles G. How do I sequence therapy for follicular lymphoma? Hematology Am Soc Hematol Educ Program. 2020;2020(1):287-294.
4 Sarkozy C, Maurer MJ, Link BK, et al. Cause of death in follicular lymphoma in the first decade of the rituximab era: a pooled analysis of French and US cohorts. J Clin Oncol. 2019;37(2):144.
5. Dornan D, Bennett F, Chen Y, et al. Therapeutic potential of an anti-CD79b antibody-drug conjugate, anti-CD79b-vc-MMAE, for the treatment of non-Hodgkin lymphoma. Blood. 2009;114(13):2721-2729.
6. Polson AG, Ho WY, Ramakrishnan V. Investigational antibodydrug conjugates for hematological malignancies. Expert Opin Investig Drugs. 2011;20(1):75-85.
7 Doronina SO, Toki BE, Torgov MY, et al. Development of potent monoclonal antibody auristatin conjugates for cancer therapy. Nat Biotechnol. 2003;21(7):778-784.
8. Assi R, Masri N, Abou Dalle I, et al. Polatuzumab vedotin: current role and future applications in the treatment of patients with diffuse large B-cell lymphoma. Clin Hematol Int. 2021;3(1):21.
9 Sehn LH, Herrera AF, Flowers CR, et al. Polatuzumab vedotin in relapsed or refractory diffuse large B-cell lymphoma. J Clin Oncol. 2020;38(2):155.
preted clinical data. AY contributed to the statistical analysis. LM and CRF wrote the manuscript with input and approval of the final version from all co-authors. All authors collected and analyzed the data, reviewed the data, provided critical review of the manuscript, confirmed the completeness and accuracy of the results and the trial’s fidelity to the protocol, and agreed on its submission for publication.
This study was sponsored by F. Hoffmann-La Roche Ltd. and Genentech, Inc. Third-party editorial assistance, under the direction of the authors, was provided by Carla Smith MSc of Ashfield MedComms, an Inizio company, and funded by F. Hoffmann-La Roche Ltd.
For eligible studies, qualified researchers may request access to individual patient level clinical data through a data request platform. At the time of writing, this request platform is Vivli. https://go.roche.com/data_sharing. For up-to-date details on Roche’s Global Policy on the Sharing of Clinical Information and how to request access to related clinical study documents, see here: https://go.roche.com/data_sharing. Anonymized records for individual patients across more than one data source external to Roche cannot, and should not, be linked due to a potential increase in risk of patient re-identification.
10. European Medicines Agency. POLIVY® Summary of Product Characteristics. https://www.ema.europa.eu/en/documents/ product-information/polivy-epar-product-information_en.pdf. Accessed December 1, 2022.
11. U.S. Food and Drug Administration. POLIVY® Prescribing information. https://www.accessdata.fda.gov/drugsatfda_docs/ label/2023/761121s008lbl.pdf. Accessed December 1, 2022.
12. Hiddemann W, Barbui AM, Canales MA, et al. Immunochemotherapy with obinutuzumab or rituximab for previously untreated follicular lymphoma in the GALLIUM study: influence of chemotherapy on efficacy and safety. J Clin Oncol. 2018;36(23):2395-2404.
13. Townsend W, Hiddemann W, Buske C, et al. Obinutuzumab plus chemotherapy demonstrates long-term benefit over rituximab plus chemotherapy in patients with previously untreated follicular lymphoma: final analysis of the GALLIUM study. Hemasphere. 2022;6(S3):107-108.
14 Sehn LH, Herrera AF, Flowers CR, et al. Polatuzumab vedotin in relapsed or refractory diffuse large B-cell lymphoma. J Clin Oncol. 2020;38(2):155-165.
15. Sehn LH, Hertzberg M, Opat S, et al. Polatuzumab vedotin plus bendamustine and rituximab in relapsed/refractory DLBCL: survival update and new extension cohort data. Blood Adv. 2022;6(2):533-543.
16. World Medical Association. World Medical Association Declaration of Helsinki. Ethical principles for medical research
involving human subjects. Bull World Health Organ. 2001;79(4):373-374.
17 Brice P, Bastion Y, Lepage E, et al. Comparison in low-tumorburden follicular lymphomas between an initial no-treatment policy, prednimustine, or interferon alfa: a randomized study from the Groupe d’Etude des Lymphomes Folliculaires. Groupe d’Etude des Lymphomes de l’Adulte. J Clin Oncol. 1997;15(3):1110-1117.
18. Smith TJ, Bohlke K, Lyman GH, et al. Recommendations for the use of WBC growth factors: American Society of Clinical Oncology Clinical Practice Guideline Update. J Clin Oncol. 2015;33(28):3199-3212.
19 Cheson BD, Fisher RI, Barrington SF, et al. Recommendations for initial evaluation, staging, and response assessment of Hodgkin and non-Hodgkin lymphoma: the Lugano classification. J Clin Oncol. 2014;32(27):3059-3068.
20 Cheson BD, Chua N, Mayer J, et al. Overall survival benefit in patients with rituximab-refractory indolent non-Hodgkin lymphoma who received obinutuzumab plus bendamustine induction and obinutuzumab maintenance in the GADOLIN study. J Clin Oncol. 2018;36(22):2259-2266.
21. Leonard JP, Trneny M, Izutsu K, et al. AUGMENT: a phase III study of lenalidomide plus rituximab versus placebo plus rituximab in relapsed or refractory indolent lymphoma. J Clin Oncol. 2019;37(14):1188-1199.
22. Tilly H, Morschhauser F, Bartlett NL, et al. Polatuzumab vedotin in combination with immunochemotherapy in patients with previously untreated diffuse large B-cell lymphoma: an openlabel, non-randomised, phase 1b-2 study. Lancet Oncol. 2019;20(7):998-1010.
23. Hagemeister F, Manoukian G. Bendamustine in the treatment of non-Hodgkin’s lymphomas. Onco Targets Ther. 2009;2:269-279.
24. Rummel MJ, Niederle N, Maschmeyer G, et al. Bendamustine plus rituximab versus CHOP plus rituximab as first-line treatment for patients with indolent and mantle-cell lymphomas: an open-label, multicentre, randomised, phase 3 non-inferiority trial. Lancet. 2013;381(9873):1203-1210.
25. Erblich T, Montoto S. Treating relapsed follicular lymphoma. Expert Rev Hematol. 2018;11(5):403-410.
26. Ghielmini M, Schmitz S, Cogliatti S, et al. Prolonged treatment with rituximab in patients with follicular lymphoma significantly increases event-free survival and response duration compared with the standard weekly x 4 schedule. Blood. 2004;103(12):4416-4423.
27. Liewer S. Toxicity of bendamustine therapy. The Oncology Pharmacist. 2021. https://www.theoncologypharmacist.com/cat egories?view=article&secid=15091:faculty-perspectives-may2013-vol-4-no-3-top&artid=15761:toxicity-of-bendamustinetherapy&catid=4022. Accessed September 14, 2023.
Gege Chen,1* Xuejie Gao,1* Xinyan Jia,1 Yingcong Wang,2 Li Xu,1 Dandan Yu,2 Shuaikang Chang,1 Hui Deng,1 Ke Hu,1 Guanli Wang,1 Bo Li,3 Zhijian Xu,3 Yumeng Lu,2 Huaping Wang,2 Ting Zhang,2 Dongliang Song,2 Guang Yang,2 Xiaosong Wu,2 Huabin Zhu,2 Weiliang Zhu3 and Jumei Shi1
1Department of Hematology, Shanghai East Hospital, Tongji University School of Medicine; 2Department of Hematology, Shanghai Tenth People’s Hospital, Tongji University School of Medicine and 3CAS Key Laboratory of Receptor Research, State Key Laboratory of Drug Research, Drug Discovery and Design Center, Shanghai Institute of Materia Medica, Chinese Academy of Sciences, Shanghai, China
*GC and XG contributed equally as first authors.
Abstract
Correspondence: J. Shi shijumei@tongji.edu.cn
W. Zhu wlzhu@simm.ac.cn
Received: January 20, 2023.
Accepted: September 15, 2023.
Early view: September 28, 2023.
https://doi.org/10.3324/haematol.2023.282789
Published under a CC BY license
Multiple myeloma (MM) remains incurable due to drug resistance. Ribosomal protein S3 (RPS3) has been identified as a non-Rel subunit of NF-κB. However, the detailed biological roles of RPS3 remain unclear. Here, we report for the first time that RPS3 is necessary for MM survival and drug resistance. RPS3 was highly expressed in MM, and knockout of RPS3 in MM inhibited cell growth and induced cell apoptosis both in vitro and in vivo. Overexpression of RPS3 mediated the proteasome inhibitor resistance of MM and shortened the survival of MM tumor-bearing animals. Moreover, our present study found an interaction between RPS3 and the thyroid hormone receptor interactor 13 (TRIP13), an oncogene related to MM tumorigenesis and drug resistance. We demonstrated that the phosphorylation of RPS3 was mediated by TRIP13 via PKC δ, which played an important role in activating the canonical NF-κB signaling and inducing cell survival and drug resistance in MM. Notably, the inhibition of NF-κB signaling by the small-molecule inhibitor targeting TRIP13, DCZ0415, was capable of triggering synergistic cytotoxicity when combined with bortezomib in drug-resistant MM. This study identifies RPS3 as a novel biomarker and therapeutic target in MM.
Multiple myeloma (MM), a terminal differentiation of plasma cell hematological malignancy, typically evolves from asymptomatic precursor stages, i.e., monoclonal gammopathy of undetermined significance (MGUS) and smouldering multiple myeloma (SMM), which progress to symptomatic MM.1,2 MM is characterized by the infiltration of clonal plasma cells into the bone marrow (BM), producing high levels of M-protein (monoclonal globulin or immunoglobulin [Ig] fragment) and inducing end-organ damage, i.e., CRAB –hypercalcemia, renal injury, anemia, and/or bone lesions.1,2 While the overall survival (OS) of patients with MM has markedly improved with the introduction of chimeric antigen receptor T-cell immunotherapy, autologous stem cell transplantation, and novel agents like proteasome inhibitor bortezomib, immunomodulatory agents, and antibodies targeting cell surface molecules, a large majority of patients
still relapse and eventually become refractory owing to the complex genetic heterogeneity and clonal evolution of MM.3,4 Genomic alterations, including IgH translocations and hyperdiploidy, occur as early as in the precancerous stages MGUS and SMM, from which MM develops.5 The evolution of MM is reflected in the progressive increase in the number and complexity of genomic alterations, leading to universal aneuploidy and recurrent chromosomal aberrations, which are usually classified as chromosomal instability.5,6 Ribosomal protein S3 (RPS3), a component of the 40S subunit of the eukaryotic ribosome, directly participates in ribosome maturation and translation initiation.7 However, RPS3 is a multifunctional protein implicated in several extra-ribosomal events including DNA repair, apoptosis, selective gene transcription, and host-pathogen interactions, which are mediated by specific post-translational modifications, such as phosphorylation, methylation, and neddylation.8-11 Notably, RPS3 has been identified as a non-
Rel subunit of nuclear factor-κ B (NF-κB), capable of cooperating with NF-κB Rel proteins to regulate specific NF-κB target gene transcription.11,12 In resting cells, RPS3 interacts with NF-κB p65-p50-IκBα complexes in the cytoplasm.11,12 Extracellular stimuli, like tumor necrosis factor α (TNF-α) or lipopolysaccharides, trigger the canonical NF-κB pathway; IκB proteins are phosphorylated by activated IκB kinase (IKK) complex, which then induces the proteasomal degradation of IκB and its degradation from NF-κB complexes; NF-κB Rel complexes and non-Rel subunit RPS3 translocate from the cytoplasm to the nucleus, dramatically stabilizing the binding of NF-κB Rel subunits to specific κB sites that are involved in regulating multiple physiological conditions, e.g., cell survival, apoptosis, radioresistance, and immunoglobulin κ light chain gene expression in B cells.12-14 However, the detailed biological roles of RPS3 remain largely unknown. The thyroid hormone receptor interactor 13 (TRIP13) gene, located on the short arm p15 of chromosome 5, is one of the ten chromosomal instability genes highly linked to MM drug resistance and rapid relapse.15-17 We previously identified TRIP13 as an oncogene of MM and demonstrated that overexpression of TRIP13 promotes MM tumorigenesis, tumor progression, and drug resistance, making it a potentially novel therapeutic target of MM.15-17 Besides MM, elevated TRIP13 expression triggers malignant transformation and cancer development in breast cancer, colorectal cancer, lung adenocarcinoma and head and neck cancer.18-21 The AAA-ATPase TRIP13 protein, a member of a large AAA+ protein superfamily of ring-shaped P-loop NTPases, contributes to the regulation of spindle assembly checkpoints and DNA repair pathways during cell division.22-24 Recently, we have elucidated the crystal structure of wild-type human TRIP13 protein at a resolution of 2.6 Å, based on which we identified the first small-molecule inhibitor of TRIP13, DCZ0415, capable of binding to TRIP13 and exerting potent anti-myeloma activity by impairing DNA repair and inhibiting NF-κB pathway.17 However, the precise mechanisms of TRIP13 in mediating the drug resistance of MM remains unclear. Here, we demonstrated for the first time that RPS3 was necessary for MM survival and drug resistance, suggesting that it is a novel potential biomarker and therapeutic target in MM. Moreover, TRIP13-mediated phosphorylation of NF-κB non-Rel subunit RPS3 by PKCδ is important in activating the canonical NF-κB signaling and inducing drug resistance in MM. Notably, the inhibition of NF-κB signaling by DCZ0415 was capable of triggering synergistic drug-resistant MM cytotoxicity when combined with bortezomib.
Cell lines were purchased from the American Type Culture Collection (Mananssas, VA, USA) or obtained as described in our previous articles.25,26 All samples were obtained from
patients with MM and normal donors who gave informed consent in accordance with the Declaration of Helsinki. Approval was obtained by the Shanghai Tenth People’s Hospital Institutional Review Board. Details are available in the Online Supplementary Appendix
DCZ0415 was synthesized at Shanghai Institute of Materia Medica, Chinese Academy of Sciences. Reagents and antibodies were purchased as detailed in the Online Supplementary Appendix.
The full-length cDNA of human TRIP13 and RPS3 were synthesized and cloned into the pLVX-EGFP-IRESpuro (Invitrogen, Carlsbad, CA, USA). The RPS3 mutation was generated by quick change point mutagenesis (Toyobo, Osaka, Japan). Details are available in the Online Supplementary Appendix
In vitro assays including cell viability, EdU cell proliferation assay, colony formation, apoptosis measurement, cell cycle analysis, quantitative real-time polymerase chain reaction (qRT-PCR), nuclear and cytoplasmic protein extraction, dual-luciferase reporter assay immunoblotting, co-immunoprecipitation (Co-IP) and immunofluorescence were performed as described previously.17,27 Details are available in the Online Supplementary Appendix and Online Supplementary Table S1.
Knockout cells were generated using lentivirus-mediated CRISPR/Cas9 technology as described previously.17 The single guided RNA (sgRNA) sequences targeting human TRIP13 was: #1, TGAGTAGCTTTCTAACACTC, #2, CCAAGCTGTCCCAAAGCCCA. The sgRNA sequences targeting human RPS3 were: #1, CTCACCTCTACACTGCCCTC, #2, CTTTCCAGAGGGCAGTGTAG. Details are available in the Online Supplementary Appendix.
Total RNA was extracted using the RNA-Quick purification kit (ES Science, Shanghai, China) and preserved using TRIZOL (Ambion, Austin, TX, USA), which was sent to OE biotech Co., Ltd. (Shanghai, China) for RNA-sequencing (RNA-seq) analysis. Details are available in the Online Supplementary Appendix.
Gene expression analysis using publicly available data sets
The Kaplan-Meier analysis of OS and progression-free survival (PFS) in 436 newly diagnosed MM patients related to RPS3 expression was performed using the database with GSE136324. Gene expression profiles for healthy donors, patients with MM, MGUS, SMM and relapsed MM were performed using the Gene Expression Omnibus data sets (GSE5900 and GSE6477), 208692_at is the probe for RPS3.
Gene expression analysis was performed using Partek Genomic Suite 6.6 with fold changes calculated as relative changes compared to normal plasma cells. Fold changes of at least 2-fold with a P<0.05 and a false discovery rate (FDR)<0.05 were considered for further analysis.
Animal studies
MM cells were injected subcutaneously into athymic nude mice (5-week-old). All animal procedures were approved by the Institutional Review Board of the Shanghai Tenth People’s Hospital (approval no. SHDSYY-2020-991). Details are available in the Online Supplementary Appendix.
Statistical analysis
All data are presented as the mean ± standard deviation of three separate experiments. Statistical significance was determined by Student’s t test or ANOVA using SPSS v22.0 (IBM, Armonk, NY, USA). P<0.05 was considered statistically significant. The CalcuSyn software program (Biosoft, Ferguson, MO, USA) was used to quantify the synergy of the two drugs, and a 95% confidence interval (CI) <1 indicated synergistic activity.
TRIP13 activates the canonical NF-κB signaling
We first determined the role of TRIP13 in regulating NF-κB signaling by using RNA-seq analysis in TRIP13 overexpressing (TRIP13-OE) and the corresponding empty vector (EV)-transfected ARP-1 cells. The RNA-seq data analysis showed a subset of genes that were differentially expressed upon TRIP13 overexpression, including 533 upregulated genes and 232 downregulated genes (Figure 1A). The gene set enrichment (GSEA) analysis indicated that overexpression of TRIP13 in MM cells was positively correlated with NF-κB signaling activation (Figure 1B). In order to confirm the results, we performed immunoblotting to investigate the expression levels of proteins involved in NF-κB signaling and found that TRIP13 overexpression in MM cells effectively elevated levels of p-IKKb and p-IκBα (Figure 1C). Meanwhile, TNF-α elevated levels of NF-κB downstream p-IκBα, but knockout of TRIP13 in MM cells partly eliminated TNF-α-induced elevation of p-IκBα (Figure 1D). Moreover, we extracted NFκB p65 proteins in both nucleus and cytoplasm in TRIP13 OE and corresponding EV MM cells and observed that high expression of TRIP13 promoted the translocation of NF-κB p65 into the nuclei (Figure 1E). Similarly, knockout of TRIP13 partly eliminated TNF-α-induced nuclear translocation of NF-κB p65 (Figure 1F).
TRIP13 interacts with NF-κB non-Rel subunit RPS3
We subsequently performed liquid chromatography-tandem mass spectrometry (LC-MS/MS) to identify the potential interacting proteins of TRIP13. TRIP13-tagged Flag (Flag-TRIP13)
and Flag-vector were transfected into HEK293T cells to construct transient strains; TRIP13 and its binding proteins were then purified by Flag beads, and proteins interacting with TRIP13 were identified by mass spectrometry. More than 600 proteins interacting with TRIP13 were identified. We were interested in RPS3 as its key role in regulating NF-κB signaling (Figure 2A). We performed exogenous Co-IP in HEK293T cells transfected with Flag-TRIP13, HA-tagged RPS3 (HA-RPS3), or both constructs and observed that RPS3 interacted with TRIP13 (Figure 2B). We also confirmed the interaction between RPS3 and TRIP13 in ARP-1 cells via endogenous Co-IP (Figure 2C). Immunofluorescence showed that RPS3 was co-localized with TRIP13 in the cytoplasm under normal conditions, which then translocated into the nucleus when NF-κB signaling was activated by TNF-α (Figure 2D).
In order to understand the regulatory mechanism of RPS3 and TRIP13, we assessed the PRS3 expression in MM cells (ARP-1 and OCI-MY5) with stable overexpression of TRIP13. There was no significant difference in total RPS3 expression between TRIP13-overexpressed MM cells and the corresponding control (Online Supplementary Figure S1A). Meanwhile, knockout of TRIP13 in MM cells using CRISPR-Cas9 had no significant effect on total RPS3 expression (Online Supplementary Figure S1B). The phosphorylation status of RPS3 has been studied in conjunction with its biological function. We, therefore, investigated the phosphorylation status of RPS3 in MM cells with stable overexpression of TRIP13 in the presence or absence of TNF-α. RPS3 was immunoprecipitated from TRIP13-OE and the corresponding EV MM cells, and then the phosphorylated residues were enriched by phosphorylated threonine (p-Thr), serine, and tyrosine. We observed that RPS3 was highly phosphorylated at threonine residue(s), especially in the presence of TNF-α (Figure 3A). In order to investigate the mechanism of phosphorylation, we performed mass spectrometry phosphoproteomic analysis to identify the potential phosphorylation sites of RPS3. Interestingly, phosphorylated threonine 221 (T221) on RPS3 was identified as a specific site that was affected by TRIP13 (Figure 3B; Online Supplementary Figure S2A). We then mutated the threonine 221 on RPS3 to alanine (T211A) by in vitro site-directed mutagenesis to inactivate the original phosphorylation site in MM cells and observed the expression of downstream effector protein p-IκBα in NF-κB signaling. Our results showed that the RPS3 T211A blocked TRIP13-induced phosphorylation of IκBα (Figure 3C), suggesting that the phosphorylation of RPS3 at T221 site is responsible for the TRIP13-driven NF-κB activation. Moreover, we have successfully generated a rabbit polyclonal antibody specific for RPS3 phosphorylated on T221. Immunoblotting analysis revealed a significant upregulation of phosphorylated RPS3 levels upon overexpression of TRIP13 in MM cells (Figure 3D). Subsequently, we conducted an investigation
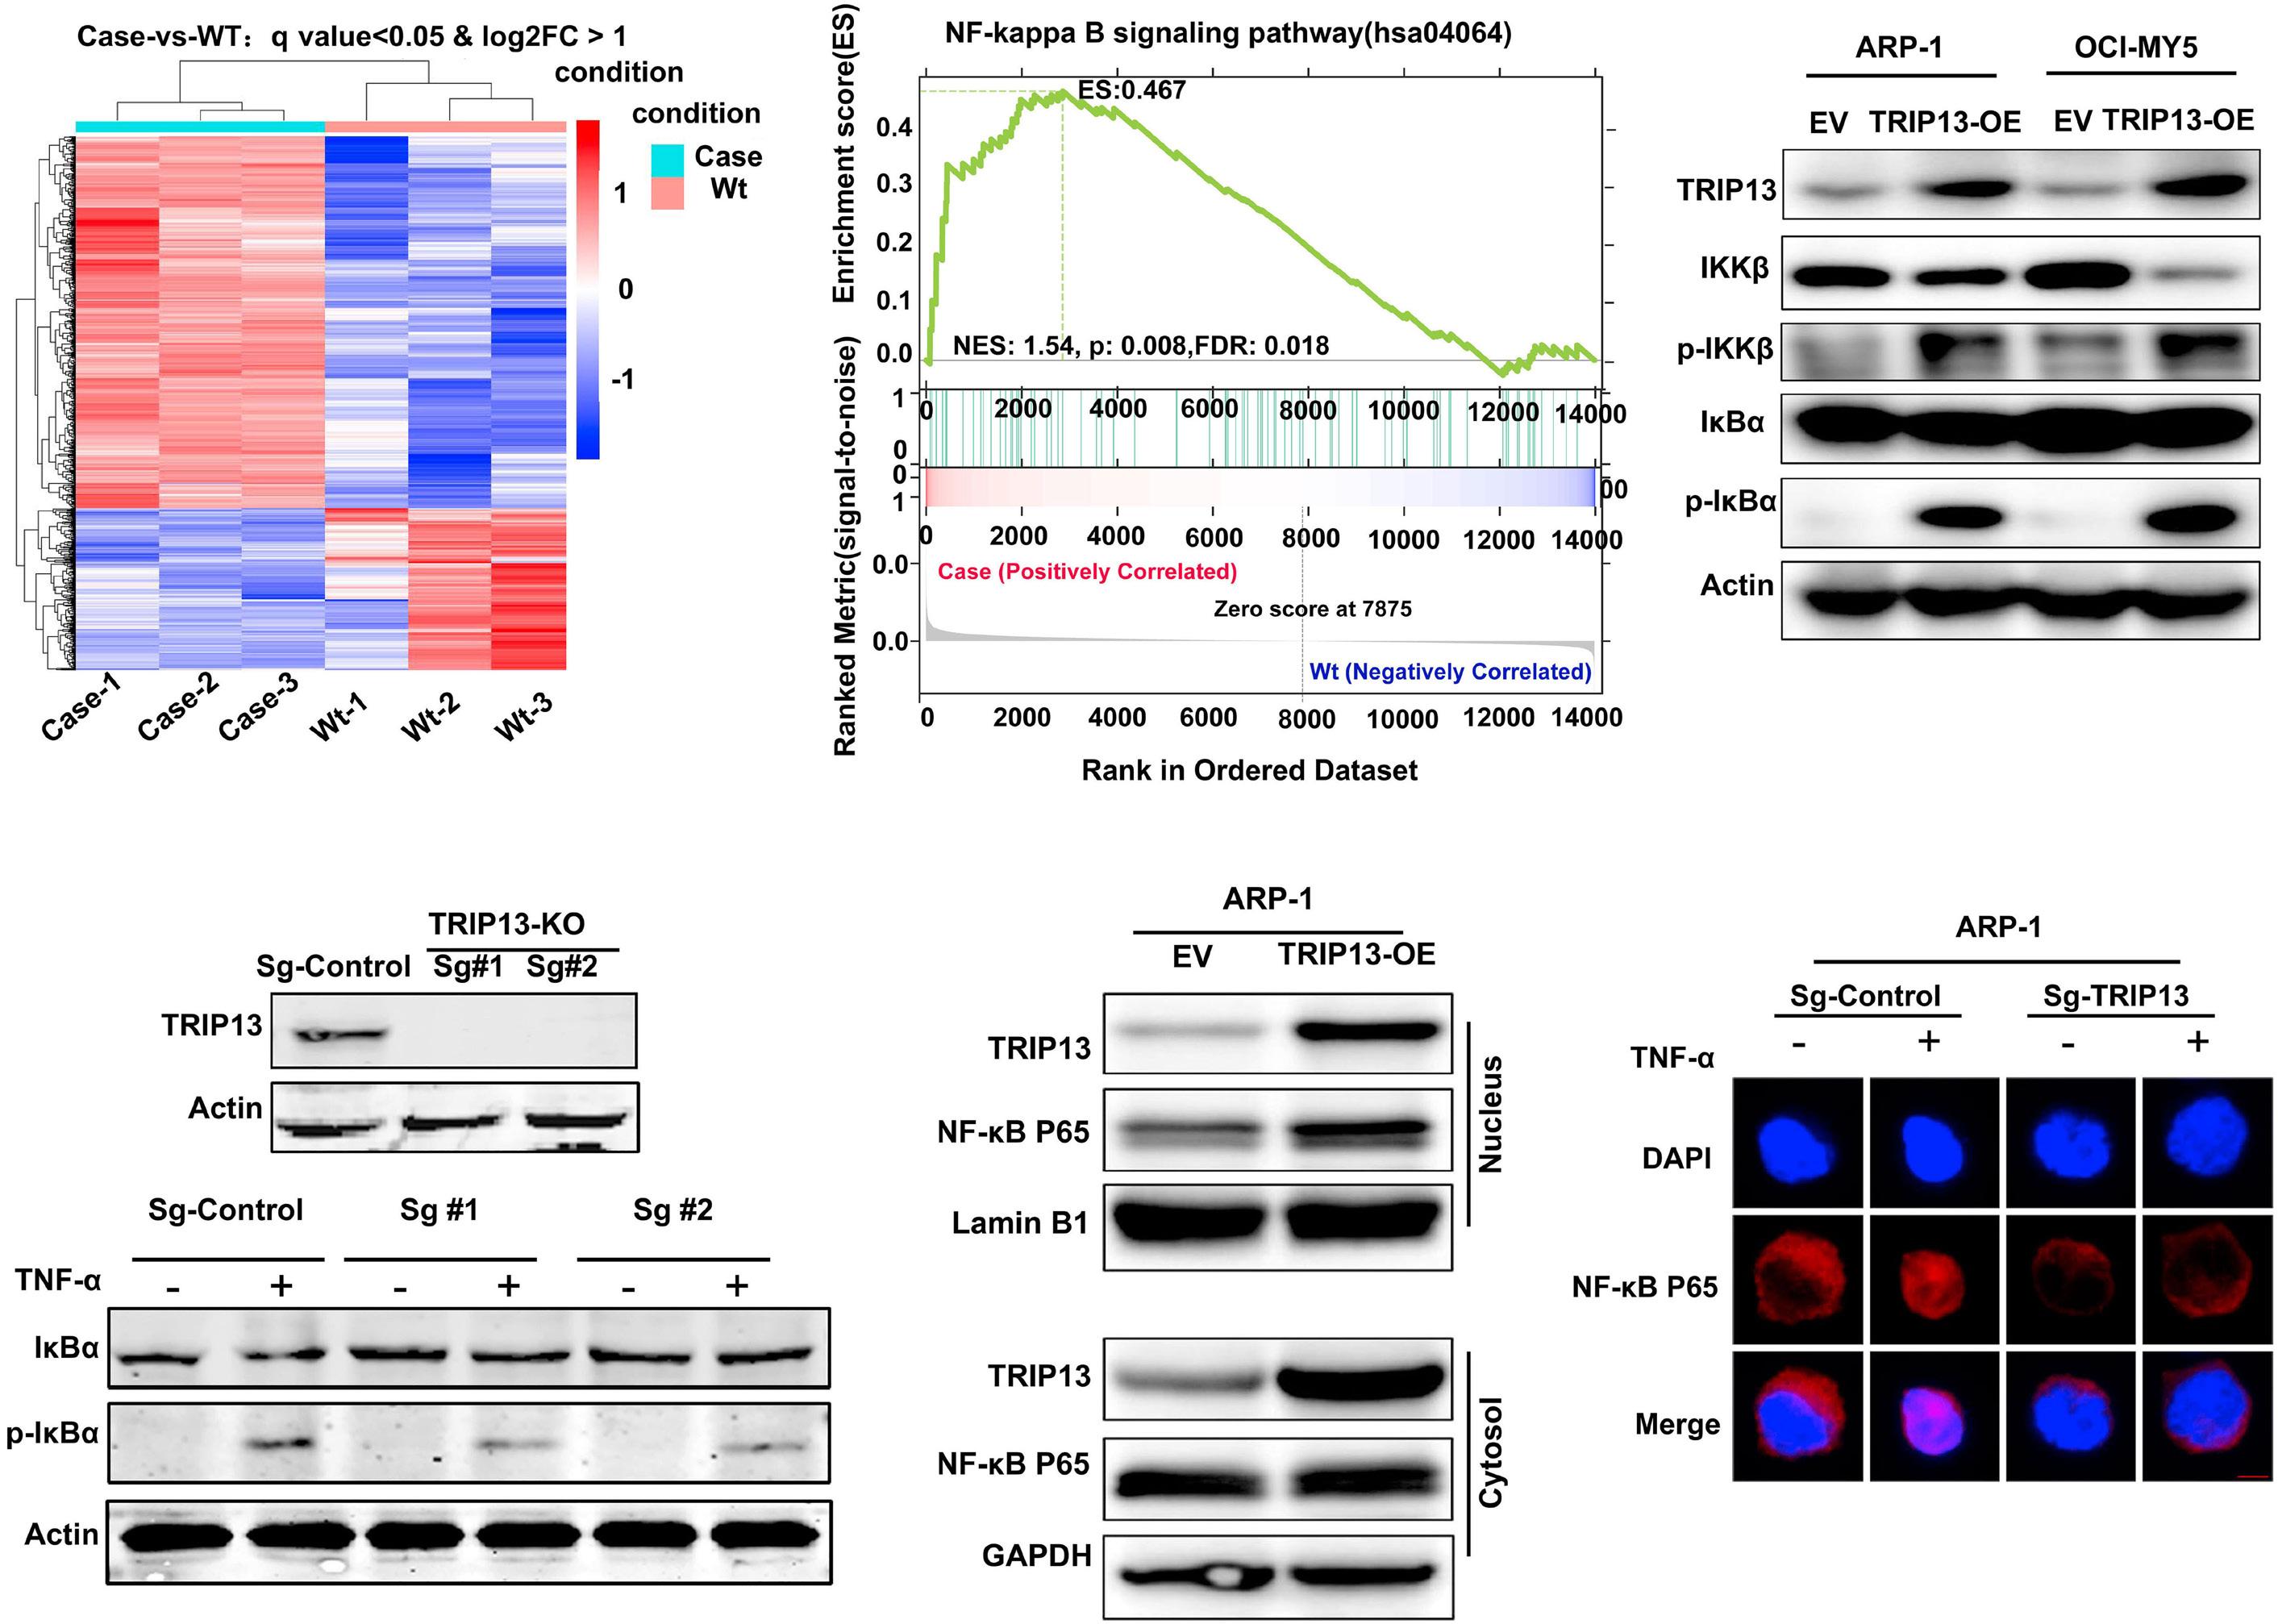
(A) RNA-sequencing analysis of the differentially expressed transcripts in empty vector (EV) and TRIP13-OE ARP-1 cells (red and blue represent high and low mRNA expression levels, respectively). Case represents ARP-1 cells stably transfected with TRIP13-OE; wild-type (wt) represents ARP-1 cells stably transfected with EV. (B) Gene set enrichment analysis (GSEA) indicated a positive correlation between TRIP13 overexpression and NF-κB signallng activation. NES: normalized enrichment score. (C) Immunoblotting analysis of proteins levels involved in canonical NF-κB signaling (IKKb, p-IKKb, IκBα, p-IκBα) in EV and TRIP13 OE ARP-1/OCI-MY5 cells. Actin served as a loading control. (D) Immunoblotting confirmed the knockout of TRIP13 (TRIP13-KO) in ARP-1 cells via CRISPR-Cas9 (upper panel). TRIP13-KO or the corresponding control ARP-1 cells were stimulated with or without TNF-α (30 ng/mL, 30 minutes), followed by immunoblotting analysis of IκBα and p-IκBα proteins levels (lower panel). Actin served as a loading control. (E) EV and TRIP13-OE ARP-1 cells were collected. Cytosolic and nuclear proteins were then extracted using a nuclear and cytoplasmic protein extraction kit, followed by immunoblotting analysis of NF-κB p65 levels in the cytoplasm and nucleus. Lamin B1 and GAPDH were used as loading controls for the nucleus and cytoplasm, respectively. (F) Confocal micrographs of TRIP13-KO and the corresponding control ARP-1 cells stimulated with or without TNF-α (30 ng/mL, 30 minutes). The fixed cells were stained with anti-NF-κB p65 (red) and the nuclear dye DAPI (blue). Scale bars =10 µM.
to ascertain the contribution of RPS3 in TRIP13-mediated drug resistance in MM cells. We reduced RPS3 expression in TRIP13-OE MM cells with short interfering RNA targeting RPS3 (siRPS3). Then, the TRIP13-OE, TRIP13-OE+siRPS3, or the EV-transfected MM cells were treated with bortezomib. Consistent with the previous findings, we found that overexpression of TRIP13 induced bortezomib resistance in MM; knockdown of RPS3 re-sensitized the effects of bortezomib on TRIP13-OE MM cells (Figure 3E).
Protein kinase C δ (PKCδ) is a serine-threonine protein kinase that has been demonstrated to phosphorylate T221 residues
of RPS3.28,29 In order to further validate the involvement of phosphorylation of T221 in the TRIP13-driven canonical NFκB activation, we first performed endogenous Co-IP with TRIP13 antibody in ARP-1 cells and observed an interaction of RPS3, TRIP13, and PKCδ (Figure 3F). Then, TRIP13-OE or EV MM cells (ARP-1/OCI-MY5) were treated with a potent and selective PKCδ inhibitor, BJE6-106. Immunoblotting showed that BJE6-106 suppressed TRIP13-induced activation of proteins in NF-κB signaling (Figure 3G), suggesting that PKCδ is responsible for the TRIP13-driven canonical NF-κB activation. We also determined the effect of BJE6-106 on
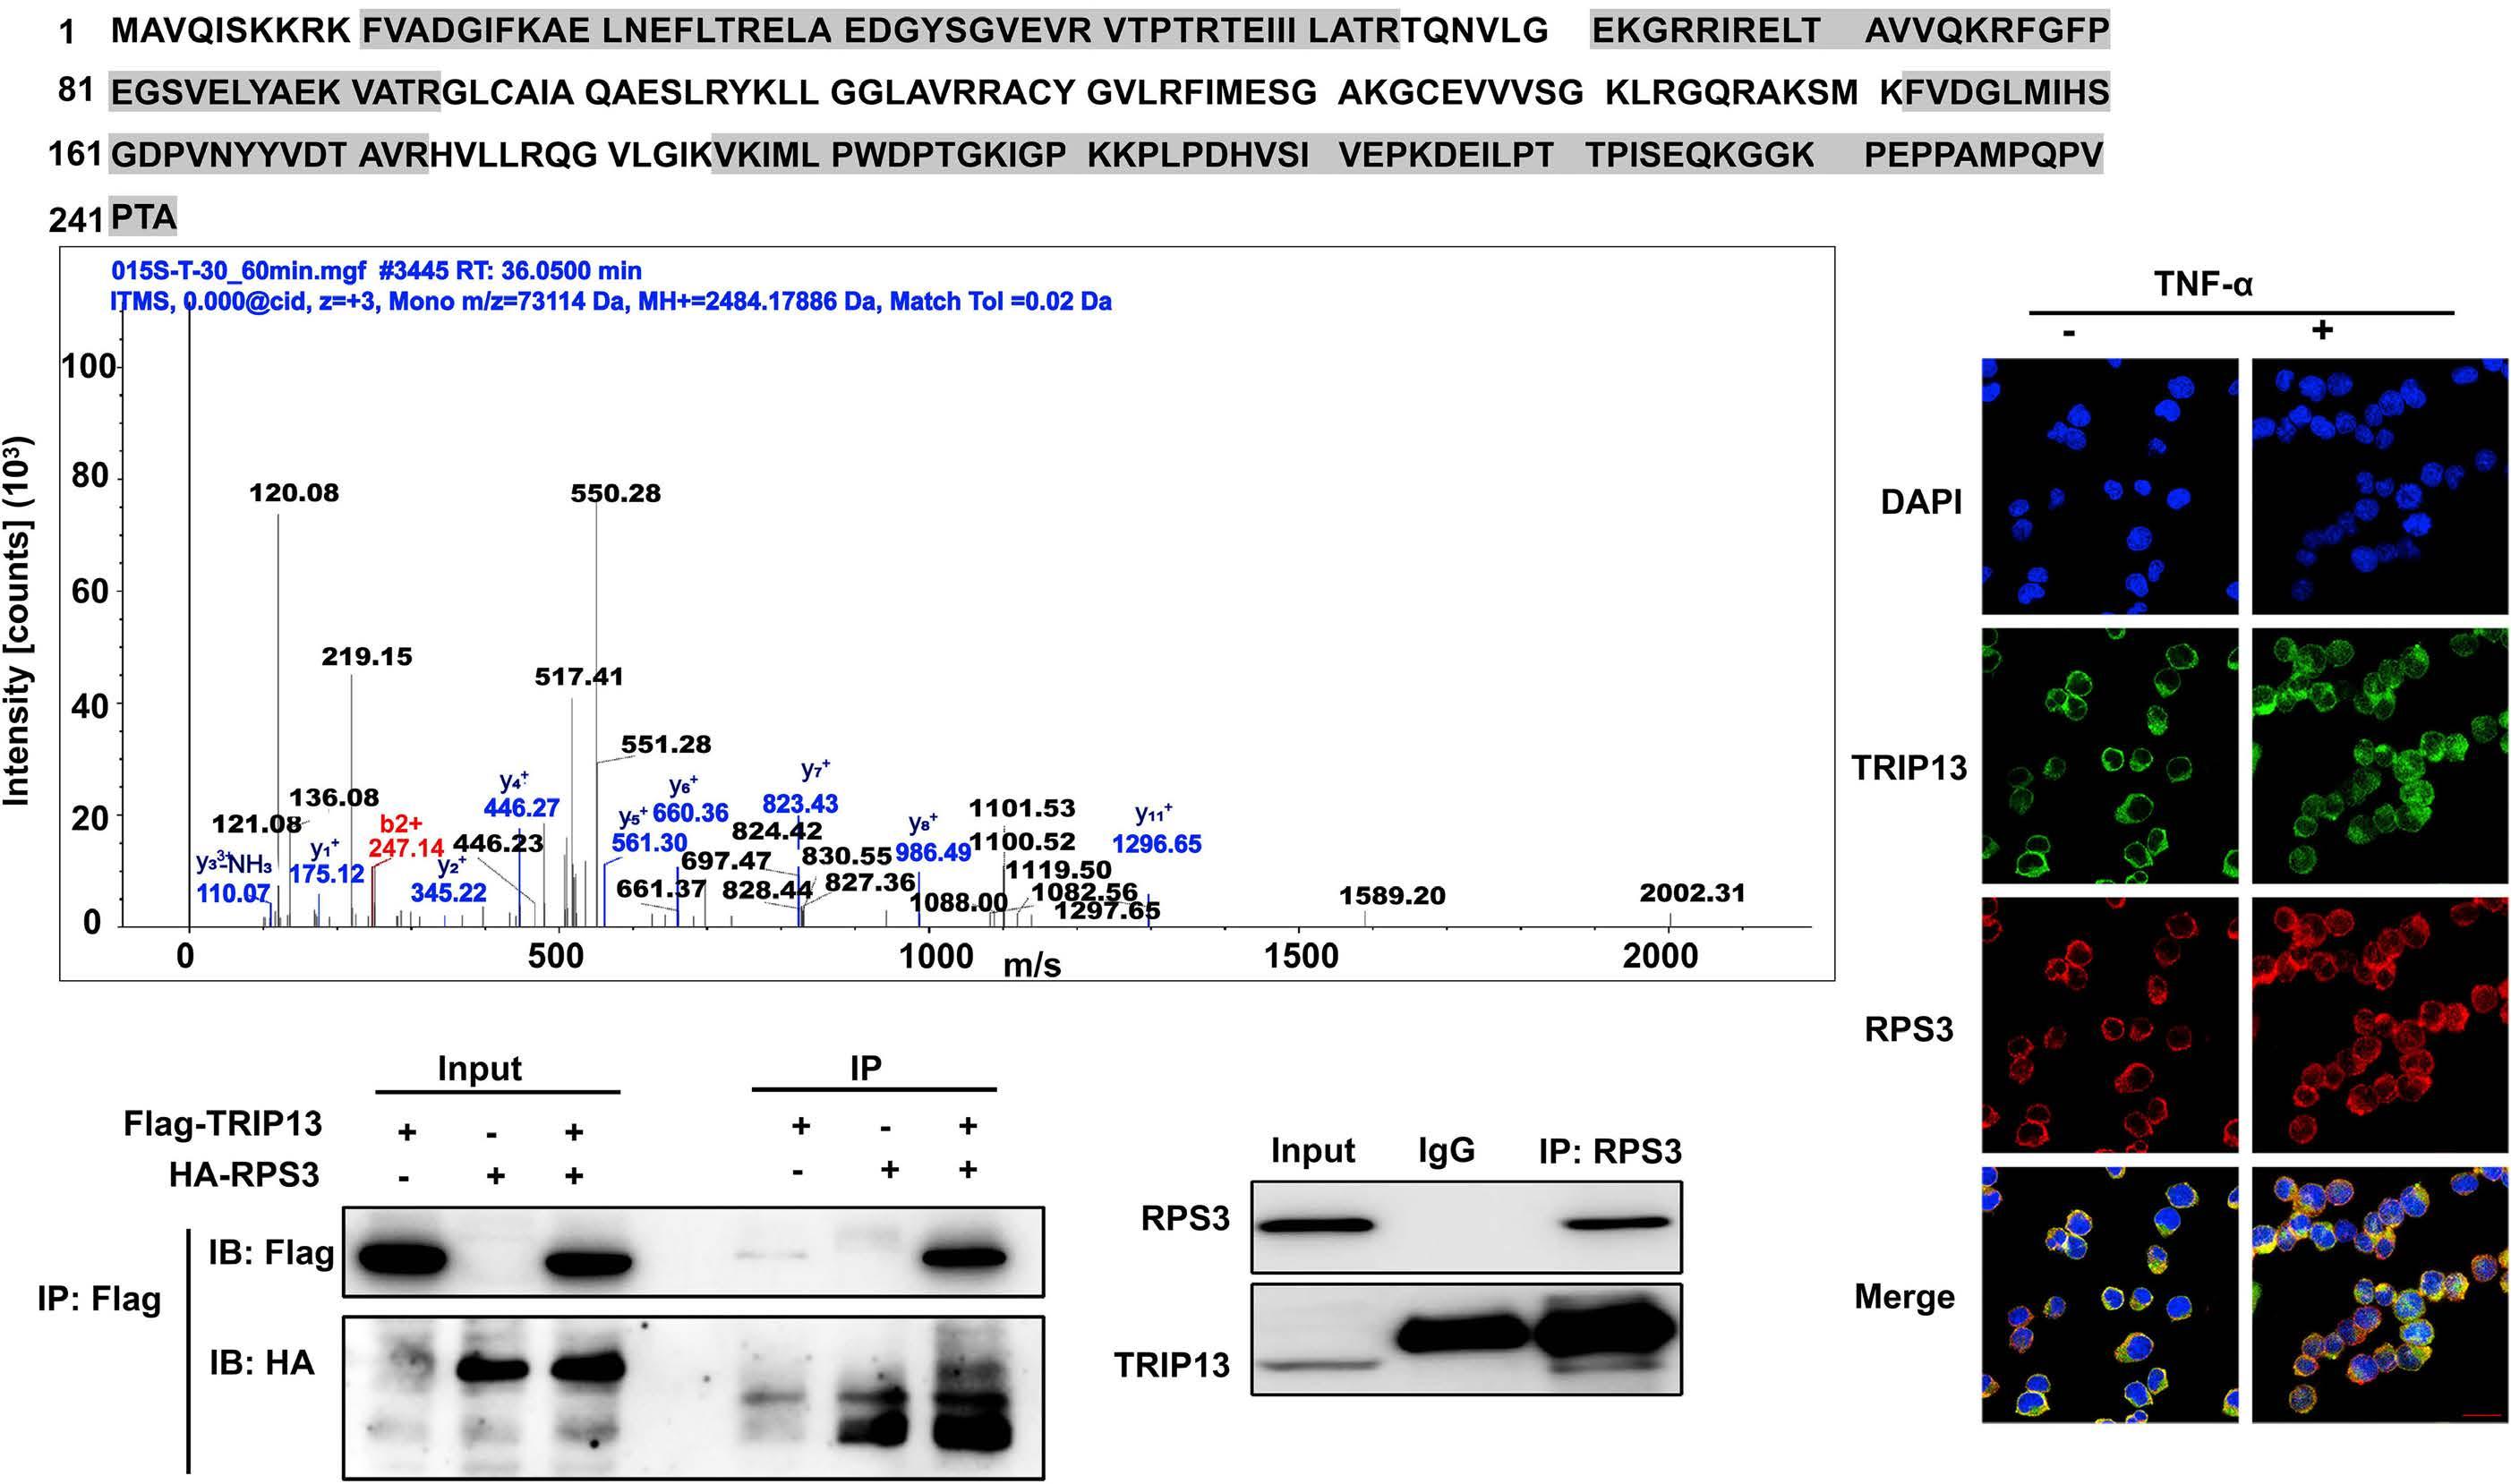
were transfected with Flag-TRIP13, HA-RPS3, or both constructs. Cell lysates were immunoprecipitated using anti-Flag and the immunoprecipitants or input were analyzed by immunoblotting with anti-HA or anti-Flag. (C) Endogenous co-immunoprecipitation was conducted with ARP-1 cells using anti-RPS3, followed by immunoblotting using anti-TRIP13 or anti-RPS3. Anti-IgG was used as a non-specific control. (D) Confocal micrographs of ARP-1 cells stimulated with or without TNF-α (30 ng/mL, 30 minutes). The fixed cells were stained with anti-TRIP13 (green), anti-RPS3 (red), and the nuclear dye DAPI (blue). Scale bars =10 µM.
the transcriptional activity of NF-κB in TRIP13-OE or EV MM cells by using a dual-luciferase reporter assay. The results revealed that overexpression of TRIP13 induced significant activation of NF-κB transcription, but the effect could be reversed by BJE6-106 (Figure 3H). We previously demonstrated that overexpression of TRIP13 induced bortezomib resistance in MM cells.15,17 We further determined whether PKCδ inhibitor could overcome TRIP13-induced bortezomib resistance of MM cells. TRIP13-OE or EV MM cells were treated with BJE6-106 in the presence or absence of bortezomib. Consistently, we observed that bortezomib significantly suppressed cell viability of EV MM cells but had no obvious effect on TRIP13-OE MM cells (Online Supplementary Figure S2B). Additionally, a significant decrease of cell viability was observed in TRIP13-OE MM cells in the presence of BJE6-106 and bortezomib (Online Supplementary Figure S2B).
RPS3 is highly expressed in multiple myeloma and is required for multiple myeloma survival in vitro and in vivo We determined the expression of RPS3 in MGUS, SMM, MM, relapsed MM and normal donors in two independent publicly available data sets. RPS3 was significantly overex-
pressed in MGUS, SMM, MM and relapsed MM compared to that in the corresponding normal donors (Figure 4A). We also compared the RPS3 messenger RNA (mRNA) levels in CD138-enriched plasma cells from five patients with MM and peripheral blood mononuclear cells from normal donors using qRT-PCR and confirmed high levels of RPS3 mRNA in MM (Online Supplementary Figure S3A). We further examined RPS3 expression using immunoblotting and observed upregulated RPS3 protein levels in patients with MM compared to that in the normal donors (Figure 2B). Meanwhile, immunohistochemistry using BM biopsies from patients with MM and normal donors showed higher RPS3 expression in MM than in the normal donors (Online Supplementary Figure S3B). Additionally, the Kaplan-Meier analysis showed that MM patients with higher RPS3 expression had significantly shorter overall survival and PFS (Figure 4C).
In order to elucidate the biological function of RPS3, RPS3 expression in MM cells (ARP-1/OCI-MY5) was stably knocked out using sgRNA targeting RPS3 (sg-RPS3) by CRISPR-Cas9 (Figure 4D). Results from Cell Counting Kit (CCK)-8 and EdU cell proliferation assays showed that knockout of RPS3 significantly suppressed proliferation of MM cells (Figure 4E;
Online Supplementary Figure S3C). Cell apoptosis analysis showed that RPS3 knockout induced significant MM cell apoptosis (Online Supplementary Figure S3D), which was further supported by increased levels of cleaved caspase
3/8/9 proteins in sg-RPS3 MM cells (Online Supplementary Figure S3E). Additionally, cell-cycle analysis suggested that knockout of RPS3 disrupted cell-cycle progression, with G2/M-phase arrest (Online Supplementary Figure S3F). Con-
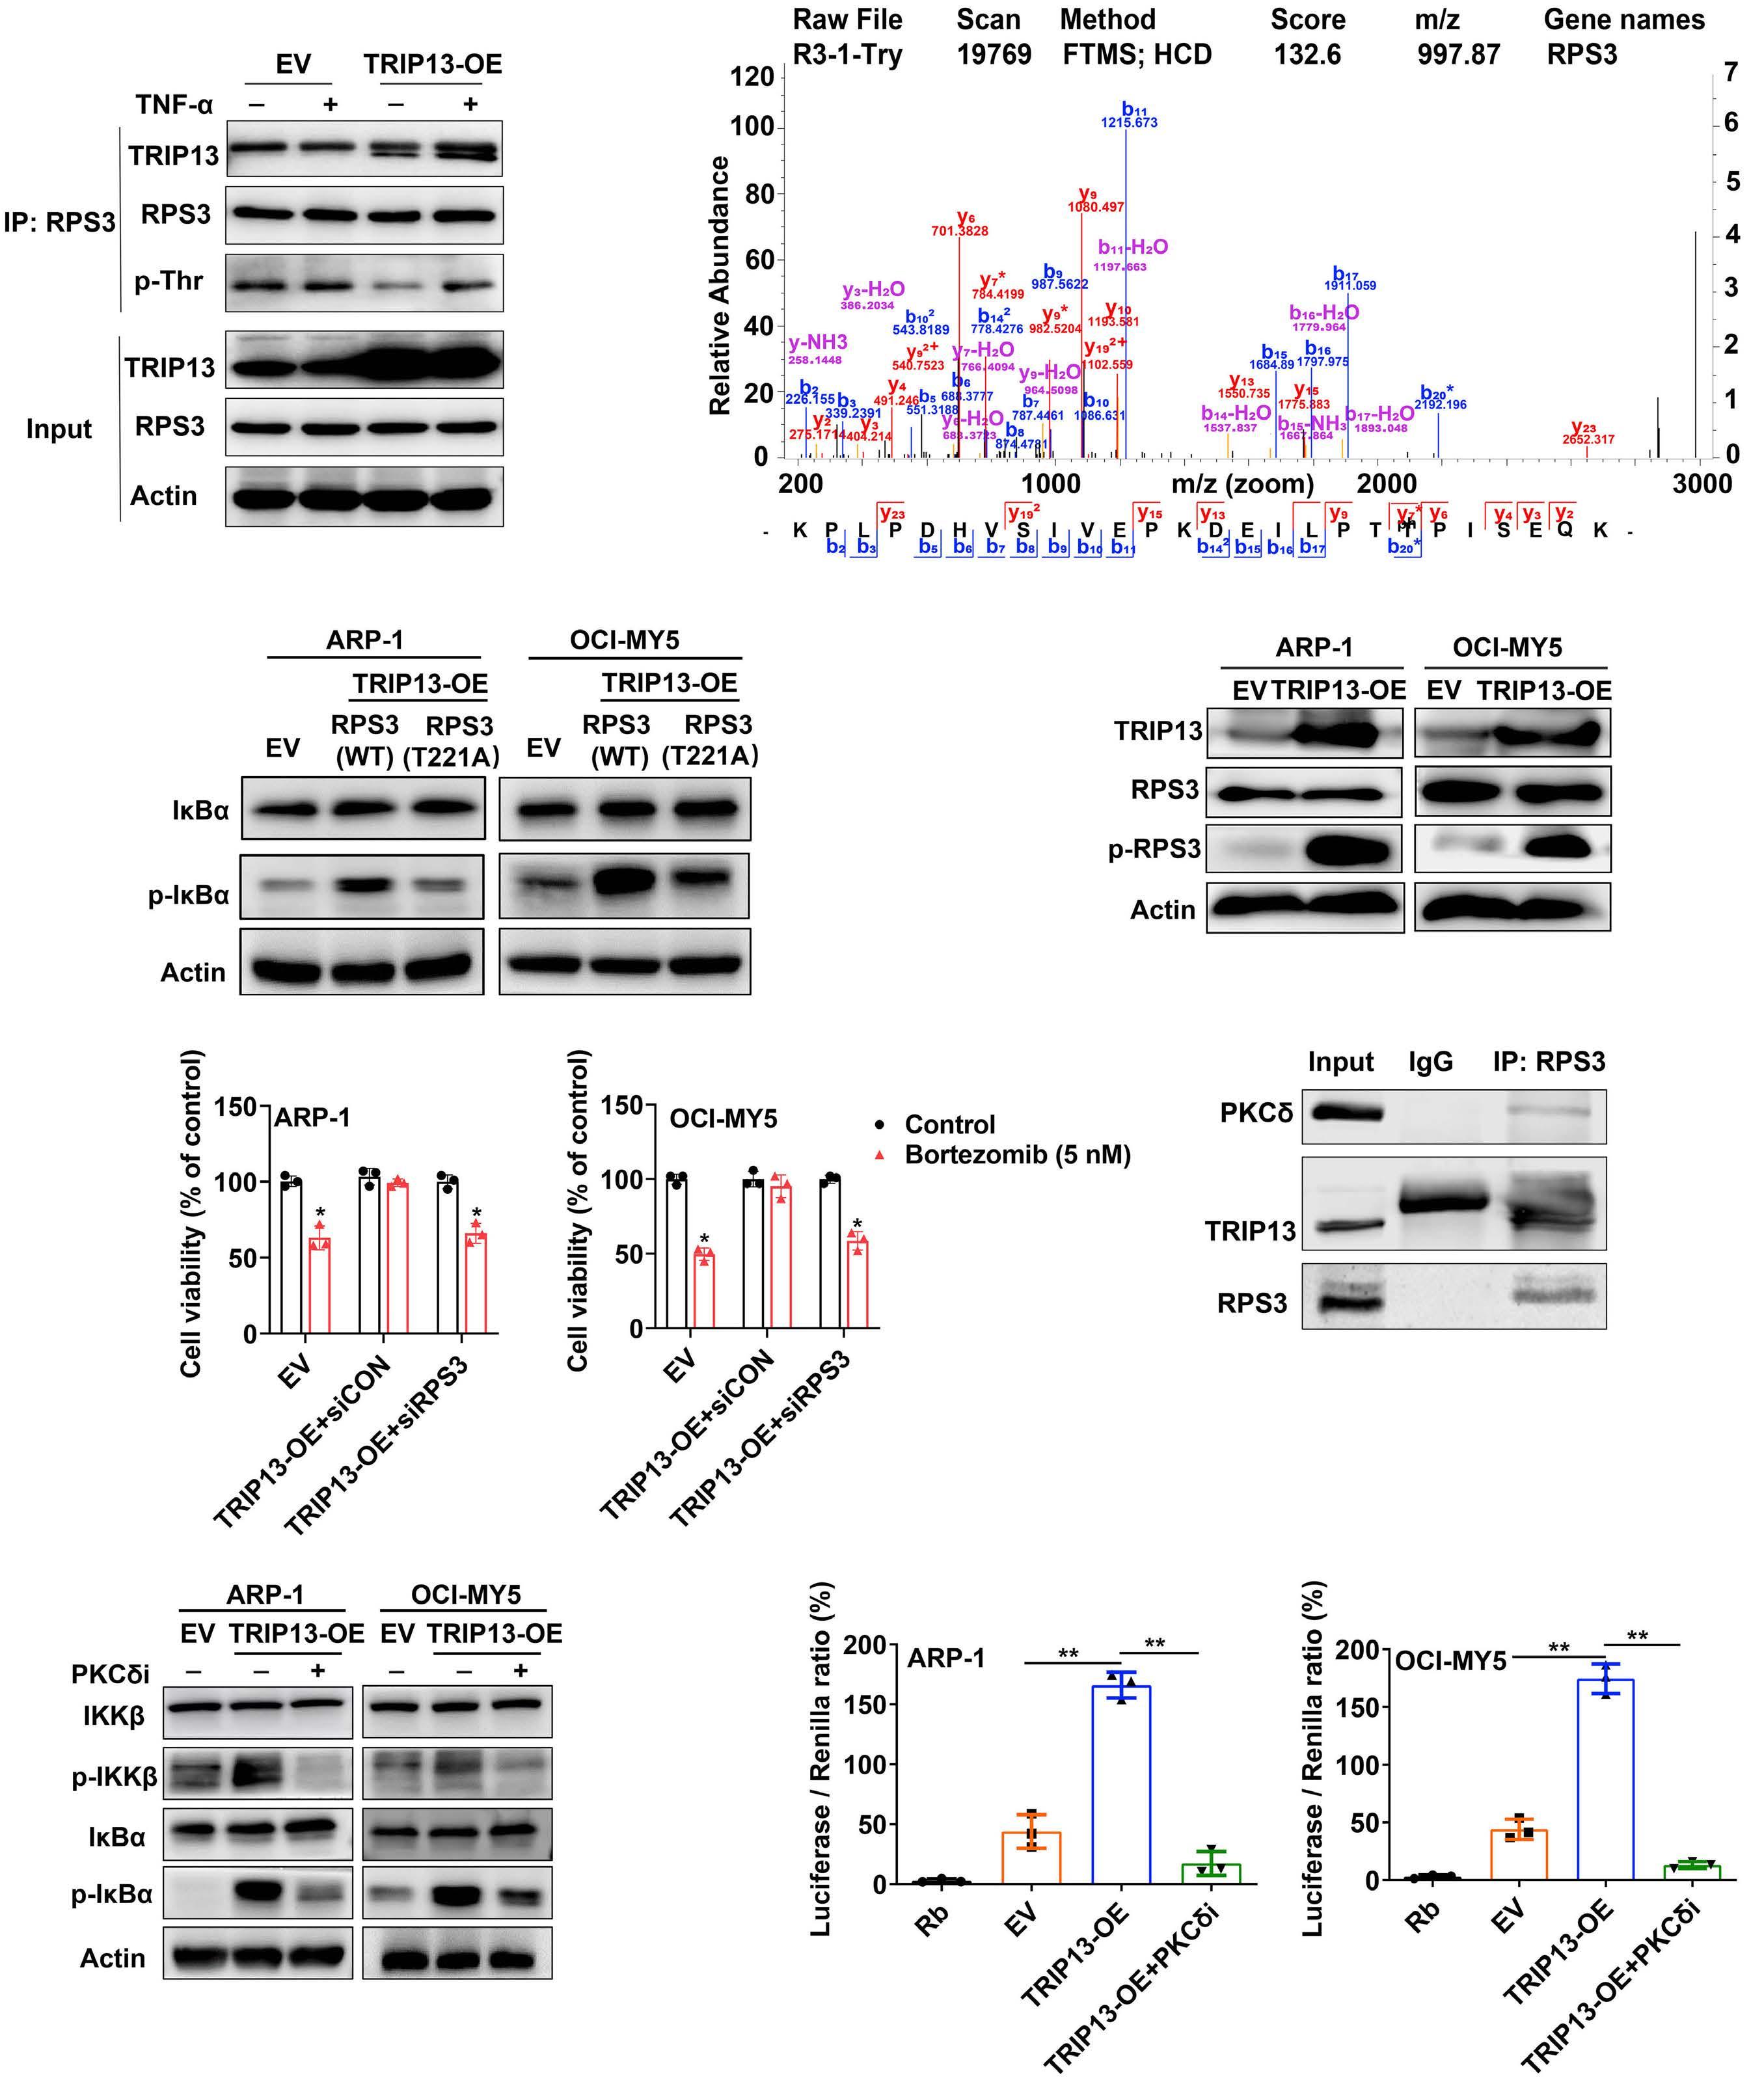
3.
PKC
. (A) ARP-1 cells stably transfected with lentivirus-mediated human TRIP13-cDNA (TRIP13-OE) or the empty vector (EV) were stimulated with or without TNF-α (30 ng/mL, 30 minutes). Cell lysates were immunoprecipitated using anti-RPS3 and the immunoprecipitants or input were analyzed by immunoblotting with anti-TRIP13, anti-RPS3, anti-phosphorylated threonine (p-Thr). Actin served as a loading control. (B) Mass spectrometry phosphoproteomic analysis identified phosphorylated threonine 221 (T221) on RPS3. (C) Threonine 221 on RPS3 was mutated to alanine (T211A). EV and TRIP13-OE multiple myeloma (MM) cells were then transfected with RPS3 (WT) or T211A, followed by immunoblotting with IκBα or p-IκBα antibodies. Actin served as a loading control. (D) Immunoblotting detection of protein levels of RPS3 and phosphorylated RPS3 (p-RPS3) in EV and TRIP13-OE ARP-1/OCI-MY5 cells. Actin served as a loading control. (E) TRIP13-OE transfected with short interfering RNA targeting RPS3 (TRIP13-OE+siRPS3) or siCON (TRIP13-OE+siCON), or EV ARP-1 (left panel) and OCIMY5 (right panel) MM cells were treated with vehicle or bortezomib (5 nM) for 48 hours, followed by CCK-8 assay analysis of cell viability. Data are shown as mean ± standard deviation with P value based on unpaired t test (N=3, *P<0.05, **P<0.01). The experiments were repeated 3 times. (F) Endogenous co-immunoprecipitation was conducted with ARP-1 cells using anti-TRIP13, followed by immunoblotting using anti-TRIP13, anti-PKCδ, or anti-RPS3. Anti-IgG was used as a non-specific control. (G) EV and TRIP13-OE MM cells were treated with the 0.1 µM PKCδ inhibitor (PKCδi), BJE6-106, for 24 hours, followed by immunoblotting with IKKb, p-IKKb, IκBα or p-IκBα antibodies. Actin served as a loading control. (H) EV and TRIP13-OE ARP-1 (left panel) and OCI-MY5 (right panel) MM cells were transiently transfected with NF-κB luciferase reporter. The cells were then treated with or without 0.1 µM PKCδi (BJE6-106) for 24 hours, followed by a dual-luciferase reporter assay analysis of NF-κB transcriptional activity. Data are shown as mean ± standard deviation with P value based on unpaired t test (N=3, **P<0.01). The experiments were repeated 3 times.
sistently, immunoblotting demonstrated that RPS3 knockout significantly reduced the levels of G2/M-phase-related proteins including CDC25C, Cyclin B1, and CDK1 (Online Supplementary Figure S3G). In order to further evaluate the efficacy of RPS3 in MM growth in vivo, we established a MM xenograft model via subcutaneous injection of RPS3-knockout ARP-1 or the corresponding control cells in nude mice. As expected, RPS3 knockout significantly suppressed tumor growth in vivo (Figure 4F; Online Supplementary Figure S3H). Meanwhile, much lower tumor weight was observed in the RPS3-knockout group than in the control group (Online Supplementary Figure S3I). Additionally, immunohistochemistry showed that the proliferation marker Ki-67 was obviously decreased in the RPS3 knockout group than in the control (Online Supplementary Figure S3J). TUNEL assays revealed that RPS3 knockout induced increased cell apoptosis compared to the control (Online Supplementary Figure S3J).
RPS3 overexpression induces proteasome inhibitor resistance in multiple myeloma and is negatively correlated with multiple myeloma survival
We overexpressed RPS3 in the MM cells (ARP-1/OCI-MY5) using lentivirus-mediated human RPS3-cDNA (Figure 5A). We first evaluated the effect of RPS3 on MM proliferation with RPS3 overexpressed (RPS3-OE) or the empty vector (EV)-transfected MM cells. CCK-8 and EdU cell proliferation assays showed that overexpression of RPS3 significantly increased proliferation of MM cells (Figure 5B; Online Supplementary Figure S4A). RPS3-OE or EV-transfected MM cells were then treated with increasing concentrations of proteasome inhibitors bortezomib or carfizomib. Interestingly, we found that the proteasome inhibitors significantly decreased the cell viability of EV MM cells but had no obvious effects on RPS3-OE MM cells (Figure 5C; Online Supplementary Figure S4B). Additionally, colony formation assay showed that while RPS3 overexpression increased colony formation of MM, the proteasome inhibitors decreased the colony formation rate of EV MM cells but had a much less
effect on RPS3-OE MM cells (Online Supplementary Figure S4C, D). In order to further examine the in vivo efficacy of RPS3-induced drug resistance of MM, RPS3-OE or EV ARP-1 cells implanted subcutaneously in nude mice were treated with bortezomib or the vehicle. Consistent with the findings in vitro, we observed that bortezomib significantly suppressed tumor growth in the EV group but had no obvious effect on tumors in the RPS3-OE nude mice (Figure 5D; Online Supplementary Figure S4E). Meanwhile, immunohistochemistry showed an increase in Ki-67 expression in RPS3-OE tumors (Online Supplementary Figure S4F). Additionally, RPS3-OE mice treated with or without bortezomib displayed a significant decrease in survival as compared to that in mice in the EV or EV + bortezomib group (Figure 5E).
DCZ0415 synergizes with bortezomib in drug-resistant multiple myeloma cells in vitro and in vivo
Proteins involved in NF-κB signaling were activated in bortezomib-resistant (BR) cells (Online Supplementary Figure S5A). We also evaluated the expression of RPS3 at both mRNA and protein levels, including both total and phosphorylated forms, in isogenic pair of MM cell lines with induced resistance to bortezomib (H929/H929R and RPMI-8226/RPMI-8226R5).
We observed a notable upregulation of p-RPS3 in BR MM cells, while no significant differences were found in the expression levels of RPS3 at both mRNA (data not shown) and total protein levels when comparing BR MM cells with their sensitive counterparts (Online Supplementary Figure S5A). Our previous paper demonstrated that DCZ0415, a small inhibitor specifically targeting TRIP13, induced cell death by inhibiting the NF-κB signaling pathway.17 We further investigated the effects of DCZ0415 on NF-κB signaling. Immunoblotting showed that DCZ0415 significantly inactivated proteins (p-IKKb, p-p65, and p-IκBα) involved in NF-κB signaling (Online Supplementary Figure S5B). Meanwhile, immunofluorescence observed that DCZ0415 effectively hijacked the nuclear translocation of NF-κB p65 in H929R cells (Online Supplementary Figure S5C). In order to gain
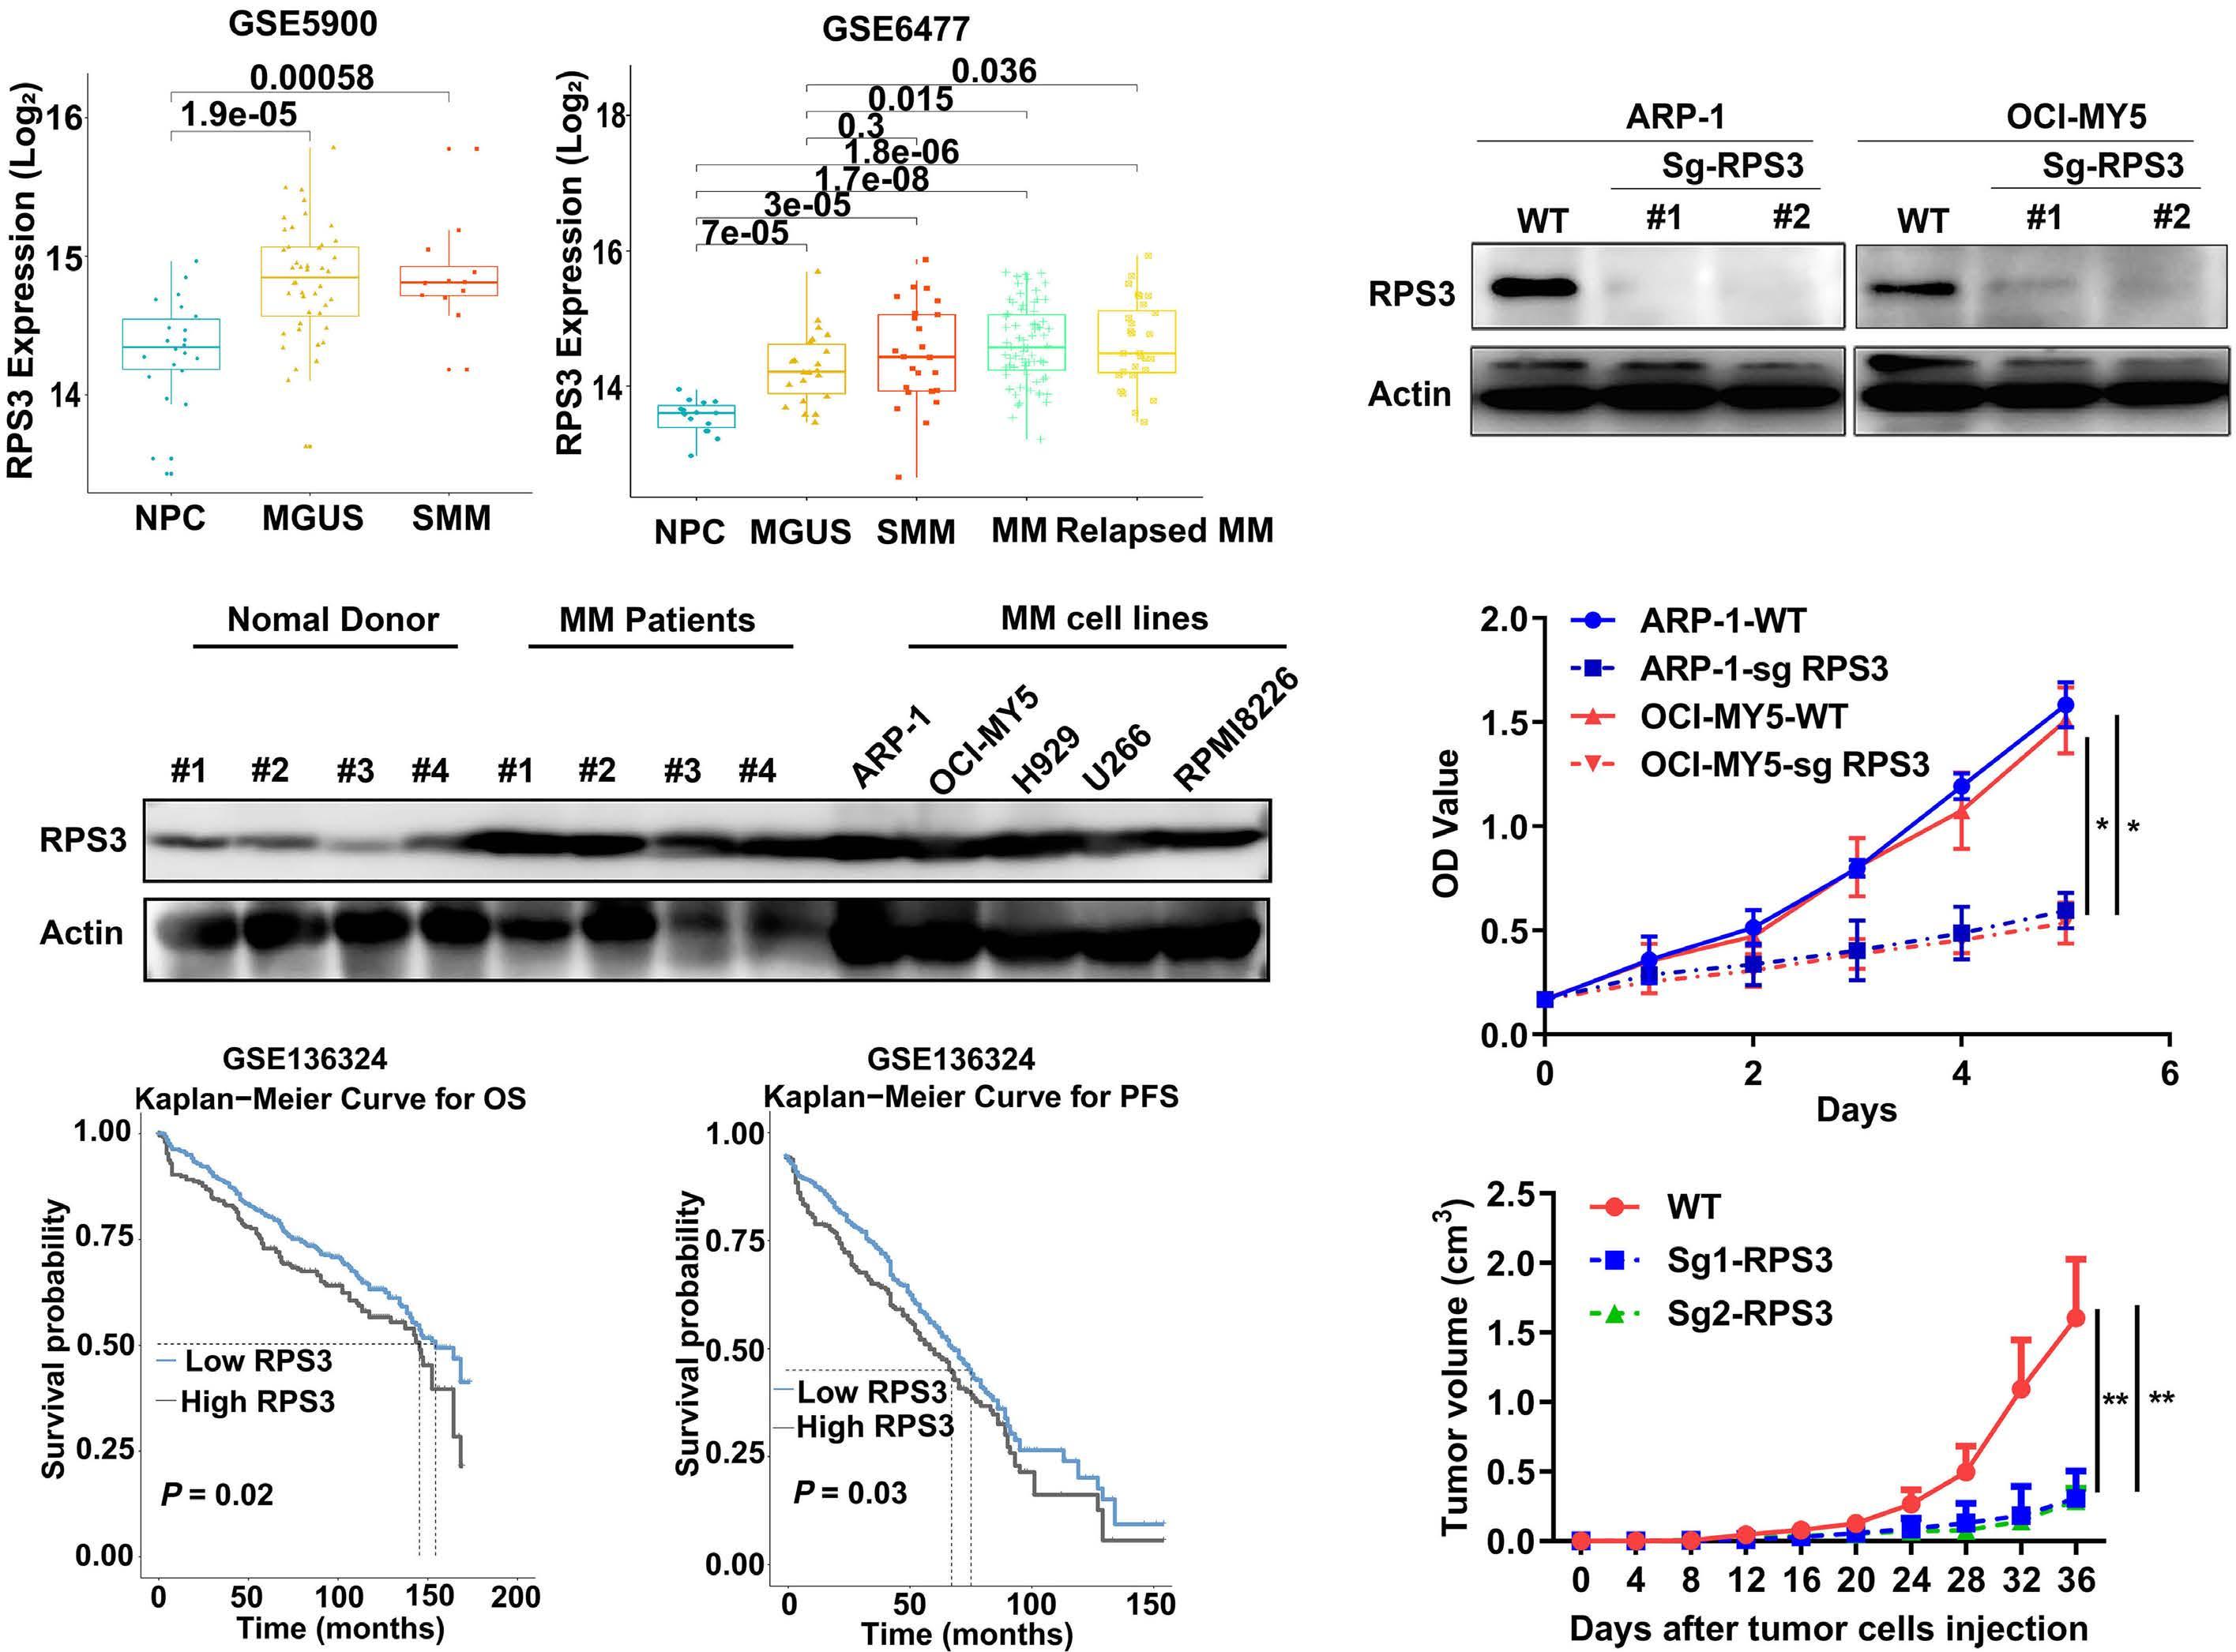
Figure 4. RPS3 is overexpressed in multiple myeloma and is required for multiple myeloma survival in vitro and in vivo. (A) Analysis of RPS3 expression in normal donors (NPC), monoclonal gammopathy of undetermined significance (MGUS), smouldering multiple myeloma (SMM), multiple myeloma (MM) and relapsed MM by using 2 independent publicly available data sets from NCBI Gene Expression Omnibus (GEO) database under accession numbers (left GSE5900, right GSE6477). Statistics were calculated using Wilcoxon rank sum test. (B) Immunoblotting showed upregulated RPS3 protein levels in patients with MM and MM cell lines compared with that of the normal donors. Actin served as a loading control. (C) Kaplan-Meier curves of overall survival (OS) and progression-free survival (PFS) in 436 newly diagnosed MM patients related to RPS3 expression. The dataset was obtained from NCBI GEO database with GSE136324. Significant differences were calculated by log-rank Mantel-Cox test. (D) Immunoblotting confirmed the knockout of RPS3 in MM cells (ARP-1/OCI-MY5) by single guided RNA (sgRNA) targeting RPS3 (SgRPS3) using CRISPR-Cas9. Sg-Control represents MM transfected with empty vector (EV). Actin served as a loading control. (E) Cell survival of MM transfected with Sg-RPS3 or Sg-Control was measured by CCK-8 assay. The Y-axis represents the optical density (OD) value corresponding to the viability of the cells. Data are shown as mean ± standard deviation with P value based on two-way ANOVA (N= 3, *P<0.05). The experiments were repeated 3 times. (F) ARP-1 cells transfected with Sg-RPS3 or Sg-Control were subcutaneously injected into nude mice. Graphic represents curves of the tumor growth in nude mice. Data are shown as mean ± standard deviation with P value based on two-way ANOVA (N= 5, **P<0.01).
further insights into the mechanistic effects of DCZ0415, we conducted additional investigations on its impact on RPS3 expression. MM cells were treated with increasing doses of DCZ0415, or TRIP13-OE MM cells were treated with or without DCZ0415. Immunoblotting revealed a significant reduction in p-RPS3 levels upon treatment with DCZ0415 in both MM cells and TRIP13-OE MM cells, indicating that the TRIP13/RPS3 axis might be involved in DCZ0415-induced cell death (Figure 6A, B). We further determined the effects
of DCZ0415 on RPS3-knockout or the sgControl-transfected wild-type MM cells, and observed that knockout of RPS3 significantly reduced the sensitivity of MM cells to DCZ0415 (Figure 6C). In order to determine whether the effects of DCZ0415 on drug-resistant cells was dependent on TRIP13RPS3 axis, we treated TRIP13-OE, TRIP13-OE+siRPS3, or the corresponding EV cells with increasing doses of DCZ0415. CCK-8 assay revealed that treatment of TRIP13-OE cells with DCZ0415 exhibited augmented cytotoxicity, while this
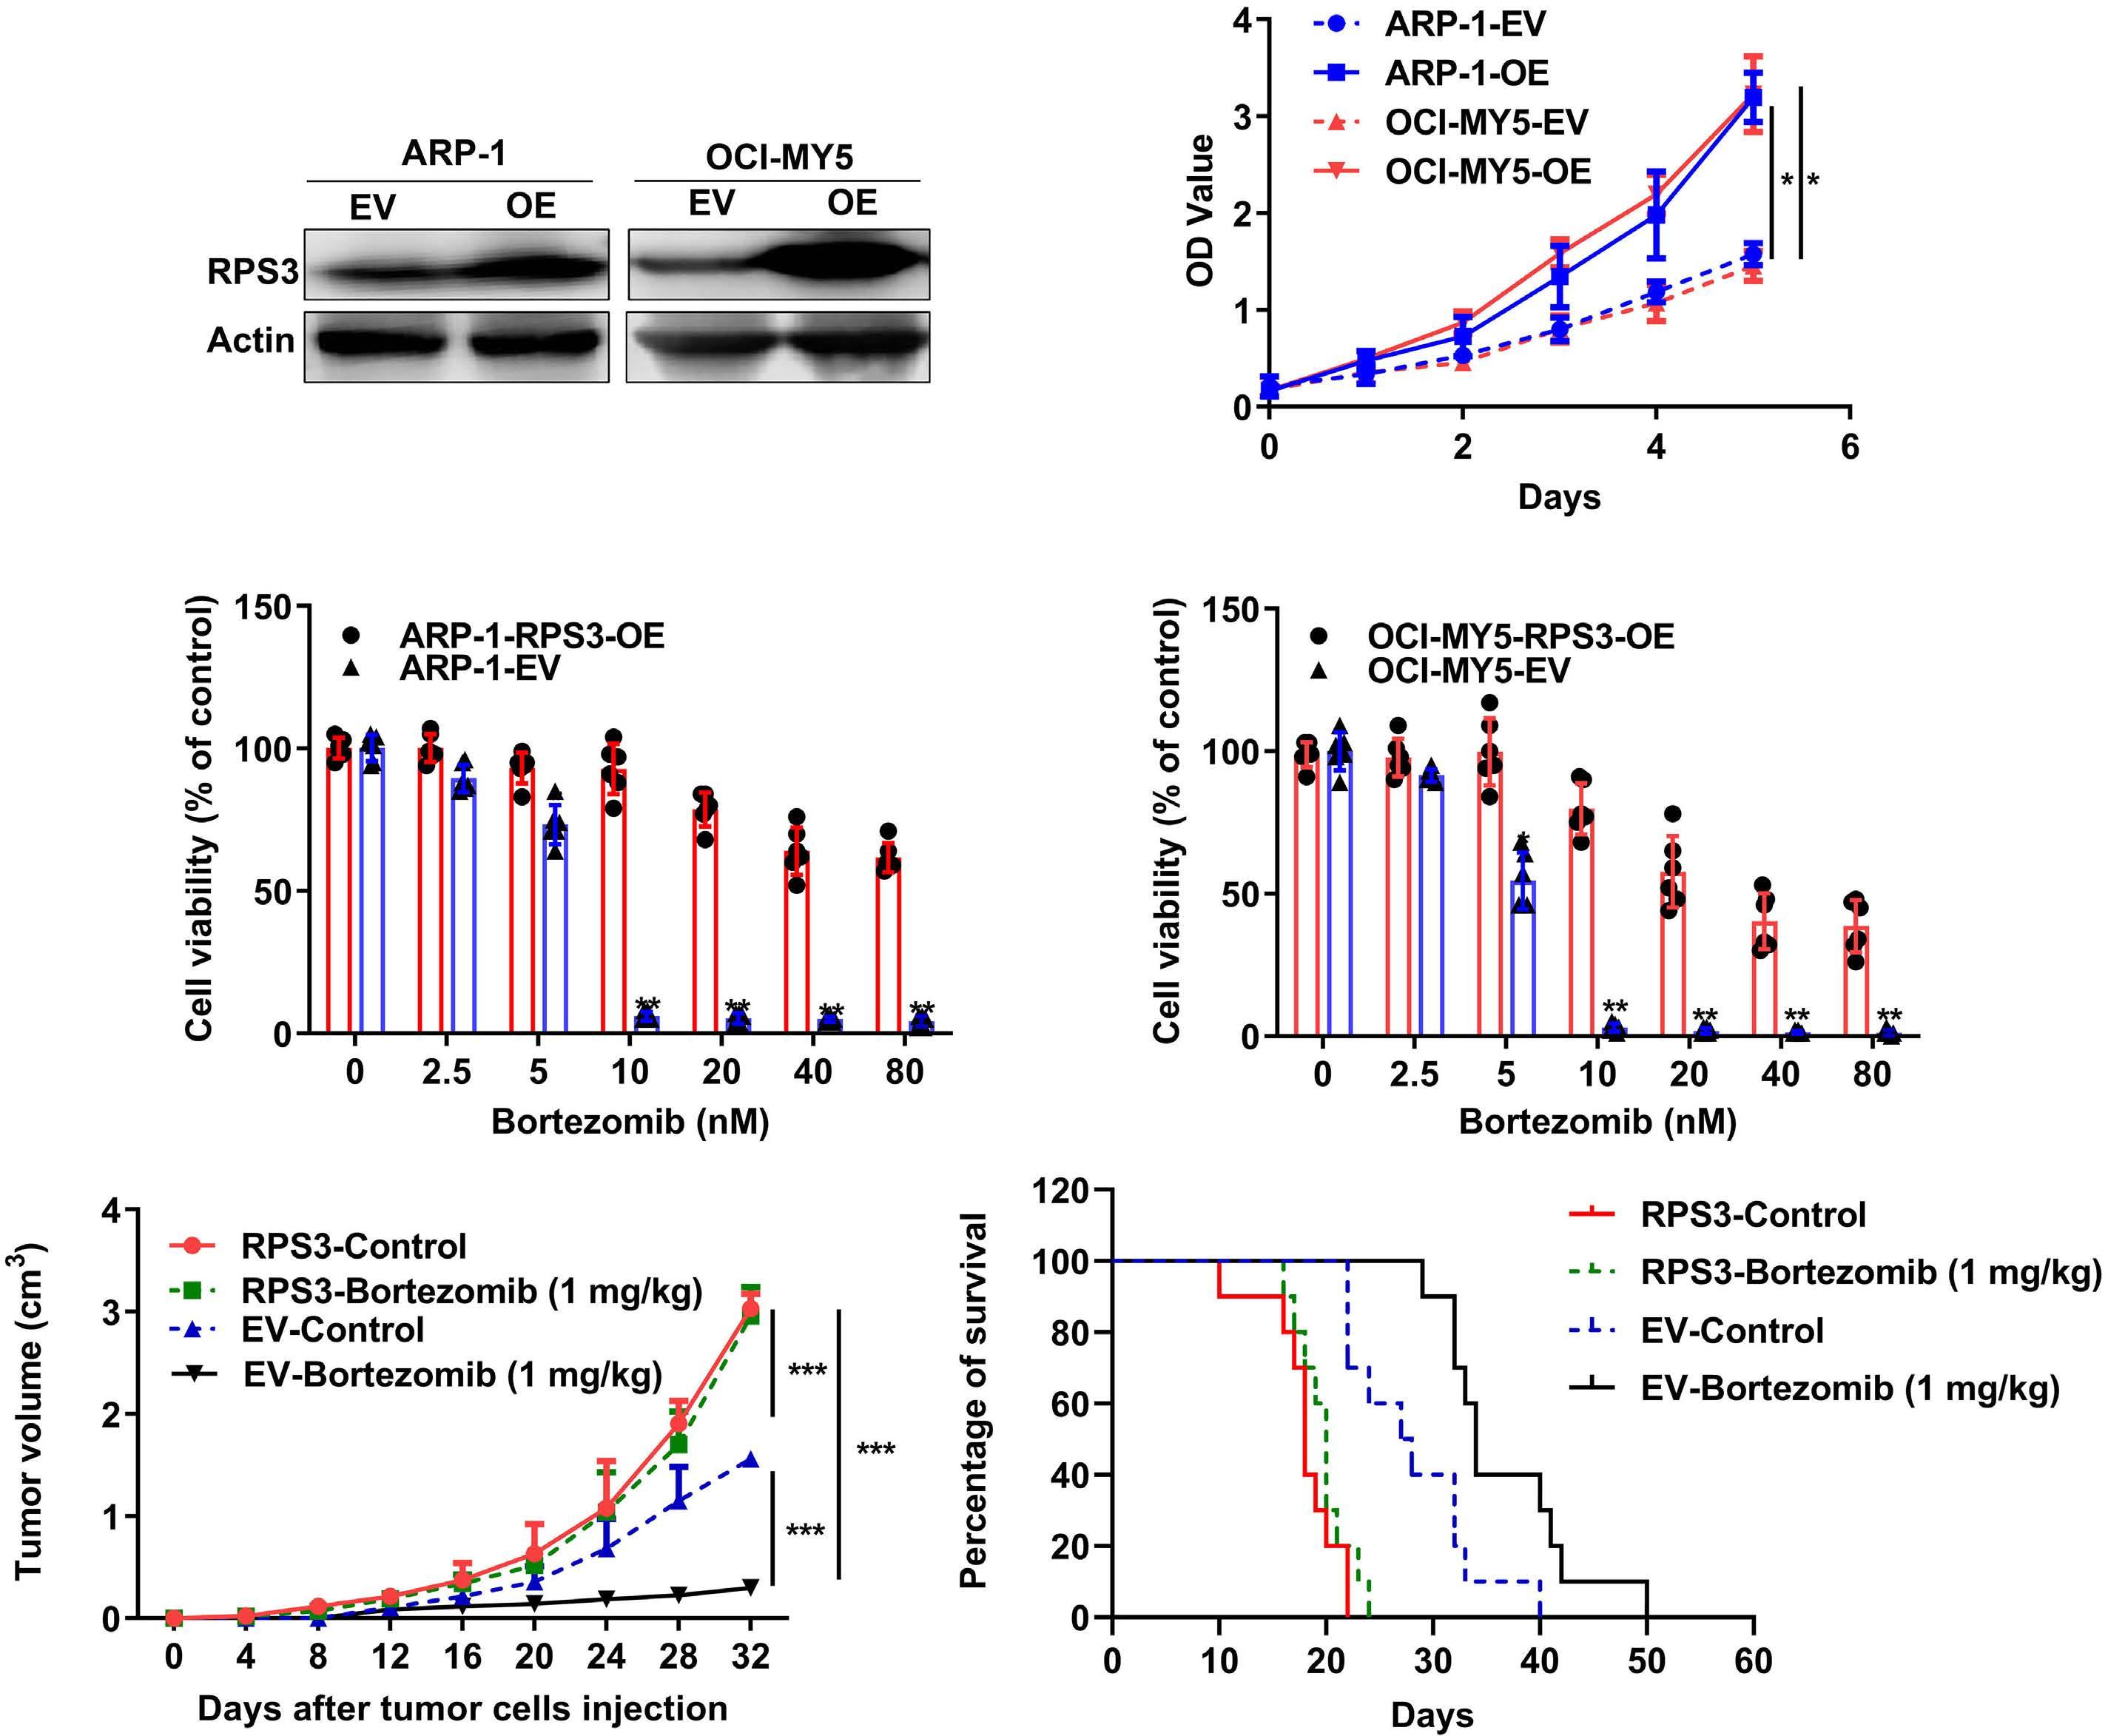
multiple myeloma and is negatively correlated with
(A) Immunoblotting confirmed overexpression of RPS3 in multiple myeloma (MM) cells (ARP-1/OCIMY5) stably transfected with lentivirus-mediated human RPS3-cDNA (RPS3-OE). EV represents MM cells stably transfected with empty vector. Actin served as a loading control. (B) Cell survival of MM transfected with RPS3-OE or EV was measured by CCK-8 assay. The Y-axis represents the optical density (OD) value corresponding to the viability of the cells. Data are shown as mean ± standard deviation (SD) with P value based on two-way ANOVA (N= 3, *P<0.05). The experiments were repeated 3 times. (C) CCK8 assay examined cell viability of RPS3-OE or EV MM cells treated with increasing doses of bortezomib (0-80 nM) for 48 hours. Data are shown as mean ± SD with P value based on unpaired t test (N= 6, **P<0.01). The experiments were repeated 3 times. (D) RPS3-OE and EV ARP-1 cells implanted subcutaneously in nude mice were treated with bortezomib (1 mg/kg, twice/week) or vehicle. Graphic represents curves of the tumor growth. Data are shown as mean ± SD with P value based on two-way ANOVA (N= 3, ***P<0.001). (E) RPS3-OE and EV ARP-1 cells implanted subcutaneously in nude mice were treated with bortezomib (1 mg/ kg, twice/week) or vehicle. Kaplan-Meier and log-rank analysis of the median overall survival of mice in the 4 groups. Significant differences were calculated by log-rank Mantel-Cox test (N=10, EV-Control vs. EV-Bortezomib, P=0.0059; EV-Control vs. RPS3-Control, P<0.0001; EV-Bortezomib vs. OE-Bortezomib, P<0.0001; RPS3-Control vs. OE Bortezomib, non-significant).
effect was partially attenuated upon knockdown of RPS3 (Figure 6D). These findings indicate that DCZ0415 holds immense potential for drug resistant MM. We further determined the effects of DCZ0415 on drug resistance in MM. BR MM cells (H929R and RPMI-8226R5) were first treated with increasing doses of DCZ0415 for 72 h. CCK-8 assay
showed that DCZ0415 significantly decreased cell viability of H929R/RPMI-8226R cells in a dose-dependent manner (Online Supplementary Figure S6A). Flow cytometry revealed that DCZ0415 significantly promoted apoptosis of BR cells, which was further supported by increased levels of cleaved caspase-3/8/9 and PARP proteins in BR cells treated with
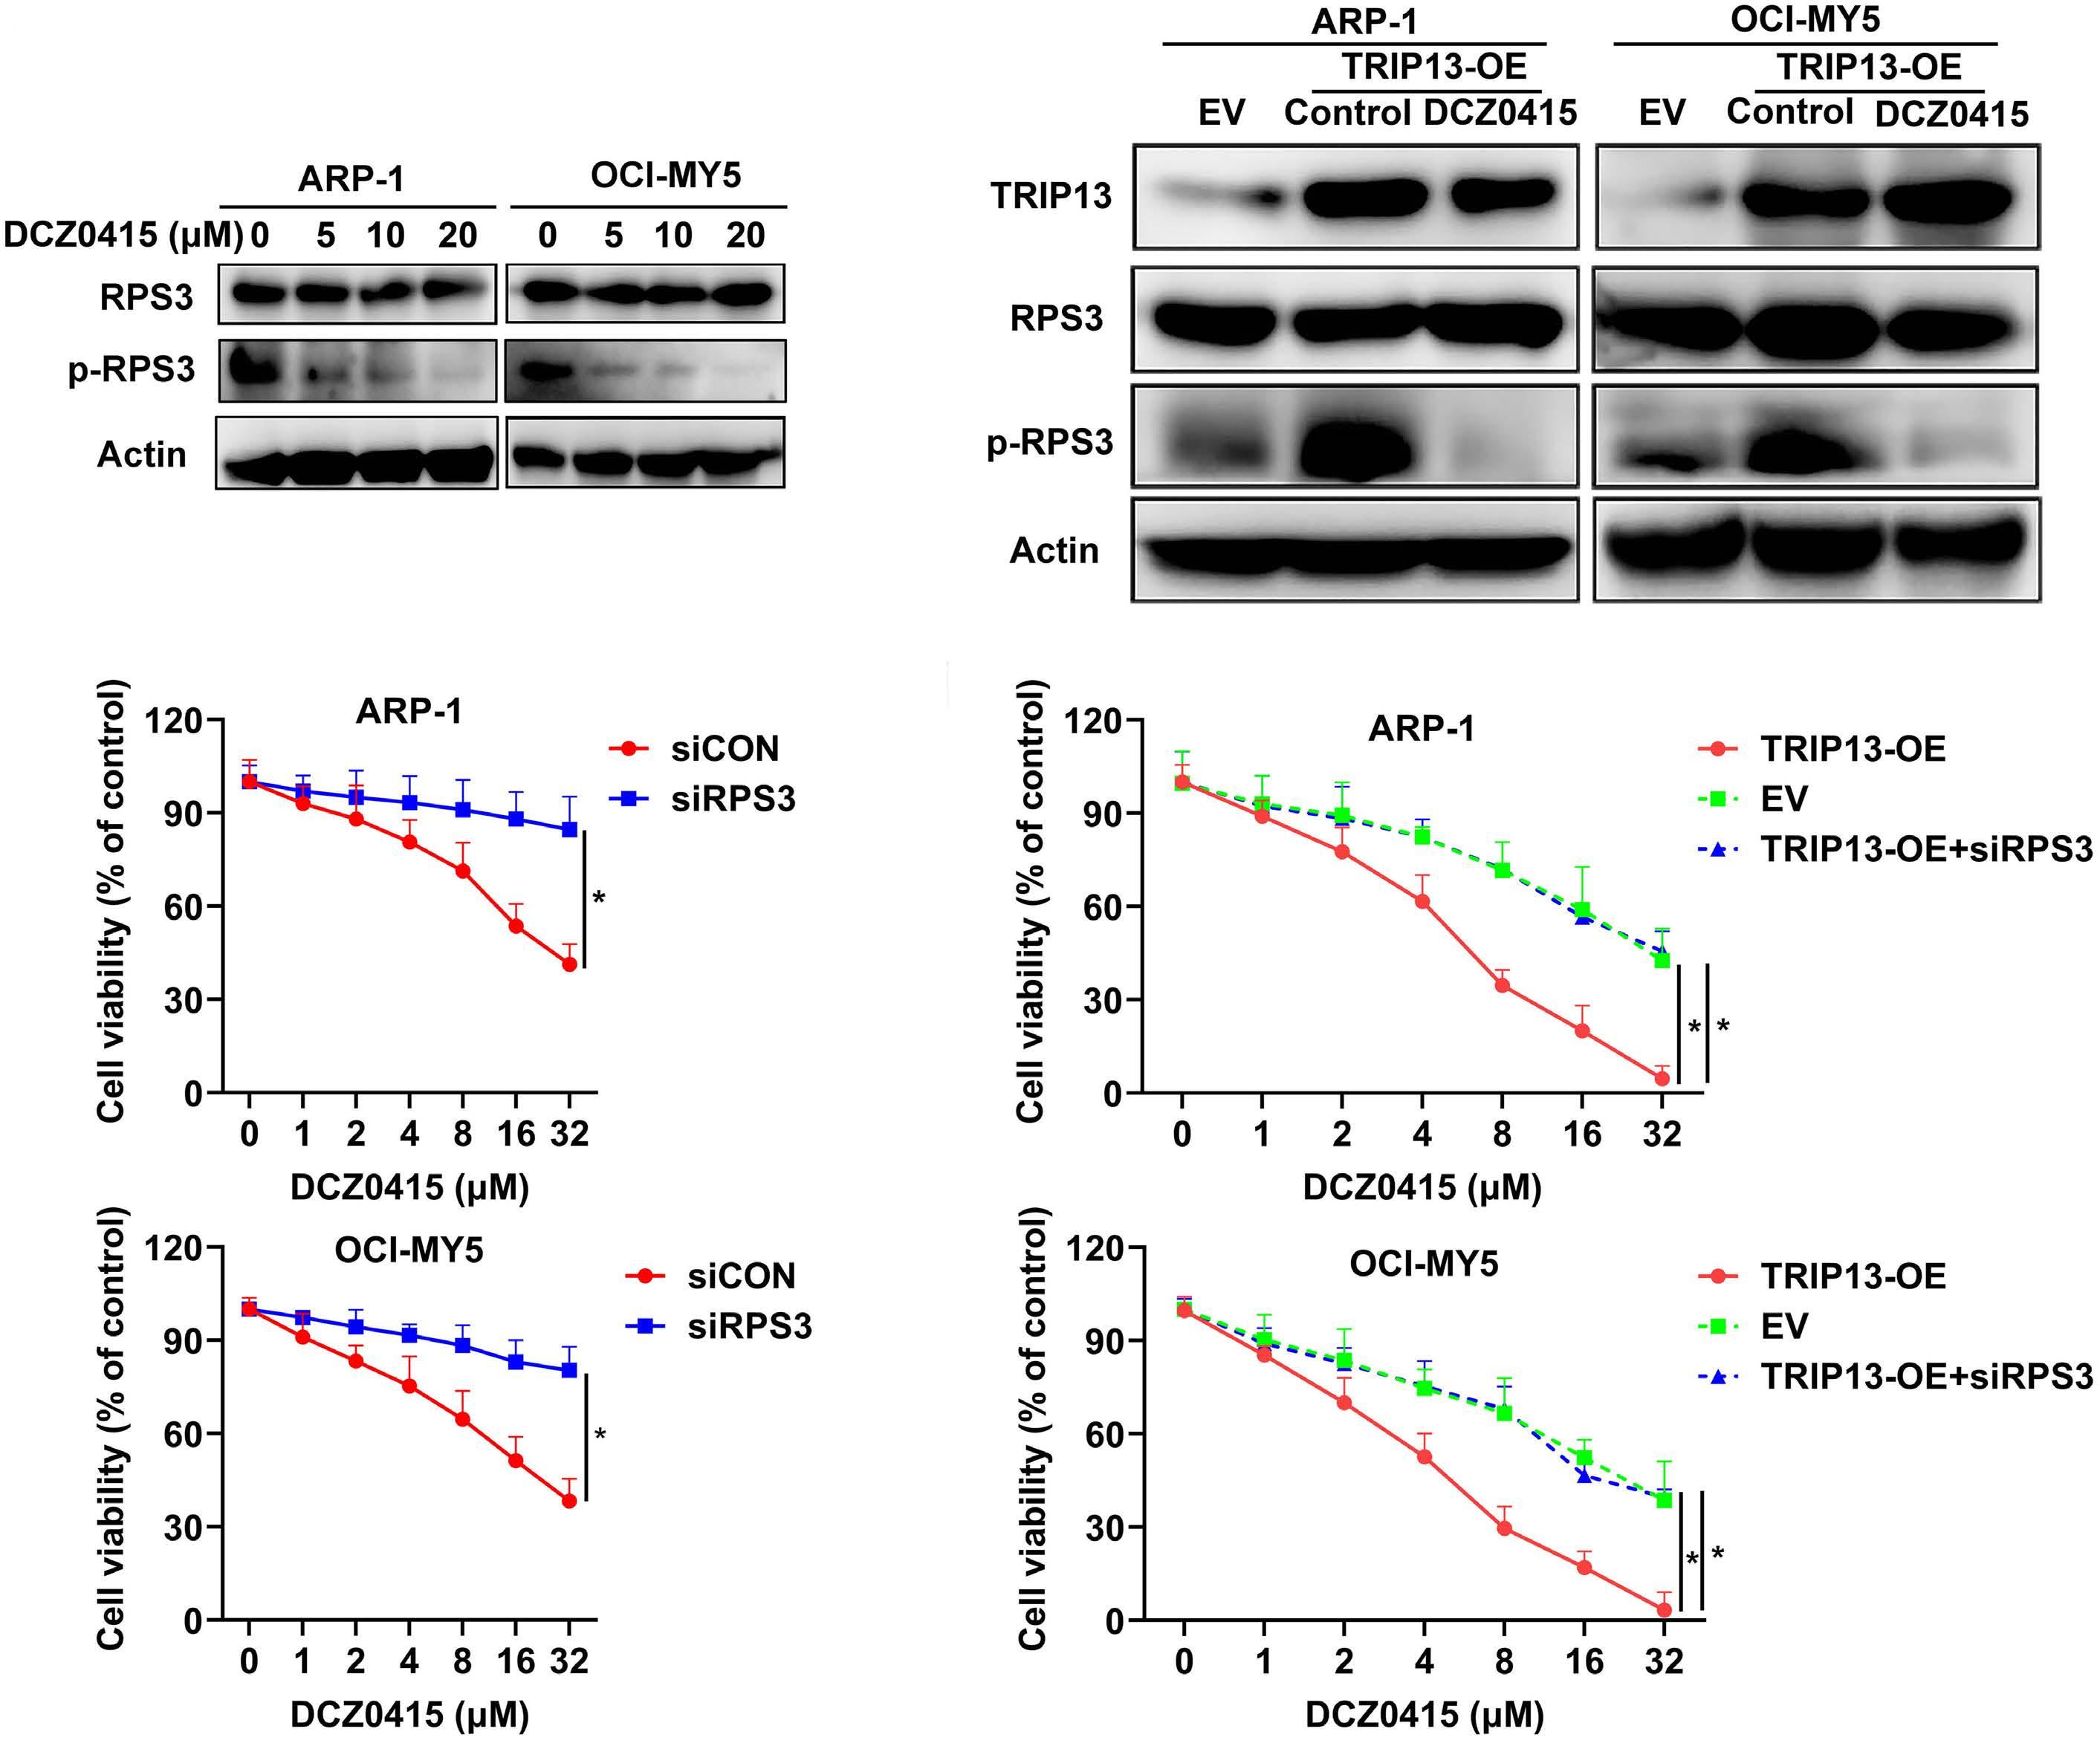
TRIP13-RPS3 axis. (A) Multiple myeloma (MM) cells (ARP-1 and OCI-MY5)
treated with increasing doses of DCZ0415 (0-20 µM) for 72 hours (h), followed by immunoblotting detection of RPS3 and p-RPS3 levels. Actin served as a loading control. (B) Empty vecotor (EV) or TRIP13-OE MM cells treated with or without DCZ0415, followed by immunoblotting detection of TRIP13, RPS3 and p-RPS3 levels. Actin served as a loading control. (C) MM cells (ARP-1 and OCI-MY5) transfected with siRPS3 or the corresponding control (siCON) were treated with increasing doses of DCZ0415 (0-32 µM) for 72 h, followed by CCK-8 assay analysis of cell viability. Data are shown as mean ± standard deviation with P value based on two-way ANOVA (N= 3, *P<0.05). (D) TRIP13-OE+siRPS3, TRIP13-OE+siCON, or the corresponding EV cells with increasing doses of DCZ0415 for 72 h, followed by CCK-8 assay analysis of cell viability. Data are shown as mean ± standard deviation with P value based on two-way ANOVA (N= 3, *P<0.05).
DCZ0415 (Online Supplementary Figure S6B, C). We further determined the effects of DCZ0415 in combination with bortezomib. Colony formation assay showed that bortezomib alone had no obvious effect on colony formation rates of BR cells, but treatment with bortezomib in combination with DCZ0415 had much lower colony formation rates than that of those treated with DCZ0415 or bortezomib alone (Online Supplementary Figure S6D), suggesting that DCZ0415 treatment resensitized BR MM cells. Additionally, the median dose effect analysis was used to calculate the CI values
between DCZ0415 and bortezomib. Interestingly, we found a high synergy between DCZ0415 and bortezomib, with the CI values <1 both in H929R and RPMI-8226R5 MM cells (Figure 7A). Additionally, immunoblotting showed that the combination of DCZ0415 and bortezomib induced an observable decrease in levels of p-IKKb and p-IκBα in both H929R and RPMI-8226R5 cells (Figure 7B). We also determined whether DCZ0415 treatment could enhance the sensitivity of BR MM cells to bortezomib in vivo by establishing a MM xenograft model using nude mice subcutaneously injected
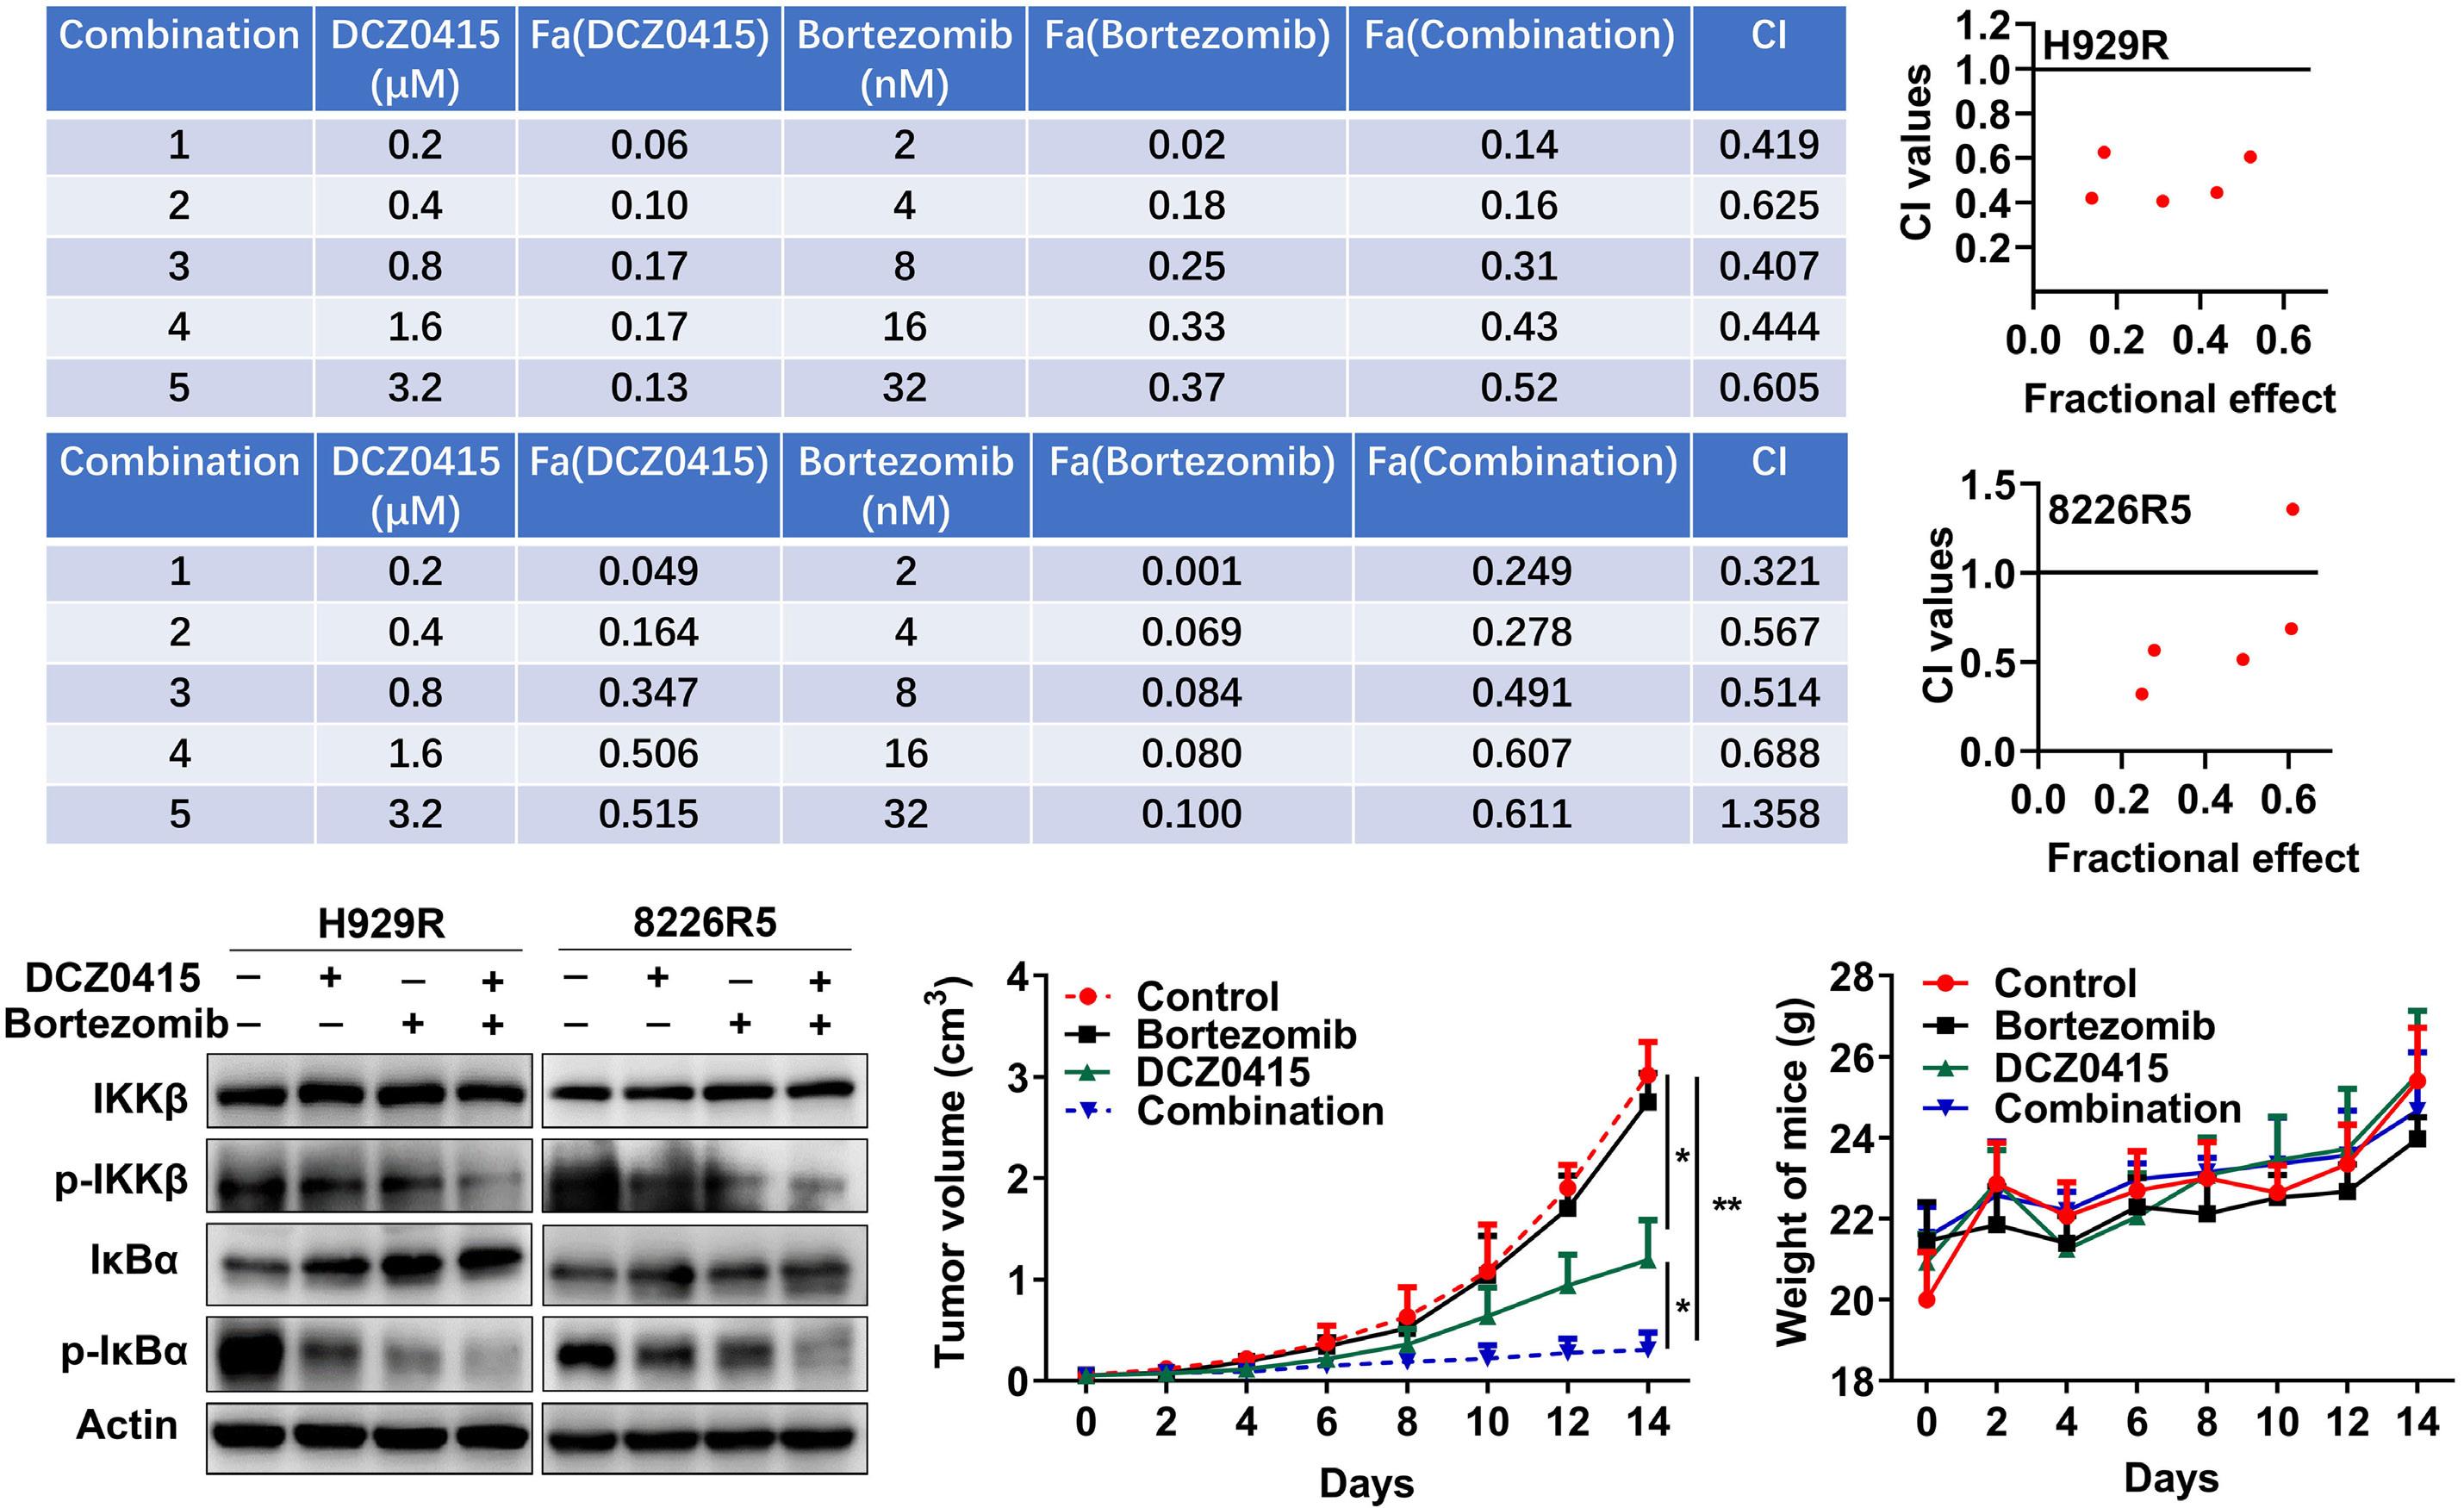
multiple myeloma cells in vitro and in vivo. (A) H929R (upper panel) and RPMI-8226R5 (lower
cells were treated with vehicle, bortezomib (2-32 nM), and DCZ0415 (0.2-3.2 µM) alone or in combination for 72 hours (h), followed by CCK-8 assay analysis of cell viability. Confidence interval (CI) values were calculated using the Chou–Talalay method (right panel). (B) Immunoblotting detection of the protein levels of IKKb, p-IKKb, IκBα, and p-IκBα in H929R (left panel) and RPMI-8226R5 (right panel) cells treated with the medium, bortezomib (20 nM), and DCZ0415 (10 µM) alone or in combination. (C, D) Nude mice bearing H929R multiple myeloma (MM) tumors were treated with vehicle, bortezomib (1 mg/kg, twice/week), and DCZ0415 (50 mg/kg, twice/week) alone or in combination. (C) Graphic represents curves of the tumor growth. Data are shown as mean ± standard deviation with P value based on two-way ANOVA (N=4, *P<0.05, **P<0.01). (D) Weight of mice.
with H929R cells. Consistent with the findings in vitro, we observed that DCZ0415 treatment was pivotal in re-sensitizing BR MM cells in vivo (Figure 7C; Online Supplementary Figure S6E, F). Meanwhile, the body weights of the mice had no significant difference among groups during treatment (Figure 7D). Moreover, immunohistochemistry and TUNEL assays showed that the co-administration of DCZ0415 and bortezomib induced a decrease in Ki-67 and an increase in apoptosis, compared with that in the vehicle, DCZ0415, or bortezomib alone (Online Supplementary Figure S6G).
The development of drug resistance is a clinical challenge observed in a variety of therapeutic approaches. Despite the establishment of novel therapeutic interventions, MM remains invariably incurable owing to the development of drug resistance and subsequent relapse.30
RPS3 can interact with the p65 subunit of NF-κB, thereby facilitating NF-κB binding to DNA and preferentially directing it to specific κB sites in the promoters of target genes.11,12 Other studies have shown that the inhibitor of κB kinase b (IKKb) can phosphorylate RPS3 at serine 209 and enhance the binding of phosphorylated RPS3 with importin-α, facilitating RPS3 entry into the nuclear transporter pathway.13 IKKb is the major kinase that phosphorylates IκBα, leading to its degradation from NF-κB complexes.12 The NF-κB dimers translocate into the nucleus, where they bind to specific DNA sites and activate the transcription of target genes.12 It has been reported that the secreted RPS3 protein is an indicator of some malignant tumors.14,31,32 RPS3 is capable of regulating melanoma cell growth and apoptosis by targeting Cyto C/Ca2+/MICU1-dependent mitochondrial signaling.32 Moreover, RPS3 is a key control point of radioresistance in glioblastoma and non-small cell lung cancer by promoting the repair of DNA damage.14,33 Here, we found for the first time that RPS3 was significantly overexpressed in MM, and
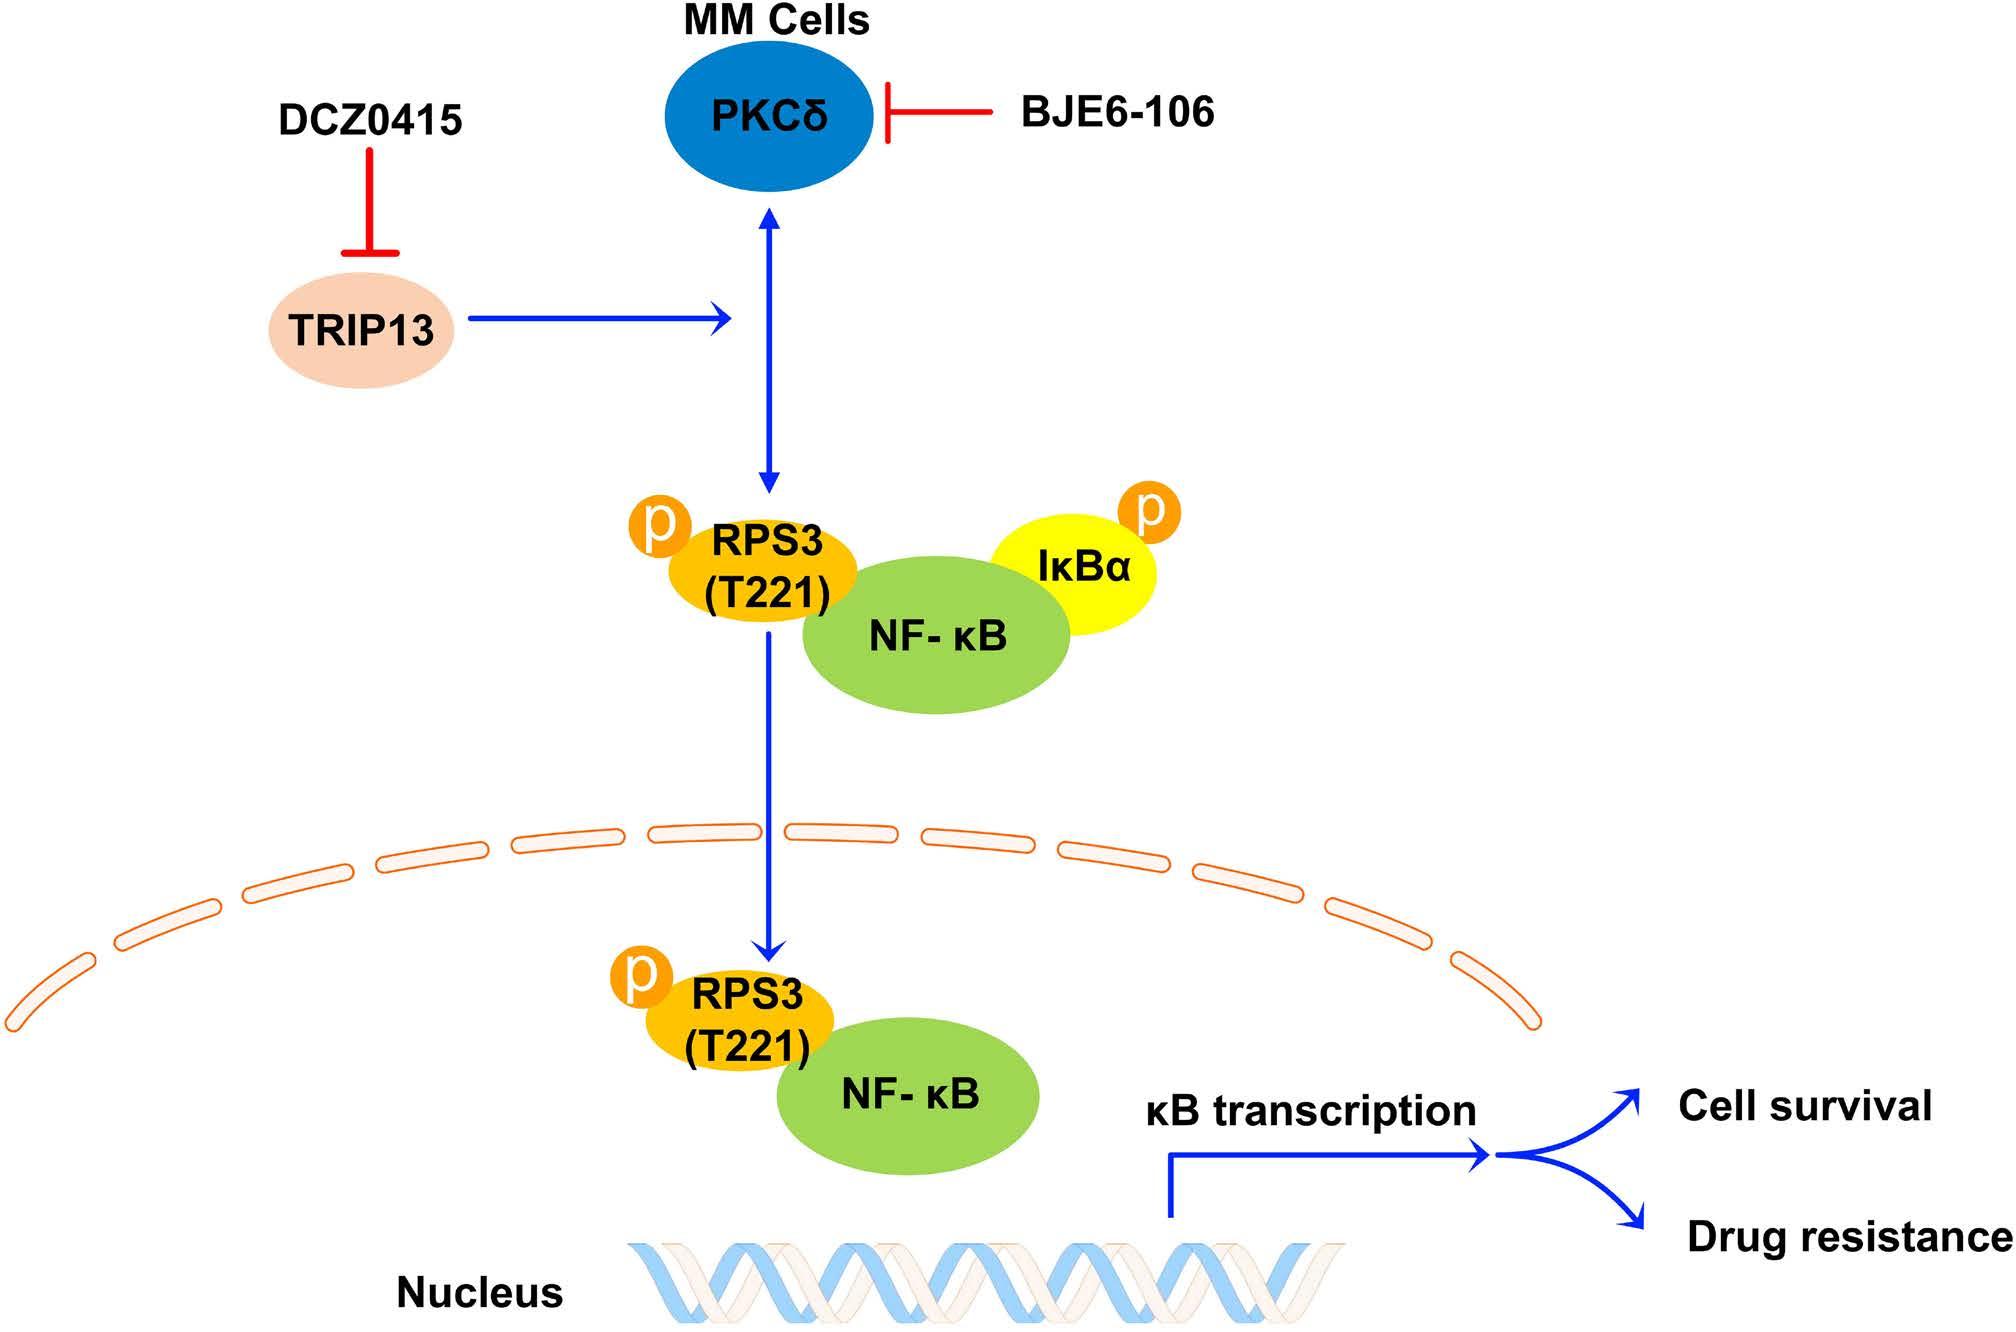
its overexpression status correlated with poor prognosis of patients with MM. The knockout of RPS3 could induce cell cycle arrest and cell apoptosis in MM. Importantly, overexpression of RPS3 could promote MM proliferation and confer proteasome inhibitor resistance to MM, as demonstrated in a mouse model which showed that RPS3 overexpression could significantly shorten survival even under the treatment of bortezomib. Our findings in the current study first demonstrate that RPS3 is closely associated with drug resistance and poor prognosis in MM. RPS3 could be a potential therapeutic target of MM. The small molecule inhibitors specifically targeting RPS3 could be developed for the treatment of MM and to overcome proteasome inhibitor resistance.
TRIP13 is identified as a driver of B-cell malignancies.15-17 We previously demonstrated that overexpression of TRIP13 is functionally linked to drug resistance of MM, and inhibition of TRIP13 can be an effective target for the treatment of MM.15,17 We also found that inhibition of TRIP13 could suppress the activation of NF-κB-dependent transcription.15 Moreover, many studies indicate that the NF-κB pathway is widely involved in mediating the progression and drug resistance in MM.34-36 Therefore, we hypothesized that TRIP13 could activate the NF-κB pathway in MM. In order to confirm this, we performed RNA-seq analysis and found that TRIP13 was positively correlated with the activation of NF-κB pathway. Moreover, results of immunoblotting and immunofluorescence suggested high expression of TRIP13 activated proteins involved in NF-κB signaling and an increase in the transfer of NF-κB p65 from cytoplasm to nucleus. In order to further investigate the specific mechanism of how TRIP13 activated the NF-κB pathway, we overlaid the list of proteins identified in the TRIP13 co-immunoprecipitation group from the LC-
δ/PRS3/ NF-κB
in multiple myeloma. RPS3 is necessary for multiple myeloma (MM) survival and drug resistance. TRIP13 acts as a mediator through binding PKCδ and RPS3 to promote the phosphorylation activation of RPS3 by PKCδ, which further activates canonical NF-κB signaling and inducing cell survival and drug resistance of MM. The inhibition of NF-κB signaling by DCZ0415, a small molecule inhibitor targeting TRIP13, is capable of overcoming drug resistance of MM cells.
MS/MS analysis. Of note, RPS3, a non-Rel subunit of NF-κB known to regulate several physiological processes, was first identified to interact with TRIP13 in our current study. In order to understand the regulatory mechanism between TRIP13 and RPS3, we performed a series of in vitro experiments and found no effect on the expression of RPS3 regardless of whether TRIP13 was overexpressed or knocked down. Studies have shown that post-translational modifications play important roles in regulating the various extraribosomal functions of RPS3.10 Specifically, the phosphorylation status of RPS3 can influence its binding function.10,12 Here, we demonstrate for the first time that RPS3 is hyperphosphorylated at threonine residues when TRIP13 is overexpressed, and T221 on RPS3 is identified as a specific site that was affected by TRIP13. However, TRIP13 itself has no kinase activity. In line with previous reports that PKCδ could phosphorylate RPS3 at T221 site,28,29 we observed that PKCδ was involved in the phosphorylation of RPS3 and the activation of NF-κB pathway in the context of TRIP13 overexpression. Additionally, selective inhibition of PKCδ could also overcome TRIP13-induced bortezomib resistance of MM. Overall, TRIP13 acts as a mediator through binding PKCδ and RPS3 to promote the phosphorylation activation of RPS3 by PKCδ, which further activates NF-κB signaling, including cell survival and drug resistance of MM (Figure 8). TRIP13 has been identified as an AAA-ATPase.22-24 Currently, the detailed mechanisms underlying the regulation of the TRIP13-RPS3 axis, including the role of TRIP13 ATP hydrolysis and other potential factors, are the focus of ongoing studies in our laboratory. We found that protein expression levels of TRIP13 and phosphorylated RPS3 in BR MM cells were significantly higher than that in bortezomib-sensitive ones. And we observed hyperactivation of the NF-κB pathway in drug-resistant cells.
It has been reported that MM cells hijack stromal cells to secrete cytokines to activate the NF-κB pathway, resulting in tumor growth and drug resistance.37 In our previous study, DCZ0415 acted as a small molecule inhibitor that could target TRIP13 and induce cell death by inhibiting the NF-κB signaling pathway.17 Intriguingly, we found in the current study that DCZ0415 significantly decreased levels of p-RPS3 in both MM cells and TRIP13-OE MM cells. Our previous paper demonstrated that the antimyeloma activity of DCZ0415 was dependent on TRIP13.17 In the current study, we observed that the knockout of RPS3 induced the loss of sensitivity MM cells to DCZ0415. Moreover, treatment of TRIP13-OE cells with DCZ0415 exhibited augmented cytotoxicity, while this effect was partially attenuated upon knockdown of RPS3. These findings indicate that DCZ0415 holds immense potential for drug-resistant MM, and the effects of DCZ0415 on drug-resistant cells is dependent on TRIP13-RPS3 axis. Our previous paper reported the antimyeloma activity of DCZ0415 in primary cells derived from drug-resistant patients with myeloma.17 The findings in current study provide additional insights into the significant role of DCZ0415 in synergistically enhancing the efficacy of bortezomib in drug-resistant MM both in vivo and in vitro, providing the preclinical framework for combination clinical trials. Mechanically, DCZ0415 combined with bortezomib had a potent role in suppressing the activation of the NF-κB pathway.
In conclusion, our current studies have identified a novel
1. van de Donk N, Pawlyn C, Yong KL. Multiple myeloma. Lancet. 2021;397(10272):410-427.
2. Cowan AJ, Green DJ, Kwok M, et al. Diagnosis and management of multiple myeloma: a review. JAMA. 2022;327(5):464-477.
3. Nishida H. Rapid progress in immunotherapies for multiple myeloma: an updated comprehensive review. Cancers (Basel). 2021;13(11):4.
4. Podar K, Leleu X. Relapsed/refractory multiple myeloma in 2020/2021 and beyond. Cancers (Basel). 2021;13(20):5.
5. Alagpulinsa DA, Szalat RE, Poznansky MC, Shmookler Reis RJ. Genomic instability in multiple myeloma. Trends Cancer. 2020;6(10):858-873.
6. Neri P, Bahlis NJ. Genomic instability in multiple myeloma: mechanisms and therapeutic implications. Expert Opin Biol Ther. 2013;13(Suppl 1):S69-82.
7 Mitterer V, Murat G, Rety S, et al. Sequential domain assembly of ribosomal protein S3 drives 40S subunit maturation. Nat Commun. 2016;7:10336.
8. Lee SB, Kwon IS, Park J, et al. Ribosomal protein S3, a new substrate of Akt, serves as a signal mediator between neuronal apoptosis and DNA repair. J Biol Chem. 2010;285(38):29457-29468.
9. Gao X, Hardwidge PR. Ribosomal protein s3: a multifunctional target of attaching/effacing bacterial pathogens. Front Microbiol. 2011;2:137.
10 Graifer D, Malygin A, Zharkov DO, Karpova G. Eukaryotic ribosomal protein S3: a constituent of translational machinery
role of TRIP13-PKCδ/PRS3 in consistently activating NF-κB during the development of resistance against proteasome inhibitor therapy in MM. This work raises the possibility and provides the first proof of concept in mouse models that targeting RPS3 in combination with the MM first-line therapeutic bortezomib may be a suitable way to overcome therapy resistance.38
No conflicts of interests to disclose.
JS, GC, XG and WZ designed the experiments, analyzed data and prepared the manuscript. GC, XJ, YW, L-X, DY, SC, H-D, K-H, GW, B-L, ZX, YL, HW, T-Z, DS, G-Y and XW performed the experiments. All authors discussed the results and approved the final version of the manuscript.
Funding
This work was supported by the grants from the National Natural Science Foundation of China (grant no. 82170200, 81900210, 82070224, 82000220 and 81971529); Shanghai Sailing Program, China (21YF1435000).
Data-sharing statement
Original data is available by contacting the corresponding authors.
and an extraribosomal player in various cellular processes. Biochimie. 2014;99:8-18.
11. Wan F, Anderson DE, Barnitz RA, et al. Ribosomal protein S3: a KH domain subunit in NF-kappaB complexes that mediates selective gene regulation. Cell. 2007;131(5):927-939.
12. Wan F, Lenardo MJ. The nuclear signaling of NF-kappaB: current knowledge, new insights, and future perspectives. Cell Res. 2010;20(1):24-33.
13. Wan F, Weaver A, Gao X, Bern M, Hardwidge PR, Lenardo MJ. IKKbeta phosphorylation regulates RPS3 nuclear translocation and NF-kappaB function during infection with Escherichia coli strain O157:H7. Nat Immunol. 2011;12(4):335-343.
14 Yang HJ, Youn H, Seong KM, Jin YW, Kim J, Youn B. Phosphorylation of ribosomal protein S3 and antiapoptotic TRAF2 protein mediates radioresistance in non-small cell lung cancer cells. J Biol Chem. 2013;288(5):2965-2975.
15. Tao Y, Yang G, Yang H, et al. TRIP13 impairs mitotic checkpoint surveillance and is associated with poor prognosis in multiple myeloma. Oncotarget. 2017;8(16):26718-26731.
16. Li C, Xia J, Franqui-Machin R, et al. TRIP13 modulates protein deubiquitination and accelerates tumor development and progression of B cell malignancies. J Clin Invest. 2021;131(14):e146893.
17 Wang Y, Huang J, Li B, et al. A small-molecule inhibitor targeting TRIP13 suppresses multiple myeloma progression. Cancer Res. 2020;80(3):536-548.
18. Lan J, Huang J, Tao X, et al. Evaluation of the TRIP13 level in
breast cancer and insights into potential molecular pathways. J Cell Mol Med. 2022;26(9):2673-2685.
19 Sheng N, Yan L, Wu K, et al. TRIP13 promotes tumor growth and is associated with poor prognosis in colorectal cancer. Cell Death Dis. 2018;9(3):402.
20 Li W, Zhang G, Li X, et al. Thyroid hormone receptor interactor 13 (TRIP13) overexpression associated with tumor progression and poor prognosis in lung adenocarcinoma. Biochem Biophys Res Commun. 2018;499(3):416-424.
21. Banerjee R, Russo N, Liu M, et al. TRIP13 promotes error-prone nonhomologous end joining and induces chemoresistance in head and neck cancer. Nat Commun. 2014;5:4527.
22. Alfieri C, Chang L, Barford D. Mechanism for remodelling of the cell cycle checkpoint protein MAD2 by the ATPase TRIP13. Nature. 2018;559(7713):274-278.
23. Ye Q, Rosenberg SC, Moeller A, Speir JA, Su TY, Corbett KD. TRIP13 is a protein-remodeling AAA+ ATPase that catalyzes MAD2 conformation switching. Elife. 2015;4:e07367.
24. Sarangi P, Clairmont CS, Galli LD, Moreau LA, D’Andrea AD. p31(comet) promotes homologous recombination by inactivating REV7 through the TRIP13 ATPase. Proc Natl Acad Sci U S A. 2020;117(43):26795-26803.
25. Hu L, Li B, Chen G, et al. A novel M phase blocker, DCZ3301 enhances the sensitivity of bortezomib in resistant multiple myeloma through DNA damage and mitotic catastrophe. J Exp Clin Cancer Res. 2020;39(1):105.
26. Xie Y, Wang Y, Xu Z, et al. Preclinical validation and phase I trial of 4-hydroxysalicylanilide, targeting ribonucleotide reductase mediated dNTP synthesis in multiple myeloma. J Biomed Sci. 2022;29(1):32.
27. Chen G, Hu K, Sun H, et al. A novel phosphoramide compound, DCZ0847, displays in vitro and in vivo anti-myeloma activity, alone or in combination with bortezomib. Cancer Lett.
2020;478:45-55.
28. Kim TS, Kim HD, Kim J. PKCdelta-dependent functional switch of rpS3 between translation and DNA repair. Biochim Biophys Acta. 2009;1793(2):395-405.
29 Kim TS, Kim HD, Shin HS, Kim J. Phosphorylation status of nuclear ribosomal protein S3 is reciprocally regulated by protein kinase Cdelta and protein phosphatase 2A. J Biol Chem. 2009;284(32):21201-21208.
30. Robak P, Drozdz I, Szemraj J, Robak T. Drug resistance in multiple myeloma. Cancer Treat Rev. 2018;70:199-208.
31. Nagao-Kitamoto H, Setoguchi T, Kitamoto S, et al. Ribosomal protein S3 regulates GLI2-mediated osteosarcoma invasion. Cancer Lett. 2015;356(2 Pt B):855-861.
32. Tian Y, Qin L, Qiu H, et al. RPS3 regulates melanoma cell growth and apoptosis by targeting Cyto C/Ca2+/MICU1 dependent mitochondrial signaling. Oncotarget. 2015;6(30):29614-29625.
33. Kim W, Youn H, Lee S, et al. RNF138-mediated ubiquitination of rpS3 is required for resistance of glioblastoma cells to radiation-induced apoptosis. Exp Mol Med. 2018;50(1):e434.
34 Baud V, Karin M. Is NF-kappaB a good target for cancer therapy? Hopes and pitfalls. Nat Rev Drug Discov. 2009;8(1):33-40.
35. Vrabel D, Pour L, Sevcikova S. The impact of NF-kappaB signaling on pathogenesis and current treatment strategies in multiple myeloma. Blood Rev. 2019;34:56-66.
36. Vo JN, Wu YM, Mishler J, et al. The genetic heterogeneity and drug resistance mechanisms of relapsed refractory multiple myeloma. Nat Commun. 2022;13(1):3750.
37. Fabre C, Mimura N, Bobb K, et al. Dual inhibition of canonical and noncanonical NF-kappaB pathways demonstrates significant antitumor activities in multiple myeloma. Clin Cancer Res. 2012;18(17):4669-4681.
38. Moreau P, Richardson PG, Cavo M, et al. Proteasome inhibitors in multiple myeloma: 10 years later. Blood. 2012;120(5):947-959.
Single-cell analysis of the CD8+ T-cell compartment in multiple myeloma reveals disease specific changes are chiefly restricted to a CD69- subset suggesting potent cytotoxic effectors exist within the tumor bed
James Favaloro,1,2* Christian E. Bryant,1,3* Edward Abadir,1,3 Samuel Gardiner,4 Shihong Yang,1 Tracy King,1,3 Najah Nassif,2 Lisa M. Sedger,5,6 Richard Boyle,7 Douglas E. Joshua1,3 and P. Joy Ho1,2,3
1Institute of Hematology, Multiple Myeloma Research Laboratory, New South Wales Health Pathology, Royal Prince Alfred Hospital, Camperdown; 2School of Life Sciences, University of Technology Sydney, Ultimo, Sydney; 3Sydney Medical School, the University of Sydney, Sydney; 4Sydney Local Health District Clinical Research Institute, Royal Prince Alfred Hospital, Camperdown; 5Institute for Clinical Pathology and Medical Research (ICPMR), New South Wales Health Pathology, Westmead Hospital, Westemead; 6Center for Virus Research, Westmead Institute for Medical Research, Westmead and New South Wales, Sydney and 7Orthopedics Department, Sydney Local Health District, Royal Prince Alfred Hospital, Camperdown, New South Wales, Australia
*JF and CEB contributed equally as first authors.
Correspondence: J. Favaloro james.favaloro@health.nsw.gov.au
C.E. Bryant christian.bryant@health.nsw.gov.au.
Received: May 14, 2023.
Accepted: September 28, 2023.
Early view: October 5, 2023.
https://doi.org/10.3324/haematol.2023.283062
©2024 Ferrata Storti Foundation
Published under a CC BY-NC license
Multiple myeloma (MM) is an incurable disease of the bone marrow (BM) characterized by the uncontrolled proliferation of neoplastic plasma cells. While CD8+ T cells have an established role in disease control, few studies have focused on these cells within the MM tumor microenvironment (TME). We analyzed CD8+ T cells in the BM and peripheral blood (PB) of untreated patients with MM and non-myeloma controls using flow cytometry, mass cytometry and single-cell RNA sequencing, using several novel bioinformatics workflows. Inter-tissue differences were most evident in the differential expression of Granzymes B and K, which were strongly associated with two distinct subsets of CD8+ T cells delineated by the expression of CD69, accounting for roughly 50% of BM-CD8+ T cells of all assessed cohorts. While few differences were observable between health and disease in the BM-restricted CD8CD69+ T-cell subset, the CD8+CD69- T-cell subset in the BM of untreated MM patients demonstrated increased representation of highly differentiated effector cells and evident compositional parallels between the PB, absent in age-matched controls, where a marked reduction of effector cells was observed. We demonstrate the transcriptional signature of BM-CD8+ T cells from patients with MM more closely resembles TCR-activated CD8+ T cells from age-matched controls than their resting counterparts.
Multiple myeloma (MM) is an incurable disease of the bone marrow (BM). It is preceded by the premalignant stage monoclonal gammopathy of undetermined significance (MGUS) and is characterized by the uncontrolled proliferation of neoplastic plasma cells (PC).1 Healthy BM is a heterogeneous tissue that is highly vascularized and the site of hematopoiesis.2 The BM acts as a reservoir of antigen-experienced CD8+ tissue-resident memory T cells
(TRM)3 and long-lived PC.4 MM has an established detrimental effect on this compartment,5 as the BM transforms to an increasingly hypoxic, inflammatory, myeloma-promotive tumor microenvironment (TME), non-conducive to normal homeostasis.6
Substantial evidence exists to support the concept that CD8+ T cells play an important role in disease control.7 We have previously shown that T-cell receptor (TCR) Vb restricted terminally differentiated CD8+ T-cell (TTE) clonal expansions are detectable in the peripheral blood (PB) of
patients with MM and their presence correlates with improved patient outcomes.8 These cells have a senescent secretory effector phenotype,9 including low levels of programmed cell death protein 1 (PD-1), which may in part explain the poor results with anti-PD-1 monotherapy.10 T cells circulate between the BM and PB, and in MM, cells entering the TME are exposed to myeloma-associated antigens.11 Recently, we demonstrated that clonally expanded TCRVb restricted CD8+ TTE, capable of exerting specific killing of autologous MM cells in vitro, are detectable in the BM of several patients.12 Despite this, the effect of the TME on these crucial effectors, as well as the plethora of other CD8+ T-cell subsets has not been investigated indepth. Thus, a comprehensive analysis of CD8+ T cells in the BM and PB of patients with MM may permit a greater understanding of disease and the host immune response. In this study, we analyzed CD8+ T cells in the BM and PB of age-matched controls, premalignant MGUS, and untreated, newly diagnosed (ND) patients with MM using flow cytometry, mass cytometry and single-cell RNA sequencing (scRNA-Seq). We show that CD8+ T cells from the BM of all subjects can be divided based on the expression of CD69 and these cells demonstrate unique, disease-associated Granzyme expression patterns. We further show the transcriptional signature of BM-CD8+ T cells from patients with MM resemble TCR-activated CD8+ T cells from agematched controls.
MGUS and NDMM patients, diagnosed by the International Myeloma Working Group criteria, were recruited through the Department of Hematology, Royal Prince Alfred Hospital (RPAH). Age-matched controls without diagnosed malignancy or active infection, undergoing hip arthroplasty were recruited through the Department of Orthopedic Surgery, RPAH. Characteristics of patients and controls are summarized in Table 1. Paired BM and PB samples were collected and analyzed by mass cytometry, flow cytometry or scRNAseq. The study was approved by the Institutional Human Research Ethics Committee. All patients provided informed consent before sample collection, following the amended Declaration of Helsinki.
Purified CD8+ cells were isolated from cryopreserved samples through a two-stage enrichment using a human CD8+ T-cell Isolation kit (Miltenyi Biotech) followed by FACS sorting as CD45+CD8+CD4-CD56- cells on a BD FACS Aria II. Single cells were encapsulated for cDNA synthesis and barcoded using the Chromium Single-cell 5′ V(D)J Reagent kit v1.1 (10x Genomics) followed by library construction according to the manufacturer’s recommendations. Libraries were sequenced on an Illumina NovaSeq 6000 (NovaSeq Control
NDMM: newly diagnosed multiple myeloma; MGUS: monoclonal gammopathy of undetermined significance; FISH: fluorescence in situ hybridization; IgA: immunoglobulin A; IgG: immunoglobulin G; R-ISS: Revised International Staging System; LDH: lactate dehydrogenase; N/A: not applicable.
Software v.1.6.0 / Real-Time Analysis v.3.4.4) using a NovaSeq S4 reagent kit (Illumina). Bioinformatics analysis is detailed in the Online Supplementary Appendix.
Flow cytometry was performed with monoclonal antibodies (mAb) targeting surface antigens (Online Supplementary Table S1), fixed and permeabilized using either fixation/ permeabilization buffer (BD Biosciences) for assessment of intracellular cytokines or Foxp3/Transcription Factor Staining Buffer Set (Thermo-Fisher Scientific) for assessment of transcription factors, then stained with mAb specific to intracellular proteins Granzyme B, Granzyme K and Perforin in perm/wash buffer (BD Biosciences) or TCF-1 in permeabilization buffer (Thermo-Fisher Scientific). Analysis of flow cytometry data was performed using FlowJo (Version 10.8.1, BD Biosciences). Mass cytometry utilized an expanded panel of antibodies (Online Supplementary Table S2) and is detailed in the Online Supplementary Appendix. Gating of T-cell subsets followed our previously defined approach (Online Supplementary Figure S1).
The non-parametric Mann-Whitney U and the Wilcoxon Signed Rank test were used to compare unpaired and paired data sets respectively. Statistical significance was determined at P<0.05 for all statistical analyses and was performed using GraphPad Prism version 9.01 (GraphPad Software) or R (v. 4.2.1 [see Online Supplementary Appendix]).
Unsupervised clustering reveals an unequal distribution of memory, effector and naïve-like subsets in the bone marrow and peripheral blood of newly diagnosed multiple myeloma patients
Although CD8+ T cells are well documented to contribute to disease control in MM,7 the effect of the TME on these cells is poorly understood. We constructed a transcriptomic map of CD8+ T cells purified from the BM and PB of newly diagnosed multiple myeloma (NDMM) patients using the 10x genomics platform (Online Supplementary Figure S2A). After strict quality control (QC), we recovered transcriptional data from an average of 6,929 cells from paired BM and PB samples and an average of 1,146 genes and 3,317 unique molecular identifiers (Online Supplementary Table S3). Unsupervised clustering in an integrated analysis revealed six clusters (Figure 1Ai), with broad differences between BM and PB samples observable on Uniform Manifold Approximation and Projection (UMAP), with PB cells containing a more prominent terminal effector population than those from BM (Figure 1Aii). Canonical transcriptional signatures, assisted by the cell type identification R package “SingleR”, in conjunction with reference datasets, permitted annota-
tion of clusters (Figure 1B; Online Supplementary Table S4). The dominant cluster was representative of activated and/ or stressed CD8+ effector memory T cells (TEM), defined by the expression GZMK, several AP-1 associated genes: DUSP2, JUN, DUSP1, JUNB and FOS, and activation markers CD69 and CD74, in addition to reduced expression of genes associated with naïve T cells (TN) and central memory T cells (TCM) (i.e., SELL, LTB, CCR7 and IL7R). The second most dominant cluster, representative of CD8+ TTE was characterized by genes associated primarily with cytotoxicity: GNLY, GZMB, NKG7, PRF1 and LGALS1, in addition to reduced expression of genes that defined both the dominant TEM cluster and smaller TN and TCM clusters. The TN cluster was identified by genes associated with cell homing, metabolism and stemness: SELL, LTB, CCR7, and TCF7 and reduced expression of genes associated with TEM and TTE. Beyond the three major clusters, three smaller clusters were identified: (i) the first comprising a mixture of cytotoxic cells characterized by expression of GZMA, KLRB1 and KLRD1 and reduced expression of naïve-associated genes was designated as a cytotoxic memory cluster (Cyto-TEM); (ii) a small cluster characterized by higher than average levels of five genes associated with chemotaxis: CCL4, CCL3, CCL4L2, XCL2 and XCL1 shares features of recently defined pre-exhausted T cells (PREEX);13 (iii) the smallest cluster shared many features with TN, additionally expressed high levels of IL7R and LGALS3 and clustered between the larger TN and TEM clusters and was deemed to represent TCM.
The first three clusters accounted for more than 75% of all cells from both the BM and PB. However, differences in cluster distribution were evident: the dominant TEM cluster as well as TN and PRE-EX clusters were enriched in the BM, whereas the TTE cluster predominated the PB (Figure 1C). Single-cell gene set enrichment analysis (sc-GSEA) revealed enrichment towards the hallmark gene sets of hypoxia and tissue necrosis factor (TNF) α signaling via nuclear factor (NF)-κb in all but the TN and TCM clusters in the BM as compared to the PB (Online Supplementary Figure S2B), most evident in the dominant TEM subset, but did not demonstrate overt inter-tissue differences with regards to other signaling or metabolic pathways (Online Supplementary Table S5).
An unsupervised, high-dimensional approach reveals inter-tissue differences highlighted by distinct Granzyme expression patterns
Inter-tissue differences were evident when stratifying clusters by the level of gene expression (Figure 2A; Online Supplementary Table S6), mainly restricted to genes that defined the TEM and TTE subsets (Online Supplementary Figure S2C), reflecting the compositional differences between these two tissue compartments. Although the TN, TCM and TTE clusters demonstrated little to distinguish between BM and PB, BM-CD8+ TEM demonstrated a greater level of both gene expression and proportion of cells expressing all genes that defined the cluster, except for CD74 which was comparable
T-cell clusters found through unsupervised clustering. (A) Uniform Manifold Approximation and Projection (UMAP) of identified clusters. After stringent quality control (detailed in the Online Supplementary Appendix) revealed poor quality data for 2 bone marrow (BM) samples (excluded from further analysis), Seurat clustered CD8+ T cells from paired BM and peripheral blood (PB) of newly diagnosed multiple myeloma (NDMM) patients (N=2) into 6 clusters. Each dot represents a single cell colored according to (i) cluster or (ii) tissue compartment (BM = blue, PB = red). (B) Single-cell heat map illustrating transcriptional heterogeneity of CD8+ T cells. Each vertical line represents a single cell demonstrating the expression level, relative to the average expression level (upregulated = yellow, downregulated = purple) of the top 10 unique genes (y-axis) contributing to the transcriptional signature of each of the 6 identified clusters arranged by size of cluster (colored) and tissue (BM = blue, PB = red). (C) Bar plot quantifying cluster distribution. Quantification of the number of cells (y-axis) contributing to each identified cluster (color) from each of the contributing samples (x-axis). TEM: effector memory T cells; TTE: terminally differentiated CD8+ T cells; TN: naive T cells; Cyto TEM: cytotoxic effector memory T cells; PRE EX: pre-exhausted T cells; TCM: central memory T cells.
between the two tissues (Figure 2A; Online Supplementary Figure S2C). While the Cyto TEM and PRE EX clusters appear ontologically related, both showed marked differences between the BM and PB, with cells from BM co-expressing high levels of genes that defined the TEM cluster and PB cells co-expressing genes that defined the TTE cluster (Figure 2A; Online Supplementary Figure S2C). Quantification of the five human Granzymes revealed that while GZMA, GZMH and
GZMM were similar between clusters within the BM and PB (Online Supplementary Figure S2D), GZMK was largely restricted to the BM and GZMB to the PB, with the exceptions of the PB TEM and BM TTE clusters respectively, which are non-dominant clusters in the PB and BM respectively (Figure 2B). Overlaying expression of several cluster-defining genes revealed a high level of co-expression of CD69 and GZMK, largely restricted to the BM, while co-expression of
PRF1 demonstrated no overlap with GZMK but a high degree of overlap with GZMB, particularly in the PB (Figure 2C).
Flow cytometry was performed on paired BM and PB samples from NDMM patients and age-matched controls (N=12)
to both determine if the same patterns observed in gene expression were reflected in protein expression and to query the effect of disease. CD69 protein expression was restricted to cells from the BM, with a small but not significant reduction in the proportion of CD8+ T cells expressing CD69 in NDMM patients relative to age-matched controls
to the same cluster in the opposing tissue (solid = upregulated,
= downregulated). (B) Violin plots showing expression levels (y-axis) of GZMB (top) and GZMK (bottom)
of GZMB in the TTE
by tissue (BM = blue, PB = red). The box highlights similar
(C) Uniform Manifold Approximation and Projection (UMAP) highlighting co-expression of Granzyme B and Granzyme K (orange) with CD69 and Perforin (green) in the BM (top) and PB (bottom). Boxes highlight clusters with high levels of co-expression (yellow). TEM: effector memory T cells; TTE: terminally differentiated CD8+ T
(medians 41.4% and 53.8%; P=not significant [NS]) (Figure 3A; Online Supplementary Figure S3A). Canonical subset distribution across the two broad subsets within the BM demonstrated a reduction in TN (medians 12.3% and 28.4%; P=NS), and a significant decrease in TCM (medians 20.6%
and 27.6%; P=0.0449), mirrored by a significant increase in TTE (medians 30.4% and 10.6%; P=0.0023) in the CD8+CD69subset in NDMM patients relative to age-match controls, but no differences in the proportion of TEM (Figure 3Bi). In contrast, the CD8+ TEM subset accounted for the majority of
(circles;
age-matched controls (square; N=12) and
canonical CD8+ T-cell subsets in the broad BM-CD8+CD69- (i, open shapes) and BM-CD8+CD69+ (ii, solid shapes) subsets of age-matched controls (squares; N=12) and NDMM patients (circles; N=12). (C)
Granzyme B (top), Granzyme K (middle) or Granzyme B-/K- (bottom) in (i) PB-CD8+ (left; hollow red), (ii) BM-CD8+CD69-, (middle; hollow blue) and (iii) BM-CD8+CD69+, (right; solid blue) of age-matched controls (squares; N=6) and NDMM patients (circles; N=6). (D) Median fluorescence intensity (MFI) of Perforin expression across the Granzyme B+ (top) Granzyme B+/K+ (middle) or Granzyme K+ (bottom) subsets in (i) BM-CD8+CD69- (left; hollow blue) and (ii) BM-CD8+CD69+ (right; solid blue) of age-matched controls (squares; N=6) and NDMM patients (circles; N=6). Significance levels: *P<0.05, **P<0.01; Mann-Whitney U test. NS: not significant; TEM: effector memory T cells; TTE: terminally differentiated CD8+ T cells; TN: naive T cells; TCM: central memory T cells.
all CD8+CD69+ cells, however, no significant differences were observed between patient cohorts in any subset (Figure 3Bii). Contrasting the transcriptional assessment where cells expressed either GZMB or GZMK, flow cytometry revealed co-expression of both Granzyme B and Granzyme K in both NDMM patients and age-matched controls (Online Supplementary Figure S3A). NDMM patients demonstrated a significant increase in the proportion of both BM-CD8+CD69(median 64.3 vs. 18.7%; P=0.022) and PB-CD8+ T cells (median 64.0 vs. 32.5%; P=0.0087) expressing Granzyme B compared to age-matched controls, paralleled by significantly fewer Granzyme-negative cells in these two subsets (median 21.5 vs. 49.8%; P=0.022) (median 19.0 vs. 44.5%; P=0.0152) (Figure 3Ci, ii). Further, Granzyme B expression patterns in the BMCD8+CD69- subset of NDMM patients mimicked expression patterns observed in the PB closer than age-matched controls (average ratio of BM-CD8+CD69-: PB-CD8+: 1.01 vs. 0.36 NDMM patients vs. age-matched controls; P=0.026) (Online Supplementary Figure S3B). In contrast, while Granzyme K was largely restricted to the BM-CD69+ subset (though not exclusive), the expression did not differ between health and disease (Figure 3Ciii). Overall, while marked differences in Granzyme expression patterns were observable between patient cohorts in both the PB-CD8+ (Online Supplementary Figure S3Ci) and BM-CD8+CD69- subsets (Online Supplementary Figure S3Cii), the BM-CD8+CD69+ subset appeared almost identical (Online Supplementary Figure S3C iii). Compositional alterations of the BM-CD8+CD69- subset in MM were further reinforced by analysis of canonical subset
distribution, where a significant difference (P=0.0312) in the distribution of TTE was observable between the two BM subsets in NDMM, but not in age-matched controls (Online Supplementary Figure S3D).
In keeping with compositional similarities of Granzyme expression, perforin expression in the BM-CD8+CD69- subset appeared to mimic that observed in the PB in NDMM patients, but not age-matched controls (Figure 3D; Online Supplementary Figure S4A). While perforin expression was higher in all Granzyme subsets in the PB-CD8+ subset of NDMM patients (Online Supplementary Figure S4B), it was significantly higher in Granzyme B-expressing cells in the BMCD8+CD69- subset (Figure 3Di); applying to both Granzyme B single positive (average median fluorescence intensity [ave. MFI] 5,907 vs. 2,567; P=0.0411) and Granzyme B+/K+ (ave. MFI 1,590 vs. 699; P=0.0158) cells. Although BM-CD8+CD69+GZB+T cells consisted of only a minority of cells in both cohorts, NDMM patients again demonstrated a marked increase in perforin expression compared to age-matched controls (ave. MFI 377 vs. 2,175; P=0.0087) (Figure 3Dii).
Mass cytometry demonstrates CD8+CD69⁺ effector memory T cells are phenotypically restrained relative to their CD69- counterparts
In order to obtain a more comprehensive phenotype, and further interrogate the effect of the microenvironment on the BM-dominant TEM subset, we performed FlowSOM analysis14 of paired BM and PB samples from MGUS and NDMM patients. This revealed four metaclusters enriched in the BM
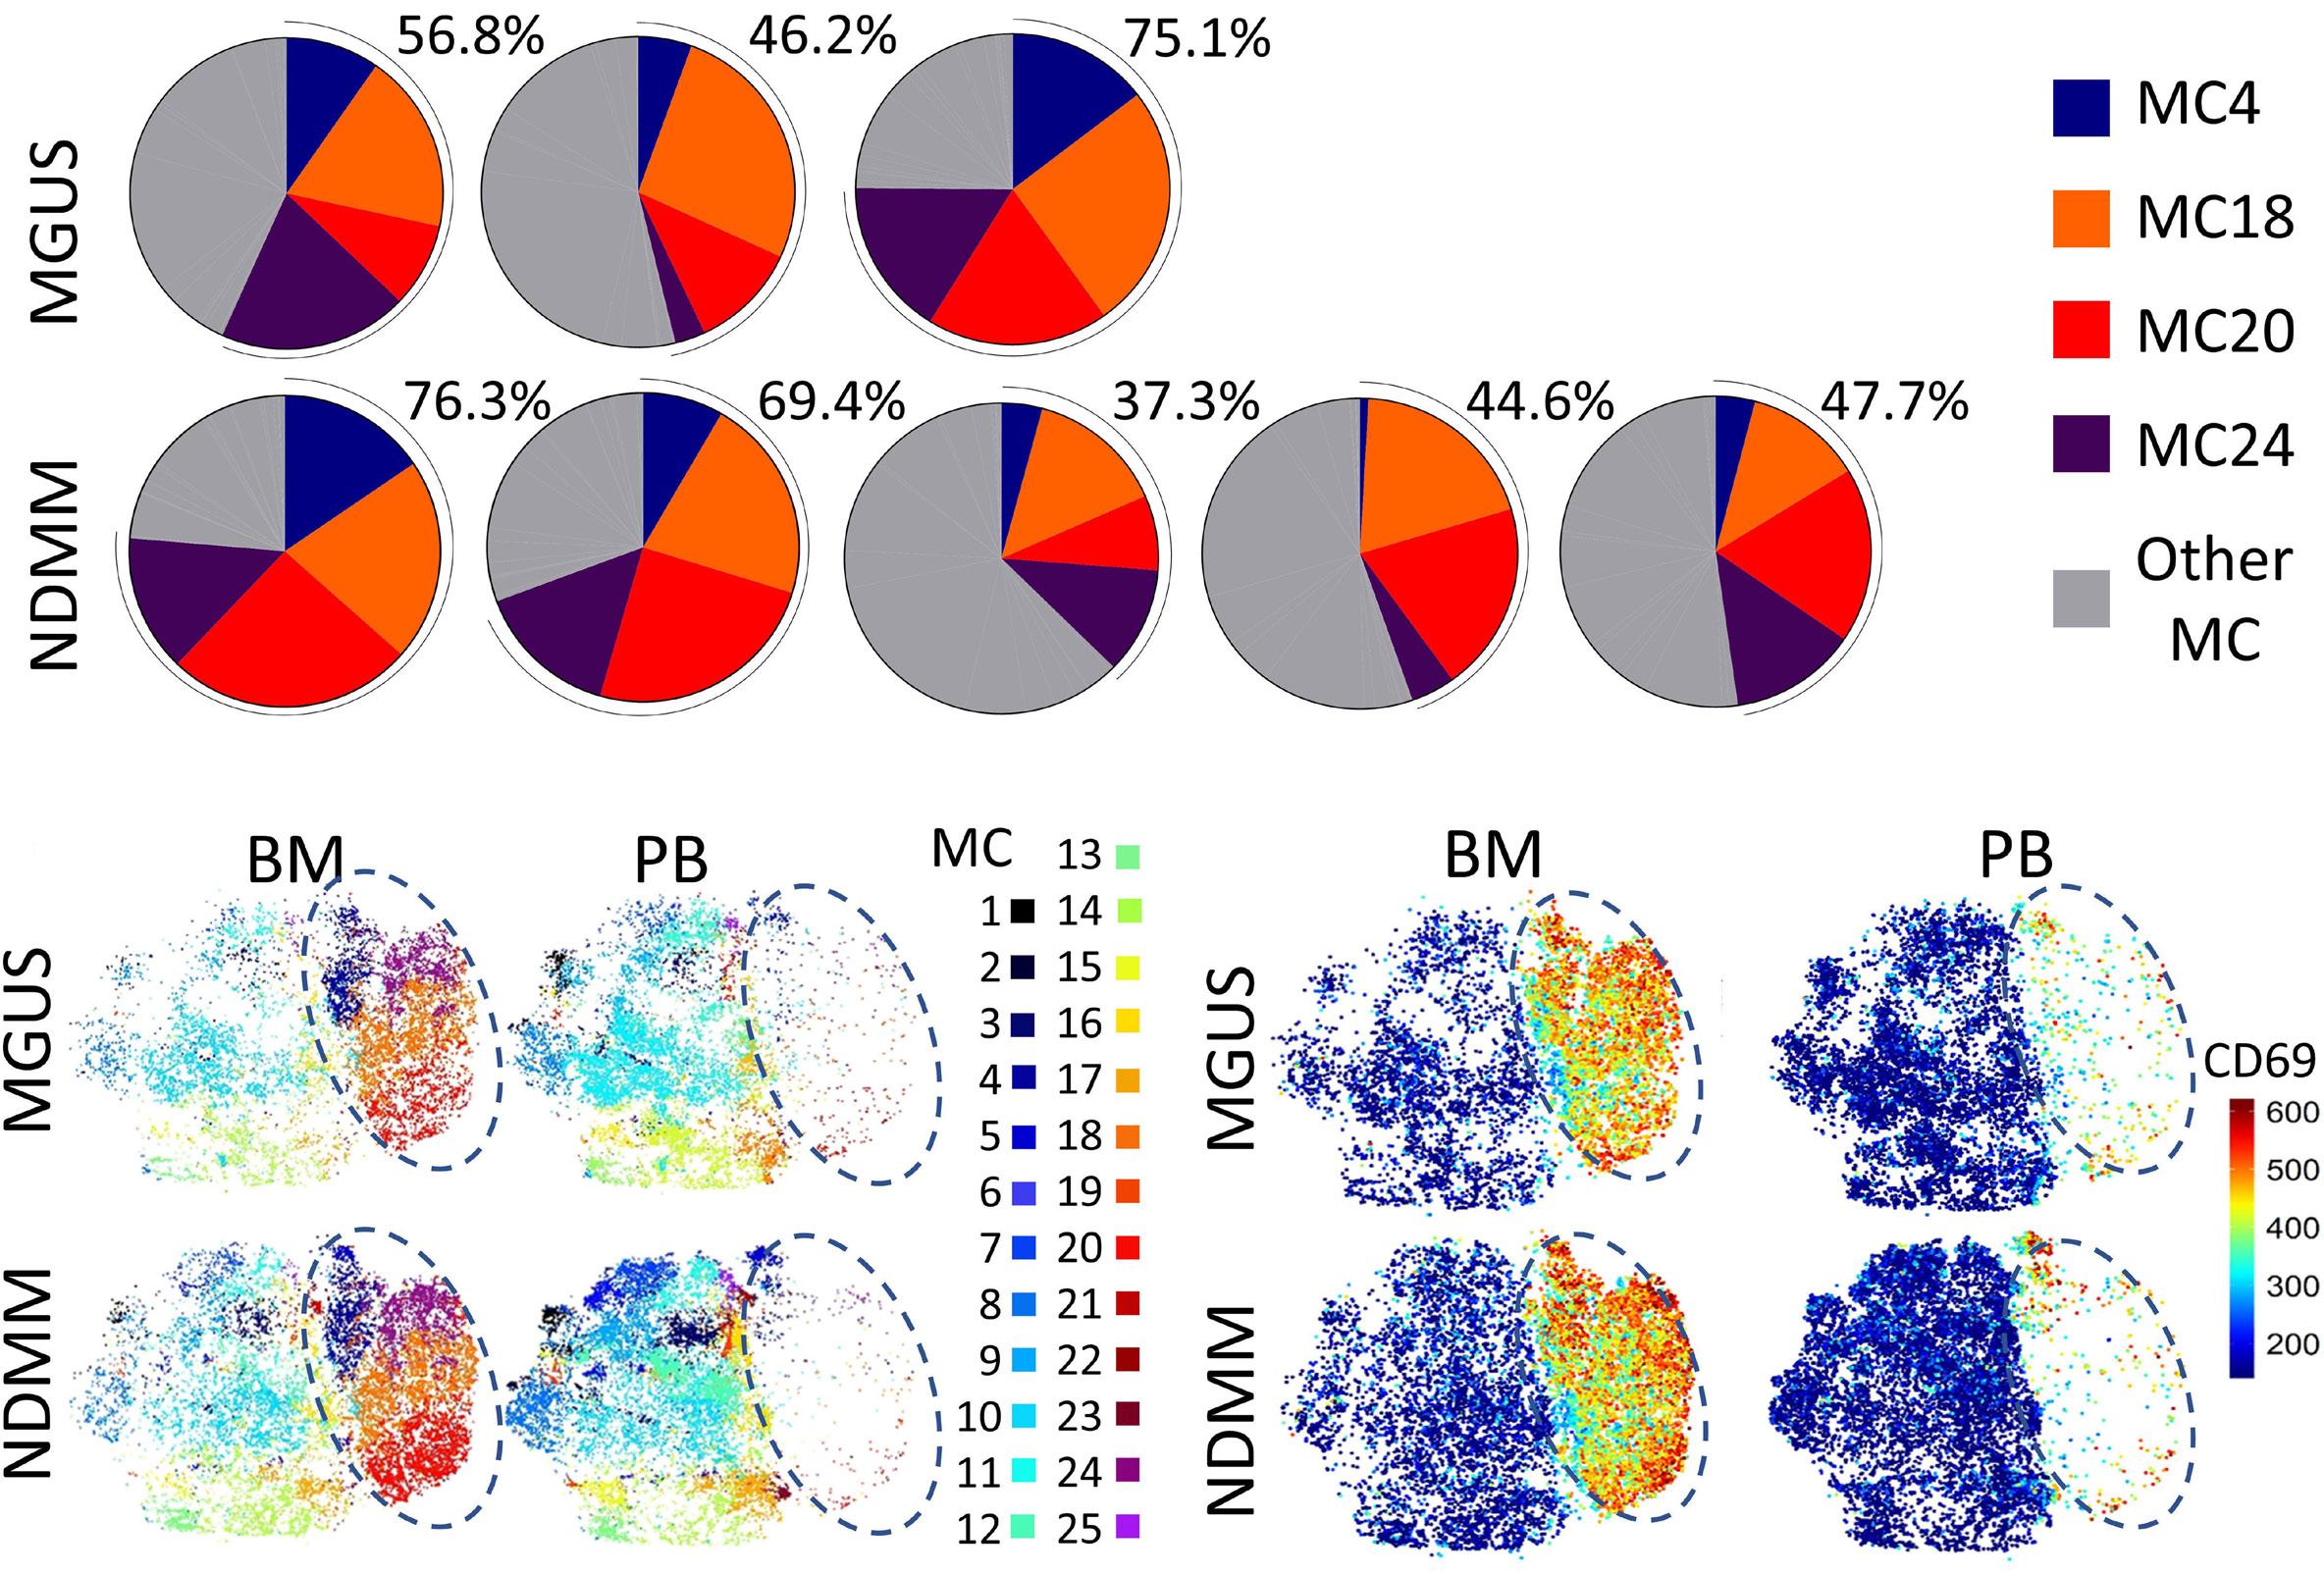
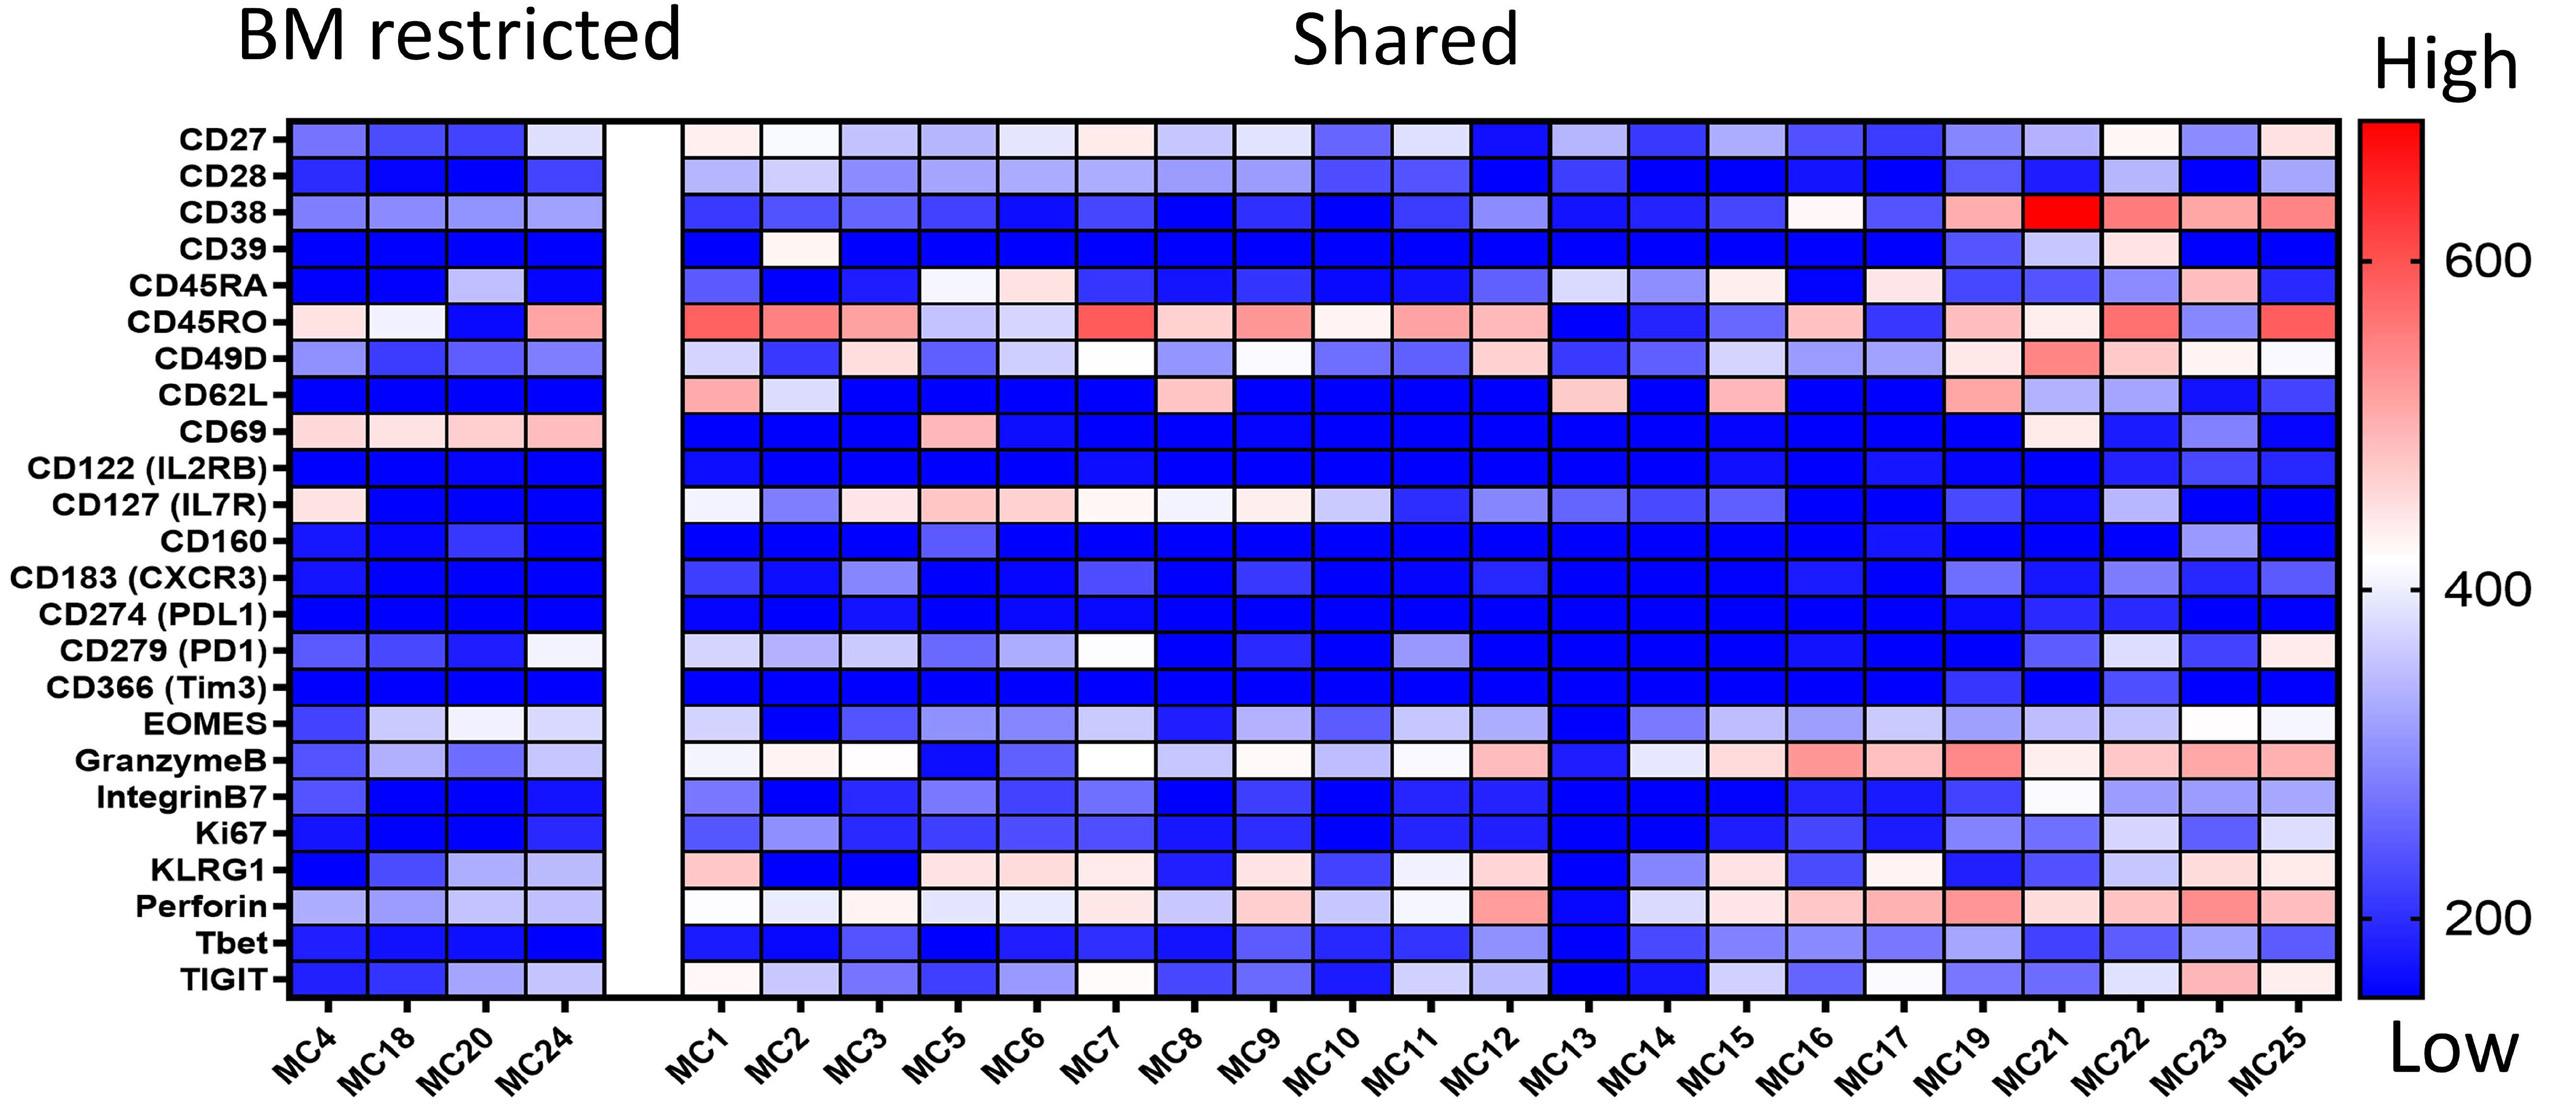
phenotypically restrained compared to cells shared between
the contribution of the 4 metacluster (MC) (MC4: blue, MC18: orange, MC20: red and MC24: purple) overrepresented in the bone marrow (BM) of monoclonal gammopathy of undetermined significance (MGUS) (top) and newly diagnosed multiple myeloma (NDMM) (bottom) patients (remaining MC: grey). (B) t-distributed stochastic neighbour embedding (tSNE) visualization of identified MC within the BM (left) and peripheral blood (PB) (right) in MGUS (top) and NDMM (bottom) patients. The right half of each plot is occupied entirely by 4 MC (highlighted by the dark blue dashed ovals). Each dot represents an individual cell, colored by the assigned MC. (C) tSNE visualization of CD69 expression showing restriction to the same region that encompasses the 4 BM-restricted MC, colored by the level of expression from low (blue) to high (red). (D) Heat map showing the phenotype of the 25 MC. MC4, MC18, MC20, and MC24 contain CD69+ effector memory T cells (TEM) (left) are BM-restricted, with the remaining 21 MC shared between BM and PB. The color represents the median intensity of the signal from low (blue) to high (red) for an individual marker (row) in an individual MC (column).
of both MGUS and NDMM (Figure 4A). Visualization of cluster distribution on t-distributed stochastic neighbor embedding (tSNE) (Figure 4B) revealed these four metaclusters as cells expressing high levels of CD69 (Figure 4C), confirming tissue-restricted expression of this protein. Despite accounting for approximately half of all cells in both cohorts, FlowSOM determined these cells sufficiently homogeneous as to cluster them into only four metaclusters, suggesting the bulk of phenotypic heterogeneity exists across the 21 metaclusters shared between BM and PB (Figure 4D).
Flow cytometry demonstrates enhanced levels of CD38 and CD69 differentiate health and disease within the bone marrow-CD8+CD69+ population
Focusing on differences within the BM, FlowSOM analysis of high dimensional flow cytometry data of the BM-CD8+ TEM subset revealed differences between MM and age-matched controls were largely restricted to levels of expression of markers associated with TCR-activation, CD38 and CD69, but not CD25 (Figure 5A). However, differences were not restricted to the dominant CD8+ TEM subset, with manual analysis revealing significantly higher levels of CD69 expression evident in MM compared to age-matched controls evident across all antigen-experienced cells (Figure 5B). CD38 was similarly expressed at significantly higher levels in all canonical subsets in both the BM-CD8+CD69and BM-CD8+CD69+ T cells in MM (Figure 5C). Analysis of
inhibitory markers PD-1 and TIGIT revealed disease-associated differences evident only within the CD69- subset; BM-CD8+CD69- TTE demonstrated significantly fewer cells expressing PD-1 in MM compared to age-matched controls (Figure 5D). Similarly, significantly fewer BM-CD8+CD69- TEM and TTE expressed TIGIT in MM compared to age-matched controls (Figure 5E).
Broad dissimilarities between BM-CD8+CD69- and BMCD8+CD69+ TEM subsets were evident in expression patterns of the interleukin-7 receptor α (IL-7R/CD127) and killer cell lectin-like receptor G1 (KLRG1), markers associated with effector/memory distinction,15 with a marked reduction in cells expressing CD127 in the BM-CD8+CD69+ subset (Online Supplementary Figure S4C). However, there were no significant differences between cohorts (Online Supplementary Figure S4D). Finally, assessment of TCF-1 expression, a transcription factor crucial in the maintenance of “stemness” in the TME16 across canonical subsets within the BM demonstrated no disease-associated differences (Online Supplementary Figure S4E).
Bone marrow-CD8+ T cells from newly diagnosed multiple myeloma patients share compositional similarity to T-cell receptor-activated age-matched controls
Generation of reference atlases from the BM of two (Online Supplementary Figure S5A) and PB of four (Online Supplementary Figure S5B) NDMM patients, using the R package
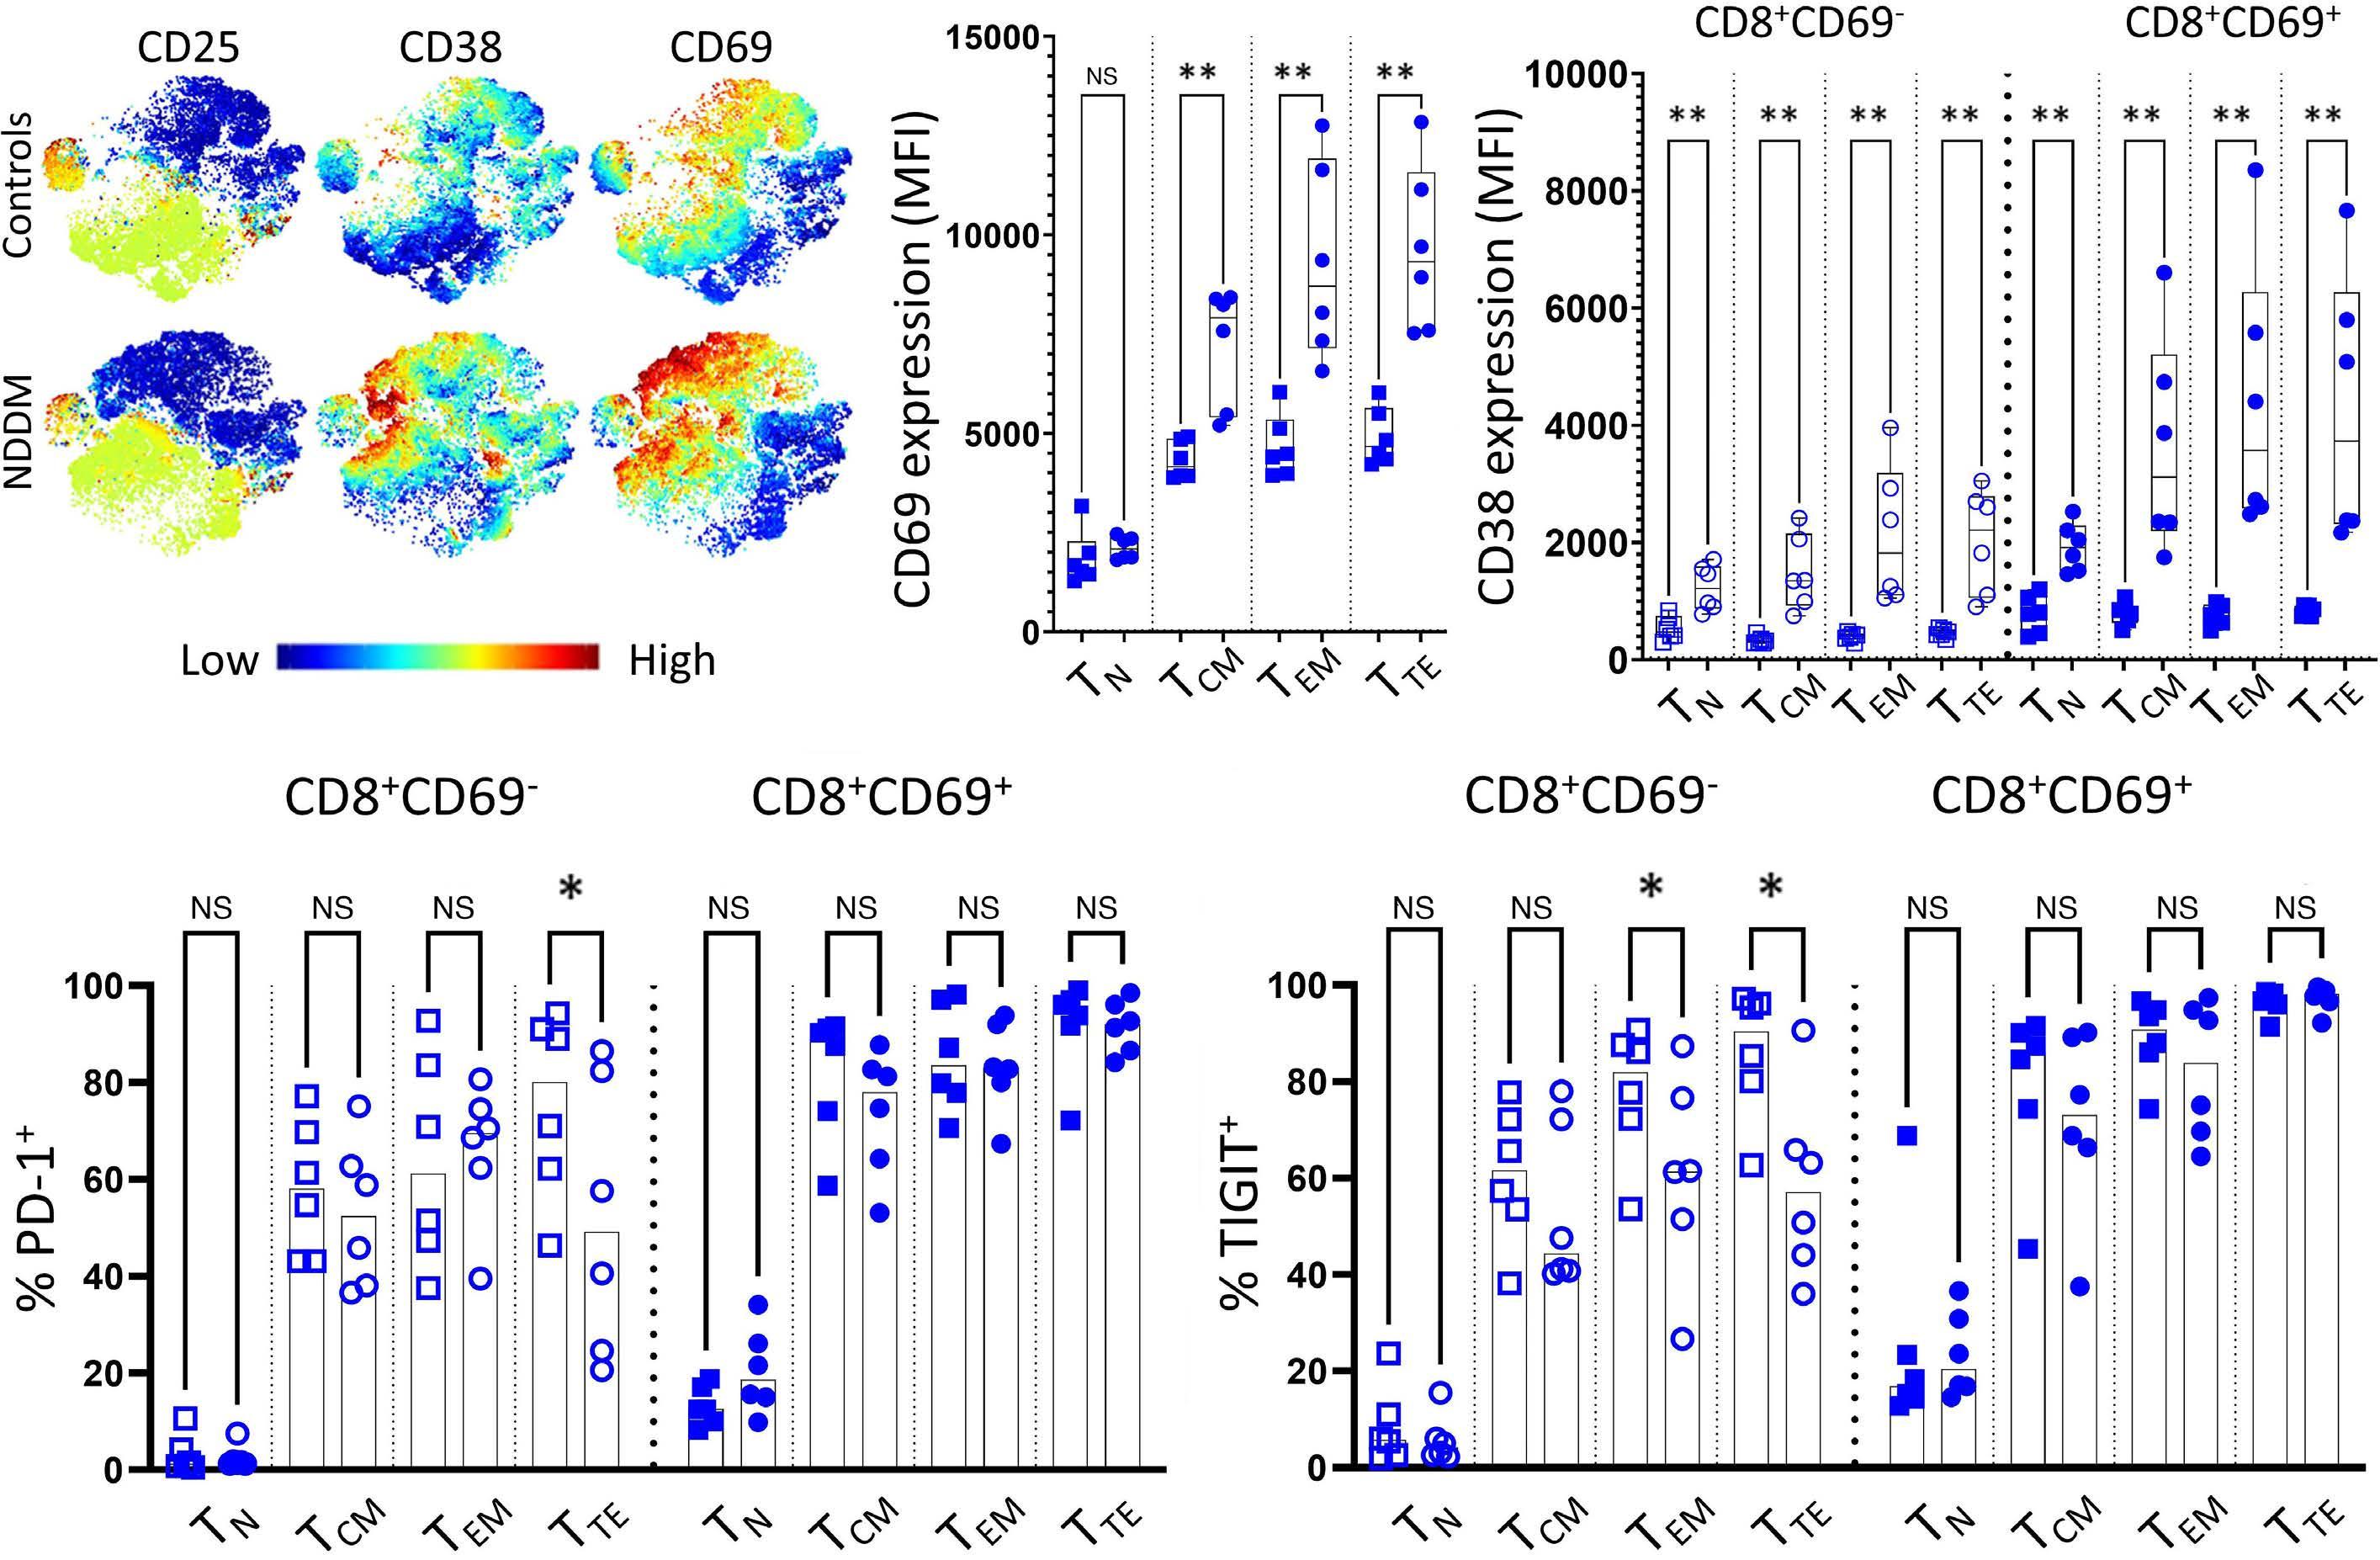
5. Bone marrow-CD8+CD69+ T
phenotype in multiple myeloma. (A) t-distributed stochastic neighbour embedding (tSNE) plots of FlowSOM clustered bone marrow CD8+ effector memory T cells (BM-CD8+ TEM) showing expression of CD25 (left), CD38 (middle) and CD69 (right) in the BM of age-matched controls (top) and newly diagnosed multiple myeloma (NDMM) patients (bottom). Each dot represents a single cell, the scale shows the level of expression of each marker from low (blue) to high (red). (B) Median fluorescence intensity (MFI) of CD69 expression on the 4 canonical CD8+ T-cell subsets of the CD8+CD69+ subset between age-matched controls (squares) and NDMM patients (circles). (C) MFI of CD38 expression on the 4 canonical CD8+ T-cell subsets within the broad BM-CD8+CD69- (left, open shapes) and BM-CD8+CD69+ (right, solid shapes) subsets between age-matched controls (squares) and NDMM patients (circles). (D, E) Bars (median with scatter) showing proportions of TN, TCM, TEM and TTE in the broad BM-CD8+CD69- (left, open shapes) and BM-CD8+CD69+ (right, solid shapes) subsets expressing (D) PD-1 and (E) TIGIT in age-matched controls (squares) and NDMM patients (circles). Significance levels: *P<0.05, **P<0.01; Mann-Whitney U test. MC: metacluster; TTE: terminally differentiated CD8+ T cells; TN: naive T cells; Cyto TEM: cytotoxic effector memory T cells; PRE EX: pre-exhausted T cells; TCM: central memory T cells; NS: not significant.
“ProjecTILs”, permitted unbiased comparisons with agematched control data.13 Atlases comprised of 6,275 cells from each input sample and captured a total of 16,316 and 16,840 genes respectively. Both atlases formed six clusters comprising transcriptionally similar TEM, TTE and TN clusters observable in the integrated analysis as well as a more evident IL7R+ memory cluster (designated IL7R+ TM) and a smaller cluster of activated cells defined by high levels of the HLA-DR family of genes.17 Unique to each atlas was one small cluster; a Cyto-TEM like cluster in the BM, with high levels of KLRD1, KLRC3 and KIR3DL2 and a IFN-stimulated cluster in the PB.
Comparing generated atlases against resting and TCR-activated CD8+ T cells from the BM and PB of age-matched controls18 revealed resting BM cells predominantly clustering
into the dominant TEM cluster, then equally into the IL7R+ TM and TTE clusters, whereas resting cells from PB skewed toward the dominant TTE cluster. TCR activation induced marked compositional changes evident only in the BM (Figure 6A), such that clustering was near exclusive to the dominant TEM cluster, whilst few compositional differences were observed in the PB (Online Supplementary Figure S6A).
Sc-GSEA revealed that the previous BM enrichment towards hypoxia and TNFα signaling via NF-κb were attributable to micro-environmental differences between health and disease, rather than differences between the two tissue compartments alone: while TCR activation of BM-CD8+ T cells induced slight enrichment towards these two gene sets, both were markedly higher in myeloma (Online Supplementary Figure S7A; Online Supplementary Table S7). In
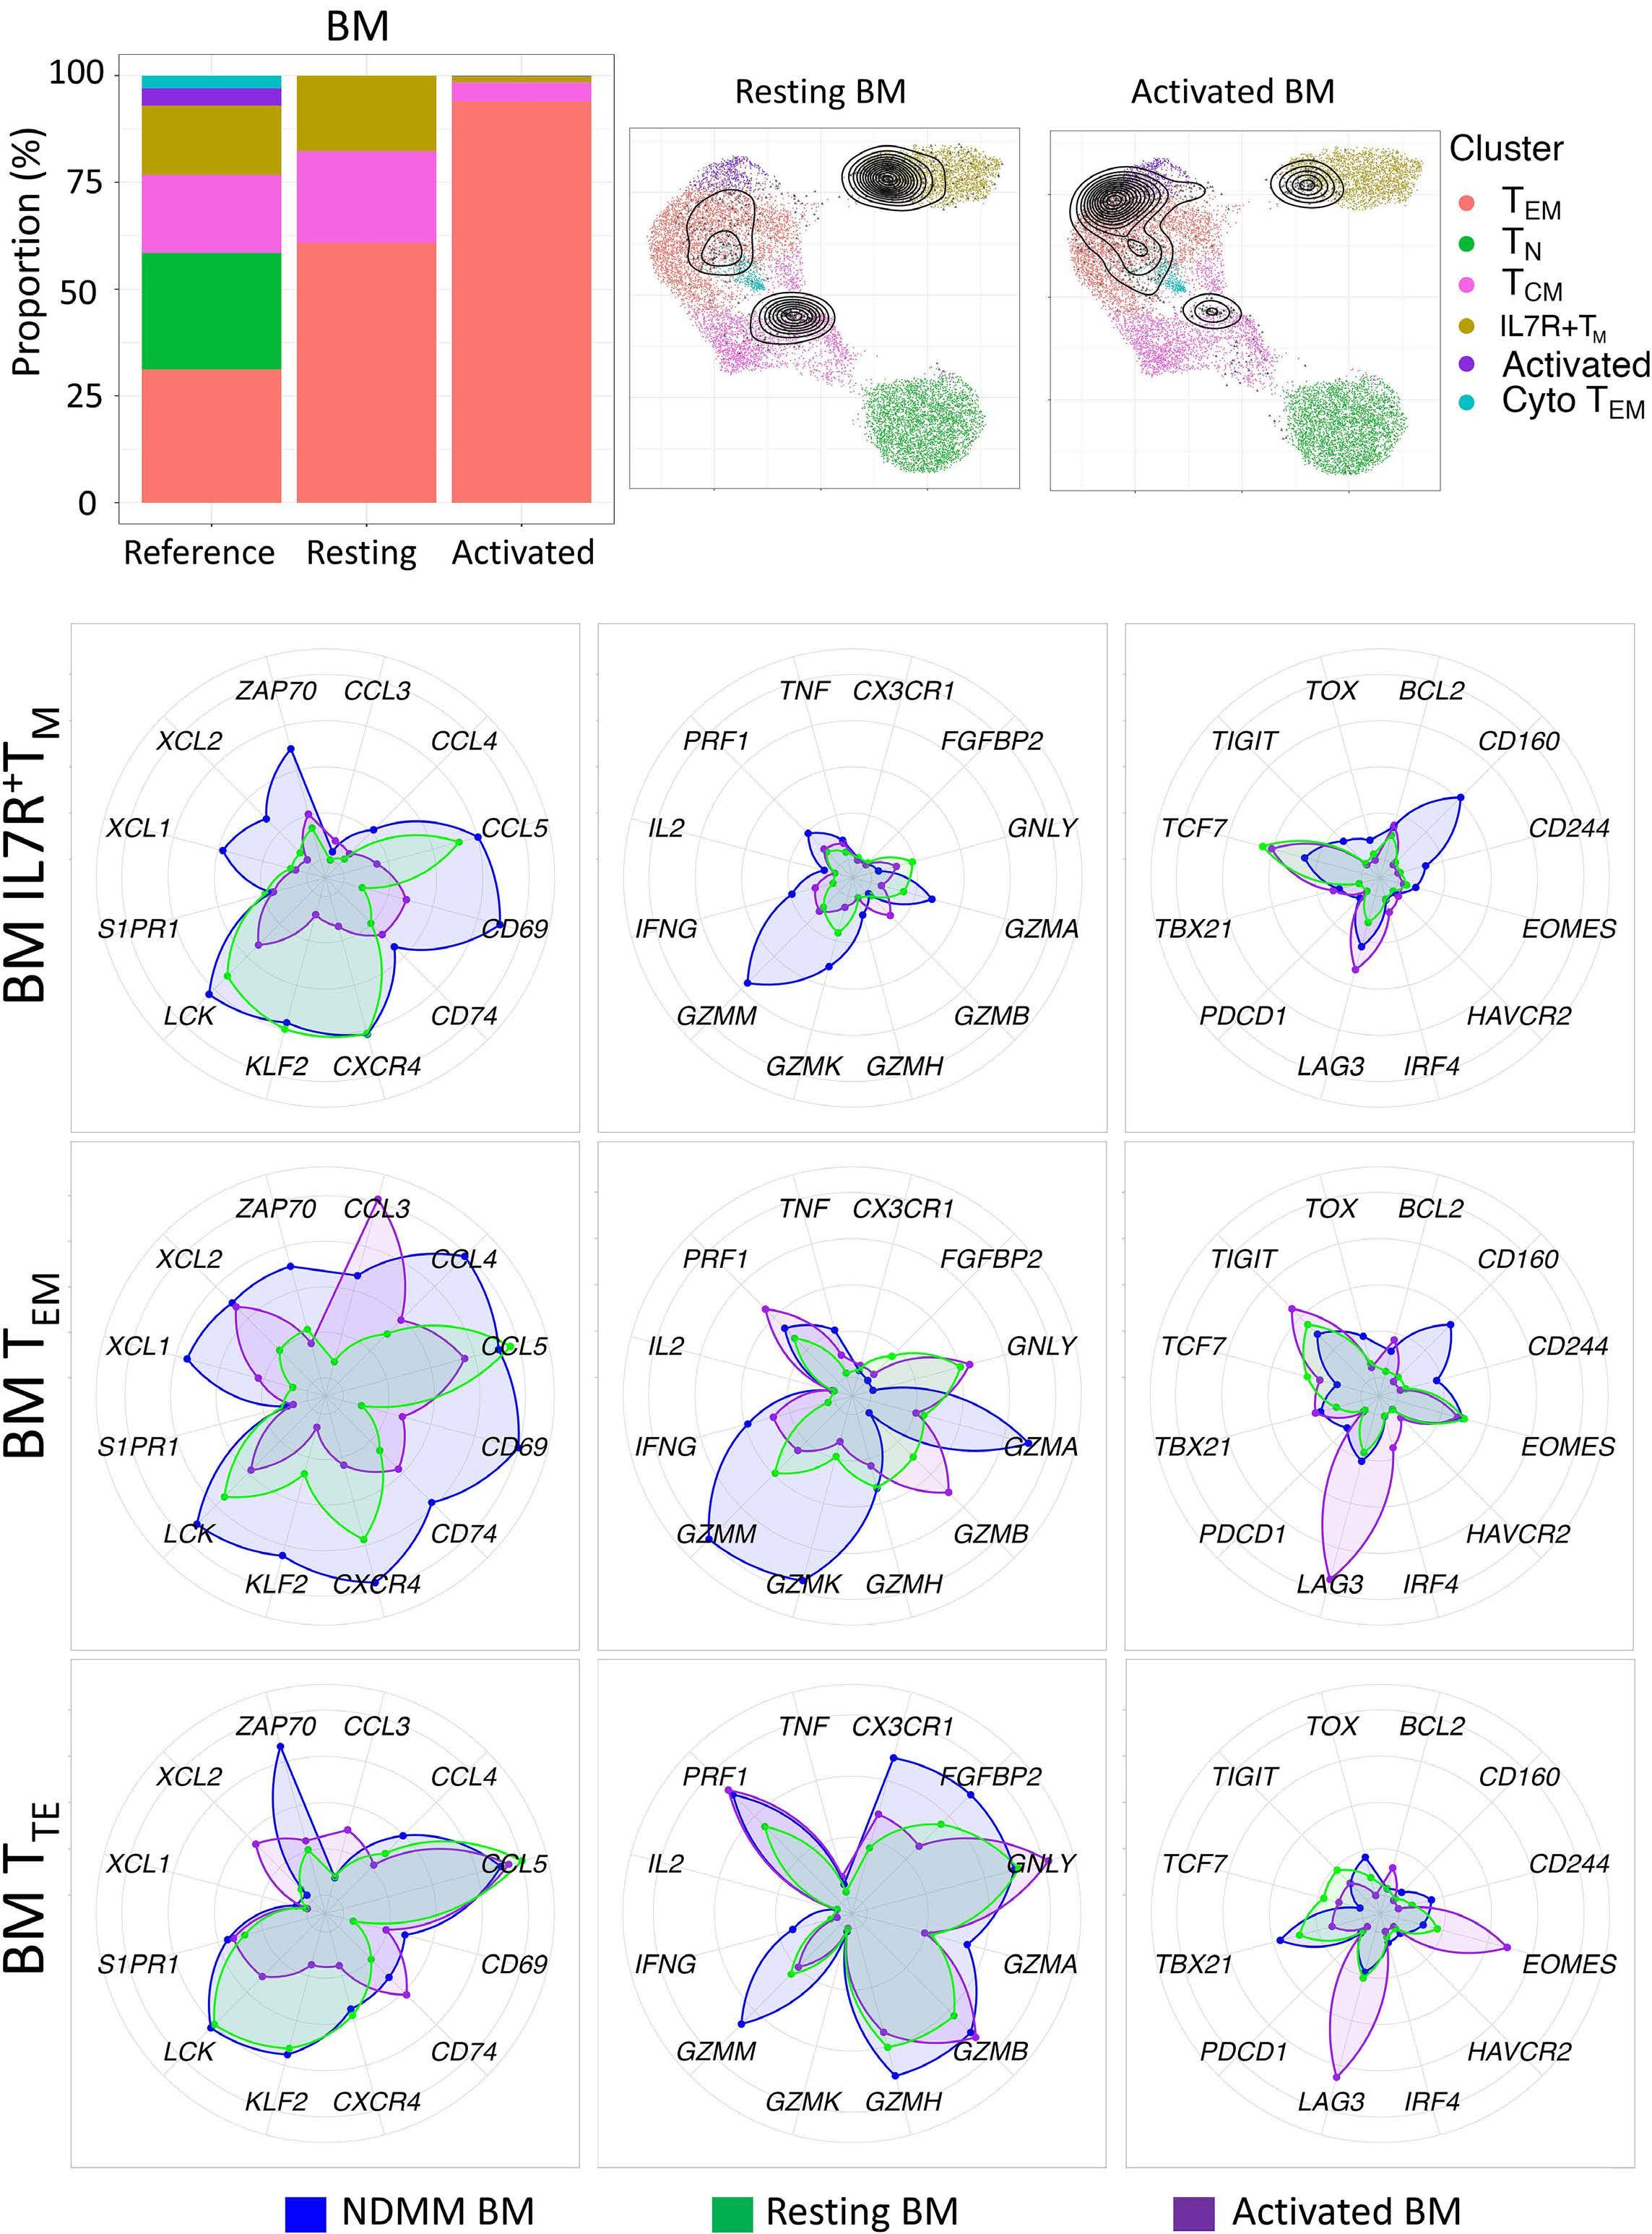
contrast, while TCR activation did not result in enrichment towards hypoxia in the PB, it induced enrichment in TNFα signaling via NF-κb above the myeloma reference (Online Supplementary Figure S7B; Online Supplementary Table S7). Differential expression testing of the dominant TEM cluster comparing resting and TCR-activated age-matched cells from the BM to the MM reference indicated TCR activation induced marked changes, including upregulation of many expected genes such as CD69, CD74, GZMB, IL2RA and IL2RG, relative to the MM reference (Online Supplementary Table S8A). Comparisons of age-matched cells from the PB to the dominant MM PB TTE showed TCR activation-induced upregulation of several chemokine ligands (CCL3, CCL4, XCL1 and XCL2) and, contrasting cells from the BM, upregulation of several AP-1 associated genes (e.g., JUNB, DUSP2) (Online Supplementary Table S8B).
Finally, relative expression of key genes across the IL7R+ TM, TEM and TTE clusters of the BM (Figure 6B) and PB (Online Supplementary Figure S6B) demonstrated that although TCR activation induced upregulation of several genes associated with T-cell activation relative to resting cells, only CCL3 was consistently expressed at a higher level than the MM reference. Expression of all Granzymes, except for GZMB, was higher in the MM reference than in either TCR-activated or resting cells from age-matched controls, while PRF1 expression in TCR-activated cells demonstrated similar expression patterns to the MM reference. NDMM BM TEM demonstrated markedly higher levels of many inflammatory-associated chemokine genes including XCL1, XCL2, CCL4 and CXCR4 than either resting or TCR-activated age-matched samples and, suggestive of highly differentiated cells, NDMM TTE in both the BM and PB demonstrated higher levels of CX3CR1 relative to age-matched controls. Low levels of inhibitory markers were evident across all subsets, however, TCR activation induced expression of LAG3 and HAVCR2 and IRF4 in all but the BM TTE subset, which demonstrated a marked increase in EOMES. In keeping with flow assessment of TCF1, no notable differences were evident in the expression of TCF7 in the BM.
The tumor microenvironment has a demonstrable impact on the function and clonal composition of CD8+ T cells in both solid cancers19 and several hematological malignancies,20,21 but remains under investigation in MM. Previous reports have suggested that T cells exhibit signs of exhaustion22 and senescence in the TME23 but few have focused in depth on differences between clonal T cells across the BM and PB. In this study, we utilized several single-cell technologies to probe tumor-induced differences in CD8+ T cells in NDMM patients. Using an unsupervised approach, we found several clusters aligned with canonical T-cell maturation shared between the BM and PB, with no tissue or patient-restricted
clusters evident. Inter-tissue differences were evident in the differential expression of Granzyme B and Granzyme K, which were strongly associated with two distinct subsets of CD8+ T cells delineated by the expression of CD69, accounting for roughly 50% of all T cells in the BM of both health and disease. While the CD69- subset in NDMM patients demonstrated a marked skewing towards more differentiated cells compared to age-matched controls, the CD69-positive subset was comprised primarily of TEM with a similar expression between NDMM and controls. Given the restriction to the BM and the established role of CD69 as a marker of tissue residency,24 it is reasonable to assume that the CD69+ population is resident within the BM, whereas the CD69subset represents an infiltrating, or circulating population. Thus, alterations in both canonical subset distribution and Granzyme B and Granzyme K expression patterns observed in MM may represent either an influx of more differentiated cells responding to an altered chemokine gradient within the inflamed marrow, an expedited differentiation of cells into a more potent effector-like cell or both.
Expression of Granzyme B and Granzyme K in the BMCD8+CD69- T-cell subset of NDMM patients demonstrated increased representation of highly differentiated effector cells and evident compositional parallels to PB CD8+ T cells, contrasting a marked reduction of effector cells in agematched controls. This may indicate greater infiltration of the BM microenvironment by Granzyme B-positive CD8+CD69- T cells in NDMM than age-matched controls. Phase I clinical trial results of Teclistamab25 and Talquetamab26 suggest the pool of highly potent effector cells with low levels of co-inhibitory molecules evident in the MM TME are therapeutically exploitable, irrespective of innate TCR specificity. In our study, GZMK expression was strongly associated with CD69 expression in the BM. Further, we observed upregulation of several chemokine ligands, suggesting a role for these cells as not only potential inflammatory mediators but as chemoattractant cells. While Granzyme B has an established role in cytotoxicity,27 far less is known about the role of Granzyme K,28 and less still about its role in MM. Increased frequencies of Granzyme K+CD8+ T cells have been detected in inflamed tissue, and their presence correlates with increased plasma levels of IL-6, IL-8 and TNFα 29 Granzyme K+CD8+ T cells were recently identified as hallmarks of “inflammaging”,29 and have been demonstrated to induce both IL-6 and IL-8 expression in stromal cells,30 potentially contributing to the pathophysiology of myeloma as inflammatory mediators are well-established drivers of disease.31 The classification of these cells is a current point of contention in MM: De Jong et al, postulated that a Granzyme K+CD8+ T-cell subset was partially responsible for increased levels of inflammation in the MM TME,32 whereas GZMK+ cells have been referred to as ‘protective memory’ by Zavidij et al.33 In keeping with recent findings by Bailur et al., 34 we did not observe differences between health and disease in the expression of either TCF7 or the protein it
encodes. The lack of observable differences between health and disease in both proportions of Granzyme K+CD8+ T cells, TCF-1 expression (as well as other relevant genes e.g., BCL2 and TOX) and lack of difference in the enrichment of the Wnt-b-catenin signaling pathway, as analyzed by sc-GSEA (Online Supplementary Table S7), suggests CD8+ T-cell memory maintenance in MM may not be impeded to a significant level. Rather, the perceived reduction of ‘protective memory’ may be attributable to proportional skewing towards a more differentiated phenotype within the TME, rather than a reduction in absolute numbers as more ‘space’ within the BM is repurposed for malignant PC growth.
The BM-dominant CD8+CD69+ TEM subset was phenotypically similar in age-matched controls and NDMM, except for increased expression levels of CD69 and CD38 in NDMM, observable across all antigen-experienced T cells. While upregulated CD38 may render these cells susceptible to the on-target, off-tumor action of Daratumumab,35 upregulated CD69 on BM CD8+ T cells in NDMM is intriguing. CD69 is a multifunctional protein with at least four known ligands.36 Of these, galectin-1 (gal-1) is highly relevant to MM given its established role in T-cell responses and over-representation in the NDMM extracellular matrix.37 Over-representation of gal-1 in MM may be due to overexpression by both malignant PC, with expression upregulated in response to hypoxia,38 but also degranulation by cytotoxic T cells.39 Upregulated CD69 may also imply a greater likelihood of cells remaining within the marrow as CD69 functions to inhibit cell egress to the periphery.24,36 Although recent data suggests accumulation of CD8+CD69+ T cells within the MM TME is associated with an increase in progression-free survival,40 reduced GZMB is associated with rapid disease progression.22 CD69 is a direct hypoxia-inducible factor 1-α (HIF-1 α) target gene.41 This may suggest that the CD69 expression observable in the BM may be associated with cellular stress, chiefly hypoxia-related, either in addition to or, rather than, T-cell activation. While hypoxia can to negatively impact CD8+ T-cell function, it can, conversely, enhance effector CD8+ T-cell response to persistent antigens.42 In this respect, hypoxia enhances TEM proliferation through a positive feedback loop involving HIF1α and glycolysis.43 GSEA revealed differences in enrichment towards the hallmark gene set of glycolysis between health and disease in the TEM subset of the BM (Online Supplementary Table S7), however the low levels of Ki67 (evident by mass
1. Rajkumar SV. Multiple myeloma: 2020 update on diagnosis, risk-stratification and management. Am J Hematol. 2020;95(5):548-567.
2. Wang H, Leng Y, Gong Y. Bone marrow fat and hematopoiesis. Front Endocrinol (Lausanne). 2018;9:694.
3. Di Rosa F, Gebhardt T. Bone marrow T cells and the integrated functions of recirculating and tissue-resident memory T cells. Front Immunol. 2016;7:51.
cytometry) suggest these cells are quiescent. Preliminary functional work has demonstrated robust cytokine production and capacity to degranulate in both CD69+/- subsets in both NDMM patients and age-matched controls upon magnetic bead stimulation (data not shown) reinforcing our previous findings,12 however further clarification of the role of CD8+CD69+ T cells as a resident memory pool within the MM TME is required. Finally, clonally restricted cells have been observed in both CD8+CD69+ and CD8+CD69- T-cell subsets, and their cognate antigens are under investigation.
No conflicts of interest to disclose
JF and CEB designed and performed the research, analyzed the data, wrote the human ethics and wrote the paper. EA and SY performed the research and analyzed the data. SG assisted with the bioinformatics and analyzed the data. NN and LMS assisted in research design and data analyis. CEB, EA, TK, and PJH assisted in research design, reviewed patients, and assisted with the collection of patient samples and clinical information. RB reviewed patients undergoing hip arthroplasty and designed research. DJ and PJH were involved in research design, analysis of data and writing the paper.
The authors thank Dr Alberto Catalano for excellent research management support, RPAH Hematology Clinicians for collection of patient samples and informed consent, and patients and their families for donating samples for research. They would also like to thank Prof Joseph Powell and Dr Walter Muscovic from the Garvan-Weizmann Center for Cellular Genomics as well as Dr Slavica Vuckovic for their contributions in the earlier stages of this project.
This work is funded by a Brian D. Novis research grant from the International Myeloma Foundation (to CEB) and Sydney Blood Cancer Research.
Data may be made available by contacting the corresponding author.
4 Lightman SM, Utley A, Lee KP. Survival of long-lived plasma cells (LLPC): piecing together the puzzle. Front Immunol. 2019;10:965.
5. Bruns I, Cadeddu RP, Brueckmann I, et al. Multiple myelomarelated deregulation of bone marrow-derived CD34(+) hematopoietic stem and progenitor cells. Blood. 2012;120(13):2620-2630.
6. Gooding S, Olechnowicz SWZ, Morris EV, et al. Transcriptomic profiling of the myeloma bone-lining niche reveals BMP signalling
inhibition to improve bone disease. Nat Commun. 2019;10(1):4533.
7 Vuckovic S, Minnie SA, Smith D, et al. Bone marrow transplantation generates T cell-dependent control of myeloma in mice. J Clin Invest. 2019;129(1):106-121.
8. Bryant C, Suen H, Brown R, et al. Long-term survival in multiple myeloma is associated with a distinct immunological profile, which includes proliferative cytotoxic T-cell clones and a favourable Treg/Th17 balance. Blood Cancer J. 2013;3(9):e148.
9. Suen H, Brown R, Yang S, et al. Multiple myeloma causes clonal T-cell immunosenescence: identification of potential novel targets for promoting tumour immunity and implications for checkpoint blockade. Leukemia. 2016;30(8):1716-1724.
10 Suen H, Brown R, Yang S, Ho PJ, Gibson J, Joshua D. The failure of immune checkpoint blockade in multiple myeloma with PD-1 inhibitors in a phase 1 study. Leukemia. 2015;29(7):1621-1622.
11. Shah N, Chari A, Scott E, Mezzi K, Usmani SZ. B-cell maturation antigen (BCMA) in multiple myeloma: rationale for targeting and current therapeutic approaches. Leukemia. 2020;34(4):985-1005.
12. Vuckovic S, Bryant CE, Lau KHA, et al. Inverse relationship between oligoclonal expanded CD69- TTE and CD69+ TTE cells in bone marrow of multiple myeloma patients. Blood Adv. 2020;4(19):4593-4604.
13. Andreatta M, Corria-Osorio J, Müller S, Cubas R, Coukos G, Carmona SJ. Interpretation of T cell states from single-cell transcriptomics data using reference atlases. Nat Commun. 2021;12(1):2965.
14 Van Gassen S, Callebaut B, Van Helden MJ, et al. FlowSOM: using self-organizing maps for visualization and interpretation of cytometry data. Cytometry A. 2015;87(7):636-645.
15. Remmerswaal EBM, Hombrink P, Nota B, et al. Expression of IL-7Rα and KLRG1 defines functionally distinct CD8(+) T-cell populations in humans. Eur J Immunol. 2019;49(5):694-708.
16. Wen S, Lu H, Wang D, Guo J, Dai W, Wang Z. TCF-1 maintains CD8(+) T cell stemness in tumor microenvironment. J Leukoc Biol. 2021;110(3):585-590.
17. Saraiva DP, Azeredo-Lopes S, Antunes A, et al. Expression of HLA-DR in cytotoxic T lymphocytes: a validated predictive biomarker and a potential therapeutic strategy in breast cancer. Cancers. 2021;13(15):3841.
18. Szabo PA, Levitin HM, Miron M, et al. Single-cell transcriptomics of human T cells reveals tissue and activation signatures in health and disease. Nat Commun. 2019;10(1):4706.
19 Goulart MR, Stasinos K, Fincham REA, Delvecchio FR, Kocher HM. T cells in pancreatic cancer stroma. World J Gastroenterol. 2021;27(46):7956-7968.
20 Abbas HA, Hao D, Tomczak K, et al. Single cell T cell landscape and T cell receptor repertoire profiling of AML in context of PD-1 blockade therapy. Nat Commun. 2021;12(1):6071.
21. Nath K, Law SC, Sabdia MB, et al. Intra-tumoral CD8+ T-cells in follicular lymphoma contain large clonal expansions that are amenable to dual-checkpoint blockade. Blood. 2019;134(Suppl 1):2793.
22. Pilcher W, Thomas BE, Bhasin SS, et al. Characterization of T-cell exhaustion in rapid progressing multiple myeloma using cross center Scrna-Seq study. Blood. 2021;138(Suppl 1):401.
23. Zelle-Rieser C, Thangavadivel S, Biedermann R, et al. T cells in multiple myeloma display features of exhaustion and senescence at the tumor site. J Hematol Oncol. 2016;9(1):116.
24. Kumar BV, Ma W, Miron M, et al. Human tissue-resident memory T cells are defined by core transcriptional and functional signatures in lymphoid and mucosal sites. Cell Rep. 2017;20(12):2921-2934.
25. Moreau P, Garfall AL, van de Donk N, et al. Teclistamab in relapsed
or refractory multiple myeloma. N Engl J Med. 2022;387(6):495-505.
26. Chari A, Minnema MC, Berdeja JG, et al. Talquetamab, a T-cellredirecting GPRC5D bispecific antibody for multiple myeloma. N Engl J Med. 2022;387(24):2232-2244.
27. Voskoboinik I, Whisstock JC, Trapani JA. Perforin and granzymes: function, dysfunction and human pathology. Nat Rev Immunol. 2015;15(6):388-400.
28. Harari A, Bellutti Enders F, Cellerai C, Bart PA, Pantaleo G. Distinct profiles of cytotoxic granules in memory CD8 T cells correlate with function, differentiation stage, and antigen exposure. J Virol. 2009;83(7):2862-2871.
29 Mogilenko DA, Shpynov O, Andhey PS, et al. Comprehensive profiling of an aging immune system reveals clonal GZMK(+) CD8(+) T cells as conserved hallmark of inflammaging. Immunity. 2021;54(1):99-115.
30 Cooper DM, Pechkovsky DV, Hackett TL, Knight DA, Granville DJ. Granzyme K activates protease-activated receptor-1. PLoS One. 2011;6(6):e21484.
31. Musolino C, Allegra A, Innao V, Allegra AG, Pioggia G, Gangemi S. Inflammatory and anti-inflammatory equilibrium, proliferative and antiproliferative balance: the role of cytokines in multiple myeloma. Mediators Inflamm. 2017;2017:1852517.
32. de Jong MME, Kellermayer Z, Papazian N, et al. The multiple myeloma microenvironment is defined by an inflammatory stromal cell landscape. Nat Immunol. 2021;22(6):769-780.
33. Zavidij O, Haradhvala NJ, Mouhieddine TH, et al. Single-cell RNA sequencing reveals compromised immune microenvironment in precursor stages of multiple myeloma. Nat Cancer. 2020;1(5):493-506.
34. Bailur JK, McCachren SS, Doxie DB, et al. Early alterations in stemlike/resident T cells, innate and myeloid cells in the bone marrow in preneoplastic gammopathy. JCI Insight. 2019;5(11):e127807.
35. Krejcik J, Casneuf T, Nijhof IS, et al. Daratumumab depletes CD38+ immune regulatory cells, promotes T-cell expansion, and skews T-cell repertoire in multiple myeloma. Blood. 2016;128(3):384-394.
36. Cibrián D, Sánchez-Madrid F. CD69: from activation marker to metabolic gatekeeper. Eur J Immunology. 2017;47(6):946-953.
37. Glavey SV, Naba A, Manier S, et al. Proteomic characterization of human multiple myeloma bone marrow extracellular matrix. Leukemia. 2017;31(11):2426-2434.
38. Storti P, Marchica V, Airoldi I, et al. Galectin-1 suppression delineates a new strategy to inhibit myeloma-induced angiogenesis and tumoral growth in vivo. Leukemia. 2016;30(12):2351-2363.
39 Clemente T, Vieira NJ, Cerliani JP, et al. Proteomic and functional analysis identifies galectin-1 as a novel regulatory component of the cytotoxic granule machinery. Cell Death Dis. 2017;8(12):e3176.
40 Dhodapkar KM, Cohen AD, Kaushal A, et al. Changes in bone marrow tumor and immune cells correlate with durability of remissions following BCMA CAR T therapy in myeloma. Blood Cancer Discov. 2022;3(6):490-501.
41. Labiano S, Meléndez-Rodríguez F, Palazón A, et al. CD69 is a direct HIF-1α target gene in hypoxia as a mechanism enhancing expression on tumor-infiltrating T lymphocytes. Oncoimmunology. 2017;6(4):e1283468.
42. Doedens AL, Phan AT, Stradner MH, et al. Hypoxia-inducible factors enhance the effector responses of CD8(+) T cells to persistent antigen. Nat Immunol. 2013;14(11):1173-1182.
43. Xu Y, Chaudhury A, Zhang M, et al. Glycolysis determines dichotomous regulation of T cell subsets in hypoxia. J Clin Invest. 2016;126(7):2678-2688.
Targeting TFH cells is a novel approach for donor-specific antibody desensitization of allograft candidates: an in vitro and in vivo study
Ning Ma,1* Wei-Bing Wu,1* Xiang-Yu Zhao,1 Lan-Ping Xu,1 Xiao-Hui Zhang,1 Yu Wang,1 Xiao-Dong Mo,1 Yuan-Yuan Zhang,1 Xiao-Su Zhao,1 Yu-Qian Sun,1 Yi-Fei Cheng,1 Kai-Yan Liu,1 Ying-Jun Chang1 and Xiao-Jun Huang1,2,3
1Peking University People’s Hospital & Peking University Institute of Hematology, National Clinical Research Center for Hematologic Disease, Beijing Key Laboratory of Hematopoietic Stem Cell Transplantation; 2Peking-Tsinghua Center for Life Sciences and 3Research Unit of Key Technique for Diagnosis and Treatments of Hematologic Malignancies, Chinese Academy of Medical Sciences, Beijing, China
*NM and W-BW contributed equally as first authors.
Abstract
Correspondence: Y-J. Chang rmcyj@bjmu.edu.cn
X-J. Huang xjhrm@medmail.com.cn
Received: June 6, 2023.
Accepted: October 3, 2023.
Early view: October 12, 2023.
https://doi.org/10.3324/haematol.2023.283698
©2024 Ferrata Storti Foundation
Published under a CC BY-NC license
The presence of donor-specific antibodies (DSA) are associated with graft failure either following human leukocyte antigen (HLA)-mismatched allogeneic stem cell transplantation or after organ transplantation. Although targeting B cells and plasma cells have been used for desensitization, there have been reports of failure. T-follicular helper (Tfh) cells assist B cells in differentiating into antibody-secreting plasma cells. We used haploidentical allograft as a platform to investigate the possibility of targeting Tfh cells to desensitize DSA. The quantities of circulating Tfh (cTfh) cell subsets in allograft candidates were abnormal, and these cells, including the cTfh2 and cTfhem cell subsets, were positively related to the production of anti-HLA antibodies. Ex vivo experiments showed that the cTfh cells of anti-HLA antibody-positive allograft candidates could induce B cells to differentiate into DSA-producing plasmablasts. The immune synapse could be involved in the assistance of cTfh cells to B cells in antibody production. In vitro experiments and in vivo clinical pilot studies indicated that targeting cTfh cells with sirolimus can inhibit their auxiliary function in assisting B cells. Ex vivo and in vivo studies demonstrated the effect of sirolimus and rituximab on DSA desensitization compared with either sirolimus or rituximab alone (60%, 43.75%, and 30%, respectively). Our findings provide new insight into the role of Tfh cells in the pathogenesis of DSA production in HLA-mismatched transplant candidates. Our data also indicate that targeting Tfh cells is a novel strategy for DSA desensitization and combination of sirolimus and rituximab might be a potential therapy. The prospective cohort of this study is registered at http://www.chictr.org.cn as #ChiCTR-OPC-15006672.
Donor-specific antibodies (DSA) are anti-human leukocyte antigen (HLA) antibodies in transplant candidates that specifically correspond to mismatched donor antigens.1-5 The presence of DSA contribute not only to graft failure following organ transplantation,1,2,6,7 but also to graft failure, including graft rejection, and poor graft function, after HLA-mismatched allogeneic hematopoietic stem cell transplantation (allo-HSCT).4,5,8,9 Multiple desensitization strategies for DSA targeting B cells and plasma cells have been implemented for patients who have undergone a transplant; however, there have been several instances of
failure.2,10-12 It has been demonstrated that, T-follicular helper (Tfh) cells are a lineage of CD4+ T cells distinguishable by their unique expression of CXCR5, which are required for class-switching and high-affinity antibody generation by B cells, through Tfh cell-dependent B-cell responses.13-16 The Tfh cell-assisted B cells then differentiate into antibody-secreting plasma cells. Therefore, in addition to targeting B and plasma cells,10-12 clinical manipulation of Tfh cells may provide a therapeutic intervention for antibody-mediated diseases.17-19
The difficulties in accessing lymphoid tissues in humans have led to the analysis of circulating Tfh (cTfh) cells which have proven to be valuable in understanding alterations
in the Tfh-cell response that contribute to antibody production, involved in auto- and allo-immunity.20-23 These studies suggest that cTfh cells are reliable surrogate indicators of germinal center activity.17-24 As far as the effects of Tfh cells on production of DSA by B cells are concerned, Mohammed et al.25 showed the crucial role of Tfh cells in promoting DSA responses and antibody-mediated rejection (AMR); they demonstrated that deletion of Tfh cells at the time of transplantation leads to significantly less severe allograft AMR in mouse models of solid organ transplantation. Louis et al.18 found that cTfh cells obtained from AMR patients with positive DSA could promote memory B cells to generate DSA in kidney transplant recipients. Cano-Romero et al.19 reported that for patients who had undergone renal transplant, induction therapy with thymoglobulin drastically eliminated cTfh cells and it took 6 months for these cells to recover, whereas basiliximab did not deplete the cTfh cells. Komagome et al.26 reported that in a liver transplant recipient with refractory DSA-mediated rejection, desensitization with plasma exchange and bortezomib improved liver function tests; additionally, cholestasis in the graft improved after everolimus administration, which might have targeted the cTfh cells. These studies suggest that biotherapeutic targeting of Tfh cells could represent an alternative therapy for DSA desensitization.17-19,26,27
Presently, there are no data on the characteristics of cTfh cells and the role of these cells in DSA production by B cells in patients who are candidates for HLA-mismatched allo-HSCT.4,5,8,9 Furthermore, it is currently unclear whether targeting Tfh cells can successfully desensitize DSA in the HLA-mismatched allo-HSCT candidates.4,5,8,9 In the
current study, using haploidentical HSCT as a platform,8,28 we showed that cTfh cells, from DSA-positive allografting candidates, are abnormal in terms of quantity and quality and can promote the generation of DSA by B cells. In vitro and in vivo studies have indicated that targeting Tfh cells can offer an alternative approach for the desensitization of DSA in allografting candidates. In addition, the simultaneous targeting of Tfh and B cells has a synergistic effect on DSA desensitization.
Between July 2020 and March 2022, 83 haploidentical allografting candidates were prospectively enrolled (Table 1). Patient sera were collected for DSA testing within 1 month of the initiation of haploidentical hematopoietic HSCT conditioning. This study met the guidelines of the Declaration of Helsinki and was approved by the Ethics Committee of the Peking University People’s Hospital. Informed consent was obtained from all the patients or their guardians and donors.
Detection of donor-specific antibodies
DSA were detected in accordance to our previously reported method.10,29
Flow cytometry
The antibodies used are listed in Online Supplementary Table S1. More details are included in the Online Supplementary Appendix.
Cell sorting
Peripheral blood mononucelar cells (PBMC) were stained and sorted using a BD Biosciences FACSAria II cytometer (BD Biosciences). cTfh cells were sorted as CD3 + CD4+ CD45RA- CXCR5+ cells, while memory B cells were sorted as CD3- CD19+ CD27+ cells.
Co-cultures
Sorted cTfh cells were co-cultured with sorted autologous memory B cells (5×10⁴) in a 1:1 ratio with staphylococcal enterotoxin B (SEB) (1 mg/mL; Toxin Technology) in complete RPMI medium supplemented with 10% fetal calf serum, 100 IU/mL penicillin, and 100 mg/mL streptomycin (Life Technologies). After 6 days of co-culture, the cells were stained with antibodies against CD3, CD4, CD19, CD20, CD27, and CD38 before data acquisition on a cytometer. In the drug experiments, the target cells were cultured with the corresponding drug at an appropriate concentration for 1 day (IL-21b,30 ruxolitinib,31 sirolimus,32 CTLA4-Ig [50 µ g/mL]33), then fully washed, and finally co-cultured with other cells in the co-culture system described earlier.
Transwell experiments
In the experiment using transwells, we selected cTfh and memory B cells from five healthy donors and placed them on a transwell plate (PET membrane, 0.4 µ m, Corning). Specifically, 5×10⁴ cTfh was inoculated on the base plate, while the same number of memory B cells were placed in the diaphragm pore. The data were collected after the cells were trained for the same period of time.
Enzyme-linked immunosorbant assay
Details are included in the Online Supplementary Appendix.
RNA sequencing and ATAC-sequencing
Details are included in the Online Supplementary Appendix.
Treating patients with sirolimus and/or rituximab
This pilot study was conducted at the Peking University People’s Hospital. Informed consent was obtained from all the DSA-positive patients defined according to cutoff value of mean fluorescent intensity (MFI) ≥2,000 as previously reported by us8,10 or their guardians and donors. DSA desensitization treatment flow chart is shown in Online Supplementary Figure S1 . Sixteen patients were treated with sirolimus alone (orally at a dose of 2 mg/day for 4 weeks) to keep the trough level at 5-20 ng/mL. Ten patients were treated with rituximab (intravenously at a dose of 375 mg/m2 weekly, for 4 weeks) for DSA desensitization. Eight patients were administered rituximab or sirolimus (Online Supplementary Table S2). During transplantation, cyclosporine (CSA), mycophenolate mofetil (MMF), and short-term methotrexate (MTX) was administered to prevent graft- versus -host disease GVHD according to our previous study (Online Supplementary Figure S1).34 The
MFI of DSA was used to evaluate the efficiency of the different methods for DSA desensitization.
Statistical analyses
Details are included in the Online Supplementary Appendix
Correlation of cTfh with the level of anti-human leukocyte antigen A antibodies in allogeneic hematopoietic stem cell transplantation candidates Eighty-three haploidentical HSCT candidates were classified as anti-HLA antibody-positive (n=40, group A) and anti-HLA antibody-negative (n=43, group B) candidates defined according to cutoff value of MFI more than 500 as previously reported by others and us, 4,8,29,35 and 20 healthy donors were used as the control group (Table 1) according to previous studies.18,23 Flow cytometry representation graphs of cTfh and its subsets are shown in Online Supplementary Figure S2. The percentage of cTfh cells in CD3+CD4+ T cells (P<0.001) and the absolute cTfh cell counts ( P<0.001) in group A were higher than in group B (Figure 1A; Online Supplementary Figure S3A ). The absolute numbers of cTfh1, cTfh2, and cTfh17 subsets in group A were higher than those in group B (P<0.001, P<0.001, and P=0.031, respectively), although only the percentage of cTfh2 cells among cTfh cells in group A was higher than that in group B (P=0.032) (Figure 1B, C). The percentage of cTfhem subsets in cTfh cells (P=0.013) and absolute cTfhem cell counts (P<0.001) in group A were higher than those in group B (Figure 1D). There were no differences in absolute cTfhcm cell counts between group A and group B, although the percentage of cTfhcm cell subsets in cTfh cells (P=0.004) in group B was higher than that in group A (Figure 1D).
The percentages of either cTfhem or cTfh2 cell subsets in cTfh cells were positively correlated with the MFI of the anti-HLA antibody (r=0.3942, P=0.0118; r=0.3318, P=0.0365, respectively) (Figure 1E). The absolute numbers of cTfhem cells was also positively correlated with the MFI of the anti-HLA antibody (r=0.3570, P=0.0237) (Online Supplementary Figure S3C). Collectively, these observations show that quantities of the cTfh subsets were abnormal and that these cells, including the cTfh2 and cTfhem cell subsets, were positively related to the production of anti-HLA antibodies in allo-HSCT candidates.
In order to investigate the capacity of cTfh cells to assist B cells in anti-HLA antibody production, cTfh cells were sorted and cultured with autologous memory B cells in superantigen SEB (Figure 2A; Online Supplementary Figure S4). In vitro experiments showed that cTfh cells of pa-
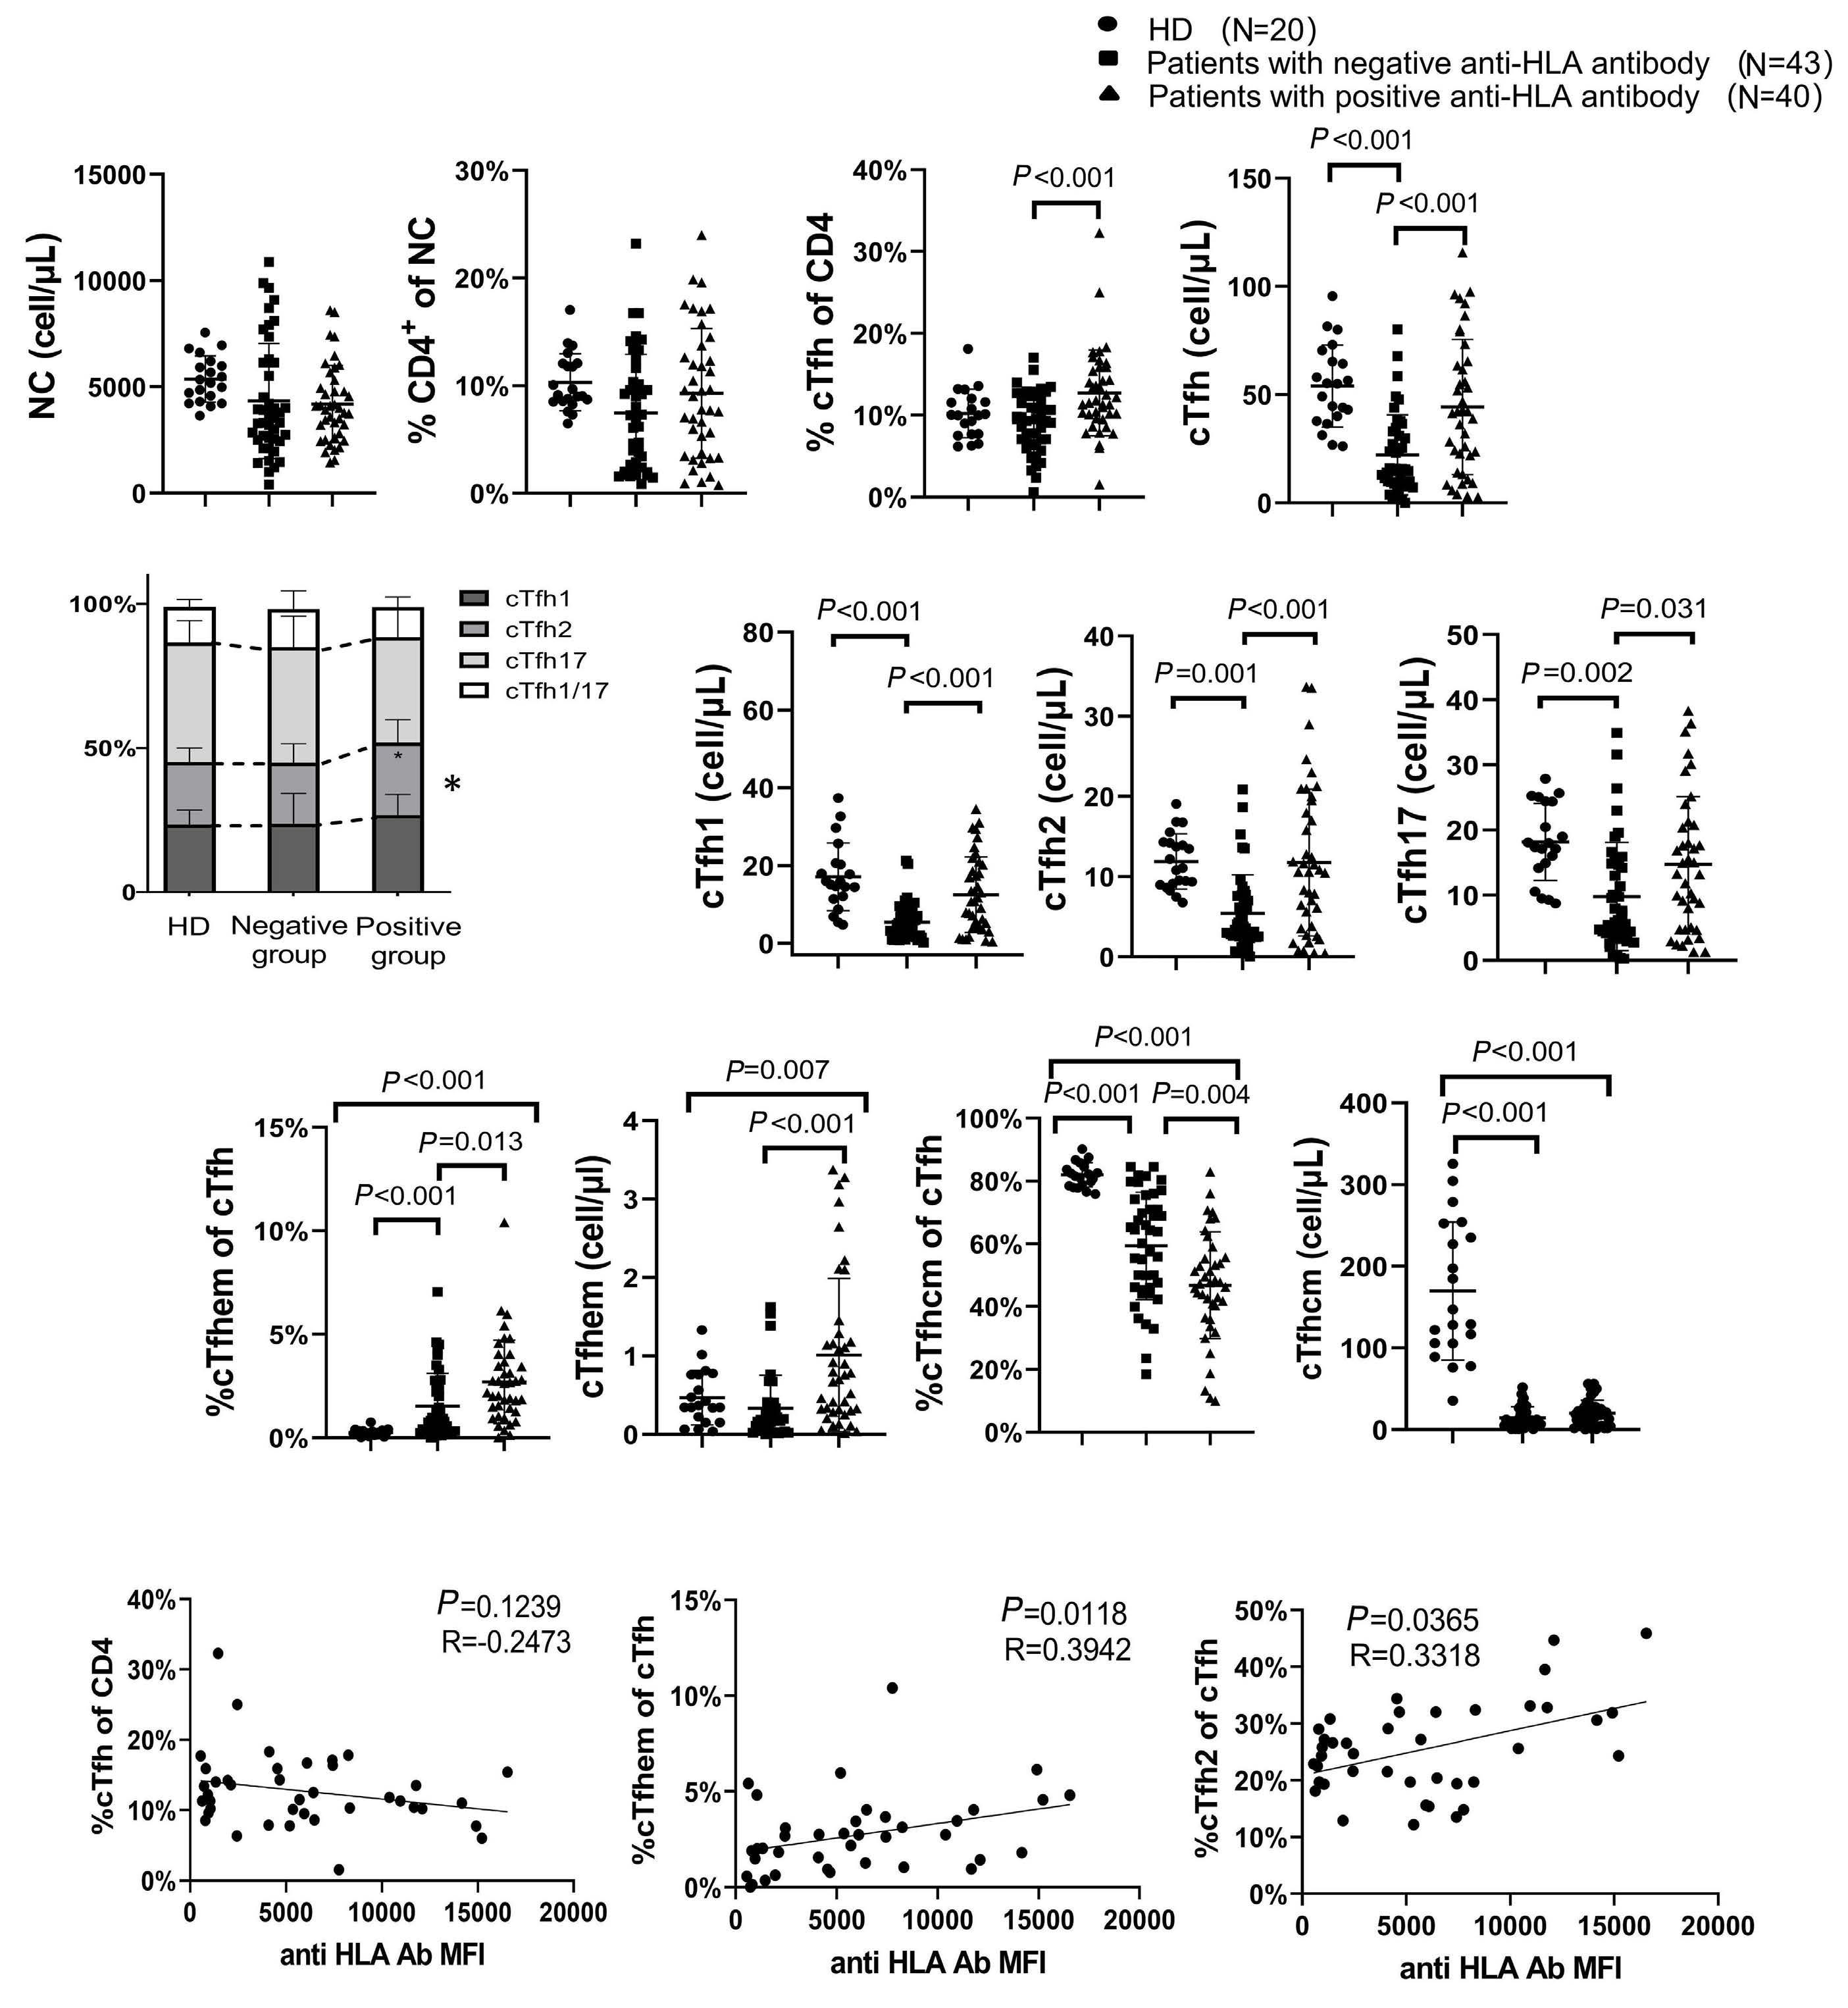
Figure 1.
circulating T-follicular
the titers of anti-human leukocyte antigen antibodies in transplant
were
flow cytometry. (A) The number of nucleated cells (NC) per microliter of peripheral blood in transplant candidates negative for anti-human leukocyte antigen (HLA) antibodies (Ab) (N=43), transplant candidates positive for anti-HLA Ab (N=40), and healthy controls (N=20). The proportion of CD4+ T cells among NC. The proportion of circulating T-follicular helper cells (cTfh, CD3+ CD4+ CD45RA- CXCR5+) to CD4+ T cells. The absolute number of cTfh cells per microliter. (B) Proportions and absolute numbers of cTfh1 (CXCR3+ CCR6-), cTfh2 (CXCR3- CCR6-), cTfh17 (CXCR3- CCR6+), and cTfh1/17(CXCR3+ CCR6+) in cTfh cells from different groups. The proportion and absolute numbers of cTfhem (ICOS+ PD-1+ CCR7-) (C) and cTfhcm (ICOS- PD-1- CCR7+) (D) in different populations. Correlation between cTfh and donor-specific Ab DSA mean fluorescent intensity (MFI) in transplant candidates (E). The Wilcoxon rank-sum test was performed to assess the significance of (A-D), and the Spearman test was applied to (E). *P<0.05. HD: healthy donor.
tients in the anti-HLA antibody positive group could assist autologous memory B cells to produce a higher proportion of plasmablasts than patients in the negative group (P<0.001) (Figure 2B). The supernatant of the co-culture system of anti-HLA antibody-positive allo-HSCT patients contained higher levels of immunglobulin (Ig)M (P=0.043),
IgG ( P =0.002), CXCL13 (P=0.004), and interleukin (IL)-21 (P=0.011), but no difference in the levels of IgA and IL-2 compared with anti-HLA antibody-negative cases (Figure 2C, D). The percentages of IL-21+ cTfh cells in the co-culture system of the anti-HLA antibody group was higher than that in the negative group (P<0.001) (Figure 2E).
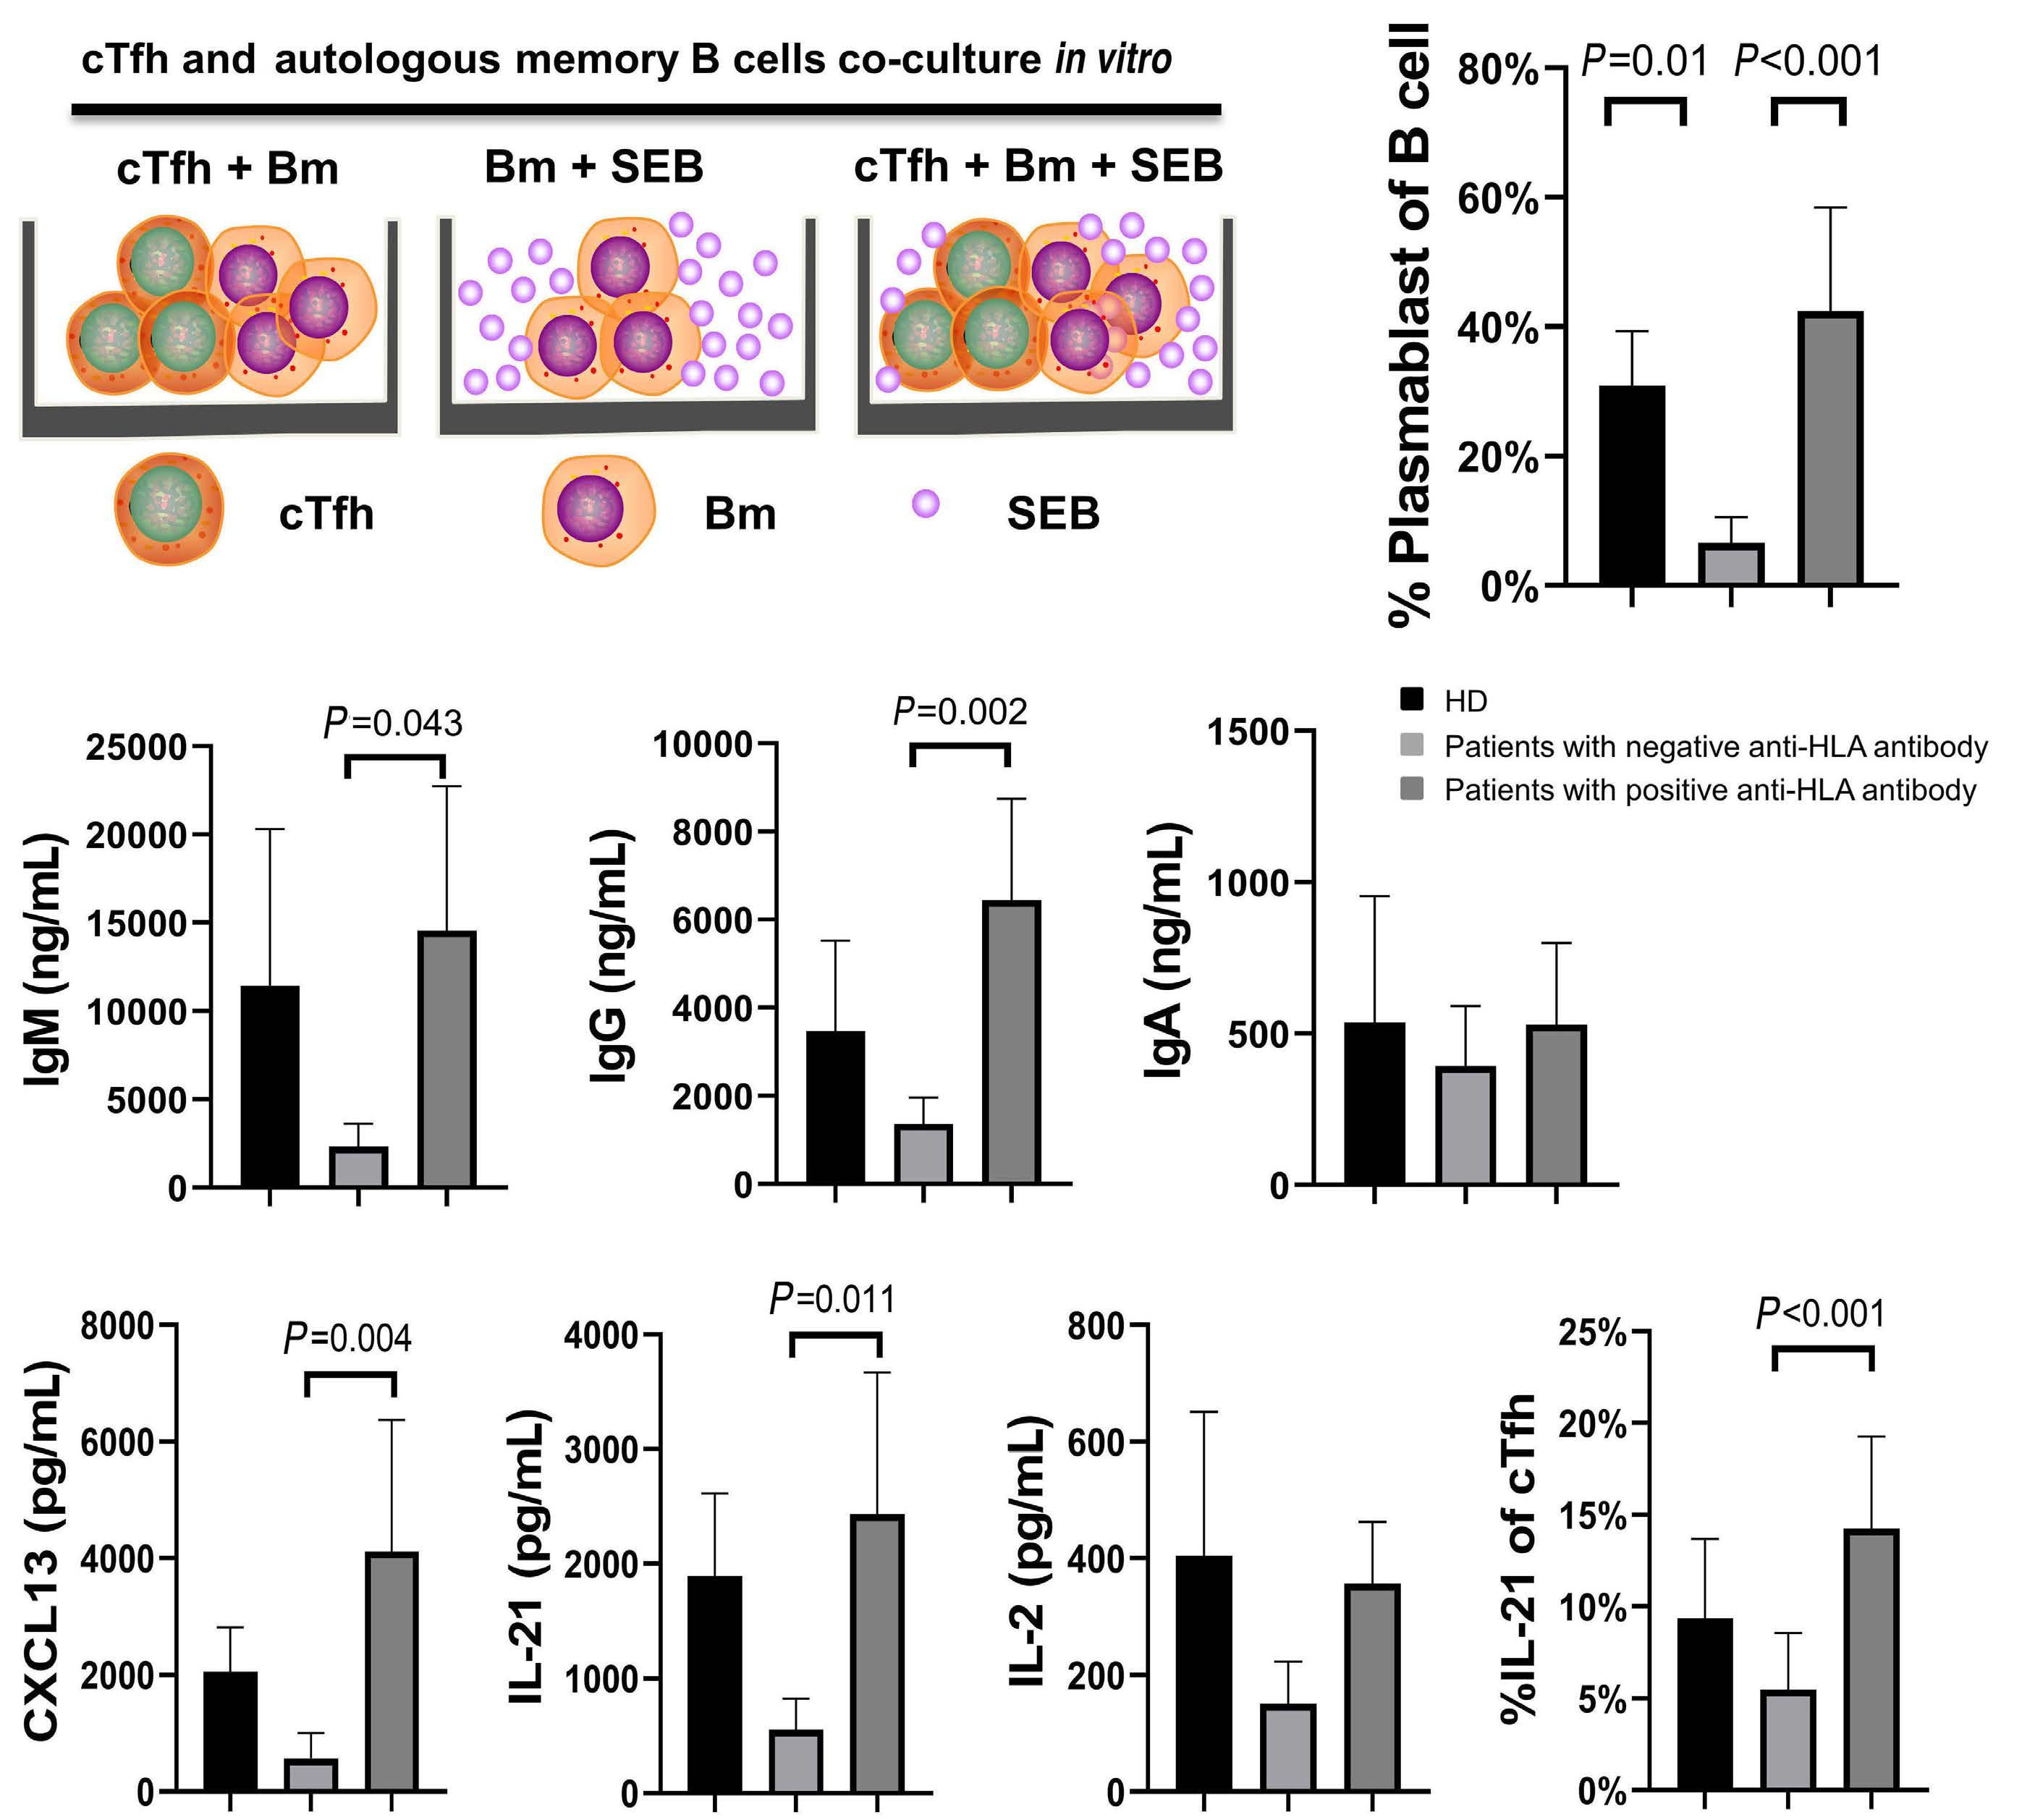
Figure 2.
by memory B cells in allogeneic hematopo-
leukocyte antigen antibodies. (A) In vitro culture pattern of circulating T-follicular helper (cTfh) and autologous
B cells. Peripheral blood mononucelar cells (PBMC) was isolated from PB of healthy donors, and transplant candidates positive and negative for anti-human leukocyte antigen (HLA) antibody (N=5). The cTfh and memory B (Bm) cells (CD3-CD19+CD27+) were then isolated by flow cytometry and finally co-cultured in the presence of staphylococcal enterotoxin B (SEB) (1 mg/mL) for 6 days. (B) The transformation ratio of Bm cells to plasmablast cells (CD3- CD20- CD27+ CD38+) was detected by flow cytometry. (C) The immunoglobulin (Ig) level was detected by enzyme-linked immunosorbant assay (ELISA) in the supernatant. (D) The levels of CXCL13, interleukin (IL)-21 and IL-2 were also detected by ELISA in the supernatant. (E) Flow cytometry was used to detect the expression of IL-21 in peripheral blood cTfh cells of different populations (N=10) after 4 hours of phorbol 12-myristate 13-acetate (PMA)/ionomycin stimulation. Wilcoxon rank sum test was performed to assess the significance in (B-E). HD: healthy donor.
In order to explore whether the presence of anti-HLA antibodies in the supernatant after co-culture, anti-HLA antibodies were tested. The results showed that only the supernatant of the co-culture system of anti-HLA antibody-positive allo-HSCT patients contains class I and/ or class II anti-HLA antibodies ( Online Supplementary Figure S5). In addition, the profiles of anti-HLA antibodies produced by memory B cells in vitro were consistent with the in vivo analysis ( Online Supplementary Figure S5), except for some differences in the MFI. Collectively, these observations show that the cTfh cells of anti-HLA antibody-positive allo-HSCT candidates induce B cells to differentiate into DSA-producing plasmablasts.
Contribution of immune synapse to circulating T-follicular helper cells in assisting B cells
In order to investigate whether cTfh assists memory B cells in antibody production through the direct contact pathway, we sorted cTfh and memory B cells from five healthy donors for Transwell experiments (Figure 3A). Compared to the control group, the percentages of plasmablast produced by cTfh cell-assisted autologous memory B cells in the experimental group decreased significantly ( P=0.007; Figure 3B). The levels of IL-21 (P=0.032), CXCL13 (P=0.014), IgG (P=0.011), and IgM (P=0.024) in the supernatant of the experimental group were also significantly lower than that in the control (Figure 3C, D). These results suggest that the direct-contact pathway plays an important role in cTfh cell-assisted antibody production by B cells. Subsequently, immunosynaptic-associated adhesion molecules and co-stimulatory molecules (mainly LFA-1, ICOS, CD40L, and CD28 on cTfh and CD86, CD80, CD40, ICOSL, and ICAM-1) expressed in cTfh cells and memory B cells in patients positive (n=10, group C) and negative (n=10, group D) for anti-HLA antibody were determined. The results showed higher expression of CD28 (P=0.036) and ICOS (P=0.029) in cTfh cells in patients of group C than in group D (Figure 4A); as well as higher expression of CD86 (P=0.003) and ICAM-1 ( P=0.031) in memory B cells (Figure 4B). These results suggest that immune synapses may be involved in the assistance of B cells by cTfh cells in anti-HLA antibody-positive patients.
We investigated whether the inhibition of molecules related to immune synapses could affect the auxiliary effect of cTfh cells on antibody production by B cells. The sorted cTfh cells were co-incubated with autologous memory B cells in vitro in the presence of CTLA-4 Ig. The CTLA-4 Ig inhibition of CD28 effectively reduced the percentages of plasmablast (P=0.011), IL-21 (P=0.006), CXCL13 (P=0.002), IgG (P<0.001), IgM (P<0.001), and IgA (P=0.018) in B cells compared to that in the control group (Figure 4C-E). We further explored the differences in the transcriptome of cTfh cells between patients positive and negative for anti-HLA antibodies. The top 70 differential genes are shown in Online Supplementary Figure S6A . ATAC-se -
quencing data showed that 609 genomic regions exhibited greater chromatin accessibility and 3,778 genomic regions exhibited reduced accessibility in patients with positive anti-HLA antibody (Online Supplementary Figure S6B). Pathway enrichment analysis of the RNA-sequencing results revealed that the upregulated genes were mainly involved in positive regulation of synaptic transmission (Online Supplementary Figure S6C ). Notably, not only was the BAIAP3 gene upregulated, but the degree of chromatin accessibility of the BAIAP3 molecule located on chromosome 16 was also increased in the cTfh cells of patients positive for anti-HLA antibody (Online Supplementary Figure S6D). The association of BAIAP3 with post-synaptic neurotransmission36 and our results suggest a correlation between BAIAP3 gene expression and the positive regulation of synaptic transmission in the cTfh cell of anti-HLA antibody positive patients.
In summary, our observations suggest that the immune synapse may contribute in the assistance of B cells in antibody production by cTfh cells.
In vitro targeting circulating T-follicular helper cells inhibits their auxiliary function on B cells
We investigated the effects of ruxolitinib, sirolimus and IL-21 blocking antibody (IL-21b) on the function of cTfh cells in assisting B cells in vitro. The sorted cTfh cells were treated with the drugs for 24 hours, after which the drugs were eluted and the cells were incubated with autologous memory B cells, the ratio of cTfh cells to memory B cells was 1:1 according to previous studies18,20,21 (Figure 5A). All three drugs were found to inhibit the differentiation of B cells into plasmablasts in five healthy donors (Figure 5B), and there was a significant decrease in the levels of IgG, IgA, and IgM, as well as IL-21 and CXCL13, in the experimental group compared with those in the control group (Figure 5C, D). As previously reported,22 the percentage of ICOS+ CD28+ cTfh cells among all the cTfh cells was used to reflect the intensity of immune synaptic activity. Targeting cTfh cells with the three drugs significantly decreased the percentage of ICOS+ CD28+ cTfh subsets in the cTfh cells (Figure 5E). Overall, in vitro experiments indicated that targeting cTfh cells inhibited their auxiliary function in antibody production by B cells.
In vivo targeting of circulating T-follicular helper cells with sirolimus reduces donor-specific antibody levels in allografting candidates
Based on the literature32 and our in vitro experiments, a pilot study was performed to investigate whether sirolimus can reduce DSA levels by suppressing cTfh cells in allo-SCT candidates. Sixteen transplant candidates positive for DSA were enrolled (Online Supplementary Table S2). A 50% reduction in a patient’s DSA MFI was defined as an effective treatment; however, the effective rate of sirolimus treatment was 43.75% for all patients (Figure 6A; Online Supplemen-
tary Figure S7A-E). The levels of IL-21 (P=0.002) and CXCL13 (P=0.002) after 2 weeks of sirolimus treatment decreased significantly compared with levels prior to treatment (Figure 6B, C). Following sirolimus administration, we observed a significant decrease in the percentages of cTfhem cells (P=0.01) and ICOS+CD28+ cTfh cells (P<0.001) (Figure 6D-F). Collectively, these observations suggest that in vivo targeting of cTfh cells could provide a novel approach for the desensitization of DSA-positive allografting candidates.
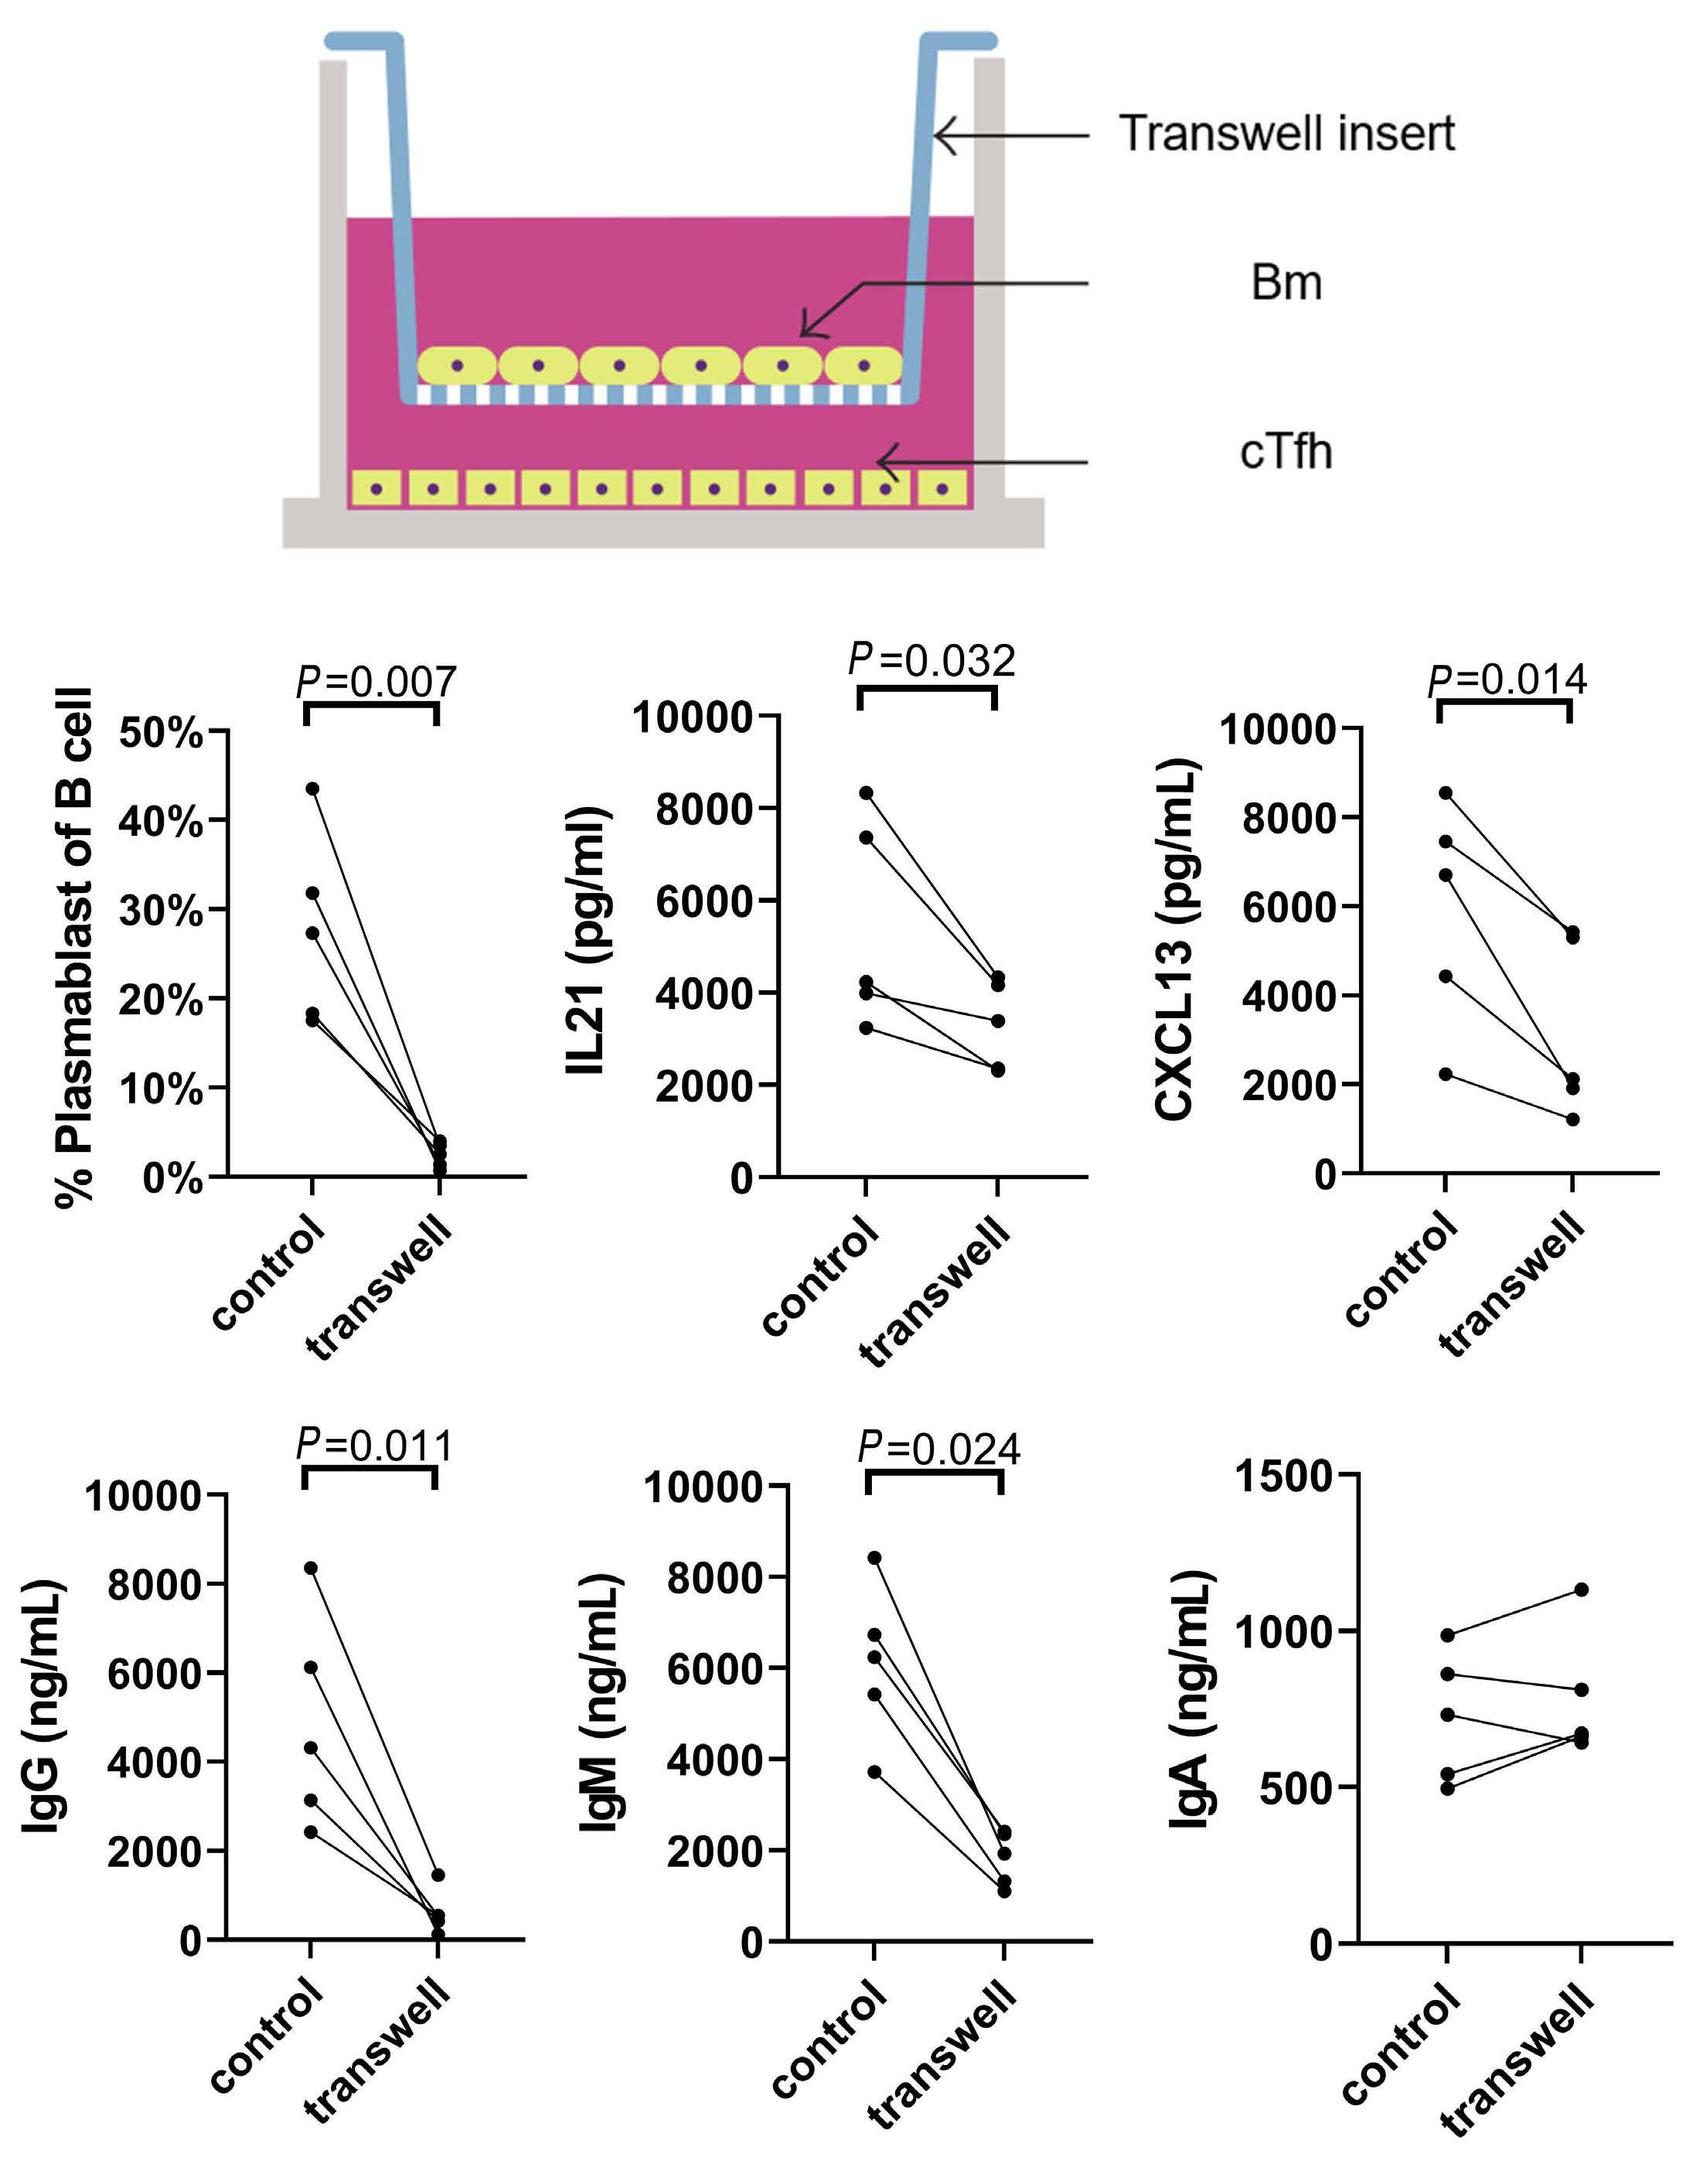
of Bm cells to plasmablast cells was
by flow cytometry. The levels of interleukin (IL)-21 and CXCL13 (C) were detected by enzyme-linked immunosorbant assay (ELISA) in the supernatant.
by ELISA in the supernatant. Paired t
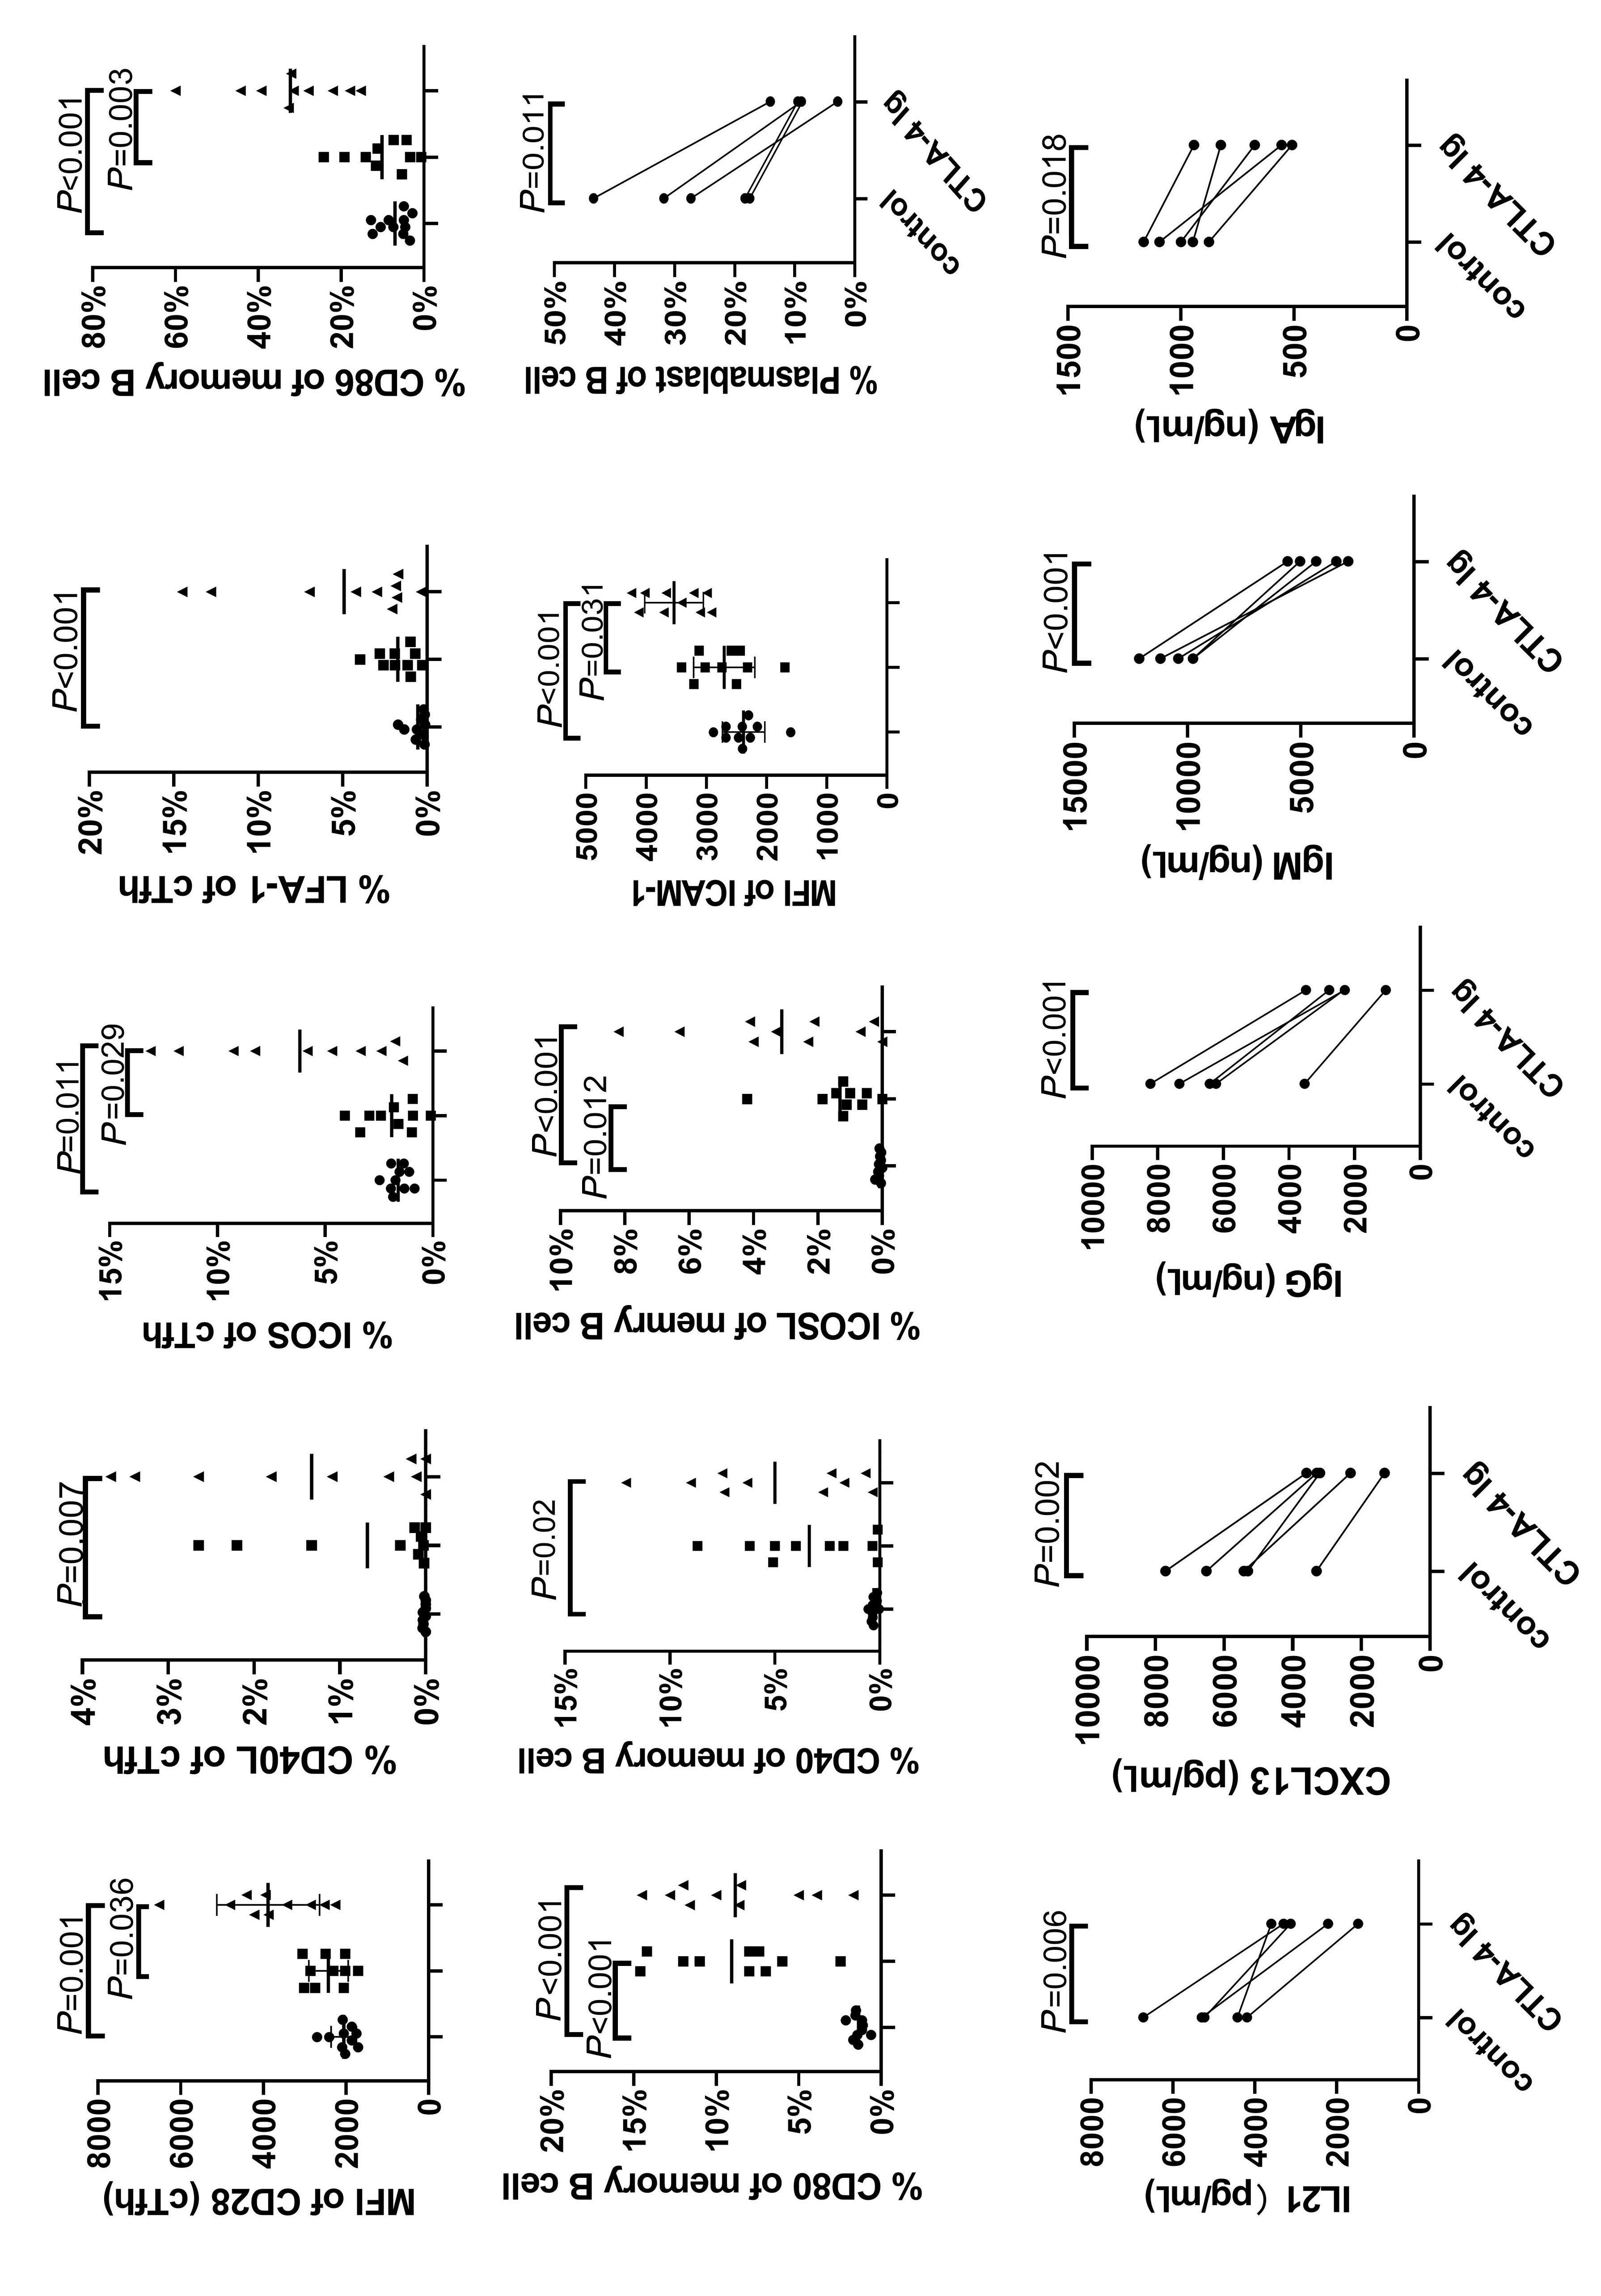
Figure 4. Expression of immune synapse molecules on circulating T-follicular helper and memory B cells in allogeneic hematopoetic stem cell transplantation candidates with positive anti-human leukocyte antigen antibodies. (A) The expression levels of immune synapse-related molecules on circulating T-follicular helper (cTfh) were detected using flow cytometry in different groups (N=10). (B) Expression levels of immune synapse-related molecules in memory B cells (N=10). Peripheral blood samples from healthy donors (N=5) were used for the in vitro experiments. CTLA-4-immunoglobulin (Ig)-binding ligands CD80 and CD86 were used to prevent them from binding to CD28. The ratio of plasmablast cells was detected (C), and interleukin (IL)-21, CXCL13 (D), and Ig were detected in the supernatant (E). The Wilcoxon rank-sum test was used to assess the significance of (A, B), and a paired t test was used to assess the significance of (C-E). MFI: mean fluorescence intensity.
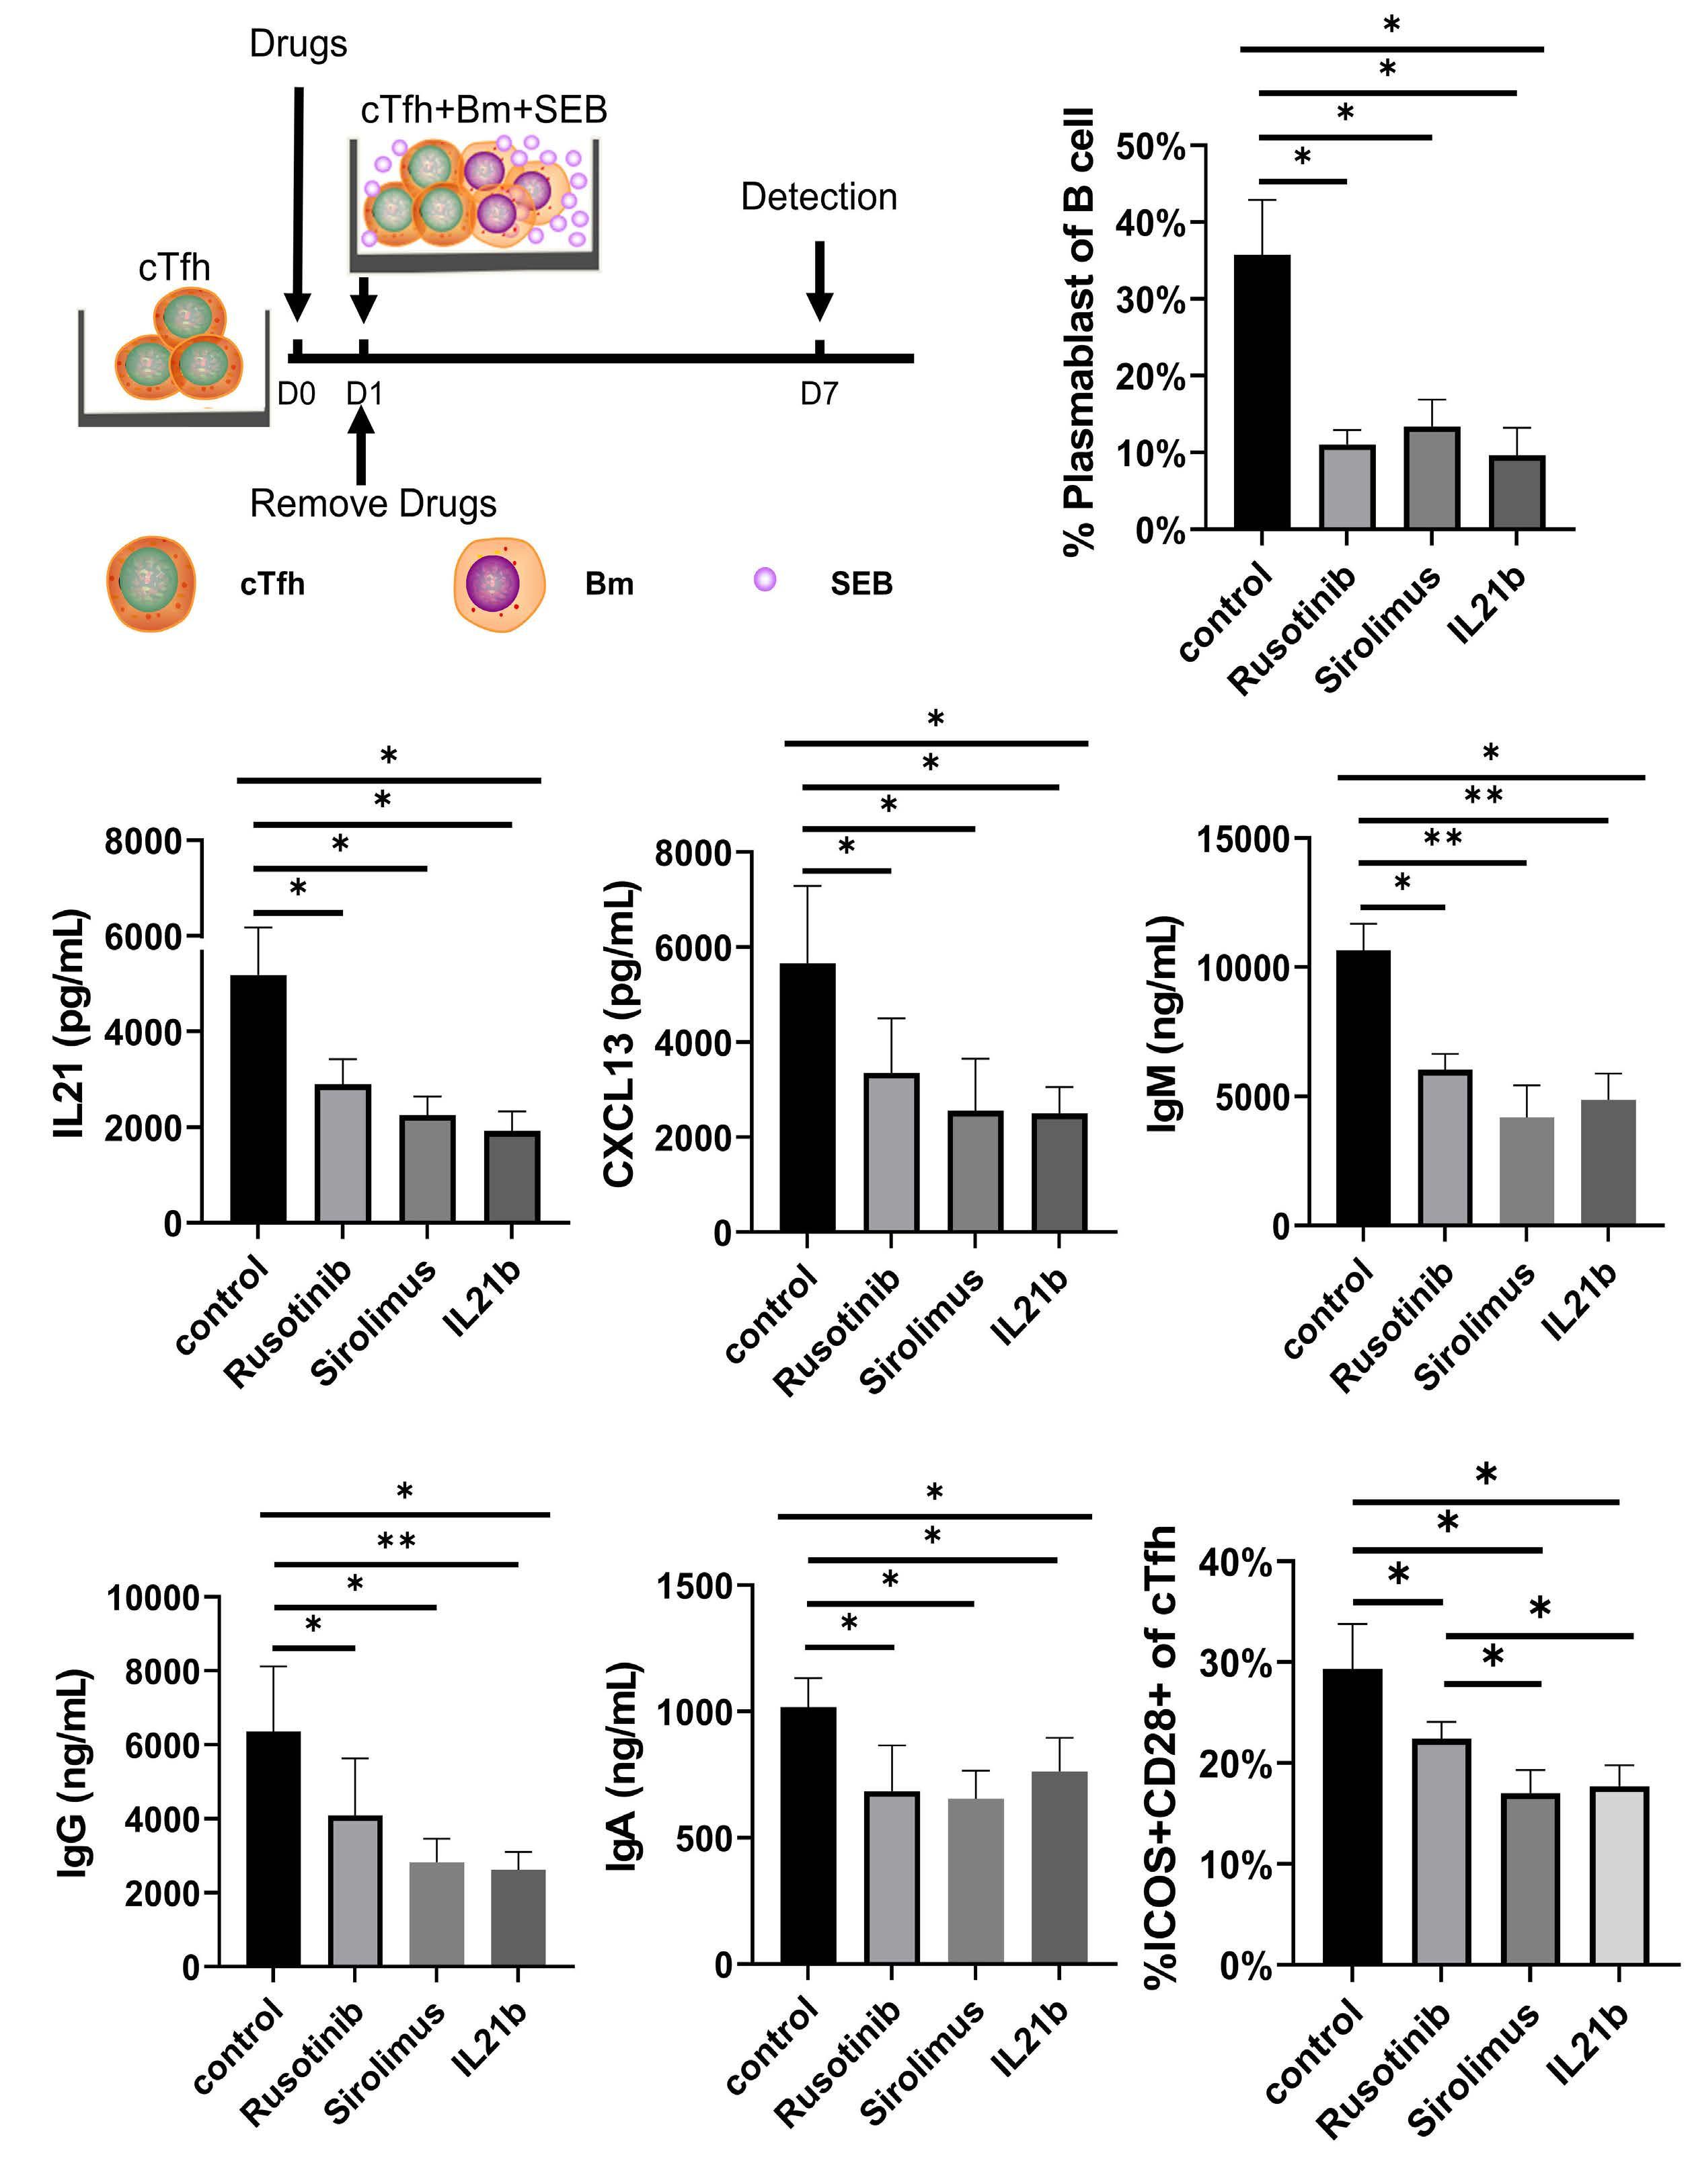
interleukin (IL)-21 and CXCL13
Wilcoxon
Ex vivo and in vivo experiments on the combination of rituximab and sirolimus for antibody reduction
In previous studies,2,10 rituximab had a significant desensitization effect on DSA; therefore, we further explored whether sirolimus and rituximab have a combined effect on antibody production. Using an ex vivo experiment, we found that the combination of sirolimus and rituximab significantly inhibited the differentiation of B cells into plasmablasts
and decreased the levels of IgG, IgM, and IgA as opposed to sirolimus and rituximab used independently (Figure 7A). In the clinical study, we showed that the effective rates of the combination of sirolimus and rituximab as well as sirolimus or rituximab used independently in desensitizing DSA-positive patients were 60%, 43.75%, and 30%, respectively (Figure 7B–F), when a 50% reduction in a patient’s DSA MFI was defined as effective treatment. Collectively, the in vitro and
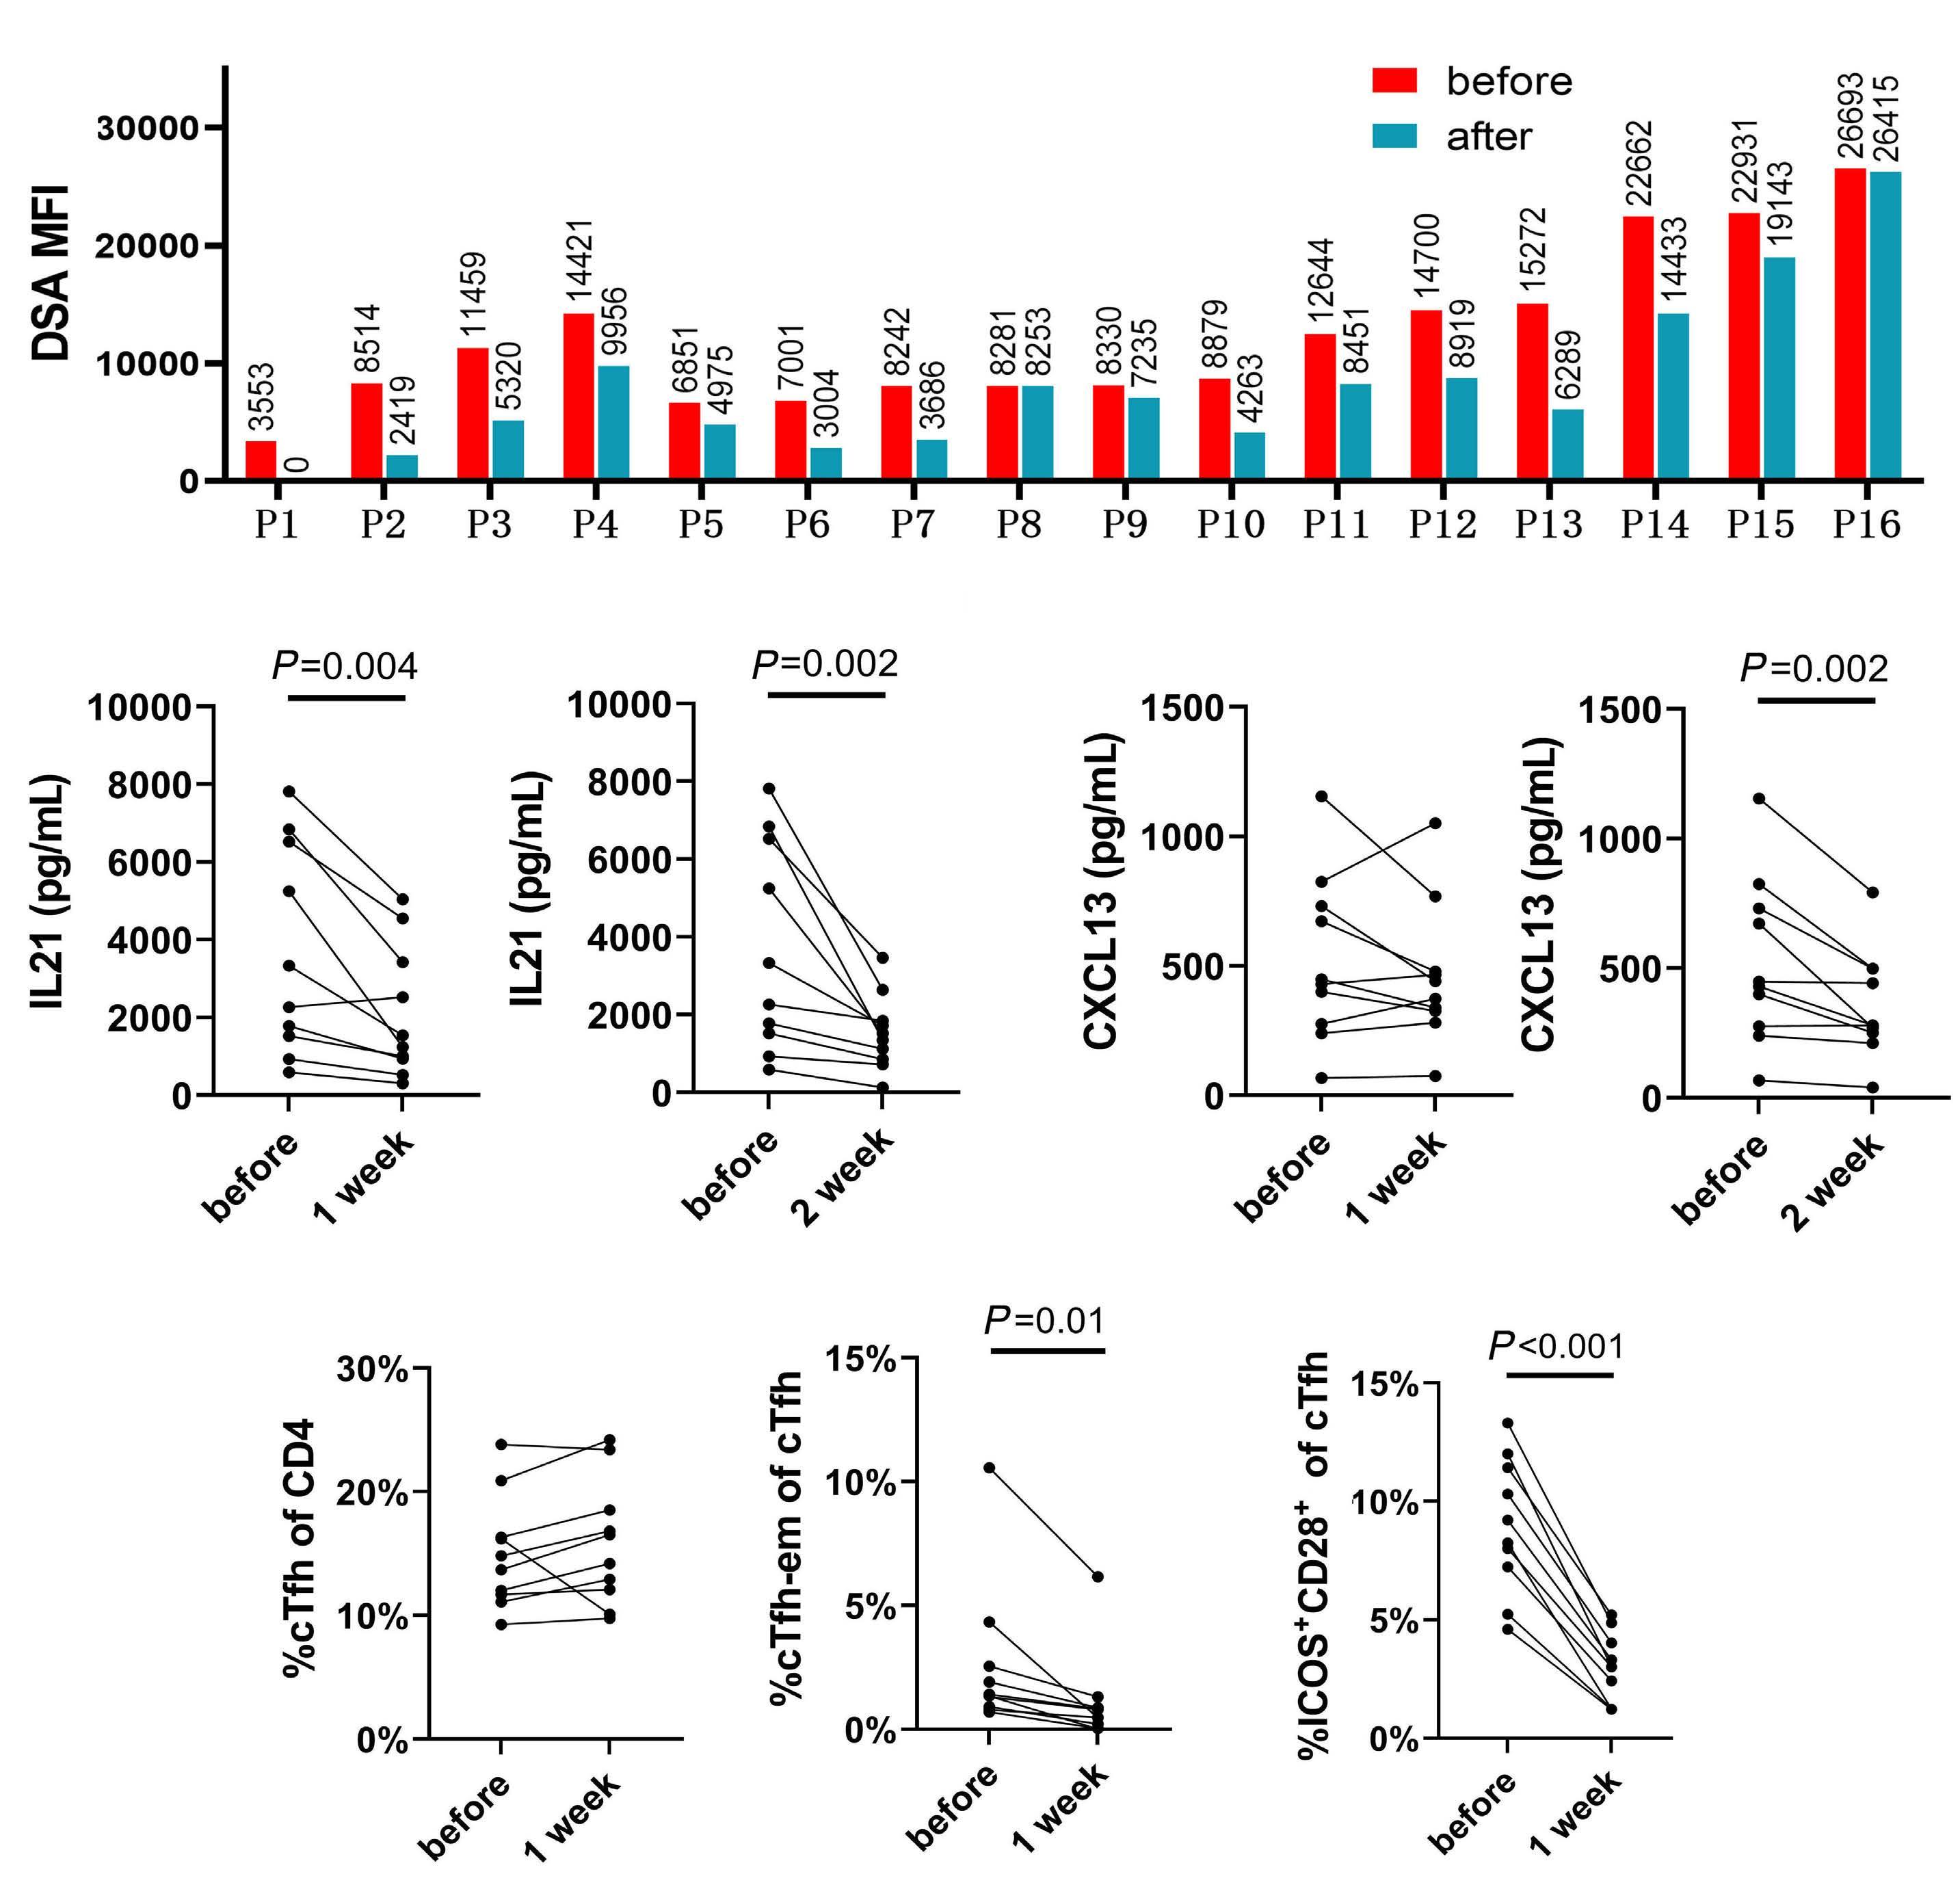
of
in vivo studies demonstate the efficiency of DSA desensitization using a combination of sirolimus and rituximab as well as sirolimus or rituximab used independently. The infection rates of COVID-19 of patients treated with sirolimus or rituximab either alone or incombination were 75%, 60%, and 50%, respectively. Other side effects are listed in Online
Supplementary Table S3
This study demonstrated that cTfh cells from candidates undergoing allografting aided B cells in producing DSA, which suggests a potential role of the immune synapse between cTfh cells and B cells. Moreover, we observed that targeting cTfh cells can inhibit the DSA secretion by B cells, in the in vitro and in vivo studies. As per our knowledge, these results present the first evidence that targeting Tfh cells independently or targeting both the Tfh and B cells can control humoral allogeneic immunity in patients with positive DSA who are candidates for HLA-mismatched allo-HSCT.
The cTfh cells contain two functionally distinct subgroups:13,20-22 efficient helpers (cTfh2 and cTfh17 cells) and non-efficient helpers (cTfh1 cells). cTfh2 and cTfh17 cells secrete IL-21 and induce B cells to proliferate, differentiate into antibody-producing cells, and undergo class-switching to IgG and IgA, whereas cTfh1 cells lack these characteristics.13,21,22 We found that the cTfh2 cells were correlated with the level of anti-HLA antibodies in the candidates for HLA-mismatched allo-SCT. This was consistent with the function of cTfh2 cells, as previously demonstrated.37,38 Moreover, we also observed an association between the percentages and absolute numbers of cTfhem cell subsets and the level of anti-HLA antibodies. Danger et al.39 and La Muraglia et al.17 observed a similar association in organ transplantation settings. Except for the results reported by others in different clinical settings, such as vaccination,40 viral infection,24,37 autoimmune disease31 and organ transplantation,17,19 our results provide further evidence suggesting that the activated ICOS+PD-1+ populations (the cTfhem subsets) may represent the most efficient helpers among the cTfh cells.
In the present study, we observed that cTfh cells induced B cells to differentiate into DSA-producing plasmablasts, which was in accordance with the observation of Louis et al.18 In contrast to the study by Louis et al., 18 our results suggest the probable involvement of the immune synapse in the assistance of B cells by cTfh cells during the production of anti-HLA antibodies. This observation was based on the following findings: first, higher expression of CD28 and ICOS on cTfh cells, as well as CD86 and ICAM on B cells in DSA-positive patients was observed. Second, in vitro experiments demonstrated that blocking CD28 on cTfh cells with CTLA-4 Ig significantly reduced the percentage of plasmablasts in B cells, as well as the antibody levels. Third, patients with
positive anti-HLA antibodies had genes that were upregulated in expression, such as BAIAP3, which were mainly involved in the positive regulation of synaptic transmission. These observations suggest that targeting immune synapse-related molecules could be a novel strategy for inhibiting cTfh cell function, although further studies are required.
The important role of cTfh cells in DSA production, demonstrated in our study, prompted us to investigate drugs that can effectively inhibit DSA function in vitro. We found that in vitro treatment of cTfh cells with ruxolitinib,31 sirolimus32 or IL-21b30 effectively inhibited the differentiation of plasmablasts from B cells and decreased the levels of CXCL13 and antibodies. Based on previous studies reported by others and our group that showed the effects of rituximab in desensitizing DSA either in the haploidentical HSCT modality10,11 or in renal transplant settings,2,12 we further demonstrated the synergistic effect of sirolimus and rituximab in DSA desensization ex vivo. Our results indicate that targeting cTfh cells or B cells can inhibit antibody production by B cells. Overall, in vitro experimental results indicate that targeting cTfh cells can inhibit their assistance in antibody production by B cells, which provides evidence for the clinical use of cTfh cell-targeted drugs in candidates for HLA-mismatched allografting with positive DSA.
Based on the results of in vitro experiments, and considering the evidence that sirolimus has been used in allo-SCT patients for GVHD prophylaxis.41,42 we performed a pilot study to investigate the efficiency of sirolimus in desensitizing DSA of candidates for HLA-mismatched allografting. We observed that the efficacy rate of sirolimus as a sole agent was 43.75% in all patients. The decrease in the level of DSA was accompanied by the following changes: i) a decrease in the levels of IL-21 and CXCL13 and ii) a decrease in the percentages of cTfhem and ICOS+CD28+ cTfh cells. Thus, the results of our in vivo study and those of other studies17,19,25 indicate that targeting Tfh cells can provide effective strategies for DSA desensitization in both allo-HSCT and organ transplant settings. In our study, although the role of other immune cells in reducing DSA could not be completely excluded,43-46 the results of our study and the data reported by other researchers17-20 support the conclusion that, in terms of reducing the DSA of actual patients, cTfh cells might be more important than other T cells, even when considering the complex interaction between Tfh cells and other T/B cells of patients with positive DSA in vivo. Additionally, the comparison between sirolimus and rituximab in DSA desensitization as well as whether treating patients with combined sirolimus and rituximab is better than using either sirolimus or rituximab alone will be investigated in future studies. In summary, we demonstrated for the first time that there were quantity and quality abnormalities in cTfh cells characterized by an increase in the cTfh2 and cTfhem subsets, and the enhanced ability of cTfh cells in assisting B cells in DSA production, in HLA-mismatched transplant candidates.
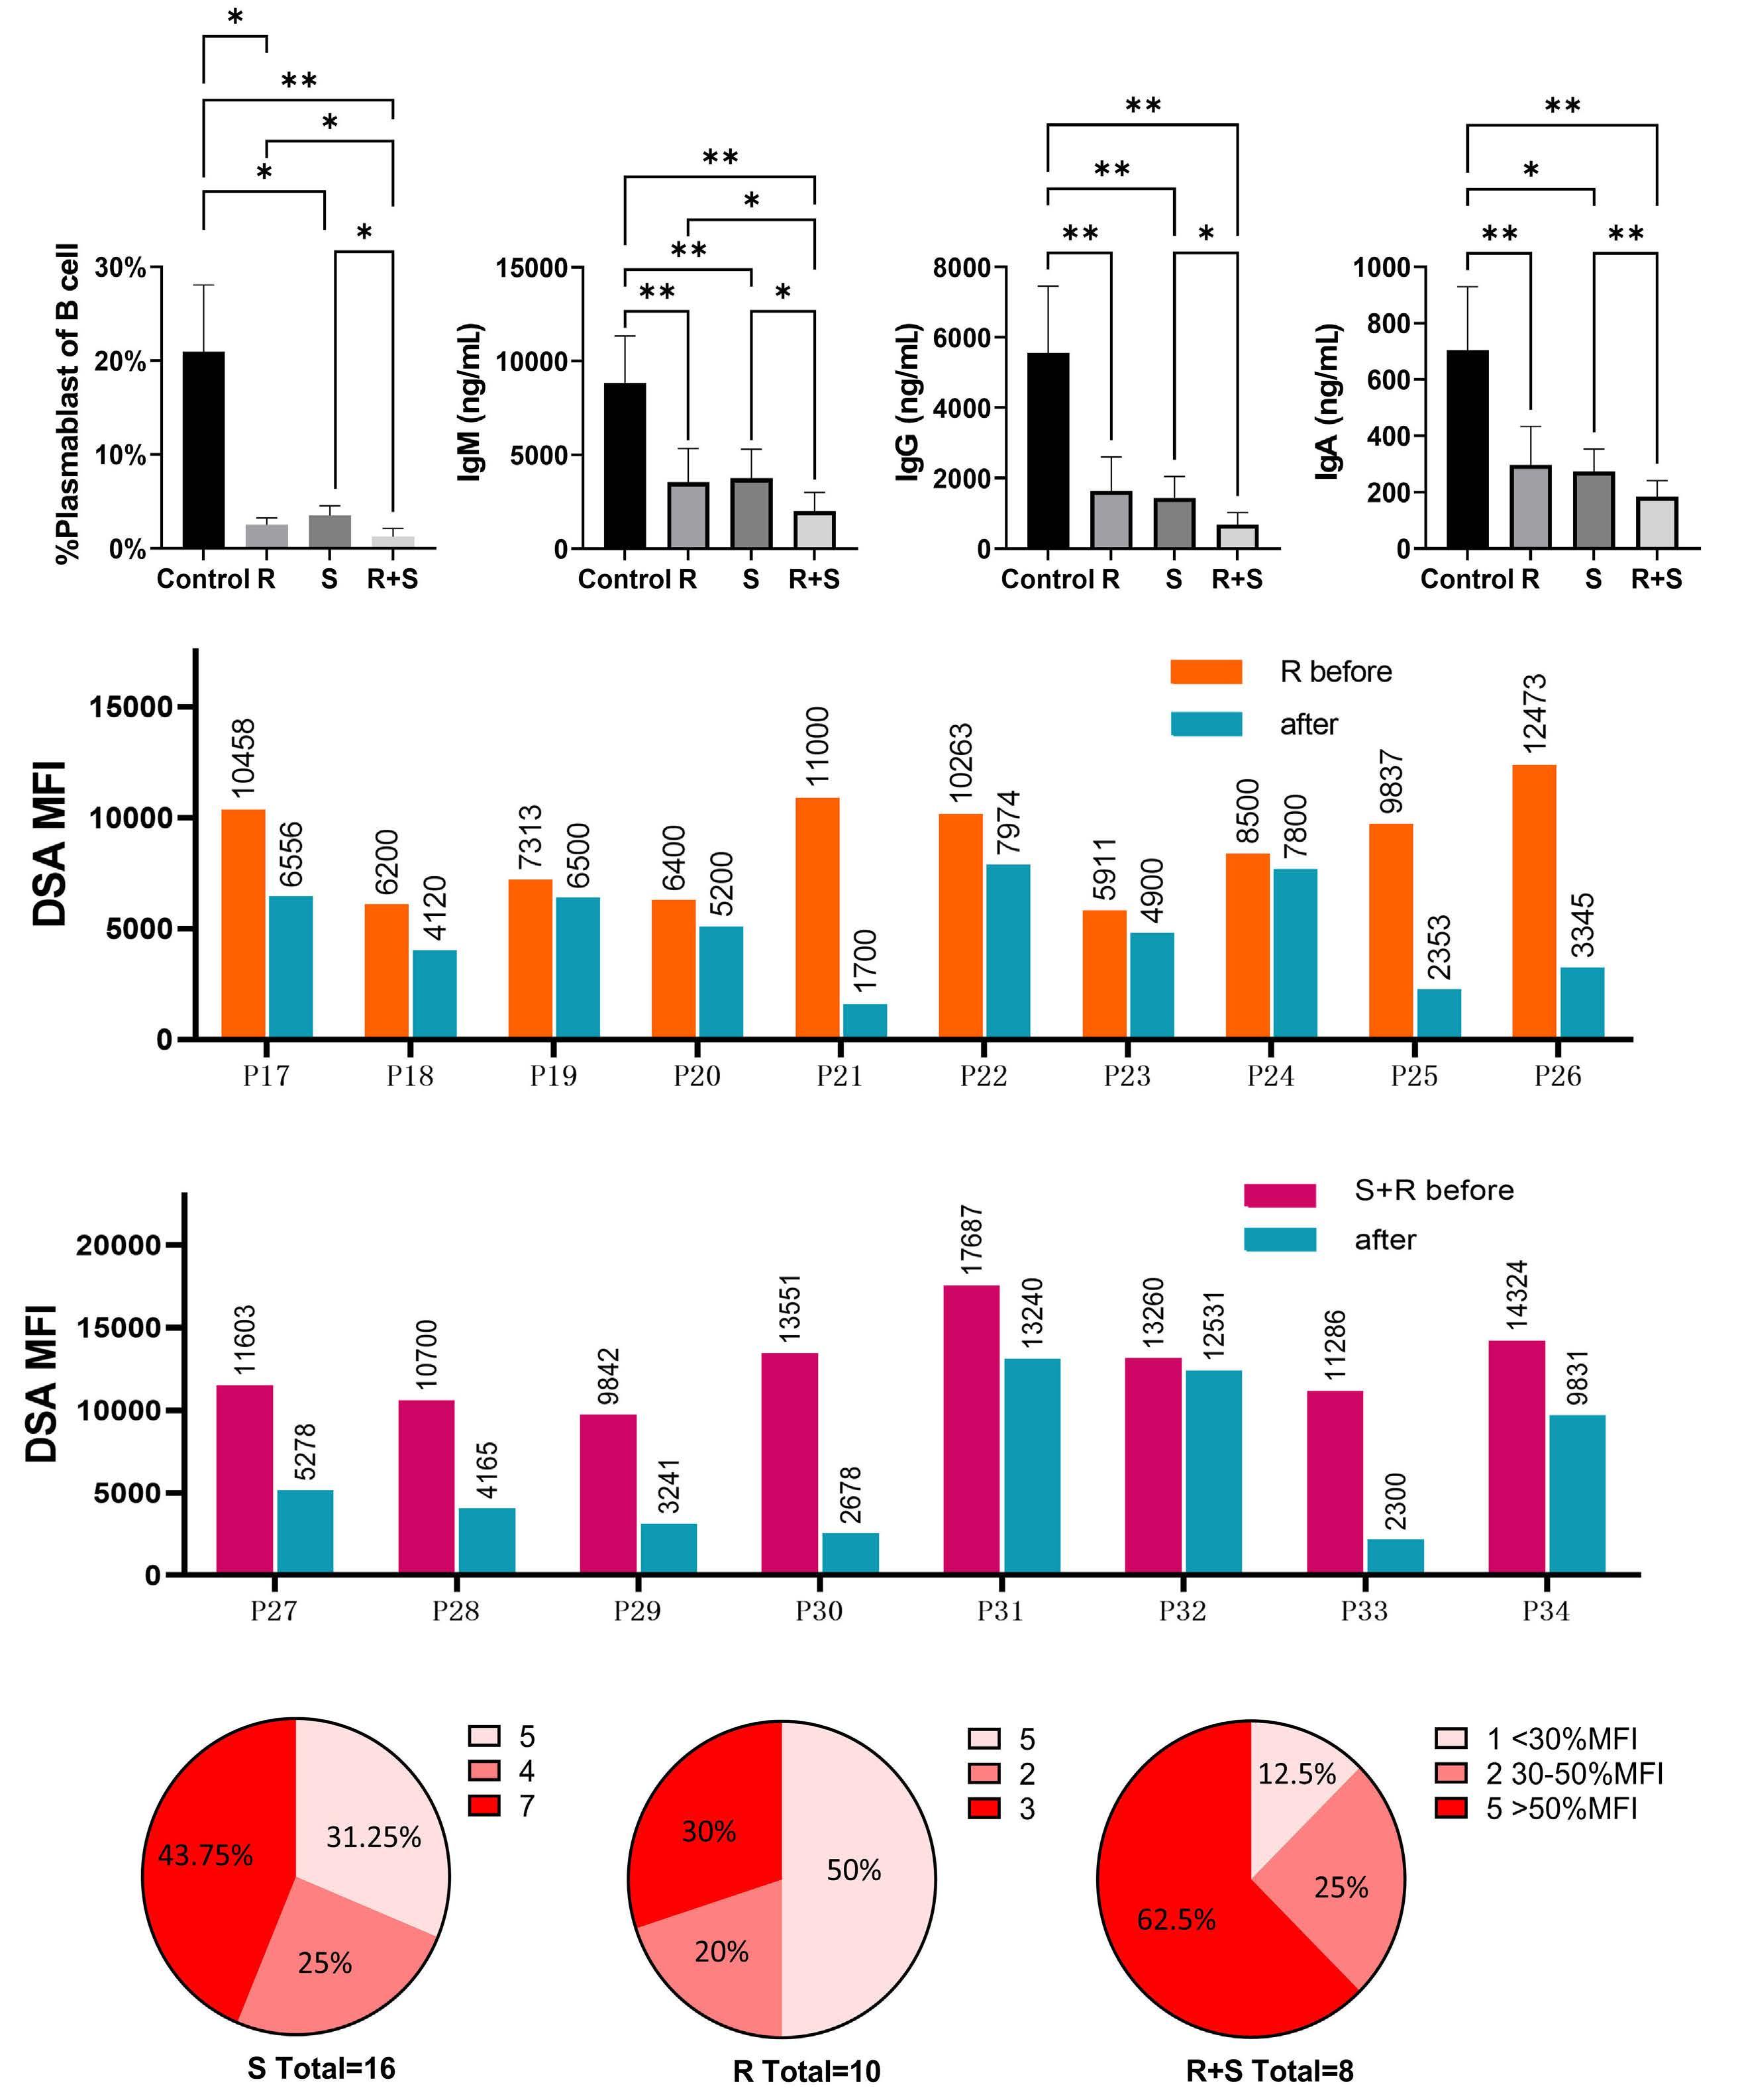
7.
desensitization ex vivo and in vivo. Cells from healthy donors
for in vitro
indices after co-culturing in different drug groups were analyzed (A). (B) Comparison of donor-specific antibody (DSA) mean fluorescent intensity (MFI) before and after treatment in patients who were administrated with rituximab (R) (N=10). (C) Comparison of the DSA MFI in patients in the sirolimus (S) and R groups (N=8) before and after treatment. (D-F) Comparison of the therapeutic effects in different experimental drug groups. One-way ANOVA (Welch test) was performed to assess the significance in (A). The χ2 test was used for rate comparison and the Bonferroni test was used for the pairwise control test (D-F). *P<0.05; **P<0.01. R+S: sirolimus and rituximab.
In vitro and in vivo experiments indicated that targeting Tfh cells independently or both Tfh and B cells can provide novel methods for DSA desensitization. Further studies are required to identify potential agents for inhibiting cTfh cells. Prospective studies that are clinically focused, conducted in multiple centers, and encompassing a large-sample are warranted to investigate the effectiveness of the agents that target cTfh cells and aid in desensitizing DSA in candidates undergoing allografting.
Disclosures
No conflicts of interest to disclose.
Contributions
X-JH and Y-JC designed the study. X-JH and Y-JC conceived
1. Girnita AL, Duquesnoy R, Yousem SA, et al. HLA-specific antibodies are risk factors for lymphocytic bronchiolitis and chronic lung allograft dysfunction. Am J Transplant. 2005;5(1):131-138.
2. Vo AA, Lukovsky M, Toyoda M, et al. Rituximab and intravenous immune globulin for desensitization during renal transplantation. N Engl J Med. 2008;359(3):242-251.
3. Lefaucheur C, Louis K, Morris AB, et al. Clinical recommendations for posttransplant assessment of anti-HLA (human leukocyte antigen) donor-specific antibodies: a sensitization in transplantation: assessment of risk consensus document. Am J Transplant. 2023;23(1):115-132.
4 Ciurea SO, Thall PF, Wang X, et al. Donor-specific anti-HLA Abs and graft failure in matched unrelated donor hematopoietic stem cell transplantation. Blood. 2011;118(22):5957-5964.
5. Cutler C, Kim HT, Sun L, et al. Donor-specific anti-HLA antibodies predict outcome in double umbilical cord blood transplantation. Blood. 2011;118(25):6691-6697.
6. Bouquegneau A, Loheac C, Aubert O, et al. Complementactivating donor-specific anti-HLA antibodies and solid organ transplant survival: a systematic review and meta-analysis. PLoS Med. 2018;15(5):e1002572.
7 Gochi F, Chen-Yoshikawa TF, Kayawake H, et al. Comparison of de novo donor-specific antibodies between living and cadaveric lung transplantation. J Heart Lung Transplant. 2021;40(7):607-613.
8. Chang YJ, Zhao XY, Xu LP, et al. Donor-specific anti-human leukocyte antigen antibodies were associated with primary graft failure after unmanipulated haploidentical blood and marrow transplantation: a prospective study with randomly assigned training and validation sets. J Hematol Oncol. 2015;8:84.
9 Ruggeri A, Rocha V, Masson E, et al. Impact of donor-specific anti-HLA antibodies on graft failure and survival after reduced intensity conditioning-unrelated cord blood transplantation: a Eurocord, Societe Francophone d’Histocompatibilite et d’Immunogenetique (SFHI) and Societe Francaise de Greffe de Moelle et de Therapie Cellulaire (SFGM-TC) analysis. Haematologica. 2013;98(7):1154-1160.
10 Chang YJ, Xu LP, Wang Y, et al. Rituximab for desensitization during HLA-mismatched stem cell transplantation in patients with a positive donor-specific anti-HLA antibody. Bone Marrow Transplant. 2020;55(7):1326-1336.
the project and drafted the manuscript. All authors contributed to data interpretation and manuscript preparation. All authors approved the final version of the manuscript.
This work was partly supported by grants from the Beijing Municipal Science and Technology Commission (no. Z221100007422008), the National Key Research and Development Program of China (no. 2022YFA1103300), and Bethune Charitable Foundation (no. 2020-Z-07).
The data that support the findings of this study are available upon reasonable request from the corresponding author.
11. Ciurea SO, Cao K, Fernandez-Vina M, et al. The European Society for Blood and Marrow Transplantation (EBMT) Consensus Guidelines for the detection and treatment of donor-specific anti-HLA antibodies (DSA) in haploidentical hematopoietic cell transplantation. Bone Marrow Transplant. 2018;53(5):521-534.
12. Crespo M, Zarraga S, Alonso A, et al. Monitoring of donor-specific anti-HLA antibodies and management of immunosuppression in kidney transplant recipients: an evidence-based expert paper. Transplantation. 2020;104(8 Suppl 2):S1-S12.
13. Vinuesa CG, Linterman MA, Yu D, MacLennan IC. Follicular helper T cells. Annu Rev Immunol. 2016;34:335-368.
14 Chen Z, Cui Y, Yao Y, et al. Heparan sulfate regulates IL-21 bioavailability and signal strength that control germinal center B cell selection and differentiation. Sci Immunol. 2023;8(80):eadd1728.
15. Liu D, Yan J, Sun J, et al. BCL6 controls contact-dependent help delivery during follicular T-B cell interactions. Immunity. 2021;54(10):2245-2255.
16. Quast I, Dvorscek AR, Pattaroni C, et al. Interleukin-21, acting beyond the immunological synapse, independently controls T follicular helper and germinal center B cells. Immunity. 2022;55(8):1414-1430.
17 La Muraglia GM, 2nd, Wagener ME, Ford ML, Badell IR. Circulating T follicular helper cells are a biomarker of humoral alloreactivity and predict donor-specific antibody formation after transplantation. Am J Transplant. 2020;20(1):75-87.
18. Louis K, Macedo C, Bailly E, et al. Coordinated circulating T follicular helper and activated B cell responses underlie the onset of antibody-mediated rejection in kidney transplantation. J Am Soc Nephrol. 2020;31(10):2457-2474.
19 Cano-Romero FL, Laguna Goya R, Utrero-Rico A, et al. Longitudinal profile of circulating T follicular helper lymphocytes parallels anti-HLA sensitization in renal transplant recipients. Am J Transplant. 2019;19(1):89-97.
20 He J, Tsai LM, Leong YA, et al. Circulating precursor CCR7(lo) PD-1(hi) CXCR5(+) CD4(+) T cells indicate Tfh cell activity and promote antibody responses upon antigen reexposure. Immunity. 2013;39(4):770-781.
21. Morita R, Schmitt N, Bentebibel SE, et al. Human blood CXCR5(+) CD4(+) T cells are counterparts of T follicular cells and contain specific subsets that differentially support antibody secretion.
Immunity. 2011;34(1):108-121.
22. Walker LSK. The link between circulating follicular helper T cells and autoimmunity. Nat Rev Immunol. 2022;22(9):567-575.
23. Forcade E, Kim HT, Cutler C, et al. Circulating T follicular helper cells with increased function during chronic graft-versus-host disease. Blood. 2016;127(20):2489-2497.
24. Juno JA, Tan HX, Lee WS, et al. Humoral and circulating follicular helper T cell responses in recovered patients with COVID-19. Nat Med. 2020;26(9):1428-1434.
25. Mohammed MT, Cai S, Hanson BL, et al. Follicular T cells mediate donor-specific antibody and rejection after solid organ transplantation. Am J Transplant. 2021;21(5):1893-1901.
26. Komagome M, Maki A, Nagata R, et al. Refractory acute antibody mediated rejection in liver transplant after desensitization of preformed donor specific antibody-validity of bortezomib and everolimus: a case report. Transplant Proc. 2022;54(1):147-152.
27. Louis K, Macedo C, Metes D. Targeting T follicular helper cells to control humoral allogeneic immunity. Transplantation. 2021;105(11):e168-e180.
28. Huang XJ, Zhu HH, Chang YJ, et al. The superiority of haploidentical related stem cell transplantation over chemotherapy alone as postremission treatment for patients with intermediate- or high-risk acute myeloid leukemia in first complete remission. Blood. 2012;119(23):5584-5590.
29 Ma N, Guo JP, Zhao XY, et al. Prevalence and risk factors of antibodies to HLA according to different cut-off values of mean fluorescence intensity in haploidentical allograft candidates: A prospective study of 3805 subjects. HLA. 2022;100(4):312-324.
30. Bucher C, Koch L, Vogtenhuber C, et al. IL-21 blockade reduces graft-versus-host disease mortality by supporting inducible T regulatory cell generation. Blood. 2009;114(26):5375-5384.
31. Ricard L, Jachiet V, Malard F, et al. Circulating follicular helper T cells are increased in systemic sclerosis and promote plasmablast differentiation through the IL-21 pathway which can be inhibited by ruxolitinib. Ann Rheum Dis. 2019;78(4):539-550.
32. Caballero-Velazquez T, Sanchez-Abarca LI, Gutierrez-Cosio S, et al. The novel combination of sirolimus and bortezomib prevents graft-versus-host disease but maintains the graftversus-leukemia effect after allogeneic transplantation. Haematologica. 2012;97(9):1329-1337.
33. Pistillo MP, Tazzari PL, Palmisano GL, et al. CTLA-4 is not restricted to the lymphoid cell lineage and can function as a target molecule for apoptosis induction of leukemic cells. Blood. 2003;101(1):202-209.
34 Lu DP, Dong L, Wu T, et al. Conditioning including antithymocyte globulin followed by unmanipulated HLA-mismatched/
haploidentical blood and marrow transplantation can achieve comparable outcomes with HLA-identical sibling transplantation. Blood. 2006;107(8):3065-3073.
35. Susal C, Wettstein D, Dohler B, et al. Association of kidney graft loss with de novo produced donor-specific and non-donorspecific HLA antibodies detected by single antigen testing. Transplantation. 2015;99(9):1976-1980.
36. Kim H, Kim J, Lee H, et al. Baiap3 regulates depressive behaviors in mice via attenuating dense core vesicle trafficking in subsets of prefrontal cortex neurons. Neurobiol Stress. 2022;16:100423.
37. Locci M, Havenar-Daughton C, Landais E, et al. Human circulating PD-1+CXCR3-CXCR5+ memory Tfh cells are highly functional and correlate with broadly neutralizing HIV antibody responses. Immunity. 2013;39(4):758-769.
38. Boswell KL, Paris R, Boritz E, et al. Loss of circulating CD4 T cells with B cell helper function during chronic HIV infection. PLoS Pathog. 2014;10(1):e1003853.
39 Danger R, Chesneau M, Delbos F, et al. CXCR5(+)PD1(+)ICOS(+) Circulating T follicular helpers are associated with de novo donor-specific antibodies after renal transplantation. Front Immunol. 2019;10:2071.
40 Mudd PA, Minervina AA, Pogorelyy MV, et al. SARS-CoV-2 mRNA vaccination elicits a robust and persistent T follicular helper cell response in humans. Cell. 2022;185(4):603-613.
41. Shaw BE, Jimenez-Jimenez AM, Burns LJ, et al. National Marrow Donor Program-sponsored multicenter, phase II trial of HLA-mismatched unrelated donor bone marrow transplantation using post-transplant cyclophosphamide. J Clin Oncol. 2021;39(18):1971-1982.
42. Pidala J, Walton K, Elmariah H, et al. Pacritinib combined with sirolimus and low-dose tacrolimus for GVHD prevention after allogeneic hematopoietic cell transplantation: preclinical and phase I trial results. Clin Cancer Res. 2021;27(10):2712-2722.
43. Kumar D, Nguyen TH, Bennett CM, et al. mTOR inhibition attenuates cTfh cell dysregulation and chronic T-cell activation in multilineage immune cytopenias. Blood. 2023;141(3):238-243.
44 Gallon L, Traitanon O, Yu Y, et al. Differential effects of calcineurin and mammalian target of rapamycin inhibitors on alloreactive Th1, Th17, and regulatory T cells. Transplantation. 2015;99(9):1774-1784.
45. Tresoldi E, Dell’Albani I, Stabilini A, et al. Stability of human rapamycin-expanded CD4+CD25+ T regulatory cells. Haematologica. 2011;96(9):1357-1365.
46. Yin Y, Mitson-Salazar A, Wansley DL, Singh SP, Prussin C. Rapamycin preferentially inhibits human IL-5(+) T(H)2-cell proliferation via an mTORC1/S6 kinase-1-dependent pathway. J Allergy Clin Immunol. 2017;139(5):1701-1704.
Acute lymphoblastic leukemia (ALL) is the most common malignancy among children in industrialized countries, with a peak incidence between 2 and 5 years of age.1 The early onset of this cancer and heterogeneity in incidence by race and ethnicity implicates the influence of inherited genetic susceptibility in which evidence from genome-wide association studies (GWAS) of childhood ALL have identified several genomic regions associated with risk.2 To date, the identification of risk loci has been driven by studies conducted in populations of Hispanic or European ancestry, with a paucity of genome-wide studies performed in Asian populations.3 Pursuit of potential population-specific loci through genome-wide assessment and characterization of known loci across diverse populations is important to advance our understanding of inherited genetic variation in the risk childhood ALL.
Our previous study of targeted loci conducted within the Tokyo Children Cancer Study Group (TCCSG) showed that risk associations for single nucleotide polymorphism (SNP) in ARID5B, IKZF1 and PIP4K2A transfer to the Japanese population.4 As a next step, this current study included two independent GWAS series assembled through TCCSG and the Japanese Pediatric Leukemia/Lymphoma Study Group (JPLSG), including a total of 1,088 cases and 5,315 controls, in the first comprehensive evaluation of genetic variation in the risk of childhood ALL in Japanese. The first series (TCCSG GWAS) comprised patients from the TCCSG clinical network,4, 5 and included childhood ALL patients diagnosed at age 19 years or younger prior to 2012 (N=621) from outpatient clinic visits between 2013 and 2015 through a convenience sampling approach. Controls comprised adult participants from the Nagahama Prospective Cohort for Comprehensive Human Bioscience (the Nagahama Study) (N=1,846) and the Hospital-based Epidemiologic Research Program at Aichi Cancer Center (HERPACC) Study (N=2,170).6, 7 The second series (JPLSG GWAS) comprised childhood B-cell precursor (BCP) ALL patients (N=572) aged 1 to 19 years newly diagnosed between 2012 and 2018 through the nationwide ALL-B12 clinical study (registry: UMIN000009339).5, 8 Controls comprised a subset of participants from the Nagahama Study (N=1,924). DNA were extracted from saliva samples (TCCSG) or peripheral blood at remission (JPLSG) and were genotyped with the Illumina HumanCoreExome and OmniExpress microarrays, respectively. Institutional review board approvals were obtained from St. Luke’s International University and the major collaborating centers.
We performed quality control (QC) steps separately for the TCCSG and JPLSG cases and controls followed by additional QC filters after merging the case-control series for the
TCCSG and JPLSG GWAS separately. After sample and SNP exclusions based on a standard QC approach (Online Supplementary Figure S1), a total of 258,069 and 481,270 directly genotyped SNP was available for the TCCSG GWAS (540 cases and 3,714 controls) and JPLSG GWAS (548 cases and 1,601 controls), respectively. Genome-wide SNP imputation was performed using ShapeIT2 and Minimac4 with an in-house Japanese haplotype reference panel. After post-imputation QC, bi-allelic loci shared between the TCCSG and JPLSG case-control series resulted in data for a total of 6,446,781 SNP for both GWAS.
Patients included in the TCCSG and JPLSG series comprised predominately of B-cell ALL (TCCSG, 93%; JPLSG, 100%), greater numbers of males (TCCSG, 52%; JPLSG, 58%) than females, and showed the majority to be between 1 and 6 years of age (TCCSG, 69%; JPLSG, 57%). We first performed a discovery analysis in the TCCSG series and observed a novel association represented by SNP rs116977518 (odds ratio [OR] =1.99, P=4.2x10⁻⁹) at 1q24.1 (intergenic, proximity to FMO8P) and an association at a known region represented by rs4245595 (OR=1.84, P=3.4x10⁻¹⁷) located at 10q21.2 (ARID5B) (Table 1; Online Supplementary Figure S2A). An association with the previously identified IKZF1 region was also found (rs77563422, OR=1.62, P=9.5x10⁻⁸). Only SNP in ARID5B (rs4245595, OR=1.82, P=2.0x10⁻¹⁰) and IKZF1 (rs77563422, OR=1.44, P=0.002) replicated in the JPLSG series (Table 1). Confirmation is still necessary for the putative risk locus at 1q24.1. This locus is located adjacent to the FMO8P and FMO9P pseudogenes, and contains expression quantitative trait loci (eQTL) in blood for the deoxyuridine triphosphatase pseudogene 6 (DUTP6) gene as documented in the Genotype-Tissue Expression (GTEx) portal. In a gene expression profiling study of tonsil squamous cell carcinoma, DUTP6, along with other pseudogenes and small nuclear RNA, were found to be upregulated in blood mononuclear cells of patients compared to controls.9 Interestingly, the leading SNP in this region, rs116977518, is rare or not present in most other racial and ethnic populations.
Next, we performed a discovery analysis in the JPLSG GWAS, and observed an association with the known ARID5B region (rs4506592, OR=1.85, P=5.7x10⁻¹¹), along with another region at 6q23.1 in the sterile α motif domain containing 3 (SAMD3) gene (rs137991838, OR=0.21, P=1.9x10⁻⁸) (Table 1; Online Supplementary Figure S2B). The novel SAMD3 SNP association did not appear to replicate in the overall TCCSG case-control series, but limiting to only B-cell ALL showed a reduced risk (rs137991838, OR=0.67, P=0.046). The SAMD3 gene exhibits the highest expression levels in lymphoid tissues and blood.10 It belongs to the sterile α motif (SAM) domain superfamily in
which the characteristic SAM domain suggests involvement in diverse protein-protein interactions important in assembly, regulation, and localization of functional elements.11 The leading SNP, rs137991838, is unique to the Japanese population and resides within a region that contain eQTL for SAMD3 in lymphoblastoid cell lines according to GTEx and RegulomeDB. Chromosomal aberrations of the 6q23 region are known to be common across a diverse range of tumor
types, including hematologic malignancies.12 In a genome-wide SNP meta-analysis of the TCCSG and JPLSG GWAS combined, three SNP representing regions with genome-wide significant associations included rs77563422 (IKZF1, OR=1.55, P=5.9x10⁻¹⁰), and two uncorrelated SNP in ARID5B separated by about 38 kb (r2=0.07), rs2393784 (OR=1.52, P=6.3x10⁻¹³) and rs7896246 (OR=1.83, P=1.4x10⁻²⁵) (Table 2; Figure 1). Replication opportunities of discovery
rs4245595
rs79649658
aChromosome and genomic positions are based on GRCh37/hg19. bMinor/major allele. cOdds ratio and 95% confidence intervals associated with the minor allele were calculated using logistic regression assuming a log-additive genetic model and adjusting for genetic ancestry; a P<5.0x10⁻⁸ was considered genome-wide significant. TCCSG: Tokyo Children Cancer Study Group; JPLSG: Japanese Pediatric Leukemia/Lymphoma Study Group; GWAS: genome-wide association study; Chr: chromosome; CI: confidence interval; MAF: minor allele frequency; OR: odds ratio; SNP: single nucleotide polymorphism.
CCRLP.
Genome-wide significant SNP (P<5.0×10⁻⁸ in meta-analysis)
rs77563422
rs2393784
rs7896246
Suggestive SNP (P<5×10⁻⁶ in meta-analysis)
rs116977518
rs61459905
rs4596201
rs11753269
rs142498523
rs9641181
rs142757968
rs1331625
rs4750853
(0.79-2.33)
(0.73-1.77)
(0.71-1.65) 1.04 (0.49-2.20)
0.86 (0.44-1.67)
0.87 (0.64-1.20)
0.97 (0.78-1.21)
1.60 (1.35-1.90)
1.21 (1.10-1.34)
1.51 (1.24-1.85)
1.75 (1.31-2.34)
2.13 (1.53-2.96)
0.59 (0.47–0.74)
2.77 (1.81-4.24)
0.67 (0.56-0.81)
0.78 (0.70-0.87)
aChromosome and genomic positions are based on GRCh37/hg19. bMinor/major allele. cOdds ratio and 95% confidence intervals associated with the minor allele were calculated using logistic regression assuming a log-additive genetic model and adjusting for genetic ancestry; a P<5.0x10⁻⁸ was considered genome-wide significant. TCCSG: Tokyo Children Cancer Study Group; JPLSG: Japanese Pediatric Leukemia/Lymphoma Study Group; CCRLP: California Cancer Records Linkage Poject; Chr: chromosome; CI: confidence interval; MAF: minor allele frequency; OR: odds ratio; SNP: single nucleotide polymorphism; NA: not applicable.
results were pursued within cases (N=318) and controls (N=5,107) of East Asian ancestry from the California Cancer Records Linkage Project (CCRLP), a study based on the birth population of California previously reported.13 The associations were confirmed in this CCRLP replication series except for rs2393784 in ARID5B (Table 2). Conditional analysis of the two ARID5B SNP showed attenuation in effect size for both loci, but evidence of independent associations remained (rs2393784, OR=1.22, P=2.1x10⁻³; rs7896246, OR=1.69, P=1.6x10⁻¹⁶). rs2393784 is located about 38 kb upstream in intron 2, a SNP in LD (rs6479778) has been shown associated with both ALL relapse and disease risk in a US population.14 ARID5B SNP associations represent some of the most consistently observed in childhood ALL susceptibility, all of which suggest a role for variation in intronic regions and thus, mechanisms that involve gene regulation through
affecting RNA splicing, transcription factor binding, and other processes. In a UK study, fine-mapping in high-hyperdiploid ALL cases and controls identified two plausibly casual SNP in LD, one of which is the same top hit identified in the current study (rs7896246).15
The association between IKZF1 and ALL risk has been confirmed repeatedly for rs4132601 and rs11978267 in populations of European, Hispanic, and African ancestry, but has been less clear for East Asians.3 For both SNP, East Asians exhibit among the lowest allele frequencies (MAF~0.08), and previous studies in this population may have been hampered by statistical power. ALL associations replicated for both rs4132601 and rs11978267 (P<0.01). We also identified a genome-wide significant region in IKZF1 (rs77563422), which is uncorrelated with the known risk locus (r2<0.01), and results conditioning on the presence of rs4132601 resulted in a stronger effect
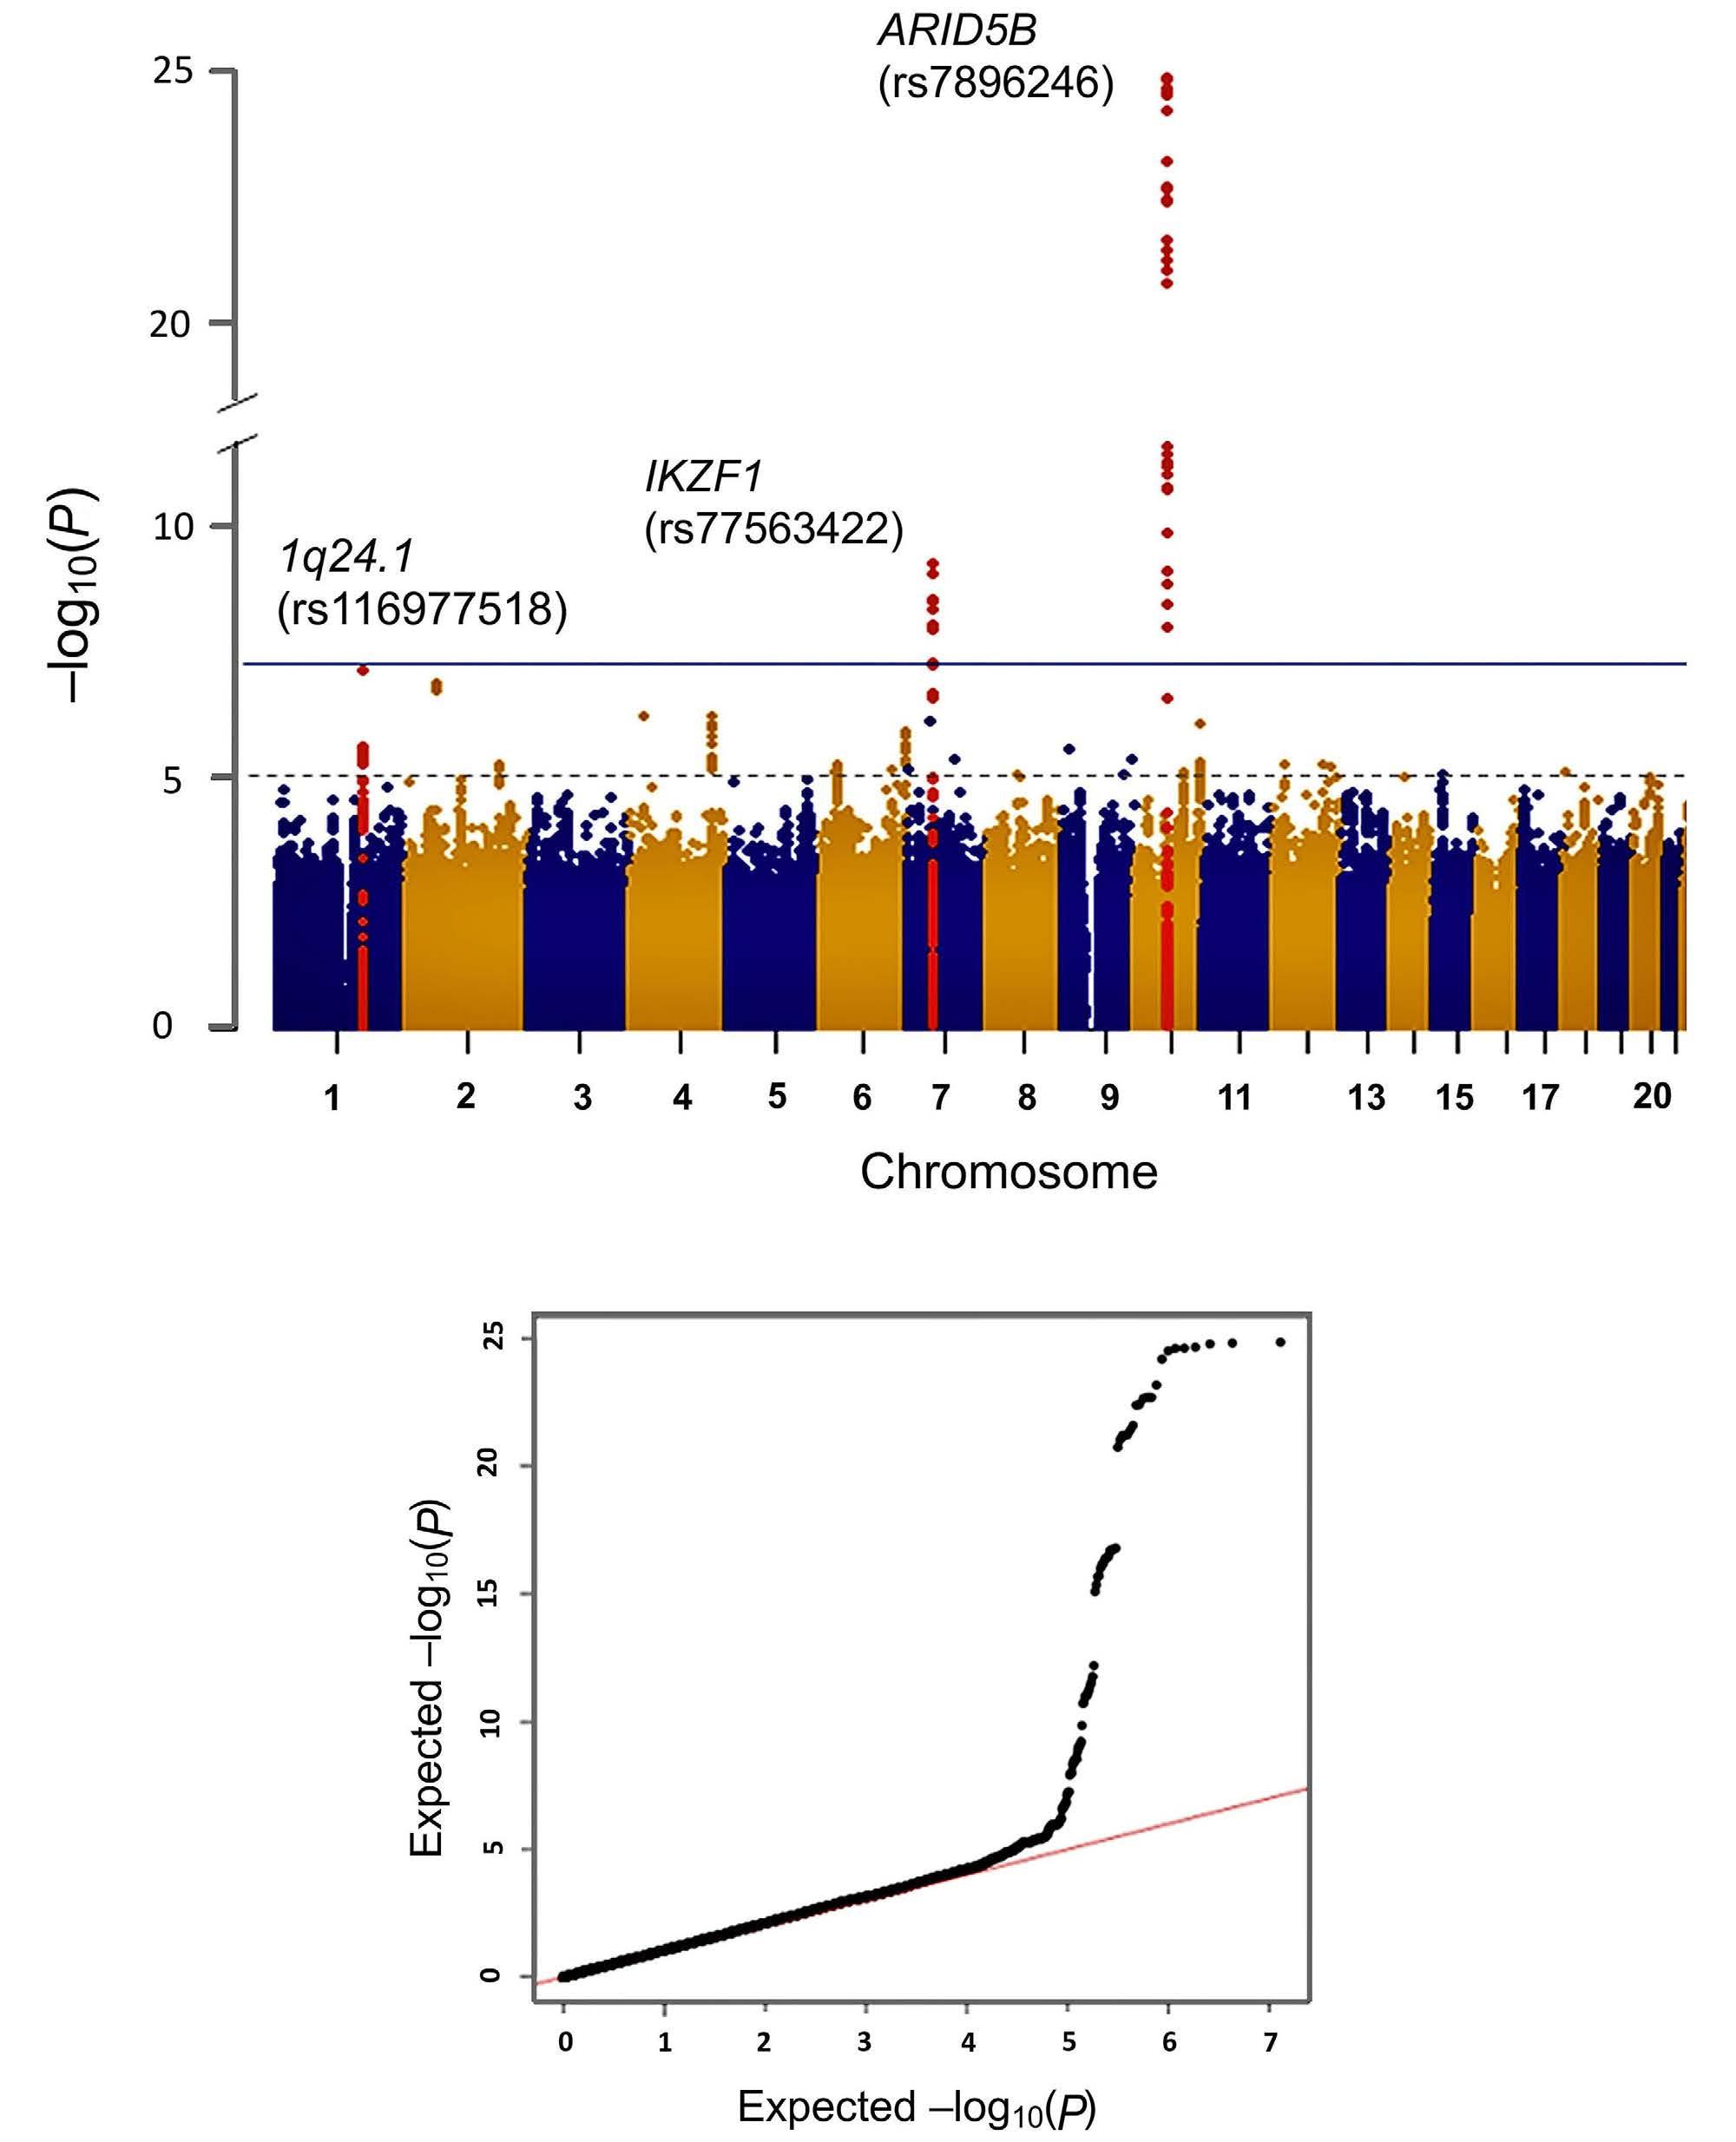
Figure 1. Results of meta-analysis combining the TCCSG and JPLSG genome-wide association analysis results. (A) The Manhattan plot shows the -log10 (P value) of the logistic regression analysis plotted against the chromosomal position (GRCh37/ hg19). The blue line indicates the genome-wide significant P value threshold of 5x10⁻⁸, and the dotted line was the threshold (1x10⁻⁶) for considering results as suggestive. (B) A quantile-quantile plot of the observed versus expected distribution of the -log10 (P value) from the analysis. TCCSG: Tokyo Children Cancer Study Group; JPLSG: Japanese Pediatric Leukemia/Lymphoma Study Group.
size and significance for both variants (rs77563422, OR=1.61, P=2.6x10⁻¹¹; rs4132601, OR=1.49, P=5.5x10⁻⁵). SNP rs77563422 is rare in populations of European ancestry and is located in a different intronic region about 16 kb upstream of the other known variants.
We were able to confirm associations for known risk loci representing ARID5B, IKZF1, DDC, CEBPE, PIP4K2A, GATA3, IKZF3, and 8q24.21, with some showing a different leading SNP in Japanese (Online Supplementary Table S1). There are several reasons why certain associations may not have been detected, including insufficient statistical power due to lower allele frequencies and/or effect sizes, unavailable SNP data in sufficient LD with the causal locus, and analyses without similar subtype specificity as the original study. An overall limitation of the current study included limited access to molecular subtype data for this analysis. Notably, it is possible that the recruitment strategy of the TCCSG series may have over-represented patients with higher survival probabilities and specific molecular subtype profiles which could have affected replication attempts for loci that show subtype-specificity. In addition, the CCRLP replication population represented a broadly defined group of cases and controls of East Asian ancestry, and differing genetic substructure between Japanese and others of East Asian origins needs consideration in interpreting the failure to replicate.
In this first case-control GWAS effort in Japanese, we confirmed the strong ALL risk associations with ARID5B and IKZF1 variation, and we report two putative ALL risk associations suggesting a role for the 1q24.1 region and SAMD3, but confirmation is necessary. Together with also characterizing the effects of known risk loci in Japanese, we expect this study to aid efforts in understanding the heritability of childhood ALL in this population, a key step for elucidating the causes of this devastating disease.
Mayumi Hangai,1,2* Takahisa Kawaguchi,3* Masatoshi Takagi,4 Keitaro
Matsuo,5 Soyoung Jeon,6 Charleston W.K. Chiang,6,7 Andrew T. Dewan,8 Adam J. de Smith,6 Toshihiko Imamura,9 Yasuhiro Okamoto,10 Akiko M. Saito,11 Takao Deguchi,12 Michiaki Kubo,13 Yoichi Tanaka,14 Yoko Ayukawa,1
Toshinari Hori,15 Kentaro Ohki,16 Nobutaka Kiyokawa,16 Takeshi Inukai,17
Yuki Arakawa,18 Makiko Mori,18 Daisuke Hasegawa,19 Daisuke Tomizawa,12
Hiroko Fukushima,20 Yuki Yuza,21 Yasushi Noguchi,22 Yuichi Taneyama,23
Setsuo Ota,24 Hiroaki Goto,25 Masakatsu Yanagimachi,25 Dai Keino,25
Kazutoshi Koike,26 Daisuke Toyama,27 Yozo Nakazawa,28 Kozue
Nakamura,29 Koichi Moriwaki,30 Yujin Sekinaka,31 Daisuke Morita,28
Shinsuke Hirabayashi,32 Yosuke Hosoya,19 Yuri Yoshimoto,33 Hiroki
Yoshihara,19 Miwa Ozawa,19 Shinobu Kobayashi,1 Naho Morisaki,1
Tshewang Gyeltshen,34 Osamu Takahashi,34 Yukinori Okada,35,36,37
Makiko Matsuda,38 Toshihiro Tanaka,38 Johji Inazawa,39 Junko Takita,40
Yasushi Ishida,41 Akira Ohara,42 Catherine Metayer,43 Joseph L. Wiemels,6 Xiaomei Ma,8 Shuki Mizutani,4 Katsuyoshi Koh,18 Yukihide
Momozawa,13 Keizo Horibe,11 Fumihiko Matsuda,3 Motohiro Kato,2# Atsushi Manabe32# and Kevin Y. Urayama1,34#
1Department of Social Medicine, National Center for Child Health and Development, Tokyo, Japan; 2Department of Pediatrics, the University of Tokyo, Tokyo, Japan; 3Center for Genomic Medicine, Kyoto University Graduate School of Medicine, Kyoto, Japan; 4Department of Pediatrics and Developmental Biology, Tokyo Medical and Dental University, Tokyo, Japan; 5Division of Cancer Epidemiology and Prevention, Aichi Cancer Center Research Institute, Nagoya, Japan; 6Center for Genetic Epidemiology, Department of Population and Public Health Sciences, Keck School of Medicine, University of Southern California, Los Angeles, CA, USA; 7Department of Quantitative and Computational Biology, University of Southern California, Los Angeles, CA, USA; 8Department of Chronic Disease Epidemiology, Yale School of Public Health, New Haven, CO, USA; 9Department of Pediatrics, Kyoto Prefectural University of Medicine, Kyoto, Japan; 10Department of Pediatrics, Graduate School of Medical and Dental Sciences, Kagoshima University, Kagoshima, Japan; 11Clinical Research Center, National Hospital Organization Nagoya Medical Center, Nagoya, Japan; 12Children’s Cancer Center, National Center for Child Health and Development, Tokyo, Japan; 13Laboratory for Genotyping Development, RIKEN Center for Integrative Medical Sciences, Kanagawa, Japan; 14Division of Medicinal Safety Science, National Institute of Health Sciences, Kawasaki, Japan; 15Department of Pediatrics, Aichi Medical University Hospital, Nagoya, Japan; 16Department of Pediatric Hematology and Oncology Research, National Center for Child Health and Development, Tokyo, Japan; 17Department of Pediatrics, University of Yamanashi, Yamanashi, Japan; 18Department of Hematology/Oncology, Saitama Children’s Medical Center, Saitama, Japan; 19Department of Pediatrics, St. Luke’s International Hospital, Tokyo, Japan; 20Department of Child Health, Faculty of Medicine, University of Tsukuba, Tsukuba, Japan; 21Department of Hematology/Oncology, Tokyo Metropolitan Children’s Medical Center, Tokyo, Japan; 22Department of Pediatrics, Japanese Red Cross Narita Hospital, Chiba, Japan; 23Department of Hematology/Oncology, Chiba Children’s Hospital, Chiba, Japan; 24Department of Pediatrics, Teikyo University Chiba Medical Center, Chiba, Japan; 25Division of Hematology/Oncology, Kanagawa Children’s Medical Center, Yokohama, Japan; 26Division of Pediatric Hematology and Oncology, Ibaraki Children’s Hospital, Mito, Japan; 27Division of Pediatrics, Showa University Fujigaoka Hospital, Yokohama, Japan; 28Department of Pediatrics, Shinshu University School of Medicine, Matsumoto, Japan; 29Department of Pediatrics, Teikyo University Hospital, Tokyo, Japan; 30Department of Pediatrics, Saitama Medical Center, Saitama Medical University, Saitama, Japan; 31Department of Pediatrics, National Defense Medical College, Saitama, Japan; 32Department of Pediatrics, Hokkaido University, Sapporo, Japan; 33Department of Pediatrics, National Center for Global Health and Medicine, Tokyo, Japan; 34Graduate School of Public Health, St. Luke’s International University, Tokyo, Japan; 35Department of Statistical Genetics, Graduate School of Medicine, Osaka University, Osaka, Japan; 36Department of Genome Informatics, Graduate School of Medicine, the University of Tokyo,
Tokyo, Japan; 37Laboratory for Systems Genetics, RIKEN Center for Integrative Medical Sciences, Kanagawa, Japan; 38Department of Human Genetics and Disease Diversity, Tokyo Medical Dental University, Tokyo, Japan; 39Department of Molecular Cytogenetics, Tokyo Medical and Dental University, Tokyo, Japan; 40Department of Pediatrics, Kyoto University Graduate School of Medicine, Kyoto, Japan; 41Pediatric Medical Center, Ehime Prefectural Central Hospital, Matsuyama, Japan; 42Department of Pediatrics, Toho University, Tokyo, Japan and 43School of Public Health, University of California Berkeley, Berkeley, CA, USA
*MH and TK contributed equally as first authors. #KYU, AM and MK contributed equally as senior authors.
Correspondence:
K.Y. URAYAMA - kevurayama@gmail.com
https://doi.org/10.3324/haematol.2023.282914
Received: February 14, 2023.
Accepted: October 16, 2023.
Early view: October 26, 2023.
©2024 Ferrata Storti Foundation
Published under a CC BY-NC license
Disclosures
No conflicts of interest to disclose.
Contributions
MH, TK, MT, KM, TI, YO, OT, JLW, XM, CM, YI, AO, SM, KK, YM, KH, FM, MK, AM, and KYU conceived and designed the study. MH, MT, KM, YT, YA, TH, KO, NK, TI, TI, YO, AMS, TD, YA, MM, DH, DT, HF, YY, YN, YU, SO, HG, MY, DK, KK, DT, YN, KN, KM, YS, DM, SH, YH, YY, HY, MO, JLW, XM, CM, JT, YI, AO, SM, KK, MK, KH, AM, and KYU were involved in patient recruitment and sample and data collection. HM, TK, MT, KM, YA, KO, NK, MK, NM, SK, SJ, CWKC, ATD, AJD, TG, YO, TT, JI, YM, FM, and KYU contributed to the laboratory analyses and assembly of genomic data. HM, TK, SJ, CWKC, ATD, AJD, and KYU conducted the statistical analysis and bioinformatics evaluations. HM, TK and KYU drafted the first version of the manuscript. All authors critically reviewed and edited the manuscript for intellectual content and gave final approval of the final version.
We would like to thank the patients and families participating in this study, and staff of the collaborating hospitals for their various
1. Hunger SP, Mullighan CG. Acute lymphoblastic leukemia in children. N Engl J Med. 2015;373(16):1541-1552.
2. Moriyama T, Relling MV, Yang JJ. Inherited genetic variation in childhood acute lymphoblastic leukemia. Blood.
contributions. This study made use of data from the 1000 Genomes Project (http://www.internationalgenome.org/data) and the International HapMap Project.
This work was support by funding from St. Luke’s Life Science Institute (Tokyo, Japan), Japan Society for the Promotion of Science (JSPS) KAKENHI grant number 26253041), Japan Agency for Medical Research and Development (grant numbers 15km0305013h0101, 16km0405107h0004, 21kk0305014), the Children’s Cancer Association of Japan, and the Japan Leukemia Research Fund. The HERPACC Study was supported by Grants-in-Aid for Scientific Research from the Ministry of Education, Science, Sports, Culture and Technology of Japan Priority Areas of Cancer (17015018), Innovative Areas (221S0001), and JSPS KAKENHI grants (JP16H06277 and 22H04923 [CoBiA], JP26253041, JP20K10463) and Grant-in-Aid for the Third Term Comprehensive 10-year Strategy for Cancer Control from the Ministry of Health, Labour and Welfare of Japan. The work pertaining to the CCRLP replication series was supported by grants from the US National Institutes of Health (R01CA155461, R35GM142783). The biospecimens and/or data used in CCRLP were obtained from the California Biobank Program (SIS request#26), Section 6555(b), 17 CCR. The collection of cancer incidence data used in the CCRLP study was supported by the California Department of Public Health pursuant to California Health and Safety Code Section 103885, Centers for Disease Control and Prevention’s (CDC) National Program of Cancer Registries, under cooperative agreement
5NU58DP003862-04/DP003862, the National Cancer Institute’s Surveillance, Epidemiology and End Results Program under contract HHSN261201000140C awarded to the Cancer Prevention Institute of California, contract HHSN261201000035C awarded to the University of Southern California, and contract HHSN261201000034C awarded to the Public Health Institute. The ideas and opinions expressed herein are those of the author(s) and do not necessarily reflect the opinions of the State of California, Department of Public Health, the National Institutes of Health, and the Centers for Disease Control and Prevention or their Contractors and Subcontractors. This study used birth data obtained from the State of California Center for Health Statistics and Informatics. The California Department of Public Health is not responsible for the analyses, interpretations, or conclusions drawn by the authors regarding the birth data used in this publication.
The datasets generated and analyzed during the current study are not publicly available due to privacy and ethical restrictions, but are available from the corresponding author on reasonable request.
2015;125(26):3988-3995.
3. Shi Y, Du M, Fang Y, et al. Identification of a novel susceptibility locus at 16q23.1 associated with childhood acute lymphoblastic leukemia in Han Chinese. Hum Mol Genet. 2016;25(13):2873-2880.
4 Urayama KY, Takagi M, Kawaguchi T, et al. Regional evaluation of childhood acute lymphoblastic leukemia genetic susceptibility loci among Japanese. Sci Rep. 2018;8(1):789.
5. Kato M, Manabe A. Treatment and biology of pediatric acute lymphoblastic leukemia. Pediatr Int. 2018;60(1):4-12.
6. Inoue M, Tajima K, Takezaki T, et al. Epidemiology of pancreatic cancer in Japan: a nested case-control study from the Hospital-based Epidemiologic Research Program at Aichi Cancer Center (HERPACC). Int J Epidemiol. 2003;32(2):257-262.
7 Terao C, Ota M, Iwasaki T, et al. IgG4-related disease in the Japanese population: a genome-wide association study. Lancet Rheumatol. 2019;1(1):e14-e22.
8. Koh K, Kato M, Saito AM, et al. Phase II/III study in children and adolescents with newly diagnosed B-cell precursor acute lymphoblastic leukemia: protocol for a nationwide multicenter trial in Japan. Jpn J Clin Oncol. 2018;48(7):684-691.
9 Marcussen M, Sonderkaer M, Bodker JS, et al. Oral mucosa tissue gene expression profiling before, during, and after radiation therapy for tonsil squamous cell carcinoma. PLoS One. 2018;13(1):e0190709.
10 Uhlen M, Fagerberg L, Hallstrom BM, et al. Proteomics. Tissuebased map of the human proteome. Science. 2015;347(6220):1260419.
11. Qiao F, Bowie JU. The many faces of SAM. Sci STKE. 2005;2005(286):re7.
12. Wang DM, Miao KR, Fan L, et al. Intermediate prognosis of 6q deletion in chronic lymphocytic leukemia. Leuk Lymphoma. 2011;52(2):230-237.
13. Jeon S, de Smith AJ, Li S, et al. Genome-wide trans-ethnic meta-analysis identifies novel susceptibility loci for childhood acute lymphoblastic leukemia. Leukemia. 2022;36(3):865-868.
14 Xu H, Cheng C, Devidas M, et al. ARID5B genetic polymorphisms contribute to racial disparities in the incidence and treatment outcome of childhood acute lymphoblastic leukemia. J Clin Oncol. 2012;30(7):751-757.
15. Studd JB, Vijayakrishnan J, Yang M, Migliorini G, Paulsson K, Houlston RS. Genetic and regulatory mechanism of susceptibility to high-hyperdiploid acute lymphoblastic leukaemia at 10p21.2. Nat Commun. 2017;8:14616.
Recent years witnessed remarkable advances in developing BH3 mimetic drugs that target anti-apoptotic BCL-2, BCLXL, and MCL-1 proteins.1,2 With BCL-2 inhibitor venetoclax (ABT-199) approval and its remarkable clinical results, the development of BH3 mimetics at most pharmaceutical companies has been accelerated and the number of new BH3 mimetic compounds has been dramatically increased. Nonetheless, with a huge number of preclinical studies and hundreds of clinical trials ongoing in cancers, there is no convenient pharmacodynamic (PD) biomarkers for the activity of BH3 mimetics. PD biomarker provide information about the pharmacologic effects of a drug on its target, important for successful development of candidate drugs. When a BCL-2 inhibitor engages its target BCL-2, the pro-apoptotic proteins sequestered by BCL-2 would be replaced and the freed pro-apoptotic proteins could subsequently be bound by other anti-apoptotic proteins such as MCL-1, assuming that the studied cells express both proteins. As a result, the treated cells would become less dependent on BCL-2 and more dependent on MCL-1 for survival. The opposite would happen when an MCL-1 inhibitor binds MCL-1. An assay that can determine these dynamic changes can thus be used in PD studies of BH3 mimetics. BH3 profiling is a functional assay which can determine cell’s different dependence on BCL-2 anti-apoptotic proteins.2-7 In the current study, we tested whether BH3 profiling can serve as a reliable peripheral blood-based PD biomarker for the activity of BH3 mimetics.
Our previous work established that BH3 profiling can identify cell dependence on different anti-apoptotic proteins for survival.2,3,8 In the current study, we first used two cell lines with defined dependency to validate the robustness of the technique. O-BCL2 and O-MCL1 are leukemia cell lines overexpressing BCL-2 and MCL-1, respectively (Online Supplementary Figure S1A), where the overexpression overrides the cells’ dependency on other anti-apoptotic proteins for survival.9,10 In a blinded fashion, we performed BH3 profiling on the two cell lines (Methods as previously described3,11) and found that among the selective peptides and BH3 mimetics (Online Supplementary Figure S1B), only the BCL-2 binding ABT-199 and the BCL-2/BCL-XL binding BAD peptide induced cytochrome c release from mitochondria of O-BCL2 (Online Supplementary Figure S1C) and only the MCL-1 binding MS-1 peptide or S63845 induced cytochrome c release from O-MCL1. This result validated that BH3 profiling can reliably identify anti-apoptotic dependence of tested cells. We reasoned that BH3 profiling should be able to detect changes of anti-apoptotic dependence induced by BH3 mimetics and the changes may
serve as a PD biomarker for the activity of BH3 mimetics (i.e., the engagement of a given BH3 mimetic on its target protein).
We next validated that BCL-2 inhibitor BCL201, and MCL1 inhibitor S63845 are bona fide BH3 mimetics and then chose them as representative BH3 mimetics to test our hypothesis. As shown in Online Supplementary Figure S1D, BCL201 and S63845 respectively induced cytochrome c release from O-BCL2 and O-MCL1 cells, but not from cell lines with other dependency, suggesting that BCL201 and S63845 are highly selective for BCL-2 and MCL-1 respectively, thus being ideal compounds for this study. A PD biomarker is used to evaluate whether a compound engages its target in an expected fashion. We did not choose to use primary cancer cells in this study because they vary from sample to sample and different samples may have high, low, or even zero expression of the targeted proteins (in this case, BCL-2 and MCL-1), making it difficult to evaluate whether a BH3 mimetic engages its target protein. Instead, we chose to use primary human lymphocytes based on the following reasons: i) both normal T and B cells express significant levels of BCL-2 and MCL-1;12 ii) they can be easily isolated from a simple blood draw from patients; iii) T or B cells readily respond to BH3 peptides-the probes for BH3 profiling (Figure 1A), suggesting they would respond to BH3 mimetics as well. The changes of anti-apoptotic dependence in normal peripheral T/B cells taken from a treated tumor patient, should be detectable by BH3 profiling. The observed changes in T/B cells (e.g., a shift of dependence from BCL-2 to MCL-1) can serve as a PD biomarker to evaluate whether a given BH3 mimetic at used doses is able to act upon its target protein. Human peripheral blood mononuclear cells (PBMC) were isolated using CPT tubes (BD, cat#362753) via a quick centrifugation (Online Supplementary Figure S1E for the workflow). Use of human samples was approved by the Dana-Farber Cancer Institute and Harvard University human studies review boards. Next, three million of PBMC cells were treated with BCL-201 or S63844 at concentrations that are clinically achievable in blood plasma as revealed by our pharmacodynamic studies. After treatment, BH3 profiling was performed on PBMC cells as previously described.3,11 Using BH3 peptides as probes, we analyzed the treatment-induced changes of mitochondrial priming (delta priming) of viable CD3+CD19/20– T cells and CD3–CD19/20+ B cells (Online Supplementary Figure S1F for gating strategy). Delta priming is defined as the values of mitochondrial priming of treated cells from which the values of baseline priming (priming of vehicle treated cells) are subtracted.
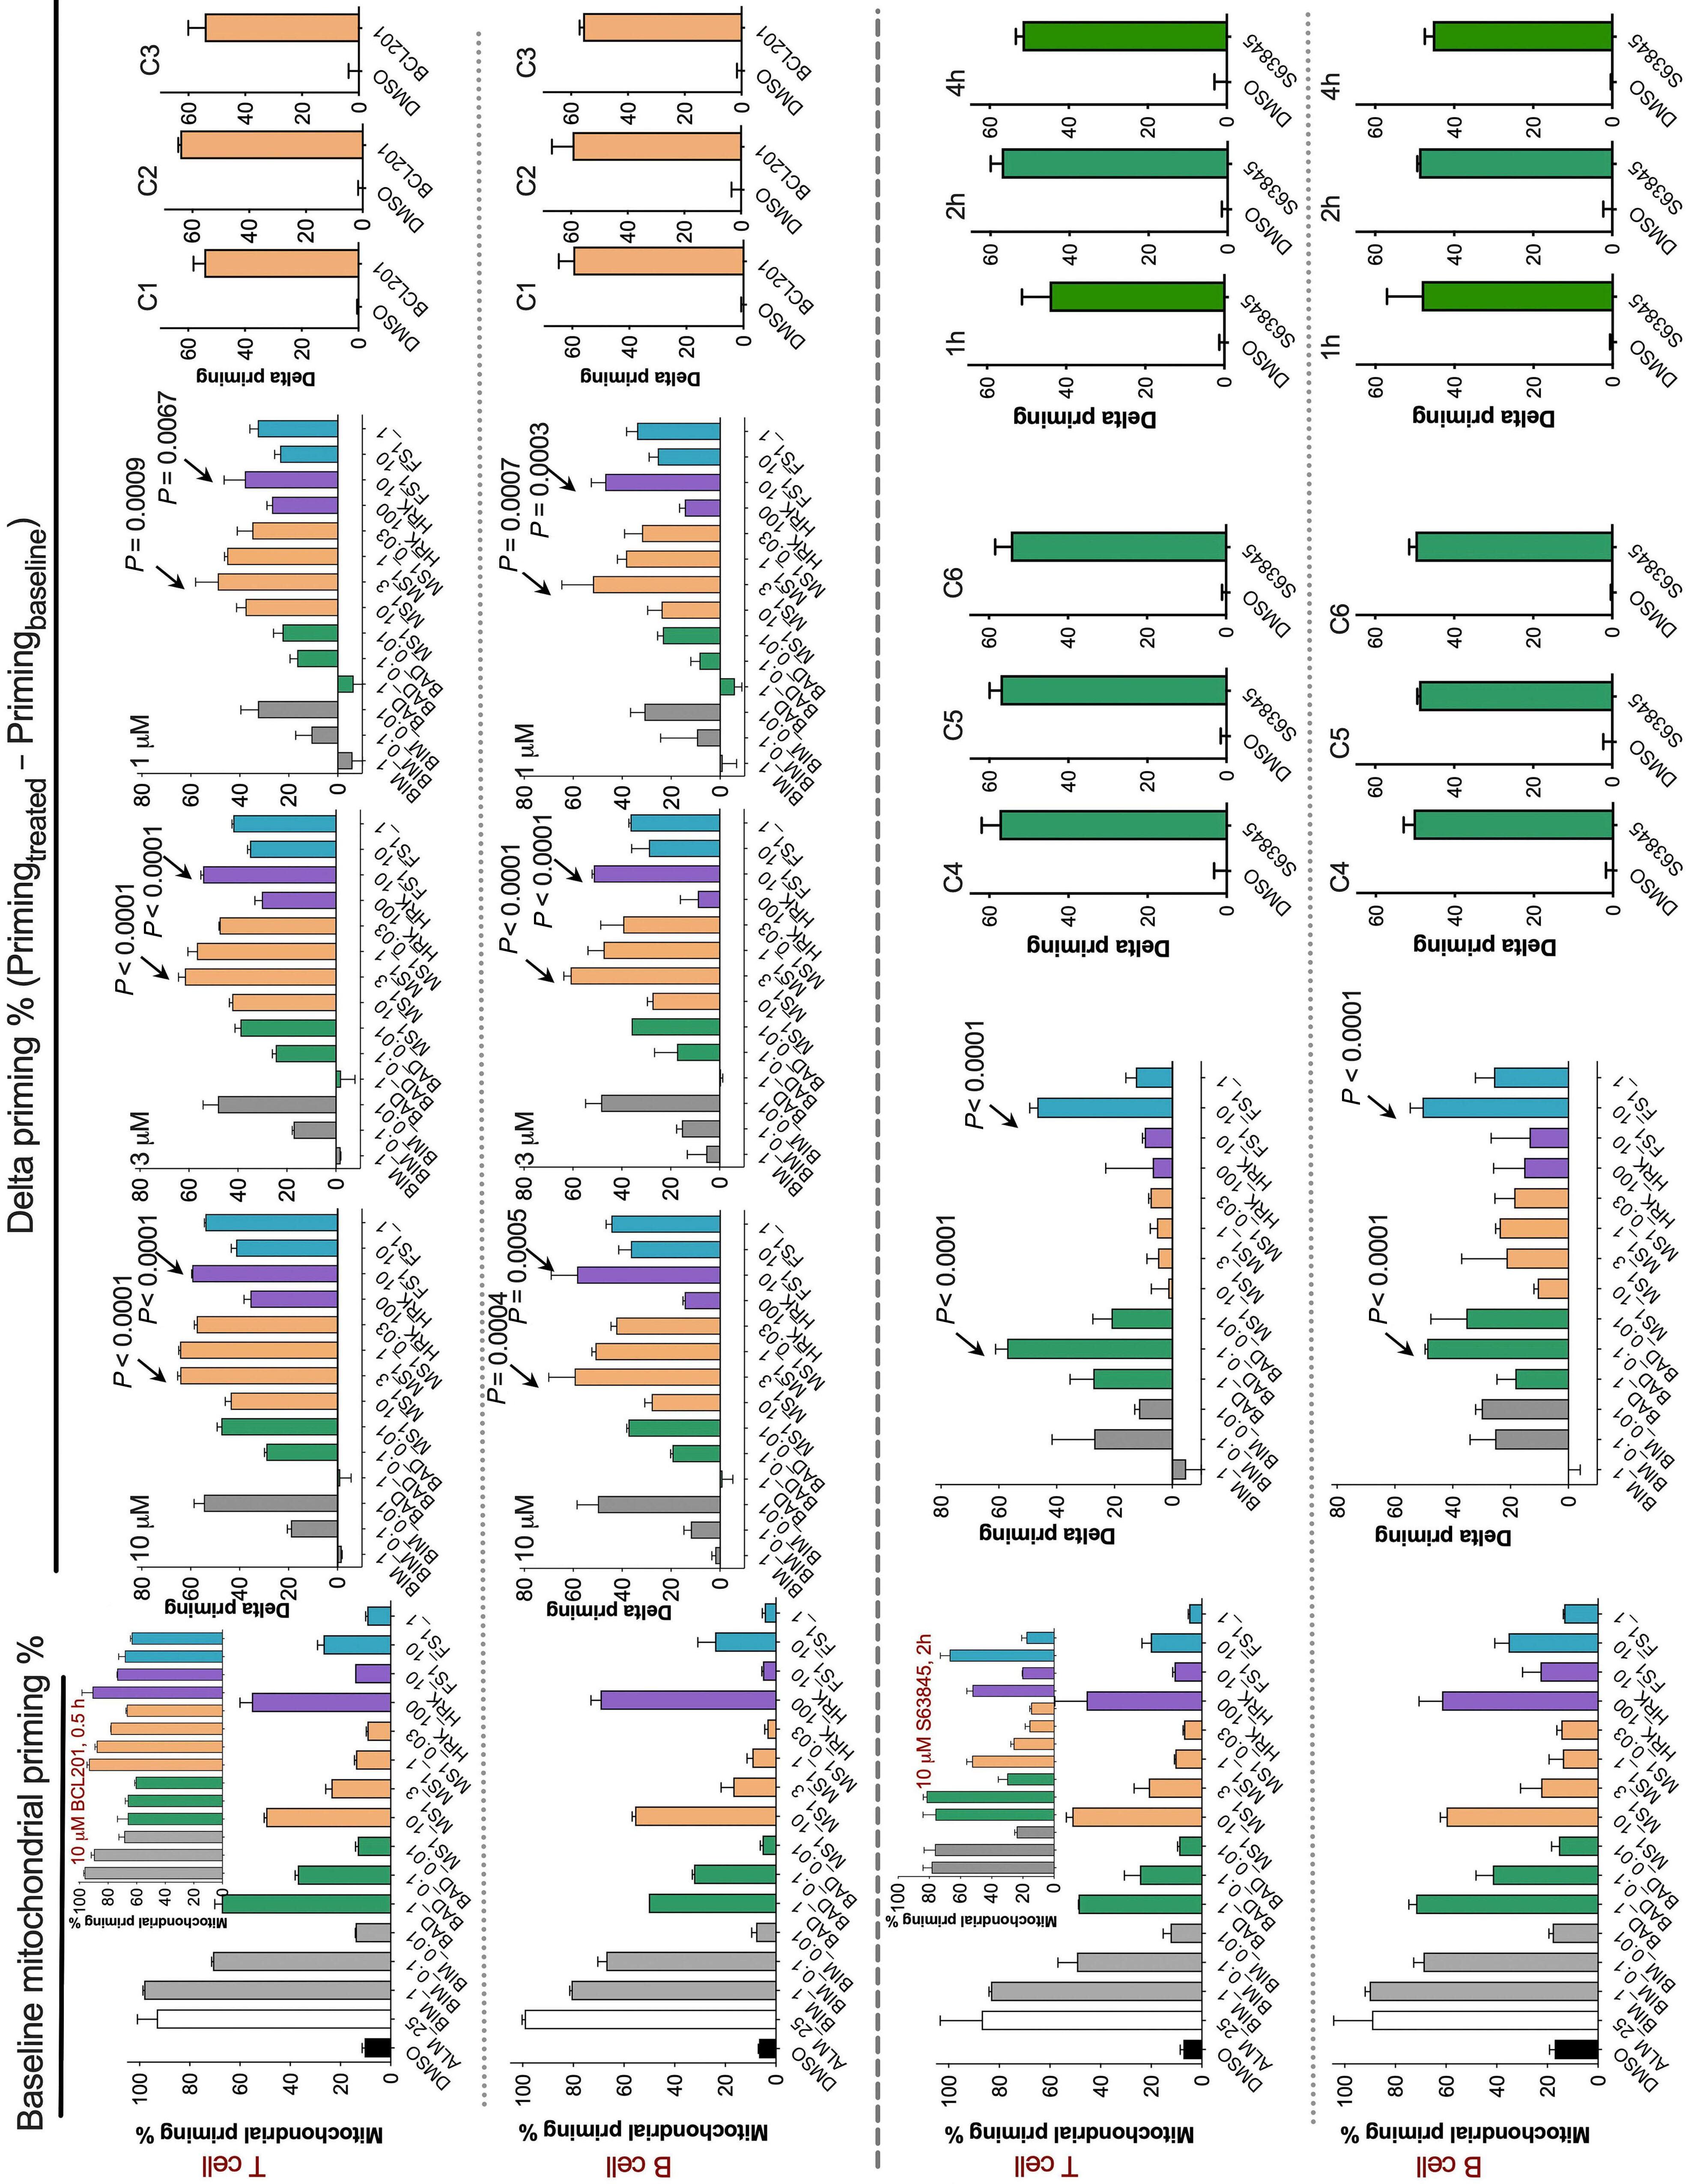
BH3 mimetics in vitro (A) Baseline
samples (i.e., untreated control). The inserted bar graph in the upper panel shows mitochondrial priming of T cells after treatment with 10 µM BCL201 for 0.5 hours (h), serving as an example of ‘Primingtreated’. (B) Delta priming of human T and B cells after treatment with indicated concentrations of BCL201 (0.5 h treatment). Arrows indicate bars with largest values in each graph. P value for the arrowed bar was calculated using Student’s t test to compare the values of Primingtreated and Primingbaseline. (C) Delta priming of T and B cells from 3 PBMC samples as determined using MS1 peptide at 3 µM (BCL201 treatment for 0.5 h, 3 µM). (D) Baseline priming of T and B cells (i.e., untreated control). The inserted bar graph in the upper panel shows overall mitochondrial priming of T cells after treatment with 10 µM S63845 for 2 h, serving as an example of ‘Primingtreated’. (E) Delta priming of T and B cells after treatment with 10 µM S63845 (2-h treatment). (F) Δ priming of T and B cells from 3 different samples after 2-h treatment with 10 µM S63845 (left panels). Delta priming of T and B cells from 1 representative donor after 1-, 2-, or 4-h treatment with 10 µM S63845. BH3 profiling was performed using BAD peptide at 0.1 µM. Data were presented as mean ± standard error of the mean of triplicate experiments. P value was calculated using Student’s t test to compare the values of Primingtreated and Primingbaseline
Increased priming indicates increased dependence on corresponding anti-apoptotic proteins. In order to explore which BH3 peptide is the most sensitive probe in detecting delta priming, we included BIM, BAD, MS-1, HRK, and FS-1 peptide (Online Supplementary Figure S1B) in our panel. After treatment with 1 µM BCL201 for 30 minutes, we conducted BH3 profiling on viable T cells and found that among all the tested peptides, MS-1 peptide performs the best, especially when used at 3 µM (Figure 1B). We further tested other concentrations of BCL201 like 3 µM and 10 µM (achievable levels in vivo). MS-1 peptide is again the most robust probe in detecting delta priming caused by BCL201 treatment (Figure 1B). Importantly, the induced delta priming by BCL201 were consistently and readily detected when we used blood samples from three different donors (Figure 1C). Similarly, MS-1 peptide at 3 µM also worked the best at detecting delta priming in B cells after BCL201 treatment (Figure 1C, lower panels). Since MS-1 peptide is selective for MCL-1, these results suggest that BCL201 replaced pro-apoptotic proteins that are sequestered by BCL-2, and freed pro-apoptotic proteins could be subsequently bound by MCL-1 in T/B cells. Therefore, BCL201 treatment augments T/B-cell dependency on MCL-1 and BH3 profiling of T/B cells with the MCL-1 selective MS-1 peptide can serve as a PD marker for the activity of a BCL-2 inhibitor. We next studied whether BH3 profiling can serve as a PD marker for the activity of an MCL-1 inhibitor. We found that in both T and B cells, MCL-1 inhibitor S63845 significantly increased mitochondrial sensitivity to BAD and FS1 peptides (Figure 1E). BAD peptide also reliably detected the increased delta priming of samples from multiple donors (N=3) after treatment with S63845 (Figure 1F), or at different time points such as 1, 2, or 4 hours (h) (Figure 1F, right panels), suggesting BH3 profiling of T/B cells with BAD peptide may serve as a robust PD marker for the activity of an MCL-1 inhibitor.
We next asked if we could use BH3 profiling as a PD marker for in vivo treatment with BH3 mimetics. For in vivo studies, we chose rat models because 3 mL of blood can be readily obtained via retro-orbital bleeding (see Figure 2A for workflow). The animal experiments were performed in accordance with the approved Institutional Animal Care
and Use Committee (IACUC) guidelines at Novartis animal facility. Animal experiments were performed on 3-4 months old, body weight 200-300 g, female WISTAR HAN rats from Charles River Laboratories (catalog #273). BCL201 was administered via oral gavage at 100 mg/kg. Blood was collected 2 h later and PBMC were isolated using CPT tubes. Since T cells and B cells performed quite similarly in the in vitro studies, we further simplified the process and performed BH3 profiling on isolated lymphocytes without staining for T/B cells. We found that again MS-1 peptide is the most sensitive probe in detecting the delta priming caused by BCL201 (Figure 2C), consistent with our in vitro results. Taken together, BH3 profiling with MS-1 peptide can provide a PD biomarker for the activity of a BCL-2 inhibitor. MCL-1 inhibitor MIK665 (S64315) is the clinical counterpart of the above-used S63845 with better in vivo pharmacokinetics.13 It was thus chosen for rat in vivo study. MIK665 was formulated in clinical liposomal formulation, administered via intravenous (tail lateral vein) injection at 5 mL/kg. Blood was collected 30 minutes post dosing with MIK665. Rat PBMC were isolated and profiled with BH3 peptides. Consistent with the in vitro results, BAD peptide is the most robust probe in detecting delta priming caused by the MCL-1 inhibitor (Figures 2D, E). This stays true for both tested doses of 15 mg/kg or 30 mg/kg, the regularly used MIK665 doses (intravenously) for rat studies. Our results suggest that BH3 profiling with BAD peptide can work as a PD biomarker for the activity of an MCL-1 inhibitor, both in vitro and in vivo.
Finally, we conducted additional tests on paired human cancer cells and surrogate lymphocytes to evaluate the proposed strategy. PBMC were isolated from untreated acute myeloid leukemia (AML) patients according to protocols approved by the institutional human studies review boards. After treating PBMC in vitro with venetoclax for 1 h, BH3 profiling was performed with 3 µM MS-1, the identified peptide and dose sensitive in detecting delta priming caused by BCL-2 inhibitors (Figures 1B and 2C). Consistent with our in vitro and in vivo findings, MS-1 peptide reliably detected the increased delta priming of CD3+/CD19+CD45hi lymphocytes in all four AML patient samples (Figures 3A-C). Furthermore, a significant increase in mitochondrial prim-
ing was observed in CD3 19 33+64 11b 16 myeloblast cells from all four AML samples (Figure 3D). It is worth noting that myeloblasts from two AML samples became significantly more primed than the other two (Figure 3E), which could ensue from different expression profiles of BCL-2 proteins in different samples. Nevertheless, the observed increased priming in all four tested AML samples aligns
with our earlier report that AML generally have dependence on BCL-2 for survival.8 Altogether, BH3 profiling with MS-1 peptide readily detected the PD effects of venetoclax on AML blasts and lymphocytes. Non-cancerous T/B cells are reliable and arguably more sensitive and consistent surrogates than AML blasts for pharmacodynamic data. Baseline priming results suggests that both T and B cells
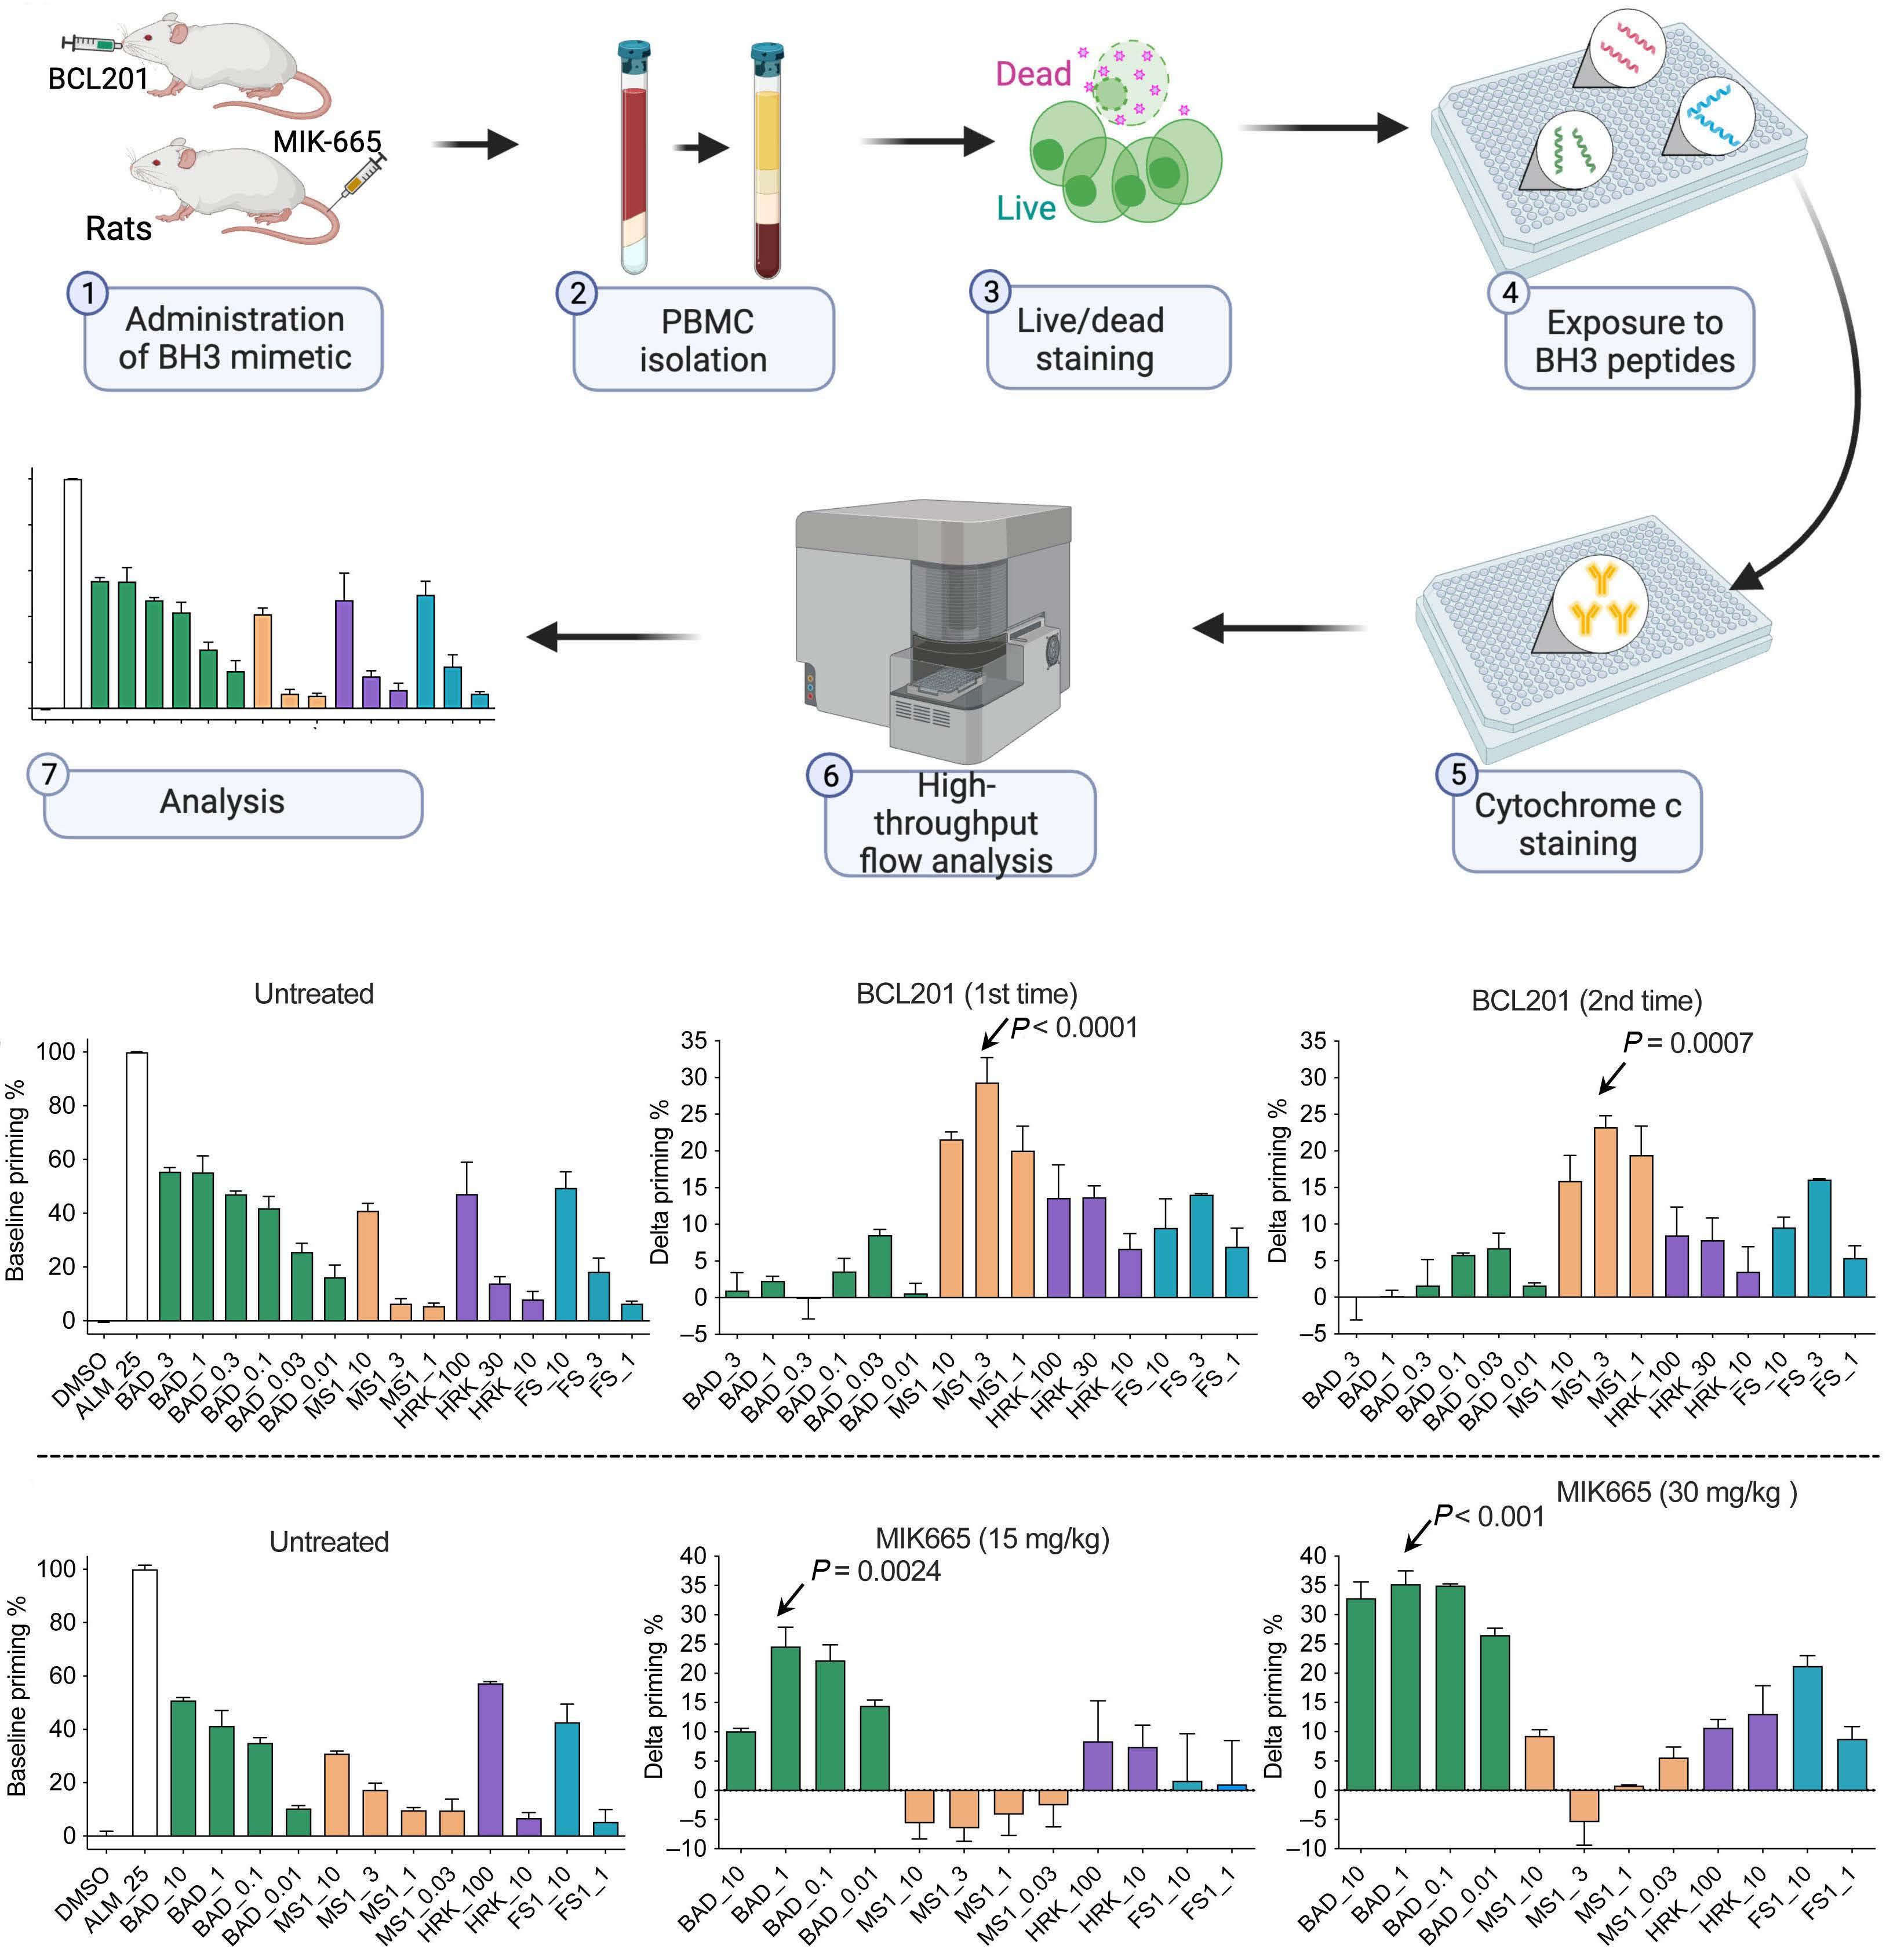
BH3
in vivo
in vivo. (A)
BH3
with BH3 mimetics. BCL201 was administered by oral gavage and MIK665 was given by tail vein injection. (B) Baseline priming of lymphocytes from untreated rats (untreated control). (C) Delta priming of rat lymphocytes after in vivo treatment with BCL201. The drug was administered via oral gavage at 100 mg/kg and peripheral blood was collected 2 hours (h) after a single dose of BCL201. The rat experiments were repeated twice. (D) Baseline priming of lymphocytes from untreated rats (untreated control for panel E). (E) Delta priming of rat lymphocytes after treatment with MIK665. MIK665 was given by intravenous injection at 15 or 30 mg/kg and peripheral blood was collected 0.5 h after a single dose of MIK665. Data were presented as mean ± standard error of the mean of triplicate experiments. Arrows indicate bars with largest values in each graph. P value for the arrowed bar was calculated using Student’s t test to compare the values of Primingtreated and Primingbaseline
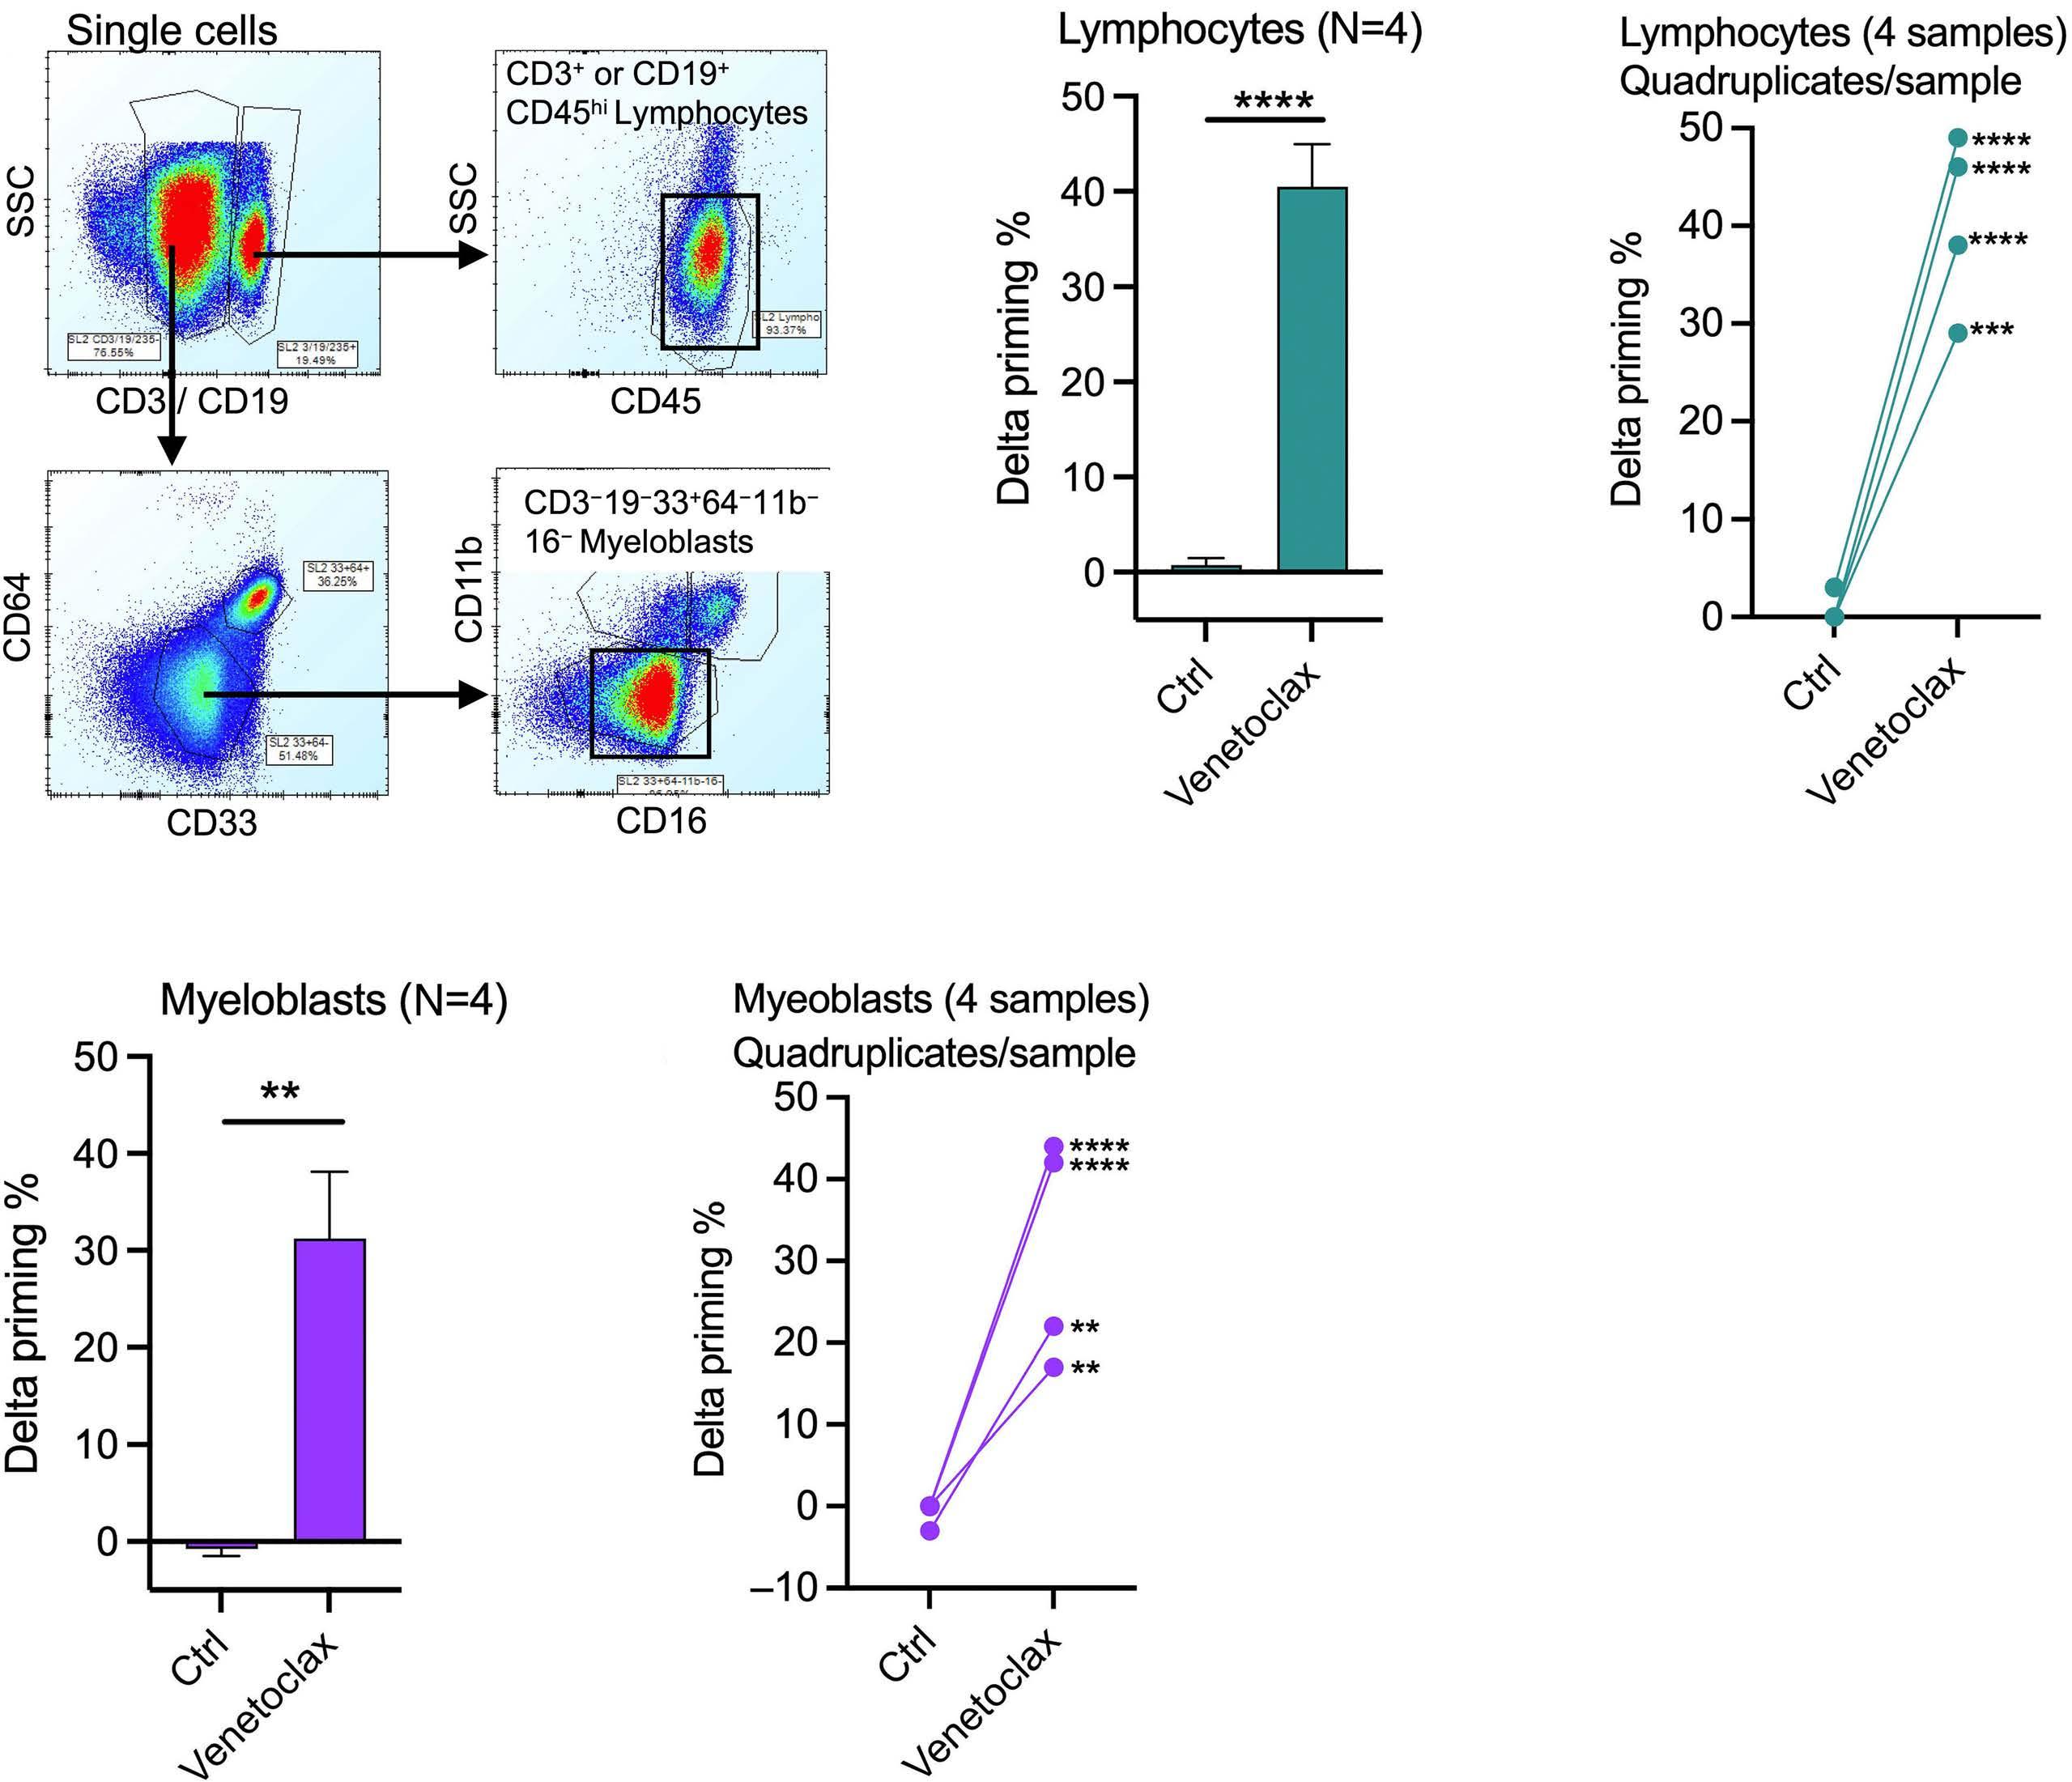
respond well to BAD, MS1, and HRK peptides (Figure 1A, D), indicating that they have dependence on BCL-2, MCL-1,and BCL-XL for survival. When treated with BCL-2 inhibitor, the anti-apoptotic capability of BCL-2 protein would be significantly neutralized and the released pro-apoptotic proteins from BCL-2 sequestration could then be significantly buffered by MCL-1. The mitochondria are thus becoming more dependent on MCL-1, which can be readily determined by the MCL-1-selective MS-1 peptide. Similarly, a significant portion of pro-apoptotic proteins freed from MCL-1 se-
Figure 3. BH3 profiling manifested the pharmacodynamic effects of venetoclax in paired lymphocytes and myeloblasts from acute myeloid leukemia patients. (A) Gating strategy for human primary acute myeloid leukemia (AML) myeloblasts and lymphocytes. (B, C) Delta priming of CD45+CD3/19+ lymphocytes from four AML patients after treatment with 0.1 µM venetoclax for 1 hour (h). Frozen AML peripheral blood mononuclear cells (PBMC) were thawed, treated, and then probed with 3 µM MS-1 peptide using BH3 profiling. (D, E) Delta priming of CD3 19 33+64 11b 16 myeloblast from four AML patients after treatment with 0.1 µM venetoclax for 1 h. Frozen AML PBMC were thawed, treated, and then probed with 3 µM MS-1 peptide. Data were presented as mean ± standard error of the mean of quadruplicate experiments. P value was calculated using Student’s t test to compare the values of control and venetoclax-treated samples.
questration by an MCL-1 inhibitor can be sequestered by BCL-2 and BCL-XL in lymphocytes. The mitochondria thus become more dependent on BCL-2 and BCL-XL and this change can be readily detected by BH3 profiling using BAD peptide. This likely explains why BH3 profiling works well as a PD biomarker for BH3 mimetics.
In conclusion, we found that BH3 profiling, with lymphocytes as surrogate cells, provides a robust and convenient PD biomarker for the activity of BH3 mimetics. The current study indicates that BH3 profiling could be used as a PD
biomarker for the activity of BH3 mimetics in cellular assays and preclinical animal studies. These findings provide the preclinical basis for testing of BH3 profiling as a PD marker in clinical trials of BH3 mimetics.
Rongqing Aaron Pan,1,2,3 Youzhen Wang,4 Shumei Qiu,4 Mariana Villalobos-Ortiz,2,3 Jeremy Ryan,2,3 Erick Morris,4 Ensar Halilovic4 and Anthony Letai2,3
1Bone Marrow Transplantation Center of the First Affiliated Hospital & Institute of Hematology & Department of Immunology, Zhejiang University School of Medicine, Hangzhou, Zhejiang, China; 2Department of Medical Oncology, Dana-Farber Cancer Institute, Boston, MA, USA; 3Harvard Medical School, Boston, MA, USA and 4Novartis Institute of Biomedical Research, Oncology Drug Discovery, Cambridge, MA, USA
Correspondence:
A. LETAI - anthony_letai@dfci.harvard.edu
https://doi.org/10.3324/haematol.2023.283060
Received: March 3, 2023.
1. Diepstraten ST, Anderson MA, Czabotar PE, Lessene G, Strasser A, Kelly GL. The manipulation of apoptosis for cancer therapy using BH3-mimetic drugs. Nat Rev Cancer. 2022;22(1):45-64.
2. Singh R, Letai A, Sarosiek K. Regulation of apoptosis in health and disease: the balancing act of BCL-2 family proteins. Nat Rev Mol Cell Biol. 2019;20(3):175-193.
3. Pan R, Ryan J, Pan D, Wucherpfennig KW, Letai A. Augmenting NK cell-based immunotherapy by targeting mitochondrial apoptosis. Cell. 2022;185(9):1521-1538.e18.
4 Letai A. Functional precision medicine: putting drugs on patient cancer cells and seeing what happens. Cancer Discov. 2022;12(2):290-292.
5. Letai AG. Diagnosing and exploiting cancer’s addiction to blocks in apoptosis. Nat Rev Cancer. 2008;8(2):121-132.
6. Montero J, Sarosiek KA, DeAngelo JD, et al. Drug-induced death signaling strategy rapidly predicts cancer response to chemotherapy. Cell. 2015;160(5):977-989.
7 Ni Chonghaile T, Sarosiek KA, Vo TT, et al. Pretreatment mitochondrial priming correlates with clinical response to cytotoxic chemotherapy. Science. 2011;334(6059):1129-1133.
Accepted: October 13, 2023.
Early view: October 26, 2023.
©2024 Ferrata Storti Foundation
Published under a CC BY-NC license
Disclosures
This work is supported by a NCI/NIH grant R35 CA242427 and a research agreement with Novartis A10838. RP and MV have no conflicts of interest to disclose. JR is a consultant for Zentalis Pharmaceuticals. SQ and EH are employees at and shareholders of Novartis. EM and YW were employees at and shareholders of Novartis during this work. AL is on the scientific advisory boards of Zentalis Pharmaceuticals and Flash Therapeutics. He has performed consulting for AbbVie and Boehringer-Ingelheim.
Contributions
RP, EH and AL designed the research. RP, JR, YW and SQ performed the research. MV and JR contributed vital reagents. RP, YW, EH, EM and AL analyzed the data. RP wrote the original draft. RP, EM, EH and AL reviewed and edited the manuscript.
Data-sharing statement
Interested people can obtain data through contacting the corresponding author.
8. Pan R, Hogdal LJ, Benito JM, et al. Selective BCL-2 inhibition by ABT-199 causes on-target cell death in acute myeloid leukemia. Cancer Discov. 2014;4(3):362-375.
9 Villalobos-Ortiz M, Ryan J, Mashaka TN, Opferman JT, Letai A. BH3 profiling discriminates on-target small molecule BH3 mimetics from putative mimetics. Cell Death Differ. 2020;27(3):999-1007.
10. Koss B, Ryan J, Budhraja A, et al. Defining specificity and ontarget activity of BH3-mimetics using engineered B-ALL cell lines. Oncotarget. 2016;7(10):11500-11511.
11. Ryan J, Letai A. BH3 profiling in whole cells by fluorimeter or FACS. Methods. 2013;61(2):156-164.
12. Sarosiek KA, Fraser C, Muthalagu N, et al. Developmental regulation of mitochondrial apoptosis by c-Myc governs ageand tissue-specific sensitivity to cancer therapeutics. Cancer Cell. 2017;31(1):142-156.
13. Szlavik Z, Csekei M, Paczal A, et al. Discovery of S64315, a potent and selective Mcl-1 inhibitor. J Med Chem. 2020;63(22):13762-13795.
Sickle cell disease (SCD) is a monogenic disorder that affects ~100,000 African Americans and over 3 million people world-wide.1,2 Acute systemic painful vaso-occlusive episode (VOE) is the primary reason for hospitalization of SCD patients and may serve as an antecedent to acute chest syndrome, a type of acute lung injury and one of the primary reasons for mortality among SCD patients.3,4 Intravenous (IV) infusion of humanized anti-P-selectin antibody (Ab) has been shown to reduce frequency of VOE in SCD patients.5 However, the IV route of administration often requires an out-patient visit to the clinic, thus highlighting the need for therapies that can cut down the health care cost by enabling self-administration by SCD patients at home during the prodromal phase of a VOE.6 IHP-102, a novel glycan drug is the first subcutaneously (SQ) administrable therapeutic with dual blocking activity against P-selectin (half maximal inhibitory concentration [IC50] =0.7 µg/mL) and complement pathway. Here, we show that IHP-102 is bioavailable in the blood circulation of rats within 30 minutes (min) following SQ administration and the P-selectin blocking activity persists up to 8 hours. Remarkably, intravital lung microscopy revealed that SQ administration of IHP-102 led to amelioration of IV oxy-hemoglobin (oxy-Hb) triggered lung vaso-occlusion in SCD mice by 80%. These findings highlight the therapeutic potential of IHP-102 as the first SQ administrable treatment for the prevention of VOE in SCD.
IV infusion of humanized anti-P-selectin Ab is now a Food and Drug Administration-approved therapy for the prevention of VOE in SCD patients.5 Interestingly, VOE is often preceded by a 1- to 2-day long prodromal phase defined by fatigue and diffused body pain, which progresses to more severe and localized pain over the next few days.6 Although this pathophysiology provides an opportunity for early intervention, this therapeutic window remains underutilized because the IV infusion requires visiting the hospital that many SCD patients wait to do until the onset of unbearable symptoms.6,7 The annual medical care cost for SCD patients in the US is estimated to be over $3 billion and 80% of this cost accounts for inpatient hospitalization secondary to VOE.8 VOE also result in reduced quality of life, uncompensated care and lost productivity, which indirectly further contributes to the economic burden of SCD.8 SQ injection in the fatty tissue, just under the skin is widely used as a self-administrable mode of administering therapeutics like insulin, blood thinners, and fertility drugs. A disease modifying SQ therapeutic for VOE would have the potential to be self-administered by SCD patients at home, and if effective, could avoid hospitalization and the
associated costs. Heparin or structurally similar semi-synthetic polysaccharides are widely used glycan drugs with both anticoagulant, anti-complement and anti-P-selectin activity.9-11 IHP-102 is a novel glycan drug with dual activity against P-selectin-mediated cell adhesion and complement cascade, both of which contribute to the pathogenesis of VOE in SCD.4,12,13 IHP-102 was developed by adding unique chemical modifications to heparin, resulting in relatively weak anti-thrombin activity (<10 U/mg), potent anti-P-selectin and anti-complement activity, and higher absorption following SQ administration. The goal of the current study was to determine whether SQ administered IHP-102 is effective in preventing vaso-occlusion in Townes knock-in humanized SCD mice.
We recently developed a model of vaso-occlusive crisis in Townes SCD mice triggered by IV administration of 10 µmol/ kg oxy-Hb, which led to lung vaso-occlusion by large neutrophil-platelet aggregates.14 Previously, we have also shown that IV administration of P-selectin blockers attenuate lung vaso-occlusion in SCD mice.13,15 Therefore, we first assessed the efficacy of IHP-102 administered via the IV route, in preventing lung vaso-occlusion in SCD mice. SCD mice were IV administered 10 µmol/kg oxy-Hb without or with 30 mg/kg IHP-102 and lung vaso-occlusion was assessed using quantitative fluorescence intravital lung microscopy (qFILM) approach (Figure 1A) as described elsewhere.13,14,16 Briefly, mice were anesthetized, ventilated with 95% oxygen containing 1-2% isoflurane, thoracic surgery was performed, and a small portion of the left lung was immobilized against a coverslip using a vacuum enabled micro-machined device as described elsewhere.13,14,16 Next, fluorescein isothiocyanate (FITC)-conjugated dextran, Alexa Fluor 546-conjugated anti-Ly6g Ab and pacific-blue-conjugated anti-mouse CD49b Ab were IV administered for visualization of blood vessels and in vivo staining of neutrophils and platelets, respectively, and the lung microvasculature was visualized using a Nikon multi-photon-excitation fluorescence microscope. Although IV oxy-Hb triggered the occlusion of pulmonary arteriole “bottlenecks” (junction of pulmonary arterioles with pulmonary capillaries) with large neutrophil-platelet aggregates (marked with white ovals) in the lungs of SCD mice (Figure 1B), such aggregates were absent in the pulmonary arterioles of SCD mice IV administered both oxy-Hb and IHP-102 (Figure 1C). Time series of qFILM images were recorded in 10-15 field of view [FOV] size ~ 65,536 µm2) in the lung of each mouse and analyzed using the strategy described elsewhere13,14,16 to quantify pulmonary vaso-occlusion. The number of pulmonary vaso-occlusions per FOV (Figure 1D), number of large pulmonary
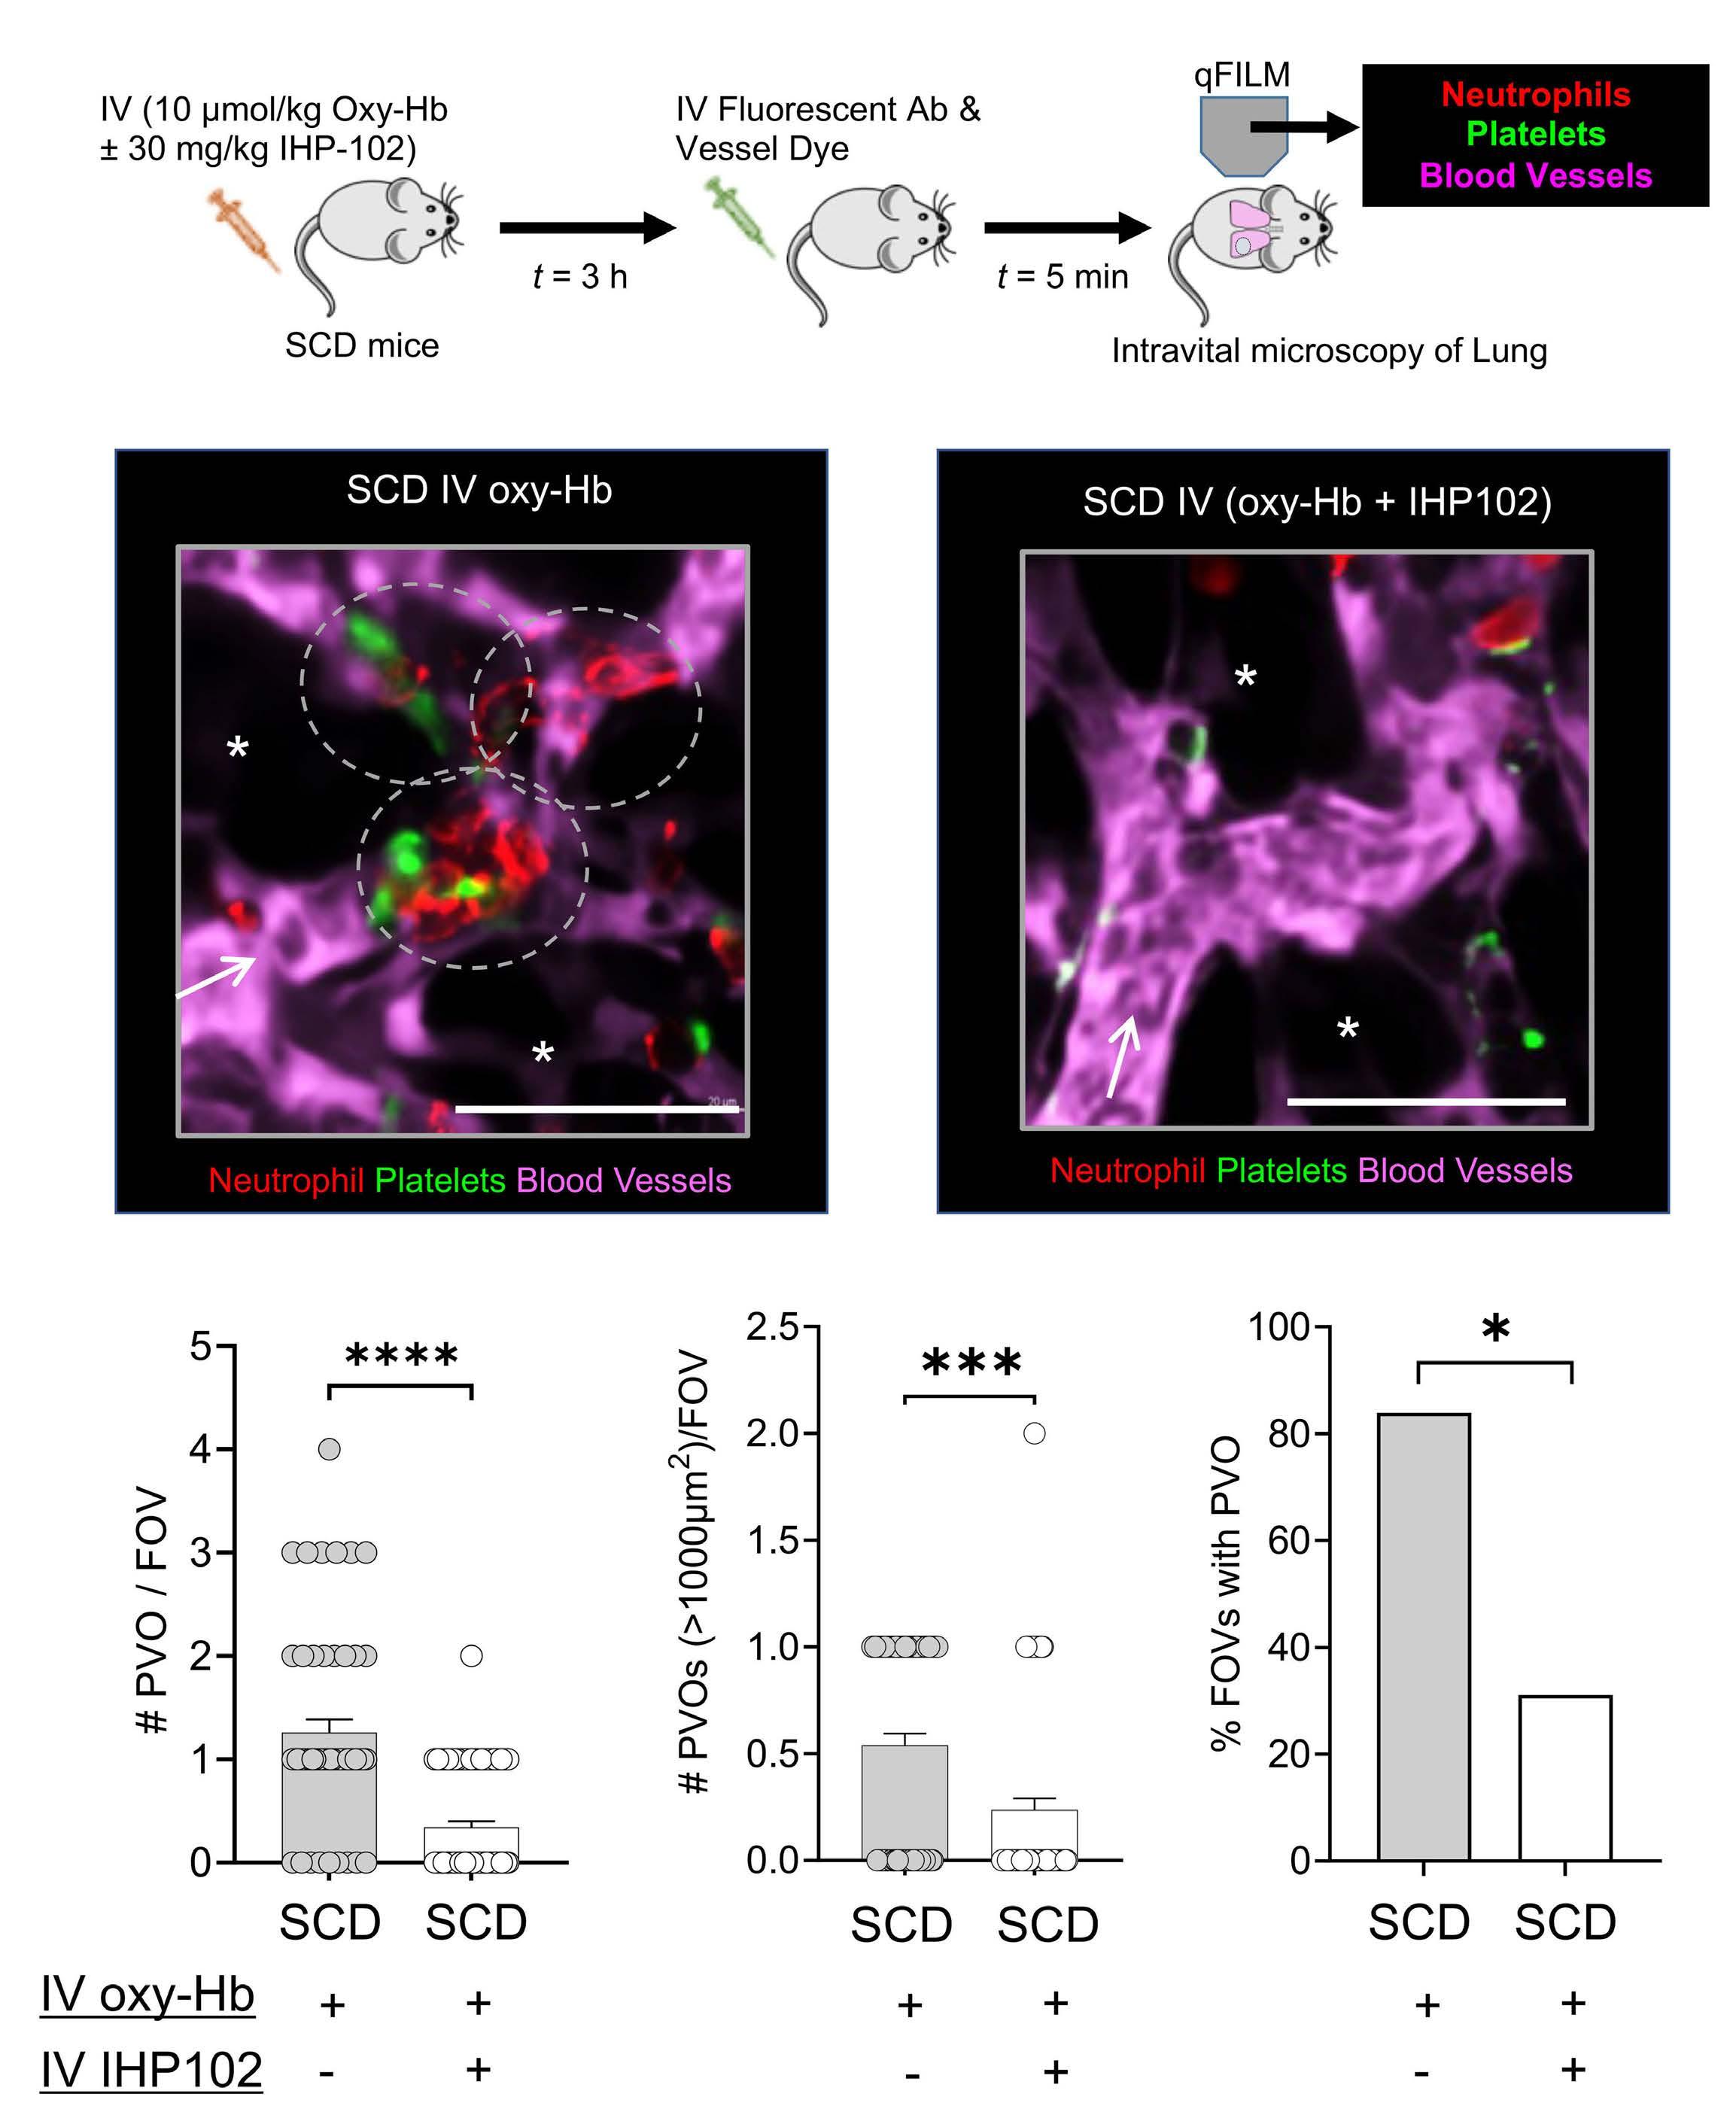
Figure 1. Intravenously administered IHP-102 ameliorates lung vaso-occlusion in SCD mice. (A) Experimental scheme - SCD mice were intravenously (IV) administered 10 µmol/kg oxy-hemoglobin (oxy-Hb) without or with 30 mg/kg IHP-102 and quantitative fluorescence intravital lung microscopy (qFILM) was used to assess the absence or presence of vaso-occlusion in the lung. Pulmonary microcirculation (pseudo-colored purple), neutrophils (red), and platelets (pseudo-colored green) were labeled in vivo by IV administration of fluorescein isothiocyanate (FITC) dextran, AF546-anti-Ly6G antibody (Ab), and pacific blue-anti-CD49b Ab, respectively. (B) Representative qFILM image showing occlusion of arteriolar bottlenecks by large neutrophil-platelet aggregates (marked by dotted white ovals) in the lung of an SCD mouse IV administered 10 µmol/kg oxy-Hb. (C) Representative qFILM image showing absence of neutrophil-platelet aggregates in the pulmonary arteriole of an SCD mouse IV administered 10 µmol/ kg oxy-Hb + 30 mg/kg IHP-102. Scale bars 50 µm. Arrows denote blood flow direction in the pulmonary arteriole. Alveolar air spaces marked by *. (D) Number of pulmonary vaso-occlusions per field of view (#PVO/FOV), (E) number of large PVO (with area >1,000 µm2) per FOV, and (F) FOV and PVO were significantly reduced by greater than 50% in SCD mice administered IV oxy-Hb + IHP-102 compared to SCD mice administered IV oxy-Hb. Each data point (circle) in (D) and (E) denotes #PVO observed in a single qFILM FOV (size ~65,536 µm2). IV oxy-Hb: 56 FOV in 4 mice. IV oxy-Hb + IHP-102: 73 FOV in 4 mice. Bars in (D) and (E) represents mean ± standard error and compared using Student’s t test. Bars in (F) represent percentage and compared using 4-fold table analysis with χ2 statistics. *P<0.05, ***P<0.001; ****P<0.0001.
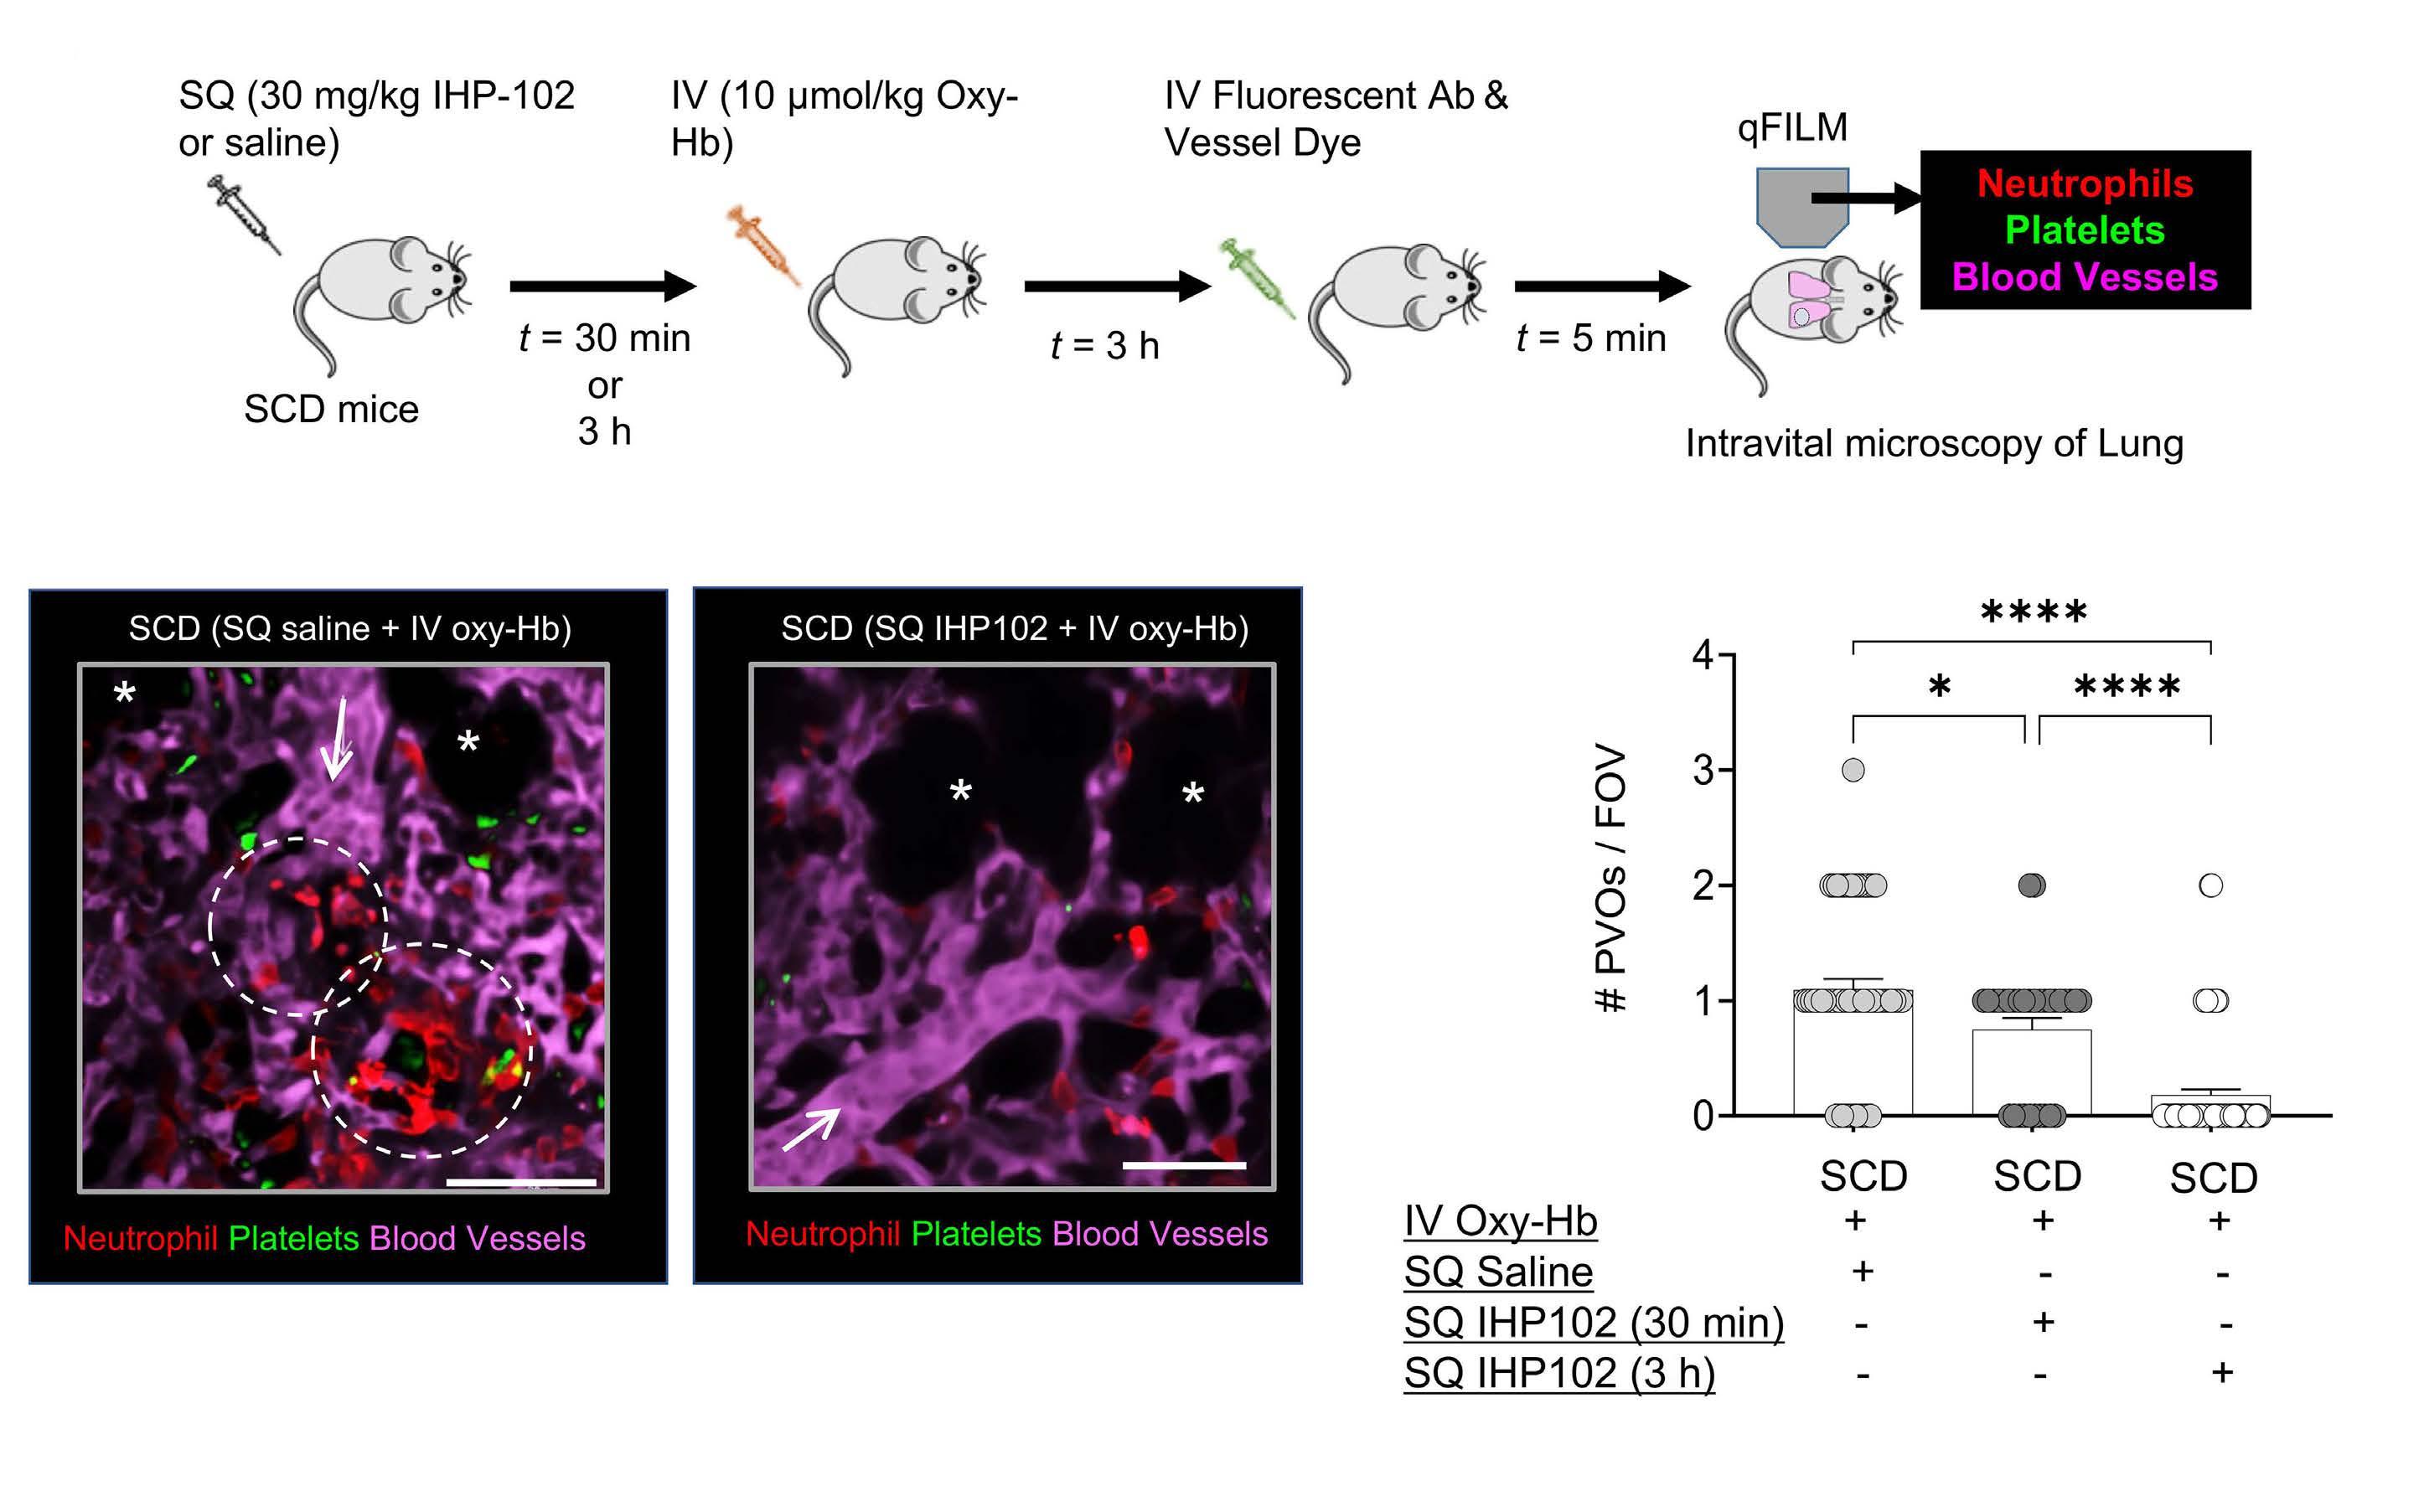
Figure 2. Subcutaneously administered IHP-102 attenuates lung vaso-occlusion in SCD mice. (A) Experimental scheme - SCD mice were subcutaneously (SQ) administered saline or 30 mg/kg IHP-102. After 30 minutes (min) or 3 hours (h), 10 µmol/kg oxy-hemoglobin (oxy-Hb) was intravenously (IV) administered to trigger vaso-occlusive crisis, and quantitative fluorescence intravital lung microscopy (qFILM) was used to assess the absence or presence of vaso-occlusion in the lung. Pulmonary microcirculation (pseudo-colored purple), neutrophils (red), and platelets (pseudo-colored green) were labeled in vivo by IV administration of fluorescein isothiocyanate (FITC) dextran, AF546-anti-Ly6G antibody (Ab), and pacific blue-anti-CD49b Ab, respectively. (B) Representative qFILM image showing two large neutrophil-platelet aggregates (marked by dotted white ovals) occluding the arteriolar bottlenecks in the lung of an SCD mouse administered SQ saline + IV oxy-Hb. (C) Representative qFILM image showing absence of neutrophil-platelet aggregates in the pulmonary arteriole of an SCD mouse administered SQ IHP-102 + IV oxy-Hb. Scale bars 50 µm. Arrows denote blood flow direction in the pulmonary arteriole. Alveolar air spaces marked by *. Complete time series for (B) and (C) are shown in Online Supplementary Movie S1 and S2, respectively. (D) Number of pulmonary vaso-occlusions per field of view (#PVO/FOV) were significantly less in SCD mice SQ administered 30 mg/kg IHP-102 than SCD mice SQ administered saline prior to IV administration of 10 µmol/kg oxy-Hb (30% and 80% reduction with IHP-102 administration 30 min and 3 h, respectively prior to IV oxy-Hb). Each data point (circle) in D denotes #PVO observed in a single qFILM FOV (size ~ 65,536 µm2). SQ saline + IV oxy-Hb: 55 FOV in 4 mice. SQ IHP-102 (30 min) + IV oxy-Hb: 32 FOV in 3 mice. SQ IHP-102 (3 h) + IV oxy-Hb: 78 FOV in 5 mice. Bars in (D) show mean ± standard error and compared using Student’s t test. *P<0.05; ****P< 0.0001.
vaso-occlusions (size > 1,000 µm2) per FOV (Figure 1E), and percent FOV with at least one pulmonary vaso-occlusion (Figure 1F) were significantly reduced by greater than 50% in SCD mice IV administered oxy-Hb + IHP-102 compared to SCD mice administered IV oxy-Hb only. Recently, we have shown that lung vaso-occlusion is reduced by ~50% in P-selectin-deficient SCD mice, suggesting that the remaining ~50% vaso-occlusive pathophysiology is P-selectin independent.14 Therefore, greater than 50% reduction in lung vaso-occlusion caused by IV IHP-102 is suggestive of additional therapeutic effects beyond P-selectin-inhibition. As shown in Online Supplementary Figure S1A, in vitro pretreatment with IHP-102 led to significant inhibition of complement pathway in human serum samples. Interest-
ingly, complement activation is known to contribute to vaso-occlusion in SCD.12 Although IHP-102 also manifests potent anti-complement activity (Online Supplementary Figure S1A), more elaborate studies would be needed in the future to assess the role of complement inhibition in the P-selectin-independent therapeutic effects of IHP-102. Next, we assessed the pharmacokinetics of IHP-102 bioavailability in the blood following SQ administration. Importantly, such studies require blood draws at multiple time points, which is hard to achieve in mice with relatively small total blood volume (~1-1.5 mL). Therefore, Sprague Dawley rats were SQ administered IHP-102 (30 mg/kg) and serum samples collected at different time points were analyzed for P-selectin blocking activity using an in vitro P-selectin
cell adhesion assay (Online Supplementary Figure S1B). Remarkably, P-selectin blocking activity was detectable in the serum in less than 30 min and persisted for greater than 8 hours post SQ administration of IHP-102 (Online Supplementary Figure S1B). Based on this, SCD mice were SQ administered IHP-102 (30 mg/kg) or saline ~30 min or 3 h prior to IV administration of 10 µmol/kg oxy-Hb and lung vaso-occlusion was assessed using qFILM (experimental scheme shown in Figure 2A). Large neutrophil-platelet aggregates were observed to occlude the pulmonary arterioles in the lung of SCD mice administered SQ saline + IV oxy-Hb (representative FOV shown in Figure 2B and Online Supplementary Movie S1), however, such aggregates were fewer in the lung of SCD mice administered SQ IHP102 + IV oxy-Hb. A representative FOV (Figure 2C; Online Supplementary Movie S2) shows unobstructed blood flow through the pulmonary arteriole and into the pulmonary capillary network, suggestive of the absence of lung vaso-occlusion in an SCD mouse administered SQ IHP-102 + IV oxy-Hb. Indeed, the quantitative analysis of qFILM data revealed that the number of pulmonary vaso-occlusions per FOV were significantly reduced by ~30% and 80% in SCD mice administered IHP-102 SQ 30 min and 3 h, respectively prior to IV oxy-Hb compared to SCD mice administered SQ saline + IV oxy-Hb (Figure 2D).
Taken together, our findings suggest that IHP-102 prevents lung vaso-occlusion in SCD mice possibly through potent anti-P-selectin and anti-complement mechanisms. Most importantly, IHP-102 is effective in preventing vaso-occlusion in the lung of SCD mice following administration via the SQ route. The interpretation of our findings is associated with few limitations, justifying the need for further investigation in more elaborate future studies. First, the efficacy of IHP-102 was assessed in the current study by only using IV oxy-Hb to trigger vaso-occlusive crisis in SCD mice, therefore, it would be beneficial to validate these findings in future studies using inflammatory triggers other than oxy-Hb as well. Second, the efficacy of SQ IHP-102 in preventing vaso-occlusion needs to be compared with the efficacy of SQ heparin in future studies. Third, the efficacy of IHP-102 also needs to be assessed in P-selectin deficient SCD mice to validate the P-selectin independent benefits of IHP-102. Fourth, our current study only assesses the efficacy of IHP-102 as an acute SQ therapy in preventing vaso-occlusion in SCD mice, therefore, the potential of IHP-102 as a prophylactic chronic therapy remains to be determined in future studies. Fifth, it would be useful to assess the efficacy of SQ IHP-102 administered post IV oxy-Hb challenge in SCD mice. Notwithstanding these limitations, our current findings inform the need for clinical studies to evaluate the safety and efficacy of IHP-102 as a potential self-administrable SQ therapy for early treatment of VOE and prevention of VOE-associated hospitalization among SCD patients.
Rikesh K. Dubey,1,2* Ravi Vats,2,3* Tomasz Brzoska,2,4 Tomasz W. Kaminski,1,2 Omika Katoch,1,2 Jesus Tejero,2,3,5 Gabriel Njikang,6 John Paderi6 and Prithu Sundd1,2,3,5,7
1Thrombosis and Hemostasis Program, VERSITI Blood Research Institute, Milwaukee, WI; 2Vascular Medicine Institute, University of Pittsburgh School of Medicine, Pittsburgh, PA; 3Department of Bioengineering, University of Pittsburgh, Pittsburgh, PA; 4Division of Hematology and Oncology, University of Pittsburgh, Pittsburgh, PA; 5Pulmonary Allergy and Critical Care Medicine, University of Pittsburgh, Pittsburgh, PA; 6IHP Therapeutics, San Carlos, CA and 7Sickle Cell Center of Excellence, University of Pittsburgh, Pittsburgh, PA, USA
RKD and RV contributed equally as first authors.
Correspondence:
P. SUNDD - psundd@versiti.org
https://doi.org/10.3324/haematol.2023.283716
Received: June 13, 2023.
Accepted: October 12, 2023.
Early view: October 19, 2023.
©2024 Ferrata Storti Foundation
Published under a CC BY-NC license
Disclosures
PS received funding as a part of sponsored research agreements with CSL Behring Inc (not relevant to the current study), IHP Therapeutics (relevant to the current study) and Novartis Inc (not relevant to the current study). PS is also the recipient of 2021 Bayer Hemophilia Award Program (not relevant to the current study). JT is a shareholder, officer and member of the board of directors of Globin Solutions, Inc (not relevant to the current study). JP and GN receive compensation and are shareholders in IHP Therapeutics. Other authors have no conflict of interest to disclose.
Contributions
RKD and RV performed the qFILM studies with SCD mice. TWK and TB contributed to qFILM studies in SCD mice. OK was involved in breeding and genotyping SCD mice. JT prepared oxy-hemoglobin used in in vivo mice studies. GN and JP were involved in formulation of IHP-102, complement testing, and conducting pharmacokinetic studies in rats. JP contributed to study design. PS was responsible for experimental design and project supervision. PS and RKD wrote the manuscript in consultation with all the co-authors.
Funding
This study was supported by the sponsored research agreement with IHP Therapeutics and the NIH-NHLBI R44HL167473 to JP. PS was supported by NIH-NHLBI R01HL128297, R01HL141080,
R01HL166345 and American Heart Association 18TPA34170588. RKD was supported by the Keystone Grant from the Histochemical Society. RV was supported by American Heart Association predoctoral fellowship 19PRE34430188. TWK was supported by American Heart Association postdoctoral fellowship AHA828786. TB was supported by American Society of Hematology (ASH) Research
1. Rees DC, Williams TN, Gladwin MT. Sickle-cell disease. Lancet. 2010;376(9757):2018-2031.
2. Abubakar II, Tillmann T, Banerjee A. Global, regional, and national age-sex specific all-cause and cause-specific mortality for 240 causes of death, 1990-2013: a systematic analysis for the Global Burden of Disease Study 2013. Lancet. 2015;385(9963):117-171.
3. Kato GJ, Piel FB, Reid CD, et al. Sickle cell disease. Nat Rev Dis Primers. 2018;4:18010.
4. Sundd P, Gladwin MT, Novelli EM. Pathophysiology of sickle cell disease. Annu Rev Pathol. 2019;14:263-292.
5. Ataga KI, Kutlar A, Kanter J, et al. Crizanlizumab for the prevention of pain crises in sickle cell disease. N Engl J Med. 2017;376(5):429-439.
6. Kavanagh PL, Fasipe TA, Wun T. Sickle cell disease: a Review. JAMA. 2022;328(1):57-68.
7 Telen MJ. Curative vs targeted therapy for SCD: does it make more sense to address the root cause than target downstream events? Blood Adv. 2020;4(14):3457-3465.
8. Johnson KM, Jiao B, Ramsey SD, Bender MA, Devine B, Basu A. Lifetime medical costs attributable to sickle cell disease among nonelderly individuals with commercial insurance. Blood Adv. 2023;7(3):365-374.
9 Kutlar A, Ataga KI, McMahon L, et al. A potent oral P-selectin blocking agent improves microcirculatory blood flow and a
Restart Award. The Nikon multiphoton excitation microscopes were funded by NIH grants S10RR028478 and S10OD025041.
Data will be made available upon reasonable request to the corresponding author.
marker of endothelial cell injury in patients with sickle cell disease. Am J Hematol. 2012;87(5):536-539.
10. Girardi G, Redecha P, Salmon JE. Heparin prevents antiphospholipid antibody-induced fetal loss by inhibiting complement activation. Nat Med. 2004;10(11):1222-1226.
11. van Zuuren EJ, Fedorowicz Z. Low-molecular-weight heparins for managing vaso-occlusive crises in people with sickle cell disease. Cochrane Database Syst Rev. 2015;2015(12):CD010155.
12. Vercellotti GM, Dalmasso AP, Schaid TR, Jr., et al. Critical role of C5a in sickle cell disease. Am J Hematol. 2019;94(3):327-337.
13. Bennewitz MF, Jimenez MA, Vats R, et al. Lung vaso-occlusion in sickle cell disease mediated by arteriolar neutrophil-platelet microemboli. JCI Insight. 2017;2(1):e89761.
14 Vats R, Kaminski TW, Brzoska T, et al. Liver-to-lung microembolic NETs promote gasdermin D-dependent inflammatory lung injury in sickle cell disease. Blood. 2022;140(9):1020-1037.
15. Vats R, Tutuncuoglu E, Pradhan-Sundd T, Tejero J, Shaw GD, Sundd P. Tandem P-selectin glycoprotein ligand immunoglobulin prevents lung vaso-occlusion in sickle cell disease mice. Exp Hematol. 2020;84:1-6.
16. Vats R, Brzoska T, Bennewitz MF, et al. Platelet extracellular vesicles drive inflammasome-IL-1beta-dependent lung injury in sickle cell disease. Am J Respir Crit Care Med. 2020;201(1):33-46.
Outcome of Philadelphia-positive acute lymphoblastic leukemia (Ph+ ALL) improved significantly with the introduction of tyrosine kinase inhibitors (TKI) in combination with chemotherapy. Although autologous stem cell transplantation (auto-SCT) has never been considered as a standard of care in this setting, it has been widely used by several groups.1-3 In the setting of first molecular remission of Ph+ ALL, outcome after auto-SCT has been reported as similar compared to allogeneic SCT (allo-SCT), as well as in a large retrospective registry study4 as in at least two prospective clinical trials,2,3 all in the TKI era. Recent targeted immunotherapies, namely blinatumomab and anti-CD19 chimeric antigen receptor T cells (CAR T cells) have improved patients’ outcome, rendering the role of SCT as the optimal curative therapy for Ph+ ALL in first remission to be re-evaluated.5–7 However, auto- or allo-SCT may be considered after relapse in case of CD19 loss of expression where blinatumomab and CAR T cells cannot be considered. In case of a CD19-positive relapse, blinatumomab in combination with TKI and/or chemotherapy may be used to reach a further molecular remission and possibly bridge to auto- or allo-SCT.
We hypothesized that minimal residual disease (MRD) evaluation by BCR::ABL1 transcript quantification within mobilized peripheral blood stem cells (PBSC) collected from patients with Ph+ ALL in molecular remission would predict the risk of relapse after auto-SCT. We thus compared the outcome of 34 patients receiving BCR::ABL1negative PBSC with a control group of 35 patients receiving PBSC that were not monitored for putative BCR::ABL1 contamination. After matching the two cohorts on patient age at time of auto-SCT, the cumulative incidence of relapse (CIR) at 5 years was significantly lower in patients receiving MRD-negative PBSC as compared to the control group, which translated into a significant advantage in the probability of disease-free survival (DFS). Written informed consent was obtained from all patients.
Between March 2009 and September 2022, we mobilized consecutively 35 patients diagnosed with Ph+ ALL in order to collect PBSC before auto-SCT. BCR::ABL1 transcript levels by quantitative reverse-transcription polymerase chain reaction (qRT-PCR) using standardized methods with international scale were used to monitor MRD.8,9 As shown in study flow-chart (Figure 1A), BCR::ABL1 quantification in PBSC was found negative in 32 patients. In
three others with BCR::ABL1-positive detection in PBSC, we aimed to further improve their molecular response in order to collect PBSC without detectable residual disease. To that aim, one patient received blinatumomab while the two others were switched from nilotinib to ponatinib in combination with chemotherapy, which led to a deeper molecular response in the three patients (BCR::ABL1/ABL ratio of ≤0.01% in marrow). All three were mobilized again in these better conditions. BCR::ABL1 quantification in PBSC was found negative in two but still positive in one who was thus excluded from the final analysis. Consequently, 34 patients (17 females, 17 males; median age 58 years; range, 17-76) received in vivo-purged ASCT in CR1 (N=32) or CR2 (N=2) at a median interval of 6 months (range, 4-66) after diagnosis of ALL. One patient had initial central nervous system (CNS) leukemic disease. Transcripts types were m-BCR and M-BCR in 28 and six patients, respectively All patients had previously received a first-line treatment combining chemotherapy with TKI, namely imatinib (16), nilotinib (7), dasatinib (10) or ponatinib (1). Response was evaluated after induction/consolidation courses by conventional morphologic criteria together with MRD evaluation in bone marrow. Major molecular response (MMolR) was defined as a BCR::ABL1/ABL ratio of ≤0.1% in the bone marrow, and molecular complete remission (CR) was defined by the absence of detectable MRD. As recommended by the French-Belgian-Swiss Group for Research on adult acute lymphoblastic leukemia (GRAALL), patients in MMolR after induction/consolidation were eligible for auto-SCT using myeloablative conditioning regimen, particularly when they lacked an HLA-matched sibling or unrelated donor. Figure 1B parallels BCR::ABL1 quantification in i) bone marrow at the last time point before mobilization (median 0.008%; range, 0-0.05%) and ii) collected PBSC in which no MRD was detected in any of the 34 patients. The median infused CD34+ cell dose was 6.0x10⁶/kg (range, 2.6-18.0). Maintenance therapy was given after autologous SCT in all patients with imatinib (11), nilotinib (6), dasatinib (7), ponatinib (2), bosutinib (1), unknown (2) or TKI successive combinations (5). TKI could be finally interrupted in ten of the 23 patients (43%) who survived disease-free at 2 years, at a median time of 55 months (range, 25-77) after auto-SCT as their long term MRD remained negative by BCR::ABL1 quantification in PB every 1 to 3 months. In order to analyze the impact of using MRD-negative
PBSC, we compared the outcome of this cohort with a control group of patients aged 18 to 59 years who were included in the GRAAPH-2005 trial of the GRAALL group and received auto-SCT in first CR.3 In this trial, mobilized PBSC were not planned to be analyzed for the presence of residual BCR::ABL1 contamination and the recommended conditioning regimen before auto-SCT combined cyclophosphamide and fractionated total body irradiation (8 to 12 Gy). The main difference between our cohort and the GRAAPH-2005 control group relied on patient age at the time of auto-SCT that was significantly higher in patients receiving residual disease-negative PBSC (Table 1). After a median follow-up of 6.1 and 4.1 years, the cumulative incidence of relapse (CIR) and of non-relapse mortality (NRM) at 5 years post-transplant were 36% (95% confidence interval [CI]: 20-53) versus 51% (95% CI: 32-67; P=0.17) and 9% (95% CI: 2-22) versus. 6% (95% CI: 1-19;
P=0.7) in patients receiving residual disease-negative PBSC and control group, respectively (Figure 2). In these same groups, the probabilities of disease-free survival (DFS) and overall survival (OS) at 5 years post-transplant were 55% (95% CI: 36-70) versus 43% (95% CI: 25-59; P=0.25; Figure 1B) and 67% (95% CI: 48-80) versus 54% (95% CI: 35-69; P=0.6), respectively. Causes of non-relapse deaths in both cohorts are given in Online Supplementary Appendix. Among patients receiving residual disease-negative PBSC who survived disease-free at 2 years, probabilities of CIR and DFS at 5 years tended to be better when TKI could be interrupted following SCT versus not (23% [95% CI: 5-47] vs. 0%; P=0.11 and 100% vs. 61% [95% CI: 31-0 81]; P=0.03, respectively; Online Supplementary Figure S1). As patient age was the main factor differing between the two cohorts, we estimated these same probabilities in a subgroup of patients aged 59 years or less as 59 years was
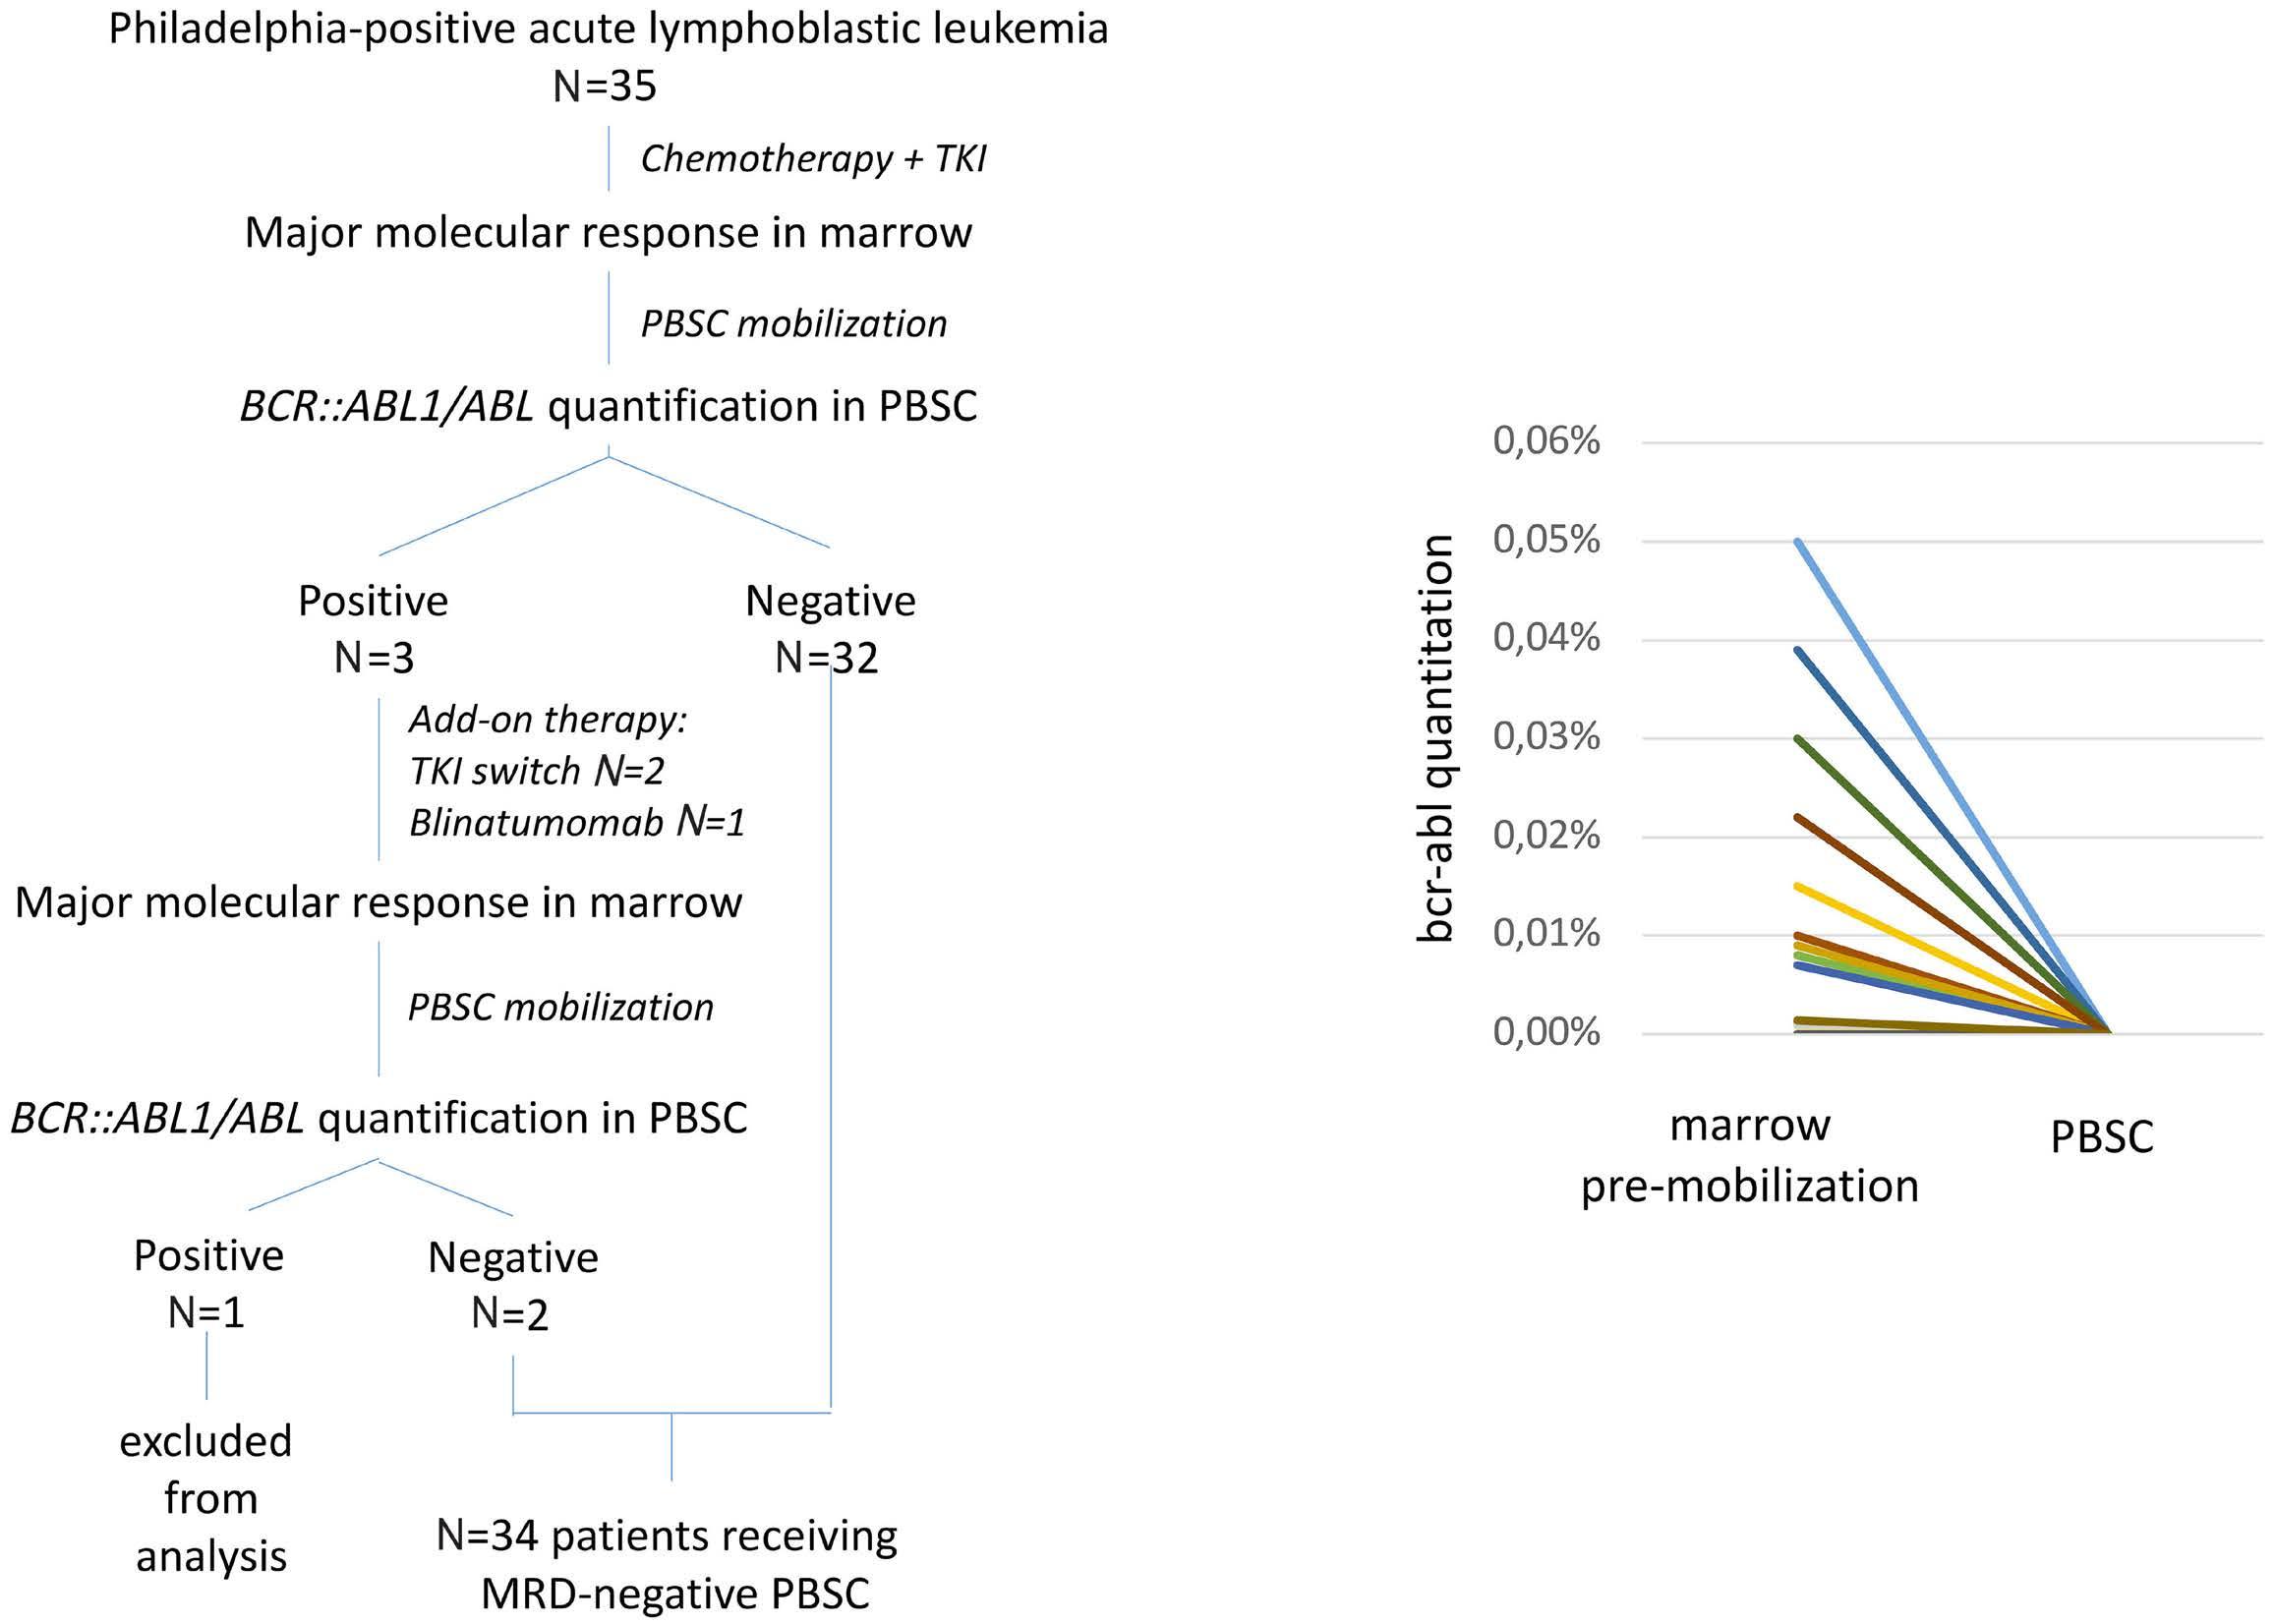
as a BCR::ABL1
≤0.1%
bone
i)
at the last time point before mobilization and ii) collected peripheral blood stem cells (PBSC). For BCR::ABL1 quantitation, mononuclear cells from peripheral blood, bone marrow and PBSC were isolated by density gradient centrifugation (Lymphocytes separation medium, Eurobio® or Abcys®), lysed in TriZol (Thermofisher®) and RNA extracted according to the manufacturer’s instructions. MBCR::ABL1 transcripts were quantified on the international scale (IS) using the automated GeneXpert® platform (Cepheid®, Sunnyvale, CA, USA) with a detection limit of 0.003%. mBCR::ABL1 transcripts were quantified using the EAC standardized polymerase chain reaction protocol and plasmid standards from Qiagen (Courtaboeuf, France) (Gabert et al., 8 PMID: 14562125). When mBCR::ABL1 was undetectable, the limit of detection was expressed in percentage as 100/(ABL1 transcript copies). The average background signal was quantified using 19 mBCR::ABL1-negative RNA samples. A Ct threshold corresponding to the average background Ct value minus two times the standard deviation of the background Ct values was calculated and found at 37.1. Any sample with mBCR::ABL1 Ct >37.1 was reported as undetectable. TKI: tyrosine kinase inhibitor; MRD: minimal residual
the upper limit of age to be included in the GRAAPH-2005 trial control group. In this subgroup, the probability of disease-free survival (DFS) at 5 years post-transplant was higher in patients receiving residual disease-negative PBSC (65% [95% CI: 40-81] vs . 42% [95% CI: 24-59] in the control group; P =0.047; Figure 2). This difference correlated with the CIR which was also lower in patients receiving residual disease-negative PBSC (25% [95% CI: 9-45] vs 51% [95% CI: 32-68] in the control group; P =0.038) while NRM did not differ between the two groups. Within patients receiving residual disease-negative PBSC, the CIR at 5 years thus reduced from 36% in the whole cohort to 25% in patients aged 59 years or less. This may be related to a significantly higher use of intensive conditioning regimen before auto-SCT in the latter population. Indeed, the use of TBI or of 4-days busulfan was more frequent in patients aged 59 years or less versus older ones within the group receiving residual disease-negative PBSC ( P =0.01).
There are at least two limitations in our study. The first one concerns the definition of the control group. As PBSC within this group of patients were not analyzed for their
putative MRD contamination, one cannot exclude that some of those may be MRD-negative. In case, this may have lowered the difference in outcome between the two groups. As six of 35 patients (17%) within this control group did not reach MMolR at time of mobilization, MRD contamination of PBSC may have been more frequent in this group as compared to our cohort in which all patients were in MMolR at time of mobilization. However, this was probably not the sole explanation since differences in outcome between the two cohorts were not modified when excluding these six patients from the comparison. Second, MRD monitoring in bone marrow and in PBSC was based on quantification of BCR::ABL1 fusion transcripts but not of immunoglobulin/T-cell receptor (Ig/TCR) gene rearrangements. In MRD longitudinal monitoring, the overall concordance between the two methods is 70% to 80% with significantly higher positivity by BCR::ABL1 . 10,11 In that sense, BCR::ABL1 may be more sensitive than Ig/ TCR monitoring for prediction of relapse. Of note, in a previous study of 32 ALL patients receiving auto-SCT including 12 patients with Ph + ALL, the detection of Ig/ TCR gene rearrangements within mobilized PBSC also
Categorical variables were compared by Fisher exact tests. Median comparisons were performed by the Mann-Whitney two-sample test. Type 1 error was fixed at the 5% level. All tests were two-tailed. Ph+ ALL: Philadelphia-positive acute lymphoblastic leukemia; PBSC: peripheral blood stem cell; M: male; F: female; WBC: white blood cell count; CNS: central nervous system; SCT: stem cell transplantation; CR: complete remission; TBI: total body irradiation; BU: busulfan; Mel: melphalan; ND: not determined; Cy: cyclophosphamide.
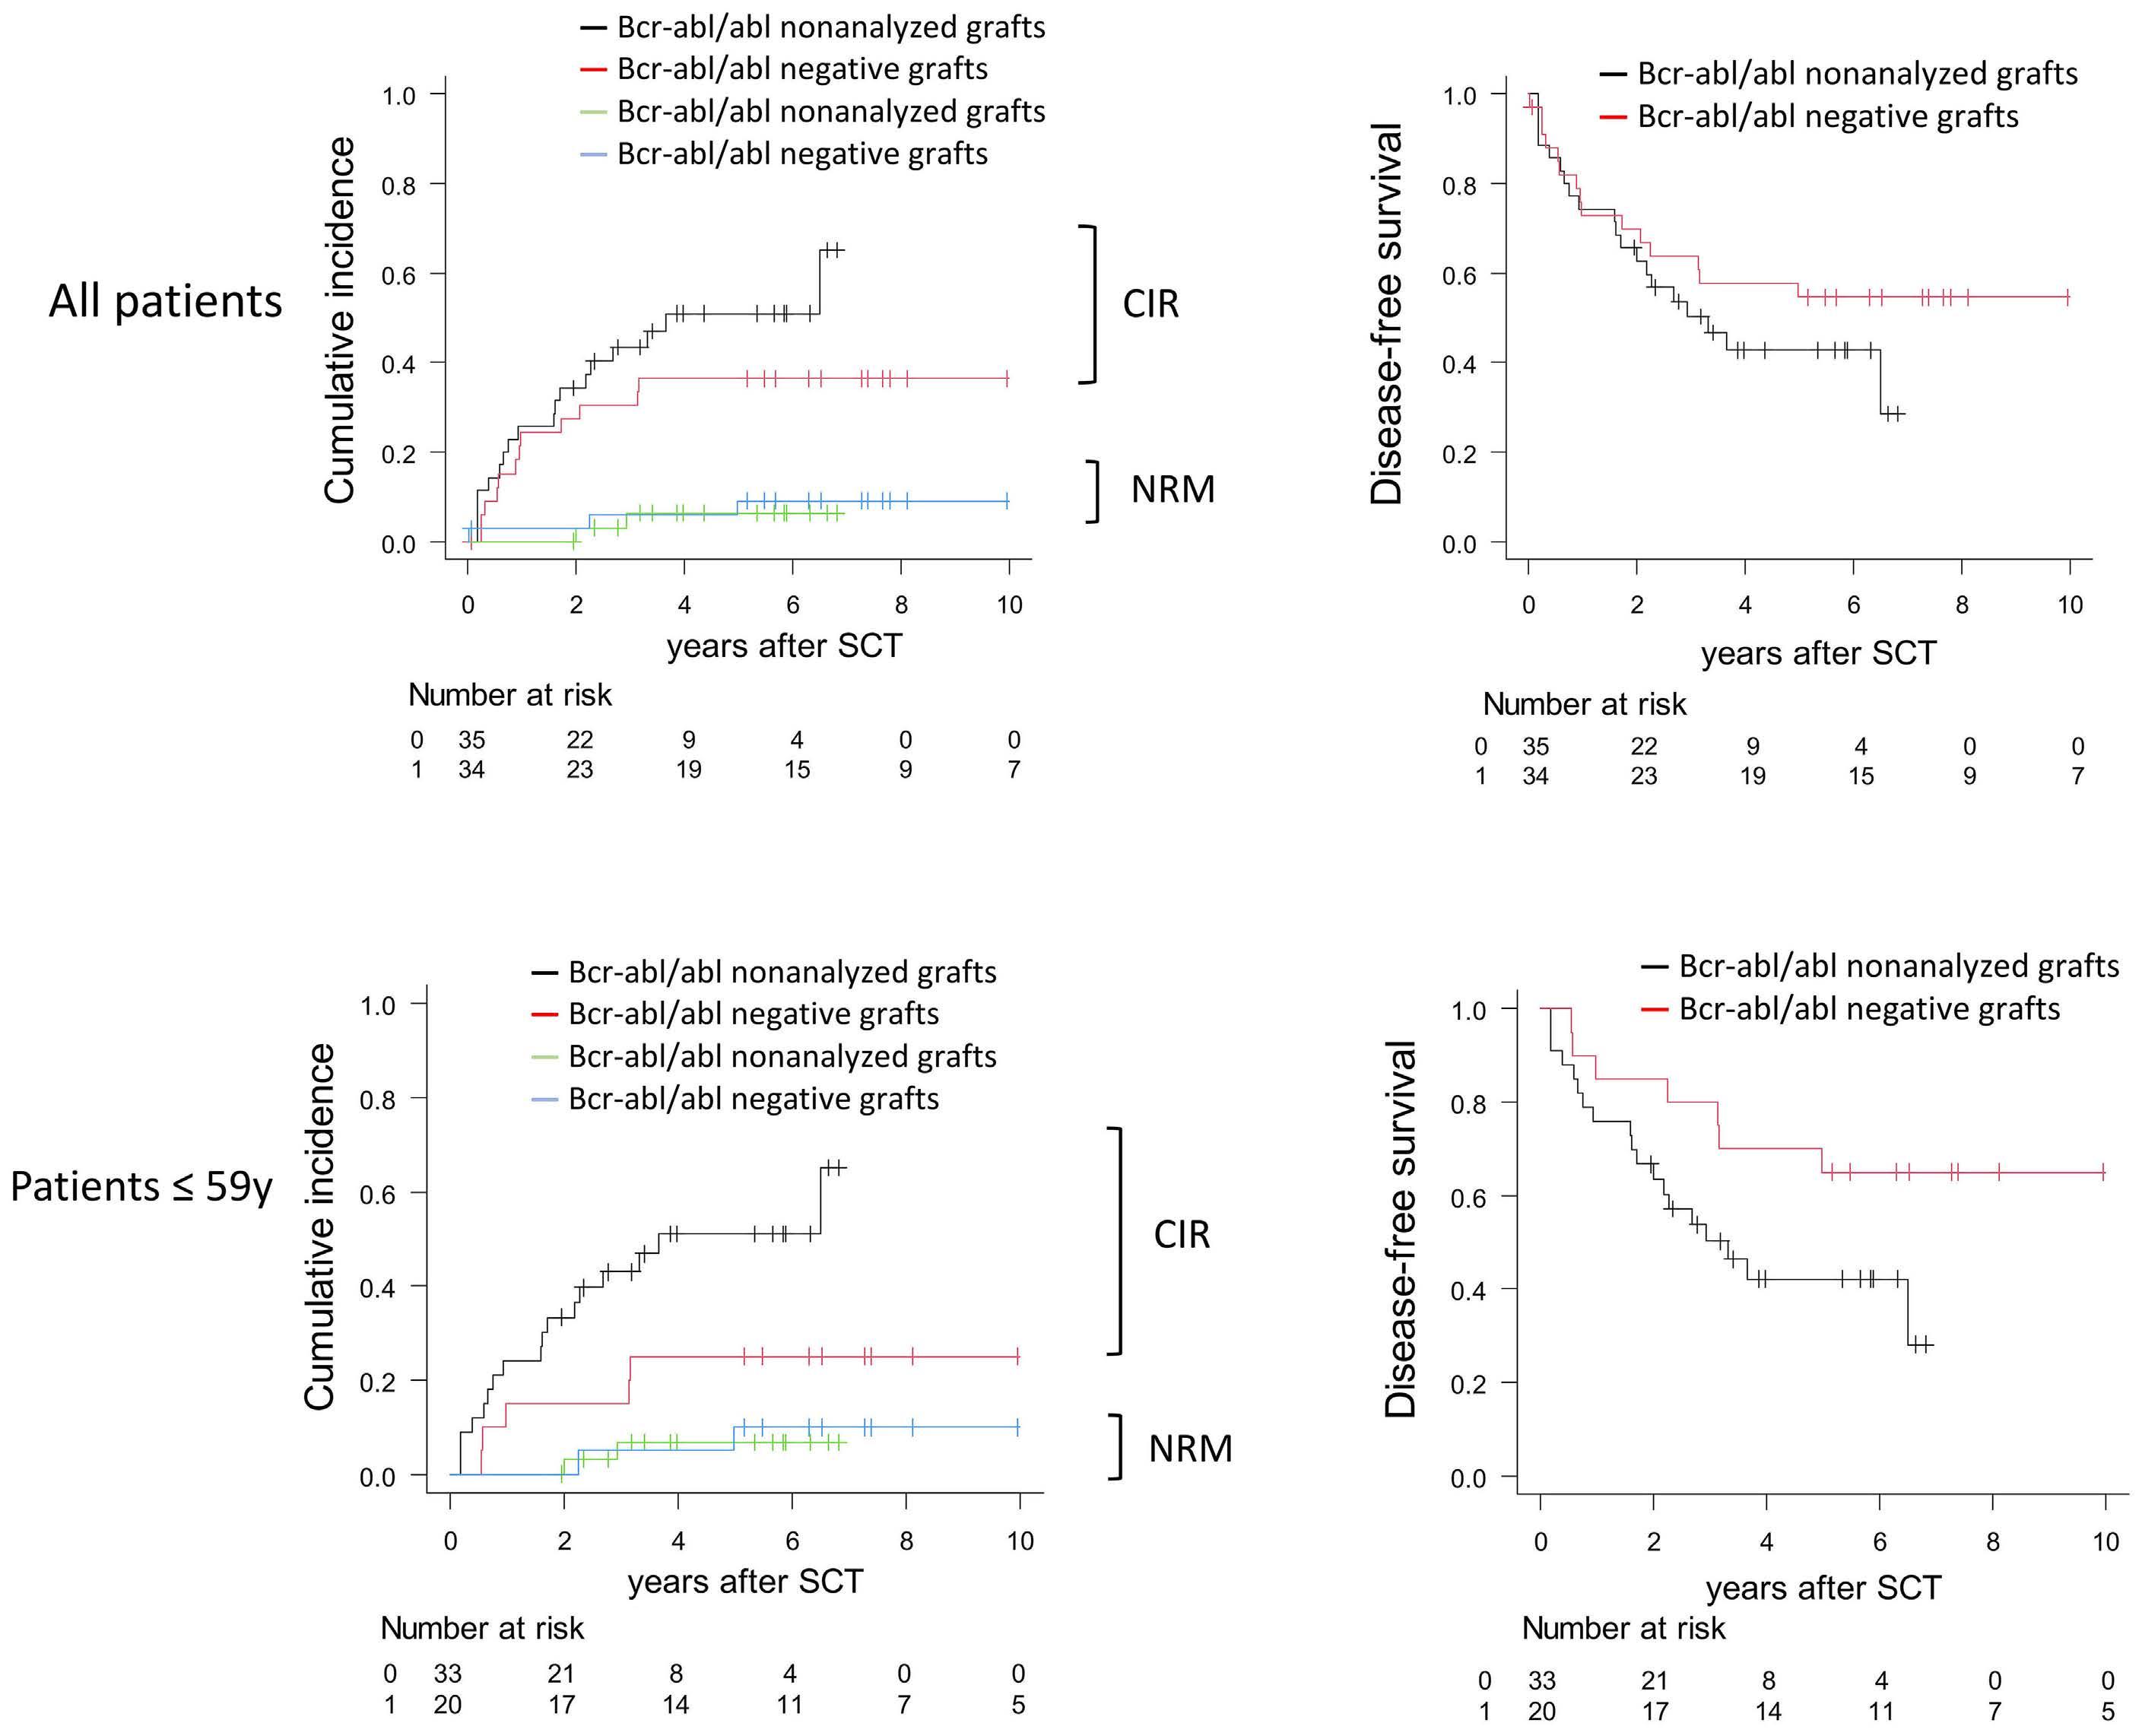
blood stem
not
BCR::ABL1-negative peripheral blood stem cells with a control group
for BCR::ABL1 contamination. Cumulative incidence of relapse (CIR) and of non-relapse mortality (NRM) were estimated in (A) the whole cohort as well as in (C) patients aged 59 years or less. Similarly, disease-free survival was estimated in (B) the whole cohort as well as in (D) patients aged 59 years or less. Failure time data, except for cumulative incidences, were estimated by the Kaplan-Meier method, then compared by the log-rank test, with 95% confidence intervals (CI) estimated by the Cox model. For CIR and non-relapse mortality (NRM), deaths in remission and relapses were respectively taken into account as competing risks, using the cumulative incidence curves, then compared by the Gray test while the Fine and Gray model was used to estimate sub-distribution hazard ratio. y: years.
correlated with DFS.12
In conclusion, our study indicates that the absence of MRD contamination in autologous PBSC correlates with a better outcome after auto-SCT in Ph + ALL. This reinforces the need to mobilize patients in the situation of profound molecular remission. In case of contaminated PBSC, the option to remobilize patients if deeper molecular response can be reached may be envisaged. Although no transplant is an emerging option in the era of targeted immunotherapies for B-cell precursor ALL, auto- or allo-SCT may be considered in second or further remission, particularly in case of CD19 loss of expression.
Leo Caillot,1 Mathieu Leclerc,2 Emmanuel Jacques Raphaël Sleiman,1 Ivan Sloma,2 Orianne Wagner-Ballon,2 Alexis Claudel,2 Florence Beckerich,2 Rabah Redjoul,2 Christine Robin,2 Vincent Parinet,2 Cécile Pautas,2 Dehbia Menouche,2 Selwa Bouledroua,2 Ludovic Cabanne,2 Yakout Nait-Sidenas,2 Eric Gautier,3 Helene Rouard,3 Ingrid Lafon,1 Yves Chalandon,4 Nicolas Boissel,5 Denis Caillot1 and Sébastien Maury2 for the Group for Research on Adult Acute Lymphoblastic Leukemia (GRAALL)
1Hematology Department, CHU Francois Mitterrand, Dijon, France;
2AP-HP, UPEC University, Henri Mondor Hospital, Hematology Department, Créteil, France; 3Etablissement Français du Sang, Ile de France, UPEC University, Créteil, France ; 4Division of Hematology, Department of Medical Specialties, University Hospital and University of Geneva, Geneva, Switzerland and 5AP-HP, Paris Cité University, Unité d’Hématologie Adolescents et Jeunes Adultes, Hôpital Saint Louis, Paris, France
Correspondence:
S. MAURY - sebastien.maury@aphp.fr
https://doi.org/10.3324/haematol.2023.283742
Received: June 14, 2023
Accepted: November 20, 2023.
Early view: November 30, 2023.
©2024 Ferrata Storti Foundation
Published under a CC BY-NC license
1. Giebel S, Labopin M, Gorin NC, et al. Improving results of autologous stem cell transplantation for Philadelphia-positive acute lymphoblastic leukaemia in the era of tyrosine kinase inhibitors: a report from the Acute Leukaemia Working Party of the European Group for Blood and Marrow Transplantation. Eur J Cancer. 2014;50(2):411-417.
2. Wetzler M, Watson D, Stock W, et al. Autologous transplantation for Philadelphia chromosome-positive acute lymphoblastic leukemia achieves outcomes similar to allogeneic transplantation: results of CALGB Study 10001 (Alliance). Haematologica. 2014;99(1):111-115.
3. Chalandon Y, Thomas X, Hayette S, et al. Randomized study of reduced-intensity chemotherapy combined with imatinib in adults with Ph-positive acute lymphoblastic leukemia. Blood. 2015;125(24):3711-3719.
4 Giebel S, Labopin M, Potter M, et al. Comparable results of autologous and allogeneic haematopoietic stem cell transplantation for adults with Philadelphia-positive acute lymphoblastic leukaemia in first complete molecular remission: an analysis by the Acute Leukemia Working Party of the EBMT. Eur J Cancer. 2018;96:73-81.
5. Jabbour E, Short NJ, Jain N, et al. Hyper-CVAD and sequential blinatumomab for newly diagnosed Philadelphia chromosomenegative B-cell acute lymphocytic leukaemia: a single-arm, single-centre, phase 2 trial. Lancet Haematol. 2022;9(12):e878-e885.
6. Jabbour E, Short NJ, Jain N, et al. Ponatinib and blinatumomab for Philadelphia chromosome-positive acute lymphoblastic leukaemia: a US, single-centre, single-arm, phase 2 trial. Lancet
Disclosures
No conflicts of interest to disclose.
Contributions
LeC, ML, DC and SM conceived the study and interpreted data. SM performed statistical analyses and drafted the initial version of the manuscript. EJRS, IS and OWB performed molecular analyses and interpreted data. AC, LuC and YNSB collected and monitored clinical data. LeC, ML, DC, FB, RR, CR, VP, CP, SB, IL, DC and SM included patients. DM was responsible for apheresis. EC and HR were responsible for cell therapy unit. YC and NB provided data of the control cohort. All authors reviewed and approved the final version of the manuscript.
Data-sharing statement
Original data can be obtained by contacting the corresponding author.
Haematol. 2023;10(1):e24-e34.
7 Foà R, Bassan R, Vitale A, et al. Dasatinib-blinatumomab for Ph-positive acute lymphoblastic leukemia in adults. N Engl J Med. 2020;383(17):1613-1623.
8. Gabert J, Beillard E, van der Velden VHJ, et al. Standardization and quality control studies of “real-time” quantitative reverse transcriptase polymerase chain reaction of fusion gene transcripts for residual disease detection in leukemia - a Europe Against Cancer program. Leukemia. 2003;17(12):2318-2357.
9 Saygin C, Cannova J, Stock W, Muffly L. Measurable residual disease in acute lymphoblastic leukemia: methods and clinical context in adult patients. Haematologica. 2022;107(12):2783-2793.
10 Zaliova M, Fronkova E, Krejcikova K, et al. Quantification of fusion transcript reveals a subgroup with distinct biological properties and predicts relapse in BCR/ABL-positive ALL: implications for residual disease monitoring. Leukemia. 2009;23(5):944-951.
11. Cazzaniga G, De Lorenzo P, Alten J, et al. Predictive value of minimal residual disease in Philadelphia-chromosome-positive acute lymphoblastic leukemia treated with imatinib in the European intergroup study of post-induction treatment of Philadelphia-chromosome-positive acute lymphoblastic leukemia, based on immunoglobulin/T-cell receptor and BCR/ ABL1 methodologies. Haematologica. 2018;103(1):107-115.
12. Mannis GN, Martin TG, Damon LE, et al. Quantification of acute lymphoblastic leukemia clonotypes in leukapheresed peripheral blood progenitor cells predicts relapse risk after autologous hematopoietic stem cell transplantation. Biol Blood Marrow Transplant. 2016;22(6):1030-1036.
Glofitamab monotherapy induces high complete response rates and manageable safety in Chinese patients with heavily pretreated relapsed or refractory diffuse large B-cell lymphoma
Current standard-of-care for relapsed or refractory (R/R) diffuse large B-cell lymphoma (DLBCL) comprises chemotherapy and autologous stem cell transplantation (ASCT).1 Patients who are ineligible for ASCT/who relapse shortly after ASCT have a poor prognosis.2
Chimeric antigen receptor (CAR) T-cell therapy has recently been approved for treatment of R/R DLBCL following ≥2 prior lines of therapy. However, CAR T-cell therapy may be complicated by severe toxicities and logistical challenges which can delay treatment initiation, and access may be restricted to specialist treatment centers. Furthermore, patients who fail CAR T-cell therapy have extremely limited treatment options and inferior outcomes.3,4 Tolerable treatments with increased efficacy and off-the-shelf availability are needed to improve outcomes for these patients.
Glofitamab is a CD20xCD3 bispecific antibody with a novel 2:1 format that engages and redirects T cells to eliminate B cells.5 As an off-the-shelf treatment, glofitamab can be initiated without delay. In pivotal cohorts of the global NP30179 phase I/II study (clinicaltrials gov. Identifier: NCT03075696), 155 patients with R/R DLBCL who had received ≥2 prior therapies were administered fixed-duration glofitamab monotherapy. Glofitamab demonstrated a manageable and well tolerated safety profile, with high response rates (objective response rate [ORR]: 52%; complete response [CR]: 39%) and durable CR.6 Only a small number of Asian patients were enrolled in the study (2 centers in Taiwan) and limited information is known about the impact of racial differences on the outcomes of patients with R/R DLBCL treated with glofitamab. We report data from a multicenter, open-label, phase I study (clinicaltrials gov. Identifier: NCT04657302), where pharmacokinetics (PK), efficacy, and safety of glofitamab were investigated in Chinese patients with R/R DLBCL after ≥2 prior lines of therapy including ≥1 anti-CD20 antibody-containing and ≥1 anthracycline-containing regimen. The study was conducted in accordance with the principles of the Declaration of Helsinki, International Conference on Harmonization Guidelines for Good Clinical Practice, and applicable laws. The protocol was approved by the Institutional Review Board and/or the Independent Ethics Committee, and written informed consent was provided by all patients. Patients aged ≥18 years with histologically confirmed DLBCL-not otherwise specified (NOS), high-grade B-cell lymphoma (HGBCL), primary mediastinal large B-cell
lymphoma (PMBCL), or transformed follicular lymphoma (trFL) were included. Patients received obinutuzumab pretreatment (1,000 mg) on cycle (C) 1 day (D) 1, followed by step-up dosing of intravenous glofitamab during C1 (2.5 mg D8, 10 mg D15), then the target dose (30 mg) on D1 of C2–12 (21-day cycles) for up to 12 cycles or until disease progression (PD) or unacceptable toxicity. Premedication with corticosteroids before each infusion of obinutuzumab and glofitamab was mandatory in C1 and
Table 1. Demographic and baseline clinical characteristics (safety population).
ECOG
Ann
NHL subtype, N (%)
Diffuse large B-cell lymphoma NOS
Bulky disease at study entry, N (%)
Prior
Prior
Prior autologous stem cell transplant , N (%)
Relapsed/refractory status, N (%)
Refractory to any prior therapy
Refractory to last prior therapy
Refractory to first-line therapy
Refractory to prior CAR T-cell therapy
CAR: chimeric antigen receptor; ECOG: Eastern Cooperative Oncology Group; NHL: non-Hodgkin lymphoma; NOS: not otherwise specified.
C2 but optional thereafter in patients not considered high risk for cytokine release syndrome (CRS).
Efficacy endpoints included response, duration of response (DOR), progression-free survival (PFS), and overall survival (OS).
Response was assessed by an Independent Review Committee (IRC) and by investigators according to Lugano 2014 criteria.7
The safety analysis included patients who received ≥1 dose of glofitamab or obinutuzumab; the efficacy analysis included all patients who received ≥1 glofitamab dose.
As of December 2, 2022, 30 patients (12 in the PK cohort; 18 in the expansion cohort) were enrolled at five sites across
China (27 received ≥1 glofitamab dose; 3 patients received obinutuzumab pretreatment alone and discontinued). At data cutoff, 12 patients had completed treatment and 18 had discontinued (discontinuations due to: PD, N=9; patient withdrawal, N=4; physician’s decision, N=2; adverse events [AE], N=2; other, N=1).
Median age was 57.5 years (range, 20-82). Two-thirds of patients had DLBCL-NOS (Table 1). All patients had an Eastern Cooperative Oncology Group performance status (ECOG PS) of 0/1 and most had advanced disease (Ann Arbor stage III–IV: 90.0%). Median number of prior thera-
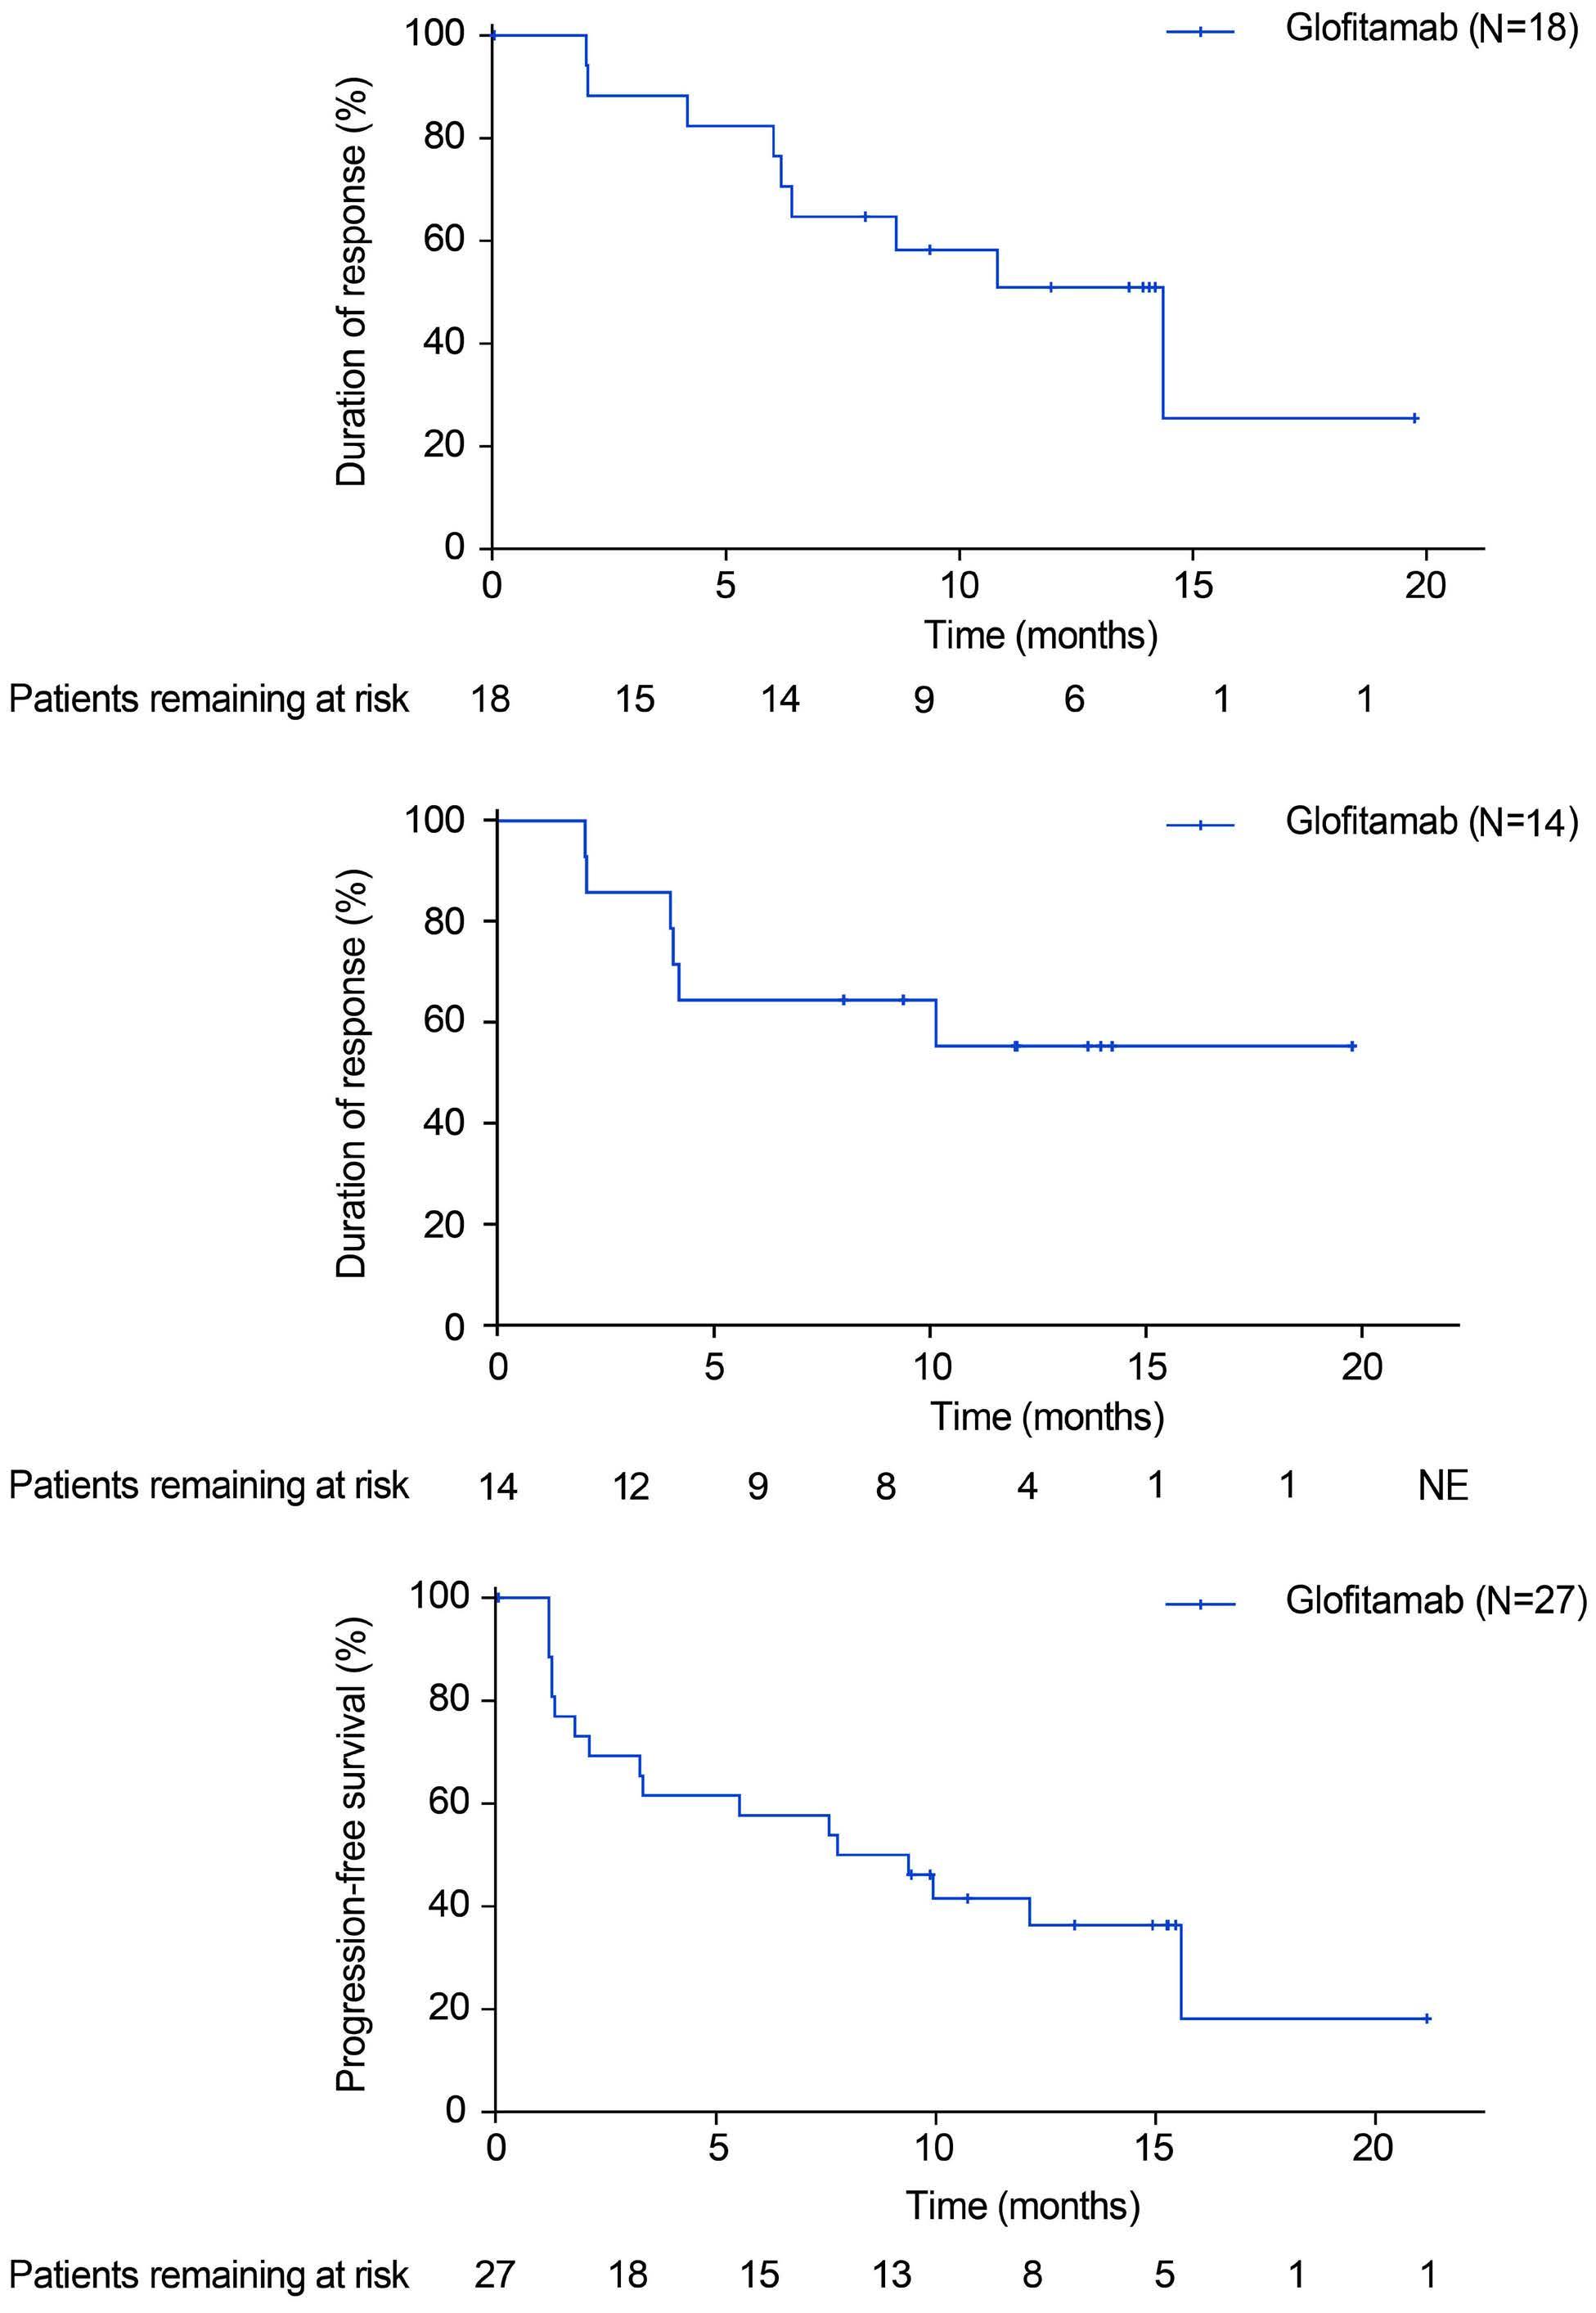
pies was 2 (range, 2-6); 43.3% of patients had received ≥3 prior lines. Two-thirds of patients were refractory to first-line treatment, 90.0% were refractory to their most recent regimen, and 20.0% had received CAR T-cell therapy (13.3% of enrolled patients were refractory to CAR T-cell therapy; Table 1). Median duration of glofitamab treatment was 7.2 months (range, 0.3-8.8); median number of cycles received was 11 (range, 1-12).
Serum concentrations of glofitamab increased in an approximately dose-proportional manner ( Online Supplementary Figure S1). The PK profile of glofitamab appeared bi-phasic with an apparent half-life of 5 days. Mean maximum concentration (coefficient of variation %) following dosing on C2D1 was 10.5 µ g/mL (28.9%). No post-dose anti-glofitamab antibodies were identified in the PK cohort (0/11 evaluable patients).
After a median follow-up of 15 months (range, 0-23), CR rate and ORR (as best response) by IRC were 51.9% (95% confidence interval [CI]: 32.0-71.3; 14/27 patients) and 66.7% (95% CI: 46.0-83.5; 18/27), respectively. Anti-tumor activity was observed in most patients, with similar activity seen in different DLBCL subtypes and in patients with/without prior CAR T-cell therapy (Online Supplementary Figure S2).
Median time to CR was 43 days (95% CI: 40.0-104.0). Median DOR was 14.4 months (95% CI: 6.2-not reached [NR]) and median duration of CR was NR (Figure 1A, B, respectively). A total of 57.1% of CR (8/14 patients) and 50.0% of objective responses (9/18) were ongoing at data cutoff. By DLBCL subtype, IRC-assessed CR rate and ORR, respectively, were: DLBCL-NOS, 52.9% (9/17 patients) and 58.8% (10/17); PMBCL, 40.0% (2/5) and 80.0% (4/5); HGBCL, both 66.7% (2/3); trFL, 50.0% (1/2) and 100.0% (2/2). IRC-assessed CR rate and ORR were 50.0% (2/4 patients) in patients refractory to prior CAR T-cell therapy, and 100.0% (2/2) in those who relapsed after prior CAR T-cell therapy. IRC-assessed median PFS was 8.6 months (95% CI: 3.3-15.6) (Figure 1C). IRC-assessed 12- and 15-month PFS rates were 41.5% (95% CI: 22.3-60.8) and 36.3% (95% CI: 17.0-55.7), respectively. Median OS was NR (95% CI: 9.5-NR). The estimated 15-month OS rate was 61.3% (95% CI: 42.5-80.1).
The most common AE were CRS (63.3%), anemia (56.7%), and decreased white blood cell count (53.3%) (Online Supplementary Table S1). The most frequent grade 3/4 AE (76.7% overall) was neutropenia (30.0%). Serious AE occurred in 43.3% of patients; there were no grade 5 AE (Table 2). AE leading to treatment discontinuation were reported in two patients (6.7%): acute myocardial infarction in one patient, and anemia, pancreatitis, CRS, and peritonitis in the other. CRS events were predominantly low grade per ASTCT criteria (any grade: 63.3%; grade 1: 56.7%; grade 2: 3.3%; grade 3: 3.3%) and all resolved. CRS events primarily occurred during C1; no grade ≥2 CRS events occurred after C2. Following the first dose of glofitamab, CRS events were reported in 13 of 27 (48.1%) patients. Median time to CRS onset after the start of the first glofitamab infusion was 18.3 hours (range,
9.3-35.9) and median duration of CRS was 14.3 hours (range, 0.0-456.0). Following the second dose of glofitamab, CRS events were reported in 11 of 27 (40.7%) patients. Median time to CRS onset after the start of the second glofitamab infusion was 23.8 hours (range, 12.9-36.1) and median duration of CRS was 15.6 hours (range, 1.4-623.6). CRS man-
Adverse events, N (%)
Any AE
Most common AE (occurring in ≥20% of patients)
CRS
Anemia
Decreased white blood cell count
Neutropenia
Thrombocytopenia
Hypoalbuminemia
Pyrexia
Increased ALT
Decreased lymphocyte count
Increased AST
Increased C-reactive protein Hypertriglyceridemia
Hypocalcemia Cytokine
Infusion-related
Decreased lymphocyte count
N=30
30 (100.0)
AE: adverse event; ALT: alanine aminotransferase; AST: aspartate aminotransferase; ASTCT: American Society for Transplantation and Cellular Therapy; CRS: cytokine release syndrome.
agement included tocilizumab (8/19 [42.1%] patients with CRS), corticosteroids (31.6%), single pressors (5.3%), lowflow oxygen (5.3%), and high-flow oxygen (5.3%); intensive care unit admission or multiple pressors were not used. One (3.3%) patient experienced a CRS event that led to glofitamab discontinuation.
Neurologic AE occurred in 26.7% (8/30) of patients (grade 1: 16.7%; grade 2: 6.7%; grade 3: 3.3%) and were most commonly Herpes zoster infection (13.3%), headache (6.7%), and post-herpetic neuralgia (6.7%). Neurologic AE potentially consistent with immune effector cell-associated neurotoxicity syndrome (ICANS) were not reported.
Infections were observed in 43.3% of patients (18 events), the most frequent being Herpes zoster (13.3%). Three serious infections were reported: grade 3 infection in one patient concurrent with grade 1 CRS but with no clear infectious focus (the event resolved after treatment with antibiotics), and two cases of Herpes zoster (grades 2 and 3; 1 unresolved and 1 resolved at data cutoff).
Ten patients had hepatitis B virus (HBV) infection that resolved before enrollment (defined as hepatitis B surface antigen-negative and hepatitis B core antibody positive, at baseline). Two patients received prophylactic nucleos(t) ide analogs. One patient, who did not receive prophylaxis, developed HBV reactivation (grade 2, non-serious) on D197. This resolved on D204 after treatment with entecavir. No patients developed HBV-related hepatitis. Glofitamab should not be administered to patients with an active infection; anti-infective prophylaxis and treatment for viral, fungal, bacterial, or pneumocystis infections are permitted and should be administered per institutional practice or investigator preference on the basis of individual patient risk factors. Nine patients died due to PD; three died due to other reasons after PD (one cardiac arrest) and following initiation of a new anti-lymphoma treatment (one unknown; one sudden cardiac death) beyond the AE reporting period.
This analysis is limited by the small patient number. The PK profile of glofitamab in Chinese patients was similar to that reported in the NP30179 study.8 The CR rate was also comparable with that of the global population (CR 39%)6 and glofitamab had a manageable safety profile with no major differences versus the NP30179 study.6 Low rates of HBV reactivation in patients with prior HBV infection, and those considered at risk of developing HBV reactivation, were reassuring.
Yu-Qin Song,1 Hui-Lai Zhang,2 Hui-Qiang Huang,3 Qing-Yuan Zhang,4 Hong-Mei Jing,5 Chao Wang,6 Chun Wu,6 Dong-Hang Li,6 Yu Dai,7 Kathryn Humphrey8 and Jun Zhu1
1Key Laboratory of Carcinogenesis and Translational Research (Ministry of Education), Peking University Cancer Hospital & Institute,
Beijing, China; 2Tianjin Medical University Cancer Institute and Hospital, Tianjin, China; 3Sun Yat-sen University Cancer Center, Guangzhou, China; 4Harbin Medical University Cancer Hospital, Harbin, China; 5Peking University Third Hospital, Beijing, China; 6Roche (China) Holding Ltd., Shanghai, China; 7Roche R&D Center (China) Ltd., Shanghai, China and 8Roche Products Ltd., Welwyn Garden City, UK
Correspondence: J. ZHU - zhujun@csco.org.cn
https://doi.org/10.3324/haematol.2023.283802
Received: June 21, 2023.
Accepted: October 9, 2023.
Early view: October 19, 2023.
©2024 Ferrata Storti Foundation
Published under a CC BY-NC license
Disclosures
CWa is an employee and holds stock in Roche. CWu is an employee and holds stock in Roche. D-HL is an employee of Roche. YD is an employee of Roche. KH is an employee and holds stock in Roche. All other authors have no conflicts of interest to disclose.
Contributions
Y-QS, CWa, CWu, D-HL, KH, and JZ were involved in conception and design of the study. Y-QS, H-LZ, H-QH, Q-YZ, HM-J, and JZ provided study materials or patients. Y-QS, H-LZ, H-QH, Q-YZ, HM-J, CWa, CWu, D-HL, YD, and JZ participated in collection and assembly of data. Y-QS, H-LZ, H-QH, Q-YZ, HM-J, CWa, CWu, D-HL, YD, KH, and JZ were involved in data analysis and interpretation. All authors were involved in manuscript writing and provided final approval for submission and publication. All authors are accountable for all aspects of the work.
Acknowledgments
Third party medical writing assistance, under the direction of all authors, was provided by Aisling Lynch, PhD, of Ashfield MedComms, an Inizio company, and was funded by F. Hoffmann-La Roche Ltd.
Funding
This study was funded by F. Hoffmann-La Roche Ltd.
Data-sharing statement
Qualified researchers may request access to individual patient-level data through the clinical study data request platform (https://vivli. org/). Further details on Roche’s criteria for eligible studies are available at https://vivli.org/members/ourmembers/. For further details on Roche’s Global Policy on the Sharing of Clinical Information and how to request access to related clinical study documents, see https://www.roche.com/research_and_development/ who_we_are_how_we_work/clinical_trials/our_commitment_to_ data_sharing.htm.
1. Gisselbrecht C, Glass B, Mounier N, et al. Salvage regimens with autologous transplantation for relapsed large B-cell lymphoma in the rituximab era. J Clin Oncol. 2010;28(27):4184-4190.
2. Crump M, Neelapu S, Farooq U, et al. Outcomes in refractory diffuse large B-cell lymphoma: results from the international SCHOLAR-1 study. Blood. 2017;130(16):1800-1808.
3. Brudno J, Kochenderfer J. Toxicities of chimeric antigen receptor T cells: recognition and management. Blood. 2016;127(26):3321-3330.
4 Tomas A, Fein J, Fried S, et al. Outcomes of first therapy after CD19-CAR-T treatment failure in large B-cell lymphoma. Leukemia. 2023;37(1):154-163.
5. Bacac M, Colombetti S, Herter S, et al. CD20-TCB with obinutuzumab pretreatment as next-generation treatment of
hematologic malignancies. Clin Cancer Res. 2018;24(19):4785-4797.
6. Dickinson M, Carlo-Stella C, Morschhauser F, et al. Glofitamab for relapsed or refractory diffuse large B-cell lymphoma. N Engl J Med. 2022;387(24):2220-2231.
7. Cheson B, Fisher R, Barrington S, et al. Recommendations for initial evaluation, staging, and response assessment of Hodgkin and non-Hodgkin lymphoma: the Lugano classification. J Clin Oncol. 2014;32(27):3059-3068.
8. Hutchings M, Morschhauser F, Iacoboni G, et al. Glofitamab, a novel, bivalent CD20-targeting T-cell-engaging bispecific antibody, induces durable complete remissions in relapsed or refractory B-cell lymphoma: a phase I trial. J Clin Oncol. 2021;39(18):1959-1970.
Low-dose azacitidine, pioglitazone and all-trans retinoic acid is safe in patients aged ≥60 years with acute myeloid leukemia refractory to standard induction chemotherapy (AMLSG 26-16/AML-ViVA): results of the safety
Patients with acute myeloid leukemia (AML) refractory to intensive induction therapy (primary induction failure) have an unfavorable outcome. In elderly patients not fit for further intensive salvage treatment due to age and comorbidities, effective treatment options are lacking.1,2 The median overall survival (mOS) ranges from 1.6 to 3.1 months for non-intensive/palliative treatment.3 In retrospective studies, response rates (complete remission [CR], CR with incomplete recovery of neutrophils or platelets [CRi]) for monotherapy with hypomethylating agents [HMA], i.e., 5-azacytidine [azacitidine] and 2-deoxy-5-azactidine [decitabine]) were low (up to 16%) in patients with relapsed/refractory (r/r) AML4 indicating the high unmet medical need. During the last years, we have developed a biomodulatory treatment for AML with low-dose azacitidine, all- trans retinoic acid (ATRA) and pioglitazone, a peroxisome proliferator-activated receptor (PPAR) g agonist with the aim to overcome treatment resistance, induce differentiation of leukemic blasts and reduce toxicity. Besides preclinical data, this approach was also supported by our clinical results on five chemorefractory AML patients, who developed CR associated with strong myeloid differentiation upon treatment with low-dose azacitidine, ATRA and pioglitazone.5
We here report the final analysis of the safety run-in part of the AMLSG 26-16/AML-ViVA trial (clinicaltrials gov. Identifier: NCT02942758; EudraCT number 2016‐000421‐39). The AMLSG 26-16/AML-ViVA trial is a multicenter, prospective, open-label, randomized phase II trial with dose-finding safety run-in phase in patients ≥60 years of age with AML refractory to at least one standard induction chemotherapy and not eligible for further intensive induction therapy based on medical reasons or not immediate candidates for allogeneic hematopoietic stem cell transplantation, respectively. Patients with acute promyelocytic leukemia (APL) were not eligible. All patients gave written informed consent in accordance with the Declaration of Helsinki. Approval was obtained from the ethics committees of all participating trial centers.
Between May 2017 and March 2020, ten patients were treated in the dose-finding safety run-in phase at five of 19 participating sites of the German-Austrian AML study group (AMLSG) in Germany in a modified dose de-escalation 3+3 design to evaluate the safety of the combination of azacitidine, ATRA, and pioglitazone. Patients were enrolled in
dose level 0 at an ATRA dose of 45 mg/m²/day from day 1 to day 28 and 15 mg/m² thereafter (per os) in combination with subcutaneously administered azacitidine (75 mg fixed dose from day 1 to day 7 per 28-day treatment cycle) and pioglitazone (45 mg/day, per os, continuously starting at
1. Baseline and disease characteristics of patients.
(mutations) at baseline, N (%) none*
NF1
*Analyzed in standard panel: MLLT3/MLL, CEBPA, PML/RARA, RUNX1, FLT3-ITD, FLT3-TKD, NPM1). AML: acute myeloid leukemia; ECOG: Eastern Cooperative Oncology Group; ELN: European LeukemiaNet.
day 1). Patients continued treatment as long as clinically appropriate, until AML progression or relapse. According to the study protocol, it was planned to proceed with a randomized (1:1 ratio) phase II part of the study to treat 76 patients with low-dose azacitidine, ATRA and pioglitazone or with standard-dose azacitidine. Due to a slow accrual rate, the study was prematurely terminated after completion of the safety run-in phase. All ten patients received at least one dose of the study treatment and are thus part of the safety population. Baseline clinical and disease characteristics are summarized in Table 1. Among the patient cohort, the median age was 67 years (range, 60-76 years), and 70% of patients had an Eastern Cooperative Oncology Group (ECOG) performance status of 1. Six patients had de novo AML, two patients had secondary AML, and another two patients had therapy-related AML (t-AML). Nine patients had a complex karyotype. All patients suffered from AML categorized as adverse risk according to European LeukemiaNet (ELN) recommendations of 2017.1 Most patients exhibited severe cytopenia at baseline with a median neutrophil count of 0.2x10⁹/L (range, 0-2.7). Nine patients were analyzed for dose finding since one patient withdrew informed consent on day 9 of cycle 1.
After a median follow-up of 131 days, the mean treatment duration was 126 days (range, 27-426 days). Reported AE (grade 3 and 4) on a patient basis are listed in Online Supplementary Table S1 . Seven of 13 reported serious adverse events (SAE) were infections, followed by only one-time occurrences of anemia, pancytopenia, gastric or urinary tract hemorrhage, fever, and panic attack. Four SAE were reported with fatal outcome. Since infections are an expected risk for patients undergoing treatment of AML, these events were unremarkable from a safety monitoring perspective. All infection SAE were assessed unrelated to study medication and instead related to the underlying disease. No DLT were reported throughout the safety run-in phase and it was not necessary to de-escalate the dose of ATRA. Three AE were rated definitely related to study drug, N=2 for azacitidine (“injection site reaction” and “platelet count decreased”); N=1 for ATRA “hyperkeratosis”)]. Thirty-five AE were rated to be probably related to study drug. Overall, the safety profile was tolerable, and the observed toxicities were comparable in type and frequency to those described in other clinical trials with r/r AML patients.
OS as the primary objective of the phase II part was analyzed exploratory for the safety run-in population (Online Supplementary Figure S1). A total of seven patients died during treatment/follow-up. All deaths were either directly attributable to AML or attributable to SAE arising from the underlying AML. The mOS was 131 days, i.e., 4.3 months. All secondary endpoints were part of the randomized part of the trial, which was not performed. Patients received a median of two cycles of study treatment (range, 1-14)
Table 2. Treatment and best overall response.
Outcome
N=10
CR, N (%) 3 (30)
CRi, N (%)
HI-N, N (%)
PR, N (%)
SD, N (%)
PD, N (%)
NA
(20)
(10)
(40)
(38)
(10)* Treatment cycles, median (range)
Reason for discontinuation, N (%)
(1-14)
*Study treatment stopped on day 9 of cycle 1 due to patient’s wish. CR: complete remission; CRi: complete remission with incomplete hematologic recovery; HI-N: hematologic improvement of neutrophils; PR: partial remission; SD: stable disease; PD: progressive disease; NA: not analyzed; allo-HSCT: allogeneic hematopoietic stem cell transplantation.
(Table 2). Three patients achieved a CR, one patient a PR and four a SD (Table 2). CR occurred fast after one (2 patients) or two (1 patient) treatment cycles. Two patients underwent allogeneic hematopoietic stem cell transplantation after the second cycle of treatment.
Interestingly, morphologic review of bone marrow smears showed signs of differentiation of AML blasts in responding patients (Figure 1). Besides the patients developing CR or PR, hematologic improvement of neutrophils (HI-N) was observed in two additional patients. In line with this, one patient demonstrated resolution of fungal pneumonia during the study (Online Supplementary Figure S2). Primary induction failure still poses a major therapeutic challenge in AML. With the AMLSG 26-16/AML-ViVA trial we investigated a novel, low-intensity, biomodulatory regimen. Common grade 3/4 AE included hematologic cytopenias and infections. Since most patients were enrolled with severe baseline cytopenia, most likely due to refractory AML and high toxicity burden of previous induction therapy, many hematological AE were attributed to underlying disease or previous treatment. Piccini et al. recently reported in a retrospective study on venetoclax-based HMA combinations in r/r AML neutropenia grade ≥4 in 100%, febrile neutropenia in 45%, thrombocytopenia grade ≥4 in 95,7% and infections in 36% of patients. In this context, the AML-ViVA treatment seems to be less myelosuppressive.6 In our safety run-in population, we observed a median OS of 4.3 months. The overall response rate (ORR) was 40% (4/10) with three CR (30%) and one long-lasting PR in this elderly patient cohort consisting of exclusively ELN adverse risk AML. Among the three patients harboring mutations in TP53, two developed CR, one patient a PR. In general, in patients with r/r AML remissions are hardly achieved. A large international, retrospective study com-
prising 655 patients from 12 centers demonstrated a CR/ CRi-rate of 16% for azacitidine or decitabine monotherapy with a median OS from the time of initiation of HMA of 6.7 months (95% confidence interval [CI]: 6.1-7.3).4 Several retrospective studies and one prospective study on the use of venetoclax + HMA in r/r-AML described CR/CRi
rates of 12-55% with median OS from 3.4 to 10.7 months.6-8 These data suggest that the AML-ViVA treatment was at least not less effective than standard care in this elderly patient group, with the major limitation of a small patient cohort. In terms of HMA + ATRA combinations, decitabine + ATRA resulted in an improved ORR and survival compared
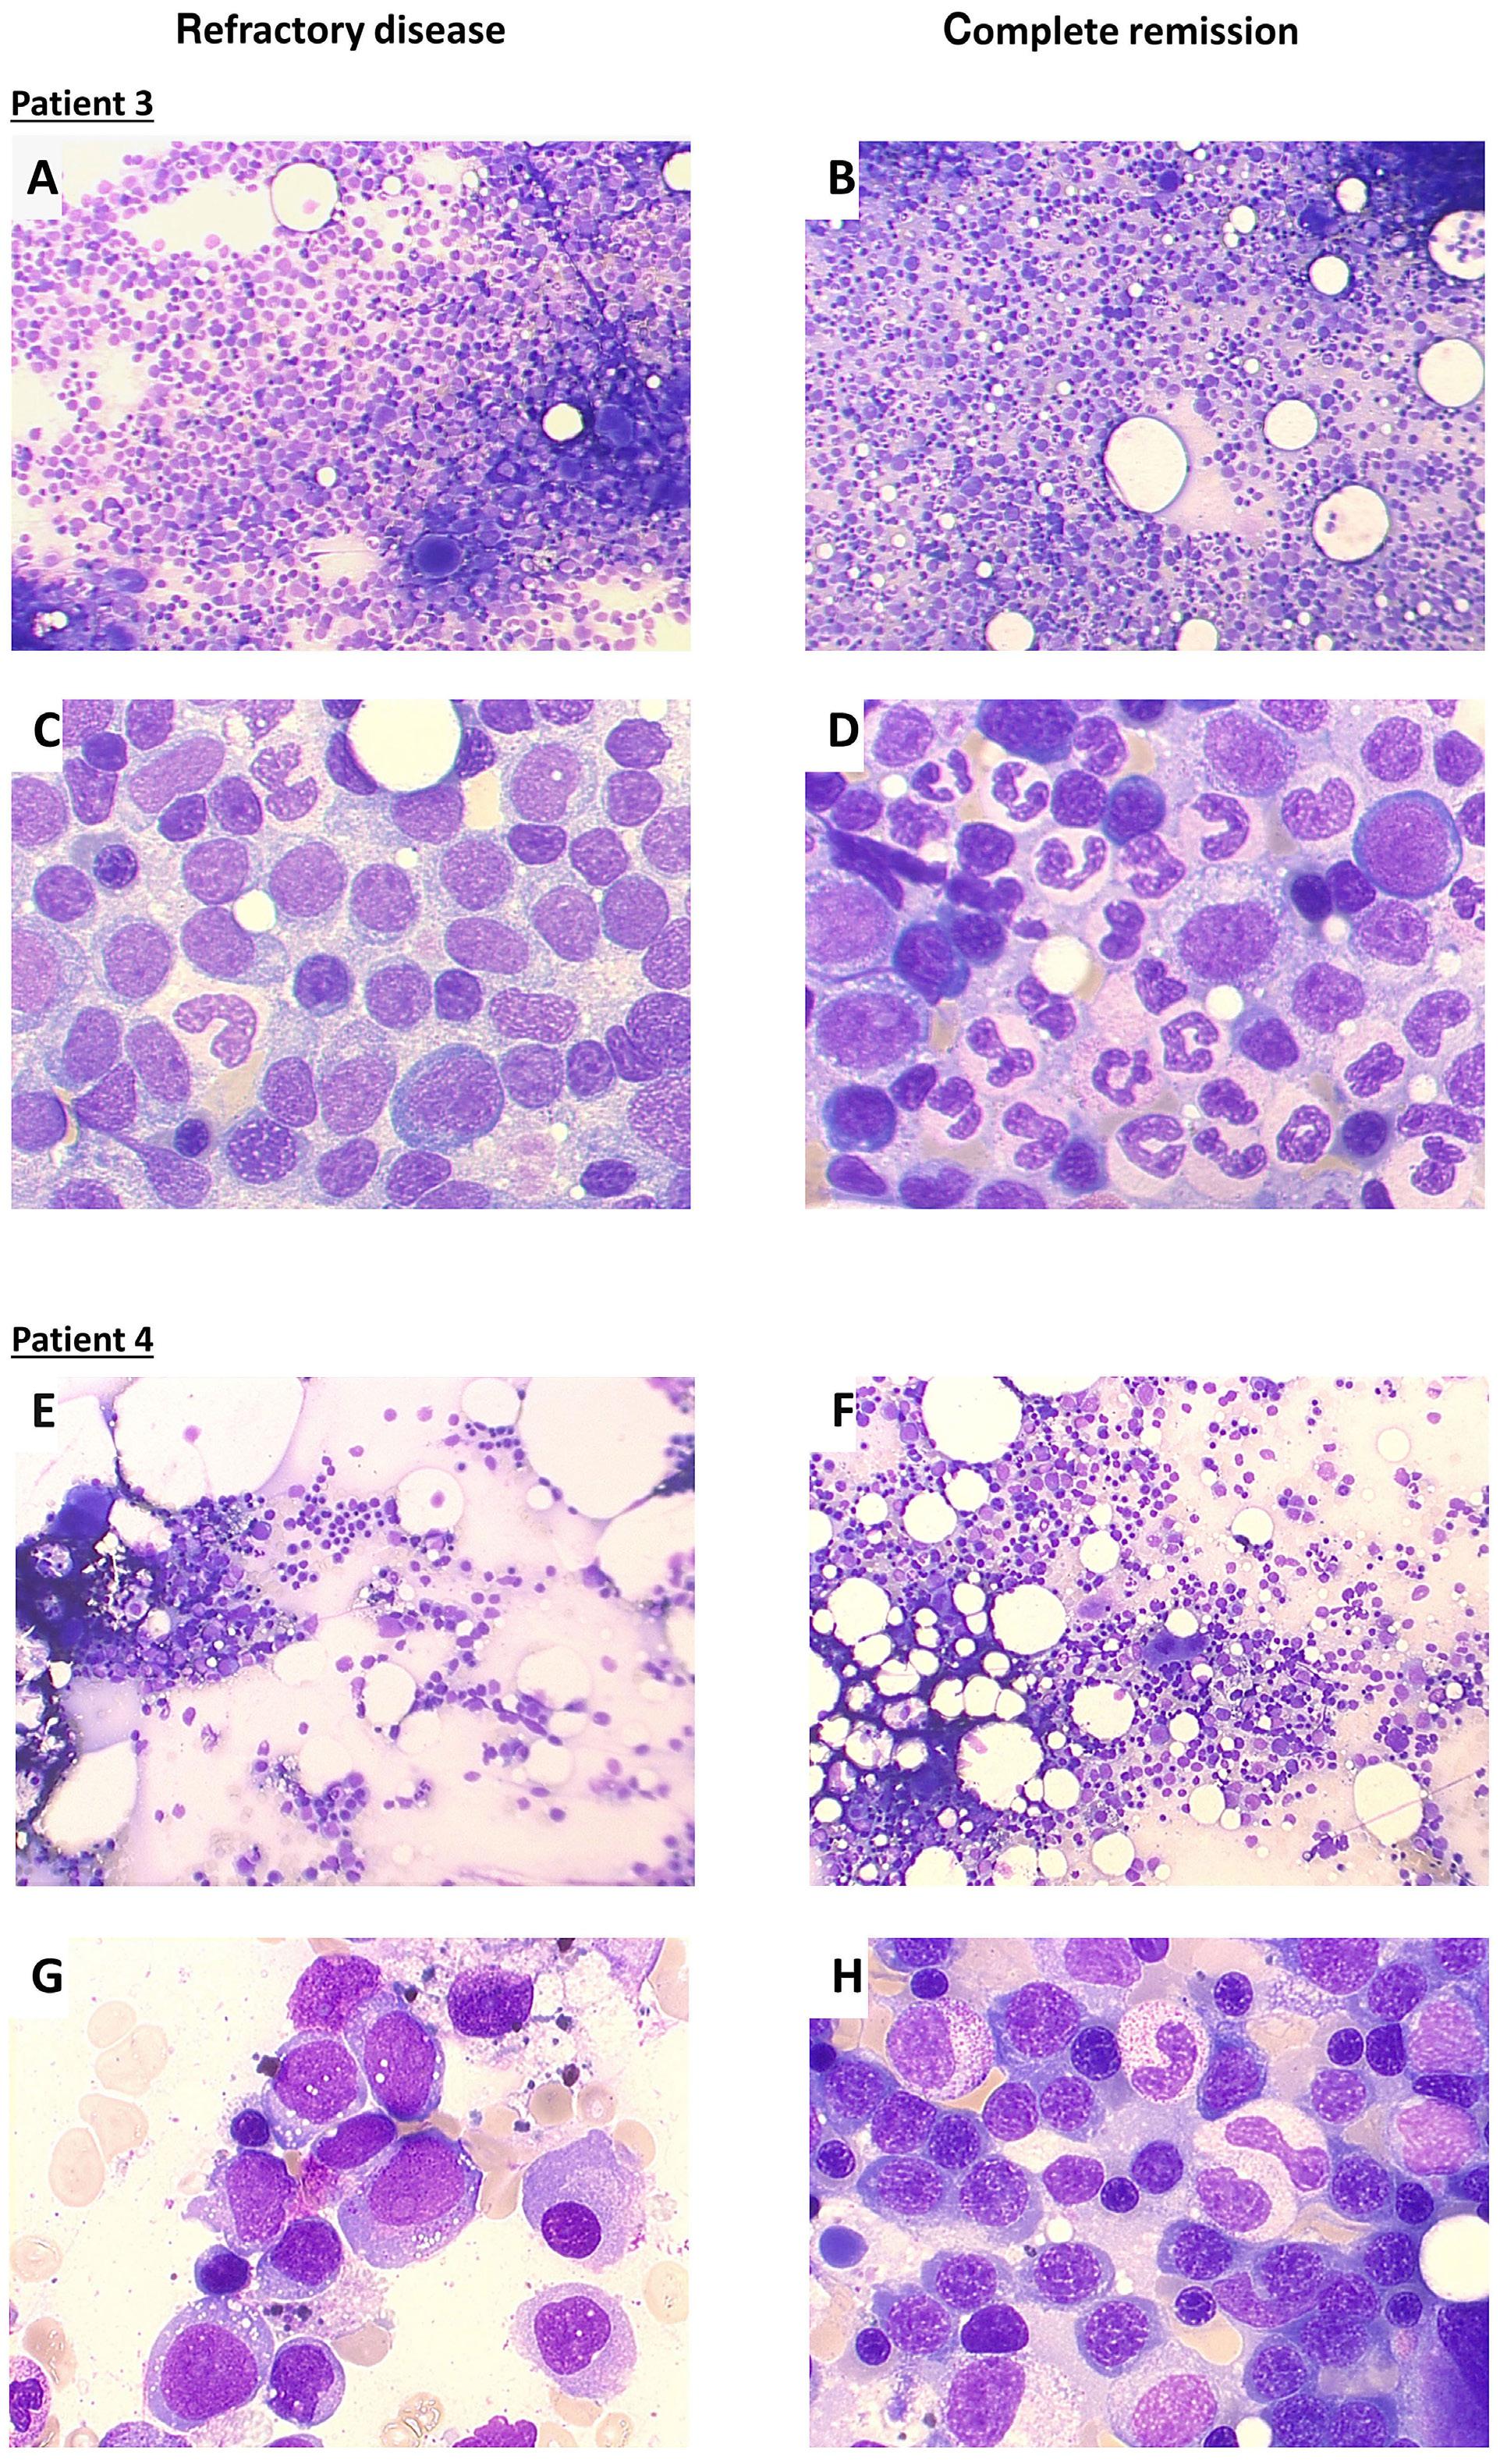
3
and
4 (E-H) were
by light microscopy after May-Grünwald and Giemsa staining at the time point of study enrollment (refractory disease after 1 cycle of cytarabine/daunorubicin therapy each) (A, C, E, G) and at the time point of complete response after the first cycle of study treatment (B, D, F, H); magnification 100x (A, B, E, F) and 630x oil immersion (C, D, G, H).
to decitabine alone highlighting the potential efficacy of HMA + ATRA combinations.9
Interestingly, CR in our phase I study were achieved early after only one or two cycles. Responding patients showed improvement/normalization of cell counts. This clinical observation has already been made in a previously treated patient series of five patients and two other cases of refractory high-risk AML.5,10,11 Thereby, we already showed that the early increase of neutrophils upon AML-ViVA treatment included a fraction of differentiated leukemic blasts still harboring leukemia-specific genetic alterations.5 In vitro studies on primary AML blasts confirmed the differentiation promoting ability of AML-ViVA treatment. AML blast derived neutrophils were functionally capable of reactive oxygen species production and phagocytosis.12 ATRA-induced differentiation has also been shown in another pilot trial using LSD1 inhibition combined with ATRA in r/r AML patients.13 As neutropenic infections represent a major cause of mortality in AML patients, differentiation-inducing therapies are highly relevant as they diminish leukemic blasts along with improving immunity. With the underlying molecular mechanism of action being still mostly unclear, further preclinical investigations are needed to enhance its clinical activity.
We acknowledge the small sample size of ten patients as a major limitation of our study. Also considering the great heterogeneity of r/r AML the extrapolation of clinical efficacy in a greater population has to be done with great caution requiring larger clinical trials. Still, the AML-ViVA treatment was well-tolerated and yielded encouraging results in an elderly, adverse-risk patient population.
Daniel Heudobler,1,2 Florian Lüke,1,3 Joachim Hahn,1 Matthias Grube,1 Pavla Schlosser,1 Stephan Kremers,4 Thomas Südhoff,5 Jörg Westermann,6 Marie Luise Hütter-Krönke,6,7 Richard F. Schlenk,8,9 Daniela Weber,7 Peter Paschka,7 Florian Zeman,10 Hartmut Döhner,7 Wolfgang Herr,1 Albrecht Reichle1# and Simone Thomas1,11#
1University Hospital Regensburg, Department of Internal Medicine III, Hematology and Oncology, Regensburg; 2Bavarian Center for Cancer Research, University Hospital Regensburg, Regensburg; 3Division of Personalized Tumor Therapy, Fraunhofer Institute for Toxicology and Experimental Medicine, Regensburg; 4Caritaskrankenhaus Lebach, Department of Hematology/Oncology, Lebach; 5Klinikum Passau, Department Hematology and Oncology, Passau; 6Charité - University Medical Center Berlin - Department of Hematology, Oncology and Tumor Immunology, Campus VirchowKlinikum, Berlin; 7University Hospital Ulm, Department of Internal Medicine III, Ulm; 8National Center of Tumor Diseases Trial Center, German Cancer Research Center and Heidelberg University Hospital, Heidelberg; 9Heidelberg University Hospital, Department of Internal Medicine V, Heidelberg; 10Center for Clinical Studies,
University Hospital Regensburg, Regensburg and 11Leibniz Institute for Immunotherapy, Division of Genetic Immunotherapy, Regensburg, Germany
#AR and ST contributed equally as senior authors.
Correspondence:
D. HEUDOBLER - daniel.heudobler@ukr.de
https://doi.org/10.3324/haematol.2023.283864
Received: July 4, 2023.
Accepted: October 13, 2023.
Early view: October 26, 2023.
©2024 Ferrata Storti Foundation
Published under a CC BY-NC license
Disclosures
DH discloses consultancy for and/or advisory board membership of AbbVie, Bristol Myers Squibb, Celgene, Jazz; has received clinical research funding to Institution (Regensburg University Hospital) from Bristol Myers Squibb, Celgene and Janssen. PP discloses consultancy for and/or advisory board membership of AbbVie, Agios, Astellas, Astex, Bristol Myers Squibb, Celgene, Jazz, Novartis, Otsuka, Pfizer and Sunesis; has received honoraria for lectures from AbbVie, Agios, Astellas, Bristol Myers Squibb, Celgene, Jazz, Novartis and Pfizer; discloses other support from AbbVie, Amgen, Bristol Myers Squibb, Celgene, Janssen, Novartis and Takeda; has received travel or accommodation expenses from AbbVie, Amgen, Bristol-Meyers Squibb, Celgene, Janssen, Novartis and Takeda. HD discloses consultancy for and/or advisory board membership of AbbVie, Agios, Amgen, Astellas, AstraZeneca, Berlin-Chemie, Bristol Myers Squibb, Celgene, Daiichi Sankyo, Gilead, Janssen, Jazz, Novartis, Servier, Stemline and Syndax; has received clinical research funding to Institution (Ulm University Hospital) from AbbVie, Agios, Amgen, Astellas, Bristol Myers Squibb, Celgene, Jazz Pharmaceuticals, Kronos Bio, Novartis and Pfizer. ST discloses consultancy for and/or advisory board membership of Brystol Myers Squibb/Celgene, EUSA Pharma, Janssen, Gilead and Novartis; has received honoraria for lectures from Abbvie, Brystol Myers Squibb/ Celgene, Gilead and Novartis; has received research funding to Institution (University Hospital Regensburg) from Cegene, Gilead (Leibniz Institute for Immunotherapy); has received travel or accommodation expenses from Brystol Myers Squibb/Celgene, Jansssen, Gilead and Novartis. RFS received financial support for consulting from Daiichi Sankyo and Pfizer; for speakers’ bureau by Pfizer, Daiichi Sankyo and Novartis; discloses travel expenses by Daiichi Sankyo; has received research funding from PharmaMar, AstraZeneca, Pfizer, Daiichi Sankyo, Roche and Recordati. All other authors have no conflicts of interest to dislose.
ST, AR, RFS, and HD developed the concept and design of the study and provided administrative support. ST and PS performed trial setup. DH, FL, JH, PS, MG, SK, TS, JW, JH, MHK, PP, HD, WH,
ST and AR treated the patients and collected the epidemiological and clinical data. DH, DW, FZ, ST and AR analyzed the data. DH, ST, and AR drafted the manuscript. All authors critically revised the final manuscript and are accountable for all aspects of the work in ensuring that questions related to the accuracy or integrity of any part of the work are appropriately investigated and resolved.
We thank the patients, their families and caregivers for
1. Döhner H, Estey E, Grimwade D, et al. Diagnosis and management of AML in adults: 2017 ELN recommendations from an international expert panel. Blood. 2017;129(4):424-447.
2. Thol F, Schlenk RF, Heuser M, Ganser A. How I treat refractory and early relapsed acute myeloid leukemia. Blood. 2015;126(3):319-327.
3. Wattad M, Weber D, Döhner K, et al. Impact of salvage regimens on response and overall survival in acute myeloid leukemia with induction failure. Leukemia. 2017;31(6):1306-1313.
4 Stahl M, DeVeaux M, Montesinos P, et al. Hypomethylating agents in relapsed and refractory AML: outcomes and their predictors in a large international patient cohort. Blood Adv. 2018;2(8):923-932.
5. Thomas S, Schelker R, Klobuch S, et al. Biomodulatory therapy induces complete molecular remission in chemorefractory acute myeloid leukemia. Haematologica. 2015;100(1):e4-6.
6. Piccini M, Pilerci S, Merlini M, et al. Venetoclax-based regimens for relapsed/refractory acute myeloid leukemia in a real-life setting: a retrospective single-center experience. J Clin Med. 2021;10(8)1684.
7 Labrador J, Saiz-Rodríguez M, Miguel D de, et al. Use of venetoclax in patients with relapsed or refractory acute myeloid leukemia: the PETHEMA registry experience. Cancers (Basel). 2022;14(7):1734.
8. DiNardo CD, Maiti A, Rausch CR, et al. 10-day decitabine with
participating in this trial as well as all investigators and site personnel.
This work was supported by Celgene and the Anticancer Fund.
The data supporting the conclusions of this article will be made available by the authors upon reasonable request.
venetoclax for newly diagnosed intensive chemotherapy ineligible, and relapsed or refractory acute myeloid leukaemia: a single-centre, phase 2 trial. Lancet Haematol. 2020;7(10):e724-e736.
9. Lübbert M, Grishina O, Schmoor C, et al. Valproate and retinoic acid in combination with decitabine in elderly nonfit patients with acute myeloid leukemia: results of a multicenter, randomized, 2 × 2, phase II trial. J Clin Oncol. 2020;38(3):257-270.
10 Heudobler D, Klobuch S, Thomas S, Hahn J, Herr W, Reichle A. Cutaneous leukemic infiltrates successfully treated with biomodulatory therapy in a rare case of therapy-related high risk MDS/AML. Front Pharmacol. 2018;9:1279.
11. Kattner A-S, Holler E, Herr W, Reichle A, Wolff D, Heudobler D. Successful treatment of early relapsed high-risk AML after allogeneic hematopoietic stem cell transplantation with biomodulatory therapy. Front Oncol. 2020;10:443.
12. Klobuch S, Steinberg T, Bruni E, et al. Biomodulatory treatment with azacitidine, all-trans retinoic acid and pioglitazone induces differentiation of primary AML blasts into neutrophil like cells capable of ROS production and phagocytosis. Front Pharmacol. 2018;9:1380.
13. Wass M, Göllner S, Besenbeck B, et al. A proof of concept phase I/II pilot trial of LSD1 inhibition by tranylcypromine combined with ATRA in refractory/relapsed AML patients not eligible for intensive therapy. Leukemia. 2021;35(3):701-711.
Multiple myeloma (MM) is a hematologic neoplasia that typically affects elderly patients. During the last decades, its prognosis has greatly improved. Nevertheless, older adults have multiple comorbidities, making therapy endurance a continuous challenge.1 In order to personalize therapy, it has been suggested to objectively assess patients’ overall fitness. Comorbidity/frailty scores (comorbidity indices [CI]) have shown prognostic precision to define “fit” versus “frail” patients.2-4 They may also prove advantageous to adjust patient-specific regimens and reduce therapy-induced side effects.5,6 There are several CI in clinical use, for example the International Myeloma Working Group (IMWG) frailty index or Revised Myeloma Comorbidity Index (R-MCI) apart from others (Online Supplementary Table S1).7,8 For the R-MCI, patients can be divided in two or three risk groups (“fit” vs. “frail” or “fit”, “intermediate-fit” vs. “frail”) which
reveal significantly different overall survival (OS), progression-free survival (PFS) and therapy endurance.5,8,9 Since no CI is broadly established,10 their selection may include the practicability for everyday use, and their applicability for retrospective and prospective data, assuring reproducibility and comparability if used from post hoc analyses.1,11 Here we evaluated, how the four CI R-MCI,8 IMWG frailty index,7 “Charlson Comorbidity Index” (CCI)12 and Mayo risk score13 perform, if determined from retrospective data (N=726 patients, test analysis) as compared to their prospective assessment (N=354 patients, validation analysis; Table 1; Figure 1). In addition, five internationally well-discussed CI, namely R-MCI,8 IMWG frailty index,7 CCI,12 Mayo risk score13 and Myeloma Research Alliance Risk Profile (MRP) score14 were compared in terms of OS and PFS prediction in fit versus frail risk groups. This comparison was done in a pro-
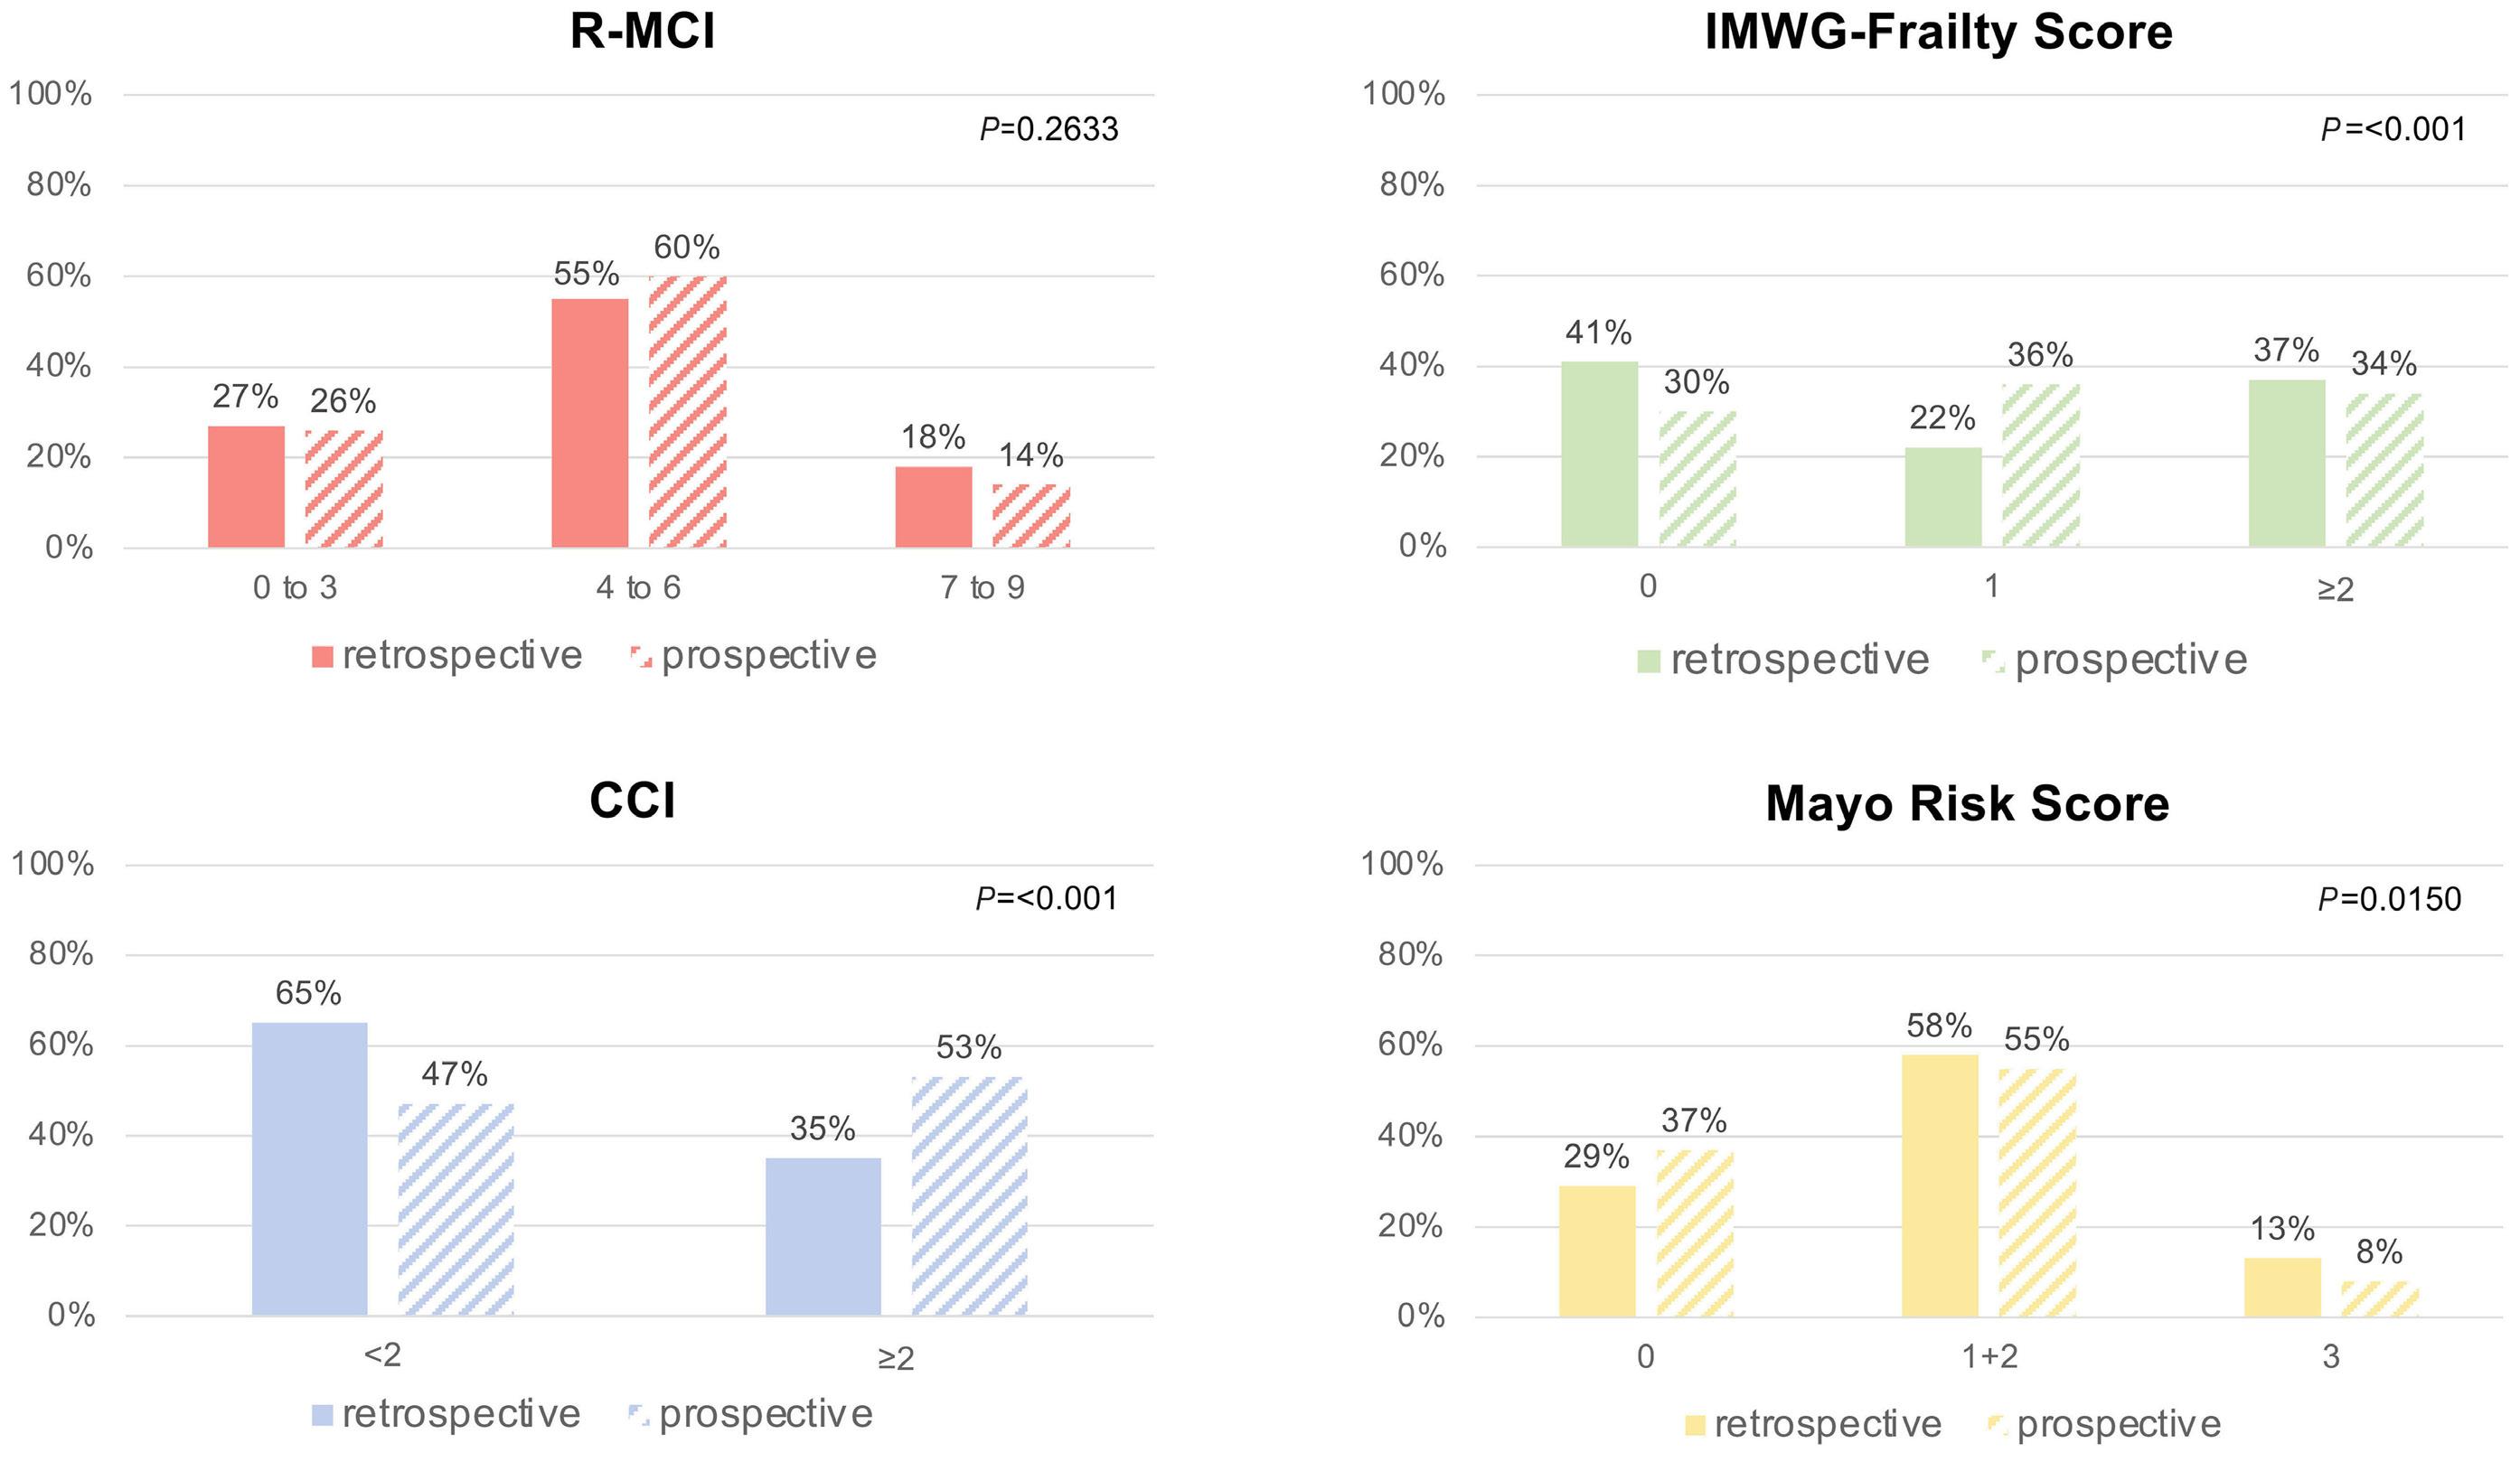
spective cohort of 354 newly diagnosed (ND) MM patients treated at our university medical center (UKF) to determine each score’s differentiation of fit versus frail patients and of notable differences (Figure 2; Online Supplementary Table S2). The patients were included only once in each analysis. As summarized in Table 1, 1,080 NDMM patients treated at the UKF were assessed for the comparison of a retrospective and prospective cohort, with focus on patient characteristics and CI risk group distribution. Differences in risk group distribution within both cohorts were analyzed via χ2 tests.
The MRP score had to be excluded from the retrospective assessment due to missing laboratory data (CRP; Figure 1).
For the prospective analysis, we performed a detailed geriatric assessment in 354 patients, assessing all five CI.5 Patients were divided into three different risk groups “fit”, “intermediate-fit” and “frail”, except for the CCI, which incorporates two groups only (Online Supplementary Table S1). OS and PFS for the five CI and age groups were estimated by Kaplan-Meier method and compared via log-rank test in the prospective cohort (Figure 2; Online Supplementary Figures S1 and S2).
Both retrospective and prospective cohorts were well compa-
rable in terms of patient- and myeloma-specific data (Table 1). The median age in both cohorts was typical for tertiary centers. Patients >70 years were fairly numerous (~1/3) in both cohorts. Concerning myeloma-specific characteristics, both cohorts were comparable, most with advanced International Staging System (ISS II+III) at time of the initial diagnosis (71% and 59%, respectively). Both retrospective and prospective cohorts showed similar organ impairments, like renal function impairment (estimated glomerular filtration rate [eGFR] <60 mg/mL/1.73m2) in 30% and 36%, lung impairment in 25% and 12% and Karnofsky performance status (KPS) decline <70% in 59% and 46%, respectively (Table 1). Induction in both cohorts was predominantly bortezomib-alkylator-dexamethasone-based (VCD).5,8,9
Of note, comparing the retrospective and prospective results of different CI via χ2 test, the R-MCI was the only CI that did not show significant differences in risk group distribution between retrospective and prospective cohorts, whereas for the IMWG frailty index (P<0.001), CCI (P<0.001) and Mayo risk score (P=0.0150), significant differences were apparent (Figure 1A; Online Supplementary Table S2). Respective results for the IMWG frailty index (Figure 1B) and CCI (Figure
Retrospective
MM details
Type of MM IgG/IgA/IgM/LC-only/biclonal/non-secretory κ/λ/biclonal/non-secretory AL-amyloidosis
ISS: I/II/III
Cytogenetics: favorable/unfavorable/missing
Renal function: eGFR ≥60/<60 mg/mL/1.73m2
Lung function: non-impaired2/mild-severely impaired3
Karnofsky performance status:
100% 80-90% <70%
Anti-MM therapy
Supportive/localized therapy alone4
Standard NA-therapy w/o SCT
412
211
250 (35)
430 (59)
72 (10)
321 (44)
244 (34)/89 (12)
(38)
64 (22-92)
196 (56)/66 (19)/11 (3)/72 (20)/5 (1)/4 (1)
222 (63)/129 (35)/2 (1)/1 (1)
20 (6)
144 (41)/96 (27)/114 (32)
155 (44)/130 (37)/69 (19)
228 (64)/126 (36)
312 (88)/42 (12)
15 (4)
178 (50)
161 (46)
42 (12)
82 (23)
204 (58)/26 (7)
1Not evaluated in N=2 patients due to missing data; 2FEV1 <80%; 3FEV1 <60%; 4watch & wait or radiation/local therapy or steroids alone. MM: multiple myeloma; Ig: immunoglobulin; eGFR: estimated glomerular filtration rate; ISS:International Staging System; NA: novel agent-based anti-MM-therapy; SCT: stem cell transplantation; allo-SCT: allogeneic stem cell transplantation; ASCT: autologous stem cell transplantation; w/o: without.
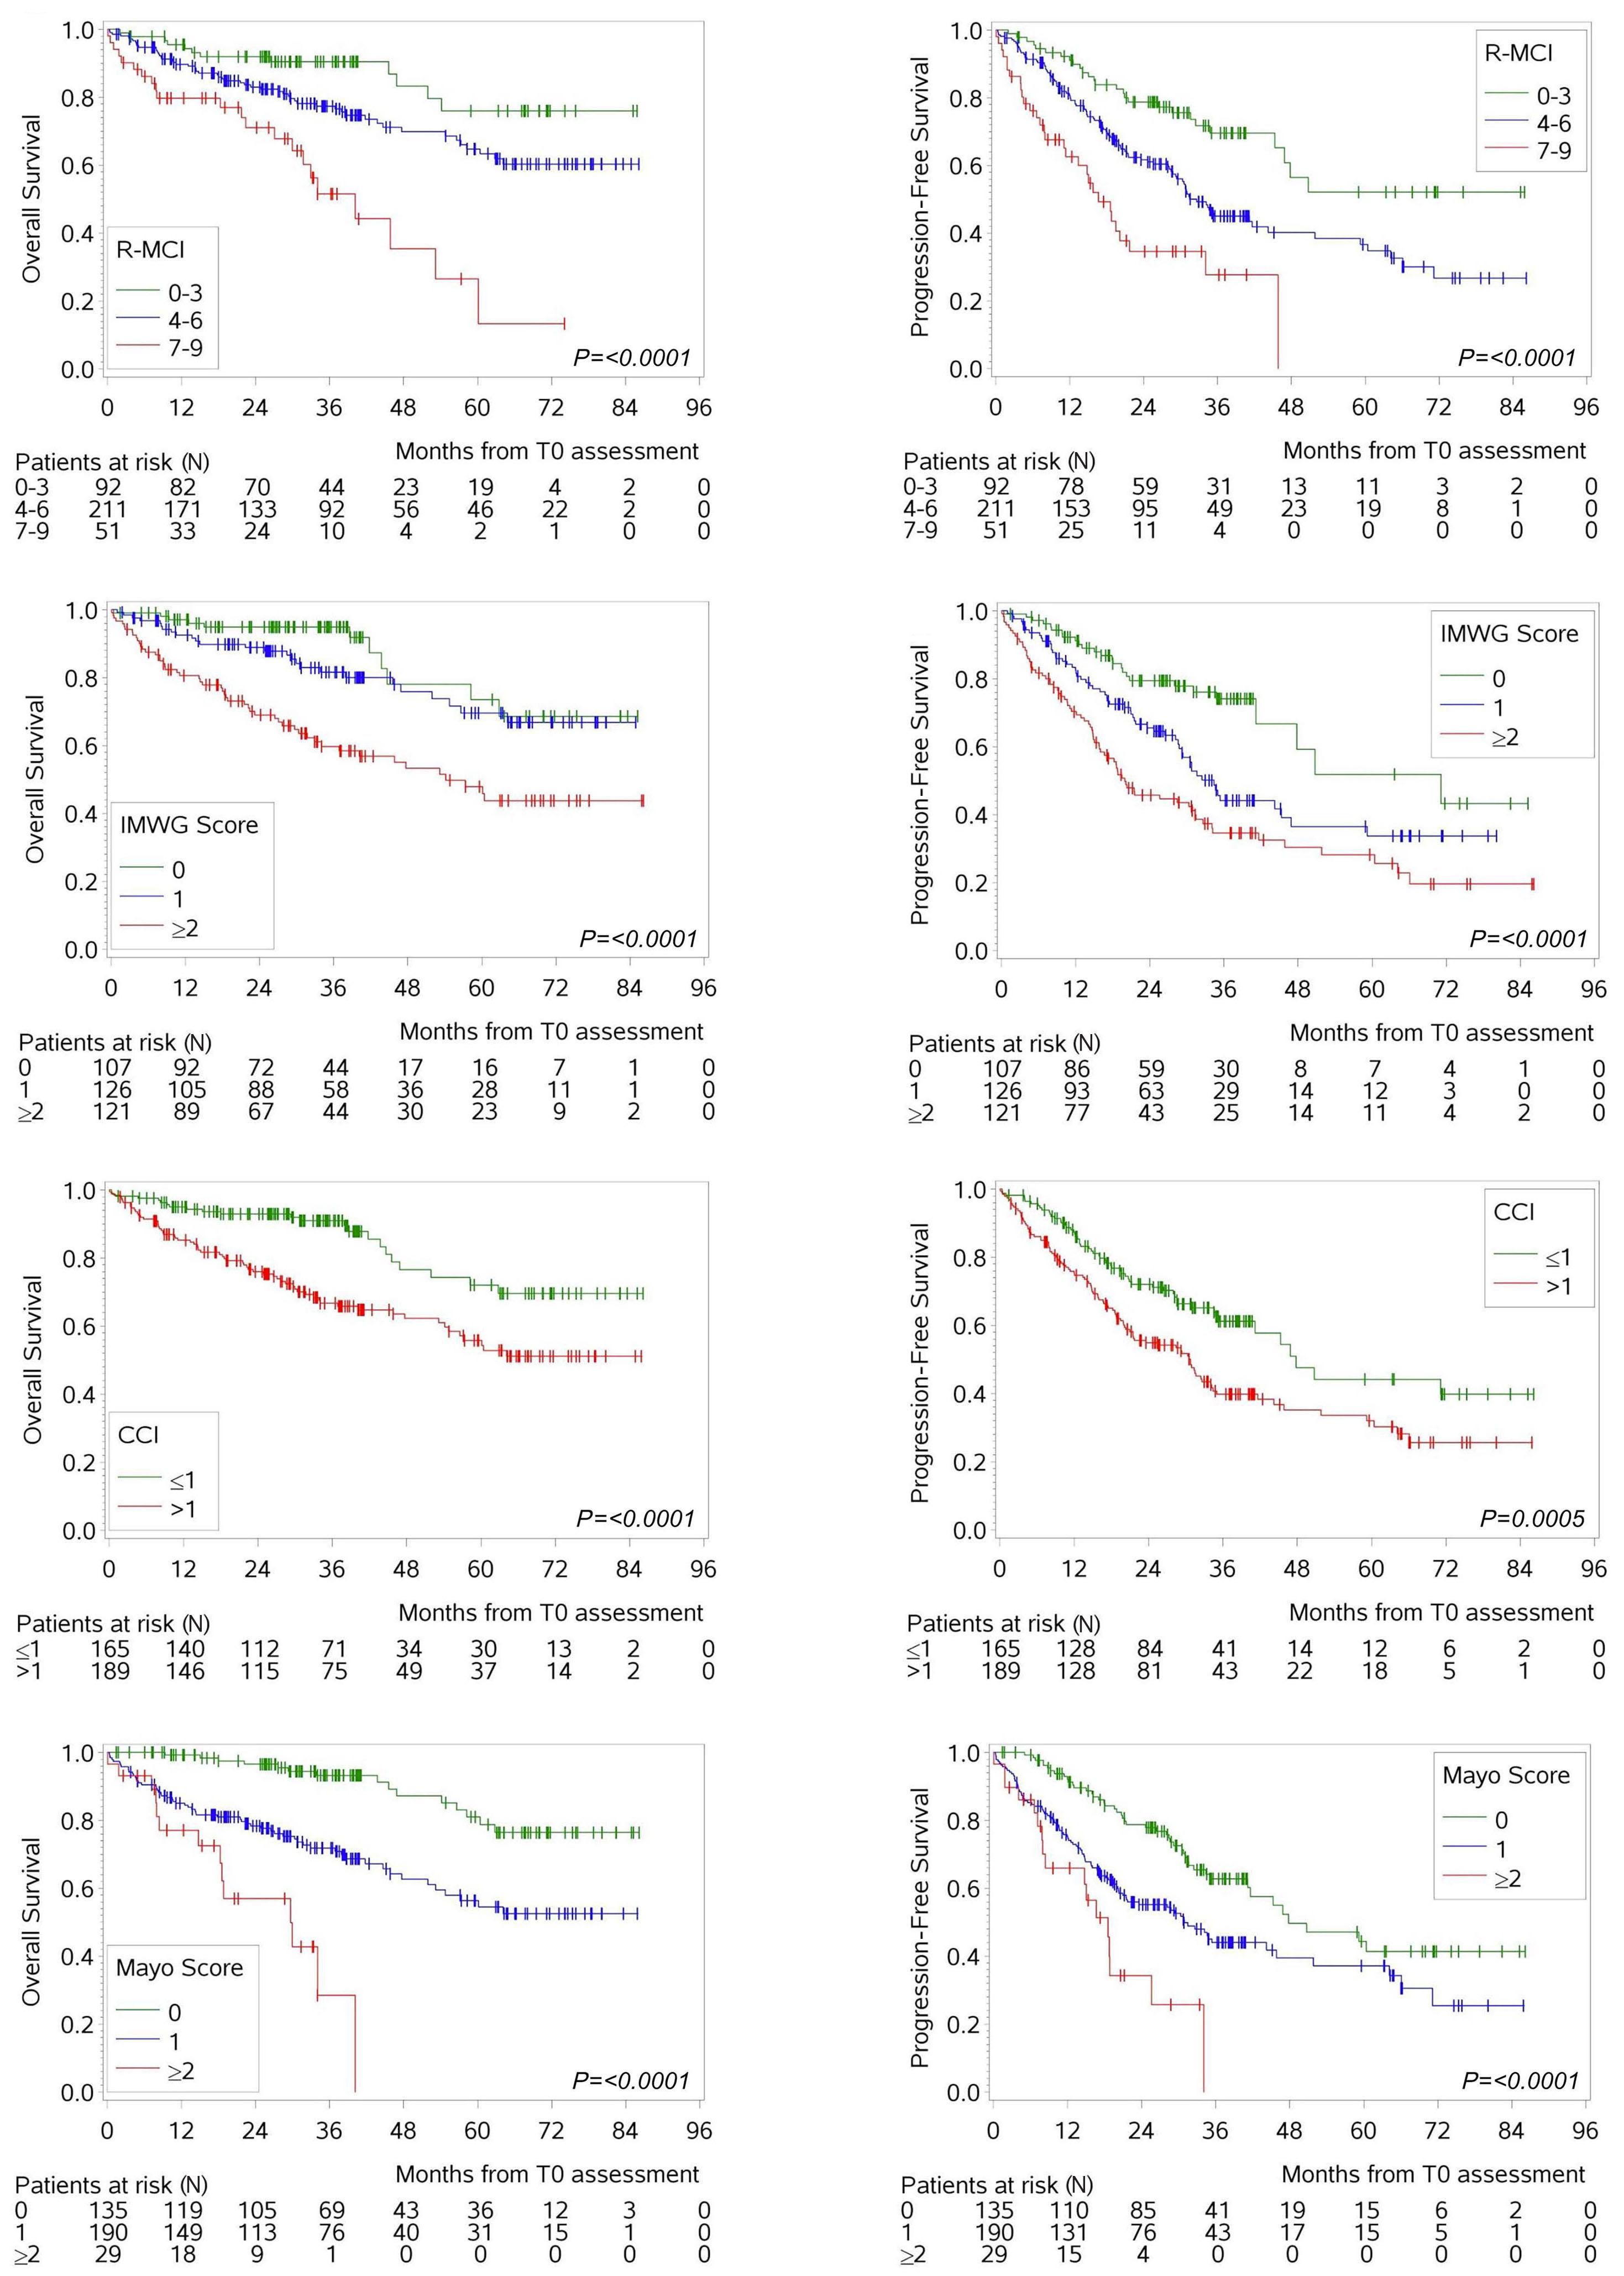
1C) showed that significantly more patients were defined as “fit” in the retrospective than prospective cohort with 41% versus 30% and 65% versus 47%, respectively. The CCI is no standard tool that is routinely assessed in clinical trials or real-world records (due to numerous comorbidities included therein), therefore has to be assessed as best as possible using retrospective data from medical documents. Thus, the number of “frail” patients is often underestimated in retrospective cohorts (Online Supplementary Tables S1 and S2). In line, the IMWG frailty index overestimated “fit” patients from retrospective cohorts (Figure 1B). Not only is the CCI part of the IMWG frailty index, but two functional tests are included: “activity of daily living” (ADL) and “instrumental activity of daily living” (IADL). Since ADL and IADL results about self-care limitations cannot be assessed retrospectively, this information must be assumed as best as possible from medical records. If unavailable, misleading results are obtained retrospectively, which is why it is neither reliable nor feasible to assess the IMWG frailty index retrospectively. This was the reasons, why post hoc analyses on frailty were performed with a simplified IMWG frailty index, that contains only age, performance status and CCI.6,9,10 In contrast, the results for the Mayo risk score (Figure 1D) revealed that 29% of the retrospective cohort were classified as “fit” versus 37% of the prospective cohort (P=0.0209), space missing (underestimating “fit” patients retrospectively. Moreover, for our retrospective assessment of the Mayo risk score, only 40% of patients could be included due to missing NT-proBNP data as this is not routinely assessed in MM patients (although being used now more frequently to evaluate cardiac function in some centers). Therefore, the Mayo risk score based on performance status, NT-proBNP and age may likewise be challenging to use for retrospective data (Figure 1).
Analyzing the prospective cohort with a median follow-up of 37 months and median OS and PFS of not reached and 35 months, respectively, important group differences in age groups for OS and PFS were evident (Online Supplementary Figure S1), but more substantially via CI (Figure 2A-H; Online Supplementary Figure S2A, B). Regarding the outcome of different age groups, the median OS was not reached for the younger two age cohorts versus 60 months in ≥70-yearold patients (Online Supplementary Figure S1). Although the Kaplan-Meier curves showed age group differences, especially the two older age groups did not distinctly separate. Thus, advanced age remains to have an impact on prognosis, but other risk factors beyond age play a significant role in determining outcome as well.
Therefore, the five CI R-MCI,8 IMWG frailty index,7 CCI12, Mayo risk score13 and MRP score14 were compared regarding survival prediction (Figure 2A-H; Online Supplementary Figure S2A,
B). Notable was, that all five CI could divide patients into risk groups with significantly different OS and PFS (P<0.05). The 3-year OS for “fit”, “intermediate-fit” and “frail” patients via R-MCI was 91%, 77% and 52% (P<0.0001; Figure 2A), via IMWG frailty index 95%, 82% and 60% (P<0.0001; Figure 2C), via Mayo risk score 93%, 72% and 29% (P<0.0001; Figure 2G) and via MRP score 88%, 68% and 44% (P<0.0001; Online Supplementary Figure S2A), respectively. Consequently, the differences in 3-year OS between “fit” and “frail” patients for R-MCI score, IMWG frailty scrore, Mayo risk score and MRP score were 39%, 35%, 64% and 44%, respectively. Of note, the Kaplan-Meier survival curves for “fit” and “intermediate-fit” patients via IMWG frailty index were superimposable for OS (Figure 2C) and less distinct as compared to the other scores, suggesting that “fit” versus “frail” differentiation may suffice in the future.9 Of interest was also, that albeit the CCI separated “fit” (CCI ≤1) from “frail” (CCI >1) patients, differences in 3-year OS for “fit” (91%) and “frail” (67%) patients were achieved with a 24% difference only (P<0.0001; Figure 2E).
The 3-year PFS for all the different risk groups (“fit”, “intermediate-fit” and “frail” patients) was 70%, 45% und 28% via R-MCI (P<0.0001; Figure 2B), 74%, 44% und 35% via IMWG frailty index (P<0.0001; Figure 2D), 63%, 44% und 0% via Mayo risk score (P<0.0001; Figure 2H) and 59%, 39% and 19% via MRP score (P<0.0001; Online Supplementary Figure S2B). For the 3-year PFS, most obvious differences between “fit” and “frail” patients appeared for the R-MCI (42%), IMWG frailty index (39%), Mayo risk score (63%) and MRP score (40%). Again, the CCI showed lowest PFS difference with 21% between “fit” and “frail” patients: the 3-year PFS using the CCI was 61% for “fit” patients and 40% for “frail” patients (P=0.0005; Figure 2F).
In conclusion, this analysis (registration no.: DRKS-00003868) impressively revealed that the R-MCI was the only CI that did not show significant differences in risk group distribution for both retrospective and prospective data and was reliably assessable in both (Figure 1). Another convenience is that the R-MCI offers a user-friendly homepage (www.myelomacomorbidityindex.org; Online Supplementary Table S2). Of interest, all five CI can divide patients into risk groups with significantly different OS and PFS, albeit group differences between “fit” and “frail” patients were distinctly different and less with age groups alone (Figure 2A-H; Online Supplementary Figures S1 and S2). While in other hematological diseases, CI and fitness assessments are used for tailoring therapy, it is not yet routinely established in MM patients, albeit studies exist to elucidate their usefulness.5,9,15 Studies showing that “overtreatment” in frail cohorts can impair outcomes have been performed (i.e., the MUK eight study
in which triple therapy was associated with worse OS than double therapy with near significance in frail patients16) or our test and validation analysis of the R-MCI, where both undertreatment in fit and overtreatment in frail patients were observed8 - to name only two examples. The future perspective suggests to include CI in therapy decisions, as shown by Holler et al., who described that fitter patients benefit from intensive therapies, whereas frail patients may need initial and/or sustained dose reductions.9 Despite this and ongoing studies in frail patients, there is still a shortage of standardized tools to assess frailty, hindering the full utilization of its potential to enhance outcome and minimize therapy-related toxicity. Moreover, there are limitations in our current knowledge of whether frailty-adjusted treatment should be generally applied, leads to better treatment outcomes and clinical trials testing ‘treatment as usual’ versus ‘frailty-adjusted treatment choices’ (i.e., performed in the UK-MRA Myeloma XIV trial) are rare.2 As of today, 25% of MM physicians are reckoned to use frailty scores to aid in risk assessment and clinical decision making, whereas 75% rely on their clinical judgement alone (personal communication E. Terpos). Thus, our and other studies continue to substantiate benefits of CI-guided treatment decisions, which might change these percentages in the future. Further research through prospective clinical trials seems eminent to determine the optimal, personalized treatment options for each patient. Building on this approach, Mian et al. published a systematic review including 43 clinical trials considering frailty tools and showed an encouraging trend to incorporate frailty assessments in clinical evaluations and treatment decisions.10 As demonstrated by the underlying analysis, the R-MCI provides a coherent score that provides the basis for further research into preeminent ways to personalize MM care according to patients’ risk profiles today.
Katja Schoeller,1,2+ Gabriele Ihorst,3 Heike Reinhardt,1,2 Maximilian Holler,1,2 Sophia Scheubeck,1,2 Georg Herget,2,4 Ralph Wäsch1,2 and Monika Engelhardt1,2+
1Department of Medicine I Hematology and Oncology; 2Comprehensive Cancer Center Freiburg (CCCF); 3Clinical Trials Unit and 4Department of Orthopedics and Trauma Surgery, Medical Center - University of
1. Larocca A, Dold SM, Zweegman S, et al. Patient-centered practice in elderly myeloma patients: an overview and consensus from the European Myeloma Network (EMN). Leukemia. 2018;32(8):1697-1712.
Freiburg, Faculty of Medicine, Freiburg, Germany
+KS and ME contributed equally.
Correspondence:
M. ENGELHARDT - monika.engelhardt@uniklinik-freiburg.de
https://doi.org/10.3324/haematol.2023.283884
Received: August 23, 2023.
Accepted: November 21, 2023.
Early view: November 30, 2023.
©2024 Ferrata Storti Foundation
Published under a CC BY-NC license
Disclosures
No conflicts of interest to disclose.
Contributions
The results of this work are based on the results of the dissertation of KS. KS acquired and analyzed the data, and both ME and KS wrote the paper. GI performed the statistical analysis. All authors discussed the results and contributed to the final manuscript.
The authors thank distinguished IMWG, EMN, DSMM and GMMG experts and friends. We are specially obliged to Prof Dr J. Duyster (Freiburg, UKF), Dr Dr J. Jung (TU München), Dr J. Waldschmidt (UK Würzburg), Dr C. Miething (UKF), Dr M. Rassner (UKF, now postdoc in Japan). We are also very thankful to all AG Engelhardt & Wäsch group members for their utmost MM enthusiasm, feedback and revision input. We thank the Center for biobanking (FREEZE-Biobank) for their support. We acknowledge the interdisciplinary multiple myeloma (MM) tumor board group of our CCCF, Prof Dr G Herget, Dr H. Schäfer, PD Dr J. Neubauer, Prof Dr Dr R. Schmelzeisen, Prof Dr G. Walz, and Prof Dr W. Kühn for their outstanding support. We greatly acknowledge the anonymous reviewers for their input and recommendations. We are also indebted to IMWG, EMN and DSMM/ GMMG experts for their insights on the data and manuscript, and thank all MM patients who participated in this study.
The data that supports the findings of this study are available from the corresponding author upon reasonable request.
2. Coulson AB, Royle K-L, Pawlyn C, et al. Frailty-adjusted therapy in transplant non-eligible patients with newly diagnosed multiple myeloma (FiTNEss (UK-MRA Myeloma XIV Trial)): a study protocol for a randomised phase III trial. BMJ Open. 2022;12(6):e056147.
3. Efficace F, Gaidano G, Petrucci MT, et al. Association of IMWG frailty score with health-related quality of life profile of patients with relapsed refractory multiple myeloma in Italy and the UK: a GIMEMA, multicentre, cross-sectional study. Lancet Healthy Longev. 2022;3(9):e628-e635.
4 Pawlyn C, Khan AM, Freeman CL. Fitness and frailty in myeloma. Hematol Am Soc Hematol Educ Program. 2022;2022(1):337-348.
5. Scheubeck S, Ihorst G, Schoeller K, et al. Comparison of the prognostic significance of 5 comorbidity scores and 12 functional tests in a prospective multiple myeloma patient cohort. Cancer. 2021;127(18):3422-3436.
6. Facon T, Dimopoulos MA, Meuleman N, et al. A simplified frailty scale predicts outcomes in transplant-ineligible patients with newly diagnosed multiple myeloma treated in the FIRST (MM020) trial. Leukemia. 2020;34(1):224-233.
7. Palumbo A, Bringhen S, Mateos M-V, et al. Geriatric assessment predicts survival and toxicities in elderly myeloma patients: an International Myeloma Working Group report. Blood. 2015;125(13):2068-2074.
8. Engelhardt M, Domm A-S, Dold SM, et al. A concise revised Myeloma Comorbidity Index as a valid prognostic instrument in a large cohort of 801 multiple myeloma patients. Haematologica. 2017;102(5):910-921.
9 Holler M, Ihorst G, Reinhardt H, et al. An objective assessment in newly diagnosed multiple myeloma to avoid treatment complications and strengthen therapy adherence. Haematologica. 2023;108(4):1115-1126.
10. Mian H, McCurdy A, Giri S, et al. The prevalence and outcomes of frail older adults in clinical trials in multiple myeloma: a
systematic review. Blood Cancer J. 2023;13(1):1-13.
11. Mateos M-V, Dimopoulos MA, Cavo M, et al. Daratumumab plus bortezomib, melphalan, and prednisone versus bortezomib, melphalan, and prednisone in transplant-ineligible newly diagnosed multiple myeloma: frailty subgroup analysis of ALCYONE. Clin Lymphoma Myeloma Leuk. 2021;21(11):785-798.
12. Charlson ME, Pompei P, Ales KL, MacKenzie CR. A new method of classifying prognostic comorbidity in longitudinal studies: development and validation. J Chronic Dis. 1987;40(5):373-383.
13. Milani P, Vincent Rajkumar S, Merlini G, et al. N-terminal fragment of the type-B natriuretic peptide (NT-proBNP) contributes to a simple new frailty score in patients with newly diagnosed multiple myeloma. Am J Hematol. 2016;91(11):1129-1134.
14 Cook G, Royle K-L, Pawlyn C, et al. A clinical prediction model for outcome and therapy delivery in transplant-ineligible patients with myeloma (UK Myeloma Research Alliance Risk Profile): a development and validation study. Lancet Haematol. 2019;6(3):e154.e166.
15. Eichhorst B, Hallek M, Goede V. Management of unfit elderly patients with chronic lymphocytic leukemia. Eur J Intern Med. 2018;58:7-13.
16. Auner HW, Brown SR, Walker K, et al. Ixazomib with cyclophosphamide and dexamethasone in relapsed or refractory myeloma: MUKeight phase II randomised controlled trial results. Blood Cancer J. 2022;12(4):52.
Patients undergoing hematopoietic stem cell transplantation (HSCT) require a versatile venous catheter for a variety of purposes, including chemotherapy infusion, administering antibiotics, transfusing blood products, providing parenteral nutrition, and collecting systematic samples. Due to the frequent occurrence of vasculature issues, an intermediate-term, large-bore catheter is typically necessary.
Two types of catheters are commonly used - conventional central venous catheters (CICC) and peripherally inserted central catheters (PICC). CICC are inserted through large central veins, whereas PICC are inserted through smaller peripheral veins, typically in the upper limb.
The use of CICC remains prevalent in many transplant centers due to their accessibility, affordability, and operator preference. However, the insertion and removal of these devices pose considerable risks, including arterial puncture or catheterization, nerve damage, tissue hematoma, hemothorax, air embolism, and pneumothorax. McGee et al. found that 6-19% of CICC implantations result in mechanical complications, with a pneumothorax rate as high as 3%.1
PICC insertion is a safe procedure, deprived of life-threatening complications with fewer insertion and removal-related complications than CICC.23The PICC is typically inserted into the upper arm using ultrasound guidance and the modified Seldinger’s technique. The basilic vein is the best location for insertion, and the medial distal part of the arm is the recommended puncture site. Catheter to vein ratio should not exceed 45% as advocated by the Infusion Therapy Standards of Practice.4
Alternative vascular devices to PICC are midline catheters (MLC). MLC are devices inserted into the peripheral veins of the upper and terminate in the peripheral veins, not the central veins. The tip of the MLC catheter should be located at or below the axillary vein, distal to the shoulder.56
One of the typical complications involving mid- to longterm vascular devices is catheter-related thrombosis (CRT). Thrombotic complications can occur with catheter use, with reported rates varying from around 5% to an overall rate of 18%.7 Cancer patients with indwelling devices seem particularly prone to this complication due to frequent immobility, hyperinflammation, chemotherapy administration, and prolonged catheterization. In addition, CRT is associated with complications of pulmonary embolism, systemic sepsis, loss of intravenous access, and post-thrombotic syndrome.8 Data on PICC-associated thrombosis present ambiguous results. A systematic review and meta-analysis concluded that PICC are associated with an increased risk of CRT compared to other tunneled CVC but not pulmonary embolism.9 The data on MLC in non-malignant settings
suggests that MLC cause more catheter-related thrombosis (CRT) than PICC.10 It is worth emphasizing that most of the reported data derived from oncologic patients and stem cell transplant recipients may have altered CRT risk, especially in the case of severe thrombocytopenia, which is common in the transplantation setting. Additionally, in the context of stem cell transplantation, catheters are generally removed once therapy is completed. Conversely, in the case of oncology patients, vascular devices are typically left in place unless they become dysfunctional or infected. This study presents the results of a comparative analysis of the feasibility and safety of PICC and MLC, in patients undergoing HSCT. The primary objective was to evaluate the incidence of CRT associated with PICC and MLC in comparison to CICC. This study was conducted in accordance with
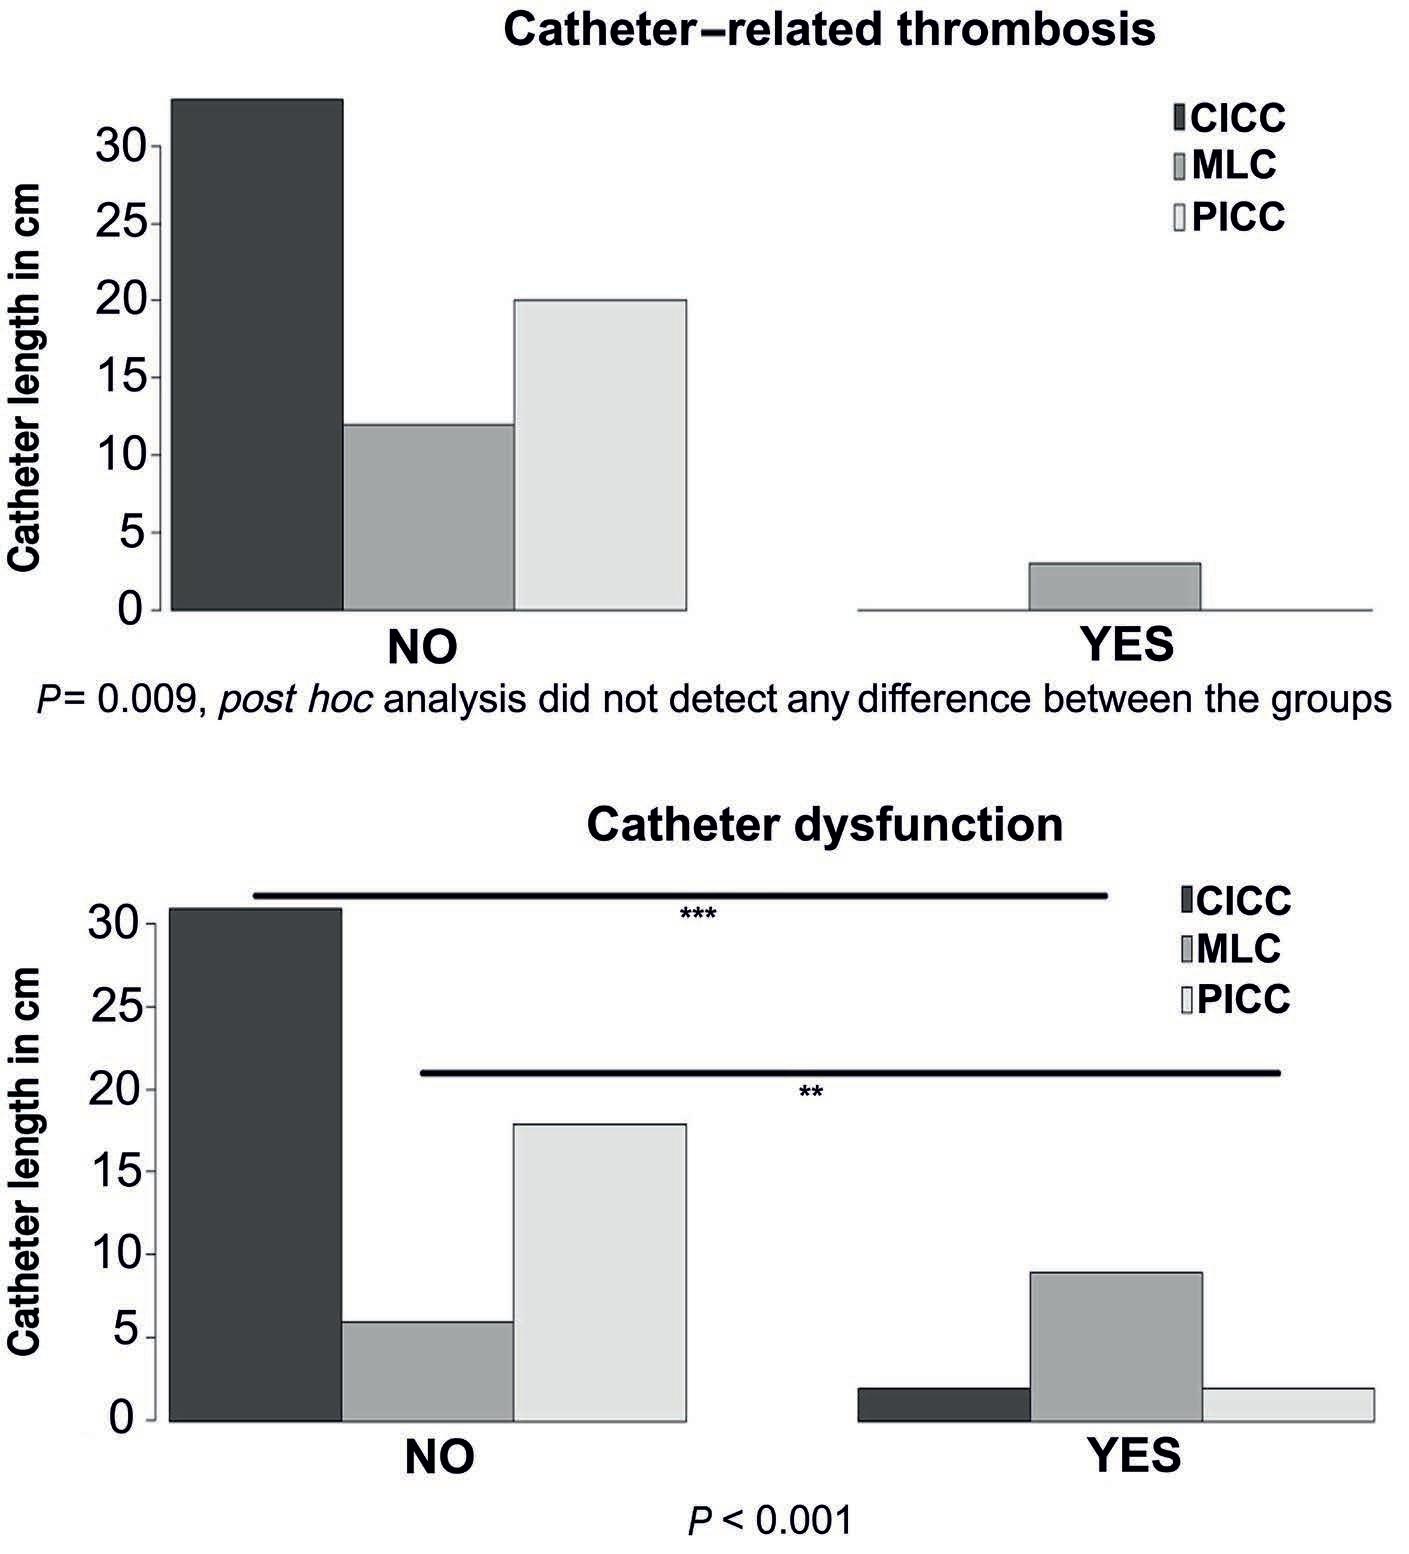
(A)
for the study. Since there was a statistically significant difference between the devices, post hoc analysis with Bonferroni correction for multiple testing was conducted. P value <0.05 was considered statistically significant. **P<0.01; ***P<0.001. PICC: peripherally inserted central venous catheter; MLC: midline catheter; CICC: conventionally inserted central venous catheter.
the Declaration of Helsinki and approved by the Bioethical Committee of Pomeranian Medical University in Szczecin (approval number: RPW/10177/2022P). Informed consent was obtained from all subjects involved in the study. We conducted a retrospective observational study investigating 68 consecutive autologous and allogeneic HSCT procedures. The Online Supplementary Appendix presents detailed patients and catheter characteristics (Online Supplementary Table S1). The patients were divided into two groups: the study group consisted of 35 patients undergoing transplantation with peripheral catheters (PICC or MLC), and the control group consisted of 33 patients with CICC. We have analyzed subgroups regarding catheter length, diameter, and particularly in terms of CRT and catheter dysfunction (CD). CD was defined as the inability to either aspirate or infuse fluids.
The prevalence of CRT did not differ between CICC and peripheral catheters (PICC and MLS combined). Subsequently, we examined if CRT is associated with a particular type of intravenous device. We analyzed CICC, PICC, and MLC separately. Although Fisher’s exact test revealed a statistically significant result (P=0.009), indicating increased CRT prevalence in MLC, the post hoc analysis did not confirm the difference between the catheters (Figure 1A). Subsequently, we examined if CRT is associated with a particular type of intravenous device. We analyzed CICC, PICC and MLC separately. Although Fisher’s exact test revealed a statistically significant result (P=0.009), the post hoc analysis did not confirm the difference between the catheters (Figure 1A).
Catheter dysfunction occurred significantly more frequently in the peripheral catheters (P=0.01) (Table 1). We analyzed CICC, PICC and MLC separately (P=0.009) (Figure 1B). Our findings indicate that MLC have a significantly higher incidence of dysfunction compared to CICC and PICC (P<0.001 and P<0.01, respectively). However, there were no significant differences between PICC and CICC (Figure 1B).
We used a multiple logistic regression model to determine predictors for a CD. Results are presented in Online Supplementary Table S2 and depicted in Figure 2. We considered catheter length and diameter as potential
predictors, as there were significant differences in these parameters between the groups. Additionally, we included the type of HSCT and the length of stay in our model, as a longer hospitalization duration is associated with a higher probability of CD acquisition. We observed that a smaller catheter diameter was significantly associated with device dysfunction (odds ratio [OR] =0.012; P<0.001). However, we found no significant association between CD and catheter length, length of stay, or type of HSCT.
Regarding CRT, studies have presented ambiguous results, mainly deriving the data from studies limited to oncology patients. According to our knowledge, this study is the first specifically conducted to compare different peripheral vascular devices in adult patients undergoing stem
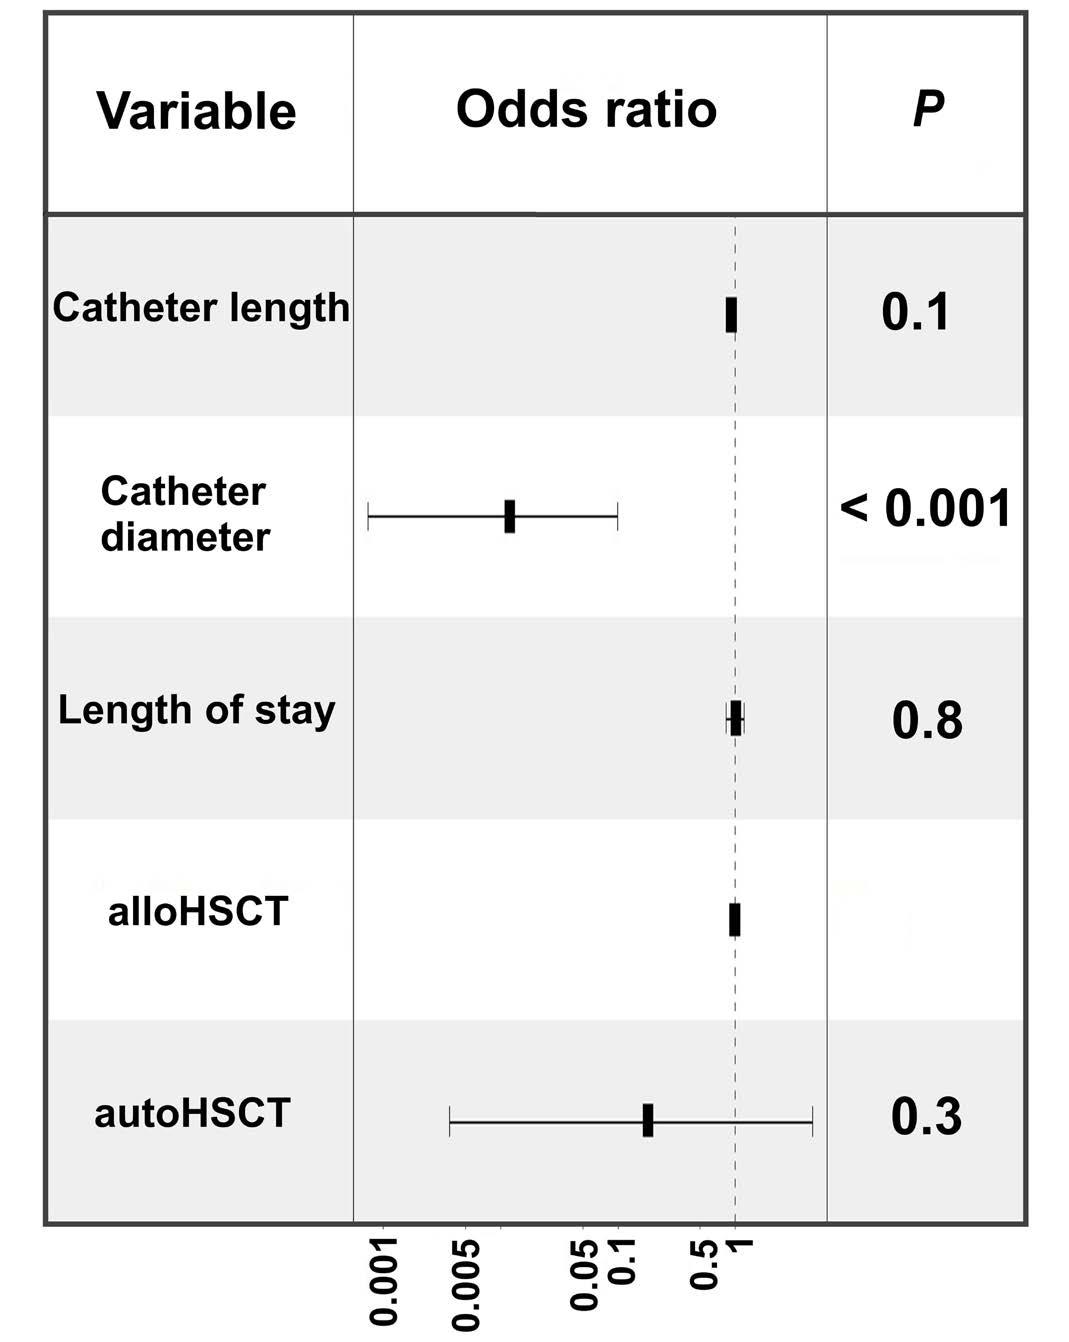
Figure 2.
demonstrating odds ratios for a catheter dysfunction. Catheter length, catheter diameter, length of stay and type of HSCT were used as independent variables. P value <0.05 was considered statistically significant. AlloHSCT: allogenic hematopoietic stem cell transplantation; autoHSCT: autologous stem cell transplantation.
Mann-Whitney U test was used to analyze differences between the continuous variables. Fisher exact test was implemented to compare categorical data. P value <0.05 was considered statistically significant. N: number; IQR: interquartile range; CRT: catheter-related thrombosis CD: catheter dysfunction.
cell transplantation. We have focused on catheter-related thrombosis and dysfunction, which are usually intertwined. We demonstrated that although CRT occurred more often in patients with peripherally inserted venous catheters, the difference between the CICC group was not statistically significant. Detailed analysis of different catheter types revealed that MLC tend to be associated with a greater risk of CRT. However, after post hoc analysis, catheter types did not differ. Nonetheless, it is worth emphasizing that all cases of CRT occurred in patients with MLC. The lack of statistically significant difference could be attributed to a relatively small sample size. Therefore, further studies should investigate the relationship between different types of peripherally inserted catheters and CRT in the transplantation setting. According to the latest literature data, no consensus exists on whether MLC are associated with lower CRT incidence than PICC. Bahl and co-workers demonstrated that patients with MLC are far more likely to develop CRT than individuals with PICC.10 Still, Xu et al demonstrated that MLC were not different from PICC regarding CRT.11 Similar results were revealed in other studies,12,13 in which MLCs were not inferior to PICC concerning the frequency of CRT.
CRT in our cohort was diagnosed exclusively after engraftment when the platelet count was greater than 20x109/L. This may suggest that thrombocytopenia may have a protective effect against CRT. Indeed, this observation is coherent with other studies investigating thrombotic complications after HSCT.14,15 Therefore, it might be concluded that individuals undergoing HSCT during the pre-engraftment phase exhibit features, of potentially protective qualities, different from other populations of patients.
On top of CRT, another catheter-related complication is CD which can be defined as the inability to either infuse fluids or aspirate them. Dysfunction arises from total or partial loss of catheter patency. Thrombotic and non-thrombotic events could elicit CD. Our results revealed that peripherally inserted catheters were associated with an increased risk for a catheter failure than CICC (P<0.001). After the post hoc analysis, we found that CD occurred more frequently in MLC than in PICC and in CICC. The difference was statistically significant (P<0.01 and P<0.001, respectively). After that, in a multiple logistic regression model, we have identified catheter diameter to be a predictor for a CD (OR=0.01; P<0.001).
Our study reveals that PICC are safe and feasible in the transplantation setting and seem not associated with an increased CRT incidence compared to CICC. Due to the
1. McGee DC, Gould MK. Preventing complications of central venous catheterization. N Engl J Med. 2003;348(12):1123-1133.
2. Sakai T, Kohda K, Konuma Y, et al. A role for peripherally
low rate of infectious and mechanical complications, easy maintenance, and patient comfort, PICC and MLC should be preferred whenever feasible.16 Increased CD rate is a concerning issue and efforts should be made to identify potential risk factors contributing to this complication, and a preventive strategy should be introduced. CD is a mild complication that does not alter the procedure outcomes or hospital stay and usually doesn’t require catheter removal. Furthermore, it is possible to reverse the disfunction in some instances with additional flushing or heparin lock.
Slawomir Milczarek,1,2 Piotr Kulig,1,2 Oliwia Piotrowska,1 Alina Zuchmanska,1 Anna Bielikowicz1 and Bogusław Machalinski1,2
1Department of Hematology and Transplantology, Pomeranian Medical University and 2 Department of General Pathology, Pomeranian Medical University, Szczecin, Poland
Correspondence: S. MAILCZAREK - slawomir.milczarek@pum.edu.pl
https://doi.org/10.3324/haematol.2023.283924
Received: August 7, 2023.
Accepted: October 26, 2023. Early view: November 2, 2023.
©2024 Ferrata Storti Foundation
Published under a CC BY-NC license
Disclosures
No conflicts of interest to disclose.
Contributions
Conceptualization, study design, investigation, patient care and writing of the original draf by SM. Investigation, formal analysis, writing of the original draft, patient care, figure preparation by PK. Investigation, data curation by AZ. Investigation, patient care, writing of original draft by OP. Investigation, data curation by AB. Supervision, writing, review and editing of the manuscript by BM. All authors have read and agreed to the published version of the manuscript.
Data-sharing statement
Data are available upon request addressed to the corresponding author.
inserted central venous catheters in the prevention of catheterrelated blood stream infections in patients with hematological malignancies. Int J Hematol. 2014;100(6):592-598.
3. Bellesi S, Chiusolo P, Pascale GD, et al. Peripherally inserted central catheters (PICC) in the management of oncohematological patients submitted to autologous stem cell transplantation. Support Care Cancer. 2013;21(2):531-535.
4 Pitiriga V, Bakalis J, Theodoridou K, Kanellopoulos P, Saroglou G, Tsakris A. Lower risk of bloodstream infections for peripherally inserted central catheters compared to central venous catheters in critically ill patients. Antimicrob Resist Infect Control. 2022;11(1):137.
5. Chopra V, Kaatz S, Swaminathan L, et al. Variation in use and outcomes related to midline catheters: results from a multicentre pilot study. BMJ Qual Saf. 2019;28(9):714.
6. Swaminathan L, Flanders S, Horowitz J, Zhang Q, O’Malley M, Chopra V. Safety and outcomes of midline catheters vs peripherally inserted central catheters for patients with shortterm indications. JAMA Intern Med. 2022;182(1):50-58.
7 Lee AYY, Kamphuisen PW. Catheter-related thrombosis: lifeline or a pain in the neck? Hematology Am Soc Hematol Educ Program. 2012;2012:638-644.
8. Yi X, Chen J, Li J, et al. Risk factors associated with PICCrelated upper extremity venous thrombosis in cancer patients. J Clin Nurs. 2014;23(5-6):837-843.
9 Chopra V, Anand S, Hickner A, et al. Risk of venous thromboembolism associated with peripherally inserted central catheters: a systematic review and meta-analysis. Lancet. 2013;382(9889):311-325.
10 Bahl A, Karabon P, Chu D. Comparison of venous thrombosis complications in midlines versus peripherally inserted central
catheters: are midlines the safer option? Clin Appl Thrombosis Hemostasis. 2019;25:1076029619839150.
11. Xu T, Kingsley L, DiNucci S, et al. Safety and utilization of peripherally inserted central catheters versus midline catheters at a large academic medical center. Am J Infect Control. 2016;44(12):1458-1461.
12. Caparas JV, Hu J-P. Safe adminisitration of vancomycin through a novel midline catheter: a randomized, prospective clinical trial. J Vasc Access. 2014;15(4):251-256.
13. Bing S, Smotherman C, Rodriguez RG, Skarupa DJ, Ra JH, Crandall ML. PICC versus midlines: comparison of peripherally inserted central catheters and midline catheters with respect to incidence of thromboembolic and infectious complications. Am J Surg. 2022;223(5):983-987.
14. Gonsalves A, Carrier M, Wells PS, McDiarmid SA, Huebsch LB, Allan DS. Incidence of symptomatic venous thromboembolism following hematopoietic stem cell transplantation. J Thromb Haemost. 2008;6(9):1468-1473.
15. Gerber DE, Segal JB, Levy MY, Kane J, Jones RJ, Streiff MB. The incidence of and risk factors for venous thromboembolism (VTE) and bleeding among 1514 patients undergoing hematopoietic stem cell transplantation: implications for VTE prevention. Blood. 2008;112(3):504-510.
16. Nakaya Y, Imasaki M, Shirano M, et al. Peripherally inserted central venous catheters decrease central line-associated bloodstream infections and change microbiological epidemiology in adult hematology unit: a propensity scoreadjusted analysis. Ann Hematol. 2022;101(9):2069-2077.
Patients with monoclonal gammopathy of undetermined significance (MGUS) or smoldering multiple myeloma (SMM) have a higher risk of developing myelodysplastic syndrome (MDS) or acute myeloid leukemia (AML) than the general population, even without receiving any treatment.1,2 This risk is even more important in patients with multiple myeloma (MM) receiving myeloma-specific therapies,3 with a reported prevalence of therapy-related myeloid neoplasms (t-MN) in about 3% of all patients.4
Substantial improvements in survival of patients with MM have been observed in the recent years with the emergence of new generation treatments such as proteasome inhibitors, immunomodulators and monoclonal antibodies. As a consequence, there are growing concerns about the risk of developing therapy-related myelodysplastic syndrome (t-MDS) or therapy-related acute myeloid leukemia (t-AML) with newer regimens. Those complications are uncommon but associated with a poor prognosis. The reported median survival after the diagnosis of MDS or AML is 6.7 months.5 The risk of t-MN in MM is associated to multiple factors, including age, sex, ethnicity, genetics and prior treatment received.3 Among MM-specific therapies, alkylating agents and lenalidomide have drawn specific attention. High-dose melphalan used in autograft stem cell transplantation (ASCT) conditioning is thought to induce an accumulation of mutations in myeloid cells leading to t-MN.6 The 5-year cumulative incidence of MDS and AML after ASCT for MM is 1.0%.7 And the reported median times from ASCT to t-MDS or t-AML are 5 (range, 1-15) and 4 (range, 1-9) years, respectively.8 Lenalidomide maintenance has been associated with an increased risk of developing t-MN.9,10 Those patients developing t-MN after being exposed to lenalidomide have an increased incidence of TP53 alterations in myeloid cells.11 This suggests that lenalidomide might provide a selective advantage to TP53 mutant myeloid sub-clones. Finally, the role of clonal hematopoiesis of indeterminate potential (CHIP) and pre-existing dysplastic hematopoiesis is still unclear.12,13 In this work, we hypothesized that myelodysplastic subclones might be already present at the time of MM diagnosis, even years before developing a t-MDS. We analyzed a case series of five patients with MM who developed t-MDS in our Institution between January 2017 to March 2020 and for which we had serial bone marrow samples. This study has been approved by the institutional review board (IRB) of Lille University Hospital and the Ethics Committee Nord Ouest IV (protocol # ECH23/02) in accordance with the Declaration of Helsinki. Median age at diagnosis of MM was 69 years (range, 57-75),
Table 1. Two patients had high-risk cytogenetic features per International Myeloma Working Group criteria. Median time between MM diagnosis and MDS diagnosis was 5 years (range, 3-8) and median prior lines of treatment was three (range, 1-4). Four of five patients received an ASCT and all patients received immunomodulatory drugs, specifically lenalidomide. Different treatment exposures are depicted in Table 1 and Figure 2. At the time of t-MDS, patients had a bone marrow evaluation with cytology, myeloid next generation sequencing (NGS) panel sequencing and conventional karyotypes. Of note, all patients had no or minimal plasma cell infiltration at that time point. We observed in all five cases the presence of both a monosomal karyotype and a TP53 mutation in their myeloid clones. Three patients had a complex karyotype. Other genomic mutations involved DNMT3A, TET2, RUNX1,
Table 1. Characteristics of patients.
MM: multiple myeloma; MDS: myelodysplastic syndrome; ISS: International Staging System; ASCT: autograft stem cell transplantation; R-IPSS: Revised International Prognostic Scoring System; OS: overall survival.
nosis by conventional karyotype and targeted next generation
in myeloid cells. Pt: patient.
of
myelodys-
The NGS panel covers 90 myeloid genes. Libraries were prepared using the Twist BioScience® kit and sequenced on a NovaSeq6000 for a median depth of 3,600X. Raw data were analyzed using MuTect2, Vardict, GATK and GnomAD. Droplet digital polymerase chain reaction (ddPCR) for each TP53 mutations were also performed on bone marrow samples at the time of MM and t-MDS diagnoses. Clonal evolution are depicted by variant allelic fractions (VAF). Rd: lenalidomide-dexamethasone; VAD/DCEP: vincristine-adriamycine-dexamethasone/dexamethasone-cyclophosphamide-etoposide-cisplatin; HD: high dose; Vd: bortezomib-dexamethasone; VTd: bortezomib-thalidomide-dexamethasone; R: lenalidomide; VRd: bortezomib-lenalidomide-dexamethasone; Pt: patient.
ASXL1, SETBP1 (Figure 1). In all cases, the diagnosis of MDS happened after a prolonged exposure to lenalidomide. The size of MDS clones were high with a median cancer cell fractions of TP53 mutations of 37% (range, 30-82). In order to capture the evolution of the t-MDS clones, we analyzed bone marrow samples at diagnosis of MM and at intermediate time points when available by NGS and digital droplet polymerase chain reaction (ddPCR) for TP53 mutations (except for 1 patient due to a lack of material). No mutations were detectable by NGS sequencing with a limit of detection of 1%. But all patients had a detectable TP53 subclones (with allelic fraction between 0.14% to 0.20%) at the time of MM diagnosis by ddPCR, between 3 to 8 years before being diagnosed with t-MDS (Figure 2). In all four cases with sequential samples we observed a clonal evolution of the t-MDS subclones during MM treatments. Interestingly, in one case with multiple samples (Pt#2), the selection of the TP53 subclone happened during lenalidomide treatment and not during exposure to three prior lines of treatment.
This work suggests that tiny myeloid subclones with TP53 mutations are present in patients with MM, years before developing t-MDS. The concept of acquisition or selection of pre-existing mutations is essential to better understand the processes that drive myeloid transformation during treatments. Our data indicate that TP53 mutant subclones were pre-existing and not induced by MM therapies. In a large study over 10,000 individuals, patients who had received previous cancer treatment were more likely to have CHIP compared with treatment-naive patients, likely reflecting the selection pressure induced by therapies.6 Evidences suggest that mutations are selected differentially based on prior treatment exposures. Mutations in ASXL1 are enriched in current or former smokers, whereas cancer therapy with radiation, platinum and topoisomerase II inhibitors preferentially selects for clones with mutations in DNA damage response (DDR) genes (TP53, PPM1D, CHEK2). This indicates that DDR and non-DDR clones have distinct evolutionary trajectories with different competitive fitness. This is illustrated in our case series in Pt#1 where a TP53/ DNMT3A subclone emerges during treatment with lenalidomide while a TET2 subclone is eliminated (Figure 2). In the case of Pt#2, an ASXL1 subclone is initially selected during treatment with cytotoxic agents and proteasome inhibitor but disappears during treatment with lenalidomide, while a TP53 subclone emerges during lenalidomide exposure (Figure 2). It was recently reported that lenalidomide provides a selective advantage to TP53 mutant clones in hematopoietic stem cells.11 In patients with t-MN, TP53 mutations are significantly associated with prior exposure to immunomodulatory drugs, specifically lenalidomide. Interestingly, pomalidomide does not provide an equivalent level of selection of TP53 subclones due to difference in
CK1α degradation and p53-dependent apoptosis.11 Our data demonstrate the presence of tiny TP53 myeloid subclones, in patients with MM diagnosis, up to 8 years before developing t-MDS. Those TP53 subclones are expanded during MM-specific treatments, particularly by lenalidomide exposure, and drive transformation to myeloid neoplasm. Altogether, theses data suggest the potential for exploring alternative therapeutic strategies in patients with MM and the presence of TP53 myeloid subclones in order to mitigate the risk of developing t-MN, especially due to long term exposure to lenalidomide.
Guillaume Escure,1 Elise Fournier,2 Cynthia Saade,1 Lama Hasan Bou Issa,3 Inès Arib,1 Rémi Tilmont,1 Nicolas Gazeau,1 Binta M. Thiam,1 Morgane Chovet,1 Maxime Delforge,1 Nicolas Gower,1 Léa Fléchon,3 Doriane Cavalieri,1 Paul Chauvet,1 Morgane Nudel,1 Laure Goursaud,1 Céline Berthon,1 Bruno Quesnel,1,3 Thierry Facon,1 Claude Preudhomme,1,3 Nicolas Duployez2,3 and Salomon Manier1,3
1Department of Hematology, Lille University Hospital; 2Department of Biology Pathology, Lille University Hospital and 3Canther Unit, INSERM UMR-S1277, CNRS UMR9020, ONCOLille, Lille University, Lille, France
Correspondence:
S. MANIER - salomon.manier@chu-lille.fr
https://doi.org/10.3324/haematol.2023.284050
Received: August 8, 2023.
Accepted: October 11, 2023. Early view: October 19, 2023.
©2024 Ferrata Storti Foundation
Published under a CC BY-NC license
Disclosures
No conflicts of interest to disclose.
Contributions
GE, EF, CP, ND and SM developed the concept and methodology, and acquired data. All authors analyzed the data. All authors wrote, edited and reviewed the manuscript.
Acknowledgments
We would like to express our gratitude to the Tumorothèque of Lille Univerisity Hospital for their collaboration in this project.
Data-sharing statement
Genomic data from the targeted NGS panel and the ddPCR have not been deposited for public access.
1. Roeker LE, Larson DR, Kyle RA, Kumar S, Dispenzieri A, Rajkumar SV. Risk of acute leukemia and myelodysplastic syndromes in patients with monoclonal gammopathy of undetermined significance (MGUS): a population-based study of 17 315 patients. Leukemia. 2013;27(6):1391-1393.
2. Mailankody S, Pfeiffer RM, Kristinsson SY, et al. Risk of acute myeloid leukemia and myelodysplastic syndromes after multiple myeloma and its precursor disease (MGUS). Blood. 2011;118(15):4086-4092.
3. Musto P, Anderson KC, Attal M, et al. Second primary malignancies in multiple myeloma: an overview and IMWG consensus. Ann Oncol. 2018;29(4):1074.
4 Usmani SZ, Sawyer J, Rosenthal A, et al. Risk factors for MDS and acute leukemia following total therapy 2 and 3 for multiple myeloma. Blood. 2013;121(23):4753-4757.
5. Gertz MA, Terpos E, Dispenzieri A, et al. Therapy-related myelodysplastic syndrome/acute leukemia after multiple myeloma in the era of novel agents. Leuk Lymphoma. 2015;56(6):1723-1726.
6. Bolton KL, Ptashkin RN, Gao T, et al. Cancer therapy shapes the fitness landscape of clonal hematopoiesis. Nat Genet. 2020;52(11):1219-1226.
7 Krishnan AY, Mei M, Sun CL, et al. Second primary malignancies
after autologous hematopoietic cell transplantation for multiple myeloma. Biol Blood Marrow Transplant. 2013;19(2):260-265.
8. Nadiminti K, Sidiqi MH, Meleveedu K, et al. Characteristics and outcomes of therapy-related myeloid neoplasms following autologous stem cell transplantation for multiple myeloma. Blood Cancer J. 2021;11(3):63.
9 Attal M, Lauwers-Cances V, Marit G, et al. Lenalidomide maintenance after stem-cell transplantation for multiple myeloma. N Engl J Med. 2012;366(19):1782-1791.
10 Palumbo A, Bringhen S, Kumar SK, et al. Second primary malignancies with lenalidomide therapy for newly diagnosed myeloma: a meta-analysis of individual patient data. Lancet Oncol. 2014;15(3):333-342.
11. Sperling AS, Guerra VA, Kennedy JA, et al. Lenalidomide promotes the development of TP53-mutated therapy-related myeloid neoplasms. Blood. 2022;140(16):1753-1763.
12. Maia C, Puig N, Cedena MT, et al. Biological and clinical significance of dysplastic hematopoiesis in patients with newly diagnosed multiple myeloma. Blood. 2020;135(26):2375-2387.
13. Mouhieddine TH, Sperling AS, Redd R, et al. Clonal hematopoiesis is associated with adverse outcomes in multiple myeloma patients undergoing transplant. Nat Commun. 2020;11(1):2996.
The F8 genotype is an important risk factor for the development of inhibitors against FVIII, but its significance for whether the inhibitor becomes a high-responding (HR) or low-responding (LR) inhibitor has not been studied before. In this large PedNet cohort study (N=1,202) we can highlight the risk to develop inhibitor against FVIII by genotype - stratified as high, intermediate, and low -, but also whether the inhibitor becomes a HR or LR inhibitor, which is clinically important.
Inhibitor development in severe hemophilia A (HA; FVIII<1%) is a feared complication, occurring in around 30% of patients.1 Inhibitors can be classified as LR or HR, based on whether the historical peak inhibitory titer was <5 BU (Bethesda Units) or >5 BU, respectively. While the genetic F8 variant is known to be an important risk factor,2,3 it is not known how the F8 genetic variant affects the development of a HR or LR inhibitor, which may be important when choosing initial therapy or immune tolerance therapy (ITI) for a patient. Based on the large PedNet Registry cohort, we aimed to study how the F8 genotype affects the risk (high-, intermediate- or low-risk) of developing inhibitors against FVIII, and, in addition, if the genotype affects if the type of inhibitor becomes a HR or LR inhibitor (clinicaltrials gov. Identifier: NCT02979119).
All children aged <18 years with severe HA, registered in
the PedNet registry by January 1, 2021, who had undergone at least 50 exposure days (ED) to FVIII concentrate, or who had developed an inhibitor, were included in our study (N=1,202). The well-characterized study group with a population-based inclusion per center, is followed up annually in 33 hemophilia centers in 18 countries and information on FVIII treatments and measurements of inhibitor titers are available, as well as accurate classification into having the LR or HR type inhibitor.4 Contributors are listed in Online Supplementary Table S1.
All genetic reports were reviewed at the coordinating center (Malmö, Sweden) and the variants were revised regarding the nomenclature according to the recommendations of the Human Genome Variation Society (HGVS) and classified according to the American College of Medical Genetics and Genomics criteria and terminology.5 In this study, only the reported likely pathogenic/pathogenic variants causing HA were included. In line with established F8 gene databases, the variant effect was classified as missense, nonsense, frameshift, large deletion (>50 base pairs), large duplication (>50 base pairs), small deletion/insertion/duplication (<50 base pairs), silent variant, splice site variant, promoter variant, intron variant, and inversion (inv) which was subdivided into inv22 and inv1.
Inhibitors were reported in 396 of the 1,202 patients (32.9%),
with 10.6% being LR and 22.3% HR. In 1,086 patients, a genetic report was available (90.3%). The most prevalent variant effects were: inv22 in 47.6% (N=573), frameshift in 15.3% (N=184), missense variants in 11.2% (N=135), nonsense variants in 8.5% (N=102), large deletions >50 bp in 3% (N=32), splice site in 3% (N=36), inv1 in 1% (N=17). When the spectrum of variant effects in patients with inhibitors versus patients without inhibitors was analyzed, the inv22 variant was found more often in patients with inhibitors, 62% (244/396) compared to 41% of patients without inhibitors (328/806; P<0.00001). Similarly, large deletions (>50 bp) were more prevalent in patients with inhibitors 4.5% (18/396) compared to patients without inhibitors 2% (14/806; P=0.0045). Patients without inhibitors showed significantly more frameshift variants (18% vs. 11%; P=0.0015) and missense variants (16% vs. 2%; P<0.00001) compared to inhibitor patients (Figure 1).
The highest incidence of inhibitors was seen in patients with large deletions, 56.2% (18/32), followed by inv22 (42.7%; 244/573), nonsense variants (31.4%; 32/102), splice site variants (30.6%; 11/36), inv1 variant (23.5%; 4/17), frameshift variants (22.8%; 42/184) and missense variants (6.7%; 9/135), with the overall lowest inhibitor incidence (Figure 2A; Online Supplementary Table S2).
When the effect of the F8 variant on whether the inhibitor became HR or LR was analyzed (Figure 2B; Online Supplementary Table S2), the ratio HR (28.5%; 163/572) to LR inhibitors (14.2%; 81/572) in patients with inv22 was 2.01 (95% confidence interval [CI]: 1.71-2.39). Patients with large deletions (N=32) were more likely to develop a HR (46.9%; 15/32) inhibitor compared to LR (8.3%; 3/32) with a ratio of 5.6 (95% CI: 1.6-16.9). In addition, the HR inhibitor incidence was significantly higher at 73.3% (11/15) for patients with multiple exons, compared to 21.4% (3/14) for the patients with single-exon deletions (P=0.036). For LR, no statistical
difference was seen between patients with multiple exons versus single exon. HR inhibitors were more likely to be present in patients with nonsense variants, occurring in 26.5% (27/102), compared with LR inhibitors in 4.9% (5/102), with a ratio of 5.4 (95% CI: 2.17-13.5). In splice site variants (N=36), HR developed in 19.4% and LR in 11.1% (ratio 1.75; 95% CI: 0.5-5.4). Missense variants had the overall lowest inhibitor incidence (6.7%; 9/135), LR inhibitors developed in 4.4% (6/135) and HR inhibitors in 2.2% (3/135) with a ratio of 0.5 (95% CI: 0.13-1.95). Frameshift variants had no difference in risk of developing HR or LR inhibitors. In the group of 17 patients with the inv1 variant, 23.5% of patients (4/17) developed a HR inhibitor.
Sub-analyses were made to study some factors that in previous studies have been shown to be important for the incidence per se of inhibitors. No statistical significance was found when comparing variants in the light chain versus heavy chain or variants in the C1/C2-junction versus non-C1/C2-junction. In splice site variants, no difference was found between canonical and non-canonical (i.e., +/2 bp from splice site) or between poly-A versus non-poly-A runs. Notably, 31 of 43 inhibitors (72.1%) in patients with frameshift variants occurred in exon 14, which is the largest exon. No difference in inhibitor incidence could be seen between exon 14, 24.8% (31/125) versus outside exon 14, 20.3% (12/59).
In the publication by Oldenburg et al. in 2002, a stratification into ‘low-risk and high-risk mutations’ was made, with low-risk variants defined as <10% and high-risk variants defined as >30% for developing an inhibitor.6 In the original study, 364 single center patients with all severities of HA were included. High-risk variants included large deletions, nonsense, and inv22 and were also described as ‘null-mutations’. Since inv22 is the most common variant, it has also been used as a reference to determine inhibitor
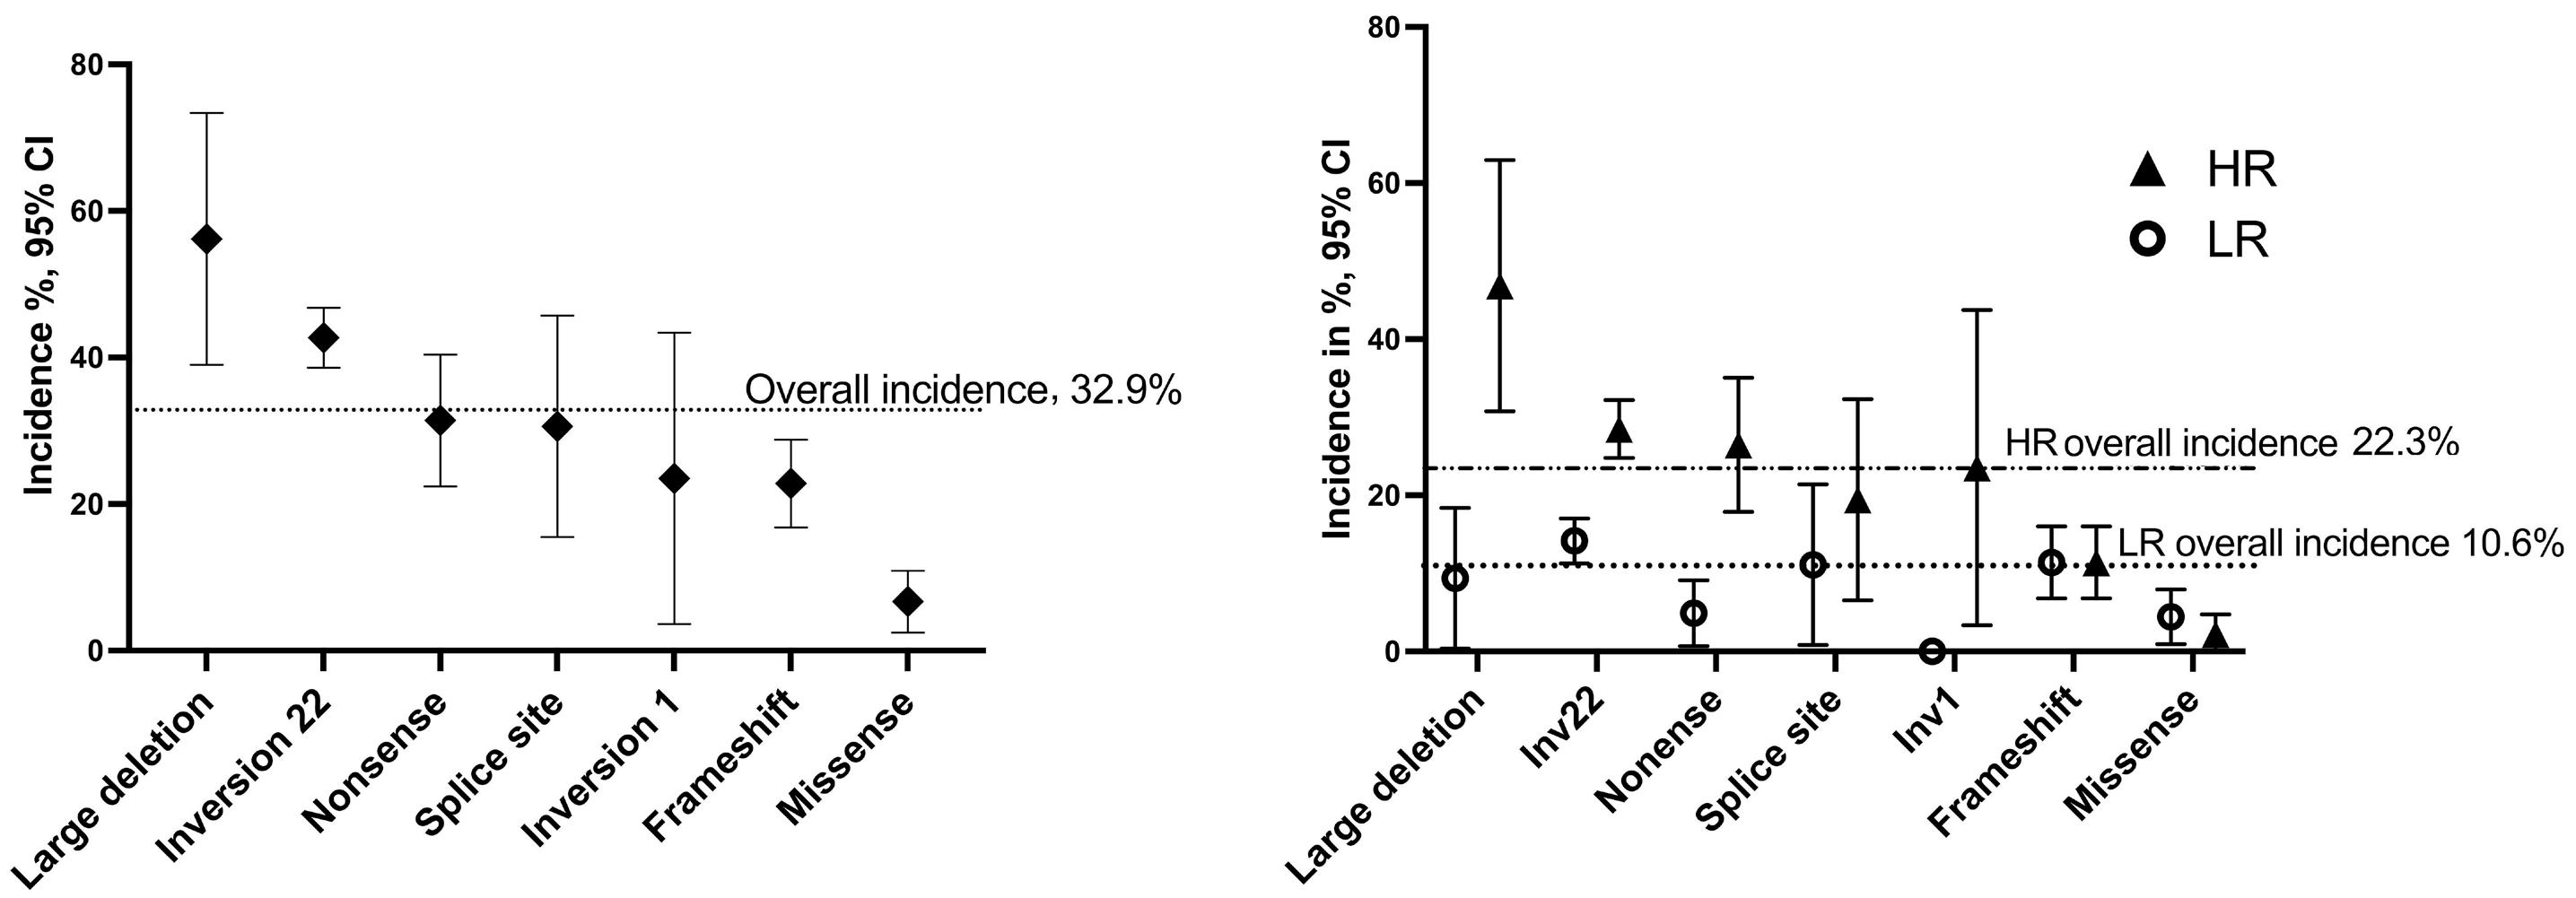
All inhibitors
High risk
Intermediate risk
Low risk
LR inhibitors
High risk
Intermediate risk
inv22, large deletions nonsense, splice site, inv1 missense, frameshift
Low risk inv22 frameshift, splice site, large deletions missense, nonsense
HR inhibitors
High risk
Intermediate risk
Low risk
inv22, large deletions nonsense, splice site, inv1 missense, frameshift
LR: low-responding; HR: high-responding; inv: inversion.
development in other variants, e.g., in the meta-analysis of Gouw et al. 3 We chose not to compare the other variant effects with inv22 since the incidence of inhibitors in inv22 varies hugely between studies: e.g., in the meta-analysis of Gouw et al., the incidence varied between 0-77% in 30 studies with different population sizes. Garagiola et al. (2018) suggested a stratification into low-, intermediate- and high-risk variants after a review of the literature: large insertion/deletion (multiple exons) and nonsense mutations on the light chain were classified as high-risk; large insertion/deletion (single exon), nonsense mutations on the heavy chain, inv22 and inv1, as intermediate risk, and frameshift, missense mutations and splice-site mutations as low risk.7 In our study, the risk of inhibitor development was evaluated for each genotype by calculating the incidence per variant effect versus the incidence for all other variant effects combined. Based on these results, we propose a division into high-, intermediate and low-risk for the development of inhibitors of all types but also with new information about the risk of HR or LR type of inhibitor (Table 1). We can confirm in our study that patients with large deletions, but also inv22, could be classified as high-risk variants whereas, on the other hand, patients with frameshift and missense could be classified as low-risk variants; nonsense, splice site, inv1 as intermediate-risk variants. The same calculation was not only done for inhibitor development, but also for development of HR and LR inhibitors (Table 1).
The strengths of this study are the large well-characterized study group with a population-based inclusion per center prospectively collected with very detailed information on the first 50 ED and the genotype characterized and being curated following current American College of Medical Genetics and Genomics guidelines in 90.3% of the patients. The spectrum of variants in our cohort have been described previously and are comparable with those cited in other locus-specific databases, such as EAHAD and
CHAMPS.8 Despite the large cohort there were relatively limited numbers of patients with splice site, inv1 and large deletion variants as well as for analyses of heavy chain versus light chain, or canonical to non-canonical variants in splice sites.
A LR inhibitor is a minor clinical problem and ITI may not be advisable in those patients. 9 Therefore, our results, which can not only be used to assess the risk of each type of inhibitor when the F8 genotype is known in the patient, may also have a valuable clinical relevance when it comes to weighing in the risk of different types of inhibitors into the choice of therapy.
Nadine G. Andersson,1,2,3 Veerle Labarque,4 Mutlu Kartal-Kaess,5 Fernando Pinto,6 Torben Stamm Mikkelsen,7 Rolf Ljung2 and PedNet Study Group members8
1Center for Thrombosis and Hemostasis, Skåne University Hospital, Malmö, Sweden; 2Department of Pediatrics, Skåne University Hospital, Lund, Sweden; 3Department of Clinical Sciences and Pediatrics, Lund University, Lund, Sweden; 4Department of Pediatrics, Pediatric Hematology and Oncology, University Hospitals Leuven, Leuven, Belgium; 5Division of Pediatric Hematology and Oncology, Department of Pediatrics, Inselspital, University Hospital, University of Bern, Bern, Switzerland; 6Royal Hospital for Children, Glasgow, UK; 7Department of Pediatric Oncology and Hematology, University Hospital, Aarhus, Denmark and 8Pednet Haemophilia Research Foundation, Barn, the Netherlands
Correspondence:
N. G. ANDERSSON - nadine.gretenkort_andersson@med.lu.se
https://doi.org/10.3324/haematol.2023.284095
Received: September 6, 2023.
Accepted: October 19, 2023. Early view: October 26, 2023.
©2024 Ferrata Storti Foundation
Published under a CC BY-NC license
Disclosures
NGA has served as a speaker and/or on advisory boards for CSL Behring, Octapharma and Sobi. VL has been as a speaker and/or advisor for Bayer, Novartis, NovoNordisk, Octapharma, Roche, Sobi, and Takeda. MK-K has been a speaker and/or advisor for Bayer, Sobi, Takeda and Roche. MK-K has received grants from Roche and financial support for travel, accommodation, and expenses from Bayer, NovoNordisk, Sobi, Takeda and Jazz. FP has received financial support for travel and accommodation from Roche. TSM has no conflicts of interest to disclose. RL has received compensation for consultancy work (DMC, advisory board) or
remuneration for lectures from SOBI, Pfizer, Sanofi, Roche, Takeda, NovoNordisk and Idogen. None of these conflicts of interest are relevant to this paper.
All authors have participated in the concept and design; analysis and interpretation of data; drafting and/or revising of the manuscript. Each author listed on the title page of the manuscript has approved the submission of this version of the manuscript and takes full responsibility for the manuscript. Contributors belonging to the PedNet Study Group are listed as the collaborative group “PedNet Group” in Online Supplementary Table S1 of the Online Supplementary Appendix
The authors greatly appreciate the support of the PedNet Foundation staff members, especially Marloes de Kovel and Ella van Hardeveld.
1. Gouw SC, van den Berg HM, Fischer K, et al. Intensity of factor VIII treatment and inhibitor development in children with severe hemophilia A: the RODIN study. Blood. 2013;121(20):4046-4055.
2. Schwaab R, Brackmann HH, Meyer C, et al. Haemophilia A: mutation type determines risk of inhibitor formation. Thromb Haemost. 1995;74(6):1402-1406.
3. Gouw SC, van den Berg HM, Oldenburg J, et al. F8 gene mutation type and inhibitor development in patients with severe hemophilia A: systematic review and meta-analysis. Blood. 2012;119(12):2922-2934.
4 Fischer K, Ljung R, Platokouki H, et al. Prospective observational cohort studies for studying rare diseases: the European PedNet Haemophilia Registry. Haemophilia. 2014;20(4):e280-286.
5. Richards S, Aziz N, Bale S, et al. Standards and guidelines for the interpretation of sequence variants: a joint consensus recommendation of the American College of Medical Genetics and Genomics and the Association for Molecular Pathology.
This study is supported by the PedNet Hemophilia Research Foundation, by grants from Region Skåne (2022-1195) and Aroseniusfonden, Sweden (2022). Unrestricted sponsorship for the PedNet Haemophilia Foundation is currently received from Bayer AG, Biotest AG, LFB Biotechnologies, Novo Nordisk Healthcare AG, Pfizer SRL, CSL Behring GmbH, Sanofi, Swedish Orphan Biovitrum AB (SOBI), Takeda and Hoffmann La-Roche.
All data used in this study are from the PedNet Registry, which is governed by the non-profit-making organization PedNet Hemophilia Research Foundation. The data that support the findings of this study are available from the Registry of the PedNet Hemophilia Research Foundation. Restrictions apply to the availability of these data, which were used under license for this study. Data are available from the authors with the permission of the PedNet Registry Foundation (www.pednet.eu).
Genet Med. 2015;17(5):405-424.
6. Oldenburg J, El-Maarri O, Schwaab R. Inhibitor development in correlation to factor VIII genotypes. Haemophilia. 2002;8(Suppl 2):23-29.
7 Garagiola I, Palla R, Peyvandi F. Risk factors for inhibitor development in severe hemophilia a. Thromb Res. 2018;168:20-27.
8. Labarque V, Mancuso ME, Kartal-Kaess M, Ljung R, Mikkelsen TS, Andersson NG. F8/F9 variants in the population-based PedNet Registry cohort compared with locus-specific genetic databases of the European Association for Haemophilia and Allied Disorders and the Centers for Disease Control and Prevention Hemophilia A or Hemophilia B Mutation Project. Res Pract Thromb Haemost. 2023;7(1):100036.
9 van den Berg HM, Mancuso ME, Konigs C, et al. ITI treatment is not first-choice treatment in children with hemophilia A and low-responding inhibitors: evidence from a PedNet Study. Thromb Haemost. 2020;120(8):1166-1172.
Extramedullary disease (EMD) is a rare manifestation of multiple myeloma (MM) characterized by a proliferation of plasma cells (PC) outside of the bone marrow (BM), and it represents an unmet medical need in the treatment of MM patients (pts). Thus, a better characterization of PC features of the EMD is critical to improve the treatment.
EMD can be found at the time of diagnosis (primary EMD) with an estimated incidence of 3–5% or at the time of relapse (secondary EMD) with an incidence of 6-20%.1 Moreover, EMD can be divided into two groups: EMD bone-related (EM-B), in which PC extend directly from osteolytic bone lesions, and EMD soft tissue-related (EM-S) that results from PC infiltration into soft tissues with no relationship to the bone. EM-B cells are still partially dependent on the BM microenvironment, while EM-S cells carry different biological characteristics.2 The outcome is worse for pts with EM-S compared with those with EM-B and this difference could be due to the different biological features of the EM PC.3 The typical sites of EM-S may be different according to the stage of MM. At diagnosis, EMD is typically found in the skin and soft tissues, with usually only one site involved.1,4 At relapse, EMD can appear in more unusual sites such as the liver, kidneys, lymph nodes, breast, pleura, pericardium, and the central nervous system.1,3 The presence of EM-S represents an aggressive form of MM linked to high-risk genetic features, increased proliferation, and resistance to therapies.2-4
Previous studies have shown that 1q21 amplification (amp(1q21)), a high-risk chromosomal abnormality, occurs more frequently in pts with EMD.5 It was shown that the frequency of amp(1q21) is higher in EM lesions than in BM. Therefore, it is possible that amp(1q21) is a contributing factor to EMD development. It is also noted that the increase in EMD amp(1q21) copy number negatively affected both progression-free survival (PFS) and overall survival (OS).5 Beyond genetic alteration, EM PC also present a modulation of different adhesion molecules involved in BM homing, which supports clonal PC migration through the bloodstream.6,7 EM PC demonstrate downregulation of adhesion glycoprotein CD56, which normally maintains the connection of MM cells to the BM osteoblastic niche.6,7 EM PC also demonstrate an upregulation of CD44, which is a membrane glycoprotein involved with cell homing and recirculation. The CD44v isoform is commonly found in cancer stem cells and has low-level expression in normal cells.7
Another important adhesion molecule in the MM biology is CD38: a multifunctional transmembrane glycoprotein, highly expressed by both normal and malignant PC. CD38 is also an ectoenzyme involved in the production of adenosine in
the BM niche.8 CD38 is considered a hallmark of MM cells and a therapeutic target for an anti-CD38 antibody-based approach. However, there is limited data regarding the efficacy of daratumumab, an anti-CD38 monoclonal antibody, in EMD.3 Clinical trials have demonstrated that daratumumab is less effective in EMD pts compared to MM pts without EMD.9 This phenomenon could be explained by decreased CD38 expression on EMD PC.10,11
The CD38 expression profile of PC in EMD pts is still unknown thus in this study, we performed a comparative analysis of CD38 expression and other adhesion molecules such as CD56 and CD44 between BM PC and EMD PC. The study was approved by the local Ethic Committee and conducted according to the Declaration of Helsinki. Pts included in the study signed a written informed consent.
We retrospectively investigated 22 MM pts with biopsy-proven EMD treated in our hematological unit at the University of Parma from 1999 to 2020. The immunostaining from BM and EMD biopsies were scored on a 5-tiered scale using a semi-quantitative evaluation of the percentage of CD38, CD56, and CD44 expressed by MM cells.
In our cohort of MM pts, three pts presented with EMD at diagnosis, while 19 pts presented EMD at relapse. Forty six percent of the pts presented with a high-stage MM (International Staging System [ISS] III). Twenty pts presented an initial diagnosis of MM, while two pts were affected by primary PC leukemia (pPCL). The median age at the time of the diagnosis was 67 years old (range, 47-76). Men made up 60% of the entire population. The median time to EMD appearance during relapse was 29 months (range, 9-201 months). The most frequent MM subtype was light chain MM (41%), followed by immunoglobulin (Ig)G and IgA. A median IgG lactate dehydrogenase value, available in 14 pts, was slightly elevated (517 U/L , normal value <500 U/L) (Table 1).
Characteristics
N=22
Sex: M/F (%) 13/9 (60/40)
Median age in years (range) 67 (47-76)
Diagnosis: MM/pPCL (%) 20/2 (91/9)
EMD-S: diagnosis/relapse (%) 3/19 (14/86)
Isotype: IgG/IgA/LC (%) 6/7/9 (27/32/41)
Light chain: κ/λ (%) 10/12 (45/55)
ISS: I/II/III (%) 6/6/10 (27/27/46)
M: male; F: female; MM: multiple myeloma; pPCL: primary plasma cell leukemia; EMD-S: extramedullary disease soft tissue-related; Ig: immunoglobulin; LC: light chain; ISS: International Staging System.
The most frequent CRAB criteria were anemia (73%), followed by bone disease (64%), renal failure (27%), and hypercalcemia (14%). In our population, a high BM tumor burden was documented with a median BM PC infiltration equal to 60% (range, 0-90%).
Overall, 15 of 18 (88%) pts with available in situ hybridization (FISH), showed two or more cytogenetic alterations. The most frequent cytogenetic aberration reported was amp(1q21) (74%), as reported by the literature, followed by del(13q) (58%), del(1p32) (42%), and hyperdiploidy (21%) ( Online Supplementary Figure S1 ).
Fifty-five percent of MM pts developed multiple plasmacytomas. The most common sites were soft tissue and the liver/spleen, which represent 42% of the total EMD, followed by lymph nodes (15%). In 41%, the EMD relapse was dissociated from the BM relapse.
Furthermore, our immunohistochemistry analysis showed a high score of CD56 (3-4) in five of 18 (28%) EMD samples and was absent in 12 of 18 (67%) pts. Discordant expression of CD56 was observed in 17% of samples, with a strong downregulation in the EMD samples compared to BM. CD44 showed a high score in ten of 16 (63%) EMD samples and was absent in three of 16 (19%). Four pts (25%) showed an upregulation of CD44 expression in the EMD samples compared to the BM (Figure 1). Moreover, the expression of CD38 had a high score in 15 of 19 BM samples (79%) and was absent in three of 19 (16%) EMD samples. A downregulation of CD38 expression was observed in 26% of the pts with in the EMD samples
compared to BM. Indeed, 42% of total EM samples were characterized by a low CD38 immunohistochemical score with a percentage of positive PC inferior to 49%. Noteworthy, in about a quarter of pts with matched BM and EMD biopsies available, a reduction of CD38 expression on neoplastic PC was observed in EM samples compared to BM (Figure 2).
This observation confirms that CD38 median fluorescence intensity (MFI) is higher in BM PC compared to circulating tumor cells, which are characterized by a weak dependence on the BM microenvironment and a tendency to egress in peripheral blood.12 Moreover, we have shown that pts with a low EMD immunohistochemical score in EM had lower baseline CD38 expression levels on BM PC compared with pts with a high immunohistochemical score (mean log 10 MFI CD38: 4,3 vs. 3,7; P =0.004). In addition, we evaluated the OS in the cohort of MM pts according to the CD38 immunohistochemical score previously used in EMD and BM samples. We found that pts with EMD and a low CD38 score have worse OS compared to pts with a high CD38 score (7,3 vs . 18,05 months; P =0.039). This observation is in line with another study that showed how a CD38-low CD45 + CD81 + phenotypic profile identified a group of MM pts with poor outcomes.13
Regarding the treatment of this cohort of pts, 20 of them received active treatment for EMD. Two pts did not receive active treatment for EMD because they had poor performance status. Radiation therapy as local therapy was delivered to two pts mainly with a disease control
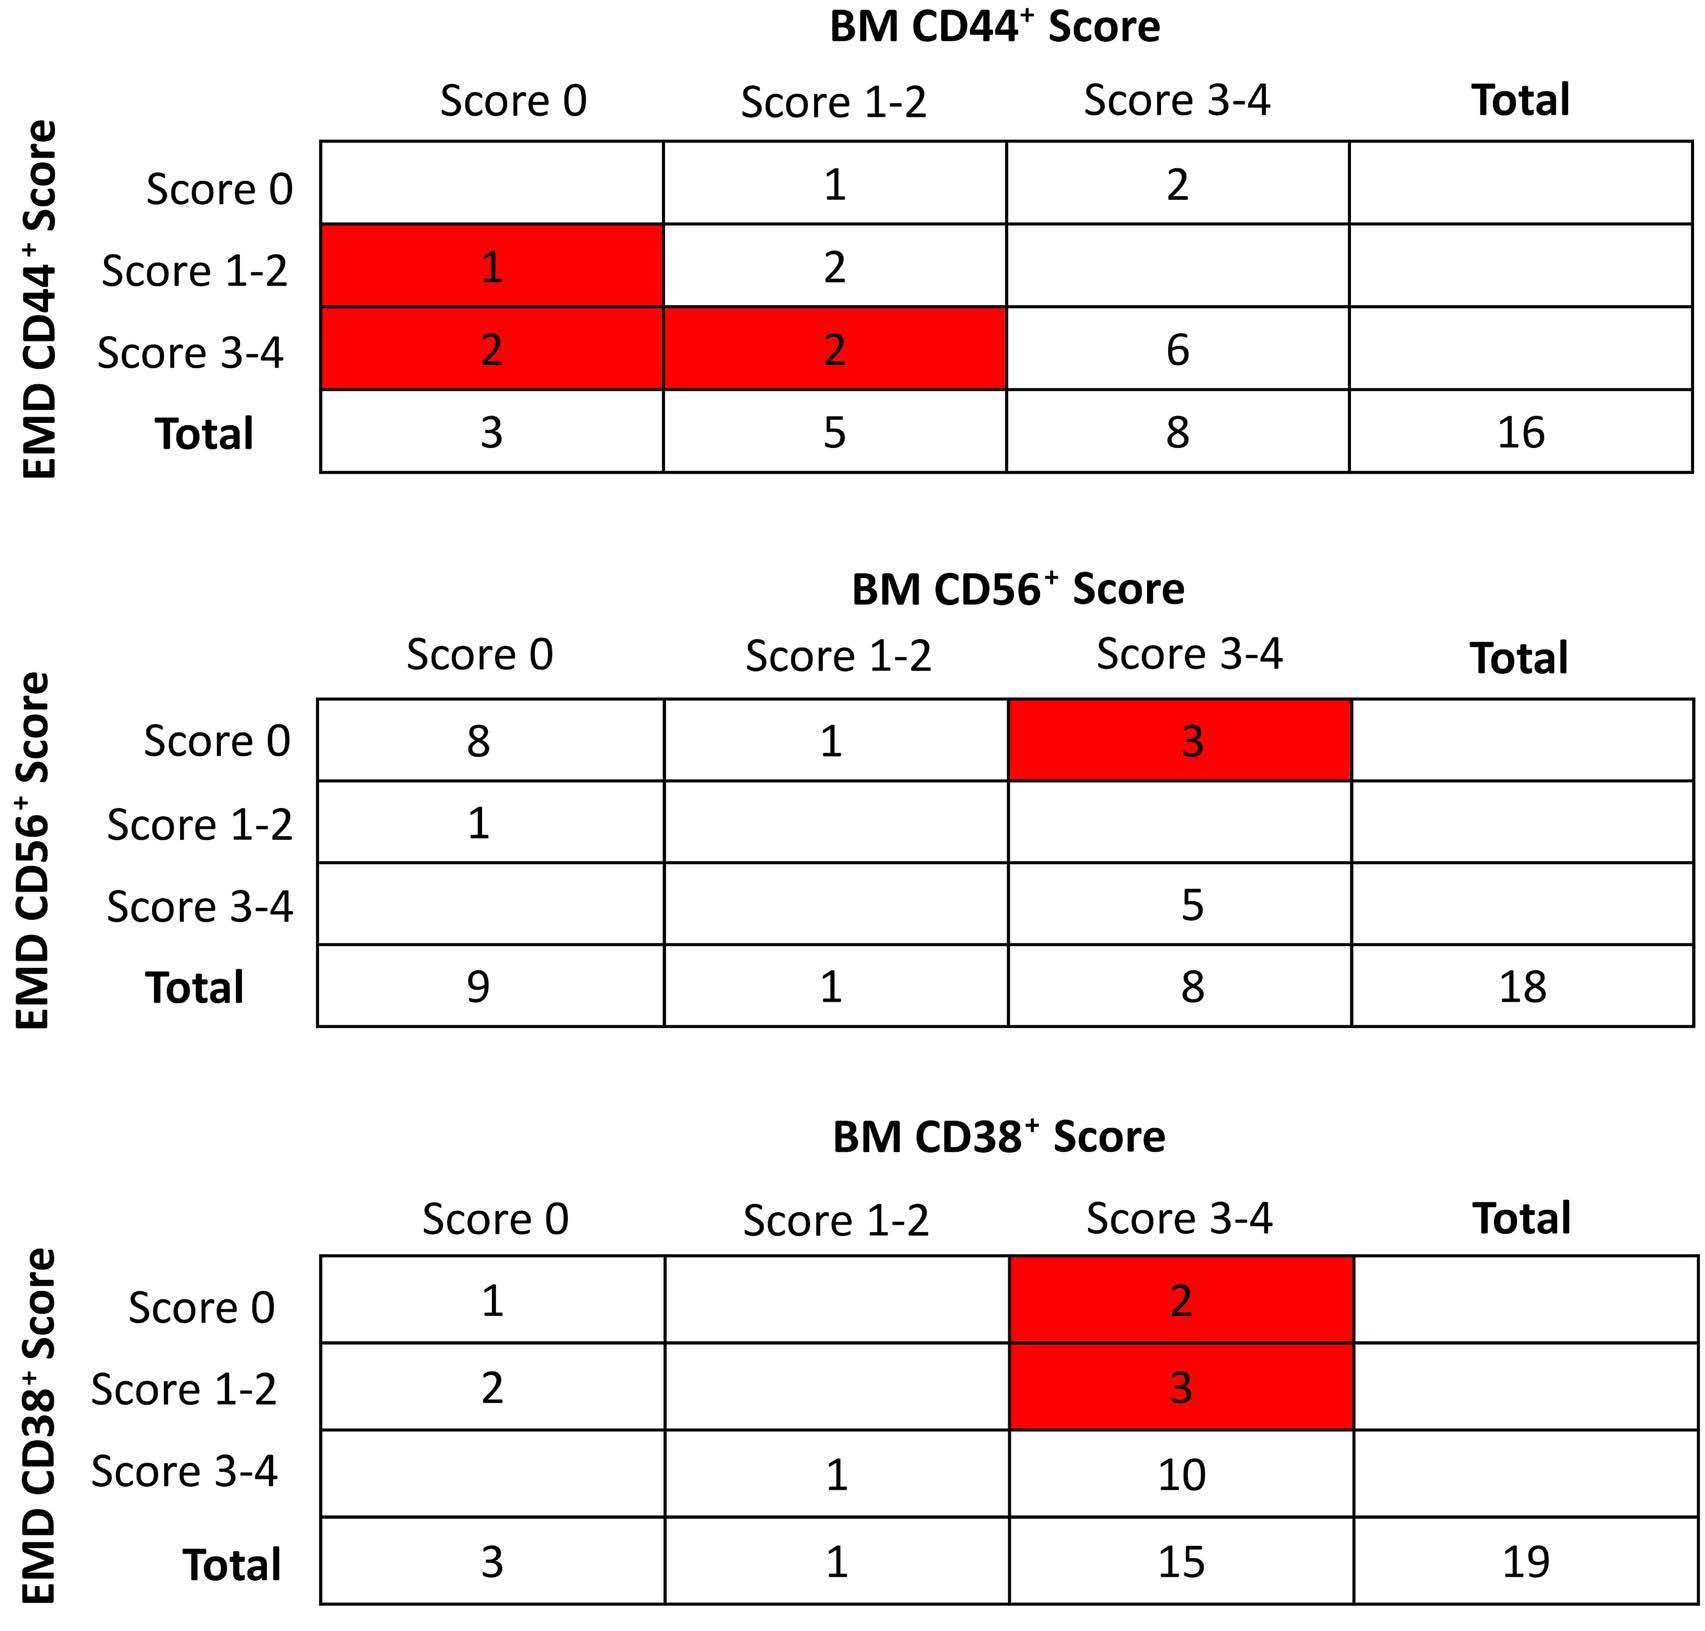
and extramedullary disease (EMD). (B) CD56 IHC
and EMD.
and EMD.
intent. Orchiectomy, a surgical procedure, was performed in two pts with an isolated EM relapse in the testes. Conventional chemotherapy was administered to three young (age ≤70 years) pts. Of the novel agents, proteasome inhibitors (PI) were the drugs most frequently used (40%), mainly in association with alkylating agents or anthracycline. Immunomodulatory drugs were administered mostly to pts already exposed to protease inhibitors (35%).
Daratumumab was used in one pts in association with conventional chemotherapy. High-dose chemotherapy followed by autologous stem cell transplant (SCT) was performed in four of 20 (20%) pts, while allogenic SCT was performed in one pt.
The median OS from MM diagnosis in the entire study population was 49.3 months (95% confidence interval [CI]: 30.97-NA) while the median OS from EMD diagnosis was only 13.1 months (95% CI: 6.8-25.3). It confirms the poor outcome of this MM clinical feature as reported by
other studies.14
In conclusion, our data indicate that the lack of CD38 expression may occur in EMD lesions when compared to BM lesions with a discordant expression of CD44 and CD56. The lack or reduced expression of CD38 in a consistent percentage of EMD samples, may have a potential therapeutic impact involving the efficacy of anti-CD38 monoclonal antibodies in MM pts with EMD. As has already been reported in the literature,11 pts with MM and EMD seem to have a lower response to anti-CD38 antibody than pts with MM without EMD. At the moment, however, this finding does not lead to a change of therapy for this subgroup of pts. Clinical data regarding the efficacy of daratumumab in EMD are needed, and clinical trial of daratumumab combined with bortezomib, cyclophosphamide, and dexamethasone in pts with EMD at diagnosis and first relapse is ongoing (EMN19 study, clinicaltrials gov. Identifier: NCT 04166565).15
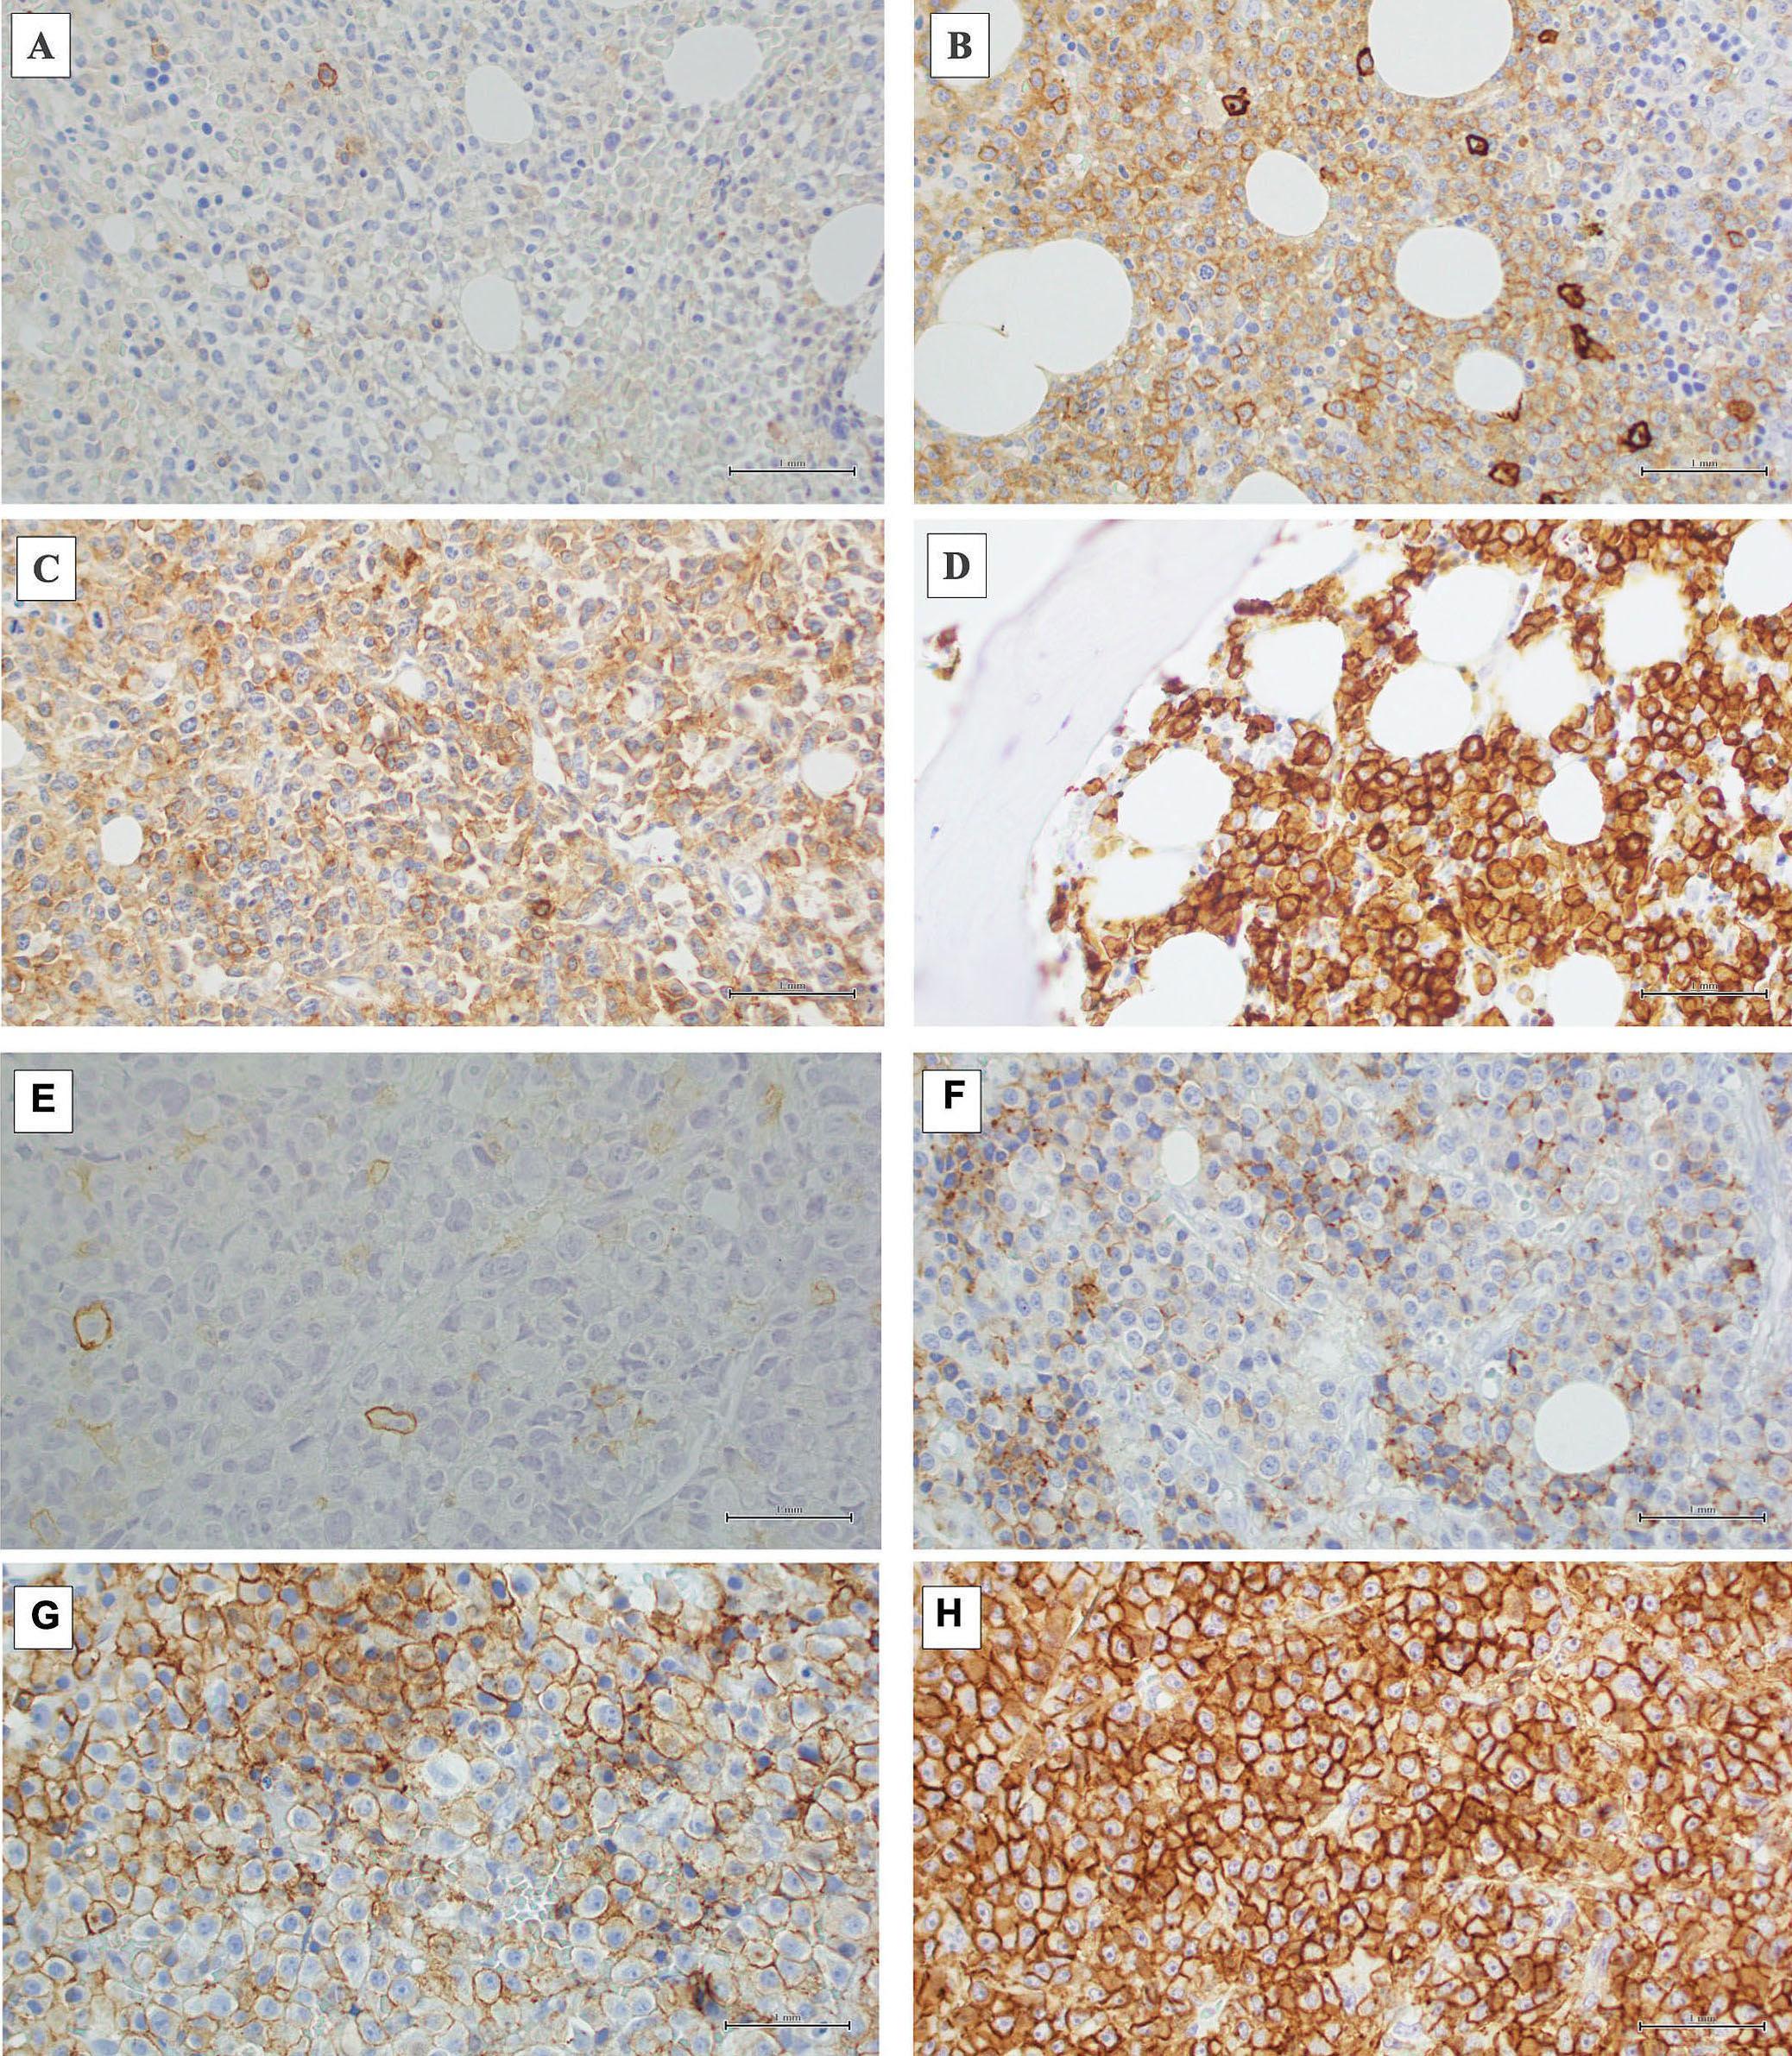
plasma cells assessed by immunohistochemistry on bone marrow and on extramedullary sites. (A) Immunohistochemistry (IHC) score 0 in bone marrow (BM) (rare CD38+ cells, <5%). (B) IHC score 1 in BM (CD38+ cells, 5-24%). (C) IHC score 3 in BM (CD38+ cells, 25-49%). (D) IHC score 4 in BM (CD38+ cells >75%). (E) Soft tissue sample, IHC score 0 (rare CD38+ cells, <5%). (F) Soft tissue sample, IHC score 1 (CD38+ cells, 5-24%). (G) Liver sample, IHC score 3 (CD38+ cells, 25-49%). (H) Bowel sample, IHC score 4 (CD38+ cells >75%). Scale bars: 1 mm.
Laura Notarfranchi,1,° Fabrizio Accardi,1,° Cristina Mancini,2 Eugenia Martella,2 Sabrina Bonomini,3 Roberta Segreto,3 Rosanna Vescovini,1 Anna Benedetta Dalla Palma,4 Gabriella Sammarelli,4 Giannalisa Todaro,4 Paola Storti,1 Jessica Burroughs-Garcia,4 Nicolas Thomas Iannozzi,1 Vincenzo Raimondi,1 Oxana Lungu,1 Stefania Ricci,4 Luisa Craviotto1,4 and Nicola Giuliani1,4
1Department of Medicine and Surgery, University of Parma; 2Pathology Unit, Azienda Ospedaliero-Universitaria di Parma; 3Azienda Ospedaliero-Universitaria di Parma and 4Hematology and BMT Unit, Azienda Ospedaliero-Universitaria di Parma, Parma, Italy
°LN current address: Hematology Unit, Azienda USL Toscana Nord Ovest, Carrara, Italy
°FA current address: Hematology, Azienda Ospedaliera «Ospedali Riuniti Villa Sofia-Cervello», Palermo, Italy
Correspondence: N. GIULIANI - nicola.giuliani@unipr.it
https://doi.org/10.3324/haematol.2023.284169
Received: August 28, 2023.
Accepted: October 31, 2023.
Early view: November 9, 2023.
1. Jagosky MH, Usmani SZ. Extramedullary disease in multiple myeloma. Curr Hematol Malig Rep. 2020;15(2):62-71.
2. Sevcikova S, Minarik J, Stork M, Jelinek T, Pour L, Hajek R. Extramedullary disease in multiple myeloma - controversies and future directions. Blood Rev. 2019;36:32-39.
3. Bhutani M, Foureau DM, Atrash S, Voorhees PM, Usmani SZ. Extramedullary multiple myeloma. Leukemia. 2020;34(1):1-20.
4 Blade J, Beksac M, Caers J, et al. Extramedullary disease in multiple myeloma: a systematic literature review. Blood Cancer J. 2022;12(3):45.
5. Gao S, Li Q, Dong F, et al. Clinical characteristics and survival outcomes of newly diagnosed multiple myeloma patients presenting with extramedullary disease: a retrospective study. Leuk Res. 2022;115:106793.
6. Gupta S, Master S, Graham C. Extramedullary multiple myeloma: a patient-focused review of the pathogenesis of bone marrow escape. World J Oncol. 2022;13(5):311-319.
7 Casucci M, Nicolis di Robilant B, Falcone L, et al. CD44v6targeted T cells mediate potent antitumor effects against acute myeloid leukemia and multiple myeloma. Blood. 2013;122(20):3461-3472.
8. Horenstein AL, Faini AC, Morandi F, et al. The circular life of human CD38: from basic science to clinics and back. Molecules. 2020;25(20):4884.
©2024 Ferrata Storti Foundation
Published under a CC BY-NC license
Disclosures
NG received research funding and honoraria from Amgen, BristolMyers Squibb, Takeda, Celgene, Millennium Pharmaceuticals, and Janssen Pharmaceuticals. The other authors have no conflicts of interest to disclose.
Contributions
LN, FA and ABDP provided clinical data and enrolled patients. JBG, PS, NTI, VR and OL collected and processed the samples. RS, RV and SB performed the flow cytometry analysis. GT and GS performed the cytogenetic analysis. LN, FA and NG analyzed data and wrote the manuscript. FA performed statistical analysis. SR managed patients clinical data. LC read and provided comments. NG approved the final version of the manuscript. All authors contributed to the article and approved the submitted version.
Acknowledgments
We would like to thank the Associazione Italiana contro Leucemie, Linfomi e Mielomi ONLUS, ParmAIL for the support.
Data-sharing statement
The data that support the findings of this study are available from the corresponding author upon reasonable request.
9 Usmani SZ, Weiss BM, Plesner T, et al. Clinical efficacy of daratumumab monotherapy in patients with heavily pretreated relapsed or refractory multiple myeloma. Blood. 2016;128(1):37-44.
10 Li Y, Sun Z, Qu X. Advances in the treatment of extramedullary disease in multiple myeloma. Transl Oncol. 2022;22:101465.
11. Jelinek T, Sevcikova T, Zihala D, et al. Limited efficacy of daratumumab in multiple myeloma with extramedullary disease. Leukemia. 2022;36(1):288-291.
12. Paiva B, Paino T, Sayagues JM, et al. Detailed characterization of multiple myeloma circulating tumor cells shows unique phenotypic, cytogenetic, functional, and circadian distribution profile. Blood. 2013;122(22):3591-3598.
13. Arana P, Paiva B, Cedena MT, et al. Prognostic value of antigen expression in multiple myeloma: a PETHEMA/GEM study on 1265 patients enrolled in four consecutive clinical trials. Leukemia. 2018;32(4):971-978.
14 Pour L, Sevcikova S, Greslikova H, et al. Soft-tissue extramedullary multiple myeloma prognosis is significantly worse in comparison to bone-related extramedullary relapse. Haematologica. 2014;99(2):360-364.
15. Rosinol L, Beksac M, Zamagni E, et al. Expert review on softtissue plasmacytomas in multiple myeloma: definition, disease assessment and treatment considerations. Br J Haematol. 2021;194(3):496-507.
We describe a patient who lived for 20 years after a strategy of minimal myeloma treatment. If treated according to current treatment algorithms, this patient would have been heavily overtreated and might have felt under pressure to accept side effects without any benefit. With this case report, we focus on the risk of overtreatment of myeloma patients.
Since 2000, approximately 15 new drugs have been approved for multiple myeloma (MM),1 and combinations of drugs have been moving from double to triple, and now quadruple combinations. Furthermore, additional treatment strategies include consolidation therapy, maintenance therapy, and sequencing of regimens. Survival has approximately doubled in population-based studies,2 and today, long-lasting remission is a highly realistic expectation for younger myeloma patients. In addition, bispecific antibodies and chimeric antigen receptor (CAR) T-cell treatment will be added to the armamentarium and may further increase expectations. MM demonstrates considerable variation in overall survival (OS). Despite this, treatment principles have remained largely unchanged except for autologous stem cell transplantation (ASCT) and the adaption of treatment for frail and high-risk patients. This is a concern, because it is very unlikely that the same treatment principles will
be optimal for those patients with a life expectancy of three months and those of 20 years, and good predictive markers for treatment effect are lacking.
A 50-year old man was referred to hospital in 1999 with stiffness in the back and general fatigue. Tests showed IgG 59.6 g/L in serum, no light chains in urine, and normal values of hemoglobin, creatinine and calcium. He had osteolytic lesions in the skull, th8 and os pubis. Performance status was estimated to be WHO 2. Bone marrow (BM) aspirate showed 45% plasma cells and he was diagnosed with MM. An overview of treatment and responses is given in Figure 1. His first ASCT, given with vincristine, adriamycin, dexamethasone (dex) induction and high-dose melphalan (HDM), produced a complete remission. Maintenance treatment was given with interferon alpha for nine months within a clinical trial. M protein reappeared in serum after four years, reaching 5 g/L (progressive disease) after five years. The patient received a second ASCT seven years after diagnosis when backpain and small osteolytic lesions appeared. He obtained partial remission and stopped treatment, whereafter M protein started to rise slowly. The next relapse, four years later, was treated with bortezomib to which he did not respond. Treatment was changed to lenalidomide-based therapy. Altogether, four separate treatment
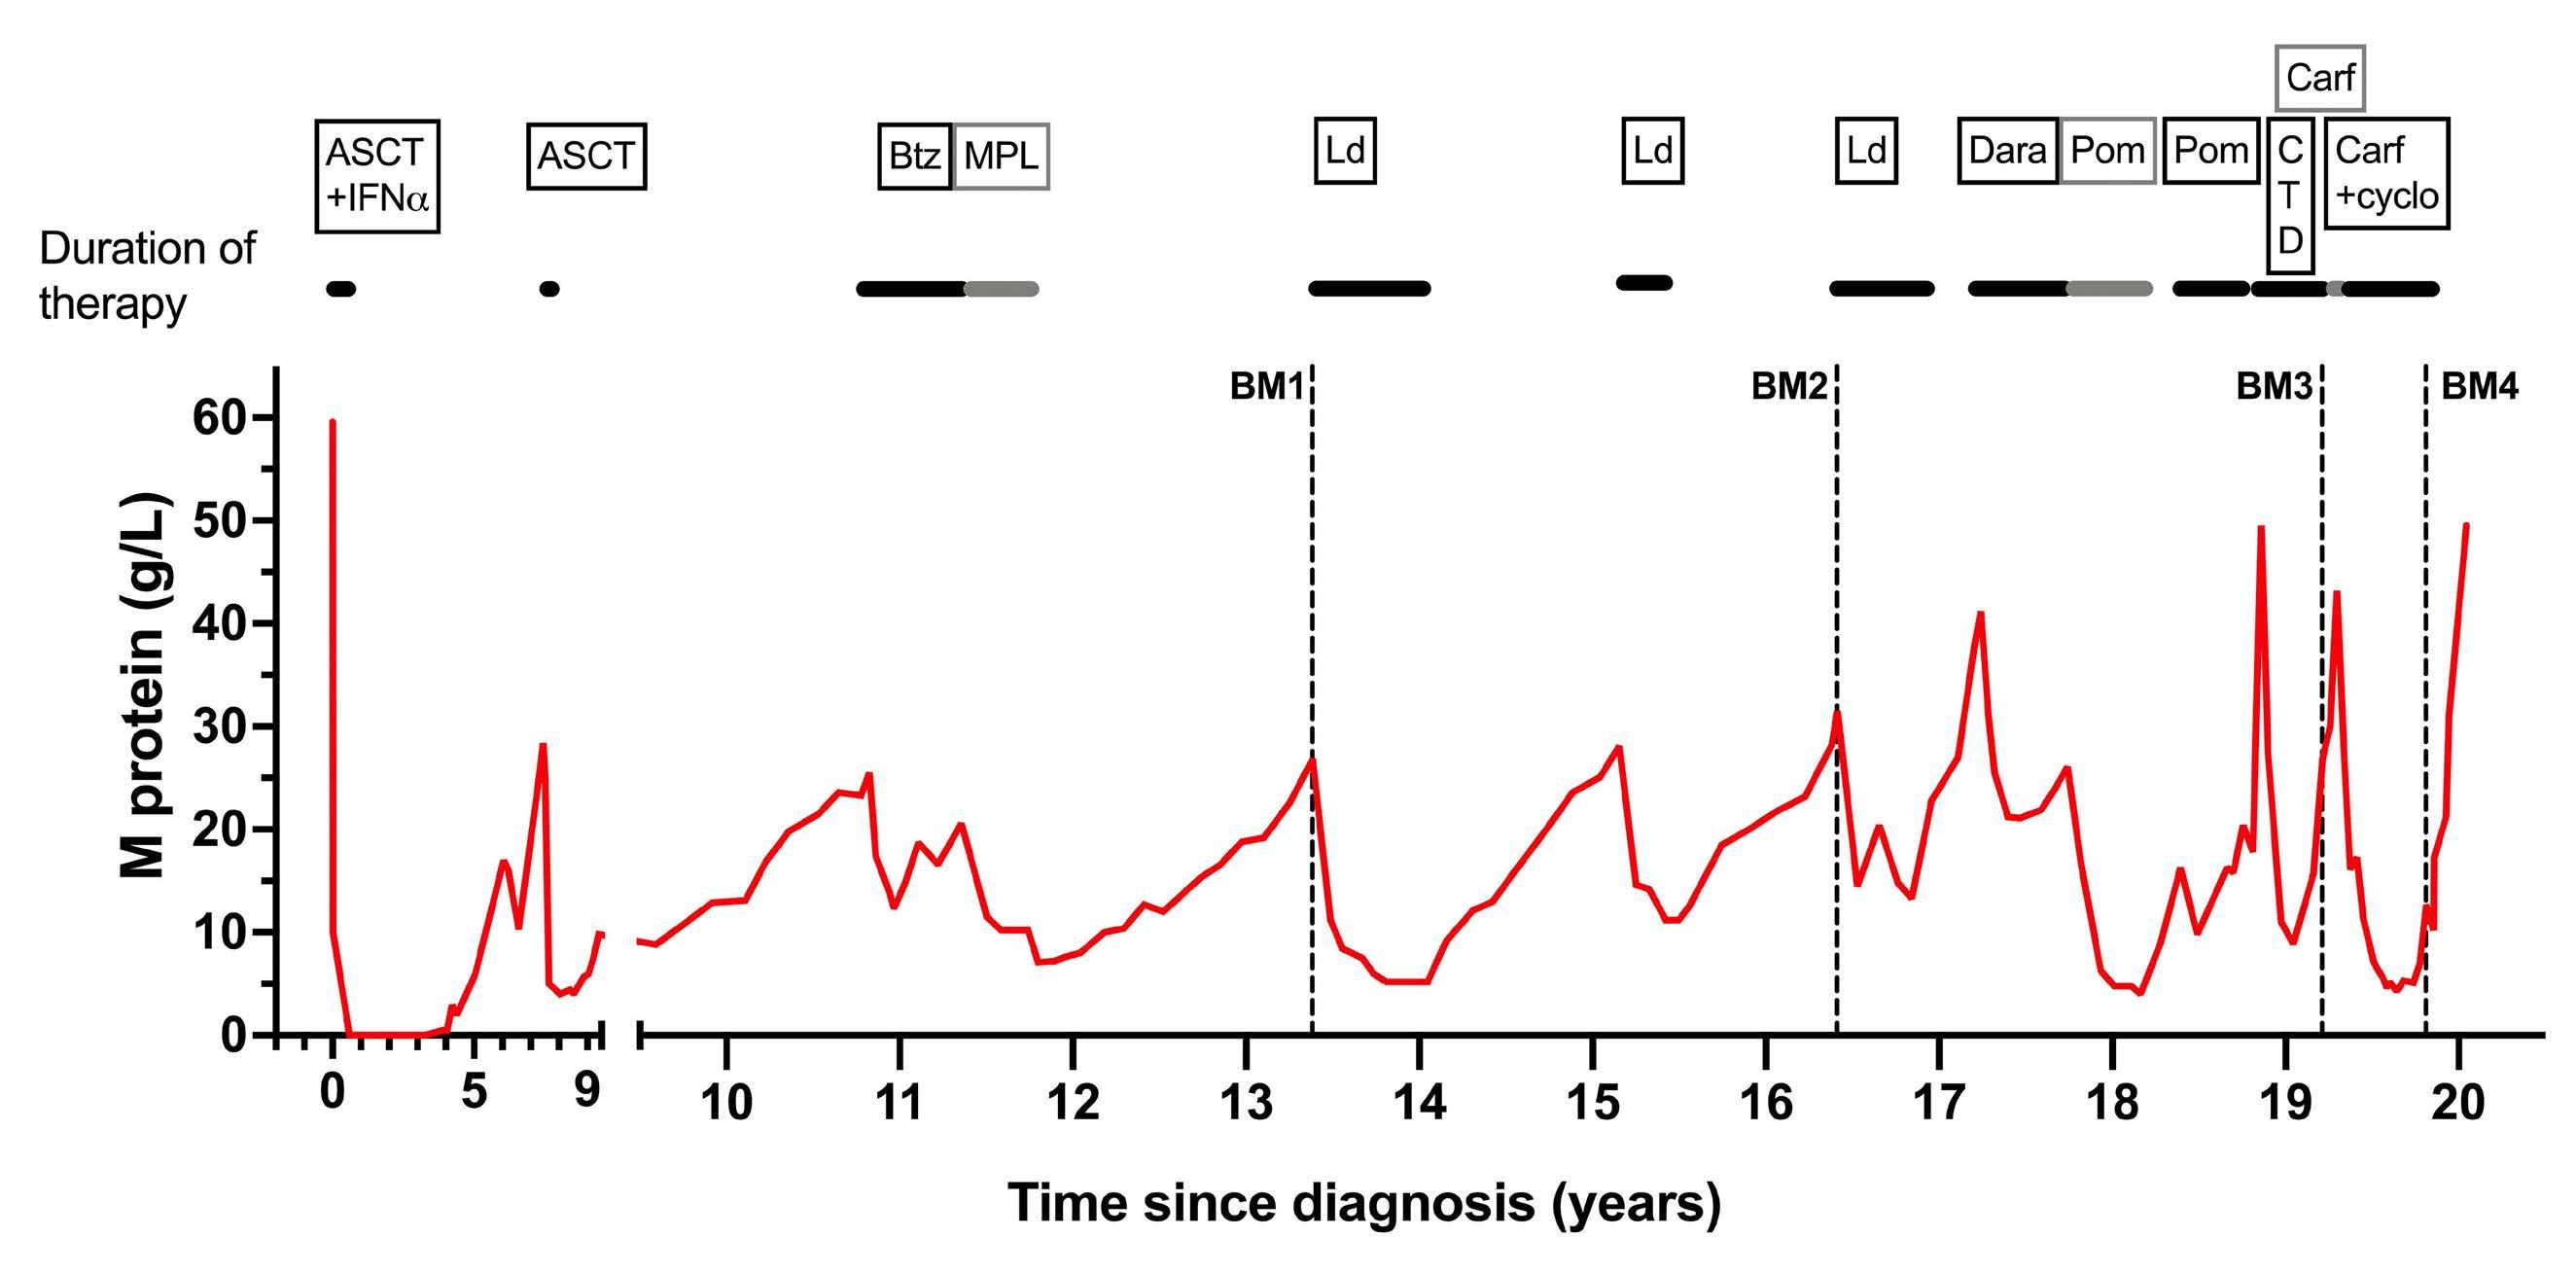
sequences were given. Treatment was continued as long as the M protein level declined and was stopped as soon as the M protein leveled off. After termination of treatment, M protein began to rise, and new treatment was started when the patient experienced relevant symptoms or according to CRAB criteria. He had grade 1-2 side effects which disappeared every time he stopped lenalidomide. The patient was informed that he had growing indolent myeloma without treatment, and we had no defined level of M protein that could suggest starting treatment. Altogether, he was sensitive to intermittent treatment with lenalidomide for a period of 77 months (Figure 1), which also included 44 months of treatment-free intervals.
During the 4 th lenalidomide-based therapy, M protein rose during treatment, demonstrating resistance. Daratumumab was administered, but after approximately four months with stable disease (SD) as best response, the M protein level increased during treatment. Pomalidomide was chosen as the next drug to which he was sensitive for ten months. The disease had now changed character and the tumor growth was more rapid. He had still significant responses to CTD and carfilzomib-cyclophosphamide lasting altogether for 12 months. However, the patient was at this point increasingly frail and fatigued, and he decided to discontinue cancer-targeted therapy. The patient passed away 20 years after being diagnosed with MM. Altogether, he had active myeloma therapy for 6.5 years and had been off myeloma drugs for 13.5 years. He received triplet myeloma drug treatment including one of the novel drugs for ten months and otherwise doublet therapy including steroids. He developed immunoparesis (suppression of normal polyclonal immunoglobulins) after ten years and had increasing problems with bacterial infections. Altogether, his general well-being was mostly good (WHO 0-2) and he had a physically active life for 18 of the 20 years with MM.
To determine the status of the tumor microenvironment (TME) in this patient with intermittent treatment and an indolent tumor, we analyzed four BM aspirates that had been taken, fractionated and frozen 13, 16, and 19 (two samples) years after diagnosis. Their relation to treatment and disease status can be seen in Figure 1 (BM1-4). Exome sequencing revealed a hyperdiploid tumor. Transcriptional analysis of CD138-positive tumor cells showed that the tumor remained stable until the last sample (BM4) when the proliferative index3 increased (Figure 2A). Mass cytometry analysis of the CD138-negative cells showed that the proportion of T cells (CD3+) was similar in BM1-3, but a drop was seen during the last two months before death (BM4) (Figure 2B). We also found that the CD4/CD8 ratios were not markedly different in BM1-3, whereas the ratio increased in BM4 (Figure 2B). We found no increase in the myeloid CD11b+CD14+HLA-DR- population in BM4 (data not shown). An increased proportion of T regulatory CD4 (Treg)
cells was found at that time point (Figure 2C), as well as an elevated proportion of exhausted CD4 T cells (Figure 2E). There was no increase in proportions of exhausted and senescent CD8 T cells in BM4 (Figure 2D). A slight increase in TCF1+ memory CD8 and CD4 T cells was seen in the last sample (BM4) (Figure 2F, G). TCR sequencing showed comparable clonality until BM4 where the hyperexpanded T-cell clones disappeared with a concurrent decrease in clonality (Figure 3A, B). Clonotype tracking revealed that the 10 most expanded TCR clones in BM1 remained relatively stable in BM1-3 but diminished or disappeared in BM4 (Figure 3C).
In summary, the T cells in the TME remained relatively stable in the period 13-19 years after diagnosis and we anticipate that this was the case also prior to the first BM sample. Two months before death (BM4), considerable changes in T-cell populations were observed with an increase in the CD4/CD8 ratio, Treg cells and exhausted CD4 T cells, as well as the disappearance of hyperexpanded T-cell clones and loss of clonality, indicating a shift in the T-cell environment at this stage. Similar changes had previously been described in patients with advanced disease.1,3,4 This coincided with transcriptional changes with an increase in PI.5 However, these data suggest that the tumor expansion seen in the last couple of months of the patient’s life was not associated with an increase in senescence or exhaustion in CD8 T cells, or a drop in TCF1+ memory T cells.4,6 Generally speaking, T-cell immunity is important for controlling tumor growth. Changes in the TME coincided with a worsening of the disease; however, at present we can only speculate on the causal relationship between these events.
Immunoparesis is commonly seen in MM demonstrating a serious deficiency in B cells producing normal immunoglobulins. In this patient, this occurred ten years prior to deterioration of the T-cell system, indicating that the disease-induced changes in these two components of the immune system may not be related.
Myeloma treatment has definitely improved but is still hampered by the lack of cure. Even bispecific antibodies and CAR T-cells have yet to prove their efficiency. In the meantime, we have to face the challenging task of treating residual indolent disease with the aim of prolonging survival without unacceptable side effects. Over time it has clearly been a tendency to intensify treatment with triplet and quadruplet drug combinations, prolonged by consolidation and maintenance. This has partly been motivated by a strong wish to remove the last myeloma cell. However, we should discern between the two very different treatment aims of cure and chronic disease. For the great majority of patients, chronic disease is still the most realistic treatment goal that often lasts for several years with a high quality of life. We should strive to give these patients optimal, not maximal, treatment. Preventing se-
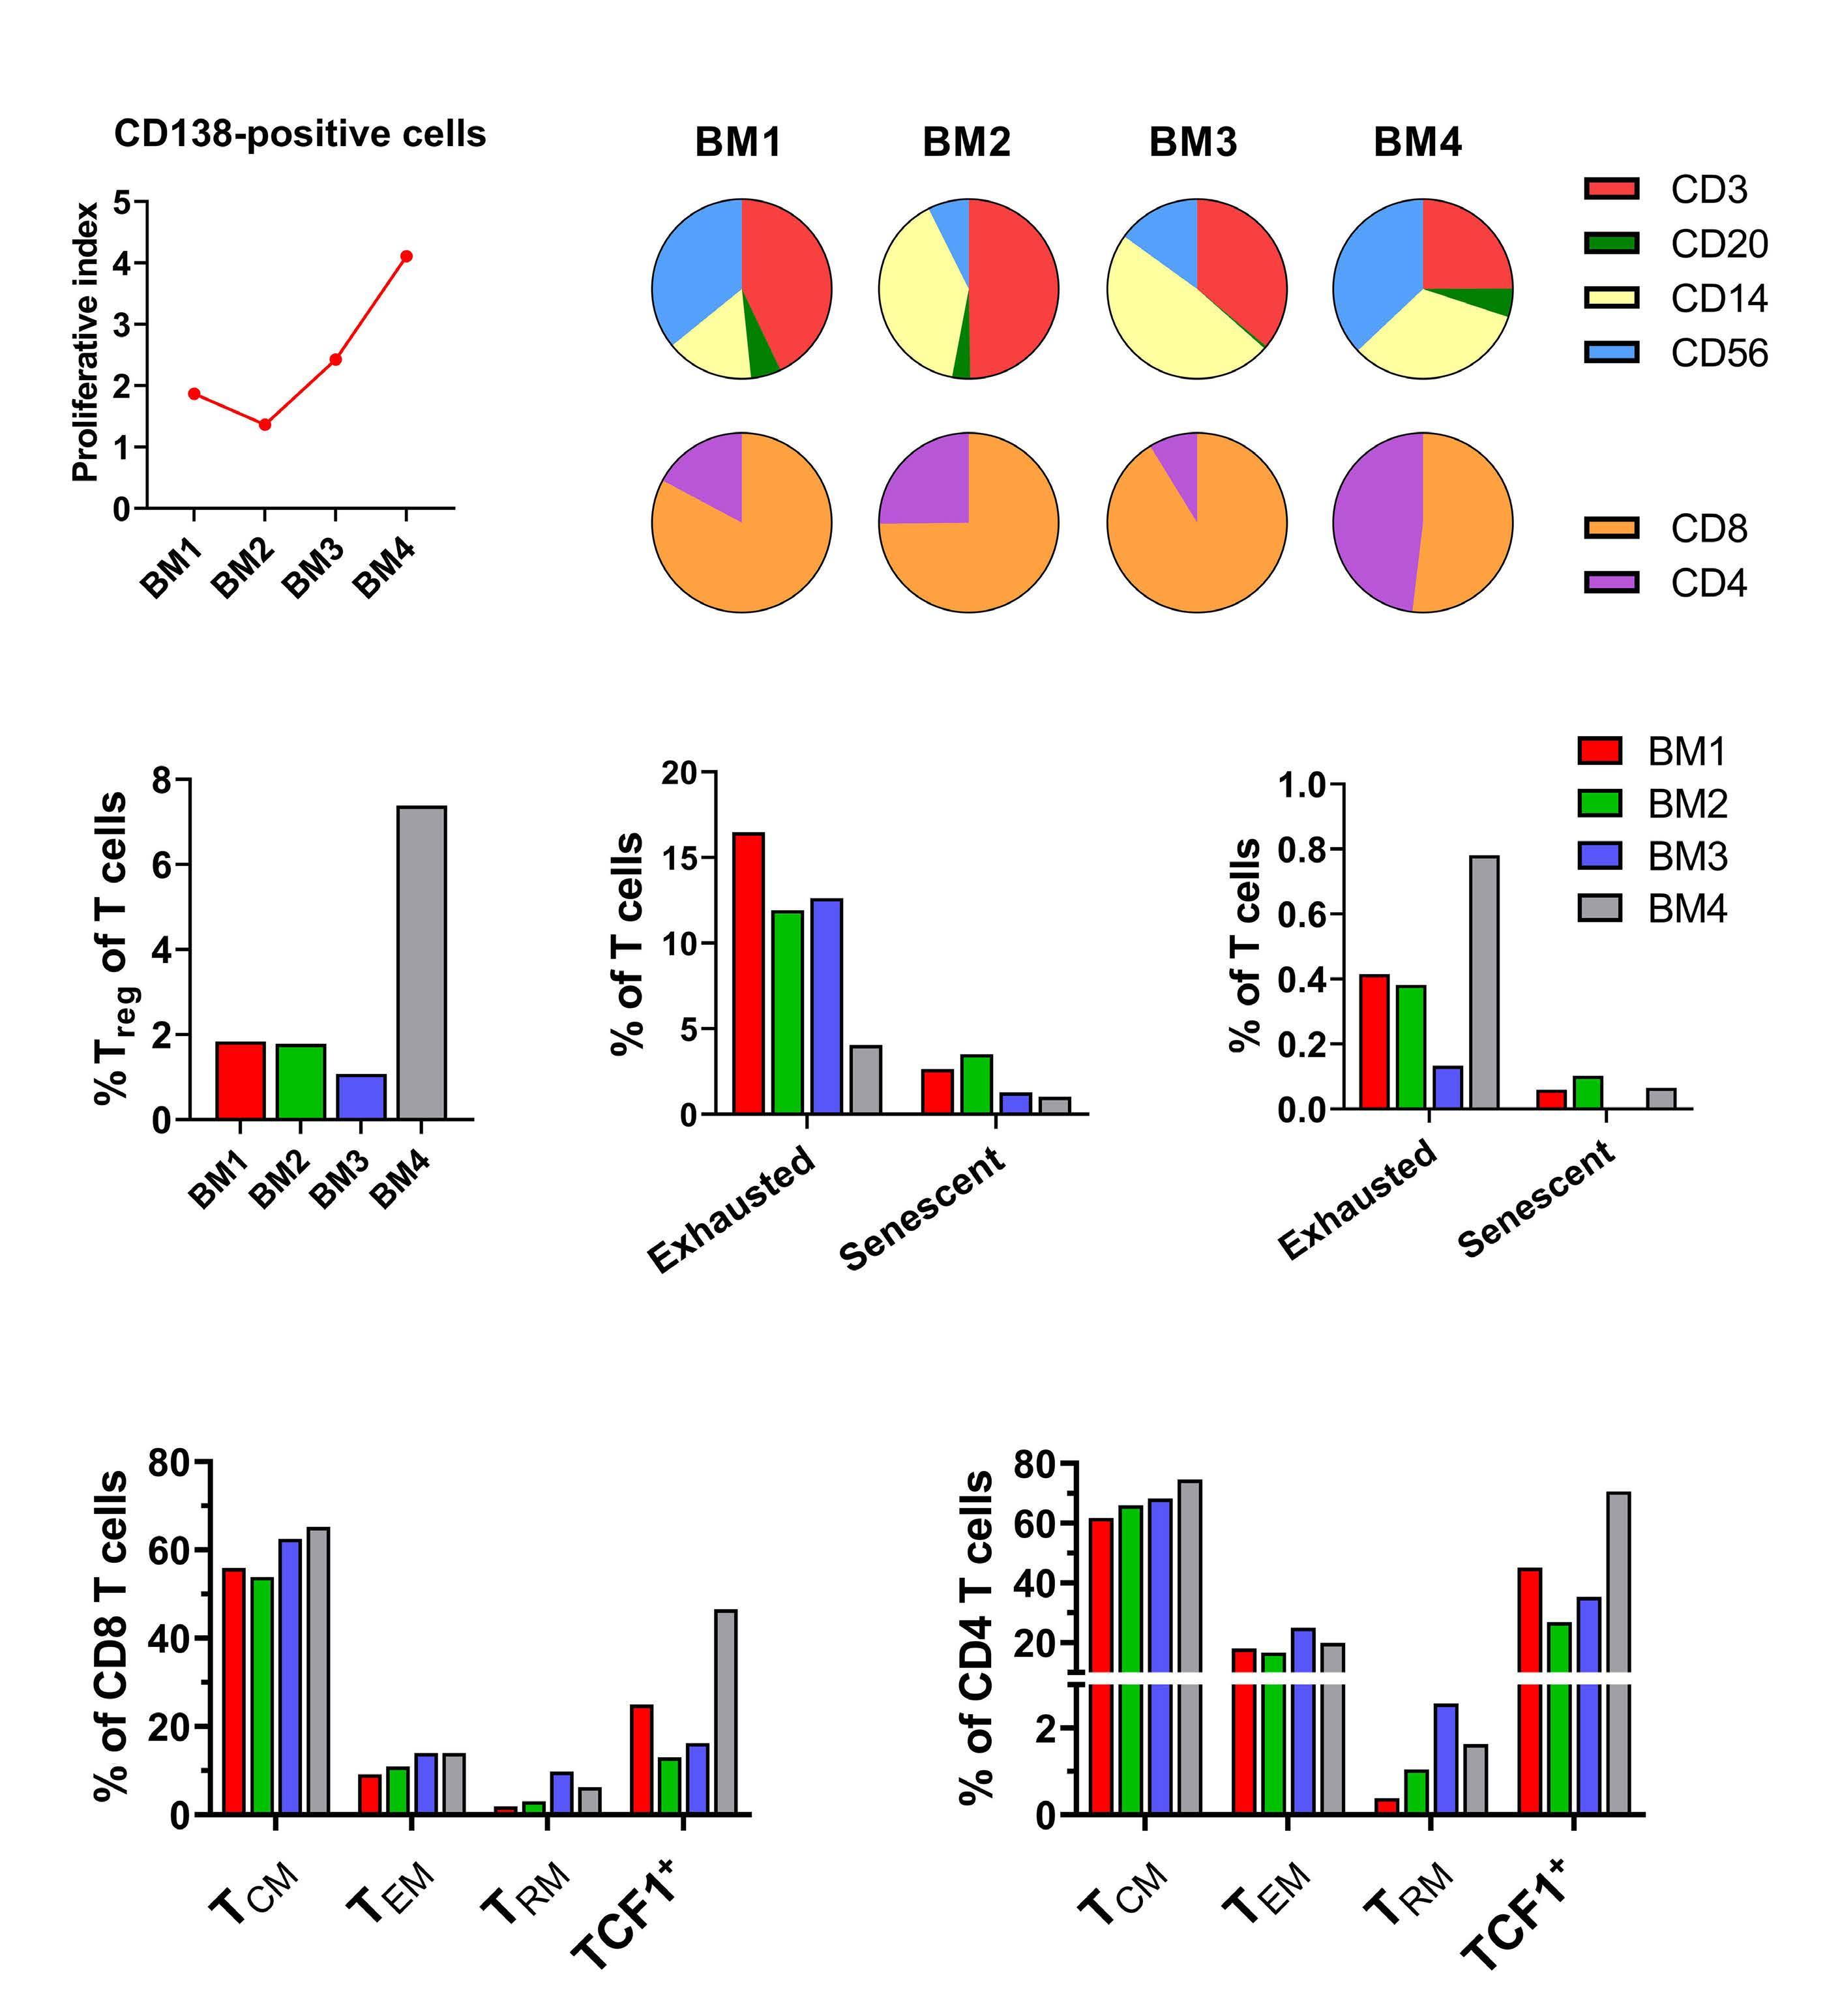
(A) Proliferative
the
a custom 37-marker panel was performed on CD138-negative cells from the patient’s bone marrow (BM). Gating was performed to investigate percentages of different immune cell populations across BM1-4. (B)
of T-cell (CD3), B-cell (CD20), myeloid (CD14), and NK-cell (CD56)
the live CD45+
of CD8 and CD4 T cells in the T-cell compartment (bottom). (C) Percentage of regulatory T (Treg) cells (CD4+FoxP3+CD25+) in the T-cell compartment. (D, E) Percentage of exhausted (Eomes+PD1+TIGIT+) and senescent (CD45RO-CD57+) CD8 (D) and CD4 (E) T cells in the T-cell compartment. (F, G) Percentages of different CD8 memory T-cell (F) and CD4 memory T-cell (G) populations in the CD8 and CD4 T-cell compartment, respectively. Central memory T (TCM) cells (CD45RO+CD27+), effector memory T (TEM) cells (CD45RO+CD27-), resident memory T (TRM) cells (CD45RO+CD103+), and TCF1+ memory T cells (CD45RO+TCF1+).
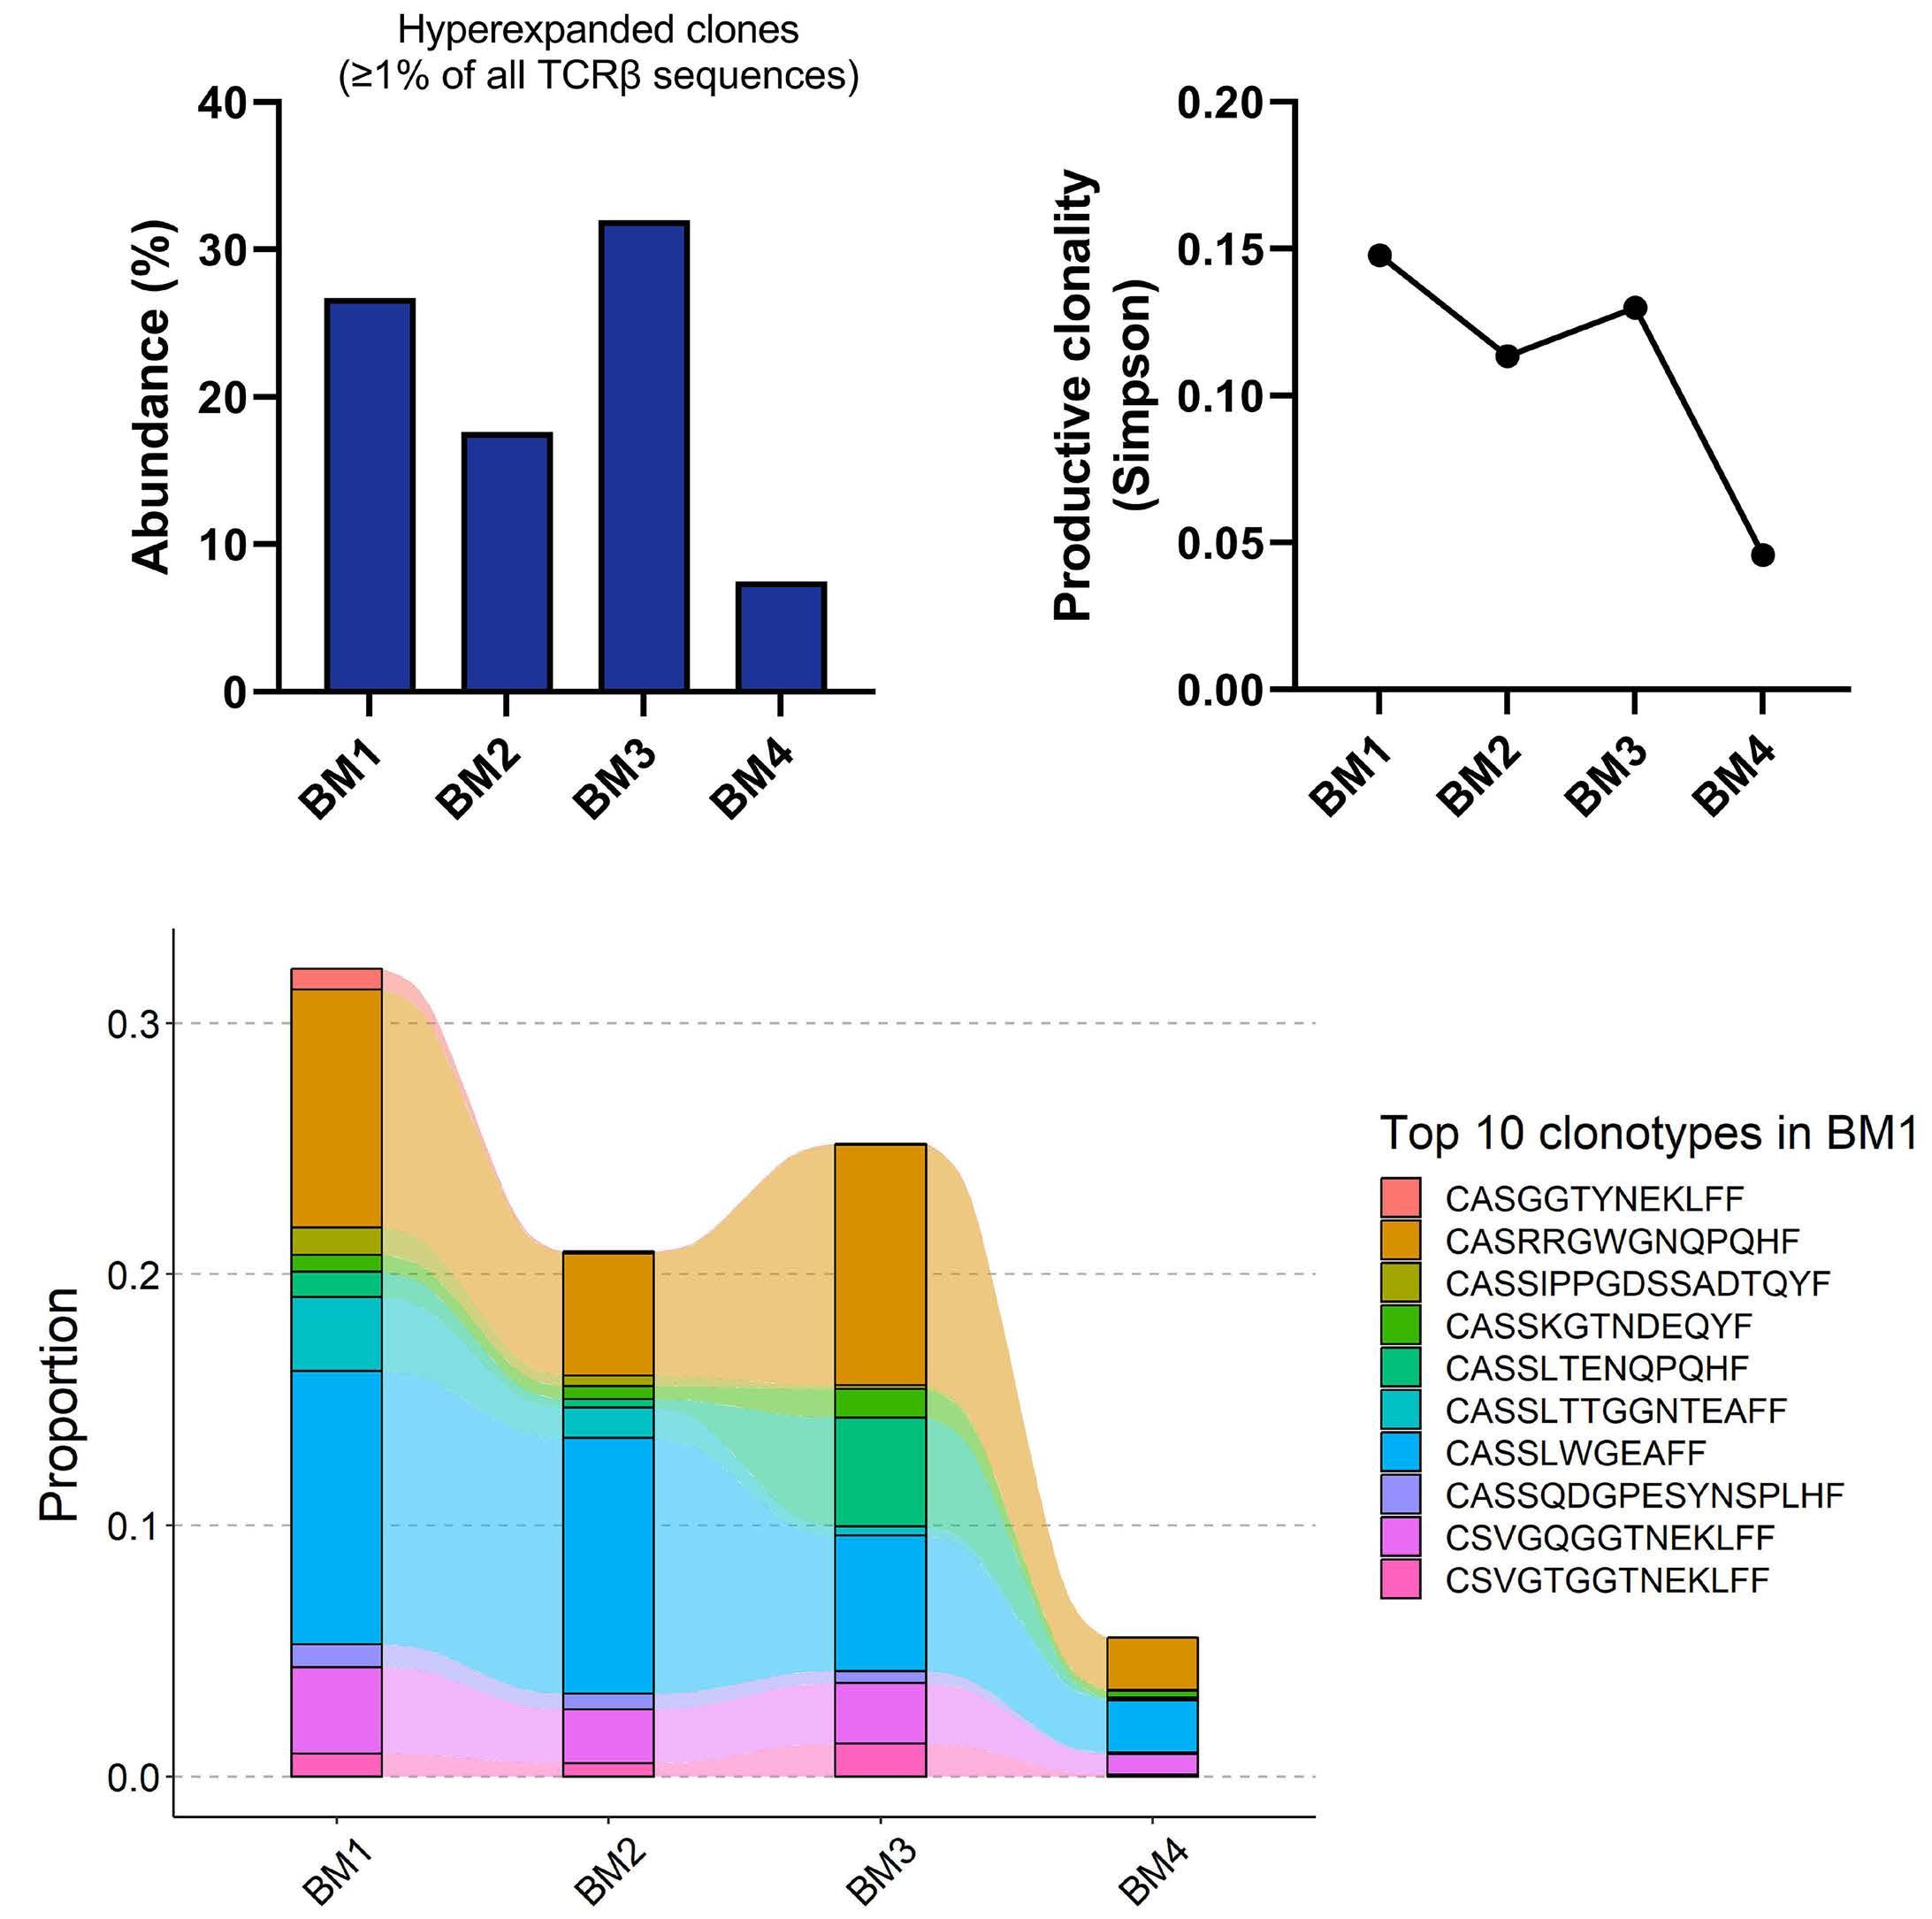
tracking of the patient’s T cells. TCRb sequencing of CD138-negative cells was performed across samples BM1-4. (A) Abundance of hyperexpanded T-cell clones, i.e., clones making up ≥1% of all TCRb sequences. (B) Productive clonality of T-cell receptors (TCR) as measured by the Simpson index, where a higher value indicates a more monoclonal TCR repertoire, and a lower value indicates a more polyclonal TCR repertoire. (C) Tracking of the top 10 clonotypes in BM1 across BM1-4.
rious myeloma events has been a concern that argues for early treatment and prolongation of treatment. This cannot be totally neglected; however, it should not over-rule all other considerations.
Although only a case study, this patient demonstrates that there is a group of patients in whom, at best, continuous and combinatory treatment only has a marginal effect. By promoting personalized medicine, we should aim to avoid treatment that is not needed, and this aspect deserves a greater research focus in future clinical trials. MRD negativity is emerging as an excellent marker of good prognosis and may serve as a reasonable basis of selection to such studies.7 Discontinuation studies have successfully been carried out in other blood cancers, such as chronic myelogenous leukemia, 8 and are highly relevant to MM.
Alenka Djarmila Behsen,1* Esten Nymoen Vandsemb,1* Tobias Schmidt Slørdahl,1,2 Henrik Hjorth-Hansen,1,2 Petter Quist-Paulsen,1,2 Kristine Misund,1,3 Anne-Marit Sponaas1 and Anders Waage1,4
1Department of Clinical and Molecular Medicine, Norwegian University of Science and Technology; 2Department of Hematology, St. Olavs Hospital; 3Department of Medical Genetics, St. Olavs Hospital and 4Biobank1, St. Olavs Hospital, Trondheim, Norway
*ADB and ENV contributed equally as first authors.
Correspondence:
A.D. BEHSEN - alenka.d.behsen@ntnu.no
https://doi.org/10.3324/haematol.2023.283563
Received: June 14, 2023.
Accepted: September 26, 2023.
Early view: October 5, 2023.
©2023 Ferrata Storti Foundation
Published under a CC BY-NC license
Disclosures
TSS has received honoraria for lectures and educational material from Takeda, Celgene, Amgen, and Janssen-Cilag, consultancy fees from Bristol Myers Squibb, and GSK, and has had an advisory board consultancy role in Amgen, Celgene, GSK, and Janssen-Cilag. ADB,
1. Pessoa de Magalhaes RJ, Vidriales MB, Paiva B, et al. Analysis of the immune system of multiple myeloma patients achieving long-term disease control by multidimensional flow cytometry. Haematologica. 2013;98(1):79-86.
2. Langseth OO, Myklebust TA, Johannesen TB, Hjertner O, Waage A. Incidence and survival of multiple myeloma: a populationbased study of 10,524 patients diagnosed 1982-2017. Br J Haematol. 2020;191(3):418-425.
3. Zavidij O, Haradhvala NJ, Mouhieddine TH, et al. Single-cell RNA sequencing reveals compromised immune microenvironment in precursor stages of multiple myeloma. Nat Cancer. 2020;1(5):493-506.
4 Bailur JK, McCachren SS, Doxie DB, et al. Early alterations in stem-like/resident T cells, innate and myeloid cells in the bone marrow in preneoplastic gammopathy. JCI Insight. 2019;5(11):e127807.
ENV, HHH, PQP, KM, AMS and AW have no conflicts of interest to disclose.
ADB, ENV, AMS and KM performed research and data analysis. AW, ADB, ENV and AMS wrote the manuscript. AW, TSS, HHH and PQP treated the patient.
The data that support the findings of this study are available on request from the corresponding author.
5. Misund K, Hofste Op Bruinink D, Coward E, et al. Clonal evolution after treatment pressure in multiple myeloma: heterogenous genomic aberrations and transcriptomic convergence. Leukemia. 2022;36(7):1887-1897.
6. Zelle-Rieser C, Thangavadivel S, Biedermann R, et al. T cells in multiple myeloma display features of exhaustion and senescence at the tumor site. J Hematol Oncol. 2016;9(1):116.
7 Costa LJ, Chhabra S, Medvedova E, et al. Daratumumab, carfilzomib, lenalidomide, and dexamethasone with minimal residual disease response-adapted therapy in newly diagnosed multiple myeloma. J Clin Oncol. 2022;40(25):2901-2912.
8. Mahon FX, Rea D, Guilhot J, et al. Discontinuation of imatinib in patients with chronic myeloid leukaemia who have maintained complete molecular remission for at least 2 years: the prospective, multicentre Stop Imatinib (STIM) trial. Lancet Oncol. 2010;11(11):1029-1035.
According to the International Consensus Classification (ICC), diagnosis of myelodysplastic syndrome (MDS) with del(5q) requires presence of i) del5q, alone or associated with no more than one other cytogenetic abnormality, exclusive of -7/del(7q), ii) <5% bone marrow (BM) and <2% circulating blasts, and iii) the absence of “multi-hit” TP53. 1 The latter is defined by the ICC as the presence of i) two or more distinct TP53 mutations, each with variant allele frequency (VAF) ≥10%, ii) a single TP53 mutation with VAF ≥50%, or iii) a single TP53 mutation with VAF ≥10% accompanied by a cytogenetically-apparent del(17p13.1), copy-neutral loss of heterozygosity (LOH) at the TP53 locus, or, in the absence of loss of heterozygosity (LOH) information, complex karyotype.1 MDS-del(5q) is uniquely characterized by its relatively indolent clinical course and its sensitivity to treatment with lenalidomide.2-4
Patients with MDS-del(5q) are known to harbor multiple somatic mutations with the two most frequent ones being TP53 (~20% incidence at diagnosis) and SF3B1 (~18%).5 These two mutations display significant clustering and are more prevalent in leukemic phase disease, with an estimated 50% incidence.5 The latter suggests vulnerability or pathogenetic contribution to progression into acute myeloid leukemia (AML). In this regard, we have recently reported on TP53 VAF >22% as being the most prominent risk factor for leukemic progression and overall survival in MDS-del(5q).5 These observations were consistent with an earlier report suggesting adverse impact of strong P53 protein expression on cytogenetic response and overall and leukemia-free survival in MDS-del(5q).6 Consistent with these observations, a 2018 report in Haematologica described the emergence of TP53 mutations and disease progression during lenalidomide therapy, in patients with MDS-del(5q).7 In the current case report of a patient with MDS-del(5q), we confirm the acquisition of TP53 mutation during lenalidomide therapy and, in addition, we describe, for the first time, successful salvage therapy with 3-day decitabine, resulting in resolution of transfusion need, cytogenetic remission, and elimination of mutant TP53 and SF3B1 clones. Informed consent was obtained from the patient.
Our patient was first diagnosed with MDS-del(5q) at 75 years of age in May 2021. Co-morbidities included history of hemochromatosis (diagnosed in 2008 based on serum ferritin value of 1,553 mcg/L and liver biopsy that showed
moderate hemosiderosis but with no documentation of genotyping and subsequently treated with phlebotomy in the remote past), atrial fibrillation, non-ischemic cardiomyopathy, mitral regurgitation, and alcohol use. The earliest complete blood count (CBC) record from January 2012 showed hemoglobin 14.1 g/dL, mean corpuscular volume (MCV) 97.3 FL, platelet count 277x109/L and leukocyte count 6.3x10⁹/L. Macrocytosis without anemia first appeared in July 2013 (MCV 103.7 FL) and by July 2015, MCV was 107.7 FL and hemoglobin 12.9 g/dL. Subsequently, his anemia worsened progressively until he required two units of packed red cell transfusion 10 days prior to his first visit to our institution in May 2021. At that time, physical examination did not reveal palpable spleen, liver, or lymph nodes; CBC showed hemoglobin 8.9 g/dL, MCV 130.9 FL, leukocyte count 4.2x10⁹/L, absolute neutrophil count (ANC) 1.96x10⁹/L, platelet count 152x109/L, normal serum B12 and folate, serum ferritin 172 mcg/dL, serum erythropoietin level 225 mIU/mL, and no circulating blasts. Bone marrow (BM) examination revealed normocellular marrow with 1% blasts and dysmegakaryopoiesis (monolobated and bilobate forms). Cytogenetic studies revealed isolated 5q deletion in eight (40%) of 20 metaphases (46,XY,del(5) (q13q33)[8]/46,XY[12]). Next-generation sequencing (NGS) of BM samples revealed DNMT3A (VAF 23%) and SF3B1 (VAF 14%) mutations, only (Figures 1 and 2).
Treatment with lenalidomide (10 mg daily) was initiated on June 16, 2021, and the patient became transfusion-independent within 3 months of treatment. Lenalidomide dose was reduced to 7.5 mg/day on May 13, 2022 because of treatment-emergent diarrhea that did not get better and was subsequently attributed to another cause, leading to treatment resumption at 10 mg/day dose (patient remained transfusion-independent during this period). CBC from January 2022 showed hemoglobin 12.8 g/dL, MCV 112.1 FL, leukocyte count 5.2x10⁹/L and platelet count 264x109/L. By December 2022, the patient had relapsed with transfusion-dependent anemia: hemoglobin 6.0 g/dL, MCV 124.7 FL, leukocyte count 3.2x10⁹/L, ANC 0.83x10⁹/L, and platelet count 53x109/L. BM examination at the time showed normocellular marrow with slightly increased blasts (5%), and persistent dysmegakaryopoiesis (Figures 1 and 2). Cytogenetic studies revealed isolated 5q deletion in 13 (65%) of 20 metaphases (46,XY,del(5)(q13q33) [13]/46,XY[7]). BM NGS revealed clonal expansion of DN-
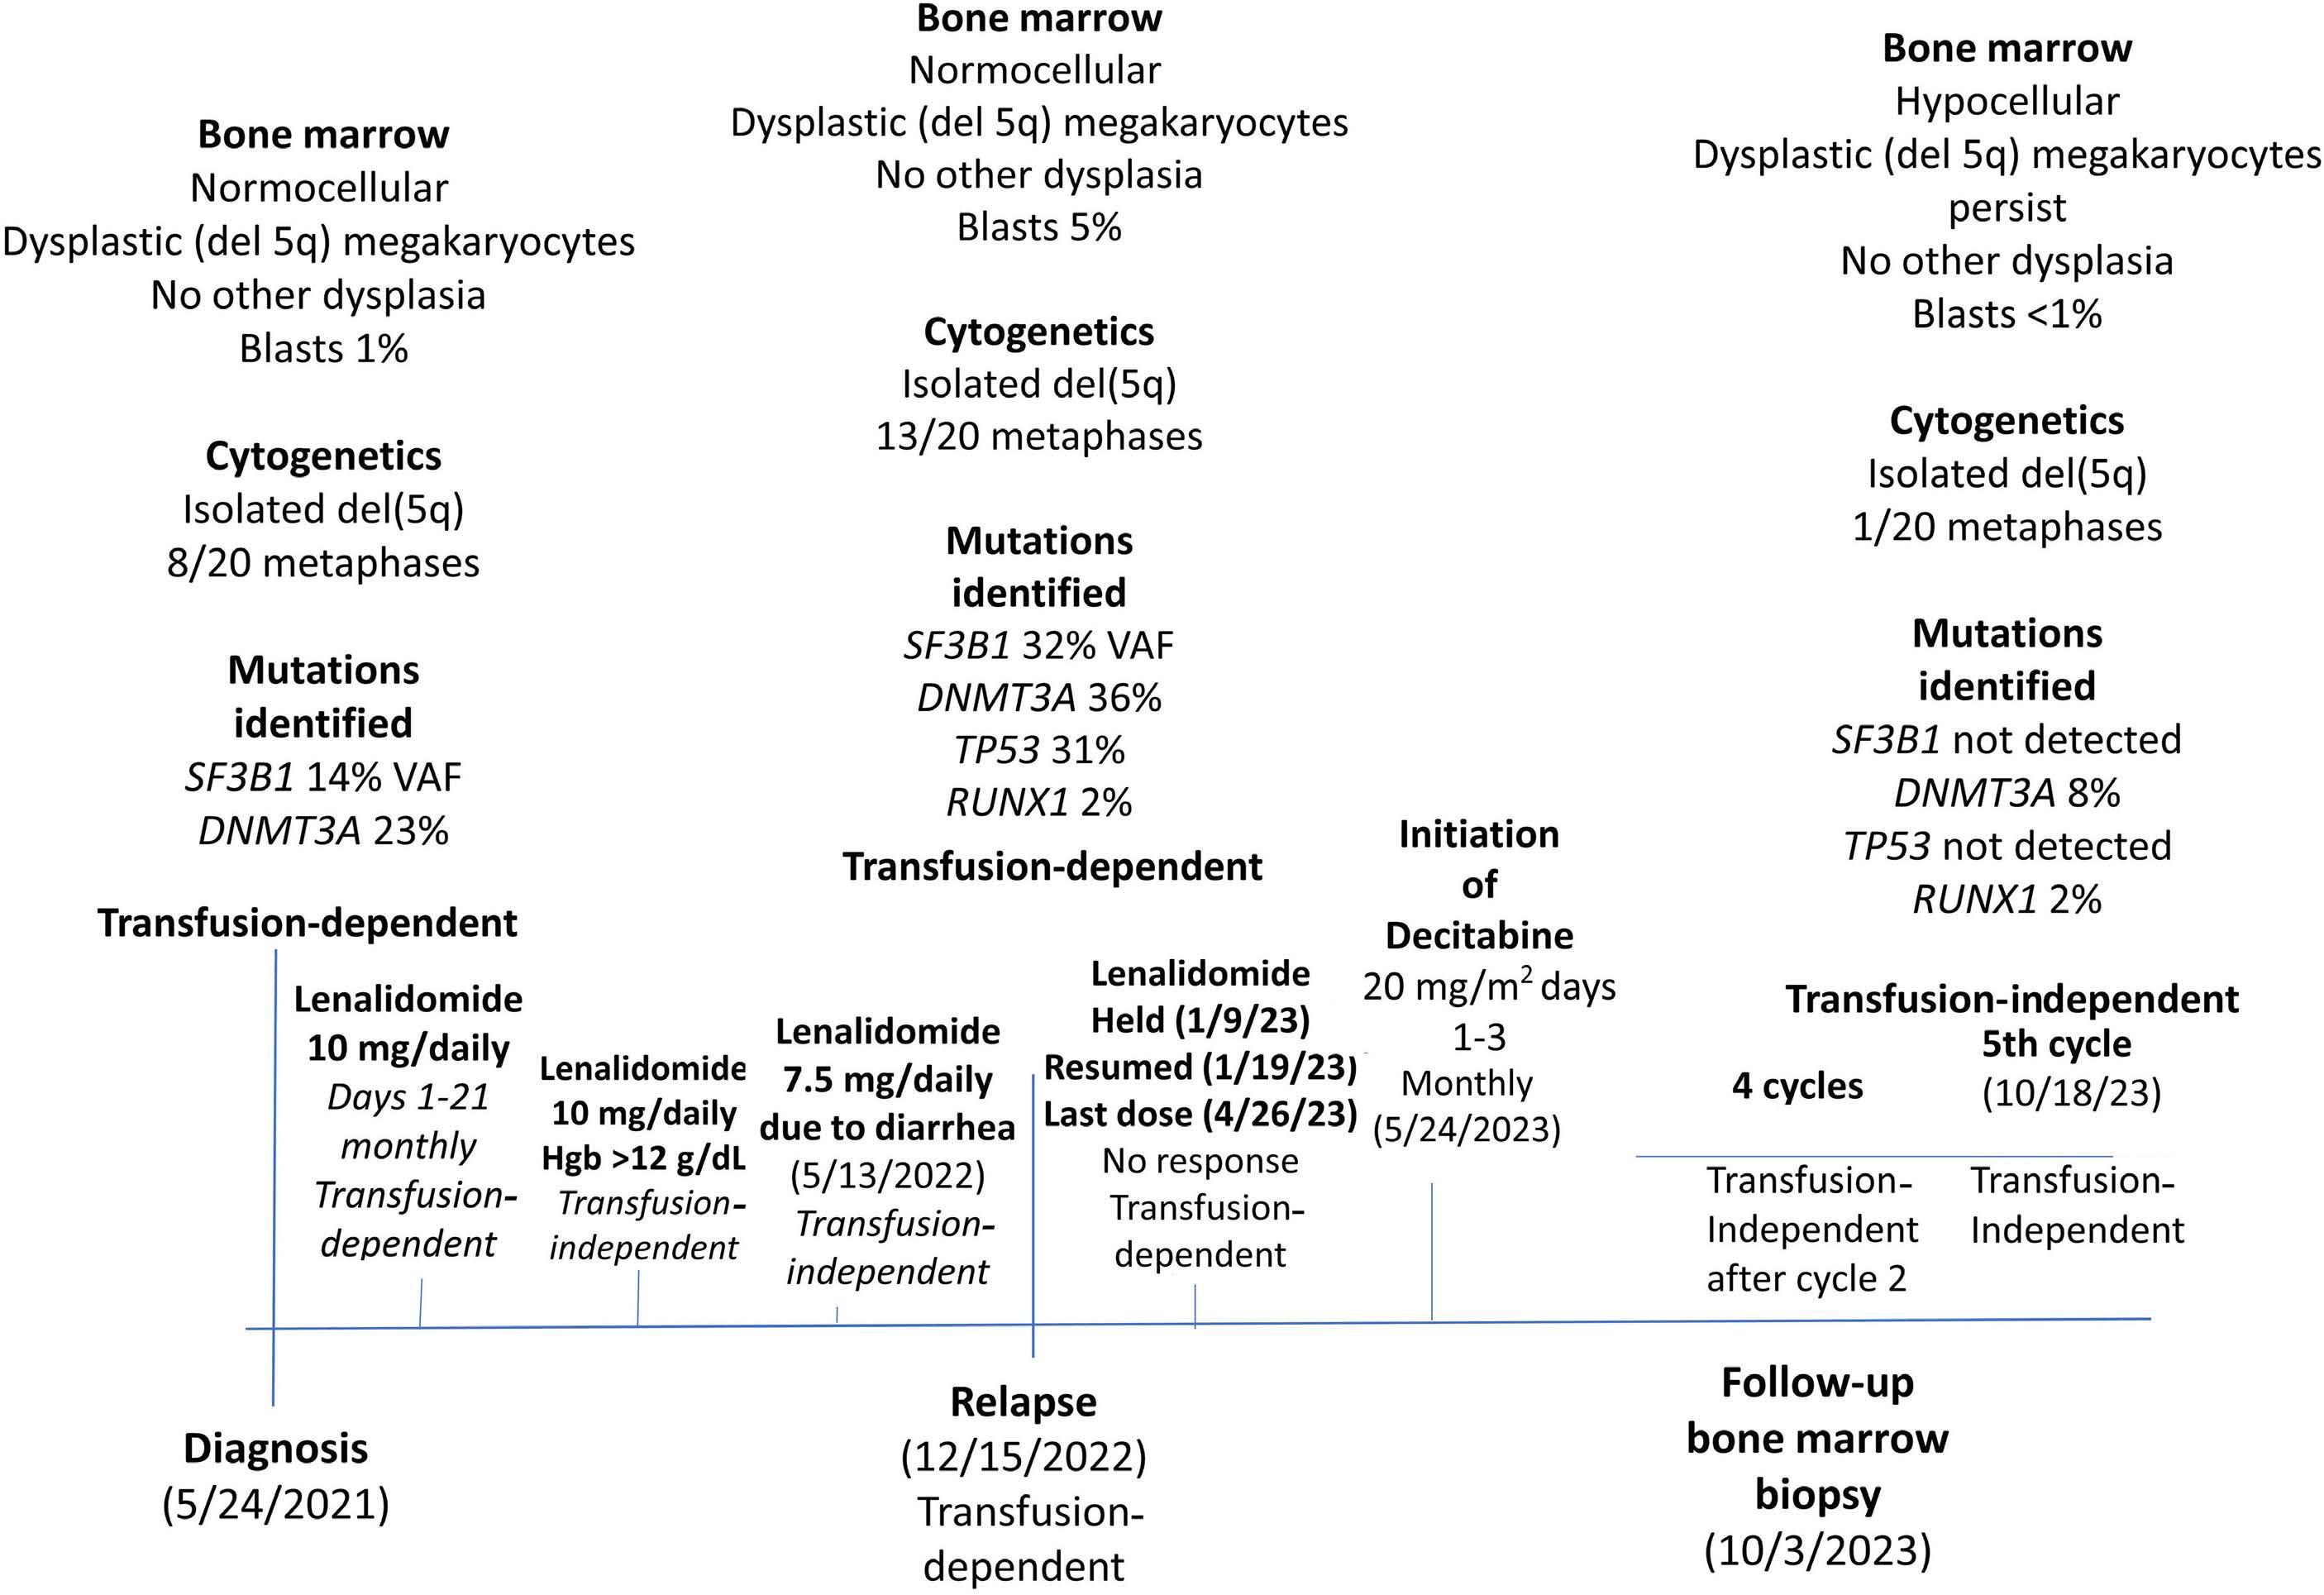
MT3A (VAF 36%) and SF3B1 (VAF 32%) mutations, as well as emergence of two new mutations: TP53 (VAF 31%), and RUNX1 (VAF 2%). Lenalidomide was held on January 9, 2023 and resumed on January 19, 2023 without any benefit and treatment discontinued on April 26, 2023. Salvage therapy with lower-dose decitabine (20 mg/m2 daily x 3 days, per 28-day cycle) was initiated on May 24, 2023, and the patient became transfusion-independent after the second cycle of treatment and has remained transfusion-independent to date (October 18, 2023); the 3-day versus the standard 5-day dose schedule for decitabine was chosen based on patient fraility. A follow-up BM examination performed on March 10, 2023, showed hypocellular marrow with <1% blasts and persistence of small hypolobated megakaryocytes, although decreased in number; cytogenetic studies revealed isolated 5q deletion in only one of (5%) of 20 metaphases (46,XY,del(5) (q13q33)[1]/46,XY[19]). BM NGS revealed disappearance of both the TP53 and SF3B1 mutant clones and a decrease in mutant allele burden for DNMT3A (VAF 8%) while RUNX1 (VAF 2%) remained unchanged (Figures 1 and 2).
The current case report confirms observations from recent
reports that suggest the emergence or clonal expansion of TP53 mutations during treatment with lenalidomide.7,8 In a cohort of 24 patients with MDS-del(5q), 18 (75%) had an erythroid response during lenalidomide therapy and five (21%) a complete cytogenetic response;7 a TP53 mutation was detected in six (25%) patients at diagnosis and in an additional nine (38%) patients during follow-up, of whom, one also manifested a new RUNX1 mutation, as was the case in the current report (median duration of exposure to lenalidomide was 11 months).7 The particular study also showed a correlation between TP53 clonal evolution and disease progression.7 In another report of 416 patients with therapy-related myeloid neoplasms, the authors described an association between TP53 mutations and prior treatment with thalidomide analogs, specifically lenalidomide.8 In the latter report, the authors were able to provide experimental evidence for lenalidomide-induced selective advantage for TP53 mutant clones.2 What is novel in our case report was the successful treatment with 3-day (instead of the standard 5-day) decitabine, culminating not only in resolution of transfusion-need but also in inducing major cytogenetic and molecular re-
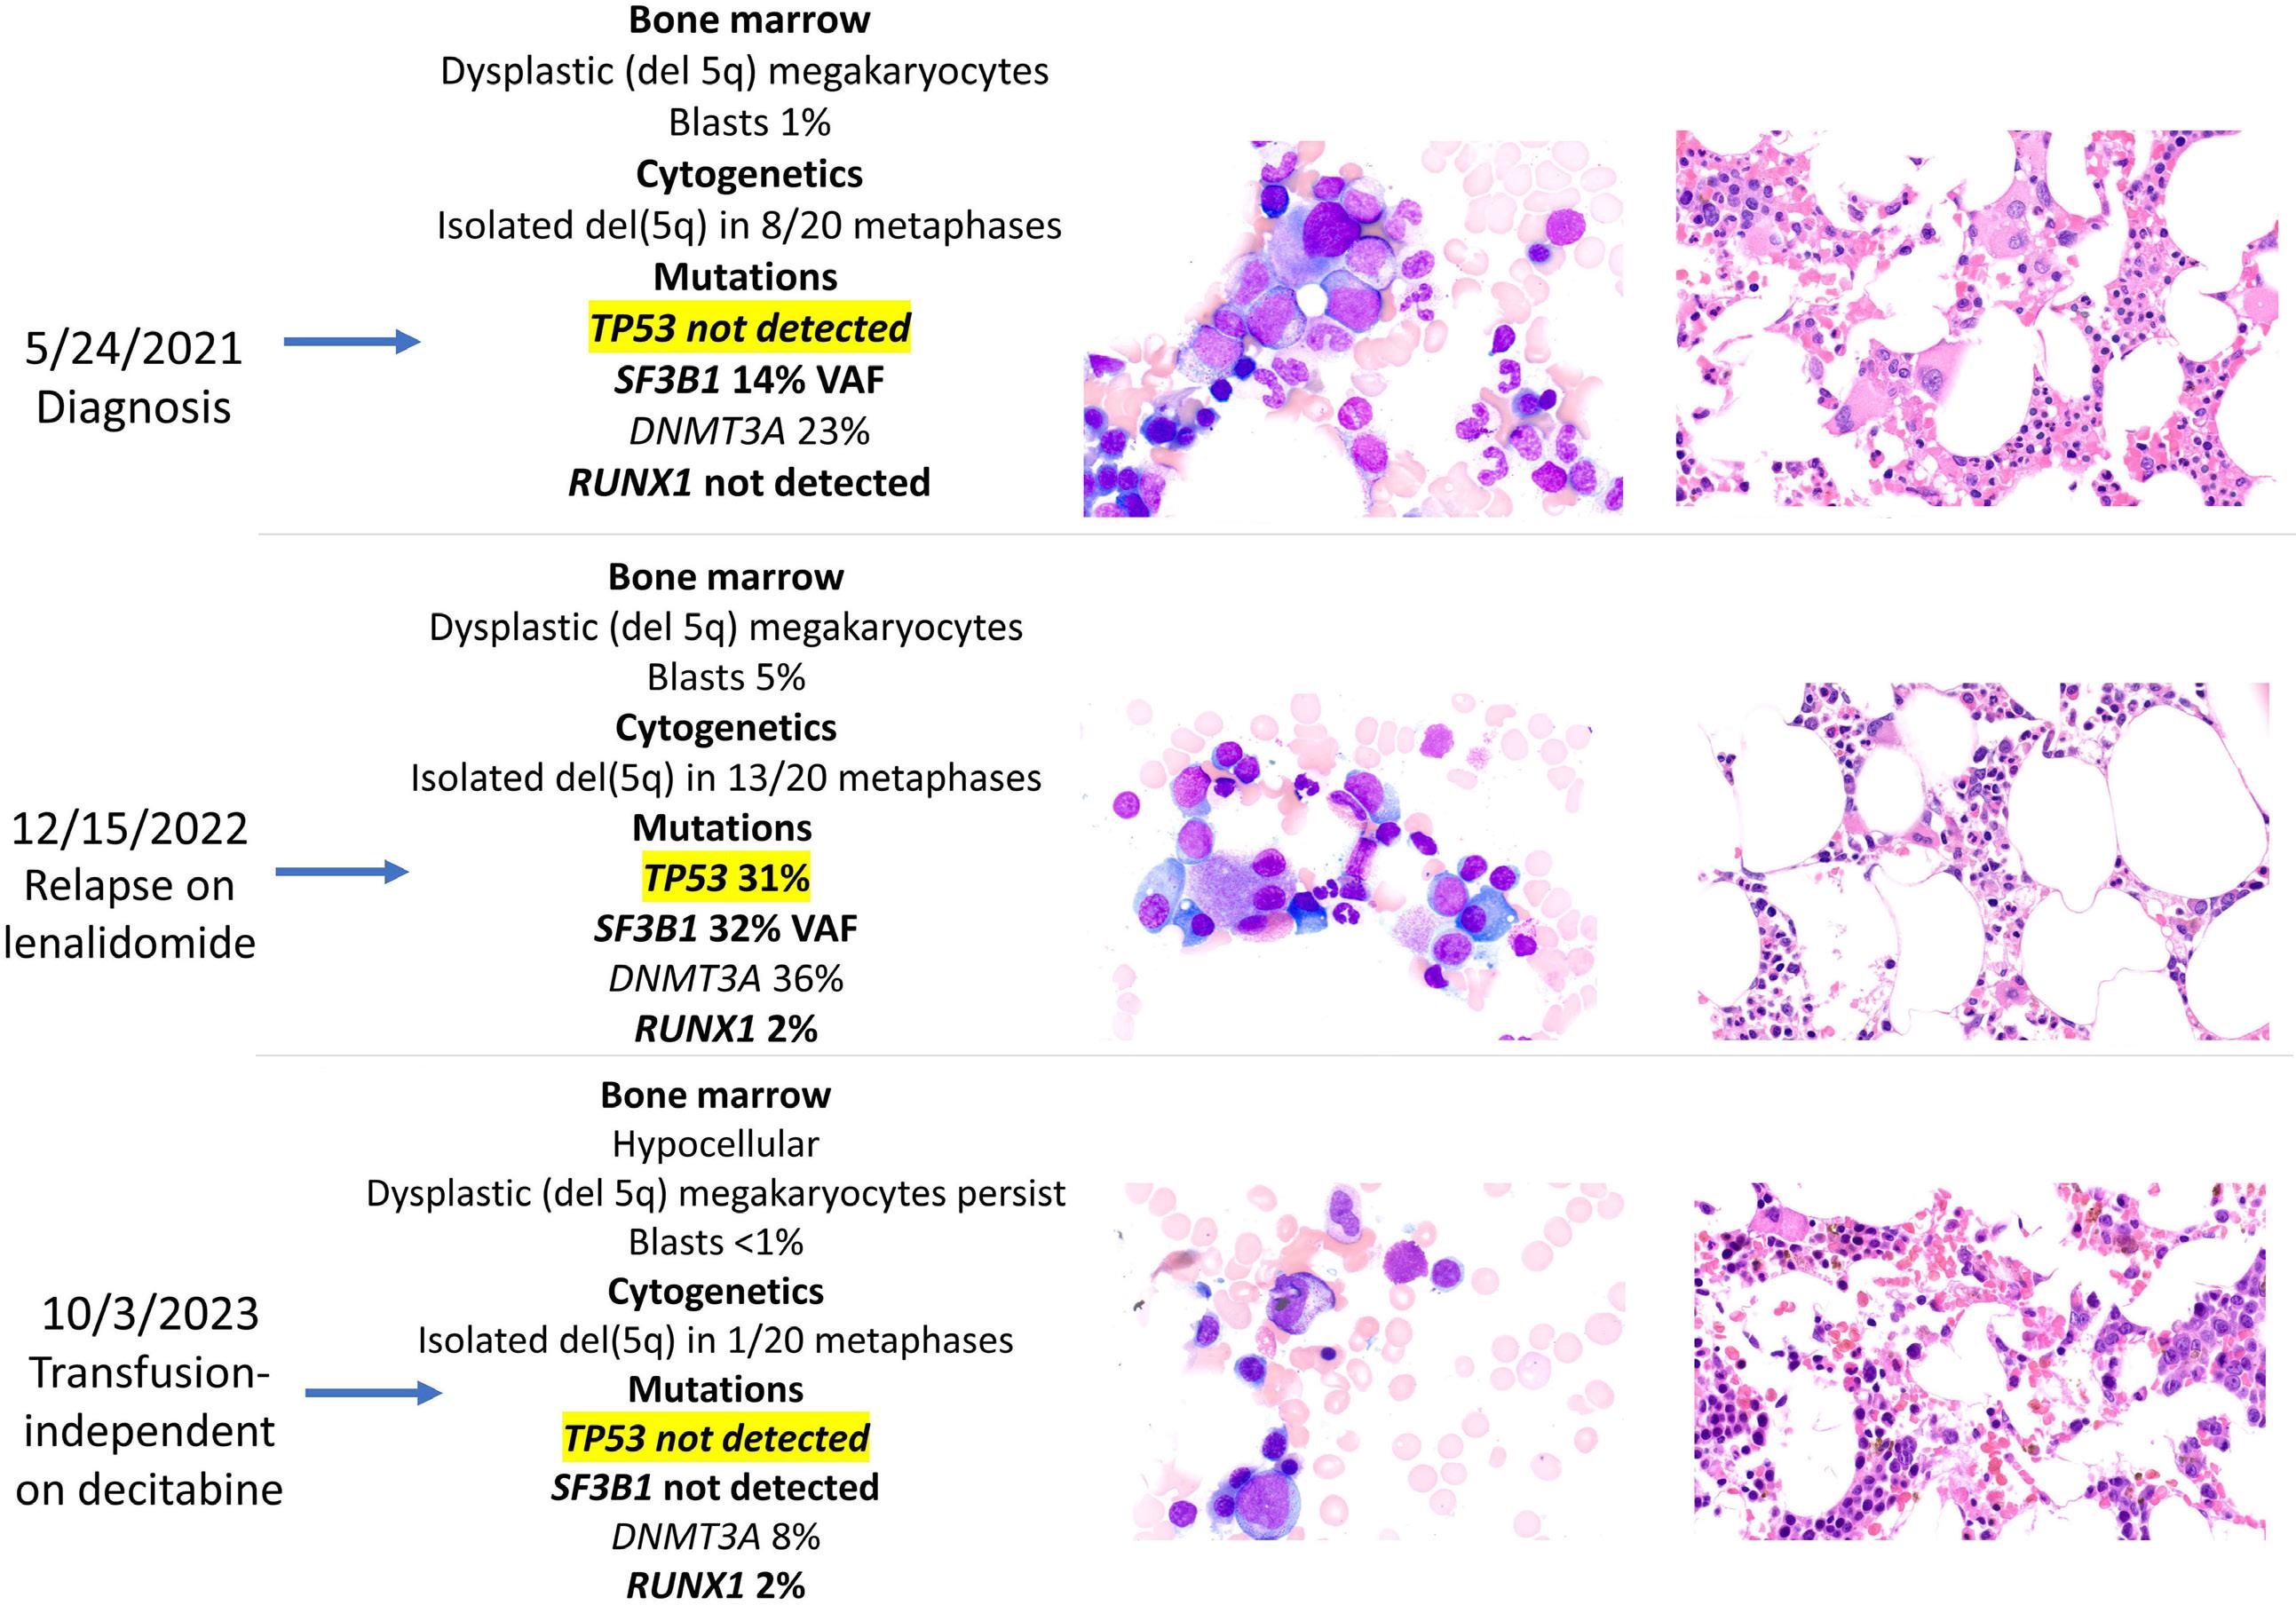
syndromes with del(5q)
on
24,
by December 15, 2022 and was successfully salvaged with decitabine
mission, including the eradication of the TP53 mutation; it is difficult, based on a single case report, to comment on whether or not the 3-day, as opposed to the standard 5-day, decitabine dosing schedule made a difference or whether we would have been as successful using azacytidine instead of decitabine.
There are a number of practically important suggestions that can be extrapolated from the current case report, but only after confirmation from additional studies. At the minimum, it is reasonable to recommend NGS in all patients with MDS-del(5q) at diagnosis as well as periodically during treatment with lenalidomide. In the event of treatment-emergent TP53 mutations or clonal expansion, we would recommend addition or switching to hypomethylating agents and continue monitoring TP53 VAF. The particular treatment strategy is also relevant in the context of bridging chemotherapy, in preparation for allogeneic stem cell transplant, which is currently the only treatment modality that can secure long-term survival in MDS-del(5q)9 as well as TP53-mutated myeloid neoplasms, especially if not associated with complex karyotype,10 which would be the case in MDS-del(5q); whether or not treatment success can further be enhanced with the
addition of venetoclax to hypomethylating agent therapy is plausible but needs to be studied.
Naseema Gangat,1 Naresh Bellam,2 Kaaren Reichard1 and Ayalew Tefferi1
1Mayo Clinic, Rochester, MN and 2Montgomery Cancer Center, Prattville Campus, Prattville, AL, USA
Correspondence:
N. GANGAT - gangat.naseema@mayo.edu
A. TEFFERI - tefferi.ayalew@mayo.edu
https://doi.org/10.3324/haematol.2023.284547
Received: October 25, 2023.
Accepted: November 20, 2023.
Early view: November 30, 2023.
©2024 Ferrata Storti Foundation
Published under a CC BY-NC license
Disclosures
No conflicts of interest to disclose.
NG and AT co-wrote the paper. NB participated in patient care. KR
1. Arber DA, Orazi A, Hasserjian RP, et al. International Consensus Classification of Myeloid Neoplasms and Acute Leukemias: integrating morphologic, clinical, and genomic data. Blood. 2022;140(11):1200-1228.
2. Patnaik MM, Lasho TL, Finke CM, et al. WHO-defined ‘myelodysplastic syndrome with isolated del(5q)’ in 88 consecutive patients: survival data, leukemic transformation rates and prevalence of JAK2, MPL and IDH mutations. Leukemia. 2010;24(7):1283-1289.
3. List A, Kurtin S, Roe DJ, et al. Efficacy of lenalidomide in myelodysplastic syndromes. N Engl J Med. 2005;352(6):549-557.
4. Fenaux P, Giagounidis A, Selleslag D, et al. A randomized phase 3 study of lenalidomide versus placebo in RBC transfusiondependent patients with low-/intermediate-1-risk myelodysplastic syndromes with del5q. Blood. 2011;118(14):3765-3776.
5. Fleti F, Chan O, Singh A, et al. TP53 mutations and variant allele frequency in myelodysplastic syndromes with del(5q): a MayoMoffitt study of 156 informative cases. Am J Hematol.
reviewed bone marrow morphology and genetic studies. All authors reviewed and approved the final draft of the paper.
Please email the corresponding author to obtain original data.
2023;98(4):E76-E79.
6. Saft L, Karimi M, Ghaderi M, et al. p53 protein expression independently predicts outcome in patients with lower-risk myelodysplastic syndromes with del(5q). Haematologica. 2014;99(6):1041-1049.
7 Lode L, Menard A, Flet L, et al. Emergence and evolution of TP53 mutations are key features of disease progression in myelodysplastic patients with lower-risk del(5q) treated with lenalidomide. Haematologica. 2018;103(4):e143-e146.
8. Sperling AS, Guerra VA, Kennedy JA, et al. Lenalidomide promotes the development of TP53-mutated therapy-related myeloid neoplasms. Blood. 2022;140(16):1753-1763.
9. Garderet L, Ziagkos D, van Biezen A, et al. Allogeneic stem cell transplantation for myelodysplastic syndrome patients with a 5q deletion. Biol Blood Marrow Transplant. 2018;24(3):507-513.
10 Pasca S, Haldar SD, Ambinder A, et al. Outcome heterogeneity of TP53-mutated myeloid neoplasms and the role of allogeneic hematopoietic cell transplantation. Haematologica. 2023 Sep 21. doi: 10.3324/haematol.2023.283886. [Epub ahead of print].
Srdan Verstovsek,1 Ruben Mesa,2 Moshe Talpaz,3 Jean-Jacques Kiladjian,4 Claire N. Harrison,5
Stephen T. Oh,6 Alessandro M. Vannucchi,7 Raajit Rampal,8 Bart L. Scott,9 Sarah A. Buckley,10 Adam R. Craig,10 Karisse Roman-Torres10 and John O. Mascarenhas11
1MD Anderson Cancer Center, Houston, TX, USA; 2Mayo Clinic, Scottsdale, AZ, USA; 3University of Michigan, Comprehensive Cancer Center, Ann Arbor, MI, USA; 4Hôpital Saint Louis, Université Paris Diderot, Paris, France; 5Guy’s and St Thomas’ NHS Foundation Trust, London, UK; 6Washington University School of Medicine, St. Louis, MO, USA; 7University of Florence, Azienda Ospedaliera-Universitaria Careggi, Florence, Italy; 8Memorial Sloan Kettering Cancer Center, New York, NY, USA; 9Fred Hutchinson Cancer Research Center, Seattle, WA, USA; 10CTI BioPharma Inc, Seattle, WA, USA and 11Icahn School of Medicine at Mount Sinai, New York, NY, USA
Correspondence: S. Verstovsek srdanverstovsek@gmail.com
Received: December 5, 2023.
Accepted: December 5, 2023.
https://doi.org/10.3324/haematol.2023.284815
©2024 Ferrata Storti Foundation
Published under a CC BY-NC license
An error was published in Table 2, row 5 of our manuscript in the July issue 2022 of Haematologica.1 The number for the Pacritinib group was erroneously published as 17.9 (5/28) and should be 25.0 (19/76). The corrected Table 2 is shown here.
Corrected Table 2. Spleen volume response and modified Total Symptom Score response rates among patients randomized to pacritinib versus best available therapy by subgroup: prior exposure to a JAK2 inhibitor (including ruxolitinib) and myelofibrosis subtype (primary vs. secondary after a prior diagnosis of polycythemia vera or essential thrombocythemia).
“much” or “very much”
BAT: best available therapy; JAK2: Janus kinase 2; MF: myelofibrosis; PGIC: Patient Global Impression of Change; TSS: Total Symptom Score. *Breslow and Day homogeneity test.
1. Verstovsek S, Mesa R, Talpaz M, et al. Retrospective analysis of pacritinib in patients with myelofibrosis and severe thrombocytopenia. Haematologica. 2022;107(7):1599-1607.
Piers Blombery,1 Lucy Fox,1 Georgina L. Ryland,2 Ella R. Thompson,3 Jennifer Lickiss,2 Michelle McBean,2 Satwica Yerneni,2 Alison Trainer,1,3 David Hughes,4 Anthea Greenway,4 Francoise Mechinaud,4 Erica M. Wood,5 Graham J. Lieschke,6 Jeff Szer,6 Pasquale Barbaro,7 John Roy,7 Joel Wight,8 Elly Lynch,9 Melissa Martyn,10 Clara Gaff9 and David Ritchie11
1Clinical Haematology, Peter MacCallum Cancer Centre, Melbourne; 2Department of Pathology, Peter MacCallum Cancer Centre, Melbourne; 3University of Melbourne, Peter MacCallum Cancer Centre, Melbourne; 4Royal Children’s Hospital, Melbourne; 5Transfusion Research Unit, Monash University, Melbourne; 6Clinical Haematology, Peter MacCallum Cancer Centre/Royal Melbourne Hospital, Melbourne; 7Children Health Queensland and University of Queensland, South Brisbane; 8Department of Haematology, Austin Health, Melbourne; 9Melbourne Genomics Health Alliance, Parkville; 10Melbourne Genomics Health Alliance, Parkville and 11Clinical Haematology, Peter MacCallum Cancer Centre/Royal Melbourne Hospital, Melbourne, Australia
Correspondence: P. Blombery piers.blombery@petermac.org
Received: November 27, 2023.
Accepted: November 27, 2023.
https://doi.org/10.3324/haematol.2023.284760
©2024 Ferrata Storti Foundation
Published under a CC BY-NC license
The list of authors of the original article “Utility of clinical comprehensive genomic characterization for diagnostic categorization in patients presenting with hypocellular bone marrow failure syndromes” published in Haematologica1 has been amended to include Alison Trainer as a co-author.
1. Blombery P, Fox LC, Ryland GL, et al. Utility of clinical comprehensive genomic characterization for diagnostic categorization in patients presenting with hypocellular bone marrow failure syndromes. Haematologica. 2021;106(1):64-73.
Gold open access journal
Everything published is available, free, for everyone

High scientific value
Everything published was reviewed by a panel of reviewers and rated as outstanding or excellent by reputed editors
No delay in knowing the most important news in all fields of Hematology
Everything published is visible as 'Early view' a few days after acceptance
Journal of the Ferrata - Storti Foundation