
Journal of the Ferrata Storti Foundation VOL. 109 MARCH 2024 haematologica.org ISSN 0390 - 6078
Editor-in-Chief
Jacob M. Rowe (Jerusalem)
Deputy Editors
Carlo Balduini (Pavia), Jerry Radich (Seattle)
Associate Editors
Shai Izraeli (Tel Aviv), Pier Mannuccio Mannucci (Milan), Jessica Okosun (London), Pavan Reddy (Ann Arbor), David C. Rees (London), Paul G. Richardson (Boston), Francesco Rodeghiero (Vicenza), Gilles Salles (New York), Kerry Savage (Vancouver), Aaron Schimmer (Toronto), Richard F. Schlenk (Heidelberg)
Statistical Consultant
Catherine Klersy (Pavia)
AI Consultant
Jean Louis Raisaro (Lausanne)
Editorial Board
Walter Ageno (Varese), Sarit Assouline (Montreal), Andrea Bacigalupo (Roma), Taman Bakchoul (Tübingen), Pablo Bartolucci (Créteil), Katherine Borden (Montreal), Marco Cattaneo (Milan), Corey Cutler (Boston), Kate Cwynarski (London), Ahmet Dogan (New York), Mary Eapen (Milwaukee), Francesca Gay (Torino), Ajay Gopal (Seattle), Alex Herrera (Duarte), Martin Kaiser (London), Marina Konopleva (Houston), Nicolaus Kröger (Hamburg), Austin Kulasekararaj (London), Shaji Kumar (Rochester), Ann LaCasce (Boston), Matthew J. Mauer (Rochester) Neha Mehta-Shah (St. Louis), Moshe Mittelman (Tel Aviv), Alison Moskowitz (New York), Yishai Ofran (Haifa), Farhad Ravandi (Houston), John W. Semple (Lund), Liran Shlush (Toronto), Sarah K. Tasian (Philadelphia), Pieter van Vlieberghe (Ghent), Ofir Wolach (Haifa), Loic Ysebaert (Toulouse)
Managing Director
Antonio Majocchi (Pavia)
Editorial Office
Lorella Ripari (Office & Peer Review Manager), Simona Giri (Production & Marketing Manager), Paola Cariati (Graphic Designer), Giulia Carlini (Graphic Designer), Debora Moscatelli (Graphic Designer), Igor Poletti (Graphic Designer), Diana Serena Ravera (Peer Review), Laura Sterza (Account Administrator)
Assistant Editors
Britta Dost (English Editor), Rachel Stenner (English Editor), Anne Freckleton (English Editor), Rosangela Invernizzi (Scientific Consultant), Marianna Rossi (Scientific Consultant), Massimo Senna (Information Technology), Luk Cox (Graphic Artist)
Haematologica | 109 March 2024
Brief information on Haematologica
Haematologica (print edition, pISSN 0390-6078, eISSN 1592-8721) publishes peer-reviewed papers on all areas of experimental and clinical hematology. The journal is owned by a non-profit organization, the Ferrata Storti Foundation, and serves the scientific community following the recommendations of the World Association of Medical Editors (www. wame.org) and the International Committee of Medical Journal Editors (www.icmje.org).
Haematologica publishes Editorials, Original articles, Review articles, Perspective articles, Editorials, Guideline articles, Letters to the Editor, Case reports & Case series and Comments. Manuscripts should be prepared according to our guidelines (www.haematologica.org/information-for-authors), and the Uniform Requirements for Manuscripts Submitted to Biomedical Journals, prepared by the International Committee of Medical Journal Editors (www.icmje.org).
Manuscripts should be submitted online at http://www.haematologica.org/.
Conflict of interests. According to the International Committee of Medical Journal Editors (http://www.icmje. org/#conflicts), “Public trust in the peer review process and the credibility of published articles depend in part on how well conflict of interest is handled during writing, peer review, and editorial decision making”. The ad hoc journal’s policy is reported in detail at www.haematologica.org/content/policies.
Transfer of Copyright and Permission to Reproduce Parts of Published Papers. Authors will grant copyright of their articles to the Ferrata Storti Foundation. No formal permission will be required to reproduce parts (tables or illustrations) of published papers, provided the source is quoted appropriately and reproduction has no commercial intent. Reproductions with commercial intent will require written permission and payment of royalties.
Subscription. Detailed information about subscriptions is available at www.haematologica.org. Haematologica is an open access journal and access to the online journal is free. For subscriptions to the printed issue of the journal, please contact: Haematologica Office, via Giuseppe Belli 4, 27100 Pavia, Italy (phone +39.0382.27129, fax +39.0382.394705, E-mail: info@haematologica.org).
Rates of the printed edition for the year 2022 are as following:
Institutional: Euro 700
Personal: Euro 170
Advertisements. Contact the Advertising Manager, Haematologica Office, via Giuseppe Belli 4, 27100 Pavia, Italy (phone +39.0382.27129, fax +39.0382.394705, e-mail: marketing@haematologica.org).
Disclaimer. Whilst every effort is made by the publishers and the editorial board to see that no inaccurate or misleading data, opinion or statement appears in this journal, they wish to make it clear that the data and opinions appearing in the articles or advertisements herein are the responsibility of the contributor or advisor concerned. Accordingly, the publisher, the editorial board and their respective employees, officers and agents accept no liability whatsoever for the consequences of any inaccurate or misleading data, opinion or statement. Whilst all due care is taken to ensure that drug doses and other quantities are presented accurately, readers are advised that new methods and techniques involving drug usage, and described within this journal, should only be followed in conjunction with the drug manufacturer’s own published literature.
Direttore responsabile: Prof. Carlo Balduini; Autorizzazione del Tribunale di Pavia n. 63 del 5 marzo 1955.
Printing: Press Up, zona Via Cassia Km 36, 300 Zona Ind.le Settevene - 01036 Nepi (VT)
Haematologica | 109 March 2024
Associated with USPI, Unione Stampa Periodica Italiana. Premiato per l’alto valore culturale dal Ministero dei Beni Culturali ed Ambientali
Table of Contents
Volume 109, Issue 3: March 2024
About the Cover
Editorials
Image taken from the editorial by Z. Jevtic and J. Schwaller in this issue.
695 Bone marrow failure on steroids: when to use androgens?
R.T. Calado
https://doi.org/10.3324/haematol.2023.283564
698 Ibrutinib and the chemotactic lymph node choreography
T.N. Hartmann
https://doi.org/10.3324/haematol.2023.283651
701 Maximal benefit of minimal residual disease monitoring in pediatric acute myeloid leukemia
H.Hasle and K.L. Juul-Dam
https://doi.org/10.3324/haematol.2023.283765
704 Understanding pharmacological complement inhibition in paroxysmal nocturnal hemoglobinuria
A.M. Risitano and C. Frieri
https://doi.org/10.3324/haematol.2023.283805
709 Prehistory of chronic lymphocytic leukemia: clues from the B-cell receptor
F.Davi
https://doi.org/10.3324/haematol.2023.283799
712 First mouse model of infant acute myeloid leukemia with t(7;12)(q36;p17)
Z.Jevtic and J. Schwaller
https://doi.org/10.3324/haematol.2023.283659
715 Stressing the stem cell in acute myeloid leukemia
G.Borthakur
https://doi.org/10.3324/haematol.2023.283919
716 What can we learn from cancer registries?
B.Burkhardt
https://doi.org/10.3324/haematol.2023.284104
Spotlight Review Article
718 Talquetamab in multiple myeloma
L.Liu and A. Krishnan
https://doi.org/10.3324/haematol.2023.283931
Articles
Acute Myeloid Leukemia
725 Aberrant MNX1 expression associated with t(7;12)(q36;p13) pediatric acute myeloid leukemia induces the disease through altering histone methylation
A.Waraky et al.
https://doi.org/10.3324/haematol.2022.282255
Haematologica | 109 March 2024 I
Acute Myeloid Leukemia
740 Genomic breakpoint-specific monitoring of measurable residual disease in pediatric non-standardrisk acute myeloid leukemia
M. Maurer-Granofszky et al.
https://doi.org/10.3324/haematol.2022.282424
Acute Myeloid Leukemia
751 DNAJC10 maintains survival and self-renewal of leukemia stem cells through PERK branch of the unfolded protein response
M. Li et al.
https://doi.org/10.3324/haematol.2023.282691
Bone Marrow Failure
765
Current use of androgens in bone marrow failure disorders: a report from the Severe Aplastic Anemia Working Party of the European Society for Blood and Marrow Transplantation
S. Pagliuca et al.
https://doi.org/10.3324/haematol.2023.282935
Cell Therapy & Immunotherapy
777 Idecabtagene vicleucel chimeric antigen receptor T-cell therapy for relapsed/refractory multiple myeloma with renal impairment
S. Sidana et al.
https://doi.org/10.3324/haematol.2023.283940
Cell Therapy & Immunotherapy
787 Regulatory T cells hamper the efficacy of T-cell engaging bispecific antibody therapy
M. Casey et al.
https://doi.org/10.3324/haematol.2023.283758
Cell Therapy & Immunotherapy
799 Lower overall survival in male patients with advanced disease undergoing allogeneic hematopoietic stem cell transplantation is associated with CYP1B1 Leu432Val polymorphism
N. Stute
https://doi.org/10.3324/haematol.2023.283649
Chronic Lymphocytic Leukemia
809 Lymphocyte migration and retention properties affected by ibrutinib in chronic lymphocytic leukemia
J. Rey-Barroso et al.
https://doi.org/10.3324/haematol.2022.282466
Chronic Lymphocytic Leukemia
824 Autonomous B-cell receptor signaling and genetic aberrations in chronic lymphocytic leukemiaphenotype monoclonal B lymphocytosis in siblings of patients with chronic lymphocytic leukemia
E. Quinten et al.
https://doi.org/10.3324/haematol.2022.282542
Chronic Lymphocytic Leukemia
835
Ultra-deep mutational landscape in chronic lymphocytic leukemia uncovers dynamics of resistance to targeted therapies
D.W. Woolston et al.
https://doi.org/10.3324/haematol.2023.283372
Non-Hodgkin Lymphoma
846 Improved survival for dose-intensive chemotherapy in primary mediastinal B-cell lymphoma: a systematic review and meta-analysis of 4,068 patients
M. Cook et al.
https://doi.org/10.3324/haematol.2023.283446
Non-Hodgkin Lymphoma
857 Lisocabtagene maraleucel for second-line relapsed or refractory large B-cell lymphoma: patientreported outcomes from the PILOT study
L.I. Gordon et al.
https://doi.org/10.3324/haematol.2023.283162
Haematologica | 109 March 2024 II
Plasma Cell Disorders
867 ANCHOR: melflufen plus dexamethasone and daratumumab or bortezomib in relapsed/refractory multiple myeloma: final results of a phase I/IIa study
E.M. Ocio et al.
https://doi.org/10.3324/haematol.2023.283490
Plasma Cell Disorders
877 Quantification of cyclin D1 and D2 proteins in multiple myeloma identifies different expression patterns from those revealed by gene expression profiling
I. J. Cardona-Benavides et al.
https://doi.org/10.3324/haematol.2023.283445
Plasma Cell Disorders
888 What is the best treatment strategy before autologous peripheral blood stem cell transplantation in POEMS syndrome?
F. Autore et al.
https://doi.org/10.3324/haematol.2023.283719
Plasma Cell Disorders
895 Efficacy and safety of melflufen plus daratumumab and dexamethasone in relapsed/refractory multiple myeloma: results from the randomized, open-label, phase III LIGHTHOUSE study
L. Pour et al.
https://doi.org/10.3324/haematol.2023.283509
Plasma Cell Disorders
906 The changing spectrum of infection with BCMA and GPRC5D targeting bispecific antibody (bsAb) therapy in patients with relapsed refractory multiple myeloma
L. Hammons et al.
https://doi.org/10.3324/haematol.2023.283590
Platelet Biology & its Disorders
915 Dynamic actin/septin network in megakaryocytes co-ordinates proplatelet elaboration
I. Becker et al.
https://doi.org/10.3324/haematol.2023.283369
Letters to the Editor
929 Phase II trials of zilucoplan in paroxysmal nocturnal hemoglobinuria
A.G. Kulasekararaj et al.
https://doi.org/10.3324/haematol.2022.281780
936 Survival disparities between children and adolescents and young adults for the major subtypes of non-Hodgkin lymphoma in the Netherlands: a large population-based study
M. Schulpen et al.
https://doi.org/10.3324/haematol.2023.283379
942 Somatic variant profiling in chronic phase pediatric chronic myeloid leukemia
Y.L. Behrens et al.
https://doi.org/10.3324/haematol.2023.283800
948 Outcome heterogeneity of TP53-mutated myeloid neoplasms and the role of allogeneic hematopoietic cell transplantation.
S. Pasca et al.
https://doi.org/10.3324/haematol.2023.283886
953 A phase II study of interrupted and continuous dose lenalidomide in relapsed/refractory Hodgkin lymphoma
T.A. Fehniger et al.
https://doi.org/10.3324/haematol.2022.282246
Haematologica | 109 March 2024 III
958 Iron deficiency responses and integrated compensations in patients according to hereditary hemorrhagic telangiectasia ACVRL1¸ ENG and SMAD4 genotypes
L. Sharma et al.
https://doi.org/10.3324/haematol.2022.282038
963 Bone mineral density in adult patients with pyruvate kinase deficiency on long-term mitapivat treatment
H. Al-Samkari et al.
https://doi.org/10.3324/haematol.2023.282884
968 Engineering a humanized animal model of polycythemia vera with minimal JAK2V617F mutant allelic burden
T.M. Parson et al.
https://doi.org/10.3324/haematol.2023.283858
974 Circulating tumor DNA and bone marrow minimal residual disease negativity confers superior outcome for multiple myeloma patients
S. Mithraprabhu et al.
https://doi.org/10.3324/haematol.2023.283831
979 Venetoclax salvage therapy in relapsed/refractory multiple myeloma
M.J. Steinhardt et al.
https://doi.org/10.3324/haematol.2023.283472
982 Brentuximab vedotin with chemotherapy in adolescents and young adults with stage III or IV classical Hodgkin lymphoma in ECHELON-1
H.E. Crosswell et al.
https://doi.org/10.3324/haematol.2023.283303
988 BH3 mimetics in relapsed and refractory adult acute lymphoblastic leukemia: a Campus ALL real-life study
F. Malfona et al.
https://doi.org/10.3324/haematol.2023.283684
Case Reports & Case Series
994 Concurrent peripheral T-cell lymphoma and T-cell lymphoblastic leukemia/lymphoma with identical STIL::TAL1 fusion events
M. Khanlari et al.
https://doi.org/10.3324/haematol.2023.283585
1000 An unusual case of thalassemia intermedia with inheritable complex repeats detected by singlemolecule optical mapping
Q. Zhang et al.
https://doi.org/10.3324/haematol.2023.282902
1007 Tucidinostat restores CCR4 expression in adult T-cell leukemia/lymphoma
T. Kawata et al.
https://doi.org/10.3324/haematol.2023.283266
Haematologica Reviewers in 2023
1010 List of the reviewers who in 2023 generously made an essential contribution to the high scientific quality of Haematologica
Haematologica | 109 March 2024 IV
Bone marrow failure on steroids: when to use androgens?
Rodrigo T. Calado
University of São Paulo, Ribeirão Preto, São Paulo, Brazil
In this issue of Haematologica, Pagliuca et al. report on the European Society of Blood and Marrow Transplantion (EBMT) retrospective analysis on the use of androgens to treat bone marrow failure syndromes.1
Androgens have been an option in the treatment of aplastic anemia since the 1960s with variable response rates.2 Different steroids with androgenic or anabolic effects have been applied, from danazol and oxymetholone to nandrolone decanoate and oxandrolone.3 These formulations vary in administration, pharmacokinetics, anabolic effects, and toxicity. The mechanisms of action on the bone marrow are multiple and at least two pathways have been described. It stimulates erythropoiesis by activating the erythropoietin (EPO) receptor and increasing EPO production in the kidneys. It also stimulates the telomerase (TERT) gene expression in the hematopoietic tissue.4
Androgens have been used to treat acquired immune and inherited aplastic anemias, including Fanconi anemia and dyskeratosis congenita, but the success of immunosuppression (anti-thymocyte globulin and cyclosporine) and, more recently, eltrombopag to treat immune aplastic anemia have meant that androgens are now very unlikely to be a therapeutic choice for acquired cases.
For inherited bone marrow failure, the collective experience supports its use in certain circumstances. Several retrospective studies in Fanconi anemia with a relatively limited number of young patients showed good responses varying from 68% to 87% with a median duration of 2-3 years but with consistent adverse events, such as virilization, liver toxicity, and myelodysplasia.5-7 In telomere diseases, including dyskeratosis congenita, prospective studies showed good hematologic responses in approximately 80% of cases associated with telomere elongation.8,9 Again, liver toxicity (elevated liver enzymes in 41-88% of cases), virilization (in up to 59%), and edema (in 26%) are common adverse events. Severe adverse events are infrequent. However, virilization may have significant physical and psychological negative impacts in younger patients, especially in girls.
The study by Pagliuca et al. is the largest retrospective cohort with 274 aplastic anemia patients treated with an-
Correspondence: R.T. Calado rtcalado@usp.br
Received: July 19, 2023.
Accepted: August 9, 2023.
Early view: August 17, 2023.
https://doi.org/10.3324/haematol.2023.283564
©2024 Ferrata Storti Foundation
Published under a CC BY-NC license

drogens in 82 EBMT centers. In total, 193 patients were diagnosed with acquired and 81 with inherited aplastic anemia with a median treatment duration of 5.6 and 20 months, respectively. Surprisingly, response rates were very similar between the two groups (acquired and inherited) with approximately one-third of patients responding at three months. Androgens as third-line therapy (or more) for acquired or after one-year post diagnosis for inherited cases were associated with improved failurefree survival. This is an important observation because inherited etiology was not comprehensively addressed in this retrospective cohort and many patients in the acquired group may have had a cryptic genetic etiology, including, for example, telomere-biology gene mutation, GATA2 deficiency, or SAMD9/9L mutation. That a genetic component is likely in this group is also supported by the late response to androgens after two or more immunosuppressive cycles. Conversely, the inherited group was mainly composed of Fanconi anemia, further suggesting that other inherited cases were allocated in the “acquired” group. The discrepancy in hematologic response between the current analysis and previous reports may be due to the response timepoint (3 months in the current analysis), as Fanconi anemia patients usually respond after six months when treated with oxymetholone and one year when danazol is administered.3 Toxicity was mainly associated with the liver, gastrointestinal tract, and kidneys, and appeared early, similar to previous analyses. The study by Pagliuca et al. reinforces the specific situations in which androgens may be a good option and those in which it should be avoided (Figure 1). First, androgens should not be considered as an option to treat acquired immune aplastic anemia, at least as first- or second-line therapy.10 On the one hand, immunosuppression combined with eltrombopag produces excellent response rates as front-line for older patients or those lacking a suitable sibling donor.11,12 On the other hand, alternative source hematopoietic stem cell transplant (HSCT) modalities may have very good results either as front-line or to rescue the minority of patients who fail eltrombopag added to immunosuppression.10,13,14 Excep-
Haematologica | 109 - March 2024 695 EDITORIAL R.T. Calado
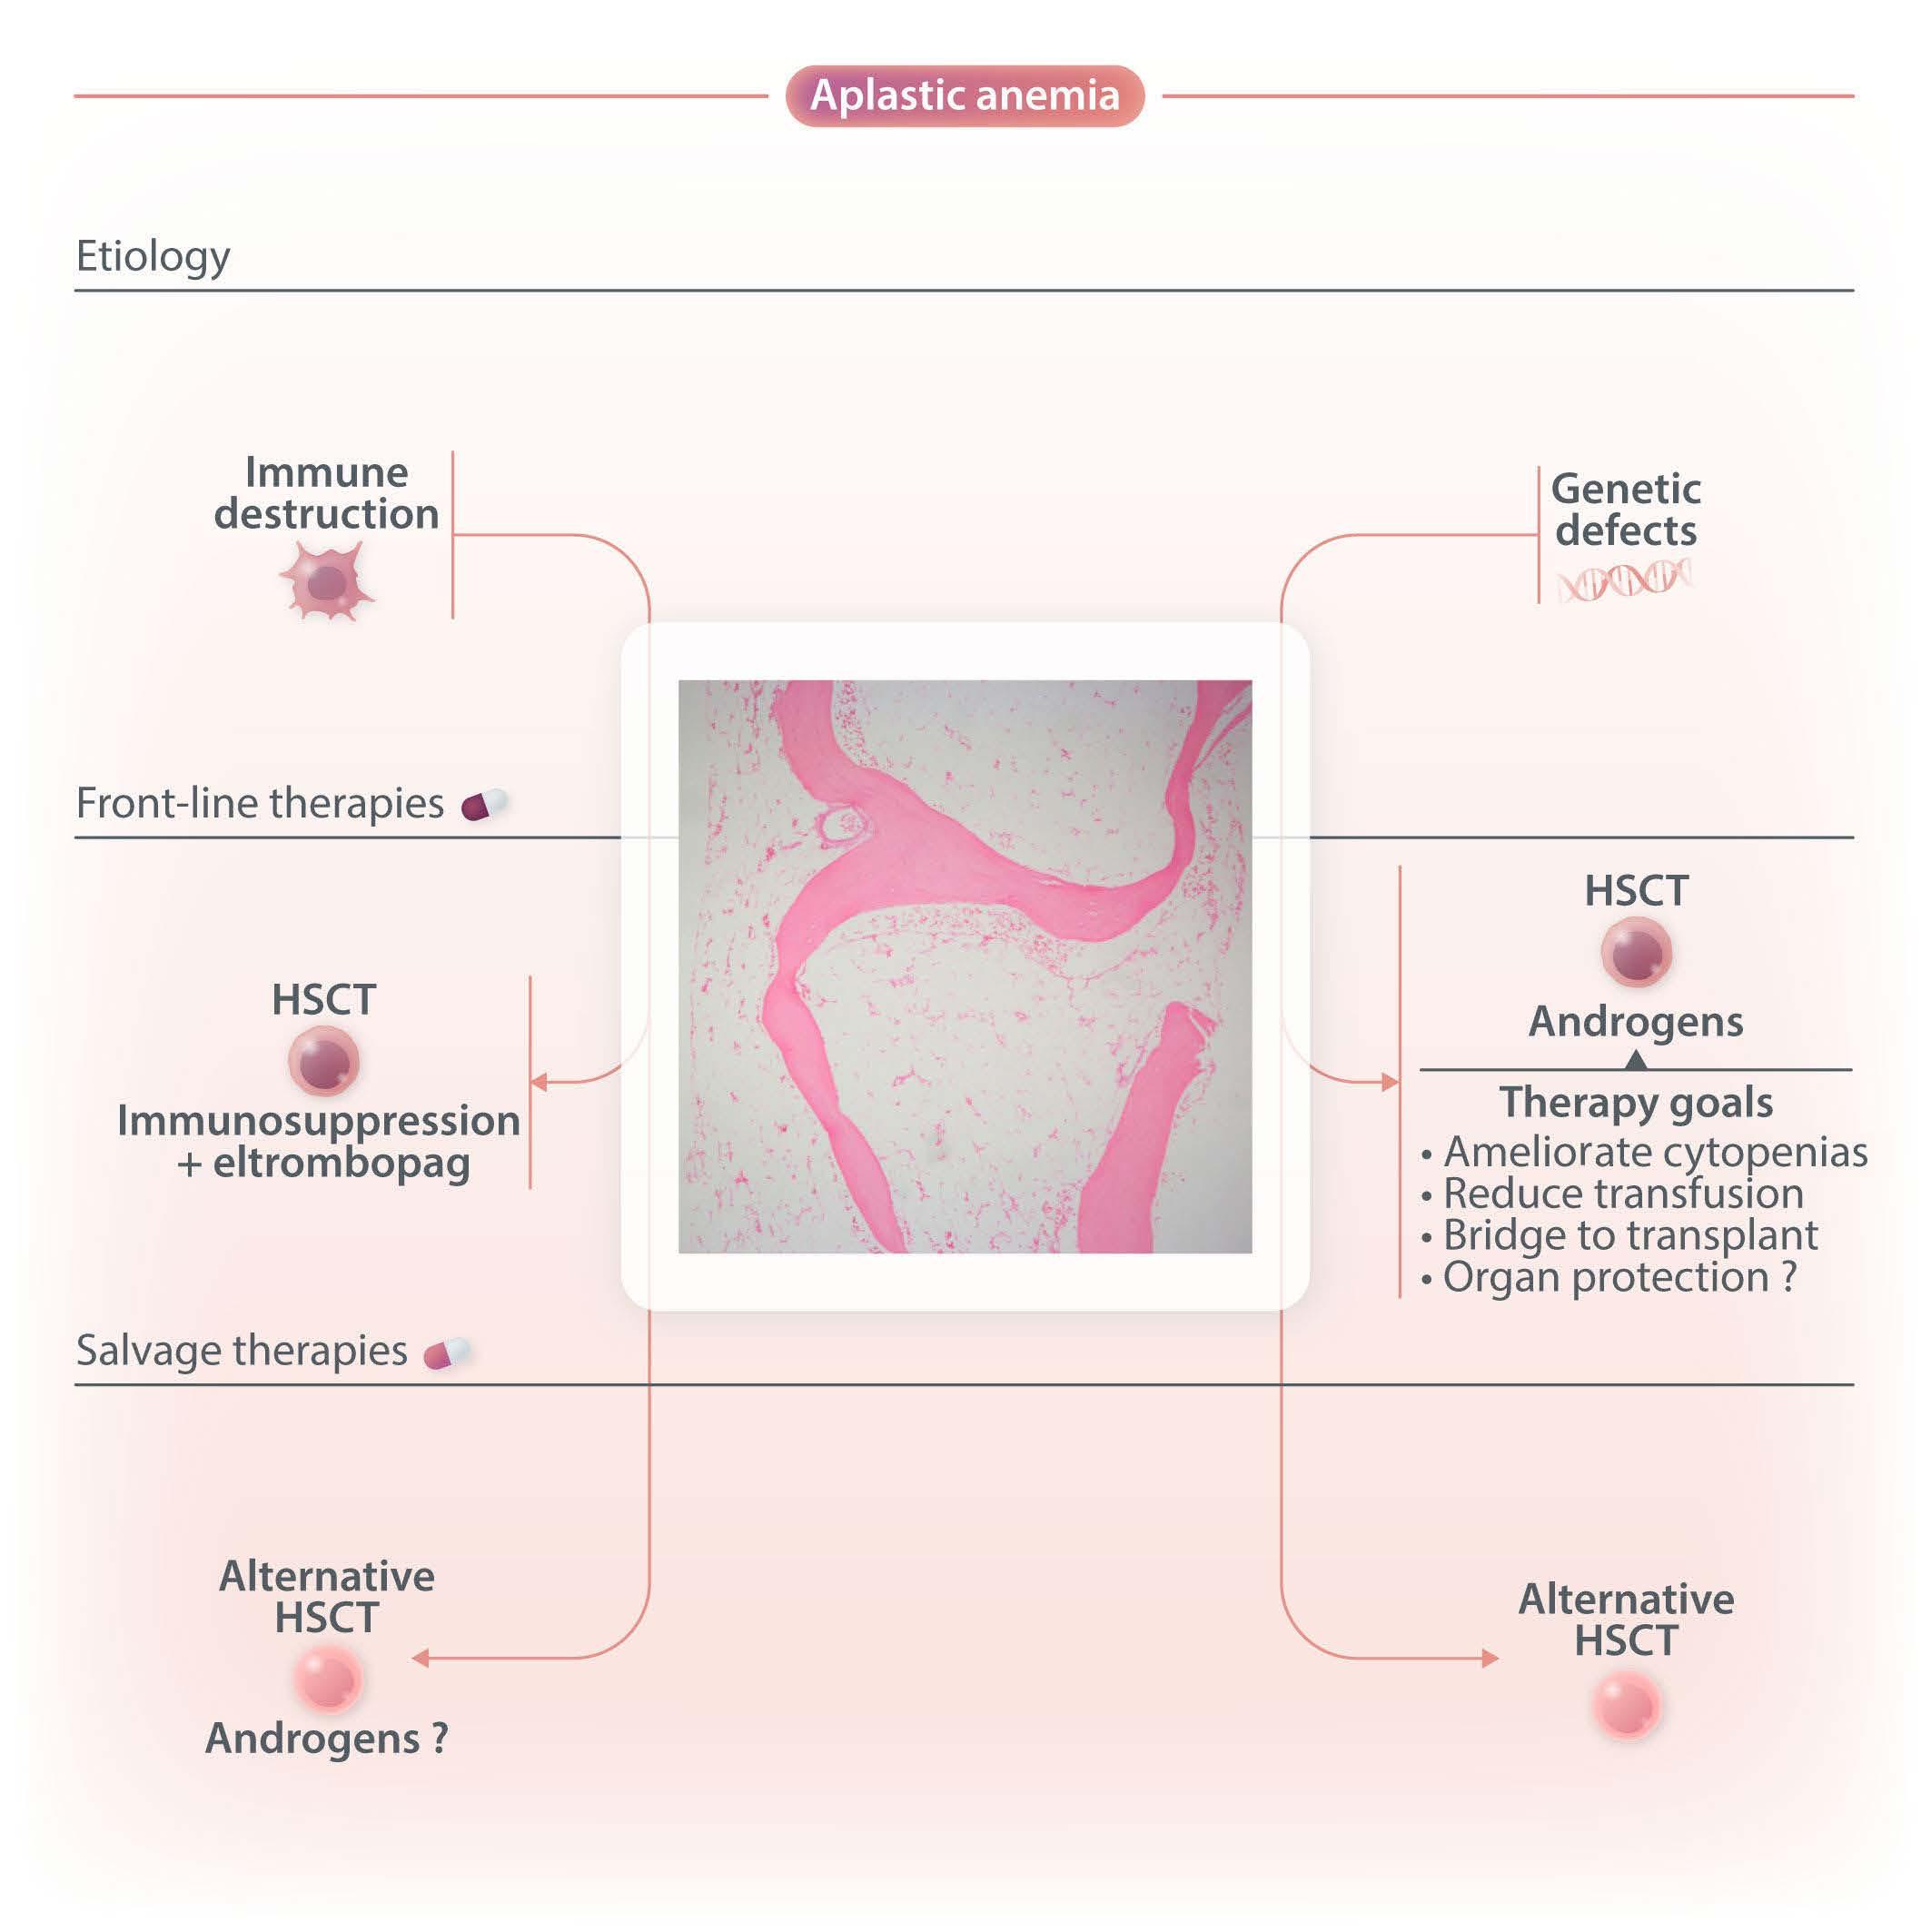
Figure 1. Different etiologies (immune-destruction, genetic defects) cause hematopoietic stem cell failure, clinically translating into aplastic anemia (empty bone marrow). Genetic defects causing marrow failure usually are related to impaired DNA repair (Fanconi anemia), defective telomere maintenance (telomeropathies), ribosomal deficiency (Shwachman-Diamond syndrome), or differentiation defect (GATA2 deficiency).10,15 Immune aplastic anemia may be effectively treated with relatedmatched hematopoietic stem cell transplant (HSCT) or intensive immunosuppression (anti-thymocyte globulin and cyclosporine) combined with eltrombopag, a TPO-agonist that stimulates hematopoietic progenitors.11,12,16 Inherited aplastic anemia may also be treated with HSCT but androgens may also be effective in alleviating cytopenias, reducing transfusion dependence, serving as a bridge to HSCT, and potentially protecting other organs.3,9,17,18 Exceptionally, androgens may be used as salvage therapy for patients with immune aplastic anemia who failed to respond to previous immunosuppression or HSCT.
tionally, androgens may be considered for patients with “acquired” aplastic anemia who failed multiple courses of immunosuppression, eltrombopag, and who are not eligible for HSCT.
For Fanconi anemia, telomeropathies, and other inherited cases, androgens may be an option under certain circumstances.3 First, these may be beneficial for patients with cytopenias not severe enough to justify a HSCT. Second, androgens may be an option for patients with severe cytopenias lacking a suitable donor. Third, androgens may be used as a bridge to HSCT to ameliorate cytopenias or transfusion dependence. Although the prevention of extra-
hematologic manifestations should be a goal, it is still unclear whether androgens can modulate liver or lung involvement.9 Finally, the androgen formulation should be based on the adverse event profile, availability, gender, and administration route. For example, oxymetholone appears to produce faster responses than danazol, but it more frequently results in virilization and should be avoided for girls.3 Nandrolone may cause less severe liver toxicity but administration is intramuscular.9
In summary, the study by Pagliuca et al. updates and summarizes the potential benefit of treating aplastic anemia patients with androgens. The benefits may be limited but
Haematologica | 109 - March 2024 696 EDITORIAL R.T. Calado
effective when appropriately used, especially in inherited cases. It may also serve as a bridge to HSCT when an appropriate donor is not readily available, or blood counts are not low enough to satisfy transplant criteria.
References
1. Pagliuca S, Kulasekararaj AG, Eikema DJ, et al. Current use of androgens in bone marrow failure disorders: a report from the Severe Aplastic Anemia Working Party of the European Society of Blood and Marrow Transplantation. Haematologica. 2024;109(3):763-774.
2. Sanchez-Medal L, Gomez-Leal A, Duarte L, Guadalupe Rico M. Anabolic androgenic steroids in the treatment of acquired aplastic anemia. Blood. 1969;34(3):283-300.
3. Calado RT, Cle DV. Treatment of inherited bone marrow failure syndromes beyond transplantation. Hematology Am Soc Hematol Educ Program. 2017;2017(1):96-101.
4. Calado RT, Yewdell WT, Wilkerson KL, et al. Sex hormones, acting on the TERT gene, increase telomerase activity in human primary hematopoietic cells. Blood. 2009;114(11):2236-2243.
5. Scheckenbach K, Morgan M, Filger-Brillinger J, et al. Treatment of the bone marrow failure in Fanconi anemia patients with danazol. Blood Cells Mol Dis. 2012;48(2):128-131.
6. Rose SR, Kim MO, Korbee L, et al. Oxandrolone for the treatment of bone marrow failure in Fanconi anemia. Pediatr Blood Cancer. 2014;61(1):11-19.
7. Paustian L, Chao MM, Hanenberg H, et al. Androgen therapy in Fanconi anemia: a retrospective analysis of 30 years in Germany. Pediatr Hematol Oncol. 2016;33(1):5-12.
8. Townsley DM, Dumitriu B, Liu DL, et al. Danazol treatment for telomere diseases. N Engl J Med. 2016;374(20):1922-1931.
9. Cle DV, Catto LFB, Gutierrez-Rodrigues F, et al. Effects of nandrolone decanoate on telomere length and clinical outcome in patients with telomeropathies: a prospective trial. Haematologica. 2023;108(5):1300-1312.
Disclosures
No conflicts of interests to disclose.
10. Young NS. Aplastic anemia. N Engl J Med. 2018;379(17):1643-1656.
11. Townsley DM, Scheinberg P, Winkler T, et al. Eltrombopag added to standard immunosuppression for aplastic anemia. N Engl J Med. 2017;376(16):1540-1550.
12. Peffault de Latour R, Kulasekararaj A, Iacobelli S, et al. Eltrombopag added to immunosuppression in severe aplastic anemia. N Engl J Med. 2022;386(1):11-23.
13. Prata PH, Eikema DJ, Afansyev B, et al. Haploidentical transplantation and posttransplant cyclophosphamide for treating aplastic anemia patients: a report from the EBMT Severe Aplastic Anemia Working Party. Bone Marrow Transplant. 2020;55(6):1050-1058.
14. DeZern AE, Zahurak M, Symons HJ, et al. Alternative donor BMT with posttransplant cyclophosphamide as initial therapy for acquired severe aplastic anemia. Blood. 2023;141(25):3031-3038.
15. Young NS, Calado RT, Scheinberg P. Current concepts in the pathophysiology and treatment of aplastic anemia. Blood. 2006;108(8):2509-2519.
16. Quintino de Oliveira B, Catto LFB, Santana BAA, et al. Eltrombopag preferentially expands haematopoietic multipotent progenitors in human aplastic anaemia. Br J Haematol. 2021;193(2):410-414.
17. Bonfim C. Special pre- and posttransplant considerations in inherited bone marrow failure and hematopoietic malignancy predisposition syndromes. Hematology Am Soc Hematol Educ Program. 2020;2020(1):107-114.
18. Nichele S, Bonfim C, Junior LGD, et al. Hematopoietic cell transplantation for telomere biology diseases: a retrospective single-center cohort study. Eur J Haematol. 2023;111(3):423-431.
Haematologica | 109 - March 2024 697 EDITORIAL R.T. Calado
Ibrutinib and the chemotactic lymph node choreography
Tanja N. Hartmann
Department of Medicine I, Medical Center-University of Freiburg, Faculty of Medicine, University of Freiburg, Freiburg, Germany
The introduction of Bruton tyrosine kinase (BTK) inhibitors has revolutionized the therapeutic management of B-cell malignancies such as chronic lymphocytic leukemia (CLL), with ibrutinib being the first covalent inhibitor in its class. BTK plays a major role in B-cell receptor signaling but is also involved in other signaling pathways and can be expressed by other immune cells. Upon starting therapy, BTK inhibitors cause an initial increase in lymphocytosis which is driven by the release of activated CLL cells from lymph nodes.1 This is therapeutically relevant as CLL cells proliferate exclusively in this compartment, in contrast to CLL cells in blood which are in a resting state. Consequently, subgroups of patients with enhanced homing and retention capacity in lymph nodes under therapy, e.g., due to high expression of the CD49d integrin, are more prone to develop resistance.2,3
The extent and kinetics of the treatment-induced lymphocytosis vary among CLL patients and there are still many gaps in understanding how BTK inhibition causes lymphocytosis. In fact, there is surprisingly little knowledge about the mechanisms of malignant B-cell trafficking out of lymph nodes. The study by Rey-Barroso and colleagues,4 published in this issue of Haematologica, addresses some of these gaps by phenotyping the effects of ibrutinib on chemotactic properties of CLL cells and T cells (Figure 1).
To this end, the authors employed a combination of in vitro flow cytometric phenotyping, chemotaxis assays, and time-lapse motility video imaging of cell motility parameters. They describe important common and differing properties of immediate (in vitro) and long-term (in vivo, “real-world”) effects of ibrutinib.
To understand the dynamics of lymphocyte homeostasis in the lymph nodes, it is essential to consider the mechanisms by which normal B lymphocytes enter and exit the lymph node. Although it is well established that B cells rely on CXCR5 to enter the lymph node from the bloodstream via high endothelial venules, their modes of exit remain unclear. For example, the involvement of the sphingosine 1-phosphate (S1P)/S1P receptor 1 (S1PR1) axis in lymphocyte exit has been well described in the context of T cells but its role in B-cell exit is still under debate.5 Fur-
Correspondence: T.N. Hartmann
tanja.hartmann@uniklinik-freiburg.de
Received: July 25, 2023.
Accepted: August 11, 2023.
Early view: August 24, 2023.
https://doi.org/10.3324/haematol.2023.283651
©2024 Ferrata Storti Foundation
Published under a CC BY-NC license
thermore, memory B cells are able to use unconventional egress routes, including the subcapsular sinus, the primary area where tissue-derived lymph fluid drains.6
Inside lymph nodes, normal B cells engage in continuous dynamic stop-and-go migration to encounter antigens and undergo activation and differentiation. The CXCR5 ligand CXCL13 plays a key role in attracting B cells to antigen-rich follicular dendritic cells and acts in concert with integrin ligands and antigen presented by these cells. The strength of antigen binding to the B-cell receptor and the migratory velocity of the malignant cells towards CXCL13 are reciprocally connected.8 The chemokine receptor CCR7 directs B cells via its ligands CCL19 and CCL21 to T-cell zones, while CXCR4 and CXCR5 shuttle the B cells between dark and light zones via CXCL12 and CXCL13 during germinal center reactions. Our knowledge of lymphocyte dynamics in the lymph node is mainly based on murine models, and there are few reports addressing the differences from the human situation.7 The study presented by Rey-Barroso and colleagues is, therefore, crucial in advancing our understanding of lymphocyte dynamics in human lymph nodes under therapy.4
It is important to note that in CLL, the lymph node architecture (such as compartmentalization of the B-cell zone and the T-cell zone, along with their zone-specific chemokines) is already disrupted at the start of therapy, with a chaotic positioning of tumor cells simultaneously overexpressing CXCR4, CXCR5, and CCR7. Long-term treatment with ibrutinib gradually restores the architecture to a more normal state. This might explain the differences that ReyBarroso and colleagues found when comparing samples treated short-term in vitro with those collected during a 6month monitoring of therapy. In particular, the repression of CXCR4- and CXCR5-induced migration in CLL cells in vivo was different from the in vitro situation and the effect of ibrutinib on the basal and chemokine-evoked migration of T cells was milder. Ibrutinib has off-target activity which affects several other tyrosine kinase pathways beside BTK, including TEC family kinases such as ITK,9 which affect Tcell responses. This off-target suppression may be particularly pronounced in vitro. Another explanation might be that
Haematologica | 109 - March 2024 698 EDITORIAL T.N. Hartmann
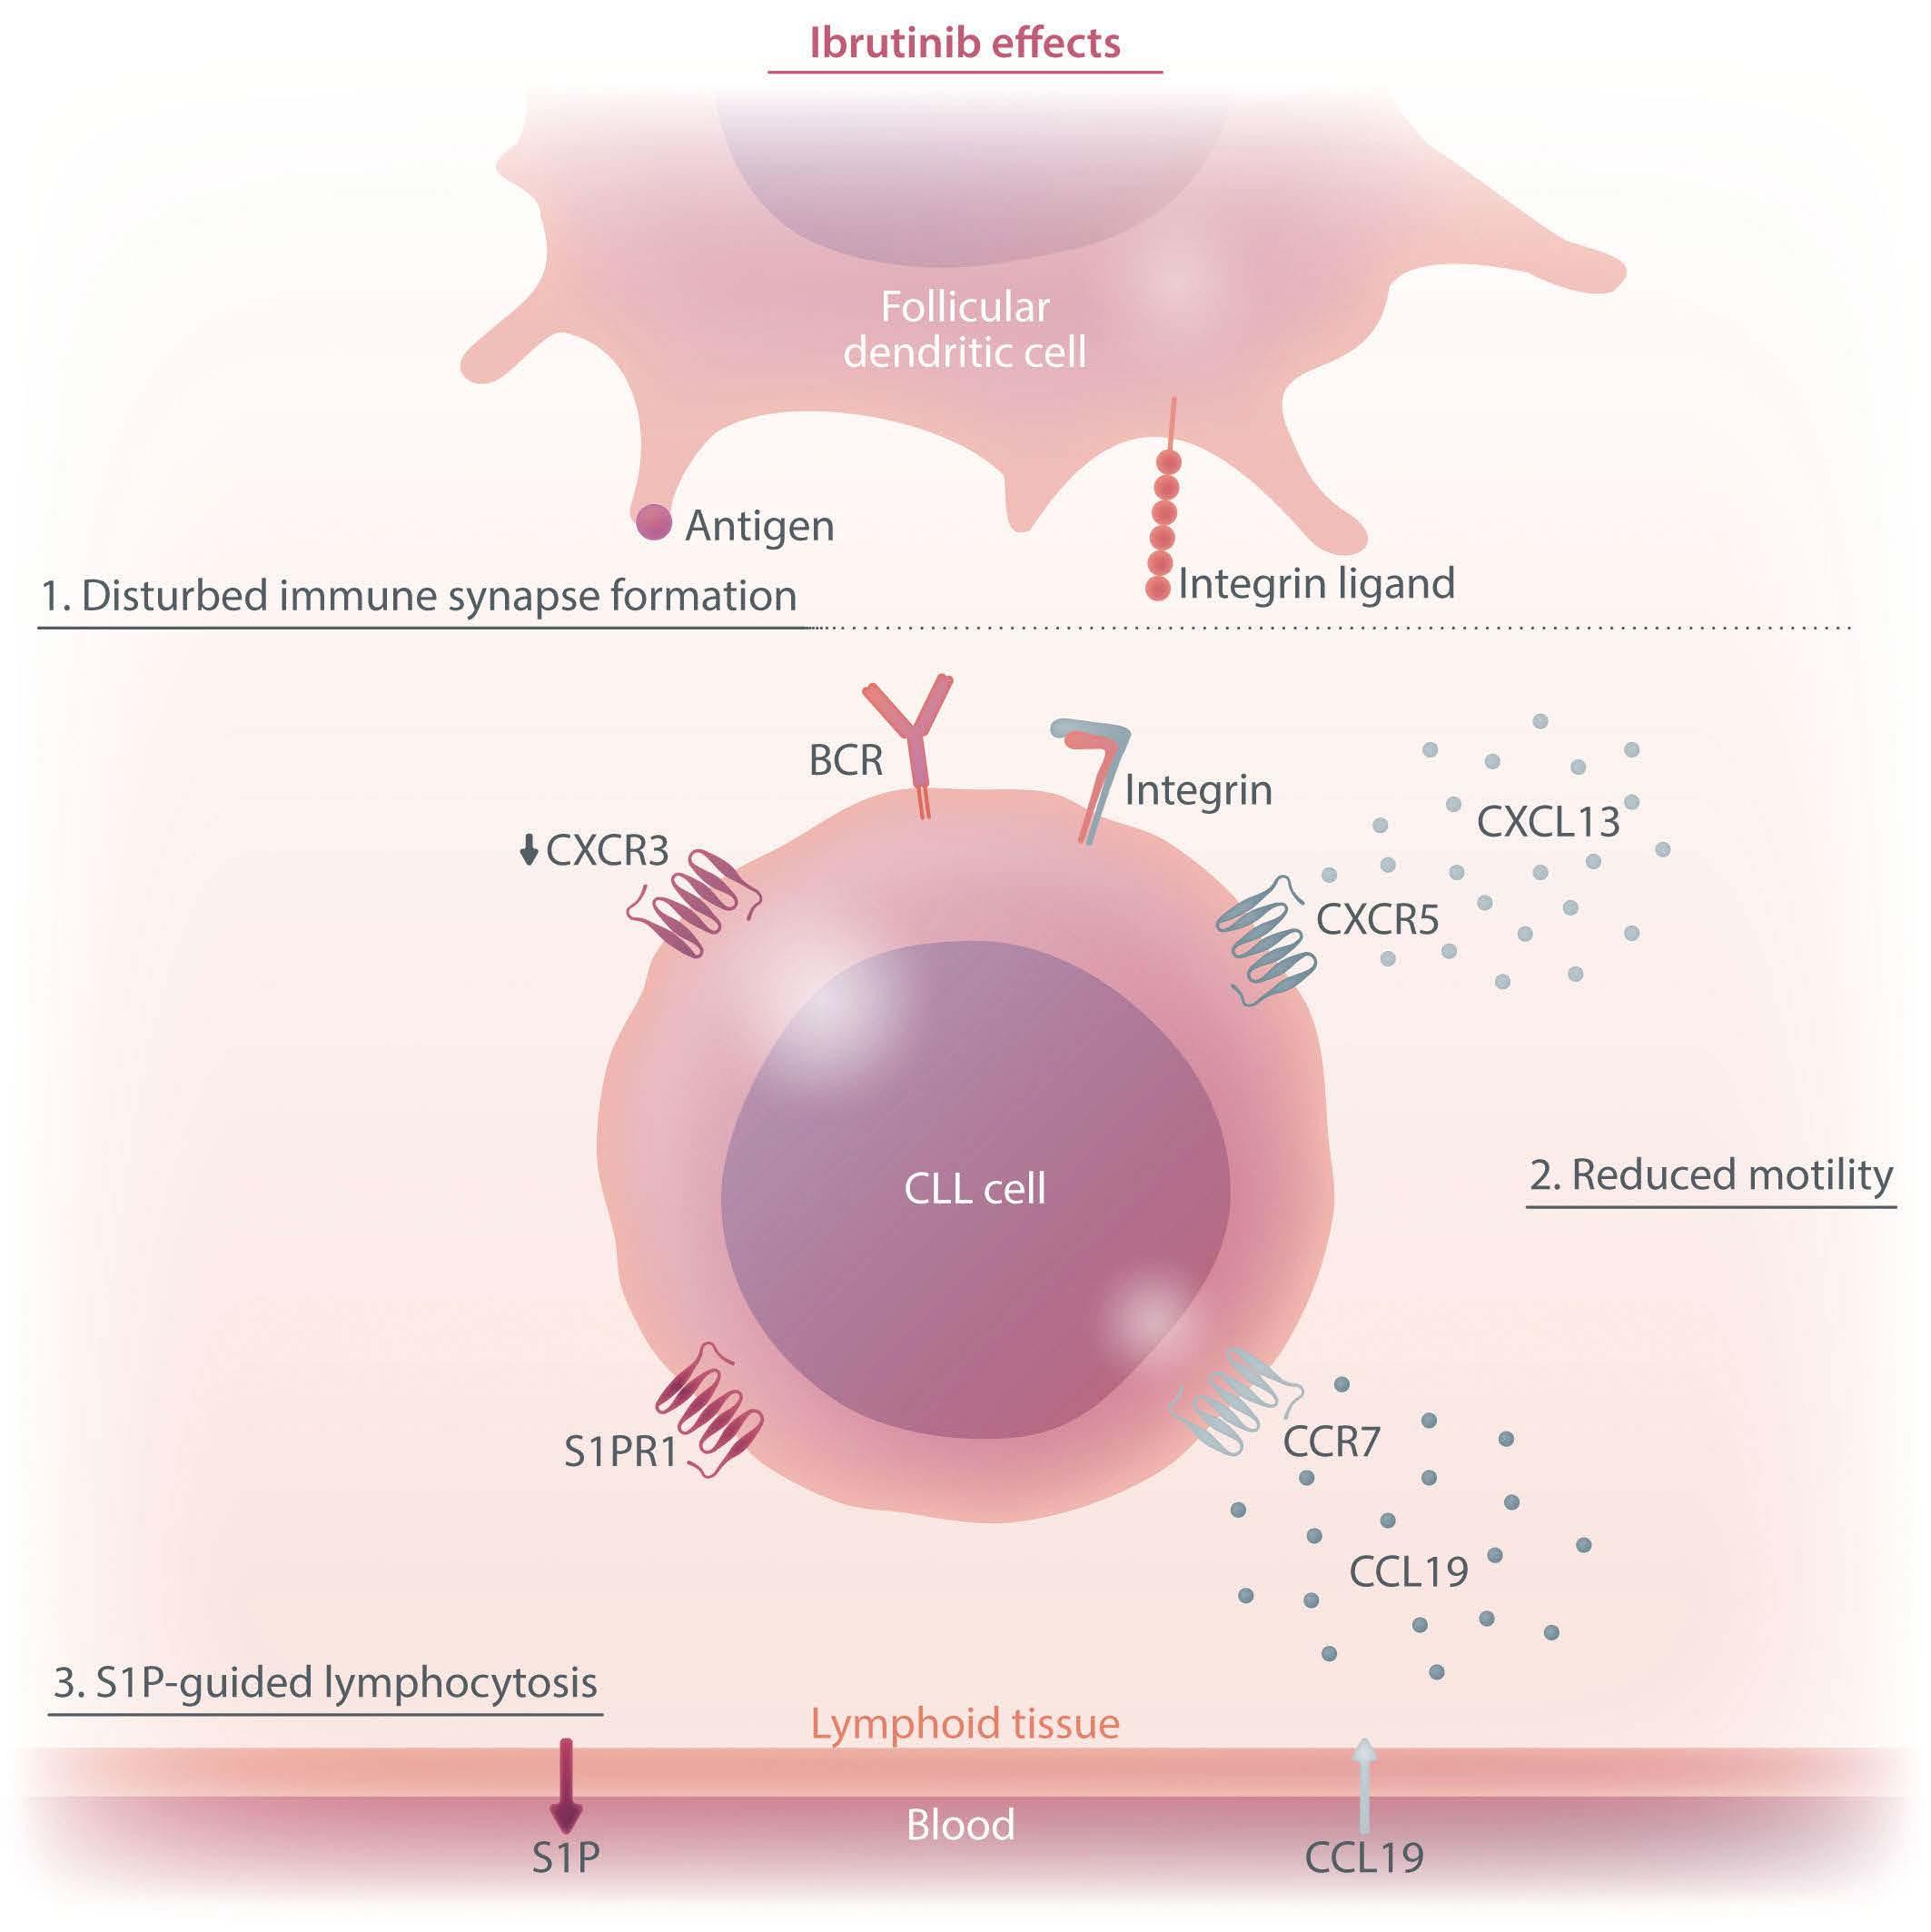
of chronic lymphocytic leukemia cells. The figure summarizes the chemotactic changes that lead to initial lymphocytosis under ibrutinib treatment. First, the immune synapse between tumor cells and follicular dendritic cells is disrupted, leading to delocalization of the tumor cells. Secondly, delocalization is promoted by reduced tumor cell motility towards CXCR5, CCR7 and CXCR3 ligands, which would direct the cells towards the follicular dendritic cell and activating T cells. Thirdly, increased responsiveness to S1P ultimately shifts the balance towards lymph node exit. BCR: B-cell receptor; CLL: chronic lymphocytic leukemia; S1P: sphingosine 1-phosphate; S1PR1:
the restoration of the lymph node architecture during longterm treatment alters the migratory properties of the T cells. Consistent ibrutinib-dependent modulation was observed for CXCR3 expression in CLL cells, with an almost complete loss of expression after 2 months, while CXCR4 expression did not vary along the 6-month follow-up period. This can be explained by the negative co-operativity of these two receptors in CLL.10 In other words, CXCR3 engagement by its inflammatory ligands leads to desensitization of the CXCR4 responsiveness to its ligand CXCL12. This is caused by intracellular downstream components and does not require or necessarily translate into an alteration in CXCR4 expression.10 It must be noted that during the CLL cell cycle, CXCR3 is dynamically expressed in a reciprocal manner to the activation marker CD69. Its loss in early phases of ibrutinib treatment likely reflects the initial mobilization of activated CLL cells from lymph nodes, in line with previous observations.1
In normal lymphocytes CD69 and S1PR1 can be considered counteractors. An important aspect of the study by ReyBarroso and colleagues is the relation of S1PR1 to CCR7 expression as a key determinant of the strength of BTK inhibition-induced lymphocytosis. This suggests that CLL cells use the classical S1P axis for exit, in analogy to B cells upon a T-dependent antigen response, with CCR7 dominance resembling an activated B cell that constantly migrates towards the T-cell zone. It is interesting that the CCR7 responsiveness towards CCL19 stimulation was retained under continuous ibrutinib treatment.
Rey-Barroso et al. did not use the validated clinical cutoff of 30% for CD49d low and high cases, and there was a relevant proportion of CD49d (VLA-4)-negative cases in their cohort. It will be beneficial to combine their chemotactic observations with those in validated CD49d-expression subgroups of patients, the highly variable extents of lymphocytosis in individual patients and, most importantly, the
Haematologica | 109 - March 2024 699 EDITORIAL T.N. Hartmann
Figure 1. The effects of ibrutinib on the chemotactic properties
S1P receptor 1.
outcome of patients under BTK inhibitor therapy. In conclusion, the study by Rey-Barroso and colleagues deepens our understanding of the intricate processes underlying lymphocytosis in CLL. By uncovering the dynamics of cell motility and chemotaxis, and by bringing our attention to the differences between in vitro and in vivo studies, the authors provide a solid basis for further ex-
References
1. Herman SE, Niemann CU, Farooqui M, et al. Ibrutinib-induced lymphocytosis in patients with chronic lymphocytic leukemia: correlative analyses from a phase II study. Leukemia. 2014;28(11):2188-2196.
2. Alsadhan A, Chen J, Gaglione EM, et al. CD49d expression identifies a biologically distinct subtype of chronic lymphocytic leukemia with inferior progression-free survival on BTK inhibitor therapy. Clin Cancer Res. 2023;29(18):3612-3621.
3. Tissino E, Benedetti D, Herman SEM, et al. Functional and clinical relevance of VLA-4 (CD49d/CD29) in ibrutinib-treated chronic lymphocytic leukemia. J Exp Med. 2018;215(2):681-697.
4. Rey-Barroso J, Munaretto A, Rouquie N, et al. Lymphocyte migration and retention properties affected by ibrutinib in chronic lymphocytic leukemia. Haematologica. 2024;109(3):807-821.
5. Sinha RK, Park C, Hwang IY, Davis MD, Kehrl JH. B lymphocytes exit lymph nodes through cortical lymphatic sinusoids by a mechanism independent of sphingosine-1-phosphate-mediated chemotaxis. Immunity. 2009;30(3):434-446.
ploration of the mechanisms underlying the clinical efficacy of BTK inhibitors. Further investigations considering different subgroups of patients and outcomes will help unravel the full potential of this therapeutic approach.
Disclosures
No conflicts of interest to disclose.
6. Zhang Y, Garcia-Ibanez L, Ulbricht C, et al Recycling of memory B cells between germinal center and lymph node subcapsular sinus supports affinity maturation to antigenic drift. Nat Commun. 2022;13(1):2460.
7. Park SM, Brooks AE, Chen CJ, et al. Migratory cues controlling B-lymphocyte trafficking in human lymph nodes. Immunol Cell Biol. 2021;99(1):49-64.
8. Saez de Guinoa J, Barrio L, Mellado M, Carrasco YR. CXCL13/CXCR5 signaling enhances BCR-triggered B-cell activation by shaping cell dynamics. Blood. 2011;118(6):1560-1569.
9. Berglof A, Hamasy A, Meinke S, et al. Targets for ibrutinib beyond B cell malignancies. Scand J Immunol. 2015;82(3):208-217.
10. Ganghammer S, Gutjahr J, Hutterer E, et al. Combined CXCR3/CXCR4 measurements are of high prognostic value in chronic lymphocytic leukemia due to negative co-operativity of the receptors. Haematologica. 2016;101(3):e99-102.
Haematologica | 109 - March 2024 700 EDITORIAL T.N. Hartmann
Maximal benefit of minimal residual disease monitoring in pediatric acute myeloid leukemia
Henrik Hasle and Kristian Løvvik Juul-Dam
Department of Pediatrics and Adolescent Medicine, Aarhus University Hospital, Aarhus, Denmark
In this issue of Haematologica, Maurer-Granofszky et al.1 report on the role of genomic breakpoint-specific monitoring of minimal/measurable residual disease (MRD) in pediatric non-standard-risk acute myeloid leukemia (AML).
The event-free survival for pediatric AML reaches 65% with an overall survival of 80% with current treatment protocols. Relapse remains the main risk of treatment failure and cause of death. Optimal treatment stratification and early detection of relapse may improve the outcome and MRD monitoring may be the most relevant avenues to explore in achieving this goal. Indeed, MRD has become an important tool in the management of pediatric AML. The two methods currently applied in clinical practice are flow cytometry (FCM) and reverse transcription quantitative polymerase chain reaction (RT-qPCR). Both technologies have been applied in many series but their comparative role, optimal timepoints of application, and the use of peripheral blood versus bone marrow are less clear.
The study by Maurer-Granofszky et al. provides a welcome comparison of the two methods of PCR- and FCM-based MRD monitoring, which is sparse in the literature. The authors describe MRD quantification using genomic breakpoint-specific sequences via quantitative polymerase chain reaction (gDNA-PCR), which allows residual disease assessment representative of absolute leukemic cell quantities as opposed to fusion transcripts detected by RT-qPCR. gDNA-PCR MRD was performed in 49 children with non-standard-risk AML and the results compared to those obtained with FCM MRD in 183 paired samples.
The overall concordance was high (90%) considering a cutoff threshold of 0.1% and both methodologies were superior to morphological evaluation. Both PCR- and FCMbased methodologies showed much higher specificity than morphology, which may challenge the traditional definition of complete response based upon less than 5% leukemic blasts detected by morphology.2
Correspondence: H. Hasle hasle@dadlnet.dk
Received: August 22, 2023.
Accepted: August 29, 2023.
Early view: September 7, 2023.
https://doi.org/10.3324/haematol.2023.283765
©2024 Ferrata Storti Foundation
Published under a CC BY-NC license
PCR-based methods may overestimate MRD compared with FCM during the early phase of therapy since PCR is also able to detect mature cells with the genetic fusion.3,4 In contrast FCM-MRD identifies cells with an immature/blast immunophenotype and immunophenotypic aberrancies, which are often lacking in already mature cells.
The technology of gDNA-PCR is complex and depends on identification of patient-specific markers through genomic breakpoint characterization but the turnaround time of the assays is 5-7 weeks after diagnosis allowing the implementation of gDNA-MRD for the combined assessment of end-of-induction response. Markers were identified in more than 90% of the selected patients with a sensitivity of at least 10-4
FCM-based MRD detection during and at the end of induction has contributed to significant improvements in risk stratification and optimal post-remission therapy in AML.5-7 Whether or not MRD is sufficient for risk stratification, neutralizing the independent prognostic impact of genetic risk groups, is the focus of ongoing studies by the Nordic Society for Pediatric Hematology Oncology (NOPHO) study group. Most pediatric AML study groups have a number of genetic aberrations defining high risk, regardless of response assessment. The role of PCRbased MRD during induction is limited and larger studies are needed using this more sensitive technology to determine whether risk stratification can be further improved. It would have been of interest to analyze the concordance between peripheral blood and bone marrow findings. However, the study by Maurer-Granofszky et al. included very few peripheral blood samples and no data derived from peripheral blood in the early phase of treatment. FCM of peripheral blood may be of clinical relevance during the first weeks after initiating therapy8 but not sufficiently sensitive later during or after therapy. For PCR-based follow-up after the end of therapy peripheral blood is at least as sensitive as and more specific than bone marrow.9
Haematologica | 109 - March 2024 701
EDITORIAL
Hasle
K.L.
H.
and
Juul-Dam
FCM
PCR
Advantages Disadvantages
Widely applicable (>90% of patients)
Rapid turn-around time
Useful for early response assessment and risk-stratification
Persistence of MRD highly predictive of relapse
Highly sensitive (up to 0.001%)
Applicable in both BM and PB
Standardized through established and validated protocols
Useful tool for post-therapy disease monitoring in PB
Limited sensitivity (0.1%)
Only applicable in BM
Sample quality variation (risk of PB dilution)
Leukemia-specific immunophenotype may be non-informative or unstable over time
Considerable operator- and expertise dependence
Applicable in only 40% (RT-qPCR) to 70% of patients (gDNA-PCR)*
Prolonged turn-around time, particularly for individualized gDNA-PCR assays
Delayed response during early assessment
Persistence of MRD in BM common despite continuous CR
*Applicable targets: RUNX1::RUNX1T1, CBFB::MYH11, KMT2A::MLLT3 and mutated NPM1 (RT-qPCR); all fusion transcripts (gDNA-PCR). BM: bone marrow; PB: peripheral blood; FCM: flow cytometry; MRD: measurable/minimal residual disease; PCR: polymerase chain reaction: RT-qPCR: reverse transcription quantitative
Some samples showed persistent positivity as assessed by gDNA-PCR but were negative by FCM, suggesting the persistence of gene fusions in maturing or terminally differentiated AML cells. While the study by Maurer-Granofszky et al. focused on the feasibility and performance of two MRD technologies, future investigations should explore the complementary prognostic impact of gDNA-PCR MRD in FCM-negative patients, of whom approximately one third are still destined to relapse.6,7
Persistence of stable, low-level, RT-qPCR-detectable MRD in bone marrow of patients with CBF-AML subtypes during consolidation or after therapy completion does not have a negative impact on outcome. However, sustained MRD positivity in peripheral blood (rather than bone marrow) or increasing levels above 10-4 during or after consolidation indicates impending relapse. Since persistent, low-level MRD in bone marrow is common and not predictive of relapse,10 routine bone marrow sampling after the end of therapy is not recommended. In contrast, peripheral blood samples are easier to collect and sustained MRD positivity in peripheral blood is strongly predictive of impending relapse.9 The PCR-based monitoring of peripheral blood may allow early detection of relapse, which may suggest the need for preemptive therapy alleviating toxicity before hematopoietic stem cell transplantation.
One limitation of the PCR-based technology is the lack of markers for some patients, which was the case for one-third of the patients in the study by Maurer-Granofszky et al. Only a handful of targets are currently used for MRD assessment by RT-qPCR and most of these aberrations are found in standard-risk patients. Even though the study by MaurerGranofszky et al.1 increases the number of patients with useful markers, a significant number of children have no marker for PCR-based MRD monitoring. In contrast, multicolor FCM is applicable in more than 90% of pediatric AML patients and is therefore currently the method of choice for response assessment in most clinicals trials (Table 1). Newer methods using whole exome sequencing or droplet digital PCR with a patient-tailored approach for molecular MRD monitoring in peripheral blood may ensure sensitive markers for almost all AML patients and enable response assessment and close monitoring in peripheral blood for early detection of AML relapse.11
Disclosures
No conflicts of interest to disclose.
Contributions
Both authors contributed equally to the writing of this editorial comment.
Table 1. Advantages and limitations of measurable/minimal residual disease assessments by flow cytometry and polymerase chain reaction in childhood acute myeloid leukemia.
Haematologica | 109 - March 2024 702 EDITORIAL H. Hasle and K.L. Juul-Dam
PCR; gDNA-PCR: genomic DNA-based PCR; CR: complete remission.
References
1. Maurer-Granofszky M, Köhrer S, Fischer S, et al. Genomic breakpoint-specific monitoring of measurable residual disease in pediatric non-standard-risk acute myeloid leukemia. Haematologica. 2024;109(3):738-748.
2. Brodersen LE, Gerbing RB, Pardo ML, et al. Morphologic remission status is limited compared to DN flow cytometry: a Children’s Oncology Group AAML0531 report. Blood Adv. 2020;4(20):5050-5061.
3. Inaba H, Coustan-Smith E, Cao X, et al. Comparative analysis of different approaches to measure treatment response in acute myeloid leukemia. J Clin Oncol. 2012;30(29):3625-3632.
4. Karlsson L, Nyvold CG, Soboli A, et al. Fusion transcript analysis reveals slower response kinetics than multiparameter flow cytometry in childhood acute myeloid leukemia. Int J Lab Hematol. 2022;44(6):1094-1101.
5. Rubnitz JE, Inaba H, Dahl G, et al. Minimal residual diseasedirected therapy for childhood acute myeloid leukaemia: results of the AML02 multicentre trial. Lancet Oncol. 2010;11(6):543-552.
6. Loken MR, Alonzo TA, Pardo L, et al. Residual disease detected by multidimensional flow cytometry signifies high relapse risk in
patients with de novo acute myeloid leukemia: a report from Children's Oncology Group. Blood. 2012;120(8):1581-1588.
7. Tierens A, Bjorklund E, Siitonen S, et al. Residual disease detected by flow cytometry is an independent predictor of survival in childhood acute myeloid leukaemia; results of the NOPHO-AML 2004 study. Br J Haematol. 2016;174(4):600-609.
8. Karol SE, Coustan-Smith E, Pounds S, et al. Clinical impact of minimal residual disease in blood and bone marrow of children with acute myeloid leukemia. Blood Adv. 2023;7(14):3651-3657.
9. Skou AS, Juul-Dam KL, Ommen HB, Hasle H. Peripheral blood molecular measurable residual disease is sufficient to identify patients with acute myeloid leukaemia with imminent clinical relapse. Br J Haematol. 2021;195(3):310-327.
10. Juul-Dam KL, Ommen HB, Nyvold CG, et al. Measurable residual disease assessment by qPCR in peripheral blood is an informative tool for disease surveillance in childhood acute myeloid leukaemia. Br J Haematol. 2020;190(2):198-208.
11. Delsing Malmberg E, Rehammar A, Pereira MB, et al. Accurate and sensitive analysis of minimal residual disease in acute myeloid leukemia using deep sequencing of single nucleotide variations. J Mol Diagn. 2019;21(1):149-162.
Haematologica | 109 - March 2024 703 EDITORIAL H. Hasle and K.L. Juul-Dam
Understanding pharmacological complement inhibition in paroxysmal nocturnal hemoglobinuria
Antonio M. Risitano and Camilla Frieri
Hematology and Bone Marrow Transplant Unit AORN S. Giuseppe Moscati, Avellino, Italy
Correspondence: A.M. Risitano amrisita@unina.it
Received: August 14, 2023.
Accepted: August 29, 2023.
Early view: September 7, 2023.
https://doi.org/10.3324/haematol.2023.283805
©2024 Ferrata Storti Foundation
Published under a CC BY-NC license

Following the description of the RAISE study,1 in this issue of Haematologica, Kulasekararaj et al. report on the efficacy and safety of zilucoplan, a 15-amino acid macrocyclic peptide which blocks the terminal pathway of complement through its high affinity and specificity binding to C5.1 The authors demonstrate that this small C5 inhibitor given subcutaneously as monotherapy efficiently controls intravascular hemolysis, as shown by lactate dehydrogenase (LDH) levels, in both eculizumab-naïve and eculizumab-treated patients with paroxysmal nocturnal hemoglobinuria (PNH), possibly leading to transfusion avoidance and hemoglobin stabilization.2 However, this clinical benefit remained quite heterogeneous, with profound inter-patient variability and limited efficacy especially in patients switching from eculizumab to zilucoplan.2
In recent years, a plethora of novel anti-complement agents have entered into preclinical and clinical development, especially for PNH,3 the prototypic example of a purely complement-mediated hemolytic anemia. Even if, clinically speaking, the most promising results are coming from the so-called proximal inhibitors,4 the development of novel terminal complement inhibitors is shedding light on our understanding of pharmacological complement inhibition. In this setting, well-conducted phase II studies are essential to investigate subtle differences among agents targeting even the same complement component, including pharmacokinetic and pharmacodynamic properties of individual inhibitors which ultimately influence their clinical efficacy and safety profile even more than their actual target. Therapeutic C5 inhibition has been well-established for more than 15 years, making the interpretation of novel observations much easier than that for novel proximal inhibitors.4
In the small phase II study by Kulasekararaj et al., PNH patients who had not received previous treatment with eculizumab had significant benefits in terms of LDH decrease and transfusion avoidance when treated with zi-
lucoplan, even if, according to the authors, changes in more meaningful clinical parameters (e.g., hemoglobin level) and other biomarkers of hemolysis were small or variable. Even more interestingly, PNH patients switching from eculizumab to zilucoplan consistently exhibited some increase in LDH level, with the largest increase seen in patients who were transfusion-dependent on eculizumab treatment (whose LDH levels were marginally increased at baseline). Collectively, these findings suggest that the C5 inhibition obtained with zilucoplan is obviously clinically meaningful (in comparison to no treatment, in eculizumab-naïve patients), but possibly less efficient than that of eculizumab (in patients switching from eculizumab). Notably, this somehow suboptimal inhibition was seen despite apparently complete complement inhibition (as assessed by functional assays measuring residual complement activity, suggesting that such assays are only partially informative as a pharmacodynamic measurement during anti-complement therapies), and despite the postulated dual mechanism of action of zilucoplan (likely because the effects on C5 cleavage and on subsequent C6 binding both rely on direct binding to C5, one being the effect of the other instead of two independent events). As a possible mechanism of reduced efficacy in patients switched from eculizumab, the authors propose the accumulation of high-density C3b on PNH erythrocytes, enabling non-enzymatic cleavage of C5 (i.e., conformational change5), claiming that this residual efficacy is a kind of iatrogenic effect due to a transiently combined effect of the two C5 inhibitors at the time of the switch.2 The authors built their hypothesis on some in vitro data, which showed that combined exposure to eculizumab and zilucoplan results in a larger proportion of C3b-opsonized PNH erythrocytes.2 However, their theory is not convincing for a number of reasons.
In 2009, we originally described C3 opsonization as an ineluctable phenomenon in PNH patients treated with eculizumab.6 This phenomenon has been reproduced in
Haematologica | 109 Marzo 2024 704 EDITORIAL
Haematologica | 109 Marzo 2024 705 EDITORIAL A.M. Risitano and C. Frieri A C B D Continued
on following page.
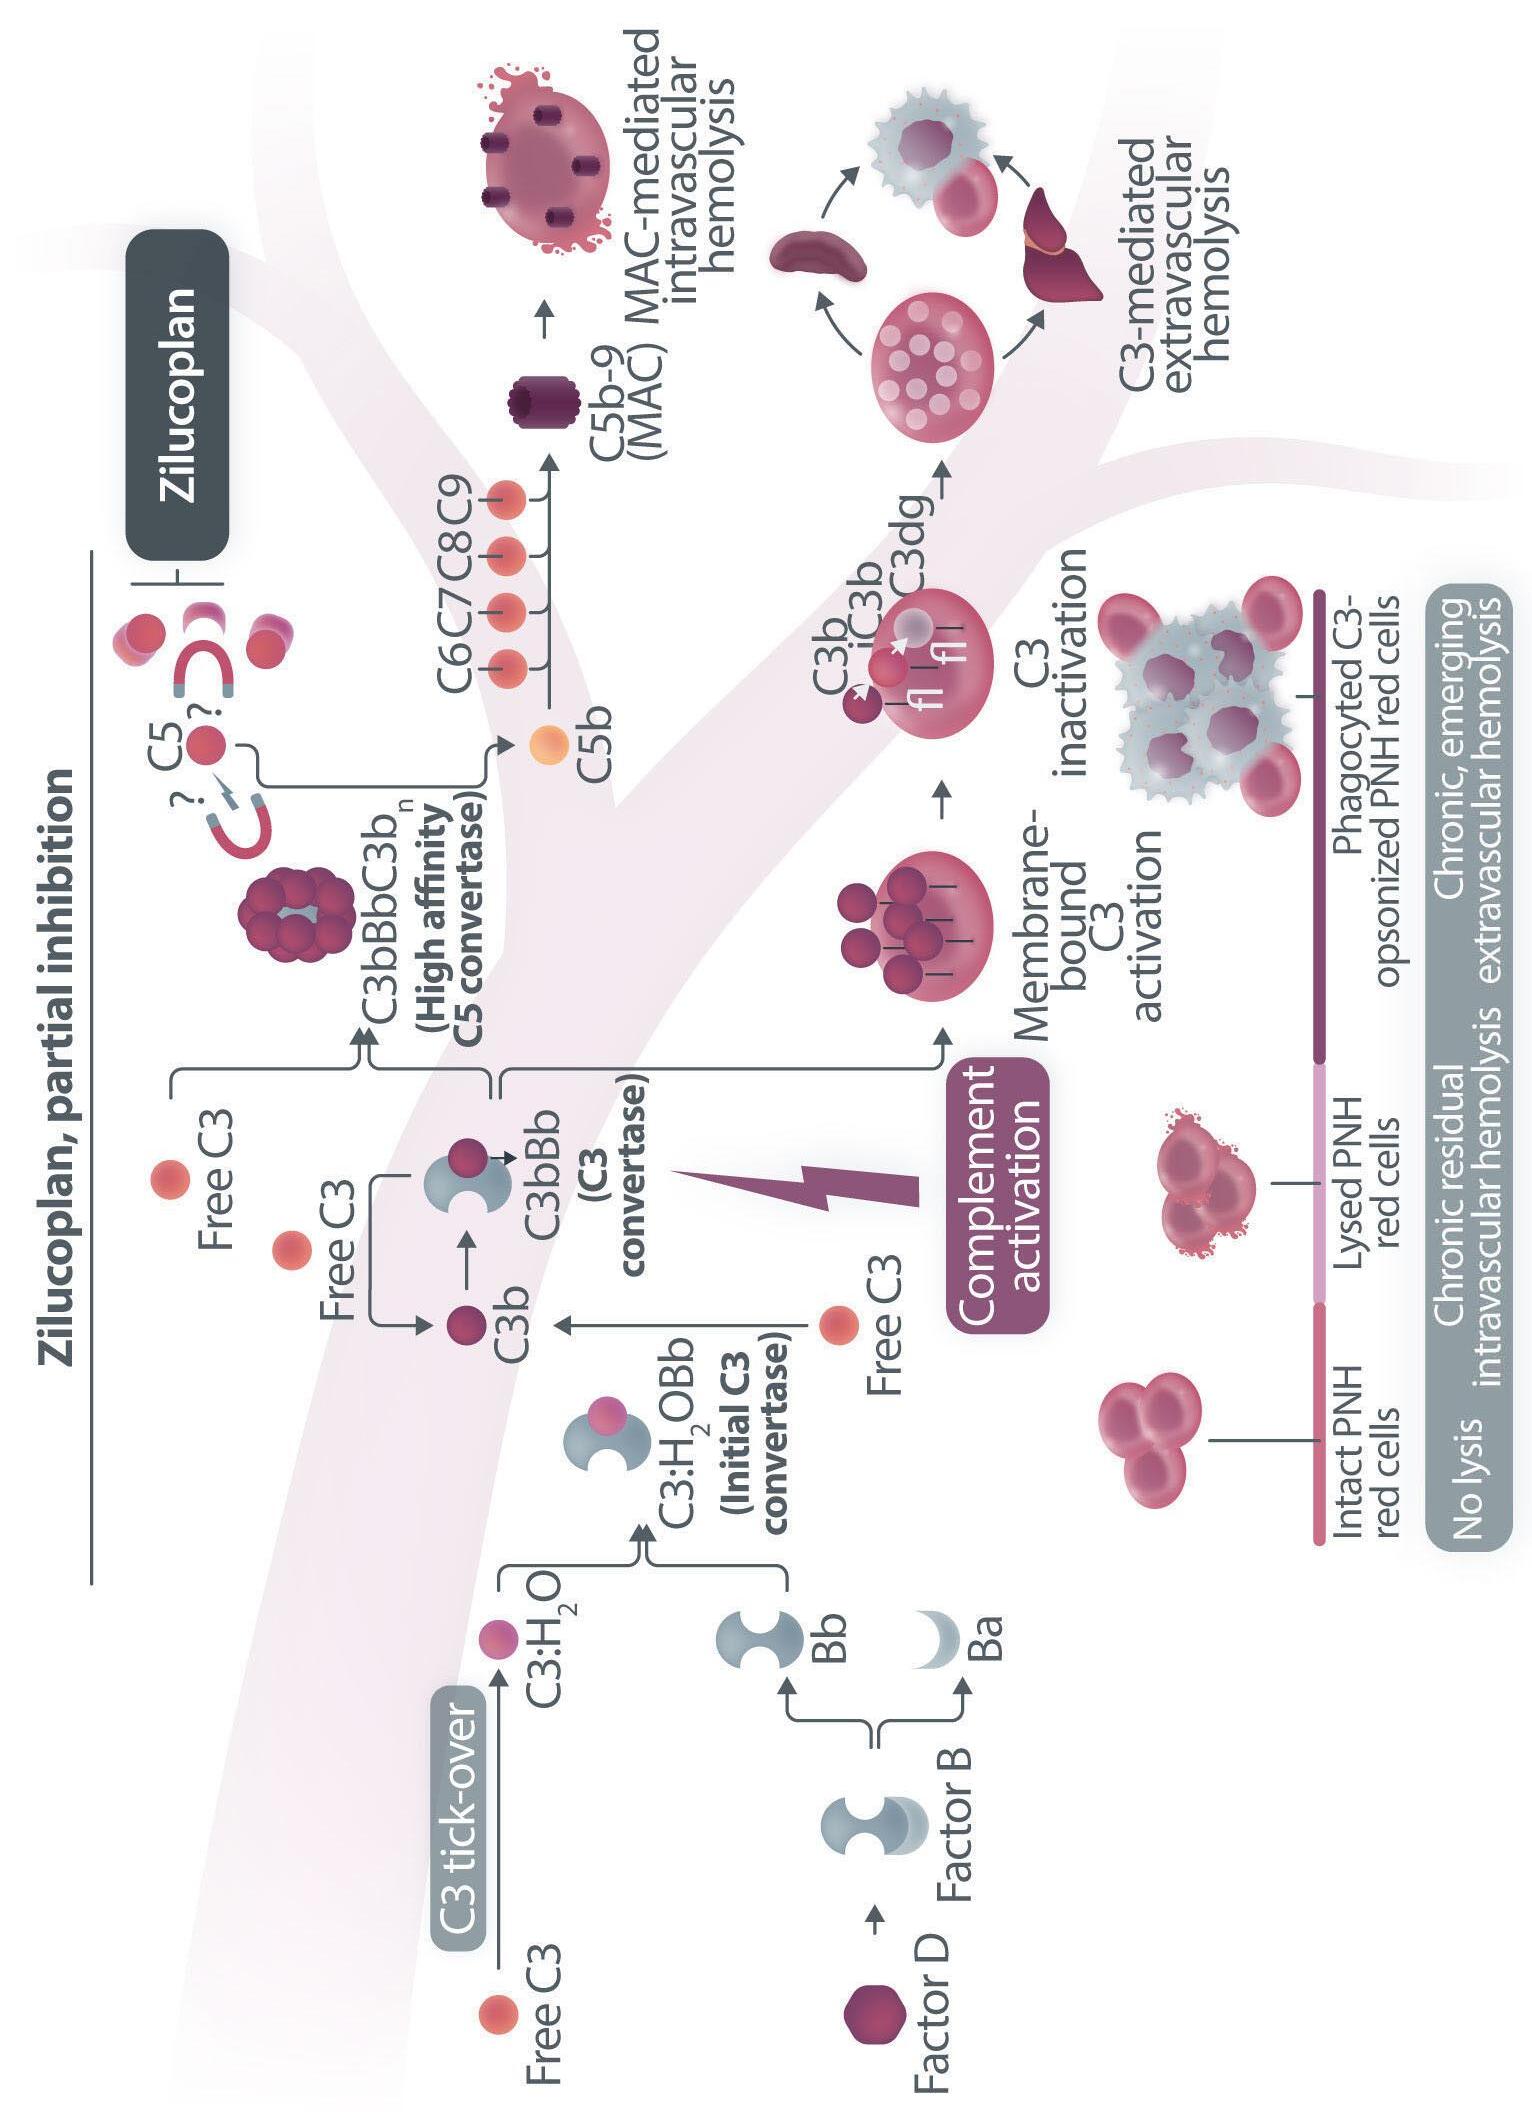
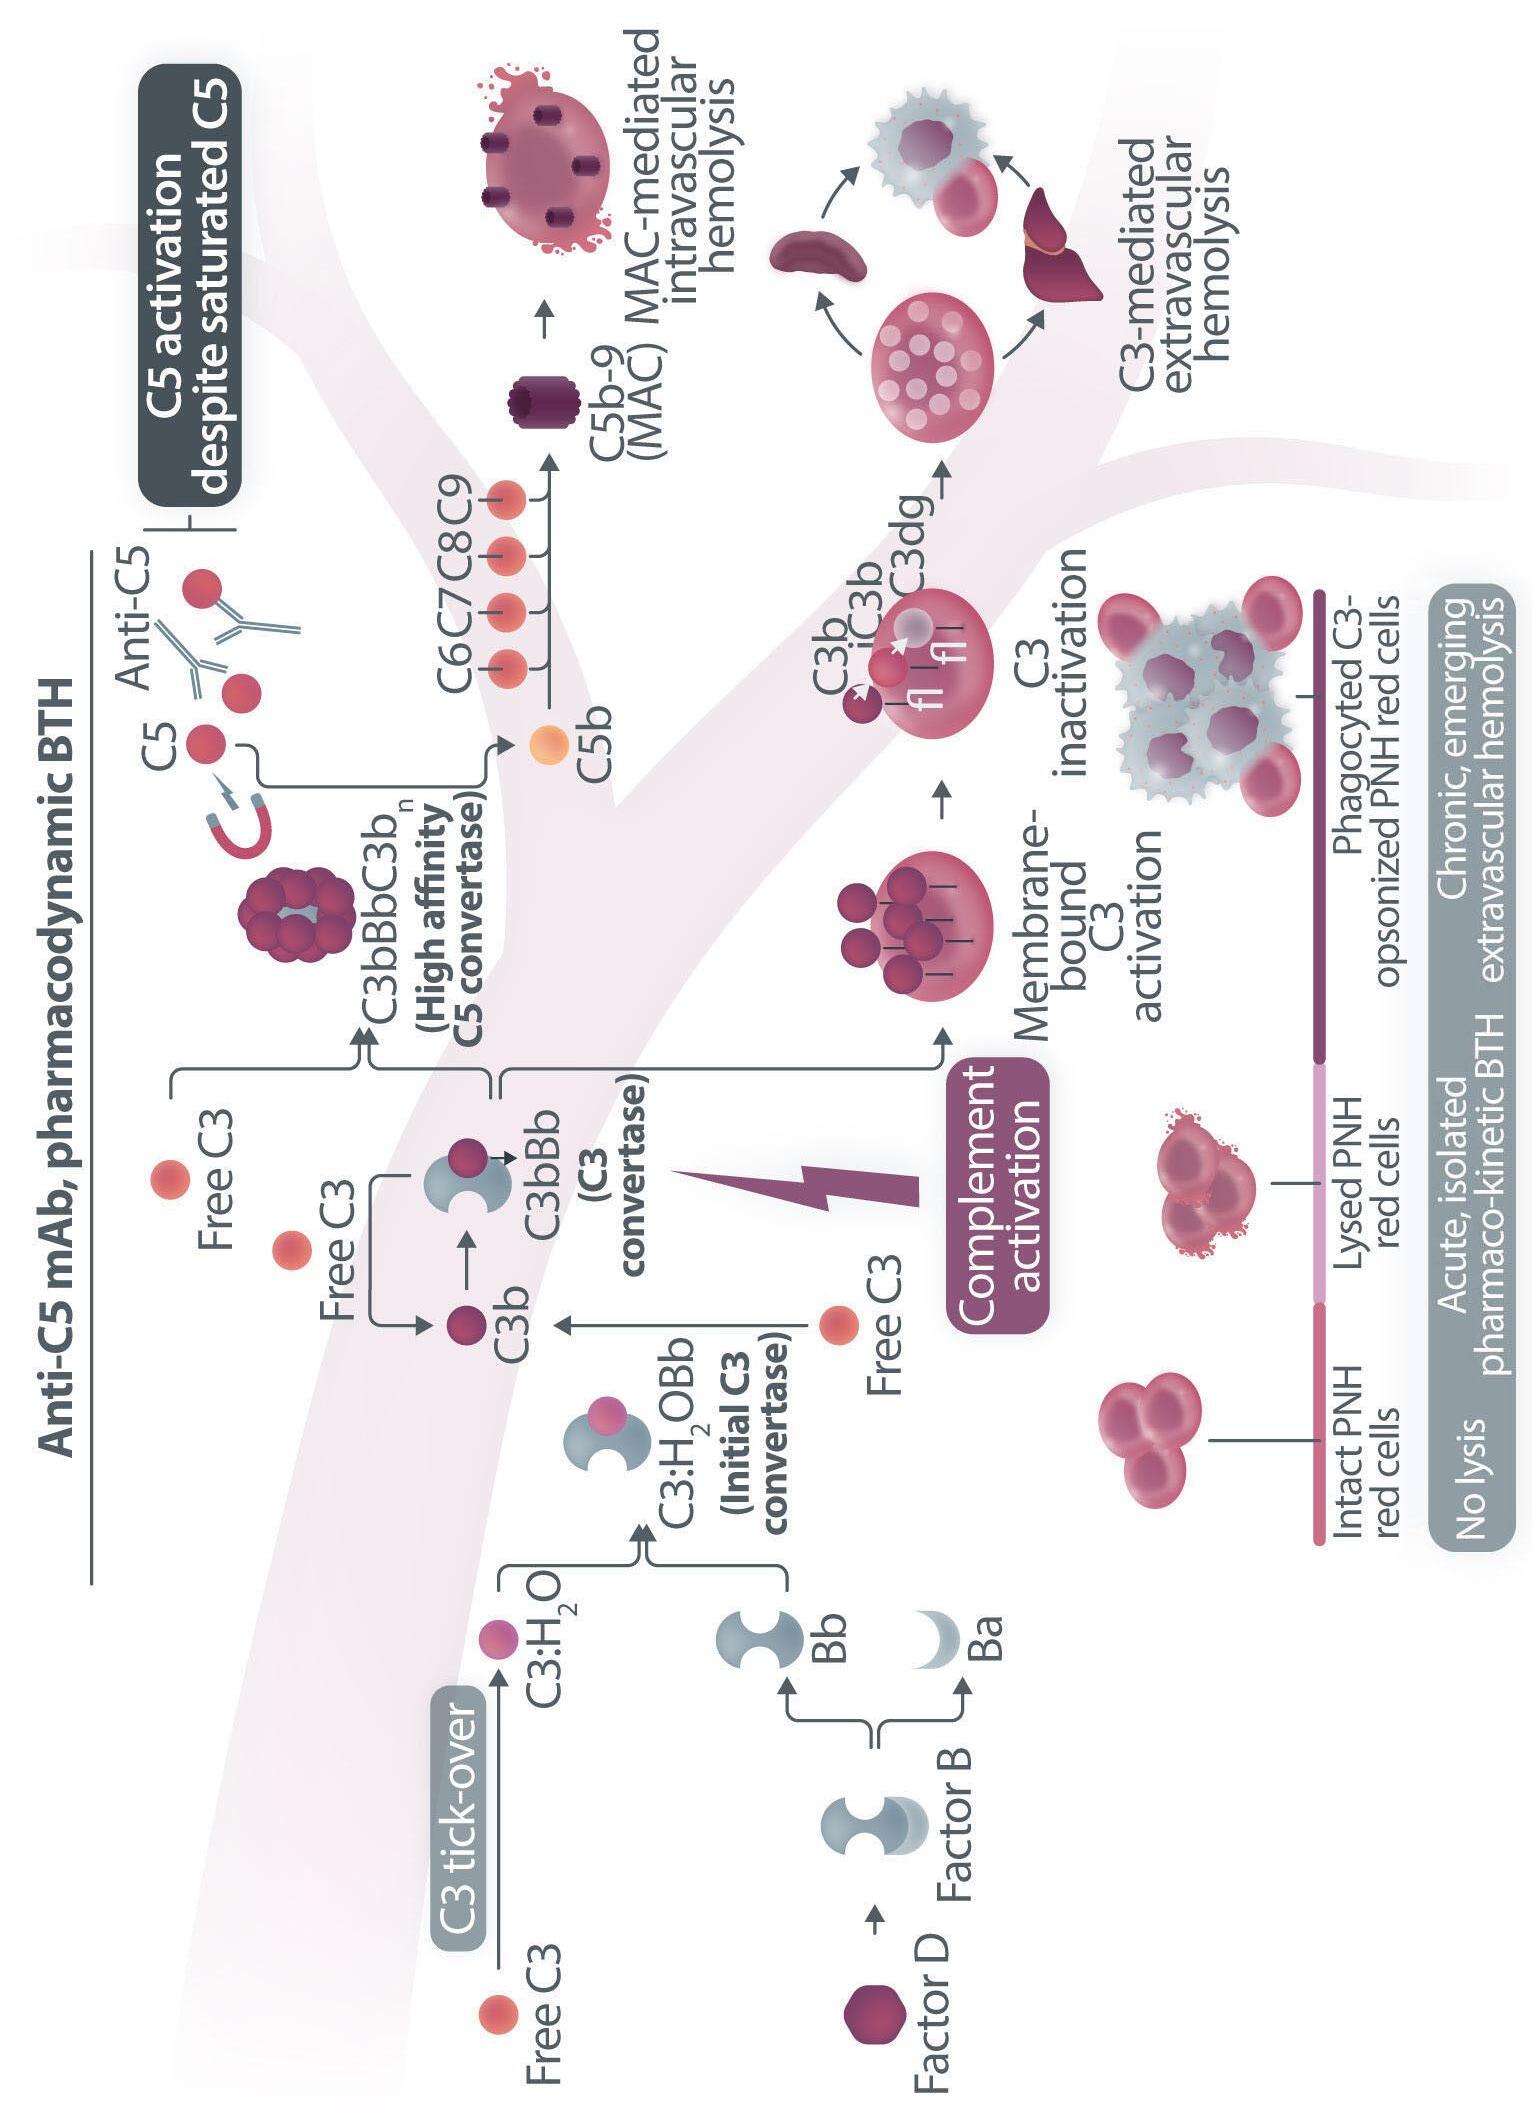
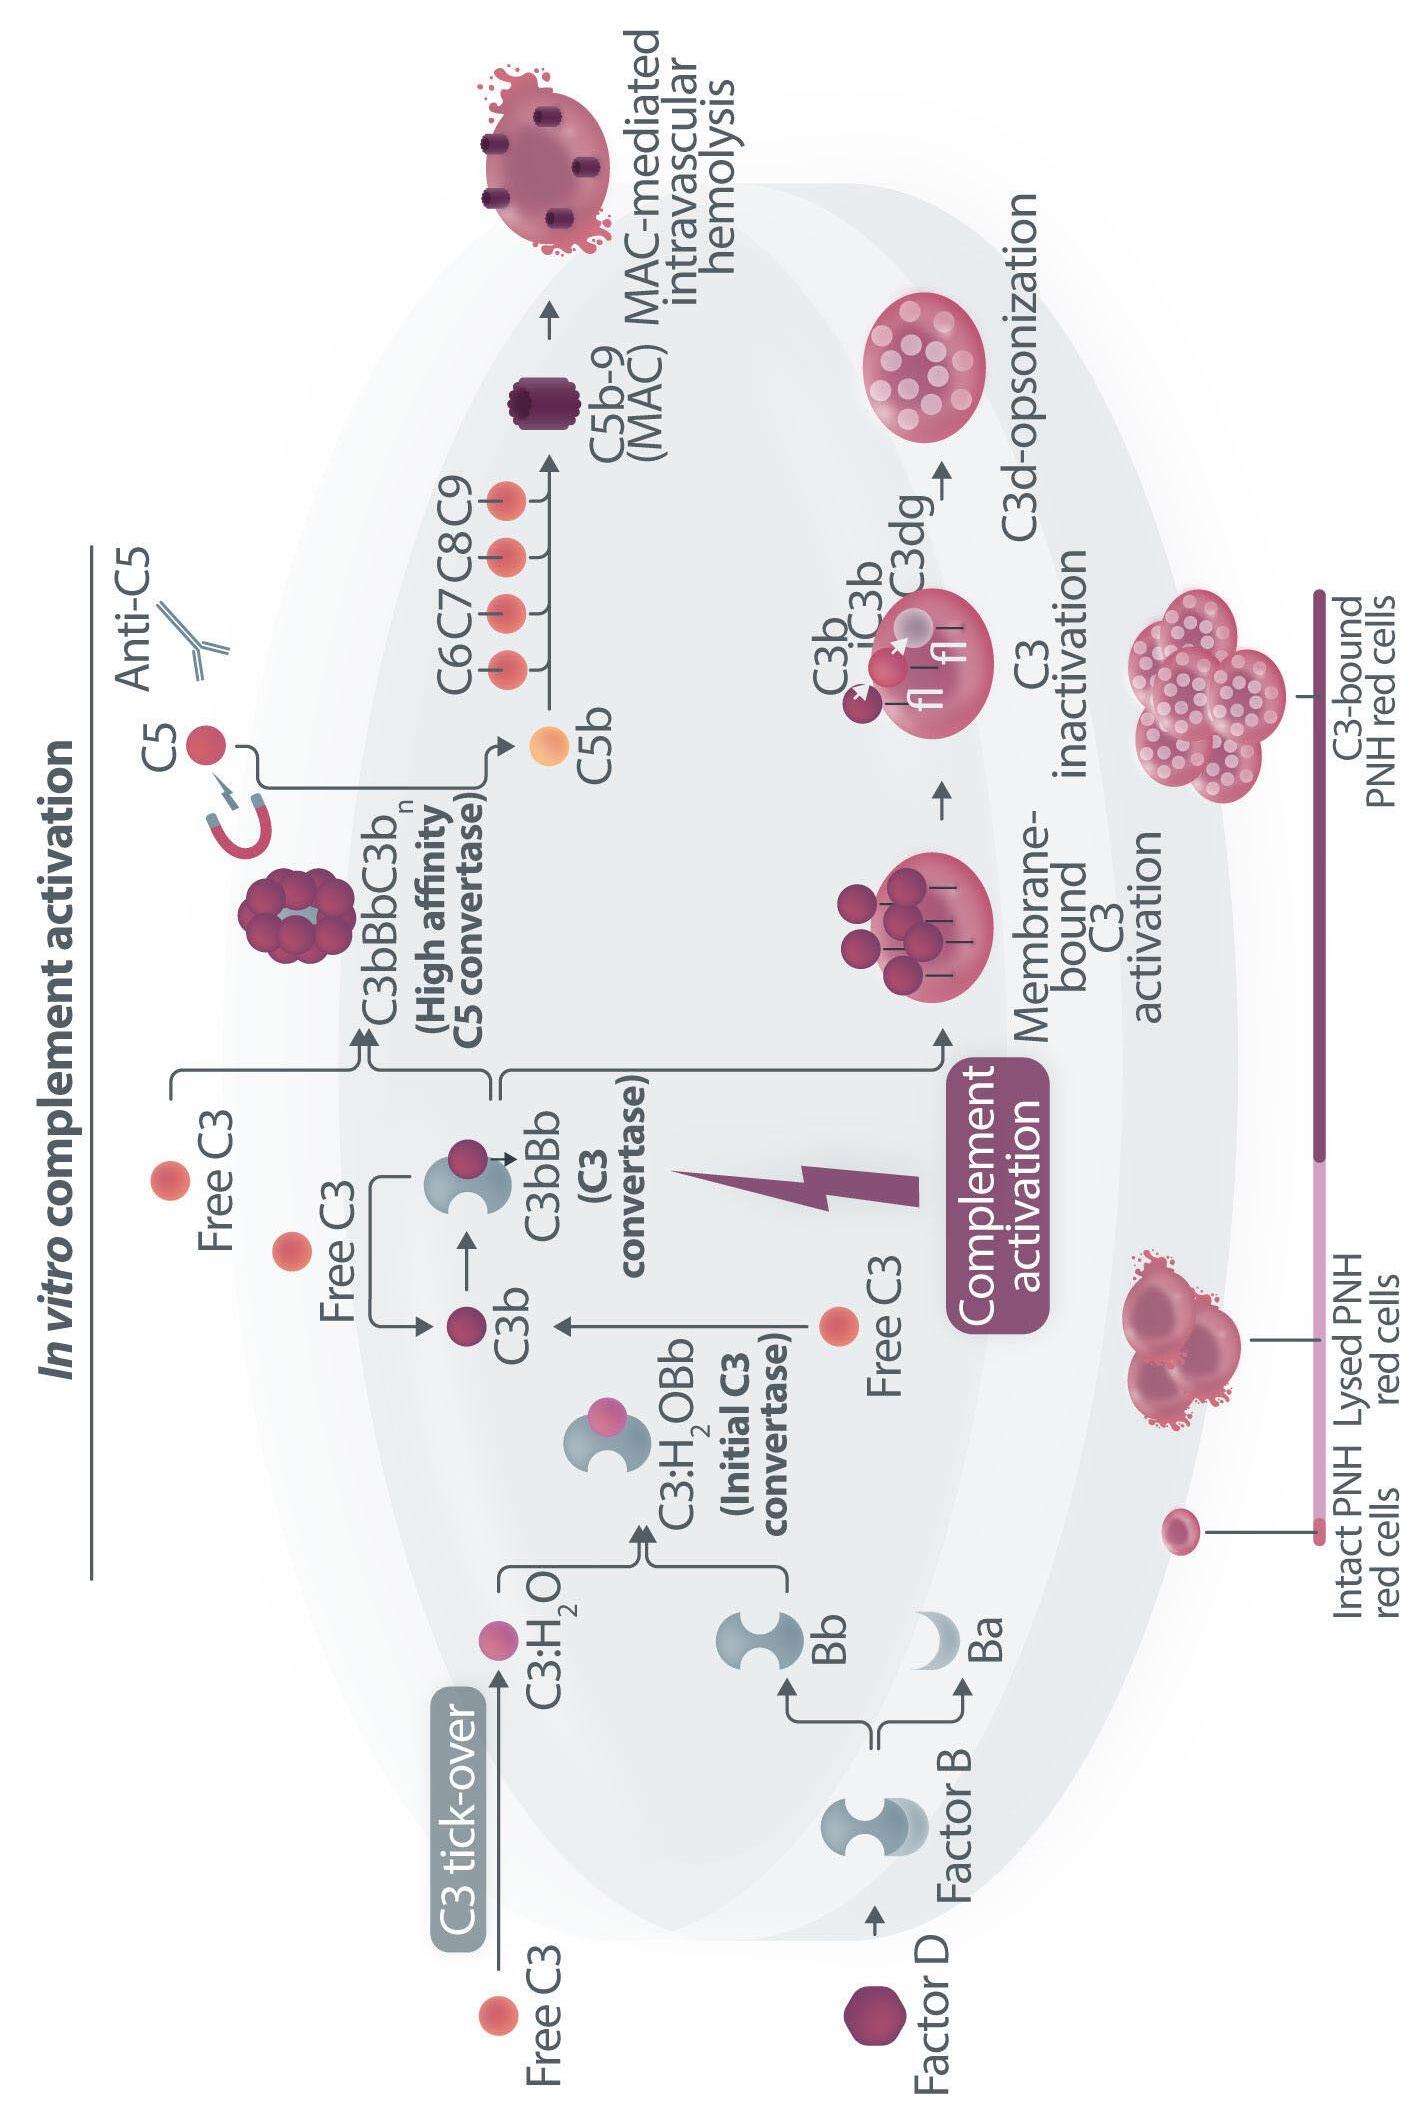
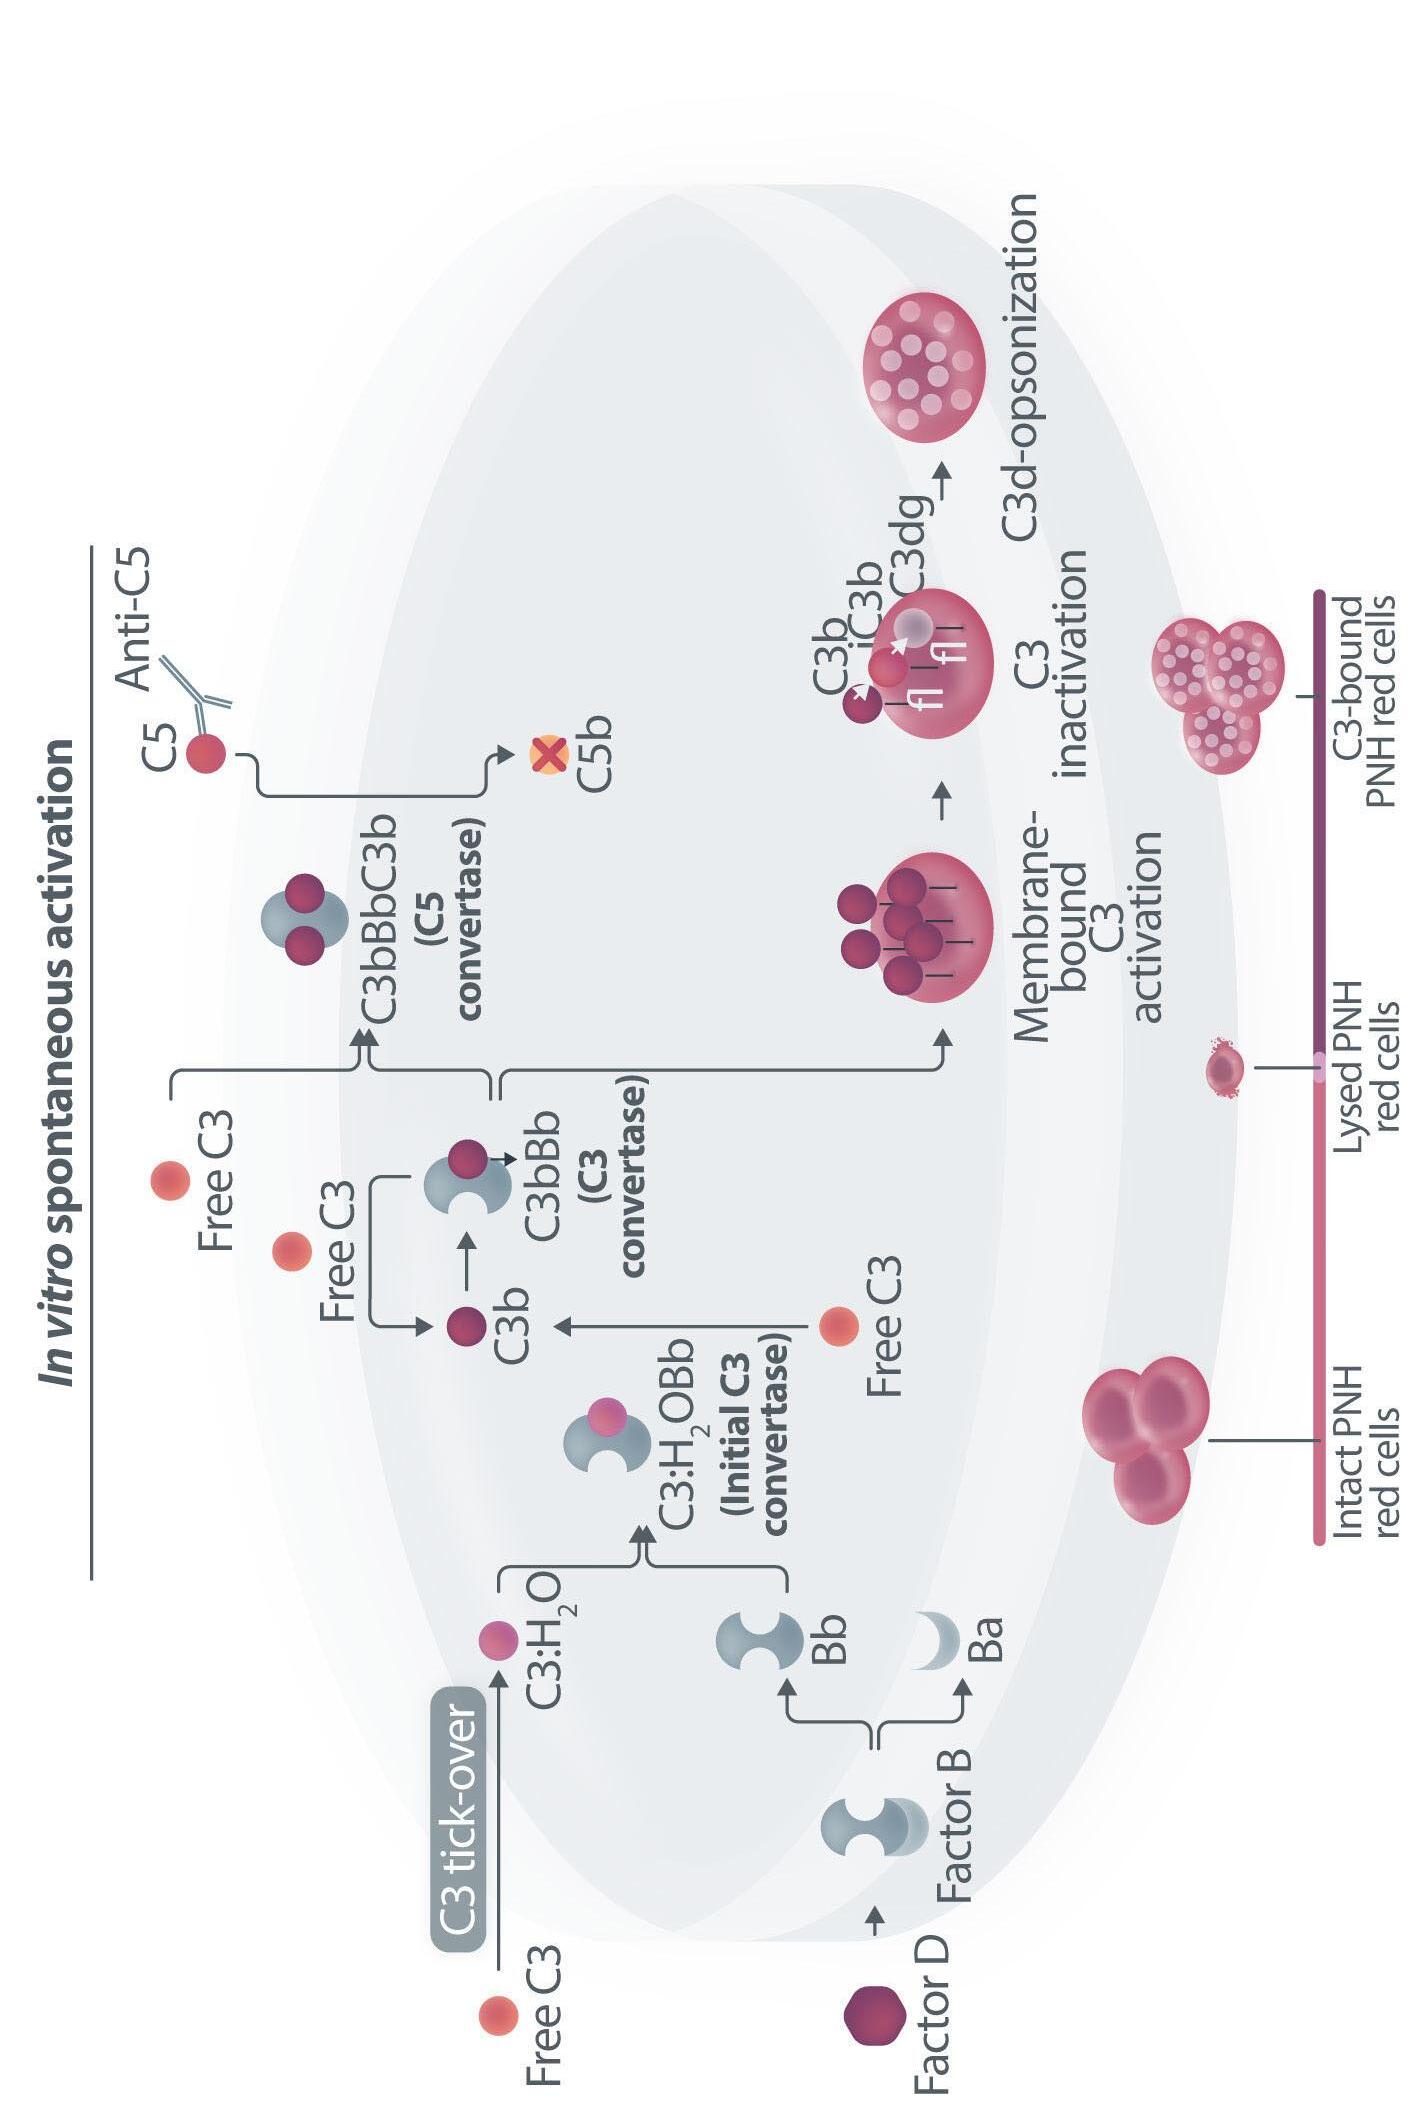
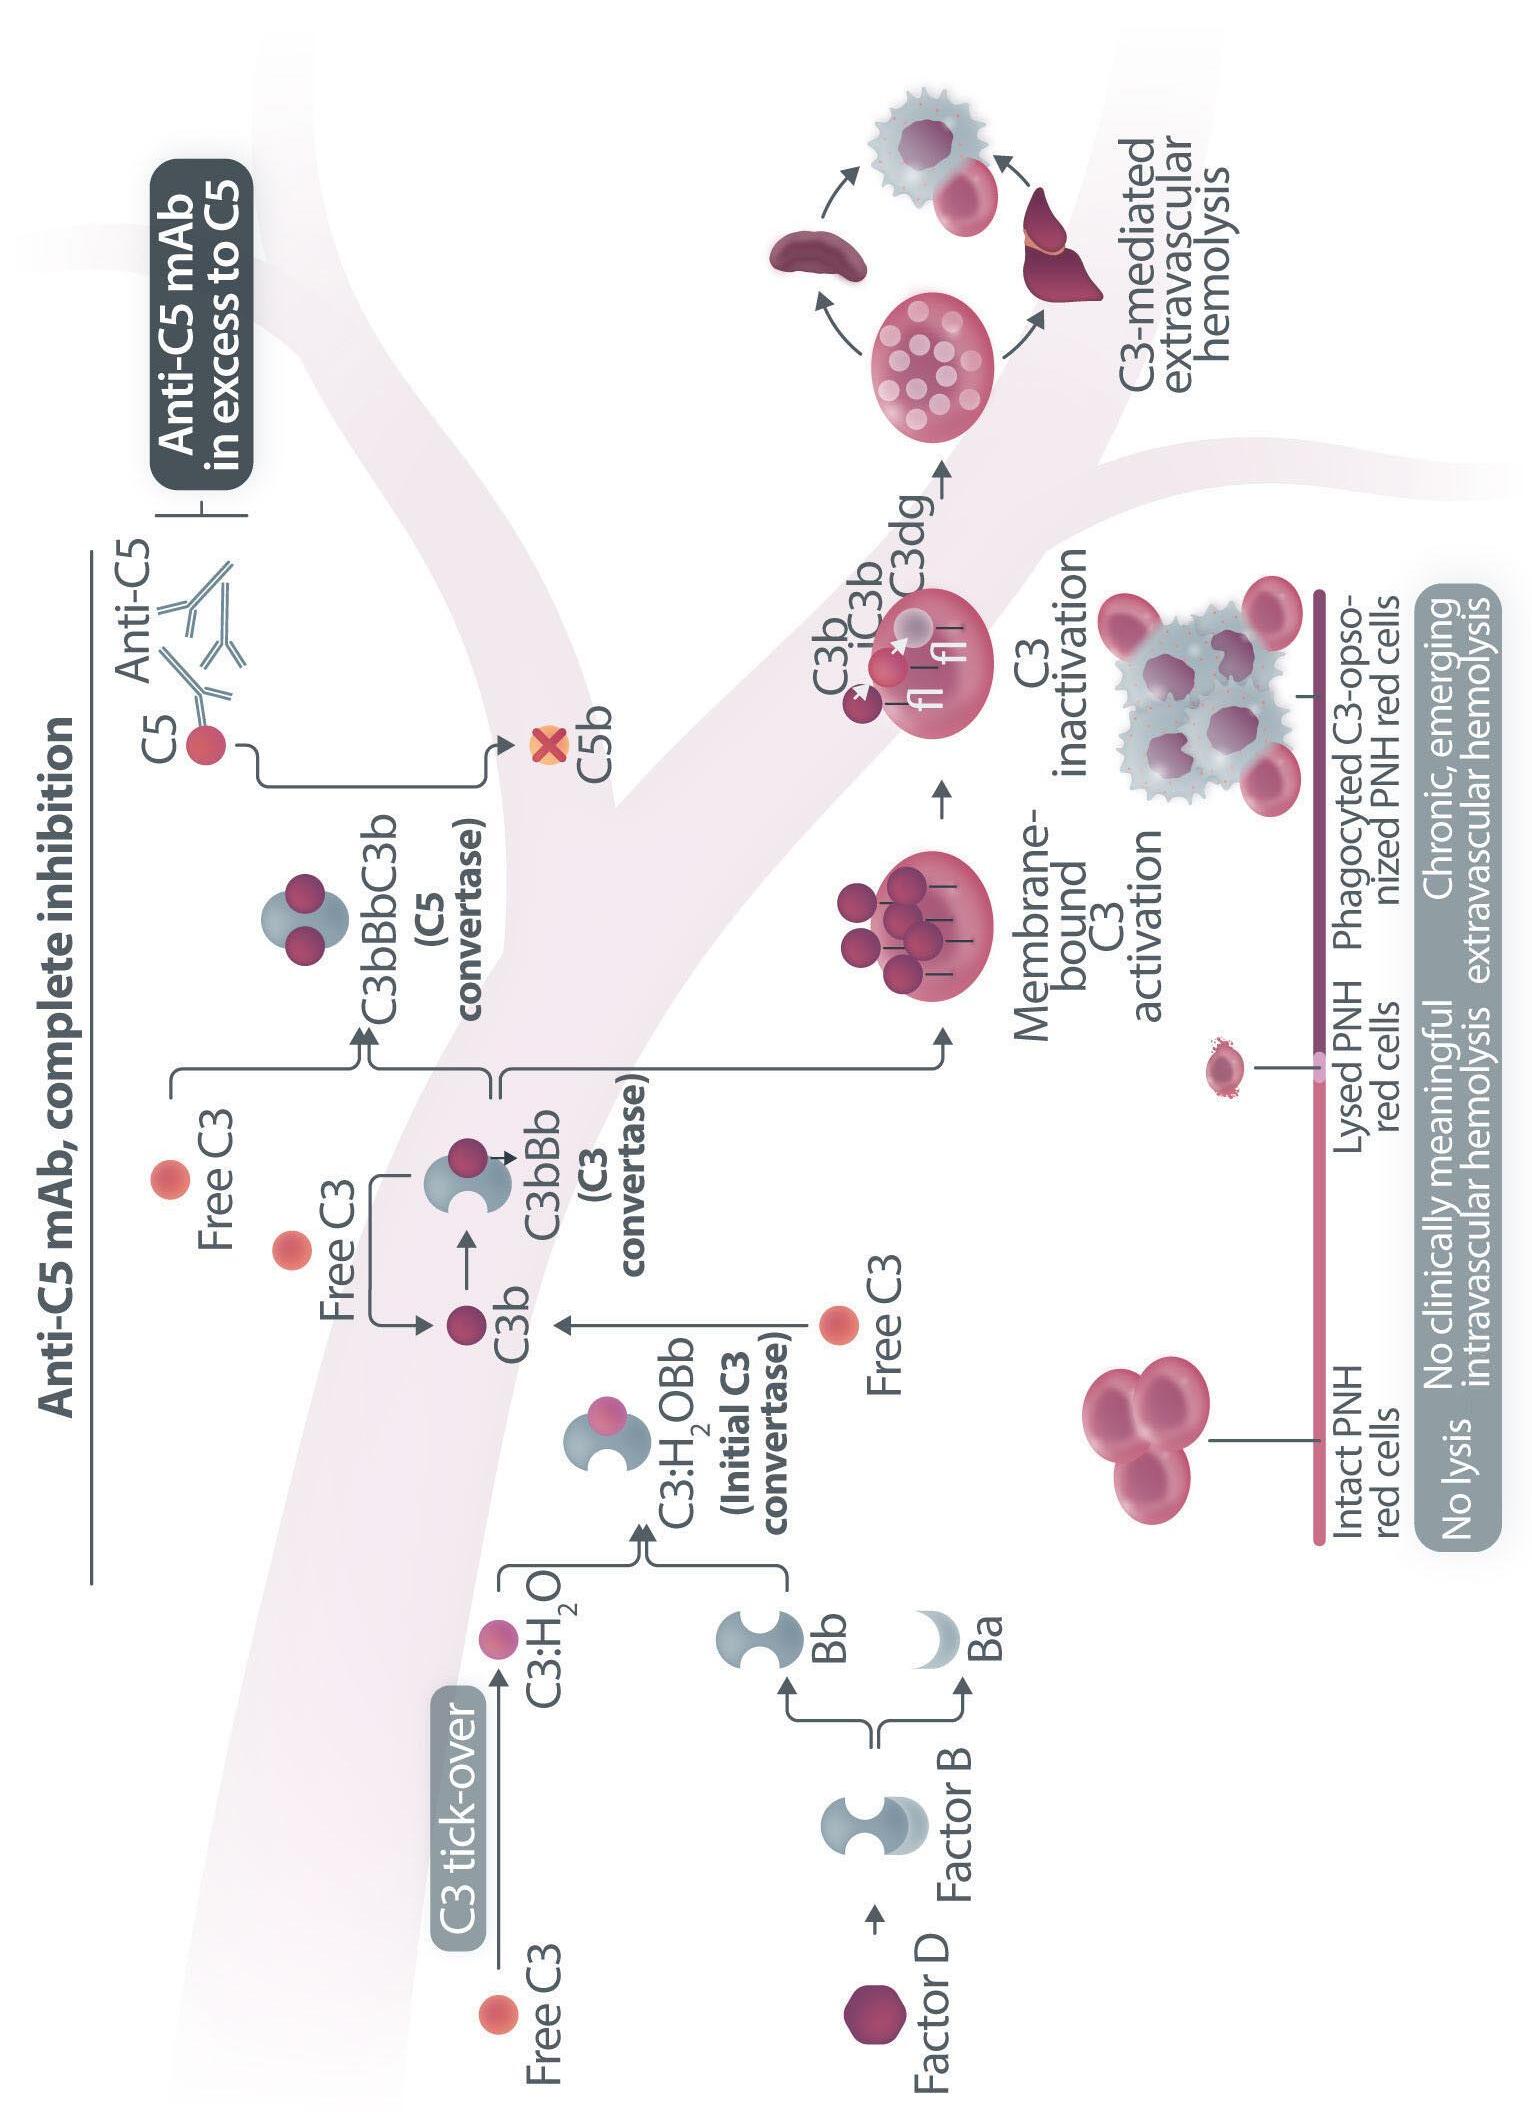
Figure 1. Mechanisms of residual hemolysis in the presence of C5 inhibitors in vitro and in vivo . (A) Complement activation with C5 inhibitors in vitro, spontaneous activation . Spontaneous, low-grade complement activation results in some degree of lysis on paroxysmal nocturnal hemoglobinura (PNH) erythrocytes in vitro ; in the presence of anti-C5 monoclonal antibody (mAb) this lysis is almost completely inhibited, but surviving PNH erythrocytes accumulate C3 on their surface. (B) Complement activation with C5 inhibitors in vitro, complement activation . When PNH erythrocytes are exposed to complement activation (i.e., by lowering the pH) the inhibition seen with anti-C5 mAb is only partial, and C3 deposition is observed in all non-lysed PNH erythrocytes. More in detail, all PNH erythrocytes suffer from C3 activation; in some cells, the excess of surface-bound C3b leads to C5b-9 assembly and subsequent lysis (C3b remains detectable on erythrocyte ghosts), while on some other cells C3b is inactivated and its split fragment C3d remains the only detectable C3 fragment on non-lysed PNH red blood cells. (C) Complement activation with C5 inhibitors in vivo, complete inhibition . Ideally, anti-C5 mAb are in excess to C5, resulting in complete inhibition of C5 which prevents C5 cleavage and further membrane attack complex (MAC) formation; thus, intravascular hemolysis may be fully blocked in vivo , even if uncontrolled C3 activation accounts for continuous, low-grade C3 activation which clinically leads to C3-mediated extravascular hemolysis. However, partial inhibition of C5 may occur, possibly resulting in reappearance of intravascular hemolysis (acute or chronic), which in addition to C3-mediated extravascular hemolysis precludes the best hematologic benefit.
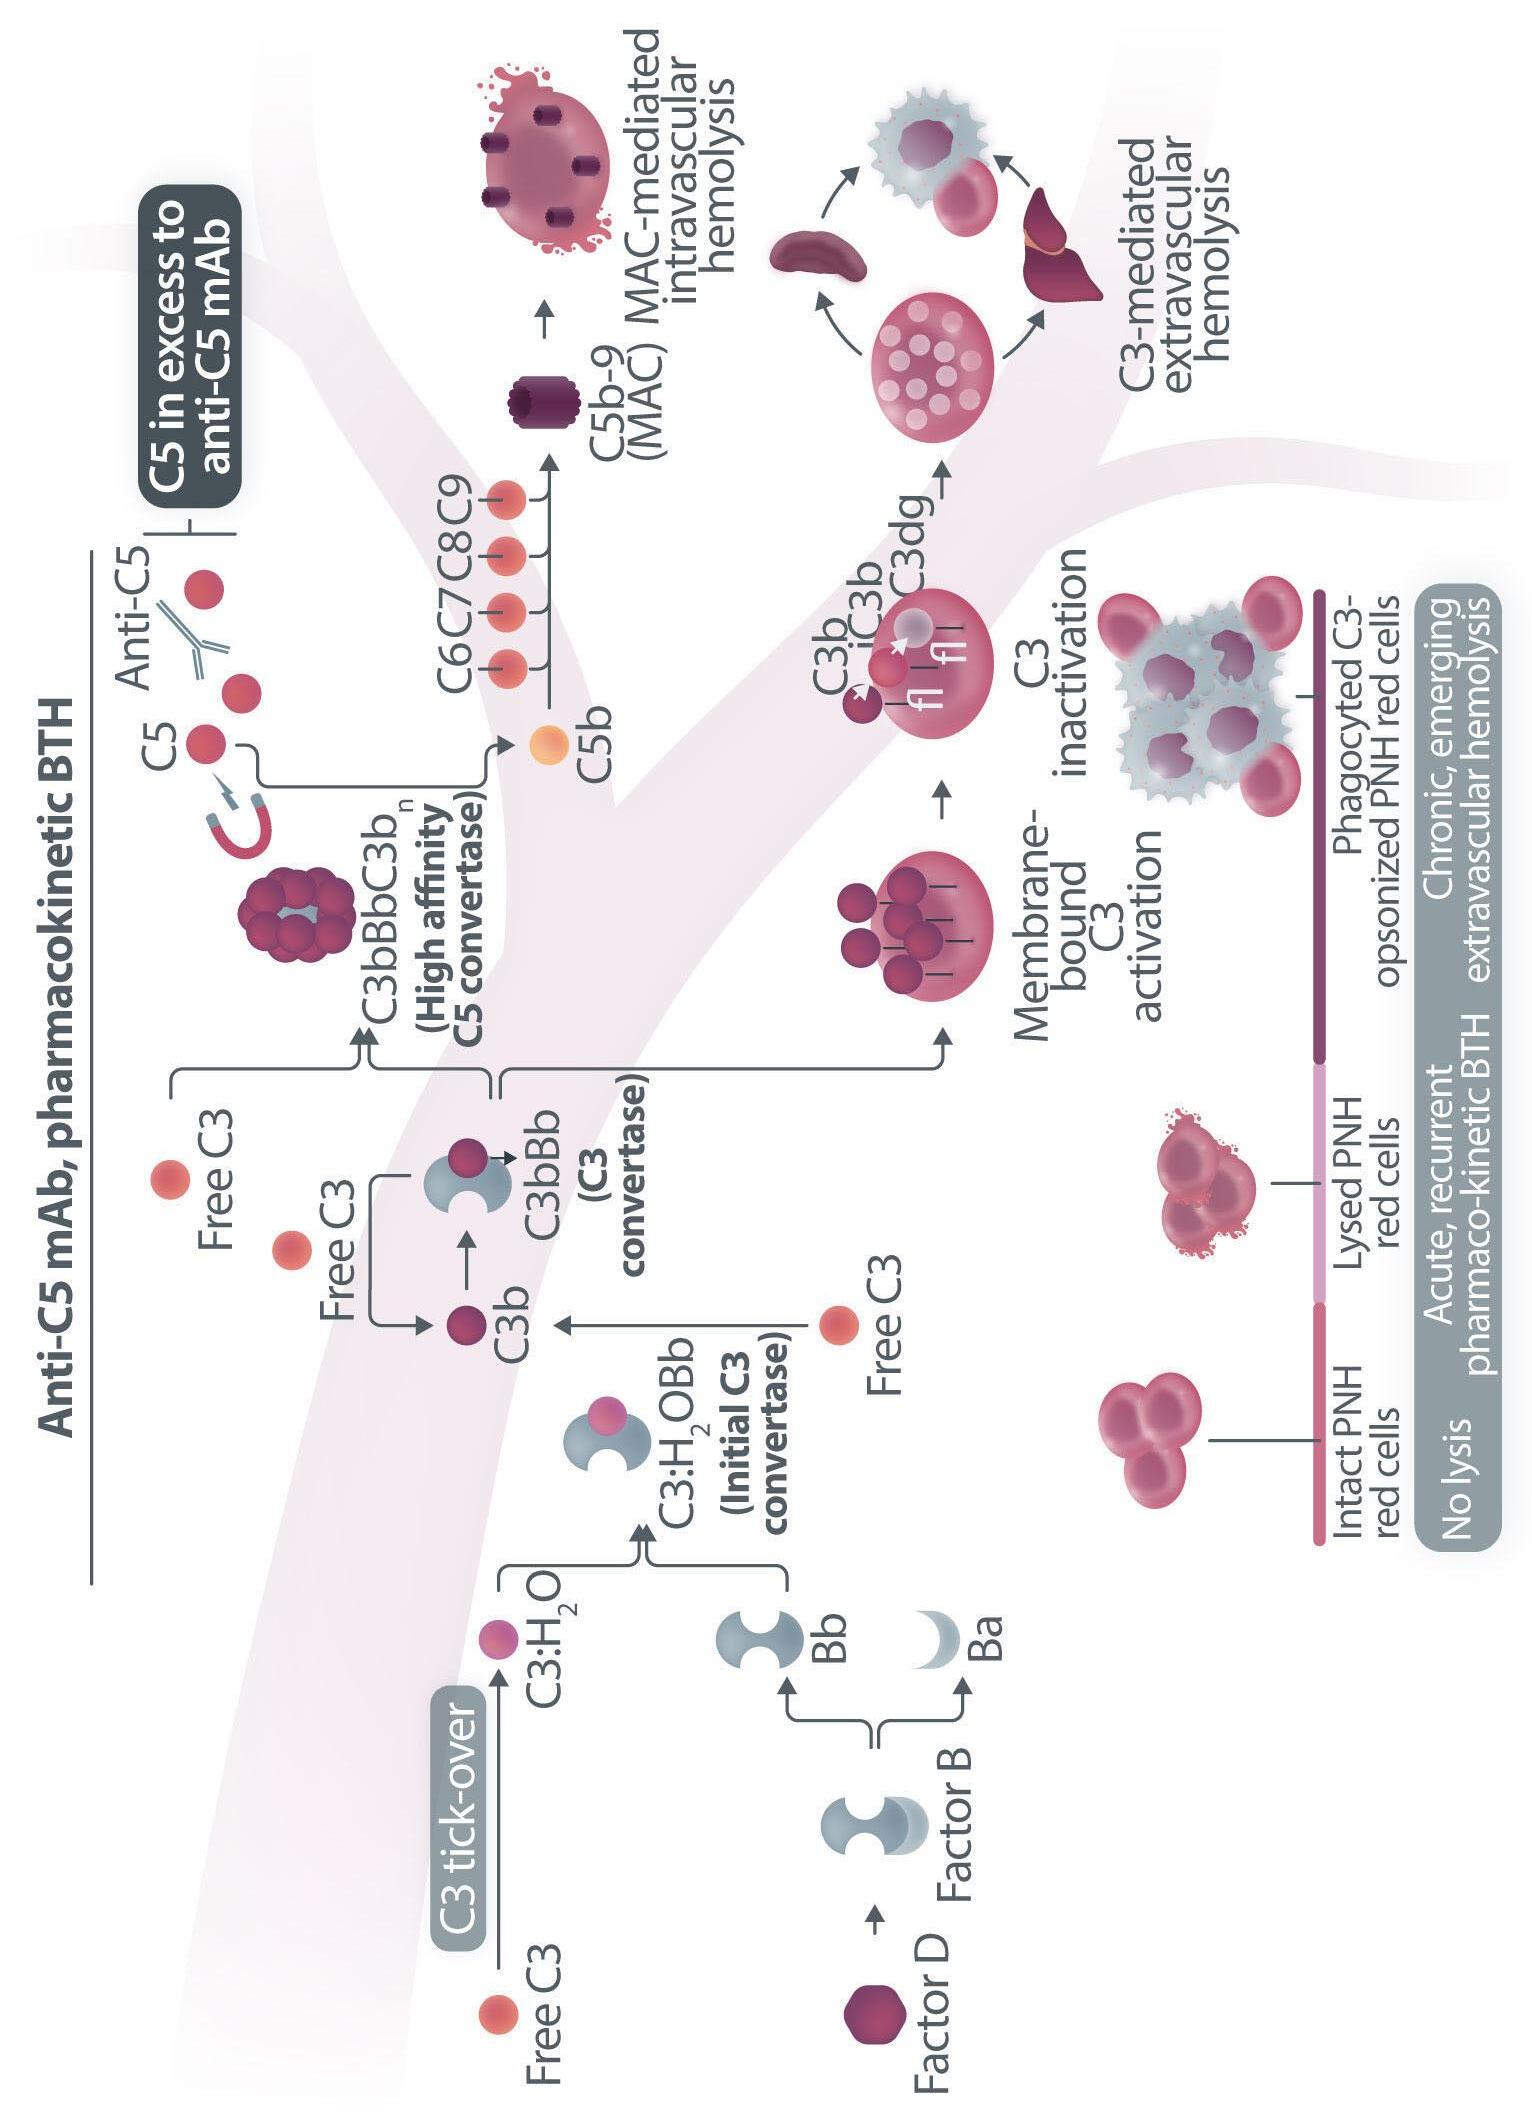
(D) Complement activation with C5 inhibitors in vivo, pharmacokinetic breakthrough hemolysis. In the case of sub-therapeutic plasma levels of anti-C5 mAb, free C5 may become available to C5 convertase for cleavage, eventually resulting in acute hemolytic events that are defined pharmacokinetic breakthrough hemolysis (BTH).
(E) Complement activation with C5 inhibitors in vivo, pharmacodynamic breakthrough hemolysis . Similar acute hemolytic events may occur even when C5 is fully saturated by the anti-C5 mAb, due to overt complement activation caused by specific triggers (i.e., complement amplifying conditions). In this case, an excess of C3b results in C3b-rich C5 convertases with enhanced affinity for C5 (eventually competing more efficiently with the anti-C5 mAb for their common target C5), or directly in a conformational change of C5 which may then start C5b-9 assembly; these acute hemolytic events are defined pharmacodynamic BTH. (F) Complement activation with C5 inhibitors in vivo, zilucoplan . Residual hemolysis is also seen with zilucoplan, resembling that seen with anti-C5 mAb in unfavorable pharmacokinetic or pharmacodynamic circumstances. It should be noted that residual hemolysis with zilucoplan seems rather chronic, in contrast to the acute BTH seen with anti-C5 mAb. Even if pharmacokinetic and pharmacodynamic information about zilucoplan is limited, this might suggest that the phenomenon of chronic, continuous residual intravascular hemolysis is associated with the specific pharmacodynamics of this compound, which may compete less efficiently with C5 convertase for their common substrate/target C5. Figure created with somersault18:24.
Haematologica | 109 Marzo 2024 706 EDITORIAL A.M. Risitano and C. Frieri
E F
vitro, clearly documenting that uncontrolled complement activation on PNH erythrocytes generates initial membrane binding of C3b, which is then quickly converted into C3d, both in vitro and in vivo. 7,8 While C3d eventually accounts for C3-mediated extravascular hemolysis (which has fostered the development of proximal inhibitors), transient high-density C3b may account for more efficient C5 activation, either via conformational change of C55 or through the generation of C3-rich high-affinity C5 convertases.9 This mechanism may justify the residual hemolysis documented in vitro in the presence of eculizumab upon complement activation,7,8 which mirrors the so-called pharmacodynamic breakthrough hemolysis observed in vivo during eculizumab treatment10 (Figure 1A, B).
However, this mechanism has nothing to do with the suboptimal efficacy of zilucoplan observed in some PNH patients in vivo. First of all, the in vitro finding of an increased proportion of C3-opsonised PNH erythrocytes after combined exposure to eculizumab and zilucoplan is simply the result of more efficient C5 inhibition (similar to that seen with coversin and eculizumab):5 indeed, fewer C3-opsonised PNH erythrocytes proceed to be lysed due to the double C5 inhibition, eventually contributing to increase their final proportion. In vivo, C3 opsonization is mostly a very slow phenomenon resulting from progressive accumulation of C3d on PNH erythrocytes that stochastically suffer from a surface activation exceeding a given threshold (C3b is quickly converted into its inactive split fragments).8 As a consequence, even a transient (from some days to a week) exposure to double C5 inhibition does not justify increased C3 deposition (which in any case was not proven in these patients). It must be highlighted that, in the presence of effective C5 blockade (such as that achieved with two concomitant inhibitors, which according to the authors would result in
References
1. Howard JF Jr, Bresch S, Genge A, et al. Safety and efficacy of zilucoplan in patients with generalised myasthenia gravis (RAISE): a randomised, double-blind, placebo-controlled, phase 3 study. Lancet Neurol. 2023;22(5):395-406.
2. Kulasekararaj AG, Lehtinen A-E, Forsyth C, et al. Phase II trials of zilucoplan in paroxysmal nocturnal hemoglobinuria. Haematologica. 2024;109(3):927-933.
3. Risitano AM, Marotta S. Toward complement inhibition 2.0: next generation anticomplement agents for paroxysmal nocturnal hemoglobinuria. Am J Hematol. 2018;93(4):564-577.
4 Risitano AM, Frieri C, Urciuoli E, Marano L. The complement alternative pathway in paroxysmal nocturnal hemoglobinuria: from a pathogenic mechanism to a therapeutic target. Immunol Rev. 2023;313(1):262-278.
5. Harder MJ, Kuhn N, Schrezenmeier H, et al. Incomplete inhibition by eculizumab: mechanistic evidence for residual C5 activity during strong complement activation. Blood. 2017;129(8):970-980.
increased C3 opsonization), even the postulated increased C3 opsonization would lead to increased C3-mediated extravascular hemolysis and never to increased intravascular hemolysis, since C3d per se cannot contribute to overcome therapeutic C5 inhibition (Figure 1C-E). Taken together, these considerations suggest that the residual intravascular hemolysis seen in PNH patients switching from eculizumab to zilucoplan is actually due to a less favorable pharmacokinetic/pharmacodynamic profile of this small molecule C5 inhibitor (Figure 1F). Unpredicted and somewhat disappointing results have been observed in different proof-of-concept trials investigating novel anti-complement therapies for PNH; for instance cemdisiran, an anti-C5 small interfering RNA, was found to be only partially effective in controlling hemolysis despite achieving a ≥95% silencing efficiency. 11 In the setting of proximal complement inhibitors, even subtle differences in pharmacokinetics and pharmacodynamics may account for meaningful clinical differences, eventually driving their use in monotherapy or in combination of different factor D inhibitors.12,13 As acknowledged by Kulasekararaj et al., all these data support the notion that in PNH any therapeutic complement blockade must be sustained and complete to result in meaningful clinical activity; to this aim, our deepest understanding of the pharmacokinetics and pharmacodynamics of any complement inhibitor is essential to optimize their best use either in monotherapy or in combination treatment.14
Disclosures
AMR has been serving in advisory board and/or speaker panels for Novartis, Apellis, SOBI, Roche, Pfizer and Alexion.
Contributions
The authors equally contributed to this work.
6. Risitano AM, Notaro R, Marando L, et al. Complement fraction 3 binding on erythrocytes as additional mechanism of disease in paroxysmal nocturnal hemoglobinuria patients treated by eculizumab. Blood. 2009;113(17):4094-4100.
7 Risitano AM, Notaro R, Pascariello C, et al. The complement receptor 2/factor H fusion protein TT30 protects paroxysmal nocturnal hemoglobinuria erythrocytes from complementmediated hemolysis and C3 fragment. Blood. 2012;119(26):6307-6316.
8. Sica M, Rondelli T, Ricci P, De Angioletti M, Risitano AM, Notaro R. Eculizumab treatment: stochastic occurrence of C3 binding to individual PNH erythrocytes. J Hematol Oncol. 2017;10(1):126.
9 Rawal N, Pangburn M. Formation of high-affinity C5 convertases of the alternative pathway of complement. J Immunol. 2001;166(4):2635-2642.
10. Risitano AM, Marotta S, Ricci P, et al. Anti-complement treatment for paroxysmal nocturnal hemoglobinuria: time for proximal complement inhibition? A position paper from the
Haematologica | 109 Marzo 2024 707 EDITORIAL A.M. Risitano and C. Frieri
SAAWP of the EBMT. Front Immunol. 2019;10:1157.
11. Hill A, Valls AG, Griffin M, et al. A subcutaneously administered investigational RNAi therapeutic (ALN-CC5) targeting complement C5 for treatment of PNH and complementmediated diseases: preliminary phase 1/2 study results in patients with PNH. Blood. 2016;128(22):3891.
12. Risitano AM, Kulasekararaj AG, Lee JW, et al. Danicopan: an oral complement factor D inhibitor for paroxysmal nocturnal
hemoglobinuria. Haematologica. 2021;106(12):3188-3197.
13. Browett PJ, Kulasekararaj A, Notaro R, et al. Vemircopan (ALXN2050) monotherapy in paroxysmal nocturnal hemoglobinuria: interim data from a phase 2 open-label proofof-concept study. Blood. 2022;140(Suppl 1):717-719.
14. Notaro R, Luzzatto L. Breakthrough hemolysis in PNH with proximal or terminal complement inhibition. N Engl J Med. 2022;387(2):160-166.
Haematologica | 109 Marzo 2024 708 EDITORIAL A.M. Risitano and C. Frieri
Prehistory of chronic lymphocytic leukemia: clues from the B-cell receptor
Frederic Davi
Department of Hematology, AP-HP, Pitié-Salpêtrière Hospital, Sorbonne Université, Paris, France
Correspondence: F. Davi frederic.davi@aphp.fr
Received: August 28, 2023.
Accepted: September 11, 2023.
Early view: September 21, 2023.
https://doi.org/10.3324/haematol.2023.283799
©2024 Ferrata Storti Foundation
Published under a CC BY-NC license
In this issue of Haematologica, Quinten et al. provide new insights into the early steps of the development of chronic lymphocytic leukemia (CLL).1 Following its initial description in 2002, monoclonal B-cell lymphocytosis (MBL) has become a well-recognized entity defined by the presence of a circulating clonal B-cell population below 5x10⁹ cells/L, in the absence of clinical symptoms or cytopenias.2 Based on their immunophenotypic profile, MBL can be divided into three subtypes: (i) CLL-type MBL, which accounts for the vast majority of cases; (ii) atypical CLL-type MBL; and (iii) non-CLL MBL.3 In addition, depending on the number of circulating clonal B cells, two categories of MBL are recognized: high-count MBL (HC-MBL) having ≥0.5x10⁹ cells/L, and low-count MBL (LC-MBL) with <0.5x10⁹ cells/L. A variable frequency (3.5% to 12%) of MBL among healthy individuals has been reported, depending on the sensitivity of the detection technique. Using highly sensitive eight-color flow cytometry, a recent large-scale study from the Mayo Clinic identified MBL in 17% of more than 10,000 individuals, with most cases (95%) being LC-MBL.4 The prevalence increases with age, and is higher in males and in individuals from families in which two or more relatives have CLL.5 HC-MBL cases share similarities with CLL, both in terms of genetic abnormalities and immunoglobulin heavy chain variable (IGHV) region gene repertoire. It is considered to be a precursor state of CLL,6 with the rate of progression from HC-MBL to CLL requiring treatment varying from 1% to 5% per year. The relationship between LC-MBL and CLL is less clear. Compared to HC-MBL, LC-MBL display a lower frequency of the genomic aberrations usually seen in CLL, and predominantly those of the ultra-stable type. They also have a different immunoglobulin (IG) gene repertoire, raising the possibility that they represent an immune senescence phenomenon rather than a pre-leukemic state.7 However, for cases of LC-MBL occurring in relatives from CLL families, the annual rate of progression to CLL has been estimated
to be 1.1%, indicating that a least a fraction of LC-MBL are precursors of CLL.5 CLL ontogeny may in fact be initiated in a much earlier progenitor, as shown by the identification of acquired CLL in the patients’ hematopoietic stem cells, and transplantation experiments of patients’ hematopoietic stem cells into immunodeficient mice.8,9
The driving forces contributing to the emergence and growth of a CLL population from normal progenitors are still unknown but clearly include genetic as well as microenvironment factors. For the latter, antigen stimulation through the B-cell receptor (BCR) plays a central role and several auto-antigens as well as microbial antigens have been identified as targets of CLL BCR. About 10 years ago, the group of Hassan Jumaa reported the striking finding that the CLL BCR itself could serve as a target, with the third complementary determining region of the IGHV domain of one BCR recognizing epitopes in the framework regions of another BCR.10 Using a sophisticated in vitro model in which a murine triple knock-out pre-B cell line was transfected with patient-derived BCR IG genes, they showed that such interactions resulted in “antigen-independent” cell-autonomous signaling evidenced by calcium flux, and moreover that this phenomenon was specific to CLL BCR.
In the present study from the same group, Quinten et al. have now applied this technique to MBL BCR in order to address the issue of the early stages of CLL ontogeny.1 They analyzed a cohort of 191 siblings of subjects with non-familial CLL and performed functional and genetic analyses in paired CLL-MBL siblings. Using six-color flow cytometry, they detected 34 (17.8%) MBL cases, most of them (94%) being LC-MBL. They obtained IG heavy and light chain sequences for 17 of them, with two cases being biclonal, a finding not unusual in MBL. A third of the monoclonal cases (5/15) had characteristic features of CLL BCR stereotypy (e.g., quasi-identical IG sequences), including two cases belonging to the aggressive subset #2 group, a frequency
Haematologica | 109 Marzo 2024 709 EDITORIAL
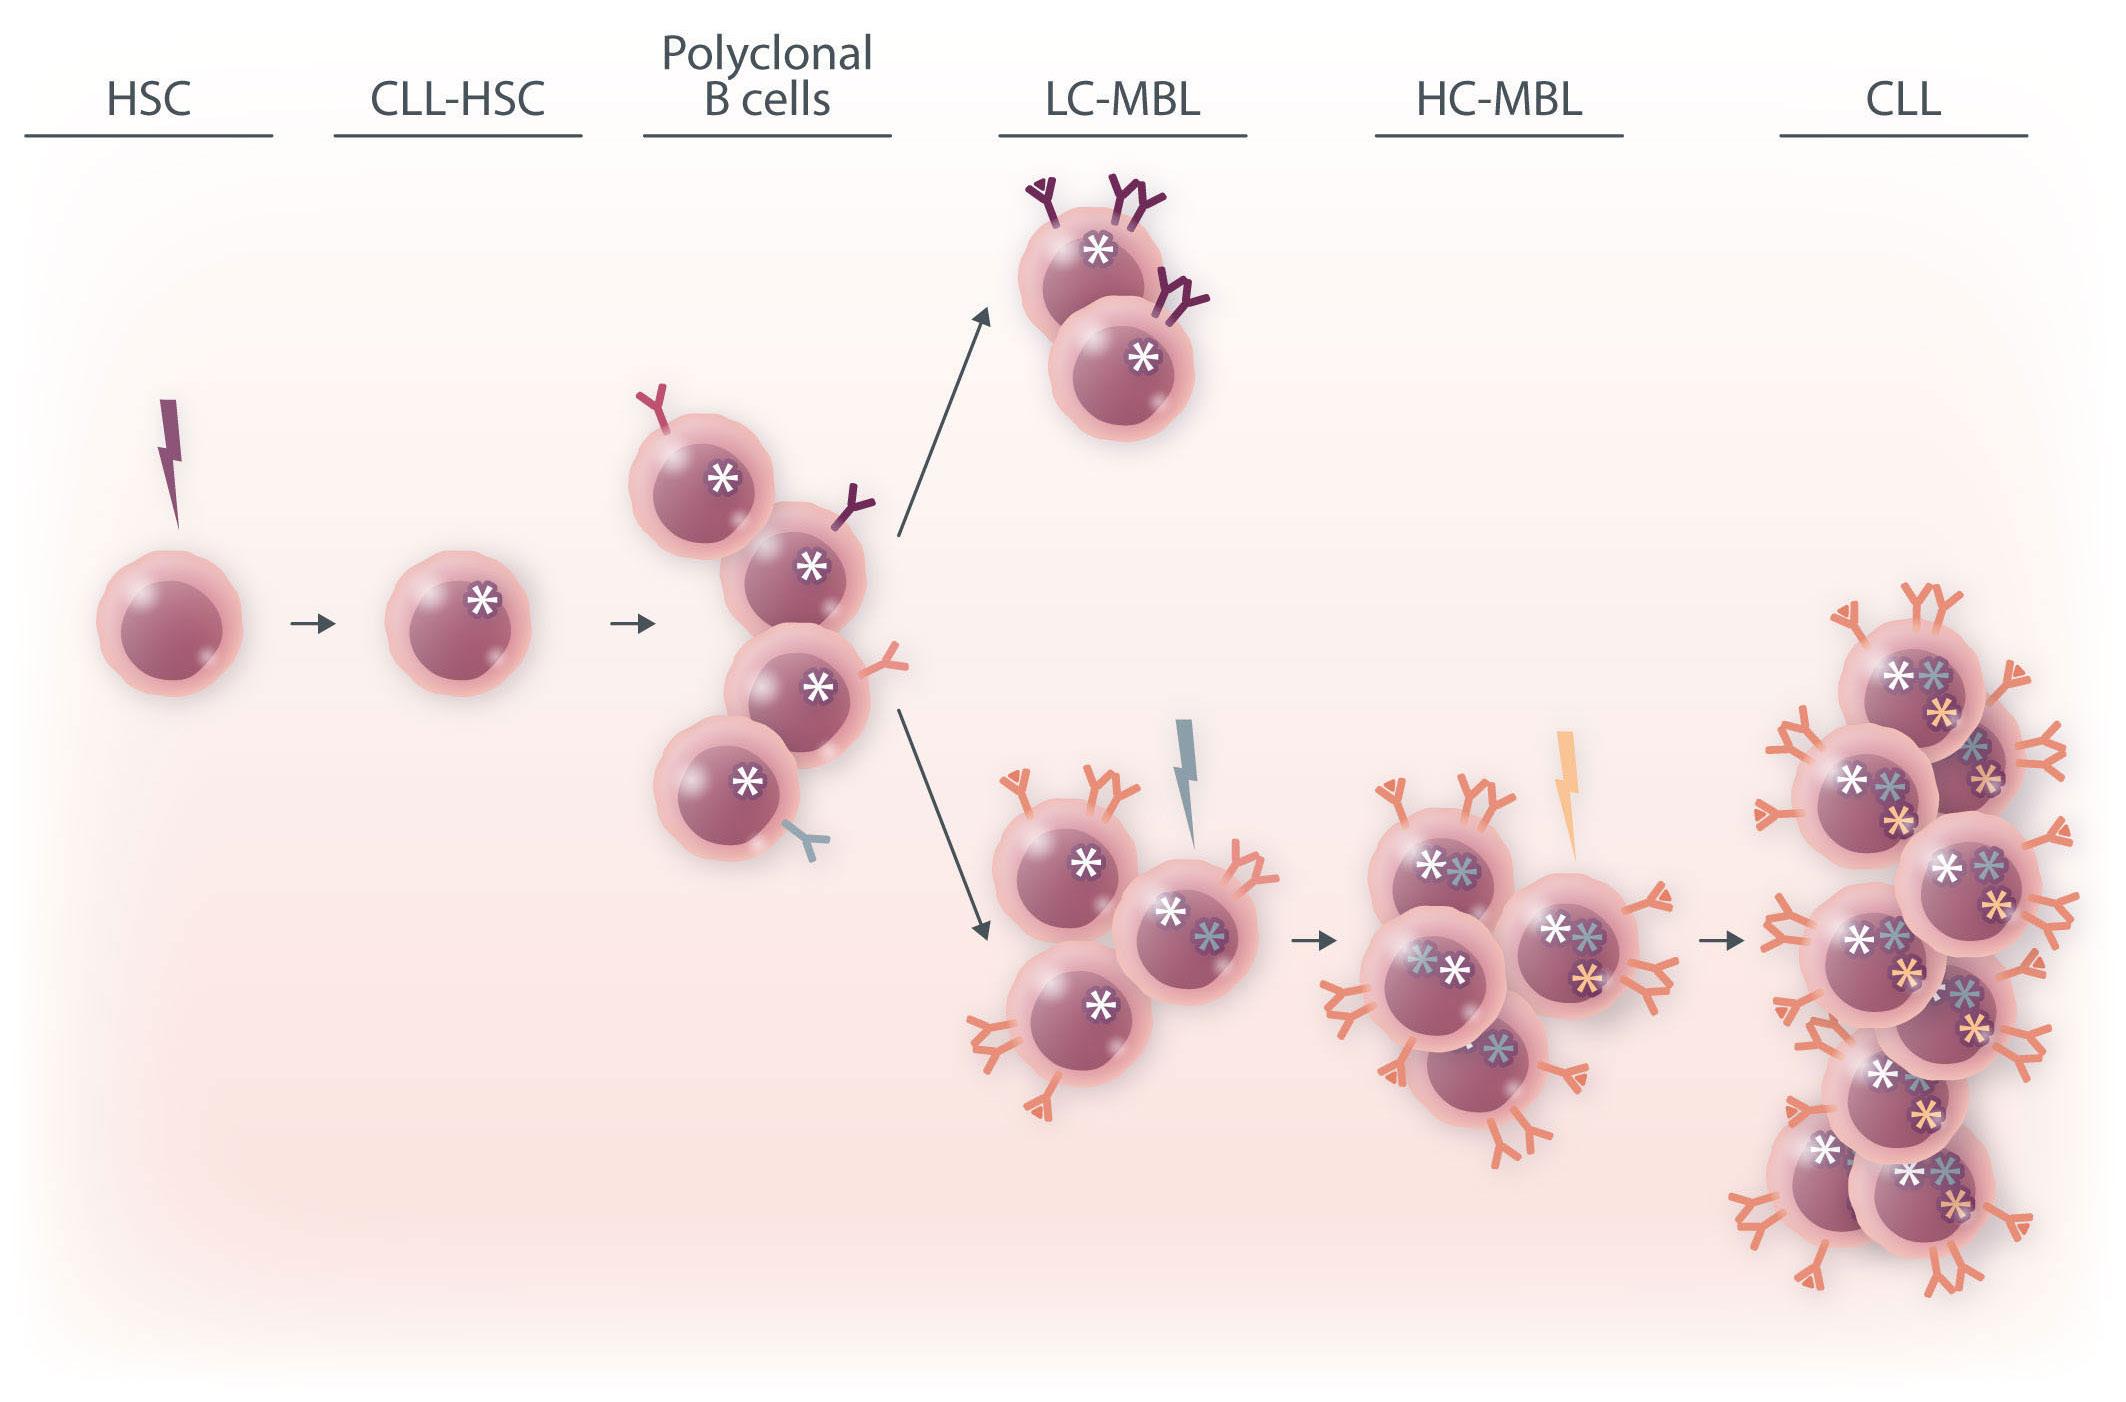
Further BCR stimulation, as well as the acquisition of genetic lesions, drive gradual selection and clonal expansion of high-count monoclonal B-cell lymphocytosis, which ultimately progresses to overt chronic lymphocytic leukemia. HSC: hematopoietic stem cell;
higher than those previously reported.7 BCR IG from 11 MBL sorted cells were transfected in triple knock-out pre-B cells, resulting in autonomous signaling for all of them. Surprisingly, when comparing CLL and MBL sibling pairs, autonomous signaling was significantly weaker with BCR IG from cases of MBL than those from patients with CLL.
To address the question of a potential genetic susceptibility, the authors tested a panel of 24 risk loci. For both CLL and MBL siblings they found a CLL polygenic score higher than the score for the reference population, indicating a genetic susceptibility to the initial expansion of CLL-type clones, but not to their progression from MBL to CLL. They also searched for CLL-associated genetic lesions, and found similar prevalences of both copy number variants and single nucleotide variants in paired CLL and MBL cases, but with a lower variant allele fraction in MBL.
Altogether, this study demonstrates that MBL, and more specifically LC-MBL, are already equipped with a BCR capable of autonomous signaling, thus allowing emergence of clonal expansions. The fact that these clones also bear CLL driver genomic alterations, albeit at a subclonal level, supports the hypothesis of a continuum between LC-MBL and CLL, with progressive clonal evolution due to stepwise acquisition of genomic lesions (Figure 1).
The article by Quinten et al. sheds further light onto the
issue of CLL ontogenesis, but also raises some questions. In particular, the finding of lower BCR signaling strength in MBL compared to CLL is puzzling. In leukemic cells, this could be explained by the fact that BCR signaling may be modulated by genetic, epigenetic and/or microenvironmental factors. Such explanations would not, however, fit with the in vitro system used by the authors, in which BCR expressed by the triple knock-out cells originated from cloned synthetic DNA fragments. Longitudinal studies to see whether the signal strength increases along with the MBL clone size would be particularly interesting. Finally, as some predisposing factors may contribute to B-cell clone emergence in siblings of CLL patients, it remains to be shown whether the same results would be obtained for MBL in individuals with no family history of CLL.
Disclosures
FD has received honoraria from AstraZeneca and Janssen. These relationships do not raise a conflict of interest regarding the published work.
Acknowledgments
I thank Luk Cox for his helpful expertise in preparing the illustration.
Haematologica | 109 Marzo 2024 710 EDITORIAL F. Davi
Figure 1. A model of the hypothesized chronic lymphocytic leukemia ontogeny. The initial hit may occur in a hematopoietic stem cell which promotes the production of polyclonal B cells bearing the founder mutation. B-cell receptor (BCR) stimulation by autonomous signaling and possibly by self or foreign antigens leads to oligoclonal low-count monoclonal B-cell lymphocytosis.
CLL: chronic lymphocytic leukemia; LC-MBL: low-count monoclonal B-cell lymphocytosis; HC-MBL: high-count monoclonal B-cell lymphocytosis.
References
1. Quinten E, Sepúlveda-Yáñez JH, Koning MT, et al. Autonomous B-cell receptor signaling and genetic aberrations in chronic lymphocytic leukemia-phenotype monoclonal B lymphocytosis in siblings of patients with chronic lymphocytic leukemia. Haematologica. 2024;109(3):822-832.
2. Rawstron AC, Green MJ, Kuzmicki A, et al. Monoclonal B lymphocytes with the characteristics of “indolent” chronic lymphocytic leukemia are present in 3.5% of adults with normal blood counts. Blood. 2002;100(2):635-639.
3. Scarfò L, Ghia P. What does it mean I have a monoclonal B-cell lymphocytosis?: recent insights and new challenges. Semin Oncol. 2016;43(2):201-208.
4 Slager SL, Parikh SA, Achenbach SJ, et al. Progression and survival of MBL: a screening study of 10 139 individuals. Blood. 2022;140(15):1702-1709.
5. Slager SL, Lanasa MC, Marti GE, et al. Natural history of monoclonal B-cell lymphocytosis among relatives in CLL
families. Blood. 2021;137(15):2046-2056.
6. Landgren O, Albitar M, Ma W, et al. B-cell clones as early markers for chronic lymphocytic leukemia. N Engl J Med. 2009;360(7):659-667.
7. Galigalidou C, Zaragoza-Infante L, Iatrou A, et al. Understanding monoclonal B cell lymphocytosis: an interplay of genetic and microenvironmental factors. Front Oncol. 2021;11:769612.
8. Damm F, Mylonas E, Cosson A, et al. Acquired initiating mutations in early hematopoietic cells of CLL patients. Cancer Discov. 2014;4(9):1088-1101.
9. Kikushige Y, Ishikawa F, Miyamoto T, et al. Self-renewing hematopoietic stem cell is the primary target in pathogenesis of human chronic lymphocytic leukemia. Cancer Cell. 2011;20(2):246-259.
10 Duhren-von Minden M, Ubelhart R, Schneider D, et al. Chronic lymphocytic leukaemia is driven by antigen-independent cellautonomous signalling. Nature. 2012;489(7415):309-312.
Haematologica | 109 Marzo 2024 711 EDITORIAL F. Davi
First mouse model of infant acute myeloid leukemia with t(7;12)(q36;p17)
Z. Jevtic and J. Schwaller
University Children’s Hospital Basel, Department of Biomedicine, University of Basel, Basel, Switzerland
Correspondence: J. Schwaller
j.schwaller@unibas.ch
Received: July 28, 2023.
Accepted: August 8, 2023.
Early view: August 17, 2023.
https://doi.org/10.3324/haematol.2023.283659
©2024 Ferrata Storti Foundation
Published under a CC BY-NC license
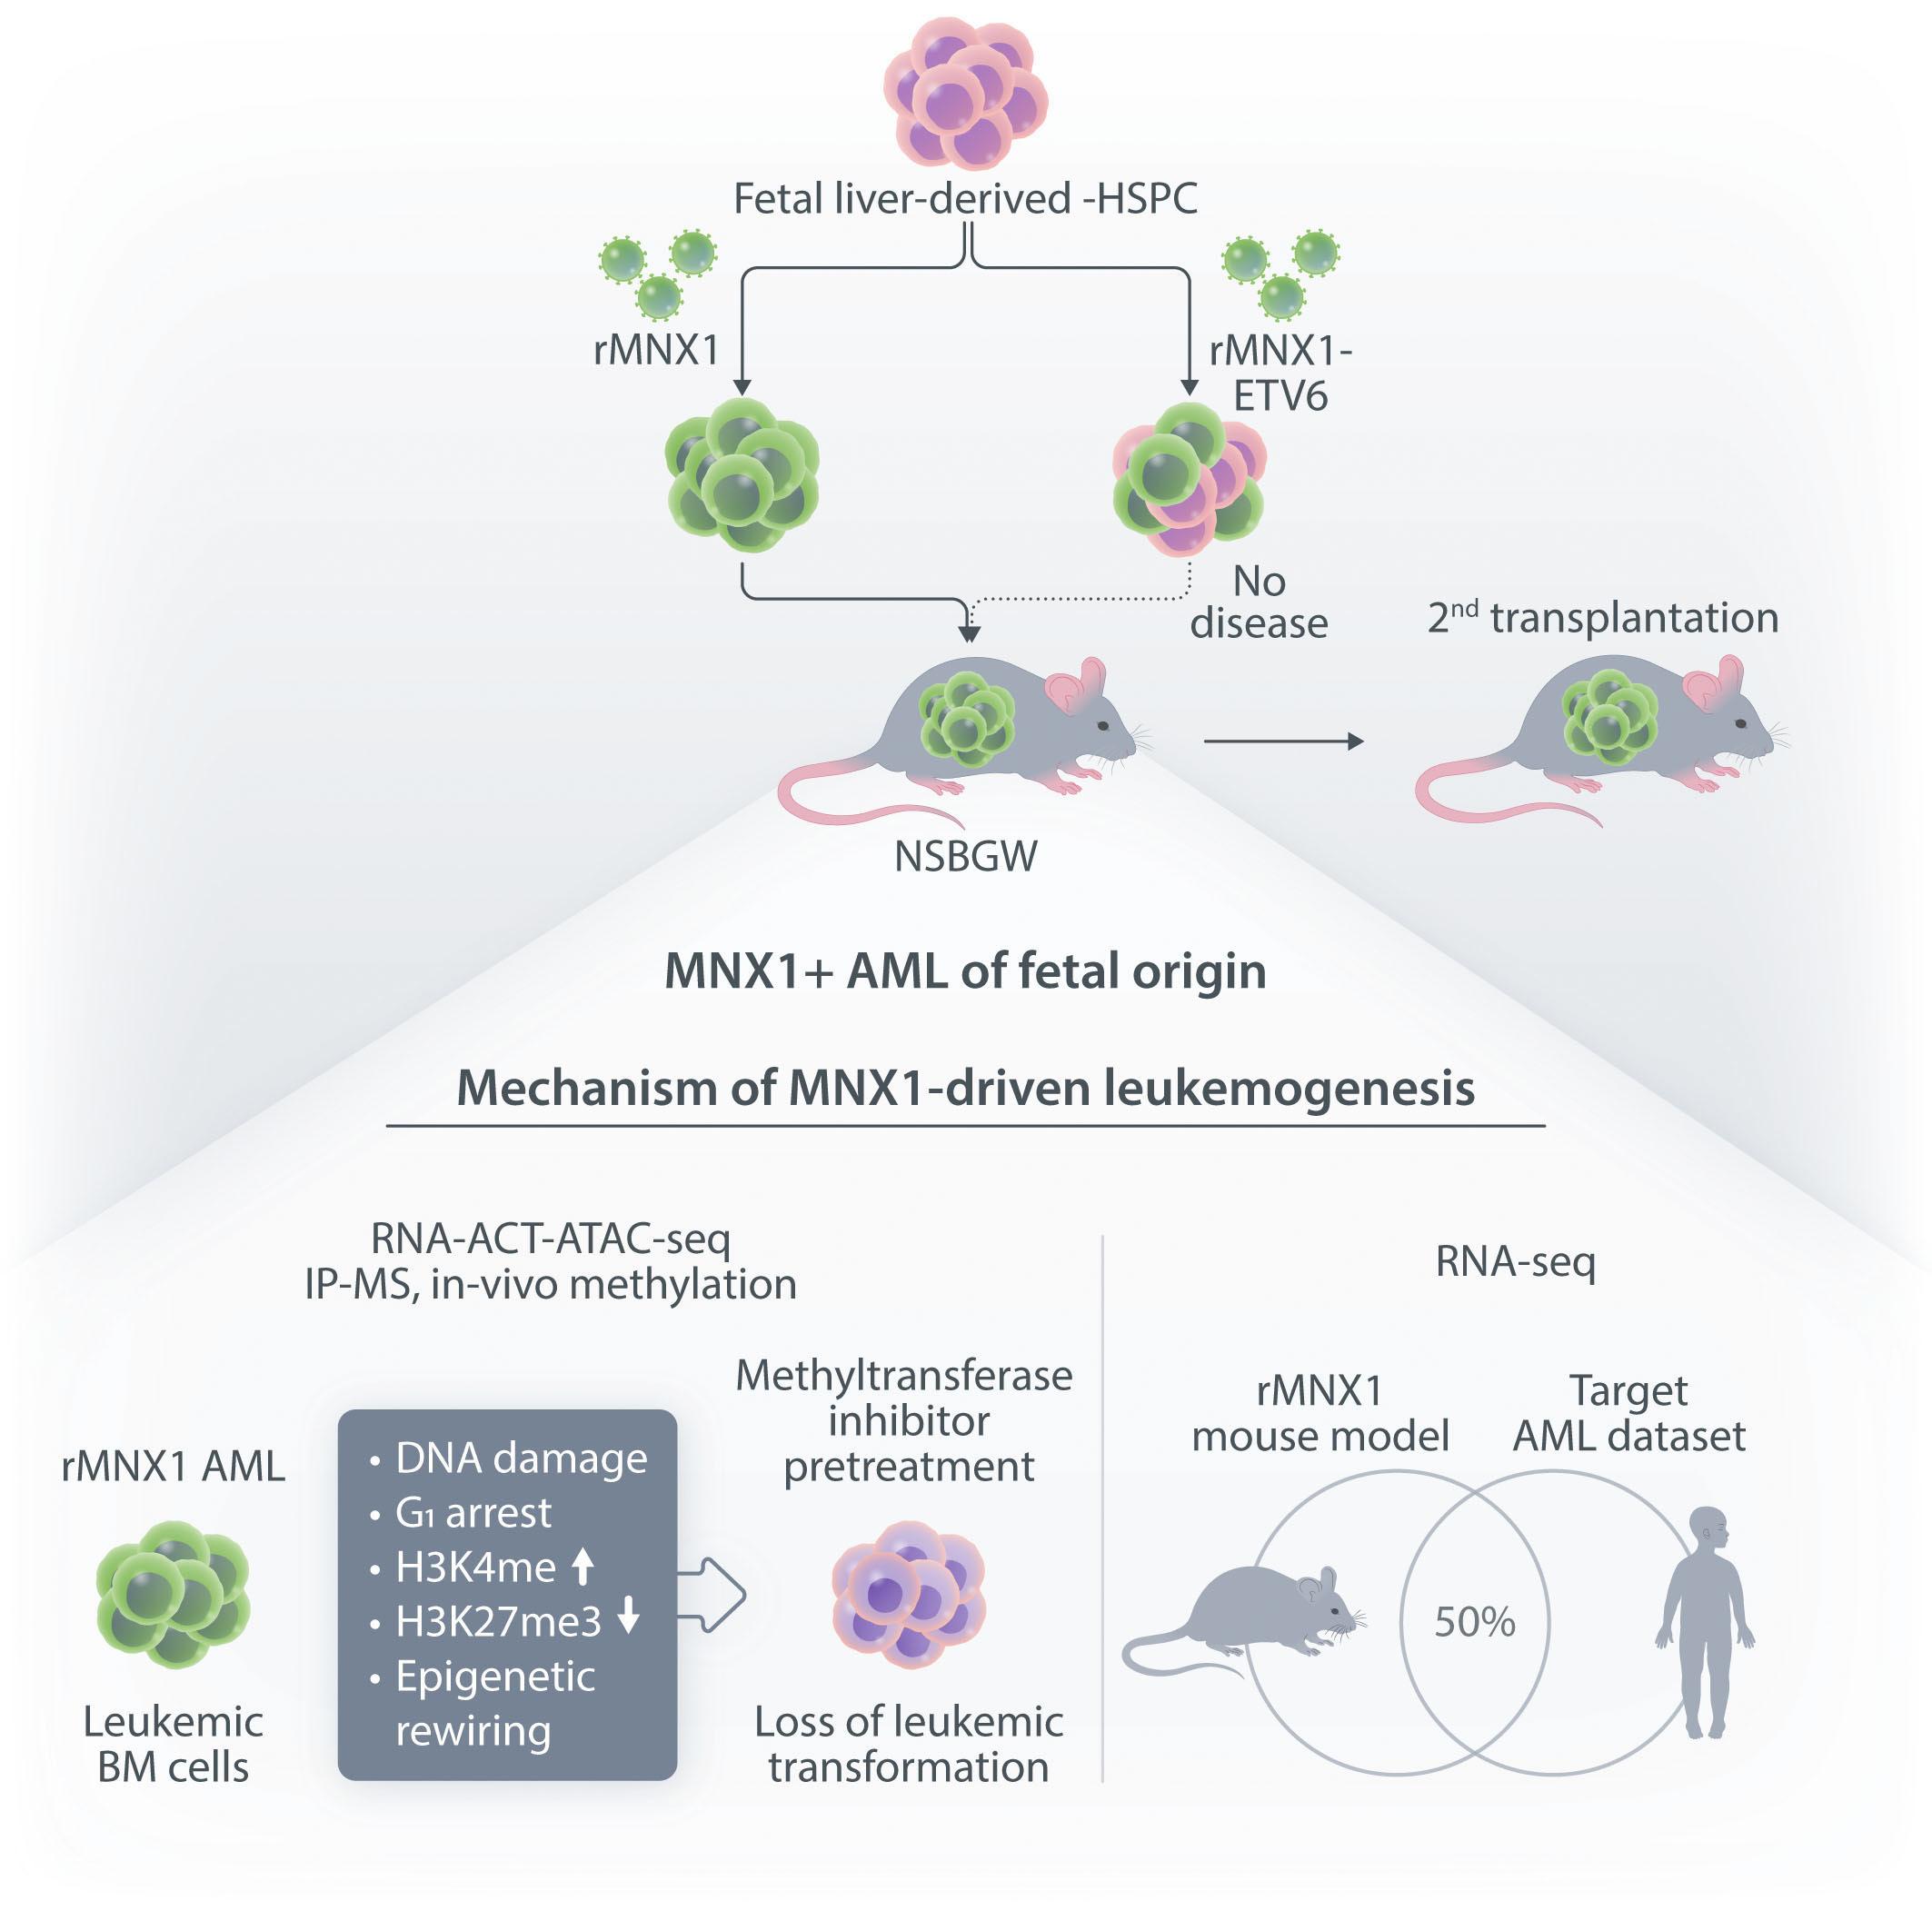
t(7;12)(q36;p17) is the second most frequent cytogenetic lesion in infant acute myeloid leukemia (AML) leading to a translocation of the motor neuron and pancreas homeobox protein 1 (MNX1) gene telomeric on 7q36 to the Ets-variant transcription factor (ETV6) gene on 12p. Although a hypothetical fusion protein containing the MNX1 N-terminus to almost the entire ETV6 ORF is formed, expression of fusion mRNA is only found in 50% of the patients.1
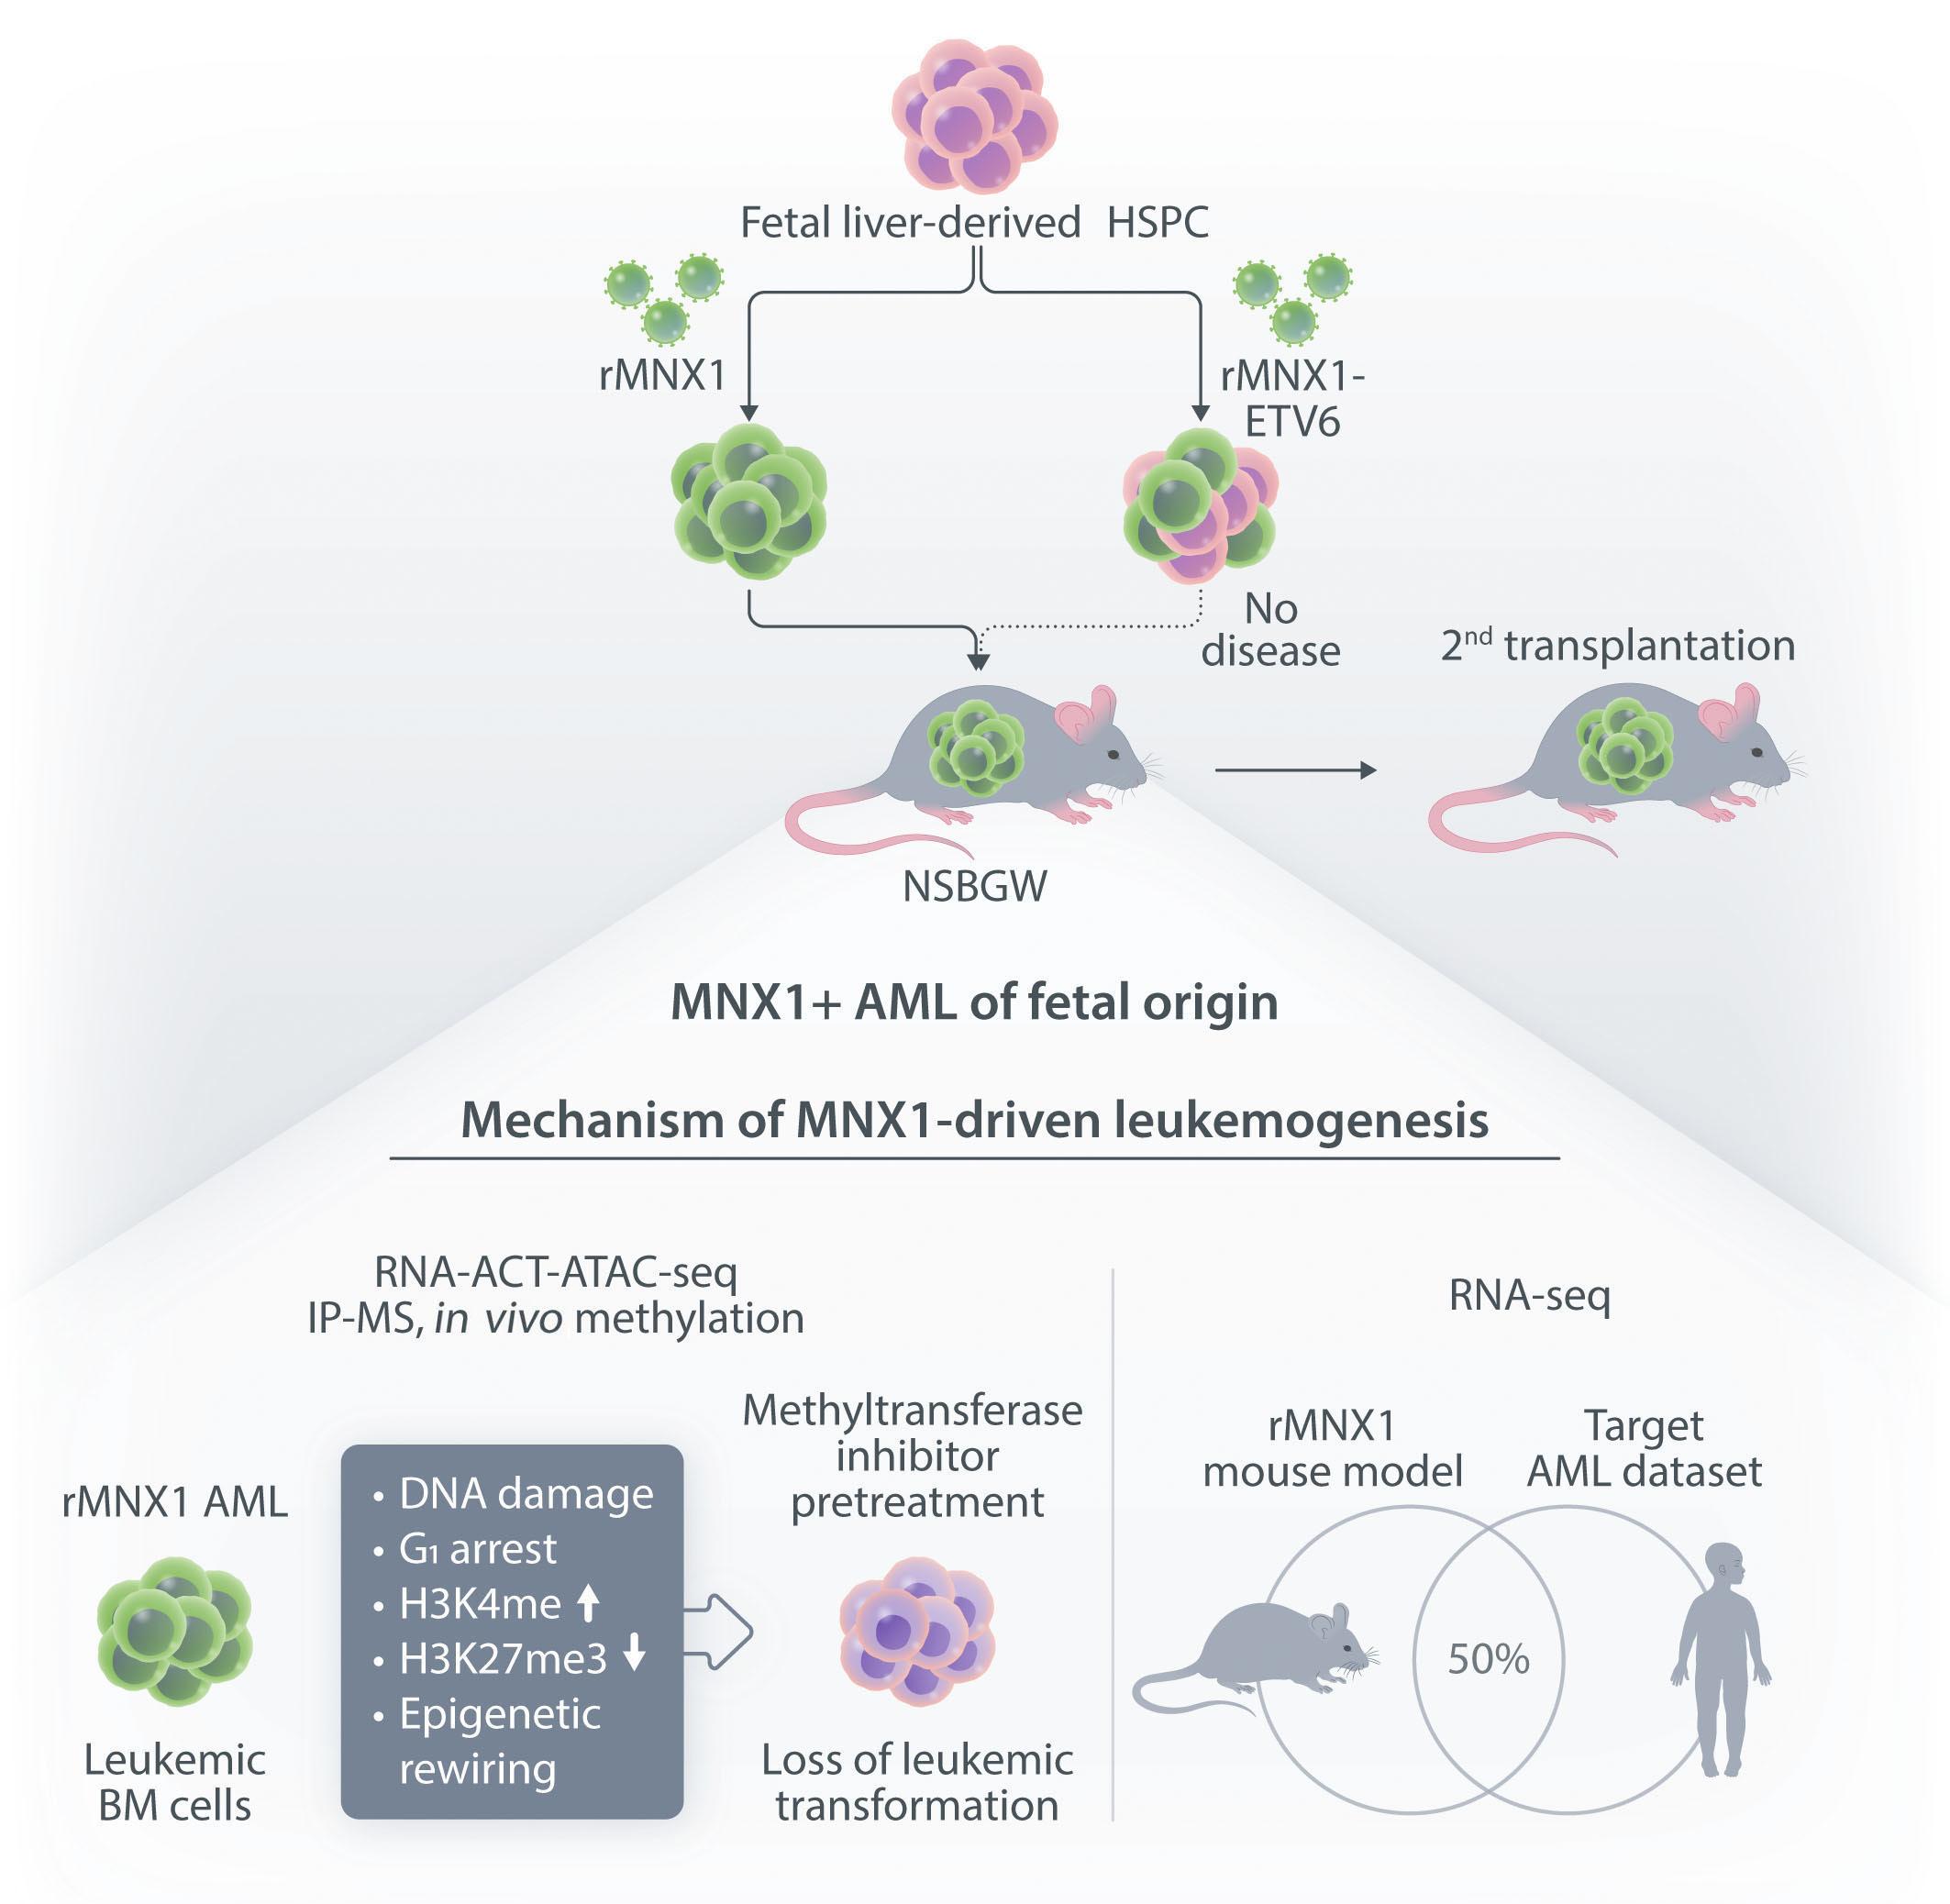
In this issue of Haematologica, Waraky et al. provide for the first time experimental evidence that MNX1 overexpression has in vivo leukemogenic potential2 (Figure 1). More precisely, overexpression of MNX1, but not the MNX1::ETV6 fusion in fetal liver (FL)-derived (but not adult bone marrow [ABM]-derived) hematopoietic stem and progenitor cells (HSPC) resulted in a fully penetrant and transplantable immature leukemia. Notably, the disease developed in non-conditioned immune-compromised NSBGW (NOD. Cg-KitW-41JTyr+Prkdcscid Il2rgtm1Wjl) mice but not in irradiated wild-type recipients.
Earlier in vitro studies have provided some insights into the transforming potential of aberrant MNX1 levels, but leukemogenic activity has never been reported in a mouse model.3 The finding that MNX1 overexpressing HSPC induce AML only when transplanted into immune-compromised mice is unexpected, as in both recipients the immune system is functionally impaired. However, NBSGW mice are not only immune-compromised, but also express a mutated partially defective KIT receptor which makes them more permissive for HSC engrafting and expansion.4 Whether impaired KIT signaling provided a particular bias for grafting and expansion of MNX1-expressing cells remains to be elucidated. The fact that the leukemogenic potential was limited to FL- but not ABM-derived HSPC could, at least in part, be the consequence of increased induction of apoptosis that Waraky et al. observed in vitro. Whether the particular transformation susceptibility by MNX1 overexpression is also the consequence of the chromatin conformation of
FL HSPC, as observed for another infant AML driver, the CBFA2T3-GLIS2 fusion, remains to be determined.5 To understand the molecular mechanisms of MNX1-induced AML, Waraky et al. determined the gene expression signatures of FL-derived MNX1-expressing AML cells indicating significant associations to multiple processes, including DNA damage repair, substantiated by increased gH2AX foci, cell cycle aberrations, and hyperploidy. Chromatin analysis of MNX1-expressing AML cells revealed changes of global histone modifications (increased H3K3me1/2/3 and reduced H3K27me3) and increased accessible regions mainly affecting promoters of differentially expressed genes involved in myeloid differentiation, cell cycle progression methylation, and DNA damage response. Cross-species comparison revealed significant overlaps between the expression signatures from MNX1-overexpressing murine AML and t(7;12)(q36;p17)-positive(+) infant AML with common enriched pathways including H3K4 methylation. Further protein pulldown and/or co-immunoprecipitation experiments identified potential interactions of MNX1 with proteins involved in methylation including the methionine adenosyl-transferase 2A/B (MAT2A/B) and the adenosyl-homocysteinase (AHCY), as well as some S-adenosylmethionine (SAM)-dependent methyltransferases. Notably, MNX1 overexpression was associated with increased cellular S-adenosylhomocysteine (SAH) and reduced free methionine, and pulled-down MNX1 showed in vitro methyltransferase activity on recombinant histone 3 (H3).
MNX1 expression was previously shown to block hematopoietic differentiation and induce premature senescence by increased DNA damage, cell cycle arrest, and hyperploidy.3
The MNX1 interactome analysis perfomed by Waraky et al. showed enrichment for the proteins involved in senescence pathway, supporting this potential connection. Interaction of MNX1 with SAM-producing enzymes MAT2A/B could imply target gene regulation by a putative mechanism that has previously been suggested for the activity of another transcription factor called MAFK, a member of the MAF on-
Haematologica | 109 Marzo 2024 712 EDITORIAL
coproteins.6 Hereby, MAFK binds to its recognition elements and recruits MAT2A/B to provide SAM for the associated histone methyltransferase (HMT), which then modifies H3K9 and H3K4, and regulates the expression of target genes. To better understand MNX1-driven leukemogenesis, one would also like to know its genome-wide binding sites. By addressing its role in motor neuron development, MacFarlan and colleagues recently identified around 6,000 MNX1-bound gene loci of which over 40% located within promoters that were highly enriched with H3K4me3 and H3K27ac.7 Despite the differences related to the cellular models, comparison of this chromatin immunoprecipitation with the RNA- and ATACseq datasets from Waraky et al. could lead to the identification of direct MNX1 targets.
Although Waraky et al. found and validated the interaction of MNX1 with the SAM producing enzymes MAF2A/B and AHCY, the nature of a potentially associated HMT remains unclear. Several HMT are well-known to play key roles in cancer, and particularly in acute leukemia of which KMT2A (also known as mixed lineage leukemia 1, MLL1) is the best characterized, as it represents a target of a large number
of chromosomal aberrations, mostly leading to fusions that are the most prevalent lesions in infant AML.8 Notably, the interactome analysis by Waraky et al. revealed MNX1 interaction with WDR5 (WD40 repeat domain protein 5), a member of the KMT2A complex, which is critical for KMT2A-mediated H3K4 methylation in AML.9 Earlier studies have shown that MNX1 physically interacts with MENIN, a scaffold protein that recruits KMT2A to the chromatin.10 These links suggest that the increase of H3K4me in MNX1 overexpressing AML cells might be mediated by WDR5/ MENIN-recruited KMT2A. Although comparative gene expression profiling suggested significant differences between t(7;12)(q36;p17)+ and 11q23/KMT2A-rearranged pediatric AML, several well-known KMT2A targets, including the HOXA gene cluster or PBX3, were also found aberrantly expressed in MNX1-overexpressing cells.8
Finally, Waraky et al. showed that a natural nucleoside SAM analog called Sinefungin rescued the aberrant histone methylation, g2HAX foci, and the myeloid differentiation block of MNX1-overexpressing cells in vitro . Sinefungin pre-treatment of MNX1-expressing FL-derived HSPC pre-
Haematologica | 109 Marzo 2024 713 EDITORIAL Z. Jevtic and J. Schwaller
Figure 1. Schematic illustration of the most important findings by Waraky et al. 2 AML: acute myeloid leukemia; BM: bone marrow; HSPC: hematopoietic stem and progenitor cells.
vented AML induction in NBSGW mice. As Sinefungin is a pan-methyltransferase inhibitor, the observed phenotype could also be related to the inhibition of non-histone methylation. Nevertheless, this observation provides a perspective for future therapeutic interventions. Once the critical MNX1-interacting HMT is identified, combined interference with the SAM donors and the executing enzyme should result in selective and potent inhibition of AML blasts transformed by aberrant MNX1 expression. Collectively, Waraky et al. established the first leukemia mouse model driven by aberrant MNX1 expression phenocopying several aspects of t(7;12)(q36;p17)+ infant AML. This model provides a platform for deeper characterization of driving molecular mechanisms and a search for strategies for targeted therapeutic interference.
References
1. Ragusa D, Dijkhuis L, Pina C, Tosi S. Mechanisms associated with t(7;12) acute myeloid leukaemia: from genetics to potential treatment targets. Biosci Rep. 2023;43(1):BSR20220489.
2. Waraky A, Östlund A, Nilsson T, et al. Aberrant MNX1 expression associated with t(7;12)(q36;p13) pediatric acute myeloid leukemia induces the disease through altering histone methylation. Haematologica. 2024;109(3):723-737.
3. Ingenhag D, Reister S, Auer F, et al. The homeobox transcription factor HB9 induces senescence and blocks differentiation in hematopoietic stem and progenitor cells. Haematologica. 2019;104(1):35-46.
4 McIntosh BE, Brown ME, Duffin BM, et al. Nonirradiated NOD,B6. SCID Il2rgamma-/- Kit(W41/W41) (NBSGW) mice support multilineage engraftment of human hematopoietic cells. Stem Cell Reports. 2015;4(2):171-180.
5. Lopez CK, Noguera E, Stavropoulou V, et al. Ontogenic changes in hematopoietic hierarchy determine pediatric specificity and disease phenotype in fusion oncogene-driven myeloid
Disclosures
No conflicts of interest to disclose.
Contributions
ZJ wrote, edited and conceived the illustration of the manuscript. JS conceptualized, wrote and edited the manuscript.
Acknowledgments
We thank Thomas Mercher (Paris, France) for critically reading the manuscript.
Funding
Our work is supported by the Swiss National Science Foundation (310030_215023/1) and Swiss Cancer Research (KFS5267-2022).
leukemia. Cancer Discov. 2019;9(12):1736-1753.
6. Katoh Y, Ikura T, Hoshikawa Y, et al. Methionine adenosyltransferase II serves as a transcriptional corepressor of Maf oncoprotein. Mol Cell. 2011;41(5):554-566.
7 Sun MA, Ralls S, Wu W, et al. Homeobox transcription factor MNX1 is crucial for restraining the expression of pan-neuronal genes in motor neurons. bioRxiv. 2021 Aug 07. doi: 10.1101/2021.08.07.455331 [preprint, not peer-reviewed].
8. Balgobind BV, Hollink IH, Arentsen-Peters ST, et al. Integrative analysis of type-I and type-II aberrations underscores the genetic heterogeneity of pediatric acute myeloid leukemia. Haematologica. 2011;96(10):1478-1487.
9 Yu X, Li D, Kottur J, et al. A selective WDR5 degrader inhibits acute myeloid leukemia in patient-derived mouse models. Sci Transl Med. 2021;13(613):eabj1578.
10 Scacheri PC, Davis S, Odom DT, et al. Genome-wide analysis of menin binding provides insights into MEN1 tumorigenesis. PLoS Genet. 2006;2(4):e51.
Haematologica | 109 Marzo 2024 714 EDITORIAL Z. Jevtic and J. Schwaller
Stressing the stem cell in acute myeloid leukemia
Gautam Borthakur
Department of Leukemia, MD Anderson Cancer Center, Houston, TX, USA
Correspondence: G. Borthakur gborthak@mdanderson.org
Received: September 15, 2023.
Accepted: September 28, 2023.
Early view: October 5, 2023.
https://doi.org/10.3324/haematol.2023.283919
©2024 Ferrata Storti Foundation
Published under a CC BY-NC license
Mitigation of cell intrinsic and cell extrinsic stress is critical for survival of leukemia stem cells (LSC) in acute myeloid leukemia (AML). Unfolded protein response (UPR) is an endoplasmic reticulum (ER)-regulated adaptive stress mitigation response and is regulated by protein kinase RNA-like ER kinase (PERK), inositol requiring enzyme 1 (IRE1), and activating transcription factor 6 (ATF6). Li et al.1 identified DNAJC10, an ER chaperone protein of the Hsp70 family of proteins, as a vulnerability in AML LSC in an MLL-AF9 model of AML. DNAJC10 (ERdj5) participates in the ER-associated degradation (ERAD) process.2 DNAJC10 knockdown (KD) resulted in dilated ER and improved mouse survival in serial transplants, indicating impact on LSC. Mechanistically, DNAJC10-KD activated PERK arm of UPR and PERK inhibition reversed the effect of DNAJC10-KD in the MLL model of mouse AML. DNAJVC10-KD increased the sensitivity of AML cell to cytarabine and daunorubicin. Interestingly, the impact of Dnajc10-KO in the MLL-AF9 mouse model was more evident in secondary and tertiary transplants, suggesting that Dnajc10 is not essential for the initiation of leukemia in this model and that attrition of the LSC compartment happens over time. Interestingly,
References
1. Li M, Wu X, Chen M, et al. DNAJC10 maintains survival and self-renewal of leukemia stem cells through PERK branch of the unfolded protein response. Haematologica. 2024;109(3):749-762.
2. Hagiwara M, MaegawaK-I, Suzuki M, et al. Structural basis of an ERAD pathway mediated by the ER-resident protein disulfide reductase ERdj5. Mol Cell. 2011;41(4):432-444.
DNAJC10 is a transcriptional target of Hoxa9,3 and, knowing the impact of Hoxa9 on LSC maintenance, the finding of LSC attrition with DNAJC10 silencing may not be surprising. However, Li et al.1 do not explore the mechanistic link with Hoxa9 in any detail.
While the data are exciting, several questions remain. First is whether this mechanism is operative in the MLL-AF9 model only. Second is the mechanistic link with activation of PERK with DNAJC10 silencing. Following on from that, the next question will be is this the result of general activation of UPR with impaired chaperone function of DNAJC10 or is this a specific response that involves the PERK arm of UPR? Loss of Dnajc10 in mice results in increased reactive oxygen (ROS) production in mouse hepatocytes.4 Given the critical need of ROS mitigation in maintenance of AML LSC, the impact of DNAJC10 silencing on AML LSC could be linked to impaired ROS mitigation. Irrespective of the underlying mechanism, Li et al.1 have clearly identified a promising target for eliminating AML LSC.
Disclosures
No conflicts of interest to disclose.
3. Palchaudhuri R, Ang K-K, Saez B, Sykes DB, Verdine GL, Scadden DT. Differentiation induction in acute myeloid leukemia using site-specific DNA-targeting. Blood. 2013;122(21):3940.
4 Hong D-G, Song GY, Eom CB, et al. Loss of ERdj5 exacerbates oxidative stress in mice with alcoholic liver disease via suppressing Nrf2. Free Radic Biol Med. 2022;184:42-52.
Haematologica | 109 Marzo 2024 715 EDITORIAL
What can we learn from cancer registries?
Birgit Burkhardt
Pediatric Hematology, Oncology and HSCT, University Hospital Münster and NHL-BFM Study Center, University Hospital Münster, Münster, Germany
In this issue of Haematologica, Maya Schulpen and colleagues report their population-based study of non-Hodgkin lymphoma (NHL) patients in the Netherlands focused on the examination of survival outcomes among a cohort comprising 5,600 children, adolescents, and young adults (AYA). Individuals were diagnosed with Burkitt lymphoma (BL), diffuse large B-cell lymphoma (DLBCL), T-cell lymphoblastic lymphoma (T-LBL) and anaplastic large cell lymphoma (ALCL) between the years 1990 and 2015.1
All data was sourced from the nationwide population-based Netherlands Cancer Registry (NCR). The analysis addresses a critical and relevant topic elucidating trends in survival and disparities between pediatric and AYA NHL patients. Further, it initiates to bridge the knowledge gap concerning the relevance of patient age at the time of diagnosis to survival outcomes.
Two major aspects contribute to the relevance of the analysis: firstly, the data acquisition employed a population-based approach within a prototypical Western Europe country. Although not explicitly presented in the paper, these data can be reasonably regarded as representative of Western countries. The second important aspect is that the data for all age groups were provided from the same registry data base and thus, following identical procedures of data collection, quality control and data analysis. Analyses like these underline the high value of national cancer registries covering all age groups.
In the context of this specific paper, the authors presented a constant improvement of survival for all analyzed NHL entities comparing children and adolescents with young adults. This favorable trajectory is notably prominent, with the exception of a relatively small cohort of young adults with ALCL wherein survival rates did not increase between 1990-99 and 2000-09, but in the following period until 2015. Results like these are of major relevance and impact for patients and their families, healthcare professionals, heath insurances, politics etc. In addition, there is a high value of publishing such expansive data providing patient characteristics and treatment for more than 5,600 patients.
Correspondence: B. Burkhardt birgit.burkhardt@ukmuenster.de
Received: October 11, 2023.
Accepted: October 23, 2023.
Early view: November 2, 2023.
https://doi.org/10.3324/haematol.2023.284104
©2024 Ferrata Storti Foundation
Published under a CC BY-NC license
These data will serve as comparator for many subsequent studies.
Results of the analyses of cancer registry data for non-Hodgkin lymphoma patients
The most frequent histological subtypes of NHL in children and adolescents are analyzed in the current study. Specifically, in BL survival rates are reported to be comparatively lower amongst young adults compared to children and adolescents; however, a relevant improvement over time, especially in the AYA cohort, was reported. A similar trend is observed for T-LBL patients with substantial variation in survival according to age at diagnosis. Interestingly, there are no or only minor survival differences for DLBCL and ALCL comparing the different age groups. From the perspective of a pediatrician, an intriguing commonality emerges between BL and T-LBL on one hand and DLBCL and ALCL on the other: the rescue chance for patients with refractory or relapsed disease (r/r). Despite all efforts, there is still almost no second chance for r/r BL and r/r T-LBL, while survival for r/r DLBCL and ALCL reaches more than 50%. To what extent does this knowledge and empirical evidence contribute to the observed variations in survival rates among different age cohorts?
Limitations of cancer registry data analyses
Why?
The main scientific limitation inherent to studies based on cancer registry data is the restricted availability of data resources to comprehensively address the question “Why?”. While the current study has revealed several statistically significant differences, the existent dataset proves to be insufficient to explain the underlying reasons for these differences or to explain the absence of distinctions among other cohorts. More extensive datasets are needed in cancer registries, to go into the details of questions reaching further, e.g., data on predisposition, diagnostics, treatment, treatment-related toxicities and cause of deaths. Adherence to data protection guidelines
Haematologica | 109 Marzo 2024 716 EDITORIAL
and additionally, the supplementary documentational requirements mandated by treating institutions and the concurrent requests for extensive documentation for a cancer registry represent another significant reason limiting the available datasets in conventional cancer registry studies. Consequently, studies such as the currently discussed are constrained as e.g., differences in treatment or treatment intensity can not be adequately taken into account. This leads to certain inaccuracies that need to be studied in subsequent projects. The strength of cancer registry studies might be to describe and raise questions.
The reported survival differences in NHL patients according to age are probably multifactorial. Both, cancer registry data analyses and translational studies on well-defined patient cohorts with access to biological samples are needed to study how aspects like
• patient characteristics like age and sex,2 weight, body surface area, predisposition
• biology of the tumor, molecular characteristics3
• treatment intensity and treatment tolerability
References
1. Schulpen M, Beishuizen A, Chamuleau MED, et al. Survival disparities between children and adolescents & young adults for the major subtypes of non-Hodgkin lymphoma in the Netherlands: a large population-based study. Haematologica. 2024;109(3):934-939.
2. Burkhardt B, Zimmermann M, Oschlies I, et al. The impact of age and gender on biology, clinical features and treatment outcome of non-Hodgkin lymphoma in childhood and adolescence. Br J Haematol. 2005;131(1):39-49.
3. Burkhardt B, Michgehl U, Rohde J, et al. Clinical relevance of molecular characteristics in Burkitt lymphoma differs according to age. Nat Commun. 2022;13(1):3881.
4. Botta L, Gatta G, Capocaccia R, et al. Long-term survival and
• treatment compliance
• country of residence4
• participation in a clinical trial
• access to new drugs
• supportive care
• psychosocial conditions and family support and others contribute to these differences.
There is another hot topic that is touched on in the current manuscript: the highly relevant discrepancies and extensive delays in drug development for children and adolescents compared to adults. Rituximab has emerged as game changer for mature B-cell lymphoma.5 Rituximab was approved for adults in the late 90th, while approval for children and adolescents with advanced B-NHL was given in 2021. Research efforts such as the current study, underscore the need for smarter approaches of drug development for vulnerable patient populations to allow access to new drugs.6,7
Disclosures
No conflicts of interest to disclose.
cure fraction estimates for childhood cancer in Europe (EUROCARE-6): results from a population-based study. Lancet Oncol. 2022;23(12):1525-1536.
5. Salles G, Barrett M, Foà R etal. Rituximab in B-cell hematologic malignancies: a review of 20 years of clinical experience. Adv Ther. 2017;34(10):2232-2273.
6. Vassal G, Kearns P, Blanc P, Scobie N, Heenen D, Pearson A. Orphan drug regulation: a missed opportunity for children and adolescents with cancer. Eur J Cancer. 2017;84:149-158.
7. Vassal G, de Rojas T, Pearson ADJ. Impact of the EU Paediatric Medicine Regulation on new anti-cancer medicines for the treatment of children and adolescents. Lancet Child Adolesc Health. 2023;7(3):214-222.
Haematologica | 109 Marzo 2024 717 EDITORIAL B. Burkhardt
Talquetamab in multiple myeloma
Lawrence Liu and Amrita Krishnan
Judy and Bernard Briskin Center for Multiple Myeloma Research, Department of Hematology and Hematopoietic Cell Transplantation, City of Hope Comprehensive Cancer Center, Duarte, CA, USA
Abstract
Correspondence: L. Liu laliu@coh.org
Received: August 9, 2023.
Accepted: October 10, 2023.
Early view: October 19, 2023.
https://doi.org/10.3324/haematol.2023.283931
©2024 Ferrata Storti Foundation
Published under a CC BY-NC license
Initial results of the phase I trial of talquetamab, a bispecific antibody targeting GPRC5D and CD3, were reported in December of 2022 for the treatment of relapsed or refractory multiple myeloma in the fourth line or later setting. It demonstrated a similar efficacy profile and durability of response to teclistamab, the first bispecific antibody therapy to be approved in multiple myeloma. Additionally, it has less infections than teclistamab but demonstrates unique class-specific side effects including skin, oral, and nail-related adverse events. Despite this, it is still a highly efficacious and well-tolerated therapy that will add to the armamentarium of therapeutics against heavily pretreated multiple myeloma.
Introduction
Historically, relapsed or refractory multiple myeloma (RRMM) has been associated with a median overall survival of 6.6-8 months in penta-refractory or penta-exposed patients.1 The arsenal of T-cell redirecting therapies like chimeric antigen receptor (CAR) T cells and bispecific antibody (BsAb) represent a step forward in improving outcomes. B-cell maturation antigen (BCMA)-targeting agents were the first approved including idecabtagene vicleucel demonstrating a 73% overall response rate (ORR) and complete response (CR) or better rate of 33% and median progression-free survival (mPFS) of 8.8 months in a heavily pretreated population in the original report.2 This was followed by ciltacabtagene autoleucel which demonstrated an impressive ORR of 97%, CR/stringent CR (sCR) rate of 67%, and mPFS that was not reached (12-month PFS was 77%) in a very similar patient population.3 In August of 2022, the results of teclistamab trial came out demonstrating an ORR of 63% with CR/ sCR of 39.4% and mPFS of 11.3 months4 transforming the landscape of relapsed and refractory disease. However, as we recognize that patients relapse post CAR T and teclistamab with different mechanisms including mutations and deletions in the BCMA target there remains a need for new targets and new drugs.
Talquetamab is an immunoglobulin (Ig)G4 BsAb binding to G-protein-coupled receptor class 5 member D (GPRC5D) and CD3 to recruit and activate T cells to target myeloma
cells.5 GPRC5D is cell surface receptor that was initially discovered in highly keratinized tissue like nails and hair.6 Gene expression studies of MM bone marrow samples have demonstrated high levels of GPRC5D in plasma cells and the levels correspond to MM disease burden.7,8 It has been demonstrated to have low RNA expression in other tissue, like lung and inferior olivary nucleus neurons. However, actual GPRC5D protein expression in lung and inferior olivary nucleus neurons was not identified.9,10 Although a preclinical study noted low level GPRC5D RNA expression in the cerebellum,11 neither RNA transcript or protein expression was noted in the translational studies of the trial.5 Following these findings, GPRC5D has become a therapeutic target for MM via CAR T-cell and BsAb therapy.11 An initial CAR T targeting GPRC5D demonstrated activity in MM resistant to BCMA CAR T in studies of xenografts in mice.9 In preclinical studies, talquetamab demonstrated high cytotoxicity in bone marrow samples with MM.12,13 As such, this therapy was an ideal candidate to move forward to clinical studies.
Efficacy
Talquetamab was initially studied in the phase I open-label MonumenTAL-1 trial demonstrating high efficacy in a heavily pretreated population with a median of six previous lines of therapy. Especially notable was that 79% of the patients were triple-class refractory and 30% were penta-refracto-
Haematologica | 109 Marzo 2024 718 SPOTLIGHT REVIEW ARTICLE
ry. In the group treated with subcutaneous talquetamab, almost a third had extramedullary disease, 17% had high disease burden (60% or more bone marrow plasma cells), and 16% had high-risk cytogenetic abnormalities.5 This is similar to the study population for teclistamab, the first approved BsAb in RRMM targeting BCMA,14 with the exception of talquetamab having had MM with extramedullary disease (32% vs. 17%) and teclistamab with slightly more high-risk cytogenetics (25.7% vs. 16%).4 Additionally, the talquetamab trial had higher percentage of International Staging System (ISS) class 2 (45% vs. 35.2%) and 3 (19% vs. 12.3%).4,5
Talquetamab administered subcutaneously at 800 mcg/ kg every 2 weeks (Q2W) or 405 mcg/kg weekly (QW) with step-up doses demonstrated similar efficacy across both levels. At a median follow-up of 12.7 months, the 0.8 mg/ kg dose level had an ORR of 71.7% and very good partial response (VGPR) or better rate of 60.7%: 9% with CR and 29.7% with sCR with a median duration of response of 7.8 months. At a median follow-up of 18.8 months, the 0.4 mg/ kg dose level achieved an ORR of 74.1% and 59.4% VGPR or better: 9.8% CR and 23.8% sCR with a median duration of response of 10.2 months.5 These results in patients with heavily pretreated and very refractory disease led to the US Food and Drug Administration granting Breakthrough Therapy Designation for talquetamab on June 29, 2022.15
The updated phase II results reported at ASCO 2023 are very similar.16 Additional benefits of talquetamab were high efficacy in high-risk MM and extramedullary disease which had ORR/CR/sCR of 55.6/33.3/11.1 and 40/6.7/6.7 for the 800 mcg/kg Q2W dosing respectively.5 These results are similar to those of teclistamab and offers another therapeutic targeting option for patients.
Of special interest is the efficacy in patients who have had prior T-cell redirection therapy such as CAR T-cell therapy or other BsAb therapy due to concern for T-cell fatigue or exhaustion.17-19 The MonumenTAL-1 phase II results were recently presented at ASCO 2023 demonstrating an ORR 63%, 53% with VGPR or better at median follow-up of 11.8 months in patients with prior BsAb or CAR T. In this cohort, 71% had prior CAR T, 35% had prior BsAb, and 6% had both. The mPFS was 5.1 months.16 The results demonstrate that talquetamab retains efficacy even in a population with prior T-cell redirection therapies. Combination therapies with talquetamab could address this area of T-cell exhaustion/ fatigue. Of particular interest is whether daratumumab can help overcome T-cell fatigue/exhaustion since it has demonstrated the ability to alter T-cell subsets to promote expansion of effector T cells and deplete regulatory T cells. Initial results of the TRIMM-2 phase Ib study with correlatives showing that the combination increased proinflammatory cytokines and levels of effector T cells supporting the ability of a daratumumab to overcome T-cell exhaustion/ fatigue when administered with a BsAb.20
Talquetamab is also being studied in combination with da-
ratumumab in the TRIMM-2 trial in patients with three or more prior lines of therapy, including a proteasome inhibitor (PI) and immunomodulatory drug (IMiD). The phase II trial recently reported results at ASCO 2023 in a population that had a median five prior lines of therapy, 18% with high-risk cytogenetics, 25% with extramedullary disease, and 58% triple-class refractory (77% were refractory to anti-CD38 therapy). With a median follow-up of 11.5 months, the ORR was 78% in the whole cohort (100% in patients without prior anti-CD38 therapy) with 45% CR/sCR and 66% VGPR or greater. The mPFS was 19.4 months and 12-month overall survival (OS) was 93%. Even in patients refractory to anti-CD38, anti-BCMA, and BsAb therapy, the ORR was 76%, 64%, and 75% respectively.21
Beyond talquetamab, the GPRC5D target has been studied as a CAR T construct. Based on preclinical data from Smith et al. of a GPRC5D CAR T with high efficacy in BCMA CAR T resistant MM,9 Mailankody et al. studied this CAR T in a phase I trial and found that in patients receiving the MTD of 150x106 cells or lower, the response rate was 58% with a median duration of response of 7.8 months.22 Of note, this trial had a broader inclusion criteria recruiting patients suffering from MM with: history of allogeneic stem cell transplantation (18%), extramedullary disease (47%), prior BCMA-directed therapy (59%), triple-class refractory status (94%), high-risk cytogenetic abnormalities (76%). Other GPRC5D CAR T constructs have been studied with ORR ranging from 86-100% and 60-64% CR/ sCR rates.23-25 Another BsAb with a two GPRC5D binding sites, RG6234, is undergoing investigation and reported ORR of 71.4% and 60.4% with CR/sCR rates of 28.5% and 18.8% for intravenous and subcutaneous administration respectively.26 (Table 1)
Safety and tolerability
All patients had adverse events (AE) and grade 3 or 4 AE were 78%. However, there were no deaths related to talquetamab use as compared to teclistamab with 5 deaths (3%).4,16 CRS was experienced in 78% with a median duration of 2 days. None of the CRS events were grade 3 or greater. Other common AE were hypogammaglobulinemia, oral AE, infections, anemia, asthenia, and skin exfoliation (all greater than 40%). Of the 63% with infections, 22% were grade 3 or 4; however, there were two patients (3%) with grade 5 (pneumonia) possibly related to the therapy. Neutropenia was noted in 38% with 26% reaching grade 3 or 4. Hypogammaglobulinemia was noted in 85% of patients; however, intravenous immunoglobulin supplementation was only utilized in 32% of patients.
The initial MonumenTAL-1 phase I study reported four dose-limiting toxicities: one was pancreatitis related to extramedullary disease in the pancreas and the other three were grade 3 rashes that resolved on stopping therapy with
Haematologica | 109 Marzo 2024 719 SPOTLIGHT REVIEW ARTICLE - Biology and targeted therapy for CNS lymphoma L. Liu and A. Krishnan
Talquetama
*These results were from the pooled results of MM-1, MM-3, and MM-9 which included patients in the initial dose finding and safety study and later patients who received the subcutaneous 76 mg weekly dose. Additionally, all patients had prior B-cell maturation antigen (BCMA)-targeting therapy.36 BsAb: bispecific antibody; NCT: national clinical trial; ORR: overall response rate; CR: complete response; sCR: stringent complete response; mDOR: median duration of response; mPFS: median progression-free survival; mOS: median overall survival; SC: subcutaneous; IV: intravenous; GPRC5D: G-protein coupled receptor, class C, group 5 member D; FcRH5: Fc receptor-homolog-5; QW: weekly; Q2W: every 2 weeks; NR: not reached; NA: not available.
two of those patients able to resume therapy without recurrence of the rash. Skin AE (largely xeroderma, pruritis, and peeling), taste issues, cytopenias, fatigue, rashes, nail issues, dry mouth, dysphagia, weight loss, fevers, diarrhea, and decreased appetite were the most common AE across all dose levels.
Cytokine-release syndrome (CRS) was noted in around 80% of the patients receiving subcutaneous talquetamab with a median duration of 2 days. However, grade 3 or greater CRS was rare (3% in the 405 mcg dose level and none in the 800 mcg dose level). Most of the CRS events (81.7%) occurred during the step-up doses. Recurrent CRS episodes with the step-up and target doses occurred in around 30% of patients for both subcutaneous dose levels; 63% of patients in 405 mcg dose level and 54% in the 800 mcg dose level received tocilizumab. Corticosteroid administration for CRS was relatively minimal (3% at the 405 mcg dose and 7% at the 800 mcg dose). Vasopressor use occurred in one patient at the 405 mcg dose level (3.3%). One patient (3.3%) in the 405 mcg dose level and two patients (4.5%) in the 800 mcg dose level required supplemental oxygen. Overall, around half of patients in both subcutaneous dose levels required other supportive care measures for CRS including intravenous fluids and anti-pyretics.
Neurotoxicity was noted in 10% of patients receiving the 405 mcg dose and 5% of patients receiving the 800 mcg
dose and were grade 1 or two and resolved. In each subcutaneous dose level, there was one event of encephalopathy occurring during the step-up doses and target dose. In the group receiving intravenous talquetamab, 3% experienced grade 3 ICANS. As such, the intravenous dose level was not pursued for the phase II trial. In the phase II trial results, ICANS was reported at a rate of 10.7% and 11% for the 0.4 mg/kg and 0.8 mg/kg groups respectively.
Nail issues and taste changes were frequent and likely related to the expression of GPRC5D in these tissue.5,10 Nail AE tended to occur at a median of 50.5 days with a wide range. These AE can range from nail thinning to complete separation of the nail plate from the matrix due to disruption of growth, onychomadesis, as noted in an early case report.27 In this report, topical corticosteroids were heavily applied to the hands, feet, and skin in general due to the patient’s diffuse xerosis and pruritis but only the pruritis and xerosis resolved with the topical corticosteroids. Despite the potential for severe nail-related AE, no discontinuations resulted from them.16 In another study, nail and skin AE were managed with ammonium lactate cream, triamcinolone cream, and Vaseline applied twice a day.28 Grade 3 rashes resolved with oral and topical corticosteroids and treatment resumption was possible afterwards in most patients.28 Oral antihistamines can also be employed to reduce associated pruritis.29 The median time to skin tox-
Haematologica | 109 Marzo 2024 720 SPOTLIGHT REVIEW ARTICLE - Biology and targeted therapy for CNS lymphoma L. Liu and A. Krishnan
BsAb Phase Acronym (NCT number) Target Minimum prior lines of therapy (median) Median follow-up time in months Administration ORR % CR/ sCR rate % mDOR in months mPFS in months mOS in months
b (SC: 405 mcg QW)16 2 Monumen TAL-1 (NCT03399799) GPRC5D 2 (6) 18.8 SC 74 33.6 9.5 7.5 76.4% 12-months OS Talquetamab (SC: 800 mcg Q2W)16 2 (5) 12.7 SC 73 38.7 NR 11.9 77.4% 12-months OS Talquetamab (IV)5 2 (6) 10.2 IV 72 72.2 27.8 -Teclistamab4 1-2 MajesTEC-1 (NCT03145181/ NCT04557098) BCMA 4 (5) 14.1 SC 63 65 18.4 11.3 18.3 Elranatamab36* 2 MagnetisMM (NCT03269136 /NCT04649359 /NCT05014412) BCMA 2 (7) 10.3 SC 45.3 17.4 NR (9 months DOR was 72.4%) 4.8 NR (9months OS was 60.1%) Cevostamab37 1 NCT03275103 FcRH5 2 (6) 6.1 SC 100 62.5 50% had DOR ≥ 6 months NA NA
Table 1. Bispecific antibody monotherapy trials.
*In the phase II trial update at ASCO, these were reported at 10.7% and 11% for the 0.4 mg/kg subcutaneous weekly and 0.8 mg/kg subcutaneous every 2 weeks dosing respectively.16 AE: adverse events; BsAb: bispecific antibody; Neutr: neutropenia; Lymph: lymphopenia; Thromb: thrombocytopenia; CRS: cytokine release syndrome; ICANS: immune effector cell associated neurotoxicity syndrome; IV: intravenous; Dysg: dysgeusia; SRE: skin-related events; NRE: nail-related events: NA: not available.
icities was 24 days in the subcutaneous dosing group with close to half resolving at a median duration was 39 days. Taste AE tended to occur at a median of 13.5 days. This and other oral AE including dysphagia, appetite loss, dry mouth can lead to significant malnutrition and weight loss. Many clinicians recommend extra vigilance for oral and esophageal candidiasis and early treatment if suspected. Other management strategies include biotin sprays and mouthwashes geared towards managing mucositis and the incorporation of thin liquids and nutritional supplement shakes to improve nutrition and caloric intake.29 Artificial saliva has been tried with limited success. Early dose and schedule adjustments seem the optimal management strategy28 (Table 2).
Infections occurred in 58.7% at the 0.4 mg/kg dose (grade 3 or 4 in 19.6%) and 66.2% at the 0.8 mg/kg dose (grade 3 or greater in 14.5%).16 Opportunistic infections were noted at 3.5% and 5.5% in the 0.4 mg/kg and 0.8 mg/kg dose groups respectively. Overall, the most common infections noted in real world studies were viral and bacterial.30,31 COVID-19 infection occurred in 13% at the 405 mcg dose and 2% at the 800 mcg dose. However, there were no fatalities related to COVID-19 infection with talquetamab use as compared to teclistamab use (7.3%). A recent pooled analysis demonstrated that in patients treated with BsAb, around half developed an infection and BCMA-targeting BsAb had almost three times more grade 3 or 4 infections compared to non-BCMA targeting BsAb. Additionally, neutropenia was lower in non-BCMA BsAb. COVID-19 infections were common although more frequent and more likely to be fatal in the BCMA-targeting BsAb.32 Furthermore, a quarter of the deaths were attributed to infections, including COVID-19, Streptococcus pneumoniae, and influenza which further supports the need for vaccination counseling.32 Opportunistic infections like cytomegalovirus (CMV), Pneumocystis jirovecii, herpes simplex virus (HSV), varicella-zoster virus (VZV) were also reported. As such, prophylaxis with acy-
clovir or valacyclovir, shingles vaccination, and Bactrim is routinely employed at our institution for patients receiving BsAb therapy. Hypogammaglobulinemia was reported in 87% at the 405 mcg dose and 71% at the 800 mcg dose.5 Our institution employed the practice of aggressive repletion with intravenous immunoglobulins if patients have recurrent infections or immunoglobulin levels under 400 mg/dL (Table 3).
Serious AE (SAE) occurred in 43% of patients receiving the 405 mcg dose and 34% of patients receiving the 800 mcg dose per the original report by Chari et al.5 In the phase II update, 14.7% and 8.3% of patients had dose reductions and 4.9% and 8.3% of patients had dose discontinuations in the 0.4 mg/kg QW and 0.8 mg/kg Q2W groups respectively.16 Despite the potential for extensive skin AE and oral AE, there were only five discontinuations for these events across the combined cohort including 288 patients.
Initiation of therapy
Talquetamab offers the advantage of subcutaneous administration with a QW and Q2W dosing schedule depending on patient preference. At our institution, patients are admitted for the step up dosing to monitor for CRS or other complications. The 405 mcg QW dosing strategy offers the advantage of quicker arrival at target dose since it only requires two step-up doses (10 and 60 mcg per kg). The 800 mcg Q2W dose requires three step-up doses (10, 60, and 300 mcg) which means a longer admission to reach the target dose but with the benefit of less frequent administration and visits for the patient. Side effects, as mentioned above, are similar between both dosing strategies with the 805 mcg Q2W dosing strategy having less infections, hypogammaglobulinemia, and neurotoxicity but with slightly increased incidence of grade 3 or greater rashes.
Haematologica | 109 Marzo 2024 721 SPOTLIGHT REVIEW ARTICLE - Biology and targeted therapy for CNS lymphoma L. Liu and A. Krishnan BsAb Grade 3 or 4 AE % Anemia grade ≥3, % Neutr grade ≥3, % Lymph grade ≥3, % Thromb grade ≥3, % CRS any grade % CRS grade ≥3, % ICANS any grade % ICANS grade ≥3, % Grade 5 AE % Dysg % SRE % NRE % Talquetamab 405 µg 87 30 60 40 23 77 3 10* 0 0 63 67 57 Talquetamab 800 µg 86 23 32 39 11 80 0 5* 0 0 57 70 27 IV Talquetamab 92 33 26 47 13 49 5 - 3 0 37 24 20 Teclistamab 94.5 37 64.2 32.7 21.2 72.1 0.6 14.5 0.6 3 NA NA NA Elranatamab - 46.5 40.7 30.2 29.1 65.1 1.2 5.8 2.3 NA NA NA NA Cevostamab 58.8 21.9 16.3 NA NA 80 1.3 13.1 NA 15 (0.6) NA NA NA
Table 2. Bispecific antibody adverse events.
Managing toxicities
First, and foremost, talquetamab should be initiated with close monitoring in a setting with direct access to tocilizumab, critical care facilities, and capacity of neurologic evaluation and treatment.
Adverse events related to the nails can be managed with ammonium lactate cream, Vaseline, and various topical steroid ointments. Skin changes like xerosis and pruritis can be managed similarly with topical steroids and oral antihistamines for itchiness. Grade 3 rashes in the original study resolved after oral or topical corticosteroid use and talquetamab was able to be restarted in most patients with this issue.
Taste and other oral adverse events can lead to significant malnourishment and weight loss and need extra vigilance. Artificial saliva, biotin sprays and anesthetic mouthwashes
can improve dry mouth, mucositis, oral cavity pain. Close monitoring for candidiasis and early treatment is necessary. It can be helpful to encourage softer diets and nutritional supplements in the form of shakes.
Infections remain a significant challenge in the field of MM immunotherapies. At our institution, acyclovir/valacyclovir and Bactrim for prophylaxis is regularly employed. Patients are encouraged to get shingles, COVID, and influenza vaccination and any other vaccines that are indicated. We regularly check immunoglobulin levels and our institution recommends intravenous immunoglobulin repletion for recurrent infections or levels below 400 mg/dL.
Sequencing of therapy
The ideal time to use talquetamab in MM is a challenging
Talq/Dara***
NCT04108195
*Cannot be a candidate for an available therapy. **High risk MM only. ***After DaraVRd, patients will receive intensification with Tec/Dara. If MRD-negative after, patients will receive Tec/Dara for 2 years. MRD-positive patients or those who become MRD positive or relapse in the Tec/Dara arm will receive Talq/Dara for 6 cycles. If MRD-negative after, patients will receive Talq/Dara for 2 years as maintenance and if MRD-positive, they will receive salvage therapy per investigator choice. NCT: national clinical trial; Talq: talquetamab; Dara: daratumumab; Pom: pomalidomide; Dpd: daratumumab/pomalidomide/dexamethasone; PFS: progression-free survival; CFZ: carfilzomib; Len: lenalidomide; DRds: daratumumab/lenalidomide/dexamethasone; NDMM: newly diagnosed multiple myeloma; RRMM: relapsed/refractory multiple myeloma; DaraVRd: daratumumab/bortezomib/lenalidomide/dexamethasone; MRD: measurable residual disease; CR: complete response; Tec: teclistamab; NA: not available; NS: not specified.
Haematologica | 109 Marzo 2024 722 SPOTLIGHT REVIEW ARTICLE - Biology and targeted therapy for CNS lymphoma L. Liu and A. Krishnan BsAb Infections % Infections grade ≥3, % Hypogammaglobulinemia % COVID-19 % CMV % PJP % PML % Talquetamab 405 µg 47 7 87 13 0 NA NA Talquetamab 800 µg 34 7 71 2 0 NA NA IV talquetamab NA NA NA NA NA NA NA Teclistamab 76.4 44.8 74.5 17.6 (12.1 grade ≥3; 11 deaths) NA NA 0.01 Elranatamab38,39 73.6 26.4 NA 25.3 NA NA NA Cevostamab 42.5 18.8 NA NA NA NA NA CMV: cytomegalovirus; PJP: Pneumocystis jirovecii; PML: progressive multifocal leukoencephalopathy; IV: intravenous; NA: not available.
Table 3. Infectious complications of bispecific antibodies
NCT number Acronym Combination Minimum prior lines of therapy Primary outcome Start date Primary completion ate NCT05455320 MonumenTAL-3 Talq/Dara vs. Talq/ Dara/Pom vs. DPd 1 PFS 10/13/2022 2/6/2026 NCT04586426 RedirecTT-1 Talq/Tec with or without Dara Triple class exposed Toxicity 12/15/2020 6/27/2025 NCT05050097 MonumenTAL-2 Combination with Talq, CFZ, Dara, Len, Pom NS Toxicity 9/22/2021 9/30/2024 NCT05552222 MajesTEC-7 Tec/Dara/Len vs. Talq/Dara/Len vs. DRd NDMM PFS and sustained MRD-negative CR 10/25/2022 5/25/2029 NCT05338775 TRIMM-3 Talq or Tec with PD-1 inhibitor RRMM* Toxicity 5/25/2022 9/21/2024 NCT05849610 GEM-TECTAL DaraVRd followed by Tec/Dara or
NDMM** MRD negative CR rate 5/2023
1/2025
Toxicity
NA Dara/Talq/Tec/Pom 3
2/21/2020 9/9/2024
Table 4. Bispecific antibody combination therapy trials.
question to answer. It can depend on many factors including, but not limited to, prior therapies (especially BCMA-directed ones), speed of progression, and institutional time from leukapheresis to CAR T administration. It has utility in post-BCMA CAR T relapse as a quick off-the-shelf option to get disease control while using a different target. Additionally, it could be utilized as a bridge to BCMA CAR T in rapid progressors or MM with high disease burden. In patients with frequent or chronic infections, this may present a therapeutic option with less suppression of humoral immunity compared to the BCMA-directed therapies. A major consideration is the potential for T-cell fatigue related to chronic antigenic stimulation from BsAb therapies which can provide a rationale not to use it before CAR T-cell therapy leukapheresis.
Combination therapies with talquetamab
Furthermore, preclinical studies have demonstrated mechanisms of antigen escape from BCMA and GPRC5D directed immunotherapy involving mutational changes in the proteins leading to disruption of BsAb or CAR T binding to the epitope.33 Preclinical studies of BsAb CAR T constructs targeting BCMA and GPRC5D demonstrated higher survival than CAR T directed to either target alone.34,35 This suggests that the simultaneous targeting of BCMA and GPRC5D or other targets may lead to improved efficacy whether it be via im-
References
1. Gill SK, Unawane R, Wang S, Ahn J, et al. I-OPen: inferior outcomes of penta-refractory compared to penta-exposed multiple myeloma patients. Blood Cancer J. 2022;12(9):138.
2. Munshi NC, Anderson LD, Shah N, et al. Idecabtagene vicleucel in relapsed and refractory multiple yeloma. N Engl J Med. 2021;384(8):705-716.
3. Berdeja JG, Madduri D, Usmani SZ, et al. Ciltacabtagene autoleucel, a B-cell maturation antigen-directed chimeric antigen receptor T-cell therapy in patients with relapsed or refractory multiple myeloma (CARTITUDE-1): a phase 1b/2 open-label study. Lancet. 2021;398(10297):314-324.
4 Moreau P, Garfall AL, Van De Donk NWCJ, et al. Teclistamab in relapsed or refractory multiple myeloma. N Engl J Med. 2022;387(6):495-505.
5. Chari A, Minnema MC, Berdeja JG, et al. Talquetamab, a T-cellredirecting GPRC5D bispecific antibody for multiple myeloma. N Engl J Med. 2022;387(24):2232-2244.
6. Inoue S, Nambu T, Shimomura T. The RAIG family member, GPRC5D, is associated with hard-keratinized structures. J Invest Dermatol. 2004;122(3):565-573.
7 Atamaniuk J, Gleiss A, Porpaczy E, et al. Overexpression of G protein-coupled receptor 5D in the bone marrow is associated with poor prognosis in patients with multiple myeloma: GPRC5D mRNA, a novel prognostic marker in MM. Eur J Clin Invest. 2012;42(9):953-960.
munotherapies with two targets or combination therapies. In addition to the previously mentioned TRIMM-2 study evaluating the daratumumab/teclistamab and daratumumab/talquetamab combinations in RRMM, there are many other studies evaluating combination therapies to improve on the efficacy of talquetamab. These combinations span the range of different lines of therapy to elucidate the best combination with talquetamab and inform the sequencing of therapy (Table 4).
Conclusion
Talquetamab represents yet another T-cell redirection option for patients with RRMM. Future trials are ongoing to answer the question of optimal sequencing of these T-cell redirecting therapies as well as optimal combinations.
Disclosures
LL has received honoraria from CancerNetwork; AK acts as a consultant/speaker for AbbVie (relationship has ended), Adaptive Biotechnologies, Bristol Myers Squibb, GlaxoSmithKline, Regeneron Pharmaceuticals (relationship has ended), Sanofi, Sutro Biopharma, and Takeda Pharmaceuticals USA.
Contributions
LL performed data search, literature review, and manuscript writing. AK provided supervision, performed manuscript writing and editing.
8. Cohen Y, Gutwein O, Garach-Jehoshua O, Bar-Haim A, Kornberg A. GPRC5D is a promising marker for monitoring the tumor load and to target multiple myeloma cells. Hematology. 2013;18(6):348-351.
9 Smith EL, Harrington K, Staehr M, et al. GPRC5D is a target for the immunotherapy of multiple myeloma with rationally designed CAR T cells. Sci Transl Med. 2019;11(485):eaau7746.
10 Goldsmith R, Cornax I, Ma JY, Yao X, Peng P, Carreira V. P-095: normal human tissue expression of G-protein coupled receptor 5D (GPRC5D), a promising novel target for multiple myeloma, is restricted to plasma cells and hard keratinized tissues. Clin Lymphoma Myeloma Leuk. 2021;21:(Suppl 2):S91.
11. Pillarisetti K, Edavettal S, Mendonça M, et al. A T-cellredirecting bispecific G-protein-coupled receptor class 5 member D x CD3 antibody to treat multiple myeloma. Blood. 2020;135(15):1232-1243.
12. Kodama T, Kochi Y, Nakai W, et al. Anti-GPRC5D/CD3 bispecific T-cell-redirecting antibody for the treatment of multiple myeloma. Mol Cancer Ther. 2019;18(9):1555-1564.
13. Verkleij CPM, Broekmans MEC, Van Duin M, et al. Preclinical activity and determinants of response of the GPRC5DxCD3 bispecific antibody talquetamab in multiple myeloma. Blood Adv. 2021;5(8):2196-2215.
14 Authors missing FDA approves teclistamab-cqyv for relapsed or refractory multiple myeloma. FDA. https://www.fda.gov/drugs/
Haematologica | 109 Marzo 2024 723 SPOTLIGHT REVIEW ARTICLE - Biology and targeted therapy for CNS lymphoma L. Liu and A. Krishnan
resources-information-approved-drugs/fda-approvesteclistamab-cqyv-relapsed-or-refractory-multiple-myeloma. Accessed August 6, 2023.
15. Authors missing Janssen announces U.S. FDA breakthrough therapy designation granted for talquetamab for the treatment of relapsed or refractory multiple myeloma.| Johnson & Johnson. https://www.jnj.com/janssen-announces-u-s-fdabreakthrough-therapy-designation-granted-for-talquetamabfor-the-treatment-of-relapsed-or-refractory-multiple-myeloma. Accessed August 5, 2023.
16. Schinke CD, Touzeau C, Minnema MC, et al. Pivotal phase 2 MonumenTAL-1 results of talquetamab (tal), a GPRC5DxCD3 bispecific antibody (BsAb), for relapsed/refractory multiple myeloma (RRMM). J Clin Oncol. 2023;41(Suppl 16):8036.
17. Philipp N, Kazerani M, Nicholls A, et al. T-cell exhaustion induced by continuous bispecific molecule exposure is ameliorated by treatment-free intervals. Blood. 2022;140(10):1104-1118.
18. Zebley CC, Brown C, Mi T, et al. CD19-CAR T cells undergo exhaustion DNA methylation programming in patients with acute lymphoblastic leukemia. Cell Rep. 2021;37(9):110079.
19 Tang L, Zhang Y, Hu Y, Mei H. T Cell Exhaustion and CAR-T immunotherapy in Hematological Malignancies. Biomed Res Int. 2021;2021:6616391.
20 Rodríguez-Otero P, D’Souza A, Reece DE, et al. A novel, immunotherapy-based approach for the treatment of relapsed/ refractory multiple myeloma (RRMM): updated phase 1b results for daratumumab in combination with teclistamab (a BCMA x CD3 bispecific antibody). J Clin Oncol. 2022;40(Suppl 16):8032.
21. Dholaria BR, Weisel K, Mateos MV, et al. Talquetamab (tal) + daratumumab (dara) in patients (pts) with relapsed/refractory multiple myeloma (RRMM): updated TRIMM-2 results. J Clin Oncol. 2023;41(Suppl 16):8003.
22. Mailankody S, Devlin SM, Landa J, et al. GPRC5D-targeted CAR T cells for myeloma. N Engl J Med. 2022;387(13):1196-1206.
23. Xia J, Li H, Yan Z, et al. Anti-G protein-coupled receptor, class C group 5 member D chimeric antigen receptor T cells in patients with relapsed or refractory multiple myeloma: a single-arm, phase II trial. J Clin Oncol. 2023;41(14):2583-2593.
24. Zhang M, Wei G, Zhou L, et al. GPRC5D CAR T cells (OriCAR-017) in patients with relapsed or refractory multiple myeloma (POLARIS): a first-in-human, single-centre, single-arm, phase 1 trial. Lancet Haematol. 2023;10(2):e107-e116.
25. Bal, Susan. BMS-986393 (CC-95266), A G protein-coupled receptor class C group 5 member (GPRC5D)- targeted CAR T-cell therapy for relapsed/refractory multiple myeloma (RRMM): results from pahse 1 study. Presented at: European Hematology Association Annual Meeting 2023; June 9, 2023. Accessed September 15, 2023.
26. Carlo-Stella C, Mazza R, Manier S, et al. RG6234, a GPRC5DxCD3 T-cell engaging bispecific antibody, is highly active in patients (pts) with relapsed/refractory multiple myeloma (RRMM): updated intravenous (IV) and first subcutaneous (SC) results from a phase I dose-escalation study. Blood. 2022;140(Suppl 1):397-399.
27. Narayan N, Williams B, Lipe B, De Benedetto A. Onychomadesis
and palmoplantar keratoderma associated with talquetamab therapy for relapsed and refractory multiple myeloma. JAAD Case Rep. 2023;31:66-68.
28. Mancia SS, Farrell A, Louw K, et al Characterization and management of oral and dermatological toxicities in patients receiving the CD3 X GPRC5D bispecific antibody talquetamab (JNJ-64407564) for the treatment of relapsed and/or refractory multiple myeloma. Blood. 2021;138(Suppl 1):1658.
29. Authors missing Oral and dermatologic toxicities associated with talquetamab can be mitigated with nurse intervention. https://www.oncnursingnews.com/view/oral-and-dermatologictoxicities-associated-with-talquetamab-can-be-mitigatedwith-nurse-intervention. Accessed August 5, 2023
30 Sim BZ, Longhitano A, Er J, Harrison SJ, Slavin MA, Teh BW. Infectious complications of bispecific antibody therapy in patients with multiple myeloma. Blood Cancer J. 2023;13(1):34.
31. Hammons LR, Szabo A, Janardan A, et al. Kinetics of humoral immunodeficiency with bispecific antibody therapy in relapsed refractory multiple myeloma. JAMA Netw Open. 2022;5(10):e2238961.
32. Mazahreh F, Mazahreh L, Schinke C, et al. Risk of infections associated with the use of bispecific antibodies in multiple myeloma: a pooled analysis. Blood Adv. 2023;7(13):3069-3074.
33. Lee H, Ahn S, Maity R, et al. Mechanisms of antigen escape from BCMA- or GPRC5D-targeted immunotherapies in multiple myeloma. Nat Med. 2023;29(9):2295-2306.
34 Fernández de Larrea C, Staehr M, Lopez AV, et al. Defining an optimal dual-targeted CAR T-cell therapy approach simultaneously targeting BCMA and GPRC5D to prevent BCMA escape-driven relapse in multiple myeloma. Blood Cancer Discov. 2020;1(2):146-154.
35. Fernandez De Larrea C, Staehr M, Lopez A, et al. Optimal dualtargeted CAR construct simultaneously targeting Bcma and GPRC5D prevents Bcma-escape driven relapse in multiple myeloma. Blood. 2019;134(Suppl 1):136.
36. Nooka AK, Lesokhin AM, Mohty M, et al. Efficacy and safety of elranatamab in patients with relapsed/refractory multiple myeloma (RRMM) and prior B-cell maturation antigen (BCMA)directed therapies: a pooled analysis from MagnetisMM studies. J Clin Oncol. 2023;41(Suppl 16):8008.
37. Lesokhin AM, Richter J, Trudel S, et al. Enduring responses after 1-year, fixed-duration cevostamab therapy in patients with relapsed/refractory multiple myeloma: early experience from a phase I study. Blood. 2022;140(Suppl 1):4415-4417.
38. Ryan C. Elranatamab induces responses in patients with relapsed/refractory multiple myeloma following BCMA-directed herapy. https://www.oncnursingnews.com/view/elranatamabinduces-responses-in-patients-with-relapsed-refractorymultiple-myeloma-following-bcma-directed-therapy. Accessed August 7, 2023.
39 Mohty M, Tomasson MH, Arnulf B, et al. Elranatamab, a B-cell maturation antigen (BCMA)-CD3 bispecific antibody, for patients (pts) with relapsed/refractory multiple myeloma (RRMM): Extended follow up and biweekly administration from the MagnetisMM-3 study. J Clin Oncol. 2023;41(Suppl 16):8039.
Haematologica | 109 Marzo 2024 724 SPOTLIGHT REVIEW ARTICLE - Biology and targeted therapy for CNS lymphoma
Liu and A. Krishnan
L.
Aberrant MNX1 expression associated with t(7;12)(q36;p13) pediatric acute myeloid leukemia induces the disease through altering histone methylation
Ahmed Waraky,1,2 Anders Östlund,1 Tina Nilsson,2 Dieter Weichenhan,3 Pavlo Lutsik,3 Marion Bähr,3 Joschka Hey,3 Gürcan Tunali,1 Jenni Adamsson,1 Susanna Jacobsson,2 Mohammad Hamdy Abdelrazak Morsy,1 Susann Li,2 Linda Fogelstrand,1,2 Christoph Plass3 and Lars Palmqvist1,2
1Department of Laboratory Medicine, Institute of Biomedicine, University of Gothenburg, Gothenburg, Sweden; 2Department of Clinical Chemistry, Sahlgrenska University Hospital, Gothenburg, Sweden and 3Division of Cancer Epigenomics, German Cancer Research Center (DKFZ), Heidelberg, Germany
Correspondence: L. Palmqvist lars.palmqvist@clinchem.gu.se
Received: October 9, 2022.
Accepted: June 5, 2023.
Early view: June 15, 2023.
https://doi.org/10.3324/haematol.2022.282255
©2024 Ferrata Storti Foundation
Published under a CC BY-NC license
Abstract
Certain subtypes of acute myeloid leukemia (AML) in children have inferior outcome, such as AML with translocation t(7;12)(q36;p13) leading to an MNX1::ETV6 fusion along with high expression of MNX1. We have identified the transforming event in this AML and possible ways of treatment. Retroviral expression of MNX1 was able to induce AML in mice, with similar gene expression and pathway enrichment to t(7;12) AML patient data. Importantly, this leukemia was only induced in immune incompetent mice using fetal but not adult hematopoietic stem and progenitor cells. The restriction in transforming capacity to cells from fetal liver is in alignment with t(7;12)(q36;p13) AML being mostly seen in infants. Expression of MNX1 led to increased histone 3 lysine 4 mono-, di- and trimethylation, reduction in H3K27me3, accompanied with changes in genome-wide chromatin accessibility and genome expression, likely mediated through MNX1 interaction with the methionine cycle and methyltransferases. MNX1 expression increased DNA damage, depletion of the Lin-/Sca1+/c-Kit+ population and skewing toward the myeloid lineage. These effects, together with leukemia development, were prevented by pre-treatment with the S-adenosylmethionine analog Sinefungin. In conclusion, we have shown the importance of MNX1 in development of AML with t(7;12), supporting a rationale for targeting MNX1 and downstream pathways.
Introduction
Non-random cytogenetic aberrations are often involved in the development of acute myeloid leukemia (AML) and several aberrations can serve as diagnostic markers, prognosis predictors, and impact the choice of therapy.1 In AML diagnosed in children under the age of 24 months, a chromosomal translocation t(7;12)(q36;p13) with poor prognosis has been reported.2 There have been contradictory results on the incidence of t(7;12), but recent studies suggest the frequency in children <24 months to be 5-7%.3,4 Similarly, different results have been reported regarding the prognosis, where recent studies show 20-43% 3-year event-free survival but with a high relapse rate, ranging from 57% to 80%.3,4 However, the mechanisms behind the leukemia transformation of t(7;12) AML remain poorly understood. The chromosomal break points in t(7;12) have consistently been found to be located close to the motor neuron and
pancreas homeobox 1 (MNX1) gene on chromosome 7, and in introns 1 or 2 in the ETV6 gene in chromosome 12.5 The translocation leads to MNX1 gene activation, and in most reported cases also to an MNX1::ETV6 fusion transcript consisting of exon1 of MNX1 transcript variant 1 spliced to the remaining ETV6 exons, depending on the location of the break point in ETV6.6
MNX1, also known as Homeobox HB9 (HLXB9), belongs to the homeobox domain family of transcription factors, with previous studies showing the importance of MNX1 in motor neuron development,7 pancreas development,8,9 and in hereditary sacral agenesis.10 ETV6, also known as TEL, belongs to the ETS-family transcription factors. ETV6 encodes a transcriptional repressor that plays a critical role in embryonic development and hematopoiesis, where it is essential for normal hematopoietic stem cell function and the generation of thrombocytes by megakaryocytes.11
Translocations involving the chromosomal region of 12p13
Haematologica | 109 - March 2024 725 ARTICLE - Acute Myeloid Leukemia
that result in the rearrangements of the ETV6 gene are one of the most observed chromosomal abnormalities in human leukemia, with more than 30 reported translocations. These chromosomal translocations can induce leukemias through the ectopic expression of a proto-oncogene in the vicinity of a chromosomal translocation12 or the constitutive activation of the partner protein.13 In addition, the formation of ETV6 fusion proteins can result in the modification of the original functions of the transcription factor,14 or loss of function of the fusion gene, affecting ETV6 and the partner gene.15
The role of the MNX1::ETV6 fusion protein in the development of AML with t(7;12) has not been established. It is also unclear whether the driver of leukemogenesis is the MNX1::ETV6 fusion protein or overexpression of MNX1. The aim of this study was to assess the transformation capacity and the molecular mechanism of the MNX1::ETV6 fusion and the ectopic expression of MNX1 in vitro and in vivo using murine transplantation models.
Methods
Plasmid constructions
The MNX1, ETV6 and MNX1::ETV6 fusion sequences are listed in Online Supplementary Table S1. An HA-tag (36bp) is introduced at the 5’ end and via a linker sequence of 24 bp attached to the separate gene sequences where the first ATG is removed. These constructs were cloned into the MSCV-IRES-GFP and MSCV-IRES-YFP vectors (Takara, Japan) #634401 under control of the viral LTR promoter.
Generation of transduced murine bone marrow cells and transplantation assays
Mice were bred and maintained at the Gothenburg University Laboratory for Experimental Biomedicine Animal Facility (Gothenburg, Sweden) in a specific pathogen-free environment. Establishment and characterization of bone marrow (BM) cell lines following transduction of BM cells with MNX1, MNX1::ETV6, ETV6 or empty vector Control (Ctrl) were performed as described previously.16 In brief, BM cell lines were established from BM cells previously treated with 5-fluorouracil (5-FU) from 8-12-week old (C57Bl/6) mice (Charles River Laboratories Inc., Wilmington, MA, USA) for three days for adult bone marrow (ABM) or from fetal liver at embryonic days 14.5 (E14.5) and maintained in liquid culture (Dulbecco's modified Eagle's medium supplemented with 18% fetal bovine serum, 10 ng/mL human interleukin [IL]-6, 6 ng/mL murine IL-3, and 50 ng/mL murine stem cell factor). All culture media were obtained from Sigma and recombinant growth factors from Peprotech. To generate MNX1, MNX1::ETV6, ETV6 or empty vector Ctrl BM cell lines, the BM cells were transduced by co-cultivation on irradiated (4000 cGy) E86 producers (ATCC, Manassas, VA, USA) for a period of two days
in the presence of 5 μ g/mL protamine sulfate (Sigma). Cells were sorted for GFP+ and/or YFP+ expression by flow cytometry analysis (fluorescence-activated cell sorting [FACS]) FACSAria (BD Biosciences) and maintained in culture for 5-7 days post transduction before transplantation in mice. Lethally (8.5 Gy) or sublethally (5.5 Gy) radiated 8-12-week old C57Bl/6 mice received the equivalent of 0.6x10⁶ rescue BM cells and/or 0.8-1x10⁶ transduced cells via tail vein injection. For immunocompromised NOD.CgKitW-41J Tyr+ Prkdcscid Il2rgtm1Wjl/ThomJ (NBSGW) mice (The Jackson Laboratory, Bar Harbor, ME, USA), cells were transplanted either with no radiation, or after lethal dose (1.6 Gy) and sublethal dose (0.9 Gy). Donor-derived engraftment and reconstitution were monitored by flow cytometry analysis for GFP+ and/or YFP+ expression in the peripheral blood of the transplants every two weeks. Mice were sacrificed using isoflurane (Baxter, Deerfield, IL, USA). Blood counts were analyzed on a Sysmex KX-21 Hematology Analyzer (Sysmex, Norderstedt, Germany).
Statistical analysis
Two-sided Student’s t test were used for comparisons between different groups in all experiments, unless stated otherwise. Log-rank test was used to compare survival between mice groups. Mann-Whitney two-tailed U-test was used for comparison between t(7;12) patients and normal human bone marrow from Target cohort. Complete methods are available in the Online Supplementary Appendix.
Ethics statement
All animal experiments have been accepted by the Swedish Agency for Agriculture (Jordbruksverket) and the animal ethics committee in Gothenburg: Dnr 5.8.18-17008/2021.
Results
MNX1 induces acute myeloid leukemia in hematopoietic cells of fetal origin
To investigate the leukemogenic potential of t(7;12), we transduced primary murine (C57BL/6) hematopoietic stem and progenitor cells (HSPC) from either adult BM after 5FU stimulation (ABM-HSPC) or fetal liver cells at E14.5 (FLHSPC) with retroviral vectors for expression of the MNX1::ETV6 fusion, MNX1, ETV6 or empty vector (Ctrl). Expression of MNX1, ETV6 and MNX1::ETV6 was confirmed in both FL-HSPC and ABM-HSPC (Online Supplementary Figure S1A-C). The transduced cells were transplanted into lethally irradiated C57BL/6 mice with rescue BM. Neither MNX1 overexpression nor MNX1::ETV6 in ABM-HSPC or FLHSPC were able to induce leukemia in these mice, as assessed by survival, white blood cell (WBC) count, hemoglobin, blood smears, and spleen size (Online Sup-
Haematologica | 109 - March 2024 726 ARTICLE - Aberrant MNX1 expression with t(7;12)(q36;p13) in pediatric AML A. Waraky et al.
plementary Figure S2A-D). However, when increasing the percentage of MNX1 chimerism through sublethal radiation with no rescue BM, 20% of the mice exhibited signs of malignant transformation after transplantation with FL-HSPC, including high WBC count, severe anemia, and enlarged spleen (Online Supplementary Figure S2E, F and 3A, B). To further examine the leukemogenic potential of MNX1 overexpression and the MNX1::ETV6 fusion, we repeated the experiment using immune-compromised non-irradiated NOD.Cg-KitW-41J Tyr+ Prkdcscid Il2rgtm1Wjl/ThomJ (NBSGW) mice. Within 12-18 weeks after transplant, the MNX1 mice showed clear signs of leukemia, including pallor, weight loss, severe anemia, leukocytosis with a high percentage of MNX1-transduced cells, elevated blast cells in blood and BM, enlarged spleen, and liver infiltrated by leukemia (Figure 1A-D). Cells from BM showed predominant expression of the c-Kit protein, but not the stem cell marker SCA-1 or more differentiated myeloid markers such as Mac-1, Ly6G1 and Ly6C1, suggesting a poorly differentiated myeloid leukemia (Figure 1D, Online Supplementary Figures S3D and S4A). To rule out the possibility that the leukemia development in immunocompromised mice was due to enhanced transplantation efficiency, we reduced the chimerism of MNX1 cells in NBSGW mice through the usage of lethal radiation and rescue BM. These mice also developed leukemia but with a slightly longer latency than mice that were sublethally irradiated without rescue BM (Online Supplementary Figure S3D). Acute leukemia induction by MNX1 was confirmed by leukemia development after secondary transplant of BM from mice with primary leukemia, both in non-irradiated mice and in sublethally irradiated mice receiving rescue BM (Online Supplementary Figure S5A). When NBSGW mice were transplanted with ABM-HSPC transduced with MNX1, there were no signs of leukemia six months after the transplant (Figure 1E, Online Supplementary Figure S5C, D). Taken together, leukemogenesis was achieved by MNX1 only in the immunocompromised setting with fetal origin of leukemic cells.
MNX1 alters differentiation in favor of myeloid lineage while increasing proliferation and colony replating capacity of the cells
In order to characterize this leukemia model, in vitro FLHSPC (r-FL) transduced with MNX1::ETV6, MNX1, ETV6 or empty retroviral vector control were assessed for their immunophenotype. Both MNX1 and MNX1::ETV6 altered differentiation in favor of myeloid lineage, with MNX1 showing the most prominent effects. MNX1 increased Mac-1 and Ly6C+ cells, accompanied by depletion of the Lin-/Sca1+/ckit+ (LSK) population, while MNX1::ETV6 only increased Ly6C+ cells (Figure 2A, B, Online Supplementary Figure S4B-D). Ectopic expression of MNX1 reduced the progenitor MEP population without significantly affecting CMP or GMP (Online Supplementary Figure S5A). In addition, MNX1
increased GEMM colonies with a concomitant reduction in BFU colonies and increased both CFU replating and proliferation capacity (Figure 2C, D, Online Supplementary Figure S6F-H). In ABM-HSPC in vitro cells (r-ABM), MNX1 had similar effects but to a lower extent, and MNX1::ETV6 fusion had no effect (Online Supplementary Figure S6C-E).
MNX1 induces DNA damage
To investigate the molecular pathway through which MNX1 is mediating its leukemogenic effect, differential gene expression between MNX1 FL-HSPC leukemic NSG BM cells and FL-HSPC transduced with empty vector (Ctrl) was assessed with RNA-sequencing (RNA-Seq) (Figure 2E, Online Supplementary Figure S7). Gene Ontology (GO) biological pathway and gene set enrichment (GSEA) analyses revealed that the highest enriched pathways in MNX1 cells involved DNA damage, cell cycle, chromatin organization, methylation of histones, metabolic processes, megakaryocyte and myeloid cell differentiation pathways (Figure 2E). Similar results were seen when using BM taken from mice transplanted with FL-HSPC with empty vector as Control (Online Supplementary Figure S8). The effect on DNA damage was confirmed through examination of γH2AX foci induction. MNX1, and to a lower extent MNX1::ETV6, induced a higher number of γH2AX foci, indicative of higher DNA damage, in in vitro FL-HSPC as well as in ABM-HSPC (r-Fl and r-ABM) (Figure 3A, B, Online Supplementary Figure S9A, B). In both MNX1 and MNX1::ETV6 transduced FL-HSPC (r-FL), the DNA damage was accompanied with a transient G1 cell cycle accumulation and fewer cells in S-phase (Figure 3C, Online Supplementary Figure S9C). No such effect was observed in ABM-HSPC (r-ABM), where the G1 cells were replaced by a Sub-G1 peak suggestive of apoptotic cells after 3-4 weeks of transduction (Online Supplementary Figure S9D). Using Annexin-V and DAPI staining, a 3.5-4-fold increase in apoptosis was induced by MNX1 in ABM-HSPC (r-ABM), but not in FL-HSPC (r-FL) (Figure 3D, E). Following up the consequences of such pronounced DNA damage, we showed that BM from NSG leukemia mice exhibited an increase in the amount of DNA or a hyperploidy in comparison with the BM from Ctrl mice as indicated by increased DNA index (Online Supplementary Figure S10A, B). An interesting candidate for mediating DNA damage identified in several differentially regulated pathways was the centrosomal protein 164 (Cep164) (Online Supplementary Table S2). Increased expression of Cep164 was confirmed with qPCR in both MNX1 transduced FL-HSPC and leukemia BM (Online Supplementary Figure S10C). Furthermore, MNX1 increased binding to the promoter of Cep164 was detected by ChIP-qPCR (Online Supplementary Figure S10C), along with altered binding of histone modifications that can change CEP164 expression, namely H3K4me3 and H3K27me3 in the same promoter region (Online Supplementary Figure S10D).
Haematologica | 109 - March 2024 727 ARTICLE - Aberrant MNX1 expression with t(7;12)(q36;p13) in pediatric AML A. Waraky et al.
MNX1 alters histone modifications globally affecting chromatin accessibility
Since MNX1 induced histone modifications H3K4me3 and H3K27me3 at the Cep164 promoter, we assessed global histone modifications. Western blotting showed altered H3K4me3, H3K27me3, and both mono- and di-methylation of the H3K4 in vitro and in BM from NSG leukemic mice
(Figure 4A, Online Supplementary Figure S10E). Co-immunoprecipitation experiments (Co-IP) confirmed the association of MNX1 to histone H3 (Online Supplementary Figure S11A). Antibody-guided chromatin tagmentation sequencing (ACT-Seq) was then used for mapping genome-wide distribution of the histone modifications (Figure 4B). H3K27me3 histone modification showed fewer accessible
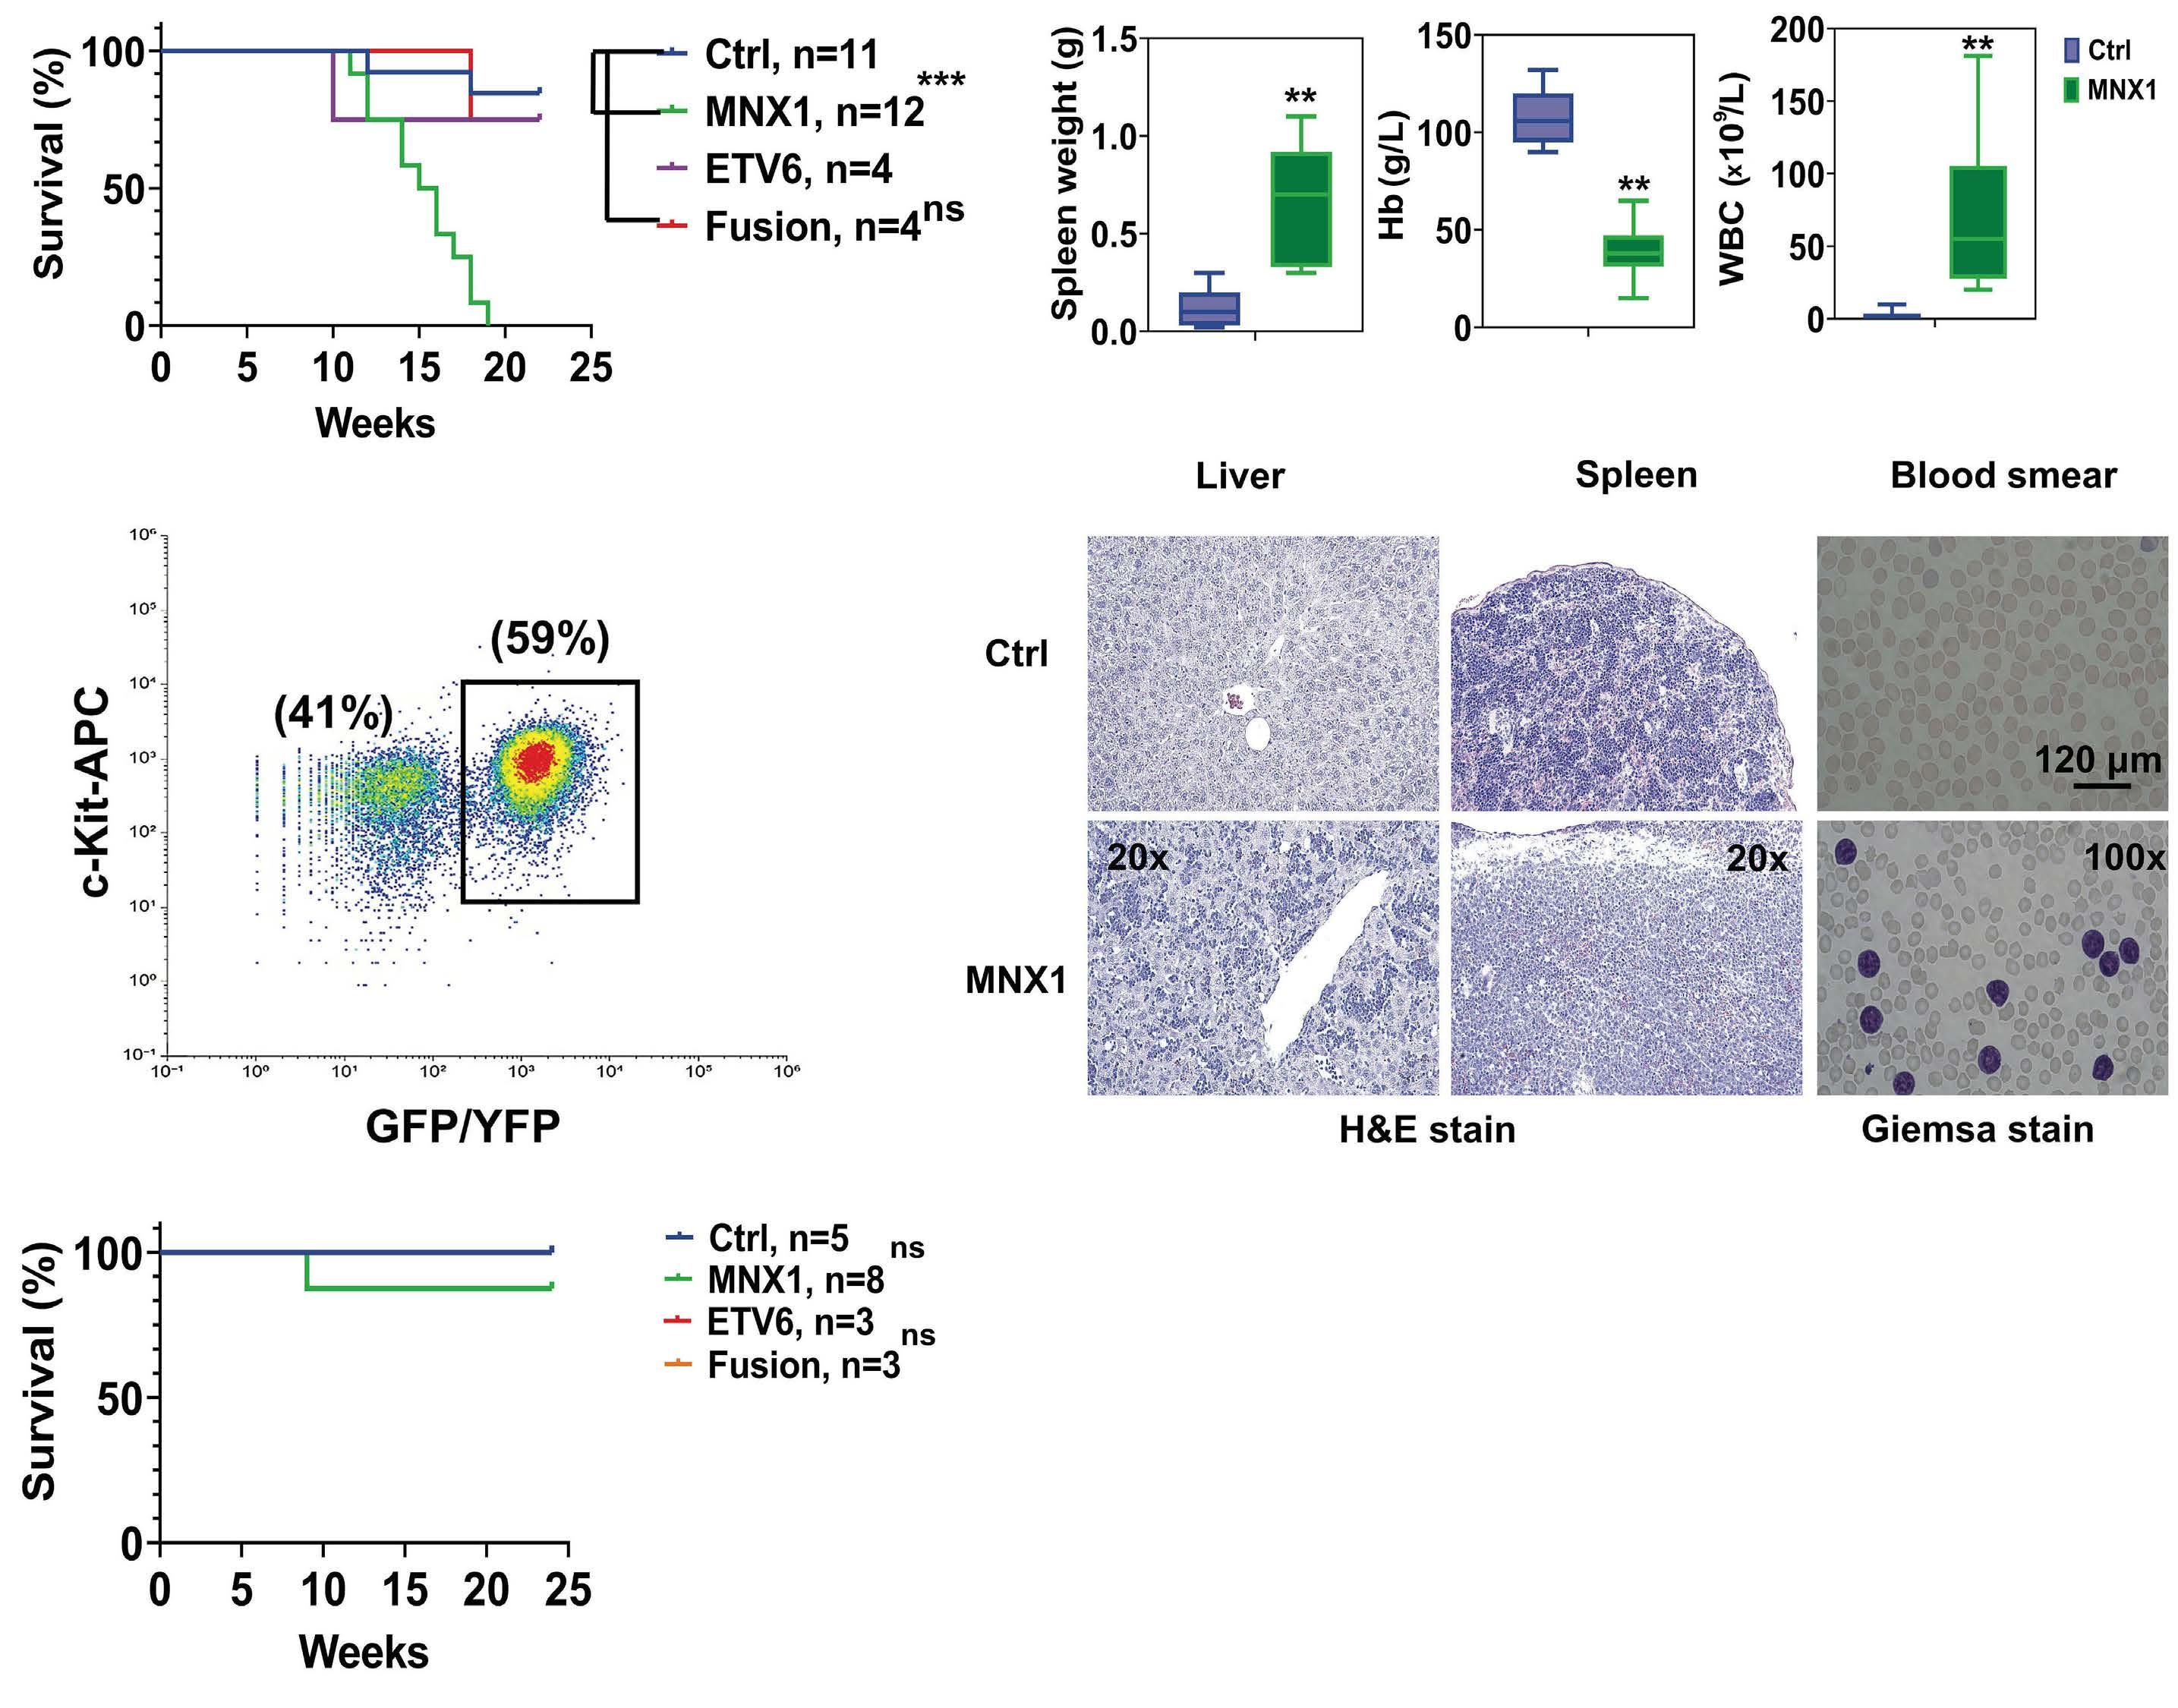
Figure 1. MNX1 induces acute myeloid leukemia in immunocompromised mice. (A) Kaplan-Meier survival curve of immunocompromised NOD.Cg-KitW-41J Tyr+ Prkdcscid Il2rgtm1Wjl/ThomJ (NBSGW) mice transplanted with fetal liver hematopoietic stem and progenitor cells after retrovirus transduction (r-FL-HSPC) with either ectopic expression of MNX1 (green), ETV6 (purple), MNX1::ETV6 fusion (red), or empty vector control (Ctrl) (blue). Results from the transplanted mice (control N=11, MNX1: N=12, ETV6 and MNX1::ETV6 N=4) were analyzed using the log-rank test: ***P≤0.01; ns: not significant. (B) Mice were euthanized when showing sign of disease or at the end of the experiment, and analyzed for spleen weight (g), white blood cell (WBC) count, and hemoglobin concentration (Hb). (C) Quantification of flow cytometry analysis of bone marrow (BM) cells from (NBSGW) mice with c-Kit expression showing all events. Green fluorescence protein (GFP) / yellow fluorescence protein (YFP) were used as indicative for MNX1 expression. (D, left) Representative images of Hematoxylin & Eosin (H&E)-stained formaldehyde fixed liver and spleen sections from Ctrl and MNX1 mice. (D, right) Representative images of Giemsa-stained peripheral blood smears from Ctrl and MNX1 mice. (E) Kaplan-Meier survival curves of NBSGW mice transplanted with adult bone marrow (ABM) cells with either ectopic expression of MNX1, ETV6, MNX1::ETV6 fusion or Ctrl after sub-lethal radiation (0.9 Gy) with no rescue BM. Results of Ctrl and transfected mice (Ctrl N= 5, MNX1 N=8, ETV6 and MNX1::ETV6 N=3) were analyzed using the log-rank test (ns: not significant). Data represent mean ± Standard Deviation of at least three experiments. Two-sided student t test: **P≤0.01; *P≤0.05; ns: not significant at P>0.05. Fusion: MNX1::ETV6 fusion; LSK: Lin Sca-1+c-Kit+; NSG: NOD.Cg-KitW-41J Tyr+ Prkdcscid Il2rgtm1Wjl/ThomJ (NBSGW).
Haematologica | 109 - March 2024 728
C D E
ARTICLE - Aberrant MNX1 expression with t(7;12)(q36;p13) in pediatric AML A. Waraky et al. B A
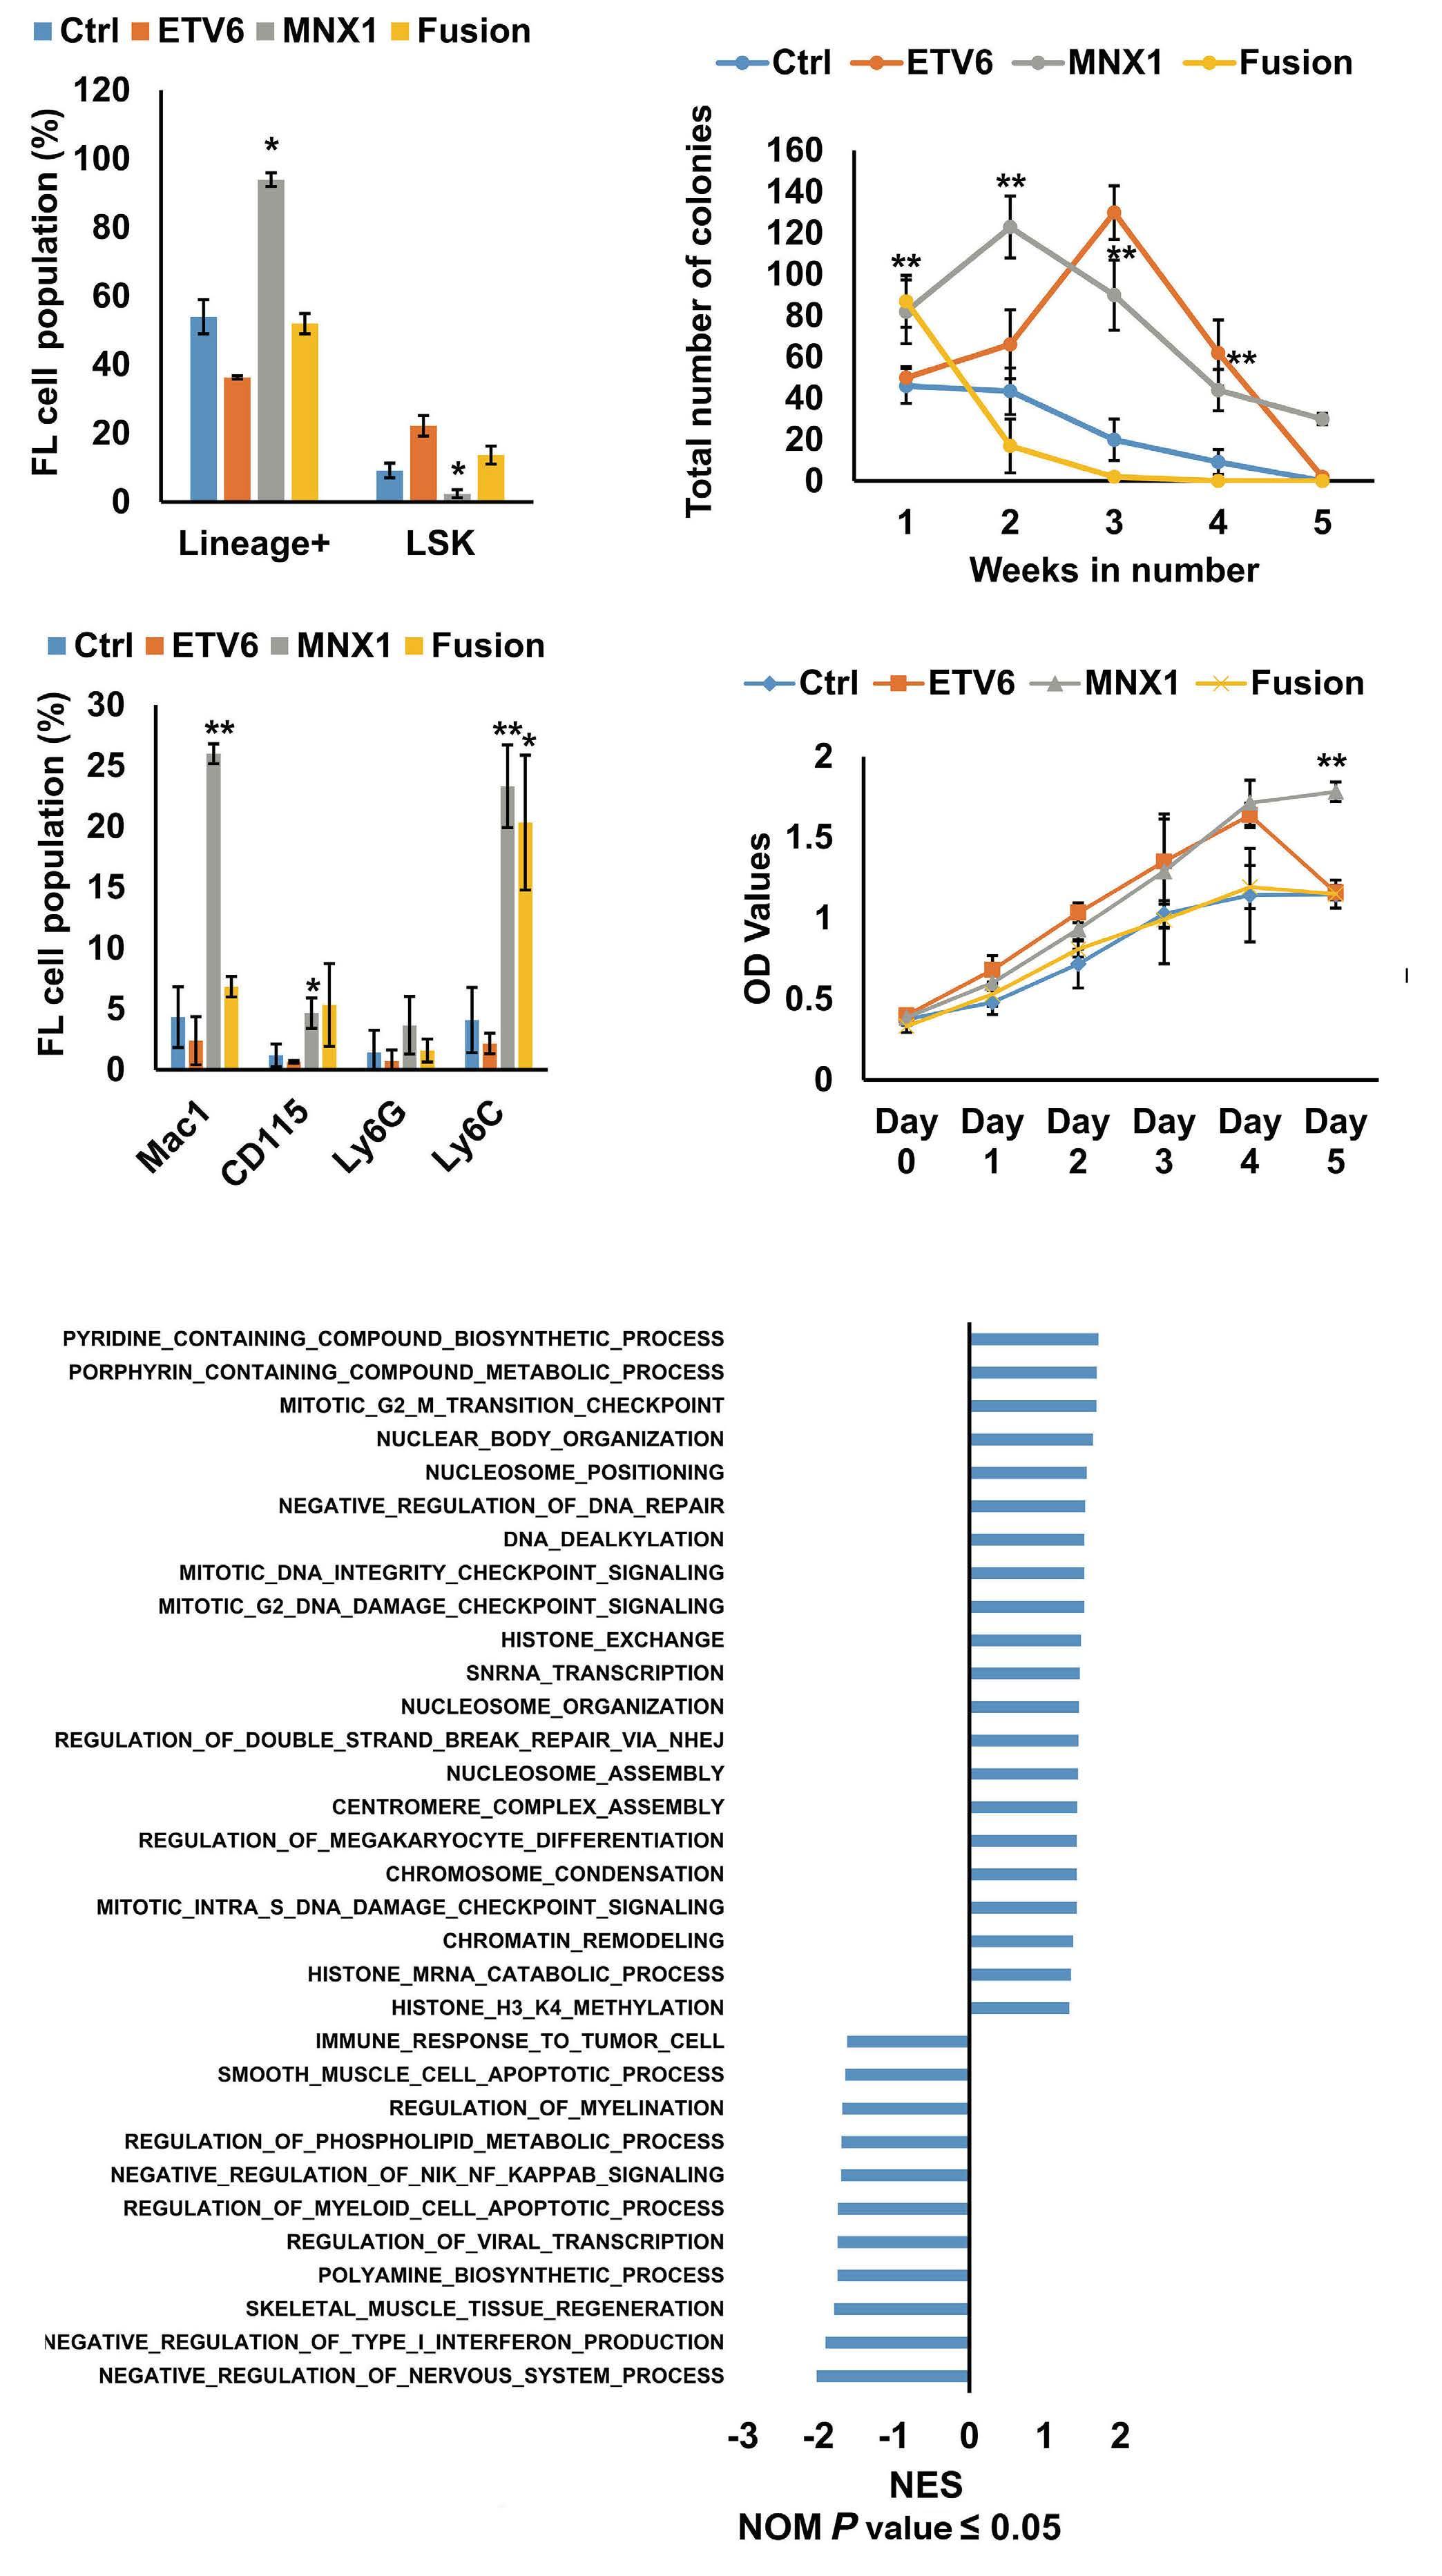
Figure 2. MNX1 alters differentiation and proliferation of fetal liver hematopoietic stem and progenitor cells. (A and B) Quantification of the flow cytometry analysis of in vitro retroviral transduced fetal liver hematopoietic stem and progenitor cells (rFL-HSPC) cells transduced with ectopic expression of MNX1, ETV6, MNX1::ETV6 fusion or empty vector control (Ctrl) with the indicated antibodies presented as percentage of population. (C) Number of colony forming unit colonies after transduction of FL-HSPC with replating for five consecutive weeks. (D) MTT proliferation assay of transduced in vitro r-FL cells. (E) Gene set enrichment analysis (GSEA) using the Gene Ontology (GO) biological pathways gene set showing normalized enrichment score (NES) (nominal P value [NOM]: P≤0.05) for pathways from leukemia BM cells with MNX1 ectopic expression in comparison with FL-HSPC with Ctrl. Data represent mean ± Standard Deviation of at least three experiments. Two-sided student t test: **P≤0.01; *P≤0.05. Fusion: MNX1::ETV6 fusion; LSK: Lin Sca-1+c-Kit+
B A C D Haematologica | 109 - March 2024 729 ARTICLE - Aberrant MNX1 expression with t(7;12)(q36;p13) in pediatric AML A. Waraky et al. E
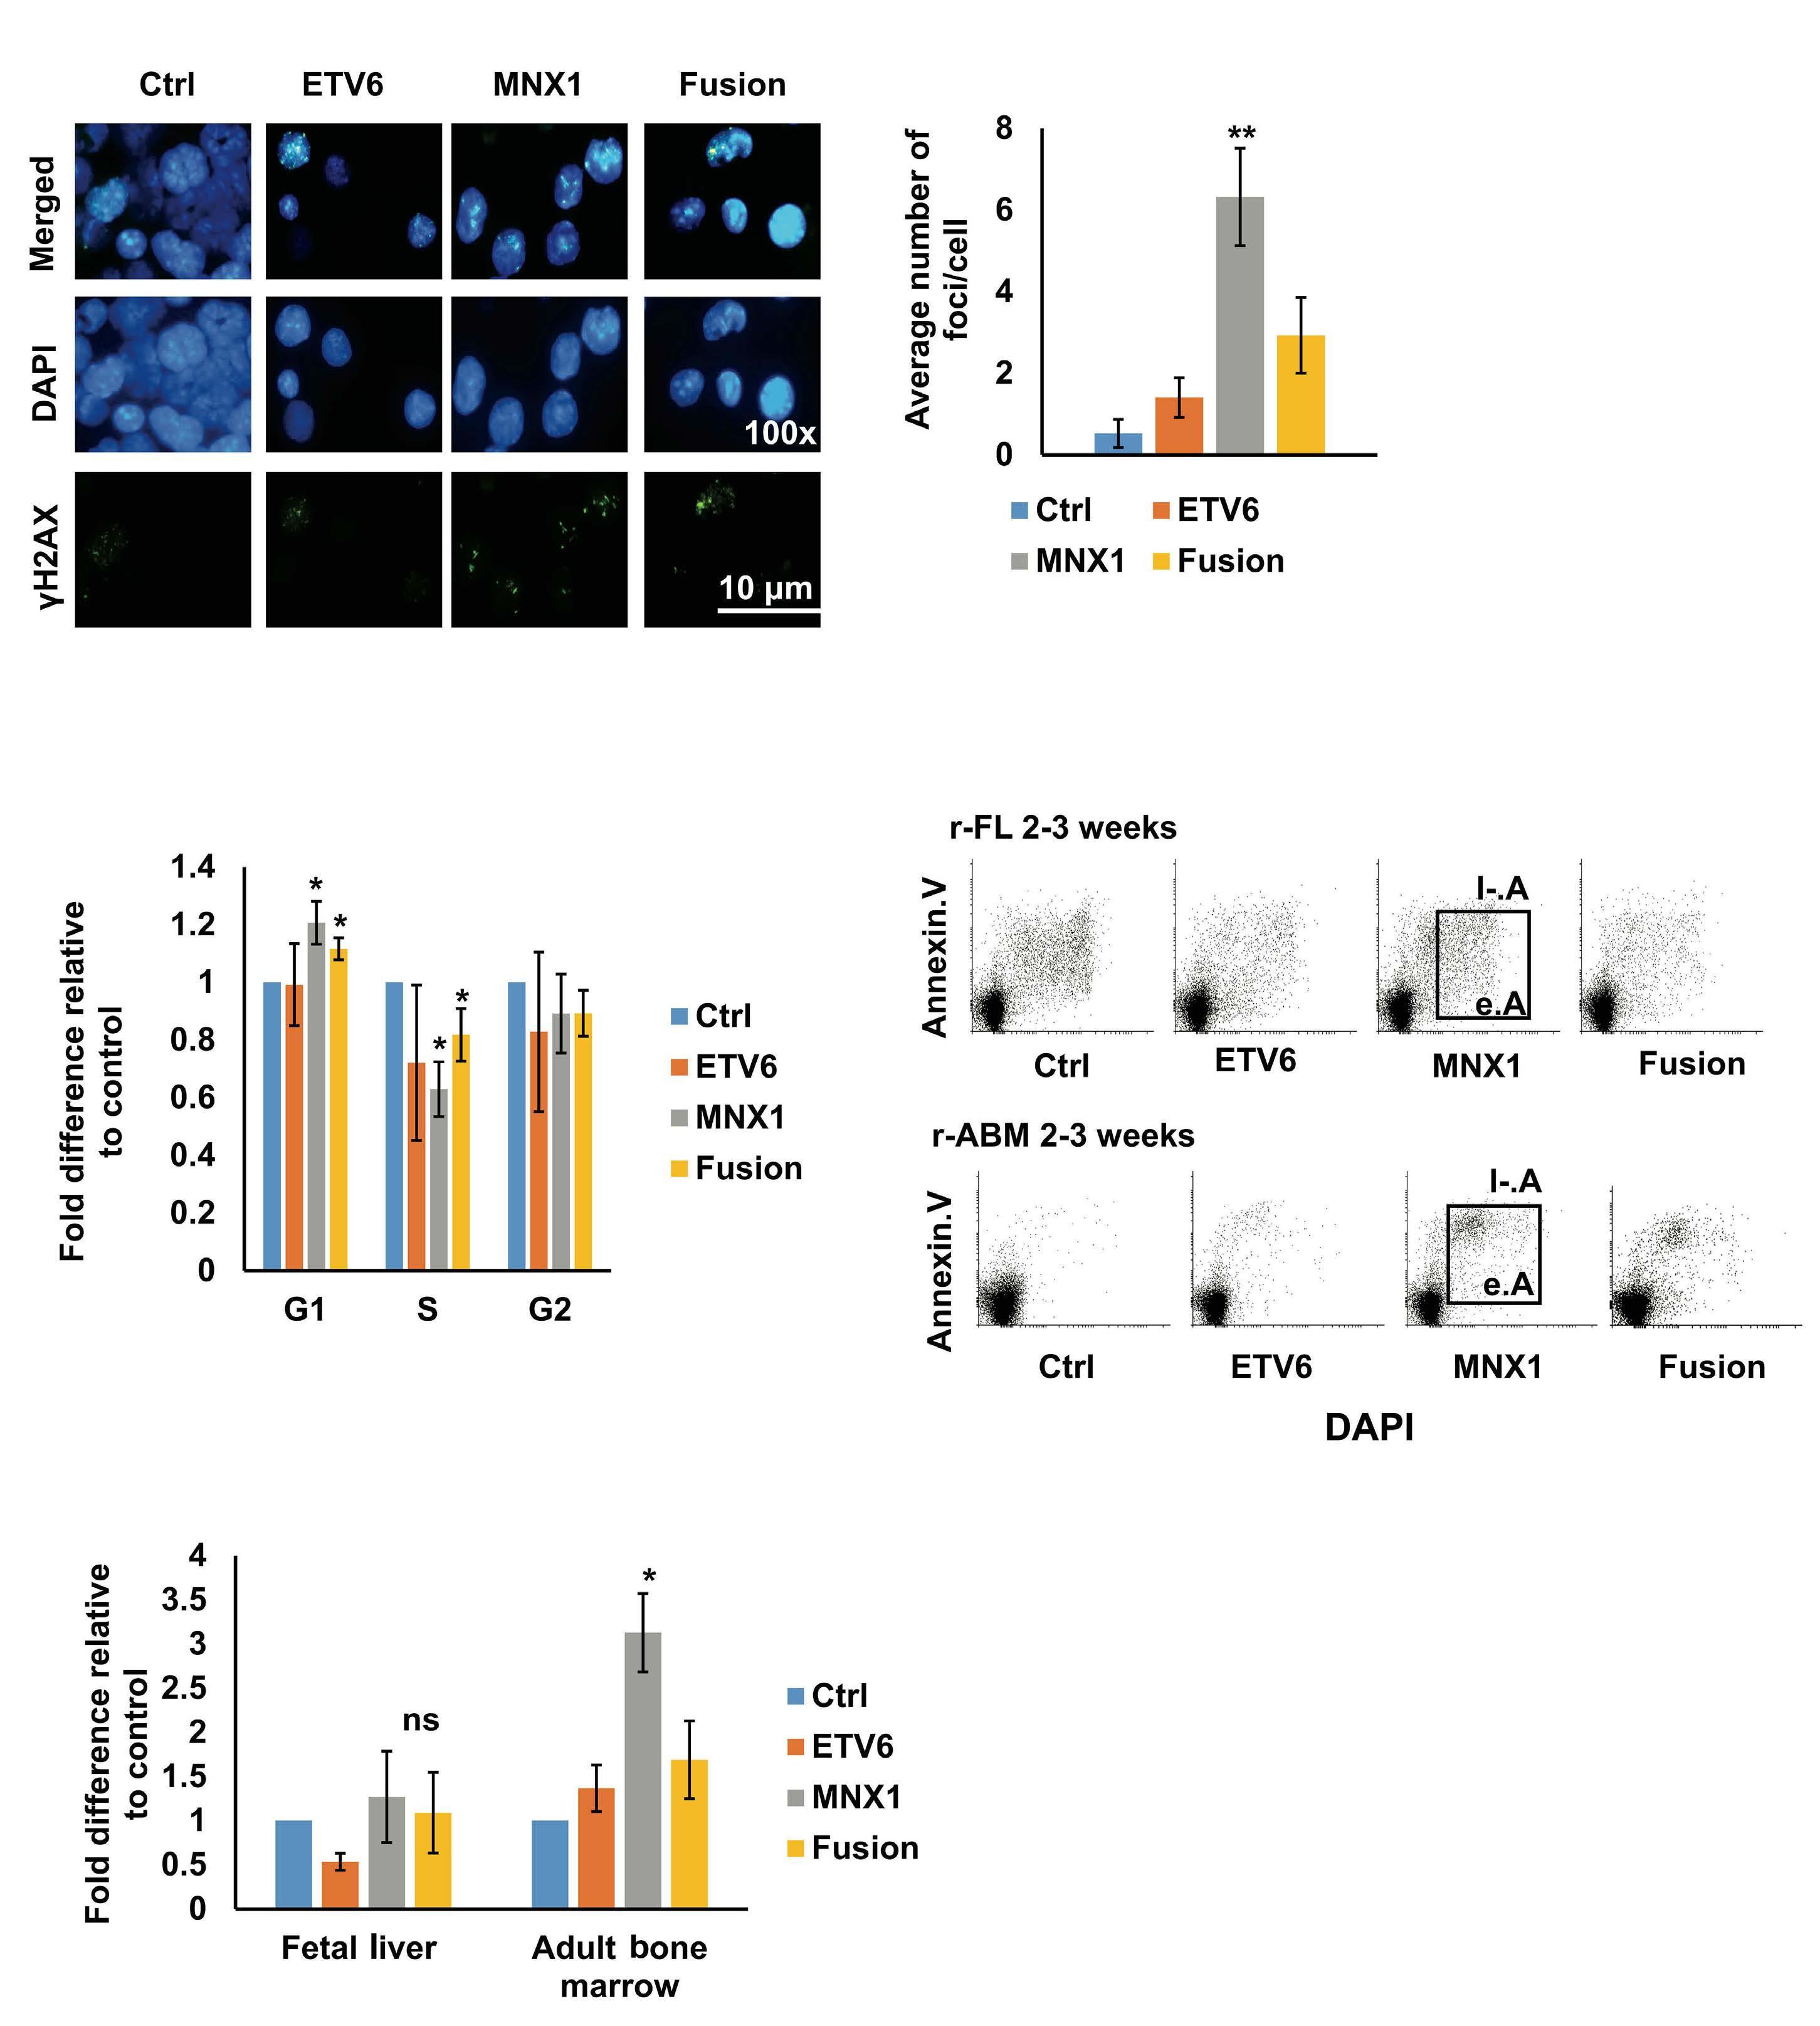
Figure 3. MNX1 induces DNA damage. (A) Immunofluorescence of in vitro retroviral transduced fetal liver hematopoietic stem and progenitor cells (r-FL-HSPC) stained with γH2AX –FITC antibody (green) and counterstained with DAPI (blue). (B) Quantification of the number of γH2AX foci/cell. At least 50 cells were counted. (C) Quantification of cell cycle distribution from flow cytometry analysis represented as fold difference relative to empty vector control (Ctrl). (D) Representative dot plots from the flow cytometry analysis of r-FL and adult bone marrow (ABM)-HSPC (r-ABM) after double staining with Annexin/V and DAPI for apoptotic analysis. (E) Quantification of the flow cytometry analysis represented as fold difference relative to Ctrl. Data represent mean ± Standard Deviation of at least three experiments. **Two-sided student t test: P≤0.01; *P≤0.05. Fusion: MNX1::ETV6 fusion; e.A: early apoptosis; l-.A: late apoptosis.
A B D C E Haematologica | 109 - March 2024 730 ARTICLE - Aberrant MNX1 expression with t(7;12)(q36;p13) in pediatric AML A. Waraky et al.
regions in MNX1 (BM from NSG leukemic mice) compared to Ctrl (FL-HSPC transduced with empty vector) (False Discovery Rate [FDR] ≤ 0.05, log2 fold change ≥ 1), involving mainly distal intergenic regions followed by promoter and other intronic regions (Figure 4B). The consequences of these histone modifications on chromatin accessibility were investigated with ATAC-Seq. MNX1 leukemic BM cells exhibited increased number of accessible chromatin re-
gions in comparison with Ctrl FL-HSPC (FDR ≤ 0.05, log2 fold change ≥ 1) (Figure 4C), mainly involving promoters, followed by distal intergenic and intronic regions, very similar to the pattern seen for H3K27me3 (Figure 4B). Pathway analysis of genes annotated to the differentially accessible regions from ATAC-Seq (FDR ≤ 0.05, log2 fold change ≥ 1) revealed similar enrichment to the RNA-Seq, with high enrichment in metabolic pathways, myeloid cell
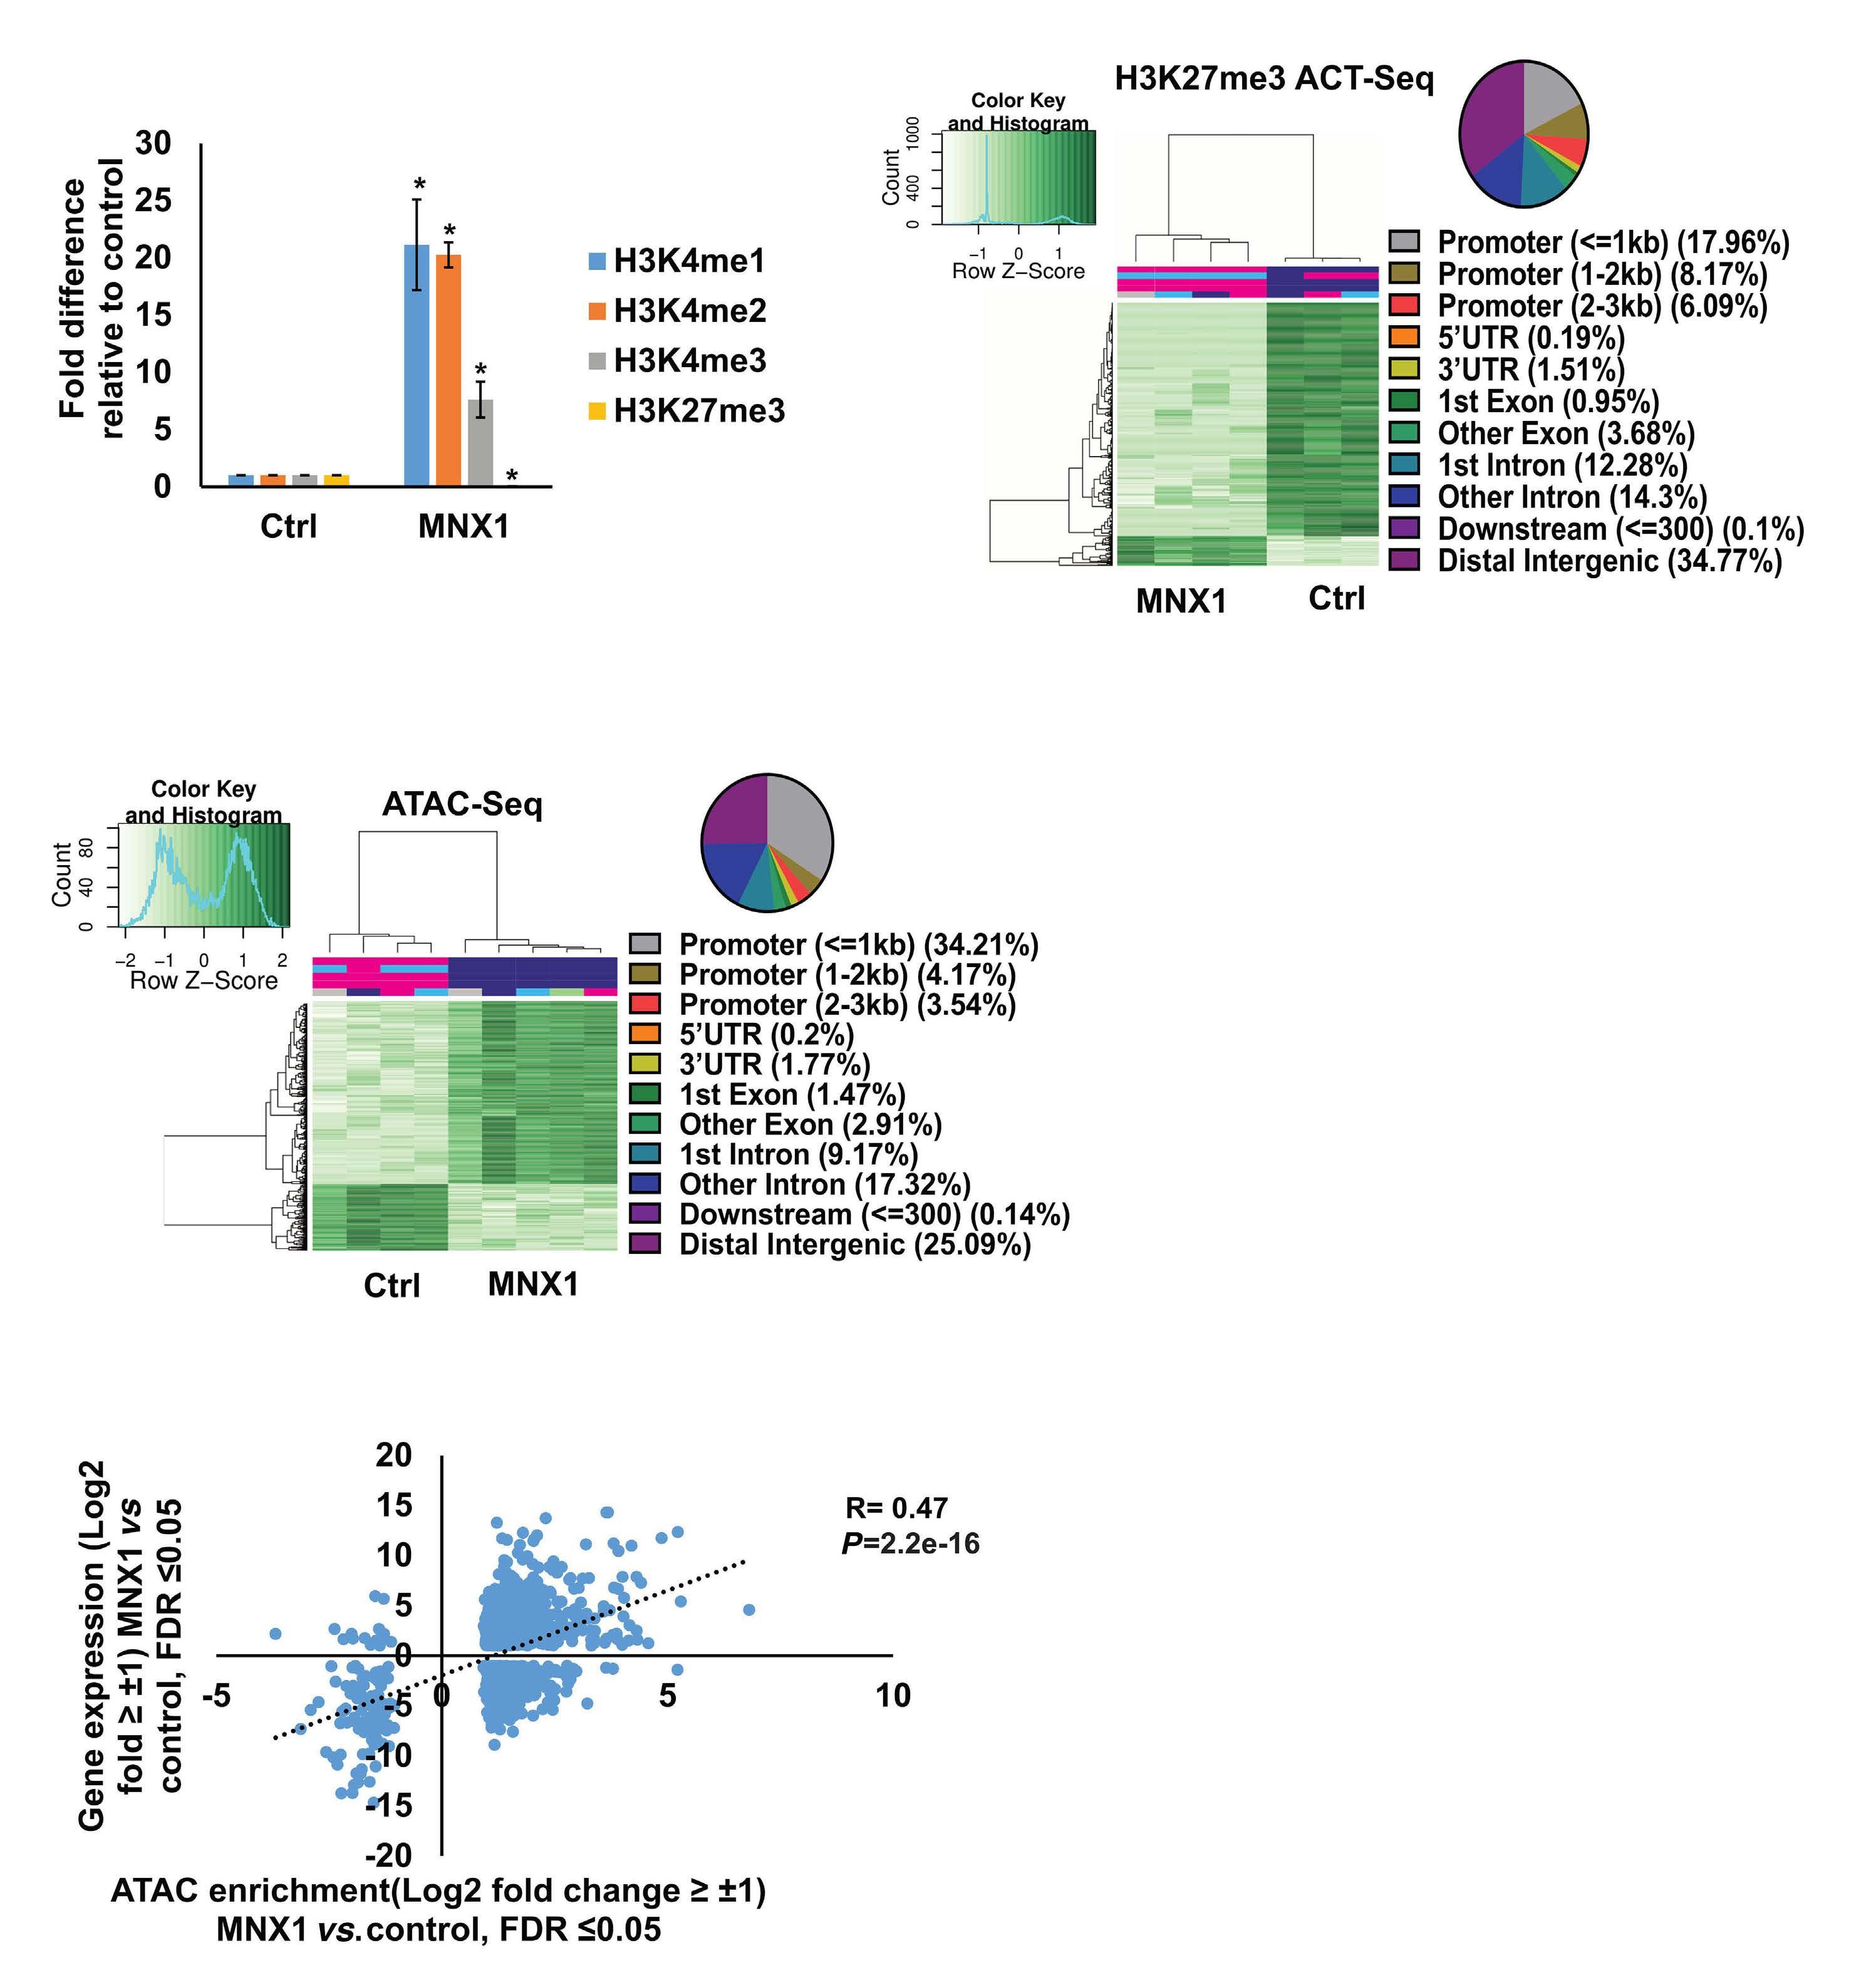
Figure 4. MNX1 alters histone methylation. (A) ImageJ quantification of western blot analysis of H3K4me1, H3K4me2, H3K4me3, and H3K27me3 as fold difference relative to loading control. (B) Heatmap of differentially bound H3K27me3 from bone marrow (BM) of leukemic mice (MNX1) versus control fetal liver hematopoietic stem and progenitor cells (FL-HSPC) transduced with empty vector (Ctrl) as determined by ACT-Seq and annotation of different enriched regions for H3K27me3 ACT-Seq. Results were considered at the log fold-change cut-off (logFC) of ≥ ǀ1ǀ and false discovery rate (FDR) of ≤0.05. (C) Heatmap of differentially accessible regions from BM of leukemic mice (MNX1) versus control FL-HSPC transduced with Ctrl as determined by ATAC-Seq and annotation of different enriched regions for ATAC-Seq. Results were considered at the log foldchange cut-off (logFC) of ≥ ǀ1ǀ and false discovery rate (FDR) of ≤0.05. (D) Scatter plot showing the correlation between differentially expressed genes from RNA-Seq expression analysis and genes with differentially accessible regions from ATACSeq analysis. Results were considered at the log fold-change cut-off (logFC) of ≥ ǀ1ǀ and FDR of ≤0.05. AML: acute myeloid leukemia.
A C D B
Haematologica | 109 - March 2024 731 ARTICLE - Aberrant MNX1 expression with t(7;12)(q36;p13) in pediatric AML A. Waraky et al.
differentiation, erythrocyte differentiation, cytoskeleton organization, cell cycle process, and apoptotic cell process (Online Supplementary Figure S11B). Further analysis through integrating ATAC-Seq data with in silico predicted transcription factor binding sites by DiffTF package, revealed 130 differentially activated sites (FDR < 0.05) between MNX1 leukemic BM cells and Ctrl FL-HSPC (Table 1, Online Supplementary Figure S11C). These were enriched in pathways of myeloid/erythrocyte differentiation, cellular metabolism, G1/S-phase transition of cell cycle, histone methylation, DNA methylation and DNA damage response (Table 1, Online Supplementary Figure S11C). A significant correlation between the accessible chromatin regions identified by ATAC-Seq and differentially expressed genes by RNA-Seq was shown at rS=0.47 and (P≤0.01) (Figure 4D). In conclusion, MNX1 induces global histone modifications that are affecting chromatin accessibility and inducing differential gene regulation.
MNX1 alters the methylation of histone H3
To understand the mechanism for the MNX1-induced global histone modifications, we performed mass spectrometry analysis to study proteins in association with MNX1. FL-HSPC cells were transduced with retroviral MNX1 with a HA-tag and MNX1-associated proteins were co-immunoprecipitated using anti-HA antibody. Pathway analysis using STRING for protein-protein interactions for the identified proteins revealed a high enrichment for methylation pathway proteins MAT2A, MAT2B and AHCY (Table 2, Figure 5A), in addition to several S-adenosylmethionine (SAM)-dependent methyl transferases and their downstream targets (Online Supplementary Table S3). Co-IP confirmed the association of MNX1 to MAT2A and AHCY
both in vitro and in NSG BM leukemic cells (Table 1, Figure 5B, Online Supplementary Figure S12A), with no effect on protein expression as shown in parallel with western blot (Online Supplementary Figure S12B). Furthermore, MNX1 overexpression increased the concentration of S-adenosylhomocysterin (SAH) and reduced free methionine in both FL cells and leukemia NSG BM cells (Online Supplementary Figure S12C-E). In support of an MNX1 role in methylation pathway and in altering histone methylation, MNX1 pulled down with Co-IP and incubated with recombinant Histone H3 resulted in methylation of Histone H3 (Figure 5C, D, Online Supplementary Figure S12F, G).
MNX1-induced leukemia in mice and in human pediatric t(7;12) acute myeloid leukemia show similar gene expression and pathway enrichment
To validate the similarity between the AML developed in our mouse model with human t(7;12) AML, we used our RNA-Seq data on leukemic cells from mice and retrieved RNA-Seq data from pediatric t(7;12) AML patient samples from the Children's Oncology Group (COG)-National Cancer Institute (NCI) TARGET AML initiative data set. Differential gene expression in mouse leukemia was determined by comparing MNX1 FL-HSPC leukemic NSG BM cells and FL-HSPC transduced with empty vector, and differential gene expression in human AML was determined by comparing pediatric t(7;12) AML patient samples with normal human BM. Comparing the differential gene expression between the mouse AML with MNX1 expression and the t(7;12) patient data revealed close to 50% overlapping differential gene expression (Figure 5E, Online Supplementary Table S4). These included increased expression of the genes MNX1, cKIT, CEP164, AHCY, MAT2A
TF:
Up-regulated TF Weighted mean difference Adj P Down-regulated TF Weighted mean difference Adj P Tal1.a 1.294844532 9.30E-79 Fosl2 -0.421333369 1.84E-24 Gata1 0.567577232 1.24E-20 Jun -0.415408916 2.58E-23 Gata3 0.550998432 1.12E-19 Cebpe -0.39280302 0.000108 Gata2 0.540274293 1.01E-16 Batf -0.387629056 1.57E-17 Alx1 0.371423122 0.023026 Fosl1 -0.384618862 4.57E-21 Nf2l2 0.288226747 2.11E-17 Cebpa -0.353311343 3.14E-06 Zeb1 0.232871599 9.60E-41 Gfi1 -0.349686909 8.73E-08 Tbx5 0.231419764 1.76E-09 Fosb -0.339609157 5.76E-15 Mafk.s 0.22701829 3.01E-10 Sta5a -0.339203846 2.94E-09 Nfe2 0.218904994 4.77E-11 Jund -0.337147615 8.92E-16 Gata6 0.213067314 2.28E-11 Cebpd -0.323368792 0.000182 Foxo3 0.202788032 0.000274 Gfi1b -0.308823273 8.94E-12
Table 1. In silico predicted transcription factor binding sites by DiffTF package from ATAC-Seq showing top differentially activated (False Discovery Rate < 0.05) transcription factors binding between MNX1 bone marrow from leukemia mice and fetal liver hematopoietic stem and progenitor cell Control cells.
transcription
Haematologica | 109 - March 2024 732 ARTICLE - Aberrant MNX1 expression with t(7;12)(q36;p13) in pediatric AML A. Waraky et al.
factors; Adj P: adjusted P value.
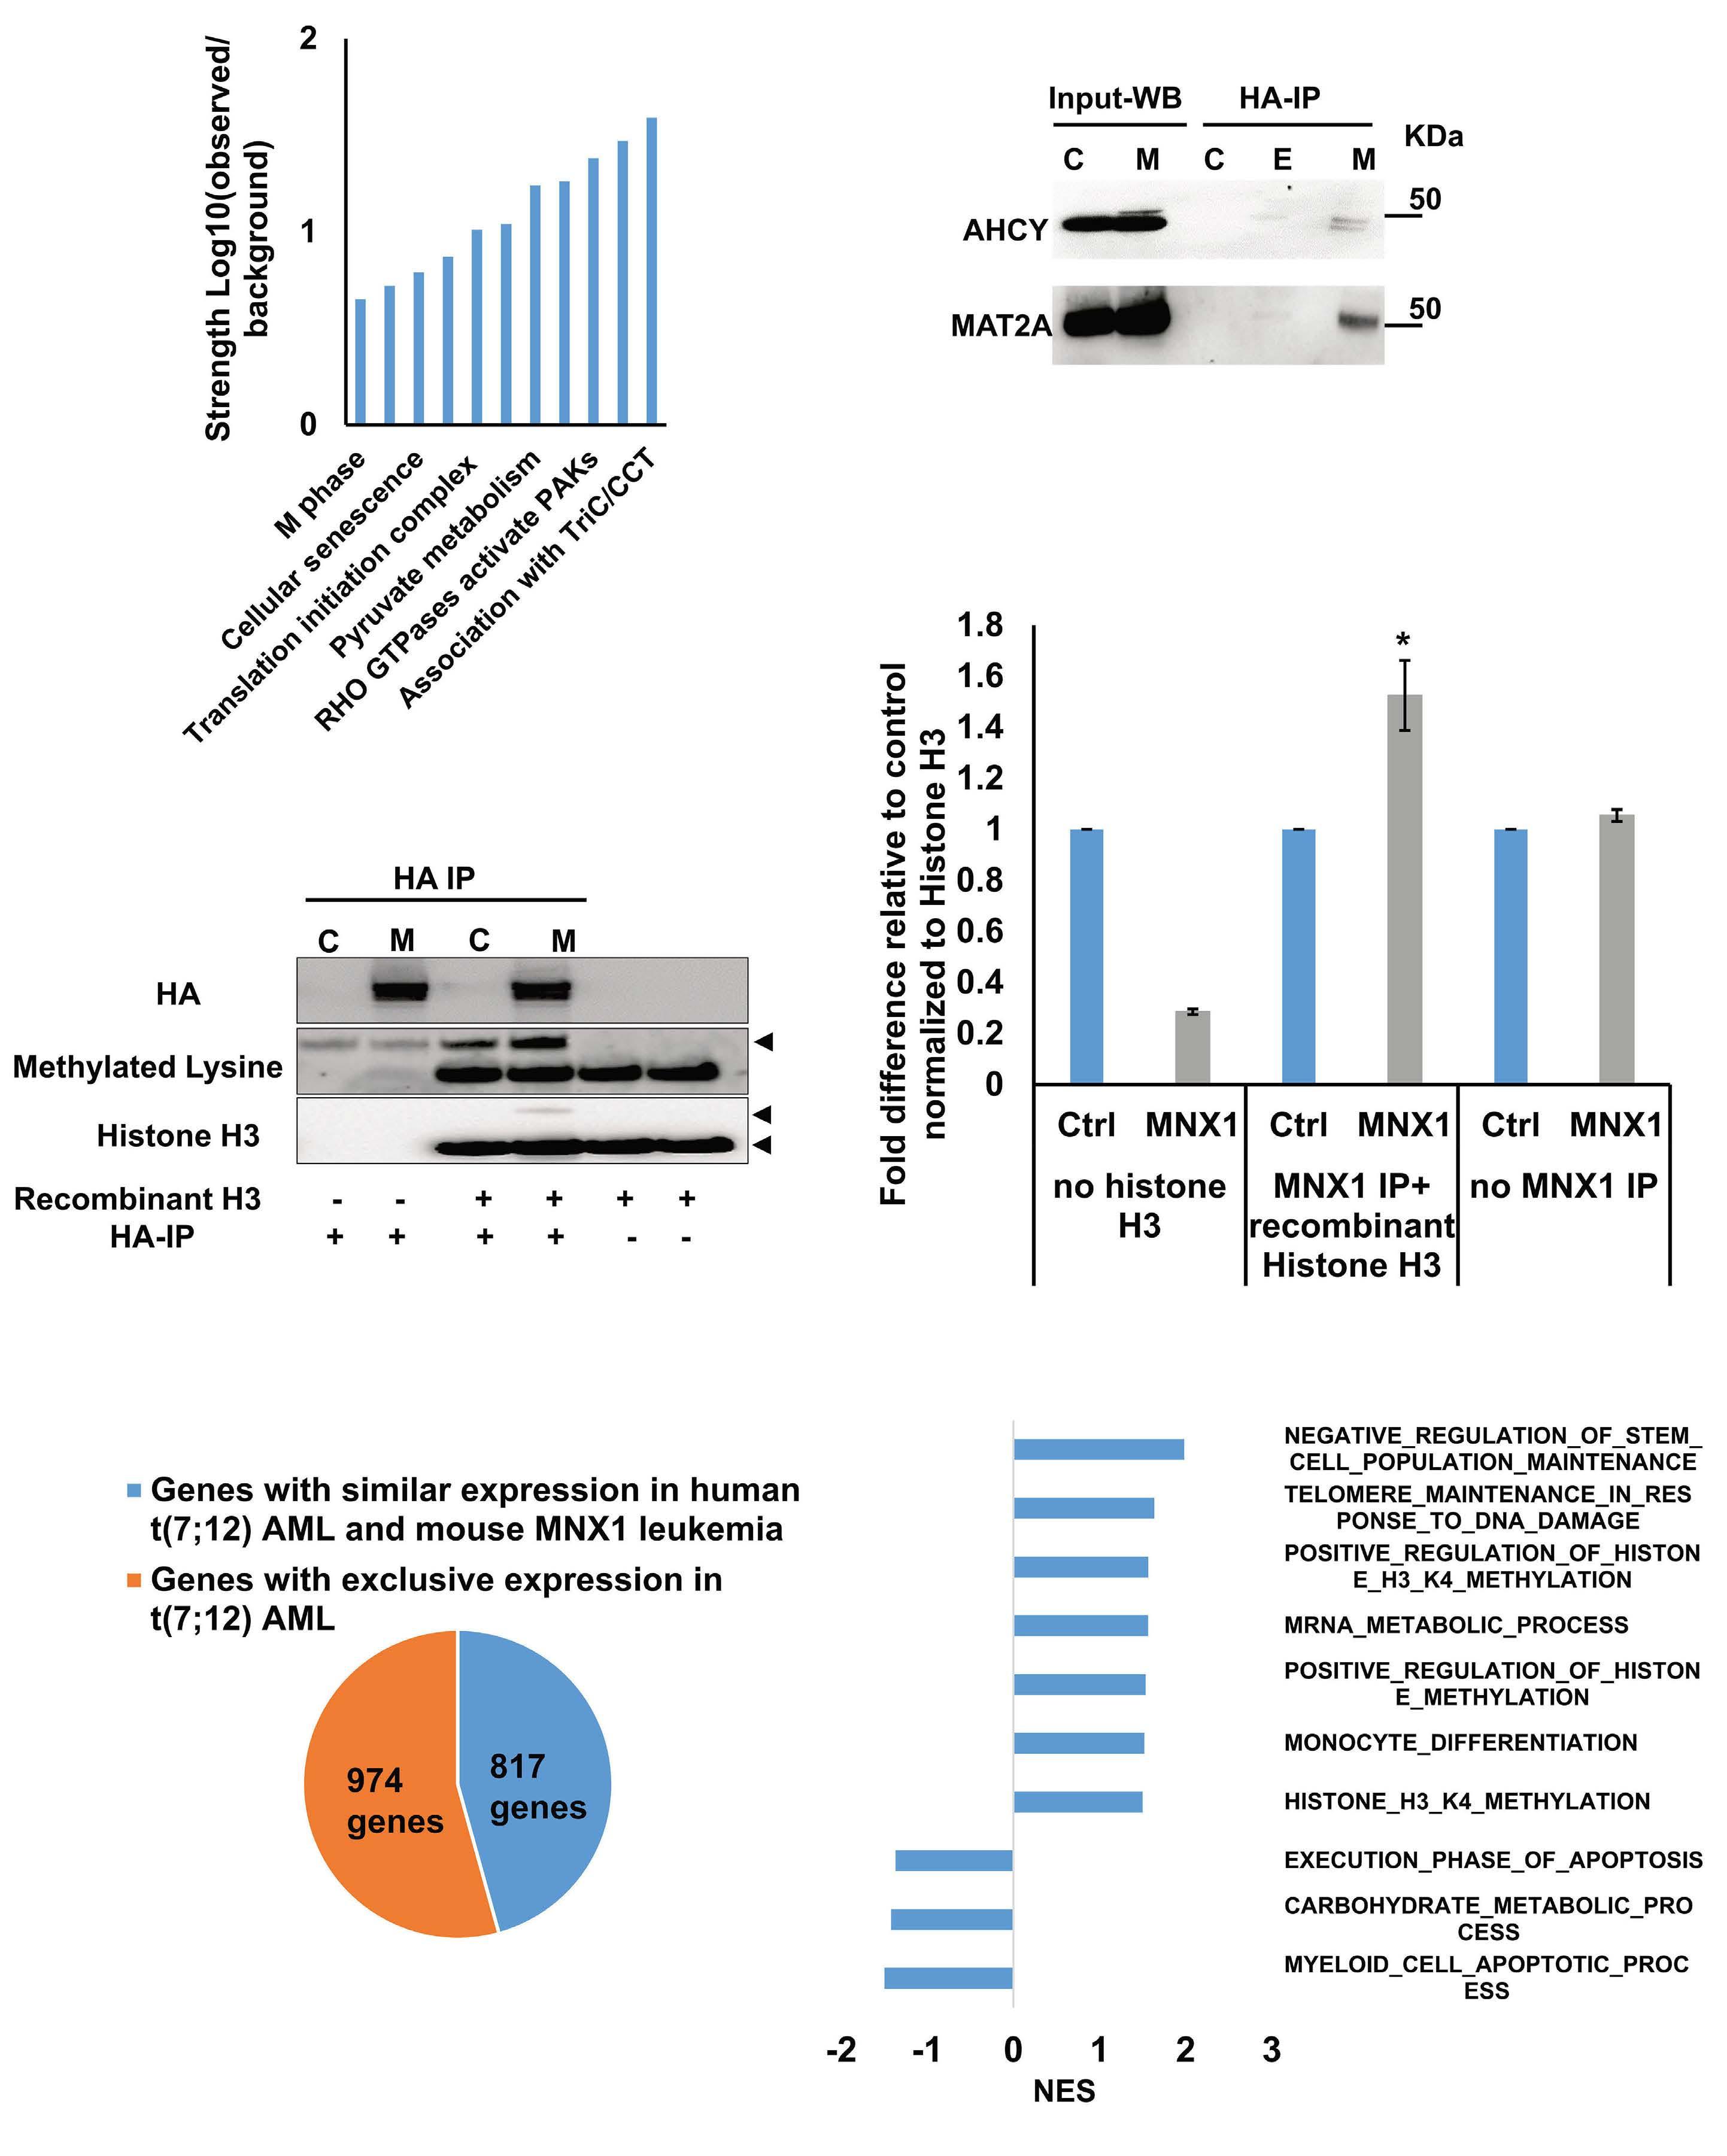
A B D C E F Haematologica | 109 - March 2024 733 ARTICLE - Aberrant MNX1 expression with t(7;12)(q36;p13) in pediatric AML A. Waraky et al. Continued
on following page.
co-immunoprecipitation
(Co-IP) and mass spectrometry using STRING with reactome data set, showing strength of the pathway as Log10 observed proteins/background in the respective pathway. (B) Binding of AHCY and MAT2A was detected by immunoprecipitation (IP) of MNX1 using HA-antibody followed by western blot (WB) using AHCY and MAT2A antibodies. ETV6 with HA tag was used as a negative control. Total protein input used as loading control (Ctrl). (C) Recombinant Histone H3.1and H3.3 were subjected to an in vitro methyltransferase reaction using MNX1 complex pulled down with HA antibody from FL-HSPC transduced with MNX1 (M), in comparison with fetal liver hematopoietic stem and progenitor cells (FL-HSPC) with empty vector control (Ctrl), in the presence of S-adenosylmethionine (SAM) and dithiothreitol (DTT). The reactions were terminated by boiling in SDS sample buffer. Separation of samples in 12% SDS-PAGE was followed by immunoblotting (IB) with mono-, di- and trimethyl-lysines antibody. Reblotting was made for detection of HA and total Histone H3. As indicated, negative controls were obtained by omitting Histone H3, or the pulled down immune complex. (D) Quantification of the in vitro methyltransferase reaction. Data represent mean ± Standard Deviation of at least three experiments. Two-sided student t test: **P≤0.01; *P≤0.05. (E) Graph showing differentially expressed genes with same or opposite regulation when comparing gene expression data from t(7;12) acute myeloid leukemia (AML) patients from the TARGET database and RNA-seq data from bone marrow (BM) from mice with MNX1-induced leukemia. Differentially expressed genes were selected based on a LogFC ±1 and false discovery rate ≤ 0.05. Gene set enrichment analysis (GSEA) using the Gene Ontology (GO) biological pathways, showing normalized enrichment score (NES) for common pathways between t(7;12) AML patients and the MNX1-induced leukemia in mice with nominal P value (NOM) P≤0.05.
and MAT2B (Online Supplementary Figure S13). Pathway enrichment analysis of the t(7;12) patient using GSEA revealed several common enriched pathways including: DNA damage, H3K4methylation, monocyte differentiation, apoptotic processes, and metabolic processes (Figure 5F, Online Supplementary Figure S14A). Interestingly, only the H3K4me3 methylation, and no other histone methylation pathway, was enriched in the GSEA analysis from t(7;12) AML patients. In addition, we analyzed the global methylation on H3K4me3 in a human t(7;12) iPSC-derived model. These cells show high expression of MNX1 when differentiated into HSPC, but also manifest other important features seen in human t(7;12) AML.17 This model gave similar results with increased methylation of H3K4me3 in t(7;12) iPSC differentiated into HSPC compared to the parental iPSC differentiated into HSPC without t(7;12) (Online Supplementary Figure S14B, C), thus, highlighting the biological significance of high MNX1 expression also in human cells with t(7;12).
The effects of MNX1 on methylation are crucial for leukemogenesis
To confirm the importance of this effect for MNX1-induced leukemia, we used the natural nucleoside analog of SAM, sinefungin, which acts as a competitor and accordingly a pan-methyltransferase inhibitor.18 Adding 5 μM of sinefungin to MNX1-transduced FL-HSPC partially or completely prevented the effects of MNX1 on histone modifications (Figure 6A, Online Supplementary Figure S15A), DNA damage induction (Figure 6B, Online Supplementary Figure S15B), cell cycle distribution (Online Supplementary Figure S15C), myeloid differentiation, and LSK depletion (Figure 6C, D). Furthermore, when MNX1 FL-HSPC was pre-treated in vitro with sinefungin and then transplanted into NBSGW mice, there were no signs of leukemia development (Figure 6E, Online Supplementary Figure S15D, E), despite maintained high MNX1 expression (Online Supplementary Figure S15F) and continuous presence of viable trans-
planted cells in blood (Online Supplementary Figure S16A). To investigate the effect of sinefungin treatment on MNX1induced differential gene expression, RNA-Seq was performed before and after treatment. Differentially expressed genes (FDR ≤ 0.05, log2 fold change ≥ 1.5) from MNX1 cells after treatment (MNX+S) clustered with MNX1 (Figure 6F), and most of the differentially expressed genes by MNX1 overexpression remained at a similar level after treatment (Figure 6F), with a limited number of genes altered in MNX1 differential gene expression after treatment (Online Supplementary Figure S16B).
Discussion
The t(7;12) has only been reported in children diagnosed with AML before the age of 24 months. The function of this translocation in inducing infant leukemia and the reason for its absence in adult leukemia is unknown. In the current study using a murine model, we showed that ectopic expression of MNX1 rather than the MNX1::ETV6 fusion was able to initiate and drive leukemogenesis. Our data suggest a mechanism through which MNX1 is mediating the leukemogenic effect through aberrant methylation that results in histone modifications and DNA damage.
The malignant transformation mediated by MNX1 overexpression in our mouse model matched the criteria for AML,19 compatible with an AML without maturation. This mouse MNX1-driven leukemia had a high degree of differentially-expressed gene that overlaps with the gene expression signature and pathway enrichment that is seen in human AML with t(7;12). It has also been shown that MNX1 clearly has oncogenic properties in both human and murine hematopoietic cells by inducing a myeloid biased perturbed hematopoietic differentiation and premature senescence.20 This fits well with the properties seen in our mouse leukemia model with both a block in differentiation
Haematologica | 109 - March 2024 734 ARTICLE - Aberrant MNX1 expression with t(7;12)(q36;p13) in pediatric AML A. Waraky et al.
Figure 5. MNX1 associates with proteins from the methionine cycle and show similar gene expression and pathway enrichment with human t(7;12) acute myeloid leukemia. (A) Pathway enrichment analysis for the identified proteins after
experiments
Pathway
Matching proteins
Association with TriC/CCT Cct8, Cct6a, Tcp1, Cct4
Methylation
Mat2b, Ahcy, Mat2a, Trmt112
RHO GTPases activate PAK Ppp1cb, Myh9, Myh11, Myh10, Myh14
Citric acid cycle (TCA cycle) Cs, Mdh2, Idh3g, Dld
Pyruvate metabolism
Pdk3, Slc16a3, Vdac1, Ldha, Dld
Actin dynamics for phagocytic Actr2, Arpc2, Myh9, Cyfip2, Arpc3, Myo5a, Actr3
Translation initiation complex Pabpc1, Eif3e, Rps21, Eif2s3x, Rps12, Rps28
RHO GTPase effectors Actr2, Mapk14, Arpc2, Ppp1cb, Myh9, Pfn1, Aurkb, S100a8, Tuba1b, Bub3, Myh11, Cyfip2, Arpc3, Myh10, Ywhaq, Myh14, Kif2a, S100a9, Actr3
Cellular senescence
Mitotic anaphase
M phase
Metabolism of proteins
Metabolism of RNA
Mapk14, Asf1a, Lmnb1, Txn1, H2afz, Hist1h1b, Hist2h2be, Eed
Psmd11, Aurkb, Psmd6, Lmnb1, Smc3, Psmd13, Chmp4b, Smc1a, Tuba1b, Rcc1, Bub3, Kif2a
Psmd11, Aurkb, Psmd6, Lmnb1, Smc3, Psmd13, Chmp4b, H2afz, Smc1a, Smc4, Tuba1b, Rcc1, Bub3, Hist2h2be, Csnk2a1, Smc2, Kif2a
Pabpc1, Srp14, Psmd11, Rab10, Ddx5, Aurkb, Psmd6, Vdac2, Ero1l, Eif3e, Mrpl21, Smc3, Psmd13, Cct8,Srp9, Txn1, Trappc3, Cct6a, Cmas, Rab27a, Rpl22l1, Smc1a, Rpl37, Mat2b, Pdia6, Fn1, Rps21, Eif2s3x, Hist2h2ab, Rps12, Tuba1b, Ctbp1, Rpl15, Rpl36, Rpl34, Lgals1, Hist2h2be, Eef1g, Csnk2a1, Vdac1, Wdr5, Rps28, Trmt112, Tcp1, Copa, Gnb4, Ctsd, Cct4, Nop58, Tceb1
Pabpc1, U2af2, Psmd11, Prpf8, Snrpd3, Ddx5, Psmd6, Wdr46, Psmd13, Rpl22l1, Rpl37, Utp15, Wdr43, Rps21, Rcl1, Rps12, Rpl15, Rpl36, Rpl34, Srsf2, Nhp2l1, Snrpb, Rps28, Srsf3, Ddx6, Hnrnpd, Apobec3, Nop58
and induced cell cycle arrest. Similar gene expression and pathway enrichment has also been shown between human cells with an engineered t(7;12) translocation, which results in high expression of MNX1, and human t(7;12) AML, suggesting a common gene expression program induced by MNX1 in hematopoietic cells.17,21 Our data showed that ectopic expression of MNX1 was able to induce AML using HSPC from fetal origin but not from adult BM. One possible reason for this was the dramatic induction of apoptosis seen in the hematopoietic progenitor cells from adult BM, prohibiting leukemic transformation. The higher susceptibility for apoptosis and DNA damage induced by MNX1 is concordant with the presence of naturally occurring DNA damage in the adult stem cells.22 Possibly, the balance between fetal and adult stem cell programs affects the transforming ability of the cells upon overexpression of MNX1. Lin28b has been shown to be a key regulator of the self-renewing capacity characteristic of fetal, but not adult, hematopoietic stem cells.23 LIN28B is, together with MNX1, a signature gene expressed in all pediatric t(7;12) AML and not seen in other AML subtypes.24 Lin28b was seen expressed in our MNX1-induced mouse
leukemia (Online Supplementary Table S2), which suggests that transformation by MNX1 might be dependent on Lin28b for its transforming effects or, and perhaps more likely, indicates that the fetal hematopoietic program is needed for MNX1 oncogenesis. However, the expression of Lin28b in our leukemia and LIN28B in human t(7;12) AML contrasts with the finding that Lin28b suppresses MLLENL fusion-driven leukemogenesis, also typically seen in infant leukemia.25 But what is intriguing is that, in adult mice, the potential of an MLL-ENL fusion to initiate leukemia development peaks during neonatal development and then drops dramatically.25 The importance of the development stage of cells that can be transformed into leukemia, including the leukemia phenotype as well as intrinsic properties of progenitor populations have been shown in several studies.26-28 Other factors that differ between fetal and adult hematopoietic stem cells and that might affect their propensity for transformation are metabolic demand and cell cycle profile.29-31 Even though MNX1 overexpression induced leukemia in the cells of fetal origin, the fusion MNX1::ETV6 by itself did not induce leukemia. This finding is in line with the previously reported inability
Haematologica | 109 - March 2024 735 ARTICLE - Aberrant MNX1 expression with t(7;12)(q36;p13) in pediatric AML A. Waraky et al.
Table 2. Identified proteins in top enriched pathways after co-immunoprecipitation experiments of proteins in complex with MNX1 and mass spectrometry analysis, as determined by STRING using reactome data set.
to induce transformation with MNX1::ETV6 (HLXB9/TEL) in vitro and the paucity of transgenic mouse models of AML with MNX1::ETV6. 32 In our study, the development of leukemia induced by MNX1 expression was primarily seen in immunocompromised NSG mice. Thus, the adaptive B- and T-cell immune response might be enough to eradicate
cells with overexpression of MNX1 and prevent leukemia development. This may be yet another clue to how AML with t(7;12) develops in very young children, typically before six months of age when the immune system is still under development.4-6
Our studies of MNX1 expression in vitro revealed an in -
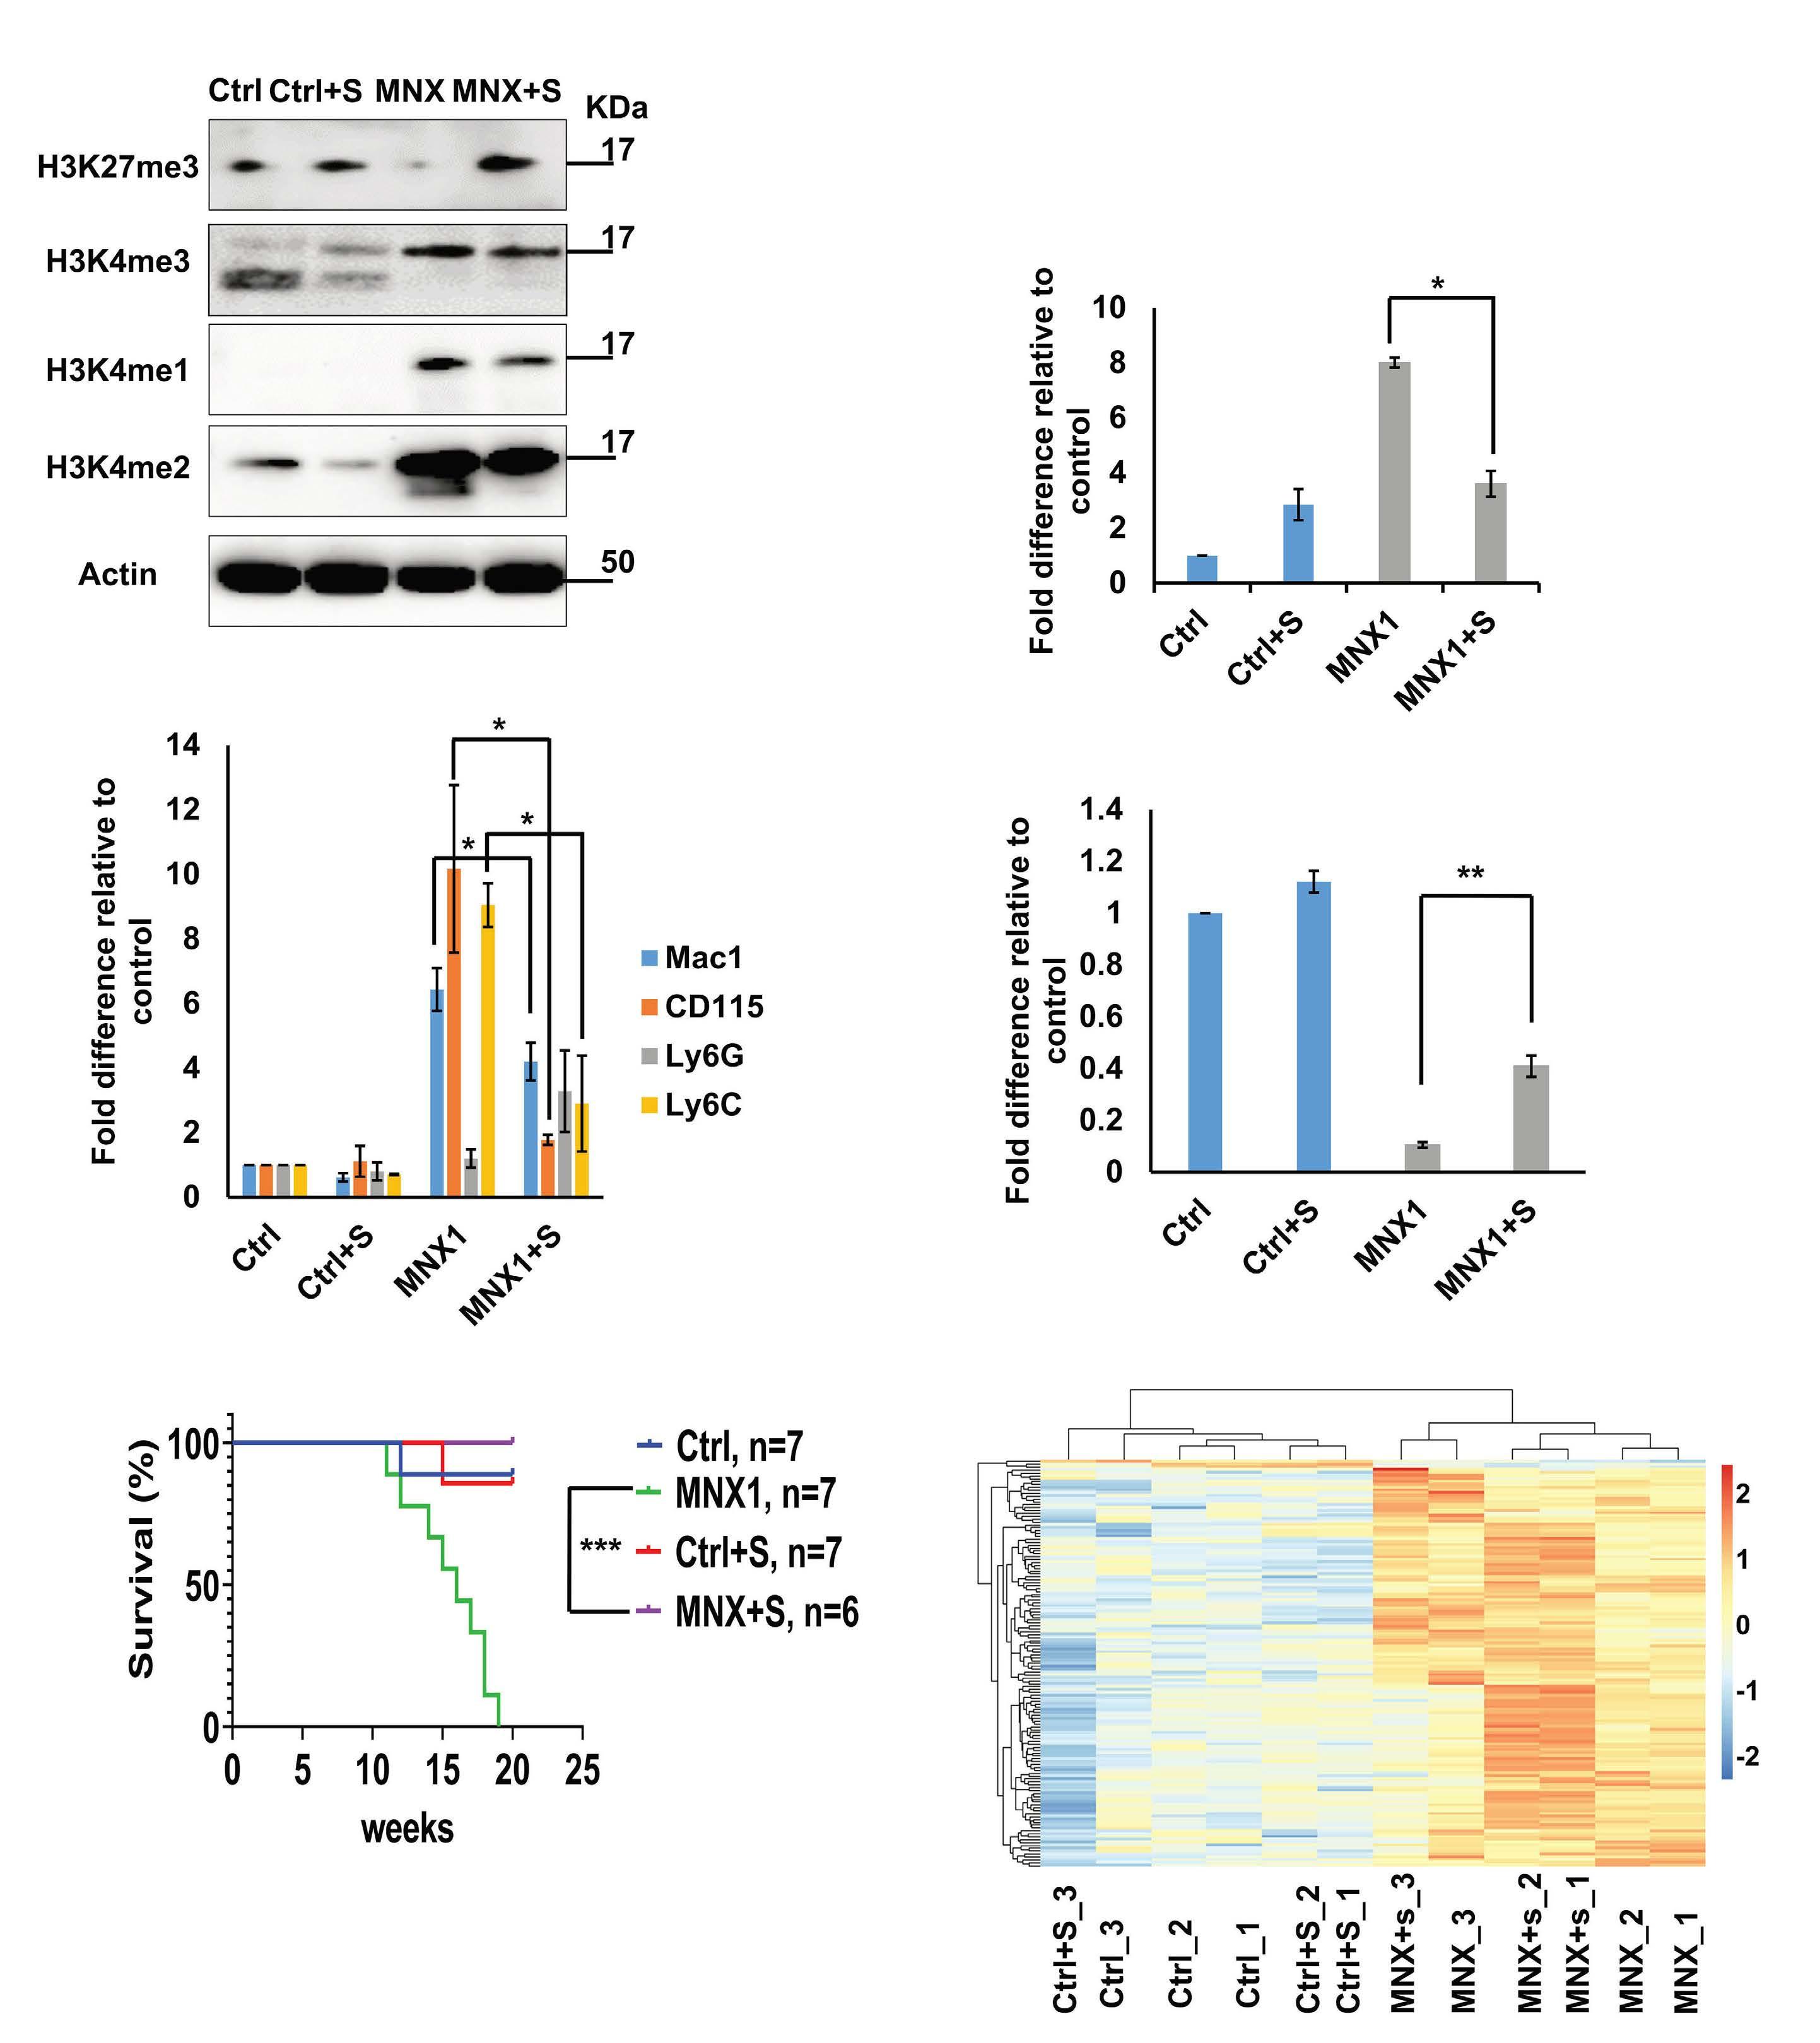
A B D F E C Haematologica | 109 - March 2024 736 ARTICLE - Aberrant MNX1 expression with t(7;12)(q36;p13) in pediatric AML A. Waraky et al. Continued on following page.
in in vitro retroviral induced fetal liver hematopoietic stem and progenitor cells (r-FL-HSPC) with either MNX1 overexpression or empty vector (Ctrl) after treatment with vehicle or 5 μM sinefungin (Ctrl+S, MNX1+S) as determined by western blotting. Actin served as loading control. (B) Quantification of the western blot analysis in Online Supplementary Figure S9A Quantification of the number of γH2AX foci/cell. At least 50 cells were counted. Data represented as fold difference relative to control. (C and D) Quantification of flow cytometry analysis of the cells with the indicated antibodies. Data represented as fold difference relative to control. Data represent mean ± Standard Deviation of at least three experiments. Two-sided Student t test between MNX1 and MNX1+S: **P≤0.01; *P≤0.05. (E) Kaplan-Meier survival curves of (NBSGW) mice transplanted with FL cells after retrovirus transduction with either ectopic expression of MNX1 or Ctrl after treatment with vehicle or 5 μM sinefungin (MNX1+S, Ctrl+S). Results of MNX1 (N=7) and sinefungin-treated MNX1 cells (MNX1+S) (N=6) were analyzed using the log-rank test: ***P≤0.01. (F) LogFC heat map of down-regulated (blue) and up-regulated (red) differentially expressed genes of FL cells with MNX1 ectopic expression (MNX) in comparison with FL cells with Ctrl, with 5 μM sinefungin (Ctrl+S, MNX+S) or without treatment (Ctrl, MNX1), showing clustering and similarity between the samples. Results were considered at the log fold-change cut-off (LogFC) ≥ ǀ1.5ǀ and false discovery rate ≤ 0.05.
duction of DNA damage both in FL-HSPC and ABM-HSPC, which could contribute to the observed skewed differentiation towards myeloid lineage evident by the depletion of LSK and MEP population and increased Mac1 + and Ly6C + populations. The influence of DNA damage in stem cells on differentiation was first demonstrated in melanocyte stem cells, where ionizing radiation triggered differentiation into mature melanocytes. 33 In hematopoietic stem cells, DNA damage can induce differentiation towards lymphoid or myeloid lineage, and may be the reason for the skewing towards myeoloid differentiation in the aging hematopoietic system. 34-37 We found MNX1 to associate with members of the methionine cycle, including MAT2A, AHCY and MAT2B, in addition to several downstream SAM-dependent methyl transferases. Methionine is an essential amino acid that is converted to the universal methyl donor SAM, which is converted to SAH upon the donation of its methyl group. This reaction is catalyzed by methionine adenosyl transferases (MAT). SAM is used as a co-factor in most methylation reactions and provides the activated methyl group for methylation of proteins, including histones, DNA, RNA, and lipids. These methylation events are highly dependent on methionine metabolism, with alterations in methionine showing profound effects on DNA and histone methylation.38,39 The role of another homeodomain protein (MSX1) in recruiting methyltransferase to regulate gene expression and chromatin structure through histone modifications has been shown in the differentiation of myoblasts. 40,41 During neural development, MNX1 binding to loci on chromatin is enriched for H3K4me1 and H3K4me3.42 Therefore, the binding and association of MNX1 with methyltranferases and members of the methionine cycle, and the subsequent change in chromatin structure and histone modifications, might represent the physiological role for MNX1 during differentiation.43,44 We conclude that the abnormal expression of MNX1 and subsequent effect on the methionine cycle and chromatin structure in hematopoietic
cells acts as the driver of leukemia transformation, supported by the inhibition of the phenotype by the SAM analog sinefungin.
In conclusion, our results provide the biological and clinical significance for MNX1 as an epigenetic regulator in pediatric t(7;12) AML. Given that many epigenetic modifications are chemically reversible, the inhibition of MNX1 ectopic expression or its downstream effects in t(7;12) could provide a foundation for alternative treatment options to improve outcome.
Disclosures
No confl icts of interest to disclose.
Contributions
LP, AÖ and AW designed the research study. AW, AÖ, TN, DW, PL, JH, JA, SL, GT, SJ and MHM performed the laboratory work and results analysis. AW, LF, CP and LP analyzed the combined data and wrote the paper.
Acknowledgments
We thank Mohamad Ali and Akram Mendez for help with bioinformatic analysis and Tova Johansson and Hanna Brissman for help with animals.
Funding
This work was supported by grants from the Swedish Cancer Society (20 0925 PjF, CAN2017/461), the Swedish Childhood Cancer Foundation (PR2014-0125, PR2019-0013 and TJ2019-0053, TJ2022-0017), Wilhelm och Martina Lundgrens Fond, Assar Gabrielsson Fond and Västra Götalandsregionen (ALFGBG-431881), and the German Funding Agency (DFG) with funding for Collaborative Research Center 1074, Project B11N (to CP). The computations were enabled by resources in project SNIC 2021/22-754 provided by the Swedish National Infrastructure for Computing (SNIC) at UPPMAX, partially funded by the Swedish Research Council through grant agreement n. 2018-05973.
Haematologica | 109 - March 2024 737 ARTICLE - Aberrant MNX1 expression with t(7;12)(q36;p13) in pediatric AML A. Waraky et al.
Figure 6. Sinefungin rescued MNX1-induced phenotype. (A) Protein expression levels of H3K4me3, H3k27me3, H3K4me1 and H3K4me2
Data-sharing statement
The data that support the findings of this study are available in the Online Supplementary Appendix of this article, from Gene Expression Omnibus (GEO) database, accession number
References
1. Lagunas-Rangel FA, Chavez-Valencia V, Gomez-Guijosa MA, Cortes-Penagos C. Acute myeloid leukemia-genetic alterations and their clinical prognosis. Int J Hematol Oncol Stem Cell Res. 2017;11(4):328-339.
2. von Bergh AR, van Drunen E, van Wering ER, et al. High incidence of t(7;12) (q36;p13) in infant AML but not in infant ALL, with a dismal outcome and ectopic expression of HLXB9. Genes Chromosomes Cancer. 2006;45(8):731-739.
3. Bolouri H, Farrar JE, Triche T Jr, et al. The molecular landscape of pediatric acute myeloid leukemia reveals recurrent structural alterations and age-specific mutational interactions. Nat Med. 2018;24(1):103-112.
4. Espersen ADL, Noren-Nystrom U, Abrahamsson J, et al. Acute myeloid leukemia (AML) with t(7;12)(q36;p13) is associated with infancy and trisomy 19: Data from Nordic Society for Pediatric Hematology and Oncology (NOPHO-AML) and review of the literature. Genes Chromosomes Cancer. 2018;57(7):359-365.
5. Beverloo HB, Panagopoulos I, Isaksson M, et al. Fusion of the homeobox gene HLXB9 and the ETV6 gene in infant acute myeloid leukemias with the t(7;12) (q36;p13). Cancer Res. 2001;61(14):5374-5377.
6. Tosi S, Mostafa Kamel Y, Owoka T, Federico C, Truong TH, Saccone S. Paediatric acute myeloid leukaemia with the t(7;12)(q36;p13) rearrangement: a review of the biological and clinical management aspects. Biomark Res. 2015;3:2.
7. Thaler J, Harrison K, Sharma K, Lettieri K, Kehrl J, Pfaff SL. Active suppression of interneuron programs within developing motor neurons revealed by analysis of homeodomain factor HB9. Neuron. 1999;23(4):675-687.
8. Li H, Arber S, Jessell TM, Edlund H. Selective agenesis of the dorsal pancreas in mice lacking homeobox gene Hlxb9. Nat Genet. 1999;23(1):67-70.
9. Harrison KA, Thaler J, Pfaff SL, Gu H, Kehrl JH. Pancreas dorsal lobe agenesis and abnormal islets of Langerhans in Hlxb9deficient mice. Nat Genet. 1999;23(1):71-75.
10. Ross AJ, Ruiz-Perez V, Wang Y, et al. A homeobox gene, HLXB9, is the major locus for dominantly inherited sacral agenesis. Nat Genet. 1998;20(4):358-361.
11. Hock H, Shimamura A. ETV6 in hematopoiesis and leukemia predisposition. Semin Hematol. 2017;54(2):98-104.
12. Rawat VP, Cusan M, Deshpande A, et al. Ectopic expression of the homeobox gene Cdx2 is the transforming event in a mouse model of t(12;13)(p13;q12) acute myeloid leukemia. Proc Natl Acad Sci U S A. 2004;101(3):817-822.
13. Golub TR, Barker GF, Lovett M, Gilliland DG. Fusion of PDGF receptor beta to a novel ets-like gene, tel, in chronic myelomonocytic leukemia with t(5;12) chromosomal translocation. Cell. 1994;77(2):307-316.
14. Zelent A, Greaves M, Enver T. Role of the TEL-AML1 fusion gene in the molecular pathogenesis of childhood acute lymphoblastic leukaemia. Oncogene. 2004;23(24):4275-4283.
15. De Braekeleer E, Douet-Guilbert N, Morel F, Le Bris MJ, Basinko A, De Braekeleer M. ETV6 fusion genes in hematological malignancies: a review. Leuk Res. 2012;36(8):945-961.
16. Arabanian LS, Johansson P, Staffas A, et al. The endothelin
GSE182168, GSE202137 and GSE205698, and from PRIDE/ProteomeXchange, accession number PDXD034416. Further details and other data that support the findings of this study are available from the corresponding author upon request.
receptor type A is a downstream target of Hoxa9 and Meis1 in acute myeloid leukemia. Leuk Res. 2018;75:61-68.
17. Nilsson T, Waraky A, Ostlund A, et al. An induced pluripotent stem cell t(7;12) (q36;p13) acute myeloid leukemia model shows high expression of MNX1 and a block in differentiation of the erythroid and megakaryocytic lineages. Int J Cancer. 2022;151(5):770-782.
18. Zhang J, Zheng YG. SAM/SAH analogs as versatile tools for SAMdependent methyltransferases. ACS Chem Biol. 2016;11(3):583-597.
19. Kogan SC, Ward JM, Anver MR, et al. Bethesda proposals for classification of nonlymphoid hematopoietic neoplasms in mice. Blood. 2002;100(1):238-245.
20. Ingenhag D, Reister S, Auer F, et al. The homeobox transcription factor HB9 induces senescence and blocks differentiation in hematopoietic stem and progenitor cells. Haematologica. 2019;104(1):35-46.
21. Ragusa D, Ciciro Y, Federico C, et al. Engineered model of t(7;12)(q36;p13) AML recapitulates patient-specific features and gene expression profiles. Oncogenesis. 2022;11(1):50.
22. Biechonski S, Yassin M, Milyavsky M. DNA-damage response in hematopoietic stem cells: an evolutionary trade-off between blood regeneration and leukemia suppression. Carcinogenesis. 2017;38(4):367-377.
23. Copley MR, Babovic S, Benz C, et al. The Lin28b-let-7-Hmga2 axis determines the higher self-renewal potential of fetal haematopoietic stem cells. Nat Cell Biol. 2013;15(8):916-925.
24. Balgobind BV, Van den Heuvel-Eibrink MM, De Menezes RX, et al. Evaluation of gene expression signatures predictive of cytogenetic and molecular subtypes of pediatric acute myeloid leukemia. Haematologica. 2011;96(2):221-230.
25. Okeyo-Owuor T, Li Y, Patel RM, et al. The efficiency of murine MLL-ENL-driven leukemia initiation changes with age and peaks during neonatal development. Blood Adv. 2019;3(15):2388-2399.
26. Ugale A, Norddahl GL, Wahlestedt M, et al. Hematopoietic stem cells are intrinsically protected against MLL-ENL-mediated transformation. Cell Rep. 2014;9(4):1246-1255.
27. Rowe RG, Lummertz da Rocha E, Sousa P, et al. The developmental stage of the hematopoietic niche regulates lineage in MLL-rearranged leukemia. J Exp Med. 2019;216(3):527-538.
28. Copley MR, Eaves CJ. Developmental changes in hematopoietic stem cell properties. Exp Mol Med. 2013;45(11):e55.
29. Manesia JK, Xu Z, Broekaert D, et al. Highly proliferative primitive fetal liver hematopoietic stem cells are fueled by oxidative metabolic pathways. Stem Cell Res. 2015;15(3):715-721.
30. Bowie MB, Kent DG, Dykstra B, et al. Identification of a new intrinsically timed developmental checkpoint that reprograms key hematopoietic stem cell properties. Proc Natl Acad Sci U S A. 2007;104(14):5878-5882.
31. Chen C, Yu W, Tober J, et al. Spatial genome re-organization between fetal and adult hematopoietic stem cells. Cell Rep. 2019;29(12):4200-4211.
32. Wildenhain S, Ruckert C, Rottgers S, et al. Expression of cellcell interacting genes distinguishes HLXB9/TEL from MLL-positive childhood acute myeloid leukemia. Leukemia.
Haematologica | 109 - March 2024 738 ARTICLE - Aberrant MNX1 expression with t(7;12)(q36;p13) in pediatric AML A. Waraky et al.
2010;24(9):1657-1660.
33. Inomata K, Aoto T, Binh NT, et al. Genotoxic stress abrogates renewal of melanocyte stem cells by triggering their differentiation. Cell. 2009;137(6):1088-1099.
34. Mandal PK, Rossi DJ. DNA-damage-induced differentiation in hematopoietic stem cells. Cell. 2012;148(5):847-848.
35. Beerman I, Bhattacharya D, Zandi S, et al. Functionally distinct hematopoietic stem cells modulate hematopoietic lineage potential during aging by a mechanism of clonal expansion. Proc Natl Acad Sci U S A. 2010;107(12):5465-5470.
36. Cho RH, Sieburg HB, Muller-Sieburg CE. A new mechanism for the aging of hematopoietic stem cells: aging changes the clonal composition of the stem cell compartment but not individual stem cells. Blood. 2008;111(12):5553-5561.
37. Scheffold A, Baig AH, Chen Z, et al. Elevated Hedgehog activity contributes to attenuated DNA damage responses in aged hematopoietic cells. Leukemia. 2020;34(4):1125-1134.
38. Kaiser P. Methionine dependence of cancer. Biomolecules. 2020;10(4):568.
39. Sanderson SM, Gao X, Dai Z, Locasale JW. Methionine
metabolism in health and cancer: a nexus of diet and precision medicine. Nat Rev Cancer. 2019;19(11):625-637.
40. Wang J, Abate-Shen C. The MSX1 homeoprotein recruits G9a methyltransferase to repressed target genes in myoblast cells. PLoS One. 2012;7(5):e37647.
41. Wang J, Kumar RM, Biggs VJ, et al. The Msx1 homeoprotein recruits polycomb to the nuclear periphery during development. Dev Cell. 2011;21(3):575-588.
42. Sun M-A, Ralls S, Wu W, et al. Homeobox transcription factor MNX1 is crucial for restraining the expression of pan-neuronal genes in motor neurons. BioRxiv. 2021 Aug 7. doi: https://doi.org/10.1101/2021.08.07.455331 [preprint, not peerreviewed].
43. Leotta CG, Federico C, Brundo MV, Tosi S, Saccone S. HLXB9 gene expression, and nuclear location during in vitro neuronal differentiation in the SK-N-BE neuroblastoma cell line. PLoS One. 2014;9(8):e105481.
44. Dalgin G, Ward AB, Hao le T, Beattie CE, Nechiporuk A, Prince VE. Zebrafish mnx1 controls cell fate choice in the developing endocrine pancreas. Development. 2011;138(21):4597-4608.
Haematologica | 109 - March 2024 739 ARTICLE - Aberrant MNX1 expression with t(7;12)(q36;p13) in pediatric AML A. Waraky et al.
Genomic breakpoint-specific monitoring of measurable residual disease in pediatric non-standard-risk acute myeloid leukemia
Margarita Maurer-Granofszky,1,2* Stefan Köhrer,1,2* Susanna Fischer,1,2 Angela Schumich,1 Karin Nebral,1,2 Patrizia Larghero,3 Claus Meyer,3 Astrid Mecklenbräuker,1,2 Nora Mühlegger,1 Rolf Marschalek,3 Oskar A. Haas,1 Renate Panzer-Grümayer1 and Michael N. Dworzak1,2,4
1St. Anna Children´s Cancer Research Institute (CCRI), Vienna, Austria; 2Labdia Labordiagnostik, Vienna, Austria; 3Institute of Pharmaceutical Biology/Diagnostic Center of Acute Leukemia (DCAL), Goethe University, Frankfurt/Main, Germany and 4St. Anna Children’s Hospital, Department of Pediatrics, Medical University of Vienna, Vienna, Austria
*MMG and SK contributed equally as first authors.
Abstract
Correspondence: M.N. Dworzak dworzak@stanna.at
Received: November 16, 2022.
Accepted: June 15, 2023.
Early view: June 22, 2023.
https://doi.org/10.3324/haematol.2022.282424
©2024 Ferrata Storti Foundation
Published under a CC BY-NC license

Pediatric acute myeloid leukemia (AML) is a highly heterogeneous disease making standardized measurable residual disease (MRD) assessment challenging. Currently, patient-specific DNA-based assays are only rarely applied for MRD assessment in pediatric AML. We tested whether quantification of genomic breakpoint-specific sequences via quantitative polymerase chain reaction (gDNA-PCR) provides a reliable means of MRD quantification in children with non-standardrisk AML and compared its results to those obtained with state-of-the-art ten-color flow cytometry (FCM). Breakpointspecific gDNA-PCR assays were established according to Euro-MRD consortium guidelines. FCM-MRD assessment was performed according to the European Leukemia Network guidelines with adaptations for pediatric AML. Of 77 consecutively recruited non-standard-risk pediatric AML cases, 49 (64%) carried a chromosomal translocation potentially suitable for MRD quantification. Genomic breakpoint analysis returned a specific DNA sequence in 100% (41/41) of the cases submitted for investigation. MRD levels were evaluated using gDNA-PCR in 243 follow-up samples from 36 patients, achieving a quantitative range of at least 10-4 in 231/243 (95%) of samples. Comparing gDNA-PCR with FCM-MRD data for 183 bone marrow follow-up samples at various therapy timepoints showed a high concordance of 90.2%, considering a cut-off of ≥0.1%. Both methodologies outperformed morphological assessment. We conclude that MRD monitoring by gDNA-PCR is feasible in pediatric AML with traceable genetic rearrangements and correlates well with FCM-MRD in the currently applied clinically relevant range, while being more sensitive below that. The methodology should be evaluated in larger cohorts to pave the way for clinical application.
Introduction
Acute myeloid leukemia (AML) is the second most frequent leukemia entity in children and adolescents, and the most aggressive variant. Despite refinement of therapeutic approaches, about 35% of pediatric patients with AML still suffer from relapse.1-4 State-of-the-art clinical trial protocols rely on risk-adapted treatment to maximize outcome while minimizing therapy-related side effects. Currently, pediatric AML patients are stratified according to the presence of specific chromosomal and/or molecular aberrations into standard-, intermediate- and high-risk groups, each characterized by distinct overall survival and relapse rates. However, due to the highly heterogeneous
nature of the disease, outcomes vary substantially even among patients of the same risk group.5-8 Thus, there is an urgent need for novel diagnostic tools to improve AML risk stratification. In addition to the genetic stratification, the precise monitoring of treatment response at the submicroscopic level, also referred to as measurable residual disease (MRD) assessment, has been proven crucial for the identification of AML patients at risk of relapse and represents an essential tool in the post-induction decision-making process.9-14 It is now widely accepted that sole reliance on morphological complete remission is insufficient to determine relapse risk for individual patients.15-17
Different techniques are available for MRD assessment in
Haematologica | 109 March 2024 740 ARTICLE - Acute Myeloid Leukemia
pediatric AML, of which quantitative RNA-based polymerase chain reaction (RT-PCR) analysis of specific gene fusions as well as multiparameter flow cytometry (FCM) are the only methods routinely used in a clinical setting.14,17 Validated molecular MRD targets for RT-PCR in AML include PML::RARA, the core-binding factor (CBF) translocations CBFB::MYH11 and RUNX1::RUNX1T1, and mutations in NPM1. Despite their straightforward implementation in the diagnostic workflow, RT-PCR-based MRD methodologies have two major disadvantages. First, RT-PCR relies on transcript levels rather than cell number as a surrogate for leukemia cell burden, which prohibits precise MRD quantification. Second, only a handful of targets are currently used for MRD assessment by RT-PCR, among which aberrations typically found in intermediate- and high-risk patients are particularly underrepresented. In contrast, multicolor FCM is applicable in more than 90% of pediatric AML patients10,14,18 and is therefore currently the method of choice for response assessment in most clinicals trials.9,11,13-15
DNA-based PCR assays utilizing patient-specific genomic breakpoint sequences are only rarely applied to assess treatment response in AML, despite their widespread use for MRD quantification in acute lymphoblastic leukemia based on immunoglobulin/T-cell receptor or KMT2A rearrangements (KMT2Ar). Advantages of DNA-based assays are the more accurate quantification of MRD levels as a surrogate of cell number due to the allele-specific nature of the assay and the highly standardized interpretation of results.19,20 Furthermore, superior stability of DNA allows for reliable MRD quantification even after cross-country shipment of samples and the patient-specific quantification reduces risk of intra-laboratory sample contamination to a minimum.
In the present study, our aim was to determine the feasibility of using genomic breakpoint-specific MRD quantification to monitor treatment response in intermediateand high-risk subtypes of pediatric AML prospectively in a routine clinical setting. To this end we also compared the performance of the genomic DNA (gDNA)-based MRD assessment with ten-color FCM-based MRD detection as well as with cytomorphological evaluation by experienced hematologists.
Methods
Patients and samples
Sampling and research were approved by the local Ethics Committee, and informed consent was obtained from patients, patients’ parents or legal guardians according to the Declaration of Helsinki. Morphology and general genetic data were retrieved from the Austrian pediatric AMLBerlin-Frankfurt Münster (BFM) registry.
We used bone marrow (BM; n=206) and peripheral blood (PB; n=37) samples from 41 pediatric patients with AML recruited between 2013 and 2022 (recruitment details in Online Supplementary Figure S1; patients’ characteristics in Online Supplementary Table S1). All 41 patients had nonstandard-risk AML (i.e., intermediate risk or high risk) according to the therapy protocol valid at that time, relapsed AML, secondary AML or mixed phenotype leukemias with dominant myeloid lineage. Patients were treated according to protocols AML-BFM 2004,21 AML-BFM 2012,22 or IBFM Relapsed AML 2001/01.23 For comparison of gDNA-PCR and FCM-MRD only data from BM samples were used. In total, 183 follow-up samples from 36 patients at various timepoints during or after therapy were available (Online Supplementary Table S2). For details on the French-American-British (FAB) or genetic classification see Online Supplementary Tables S1 and S3, respectively.
Chromosomal breakpoint characterization and MRD assessment via quantitative PCR
Mononuclear cells were isolated from BM or PB at AML diagnosis or follow-up timepoints using Ficoll® densitygradient separation followed by isolation of gDNA via the QIAmp Blood Mini Kit (Qiagen, Hilden, Germany) according to the manufacturer’s instructions. The isolated diagnostic DNA was then sent for breakpoint characterization and sequence analysis to the Diagnostic Center of Acute Leukemia at the Goethe University of Frankfurt/Main. Based on the identified sequence a chromosomal breakpoint-specific qPCR-assay, consisting of forward/reverse primers and a fluorescently labeled Taqman® probe, was designed. To ensure optimal sensitivity and specificity of our assays the primers and probes were designed according to the following qPCR guidelines. Probe: annealing temperature ~67-70°C; length ~18-34 bp (ideally covering the breakpoint); fluorescent labels 5´FAM and 3´TAMRA. Primer: annealing temperature ~10°C below the annealing temperature of the probe; length 18-30 bp; amplicon length 150-550 bp. As a general principle, probe position was aimed closer to the 3’ end of the amplicon than to the 5’ end.
MRD quantification and data interpretation of follow-up samples were performed according to the EuroMRD guidelines for MRD assessment via real-time quantitative PCR.24 Briefly, for each PCR reaction 500 ng of DNA, corresponding to approximately 105 cells, were used. To assess sensitivity and linearity of the individual PCR assays reliably, each MRD quantification in follow-up samples included a standard curve of serially diluted diagnostic BM from the respective patients. To identify unspecific PCR amplifications each analysis also included control reactions consisting of a DNA mixture from PB mononuclear cells from at least five healthy donors.
Haematologica | 109 March 2024 741 ARTICLE - gDNA-based MRD monitoring in pediatric AML M. Maurer-Granofszky et al.
FCM-MRD monitoring
The samples were stained using a dual tube approach with customized dried format antibody cocktail tubes (DuraCloneTM, Beckman Coulter, Brea, CA, USA). The approach allows for MRD detection in AML by immunophenotype as well as by different-from-normal assessment. Both tubes contain eight fluorochrome-conjugated antibodies of which five are shared by both tubes (“backbone markers”: CD34, CD117, CD33, HLA-DR and CD45). The “leukemia-associated immunophenotype tube” consisted additionally of antibodies against CD11b/CD14/CD15 plus two patient-specific drop-in markers in the phycoerythrin and allophycocyanin channels. The “colony formation unit tube” consisted of antibodies to CD38/CD45RA/CD123 in addition to the backbone markers. CD371 and CD99 were used as fixed drop-in markers in this tube. For full details
on antibodies see Online Supplementary Table S4 Patient-specific markers (drop-ins) for optimal discrimination of leukemic blasts from normal regenerating cells were determined at the time of diagnosis and used in the follow-up for MRD detection and quantification.14 As patient-specific drop-in markers against antigens aberrantly expressed by AML blasts, we used antibodies to either lymphoid antigens (CD2, CD4, CD7, CD19, CD56) or other surface molecules (CD11a, CD13, CD48, CD71, CD99, NG2).14 Both tubes were run at initial diagnosis, and during follow-up using the best discriminating drop-in markers. Data files of diagnostic and follow-up samples were analyzed independently by at least two reviewers. Positive MRD was accepted in the case of a minimum of 50 clustered cellular events fulfilling at least two of the following criteria: (i) immature cell; (ii) resembling the initial leu-
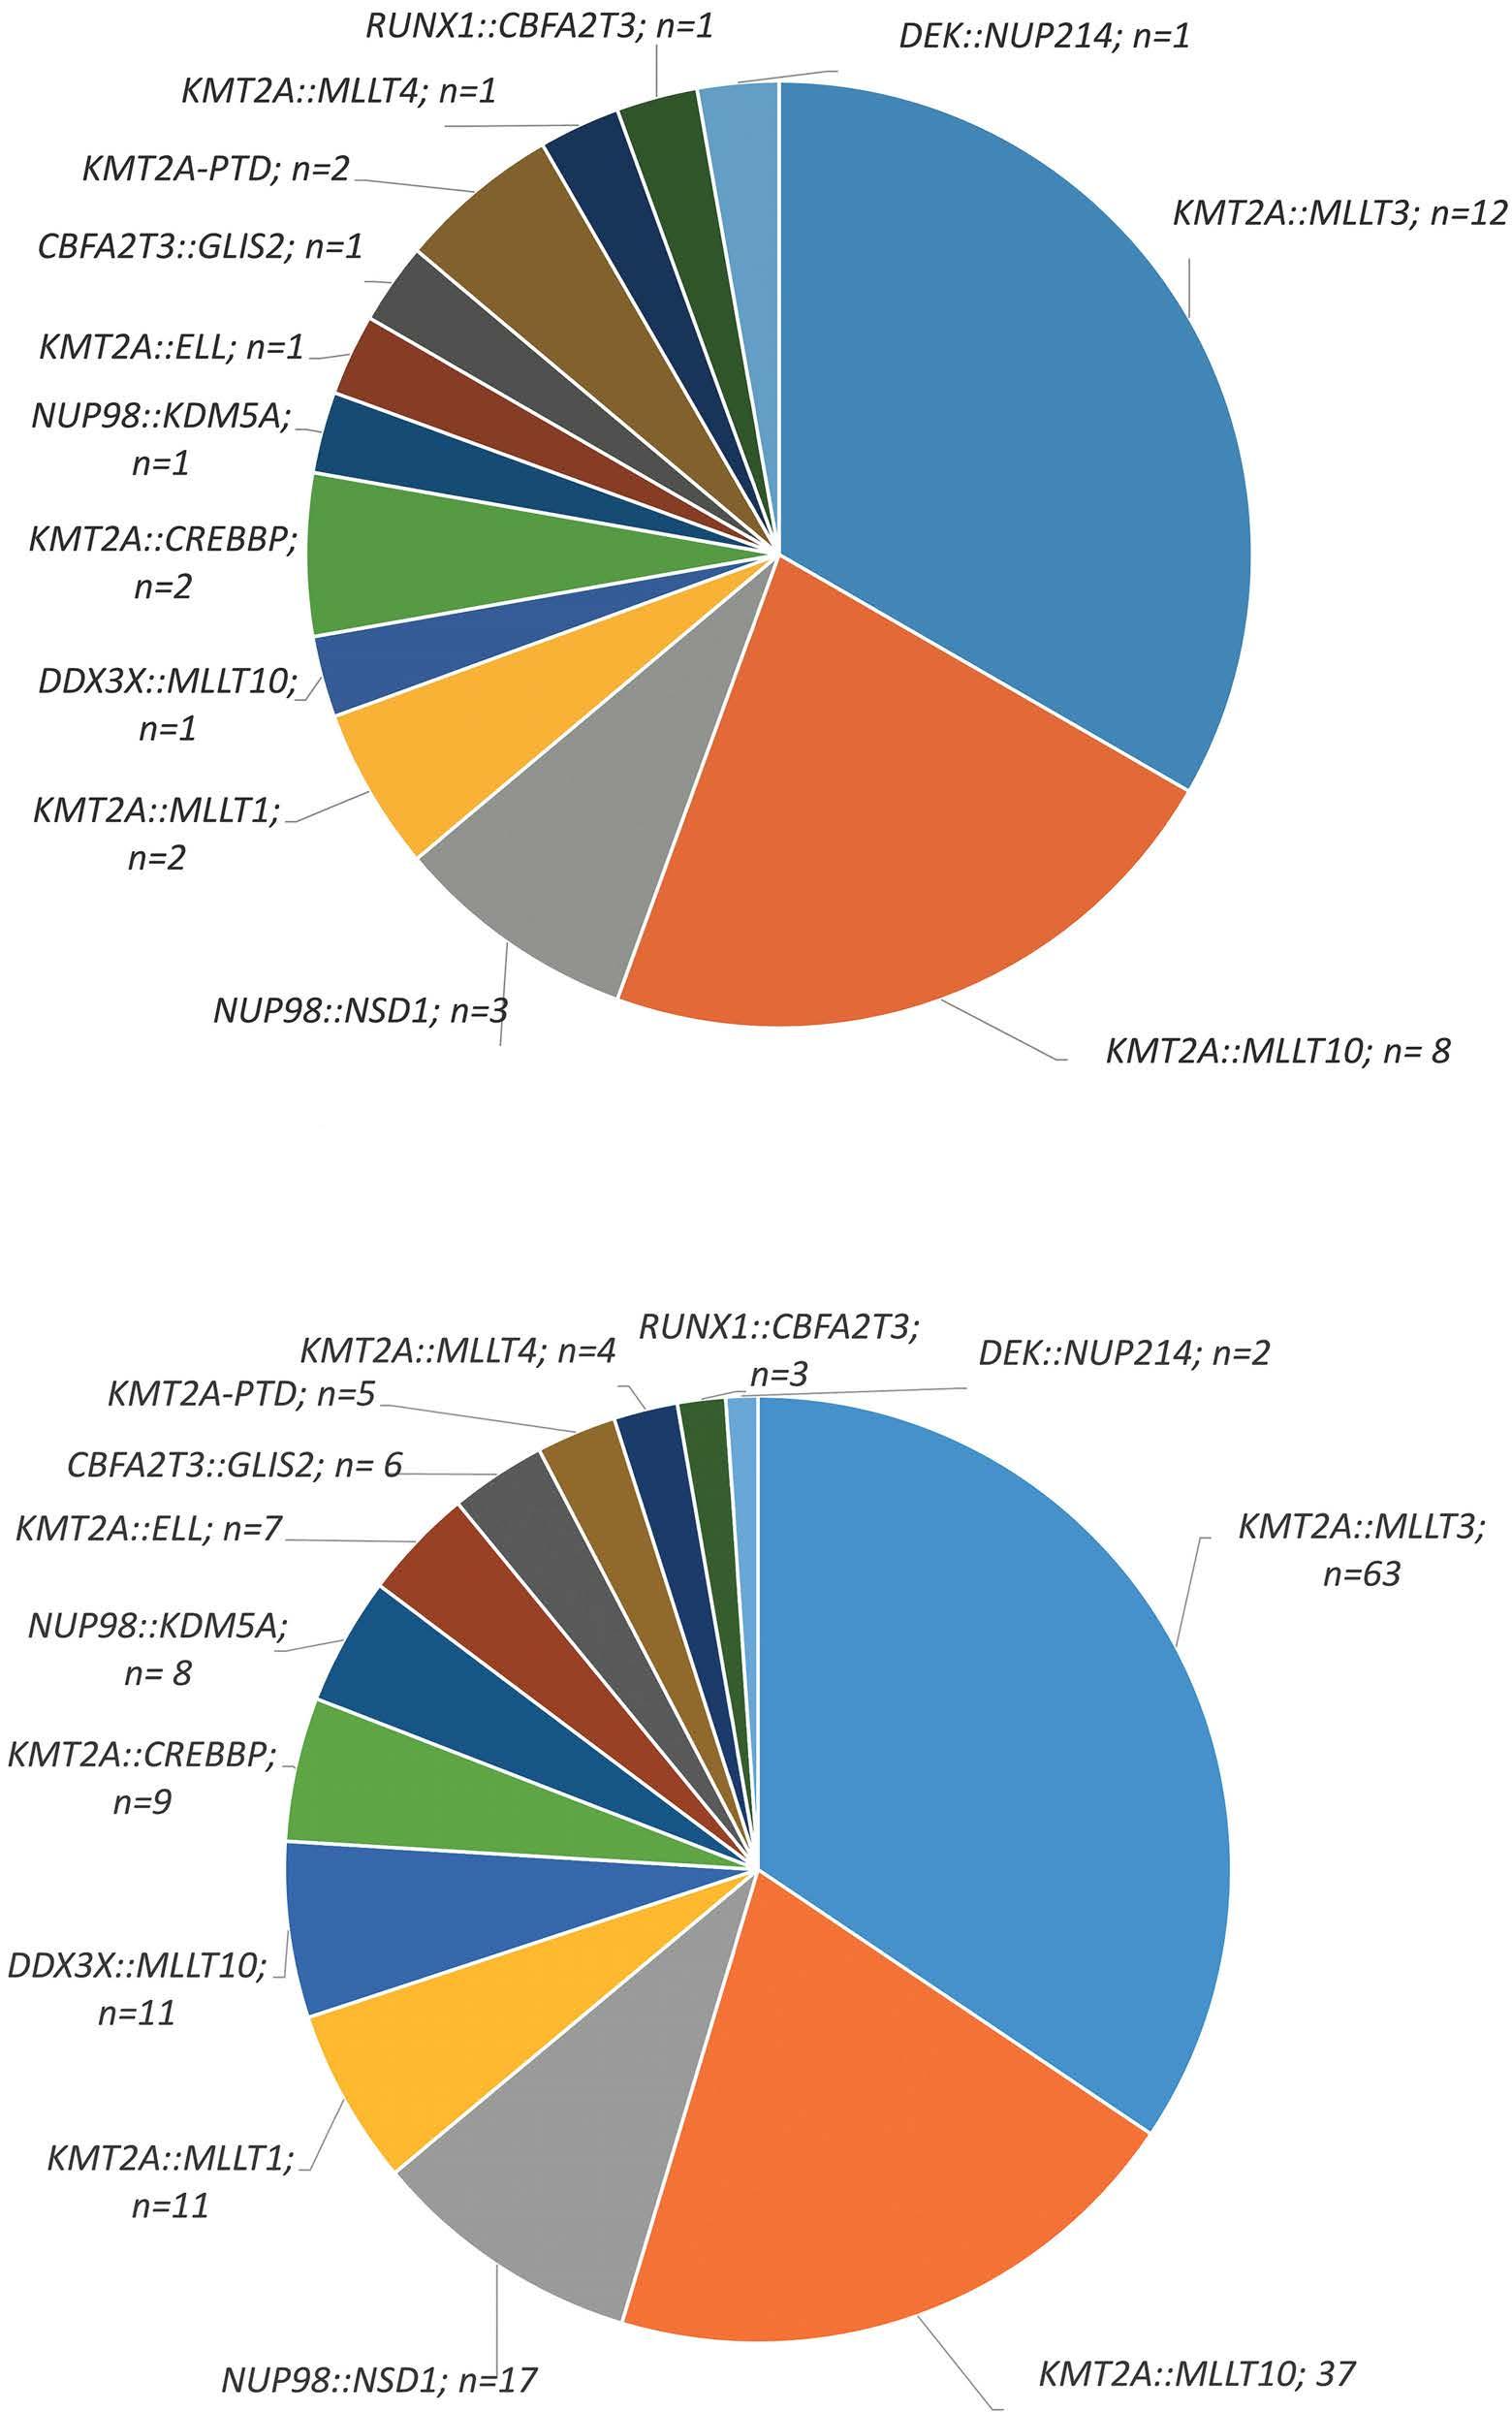
A B Haematologica | 109 March 2024 742 ARTICLE - gDNA-based MRD monitoring in pediatric AML M. Maurer-Granofszky et al.
Figure 1. Distribution of identified genomic breakpoint sequences. Distribution of the genomic breakpoint sequences that were identified among (A) patients (N=36) and (B) all follow-up samples (N=183) with matched genomic DNA polymerase chain reaction-based measurable residual disease (MRD) data and flow cytometry-based MRD data.
kemic immunophenotype determined at diagnosis, or (iii) unambiguously different from normal. If the blasts could not be clearly distinguished from normal cells and/or the number of blasts was below 50 clustered events, MRD was classified as ambiguous. Samples labeled as ambiguous were flagged but regarded as negative both in this study as well as for clinical trial stratification. MRD was calculated as the proportion of leukemic cells among CD45+ cells (the denominator).
Statistics
The statistical analysis was done using GraphPad Prism 8.3.0. and χ2 tests.
Results
Using gDNA-PCR methodology for MRD assessment in children with AML
Between 2013 and 2021, a total of 77 pediatric patients with non-standard-risk AML (n=58) and other cases at risk (n=19; including relapsed AML, secondary AML and mixed phenotype leukemias with dominant myeloid lineage) were recruited to the AML-BFM registry in Austria. It should be noted that 13 (22.4%) of the 58 non-standardrisk patients relapsed during the study but these were not counted twice in the relapsed AML group, hence, this term refers here only to patients enrolled in the study at relapse (i.e., with a de novo diagnosis before the start of the
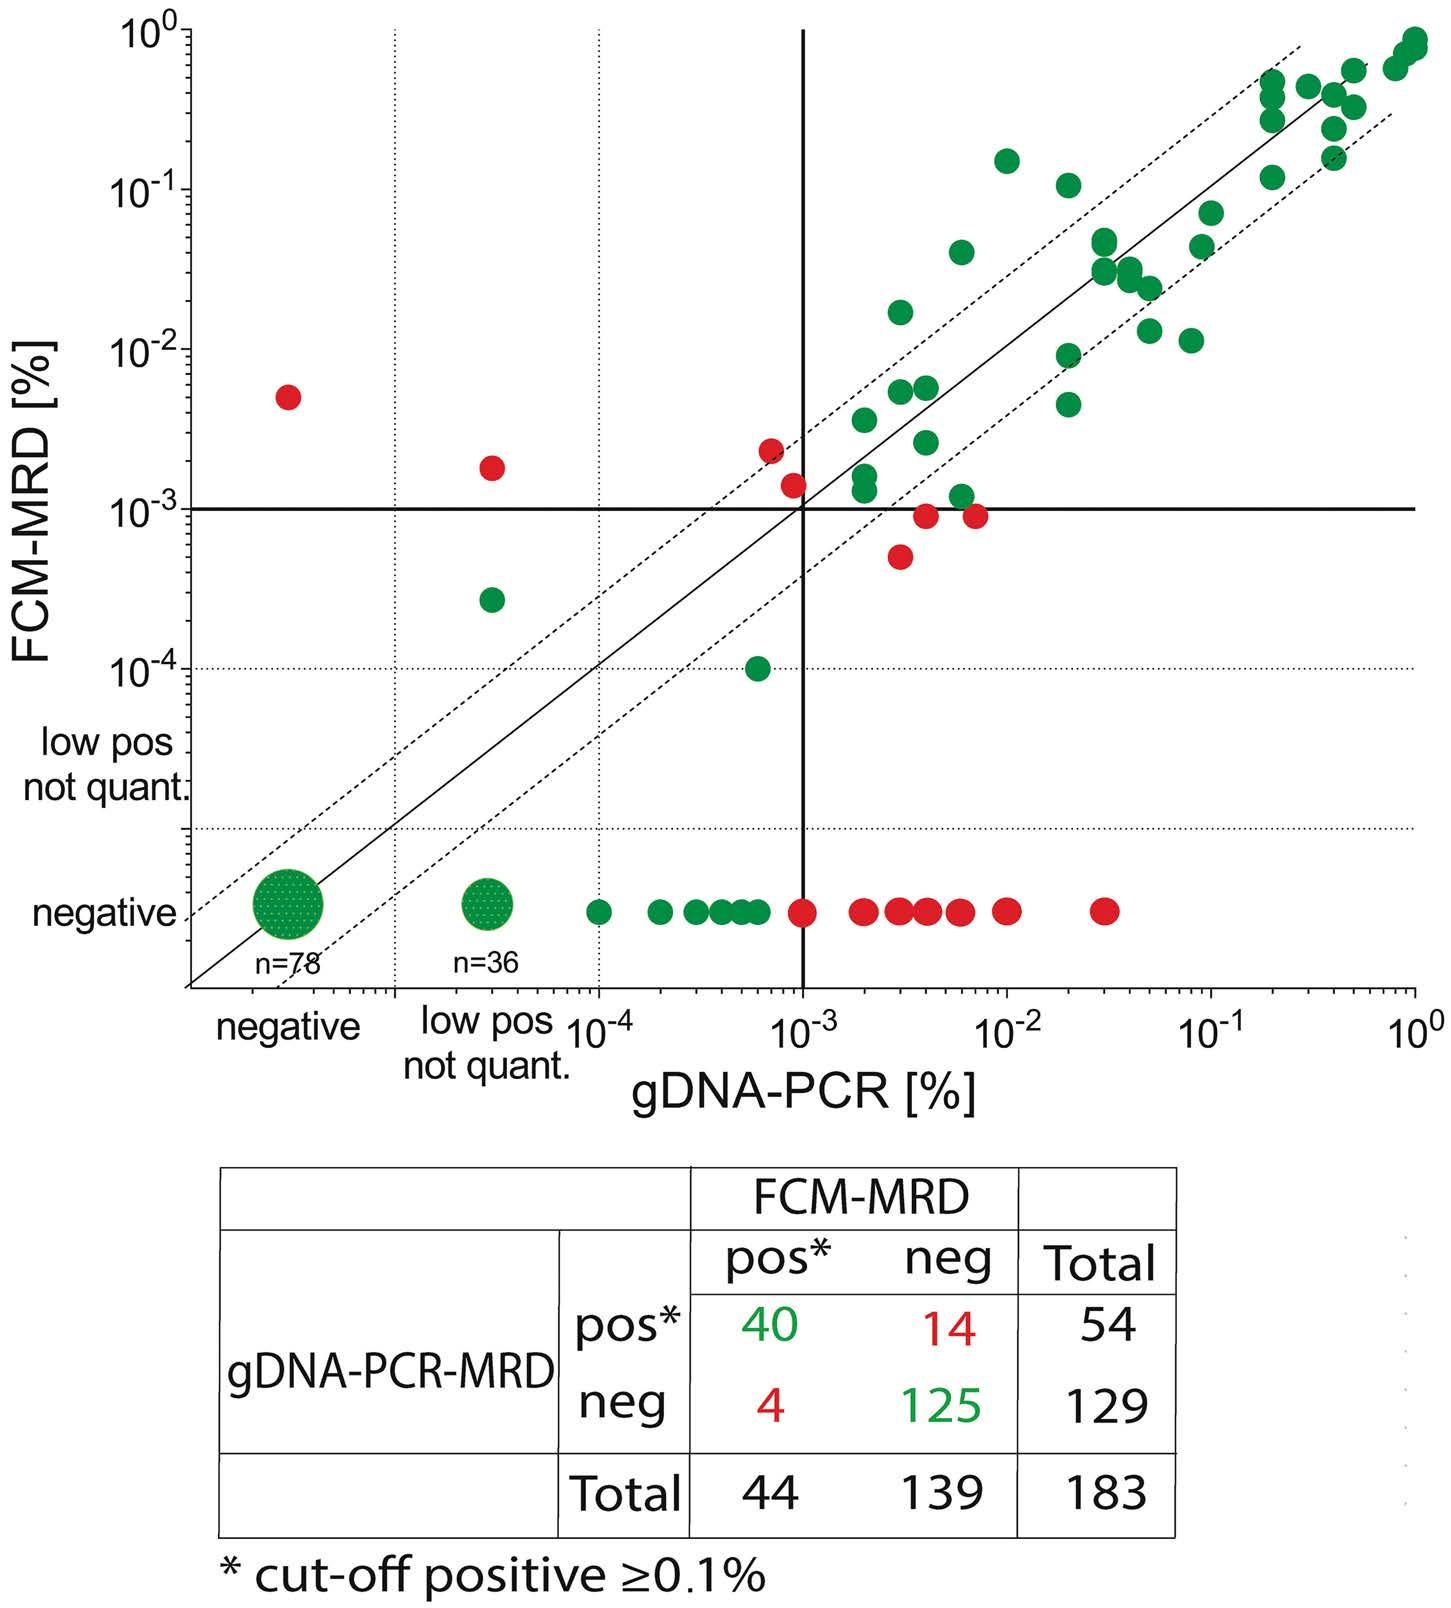
study or abroad).
Of the 77 cases, 49 harbored a recurrent gene fusion (63.6%) and were therefore eligible for breakpoint-specific MRD quantification. Focusing in an initial phase of the study only on cases of KMT2Ar AML, we excluded five otherwise eligible non- KMT2Ar cases in this early period. 25,26 Two further cases did not render sufficient material for the analysis and one patient died before treatment. Hence the specific genomic breakpoint was investigated in 41 patients and could be determined in all of them (100%) (Online Supplementary Figure S1). Details of the patients’ characteristics are summarized in Online Supplementary Table S1.
Based on the availability of at least one follow-up sample, we were able to apply the gDNA-PCR MRD methodology to 36 of the 41 patients (243 follow-up samples in total). No follow-up samples were received from five patients because of early death before follow-up assessment (n=4) or lack of samples due to clinician’s decision (n=1). In 226/243 (93%) of the analyses we achieved a quantitative range of 10-4 ; in 12 cases (5%) the quantitative range was 5x10⁻⁴ and in five cases (2%) it was 10-5 (Online Supplementary Figure S1).
From all 36 patients and from 183 follow-up samples (BM only; median: 5 [range 1-11] follow-up samples/patient), we had matching FCM-MRD data. The distribution of the genetic subtypes among those patients and samples is shown in Figure 1A, B and Online Supplementary Table S3.
Figure 2. Comparison of gDNA-PCR MRD and FCM-MRD. The plots are partitioned into four quadrants by the clinically relevant threshold of 0.1% (vertical and horizontal lines). Each symbol represents one MRD estimate. Values that are MRD-positive or MRD-negative considering the cut off of 0.1% using both methodologies are considered concordant (green dots), whereas PCRMRDneg/FCM-MRDpos and PCR-MRDpos/FCM-MRDneg values are considered discordant (red dots). In addition, dashed lines above/below the x=y line mark the range of variance according to Dworzak et al., 35 i.e. between 3x larger or smaller till 1/3 of the x=y value. Statistics performed using GraphPad Prism. gDNA: genomic DNA; PCR: polymerase chain reaction; MRD: measurable residual disease; FCM: flow cytometry.
Haematologica | 109 March 2024 743 ARTICLE - gDNA-based MRD monitoring in pediatric AML M. Maurer-Granofszky et al.
Concordance between gDNA-PCR and FCM-MRD data
To evaluate the performance of genomic breakpoint-specific MRD quantification we compared its results to the MRD levels obtained by the standard-of-care FCM assay in the aforementioned cohort of 183 follow-up samples. Overall, the concordance rate was 90.2% (165/183), when considering the clinically relevant cut-off of 0.1% (≥0.1%, MRD-positive; <0.1%, MRD-negative) (Figure 2, Table 1).
Only 4/183 (2.2%) were positive by FCM-MRD while being considered negative with gDNA-PCR. Three of these samples were positive by gDNA-PCR but below the
threshold of 0.1% (Table 1). There were more discordant samples with negative FCM-MRD but positive gDNA-PCR MRD values (14/183; 7.7%).
These 14 gDNA-PCRpos/FCM-MRDneg follow-up samples (Figure 2) were from 11 different patients (Table 1). Three of the 14 samples were positive with FCM-MRD but below the threshold of 0.1%. In seven samples no residual disease was found with FCM-MRD. The remaining four of these 14 samples were flagged as ambiguous by FCMMRD because cells resembling the initial phenotype were detected but no clear discrimination between
MRD: measurable residual disease; gDNA: genomic DNA; PCR: polymerase chain reaction; FCM: flow cytometry; FAB: French-American-British; d: day; FUP: follow-up; Ind: induction; Con: consolidation.
gDNA-PCRneg /FCM-MRDpos Patient Timepoint FAB subtype Genetic subtype PCR FCM MRD, % MRD result Cut-off ≥0.1% MRD, % MRD result Cut-off ≥0.1% P8 d15 M5 KMT2A::MLLT3 <0.01 pos not quantified negative 0.1800 positive positive Ind1 (d28) - - 0.0100 negative negative 0.5000 positive positive P24 Ind2 M7 NUP98::KDM5A 0.0900 positive negative 0.1040 positive positive P35 Ind1 (d21) M5 KMT2A::MLLT10 0.0700 positive negative 0.2300 positive positive gDNA-PCRpos/FCM-MRDneg Patient Timepoint FAB subtype Genetic subtype PCR FCM MRD, % MRD result Cut-off ≥0.1% MRD, % MRD result Cut-off ≥0.1% P2 FUP M7 KMT2A::MLLT3 0.6000 positive positive 0.0200 ambiguous negative P5 d15 M5 KMT2A::MLLT3 3.0000 positive positive 0.0010 negative negative P9 d15 M5a KMT2A::MLLT3 0.2000 positive positive 0.0010 negative negative P12 Ind1 (d28) M5a KMT2A::MLLT10 0.1000 positive positive 0.0010 negative negative P13 Ind1 (d28) M5 KMT2A::MLLT10 0.3000 positive positive 1.1400 ambiguous negative P15 Ind1 (d28) M5a KMT2A::MLLT1 0.3000 positive positive 0.0500 positive negative P23 Ind1 (d28) M2 KMT2A::ELL 0.7000 positive positive 0.0900 positive negative P25 Ind1 (d21) M5b KMT2A::MLLT3 0.2000 positive positive 0.0010 negative negative Ind1 (d28) - - 0.1000 positive positive 0.0010 negative negative P31 Con2 M7 KMT2A::MLLT4 0.4000 positive positive 0.0900 positive negative P32 FUP M2 NUP98::NSD1 0.3000 positive positive 0.0800 ambiguous negative P36 Ind1 (d21) M4 NUP98::NSD1 1.0000 positive positive 0.0500 ambiguous negative Ind2 - - 0.1000 positive positive 0.0010 negative negative Con1 - - 0.4000 positive positive 0.0010 negative negative
Table 1. Summary of cases with discrepant MRD votes between gDNA-PCR and FCM-MRD.
Haematologica | 109 March 2024 744 ARTICLE - gDNA-based MRD monitoring in pediatric AML M. Maurer-Granofszky et al.
blasts and regenerating cells was possible. Notably, in total 21/183 samples (11.5%) (from 14 different patients) were flagged as ambiguous with FCM-MRD, four of which were gDNA-PCRpos with MRD ≥ 0.1% and 11 were PCR-positive but <0.1%. Six further FCM-MRD ambiguous samples were negative with gDNA-PCR (no threshold).
When no threshold was applied, overall concordance dropped to 68.9%, with most of the discordant samples
being positive with gDNA-PCR and negative with FCMMRD (56/183; 30.6%) ( Online Supplementary Tables S5 and S6 ). Of those 56 gDNA-PCR pos samples, 36 were positive but not quantifiable (value below the quantitative range but above the sensitivity range). The PCRMRD values of the 20 remaining discordant samples were lower than those called positive by both methodologies (median: 0.1% [0.003-3%] vs. 3% [0.01-100%]), indicating a higher sensitivity of the gDNA-PCR
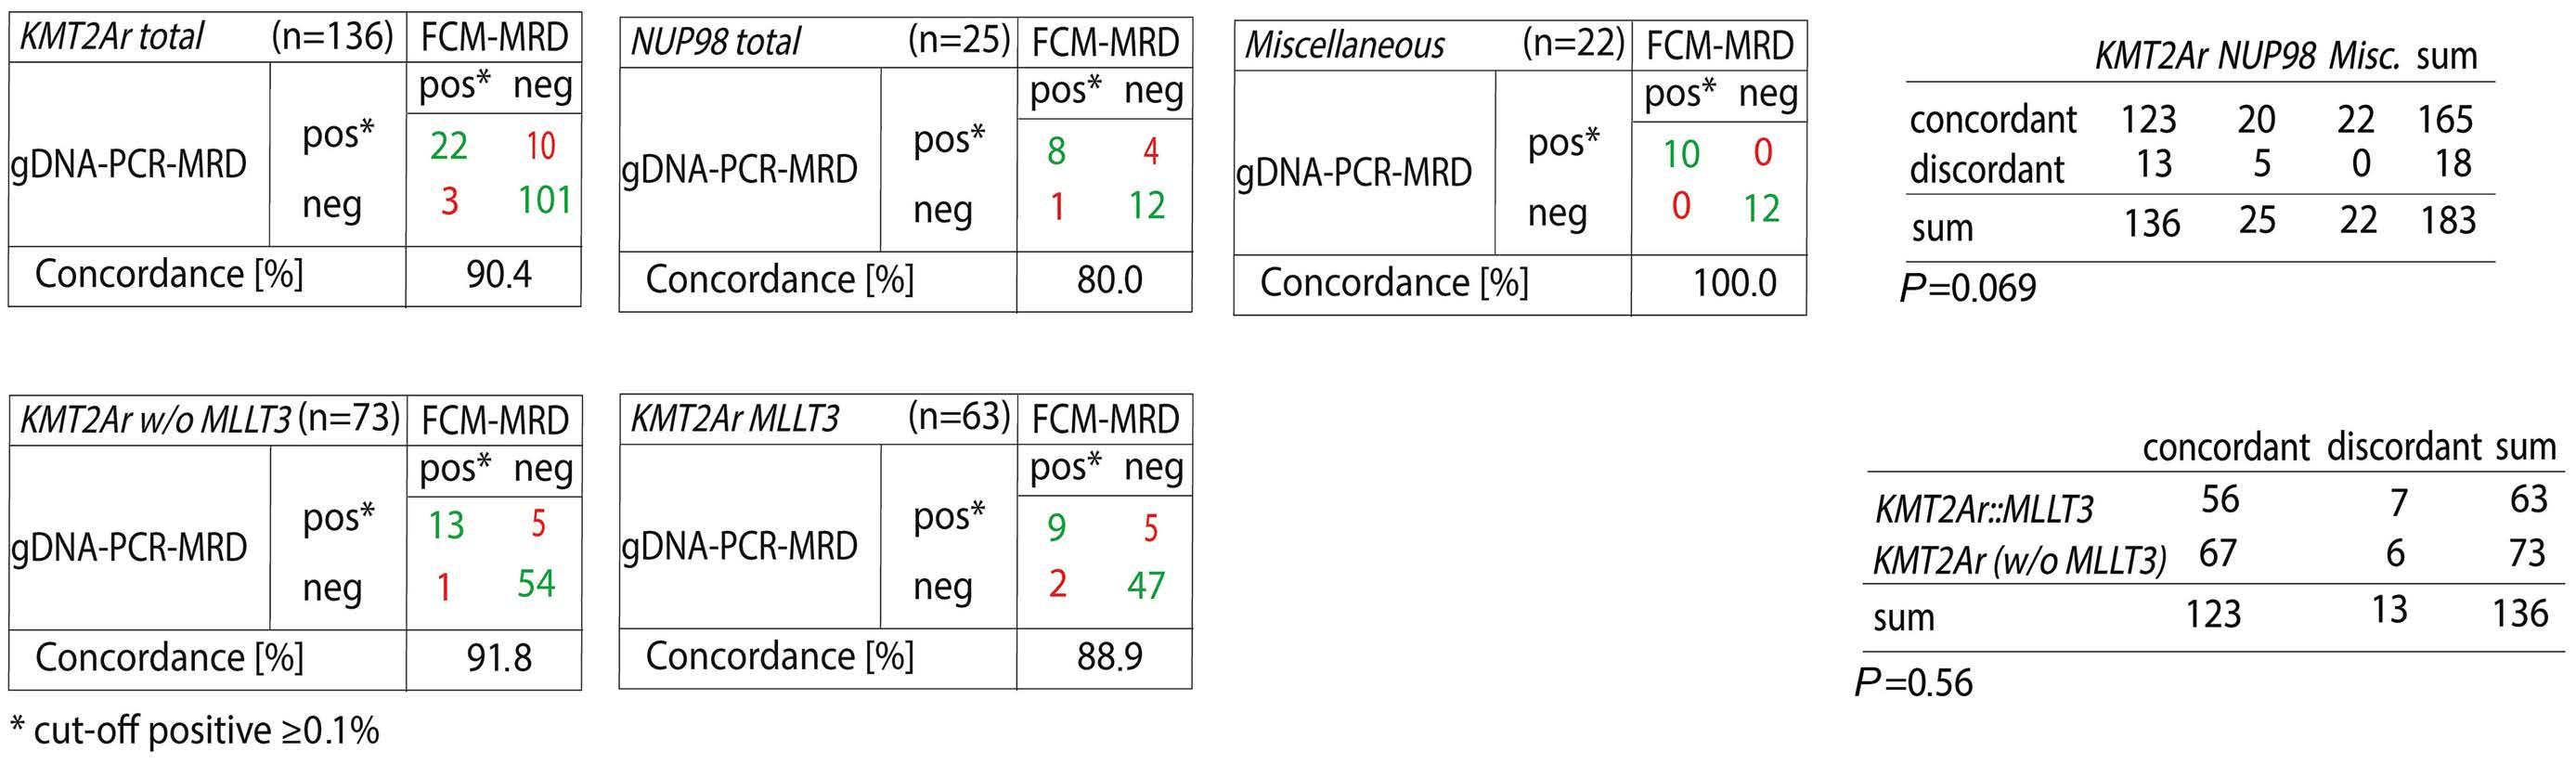
3.
MRD and FCM-MRD based on genetic subtype. A threshold of ≥0.1% was used to define positivity. (A) Genetic subtypes were summarized in three major groups. All cases with KMT2A rearrangements were summarized in the group “KMT2Ar”, those with NUP98 gene fusions in the group “NUP98” and all cases with other aberrations in the group “Miscellaneous”; P=0.069 (not statistically significant). (B) Concordance of gDNA-PCR MRD and FCM-MRD in the KMT2Ar group excluding MLLT3 cases (left) and in the KMT2A::MLLT3 group only (right); P=0.56 (not statistically significant). gDNA: genomic DNA; PCR: polymerase chain reaction; MRD: measurable residual disease; FCM: flow cytometry; w/o: without.
A
Genetic subtype Total N of samples PCRpos/FCMpos N PCRneg /FCMneg N PCRpos/FCMneg N PCRneg /FCMpos N Concordance % All 183 125 40 14 4 90.2 KMT2A::MLLT3 63 47 9 5 2 88.9 KMT2A::MLLT10 37 31 3 2 1 91.9 NUP98::NSD1 17 12 1 4 0 76.5 KMT2A::MLLT1 11 8 2 1 0 90.9 DDX3X::MLLT10 11 5 6 0 0 100.0 KMT2A::CREBBP 9 6 3 0 0 100.0 NUP98::KMD5A 8 0 7 0 1 87.5 KMT2A::ELL 7 4 2 1 0 85.7 CBFA2T3::GLIS2 6 4 2 0 0 100.0 KMT2A-PTD 5 4 1 0 0 100.0 KMT2A::MLLT4 4 1 2 1 0 75.0 RUNX1::CBFA2T3 3 1 2 0 0 100.0 DEK::NUP214 2 2 0 0 0 100.0
Figure
Comparison of gDNA-PCR
B
Table 2. Concordance of gDNA-PCR MRD and FCM-MRD data based on genetic subtype. A threshold of ≥0.1% was used to define positivity.
Haematologica | 109 March 2024 745 ARTICLE - gDNA-based MRD monitoring in pediatric AML M. Maurer-Granofszky et al.
gDNA: genomic DNA; PCR: polymerase chain reaction; MRD: measurable residual disease; FCM: flow cytometry; PTD: partial tandem duplication.
methodology compared to the FCM-MRD assay applied. Next, we compared the concordance of the two methodologies with respect to different genetic (Figure 3, Online Supplementary Figure S2, Table 2, Online Supplementary Table S5) as well as morphological (FAB) subtypes (Figure 4, Online Supplementary Figure S3, Table 3, Online Supplementary Table S6). Due to the low number of some genetic subtypes, we divided the samples according to their genomic aberrations into three groups: KMT2Ar (n=136), NUP98 (n=25) and miscellaneous (n=22) (Figure 3A).
We observed the highest concordance rates in the miscellaneous and KMT2Ar groups with, respectively, 100% and 90.4% concordance of samples with the two meth-
odologies. A lower concordance (80%) was found in the NUP98 subgroup. However, the difference in concordance between the three groups did not reach statistical significance (P=0.069). Within the KMT2Ar group, the KMT2A::MLLT3 samples, which constituted the single most frequent genetic subtype (n=63), and the remaining KMT2Ar samples (n=73) also exhibited similar concordance rates (88.9% and 91.8%, respectively; P=0.56, ns) (Figure 3B). Without the threshold, no significant difference between genetic subtypes was unveiled (Online Supplementary Figure S2).
In some FAB subtypes the concordance was lower than in others (Table 3). Those with lower concordance were FAB subtypes presenting with maturation (M2, M4).
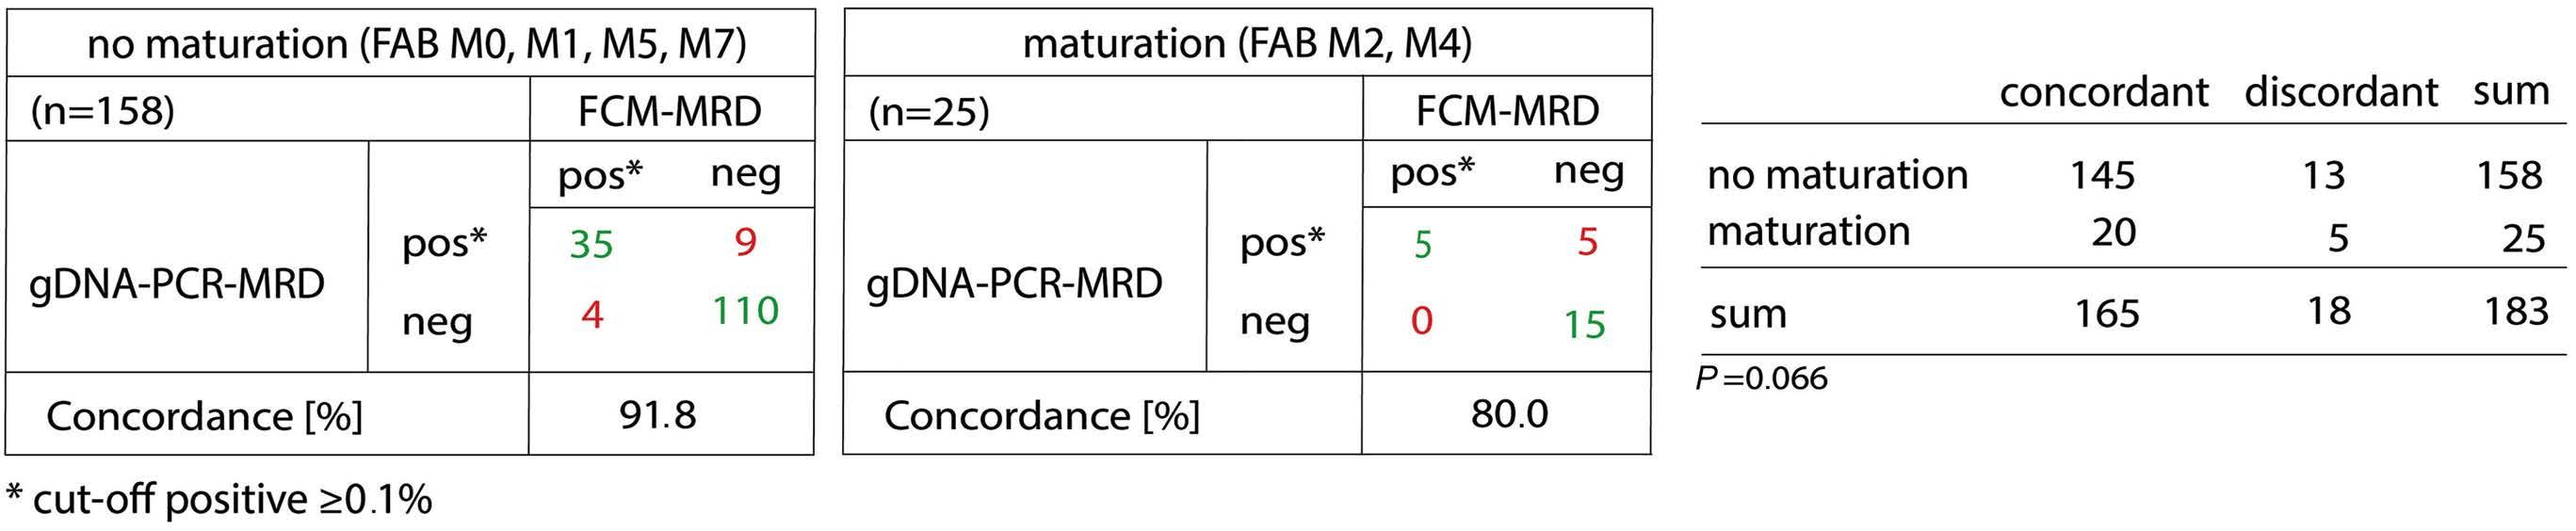
on FAB classification. A threshold of ≥0.1% was used to define MRD positivity.
of gDNA-PCR MRD and FCM-MRD (P=0.066). Statistical analysis was done using GraphPad Prism 8.3.0 and χ2 tests. gDNA: genomic DNA; PCR: polymerase chain reaction; MRD: measurable residual disease; FCM: flow cytometry; FAB: French-American-British.
gDNA: genomic DNA; PCR: polymerase chain reaction; MRD: measurable residual disease; FCM: flow cytometry; FAB: French-American-British; NA: not available.
Figure 4. Comparison of gDNA-PCR MRD and FCM-MRD based
The presence of maturation leads to reduced concordance
FAB subtype Total N of samples PCRpos/FCMpos N PCRneg /FCMneg N PCRpos/FCMneg N PCRneg /FCMpos N Concordance % All 183 40 125 14 4 90.2 M0 7 2 5 0 0 100.0 M1 5 2 3 0 0 100.0 M2 16 3 11 2 0 87.5 M3 0 NA NA NA NA NA M4 9 2 4 3 0 66.7 M5a/b 114 12 92 7 3 91.2 M6 0 NA NA NA NA NA M7 32 19 10 2 1 90.6 With maturation (FAB M2, M4) 25 5 15 5 0 80.0 Without maturation (all others) 158 35 110 9 4 91.8
Table 3. Concordance of gDNA-PCR MRD and FCM-MRD data based on FAB subtype. A threshold of ≥0,1% was used to define positivity.
Haematologica | 109 March 2024 746 ARTICLE - gDNA-based MRD monitoring in pediatric AML M. Maurer-Granofszky et al.
When we summarized FAB subtypes without (M0, M1, M5, M7) and with (M2, M4) maturation the concordance was 91.8% and 80%, respectively ( P =0.066) (Figure 4).
When using no threshold, this difference was even more obvious ( P =0.0039) ( Online Supplementary Figure S3).
Comparison of the gDNA-PCR and FCM-MRD methodologies with standard morphological assessment
We compared gDNA-PCR and FCM-MRD technologies with expert-based morphological assessment (n=177 samples with triple data).
When no threshold was applied (Figure 5), 44.6% (79/177) of all samples were found to be gDNAPCR pos /morphology neg and 16.3% (26/177) positive only with FCM-MRD but not by morphological assessment. All 26 FCM-MRD pos /morphology neg samples were also gDNA-PCR pos . Only 20 (11.3%) and 17 (9.6%) of the 177 samples were double-positive by one of the MRD technologies and morphology, respectively. Together, these results suggest that both MRD technologies are much more sensitive than morphological assessment ( P =0.0037) .
Discussion
In this study we aimed to provide proof of principle for the feasibility of using genomic-breakpoint specific MRD quantification for treatment-response assessment in pediatric patients with intermediate- and high-risk AML. gDNA-based MRD assessment is a three-step process consisting of target identification, qPCR-assay design and MRD quantification in follow-up samples. This makes breakpoint-specific MRD assessment inherently more complex than FCM- or fusion transcript-specific quantification, which rely on disease-specific rather than patientspecific markers to quantify leukemic cells. However, despite this complexity we were able to obtain target sequences in 100% of samples that were sent for sequencing analysis. Subsequent PCR-primer and -probe design yielded MRD assays with excellent performance characteristics for all patients with available follow-up samples. Indeed, in 93% of all analyzed samples we were able to reach a quantitative range of at least 10-4. This corresponds to the experience with breakpoint-specific MRD quantification in acute lymphoblastic leukemia, in which KMT2Ar-specific target sequences regularly result in MRD
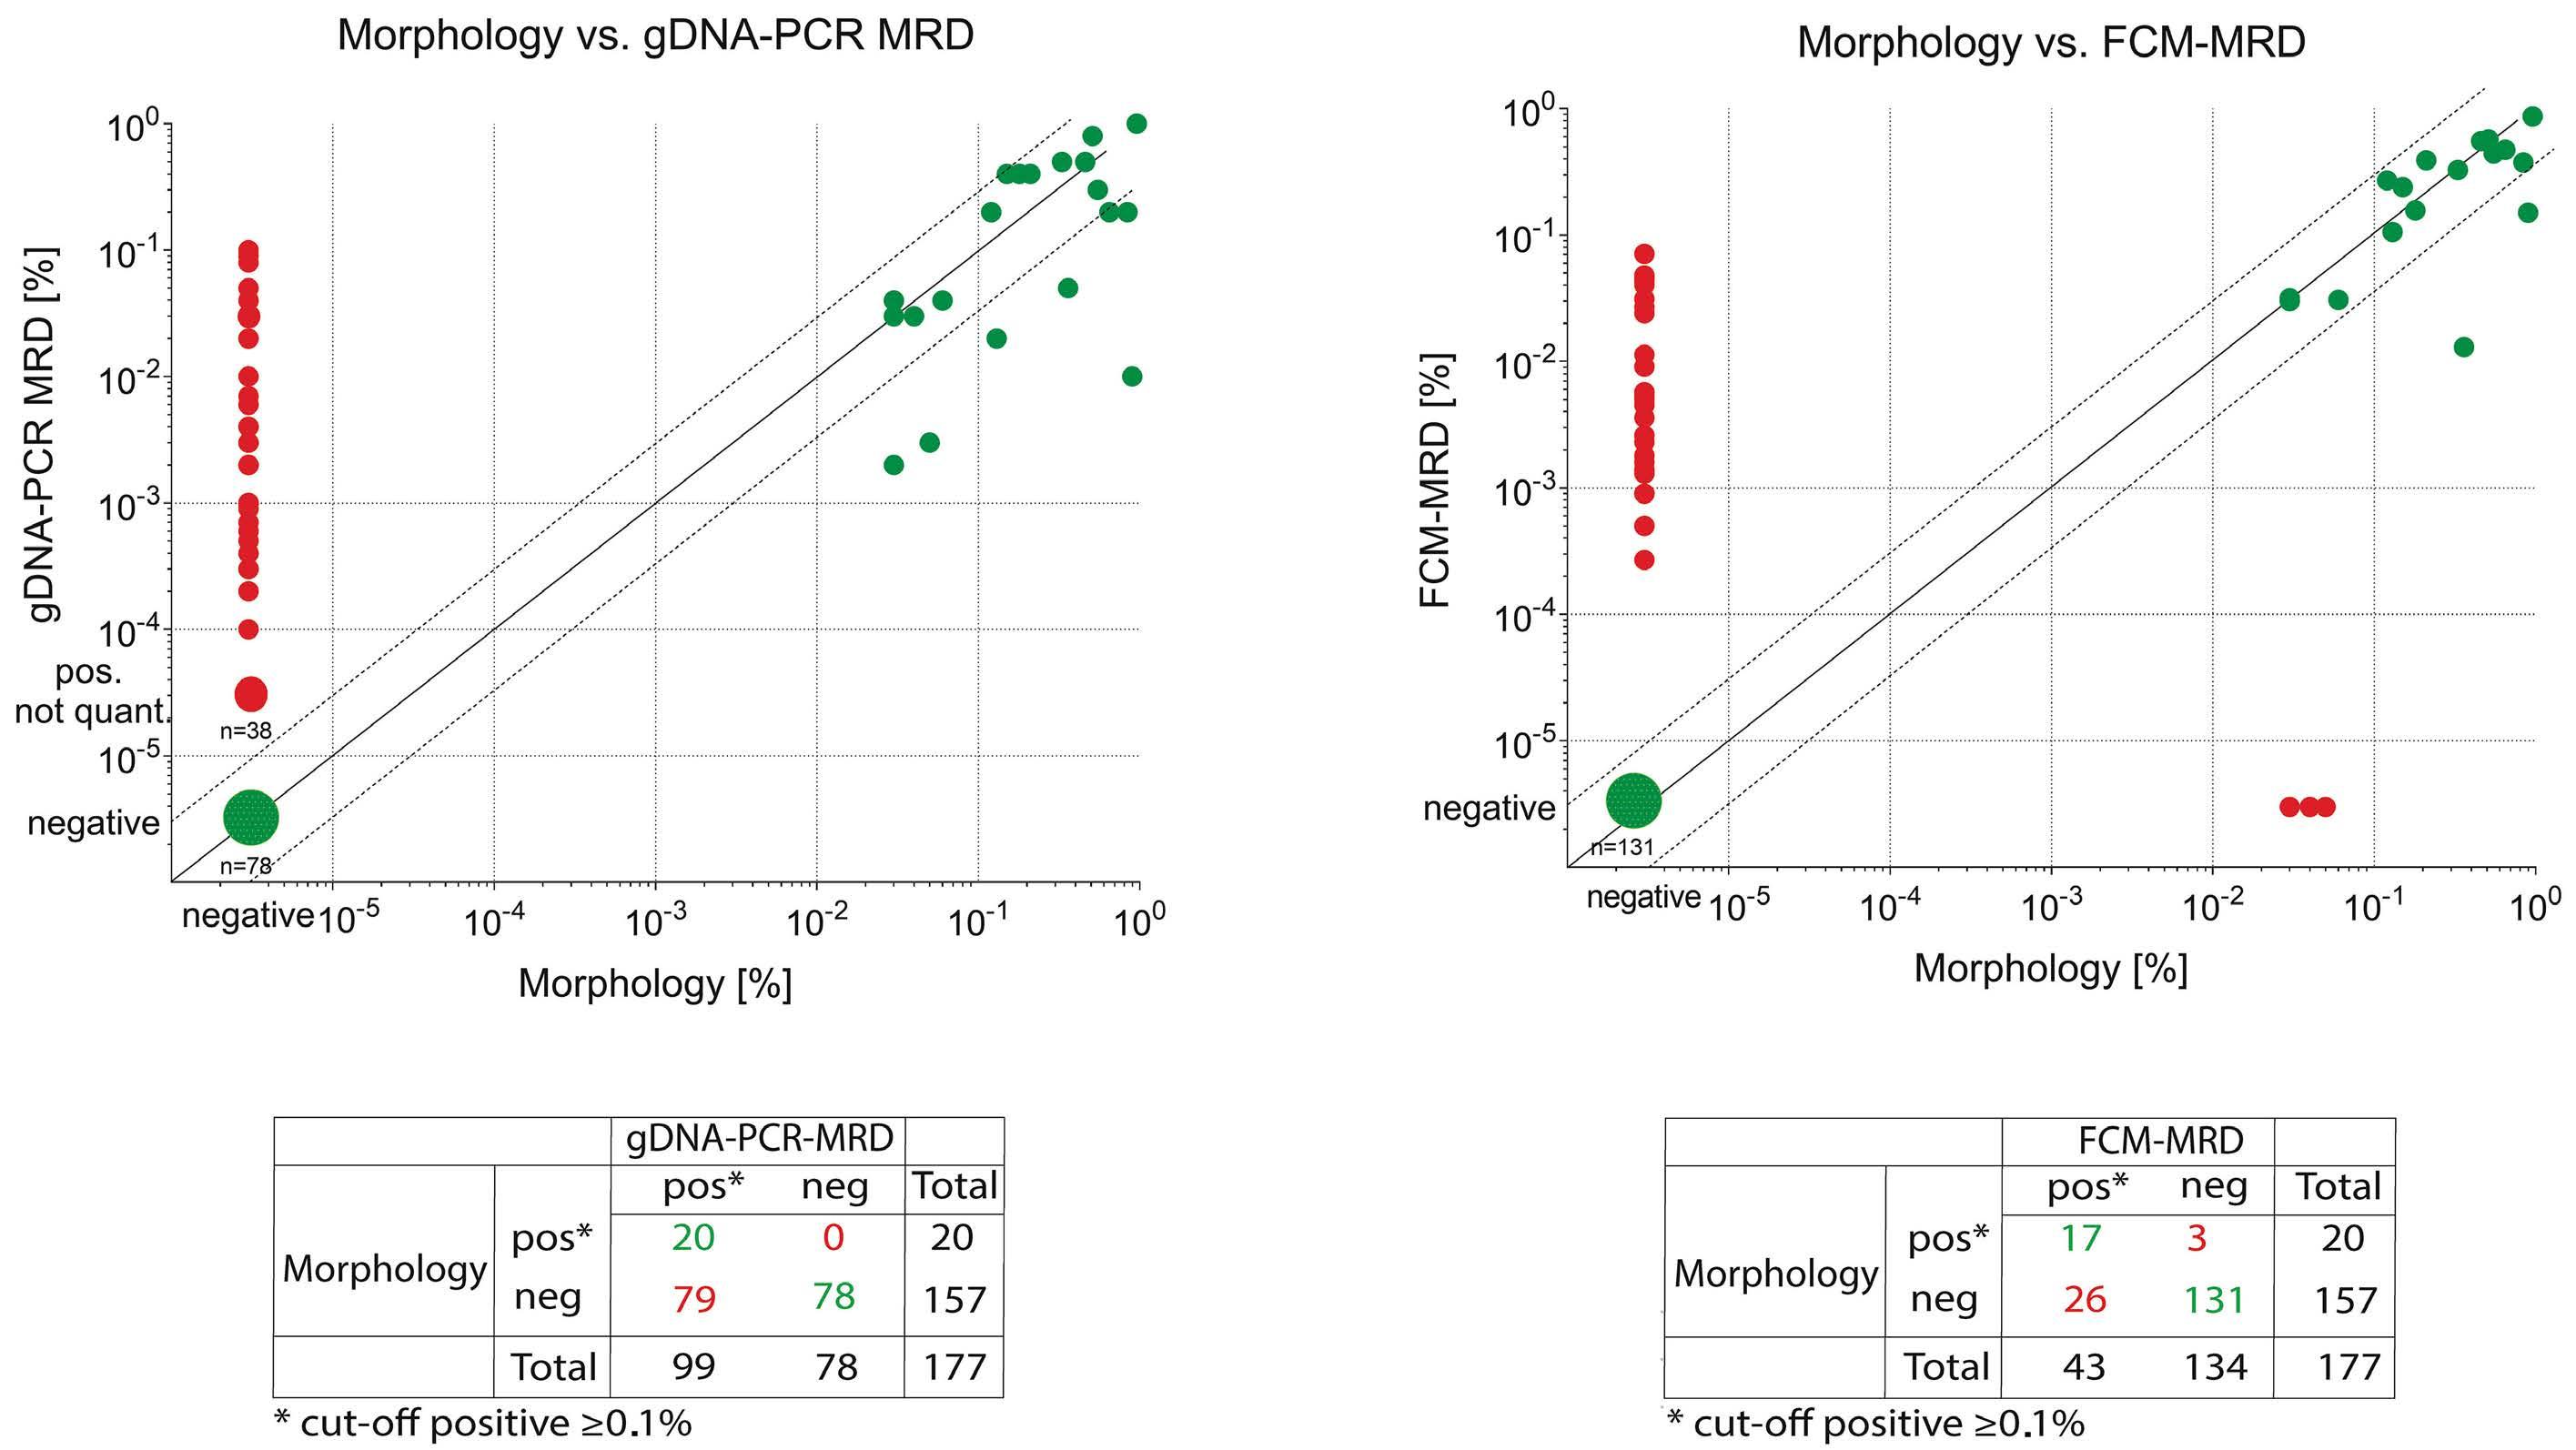
Figure 5. Concordance of gDNA-PCR MRD and FCM-MRD with conventional morphological assessment. Each symbol represents one MRD estimate. Values that are MRD-positive or MRD-negative using both methodologies are considered concordant (green dots), whereas discordant samples are negative with one methodology but positive with another (red dots). In addition, dashed lines above/below the x=y line mark the range of variance according to Dworzak et al., 35 i.e. between 3x larger or smaller till 1/3 of the x=y value. Statistics performed using GraphPad Prism. gDNA: genomic DNA; PCR: polymerase chain reaction; MRD: measurable residual disease; FCM: flow cytometry.
A B
Haematologica | 109 March 2024 747 ARTICLE - gDNA-based MRD monitoring in pediatric AML M. Maurer-Granofszky et al.
assays with high sensitivity and low background amplification.27,28 Importantly, in our pediatrc AML cohort, this also extended to targets other than KMT2Ar, confirming that these beneficial characteristics are a more general feature of breakpoint-specific MRD quantification, irrespective of the underlying breakpoint sequences. This is in line with a recent report by Lukes et al. who outlined in a cohort of 23 AML patients with standard-risk genomic aberrations that PML::RARA, CBFB::MYH11 and RUNX1::RUNX1T1 provide reliable targets for gDNA-based MRD quantification.19
Regarding turnaround times, the gDNA-PCR assays were available within 5-7 weeks after diagnosis in the majority of patients. This is comparable to the availability of KMT2Ar-based MRD results in acute lymphoblastic leukemia clinical trials. Consequently, for a typical AML treatment regimen this would allow the implementation of gDNA-MRD for the combined assessment of end-of-induction 1 and 2 therapy responses.
Unlike FCM, breakpoint-specific MRD quantification is restricted to cases with traceable gene fusions, thereby limiting its application up to a maximum of around 74% of pediatric AML cases.29 In our cohort 64% of non-standardrisk patients carried an eligible target, making genomic breakpoint-specific MRD quantification a valid option for treatment response assessment in the majority of these more aggressive AML subtypes. Among these, KMT2Arpositive pediatric AML might benefit particularly from breakpoint-specific MRD assessment. A study by Weelderen et al. (personal communication) just recently highlighted the importance of MRD quantification by FCM predicting survival and relapse risk in a cohort of KMT2Ar pediatric AML. It is tempting to speculate whether the inclusion of an even more sensitive MRD methodology, such as breakpoint-specific MRD, would further improve risk stratification of this subgroup of patients.
As expected most discrepant cases (14/18) were FCMneg, but gDNA-PCRpos (0.1% threshold). We did not detect significant differences between gross genetic subgroups (borderline significance was found for NUP98-rearranged cases) but found a trend towards lower concordance in cases characterized by signs of maturation within the leukemic cell population (FAB M2, M4). A similar phenomenon was recently described by Karlsson et al.30 While comparing RT-qPCR-MRD and FCM-MRD they observed FCMMRDneg samples which continued to show persistent positivity as assessed by RT-qPCR, suggesting the presence of fusion transcripts in maturing, or terminally differentiated AML cells, which are often hard to identify via FCM. For CBF- or PML::RARA-AML subtypes31,32 such persistence of stable low-level MRD in BM during consolidation or at therapy completion has already been shown to have no negative impact on outcome. However, sustained MRD positivity in PB (rather than BM) or increasing levels
during or after consolidation may be a more accurate discriminator of impending relapse.32
Whether the same also holds true for other AML subtypes, particularly high-risk cases such as those included in our cohort, remains to be determined. Given its resistance to gene expression variations (potentially yielding variable transcript levels from similar cell numbers), genomic breakpoint-specific MRD might prove essential in deciphering the predictive value of persistent MRD in these cases.
Lowering the threshold from 0.1% for positivity resulted in a significant decrease in concordance rates between gDNA-MRD and FCM-MRD from an average of 90% to 69%, thereby revealing the true potential of breakpoint-specific MRD quantification in pediatric AML. This drop was mainly driven by an increase in samples positive with gDNA-PCR at a level below 0.1% but negative with FCM-MRD. This underlines the higher sensitivity achieved with the breakpoint-specific genomic PCR. Due to the small size of our cohort, we could not study any impact of this increased sensitivity on outcome measures. Besides the increased sensitivity of the gDNA-PCR methodology and the ability of the latter to detect gene fusions in terminally differentiated cells as well, technical aspects such as different sampling (1st pull BM aspirate for FCM-MRD vs. pooled samples in the case of gDNA-PCR MRD) may also contribute to discrepancies in MRD levels between the two methodologies.
An average of 45% and 16% of samples were found to be gDNA-PCRpos and FCMpos, respectively, but negative according to morphology, confirming previous reports that the assessment of remission status should not rely solely on BM morphology, but also involve the quantification of MRD.33
Our investigation has several limitations. The limited number of patients included in the study leads to relatively few data regarding individual therapy timepoints and does not allow correlations to be established between the study’s findings and clinical outcomes. Furthermore, the study does not consider concordance between MRD results obtained from PB and BM,32,34 since we did not recruit matched pairs. The latter topic may be relevant together with outcome correlations, especially regarding the predictive value of persistence or resurgence of MRD, although this was not within the scope of our study.
In summary, our study shows that monitoring of MRD using gDNA-PCR is feasible in pediatric patients with AML harboring various recurrent chromosomal breakpoints. Given the advantages of a DNA-based methodology, we believe that the concept of MRD monitoring using patientspecific breakpoint sequences will be an attractive complementary methodology to the current gold-standard of FCM-based MRD detection. Our data also provide a
Haematologica | 109 March 2024 748 ARTICLE - gDNA-based MRD monitoring in pediatric AML M. Maurer-Granofszky et al.
ra-
tionale for additional studies in a larger, international setting addressing the prognostic significance of the methodologies as well as the superiority of one or the other method in well-defined AML subtypes.
Disclosures
MND received payments for travel, accommodation, or other expenses from Beckman-Coulter. The other authors declare no competing financial interests.
Contributions
MMG wrote the manuscript, performed flow cytometry experiments as well as analyzed and interpreted the data. SK wrote the manuscript, designed polymerase chain reaction experiments as well as analyzed and interpreted the data. SF, AS and AM performed experiments and analyzed data. KN performed genetic analyses as well as analyzed and interpreted the data. CM, PL and RM detected fusion genes and provided the data. NM extracted, summarized, and provided clinical data. OAH and RPG provided resources, contributed to the design of the experiments, and interpreted data. MND designed the study, provided resources, administered the project, reviewed the manuscript, and contributed to writing as well as to analyzing the data. All authors have read and agreed to the published version of the manuscript.
References
1. Creutzig U, Zimmermann M, Lehrnbecher T, et al. Less toxicity by optimizing chemotherapy, but not by addition of granulocyte colony-stimulating factor in children and adolescents with acute myeloid leukemia: results of AML-BFM 98. J Clin Oncol. 2006;24(27):4499-4506.
2. Gibson BE, Wheatley K, Hann IM, et al. Treatment strategy and long-term results in paediatric patients treated in consecutive UK AML trials. Leukemia. 2005;19(12):2130-2138.
3. Lie SO, Abrahamsson J, Clausen N, et al. Long-term results in children with AML: NOPHO-AML Study Group--report of three consecutive trials. Leukemia. 2005;19(12):2090-2100.
4. Creutzig U, Zimmermann M, Ritter J, et al. Treatment strategies and long-term results in paediatric patients treated in four consecutive AML-BFM trials. Leukemia. 2005;19(12):2030-2042.
5. Dohner H, Weisdorf DJ, Bloomfield CD. Acute myeloid leukemia. N Engl J Med. 2015;373(12):1136-1152.
6. Ossenkoppele GJ, Janssen JJ, van de Loosdrecht AA. Risk factors for relapse after allogeneic transplantation in acute myeloid leukemia. Haematologica. 2016;101(1):20-25.
7. Rollig C, Bornhauser M, Thiede C, et al. Long-term prognosis of acute myeloid leukemia according to the new genetic risk classification of the European LeukemiaNet recommendations: evaluation of the proposed reporting system. J Clin Oncol. 2011;29(20):2758-2765.
8. De Kouchkovsky I, Abdul-Hay M. Acute myeloid leukemia: a comprehensive review and 2016 update. Blood Cancer J. 2016;6(7):e441.
Acknowledgments
We thank all patients and their parents or legal representatives as well as the clinical teams for providing samples and data. We thank Dieter Printz (FACS Core Unit, CCRI) for flow-cytometer maintenance and quality control, as well as Alice Bramböck, Susanne Suhendra, Claudia Mitteregger, Daniela Scharner, Barbora Baluskova (all Labdia Labordiagnostik GmbH) for excellent technical assistance. We acknowledge Michaela Winkel, Sigrid Wachholder and their team for cytomorphological assessment as part of the clinical diagnostics and routine management. We are grateful to Markus Kaymer and Michael Kapinsky (both from Beckman Coulter Inc.) for kindly providing customized DuraCloneTM tubes for this study as designed by the authors. Notably, Beckman Coulter Inc. did not have any influence on study design, data acquisition and interpretation, or manuscript writing.
Funding
The study received funding from the Vienna Business Agency under grant agreement n. 2841342 (Project MyeFLOW to MMG).
Data-sharing statement
The authors will make original data and protocols available to other investigators upon request.
9. Buldini B, Rizzati F, Masetti R, et al. Prognostic significance of flow-cytometry evaluation of minimal residual disease in children with acute myeloid leukaemia treated according to the AIEOP-AML 2002/01 study protocol. Br J Haematol. 2017;177(1):116-126.
10. Grimwade D, Freeman SD. Defining minimal residual disease in acute myeloid leukemia: which platforms are ready for "prime time"? Blood. 2014;124(23):3345-3355.
11. Tierens A, Bjorklund E, Siitonen S, et al. Residual disease detected by flow cytometry is an independent predictor of survival in childhood acute myeloid leukaemia; results of the NOPHO-AML 2004 study. Br J Haematol. 2016;174(4):600-609.
12. van der Velden VH, van der Sluijs-Geling A, Gibson BE, et al. Clinical significance of flowcytometric minimal residual disease detection in pediatric acute myeloid leukemia patients treated according to the DCOG ANLL97/MRC AML12 protocol. Leukemia. 2010;24(9):1599-1606.
13. Loken MR, Alonzo TA, Pardo L, et al. Residual disease detected by multidimensional flow cytometry signifies high relapse risk in patients with de novo acute myeloid leukemia: a report from Children's Oncology Group. Blood. 2012;120(8):1581-1588.
14. Buldini B, Maurer-Granofszky M, Varotto E, Dworzak MN. Flowcytometric monitoring of minimal residual disease in pediatric patients with acute myeloid leukemia: recent advances and future strategies. Front Pediatr. 2019;7:412.
15. Brodersen LE, Gerbing RB, Pardo ML, et al. Morphologic remission status is limited compared to DeltaN flow cytometry:
Haematologica | 109 March 2024 749 ARTICLE - gDNA-based MRD monitoring in pediatric AML M. Maurer-Granofszky et al.
a Children's Oncology Group AAML0531 report. Blood Adv. 2020;4(20):5050-5061.
16. Dohner H, Estey E, Grimwade D, et al. Diagnosis and management of AML in adults: 2017 ELN recommendations from an international expert panel. Blood. 2017;129(4):424-447.
17. Schuurhuis GJ, Heuser M, Freeman S, et al. Minimal/measurable residual disease in AML: a consensus document from the European LeukemiaNet MRD Working Party. Blood. 2018;131(12):1275-1291.
18. Ravandi F, Walter RB, Freeman SD. Evaluating measurable residual disease in acute myeloid leukemia. Blood Adv. 2018;2(11):1356-1366.
19. Lukes J Jr, Winkowska L, Zwyrtkova M, et al. Identification of fusion gene breakpoints is feasible and facilitates accurate sensitive minimal residual disease monitoring on genomic level in patients with PML-RARA, CBFB-MYH11, and RUNX1-RUNX1T1. Hemasphere. 2020;4(6):e489.
20. Tsaur G, Ivanova A, Plekhanova O, et al. MRD monitoring in AML patients with MLL-MLLT4 by quantification of fusion gene transcripts and genomic chromosomal breakpoint sequences. Blood. 2008;112(11):4888.
21. Creutzig U, Zimmermann M, Bourquin JP, et al. Randomized trial comparing liposomal daunorubicin with idarubicin as induction for pediatric acute myeloid leukemia: results from study AMLBFM 2004. Blood. 2013;122(1):37-43.
22. Waack K, Schneider M, Walter C, et al. Improved outcome in pediatric AML - the AML-BFM 2012 study. Blood. 2020;136(Suppl 1):12-14.
23. Kaspers GJ, Zimmermann M, Reinhardt D, et al. Improved outcome in pediatric relapsed acute myeloid leukemia: results of a randomized trial on liposomal daunorubicin by the International BFM Study Group. J Clin Oncol. 2013;31(5):599-607.
24. van der Velden VH, Cazzaniga G, Schrauder A, et al. Analysis of minimal residual disease by Ig/TCR gene rearrangements: guidelines for interpretation of real-time quantitative PCR data. Leukemia. 2007;21(4):604-611.
25. Meyer C, Marschalek R. LDI-PCR: identification of known and unknown gene fusions of the human MLL gene. Methods Mol Biol. 2009;538:71-83.
26. Meyer C, Schneider B, Reichel M, et al. Diagnostic tool for the identification of MLL rearrangements including unknown partner genes. Proc Natl Acad Sci U S A. 2005;102(2):449-454.
27. Burmeister T, Marschalek R, Schneider B, et al. Monitoring minimal residual disease by quantification of genomic chromosomal breakpoint sequences in acute leukemias with MLL aberrations. Leukemia. 2006;20(3):451-457.
28. Stutterheim J, van der Sluis IM, de Lorenzo P, et al. Clinical implications of minimal residual disease detection in infants with KMT2A-rearranged acute lymphoblastic leukemia treated on the Interfant-06 protocol. J Clin Oncol. 2021;39(6):652-662.
29. Jovanovic J, Potter N, Kanda A, et al. Molecular MRD monitoring is feasible in the majority of children with AML and is highly predictive of outcome: results from the international MyeChild01 study. Blood. 2019;134(Suppl_1):1393-1393.
30. Karlsson L, Nyvold CG, Soboli A, et al. Fusion transcript analysis reveals slower response kinetics than multiparameter flow cytometry in childhood acute myeloid leukaemia. Int J Lab Hematol. 2022;44(6):1094-1101.
31. Inaba H, Coustan-Smith E, Cao X, et al. Comparative analysis of different approaches to measure treatment response in acute myeloid leukemia. J Clin Oncol. 2012;30(29):3625-3632.
32. Juul-Dam KL, Ommen HB, Nyvold CG, et al. Measurable residual disease assessment by qPCR in peripheral blood is an informative tool for disease surveillance in childhood acute myeloid leukaemia. Br J Haematol. 2020;190(2):198-208.
33. Loken MR, Alonzo TA, Pardo L, et al. Multidimensional flow cytometry significantly improves upon the morphologic assessment of post-induction marrow remission status –comparison of morphology and multidimensional flow cytometry; a report from the Children's Oncology Group AML protocol AAML0531. Blood. 2011;118(21):939.
34. Godwin CD, Zhou Y, Othus M, et al. Acute myeloid leukemia measurable residual disease detection by flow cytometry in peripheral blood vs bone marrow. Blood. 2021;137(4):569-572.
35. Dworzak MN, Gaipa G, Ratei R, et al. Standardization of flow cytometric minimal residual disease evaluation in acute lymphoblastic leukemia: Multicentric assessment is feasible. Cytometry B Clin Cytom. 2008;74(6):331-340.
Haematologica | 109 March 2024 750 ARTICLE - gDNA-based MRD monitoring in pediatric AML M. Maurer-Granofszky et al.
DNAJC10 maintains survival and self-renewal of leukemia stem cells through PERK branch of the unfolded protein response
Minjing Li,1* Xingli Wu,2,3* Meiyang Chen,3* Shiyu Hao,3* Yue Yu,2,3 Xiang Li,2,3 Erdi Zhao,3 Ming Xu,3 Zhenhai Yu,3 Zhiqiang Wang,3 Ning Xu,4 Changzhu Jin3,5 and Yancun Yin3
1Institute of Integrated Medicine, Binzhou Medical University, Yantai; 2The Second School of Clinical Medicine, Binzhou Medical University, Yantai; 3Laboratory of Experimental Hematology, School of Basic Medical Sciences, Binzhou Medical University, Yantai; 4Department of Gastroenterology, Yantai Affiliated Hospital of Binzhou Medical University, Yantai and 5Department of Human Anatomy, School of Basic Medicine, Qilu Medicine University, Zibo, China
*ML, XW, MC and SH contributed equally as first authors.
Abstract
Correspondence: Yancun Yin yinyc1985@126.com
Changzhu Jin jinczbmu@126.com
Received: January 11, 2023.
Accepted: July 20, 2023.
Early view: July 27, 2023.
https://doi.org/10.3324/haematol.2023.282691
©2024 Ferrata Storti Foundation
Published under a CC BY-NC license
Leukemia stem cells (LSC) require frequent adaptation to maintain their self-renewal ability in the face of longer exposure to cell-intrinsic and cell-extrinsic stresses. However, the mechanisms by which LSC maintain their leukemogenic activities, and how individual LSC respond to stress, remain poorly understood. Here, we found that DNAJC10, a member of HSP40 family, was frequently up-regulated in various types of acute myeloid leukemia (AML) and in LSC-enriched cells. Deficiency of DNAJC10 leads to a dramatic increase in the apoptosis of both human leukemia cell lines and LSC-enriched populations. Although DNAJC10 is not required for normal hematopoiesis, deficiency of Dnajc10 significantly abrogated AML development and suppressed self-renewal of LSC in the MLL-AF9-induced murine leukemia model. Mechanistically, inhibition of DNAJC10 specifically induces endoplasmic reticulum stress and promotes activation of PERK-EIF2α-ATF4 branch of unfolded protein response (UPR). Blocking PERK by GSK2606414 (PERKi) or shRNA rescued the loss of function of DNAJC10 both in vitro and in vivo. Importantly, deficiency of DNAJC10 increased sensitivity of AML cells to daunorubicin (DNR) and cytarabine (Ara-C). These data revealed that DNAJC10 functions as an oncogene in MLL-AF9-induced AML via regulation of the PERK branch of the UPR. DNAJC10 may be an ideal therapeutic target for eliminating LSC, and improving the effectiveness of DNR and Ara-C.
Introduction
Acute myeloid leukemia (AML) is characterized by uncontrolled clonal expansion and differentiation block of immature myeloid cells. It is the most frequent type of acute leukemia in adults with mortality and relapse rates of approximately 65% and 50%, respectively.1,2 There is a small population of leukemia stem cells (LSC) which are thought to be responsible for the initiation, development, and relapse of leukemia. LSC are also resistant to traditional chemotherapy treatments due to their capacity for self-renewal and differentiation block. Therefore, unraveling the underlying molecular mechanisms critical for driving LSC self-renewal improved prognostic capability and identified novel targets for treating AML subsets.
Recent studies have demonstrated that various specific surface molecules, including tyrosine kinase receptors,3 cytokine receptors,4 adhesion molecules,5 and immune
checkpoint molecules,6 are required for the maintenance of LSC stemness and may be attractive targets for eliminating LSC. Despite these elegant observations, clinical outcomes of AML patients remain poor. Simultaneously, LSC are longlived due to their capacity for self-renewal. A consequence of longevity is exposure to cell-intrinsic and cell-extrinsic stresses, including dysregulated proliferation, DNA damage, hypoxia, reactive oxygen species, nutrient deprivation, and changes in Ph levels.7,8 LSC require frequent adaptation to maintain their self-renewal ability in the face of these challenges. Nevertheless, the mechanism by which LSC maintain their leukemogenic activities, and how individual LSC respond to stress, remain poorly understood. The endoplasmic reticulum (ER) regulates the adaptive capacity of stimulated cells via activating the stress-induced signal transduction pathway called the unfolded protein response (UPR), which attempts to alleviate ER workload and restore cellular homeostasis. The UPR is governed by
Haematologica | 109 Marzo 2024 751 - Acute Myeloid Leukemia ARTICLE
three integral ER membrane sensors: protein kinase RNAlike ER kinase (PERK), inositol requiring enzyme 1 (IRE1), and activating transcription factor 6 (ATF6).9 UPR sensors could be activated in the presence of unfolded/misfolded proteins after the release of the chaperone GRP78. Mechanistically, activated PERK phosphorylates eukaryotic initiation factor 2 α subunit (EIF2α), leading to the attenuation of global protein translation. Paradoxically, EIF2α phosphorylation promotes the expression of activating transcription factor 4 (ATF4), a member of the ATF/CREB family harboring alternative open reading frames. ATF4 further promotes expression of the pro-apoptotic C/EBP-homologous protein (CHOP) via binding to the promoter region of this gene.10 ATF4-CHOP cascade can induce the apoptotic pathway following prolonged ER stress,9 whereas IRE1 splices XBP1 mRNA to produce the mature form encoding spliced XBP1 (XBP1s) and ATF6 activated by proteolytic cleavage (cATF6), promoting transcription of chaperones and proteins involved in ER biogenesis.10
Recent studies revealed that UPR are highly induced in leukemia cells, and are closely associated with cell apoptosis and progression of hematologic malignancies.11-13 Here, we found that up-regulated expression of DNAJC10, an ER co-chaperone, emerged as an independent predictor for poor survival of AML patients. Previous studies have revealed that DNAJC10 acts as a component of the ER-associated degradation (ERAD) complex involved in recognizing and degrading misfolded proteins.14-16 Recently, DNAJC10 has been found to be associated with neuroblastoma,17,18 melanoma,18 and lung adenocarcinoma.19 However, the clinical significance of DNAJC10 in hematologic malignancy has not been explored. In this study, we aim to investigate the effect of DNAJC10 on development of AML and self-renewal of LSC, and explore the underlying molecular mechanism.
Methods
Mice
DNAJC10-KO mice (C57BL/6-Dnajc10tm1cyagen) were obtained from Cyagen Biosciences (Cyagen Biosciences (Suzhou) Inc., Jiangsu, China). NSG mice (NOD-Prkdcscid Il2rgem1/ Smoc) were purchased from Shanghai Model Organisms (Shanghai Model Organisms Inc., Shanghai, China). All the mice were maintained in the standard pathogen-free animal house. Studies were performed according to the guidelines and approval of the Ethical Committee of Binzhou Medical University (approval N. 2020-087).
Establishment and analysis of the murine MLL-AF9 model
A transplantable MLL-AF9-inducible murine AML model was established as previously described.6,20 Briefly, Lin- cells were isolated from the bone marrow (BM) of wild-type (WT) or Dnajc10-knockout (KO) mice, and infected with MSCV-MLL-AF9IRES-YFP-expressing retrovirus. Infected cells (2-3x10⁵) were
transplanted into lethally irradiated (10 Gy) C57BL/6 recipient mice by retro-orbital injection. For serial transplantation, 3000 or 5000 purified YFP+ BM leukemia cells or 2000 BM YFP+Mac-1+c-Kit+ cells or 1000 L-GMP (Lin- IL7R- Sca-1- c-Kit+ CD34+ CD16/32+) cells from primary or secondary recipient mice together with 3x10⁵ normal BM cells were transplanted into lethally-irradiated recipients. Mice were monitored for MLL-AF9 AML development. For the limiting dilution analysis (LDA), the indicated numbers of YFP+ WT or Dnajc10-KO MLLAF9 YFP+ BM cells collected from secondary recipients were co-transplanted with 3x10⁵ competitor cells into lethally-irradiated recipient mice. The survival times were recorded and the frequencies of LSC were calculated according to Poisson statistics using ELDA software.
Flow cytometry
For flow cytometry analyses of mouse or human AML cells, cells were stained with anti-Mac-1-APC (M1/70), anti-Gr-1-PE (RB6-8C5), anti-CD3-APC (17A2), anti-B220PE (RA3-6B2), anti-c-Kit-PE/Cy7 (ACK2), anti-c-Kit-PE (2B8), anti-Ter-119-APC (Ter-119), anti-Gr-1-APC (RB6-8C5), anti-CD3ε-APC (145-2C11), anti-Gr-1-APC (RB6-8C5), antiB220-APC (RA3-6B2), anti-Mac-1-PerCP/Cyanine5.5 (M1/70), anti-Sca-1-PE/Cyanine7 (E13-161.7), anti-Sca-1-APC (D7), anti-IL-7Rα-APC (SB/199), anti-CD34-BV421 (SA376A4), and anti-CD16/32-APC/Cy7 (93) or anti-hCD45-PE (#555483, BD) monoclonal antibodies. For analysis of cell apoptosis, AML cells were stained with PE-conjugated anti-Annexin V and 7-AAD (BD Pharmingen, China), according to the manufacturer’s instructions. Data were analyzed using FlowJo software.
Colony-forming unit assays
For in vitro colony-forming unit (CFU) assays, 500 YFP+Mac-1+c-Kit+ LSC-enriched fractions from the BM of secondary MLL-AF9 recipient mice were plated in methylcellulose-based medium (M3534; Stem Cell Technologies, Shanghai, China) according to the manufacturer’s protocol. The 1000 cells collected from three dishes of the primary plating were seeded for the secondary plating. The numbers of colonies and total cell numbers were counted at 10 days post transplantation.
Results
DNAJC10 facilitates cell viability and inhibits apoptosis of human acute myeloid leukemia cells
To determine the function of DNAJC10 in hematopoietic malignancies, we performed an in silico analysis of DNAJC10 mRNA expression in several leukemia microarray dataset. Notably, DNAJC10 expression was significantly higher in a variety of leukemia cells compared with that in healthy BM and hematopoietic stem/progenitor cells, including hematopoietic stem cells (HSC), common myeloid progenitors (CMP), granulocyte-monocyte progenitors (GMP), multipo-
Haematologica | 109 Marzo 2024 752 ARTICLE - DNAJC10 supports development of AML M. Li et al.
tent progenitors (MPP), and megakaryocyte-erythrocyte progenitors (MEP) (Figure 1A, Online Supplementary Figure S1A, B). Moreover, Kaplan-Meier results showed that the higher expression of DNAJC10 is associated with inferior
overall survival (OS) (Figure 1B, Online Supplementary Figure S1C-F). As indicated by Cox regression analyses, DNAJC10 is an independent indicator of poor OS in AML patients (Figure 1C, Online Supplementary Figure S2).
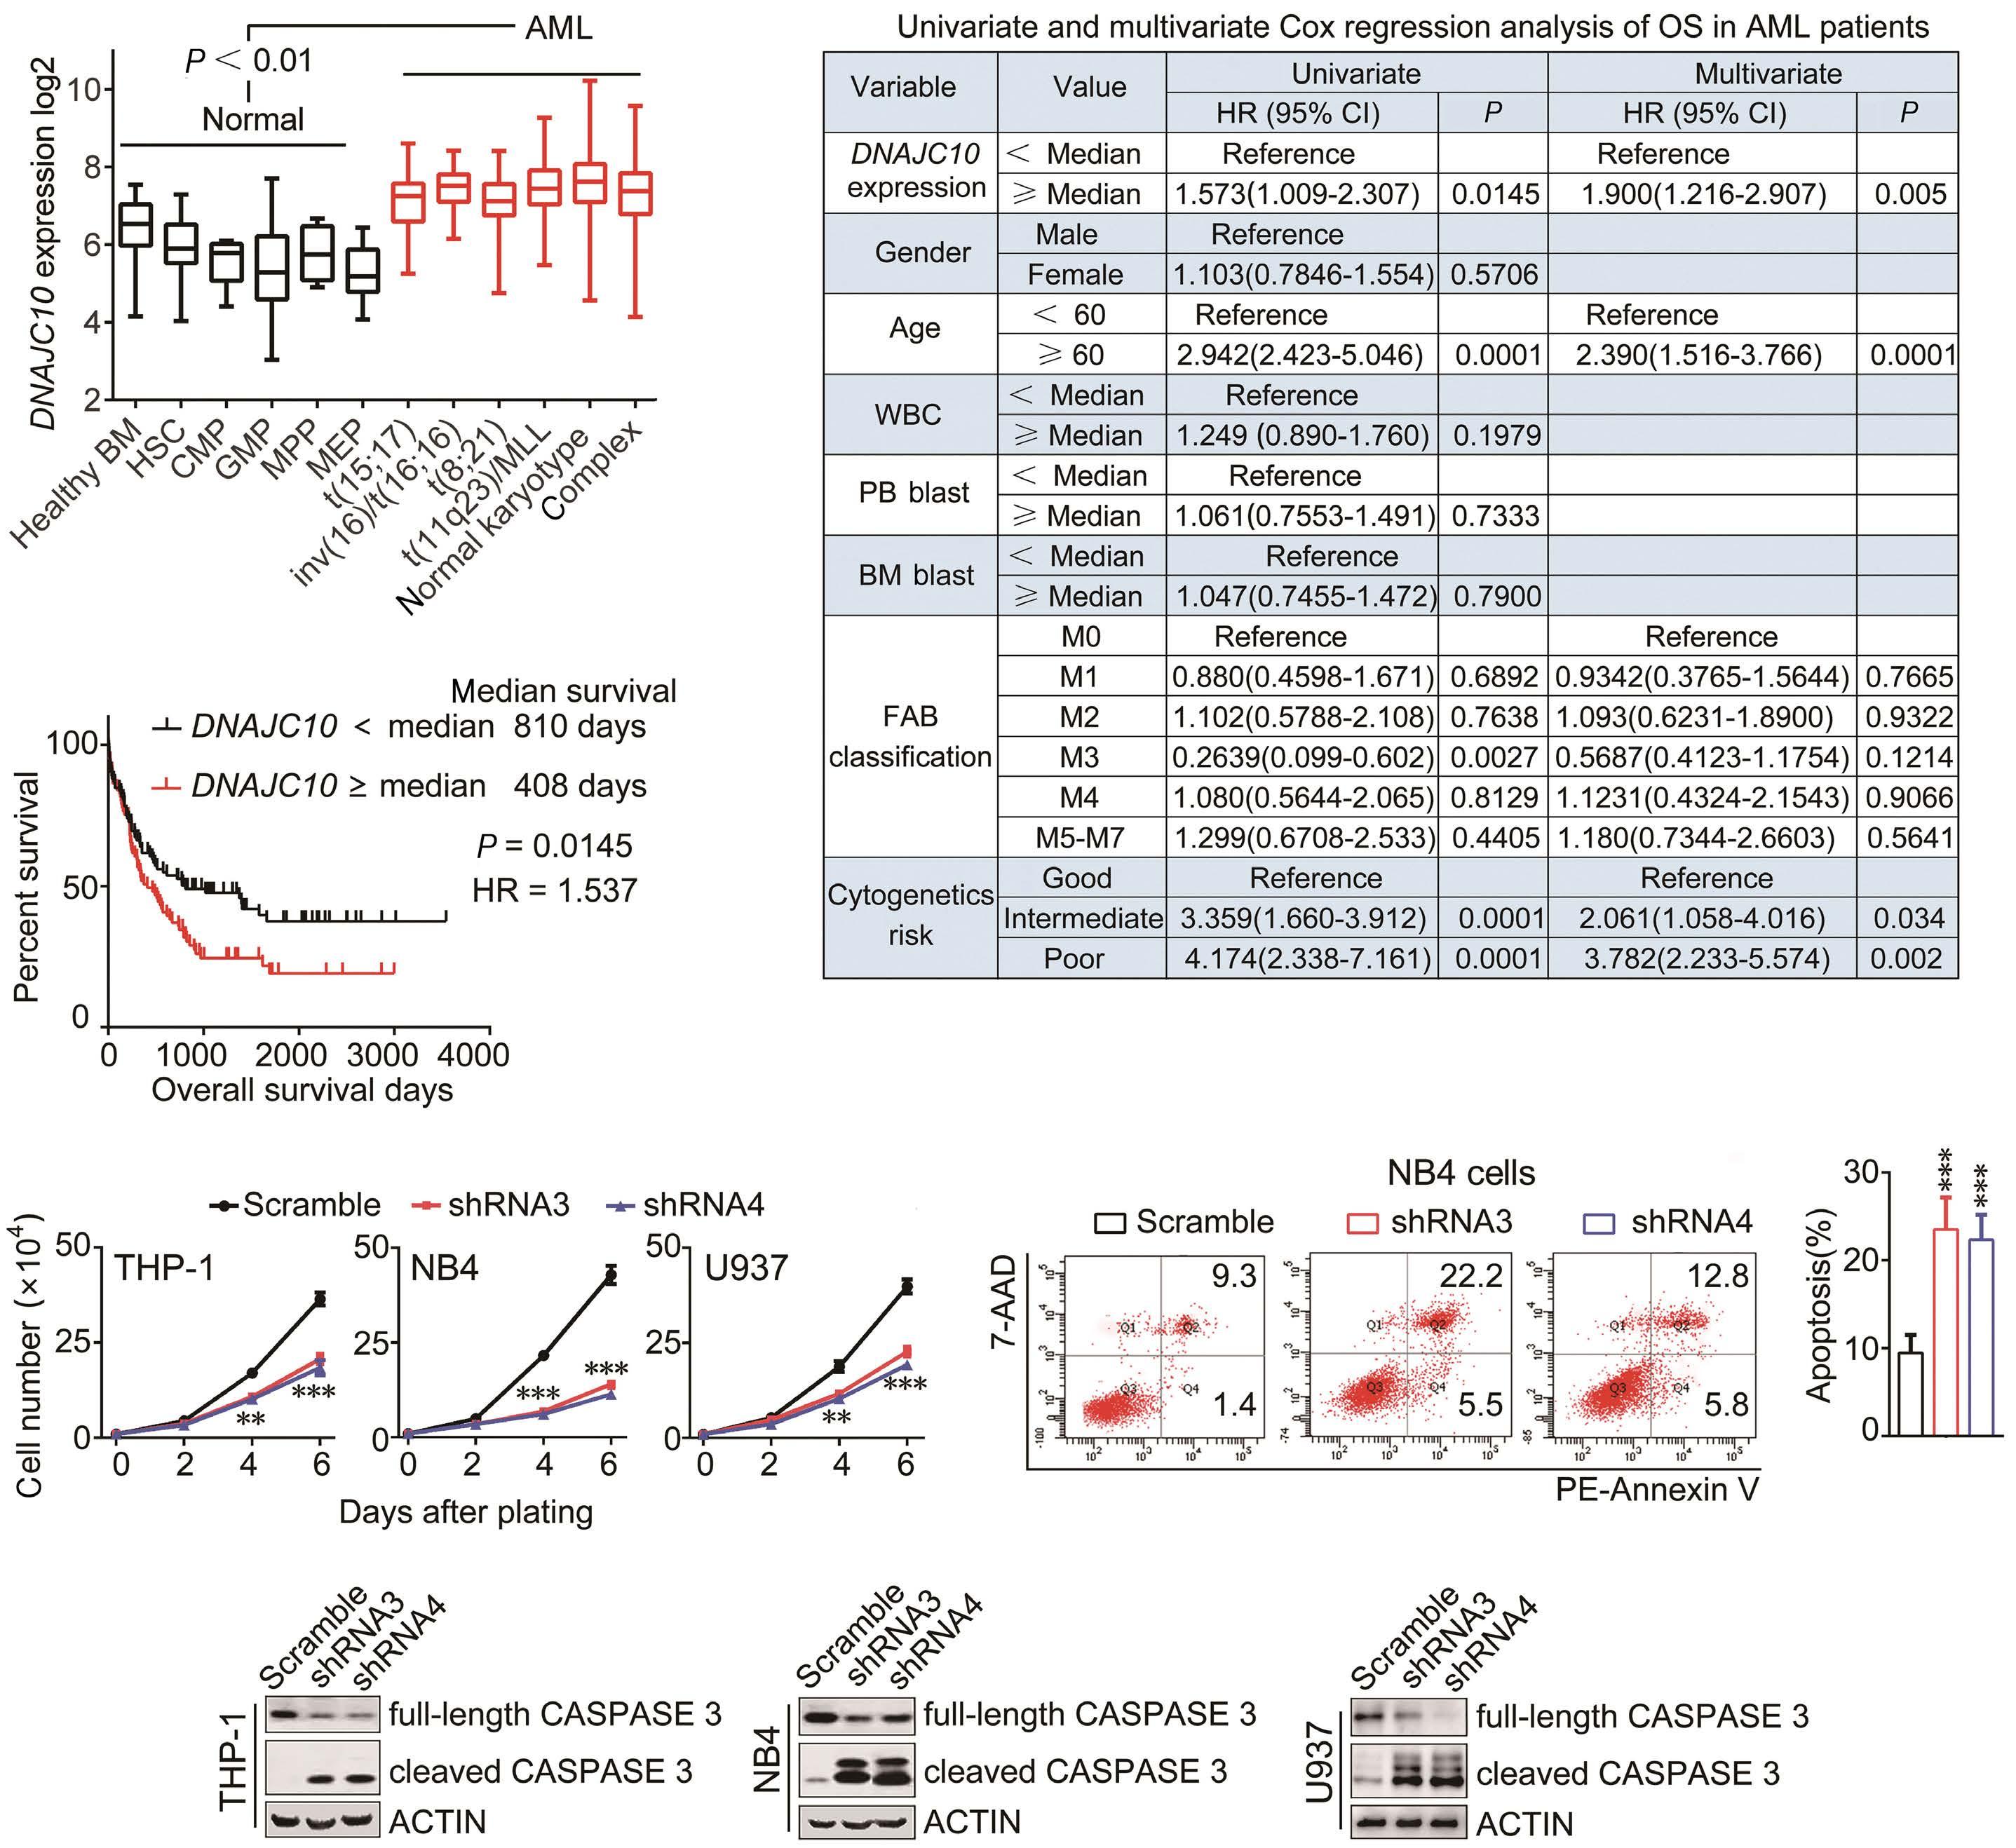
from the online BloodSpot
(B) Kaplan-Meier
of overall survival (OS) of acute myeloid leukemia (AML) patients relative to DNAJC10 mRNA expression levels above or below the 50th percentile in the TCGA AML cohort. (C) Univariate and multivariate Cox proportional hazard regression models were used to identify independent prognostic factors and calculate Hazard Ratio (HR) in the TCGA AML cohort. (D) Cell numbers at indicated days after infection were plotted. N=4. (E) Apoptosis was determined in NB4 cells infected with the shRNA indicated. Representative flow cytometric plots (left) and data summary (right) are shown. N=4. ***P<0.0001 compared to Scramble group. (F) Expression of cleaved CASPASE 3 was determined by immunoblotting. CI: Confidence Interval; HSC: hematopoietic stem cells; CMP: common myeloid progenitors; GMP: granulocyte-monocyte progenitors; MPP: multipotent progenitors; MEP: megakaryocyte-erythrocyte progenitors; WBC: white blood cells; PB: peripheral blood; BM: bone marrow; FAB: French-American-British. **P<0.005; ***P<0.001.
Haematologica | 109 Marzo 2024 753 ARTICLE - DNAJC10 supports development of AML M. Li et al.
A C B D F E
Figure 1. Knockdown of DNAJC10 inhibits growth and promotes apoptosis of acute myeloid leukemia cells. (A) Relative transcription of DNAJC10 in different hematopoietic / myeloid compartments obtained
database.
analysis
To further explore its potential role, we examined expression of DNAJC10 in human AML cell lines. Results showed that DNAJC10 was highly expressed in U937, THP-1, NB4 and HL-60 both at transcription and translation levels, but not in MV4-11 and T-lymphocyte leukemia cell line Jurkat (Online Supplementary Figure S3A, B). Next, we knocked down expression of DNAJC10 by the lentivirus-encoded shRNA (Online Supplementary Figure S3C-E). Remarkably, knockdown of DNAJC10 expression decreased the viability of each of those leukemia cell lines with higher DNAJC10 expression. In contrast, both shRNA3 and shRNA4 had no effect on DNAJC10 negative MV4-11 and Jurkat cells, suggesting the specificity of the shRNA tested (Online Supple-
mentary Figure S3F). Knockdown of DNAJC10 expression consistently induced visible cell growth inhibition in THP-1 cells (Online Supplementary Figure S3G) and reduced cell growth in a time-dependent manner (Figure 1D). The decreased cell viability may have resulted from increased apoptosis or cell cycle arrest. Interestingly, knockdown of DNAJC10 did not change the cell cycle distribution; however, it did significantly increase cell apoptosis rate (Figure 1E, Online Supplementary Figure S3H). Moreover, knockdown of DNAJC10 significantly increased cleaved CASPASE 3 expression (Figure 1F). Together, these results suggest that DNAJC10 facilitates cell viability and inhibits apoptosis of AML cells.
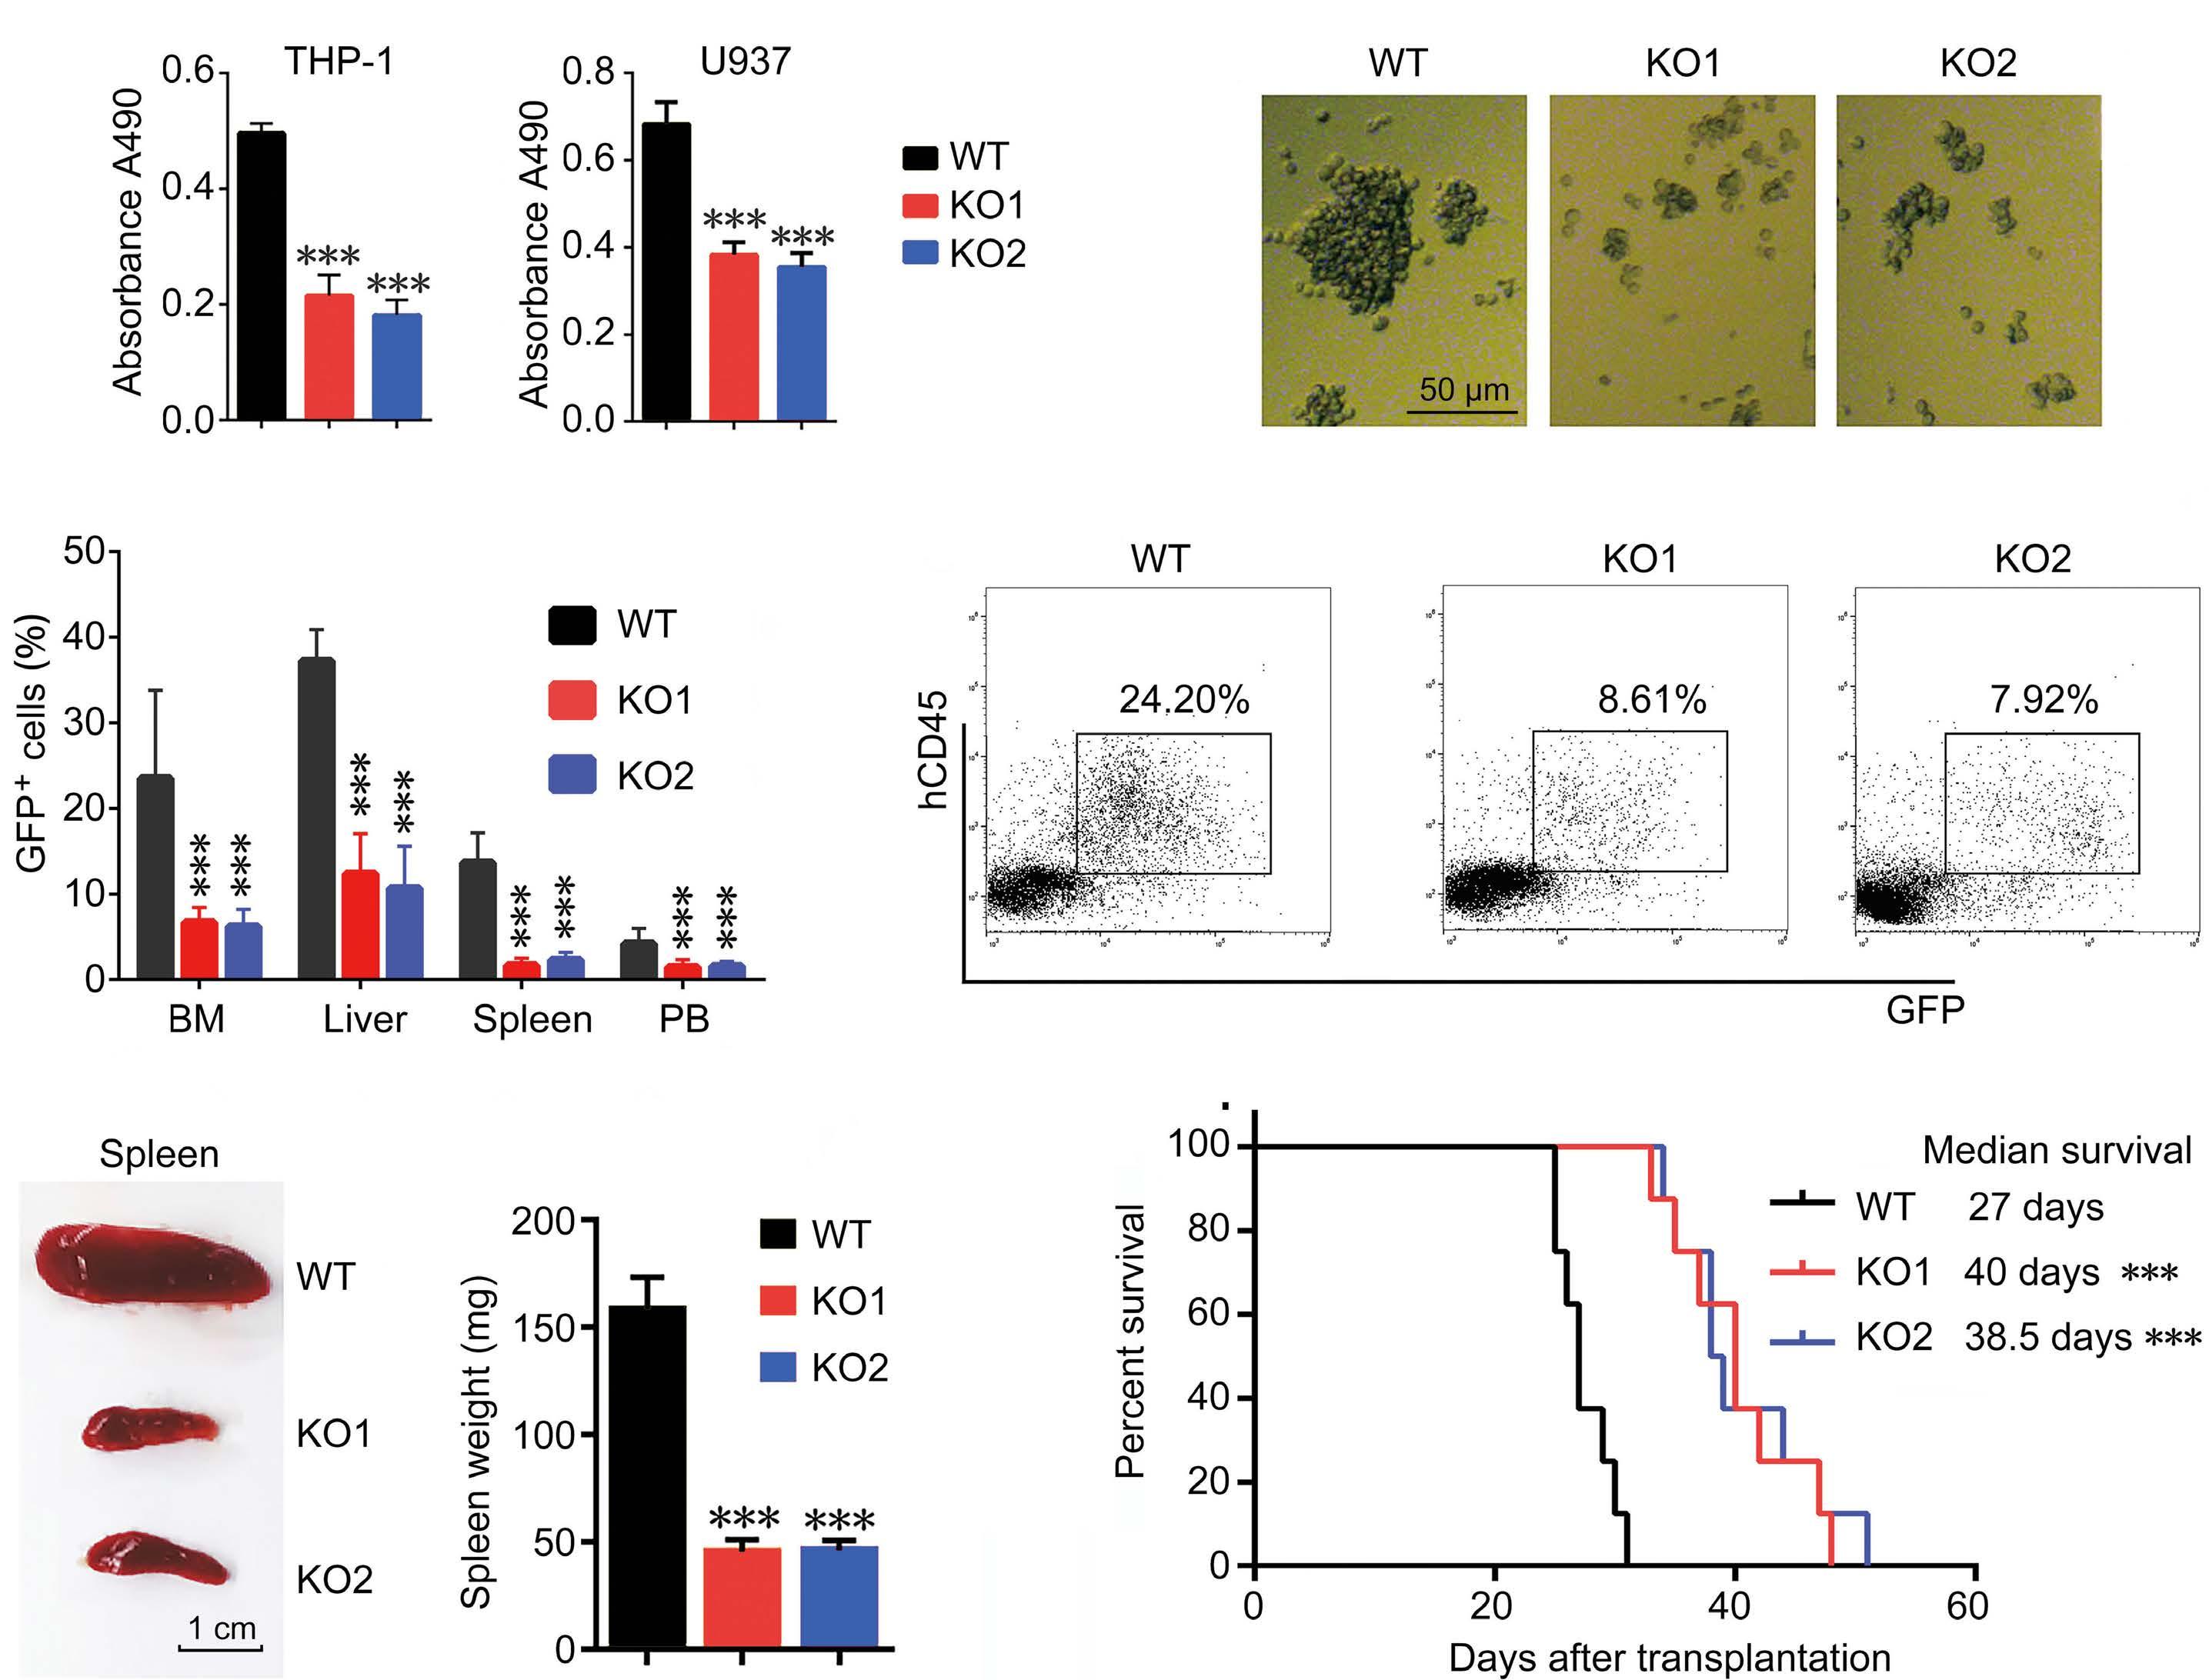
Haematologica | 109 Marzo 2024 754 ARTICLE - DNAJC10 supports development of AML M. Li et al.
A C E F D B
Figure 2. Knockout of DNAJC10 expression blocks xenograft of human leukemia cells. (A) The viability of DNAJC10-wild-type (WT) or knockout (KO) cells was determined by CCK-8 assay. N=5. (B) Representative images of DNAJC10-WT or KO THP-1 cells at 4 days post culture. (C-F) DNAJC10-WT or KO THP-1 cells were transfected into NSG mice. Mice were sacrificed at 28 days post transplantation for analysis. (C) Percentages of GFP+ cells in bone marrow (BM), liver, spleen, and peripheral blood (PB) at 28 days post transplantation. N=4 mice for each group. (D) BM cells were collected and stained with anti-human CD45 antibodies. Representative flow cytometry plots are shown. (E) Representative spleen image (left) and spleen weight summary (right). N=4 mice for each group. ***P<0.0001 compared to Scramble group. (F) Kaplan-Meier survival curve of xenografted mice. N=8 for each group. ***P<0.0001.
DNAJC10 is required for the development of human acute myeloid leukemia xenograft
CRISPR/Cas9-mediated DNAJC10 knockout cell lines were generated to further observe the functions of DNAJC10 in vivo (Online Supplementary Figure S3 I, J). Notably, deficiency of DNAJC10 significantly reduced cell growth (Figure 2A, B), consistent with the results in DNAJC10 knockdown cells mediated by shRNA. Next, we investigated the effect of DNAJC10 deficiency in transplanted NSG mice. Mice transplanted with DNAJC10-KO cells displayed significantly decreased leukemia burden as demonstrated by GFP+ cells in BM, spleen, liver, and peripheral blood (PB) compared with the WT control (Figure 2C, D). Meanwhile, mice receiving DNAJC10-deficient cells displayed a notable reduction in spleen size and weight compared with mice receiving WT cells (Figure 2E). Moreover, DNAJC10 knockout significantly prolonged the survival of the xenografted mice (Figure 2F). Together, these results indicate that deficiency of DNAJC10 delayed human AML progression in xenograft recipient mice.
DNAJC10 deficiency impairs development of MLL-AF9induced leukemia
To gain a deeper understanding of the function of Dnajc10 on AML initiation and development, a targeted deletion of Dnajc10 in C57BL/6 mice was created and confirmed by Sanger sequencing, genotyping, and immunoblotting (IB) (Online Supplementary Figure S4). Interestingly, the Dnajc10-KO mice exhibited normal development, and no obvious defects were observed in their growth or lifespan.
Moreover, the Dnajc10-KO mice have normal hematopoiesis in PB and normal Lin-Sca-1+c-Kit+ percentages in BM (Online Supplementary Figure S5), suggesting that Dnajc10 is not required for normal hematopoiesis function, which is consistent with a previous report.21 Given that DNAJC10 was higher in patients with MLL-rearrangement (Online Supplementary Figure S1B), Dnajc10-WT or KO MLL-AF9-induced AML murine models were established using MSCV-MLLAF9-IRES-YFP retroviruses (Online Supplementary Figure S6A). Consistent with a previous report,22 these AML cells only expressed myeloid cell markers Mac-1 and Gr-1, but not lymphoid cell markers CD3 and B220 (Online Supplementary Figure S6B, C).
Remarkably, loss of Dnajc10 had no effect on the percentage of YFP+ leukemia cells in PB on primary transplantation (Online Supplementary Figure S6D). Mice receiving MLL-AF9-transduced Dnajc10-KO cells also had comparable survival time with those receiving Dnajc10 WT cells (Online Supplementary Figure S6E). These results suggest that Dnajc10 is not essential for the initiation of the MLLAF9-induced murine model.
Next, we examined the function of Dnajc10 on AML development during serial transplantation. The recipient mice receiving MLL-AF9-transduced Dnajc10-KO leukemia cells had significantly delayed survival times compared with WT controls (Figure 3A). Consistently, Dnajc10-KO remarkably
decreased white blood cell (WBC) counts in the PB (Online Supplementary Figure S6F), and decreased YFP+ leukemia cells in PB, BM, and spleen (Figure 3B, C, Online Supplementary Figure S7) at second transplantation. The delayed development of the Dnajc10-KO AML was also evident from the significantly decreased size and weight of livers and spleens (Figure 3D, E). Moreover, Hematoxylin&Eosin staining displayed a significantly lower frequency of the infiltrated Dnajc10-KO leukemia cells in livers and spleens than the WT controls (Figure 3F). These results suggest that Dnajc10 promotes development of MLL-AF9-induced AML.
DNAJC10 is critical for the maintenance of leukemia stem cells in MLL-AF9 leukemia
Leukemia stem cells are significantly enriched in CD34+CD38/ low or L-GMP fractions,23 which contribute to the malignancy of leukemia. Notably, CD34+CD38- cells from AML patient blasts expressed higher DNAJC10 than normal HSC-enriched cells (Online Supplementary Figure S8A). L-GMP derived from MLL-AF9 or Hoxa9/Meis1a transduced mouse also expressed higher Dnajc10 than normal HSC, CMP and GMP, further confirming frequent overexpression of Dnajc10 in AML LSC-enriched cells (Online Supplementary Figure S8B). Therefore, we further investigated whether Dnajc10 affects the role of LSC. Previous studies reported that LSC are enriched in YFP+Mac-1+c-Kit+ cells in the MLL-AF9 model.5,22,24,25 Intriguingly, we found that primary transplants with Dnajc10-KO cells did not reduce YFP+Mac1+c-Kit+ frequency compared with WT controls (Online Supplementary Figure S8C, D). However, frequencies of YFP+Mac-1+c-Kit+ cells in Dnajc10-KO models were simultaneously reduced in BM, spleen, and PB on secondary transplantation (Online Supplementary Figure S8E-G). Moreover, both the secondary and tertiary recipient mice receiving Dnajc10-KO YFP+Mac-1+c-Kit+ cells showed longer median leukemia latency (Online Supplementary Figure S8H, I). Since the L-GMP population was suggested to be another, more stringent way to determine LSC, we detected the L-GMP frequency and showed that the percentage of Dnajc10-KO L-GMP cells was significantly reduced compared with the WT fraction (Figure 4A). In line with this, both the secondary and tertiary recipient mice receiving Dnajc10-KO L-GMP cells showed longer median leukemia latency (Figure 4B). Interestingly, the serial plating CFU assay in vitro demonstrated that Dnajc10 deficiency abolished clonogenic potential of YFP+Mac-1+c-Kit+ cells, as indicated by the dramatic decrease in the colony and total cell numbers (Figure 4C, D). Taken together, these results indicate that Dnajc10 is essential for LSC self-renewal.
Notably, Dnajc10 deficiency markedly increased apoptosis of YFP+Mac-1+c-Kit+ LSC-enriched populations in mice receiving a second transplant, as indicated by the increased Annexin-V+ percentage and up-regulated expression of cleaved Caspase-3 (Figure 4E, Online Supplementary Figure S8J). This result suggests that increased apoptosis may be
Haematologica | 109 Marzo 2024 755 ARTICLE - DNAJC10 supports development of AML M. Li et al.
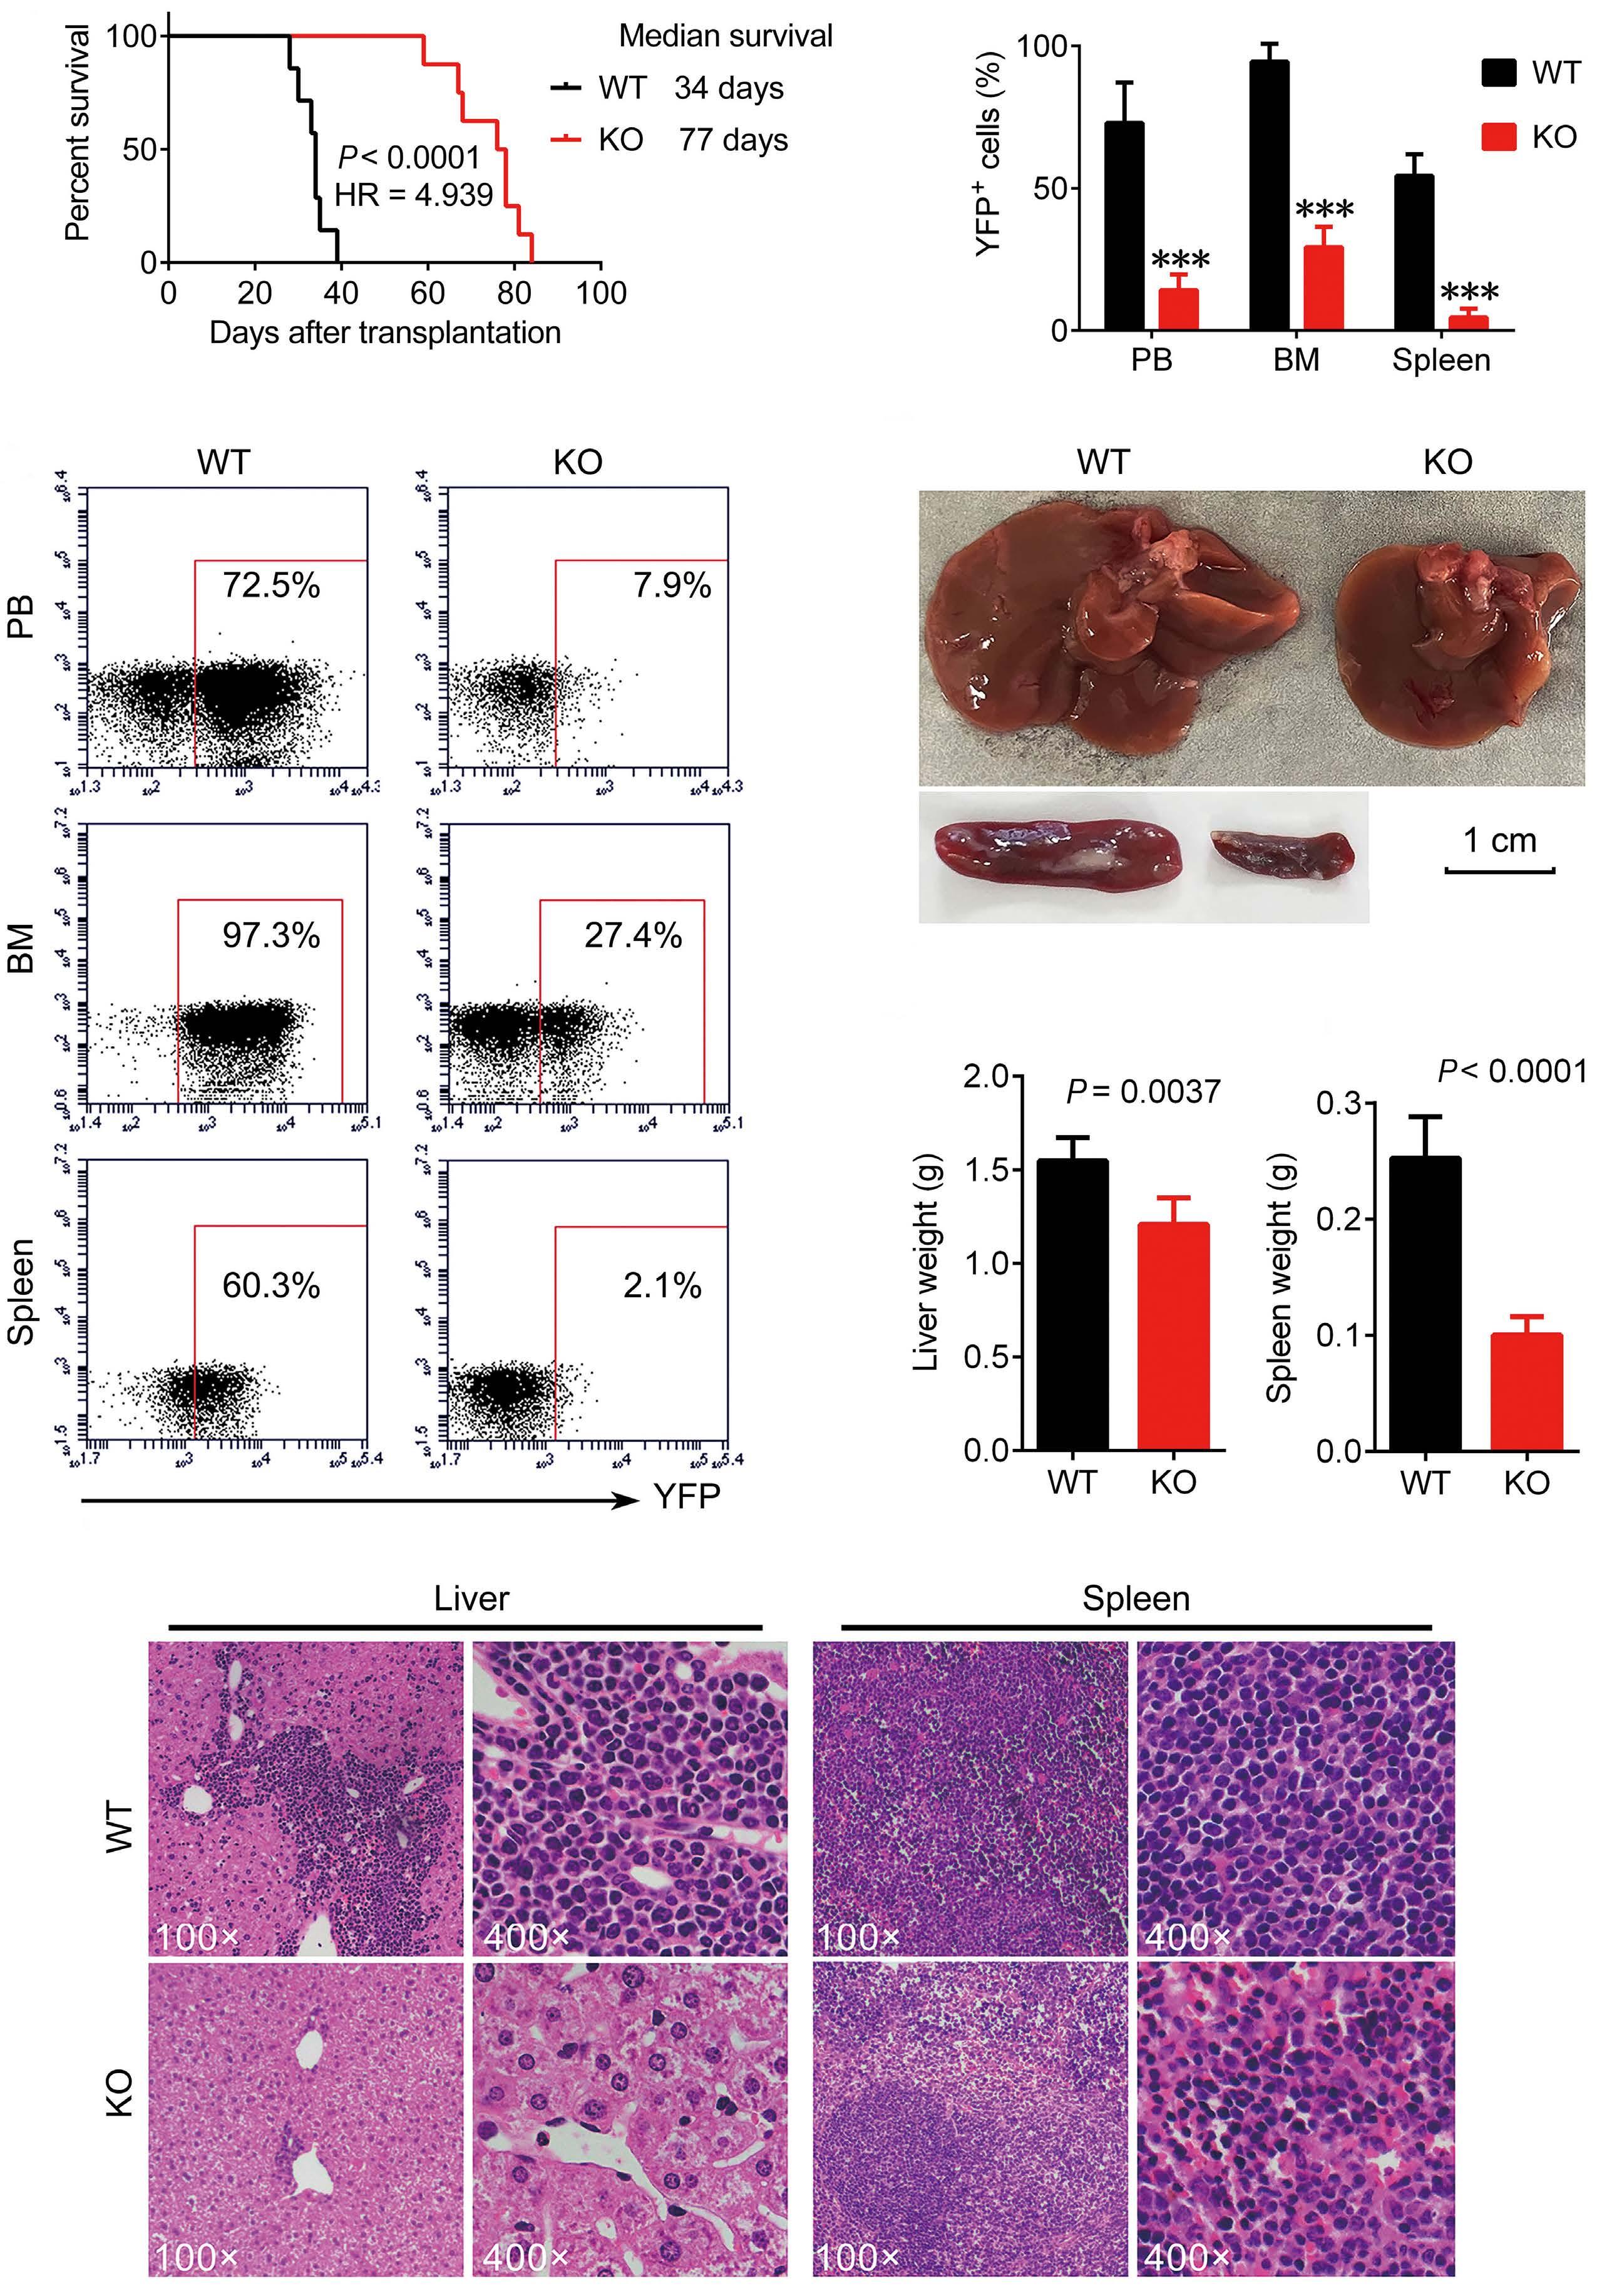
Haematologica | 109 Marzo 2024 756 ARTICLE - DNAJC10 supports development of AML M. Li et al. Continued
A C F D E B
on following page.
Figure 3. DNAJC10 is required for the development of MLL-AF9-induced murine acute myeloid leukemia. (A) Survival analysis for recipient mice receiving Dnajc10 wild-type (WT) or knockout (KO) MLL-AF9 YFP+ bone marrow (BM) cells on the second transplantation. (B) Data summary of percentages of YFP+ leukemia cells in peripheral blood (PB), BM, and spleen of secondary recipient mice receiving Dnajc10 WT or KO MLL-AF9 YFP+ BM cells. (C) Representative flow cytometry plots for (B). (D) Comparison of size of spleens and livers of secondary recipient mice. (E) Quantification of weight of livers and spleens in (D) (N=5). (F) Hematoxylin&Eosin staining analysis of acute myeloid leukemia infiltration in livers and spleens of secondary recipient mice.
responsible for Dnajc10 deficiency-induced reduction of LSC frequency. To confirm that Dnajc10 deficiency reduces frequency of the LSC, LDA was performed in Dnajc10 WT and KO leukemia cells of secondary recipient mice. Strikingly, the frequency of functional LSC in Dnajc10-KO MLL-AF9 model mice was only 1/12 (WT=1/67 vs. KO=1/554) of that in WT control mice (Figure 4F, Online Supplementary Figure S8K). Taken together, these results suggest that DNAJC10 supports LSC activity.
DNAJC10 mediates its effects in acute myeloid leukemia cells through regulation of PERK-EIF2α-CHOP cascade To understand the molecular mechanisms by which DNAJC10 promotes survival of AML, 958 DNAJC10-co-expression genes (Online Supplementary Table S3, Online Supplementary Figure S9A) were used for further Gene Ontology (GO) and Kyoto Encyclopedia of Genes and Genomes (KEGG) enrichment analysis. The top 20 significantly enriched GO terms are shown in Online Supplementary Figure S9B-D. Studies have reported that DNAJC10 is involved in quality control of proteins in the ER by recognizing and degrading unfolded/misfolded proteins.14-16 In agreement with this, we observed that the most significantly enriched KEGG pathways of DNAJC10 co-expression genes were involved in protein processing in the ER and ubiquitin-mediated proteolysis (Figure 5A). Moreover, transmission electron microscopy (TEM) assay was performed and demonstrated that DNAJC10-deficient cells displayed extensively distended and dilated ER compared with control cells (Figure 5B). Moreover, protein levels of GRP78 and GRP94, the sentinel markers of ER stress, were significantly increased in DNAJC10-deficient cells (Figure 5C), further suggesting that knockdown of DNAJC10 expression triggers ER stress in AML cells.
Given that UPR is activated through three parallel signaling pathways (PERK, ATF6, and IRE1) (Online Supplementary Figure S10A),8,26 we further analyzed the activation of these effectors of UPR. Interestingly, knockdown of DNAJC10 did not induce activation of ATF6 and the IRE1/XBP1-mediated branch, whereas it notably induced phosphorylation of PERK and downstream EIF2α (Figure 5C). As previously reported, the PERK branch mainly triggers death or apoptosis of stressed cells.26 Therefore, the activation of the PERKEIF2α branch might, to some extent, explain why DNAJC10 deletion induced apoptosis of AML cells. Furthermore, the crucial players of the PERK branch including GADD34, CHOP, and BAX, which triggers ER stress-induced apoptosis, were significantly up-regulated on knockdown of DNAJC10 (Fig-
ure 5D); vice versa, the anti-apoptotic protein BCL-2 was decreased in DNAJC10-deficient cells (Figure 5D). Moreover, PERKi treatment rescued expression of CHOP and BAX (Figure 5E), partially compromised cell viability inhibition (Figure 5F), and attenuated apoptosis (Online Supplementary Figure S10B), which were all induced by knockdown of DNAJC10. Together, these results suggest that DNAJC10 knockdown-induced apoptosis and inhibition of cell viability are linked to preferential PERK pathway activation.
PERKi treatment reverses the DNAJC10 deletionmediated elimination of leukemia stem cells in MLL-AF9 mice
In line with this, we found that the Perk branch was activated in Dnajc10-KO leukemic cells in vivo, as determined by up-regulated expression of phosphorylated Eif2α, Gadd34, Chop, and Bax (Figure 6A). Therefore, PERKi was used in a rescue experiment performed in Dnajc10-KO or WT MLLAF9 mice (Online Supplementary Figure S10C). Interestingly, PERKi treatment could reverse the delayed leukemic progression induced by Dnajc10 deficiency. We observed significant increases in the total numbers of WBC in PB (Online Supplementary Figure S10D), in the percentage of leukemic YFP+ cells in BM (Figure 6B, Online Supplementary Figure S10E), and a reduced OS (Figure 6C) in PERKi-treated Dnajc10-KO MLL-AF9 mice. Next, we examined the role played by Perk in the Dnajc10 deficiency-induced elimination of AML LSC. In agreement with this, PERKi treatment could significantly reverse the decreased YFP+Mac1+c-Kit+ frequency in the BM of MLL-AF9 mice induced by Dnajc10 deficiency (Figure 6D). The in vitro CFU assays also showed that PERKi treatment significantly compromised Dnajc10 deficiency-induced self-renewal inhibition, as determined by increased colony and total cell numbers (Online Supplementary Figure S10F-H). Furthermore, PERKi-treated Dnajc10-KO colonies showed much higher frequency of YFP+Mac1+c-Kit+ cells at third and fourth plating compared to that in PERKi-free Dnajc10-KO colonies (Figure 6E). In addition, we confirmed that PERKi treatment rescued Dnajc10 deficiency-induced activation of Perk cascade in YFP+Mac1+c-Kit+ cells, as determined by reversed expression of phosphorylated Eif2α, Gadd34, Chop, Bax, and cleaved Caspase-3 (Figure 6F). Consistent with PERKi, knockdown of Perk expression by shRNA could also significantly reverse Dnajc10 deficiency-induced self-renewal inhibition, as determined by increased colony and total cell numbers in the secondary plating (Online Supplementary Figure S11A-D). Collectively, these results indicate that Dnajc10 deficien-
Haematologica | 109 Marzo 2024 757 ARTICLE - DNAJC10 supports development of AML M. Li et al.
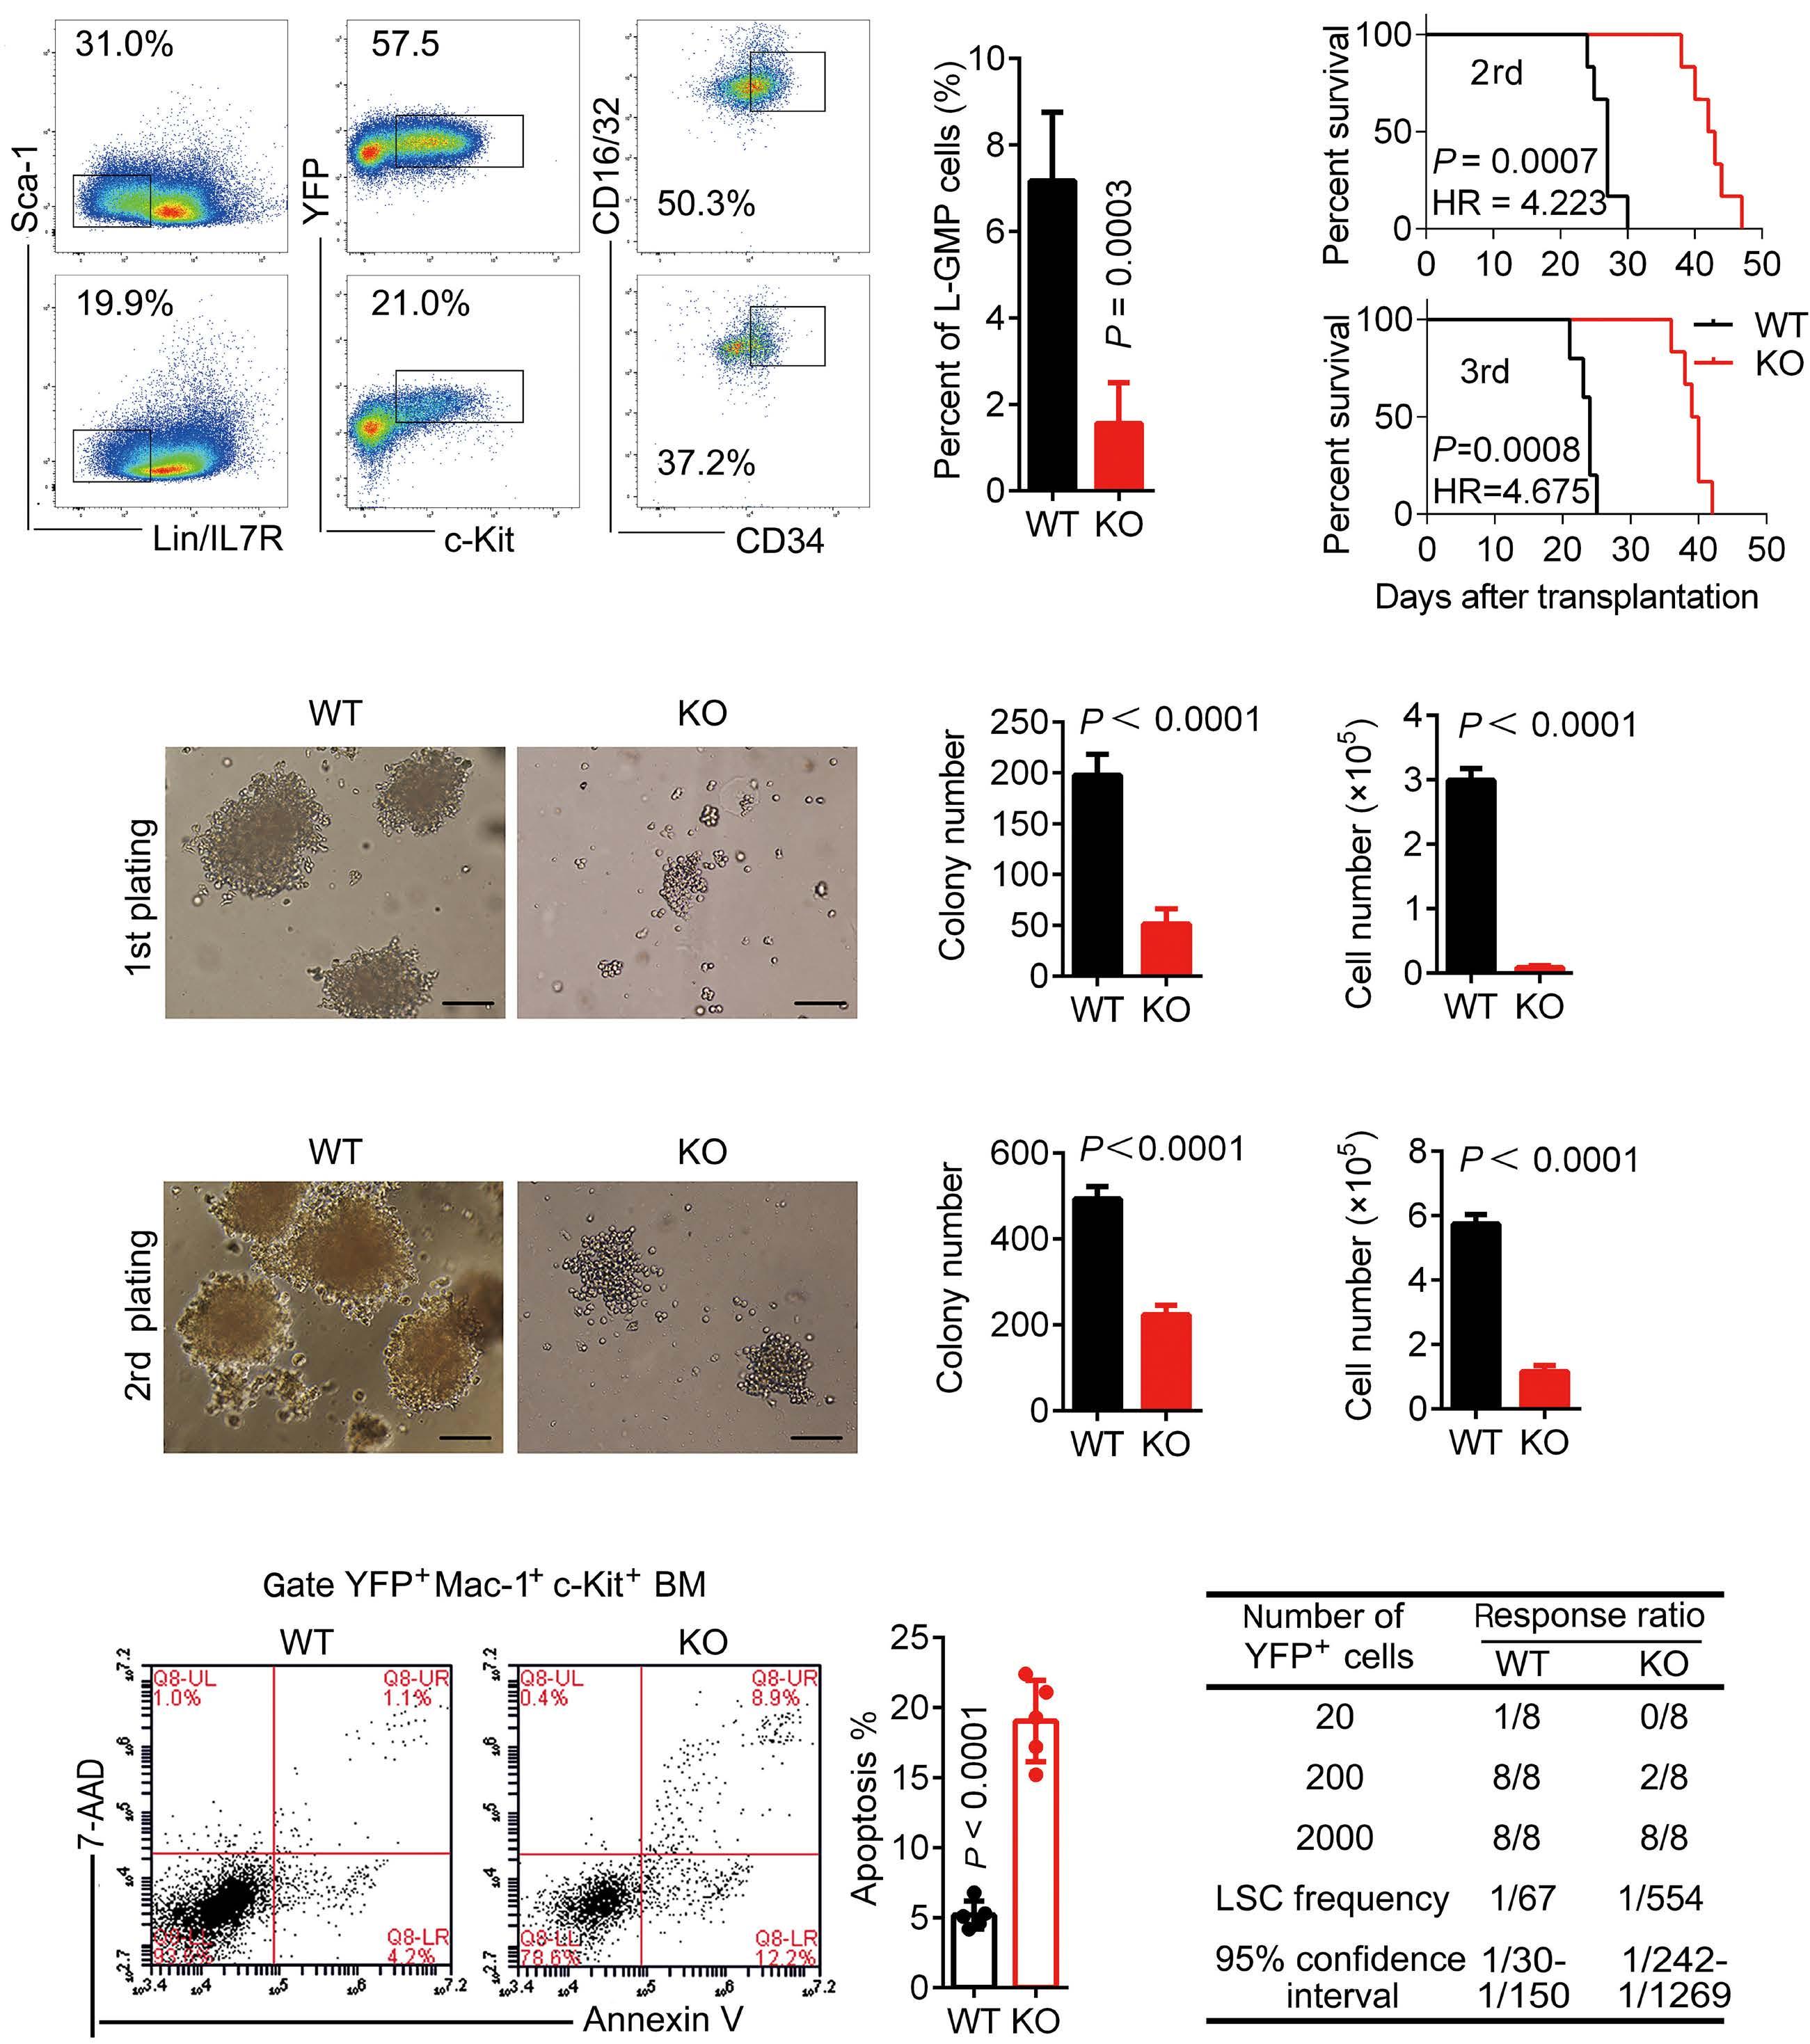
of colony
and cell
each group.
(LSC)-enriched
(right). Scale
three times with similar results. (E) Representative flow cytometric analysis of apoptosis for WT or Dnajc10-KO YFP+Mac-1+c-Kit+ LSC-enriched cells from secondary recipients (left). Summary of apoptosis percentage (right) (N=5).
four times with similar results. (F) Limiting dilution assays (LDA) estimating the frequency of LSC in WT and Dnajc10-KO MLL-AF9 leukemia cells. The frequencies were calculated by ELDA software. Table shows the number of recipients that developed leukemia and total number of recipients transplanted per cell dose. The experiment was repeated three times with similar results. Results of the repeated experiements are summarized in Online Supplementary Table S1. HR: Hazards Ratio.
Haematologica | 109 Marzo 2024 758 ARTICLE - DNAJC10 supports development of AML M. Li et al.
A B C D E F
Figure 4. DNAJC10 regulates the frequency of leukemia stem cells in MLL-AF9-induced leukemia. (A) Representative flow cytometric analysis for wild-type (WT) and Dnajc10-knockout (KO) L-GMP cells in the bone marrow (BM) of the secondary recipients (left) and L-GMP percentage summary (right) (WT: N=5; KO: N=6 ). The experiment was repeated three times with similar results. (B) Survival (%) for mice receiving WT or Dnajc10 KO L-GMP cells upon the 2nd and 3rd transplantation. N=6 mice for
(C and D) Representative images of colony formation of WT and Dnajc10-KO YFP+Mac-1+c-Kit+ leukemia stem cell
cells of the secondary recipients in the 1st (C) or 2nd (D) plating (left). Summary
numbers
numbers
bars 10µM. The experiment was repeated
The experiment was repeated
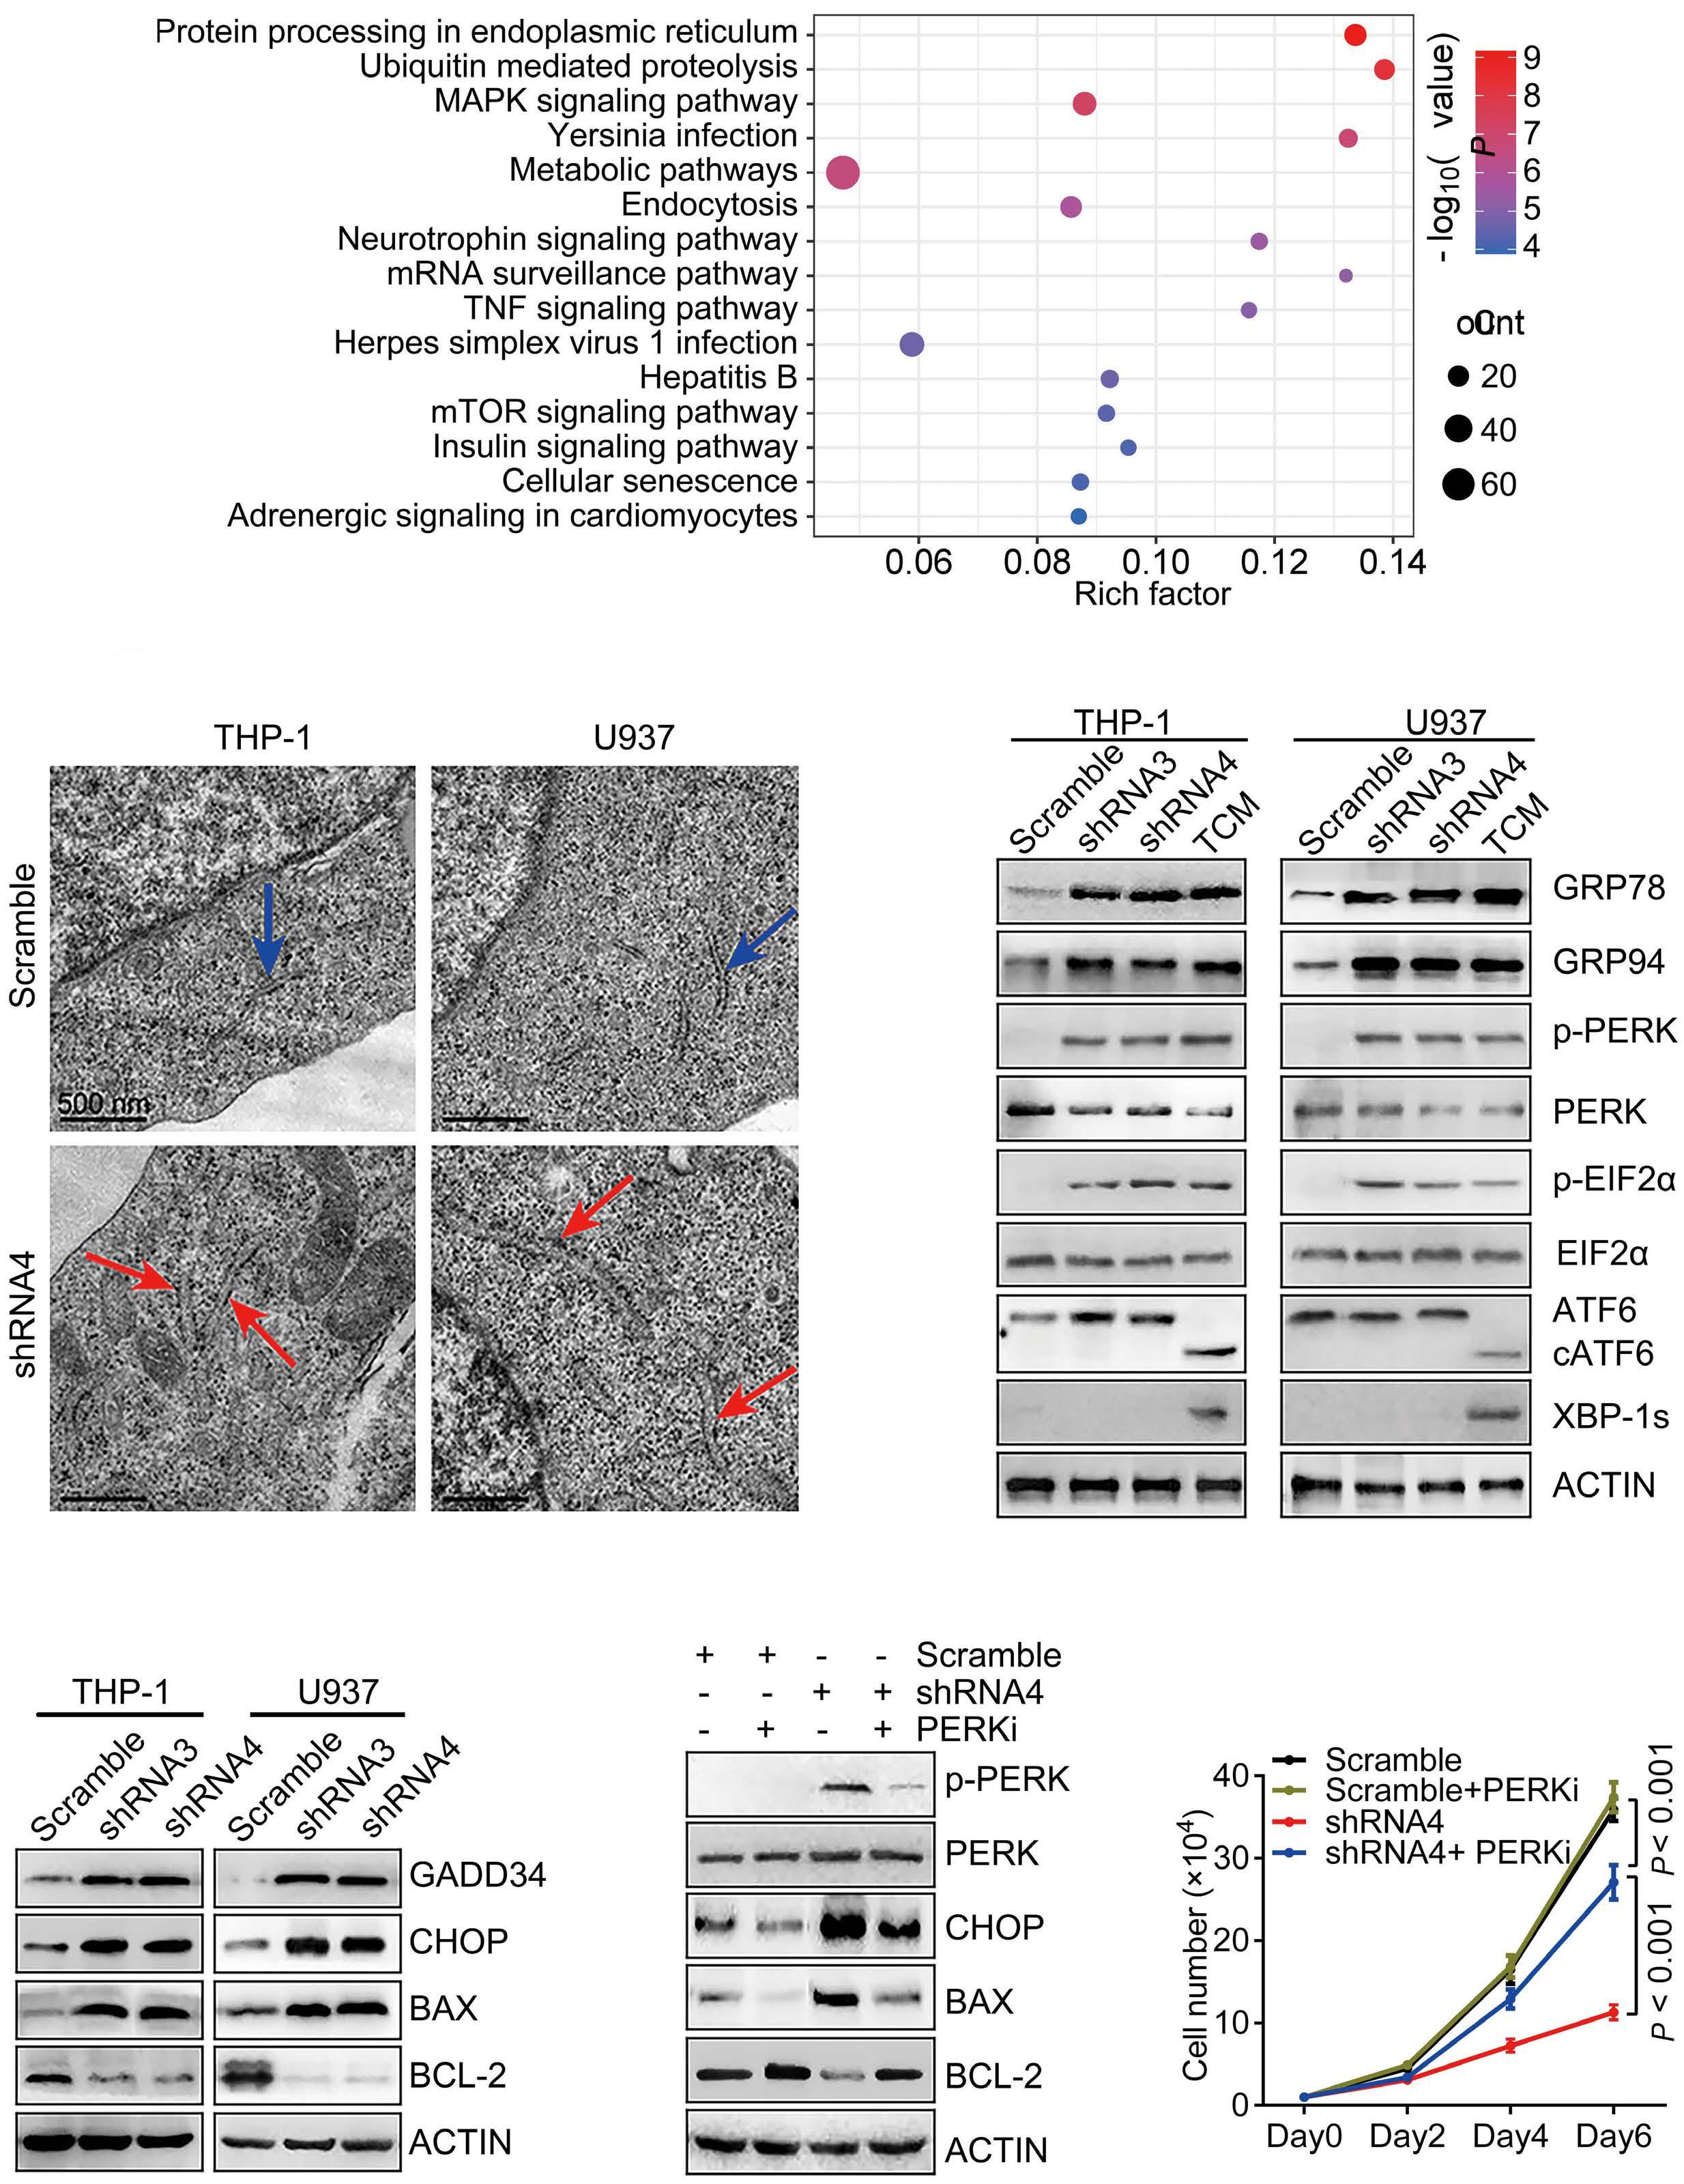
in Scramble or DNAJC10 shRNA
and D)
of the indicated
at three days post infection. Cells were treated with 2 ug/mL tunicamycin for 8 hours as positive control. (E and
Scramble or DNAJC10 shRNA-infected cells were treated with or without 1 nM PERK inhibitor GSK2606414 (PERKi).
of the indicated proteins was determined by immunoblotting.
N=4.
Haematologica | 109 Marzo 2024 759 ARTICLE - DNAJC10 supports development of AML M. Li et al.
A B D E F C
Figure 5. DNAJC10 mediates its effects in acute myeloid leukemia cells through regulation of unfolded protein response. (A) The top 15 Kyoto Encyclopedia of Genes and Genomes (KEGG) pathways with the highest enrichment of DNAJC10 co-expression genes (Online Supplementary Figure S10A). (B) Ultrastructural analysis by transmission electron microscopy confirmed the presence of dilated and irregularly shaped endoplasmic reticulum in DNAJC10 knockdown AML cells. (C
Expression
proteins
infected cells
F)
(E) At 24 hours post-PERKi treatment, expression
(F) Plots of cell numbers at indicated days after PERKi treatment.
cy-mediated reduction in LSC in AML mice is dependent on activation of the Perk-Eif2α branch of UPR.
Knockout of DNAJC10 sensitized acute myeloid leukemia cells to daunorubicin and cytarabine
Importantly, accumulation of unfolded/misfolded proteins that exceed the folding capacity is implicated in sensitiza-
tion to multiple chemotherapy treatments as it leads to the induction of the pro-apoptotic branch of the UPR.11,27 Here, we further investigated the association between DNAJC10 and daunorubicin (DNR) / cytarabine (Ara-C) resistance. In silico analysis indicated that “DNR + Ara-C” treatment significantly induced DNAJC10 expression in AML patients (Figure 7A). Moreover, Ara-C or DNR treatment significantly
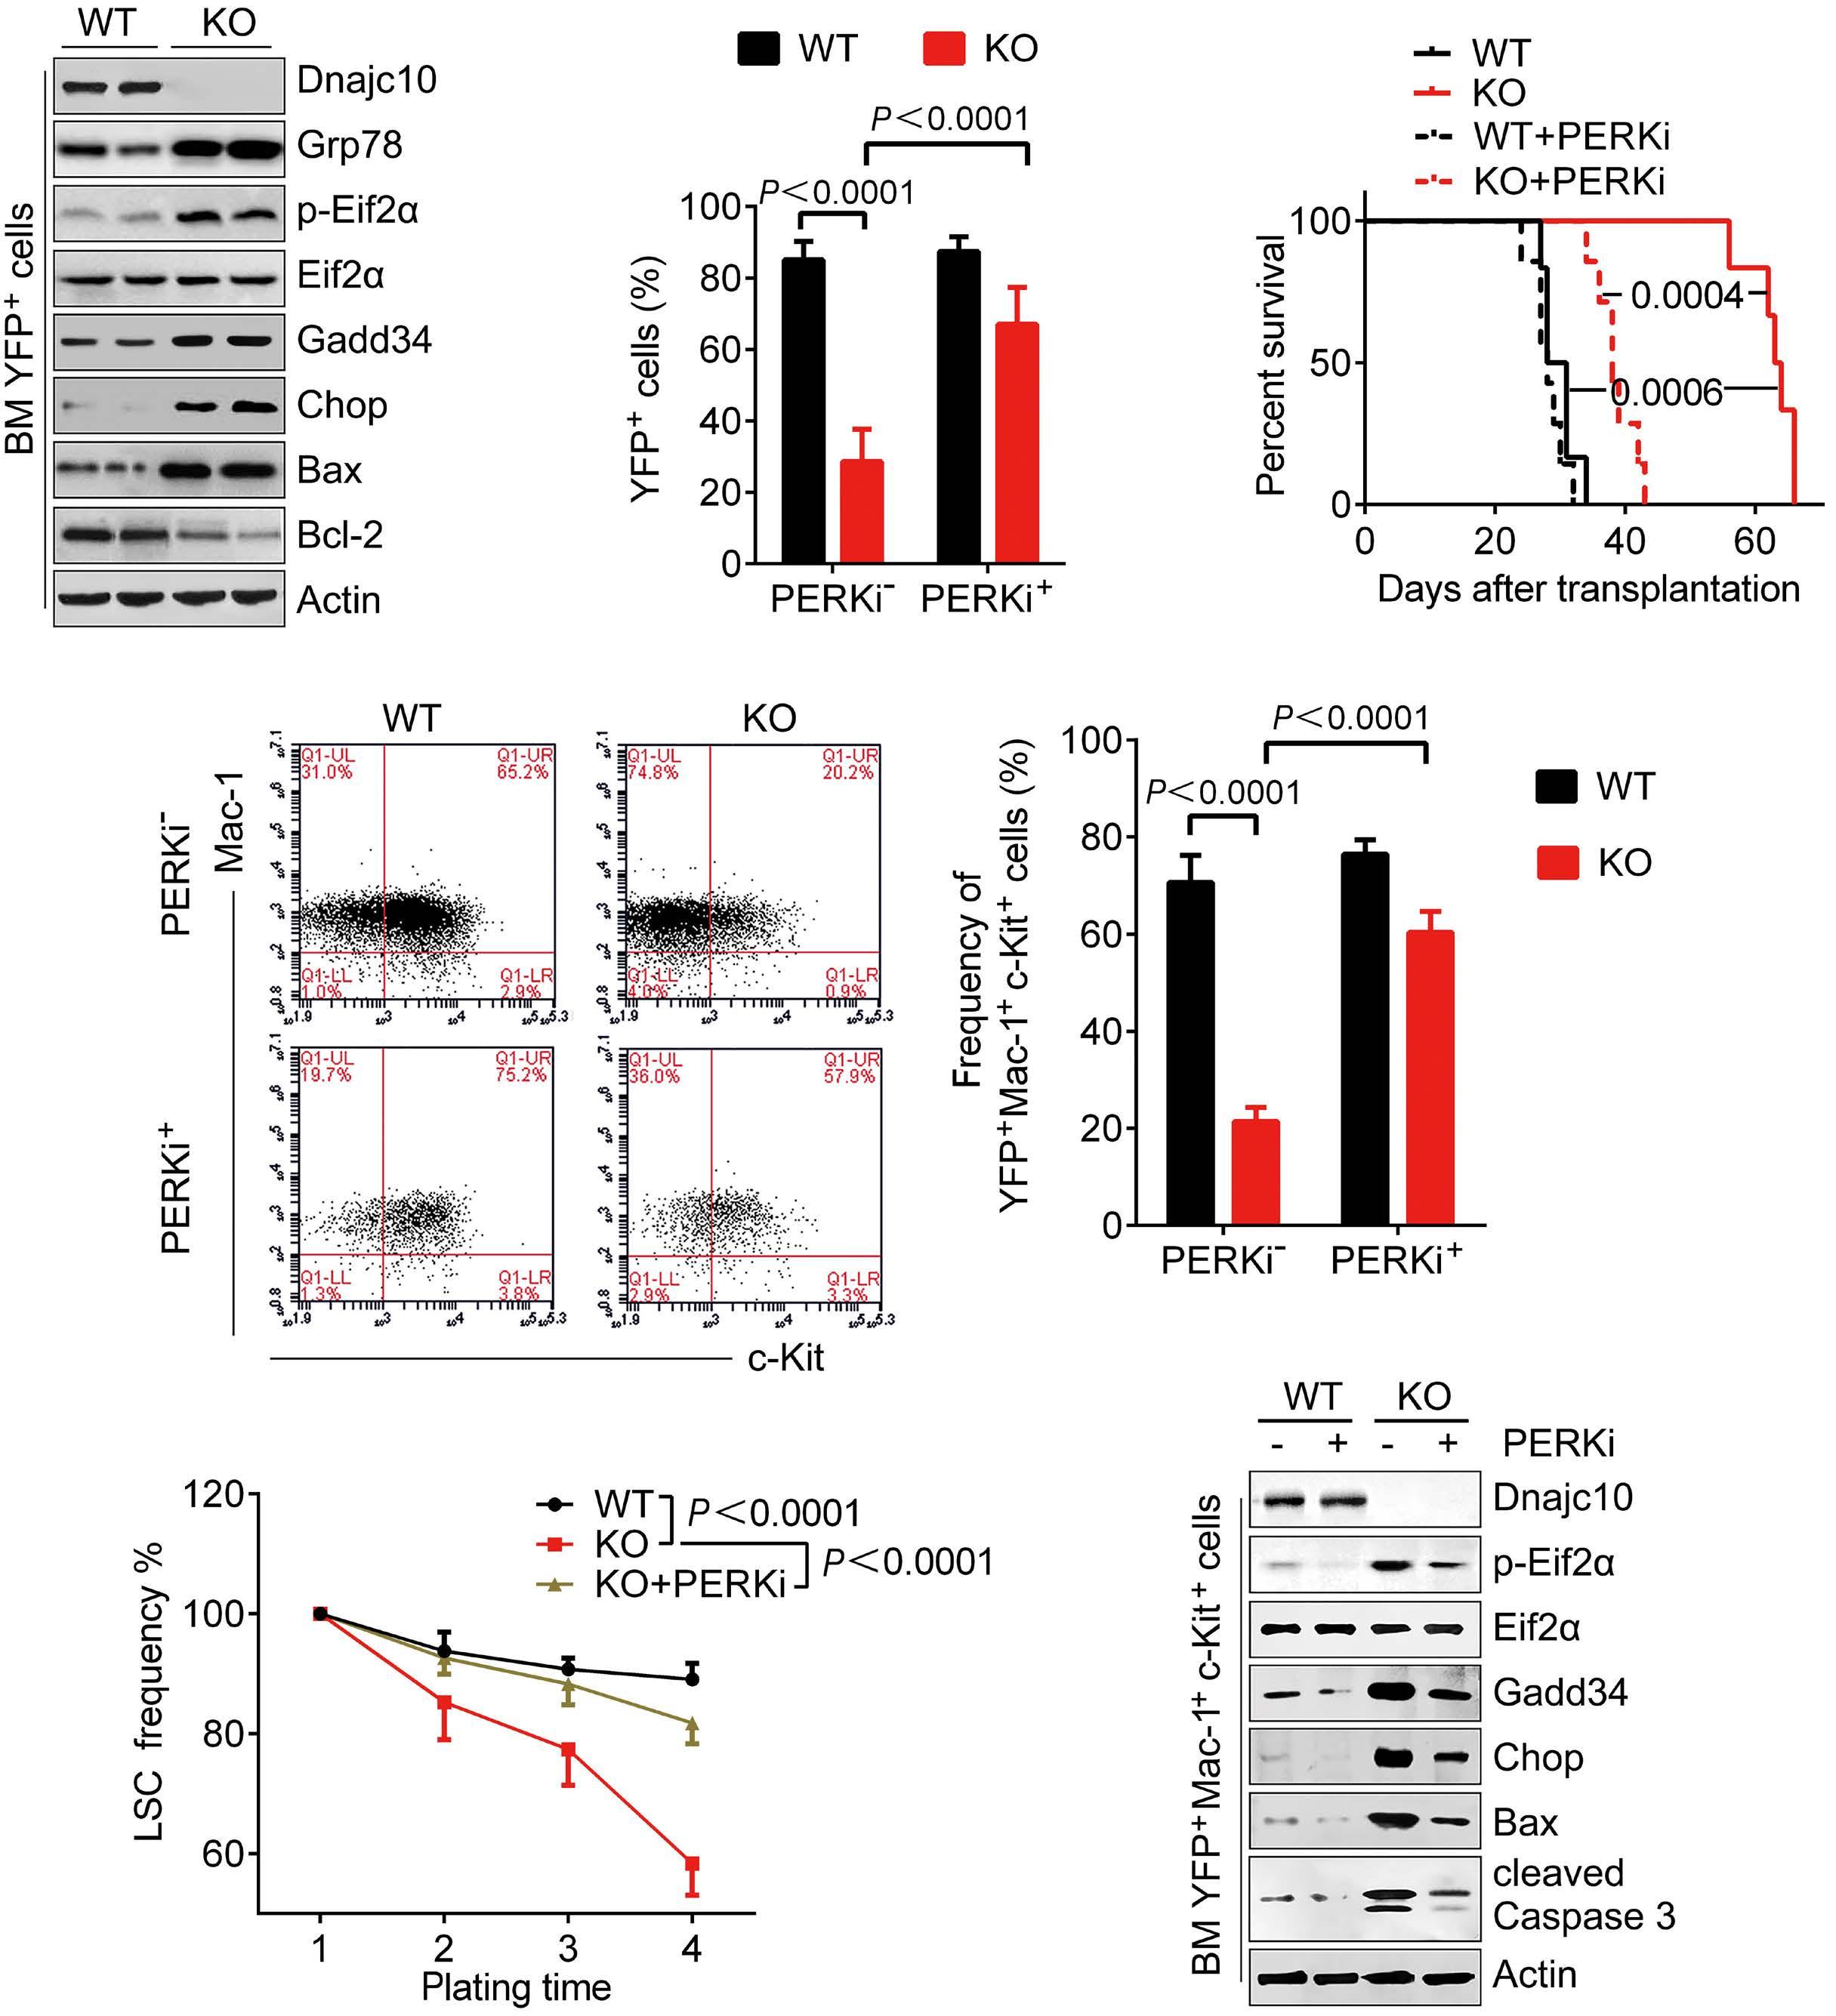
Haematologica | 109 Marzo 2024 760 ARTICLE - DNAJC10 supports development of AML M. Li et al.
A D E F B C
Figure 6. PERKi treatment can partially rescue phenotypes of Dnajc10 deletion in MLL-AF9 mice. (A) Expression of the indicated proteins in Dnajc10-knockout (KO) or wild-type (WT) YFP+ bone marrow (BM) cells of the secondary transplanted mice were determined by immunoblotting (IB). (B) Data summary of percentages of YFP+ leukemia cells in BM at day 22 post transplantation. (C) Survival analysis of Dnajc10 WT or KO MLL-AF9 mice on 2nd transplantation of rescue experiments. (D) Representative flow cytometry plots for WT and Dnajc10-KO YFP+Mac-1+c-Kit+ cells in the rescue experiments (left) and the data summary (right) (N=46). (E) Summary of YFP+Mac-1+c-Kit+ cell frequency of the colonies from 1st to 4th plating. (F) Expression of the indicated proteins in Dnajc10-KO or WT YFP+Mac-1+c-Kit+ BM cells were determined by IB in the rescue experiments.
induced DNAJC10 and GRP78 up-regulated expression in a dose-dependent manner (Figure 7B). Notably, AML patients with high DNAJC10 expression level tended to have a shorter disease-free survival (DFS) after “DNR + Ara-C” treatment (Figure 7C), suggesting that UPR activation and up-regulated DNAJC10 expression tend to cause AML cell resistance to Ara-C and DNR.
Therefore, we hypothesized that blocking DNAJC10 might sensitize AML cells to DNR and Ara-C through activating
the pro-apoptotic PERK branch of UPR. As expected, DNAJC10-KO cells exhibit a significantly reduced cell viability compared to the DNAJC10-WT cells in ER stress conditions induced by FBS-free starvation or heat-shock (Online Supplementary Figure S12A, B). Furthermore, we demonstrated that the DNAJC10 KO cells have decreased IC50 of Ara-C and DNR compared to DNAJC10 WT cells (Figure 7D, E, Online Supplementary Figure S12C, D). In addition, the IC50 of 5-Fluorouracil (F-Fu) for DNAJC10-WT THP-1 and U937
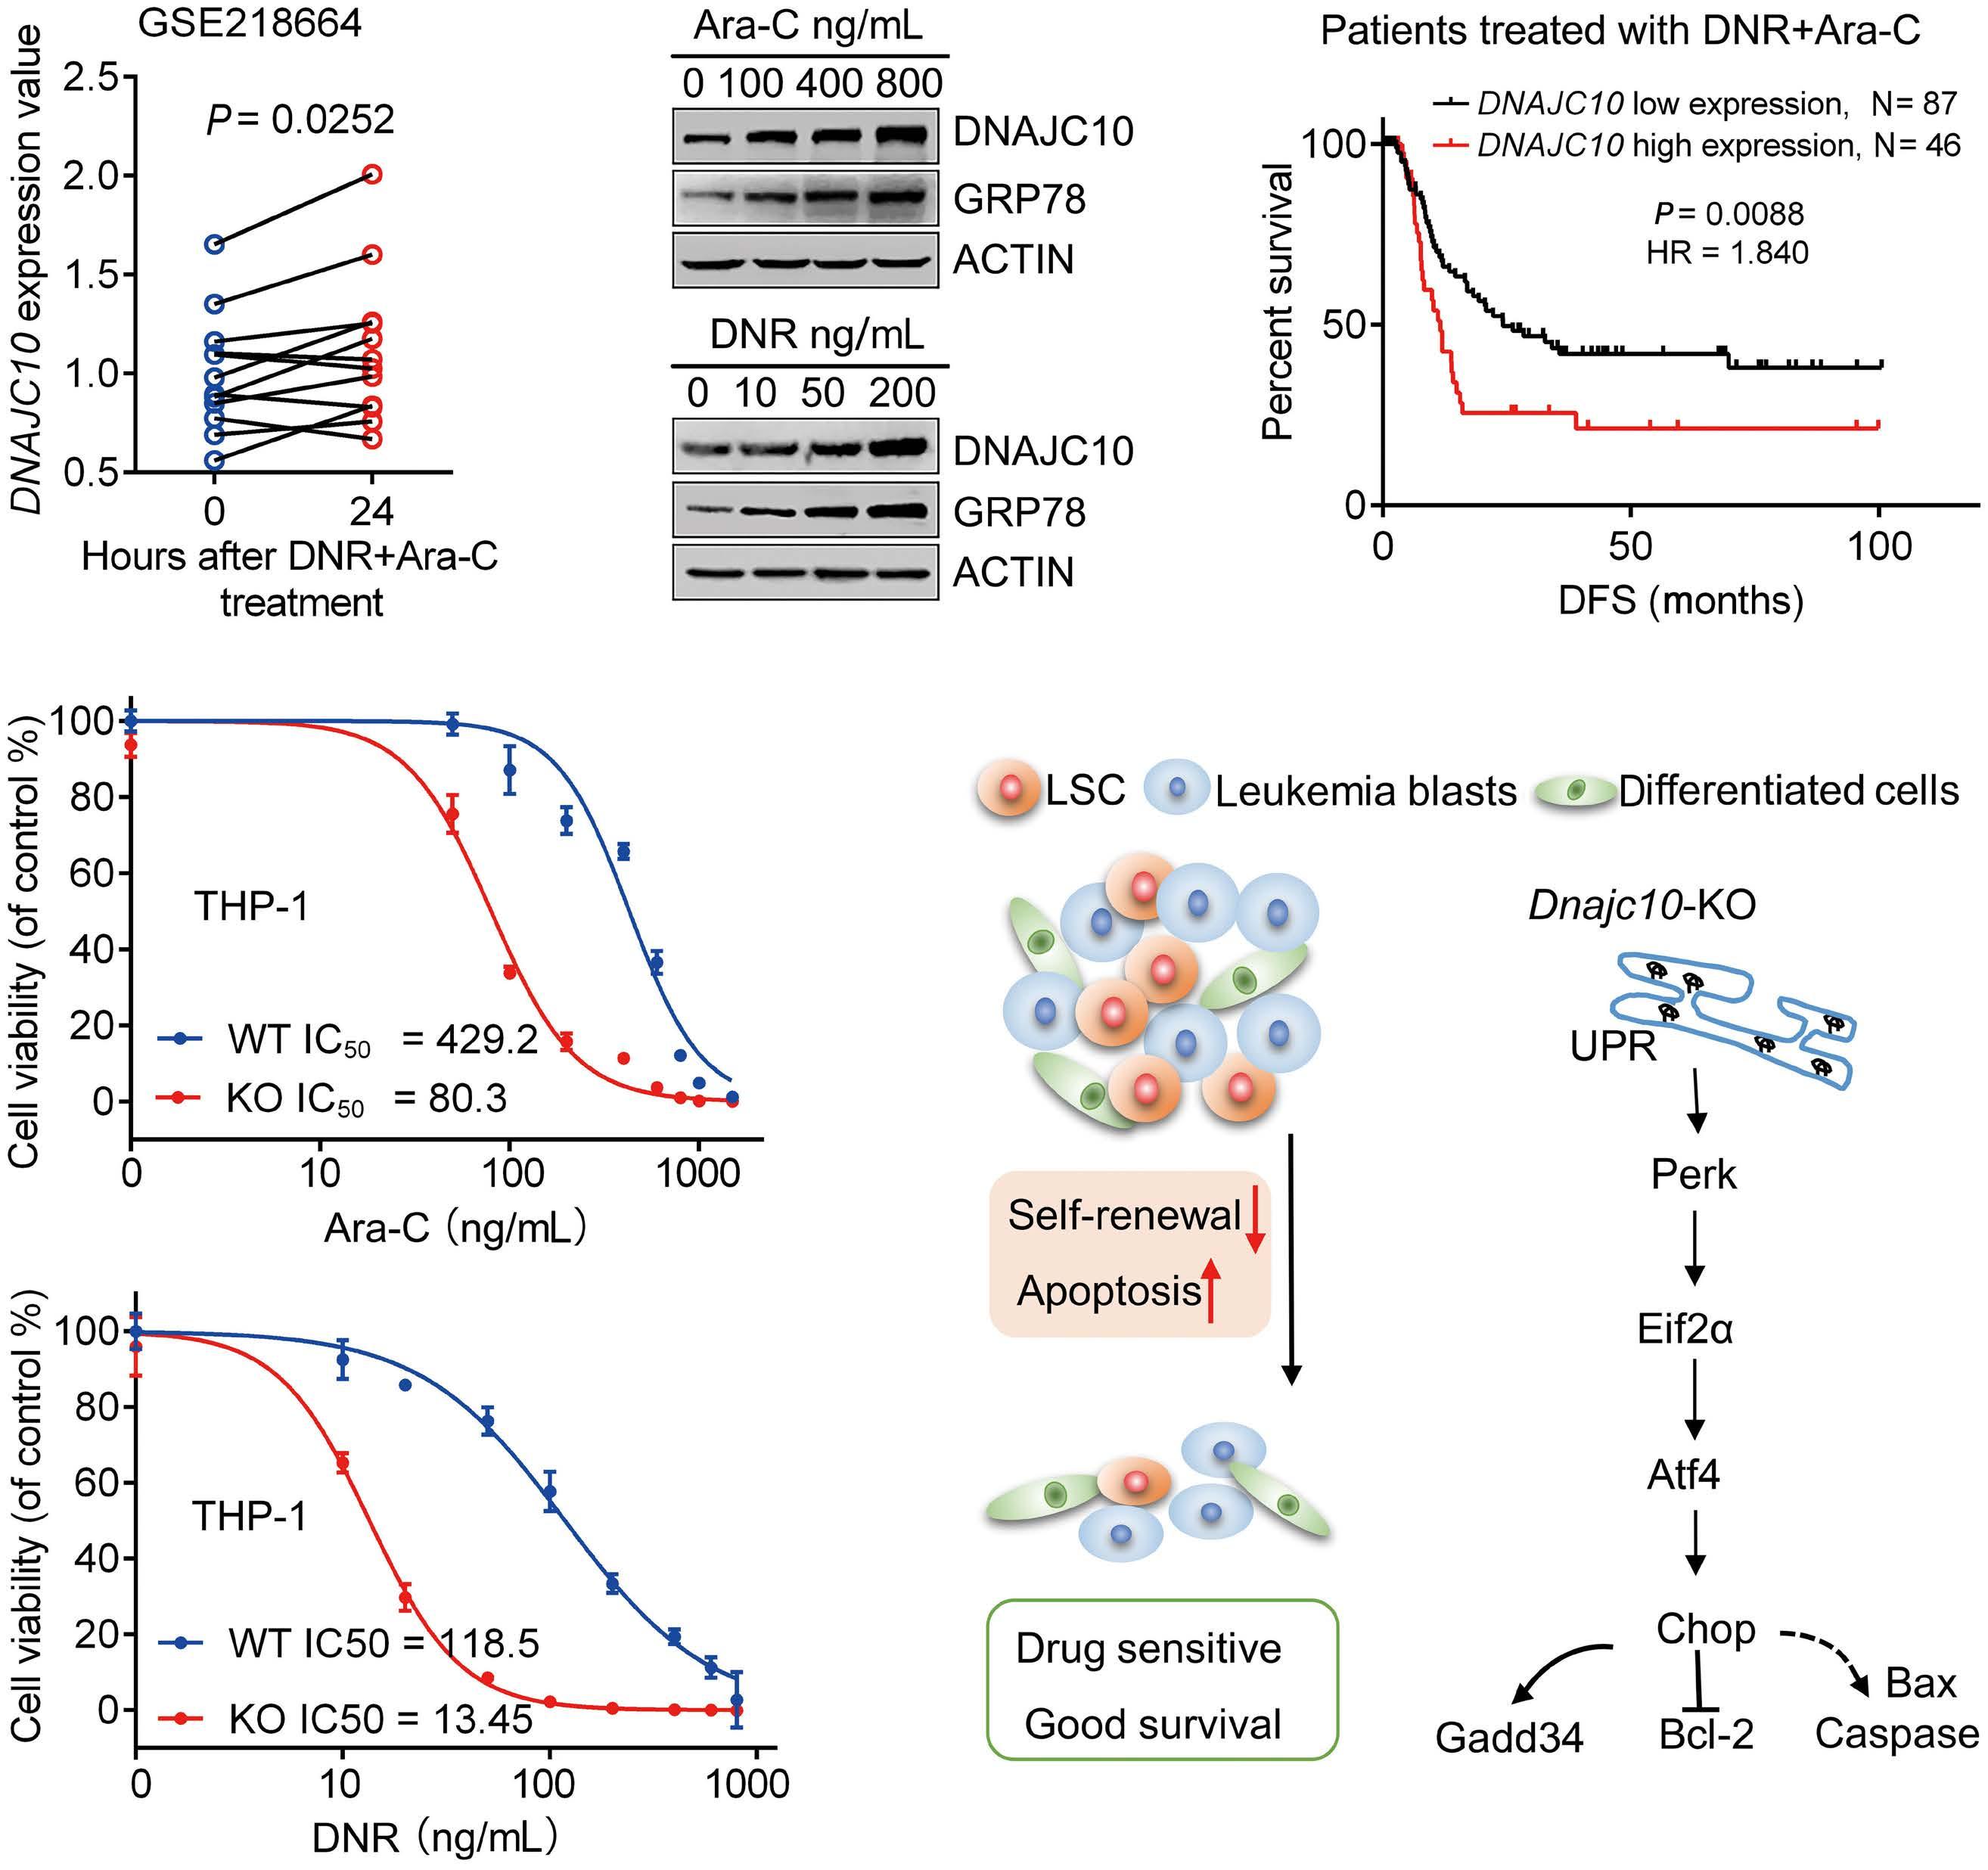
Figure 7. DNAJC10-deficiency sensitizes acute myeloid leukemia cells to daunorubicin and cytarabine. (A) Peripheral blood mononuclear cells (PBMC) from acute myeloid leukemia (AML) patients were pre-treated with daunorubicin (DNR) + cytarabine (Ara-C) for 24 hours (h). Relative transcription of DNAJC10 was shown (GSE218664). (B) THP-1 cells were treated with Ara-c or DNR at the indicated concentration for 48 h, followed by immunoblotting analysis expression of DNAJC10 and GRP78. (C) Disease-free survival (DFS) was analyzed in AML patients who received Ara-C+DNR treatment based on DNAJC10 expression level. (D, E) DNAJC10-WT or KO AML cells were treated with different concentrations of Ara-C, DNR or 5-Fu for 96 h, then cell viability was quantified by CCK-8 assay. IC50 was calculated using non-linear regression method. (F) Proposed working model of how DNAJC10 regulates AML LSC and leukemic cells.
Haematologica | 109 Marzo 2024 761 ARTICLE - DNAJC10 supports development of AML M. Li et al.
A D E F B C
cells was almost 8.5 and 5.5-fold that for DNAJC10-KO cells (Online Supplementary Figure S12E, F). Finally, to determine whether the activation of PERK is responsible for DNAJC10 deficiency sensitization of AML cells to DNR and Ara-C, DNAJC10-WT or KO THP-1 cells were infected with Scramble or PERK shRNA lentivirus, respectively. We found that knockdown of PERK partially but significantly reverses sensitization of THP-1 cells to Ara-C or DNR induced by DNAJC10-deficiency, as determined by the IC50 value (Online Supplementary Figure S12G-I). Taken together, these results revealed that the sensitivity of AML cells to DNR and Ara-C significantly increased through DNAJC10 silencing and PERK activation.
Discussion
DNAJC10, an ER co-chaperone, is part of the ERAD complex involved in recognizing, refolding or degrading unfolded/ misfolded proteins.14,15 DNAJC10 had been reported to be important in several cancers but its potential function in AML is unknown. In this study, we systematically analyzed the potential role of DNAJC10 in LSC self-renewal and AML development. Based on this study, we proposed that DNAJC10 enhances ER protein folding, activates the pro-survival branch of UPR, and maintains ER homeostasis, thus increasing LSC repopulation capacity, and leads to chemotherapy resistance. Conversely, DNAJC10 deficiency leads to accumulation of unfolded/misfolded proteins, activates the pro-apoptotic PERK branch of UPR, and eventually causes apoptosis of LSC and leukemic cells (Figure 7F).
Here, our study revealed that DNAJC10 maintains LSC activity and promotes the development of AML. The positive roles of DNAJC10 in AML are supported by a variety of evidence. 1) High expression of DNAJC10 is an independent poor prognostic indicator for AML. 2) Deficiency of DNAJC10 promotes apoptosis of human AML cells both in vitro and in vivo. 3) Dnajc10 supports the development of AML in the MLL-AF9 mouse model. 4) Dnajc10 is over-expressed in LSC-enriched cells and supports LSC self-renewal. Consistent with our results, a recent report showed that targeting the CENPU-DNAJC10 axis significantly inhibits proliferation and metastasis in lung adenocarcinoma.19 However, DNAJC10 was found to reduce neuroblastoma cell survival by down-regulating the UPR, suggesting its anti-tumor function. These contradictory results indicated that the function of DNAJC10 in cancer suppression or progression appear to be dependent on different types of cancers and the presence of the variants. Remarkably, DNAJ domain-containing proteins are suggested to stabilize and assist in the transport of p53 to the mitochondria.28 Furthermore, the stability and transport to the mitochondria of wild-type p53 or mutant p53 are crucial for their tumor suppressive and oncogenic action.29 Therefore, further studies are needed to explore p53 regulation or DNAJC10
activity in different types of cancers. Targeting LSC is a promising approach for blocking leukemogenesis and improving outcomes of AML patients. However, it has been a challenge to specifically target LSC while sparing self-renewing normal HSC to protect normal hematopoiesis, because these both appear to use the same self-renewal signaling pathways. Interestingly, the present study revealed that DNAJC10 was specifically highly expressed in LSC-enriched cells but not in normal HSC and hematopoietic progenitor cells (HPC), consistent with a previous report that DNAJ proteins including DNAJA1, DNAJB1, DNAJC9, DNAJC10, and DNAJC12 were all up-regulated in cancer stem cell populations relative to normal cell populations.30 Importantly, Dnajc10 deficiency significantly reduced the frequency of functional LSC in MLL-AF9 model mice. Meanwhile, Dnajc10-KO mice have normal hematopoiesis and normal Lin Sca-1+c-Kit+ percentages in the BM. In agreement with this, a previous report also showed that mice lacking DNAJC10 were viable, healthy, fertile, and displayed a normal life span.21 Mechanistically, we found that deficiency of DNAJC10 tends to activate the PERK-EIF2α-CHOP axis and promotes LSC apoptosis. However, ER stress stimulation activates both IRE1-XBP-1 and PERK pathways in HSC. Moreover, the HSC pool tend to maintain clonal integrity by clearance of individual HSC after stress to prevent propagation of damaged stem cells.7 These results suggest that DNAJC10 regulates normal HSC and LSC by distinct signaling axes, and DNAJC10 has different functions in different cell types. Taken together, these data suggest that DNAJC10 is required to maintain the self-renewal ability of LSC, but not HSC, which indicates that DNAJC10 may be an ideal target for eliminating LSC. Emerging evidence shows that DNAJC10 has a reductase activity, cleaves the disulfide bonds of misfolded proteins, and accelerates ERAD through its physical and functional associations with EDEM (ER degradation-enhancing a-mannosidase-like protein) and GRP78.14 In line with this, DNAJC10 has been reported to regulate ER stress-associated apoptosis in several solid tumors.18,31,32 However, the precise mechanism underlying DNAJC10 regulating ER stress and leukemia propagation has not been fully elucidated. Our observations in AML cell lines and MLL-AF9 LSC showed that DNAJC10 deficiency specifically activates the PERK-EIF2α branch of UPR, but not the ATF6 and IRE1/ XBP1-mediated branch. More importantly, blocking the PERK branch by PERKi or shRNA significantly compromised DNAJC10 deficiency-induced cell apoptosis and inhibited LSC self-renewal, suggesting that PERK is not a by-stander, but a contributor to DNAJC10 deletion-induced delayed leukemic progression. Remarkably, we showed that DNAJC10 deficiency also selectively enhances the transcription factor ATF4 and, subsequently, downstream effectors such as GADD34, CHOP, and BAX. This is in agreement with previous findings that PERK induce cell death or apoptosis through the PERK/CHOP/BCL2 axis instead of through PERK-medi-
Haematologica | 109 Marzo 2024 762 ARTICLE - DNAJC10 supports development of AML M. Li et al.
ated translation inhibition or the ATF6-mediated UPR.11,13,33 These results demonstrate that targeting DNAJC10 might be a novel approach to selectively activate the PERK-EIF2α branch of UPR to induce cancer cell apoptosis.
The combination of DNR for three days and Ara-C as a continuous infusion for seven days (known as ‘3+7’) remains the standard induction regimen for AML patients worldwide. However, resistance to “DNR+Ara-C” therapy is frequently encountered in the clinic. 34 Moreover, the underlying mechanisms of DNR or Ara-C resistance and sensitivity are still unclear. Here, we prove that up-regulated DNAJC10 expression was closely related to Ara-C and DNR resistance in AML patients. DNAJC10 deficiency remarkably enhances DNR and Ara-C sensitivity in AML cells. These findings suggest that DNAJC10 may be a novel therapeutic target for DNR and/or Ara-C resistant AML. Although the basal UPR represents a major cytoprotective mechanism for cancer cells by supporting their rapid proliferation in an unfavorable microenvironment, prolonged or unalleviated ER stress may activate multiple pro-apoptotic signaling pathways to induce cell apoptosis. Therefore, activation of pro-apoptotic elements of the UPR, such as CHOP and GADD34, could be useful to potentiate the effects of drugs targeting other pathways that also activate the UPR as a protective response.8 Interestingly, we found that DNAJC10 deficiency activates the PERK-EIF2α-CHOP axis and pro-apoptotic GADD34 and BAX, which were reported to be involved in regulating chemotherapy resistance in multiple types of cancers.35-37 Thus, deficiency of DNAJC10 may enhance the sensitivity of DNR and Ara-C by activating the pro-apoptotic PERK-EIF2α-CHOP branch of the UPR. Overall, our results suggest that inhibition of DNAJC10 appear to be a good approach to enhance sensitivity and decrease toxicity of DNR or Ara-C, thus obtaining satisfactory clinical outcomes among the socalled poor-prognosis AML subsets.
In summary, we demonstrate the expression pattern, prognostic value, and potential regulatory mechanisms of DNAJC10 in AML. We found that blocked expression of DNAJC10 decreased cell viability through activating the
References
1. Newell LF, Cook RJ. Advances in acute myeloid leukemia. BMJ. 2021;375:n2026.
2. Kantarjian H, Kadia T, DiNardo C, et al. Acute myeloid leukemia: current progress and future directions. Blood Cancer J. 2021;11(2):41.
3. Lv K, Ren JG, Han X, et al. Depalmitoylation rewires FLT3-ITD signaling and exacerbates leukemia progression. Blood. 2021;138(22):2244-2255.
4. Nguyen CH, Schlerka A, Grandits AM, et al. IL2RA promotes aggressiveness and stem cell-related properties of acute myeloid leukemia. Cancer Res. 2020;80(20):4527-4539.
5. Zhang Y, Xia F, Liu X, et al. JAM3 maintains leukemia-initiating
pro-apoptotic PERK-EIF2 α branch. Interestingly, Dnajc10 is not required for normal hematopoiesis; however, Dnajc10 deficiency significantly slowed AML development and reduced LSC activity in an MLL-AF9 model. Remarkably, blocked expression of DNAJC10 significantly increased sensitivity of AML cells to DNR and Ara-C. Taken together, our findings support the view that DNAJC10 may serve as a novel prognostic indicator and a therapeutic target for AML treatment and chemotherapy sensitization.
Disclosures
No conflicts of interest to disclose.
Contributions
ML, CJ and YYi contributed to the experimental design and writing of the manuscript. ML, XW, MC and SH prepared Figures 3-6. YYu, XL, EZ and MX prepared Figures 1 and 2. ZY, ZW and NX prepared Figure 7. All authors reviewed the manuscript for publication.
Funding
We acknowledge the financial support from the National Natural Science Foundation of China (grant N. 81600128 to YYa), the Natural Science Foundation of Shandong Province (grant N. ZR2020LZL020 to YYa, grant N. ZR2020MH120 to LM, grant N. ZR2021MH154 to XN), the Introduction and Cultivation Project for Young Creative Talents of Higher Education of Shandong Province (to YYa and ML), and Shandong Province Medical and Health Science and Technology Development Plan Project (grant N. 202003100645 to YZ, grant N. 2018WS556 to WZ).
Data-sharing statement
Data for this study are available from the corresponding authors on reasonable request. Data from the publicly available datasets used in this study can be accessed at: CbioPortal (http://www.cbioportal.org/), GEPIA (http://gepia. cancer-pku.cn/), GEO (GSE13159, GSE218664, GSE30377, and GSE20377) (https://www.ncbi.nlm.nih.gov/geo/), and BloodSpot (https://servers.binf.ku.dk/bloodspot/).
cell self-renewal through LRP5/AKT/beta-catenin/CCND1 signaling. J Clin Invest. 2018;128(5):1737-1751.
6. Deng M, Gui X, Kim J, et al. LILRB4 signalling in leukaemia cells mediates T cell suppression and tumour infiltration. Nature. 2018;562(7728):605-609.
7. van Galen P, Kreso A, Mbong N, et al. The unfolded protein response governs integrity of the haematopoietic stem-cell pool during stress. Nature. 2014;510(7504):268-272.
8. Sniegocka M, Liccardo F, Fazi F, Masciarelli S. Understanding ER homeostasis and the UPR to enhance treatment efficacy of acute myeloid leukemia. Drug Resist Updat. 2022;64:100853.
9. Han J, Back SH, Hur J, et al. ER-stress-induced transcriptional
Haematologica | 109 Marzo 2024 763 ARTICLE - DNAJC10 supports development of AML M. Li et al.
regulation increases protein synthesis leading to cell death. Nat Cell Biol. 2013;15(5):481-490.
10 Cubillos-Ruiz JR, Bettigole SE, Glimcher LH. Tumorigenic and immunosuppressive effects of endoplasmic reticulum stress in cancer. Cell. 2017;168(4):692-706.
11. Yu XX, Zhu MY, Wang JR, et al. LW-213 induces cell apoptosis in human cutaneous T-cell lymphomas by activating PERK-eIF2alphaATF4-CHOP axis. Acta Pharmacol Sin. 2021;42(2):290-300.
12. Liu M, Wu C, Luo S, et al. PERK reprograms hematopoietic progenitor cells to direct tumor-promoting myelopoiesis in the spleen. J Exp Med. 2022;219(4):e20211498.
13. Grenier A, Poulain L, Mondesir J, et al. AMPK-PERK axis represses oxidative metabolism and enhances apoptotic priming of mitochondria in acute myeloid leukemia. Cell Rep. 2022;38(1):110197.
14 Ushioda R, Hoseki J, Araki K, et al. ERdj5 is required as a disulfide reductase for degradation of misfolded proteins in the ER. Science. 2008;321(5888):569-572.
15. Oka OB, Pringle MA, Schopp IM, Braakman I, Bulleid NJ. ERdj5 is the ER reductase that catalyzes the removal of non-native disulfides and correct folding of the LDL receptor. Mol Cell. 2013;50(6):793-804.
16. Hagiwara M, Maegawa K, Suzuki M, et al. Structural basis of an ERAD pathway mediated by the ER-resident protein disulfide reductase ERdj5. Mol Cell. 2011;41(4):432-444.
17 Thomas CG, Spyrou G. ERdj5 sensitizes neuroblastoma cells to endoplasmic reticulum stress-induced apoptosis. J Biol Chem. 2009;284(10):6282-6290.
18. Corazzari M, Lovat PE, Armstrong JL, et al. Targeting homeostatic mechanisms of endoplasmic reticulum stress to increase susceptibility of cancer cells to fenretinide-induced apoptosis: the role of stress proteins ERdj5 and ERp57. Br J Cancer. 2007;96(7):1062-1071.
19. Lou Y, Lu J, Zhang Y, et al. The centromere-associated protein CENPU promotes cell proliferation, migration, and invasiveness in lung adenocarcinoma. Cancer Lett. 2022;532:215599.
20. Lu J, Zhao H, Yang L, Jiang X. Protocol to establish a stable MLL-AF9_AML mouse model. STAR Protoc. 2022;3(3):101559.
21. Hosoda A, Tokuda M, Akai R, Kohno K, Iwawaki T. Positive contribution of ERdj5/JPDI to endoplasmic reticulum protein quality control in the salivary gland. Biochem J. 2010;425(1):117-125.
22. Somervaille TC, Cleary ML. Identification and characterization of leukemia stem cells in murine MLL-AF9 acute myeloid leukemia. Cancer Cell. 2006;10(4):257-268.
23. Krivtsov AV, Twomey D, Feng Z, et al. Transformation from committed progenitor to leukaemia stem cell initiated by
MLL-AF9. Nature. 2006;442(7104):818-822.
24. Kang X, Lu Z, Cui C, et al. The ITIM-containing receptor LAIR1 is essential for acute myeloid leukaemia development. Nat Cell Biol. 2015;17(5):665-677.
25. Zhu XN, Wei YS, Yang Q, et al. FBXO22 promotes leukemogenesis by targeting BACH1 in MLL-rearranged acute myeloid leukemia. J Hematol Oncol. 2023;16(1):9.
26. Khateb A, Ronai ZA. Unfolded protein response in leukemia: from basic understanding to therapeutic opportunities. Trends Cancer. 2020;6(11):960-973.
27. Hetz C, Zhang K, Kaufman RJ. Mechanisms, regulation and functions of the unfolded protein response. Nat Rev Mol Cell Biol. 2020;21(8):421-438.
28. Ahn BY, Trinh DL, Zajchowski LD, et al. Tid1 is a new regulator of p53 mitochondrial translocation and apoptosis in cancer. Oncogene. 2010;29(8):1155-1166.
29 Whibley C, Pharoah PD, Hollstein M. p53 polymorphisms: cancer implications. Nat Rev Cancer. 2009;9(2):95-107.
30 Sterrenberg JN, Blatch GL, Edkins AL. Human DNAJ in cancer and stem cells. Cancer Lett. 2011;312(2):129-142.
31. Apostolou E, Moustardas P, Iwawaki T, Tzioufas AG, Spyrou G. Ablation of the chaperone protein ERdj5 results in a Sjogren’s syndrome-like phenotype in mice, consistent with an upregulated unfolded protein response in human patients. Front Immunol. 2019;10:506.
32. Misra UK, Pizzo SV. Modulation of the unfolded protein response in prostate cancer cells by antibody-directed against the carboxylterminal domain of GRP78. Apoptosis. 2010;15(2):173-182.
33. Huiting LN, Samaha Y, Zhang GL, et al. UFD1 contributes to MYC-mediated leukemia aggressiveness through suppression of the proapoptotic unfolded protein response. Leukemia. 2018;32(11):2339-2351.
34 Liu H. Emerging agents and regimens for AML. J Hematol Oncol. 2021;14(1):49.
35. Lei Y, He L, Yan C, Wang Y, Lv G. PERK activation by CCT020312 chemosensitizes colorectal cancer through inducing apoptosis regulated by ER stress. Biochem Biophys Res Commun. 2021;557:316-322.
36. Dadey DYA, Kapoor V, Khudanyan A, Thotala D, Hallahan DE. PERK regulates glioblastoma sensitivity to ER stress although promoting radiation resistance. Mol Cancer Res. 2018;16(10):1447-1453.
37. Urra H, Dufey E, Avril T, Chevet E, Hetz C. Endoplasmic reticulum stress and the hallmarks of cancer. Trends Cancer. 2016;2(5):252-262.
Haematologica | 109 Marzo 2024 764 ARTICLE - DNAJC10 supports development of AML M. Li et al.
Current use of androgens in bone marrow failure disorders: a report from the Severe Aplastic Anemia
Working Party of the European Society for Blood and Marrow Transplantation
Simona Pagliuca,1 Austin G. Kulasekararaj,2 Dirk-Jan Eikema,3 Brian Piepenbroek,4 Raheel Iftikhar,5 Tariq Mahmood Satti,5 Morag Griffin,6 Marica Laurino,7 Alphan Kupesiz,8 Yves Bertrand,9 Bruno Fattizzo,10 Ibrahim Yakoub-Agha,11 Mahmoud Aljurf,12 Paola Corti,13 Erika Massaccesi,14 Bruno Lioure,15 Marisa Calabuig,16 Matthias Klammer,17 Emel Unal,18 Depei Wu,19 Patrice Chevallier,20 Edouard Forcade,21 John A. Snowden,22 Hakan Ozdogu,23 Antonio Risitano24 and Régis Peffault de Latour25
1Hôpitaux de Brabois, CHRU Nancy, and CNRS, Biopôle de l’Université de Lorraine, Vandoeuvre les Nancy, France; 2King's College Hospital-NHS Foundation Trust, NIHR/Wellcome King's Clinical Research Facility and King's College London, London, UK; 3EBMT Statistical Unit, Leiden, The Netherlands; 4EBMT Leiden Study Unit, Leiden, The Netherlands; 5Armed Forces Bone Marrow Transplant Centre, Rawalpindi, Pakistan; 6Saint James, Leeds Teaching Hospitals NHS Trust, Leeds, UK; 7Ospedale Policlinico San Martino, Genova, Italy; 8Akdeniz University Medical School Antalya, Turkey; 9Institut d'Hematologie et d'Oncologie Pediatrique, Debrousse Hospital, Lyon, France; 10Fondazione IRCCS Ca’ Granda Ospedale Maggiore Policlinico, Milan, Italy; 11CHU de Lille, University of Lille, INSERM U1286, Lille, France; 12King Faisal Specialist Hospital & Research Centre, Riyadh, Saudi Arabia; 13Clinica Pediatrica Università degli Studi Milano Bicocca, San Gerardo Hospital, Monza, Italy; 14IRCCS Istituto Giannina Gaslini, Genova, Italy; 15Institut de Cancérologie Strasbourg Europe (ICANS), Strasbourg, France; 16Hospital Clinico Universitario de Valencia, Valencia, Spain; 17St. George's Hospital, London, UK; 18University of Ankara, Ankara, Turkey; 19First Affiliated Hospital of Soochow University, Suzhou, China; 20CHU Nantes, Nantes, France; 21CHU Bordeaux, F-33000, Bordeaux, France; 22Sheffield Blood & Marrow Transplant and Cellular Therapy Program, Department of Hematology, Sheffield Teaching Hospitals NHS Trust, Sheffield, UK; 23Baskent University Hospital, Adana, Turkey; 24A.O.R.N. San Giuseppe Moscati, Avellino, Italy and 25Hôpital Saint Louis, Assistance Publique-Hôpitaux de Paris, Paris, and French Reference Center for Aplastic Anemia, France
Abstract
Correspondence: S. Pagliuca s.pagliuca@chru-nancy.fr
Received: February 12, 2023.
Accepted: May 8, 2023.
Early view: May 18, 2023.
https://doi.org/10.3324/haematol.2023.282935
©2024 Ferrata Storti Foundation
Published under a CC BY-NC license

Androgens represent the historical therapeutic backbone of bone marrow failure (BMF) syndromes. However, their role has rarely been analyzed in a prospective setting, and systematic and long-term data regarding their usage, effectiveness and toxicity in both acquired and inherited BMF are currently unavailable. Here, taking advantage of a unique disease-specific international dataset, we retrospectively analyzed the largest cohort so far of BMF patients who received androgens before or in the absence of an allogeneic hematopoietic cell transplantation (HCT), re-evaluating their current use in these disorders. We identified 274 patients across 82 European Society for Blood and Marrow Transplantation (EBMT) affiliated centers: 193 with acquired (median age 32 years) and 81 with inherited (median age 8 years) BMF. With a median duration of androgen treatment of 5.6 and 20 months, respectively, complete and partial remission rates at 3 months were 6% and 29% in acquired and 8% and 29% in inherited disorders. Five-year overall survival and failure-free survival (FFS) were respectively 63% and 23% in acquired and 78% and 14% in inherited BMF. Androgen initiation after second-line treatments for acquired BMF, and after >12 months post diagnosis for inherited BMF were identified as factors associated with improved FFS in multivariable analysis. Androgen use was associated with a manageable incidence of organ-specific toxicity, and low rates of solid and hematologic malignancies. Sub-analysis of transplant-related outcomes after exposure to these compounds showed probabilities of survival and complications similar to other transplanted BMF cohorts. This study delivers a unique opportunity to track androgen use in BMF syndromes and represents the basis for general recommendations on this category of therapeutics on behalf of the Severe Aplastic Anemia Working Party of the EBMT.
Haematologica | 109 March 2024 765 ARTICLE - Bone Marrow Failure
Introduction
Anabolic steroids have been in use for several decades as a class of therapeutics in both inherited and acquired bone marrow failure (BMF), due to their pleiotropic effects on erythropoiesis, telomere regulation, and immune homeostasis.1 The potential role of androgens in this condition was initially based on the observation, back at the beginning of the 20th century, of some sporadic cases of spontaneous remission in young boys with aplastic anemia (AA) at the onset of puberty.2,3 These spontaneous hematologic recoveries, together with some reports describing the occurrence of myeloid hyperplasia in breast cancer patients receiving testosterone,4 set the stage for the use of androgen-based protocols alone or in association with various immunosuppressive regimens for the treatment of acquired or inherited BMF,5-8 with data generated from randomized trials which have been conducted since the early 1980s.9,10 Specifically, the discordant results produced by these historical trials, showing in one case no benefits in adding androgens to anti-thymocyte globulin (ATG)9 and in another case the superiority of the association in response but not in overall survival,10 did not promote the use of androgens as front-line treatment in an idiopathic setting.
Synthetic and natural anabolic steroids act via the interaction with androgen receptors (AR), members of the steroid hormone nuclear receptor family and ligand-dependent nuclear transcription factors.11 These structures are widely expressed in many tissues ensuring a large range of biological effects, including maintenance of the musculoskeletal, cardiovascular, reproductive, neural, hematopoietic, and immune systems.1,11-13
Effects on hematopoiesis in the context of BMF may depend on pleiotropic mechanisms, including: 1) stimulation of erythropoietin (EPO) receptor expression on erythroid progenitors and increased iron mobilization via hepcidin inhibition;14-16 2) telomere elongation in hematopoietic stem cells (HSC) via binding to the estrogen response elements (ERE) present in the TERT gene promoter after estrogen aromatization, indirectly impacting cell survival and proliferation signaling;6,8,17-20 3) modulation of immune differentiation programs, reducing T-cell activation, Ig production, proinflammatory cytokines, and thymic cellularity.21-23 It is thus not unlikely that the effect on each BMF type is mediated by the activation of different pathways. Furthermore, despite the observation of hematologic improvement under different androgenic analogs, the mechanism of specific molecules remains poorly understood. For instance, danazol has been reported to be able to induce telomere elongation,6,8,17 despite the fact it is structurally not an aromatizable steroid, and is thus unable to interact directly via ERE with the TERT gene promoter.24,25 The biological consequences of AR stimula-
tion on hematopoiesis have mostly been investigated in some inherited disorders including dyskeratosis congenita (DC) and Fanconi anemia (FA), where androgens still represent one of the main non-transplant therapeutical backbones, achieving satisfactory outcomes.7,17,26,27 In a setting of acquired disorders, they were used prior to the availability of ATG and later on, in combination with it as front-line therapy or as part of subsequent therapeutic approaches.5,9,10,28-33
Danazol, 3-alpha-etiocholanolone, nandrolone, oxymetholone, oxandrolone are some of the anabolic androgenic compounds used in BMF, showing variable response and toxicity profiles.6,8,19,28-30,32,34 Although integrated into the therapeutic armamentarium for acquired and inherited BMF, many outstanding questions remain unanswered concerning the ideal molecule, optimal dose, timing, disease subgroup, place in the treatment algorithm, and factors influencing response. Moreover, the lack of a systematic analysis of long-term outcomes of patients receiving androgens precludes any clear conclusions as to their safety profile, especially in terms of oncogenic potential and toxicity.
Here, we assembled the largest international cohort of patients receiving androgens for acquired or inherited BMF on behalf of the Severe Aplastic Anemia Working Party (SAAWP) of the European Society for Blood and Marrow Transplantation (EBMT) in order to track their current reallife use, indications, efficacy, toxicity, and long-term effects.
Methods
Study design and aims
This is a retrospective multicenter study based on the collection of clinico-biological data of patients receiving androgens for a BMF disorder in EBMT-affiliated centers. This research was conducted under the Institutional Review Board (IRB) and local ethics committees of all the centers involved, and all patients included agreed to participate in clinical and biological research studies conducted on behalf of the EBMT. All the procedures were carried out under the legacy and the ethical principles of the Declaration of Helsinki. Patients were included based on data provided by centers concerning the use of anabolic steroids from 1997 to 2021 as any line before or in the absence of hematopoietic cell transplantation (HCT). The primary objective was to assess the response to androgens in patients diagnosed with acquired and inherited BMF. Secondary aims were to describe the background use of androgens, to assess clinical outcomes in patients receiving androgens (including in a transplant setting), to determine prognostic factors associated with failure, and to evaluate early and late toxicities.
Haematologica | 109 March 2024 766 ARTICLE - Androgens in BMF disorders S. Pagliuca et al.
Data collection
Eligible patients were identified through the SAAWP database, a disease-specific database based on collection of clinical and biological data of patients diagnosed with acquired and inherited BMF in EBMT-affiliated centers. Non-European participating centers included hospitals in Pakistan, Russia, China, Saudi Arabia, and Turkey.
An electronic clinical report form (eCRF) was sent to all participating centers to collect information on demographics, comorbidities, primary diagnosis and classification of BMF, baseline blood product transfusions, number and type of previous treatments, date of response, timing of androgen start, type and posology of androgen treatment, response at 3 and 6 months after androgen treatment, time and duration of the response, time to next treatment, reason for stopping, time to transplant, androgen-related early and late toxicity, clonal evolution, and secondary neoplastic events, as well as post-transplant outcomes. Data collection was carried out by the SAAWP of the EBMT Data Office in Leiden, The Netherlands, according to EBMT guidelines. Letter invitations were sent to all SAAWP-affiliated centers by the EBMT data office. The EBMT office pre-filled the study report forms using data already available in the registry both for transplanted and non-transplanted patients; local investigators were asked to perform quality control and to provide additional information using the specific eCRF. After data collection, an extensive data quality check was performed, and in case of any discrepancy, additional queries were sent directly to the investigators involved in the study.
The final analysis was performed by the EBMT statistical office in Leiden after data collection and quality check.
Statistical analysis
Median values and interquartile ranges (IQR) were used to describe continuous variables, and frequencies and percentages were used to summarize categorical variables. Probabilities of survival for overall survival (OS), failurefree survival (FFS), and transplant-free survival (TFS) were calculated using Kaplan-Meier estimates, with differences between the curves based on log-rank tests. OS was defined as the time from first androgen use to death from any cause. FFS was defined as the time from first androgen use to the introduction of a further treatment line, HCT, or death. TFS was defined as the time from first androgen use to HCT or death. In the case of non-event, observations were censored at the time of last follow-up or by five years after the start of follow-up, whichever came first.
Secondary analyzed endpoints included: cumulative incidences (CI) of relapse, clonal evolution, and toxicity events, calculated in a competing risk setting, where death before relapse or next treatment were considered
the competing events. Competing risks analyses were also applied to post transplant outcomes of acute graft-versus-host disease (GvHD) grade II-IV and chronic GvHD, where only death was considered a competing event. Multivariable Cox proportional hazards models of FFS were constructed separately in the acquired and inherited BMF cohorts, with variables selected for their clinical significance.
All statistical tests were two-sided, and P<0.05 was considered statistically significant.
Statistical analyses were performed with R-Project 4.0 software packages (R Foundation for Statistical Computing, Vienna, Austria).
Results
Clinical landscape of androgen use in bone marrow failure
First, we sought to provide an epidemiologic picture of the use of androgens in EBMT-affiliated centers to understand their indications, patient demographics, disease context, treatment associations and their hierarchical place in the BMF therapeutic landscape. Overall, among 13,239 patients reported in the SAAWP registry, we identified 1,198 patients receiving an androgen treatment. We restricted our analysis to those who were treated before or in the absence of transplant between 1997 and 2021, and without missing status at the last follow-up. We thus selected 274 eligible patients, across 82 centers: 193 with acquired and 81 with inherited BMF. (See the Consort diagram in Online Supplementary Figure S1 and patients' characteristics in Table 1).
In acquired BMF, the principal diagnosis was idiopathic aplastic anemia (AA; n=176, 91%), followed by pure red cell aplasia (PRCA; n=6, 3%), hemolytic paroxysmal nocturnal hemoglobinuria (PNH; n=6, 3%), and other acquired cytopenic syndromes (n=5, 3%) (Figure 1A). Most cases with idiopathic BMF, had severe/very severe AA at diagnosis (Figure 1B). Median age at the time of androgen initiation was 32 years (IQR: 18-52) and 65% of patients were male. Median time from diagnosis to first androgen use was 4 months (IQR: 0.3-17.6), with 54% of patients receiving androgens frontline and often associated with immunosuppressive treatments (IST) (Figure 1C). In this group, these compounds were administered as second-line, third-line, or further treatment in 23%, 13%, and 10% of the patients, respectively. In patients with available data, oxymetholone was the most common anabolic steroid used in acquired BMF (57%), followed by danazol (30%), testosterone (5%), norethandrolone (4%), and others (2%) (Figure 1D). Interestingly, androgen use across the participating centers varied, with a major tendency for their upfront use in acquired BMF in centers where ATG was not available (Online
Haematologica | 109 March 2024 767 ARTICLE - Androgens in BMF disorders S. Pagliuca et al.
IQR:
Acquired Inherited N/median %/IQR Missing, N N/median %/IQR Missing, N Total 193 100 - 81 100Severity of aplastic anemia Moderate 39 26 45 2 22 72 Severe 74 50 6 67 Very severe 35 24 1 11 Sex Male 125 65 - 41 52Female 68 35 - 38 48Age at diagnosis in years 32.2 17.1-52.3 - 6.5 4.1-9.3Hemoglobin at diagnosis, g/dL 7.9 6.2-9.4 50 9.1 7.7-11.2 31 Neutrophils at diagnosis, x109/L 0.8 0.3-1.2 51 1 0.8-1.9 37 Platelets at diagnosis, x109/L 12 6-24 49 41 16-63.2 33 Age at androgen treatment for inherited group in years 32.9 18.7-52.6 - 6.5 4.1-9.3Interval from diagnosis to androgen treatment in months 3.7 0.3-17.6 - 8.5 0.3-35.6Reticulocytes on first androgen treatment, x109/L 41 18-60 156 37 11-59 66 Neutrophils on first androgen treatment, x109/L 1 0.6-1.6 111 0.8 0.4-1.3 50 Platelets on first androgen treatment, x109/L 18 6-31 108 28 13.5-39 47 N of RBC transfusions on 1st androgen treatment <20 units 57 56 92 27 49 26 20-50 units 23 23 8 14 >50 units 10 10 2 4 None 11 11 18 33 N of platelet transfusions on 1st androgen treatment <20 units 59 59 93 20 37 27 20-50 units 18 18 7 13 >50 units 8 8 5 9 None 15 15 22 41 N of lines before androgens 0 105 5474 911 44 23 6 7 2 25 13 1 1 >2 19 10 -Type of androgen Danazol 34 30 81 12 36 48 Nandrolone 1 1 1 3 Oxymetholone 64 57 6 19 Other 2 2 2 6 Nilevar 5 4 12 36 Testosterone 6 5 -Duration 1st androgen treatment in months 5.6 2.2-20.4 90 20 7-37.7Concomitant growth factors Yes 11 10 81 5 16 50 No 101 90 26 84 Concomitant association with IST Yes 80 71 80 7 22 47 No 33 29 25 78 Type of IST used CNI-based associations 29 20 47 3 50 1 ATG-based associations 2 1 -Other 3 2 3 50
Table 1. Patient characteristics.
Haematologica | 109 March 2024 768 ARTICLE - Androgens in BMF disorders S. Pagliuca et al.
interquartile range; N: number; RBC: red blood cell count; IST: immunosuppressive therapy; CNI: calcineurin inhibitor; ATG: anti-thymocyte globulin.
Supplementary Table S1, Online Supplementary Figure S2A, B) and, in general, for patients not eligible for transplant or intensive IST (84%).
In inherited BMF, most of the patients were diagnosed with Fanconi anemia (FA; n=70, 86%), followed by Dyskeratosis congenita (DC; n=9, 11%), and other BMF disorders (n=2, 3%) (Figure 1A). Also in this group, severe/very severe BMF was the predominant phenotype at diagnosis (Figure 1B); 52% of patients were male. Median age at the time of androgen start was 8 years (IQR: 6-12), while median time from diagnosis to first androgen use was 8.5 months (IQR: 0.4-34.9), with androgen given as first-line treatment in 91% of cases. Frequently-used compounds were nore-
thandrolone (36%) and danazol (36%), with a minority of patients receiving oxymetholone (19%), nandrolone (3%), and other androgens (6%) (Figure 1D).
Response and clinical outcomes after androgen therapy in acquired bone marrow failure
Median duration of androgen treatment in patients with acquired BMF was 5.6 months (range: 2.2-20.4) months. After three months of treatment, complete (CR) and partial (PR) remission were observed in 6% and 29% of patients, respectively, with most of the patients remaining in stable disease (SD) (Figure 2A). With a median followup from androgen initiation of 73.7 months (IQR: 57.1-96.4),
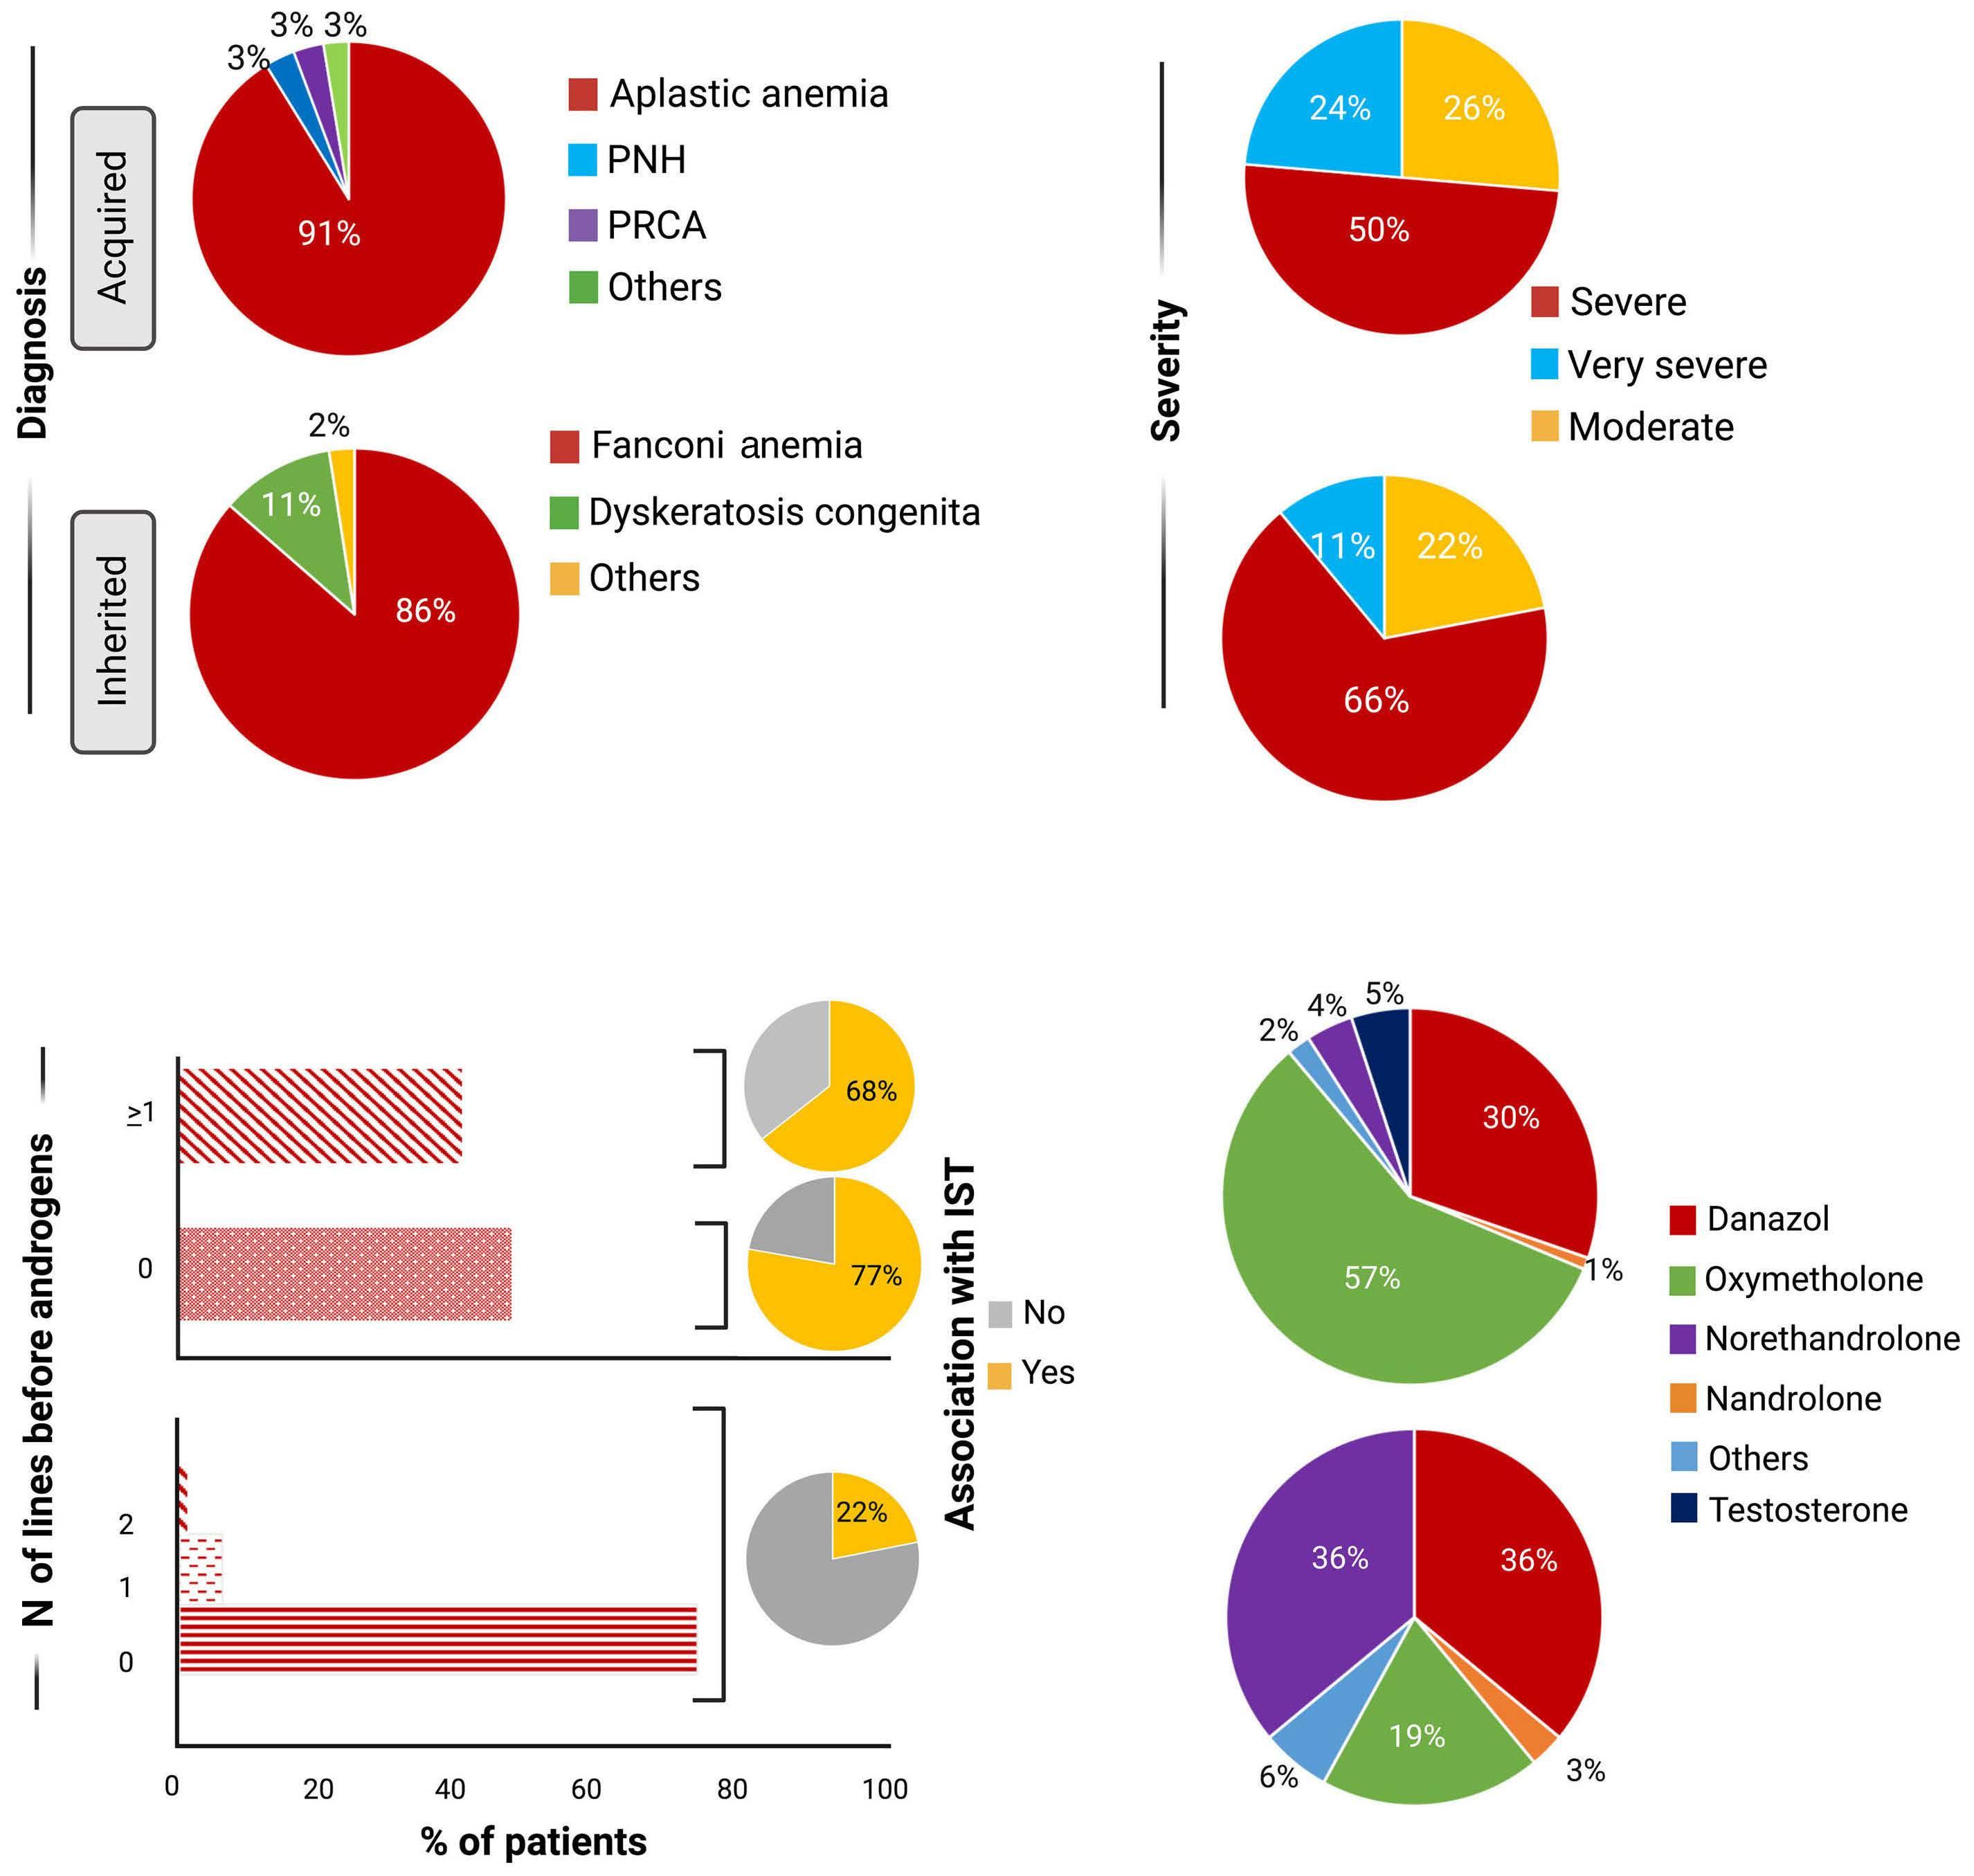
A B C D Haematologica | 109 March 2024 769 ARTICLE - Androgens in BMF disorders S. Pagliuca et al.
Figure 1. Clinical background of acquired and inherited bone marrow failure cohorts. Pie charts showing data related to acquired (top) and inherited (bottom) bone marrow failure (BMF) disorders. (A) Diagnosis as identified in the registry. (B) Distribution of severity of BMF. (C) Bar charts showing the distribution of patients according to the number of lines received before androgen therapy. Pie charts displaying the associations with immunosuppressive therapy (IST) (top: acquired BMF; bottom: inherited BMF) (D) Pie charts showing the distribution of androgenic compounds used in acquired (top) and inherited (bottom) BMF. N: number; PNH: paroxysmal nocturnal hemoglobinuria; PRCA: pure red cell aplasia.
5-year OS was 63% (95% Confidence Interval [CI]: 56-71%), TFS was 36% (28-43%), and FFS was 23% (16-30%) (Figure 2B-D). Five-year CI of relapse was 3% (0-6%). In an attempt to understand the factors associated with survival outcomes after androgen treatment, we next performed a univariable analysis of the weight of several co-variates on OS and FFS. We found that patients starting androgens more than 12 months after diagnosis, as well as patients given this treatment beyond second line, had better OS and FFS. Age showed an impact only on OS but not on FFS, with adult patients experiencing higher survival probabilities; sex did not impact on outcomes (Online Supplementary Table S2, Online Supplementary Figure S3A-D). Year of treatment was shown to impact OS but not FFS, with better survival outcomes in patients treated after 2010 (Online Supplementary Figure S4A, B). When multivariable models were fitted, the use of androgen after the second line of treatment remained the only factor positively impacting FFS (Hazard ration [HR] 0.32; [95% CI: 0.15-0.67]; P<0.001) (Figure 4A).
Response and clinical outcomes after androgen therapy in inherited bone marrow failure
In inherited BMF, androgens were given for a median duration of 20 months (IQR: 7-37.7).
After androgen start, CR and PR rates were observed respectively in 8% and 29% of patients at 3 months, while at 6 months we recorded 45% of PR without any patient achieving CR (Figure 3A). Considering the diagnostic subgroups, all DC patients with available response information (n=4) remained in SD at three months, with one subject reaching a PR at six months. Of note, the proportion of PR and CR were higher in the FA group although there were no significant differences between the two inherited subgroups at three (P=0.25) and six (P=0.73) months. For all patients with inherited BMF, median follow-up from androgen start was 82.3 (65.3-120.2) months, with 5-year OS, TFS, and FFS of 78% (68-87%), 17% (926%), and 14% (6-22%), respectively (Figure 3B-D). Univariable analyses showed no impact of any of the aforementioned factors (sex, age at androgen treatment,
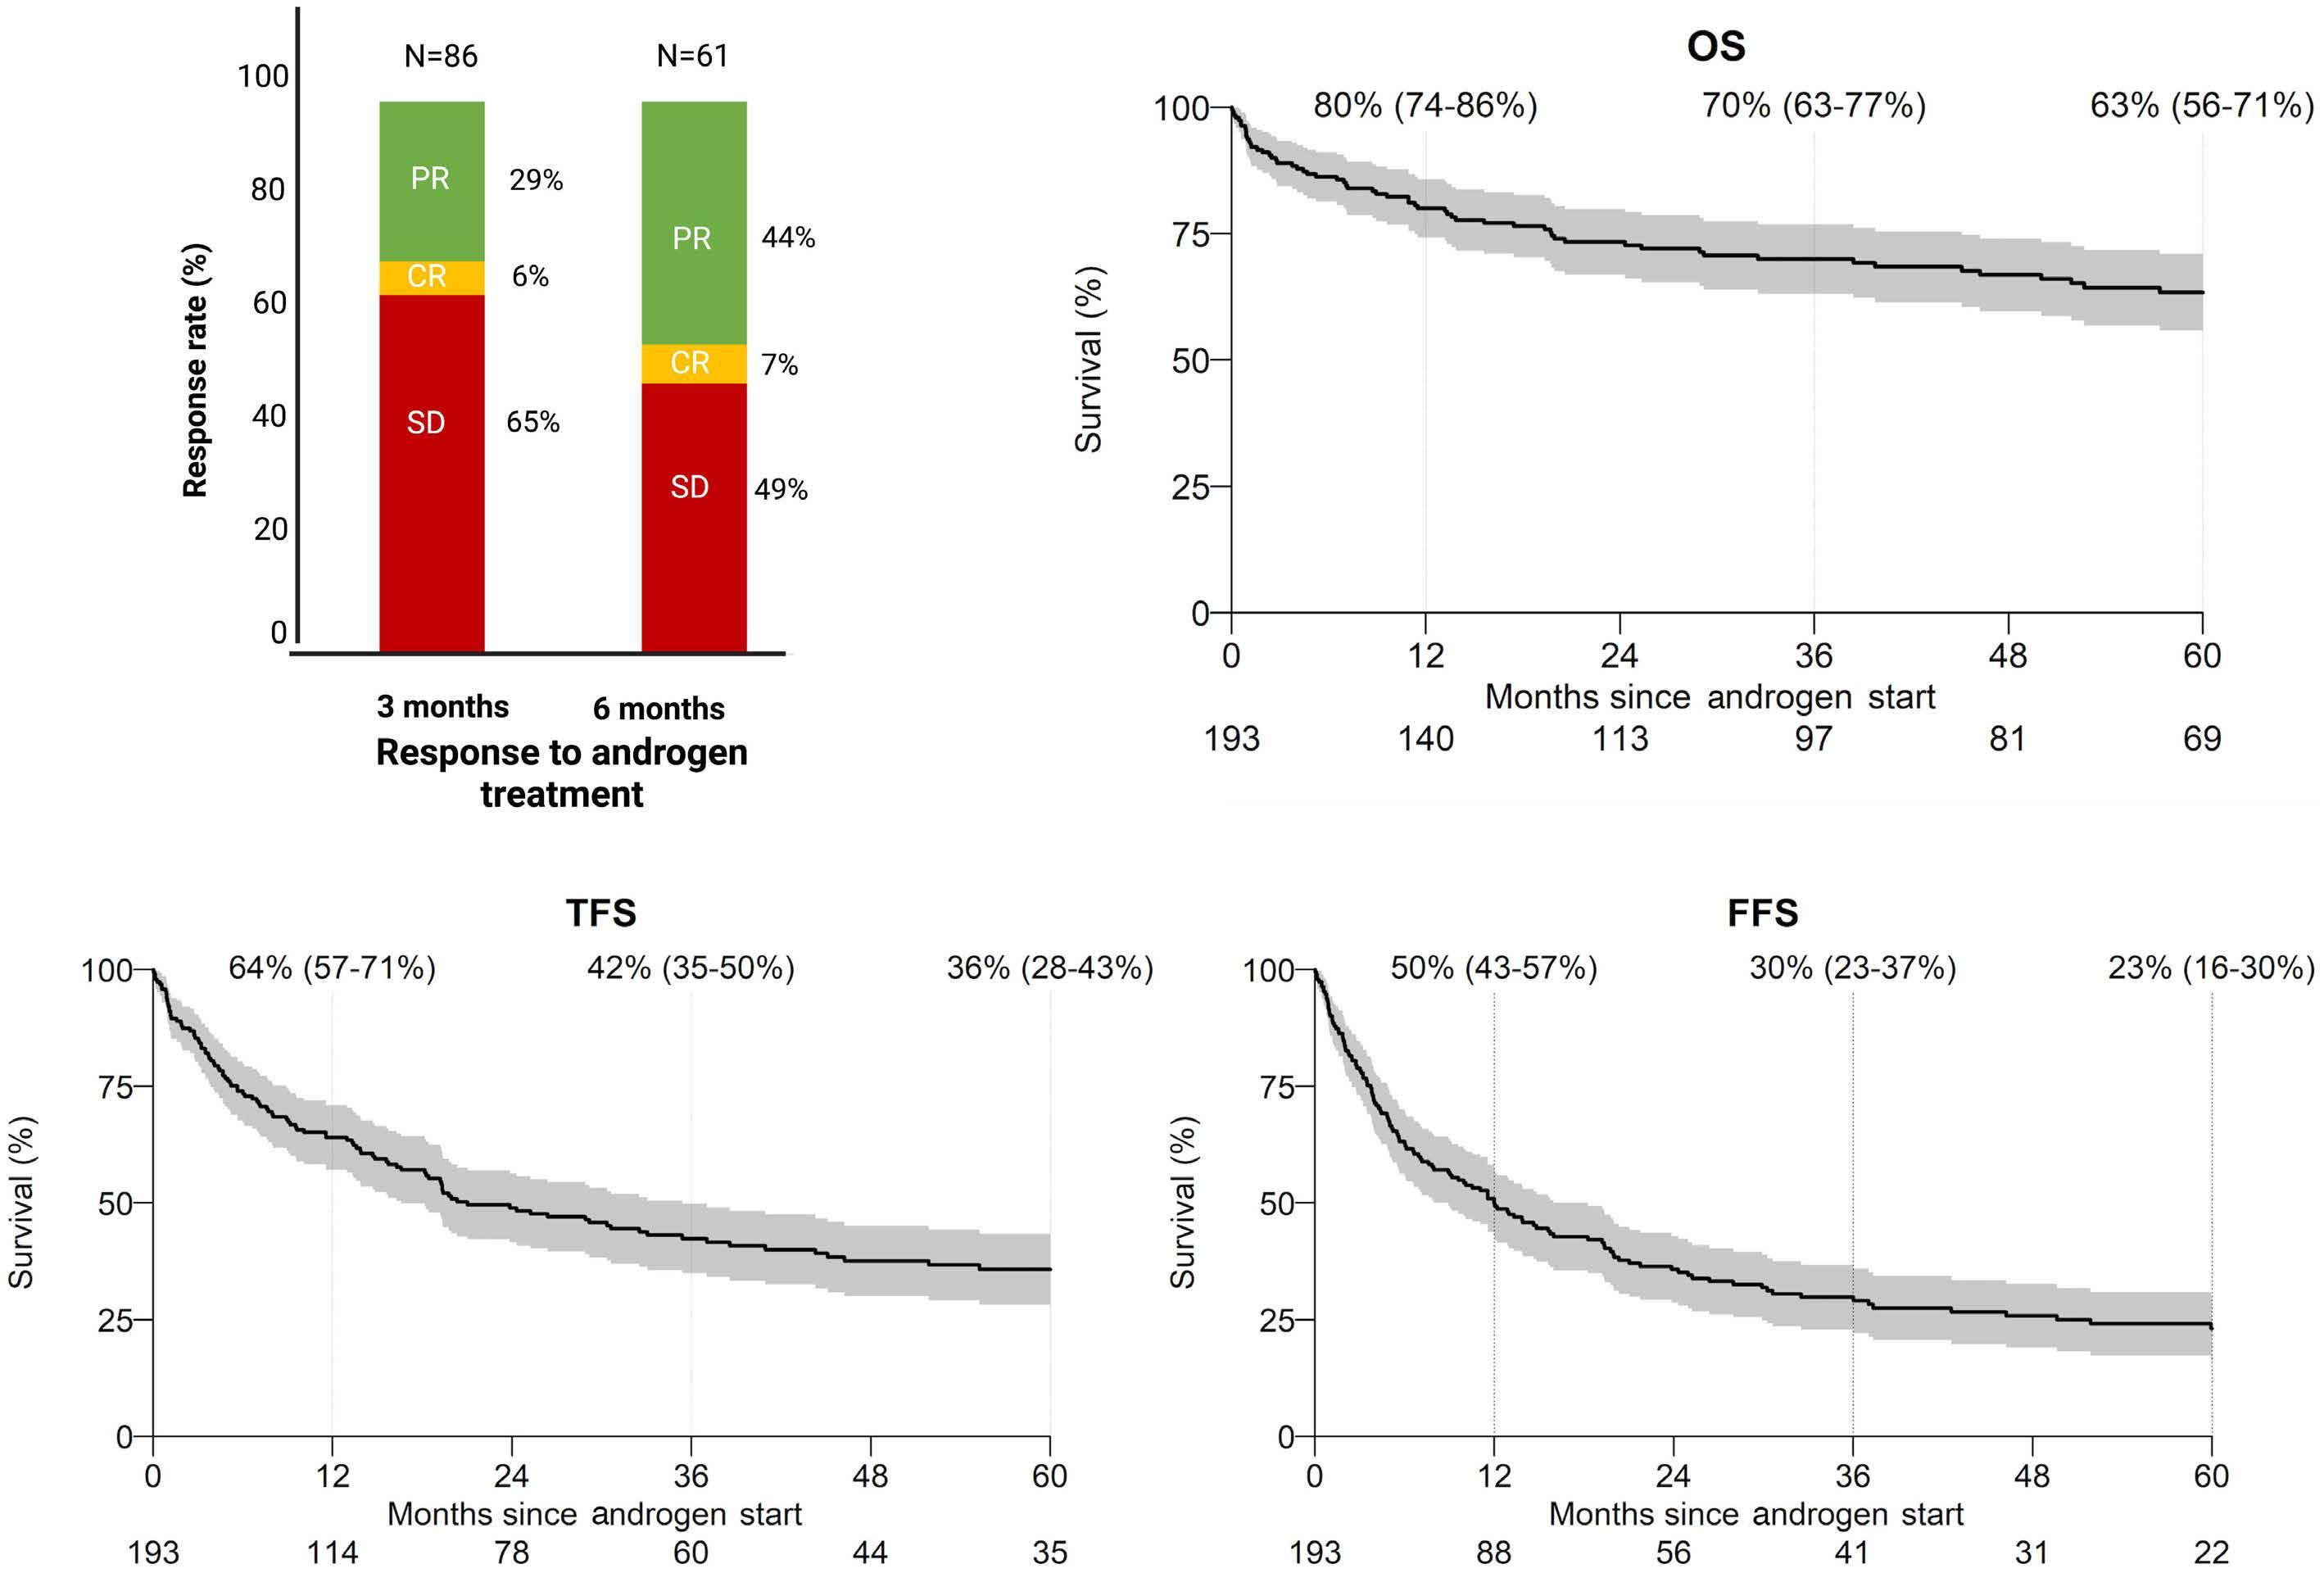
A B C D Haematologica | 109 March 2024 770 ARTICLE - Androgens in BMF disorders S. Pagliuca et al.
Figure 2. Clinical outcomes of acquired bone marrow failure patients. (A) Bar chart displaying the response rates of patients with acquired disorders. PR: partial remission; CR: complete remission; SD: stable disease; N: total number of patients with complete information for the analysis of response (at 3 months and 6 months after androgen start). Percentages show response rate. Kaplan Meyer estimates of (B) overall survival (OS), (C) transplant-free survival (TFS), and (D) failure-free survival (FFS).
interval from diagnosis, androgen line) on either OS or FFS (Online Supplementary Figure S5A-D). However, a detrimental impact of year of treatment was observed for FFS, with patients treated with androgens after 2010 showing lower probabilities of survival (Online Supplementary Figure S6A, B). Nevertheless, in multivariable analysis, a longer time from diagnosis to androgen start contributed to better FFS (Figure 4B).
Clonal evolution and androgen-related toxicity
With regards to the clonal evolution events, we observed a 5-year CI of acute myeloid leukemia and myelodysplastic syndromes (AML/MDS) of 3% (0-5%) in acquired and of 8% (0-12%) in inherited BMF, while probability of developing PNH was 2% (0-5%) in acquired disorders. All these events were considered in a competing risk setting before transplant and before other therapies. As to the rate of secondary neoplasms after androgenic treatment,
we observed a 5-year CI of 1% (95% CI: 0-4%) in both groups.
To examine the probability of specific organ-related toxicity after androgen treatment, we collected and analyzed early and late events attributed to this treatment in a competing risk setting. Overall, these data were available in 110 patients: 79 acquired and 31 inherited BMF. Interestingly, we observed that in acquired BMF, where these events were more frequent, treatment-related toxicity tended to mostly occur in early phases after androgens (median time to liver, gastrointestinal, and renal toxicity was 2.8, 6.3, 5.4 months post treatment, respectively) (Online Supplementary Table S3), with only one patient experiencing psychiatric effects appearing after 18 months. In acquired BMF, the 5-year CI was 13% (95% CI: 6-19%) for liver, 4% (95% CI: 0-8%) for gastrointestinal, 3% (95% CI: 0-6%) for renal, 1% (95% CI: 0-3%) for psychiatric disorders, with most events occurring within the first year.
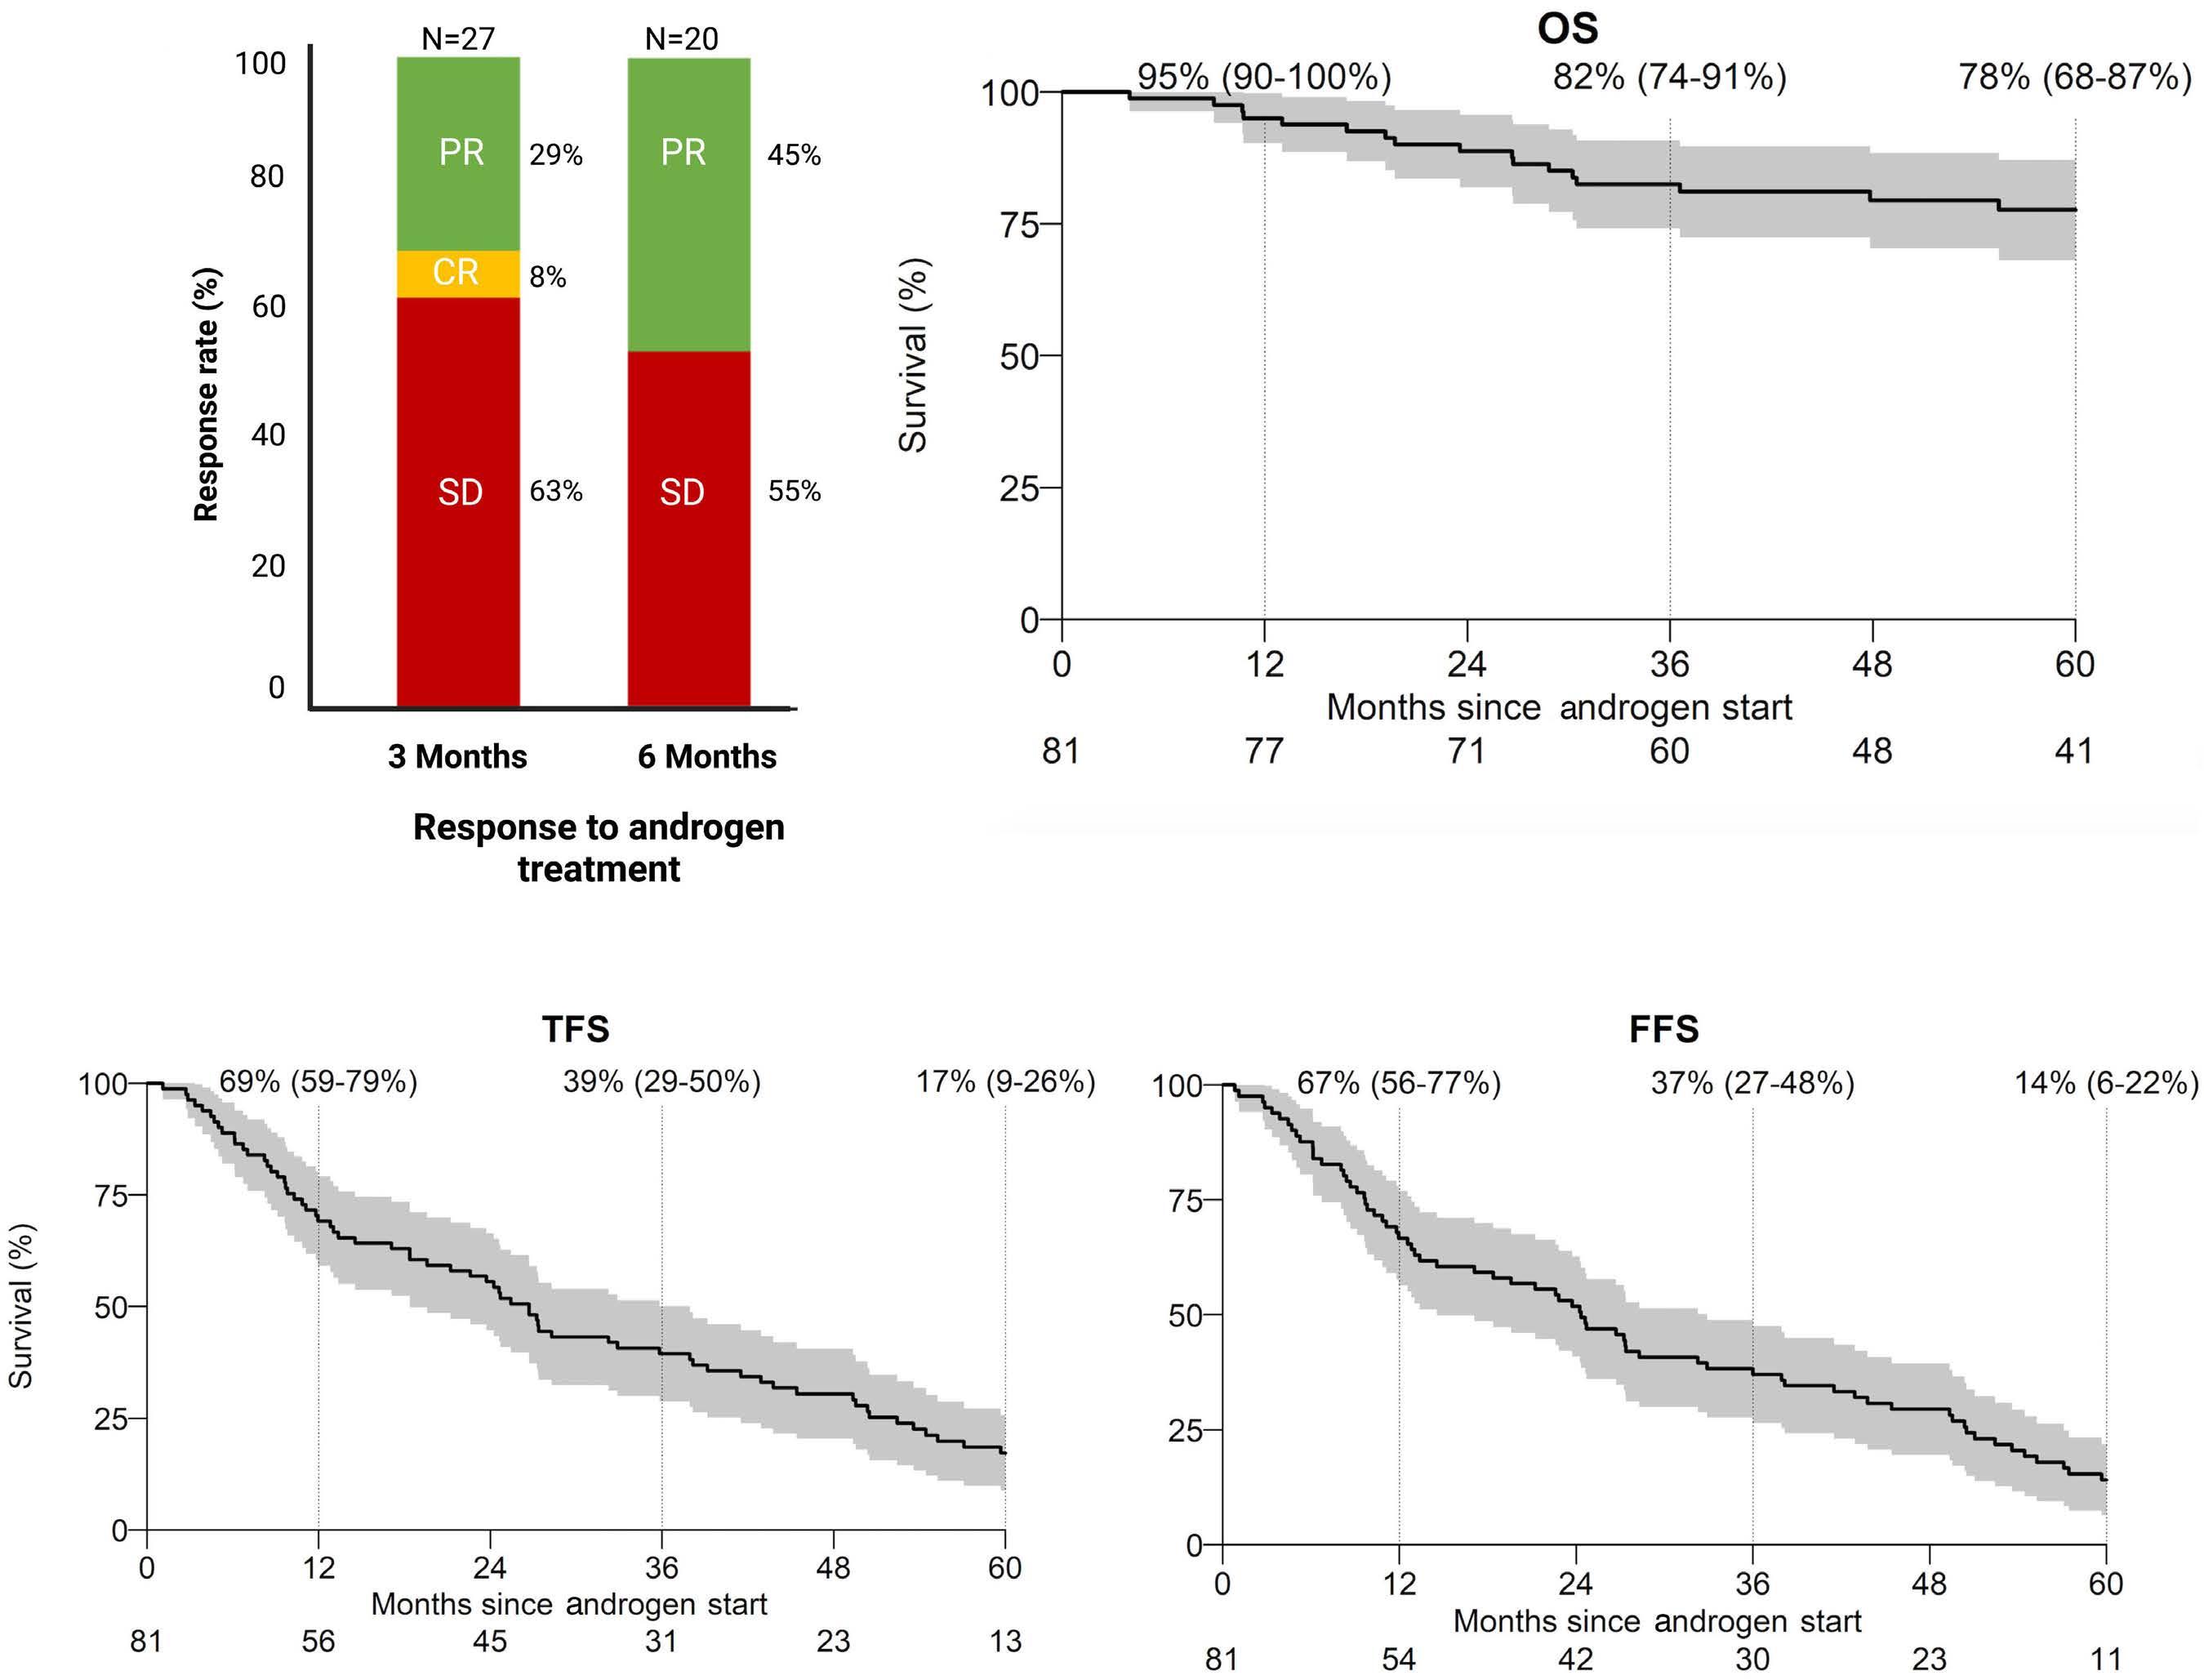
A B C D Haematologica | 109 March 2024 771 ARTICLE - Androgens in BMF disorders S. Pagliuca et al.
Figure 3. Clinical outcomes of inherited bone marrow failure patients. (A) Bar chart displaying the response rates of patients with inherited disorders. PR: partial remission; CR: complete remission; SD: stable disease; N: total number of patients with complete information for the analysis of response (at 3 months and 6 months after androgen start). Percentages show response rate. Kaplan Meyer estimates of (B) overall survival (OS), (C) transplant-free survival (TFS), and (D) failure-free survival (FFS).
For patients with inherited BMF, median time to toxicity from androgen initiation was more delayed: 22.8 (IQR: 841.5) and 15.1 (IQR: 11.5-18.7) months for liver and endocrinological toxicities, with a 5-year cumulative incidence of 13% (95% CI: 1-25%) and 6% (95% CI: 0-15%), respectively. No other types of organ-specific damage were reported.
Outcomes of patients receiving transplant after androgen treatment
A total of 82 (79 with any follow-up after transplant) in acquired and 78 (77 with any follow-up after transplant) in inherited BMF received an allogeneic HCT (Online Supplementary Table S4) at a median time of 14.3 months
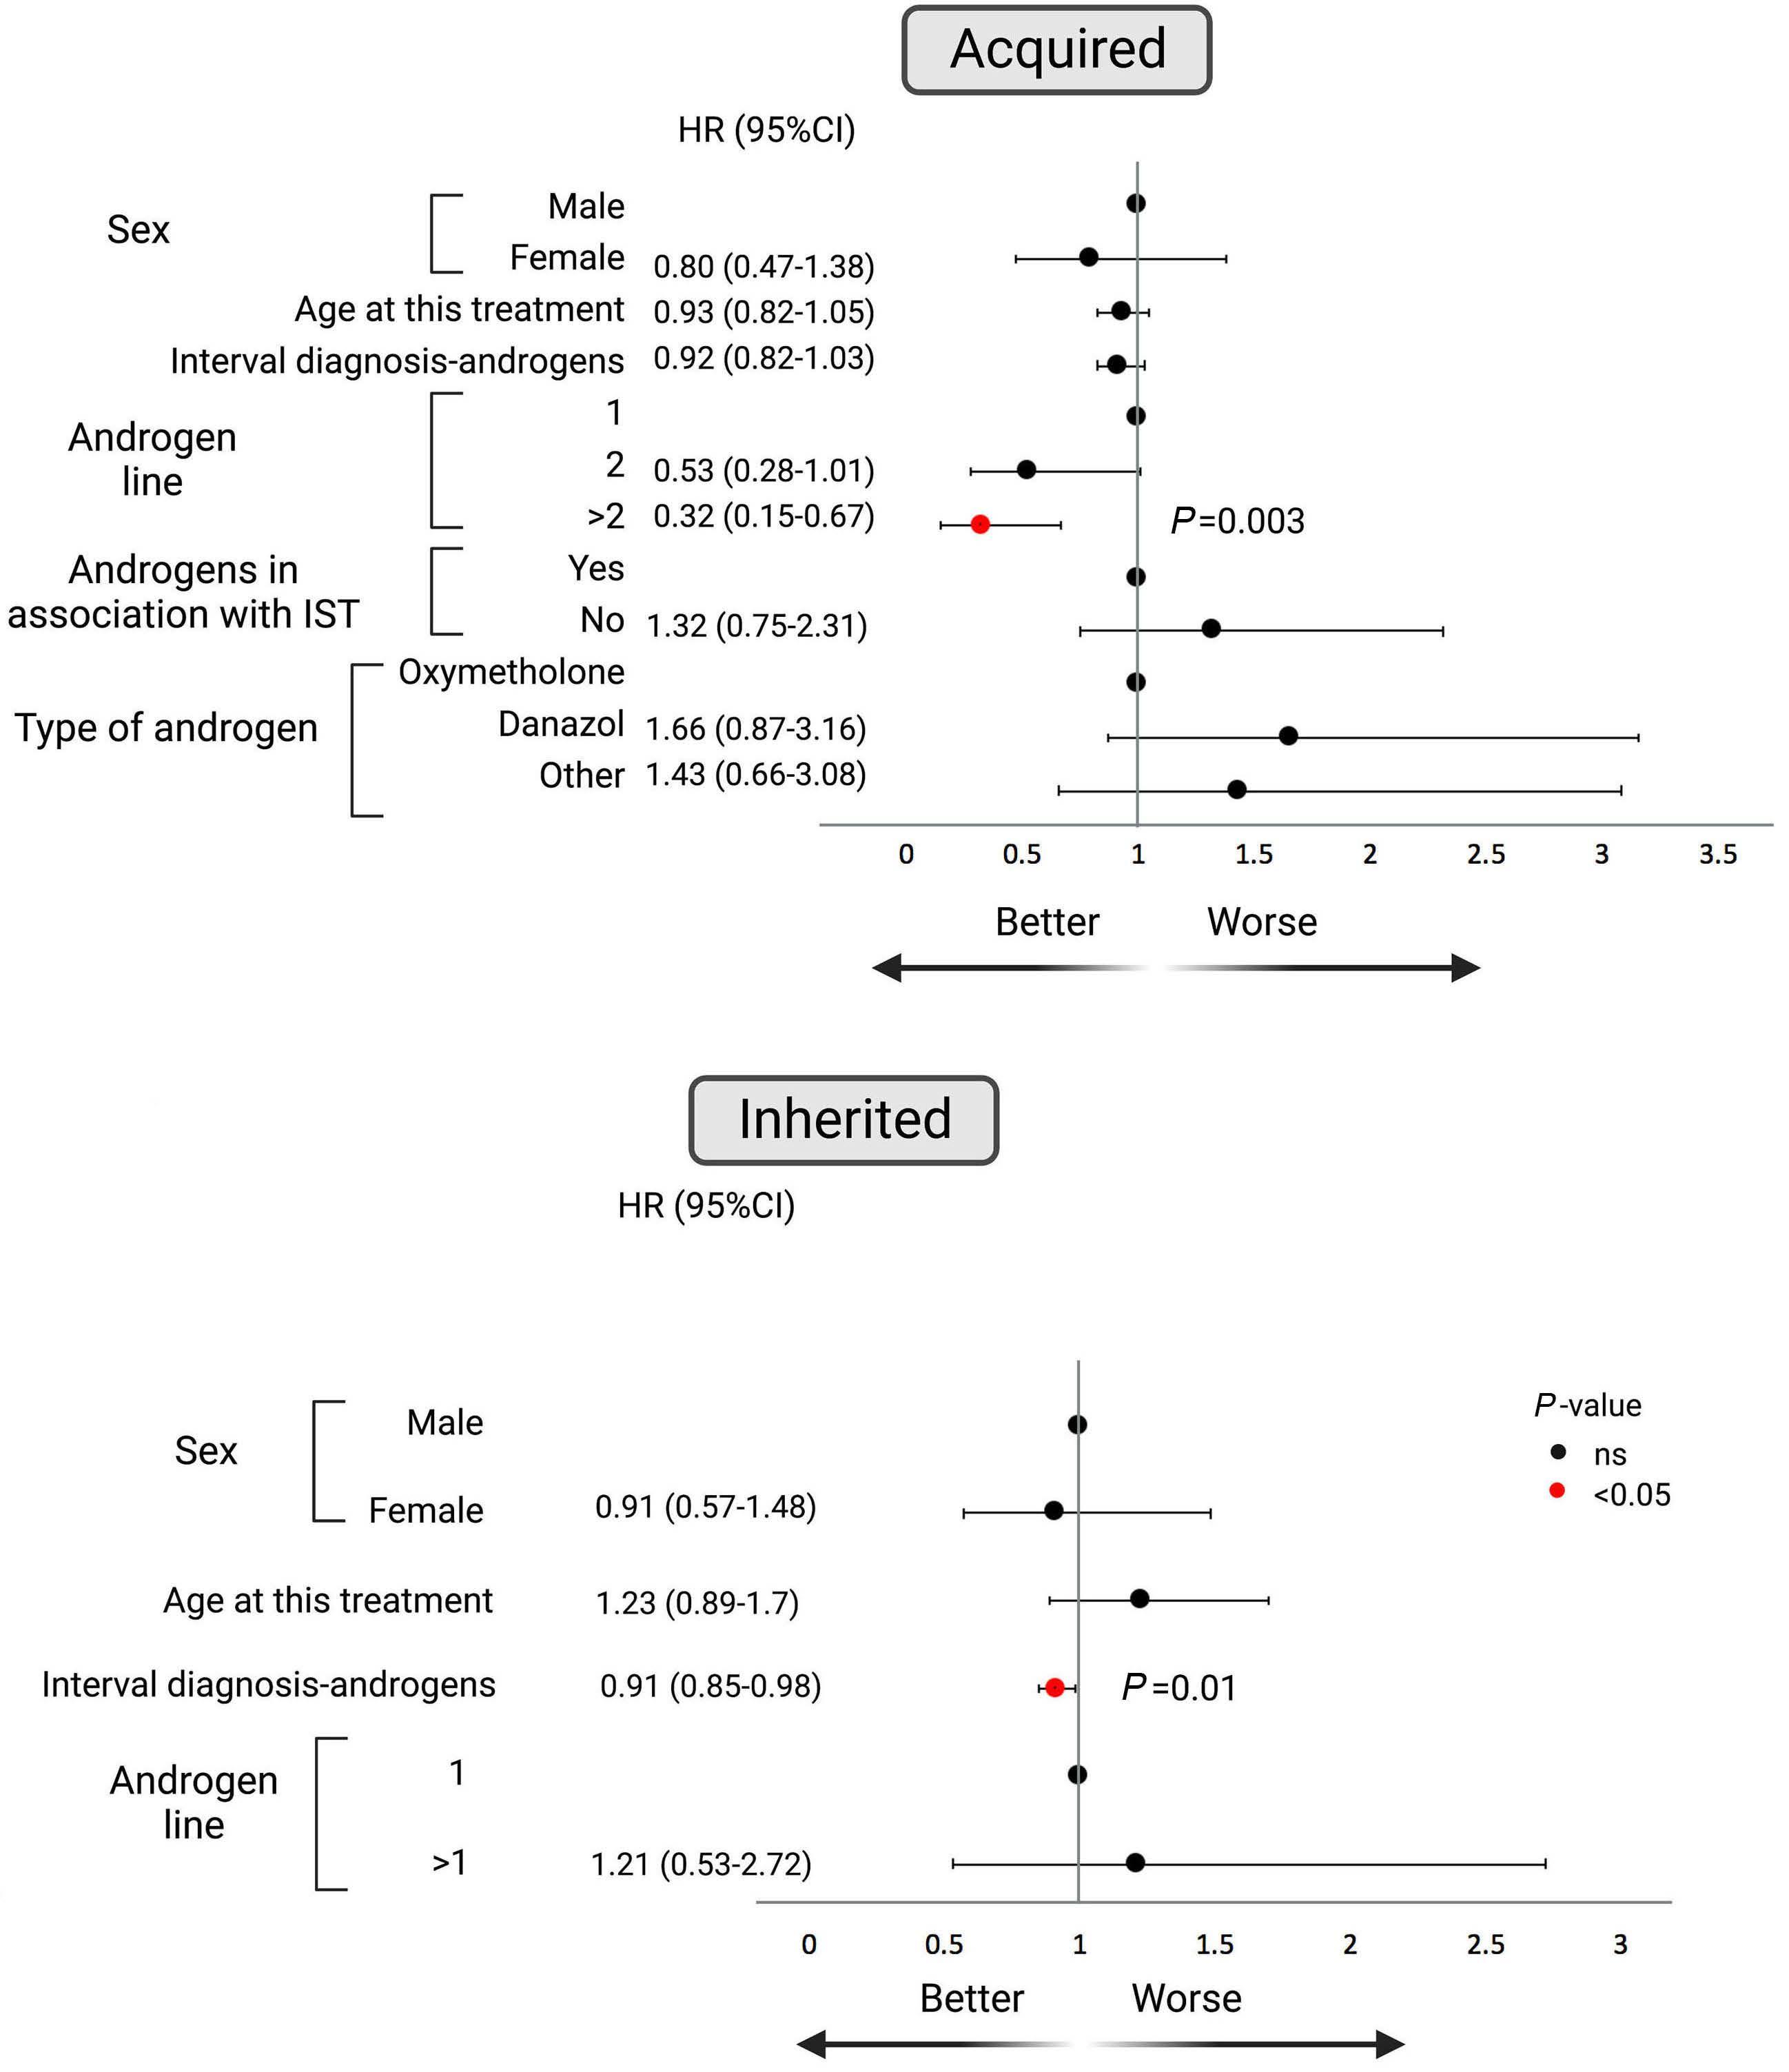
failure-free
acquired bone marrow failure (BMF). (B) Forest
the HR and the 95% CI of each group of co-variates fitting into the model for FFS in patients with inherited BMF. Of note, for both models only patients with complete co-variates, without missing status, were introduced into the models. The difference between the two models is principally due to the high number of missing data for the variables “Androgens in association with IST” (immunosuppressive therapy) and “Type of androgens” in the inherited group. For both panels, black dots indicate non-significant P-value; red dots: significant P-value. ns: not significant.
B Haematologica | 109 March 2024 772 ARTICLE - Androgens in BMF disorders S. Pagliuca et al.
Figure 4. Multivariable cox regression analysis of failure-free survival. (A) Forest plot showing the Hazard Ratio (HR: black and red dots) and the 95% Confidence Intervals (CI: black horizontal lines) of each group of co-variates fitting into the model for
survival (FFS) in patients with
plot showing
A
(IQR: 4.9-32.4) and 25.1 months (9.9-50.5) after androgen start, respectively. For patients with acquired BMF, median follow-up after transplant was 92.2 months (95% CI: 83.7118.9) with a 5-year OS of 71% (61-81%). In inherited BMF, with a median follow-up of a median 56.8 months (95% CI: 36.2-68.5), 5-year OS was 57% (45-69%) (Online Supplementary Figure S7A, B).
The CI of day 100 acute GvHD grades II-IV was 18% (95% CI: 9-27%) in acquired and 30% (95% CI: 20-41%) in inherited BMF (Online Supplementary Figure S7C, D), while 5-year CI of chronic GvHD was 25% (95% CI: 15-35%) and 27% (95% CI: 16-37%), respectively, with most of the events occurring within the first three years (Online Supplementary Figure S7E, F). Post-transplant relapse of the underlying BMF was estimated at 6% (95% CI: 0-11% and 0-13%) (Online Supplementary Figure S7G, H) for both groups, whereas no events of clonal evolution were observed after HCT in patients receiving androgen treatment.
Discussion
Although present in the therapeutic armamentarium of BMF syndromes since almost a century prior to ATG, in the current era, the role of anabolic steroids in the treatment algorithm of acquired and inherited aplastic disorders is controversial. This is due to the lack of prospective data on large cohorts of homogeneously treated patients and the decline in interest for these compounds after the approval of more efficacious treatments, especially in the acquired setting. Here, taking advantage of a disease-specific database and with the collaboration of referral centers worldwide, we were able to build, across a median follow-up period of almost eight years, the largest cohort of patients treated with androgens, reevaluating their role in these disorders.
In patients with acquired BMF, we tracked two patterns of usage. A first tendency was to choose androgens as a first-line treatment, usually in combination with classical immunosuppressive agents. Such usage was specifically observed in countries with limited access to ATG and/or for patients without a suitable donor or not fit for transplant. Survival and failure outcomes remained very unfavorable for patients in this treatment category. A second and more frequent pattern concerned their use in refractory contexts, as a single or combination treatment. Although both scenarios were associated with low response rates, we observed a higher likelihood of FFS both in univariable and multivariable analyses, when androgens were given beyond the second line, and after >12 months from diagnosis. Interestingly the type of androgen did not seem to influence outcomes, at least in the acquired group, where a proper model could be constructed taking into consideration compounds more frequently reported. Fur-
thermore, we were able to exclude any impact of sex and age on post-androgen outcomes, excluding a role of endogenous androgenic levels to influence outcome variability. Nevertheless, the status of missing data in key pre-treatment clinical and biological variables, including the associated treatments, the number of transfusions, the degree of cytopenia, the presence of a PNH clone, precludes the construction of complete models to assess the response. Also, it is important to point out that, because our study has been generated from an international registry, the criteria discriminating between inherited and acquired BMF, as well as the genes profiled during the diagnostic phase, were heterogeneous and thus may have introduced some bias. Despite these limitations, this study allows a real-life assessment of the use of these compounds and their impact on outcomes across multiple countries.
Results shown in our retrospective cohort, particularly in the inherited context, were unable to confirm the higher response rates observed in previous studies.6,36,27,36 This may be due to the variety of compounds used, likely different from the ones previously investigated, but also to the high proportion of transplanted patients in our cohort. In our analysis, allo-HCT was used after failure of androgen treatment, justifying the low FFS seen in both groups. In patients with inherited disorders, these observations were possibly in line with the tendency to use androgens as a “bridge” to transplant while a suitable donor is identified. In the acquired context, the use as both first and further lines makes the scenario more complex, but, in general, the failure of previous treatments seems to be a factor associated with better response. Nonetheless, it is not unlikely that the higher FFS in these patients is possibly related to misdiagnosed inherited conditions, rather than the positive effect of androgens, particularly when diagnoses were assessed before the availability of genomic platforms. In addition, acquired BMF patients surviving >12 months could either have non-severe disease or some improvement in neutrophils, and this would impact the response to androgens used beyond secondline therapy.
In both acquired and inherited BMF, data concerning their toxicity profile shows a low incidence of secondary events, with low rates of associated solid or hematologic malignancies within a >5-year follow-up. This result was in contrast with the putative oncogenicity of these molecules, shown in in vitro and in vivo models, and needs to be confirmed with longer follow-up.39-41 A possible explanation for this is the relatively low duration of androgen treatment in both of our cohorts, endorsed by a high failure rate. Nonetheless, one could speculate that the boundary between the absolute role of exogenous androgens in carcinogenesis and the intrinsic genetic predisposition to cancers of certain inherited disorders,
Haematologica | 109 March 2024 773 ARTICLE - Androgens in BMF disorders S. Pagliuca et al.
including FA and DC, so far remains hard to disentangle. Moreover, the CI of AML/MDS evolution does not seem to differ from the rates observed in the general population of AA patients in independent cohorts.42
Clinical trials are currently recruiting in the United States and France (clinicaltrials.gov identifiers: NCT03312400, NCT03312400) to assess the role of danazol in telomere disorders, with regard to its optimal dose, safety, effectiveness, and long-term effects, highlighting the urgent need of prospective data to answer these still open questions. A single arm prospective study from the Brazilian group recently showed an interest in intramuscular nandrolone decanoate administered every 15 days for two years in 17 patients with telomere biology disorders. The study demonstrated telomer elongation in 77% of the cases and response rates superior to 50% at three months post treatment, albeit with a high frequency of low-grade adverse events (mostly mild liver dysfunction, virilization, and acne).43 Although our analysis did not show the same response rates and the same incidence of adverse events in patients with inherited disorders, including DC, we must acknowledge the limitations of our study, due to the small sample size of this particular subgroup and the heterogeneity of the treatments received. Nevertheless, we seek to highlight, in line with previous literature, the interest in the use of androgens in telomere disorders and FA patients, especially in the absence of a transplant indication or as a “bridge” to transplant.
In acquired BMF, no recent prospective trial has been conducted to evaluate the use of androgens, besides the historical aforementioned studies,9,10 mostly investigating androgen-ATG combinations. It is, therefore, challenging to make robust recommendations for practising hematologists in this context. It is also worth mentioning the various issues concerning the reliability of the supply of some of these compounds in recent years (including danazol and norethandrolone, currently unavailable in several countries) that may have contributed to such a heterogeneous pattern of use. Nevertheless, based on these older references and our retrospective study, androgen administration should be discouraged as front-line therapy in the acquired setting but remains reasonable in other specific contexts. Although transplant procedures remain the gold standard when a suitable donor is available, in the case of younger patients, androgen treatment could still represent a possible “bridge” to transplant. It could also provide a solution in the case of donor unavailability, especially for older subjects, and in cases in which patients have already failed first-line IST, particularly in the era of upfront triple therapy.44
Older female patients with idiopathic AA and low neutrophil count were reported to have satisfactory responses to upfront androgen/IST treatment.10 Our study did not show a gender-related impact on clinical outcomes, but
this effect could be skewed by the heterogeneity of our cohort. While proper comparisons with control groups (e.g., patients not under androgen treatment) are not available in the present analysis, pre-transplant androgen exposure did not modify post-transplant outcomes. Although a more granular genetic assessment could not be covered by our study, we recognize that better clinicobiological and molecular diagnostics are necessary to improve our capacity to identify patients who can actually benefit from androgens, especially for inherited disorders, through a personalized therapeutical approach, for example, identifying specific gene mutations able to increase patient sensitivity to these compounds. This would require ongoing enrollment into international registries to ensure that good-quality data could be captured in the next ten years.
In conclusion, although a clear picture will only be possible after prospective trials, this study provides a unique opportunity to re-examine the role of androgens in BMF, showing interesting outcomes if given after second-line treatments in acquired disorders or after 12 months from diagnosis in inherited syndromes, with reasonable toxicity rates, and no consequences on a possible later allogeneic HCT.
Disclosures
No conflicts of interest to disclose.
Contributions
SP and AK were Principal Inv estigators of the study, conceptualized the study design and data collection, and interpreted the data analysis. SP provided the study synopsis and the electronic clinical report form, wrote the manuscript, and designed the figures. DJE performed the statistical analysis. BP performed the data collection and co-ordinated the study at the EBMT level. RPL and AMR supervised the study, interpreted the data analysis, gave important intellectual input, and edited the manuscript. All other authors provided clinical and biological data of the patients enrolled in this study and contributed to patient management and recruitment. The EBMT Severe Aplastic Anemia Working Party data management team takes the responsibility for the integrity and accuracy of the data presented. All authors reviewed and approved the final version of this manuscript for publication.
Acknowledgments
This work was supported by the European Society for Blood and Marrow Transplantation (EBMT), with thanks to all participating centers, patients and their families.
Data-sharing statement
All data supporting the findings of this study are available within the Article and in the Online Supplementary Appen-
Haematologica | 109 March 2024 774 ARTICLE - Androgens in BMF disorders S. Pagliuca et al.
dix. Patient clinical and biological data are intellectual properties of the European Society for Blood and Marrow Transplantation (EBMT) and of the centers involved in the study, but can be requested from the chair of the EBMT Se-
References
1. Eder IE, Culig Z, Putz T, Nessler-Menardi C, Bartsch G, Klocker H. Molecular biology of the androgen receptor: from molecular understanding to the clinic. Eur Urol. 2001;40(3):241-251.
2. Shahidi NT, Diamond LK. Testosterone-induced remission in aplastic anemia. AMA J Dis Child. 1959;98293-98302.
3. Shahidi NT. Androgens and erythropoiesis. N Engl J Med. 1973;289(2):72-80.
4. Kennedy BJ. Effects of intensive sex steroid hormone therapy in advanced breast cancer. JAMA. 1953;152(12):1135.
5. Najean Y, Haguenauer O. Long-term (5 to 20 years) evolution of nongrafted aplastic anemias. The Cooperative Group for the Study of Aplastic and Refractory Anemias. Blood. 1990;76(11):2222-2228.
6. Townsley DM, Dumitriu B, Liu D, et al. Danazol treatment for telomere diseases. N Engl J Med. 2016;374(20):1922-1931.
7. Kirschner M, Vieri M, Kricheldorf K, et al. Androgen derivatives improve blood counts and elongate telomere length in adult cryptic dyskeratosis congenita. Br J Haematol. 2021;193(3):669-673.
8. Vieri M, Kirschner M, Tometten M, et al. Comparable effects of the androgen derivatives danazol, oxymetholone and nandrolone on telomerase activity in human primary hematopoietic cells from patients with dyskeratosis congenita. Int J Mol Sci. 2020;21(19):E7196.
9. Champlin RE, Ho WG, Feig SA, Winston DJ, Lenarsky C, Gale RP. Do androgens enhance the response to antithymocyte globulin in patients with aplastic anemia? A prospective randomized trial. Blood. 1985;66(1):184-188.
10. Bacigalupo A, Chaple M, Hows J, et al. Treatment of aplastic anaemia (AA) with antilymphocyte globulin (ALG) and methylprednisolone (MPred) with or without androgens: a randomized trial from the EBMT SAA Working Party. Br J Haematol. 1993;83(1):145-151.
11. Davey RA, Grossmann M. Androgen receptor structure, function and biology: from bench to bedside. Clin Biochem Rev. 2016;37(1):3-15.
12. Papakonstanti EA, Kampa M, Castanas E, Stournaras C. A rapid, nongenomic, signaling pathway regulates the actin reorganization induced by activation of membrane testosterone receptors. Mol Endocrinol. 2003;17(5):870-881.
13. Estrada M, Espinosa A, Müller M, Jaimovich E. Testosterone stimulates intracellular calcium release and mitogen-activated protein kinases via a G protein-coupled receptor in skeletal muscle cells. Endocrinology. 2003;144(8):3586-3597.
14. Bachman E, Feng R, Travison T, et al. Testosterone suppresses hepcidin in men: a potential mechanism for testosteroneinduced erythrocytosis. J Clin Endocrinol Metab. 2010;95(10):4743-4747.
15. Guo W, Bachman E, Li M, et al. Testosterone administration inhibits hepcidin transcription and is associated with increased iron incorporation into red blood cells. Aging Cell. 2013;12(2):280-291.
16. Bachman E, Travison TG, Basaria S, et al. Testosterone induces erythrocytosis via increased erythropoietin and suppressed
vere Aplastic Anemia Working Party (SAAWP) and data management team: regis.peffaultdelatour@aphp.fr; amrisita@unina.it; saawpebmt@lumc.nl.
hepcidin: evidence for a new erythropoietin/hemoglobin set point. J Gerontol A Biol Sci Med Sci. 2014;69(6):725-735.
17. Calado RT, Yewdell WT, Wilkerson KL, et al. Sex hormones, acting on the TERT gene, increase telomerase activity in human primary hematopoietic cells. Blood. 2009;114(11):2236-2243.
18. Townsley DM, Dumitriu B, Young NS. Bone marrow failure and the telomeropathies. Blood. 2014;124(18):2775-2783.
19. Kirschner M, Vieri M, Kricheldorf K, et al. Androgen derivatives improve blood counts and elongate telomere length in adult cryptic dyskeratosis congenita. Br J Haematol. 2021;193(3):669-673.
20. Bar C, Huber N, Beier F, Blasco MA. Therapeutic effect of androgen therapy in a mouse model of aplastic anemia produced by short telomeres. Haematologica. 2015;100(10):1267-1274.
21. Radojević K, Arsenović-Ranin N, Kosec D, et al. Neonatal castration affects intrathymic kinetics of T-cell differentiation and the spleen T-cell level. J Endocrinol. 2007;192(3):669-682.
22. Pergola C, Dodt G, Rossi A, et al. ERK-mediated regulation of leukotriene biosynthesis by androgens: a molecular basis for gender differences in inflammation and asthma. Proc Natl Acad Sci U S A. 2008;105(50):19881-19886.
23. Guan X, Polesso F, Wang C, et al. Androgen receptor activity in T cells limits checkpoint blockade efficacy. Nature. 2022;606(7915):791-796.
24. Danazol treatment for telomere diseases. N Engl J Med. 2016;375(11):1095-1096.
25. Deocaporto R, Fernandez A, Brito D, Vidal T, Diaz A. Gas chromatography/mass spectrometry characterization of urinary metabolites of danazol after oral administration in human. J Chromatogr B Analyt Technol Biomed Life Sci. 2006;830(1):178-183.
26. Scheckenbach K, Morgan M, Filger-Brillinger J, et al. Treatment of the bone marrow failure in Fanconi anemia patients with danazol. Blood Cells Mol Dis. 2012;48(2):128-131.
27. Paustian L, Chao MM, Hanenberg H, et al. Androgen therapy in Fanconi anemia: a retrospective analysis of 30 years in Germany. Pediatr Hematol Oncol. 2016;33(1):5-12.
28. Seewald TR, Zeigler ZR, Gardner FH. Successful treatment of severe refractory aplastic anemia with 3-beta etiocholanolone and nandrolone decanoate. Am J Hematol. 1989;31(3):216-218.
29. Gardner FH, Juneja HS. Androstane therapy to treat aplastic anaemia in adults: an uncontrolled pilot study. Br J Haematol. 1987;65(3):295-300.
30. Androgen therapy in aplastic anaemia: a comparative study of high and low-doses and of 4 different androgens. French Cooperative Group for the Study of Aplastic and Refractory Anemias. Scand J Haematol. 1986;36(4):346-352.
31. Camitta B, O’Reilly RJ, Sensenbrenner L, et al. Antithoracic duct lymphocyte globulin therapy of severe aplastic anemia. Blood. 1983;62(4):883-888.
32. Jaime-Pérez JC, Colunga-Pedraza PR, Gómez-Ramírez CD, et al. Danazol as first-line therapy for aplastic anemia. Ann Hematol. 2011;90(5):523-527.
Haematologica | 109 March 2024 775
BMF
Pagliuca et al.
ARTICLE - Androgens in
disorders S.
33. Pierri F, Dufour C. Management of aplastic anemia after failure of frontline immunosuppression. Expert Rev Hematol. 2019;12(10):809-819.
34. Rose SR, Kim M-O, Korbee L, et al. Oxandrolone for the treatment of bone marrow failure in Fanconi anemia: oxandrolone use in FA bone marrow failure. Pediat Blood Cancer. 2014;61(1):11-19.
35. Khincha PP, Wentzensen IM, Giri N, Alter BP, Savage SA. Response to androgen therapy in patients with dyskeratosis congenita. Br J Haematol. 2014;165(3):349-357.
36. Català A, Ali SS, Cuvelier GDE, et al. Androgen therapy in inherited bone marrow failure syndromes: analysis from the Canadian Inherited Marrow Failure Registry. Br J Haematol. 2020;189(5):976-981.
37. Liao DJ, Dickson RB. Roles of androgens in the development, growth, and carcinogenesis of the mammary gland. J Steroid Biochem Mol Biol. 2002;80(2):175-189.
38. Huang H, Zegarra-Moro OL, Benson D, Tindall DJ. Androgens repress Bcl-2 expression via activation of the retinoblastoma (RB) protein in prostate cancer cells. Oncogene. 2004;23(12):2161-2176.
39. Horning ES. Carcinogenic action of androgens. Br J Cancer. 1958;12(3):414-418.
40. Escrich E, Solanas M, Bailly C, Ruiz de Villa MC, Saez S. Effects of an androgenic derivative on the development of chemicallyinduced mammary carcinogenesis in the rat. Anticancer Res. 1994;14(2A):539-543.
41. Choi J, Psarommatis B, Gao YR, Zheng Y, Handelsman DJ, Simanainen U. The role of androgens in experimental rodent mammary carcinogenesis. Breast Cancer Res. 2014;16(6):483.
42. Gurnari C, Pagliuca S, Prata PH, et al. Clinical and molecular determinants of clonal evolution in aplastic anemia and paroxysmal nocturnal hemoglobinuria. J Clin Oncol. 2022;41(1):132-142.
43. Clé DV, Catto LFB, Gutierrez-Rodrigues F, et al. Effects of nandrolone decanoate on telomere length and clinical outcome in patients with telomeropathies: a prospective trial. Haematologica. 2023;108(5):1300-1312.
44. Peffault de Latour R, Kulasekararaj A, Iacobelli S, et al. Eltrombopag added to immunosuppression in severe aplastic anemia. N Engl J Med. 2022;386(1):11-23.
Haematologica | 109 March 2024 776 ARTICLE - Androgens in BMF disorders S. Pagliuca et al.
Idecabtagene vicleucel chimeric antigen receptor T-cell therapy for relapsed/refractory multiple myeloma with renal impairment
Surbhi Sidana,1* Lauren C. Peres,2* Hamza Hashmi,3 Hitomi Hosoya,1 Christopher Ferreri,4 Jack Khouri,5 Danai Dima,5 Shebli Atrash,6 Peter Voorhees,6 Gary Simmons,7 Douglas W. Sborov,8 Nilesh Kalariya,4 Vanna Hovanky,1 Sushma Bharadwaj,1 David Miklos,1 Charlotte Wagner,8 Mehmet H. Kocoglu,9 Gurbakhash Kaur,10 James A. Davis,3 Shonali Midha11 Murali Janakiram,12 Ciara Freeman,2 Melissa Alsina,2 Frederick Locke,2 Rebecca Gonzalez,2 Yi Lin,13 Joseph McGuirk,14 Aimaz Afrough,10 Leyla Shune,14# Krina K. Patel4# and Doris K. Hansen2#
1Stanford University School of Medicine, Stanford, CA; 2H. Lee Moffitt Cancer Center and Research Institute, Tampa, FL; 3Medical University of South Carolina, Charleston, SC; 4University of Texas MD Anderson Cancer Center, Houston, TX; 5Cleveland Clinic Taussig Cancer Center, Cleveland, OH; 6Levine Cancer Institute, Charlotte, NC; 7Virginia Commonwealth University Massey Cancer Center, Richmond, VA; 8University of Utah Huntsman Cancer Institute, Salt Lake City, UT; 9University of Maryland Marlene and Stewart Greenebaum Comprehensive Cancer Center, Baltimore, MD; 10UT Southwestern Harold C. Simmons Comprehensive Cancer Center, Dallas, TX; 11Dana Farber Cancer Institute, Boston, MA; 12City of Hope Cancer Center, Duarte, CA; 13Mayo Clinic, Rochester, MS and 14The University of Kansas Medical Center, Kansas City, KS, USA
*SS and LCP contributed equally as first authors. #LS, KKP and DKH contributed equally as senior authors.
Abstract
Correspondence: S. Sidana
Surbhi.Sidana@stanford.edu
D.K. Hansen
Doris.Hansen@moffitt.org
Received: July 16, 2023.
Accepted: September 8, 2023. Early view: September 21, 2023.
https://doi.org/10.3324/haematol.2023.283940
©2024 Ferrata Storti Foundation
Published under a CC BY-NC license
We evaluated patients with relapsed multiple myeloma with renal impairment (RI) treated with standard of care idecabtagene vicleucel (ide-cel), as outcomes with chimeric antigen receptor (CAR) T-cell therapy are unknown in this population. RI was defined as creatinine clearance (CrCl) <50 mL/min. CrCl of <30 mL/min or dialysis dependence were defined as severe RI. The study cohort included 214 patients, 28 (13%) patients with RI, including 11 patients severe RI (dialysis, N=1). Patients with RI were older, more likely to be female and had higher likelihood of having Revised International Staging System stage 3 disease. Rates and severity of cytokine release syndrome (89% vs. 84%, grade ≥3: 7% vs. 2%) and immune effector cell-associated neurotoxicity syndrome (23% vs. 20%) were similar in patients with and without RI, respectively. Patients with RI had higher incidence of short-term grade ≥3 cytopenias, although cytopenias were similar by 3 months following CAR T-cell therapy. Renal function did not worsen after CAR T-cell therapy in patients with RI. Response rates (93% vs. 82%) and survival outcomes (median progression-free survival: 9 vs. 8 months; P=0.26) were comparable in patients with and without RI, respectively. Treatment with ide-cel is feasible in patients with RI, with a comparable safety and efficacy profile as patients without RI, with notable exception of higher short-term high-grade cytopenias.
Introduction
Idecabtagene vicleucel (ide-cel) is an autologous B-cell maturation antigen (BCMA)-directed chimeric antigen receptor (CAR) T-cell therapy that was approved in United States in March 2021 for the treatment of patients with relapsed/refractory multiple myeloma (RRMM) who have received four or more prior lines of therapy, including an
immunomodulatory agent (IMiD), a proteasome inhibitor (PI), and an anti-CD38 monoclonal antibody.1-5 This approval was based on the pivotal phase II KarMMa trial of ide-cel which evaluated 128 patients who had received a median of six prior lines of therapy and were mostly triple-class refractory. In this heavily pretreated population, ide-cel resulted in an overall response rate (ORR) of 73%, a complete response (CR) of 33%, and minimal residual disease (MRD)
Haematologica | 109 Marzo 2024 777 - Cell Therapy & Immunotherapy ARTICLE
negativity rate of 26%.6,7 This was significantly higher than response rates seen with other therapies that have been historically available for a similar indication, with response rates around 30% and median progression-free suvival (PFS) of 3-4 months.4,6-9
However, the KarMMa trial, akin to many other CAR T-cell therapy trials excluded patients with impaired renal function at the time of screening, excluding patients with creatinine clearance (CrCl) <45 mL/min.10-14 At diagnosis, around 20% of patients with multiple myeloma (MM) have renal impairment (RI) due to cast nephropathy or other reasons.15 Although exact estimates are not available in patients with relapsed disease, several patients do not recover renal function post-diagnosis or develop impaired renal function during the course of the treatment or due to disease relapse. This limits access of this novel therapy to a significant proportion of patients who have impaired renal function. There are two main concerns for use of CAR T-cell therapy in patients with RI. First is lack of safety and efficacy data with CAR T cells in this patient population, and second is concern about using fludarabine as part of lymphodepletion chemotherapy, which is 40% renally cleared.16-18 Most CAR T-cell therapy clinical trials have traditionally used fludarabine and cyclophosphamide lymphodepletion chemotherapy, though some clinical trials have used cyclophosphamide alone.19-21 We hypothesized that ide-cel CAR T-cell therapy will result in similar efficacy and acceptable safety profile in patients with MM with RI compared to patients without RI, after adjusting lymphodepletion chemotherapy (specifically fludarabine) doses for renal function. The goal of this study was to evaluate the real-world outcomes of relapsed/refractory MM (RRMM) patients with RI treated with standard of care (SOC) ide-cel.
Methods
This was a retrospective multicenter observational study of patients with and without RI treated with SOC ide-cel under commercial label for RRMM from 11 medical centers in the US Multiple Myeloma Immunotherapy Consortium. Each center obtained independent institutional review board approval and informed consent per institutional requirements.
Patients
All RRMM patients who underwent apheresis for SOC ide-cel by May 1, 2022 and infusion by June 21, 2022 were included. If the CAR T-cell product did not meet release criteria, patients were treated under an expanded access protocol. RI was defined as CrCl <50 mL/min at the time of CAR T-cell therapy based on the Cockroft Gault equation. CrCl of <30 mL/min or being on dialysis was defined as severe RI. The cutoffs were selected as these are commonly used cutoffs for fludarabine dose reduction. Dosing of lymphodepletion chemotherapy and toxicity management was per institutional
guidelines. High-risk cytogenetics were defined by the presence of del (17p), t(4;14), and t(14;16) at any time point prior to CAR T-cell infusion. Cytokine release syndrome (CRS) and neurotoxicity were graded based on the American Society for Transplantation and Cellular Therapy (ASTCT) criteria and hematologic toxicity was graded based on the Common Terminology Criteria for Adverse Events (CTCAE) version 5.0.22,23 Response was assessed based on the International Myeloma Working Group Criteria (IMWG),24 per investigator discretion, but due to the retrospective nature of our study, all of the IMWG criteria were not required to be fulfilled. Patients who died due to toxicity are included in the response assessment and considered as non-responders. Patients with insufficient follow-up, non-evaluable disease or where response data was not available are not included in the response-evaluable population. Cyclophosphamide (Cy) 300 mg/m2 and fludarabine (Flu) were administered according to Food and Drug Adminstration-approved standard-dose labeling for LD chemotherapy on days -5, -4, and -3 prior to CAR T-cell infusion. All patients received fludarabine, however, fludarabine was dose adjusted per institutional protocol. Each center’s instituional guidelines for fludarabine dose reduction from the conventional 30 mg/m2 dose are described in detail in Online Supplementary Table S1 Toxicity management was also per institutional guidelines.
Statistical analyses
The distribution of patient and clinical characteristics, safety, and efficacy were examined by RI using χ2 or Fisher exact tests for categorical variables or Kruskal-Wallis rank sum tests for continuous variables. PFS was calculated as time from infusion until progression or death, whichever occurred earlier. Patients who were alive and progression-free were censored at last follow-up. Overall survival (OS) was calculated as time between the date of infusion and date of death from any cause or last contact. Patients who were alive were censored at last follow-up. Kaplan Meier curves were used to depict survival data and survival outcomes by RI were compared using the log-rank test. Multivariable Cox proportional hazard regression models were used to examine the association of RI with PFS and OS, while adjusting for a priori selected patient characteristics (prior BCMA-targeted therapy, age at infusion, high-risk cytogenetics). The proportional hazard assumption was tested using covariate x time interaction terms individually and collectively. No violations of proportional hazards were observed. All analyses were conducted using R (Version 4.1.2.).
Results
The study cohort includes 214 patients from 11 medical centers who received ide-cel, of which 28 (13%) patients had RI. Among these, 11 (39%) patients had severe RI including one patient who was on dialysis. Table 1 describes patient
Haematologica | 109 Marzo 2024 778 ARTICLE - Standard-of-care ide-cel for RRMM with renal impairment S. Sidana et al.
characteristics. Patients with RI were older (median age 69 vs. 63 years; P=0.001), more likely to be female (68% vs. 36%; P=0.001) and had higher likelihood of having R-ISS stage 3 disease (43% vs. 24%; P=0.03), driven by lower albumin and higher β-2-microglobulin levels. Overall, 33% of patients had high-risk cytogenetics with higher proportion of patients with high-risk cytogenetics in the RI cohort (48% vs. 21%; P=0.09). At baseline, patients with RI had lower platelet counts, with 32% of patients having platelets <50x109/L (grade 3 or 4 thrombocytopenia) compared to 17% in the normal renal function group (P=0.06). Patients with RI were more heavily pretreated with median of eight lines of therapy compared to six prior lines of therapy in patients without RI; P=0.03. There was no difference in the proportion of patients with penta-refractory disease (36% vs. 45%; P=0.4) or prior exposure to another BCMA-targeted therapy (25% each; P>0.9) Bridging therapy was more commonly used in patients with RI (93% vs. 75%; P=0.04). Dose reduction of fludarabine was more common in patients with RI (79% vs. 21%; P<0.001). Amongst patients with RI who underwent fludarabine dose reduction, 86% of patients had >20% dose reduction. There was no difference in CAR T-cell dose infused (median: 416 vs. 406 million cells) or proportion of patients receiving ≥400 million CAR T cells.
Safety
Table 2 describes toxicities experienced post CAR T-cell therapy in patients with and without RI, respectively. Patients with RI had similar incidence, severity and timing of CRS (any grade CRS: 89% vs. 84%; P=0.8 and grade ≥3: 7% vs. 2%; P=0.2) as patients without RI. The median time to maximum severity of CRS was 1 day in both groups. Similarly, patients with RI had comparable incidence and severity of ICANS as patients without RI (any grade ICANS: 23% vs. 20%; P=0.8 and grade ≥3: 12% vs. 6%; P=0.2). Patients with RI had a longer duration of hospital stay (median: 13.5 days vs. 9 days; P=0.03) and a trend towards higher incidence of intensive care unit admission (18% vs. 8%; P=0.07). Tocilizumab (79% vs. 68%; P=0.3) or anakinra use (4% vs. 5%; P>0.9) were similar, though patients with RI had a trend towards higher use of steroids (43% vs. 26%; P=0.07). Infection rates were similar amongst patients with and without RI (43% vs. 31%; P=0.2).
At day 7, patients with RI had higher incidence of severe cytopenias, including grade ≥3 anemia (43% vs. 25%; P=0.046) and grade ≥3 thrombocytopenia (75% vs. 45%; P=0.004). At day 30 post CAR T-cell therapy, patients with RI continued to have more severe cytopenias, with higher incidence of grade ≥3 neutropenia (54% vs. 34%; P=0.047) and grade ≥3 thrombocytopenia (75% vs. 41%; P<0.001). Cytopenias recovered over time and by 3 months post CAR T-cell therapy, there was no difference in grade ≥3 cytopenias amongst the two groups. Patients with RI required more supportive care for cytopenias with higher use of thrombopoietin (TPO) agonists (36% vs. 14%; P=0.01) and a trend towards higher
use of granulocyte colony-stimulating factor (G-CSF, 89% vs. 74%; P=0.09). There was no difference in use of stem cell boost (5% vs. 4%; P>0.9).
Safety outcomes followed a similar trend when analyzing renal function as three groups: severe RI (CrCl <30 mL/min or dialysis dependence), moderate RI (CrCl 30-49 mL/min) and no RI (CrCl ≥ 50 mL/min), as shown in the Online Supplementary Table S2
Renal function improved in some patients; importantly, renal function did not deteriorate in any patient with baseline RI. Amongst patients with paired baseline and day 30 data, no patient with CrCl 30-49 mL/min (N=16) experienced worsening of CrCl to <30 mL/min at day 30, with 12 of 16 patients remaining in the same same renal function group of CrCl 30-49 mL/min, while four of 16 patients experienced improvement in renal function to CrCl ≥50 mL/min. Amongst ten patients with CrCl <30 mL/min, three patients experienced improvement in CrCl to 30-49 mL/min, while seven patients had similar CrCl at day 30. Amongst 167 patients with CrCl ≥50 mL/min at CAR T-cell therapy, renal function worsened in 11 patients (7%) at day 30 post CAR T-cell therapy (CrCl <30 mL/min, N= 5 and CrCl 30-49 mL/min, N=6) (Online Supplementary Table S3).
Efficacy
Response
Patients with and without RI had similar response rates as shown in Figure 1 and Online Supplementary Table S4. At day 30, overall response rate (ORR, partial response or better) was 92% versus 76%; P=0.06 and complete response or better rate (CR rate) of 38% versus 28%, P=0.3 in patients with and without RI, respectively. When considering best response at any time, ORR was 93% versus 82%; P=0.2 and CR rate was 61% versus 49%; P=0.2.
Survival
The median follow-up of the cohort was 9.6 months. Renal function did not impact PFS or OS (Figure 2; Online Supplementary Figure S1). Median PFS in patients with and without RI was 9 versus 8 months; P=0.28, and median OS was not reached versus 15.5 months; P=0.25, respectively. On multivariable analysis (Table 3), RI was not an independent predictor for PFS (hazard ratio [HR] =0.82; 95% confidence interval [CI]: 0.45-1.49; P=0.5), while high-risk cytogenetics and prior BCMA therapy were independent adverse prognostic factors. Similarly, RI was not an independent predictor for OS (HR=0.61; 95% CI: 0.26-1.45; P=0.3), while prior BCMA threapy and younger age were independent adverse prognostic factors. When analyzing renal function as three groups: severe RI (CrCl <30 mL/min or dialysis dependence), moderate RI (CrCl 30-49 mL/min) and no RI (CrCl ≥50 mL/ min), we observed similar results, with no difference in PFS and OS amongst the three groups, including in multivariable analysis (Online Supplementary Table S5; Online Supplementary Figure S1). Fludarabine dose reduction did
Haematologica | 109 Marzo 2024 779 ARTICLE - Standard-of-care ide-cel for RRMM with renal impairment S. Sidana et al.
CrCL: creatinine clearance; BMPC: bone marrow plasma cells; PC: plasma cells; ECOG PS: Eastern Cooperative Oncology Group performance status; R-ISS: Revised International Staging System; CAR: chimeric antigen receptor; high-risk cytogenetics: includes del(17p), t(4;14) and t(14;16); SCT: stem cell transplantation; ANC: absolute neutrophil count; BCMA: B-cell maturation antigen; triple-refractory disease: refractory to an immunomulatory drug, proteosome inhibitor, and an anti-CD38 monoclonal antibody; penta-refractory disease: refractory to lenalidomide, pomalidomide, bortezomib, carfilzomib, and daratumumab or isatuximab. *CAR T-cell dose was not known in 1 patient with CrCl ≥50 mL/min.
not impact PFS or OS, as shown in Figure 3. Median PFS for patients with no dose reduction, up to 40% dose reduction
and more than 40% dose reduction was 7.7 versus
versus 8.1 months; P=0.81 respectively.
Haematologica | 109 Marzo 2024 780 ARTICLE - Standard-of-care ide-cel for RRMM with renal impairment S. Sidana et al.
9.3
Characteristics Overall N=214 CrCl <50 mL/min N=28 CrCl ≥50 mL/min N=186 P Median (range) or N (%) Median (range) or N (%) Median (range) or N (%) Age in years 64 (36-83) 69 (50-83) 63 (36-83) 0.001 Age ≥65 years 103 (48) 20 (71) 83 (45) 0.008 Sex: Female 86 (40) 19 (68) 67 (36) 0.001 Race and ethnicity Hispanic Non-Hispanic Black Non-Hispanic White Other 22 (10) 36 (17) 148 (69) 8 (4) 0 (0) 6 (21) 20 (71) 2 (7) 22 (12) 30 (16) 128 (69) 6 (3) 0.11 Extramedullary disease 96 (45) 13 (46) 83 (45) 0.9 BMPC (≥50%) Marrow PC unknown 58 (30) 18 9 (32) 0 49 (29) 18 0.7 ECOG PS 2-4, N=206 35 (17) 6 (23) 29 (16) 0.4 R-ISS at CAR T-cell infusion, N=163 I II III 36 (22) 83 (51) 44 (27) 1 (4.3) 12 (52) 10 (43) 35 (25) 71 (51) 34 (24) 0.03 High-risk cytogenetics, N=187 62 (33) 12 (48) 50 (31) 0.09 Laboratory data ANC <1,000/uL Hemoglobin <8 g/dL Platelets <50x109/L β-2-microglobulin, mg/L Albumin, g/dL 26 (12) 33 (15) 41 (19) 3.0 (0.7-15.3) 3.6 (1.7-4.8) 2 (7.1) 6 (21) 9 (32) 4.2 (2.4-13.5) 3.3 (2.4-4.7) 24 (13) 27 (15) 32 (17) 2.9 (0.7-15.3) 3.7 (1.7-4.8) 0.5 0.4 0.06 0.004 0.005 Prior therapy Prior lines of therapy 6 (3-19) 8 (5-15) 6 (3-19) 0.03 Prior autologous SCT 180 (84) 23 (82) 157 (84) 0.8 Prior allogeneic SCT 10 (5) 2 (7) 8 (4) 0.6 Prior anti-BCMA therapy 53 (25) 7 (25) 46 (25) >0.9 Triple refractory 178 (83) 26 (93) 152 (82) 0.2 Penta refractory 93 (43) 10 (36) 83 (45) 0.4 Bridging therapy 166 (78) 26 (93) 140 (75) 0.04 CAR T-cell dose, median (range)* 406 (154-459) 416 (156-455) 406 (154-459) 0.6 Cell dose ≥400 million CAR T-cells 120 (56) 18 (64) 102 (55) 0.4 Fludarabine dose reduction, yes 61 (29) 22 (79) 39 (21) <0.001 Fludarabine dose reduction % ≤20 21-40 >40 22 (36) 16 (26) 23 (38) 3 (14) 7 (32) 12 (55) 19 (49) 9 (23) 11 (28) 0.018
Table 1. Baseline and treatment characteristics in patients with relapsed/refractory multiple myeloma with and without renal impairment receiving idecabtagene vicleucel.
Sub-group analysis for creatinine clearance cutoff of 45 mL/min
As patients with CrCl <45 mL/min were excluded from the KarMMa clinical trial, we conducted a sub-group analysis of safety and efficacy of ide-cel using this CrCL cutoff. Results were similar. Differences in baseline characteristics and safety were comparable to the analysis using the 50 mL/ min CrCL clearance cutoff (Online Supplementary Tables S6 and S7). Response rates, PFS and OS were also similar between groups (Online Supplementary Figures S2 and S3).
Discussion
This large retrospective study is the first cohort study to report on outcomes of RRMM patients with renal dysfunction treated with BCMA-directed CAR T-cell therapy. Such patients have been historically excluded from clinical trials of CAR T-cell therapy in RRMM, and the safety and efficacy of CAR T-cell therapy has not been previously described in this population. We observed that ide-cel CAR T-cell therapy is feasible in patients with RI, with efficacy comparable to
CrCL: creatinine clearance; G-CSF: granulocyte colony-stimulating factor; ICANS: immune effector cell-associated neurotoxicity; TPO: thrombopoietin. aData on ICANS was missing in 10 patients (2 in CrCl <50 mL/min cohort and 8 in CrCL ≥50 mL/min cohort. bFor hematology labs, at day 7, 1 patient missing anemia and thrombocytopenia data and 9 patients missing neutropenia data; day 30: 6 patients missing anemia and thrombocytopenia data and 7 missing neutropenia data; day 60: 46 missing anemia and thrombocytopenia data and 47 missing neutropenia data; day 90: 33 patients missing anemia and thrombocytopenia data and 34 missing neutropenia.
Haematologica | 109 Marzo 2024 781 ARTICLE - Standard-of-care ide-cel for RRMM with renal impairment S. Sidana et al.
Overall N=214 CrCl <50 mL/min N=28 CrCl ≥50 mL/min N=186 P Median (range) or N (%) Median (range) or N (%) Median (range) or N (%) Cytokine release syndrome Any Grade ≥3 82 (85) 6 (3) 25 (89) 2 (7) 157 (84) 4 (2) 0.8 0.2 ICANSa Any Grade ≥3 41 (20) 13 (6) 6 (23) 3 (12) 35 (20) 10 (6) 0.7 0.2 Resource utilization Median hospital stay, days Intensive care unit stay, yes Tocilizumab use Corticosteroid use Anakinra use 9 (5-69) 19 (9) 149 (70) 61 (29) 10 (5) 13.5 (6-69) 5 (18) 22 (79) 12 (43) 1 (4) 9 (5-68) 14 (8) 127 (68) 49 (26) 9 (5) 0.03 0.08 0.3 0.07 >0.9 Infection 69 (32) 12 (43) 57 (31) 0.2 Hematologic toxicity in 90 daysb Day 7: grade ≥ 3 cytopenia Grade ≥3 anemia Grade ≥3 neutropenia Grade ≥3 thrombocytopenia 58 (27) 143 (70) 105 (49) 12 (43) 22 (79) 21 (75) 46 (25) 121 (68) 84 (45) 0.046 0.7 0.004 Day 30: grade ≥3 cytopenia Grade ≥3 anemia Grade ≥3 neutropenia Grade ≥3 thrombocytopenia 39 (19) 76 (37) 94 (45) 8 (29) 15 (54) 21 (75) 31 (17) 61 (34) 73 (41) 0.2 0.047 <0.001 Day 60: grade ≥3 cytopenia Grade ≥3 anemia Grade ≥3 neutropenia Grade ≥3 thrombocytopenia 32 (19) 44 (26) 58 (35) 9 (39) 7 (30) 10 (43) 23 (16) 37 (26) 48 (33) 0.02 0.6 0.3 Day 90: grade≥3 cytopenia Grade ≥3 anemia Grade ≥3 neutropenia Grade ≥3 thrombocytopenia 16 (9) 24 (13) 41 (23) 2 (8) 3 (12) 5 (20) 14 (9) 21 (14) 36 (23) >0.9 >0.9 0.7 Supportive care for cytopenias G-CSF TPO agonist Stem cell boost 162 (76) 35 (17) 8 (4) 25 (89) 10 (36) 1 (5) 137 (74) 25 (14) 7 (4) 0.09 0.01 >0.9
Table 2. Toxicities in patients with relapsed/refractory multiple myeloma with and without renal impairment (creatinine clearance of <50 mL/min) receiving idecabtagene vicleucel.
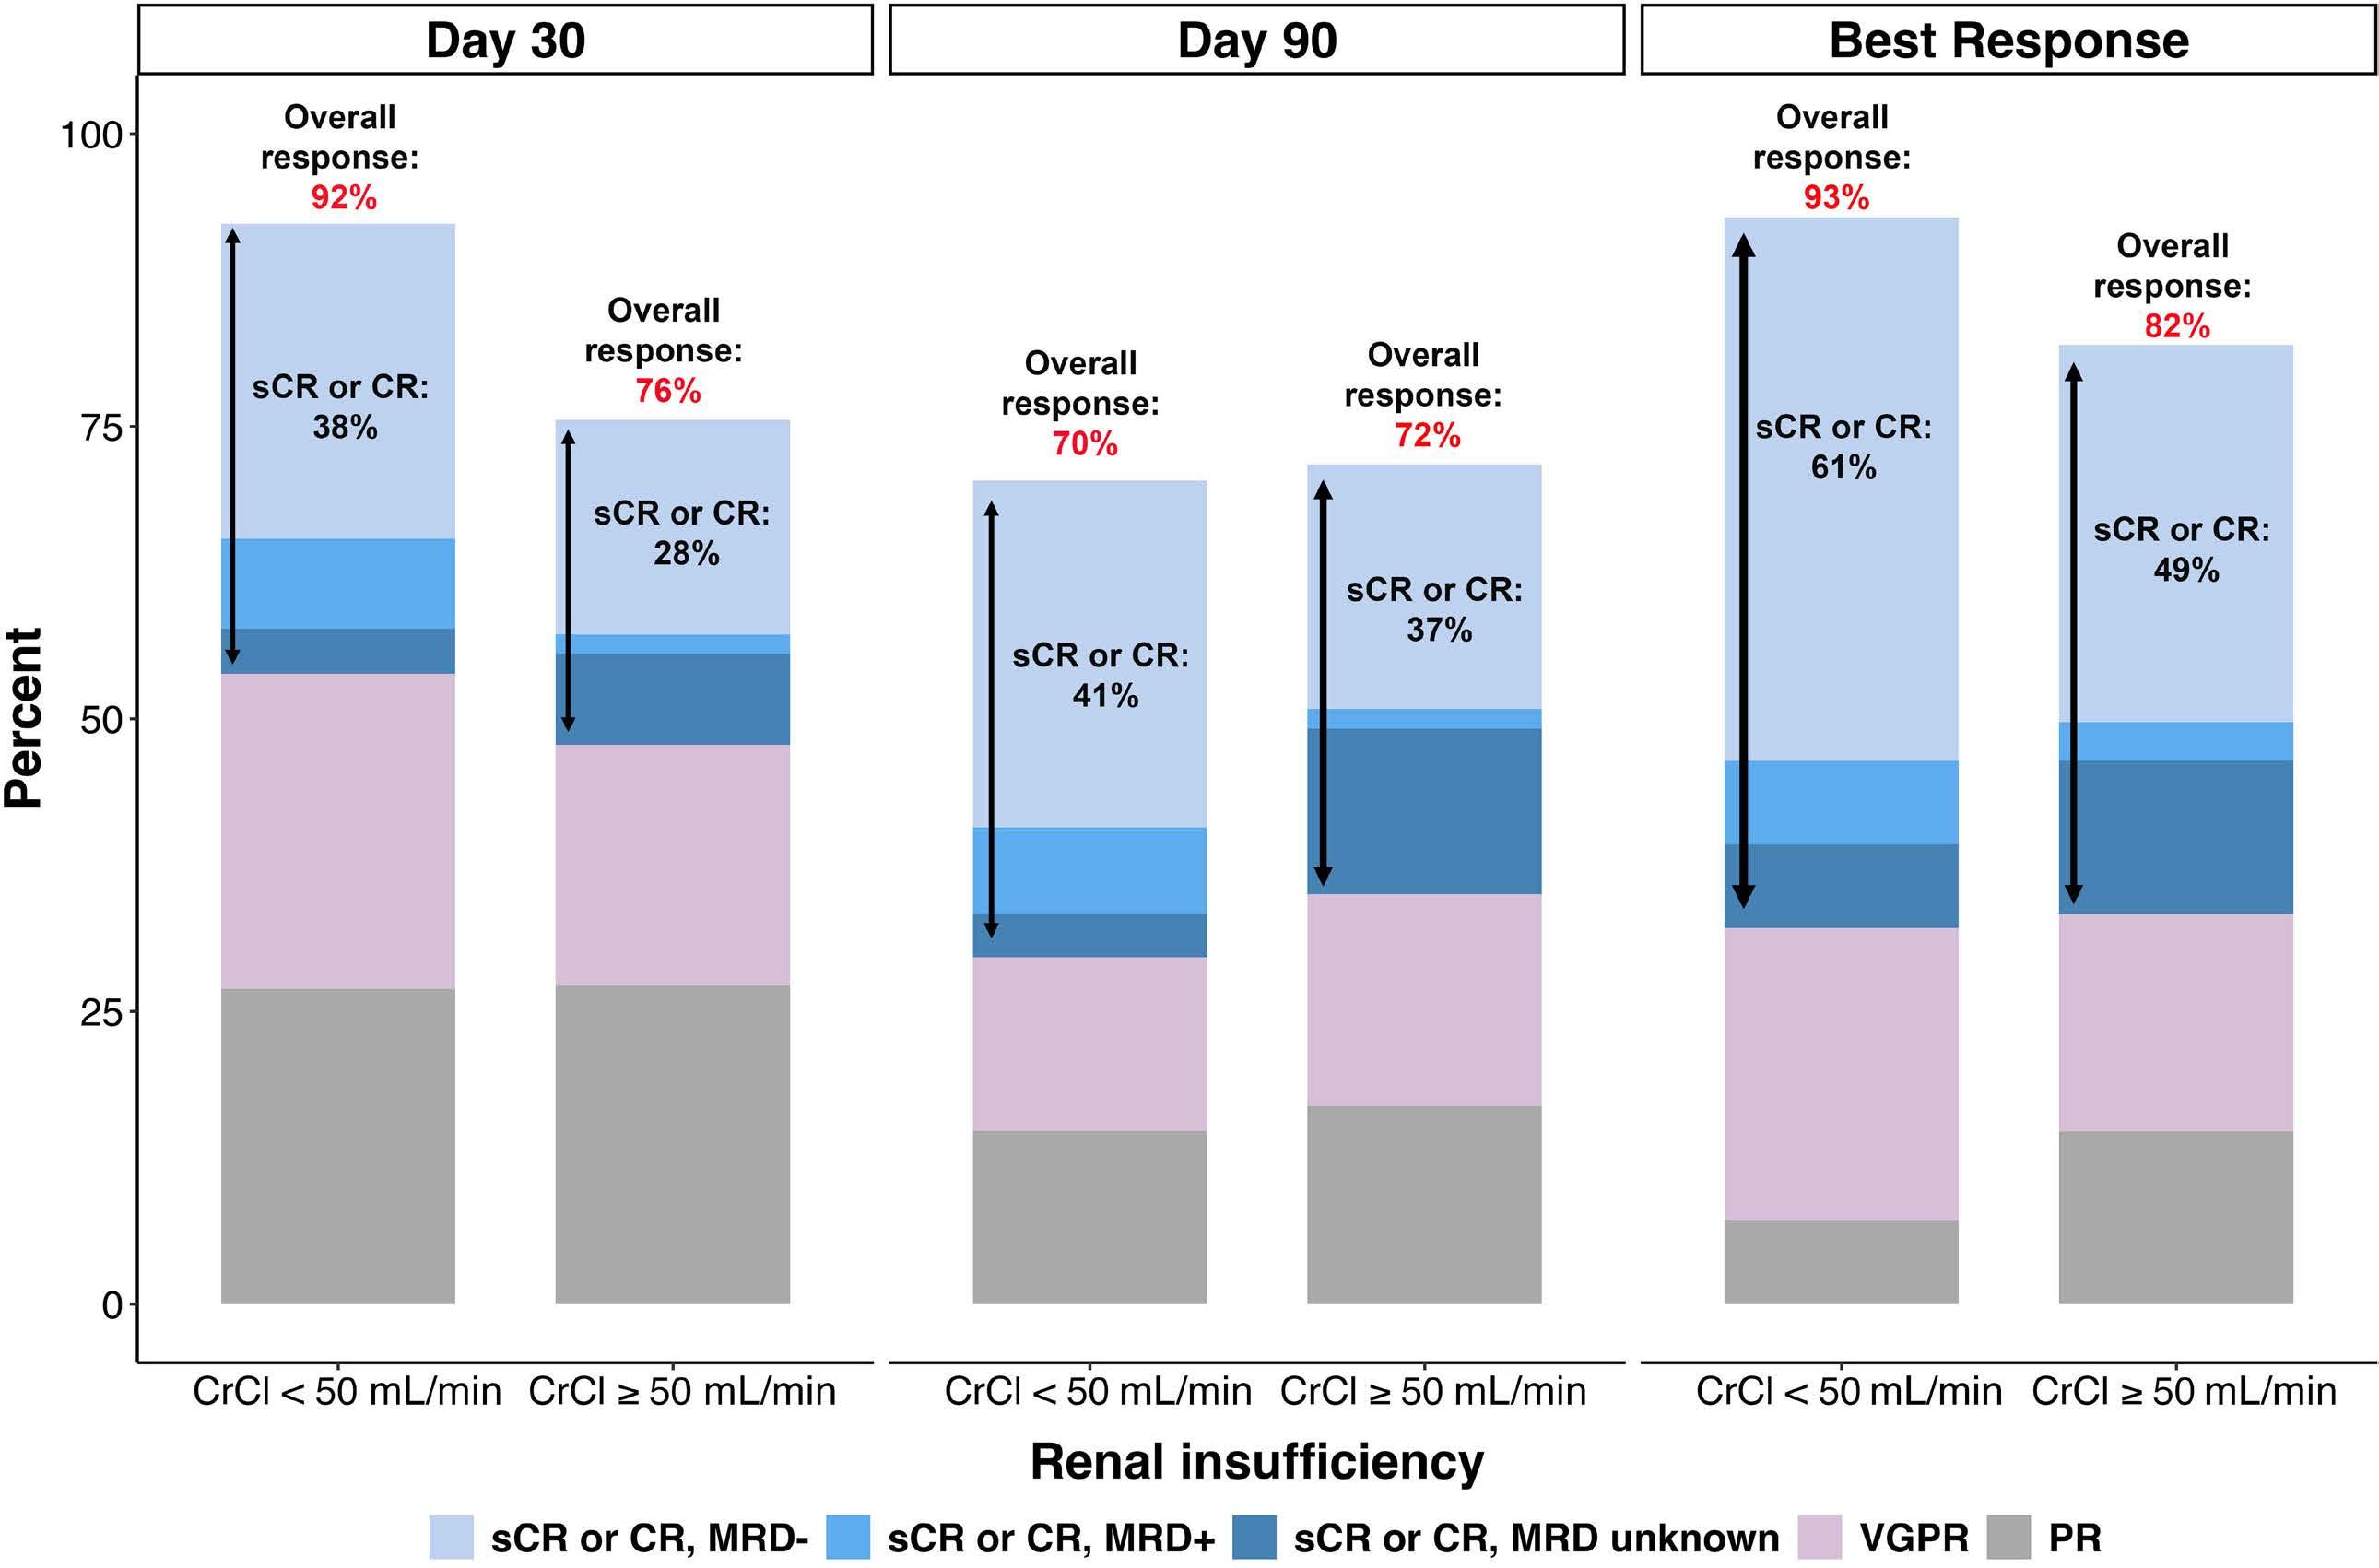
myeloma
and without renal im-
of interest were considered non-responders. Patients who were not evaluable by International Myeloma Working Group response criteria, or when data was not provided or time point not reached were excluded from the denominator. CrCL: creatinine clearance; CR: complete response; sCR: stringent complete response; MRD: minimal residual disease; VGPR: very good partial response; PR: partial response.
patients with normal renal function. Safety was also similar, although there were notable differences of short-term high grade cytopenias and longer hospital stay. In terms of safety, the incidence and severity of CRS and neurotoxicity were comparable in patients with and without RI, including in patients with severe RI (defined as CrCl <30 mL/min or dialysis dependence). There was no difference in the timing of such toxicities. Management of CRS and neurotoxcity was generally similar with no difference in rates of tocilizumab or anakinra use, although we observed a trend towards higher use of steroids in patients with RI. It is possible that investigators used a more aggressive toxicity management approach in such patients, given lack of prior safety data in this population. Compared to patients without RI, patients with RI had longer hospital stay, and while not statistically significant, a higher incidence of intensive care unit stay. The reasons for higher incidence of intensive care unit stay is unclear given similar severity of CRS and neurotoxicty. The rates of infectious complications were not significantly different amongst the two groups, though were numerically higher in patients with RI. However, we did not capture all adverse events or analyze the time trends in infectious complications, and it is unknown
whether patients with RI had more infections in the first few weeks after CAR T-cell therapy, especially in context of higher rates of severe neutropenia in the short-term in this group. Patients with RI were more likely to have ongoing grade ≥3 neutropenia and thrombocytopenia at 1 month following CAR T-cell therapy, though rates were comparable by 2 months following CAR T-cell infusion. Therefore, it was not surprising to see higher use of TPO agonists and a trend towards higher use of G-CSF in patients with RI. Given renal clearance of fludarabine, fludarabine-associated toxicities are of concern in this population. It is important to note that we did not observe any occurrence of fludarabine-related cerebellar toxicity. It was reassuring to see that renal function did not deteriorate following CAR T-cell therapy in patients with RI, and some patients actually had an improvement in renal function. There was no new need for dialysis in patients with RI following CAR T-cell infusion. Importantly, efficacy including response rates and survival outcomes following ide-cel were similar in patients with and without RI, including in patients with severe RI. There was no difference in PFS and OS, even after accounting for other known prognostic factors in a multivariable model. Consistent with previous data reported by our group in
Haematologica | 109 Marzo 2024 782 ARTICLE - Standard-of-care ide-cel for RRMM with renal impairment S. Sidana et al.
Figure 1. Efficacy of idecabtagene vicleucel in patients with relapsed/refractory multiple
with
pairment. Patients who died or progressed before the time point
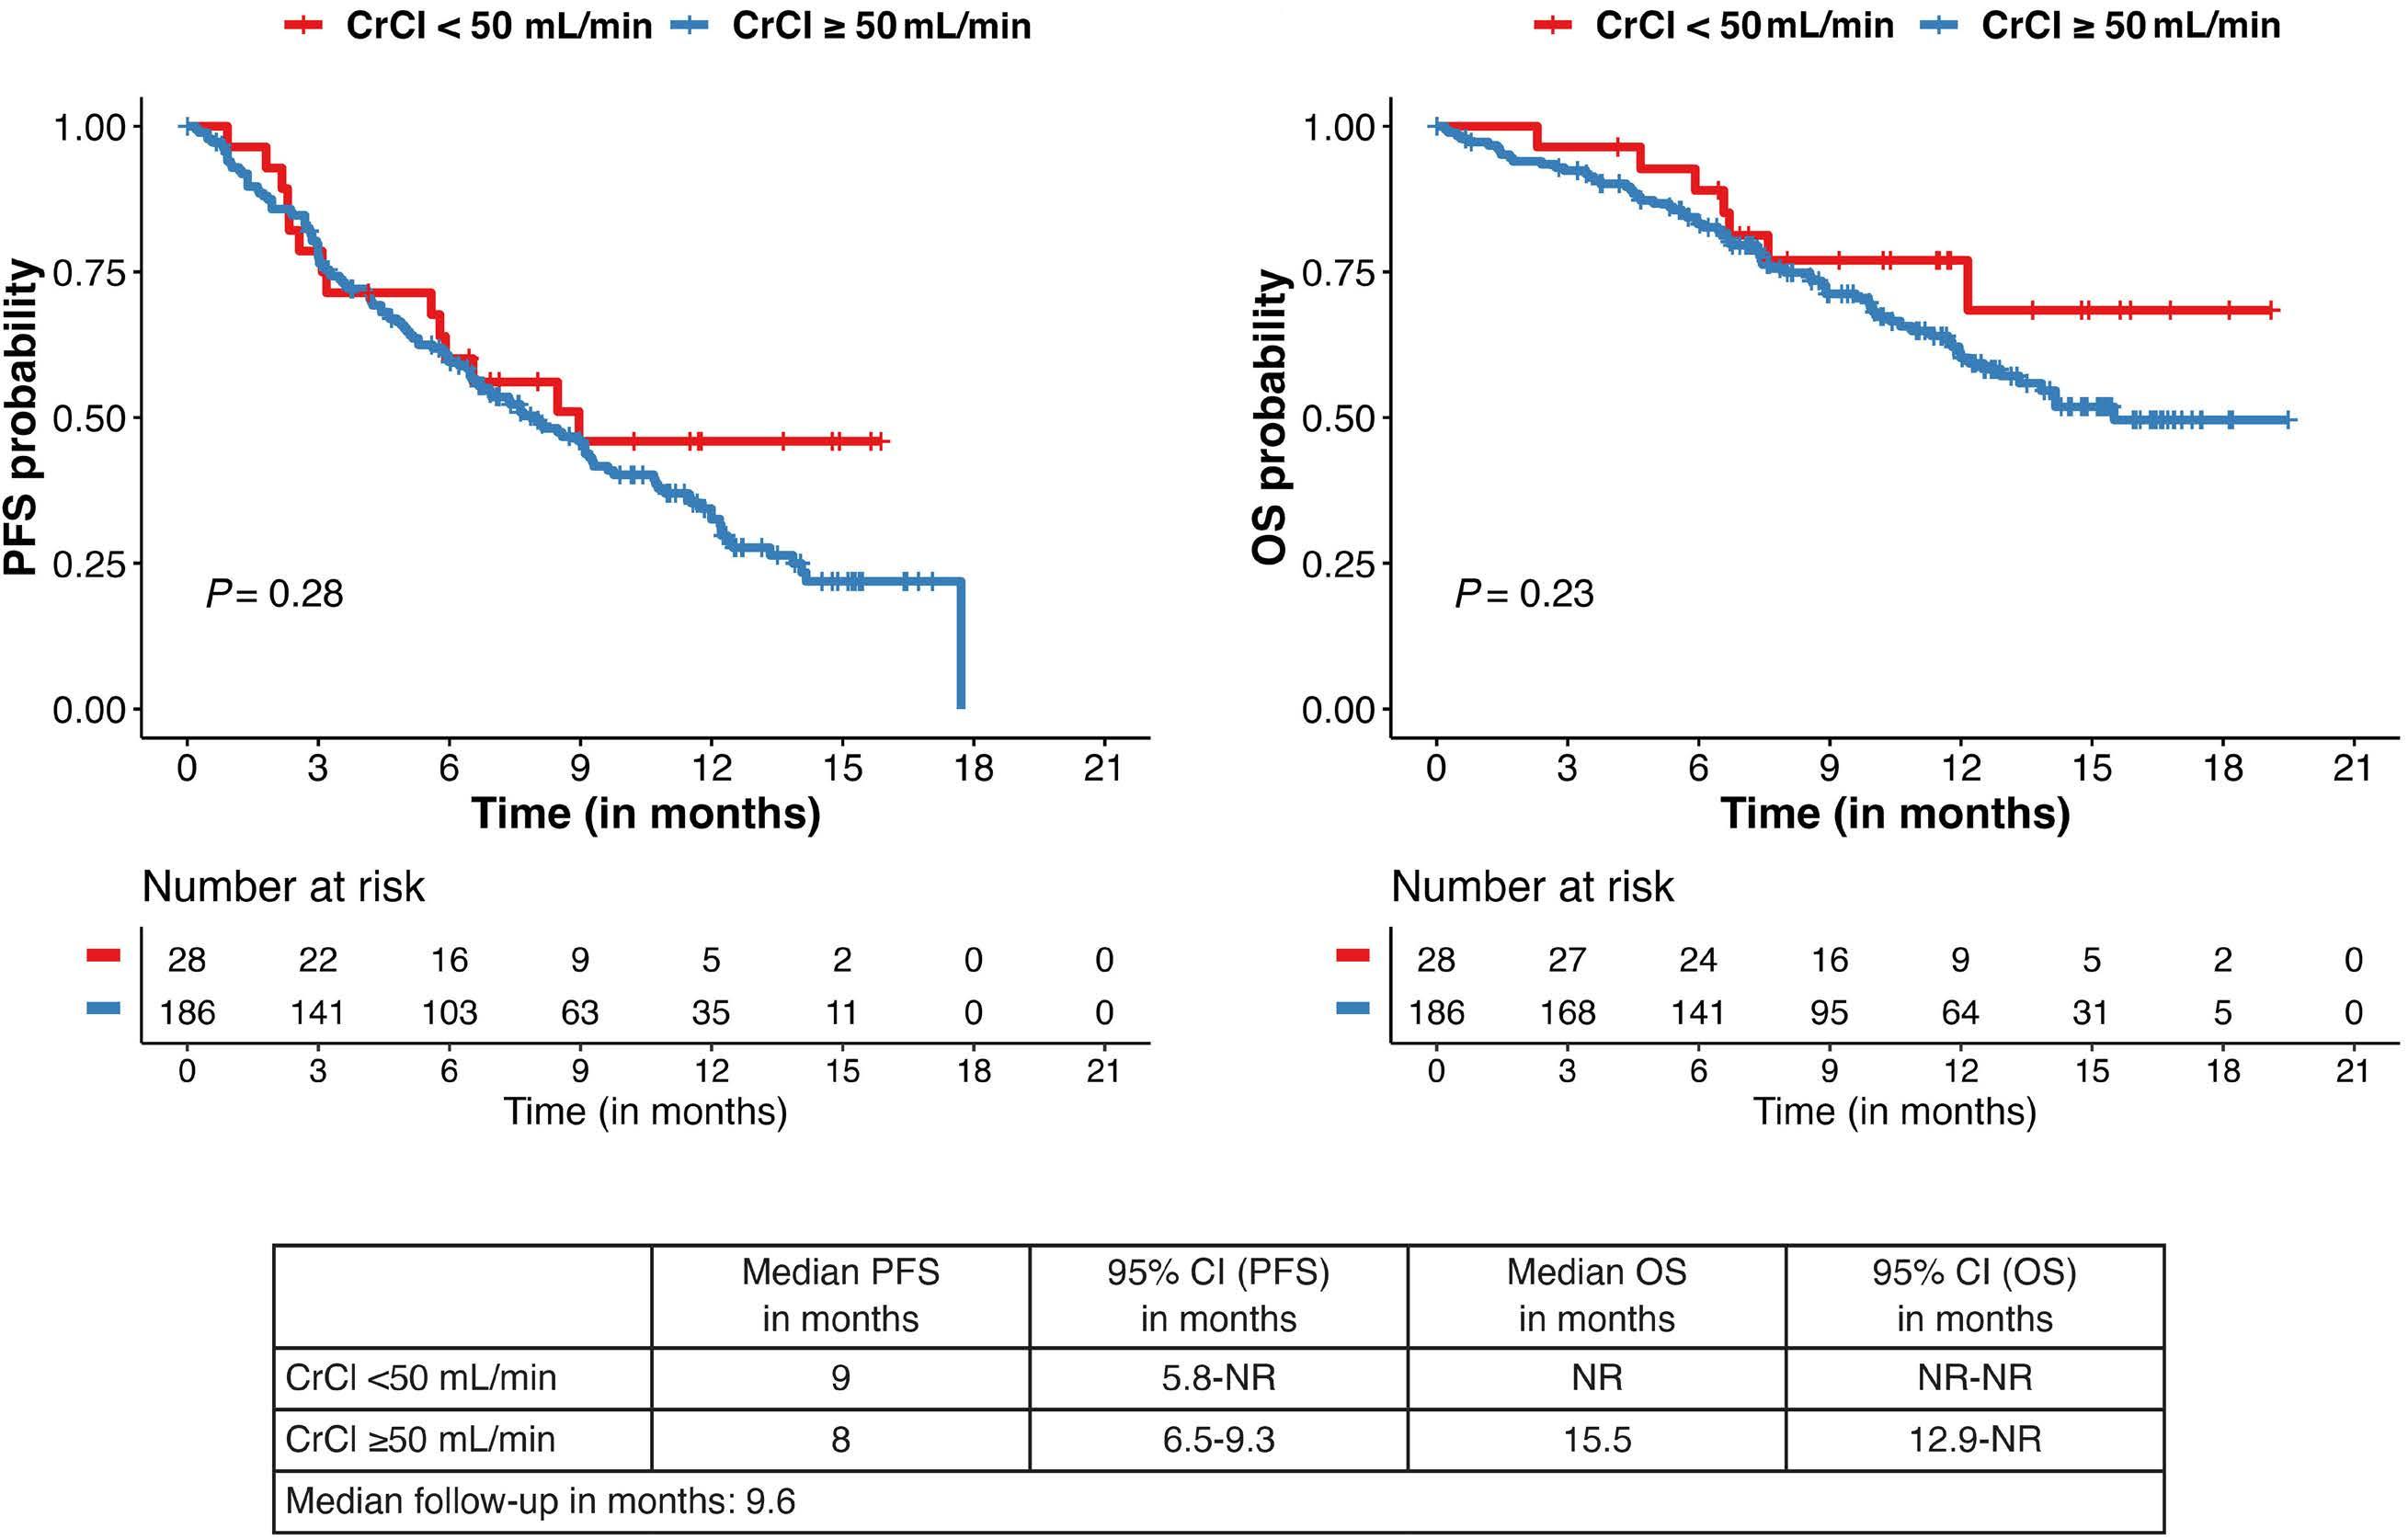
Full data on all variables available in 187 patients. Missing data in 27 patients is due to missing cytogenetic data. PFS: progression-free survival; OS: overall survival; HR: hazard ratio; CI: confidence interval; CrCl: creatinine clearance; HR: hazard ratio; BCMA-TT: B-cell maturation antigen-targeted therapy; min: minutes. High-risk cytogenetics: includes del(17p), t(4;14) and t(14;16).
patients receiving standard of care ide-cel,25 high-risk cytogenetics and prior use of BCMA-targeted therapy were independent adverse prognostic factors. Interestingly, there was no difference in survival based on fludarabine dose reduction, likely reflecting similar exposure to fludarabine with reduced dose fludarabine in patients with RI due to decreased clearance of fludarabine.
While data on use of CAR T-cell therapy in RRMM patients with RI is sparse and limited to case reports,26 a few recent studies have reported on outcomes with CD19-directed CAR T-cell therapy for large cell lymphoma in patients with RI.21,27 It has been reported that CD19 CAR T-cell therapy is feasible in patients with RI, including patients on dialysis. Safety and efficacy of CD19 CAR T-cell therapy in patients
Haematologica | 109 Marzo 2024 783 ARTICLE - Standard-of-care ide-cel for RRMM with renal impairment S. Sidana et al.
Characteristic PFS OS HR (95% CI) P HR (95% CI) P Renal function CrCl ≥50 mL/min CrCl <50 mL/min 1.00 (Referent) 0.82 (0.45-1.49) 0.5 1.00 (Referent) 0.61 (0.26-1.45) 0.3 Prior BCMA-TT No Yes 1.00 (Referent) 1.81 (1.22, 2.67) 0.003 1.00 (Referent) 1.65 (0.99-2.74) 0.05 High-risk cytogenetics No Yes 1.00 (Referent) 1.61 (1.10-2.36) 0.02 1.00 (Referent) 1.43 (0.87-2.36) 0.2 Patient age 0.98 (0.96-1.00) 0.08 0.97 (0.95-1.00) 0.06
Figure 2. Survival outcomes with idecabtagene vicleucel in patients with relapsed/refractory multiple myeloma with and without renal impairment. PFS: progression-free survival; CI: confidence interval; OS: overall survival; CrCL: creatinine clearance; min: minutes; NR: not reached.
Table 3. Multivariable models of the association of selected patient characteristics with progression-free survival and overall survival in patients with and without renal impairment treated with idecabtagene vicleucel.
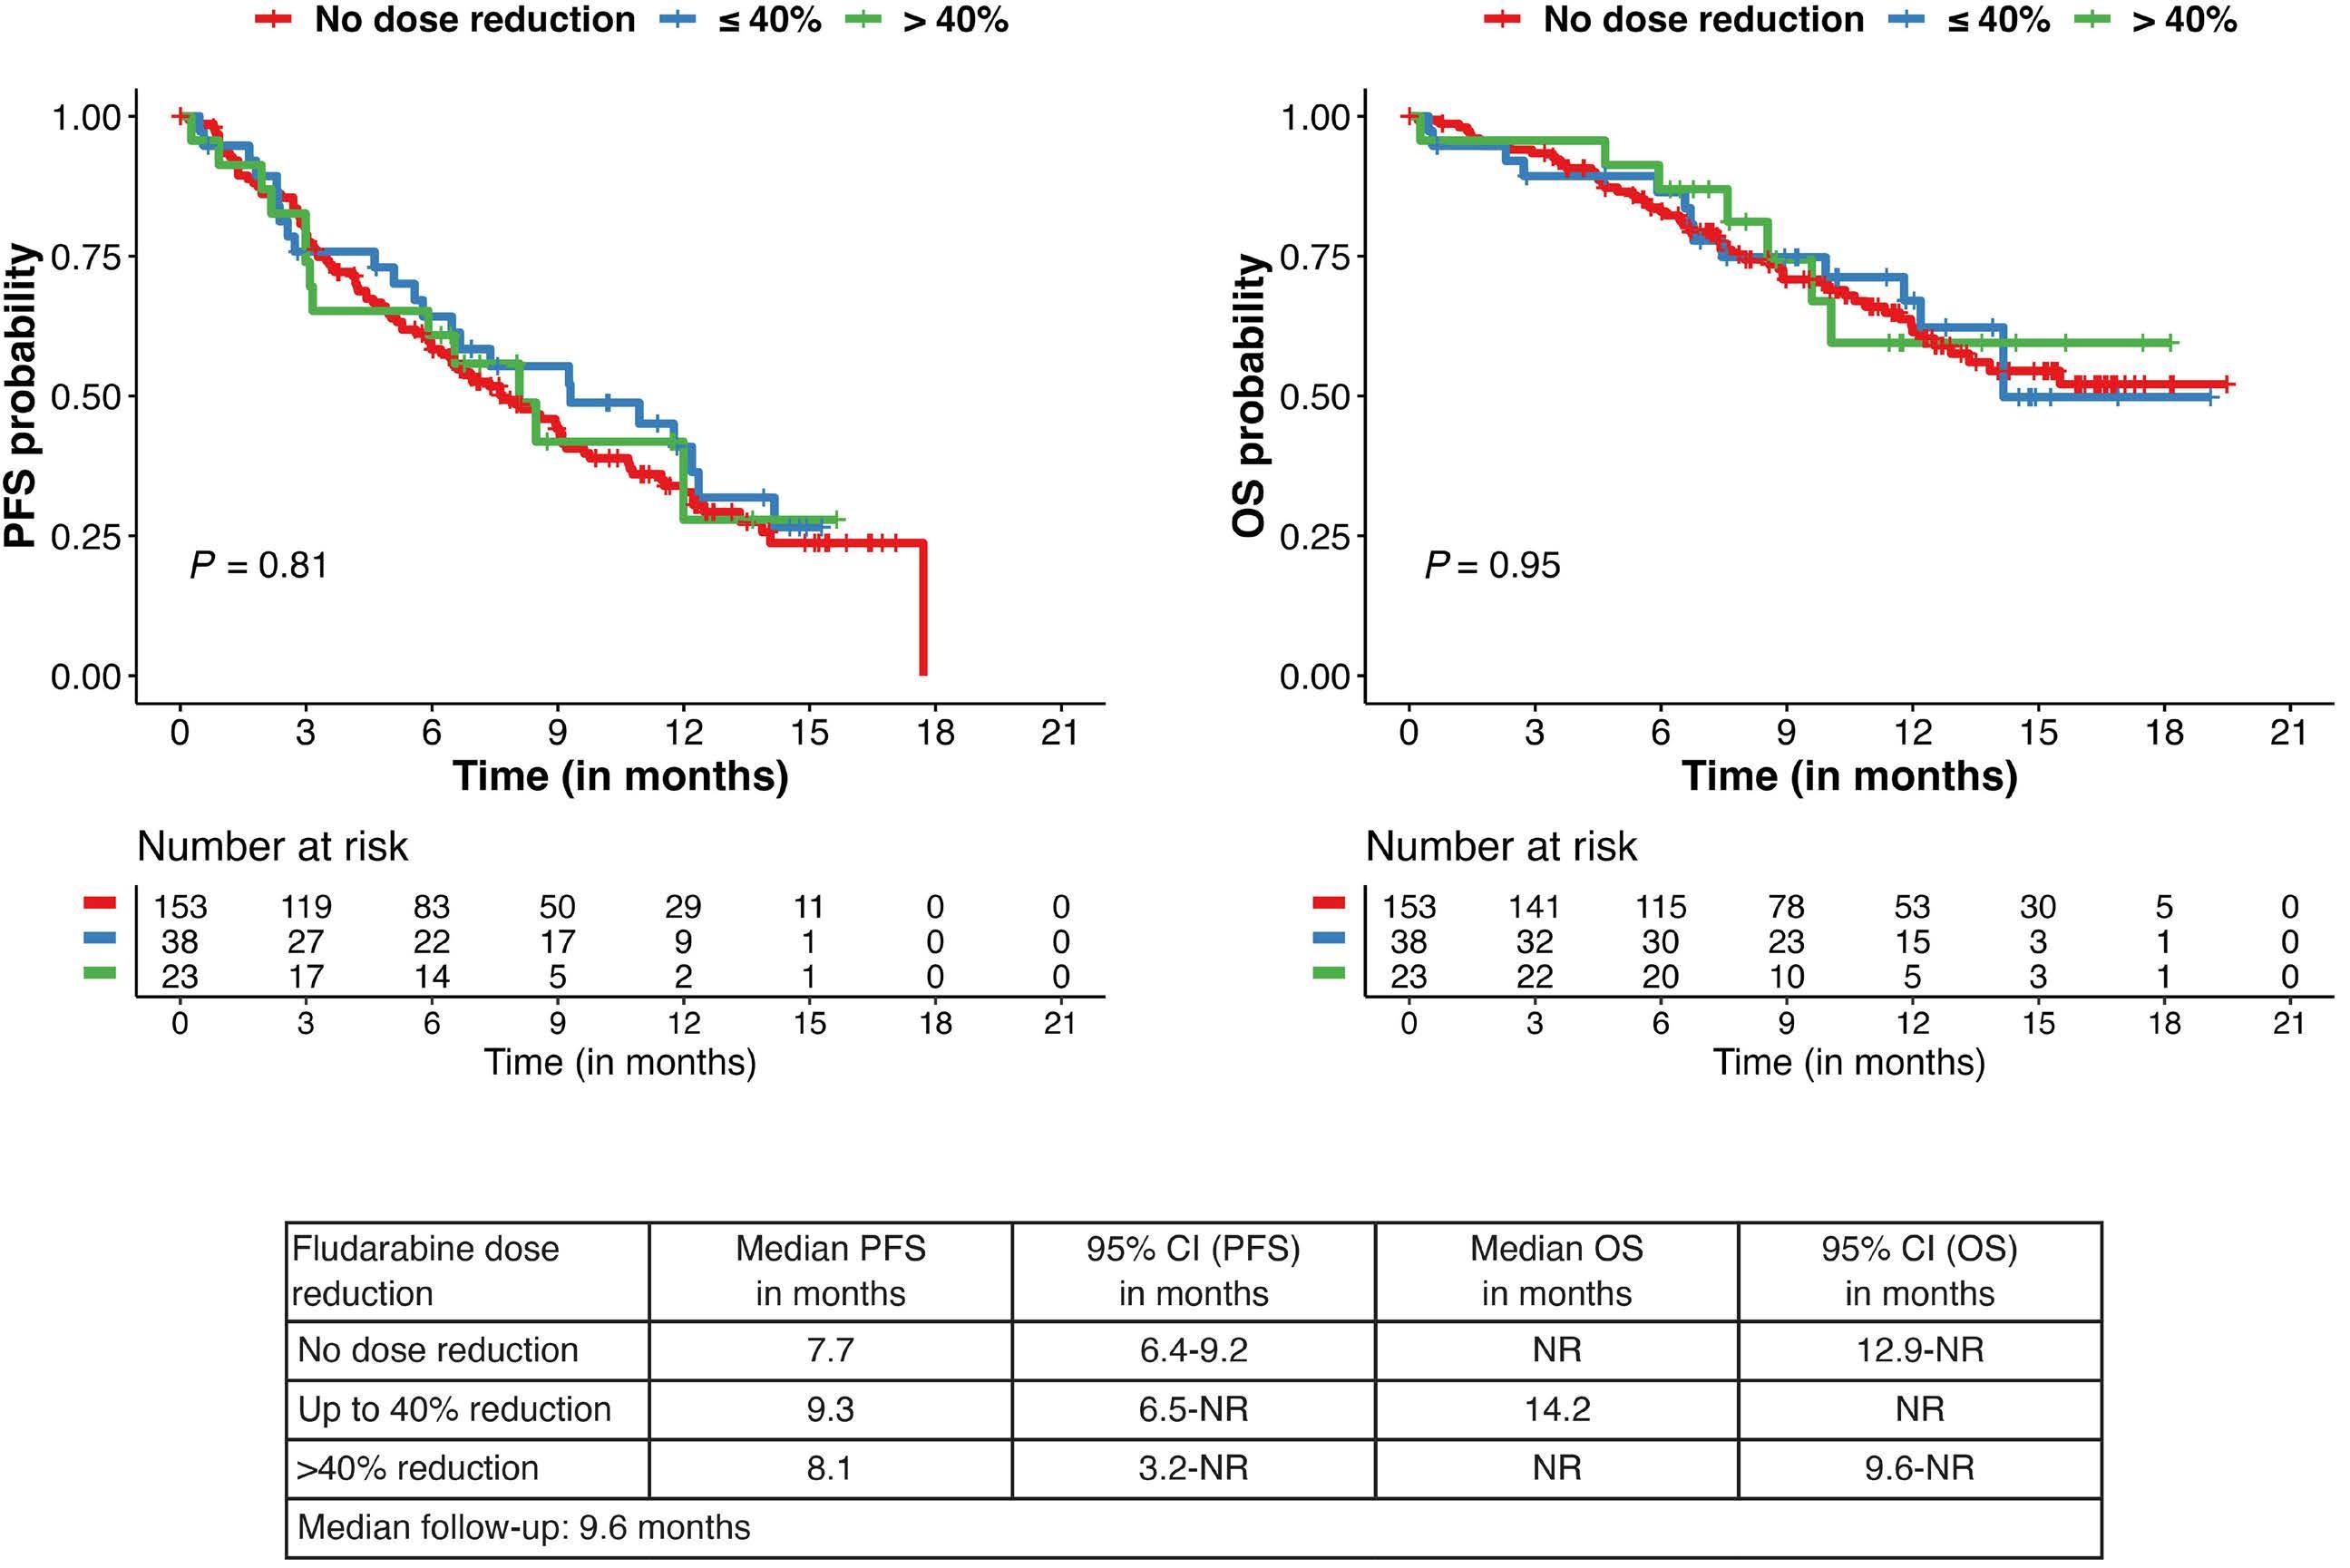
with RI was comparable to patients with normal renal function. In these two studies, RI was defined as having a CrCl <60 mL/min, while we defined RI as having a CrCl <50 mL/ min. We selected the latter threshold as CrCl of <50 mL/min for two reasons. First, this is a common cutoff for change in fludarabine dose in several institutional protocols and second, this cutoff was more closely aligned with exclusion criteria of the pivotal KarMMa clinical trial.6 We also conducted a sub-group analysis for CrCL cutoff of <45 mL/min as that was the cutoff used in the KarMMa clinical trial. Our findings investigating differences in safety and efficacy by renal insufficiency were comparable using a CrCL cutoff of 45 or 50 mL/min.
Strengths of this study include multi-institutional cohort of patients treated with ide-cel, with this being the largest cohort of patients with RI undergoing CAR T-cell therapy to best of our knowledge. Limitations of our study include its retrospective design, and heterogeneity in institutional standards for fludarabine dose reduction and toxicity management across different centers. Data on etiology of RI was not available. This data provides the foundation to further investigate CAR T-cell therapy in patients with RRMM, and a future clinical trial is planned in this population with uniform fludarabine dose reduction and toxicity management. Cast nephropathy is a hallmark feature of MM and many
patients never completely recover renal function. Additionally, adverse effects of treatment can also lead to worsening renal function in patients over time. Excluding patients with RI in clinical trials of CAR T-cell therapy limits access of these novel therapies to a large proportion of patients with RRMM. Given our findings showing that CAR T-cell therapy is feasible, safe and effective in this population, future clinical trials of CAR T-cell therapy should include patients with RI. This can be done as part of the main population under study or in unique cohorts carved out for patients with RI. In summary, it is feasible to treat patients with MM who have RI with CAR T-cell therapy. The efficacy and safety profile with SOC ide-cel in patients with RI is comparable to patients without RI, with some notable differences. Such patients should not be excluded from future clinical trials of CAR T-cell therapy in MM.
Disclosures
SS reports consulting or advisory role for Janssen, Bristol-Myers Squibb, Magenta Therapeutics, Sanofi, Takeda, Pfizer and Legend Biotech; research funding from Janssen, Magenta Therapeutics, Allogene Therapeutics, Bristol-Myers Squibb and Novartis. LCP reports research funding from Bristol-Myers Squibb. DWS reports consulting or advisory role for Sanofi, GlaxoSmithKline, Bristol-Myers Squibb, Legend
Haematologica | 109 Marzo 2024 784 ARTICLE - Standard-of-care ide-cel for RRMM with renal impairment S. Sidana et al.
Figure 3. Survival outcomes with idecabtagene vicleucel in patients with relapsed/refractory multiple myeloma based on fludarabine dose reduction. PFS: progression-free survival; CI: confidence interval; OS: overall survival; NR: not reached.
Biotech, Janssen, and Skyline Diagnostics; research funding from Janssen, BioLineRx, Sanofi, Bristol-Myers Squibb, Amgen, Cantex Pharmaceuticals, Pfizer, and Gilead Sciences. HH reports consulting or advisory role for Janssen, Bristol-Myers Squibb, Sanofi; speakers’ bureau for Sanofi, GlaxoSmithKline, and Karyopharm. SA reports honoraria from Janssen; research funding from GlaxoSmithKline, Amgen, Karyopharm Therapeutics, Janssen, Bristol-Myers Squibb; honoraria from Janssen. CF reports consulting or advisory role for Sanofi; stock/other ownership in Affimed Therapeutics. AK reports consulting or advisory role for Janssen, Bristol-Myers Squibb, Sanofi, Karyopharm Therapeutics, GlaxoSmithKline, Pfizer, Takeda, Pharmacyclics, Alnylam, and Oncopeptides. PV reports consulting or advisory role for Oncopeptides, Abbvie/ Genentech, Karyopharm Therapeutics, Bristol-Myers Squibb, Secura Bio, Pfizer, Sanofi, Janssen, and GlaxoSmithKline; research funding from Abbvie, Janssen, GlaxoSmithKline, and TeneoBio; travel, accommodations, and expenses from Sanofi. RB reports consulting or advisory role for Bristol-Myers Squibb, Abbvie, Janssen, GlaxoSmithKline, Takeda, and Pfizer; research funding from Bristol-Myers Squibb, Abbvie, Karyopharm, and Janssen; member of independent response assessment committee for GlaxoSmithKline. JK reports honoraria from OncLive. MA reports consulting or advisory role for Bristol-Myers Squibb and Janssen; speakers’ bureau for Janssen; honoraria from Janssen. JM reports honoraria from Kite Pharma, Juno Therapeutics, Allovir, Magenta Therapeutics, and EcoR1 Capital; speakers’ bureau for Kite/Gilead; research funding from Novartis, Fresenius Biotech, Astellas Pharma, Bellicum Pharmaceuticals, Novartis, Gamida Cell, Pluristem Therapeutics, Kite Pharma, and AlloVir; honoraria from Kite, AlloVir, Juno Therapeutics, and Magenta Therapeutics; travel, accommodations, expenses from Kita Pharma. FLL reports a scientific advisory role for Allogene, Amgen, Bluebird Bio, BMS/Celgene, Calibr, Cellular Biomedicine Group, GammaDelta Therapeutics, Iovance, Kite Pharma, Janssen, Legend Biotech, Novartis, Sana, Takeda, Wugen, and Umoja; research funding from Kite Pharma (institutional), Allogene (institutional), Novartis (institutional), Blue-Bird Bio (institutional), CERo Therapeutics (institutional), and BMS (institutional); patents, royalties, and other intellectual property including several patents held by the institution in his name (unlicensed) in the field of cellular immunotherapy; consulting
References
1. Gandhi UH, Cornell RF, Lakshman A, et al. Outcomes of patients with multiple myeloma refractory to CD38-targeted monoclonal antibody therapy. Leukemia. 2019;33(9):2266-2275.
2. Mikhael J. Treatment options for triple-class refractory multiple myeloma. Clin Lymphoma Myeloma Leuk. 2020;20(1):1-7.
3. Usmani S, Ahmadi T, Ng Y, et al. Analysis of real-world data on overall survival in multiple myeloma patients with ≥3 prior lines of therapy including a proteasome inhibitor (PI) and an immunomodulatory drug (IMiD), or double refractory to a PI and
roles for Cowen, EcoR1, Emerging Therapy Solutions, and Gerson Lehrman Group (GLG); and education or editorial activity for Aptitude Health, ASH, BioPharma Communications CARE Education, Clinical Care Options Oncology, Imedex, and Society of Immunotherapy of Cancer. KKP reports consulting or advisory role for Bristol-Myers Squibb, Janssen, Pfizer, Arcellx, and Karyopharm Therapeutics; research funding from Bristol-Myers Squibb, Poseida Therapeutics, Takeda, Janssen, Cellectis, Nektar, Abbvie/Genentech, Precision Biosciences, and Allogene Therapeutics; travel, accommodations, and expenses from Bristol-Myers Squibb. DKH reports research funding from Bristol-Myers Squibb, Janssen, and Adaptive Biotech; consulting or advisory role for Bristol-Myers Squibb, Janssen, and Pfizer. The remaining authors have no conflicts of interest to disclose.
Contributions
SS, LCP and DKH developed the concept and designed the study. SS, LCP, HH, HH, CF, JK, DD, SA, PV, GS, NK, VH, SB, DM, DWS, CW, CF, MA, FL, RG, MHK, GK, AA, JMG, LS, KKP and DKH provided study materials and patients. HH, HH, CF, JKi, DDa, SA, PV, GS, NK, VH, SB, DM, DWS, CW, CF, MA, FL, RG, MHK, GK, AA, JMG, LS, KKP and DKH collected and assembled data. SS, LCP, KKP and DKH analzed and interpreted data. All authors wrote the manuscript.
Funding
SS is supported by Stanford Clinical and Translational Science KL2 Career Development Award program, award no. KL2 TR003143, Stanford Cancer Institute/American Cancer Society pilot prant 2022 and Doris Duke Chairtable Foundation. This work was in part supported by the Moffitt Cancer Center National Cancer Center Institute (NCI) core grant no. P30-CA076292 and a generous donation from the Hyer family. FLL is supported by a Scholar in Clinical Research Award from The Leukemia and Lymphoma Society. DKH is supported by the International Myeloma Society Young Investigator Award for Exemplary Abstract. DKH, MA, TN, CF and FLL are supported by the Pentecost Family Myeloma Research Center.
Data-sharing statement
The data that support the findings of this study are available from the corresponding author upon reasonable request.
an IMiD. Oncologist. 2016;21(11):1355-1361.
4 Chari A, Vogl DT, Gavriatopoulou M, et al. Oral selinexor–dexamethasone for triple-class refractory multiple myeloma. N Engl J Med. 2019;381(8):727-738.
5. BMS Pharma: ABECMA (idecabtagene vicleucel)[package insert]. https://packageinserts.bms.com/pi/pi_abecma.pdf.
6. Munshi NC, Anderson LD, Jr., Shah N, et al. Idecabtagene vicleucel in relapsed and refractory multiple myeloma. N Engl J Med. 2021;384(8):705-716.
Haematologica | 109 Marzo 2024 785 ARTICLE - Standard-of-care ide-cel for RRMM with renal impairment S. Sidana et al.
7 Raje N, Berdeja J, Lin Y, et al. Anti-BCMA CAR T-cell therapy bb2121 in relapsed or refractory multiple myeloma. N Engl J Med. 2019;380(18):1726-1737.
8. Lonial S, Lee HC, Badros A, et al. Belantamab mafodotin for relapsed or refractory multiple myeloma (DREAMM-2): a twoarm, randomised, open-label, phase 2 study. Lancet Oncol. 2020;21(2):207-221.
9 Richardson PG, Oriol A, Larocca A, et al. Melflufen and dexamethasone in heavily pretreated relapsed and refractory multiple myeloma. J Clin Oncol. 2021;39(7):757-767.
10 Neelapu SS, Locke FL, Bartlett NL, et al. Axicabtagene ciloleucel CAR T-cell therapy in refractory large B-cell lymphoma. N Engl J Med. 2017;377(26):2531-2544.
11. Schuster SJ, Bishop MR, Tam CS, et al. Tisagenlecleucel in adult relapsed or refractory diffuse large B-cell lymphoma. N Engl J Med. 2019;380(1):45-56.
12. Abramson JS, Palomba ML, Gordon LI, et al. Lisocabtagene maraleucel for patients with relapsed or refractory large B-cell lymphomas (TRANSCEND NHL 001): a multicentre seamless design study. Lancet. 2020;396(10254):839-852.
13. Berdeja JG, Madduri D, Usmani SZ, et al. Ciltacabtagene autoleucel, a B-cell maturation antigen-directed chimeric antigen receptor T-cell therapy in patients with relapsed or refractory multiple myeloma (CARTITUDE-1): a phase 1b/2 open-label study. Lancet. 2021;398(10297):314-324.
14 Martin T, Usmani SZ, Berdeja JG, et al. Ciltacabtagene autoleucel, an anti-B-cell maturation antigen chimeric antigen receptor T-cell therapy, for relapsed/refractory multiple myeloma: CARTITUDE-1 2-year follow-up. J Clin Oncol. 2023;41(6):1265-1274.
15. Kyle RA, Gertz MA, Witzig TE, et al. Review of 1027 patients with newly diagnosed multiple myeloma. Mayo Clin Proc. 2003;78(1):21-33.
16. FDA. FDA fludarabine package insert. https://www.accessdata. fda.gov/drugsatfda_docs/label/2009/020038s032lbl.pdf.
17 Langenhorst JB, van Kesteren C, van Maarseveen EM, et al. Fludarabine exposure in the conditioning prior to allogeneic hematopoietic cell transplantation predicts outcomes. Blood Adv. 2019;3(14):2179-2187.
18. Fabrizio VA, Boelens JJ, Mauguen A, et al. Optimal fludarabine lymphodepletion is associated with improved outcomes after
CAR T-cell therapy. Blood Adv. 2022;6(7):1961-1968.
19 Cohen AD, Garfall AL, Stadtmauer EA, et al. B cell maturation antigen-specific CAR T cells are clinically active in multiple myeloma. J Clin Invest. 2019;130:2210-2221.
20 Zhao WH, Liu J, Wang BY, et al. A phase 1, open-label study of LCAR-B38M, a chimeric antigen receptor T cell therapy directed against B cell maturation antigen, in patients with relapsed or refractory multiple myeloma. J Hematol Oncol. 2018;11(1):141.
21. Wood AC, Perez AP, Arciola B, et al. Outcomes of CD19-targeted chimeric antigen receptor T cell therapy for patients with reduced renal function including dialysis. Transplant Cell Ther. 2022;28(12):829.e1-829.e8.
22. Lee DW, Santomasso BD, Locke FL, et al. ASTCT consensus grading for cytokine release syndrome and neurologic toxicity associated with immune effector cells. Biol Blood Marrow Transplant. 2019;25(4):625-638.
23. National Cancer Institute. Common Terminology Criteria for Adverse Events (CTCAE), Version 5.0. U.S. Department of Health and Human Services. 2017 Nov. https://ctep.cancer.gov/ protocoldevelopment/electronic_applications/docs/ctcae_v5_ quick_reference_ 5x7.pdf. Accessed 28 Jan 2022.
24. Kumar S, Paiva B, Anderson KC, et al. International Myeloma Working Group consensus criteria for response and minimal residual disease assessment in multiple myeloma. Lancet Oncol. 2016;17(8):e328-e346.
25. Hansen DK, Sidana S, Peres LC, et al. Idecabtagene vicleucel for relapsed/refractory multiple myeloma: real-world experience from the Myeloma CAR T Consortium. J Clin Oncol. 2023;41(11):2087-2097.
26. Wäsch R, Strüssmann T, Wehr C, et al. Safe and successful CAR T-cell therapy targeting BCMA in a multiple myeloma patient requiring hemodialysis. Ann Hematol. 2023;102(5):1269-1270.
27. Ahmed G, Bhasin-Chhabra B, Szabo A, et al. Impact of chronic kidney disease and acute kidney injury on safety and outcomes of CAR T-cell therapy in lymphoma patients. Clin Lymphoma Myeloma Leuk. 2022;22(11):863-868.
28. Howlader N, Noone AM, Krapcho M, et al, eds. SEER Cancer Statistics Review, 1975-2016. National Cancer Institute. Bethesda, MD, https://seer.cancer.gov/statfacts/html/mulmy. html. Accessed 21 March 2022.
Haematologica | 109 Marzo 2024 786 ARTICLE - Standard-of-care ide-cel for RRMM with renal impairment S. Sidana et al.
Regulatory T cells hamper the efficacy of T-cell-engaging bispecific antibody therapy
Mika Casey,1 Carol Lee,1 Wing Yu Kwok,1 Soi Cheng Law,2 Dillon Corvino,3 Maher K. Gandhi,2 Simon J Harrison4,5 and Kyohei Nakamura1
1Immune Targeting in Blood Cancers Laboratory, QIMR Berghofer Medical Research Institute, Brisbane, Queensland, Australia; 2Mater Research, University of Queensland, Brisbane, Queensland, Australia; 3Institute of Experimental Oncology, University Hospital Bonn, Bonn, Germany; 4Department of Clinical Haematology, Peter MacCallum Cancer Centre and Royal Melbourne Hospital, Melbourne, Victoria, Australia and 5Sir Peter MacCallum, Department of Oncology, University of Melbourne, Melbourne, Victoria, Australia.
Abstract
Correspondence: K. Nakamura
kyohei.nakamura@qimrberghofer.edu.au
Received: June 14, 2023.
Accepted: September 18, 2023.
Early view: September 28, 2023.
https://doi.org/10.3324/haematol.2023.283758
©2024 Ferrata Storti Foundation
Published under a CC BY-NC license
T-cell-engaging bispecific antibodies (T-BsAb) have produced impressive clinical responses in patients with relapsed/refractory B-cell malignancies, although treatment failure remains a major clinical challenge. Growing evidence suggests that a complex interplay between immune cells and tumor cells is implicated in the mechanism of action and therefore, understanding immune regulatory mechanisms might provide a clue for how to improve the efficacy of T-BsAb therapy. Here, we investigated the functional impact of regulatory T (Treg) cells on anti-tumor immunity elicited by T-BsAb therapy. In a preclinical model of myeloma, the activation and expansion of Treg cells in the bone marrow were observed in response to anti-B-cell maturation antigen (BCMA) T-BsAb therapy. T-BsAb triggered the generation of induced Treg cells from human conventional CD4 cells after co-culture with tumor cells. Moreover, T-BsAb directly activated freshly isolated circulating Treg cells, leading to the production of interleukin-10 and inhibition of T-BsAb-mediated CD8 T-cell responses. The activation of Treg cells was also seen in bone marrow samples from myeloma patients after ex vivo treatment with T-BsAb, further supporting that T-BsAb have an impact on Treg homeostasis. Importantly, transient ablation of Treg cells in combination with T-BsAb therapy dramatically improved effector lymphocyte activities and disease control in the preclinical myeloma model, leading to prolonged survival. Together, this information suggests that therapy-induced activation of Treg cells critically regulates anti-tumor immunity elicited by T-BsAb therapy, with important implications for improving the efficacy of such treatment.
Introduction
T-cell-engaging bispecific antibodies (T-BsAb) have emerged as a powerful “off-the-shelf” immunotherapy against B-cell malignancies. T-BsAb can simultaneously engage the tumor-associated antigen on the malignant cell and CD3 on the T cell, leading to the activation of T cells and tumor elimination. In 2014, blinatumomab (a tandem single-chain variable fragment T-BsAb targeting CD19) was approved for the treatment of relapsed or refractory B-cell precursor acute lymphoblastic leukemia.1 More recently, anti-CD20 T-BsAb have produced impressive clinical responses in patients with relapsed or refractory B-cell lymphoma.2,3 In multiple myeloma, T-BsAb against B-cell maturation antigen (BCMA), G-protein coupled receptor family C group 5 member D, and Fc receptor-homolog 5 have demonstrated clinical benefits in heavily pretreated
patients.4-6
T-BsAb-based immunotherapy is expected to play a key role in the treatment of multiple types of hematologic malignancies. However, treatment failure and relapse remain major clinical challenges. Multiple factors can be involved in the mechanisms of resistance, including loss of target tumor antigens, exhaustion of cytotoxic T cells, and an immunosuppressive microenvironment,7-11 although it remains largely unknown how better clinical responses can be achieved.
We recently reported that innate immune activation critically contributes to antitumor immune responses elicited by an anti-BCMA T-BsAb in preclinical myeloma models, indicating that a complex cross-talk between immune subsets is implicated in effector mechanisms.12 Given that T-BsAb therapy triggers dynamic changes in the immune microenvironment, understanding immune regulatory
Haematologica | 109 Marzo 2024 787 - Cell Therapy & Immunotherapy ARTICLE
mechanisms might provide a clue for how to overcome therapeutic resistance. In this context, we hypothesize that regulatory T (Treg) cells may act as key players in regulating the efficacy of T-BsAb therapy. Growing evidence suggests that myeloma favors the generation and accumulation of Treg cells in the bone marrow (BM).13,14 While Treg cells are a small population in the myeloma BM, modulation of their numbers or activities has shown great potential for improving anti-myeloma immunity.14-19 Nevertheless, their contribution to the immunological mechanism of T-BsAb therapy remains to be understood. In this study, we aimed to characterize the impact of Treg cells on anti-myeloma immune responses elicited by T-BsAb therapy.
Methods
A list of reagents and antibodies is shown in the Online Supplementary Information.
The preclinical model of myeloma
Transplantable Vk14451 myeloma cells expressing enhanced green fluorescent protein (GFP) were maintained as described previously.12 C57BL/6 wild-type and Foxp3DTR mice15 were bred and maintained in-house. Mice were intravenously challenged with 2×10⁶ Vk14451 cells. Tumor-bearing mice with paraproteinemia (producing clonal IgG2b) were treated with anti-mouse BCMA T-BsAb (25 µg, intraperitoneally). In some experiments, Foxp3DTR mice were treated with diphtheria toxin (DT; 250 ng, intraperitoneally) to deplete Treg cells. For survival experiments, tumor-bearing mice were monitored over time for clinical endpoints, typically hind-limb weakness. All experiments were approved by the Animal Ethics Committee of QIMR Berghofer Medical Research Institute.
Multiple myeloma cell lines
Human myeloma cell lines, JJN-3 and RPMI8226 cells,20 were cultured in RPMI1640 medium supplemented with sodium pyruvate, non-essential amino acids, penicillin/ streptomycin, and 10% heat-inactivated fetal bovine serum (complete RPMI), and maintained at 37°C in 5% CO 2. JJN-3 cells stably expressing GFP were generated by retrovirus transfection using a pMX-IRES-GFP vector, as described previously.21,22 Negativity for Mycoplasma was routinely tested and confirmed by MycoAlertTM.
Clinical samples
Clinical samples from patients with newly diagnosed multiple myeloma were collected at the Princess Alexandra Hospital, Brisbane. All samples used in this study were supplied with written informed consent. The study was approved by the QIMR Berghofer Human Research Ethics Committee (P2125) and by the Metro South Hospital and
Health Service Human Research Ethics Committee (9448).
Preparation of primary immune cells
Human peripheral blood mononuclear cells were isolated from buffy coats from healthy donors using LymphoprepTM density gradient medium. Isolation of CD8 T cells, CD4 T cells, and CD25+ CD127low Treg cells was performed by immune magnetic separation using EasySepTM isolation kits. Induced Treg (iTreg) cells were generated by co-culture of CD4 T cells and JJN-3 myeloma cells in the presence of T-BsAb at a 4:1 CD4 T-to-target cell ratio for 4 days. After the removal of CD138+ myeloma cells by magnetic beads, T-BsAb-mediated iTreg cells were used for subsequent assays. Control CD4 T cells were generated by stimulation with anti-CD3/CD28 beads (ImmunoCult™ Human CD3/ CD28 T-Cell Activator) according to the manufacturer’s instructions.
T-cell-engaging bispecific antibody assays
For T-cell proliferation assays, CD8 T cells (1×10⁵) were labeled with CellTrace™ Violet (CTV), and co-cultured with JJN-3 myeloma cells (5×10⁴) in complete RPMI supplemented with interleukin (IL)-2 (100 U/mL), using 96-well, U-bottomed plates. These cells were stimulated with anti-human BCMA T-BsAb in the presence of different ratios of Treg cells. CTV dilution was measured by flow cytometry. In order to phenotype activated CD4 T cells, peripheral blood mononuclear cells were stained with the indicated markers 4 and 10 days after T-BsAb stimulation. To assess immunosuppressive activities, isolated T-BsAb-mediated iTreg cells or CD4 T cells activated by anti-CD3/CD28 beads were added to co-cultures of CD8 T cells (1×10⁵) and JJN-3 cells (1×10⁵) in the presence of T-BsAb (0.25 µg/mL). For conjugation assays, CTV-labeled CD8 T cells, PKH26-labeled iTreg cells, and GFP-expressing RPMI8226 myeloma cells were co-cultured at a 1:1:1 ratio. Cells were fixed with Image-iT™ Fixative Solutions, and then evaluated by flow cytometry and confocal microscopy. To assess T-BsAb-induced IL-10 production, isolated CD4+CD25+CD127low Treg cells (2×10⁵) were co-cultured with JJN-3 myeloma cells (1×10⁵) with the indicated concentrations of anti-BCMA T-BsAb for 3 days, followed by measurement of IL-10 levels in culture supernatants by enzyme-linked immunosorbent assay. For Treg suppression assays, isolated CD4+CD25+CD127low Treg cells were co-cultured with CTV-labeled CD8 T cells (1×10⁵) in the presence of T-BsAb and JJN-3 myeloma cells (1×10⁵) at different Treg/CD8 T-cell ratios. The suppressive activity (% suppression) was calculated as follows: 100 − (% proliferating CD8 T cells with Treg cells) / (% proliferating CD8 T cells without Treg cells) × 100. The supernatant level of interferon-g was determined by enzyme-linked immunosorbent assay. For ex vivo stimulation in primary samples, bulk BM mononuclear cells (1×10⁶) were stimulated with anti-human BCMA T-BsAb (0.25 µ g/mL) in complete RPMI
Haematologica | 109 Marzo 2024 788 ARTICLE - Treg and T-cell-engaging bispecific antibodies M. Casey et al.
medium supplemented with IL-2 (100 U/mL) for 4 days.
Flow cytometry
Single-cell suspensions were immunostained according to standard protocols. Cell surface staining was performed in the presence of the indicated monoclonal antibodies. For intracellular staining, cells were fixed and permeabilized with Foxp3/Transcription Factor Staining Buffer, and then stained with specific monoclonal antibodies. For intracellular cytokine staining, BM cells were stimulated for 3 h by Cell Stimulation Cocktail plus a protein transport inhibitor according to the manufacturer’s instructions, followed by intracellular staining. Tumor burden was determined by GFP-positive tumor cells in the femoral BM. The numbers of cells of each subset were calculated by counting beads. The flow cytometry-based conjugation assays were performed as described previously.23 Samples were acquired by a BD LSR Fortessa Flow Cytometer and analyzed with FlowJo version 10. The t-distributed stochastic neighbor embedding (t-SNE) analysis of concatenated samples was visualized using the built-in FlowJo plugin and Adobe Illustrator.
Confocal imaging
For conjugate formation, CTV-labeled CD8 T cells, PKH26-labeled iTreg cells, and GFP-expressing RPMI8226 myeloma cells were co-cultured for 30 min, and then fixed with image-iT™ Fixative Solutions for 30 min. In order to image the immunological synapse, freshly isolated Treg cells were co-cultured with RPMI8226-GFP cells at a 1:1 ratio in the presence or absence of anti-human BCMA T-BsAb (0.25 µ g/mL) for 2 h. For the last 30 min, cells were incubated with biotin anti-CD11a/LFA-1 monoclonal antibody, and stained with Alexa Fluor 647 streptavidin. Cells were fixed with image-iT™ Fixative Solutions for 30 min, followed by permeabilization with 0.05% Triton X-100 for 10 min. The cells were then stained with ActinRed 555
Ready Probes to detect F-actin. Confocal fluorescence images were obtained using a Zeiss 780-NLO confocal microscope; cells were examined with a 63x objective for conjugate formation and a 100× objective for immunological synapses. Images were captured using dual-channel excitation and analyzed using Zeiss software.
Statistical analysis
Statistical analyses were performed with GraphPad Prism 8 software. A Mann-Whitney U test or a paired t test was used for comparisons between two groups. For multiple comparisons, two-way analysis of variance (ANOVA) with a post-hoc Tukey multiple comparisons test was used. For multiple comparisons of paired samples, a repeated measures ANOVA with post-hoc Tukey multiple comparisons test or Dunnett multiple comparisons test was used. Differences in survival were evaluated with a Mantel-Cox test. P values <0.05 were considered statistically signifi-
cant (*P<0.05, **P<0.01, ***P<0.001, and **** P<0.0001).
Results
Activation and expansion of regulatory T cells in the myeloma bone marrow after T-cell-engaging bispecific antibody therapy.
To examine the impact of T-BsAb therapy on the immune microenvironment, C57BL6 wild-type mice were intravenously challenged with Vk14451 multiple myeloma cells. In this preclinical myeloma model, mice typically develop IgG2b paraproteinemia 4 weeks after tumor challenge, followed by progressive tumor growth in the BM.12 In response to T-BsAb therapy, both CD8 T cells and Foxp3+ Treg cells upregulated CD69 expression within 24 h (Online Supplementary Figure S1), indicating rapid T-cell activation in the myeloma BM.
To understand late immune responses, BM cells were analyzed 2 weeks after treatment (Figure 1A). Treatment with the anti-BCMA T-BsAb dramatically reduced tumor burden (Figure 1B). Intriguingly, t-SNE plots of BM TCR-β + cells revealed enrichment of Foxp3+ Treg cells in the myeloma BM from the treatment group (Figure 1C). Indeed, while an increased number of BM CD8 T cells was observed after T-BsAb therapy, the number of Foxp3 + Treg cells was also significantly increased (Figure 1D). As a result, the CD8/ Treg ratio was decreased in the myeloma BM (Figure 1E). Phenotypically, BM CD8 T cells from the treatment group showed lower expression levels of PD-1 and CD38, which might be due to the expansion of non-exhausted CD8 T cells (Figure 1F). By contrast, BM Treg cells from the treatment group showed high expression of PD-1, Tigit, and CD38 (Figure 1F), which are known to be upregulated in activated Treg cells in the tumor microenvironment.24,25 These results suggest that T-BsAb therapy has a strong impact on the numbers and phenotypes of Treg cells in myeloma BM.
Generation of induced regulatory T cells after stimulation with T-cell-engaging bispecific antibodies
We next examined the impact of T-BsAb therapy on human Treg cells. To this end, we co-cultured bulk peripheral blood mononuclear cells from healthy donors and BCMA+ JJN-3 myeloma cells in the presence of anti-human BCMA T-BsAb (Figure 2A and Online Supplementary Figure S2A). Treatment with T-BsAb triggered the proliferation of CD8 T cells and CD4 T cells in a concentration-dependent manner (Online Supplementary Figure S2B). Intriguingly, an increased frequency of CD4 T cells expressing CD25 and FOXP3 was observed after T-BsAb treatment (Figure 2B). These cells co-expressed ICOS and CTLA-4 (Figure 2B), which are recognized as key markers for activated human Treg cells with highly immunosuppressive activities.26 While murine CD4 T cells can differentiate into
Haematologica | 109 Marzo 2024 789 ARTICLE - Treg and T-cell-engaging bispecific antibodies M. Casey et al.

experimental design. (B) Representative plots and graphs showing frequencies of enhanced green fluorescent protein-positive tumor cells in the bone marrow (BM) (N=9 per group), pooled from two experiments. (C) t-distributed stochastic neighbor embedding plots showing the density of events of indicated subsets in BM TCRβ-positive cells from one experiment (N=4 per group). (D, E) Graphs showing numbers of indicated immune cells (D) and the CD8/Treg ratio (E) in the myeloma BM (N=9 per group), pooled from two experiments. (F) Histograms and graphs showing expression levels of PD-1, Tigit and CD38 on CD8 T cells and Treg cells in the myeloma BM. Representative results from two experiments are shown (N=4-5). Numbers indicate mean fluorescence intensity. Data are shown as mean ± standard error of mean. Differences were tested for statistical significance, using a Mann-Whitney U test (B, D, and E) and Student t test (F). *P<0.05, **P<0.01, ****P<0.0001. WT: wild-type; T-BsAb: T-cell-engaging bispecific antibody; BM: bone marrow; SSC; side scatter; EGFP: enhanced green fluorescent protein; t-SNE: t-distributed stochastic neighbor embedding; Treg: regulatory T cells; FMO: fluorescence
Haematologica | 109 Marzo 2024 790 ARTICLE - Treg and T-cell-engaging bispecific antibodies M. Casey et al.
A B C D E F
Figure 1. T-cell-engaging bispecific antibody therapy triggers the activation of regulatory T cells in myeloma bone marrow. (A) C57BL6 wild-type mice were challenged with Vk14451 myeloma cells, and treated with anti-mouse B-cell maturation antigen T-cell engaging bispecific antibody. The schematic illustrates the
minus one; MFI: mean fluorescence intensity.
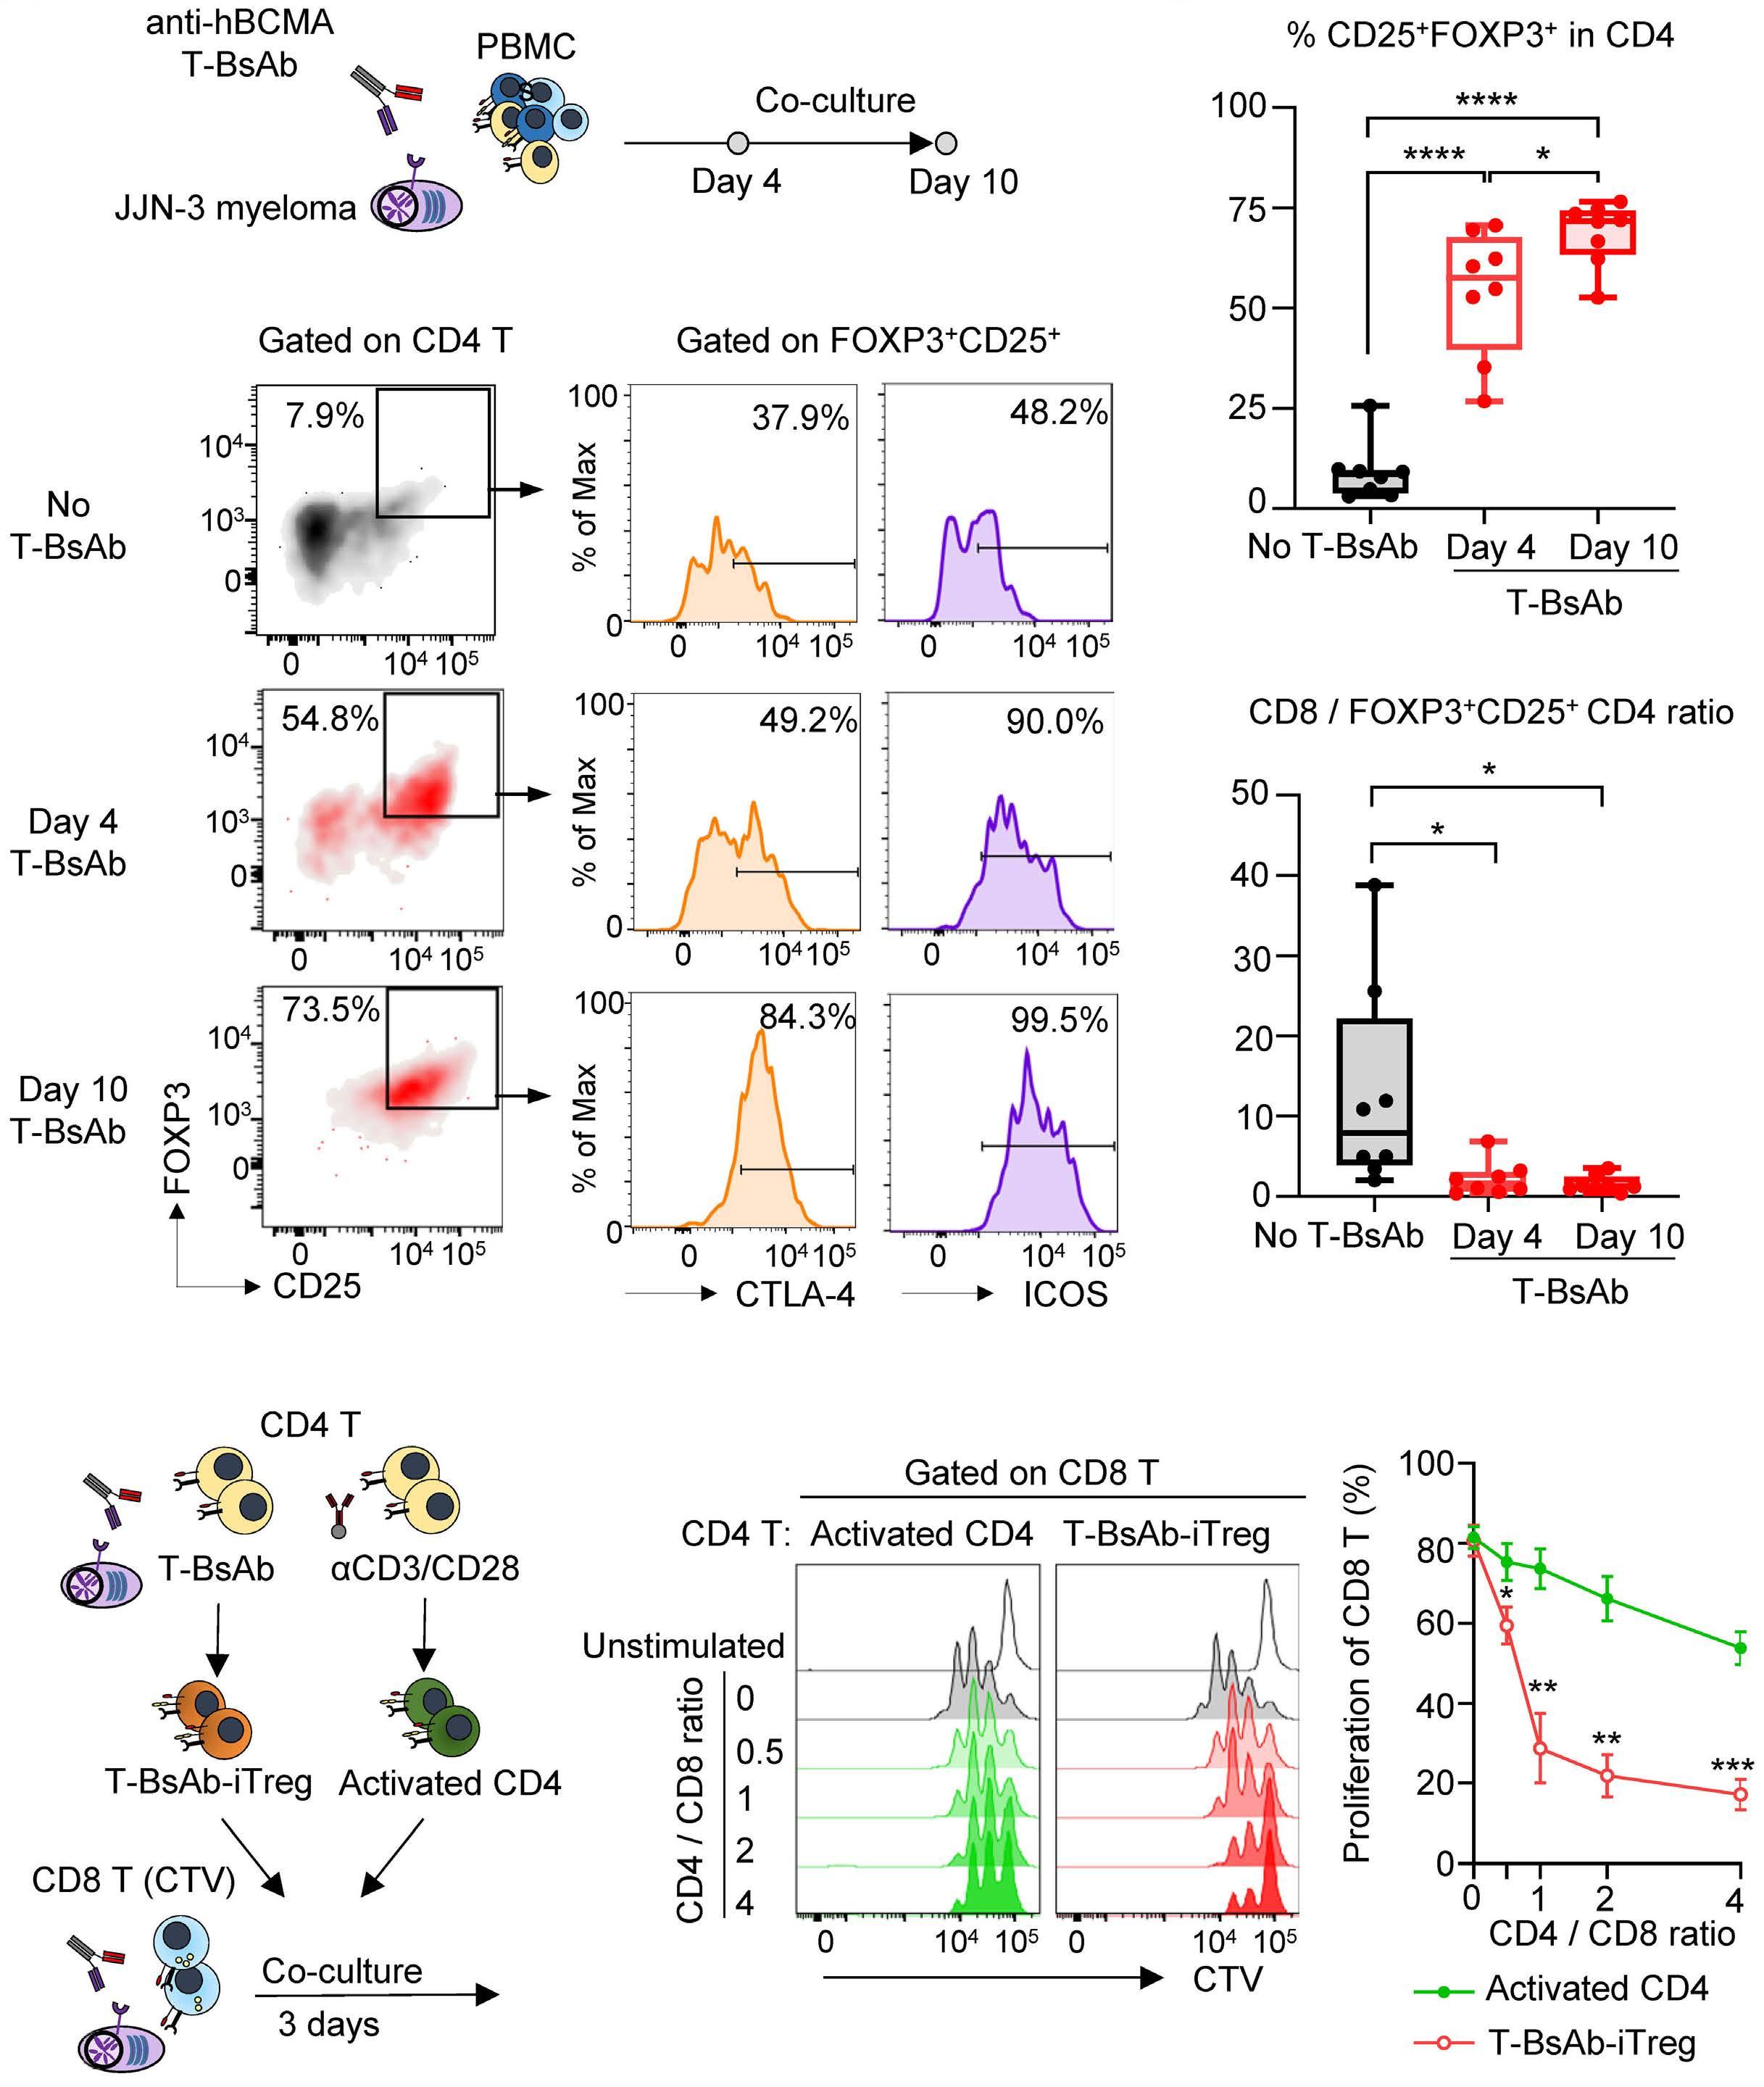
Figure 2. In vitro differentiation
induced regulatory T cells by T-cell-engaging bispecific antibody therapy. (A) Peripheral blood mononuclear cells were co-cultured with JJN-3 myeloma cells in the presence of anti-human B-cell maturation antigen T-cell-engaging bispecific antibody (T-BsAb). A schematic illustrating the experimental design. (B) Representative flow cytometry plots showing the frequency of CD4 T cells expressing FOXP3 and CD25 at the indicated time points (left). Representative histograms showing expression levels of CTLA-4 and ICOS in CD25+FOXP3+CD4 T cells (right). (C, D) Box and whisker plots showing the frequency of FOXP3+CD25+ cells in CD4 T cells (C), and the CD8/FOXP3+CD25+CD4 ratio (D) at indicated time points after treatment with T-BsAb. Pooled results from two experiments are shown (N=8). (E, F) Isolated CD4 T cells were stimulated with T-BsAb or anti-CD3/CD28 beads for 4 days. Subsequently, T-BsAb-mediated induced regulatory T cells and activated CD4 T cells were co-cultured with CellTrace™ Violet-labeled CD8 T cells to test immunosuppressive activities. A schematic illustrating the experimental design (E). Representative histograms and graphs showing CD8 T-cell proliferation at the indicated CD4/CD8 ratios 3 days after stimulation (F). Data are shown as mean ± standard error of mean, pooled from two experiments (N=6). Differences were tested for statistical significance using repeated measures analysis of variance with a post-hoc Tukey multiple comparisons test (C, D) and a paired t test (F). *P<0.05, **P<0.01, ***P<0.001, ****P<0.0001. hBCMA; human B-cell maturation antigen; PBMC: peripheral blood mononuclear
Haematologica | 109 Marzo 2024 791 ARTICLE - Treg and T-cell-engaging bispecific antibodies M. Casey et al.
A B C D E F
of
cells; iTreg; induced regulatory T cells; CTV: CellTrace™ Violet.
iTreg cells by T-cell receptor (TCR) stimulation in the presence of TGF- β , activated human conventional CD4 T cells are known to transiently upregulate FOXP3 without acquiring immunosuppressive activity. 27,28 However, we observed that T-BsAb-stimulated CD4 T cells maintained FOXP3 expression even 10 days after stimulation (Figure 2B-D), raising the possibility that these cells might have acquired iTreg phenotypes. Of note, iTreg-like cells were not observed after treatment with control T-BsAb (Online Supplementary Figure S2C, D), supporting the idea that T-BsAb can induce iTreg-like phenotypes in a target antigen-specific manner.
To examine their immunosuppressive activity, T-BsAb-mediated iTreg-like cells were isolated 4 days after co-culture with JJN-3 myeloma cells. Subsequently, these cells were co-cultured with CTV-labeled CD8 T cells from the same donor (Figure 2E). Indeed, T-BsAb-induced CD8 T-cell proliferation was potently inhibited in the presence of iTreglike cells, compared to control CD4 T cells (Figure 2F). These results support the generation of iTreg cells from conventional CD4 T cells after stimulation with T-BsAb.
To further understand the interaction between iTreg cells and tumor cells, we next co-cultured CTV-labeled CD8 T cells, PKH26-labeled iTreg cells, and GFP-expressing RPMI8226 myeloma cells in a 1:1:1 ratio in the presence of T-BsAb (Figure 3A). Notably, iTreg cells preferentially formed aggregates around myeloma cells, compared to CD8 T cells (Figure 3B-D). These results suggest that iTreg cells can actively interact with myeloma cells, leading to
negative regulation of CD8 T-cell responses elicited by T-BsAb.
Regulatory T cells and tumor engagement negatively regulate CD8 T-cell responses
In addition to the differentiation of iTreg cells from conventional CD4 T cells, we hypothesized that T-BsAb therapy could directly trigger the activation of circulating Treg cells. To address this possibility, we next used freshly isolated human CD4 +CD25+CD127low Treg cells from peripheral blood mononuclear cells (Figure 4A). In general, engagement of the TCR/CD3 complex leads to immunological synapse formation at the contact site, which acts as a molecular platform for T-cell activation.29 To investigate immunological synapse formation, freshly isolated human CD4+CD25+CD127low Treg cells were cultured with RPMI8226 cells expressing GFP. In the presence of T-BsAb, clustering of LFA-1, a leukocyte adhesion molecule, and reorganization of F-actin were observed at the contact site (Figure 4B), supporting the immunological synapse formation between Treg cells and tumor cells. Production of an anti-inflammatory cytokine, IL-10, is a key feature of activated Treg cells in the tumor microenvironment.30 Indeed, T-BsAb triggered IL-10 production from isolated Treg cells in a concentration-dependent manner (Figure 4C). These results provide direct evidence for the activation of Treg cells by T-BsAb.
To further examine the functional impact of T-BsAb-activated Treg cells, freshly isolated Treg cells and CD8
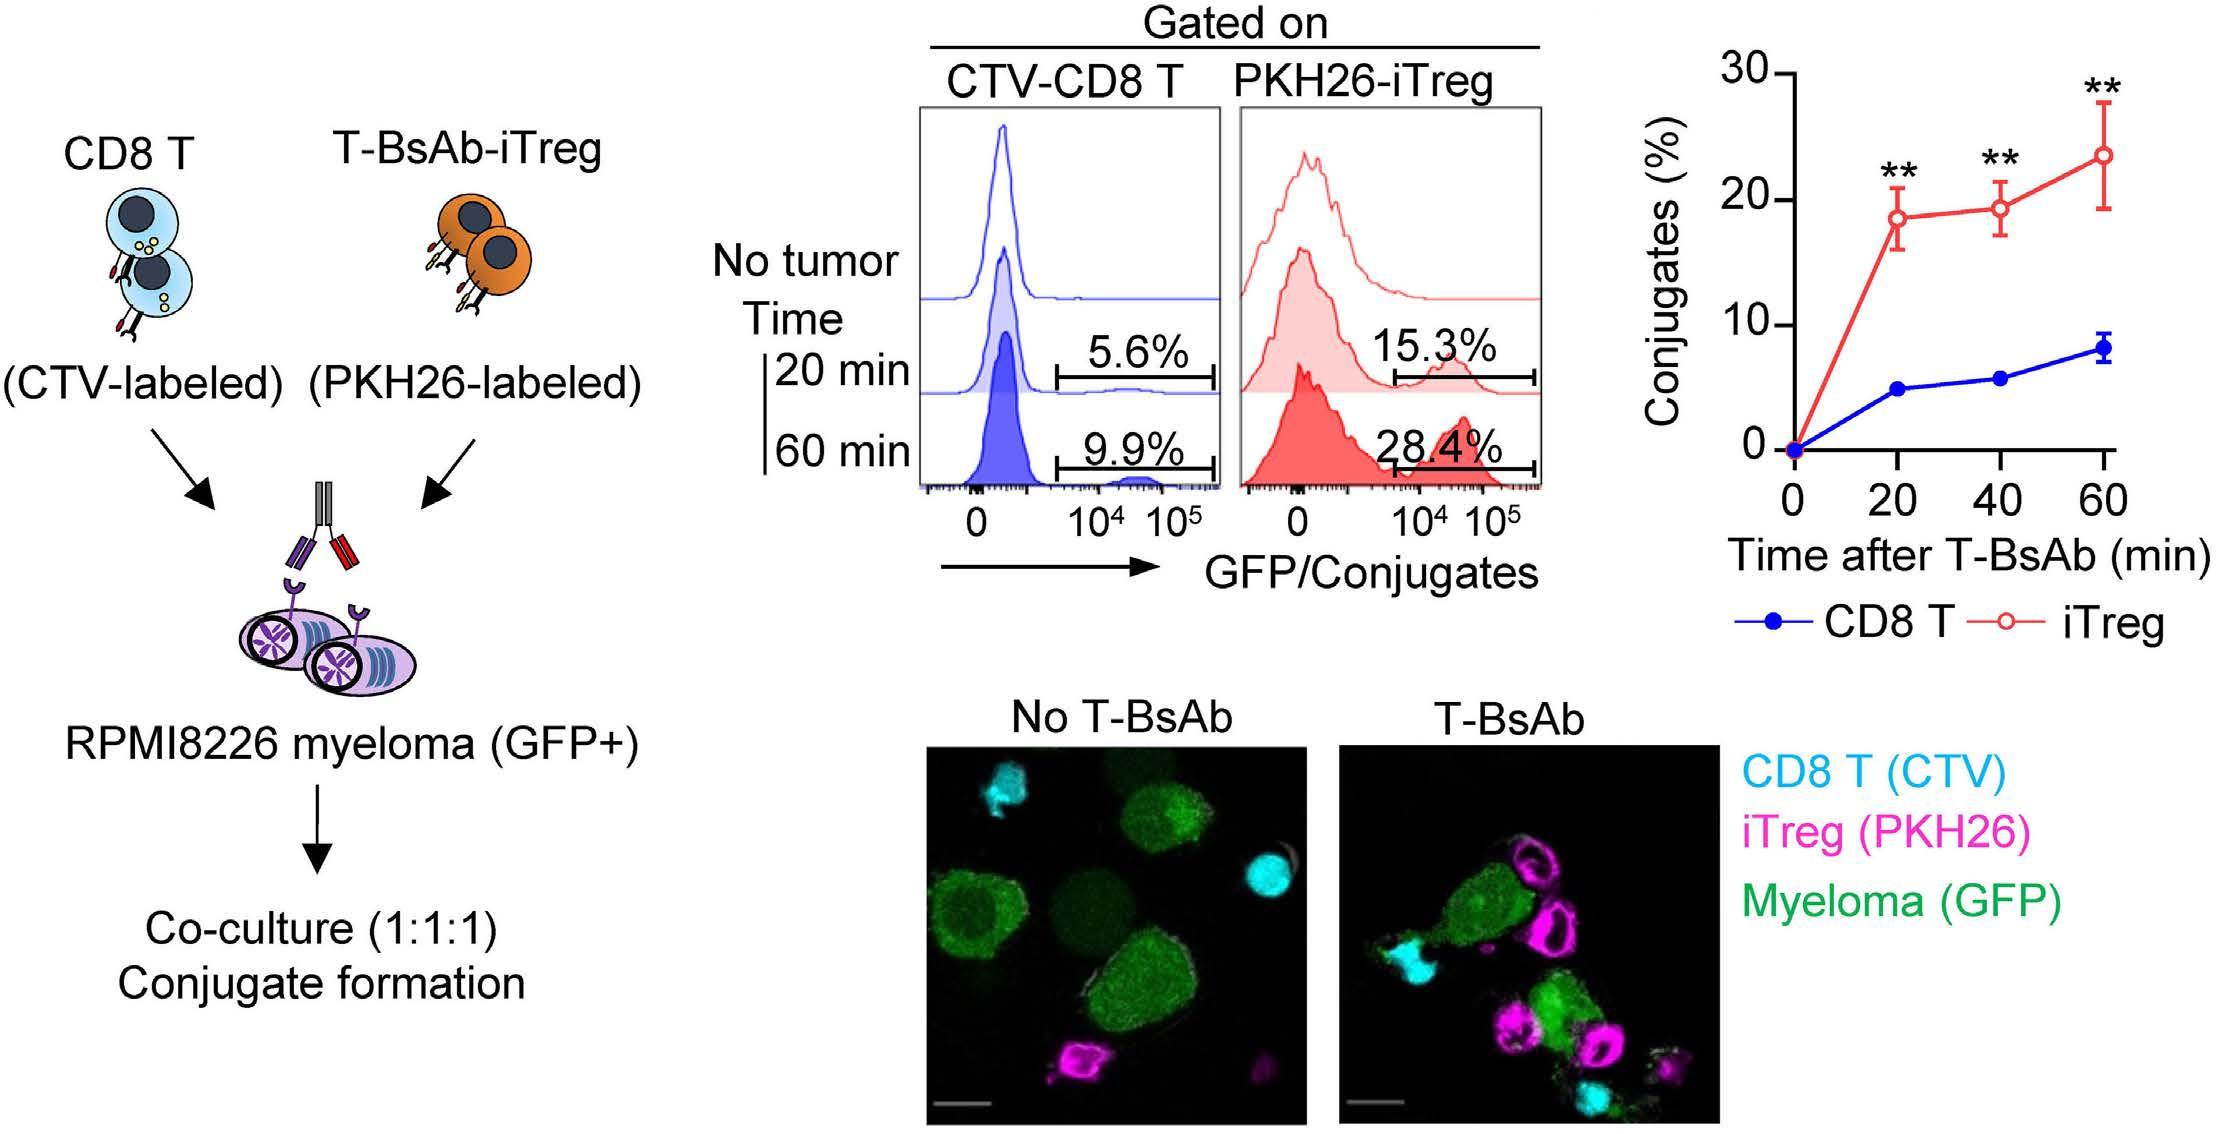
Violet-labeled CD8 T cells, PKH26-labeled T-cell-engaging bispecific antibody (T-BsAb)-mediated induced regulatory T cells (iTreg) and green fluorescent protein (GFP)-expressing RPMI8226 myeloma cells were co-cultured in a 1:1:1 ratio in the presence of anti-B-cell maturation antigen T-BsAb (0.1 µg/mL). The schematic illustrates the experimental design. (B, C) Representative histograms (B) and graphs (C) showing conjugate formation with GFP+ myeloma cells by CD8 T cells or iTreg cells. Data are shown as mean ± standard error of mean, pooled from two experiments (N=6). Differences were tested for statistical significance using a paired t-test. **P<0.01. (D) Confocal images showing conjugate formation 30 min after co-culture (scale bar: 10 µm). Representative images from six donors are shown. CTV: CellTrace™ Violet.
Haematologica | 109 Marzo 2024 792 ARTICLE - Treg and T-cell-engaging bispecific antibodies M. Casey et al.
B C D
Figure 3. Induced T regulatory cells preferentially form aggregates around tumor cells. (A) CellTrace™
A
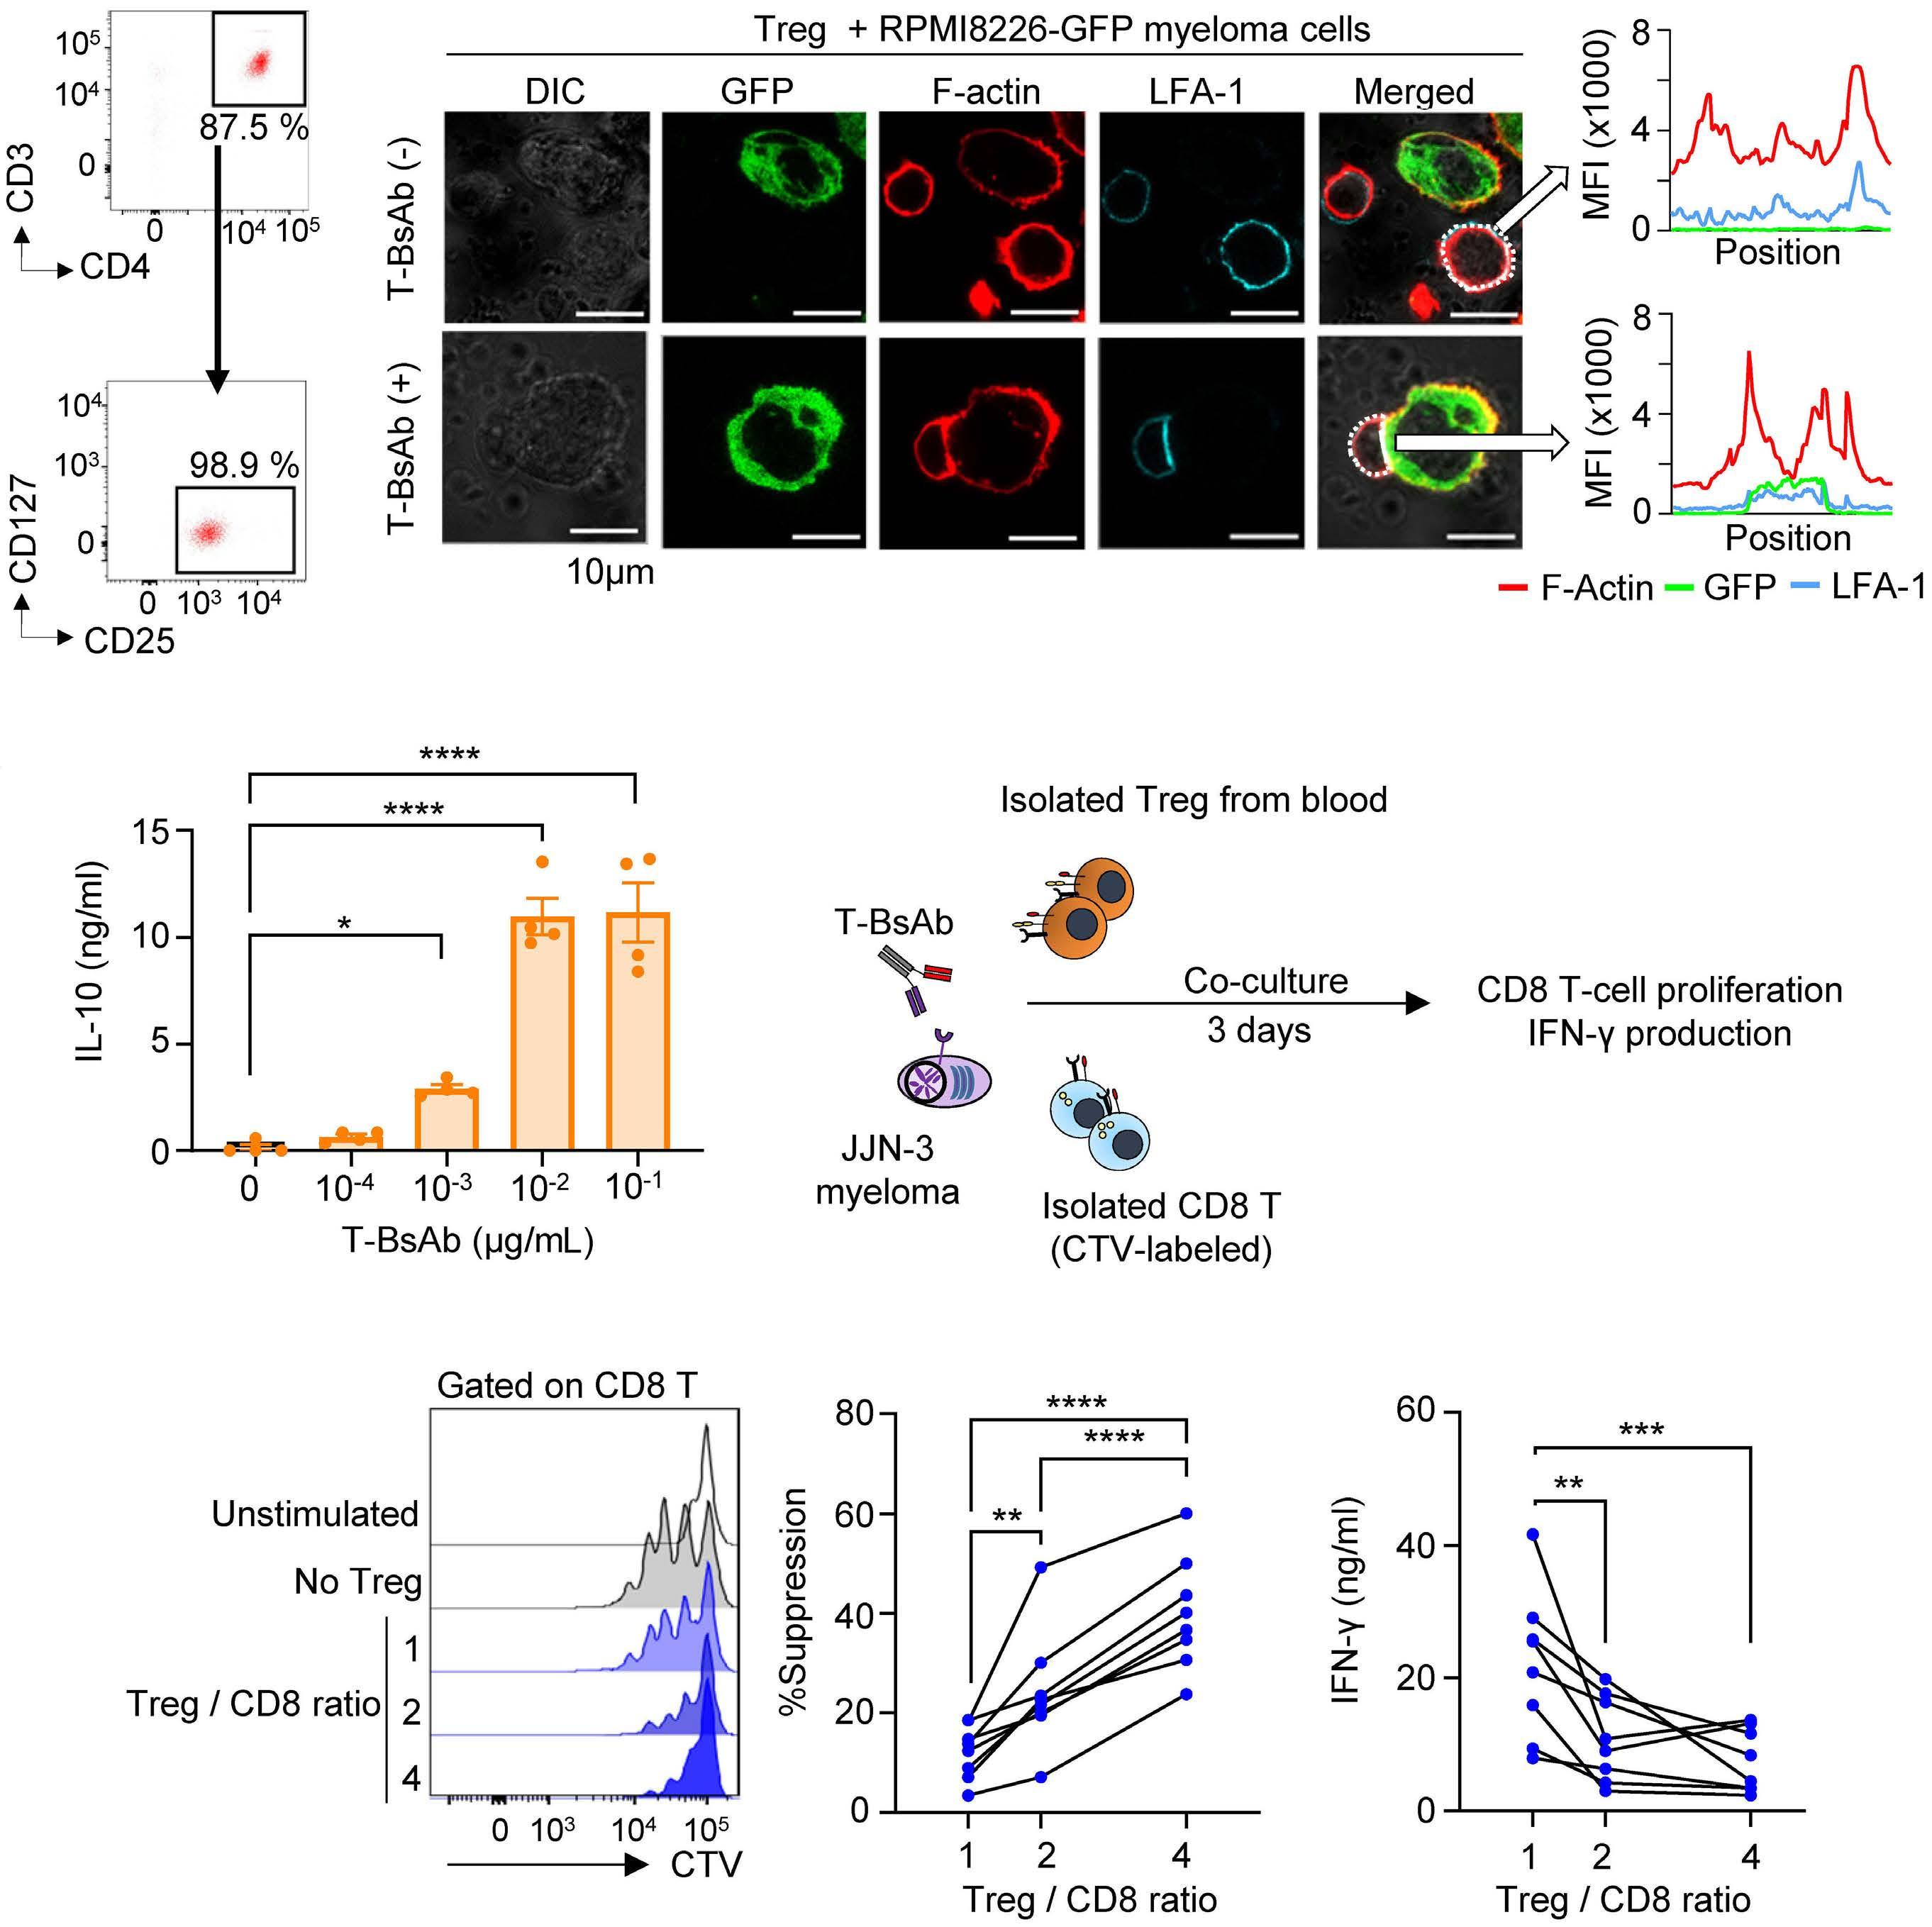
Figure 4. T-cell-engaging bispecific antibody-activated regulatory T cells negatively regulate CD8 T-cell responses. (A) Representative flow cytometry plots showing purity of CD25+CD127low regulatory cells (Treg cells) isolated from peripheral blood mononuclear cells. (B) Freshly isolated human Treg cells were co-cultured with RPMI8226 myeloma cells expressing green fluorescent protein in the presence or absence of anti-B-cell maturation antigen (BCMA) T-cell-engaging bispecific antibody (T-BsAb). Representative confocal images and graphs showing accumulation of LFA-1 and F-actin between Treg cells and multiple myeloma cells after stimulation by anti-BCMA T-BsAb (scale bar: 10 µm). Images were processed using MetaMorph software. Representative results from two experiments are shown. (C) CD25+CD127low Treg cells (2×10⁵) were co-cultured with JJN-3 myeloma cells (1×10⁵) with indicated concentrations of anti-BCMA T-BsAb for 3 days. The graphs show levels of interleukin-10 in culture supernatants. Data are shown as mean ± standard error of mean (N=4). (D) CD4+CD25+CD127low Treg cells and CD8 T cells were co-cultured with JJN-3 myeloma cells at different Treg/CD8 ratios in the presence of anti-BCMA T-BsAb for 3 days. The schematic illustrates the experimental design. (E, F) Representative histograms showing CD8 T-cell proliferation at indicated Treg/CD8 ratios (E, left). Individual graphs showing the suppressive effect of Treg cells on CD8 T-cell proliferation (E, right). Individual graphs showing interferon-g production at different Treg/CD8 ratios (F). Pooled results from three experiments are shown (N=8). Differences were tested for statistical significance using a repeated measures analysis of variance with a post-hoc Dunnet multiple comparisons test (C) and Tukey multiple comparisons test (E, F). *P<0.05, **P<0.01, ***P<0.001, ****P<0.0001. DIC: differential interference contrast; GFP: green fluorescent protein; LFA-1: lymphocyte function-associated antigen 1; MFI: mean fluorescent intensity; CTV: CellTrace™ Violet; IL: interleukin; IFN: interferon.
Haematologica | 109 Marzo 2024 793 ARTICLE - Treg and T-cell-engaging bispecific antibodies M. Casey et al.
A B C D E F
T cells were co-cultured with JJN-3 cells (Figure 4D). T-BsAb-induced proliferation of CD8 T cells (Figure 4E) and production of interferon-g (Figure 4F) were markedly attenuated in the presence of Treg cells. These results indicate that the T-BsAb-mediated interaction between Treg cells and myeloma cells negatively regulates CD8 T-cell responses.
Transient ablation of regulatory T cells augments in vivo anti-tumor effects by T-cell-engaging bispecific antibody therapy
To further investigate the impact of Treg cells on anti-tumor effects, we challenged Vk14451 myeloma cells in mice expressing diphtheria toxin receptor (DTR) under the control of the Foxp3 promoter, and treated with T-BsAb in combination with DT (Figure 5A). Ablation of Treg cells augmented systemic release of effector molecules including interferon-g and granzyme B by T-BsAb therapy (Figure
5B). In the absence of Treg cells, BM CD8 T cells showed higher levels of expression of interferon- g in response to anti-BCMA T-BsAb therapy (Figure 5C), highlighting the strong impact of Treg cells on effector lymphocyte activities. Strikingly, transient ablation of Treg cells in combination with anti-BCMA T-BsAb therapy significantly improved disease control, leading to prolonged survival (Figure 5D). Together, these results demonstrate that Treg cells potently inhibit the efficacy of T-BsAb therapy.
T-cell-engaging bispecific antibody-induced activation of bone marrow regulatory T cells in multiple myeloma patients
To further confirm that treatment with T-BsAb could contribute to the activation of Treg cells in the myeloma BM, BM mononuclear cells from newly diagnosed patients were cultured in the presence of T-BsAb for 4 days (Figure 6A). FOXP3+CD25+CD4 T cells were indeed markedly
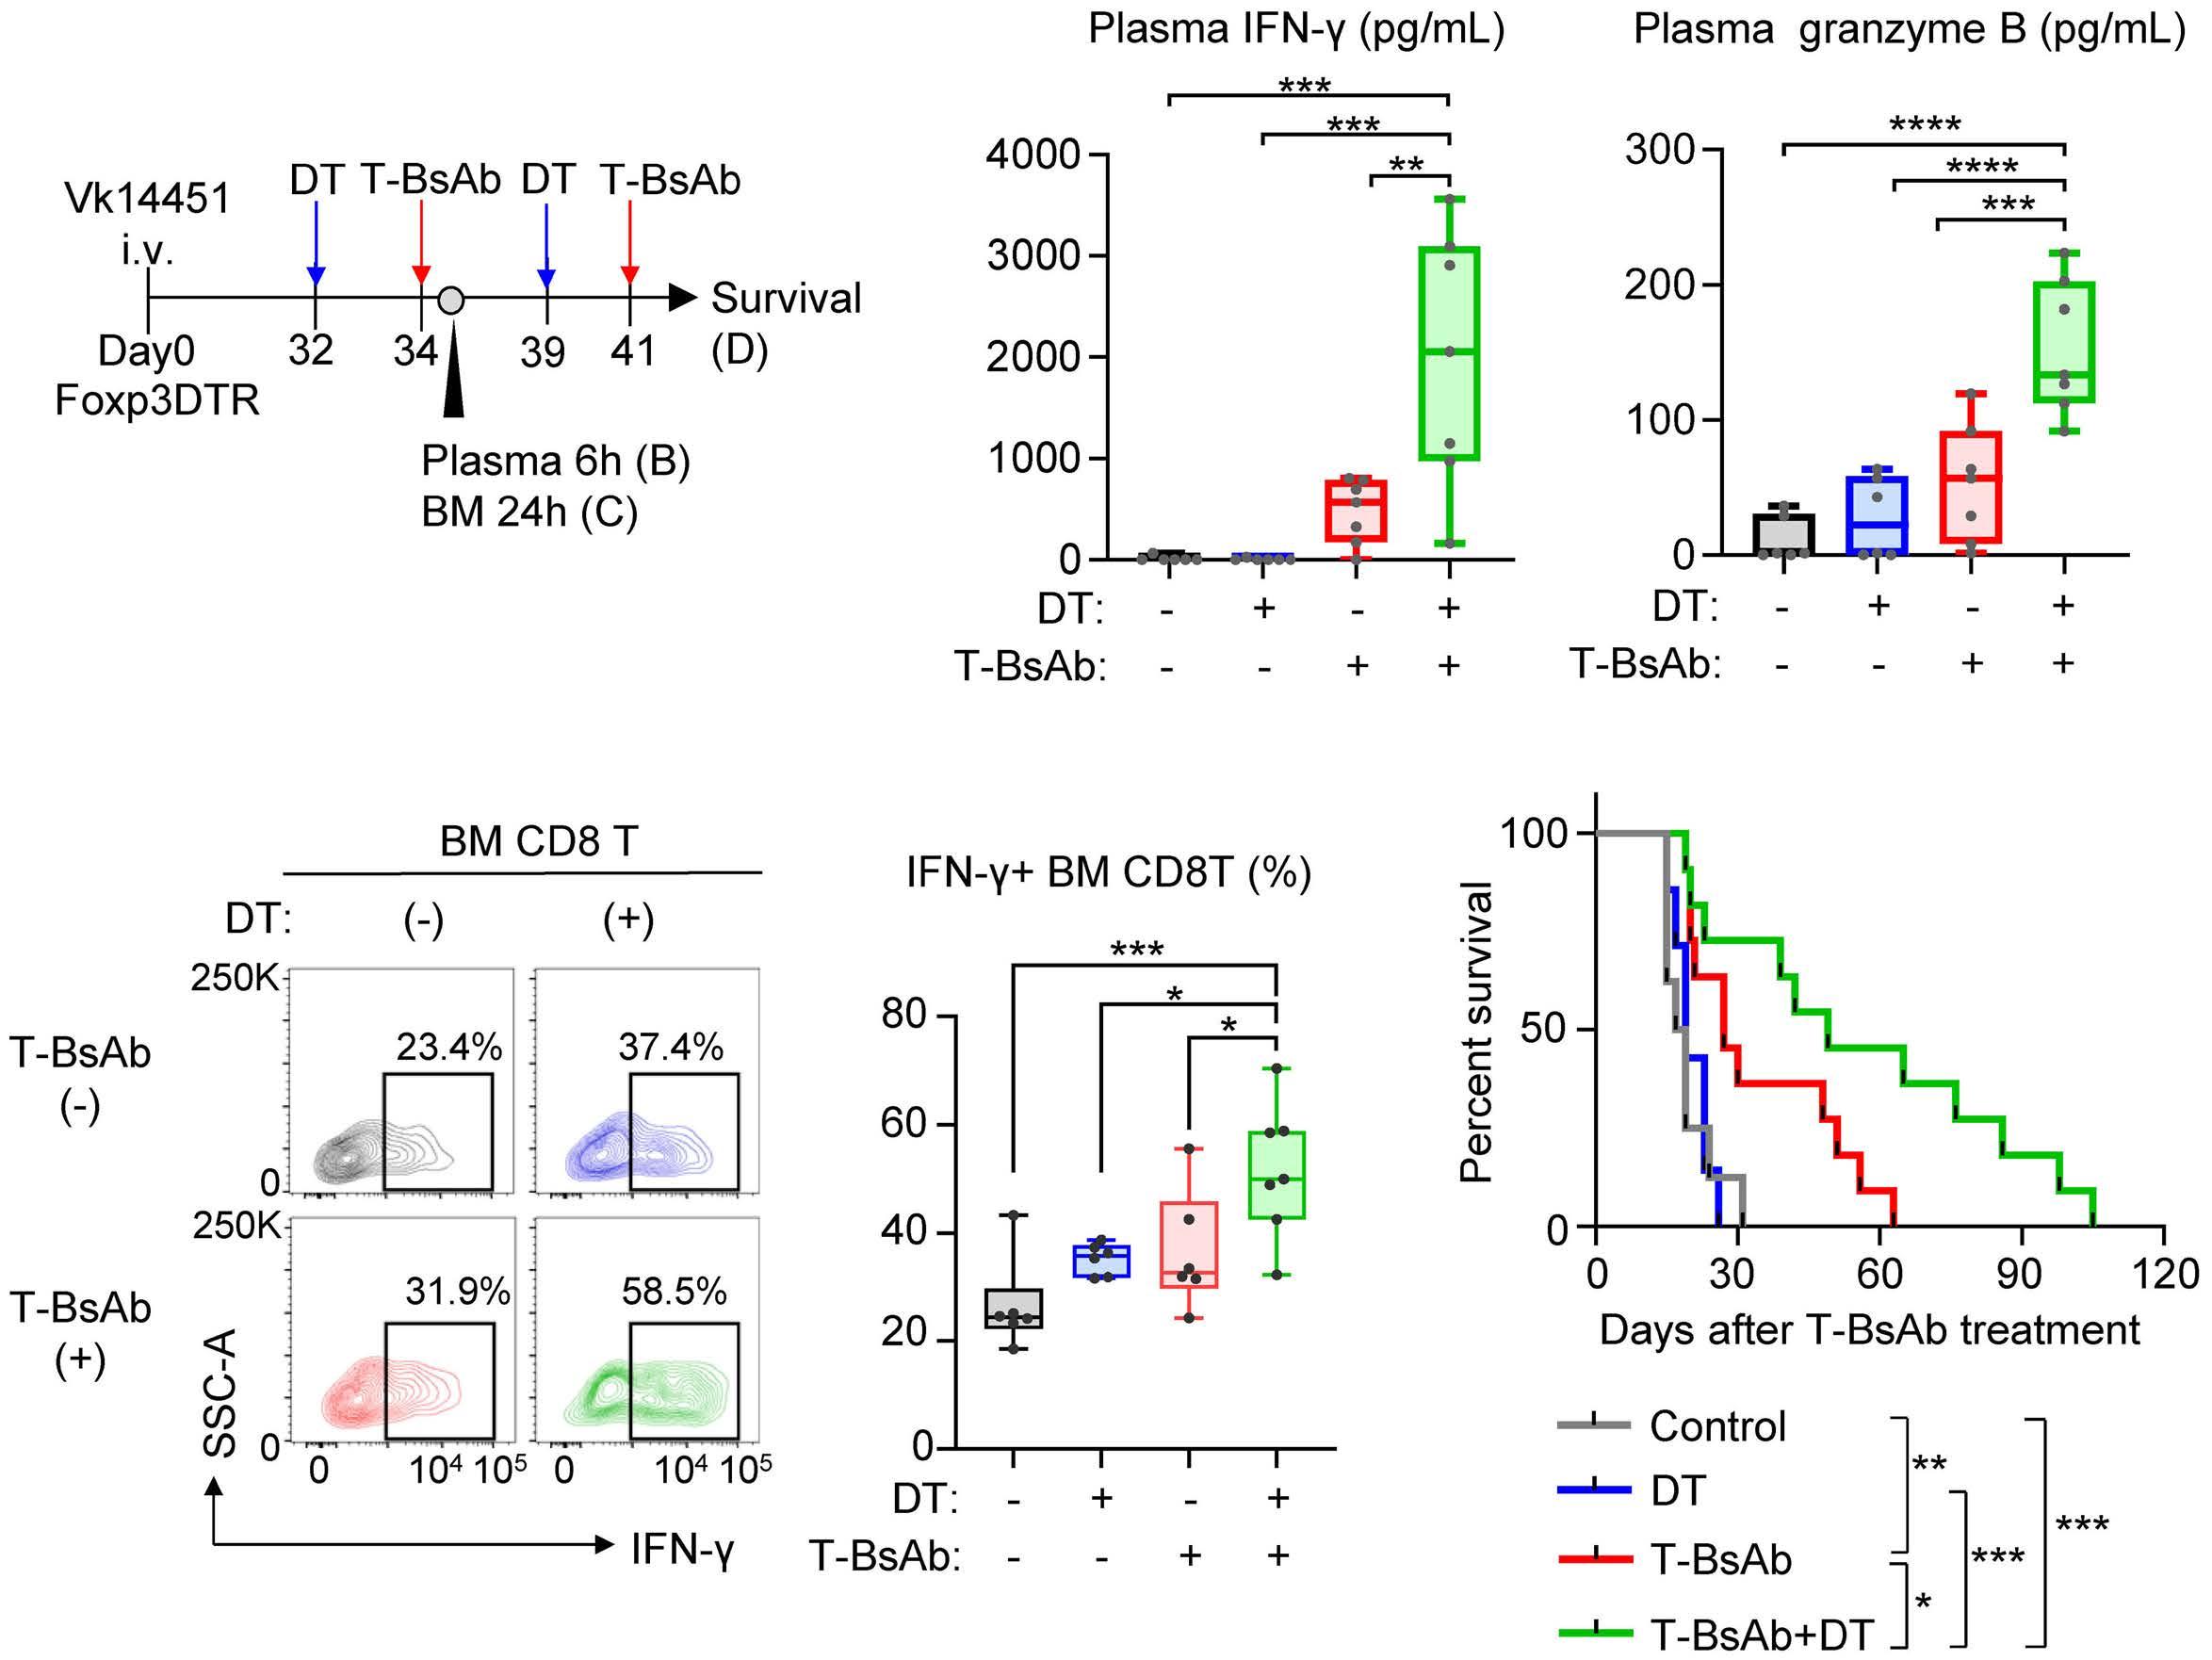
T-cell-engaging bispecific an-
Foxp3DTR
with Vk14451 multiple myeloma cells, and treated with diphtheria toxin in combination with anti-mouse B-cell maturation antigen T-cell-engaging bispecific antibodies (T-BsAb). The schematic illustrates the the experimental design. (B) Tumor-bearing mice were given the indicated treatment. Box and whisker plots showing levels of interferon-g and granzyme B in plasma 6 h after treatment (N=6-7 per group). (C) Representative flow cytometry plots and box and whisker
showing frequencies of interferon-g+ CD8 T cells in the myeloma bone marrow 24 h after treatment (N=6-7 per group). (D) Kaplan-Meier survival curves of mice after the indicated treatment (N=7-11 per group). Data are pooled from two independent experiments. Differences were tested for statistical significance using two-way analysis of variance with a post-hoc Tukey multiple comparisons test (B, C) and a Mantel-Cox test (D). *P<0.05, **P<0.01, ***P<0.001, ****P<0.0001. DTR: diphtheria toxin receptor; DT:
Haematologica | 109 Marzo 2024 794 ARTICLE - Treg and T-cell-engaging bispecific antibodies M. Casey et al.
C D
Figure 5. Transient ablation of regulatory T cells improves the efficacy of anti-B-cell maturation
tibody therapy. (A) C57BL6
mice were challenged
plots
diphtheria toxin; T-BsAb: T-cell-engaging bispecific antibody; BM: bone marrow; IFN: interferon.
A B
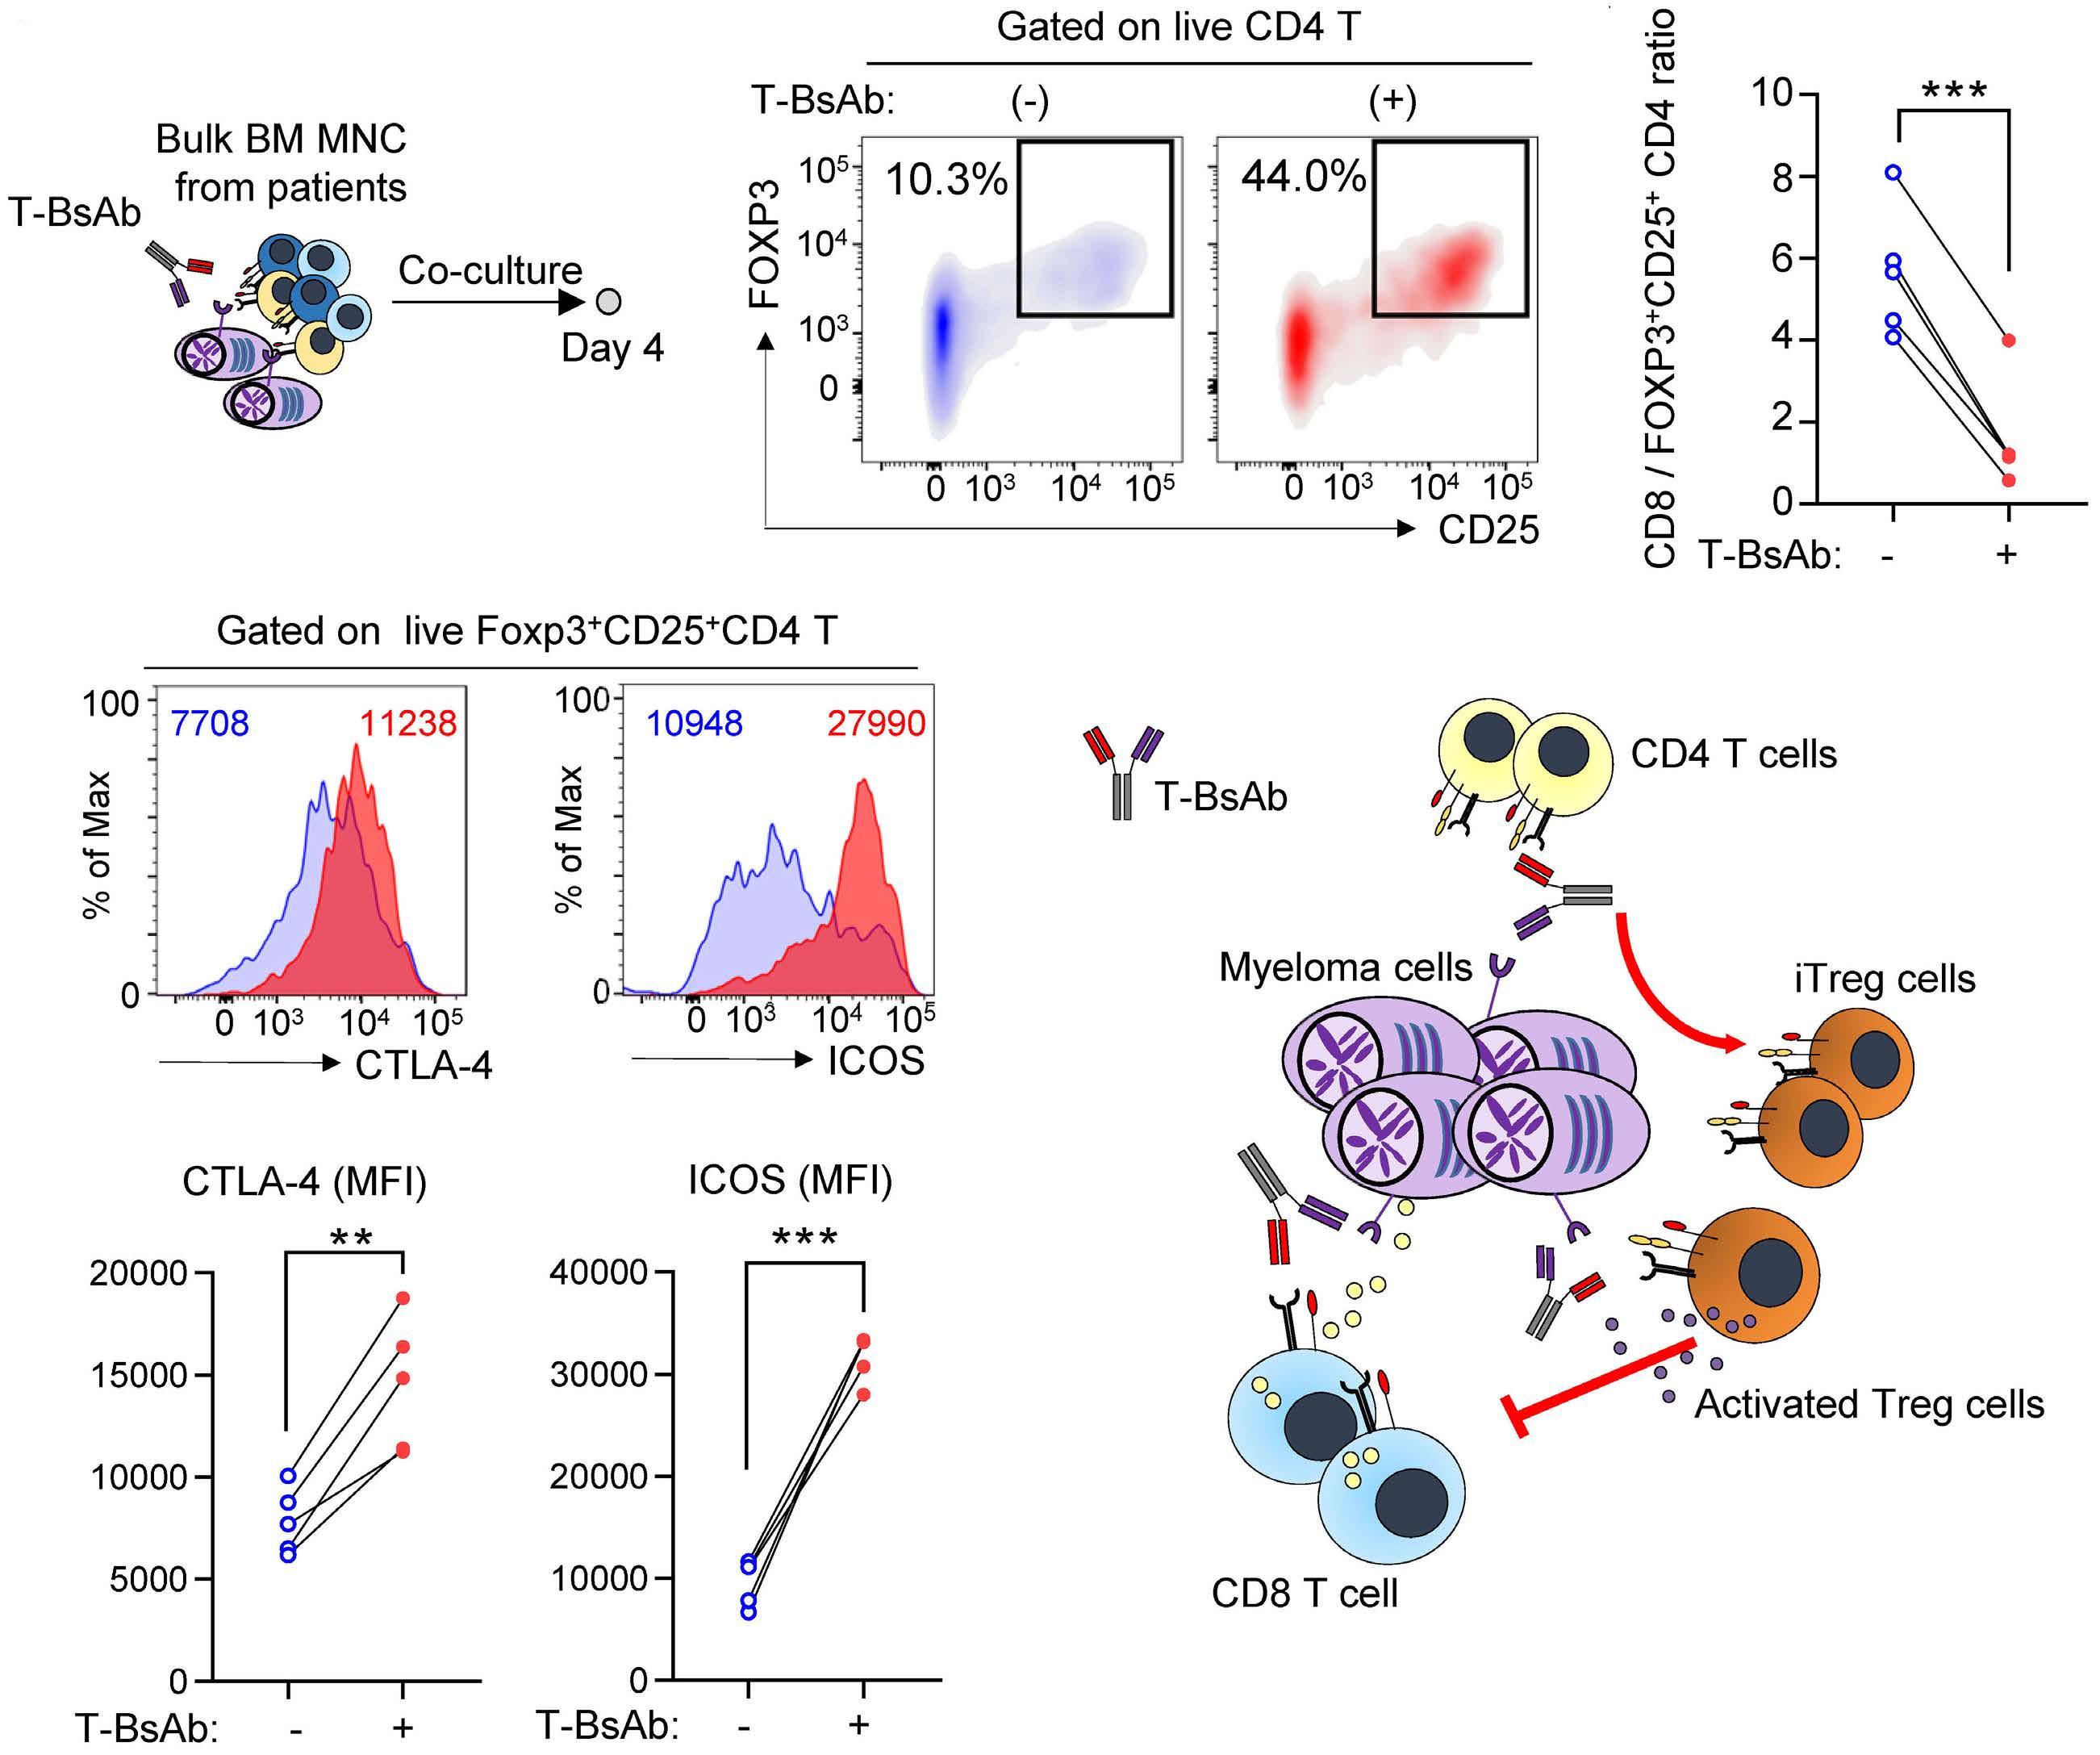
Figure 6. T-cell-engaging bispecific antibody-mediated activation of regulatory T cells in primary bone marrow samples from patients with multiple myeloma. (A) Bone marrow mononuclear cells (1×10⁶ cells) from newly diagnosed patients with multiple myeloma were stimulated with anti-human B-cell maturation antigen T-cell-engaging bispecific antibody (T-BsAb). The schematic illustrates the the experimental design. (B, C) Representative flow cytometry plots showing frequencies of CD4 T cells expressing FOXP3 and CD25 4 days after treatment (B). Graphs showing the CD8/FOXP3+CD25+CD4 ratio 4 days after treatment (C). (D, E) Representative histograms (D) and graphs (E) showing expression levels of CTLA-4 and ICOS in FOXP3+CD25+CD4 T cells (D). Numbers indicate mean fluorescence intensity. Results from one experiment (N=5) are shown. Differences were tested for statistical significance using a paired t-test. **P<0.01, ***P<0.001. (F) A graphical summary of the results. T-BsAb therapy triggers (i) differentiation of induced regulatory T cells from CD4 T cells, and (ii) activation of regulatory T cells, leading to suppression of CD8 T-cell responses. BM MNC: bone marrow mononuclear cells; MFI: mean fluorescence intensity; Treg: regulatory T cells; iTreg: induced regulatory T cells.
increased after T-BsAb stimulation (Figure 6B, C), with upregulation of activation markers including CTLA-4 and ICOS (Figure 6D, E). Together, these results indicate that the activation of Treg cells is an important concept for improving the efficacy of T-BsAb.
Discussion
In this study, we provide evidence that Treg cells negatively regulate anti-myeloma immune responses elicited
by T-BsAb therapy. Our results suggest that T-BsAb therapy triggers at least two events for Treg homeostasis: (i) differentiation of iTreg cells from conventional CD4 T cells, and (ii) direct activation of Treg cells in the tumor microenvironment (Figure 6F).
Accumulation of Treg cells in tumor tissues can be explained either by recruitment and proliferation of circulating Treg cells, or by differentiation from conventional CD4 T cells, namely iTreg cells.31 A recent study in solid malignancies showed that the TCR repertoires of tumor-infiltrating Treg cells display some overlap with those of
Haematologica | 109 Marzo 2024 795 ARTICLE - Treg and T-cell-engaging bispecific antibodies M. Casey et al.
A B C D E F
circulating Treg cells, but not with conventional CD4 T cells, implying limited contributions of iTreg cells.32 However, it is plausible that myeloma-associated Treg cells are maintained differently, as myeloma predominantly grows in the BM, a lymphoid organ containing Treg cells with unique phenotypes and functions.7,33,34 Intriguingly, Feng et al . reported that the co-culture of peripheral blood mononuclear cells with human myeloma cells can modestly, but significantly, increase the frequency of CD38+ iTreg cells even without any additional stimulation.14 Indeed, our results showed that the majority of CD4 T cells acquired an iTreg phenotype after T-BsAb stimulation, indicating that CD4 T-cell activation in the presence of myeloma cells contributes to the differentiation of iTreg cells. Notably, a recent study using single-cell TCR tracing of T cells from T-BsAb-treated patients showed that a fraction of naïve CD4 T cells exhibits a Treg cell-like phenotype after treatment, supporting the differentiation of iTreg cells under T-BsAb therapy.8 Taken together, the myeloma microenvironment might favor the generation of iTreg cells, especially in the context of T-BsAb therapy. Various environmental factors might be implicated in the generation and functional maturation of myeloma-associated Treg cells, such as TGF-β , hypoxia-driven adenosine, and metabolic reprogramming,7,35,36 although further studies are warranted to understand the mechanism.
Growing evidence suggests that Treg cells act as a major barrier to the optimal efficacy of immune checkpoint inhibitors. For example, Kamada et al. have shown that in gastric cancer patients who experienced hyper-progressive disease after PD-1 blockade, therapy-induced activation and proliferation of PD-1+ Treg cells are implicated in the immunological mechanism.37 Accordingly, the balance of PD-1 expression between CD8 T cells and Treg cells in the tumor microenvironment can predict clinical responses to PD-1 blockade in gastric cancer patients.38 Similarly, CTLA-4 blockade can trigger the CD28-mediated activation and proliferation of tumor-associated Treg cells, supporting that T-cell reinvigoration by immune checkpoint inhibitors is not restricted to effector T cells.39 Our results provide evidence that T-BsAb-activated Treg cells hamper anti-tumor immune responses. Importantly, TCR signaling in Treg cells is known to augment suppressive functions by altering cellular metabolism and enhancing Treg cell aggregation on antigen-presenting cells.40,41 Indeed, we observed iTreg cells preferentially formed aggregates around tumor cells, compared to CD8 T cells. Thus, activated Treg cells play non-negligible roles in limiting anti-tumor immunity elicited by T-BsAb therapy. Together, therapy-induced activation of Treg cells will be an important consideration to achieve better clinical responses for T-cell–redirecting immunotherapy.
While our results strongly support the negative impact of Treg cells on the efficacy of T-BsAb therapy, a previous study found that Treg cells showed in vitro killing activities
against solid tumor cells in the presence of anti-EGFRvIII T-BsAb therapy.42 However, their cytotoxic potential remains controversial, as another group observed no direct cytotoxicity by human CD4+CD25+CD127low cells.43,44 Even if T-BsAb-activated Treg cells have cytotoxic potential, either by TCR-mediated killing or by death receptor-ligand interaction, their immunosuppressive activity would outweigh their tumoricidal activity, as supported by our results showing the benefit of transient ablation of Treg cells in the preclinical model.
For therapeutically targeting Treg cells, anti-CD38 monoclonal antibodies (daratumumab and isatuximab) have the ability to deplete CD38+ Treg cells,14,17 although the expression of CD38 can also be upregulated on activated effector lymphocytes. Alternatively, given that depletion of CD25+ cells from grafts can safely delay the recovery of Treg cells after autologous stem cell transplant in patients with multiple myeloma,45 Treg-depleted transplantation, followed by T-BsAb-based maintenance therapy may be a rational approach. While long-term ablation of Treg cells may theoretically increase the risk of immune-related adverse events, including cytokine release syndrome, the combination therapy was tolerable in our preclinical study. In addition, as T-BsAb therapy induces rapid clearance of myeloma cells from the BM,4,5 limited-duration therapy may be preferable to minimize long-term side effects. One of the limitations of this study is that we have not designed the optimal therapeutic approach for targeting Treg cells in combination with T-BsAb therapy in a safe manner. Additionally, the impact of T-BsAb therapy on Treg homeostasis will need to be validated using on-treatment clinical samples. Despite these limitations, our results have important implications for improving the efficacy of T-BsAb therapy.
Disclosures
MKG reports research support unrelated to this work from Janssen and Beigene. SJH reports support unrelated to this work from AbbVie (consultancy, advisory board participation, investigator on studies), Amgen (consultancy, honoraria, advisory board, participation, research funding, investigator on studies), Celgene (consultancy, honoraria, advisory board participation, research funding, investigator on studies), GSK (consultancy, research funding, advisory board participation), Janssen Cilag (consultancy, honoraria, advisory board participation, research funding, investigator on studies), Novartis (consultancy, honoraria, advisory board participation, research funding, investigator on studies), Roche/Genentech (consultancy, honoraria, advisory board participation, investigator on studies), Takeda (consultancy, honoraria, advisory board participation), Haemalogix (scientific advisory board participation, research funding, investigator), and Sanofi (consultancy/adivisory role). KN has received honoraria from Janssen, Sanofi, and Bristol Myers Squibb. The other authors declare that they have no conflicts of interest to disclose.
Haematologica | 109 Marzo 2024 796 ARTICLE - Treg and T-cell-engaging bispecific antibodies M. Casey et al.
Contributions
MC and KN designed the research and wrote the manuscript. MC, CL, WYK, and KN performed experimental work and analyzed the data. DC analyzed data. SCL and MKG provided key materials. MKG and SJH contributed to critical discussion and data interpretation. KN conceived and supervised the study. All authors read and approved the final version of the manuscript.
Acknowledgments
We thank Bristol Myers Squibb for providing anti-mouse T-BsAb. We also thank Dr Nigel Waterhouse for technical assistance.
References
1. Tian Z, Liu M, Zhang Y, Wang X. Bispecific T cell engagers: an emerging therapy for management of hematologic malignancies. J Hematol Oncol. 2021;14(1):75.
2. Bannerji R, Arnason JE, Advani RH, et al. Odronextamab, a human CD20×CD3 bispecific antibody in patients with CD20positive B-cell malignancies (ELM-1): results from the relapsed or refractory non-Hodgkin lymphoma cohort in a single-arm, multicentre, phase 1 trial. Lancet Haematol. 2022;9(5):e327-e339.
3. Thieblemont C, Phillips T, Ghesquieres H, et al. Epcoritamab, a novel, subcutaneous CD3xCD20 bispecific T-cell-engaging antibody, in relapsed or refractory large B-cell lymphoma: dose expansion in a phase I/II trial. J Clin Oncol. 2023;41(12):2238-2247.
4 Moreau P, Garfall AL, van de Donk N, et al. Teclistamab in relapsed or refractory multiple myeloma. N Engl J Med. 2022;387(6):495-505.
5. Chari A, Minnema MC, Berdeja JG, et al. Talquetamab, a T-cellredirecting GPRC5D bispecific antibody for multiple myeloma. N Engl J Med. 2022;387(24):2232-2244.
6. Cohen AD, Harrison SJ, Krishnan A, et al. Initial clinical activity and safety of BFCR4350A, a FcRH5/CD3 T-cell-engaging bispecific antibody, in relapsed/refractory multiple myeloma. Blood. 2020;136(Suppl 1):42-43.
7 Nakamura K, Smyth MJ, Martinet L. Cancer immunoediting and immune dysregulation in multiple myeloma. Blood. 2020;136(24):2731-2740.
8. Friedrich MJ, Neri P, Kehl N, et al. The pre-existing T cell landscape determines the response to bispecific T cell engagers in multiple myeloma patients. Cancer Cell. 2023;41(4):711-725.
9 Meermeier EW, Welsh SJ, Sharik ME, et al. Tumor burden limits bispecific antibody efficacy through T cell exhaustion averted by concurrent cytotoxic therapy. Blood Cancer Discov. 2021;2(4):354-369.
10. Velasquez MP, Bonifant CL, Gottschalk S. Redirecting T cells to hematological malignancies with bispecific antibodies. Blood. 2018;131(1):30-38.
11. Dhodapkar MV. The immune system in multiple myeloma and precursor states: lessons and implications for immunotherapy and interception. Am J Hematol. 2023;98 (Suppl 2):S4-S12.
12. Casey M, Tu C, Harrison SJ, Nakamura K. Invariant NKT cells dictate antitumor immunity elicited by a bispecific antibody cotargeting CD3 and BCMA. Blood Adv. 2022;6(17):5165-5170.
Funding
The authors appreciate donation support from Play for a Cure Foundation. KN is supported by the NHMRC Project Grant (1159593) and Naito Foundation. This project was supported by grant 2000538 awarded through the 2020 Priority-driven Collaborative Cancer Research Scheme and funded by the Leukaemia Foundation with the support of Cancer Australia.
Data-sharing statement
The data that support the findings of this study are available from the corresponding author upon reasonable request.
13. Zavidij O, Haradhvala NJ, Mouhieddine TH, et al. Single-cell RNA sequencing reveals compromised immune microenvironment in precursor stages of multiple myeloma. Nat Cancer. 2020;1(5):493-506.
14 Feng X, Zhang L, Acharya C, et al. Targeting CD38 suppresses induction and function of T regulatory cells to mitigate immunosuppression in multiple myeloma. Clin Cancer Res. 2017;23(15):4c90-4300.
15. Guillerey C, Nakamura K, Pichler AC, et al. Chemotherapy followed by anti-CD137 mAb immunotherapy improves disease control in a mouse myeloma model. JCI Insight. 2019;5(14):e125932.
16. Dahlhoff J, Manz H, Steinfatt T, et al. Transient regulatory T-cell targeting triggers immune control of multiple myeloma and prevents disease progression. Leukemia. 2022;36(3):790-800.
17 Krejcik J, Casneuf T, Nijhof IS, et al. Daratumumab depletes CD38+ immune regulatory cells, promotes T-cell expansion, and skews T-cell repertoire in multiple myeloma. Blood. 2016;128(3):384-394.
18. Ohue Y, Nishikawa H. Regulatory T (Treg) cells in cancer: can Treg cells be a new therapeutic target? Cancer Sci. 2019;110(7):2080-2089.
19. Larrayoz M, Garcia-Barchino MJ, Celay J, et al. Preclinical models for prediction of immunotherapy outcomes and immune evasion mechanisms in genetically heterogeneous multiple myeloma. Nat Med. 2023;29(3):632-645.
20 Sze JH, Raninga PV, Nakamura K, et al. Anticancer activity of a gold(I) phosphine thioredoxin reductase inhibitor in multiple myeloma. Redox Biol. 2020;28:101310.
21. Nakamura K, Casey M, Oey H, et al. Targeting an adenosinemediated “don’t eat me signal” augments anti-lymphoma immunity by anti-CD20 monoclonal antibody. Leukemia. 2020;34(10):2708-2721.
22. Casey M, Segawa K, Law SC, et al. Inhibition of CD39 unleashes macrophage antibody-dependent cellular phagocytosis against B-cell lymphoma. Leukemia. 2023;37(2):379-387.
23. Burshtyn DN, Davidson C. Natural killer cell conjugate assay using two-color flow cytometry. Methods Mol Biol. 2010;612:89-96.
24. Joller N, Lozano E, Burkett PR, et al. Treg cells expressing the coinhibitory molecule TIGIT selectively inhibit proinflammatory Th1 and Th17 cell responses. Immunity. 2014;40(4):569-581.
25. Kurtulus S, Sakuishi K, Ngiow SF, et al. TIGIT predominantly regulates the immune response via regulatory T cells. J Clin
Haematologica | 109 Marzo 2024 797 ARTICLE - Treg and T-cell-engaging bispecific antibodies M. Casey et al.
Invest. 2015;125(11):4053-4062.
26. Li DY, Xiong XZ. ICOS(+) Tregs: a functional subset of Tregs in immune diseases. Front Immunol. 2020;11:2104.
27. Allan SE, Crome SQ, Crellin NK, et al. Activation-induced FOXP3 in human T effector cells does not suppress proliferation or cytokine production. Int Immunol. 2007;19(4):345-354.
28. Wang J, Ioan-Facsinay A, van der Voort EI, Huizinga TW, Toes RE. Transient expression of FOXP3 in human activated nonregulatory CD4+ T cells. Eur J Immunol. 2007;37(1):129-138.
29 Dustin ML. The immunological synapse. Cancer Immunol Res. 2014;2(11):1023-1033.
30. Sawant DV, Yano H, Chikina M, et al. Adaptive plasticity of IL-10(+) and IL-35(+) T(reg) cells cooperatively promotes tumor T cell exhaustion. Nat Immunol. 2019;20(6):724-735.
31. Itahashi K, Irie T, Nishikawa H. Regulatory T-cell development in the tumor microenvironment. Eur J Immunol. 2022;52(8):1216-1227.
32. Ahmadzadeh M, Pasetto A, Jia L, et al. Tumor-infiltrating human CD4(+) regulatory T cells display a distinct TCR repertoire and exhibit tumor and neoantigen reactivity. Sci Immunol. 2019;4(31):eaao4310.
33. Hirata Y, Furuhashi K, Ishii H, et al. CD150(high) bone marrow Tregs maintain hematopoietic stem cell quiescence and immune privilege via adenosine. Cell Stem Cell. 2018;22(3):445-453.
34 Glatman Zaretsky A, Konradt C, Depis F, et al. T regulatory cells support plasma cell populations in the bone marrow. Cell Rep. 2017;18(8):1906-1916.
35. Kurniawan H, Soriano-Baguet L, Brenner D. Regulatory T cell metabolism at the intersection between autoimmune diseases and cancer. Eur J Immunol. 2020;50(11):1626-1642.
36. Ohta A, Sitkovsky M. Extracellular adenosine-mediated
modulation of regulatory T cells. Front Immunol. 2014;5:304.
37. Kamada T, Togashi Y, Tay C, et al. PD-1(+) regulatory T cells amplified by PD-1 blockade promote hyperprogression of cancer. Proc Natl Acad Sci U S A. 2019;116(20):9999-10008.
38. Kumagai S, Togashi Y, Kamada T, et al. The PD-1 expression balance between effector and regulatory T cells predicts the clinical efficacy of PD-1 blockade therapies. Nat Immunol. 2020;21(11):1346-1358.
39. Marangoni F, Zhakyp A, Corsini M, et al. Expansion of tumorassociated Treg cells upon disruption of a CTLA-4-dependent feedback loop. Cell. 2021;184(15):3998-4015.
40. Li MO, Rudensky AY. T cell receptor signalling in the control of regulatory T cell differentiation and function. Nat Rev Immunol. 2016;16(4):220-233.
41. Onishi Y, Fehervari Z, Yamaguchi T, Sakaguchi S. Foxp3+ natural regulatory T cells preferentially form aggregates on dendritic cells in vitro and actively inhibit their maturation. Proc Natl Acad Sci U S A. 2008;105(29):10113-10118.
42. Choi BD, Gedeon PC, Herndon JE 2nd, et al. Human regulatory T cells kill tumor cells through granzyme-dependent cytotoxicity upon retargeting with a bispecific antibody. Cancer Immunol Res. 2013;1(3):163.
43. Koristka S, Cartellieri M, Arndt C, et al. Cytotoxic response of human regulatory T cells upon T-cell receptor-mediated activation: a matter of purity. Blood Cancer J. 2014;4(4):e199.
44 Koristka S, Cartellieri M, Arndt C, et al. Tregs activated by bispecific antibodies: killers or suppressors? Oncoimmunology. 2015;4(3):e994441.
45. Derman BA, Zha Y, Zimmerman TM, et al. Regulatory T-cell depletion in the setting of autologous stem cell transplantation for multiple myeloma: pilot study. J Immunother Cancer. 2020;8(1):e000286.
Haematologica | 109 Marzo 2024 798 ARTICLE - Treg and T-cell-engaging bispecific antibodies M. Casey et al.
Lower overall survival in male patients with advanced disease undergoing allogeneic hematopoietic stem cell transplantation is associated with CYP1B1
Leu432Val polymorphism
Norbert Stute1,2 and Michael Koldehoff1,3,4
1Department of Bone Marrow Transplantation, West German Cancer Center, University Hospital of Essen, University of Duisburg-Essen, Essen, Germany; 2Third Medical Department with Hematology, Medical Oncology, Hemostaseology, Infectious Diseases and Rheumatology, Paracelsus Medical University, Salzburg, Austria; 3Department of Hygiene and Environmental Medicine, University Hospital Essen, University of Duisburg-Essen, Essen, Germany and 4Institute for Laboratory Medicine and Transfusion Medicine, Zotz Klimas, Düsseldorf, Germany
Abstract
Correspondence: M. Koldehoff koldehoff@zotzklimas.de
Received: June 1, 2023.
Accepted: September 18, 2023.
Early view: September 28, 2023.
https://doi.org/10.3324/haematol.2023.283649
©2024 Ferrata Storti Foundation
Published under a CC BY-NC license
Human cytochrome P450 1B1 (CYP1B1) is an extrahepatic key enzyme involved in estrogen metabolism, steroid synthesis, and pro-carcinogen activation. In a single-center retrospective study, 382 patients who underwent allogeneic hematopoetic stem cell transplantation and their donors were genotyped for CYP1B1 C432G polymorphism by reverse transcription polymerase chain reaction. One hundred and sixty-nine patients (44%) were homozygous wild-type (wt) gene CC, 157 (41%) heterozygous CG and 56 (15%) homozygous gene mutated GG. Of interest, mutated CYP1B1 was more common in male (62%) than in female patients (48%) P=0.006, unlike in donors. Five-year estimate for overall survival (OS) was 58±4% (CC) versus 48±3% (CG and GG), P=0.048. Surprisingly, this difference was only evident in males (P=0.024): OS 58±6% versus 42±4%, whereas it was virtually absent in females. Importantly, this difference was only evident in male patients with advanced disease (AD) (n=118, P=0.002): OS 44±8% (CC) versus 32±6% (CG) versus 6±6% (GG), whereas it was virtually absent in male patients with early disease. One-year non-relapse mortality in male patients with AD was 8±4% (CC) versus 21±5% (CG) versus 50±12% (GG), P=0.002. Three-year relapse rate in male patients with AD was 31±7% (wt) versus 42±6% (mut), P=0.04. Multivariate analysis for OS in male patients with AD revealed CYP1B1 polymorphism as the only prognostic factor: RR 1.78, P=0.001. In conclusion, these results suggest that male patients with AD and mutant CYP1B1 polymorphism have lower OS after allogeneic hematopoetic stem cell transplantation due to a higher non-relapse mortality and a higher relapse rate.
Introduction
Hematopoietic stem cell transplantation (HSCT) offers the only cure for many hematological neoplasms; however, the mortality rate remains high. Complications after allogeneic HSCT include relapse, graft-versus-host disease (GVHD), graft rejection, organ damage, and infection. The outcome of HSCT is influenced both by clinical and genetic factors. Human leukocyte antigen (HLA) compatibility is a well-known limiting factor for the success of allogeneic HSCT.1 In addition, genes other than those of the HLA system (both minor HLA and non-HLA antigens including KIR), in particular those that
are also polymorphic, have been shown as potential factors affecting the success of HSCT.2 The polymorphic expression of drug-metabolizing enzymes is one of the major factors which causes interindividual variability in drug metabolism, and thereby in pharmacologic and toxicologic responses. Single nucleotide polymorphisms (SNP) within non-HLA genes that are involved with an individual’s capability to mount an immune response to infectious pathogens, residual leukemia, alloantigens or genes involved in drug metabolism, have been studied for their association with acute GVHD,3 host organ function, cancer cells, and immune cells, and thus HSCT outcome.4 These include chemokines and cytokines,5
Haematologica | 109 Marzo 2024 799 - Cell Therapy & Immunotherapy ARTICLE
and other predictive biomarkers like CYP2C19,6 TLR9, NOD2 and IL23R,7 TGFB1,8 and NOD2/CARD15.9,10
Human cytochrome P450 1B1 (CYP1B1) is an extrahepatic key enzyme overexpressed in many tumors. It is involved in the production of reactive metabolites, and in the bioactivation of environmental carcinogens.11-14 CYP1B1 is also involved in sex hormone and estrogen metabolism, and steroid and lipid synthesis. It specifically catalyzes the 4-hydroxylation of 17β-estradiol into 4-hydroxyestradiol, which enables the formation of free radicals that cause DNA damage through redox cycling from compounds such as hydroquinones.15 The enzyme is primarily found in the endoplasmatic reticulum, and its gene is located on the human chromosome 2p,16,17 whereas the genes for the HLA system are located on chromosome 6p. The CYP1B1 gene is transcriptionally activated by polycyclic aromatic hydrocarbons, which act via the dioxin inducible Ah receptor complex.18
CYP1B1 is strongly overexpressed in multiple human malignancies18,19 and has been used as a target for cancer chemotherapy20,21 and immunotherapy.22,23 Several anticancer agents interact with CYP1B1,20,24 and CYP1B1 inhibitors have been investigated for their anticancer effects.25 CYP1B1 is expressed in human lymphocytes, variable and highly inducible,26 and also in monocytes and macrophages.27 It plays a role in hematopoietic stem and progenitor cell (HSPC) expansion.28 CYP1B1 is also overexpressed in acute lymphoblastic leukemia (ALL), acute myeloid leukemia (AML), lymphoma, and myeloma.29,30 Methylation of CYP1B1 was associated with worse overall survival (OS) and disease-free survival in young adults with ALL and correlated with decreased CYP1B1 expression.31 Several polymorphisms were identified in the CYP1B1 gene causing interindividual variability32,33 and being associated with a variety of cancers.13,34,35 The CYP1B1 polymorphism C432G = Leu432Val also called rs1056836 causes an amino acid exchange at codon 432, where the C-allele codes for Leu432 (wild-type [wt]), and the G-allele codes for Val432 (variant). Amongst others, this affects the conversion of estradiol to the carcinogenic metabolite 4-hydroxyestradiol.32,33 Mutant (mut)
CYP1B1 Val432Leu is possibly linked with myeloid leukemia.36 We hypothesized that altered polymorphic drug metabolism by CYP1B1 in patients who underwent allogeneic HSCT, might influence host organ function, cancer cells and donor immune cells, and thus transplant outcome. The aim of our study was to evaluate whether the Leu432Val (or C432G) polymorphism of CYP1B1 enzyme in patients influences the outcome of allogeneic HSCT, in particular: OS, non-relapse mortality (NRM), relapse of disease, and incidence of GVHD.
Methods
Patients
We included a total of 382 patients (and donors) for the CYP1B1 gene polymorphism analysis, who were transplanted at the University Hospital of Essen, Department of Bone
Marrow Transplantation. Patient characteristics are outlined in Table 1.
Selection of patients was performed purely on the basis that genetic material (peripheral blood) from both the recipient and the donor were available. Genotyping was performed without knowledge of clinical data, or outcome of the patients analyzed. This study was conducted in accordance with the
AML: acute myeloid leukemia; ALL: acute lymphocytic leukemia; CML: chronic myeloid leukemia; MDS: mylelodysplastic syndrome; OMF: osteomyelofibrosis; MM: multiple myeloma; NHL: non-Hodgkin lymphoma; CLL: chronic lymphocytic leukemia; CMML: chronic myelomonocytic leukemia; HLA: human leukocyte antigen; M: male; F: female; PBSC: peripheral blood stem cells; BM: bone marrow; MAC: myeloablative conditioning; RIC: reduced-intensity conditioning; TBI: total body irradiation; GVHD: graft-versus-host disease; CSA-MTX: cyclosporin and methotrexate; HSCT: hematopoietic stem cell transplantation.
Haematologica | 109 Marzo 2024 800 ARTICLE - CYP1B1 polymorphism and survival in allogeneic HSCT N. Stute and M. Koldehoff
Characteristics N=382 Age in years, median (range) 42 (15-67) Sex, M/F, % 53/47 Diseases, N AML 142 ALL 53 CML 91 MDS 35 OMF 14 MM 14 NHL 12 CLL 6 CMML 5 Other 9 Acute leukemias, % 51 Advanced disease, N (%) M 118/204 (58) F 97/178 (54) Donor HLA-type, % Matched 80 Mismatched 20 Stem cell source, % PBSC 82 BM 18 Donor (F to M) % of all patients 11 % of male patients 21 Conditioning, % MAC 95 RIC 5 TBI 74 Chemotherapy only 26 GVHD prophylaxis, % CSA-MTX only 64 T-cell depletion 36 Years of HSCT, range (median) 1993-2003 (2002) Median follow-up in months (last follow-up) 76 (April 2014)
Table 1. Patient demographics, disease and transplant characteristics.
amended Declaration of Helsinki. All aspects of this study were approved by the Institutional Review Board on Medical Ethics at the University Hospital of Essen (BO 06-3057), and all patients and donors gave their written informed consent.
Early disease versus advanced disease
Early disease (ED): patients with acute leukemia (AL) in first complete remission (CR), chronic myloid leukemia (CML) in first chronic phase, osteomyelofibrosis, severe aplastic anemia, paroxysmal nocturnal hemoglobinuria, hypereosinophilic syndrome, refractory anemia (RA) and refractory anemia with ring sideroblast (RARS) (both untransformed myelodysplastic syndrome [MDS]).
Advanced disease (AD): patients with AL in partial remission (PR) or second CR, secondary AML, relapsed AL, CML with accelerated phase or blast crisis, refractory anemia with excess blasts (RAEB), chronic myelomonocytic leukemia, transformed MDS, multiple myeloma, non-Hodgkin lymphoma, chronic lymphocytic leukemia stage ≥3.
Conditioning regimen and clinical study endpoints
All protocols and procedures are described in detail in the Online Supplementary Appendix.
Isolation of genomic DNA
DNA was prepared from peripheral blood mononuclear cells obtained from the donor and patient before the transplant, using the phenol/chloroform method.43
Genotyping for CYP1B1 codon 432 polymorphism
CYP1B1 Leu432Val polymorphism (rs1056836) was analyzed by a LightCycler (Roche Diagnostics; Mannheim, Germany) protocol using the polymerase chain reaction (PCR) primers and hybridization probes published by Brüning et al. 44 The primers for the PCR (and the hybridization probes) were synthesized by MWG Biotech (Ebersberg, Germany). Polymorphisms of CYP1B1 at codon 432 were determined by use of the hybridization probe format. The following genotypes were determined by reverse transcription (rt)-PCR: CYP1B*1/*1 = CC (wt), CYP1B*1/*2 = CG, CYP1B*2/*2 = GG (homozygous mut). PCR and subsequent melting curve analysis were performed using the LightCycler device and software (Roche Applied Science; Mannheim, Germany). Control samples confirmed by sequencing were included in each run.
Statistical analysis
Probabilities of OS were calculated using the Kaplan-Meier method.45 Differences between time-to-event distribution functions were compared by a log-rank test (SPSS).46 Cumulative incidence was used to estimate the endpoints of NRM, relapse and GVHD to accommodate for competing risks (R statistic).47 Relapse and NRM were analyzed as competing risks.48 Combined data are shown as mean ± standard error. In order to study acute and chronic GVHD, we considered relapse and death to be competing events. Comparisons
between categorical covariates were conducted using the χ2 test where appropriate. P values are always two-sided. A Cox proportional hazards model was used for multivariate regression to evaluate the prognostic significance of different covariates on the endpoints of OS, NRM, and relapse. Covariates analyzed - see the Online Supplementary Appendix. All interactions between patient sex, AD and other covariates were tested. Relative risk (RR) estimates and their 95% confidence intervals (95% CI) were derived from Cox regression after adjustment for all other covariates in the model. Statistics Software used are presented in the Online Supplementary Appendix.
Results
CYP1B1 genetic polymorphism in patients and donors
Among recipients (R) 169 (44%) were genotyped as homozygous wt gene CC, 157 (41%) as heterozygous genotype CG, and 56 (15%) had the homozygous gene mutation GG. As shown in Table 2, regarding demographic and transplant characteristics, there was no difference between the three CYP1B1 C432G polymorphism groups CC, CG and GG in male patients with AD. With exception to age group >50 years, where there appeared to be a higher percentage of wt R SNP. The same holds true when looking at all male patients and the patient cohort overall (data not shown).
Interestingly, male R were more likely to have the mut SNP
Table 2. Male patients with advanced disease - demographic and transplant characteristics (N=118).
Male patients with advanced disease characteristics are balanced for the 3 CYP1B1 allele frequencies (in %) between wild-type (CC genotype), heterozygous mutant (CG genotype), and homozygous mutant (GG genotype). Statistical analysis was performed by χ2 test. Genotype indicates CYP1B1 C432G polymorphism; NS: not significant; PBSCT: peripheral blood stem cell transplantation; MAC: myeloablative conditioning; TBI: total body irradiation.
Haematologica | 109 Marzo 2024 801 ARTICLE - CYP1B1 polymorphism and survival in allogeneic HSCT N. Stute and M. Koldehoff
Characteristics Genotype P CC CG GG Patients, N (%) 39 (33) 63 (53) 16 (14) Age in years, median (range) >40, N >50, N Patients, % 47 (19-64) 25 17 52 42 (19-65) 39 12 36 44 (23-63) 12 4 12 NS 0.62 0.03 Donor type Unrelated, N (%) HLA-mismatched, N Female, N 18 (26) 10 10 40 (57) 15 12 12 (17) 5 3 0.09 0.83 0.71 Transplant source, N PBSCT 34 58 14 0.69 Treatment regime, N MAC TBI consisting T-cell depletion 36 25 16 58 45 22 15 12 4 0.97 0.65 0.52
compared to female R (62% vs. 48%), whereas the wt SNP was more common in females (52% vs. 38%), P=0.006 (χ2), see Table 3A. This difference was even more pronounced in AD: the prevalence of mut SNP in male R was 67% versus 50% in female R.
Among donors (D) 167 (44%) were genotyped as homozygous wt gene CC, 162 (42%) as heterozygous genotype CG, and 53 (14%) had the homozygous gene mutation GG. Calculated genotype frequencies were comparable to the R group. Within the donor group however, there was no sex difference in distribution between wt and mut SNP, as shown in Table 3B, in contrast to the R group. Our data with donor CYP1B1 polymorphism or D SNP yielded interesting results. However, D SNP data did not influence the outcome results presented in this paper. Due to clarity and space constraints, they are not included here.
Across all patients with wt R SNP (n=169), 52% of women, and 51% of men had AD (P=0.843). Whereas across all patients with mut R SNP (n=213), 56% of women, and 62% of men had AD (P=0.351). Of all male patients (n=204), mut R SNP was 56% in ED, and 67% in AD (P=0.105). Whereas of all female patients (n=178), mut R SNP was 46% in ED, and 50% in AD (P=0.626).
Overall survival
Across all patients (n=382) the 5-year estimate for OS was 58±4% for the CC group, 50±4% for the CG, and 46±7% for the GG group (P=0.141), whereas it was 58±4% for wt R SNP, and 48±3% for the mut R SNP (CG and GG combined) (P=0.048). Multivariate analysis was performed. In all patients the following factors available at transplant influenced the OS: AD (RR 2.70; 95% CI: 1.94-3.77; P<0.001), mismatch donor (RR 1.64; 95% CI: 1.19-2.27; P=0.003), and age >40 years (RR 1.54; 95% CI: 1.16-2.06; P=0.003), and R SNP (RR 1.22; 95% CI: 1.01-1.49; P=0.044).
Importantly, this difference was evident especially in male patients (n=204) where the group with CYP1B1 mutations did significantly worse: 5-year OS was 58±6% versus 44±5% versus 37±9% ( P =0.062) (Figure 1A), whereas it was 58±6% for wt R SNP versus 42±4% for mut R SNP ( P =0.024). In sharp contrast, OS of female patients was almost identical between the three groups (5-year OS: 58±5% vs . 58±6% vs . 58±10%) (Figure 1B). Multivariate analysis was performed. In male patients only the following factors available at transplant influenced OS: AD (RR 2.52; 95% CI: 1.59-4.00; P <0.001), R SNP (RR 1.46; 95% CI: 1.12-1.91; P =0.005), and age >40 years (RR 1.50; 95% CI: 1.03-2.19; P =0.034).
Interestingly, this difference in survival rate was observed primarily in male patients with AD (n=118), where the group with CYP1B1 mutations did significantly worse: their 5-year OS was 44±8% versus 32±6% versus 6±6% ( P =0.002) (Figure 2A). In contrast, regarding male patients with ED, OS was almost identical between the three groups (5-year OS: 74±7% vs . 69±8% vs . 69±12%)
(48)
(56)
Wild-type (wt) single nucleotide polymorhism (SNP) equals CC genotype and mutant (mut) SNP stands for CG and GG genotype. Percentages indicate the prevalence of wt and mut SNP in the respective recipient or donor group: each row equals the sum of 100%. (A) P=0.006 (χ2); (B) P=0.833 (χ2).
(Figure 2B). Multivariate analysis was performed (Table 4). In male patients with AD, only the following factor available at transplant influenced OS: R SNP with RR 1.78; 95% CI: 1.25-2.52; P =0.001.
Non-relapse mortality
One-year estimate for NRM in male patients with AD was 8±4% for wt/wt versus 21±5% for mut/wt versus 50±12% for mut/mut CYP1B1 R SNP (P=0.002) (Figure 3A). In contrast, there was no difference in the outcome concerning male patients with ED (NRM 13% vs. 13% vs. 19%) (Figure 3B). Multivariate analysis was performed (Table 4). In male patients with AD, only the following factor influenced NRM: CYP1B1 R SNP (RR 1.98; 95% CI: 1.21-3.25; P=0.007). Causes of death (n=15) in the GG group (n=16) of male patients with AD were: relapse n=6, sepsis n=4, invasive fungal infection n=3, and veno-occlusive disease n=2 patients. When looking at the R SNP group GG in male patients with AD, there was no pattern with regards to clinical features (see Table 2), other outcomes or causes of death compared to group CG and group CC. Relapse and infections were a common cause of death.
Occurrence of relapse
When looking at relapse, CYP1B1 genetic polymorphism in patients (R SNP) at first did not seem to make a difference in either sex. However, in male patients with AD (n=118), mut R SNP was associated with more relapses at 3 years than wt R SNP: 31±7% versus 43±6% versus 38±12% (P=0.08) (Figure 4A). When combining wt/mut and mut/ mut the numbers were 31±7% versus 42±6% (P=0.04). In contrast, male patients with ED did not show this phenomenon (relapse 24% vs. 16% vs. 19%) (Figure 4B). This was confirmed by multivariate analysis in male patients with AD (Table 4) where R SNP was the strongest predictor for relapse (RR 1.92; 95% CI: 1.21-3.07; P=0.006), with mut R SNP performing worse, and graft type (RR 0.38;
Haematologica | 109 Marzo 2024 802 ARTICLE - CYP1B1 polymorphism and survival in allogeneic HSCT N. Stute and M. Koldehoff
A B Recipient Genotype wt N=169 Genotype mut N=213 Donor Genotype wt N=166 Genotype mut N=216 Male, N (%) N=204 77 (38) 127 (62) Male, N (%) N=237 102 (43) 135
Female, N
N=178 92
86
Female, N
N=145 64
81
Table 3. CYP1B1 polymorphism (Leu432Val) of recipients (A) and donors (B), N=382.
(57)
(%)
(52)
(%)
(44)
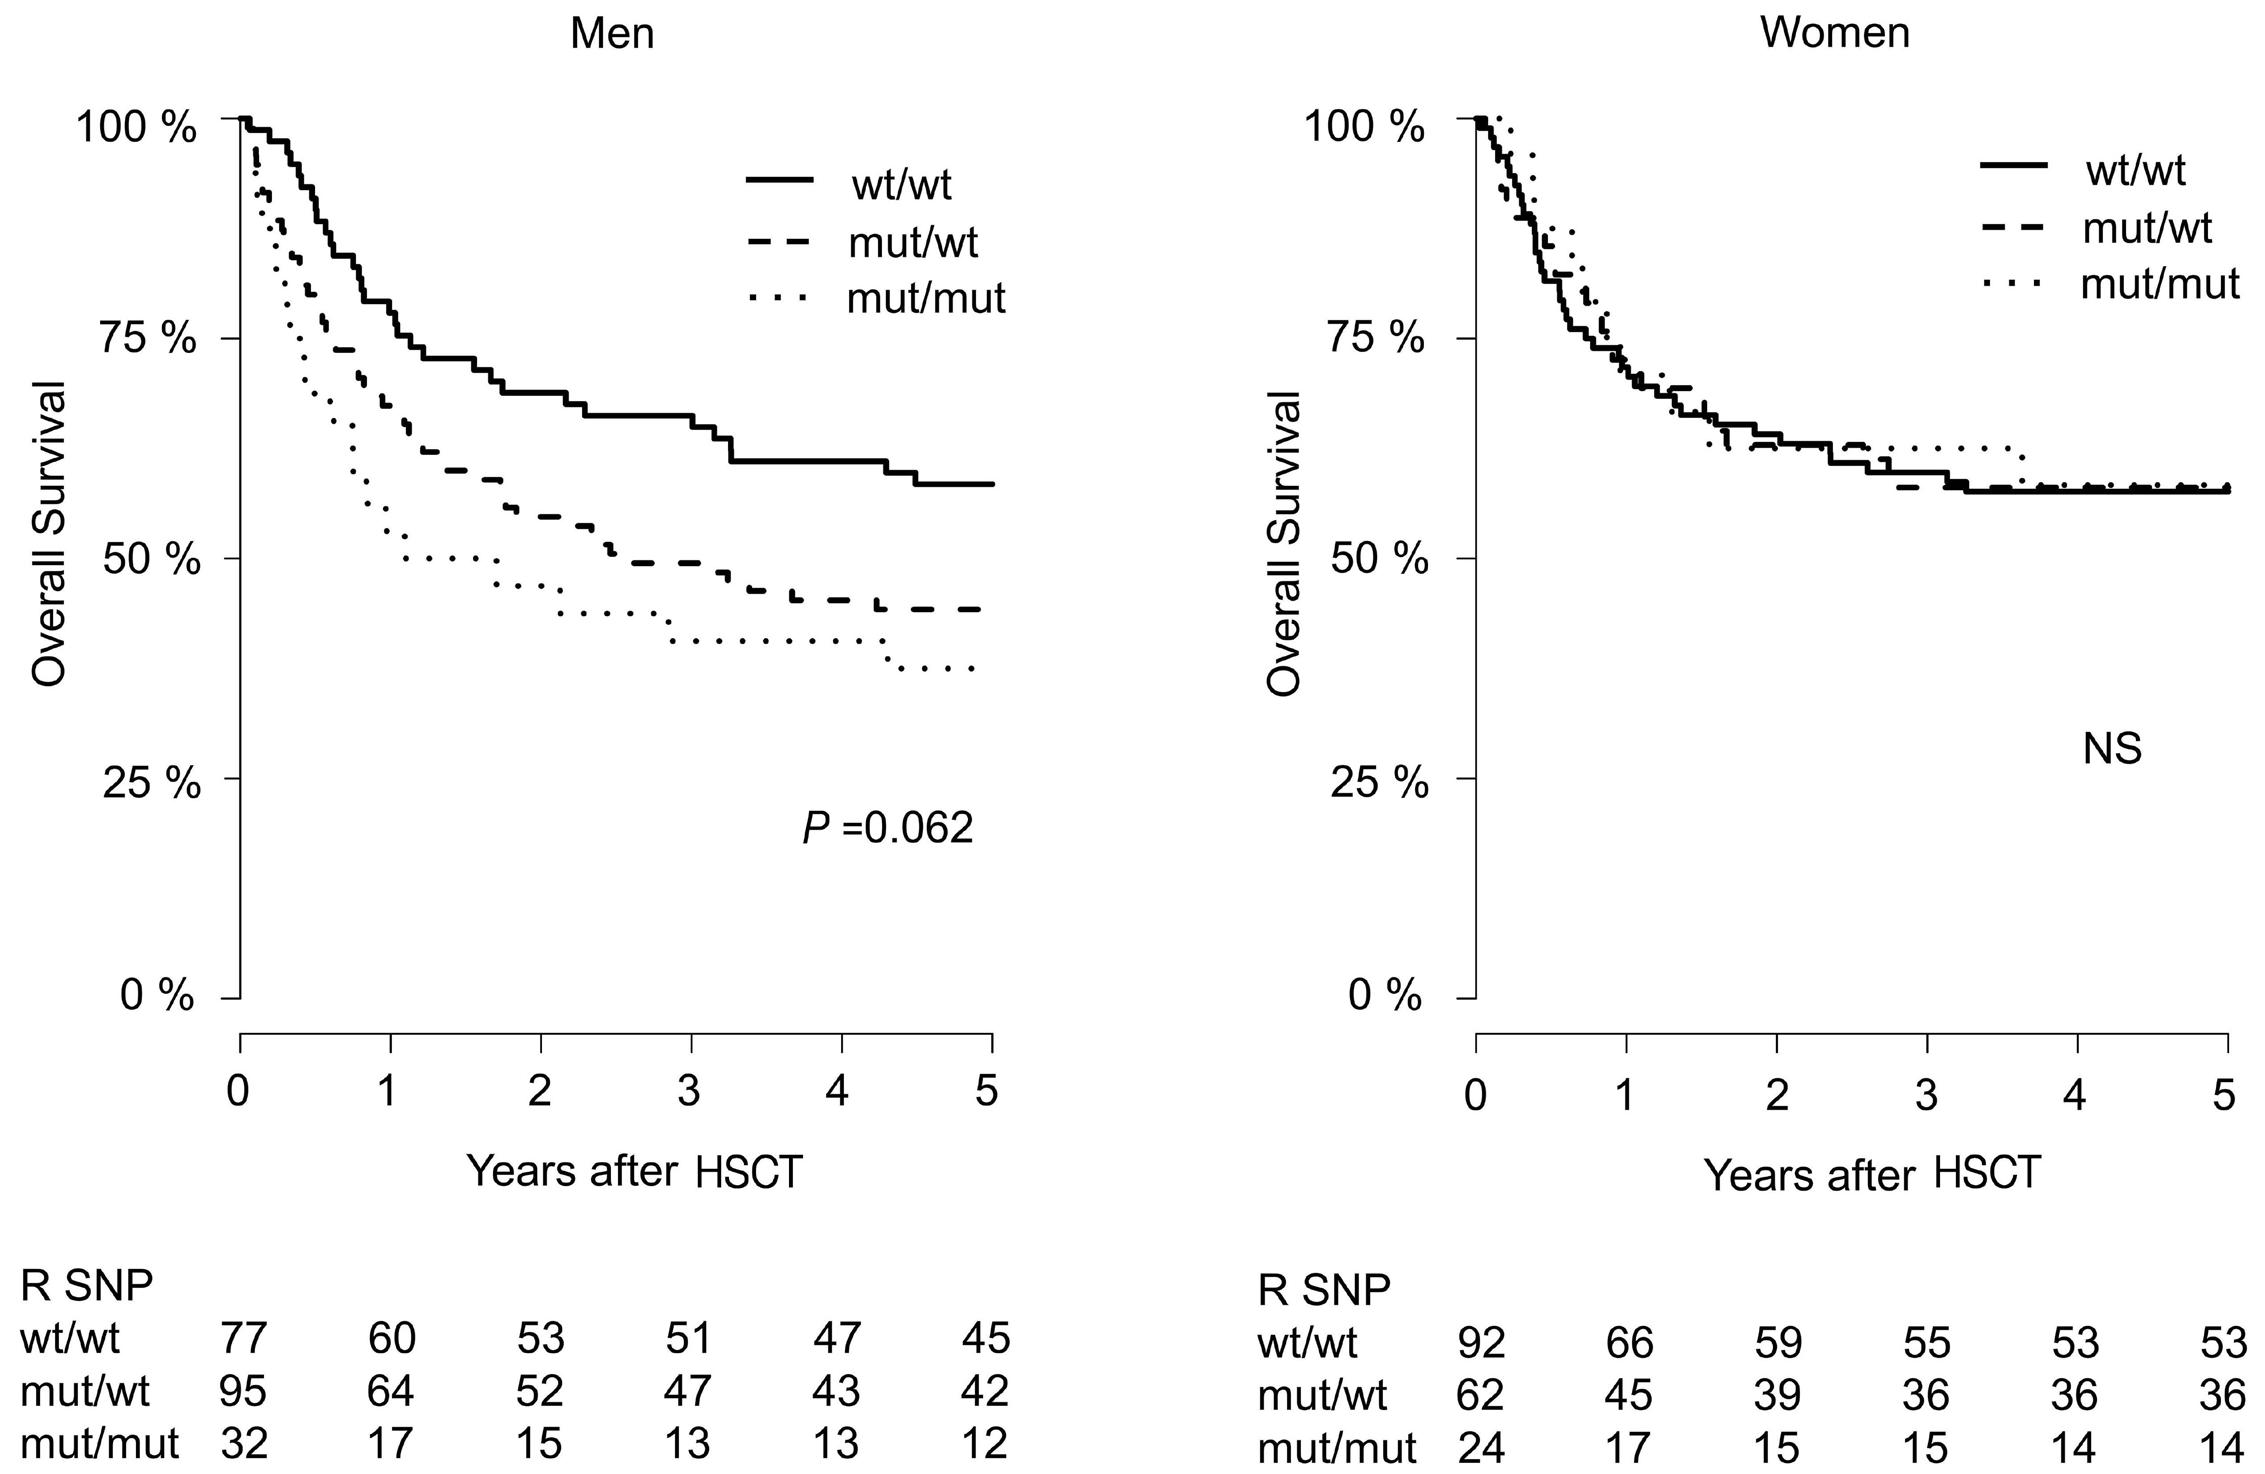
wild-type (wt) R
(not significant [NS]). R SNP here CYP1B1 C432G polymorphism CC, CG and GG. HSCT: hematopoietic stem cell transplantation.
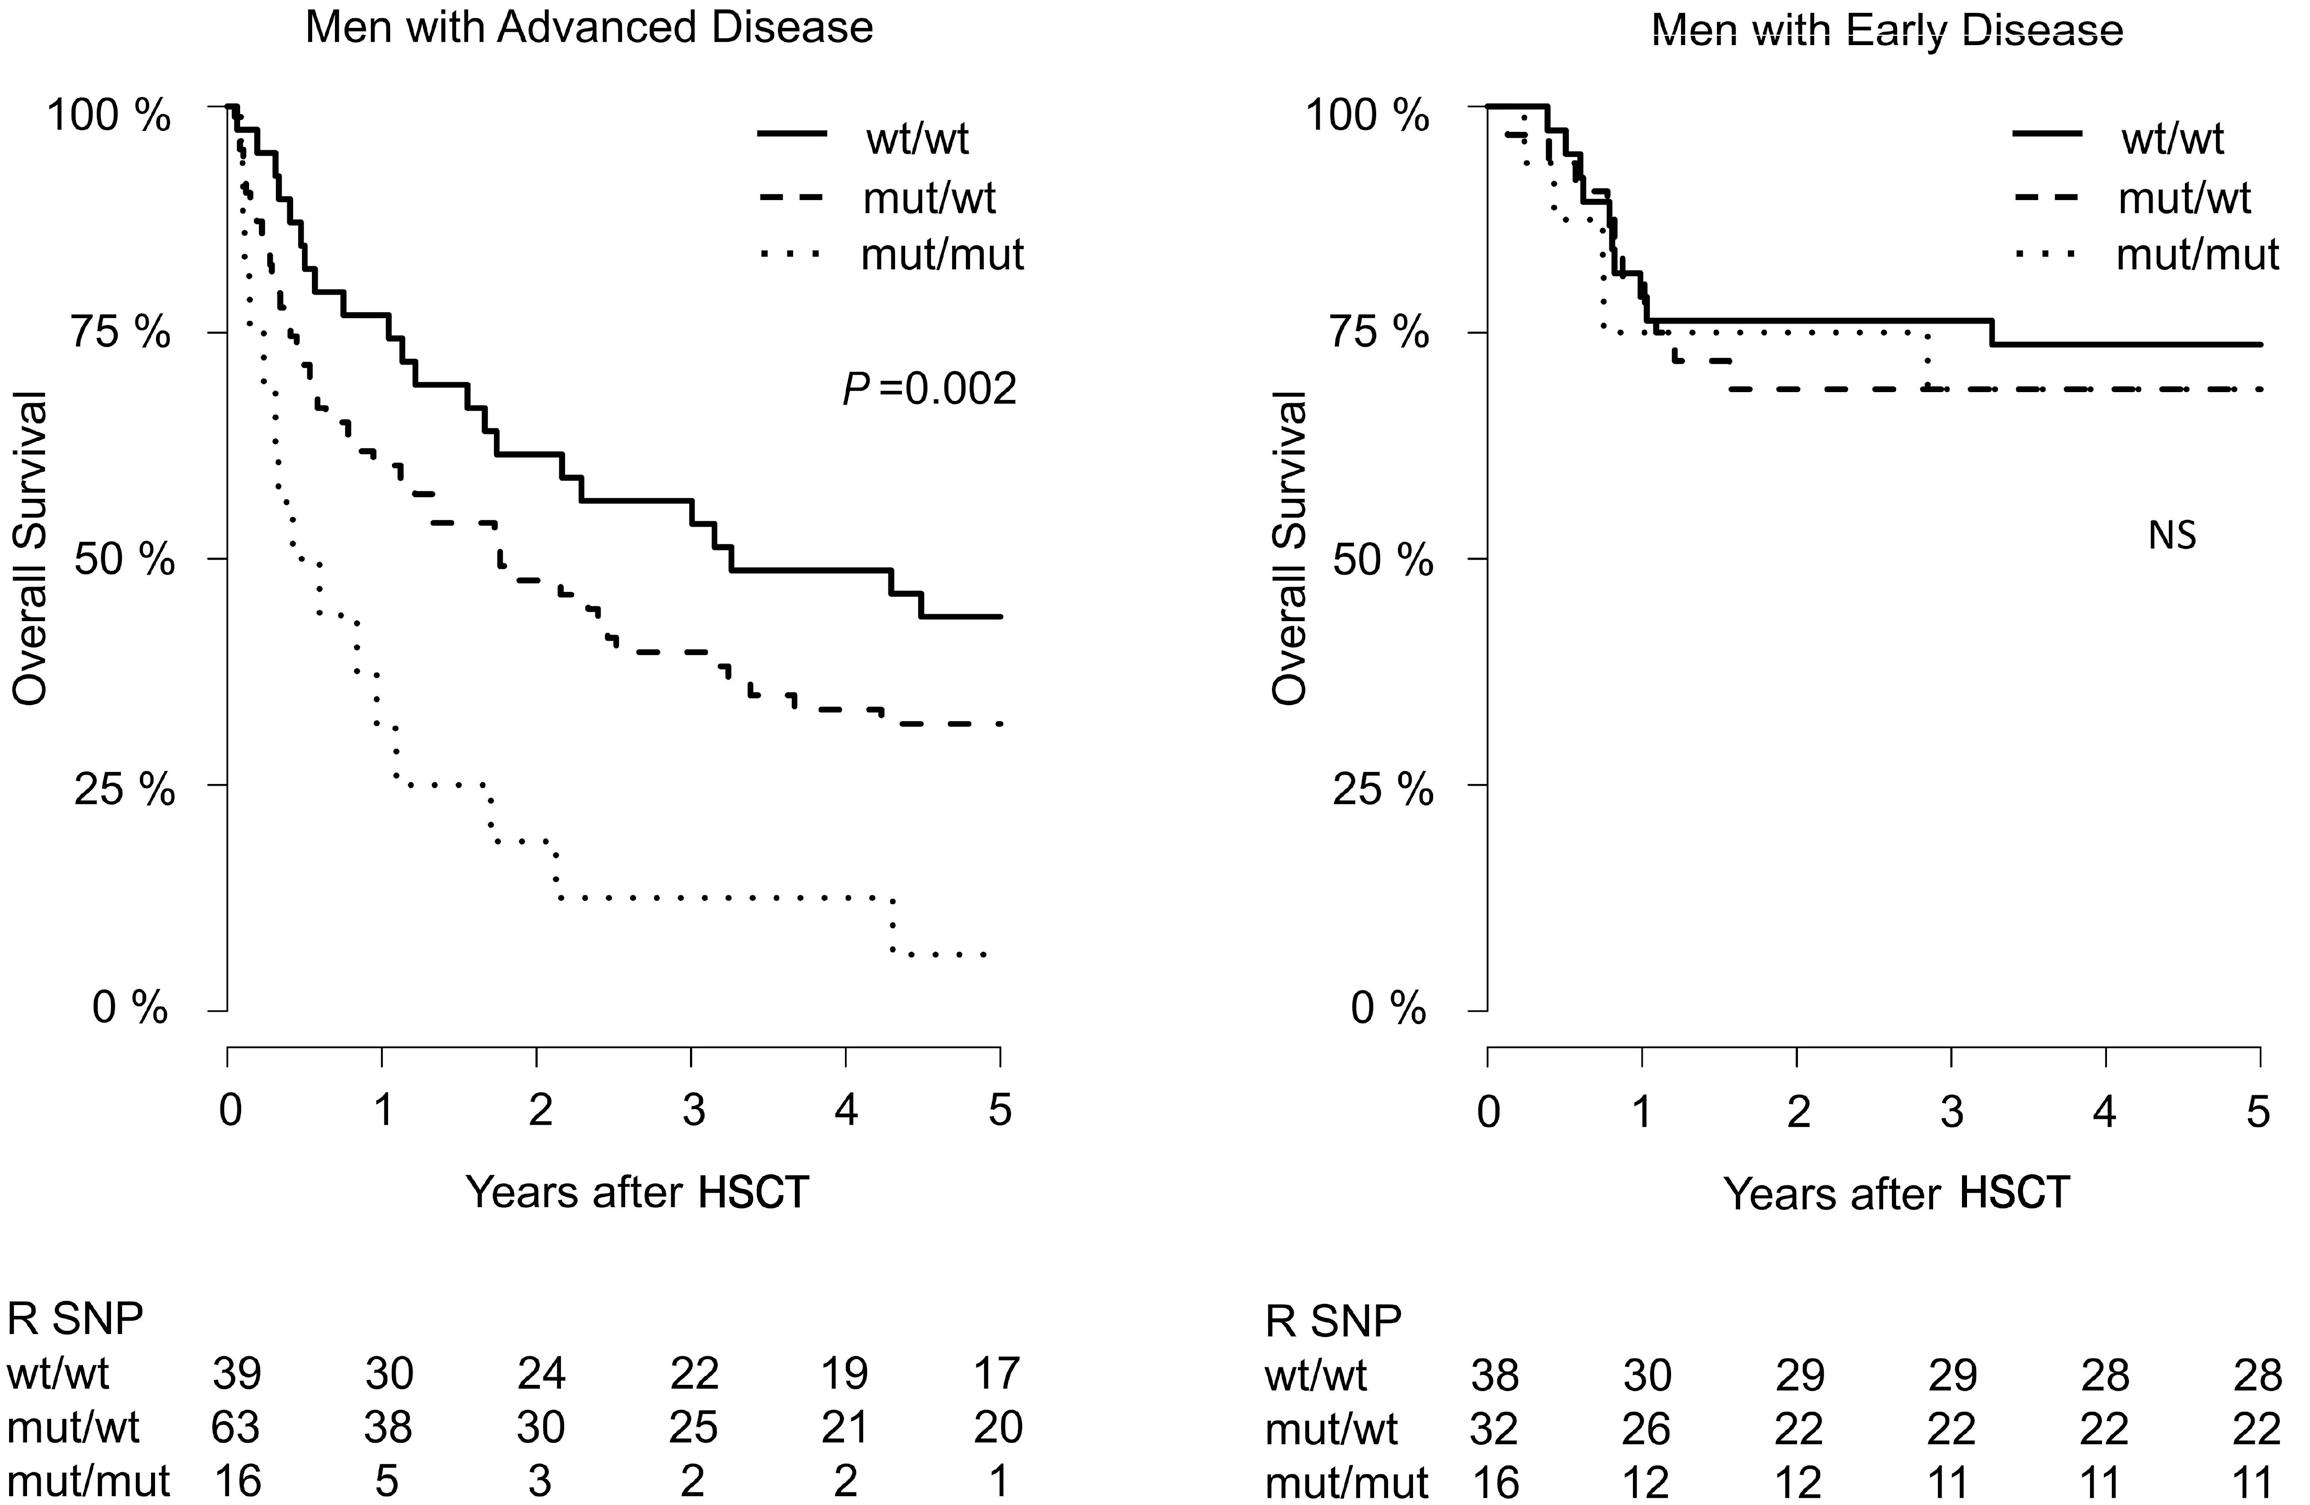
Haematologica | 109 Marzo 2024 803 ARTICLE - CYP1B1 polymorphism and survival in allogeneic HSCT N. Stute and M. Koldehoff
A
Figure 1. Overall survival estimate by CYP1B1 polymorphism. (A) Male patients (N=204): patients with mutant (mut) recipient single nucleotide polymorphism (R SNP) (wt/mut and mut/mut) had lower overall survival (OS) than patients with
SNP (wt/wt). (B) Female patients (N=178) displaying no difference
B
A
Figure 2. Overall survival estimate in male patients by CYP1B1 polymorphism. (A) Male patients with advanced disease (N=118): patients with mutant (mut) recipient single nucleotide polymorphism (R SNP) had lower overall survival (OS) than patients with wild-type (wt) R SNP. (B) Male patients with early disease (N=86) displaying no difference (not significant [NS]). HSCT: hematopoietic stem cell transplantation.
B
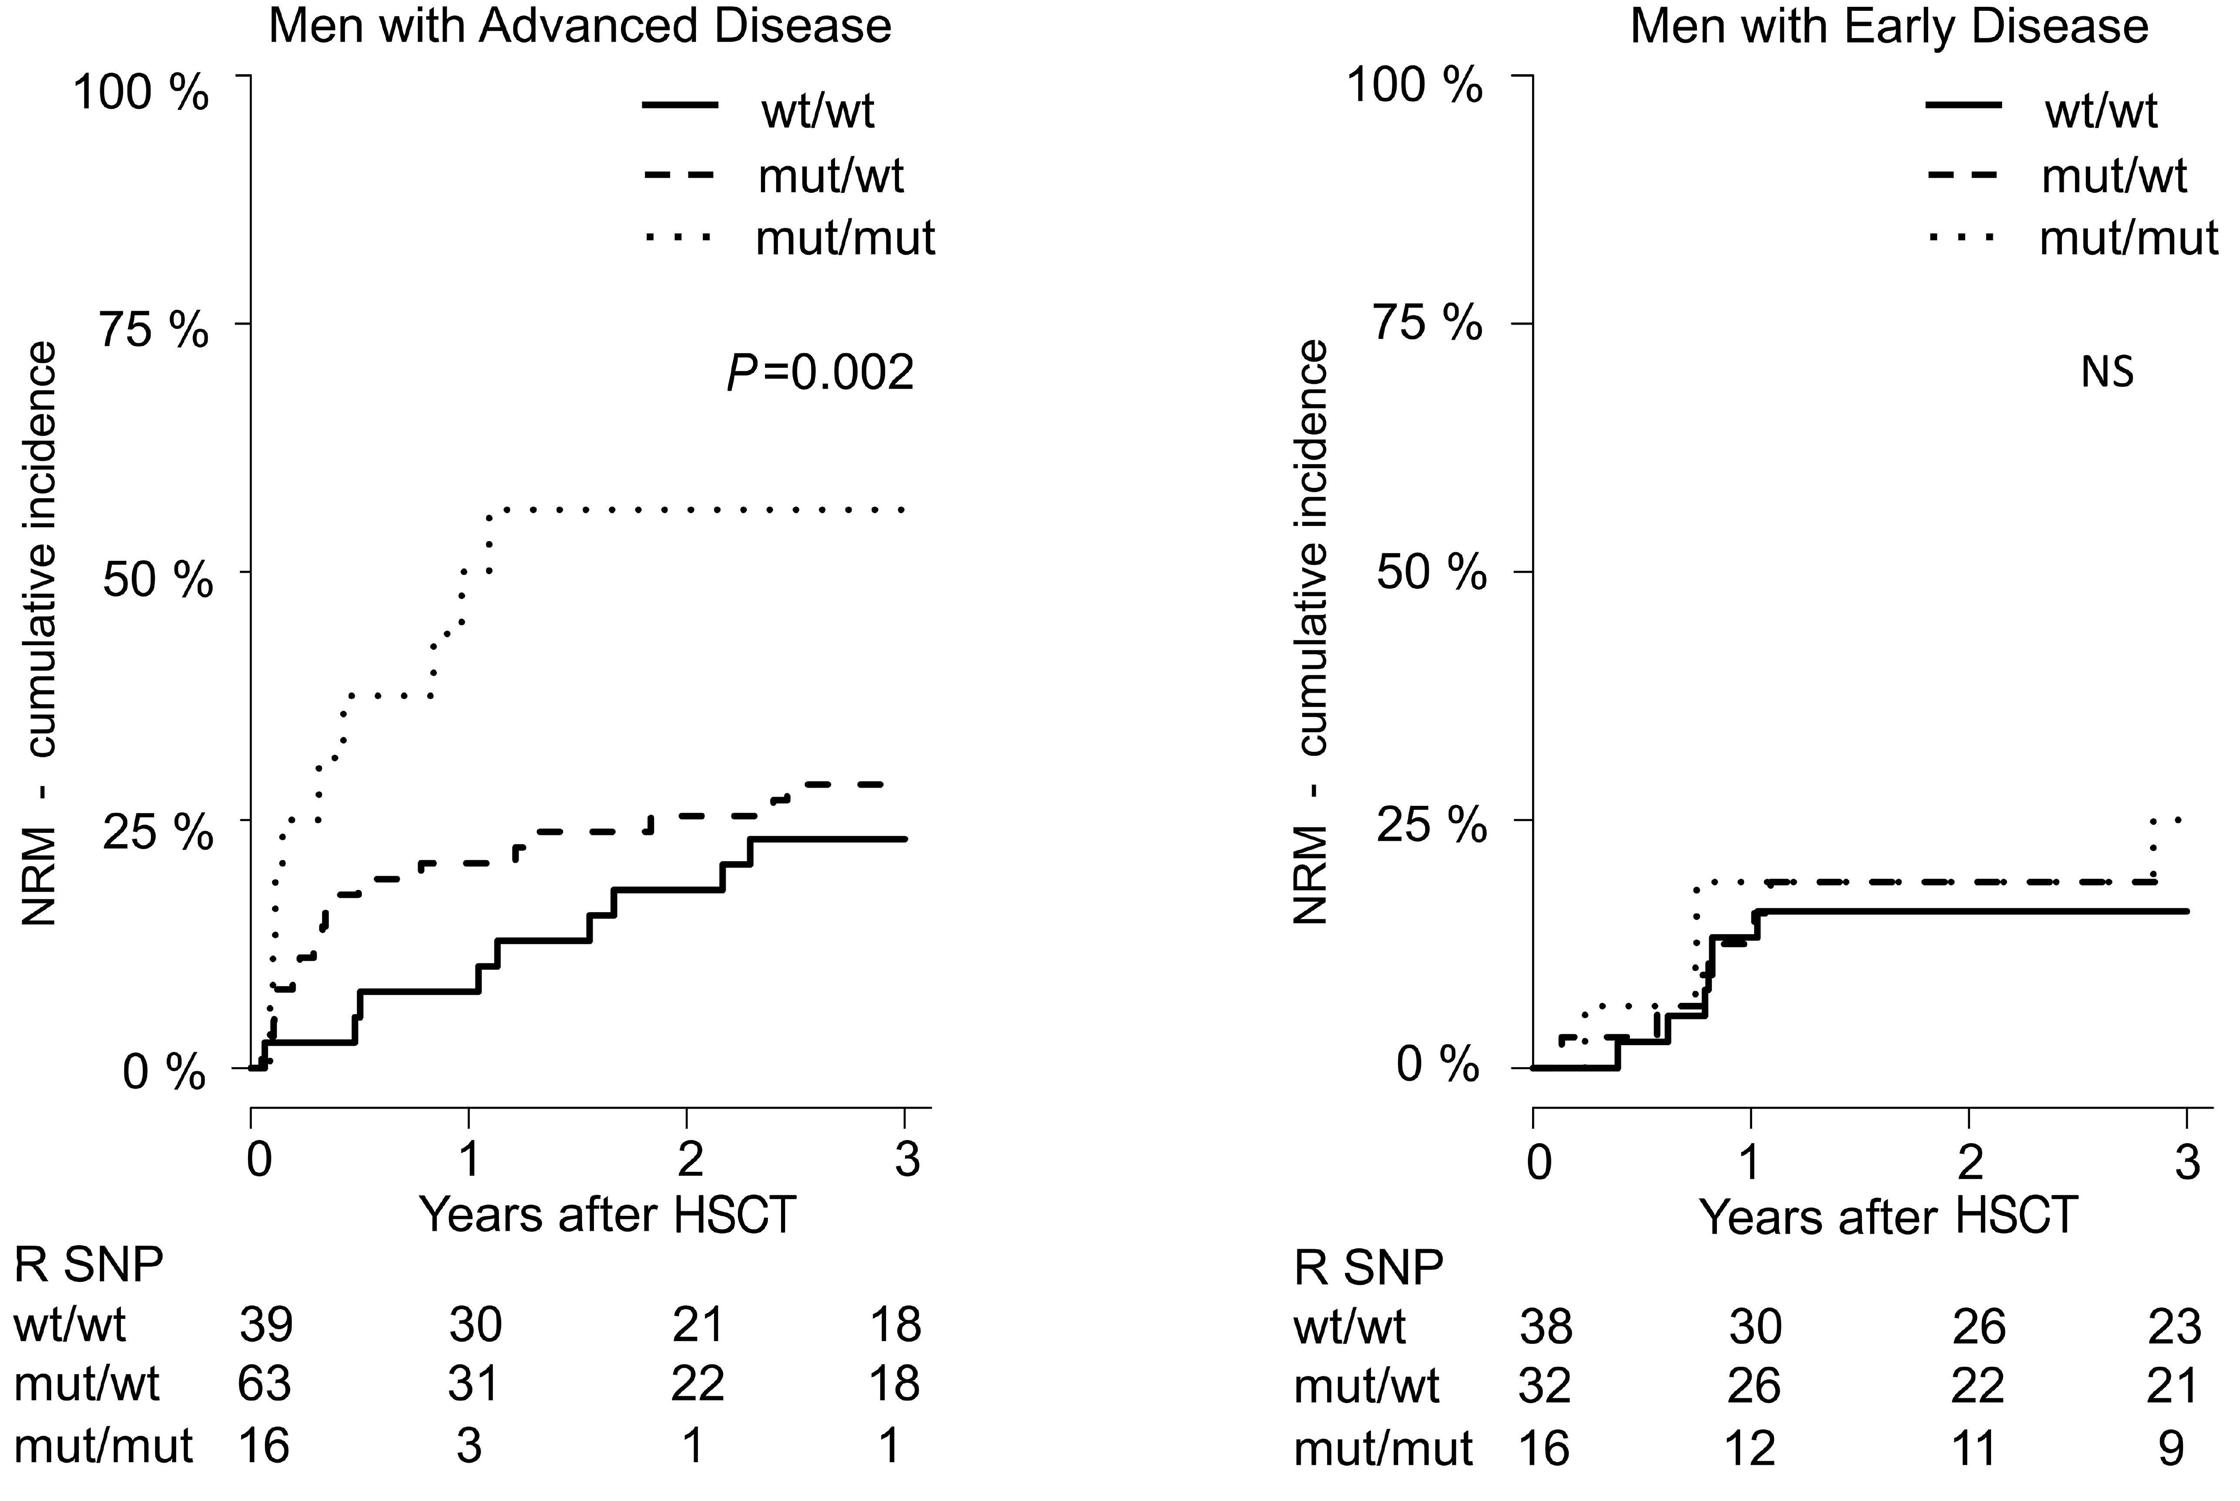
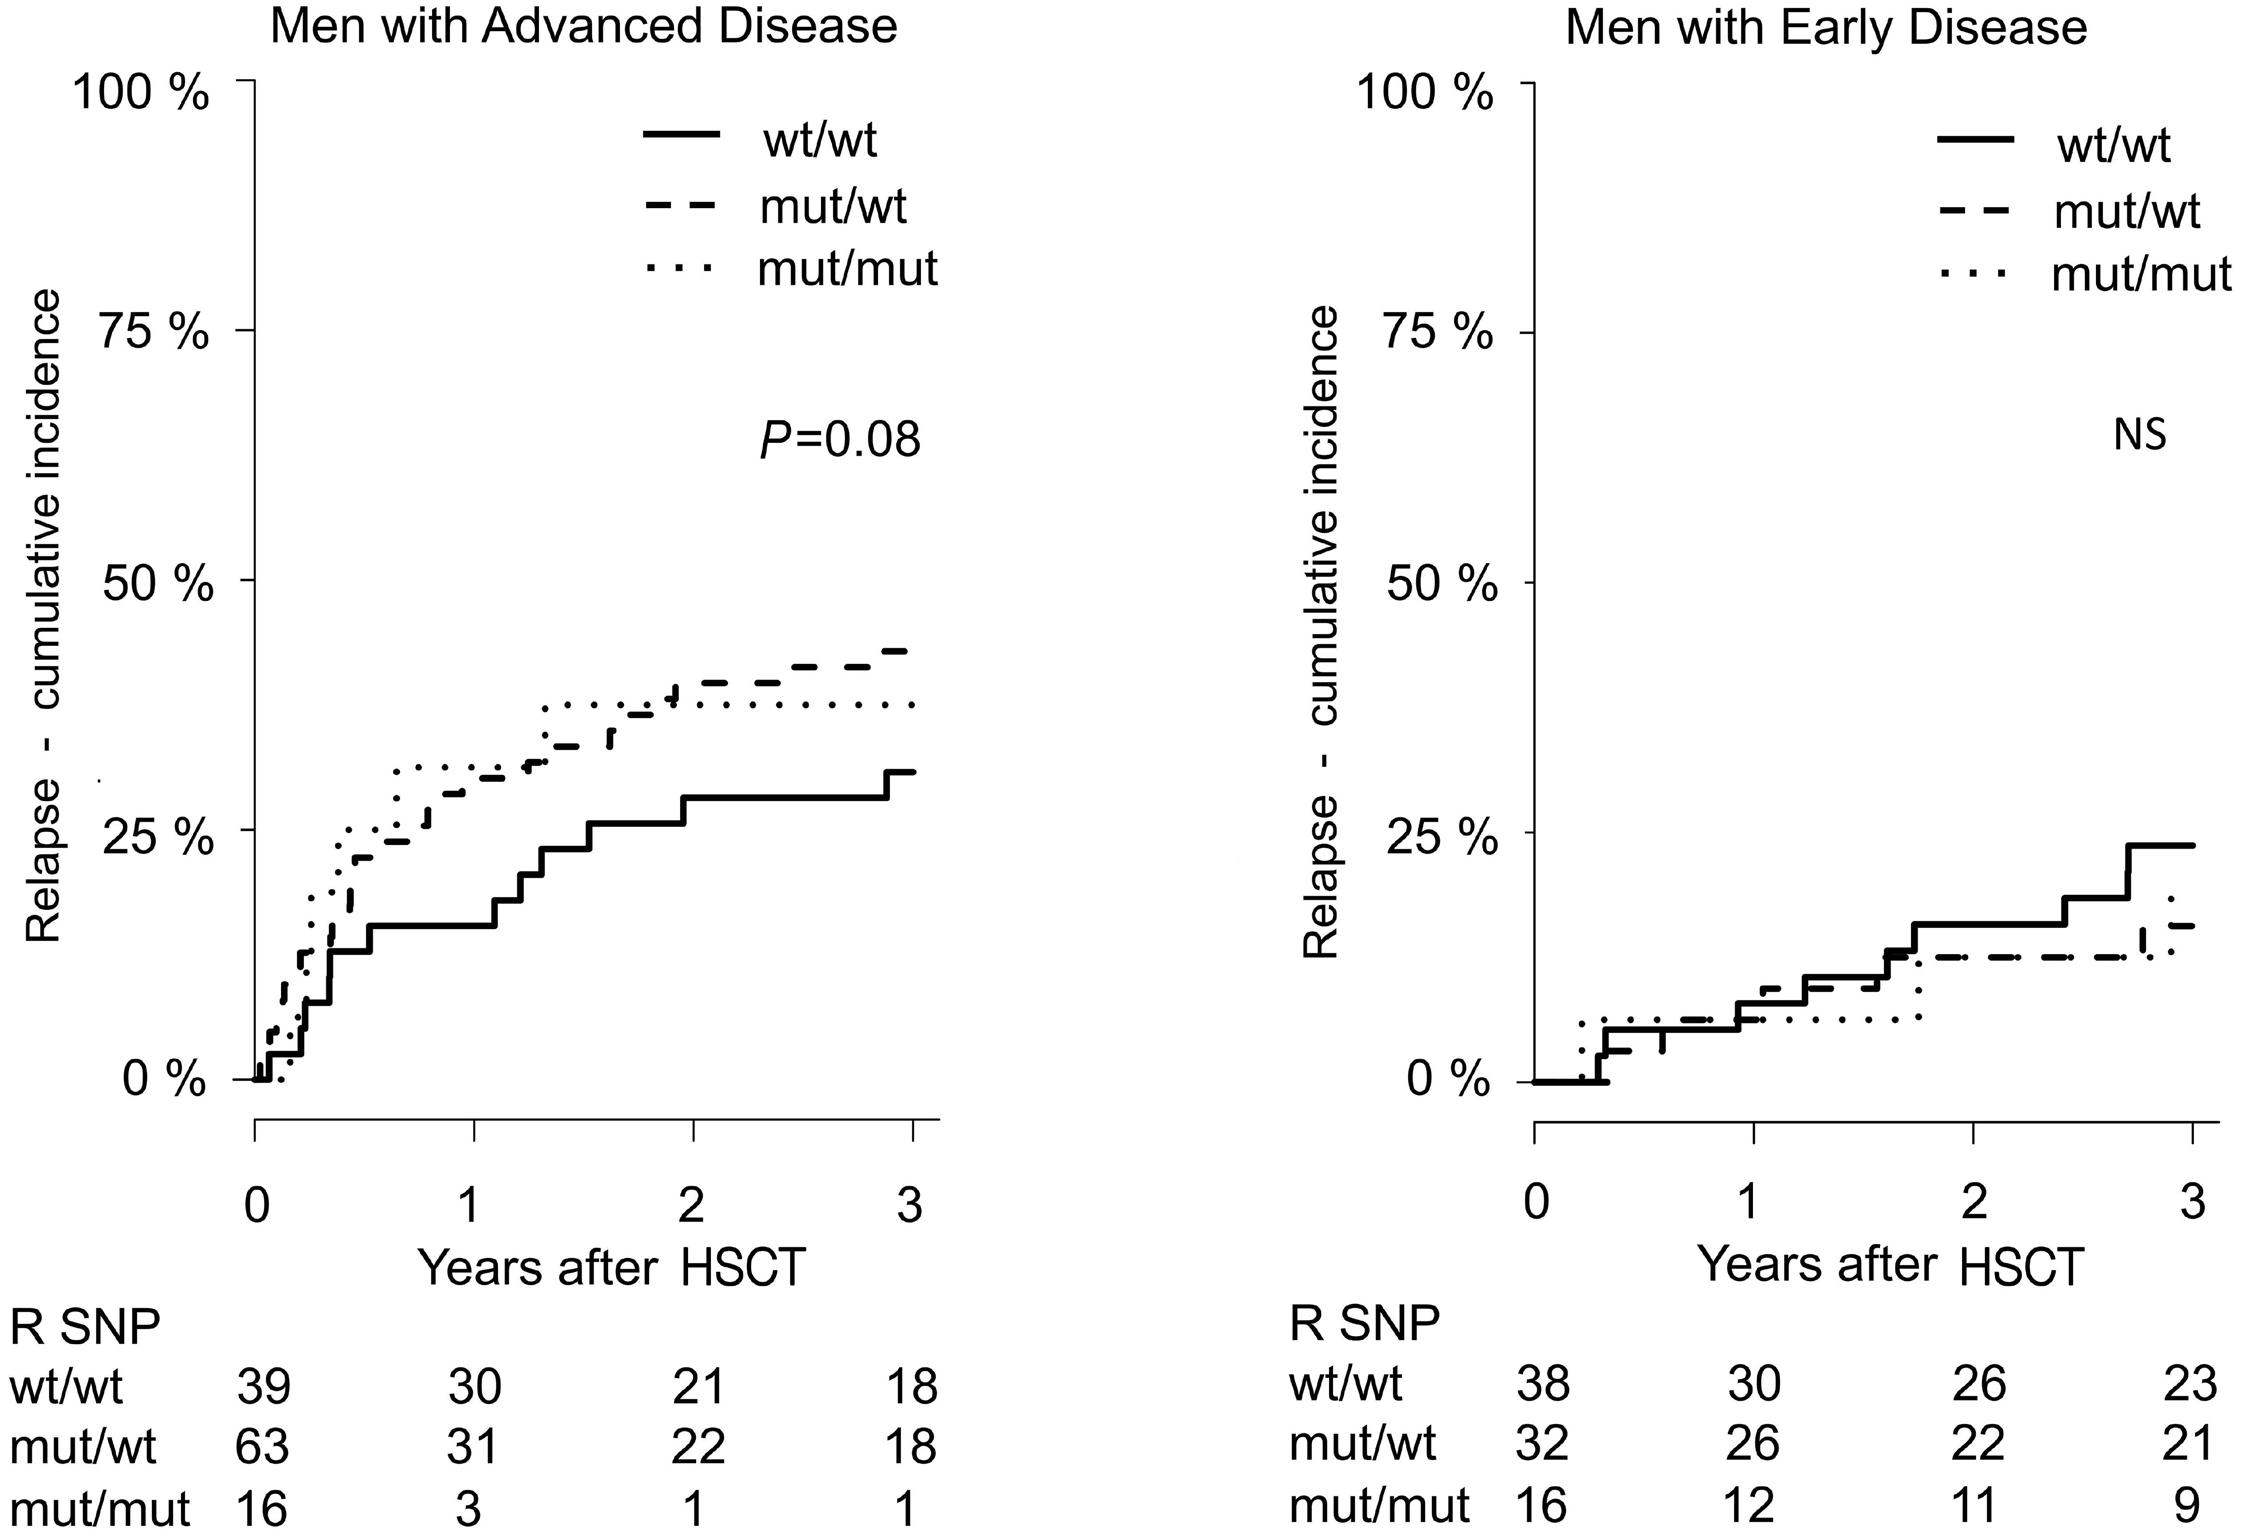
Haematologica | 109 Marzo 2024 804 ARTICLE - CYP1B1 polymorphism and survival in allogeneic HSCT N. Stute and M. Koldehoff
A B
Figure 3. Non-relapse mortality estimate in male patients by CYP1B1 polymorphism. (A) Male patients with advanced disease (N=118): male patients with mutant (mut) recipient single nucleotide polymorphism (R SNP) had a higher non-relapse mortality (NRM) than those with wild-type (wt) R SNP. (B) Male patients with early disease (N=86) displaying no difference (not significant [NS]). HSCT: hematopoietic stem cell transplantation.
A B
Figure 4. Relapse estimate in male patients by CYP1B1 polymorphism. (A) Male patients with advanced disease (N=118). Male patients with mutant (mut) recipient single nucleotide polymorphism (R SNP) had a higher relapse rate than those with wild-type (wt) R SNP. (B) Male patients with early disease (N=86) displaying no difference (not significant [NS]). HSCT: hematopoietic stem cell transplantation.
95% CI: 0.16-0.89; P=0.026) with PBSC being associated with a lower relapse rate.
Acute and chronic graft-versus-host disease
In male patients with AD (n=118) the estimated incidence of acute GVHD, grade 3-4 on day 30 post HSCT was 3±3% versus 19±6% versus 40±14% for R SNP (P=0.177). Whereas for male patients with early disease it was 12% versus 13% versus 7% (P=0.633). Although displaying a trend, the numbers were relatively small and not significant. R SNP was also not significant in multivariate analysis for severe acute GVHD. The incidence of chronic GVHD (all stages) was similar in the three R subgroups (R SNP), with 64% in CC, 60% in CG, and 44% in GG (χ2, P=0.367) in male patients with AD. R SNP was also not significant in multivariate analysis for all stages of chronic GVHD.
CYP1B1 is not involved in metabolism of immunosuppressants like cyclosporine, and there was no difference observed between the three subgroups of R SNP when comparing cyclosporine or cortisone doses upon discharge. For the role of sex mismatch on outcome please see the Online Supplementary Appendix.
Engraftment, kidney and liver toxicity
For 198 of 382 patients (52%) additional data was available. This was an unselected group. Male patients with AD, 57 of 198 (29%) displayed no significant difference in engraftment of neutrophils or thrombocyytes between wt and mut R SNP. We also evaluated the maximum creatinine and bilirubin values after transplant. While there was a tendency towards higher mean (not median) creatinine and bilirubin values in patients with mut R SNP, this difference was small and by no means significant.
Discussion
In this retrospective single-center study we evaluated the influence of CYP1B1 polymorphism (Leu432Val) on the clinical outcome after allogeneic HSCT in adult patients. We found that mut SNP is associated with lower OS in male patients with AD due to increased non-relapse mortality, and a higher relapse rate after HSCT. This outcome difference in male patients is not explained by other prognostic factors available at time of transplant. In contrast, this association has not been seen in male patients with ED or in female patients. Of note, the above has been found in a primarily myeloablative setting.
Interestingly, male patients were more likely to have the mut SNP of CYP1B1 compared to female patients (62% vs. 48%). However, in contrast to the R group (which had hematological cancer - therefore, had also been exposed to anticancer drugs and radiation), there was no sex difference in distribution between wt and mut SNP within the donor group. Calculated Leu432Val (or C432G) genotype frequencies of CYP1B1 did not differ much from that reported earlier for Caucasians: CC 37%, CG 46% and GG 17%.44,50
It could therefore be postulated that men with mut SNP have a higher risk of hematological cancer, or are more likely to relapse post induction and consolidation therapy (and thus become transplant candidates more often) than men with wt SNP. This conclusion is corroborated by Tang et al 51 who found that among Caucasians 34% of men with prostate cancer were homozygous for the Val432 polymorphism (or GG in other words), while only 12% of matched control subjects had this genotype. Also by Fritsche et al. 50 who reported that genotypes heterozygous and homozygous for the Val432 polymorphism (i.e., CG and GG or mut SNP) were
Cox regression was performed using R. Shown are clinically relevant parameters available at transplant entering the multivariate analysis: see statistics. *Age >50 years was chosen for relapse since it had a better correlation than age >40 years. RR: relative risk; NRM: non relapse mortality; relation: sibling versus unrelated; mismatch: HLA-constellation between patient and donor (identical vs. mismatch); graft: peripheral blood stem cells versus bone marrow; RICMAC: reduced intensity versus myeloablative conditioning; TBI: total body irradiation; TC-depletion: in vivo T-cell depletion; R SNP: recipient single nucleotide polymorphism (SNP) - here CYP1B1 C432G polymorphism CC, CG and GG.
Haematologica | 109 Marzo 2024 805 ARTICLE - CYP1B1 polymorphism and survival in allogeneic HSCT N. Stute and M. Koldehoff
Characteristics Overall survival Relapse NRM RR P RR P RR P Age >40 years 1.57 0.057 1.88* 0.051 1.86 0.073 Donor sex 1.00 0.999 0.90 0.790 1.18 0.693 Relation 1.07 0.803 0.95 0.881 1.11 0.799 Mismatch 1.27 0.353 0.60 0.189 1.64 0.149 Graft 0.66 0.263 0.38 0.026 1.21 0.762 RICMAC 1.15 0.755 1.50 0.489 1.44 0.571 TBI 0.86 0.561 1.00 0.000 0.71 0.340 TC-depletion 1.27 0.332 1.32 0.410 0.88 0.728 R SNP 1.78 0.001 1.93 0.006 1.98 0.007
Table 4. Results of multivariate analysis for main outcomes after hematopoietic stem cell transplantation - male patients with advanced disease only (N=118).
more frequent in patients with colorectal cancer compared to controls.
Of interest, even though wt SNP was more common in female patients, it does not appear to be associated with a better outcome. Whereas mut SNP appears to have a clear negative effect in men with AD. Female patients with mut SNP seem to have a better outcome than their male counterparts. It could be speculated that this is due to the presence of estrogens.
Sissung et al. 52 made a similar observation in male patients with prostate cancer: patients with CYP1B1*3 polymorphic variant (L432V) GG had a decreased OS after docetaxel-based therapies compared with individuals carrying at least one copy of the CYP1B1*1 (allele CC or CG).
NRM was higher in male patients with mut SNP compared to male patients with wt SNP in the AD setting, whereas this difference did not show at all in female patients. An explanation for the NRM increase in male patients with mut SNP could be a higher rate of organ toxicity or more infections due to chemotherapy, radiotherapy or immunotherapy. Relapse was higher in male patients with AD for mut SNP compared to wt SNP. This could be due to a poor response of cancer cells with mut SNP to chemotherapy, radiotherapy, and immunotherapy, thus leading to a higher relapse rate in patients with AD.
Of note, most patients analyzed received myeloablative transplants in the years 1993-2006, median 2002. The field of transplantation has changed over the years due to advances in donor selection and supportive care, i.e., infection disease and GVHD control, resulting in improved survival.
The sex differences observed in this study comparing wt and mut SNP in recipients were striking. So far, sex differences in outcome after allogeneic HSCT have not been reported with the exception of increased rates of chronic GVHD for female donors and male recipients.53 T cells of female donors specific for minor histocompatibility antigens encoded by genes on chromosome Y may contribute to GVHD, graft rejection, and graft-versus-leukemia effects in hematological malignancies.54
In conclusion, our retrospective single-center cohort study provides strong evidence that male patients with mut genetic polymorphism of CYP1B1 have a lower OS in AD after HSCT, and that this is due to a higher NRM and relapse rate.
References
1. Lee SJ, Klein J, Haagenson M, et al. High-resolution donorrecipient HLA matching contributes to the success of unrelated donor marrow transplantation. Blood. 2007;110(13):4576-4583.
2. Dickinson AM, Norden J. Non-HLA genomics: does it have a role in predicting haematopoietic stem cell transplantation outcome? Int J Immunogenet. 2015;42(4):229-238.
3. Chien JW, Zhang XC, Fan W, et al. Evaluation of published single nucleotide polymorphisms associated with acute GVHD. Blood. 2012;119(22):5311-5319.
Genotyping for CYP1B1 C432G polymorphism might therefore help identify patients with higher risk for allogeneic HSCT in the future, and may perhaps also explain some sex differences in outcome. Validation of the role of CYP1B1 C432G polymorphism in a prosppective study or confirmation in an independent cohort are warranted before any clinical conclusions are drawn. We also suggest further in vitro and in vivo studies on hematological cancers and lymphocytes regarding the role of CYP1B1 and its Leu432Val polymorphism.
Disclosures
No conflicts of interest to disclose.
Contributions
NS was responsible for the analysis of data, interpretation of results, and literature research. He performed the statistical analyses, created tables and figures, and wrote the manuscript. MK was responsible for the design of the study and conduct of the research. He obtained funds, designed the laboratory protocol, supervised experiments, and extracted and collected both clinical and lab data. He also revised and edited the manuscript. Both authors approved the final version of the manuscript.
Acknowledgments
We thank Christiane Schary, Melanie Kroll, Silke Gottwald, and Ines Riepenhoff (all Essen, Germany) for their excellent technical assistance with PCR analyses. We also wish to thank patients and donors who participated in this study, as well as our colleagues, and the entire medical team at the BMT Center in Essen, especially Prof. Dr. Ahmet H. Elmaagacli. The EBMT statistics course in Leiden 2018 was very beneficial for implementing R. As a native English speaker Rachael Mellor assisted with grammar.
Funding
This work was supported by a grant from Deutsche Kulturstiftung Essen e.V. - research project (05 045).
Data-sharing statement
The data supporting the findings of this study are available upon request from the corresponding author.
4 Hansen JA, Chien JW, Warren EH, Zhao LP, Martin PJ. Defining genetic risk for graft-versus-host disease and mortality following allogeneic hematopoietic stem cell transplantation. Curr Opin Hematol. 2010;17(6):483-492.
5. Loeffler J, Ok M, Morton OC, Mezger M, Einsele H. Genetic polymorphisms in the cytokine and chemokine system: their possible importance in allogeneic stem cell transplantation. Curr Top Microbiol Immunol. 2010;341:83-96.
6. Elmaagacli AH, Koldehoff M, Steckel NK, Trenschel R, Ottinger H, Beelen DW. Cytochrome P450 2C19 loss-of-function
Haematologica | 109 Marzo 2024 806 ARTICLE - CYP1B1 polymorphism and survival in allogeneic HSCT N. Stute and M. Koldehoff
polymorphism is associated with an increased treatmentrelated mortality in patients undergoing allogeneic transplantation. Bone Marrow Transplant. 2007;40(7):659-664.
7 Elmaagacli AH, Steckel N, Ditschkowski M, et al. Toll-like receptor 9, NOD2 and IL23R gene polymorphisms influenced outcome in AML patients transplanted from HLA-identical sibling donors. Bone Marrow Transplant. 2011;46(5):702-708.
8. Arrieta-Bolanos E, Mayor NP, Marsh SG, et al. Polymorphism in TGFB1 is associated with worse non-relapse mortality and overall survival after stem cell transplantation with unrelated donors. Haematologica. 2016;101(3):382-390.
9. Holler E, Rogler G, Herfarth H, et al. Both donor and recipient NOD2/CARD15 mutations associate with transplant-related mortality and GvHD following allogeneic stem cell transplantation. Blood. 2004;104(3):889-894.
10 Elmaagacli AH, Koldehoff M, Hindahl H, et al. Mutations in innate immune system NOD2/CARD 15 and TLR-4 (Thr399Ile) genes influence the risk for severe acute graft-versus-host disease in patients who underwent an allogeneic transplantation. Transplantation. 2006;81(2):247-254.
11. D’Uva G, Baci D, Albini A, Noonan DM. Cancer chemoprevention revisited: cytochrome P450 family 1B1 as a target in the tumor and the microenvironment. Cancer Treat Rev. 2018;63:1-18.
12. He X, Feng S. Role of metobolic enzymes P450 (CYP) on activating procarcinogen and their polymorphisms on the risk of cancers. Curr Drug Metab. 2015;16(10):850-863.
13. Sissung TM, Price DK, Sparreboom A, Figg WD. Pharmacogenetics and regulation of human cytochrome P450 1B1: implications in hormone-mediated tumor metabolism and a novel target for therapeutic intervention. Mol Cancer Res. 2006;4(3):135-150.
14 Shimada T, Hayes CL, Yamazaki H, et al. Activation of chemically diverse procarcinogens by human cytochrome P-450 1B1. Cancer Res. 1996;56(13):2979-2984.
15. Hayes CL, Spink DC, Spink BC, Cao JQ, Walker NJ, Sutter TR. 17 beta-estradiol hydroxylation catalyzed by human cytochrome P450 1B1. Proc Natl Acad Sci U S A. 1996;93(18):9776-9781.
16. Sutter TR, Tang YM, Hayes CL, et al. Complete cDNA sequence of a human dioxin-inducible mRNA identifies a new gene subfamily of cytochrome P450 that maps to chromosome 2. J Biol Chem. 1994;269(18):13092-13099.
17 Tang YM, Wo YY, Stewart J, et al. Isolation and characterization of the human cytochrome P450 CYP1B1 gene. J Biol Chem. 1996;271(45):28324-28330.
18. Murray GI, Melvin WT, Greenlee WF, Burke MD. Regulation, function, and tissue-specific expression of cytochrome P450 CYP1B1. Annu Rev Pharmacol Toxicol. 2001;41:297-316.
19 Murray GI, Taylor MC, McFadyen MC, et al. Tumor-specific expression of cytochrome P450 CYP1B1. Cancer Res. 1997;57(14):3026-3031.
20 McFadyen MC, Melvin WT, Murray GI. Cytochrome P450 enzymes: novel options for cancer therapeutics. Mol Cancer Ther. 2004;3(3):363-371.
21. McFadyen MC, Murray GI. Cytochrome P450 1B1: a novel anticancer therapeutic target. Future Oncol. 2005;1(2):259-263.
22. Luby TM, Cole G, Baker L, Kornher JS, Ramstedt U, Hedley ML. Repeated immunization with plasmid DNA formulated in poly(lactide-co-glycolide) microparticles is well tolerated and stimulates durable T cell responses to the tumor-associated antigen cytochrome P450 1B1. Clin Immunol. 2004;112(1):45-53.
23. Gribben JG, Ryan DP, Boyajian R, et al. Unexpected association between induction of immunity to the universal tumor antigen CYP1B1 and response to next therapy. Clin Cancer Res.
2005;11(12):4430-4436.
24. Rochat B, Morsman JM, Murray GI, Figg WD, McLeod HL. Human CYP1B1 and anticancer agent metabolism: mechanism for tumor-specific drug inactivation? J Pharmacol Exp Ther. 2001;296(2):537-541.
25. Chun YJ, Kim S. Discovery of cytochrome P450 1B1 inhibitors as new promising anti-cancer agents. Med Res Rev. 2003;23(6):657-668.
26. Spencer DL, Masten SA, Lanier KM, et al. Quantitative analysis of constitutive and 2,3,7,8-tetrachlorodibenzo-p-dioxin-induced cytochrome P450 1B1 expression in human lymphocytes. Cancer Epidemiol Biomarkers Prev. 1999;8(2):139-146.
27. Baron JM, Zwadlo-Klarwasser G, Jugert F, et al. Cytochrome P450 1B1: a major P450 isoenzyme in human blood monocytes and macrophage subsets. Biochem Pharmacol. 1998;56(9):1105-1110.
28. Rentas S, Holzapfel N, Belew MS, et al. Musashi-2 attenuates AHR signalling to expand human haematopoietic stem cells. Nature. 2016;532(7600):508-511.
29 Maecker B, Sherr DH, Vonderheide RH, et al. The shared tumorassociated antigen cytochrome P450 1B1 is recognized by specific cytotoxic T cells. Blood. 2003;102(9):3287-3294.
30 Nagai F, Hiyoshi Y, Sugimachi K, Tamura HO. Cytochrome P450 (CYP) expression in human myeloblastic and lymphoid cell lines. Biol Pharm Bull. 2002;25(3):383-385.
31. DiNardo CD, Gharibyan V, Yang H, et al. Impact of aberrant DNA methylation patterns including CYP1B1 methylation in adolescents and young adults with acute lymphocytic leukemia. Am J Hematol. 2013;88(9):784-789.
32. Li DN, Seidel A, Pritchard MP, Wolf CR, Friedberg T. Polymorphisms in P450 CYP1B1 affect the conversion of estradiol to the potentially carcinogenic metabolite 4-hydroxyestradiol. Pharmacogenetics. 2000;10(4):343-353.
33. Hanna IH, Dawling S, Roodi N, Guengerich FP, Parl FF. Cytochrome P450 1B1 (CYP1B1) pharmacogenetics: association of polymorphisms with functional differences in estrogen hydroxylation activity. Cancer Res. 2000;60(13):3440-3444.
34. Gajjar K, Martin-Hirsch PL, Martin FL. CYP1B1 and hormoneinduced cancer. Cancer Lett. 2012;324(1):13-30.
35. Liu JY, Yang Y, Liu ZZ, Xie JJ, Du YP, Wang W. Association between the CYP1B1 polymorphisms and risk of cancer: a meta-analysis. Mol Genet Genomics. 2015;290(2):739-765.
36. Vineis P, Veglia F, Garte S, et al. Genetic susceptibility according to three metabolic pathways in cancers of the lung and bladder and in myeloid leukemias in nonsmokers. Ann Oncol. 2007;18(7):1230-1242.
37. Ottinger HD, Ferencik S, Beelen DW, et al. Hematopoietic stem cell transplantation: contrasting the outcome of transplantations from HLA-identical siblings, partially HLAmismatched related donors, and HLA-matched unrelated donors. Blood. 2003;102(3):1131-1137.
38. Elmaagacli AH, Basoglu S, Peceny R, et al. Improved diseasefree-survival after transplantation of peripheral blood stem cells as compared with bone marrow from HLA-identical unrelated donors in patients with first chronic phase chronic myeloid leukemia. Blood. 2002;99(4):1130-1135.
39. Elmaagacli AH, Peceny R, Steckel N, et al. Outcome of transplantation of highly purified peripheral blood CD34+ cells with T-cell add-back compared with unmanipulated bone marrow or peripheral blood stem cells from HLA-identical sibling donors in patients with first chronic phase chronic myeloid leukemia. Blood. 2003;101(2):446-453.
40. Thomas ED, Storb R, Clift RA, et al. Bone-marrow transplantation (second of two parts). N Engl J Med.
Haematologica | 109 Marzo 2024 807 ARTICLE - CYP1B1 polymorphism and survival in allogeneic HSCT N. Stute and M. Koldehoff
1975;292(17):895-902.
41. Przepiorka D, Weisdorf D, Martin P, et al. 1994 Consensus Conference on Acute GVHD Grading. Bone Marrow Transplant. 1995;15(6):825-828.
42. Shulman HM, Sullivan KM, Weiden PL, et al. Chronic graftversus-host syndrome in man. A long-term clinicopathologic study of 20 Seattle patients. Am J Med. 1980;69(2):204-217.
43. Maniatis T, Fritsch EF, Sambrook J. Molecular Cloning. A Laboratory Manual. Cold Spring Harbor Laboratory Press. 1982.
44 Bruning T, Abel J, Koch B, et al. Real-time PCR-analysis of the cytochrome P450 1B1 codon 432-polymorphism. Arch Toxicol. 1999;73(8-9):427-430.
45. Kaplan EL, Meier P. Non-parametric estimation from incomplete observations. J Am Stat Assoc. 1958;53(282):457-481.
46. Cox DR. Regression models and life-tables. J R Stat Soc Ser B. 1972;34(2):187-220.
47. R Core Team. R: A Language and Environment for Statistical Computing. R Foundation for Statistical Computing. 2018.
48. Iacobelli S, EBMT Statistical Committee. Suggestions on the use of statistical methodologies in studies of the European Group for Blood and Marrow Transplantation. Bone Marrow Transplant. 2013;48(Suppl 1):S1-37.
49 RStudio Team. RStudio: Integrated Development Environment for R. RStudio, Inc. 2015.
50 Fritsche E, Bruning T, Jonkmanns C, Ko Y, Bolt HM, Abel J. Detection of cytochrome P450 1B1 Bfr I polymorphism: genotype distribution in healthy German individuals and in patients with colorectal carcinoma. Pharmacogenetics. 1999;9(3):405-408.
51. Tang YM, Green BL, Chen GF, et al. Human CYP1B1 Leu432Val gene polymorphism: ethnic distribution in African-Americans, Caucasians and Chinese; oestradiol hydroxylase activity; and distribution in prostate cancer cases and controls. Pharmacogenetics. 2000;10(9):761-766.
52. Sissung TM, Danesi R, Price DK, et al. Association of the CYP1B1*3 allele with survival in patients with prostate cancer receiving docetaxel. Mol Cancer Ther. 2008;7(1):19-26.
53. Loren AW, Bunin GR, Boudreau C, et al. Impact of donor and recipient sex and parity on outcomes of HLA-identical sibling allogeneic hematopoietic stem cell transplantation. Biol Blood Marrow Transplant. 2006;12(7):758-769.
54 Gahrton G. Risk assessment in haematopoietic stem cell transplantation: impact of donor-recipient sex combination in allogeneic transplantation. Best Pract Res Clin Haematol. 2007;20(2):219-229.
Haematologica | 109 Marzo 2024 808 ARTICLE - CYP1B1 polymorphism and survival in allogeneic HSCT N. Stute and M. Koldehoff
Lymphocyte migration and retention properties affected by ibrutinib in chronic lymphocytic leukemia
Javier Rey-Barroso,1° Alice Munaretto,1+ Nelly Rouquié,1+ Aurélie Mougel,1 Malika Chassan,2 Sébastien Gadat,3,4 Océane Dewingle,5° Renaud Poincloux,6 Sarah Cadot,5 Loïc Ysebaert,5,7 Anne Quillet-Mary5 and Loïc Dupré1,8
1Toulouse Institute for Infectious and Inflammatory Diseases (INFINITy), INSERM, CNRS, Toulouse III Paul Sabatier University, Toulouse, France; 2Institut de Mathématiques de Toulouse, CNRS UMR 5219, Université Toulouse 3 Paul Sabatier, Toulouse, France; 3Toulouse School of Economics, CNRS UMR 5314, Université Toulouse 1 Capitole, Toulouse, France; 4Institut Universitaire de France, Paris, France; 5Toulouse Cancer Research Center (CRCT), INSERM, CNRS, Toulouse III Paul Sabatier University, Toulouse, France; 6Institut de Pharmacologie et Biologie Structurale, IPBS, CNRS, UPS, Université de Toulouse, France; 7Clinical Hematology, IUCT Oncopole, Toulouse University Hospital, Toulouse, France and 8Department of Dermatology, Medical University of Vienna, Vienna, Austria
+AM and NR contributed equally.
°Current address: Institut de Pharmacologie et Biologie Structurale, IPBS, CNRS, UPS, Université de Toulouse, Toulouse, France.
Abstract
Correspondence: L. Dupré loic.dupre@inserm.fr
Received: November 28, 2022.
Accepted: June 20, 2023.
Early view: June 29, 2023.
https://doi.org/10.3324/haematol.2022.282466
©2024 Ferrata Storti Foundation
Published under a CC BY-NC license
The Bruton tyrosine kinase (BTK) inhibitor ibrutinib is widely used for treatment of patients with relapsed/refractory or treatment-naïve chronic lymphocytic leukemia (CLL). A prominent effect of ibrutinib is to disrupt the retention of CLL cells from supportive lymphoid tissues, by altering BTK-dependent adhesion and migration. To further explore the mechanism of action of ibrutinib and its potential impact on non-leukemic cells, we quantified multiple motility and adhesion parameters of human primary CLL cells and non-leukemic lymphoid cells. In vitro, ibrutinib affected CCL19-, CXCL12- and CXCL13-evoked migration behavior of CLL cells and non-neoplastic lymphocytes, by reducing both motility speed and directionality. De-phosphorylation of BTK induced by ibrutinib in CLL cells was associated with defective polarization over fibronectin and inability to assemble the immunological synapse upon B-cell receptor engagement. In patients’ samples collected during a 6-month monitoring of therapy, chemokine-evoked migration was repressed in CLL cells and marginally reduced in T cells. This was accompanied by profound modulation of the expression of chemokine receptors and adhesion molecules. Remarkably, the relative expression of the receptors governing lymph node entry (CCR7) versus exit (S1PR1) stood out as a reliable predictive marker of the clinically relevant treatment-induced lymphocytosis. Together, our data reveal a multifaceted modulation of motility and adhesive properties of ibrutinib on both CLL leukemic cell and T-cell populations and point to intrinsic differences in CLL recirculation properties as an underlying cause for variability in treatment response.
Introduction
A paradigmatic shift in the clinical management of B-cell malignancies including chronic lymphocytic leukemia (CLL) has been the introduction of small molecule inhibitors of kinases composing the B-cell receptor (BCR) signalosome such as LYN, SYK, PI3K and Bruton tyrosine kinase (BTK).1 Ibrutinib, a first-in-class BTK inhibitor has rapidly become a leading treatment of patients with relapsed/refractory or treatment-naïve CLL.2-6 A remarkable effect of ibrutinib is to cause a rapid and prolonged lymphocytosis due to the redistribution of CLL cells from lymphoid tissues to peripheral blood and a progressive resolution of adenopathy.7-
10 The displacement of leukemic cells away from the supportive lymphoid tissue microenvironment affects cell proliferation, survival and overall burden.11,12
Current knowledge on the mechanistic basis of ibrutinibevoked CLL redistribution points to the alteration of adhesion and motility steps governing tissue residency and homing. In particular, preclinical and clinical studies have established that BTK inhibition via ibrutinib directly alters CLL cell motility in response to chemokines13,14 and adhesion via very late antigen-4 (VLA-4).13,15,16 Ibrutinib treatment has also been shown to decrease expression of C-C motif chemokine receptor 7 (CCR7)17 and VLA-4,16 while increasing that of sphingosine-1-phosphate receptor 1
Haematologica | 109 - March 2024 809
ARTICLE - Chronic Lymphocytic Leukemia
(S1PR1).17 Such alterations of receptor expression are expected to indirectly favor lymphoid organ egress over reentry. Although redistribution lymphocytosis is a hallmark of ibrutinib treatment, important inter-patient variability in the degree and kinetics of lymphocytosis has been reported.5,7,11,16 In particular elevated VLA-4 expression by CLL cells in a subset of patients has been associated with reduced lymphocytosis, inferior nodal response and shorter progression-free survival.16 Whether other parameters related to tissue homing and retention might condition response to treatment remains to be investigated. A further open question relates to the leakiness of ibrutinib, which not only targets BTK but also the related interleukin-2-inducible T-cell kinase (ITK). Ibrutinib treatment induces phenotypic modifications of the T-cell compartment, such as a reduction in the proportions of Th2 and Treg cell subsets, which support CLL cell survival.18,19 Furthermore, both CLL and non-leukemic cells progressively acquire a quiescentlike status upon ibrutinib treatment with downregulation of genes involved in various processes, including cell adhesion and cell:cell interaction.20 Whether ibrutinib might also alter the motility properties of T cells and other nonneoplastic lymphocytes remains to be investigated in order to gain broader insight into its immunomodulatory effects, because severe infections often jeopardize its efficacy.21 Using a combination of quantitative cell imaging approaches, we here explored the effects of ibrutinib on the ability of CLL cells to migrate directionally along chemokine gradients and to assemble BCR-evoked synapses. We also assessed the in vivo activity of ibrutinib by monitoring over a 6-month treatment period the expression of multiple adhesion and motility receptors at the surface of CLL cells and non-leukemic T cells.
Methods
Healthy donors and patients
The study on healthy peripheral blood mononuclear cells (PBMC) was approved by the French South-West and Overseas ethical committee and was registered at the French Ministry of Higher Education and Research (DC-2015-2488). CLL cells considered for the in vitro ibrutinib exposure experiments were from a registered PBMC cell bank described previously.22 The corresponding patients (n=32) had not been treated with ibrutinib at the time of blood sampling. Their mean age was 70.4 years (range, 45-85 years) and the male-to-female sex ratio was 0.58. CLL patients considered for the longitudinal follow-up of ibrutinib treatment are reported in Table 1. All patients were referred for CLL according to International Workshop on CLL criteria. The studies on PBMC isolated from healthy donors and CLL patients were performed in agreement with the guidelines of the Declaration of Helsinki.
Chemotaxis assays
Standard Transwell assays were used to monitor chemokine-evoked migration of CLL cells and non-neoplastic lymphocytes both upon in vitro exposure to ibrutinib and in cells recovered from treated patients (see Online Supplementary Methods).
Live recording of cell motility behaviors
The study of basal and chemokine-evoked motility of CLL cells and T cells upon ibrutinib exposure was further evaluated by recording cell tracks in dedicated imaging chambers (see Online Supplementary Methods).
Immunological synapse of chronic lymphocytic leukemia cells
The ability of ibrutinib-exposed CLL cells to assemble the immunological synapse was studied with a high-content cell imaging approach and by scanning electron microscopy (see Online Supplementary Methods).
Flow cytometry bar coding
The longitudinal analysis of the phenotype of CLL cells and T cells in patients treated with ibrutinib was conducted with a flow cytometry bar coding approach as described in the Online Supplementary Methods section and shown in Online Supplementary Table S1 and Online Supplementary Figure S6
Statistical analysis
A D'Agostino & Pearson omnibus normality test was applied to all datasets. On that basis, a parametric test was applied to the datasets with a Gaussian distribution, whereas a nonparametric test was applied to the datasets that did not match a Gaussian distribution. The specific tests selected for each dataset are indicated in the corresponding legends. The statistical significance of the results was defined as: not statistically significant (ns) P≥0.05; *P<0.05; **P<0.01; ***P<0.001; ****P<0.0001.
Results
Ibrutinib impairs basal motility and chemokine-driven directional migration of chronic lymphocytic leukemia cells
The precise effects of ibrutinib on key aspects of cell motility, such as cell velocity and orientation in chemokine gradients has remained unexplored. PBMC from untreated CLL patients were exposed in vitro to 500 nM ibrutinib, a concentration comparable to that in the plasma of patients treated with a daily dose of 420 mg.23 We confirmed that ibrutinib reduced the ability of CLL cells to migrate towards CCL19, CXCL12 and CXCL13 in Transwell assays (Figure 1A). A reduction in the proportion of migrating cells was
Haematologica | 109 - March 2024 810 ARTICLE - Motility alterations in ibrutinib-treated CLL J. Rey-Barroso et al.
Patient Gender Age in years Previous treatment lines, N Response to IBRU (PFS) in months ALC at IBRU treatment start, x10 9 /L IBRU-induced lymphocytosis LFA1 VLA4 IGHV 98 status Trisomy Chr12 Del Chr11q Del Chr13q Del Chr17p or mutated P53 Complex karyotype CPT1 M 60 >2 24 74.16 Transient Y N UM N N N N Y CPT2 F 65 >2 65 149 Sustained Y N M N N Y Y Y CPT4 F 56 1 47 159.5 Transient Y N UM N N Y Y Y CPT7 M 77 >2 52 390 Transient Y N M N Y Y Y Y CPT8 F 70 1 63 159.4 None N N UM N N N Y N CPT9 M 55 >2 11 57 Transient Y Y UM N N Y N N CPT10 M 76 >2 59 8 None Y Y M Y Y Y N N CPT11 F 70 >2 40 177.7 None Y N UM N N N Y Y CPT12 F 74 >2 62 137.8 Sustained Y Y UM N N N N Y CPT15 M 73 >2 50 47.3 Sustained Y Y UM N Y Y N N CPT16 M 68 >2 34 189.8 Sustained N N UM N Y N N Y CPT17 M 55 >2 59 180 Transient N N UM N Y N Y N CPT18 M 76 >2 24 6.6 Sustained N Y UM N Y N N Y CPT19 M 79 1 58 14.7 Sustained N Y UM N N N Y N CPT20 M 85 1 58 9.7 Sustained Y Y UM Y N N Y Y CPT21 M 53 >2 21 34.7 Transient Y N UM N Y N N N CPT22 M 65 >2 57 199.6 None Y N UM Y N Y N N CPT24 M 49 >2 45 88.6 None Y Y M N N N N N CPT32 M 80 >2 51 140 Sustained Y N UM N N N Y N CPT36 M 66 >2 31 70.2 Transient Y Y UM N N N N N
Characteristics
ibrutinib-treated patients. IBRU: ibrutinib; PFS: progression-free survival; ALC:
count; Chr: chromosome;
expression cut-off:
fl uor
Haematologica | 109 - March 2024 811 ARTICLE - Motility alterations in ibrutinib-treated CLL J. Rey-Barroso et al.
Table 1.
of the
absolute lymphocyte
M: male; F: female; Y: yes; N: no; UM: unmutated; M: mutated; LFA1 and VLA4
2X
escence-minus-one value.
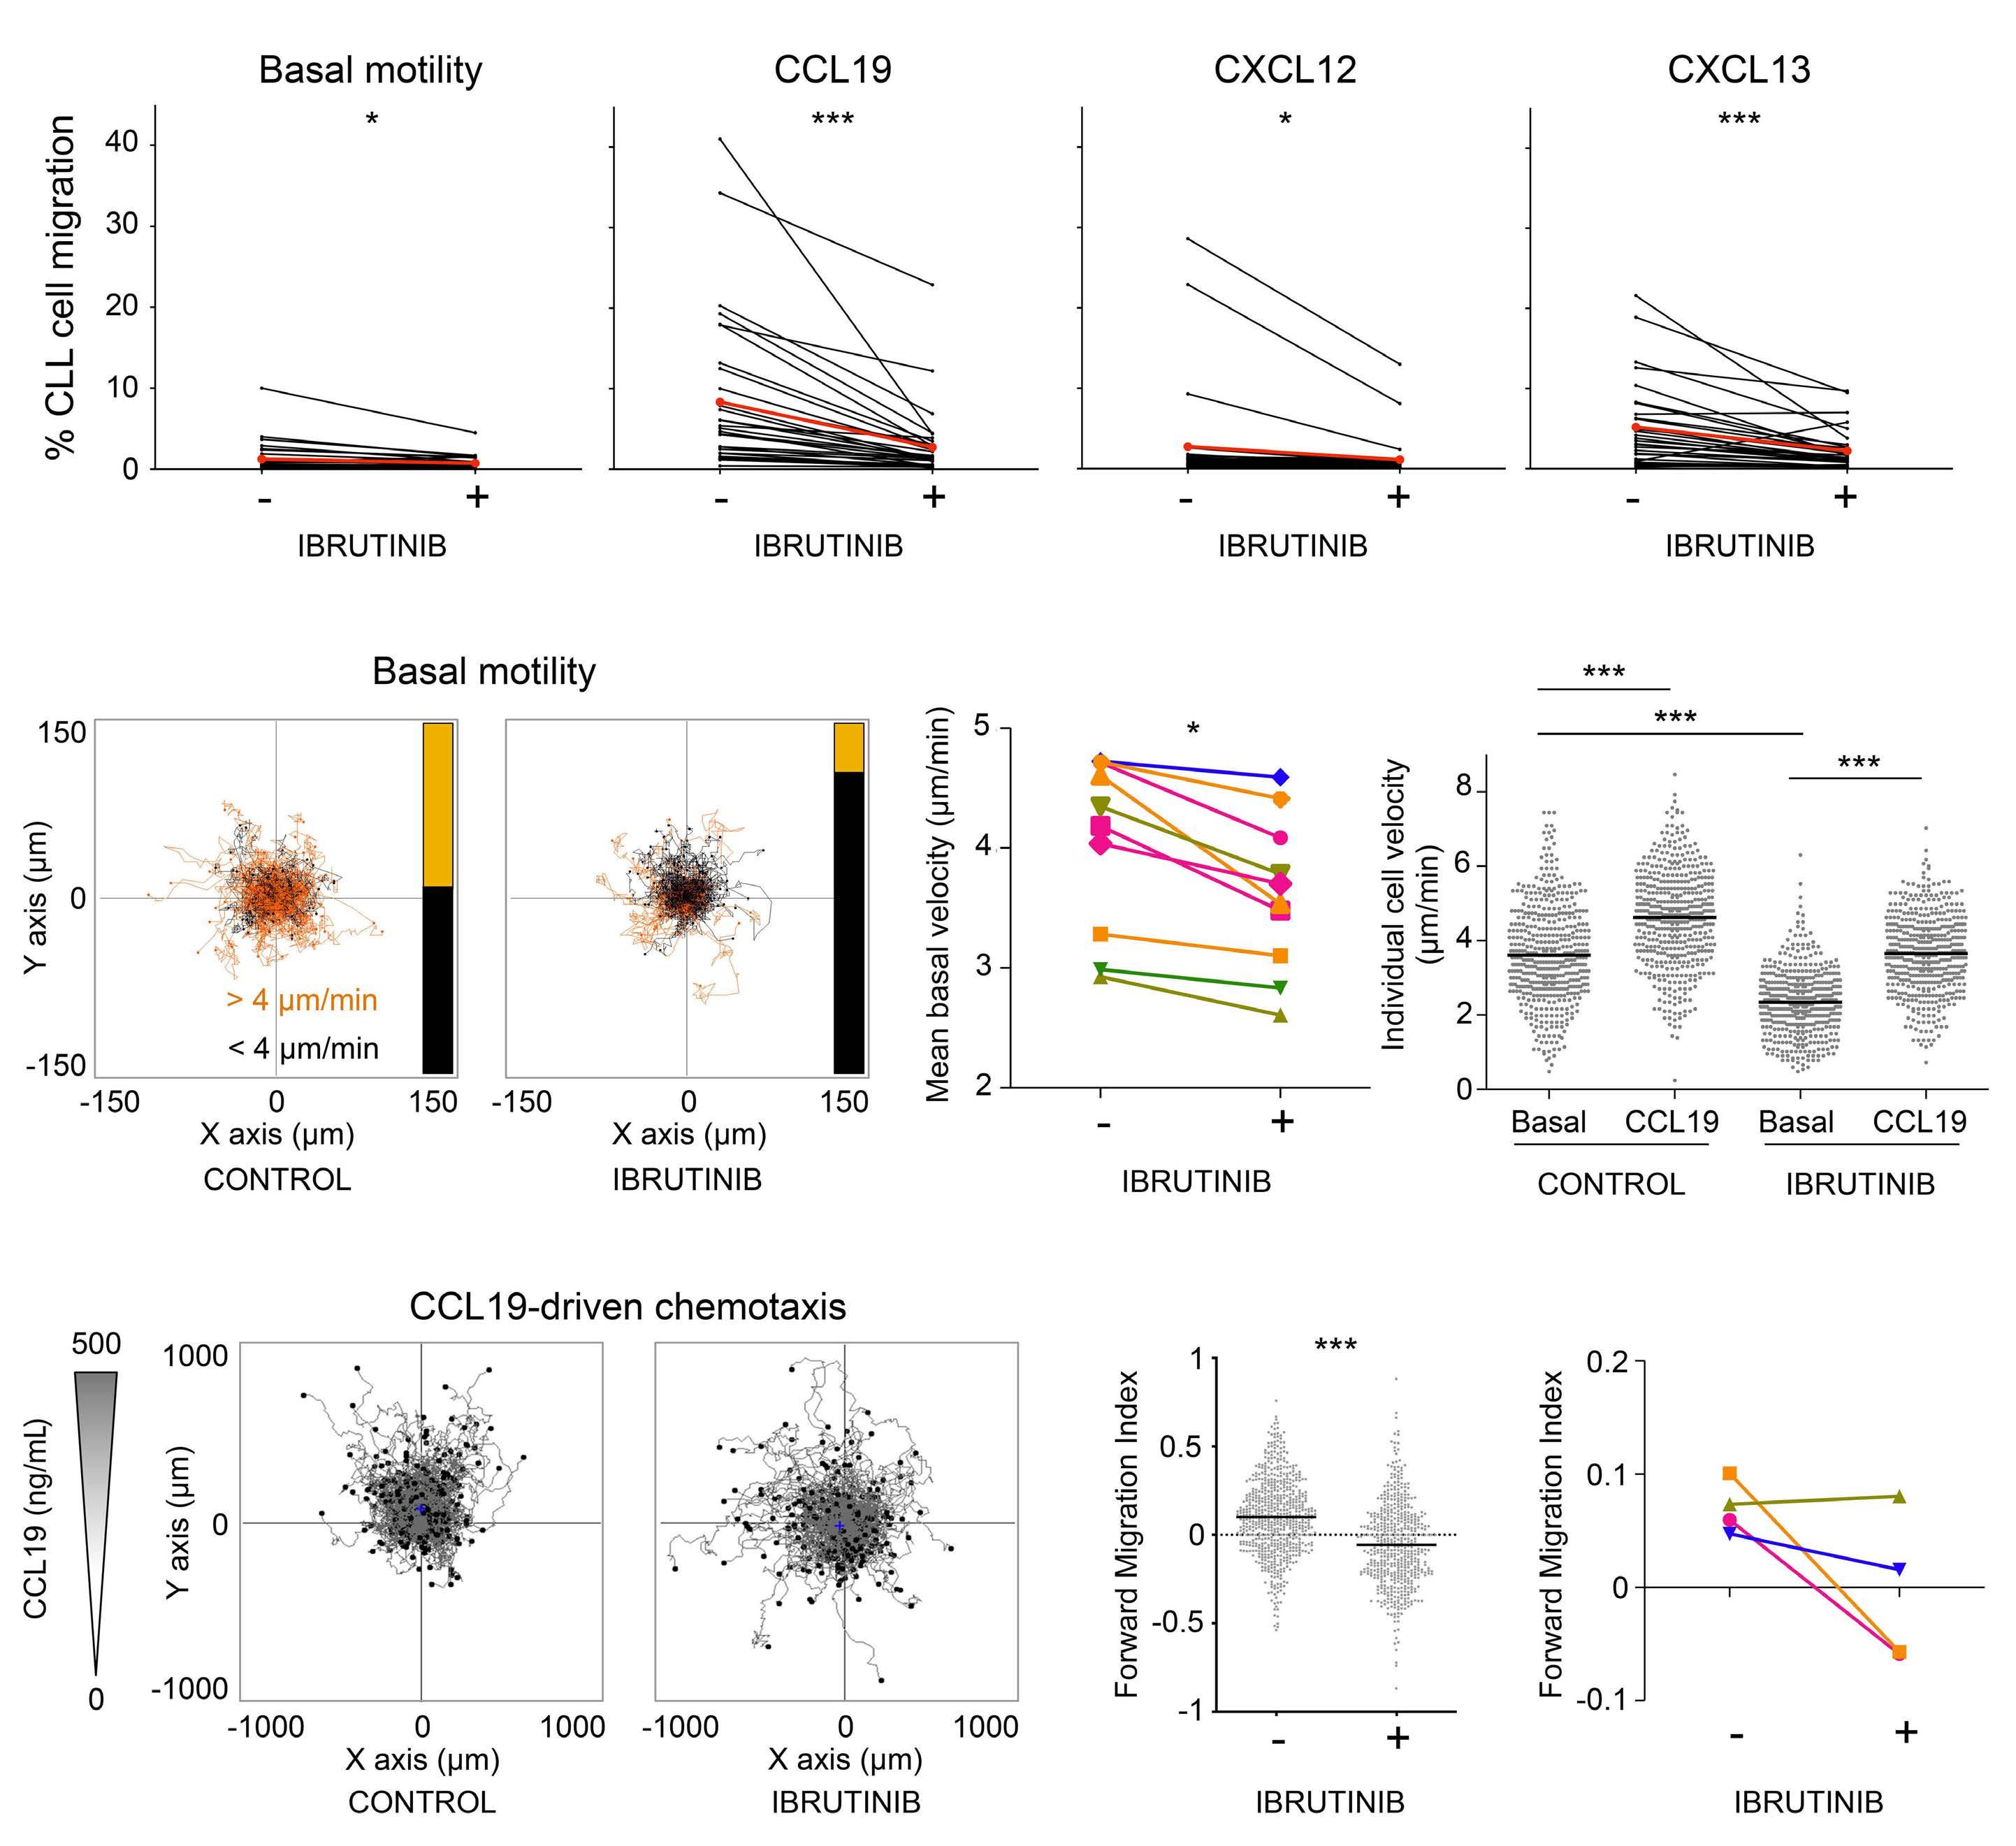
Figure 1. In vitro exposure to ibrutinib reduces random motility and chemokine-evoked directional motility in chronic lymphocytic leukemia cells. (A) Control or ibrutinib-treated peripheral blood mononuclear cells (PBMC) were seeded into Transwell inserts and exposed to CXCL12, CXCL13 or CCL19. Migrating chronic lymphocytic leukemia (CLL) cells were counted after 6 h by flow cytometry. Data represent the mean value from duplicate wells. N=32 patients. The mean of patients is indicated in red. Wilcoxon matched-pairs signed rank tests were applied since values did not have a Gaussian distribution. (B) Control or ibrutinib-treated PBMC were seeded on fibronectin and leukemic cells were tracked by live imaging. Panels show 2 h tracks, color-coded using a 4 mm/min threshold for mean speed; the bar on the right summarizes the proportion of cells over (orange) and under (black) the threshold (control 104 vs. 114, ibrutinib 32 vs. 186). (C) Comparison of mean basal velocity between control and ibrutinib-treated CLL cells. N=10 patients. A Wilcoxon matched-pairs signed rank test was applied. (D) Control or ibrutinib-treated PBMC were seeded on fibronectin in the presence or absence of CCL19 and tracked to calculate individual CLL cell velocity. One-way analysis of variance (ANOVA) with Bonferroni multiple comparison tests were applied. Results from a representative experiment out of four are shown. (E) Control or ibrutinib-treated PBMC were seeded on fibronectin, exposed to a CCL19 chemokine gradient and imaged. Panels show tracks of 441 control and 337 ibrutinib-treated CLL cells. (F) Forward Migration Index (FMI) along the CCL19 gradient (Y axis) of cells tracked in (E). Values for individual cells and mean are presented. The Mann-Whitney test was applied to compare conditions. (G) FMI index along the CCL19 gradient (Y axis) of cells from four CLL patients (mean values). Two-way ANOVA (mixed model) and Bonferroni multiple comparison tests were applied and revealed statistically significant reduction of the FMI upon ibrutinib treatment for three of the four patients. *P<0.05; ***P<0.001.
A B C D E F G Haematologica | 109 - March 2024 812 ARTICLE - Motility alterations in ibrutinib-treated CLL J. Rey-Barroso et al.
observed for all three chemokines in most of the patients (respectively 32, 30 and 29 out of 32). The proportion of migrating cells was reduced on average by 40%. A reduction of random transmigration was also measured in the absence of chemokine (21 out of 32 patients). To gain insight into how ibrutinib affects CLL motility, we tracked CLL cell displacement using dedicated chemotaxis microslides. Following in vitro exposure to ibrutinib, the basal motility of CLL cells was affected as indicated by shorter migration tracks and reduced velocity (Figure 1B, C). Addition of CCL19 evoked an increase in velocity for both control and ibrutinib-treated CLL cells (Figure 1D), indicating that ibrutinib did not prevent chemokine sensing. In contrast, ibrutinib strongly affected the ability of CLL cells to migrate directionally along a CCL19 gradient (Figure 1E). Accordingly, the Forward Migration Index of treated cells was reduced (Figure 1F, G). Treatment of CLL cells with acalabrutinib, a more selective inhibitor of BTK,24 resulted in comparable inhibition of migration along CCL19 gradients (Online Supplementary Figure S1A-C), indicating that the observed effects of ibrutinib were attributable to BTK inhibition. Collectively, these data reveal that ibrutinib affects the basal motility of CLL cells. In addition, although treated cells are responsive to CCL19 in terms of velocity, they fail to migrate directionally toward this chemokine.
Ibrutinib impairs BTK phosphorylation associated with immunological synapse assembly
The finding that ibrutinib affects CLL cell basal motility independently from chemokines suggests that this drug might also affect the ability of CLL cells to spread following adhesive stimuli such as during immunological synapse assembly. In agreement with previous studies,25-28 flow cytometry analysis showed that, as compared to healthy B cells, CLL cells expressed low to barely detectable levels of the integrins lymphocyte function-associated antigen 1 (LFA-1) and VLA-4 at their surface, based on the eight patients who were tested (Figure 2A). In this context, we studied the impact of ibrutinib on the assembly of the immunological synapse upon LFA-1 and BCR engagement by extracting metrics pertaining to cell spreading, BTK phosphorylation and actin cytoskeleton organization using a high-content confocal imaging pipeline.29 During a 20-min interaction of CLL cells with coated intercellular adhesion molecule 1 (ICAM-1), we could not detect cell spreading, activation of pBTK, nor actin remodeling (Figure 2B, C). BCR stimulation mostly stimulated pBTK, but not spreading. Interestingly, combined BCR and ICAM-1 stimulated cell spreading for the two patients expressing intermediatelevel LFA-1, but not for those with extremely low LFA-1 levels. This effect appeared to be dependent on a direct ICAM-1 to LFA-1 interaction since it was lost upon addition of a LFA-1 blocking antibody (Online Supplementary Figure S2). These data suggest that CLL cells that retain some
level of LFA-1 expression are more prone to spread upon BCR engagement. in vitro exposure to ibrutinib markedly reduced the intensity of the BCR-evoked phosphorylated BTK signal, as assessed by automated cell imaging (Figure 2C) and flow cytometry (Online Supplementary Figure S3AC). In vitro ibrutinib exposure also reduced the emission of protrusions emanated from the cell body, which directly impacted the spreading area, in particular for the two patients expressing LFA-1 (Figure 2C). Complementary analysis of the assembly of the synapse upon BCR and LFA-1 triggering in 13 patients confirmed the impact of ibrutinib on reducing BTK phosphorylation, cell spreading but also actin cytoskeleton organization (Online Supplementary Figure S4A, B).
To gain more insight into the alteration of CLL synapse assembly upon ibrutininb exposure, we assessed cell morphology by scanning electron microscopy. While CLL cells on PLL displayed a rather spherical shape and a surface covered by a dense network of microvilli, CLL cells on ICAM-1/anti-BCR antibody emitted filopodia and lamellipodia protrusions, associated with spreading and a partial loss of microvilli (Figure 2D). Remarkably, in vitro exposure to ibrutinib prevented the ability of CLL cells to spread over the ICAM-1/anti-BCR antibody-coated surface. Collectively, our data indicate that BTK is essential for CLL synapse assembly. These data complete our understanding of the effects of ibrutinib on CLL cell biology by suggesting that the blockade of BTK phosphorylation has a prominent impact on F-actin remodeling, sustaining emission of proadhesive structures in response to integrin and BCR stimulation.
Ibrutinib impairs chemokine-evoked motility in non-neoplastic lymphocytes
Although evidence has been collected that ibrutinib targets the function not only of CLL cells but also that of nonneoplastic lymphocytes via BTK or ITK,19 its potential impact on the motility of non-neoplastic B, T and NK cells has not been assessed yet. We first evaluated whether the ability of T cells from untreated CLL patients to respond to chemokines would be affected. Transwell assays on total CLL PBMC, in which T-cell migration could be assessed following CD3 staining, revealed that in vitro exposure to ibrutinib reduced the proportion of T cells migrating towards CCL19, CXCL12 and CXCL13 in most of the 32 tested CLL samples (Figure 3A). The level of inhibition was not complete, implying that upon ibrutinib treatment nonneoplastic T cells might retain some of their sensitivity to chemokines. In agreement, the motility of T cells over fibronectin was reduced, as assessed by live microscopy recordings (Online Supplementary Figure S5A, B).
To further explore the activity of ibrutinib in affecting the migration of non-neoplastic lymphocytes, we next sought to test its effects on B, T and NK cells from healthy indi-
Haematologica | 109 - March 2024 813 ARTICLE - Motility alterations in ibrutinib-treated CLL J. Rey-Barroso et al.
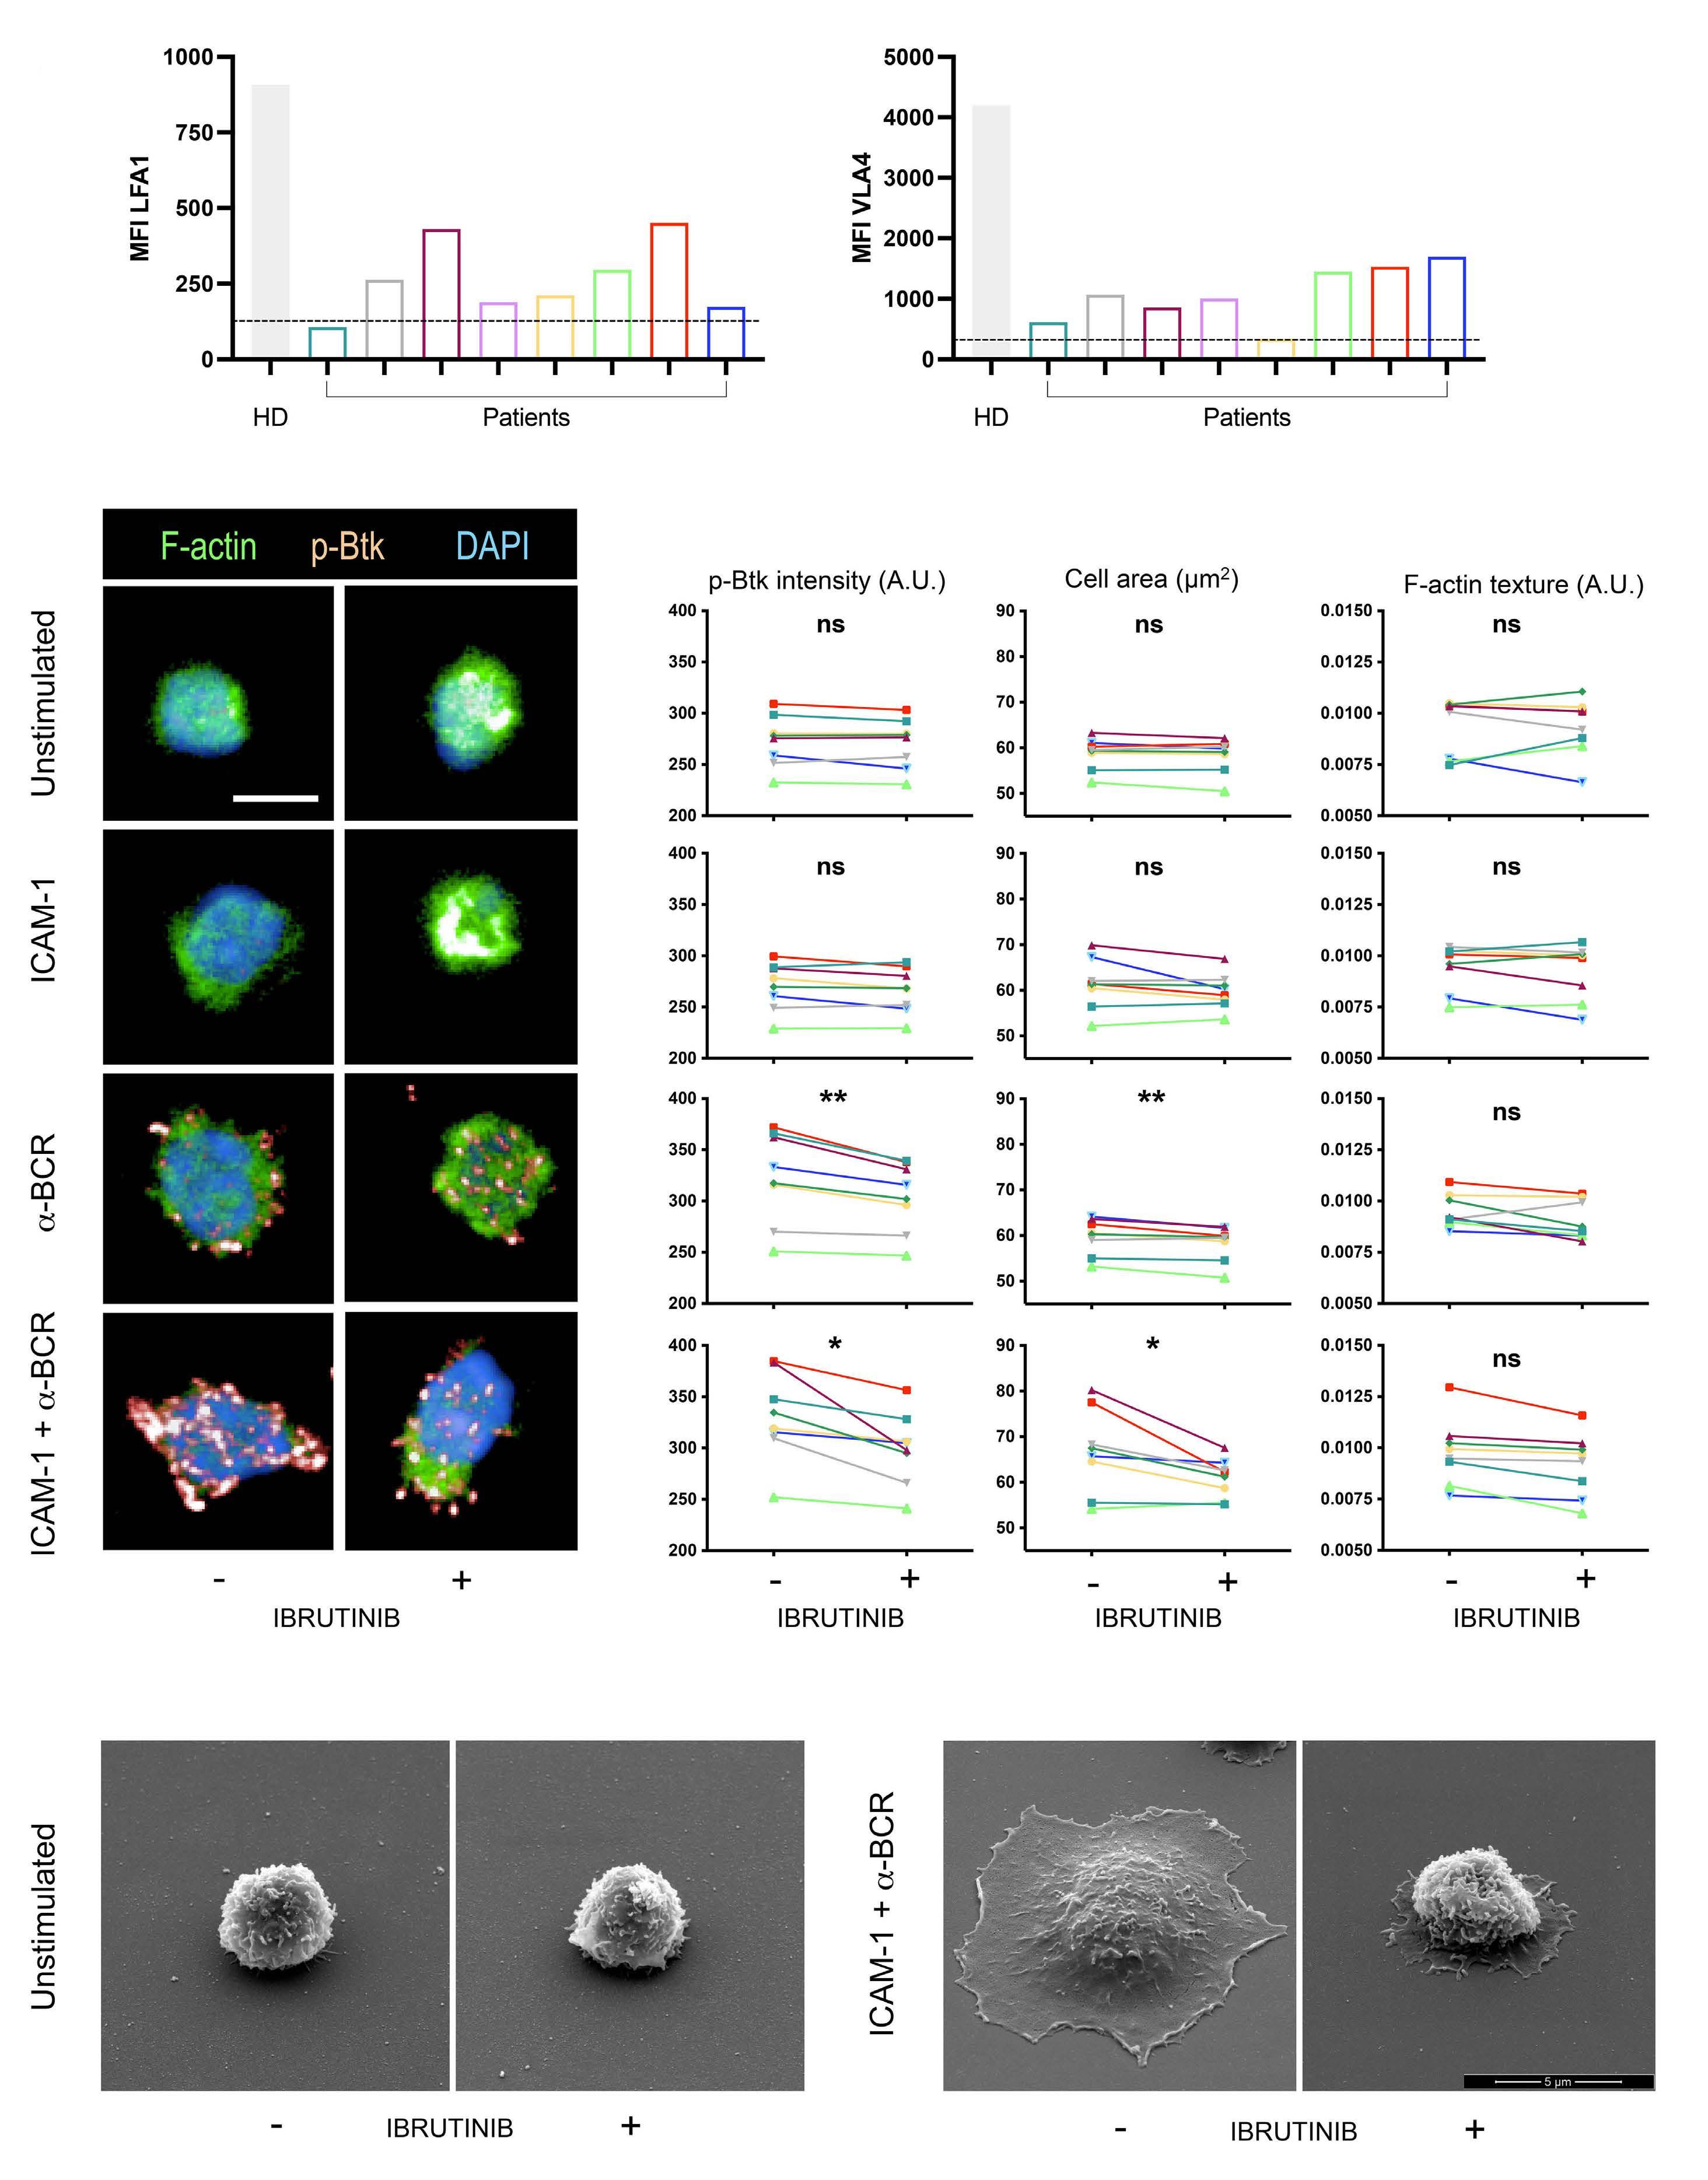
A B D C Haematologica | 109 - March 2024 814 ARTICLE - Motility alterations in ibrutinib-treated CLL J. Rey-Barroso et al.
Continued on following page.
2. In
of LFA-1 and VLA-4 at the surface of chronic lymphocytic leukemia (CLL) cells. Histograms represent mean fluorescence intensity in B cells from one healthy donor and in CLL cells from eight patients. The dashed line represents the background signal (fluorescence minus one). (B) Representative images of CLL cells stained for F-actin, phosphorylated BTK (p-BTK) and DAPI, and imaged on an automated confocal microscope. (C) Following automated recognition of individual cells based on the DAPI and F-actin staining, p-BTK intensity, cell area and F-actin texture were quantified for each cell. N>100 cells/condition. Mean parameter values for the eight patients analyzed in (A) are shown. Wilcoxon matched-pairs signed rank tests were applied to estimate the statistical significance of ibrutinib inhibition. (D) Scanning electron microscopy micrographs of representative unstimulated CLL cells or CLL cells spreading over ICAM-1/anti-BCR antibody. CLL cells were exposed in vitro to ibrutinib, as indicated. ns: not statistically significant (P≥0.05); *P<0.05; **P<0.01. MFI: mean fluorescence intensity; HD: healthy donor; A.U.: arbitrary units.
viduals. PBMC from five donors were submitted to Transwell assays, in which the emigrated cells were stained with CD19, CD3 and CD56 antibodies to distinguish and count the proportion of migrating cells within the subsets of B, T and NK cells. All three tested chemokines, CCL19, CXCL12 and CXCL13, increased the proportion of migrating B cells over the basal values. Very clearly, in vitro exposure to ibrutinib systematically reduced the proportion of migrating B cells for all tested donors and chemokines (Figure 3B). T cells from the five donors displayed a robust migration in response to CCL19 and CXCL12, while migration to CXCL13 was restricted to one donor, probably because of a limited proportion of CXCR5-expressing T cells. Ibrutinib exposure reduced the proportion of migrating T cells upon CCL19 and CXCL12 stimulation, but also in the context of basal migration (Figure 3B). Finally, our data show that the migration of the NK-cell subset was also affected by ibrutinib, both in terms of basal migration and CXCL12-evoked migration (Figure 3B). These data therefore provide the evidence that ibrutinib reduces both basal and chemokineevoked migration in non-neoplastic T cells from CLL patients, as well as in the main lymphocyte subsets of healthy donors.
Ibrutinib treatment of chronic lymphocyte leukemia patients reduces migratory capacities of the leukemic cells
Following the characterization of the in vitro effects of ibrutinib on CLL cells and non-neoplastic lymphocyte subsets, we evaluated ibrutinib’s in vivo impact on cell motility along the course of treatment. For that purpose, we longitudinally monitored a cohort of 20 CLL patients who received ibrutinib monotherapy (Table 1). PBMC were collected immediately prior to treatment and after 1, 2, 3 and 6 months of treatment implementation. PBMC were frozen until completion of the sample collection and then thawed in parallel to test chemokine-evoked migration of CLL cells and T cells in Transwell assays. In line with the inhibitory effect of ibrutinib in vitro, the migration of CLL cells was reduced upon ibrutinib therapy. This was most evident upon CCL19 stimulation at 1 and 2 months of treatment with a drop in migration for nearly all of the 20 patients (Figure 4A). CXCL13-evoked migration was also
reduced upon ibrutinib therapy with a maximal effect at 2 months of treatment. The effect of ibrutinib treatment on the ability of CLL cells to migrate to CXCL12 (not shown) could not be interpreted because of a generally low migratory response. Although our in vitro study pointed to a potent effect of ibrutinib on the basal and chemokineevoked migration of T cells, the effect of ibrutinib treatment in vivo had a very modest effect on T-cell migration (Figure 4B). This suggests that although T cells appear to be as sensitive as CLL cells to ibrutinib in the context of an acute in vitro exposure, they might have lower sensitivity than CLL cells in vivo.
Alteration of chronic lymphocytic leukemia and T-cell homing receptor expression during ibrutinib treatment Beyond affecting intrinsic adhesive and motility properties, ibrutinib might affect CLL recirculation in vivo also by altering the expression of receptors relevant for migration and adhesion. We here examined the expression of a large panel of receptors for chemotactic factors, adhesion molecules and co-receptors. To ensure the highest accuracy in the comparison of serially collected samples, we implemented a flow cytometry bar-coding approach to stain in parallel five samples (pre-treatment, months 1, 2, 3 and 6 after treatment) from a given patient in a single tube (Online Supplementary Figure S6A-C). Although the CLL cells from the 20 tested patients initially expressed heterogeneous levels of motility receptors, ibrutinib reproducibly reduced the expression of CCR7, CXCR5, CCR5, S1PR1 and CXCR3 over time (Figure 5A). Interestingly, the effect of ibrutinib treatment on CXCR3 expression followed a distinct pattern with an almost complete loss of expression after 2 months. In sharp contrast, CXCR4 expression did not vary along the 6-month follow-up period. These data point to a selective effect of ibrutinib in reprograming the repertoire of motility receptors in CLL cells. Ibrutinib treatment also resulted in selective effects towards the expression of adhesion molecules (Figure 5B). While the expression of LFA-1, LFA-3, CD11c and CD44 progressively diminished upon treatment, the expression of VLA-4 remained unchanged and that of ICAM-1 increased (Figure 5B). Notably, ibrutinib treatment led to a progressive and marked reduction of the expression of the co-receptors
Haematologica | 109 - March 2024 815 ARTICLE - Motility alterations in ibrutinib-treated CLL J. Rey-Barroso et al.
Figure
vitro exposure to ibrutinib impairs immunological synapse assembly in chronic lymphocytic leukemia cells. (A) Flow cytometry analysis of the expression
BTLA and CD276, while the expression of LAG-3 remained stable (Figure 5C).
We further explored whether the levels of the integrins LFA-1 and VLA-4, previously shown to be associated with CLL recirculation steps,26 might relate to the levels of other examined markers or delineate a particular response to treatment. We observed that the samples that were negative for LFA-1 remained so over the five consecutive
time points (Online Supplementary Figure S7A-C), indicating that this was a stable trait not impacted by treatment. Interestingly, both LFA-1-negative samples and VLA-4negative samples, which partially overlapped, tended to express high CD44 (Online Supplementary Figures S7A-C and S8A-C). Together this longitudinal analysis revealed that ibrutinib treatment progressively reprograms the repertoire of key motility/adhesion receptors at the surface
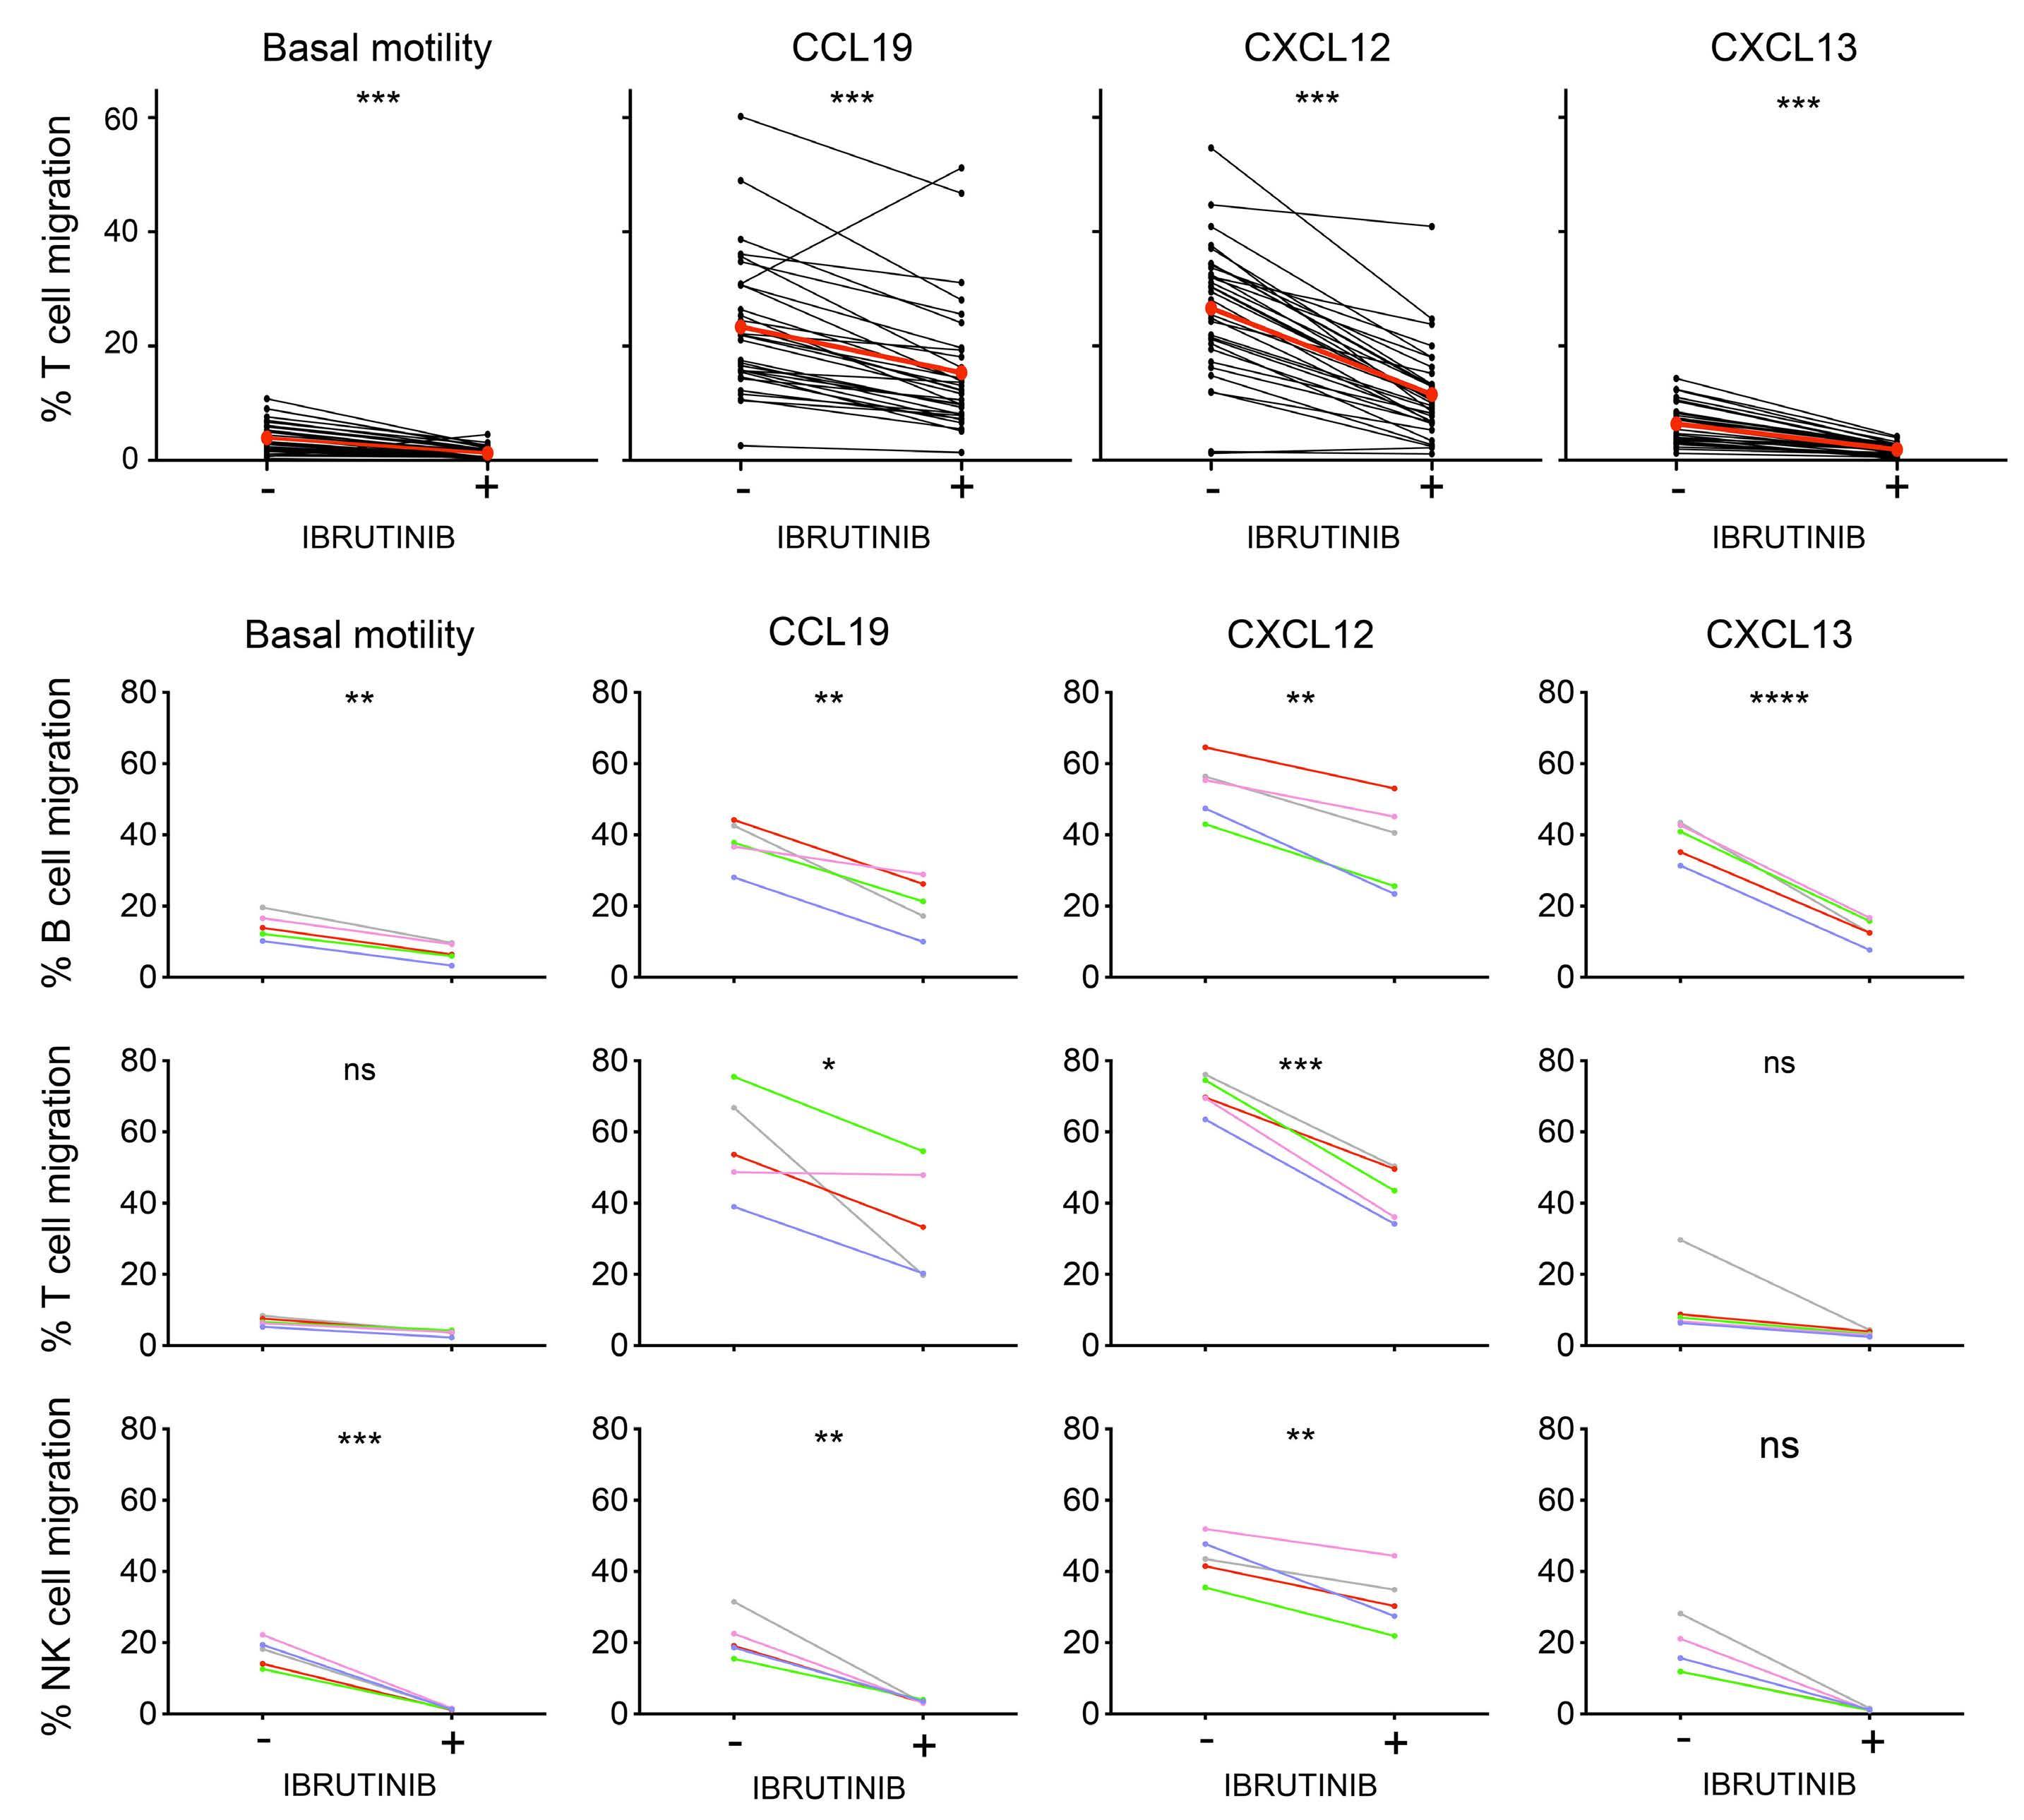
of non-neoplastic lymphocytes from chronic lymphocytic leukemia
and healthy
(A) Control or ibrutinib-treated peripheral blood mononuclear cells (PBMC) from 32 chronic lymphocytic leukemia (CLL) patients were seeded into Transwell inserts and exposed to CXCL12, CXCL13 or CCL19 for 6 h at 37°C. Migration of non-neoplastic T cells was quantified by flow cytometry. Data represent the mean value from duplicate wells. The mean of patients is indicated in red. Wilcoxon matched-pairs signed rank tests were applied to estimate the statistical significance of ibrutinib inhibition. (B) Control or ibrutinib-treated PBMC from five healthy donors were seeded into Transwell inserts and exposed to CXCL12, CXCL13 or CCL19 for 6 h at 37°C. Migration of B cells, T cells and NK cells was quantified by flow cytometry following specific staining of the migrated cells. Data represent the mean value from duplicate wells. Paired t tests were applied. ns: not statistically significant (P≥0.05); *P<0.05; **P<0.01; ***P<0.001; ****P<0.0001.
A B Haematologica | 109 - March 2024 816 ARTICLE - Motility alterations in ibrutinib-treated CLL J. Rey-Barroso et al.
Figure 3. In vitro exposure to ibrutinib reduces chemokine-evoked migration
patients
donors.
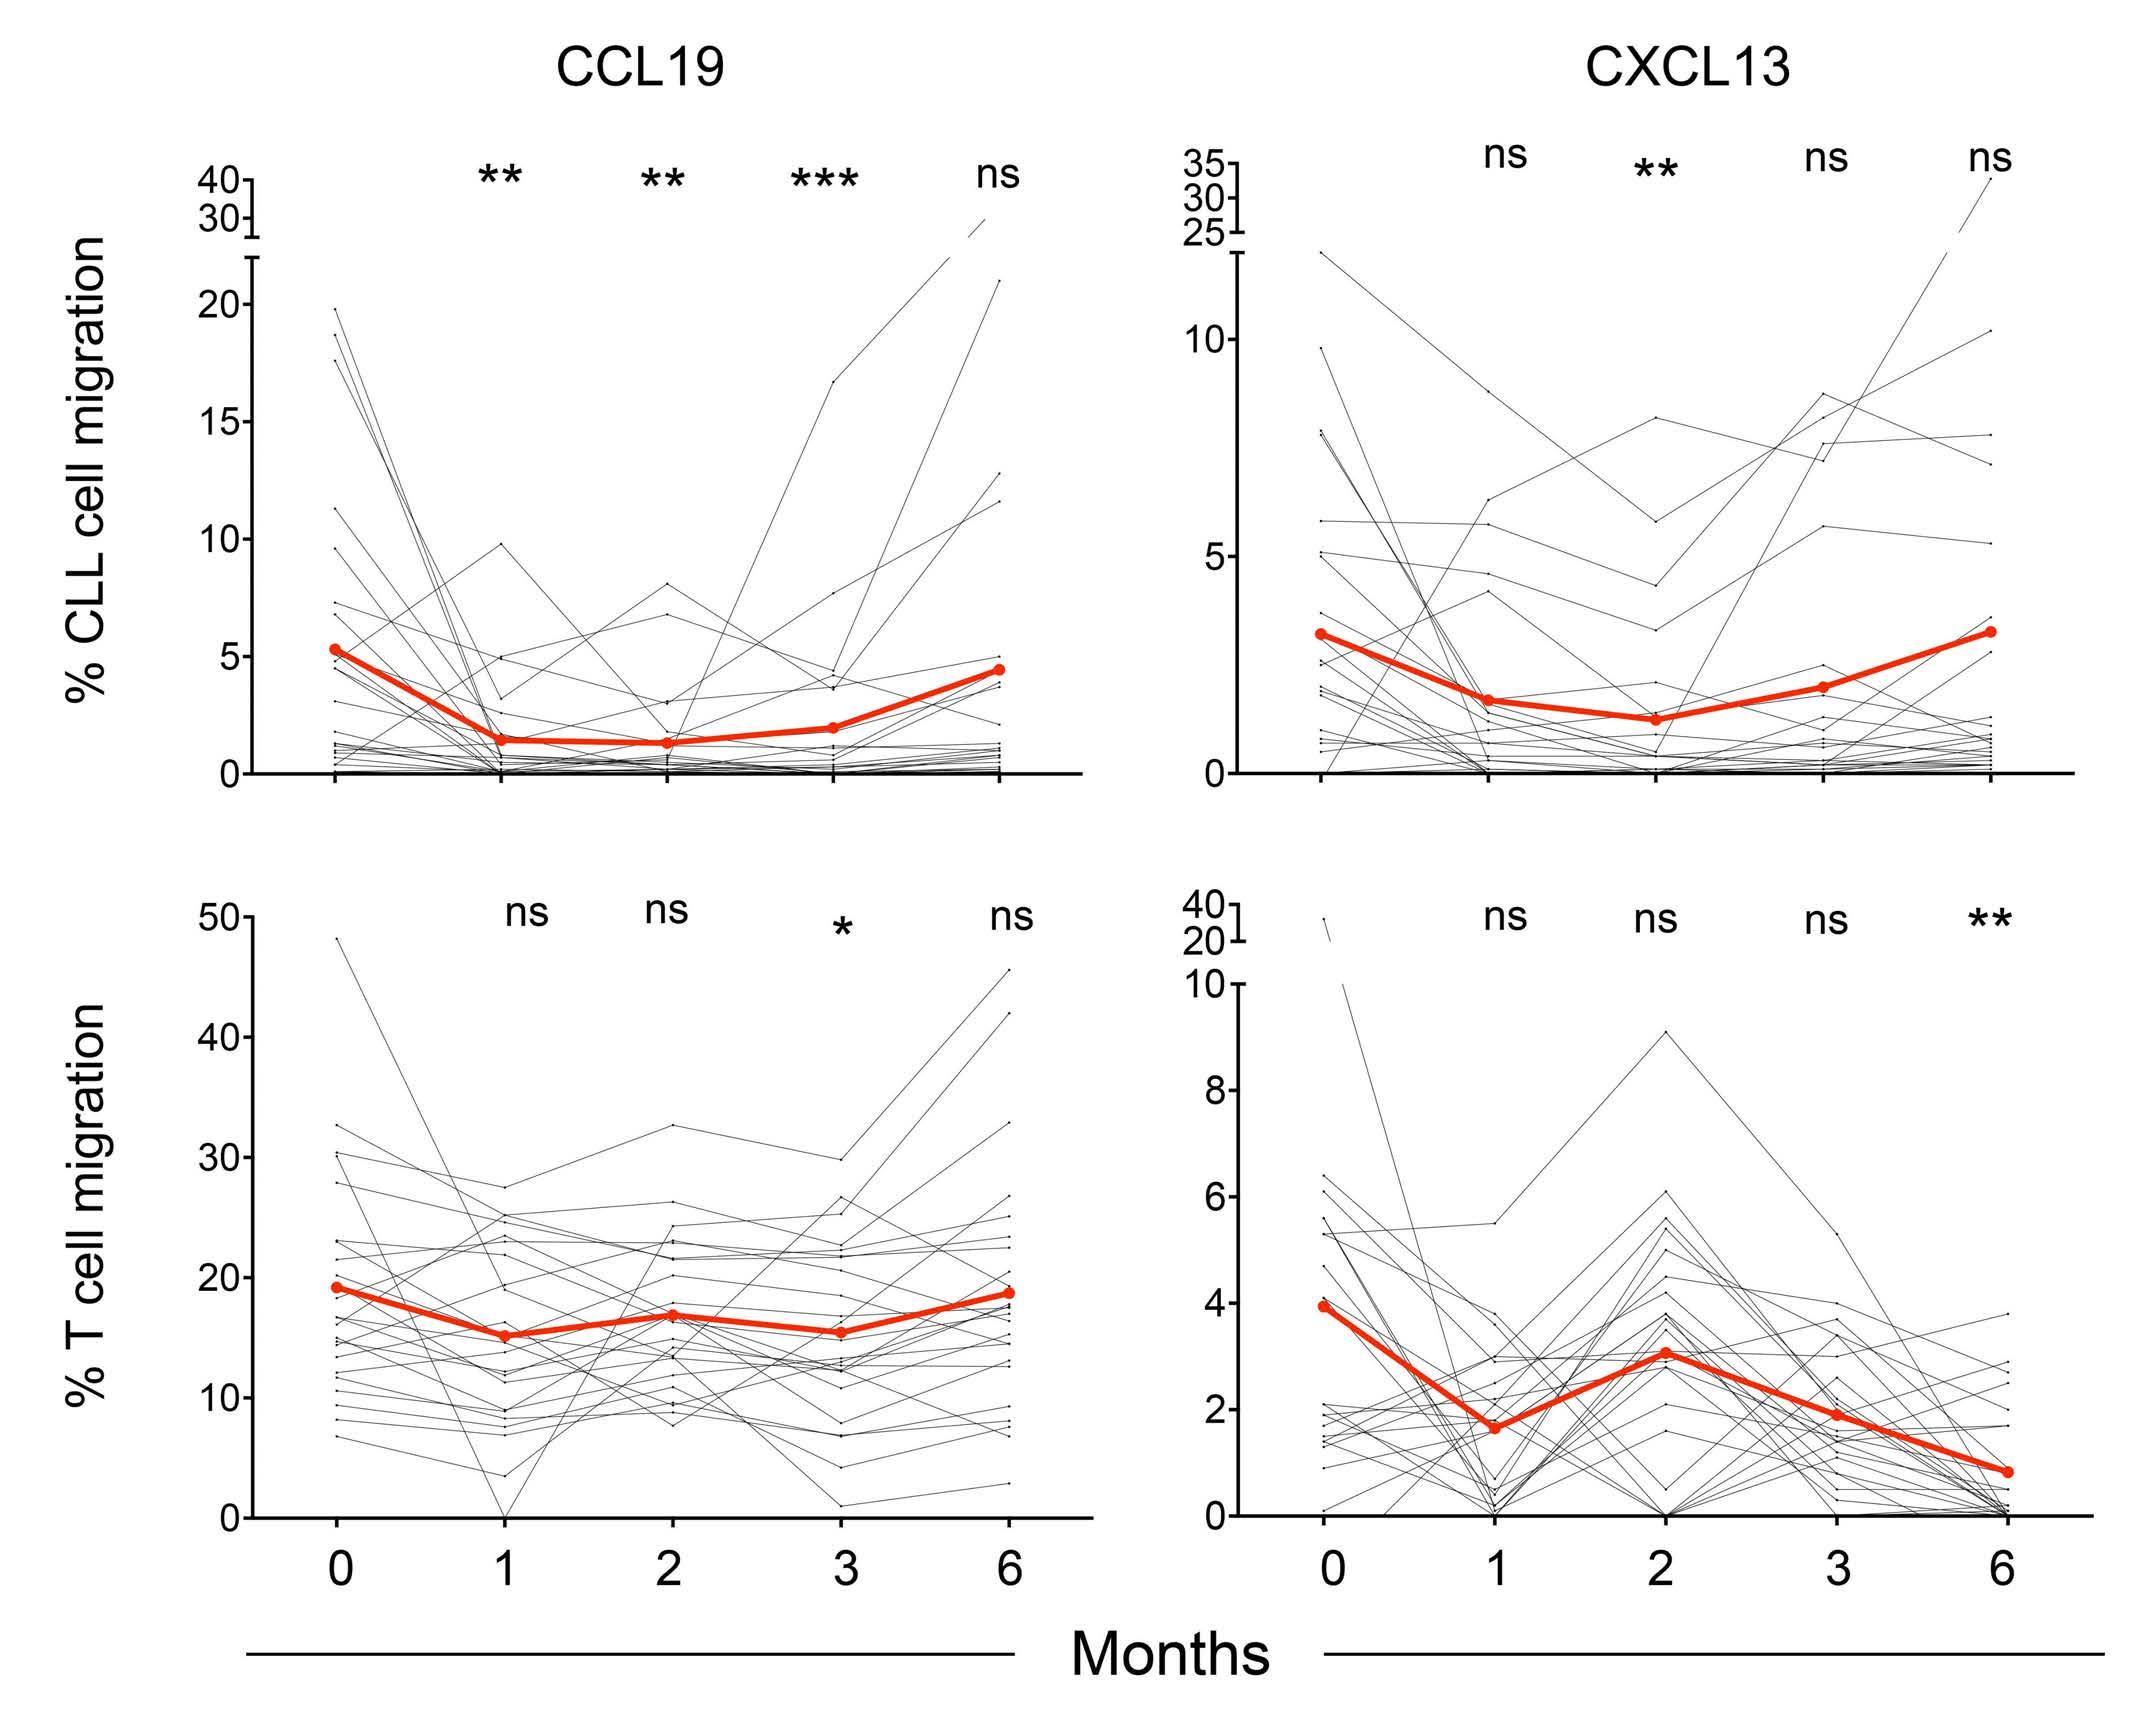
Figure 4. Ibrutinib treatment leads to a progressive reduction of chemokine-evoked migration in chronic lymphocytic leukemia cells. (A) Peripheral blood mononuclear cells (PBMC) from 20 chronic lymphocytic leukemia (CLL) patients were collected before and 1, 2, 3 and 6 months after the initiation of ibrutinib treatment. The five longitudinally collected and frozen samples were thawed together, seeded into Transwell inserts and exposed to CCL19 or CXCL13 for 6 h at 37°C. Migration of CLL cells was quantified by flow cytometry. Data represent the mean value from duplicate wells. The mean of patients is indicated in red. A Friedman test with Dunn multiple comparison tests were applied to estimate the statistical significance of ibrutinib inhibition as compared to the pre-treatment values. (B) Migration of T cells was quantified by flow cytometry from the same experiments as those presented in (A). Data represent the mean value from duplicate wells. The mean of patients is indicated in red. A Friedman test with Dunn multiple comparison tests with respect to pre-treatment values were applied. ns: not statistically significant (P≥0.05); *P<0.05; **P<0.01; ***P<0.001.
of CLL cells, but that distinct features among subgroups of patients (e.g., patients with low integrin expression) are maintained along treatment.
We then investigated whether ibrutinib would also alter the expression of receptors for chemotactic factors, adhesion molecules and co-receptors at the surface of non-neoplastic CD4+ and CD8+ T cells (Online Supplementary Figures S9A-C and S10A-C). As compared to the CLL cell compartment, less pronounced modulation of receptor expression was detected at the surface of T cells. In CD4+ T cells, the expression of CCR7, CXCR5, CCR5, CXCR3, VLA-4, LFA-1, LFA-3, and BTLA diminished progressively to reach their lowest levels at the 6-month timepoint, while the expression of the other tested receptors did not vary significantly. Similarly, in CD8+ T cells, the expression of CCR7, CXCR5, CXCR3 and BTLA diminished progressively to reach lowest levels at the 6-month timepoint, while the expression of the other tested receptors did not vary significantly. We additionally measured the expression of perforin, granzyme B and LAMP-1 as a proxy for the cytotoxic potential of CD8+ T cells.
Ibrutinib was found to have no impact on the expression of those molecules over the course of treatment. Together, these data indicate a moderate and progressive effect of ibrutinib treatment in selectively modulating a set of motility and activation markers in T cells.
Ibrutinib-driven redistribution lymphocytosis relates to relative expression of S1PR1 and CCR7 Redistribution lymphocytosis has been related to the efficiency of ibrutinib in individual patients, highlighting the importance of CLL trafficking on treatment outcome. In agreement with previous reports,7,10,16 the herein studied ibrutinib-treated CLL cohort of patients displayed very heterogeneous redistribution lymphocytosis, ranging from sustained lymphocytosis to early decline of leukemic cells in the blood (Figure 6A). According to the criteria defined by Herman and colleagues,7 patients were clustered into three subgroups that had either sustained lymphocytosis, transient lymphocytosis or no lymphocytosis (Figure 6B, Table 1). Given the unique collection of motility parameters
A B Haematologica | 109 - March 2024 817 ARTICLE - Motility alterations in ibrutinib-treated CLL J. Rey-Barroso et al.
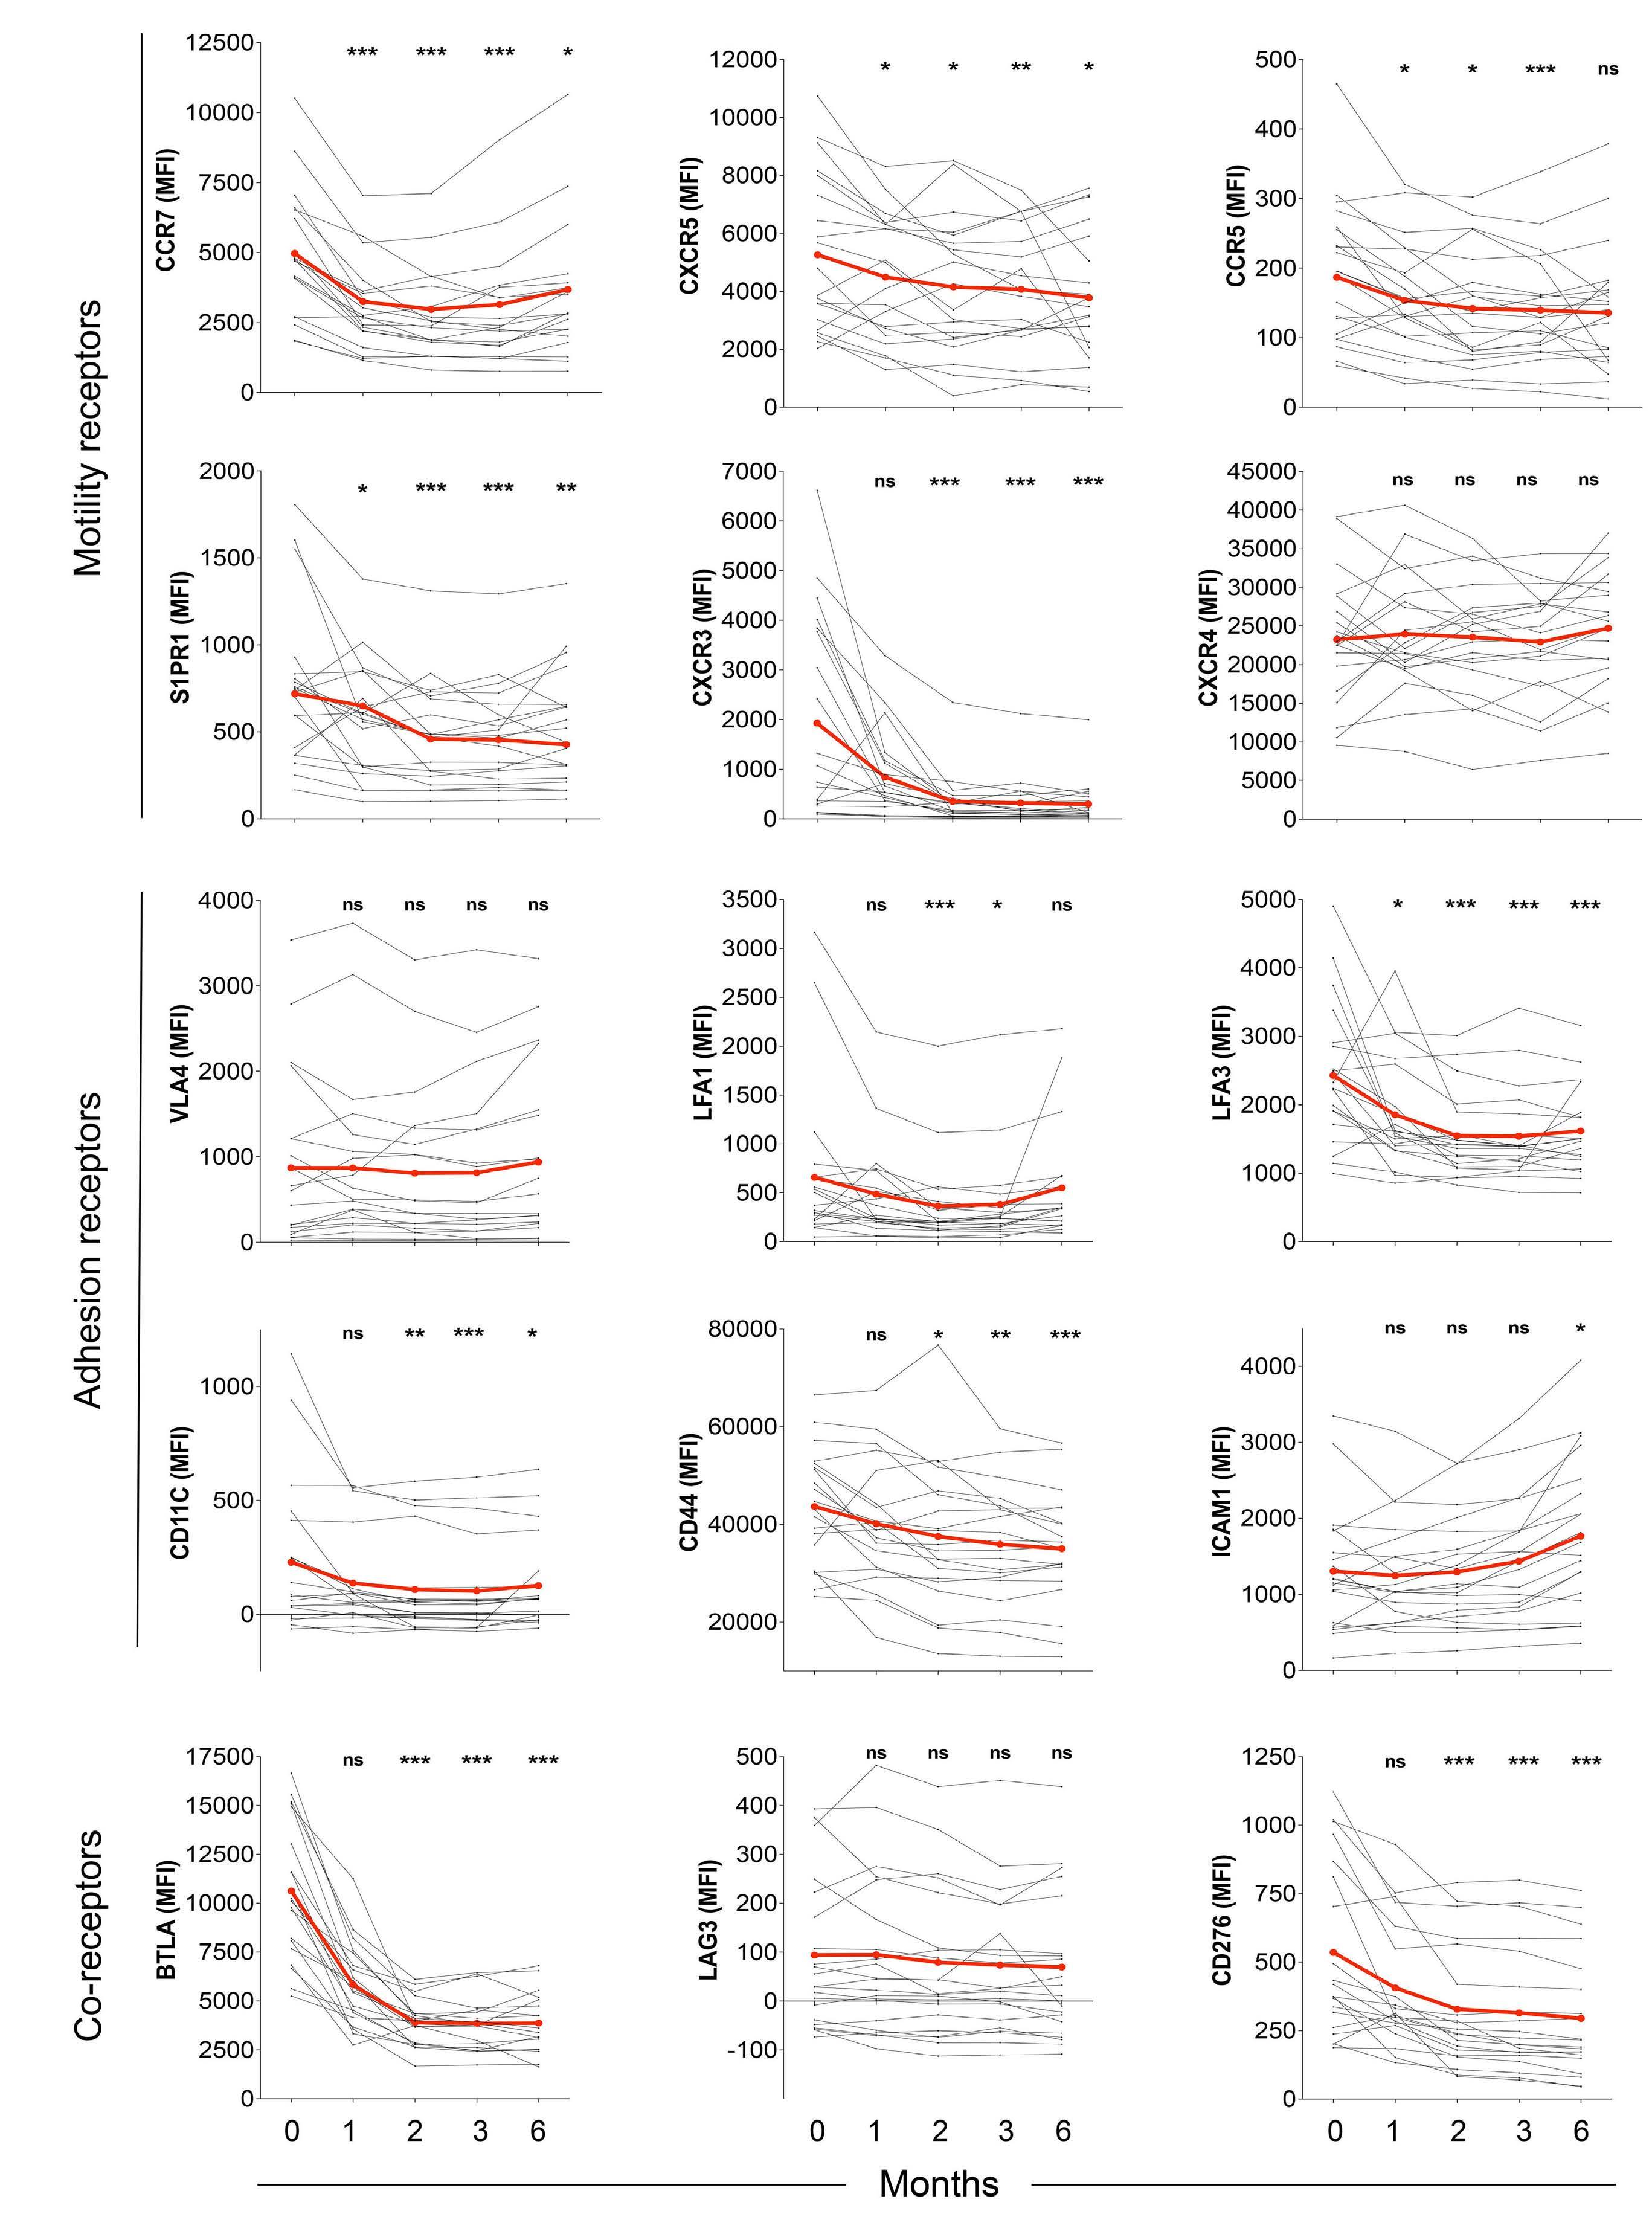
A B C Haematologica | 109 - March 2024 818 ARTICLE - Motility alterations in ibrutinib-treated CLL J. Rey-Barroso et al.
Continued on following page.
leukemia cells. (A) Peripheral blood mononuclear cells (PBMC) from 20 chronic lymphocytic leukemia (CLL) patients were collected before and 1, 2, 3 and 6 months after the initiation of ibrutinib treatment. The five longitudinally collected and frozen samples were thawed together, pre-stained with distinct concentrations of CellTrace™ Violet, mixed in a single tube and stained with antibodies specific for the indicated motility receptors. Data represent the longitudinal evolution of the expression of the indicated receptors as mean fluorescence intensity on CLL leukemic cells for each patient (black dots and lines) and as a mean (red dots and lines). A Friedman test with Dunn multiple comparison tests with respect to pre-treatment values were applied. (B) The indicated adhesion receptors were studied with the same approach as in (A). (C) The indicated coreceptors were studied with the same approach as in (A). ns: not statistically significant (P≥0.05); *P<0.05; **P<0.01; ***P<0.001. MFI: mean fluorescence intensity.
collected longitudinally in our cohort, we then sought to search for markers that may account for the inter-individual heterogeneity in lymphocytosis. Among the tested receptors known to instruct CLL homing and motility behaviors, CCR7 and S1PR1 emerged as the ones most related to the magnitude of the redistribution lymphocytosis, when considering their expression level along the 6-month follow-up period (Figure 6C). CCR7 expression appeared to relate inversely to lymphocytosis, in agreement with the function of CCR7 to instruct homing to and retention in lymph nodes. In contrast, S1PR1 expression appeared to relate positively to lymphocytosis, in agreement with the function of S1PR1 to instruct exit of CLL cells from lymph nodes to the blood circulation. Interestingly, our analysis further pointed to a negative correlation between the expression of CCR7 and S1PR1 on CLL cells among individual patients (Figure 6D). This is reminiscent of previous data in murine T cells showing coordinated upregulation of S1PR1 and downregulation of CCR7, as a switch mechanism to favor egress over retention.30
The S1PR1/CCR7 ratio was then calculated as a molecular marker of the egress/retention equilibrium in individual patients (Figure 6E). Remarkably, this ratio was >1 (in favor of egress) in patients with sustained lymphocytosis, while it was <1 (in favor of retention) in patients with reduced lymphocytosis. This ratio was at a value close to 1 (egress and retention in equilibrium) for patients with intermediate lymphocytosis. Interestingly, the S1PR1/CCR7 ratio remained very stable over time for each patient, although the expression levels of S1PR1 and CCR7 decreased upon treatment. This was explained by a very parallel decrease of S1PR1 and CCR7 expression during the course of treatment. Collectively, these data suggest that a pre-existing heterogeneity in the turnover of CLL in lymphoid organs associated with the levels of S1PR1 and CCR7 accounts for the magnitude of ibrutinib-induced redistribution lymphocytosis in individual CLL patients.
Discussion
Understanding the mode of action of ibrutinib on CLL biology and identifying molecular markers accounting for treatment efficacy are key to the optimization of individ-
ualized clinical management. This study provides novel insight into the effects of ibrutinib on the motility properties of CLL cells and non-neoplastic lymphocytes. It also explores how ibrutinib affects CLL adhesion and the immunological synapse. It quantifies the in vivo impact of ibrutinib treatment on the motility capacity of these cell subsets along a 6-month follow-up. Finally, it identifies CCR7 and S1PR1 as key motility receptors that determine the degree of treatment-induced lymphocytosis. Beyond the well-described inhibitory effect of ibrutinib on CLL adhesion and migration,13-15 our study identifies the precise parameters accounting for the activity of ibrutinib on CLL cell adhesion and motility. In vitro exposure of leukemic cells from CLL patients to ibrutinib induced a very reproducible reduction in chemokine-evoked migration. However, the concentration of 500 nM ibrutinib tested in vitro, in accordance with in vivo measurements,23 did not completely blunt migration or adhesion of CLL cells, suggesting that alternative BTK-independent pathways can sustain these cellular activities. Directional migration was affected to a comparable degree upon ibrutinib and acalabrutinib treatment, reinforcing the notion that BTK activity is particularly central to governing chemotaxis in CLL. The inhibition of chemokine-induced migration at different timepoints after ibrutinib treatment was comparable to that measured upon in vitro exposure, suggesting that the daily delivery of ibrutinib might exert an acute effect on chemokine responsiveness via the maintenance of BTK inhibition.
An additional effect of treatment might relate to profound remodeling of the expression of multiple key adhesion and motility receptors, in particular CCR7 and CXCR5, which might account, at least in part, for the measured drop in responsiveness to CCL19 and CXCL13. Similarly to CCR7 and CXCR5, CCR5 and S1PR1 were progressively reduced. In our study, global CXCR4 expression remained stable over the course of treatment. It should be noted, however, that ibrutinib treatment has been reported to increase the proportion of long-term circulating CXCR4brightCD5dim cells and to result in an adaptation mechanism via the FOXO1-GAB1pAKT axis to promote survival in cells unable to home back to lymphoid niches.31,32 The most drastic alteration of expression was observed for CXCR3, whose expression dropped massively. CXCR3 expression has been shown to inversely mirror the activation status of CLL and to be re-
Haematologica | 109 - March 2024 819
- Motility alterations in ibrutinib-treated CLL J. Rey-Barroso et al.
Figure 5. Ibrutinib treatment differentially affects the expression of chemokine receptors, adhesion molecules and co-receptors in chronic lymphocytic
ARTICLE
lated to a good prognosis.33 The drop in CXCR3 does, however, argue against the possibility that CXCR3 participates in treatment efficacy. How this might affect CLL migration towards inflammatory sites rich in CXCR3 ligands remains to be investigated.
In contrast to previous reports that focused on VLA-4 as an important integrin for CLL trafficking and tumor microenvironment interactions,15,16 we failed to detect an effect of ibrutinib on the expression of this integrin. Instead, we measured a progressive downregulation of the adhesion receptors LFA-1, LFA-3, CD11c and CD44, pointing to a broad alteration of the CLL adhesive potential. Low expression of LFA-1 and VLA-4 partially overlapped across the examined samples, indicating that the regulation of
LFA-1 and VLA-4 expression might be coupled, in line with the fact that both depend on a methylation process related to trisomy 12 status.28,34 Further analysis indicated that samples with low integrin expression had high CD44 levels. This is interesting in light of the fact that CD44 has been shown to support CLL survival in the context of the lymphoid organs.35 It is therefore unexpected that CLL with low/negative integrin expression are associated with high CD44. However, the CD44v6 isoform, which is induced by the tumor microenvironment, has been shown recently to be particularly relevant for CLL progression.36 Our study also provides insight into the assembly of the immunological synapse of CLL cells and its impairment by ibrutinib. While the BCR was the main trigger of BTK
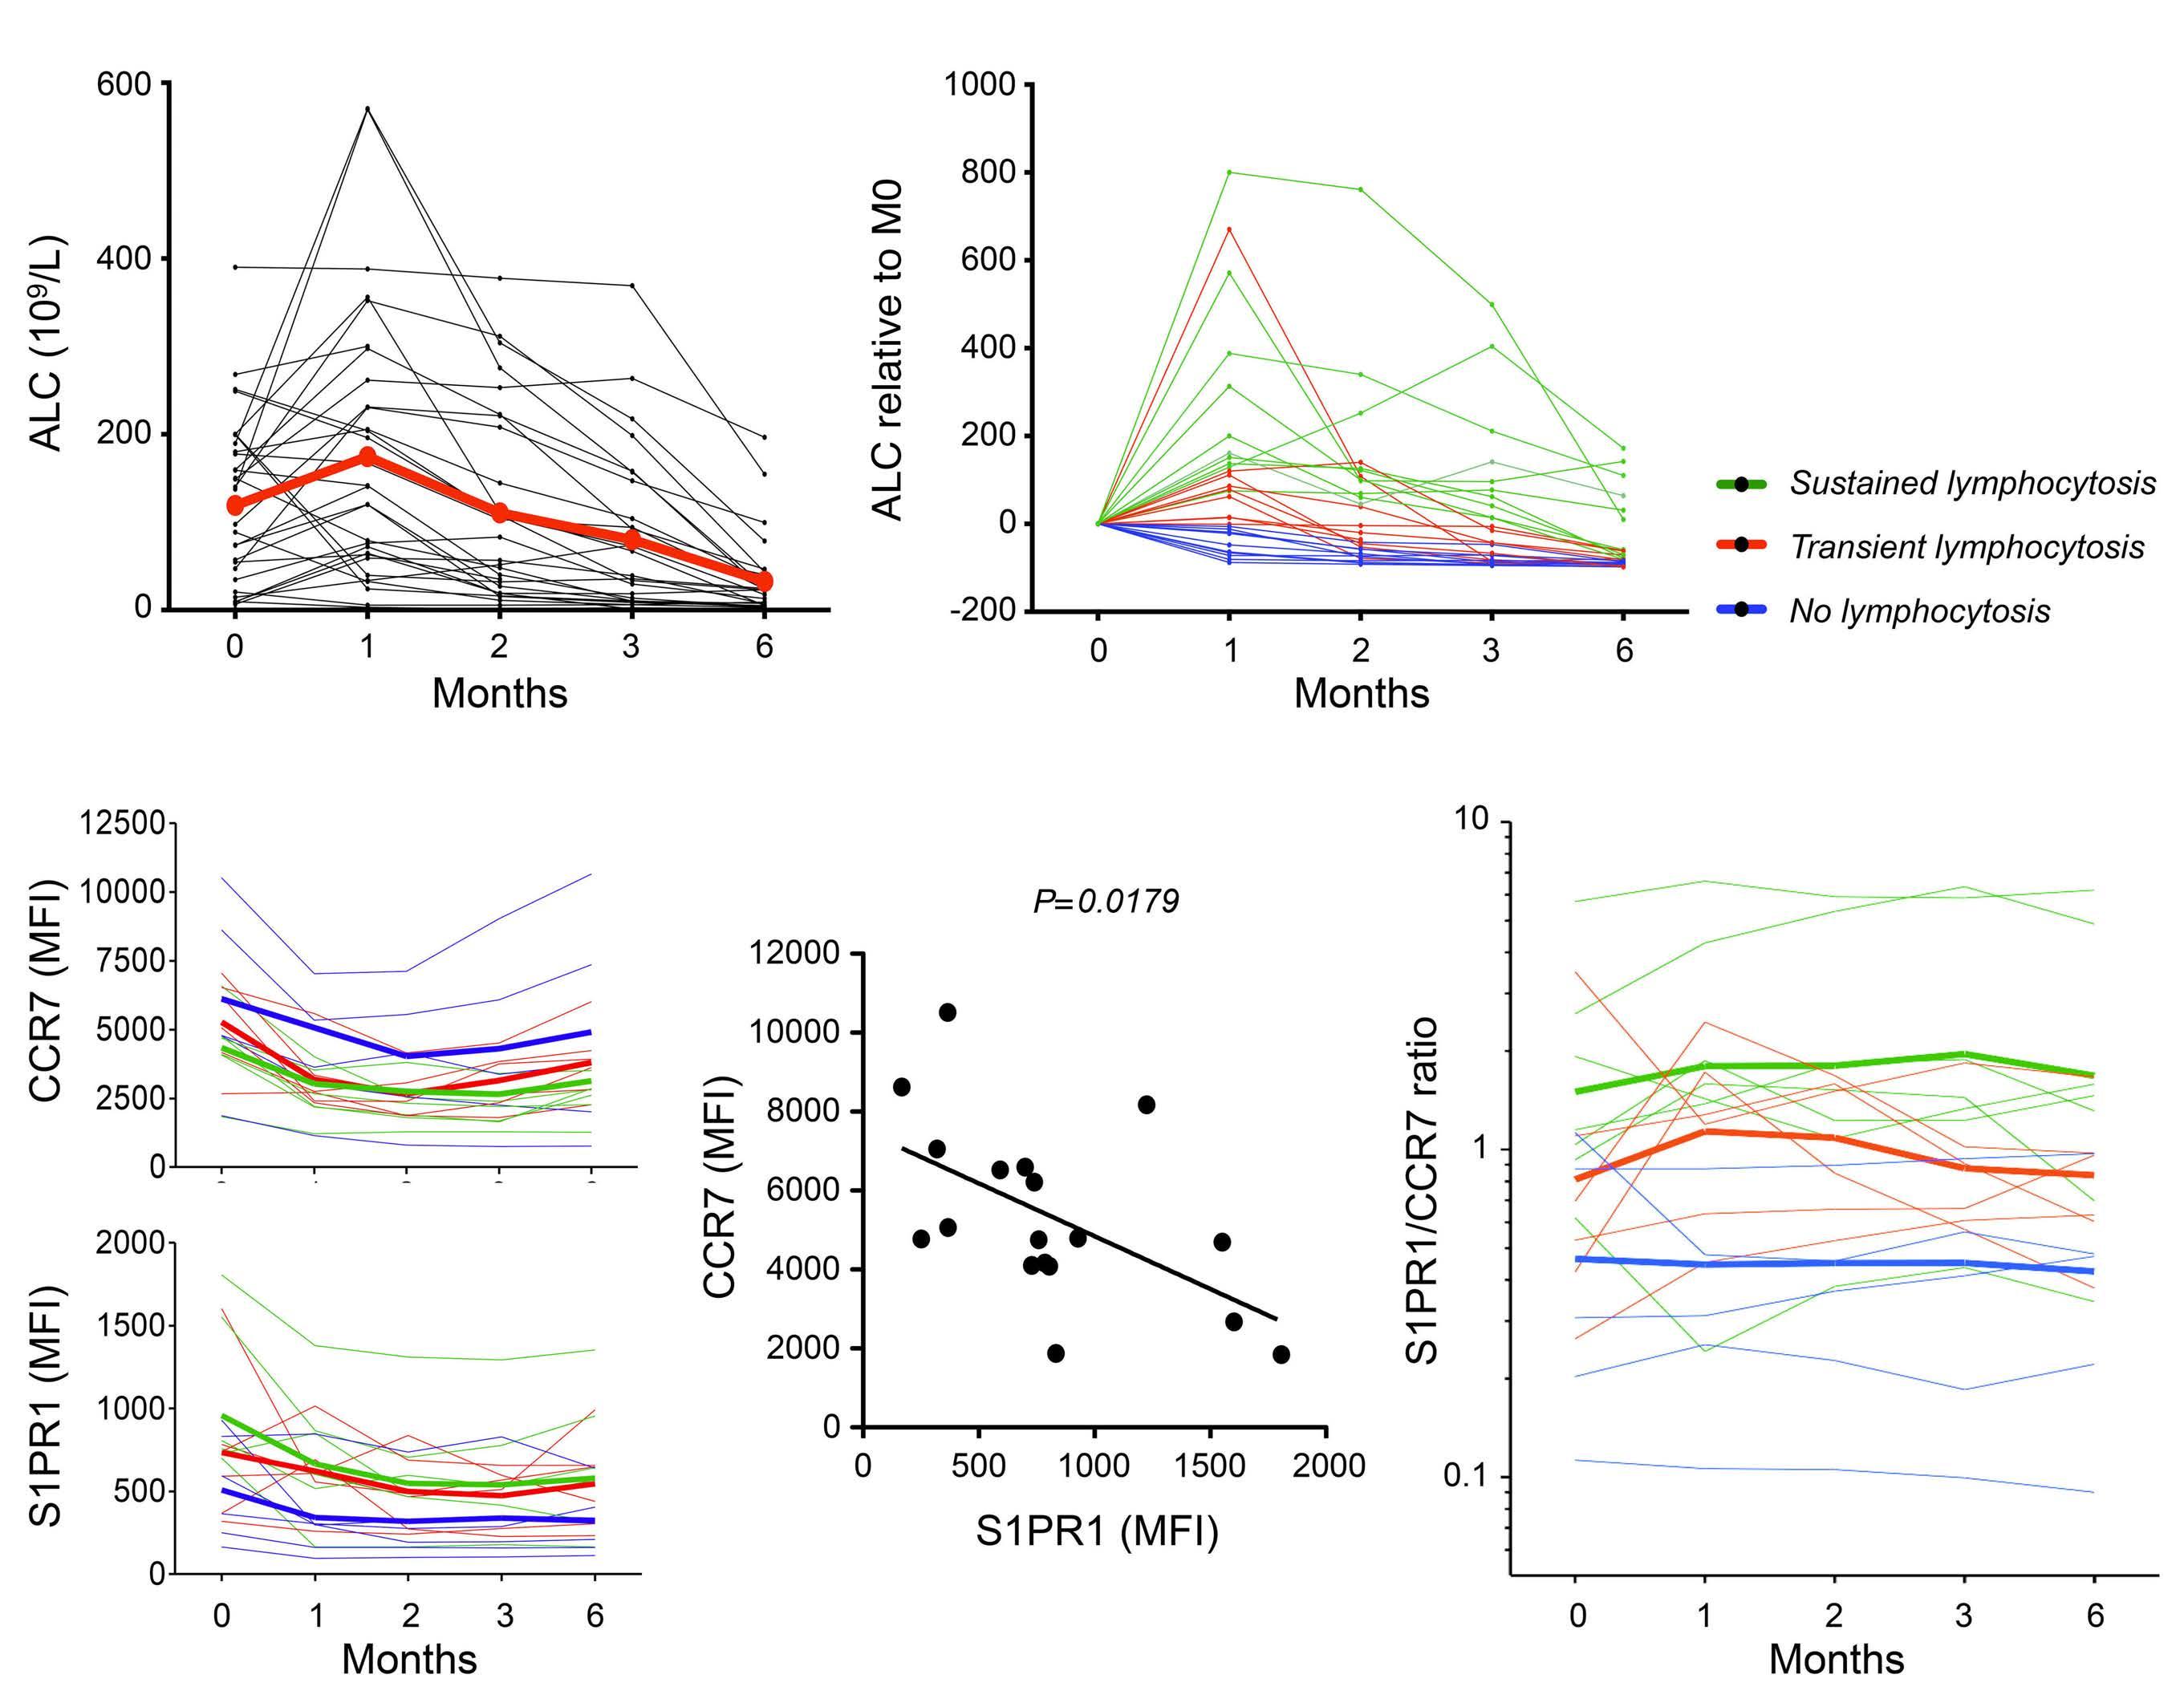
subgroups, as indicated in (B). (D)
analysis of the expression of CCR7 and S1PR1
(E)
of S1PR1 and CCR7
the
of CLL cells from individual patients prior to ibrutinib treatment
the surface of CLL cells from individual patients at various timepoints along ibrutinib treatment. Colors
lymphocytosis subgroups, as indicated in (B). Two-way analysis of variance (ANOVA) (mixed model) was applied: lymphocytosis subgrouping accounted for 27.42% of the total variance (after adjusting for matching) with P=0.0702.
M=0 of subgroup medians showed differences with P=0.0602. MFI: mean fluorescence
A C D E B Haematologica | 109 - March 2024 820 ARTICLE - Motility alterations in ibrutinib-treated CLL J. Rey-Barroso et al.
Figure 6. The S1PR1/CCR7 ratio is associated with the rate of ibrutinib-induced lymphocytosis. (A) Absolute leukocyte counts (ALC) are plotted during the course of ibrutinib treatment for individual chronic lymphocytic leukemia (CLL) patients (black dots and lines). Mean values are shown in red. (B) Fold change of ALC for the CLL patient cohort divided according to the indicated subgroup. (C) Level of expression (as determined by mean fluorescence intensity) of CCR7 and S1PR1 at various timepoints after treatment in individual patients with colors indicating lymphocytosis
Correlation
expression at
surface
initiation.
Normalized ratio
expression at
represent
One-way ANOVA test at
intensity.
phosphorylation, LFA-1 potentiated synaptic spreading at least in patients who retained LFA-1 expression. This is in line with the notion that BCR signaling via BTK activates integrin-dependent adhesion.37,38 In this context, ibrutinib exposure severely impaired immunological synapse assembly by blocking BTK phosphorylation and associated actin remodeling. Complementary investigation of the role of additional co-receptors in CLL synapse assembly and their sensitivity to ibrutinib would be of interest, also because of the expression modulation observed by cytometry. The profound reprogramming of the motility/adhesion/interaction potential of CLL cells upon treatment is in line with an erosion of CLL identity, as characterized by single-cell RNA-sequencing analysis.20 Our data further support a model whereby intrinsic differences in the recirculation properties of CLL cells, governed by S1PR1 and CCR7 expression, play a pivotal role in the individual response to ibrutinib. In particular, we identi fi ed that the S1PR1/CCR7 ratio, refl ecting the exit/entry rate of CLL cells, is set differently in individual patients prior to treatment and that it is associated with the redistribution behavior of the CLL cells upon treatment. A state of imbalance in the expression of S1PR1 and CCR7 has been previously proposed to contribute to retaining CLL cells in the stromal microenvironment.17,39,40 In vitro data have pointed to the ability of ibrutinib to increase S1PR1 and decrease CCR7, thereby leading to a normalization of the imbalance between CCR7 and S1PR1 to favor CLL redistribution. However, our study shows that prolonged in vivo treatment leads to decreased expression of both S1PR1 and CCR7. Remarkably, the S1PR1/CCR7 ratio at the surface of CLL cells emerges as a set value in individual patients which is not affected by treatment. This is probably related to mechanisms in place to co-regulate the expression of these two receptors,41 agreeing with the inverse correlation between S1PR1 and CCR7 in individual patients. How could the S1PR1 axis be targeted to promote the egress of ibrutinib-resistant CLL? Larger cohorts might be used to validate the robustness of the S1PR1/CCR7 ratio to predict ibrutinib responsiveness. Then, combination therapy might help to overcome the S1PR1-related egress deficiency. In particular, SYK and PI3K inhibitors may promote S1P-mediated egress, in particular by relieving BCR-mediated repression of S1PR1 expression.40,42 We also focused here on the off-target effects of ibrutinib on non-neoplastic cell subsets. Our in vitro exposure experiments showed a decrease in T-cell transmigration in response to CCL19 and CXCL12 in both CLL patients and healthy donors. Basal motility of T cells was also affected by ibrutinib. Notably, these in vitro effects did not translate into a substantial alteration of chemokine-evoked migration in T cells from treated CLL patients along our longitudinal follow-up study, in agreement with preserved
CCR7-dependent migration of T cells in ibrutinib-treated CLL patients.43 Interestingly, expression of CXCR3 on T cells was strongly affected by ibrutinib treatment, suggesting that T-cell homing properties might be altered in vivo. Our study further points to cell adhesion and cell:cell interactions as pathways affected during the course of ibrutinib treatment, in parallel in CLL cells and non-neoplastic lymphocytes. This observation is in agreement with a recent single-cell RNA-sequencing analysis.20
In conclusion, our study provides novel insight into the mechanism of action of ibrutinib in the context of CLL treatment. We identified a set of mechanisms that are reproducibly altered by ibrutinib in both CLL cells and nonneoplastic lymphocytes. Furthermore, our data reinforce the notion that the intrinsically low turnover of CLL cells from secondary lymphoid organs is a major mechanism of resistance to treatment efficacy. In particular the balance between CCR7 and S1PR1, which appears to be set in individual patients and to not vary during the course of treatment appears as a potential marker to predict treatment efficacy.
Disclosures
No conflicts of interest to disclose.
Contributions
JR-B performed experiments, analyzed data, and wrote the paper. AMu, NR, and AMo designed, performed and analyzed experiments. MC and SG designed and applied analytical solutions. OD, RP and SC performed experiments and analyzed data. LY and AQ-M provided CLL samples, participated in research design and scientific discussions. LD designed the research, supervised data analysis and wrote the paper.
Acknowledgments
We thank Sophie Allart and Simon Lachambre from the cell imaging facility of INFINITy, as well as Fatima-Ezzahra L’Faqihi-Olive, Valérie Duplan-Eche, Anne-Laure Iscache and Lidia De La Fuente-Vizuete from the cytometry facility of INFINITy. We also thank Isabelle Fernandes and David Sagnat from the Organoid platform of IRSD. Finally, we thank Pauline Gonnord, Salvatore Valitutti and Fabien Crauste for helpful discussions.
Funding
This work was supported by the INSERM Plan Cancer program (C15092BS to LD, LY and SG) and the Association Laurette Fugain (to LD).
Data-sharing statement
The image-based and flow cytometry-based data reported in the study have not been deposited in a public repository but are available from the corresponding author upon request.
Haematologica | 109 - March 2024 821 ARTICLE - Motility alterations in ibrutinib-treated CLL J. Rey-Barroso et al.
References
1. Burger JA, O'Brien S. Evolution of CLL treatment - from chemoimmunotherapy to targeted and individualized therapy. Nat Rev Clin Oncol. 2018;15(8):510-527.
2. Brown JR, Hillmen P, O'Brien S, et al. Extended follow-up and impact of high-risk prognostic factors from the phase 3 RESONATE study in patients with previously treated CLL/SLL. Leukemia. 2018;32(1):83-91.
3. Byrd JC, Furman RR, Coutre SE, et al. Ibrutinib treatment for first-line and relapsed/refractory chronic lymphocytic leukemia: final analysis of the pivotal phase Ib/II PCYC-1102 study. Clin Cancer Res. 2020;26(15):3918-3927.
4. Byrd JC, Furman RR, Coutre SE, et al. Targeting BTK with ibrutinib in relapsed chronic lymphocytic leukemia. N Engl J Med. 2013;369(1):32-42.
5. Farooqui MZ, Valdez J, Martyr S, et al. Ibrutinib for previously untreated and relapsed or refractory chronic lymphocytic leukaemia with TP53 aberrations: a phase 2, single-arm trial. Lancet Oncol. 2015;16(2):169-176.
6. Gribben JG, Bosch F, Cymbalista F, et al. Optimising outcomes for patients with chronic lymphocytic leukaemia on ibrutinib therapy: European recommendations for clinical practice. Br J Haematol. 2018;180(5):666-679.
7. Herman SE, Niemann CU, Farooqui M, et al. Ibrutinib-induced lymphocytosis in patients with chronic lymphocytic leukemia: correlative analyses from a phase II study. Leukemia. 2014;28(11):2188-2196.
8. O'Brien S, Furman RR, Coutre SE, et al. Ibrutinib as initial therapy for elderly patients with chronic lymphocytic leukaemia or small lymphocytic lymphoma: an open-label, multicentre, phase 1b/2 trial. Lancet Oncol. 2014;15(1):48-58.
9. Wodarz D, Garg N, Komarova NL, et al. Kinetics of CLL cells in tissues and blood during therapy with the BTK inhibitor ibrutinib. Blood. 2014;123(26):4132-4135.
10. Woyach JA, Smucker K, Smith LL, et al. Prolonged lymphocytosis during ibrutinib therapy is associated with distinct molecular characteristics and does not indicate a suboptimal response to therapy. Blood. 2014;123(12):1810-1817.
11. Burger JA, Li KW, Keating MJ, et al. Leukemia cell proliferation and death in chronic lymphocytic leukemia patients on therapy with the BTK inhibitor ibrutinib. JCI Insight. 2017;2(2):e89904.
12. Burger JA, Montserrat E. Coming full circle: 70 years of chronic lymphocytic leukemia cell redistribution, from glucocorticoids to inhibitors of B-cell receptor signaling. Blood. 2013;121(9):1501-1509.
13. de Rooij MF, Kuil A, Geest CR, et al. The clinically active BTK inhibitor PCI-32765 targets B-cell receptor- and chemokinecontrolled adhesion and migration in chronic lymphocytic leukemia. Blood. 2012;119(11):2590-2594.
14. Ponader S, Chen SS, Buggy JJ, et al. The Bruton tyrosine kinase inhibitor PCI-32765 thwarts chronic lymphocytic leukemia cell survival and tissue homing in vitro and in vivo. Blood. 2012;119(5):1182-1189.
15. Herman SE, Mustafa RZ, Jones J, Wong DH, Farooqui M, Wiestner A. Treatment with ibrutinib inhibits BTK- and VLA-4dependent adhesion of chronic lymphocytic leukemia cells in vivo. Clin Cancer Res. 2015;21(20):4642-4651.
16. Tissino E, Benedetti D, Herman SEM, et al. Functional and clinical relevance of VLA-4 (CD49d/CD29) in ibrutinib-treated chronic lymphocytic leukemia. J Exp Med. 2018;215(2):681-697.
17. Patrussi L, Capitani N, Martini V, et al. Enhanced chemokine receptor recycling and impaired S1P1 expression promote
leukemic cell infiltration of lymph nodes in chronic lymphocytic leukemia. Cancer Res. 2015;75(19):4153-4163.
18. Dubovsky JA, Beckwith KA, Natarajan G, et al. Ibrutinib is an irreversible molecular inhibitor of ITK driving a Th1-selective pressure in T lymphocytes. Blood. 2013;122(15):2539-2549.
19. Long M, Beckwith K, Do P, et al. Ibrutinib treatment improves T cell number and function in CLL patients. J Clin Invest. 2017;127(8):3052-3064.
20. Rendeiro AF, Krausgruber T, Fortelny N, et al. Chromatin mapping and single-cell immune profiling define the temporal dynamics of ibrutinib response in CLL. Nat Commun. 2020;11(1):577.
21. Varughese T, Taur Y, Cohen N, et al. Serious infections in patients receiving ibrutinib for treatment of lymphoid cancer. Clin Infect Dis. 2018;67(5):687-692.
22. Gonnord P, Costa M, Abreu A, et al. Multiparametric analysis of CD8(+) T cell compartment phenotype in chronic lymphocytic leukemia reveals a signature associated with progression toward therapy. Oncoimmunol. 2019;8(4):e1570774.
23. Gallais F, Ysebaert L, Despas F, et al. Population pharmacokinetics of ibrutinib and its dihydrodiol metabolite in patients with lymphoid malignancies. Clin Pharmacokinet. 2020;59(9):1171-1183.
24. Byrd JC, Harrington B, O'Brien S, et al. Acalabrutinib (ACP-196) in relapsed chronic lymphocytic leukemia. N Engl J Med. 2016;374(4):323-332.
25. Till KJ, Harris RJ, Linford A, Spiller DG, Zuzel M, Cawley JC. Cell motility in chronic lymphocytic leukemia: defective Rap1 and alphaLbeta2 activation by chemokine. Cancer Res. 2008;68(20):8429-8436.
26. Hartmann TN, Grabovsky V, Wang W, et al. Circulating B-cell chronic lymphocytic leukemia cells display impaired migration to lymph nodes and bone marrow. Cancer Res. 2009;69(7):3121-3130.
27. Riches JC, O'Donovan CJ, Kingdon SJ, et al. Trisomy 12 chronic lymphocytic leukemia cells exhibit upregulation of integrin signaling that is modulated by NOTCH1 mutations. Blood. 2014;123(26):4101-4110.
28. Hutterer E, Asslaber D, Caldana C, et al. CD18 (ITGB2) expression in chronic lymphocytic leukaemia is regulated by DNA methylation-dependent and -independent mechanisms. Br J Haematol. 2015;169(2):286-289.
29. German Y, Vulliard L, Kamnev A, et al. Morphological profiling of human T and NK lymphocytes by high-content cell imaging. Cell Rep. 2021;36(1):109318.
30. Pham TH, Okada T, Matloubian M, Lo CG, Cyster JG. S1P1 receptor signaling overrides retention mediated by G alpha icoupled receptors to promote T cell egress. Immunity. 2008;28(1):122-133.
31. Pavlasova G, Borsky M, Seda V, et al. Ibrutinib inhibits CD20 upregulation on CLL B cells mediated by the CXCR4/SDF-1 axis. Blood. 2016;128(12):1609-1613.
32. Seda V, Vojackova E, Ondrisova L, et al. FoxO1-GAB1 axis regulates homing capacity and tonic AKT activity in chronic lymphocytic leukemia. Blood. 2021;138(9):758-772.
33. Ganghammer S, Gutjahr J, Hutterer E, et al. Combined CXCR3/CXCR4 measurements are of high prognostic value in chronic lymphocytic leukemia due to negative co-operativity of the receptors. Haematologica. 2016;101(3):e99-102.
34. Zucchetto A, Caldana C, Benedetti D, et al. CD49d is overexpressed by trisomy 12 chronic lymphocytic leukemia
Haematologica | 109 - March 2024 822 ARTICLE - Motility alterations in ibrutinib-treated CLL J. Rey-Barroso et al.
cells: evidence for a methylation-dependent regulation mechanism. Blood. 2013;122(19):3317-3321.
35. Fedorchenko O, Stiefelhagen M, Peer-Zada AA, et al. CD44 regulates the apoptotic response and promotes disease development in chronic lymphocytic leukemia. Blood. 2013;121(20):4126-4136.
36. Gutjahr JC, Szenes E, Tschech L, et al. Microenvironmentinduced CD44v6 promotes early disease progression in chronic lymphocytic leukemia. Blood. 2018;131(12):1337-1349.
37. Spaargaren M, Beuling EA, Rurup ML, et al. The B cell antigen receptor controls integrin activity through Btk and PLCgamma2. J Exp Med. 2003;198(10):1539-1550.
38. Montresor A, Toffali L, Rigo A, Ferrarini I, Vinante F, Laudanna C. CXCR4- and BCR-triggered integrin activation in B-cell chronic lymphocytic leukemia cells depends on JAK2-activated Bruton's tyrosine kinase. Oncotarget. 2018;9(80):35123-35140.
39. Sic H, Kraus H, Madl J, et al. Sphingosine-1-phosphate receptors control B-cell migration through signaling components associated with primary immunodeficiencies, chronic lymphocytic leukemia, and multiple sclerosis. J Allergy Clin
Immunol. 2014;134(2):420-428.
40. Till KJ, Pettitt AR, Slupsky JR. Expression of functional sphingosine-1 phosphate receptor-1 is reduced by B cell receptor signaling and increased by inhibition of PI3 kinase delta but not SYK or BTK in chronic lymphocytic leukemia cells. J Immunol. 2015;194(5):2439-2446.
41. Capitani N, Patrussi L, Trentin L, et al. S1P1 expression is controlled by the pro-oxidant activity of p66Shc and is impaired in B-CLL patients with unfavorable prognosis. Blood. 2012;120(22):4391-4399.
42. Borge M, Remes Lenicov F, Nannini PR, et al. The expression of sphingosine-1 phosphate receptor-1 in chronic lymphocytic leukemia cells is impaired by tumor microenvironmental signals and enhanced by piceatannol and R406. J Immunol. 2014;193(6):3165-3174.
43. Mateu-Albero T, Marcos-Jimenez A, Wissmann S, et al. Ibrutinib does not impact CCR7-mediated homeostatic migration in Tcells from chronic lymphocytic leukemia patients. Cancers. 2022;14(11):2729.
Haematologica | 109 - March 2024 823 ARTICLE - Motility alterations in ibrutinib-treated CLL J. Rey-Barroso et al.
Autonomous B-cell receptor signaling and genetic aberrations in chronic lymphocytic leukemia-phenotype monoclonal
B lymphocytosis in siblings of patients with chronic lymphocytic leukemia
Edwin Quinten,1* Julieta H. Sepúlveda-Yáñez,1,2* Marvyn T. Koning,1 Janneke A. Eken,1 Dietmar Pfeifer,3 Valeri Nteleah,1 Ruben A.L. de Groen,1 Diego Alvarez Saravia,2 Jeroen Knijnenburg,4 Hedwig E. Stuivenberg-Bleijswijk,1 Milena Pantic,3 Andreas Agathangelidis,5,6 Andrea KepplerHafkemeyer,3 Cornelis A. M. van Bergen,1 Roberto Uribe-Paredes,7,8 Kostas Stamatopoulos,6,9 Joost S.P. Vermaat,1 Katja Zirlik,3,10 Marcelo A. Navarrete,2 Hassan Jumaa11 and Hendrik Veelken1
1Department of Hematology, Leiden University Medical Center, Leiden, The Netherlands; 2School of Medicine, Universidad de Magallanes, Punta Arenas, Chile; 3Department of Medicine I, University Medical Center Freiburg, Freiburg, Germany; 4Department of Clinical Genetics, Leiden University Medical Center, Leiden, The Netherlands; 5Department of Biology, School of Science, National and Kapodistrian University of Athens, Athens, Greece; 6Institute of Applied Biosciences, Center for Research and Technology Hellas, Thessaloniki, Greece; 7Department of Computer Engineering, Universidad de Magallanes, Punta Arenas, Chile; 8Center for Biotechnology and Bioengineering, Santiago, Chile; 9Department of Molecular Medicine and Surgery, Karolinska Institutet, Stockholm, Sweden; 10Tumor- und Brustzentrum Ostschweiz, Chur, Switzerland and 11Institute of Immunology, University of Ulm, Ulm, Germany
*EQ and JHS-Y contributed equally as first authors.
Abstract
Correspondence: H. Veelken
j.h.veelken@lumc.nl
Received: March 1, 2023.
Accepted: June 30, 2023.
Early view: July 13, 2023.
https://doi.org/10.3324/haematol.2022.282542
©2024 Ferrata Storti Foundation
Published under a CC BY-NC license

Clonal expansion of CD5-expressing B cells, commonly designated as monoclonal B lymphocytosis (MBL), is a precursor condition for chronic lymphocytic leukemia (CLL). The mechanisms driving subclinical MBL B-cell expansion and progression to CLL, occurring in approximately 1% of affected individuals, are unknown. An autonomously signaling B-cell receptor (BCR) is essential for the pathogenesis of CLL. The objectives of this study were functional characterization of the BCR of MBL in siblings of CLL patients and a comparison of genetic variants in MBL-CLL sibling pairs. Screening of peripheral blood by flow cytometry detected 0.2-480 clonal CLL-phenotype cells per microliter (median: 37/μL) in 34 of 191 (17.8%) siblings of CLL patients. Clonal BCR isolated from highly purified CLL-phenotype cells induced robust calcium mobilization in BCR-deficient murine pre-B cells in the absence of external antigen and without experimental crosslinking. This autonomous BCR signal was less intense than the signal originating from the CLL BCR of their CLL siblings. According to genotyping by single nucleotide polymorphism array, whole exome, and targeted panel sequencing, CLL risk alleles were found with high and similar prevalence in CLL patients and MBL siblings, respectively. Likewise, the prevalence of recurrent CLL-associated genetic variants was similar between CLL and matched MBL samples. However, copy number variations and small variants were frequently subclonal in MBL cells, suggesting their acquisition during subclinical clonal expansion. These findings support a stepwise model of CLL pathogenesis, in which autonomous BCR signaling leads to a non-malignant (oligo)clonal expansion of CD5+ B cells, followed by malignant progression to CLL after acquisition of pathogenic genetic variants.
Introduction
Chronic lymphocytic leukemia (CLL) is a monoclonal expansion of more than 5,000 mature CD5-expressing B
cells per microliter of peripheral blood.1,2 The clinical behavior of CLL is highly variable and depends strongly on structural and functional properties of the B-cell receptor (BCR) as well as the presence of various recurrent genetic
Haematologica | 109 March 2024 824 ARTICLE - Chronic Lymphocytic Leukemia
aberrations.1-6 Autonomous signaling of the clonotypic BCR expressed by CLL cells, i.e. signaling without engagement of an external antigen, is an indispensable oncogenic signal in CLL.7 This peculiar property of CLL BCR is absent in other types of indolent B-cell lymphoma and in antigenspecific normal B cells.7 Autonomous BCR signaling is caused by physical interaction between neighboring BCR complexes on the cell surface, as demonstrated by seminal crystallographic studies in paradigmatic CLL BCR.8 In the E -TCL1 transgenic mouse model, autonomous BCR signaling is indispensable for CLL development even when all B cells primarily express an antigen-specific transgenic BCR and are stimulated by their cognate antigen.9 CLL is characterized by remarkable skewing in the BCR immunoglobulin (BCR IG) gene repertoire, culminating in the existence of subsets of cases with restricted BCR IG features.5 The largest immunogenetic CLL subset, stereotyped subset #2L, is defined by the expression of a BCR with a light chain utilizing the IGLV3-21 gene that carries a G110R mutation at the junction between the variable and constant domains.10 This seminal IGLV3-21 G110R mutation facilitates autonomous BCR signaling.8
Numerous gene polymorphisms predispose to the development of CLL.11-13 Formally, CLL develops through a precursor stage, a subclinical expansion of mature B cells with the characteristic CD5+CD20lowCD79low CLL phenotype, commonly referred to as CLL-phenotype monoclonal B lymphocytosis (MBL).14 The prevalence of MBL is approximately 100 times higher than that of CLL and is relatively increased in siblings of CLL patients.15,16 Similarly to cases of indolent CLL, MBL cells carry relatively few genetic aberrations.17,18 However, the mechanisms leading to benign, longitudinally stable clonal expansion of CLLphenotype B cells, and the hierarchy and sequence of events causing eventual progression to overt CLL are not fully elucidated yet.
In order to investigate the early stages in the ontogeny of CLL, we screened siblings of CLL patients for the presence of MBL with CLL phenotype. Specifically, we sought to clarify whether these MBL cells express BCR with autonomous signaling capacity. In addition, we compared the prevalence of inherited risk loci and acquired genetic aberrations between CLL patients and their first-degree MBL relatives.
Methods
Patients, probands, and samples
CLL patients under management of the outpatient clinics at the participating centers were asked to inform their respective living siblings about this study and to provide their contact information. These siblings were asked to provide a single blood sample. Both CLL patients and their
siblings gave written informed consent to participation in the study, which was conducted according to the Declaration of Helsinki and approved by the Ethical Committees of both participating institutions (Leiden: P12.059; Freiburg: 44/08). These approvals explicitly excluded longitudinal analyses and mandated providing siblings with a categorical screening result.
Detection, isolation, and processing of chronic lymphocytic leukemia-phenotype cells
MBL was detected as discrete CD19+CD5+CD20lowCD79low populations (Figure 1) by six-color flow cytometry. DNA and RNA were isolated from MBL cells sorted to >95% purity (Allprep DNA/RNA mini kit; Qiagen, Hilden, Germany). Frequencies of MBL cells were calculated from gated cells and absolute lymphocyte counts.
Identification of clonal B-cell receptor transcripts
VDJ and VJ sequences were determined by ARTISAN PCR.19,20 Ig sequences were analyzed by Geneious 10.2.6 (Geneious, Auckland, New Zealand) and IMGT/V-QUEST.21,22 Assignment to CLL stereotypes was performed by an established purpose-built algorithm.5,23
Analysis of B-cell receptor signaling activity
Murine TKO pre-B cells were transduced with retroviral pMIZCC and pMIZYN vectors encoding paired Ig heavy and light chain sequences from individual cases.7,10 TKO cells are genetically deficient of Rag2, Lambda5, and Slp65. Slp65 function is reconstituted by a 4-hydroxytamoxifeninducible Slp65-ERT2 fusion gene.7,24 Calcium mobilization was measured in indo-1 AM-loaded (ThermoFisher, Waltham, MA, USA), live-gated TKO cells by flow cytometry prior to and after addition of 2 μ M 4-hydroxytamoxifen (Sigma Aldrich, St Louis, MO, USA). Maximum BCR signaling was measured after addition of crosslinking anti-IgM or anti-IgG antibodies (clones 2022-01 and 2042-01; Southern Biotech, Birmingham, AL, USA). Autonomous BCR signaling was quantitated with correction for totally unresponsive cells during BCR crosslinking (Online Supplementary Material) at least twice at approximately 3 and 4 weeks after transduction.
Genetic characterization
Variants in 52 B-cell lymphoma-related genes were analyzed by the LYMFv1 custom targeted sequencing panel on an Ion S5 system (ThermoFisher).25 Sequencing reads were aligned to the GRCh37/hg19 human reference genome with TMAP 5.0.7 software under default parameters. CLL-associated copy number variations (CNV) were detected by single nucleotide polymorphism (SNP) arrays.26 Whole exome sequencing (WES) was performed with SureSelect Human All Exon V7 kit (Agilent, Santa Clara, CA, USA) capture on the HiSeq2000 (Illumina, San Diego, CA,
Haematologica | 109 March 2024 825
Oncogenic
E. Quinten et al.
ARTICLE -
features of monoclonal B lymphocytosis
USA) platform to an average coverage of 50x. If necessary, DNA was amplified by isothermal alkaline genome amplification (REPLI-g kit; Qiagen). Detected variants were annotated for predicted pathogenicity and occurrence in both CLL and MBL siblings (Online Supplementary Material). The global distribution of variant allele frequencies (VAF) in CLL and MBL was estimated using the Wilcoxon rank sum test with a continuity correction (Mann-Whitney U test) R function 'wilcox.test()' (www.R-project.org) and the probability density function of VAF calculated by kernel density estimation using the R function 'density()’. Monoallelic and subclonal variants present in CLL and MBL samples from siblings were tested using the Wilcoxon signed-rank test R function 'wilcox.test(paired=TRUE)'. All tests were only performed after checking the corresponding test assumptions. Inherited CLL risk loci were genotyped by targeted Sanger sequencing of 24 CLL susceptibility alleles, genes and loci covered by WES and the SNP array.12,27-31 Observed frequencies of risk alleles were compared to the most appropriate reference population from the gnomAD database by the Fisher exact test.32 CLL risk SNP were compared with WES-based data of Northwestern Europeans in gnomAD v2.1.1 and with whole genome sequenc-
ing-based data of non-Finnish Europeans in gnomAD v3.1.2. Polygenic risk scores were calculated for individual MBL probands and CLL patients for their genotyped risk loci based on the most recent reported odds ratios.12,13 The extent of genetic analyses was restricted in individual cases by insufficient amounts of DNA due to the paucity of clonal CLL-phenotype B cells ( Online Supplementary Figure S1; Online Supplementary Table S1).
Results
Prevalence and frequency of chronic lymphocytic leukemia-phenotype cells in siblings of patients with chronic lymphocytic leukemia
Peripheral blood samples from 191 siblings of CLL patients were received and analyzed at two academic medical centers. Flow cytometry revealed a discrete population of CLL-phenotype CD19+CD5+CD20lowCD19low cells, in the majority with evident light chain restriction, in 34 siblings (17.8%) of 26 CLL patients (Figure 1; Online Supplementary Table S1). The median age of siblings with CLL-phenotype cells was 68 years (range, 43-80 years). No sibling with detectable MBL was a member of a family with a CLL back-
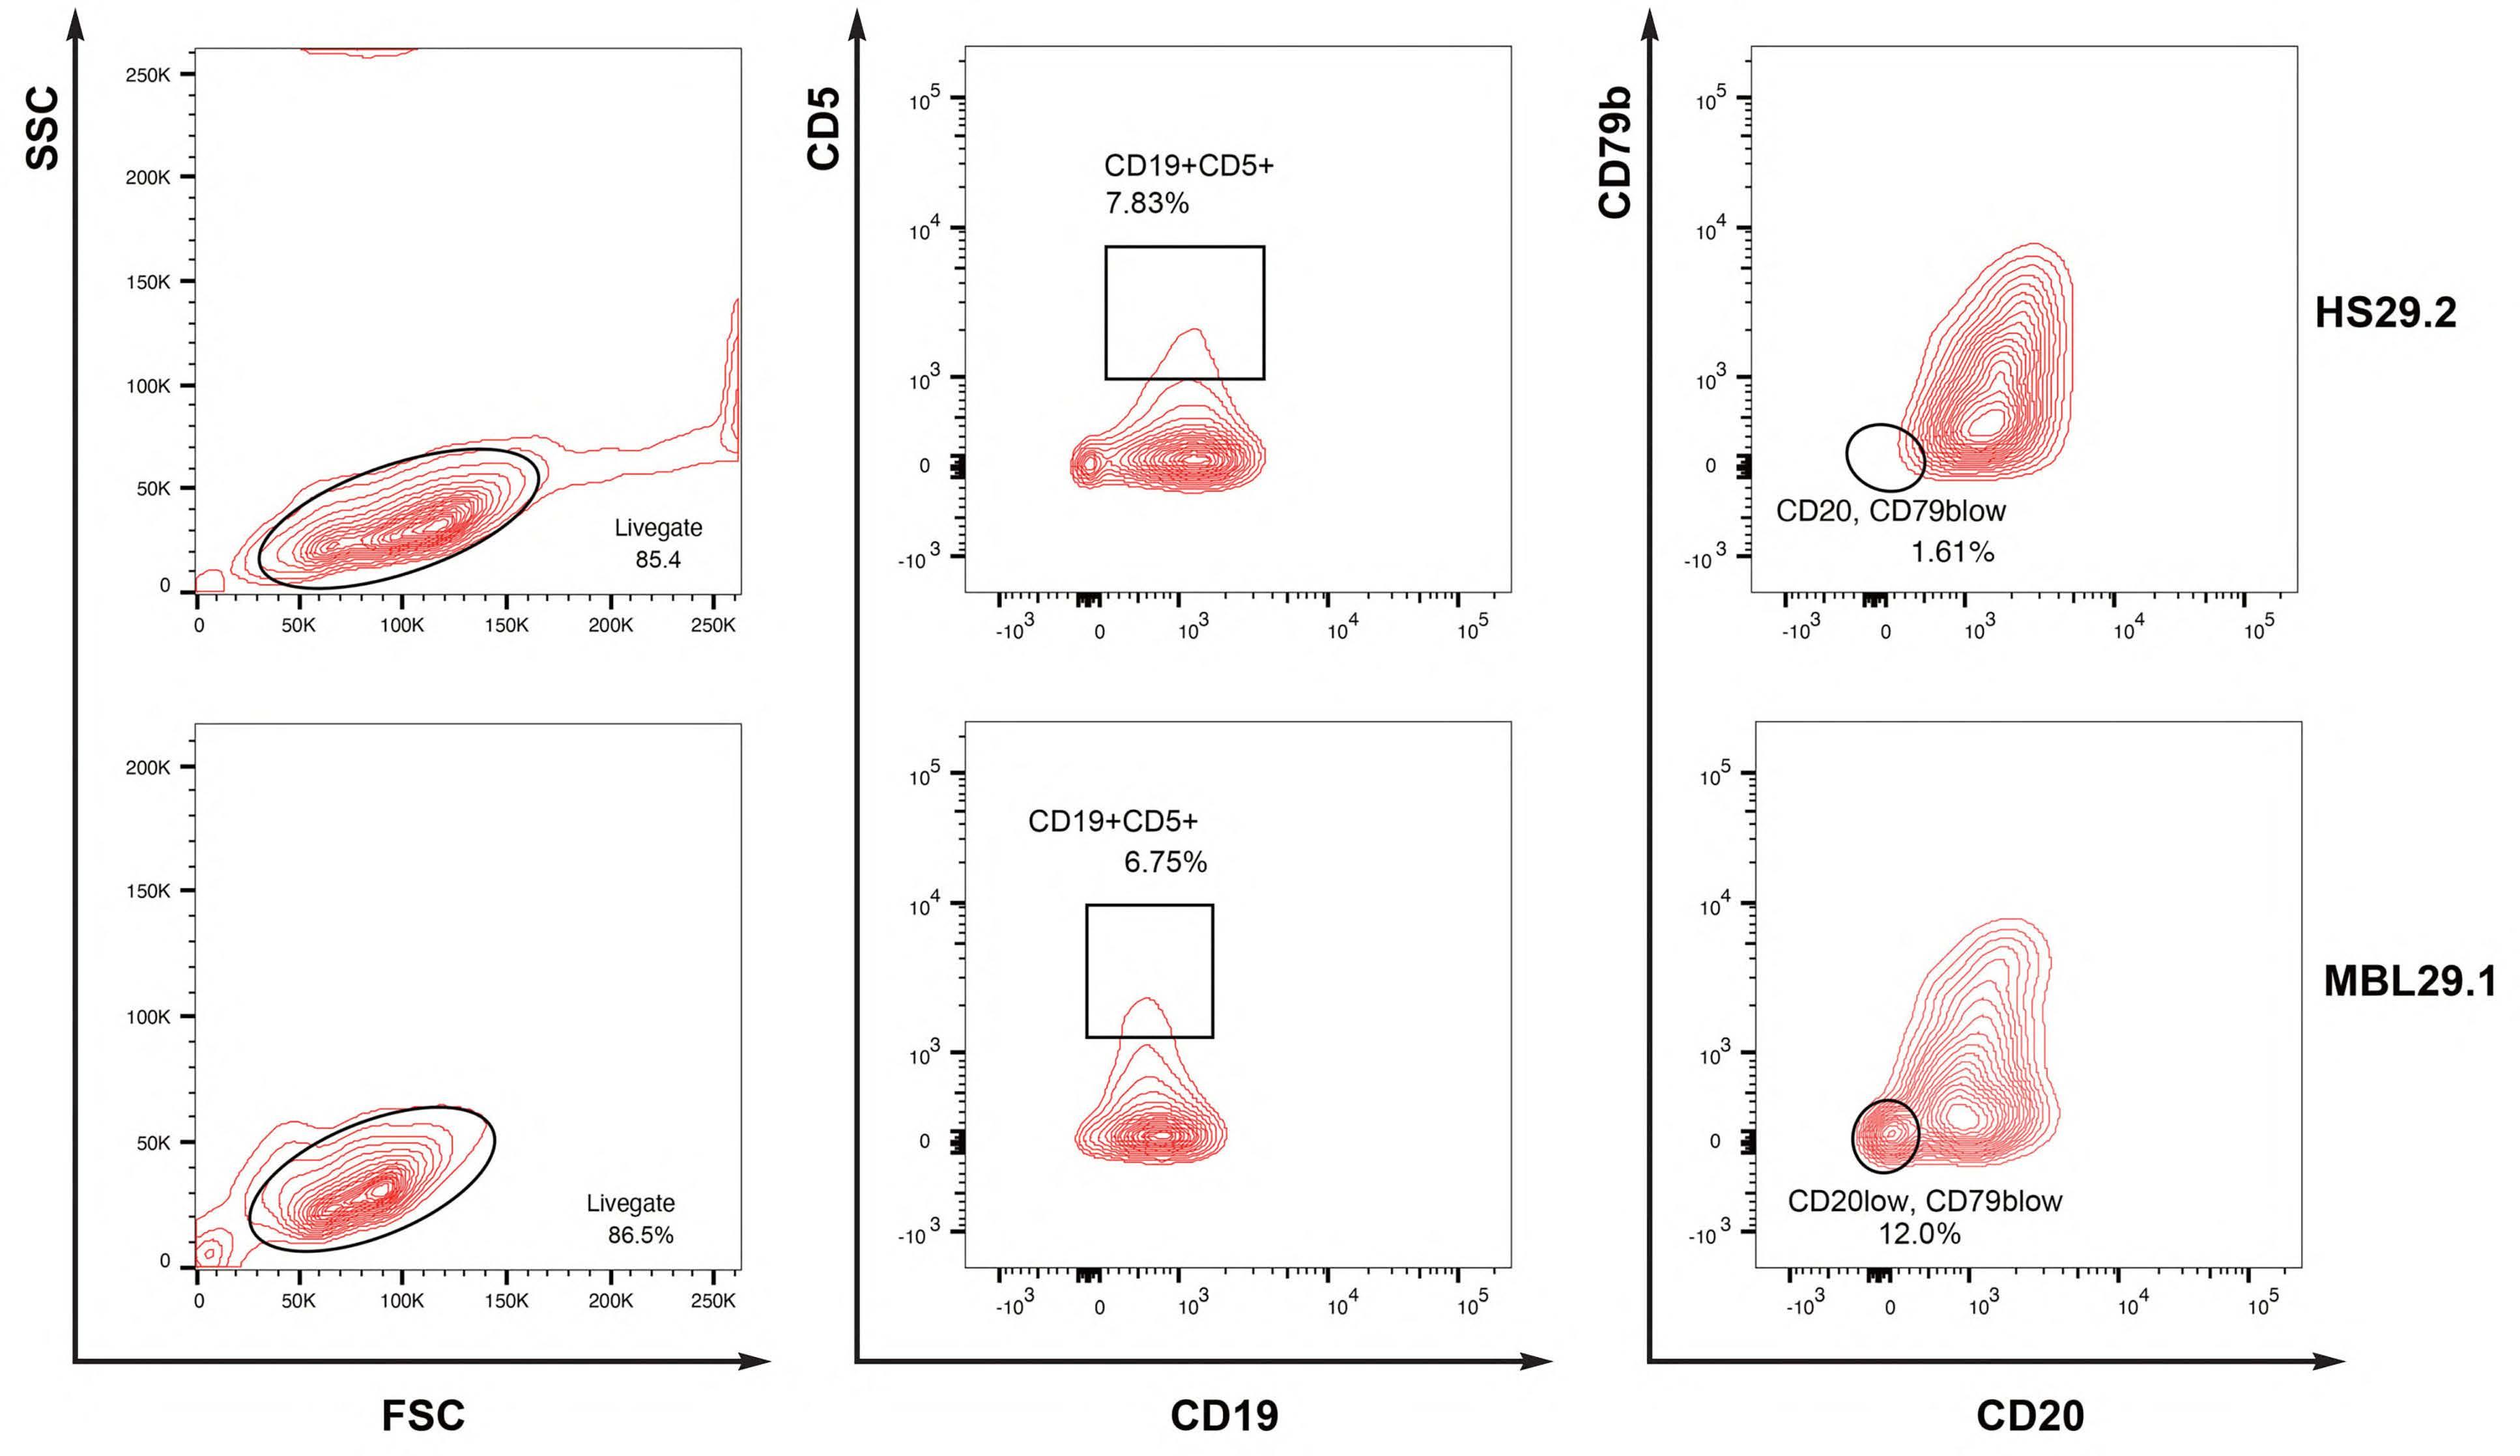
Haematologica | 109 March 2024 826 ARTICLE - Oncogenic features of monoclonal B lymphocytosis E. Quinten et al.
Figure 1. Detection of chronic lymphocytic leukemia-phenotype monoclonal B lymphocytosis cells. Flow cytometry screening of two healthy siblings of chronic lymphocytic leukemia (CLL) patient 29.1. Upper row: Healthy sibling HS29.2 without detectable CLL-phenotype cells. Lower row: Healthy sibling MBL29.1 with the lowest detected expansion of CLL-phenotype cells (CD19+CD5+CD20lowCD79low) in this study. SSC: side scatter; FSC: forward scatter.
ground. The absolute number of CLL-phenotype MBL cells ranged from 0.2/ μ L to 1,863/ μ L of blood, and 32 siblings (94%) were classified as having low-count MBL with fewer than 500 clonal CLL-phenotype cells per microliter (Figure 2A). 33
Sequence characteristics of clonally dominant B-cell receptor transcripts of chronic lymphocytic leukemiaphenotype cells in chronic lymphocytic leukemia patients and their healthy siblings
BCR IG transcripts from highly purified CLL-phenotype cells were sequenced in 17 siblings of CLL patients. In two siblings, two different productive VDJ gene rearrangements were identified within the CLL-phenotype MBL cell population (MBL01.1, MBL04.1); all other siblings carried an apparently monoclonal MBL population. Five MBL clones in healthy siblings could be assigned to CLL stereotyped subsets according to expanded immunogenetic criteria (Online Supplementary Table S1).5,23 In particular, the BCR of MBL07.1 and MBL27.2 belonged to CLL subset #2 and #2L, respectively, based on expression of a BCR light chain utilizing the IGLV3-21 gene with the G110R mutation.10 An IgG-expressing MBL fulfilled the criteria of CLL subset #4.34 These MBL BCR were predicted to exert autonomous signaling based on structural analyses.8 Furthermore, all sequenced MBL BCR contained one or both of the FR2 VRQ and FR3 YYC motifs proposed as structural requirements for autonomous BCR signaling in the majority of
CLL cases.7,35 The somatic mutation status of the clonotypic rearranged IGHV gene did not correlate to the degree of expansion of CLL-phenotype cells (Figure 2B). In addition, IGHV gene mutational status could differ between CLL patients and their siblings; in particular, three non-subset #2L MBL (17.6%) expressed unmutated BCR IG, whereas the corresponding CLL BCR was mutated (Figure 2C).
Functional characteristics of monoclonal B lymphocytosis B-cell receptors from siblings of patients with chronic lymphocytic leukemia
BCR from clonally dominant MBL cells of 11 siblings of CLL patients, including all five MBL assigned to a CLL stereotyped subset, were expressed in TKO cells and tested for calcium mobilization prior to and after tamoxifen-induced reconstitution of the BCR signaling cascade and after BCR crosslinking. As predicted,10 both CLL subset #2L MBL BCR showed robust calcium flux upon addition of 4-hydroxytamoxifen without antigen exposure or BCR crosslinking (Figure 3). In addition, all other tested MBL BCR from siblings of CLL patients had autonomous BCR signaling activity. On average, autonomous BCR signaling was slightly stronger in CLL than in MBL in each individual sibling pair (Figure 4A). There was no quantitative correlation between BCR signaling activity of CLL and MBL sibling pairs (Figure 4B). BCR signaling strength was positively correlated with MBL cell counts at the time of sampling (Figure 4C).
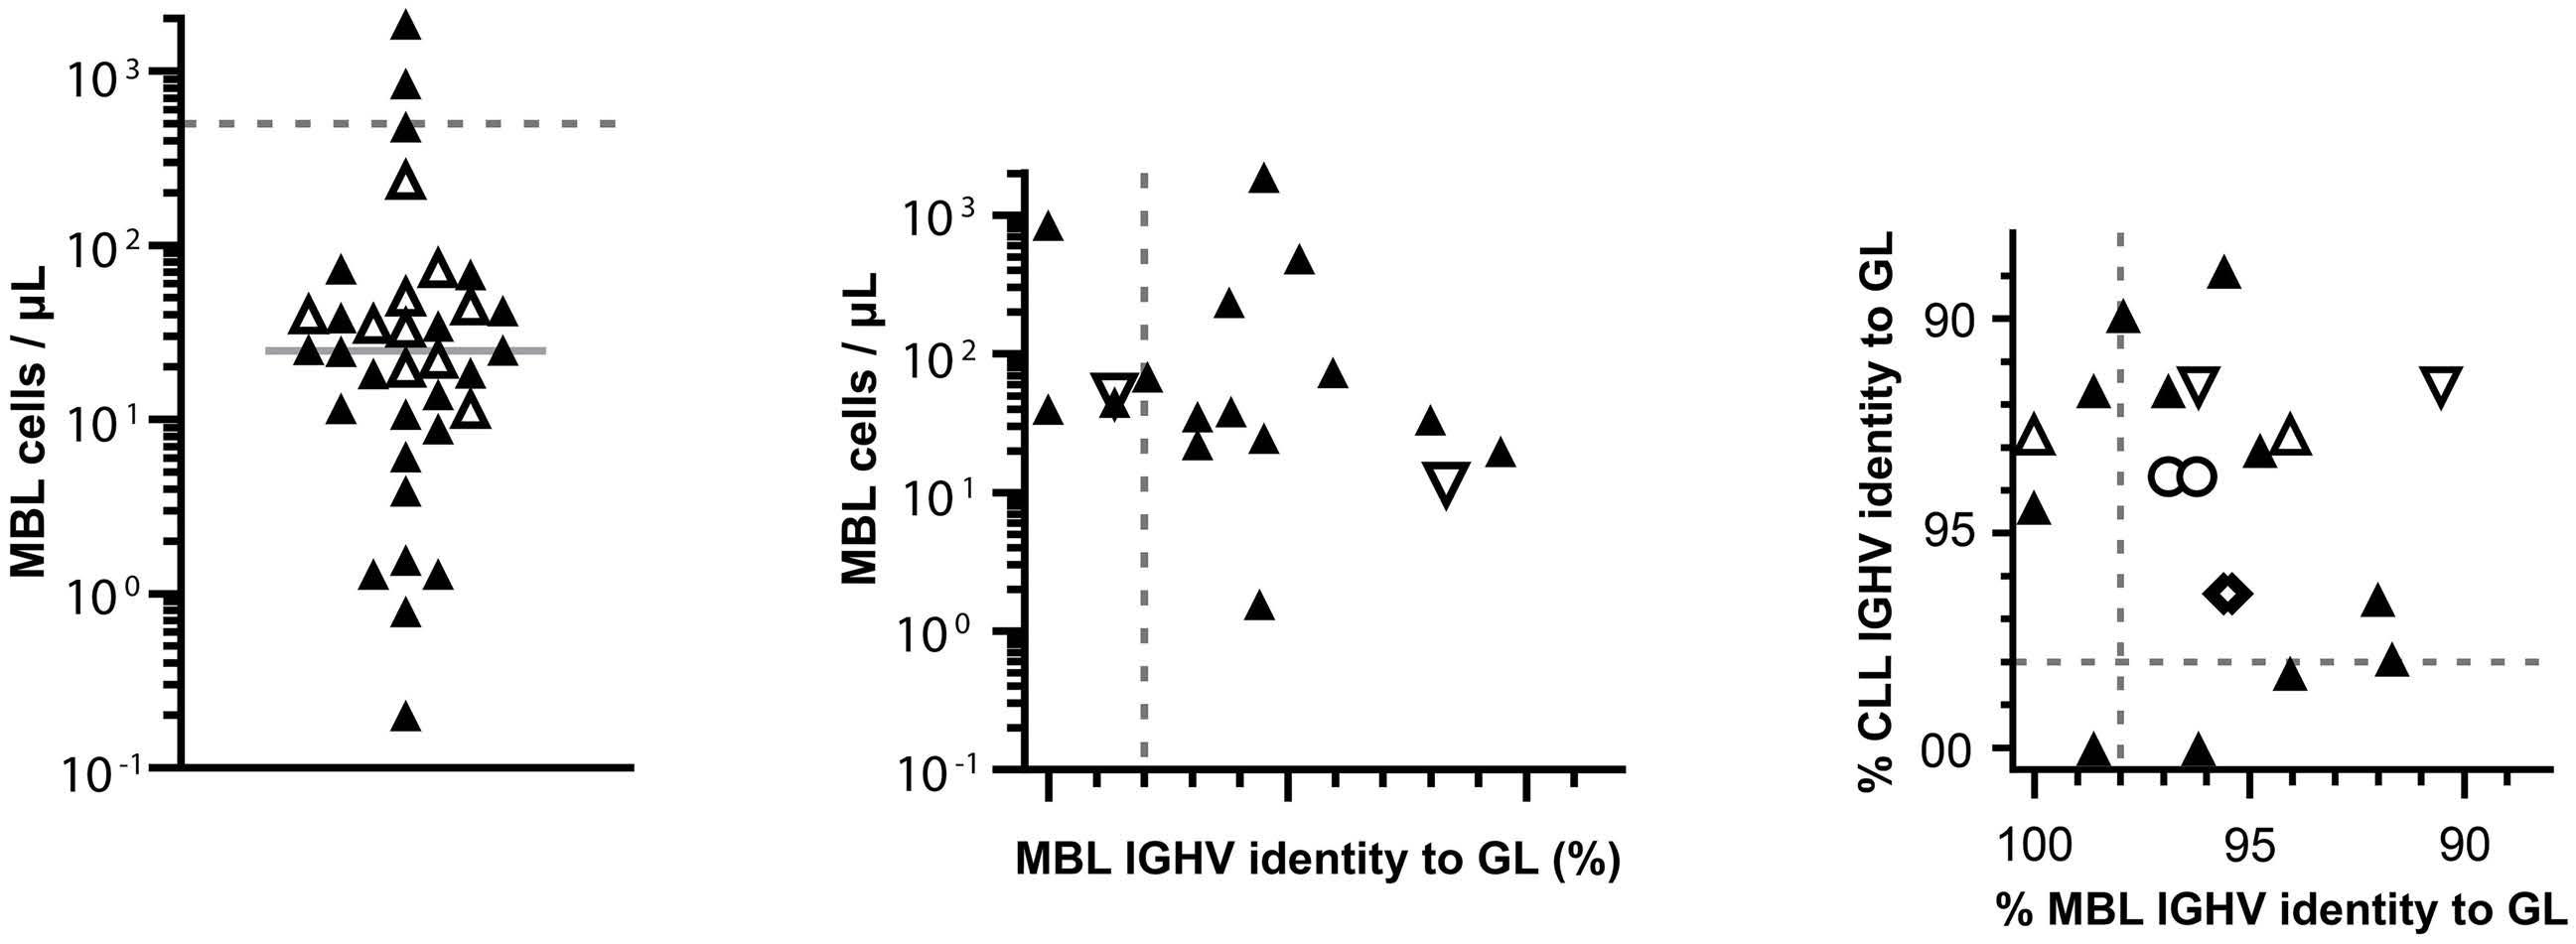
B-cell
Solid
median. Dotted
accepted threshold between low- and high-count MBL. Open triangles: MBL
for functional B-cell receptor (BCR) testing. (B) IGHV gene somatic hypermutation status (x axis) and counts of MBL cells (y axis). Dotted line: commonly accepted threshold between mutated and unmutated BCR status in CLL. Inverted open triangles: MBL cells from two CLL siblings expressing a CLL subset #2 BCR predicted to exert autonomous signaling.10 (C) IGHV gene identity to germline in MBL cells (x axis) and CLL cells (y axis) in siblings. Dotted lines: commonly accepted boundary between mutated and unmutated BCR status in CLL. Open triangles: two cases of MBL with expression of two immunoglobulin heavy chains (MBL01.1: upright triangles, MBL04.1: inverted triangles). Open diamonds: patient CLL24.1 with two MBL siblings (MBL24.1, MBL24.2). Open circles: patient CLL30.1 with two MBL siblings (MBL30.1; MBL30.2). Closed triangles: all other CLL-MBL pairs. GL: germline.
A
C Haematologica | 109 March 2024 827 ARTICLE - Oncogenic features of monoclonal B lymphocytosis E. Quinten et al.
Figure 2. Characteristics of monoclonal B lymphocytosis cells in chronic lymphocytic leukemia siblings. (A) Monoclonal B lymphocytosis (MBL) counts of all 34 siblings with a detectable chronic lymphocytic leukemia (CLL)-phenotype
population (CD19+CD5+CD20lowCD79low).
line:
line: commonly
selected
B
Comparative genetics of chronic lymphocytic leukemia patients and monoclonal B lymphocytosis siblings
Analysis of known germline variants from up to 26 different gene loci associated with increased incidence of CLL revealed a significantly higher prevalence of 12 risk alleles within our cohort (Online Supplementary Table S2). A polygenic CLL risk score composed of 24 risk loci was higher in both CLL and MBL siblings than the average reference score calculated from reference population data (Figure 5A).32 An extended analysis incorporating five to eight CLL risk loci, as assessable by WES and SNP array data, in additional cases (Online Supplementary Table S2) yielded no evidence of higher polygenic risk scores in CLL cases in a matched-pair comparison to their MBL siblings. Taken together, these findings suggest that CLL risk loci predispose to clonal expansion of CLL phenotype cells in both low-count MBL and CLL. Vice versa, we did not find evidence of a particular association of CLL risk alleles with malignant progression from MBL to clinical CLL.
Fifteen MBL samples with sufficient DNA were genotyped by SNP arrays to detect recurrent CLL-associated CNV. Ten
MBL carried recurrent CLL-associated CNV, including a del(17)(p13-q21) in one case and del(13)(q14) in nine cases. One additional MBL case carried a del(14)(q22.2) in combination with a trisomy 18q12, resulting in a total of 11 MBL samples with informative CNV (Table 1). Eleven of 15 genotyped CLL cases within this study carried informative CNV, suggesting a similar overall prevalence of CNV between CLL cases and MBL in their siblings. Quantitative analysis of the SNP array data indicated that all malignant cells harbored the respective CNV in nine of 11 CLL samples. In contrast, individual CNV were present in only a minor fraction of the highly purified MBL cells in ten of 11 samples (P=0.0019; Fisher exact test).
We corroborated these quantitative CNV data with analysis of small variants, i.e., single nucleotide variants and indels from WES in ten CLL-MBL sample pairs. Identical variants detected in a CLL case and the patient’s MBL sibling were presumed to be inherited and were considered noninformative with respect to a differential pathogenesis between MBL and CLL. In contrast, variants that were not shared between siblings, i.e., variants observed exclusively
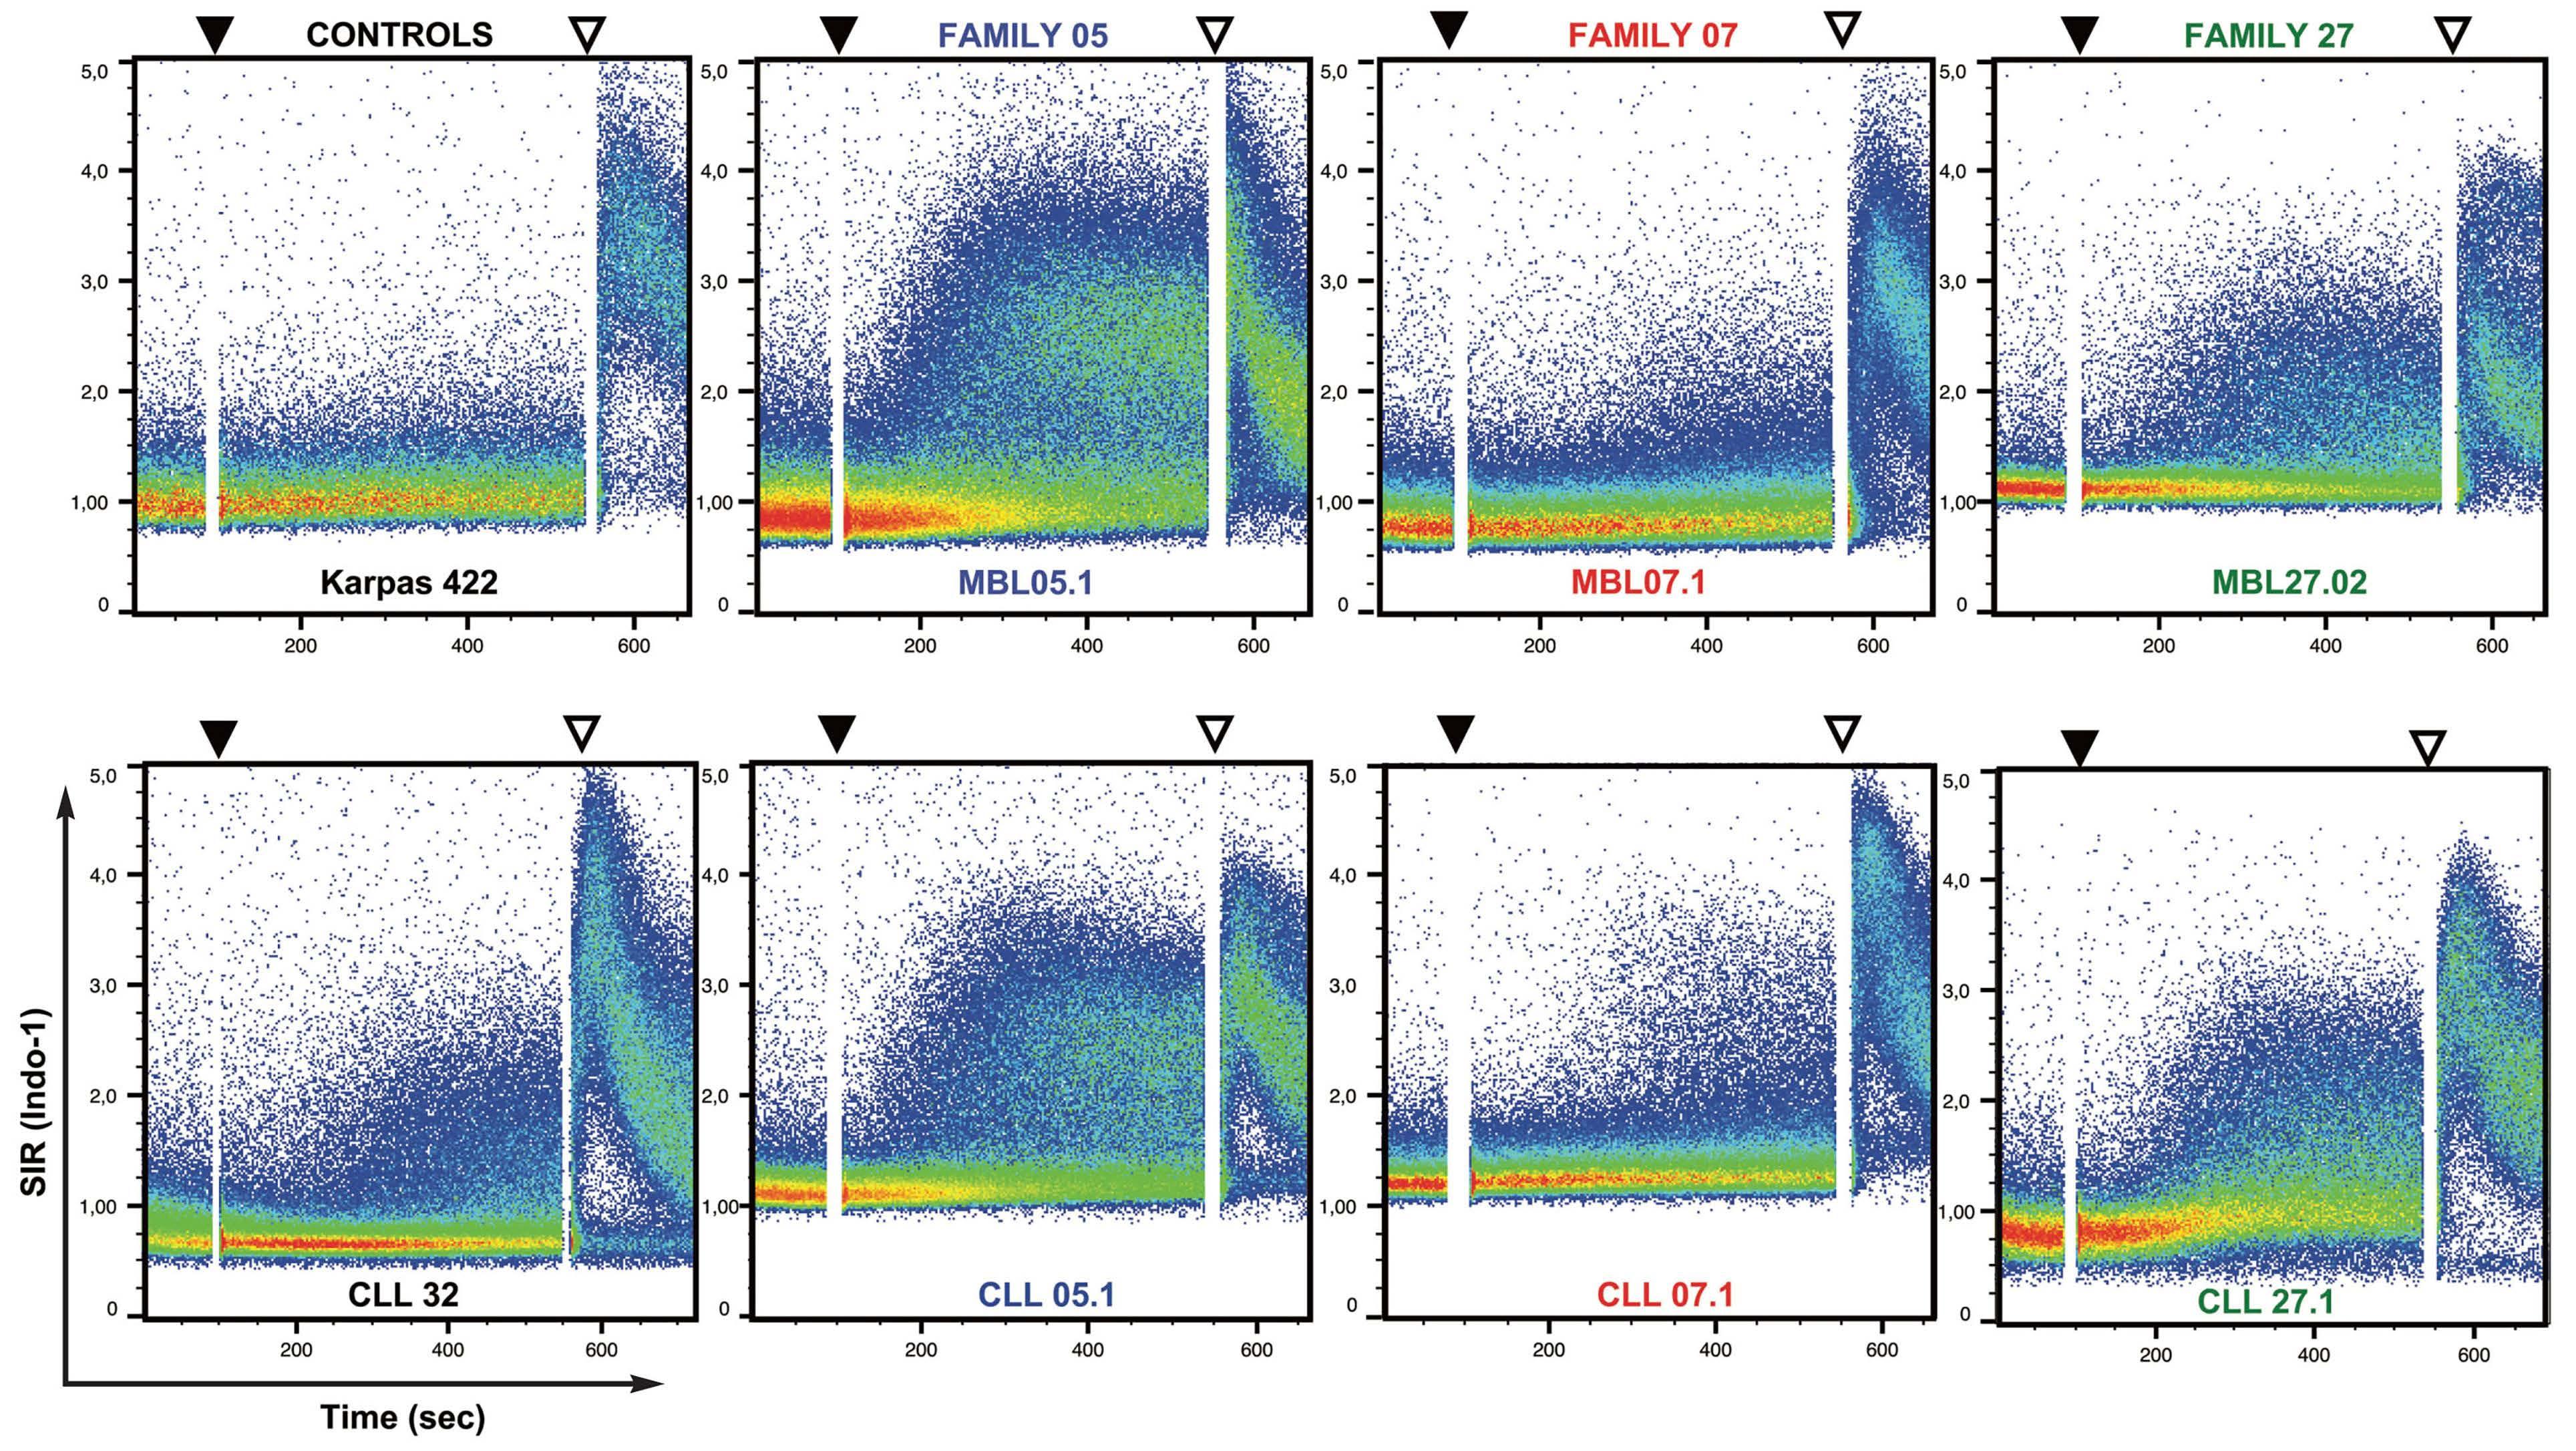
of anti-IgM/IgG crosslinking antibody. K422: TKO cells transduced with BCR of the lymphoma cell line Karpas 422 as a negative control. CLL 32: TKO cells transduced with BCR of patient 32 with chronic lymphocytic leukemia (CLL) as a positive control.7 MBL05.1: TKO cells transduced with BCR of monoclonal B lymphocytosis (MBL) cells in a sibling expressing a CLL subset #60 BCR.5,23 MBL07.1, MBL27.2: TKO cells transduced with BCR of MBL cells in siblings expressing a CLL subset #2 BCR. TKO cells transduced with CLL BCR are depicted below the MBL of their respective siblings. SIR: signal intensity ratio.
Haematologica | 109 March 2024 828 ARTICLE - Oncogenic features of monoclonal B lymphocytosis E. Quinten et al.
Figure 3. Autonomous B-cell receptor signaling of chronic lymphocytic leukemia and monoclonal B lymphocytosis cells in three representative sibling pairs. Calcium mobilization was measured by flow cytometry as indo-1 AM signal intensity ratios of Bcell receptor (BCR)-transduced TKO cells. Black triangle: timepoint of addition of 4-hydroxytamoxifen to reconstitute a functional BCR signaling cascade. White triangle: timepoint of addition
in either a CLL sample or that from the sibling with MBL, could be either inherited or acquired somatically and were considered as potentially informative for differential MBLCLL pathogenesis. Initially, we focused on 120 genes recurrently mutated in CLL according to the COSMIC database (Online Supplementary Table S3). As determined by targeted panel sequencing and/or WES analysis in ten CLL-MBL sample pairs, CLL and MBL cases carried similar numbers of unique gene variants with predicted patho-
genic relevance (Online Supplementary Table S4). Variants in these genes were infrequent, and their VAF did not differ significantly between CLL and MBL (Figure 5B). Genome-wide, VAF of non-shared variants were significantly lower in MBL samples than in CLL cases (Figure 6A). Kernel density estimation indicated that this difference was mainly attributable to variants with an allele frequency of 0.15 to 0.3 (Figure 6B). In order to formally test whether this difference could be attributed to a higher fraction of subclonal
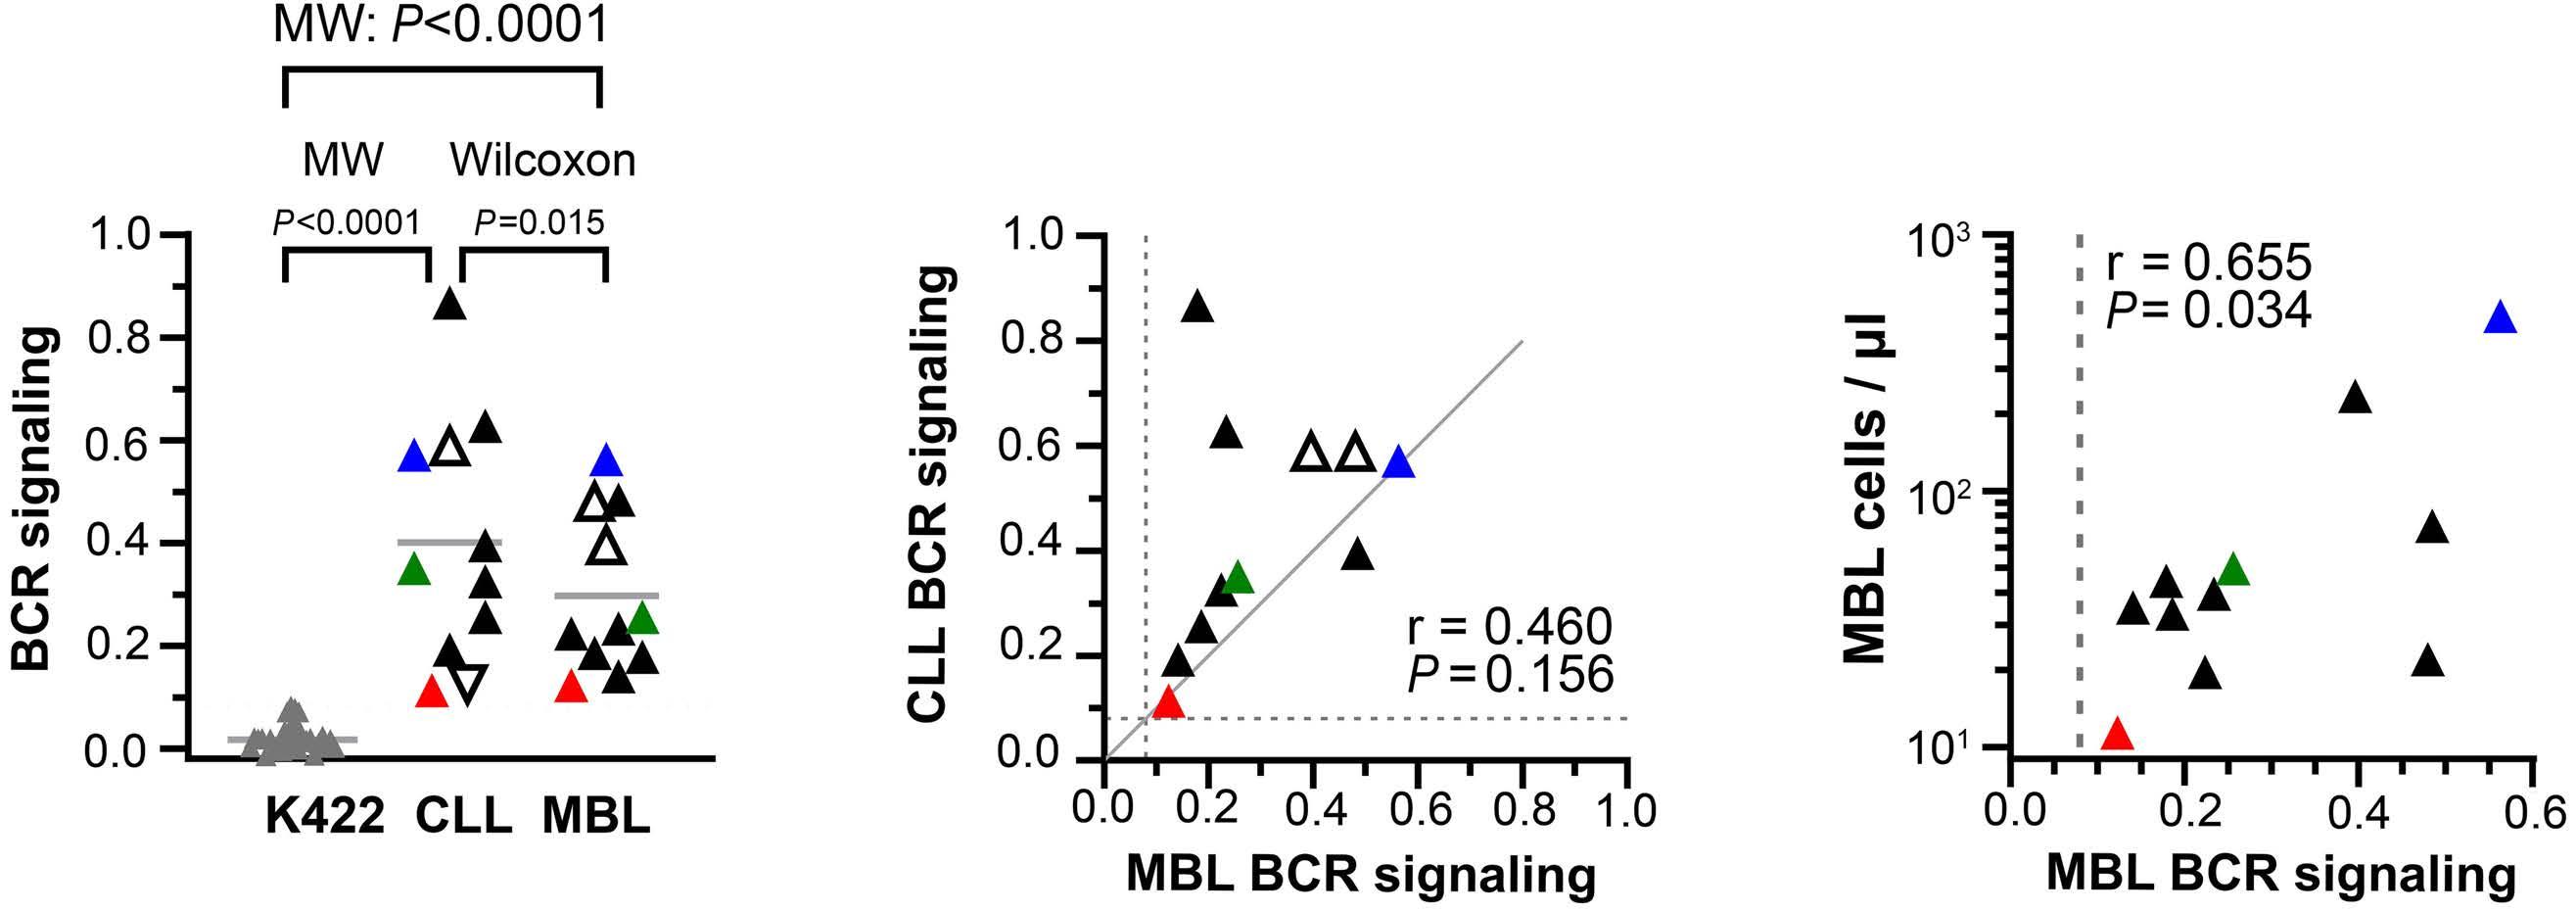
4. Quantitative analysis of autonomous B-cell receptor signaling of cells from subjects with chronic lymphocytic leukemia cells or monoclonal B lymphocytosis. (A) Autonomous B-cell receptor (BCR) signaling strength in TKO cells transduced with clonal BCR. K422: all measurements of Karpas 422 BCR (negative control) performed during this study. Inverted open triangles: CLL 32 (positive control). Open triangles: a case of chronic lymphocytic leukemia (CLL) with two siblings with monoclonal B lymphocytosis (MBL). Other triangle colors correspond to those in Figure 3. Black triangles: all remaining tested CLL and MBL cases. MW: unpaired comparison by the Mann-Whitney test. Wilcoxon: paired comparison between CLL and MBL within siblings by the Wilcoxon matchedpair signed rank test. (B) Correlation of autonomous BCR signaling strength between CLL and MBL siblings. Colors correspond to those in Figure 3 and 4A. Dashed lines indicate maximum BCR signaling strength observed in the Karpas 422 negative controls. (C) MBL counts (y axis) according to autonomous BCR signaling strength (x axis). Colors correspond to those in Figures 3 and 4A, B. The dashed line indicates maximum BCR signaling strength observed in the Karpas 422 negative controls.
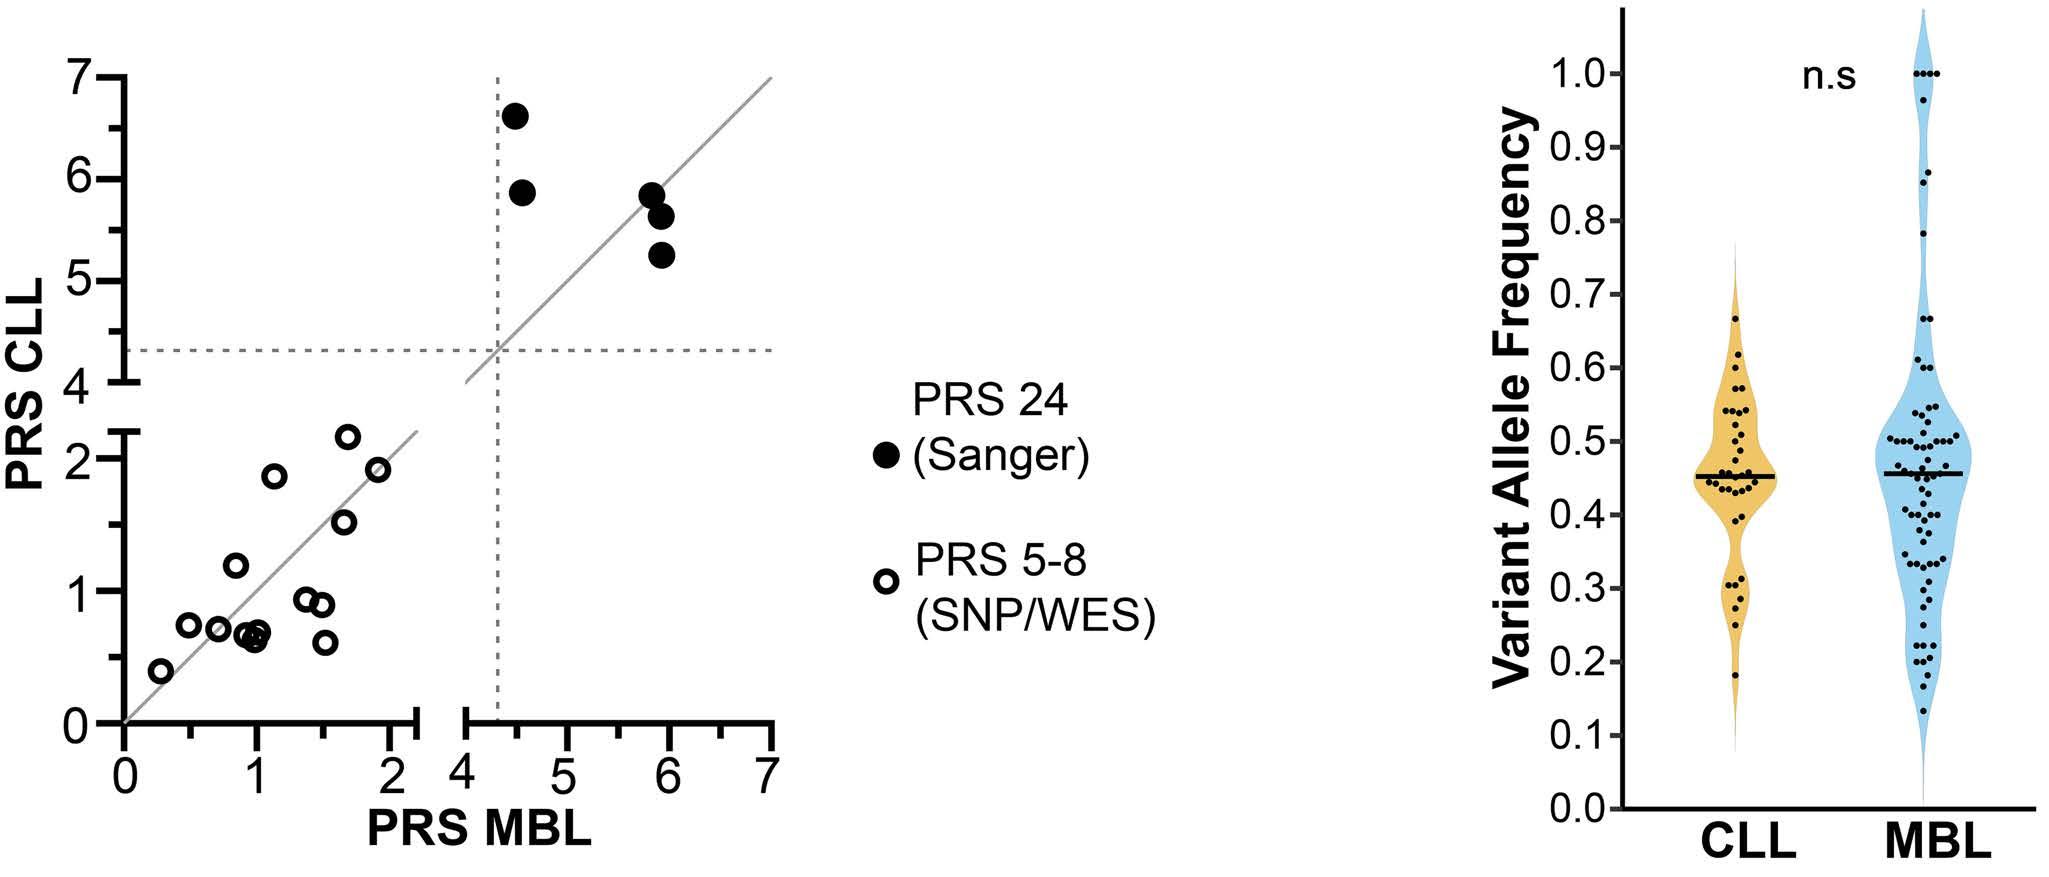
(CLL) in probands with monoclonal B lympho-
on available data, the PRS was calculated for 24 CLL risk loci (black dots) or five to eight loci as assessed by single nucleotide polymorphism array and/or targeted Sanger sequencing (open circles). Dashed lines indicate the mean PRS of the reference European population for the 24 loci analyzed. (B) Distribution of variant allele frequencies of non-shared variants in 120 CLL driver genes as detected by whole exome sequencing in seven CLL cases and ten MBL siblings from seven families. CLL and MBL were compared by the Wilcoxon signed rank test. SNP: single nucleotide polymorphism;
C A
Figure
B
A B Haematologica | 109 March 2024 829 ARTICLE - Oncogenic features of monoclonal B lymphocytosis E. Quinten et al.
Figure 5. Comparison of chronic lymphocytic leukemia-associated variants in monoclonal B lymphocytosis-chronic lymphocytic leukemia siblings. (A) Polygenic risk score (PRS) for chronic lymphocytic leukemia
cytosis (MBL) (x axis) and their CLL sibling (y axis). Depending
WES: whole exome sequencing; n.s.: not significant.
variants in MBL compared to CLL, we separately compared in sibling pairs the numbers of non-shared monoallelic variants (VAF=0.43-0.55), presumably carried by all cells in a given sample, and numbers of monoallelic subclonal variants (VAF=0.1-0.33). In accordance with this hypothesis, monoallelic variants were detected at similar frequencies in CLL samples and their respective sibling MBL samples (Figure 6C). In contrast, the prevalence of subclonal variants
was higher in MBL cells than in the sibling CLL counterparts (Figure 6D).
Discussion
This systematic study was undertaken to clarify whether the presence of an autonomous BCR signal could explain
2p22.1p16.1x1 8q24.22x1
4 - - CLL04.1 no CNV
5 MBL05.1 no CNV
6 MBL06.1 MBL06.2 13q14.2q14.3x1 14q22.2q32.12x1[0.6] 18q12.3q23x3[0.6]
7 MBL07.1 MBL07.2 13q14.2q14.3x1[0.15] 13q14.13q31.1x1[0.15]
CLL06.1 14q23.2q32.13x1
CLL07.1 13q14.11q14.2x1
8 MBL08.1 13q14.2q14.3x1[0.85] CLL08.1
5q33.1q35.3x3[0.3] 6q14.1q27x1 8q23.1q24.3x3
17p13.3p12x0[0,5]
9 MBL09.1 no CNV CLL09.1 no CNV
10 MBL10.1 13q14.2q14.3x1[0.5] CLL10.1 13q14x1
11 MBL11.1 13q14.2q14.3x1[0.7] CLL11.1 no CNV
12 MBL12.1
13
4p16.3p15.2x1[0.3]
4p14x1[0.3]
4p13x1[0.3]
4p13x1[0.3]
5p15.33p15.2x1[0.3] (11)cx[0.3~0.8]
13q14.11q14.2x1[0.5]
13q14.2q21.33x0[0.8]
13q21.33q22.3)x1[0.5]
Family MBL CLL Case Aberration Case Aberration 1 MBL01.1 13q14.2q14.3x0[0.7] CLL01.1 13q14.2q14.3x1 2 MBL02.1 13q14.2x1[0.6] 13q14.2q14.3x0[0.6] 13q14.3x1[0.6] CLL02.1 13q14x1 8q21.3qterx3 15q26.1q26.3x1
MBL03.1 no CNV CLL03.1
Table 1. Copy number variations in monoclonal B lymphocytosis and chronic lymphocytic leukemia samples as detected by single nucleotide polymorphism array.
3
CLL05.1
13q14.13q14.2x1[0.5] 13q14.2q14.3x0[0.5] 13q14.3x1[0.5]
13q14.2q14.3x0[0.5] CLL12.1 13q14.2q14.3x1
CLL13.1
CLL15.1
MBL16.1 2q36.3q37.3x1[0.7] 17p13.3q21.2x1[0.7] CLL16.1
- -
11q22.3q25x1 3q26.1q29x3 4p16.3p14x1 17q21.32q25.3x3 15
no CNV 16
Total analyzed 14 15 With CNV 11 11 With clonal CNV 1 9 With subclonal CNV only 10 2
monoclonal B lymphocytosis; CLL: chronic lymphocytic leukemia; CNV: copy number variation. Haematologica | 109 March 2024 830 ARTICLE - Oncogenic features of monoclonal B lymphocytosis E. Quinten et al.
MBL:
the different clinical behavior between non-malignant clonal expansions of cells with a CLL phenotype (MBL) and clinically malignant CLL. In order to minimize potential confounding effects of inherited germline variants, we investigated this hypothesis in a comparative manner in siblings of CLL patients.
The detection limit and range of clonal B cells with a CLL phenotype were very similar to those in a recently published study of members of CLL families.16 However, the observed MBL prevalence of 17.8% was relatively high compared to that in previous reports on CLL siblings and in the range of individuals belonging to CLL families defined by more than one first-degree relative diagnosed with CLL.15,16 Unbiased amplification of expressed heavy and light IG chain gene rearrangements revealed single dominant BCR
in 15 and potential biclonality in two MBL subjects. Potential MBL oligoclonality has been recognized in MBL, especially in the low-count subtype.36,37 The identification of a fraction of MBL with unmutated BCR IG in our series is also in line with a published study.36 Whereas low-count MBL was reported to belong only rarely to any immunogenetically defined CLL stereotype subset,36,38 we encountered five instances of BCR IG from low-count MBL (33.3%) that could be assigned to such CLL subsets.5,23 It remains hypothetical whether this apparent discrepancy is due to focusing on MBL carriers with CLL siblings in our study. In healthy people who eventually developed CLL, approximately 20% of dominant clonotypes identified during the pre-diagnostic period could be assigned to CLL stereotypes.39

U test). Shaded
of
(C) and
and rug plots of VAF in CLL and MBL. The rug
x-axis (top and
indicate positions of the VAF for CLL and MBL, respectively. A total of 105,215 CLL data points and 154,297 MBL data points were analyzed. (C) Numbers of monoallelic variants (VAF=0.43-0.55; present in all cells) of CLL and MBL samples from siblings. Correlations between CLL and MBL samples were calculated by the nonparametric Spearman correlation. CLL and MBL samples were compared by the Wilcoxon matched-pair signed rank test. (D) Numbers of subclonal variants (VAF=0.1-0.33) in CLL and MBL samples from siblings. Correlations between CLL and MBL samples were calculated by the nonparametric Spearman correlation. CLL and MBL samples were compared by the Wilcoxon matchedpair signed rank test. CLL: chronic lymphocytic leukemia; MBL: monoclonal B lymphocytosis.
A B C D Haematologica | 109 March 2024 831 ARTICLE - Oncogenic features of monoclonal B lymphocytosis E. Quinten et al.
Figure 6. Comparison of genome-wide variants in siblings with monoclonal B lymphocytosis or chronic lymphocytic leukemia. (A) Global distribution of variant allele frequencies (VAF) in cases of chronic lymphocytic leukemia (CLL) and monoclonal B lymphocytosis (MBL). VAF were compared by the Wilcoxon rank sum test with continuity correction (Mann–Whitney
boxes indicate the ranges
VAF analyzed in
(D). (B) Kernel density estimation distribution
plot marks along the
bottom)
With respect to the primary aim of our study, MBL BCR IG resembling certain CLL subsets were predicted to have autonomous BCR signaling activity akin to that in CLL. This prediction applied especially to the herein first reported low-count MBL expressing an isotype-switched BCR of CLL subset #4, and two subset #2L MBL cases expressing an IGLV3-21 light chain with the seminal G110R mutation. Both of these structural BCR IG characteristics mechanistically cause autonomous BCR signaling by facilitating steric interactions between neighboring BCR complexes on the cell surface.8,10 Limited by the sample size, we found no evidence for correlations in structural features of the BCR, e.g., mutational status or IG gene usage, between CLL-MBL sibling pairs.
As already suggested by the MBL BCR IG sequences, our findings unequivocally establish, by quantifiable functional testing, that the BCR of MBL, i.e., a premalignant clonal expansion of CD5-positive B cells with CLL phenotype, exerts antigen-independent, autonomous signaling. All known origins of autonomous BCR signaling in CLL were also encountered in our MBL cases, i.e., acquisition during primary V(D)J recombination in cases with unmutated BCR, acquisition by somatic hypermutation as exemplified best by the single G110R mutation of the IGLV3-21 gene,10 and acquisition by class switch recombination.8
Since our study specifically addressed CLL-MBL sibling pairs, we were able to compare the autonomous BCR signaling strength quantitatively in a matched-pair fashion. This analysis revealed significantly lower intensity of BCR signaling in MBL compared to CLL. While autonomous BCR signaling is generally dependent on individual HCDR3 in conjunction with recurrent motifs in FR2 and interactions of defined amino acid residues in some instances,7,8,10,35 quantitative differences in autonomous BCR signaling cannot be assigned yet to defined structural BCR characteristics. However, BCR signaling strength was directly correlated to the expansion of the MBL clone at the time of sampling. This novel observation requires validation in independent cohorts. Nevertheless, the quantitative differences of BCR signaling between CLL and MBL and in MBL expansion suggest a possible causal and differential role of BCR signaling in growth kinetics and subsequent clinical behavior of a neoplastic CLL-phenotype B-cell clone.
It would have been highly desirable to validate the correlation between BCR signaling strength and clonal B-cell expansion by longitudinal sampling. However, the approvals by the institutional ethics committees explicitly excluded longitudinal analyses and mandated that the healthy siblings were provided with a categorical result of the screening. Since lowcount MBL does not represent a definite pathological condition and rarely progresses to CLL,16,33 it was reported as absence of pathological findings. As a consequence, the ethical committees concluded that repeat sampling could po-
tentially give rise to anxiety given the prior absence of pathology in the healthy siblings, and explicitly denied approval for longitudinal analysis.
In order to interpret BCR function in the context of genetic mechanisms in CLL pathogenesis, we addressed genetic susceptibility, genetic instability, and recurrent CLL-associated genetic changes in CLL cases and their MBL siblings. These studies were restricted by limited quantities of DNA extracted from the MBL samples. Nevertheless, analysis of CLL susceptibility loci indicated that both CLL and MBL probands have similar polygenic risk scores for CLL, which were higher than in the general (Northern) European reference population from the gnomAD database. While these findings were predictable from the study design in CLL-MBL sibling pairs, on the other hand they do not provide any evidence that these CLL risk loci drive malignant progression rather than initial premalignant expansion of the CLL-phenotype clone. With respect to the possible inherited shared predisposition to MBL and CLL, it would have been highly desirable to strengthen this conclusion by showing lower polygenic risk scores in the CLL siblings without detectable MBL cells. The study design, however, did not include informed consent for genetic analyses in non-MBL probands. Notwithstanding this limitation of our study, there appears to be no plausible causal relationship between the presence of any risk allele and the stochastic acquisition of a BCR with autonomous signaling based on the known function of the genes located at the CLL risk loci.
The overall prevalence of CLL-associated CNV and gene variants was not evidently different between CLL and MBL in matched comparisons. In accordance with the literature, del(13)(q14) was the most abundant CNV in MBL, but the detected del(17)(p) has also been described occasionally.40 Our observed low prevalence of potentially pathogenic variants in CLL driver genes is also in accordance with published data.18 However, we noted that CLL-associated CNV were frequently subclonal in MBL, suggesting that these aberrations might be gradually acquired at this stage. This observation is in accordance with findings from a longitudinal study in low-count MBL, in which the categorical presence of CLL-associated CNV approximately doubled, compared to the primary sample, after a median interval of 7 years.41 The impression of gradual acquisition of mutations in MBL was independently supported by the observation that MBL cells carry more subclonal variants detected by next-generation sequencing than CLL, whereas the number of variants carried by all clonal cells did not differ between CLL and MBL. In CLL, the presence of subclonal drivers is associated with clinical outcome.42
In summary, our data demonstrate that autonomous BCR signaling operates in MBL in similarity to CLL. A hypothetical absence of this mechanism therefore does not explain the difference between benign MBL and malignant CLL. However, relatively low BCR signaling strength in MBL may offer
Haematologica | 109 March 2024 832 ARTICLE - Oncogenic features of monoclonal B lymphocytosis E. Quinten et al.
a plausible explanation for less aggressive expansion than in CLL. Our data suggest that CLL risk loci likewise cannot account for the different clinical behavior between the two conditions, and lend further support to the conclusion that the prevalence and type of genetic pathogenic changes are indistinguishable between MBL and low-risk CLL.18,41 However, the observation of subclonal genetic CLL driver mutations in MBL supports a scenario of gradual clonal expansion driven by moderate autonomous BCR signaling, possibly leading to a certain degree of genetic instability that facilitates gradual acquisition of CLL driver mutations. This conclusion supports the notion that MBL and CLL represent a spectrum of the same biological condition, in which the cumulative stimuli from constitutive immune signaling through the BCR together with timing and type of eventually acquired genetic drivers govern the clonal dynamics from long-term balance between expansion and apoptosis over gradual expansion to clinically aggressive CLL.
Disclosures
No conflicts of interest to disclose.
References
1. Hallek M, Shanafelt TD, Eichhorst B. Chronic lymphocytic leukaemia. Lancet. 2018;391(10129):1524-1537.
2. Delgado J, Nadeu F, Colomer D, Campo E. Chronic lymphocytic leukemia: from molecular pathogenesis to novel therapeutic strategies. Haematologica. 2020;105(9):2205-2217.
3. Damle RN, Wasil T, Fais F, et al. Ig V gene mutation status and CD38 expression as novel prognostic indicators in chronic lymphocytic leukemia. Blood. 1999;94(6):1840-1847.
4. Hamblin TJ, Davis Z, Gardiner A, Oscier DG, Stevenson FK. Unmutated Ig V(H) genes are associated with a more aggressive form of chronic lymphocytic leukemia. Blood. 1999;94(6):18481854.
5. Agathangelidis A, Chatzidimitriou A, Gemenetzi K, et al. Higherorder connections between stereotyped subsets: implications for improved patient classification in CLL. Blood. 2021;137(10):1365-1376.
6. Jaramillo S, Agathangelidis A, Schneider C, et al. Prognostic impact of prevalent chronic lymphocytic leukemia stereotyped subsets: analysis within prospective clinical trials of the German CLL Study Group (GCLLSG). Haematologica. 2020;105(11):2598-2607.
7. Duhren-von Minden M, Ubelhart R, Schneider D, et al. Chronic lymphocytic leukaemia is driven by antigen-independent cellautonomous signalling. Nature. 2012;489(7415):309-312.
8. Minici C, Gounari M, Ubelhart R, et al. Distinct homotypic B-cell receptor interactions shape the outcome of chronic lymphocytic leukaemia. Nat Commun. 2017;8:15746.
9. Iacovelli S, Hug E, Bennardo S, et al. Two types of BCR interactions are positively selected during leukemia development in the Emu-TCL1 transgenic mouse model of CLL. Blood. 2015;125(10):1578-1588.
10. Maity PC, Bilal M, Koning MT, et al. IGLV3-21*01 is an inherited risk factor for CLL through the acquisition of a single-point mutation enabling autonomous BCR signaling. Proc Natl Acad
Contributions
EQ, MTK, JAE, and CAMvB performed the BCR analysis and functional testing. JHS-Y, DP, VN, RALdG, DAS, JK, and RUP performed genetic testing and bioinformatic analyses. AA and KS analyzed CLL subsets. HES-B, AK-H, and KZ recruited probands. JSPV, MAN, and HJ supervised data acquisition. HV designed the study.
Funding
This study was funded by the German Cancer Aid Foundation (Deutsche Krebshilfe) 108935. MAN and JHS-Y are funded by Fondecyt 1230298 (ANID, Chile). RU-P is funded by MAG2095 (MINEDUC, Chile). JHS-Y is funded by Doctorado Becas Chile (2016-72170683)
Data-sharing statement
SNP array datasets generated during this study are available from the corresponding author on reasonable request. Whole exome sequencing datasets generated during this study are available in the DRYAD repository at: https://datadryad.org/stash/dataset/doi:10.5061/dryad.np5hqbzwz.
Sci U S A. 2020;117(8):4320-4327.
11. Cerhan JR, Slager SL. Familial predisposition and genetic risk factors for lymphoma. Blood. 2015;126(20):2265-2273.
12. Law PJ, Berndt SI, Speedy HE, et al. Genome-wide association analysis implicates dysregulation of immunity genes in chronic lymphocytic leukaemia. Nat Commun. 2017;8:14175.
13. Kleinstern G, Camp NJ, Goldin LR, et al. Association of polygenic risk score with the risk of chronic lymphocytic leukemia and monoclonal B-cell lymphocytosis. Blood. 2018;131(23):2541-2551.
14. Landgren O, Albitar M, Ma W, et al. B-cell clones as early markers for chronic lymphocytic leukemia. N Engl J Med. 2009;360(7):659-667.
15. Rawstron AC, Yuille MR, Fuller J, et al. Inherited predisposition to CLL is detectable as subclinical monoclonal B-lymphocyte expansion. Blood. 2002;100(7):2289-2290.
16. Slager SL, Lanasa MC, Marti GE, et al. Natural history of monoclonal B-cell lymphocytosis among relatives in CLL families. Blood. 2021;137(15):2046-2056.
17. Rawstron AC, Bennett FL, O'Connor SJ, et al. Monoclonal B-cell lymphocytosis and chronic lymphocytic leukemia. N Engl J Med. 2008;359(6):575-583.
18. Agathangelidis A, Ljungstrom V, Scarfo L, et al. Highly similar genomic landscapes in monoclonal B-cell lymphocytosis and ultra-stable chronic lymphocytic leukemia with low frequency of driver mutations. Haematologica. 2018;103(5):865-873.
19. Koning MT, Kielbasa SM, Boersma V, et al. ARTISAN PCR: rapid identification of full-length immunoglobulin rearrangements without primer binding bias. Br J Haematol. 2017;178(6):983-986.
20. Koning MT, Quinten E, Zoutman WH, et al. Acquired N-linked glycosylation motifs in B-cell receptors of primary cutaneous B-cell lymphoma and the normal B-cell repertoire. J Invest Dermatol. 2019;139(10):2195-2203.
21. Brochet X, Lefranc MP, Giudicelli V. IMGT/V-QUEST: the highly
Haematologica | 109 March 2024 833 ARTICLE - Oncogenic features of monoclonal B lymphocytosis E. Quinten et al.
customized and integrated system for IG and TR standardized V-J and V-D-J sequence analysis. Nucleic Acids Res. 2008;36(Web Server issue):W503-508.
22. Giudicelli V, Brochet X, Lefranc MP. IMGT/V-QUEST: IMGT standardized analysis of the immunoglobulin (IG) and T cell receptor (TR) nucleotide sequences. Cold Spring Harb Protoc. 2011;2011(6):695-715.
23. Agathangelidis A, Darzentas N, Hadzidimitriou A, et al. Stereotyped B-cell receptors in one-third of chronic lymphocytic leukemia: a molecular classification with implications for targeted therapies. Blood. 2012;119(19):4467-4475.
24. Meixlsperger S, Kohler F, Wossning T, Reppel M, Muschen M, Jumaa H. Conventional light chains inhibit the autonomous signaling capacity of the B cell receptor. Immunity. 2007;26(3):323-333.
25. de Groen RAL, van Eijk R, Bohringer S, et al. Frequent mutated B2M, EZH2, IRF8, and TNFRSF14 in primary bone diffuse large B-cell lymphoma reflect a GCB phenotype. Blood Adv. 2021;5(19):3760-3775.
26. Pfeifer D, Pantic M, Skatulla I, et al. Genome-wide analysis of DNA copy number changes and LOH in CLL using high-density SNP arrays. Blood. 2007;109(3):1202-1210.
27. Berndt SI, Skibola CF, Joseph V, et al. Genome-wide association study identifies multiple risk loci for chronic lymphocytic leukemia. Nat Genet. 2013;45(8):868-876.
28. Di Bernardo MC, Crowther-Swanepoel D, Broderick P, et al. A genome-wide association study identifies six susceptibility loci for chronic lymphocytic leukemia. Nat Genet. 2008;40(10):1204-1210.
29. Slager SL, Rabe KG, Achenbach SJ, et al. Genome-wide association study identifies a novel susceptibility locus at 6p21.3 among familial CLL. Blood. 2011;117(6):1911-1916.
30. Speedy HE, Di Bernardo MC, Sava GP, et al. A genome-wide association study identifies multiple susceptibility loci for chronic lymphocytic leukemia. Nat Genet. 2014;46(1):56-60.
31. Crowther-Swanepoel D, Broderick P, Di Bernardo MC, et al. Common variants at 2q37.3, 8q24.21, 15q21.3 and 16q24.1 influence chronic lymphocytic leukemia risk. Nat Genet. 2010;42(2):132-136.
32. Karczewski KJ, Francioli LC, Tiao G, et al. The mutational constraint spectrum quantified from variation in 141,456 humans. Nature. 2020;581(7809):434-443.
33. Strati P, Shanafelt TD. Monoclonal B-cell lymphocytosis and early-stage chronic lymphocytic leukemia: diagnosis, natural history, and risk stratification. Blood. 2015;126(4):454-462.
34. Stamatopoulos K, Belessi C, Moreno C, et al. Over 20% of patients with chronic lymphocytic leukemia carry stereotyped receptors: pathogenetic implications and clinical correlations. Blood. 2007;109(1):259-270.
35. Binder M, Muller F, Frick M, et al. CLL B-cell receptors can recognize themselves: alternative epitopes and structural clues for autostimulatory mechanisms in CLL. Blood. 2013;121(1):239-241.
36. Vardi A, Dagklis A, Scarfo L, et al. Immunogenetics shows that not all MBL are equal: the larger the clone, the more similar to CLL. Blood. 2013;121(22):4521-4528.
37. Lanasa MC, Allgood SD, Volkheimer AD, et al. Single-cell analysis reveals oligoclonality among 'low-count' monoclonal Bcell lymphocytosis. Leukemia. 2010;24(1):133-140.
38. Agathangelidis A, Galigalidou C, Scarfo L, et al. Infrequent "chronic lymphocytic leukemia-specific" immunoglobulin stereotypes in aged individuals with or without low-count monoclonal B-cell lymphocytosis. Haematologica. 2021;106(4):1178-1181.
39. Kolijn PM, Hosnijeh FS, Spath F, et al. High-risk subtypes of chronic lymphocytic leukemia are detectable as early as 16 years prior to diagnosis. Blood. 2022;139(10):1557-1563.
40. Fazi C, Scarfo L, Pecciarini L, et al. General population lowcount CLL-like MBL persists over time without clinical progression, although carrying the same cytogenetic abnormalities of CLL. Blood. 2011;118(25):6618-6625.
41. Criado I, Rodriguez-Caballero A, Gutierrez ML, et al. Low-count monoclonal B-cell lymphocytosis persists after seven years of follow up and is associated with a poorer outcome. Haematologica. 2018;103(7):1198-1208.
42. Landau DA, Tausch E, Taylor-Weiner AN, et al. Mutations driving CLL and their evolution in progression and relapse. Nature. 2015;526(7574):525-530.
Haematologica | 109 March 2024 834 ARTICLE - Oncogenic features of monoclonal B lymphocytosis E. Quinten et al.
Ultra-deep mutational landscape in chronic lymphocytic leukemia uncovers dynamics of resistance to targeted therapies
David W. Woolston,1* Nathan D. Lee,2* Mazyar Shadman,1,2* Elena Latorre-Esteves,2 Xin Ray Tee,2 Jeanne Fredrickson,2 Brendan F. Kohrn,2 Chaitra Ujjani,1,2 Ashley Eckel,2 Brian Till,1,2 Min Fang,1,2 Jerald Radich,1,2 Ivana Bozic,1,2# Rosa Ana Risques2# and Cecilia C.S. Yeung1,2#
1Fred Hutchinson Cancer Center and 2University of Washington, Seattle, WA, USA
*DWW, NDL, and MS contributed equally as first authors. #IB, RAR, and CCSY contributed equally as senior authors.
Correspondence: C. Yeung cyeung@fredhutch.org
Received: April 19, 2023.
Accepted: September 4, 2023.
Early view: September 14, 2023.
https://doi.org/10.3324/haematol.2023.283372
©2024 Ferrata Storti Foundation
Published under a CC BY-NC license
Abstract
BTK inhibitors, Bcl-2 inhibitors, and other targeted therapies have significantly improved the outcomes of patients with chronic lymphocytic leukemia (CLL). With increased survivorship, monitoring disease and deciphering potential mechanisms of resistance to these agents are critical for devising effective treatment strategies. We used duplex sequencing, a technology that enables detection of mutations at ultra-low allelic frequencies, to identify mutations in five genes associated with drug resistance in CLL and followed their evolution in two patients who received multiple targeted therapies and ultimately developed disease progression on pirtobrutinib. In both patients we detected variants that expanded and reached significant cancer cell fractions (CCF). In patient R001, multiple known resistance mutations in both BTK and PLCG2 appeared following progression on zanubrutinib (BTK p.L528W, p.C481S; PLCG2 S707F, L845F, R665W, and D993H). In contrast, patient R002 developed multiple BTK mutations following acalabrutinib treatment, including known resistance mutations p.C481R, p.T474I and p.C481S. We found that pirtobrutinib was able to suppress, but not completely eradicate, BTK p.C481S mutations in both patients, but other resistance mutations such as mutations in PLCG2 and new BTK mutations increased while the patients were receiving pirtobrutinib. For example, BTK p.L528W in patient R001 increased in frequency more than 1,000-fold (from a CCF of 0.02% to 35%), and the CCF in p.T474I in patient R002 increased from 0.03% to 4.2% (more than 100-fold). Our data illuminate the evolutionary dynamics of resistant clones over the patients’ disease course and under selective pressure from different targeted treatments.
Introduction
Standard frontline therapies for chronic lymphocytic leukemia (CLL) consist of Bruton tyrosine kinase (BTK) inhibitors, such as the irreversible covalently binding agents ibrutinib, acalabrutinib, and zanubrutinib, and the Bcl-2 inhibitor venetoclax with obinutuzumab.1 First- and second-generation BTK inhibitors irreversibly inhibit BTK activity by covalently binding cysteine residue C481 in the ATP-binding site of BTK.2-4 Although 80-90% of CLL patients respond to targeted therapy, relapses occur. Patients given ibrutinib as a first-line treatment had a 7-year progression-free survival of 59%, while those treated in the relapsed setting had a lower 5-year progression-free survival of 40%.5,6 Most patients with CLL (65-85%) who progress after BTK
inhibitor therapy develop resistance mutations after 24-48 months of treatment at the BTK drug binding site or activating mutations in PLCG2 7-15 Therapy toxicity is the most common reason for discontinuing BTK inhibitor treatment in real-world clinical practice, followed by disease resistance and progression.16 To overcome these limitations, non-covalently binding, third-generation BTK inhibitors were developed.17 Pirtobrutinib (LOXO-305), a reversible selective BTK inhibitor that inhibits Y223 autophosphorylation, even in cells with the known resistance mutation BTK C481, has shown efficacy in ibrutinib-naïve and -resistant CLL patients.17-19 Based on the findings of early phase I and phase II studies, pirtobrutinib was reported to be safe and effective for CLL treatment.20
The Bcl-2 inhibitor venetoclax, combined with an anti-CD20
Haematologica | 109 Marzo 2024 835 - Chronic Lymphocytic Leukemia ARTICLE
monoclonal antibody, is another frontline treatment for CLL. Resistance mutations resulting from venetoclax monotherapy include those observed in BCL2 and BAX. 21,22 Other targeted therapeutic agents for CLL include phosphatidyl-inositol 3-kinase inhibitors (duvelisib and idelalisib), with reported objective response rates of 85%.23 These drugs are less utilized due to toxicity concerns and the fact that resistance mechanisms are less well known.24 The success of BTK inhibitors, Bcl-2 inhibitors, and other targeted therapies3,25 has changed the paradigm of disease monitoring, and data now support that demonstration of undetectable measurable residual disease (MRD) at the end of treatment is an independent indicator of favorable prognosis.26-28 Discovery of ultra-low levels of resistance mutations, and the ability to monitor the evolution of such clones, could be an essential element of CLL management and care during treatment with targeted therapies.26,29 Duplex sequencing is one of the most accurate sequencing methods currently available and has been used for MRD detection in acute myeloid leukemia, acute lymphocytic leukemia, and chronic myeloid leukemia.30-32 In duplex sequencing, each DNA strand is tagged with molecular barcodes to enable double-strand error correction, providing unprecedented resolution for the identification of mutant variants (<1/10,000).33-36 This high resolution could change the paradigm for the early identification of therapy resistance and MRD in hematologic malignancies but has not yet been applied to CLL.
In this work, we follow the complex clinical course of two patients with CLL who developed resistance to multiple targeted therapies and study the molecular and cytogenetic clonal evolution of their disease at unprecedented resolution. We combined duplex sequencing with longitudinal assessment to screen for mutations in five key genes responsible for resistance to targeted treatments: BTK, PLCG2, BCL2, BAX, and TP53. We report the detection of resistance mutations at ultra-low allelic frequencies in serial marrow and blood samples collected as the disease progressed through various therapies, with important implications for understanding and monitoring clonal dynamics in CLL.
Methods
Patients and samples
This study features two patients who received pirtobrutinib in a separate study of patients with previously treated CLL or non-Hodgkin lymphoma (NCT03740529). After discontinuing pirtobrutinib due to progression, the patients gave consent to a Fred Hutchinson Cancer Center institutional review board-approved biorepository protocol. Samples were then obtained for tumor banking and resistance mutation profiling. In addition to collecting fresh post-pirtobrutinib peripheral blood (PB) samples, archival specimens were retrieved from as many timepoints as possible from
cytogenetic, molecular, histology, and flow cytometry clinical laboratories (Online Supplementary Tables S1 and S2). Mononuclear cells were isolated from fresh PB samples, using Ficoll-Paque media and density gradient centrifugation. They were then suspended in fetal bovine serum with 10% dimethylsulfoxide and cryopreserved in liquid nitrogen. DNA was extracted from the cryopreserved cells using the Gentra Puregene Blood Kit (Qiagen) and was quantified using the Qubit dsDNA HS Assay Kit (ThermoFisher Scientific). Clinical archival specimens were extracted according to Clinical Laboratory Improvement Amendments/College of American Pathologists (CLIA/CAP) standard operating procedures per laboratory of origin.
DNA duplex-sequencing library preparation
From each sample, 500 ng of DNA were prepared into libraries for duplex sequencing according to published protocols33,35 and using commercially available kits (TwinStrand Biosciences, Seattle, WA, USA) with a customized panel to target the coding region of TP53 and key hotspot drug resistance mutations in BCL2, BAX, BTK, and PLCG2 identified in relapsed CLL (Online Supplementary Tables S3 and S4).7-10,37 Library preparation consisted of sequential sonication, end-repair, A-tailing, ligation to duplex adapters, fragment amplification, two rounds of hybridization capture with biotinylated probes (Online Supplementary Methods), and library amplification. Proper library fragment size was confirmed by an Agilent 4200 High Sensitivity TapeStation. Indexed libraries were quantified using a Qubit dsDNA HS Assay Kit. Libraries were sequenced using 150 bp paired end reads on a NovaSeq Illumina platform on site or HiSeq at Genewiz (South Plainfield, NJ, USA), allocating approximately 15 million reads per sample for a target average depth of about 10,000x.
Duplex-sequencing analysis
Sequencing reads were analyzed using pipeline v2.1.2 available at https://github.com/Kennedy-Lab-UW/Duplex-Seq-Pipeline, which grouped them by molecular tags to produce highly accurate consensus “duplex reads” (Online Supplementary Methods). Variant allele frequencies (VAF) were calculated by dividing the number of mutant duplex reads by the duplex depth at the mutated position. Variants present in all samples from a given patient at a VAF >0.9 (homozygous) or between 0.4 and 0.6 (heterozygous) and had a single nucleotide polymorphism (SNP) database identifier were considered SNP (Online Supplementary Tables S5 and S6). Variants present in all samples from a patient, with a SNP database identifier, and a difference in VAF across samples (maximum minus minimum VAF) >0.2, were considered SNP-loss-of-heterozygosity (SNPLOH). All non-SNP and non-SNP-LOH variants with a depth >1,000 were considered mutations. Each sample’s mutation frequency was calculated as the number of mutant positions in coding regions divided by the total number of
Haematologica | 109 Marzo 2024 836 ARTICLE - Dynamics of CLL resistance to targeted therapy D.W. Woolston et al.
duplex nucleotides sequenced in coding regions. To study the clonal evolution of CLL under therapy, we converted the VAF of each mutation to its cancer cell fraction (CCF) (i.e., the fraction of cancer cells containing the mutation), which incorporates the sample’s tumor burden and ploidy at the genomic location (Online Supplementary Methods).
Results
Patients and specimens
For our first patient (R001), we analyzed six samples (A to F): four PB samples (A, B, C, and F) and one bone marrow aspiration (BMA) sample processed in replicate (D and E) (Online Supplementary Table S1). The same BMA sample was archived at two different clinical laboratories (cytogenetics and molecular) and underwent two independent specimen processing, DNA extraction, and library preparation processes, thus providing a technical replicate for quality control. For our second patient (R002), we analyzed five samples (A to E): one PB sample and four BMA samples (Online Supplementary Table S2).
Patient R001 was diagnosed with IGHV-unmutated CLL with del(11q) and del(17p) at the age of 67, 6 years before beginning pirtobrutinib therapy. Prior therapies included bendamustine and rituximab, ibrutinib (discontinued at 7 months due to multiple soft tissue infections, arthralgia, and myalgia), and venetoclax. Venetoclax was discontinued after 17 months because of progressive disease ( Online Supplementary Figure S1). Fluorescence in situ hybridization (FISH) and chromosomal genomic array testing (CGAT) performed analysis were performed on a PB sample (R001-A) collected at this time demonstrated del(17p) with loss of TP53. The patient was referred for an investigational CD19-targeted chimeric antigen receptor (CAR) T-cell therapy which was unsuccessful. She subsequently received acalabrutinib, which was discontinued after 9 months because of arthralgia and myalgia, followed by zanubrutinib which was discontinued after 9 months due to progressive disease. Sample R001-B was collected after discontinuation of acalabrutinib, and samples R001-C/D/E were collected prior to zanubrutinib discontinuation. The patient received pirtobrutinib for 4 months until she developed progressive disease. She then received duvelisib for 1.5 months (during which sample R001-F was collected) without response and subsequently died due to complications of CLL. Overall, six samples (including a technical replicate of a BMA) were available for study spanning over 3 years of follow up (Figure 1, Online Supplementary Figure S1, Online Supplementary Table S1).
Patient R002 was diagnosed with CLL in his early 60s; he initially received fludarabine, cyclophosphamide, and rituximab and achieved a durable remission. At the time of relapse, cytogenetic and molecular characterization of his CLL revealed several abnormalities such as deletions
of 1q41qter-, 7pterp21-, and 9p21, gain of 3q26qter+ and 8q13qter+, and copy-neutral LOH of 9pterp13. There was no evidence of del(17p) or other alterations to TP53, and IGHV was unmutated. The patient received ibrutinib for 3 years until his disease progressed, followed by venetoclax for 2 years until further progressive disease. He subsequently received the combination of ibrutinib and venetoclax. Ibrutinib was switched to acalabrutinib due to the development of atrial fibrillation. Sample R002-A was collected after 3 months of combination therapy with ibrutinib and venetoclax. The novel agents were discontinued in favor of a CD19-directed CAR T-cell clinical trial, which was unsuccessful. Sample R002-B was collected a month after CAR T-cell infusion. The patient resumed acalabrutinib nearly 4 months after CAR T-cell infusion and experienced controlled disease for 9 months. Sample R002-C was collected at the time of progressive disease. The patient then received pirtobrutinib on a clinical trial for 2.5 months; sample R002-D (BMA) was collected at the time of progressive disease. Subsequent therapies included idelalisib (10 days, stopped due to gastrointestinal intolerance), a bispecific anti-CD20/CD3 antibody, highdose corticosteroids, and bendamustine. The patient died from complications of CLL 2 months after stopping pirtobrutinib. A PB specimen (R002-E) was collected 2 weeks before his death. Four BMA samples were available: three before pirtobrutinib treatment and one after pirtobrutinib treatment (Figure 2, Online Supplementary Figure S2, Online Supplementary Table S2).
Testing for targeted chronic lymphocytic leukemia drug resistance mutations by duplex sequencing
Eleven samples, six from patient R001 and five from patient R002, were duplex sequenced with a panel including BAX, BCL2, BTK, PLCG2, and TP53 (Online Supplementary Table S3). The average depth of sequencing across samples was 9,708x (range, 7,812x to 11,170x) (Online Supplementary Table S7, Online Supplementary Figure S3A). Both patients showed most mutations at the latest datapoint, which also corresponded to the highest percentage of disease (95%) (Online Supplementary Table S7, Online Supplementary Figure S3B). All coding mutations identified in either patient are listed in Online Supplementary Tables S8 and S9 and summarized by gene in Online Supplementary Figure S3C.
Monitoring clonal trends by cancer cell fraction derived from serial duplex data
To determine clonal dynamics during the disease course, we transformed the VAF into CCF for all mutations with more than one duplex reads in at least one of the samples analyzed, taking into consideration the percentage of disease in the sample and the estimated LOH by SNP duplex sequencing data and cytogenetics (see the Methods section). Patient R001 had no cytogenetic alterations affecting BAX, PLCG2, and BTK, which was confirmed by the
Haematologica | 109 Marzo 2024 837 ARTICLE - Dynamics of CLL resistance to targeted therapy D.W. Woolston et al.
and
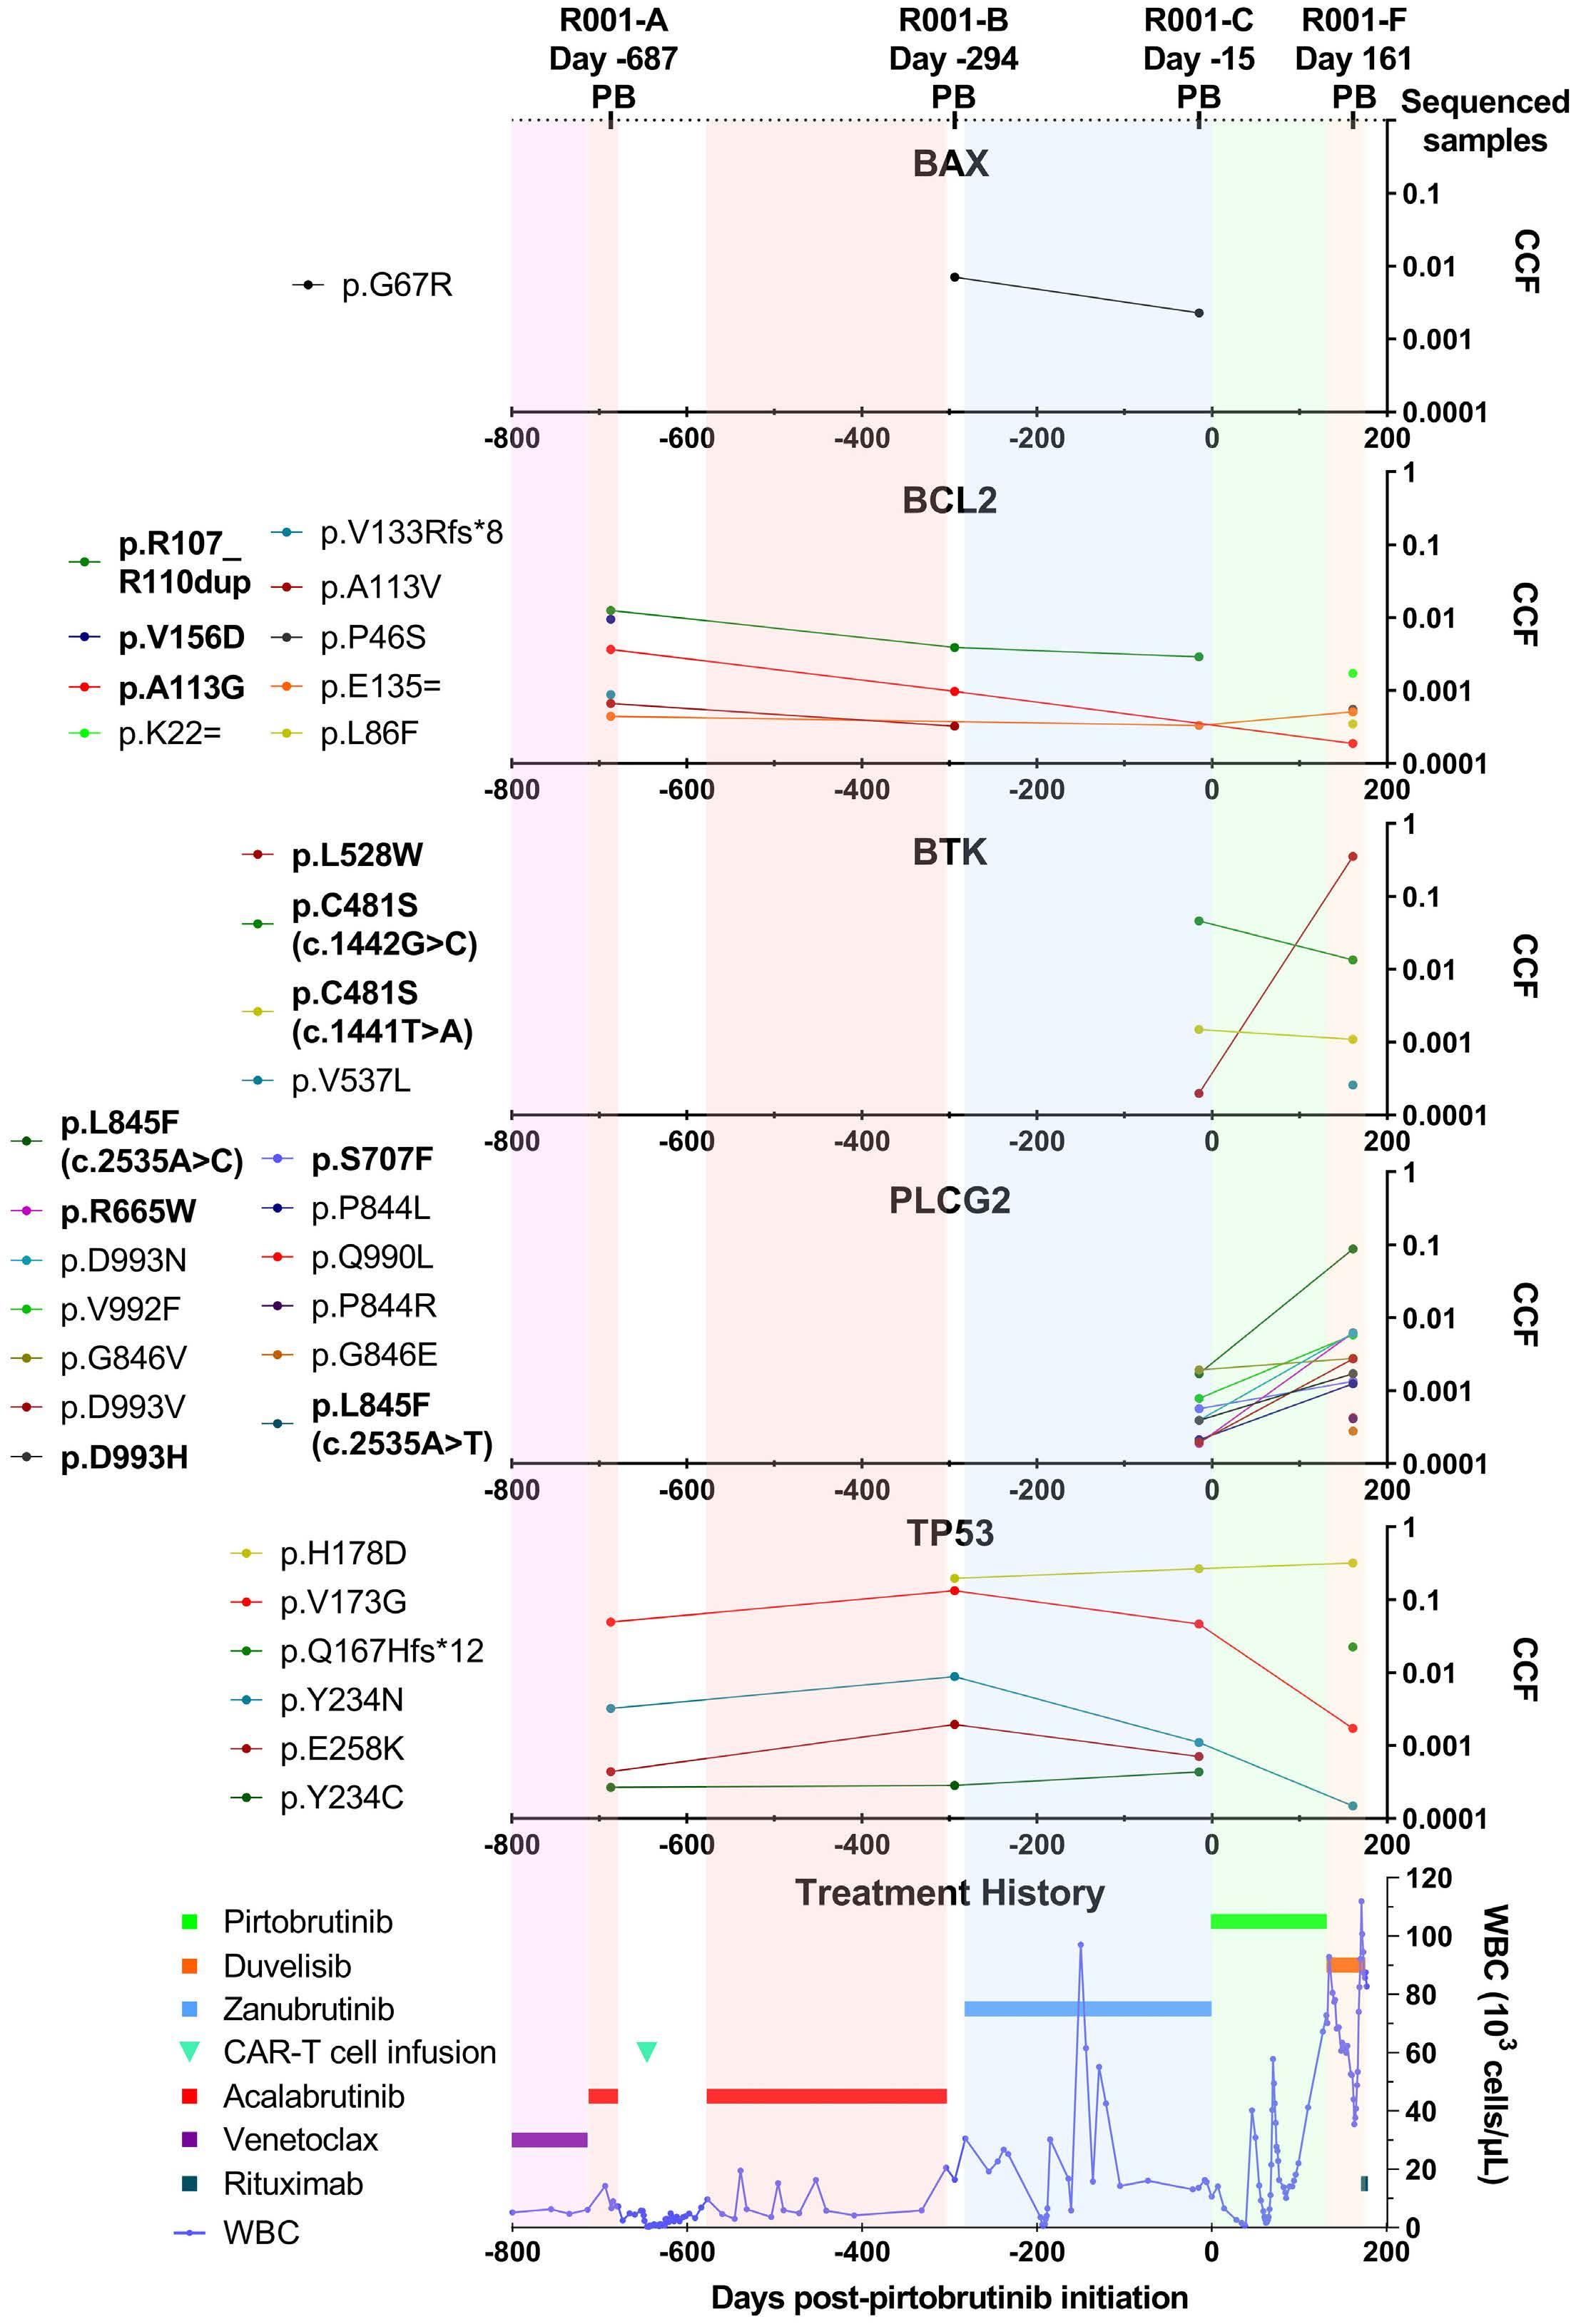
The
the
a
of the
using bold font to in-
the patient’s treatment histo-
prior to the first sample and
Haematologica | 109 Marzo 2024 838 ARTICLE - Dynamics of CLL resistance to targeted therapy D.W. Woolston et al.
Figure 1. Patient R001 clonal evolution and treatment history. The timeline on the x-axis indicates days after initiation of pirtobrutinib treatment. Four peripheral blood samples were collected at the indicated days. The top five panels correspond to sequenced genes and include all mutations identified in at least one sample by two mutant duplex reads. The cancer cell fraction of each mutation is indicated on the y-axis. Mutations are color-coded and listed to
left
plots,
dicate resistance mutations common in chronic lymphocytic leukemia.
bottom panel depicts
ry
disease evolution based on white blood cell counts. Only treatments within
year
that lasted more than 30 days are shown. PB: peripheral blood; CCF: cancer cell fraction; WBC: white blood cell count.
presence of heterozygous SNP at a VAF of approximately 50% in all samples (Online Supplementary Tables S5 and S10 ). Patient R001 had two heterozygous SNP (c.1101375G>A and c.97-6C>T) that indicated SNP-LOH in TP53, at a frequency ranging from 51% to 91%. This finding was corroborated by cytogenetic data including CGAT analysis, which confirmed deletion of 17p at three timepoints prior to treatment with pirtobrutinib at a frequency comparable between CGAT and duplex sequencing (Online Supplementary Table S10). In patient R002, with our target panel, no SNP-LOH was found to alter CCF calculations. Thus, for this male patient, a copy number of two was used for mutations located on autosomes (except for the high-VAF BAX mutation p.E41Gfs*33; see Online Supplementary Methods), and a copy number of one was used for mutations located on the X chromosome. The CCF values are indicated in Online Supplementary Tables S11 (patient R001) and S12 (patient R002) and were used to illustrate the evolution of mutations in serial samples over the treatment course for patient R001 (Figure 1) and patient R002 (Figure 2).
Clonal evolution in both patients prior to pirtobrutinib treatment
Both patients’ first sequencing sample was collected after cessation of the Bcl-2 inhibitor venetoclax (patient R001: +29 days; patient R002: +1 day) (Figures 1 and 2, respectively). At this point, both patients had several TP53 mutations, and no mutations in either BTK or PLCG2. Patient R001 also had multiple BCL2 mutations (3 known resistance mutations), whereas patient R002 had multiple BAX mutations (1 known resistance mutation). After venetoclax, both patients went on to receive CAR T-cell therapy followed by acalabrutinib monotherapy. After cessation of acalabrutinib, patient R001 developed a low frequency BAX mutation and a new TP53 mutation at the greatest CCF of all TP53 mutations (p.H178D, CCF 19%). No mutations in BTK or PLCG2 appeared after acalabrutinib treatment in this patient, but multiple known resistance mutations in BTK and PLCG2 did emerge after subsequent treatment with the BTK inhibitor zanubrutinib, including BTK p.L528W and p.C481S as well as PLCG2 S707F, L845F, R665W, and D993H. In contrast, patient R002 developed multiple BTK mutations following acalabrutinib treatment, including known resistance mutations p.C481R, p.T474I and p.C481S. Additionally, the BAX mutation E41Gfs*33, which he carried at a CCF of 9% after venetoclax cessation, increased dramatically to a CCF of 92% in less than a year after cessation of acalabrutinib.
Effect of pirtobrutinib on the clonal landscape of patient R001
After treatment with zanubrutinib, patient R001 received pirtobrutinib which suppressed minor clones with mutations in BAX and BCL2. Strikingly, even though pirtobrutinib
was able to suppress the pre-existing BTK C481S mutation, which was present at a CCF of 5% before pirtobrutinib and decreased to a CCF of 1% after treatment, the CCF of another BTK mutation, L528W, increased by three orders of magnitude following pirtobrutinib treatment, from 0.02% to 35% (Figure 1). Importantly, ultra-deep duplex sequencing detected this mutation at a very low VAF in the pre-pirtobrutinib sample, demonstrating that it was pre-existing and did not arise de novo during pirtobrutinib treatment.
We also detected multiple PLCG2 mutations in patient R001 who exhibited a significant CCF increase following pirtobrutinib. Most notably, the L845F mutation increased in CCF from 0.2% before pirtobrutinib to 9% after pirtobrutinib. Similarly, the TP53 H178D mutation, which was first detected at a CCF of 2% about a year prior to pirtobrutinib initiation, steadily increased to a CCF of 32% after pirtobrutinib cessation. The TP53 mutations occurred on the background of TP53 LOH/deletion, which was present at 80-100% CCF (i.e., clonal, or nearly clonal) in all sequenced samples from this patient (Online Supplementary Table S11).
Effect of pirtobrutinib on the clonal landscape of patient R002
In patient R002, most TP53 mutant clones were suppressed by acalabrutinib treatment and remained at low CCF during subsequent treatment with pirtobrutinib. As in patient R001, while some BTK clones (including a low frequency C481S mutation) were suppressed by pirtobrutinib treatment, one clone harboring a common CLL resistance mutation, p.T474I, expanded more than two orders of magnitude from a CCF of 0.03% to 4.2% (Figure 2, Online Supplementary Table S12). Several additional BTK mutations appeared following the start of pirtobrutinib treatment, including multiple CLL resistance mutations, which persisted during the subsequent idelalisib treatment. A pre-existent PLCG2 mutant clone (p.Y648C) also expanded during pirtobrutinib treatment, and a new mutant clone harboring a common PLCG2 CLL resistance mutation (p.L845V) emerged after the treatment. The major mutant BAX clone, which was detected after venetoclax treatment and expanded during therapy with acalabrutinib, persisted at a very high CCF after pirtobrutinib (CCF 90%) and expanded fully after idelalisib (CCF 100%).
Reproducibility of duplex-sequencing findings across technical replicates and different sample types
We leveraged the availability of two BMA samples from patient R001 (R001-D and R001-E), collected in a single procedure but processed independently, to test the reproducibility of low frequency mutation detection with duplex sequencing. The sequencing depth was lower for R001-D than for R001-E and fewer mutations were detected (32 vs. 37) (Online Supplementary Table S7). Twenty of those
Haematologica | 109 Marzo 2024 839 ARTICLE - Dynamics of CLL resistance to targeted therapy D.W. Woolston et al.
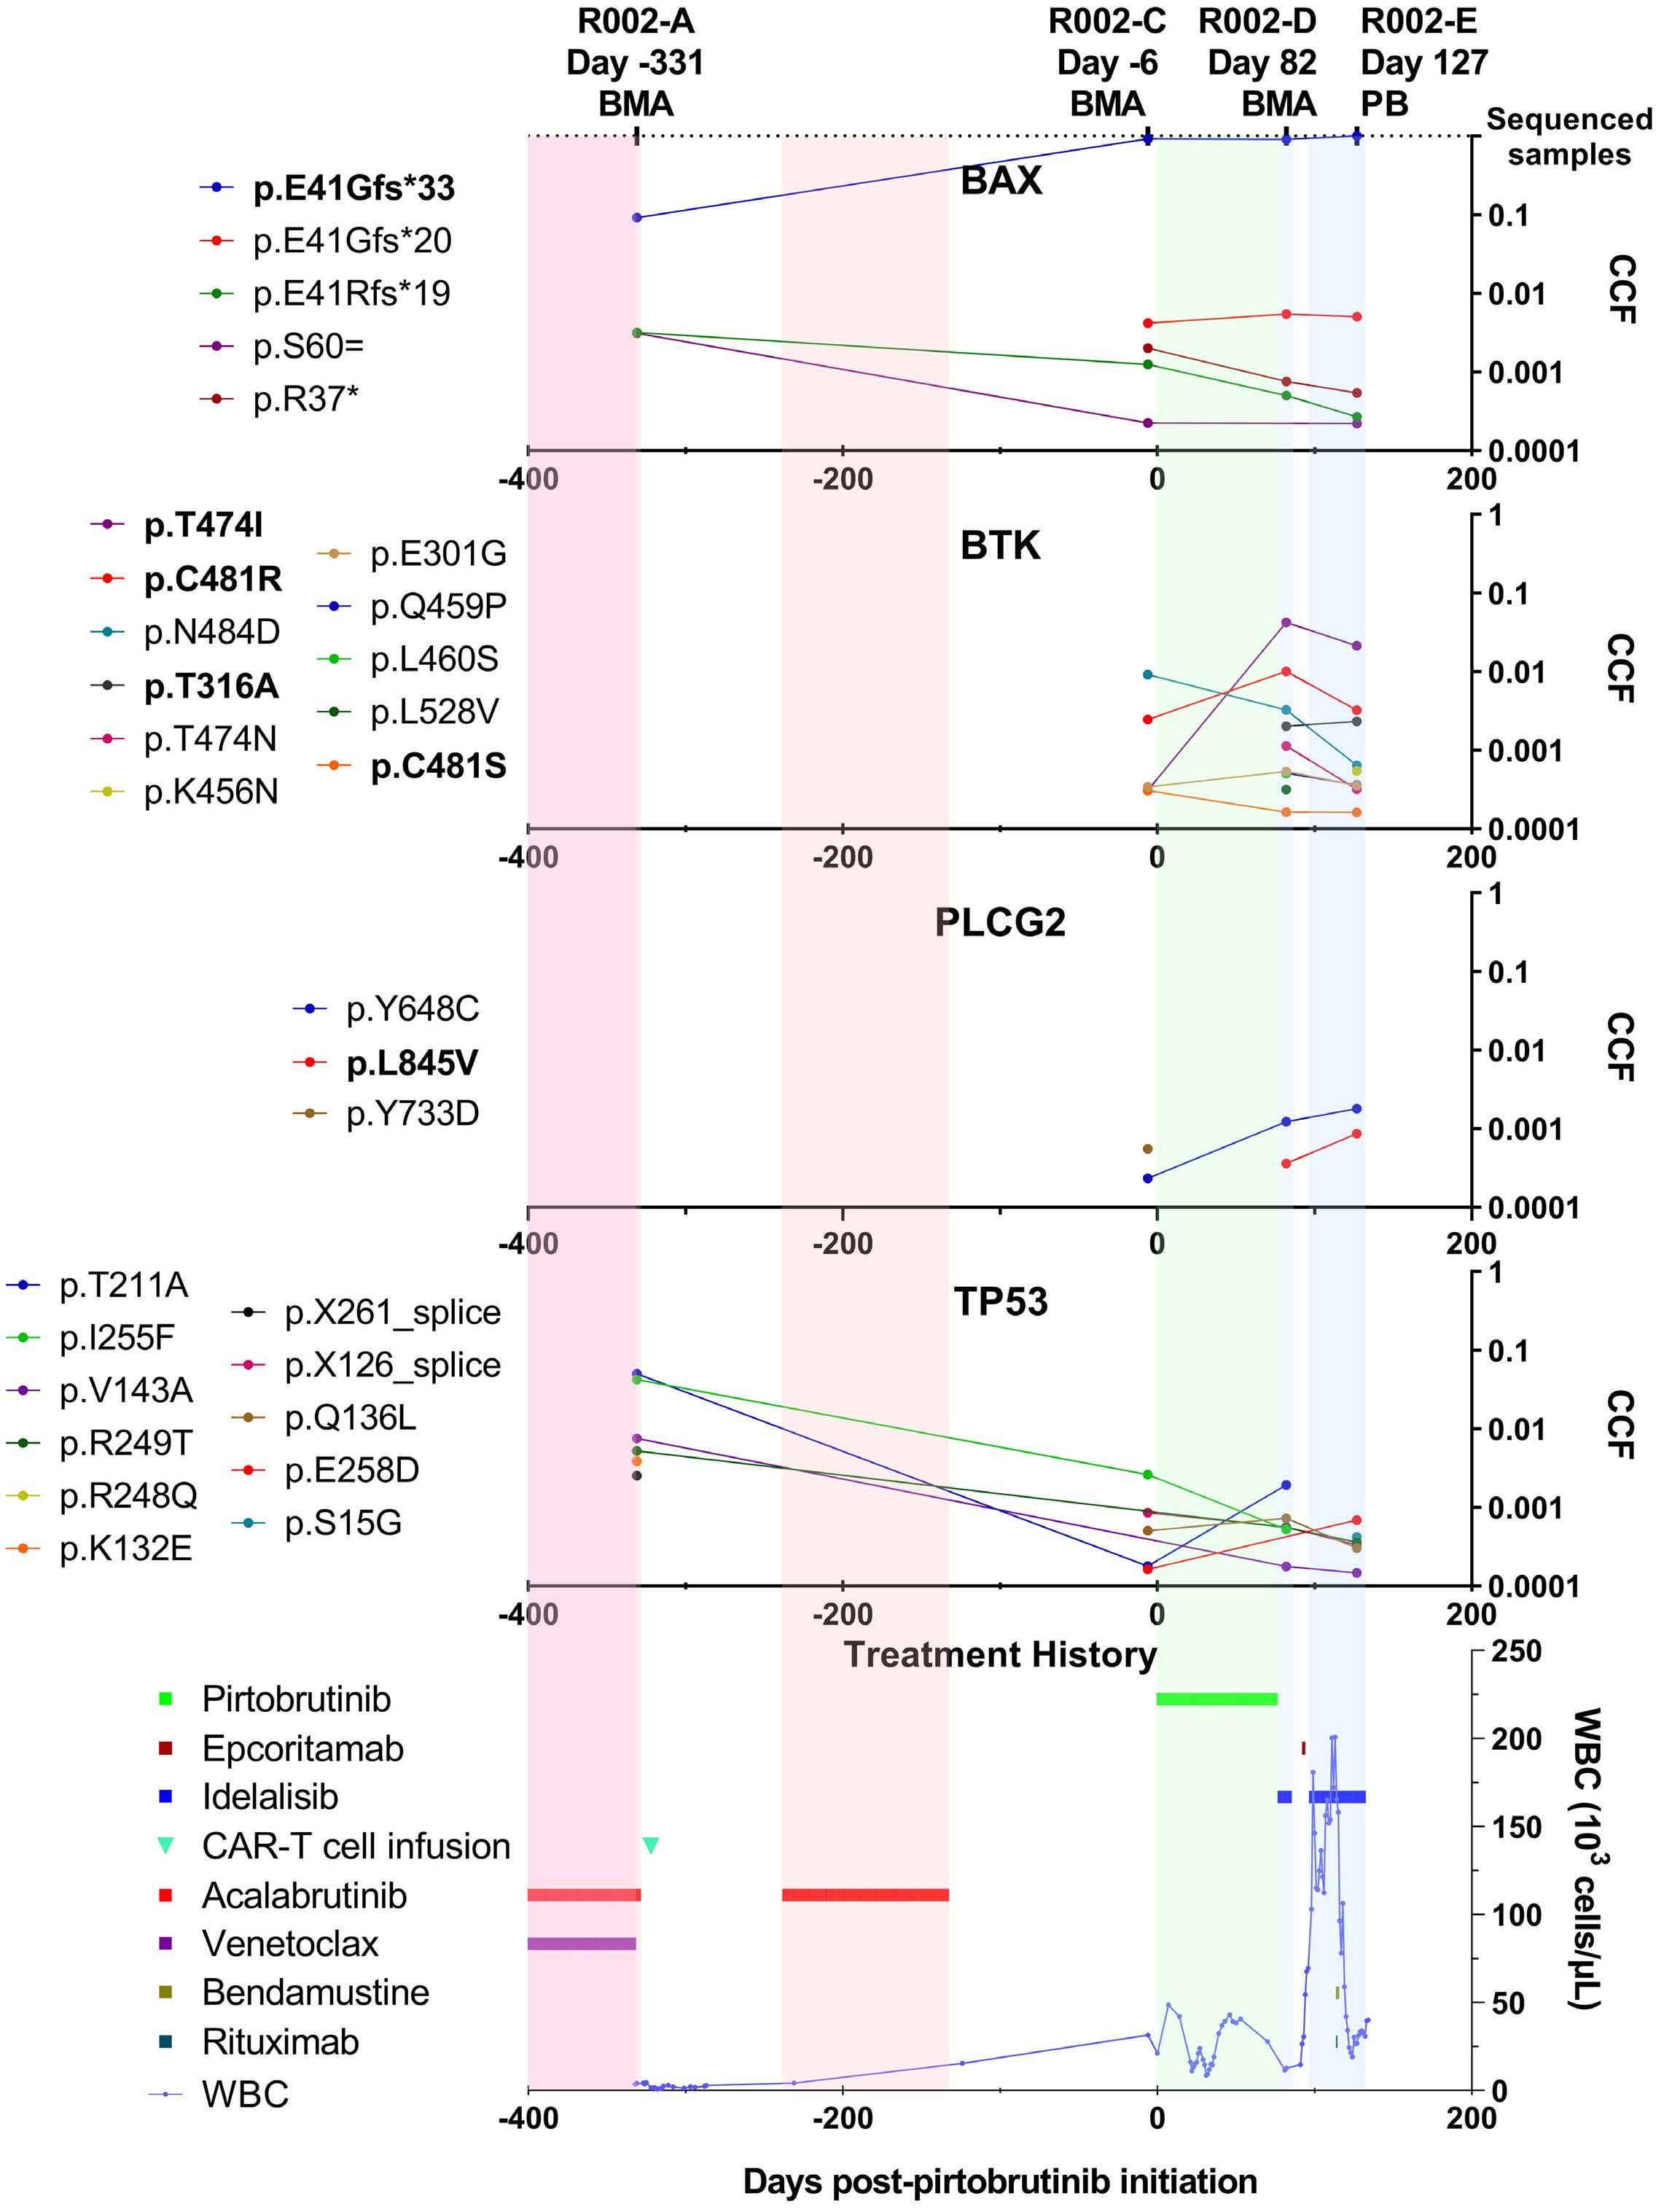
Mutations are color-coded and listed to the left of the plots, using bold font to indicate common chronic lymphocytic leukemia resistance mutations. The bottom panel depicts the patient’s treatment history and disease evolution based on white blood cell counts. Only treatments within a year prior to the first sample and
shown. BMA: bone marrow aspirate;
Haematologica | 109 Marzo 2024 840 ARTICLE - Dynamics of CLL resistance to targeted therapy D.W. Woolston et al.
Figure 2. Patient R002 clonal evolution and treatment history. The timeline on the x-axis indicates days after initiation of pirtobrutinib treatment. Three bone marrow aspirate samples and one peripheral blood sample were collected at the indicated days. The top five panels correspond to sequenced genes and include all mutations identified in at least one sample by two mutant duplex reads. The cancer cell fraction of each mutation is indicated on the y-axis.
that lasted more than 30 days are
PB: peripheral blood; CCF: cancer cell fraction; CAR: chimeric antigen receptor; WBC: white blood cell count.
mutations were, however, common in the two samples and showed very reproducible VAF values (Spearman r=0.89, P<2.2x10⁻¹⁶) (Online Supplementary Figure S4 ). Most of the mutations that were not seen in both samples corresponded to mutations that had only one mutant read and very low VAF (<0.02%), which are likely subject to sampling error. To demonstrate the comparability between BMA and PB for mutational assessment, we compared the CCF of mutations identified in the two BMA samples with those identified in PB collected 9 days before the BMA (Figure 3). Mutations seen in BMA were also found in PB at similar
CCF, confirming the suitability of both types of sample for the assessment of resistance mutations.
Orthogonal validation of duplex sequencing with clinical next-generation sequencing and earlier detection of resistance mutations
While the availability of clinical next-generation sequencing (NGS) data was limited, such sequencing did identify two mutations in patient R001 (BTK p.C481S, c.1442G>C and TP53 p.H178D, c.532C>G) and one mutation in patient R002 (BTK p.T474I, c.1421C>T) included in the regions analyzed by
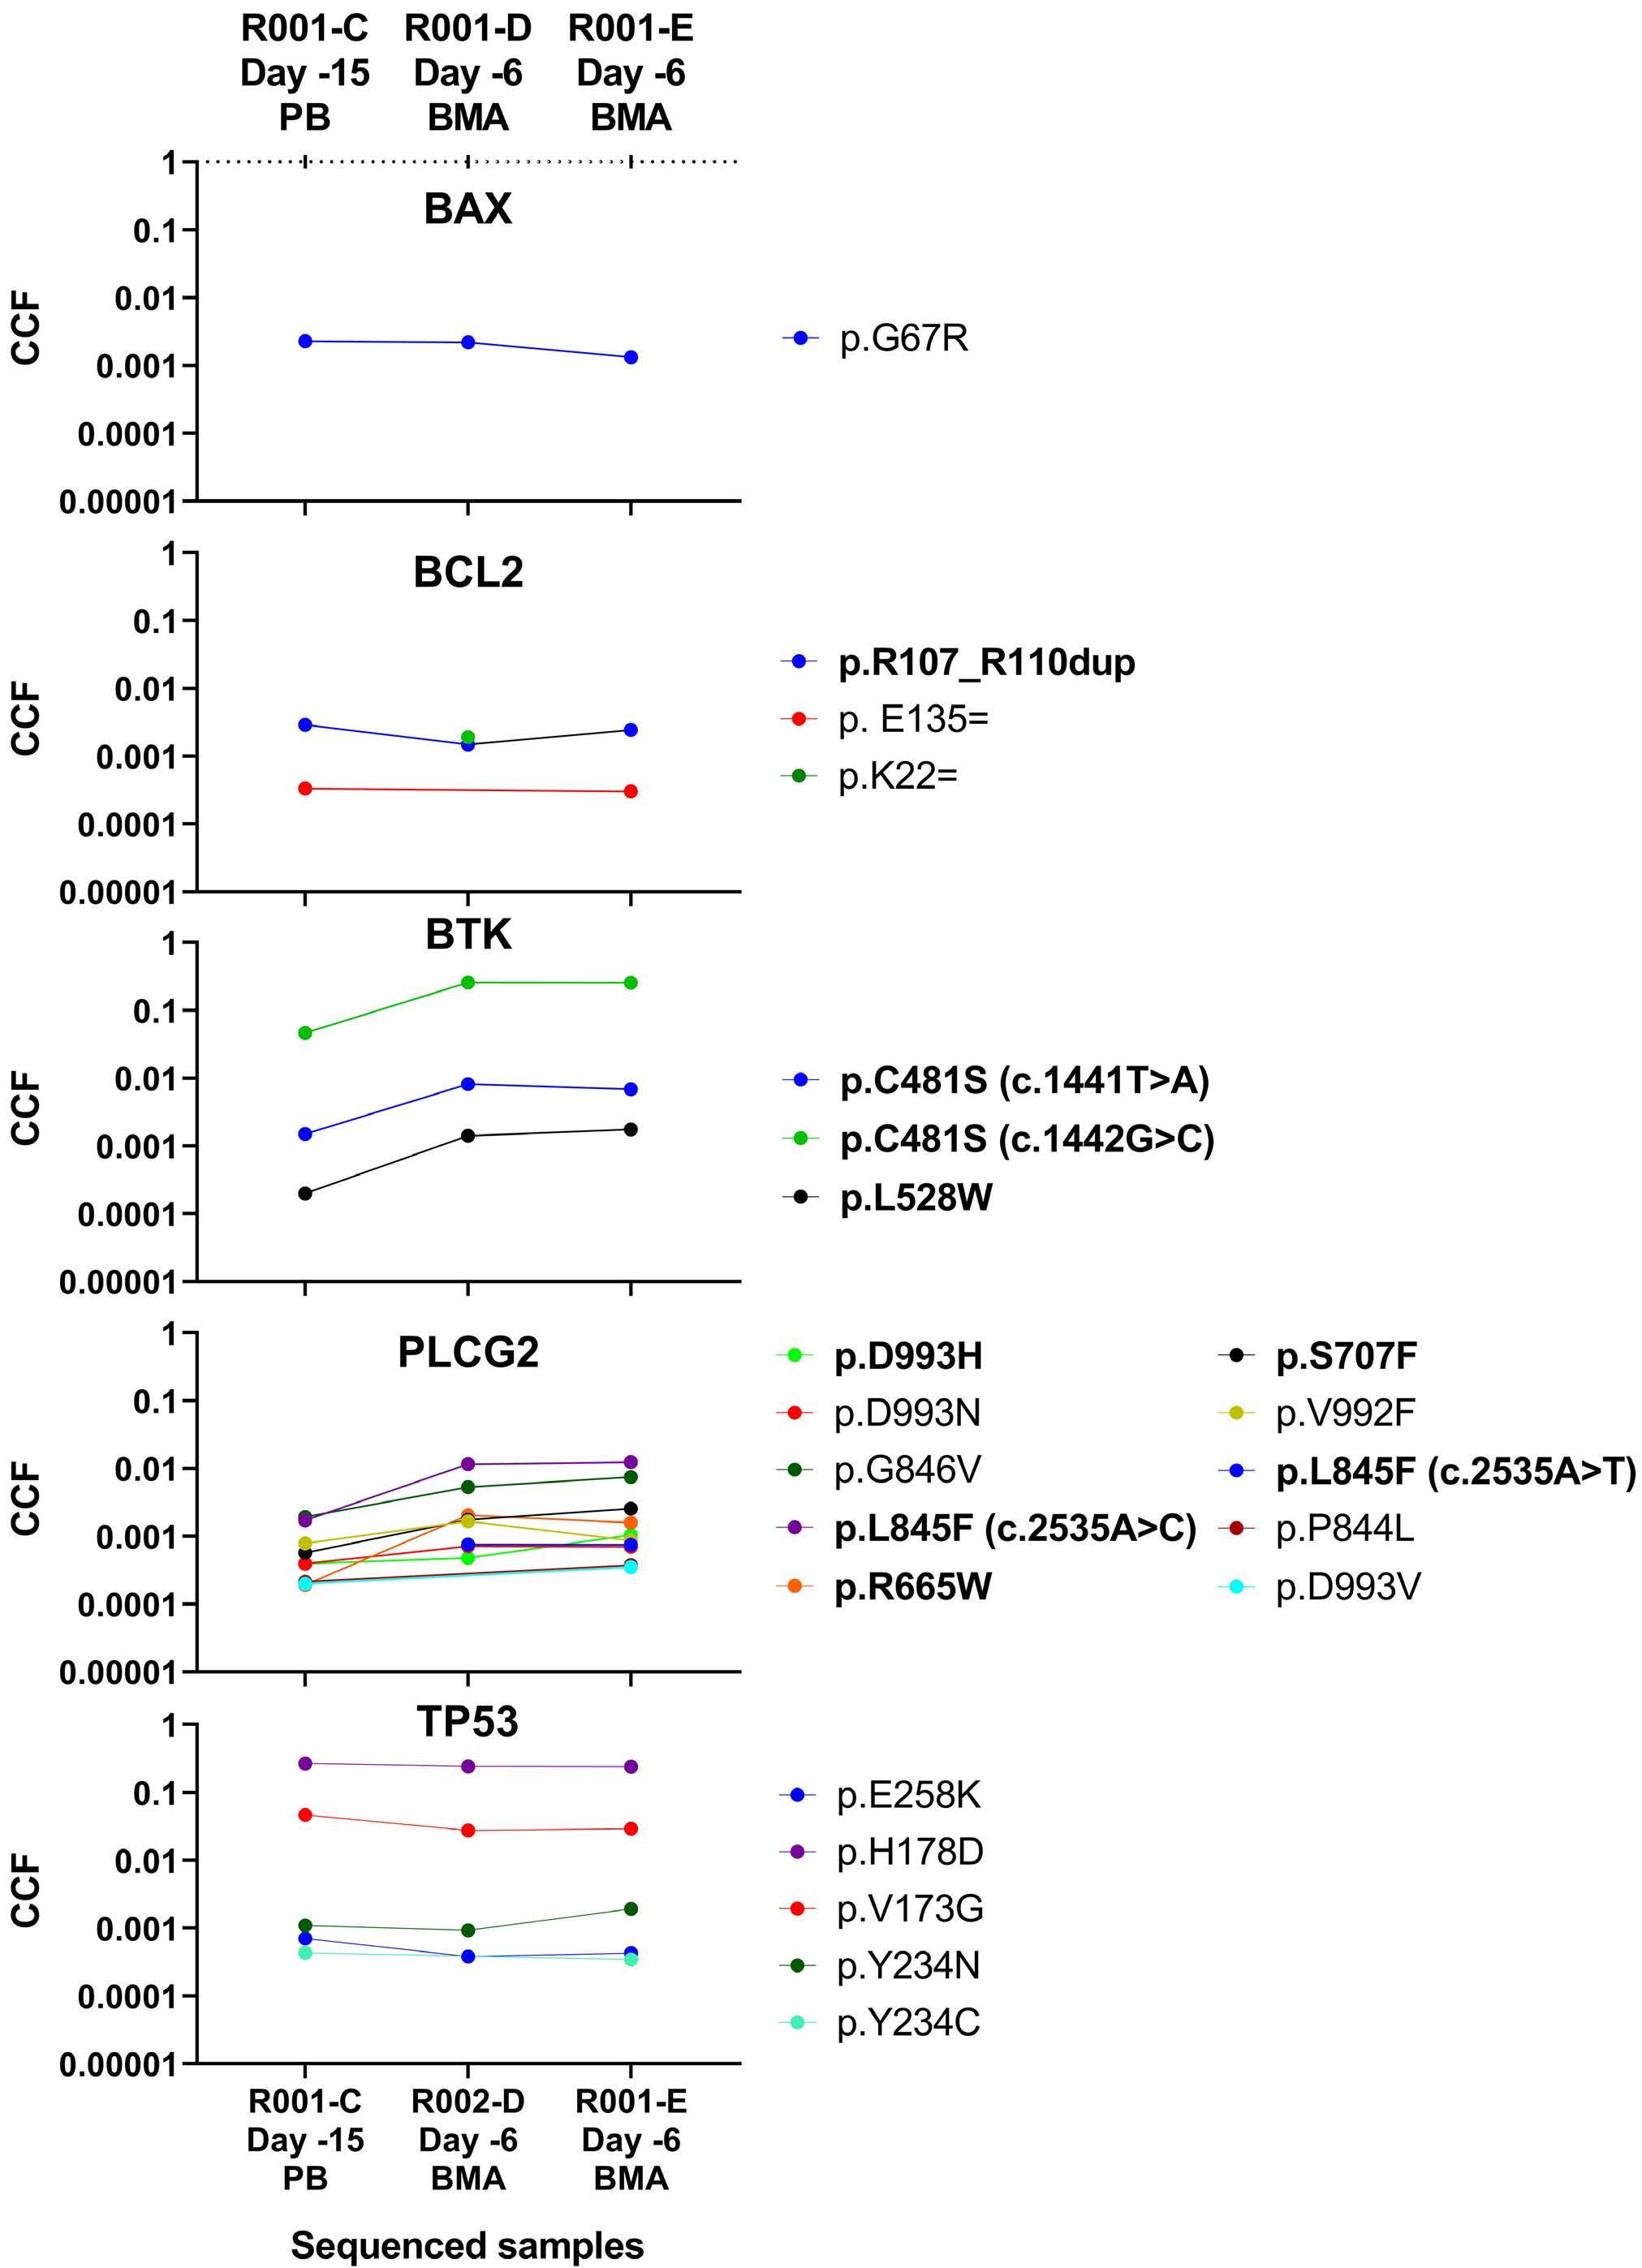
Figure 3. High sensitivity detection of chronic lymphocytic leukemia resistance mutations in bone marrow aspirate and peripheral blood collected 9 days apart. Variant allele frequency (VAF) is indicated on the y-axis. All mutations with a VAF >0.0002 are represented for each gene and sample, with known chronic lymphocytic leukemia resistance mutations in bold on the right side of each plot. The two bone marrow aspirate samples are replicates from a single procedure. CLL: chronic lymphocytic leukemia; BMA: bone marrow aspirate; PB: peripheral blood: Days: days prior to pirtobrutinib treatment.
Haematologica | 109 Marzo 2024 841 ARTICLE - Dynamics of CLL resistance to targeted therapy D.W. Woolston et al.
duplex sequencing. We confirmed that the three mutations were detected by duplex sequencing in the corresponding samples at VAF very similar to those measured by NGS (Online Supplementary Table S13). Importantly, for patient R002, the resistance mutation BTK p.T474I, c.1421C>T was identified by duplex sequencing in sample R002-C, which was collected 6 days prior to the pirtobrutinib initiation, at a VAF of 0.03% (Figure 4). This VAF is about two orders of magnitude under the limit of detection of the clinical NGS method and thus was not identified by clinical NGS in the same sample. These results were corroborated by digital polymerase chain reaction (Online Supplementary Figure S5) and indicate that the high sensitivity of duplex sequencing is helpful to identify very low frequency pre-existing CLL resistance mutations.
Discussion
We report mutation analysis of targeted DNA duplex sequencing on serial PB and BMA samples from two patients whose CLL demonstrated clinical resistance to pirtobrutinib. Our data highlight the presence of resistance mutations that complicate pirtobrutinib therapy and demonstrate the evolutionary dynamics of resistant clones under different targeted therapeutic pressures including a Bcl-2 inhibitor, and multiple covalent and non-covalent BTK inhibitors. Our first patient had a more aggressive CLL, with primary disease demonstrating 17p and 11q deletions. Her disease was
treated within 2 years of initial diagnosis with different targeted agents, including BTK inhibitors and CAR T cells, but progressed prior to enrollment in the pirtobrutinib clinical trial. In contrast, our second patient had a long-standing history of CLL (over a decade) before starting a series of targeted therapies to which the CLL developed resistance, including BTK and Bcl-2 inhibitors and CAR T-cell therapy, before enrollment in the pirtobrutinib clinical trial, which was then followed by treatment with a novel bispecific antibody. By using ultra-deep, ultra-accurate sequencing, we demonstrate that resistance mutations often exist prior to the start of therapy, at very small (CCF <0.01%) frequencies. Importantly, while other studies typically focus on a single treatment modality to identify resistance mutations through either a single snapshot in time or a comparison of the diagnostic sample to a relapse sample,9,38 our study models itself on the designs of studies by Burger et al.39 and Landau et al., 40 who sequenced serial PB and BMA samples to recapitulate the trends of a growing number of clones at low allelic frequencies prior to relapse or progression, and as CLL disease responds to or persists through various targeted therapy pressures. However, our study is limited by this sequencing assay only targeting five key genes recognized in CLL resistance to targeted therapies. For example, while we observed multiple BTK, BCL2, and TP53 mutations contract or expand differently with specific treatments, our study does not explore whether other genes co-mutate with these variants to confer a selective advantage.
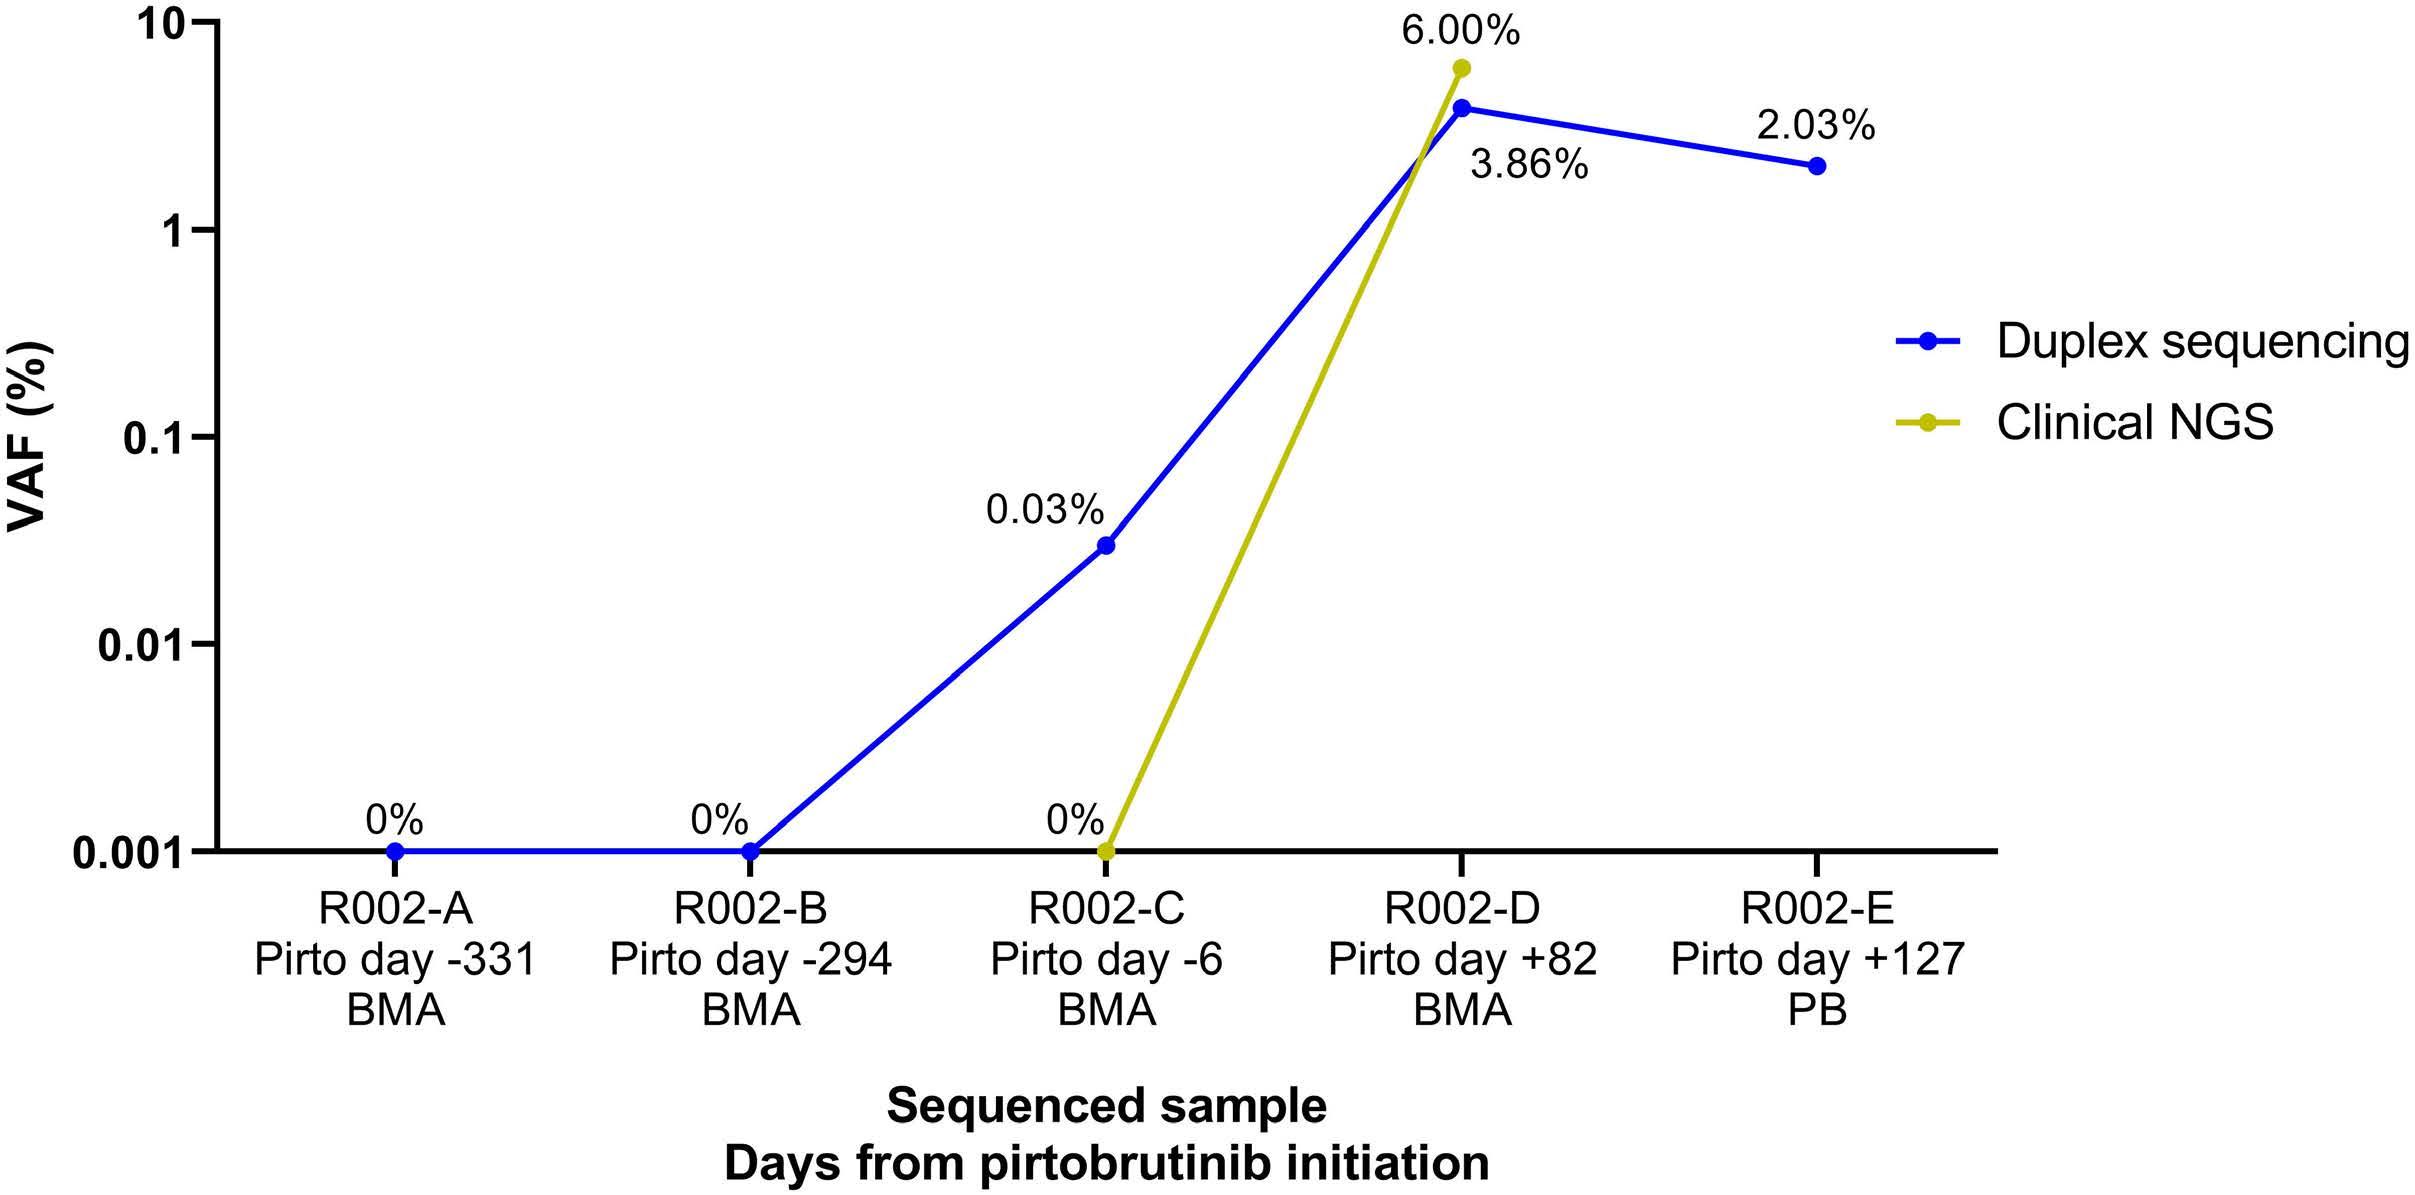
In sample R002-C the resistance mutation BTK p.
by duplex-sequencing but not clinical next-generation sequencing and was identified with both methods in sample R002-D at a greater VAF. Samples with 0% VAF were assigned a surrogate value of 0.001% for purposes of presentation on a logarithmic scale. Clinical next-generation sequencing was not performed on samples at timepoints A, B, and E and could not be directly compared to Duplex-sequencing. NGS: next-generation sequencing; Pirto: pirtobrutinib; BMA: bone
Haematologica | 109 Marzo 2024 842 ARTICLE - Dynamics of CLL resistance to targeted therapy D.W. Woolston et al.
Figure 4. Detection of pre-existent BTK p.T474I (c.1421C>T) resistance mutation using duplex-sequencing versus clinical next-generation sequencing. Variant allele frequency (VAF) is indicated on the y-axis.
T474I (c.1421C>T) was identified
marrow aspirate; PB: peripheral blood.
Pirtobrutinib, a third-generation, non-covalent BTK inhibitor, was developed to target both wild-type CLL and CLL with BTK resistance mutations such as C48120 and showed great promise with high overall response rates in initial trials.41 However, both of our patients with post-pirtobrutinib relapse demonstrated increased counts of pathogenic variants and showed clonal expansion of resistance mutations in PLCG2 and BTK, with persistent mutations in TP53. In particular, we found that the resistance mutation BTK L528W,42 seen in both of our patients after treatment, was potentially a significant driver of pirtobrutinib resistance especially in patient R001. Both patients also carried persistent, low-level BTK C481 mutations during and after pirtobrutinib treatment. The observations of expanding PLCG2 and BTK resistance mutations are supported by other groups who also noted resistance developing under treatment with pirtobrutinib.43,44 Our study pioneers the use of duplex sequencing on serial CLL samples to detect clonal trends in resistance mutations at ultra-low levels, enabling the identification of allelic frequencies down to a VAF of 0.01%. This was most notably demonstrated in the case of the pre-existing resistance mutation BTK p.T474I, C.1421C>T, which was found at low levels (CCF 0.03%) in the pre-pirtobrutinib sample R002-C by duplex sequencing. In contrast, NGS detected 0% of this variant (Online
Supplementary Table S13).
More recently, Naeem et al. reported, in primary CLL cells from patients treated with pirtobrutinib, that at progression, CLL cells showed increased BCR signaling and cell viability as well as accumulation of TP53 mutations and second-site BTK mutations such as BTK L528W and BTK T474I.44 Our study confirms these findings in longitudinally collected pirtobrutinib-resistant samples. In addition, we show that monitoring the clonal evolution of TP53 in this manner might inform prognosis. For example, patient R001 carried a 17p deletion at a very high clonal frequency which served as a background for the emergence of a pathogenic TP53 H178 mutant clone after acalabrutinib treatment, followed by its significant clonal expansion during pirtobrutinib-resistant disease. In concordance with others who have noted associations with shorter overall survival and alterations in TP53, 37 patient R001 also had a more aggressive clinical course and shorter survival than patient R002, who did not experience major TP53 clonal expansions after pirtobrutinib relapse.
Examining the clonal evolution patterns observed in patient R002, the most remarkable finding was the expansion of BAX mutation p.E41Gfs*33, which was reported as a mechanism of resistance in CLL45,46 and acute myeloid leukemia.47 Mutations in BAX were previously described in CLL patients treated with venetoclax.45,46,48,49 Interestingly, Blombery et al. reported that in CLL patients, loss of function BAX mutations occur in the myeloid compartment and are associated with clonal hematopoiesis.45,50 In our study we could not discern with certainty the lineage of the cells
harboring the mutation because the duplex sequencing was conducted with bulk sequencing. However, that this patient had a high disease burden in the three samples collected after acalabrutinib treatment, i.e., 95% (R002-C), 91% (R002-D), and 95% (R002-E) (Online Supplementary Table S2), and that this mutation was present with a high CCF in those samples (92.13%, 90.69% and 100%, respectively) indicates that this mutation occurred and expanded in neoplastic lymphocytes and persisted after pirtobrutinib treatment.
In summary, we present new data that illustrate the evolutionary dynamics of resistant clones in CLL and elucidate their underlying resistance mechanisms under pressure from targeted therapies. There is an important need for MRD monitoring in patients receiving targeted therapy for CLL to identify low VAF clones of resistance mutations and, as expanding clones are detected, the addition of a secondary therapy which acts via a different mechanism is recommended. We envision ultra-sensitive targeted NGS assays will become an established mechanism for monitoring resistance mutations in CLL and guide subsequent therapies based on mutational profiles.
Disclosures
CY and RAR are consultants and equity holders at TwinStrand Biosciences Inc. RAR is an equity holder at NanoString Technologies Inc. RAR is named inventor on patents owned by the University of Washington and licensed to TwinStrand Biosciences Inc.
Contributions
DWW curated clinical data, isolated and extracted raw materials, drafted, reviewed and revised the manuscript, and created figures. NDL analyzed data and drafted the manuscript. MS conceived and designed the study, identified the patients, participated in the enrollment of the patients into the study, and reviewed and revised the manuscript. EL performed experiments and contributed to data analysis and drafting the manuscript. XRT and JF performed experiments. BK analyzed data and created the figures. CU was the primary-site enrolling Principal Investigator and reviewed and revised the manuscript. AE and BT contributed samples and reviewed and revised the manuscript. MF analyzed data, reviewed clinical data, and reviewed and revised the manuscript. JR reviewed clinical data and reviewed and revised the manuscript. IB obtained funding for the study, developed data analysis methods, and drafted, reviewed and revised the manuscript. RAR conceived and designed the study, obtained funding for the study, supervised experiments, analyzed data, and drafted, reviewed and revised the manuscript. CCSY conceived and designed the study, obtained funding for the study, reviewed patients’ charts and clinical data, and drafted, reviewed and revised the manuscript.
Acknowledgments
We would like to thank the staff of the FHCC Pathology and
Haematologica | 109 Marzo 2024 843 ARTICLE - Dynamics of CLL resistance to targeted therapy D.W. Woolston et al.
UW Hematopathology for procuring the archival material and performing the laboratory techniques used in this study. Our thanks to Neta Gilderman and Olga Sala-Torra for their work running digital PCR assays. We would especially like to thank the patients who consented that their archived specimens could be used in research.
Funding
This research was funded in part by a grant to RAR and CCSY from the Brotman Baty Institute for Precision Medicine, by
References
1. Wierda WG, Brown J, Abramson JS, et al. NCCN Guidelines® Insights: chronic lymphocytic leukemia/small lymphocytic lymphoma, version 3.2022. J Natl Compr Canc Netw. 2022;20(6):622-634.
2. Honigberg LA, Smith AM, Sirisawad M, et al. The Bruton tyrosine kinase inhibitor PCI-32765 blocks B-cell activation and is efficacious in models of autoimmune disease and B-cell malignancy. Proc Natl Acad Sci U S A. 2010;107(29):13075-13080.
3. Yeung CCS, Shadman M. How to choose the best treatment and testing for chronic lymphocytic leukemia in the tsunami of new treatment options. Curr Oncol Rep. 2019;21(8):74.
4 Byrd JC, Furman RR, Coutre SE, et al. Targeting BTK with ibrutinib in relapsed chronic lymphocytic leukemia. N Engl J Med. 2013;369(1):32-42.
5. Barr PM, Owen C, Robak T, et al. Up to 8-year follow-up from RESONATE-2: first-line ibrutinib treatment for patients with chronic lymphocytic leukemia. Blood Adv. 2022;6(11):3440-3450.
6. Munir T, Brown JR, O’Brien S, et al. Final analysis from RESONATE: up to six years of follow-up on ibrutinib in patients with previously treated chronic lymphocytic leukemia or small lymphocytic lymphoma. Am J Hematol. 2019;94(12):1353-1363.
7 Furman RR, Cheng S, Lu P, et al. Ibrutinib resistance in chronic lymphocytic leukemia. N Engl J Med. 2014;370(24):2352-2354.
8. Sedlarikova L, Petrackova A, Papajik T, Turcsanyi P, Kriegova E. Resistance-associated mutations in chronic lymphocytic leukemia patients treated with novel agents. Front Oncol. 2020;10:894.
9 Woyach JA, Ruppert AS, Guinn D, et al. BTKC481S-mediated resistance to ibrutinib in chronic lymphocytic leukemia. J Clin Oncol. 2017;35(13):1437-1443.
10 Liu T-M, Woyach JA, Zhong Y, et al. Hypermorphic mutation of phospholipase C, g2 acquired in ibrutinib-resistant CLL confers BTK independency upon B-cell receptor activation. Blood. 2015;126(1):61-68.
11. Maddocks KJ, Ruppert AS, Lozanski G, et al. Etiology of ibrutinib therapy discontinuation and outcomes in patients with chronic lymphocytic leukemia. JAMA Oncol. 2015;1(1):80-87.
12. Woyach J, Huang Y, Rogers K, et al. Resistance to acalabrutinib in CLL is mediated primarily by BTK mutations. Blood. 2019;134(Suppl_1):504.
13. Bonfiglio S, Sutton L-A, Ljungström V, et al. BTK and PLCG2 remain unmutated in one third of patients with CLL relapsing on ibrutinib. Blood Adv. 2023;7(12):2794-2806.
14. Ahn IE, Brown JR. Targeting Bruton’s tyrosine kinase in CLL. Front Immunol. 2021;12:687458.
start-up funds from the Department of Laboratory Medicine and Pathology to RAR, and by funds from the Department of Applied Mathematics, University of Washington to IB.
Data-sharing statement
The Duplex-seq Pipeline is available at https://github.com/ Kennedy-Lab-UW/Duplex-Seq-Pipeline. Sequencing data from this study have been submitted to the NCBI BioProject database (https://www.ncbi.nlm.nih.gov/bioproject) under accession number (SRA number) SUB12404430.
15. Kittai AS, Woyach JA. Resistance mechanisms to targeted agents in chronic lymphocytic leukemia. Cancer J. 2019;25(6):428-435.
16. Mato AR, Nabhan C, Thompson MC, et al. Toxicities and outcomes of 616 ibrutinib-treated patients in the United States: a real-world analysis. Haematologica. 2018;103(5):874-879.
17 Brandhuber B, Gomez E, Smith S, et al. LOXO-305, a next generation reversible BTK inhibitor, for overcoming acquired resistance to irreversible BTK inhibitors. Clin Lymphoma Myeloma Leuk. 2018;18(Suppl 1):S216.
18. Gomez EB, Isabel L, Rosendahal MS, Rothenberg SM, Andrews SW, Brandhuber BJ. Loxo-305, a highly selective and noncovalent next generation BTK inhibitor, inhibits diverse BTK C481 substitution mutations. Blood. 2019;134(Suppl_1):4644.
19 Naeem AS, Nguy WI, Tyekucheva S, et al. LOXO-305: targeting C481S Bruton tyrosine kinase in patients with ibrutinibresistant CLL. Blood. 2019;134(Suppl_1):478.
20 Mato AR, Shah NN, Jurczak W, et al. Pirtobrutinib in relapsed or refractory B-cell malignancies (BRUIN): a phase 1/2 study. Lancet. 2021;397(10277):892-901.
21. Xu Y, Ye H. Progress in understanding the mechanisms of resistance to BCL-2 inhibitors. Exp Hematol Oncol. 2022;11(1):31.
22. Tariq S, Tariq S, Khan M, Azhar A, Baig M. Venetoclax in the treatment of chronic lymphocytic leukemia: evidence, expectations, and future prospects. Cureus. 2020;12(6):e8908.
23. Sharman JP, Coutre SE, Furman RR, et al. Final results of a randomized, phase III study of rituximab with or without idelalisib followed by open-label idelalisib in patients with relapsed chronic lymphocytic leukemia. J Clin Oncol. 2019;37(16):1391-1402.
24. Klein U. Resolving PI3K-δ inhibitor resistance in CLL. Blood. 2019;134(6):496-498.
25. Iskierka-Jażdżewska E, Obracaj A, Urbaniak M, Robak T. New treatment options for newly-diagnosed and relapsed chronic lymphocytic leukemia. Curr Treat Options Oncol. 2022;23(6):775-795.
26. Wierda WG, Rawstron A, Cymbalista F, et al. Measurable residual disease in chronic lymphocytic leukemia: expert review and consensus recommendations. Leukemia. 2021;35(11):3059-3072.
27. García-Marco JA, Jiménez JL, Recasens V, et al. High prognostic value of measurable residual disease detection by flow cytometry in chronic lymphocytic leukemia patients treated with front-line fludarabine, cyclophosphamide, and rituximab, followed by three years of rituximab maintenance.
Haematologica | 109 Marzo 2024 844 ARTICLE - Dynamics of CLL resistance to targeted therapy D.W. Woolston et al.
Haematologica. 2019;104(11):2249-2257.
28. Del Giudice I, Raponi S, Della Starza I, et al. Minimal residual disease in chronic lymphocytic leukemia: a new goal? Front Oncol. 2019;9:689.
29 Ruppert AS, Yin J, Davidian M, et al. Application of a sequential multiple assignment randomized trial (SMART) design in older patients with chronic lymphocytic leukemia. Ann Oncol. 2019;30(4):542-550.
30. Short NJ, Kantarjian H, Kanagal-Shamanna R, et al. Ultraaccurate duplex sequencing for the assessment of pretreatment ABL1 kinase domain mutations in Ph+ ALL. Blood Cancer J. 2020;10(5):61.
31. Kamath-Loeb AS, Shen J-C, Schmitt MW, et al. Accurate detection of subclonal variants in paired diagnosis-relapse acute myeloid leukemia samples by next generation duplex sequencing. Leuk Res. 2022;115:106822.
32. Schmitt MW, Pritchard JR, Leighow SM, et al. Single-molecule sequencing reveals patterns of preexisting drug resistance that suggest treatment strategies in Philadelphia-positive leukemias. Clin Cancer Res. 2018;24(21):5321-5334.
33. Kennedy SR, Schmitt MW, Fox EJ, et al. Detecting ultralowfrequency mutations by duplex sequencing. Nat Protoc. 2014;9(11):2586-2606.
34. Krimmel JD, Schmitt MW, Harrell MI, et al. Ultra-deep sequencing detects ovarian cancer cells in peritoneal fluid and reveals somatic TP53 mutations in noncancerous tissues. Proc Natl Acad Sci U S A. 2016;113(21):6005-6010.
35. Schmitt MW, Kennedy SR, Salk JJ, Fox EJ, Hiatt JB, Loeb LA. Detection of ultra-rare mutations by next-generation sequencing. Proc Natl Acad Sci U S A. 2012;109(36):14508-14513.
36. Salk JJ, Schmitt MW, Loeb LA. Enhancing the accuracy of next-generation sequencing for detecting rare and subclonal mutations. Nat Rev Genet. 2018;19(5):269-285.
37. Malcikova J, Pavlova S, Kunt Vonkova B, et al. Low-burden TP53 mutations in CLL: clinical impact and clonal evolution within the context of different treatment options. Blood. 2021;138(25):2670-2685.
38. Quinquenel A, Fornecker L-M, Letestu R, et al. Prevalence of BTK and PLCG2 mutations in a real-life CLL cohort still on ibrutinib after 3 years: a FILO group study. Blood. 2019;134(7):641-644.
39 Burger JA, Landau DA, Taylor-Weiner A, et al. Clonal evolution in
patients with chronic lymphocytic leukaemia developing resistance to BTK inhibition. Nat Commun. 2016;7(1):11589.
40 Landau DA, Sun C, Rosebrock D, et al. The evolutionary landscape of chronic lymphocytic leukemia treated with ibrutinib targeted therapy. Nat Commun. 2017;8(1):2185.
41. Mato AR, Pagel JM, Coombs CC, et al. Pirtobrutinib, a next generation, highly selective, non-covalent BTK inhibitor in previously treated CLL/SLL: updated results from the phase 1/2 BRUIN study. Blood. 2021;138(Suppl 1):391-391.
42. Blombery P, Thompson ER, Lew TE, et al. Enrichment of BTK Leu528Trp mutations in patients with CLL on zanubrutinib: potential for pirtobrutinib cross-resistance. Blood Adv. 2022;6(20):5589-5592.
43. Wang E, Mi X, Thompson MC, et al. Mechanisms of resistance to noncovalent Bruton’s tyrosine kinase inhibitors. N Engl J Med. 2022;386(8):735-743.
44 Naeem A, Utro F, Wang Q, et al. Pirtobrutinib targets BTK C481S in ibrutinib-resistant CLL but second-site BTK mutations lead to resistance. Blood Adv. 2023;7(9):1929-1943.
45. Blombery P, Lew TE, Dengler MA, et al. Clonal hematopoiesis, myeloid disorders and BAX-mutated myelopoiesis in patients receiving venetoclax for CLL. Blood. 2022;139(8):1198-1207.
46. Thomalla D, Beckmann L, Grimm C, et al. Deregulation and epigenetic modification of BCL2-family genes cause resistance to venetoclax in hematologic malignancies. Blood. 2022;140(20):2113-2126.
47. Moujalled DM, Brown FC, Pomilio G, et al. Acquired mutations in BAX confer resistance to BH3 mimetics in acute myeloid leukemia. Blood. 2020;136(Suppl 1):7-8.
48. Popovic R, Dunbar F, Lu C, et al. Identification of recurrent genomic alterations in the apoptotic machinery in chronic lymphocytic leukemia patients treated with venetoclax monotherapy. Am J Hematol. 2022;97(2):E47-E51.
49. Thijssen R, Tian L, Anderson MA, et al. Single-cell multiomics reveal the scale of multilayered adaptations enabling CLL relapse during venetoclax therapy. Blood. 2022;140(20):2127-2141.
50 Blombery P, Thompson ER, Chen X, et al. BAX-mutated clonal hematopoiesis in patients on long-term venetoclax for relapsed/refractory chronic lymphocytic leukemia. Blood. 2020;136(Suppl 1):9-10.
Haematologica | 109 Marzo 2024 845 ARTICLE -
of
therapy D.W. Woolston et al.
Dynamics
CLL resistance to targeted
Improved survival for dose-intensive chemotherapy in primary mediastinal B-cell lymphoma: a systematic review and meta-analysis of 4,068 patients
Correspondence: M.R. Cook
Michael.Cook@pennmedicine.upenn.edu
1Perelman School of Medicine, University of Pennsylvania, Abramson Cancer Center, Philadelphia, PA; 2Lombardi Comprehensive Cancer Center and Georgetown University Hospital, Washington, DC; 3Dahlgren Memorial Library, Georgetown University, Washington, DC and 4Department of Biostatistics, Bioinformatics and Biomathematics, Georgetown University, Washington, DC, USA
Abstract
K. Dunleavy
kieron.m.dunleavy@medstar.net
Received: April 29, 2023.
Accepted: August 23, 2023.
Early view: August 31, 2023.
https://doi.org/10.3324/haematol.2023.283446
©2024 Ferrata Storti Foundation
Published under a CC BY-NC license
Primary mediastinal B-cell lymphoma (PMBCL) is a distinct clinicopathologic entity. Currently, there is a paucity of randomized prospective data to inform on optimal front-line chemoimmunotherapy (CIT) and use of consolidative mediastinal radiation (RT). To assess if distinct CIT approaches are associated with disparate survival outcomes, we performed a systematic review and meta-analysis comparing dose-intensive (DI-CIT) versus standard CIT for the front-line treatment of PMBCL. Standard approach (S-CIT) was defined as R-CHOP-21/CHOP-21, with or without RT. DI-CIT were defined as regimens with increased frequency, dose, and/or number of systemic agents. We reviewed data on 4,068 patients (2,517 DI-CIT; 1,551 S-CIT) with a new diagnosis of PMBCL. Overall survival for DI-CIT patients was 88% (95% CI: 85-90) compared to 80% for the S-CIT cohort (95% CI: 74-85). Meta-regression revealed an 8% overall survival (OS) benefit for the DI-CIT group (P<0.01). Survival benefit was maintained when analyzing rituximab only regimens; OS was 91% (95% CI: 89-93) for the rituximab-DI-CIT arm compared to 86% (95% CI: 82-89) for the R-CHOP-21 arm (P=0.03). Importantly, 55% (95% CI: 43-65) of the S-CIT group received RT compared to 22% (95% CI: 15-31) of DI-CIT patients (meta-regression P<0.01). To our knowledge, this is the largest meta-analysis reporting efficacy outcomes for the front-line treatment of PMBCL. DI-CIT demonstrates a survival benefit, with significantly less radiation exposure, curtailing long-term toxicities associated with radiotherapy. As we await results of randomized prospective trials, our study supports the use of dose-intensive chemoimmunotherapy for the treatment of PMBCL.
Introduction
Primary mediastinal B-cell lymphoma (PMBCL) is recognized as a distinct diagnostic entity based on unique clinical and biological features.1 It has significant overlap with classical Hodgkin lymphoma (cHL) as both diseases are putatively derived from a thymic B cell. PMBCL predominantly affects adolescents and young adults (AYA), with a predilection for females, and fortunately is highly curable with modern therapeutic approaches. However, based on its localization to the mediastinum, consolidation radiation therapy has historically been a critical component of treatment and continues to be used in a high proportion of patients.
The use of mediastinal radiation in this predominantly female AYA population is problematic given its well-recognized association with an increased risk of secondary malignancy, particularly breast cancer.2 Curative strategies that obviate the need for radiation in PMBCL are, therefore, needed and the question of which strategies may be able to reliably omit RT is under investigation. To this point, retrospective studies in PMBCL demonstrate improved outcomes for dose-intensive chemoimmunotherapeutic approaches compared to R-CHOP-21.3 Improved sensitivity of PMBCL to higher intensity therapeutics could potentially be explained by its young age distribution and/or tumor biology that closely resembles cHL, a disease known to benefit
Haematologica | 109 Marzo 2024 846 - Non-Hodgkin Lymphoma ARTICLE
Michael R. Cook,1 Lacey S. Williams,2 Charles Scott Dorris,3 Yutong Luo,4 Kepher Makambi4 and Kieron Dunleavy2
from increased therapeutic intensity.4 These hypothetical concepts have led to the investigation of dose-intensive chemoimmunotherapy (DI-CIT) for PMBCL, but currently there is a paucity of prospective randomized trials showing superiority of these treatment regimens compared to R-CHOP-21.5 Thus, our study goal was to analyze all published first-line treatment data for PMBCL with either DICIT or standard approach chemoimmunotherapy (S-CIT), to evaluate differences in survival outcomes and reliance on mediastinal radiation.
Methods
We performed a comprehensive systematic review on the front-line treatment of PMBCL. Studies included in our meta-analysis were prospective or retrospective published datasets that reported treatment outcomes (progression-free survival, PFS; overall survival, OS) for specific CIT regimens for children and adults diagnosed with PMBCL. Standard chemoimmunotherapy (S-CIT) was defined as R-CHOP-21 or CHOP-21, with or without RT. DI-CIT approaches were defined as regimens that increase the frequency, dose or number of systemic agents in comparison to R-CHOP-21. Case reports, small case series (<5 PMBCL patients) and unpublished conference abstracts were excluded.
We searched MEDLINE, Embase, and Cochrane CENTRAL via Ovid and Web of Science for all published literature on this topic on February 8, 2022. Please refer to the Online Supplementary Appendix for complete search strategies. This study followed the Preferred Reporting Items for Systematic Reviews and Meta-analyses (PRISMA) reporting guideline and the PRISMA extension statement.6 Two independent authors screened all studies to compile a final list of included publications, from which data were extracted. Patient number, trial type, treatment, consolidative mediastinal RT, PFS, and OS data were collected from each study and divided according to individual CIT regimens for comparison. The primary outcome of our study was to assess OS for DI-CIT compared to S-CIT. Key secondary outcomes included comparing these two treatment cohort’s PFS and use of consolidative mediastinal radiation. We also analyzed all endpoints for cohorts of patients treated with dose adjusted-EPOCH-R (da-EPOCH-R) compared to R-CHOP-21 and rituximab-DI-CIT compared to R-CHOP-21 (R-S-CIT).
Individual patient demographic and clinical characteristics were collected from each publication, then grouped for studies that reported characteristics for specific DI-CIT and S-CIT regimens. Data for pediatric-only studies are reported separately as reported clinical characteristics differed. Clinical characteristics that were not reported for the subpopulation of PMBCL within the published series could not be evaluated in this analysis.
Selected characteristics of the included studies were summarized as percentages. The significance of the difference in means or proportions between two groups was evaluated using the t test or χ2 test. Meta-analysis was conducted separately for the selected outcomes of the study. Heterogeneity of proportions/risks across studies was tested using Cochran’s Q-statistic. The I2-statistic was also used as an indicator of the percentage of variation among the studies due to true heterogeneity rather than chance, with 25% indicating low heterogeneity, 50% moderate heterogeneity, and 75% high heterogeneity.7 The fixed effect or random effects approach was followed using the inverse variance method depending on whether the study heterogeneity hypothesis was significant or not, and a large or small value of the I2-statistic was obtained. For the random effects approach, heterogeneity variance was estimated using the DerSimonian-Laird approach.8 Meta-regression analysis (Online Supplementary Table S1) was used to evaluate the significance of the difference in outcome (proportion) between DI-CIT and S-CIT (as well as for subgroup analysis), adjusted for years of follow-up. The meta-analysis was conducted using the METAPROP and METAREG functions in the package META in R for Windows.9
Results
Overall, the literature search identified 2,112 studies (Figure 1), which resulted in the inclusion of 52 publications:3,10-60 11 prospective and 41 retrospective studies. This identified 4,068 PMBCL adult and pediatric patients who were treated with first-line dose-intensive (n=2,517) and standard (n=1,551) chemoimmunotherapy.
Reported demographic and clinical characteristics varied in each publication; Table 1 summarizes the most commonly reported patients’ characteristics. In the DI-CIT cohort (24 evaluable studies), median age of patients was 32.8 years (60.5% female). Most patients were classified as stage I or II disease (67.7%) with a majority reported to have a bulky mediastinal mass (>10 cm or 1/3 of the thoracic diameter; 72.7%). Lactate dehydrogenase (LDH) was elevated in 77.7% and 35.6% had extranodal involvement. In the S-CIT cohort (19 evaluable studies), median age was 33.8 years (56.3% female). Again, the majority of patients had stage I/II disease (70.7%) with bulky mediastinal involvement (62.7%). LDH was elevated in 71.5% of this cohort, with 35.3% of patients reported to have extranodal involvement. The test for difference in means (or proportions) of selected characteristics between D-CIT and S-CIT was significant for the median age, gender, B symptoms, bulky disease, and elevated LDH. Clinical characteristics reported in publications that did not report separate patients’ characteristics for different treatment regimens, as well as pediatric only studies are reported in Online Supplementary Tables S2 and S3. Table 2 summarizes the CIT regimens that were
Haematologica | 109 Marzo 2024 847 ARTICLE - Intensive chemotherapy improves survival in PMBCL M. Cook et al.
included. In the DI-CIT cohort, the majority of patients received da-EPOCH-R (n=670), VACOP/MACOP-B +/- rituximab (n=458), and “2nd/3rd generation chemotherapy” (VACOP/MACOP-B, ProMACE, CytaBOM, n=375). There were
329 pediatric patients included in the DI-CIT cohort who received a variety of intensive pediatric regimens (IPR). In the S-CIT cohort, 1,095 patients received R-CHOP-21 and 456 were treated with CHOP-21. In the DI-CIT group, 60.5%
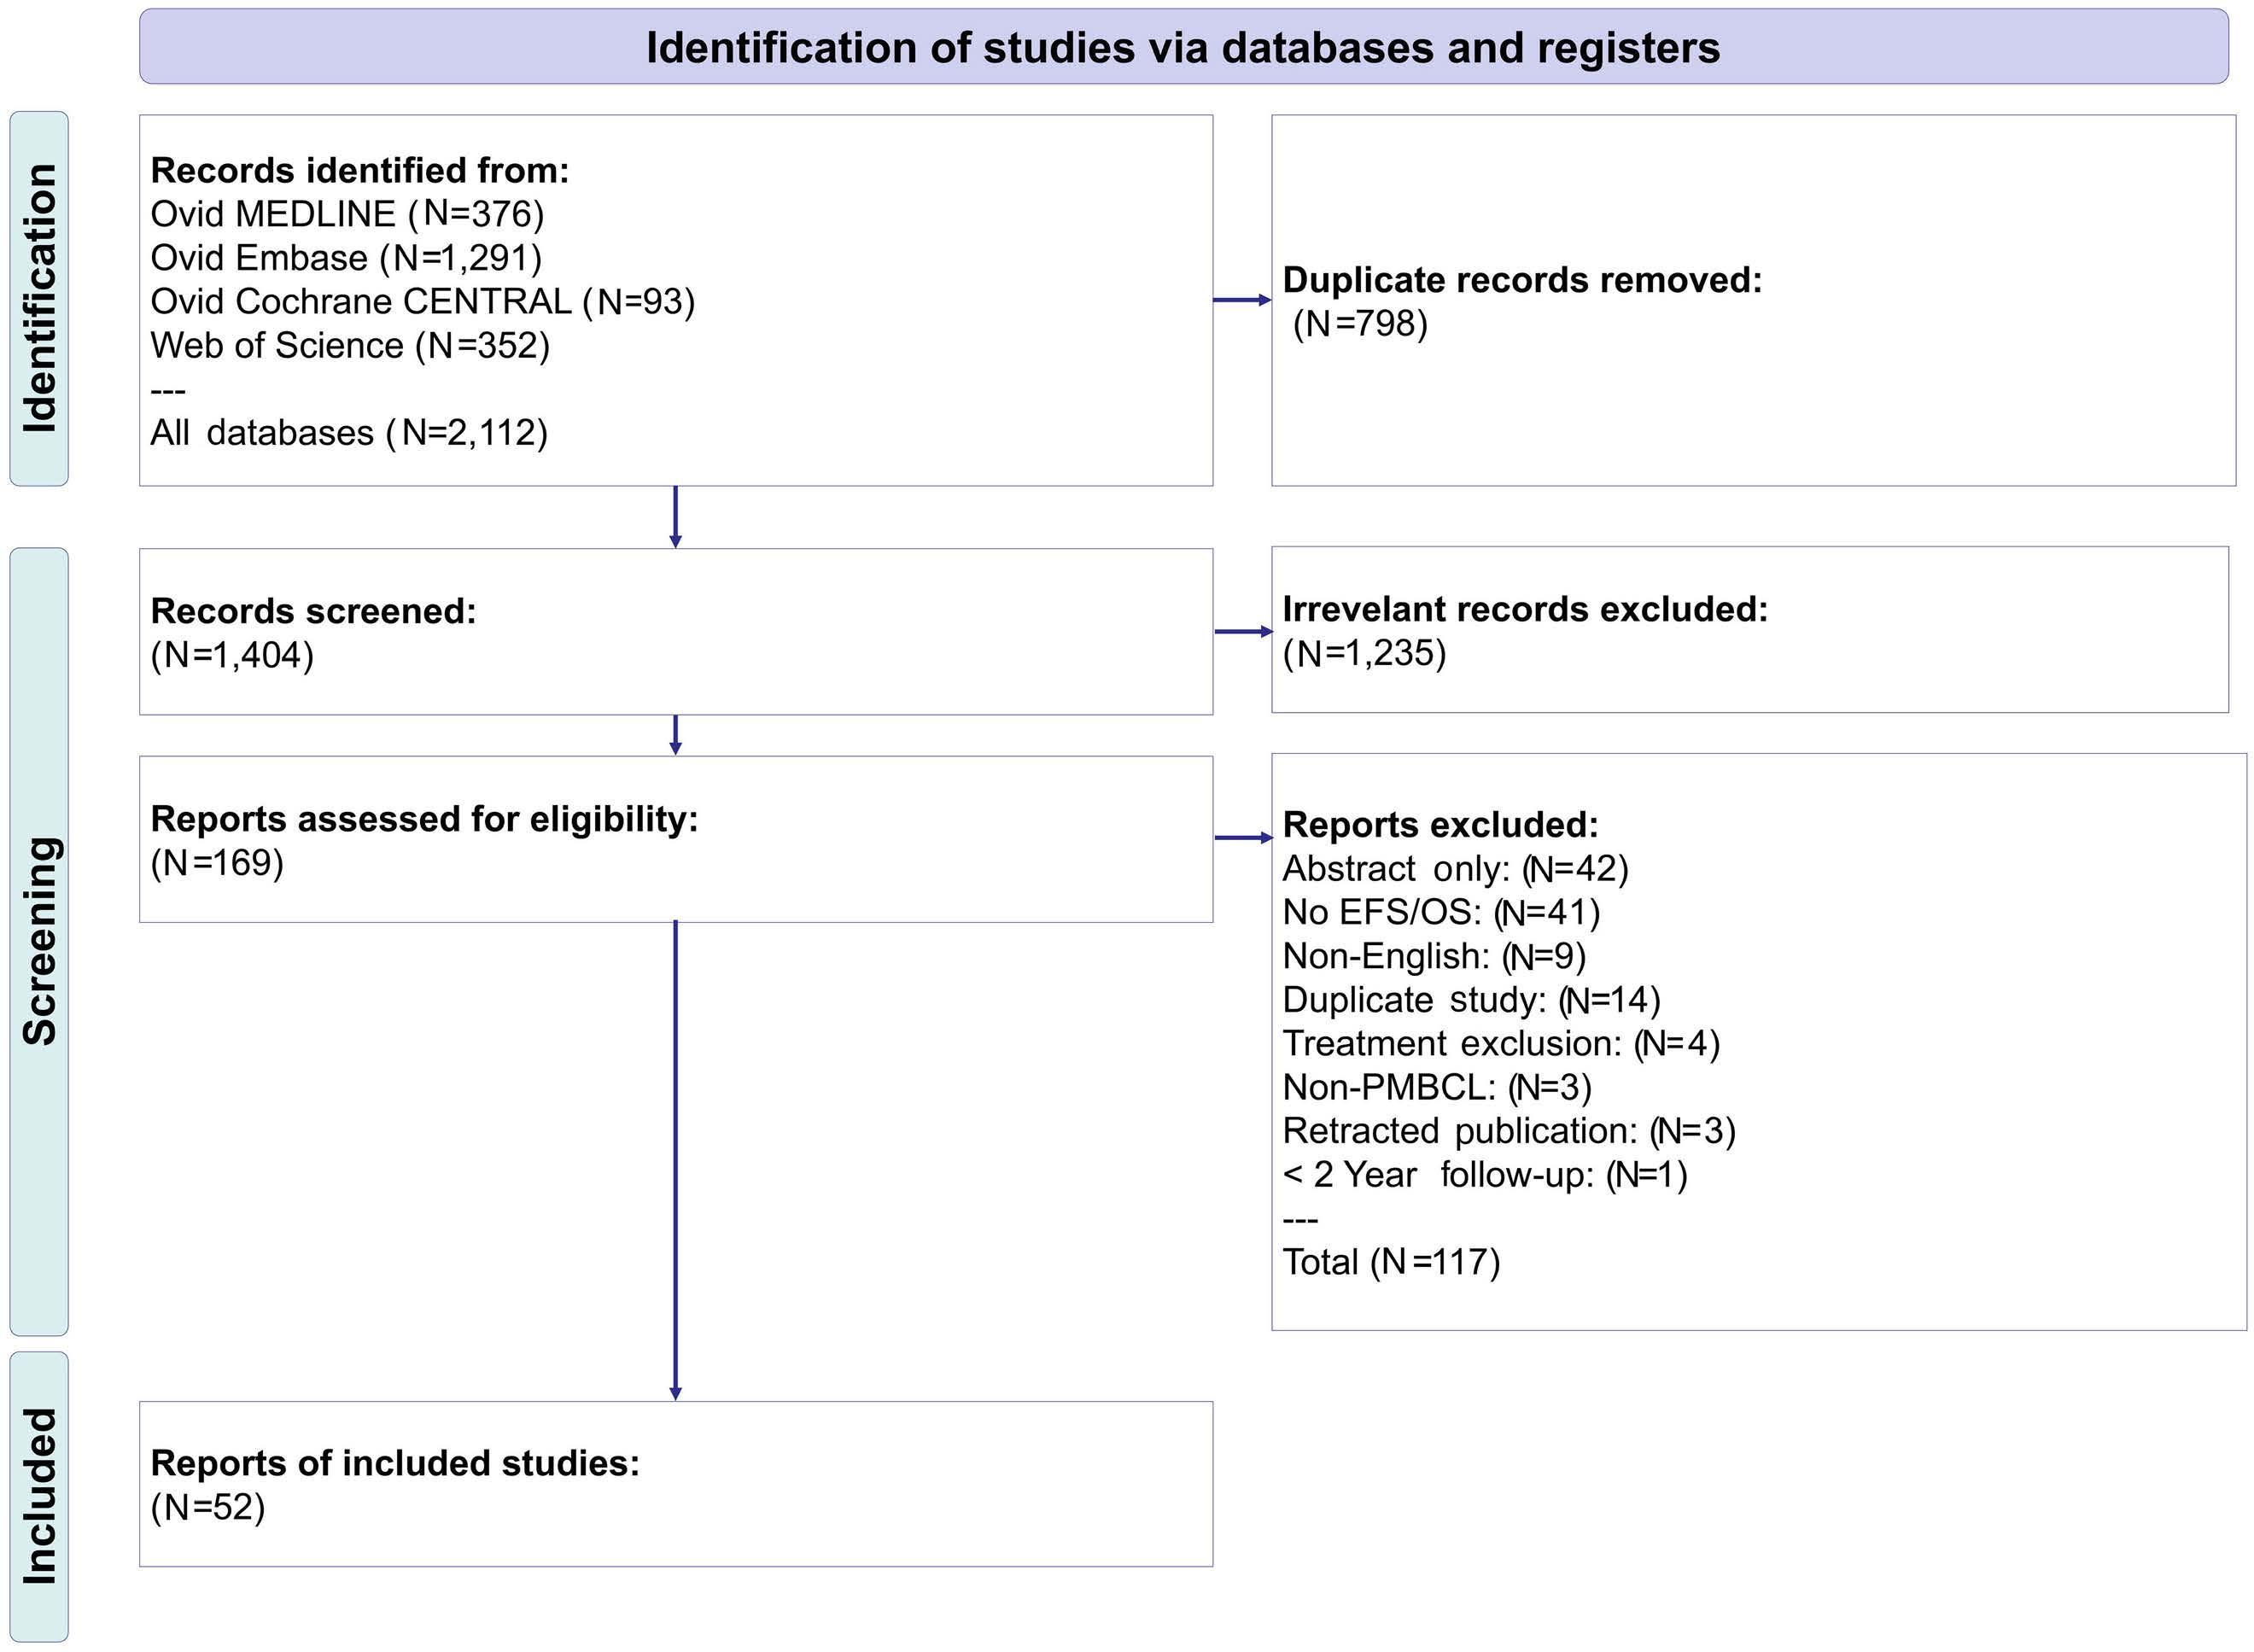
Clinical characteristics for patients that were treated with dose-intensive chemoimmunotherapy (DI-CIT) compared to standard approach chemoimmunotherapy (S-CIT). Clinical characteristics for publications that were not divided by specific CIT regimen and pediatric only studies are reported separately in the Online Supplementary Appendix. *P-value from t test or χ2 test. N: number; LDH: lactate dehydrogenase; ULN: Upper Limit of Normal.
Haematologica | 109 Marzo 2024 848 ARTICLE - Intensive chemotherapy improves survival in PMBCL M. Cook et al.
DI-CIT N (%) S-CIT N (%) P* Median age in years (range), N=1,860 32.8 (9-82) Median age in years (range), N=1,307 33.8 (11-88) <0.01 Female, N=1,838 1,112 (60.5) Female, N=1,251 704 (56.3) 0.02 Stage, N=1,773 I - II III-IV 1,201 (67.7) 572 (32.3) Stage, N=1,244 I - II III-IV 879 (70.7) 365 (29.3) 0.10 B symptoms, N=1,526 628 (41.2) B symptoms, N=1,089 377 (34.6) <0.01 Bulky disease, N=1,832 1,331 (72.7) Bulky disease, N=1,242 779 (62.7) <0.01 LDH > ULN, N=1,441 1,119 (77.7) LDH > ULN, N=1,159 829 (71.5) <0.01 Pleural effusion, N=913 320 (35.0) Pleural effusion, N=270 89 (33.0) 0.58 Pericardial effusion, N=824 224 (27.2) Pericardial effusion, N=245 56 (22.9) 0.20
Figure 1. PRISMA diagram depicting the identification, screening and inclusion/exclusion of studies.
Table 1. Clinical characteristics of dose-intensive versus standard chemoimmunotherapy cohorts.
Chemoimmunotherapy regimens included in both cohorts. DI-CIT: dose-intensive chemoimmunotherapy; S-CIT: standard approach chemoimmunotherapy; a-EPOCH-R: dose-adjusted etoposide, prednisone, vincristine, cyclophosphamide, doxorubicin, rituximab; VACOP-B: etoposide, doxorubicin, cyclophosphamide, vincristine, prednisone, bleomycin; MACOP-B: methotrexate, doxorubicin, cyclophosphamide, vincristine, prednisone, bleomycin; R-CHOP: rituximab, cyclophosphamide, doxorubicin, vincristine, prednisone; R-CHOEP: rituximab, cyclophosphamide, doxorubicin, vincristine, etoposide, prednisone; R-ACVBP: rituximab, doxorubicin, cyclophosphamide, vindesine, bleomycin, prednisone; GMALL: German multicenter ALL protocol; R-ICE: rituximab, ifosfamide, carboplatin, etoposide; HCVAD: hyper-cyclophosphamide, vincristine, doxorubicin, dexamethasone; 2nd/3rd gen. chemo: second-/third generation chemotherapy (MACOP-B, VACOP-B, ProMACE, CytaBOM); IPR: intensive pediatric regimens; auto-SCT: autologous stem cell transplantation.
(n=1,522) received rituximab-containing regimens compared to 70.6% (n=1,095) of the S-CIT cohort.
Median follow up was 56 months for both the DI-CIT and S-CIT cohorts. The test for homogeneity of proportions across DI-CIT and S-CIT studies (Figures 2, 3) was significant (P<0.01), depicting heterogeneity across the studies, thus the random effect model was employed. The lone exception was the analysis of rituximab-DI-CIT, which was found to have no significant heterogeneity (P=0.38), so the fixed effect model was used. Primary outcome data revealed a pooled overall survival of 88% (95% CI: 85-90) for the dose-intensive treatments, compared to 80% (95% CI: 74-85) for the S-CIT group (Table 3, Figure 2). Meta-regression analysis revealed an 8% survival benefit for the DI-CIT group (P<0.01). Key secondary outcome analysis (Table 3, Online Supplementary Figure S1) found a preserved survival advantage for rituximab-DI-CIT (pooled OS 91%, 95% CI: 89-93) compared to R-CHOP-21 (pooled
OS 86%, 95% CI: 82-89). Meta-regression revealed a 4% survival benefit for patients treated with ritximab-DI-CIT (P=0.03). Pooled PFS was 83% (95% CI: 79-86) for the DICIT group, compared to 72% (95% CI: 65-79) for patients treated with S-CIT (Table 3, Online Supplementary Figure S3). Meta-regression predicted a 13% higher proportion of PFS for the DI-CIT group (P<0.01). Finally, consolidative mediastinal radiation (Table 3, Figure 3) was administered to 22% (95% CI: 15-31) of patients treated with dose-intensive regimens, compared to 55% (95% CI: 43-65) of R-CHOP-21/ CHOP-21. Meta-regression analysis reported patients in the DI-CIT arm had a 24% reduced rate of receiving mediastinal radiation (P<0.01).
Investigation of da-EPOCH-R compared to R-CHOP-21 found a pooled OS of 90% (95% CI: 88-93) compared to 86% (95% CI: 82-89) and a PFS of 83% (95% CI: 78-87) and 77% (95% CI: 72-82), respectively (Table 3, Online Supplementary Figures S2, S4). Meta-regression analysis of these endpoints did not show a statistically significant difference when follow-up time was held constant. Consolidative mediastinal radiation was administered to 13% (95% CI: 7-21) of the da-EPOCH-R patients, compared to 57% (95% CI: 43-70) of the R-CHOP-21 arm (Table 3, Online Supplementary Figure S5). Meta-regression estimated a 42% reduction in consolidative RT for patients treated with da-EPOCH-R (P<0.01).
Discussion
Primary mediastinal B-cell lymphoma is a rare, aggressive B-cell lymphoma. While cure rates are high with chemoimmunotherapy, controversy remains regarding the optimal management and in particular the benefit of dose-intensity versus standard R-CHOP-21. Early retrospective studies led by Italian investigators demonstrated improved responses and outcomes with dose intensive approaches such as MACOP-B and VACOP-B when compared to CHOP-21.56 Subsequent single-arm prospective20 and retrospective3,24 experiences reproduced excellent results with a variety of DI-CIT regimens. Despite this, obtaining prospective randomized data has been a challenge due to the rarity of the disease. Identifying the optimal approach is critical given that the disease typically affects the AYA population, and primary refractory or relapsed cases are challenging to cure.61 Another important therapeutic consideration is the use of consolidative mediastinal radiation. This was historically a standard part of front-line treatment for PMBCL and continues to be used with significant frequency, particularly following R-CHOP-21. It is now well established from childhood cohort studies that mediastinal radiation use in the pediatric and AYA population significantly increases risk of secondary tumors62 and cardiac disease.63,64 Specifically, the risk of breast cancer beyond ten years of receiving mediastinal radiation in a similar population
Haematologica | 109 Marzo 2024 849 ARTICLE - Intensive chemotherapy improves survival in PMBCL M. Cook et al.
DI-CIT N=2,517 Rituximab-DI-CIT 1,522 da-EPOCH-R 670 VACOP/MACOP-B +/-R 458 2nd/3rd gen. chemo 375 IPR 329 R-CHOP-14/R-CHOEP-14 199 R-ACVBP 180 Front-line auto-SCT 141 GMALL 78 R-CHOP/R-ICE 49 R-HCVAD 38 S-CIT N=1,551 R-CHOP-21 1,095 CHOP-21 456
Table 2. Characteristics of dose-intensive versus standard approach chemoimmunotherapy.
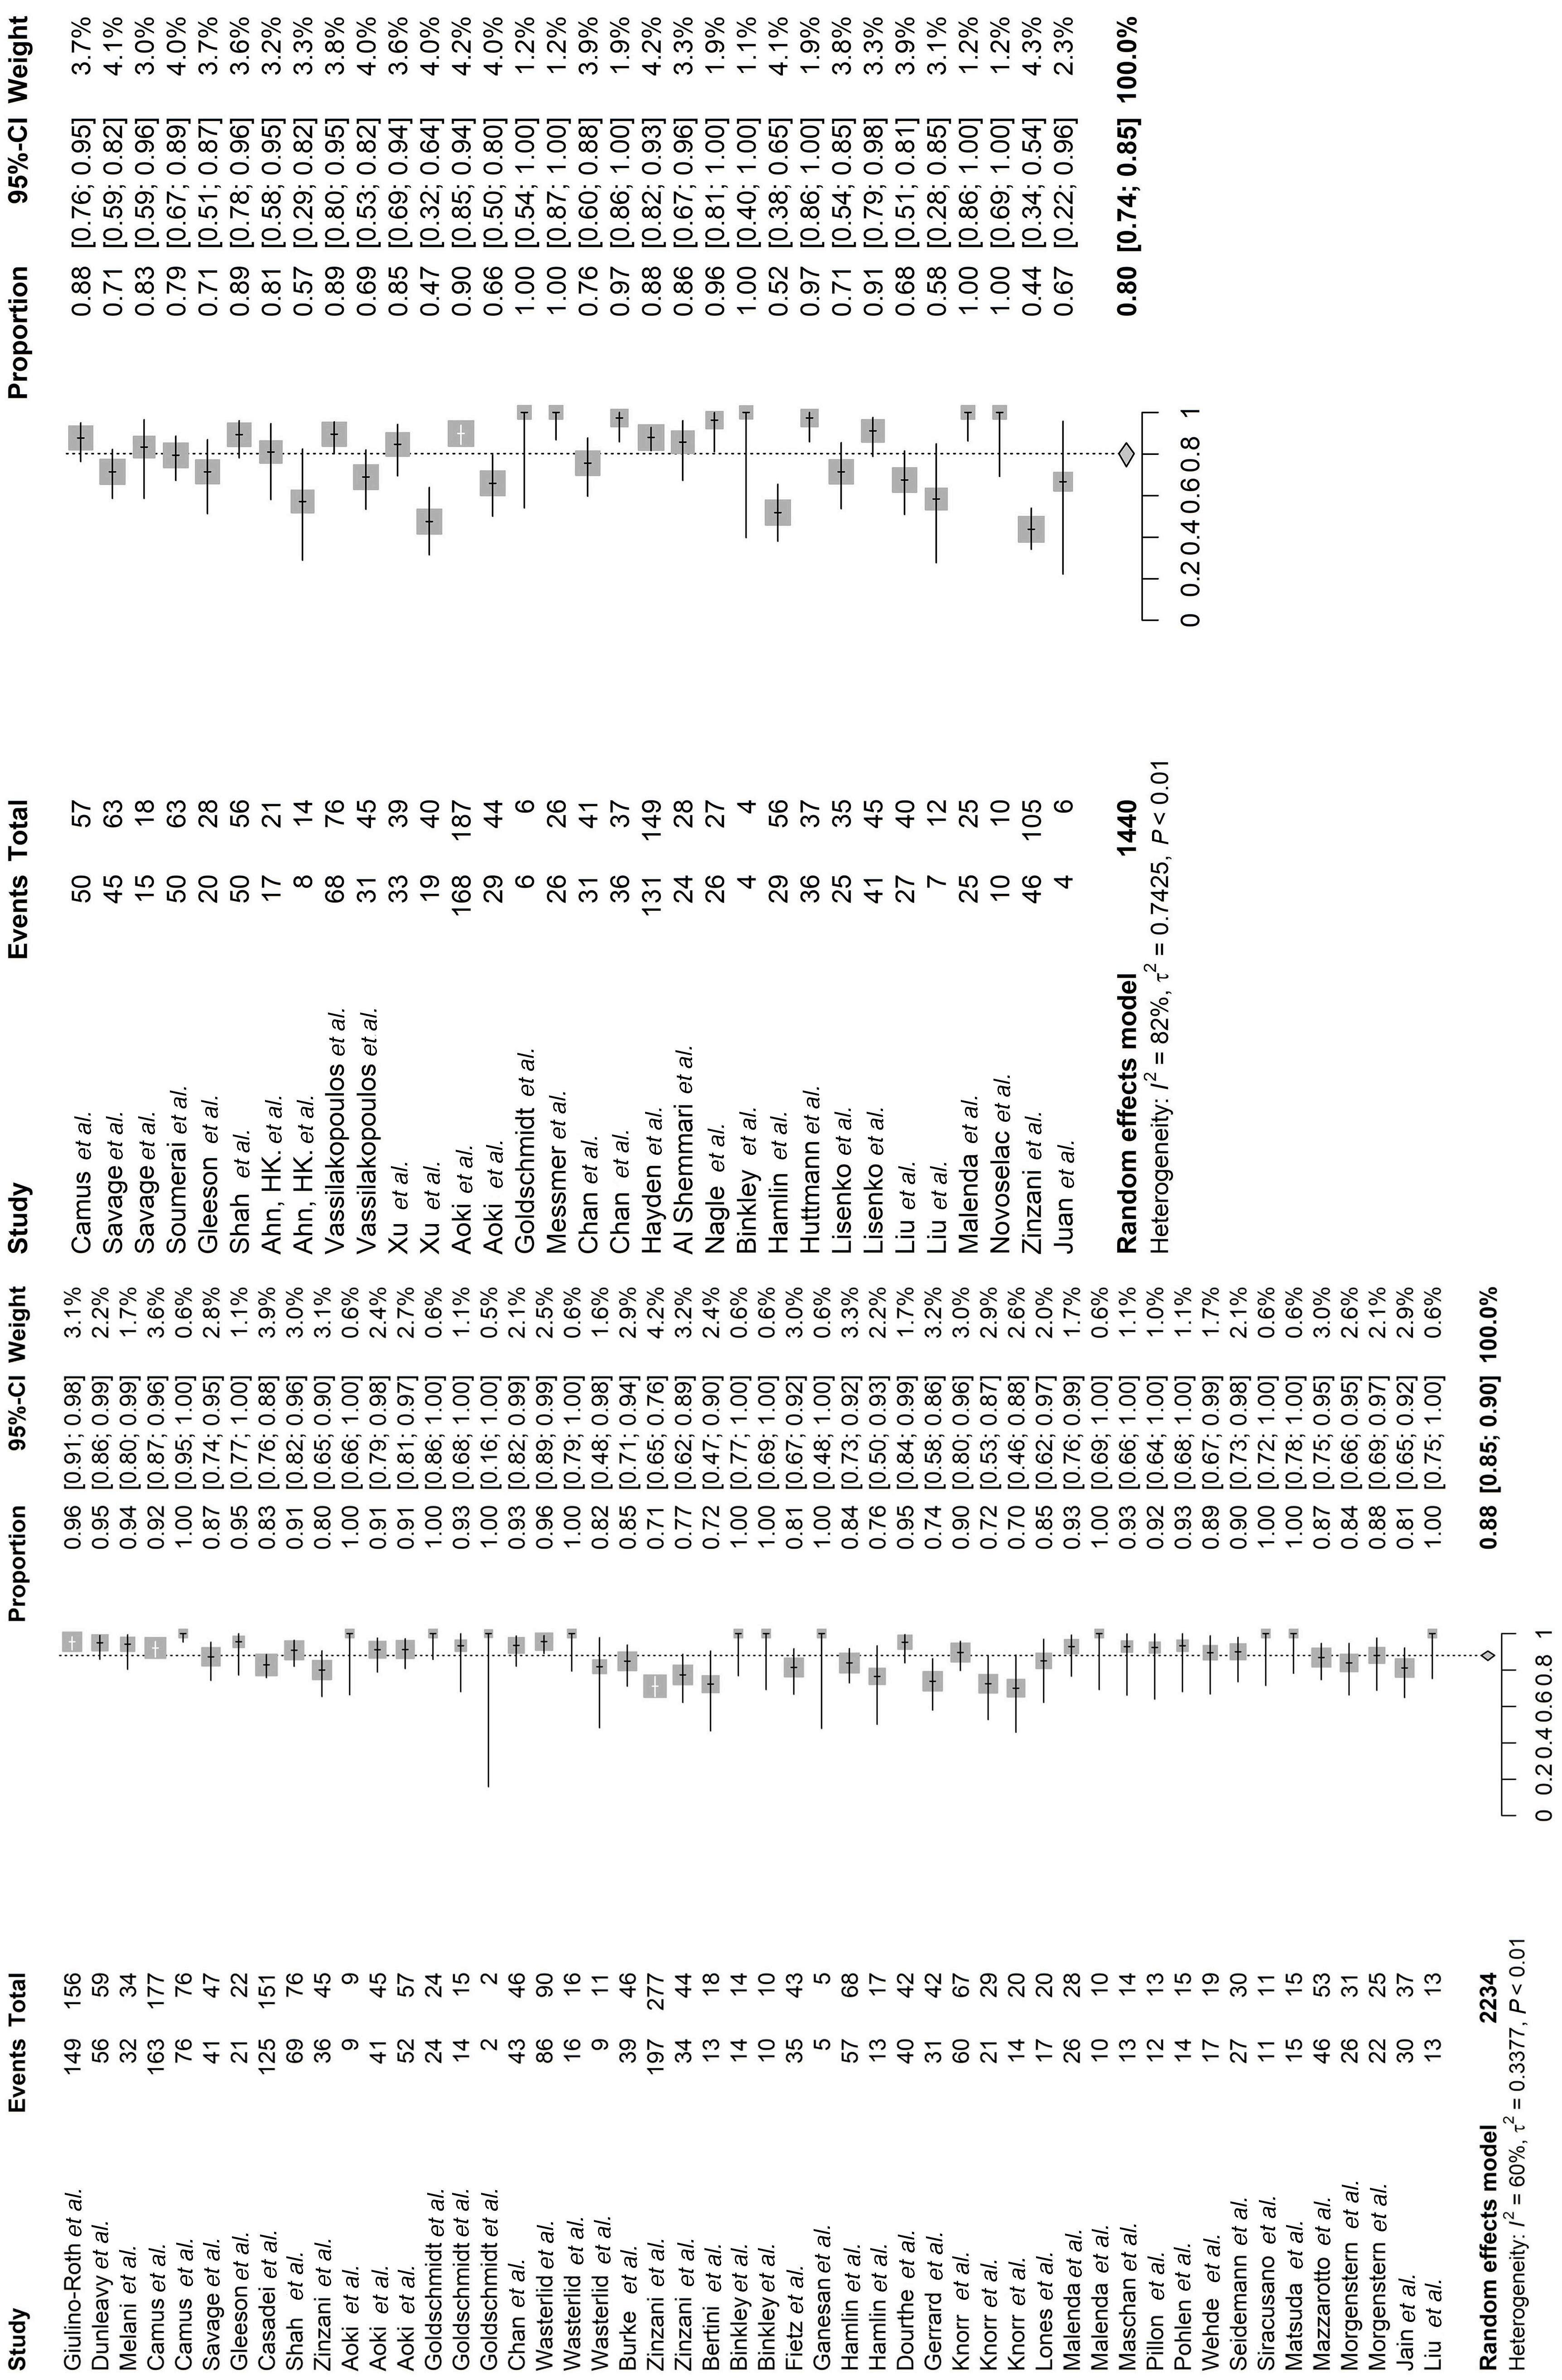
Haematologica | 109 Marzo 2024 850 ARTICLE - Intensive chemotherapy improves survival in PMBCL M. Cook et al.
Figure 2. Forest plot comparing pooled overall survival for dose-intensive chemoimmunotherapy (DI-CIT) (left) and standard approach chemoimmunotherapy (S-CIT) (right) studies. Patient survival is recorded as the event next to total number of patients for each study.
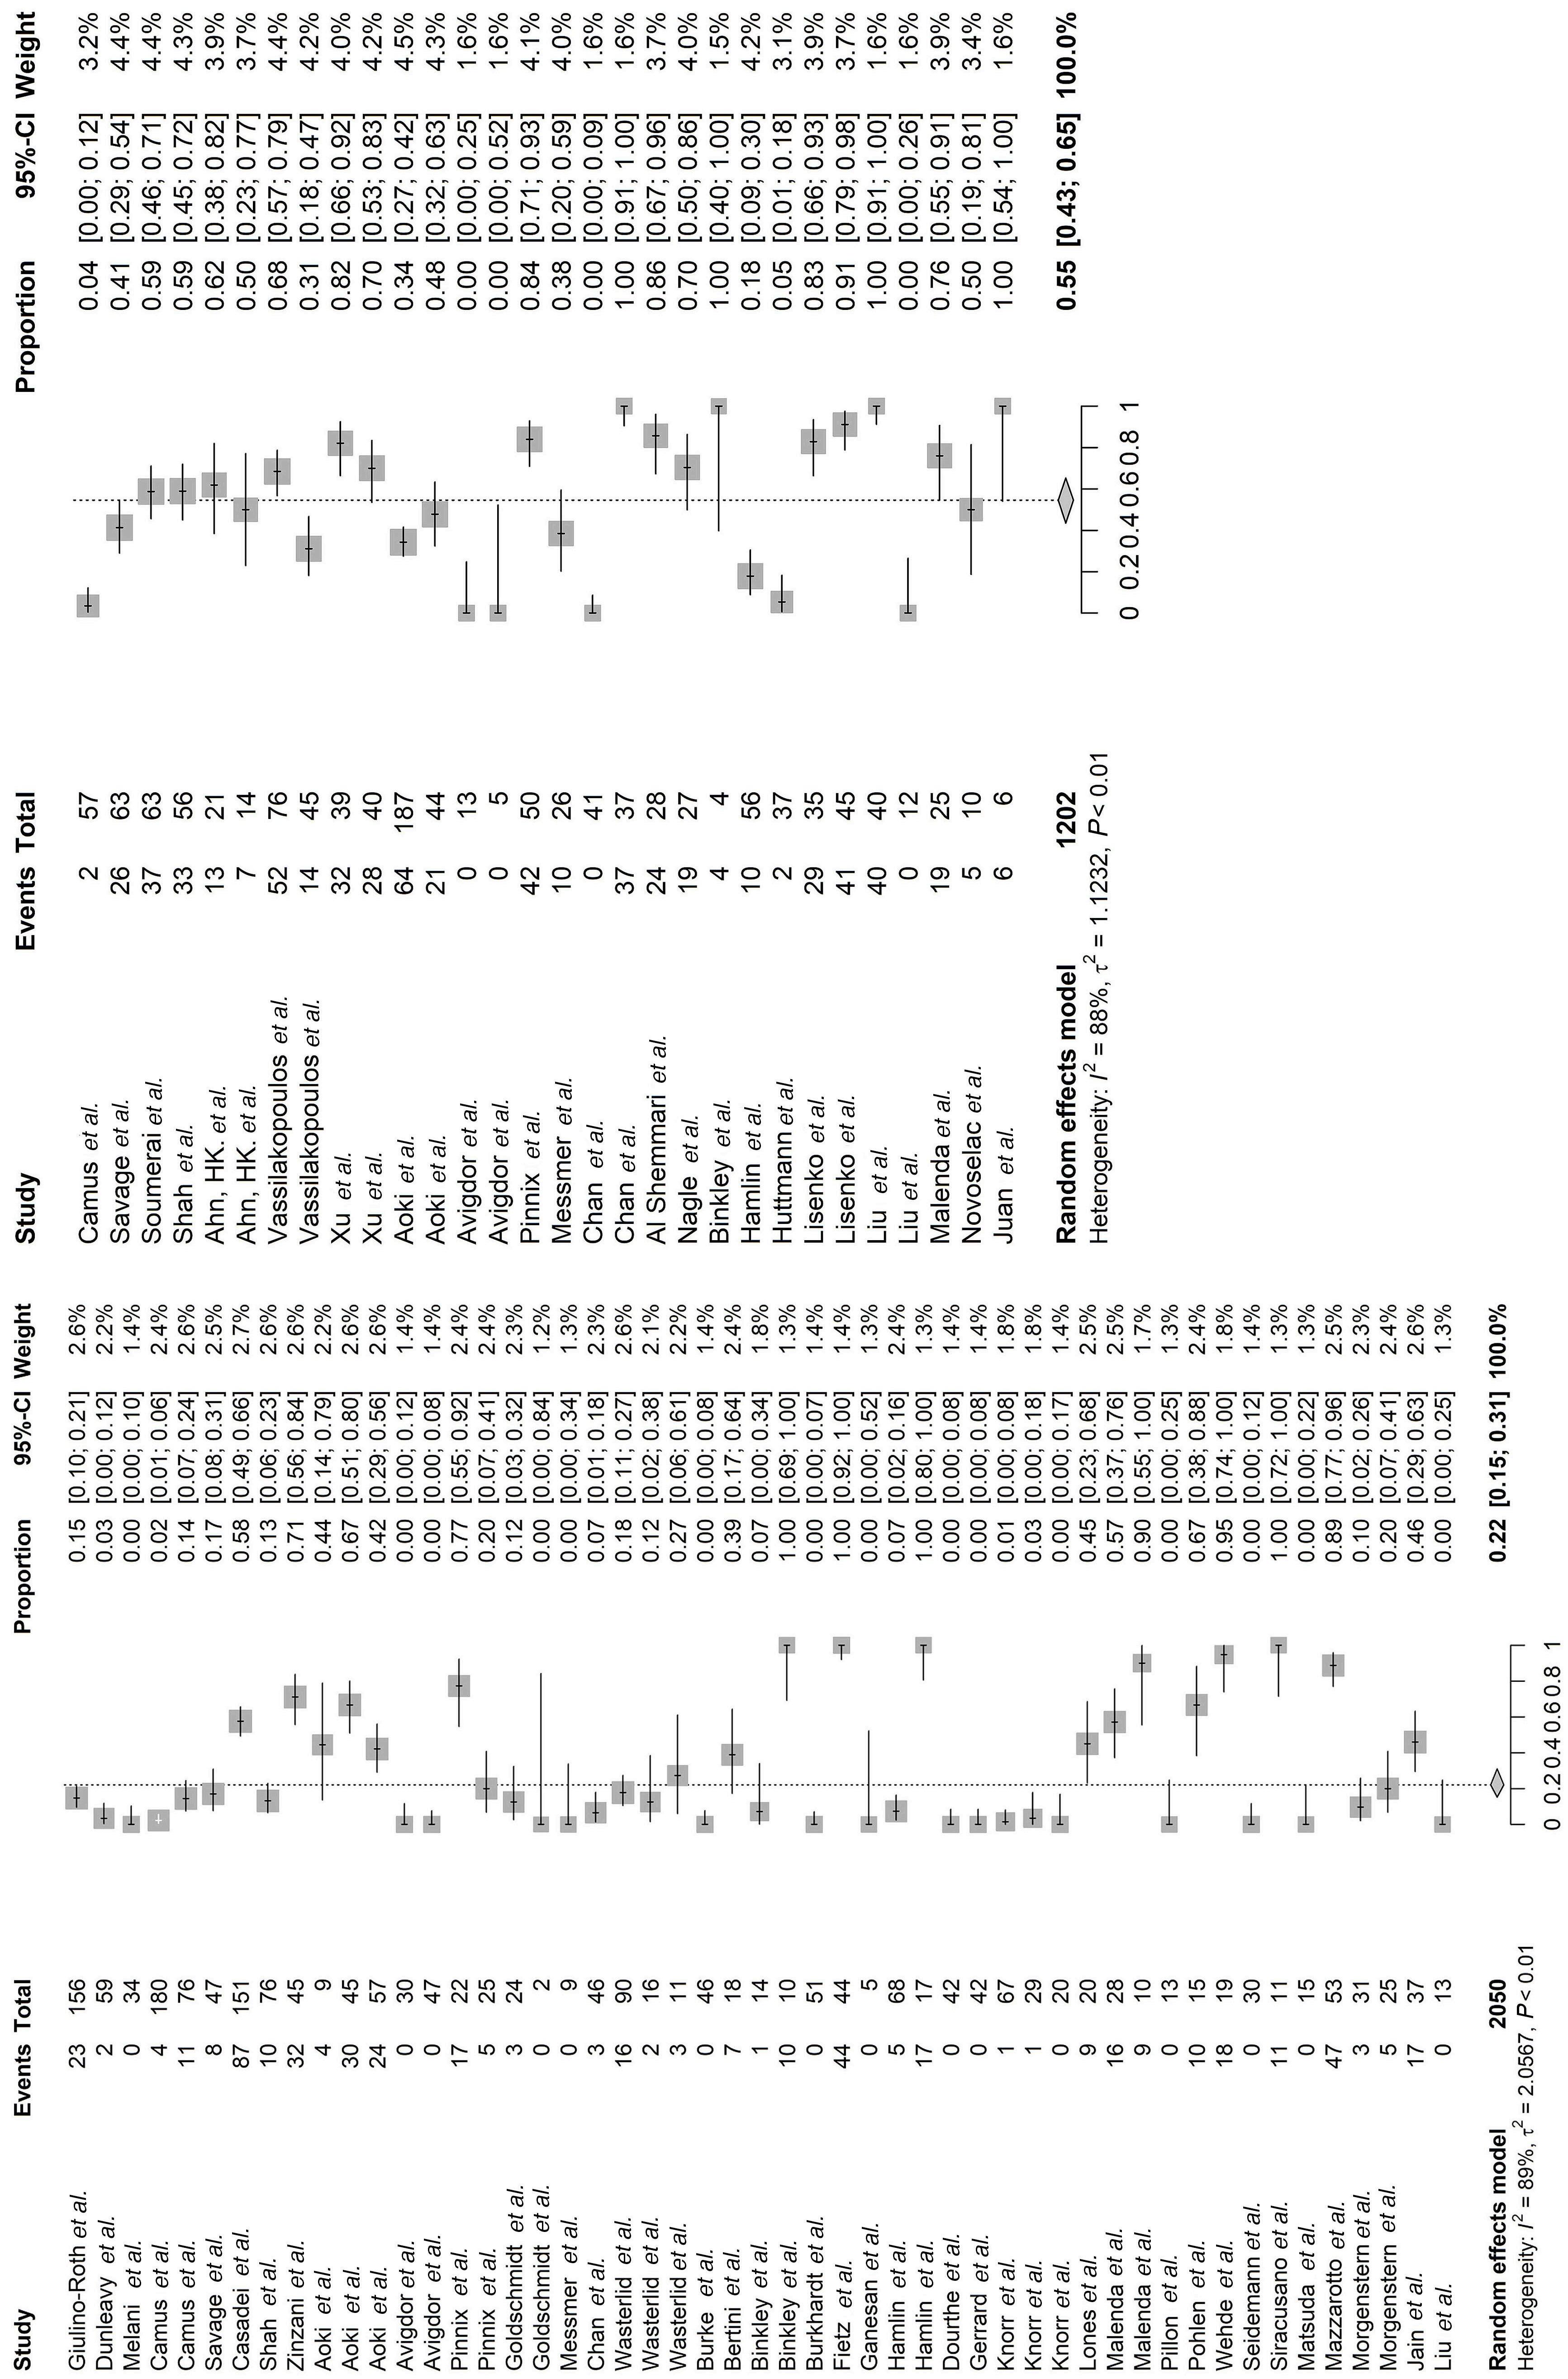
Haematologica | 109 Marzo 2024 851 ARTICLE - Intensive chemotherapy improves survival in PMBCL M. Cook et al.
Figure 3. Forest plot comparing pooled consolidative mediastinal radiation for dose-intensive chemoimmunotherapy (DI-CIT) (left) and standard approach chemoimmunotherapy (S-CIT) (right) studies. Use of radiation is recorded as the event next to the total number of patients for each study.
is notably high, with a reported incidence of 35% among childhood Hodgkin lymphoma survivors.2 Therefore, using strategies that achieve high cure rates and at the same time obviate the need for mediastinal radiation with its associated toxicities is a key priority for advancing PMBCL therapeutics. Consequently, the goal of our systematic review and meta-analysis was to analyze all available published data comparing S-CIT versus DI-CIT to inform on the optimal approach in treating newly diagnosed PMBCL. Survival and progression-free outcomes appear to favor dose-intensive therapy upon analysis of 4,068 patients with newly diagnosed PMBCL. Pooled overall survival was superior for DI-CIT (88% [95% CI: 85-90]) compared to S-CIT (80% [95% CI: 74-85]) with meta-regression demonstrating an 8% OS benefit for the DI-CIT group (P<0.01). Notably, this survival advantage held when comparing rituximab-DI-CIT (91%, 95% CI: 89-93) to R-CHOP-21 (86%, 95% CI: 82-89; P=0.03) hypothesizing that the intensity of the underlying chemotherapy backbone is vital to achieve the best possible treatment outcome in patients with PMBCL. Pooled PFS was also significantly higher for the DI-CIT group (83% vs. 72%; meta-regression 13% PFS benefit, P<0.01). Importantly, there was a much lower rate of reliance on consolidative mediastinal radiation in the DI-CIT arm; only 22% received RT, compared to 55% in the S-CIT arm. We would hypothesize that less radiation exposure will curtail incidence of secondary malignancy and ischemic heart disease; however, this study was unable to statistically answer this important question, as included evidence did not follow patients long enough (median follow-up: 56 months) to reliably analyze chronic toxicity. We also acknowledge that
our study was not designed to assess the differences in toxicity between the two cohorts. DI-CIT has been reported to increase acute toxicity, such as febrile neutropenia, infection, mucositis and peripheral neuropathy compared to R-CHOP-21.3,65 The comparative risk of chronic toxicity such as secondary malignancy or cardiotoxicity of DI-CIT and S-CIT +/- RT remains an important unknown that will require further dedicated investigation.
Secondary outcome analysis found numerically higher OS (90% vs. 86%) and PFS (83% vs. 77%) for patients treated with da-EPOCH-R (n=670) compared to R-CHOP-21 (n=1,095), although these endpoints did not meet statistical significance on meta-regression analysis. Dose-adjusted EPOCH-R allowed for only 13% of patients to require consolidative RT, a 42% reduction (meta-regression P<0.01) when compared to R-CHOP-21 treatment protocols. Despite the lack of statistical survival benefit, the favorable numerical survival and infrequent radiation use would suggest a strong net benefit for da-EPOCH-R compared to R-CHOP-21. These results support the aforementioned retrospective3,24 and single arm prospective20,66 landmark studies of DI-CIT, and highlight the vital concept that dose-intensive treatment is associated with less disease progression and death from PMBCL. Our results also align with recently presented conference abstracts reporting excellent outcomes for DI-CIT in PMBCL.67,68 Additionally, our study highlights that patients treated with S-CIT had less bulky disease (62.7% vs. 72.7%; P<0.01), lower rates of B-symptoms (34.6% vs. 41.2%; P<0.01) and lower median LDH levels (71.5% vs. 77.7%; P<0.01), suggesting a more favorable patient population who nevertheless had inferior outcomes compared to
Consolidative
Primary and secondary outcome data for different treatment cohorts. Meta-regression analysis was performed for each endpoint, compared dose-intensive chemoimmunotherapy (DI-CIT) versus standard approach chemoimmunotherapy (S-CIT), da-EPOCH-R versus R-CHOP21 and rituximab-containing DI-CIT versus S-CIT only. da-EPOCH-R: dose-adjusted etoposide, prednisone, vincristine, cyclophosphamide, doxorubicin, rituximab; R-CHOP: rituximab, cyclophosphamide, doxorubicin, vincristine, prednisone.
Haematologica | 109 Marzo 2024 852 ARTICLE - Intensive chemotherapy improves survival in PMBCL M. Cook et al.
Treatment cohort Overall survival, % (95% CI) Meta-regression P DI-CIT, N=2,234 88 (85-90) < 0.01 S-CIT, N=1,440 80 (74-85) da-EPOCH-R, N=636 90 (88-93) < 0.25 R-CHOP21, N=1,032 86 (82-89) R-DI-CIT, N=1,279 91 (89-93) 0.03 R-S-CIT, N=1,032 86 (82-89) Progression-free survival, % (95% CI) DI-CIT, N=1,501 83 (79-86) < 0.01 S-CIT, N=1,200 72 (65-79) da-EPOCH-R, N=276 83 (78-87) 0.18 R-CHOP21, N=957 77 (72-82)
radiation, % (95% CI) DI-CIT, N=2,050 22 (15-31) <0.01 S-CIT, N=1,202 55 (43-65) da-EPOCH-R, N=670 13 (7-21) <0.01 R-CHOP21, N=894 57 (43-70)
Table 3. Primary and secondary outcomes.
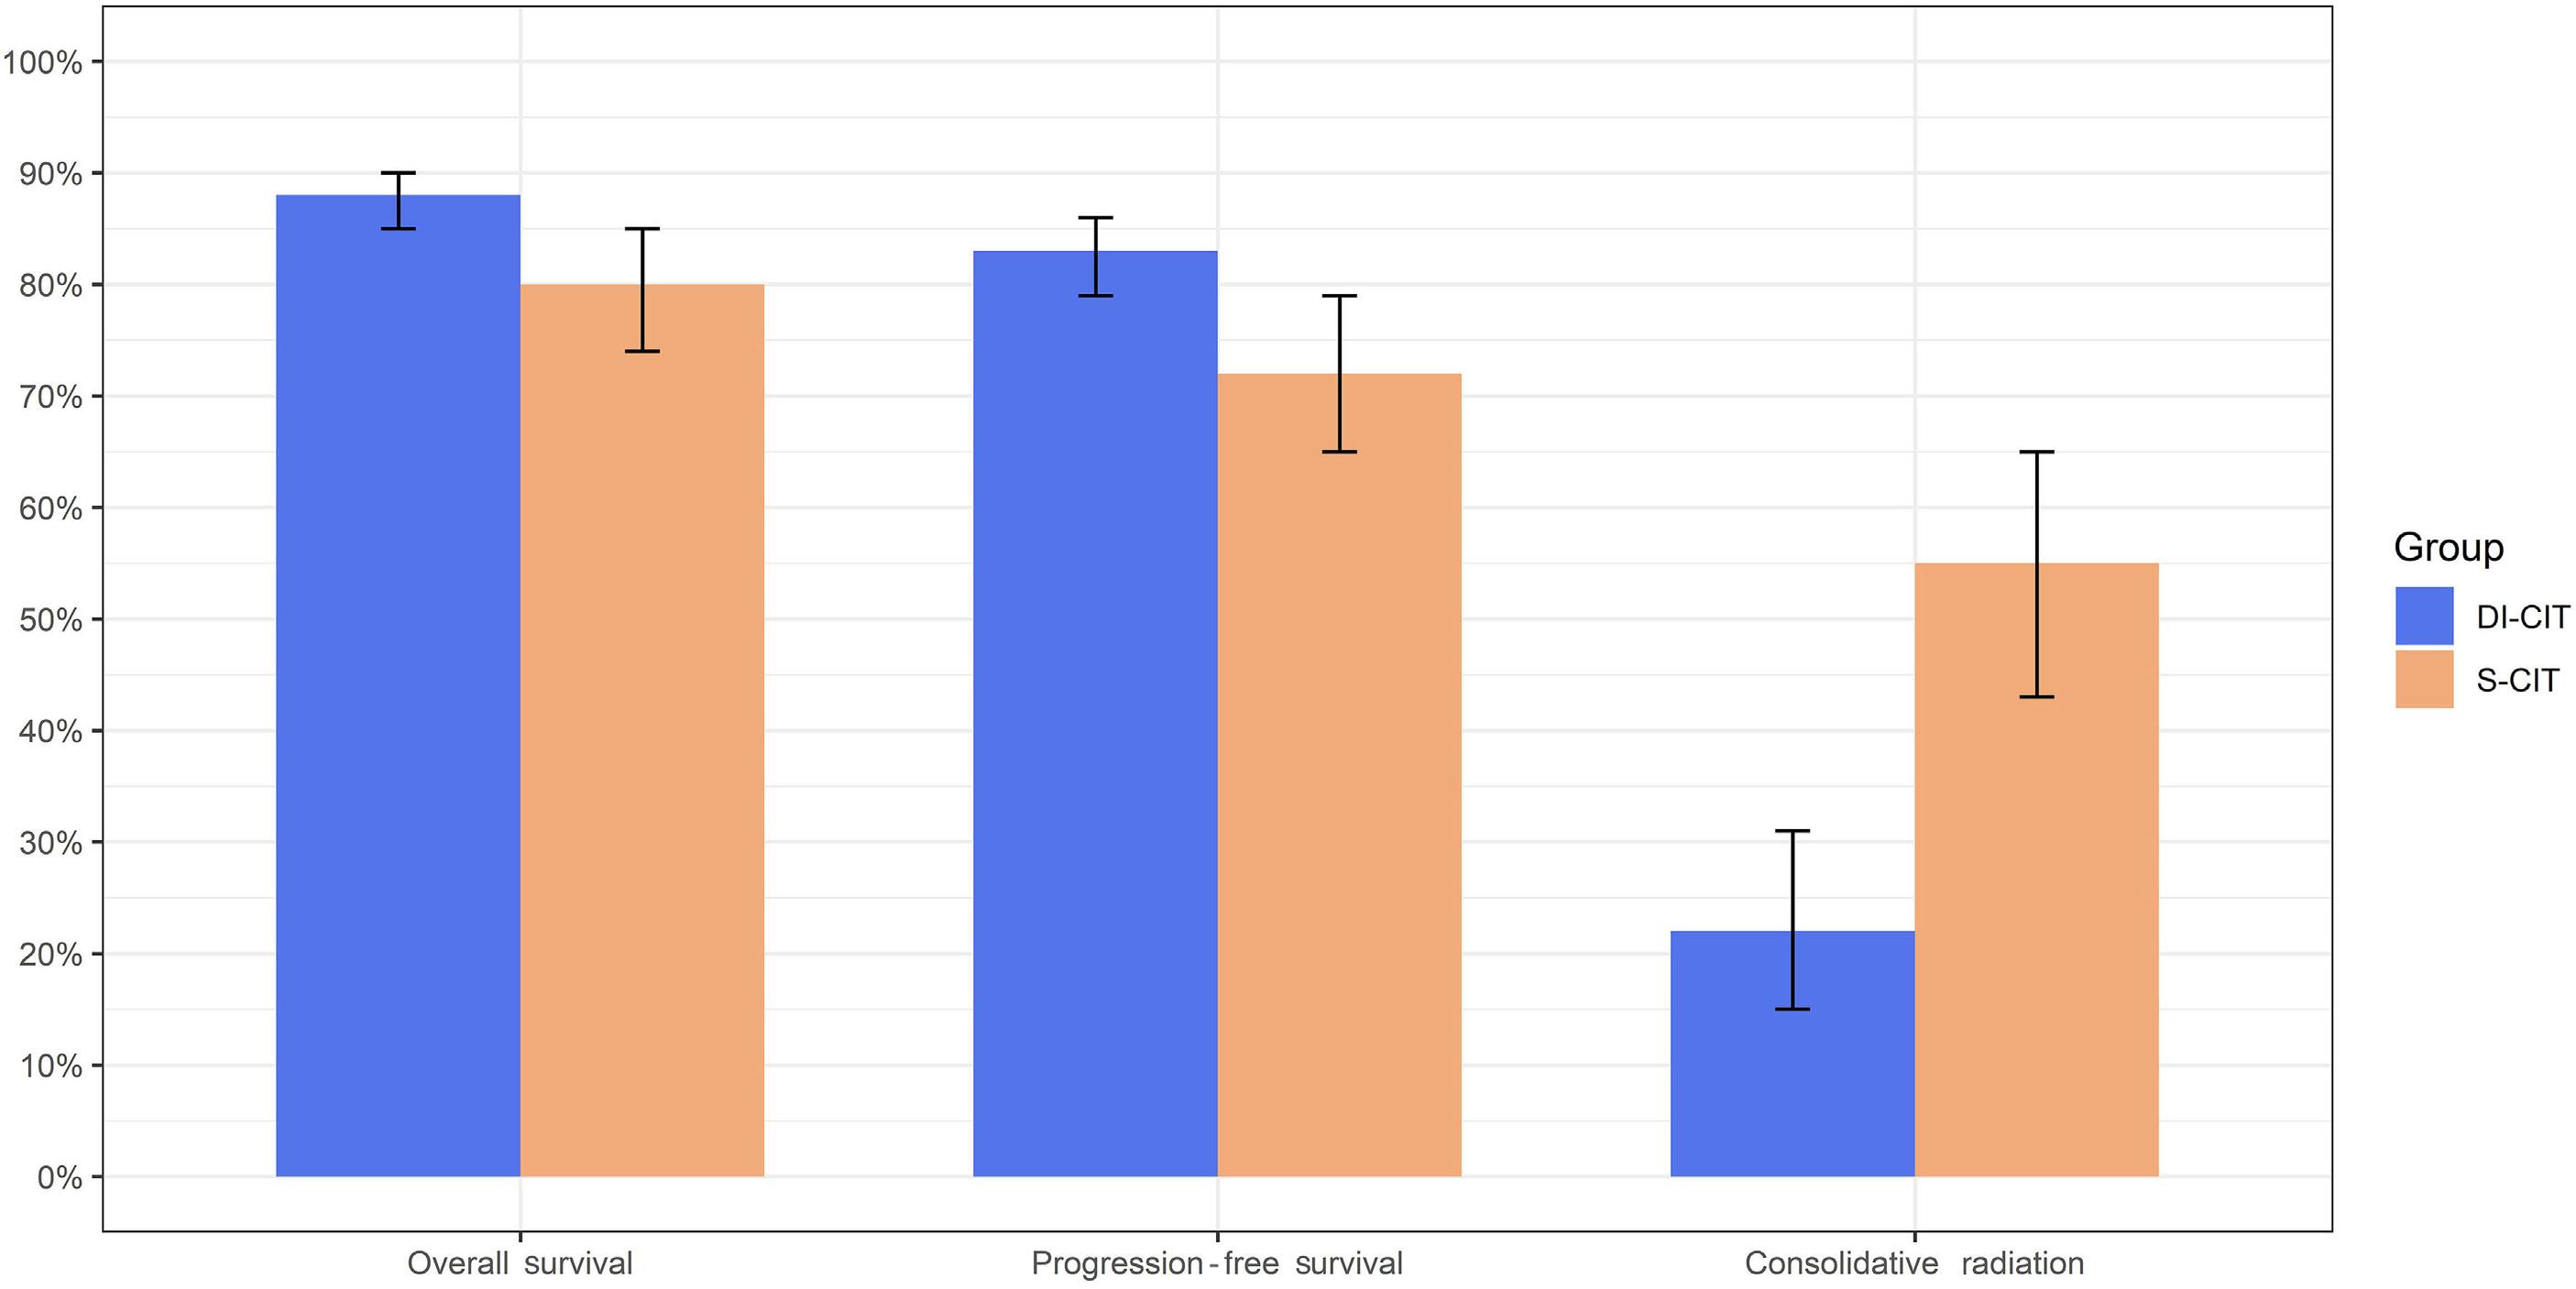
the DI-CIT group. Finally, the standard CIT group received more rituximab containing regimens (70.6% vs. 60.5%), which further strengthens the survival advantage seen in the DI-CIT cohort.
Our study’s principal limitation is that it is a meta-analysis and not a prospective randomized comparative trial, which would be the ideal setting to answer the question of benefit of DI-CIT over S-CIT in PMBCL. Currently, the IELSG-37 trial is prospectively evaluating the role of consolidative radiation in PMBCL and additionally assessing the impact of different induction regimens on outcome in PMBCL. In line with our findings, an early report from IELSG-37, demonstrated inferior outcomes with R-CHOP-21 compared to dose-dense/dose-intensive regimens.69 A more recent update of the trial demonstrated patients in complete remission by FDG-PET imaging at the end of therapy had no difference in OS when randomized to observation versus radiotherapy.70 We look forward to the final published analysis with a focus on survival outcomes stratified by chemoimmunotherapy regimen. Another inherent limitation to meta-analysis is the heterogeneity of the data included, which was highlighted in our study with the Cochran’s Q and I2 statistics. The practical impact of heterogeneity statistics depends on the size and direction of treatment effect.7 Given our large sample size, similar heterogeneity and direction of both treatment outcomes, and large statistically significant survival and radiation benefit for the DI-CIT treatment protocols, we perceive these results to be impactful regardless of the heterogeneity statistic. Available evidence of treatment for PMBCL
is by definition heterogeneous; to develop a sizeable dataset in a rare disease clinicians must collect data across a lengthy timeline, wherein medical advances change standard of care practice. Two concrete examples in PMBCL would be the widespread implementation of rituximab in B-cell lymphomas, as well as the use of PET/CT scans for disease responsiveness. Many of our included datasets report outcomes before and after the application of these tools; excluding these studies would have impacted the size and strength of this analysis. Finally, data used for this analysis are summarized published information, which is less reliable than individual patient’s statistics from each publication dataset.
In conclusion, to our knowledge this study is the largest systematic review and meta-analysis looking to combine the aforementioned published data to evaluate if dose-intensive CIT improves outcomes in PMBCL. As we await prospective randomized data (clinicaltrials.gov identifiers NCT01599559 and NCT04759586) our findings suggest that dose-intensive CIT alone should be the preferred approach in the management of patients with newly diagnosed PMBCL as it is associated with higher survival outcomes and significantly less reliance on mediastinal radiation.
Disclosures
KD served on the advisory board/consulting for AstraZeneca, Beigene, AbbVie, Daiichi Sankyo, ADC Therapeutics, Incyte, Morphosys, Genmab, Cellectar, and has received research funding from Kymera, ONO, Genentech, Merck. MRC, LSW, CSD, YL and KM have no conflicts of interest to disclose.
Haematologica | 109 Marzo 2024 853 ARTICLE - Intensive chemotherapy improves survival in PMBCL M. Cook et al.
Figure 4. Graphical representation of the pooled primary and secondary outcomes for patients treated with dose-intensive chemoimmunotherapy (DI-CIT) compared to standard approach chemoimmunotherapy (S-CIT).
Contributions
MRC and KD designed the study concept and methodology. CSD carried out the systematic review using pre-specified keywords and template publications (supplied by MRC and KD) to be included in the analysis. MRC and LSW reviewed the systematic literature search, applying inclusion/exclusion criteria, and extracting data from included publications. YL and KM performed all the statistical analysis. All authors contributed to writing the manuscript and/or editing.
Acknowledgments
We would like to acknowledge and thank all of the patients and investigators who contributed to the data that were used for this meta-analysis.
References
1. Alaggio R, Amador C, Anagnostopoulos I, et al. The 5th edition of the World Health Organization Classification of Haematolymphoid Tumours: Lymphoid Neoplasms. Leukemia. 2022;36(7):1720-1748.
2. Moskowitz CS, Chou JF, Wolden SL, et al. Breast cancer after chest radiation therapy for childhood cancer. J Clin Oncol. 2014;32(21):2217-2223.
3. Camus V, Rossi C, Sesques P, et al. Outcomes after first-line immunochemotherapy for primary mediastinal B-cell lymphoma: a LYSA study. Blood Adv. 2021;5(19):3862-3872.
4. von Tresckow B, Plütschow A, Fuchs M, et al. Doseintensification in early unfavorable Hodgkin’s lymphoma: final analysis of the German Hodgkin Study Group HD14 trial. J Clin Oncol. 2012;30(9):907-913.
5. Cook MR, Dunleavy K. Optimizing outcomes in primary mediastinal B-cell lymphoma: is R-CHOP enough? Blood Adv. 2021;5(19):3873-3875.
6. Page MJ, McKenzie JE, Bossuyt PM, et al. The PRISMA 2020 statement: an updated guideline for reporting systematic reviews. BMJ. 2021;372:n71.
7 Higgins JP, Thompson SG, Deeks JJ, Altman DG. Measuring inconsistency in meta-analyses. BMJ. 2003;327(7414):557-560.
8. DerSimonian R, Laird N. Meta-analysis in clinical trials. Control Clin Trials. 1986;7(3):177-188.
9 Foundation TR. R: a language and environment for statistical computing. Vienna, Austria: R Foundation for Statistical Computing. https://www.r-project.org/ Accessed September 28, 2014.
10 Ahn HK, Kim SJ, Yun J, et al. Improved treatment outcome of primary mediastinal large B-cell lymphoma after introduction of rituximab in Korean patients. Int J Hematol. 2010;91(3):456-463.
11. Aoki T, Izutsu K, Suzuki R, et al. Prognostic significance of pleural or pericardial effusion and the implication of optimal treatment in primary mediastinal large B-cell lymphoma: a multicenter retrospective study in Japan. Haematologica. 2014;99(12):1817-1825.
12. Avigdor A, Sirotkin T, Kedmi M, et al. The impact of R-VACOP-B and interim FDG-PET/CT on outcome in primary mediastinal large B cell lymphoma. Ann Hematol. 2014;93(8):1297-1304.
13. Bertini M, Orsucci L, Vitolo U, et al. Stage II large B-cell lymphoma with sclerosis treated with MACOP-B. Ann Oncol. 1991;2(10):733-737.
Funding
We did not receive any support from individuals not listed as authors, organizations, grants, corporations and/or any other outside source for this project or the creation of this manuscript. This research received no specific grant or financial support from any funding agency in the public, commercial or not-for-profit sectors.
Data-sharing statement
For original data, please refer to the references that were included within the meta-analysis. For our extracted conglomerate datasets please contact Michael.Cook@pennmedicine.upenn.edu
14. Burke GAA, Minard-Colin V, Aupérin A, et al. Dose-adjusted etoposide, doxorubicin, and cyclophosphamide with vincristine and prednisone plus rituximab therapy in children and adolescents with primary mediastinal B-cell lymphoma: a multicenter phase II trial. J Clin Oncol. 2021;39(33):3716-3724.
15. Burkhardt B, Oschlies I, Klapper W, et al. Non-Hodgkin’s lymphoma in adolescents: experiences in 378 adolescent NHL patients treated according to pediatric NHL-BFM protocols. Leukemia. 2011;25(1):153-160.
16. Casadei B, Argnani L, Morigi A, et al. Treatment and outcomes of primary mediastinal B cell lymphoma: a three-decade monocentric experience with 151 patients. Ann Hematol. 2021;100(9):2261-2268.
17. Chan EHL, Koh LP, Lee J, et al. Real world experience of R-CHOP with or without consolidative radiotherapy vs DAEPOCH-R in the first-line treatment of primary mediastinal B-cell lymphoma. Cancer Med. 2019;8(10):4626-4632.
18. Al Shemmari S, Sankaranarayanan SP, Krishnan Y. Primary mediastinal large B-cell lymphoma: clinical features, prognostic factors and survival with RCHOP in Arab patients in the PET scan era. Lung India. 2014;31(3):228-231.
19 Dourthe ME, Phulpin A, Auperin A, et al. Rituximab in addition to LMB-based chemotherapy regimen in children and adolescents with primary mediastinal large B-cell lymphoma: results of the French LMB2001 prospective study. Haematologica. 2022;107(9):2173-2182.
20 Dunleavy K, Pittaluga S, Maeda LS, et al. Dose-adjusted EPOCHrituximab therapy in primary mediastinal B-cell lymphoma. N Engl J Med. 2013;368(15):1408-1416.
21. Fietz T, Knauf WU, Hänel M, et al. Treatment of primary mediastinal large B cell lymphoma with an alternating chemotherapy regimen based on high-dose methotrexate. Ann Hematol. 2009;88(5):433-439.
22. Ganesan P, Ganesan TS, Atreya H, et al. DA-EPOCH-R in aggressive CD 20 positive B cell lymphomas: real-world experience. Indian J Hematol Blood Transfus. 2018;34(3):454-459.
23. Gerrard M, Waxman IM, Sposto R, et al. Outcome and pathologic classification of children and adolescents with mediastinal large B-cell lymphoma treated with FAB/LMB96 mature B-NHL therapy. Blood. 2013;121(2):278-285.
24. Giulino-Roth L, O’Donohue T, Chen Z, et al. Outcomes of adults
Haematologica | 109 Marzo 2024 854 ARTICLE - Intensive chemotherapy improves survival in PMBCL M. Cook et al.
and children with primary mediastinal B-cell lymphoma treated with dose-adjusted EPOCH-R. Br J Haematol. 2017;179(5):739-747.
25. Gleeson M, Hawkes EA, Cunningham D, et al. Rituximab, cyclophosphamide, doxorubicin, vincristine and prednisolone (R-CHOP) in the management of primary mediastinal B-cell lymphoma: a subgroup analysis of the UK NCRI R-CHOP 14 versus 21 trial. Br J Haematol. 2016;175(4):668-672.
26. Goldschmidt N, Kleinstern G, Orevi M, et al. Favorable outcome of primary mediastinal large B-cell lymphoma patients treated with sequential RCHOP-RICE regimen without radiotherapy. Cancer Chemother Pharmacol. 2016;77(5):1053-1060.
27. Hayden AR, Tonseth P, Lee DG, et al. Outcome of primary mediastinal large B-cell lymphoma using R-CHOP: impact of a PET-adapted approach. Blood. 2020;136(24):2803-2811.
28. Hüttmann A, Rekowski J, Müller SP, et al. Six versus eight doses of rituximab in patients with aggressive B cell lymphoma receiving six cycles of CHOP: results from the “Positron Emission Tomography-Guided Therapy of Aggressive NonHodgkin Lymphomas” (PETAL) trial. Ann Hematol. 2019;98(4):897-907.
29 Jain H, Kapoor A, Sengar M, et al. Outcomes of patients with primary mediastinal B-cell lymphoma treated with dose adjusted R-EPOCH regimen: a single centre experience. Indian J Hematol Blood Transfus. 2021;37(3):379-385.
30 Knörr F, Zimmermann M, Attarbaschi A, et al. Dose-adjusted EPOCH-rituximab or intensified B-NHL therapy for pediatric primary mediastinal large B-cell lymphoma. Haematologica. 2021;106(12):3232-3235.
31. Lisenko K, Dingeldein G, Cremer M, et al. Addition of rituximab to CHOP-like chemotherapy in first line treatment of primary mediastinal B-cell lymphoma. BMC Cancer. 2017;17(1):359.
32. Liu X, Deng T, Guo X, et al. A retrospective analysis of outcomes for primary mediastinal large B-cell lymphoma treated with RCHOP followed by radiotherapy or front-line autologous stem cell transplantation. Hematology. 2017;22(5):258-264.
33. Lones MA, Perkins SL, Sposto R, et al. Large-cell lymphoma arising in the mediastinum in children and adolescents is associated with an excellent outcome: a Children’s Cancer Group report. J Clin Oncol. 2000;18(22):3845-3853.
34 Malenda A, Kołkowska-Leśniak A, Puła B, et al. Outcomes of treatment with dose-adjusted EPOCH-R or R-CHOP in primary mediastinal large B-cell lymphoma. Eur J Haematol. 2020;104(1):59-66.
35. Maschan A, Myakova N, Aleinikova O, et al. Rituximab and reduced-intensity chemotherapy in children and adolescents with mature B-cell lymphoma: interim results for 231 patients enrolled in the second Russian-Belorussian multicentre study B-NHL-2010M. Br J Haematol. 2019;186(3):477-483.
36. Matsuda S, Suzuki R, Takahashi T, et al. Dose-adjusted EPOCH with or without rituximab for aggressive lymphoma patients: real world data. Int J Hematol. 2020;112(6):807-816.
37. Mazzarotto R, Boso C, Vianello F, et al. Primary mediastinal large B-cell lymphoma: results of intensive chemotherapy regimens (MACOP-B/VACOP-B) plus involved field radiotherapy on 53 patients. A single institution experience. Int J Radiat Oncol Biol Phys. 2007;68(3):823-829.
38. Melani C, Advani R, Roschewski M, et al. End-of-treatment and serial PET imaging in primary mediastinal B-cell lymphoma following dose-adjusted EPOCH-R: a paradigm shift in clinical decision making. Haematologica. 2018;103(8):1337-1344.
39. Messmer M, Tsai HL, Varadhan R, et al. R-CHOP without radiation in frontline management of primary mediastinal B-cell
lymphoma. Leuk Lymphoma. 2019;60(5):1261-1265.
40 Morgenstern Y, Aumann S, Goldschmidt N, et al. Dose-adjusted EPOCH-R is not superior to sequential R-CHOP/R-ICE as a frontline treatment for newly diagnosed primary mediastinal B-cell lymphoma: results of a bi-center retrospective study. Cancer Med. 2021;10(24):8866-8875.
41. Nagle SJ, Chong EA, Chekol S, et al. The role of FDG-PET imaging as a prognostic marker of outcome in primary mediastinal B-cell lymphoma. Cancer Med. 2015;4(1):7-15.
42. Novoselac AV, Kunamneni RK, McMasters M, Radevic MR, Levine RL. Primary mediastinal large B-cell lymphoma: a retrospective analysis of rituximab and CHOP chemotherapy. Community Oncol. 2007;11(4):673-677.
43. Pillon M, Carraro E, Mussolin L, et al. Primary mediastinal large B-cell lymphoma: outcome of a series of pediatric patients treated with high-dose methotrexate and cytarabine plus anti-CD20. Pediatr Blood Cancer. 2018;65(2).
44. Pinnix CC, Dabaja B, Ahmed MA, et al. Single-institution experience in the treatment of primary mediastinal B cell lymphoma treated with immunochemotherapy in the setting of response assessment by 18fluorodeoxyglucose positron emission tomography. Int J Radiat Oncol Biol Phys. 2015;92(1):113-121.
45. Pohlen M, Gerth HU, Liersch R, et al. Efficacy and toxicity of a rituximab and methotrexate based regimen (GMALL B-ALL/NHL 2002 protocol) in Burkitt’s and primary mediastinal large B-cell lymphoma. Am J Hematol. 2011;86(12):E61-64.
46. Savage KJ, Al-Rajhi N, Voss N, et al. Favorable outcome of primary mediastinal large B-cell lymphoma in a single institution: the British Columbia experience. Ann Oncol. 2006;17(1):123-130.
47. Seidemann K, Tiemann M, Lauterbach I, et al. Primary mediastinal large B-cell lymphoma with sclerosis in pediatric and adolescent patients: treatment and results from three therapeutic studies of the Berlin-Frankfurt-Münster Group. J Clin Oncol. 2003;21(9):1782-1789.
48. Shah NN, Szabo A, Huntington SF, et al. R-CHOP versus doseadjusted R-EPOCH in frontline management of primary mediastinal B-cell lymphoma: a multi-centre analysis. Br J Haematol. 2018;180(4):534-544.
49 Siracusano L, Balzarotti M, Magagnoli M, et al. Primary mediastinal B-cell lymphoma with sclerosis: report of 11 cases treated with intensified-CHOP plus radiotherapy. Am J Hematol. 2005;78(4):312-313.
50 Soumerai JD, Hellmann MD, Feng Y, et al. Treatment of primary mediastinal B-cell lymphoma with rituximab, cyclophosphamide, doxorubicin, vincristine and prednisone is associated with a high rate of primary refractory disease. Leuk Lymphoma. 2014;55(3):538-543.
51. Todeschini G, Secchi S, Morra E, et al. Primary mediastinal large B-cell lymphoma (PMLBCL): long-term results from a retrospective multicentre Italian experience in 138 patients treated with CHOP or MACOP-B/VACOP-B. Br J Cancer. 2004;90(2):372-376.
52. Vassilakopoulos TP, Pangalis GA, Katsigiannis A, et al. Rituximab, cyclophosphamide, doxorubicin, vincristine, and prednisone with or without radiotherapy in primary mediastinal large B-cell lymphoma: the emerging standard of care. Oncologist. 2012;17(2):239-249.
53. Wästerlid T, Hasselblom S, Joelsson J, et al. Real-world data on treatment and outcomes of patients with primary mediastinal large B-cell lymphoma: a Swedish lymphoma register study. Blood Cancer J. 2021;11(5):100.
Haematologica | 109 Marzo 2024 855 ARTICLE - Intensive chemotherapy improves survival in PMBCL M. Cook et al.
54 Wehde N, Borte G, Liebmann A, et al. Primary mediastinal large B cell lymphoma: frontline treatment with an alternating chemotherapy regimen based on high dose methotrexate-a single institution experience. JAMA. 2017;31(1):8.
55. Xu LM, Fang H, Wang WH, et al. Prognostic significance of rituximab and radiotherapy for patients with primary mediastinal large B-cell lymphoma receiving doxorubicincontaining chemotherapy. Leuk Lymphoma. 2013;54(8):1684-1690.
56. Zinzani PL, Martelli M, Bertini M, et al. Induction chemotherapy strategies for primary mediastinal large B-cell lymphoma with sclerosis: a retrospective multinational study on 426 previously untreated patients. Haematologica. 2002;87(12):1258-1264.
57 Zinzani PL, Stefoni V, Finolezzi E, et al. Rituximab combined with MACOP-B or VACOP-B and radiation therapy in primary mediastinal large B-cell lymphoma: a retrospective study. Clin Lymphoma Myeloma. 2009;9(5):381-385.
58. Binkley MS, Hiniker SM, Wu S, et al. A single-institution retrospective analysis of outcomes for stage I-II primary mediastinal large B-cell lymphoma treated with immunochemotherapy with or without radiotherapy. Leuk Lymphoma. 2016;57(3):604-608.
59 Hamlin PA, Portlock CS, Straus DJ, et al. Primary mediastinal large B-cell lymphoma: optimal therapy and prognostic factor analysis in 141 consecutive patients treated at Memorial Sloan Kettering from 1980 to 1999. Br J Haematol. 2005;130(5):691-699.
60 Juan MT, Sheu LF, Chang JY, Hwang WS. Primary non-Hodgkin’s lymphoma of the mediastinum: a clinicopathological report of six cases. Zhonghua Yi Xue Za Zhi (Taipei). 1995;55(4):325-330.
61. Sehn LH, Antin JH, Shulman LN, et al. Primary diffuse large B-cell lymphoma of the mediastinum: outcome following high-dose chemotherapy and autologous hematopoietic cell transplantation. Blood. 1998;91(2):717-723.
62. Giulino-Roth L, Pei Q, Buxton A, et al. Subsequent malignant neoplasms among children with Hodgkin lymphoma: a report from the Children’s Oncology Group. Blood. 2021;137(11):1449-1456.
63. Hancock SL, Donaldson SS, Hoppe RT. Cardiac disease following
treatment of Hodgkin’s disease in children and adolescents. J Clin Oncol. 1993;11(7):1208-1215.
64 Galper SL, Yu JB, Mauch PM, et al. Clinically significant cardiac disease in patients with Hodgkin lymphoma treated with mediastinal irradiation. Blood. 2011;117(2):412-418.
65. Bartlett NL, Wilson WH, Jung S-H, et al. Dose-adjusted EPOCH-R compared with R-CHOP as frontline therapy for diffuse large B-cell lymphoma: clinical outcomes of the phase III Intergroup Trial Alliance/CALGB 50303. J Clin Oncol. 2019;37(21):1790-1799.
66. Rieger M, Österborg A, Pettengell R, et al. Primary mediastinal B-cell lymphoma treated with CHOP-like chemotherapy with or without rituximab: results of the Mabthera International Trial Group study. Ann Oncol. 2011;22(3):664-670.
67. Santarsieri AB, Hopkins R, Lewis D, et al. R-DA-EPOCH treatment is highly effective therapy for primary mediastinal large B-cell lymphoma: a real-world multi-centre retrospective evaluation. In: 627. Aggressive Lymphomas: Clinical and Epidemiological: Poster III. 64th ASH Annual Meeting and Exposition; December 12, 2022; New Orleans, LA, USA. https:// ash.confex.com/ash/2022/webprogram/Paper166181.html. Accessed February 2, 2023.
68. Sibon DG, Molina C, Vamus T, et al. Outcome of patients with primary mediastinal large B-cell lymphoma after R-CHOP21, R-CHOP14 and R-ACVBP: a pooled analysis of clinical trials from Lysa. In: 627. Aggressive Lymphomas: Clinical and Epidemiological: Rare Populations. 64th ASH Annual Meeting and Exposition; December 11, 2022; New Orleans, LA, USA. https://ash.confex.com/ash/2022/webprogram/Paper166228. html. Accessed February 2, 2023.
69. Martelli M, Zucca E, Botto B, Kryachok I. Impact of different induction regimens on the outcome of primary mediastinal B cell lymphoma in the prospective IELSG 37 trial. Hematol Oncol. 2021;39(S2):90-92.
70. Martelli MC, Ceriani L, Zucca, E, Kryachok I. Omission of radiotherapy in primary mediastinal B cell lymphoma patients following complete metabolic response to standard immunochemotherapy: results of the IELSG37 randomised trial (NCT01599559). Hemasphere. 2023;7:e2454568.
Haematologica | 109 Marzo 2024 856 ARTICLE - Intensive chemotherapy improves survival in PMBCL M. Cook et al.
Lisocabtagene maraleucel for second-line relapsed or refractory large B-cell lymphoma: patient-reported outcomes from the PILOT study
Leo I. Gordon,1 Fei Fei Liu,2 Julia Braverman,2 Daanish Hoda,3 Nilanjan Ghosh,4 Mehdi Hamadani,5 Gerhard C. Hildebrandt,6° Lily Peng,7 Shien Guo,8 Ling Shi8 and Alison Sehgal9
1Northwestern University, Feinberg School of Medicine, Robert H. Lurie Comprehensive Cancer Center, Chicago, IL; 2Bristol Myers Squibb, Princeton, NJ; 3Intermountain Healthcare, Loveland Clinic for Blood Cancer Therapy, Salt Lake City, UT; 4Levine Cancer Institute, Atrium Health, Charlotte, NC; 5BMT & Cellular Therapy Program, Medical College of Wisconsin, Milwaukee, WI; 6Markey Cancer Center, University of Kentucky, Lexington, KY; 7Bristol Myers Squibb, Seattle, WA; 8Evidera, Bethesda, MD and 9University of Pittsburgh Medical Center, Hillman Cancer Center, Pittsburgh, PA, USA
°Current address: University of Missouri - Columbia, Columbia, MO, USA
Abstract
Correspondence: L.I. Gordon l-gordon@northwestern.edu
Received: March 23, 2023.
Accepted: August 21, 2023.
Early view: August 31, 2023.
https://doi.org/10.3324/haematol.2023.283162
©2024 Ferrata Storti Foundation
Published under a CC BY-NC-ND license

In the single-arm, open-label, multicenter, phase II PILOT study, second-line treatment with the chimeric antigen receptor (CAR) T-cell therapy lisocabtagene maraleucel (liso-cel) in patients with relapsed or refractory (R/R) large B-cell lymphoma (LBCL) for whom hematopoietic stem cell transplantation (HSCT) was not intended resulted in high response rates, durable responses, and a safety profile consistent with previous reports. Here, we analyzed changes in health-related quality of life (HRQOL) in patients who received liso-cel in PILOT. Patients received liso-cel, an autologous, CD19-directed, 4-1BB CAR T-cell product administered at equal target doses of CD8+ and CD4+ CAR+ T cells, for a total target dose of 100×10⁶ CAR+ T cells. HRQOL, a secondary endpoint of PILOT, was assessed as prespecified using three patient-reported outcome instruments (EORTC QLQ-C30; FACT-LymS; EQ-5D-5L). Evaluable datasets for the EORTC QLQ-C30, FACT-LymS, and EQ-5D-5L health utility index, and visual analog scale (EQ-VAS) included 56 (92%), 49 (80%), 55 (90%), and 54 (89%) patients, respectively. Clinically meaningful improvement was achieved across most post-treatment visits for EORTC QLQ-C30 fatigue and FACT-LymS. Overall mean changes from baseline through day 545 showed significant improvements in EORTC QLQ-C30 fatigue, pain, and appetite loss, FACT-LymS, and EQ VAS. In within-patient analyses, clinically meaningful improvements or maintenance in scores were observed in most patients at days 90, 180, 270, and 365. HRQOL was maintained or improved in patients who received liso-cel as second-line therapy in PILOT. These findings support liso-cel as a preferred second-line treatment in patients with R/R LBCL not intended for HSCT (clinicaltrials gov. Identifier: NCT03483103).
Introduction
Approximately one-third of patients with aggressive large B-cell lymphoma (LBCL) have relapsed or refractory (R/R) disease after first-line therapy,1 and only half of these patients are considered suitable for potentially curative high-dose chemotherapy (HDCT) and hematopoietic stem cell transplantation (HSCT). While survival outcomes for patients who are not candidates for HDCT/HSCT were historically poor because there was no effective established standard of care (SOC),2 recent advances have led to several new treatment options for patients with R/R LBCL in the
second or later line, including chimeric antigen receptor (CAR) T-cell therapy.3-6
Lisocabtagene maraleucel (liso-cel) is an autologous, CD19-directed, 4-1BB CAR T-cell product administered at equal target doses of CD8+ and CD4+ CAR+ T cells.7 The antitumor activity and safety of liso-cel as second-line treatment in patients with R/R LBCL not intended for HSCT were evaluated in the single-arm, phase II, open-label, multicenter PILOT study (clinicaltrials gov. Identifier: NCT03483103).6 In the primary analysis of PILOT at a median study follow-up of 12.3 months, the overall response and complete response (CR) rates were 80% and 54%, respectively, median
Haematologica | 109 Marzo 2024 857 - Non-Hodgkin Lymphoma ARTICLE
duration of response- and progression-free survival were 12.1 and 9.0 months, respectively, and median overall survival was not reached (NR).6 Additionally, in the primary analysis of the open-label phase III TRANSFORM study (clinicaltrials gov. Identifier: NCT03575351) of liso-cel as second-line therapy for patients with primary refractory or early relapsed LBCL who were intended for HSCT, liso-cel demonstrated superiority over SOC treatment (3 cycles of salvage platinum-based immunochemotherapy followed by HDCT and autologous HSCT in responding patients) in the primary endpoint of event-free survival (median NR vs. 2.4 months), significantly higher CR rate (74% vs. 43%), and significantly longer progression-free survival (median NR vs. 6.2 months) than SOC.8
As cancer treatments improve and patients live longer, it has become more important to evaluate the impact of new treatments on patients’ health-related quality of life (HRQOL). Reports of patients’ HRQOL after CAR T-cell therapy have been limited to date.9 However, an analysis of patient-reported outcomes (PRO) in TRANSFORM found that many PRO domains improved with liso-cel versus SOC, particularly European Organisation for Research and Treatment of Cancer Quality of Life Questionnaire - 30 items (EORTC QLQ-C30) cognitive functioning and fatigue.10 Additionally, patients with third-line or later LBCL treated with liso-cel in TRANSCEND NHL 001 (clinicaltrials gov. Identifier: NCT02631044) had early, sustained, and clinically meaningful improvements in HRQOL that correlated with antitumor activity.11 Clinically meaningful improvements in HRQOL have also been demonstrated with other CAR T-cell therapies as second-line or later12 and third-line or later therapy.13
Here, we analyzed changes in HRQOL and PROs to explore the impact of liso-cel as second-line therapy in patients with R/R LBCL who were not intended for HSCT and received liso-cel in PILOT.
Methods
Study overview
PILOT is an open-label, multicenter, phase II study that enrolled patients at 18 clinical sites in the United States.6 The study design has been previously described.6 Further details are in the Online Supplementary Appendix . The study was conducted in accordance with the Declaration of Helsinki, International Conference on Harmonization Good Clinical Practice guidelines, and applicable regulatory requirements. Institutional review boards at participating institutions approved the study protocol and amendments. All patients provided written informed consent.
Patient-reported outcomes
HRQOL, a secondary endpoint of PILOT, was assessed using the EORTC QLQ-C30, Functional Assessment of Cancer Thera-
py - Lymphoma “Additional Concerns” Subscale (FACT-LymS), and EQ-5D-5L (Online Supplementary Table S1). Patients completed PRO questionnaires electronically on tablets at the initiation of study visits before any procedure or clinical evaluation at screening (defined as baseline); before treatment (≤7 days before lymphodepletion); pre-infusion on the day of liso-cel infusion (day 1); after treatment on days 29, 60, 90, 180, 270, 365, 545, and 730 (end of study); and at disease progression. Final PRO assessments were obtained from patients who discontinued the study early.
Primary domains of interest included EORTC QLQ-C30 global health (GH)/quality of life (QOL), physical functioning, role functioning, cognitive functioning, fatigue, pain, and FACT-LymS. These domains have been identified as important and clinically relevant measurements of symptoms and functioning for the target population of patients with lymphoma14 or have been used to assess changes in patient HRQOL in lymphoma studies.11,15,16 For the EORTC QLQ-C30 GH/QOL and functioning domains, increased score indicates improved QOL/functioning; for the EORTC QLQ-C30 symptom domains, increased score indicates worsening symptoms. For FACT-LymS, increased score indicates improved QOL. Secondary domains of interest included EORTC QLQ-C30 emotional functioning, social functioning, nausea/vomiting, dyspnea, insomnia, appetite loss, constipation, diarrhea, and financial difficulties, and EQ-5D-5L health utility index (HUI) and visual analog scale (EQ-VAS) scores. Unless otherwise specified, analyses were based on the PRO-evaluable set, including liso-cel–treated patients who had valid assessments at baseline and ≥1 postbaseline visit.
For assessment of within-group changes in EORTC QLQ-C30 domains, two minimally important difference (MID) threshold sets were used to determine whether the mean change from baseline (improvement or deterioration) was clinically meaningful as follows: the conventional 10-point MID of Osoba et al. 17 and the MID thresholds of Cocks et al. 18 The MID to determine clinically meaningful within-group change from baseline (improvement or deterioration) for the FACT-LymS were set to a ± 3-point change, as suggested by Hlubocky et al., 19,20 and set to ± 0.08 points for EQ-5D-5L HUI21 and 7 points for EQ VAS as suggested by Pickard et al. 21 For assessment of within-patient changes, proportions of patients with clinically meaningful HRQOL worsening or improvement from baseline were calculated using responder definitions (RD) of 10 points for EORTC QLQ-C30 domains,17 3 points for FACT-LymS,19 0.08 points for EQ5D-5L HUI, 21 and 7 points for EQ VAS. 21 Improvement was defined as a beneficial change from baseline ≥ the RD and worsening as a deleterious change from baseline ≥ the RD; no change was defined as a change from baseline in either direction < the RD.
Statistical analysis
Linear mixed-effects regression models for repeated mea-
Haematologica | 109 Marzo 2024 858 ARTICLE - Liso-cel for 2L R/R LBCL: PRO from PILOT L.I. Gordon et al.
sures assessed the least squares (LS) mean change from baseline across postbaseline assessments with ≥10 patients (i.e., up to day 545). Missing data were handled under the assumption of missing at random. Time to confirmed HRQOL deterioration or improvement, defined as ≥2 consecutive visits with changes from baseline ≥ the RD thresholds,17,19-21 was analyzed using the safety set including all patients who received liso-cel.6
The Kaplan-Meier product-limit method was used to estimate survival distribution functions. P values <0.05 were considered statistically significant. Analyses were not adjusted for multiple comparisons.
Results
HRQOL questionnaire completion rates
A total of 61 patients received liso-cel in PILOT and were included in the safety set. The PRO-evaluable set included 56 patients for the EORTC QLQ-C30, 49 patients for FACTLymS, 55 patients for EQ-5D-5L HUI, and 54 patients for EQ-VAS (Online Supplementary Figure S1). Across most visits, the HRQOL questionnaire completion rate (defined as the percentage of liso-cel–treated patients with valid PRO assessment at a given time point out of the total liso-cel–treated patients who were expected to provide PRO assessments at that time point) was high (≥80%) for all PRO instruments (Online Supplementary Table S2). The number of patients expected to provide PRO assessments decreased over time, mostly due to death or inadequate follow-up time. At screening (baseline), 93% of patients (57/61) completed the EORTC QLQ-C30, 82% (50/61 patients) completed the FACT-LymS, 92% (56/61 patients) completed the EQ-5D-5L HUI, and 90% (55/61 patients) completed the EQ-VAS. At days 60, 180, and 365, 83-89% (44-47/53 patients), 84-87% (31-32/37 patients), and 81-91% (17-19/21 patients) completed PRO assessments, respectively.
Population characteristics
Baseline demographic and disease characteristics in the EORTC QLQ-C30-evaluable set were comparable with those of the overall safety set in PILOT (Table 1). In the EORTC QLQ-C30-evaluable set, mean age was 72.8 years and 59% of patients were male. Mean time from diagnosis to liso-cel administration was 27.4 months. The best prior treatment response was a CR in nearly half (48%) of patients. Most patients (88%) had received systemic treatment as the last line of therapy before liso-cel, and mean time from the last systemic regimen to liso-cel administration was 21.0 months. Additional baseline disease characteristics are shown in Online Supplementary Table S3
HRQOL at baseline
Patients in this analysis had slightly worse mean baseline HRQOL scores across most of the primary and second-
ary domains of interest compared with reference ageand matched general populations (Table 2).22,23 For EORTC QLQ-C30 fatigue, social functioning, and appetite loss domains, baseline scores were worse than scores in the general population to a clinically meaningful extent (i.e., the
response, N (%)
C30–evaluable population N=56
Note that total percentages per category may equal >100 due to rounding. aDefined as patients who achieved a best response to previous chemoimmunotherapy of stable disease or progressive disease. EORTC QLQ-C30: European Organisation for Research and Treatment of Cancer Quality of Life Questionnaire - 30 items; SD: standard deviation; ECOG PS: Eastern Cooperative Oncology Group performance status; liso-cel: lisocabtagene maraleucel.
Haematologica | 109 Marzo 2024 859 ARTICLE - Liso-cel for 2L R/R LBCL: PRO from PILOT L.I. Gordon et al.
EORTC QLQ-
Age in years Mean (SD) Median (range) 72.8 (6.8) 74.0 (53-84) Sex, N (%) Male 33 (59)
N (%) Asian Black or African American White Missing 1 (2) 1 (2) 50 (89) 4 (7) Ethnicity, N (%) Not Hispanic or Latino Missing 49 (87.5) 7 (12.5) ECOG PS at screening, N (%) 0 1 2 17 (30) 23 (41) 16 (29) Time from diagnosis to liso-cel administration in months Mean (SD) Median (range) 27.4 (37.7) 13.7 (2.3-183.4) Time from last systemic regimen to liso-cel administration in months Mean (SD) Median (range) 21.0 (34.8) 8.1 (1.5-174.5)
prior treatment
Complete response Partial response Stable disease Progressive disease 27 (48) 13 (23) 5 (9) 11 (20) Disease relapsed or refractory to first-line therapy, N (%) Refractory Relapsed 29 (52) 27 (48) Chemotherapy refractory or chemotherapy sensitive, N (%) Chemotherapy refractorya Chemotherapy sensitive 16 (29) 40 (71) Last line of therapy before liso-cel, N (%) Systemic treatment Systemic treatment plus radiotherapy 49 (88) 7 (13)
Race,
Best
Table 1. Demographics and baseline characteristics of the EORTC QLQ-C30–evaluable population.
difference in mean scores was greater than the 10-point MID set by Osoba et al.15).
Within-group changes in HRQOL scores over time
After transient worsening at day 1 or day 29 in most domains, improvements in LS mean HRQOL scores over time were generally observed for the primary domains of interest (Figure 1). For the EORTC QLQ-C30 primary domains of interest, changes from baseline exceeding the conventional 10-point MID proposed by Osoba et al . were observed at day 1 in role functioning (deterioration); days 90, 180, and 545 in fatigue (all improvement); and day 29 in pain (improvement). Clinically meaningful improvement from baseline based on the MID thresholds defined by Cocks et al . was achieved at days 60 and 180 for GH/ QOL and across most post-treatment visits for EORTC QLQ-C30 fatigue and FACT-LymS. Slight score deterioration was observed at day 270 in several domains with subsequent improvement at later time points. LS mean score changes from baseline over time for the secondary domains of interest are shown in Online Supplementary Figure S2 . Notably, EQ-5D-5L HUI and EQ-VAS scores were
maintained or improved across visits. Clinically meaningful improvements in EQ-VAS were observed at days 60 and 180. Overall LS mean changes from baseline through day 545 showed significant improvements in EORTC QLQ-C30 fatigue, pain, and appetite loss, FACT-LymS, and EQ-VAS (Table 3). For FACT-LymS, the improvement was clinically meaningful.19,20 For EORTC QLQ-C30 fatigue, the improvement was clinically meaningful when using the MID defined by Cocks et al. 18 Significant or clinically meaningful worsening was not observed for any of the primary or secondary domains of interest.
Within-patient changes in HRQOL scores over time
In within-patient analyses of changes from baseline for each EORTC QLQ-C30 primary domain of interest and FACT-LymS, clinically meaningful improvements or no clinically meaningful change from baseline at days 29, 60, and 90 were reported in 52-94%, 69-97%, and 69-87% of patients, respectively. A clinically meaningful change only was shown at days 29, 60, and 90 in 12.5-57%, 24-68%, and 20.5-71% of patients, respectively (Figure 2). Most patients continued to show clinically meaningful improvements or
-3/+5 -3/+2
Pickard et al 21
aPrimary domains of interest are in roman typeface; secondary domains of interest are in italics. bMean scores that were clinically meaningfully worse than the European general population norm (i.e., difference in mean scores above the prespecified MID). cEORTC QLQ-C30 norm scores were from European general population data based on 11 European Union countries (N=11,343),23 and EQ-5D-5L norm scores were from a UK general population (N=3,395).22 Both sets of general population norms were reweighted by the EORTC QLQ-C30–evaluable population’s age and sex distributions. dValues on the left indicate thresholds for clinically meaningful improvement and values on the right indicate thresholds for clinically meaningful worsening. For the EORTC QLQ-C30 GH/QOL and functioning domains, a higher score denotes better QOL/function; for symptom domains, a higher score denotes worse symptoms. For the FACT-LymS, EQ-5D-5L HUI, and EQ-VAS, a higher score indicates better QOL. HRQOL: health-related quality of life; MID: minimally important difference; PRO: patient-reported outcome; EORTC QLQ-C30: European Organisation for Research and Treatment of Cancer Quality of Life Questionnaire - 30 items; GH: global health; QOL: quality of life; FACT-LymS: Functional Assessment of Cancer Therapy - Lymphoma “Additional Concerns” Subscale; HUI: health utility index; VAS: visual analog scale.
Haematologica | 109 Marzo 2024 860 ARTICLE - Liso-cel for 2L R/R LBCL: PRO from PILOT L.I. Gordon et al.
Domaina Domain mean score MID PROevaluable set General population normc EORTC QLQ-C30 GH/QOL Physical functioning Role functioning Cognitive functioning Fatigue Pain Emotional functioning Social functioning Nausea/vomiting Dyspnea Insomnia Appetite loss Constipation Diarrhea Financial difficulties 66.8 77.8 77.1 83.3 36.7b 26.5 81.1 74.7b 5.7 10.7 25.6 18.8b 11.9 13.7 13.7 67.4 81.8 83.5 87.3 24.6 23.3 82.3 89.4 2.3 17.1 23.9 6.6 10.9 5.9 7.1 Osoba et al.17 ±10 ±10 ±10 ±10 ±10 ±10 ±10 ±10 ±10 ±10 ±10 ±10 ±10 ±10 ±10 Cocks et al.18d +5/-5 +2/-5 +6/-7 +3/-1 -4/+5 -5/+3 +6/-3 +3/-6 -3/+5 -2/+5 -5/+2 -7/+2 -4/+5
FACT-Lym FACT-LymS 44.2Hlubocky et al 19,20EQ-5D-5L EQ-5D-5L HUI EQ-VAS 0.74 71.6 0.76 76.1
±0.08 ±7
Table 2. Baseline HRQOL scores.
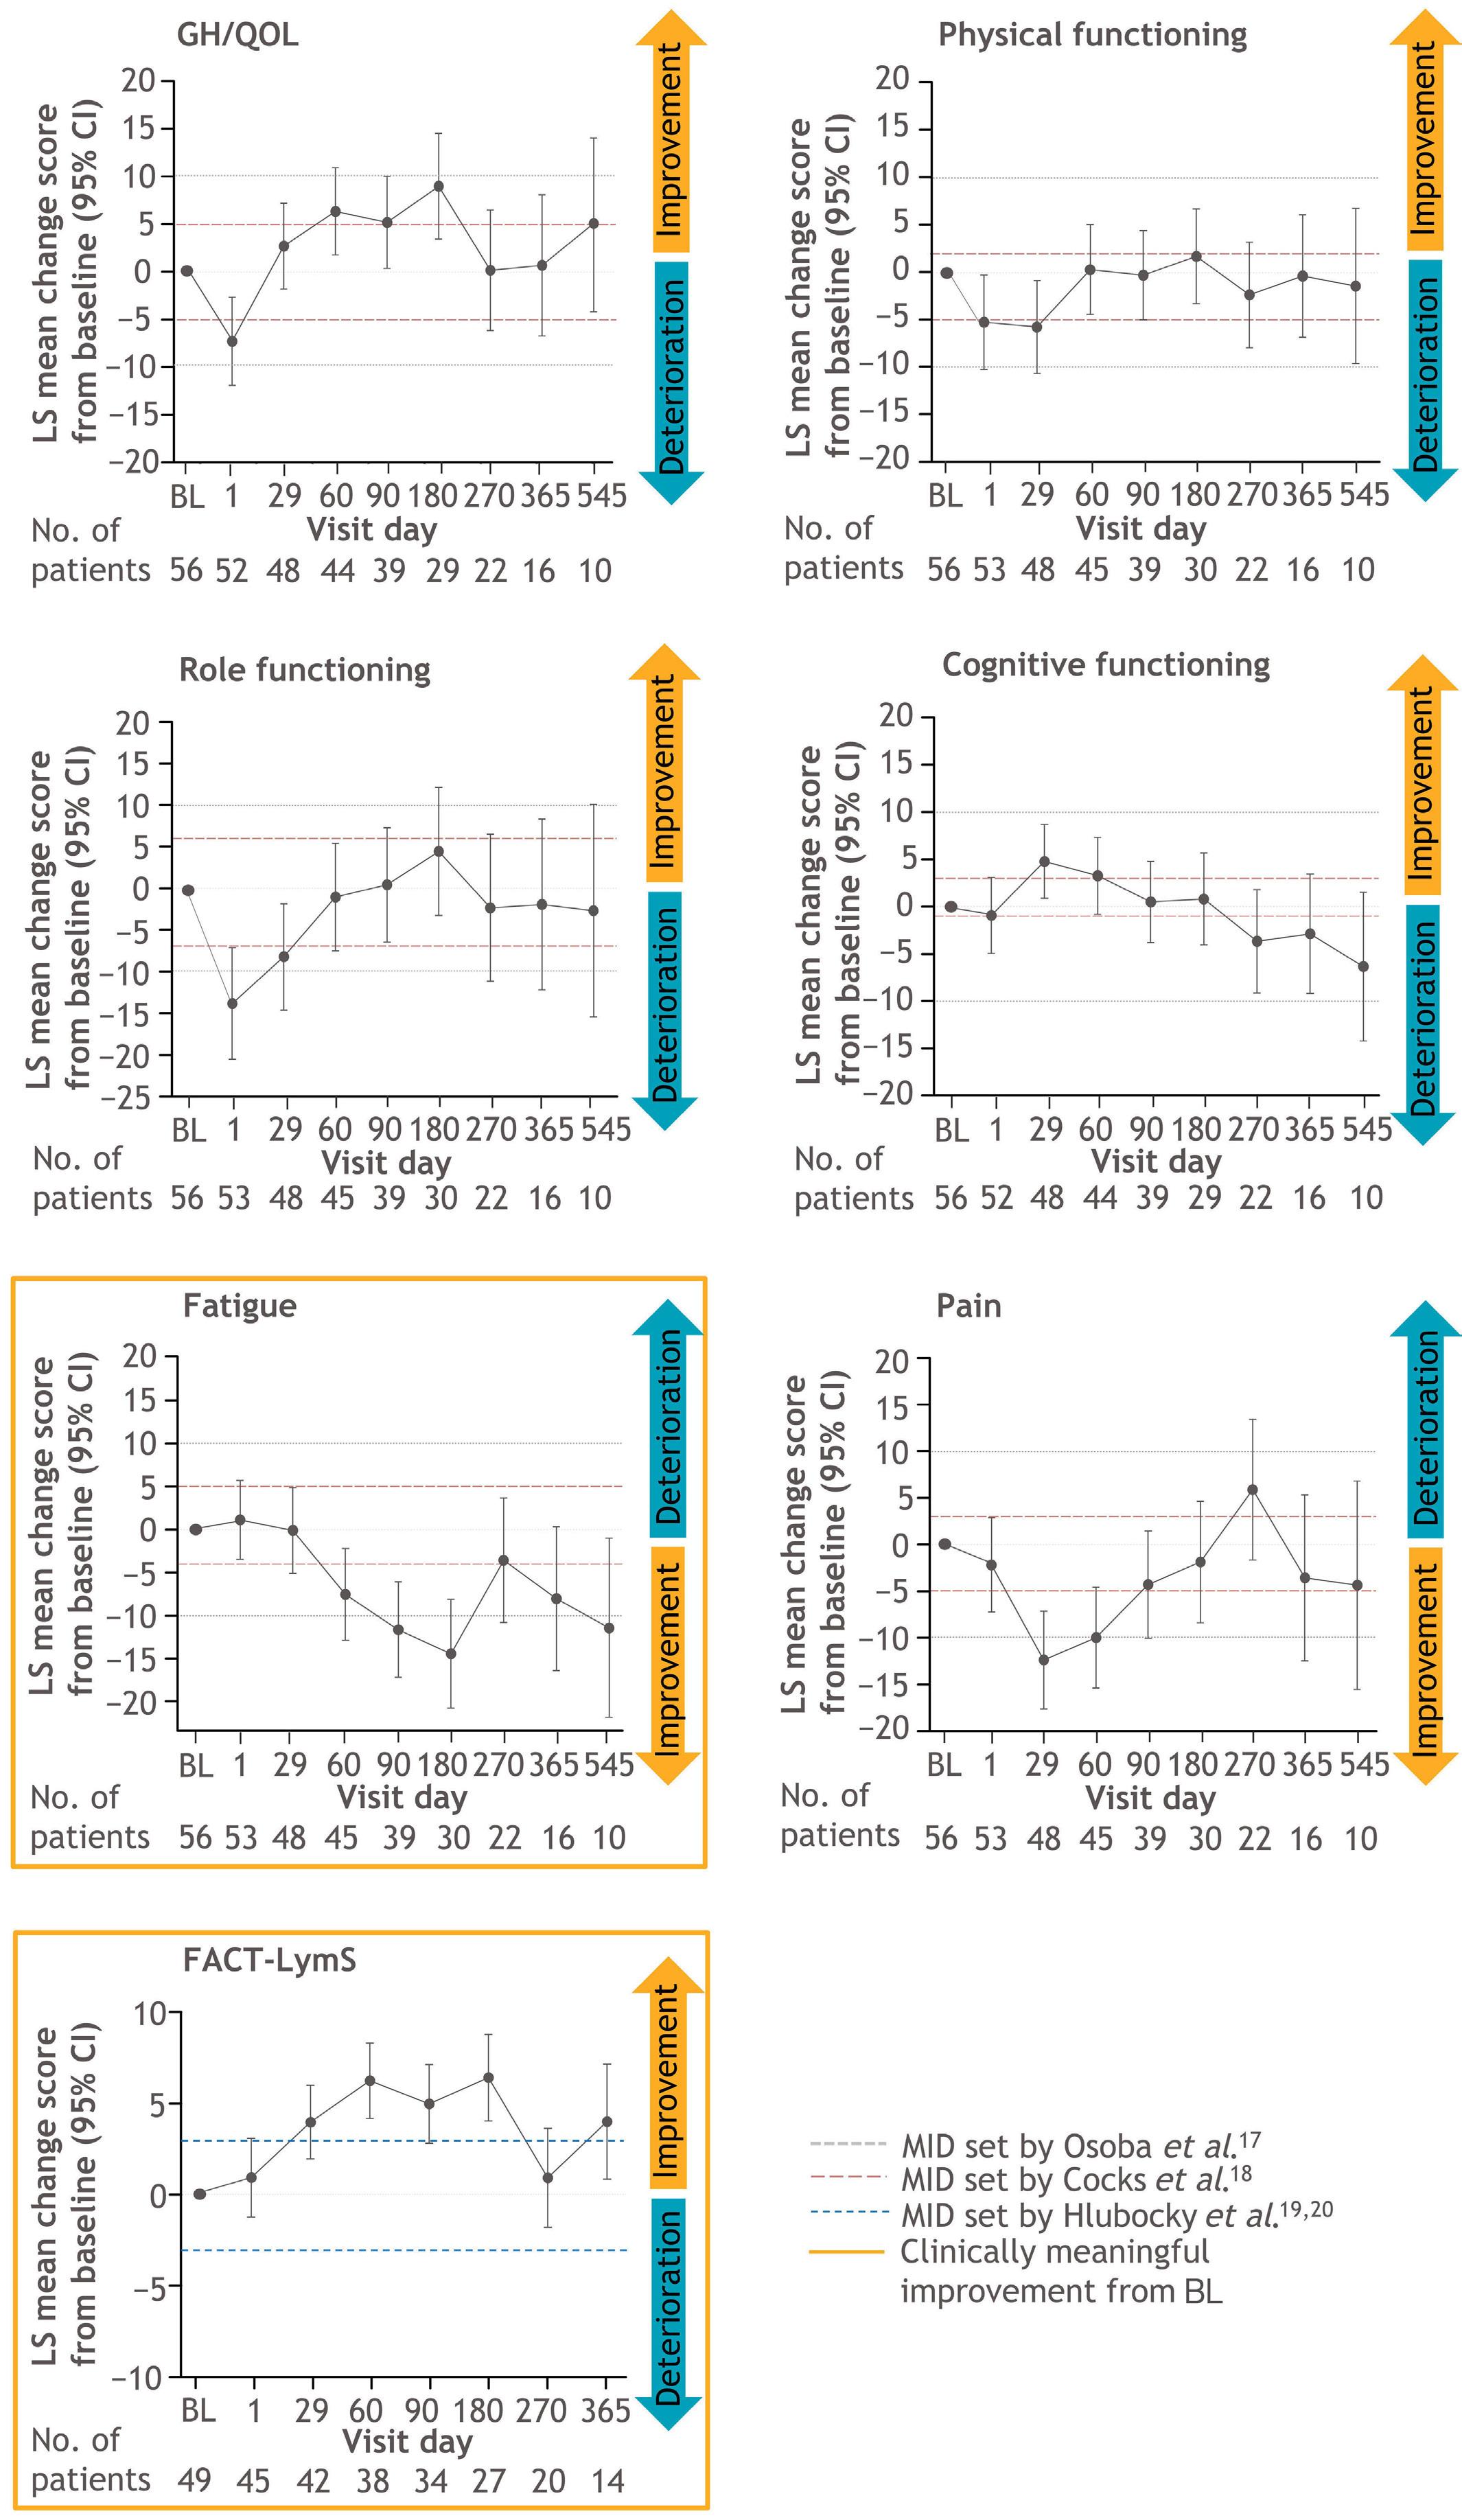
Figure 1. Least squares mean changes from baseline in the primary domains of interest over time. For the EORTC QLQ-C30 domains of GH/QOL (A), physical functioning (B), role functioning (C), cognitive functioning (D), fatigue (E), and pain (F), 2 sets of minimally important differences (MID) were used to assess whether a change from baseline (BL) (improvement or deterioration) was clinically meaningful: the conventional 10-point change suggested by Osoba et al. (dotted gray lines)17 and the MID suggested by Cocks et al. (dashed red lines).18 For the FACT-LymS (G), an MID of 3 points, as suggested by Hlubocky et al. (dotted dark blue lines),19,20 was used to identify clinically meaningful improvement and deterioration from BL. For the EORTC QLQ-C30 GH/QOL and functioning domains, an increased score indicates improved QOL/functioning; for the EORTC QLQ-C30 symptom domains, an increased score indicates worsening symptoms. For FACT-LymS, an increased score indicates improved QOL. LS: least squares; CI: confidence interval; EORTC QLQ-C30: European Organisation for Research and Treatment of Cancer Quality of Life Questionnaire - 30 items; GH: global health; QOL: quality of life; FACT-LymS: Functional Assessment of Cancer Therapy - Lymphoma “Additional Concerns” Subscale.
Haematologica | 109 Marzo 2024 861 ARTICLE - Liso-cel for 2L R/R LBCL: PRO from PILOT L.I. Gordon et al.
A C E G B D F
no clinically meaningful change over the medium term with 80-96% at day 180 (23-70% with clinically meaningful improvement only) and 59-82% at day 270 (9-60% with clinically meaningful improvement only). After long-term follow-up, 75-88% of patients showed clinically meaningful improvements or no clinically meaningful change at day 365 (12.5-50% with clinically meaningful improvement only) and 60-100% at day 545 (0-50% with clinically meaningful improvement only). For EORTC QLQ-C30 fatigue, the only primary domain of interest that was meaningfully worse than the general population at baseline, clinically meaningful improvements occurred in 33% of patients at day 29, 42% at day 60, 62% at day 90, 60% at day 180, 44% at day 365, and 50% at day 545.
Clinically meaningful improvements in FACT-LymS occurred in 57% of patients at day 29, 68% at day 60, 71% at day 90, 70% at day 180, 60% at day 270, and 50% at day 365 (Figure 2). Clinically meaningful improvements over time for secondary domains of interest are shown in Online Supplementary Figure S3.
Time to confirmed improvement in HRQOL
Among the primary domains of interest, the median time to confirmed improvement was 19.1 weeks (95% confidence interval [CI]: 11.9-not reached [NR]) for role functioning,
18.1 weeks (95% CI: 11.6-NR) for fatigue, 9.9 weeks (95% CI: 8.6-12.7) for pain, and 17.6 weeks (95% CI: 11.1-NR) for FACT-LymS, and was NR for GH/QOL, physical functioning, and cognitive functioning (Online Supplementary Figure S4). Time to confirmed improvement for the secondary domains of interest are shown in Online Supplementary Figure S5.
Time to confirmed deterioration in HRQOL
The median time to confirmed deterioration among the primary domains of interest was 11.9 weeks (95% CI: 6.4NR) for GH/QOL, 11.9 weeks (95% CI: 7.1-NR) for physical functioning, 37.3 weeks (95% CI: 8.3-NR) for role functioning, and 52.3 weeks (95% CI: 10.7-NR) for fatigue and was NR for cognitive functioning, pain, or FACT-LymS (Online Supplementary Figure S6). Time to confirmed deterioration of HRQOL for the secondary domains of interest are shown in Online Supplementary Figure S7.
Discussion
HRQOL improved or was maintained in patients with R/R LBCL not intended for HSCT who received liso-cel as second-line therapy in the PILOT study. Baseline HRQOL, functional status, and symptom severity were generally
Domaina
EORTC QLQ-C30
GH/QOL
Physical functioning
Role functioning
Cognitive functioning
Fatigue
Pain
Emotional functioning
Social functioning
Nausea/vomiting
Dyspnea
Insomnia
Appetite loss
Constipation
Diarrhea
Financial difficulties
2.77 (-0.36 to 5.91)
-1.67 (-4.88 to 1.53)
-3.21 (-8.01 to 1.60)
-0.55 (-3.50 to 2.41)
-6.94 (-10.34 to -3.55)b
-4.12 (-7.62 to -0.62)b
2.47 (-0.36 to 5.30)
-2.39 (-7.60 to 2.81)
1.25 (-0.96 to 3.47)
0.99 (-2.61 to 4.59)
0.76 (-3.77 to 5.29)
-5.66 (-9.84 to -1.47)b
-1.30 (-4.39 to 1.79)
-2.92 (-6.53 to 0.70)
Osoba
aPrimary domains of interest are in roman typeface; secondary domains of interest are in italics. bDomains showing significant improvements from baseline. cValues on the left indicate thresholds for clinically meaningful improvement and values on the right indicate thresholds for clinically meaningful worsening. The analysis was based on changes in HRQOL from baseline through day 545. For the EORTC QLQ-C30 GH/ QOL and functioning domains, an increased score denotes improved QOL/function; for symptom domains, an increased score denotes worsened symptoms. For the FACT-LymS, EQ-5D-5L HUI, and EQ-VAS, an increased score indicates improved QOL. LS: least squares; CI: confidence interval; MID: minimally important difference; EORTC QLQ-C30: European Organisation for Research and Treatment of Cancer Quality of Life Questionnaire - 30 items; GH: global health; QOL: quality of life; FACT-LymS: Functional Assessment of Cancer Therapy - Lymphoma “Additional Concerns” Subscale; HUI: health utility index; VAS: visual analog scale; HRQOL: health-related quality of life.
Haematologica | 109 Marzo 2024 862 ARTICLE - Liso-cel for 2L R/R LBCL: PRO from PILOT L.I. Gordon et al.
Overall LS mean change (95% CI) MID P
1.27
5.26)
(-2.72 to
et al.17 ±10 ±10 ±10 ±10 ±10 ±10 ±10 ±10 ±10 ±10 ±10 ±10 ±10 ±10 ±10 Cocks et al 18c +5/-5 +2/-5 +6/-7 +3/-1 -4/+5 -5/+3 +6/-3 +3/-6 -3/+5 -2/+5 -5/+2 -7/+2 -4/+5 -3/+5 -3/+2 0.082 0.298 0.187 0.711 <0.001 0.022 0.086 0.362 0.262 0.585 0.740 0.009 0.402 0.111 0.526 FACT-Lym FACT-LymS 4.08 (2.55-5.61)b Hlubocky et al 19,20 ±3 <0.001 EQ-5D-5L EQ-5D-5L HUI EQ-VAS 0.02 (-0.02 to 0.06) 4.35 (1.27-7.43)b Pickard et al 21 ±0.08 ±7 0.341 0.006
Table 3. Overall least squares mean changes from baseline to day 545.
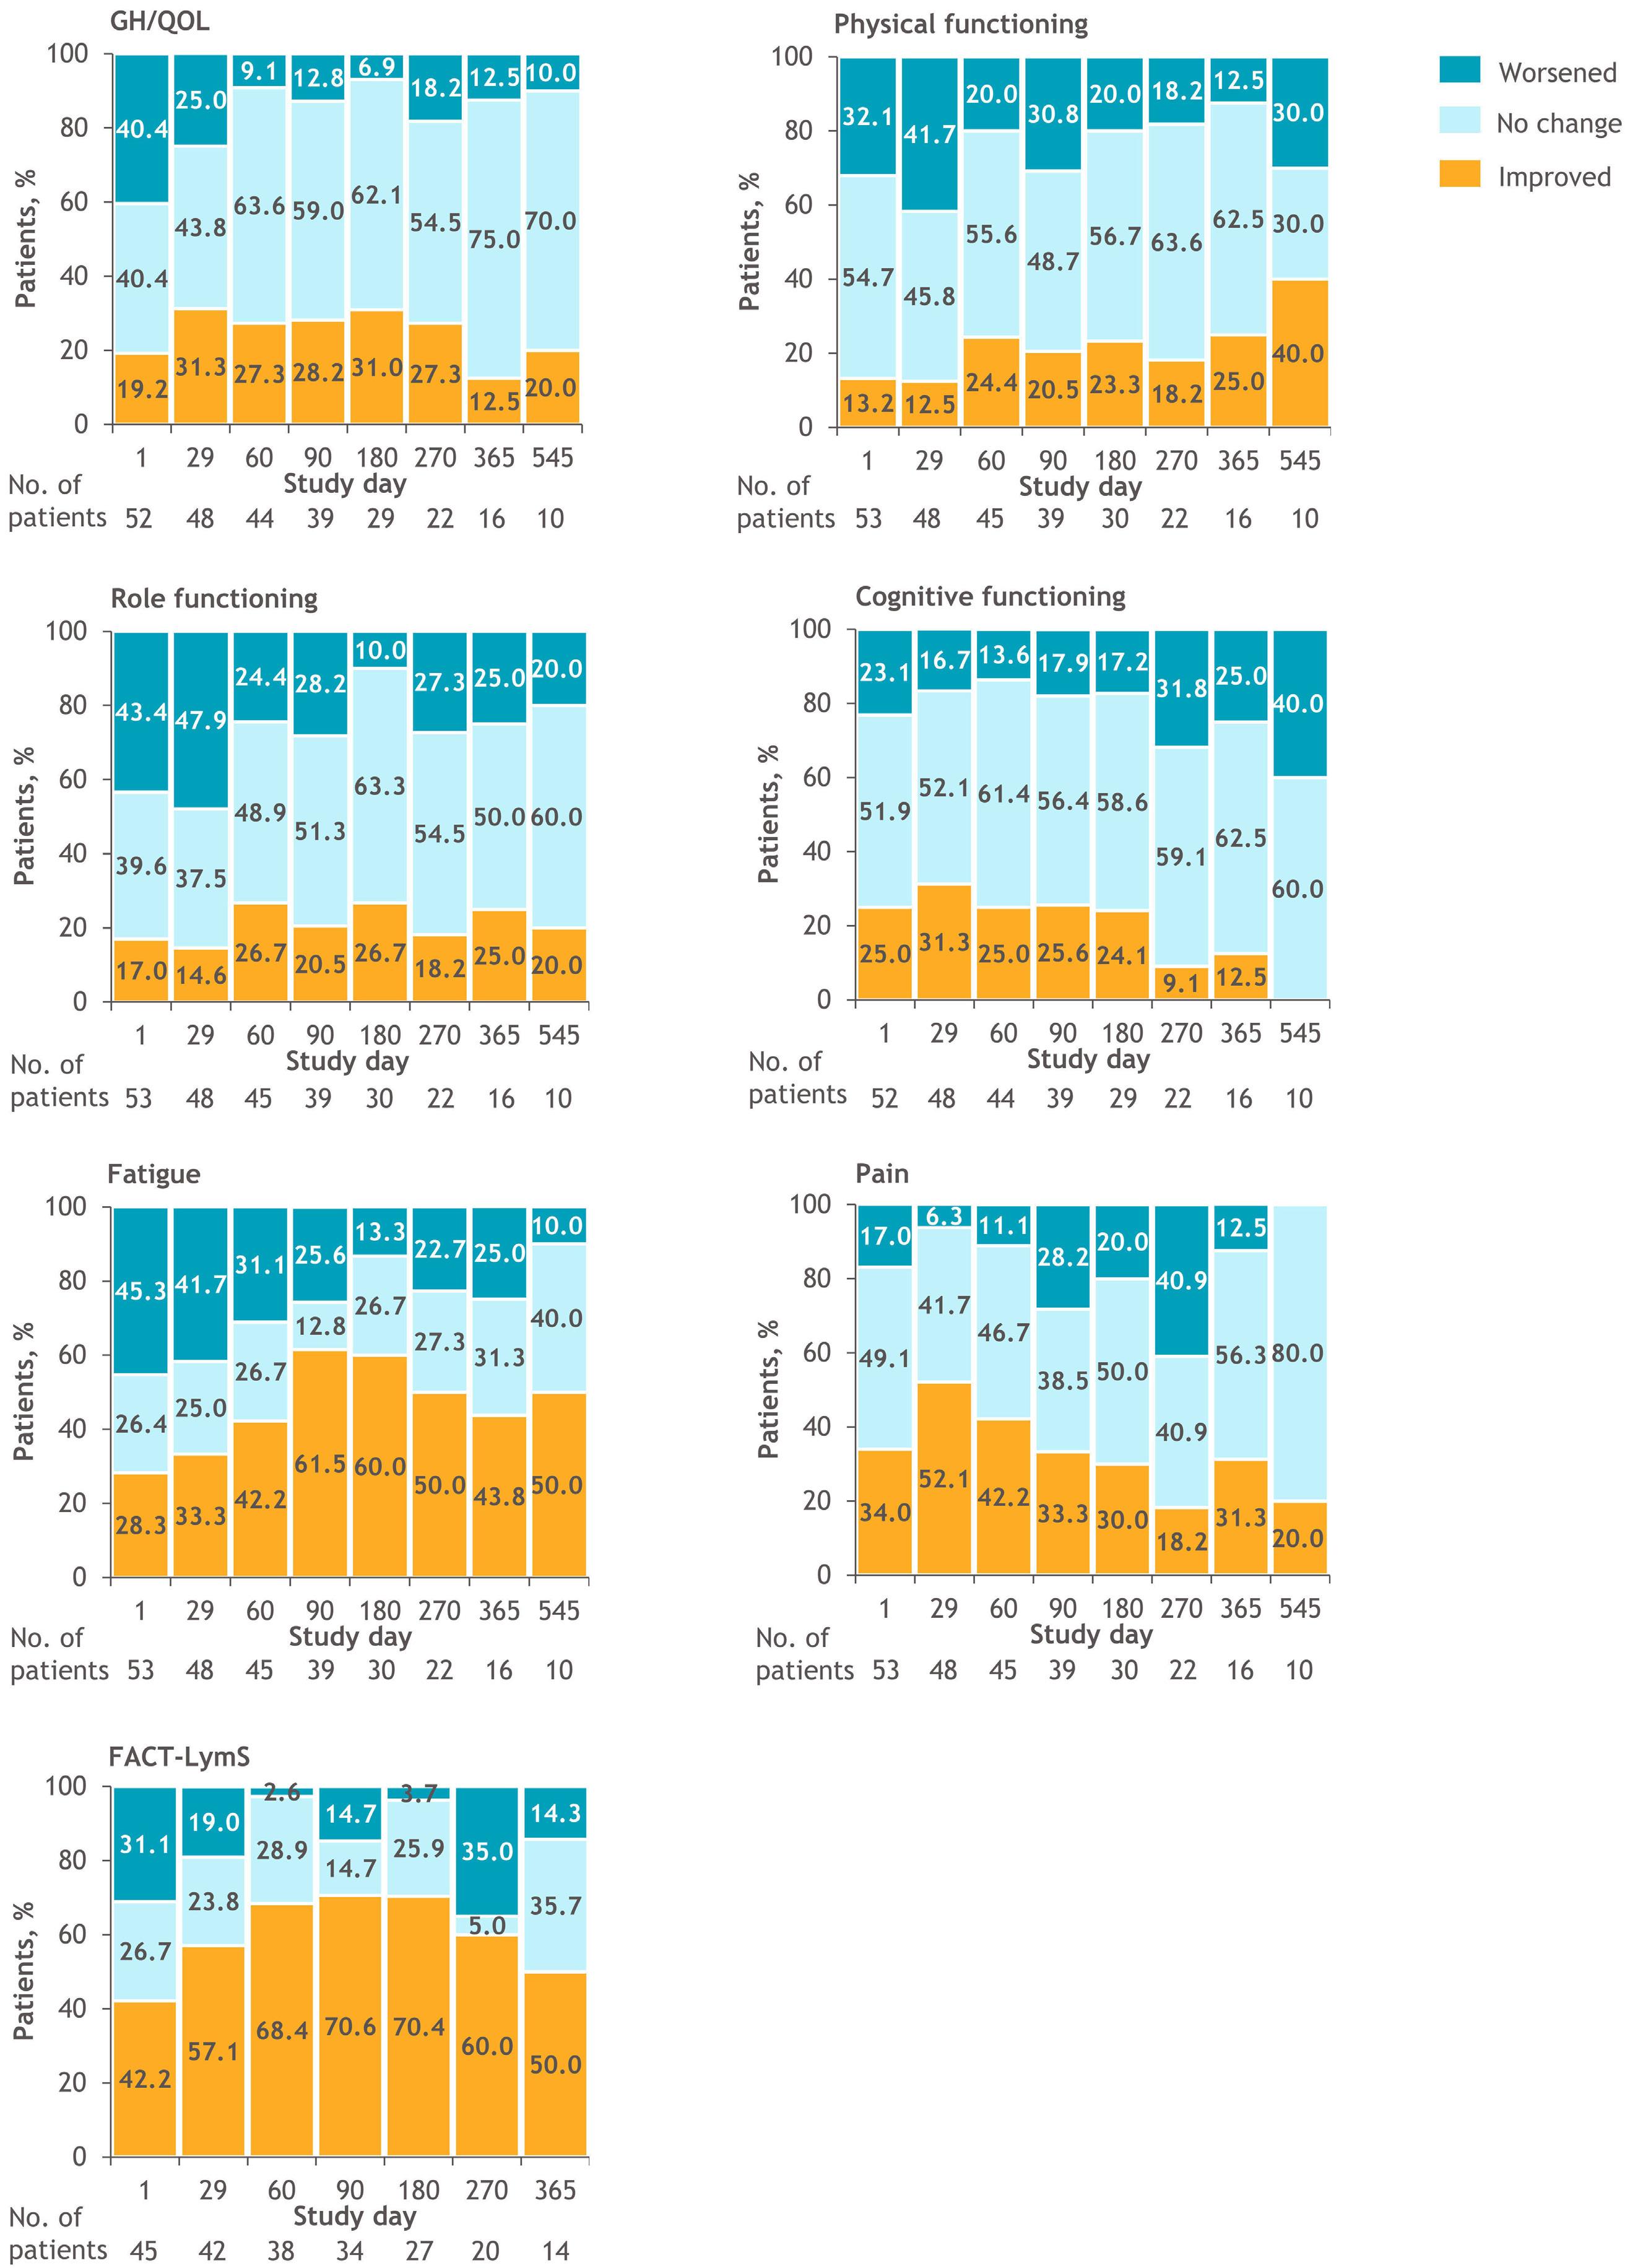
2. Within-patient analysis of changes from baseline for the primary domains of interest. Responder definitions of 10 for the EORTC QLQ-C30 domains of GH/QOL (A), physical functioning (B), role functioning (C), cognitive functioning (D), fatigue (E), and pain (F)17 and 3 for FACT-LymS (G)19,20 were applied. Data are shown up to the last visit with ≥10 patients. Gold bars indicate improvement, light blue bars indicate no change, and aqua bars indicate worsening from baseline. EORTC QLQ-C30: European Organisation for Research and Treatment of Cancer Quality of Life Questionnaire - 30 items; GH: global health; QOL: quality of life; FACT-LymS: Functional Assessment of Cancer Therapy - Lymphoma “Additional Concerns” Subscale.
Haematologica | 109 Marzo 2024 863 ARTICLE - Liso-cel for 2L R/R LBCL: PRO from PILOT L.I. Gordon et al.
A C E G B D F
Figure
slightly worse than in the general population; for EORTC QLQ-C30 fatigue, social functioning, and appetite loss, baseline scores were worse than general population scores to a clinically meaningful extent. After transient worsening in most domains, scores for the primary domains of interest generally improved over time. No significant or clinically meaningful worsening was observed for any of the primary and secondary HRQOL domains of interest across visits after liso-cel infusion. Moreover, scores for EORTC QLQ-C30 fatigue, pain, appetite loss, FACT-LymS, and EQVAS showed significant improvements across postbaseline assessments, with clinically meaningful improvements observed for EORTC QLQ-C30 fatigue and FACT-LymS. In within-patient analyses, clinically meaningful improvements or no meaningful change in the primary domains of interest were reported for most patients at day 180 and day 365. Median time to confirmed improvement was NR for EORTC QLQ-C30 GH/QOL, physical functioning, and cognitive functioning. These results may be because mean baseline scores for these domains were similar to the general population scores. With a potentially limited scope for improvement, it was harder for these patients to achieve an improvement in score exceeding the meaningful improvement threshold. However, median time to confirmed improvement was relatively short for EORTC QLQ-C30 pain. For cognitive functioning, pain, and FACT-LymS, median time to confirmed deterioration was NR. Deterioration in domains showing the largest change from baseline on day 1 (i.e., role functioning and social functioning) was likely due to hospitalization for liso-cel infusion, as patients could not perform their normal daily roles during that time. Median times to confirmed deterioration were relatively short for EORTC QLQ-C30 GH/QOL and physical functioning, likely due to a transient deterioration during lymphodepletion and in the period immediately after liso-cel infusion. Worsening in other symptom and/or functioning domains on day 1 was likely due to treatment-related symptoms from bridging therapy or lymphodepletion treatments.
These findings add to evidence supporting the beneficial or lack of detrimental effects of CAR T-cell therapy on HRQOL in patients with R/R LBCL not intended for HSCT, addressing an unmet need highlighted by a recent Cochrane review.24 These results are similar to previously reported beneficial effects of CAR T-cell therapies on HRQOL in the second-line setting.10,12 In TRANSFORM, a study in patients with R/R LBCL intended for autologous HSCT, second-line treatment with liso-cel improved some HRQOL domains, including GH/QOL, cognitive functioning, and fatigue, and maintained HRQOL in most of the remaining domains, compared with SOC. Additionally, in the randomized phase III ZUMA-7 study, the CAR T-cell therapy axicabtagene ciloleucel demonstrated significant and clinically meaningful improvements in mean changes in EORTC QLQ-C30 GH/ QOL and physical functioning and EQ-VAS from baseline compared with SOC at day 100 (P<0.0001 for all).12 Altogether,
these results further support the use of CAR T-cell therapies as second-line treatment in patients with R/R LBCL. CAR T-cell therapy may be a good alternative to HSCT from the patient perspective. A study comparing changes in QOL and adverse events after treatment with CAR T-cell therapy or HSCT (autologous or allogeneic) in patients with myeloma, lymphoma, leukemia, and other myeloid neoplasms found that overall QOL and physical and functional well-being deteriorated significantly less with CAR T-cell therapy than with HSCT and returned to baseline levels faster.25 These findings are supported by HRQOL results from the phase III, randomized, pivotal TRANSFORM and ZUMA-7 studies, comparing treatment with CAR T-cell therapy (liso-cel and axicabtagene ciloleucel, respectively) versus SOC therapy, including salvage platinum-based immunochemotherapy followed by high-dose chemotherapy and autologous HSCT in responding patients as second-line therapy for patients with LBCL.10,12 In TRANSFORM, HRQOL was either improved or maintained from baseline in patients in the liso-cel arm versus the SOC arm.10 Similar improvement in HRQOL was observed in patients in the axicabtagene ciloleucel arm versus the SOC arm in the ZUMA-7 study at day 100.12 Additionally, HRQOL is low in older patients with diffuse LBCL and has been observed to decrease after diagnosis, possibly due to therapy.26 While some elderly, fit patients may proceed to HSCT after relapse, most have comorbidities that preclude intensive therapy options.27 The current results, paired with the results from the PILOT primary analysis,6 demonstrate that liso-cel is an effective treatment that can maintain or improve HRQOL for patients with R/R LBCL for whom HSCT is not intended.
Our findings should be interpreted with caution because of the small sample size and single-arm study design of PILOT. Additionally, the PILOT population was predominantly White, potentially limiting the generalizability of these data to minority populations. Data at later time points (≥270 days) may have been influenced by the COVID-19 pandemic, as most visits on day 270 (86%) occurred after the outbreak was declared a pandemic on March 11, 2020. By comparison, ≤55% of visits on day 90 or earlier occurred before this date. Additionally, PRO data were not collected after the end of study visit in patients who experienced disease progression; thus, there is a potential for survivorship bias.
In conclusion, HRQOL improved or was maintained in patients with R/R LBCL not intended for HSCT who received liso-cel as second-line therapy in the PILOT study. Liso-cel treatment was associated with clinically meaningful improvements in EORTC QLQ-C30 fatigue and FACT-LymS scores in most patients and did not negatively affect other HRQOL measures. These findings provide additional evidence from the patient’s perspective to support the use of liso-cel as a second-line treatment in patients with R/R LBCL not intended for HSCT and highlight the importance of HRQOL measures in future clinical trials of novel agents or modalities in clinical cancer research.
Haematologica | 109 Marzo 2024 864 ARTICLE - Liso-cel for 2L R/R LBCL: PRO from PILOT L.I. Gordon et al.
Disclosures
LIG reports receipt of consulting fees from AstraZeneca, Epizyme, Janssen, Karyopharm, and Kite-Gilead; a patent on gold nanoparticles for cancer; and co-founding Zylem Biosciences. FFL, JB, and LP report being employees of and receiving stock/ stock options in Bristol Myers Squibb. DH has no conflicts of interest to disclose. NG reports receipt of consulting fees from Adaptive Biotech, ADC Therapeutics, AstraZeneca, BeiGene, Bristol Myers Squibb, Genmab, Gilead Sciences, Incyte, Janssen, Karyopharm, Loxo Oncology, Novartis, Pharmacyclics, Roche/ Genentech, Seagen, and TG Therapeutics; receipt of honoraria from AstraZeneca, Bristol Myers Squibb, Epizyme, Gilead, Janssen, and Pharmacyclics; and research funding from AbbVie, Bristol Myers Squibb, Genentech/Roche, Gilead, MorphoSys, and TG Therapeutics. MH reports receipt of consulting fees from ADC Therapeutics, Gamida Cell, Genmab, Incyte Corporation, Kite, Legend Biotech, MorphoSys, Novartis, Omeros, SeaGen, and Verastem; receipt of honoraria from ADC Therapeutics, AstraZeneca, BeiGene, and Sanofi Genzyme; and research funding from ADC Therapeutics, Astellas Pharma, DMC: Myeloid Therapeutics, Inc., Spectrum Pharmaceuticals, and Takeda Pharmaceuticals. GCH reports receipt of consulting fees from Alexion Pharmaceuticals, Incyte, Janssen Pharmaceuticals, Karyopharm Therapeutics, MorphoSys, and Seattle Genetics; support for meetings or travel from Falk Foundation, Incyte, and Takeda; stock or stock options in AbbVie, Aimmune Therapeutics Inc (AIMT), ANGI Homeservices Inc, Bayer, Bluebird Bio, Bristol Myers Squibb/Medarex, Cardinal Health, CareTrust Reit Inc (CTRE), Celgene, Cellectis, Charlotte’s Webb (CWBHF), Clovis Oncology, CRISPR Therapeutics, CVS Health, GW Pharmaceuticals, IDEXX Laboratories, Insys Therapeutics, Johnson & Johnson, Medical Properties Trust Inc. (MPW), Moderna Therapeutics, Novartis, Pfizer, Procter & Gamble, Scotts-Miracle, and Vertex; and research funding from AstraZeneca, Incyte, Jazz Pharmaceuticals, Pharmacyclics, and Takeda. SG reports be-
References
1. Coiffier B, Sarkozy C. Diffuse large B-cell lymphoma: R-CHOP failure-what to do? Hematology Am Soc Hematol Educ Program. 2016;2016(1):366-378.
2. Nowakowski GS, Blum KA, Kahl BS, et al. Beyond RCHOP: a blueprint for diffuse large B cell lymphoma research. J Natl Cancer Inst. 2016;108(12):djw257.
3. Kamdar M, Solomon SR, Arnason J, et al.; for the TRANSFORM investigators. Lisocabtagene maraleucel versus standard of care with salvage chemotherapy followed by autologous stem cell transplantation as second-line treatment in patients with relapsed or refractory large B-cell lymphoma (TRANSFORM): results from an interim analysis of an open-label, randomised, phase 3 trial. Lancet. 2022;399(10343):2294-2308.
4 Locke FL, Miklos DB, Jacobson CA, et al.; for all ZUMA-7 investigators and contributing Kite members. Axicabtagene ciloleucel as second-line therapy for large B-cell lymphoma. N Engl J Med. 2022;386(7):640-654.
5. Bishop MR, Dickinson M, Purtill D, et al. Second-line
ing an employee of Evidera, which received research funding from Bristol Myers Squibb; receipt of consulting fees from Bristol Myers Squibb, Gilead, and Janssen. LS reports being an employee of Evidera, which received research funding from Bristol Myers Squibb. AS reports receipt of honoraria from OncLive and PeerView Live; and research funding from Juno Therapeutics and Kite/Gilead.
Contributions
LIG, DH, NG, MH, and GH acquired the data. JB, FFL, and LP were involved in study conception or design, data analysis, and data interpretation. SG and LS analyzed and interpreted the data. AS was involved in study conception or design and acquired the data. All authors approved the final version of the manuscript.
Acknowledgments
We thank the patients and families who made this study possible and the investigators and clinical study teams who participated in the study. All authors contributed to and approved the manuscript; writing and editorial assistance were provided by John Plant, BPharm, and Stephen Gilliver, PhD, of Evidera (Sweden), and Allison Green, PhD, CMPP, of The Lockwood Group (Stamford, CT, USA), funded by Bristol Myers Squibb.
Funding
This study was funded by Juno Therapeutics, a Bristol-Myers Squibb Company.
Data-sharing statement
Bristol Myers Squibb policy on data sharing may be found at https://www.bms.com/researchers-and-partners/independent-research/data-sharing-request-process.html.
tisagenlecleucel or standard care in aggressive B-cell lymphoma. N Engl J Med. 2022;386(7):629-639.
6. Sehgal A, Hoda D, Riedell PA, et al. Lisocabtagene maraleucel as second-line therapy in adults with relapsed or refractory large B-cell lymphoma who were not intended for haematopoietic stem cell transplantation (PILOT): an open-label, phase 2 study. Lancet Oncol. 2022;23(8):1066-1077.
7 Abramson JS, Palomba ML, Gordon LI, et al. Lisocabtagene maraleucel for patients with relapsed or refractory large B-cell lymphomas (TRANSCEND NHL 001): a multicentre seamless design study. Lancet. 2020;396(10254):839-852.
8. Abramson JS, Solomon SR, Arnason JE, et al. Lisocabtagene maraleucel (liso-cel) versus standard of care (SOC) with salvage chemotherapy followed by autologous stem cell transplantation (ASCT) as second-line (2L) treatment in patients with relapsed or refractory large B-cell lymphoma (LBCL): primary analysis of the randomized, phase 3 Transform study. Blood. 2022;140(Suppl 1):S1581-1583.
Haematologica | 109 Marzo 2024 865 ARTICLE - Liso-cel for 2L R/R LBCL: PRO from PILOT L.I. Gordon et al.
9 Cheng R, Scippa K, Locke FL, Snider JT, Jim H. Patient perspectives on health-related quality of life in diffuse large B-cell lymphoma treated with Car T-cell therapy: a qualitative study. Oncol Ther. 2022;10(1):123-141.
10 Abramson JS, Johnston PB, Kamdar M, et al. Health-related quality of life with lisocabtagene maraleucel vs standard of care in relapsed or refractory LBCL. Blood Adv. 2022;6(23):5969-5979.
11. Patrick DL, Powers A, Jun MP, et al. Effect of lisocabtagene maraleucel on HRQoL and symptom severity in relapsed/refractory large B-cell lymphoma. Blood Adv. 2021;5(8):2245-2255.
12. Elsawy M, Chavez JC, Avivi I, et al. Patient-reported outcomes in ZUMA-7, a phase 3 study of axicabtagene ciloleucel in secondline large B-cell lymphoma. Blood. 2022;140(21):2248-2260.
13. Maziarz RT, Waller EK, Jaeger U, et al. Patient-reported longterm quality of life after tisagenlecleucel in relapsed/refractory diffuse large B-cell lymphoma. Blood Adv. 2020;4(4):629-637.
14 Oerlemans S, Mols F, Nijziel MR, Lybeert M, van de Poll-Franse LV. The impact of treatment, socio-demographic and clinical characteristics on health-related quality of life among Hodgkin’s and non-Hodgkin’s lymphoma survivors: a systematic review. Ann Hematol. 2011;90(9):993-1004.
15. Kang D, Cho J, Kim IR, Kim MK, Kim WS, Kim SJ. Health-related quality of life in non-Hodgkin lymphoma survivors: a prospective cohort study. Cancer Res Treat. 2018;50(4):1051-1063.
16. Sehn LH, MacDonald D, Rubin S, et al. Bortezomib added to R-CVP is safe and effective for previously untreated advancedstage follicular lymphoma: a phase II study by the National Cancer Institute of Canada Clinical Trials Group. J Clin Oncol. 2011;29(25):3396-3401.
17 Osoba D, Rodrigues G, Myles J, Zee B, Pater J. Interpreting the significance of changes in health-related quality-of-life scores. J Clin Oncol. 1998;16(1):139-144.
18. Cocks K, King MT, Velikova G, et al. Evidence-based guidelines for interpreting change scores for the European Organisation for the Research and Treatment of Cancer Quality of Life Questionnaire Core 30. Eur J Cancer. 2012;48(11):1713-1721.
19 Hlubocky FJ, Webster K, Cashy J, Beaumont J, Cella D. The development and validation of a measure of health-related quality of life for non-Hodgkin’s lymphoma: the Functional Assessment of Cancer Therapy—Lymphoma (FACT-Lym). Lymphoma. 2013;2013:147176.
20 Hlubocky FJ, Webster K, Beaumont J, et al. A preliminary study of a health related quality of life assessment of priority symptoms in advanced lymphoma: the National Comprehensive Cancer Network-Functional Assessment of Cancer Therapy - Lymphoma Symptom Index. Leuk Lymphoma. 2013;54(9):1942-1946.
21. Pickard AS, Neary MP, Cella D. Estimation of minimally important differences in EQ-5D utility and VAS scores in cancer. Health Qual Life Outcomes. 2007;5:70.
22. Janssen B, Szende A. Population norms for the EQ-5D. In: Szende A, Janssen B, Cabases J, editors. Self-Reported Population Health: An International Perspective based on EQ-5D. Dordrecht (NL): Springer; 2014. p. 19-30.
23. Nolte S, Liegl G, Petersen MA, et al.; on behalf of the EORTC Quality of Life Group. General population normative data for the EORTC QLQ-C30 health-related quality of life questionnaire based on 15,386 persons across 13 European countries, Canada and the Unites States. Eur J Cancer. 2019;107:153-163.
24. Ernst M, Oeser A, Besiroglu B, et al. Chimeric antigen receptor (CAR) T-cell therapy for people with relapsed or refractory diffuse large B-cell lymphoma. Cochrane Database Syst Rev. 2021;9(9):CD013365.
25. Sidana S, Dueck AC, Thanarajasingam G, et al. Longitudinal patient reported outcomes with CAR-T cell therapy versus autologous and allogeneic stem cell transplant. Transplant Cell Ther. 2022;28(8):473-482.
26. Kelly JL, Pandya C, Friedberg JW, Mohile SG. Health-related quality of life in older patients following diffuse large B-cell lymphoma (DLBCL) diagnosis. Blood. 2012;120:4287.
27. Sarkozy C, Sehn LH. Management of relapsed/refractory DLBCL. Best Pract Res Clin Haematol. 2018;31(3):209-216.
Haematologica | 109 Marzo 2024 866 ARTICLE - Liso-cel for 2L R/R LBCL: PRO from PILOT L.I. Gordon et al.
ANCHOR: melflufen plus dexamethasone and daratumumab or bortezomib in relapsed/refractory multiple myeloma: final results of a phase I/IIa study
Enrique M. Ocio,1 Yvonne A. Efebera,2 Roman Hájek,3 Jan Straub,4 Vladimir Maisnar,5 JeanRichard Eveillard,6 Lionel Karlin,7 María-Victoria Mateos,8 Albert Oriol,9 Vincent Ribrag,10 Paul G. Richardson,11 Stefan Norin,12 Jakob Obermüller,12 Nicolaas A. Bakker12 and Luděk Pour13
1Hospital Universitario Marqués de Valdecilla (IDIVAL), Universidad de Cantabria, Santander, Spain; 2Department of Hematology/Oncology, Division of Blood and Marrow Transplant and Cellular Therapy, OhioHealth, Columbus, OH, USA; 3Department of Hematooncology, University Hospital Ostrava and Faculty of Medicine, University of Ostrava, Ostrava, Czech Republic; 4Všeobecná Fakultní Nemocnice, Prague, Czech Republic; 5Fourth Department of Medicine - Hematology, Charles University Hospital, Hradec Králové, Czech Republic; 6Hôpital Morvan, Brest, France; 7Department of Hematology, Centre Hospitalier Lyon-Sud, University Claude Bernard Lyon 1, Pierre-Bénite, France; 8Hospital Clinico Universitario de Salamanca/IBSAL/CIC, Salamanca, Spain; 9Institut Català d’Oncologia and Josep Carreras Research Institute, Hospital Germans Trias i Pujol, Badalona, Spain; 10Drug Development Department (DITEP), Gustave Roussy, Université Paris-Saclay, Villejuif, France; 11Dana-Farber Cancer Institute, Harvard Medical School, Boston, MA, USA; 12Oncopeptides AB, Stockholm, Sweden and 13Fakultní Nemocnice Brno, Brno, Czech Republic
Abstract
Correspondence: Enrique M. Ocio ocioem@unican.es
Received: May 8, 2023.
Accepted: August 17, 2023.
Early view: August 31, 2023.
https://doi.org/10.3324/haematol.2023.283490
Published under a CC BY license

Melphalan flufenamide (melflufen), a first-in-class, alkylating peptide-drug conjugate, demonstrated clinical benefit in combination with dexamethasone in triple-class refractory multiple myeloma (MM). The phase I/IIa ANCHOR study evaluated melflufen (30 or 40 mg) and dexamethasone (40 mg with daratumumab; 20 mg followed by 40 mg with bortezomib; dose reduced if aged ≥75 years) in triplet combination with daratumumab (16 mg/kg; daratumumab arm) or bortezomib (1.3 mg/m2; bortezomib arm) in patients with relapsed/refractory MM refractory to an immunomodulatory agent and/or a proteasome inhibitor and who had received one to four prior lines of therapy. Primary objectives were to determine the optimal dose of melflufen in triplet combination (phase I) and overall response rate (phase IIa). In total, 33 patients were treated in the daratumumab arm and 23 patients received therapy in the bortezomib arm. No dose-limiting toxicities were reported at either melflufen dose level with either combination. With both triplet regimens, the most common grade ≥3 treatment-emergent adverse events were thrombocytopenia and neutropenia; thrombocytopenia was the most common treatment-emergent adverse event leading to treatment discontinuation. In the daratumumab arm, patients receiving melflufen 30 mg remained on treatment longer than those receiving the 40-mg dose. In the daratumumab arm, the overall response rate was 73% and median progression-free survival was 12.9 months. Notably, in the bortezomib arm, the overall response rate was 78% and median progression-free survival was 14.7 months. Considering the totality of the data, melflufen 30 mg was established as the recommended dose for use with dexamethasone and daratumumab or bortezomib for future studies in relapsed/refractory MM.
Introduction
Multiple myeloma (MM) is the second most common hematologic malignancy and is a disease of terminally differentiated plasma cells.1 The introduction of newer therapies over the past few years has improved the outcome of patients with MM; however, the disease will eventually develop resistance mechanisms toward treatment, with subsequent
relapse as a result.2,3 Because MM becomes increasingly refractory as the disease progresses, and remission duration with each subsequent relapse is shorter, new therapy combinations with deeper and more prolonged responses are urgently needed.2,4
Melphalan flufenamide (melflufen) is a first-in-class, alkylating peptide-drug conjugate.5-10 Due to its high lipophilicity, melflufen is rapidly and passively taken up by tumor
Haematologica | 109 Marzo 2024 867 - Plasma Cell Disorders ARTICLE
cells. Once inside the cell, melflufen is rapidly hydrolyzed by peptidases and esterases, which leads to the intracellular distribution and enrichment of cytotoxic, hydrophilic alkylating agents (melphalan and desethyl-melflufen).8-10 Melflufen plus dexamethasone was approved for use in Europe in patients with triple-class refractory (i.e., refractory to ≥1 immunomodulatory agent, ≥1 proteasome inhibitor, and ≥1 anti-CD38 monoclonal antibody) relapsed/refractory MM (RRMM) who have received ≥3 prior lines of therapy, who have demonstrated disease progression on or after the last line of therapy, and who have progressed ≥3 years after a previous autologous stem cell transplant (ASCT), if one was received.11 Approval was based on results from the pivotal, phase II HORIZON study and was supported by results from the phase III, randomized, controlled OCEAN study.11-13
Proteasome inhibitors (e.g., bortezomib), immunomodulatory agents (e.g., lenalidomide), and anti-CD38 monoclonal antibodies (e.g., daratumumab) are standard-of-care drug classes for patients with MM,14 but development of resistance to these agents is of clinical concern. 3 Current treatment guidelines recommend triplet combination regimens when available for patients in first relapse and beyond.14 Furthermore, regimens should contain at least two new drugs to which the patient is not refractory.14,15 In preclinical studies, melflufen showed anti-myeloma activity in bortezomib-resistant MM cell lines,16 suggesting that it may also have the potential to synergize with bortezomib therapy. Thus, the ANCHOR study evaluated the safety and efficacy of the triplet combinations of melflufen plus dexamethasone and daratumumab or bortezomib.
Methods
Study design and patients
ANCHOR (OP-104; NCT03481556) was an open-label, phase I/IIa, non-comparative study investigating melflufen in combination with dexamethasone and either daratumumab or bortezomib in patients with RRMM.
Eligible patients aged ≥18 years had a prior diagnosis of MM with disease progression after one to four prior lines of therapy, were refractory to (or intolerant of) an immunomodulatory agent and/or a proteasome inhibitor, and had measurable disease at the time of screening. In the bortezomib arm, prior proteasome inhibitor therapy was allowed, but patients could not be refractory to proteasome inhibitors in the last line of therapy. In the daratumumab arm, prior anti-CD38 monoclonal antibody therapy was not allowed (see the Online Supplementary Data for full eligibility criteria).
The phase I portion of the study followed a standard 3+3 dose-escalation design. The starting dose of melflufen was 30 mg. If no dose-limiting toxicities were reported, the next cohort received melflufen 40 mg. Patients received
melflufen intravenously on day 1 of each 28-day cycle. In the daratumumab arm, patients also received daratumumab 16 mg/kg intravenously on days 2, 8, 15, and 22 in cycle 1, days 1, 8, 15, and 22 in cycle 2, days 1 and 15 in cycles 3 to 6, and day 1 in cycle 7 and beyond, and dexamethasone 40 mg on days 1, 8, 15, and 22 (reduced to 20 mg for patients aged ≥75 years). In the bortezomib arm, patients also received bortezomib 1.3 mg/m2 subcutaneously on days 1, 4, 8, and 11, and dexamethasone 20 mg on days 1, 4, 8, and 11 and 40 mg on days 15 and 22 (reduced to 12 and 20 mg, respectively, if aged ≥75 years). Patients received assigned therapy until disease progression, unacceptable toxicity, or if the patient or physician determined it was not in the patient’s best interest to continue therapy. In the phase IIa portion of the study, 20 additional efficacy-evaluable patients were planned to be treated at the recommended dose. Further details of the study design are provided in the Online Supplementary Data
The study sponsor (Oncopeptides AB) together with two authors (EMO and PGR) designed the protocol. National regulatory authorities and independent ethics committees or institutional review boards approved the study, which was conducted in accordance with the Declaration of Helsinki and the International Conference on Harmonisation and Good Clinical Practice guidelines. All patients provided written informed consent. All authors had full access to the data, participated in data interpretation, and reviewed and approved the manuscript before submission.
Endpoints and analyses
The primary objectives were to determine the optimal dose of melflufen plus dexamethasone and bortezomib or daratumumab (phase I) and to evaluate the overall response rate (ORR) of melflufen in triplet combination at the dosage determined in phase I (phase IIa). Secondary endpoints included best response, duration of response, progression-free survival (PFS), overall survival (OS), and frequency and grade of adverse events (AE). All patients were included in safety and efficacy analyses (see the Online Supplementary Data for all endpoints and statistical analyses).
Results
Patients
As of February 9, 2022, the data cutoff date, 33 patients had received therapy with melflufen, daratumumab, and dexamethasone (daratumumab arm), whereas 23 patients had received therapy with melflufen, bortezomib, and dexamethasone (bortezomib arm) in 13 sites in four countries (Czech Republic, France, Spain, USA). The study was prematurely terminated on February 23, 2022, due to financial considerations following a partial clinical hold issued by the US Food and Drug Administration for studies evaluating
Haematologica | 109 Marzo 2024 868 ARTICLE - Melflufen and dex plus dara or bortezomib in RRMM E.M. Ocio et al.
melflufen. In the daratumumab arm, patients had begun to receive therapy on April 12, 2018, and the study arm was fully enrolled at the time of study termination. Patients in the bortezomib arm had begun to receive therapy on May 7, 2018; the study was still enrolling patients at the time of study termination.
In the daratumumab arm in the dose-finding portion of the study (phase I), four patients received melflufen 30 mg and six patients received melflufen 40 mg (Online Supplementary Table S1). No dose-limiting toxicities were observed at either melflufen dose level; thus, 21 more patients were enrolled at the 40-mg dose level in the dose-expansion portion. An additional two patients received melflufen 30 mg in phase IIa due to a site error at the first dosing, and it was decided that these patients would continue with melflufen 30 mg for the remainder of the study. Among a total of 33 patients enrolled in the daratumumab arm (30 mg, n=6; 40 mg, n=27), the most common reasons for treatment discontinuation were progressive disease (30 mg, n=2 [33%]; 40 mg, n=13 [48%]) and AE (30 mg, n=1 [17%]; 40 mg, n=7 [26%]).
The dose-finding portion (phase I) of the bortezomib arm included six patients who received melflufen 30 mg and seven patients who received melflufen 40 mg ( Online Supplementary Table S1). No dose-limiting toxicities were observed at either dose of melflufen. Phase IIa enrolled nine patients into the 30-mg cohort and one patient into the 40-mg cohort due to a site error at the first dosing, but the patient continued at the 30-mg dose thereafter. Among the total of 23 patients enrolled in the bortezomib arm (30 mg, n=15; 40 mg, n=8), the most common reason for treatment discontinuation was study termination (30 mg, n=7 [47%]; 40 mg, n=3 [38%]).
The patients’ baseline characteristics and demographics are shown in Table 1. In the daratumumab arm, the median age was 63 years (range, 35-78), the median number of prior lines of therapy was 2.0 (range, 1-4), 26 patients (79%) had undergone a prior ASCT in front-line therapy, 21 patients (64%) had disease refractory to an immunomodulatory agent, and four patients (12%) had evidence of extramedullary disease. In the bortezomib arm, the median age was 70 years (range, 55-82), the median number of prior lines of therapy was 3.0 (range, 1-4); nine patients (39%) had undergone a prior ASCT in front-line therapy, 21 patients (91%) had disease refractory to an immunomodulatory agent, and four patients (17%) had evidence of extramedullary disease.
Melflufen, daratumumab, and dexamethasone (daratumumab arm)
Among 33 patients who received melflufen, dexamethasone, and daratumumab treatment in phase I and phase IIa, the most common any-grade and grade ≥3 treatment-emergent (TE)AE were thrombocytopenia (88% and 85%), neutropenia (79% and 73%), and anemia (64% and 24%) (Online
Supplementary Table S2). In total, 12 patients (36%; 30 mg, 3 [50%]; 40 mg, 9 [33%]) reported a treatment-emergent infection in association with grade ≥3 neutropenia, defined as an infection with an onset date within ±7 days of the onset and/or resolution date of a grade 3 or 4 decrease in absolute neutrophil count. No TEAE related to bleeding occurred in >10% of patients. Second primary malignancies were reported in two patients (6%). One patient (3%) with prior exposure to cyclophosphamide and a prior ASCT with high-dose melphalan had osteosarcoma while in OS follow-up, occurring 17.1 months after the first dose of study treatment and 9 months after the last dose of melflufen. One case (3%) of acute myeloid leukemia was reported in a patient with no prior exposure to cyclophosphamide who had received prior ASCT with high-dose melphalan while in OS follow-up, occurring 21.2 months after the first dose of study treatment and 3.9 months after the last dose of melflufen. Of a total of four fatal AE reported, two occurred ≤30 days after the last dose of study drug (sepsis, 30-mg group; chronic cardiac failure, 40-mg group), and two occurred >30 days after the last dose of study drug (sepsis and general physical health deterioration, both in the 40-mg group). Among these deaths, only one (the sepsis event) was considered related to melflufen by the site investigator. In the daratumumab arm, the median duration of treatment was 24.2 months (range, 0.9-44.7) in the 30-mg cohort and 6.2 months (range, 0.9-41.2) in the 40-mg cohort at a median follow-up of 34.0 months and 18.4 months, respectively (Online Supplementary Table S3). TEAE that led to melflufen dose interruptions occurred in 29 patients overall (6 of 6 patients [100%] in the 30-mg group and 23 of 27 patients [85%] in the 40-mg group) (Online Supplementary Table S4), most commonly thrombocytopenia (4 patients [67%] in the 30-mg group and 19 patients [70%] in the 40-mg group) and neutropenia (3 patients [50%] in the 30-mg group and 7 patients [26%] in the 40-mg group). The interval between doses while on the assigned melflufen dose was longer in the 30-mg group than in the 40-mg group (median interval: 35 days and 28 days, respectively), but a similar number of patients experienced at least one prolonged treatment cycle (lasting ≥32 days) in the 30-mg group as in the 40-mg group (5 of 6 patients [83%] and 21 of 27 patients [78%], respectively). A total of 12 patients (4 of 6 [67%] in the 30-mg group, 8 of 27 [30%] in the 40-mg group) experienced a prolonged treatment cycle in their first cycle, which delayed initiation of cycle 2 treatment; hematologic toxicities were the reason for treatment delay in nine of these patients (2 [33%] in the 30-mg group; 7 [26%] in the 40-mg group). TEAE leading to melflufen dose reductions occurred in three of six patients (50%) in the 30-mg group and 19 of 27 patients (70%) in the 40-mg group. At the 30-mg and 40-mg doses, the median number of cycles before the first melflufen dose reduction was 5.0 (range, 1-5) and 3.0 (range, 1-12), respectively, whereas the median number of treatment cycles after the first melflufen
Haematologica | 109 Marzo 2024 869 ARTICLE - Melflufen and dex plus dara or bortezomib in RRMM E.M. Ocio et al.
dose reduction was 9.0 (range, 1-15) and 2.0 (range, 1-19), respectively. The most common TEAE leading to study treatment discontinuation were thrombocytopenia (1 of 6 patients [17%] in the 30-mg group, 11 of 27 patients [41%] in the 40-mg group). In the 30-mg and 40-mg groups, the patients received a median of 21.5 (range, 1-45) and 6.0 (range, 1-41) treatment cycles, respectively; two patients (33%) and seven patients (26%) discontinued melflufen but continued daratumumab and dexamethasone for a median of 8.5 (range, 8-9) and 9.0 (range, 1-13) treatment cycles. In the 30-mg and 40-mg groups, red blood cell transfusions were required by 67% versus 33% of the patients, respectively, and platelets were needed by 50% versus 33% of patients, respectively. The median total cumulative dose of melflufen administered was 334 mg (range, 30-1,350) in the 30-mg group and 150 mg (range, 40-870) in the 40-
mg group (Online Supplementary Table S3). Overall, these data show that patients in the 30-mg group remained on treatment for a longer time than those in the 40-mg group, leading to higher drug exposure in the 30-mg group. In total, 24 of 33 patients achieved a partial response or better for an ORR of 73% (95% confidence interval [95% CI]: 55-87) in the overall population (i.e., 30-mg and 40mg groups combined), with one patient (3%) achieving a stringent complete response, two patients (6%) a complete response, eight patients (24%) a very good partial response, and 13 patients (39%) a partial response (Table 2). A ≥25% reduction in M-protein was observed in 28 of 33 (85%) patients (Online Supplementary Figure S1). The median duration of response was 12.0 months (95% CI: 7.6-24.2) (Online Supplementary Figure S2). At a median follow-up of 30.2 months, the median PFS was 12.9 months
Triplet regimen evaluated Melflufen, dexamethasone, daratumumab Melflufen, dexamethasone, bortezomib
aCytogenetics identified by fluorescent in situ hybridization and karyotype at study entry. bIn total, 29 patients (5 [83%] in the 30-mg group; 24 [89%] in the 40-mg group) in the daratumumab arm and 20 patients (15 [100%] in the 30-mg group; 5 [63%] in the 40-mg group) in the bortezomib arm had been exposed to an alkylator. cDouble refractory was defined as refractory to both an immunomodulatory agent and a proteasome inhibitor. dFailure to achieve at least a minimal response or progression on therapy within 60 days of the last dose of treatment. ECOG PS: Eastern Cooperative Oncology Group performance status; ISS: International Staging System; ASCT: autologous stem cell transplantation.
Haematologica | 109 Marzo 2024 870 ARTICLE - Melflufen and dex plus dara or bortezomib in RRMM E.M. Ocio et al.
Table 1. Baseline patient and disease characteristics.
Melflufen dose 30 mg N=6 40 mg N=27 Overall N=33 30 mg N=15 40 mg N=8 Overall N=23 Age in years, median (range) 57 (49-78) 66 (35-77) 63 (35-78) 70 (55-82) 71 (61-76) 70 (55-82) Female, N (%) 3 (50) 8 (30) 11 (33) 7 (47) 1 (13) 8 (35) Time since diagnosis in years, median (range) 3.1 (1.9-8.0) 3.9 (0.7-15.6) 3.8 (0.7-15.6) 5.8 (1.4-10.7) 2.0 (1.2-8.0) 5.1 (1.2-10.7) ECOG PS, N (%) 0 1 2 3 (50) 2 (33) 1 (17) 11 (41) 14 (52) 2 (7) 14 (42) 16 (48) 3 (9) 7 (47) 7 (47) 1 (7) 2 (25) 6 (75) 0 9 (39) 13 (57) 1 (4) ISS at study entry, N (%) I II III 6 (100) 0 0 20 (74) 4 (15) 3 (11) 26 (79) 4 (12) 3 (9) 10 (67) 3 (20) 2 (13) 5 (63) 2 (25) 1 (13) 15 (65) 5 (22) 3 (13) Cytogenetic risk group, N (%)a High risk Standard risk Unknown 3 (50) 1 (17) 2 (33) 12 (44) 3 (11) 12 (44) 15 (45) 4 (12) 14 (42) 6 (40) 3 (20) 6 (40) 3 (38) 1 (13) 4 (50) 9 (39) 4 (17) 10 (43) Extramedullary disease, N (%) 0 4 (15) 4 (12) 3 (20) 1 (13) 4 (17) Previous lines of therapy, median (range) 2.5 (1-3) 2.0 (1-4) 2.0 (1-4) 4.0 (2-4) 2.5 (1-4) 3.0 (1-4) Prior ASCT, N (%) As front-line therapy As salvage therapy 5 (83) 2 (33) 21 (78) 4 (15) 26 (79) 6 (18) 6 (40) 1 (7) 3 (38) 1 (13) 9 (39) 2 (9) Refractory to prior therapy, N (%) Alkylatorb Anti-CD38 monoclonal antibody Immunomodulatory agent Proteasome inhibitor Double refractoryc Last lined 3 (50) 1 (17) 0 3 (50) 0 0 3 (50) 21 (78) 3 (11) 0 18 (67) 15 (56) 12 (44) 18 (67) 24 (73) 4 (12) 0 21 (64) 15 (45) 12 (36) 21 (64) 15 (100) 3 (20) 5 (33) 15 (100) 3 (20) 3 (20) 13 (87) 7 (88) 1 (13) 2 (25) 6 (75) 1 (13) 1 (13) 6 (75) 22 (96) 4 (17) 7 (30) 21 (91) 4 (17) 4 (17) 19 (83)
(95% CI: 7.7-15.4) (Figure 1A). At a median follow-up of 32.8 months, the median OS was 26.1 months (95% CI: 16.4-not estimable) (Figure 1B). Of four patients with extramedullary disease, four (100%) achieved a partial response or better while on therapy with melflufen (40 mg), daratumumab, and dexamethasone.
Melflufen, bortezomib, and dexamethasone (bortezomib arm)
The most common any-grade and grade ≥3 TEAE among the 23 patients who received therapy in the bortezomib arm were thrombocytopenia (91% and 87%, respectively), neutropenia (78% and 48%, respectively), and anemia (70% and 43%, respectively) (Online Supplementary Table S5).
In total, nine patients (39% overall; 5 of 15 [33%] in the 30-mg group; 4 of 8 [50%] in the 40-mg group) reported a treatment-emergent infection in association with grade ≥3 neutropenia. TEAE related to bleeding occurred in <10% of
Best confirmed response, N (%)
Stringent complete response
Complete response
Very good partial response
Partial response
Minimal response
Stable disease
Progressive disease
Missing
aIn the daratumumab arm, five patients had unconfirmed responses: one progressive disease, two stable disease, one partial response, and one not evaluable (no response assessment). bIn the bortezomib arm, one patient had an unconfirmed best response of stable disease. ORR: overall response rate; 95% CI: 95% confidence interval.
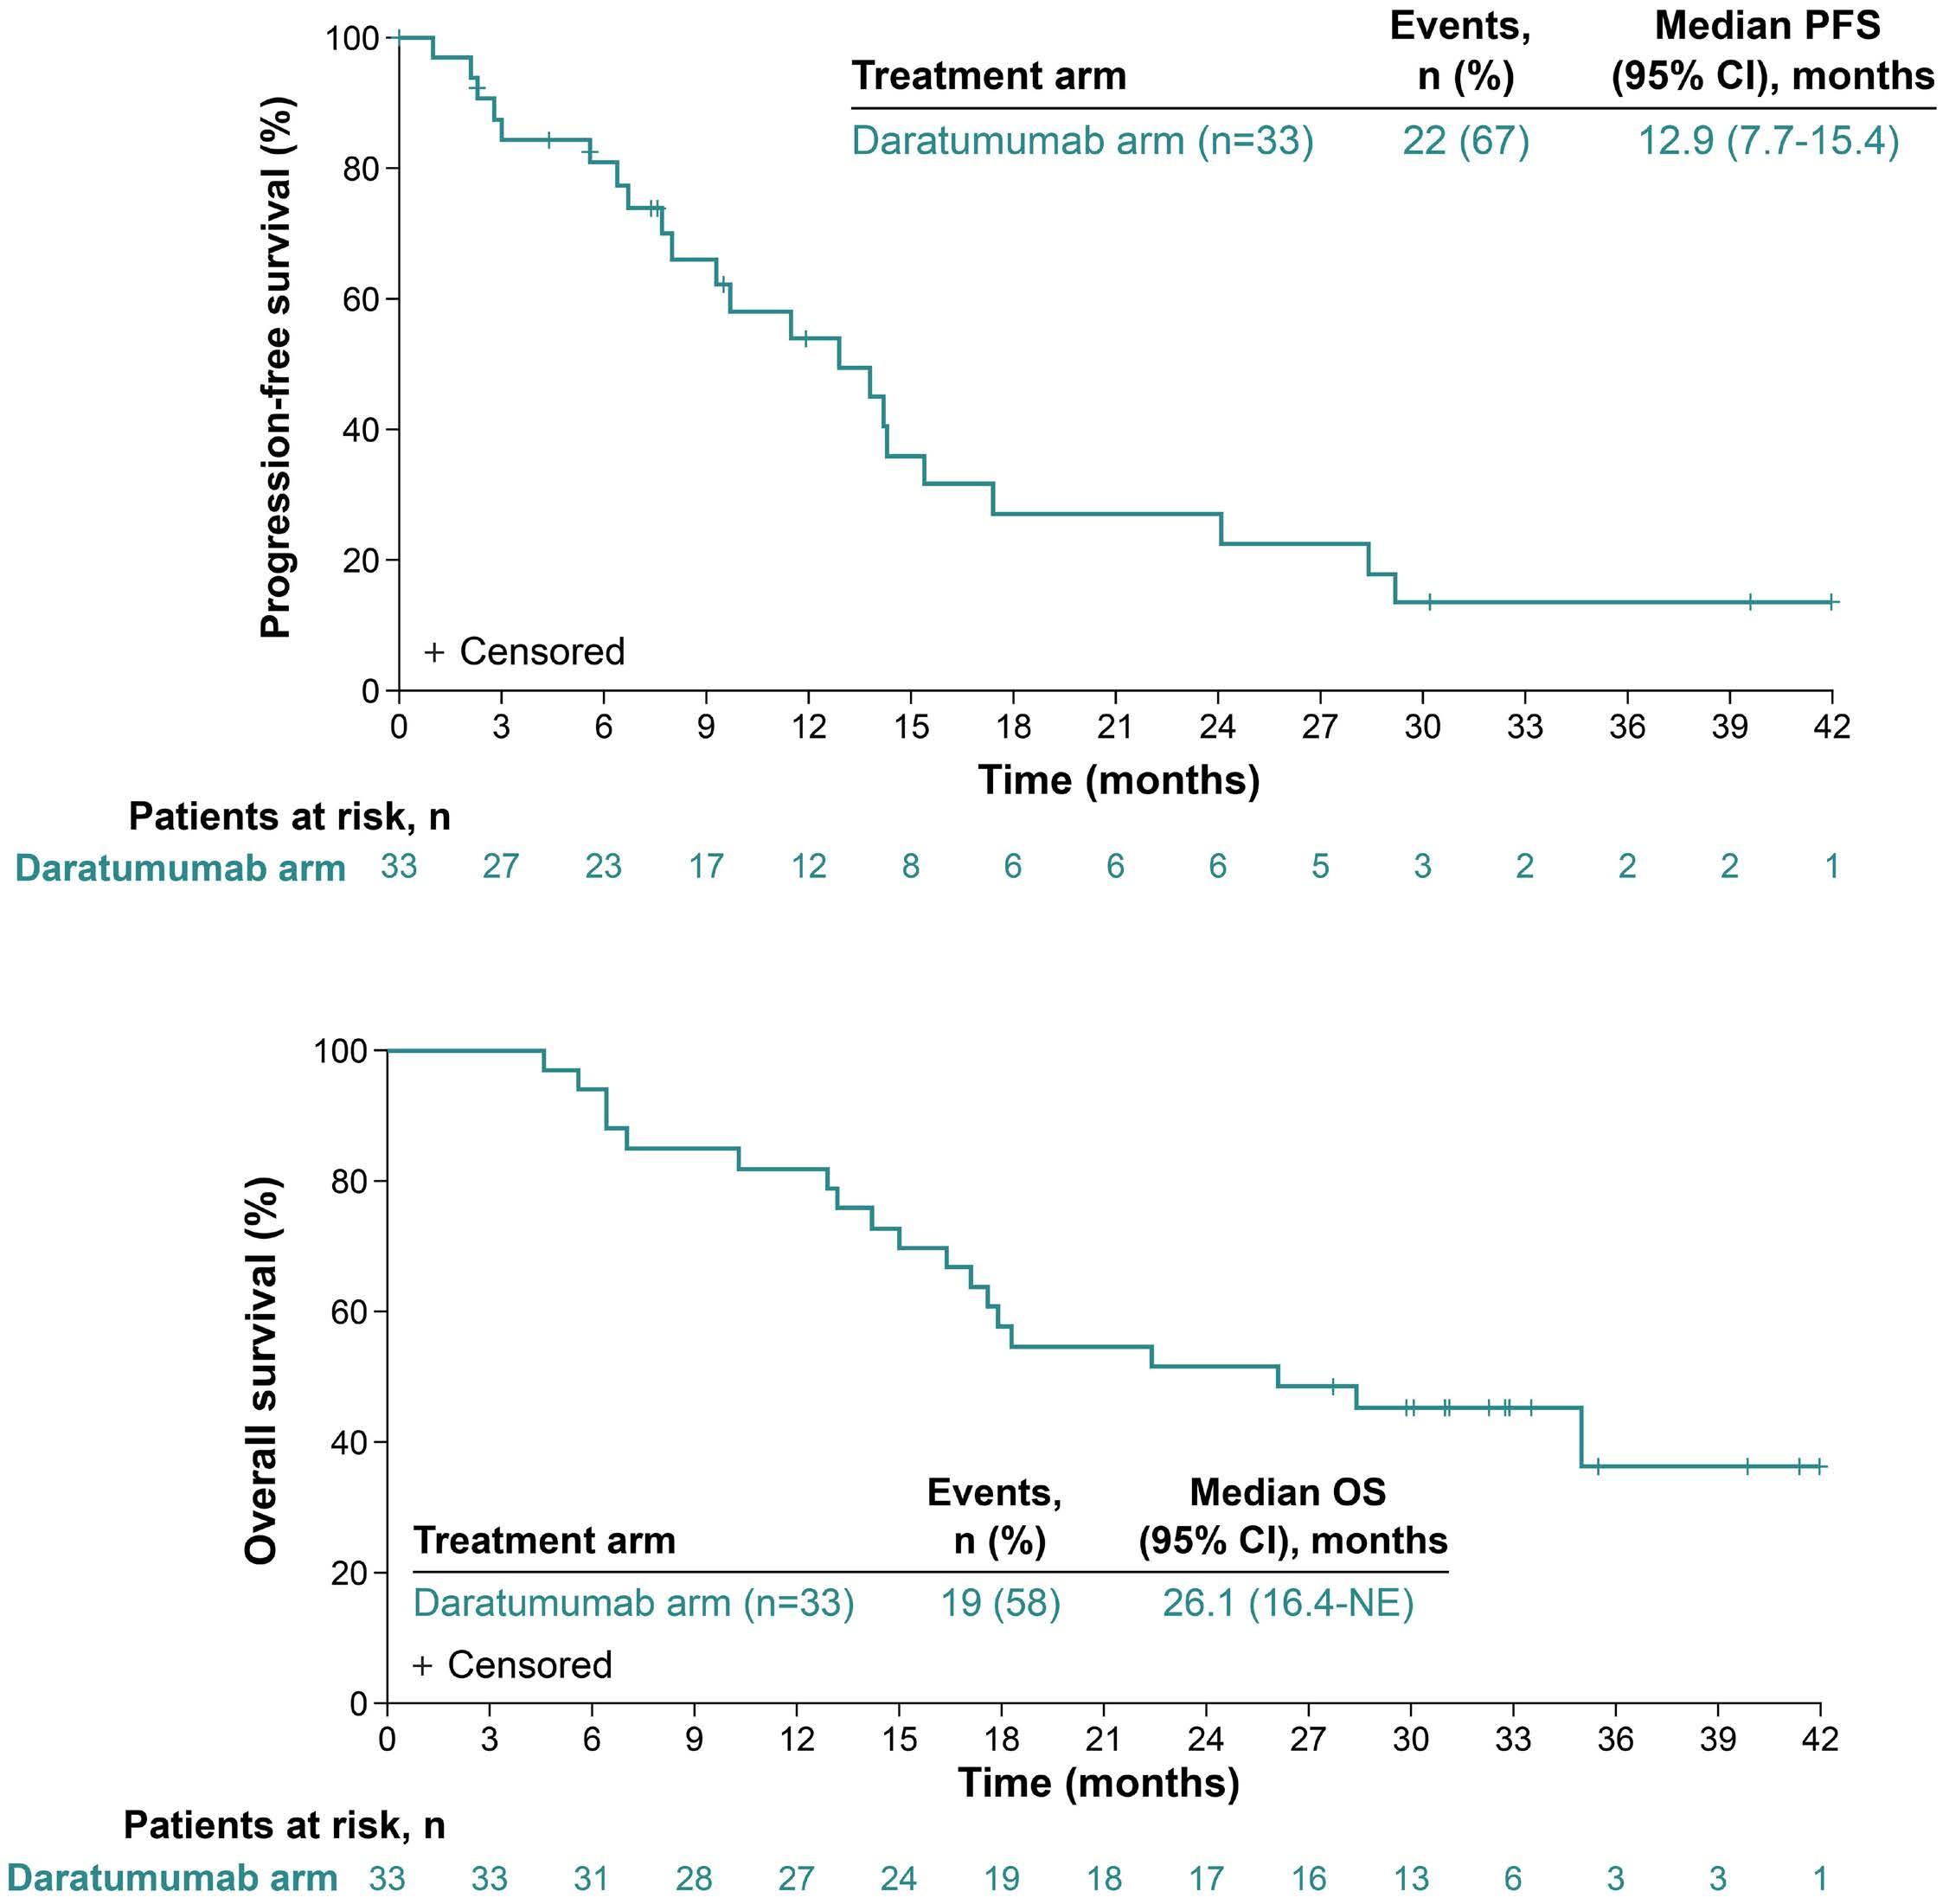
Haematologica | 109 Marzo 2024 871 ARTICLE - Melflufen and dex plus dara or bortezomib in RRMM E.M. Ocio et al.
Response category Daratumumab arm N=33 Bortezomib arm N=23
1 (3) 2 (6) 8 (24) 13 (39) 1 (3) 2 (6) 1 (3) 5 (15)a 1 (4) 1 (4) 5 (22) 11 (48) 1 (4) 3 (13) 0 1 (4)b
24 (73)
18 (78)
ORR, N (%) [95% CI]
[55-87]
[56-93]
Table 2. Overall response rate.
A B
Figure 1. Survival outcomes with melflufen, daratumumab, and dexamethasone (daratumumab arm). (A) Progression-free survival. (B) Overall survival. PFS: progression-free survival; 95% CI: 95% confidence interval; OS: overall survival; NE: not estimable.
patients. No secondary primary malignancies were reported. In total, three fatal AE were reported ≤30 days after the last dose of study drug (COVID-19 pneumonia, 1 event each in the 30-mg and 40-mg groups; chronic cardiac failure, 1 event in the 30-mg group). No fatal AE were reported >30 days after the last dose of study drug. None of the fatal AE was considered related to melflufen.
In the bortezomib arm, at a median follow-up of 9.0 months and 22.9 months, treatment duration was 8.2 months (range, 2.9-40.0) in the 30-mg group and 11.8 months (range, 2.134.7) in the 40-mg group (Online Supplementary Table S3). In total, 19 of 23 patients (83%) who received therapy in the bortezomib arm experienced at least one TEAE leading to dose interruptions of melflufen (Online Supplementary Table S4), most commonly thrombocytopenia (5 of 15 patients [33%] in the 30-mg group and 7 of 8 patients [88%] in the 40-mg group) and neutropenia (3 patients [20%] in the 30mg group and 3 patients [38%] in the 40-mg group). In total, 19 patients (11 of 15 [73%] in the 30-mg group; 8 of 8 [100%] in the 40-mg group) experienced at least one prolonged treatment cycle (lasting ≥32 days) at some time and ten patients (5 [33%] in the 30-mg group and 5 [63%] in the 40-mg group) experienced a prolonged treatment cycle in their first treatment cycle, with the reason for the delayed initiation of cycle 2 being a hematologic toxicity in four of the ten patients (1 [7%] in the 30-mg group; 3 [38%] in the 40-mg group). TEAE leading to dose reductions occurred in eight of 15 patients (53%) in the 30-mg group and six of eight patients (75%) in the 40-mg group. At the 30-mg and 40-mg doses, the median number of cycles before the first melflufen dose reduction was 4.5 (range, 1-28) and 2.0 (range, 1-6), respectively, whereas the median number of treatment cycles after the first melflufen dose reduction was 5.0 (range, 3-18) and 5.5 (range, 2-16). The most common TEAE leading to study treatment discontinuation was thrombocytopenia (in 1 of 15 [7%] patients in the 30-mg group and in 2 of 8 [25%] patients in the 40-mg group). Patients in the bortezomib arm received a median of 8.0 (range, 3-35) and 9.5 (range, 2-31) treatment cycles in the 30-mg and 40-mg groups, respectively (Online Supplementary Table S3). In the 30-mg and 40-mg groups, red blood cell transfusions were required by 47% versus 50% and platelets by 40% versus 50% of patients, respectively. The median total cumulative dose of melflufen administered was 210 mg (range, 90-940) in the 30-mg group and 225 mg (range, 80-1,240) in the 40-mg group. Overall, these data show that treatment duration and melflufen exposure were similar between the 30-mg and 40-mg groups. Among 23 patients in the bortezomib arm, 18 achieved a partial response or better for an ORR of 78% (95% CI: 56-93), with one patient (4%) each achieving a stringent complete response and complete response, five patients (22%) a very good partial response, and 11 patients (48%) a partial response (Table 2). A ≥25% reduction in M-protein was observed in 20 of 23 (87%) of patients (Online Supple-
mentary Figure S3). The median duration of response was 15.8 months (95% CI: 5.8-not estimable) (Online Supplementary Figure S4). At a median follow-up of 21.0 months, the median PFS was 14.7 months (95% CI: 8.5-33.5) (Figure 2A). At a median follow-up of 17.6 months, OS data were immature, with 17 patients (74%) alive as of the data cutoff date (Figure 2B). Among four patients with extramedullary disease, two (50%) achieved a partial response or better while on therapy with melflufen, bortezomib, and dexamethasone (30-mg group, n=1; 40-mg group, n=1).
Discussion
The ANCHOR study builds on the doublet backbone of melflufen plus dexamethasone evaluated in previous clinical studies in heavily pretreated patients with RRMM12,17 and adds a third agent, daratumumab or bortezomib, to demonstrate the potential of melflufen in a triplet combination therapy. In the daratumumab combination arm, no dose-limiting toxicities were observed at either the 30-mg or 40-mg dose level in the phase I part of the study. The safety profile of melflufen in triplet combination with daratumumab was consistent with previous reports, with any-grade and grade ≥3 TEAE primarily being hematologic and clinically manageable with dose reductions, dose delays, and supportive interventions such as red blood cell and platelet transfusions.12,13,17 In the daratumumab arm, the most common any-grade non-hematologic TEAE was fatigue, with the most common grade ≥3 non-hematologic TEAE being pneumonia and influenza. These safety results, including rates of grade ≥3 infections, are also comparable with those of other clinical studies investigating triplet combinations with daratumumab in patients with RRMM who had received ≥1 prior lines of therapy, albeit with higher rates of thrombocytopenia observed in the present study.18-22 Overall, the frequency of hematologic toxicity in early cycles was higher in the 40-mg group than in the 30-mg group, which prevented new cycle initiation, led to earlier and longer (≥2 weeks) cycle delays, greater melflufen dose reductions, and increased discontinuation of therapies due to AE with melflufen 40 mg. In contrast, patients in the 30-mg group stayed on treatment longer at the assigned melflufen dose without dose reductions and continued treatment for a longer time with melflufen after their first dose reduction, which, collectively, led to higher drug exposure in the 30-mg group. Furthermore, two of the four patients (50%) in the 30-mg group who had a prolonged treatment cycle in their first cycle had hematologic toxicity preventing initiation of cycle 2 compared with seven of eight patients (88%) in the 40mg group. Notably, the number of missed daratumumab doses was small, thus not affecting treatment intensity in a substantial way.
The triplet combination of melflufen, daratumumab, and
Haematologica | 109 Marzo 2024 872 ARTICLE - Melflufen and dex plus dara or bortezomib in RRMM E.M. Ocio et al.
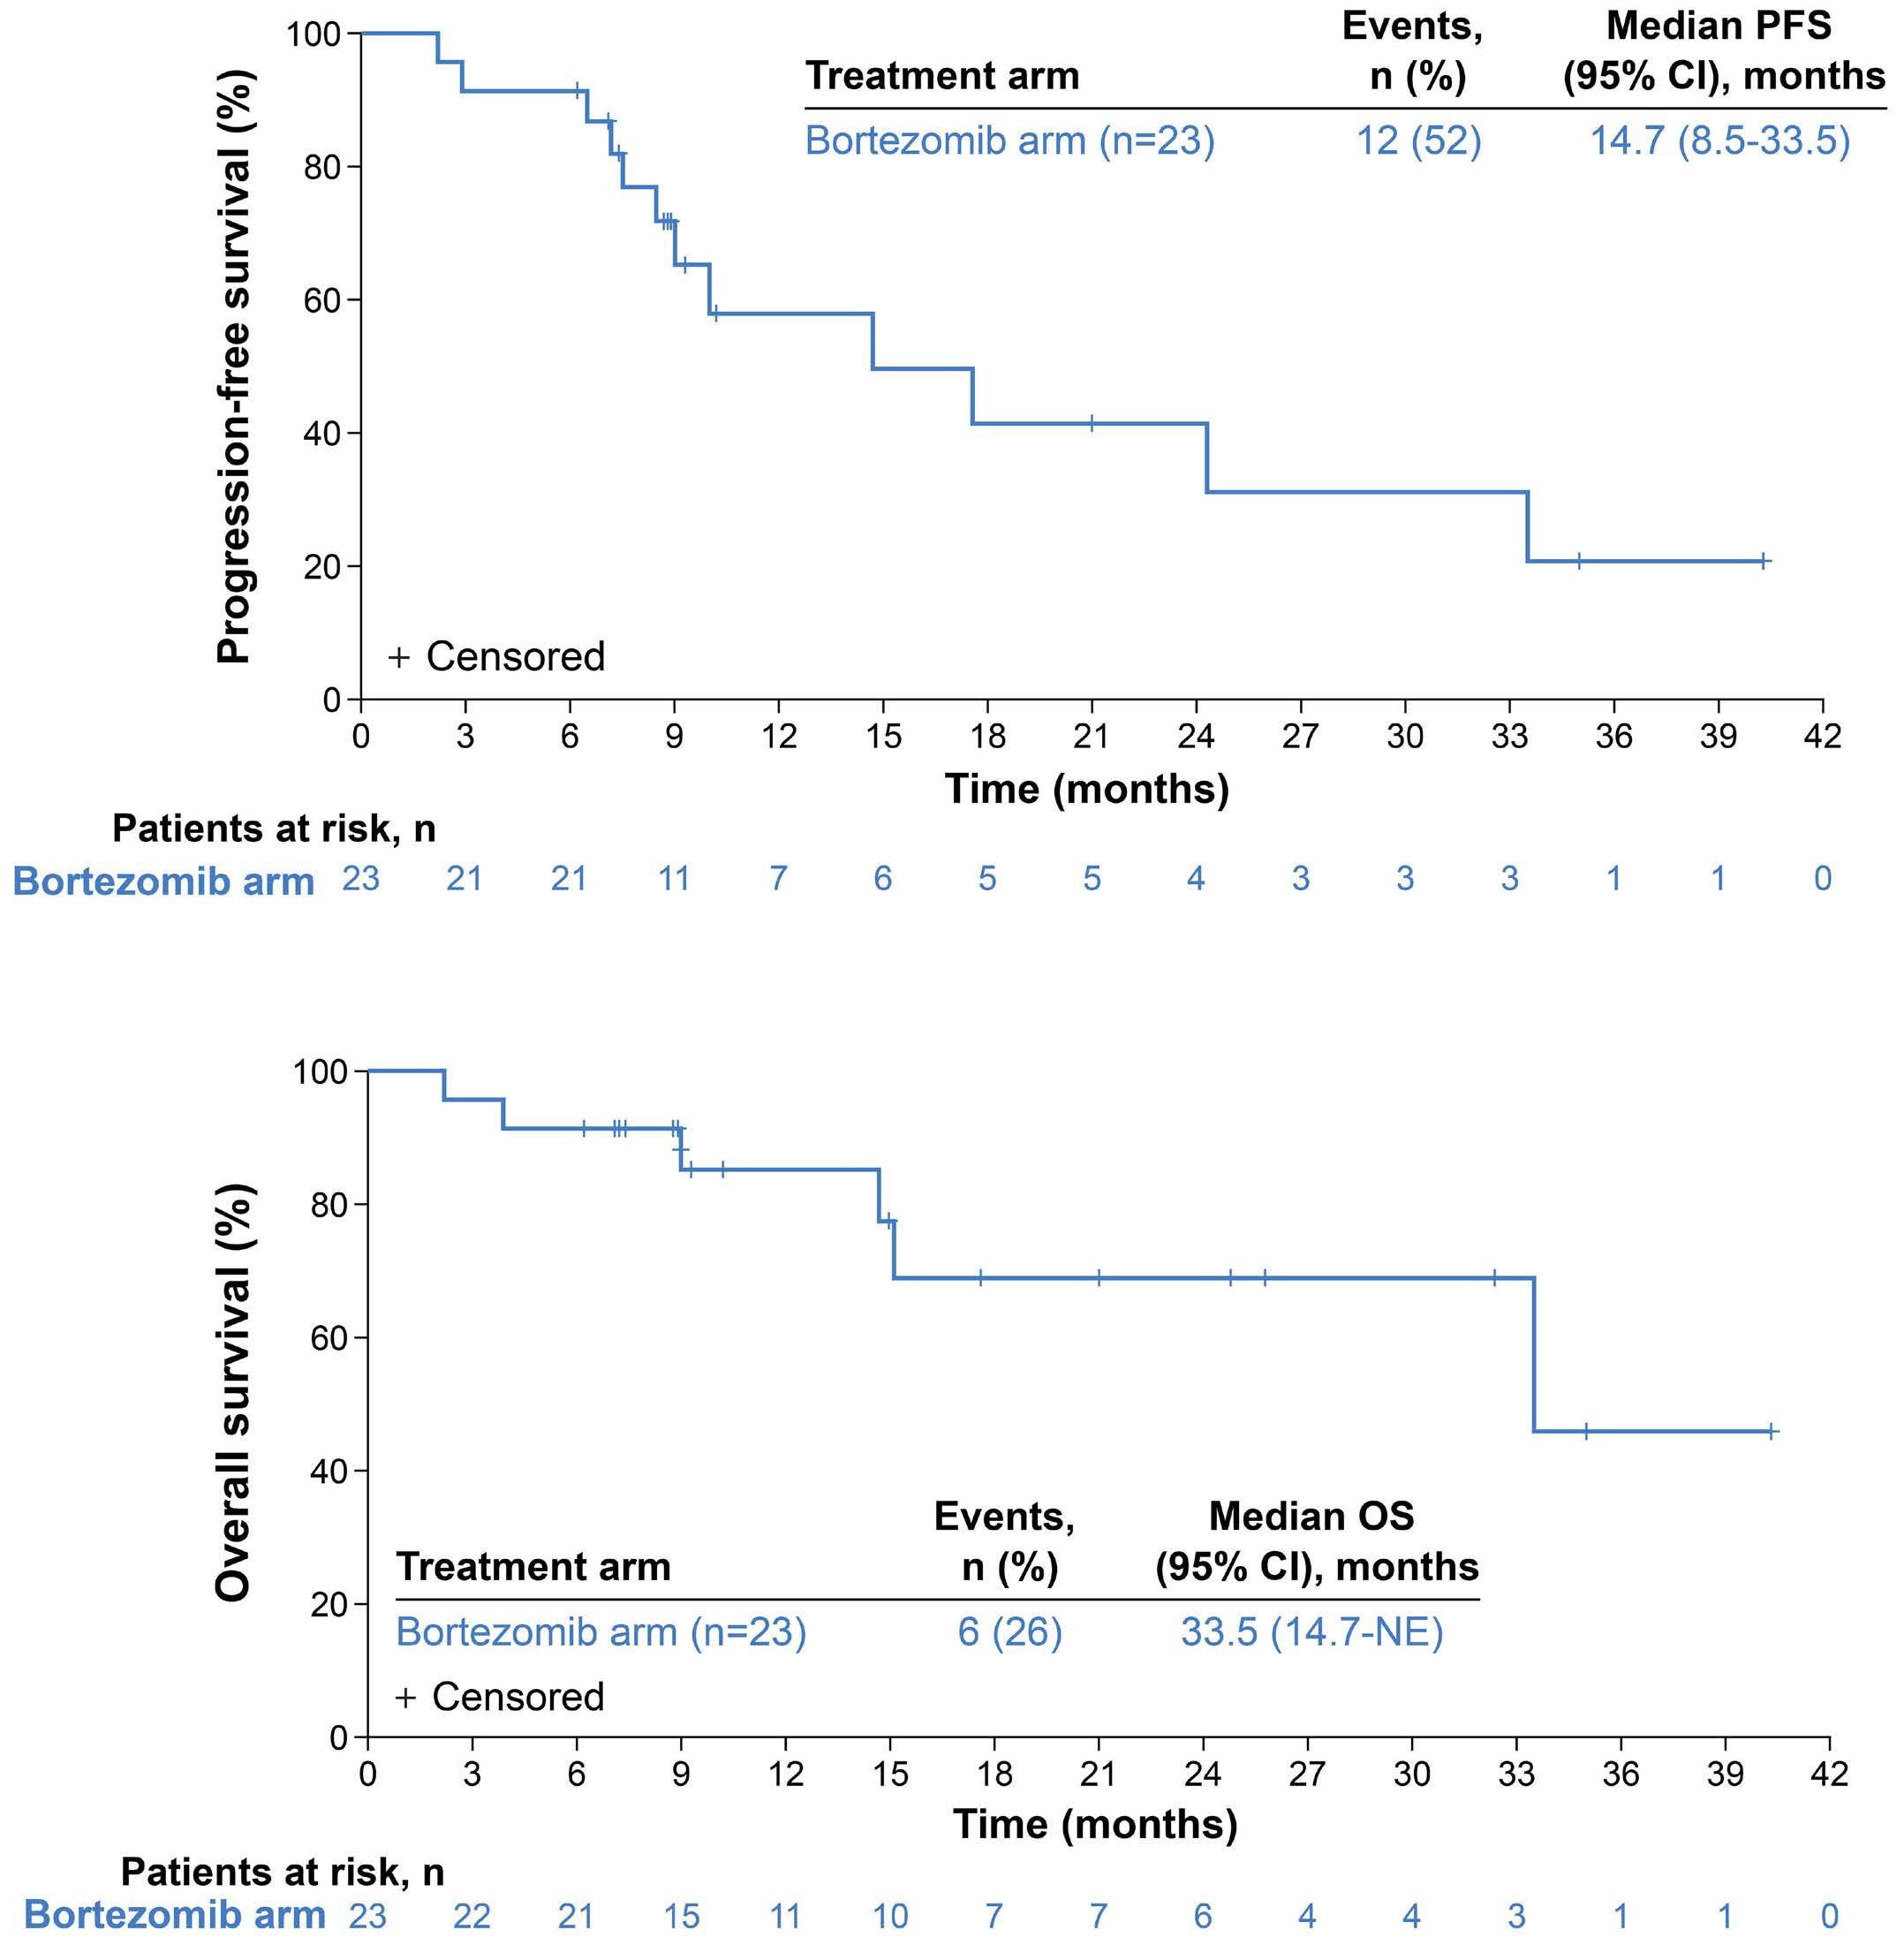
dexamethasone resulted in encouraging clinical responses that were durable. The ORR of 73% was comparable to those of larger phase III studies, such as the ICARIA-MM study of isatuximab plus pomalidomide and dexamethasone in patients with RRMM who had received a median of three prior lines of therapy and in the APOLLO study of daratumumab plus pomalidomide and dexamethasone in patients with RRMM who had received a median of two prior lines of therapy, which showed ORR of 60% and 69%, respectively.22,23 The median PFS of 12.9 months was also comparable to that observed in the APOLLO and ICARIA-MM studies (12.4 and 11.5 months, respectively).22,23 Overall, similar total drug exposure and efficacy results were observed with melflufen 30 mg and 40 mg, with more frequent early dose adjustments and discontinuations due to hematologic AE at the 40-mg dose level, leading to melflufen 30 mg being selected as the recommended dose in combination with dexamethasone and daratumumab in patients with RRMM.
The triplet combination of melflufen, bortezomib, and dexamethasone also showed promising clinical activity and a manageable safety profile. No dose-limiting toxicities were reported with either melflufen dose (30 mg or 40 mg). The safety profile of melflufen, bortezomib, and dexamethasone was consistent with that of other triplet combinations with a proteasome inhibitor backbone in patients with RRMM, albeit with higher rates of hematologic toxicities but lower rates of peripheral neuropathy.20,24,25 Similar to the daratumumab arm, hematologic toxicities were clinically manageable with dose reductions, dose delays, and supportive care (red blood cell and platelet transfusions). As with the daratumumab combination, the triplet combination of melflufen, bortezomib, and dexamethasone resulted in high clinical response rates (ORR of 78%), and responses were durable. These response rates were comparable to those reported in phase III studies in patients with RRMM who had received fewer lines of therapy, including the BOSTON
Haematologica | 109 Marzo 2024 873 ARTICLE - Melflufen and dex plus dara or bortezomib in RRMM E.M. Ocio et al.
A B
Figure 2. Survival outcomes with melflufen, bortezomib, and dexamethasone (bortezomib arm). (A) Progression-free survival. (B) Overall survival. 95% CI: PFS: progression-free survival; 95% confidence interval; OS: overall survival; NE: not estimable.
study of selinexor, bortezomib, and dexamethasone (ORR, 76%; median 2 prior lines of therapy) and the OPTIMISMM study of pomalidomide, bortezomib, and dexamethasone (ORR, 82%; median 2 prior lines of therapy).24,26 Similarly, the median PFS of 14.7 months observed in our study was comparable to that seen in the BOSTON and OPTIMISMM studies (13.9 and 11.2 months, respectively); however, the small sample size in our study (early termination of the bortezomib arm) precludes effective comparison.24,26 Based on the overall data for the bortezomib arm, including the higher incidence of hematologic toxicities leading to dose adjustments or treatment discontinuation with the 40mg dose of melflufen, the 30-mg dose was chosen as the recommended dose of melflufen for use in triplet combination with bortezomib and dexamethasone. However, small numbers of patients, differences in baseline characteristics (e.g., median prior lines of therapy and proportion exposed to previous alkylator therapy) and differences in follow-up times (median follow-up was 2.5 times longer in the 40mg group) between the melflufen dose groups may be confounding factors.
In summary, the safety profile of melflufen in triplet combinations with daratumumab or bortezomib was consistent with the known safety profile of melflufen, namely primarily hematologic AE that were clinically manageable with dose reductions, dose delays, and supportive care, and no treatment-related mortalities were reported, as assessed by the study steering committee. Response rates reported in this study with melflufen, dexamethasone, and daratumumab indicate a clinically meaningful effect of melflufen at a dose of either 30 mg or 40 mg. Response rates observed in patients with extramedullary disease were also highly encouraging. Taken together, melflufen 30 mg plus daratumumab and dexamethasone constitutes the optimal combination regimen and was pursued in the randomized, controlled, open-label, phase III LIGHTHOUSE study (OP108; NCT04649060) in patients with relapsed MM or RRMM who had received at least three prior lines of therapy, including a proteasome inhibitor and an immunomodulatory agent, or who were double refractory to a proteasome inhibitor and an immunomodulatory agent. Unfortunately, the LIGHTHOUSE study was also terminated prematurely due to resource considerations resulting from the clinical trial hold issued by the US Food and Drug Administration. Despite this, topline efficacy results from LIGHTHOUSE were very encouraging (superior PFS and ORR with melflufen, daratumumab, and dexamethasone vs. daratumumab), and the safety profile of melflufen in triplet combination with daratumumab was consistent with this report.27 Lastly, results from ANCHOR suggest that the combination of melflufen, bortezomib, and dexamethasone also has meaningful clinical activity and a manageable safety profile in patients with RRMM, supporting the translation of these results, as well as those seen in the LIGHTHOUSE study, to real-world practice. 28
Disclosures
EMO reports consulting or an advisory role for Amgen, AbbVie, Bristol Myers Squibb, GlaxoSmithKline, Janssen, Karyopharm, Menarini-Stemline, Mundipharma, Oncopeptides, Sanofi, Secura Bio, and Takeda; meeting and/or travel expenses from Bristol Myers Squibb, GlaxoSmithKline, Janssen, Lilly, and Sanofi; and honoraria from Amgen, Asofarma, Bristol Myers Squibb, GlaxoSmithKline, Janssen, MSD, Pfizer, Sanofi, and Takeda. YAE reports speakers’ bureau fees from Adaptive, Alnylam, Janssen, Oncopeptides, and Takeda; advisory board work for and honoraria from Alnylam, GlaxoSmithKline, Janssen, Oncopeptides, Sanofi, and Takeda; sitting on independent adjudication committees for Orca and Takeda; and research support from Bristol Myers Squibb/Celgene. RH reports receiving consultancy fees from AbbVie, Amgen, Bristol Myers Squibb, Celgene, Janssen, Pharma MAR, Novartis, and Takeda; research funding from Amgen, Celgene, Janssen, and Novartis; being a member of the Board of Directors or advisory committees for Amgen and Takeda; and honoraria from AbbVie, Bristol Myers Squibb, Celgene, and Takeda. VM reports honoraria from Amgen, Bristol Myers Squibb/Celgene, Janssen, Sanofi, and The Binding Site; consulting or advisory role for Amgen, Bristol Myers Squibb/Celgene, Janssen, and Sanofi; and speakers’ bureau fees from Amgen, Bristol Myers Squibb/Celgene, Janssen, Sanofi, and The Binding Site. J-RE reports congress travel, accommodation, and other expenses from Amgen, Celgene, Janssen, and Novartis. LK reports honoraria from AbbVie, Amgen, Bristol Myers Squibb/Celgene, GlaxoSmithKline, Janssen, Oncopeptides, and Takeda; meeting and/or travel expenses from Amgen, Janssen, and Takeda; and being a member of advisory boards for Amgen, Celgene, GlaxoSmithKline, Janssen, and Takeda. M-VM reports payment or honoraria for lectures, presentations, speakers’ bureau, manuscript writing, or educational events from Amgen, Bristol Myers Squibb/Celgene, GlaxoSmithKline, Janssen, Pfizer, Sanofi, and Takeda and participation in a Data Safety Monitoring Board or advisory board for Amgen, Bristol Myers Squibb/Celgene, GlaxoSmithKline, Janssen, Oncopeptides, Pfizer, Regeneron, Sanofi, and Takeda. AO reports consulting or an advisory role for Bristol Myers Squibb, GlaxoSmithKline, and Sanofi; and participation in speakers’ bureau for Amgen, Bristol Myers Squibb, and Sanofi. VR reports personal fees from AstraZeneca, Bristol Myers Squibb, Gilead, Incyte, Infinity, MSD, NanoString, and Roche; grants from Argen-X and GlaxoSmithKline; and non-financial support from Astex. PGR reports grants from or contracts with Bristol Myers Squibb/Celgene, Oncopeptides, Karyopharm, and Takeda; and consulting fees from AstraZeneca, Bristol Myers Squibb/Celgene, GlaxoSmithKline, Janssen, Karyopharm, Protocol Intelligence, Regeneron, Sanofi, Secura Bio, and Takeda. SN reports employment and equity ownership with Oncopeptides. JO reports employment with Oncopeptides. NAB reports employment and holding stock or stock options with Oncopeptides. JS and LP have no conflicts of interest to disclose.
Haematologica | 109 Marzo 2024 874 ARTICLE - Melflufen and dex plus dara or bortezomib in RRMM E.M. Ocio et al.
Contributions
The study sponsor (Oncopeptides AB), EMO, and PGR designed the protocol. EMO, YAE, RH, JS, VM, J-RE, LK, M-VM, AO, VR, PGR, and LP treated the patients and collected the data. SN, JO, and NAB analyzed the data, and a Data Safety Monitoring Committee monitored the overall conduct of the study. All authors had access to the data; contributed to the writing, editing, data analysis, and interpretation of the paper; reviewed the manuscript and approved its submission; and are accountable for all aspects of the work.
Acknowledgments
We thank the patients and their families for participating in this trial and the trial investigators and coordinators for their contributions to the trial. We thank Jared D. Hoffman, PhD, and Katherine Mills-Lujan, PhD, CMPP, of Team 9 Science for providing medical editorial assistance under the guidance of the authors, in accordance with Good Publications Practice (GPP) 2022 guidelines.
Funding
Funding for the study (ClinicalTrials.gov identifier: NCT04649060) and for editorial assistance was provided by Oncopeptides AB.
Data-sharing statement
Oncopeptides commits to sharing clinical study data with qualified researchers to enable enhancement of public health. As such, Oncopeptides will share anonymized patient-level
References
1. Kumar SK, Rajkumar V, Kyle RA, et al. Multiple myeloma. Nat Rev Dis Primers. 2017;3:17046.
2. Kumar SK, Dimopoulos MA, Kastritis E, et al. Natural history of relapsed myeloma, refractory to immunomodulatory drugs and proteasome inhibitors: a multicenter IMWG study. Leukemia. 2017;31(11):2443-2448.
3. Robak P, Drozdz I, Szemraj J, Robak T. Drug resistance in multiple myeloma. Cancer Treat Rev. 2018;70:199-208.
4. Gandhi UH, Cornell RF, Lakshman A, et al. Outcomes of patients with multiple myeloma refractory to CD38-targeted monoclonal antibody therapy. Leukemia. 2019;33(9):2266-2275.
5. Chauhan D, Ray A, Viktorsson K, et al. In vitro and in vivo antitumor activity of a novel alkylating agent, melphalanflufenamide, against multiple myeloma cells. Clin Cancer Res. 2013;19(11):3019-3031.
6. Ray A, Ravillah D, Das DS, et al. A novel alkylating agent melflufen induces irreversible DNA damage and cytotoxicity in multiple myeloma cells. Br J Haematol. 2016;174(3):397-409.
7. Strese S, Wickstrom M, Fuchs PF, et al. The novel alkylating prodrug melflufen (J1) inhibits angiogenesis in vitro and in vivo. Biochem Pharmacol. 2013;86(7):888-895.
8. Gullbo J, Tullberg M, Vabeno J, et al. Structure-activity relationship for alkylating dipeptide nitrogen mustard derivatives. Oncol Res. 2003;14(3):113-132.
9. Wickström M, Nygren P, Larsson R, et al. Melflufen - a
data on request or if required by law or regulation. Qualified scientific and medical researchers can request patient-level data for studies of Oncopeptides’ pharmaceutical substances listed on ClinicalTrials.gov and approved by health authorities in the USA and European Union. Patient-level data for studies of newly approved pharmaceutical substances or indications can be requested 9 months after US Food and Drug Administration and European Medicines Agency approval. Such requests are assessed at Oncopeptides’ discretion, and the decisions depend on the scientific merit of the proposed request, data availability, and the purpose of the proposal. The applicants should be willing to submit both positive and negative findings to a scientific journal. If Oncopeptides agrees to share clinical data for research purposes, the applicant is required to sign an agreement for data sharing before data release to ensure that the patients’ data are deidentified. In case of any risk of re-identification on anonymized data despite measures to protect patients’ confidentiality, the data will not be shared. The patients’ informed consent will always be respected. If the anonymization process will provide futile data, Oncopeptides will have the right to refuse the request. Oncopeptides will provide access to patient-level clinical trial analysis datasets in a secured environment upon execution of the data-sharing agreement. Oncopeptides will also provide the protocol, statistical analysis plan, and the clinical study report synopsis if needed. For additional information or requests for access to Oncopeptides’ clinical trial data for research purposes, please contact medinfo@ oncopeptides.com.
peptidase-potentiated alkylating agent in clinical trials. Oncotarget. 2017;8(39):66641-66655.
10. Wickström M, Viktorsson K, Lundholm L, et al. The alkylating prodrug J1 can be activated by aminopeptidase N, leading to a possible target directed release of melphalan. Biochem Pharmacol. 2010;79(9):1281-1290.
11. European Medicines Agency. Pepaxti®(melflufen): Summary of Product Characteristics (2022) https://www.ema.europa.eu/en/ documents/product-information/pepaxti-epar-productioninformation_en.pdf Accessed on July 22, 2023.
12. Richardson PG, Oriol A, Larocca A, et al. Melflufen and dexamethasone in heavily pretreated relapsed and refractory multiple myeloma. J Clin Oncol. 2021;39(7):757-767.
13. Schjesvold FH, Dimopoulos MA, Delimpasi S, et al. Melflufen or pomalidomide plus dexamethasone for patients with multiple myeloma refractory to lenalidomide (OCEAN): a randomised, head-to-head, open-label, phase 3 study. Lancet Haematol. 2022;9(2):e98-e110.
14. Dimopoulos MA, Moreau P, Terpos E, et al. Multiple myeloma: EHA-ESMO clinical practice guidelines for diagnosis, treatment and follow-up. Ann Oncol. 2021;32(3):309-322.
15. Rajkumar SV, Kumar S. Multiple myeloma current treatment algorithms. Blood Cancer J. 2020;10(9):94.
16. Byrgazov K, Besse A, Kraus M, et al. Novel peptide-drug conjugate melflufen efficiently eradicates bortezomib-resistant
Haematologica | 109 Marzo 2024 875 ARTICLE - Melflufen and dex plus dara or bortezomib in RRMM E.M. Ocio et al.
multiple myeloma cells including tumor-initiating myeloma progenitor cells. Hemasphere. 2021;5(7):e602.
17 Richardson P, Bringhen S, Voorhees P, et al. Melflufen plus dexamethasone in relapsed and refractory multiple myeloma (O-12-M1): a multicentre, international, open-label, phase 1–2 study. Lancet Haematol. 2020;7(5):e395-e407.
18. Chari A, Suvannasankha A, Fay JW, et al. Daratumumab plus pomalidomide and dexamethasone in relapsed and/or refractory multiple myeloma. Blood. 2017;130(8):974-981.
19 Bahlis NJ, Siegel DS, Schiller GJ, et al. Pomalidomide, dexamethasone, and daratumumab immediately after lenalidomide-based treatment in patients with multiple myeloma: updated efficacy, safety, and health-related quality of life results from the phase 2 MM-014 trial. Leuk Lymphoma. 2022;63(6):1407-1417.
20 Dimopoulos M, Quach H, Mateos MV, et al. Carfilzomib, dexamethasone, and daratumumab versus carfilzomib and dexamethasone for patients with relapsed or refractory multiple myeloma (CANDOR): results from a randomised, multicentre, open-label, phase 3 study. Lancet. 2020;396(10245):186-197.
21. Palumbo A, Chanan-Khan A, Weisel K, et al. Daratumumab, bortezomib, and dexamethasone for multiple myeloma. N Engl J Med. 2016;375(8):754-766.
22. Dimopoulos MA, Terpos E, Boccadoro M, et al. Daratumumab plus pomalidomide and dexamethasone versus pomalidomide and dexamethasone alone in previously treated multiple myeloma (APOLLO): an open-label, randomised, phase 3 trial. Lancet Oncol. 2021;22(6):801-812.
23. Attal M, Richardson PG, Rajkumar SV, et al. Isatuximab plus
pomalidomide and low-dose dexamethasone versus pomalidomide and low-dose dexamethasone in patients with relapsed and refractory multiple myeloma (ICARIA-MM): a randomised, multicentre, open-label, phase 3 study. Lancet. 2019;394(10214):2096-2107.
24. Grosicki S, Simonova M, Spicka I, et al. Once-per-week selinexor, bortezomib, and dexamethasone versus twice-perweek bortezomib and dexamethasone in patients with multiple myeloma (BOSTON): a randomised, open-label, phase 3 trial. Lancet. 2020;396(10262):1563-1573.
25. Kumar SK, Harrison SJ, Cavo M, et al. Venetoclax or placebo in combination with bortezomib and dexamethasone in patients with relapsed or refractory multiple myeloma (BELLINI): a randomised, double-blind, multicentre, phase 3 trial. Lancet Oncol. 2020;21(12):1630-1642.
26. Richardson PG, Oriol A, Beksac M, et al. Pomalidomide, bortezomib, and dexamethasone for patients with relapsed or refractory multiple myeloma previously treated with lenalidomide (OPTIMISMM): a randomised, open-label, phase 3 trial. Lancet Oncol. 2019;20(6):781-794.
27. Mateos MV, Szarejko M, Bila J, et al. LIGHTHOUSE (OP-108): melflufen plus daratumumab and dexamethasone versus daratumumab in relapsed/refractory multiple myeloma refractory to an immunomodulatory drug and a proteasome inhibitor or had received ≥3 prior lines of therapy including an immunomodulatory drug and a proteasome inhibitor. Hemasphere. 2023;7(Suppl):29-30.
28. Richardson PG, San Miguel JF, Moreau P, et al. Interpreting clinical trial data in multiple myeloma: translating findings to the real-world setting. Blood Cancer J. 2018;8(11):109.
Haematologica | 109 Marzo 2024 876 ARTICLE - Melflufen and dex plus dara or bortezomib in RRMM E.M. Ocio et al.
Quantification of cyclin D1 and D2 proteins in multiple myeloma identifies different expression patterns from those revealed by gene expression profiling
Ignacio J. Cardona-Benavides,1,2 Irena Misiewicz-Krzeminska,3 Elizabeta A. Rojas,1,2 Cristina De Ramón,1,2 Antonio Sanz-Solas,1,2 Isabel Isidro,1,2 Dalia Quwaider,1,2 Aida M. López-Guerrero,1,2 Myriam Cuadrado,1,2 María-José Calasanz,4,5 Laura Rosiñol,6 Joaquín Martínez-López,5,7,8 Jesús F. San Miguel,4,5 María-Victoria Mateos,1,2,5 Luis A. Corchete1,2,5# and Norma C. Gutiérrez1,2,5# on behalf of the GEM/PETHEMA (Grupo Español de Mieloma/Programa para el Estudio de la Terapéutica en Hemopatías Malignas) cooperative study group
1Hematology Department, University Hospital of Salamanca, Institute of Biomedical Research of Salamanca (IBSAL), Salamanca, Spain; 2Cancer Research Center-IBMCC (USAL-CSIC), Salamanca, Spain; 3Department of Experimental Hematology, Institute of Hematology and Transfusion Medicine, Warsaw, Poland; 4Clínica Universidad de Navarra, Centro de Investigaciones Biomédicas Aplicadas (CIMA), Instituto de Investigación Sanitaria de Navarra (IdiSNA), Pamplona, Spain; 5Centro de Investigación Biomédica en Red de Cáncer (CIBERONC), Spain. 6Hospital Clinic of Barcelona, Instituto de Investigaciones Biomédicas August Pi I Sunyer (IDIBAPS), Barcelona, Spain; 7Spanish National Cancer Research Center (CNIO), Madrid, Spain and 8Hematology Department, Hospital 12 de Octubre, Medicine Department, Complutense University Madrid, Madrid, Spain
#LAC and NCG contributed equally as senior authors.
Abstract
Correspondence: N.C. Gutiérrez normagu@usal.es
Received: May 5, 2023.
Accepted: August 18, 2023.
Early view: August 31, 2023.
https://doi.org/10.3324/haematol.2023.283445
©2024 Ferrata Storti Foundation
Published under a CC BY-NC license
Upregulation of a cyclin D gene determined by expression microarrays is an almost universal event in multiple myeloma (MM), but this finding has not been properly confirmed at the protein level. For this reason, we carried out a quantitative analysis of cyclin D proteins using a capillary electrophoresis nanoimmunoassay in newly diagnosed MM patients. Exclusive expression of cyclin D1 and D2 proteins was detected in 54 of 165 (33%) and 30 of 165 (18%) of the MM patients, respectively. Of note, cyclin D1 or D2 proteins were undetectable in 41% of the samples. High levels of cyclin D1 protein were strongly associated with the presence of t(11;14) or 11q gains. Cyclin D2 protein was detected in all the cases bearing t(14;16), but in only 24% of patients with t(4;14). The presence of cyclin D2 was associated with shorter overall survival (hazard ratio =2.14; P=0.017), although patients expressing cyclin D2 protein, but without 1q gains, had a favorable prognosis. In conclusion, although one of the cyclins D is overexpressed at the mRNA level in almost all MM patients, in approximately half of the patients this does not translate into detectable protein. This suggests that cyclins D could not play an oncogenic role in a proportion of patients with MM (clinicaltrials gov. identifier: NCT01916252).
Introduction
Dysregulation of D-type cyclins has been invoked as an early and unifying oncogenic event in multiple myeloma (MM) and monoclonal gammopathy of undetermined significance (MGUS), which is a premalignant condition.1-3 Gene expression profiling (GEP) has demonstrated that 98% of patients with MM overexpressed CCND mRNA: CCND1, CCND2 and CCND3 were overexpressed in about 46%, 41% and 3% of patients, respectively; additionally, CCND1 and
CCND2 were co-expressed in 8% of patients. CCND1 and CCND2 expression was found to be mutually exclusive in almost all cases.1-3 Thereafter, these results seem to have been confirmed when MM samples were analyzed by RNA sequencing.4
CCND1 mRNA overexpression is attributable in 15-20% of cases to t(11;14), which leads to high levels of cyclin D1. In most of the other MM patients with CCND1 overexpression, polysomy of chromosome 11 is the probable cause of this CCND1 dysregulation.5,6 On the other hand, CCND2 overex-
Haematologica | 109 Marzo 2024 877 - Plasma Cell Disorders ARTICLE
pression apparently arises from mechanisms that are not directly associated with CCND2 gene abnormalities, but rather are a consequence of the dysregulation of other genes. MAF and MAFB leucine zipper transcription factors, which are involved in the t(14;16) and t(14;20) translocations, respectively, have been shown to upregulate CCND2 through their transactivation function, leading to an increase in the rate of cell division and DNA synthesis.7 Beyond the MAF family, ZKSCAN3, a zinc finger transcription factor, has been described as inducing CCND2 promoter activity and thereby cyclin D2 upregulation.8 More recently, our group described that the shortening of CCND2 3’UTR by alternative polyadenylation with the consequent loss of miRNA binding sites is also involved in CCND2 upregulation.9 Dysregulation of D-type cyclins and their associated pathways is common in both solid and hematological malignancies.10 A central role of D-type cyclins is the regulation of cyclin-dependent kinases (CDK), in particular CDK4 and CDK6, to promote cell-cycle progression (G1-S transition) through the phosphorylation and inactivation of the RB tumor-suppressor protein.11-14 The oncogenic role of cyclin D1 is well established in many tumors, and its amplification and overexpression is generally associated with negative outcomes.15-17 However, the overexpression of CCND1 , which is strongly associated with t(11;14) and trisomy 11, does not confer an unfavorable prognosis on patients with MM. 3,18 The function of cyclins D2 and D3 in tumorigenesis has been less thoroughly explored, and their consequences for survival are sometimes mixed 19 Particularly in MM, overexpression of CCND2 has been associated with poor prognosis, probably due to the predominance of high-risk cytogenetic alterations in this group of patients. 20-24
The overexpression of cyclin D mRNA in almost all MM cases contrasts with the generally low proliferation rate observed in tumor plasma cells.1,3,25 One possible explanation for this is that cyclins D may perform other functions that are unrelated to cell-cycle progression.13 Another possibility is that protein levels of cyclins D may not be high or stable enough to trigger cell-cycle transition from G1 to S phase. In this regard, few studies have analyzed the expression of cyclin D proteins, and most of those that have done so used immunohistochemical techniques.26,27 Although immunohistochemistry (IHC) provides valuable information about the expression of proteins in the tissue context, the technique is usually semiquantitative and uses arbitrary cutoff levels. The adoption of capillary electrophoresis nanoimmunoassay (CNIA) technology may help overcome these drawbacks, given its capacity to facilitate the quantitative analysis of proteins with high sensitivity and its requirement for only nanogram amounts of sample.28,29 In order to shed light on these elusive aspects related to the expression of cyclins D in MM, we carried out a quantitative analysis of cyclin D proteins in a large cohort of newly diagnosed MM (NDMM) patients who were homogeneously
treated according to GEM2012 clinical trial. We compared the results with CCND1 and CCND2 mRNA levels quantified by quantitative real-time polymerase chain reaction (qRTPCR). The impact of cyclin D expression on survival of MM patients was also explored.
Methods
Patient samples
A total of 165 samples from NDMM patients treated as part of the Spanish Myeloma Group clinical trial GEM2012 (clinicaltrial gov. Identifier: NCT01916252) were included in the study,30 which was approved by the local ethics committee and conducted in accordance with the Declaration of Helsinki. Informed consent was required prior to patient participation in the clinical trial. Patients were treated with six cycles of VRD (bortezomib, lenalidomide and dexamethasone) as induction followed by autologous stem cell transplantation with melphalan 200 versus busulfan-melphalan, and consolidation treatment with two cycles of VRD. CD138+ plasma cells were isolated from bone marrow aspirates using the AutoMACS immunomagnetic separation system (Miltenyi-Biotec, Germany). Plasma cell purity was > 80% in all the cases. All samples were immediately frozen in RLT+ buffer (Qiagen, Germany) and stored at -80°C for further analysis, as previously described.29 RNA, DNA and protein were extracted using an AllPrep DNA/RNA Mini Kit (Qiagen). Proteins were extracted by ice-cold acetone precipitation.28,29 Cytogenetic analysis by fluorescence in situ hybridization (FISH) for detecting IGH translocations, 17p deletions, 1q gains and 1p losses was carried out in all patients, as previously described.
The main characteristics of patients are summarized in the Online Supplementary Table S1. This cohort of patients was representative of the whole GEM2012 trial dataset.30
Capillary electrophoresis nanoimmunoassay
CNIA was performed using the WES machine (ProteinSimple, California, EEUU) according to the manufacturer’s protocols, and as previously used by our group.28,29,31
Primary antibodies used in the study under optimized conditions were: rabbit monoclonal cyclin D1 (Abcam [Cambridge, UK], ab134175, dilution 1/50), rabbit monoclonal cyclin D2 (Cell Signaling [Danvers, EEUU], #3741, dilution 1/50) and rabbit monoclonal GAPDH (Cell Signaling, #2118, dilution 1/50). Cyclin D1 and D2 protein peaks were normalized with respect to the GAPDH median area under the peak. Expression of each protein was represented relative to that of GAPDH. A more extensive protocol for relative protein quantification by CNIA has been reported elsewhere.28,29
Quantitative real-time polymerase chain reaction
RNA concentration and integrity were assessed with an Agilent 2100 Bioanalyzer. Approximately 200 ng of total RNA
Haematologica | 109 Marzo 2024 878 ARTICLE - Quantification of cyclin D1 and D2 proteins in MM I. J. Cardona-Benavides et al.
were reverse-transcribed into cDNA using the SuperScript II First-Strand Synthesis kit (Thermo Fisher, California, EEUU). Gene expression of CCND1 and CCND2 were evaluated with TaqMan qRT-PCR assays, Hs00765553_m1 and Hs00153380_m1, respectively (Thermo Fisher). The PGK1 gene (Hs00943178_g1, Thermo Fisher) was used as the endogenous control. Relative expression was calculated whereby ΔCt =Ct housekeeping gene minus Ct target gene.
Statistical analysis
Continuous variables were assessed for normality using the Shapiro-Wilk test. Differences between the experimental groups were analyzed using two-tailed t tests or Mann-Whitney U tests, as appropriate, for normally and non-normally distributed continuous variables, respectively. The mclust package (v.5.4.10) was used to model these data as a Gaussian mixture in which the optimal number of components would be determined from the Bayesian Information Criterion (BIC) values of the adjusted models. Fisher’s exact test was used to evaluate the association between the resulting categorical variables. The Spearman rank test was used to estimate correlations. Survival curves were depicted using the Kaplan-Meier estimator and were compared with the log-rank test in the survival R package (v.3.3-1). The endpoints included in this survival analysis were time to progression (TTP) and overall survival (OS). The events of interest for TTP were restricted to disease progression and relapse, whereas OS was defined as the time from diagnosis until the date of death from any cause. Values of P<0.05 were considered statistically significant for all tests. Statistical analyses were carried out in R (v.4.2.1).
Results
Expression profile of cyclin D1 and cyclin D2 proteins
Expression of cyclin D1 and cyclin D2 proteins was highly variable among the samples, particularly in the case of cyclin D1. Expression values of cyclin D1 ranged from 0 to 15.05, while those of cyclin D2 varied from 0 to 1.18 (Figure 1A). Excluding non-expressed values, the non-parametric coefficients of variation for cyclin D1 and cyclin D2 were 96% and 70%, respectively.
Patients were divided into four groups based on their cyclin D1 and cyclin D2 protein expression: expression of cyclin D1 exclusively (54/165, 33%); expression of cyclin D2 exclusively (30/165, 18%); co-expression of both proteins (14/ 165, 8%); no expression of either cyclin D protein (67/165, 41%) (Figure 1B).
The group of MM patients expressing only cyclin D1 contained all the 23 cases with t(11;14) and 55% (21/38) of the cases with 11q13 gains. In other words, cyclin D1 expression was associated with t(11;14) or 11q13 gains in 82% (44/54) of the patients. We next dichotomized the expression of this group of patients by fitting a Gaussian mixture model that
differentiated two groups, one with a high level of cyclin D1 expression (cyclin D1 >0.057), and the other with a low level (cyclin D1 ≤0.057) (Figure 1C). Eighteen of the 23 patients (78%) with t(11;14) were classified in the group with high cyclin D1 expression, while only two of the 38 patients (5%) with 11q13 gains were included in that group (Figure 1D). IGH translocations other than t(11;14) were rarely found in the group of patients expressing only cyclin D1. In fact, t(4;14) was detected in only two cases that also featured 11q13 gain, which were in turn classified into the low cyclin D1 expression group.
In the group of patients who exclusively expressed cyclin D2, none had t(11;14) as expected, although 11q13 gain was present in three of the 30 patients (10%). The distribution of the other cytogenetic abnormalities in this group was as follows: t(4;14) and t(14;16) were each present in 13% (4/30) of the cases; 1q gains, and 1p and 17p deletions, were found in 80% (24/30), 27% (8/30) and 20% (6/30) of cases, respectively. t(14;16), 1q gains and 1p deletions were significantly enriched in the group of patients expressing only cyclin D2 compared with the other MM patients (13% vs. 0%, P<0.001; 80% vs. 40%, P<0.001; 27% vs. 10%, P=0.03, respectively). FISH studies yielded normal results in only two of the 30 patients expressing solely cyclin D2. In the same way as for cyclin D1, patients with cyclin D2 expression were dichotomized into two groups, one with high cyclin D2 expression (cyclin D2 >0.058) and the other with low expression (cyclin D2 ≤0.058) (Online Supplementary Figure S1A). Cytogenetic abnormalities were uniformly distributed throughout the two groups (Online Supplementary Figure S1B).
In the group of patients co-expressing both cyclins D a preference for the expression of one of them was observed in 10 of the 14 patients (71%) (Figure 1E). Based on the level of expression of each cyclin D, most cases (71%) expressed low levels of cyclin D1 and D2. Two cases each exhibited high levels of expression of cyclin D1 and of cyclin D2. None of the patients belonging to this group showed t(11;14), while 11q13 gain was detected in three patients who expressed low levels of both cyclins D.
Finally, the largest group of patients analyzed (41%) expressed neither of the cyclins D. The distribution of cytogenetic abnormalities analyzed by FISH within this group is summarized and compared with the other three groups of cyclin D expression in the Online Supplementary Table S2. Interestingly, more than half of the patients with t(4;14) did not express cyclin D2, whereas all the four samples with t(14;16) did express it.
Expression profiles of CCND1 and CCND2 mRNA
Quantifying cyclin D1 and D2 proteins showed a high proportion of MM patients without expression of any of the cyclins D. In order to gain more insight into this unexpected finding, we evaluated the expression of CCND1 and CCND2 at the mRNA level using qRT-PCR in 110 of the 165 samples
Haematologica | 109 Marzo 2024 879 ARTICLE - Quantification of cyclin D1 and D2 proteins in MM I. J. Cardona-Benavides et al.
for which RNA was available. Expression of CCND1 and CCND2 mRNA was quantified in 16 normal plasma cells (NPC) to establish the baseline expression level for both mRNA in the cohort. CCND1 and CCND2 mRNA were considered to be overexpressed when their expression in MM samples was above the upper 95th percentile expression level in NPC (ΔCt=-5.99 for CCND1 and ΔCt=-3.51 for CCND2) (Figure 2A, B). According to these
criteria, exclusive overexpression of CCND1 or CCND2 was detected in 53% (58/110) and 21% (23/110) of patients, respectively. Overall, 6% (7/110) of the samples simultaneously expressed CCND1 and CCND2 at the mRNA level.
The Spearman’s rank-order correlation between mRNA and protein expression levels was stronger for cyclin D1 than for cyclin D2 (rho=0.7 vs. rho=0.53; P< 0.001) (Online Supplementary Figure S2A, B).
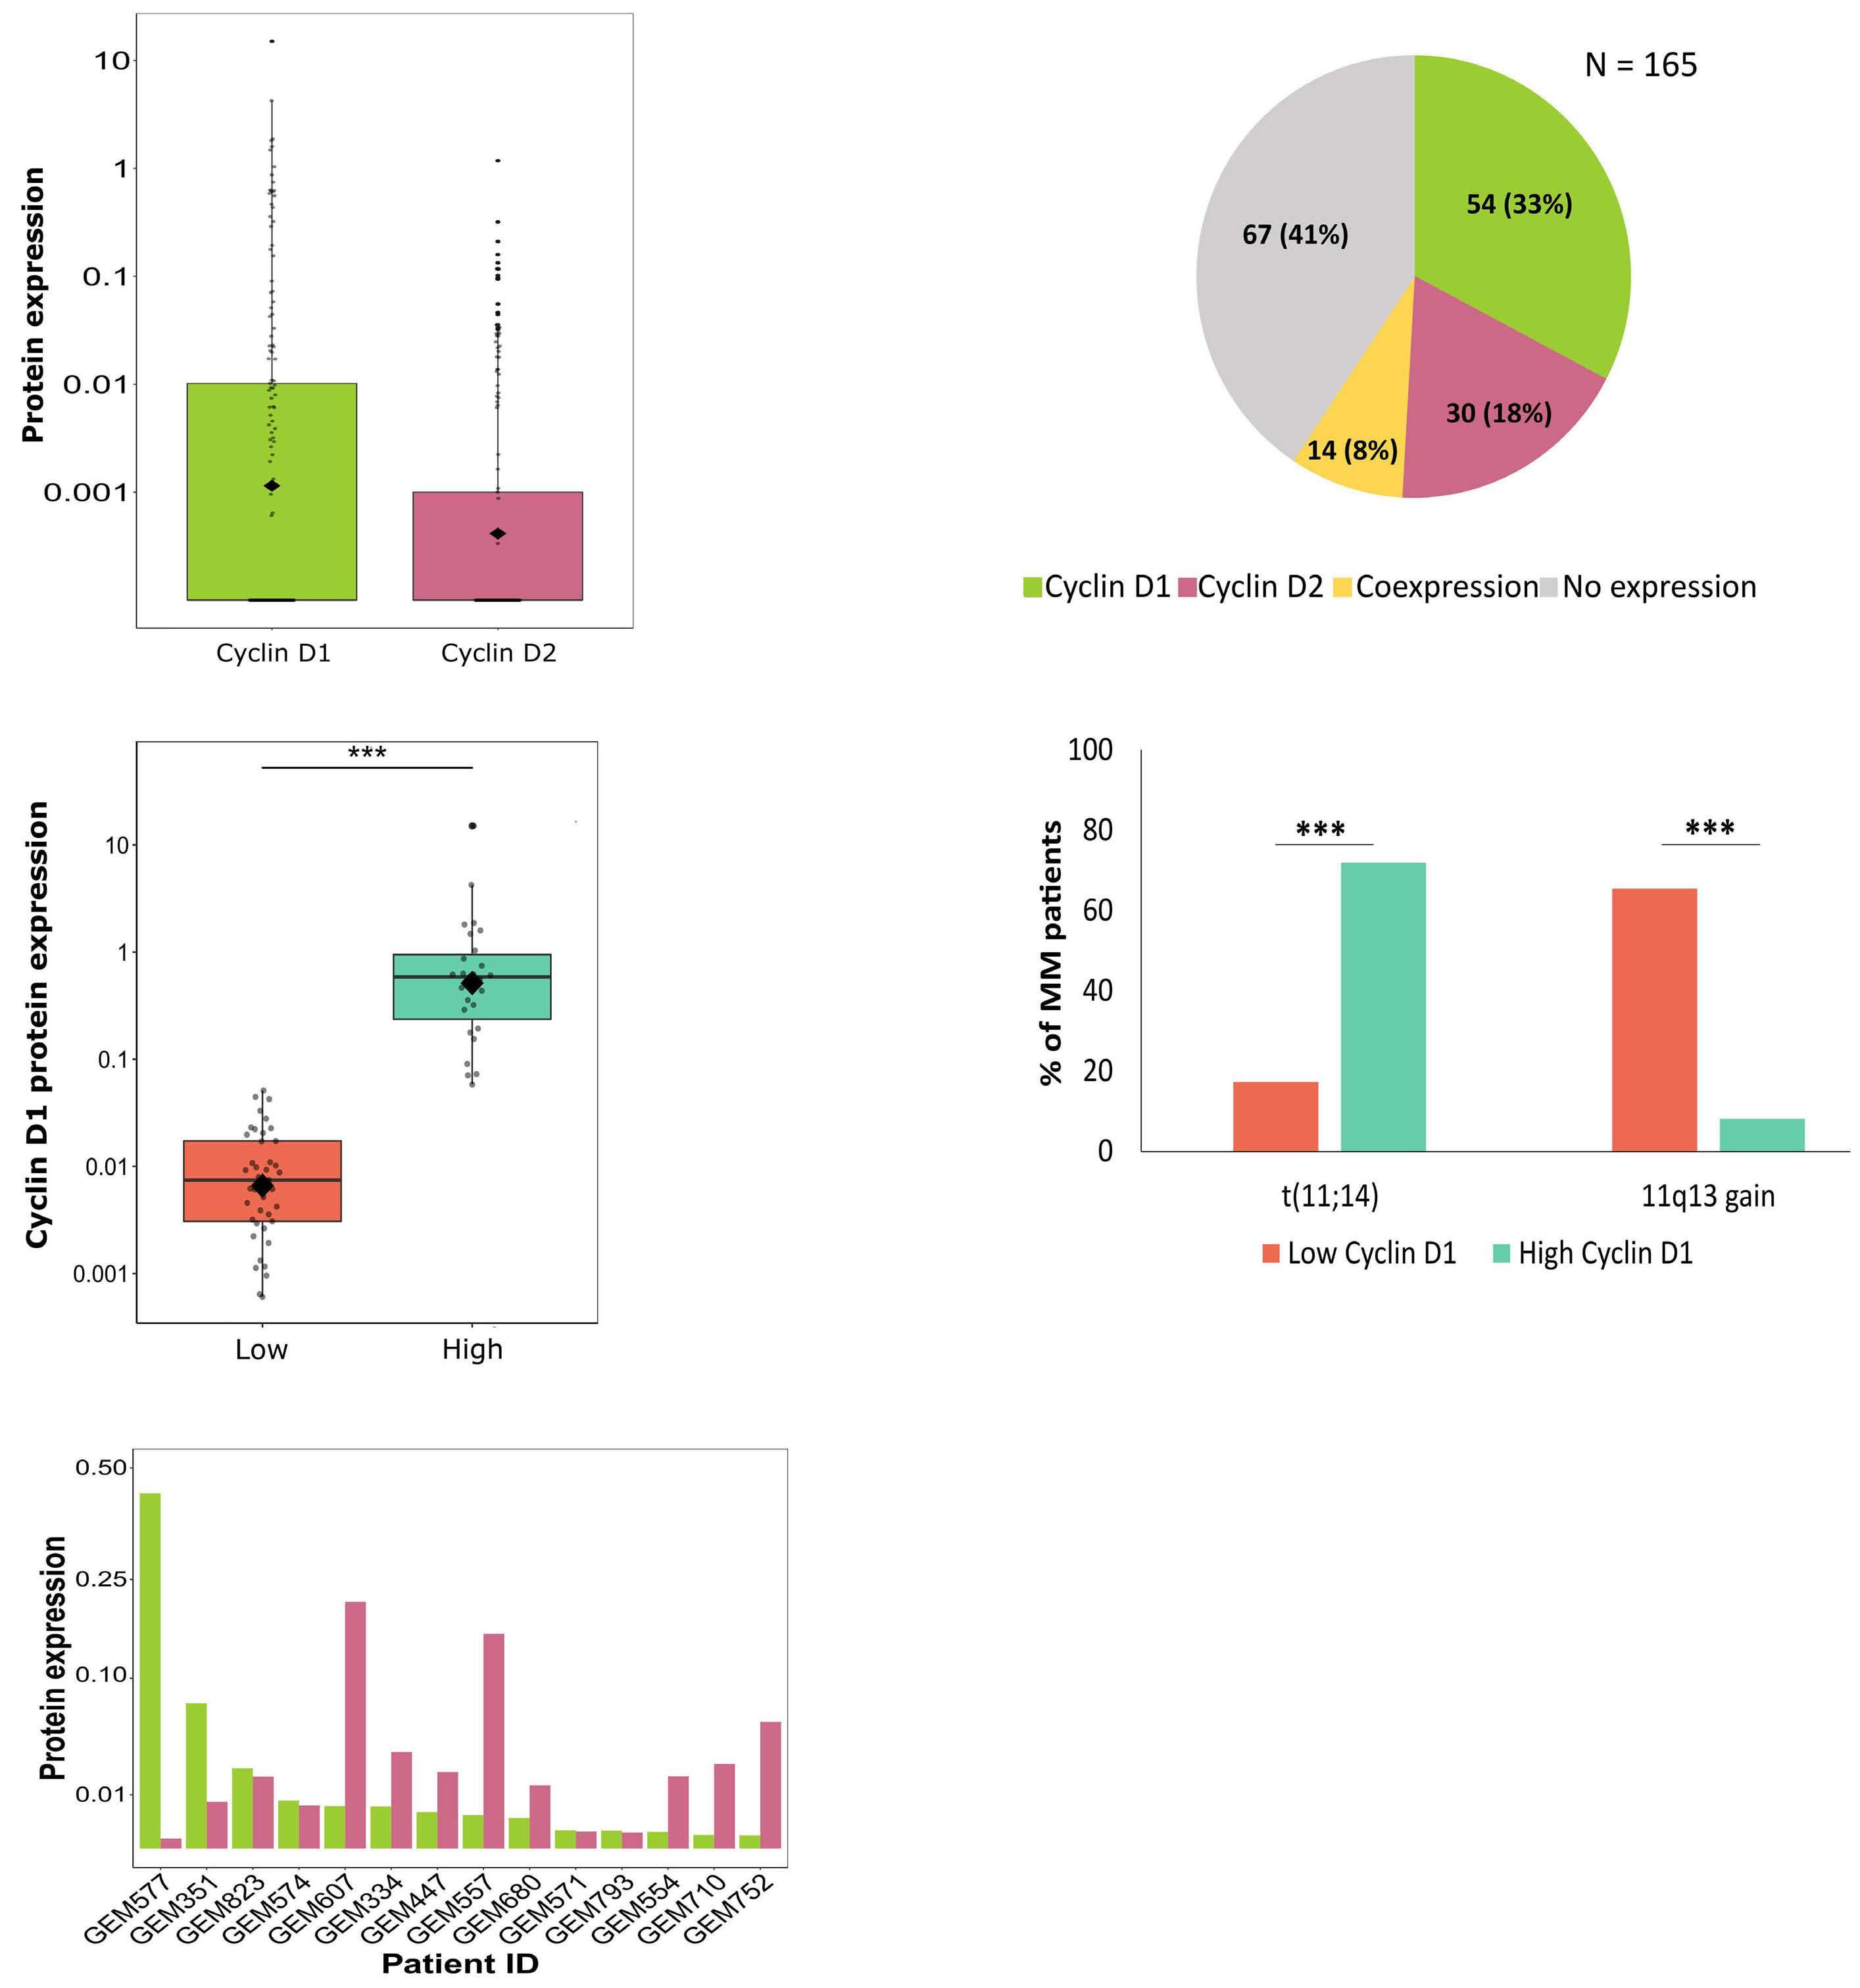
Figure 1. Cyclin D protein expression in 165 samples from newly diagnosed multiple myeloma patients. Cyclin D1 and D2 protein expression were measured by capillary electrophoresis nanoimmunoassay technology (simple western blotting). Data were normalized relative to GAPDH protein expression. (A) Protein expression levels of cyclin D1 and D2. (B) Pie chart showing percentage of cyclin D1 and D2 protein expression in the patient cohort.
(C) Distribution of cyclin D1 protein expression in the 2 groups generated after dichotomization using a Gaussian mixture model. Patients with cyclin D1 expression ≤0.057 and >0.057 were classified as “Low” and “High”, respectively. (D) Comparison of the distribution of cyclin D1 expression between patients harboring t(11;14) or 11q13 gains (***P<0.001). (E) Co-expression of cyclin D1 and D2 in newly diagnosed multiple myeloma patients.
Haematologica | 109 Marzo 2024 880 ARTICLE - Quantification of cyclin D1 and D2 proteins in MM I. J. Cardona-Benavides et al.
A C E D B
Almost all the samples that exclusively expressed cyclin D1 protein overexpressed CCND1 mRNA (40/41 samples for which protein and mRNA material was available) (Figure 2C). The highest levels of CCND1 mRNA were observed in MM patients with t(11;14).
However, when we compared the expression of cyclin D2 at the protein and mRNA levels in the samples for which both molecules were available, we found that 71% (15/21) of the patients exclusively expressing cyclin D2 protein also overexpressed CCND2 mRNA (Figure 2C). Finally, the 41% of patients who did not express either cyclin D1 or cyclin D2 protein expressed mRNA at levels lower than those observed in NPC, whereas 59% of those patients expressed the mRNA of at least one cyclin D.
Prognostic effect of cyclin D protein expression
The survival analysis considered only the patients who exclusively expressed cyclin D1 or D2, and compared them with patients who did not express the corresponding cyclin D. Expression of cyclin D1 protein was significantly associated with longer OS (hazard ratio [HR] =0.44; 95% confidence interval [CI]: 0.22-0.91; P=0.022) (Figure 3A). Conversely, expression of cyclin D2 was significantly associated with shorter OS (HR=2.14; 95% CI: 1.13-4.05; P=0.017) (Figure 3B). No statistically significant differences were found in the TTP among the patients classified by their cyclin D1 or D2 expression status (Figure 3C, D). A positive effect of CCND1 mRNA overexpression on OS was also observed (Online Supplementary Figure S3). Given the significant association between cyclin D2 protein
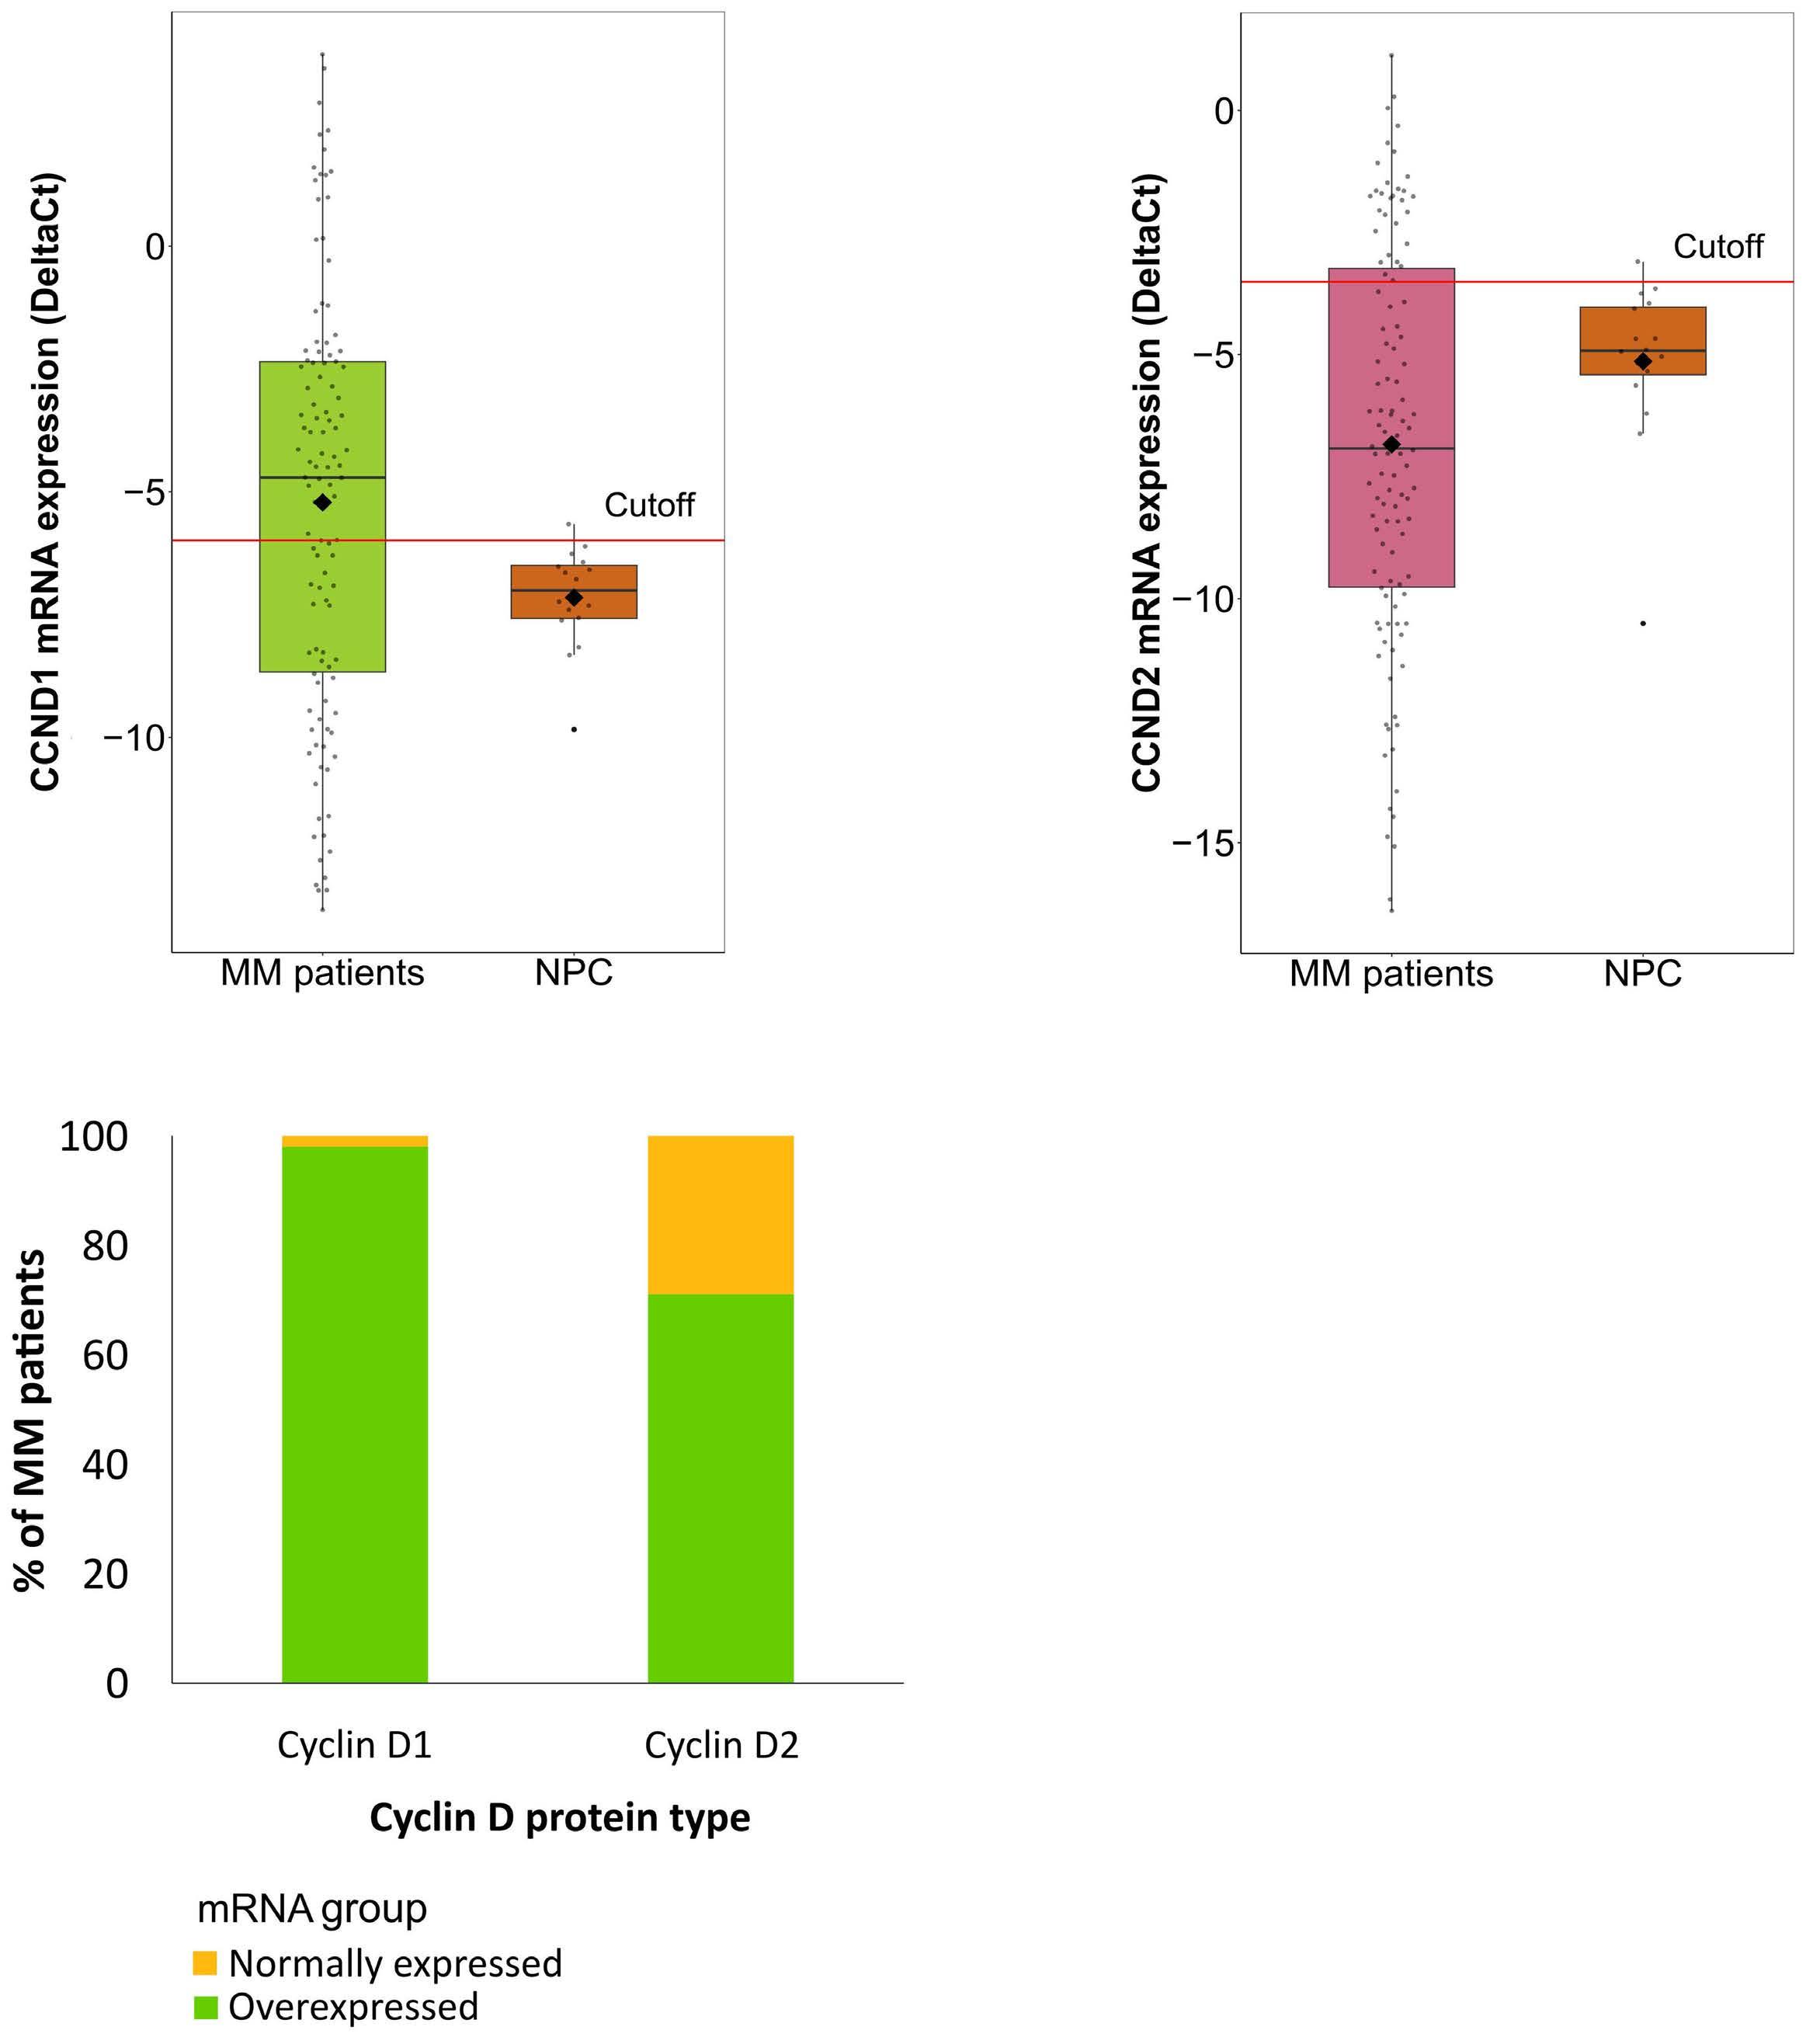
Figure 2. CCND1 and CCND2 mRNA expression analysis. (A) Comparison between CCND1 mRNA levels of multiple myeloma (MM) patients and those of normal plasma cells (NPC). (B) Comparison between CCND2 mRNA levels of MM patients and those of NPC. Cutoff point for CCND1 and CCND2 mRNA overexpression was the 95th percentile (red line) of NPC. (C) Distribution of CCND mRNA expression group (normal expression or overexpression) by cyclin D protein type.
Haematologica | 109 Marzo 2024 881 ARTICLE - Quantification of cyclin D1 and D2 proteins in MM I. J. Cardona-Benavides et al.
A
C
B
expression and 1q gains, we investigated how this relationship was related to survival. We found that the prognosis of patients with 1q gains was not affected by cyclin D2 protein levels, while cases expressing cyclin D2 exhibited short survival only if they also had 1q gains (Figure 4). A subsequent survival analysis considering the groups of high and low expression of both cyclins D revealed no significant differences in OS between the two groups (Figure 5A). However, TTP was significantly shorter among patients with high levels of cyclin D1 (HR=2.43; 95% CI: 1.06-5.55; P=0.03), indicating a less favorable prognosis for patients with t(11;14) than for those with 11q gains (Figure 5B). Partitioning the patients into the high and low level cyclin D2 groups revealed no differential association with survival.
Discussion
Upregulation of D cyclins has been considered an early
initiating event in MM pathogenesis since one of the cyclin D genes is known to be overexpressed in almost all MGUS and MM patients.1-3 These results were based on mRNA quantification using microarrays.1,3,18 Only limited attempts have been made to validate this overall finding at the protein level; the few studies carried out have only analyzed cyclin D1 protein by IHC in short series of patients.32-36 In this study, we quantified cyclin D1 and D2 proteins using CNIA in 165 newly diagnosed MM patients. Cyclin D3 was not included because of the very low frequency of MM cases overexpressing this cyclin D in previous analyses. We observed expression of the two cyclin D proteins, singly or together, in 59% of the patients. These results are in agreement with those of a previous analysis of cyclin D1 and D2 using IHC in almost 100 bone marrow biopsies, in which cyclin D1 protein was detected in 32%, cyclin D2 was found in 18% and both cyclins D were identified in 14% of MM patients.36 Therefore, we did not detect any cyclin D expression in almost half of the MM samples, even using
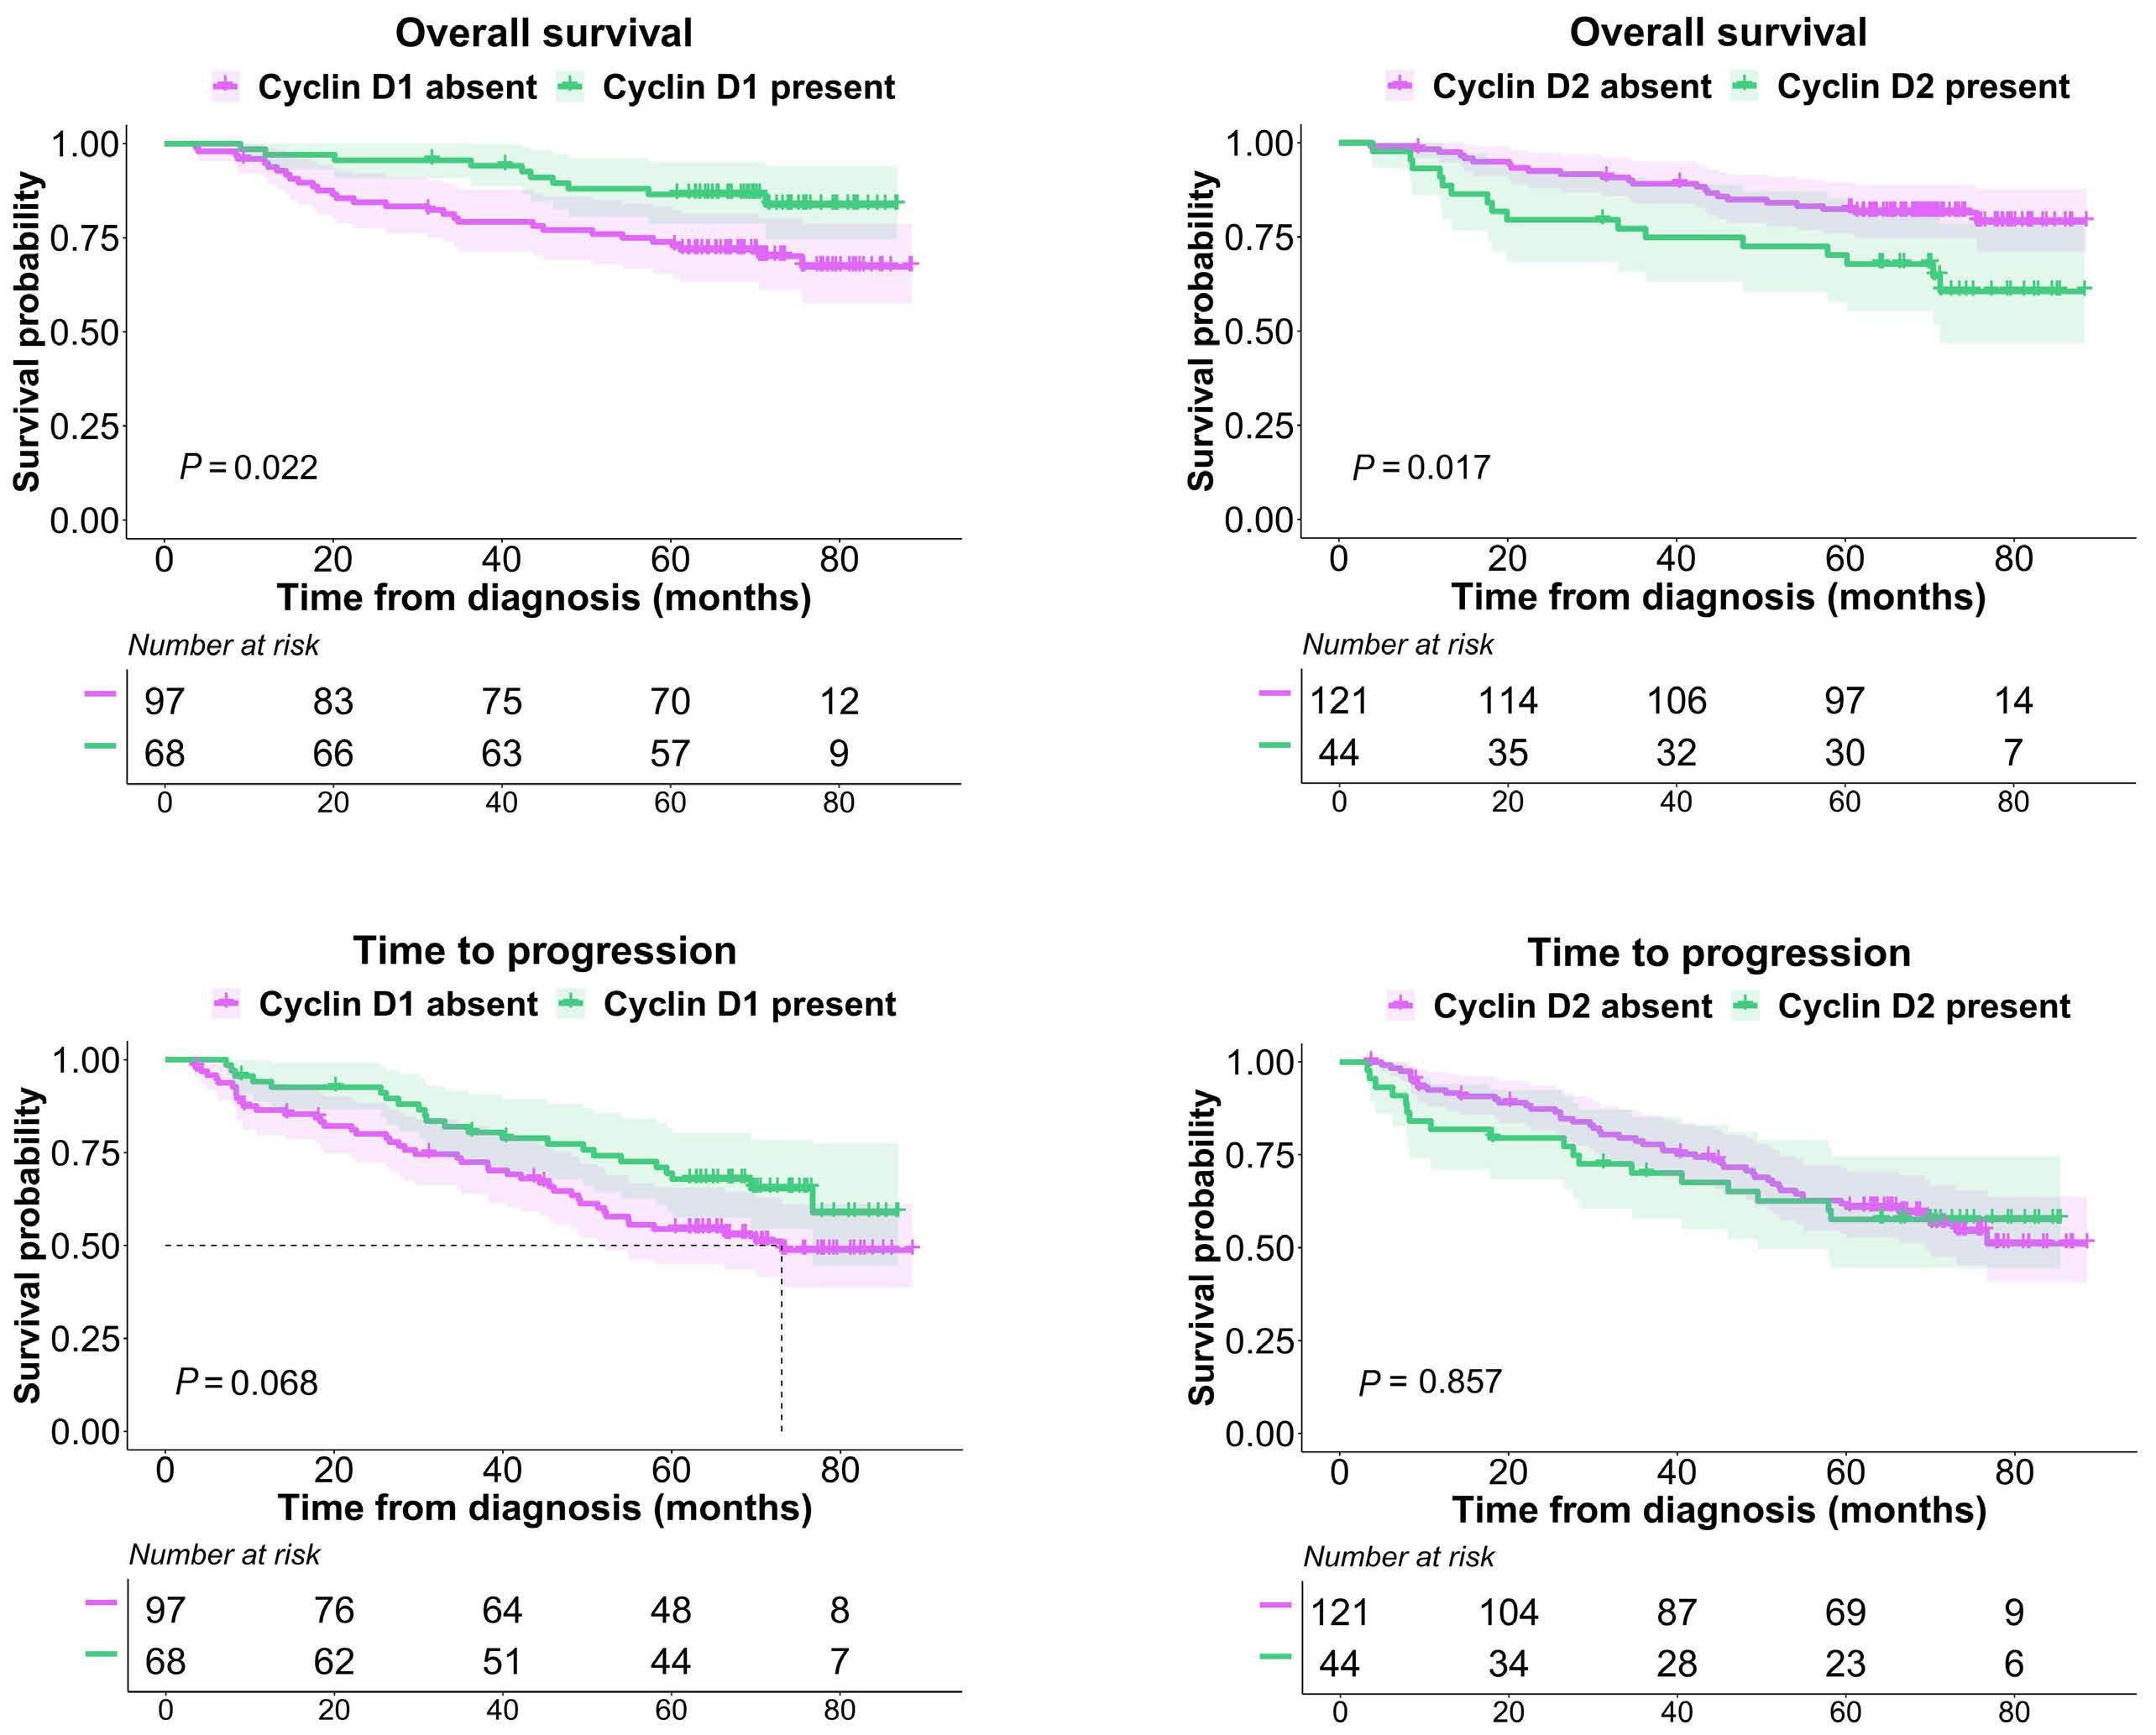
Haematologica | 109 Marzo 2024 882 ARTICLE - Quantification of cyclin D1 and D2 proteins in MM I. J. Cardona-Benavides et al.
A C
D
Figure 3. Impact of cyclin D1 and cyclin D2 protein expression on survival of multiple myeloma patients. (A, B) Kaplan-Meier curves of overall survival by cyclin D1 and cyclin D2 protein expression group, respectively. (C, D) Kaplan-Meier curves of time to progression by cyclin D1 and cyclin D2 protein expression group, respectively. Log-rank (Mantel-Cox) test P values are shown.
B
the CNIA method, which can accurately quantify proteins and is more sensitive than IHC. This finding prompted us to investigate CCND1 and CCND2 levels by RT-PCR, using the expression levels of both CCND in NPC as a cutoff to establish gene overexpression. It has been pointed out that CCND1 is not expressed in NPC,1,18,37,38 and CCND2, is present at very low or null levels in NPC.1,18,39 We detected CCND1 and CCND2 overexpression in 53% and 21% of the patients, respectively, and simultaneous overexpression of CCND1 and CCND2 in a small group of patients. CCND genes were not expressed at levels above that of NPC in 20% of MM patients. This latter finding contrasts with the previously published results obtained using microarrays and RT-PCR, in which the proportion of MM patients not overexpressing cyclins D did not exceed 8%. Expression microarrays have
shown that CCND1 and CCND2 genes are both overexpressed in about 40-45% of MM patients, and that the other patients (approximately 11%) simultaneously express CCND1 and CCND2 or CCND3. These results were corroborated in other series of MM patients assessed using microarrays.1,18 Moreover, there was a very good concordance between cyclin D expression assessed by microarrays and RT-PCR.18 The fact that RT-PCR provides a relative quantification of mRNA may largely explain the differences between the percentage of MM patients who did not express D-cyclin mRNA in our study and in that of Agnelli’s group.18
Protein expression of cyclins D in the present study also showed that cyclin D1 and cyclin D2 were overexpressed in an exclusive manner, and only a small proportion of patients coexpressed both cyclins D, as revealed by mRNA
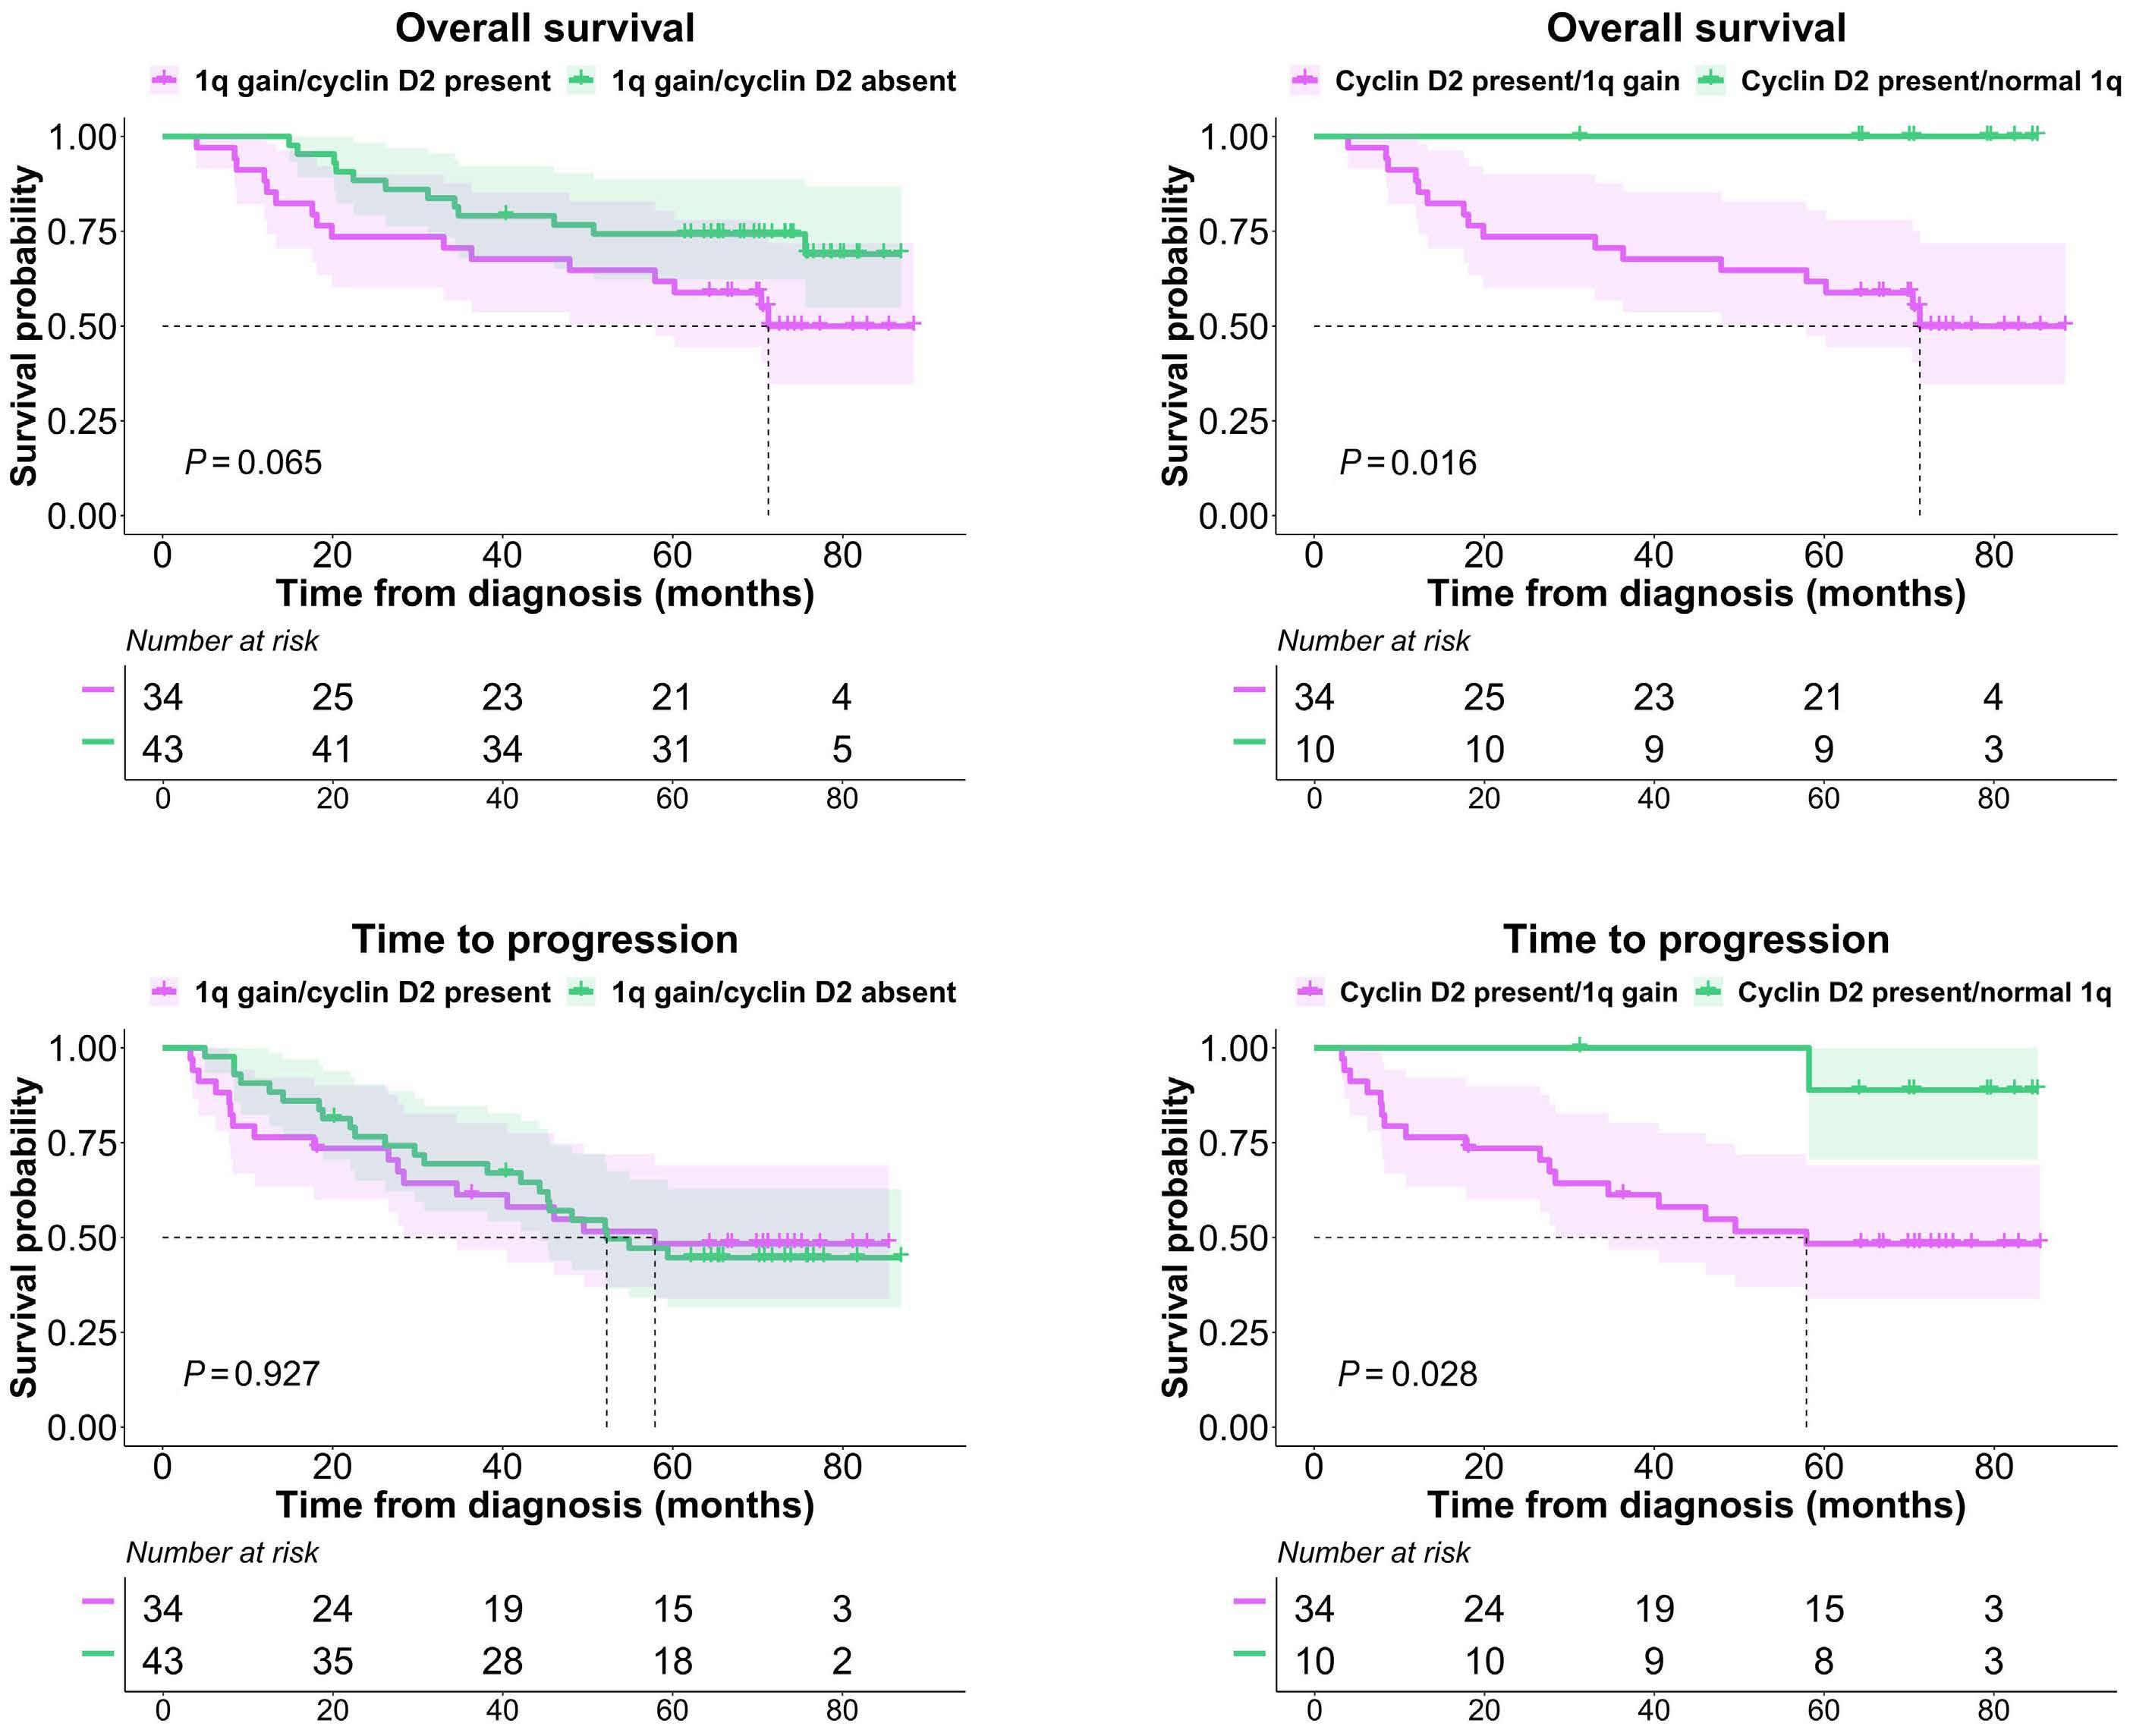
are shown.
Haematologica | 109 Marzo 2024 883 ARTICLE - Quantification of cyclin D1 and D2 proteins in MM I. J. Cardona-Benavides et al.
A C B D
Figure 4. Survival analysis of the combination of cyclin D2 expression with 1q gain abnormality in multiple myeloma patients. (A, B) Kaplan-Meier curves of overall survival and time to progression (TTP), respectively, in patients with 1q gains according to the presence or absence of cyclin D2 protein. (C, D) Kaplan-Meier curves of overall survival and time to progression, respectively, in patients expressing cyclin D2 protein according to the presence or absence of 1q gains. Log-rank (Mantel-Cox) test P values
quantification1,3,18 and protein assays.36
Our findings confirmed the strong association between the overexpression of cyclin D1 and the presence of t(11;14), as all the cases with this translocation overexpressed cyclin D1 protein, mostly at high levels. The patients overexpressing cyclin D1 at lower levels corresponded mainly to cases with 11q13 gains, although 37% of cases with this abnormality did not express cyclin D1 protein. As with the proteins, patients with high CCND1 mRNA values had the t(11;14) translocation, and patients with 11q13 gain had intermediate levels of mRNA expression. These results are consistent with previous reports in which high levels and moderate levels of cyclin D1 mRNA were associated with t(11;14) and polysomy 11, respectively.1,3,5,26,40,41
Overexpression of cyclin D2 may arise from different mechanisms that are not linked to translocations or amplification of CCND2 gene.7-9 We found a significant association between cyclin D2 overexpression and t(14;16), 1q gain and 1p deletion, as described in particular in the case of t(14;16).1,3,7 However, 53% of patients with the t(4;14) translocation did not express cyclin D2. Even though the correlation between the protein and mRNA for the unique expression of cyclin D2 was weaker than that for cyclin D1, most of the samples expressing cyclin D2 protein also overexpressed CCND2 mRNA. Six cases expressed cyclin D2 protein but with mRNA CCND2 levels less than those found in NPC. This could be the result of the protein being generated by insignificant levels of CCND2 mRNA.
Of the samples without cyclin D protein expression, the levels of mRNA expression of both CCND1 and CCND2 were less than the NPC cutoff in almost half of the patients, which explains the absence of protein. However, in the other patients one of the cyclins D was overexpressed at the mRNA level. This discrepancy could be related to post-transcriptional and post-translational modifications,
among other possible explanations.42-45 On the other hand, the greater sensitivity of qRT-PCR compared to the CNIA technique could explain why some cases in which protein expression was not observed, the corresponding mRNA was detected. However, mRNA levels cannot be considered as the final output of gene expression, while proteins are closer to phenotypes and to gene function.46
Survival analysis showed that OS was significantly shorter for patients expressing cyclin D2 protein, while high levels of cyclin D1 protein were associated with prolonged OS. These results are consistent with those previously published, which demonstrate a significantly better prognosis for the patients who expressed high levels of cyclin D1 protein detected by immunohistochemistry than for those with low or null levels of cyclin D1 expression.27,47 Overexpression of CCND1 mRNA has also been associated with better prognosis.3 The different effect on OS depending on the levels of cyclin D1 and cyclin D2 was not observed for TTP in the present series, indicating the effectiveness of VRD induction and ASCT consolidation in all patients independently of the level of expression of cyclin D proteins. However, the strong association between the expression of cyclin D1 and t(11;14) and polysomy 11, and between the expression of cyclin D2 and the presence of high-risk cytogenetic abnormalities suggests that the differences in survival for each cyclin D are related to cytogenetic abnormalities rather than to cyclin D expression.3,39 In fact, patients with cyclin D2 protein expression but without 1q gains had a favorable prognosis.
When the survival analysis partitioned the cyclin D1 expression into high and low levels, we found that patients with high levels of cyclin D1 protein had significantly shorter TTP than did those with low levels, although this difference was not maintained during the subsequent course of the disease, since OS was similar for both groups. The strong
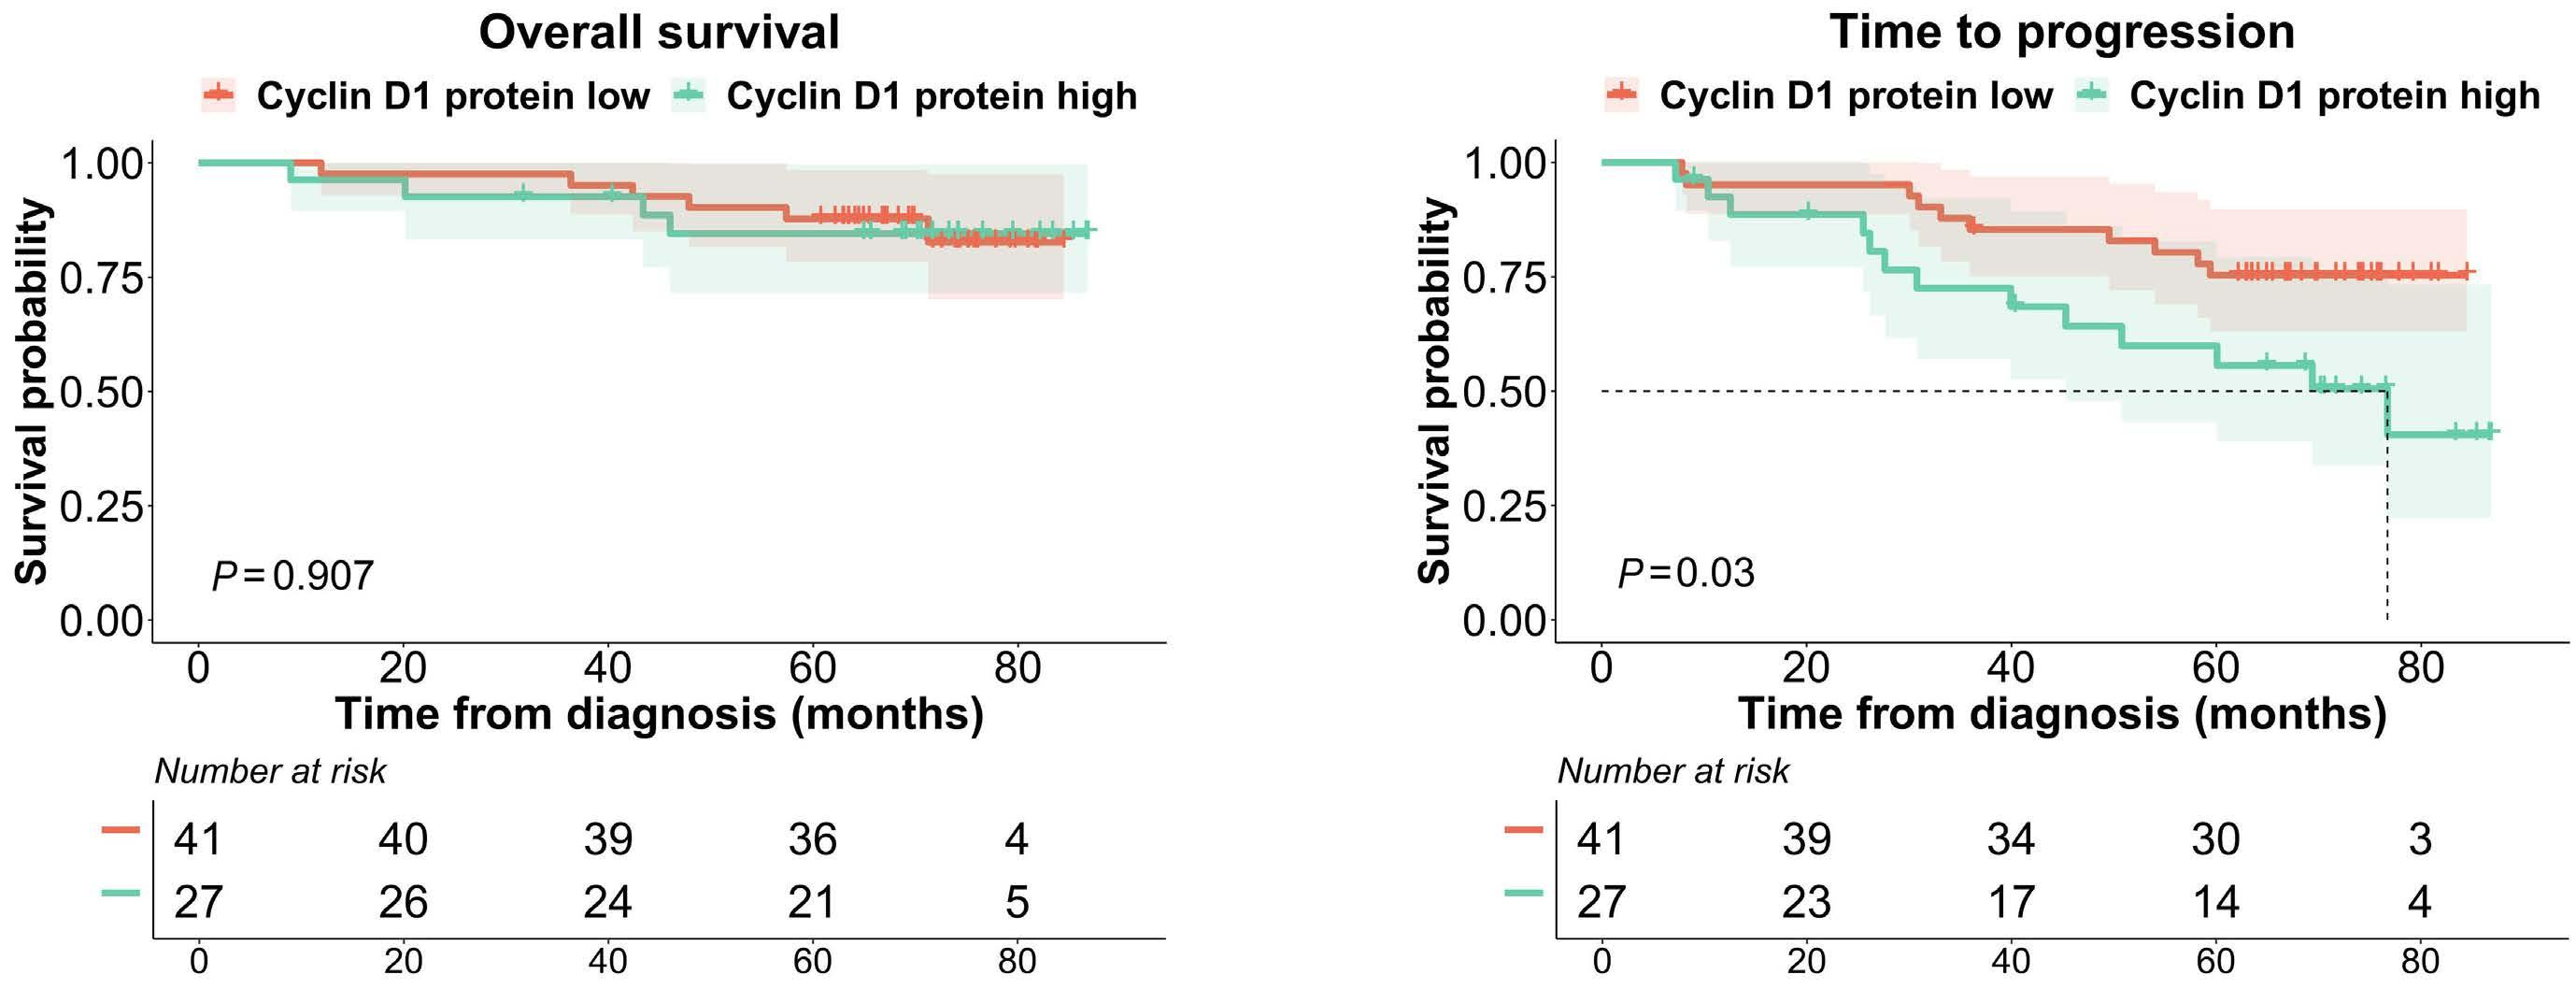
Haematologica | 109 Marzo 2024 884 ARTICLE - Quantification of cyclin D1 and D2 proteins in MM I. J. Cardona-Benavides et al.
A B
Figure 5. Survival analysis by dichotomized cyclin D1 protein expression groups (high and low). (A and B) Kaplan-Meier curves for overall survival and time to progression, respectively. Log-rank (Mantel-Cox) test P values are shown.
association between lower cyclin D levels and 11q13 gains indicates a more favorable outcome for MM patients with 11q13 than for those with t(11;14). This is consistent with the findings of earlier studies.48,49
In summary, no cyclin D1 or D2 protein expression was detected in about half of the MM patients, in whom 41% of the cases could be explained by very low mRNA levels (values less than the NPC cutoff). The discrepancy between cyclin D protein abundance and mRNA levels in the other cases may be related to post-transcriptional and post-translational mechanisms. In any case, our data demonstrate that D cyclin proteins are not universally expressed in MM. While we found that cyclin D1 was overexpressed in almost all cases with t(11;14) and 11q13 gain, cyclin D2 was not detected in the majority of the MM patients not expressing cyclin D1. Although GEP had demonstrated dysregulation of one of the D cyclins at the mRNA level in almost all MM, this increased expression does not culminate in the production of more protein, especially in the case of cyclin D2. This suggests that cyclins D could not play an oncogenic role in a proportion of patients with MM. On the other hand, it remains to be determined whether the high levels of cyclin D present in approximately 60% of patients with MM are always functionally relevant. In terms of the prognostic impact of cyclins D, our results support that the relationship of their overexpression with the prognosis of patients with MM is driven more by genetic alterations associated with cyclin D1 and D2 upregulation than by their dysregulation per se
Disclosures
LR has received consulting fees from Amgen, BMS/Celgene, Sanofi, Janssen, Takeda, GSK and Karyofarm. JML has received honoraria and consulting fees from BMS/Celgene, Incyte, Janssen, Novartis, Sanofi and Roche. JSM has consulting and advisory roles with Amgen, Bristol-Myers Squibb, Celgene, Janssen, MSD, Novartis, Takeda, and Roche. MVM served on speakers bureaus and advisory boards for AbbVie, Adaptive, Amgen, Celgene, GlaxoSmithKline, Janssen, Mundipharma, Oncopeptides, PharmaMar, Roche, Seattle Genetics, and Takeda. NCG receives honoraria from Janssen and Amgen. All the other authors have no conflicts of interest to disclose.
References
1. Bergsagel PL, Kuehl WM, Zhan F, Sawyer J, Barlogie B, Shaughnessy J. Cyclin D dysregulation: an early and unifying pathogenic event in multiple myeloma. Blood. 2005;106(1):296-303.
2. Bergsagel PL, Kuehl WM. Molecular pathogenesis and a consequent classification of multiple myeloma. J Clin Oncol. 2005;23(26):6333-6338.
3. Zhan F, Huang Y, Colla S, et al. The molecular classification of multiple myeloma. Blood. 2006;108(6):2020-2028.
4 Skerget S, Penaherrera D, Chari A, et al. Genomic basis of
Contributions
IJCB developed and performed qRT-PCR, analyzed data, prepared the figures and wrote the manuscript. IMK conceived the idea, developed and performed CNIA experiments and analyzed protein data. EAR performed CNIA experiments and analyzed protein data. CDR obtained the patients’ clinical data. II assisted with CNIA experiments. ASS and DQ assisted with qRT-PCR experiments. AMLG and MC assisted with laboratory experiments. MJC, LR, JML, JSM and MVM provided patient samples and clinical data, and were responsible for obtaining informed consent from patients. LAC analyzed the clinical data, supervised the statistical analysis, helped prepare the figures and supervised the whole study. NCG conceived the idea and designed the study, participated in writing the manuscript, supervised the whole study, and provided funding. All authors critically reviewed and approved the manuscript.
Acknowledgments
The authors thank Vanesa Gutiérrez for her technical assistance with MM cell purification and FISH analysis, and Phil Mason for his help in reviewing the English language of the manuscript.
Funding
This study was funded by the Instituto de Salud Carlos III and co-financed by FEDER (PI16/01074 and PI19/00674); by the Asociación Española Contra el Cancer (AECC) (Proyectos Estratégicos: PROYE20047GUTI); and by the Gerencia Regional de Salud, Junta de Castilla y León grants (GRS1654/A/17, GRS1849/A/18, and GRS2058/A/19). IJCB was supported by a fellowship (contract PFIS-2020: FI20/00226) from the Instituto de Salud Carlos III (contract PFIS-2020: FI20/00226). CDR was supported by a fellowship from the AECC (CLJUN18010DERA); EARR was supported by the Consejería de Educación de Castilla y León and FEDER funds. The WES platform was acquired thanks to the INNOCAMPUS program (CEI10-1-0010).
Data-sharing statement
The original data and protocols used for this article can be acquired by writing to the first author (icarbe96@usal.es) or the corresponding author.
multiple myeloma subtypes from the MMRF CoMMpass Study. medRxiv. 2021 Aug 5. doi: 10.1101/2021.08.02.21261211 [preprint, not peer-reviewed].
5. Soverini S, Cavo M, Cellini C, et al. Cyclin D1 overexpression is a favorable prognostic variable for newly diagnosed multiple myeloma patients treated with high-dose chemotherapy and single or double autologous transplantation. Blood. 2003;102(5):1588-1594.
6. Lesage D, Troussard X, Sola B. The enigmatic role of cyclin D1 in
Haematologica | 109 Marzo 2024 885 ARTICLE - Quantification of cyclin D1 and D2 proteins in MM I. J. Cardona-Benavides et al.
multiple myeloma. Int J Cancer. 2005;115(2):171-176.
7 Hurt EM, Wiestner A, Rosenwald A, et al. Overexpression of c-maf is a frequent oncogenic event in multiple myeloma that promotes proliferation and pathological interactions with bone marrow stroma. Cancer Cell. 2004;5(2):191-199.
8. Yang L, Wang H, Kornblau SM, et al. Evidence of a role for the novel zinc-finger transcription factor ZKSCAN3 in modulating Cyclin D2 expression in multiple myeloma. Oncogene. 2011;30(11):1329-1340.
9 Misiewicz-Krzeminska I, Sarasquete ME, Vicente-Dueñas C, et al. Post-transcriptional modifications contribute to the upregulation of cyclin D2 in multiple myeloma. Clin Cancer Res. 2016;22(1):207-217
10 Montalto FI, De Amicis F. Cyclin D1 in cancer: a molecular connection for cell cycle control, adhesion and invasion in tumor and stroma. Cells. 2020;9(12):2648.
11. Tiedemann RE, Mao X, Shi C-X, et al. Identification of kinetin riboside as a repressor of CCND1 and CCND2 with preclinical antimyeloma activity. J Clin Invest. 2008;118(5):1750-1764.
12. Barwick BG, Gupta VA, Vertino PM, Boise LH. Cell of origin and genetic alterations in the pathogenesis of multiple myeloma. Front Immunol. 2019;10:1121.
13. Hydbring P, Malumbres M, Sicinski P. Non-canonical functions of cell cycle cyclins and cyclin-dependent kinases. Nat Rev Mol Cell Biol. 2016;17(5):280-292.
14 Musgrove EA, Caldon CE, Barraclough J, Stone A, Sutherland RL. Cyclin D as a therapeutic target in cancer. Nat Rev Cancer. 2011;11(8):558-572.
15. Comstock CES, Augello MA, Benito RP, et al. Cyclin D1 splice variants: polymorphism, risk, and isoform-specific regulation in prostate cancer. Clin Cancer Res. 2009;15(17):5338-5349.
16. Tchakarska G, Sola B. The double dealing of cyclin D1. Cell Cycle. 2020;19(2):163-178.
17 Dai J, Wei R-J, Li R, Feng J-B, Yu Y-L, Liu P-S. A study of CCND1 with epithelial ovarian cancer cell proliferation and apoptosis. Eur Rev Med Pharmacol Sci. 2016;20(20):4230-4235.
18. Agnelli L, Bicciato S, Mattioli M, et al. Molecular classification of multiple myeloma: a distinct transcriptional profile characterizes patients expressing CCND1 and negative for 14q32 translocations. J Clin Oncol. 2005;23(29):7296-7306.
19. Ding Z-Y, Li R, Zhang Q-J, et al. Prognostic role of cyclin D2/D3 in multiple human malignant neoplasms: A systematic review and meta-analysis. Cancer Med. 2019;8(6):2717-2729.
20. Cardona-Benavides IJ, de Ramón C, Gutiérrez NC. Genetic abnormalities in multiple myeloma: prognostic and therapeutic implications. Cells. 2021;10(2):336.
21. Hideshima T, Mitsiades C, Tonon G, Richardson PG, Anderson KC. Understanding multiple myeloma pathogenesis in the bone marrow to identify new therapeutic targets. Nat Rev Cancer. 2007;7(8):585-598.
22. Rajkumar SV, Dimopoulos MA, Palumbo A, et al. International Myeloma Working Group updated criteria for the diagnosis of multiple myeloma. Lancet Oncol. 2014;15(12):e538-548.
23. Fonseca R, Bergsagel PL, Drach J, et al. International Myeloma Working Group molecular classification of multiple myeloma: spotlight review. Leukemia. 2009;23(12):2210-2221.
24. Avet-Loiseau H, Durie BGM, Cavo M, et al. Combining fluorescent in situ hybridization data with ISS staging improves risk assessment in myeloma: an International Myeloma Working Group collaborative project. Leukemia. 2013;27(3):711-717.
25. Quinn J, Glassford J, Percy L, et al. APRIL promotes cell-cycle progression in primary multiple myeloma cells: influence of D-type cyclin group and translocation status.
Blood. 2011;117(3):890-901.
26. Specht K, Kremer M, Müller U, et al. Identification of cyclin D1 mRNA overexpression in B-cell neoplasias by real-time reverse transcription-PCR of microdissected paraffin sections. Clin Cancer Res. 2002;8(9):2902-2911.
27. Dawson MA, Opat SS, Taouk Y, et al. Clinical and immunohistochemical features associated with a response to bortezomib in patients with multiple myeloma. Clin Cancer Res. 2009;15(2):714-722.
28. Misiewicz-Krzeminska I, Corchete LA, Rojas EA, et al. A novel nano-immunoassay method for quantification of proteins from CD138-purified myeloma cells: biological and clinical utility. Haematologica. 2018;103(5):880-889.
29 Misiewicz-Krzeminska I, Isidro I, Gutiérrez NC. Capillary nanoimmunoassay for quantification of proteins from CD138-purified myeloma cells. Bio-Protoc. 2019;9(12):e3267.
30 Rosiñol L, Oriol A, Rios R, et al. Bortezomib, lenalidomide, and dexamethasone as induction therapy prior to autologous transplant in multiple myeloma. Blood. 2019;134(16):1337-1345.
31. Misiewicz-Krzeminska I, de Ramón C, Corchete LA, et al. Quantitative expression of Ikaros, IRF4, and PSMD10 proteins predicts survival in VRD-treated patients with multiple myeloma. Blood Adv. 2020;4(23):6023-6033.
32. Kremer M, Ott G, Nathrath M, et al. Primary extramedullary plasmacytoma and multiple myeloma: phenotypic differences revealed by immunohistochemical analysis. J Pathol. 2005;205(1):92-101.
33. Athanasiou E, Kaloutsi V, Kotoula V, et al. Cyclin D1 overexpression in multiple myeloma. A morphologic, immunohistochemical, and in situ hybridization study of 71 paraffin-embedded bone marrow biopsy specimens. Am J Clin Pathol. 2001;116(4):535-542.
34 Padhi S, Varghese RG, Ramdas A. Cyclin D1 expression in multiple myeloma by immunohistochemistry: Case series of 14 patients and literature review. Indian J Med Paediatr Oncol. 2013;34(4):283-291.
35. Markovic O, Marisavljevic D, Cemerikic V, Suvajdzic N, Milic N, Colovic M. Immunohistochemical analysis of cyclin D1 and p53 in multiple myeloma: relationship to proliferative activity and prognostic significance. Med Oncol. 2004;21(1):73-80.
36. Mansoor A, Akhter A, Pournazari P, et al. Protein expression for novel prognostic markers (Cyclins D1, D2, D3, B1, B2, ITGβ7, FGFR3, PAX5) correlate with previously reported gene expression profile patterns in plasma cell myeloma. Appl Immunohistochem Mol Morphol. 2015;23(5):327-333.
37. Zhan F, Hardin J, Kordsmeier B, et al. Global gene expression profiling of multiple myeloma, monoclonal gammopathy of undetermined significance, and normal bone marrow plasma cells. Blood. 2002;99(5):1745-1757.
38. De Vos J, Thykjaer T, Tarte K, et al. Comparison of gene expression profiling between malignant and normal plasma cells with oligonucleotide arrays. Oncogene. 2002;21(44):6848-6857.
39 Hanamura I, Huang Y, Zhan F, Barlogie B, Shaughnessy J. Prognostic value of cyclin D2 mRNA expression in newly diagnosed multiple myeloma treated with high-dose chemotherapy and tandem autologous stem cell transplantations. Leukemia. 2006;20(7):1288-1290.
40 Specht K, Haralambieva E, Bink K, et al. Different mechanisms of cyclin D1 overexpression in multiple myeloma revealed by fluorescence in situ hybridization and quantitative analysis of mRNA levels. Blood. 2004;104(4):1120-1126.
41. Pruneri G, Fabris S, Baldini L, et al. Immunohistochemical
Haematologica | 109 Marzo 2024 886 ARTICLE - Quantification of cyclin D1 and D2 proteins in MM I. J. Cardona-Benavides et al.
analysis of cyclin D1 shows deregulated expression in multiple myeloma with the t(11;14). Am J Pathol. 2000;156(5):1505-1513.
42. Vogel C, Marcotte EM. Insights into the regulation of protein abundance from proteomic and transcriptomic analyses. Nat Rev Genet. 2012;13(4):227-232.
43. Liu Y, Beyer A, Aebersold R. On the dependency of cellular protein levels on mRNA abundance. Cell. 2016;165(3):535-550.
44 Qie S, Diehl JA. Cyclin D1, cancer progression, and opportunities in cancer treatment. J Mol Med. 2016;94(12):1313-1326.
45. Simoneschi D, Rona G, Zhou N, et al. CRL4AMBRA1 is a master regulator of D-type cyclins. Nature. 2021;592(7856):789-793.
46. Buccitelli C, Selbach M. mRNAs, proteins and the emerging principles of gene expression control. Nat Rev Genet. 2020;21(10):630-644.
47. Cook JR, Hsi ED, Worley S, Tubbs RR, Hussein M. Immunohistochemical analysis identifies two cyclin D1+ subsets of plasma cell myeloma, each associated with favorable survival. Am J Clin Pathol. 2006;125(4):615-624.
48. Gran C, Uttervall K, Borg Bruchfeld J, et al. Translocation (11;14) in newly diagnosed multiple myeloma, time to reclassify this standard risk chromosomal aberration? Eur J Haematol. 2019;103(6):588-596.
49. Joseph NS, Kaufman JL, Dhodapkar MV, et al. Long-term follow-up results of lenalidomide, bortezomib, and dexamethasone induction therapy and risk-adapted maintenance approach in newly diagnosed multiple myeloma. J Clin Oncol. 2020;38(17):1928-1937.
Haematologica | 109 Marzo 2024 887 ARTICLE - Quantification of cyclin D1 and D2 proteins in MM I. J. Cardona-Benavides et al.
What is the best treatment strategy before autologous peripheral blood stem cell transplantation in POEMS syndrome?
Francesco Autore,1* Stefania Bramanti,2* Federica Lessi,3 Idanna Innocenti,1 Eugenio Galli,1 Serena Rocchi,4,5 Rossella Ribolla,6 Daniele Derudas,7 Stefania Oliva,8 Paola Stefanoni,9 Magda Marcatti,10 Angelo Schenone,11,12 Giorgio La Nasa,7 Claudia Crippa,6 Elena Zamagni,4,5 Marcello Riva,3 Rita Mazza,2 Daniele Mannina,2 Simona Sica,1,13 Andrea Bacigalupo1,13 and Luca Laurenti1,13
1Dipartimento di Diagnostica per Immagini, Radioterapia Oncologica ed Ematologia, Fondazione Policlinico Universitario “A. Gemelli” IRCCS, Roma; 2Istituto Clinico Humanitas IRCCS, Rozzano; 3Azienda Ospedale Università Padova, Padova; 4IRCCS Azienda OspedalieroUniversitaria di Bologna, Istituto di Ematologia “Seràgnoli”, Bologna; 5Dipartimento di Scienze Mediche e Chirurgiche, Università di Bologna, Bologna; 6Spedali Civili, Brescia; 7SC di Ematologia e CTMO - Ospedale Oncologico di Riferimento Regionale “A. Businco”, ARNAS “G. Brotzu”, Cagliari; 8S. Giovanni Battista Hospital, Torino; 9ASST Papa Giovanni XXIII Hospital, Bergamo; 10San Raffaele Hospital, Milano; 11Department of Neurosciences, Rehabilitation, Ophthalmology, Genetic and Maternal and Infantile Sciences (DINOGMI), University of Genoa, Genova; 12IRCCS San Martino Hospital, Genova and 13Sezione di Ematologia, Dipartimento di Scienze Radiologiche ed Ematologiche, Università Cattolica del Sacro Cuore, Roma, Italy
*FA and SB contributed equally as first authors.
Abstract
Correspondence: F. Autore francesco.autore@policlinicogemelli.it
Received: June 12, 2023.
Accepted: August 21, 2023.
Early view: August 31, 2023.
https://doi.org/10.3324/haematol.2023.283719
©2024 Ferrata Storti Foundation
Published under a CC BY-NC license
Autologous peripheral blood stem cell transplantation (aPBSCT) provides optimal outcomes in POEMS syndrome but the definition of the best treatment before aPBSCT remains to be defined because of the rarity of the disease and the heterogeneity of published case series. We collected clinical and laboratory data of patients with POEMS syndrome undergoing aPBSCT from 1998 to 2020 in ten Italian centers. The primary endpoint of the study was to evaluate the impact of prior therapies and mobilization regimen on outcome. We divided the patients into three groups: patients who did not receive any treatment before transplant (15 patients, group A: front-line), patients pre-treated with other agents (14 patients, group B) and patients treated with cyclophosphamide as their mobilizing regimen (16 patients, group C). The three groups did not show differences in terms of demographic and clinical characteristics. All 45 patients underwent aPBSCT after a high-dose melphalan conditioning regimen, with a median follow-up of 77 months (range, 37-169 months). The responses were not statistically different between the three groups (P=0.38). Progression-free and overall survival rates at 6 years were: 70% (95% confidence interval: 55-85%) and 91% (95% confidence interval: 82-99) 65%, respectively, and did not differ between the three groups. The cumulative incidence of transplant-related mortality and relapse was 4% and 36%, respectively. In conclusion, in a relatively large number of patients with POEMS syndrome, undergoing an autologous transplant, pre-treatment and disease status at transplant did not appear to have an impact on major transplant outcomes.
Introduction
POEMS syndrome is a rare paraneoplastic condition associated with an underlying plasma cell disorder. The acronym POEMS refers to the main features of this syndrome: polyradiculoneuropathy, organomegaly, endocrinopathy, monoclonal plasma cell disorder, and skin changes.1-3 Treatment recom-
mendations are based on limited trial data: the disease is so rare that literature consists mainly of small retrospectives studies or case series.
The main experience in the treatment has been with alkylating-based therapy with autologous peripheral blood stem cell transplantation (aPBSCT). Reports on the use of cyclophosphamide-based therapies are interesting with excellent
Haematologica | 109 Marzo 2024 888 - Plasma Cell Disorders ARTICLE
hematologic and clinical responses, good achievement of neurological improvement and also vascular endothelial growth factor (VEGF) reduction, allowing optimal progression-free survival (PFS) and overall survival (OS).4-16
For patients fit to undergo a transplant, in the absence of organ dysfunction, high-dose chemotherapy and aPBSCT appear to be the best strategy. The dose of melphalan in the conditioning has ranged from 140 to 200 mg/m2, with very high response rates; the responses are long-lasting, although relapses have been reported.10,11,15,17-21 Tandem transplantation has been applied anecdotally, but little information is available regarding any added value of the second transplant.22,23 For unfit patients, for whom high-dose chemotherapy is not recommended, many therapeutic approaches have been suggested, including steroids and low-dose alkylating agents associated with steroids or radiotherapy.3
Other promising treatments are lenalidomide,19,24-29 thalidomide,30,31 bortezomib,32-37 and drugs with anti-VEGF and anti-tumor necrosis factor effects.38 Single-agent intravenous immunoglobulin and plasmapheresis are not helpful to cure patients with POEMS syndrome.3
A recent retrospective study on the best first-line treatment in POEMS, conducted on 347 patients, focused attention on three options: melphalan plus dexamethasone, aPBSCT, or lenalidomide plus dexamethasone. The highest response rates were seen with aPBSCT, followed by lenalidomide plus dexamethasone, and melphalan plus dexamethasone. Although all these three treatments produced reasonable responses and survival outcomes, patients at higher risk may benefit more from aPBSCT.21 In the setting of aPBSCT, reports on the clinical outcomes of patients with advanced disease and poor performance status are few and appropriate patient selection remains an important issue regarding the risk-benefit ratio associated with the procedure.18,21,39 The best protocol to collect PBSC in patients with POEMS syndrome remains to be defined because the efficacy of different treatments has not been previously compared in large cohorts of patients, and the rarity of the disease makes it difficult to conduct randomized controlled trials. Cyclophosphamide plus granulocyte colony-stimulating factor (G-CSF) mobilizes more CD34+ cells and reduces the incidence of engraftment syndrome in patients with POEMS syndrome, although the combination potentially increases the risks related to the procedure, without a significant tumor mass reduction. Several published series document successful mobilization and collection through chemo-mobilization, as well as with the use of G-CSF alone.8,10,13,15,17,40-45
Because of the rarity of POEMS syndrome and the heterogeneity of published case series, the best treatment before aPBSCT remains to be defined. Therefore, we decided to collect data on patients with POEMS syndrome who underwent aPBSCT in different Italian centers to evaluate response to and survival after the treatment prior to transplantation as well as the response to and survival after the transplant itself.
Methods
We collected clinical and laboratory data of patients with POEMS syndrome from ten Italian centers, including all consecutive patients who underwent aPBSCT from January 1998 to December 2020. We divided our population into three different groups: patients who did not receive any treatment before transplantation (group A, front-line), patients pre-treated with other agents (group B) and patients treated with cyclophosphamide as their mobilizing regimen (group C). Before transplantation, patients in group A received G-CSF 10 mg/kg/day alone for 5 consecutive days as their mobilizing regimen. Patients in group C were given cyclophosphamide 2-4 g/m2 followed by G-CSF 5 mg/kg/day. Group B included patients treated with Len-Dex (lenalidomide 10-25 mg on days 1-21, dexamethasone 40 mg on days 1, 8, 15, and 22), Vel-Dex (bortezomib 1 mg/m2 on days 1, 4, 8, and 11, plus dexamethasone 20 mg on days 1-4 and 8-11) or radiotherapy; all these patients were mobilized with G-CSF 5-10 mg/kg/day for 5 consecutive days.
Patients in all the groups were treated with melphalan, at the dose of 140 or 200 mg/m2 (Mel140 and Mel200, respectively), as the conditioning regimen. G-CSF was given after the transplant from day +6 until engraftment of neutrophils, defined as >1,000/mm3. No patient received maintenance therapy after aPBSCT. All patients provided informed consent. The study was approved by the Institutional Review Board and conducted following the ethical guidelines of the Declaration of Helsinki.
Patients were evaluated for responses (clinical, hematologic, and radiological), toxicity, PFS and OS. Hematologic response was defined by the response criteria for POEMS syndrome.3,46 Complete remission (CR) was determined by negative bone marrow, negative immunofixation of the serum and urine, and a normalized VEGF level. Very good partial remission (VGPR) was defined by a 90% reduction in M-protein or immunofixation positivity only as long as the M-protein was at least 0.5 g/dL at baseline, and the VEGF level improved by at least 50%. Partial remission (PR) was defined by a 50% reduction in M-protein or immunofixation positivity as long as the baseline M-protein was at least 1.0 g/dL. Progressive disease (PD) was assessed by a more than 50% increase in these proteins or the reappearance of the proteins after CR; stable disease (SD) was considered as all the statuses other than CR, VGPR, PR, and PD.
A first evaluation of the response was made before transplantation for patients in groups B and C. After the transplant we evaluated the best response for patients in all the groups using clinical, serological and radiological examinations. We also determined toxicities, defined as per the Common Terminology Criteria for Adverse Events version 4.0 (CTCAEv4.0).
Statistical analysis
PFS was the time from treatment to recurrence, the reappearance of clinical symptoms, or death. OS was defined
Haematologica | 109 Marzo 2024 889 ARTICLE - Treatment strategy before aPBSCT in POEMS syndrome F. Autore et al.
as the time from treatment to death. Patients lost to follow-up were censored on the day of the last follow-up visit. The χ2 test or Fisher exact test, when appropriate, was used to determine the statistical significance of differences in the values of categorical variables. Continuous variables were compared by discrete categorization variables (e.g., groups) using the equal-variances t test or with the Mann-Whitney test if the distribution was not normal. P values <0.05 were considered statistically significant. Cut-off determination for a continuous variable to predict an event was explored with receiver operating characteristic curve analysis. PFS and OS were calculated with the Kaplan-Meier log-rank test. Tests were performed with NCSS 2020 Statistical Software (2020) (NCSS, LLC. Kaysville, UT, USA; ncss.com/ software/ncss).
Results
Our dataset was derived from 45 patients with POEMS syndrome who underwent aPBSCT. The patients’ baseline characteristics are shown in Table 1. Their median age at the time of the diagnosis was 53 years (range, 38-71) and 71% were men. Polyneuropathy was present in all the patients and gammopathy was found in 95% of them (monoclonal IgA in 64%). We conducted the analysis dividing the cohort in three different groups: 15 patients in group A, 14 patients into group B and 16 patients in group C. No differences were shown between these three groups in terms of demographic and clinical characteristics, except for the level of hemoglobin (lower in group A) and white blood cell count (higher in group C), as shown in Table 2.
Data on stem cell mobilization showed that the median number of CD34+ cells collected was 5.98x10⁶/kg overall (6.4x10⁶/kg in group A patients, 6.2x10⁶/kg in group B patients, and 5.3x10⁶/kg in group C patients; P=0.11) with a median of one single procedure per mobilization (range, 1-3). Use of plerixafor was allowed but it was necessary in only seven patients (3 in group A and 4 in group B). The procedure was generally good in terms of effectiveness and safety in all the groups.
Evaluation of response before transplantation documented that the patients in groups B and C achieved VGPR in 14% and 13% of cases and PR in 29% and 25% of cases, respectively, such that the response rate to the treatment before aPBSCT was good. Data on conditioning and transplantation are presented in Table 3. Mel200 was the choice of conditioning regimen for 87% of the patients; the other six patients were conditioned with Mel140, with this dose being chosen by physicians based on their patients’ fitness status.
aPBSCT was complicated by febrile neutropenia in 62% of all the patients, gastrointestinal toxicity in 47% and infections in 42%; a median of two red blood cell units/patient (range, 0-13) and three platelet units/patient (range, 0-10) was the transfusion need during hospitalization. Polymorphonuclear
Table 1. Patients’ characteristics.
Characteristic
Age in years, median
Male, N (%)
Polyneuropathy, N (%)
Endocrinopathy, N (%)
Organomegaly, N (%)
Gammopathy, N (%)
Monoclonal IgA, N (%)
Monoclonal others, N (%)
Skin lesions, N (%)
Fluid overload, N (%)
Hemoglobin, g/dL, median
All patients, N=45
53
32 (71)
45 (100)
34 (76)
38 (84)
43 (95)
29 (64)
14 (31)
31 (69)
19 (42)
14.1
Platelet count, x109/L, median 476
Platelet count >500x109/L, N (%)
WBC: white blood cell.
17 (38)
cell counts >500 x106/L were reached at a median of 14 days, and platelet counts >25x109/L also at a median of 14 days.
The median time spent in hospital after transplantation was 22 days (range, 13-69). No significant differences were noted between the three groups in terms of complications, toxicity, blood support, engraftment and hospitalization.
The best response rates after aPBSCT were as follows: CR in 46%, VGPR in 23%, PR in 18%, SD in 8% and PD in 5%, evaluated at a median time of 5.5 months (95% confidence interval: 5.3-19). When comparing the response rate (CR vs VGPR/PR vs. SD/PD) between the three groups, no difference was found (P=0.38). Considering that patients in group A were not treated before transplantation and that the outcomes in the three groups of patients were similar, we did not find significant differences also when comparing patients with some type of response versus PD at transplantation. In ten cases, a re-admission to hospital was necessary: in five cases for relapse and in five cases for infectious complications.
The median follow-up was 77 months (range, 37-169): 17 patients (37.8%) experienced disease progression without a statistical difference between the three groups. The overall 6-year PFS rate was 70% (95% confidence interval: 55-85).
The three groups did not show significant differences; there was a tendency to a unfavorable PFS for patients in group C (6-year PFS of 63% for group C vs. 78% for group A and 68% for group B; P=0.3), but no variable was found to negatively affect PFS. Likewise, the treatment chosen before transplantation had no effect on PFS (Figure 1A).
The overall 6-year rate of requiring retreatment was 27% and did not differ among the treatment groups (P=0.29) (Figure 1B). The retreatment choice was lenalidomide plus dexamethasone in most cases (12 out of 17 patients); other choices were cyclophosphamide, radiotherapy, daratumum-
Haematologica | 109 Marzo 2024 890 ARTICLE - Treatment strategy before aPBSCT in POEMS syndrome F. Autore et al.
7.6
WBC count, x109/L, median
NA: not applicable; WBC: white blood cell.
Mel140: melphalan 140 mg/m2; Mel200: 200 mg/m2; G-CSF: granulocyte colony-stimulating factor; GI: gastrointestinal; RBC: red blood cell; PMN: polymorphonuclear cell.
Haematologica | 109 Marzo 2024 891 ARTICLE - Treatment strategy before aPBSCT in POEMS syndrome F. Autore et al. Characteristics All patients N=45 Group A No treatment N=15 Group B Other treatments N=14 Group C Cyclophosphamide N=16 P Age at diagnosis in years, median 53 51 53 53 0.5 Male gender, N (%) 32 (71) 12 (80) 11 (79) 9 (56) 0.26 Median year of diagnosis 2013 2011 2014 2012Median year of transplant 2013 2012 2017 2012Gammopathy, N (%) 43 (96) 14 (93) 13 (93) 16 (100) 0.56 Gammopathy IgA, N (%) 29 (64) 8 (53) 8 (57) 13 (81) 0.48 Gammopathy others, N (%) 14 (31) 6 (40) 5 (34) 3 (19)Polyneuropathy, N (%) 45 (100) 15 (100) 14 (100) 16 (100) NA Bone lesions, N (%) 27 (60) 7 (47) 10 (71) 10 (62) 0.38 Endocrinopathy, N (%) 34 (76) 11 (73) 9 (64) 14 (87) 0.33 Skin lesions, N (%) 31 (69) 9 (60) 10 (71) 12 (75) 0.65 Fluid overload, N (%) 19 (42) 6 (40) 6 (43) 7 (44) 0.98 Organomegaly, N (%) 38 (84) 14 (93) 10 (71) 14 (87) 0.24 Hemoglobin, g/dL, median 14.1 11.5 14.4 14.4 0.01 Platelet count, x109/L, median 476 358 401 508 0.16 Platelet count >500x109/L, N (%) 17 (38) 3 (20) 4 (28) 10 (62) 0.035 WBC count, x109/L, median 7.6 5.7 4.7 15.5 0.01
Table 2. Characteristics of the whole cohort of patients and of those in groups A, B, and C.
Characteristics All patients N=45 Group A No treatment N=15 Group B Other treatments N=14 Group C Cyclophosphamide N=16 P Age at transplant in years, median 53 51 54 54 0.5 Conditioning with Mel140, N (%) 6 (13) 3 (20) 1 (7) 2 (12) 0.59 Conditioning with Mel200, N (%) 39 (87) 12 (80) 13 (93) 14 (88) 0.59 CD34+ cells, infused x106/kg, median 4.01 3.95 4.22 3.91 0.52 G-CSF, days, median 8 8 10 8 0.23 GI toxicity, N (%) 21 (47) 7 (50) 9 (64) 5 (31) 0.19 Febrile neutropenia, N (%) 28 (62) 9 (64) 8 (57) 11 (69) 0.80 Infections, N (%) 19 (42) 7 (50) 5 (36) 7 (44) 0.75 RBC unit transfusions, median 2 4 2 2 0.15 Platelet unit transfusions, median 3 3.5 2 3 0.43 Time to PMN count >500x106/L in days, median 14 13 14 14 0.47 Time to platelet count >25x109/L in days, median 14 14 14.5 14 0.29 Duration of hospitalization in days, median 27 29.5 27 23.5 0.33
Table 3. Conditioning and transplant details.
ab added to lenalidomide and steroids or rituximab. The overall 6-year OS was 91% (95% confidence interval: 8299) and did not differ among the treatment groups (P=0.35) (Figure 1C). Seven out of 45 patients (15.6%) died, four of PD and three of transplant-related infectious complications.
Discussion
Our data show that pre-transplant therapy, whether cyclophosphamide or other agents, did not have an impact on the outcome of the transplant. The results were in fact impressive in terms of PFS, time to retreatment and OS for patients affected by POEMS syndrome who underwent transplantation, confirming that aPBSCT is an effective and safe procedure in patients with this syndrome, independently of the mobilizing treatment. Zhao et al. recently concluded that aPBSCT was the best first-line treatment for POEMS syndrome, being better than lenalidomide plus dexamethasone and melphalan plus dexamethasone.21
The rarity of POEMS syndrome makes it difficult to conduct randomized trials. Consequently, a comparison between patients treated with different protocols evaluated in a multicenter cohort could be an option to stimulate debate about open questions in POEMS syndrome. In the
B
literature there are many reports of favorable outcomes in patients who underwent aPBSCT with similar results from retrospective studies: a CR rate over 45%, improvement of neurological signs, as well as low rates of complications and transplant-related mortality.11,15,17,18,21
The best protocol to collect the peripheral blood stem cells (PBSC) for transplantation remains to be defined in patients with POEMS syndrome, even if PBSC mobilization was optimal in all our three groups. We recently published a report of a study to determine the better mobilizing regimen between G-CSF and alkylating agents: in 25 patients both strategies to mobilization of PBSC enabled the harvest of sufficient CD34+ cell doses and allowed good and rapid engraftment.45
We noted that plerixafor was not used in patients in group C, so treatment with cyclophosphamide was able to yield a sufficient dose of PBSC only with G-CSF. Our previous study registered only a few poor mobilizers, equally distributed between the G-CSF and cyclophosphamide groups, so this finding would be better confirmed in a larger population of patients.
In the present analysis no significant differences were noted in clinical and laboratory characteristics between pre-treated patients and patients who underwent front-line aPBSCT. Sometimes the previous treatment with cyclophosphamide
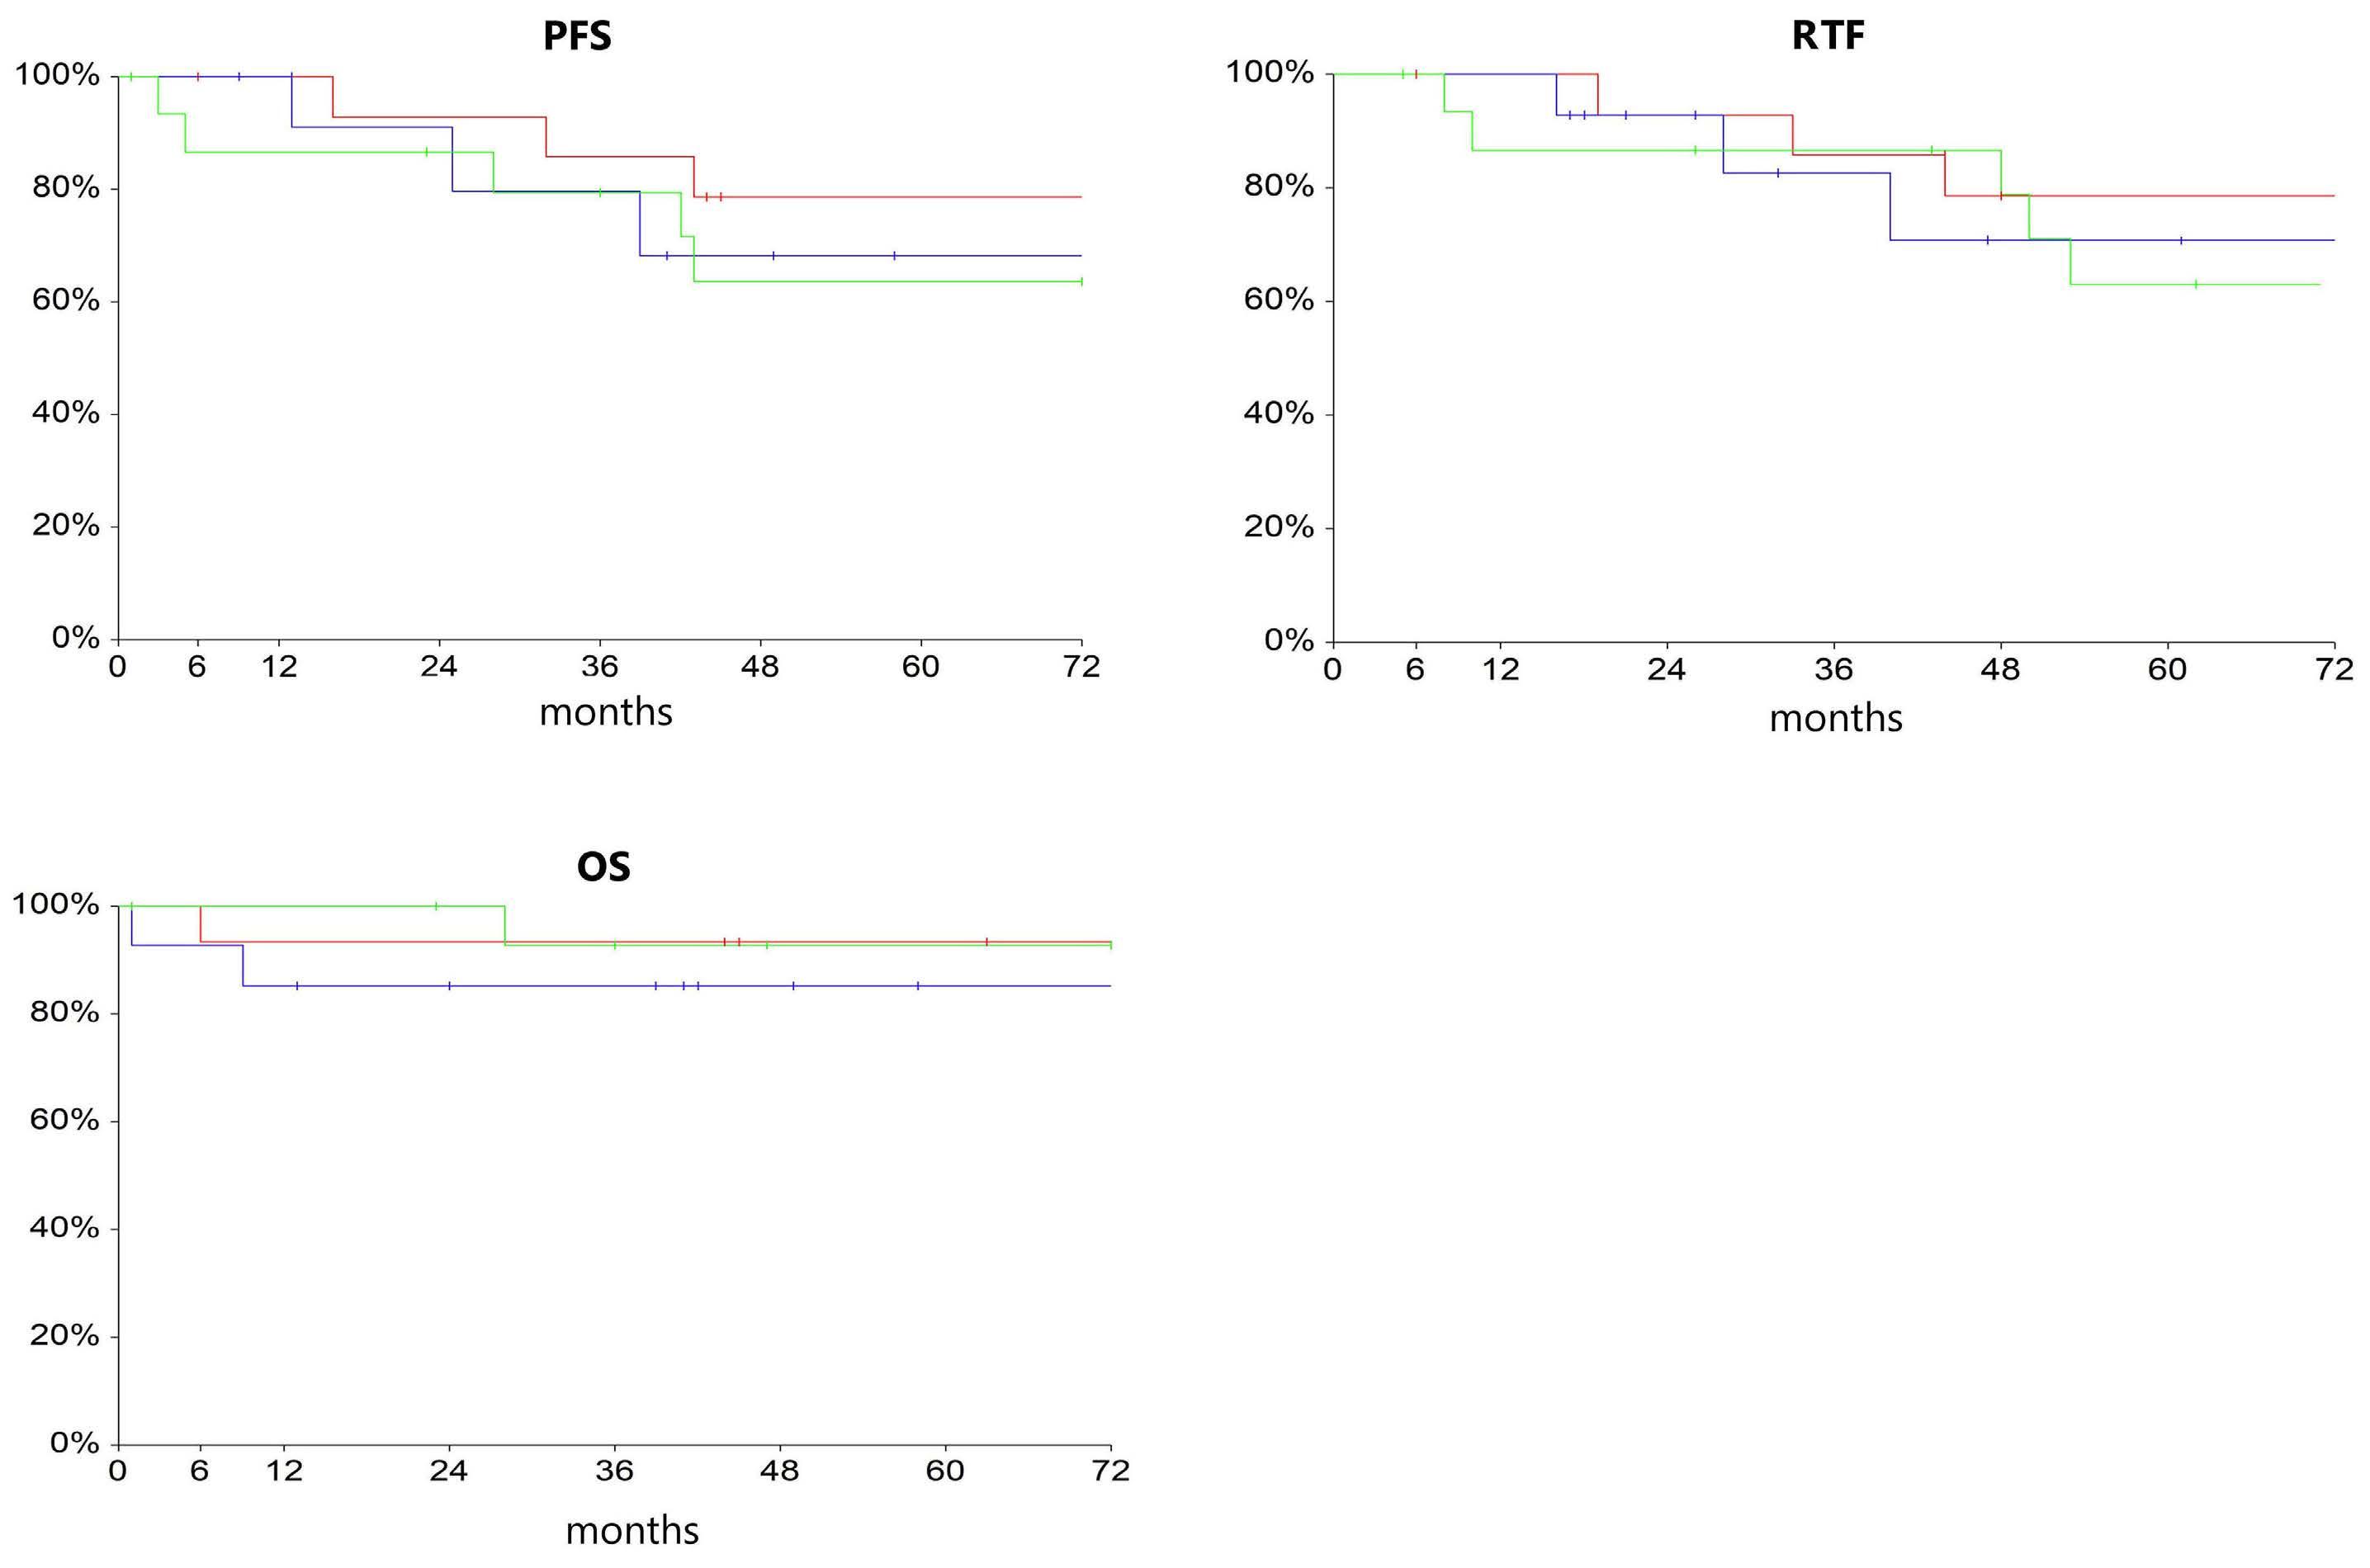
Haematologica | 109 Marzo 2024 892 ARTICLE - Treatment strategy before aPBSCT in POEMS syndrome F. Autore et al. A
C
Figure 1. Outcomes of the three groups of patients with POEMS syndrome receiving different treatments prior to autologous peripheral blood stem cell transplantation. Group A (red): no treatment; group B (blue): other treatment; group C (green): cyclophosphamide). (A) Progression-free survival (PFS). (B) Percentage not requiring retreatment (retreatment-free, RTF). (C) Overall survival (OS).
served as a purging therapy to ameliorate the fitness of patients, leading them to the transplant procedure. Other studies looked at purging therapies before transplantation with cyclophosphamide as a promising approach in POEMS syndrome with disseminated bone marrow involvement.3 In fact, we noted a role of chemotherapy in terms of eligibility to transplant for patients initially unfit for the procedure, so that patients who were not candidates for aPBSCT, after the pre-treatment achieved a better condition, becoming suitable for performance of the transplantation.
All our patients were conditioned with melphalan: Mel200 is the best option and no differences in toxicity were noted with this regimen compared to Mel140. There is a consensus in the literature about the use of melphalan, with rates of over 90-95% being registered.11,18,21 Considering the main case series reported in literature we calculated that 460 patients were treated with Mel200/Mel140 and fewer than ten patients were treated with other conditioning regimes, mainly BEAM (carmustine, etoposide, cytarabine, and melphalan).11,15,17,18,20,21,45,47 Engraftment was similar in our three groups of patients and no differences between the three groups were seen in transplant complications, such as infections, hospitalization and transfusion requirements.
References
1. Bardwick PA, Zvaifler NJ, Gill GN, Newman D, Greenway GD, Resnick DL. Plasma cell dyscrasia with polyneuropathy, organomegaly, endocrinopathy, M protein, and skin changes: the POEMS syndrome. Report on two cases and a review of the literature. Medicine (Baltimore). 1980;59(4):311-322.
2. Dispenzieri A, Kyle RA, Lacy MQ, et al. POEMS syndrome: definitions and long-term outcome. Blood. 2003;101(7):2496-2506.
3. Dispenzieri A. POEMS syndrome: 2021 update on diagnosis, risk-stratification, and management. Am J Hematol. 2021;96(7):872-888.
4 Rovira M, Carreras E, Blade J, et al. Dramatic improvement of POEMS syndrome following autologous haematopoietic cell transplantation. Br J Haematol. 2001;115(2):373-375.
5. Hogan WJ, Lacy MQ, Wiseman GA, Fealey RD, Dispenzieri A, Gertz MA. Successful treatment of POEMS syndrome with autologous hematopoietic progenitor cell transplantation. Bone Marrow Transplant. 2001;28(3):305-309.
6. Soubrier M, Ruivard M, Dubost JJ, Sauvezie B, Philippe P. Successful use of autologous bone marrow transplantation in treating a patient with POEMS syndrome. Bone Marrow Transplant. 2002;30(1):61-62.
7 Peggs KS, Paneesha S, Kottaridis PD, et al. Peripheral blood stem cell transplantation for POEMS syndrome. Bone Marrow Transplant. 2002;30(6):401-404.
8. Jaccard A, Royer B, Bordessoule D, Brouet JC, Fermand JP. High dose therapy and autologous blood stem cell transplantation in POEMS syndrome. Blood. 2002;99(8):3057-3059.
9 Schliamser LM, Hardan I, Sharif D, Zukerman E, Avshovich N, Attias D. Significant improvement of POEMS syndrome with pulmonary hypertension following autologous peripheral blood stem cell transplant. Blood. 2003;102(11):5664.
In conclusion, there were reasonable responses to all three schemes of treatment examined (front-line without pre-treatment, cyclophosphamide or other agents) with significant improvement in symptoms, durable PFS and impressive OS in newly diagnosed patients with POEMS syndrome who underwent aPBSCT. It should be noted that our study is one of the largest national series of patients with POEMS syndrome treated with aPBSCT in Europe. Patients unsuitable to undergo front-line aPBSCT because of comorbidity could be rescued with cyclophosphamide as a therapeutic and mobilizing agent.
Disclosures
No conflicts of interest to disclose.
Contributions
FA and LL performed research. SB, FL, II, SR, RR, DD, SO, PS, MM, AS, GLN, CC, EZ, MR, and DM collected data. EG analyzed the data. FA, EG, AB, and LL wrote the manuscript. SB, SS, and AB supervised the study.
Data-sharing statement
Data are available upon reasonable request.
10. Dispenzieri A, Moreno-Aspitia A, Suarez GA, et al. Peripheral blood stem cell transplantation in 16 patients with POEMS syndrome, and a review of the literature. Blood. 2004;104(10):3400-3407.
11. Dispenzieri A, Lacy MQ, Hayman SR, et al. Peripheral blood stem cell transplant for POEMS syndrome is associated with high rates of engraftment syndrome. Eur J Haematol. 2008;80(5):397-406.
12. Kuwabara S, Misawa S, Kanai K, et al. Neurologic improvement after peripheral blood stem cell transplantation in POEMS syndrome. Neurology. 2008;71(21):1691-1695.
13. Laurenti L, De Matteis S, Sabatelli M, et al. Early diagnosis followed by front-line autologous peripheral blood stem cell transplantation for patients affected by POEMS syndrome. Leuk Res. 2008;32(8):1309-1312.
14 Barete S, Mouawad R, Choquet S, et al. Skin manifestations and vascular endothelial growth factor levels in POEMS syndrome: impact of autologous hematopoietic stem cell transplantation. Arch Dermatol. 2010;146(6):615-623.
15. D’Souza A, Lacy M, Gertz M, et al. Long-term outcomes after autologous stem cell transplantation for patients with POEMS syndrome (osteosclerotic myeloma): a single-center experience. Blood. 2012;120(1):56-62.
16. Karam C, Klein CJ, Dispenzieri A, et al. Polyneuropathy improvement following autologous stem cell transplantation for POEMS syndrome. Neurology. 2015;84(19):1981-1987.
17. Nakaseko C. Autologous stem cell transplantation for POEMS syndrome. Clin Lymphoma Myeloma Leuk. 2014;14(1):21-23.
18. Cook G, Iacobelli S, van Biezen A, et al. High-dose therapy and autologous stem cell transplantation in patients with POEMS syndrome: a retrospective study of the Plasma Cell Disorder sub-committee of the Chronic Malignancy Working Party of the
Haematologica | 109 Marzo 2024 893 ARTICLE - Treatment strategy before aPBSCT in POEMS syndrome F. Autore et al.
European Society for Blood & Marrow Transplantation. Haematologica. 2017;102(1):160-167.
19 Autore F, Innocenti I, Luigetti M, et al. Autologous peripheral blood stem cell transplantation and the role of lenalidomide in patients affected by POEMS syndrome. Hematol Oncol. 2018;36(2):392-398.
20 Saini NY, Patel RD, Varma A, et al. Long-term durable efficacy of autologous stem cell transplantation in POEMS syndrome. Am J Hematol. 2019;94(3):E72-E74.
21. Zhao H, Huang XF, Gao XM, et al. What is the best first-line treatment for POEMS syndrome: autologous transplantation, melphalan and dexamethasone, or lenalidomide and dexamethasone? Leukemia. 2019;33(4):1023-1029.
22. Kojima H, Katsuoka Y, Katsura Y, et al. Successful treatment of a patient with POEMS syndrome by tandem high-dose chemotherapy with autologous CD34+ purged stem cell rescue. Int J Hematol. 2006;84(2):182-185.
23. Autore F, Innocenti I, Sora F, et al. Successful second autologous stem cell transplantation for late disease progression after the first procedure in POEMS syndrome. Appl Sci. 2022;12(5):2577.
24. Royer B, Merlusca L, Abraham J, et al. Efficacy of lenalidomide in POEMS syndrome: a retrospective study of 20 patients. Am J Hematol. 2013;88(3):207-212.
25. Dispenzieri A, Klein CJ, Mauermann ML. Lenalidomide therapy in a patient with POEMS syndrome. Blood. 2007;110(3):1075-1076.
26. Vannata B, Laurenti L, Chiusolo P, et al. Efficacy of lenalidomide plus dexamethasone for POEMS syndrome relapsed after autologous peripheral stem-cell transplantation. Am J Hematol. 2012;87(6):641-642.
27. Jaccard A, Lazareth A, Karlin L, et al. A prospective phase II trial of lenalidomide and dexamethasone (LEN-DEX) in POEMS syndrome. Blood. 2014;124(21):36.
28. Nozza A, Terenghi F, Gallia F, et al. Lenalidomide and dexamethasone in patients with POEMS syndrome: results of a prospective, open-label trial. Br J Haematol. 2017;179(5):748-755.
29. Li J, Huang XF, Cai QQ, et al. A prospective phase II study of low dose lenalidomide plus dexamethasone in patients with newly diagnosed polyneuropathy, organomegaly, endocrinopathy, monoclonal gammopathy, and skin changes (POEMS) syndrome. Am J Hematol. 2018;93(6):803-809.
30 Kim SY, Lee SA, Ryoo HM, Lee KH, Hyun MS, Bae SH. Thalidomide for POEMS syndrome. Ann Hematol. 2006;85(8):545-546.
31. Sinisalo M, Hietaharju A, Sauranen J, Wirta O. Thalidomide in POEMS syndrome: case report. Am J Hematol. 2004;76(1):66-68.
32. Tang X, Shi X, Sun A, et al. Successful bortezomib-based treatment in POEMS syndrome. Eur J Haematol. 2009;83(6):609-610.
33. Kaygusuz I, Tezcan H, Cetiner M, Kocakaya O, Uzay A, Bayik M. Bortezomib: a new therapeutic option for POEMS syndrome. Eur J Haematol. 2010;84(2):175-177.
34. Zeng K, Yang JR, Li J, et al. Effective induction therapy with
subcutaneous administration of bortezomib for newly diagnosed POEMS syndrome: a case report and a review of the literature. Acta Haematol. 2013;129(2):101-105.
35. Warsame R, Kohut IE, Dispenzieri A. Successful use of cyclophosphamide, bortezomib, and dexamethasone to treat a case of relapsed POEMS. Eur J Haematol. 2012;88(6):549-550.
36. He H, Fu W, Du J, Jiang H, Hou J. Successful treatment of newly diagnosed POEMS syndrome with reduced-dose bortezomib based regimen. Br J Haematol. 2018;181(1):126-128.
37. Riva M, Lessi F, Berno T, et al. Bortezomib-based regimens in patients with POEMS syndrome: a case series in newly diagnosed and relapsed patients. Leuk Lymphoma. 2019;60(8):2067-2070.
38. Buxhofer-Ausch V, Gisslinger B, Stangl G, Rauschka H, Gisslinger H. Successful treatment sequence incorporating bevacizumab for therapy of polyneuropathy in two patients with POEMS syndrome. Leuk Res. 2012;36(5):e98-e100.
39. Li J, Zhou DB. New advances in the diagnosis and treatment of POEMS syndrome. Br J Haematol. 2013;161(3):303-315.
40 Jimenez-Zepeda VH, Trudel S, Reece DE, Chen C, Rabea AM, Kukreti V. Cyclophosphamide and prednisone induction followed by cyclophosphamide mobilization effectively decreases the incidence of engraftment syndrome in patients with POEMS syndrome who undergo stem cell transplantation. Am J Hematol. 2011;86(10):873-875.
41. Keyzner A, D’Souza A, Lacy M, et al. Low levels of interleukin-1 receptor antagonist (IL-1RA) predict engraftment syndrome after autologous stem cell transplantation in POEMS syndrome and other plasma cell neoplasms. Biol Blood Marrow Transplant. 2013;19(9):1395-1398.
42. Patel K, Nusrat M, Shah N, et al. Durable responses with autologous hematopoietic SCT in patients with POEMS syndrome. Bone Marrow Transplant. 2014;49(3):465-466.
43. Jang IY, Yoon DH, Kim S, et al. Advanced POEMS syndrome treated with high-dose melphalan followed by autologous blood stem cell transplantation: a single-center experience. Blood Res. 2014;49(1):42-48.
44 Li J, Duan MH, Wang C, et al. Impact of pretransplant induction therapy on autologous stem cell transplantation for patients with newly diagnosed POEMS syndrome. Leukemia. 2017;31(6):1375-1381.
45. Autore F, Piccirillo N, Nozza A, et al. Peripheral blood hemopoietic stem cell mobilization regimens in POEMS syndrome: a retrospective study at 2 hematologic Italian centers. Biol Blood Marrow Transplant. 2019;25(12):2514-2516.
46. Durie BG, Harousseau JL, Miguel JS, et al. International uniform response criteria for multiple myeloma. Leukemia. 2006;20(9):1467-1473.
47. Mills W, Chopra R, McMillan A, Pearce R, Linch DC, Goldstone AH. BEAM chemotherapy and autologous bone marrow transplantation for patients with relapsed or refractory nonHodgkin’s lymphoma. J Clin Oncol. 1995;13(3):588-595.
Haematologica | 109 Marzo 2024 894 ARTICLE - Treatment strategy before aPBSCT in POEMS syndrome F. Autore et al.
Efficacy and safety of melflufen plus daratumumab and dexamethasone in relapsed/refractory multiple myeloma: results from the randomized, open-label, phase III
LIGHTHOUSE study
Luděk Pour,1 Monika Szarejko,2 Jelena Bila,3 Fredrik H. Schjesvold,4 Ivan Spicka,5 Vladimir Maisnar,6 Artur Jurczyszyn,7 Zhanet Grudeva-Popova,8 Roman Hájek,9 Ganna Usenko,10 Marcus Thuresson,11 Stefan Norin,11 Sara Jarefors,11 Nicolaas A. Bakker,11 Paul G. Richardson12 and Maria-Victoria Mateos13
1Department of Internal Medicine, Hematology and Oncology, University Hospital Brno, Babak Myeloma Group, Faculty of Medicine, Masaryk University, Brno, Czech Republic; 2University Clinical Centre, Department of Hematology and Transplantology, Gdansk, Poland; 3Clinic of Hematology, Clinical Center of Serbia, Faculty of Medicine, University of Belgrade, Belgrade, Serbia; 4Oslo Myeloma Center, Department of Hematology, Oslo University Hospital and KG Jebsen Center for B Cell Malignancies, University of Oslo, Oslo, Norway; 51st Department of Medicine - Department of Hematology, First Faculty of Medicine, Charles University and General Hospital in Prague, Prague, Czech Republic; 64th Department of Medicine –Hematology, Charles University Hospital and Faculty of Medicine, Hradec Kralove, Czech Republic; 7Plasma Cell Dyscrasias Center, Department of Hematology, Jagiellonian University Faculty of Medicine, Krakow, Poland; 8Department of Clinical Oncology, Medical Faculty, Medical University of Plovdiv, Plovdiv, Bulgaria; 9Department of Hematooncology, Faculty of Medicine, University of Ostrava, Ostrava, Czech Republic; 10City Clinical Hospital No. 4 of Dnipro City Council, Dnipro, Ukraine; 11Oncopeptides AB, Stockholm, Sweden; 12Dana-Farber Cancer Institute, Boston, MA, USA and 13Hospital Clínico Universitario de Salamanca/IBSAL/ CIC, Salamanca, Spain
Abstract
Correspondence: L. Pour pour.ludek@fnbrno.cz
Received: May 12, 2023.
Accepted: August 21, 2023.
Early view: August 31, 2023.
https://doi.org/10.3324/haematol.2023.283509
Published under a CC BY license
Melphalan flufenamide (melflufen), a first-in-class alkylating peptide-drug conjugate, plus dexamethasone was approved in Europe for use in patients with triple-class refractory relapsed/refractory multiple myeloma (RRMM) with ≥3 prior lines of therapy and without prior autologous stem cell transplantation (ASCT) or with a time to progression >36 months after prior ASCT. The randomized LIGHTHOUSE study (NCT04649060) assessed melflufen plus daratumumab and dexamethasone (melflufen group) versus daratumumab in patients with RRMM with disease refractory to an immunomodulatory agent and a proteasome inhibitor or who had received ≥3 prior lines of therapy including an immunomodulatory agent and a proteasome inhibitor. A partial clinical hold issued by the US Food and Drug Administration for all melflufen studies led to financial constraints and premature study closure on February 23rd 2022 (data cut-off date). In total, 54 of 240 planned patients were randomized (melflufen group, N=27; daratumumab group, N=27). Median progression-free survival (PFS) was not reached in the melflufen group versus 4.9 months in the daratumumab group (Hazard Ratio: 0.18 [95% Confidence Interval, 0.05-0.65]; P =0.0032) at a median follow-up time of 7.1 and 6.6 months, respectively. Overall response rate (ORR) was 59% in the melflufen group versus 30% in the daratumumab group ( P =0.0300). The most common grade ≥3 treatment-emergent adverse events in the melflufen group versus daratumumab group were neutropenia (50% vs . 12%), thrombocytopenia (50% vs . 8%), and anemia (32% vs . 19%). Melflufen plus daratumumab and dexamethasone demonstrated superior PFS and ORR versus daratumumab in RRMM and a safety profile comparable to previously published melflufen studies.
Haematologica | 109 Marzo 2024 895 - Plasma Cell Disorders ARTICLE
Introduction
Multiple myeloma (MM) is a plasma cell malignancy that accounts for approximately 10% of all hematologic malignancies.1,2 Despite the advent of new therapies and the improvement in response and survival rates, most patients will relapse with currently available standard-of-care therapies and have shorter remissions with each subsequent line of therapy, leaving an unmet need for the development of new and effective combinations that achieve deeper and more durable responses.1,3-5 Melphalan flufenamide (melflufen) is a first-in-class lipophilic alkylating peptide-drug conjugate that is rapidly distributed via passive transport to enter tumor cells due to its lipophilicity.6-10 Upon entering tumor cells, the peptide carrier functions as an enzymatic substrate utilizing the increased metabolic activity in cancer cells to release cytotoxic, hydrophilic alkylating metabolites (melphalan and desethyl-melflufen) leading to intracellular enrichment.9-11 In Europe, based on the phase II HORIZON and the phase III OCEAN studies, the doublet melflufen plus dexamethasone was approved for the treatment of adult patients with relapsed/refractory (RR)MM who have received ≥3 prior lines of therapy and whose disease is refractory to ≥1 proteasome inhibitor (PI), ≥1 immunomodulatory agent, and one anti-CD38 monoclonal antibody and have demonstrated disease progression on or after the last therapy; if a patient has received a prior autologous stem cell transplant (ASCT), time to progression (TTP) must be >36 months before initiating melflufen therapy.12-14 Daratumumab, an anti-CD38 monoclonal antibody with known efficacy and manageable safety that has a non-overlapping mechanism of action with melflufen, was first approved as a monotherapy in patients who have received ≥3 prior lines of therapy including a PI and an immunomodulatory agent or are double refractory to an immunomodulatory agent and a PI; more recently, daratumumab has been approved as first- and second-line treatment for MM.15-18 Real-word data show that daratumumab monotherapy is used substantially in RRMM but is more effective when given in earlier lines of therapy and as part of combination regimens.19
In the phase I/II ANCHOR study (N=33), the triplet combination of melflufen (30 or 40 mg) plus daratumumab and dexamethasone demonstrated clinical activity and manageable safety.20 The overall response rate (ORR) was 73%, and with a median follow-up of 18.9 months, the median progression-free survival (PFS) was 12.9 months (95% confidence interval [CI]: 7.7-15.4) and the median duration of response was 12.6 months (95% CI: 7.6-24.2). The overall safety profile of melflufen in triplet combination with daratumumab and dexamethasone was consistent with the known safety profile of melflufen as part of a doublet regimen, consisting primarily of clinically manageable hematologic adverse events (AE).13,14,20,21 Melflufen 30 mg was chosen as the recommended dose for future evaluation
in combination with daratumumab and dexamethasone because drug exposure was similar at both dose levels of melflufen, but more dose modifications were reported with melflufen 40 mg. These results supported further evaluation of the efficacy and safety of melflufen plus daratumumab and dexamethasone in the phase III LIGHTHOUSE study.
Methods
Study design and patients
LIGHTHOUSE (OP-108) was a randomized, controlled, open-label, phase III multicenter study investigating melflufen plus daratumumab and dexamethasone versus daratumumab in patients with RRMM (NCT04649060). Eligible patients aged ≥18 years must have been refractory to an immunomodulatory agent and a PI or had received ≥3 prior lines of therapy including an immunomodulatory agent and a PI. Prior treatment with, but not refractoriness to, an anti-CD38 monoclonal antibody was allowed (Online Supplementary Appendix ). National regulatory authorities and independent ethics committees or institutional review boards approved the study, which was conducted in accordance with the Declaration of Helsinki and the International Conference on Harmonisation and Good Clinical Practice guidelines. All patients provided written informed consent.
Randomization and study treatment
Patients were randomized 1:1 to receive therapy in the melflufen group or daratumumab group until disease progression or unacceptable toxicity. In each 28-day cycle, patients in the melflufen group received melflufen 30 mg intravenously (IV) on day 1 and oral dexamethasone 40 mg (20 mg if aged ≥75 years) weekly; patients in both groups received daratumumab 1800 mg subcutaneously on days 1, 8, 15, and 22 in cycles 1-2, on days 1 and 15 in cycles 3-6, and on day 1 in cycle 7 and beyond. Patients in the daratumumab group received dexamethasone (or an equivalent corticosteroid) pre-dose (20 mg IV or orally; dose reduction to 12 mg following the second injection allowed) and post dose (4 mg orally for 2 days). Melflufen and dexamethasone dose modifications were permitted (Online Supplementary Appendix); patients with disease progression in the daratumumab group could opt to cross over to the melflufen group.
Endpoints and analyses
The primary endpoint was PFS, assessed by the investigator according to the International Myeloma Working Group uniform response criteria.22 Secondary endpoints included ORR, overall survival (OS), and frequency and grade of treatment-emergent AE (TEAE). TEAE were graded per the National Cancer Institute’s Common Terminology Criteria for Adverse Events, version 5.0.23 Disease status was
Haematologica | 109 Marzo 2024 896 ARTICLE - LIGHTHOUSE: Melflufen plus dara and dex in RRMM L. Pour et al.
assessed at screening and pre-dose every cycle on day 1 (Online Supplementary Appendix).
Assuming a hazard ratio of 0.6 and a P value of 0.05, a total of 240 patients were planned for enrollment for an estimated 90% power to detect a significant result. The intent-to-treat (ITT) population included all patients randomized and was the primary population for all efficacy data. Safety was evaluated in patients with ≥1 exposure to any study treatment. Based on observations from the OCEAN trial, additional subgroup analyses further divided patients with no prior ASCT or with TTP >36 months after a prior ASCT and patients with TTP <36 months after a prior ASCT.
PFS and OS were summarized using the Kaplan-Meier method and analyzed using log-rank test. Cox proportional hazard models were used to estimate Hazard Ratios (HR) and 95% CI. ORR was presented together with 95% CI based on the Clopper-Pearson method, and comparison between groups was performed using a Cochran-Maentel-Haenzel test. TEAE were recorded for each patient; all TEAE were reported, regardless of potential attribution to treatment or disease progression.
Results
Patients and treatment
The LIGHTHOUSE study was initiated in December 2020, but enrollment stopped due to financial reasons after the US Food and Drug Administration requested a partial clinical hold for all melflufen studies. In total, 54 of the 240 patients planned for enrollment had been randomized to receive melflufen, daratumumab, and dexamethasone (melflufen group, N=27) or daratumumab (daratumumab group, N=27) by February 23rd 2022 (date of premature study closure and data cut-off). Two patients in the daratumumab group crossed over to receive melflufen, daratumumab, and dexamethasone after progression (Figure 1). These two patients were included in the daratumumab group for the OS analyses according to the ITT principle, but following crossover, were included in the melflufen group for safety analyses.
At baseline, in the melflufen and daratumumab groups, respectively, the median age was 65 years (range, 43-80) and 68 years (range, 50-83), and the median number of prior lines of therapy was 3 (range, 1-9) and 4 (range, 1-7)
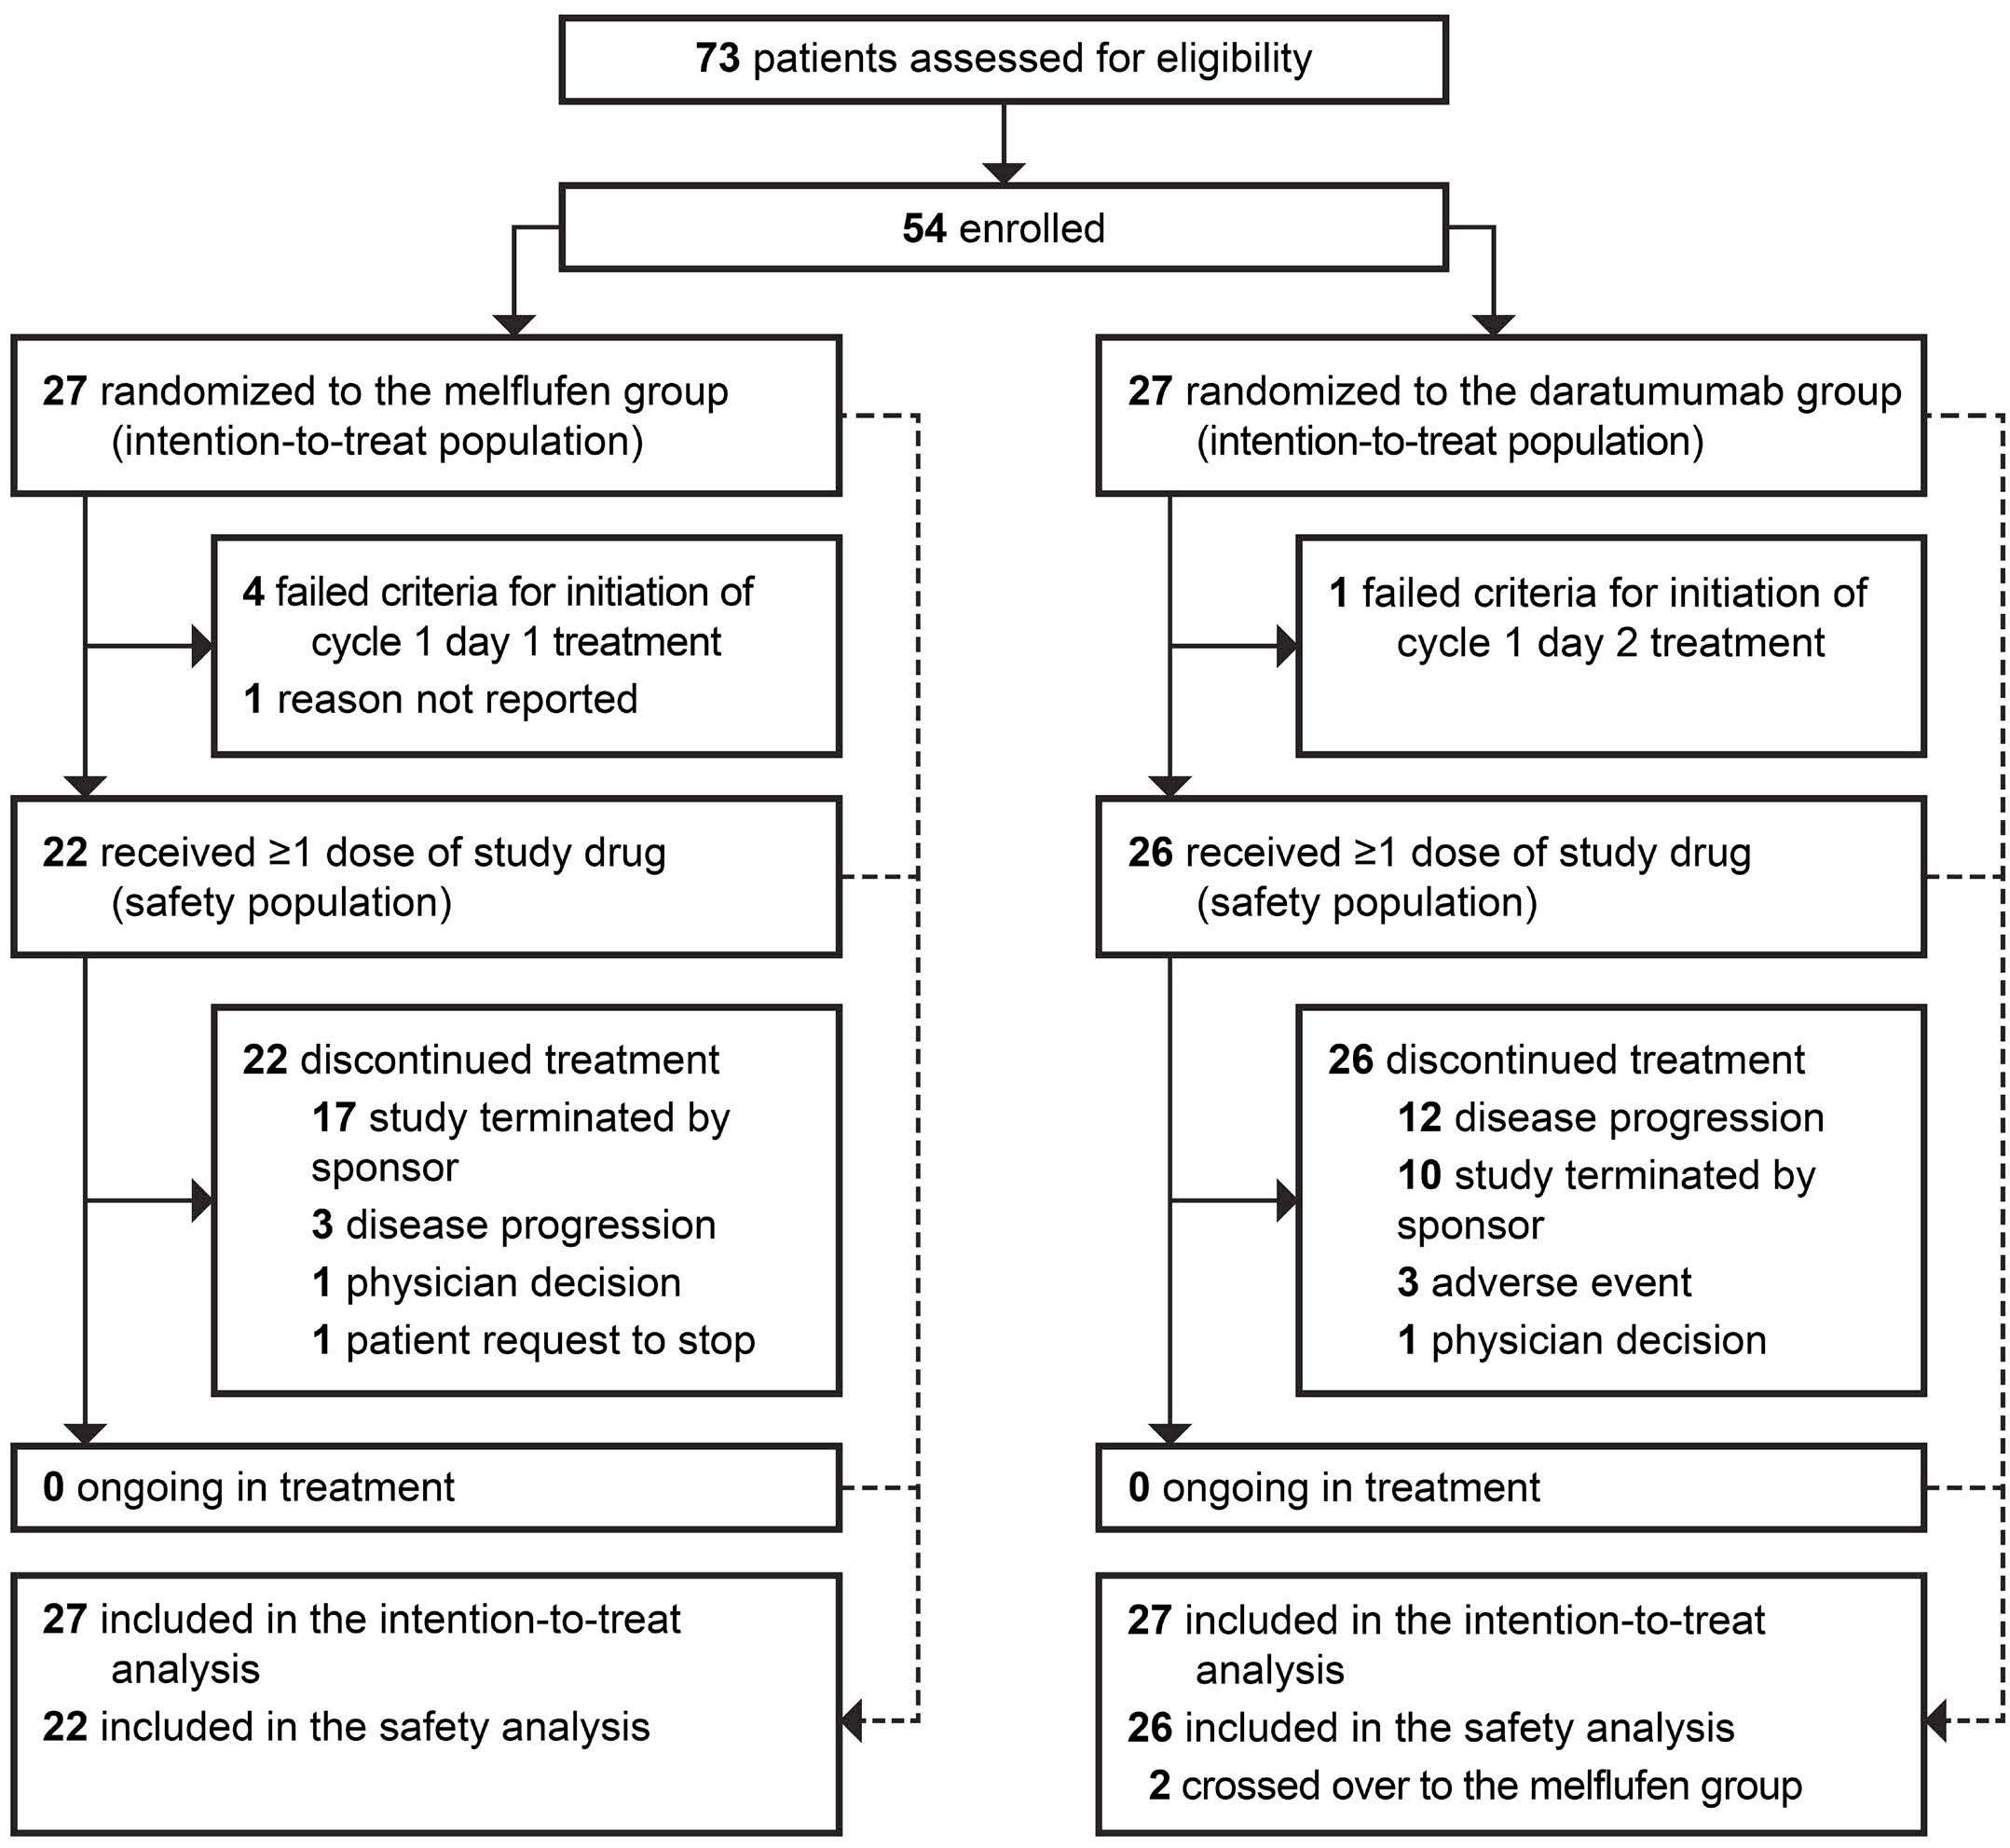
Haematologica | 109 Marzo 2024 897 ARTICLE - LIGHTHOUSE: Melflufen plus dara and dex in RRMM L. Pour et al.
Figure 1. Patient disposition. Data cut-off date: February 23rd 2022.
(Table 1). All patients had previously been exposed to a PI and immunomodulatory agent, with 16 patients (59%) and 20 patients (74%) in the melflufen group and 23 patients (85%) and 26 patients (96%) in the daratumumab group having disease refractory to a PI and immunomodulatory agent, respectively. The proportion of double-refractory patients (i.e., refractory to a PI and an immunomodulatory agent) was substantially lower in the melflufen group (13 [48%]) compared with the daratumumab group (22 [81%]). No patient in either group had had prior exposure to an anti-CD38 monoclonal antibody. In the melflufen group, 16 patients (59%) had received a prior ASCT, of which 13 patients (48%) had a TTP <36 months and 3 patients (11%) had TTP >36 months after a prior ASCT. In the daratumumab group, 14 patients (52%) had received a prior ASCT, of which 12 patients (44%) had a TTP <36 months and 2 patients (7%) had a TTP >36 months after a prior ASCT.
The median duration of treatment was 30.8 weeks (range, 12.7-38.4) and 19.3 weeks (range, 0.3-44.3) in the melflufen and daratumumab groups, respectively (Table 2). The median total number of cycles was 7 (range, 2-9) in the melflufen group and 5 (range, 1-12) in the daratumumab group.
Efficacy
In the ITT population, with a median follow-up of 7.1 months in the melflufen group, the median PFS was not reached (NR) and with a median follow-up of 6.6 months in the daratumumab group, the median PFS was 4.9 months (95% CI: 3.4-NR; HR: 0.18 [95% CI: 0.05-0.65]; log-rank P=0.0032) (Figure 2A). OS was immature, with 2 events (7%) in the melflufen group and 4 events (15%) in the daratumumab group (HR: 0.47 [95% CI: 0.09-2.57]; log-rank P=0.3721) at a median follow-up of 7.6 months and 6.6 months, respectively (Figure 2B). The ORR was 59% (95% CI: 39-78) in the melflufen group and 30% (95% CI: 14-50) in the daratumumab group (P=0.0300) (Table 3). More patients in the melflufen group had a complete response (CR; 1 patient [4%] vs. 0 patients [0%]) and very good partial response (VGPR; 4 patients [15%] vs. 3 patients [11%]) compared with the daratumumab group.
Efficacy endpoints were more pronounced in favor of the melflufen group compared with the daratumumab group among patients with no prior ASCT or TTP >36 months after a prior ASCT (melflufen group, N=14; daratumumab group, N=15). Median PFS was NR in the melflufen group and 3.9 months (95% CI: 1.4-4.9) in the daratumumab group (HR, 0.06 [95% CI: 0.01-0.49]; log-rank P=0.0005) (Figure 3A). Fewer OS events were reported in the melflufen group (1 event [7%] vs. 4 events [27%] in the daratumumab group; log-rank P=0.0369) (Figure 3B). The ORR was 64% (95% CI: 35-87) in the melflufen group and 13% (95% CI: 2-41) in the daratumumab group (P=0.0055) (Table 3). More patients in the melflufen group had a CR (1 patient [7%] vs. 0 patients [0%]) or VGPR (2 patients [14%] vs. 1 patient [7%]) compared with the daratumumab group.
Male, N (%)
(59)
N of previous lines of therapy, median (range) 3 (1-9)
ECOG performance status, N (%)
Prior ASCT status, N (%)
Exposure to prior therapy, N (%)
Proteasome inhibitor
Immunomodulatory agent
Anti-CD38 mAb
Refractory to prior therapy, N (%)
Proteasome inhibitor
Immunomodulatory agent
Anti-CD38 mAb
Alkylators
Cyclophosphamide
Melphalan
High-dose melphalan
Double refractorya
16 (59)
20 (74)
0 (0)
6 (22)
4 (15)
3 (11)
0 (0)
23 (85)
26 (96) 0 (0) 11 (41)
(30)
(4)
13 (48) 22 (81)
aRefractory to a proteasome inhibitor and an immunomodulatory agent. N: number; ASCT: autologous stem cell transplantation; ECOG: Eastern Cooperative Oncology Group; mAb: monoclonal antibody; TTP: time to progression.
Table 2. Treatment exposure. Melflufen
Treatment
Total N of treatment cycles, median (range) Any study medication
Use of dexamethasone, N (%)a 22 (100)
(73)
aDexamethasone use included as a study drug (melflufen group) or as a prophylactic (daratumumab group). N: number; NA: not applicable.
Haematologica | 109 Marzo 2024 898 ARTICLE - LIGHTHOUSE: Melflufen plus dara and dex in RRMM L. Pour et al.
Melflufen group N=27 Daratumumab group N=27
in years, median (range) 65 (43-80) 68 (50-83) Age group,
<65 years 65-74
≥75
12 (44) 12 (44) 3 (11) 8
16
3
Table 1. Baseline patient characteristics.
Characteristics
Age
N (%)
years
years
(30)
(59)
(11)
16
17
(63)
4
(1-7)
0 1 2 8 (30) 18 (67) 1 (4) 6 (22) 15 (56) 6 (22)
None Yes,
Yes,
11
13
3
13
12
2 (7)
TTP <36 months
TTP >36 months
(41)
(48)
(11)
(48)
(44)
High-dose melphalan 27
27
0 (0) 24
20 (74) 8 (30) 14
27 (100) 27 (100) 0 (0) 23 (85) 20 (74) 7 (26) 9 (33)
Alkylators Cyclophosphamide Melphalan
(100)
(100)
(89)
(52)
8
1
2 (7)
group N=22 Daratumumab group N=26
duration in weeks, median (range) 30.8 (12.7-38.4) 19.3 (0.3-44.3)
Melflufen Daratumumab 7
6.5 (2-9) 7 (2-9) 5
NA 5 (1-12)
(2-9)
(1-12)
19
Overall, no differences in efficacy between treatment groups were seen in patients with TTP <36 months after a prior ASCT (melflufen group, N=13; daratumumab group, N=12). Median PFS was NR in either arm (HR, 0.93 [95% CI: 0.13-6.59]; log-rank P=0.9391), with 2 events (15%) reported in the melflufen group and 2 events (17%) reported in the daratumumab group (Online Supplementary Table S1). For OS, 1 event (8%) was reported in the melflufen group and 0 events in the daratumumab group (P=0.3404). The ORR was 54% (95% CI: 25-81) in the melflufen group and 50% (95% CI: 21-79) in the daratumumab group (P=0.8505).
Safety
The safety population included patients who received ≥1 dose of melflufen, daratumumab, or dexamethasone (melflufen group) and 26 patients who received daratumumab monotherapy. In the safety population, ≥1 TEAE was reported in 21 patients (96%) with melflufen, daratumumab, and dexamethasone and 22 patients (85%) with daratumumab (Table 4). Overall, grade ≥3 TEAE occurred in 18 patients (82%) with melflufen, daratumumab, and dexamethasone and 14 patients (54%) with daratumumab. The most common hematologic grade ≥3 TEAE were neutropenia (melflufen
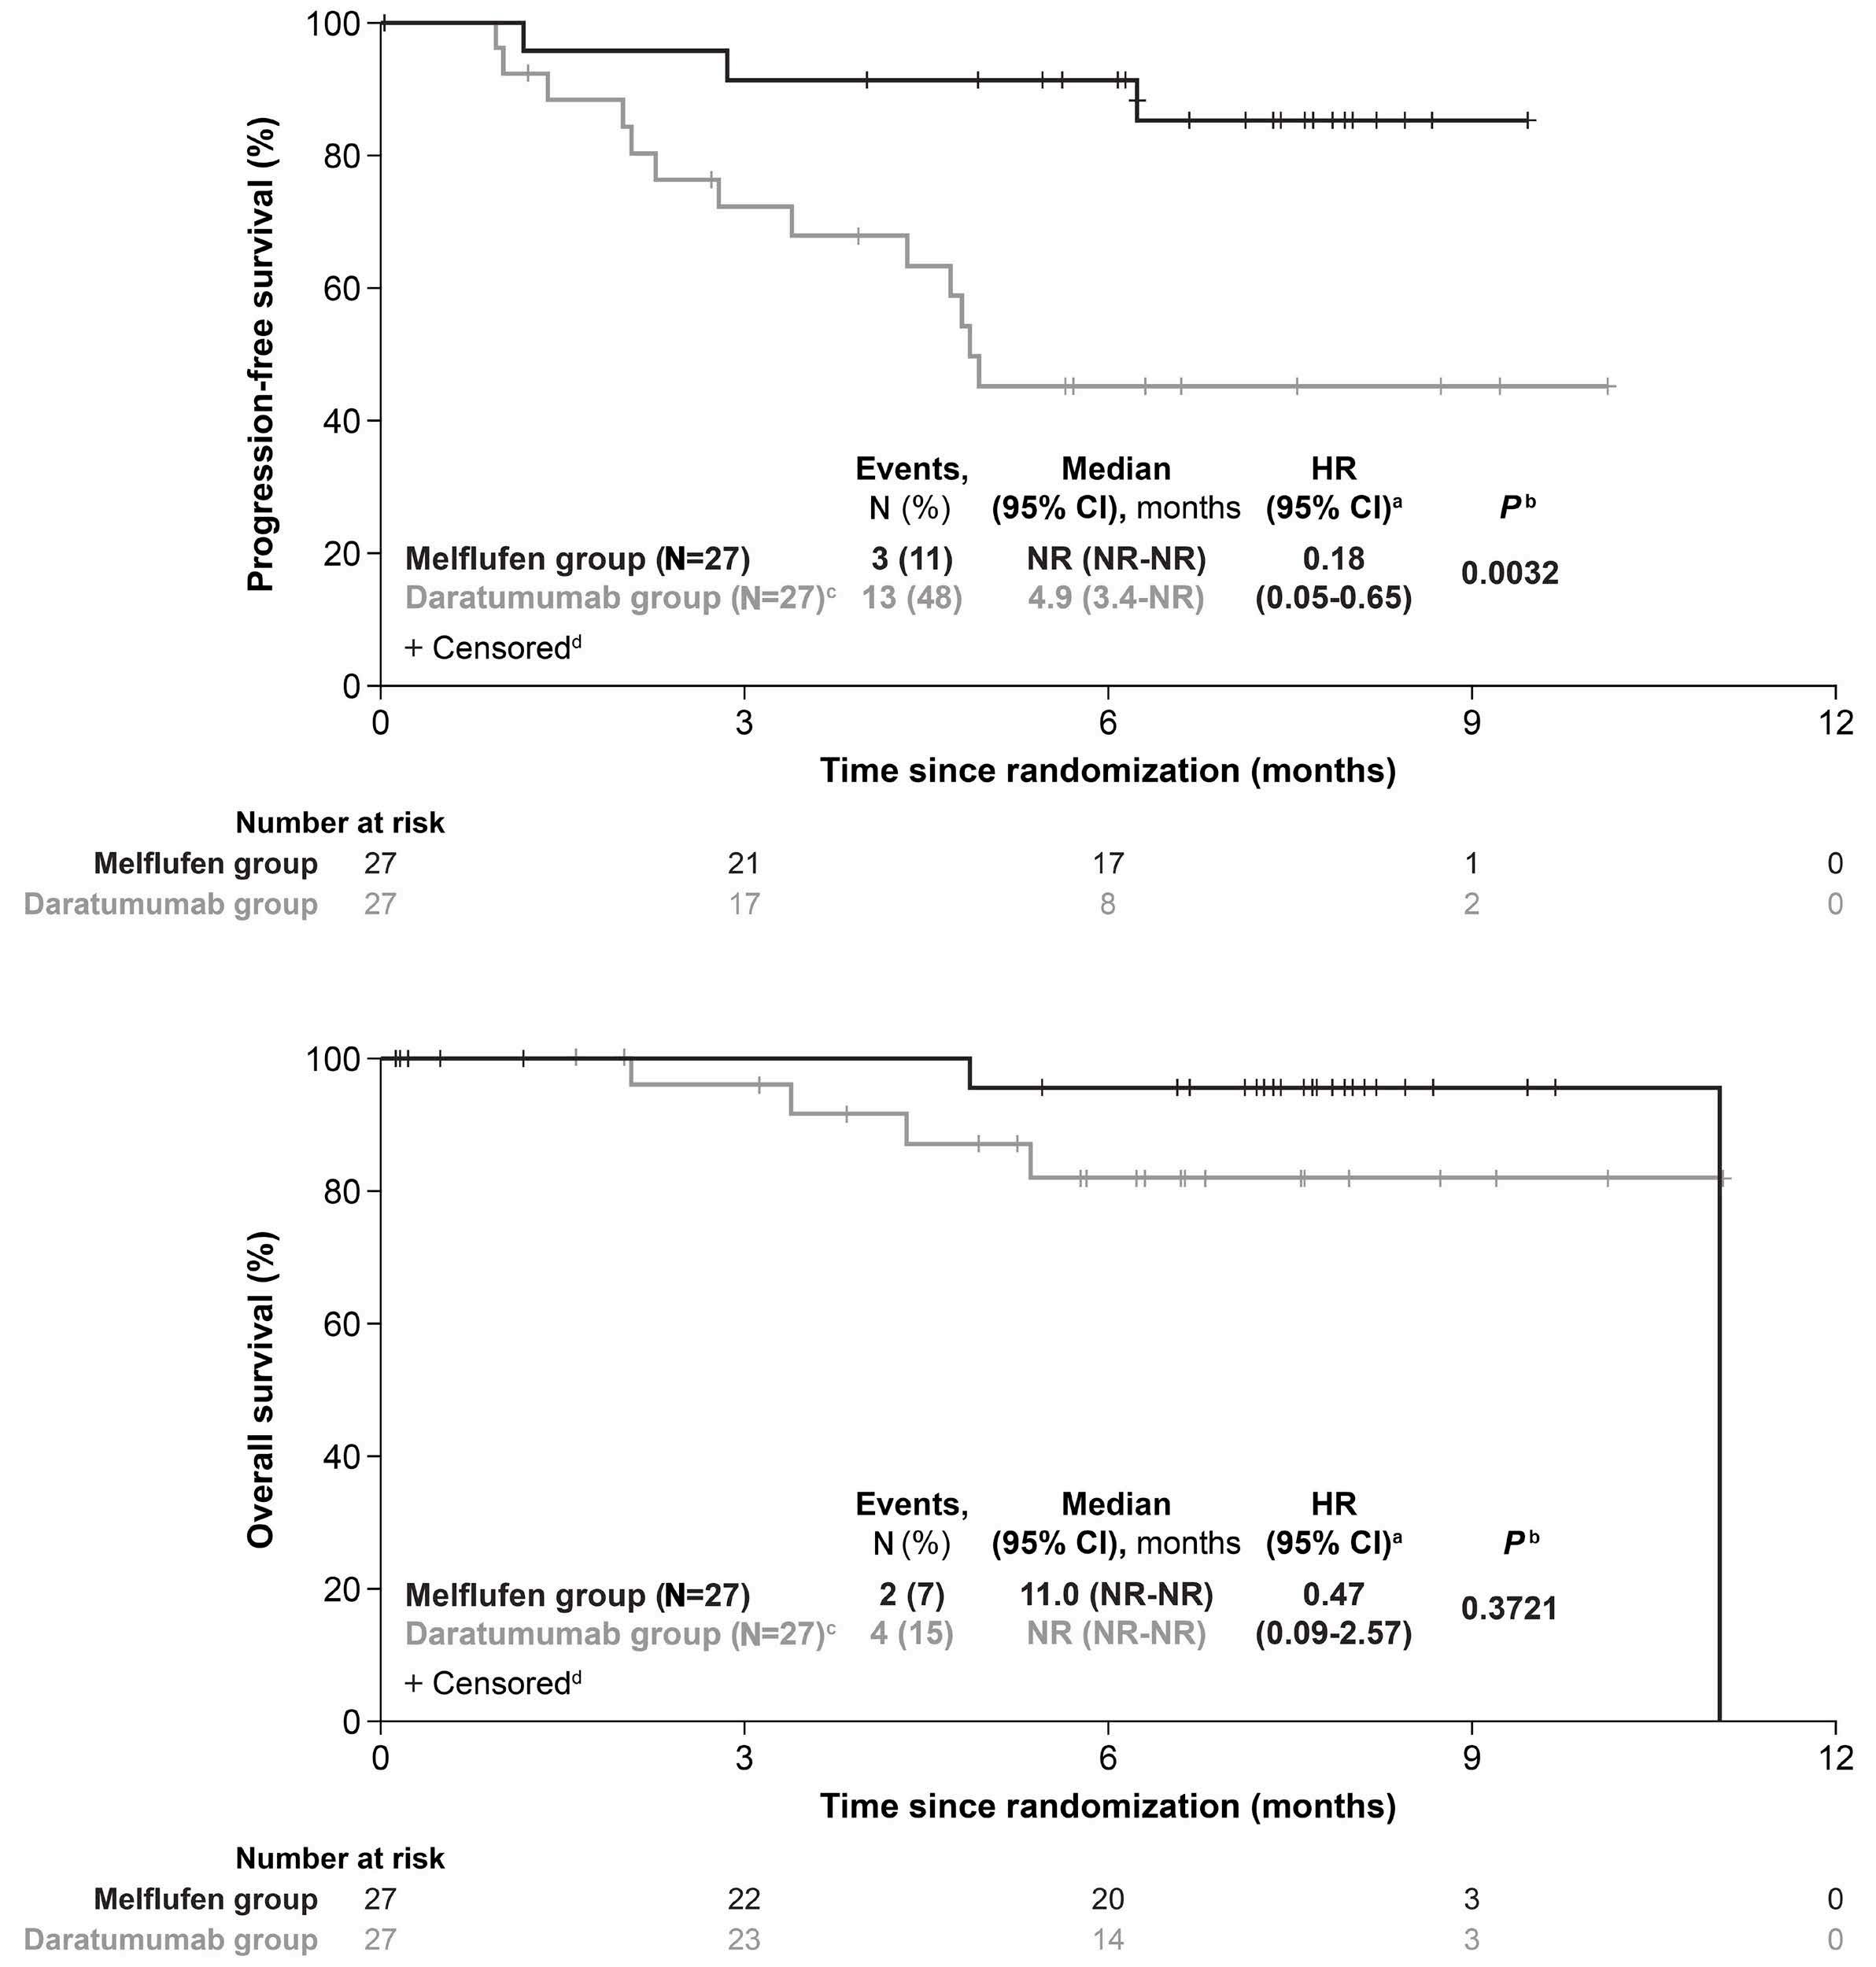
Haematologica | 109 Marzo 2024 899 ARTICLE - LIGHTHOUSE: Melflufen plus dara and dex in RRMM L. Pour et al.
A B
Figure 2. Survival outcomes in the intention-to-treat population. Progression-free survival (A) and overall survival (B) in the intention-to-treat population with melflufen, daratumumab, and dexamethasone (melflufen group) or daratumumab monotherapy (daratumumab group). aUnstratified hazard ratio (HR). bLog-rank P value. cOverall, 2 patients randomized to the daratumumab group crossed over to the melflufen group following documented disease progression. dPatients alive at the time of study termination were censored. CI: Confidence Interval; N: number; NR: not reached.
group, 11 patients [50%]; daratumumab group, 3 patients [12%]), thrombocytopenia (melflufen group, 11 patients [50%]; daratumumab group, 2 patients [8%]), and anemia (melflufen group, 7 patients [32%]; daratumumab group, 5 patients [19%]). The most common non-hematologic grade ≥3 TEAE were pneumonia (melflufen group, 2 patients [9%]; daratumumab group, 2 patients [8%]) and femur fracture (melflufen group, 0 patients [0%]; daratumumab group, 2 patients [8%]); of these, 1 event (5%) of pneumonia in the melflufen group and 1 event (4%) of femur fracture in the daratumumab group were considered treatment-related
TEAE by the investigator. Serious AE occurred in 6 patients (27%) with melflufen, daratumumab, and dexamethasone, and 12 patients (46%) with daratumumab. The most common serious AE (occurring in ≥4 patients overall) were anemia (melflufen group, 2 patients [9%]; daratumumab group, 3 patients [12%]) and pneumonia (melflufen group, 2 patients [9%]; daratumumab group, 2 patients [8%]). TEAE leading to treatment discontinuation occurred in 2 patients (9%) in the melflufen group (neutropenia and thrombocytopenia, N=1 each) and 4 patients (15%) in the daratumumab group (anemia, disease progression, hypercalcemia, and renal
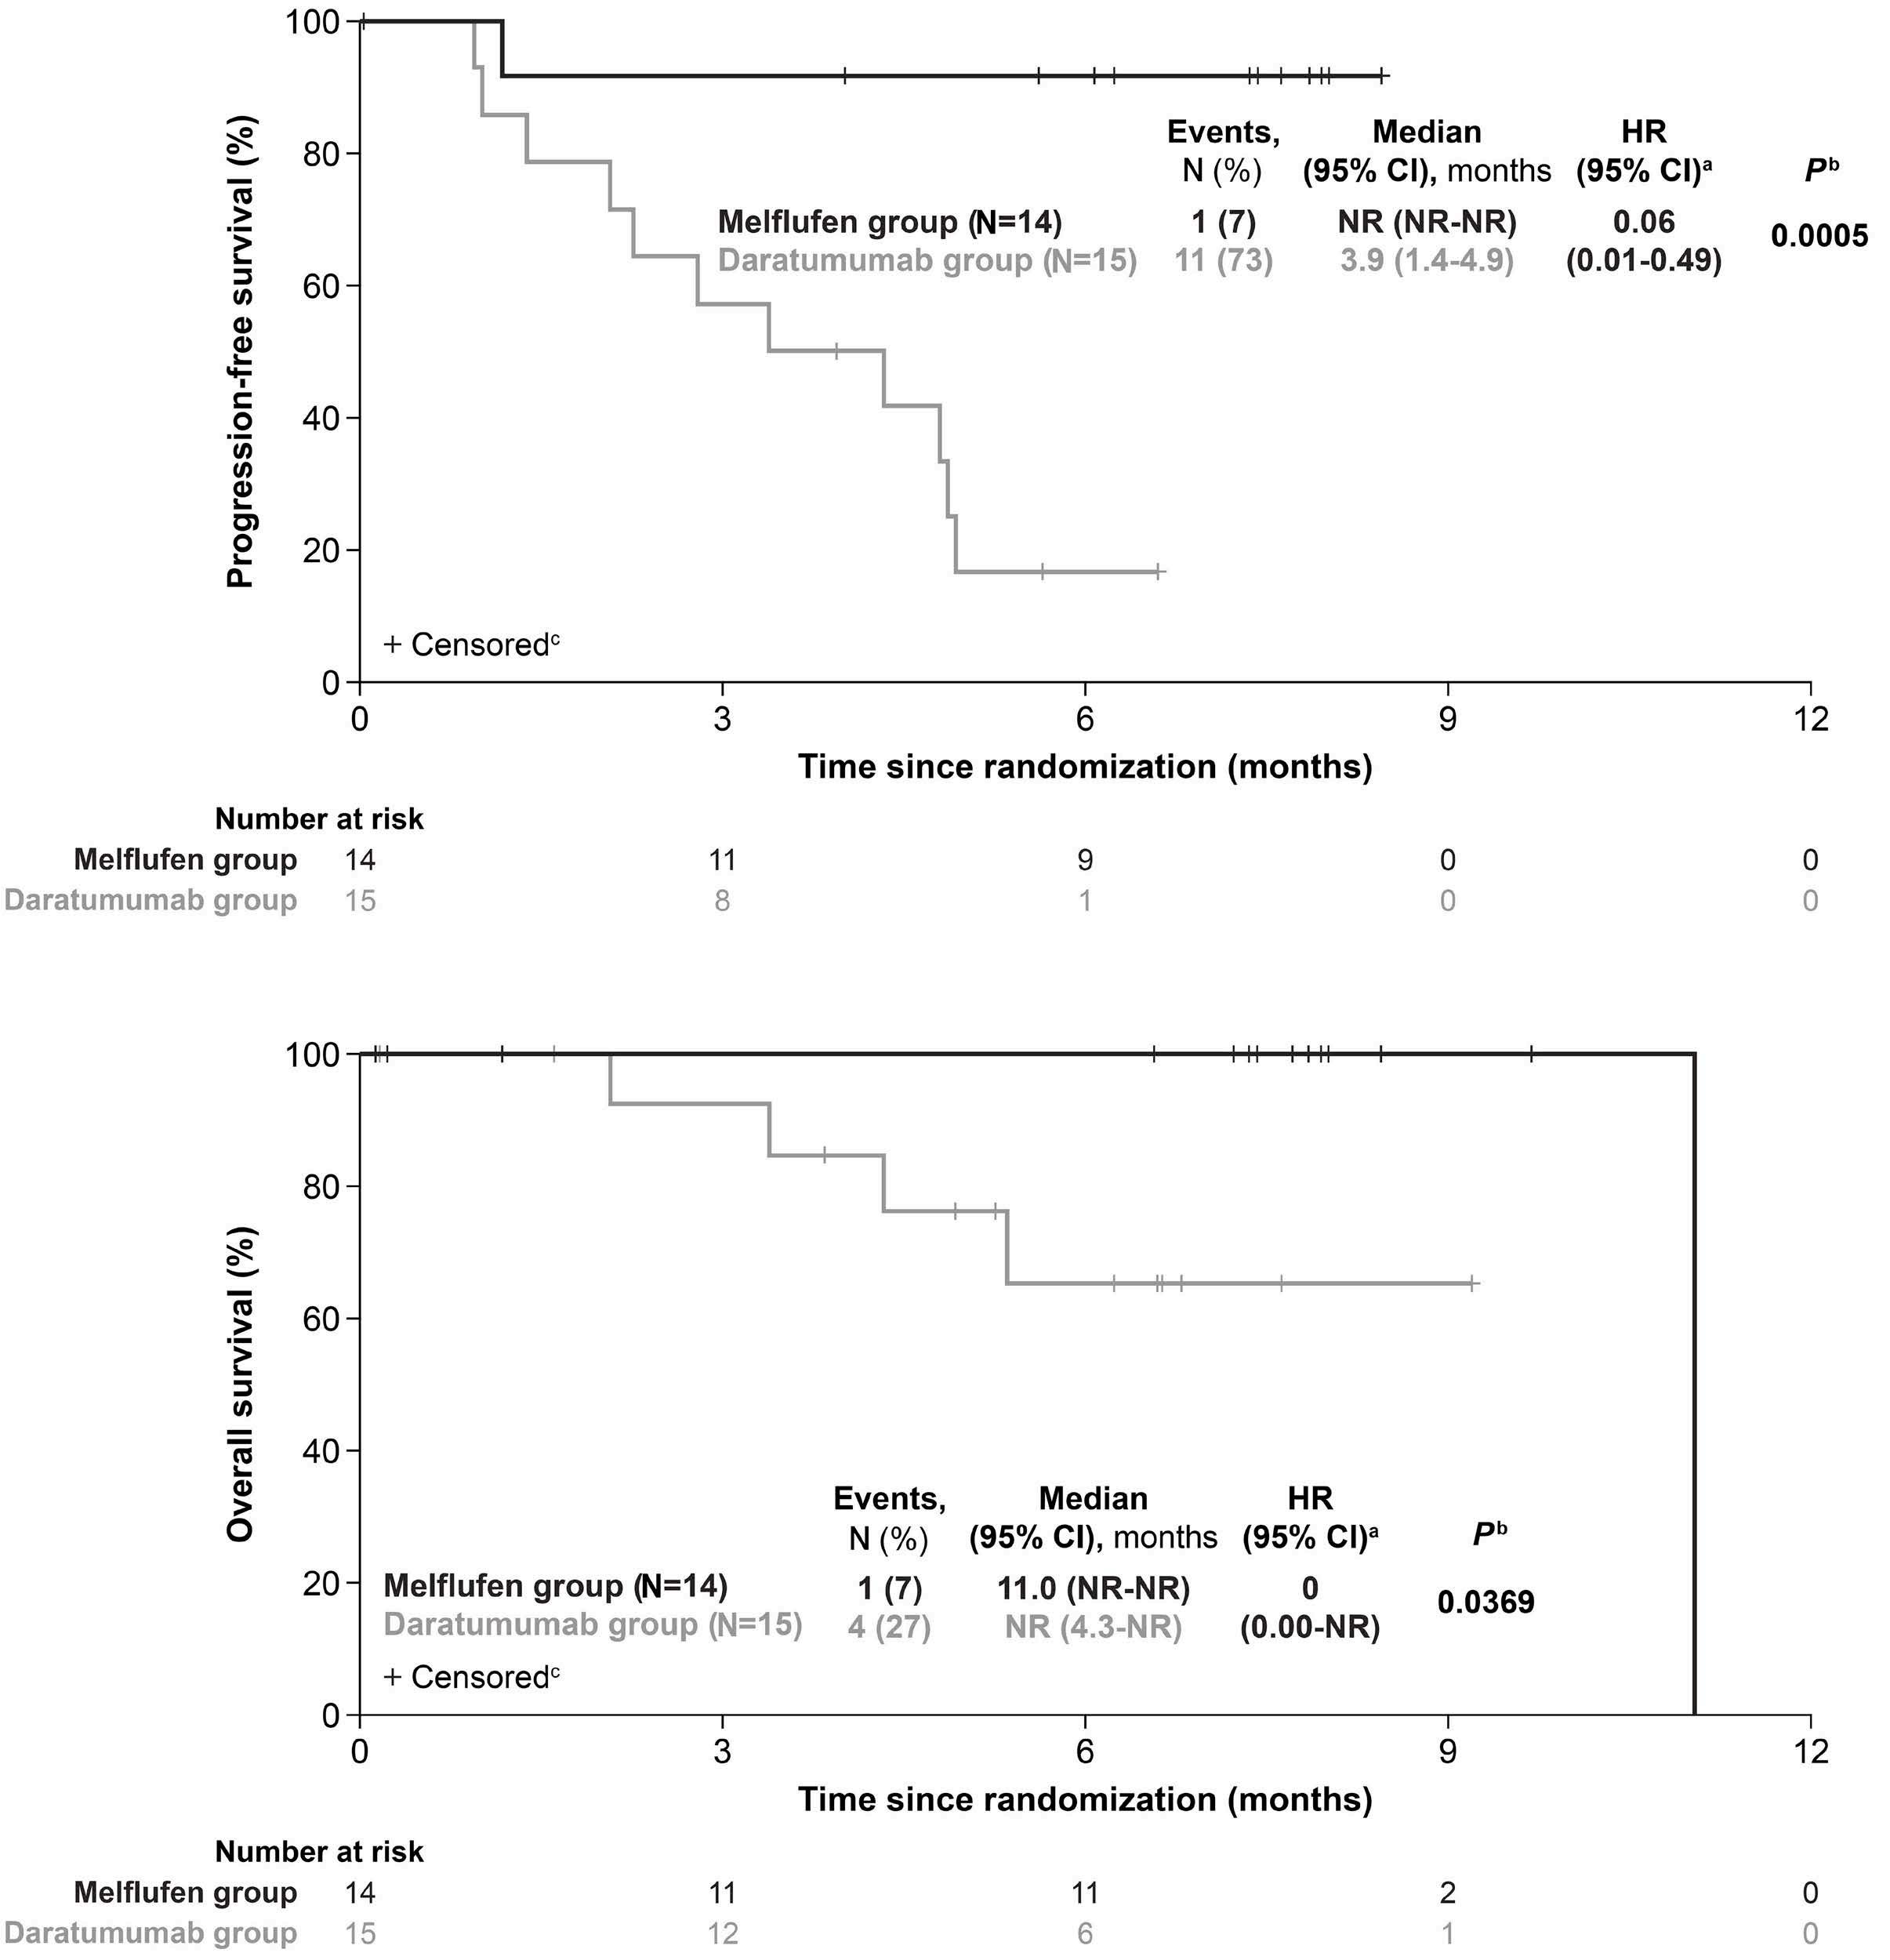
at the time of study termination were censored.
Haematologica | 109 Marzo 2024 900 ARTICLE - LIGHTHOUSE: Melflufen plus dara and dex in RRMM L. Pour et al.
A B
Figure 3. Survival outcomes in patients by autologous stem cell transplantation status. Progression-free survival (A) and overall survival (B) in patients with no prior autologous stem cell transplantation (ASCT) or with time to progression >36 months after a prior ASCT who received melflufen, daratumumab, and dexamethasone (melflufen group) or daratumumab monotherapy (daratumumab group). aUnstratified Hazard Ratio (HR). bLog-rank P value. cPatients alive
CI: Confidence Interval; N: number; NR: not reached.
Best confirmed response, N (%)
ASCT: autologous stem cell transplantation; CI: Confidence Interval; CR: complete response; ITT: intent-to-treat; MR: minimal response; N: number; NE: not estimable; ORR: overall response rate; PD: progressive disease; PR: partial response; SD: stable disease; TTP: time to progression; VGPR: very good partial response.
failure, N=1 each). Overall, 5 patients died on study before the crossover: 2 patients who received melflufen, daratumumab, and dexamethasone (1 due to disease progression and 1 due to unknown reasons, both >30 days after the last dose of study treatment) and 3 patients who received daratumumab (1 due to disease progression and 1 due to unknown reasons, both ≤30 days after the last dose of study treatment and 1 due to an AE [COVID-19 pneumonia], >30 days after the last dose of study treatment). In addition, one patient who crossed over to receive melflufen, daratumumab, and dexamethasone after progression on daratumumab died.
Discussion
The LIGHTHOUSE study of melflufen plus daratumumab and dexamethasone in patients with RRMM refractory to an immunomodulatory agent and a PI or who had received ≥3 prior lines of therapy, including an immunomodulatory agent and a PI, builds upon the results of previous clinical studies of melflufen and dexamethasone in heavily pretreated patients with RRMM.13,14 The results of the present study were consistent with ANCHOR, which used the same triplet regimen, and demonstrated the efficacy and safety of melflufen as part of a triplet regimen.20 The premature termination of the LIGHTHOUSE study, which resulted in small numbers of patients enrolled, is a primary limitation of this study. Additionally, per protocol, patients discontinuing melflufen could continue with daratumumab and dexamethasone. However, how many patients chose to continue with daratumumab therapy was not captured after the study was terminated. While the interpretation of the results may be limited by the short follow-up time
Table 4. Treatment-emergent adverse
aMost common treatment-emergent adverse events (TEAE) occurring in ≥2 patients (5%) in either treatment group. N: number; SAE: serious adverse event.
and small patient numbers, there were clear differences between patients treated with melflufen plus daratumumab and dexamethasone versus daratumumab.
The addition of daratumumab to an alkylator-based regimen has previously been shown to provide significant
Haematologica | 109 Marzo 2024 901 ARTICLE - LIGHTHOUSE: Melflufen plus dara and dex in RRMM L. Pour et al.
Response category ITT population No prior ASCT or TTP >36 months after ASCT Melflufen group N=27 Daratumumab group N=27 Melflufen group N=14 Daratumumab group N=15
Table 3. Overall response rate.
CR VGPR PR MR SD PD NE 1 (4) 4 (15) 11 (41) 3 (11) 3 (11) 1 (4) 4 (15) 0 (0) 3 (11) 5 (19) 5 (19) 5 (19) 5 (19) 4 (15) 1 (7) 2 (14) 6 (43) 2 (14) 0 (0) 1 (7) 2 (14) 0 (0) 1 (7) 1 (7) 4 (27) 2 (13) 4 (27) 3 (20) ORR (95% CI), % 59 (39-78) 30 (14-50) 64 (35-87) 13 (2-41) Unstratified P value 0.0300 0.0055
population. Patients, N (%) Melflufen group N=22 Daratumumab group N=26 Any TEAE, N (%) 21 (96) 22 (85) Any grade ≥3 TEAE, N (%) 18 (82) 14 (54) Most common hematologic TEAE, N (%)a Neutropenia Thrombocytopenia Anemia Neutrophil count decreased Platelet count decreased 11 (50) 11 (50) 7 (32) 2 (9) 2 (9) 3 (12) 2 (8) 5 (19) 0 (0) 0 (0) Most common non-hematologic TEAE, N (%)a Pneumonia Femur fracture 2 (9) 0 (0) 2 (8) 2 (8) Any SAE, N (%) 6 (27) 12 (46) Most common hematologic SAE Anemia 2 (9) 3 (12) Most common non-hematologic SAE Pneumonia Femur fracture 2 (9) 0 (0) 2 (8) 2 (8)
events: safety
clinical benefit in patients with newly diagnosed MM.17 In LIGHTHOUSE, PFS was significantly in favor of melflufen, daratumumab, and dexamethasone compared with daratumumab in patients who had received ≥3 prior lines of therapy including an immunomodulatory agent and a PI or had double-refractory disease. Results from LIGHTHOUSE were also comparable to other clinical trials evaluating triplet combinations in patients with RRMM who had received ≥3 prior lines of therapy including an immunomodulatory agent and a PI.24-26
Daratumumab monotherapy was first approved in 2015 for use in patients with RRMM who had received ≥3 prior lines of therapy, including an immunomodulatory agent and a PI, or who had disease that was double-refractory to these agents. Since then, daratumumab alone or in combination with other agents has become standard-ofcare in the RRMM and newly diagnosed MM settings. Daratumumab has most commonly been used in second- or third-line RRMM in the real-world setting, similar to the patient population of the present study, with daratumumab monotherapy used in 12-26% patients treated in the United States and up to 48% of patients treated in Europe,19,27-30 which is why it was chosen as the comparator arm for the LIGHTHOUSE study. Although cross-trial evaluations can be confounded by differences in sample size and patient-, disease-, and treatment-related factors, 31 results from the daratumumab group in LIGHTHOUSE were consistent with previously reported studies using daratumumab as a monotherapy in patients with RRMM who had received ≥3 prior lines of therapy.32-34 For example, in the phase III COLUMBA study of subcutaneous versus IV daratumumab, with a median follow-up of 29.3 months, the median PFS was 5.6 months for subcutaneous daratumumab and 6.1 months for IV daratumumab, which is generally comparable with the median PFS of 4.9 months in the daratumumab group demonstrated in the present study with a shorter follow up.31 Although the OS data are still too immature to draw conclusions, they trended in favor of melflufen, daratumumab, and dexamethasone therapy compared with daratumumab monotherapy.
In the ITT population, melflufen, daratumumab, and dexamethasone therapy also demonstrated higher response rates with an ORR of 59% compared with the 30% observed with daratumumab monotherapy. Furthermore, responses in the melflufen group were deeper, with a numerically higher CR, VGPR, and partial response rates compared with the daratumumab group.
Both the ITT population and subgroup of patients with no prior ASCT or TTP >36 months after a prior ASCT, showed longer median PFS and OS with melflufen, daratumumab, and dexamethasone compared with daratumumab alone. Furthermore, treatment responses were strikingly different in this subgroup with an ORR of 64% in the melflufen group and 13% in the daratumumab group. Although these results should be interpreted with caution due to the small
sample size of this target subgroup and immaturity of the data, they are in line with those from OCEAN showing a confirmed benefit for this patient population and with the approved indication for melflufen and dexamethasone in patients with RRMM for use in Europe.12,14 On the other hand, no differences in efficacy between treatment groups were seen in patients with TTP <36 months after a prior ASCT. This contrasts with what was observed in this subgroup of patients in the OCEAN study, where all efficacy endpoints favored pomalidomide and dexamethasone over melflufen and dexamethasone.14
In LIGHTHOUSE, the safety profile of melflufen was consistent with previous reports from the triplet of melflufen plus daratumumab and dexamethasone reported in ANCHOR and with the safety profile of melflufen as a doublet with dexamethasone.13,14,20 In LIGHTHOUSE, grade ≥3 TEAE with melflufen, daratumumab, and dexamethasone were most commonly hematologic, which is consistent with the known safety profile of melflufen. Despite a higher frequency of hematologic TEAE in the melflufen group compared with the daratumumab group, discontinuation rates due to hematologic TEAE, and TEAE in general, were generally similar in both treatment groups. Thus, the addition of melflufen to daratumumab did not increase toxicity beyond already known, and clinically manageable, hematologic TEAE.13,14,20 This is further supported by the data demonstrating that patients remained on therapy longer in the melflufen group (7 cycles) compared with the daratumumab group (5 cycles). Importantly, the safety profile of the daratumumab group was in line with previous reports of single-agent daratumumab in comparable patient populations, as well as in more advanced settings.32,34-36 Because of how TEAE and treatment-related TEAE are generally reported in clinical trials,23 and because safety data were not formally adjudicated by an independent committee, it cannot be ruled out that some TEAE reported in LIGHTHOUSE (e.g., femur fracture) were related to progression of disease rather than the study treatment.
Despite the small patient numbers and short follow up at the time of study termination, results from the LIGHTHOUSE study demonstrated a clinical benefit with melflufen plus daratumumab and dexamethasone compared with daratumumab in both the ITT population and in patients with no prior ASCT or with a TTP >36 months after a prior ASCT. The safety profile was consistent with previous reports of melflufen as a triplet and doublet, further confirming that melflufen has no safety signal affecting survival. These results further support the findings from OCEAN and the European label indication and confirm the clinical benefit of melflufen in patients with MM with no prior ASCT or a longer remission after a prior ASCT. The encouraging results of melflufen plus daratumumab and dexamethasone support the use of this combination in the real world and provide direction for future studies using combination of melflufen with other drugs in RRMM.
Haematologica | 109 Marzo 2024 902 ARTICLE - LIGHTHOUSE: Melflufen plus dara and dex in RRMM L. Pour et al.
Disclosures
JB has received honoraria for lectures or speakers’ bureau participation and expert testimony fees from Amgen, Janssen, and Takeda; meeting and/or travel support from Janssen and Takeda; and holds a leadership or fiduciary role for the Serbian Myeloma Group and Balkan Myeloma Study Group. FHS has received grants or contracts from Celgene, GlaxoSmithKline, Janssen, Oncopeptides, Targovax, and Sanofi; payment or honoraria for lectures or speakers’ bureau participation from AbbVie, Amgen, Bristol Myers Squibb, Daiichi Sankyo, GlaxoSmithKline, Janssen, Novartis, Oncopeptides, Pfizer, Sanofi, SkyliteDX, and Takeda; serving on a data safety monitoring or advisory board for AbbVie, Celgene, GlaxoSmithKline, Janssen, Oncopeptides, Sanofi, and Takeda; and stock or stock options from Nordic Nanovector and Oncopeptides. IS has received consulting fees from and served on a data monitoring or advisory board for Amgen, Bristol Myers Squibb, Celgene, Janssen-Cilag, Novartis, PharmaMar, Sanofi, and Takeda; payment or honoraria for lectures or speakers’ bureau participation from Amgen, Bristol Myers Squibb, Celgene, Janssen-Cilag, Sanofi, and Takeda; and meeting and/or travel support from Amgen, Bristol Myers Squibb, Celgene, and Janssen-Cilag. VM has received payment or honoraria for lectures or speakers’ bureau participation from Amgen, Bristol Myers Squibb/Celgene, Janssen, Sanofi, and The Binding Site; and received consulting fees from and served on a data monitoring or advisory board for Amgen, Bristol-Myers Squibb/Celgene, Janssen, and Takeda; and received meeting and/or travel support from Amgen, Bristol-Myers Squibb/Celgene, Janssen, and Takeda. ZG-P has received payment or honoraria for lectures or speakers’ bureaus from AbbVie, Bristol Myers Squibb, Novartis, Pfizer, Roche, and Takeda; meeting and/or travel support from AbbVie, Merck, and Roche; and served on a data monitoring or advisory board for Astellas, Bristol Myers Squibb, and Roche. RH reports receiving consultancy fees from AbbVie, Amgen, Bristol Myers Squibb, Celgene, Janssen, Novartis, PharmaMar, and Takeda; received honoraria for lectures or speakers’ bureau participation from Amgen, Bristol Myers Squibb, Celgene, Janssen, PharmaMar, and Takeda; research funding from Amgen, Celgene, Janssen, and Novartis; serving on a data monitoring or advisory board for Amgen, Bristol Myers Squibb, GlaxoSmithKline, Janssen, Oncopeptides, Sanofi, and Takeda; and meeting and/or travel support from Amgen, Celgene, Janssen, and Takeda. GU has received consulting fees from AbbVie, Acerta, Ascentage, Geron, Oncopeptides, Principia, Rigel, and Takeda. MT is a consultant of and receives stock or stock options from Oncopeptides. SN, JS, and NAB are employees of and receive stock or stock options from Oncopeptides. PGR has received consulting fees from Astra Zeneca, Bristol Myers Squibb/ Celgene, GlaxoSmithKline, Karyopharm, Oncopeptides, Protocol Intelligence, Regeneron, Sanofi, and Secura Bio; and grants from Bristol Myers Squibb/Celgene, Karyopharm, Oncopeptides, and Takeda. M-VM has received payment
or honoraria for lectures or speakers’ bureau participation from Amgen, Bristol Myers Squibb/Celgene, GlaxoSmithKline, Janssen, Pfizer, Sanofi, and Takeda; and served on a data safety monitoring or advisory board for Amgen, BlueBird Bio, Bristol Myers Squibb/Celgene, GlaxoSmithKline, Janssen, Oncopeptides, Pfizer, Regeneron, Sanofi, and Takeda. LP, MS and AJ have no conflicts of interest to disclose.
Contributions
The study sponsor, Oncopeptides AB, conceptualized and designed the study in collaboration with PGR and M-VM. Patient data were collected by LP, MS, JB, FHS, IS, VM, AJ, ZG-P, RH, GU, PGR and M-VM. Data were analyzed by MT, SN, SJ and NAB. MT, SN, SJ, and NAB had access to and verified the underlying study data. All authors had access to the data, participated in the interpretation of the data, took part in drafting and revising the manuscript, and approved the final version before submission.
Acknowledgments
The authors would like to thank the patients and their families for participating in this trial, the trial investigators and co-ordinators for their contributions to the trial, and Janssen Pharmaceuticals. We thank Jared D. Hoffman, MS, PhD, and Katherine Mills-Lujan, PhD, CMPP, of Team 9 Science for providing medical editorial assistance under the guidance of the authors, in accordance with Good Publications Practice (GPP) 2022 guidelines.
Funding
Funding for the study (ClinicalTrials.gov identifier: NCT04649060) and for editorial assistance was provided by Oncopeptides AB.
Data-sharing statement
Oncopeptides commits to sharing clinical study data with qualified researchers to enable enhancement of public health. As such, Oncopeptides will share anonymized patient-level data on request or if required by law or regulation. Qualified scientific and medical researchers can request patient-level data for studies of Oncopeptides’ pharmaceutical substances listed on ClinicalTrials.gov and approved by health authorities in the United States and the European Union. Patient-level data for studies of newly approved pharmaceutical substances or indications can be requested nine months after US Food and Drug Administration and European Medicines Agency approval. Such requests are assessed at Oncopeptides’ discretion, and the decisions depend on the scientific merit of the proposed request, data availability, and the purpose of the proposal. The applicants should be willing to submit both positive and negative findings to a scientific journal. If Oncopeptides agrees to share clinical data for research purposes, the applicant is required to sign an agreement for data sharing before data release to ensure that
Haematologica | 109 Marzo 2024 903 ARTICLE - LIGHTHOUSE: Melflufen plus dara and dex in RRMM L. Pour et al.
the patient data are de-identified. In case of any risk of reidentification on anonymized data despite measures to protect patient confidentiality, the data will not be shared. Patient informed consent will always be respected. If the anonymization process provides futile data, Oncopeptides will have the right to refuse the request. Oncopeptides will provide access to patient-level clinical trial analysis
References
1. Kumar SK, Rajkumar V, Kyle RA, et al. Multiple myeloma. Nat Rev Dis Primers. 2017;3:17046.
2. Rajkumar SV. Multiple myeloma: 2022 update on diagnosis, risk stratification, and management. Am J Hematol. 2022;97(8):1086-1107.
3. Kumar SK, Dimopoulos MA, Kastritis E, et al. Natural history of relapsed myeloma, refractory to immunomodulatory drugs and proteasome inhibitors: a multicenter IMWG study. Leukemia. 2017;31(11):2443-2448.
4. Rodriguez-Otero P, Paiva B, San-Miguel JF. Roadmap to cure multiple myeloma. Cancer Treat Rev. 2021;100:102284.
5. Jones JR, Weinhold N, Ashby C, et al. Clonal evolution in myeloma: the impact of maintenance lenalidomide and depth of response on the genetics and sub-clonal structure of relapsed disease in uniformly treated newly diagnosed patients. Haematologica. 2019;104(7):1440-1450.
6. Chauhan D, Ray A, Viktorsson K, et al. In vitro and in vivo antitumor activity of a novel alkylating agent, melphalanflufenamide, against multiple myeloma cells. Clin Cancer Res. 2013;19(11):3019-3031.
7 Gullbo J, Tullberg M, Vabeno J, et al. Structure-activity relationship for alkylating dipeptide nitrogen mustard derivatives. Oncol Res. 2003;14(3):113-132.
8. Ray A, Ravillah D, Das DS, et al. A novel alkylating agent melflufen induces irreversible DNA damage and cytotoxicity in multiple myeloma cells. Br J Haematol. 2016;174(3):397-409.
9 Wickström M, Nygren P, Larsson R, et al. Melflufen - a peptidase-potentiated alkylating agent in clinical trials. Oncotarget. 2017;8(39):66641-66655.
10 Wickström M, Viktorsson K, Lundholm L, et al. The alkylating prodrug J1 can be activated by aminopeptidase N, leading to a possible target directed release of melphalan. Biochem Pharmacol. 2010;79(9):1281-1290.
11. Gullbo J, Wickstrom M, Tullberg M, et al. Activity of hydrolytic enzymes in tumour cells is a determinant for anti-tumour efficacy of the melphalan containing prodrug J1. J Drug Target. 2003;11(6):355-363.
12. Pepaxti: Summary of product characteristics - European Medicines Agency. 2022. https://www.ema.europa.eu/en/ documents/product-information/pepaxti-epar-productioninformation_en.pdf Accessed April 12, 2023.
13. Richardson PG, Oriol A, Larocca A, et al. Melflufen and dexamethasone in heavily pretreated relapsed and refractory multiple myeloma. J Clin Oncol. 2021;39(7):757-767.
14 Schjesvold FH, Dimopoulos MA, Delimpasi S, et al. Melflufen or pomalidomide plus dexamethasone for patients with multiple myeloma refractory to lenalidomide (OCEAN): a randomised, head-to-head, open-label, phase 3 study. Lancet Haematol. 2022;9(2):e98-e110.
15. Dimopoulos MA, Oriol A, Nahi H, et al. Daratumumab,
datasets in a secured environment upon execution of the data-sharing agreement. Oncopeptides will also provide the protocol, statistical analysis plan, and the clinical study report synopsis if needed. For additional information or requests for access to Oncopeptides’ clinical trial data for research purposes, please contact us at medinfoglobal@ oncopeptides.com.
lenalidomide, and dexamethasone for multiple myeloma. N Engl J Med. 2016;375(14):1319-1331.
16. Dimopoulos MA, Terpos E, Boccadoro M, et al. Daratumumab plus pomalidomide and dexamethasone versus pomalidomide and dexamethasone alone in previously treated multiple myeloma (APOLLO): an open-label, randomised, phase 3 trial. Lancet Oncol. 2021;22(6):801-812.
17 Mateos MV, Dimopoulos MA, Cavo M, et al. Daratumumab plus bortezomib, melphalan, and prednisone for untreated myeloma. N Engl J Med. 2018;378(6):518-528.
18. DARZALEX [package insert]. Horsham, PA: Janssen Biotech, Inc; 2022. https://www.janssenlabels.com/package-insert/productmonograph/prescribing-information/DARZALEX-pi.pdf Accessed March 31, 2023.
19 Szabo AG, Klausen TW, Levring MB, et al. The real-world outcomes of multiple myeloma patients treated with daratumumab. PLoS One. 2021;16(10):e0258487.
20 Ocio EM, Efebere YA, Hajek R, et al. ANCHOR (OP-104): melflufen plus dexamethasone (dex) and daratumumab (dara) or bortezomib (BTZ) in relapsed/refractory multiple myeloma (RRMM) refractory to an IMiD and/or a proteasome inhibitor (PI) - updated efficacy and safety. Blood. 2020;136(s1):9-10.
21. Richardson PG, Bringhen S, Voorhees P, et al. Melflufen plus dexamethasone in relapsed and refractory multiple myeloma (O-12-M1): a multicentre, international, open-label, phase 1-2 study. Lancet Haematol. 2020;7(5):e395-e407.
22. Rajkumar SV, Harousseau JL, Durie B, et al. Consensus recommendations for the uniform reporting of clinical trials: report of the International Myeloma Workshop Consensus Panel 1. Blood. 2011;117(18):4691-4695.
23. U.S. Department of Health and Human Services. Common Terminology Criteria for Adverse Events (CTCAE). 2010. [June 14, 2010]. https://evs.nci.nih.gov/ftp1/CTCAE/CTCAE_4.03/ CTCAE_4.03_2010-06-14_QuickReference_8.5x11.pdf Accessed April 20, 2023.
24. Gasparetto C, Lentzsch S, Schiller G, et al. Selinexor, daratumumab, and dexamethasone in patients with relapsed or refractory multiple myeloma. EJHaem. 2021;2(1):56-65.
25. Chari A, Suvannasankha A, Fay JW, et al. Daratumumab plus pomalidomide and dexamethasone in relapsed and/or refractory multiple myeloma. Blood. 2017;130(8):974-981.
26. Attal M, Richardson PG, Rajkumar SV, et al. Isatuximab plus pomalidomide and low-dose dexamethasone versus pomalidomide and low-dose dexamethasone in patients with relapsed and refractory multiple myeloma (ICARIA-MM): a randomised, multicentre, open-label, phase 3 study. Lancet. 2019;394(10214):2096-2107.
27. Atrash S, Thompson-Leduc P, Tai MH, et al. Treatment patterns and effectiveness of patients with multiple myeloma initiating daratumumab across different lines of therapy: a real-world
Haematologica | 109 Marzo 2024 904 ARTICLE - LIGHTHOUSE: Melflufen plus dara and dex in RRMM L. Pour et al.
chart review study. BMC Cancer. 2021;21(1):1207.
28. Cottini F, Huang Y, Williams N, et al. Real world experience of daratumumab: evaluating lymphopenia and adverse events in multiple myeloma patients. Front Oncol. 2020;10:575168.
29 Lovas S, Varga G, Farkas P, et al. Real-world data on the efficacy and safety of daratumumab treatment in Hungarian relapsed/ refractory multiple myeloma patients. Int J Hematol. 2019;110(5):559-565.
30. Girvan A, Yu J, Emechebe N, Kamalakar R, Luo Y. Real-world treatment patterns and outcomes of daratumumab retreatment in multiple myeloma in the United States. Blood. 2022;140 (Suppl 1):5266-5267.
31. Richardson PG, San Miguel JF, Moreau P, et al. Interpreting clinical trial data in multiple myeloma: translating findings to the real-world setting. Blood Cancer J. 2018;8(11):109.
32. Usmani SZ, Nahi H, Legiec W, et al. Final analysis of the phase III non-inferiority COLUMBA study of subcutaneous versus
intravenous daratumumab in patients with relapsed or refractory multiple myeloma. Haematologica. 2022;107(10):2408-2417.
33. Park SS, Min Byun J, Yoon SS, et al. Daratumumab monotherapy for relapsed/refractory multiple myeloma, focussed on clinical trial-unfit patients and subsequent therapy. Br J Haematol. 2021;193(1):101-112.
34 Lonial S, Weiss BM, Usmani SZ, et al. Daratumumab monotherapy in patients with treatment-refractory multiple myeloma (SIRIUS): an open-label, randomised, phase 2 trial. Lancet. 2016;387(10027):1551-1560.
35. Usmani SZ, Weiss BM, Plesner T, et al. Clinical efficacy of daratumumab monotherapy in patients with heavily pretreated relapsed or refractory multiple myeloma. Blood. 2016;128(1):37-44.
36. Lokhorst HM, Plesner T, Laubach JP, et al. Targeting CD38 with daratumumab monotherapy in multiple myeloma. N Engl J Med. 2015;373(13):1207-1219.
Haematologica | 109 Marzo 2024 905 ARTICLE - LIGHTHOUSE: Melflufen plus dara and dex in RRMM L. Pour et al.
The changing spectrum of infection with BCMA and GPRC5D targeting bispecific antibody (bsAb) therapy in patients with relapsed refractory multiple myeloma
Lindsay Hammons,1 Aniko Szabo,2 Abhishek Janardan,3 Vineel Bhatlapenumarthi,1 Evanka Annyapu,3 Binod Dhakal,1 Samer Al Hadidi,4 Sabarinath Venniyil Radhakrishnan,1 Ravi Narra,1 Divaya Bhutani,5 Sharmilan Thanendrarajan,4 Siegfried Janz,1 Maurizio Zangari,4 Suzanne Lentzsch,5 Frits van Rhee,4 Juan Carlos Rico Crescencio,6 Anita D’Souza,1 Rajshekhar Chakraborty,5# Meera Mohan1# and Carolina Schinke4#
1Division of Hematology/Oncology, Department of Medicine, Medical College of Wisconsin, Milwaukee, WI; 2Division of Biostatistics, Institute of Health and Equity, Medical College of Wisconsin, Milwaukee, WI; 3Medical College of Wisconsin Medical School, Milwaukee, WI; 4Myeloma Center, University of Arkansas for Medical Science, Little Rock, AR; 5Multiple Myeloma and Amyloidosis Program, Columbia University, Herbert Irving Comprehensive Cancer Center, New York, NY and 6Internal Medicine, Division of Infection Disease, University of Arkansas for Medical Science, Little Rock, AR, USA
#RC, MM and CS contributed equally as senior authors.
Abstract
Correspondence: C. Schinke
CDSchinke@uams.edu
Received: June 2, 2023.
Accepted: August 22, 2023.
Early view: August 31, 2023.
https://doi.org/10.3324/haematol.2023.283590
©2024 Ferrata Storti Foundation
Published under a CC BY-NC license
There is a paucity of granular data on infection risk with B-cell maturation antigen (BMCA) and GPRC5D bispecific antibodies (bsAb) in relapsed/refractory multiple myeloma (RRMM). The aim of our multi-institutional study was to characterize the incidence, etiologies, and risk factors of infections from the start of therapy to the last follow-up or 90 days after study exit. A total of 66 patients received BCMA bsAb monotherapy, 15 GPRC5D bsAb monotherapy, and 15 GPRC5D bsAb combination therapy with daratumumab and/or pomalidomide. While the infection rate per 100 days was 0.57 for BCMA bsAb, it was 0.62 for GPRC5D bsAb combination and 0.13 for GPRC5D bsAb monotherapy; P=0.05. The proportion of infections that were grade ≥3 was higher in the BCMA bsAb group compared to the GPRC5D groups (58% vs. 36%; P=0.04). Grade 5 events were observed in 8% (n=8) of the patients, all treated with BCMA bsAb. The 9 month cumulative incidence of any grade of infection was similar in the BCMA and GPRC5D-combination groups (57% and 62%) and significantly higher than in the GPRC5D-mono group (16%); P=0.012. The cumulative incidence of grade ≥3 infections was highest in the BCMA group reaching 54% at 18 months; P=0.06. Multivariate analysis showed that BCMA bsAb therapy or GPRC5D combination therapy, history of previous infections, baseline lymphopenia, and baseline hypogammaglobulinemia were significantly associated with a higher risk of grade ≥3 infections. Our results indicate that BCMA bsAb and GPRC5D-combination therapies in RRMM are associated with higher cumulative incidence of infection and grade ≥3 infection compared to GPRC5D bsAb mono.
Introduction
Bispecific antibodies (bsAb) targeting various cell surface antigens such as B-cell maturation antigen (BMCA), G protein-coupled receptor, family C, group 5, member D (GPRC5D) and Fc receptor homolog 5 (FcRH5) have demonstrated impressive clinical efficacy in relapsed/refractory multiple myeloma (RRMM).1-12 In December 2022, teclistamab, one of the first-in-class BCMA bsAb was approved for patients with relapsed/refractory MM after ≥4 prior lines of therapy.1 Additionally, there are several non-BMCA targeting bsAb in the
pipeline including talquetamab (GPRC5D), forimtamig (GPRC5D) and cevostamab (FcRH5). Furthermore, these drugs are being investigated in earlier lines of therapy and in combination with immunomodulatory agents (IMiD) and anti-CD38 monoclonal antibodies (clinicaltriails gov. Identifier: NCT05137054, NCT05090566, NCT05730036, NCT05020236, NCT04108195) There are emerging reports of the changing spectrum of infections associated with the use of bsAb, including the risk of severe infection and infection-related death with this class of drugs. Thus far, the vast majority of these reports have focused on BCMA targeting bsAb.1,4,13 Several factors com-
Haematologica | 109 Marzo 2024 906 - Plasma Cell Disorders ARTICLE
pound the increased risk of infection in this particular drug class in addition to pre-existing host- and disease-related immunosuppression seen in RRMM.14 Currently, this class of drugs is approved specifically after exposure to anti-CD38 monoclonal antibodies which by itself causes hypogammaglobinemia and immunosuppression.15 Furthermore, BCMA targeting bsAb cause almost universal profound and prolonged hypogammaglobinemia, cytopenias (neutropenia and lymphopenia)1 and T-cell exhaustion especially with continuous therapy.16,17 Additionally, the global coronavirus disease 2019 (COVID19) pandemic, the lack of universal uptake and availability of COVID19 vaccination, and the suboptimal response to the vaccine specifically in BCMA-directed therapy also contribute to infectious mortality.18,19 Currently, there are no consensus guidelines on the optimal monitoring and prophylaxis of infections with this class of agents, neither in clinical trials nor on Food and Drug Administration prescribing guidelines for recently approved teclistamab.
While there are several early reports of infection risk with these agents, they are limited by lack of granular individual patient-level data on type of infections, risk-factors, and trajectory along the course of treatment. Furthermore, there is a gap in current knowledge whether non-BCMA targeting bsAb lead to similarly high incidents of infections. The main objective of this study is to characterize the infectious complications and identify factors contributing to risk of infections in RRMM patients treated with BCMA or GPRC5D bsAb therapies on early phase clinical trials at three academic institutions in the US.
Methods
Patients and disease variables
Patients in this study had RRMM and were treated with either BCMA or GPRC5D bsAb therapy between November 2017 and September 2022 in various phase I/II clinical trials in three academic centers in the US, Medical College of Wisconsin, Milwaukee, WI, University of Arkansas for Medical Sciences, Little Rock, AR, and Columbia University Irving Medical Center, New York, NY. Patients receiving at least one dose of the study drug as single agent or in combination with other agents (daratumumab and/or pomalidomide) in the setting of a clinical trial were included. Eligibility criteria were similar across all trials and included RRMM patients with prior exposure to an anti-CD38 monoclonal antibodies, proteasome inhibitor (PI) and IMiD with adequate blood counts (absolute neutrophil count >1,000/µL) and preserved organ function. All clinical trials also specifically excluded patients with an active infection. Data including patient demographics, disease characteristics (including bone marrow biopsy, fluorescence in situ hybridization studies, novel imaging positron emission tomography-computed tomography at the most recent assessment before starting treatment were retrospectively collected.
Immunoglobulin (Ig) levels were obtained at baseline prior to study enrollment and repeated at day 1 of every cycle of treatment protocol. Functional IgG and IgA levels were computed by subtracting serum M-protein values from the affected total Ig value. The study was approved by the Institutional Review Board of the coordinating institution (Medical College of Wisconsin) and subsequently by all participating institutions. The research was performed in compliance with the terms of the Declaration of Helsinki. Data cutoff was December 31st, 2022.
Supportive care, infection prevention and monitoring
Supportive care, infections prevention and monitoring strategies were implemented according to institutional guidelines. All patients were on antimicrobial prophylaxis with acyclovir or valacyclovir. Prophylactic use of intravenous immunoglobulin (IVIG) or primary Pneumocystis jiroveci pneumonia (PJP) prophylaxis was not implemented because there was no convincing data to support their use at start of these trials. Similarly, routine pharmacological prophylaxis or generalized monitoring of Cytomegalovirus was not employed. Neutropenic precautions with antibiotics and antifungal agents were administered at the discretion of the treating physician or according to institutional guidelines, if applicable. The decision to administer granulocyte colony-stimulating factor was directed by the absolute neutrophil count. Serum IgG, IgM and IgA concentration was evaluated before starting therapy and repeated on a monthly interval. IVIG replacement was administered if the serum IgG concentration was ≤400 mg/dL or at the discretion of treating physician or institutional guidelines as applicable.
Infection categorization
Infections confirmed by clinical, imaging, microbiological, or histopathological evidence were captured from day 1 of the first cycle of bsAb until the last follow-up or 90 days after completion of the study. Since bsAb therapy can lead to depletion of endogenous plasma cells including long lived plasma cells, we collected infection data for an extended period of 90 days after completion of study. The National Cancer Institute Common Terminology Criteria for Adverse Events, version 5, was used to describe the site and degree of infections.20
Results
Patients and treatment characteristics
For this study, 96 treatment occasions from 90 patients were included. Among these, BCMA and GPRC5D bsAb were used in 66 and 30 treatment occasions, respectively. Fifteen patients received GPRC5D bsAb-combination (GPRC5D-combination) therapy with IMiD and anti-CD38 monoclonal antibody and 15 received GPRC5D bsAb ther-
Haematologica | 109 Marzo 2024 907 ARTICLE - Bispecific antibody therapy and infections in RRMM L. Hammons et al.
apy as a single agent. The baseline characteristics of the patients included in this study are summarized in Table 1. The overall median age was 69 (range, 45-91) years and 46% (n=44) were female with no significant differences between groups. Ethnicity and race differed slightly between the groups, with a higher representation of Blacks in the GPRC5D bsAb monotherapy group and higher prevalence of Hispanics in the BCMA bsAb group, P =0.05. Disease and prior treatment-specific characteristics were similar across all groups: IgG κ (40%; n=38) was the most common subtype of MM and 97% (n=93) were triple class exposed. The patients were heavily pretreated with five (range, 2-11) prior lines of therapy and 86% (n=82) had prior autologous stem cell transplant (ASCT) including 37% (n=34) a second ASCT. The use of tocilizumab for CRS (BCMA bsAb =34%, GPRC5D bsAb combination =60% vs GPRC5D bsAb monotherapy =40%; P=0.2) and steroids for the management of CRS/ICANS (BCMA bsAb =17%, GPRC5D bsAb combination =27% vs. GPRC5D bsAb monotherapy =6.7%; P=0.3) was similar across all groups. Baseline immune function was equally similar in all groups with no significant differences. The median absolute neutrophil counts at the start of treatment were 3 x10³/ µ L (range, 1.0-10.8x10³/ µ L) and the median lymphocyte counts was 0.65 x10³/ µ L (range, 0.01-4.82x10³/ µ L). Of interest is that IVIG use during bsAb therapy was significantly higher in the BCMA bsAb and GPRC5D bsAb combination groups
compared to GPRC5D bsAb monotherapy group; P=0.01.
Incidence and etiology of infections
The median follow up was 193 days for the entire cohort. The median days at-risk were 160 (range, 27-795), 169 (range, 92-590) and 224 (range, 43-336) for the BCMA bsAb, GPRC5D bsAb combination and GPRC5D bsAb monotherapy groups, respectively. A total of 127 infections were diagnosed during the 96 at-risk periods in 90 patients; Figure 1. Amongst these, 99 infectious events occurred in recipients of BCMA bsAb (mean infection rate =1.5/patient), 24 with GPR5D bsAb combination (mean infection rate =1.6/patient) and four in GPRC5D bsAb monotherapy (mean infection rate =0.27/patient); P=0.06. The infection rate per 100 days was 0.57 for BCMA bsAb, 0.62 for GPRC5D bsAb combination, and 0.13 for GPRC5D bsAb monotherapy; P=0.055. The proportion of grade ≥3 infections were higher in BCMA bsAb treated patients (58%) compared to those treated with GPRC5D bsAb combination (33%) or monotherapy bsAb (50%); P=0.06, Table 2. Similarly, the need for hospitalization was higher in the BCMA bsAb group (74%) compared to GPRC5D bsAb single (50%) or combination therapy (54%); P=0.07. Infection-related deaths (grade 5) occurred only in the BCMA bsAb group (8.2%).
Cumulative incidence of infections
When looking at the dynamics of the infection rates, we
1Wilcoxon rank sum test; 2Pearson’s χ2 test, 3Fisher’s exact test; ASCT: autologous stem cell transplant; CRS: cytokine release syndrome; ICANS: immune effector cell-associated neurotoxicity syndrome; IVIG: intravenous immunoglobulin; BCMA: B-cell maturation antigen; GPRC5D: G protein-coupled receptor, family C, group 5, member D.
Haematologica | 109 Marzo 2024 908 ARTICLE - Bispecific antibody therapy and infections in RRMM L. Hammons et al.
Clinical characteristics Overall N=96 BCMA N=66 GPRC5D combination N=15 GPRC5D monotherapy N=15 P Age in years, median (range) 69 (45-91) 70 (50-91) 66 (45-76) 70 (59-80) 0.111 Female, N (%) 44 (46) 32 (48) 5 (33) 7 (47) 0.62 Ethnicity, N (%) American Indian Asian Black Hispanic Non-hispanic White 2 (2.1) 4 (4.2) 19 (20) 6 (6.2) 65 (68) 1 (1.5) 4 (6.1) 9 (14) 6 (9.1) 46 (70) 1 (6.7) 0 (0) 2 (13) 0 (0) 12 (80) 0 (0) 0 (0) 8 (53) 0 (0) 7 (47) 0.053 Prior lines of therapy, N, median (range) 5 (2-11) 5 (2-11) 6 (2-10 6.5 (3-10) 0.0441 Prior ASCT, N (%) 82 (86) 54 (83) 14 (93) 14 (93) 0.53 CRS grade, N (%) 0 1 2 3 34 (35) 47 (49) 13 (14) 2 (2.1) 28 (42) 27 (41) 10 (15) 1 (1.5) 1 (6.7) 14 (93) 0 (0) 0 (0) 5 (33) 6 (40) 3 (20) 1 (6.7) 0.0063 ICANS grade, N (%) 0 1 2 91 (95) 1 (1.0) 4 (4.2) 65 (98) 0 (0) 1 (1.5) 13 (87) 1 (6.7) 1 (6.7) 13 (87) 0 (0) 2 (13) 0.0323 IVIG supplementation, N (%) 47 (49) 33 (50) 11 (73) 3 (20) 0.0132
Table 1. Baseline clinical characteristics of patients.
saw a steep increase of cumulative incidence within the first 6 months for patients treated with BCMA bsAb (55%) or GPRC5D bsAb combination therapy (62%) with a continuous, but slower increase of cumulative incidences until 18 months (BMCA bsAb =69% and GPRC5D bsAb combination =70%); Figure 2A. In contrast, the cumulative incidence of infections was significantly lower in patients treated with single-agent GPRC5D bsAb at all time points with a 9-month cumulative incidence of 16%; P=0.012. Severe infections (grade ≥3) followed a similar pattern with a rapid increase of cumulative incidence until 6 months for the BCMA bsAb (33%) and GPRC5D bsAb combination (34%) groups, followed
by a slower increase in BCMA bsAb treated patients (54%) and leveling-off for patients treated with GRPC5D bsAb (34%) by 18 months; Figure 2B. Patients receiving GPRC5D bsAb monotherapy again had a lower cumulative incidence of severe infections (7.1% at 9 months); P=0.058, with all of them occurring in the first 3 months.
Infectious spectrum of bispecific antibody therapy
The distribution and rates of bacterial, viral, and fungal infection were similar across the three groups. Of the total number of infections in BCMA BsAb group (n=99), the incidence of bacterial, viral, and fungal infections was 54%,
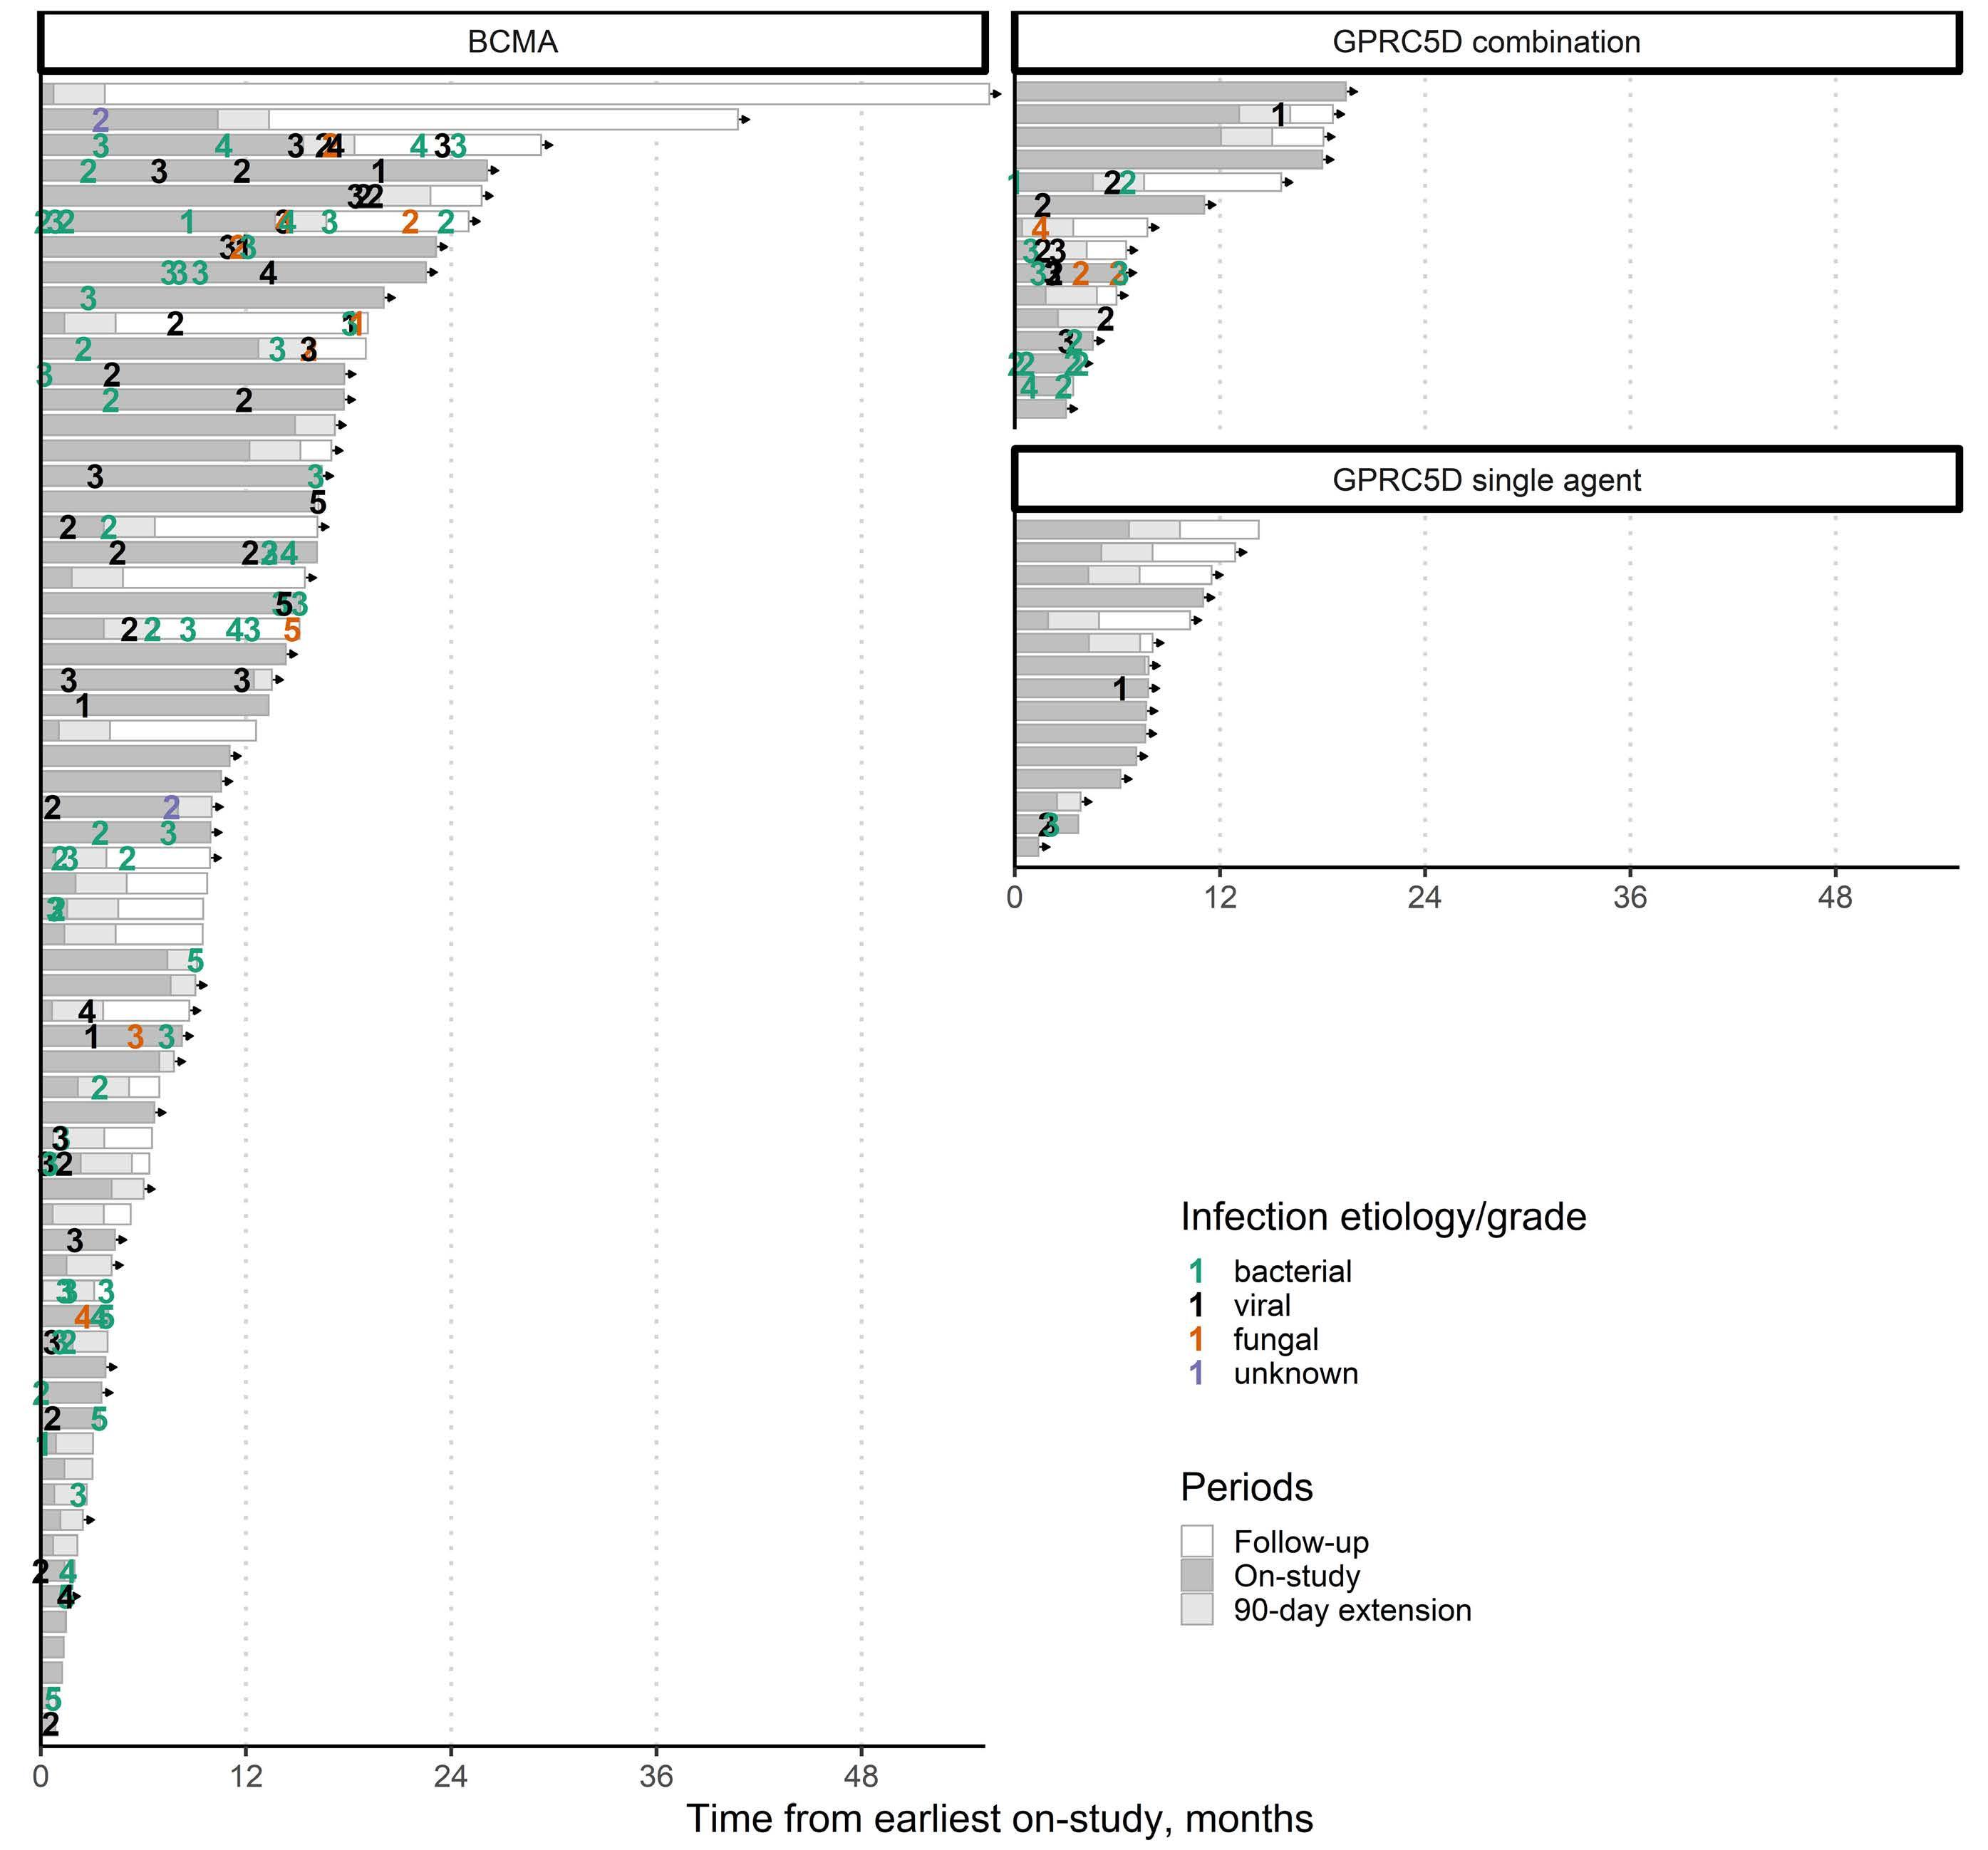
Haematologica | 109 Marzo 2024 909 ARTICLE - Bispecific antibody therapy and infections in RRMM L. Hammons et al.
Figure 1. Swimmer plot of infections with BCMA and GPRC5D bispecific antibodies. BCMA: B-cell maturation antigen; GPRC5D: G protein-coupled receptor, family C, group 5, member D.
39%, and 7% respectively. Of the 28 infectious episodes in the GRPC5D BsAb group, the incidence of bacterial, viral, and fungal infections was 50%, 38%, and 12%, respectively. Bacterial infections appeared to be more common in the BCMA bsAb group and GPRC5D bsAb combination group with 54% and 50% of all infections respectively, compared to GPRC5D bsAb monotherapy (25%), albeit this observation was non-significant. Of the four infections in the GPRC5D bsAb monotherapy group, one was bacterial and three were viral. A detailed description of some of the representative infections are as follows. Among the bacterial infections, bacteremia was observed in 24.4% of patients (31 cases; 27 with BCMA bsAb and seven with GPRC5D bsAb combination therapy). The pathogens implicated in bacteremia in this cohort include Pseudomonas aeruginosa, Capnocytophaga species, Streptococcus species, Helicobacter canis, Campylobacter jejuni , Escherichia coli, Enterococcus faecium, Rhizobium radiobacter and Ochrobactrum anthropic. A case of pseudomonas aeruginosa bacteremia with secondary purulent bacterial pericarditis developed in a patient with profound hypogammaglobinemia (IgG levels of <40 mg/dL) after being on BCMA bsAb therapy for 12 months. Interestingly, polymicrobial central-line associated blood stream recurrent infection with Ochrobactrum anthropi and Rhizobium radiobacter occurred in a patient after 5 months of BCMA bsAb therapy and required prolonged antibiotic therapy. There were 12 cases (9.4%) of pneumonia in this cohort including three cases of PJP and two cases of Asper-
gillus species. All three patients were not receiving primary PJP prophylaxis. One patient was found to have a “proven” Aspergillus infection through a positive sputum culture, while another patient showed “probable” Aspergillus infection with a nodular consolidation in the lungs, as well as a positive galactomannan test on bronchoalveolar lavage. We also note a case of necrotizing fasciitis and gangrenous cholecystitis, both in recipients of BCMA bsAb. Three patients in this cohort, all recipients of BCMA bsAb therapy, had Cytomegalovirus viremia without any associated end organ disease. We also report a case of prolonged and severe Norovirus diarrhea that lasted more than 6 months in a patient treated with BCMA bsAb after being on therapy for almost 1 year. It is noteworthy that this occurred in the setting of hypogammaglobinemia while receiving IVIG with IgG levels ranging between 300-400 mg/dL and with profound lymphopenia with absolute lymphocyte counts ranging between 0.06-0.53x10³/µL. This case of recalcitrant Norovirus infection was treated with nitazoxanide, oral human serum Ig and stem cell boost for immune reconstitution along with supportive care. This patient was finally taken off therapy due to infectious complications. In this cohort, there were 24 cases (18.9%) of COVID19 infection, 17 in BCMA bsAb, and five with GPRC5D bsAb combination and two with GPRC5D bsAb monotherapy.
Severity of infection
Infections during GPRC5D bsAb therapy were more likely
*N represents number of infectious events with a given bispecific antibody. 1Wilcoxon rank sum test; 2Pearson’s χ2 test; 3Fisher’s exact test; 4Quasi-Poisson regression. BCMA: B-cell maturation antigen; GPRC5D: G protein-coupled receptor, family C, group 5, member D.
Haematologica | 109 Marzo 2024 910 ARTICLE - Bispecific antibody therapy and infections in RRMM L. Hammons et al.
Clinical characteristic BCMA N*=99 GPRC5Dcombination N*=24 GPRC5D monotherapy N*=4 P Rate of total infections per 100 days (standard error) 0.57 (0.08) 0.62 (0.26) 0.13 (0.13) 0.0554 Rate of grade ≥3 infections per 100 days (standard error) 0.33 (0.06) 0.21 (0.13) 0.06 (0.09) 0.104 Rate of bacterial infections per 100 days (standard error) 0.31 (0.06) 0.31 (0.10) 0.03 (0.04) 0.0654 Rate of viral infections per 100 days (standard error) 0.22 (0.04) 0.23 (0.10) 0.10 (0.09) 0.44 Rate of fungal infections per 100 days (standard error) 0.03 (0.01) 0.08 (0.07) 0 (0) 0.144 Etiology, N (%) Bacterial Viral Fungal Unknown 53 (54) 38 (39) 7 (7.1) 1 (1.0) 12 (50) 9 (38) 3 (12) 0 (0) 1 (25) 3 (75) 0 (0) 0 (0) 0.631 Grade, N (%) 1 2 3 4 5 6 (6.1) 35 (36) 37 (38) 12 (12) 8 (8.2) 2 (8.3) 14 (58) 6 (25) 2 (8.3) 0 (0) 1 (25) 1 (25) 2 (50) 0 (0) 0 (0) 0.0742 Need for hospitalization, N (%) No Yes 28 (29) 70 (71) 13 (46) 15 (54) 2 (50) 2 (50) 0.073
Table 2. Characteristics of infectious events.
to be grade 1 or 2 compared to that with BCMA bsAb (65% vs. 42% respectively; P=0.023) (Table 2). The 18-month cumulative risk of grade ≥3 infection BCMA bsAb was higher at 54% (95% confidence interval [CI]: 42-87), compared to 21% (95% CI: 10-42) with GPRC5D bsAb (P=0.03). Of note, there were eight (8%), grade 5 events, all observed in recipients in BCMA bsAb therapy. The grade 5 events included severe sepsis with Candida glabrata empyema (n=1), severe COVID19 infection and multiorgan failure (n=1), severe sepsis with Pseudomonas bacteremia (n=1), severe sepsis and multiorgan failure (n=2) severe sepsis with Enterococcus faecalis bacteremia (n=1), septic shock secondary to Escherechia coli bacteremia (n=1), and combination of acute respiratory distress syndrome with septic shock secondary to concurrent PJP with Pseudomonas bacteremia (n=1). In general, 85 infection events (BCMA bsAb: 70 and GPRC5D bsAb: 15; P=0.07) required hospitalization in this cohort.
Clinical characteristics associated with an increased risk of infection
In a last step we attempted to determine factors associated with the risk of overall and grade ≥3 infections. In a multivariable Cox-regression model for risk factors of all-grade infection, with single-agent BCMA bsAb as a reference, GPRC5D bsAb monotherapy had a significantly lower risk
(hazard ratio [HR] =0.14; 95% CI: 0.02-1.03) of infections while there was no significant difference with GPRC5D bsAb combination therapies (HR=1.36; 95% CI: 0.86-2.16); P=0.006. A history of previous infections on bsAb therapy was a significant risk factor for subsequent infections in multivariate analysis (HR=1.3; 95% CI: 1.12-1.52; P=0.001). For grade ≥3 infection, with single-agent BCMA bsAb as a reference, GPRC5D bsAb monotherapy (HR=0.00; 95% CI: 0.00-not reached [NR]) and GPRC5D bsAb combination therapies (HR=0.66; 95% CI: 0.30-1.42) both had a significantly lower risk (P=0.014). Additionally, history of prior infections on bsAb therapy (HR=1.32; 95% CI: 1.07-1.63; P=0.012), baseline lymphopenia (HR=1.4; 95% CI: 0.98-2.04; P=0.016) and hypogammaglobinemia (IgG <400 mg/dL) at the start of therapy (HR=1.4; 95% CI: 1.11-1.80; P=0.012) were associated with significantly higher risk of grade ≥3 infections.
Discussion
In this study, we report that infection-related toxicities are a significant burden in patients with RRMM who were treated with bsAb. The risk of infection varies depending on bsAb therapy. Patients receiving single-agent BCMA-targeting bsAb had a higher risk of overall and grade ≥3 infections
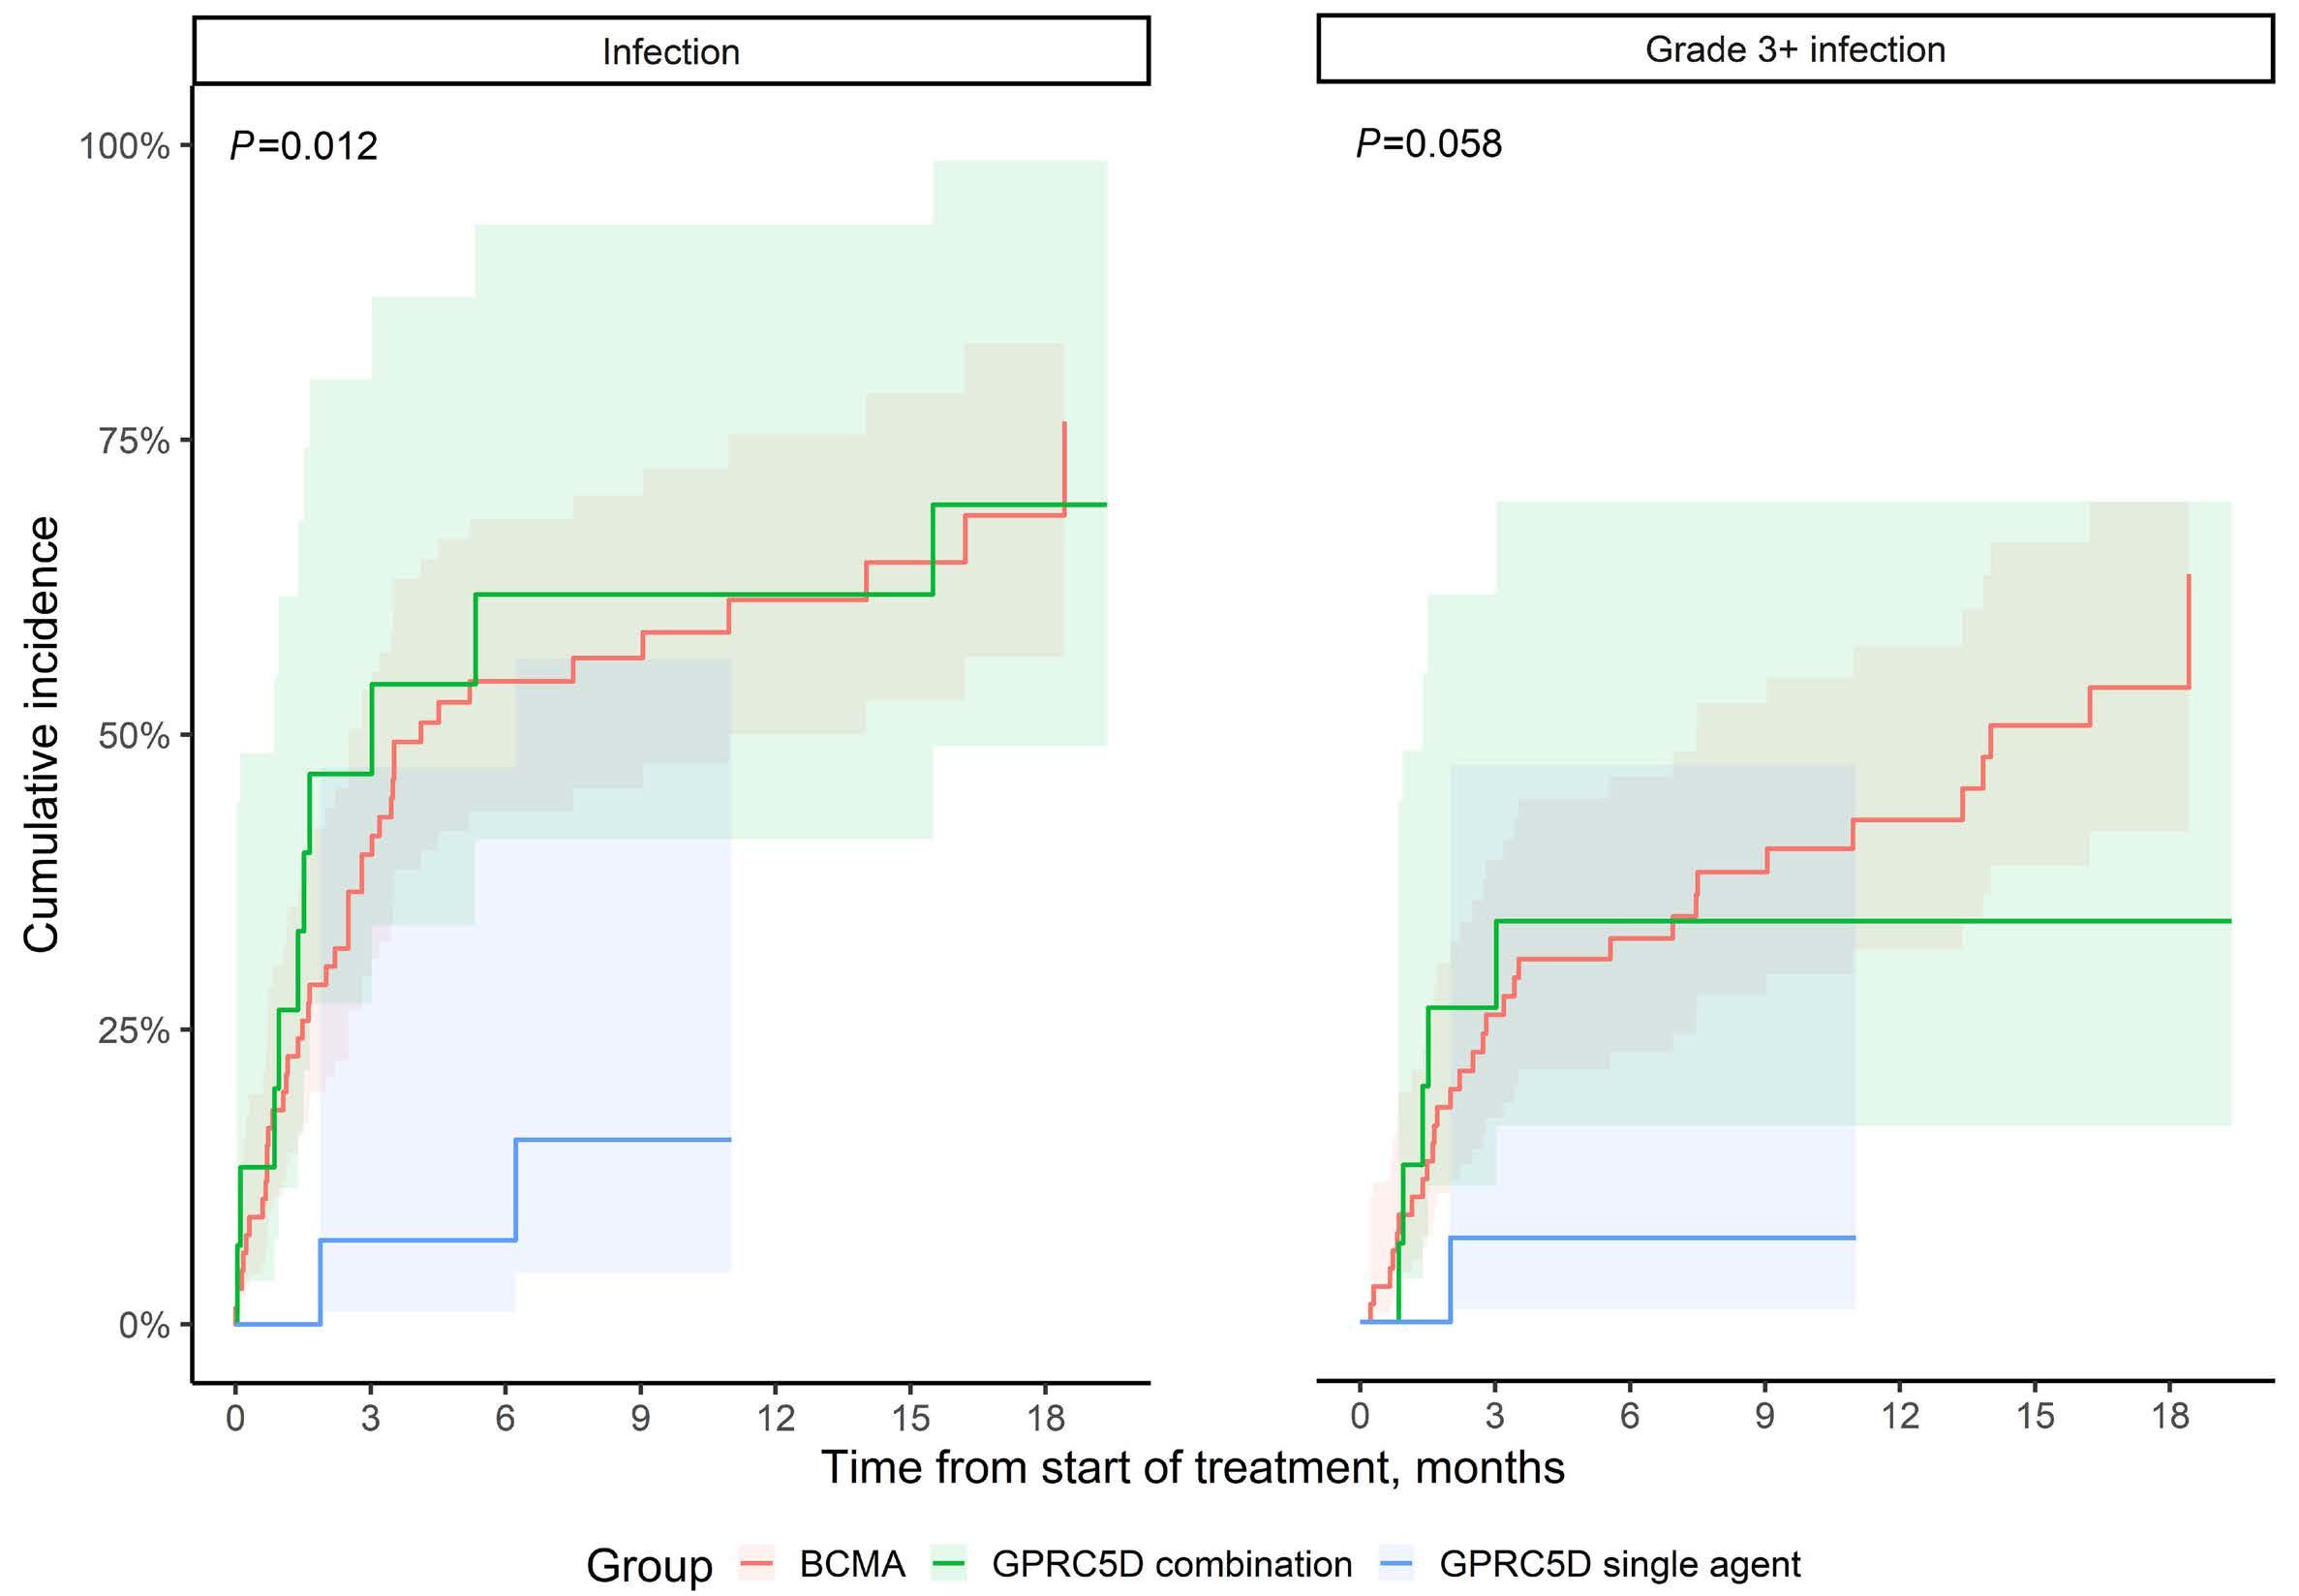
Haematologica | 109 Marzo 2024 911 ARTICLE - Bispecific antibody therapy and infections in RRMM L. Hammons et al.
B
Figure 2. Cumulative incidence of all and grade ≥3 infections with BCMA and GPRC5D bispecific antibodies. Panel (A) shows the incidence of all grade and panel (B) grade ≥3 infection with BCMA and GPRC5D bispecific antibodies. BCMA: B-cell maturation antigen; GPRC5D: G protein-coupled receptor, family C, group 5, member D.
A
compared to those receiving GPRC5D bsAb monotherapy. However, infection risk increased with GPPRC5D bsAb therapy when combined with daratumumab and/or pomalidomide. The increased risk of infections in combination group was evident despite a higher use of IVIG, suggestion that IVIG therapy may not fully mitigate the infection risk. The study also highlighted a changing spectrum of infections including rare opportunistic infections, viral reactivation syndromes, and fungal infections. The cumulative incidence of grade ≥3 infections increased with time on therapy with highest incidence at 18 months in the BCMA bsAb group. The most common etiology of infections was bacterial followed by viral and fungal. Additionally, the study found that target antigen, number of prior infections on bsAb therapy, baseline lymphopenia and hypogammaglobulinemia were independent risk factors for ≥3 infections.
Putative drivers of immunosuppression that lead to increased infection risk with bsAb include hypogammaglobulinemia, cytopenia (especially neutropenia and lymphopenia), and T-cell exhaustion. Hypogammaglobulinemia is an on-target off-tumor toxicity of bsAb due to the presence of the target antigens (BCMA)21 and GPRC5D22 in both malignant and normal plasma cells, leading to profound plasma cell ablation. In particular, BCMA is essential for the survival of long-lived plasma cells, which is a key player in maintaining humoral immunity.23 Compared to BCMA, GPRC5D expression on normal plasma cells is minimal, which may theoretically lower the occurrence of hypogammaglobinemia associated with GPRC5D targeting therapies in MM.22 This could plausibly explain the lower rates of infection we noted with GPRC5D monotherapy. Additionally, 97% of patients in our study were triple-class exposed, indicating prior exposure to anti-CD38 monoclonal antibody, which are also associated with prolonged hypogammaglobulinemia.24,25 The MajesTEC-1 study that led to the approval of BCMA bsAb, teclistamab, reported a hypogammaglobulinemia incidence of 75%.1 In our study, a baseline hypogammaglobinemia was also associated with 1.4-fold higher risk of grade ≥3 infections, Primary prophylaxis with immunoglobulin supplementation in patients with a low baseline functional IgG level to mitigate infection risk should be further tested. Baseline lymphopenia was another significant predictor of high-grade infections in our study. Of note, three of 90 patients (3.3%) developed PJP, which is comparable to the PJP incidence seen with teclistamab in MajecTEC-1 trial (3.6%),1 and highlights the importance of prophylaxis. T-cell exhaustion may also be an important driver of immunosuppression with bsAb, especially in the context of indefinite therapy26,27 and could be mitigated with treatment-free intervals as previously shown.26 Since infections associated with T-cell immunosuppression such as PJP, CMV, and fungal infections have been documented with bsAb, future studies should test fixed-duration treatment or treatment-free intervals to potentially mitigate infection risk without sacrificing efficacy. In the present manuscript,
we share our encounter with infection complications in the early clinical trials when routine infectious disease monitoring and prophylaxis such as PJP prophylaxis were not implemented in a uniform fashion. However, we have since taken proactive measures, including IVIG replacement and adjusting PJP prophylaxis based on CD4 counts, while waiting for prospective data. These changes are expected to reduce the burden of infections.
The target antigen and the use of the combination regimen were shown to modulate the risk of infection in our study. In a pooled analysis of trial-level data from 11 clinical trials testing single-agent BCMA, GPRC5D, or FcRH5 bsAb, non-BCMA bsAb were shown to have lower incidence of grade 3/4 infection compared to BCMA bsAb (12% vs. 30% respectively; P=0.01)28 which is consistent with our findings that GPRC5D bsAb therapy had a lower infection burden overall. Although a total of 28 of 1,185 patients in their study (2.4%) had infection-related deaths, the distribution of these events by target bsAb was not specified. In our study, infection-related death was observed in eight of 90 patients (8.9%), all of which were in patients who had received BCMA bsAb. In a small study of 39 patients receiving bsAb therapy, predominantly GPRC5D bsAb, 90% of cases experienced infections, with 40% being grade 3 or higher, primarily originating from the respiratory tract and commonly caused by viral etiologies. It is important to note that the study did not specify whether GPRC5D was used as a monotherapy or in combination with other treatments.29 Notably, two of 32 patients (6.3%) in MajesTEC-2 study testing teclistamab in combination with daratumumab and lenalidomide had fatal infections.30
As we bring bsAb into clinical trials in earlier lines of therapy, especially in combination regimens, randomized design should be employed early on since single-arm trials can potentially miss an increased death signal from infections. In clinical trials of autologous BCMA chimeric antigen receptor (CAR) T-cell therapy, the infection rates have varied between 42% and 69%. Specifically, grade ≥3 infections were reported in 22% of study subjects treated with idecel and 23% with ciltacabtagene autoleucel (cilta-cel) in the registrational studies.4,5 A recent real-world report showed that infections were observed in 34% of patients treated with ide-cel, with bacterial infections being the most common (20%), followed by viral infections (16%) and fungal infections (1%).31 GPRC5D CAR T-cell therapy was associated with an overall infection rate of 18%, with 12% of these being grade ≥3 infections.32 In our previous report, we observed a higher cumulative incidence of infection and infection density among recipients of BCMA BsAb therapy when compared to BCMA CAR T therapy.33 However, it is important to note that the study had several limitations, including a short follow-up period, fewer prior lines of treatment, and less heavily pretreated patients in the CAR T-therapy group compared to the BsAb group. It is reasonable to consider that continuous therapy, par-
Haematologica | 109 Marzo 2024 912 ARTICLE - Bispecific antibody therapy and infections in RRMM L. Hammons et al.
ticularly with BCMA bsAb therapy, is more likely to result in significant hypogammaglobulinemia compared to CAR T therapy, which is a one-time treatment. This increased hypogammaglobulinemia could potentially elevate the risk of infections. It is important to note that another significant factor limiting direct comparisons is the implementation of routine primary PJP and IVIG prophylaxis post CAR T therapy, whereas no prophylaxis was implemented in the described BsAb therapy group. This difference in prophylactic measures makes any direct comparison between the two treatments limited in its interpretability.
Our study has limitations. First, the current report is a retrospective analysis of patients enrolled in early phase trials and treated at varying doses and frequencies of bsAb. Second, infection prophylaxis and monitoring strategies were not standardized at our institutions during the time-period of patient enrollment in these trials, with practice varying according to the treating physician. Third, our follow-up was short. It is unclear whether the risk of infection continues to increase or there is a plateau in incidence after a certain time point. Taken together, infection-related morbidity and mortality is a clinically significant adverse effect of bsAb in MM.
Given the available data, practical recommendations for monitoring and prophylaxis of infections have been published.34,35 While waiting for robust data generated by clinical trials, it is now highly recommended to maintain a high level of vigilance by implementing routine antibacterial prophylaxis during the first month of therapy.34 Additionally, for all patients undergoing bsAb therapy, primary IVIG and PCP prophylaxis are recommended.34
In conclusion, infection-related morbidity and mortality is a clinically significant adverse effect of bsAb in multiple myeloma. Research on strategies to mitigate infection risk,
References
1. Moreau P, Garfall AL, van de Donk N, et al. Teclistamab in relapsed or refractory multiple nyeloma. N Engl J Med. 2022;387(6):495-505.
2. Chari A, Minnema MC, Berdeja JG, et al. Talquetamab, a T-cellredirecting GPRC5D bispecific antibody for multiple myeloma. N Engl J Med. 2022;387(24):2232-2244.
3. D’Souza A, Shah N, Rodriguez C, et al. A phase I first-in-human study of ABBV-383, a B-cell maturation antigen × CD3 bispecific T-cell redirecting antibody, in patients with relapsed/refractory multiple myeloma. J Clin Oncol. 2022;40(31):3576-3586.
4 Berdeja JG, Madduri D, Usmani SZ, et al. Ciltacabtagene autoleucel, a B-cell maturation antigen-directed chimeric antigen receptor T-cell therapy in patients with relapsed or refractory multiple myeloma (CARTITUDE-1): a phase 1b/2 open-label study. Lancet. 2021;398(10297):314-324.
5. Munshi NC, Anderson LD, Jr., Shah N, et al. Idecabtagene vicleucel in relapsed and refractory multiple myeloma. N Engl J Med. 2021;384(8):705-716.
6. Mailankody S, Devlin SM, Landa J, et al. GPRC5D-targeted CAR
including prophylaxis, fixed-duration treatment, and treatment-free intervals are urgently needed. Our study corroborates previous reports showing a high risk of infection with BCMA-targeting bsAb therapy. We further show that GPRC5D bsAb therapy has a significantly lower risk of infections compared to BCMA therapy. Combination GPRC5D bsAb therapy raises the overall infection rates to comparable levels of BCMA therapy, albeit the severity of infections (grade ≥3) appears still higher in BCMA bsAb- treated patients.
Disclosures
No conflicts of interest to disclose.
Contributions
MM, RC and CS developed the concept and designed the study. MM, RC, CS, LH, AD, BD, FVR, MZ, SL, DB and SH provided study materials or patients. SA and RN collected and assembled data. LH, AJ, EA and VB analyzed and interpreted data. AS, MM, RC and CS wrote the manuscript. MM, RC and CS edited the manuscript. All authors approved the final version of the manuscript.
Acknowledgments
We thank our patients and families for the opportunity to be involved in their care and their willingness to contribute to the advancement of the field.
Funding
This work was supported in part by the Advancing a Healthier Wisconsin Endowment-CTSI KL2 award (to MM).
Data-sharing statement
The data that support the findings of this study are available from the corresponding author upon reasonable request.
T cells for myeloma. N Engl J Med. 2022;387(13):1196-1206.
7 Lesokhin AM, Richter J, Trudel S, et al. Enduring responses after 1-year, fixed-duration cevostamab therapy in patients with relapsed/refractory multiple myeloma: early experience from a phase I study. Blood. 2022;140(Suppl 1):S4415-4417.
8. Wong SW, Bar N, Paris L, et al. Alnuctamab (ALNUC; BMS986349; CC-93269), a B-cell maturation antigen (BCMA) x CD3 T-cell engager (TCE), in patients (pts) with relapsed/refractory multiple myeloma (RRMM): results from a phase 1 first-inhuman clinical study. Blood. 2022;140(Suppl 1):S400-402.
9 Bahlis NJ, Tomasson MH, Mohty M, et al. Efficacy and safety of elranatamab in patients with relapsed/refractory multiple myeloma naïve to B-cell maturation antigen (BCMA)-directed therapies: results from cohort a of the Magnetismm-3 Study. Blood. 2022;140(Suppl 1):S391-393.
10 Bumma N, Richter J, Brayer J, et al. Updated safety and efficacy of REGN5458, a BCMAxCD3 bispecific antibody, treatment for relapsed/refractory multiple myeloma: a phase 1/2 first-inhuman study. Blood. 2022;140(Suppl 1):S10140-10141.
Haematologica | 109 Marzo 2024 913 ARTICLE - Bispecific antibody therapy and infections in RRMM L. Hammons et al.
11. Trudel S, Cohen AD, Krishnan AY, et al. Cevostamab monotherapy continues to show clinically meaningful activity and manageable safety in patients with heavily pre-treated relapsed/refractory multiple myeloma (RRMM): updated results from an ongoing phase I study. Blood. 2021;138(Suppl 1):S157.
12. Carlo-Stella C, Mazza R, Manier S, et al. RG6234, a GPRC5DxCD3 T-cell engaging bispecific antibody, is highly active in patients (pts) with relapsed/refractory multiple myeloma (RRMM): updated intravenous (IV) and first subcutaneous (SC) results from a phase I dose-escalation study. Blood. 2022;140(Suppl 1):S397-399.
13. Mohan M, Nagavally S, Dhakal B, et al. Risk of infections with B-cell maturation antigen-directed immunotherapy in multiple myeloma. Blood Adv. 2022;6(8):2466-2470.
14. Caro J, Braunstein M, Williams L, et al. Inflammation and infection in plasma cell disorders: how pathogens shape the fate of patients. Leukemia. 2022;36(3):613-624.
15. Johnsrud AJ, Johnsrud JJ, Susanibar SA, et al. Infectious and immunological sequelae of daratumumab in multiple myeloma. Br J Haematol. 2019;185(1):187-189.
16. Mohan M, Nagavally S, Dhakal B, et al. Risk of infections with B cell maturation antigen (BCMA) directed immunotherapy in multiple myeloma. Blood Adv. 2022;6(8):2466-2470.
17. Hammons LR, Szabo A, Janardan A, et al. Kinetics of humoral immunodeficiency with bispecific antibody therapy in relapsed refractory multiple myeloma. JAMA Netw Open. 2022;5(10):e2238961.
18. Abid MB, Rubin M, Ledeboer N, et al. Efficacy of a third SARSCoV-2 mRNA vaccine dose among hematopoietic cell transplantation, CAR T cell, and BiTE recipients. Cancer Cell. 2022;40(4):340-342.
19 Hammons LR, Szabo A, Janardan A, et al. Kinetics of humoral immunodeficiency with bispecific antibody therapy in relapsed refractory multiple myeloma. JAMA Netw Open. 2022;5(10):e2238961.
20 Department of Health and Human Services US. Common Terminology Criteria for Adverse Events (CTCAE). 2017; https://ctep. cancer.gov/protocoldevelopment/electronic_applications/docs/ ctcae_v5_quick_reference_5x7.pdf. Accessed November 27, 2017.
21. Novak AJ, Darce JR, Arendt BK, et al. Expression of BCMA, TACI, and BAFF-R in multiple myeloma: a mechanism for growth and survival. Blood. 2004;103(2):689-694.
22. Smith EL, Harrington K, Staehr M, et al. GPRC5D is a target for the immunotherapy of multiple myeloma with rationally designed CAR T cells. Sci Transl Med. 2019;11(485):eaau7746.
23. O’Connor BP, Raman VS, Erickson LD, et al. BCMA is essential
for the survival of long-lived bone marrow plasma cells. J Exp Med. 2004;199(1):91-98.
24. Vitkon R, Netanely D, Levi S, et al. Daratumumab in combination with proteasome inhibitors, rapidly decreases polyclonal immunoglobulins and increases infection risk among relapsed multiple myeloma patients: a single center retrospective study. Ther Adv Hematol. 2021;12:20406207211035272.
25. Johnsrud AJ, Johnsrud JJ, Susanibar SA, et al. Infectious and immunological sequelae of daratumumab in multiple myeloma. Br J Haematol. 2019;185(1):187-189.
26. Philipp N, Kazerani M, Nicholls A, et al. T-cell exhaustion induced by continuous bispecific molecule exposure is ameliorated by treatment-free intervals. Blood. 2022;140(10):1104-1118.
27. Longhitano AP, Slavin MA, Harrison SJ, Teh BW. Bispecific antibody therapy, its use and risks for infection: bridging the knowledge gap. Blood Rev. 2021;49:100810.
28. Mazahreh F, Mazahreh L, Schinke C, et al. Risk of infections associated with the use of bispecific antibodies in multiple myeloma: a pooled analysis. Blood Adv. 2023;7(13):3069-3074.
29 Sim BZ, Longhitano A, Er J, Harrison SJ, Slavin MA, Teh BW. Infectious complications of bispecific antibody therapy in patients with multiple myeloma. Blood Cancer J. 2023;13(1):34.
30. Searle E, Quach H, Wong SW, et al. Teclistamab in combination with subcutaneous daratumumab and lenalidomide in patients with multiple myeloma: results from One Cohort of MajesTEC-2, a phase1b, multicohort study. Blood. 2022;140(Suppl 1):S394-396.
31. Kambhampati S, Sheng Y, Huang C-Y, et al. Infectious complications in patients with relapsed refractory multiple myeloma after BCMA CAR T-cell therapy. Blood Adv. 2022;6(7):2045-2054.
32. Mailankody S, Devlin SM, Landa J, et al. GPRC5D-targeted CAR T cells for myeloma. N Engl J Med. 2022;387(13):1196-1206.
33. Mohan M, Nagavally S, Dhakal B, Chhabra S, D’Souza A, Hari P. Risk of infections with BCMA-directed immunotherapy in multiple myeloma. Blood. 2021;138(Suppl 1):S1626.
34 Mohan M, Chakraborty R, Bal S, et al. Recommendations on prevention of infections during chimeric antigen receptor T-cell and bispecific antibody therapy in multiple myeloma. Br J Haematol. 2023 Jun 7. doi: 1111/bjh.18909. [Epub ahead of print]
35. Ludwig H, Terpos E, van de Donk N, et al. Prevention and management of adverse events during treatment with bispecific antibodies and CAR T cells in multiple myeloma: a consensus report of the European Myeloma Network. Lancet Oncol. 2023;24(6):e255-e269.
Haematologica | 109 Marzo 2024 914 ARTICLE - Bispecific antibody therapy and infections in RRMM L. Hammons et al.
Dynamic actin/septin network in megakaryocytes coordinates proplatelet elaboration
Isabelle C. Becker,1,2* Adrian R. Wilkie,1,2* Bret A. Unger,3 Anthony R. Sciaudone,4 Farheen
Fatima,1,2 I-Ting Tsai,1,2 Ke Xu,3 Kellie R. Machlus1,2 and Joseph E. Italiano Jr1,2
1Vascular Biology Program, Boston Children’s Hospital, Boston, MA; 2Department of Surgery, Harvard Medical School, Boston, MA; 3Department of Chemistry, University of California, Berkeley, CA and 4Brigham and Women’s Hospital, Boston, MA, USA
*ICB and ARW contributed equally as first authors.
Correspondence: J. Italiano joseph.italiano@childrens.harvard.edu
Received: April 19, 2023.
Accepted: August 18, 2023.
Early view: September 7, 2023.
https://doi.org/10.3324/haematol.2023.283369
©2024 Ferrata Storti Foundation
Published under a CC BY-NC license
Abstract
Megakaryocytes (MK) undergo extensive cytoskeletal rearrangements as they give rise to platelets. While cortical microtubule sliding has been implicated in proplatelet formation, the role of the actin cytoskeleton in proplatelet elongation is less understood. It is assumed that actin filament reorganization is important for platelet generation given that mouse models with mutations in actin-associated proteins exhibit thrombocytopenia. However, due to the essential role of the actin network during MK development, a differential understanding of the contribution of the actin cytoskeleton on proplatelet release is lacking. Here, we reveal that inhibition of actin polymerization impairs the formation of elaborate proplatelets by hampering proplatelet extension and bead formation along the proplatelet shaft, which was mostly independent of changes in cortical microtubule sliding. We identify Cdc42 and its downstream effectors, septins, as critical regulators of intracellular actin dynamics in MK, inhibition of which, similarly to inhibition of actin polymerization, impairs proplatelet movement and beading. Super-resolution microscopy revealed a differential association of distinctive septins with the actin and microtubule cytoskeleton, respectively, which was disrupted upon septin inhibition and diminished intracellular filamentous actin dynamics. In vivo, septins, similarly to F-actin, were subject to changes in expression upon enforcing proplatelet formation through prior platelet depletion. In summary, we demonstrate that a Cdc42/septin axis is not only important for MK maturation and polarization, but is further required for intracellular actin dynamics during proplatelet formation.
Introduction
Megakaryocytes (MK) are large, polyploid cells that primarily reside within the bone marrow. MK generate platelets by remodeling their cytoplasm into long proplatelet extensions, which extend through endothelial cells into the vascular lumen and serve as assembly lines for platelet production.1 MK terminally differentiate from hematopoietic stem cells (HSC), and then mature in a complex process that culminates in polyploidization and an increase in cell size, including the development of a demarcation membrane system (DMS). Critically, both the significant assembly of cellular content as well as the ultimate production of platelets require extensive cytoskeletal rearrangements of both microtubules as well as filamentous (F)-actin structures. During proplatelet formation, MK penetrate the sinusoidal endothelium by forming transendothelial actomyosin-rich protrusions called podosomes that elongate into proplate-
lets within the vasculature.2,3 Previous studies have identified that proplatelet formation in vitro is initiated in one pole, from which tubular structures with a shaft diameter of 2-4 µm emerge, elongate, and branch out.4,5 Isolated proplatelets appear as strings with several platelet-sized beads lining the shaft and a proplatelet tip on each end.5 Upon release, proplatelets can further mature into intermediate structures (termed preplatelets) and platelets both in vitro as well as in circulation.5,6 Proplatelet shaft elongation is driven by microtubule sliding, while the motor proteins dynein and kinesin enable the simultaneous transport of granules along the developing proplatelets.7,8 Post-translational modifications on both α-tubulins as well as on the MK-specific tubulin isoform β1 regulate proplatelet formation and motor protein movement within proplatelets.9,10 In contrast to microtubules, the role of the actin cytoskeleton in proplatelet formation is much less understood. While transgenic mouse models lacking actin
Haematologica | 109 Marzo 2024 915 - Platelet Biology & its Disorders ARTICLE
regulatory proteins have markedly increased our understanding of the role of actin dynamics in MK,11 determining how they regulate the final stages of proplatelet formation is hampered in murine models due to their unavoidable impact on the maturation of the DMS.12,13 Treatment of proplatelet-forming MK with the actin-depolymerizing agents cytochalasin D (CytoD) or latrunculin A (LatA) markedly reduces the number of proplatelet tips,14,15 although an initial increase in proplatelet formation has paradoxically also been described.16,17 These observations have led researchers to conclude that the F-actin cytoskeleton is important for increasing the number of existing proplatelet tips, but definite proof for this hypothesis is still lacking. One important pathway orchestrating actin dynamics during proplatelet formation involves the Rho GTPase Cdc42, one activator of the actin nucleation protein complex Arp2/3,18 which is able to branch existing actin filaments through binding of nucleation promoting factors such as Wiskott-Aldrich protein (N-WASp) or WASp family verprolin homologous. However, while the percentage of proplatelet-forming MK derived from Arp2- or N-WASp-deficient mice in vitro is unaltered despite the microthrombocytopenia observed in vivo, 19,20 Cdc42-deficient MK display impaired proplatelet formation in vitro 15,21 Inhibition of Cdc42 using the small molecule inhibitor CASIN impairs DMS polarization and proplatelet formation due to defective signaling of p21-activated kinases (PAK).15,22 Of note, both Cdc42 and PAK are capable of activating another class of cytoskeletal proteins, namely septins.23-25 The contribution of septins to megakaryo- and thrombopoiesis, however, has not yet been investigated.
Septins are a group of GTP-binding and scaffolding proteins, described as the fourth cytoskeletal component, that can assemble into filaments, rings, and gauzes. Thirteen septins have been described so far,26 which can be divided into 4 different classes according to their sequence similarity: Sept2 (1, 2, 4 and 5), Sept6 (6, 8, 10, 11, 14), Sept7 and Sept9 (3, 9 and 12). While most are ubiquitously expressed, some exhibit cell type-specific expression, with Sept5 expression being highest in MK, platelets, and neurons.27,28 Most septins (2, 4, 5, 6, 7, 8, 9 and 11) are expressed in human platelets; however, not all have been functionally studied.29,30 Sept5 was the first platelet septin class to be characterized. It can associate with Sept4, 6, 7 and 9 and participates in granule secretion from platelets.30,31 Sept2 and 9 co-localize with the microtubule cytoskeleton in human platelets, which can be inhibited through treatment with the universal septin inhibitor forchlorfenuron (FCF),32 causing impaired clot retraction in vitro 28 Mice lacking Sept8 exhibit unaltered platelet counts, but displayed impaired platelet activation and aggregation in vitro 33 Although septins play important roles in regulating platelet function, their participation in cytoskeletal rearrangements in MK, including during proplatelet formation, has not yet been explored. Here, we identify an intracellular F-actin network in MK
that is essential for proplatelet beading and depends on interactions with septin proteins. These observations are reminiscent of a non-cortical F-actin network previously described in neurons,34 in which F-actin dynamics are dependent on the function of formin homology domain proteins, actin nucleating factors that also play important roles in MK.35 Our data provide a novel insight into how a third cytoskeletal component, the septin cytoskeleton, regulates actin dynamics, thus contributing to effective proplatelet formation.
Methods
Mice
CD-1 (#CD1(ICR)) and C57BL/6J mice (#027C57BL/6) were acquired from Charles River Laboratories (Worcester, MA, USA). All animal work was approved by the international animal care and use committee at Boston Children’s Hospital, Boston, MA, USA (00001248).
Statistical analysis
Results are displayed as mean ± standard deviation (SD) from at least three independent biological replicates per group, or as otherwise indicated. Differences were statistically analyzed using unpaired, two-tailed Student t test, one- or two-way ANOVA with Sidak’s correction for multiple comparisons. P<0.05 was considered statistically significant: *P<0.05; **P<0.01; ***P<0.001; ****P<0.0001. A detailed description of platelet depletion, MK isolation, proplatelet formation analysis and visualization, fluorescence recovery after photobleaching (FRAP), flow cytometry and three-dimensional stochastic optical reconstruction microscopy (3D-STORM) can be found in the Online Supplementary Appendix
Results
Inhibition of actin polymerization decreases proplatelet beading and impairs movement
Although the role of microtubules during proplatelet elongation has been extensively studied, how the F-actin cytoskeleton contributes to this process is not well understood. To address this, we utilized a custom imaging pipeline to assess how actin depolymerization affected proplatelet formation from murine fetal liver-derived MK.36 We confirmed that treatment with the actin polymerization inhibitors LatA or CytoD decreased proplatelet formation in vitro (Figure 1A).15 However, proplatelet formation was initiated earlier upon both LatA and CytoD treatment, consistent with previous reports suggesting that actin inhibition might actually shorten the time course until platelet formation.16 As visualized by confocal microscopy (Figure 1B), both the number of proplatelet elongations as well as the number
Haematologica | 109 Marzo 2024 916 ARTICLE - Novel role of an actin/septin axis in MK I. Becker et al.
of beads per proplatelet shaft were significantly lower in LatA-treated samples (Figure 1C, D) suggesting that inhibition of actin polymerization hampered proplatelet beading. To visualize the underlying cytoskeletal defects in already formed proplatelets, we measured proplatelet movement in a static assay by quantifying changes in pixel location using live-cell imaging. While DMSO-treated proplatelets were highly motile and demonstrated characteristic extensions, LatA-treated proplatelets moved significantly less (Figure 1E, Online Supplementary Videos S1, S2). We verified these findings by assessing fluorescence positions in GFP-transduced MK over time in kymographs. DMSO-treated proplatelets showed diagonal lines indicative of movement, whereas cells treated with actin polymerization inhibitors exhibited vertical lines (Figure 1F). To investigate the physiological relevance of these findings, we utilized a proplatelet bioreactor previously established in our lab that broadly mimics shear conditions encountered in vivo 37 We manually tracked the tips of proplatelets and plotted their position (Figure 1G) and mean velocity (Figure 1H) over time revealing that proplatelet tips extended at various different rates, with most proplatelet tips exhibiting periods of rapid extension and pausing (Online Supplementary Video S3).7 In contrast, existing proplatelets treated with LatA for 30 minutes (mins) extended at a much slower rate (Online Supplementary Video S4) suggesting that actin polymerization enables proplatelet elongation and release under flow conditions.
Extensive studies have shown that inhibition of microtubule sliding prevents proplatelet elongation, suggesting that our observations upon inhibition of actin polymerization might solely be caused by defective microtubule sliding due to actin inhibition. To test this hypothesis, we visualized F-actin and α-tubulin in proplatelet-forming fetal liver-derived MK by immunofluorescence (Figure 1 I). While cortical microtubules were stable upon LatA treatment, the intracellular microtubule cytoskeleton appeared more dispersed. We next conducted FRAP imaging on released proplatelets isolated from MSCV-dendra2-β1-tubulin-transduced MK. While we observed significant recovery into bleached regions by calculating corrected fluorescence intensity in DMSO-treated proplatelets, the microtubule stabilizer taxol that prevents sliding abolished fluorescence recovery into bleached regions (Figure 1J, Online Supplementary Videos S5, S6).7 In contrast, LatA-treated proplatelets exhibited a recovery only marginally slower than the control (Online Supplementary Video S7), thus demonstrating that defective proplatelet bead formation and motility occurred mostly independent of the cortical microtubule cytoskeleton. The existence of different actin networks has previously been observed in neurons, in which cortical (subplasmalemmal) F-actin fibers formed rings along axons,38 while actin trails occurred intracellularly,34 and long F-actin filaments extended along dendritic shafts. Whether cortical actin filaments exist and are regulated differently to intracellular
fibers, however, has not been investigated in MK to date. To examine intracellular changes to the F-actin cytoskeleton during proplatelet extension, we transduced MK with MSCV-LifeAct-mRuby and observed highly dynamic changes manifesting as F-actin foci that emerged within proplatelet shafts (Online Supplementary Video S8). In summary, our data reveal that intracellular F-actin polymerization contributes to proplatelet bead formation and movement independent of the cortical microtubule cytoskeleton.
Inhibition of Cdc42/septins impairs megakaryocyte maturation and polarization
Our data revealed that intracellular F-actin was critical for efficient proplatelet generation; however, the molecular players regulating intracellular actin dynamics under steady state remained elusive. One molecular master-switch orchestrating actin dynamics in MK is the Rho GTPase Cdc42. F-actin-dependent polarization of the DMS is essential for the initiation of proplatelet formation and was previously shown to be affected by inhibition of Cdc42.15,39 Moreover, PAK were identified as downstream effectors of Cdc42, inhibition or lack of which also impaired DMS development and subsequent proplatelet formation in a mouse model.22 Among other proteins, PAK phosphorylate septins,40 which prompted us to dissect whether septin inhibition during late MK maturation, similar to inhibition of Cdc42, would impair DMS polarization. Bone marrow-derived hematopoietic stem and progenitor cells (HSPC) were matured into MK using thrombopoietin (TPO) for 3 days upon which they were treated with the Cdc42 inhibitor CASIN or the universal septin inhibitor FCF for 24 hours (hrs). In line with previous studies,15,41 MK were stained for F-actin and glycoprotein (GP)IX, which localizes to the DMS, imaged by confocal microscopy and divided into groups according to DMS morphology: MK with a single DMS invagination (stage I), MK with several invaginations and DMS territories (stage II), and MK with a clearly polarized DMS cap associated with F-actin fibers (stage III) (Figure 2A). Treatment of MK with both CASIN or FCF resulted in an increased percentage of MK in stage I, while stage III-MK were less abundant (Figure 2B, C), suggesting that both Cdc42 and septins are essential for the polarization of the DMS in vitro. As mentioned above, Cdc42 was previously shown to be essential for the development of the DMS during MK maturation,15,39 while the role of septins during this process has not been assessed before. To investigate this, we treated bone marrow-derived HSPC with different doses of CASIN or FCF, matured them into MK and assessed the percentage of CD41/CD42d-positive cells and the mean fluorescence intensity (MFI) of CD41 by flow cytometry. As expected, we found a reduced amount of double-positive mature MK upon treatment with 10 µM of CASIN (Figure 2A) as well as a reduced expression of CD41 (Figure 2B). Similarly, treatment of HSPC with the septin inhibitor FCF impaired MK maturation as assessed by CD41/CD42d-positivity (Figure
Haematologica | 109 Marzo 2024 917 ARTICLE - Novel role of an actin/septin axis in MK I. Becker et al.
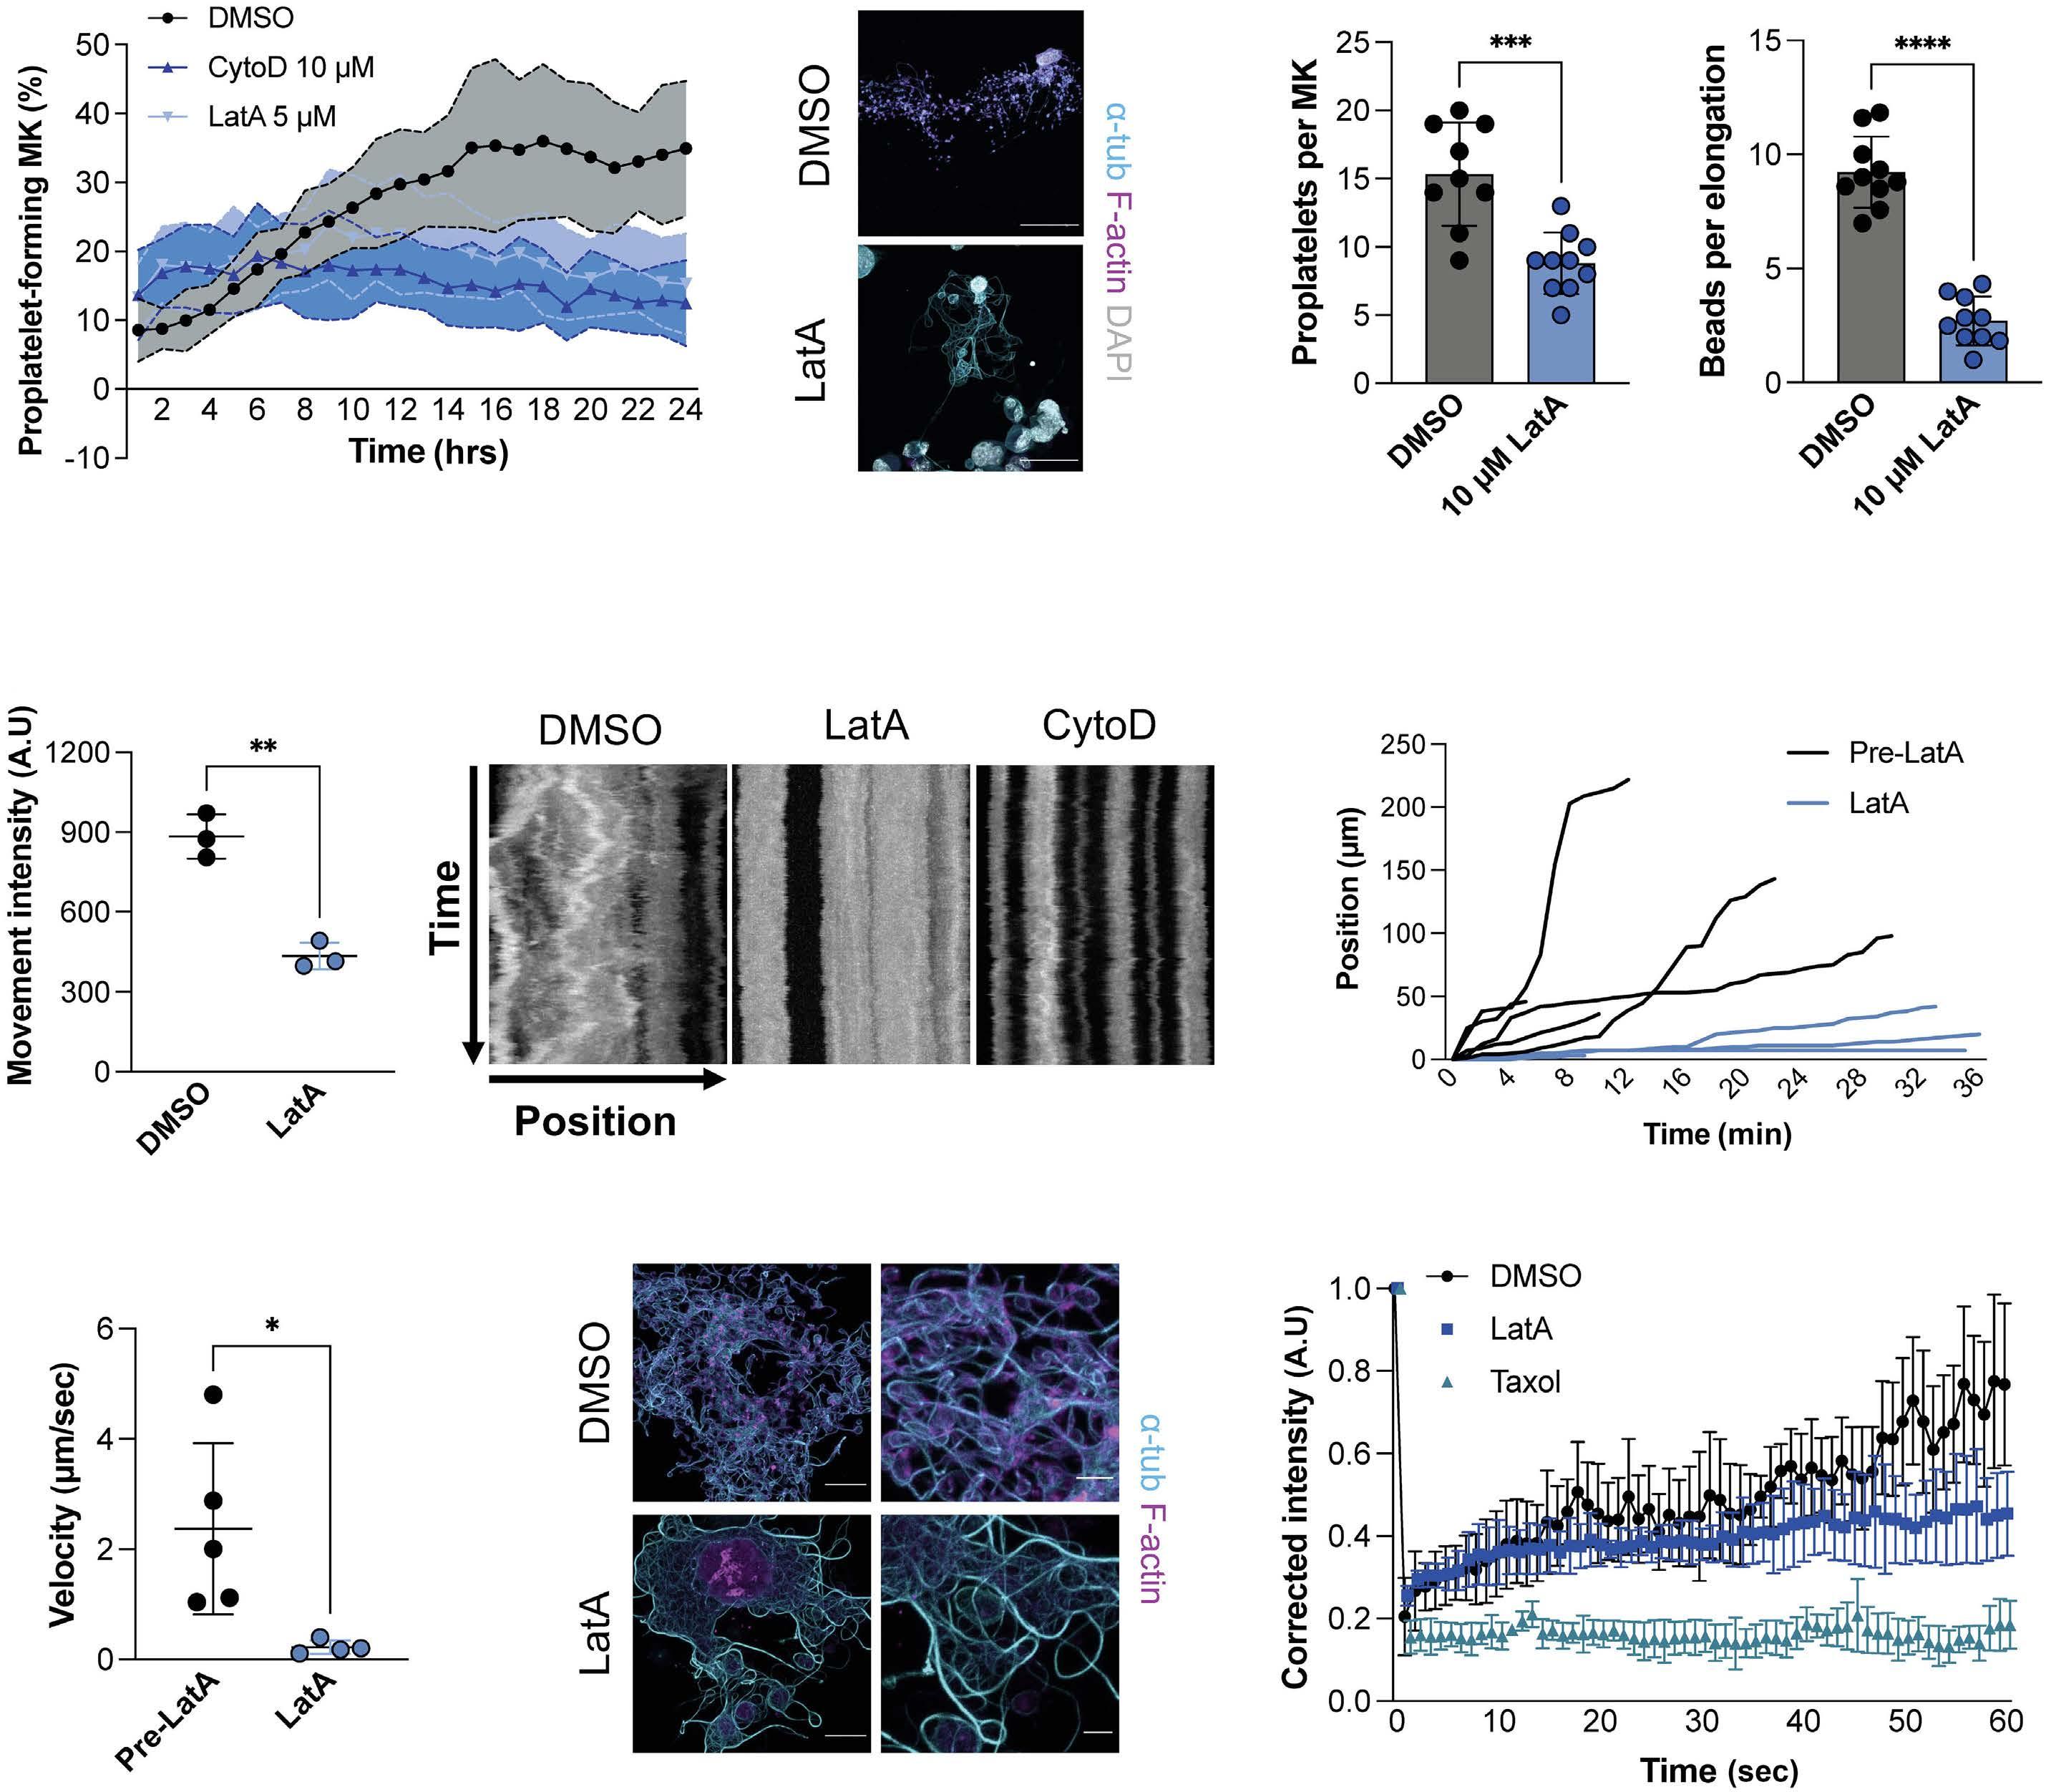
Figure 1. Inhibition of actin polymerization impairs proplatelet beading. (A) Fetal liver-derived megakaryocytes (MK) were treated with the indicated concentration of latrunculin A (LatA) and cytochalasin D (CytoD) or vehicle control (DMSO), and imaged every hour for 24 hours (hrs) using an Incucyte imaging system. Image analysis was performed using a custom image analysis pipeline as previously described.36 (B) Immunofluorescence stainings for filamentous (F)-actin and α-tubulin in fetal liver-derived MK. Scale bars: 50 µm. (C and D) Quantification of proplatelets per MK (C) and beads per proplatelet shaft (D). Data presented as mean ± standard deviation (SD). One dot represents one cell. N=3. Unpaired, two-tailed Student t test. (E) Methylcellulose-embedded proplatelets were imaged using an automated imaging system. Analysis of proplatelet movement was conducted using Difference Tracker in ImageJ Software. N=3. Unpaired, two-tailed Student t test. (F) Isolated proplatelets of MSCV-GFP-transduced MK were imaged and analyzed by monitoring changes in fluorescence localization over a 4-hr time course with kymographs. (G and H) Analysis of proplatelet tip positions (G) and mean proplatelet tip velocities (H) pre- and post-LatA treatment of fetal liver-derived MK in a custom microfluidic device was performed using ImageJ (Manual Tracker).37 Data presented as mean ± SD. Unpaired, two-tailed Student t test. (I) F-actin and α-tubulin were visualized using confocal microscopy in proplatelet-forming MK treated with DMSO or 10 µM LatA. Scale bars: 25 µm; insets: 5 µm. (J) Corrected intensity for each timepoint of fluorescence recovery after photobleaching (FRAP) on proplatelets derived from MSCV-β1-tubulin-dendra2-transduced fetal liver-derived MK treated with DMSO, 10 µM taxol, or 10 µM LatA. Data presented as mean ± SD of 5 individual cells. *P<0.05; **P<0.01; ***P<0.001; ****P<0.0001. Min: minutes; secs: seconds.
2C) and CD41 MFI (Figure 2D), thus revealing a novel and significant role for septins in MK development. In summary,
these findings point towards an essential role of Cdc42/ septins in early and late stages of MK maturation in vitro.
Haematologica | 109 Marzo 2024 918 ARTICLE - Novel role of an actin/septin axis in MK I. Becker et al.
B C D E F G H I J A
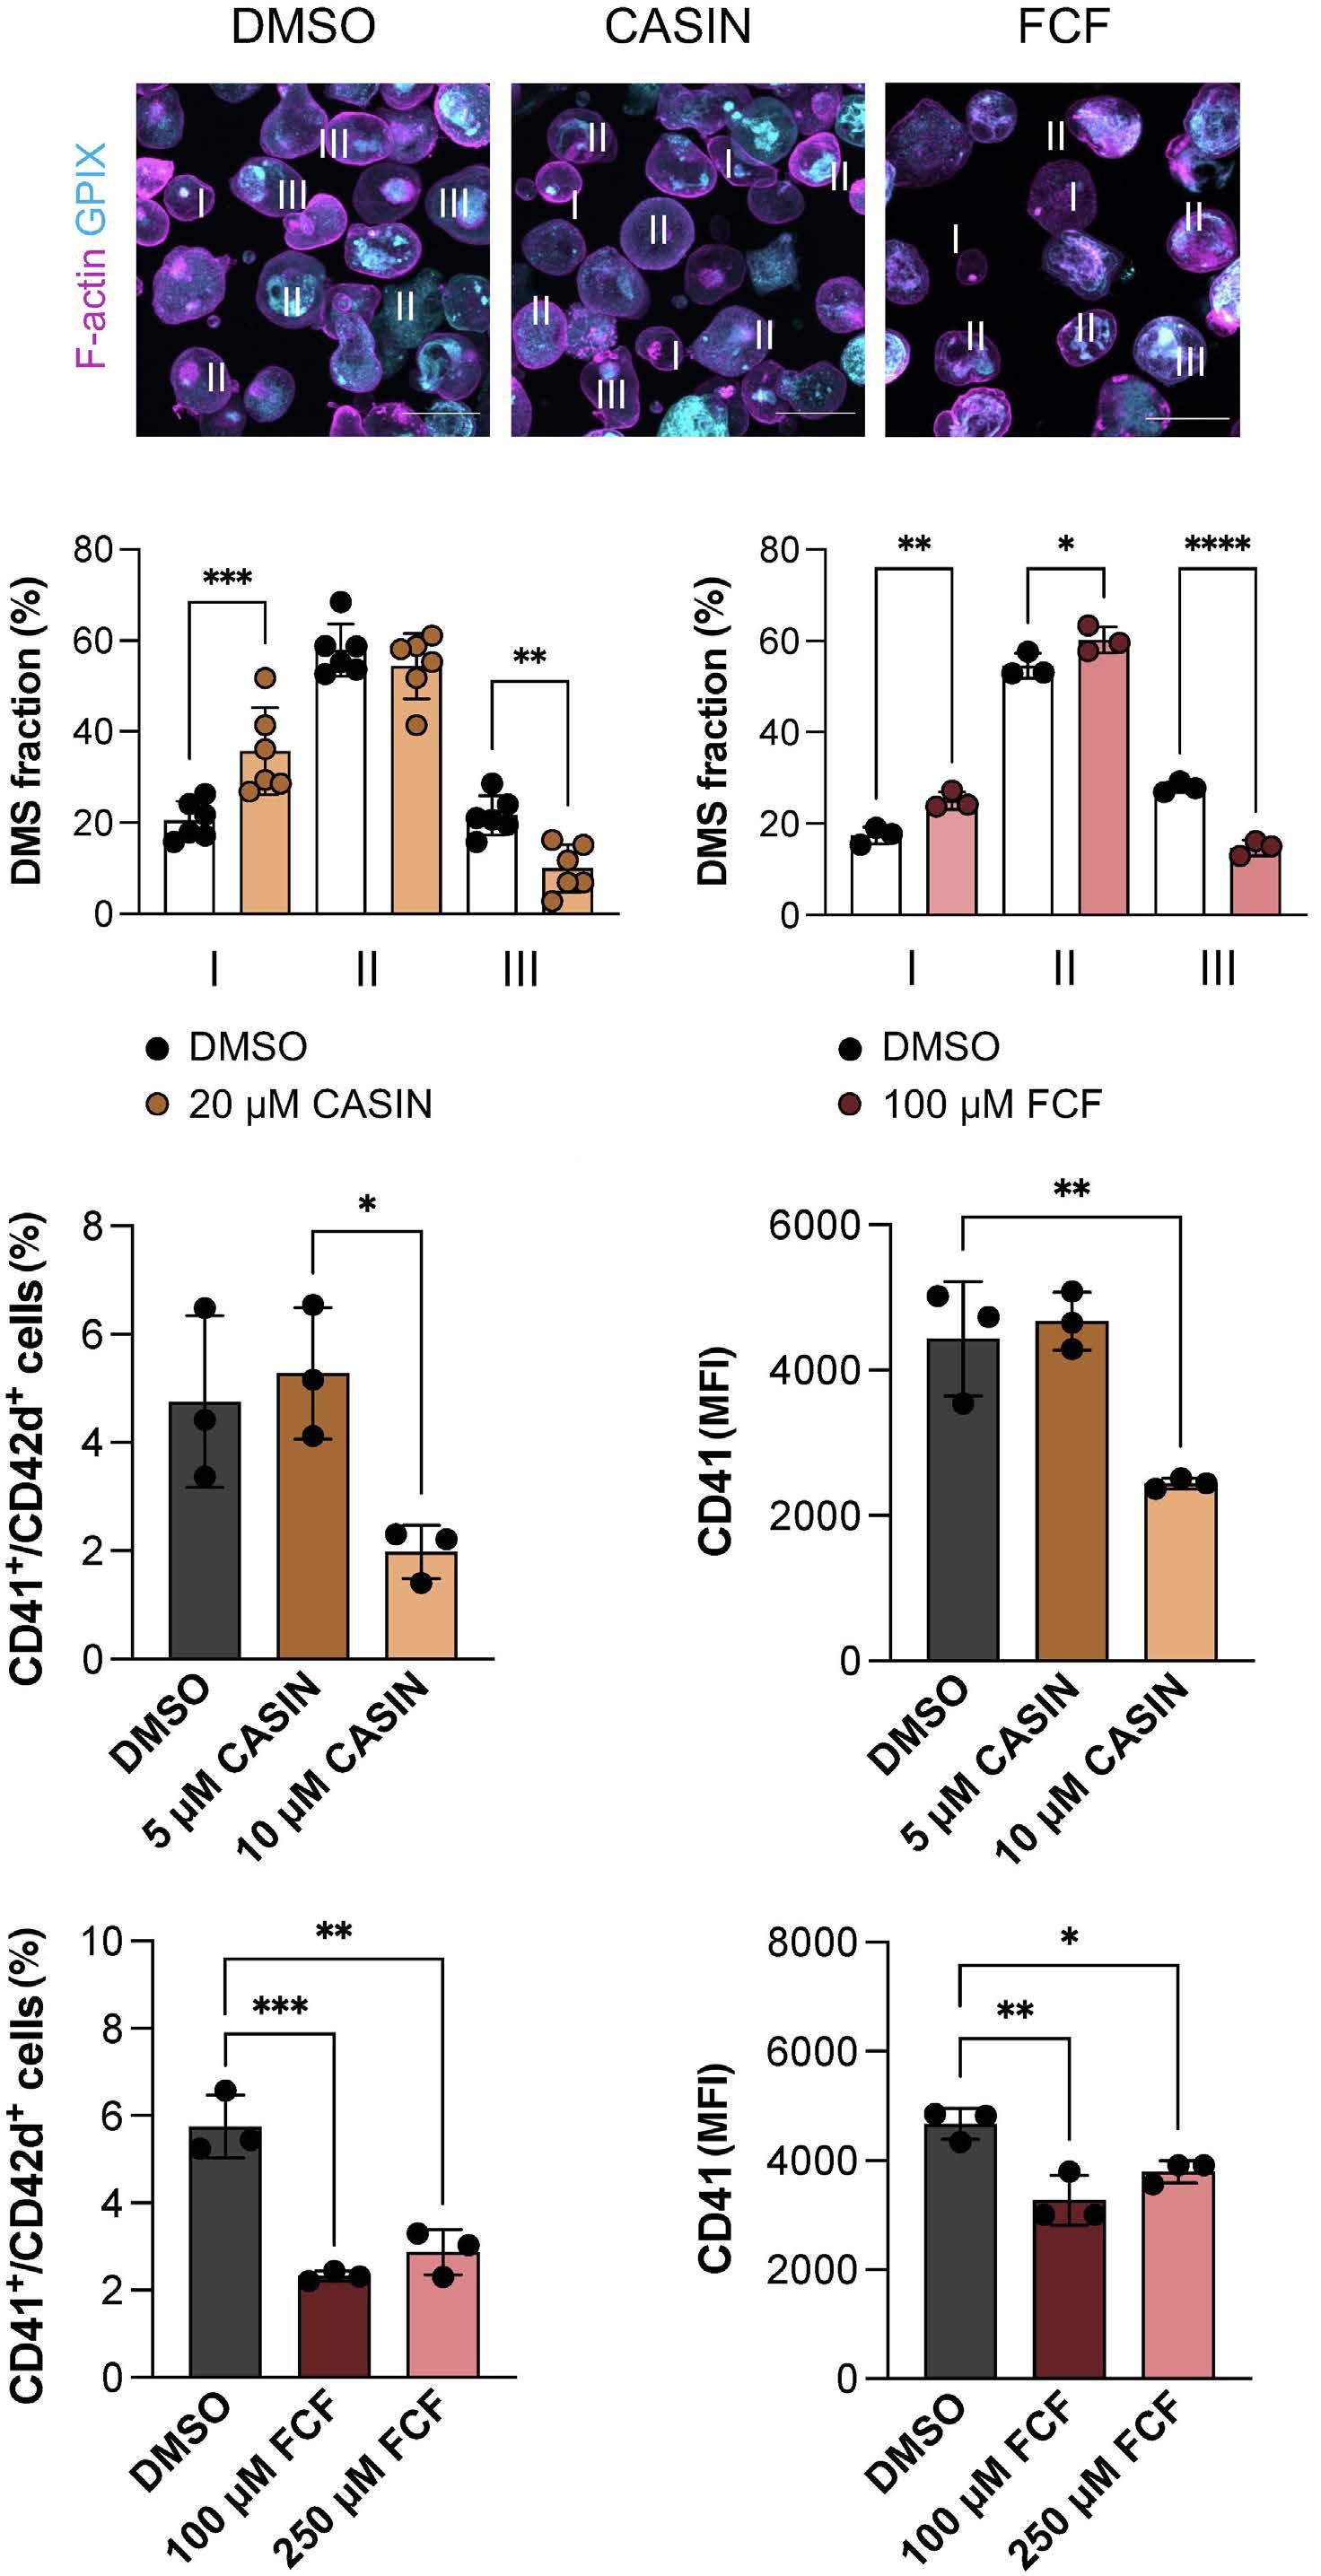
Cdc42/septins and formins but not Arp2/3-dependent actin nucleation regulate proplatelet formation in vitro The importance of septins during MK maturation made us question whether septin inhibition would also translate into altered proplatelet formation. To this end, we treated mature fetal liver-derived MK with CASIN or FCF and assessed proplatelet formation kinetics over 24 hrs using a customized image analysis pipeline.36 Inhibition of Cdc42 or septins resulted in a slightly reduced percentage of proplatelet-forming MK (DMSO: 22.7 ± 4.1%; CASIN: 13.4 ±
Figure 2. Cdc42 and septins are essential during megakaryocyte maturation. (A) Mature megakaryocytes (MK) were cultured in the presence of 20 µM CASIN or 100 µM forchlorfenuron (FCF) for 24 hours (hrs) and stained for filamentous (F)-actin and GPIX in solution. Stages of demarcation membrane system (DMS) maturation (I, II and III) are labeled. Scale bars: 30 µm. (B and C) Polarization of the DMS upon treatment with CASIN or FCF was manually quantified using ImageJ. Data presented as mean ± standard deviation (SD). Multiple Student t tests. (D and E) Percentage of CD41/ CD42d-positive cells (D) and CD41 MFI (E) in DMSO and CASIN-treated bone marrow-derived MK was assessed by flow cytometry after 4 days of culture. Data presented as mean ± SD. One-way ANOVA with Sidak correction for multiple comparisons. (F and G) Percentage of CD41/CD42d-positive cells (F) and CD41 MFI (G) in DMSO and FCF-treated bone marrow-derived MK was assessed by flow cytometry after 4 days of culture. Data presented as mean ± SD. One-way ANOVA with Sidak correction for multiple comparisons. *P<0.05; **P<0.01; ***P<0.001; ****P<0.0001. untr: untreated.
3.6%; FCF: 17.7 ± 7%) (Figure 3A, B) but most importantly, a markedly decreased proplatelet area (at 12 hrs: DMSO: 156,158 ± 50,691; CASIN: 26,117 ± 14,228; FCF: 36,801 ± 24,677) (Figure 3C). This observation suggested an important role of Cdc42 and septins in proplatelet elaboration, similar to what we observed upon inhibition of actin polymerization using LatA. Of note, like LatA treatment, inhibition of septins using FCF markedly impaired proplatelet motility as assessed by live-cell imaging ( Online Supplementary Videos S9, S10). To support the hypothesis that septins are
Haematologica | 109 Marzo 2024 919 ARTICLE - Novel role of an actin/septin axis in MK I. Becker et al.
A B C D E F G
involved in actin-dependent cytoskeletal rearrangements during proplatelet formation, we performed 3D-STORM on proplatelet-forming MK. Actin depolymerization by LatA led to the degradation of intracellular actin foci (Online Supplementary Figure S1A), while subplasmalemmal actin structures appeared more preserved. Moreover, condensed septin spots appeared to localize to specific subregions close to the concentrated F-actin clusters in DMSO-treated samples, whereas septins appeared highly dispersed upon depolymerization of actin foci using LatA (Online Supplementary Figure S1B, C).
Previous studies have suggested that actin branching might serve the diverging of proplatelets;13 however, definitive proof for this hypothesis has been lacking. Actin nucleation, the formation of a new actin filament out of actin monomers, can be executed by several actin-binding proteins such as the protein complex Arp2/3 or the protein class of formins, some of which are downstream effectors of Cdc42.42 However, although Arp2- and WASp-deficient mice present with microthrombocytopenia,19,43 proplatelet formation from Arp2-deficient MK in vitro is unaltered,19 while mice lacking certain formins present with impaired proplatelet formation in vitro similar to Cdc42-deficient
mice.44 We utilized the Arp2/3 inhibitor CK666 and analyzed proplatelet formation to assess whether Arp2/3-dependent actin branching promoted proplatelet elaboration, but did not observe any difference (Figure 3D). However, consistent with the previously described role of Arp2/3 in DMS maturation,13 late MK maturation was impaired upon treatment of HSPC with 50 µM CK666, while CD41 MFI was unaltered (Figure 3E, F). Proplatelet-forming MK on the other hand appeared as elaborate as control MK (Figure 3G), with a similar number of proplatelet tips (Figure 3H) suggesting proplatelet formation was unaffected. Most importantly, and in line with in vivo findings of reduced platelet size,19 proplatelet tip size was significantly reduced upon CK666 treatment (Figure 3 I), suggesting that Arp2/3-dependent actin nucleation and branching is dispensable for proplatelet elaboration, but important for platelet sizing. This supports observations from previous studies suggesting that Arp2/3-mediated actin nucleation and branching are important for the formation of sheet-like actin protrusions, i.e., during lamellipodia formation,19 but are dispensable for linear actin elongation and elaboration such as required for proplatelet formation. In contrast, formin inhibition using the small molecule inhibitor of formin homology 2 domains
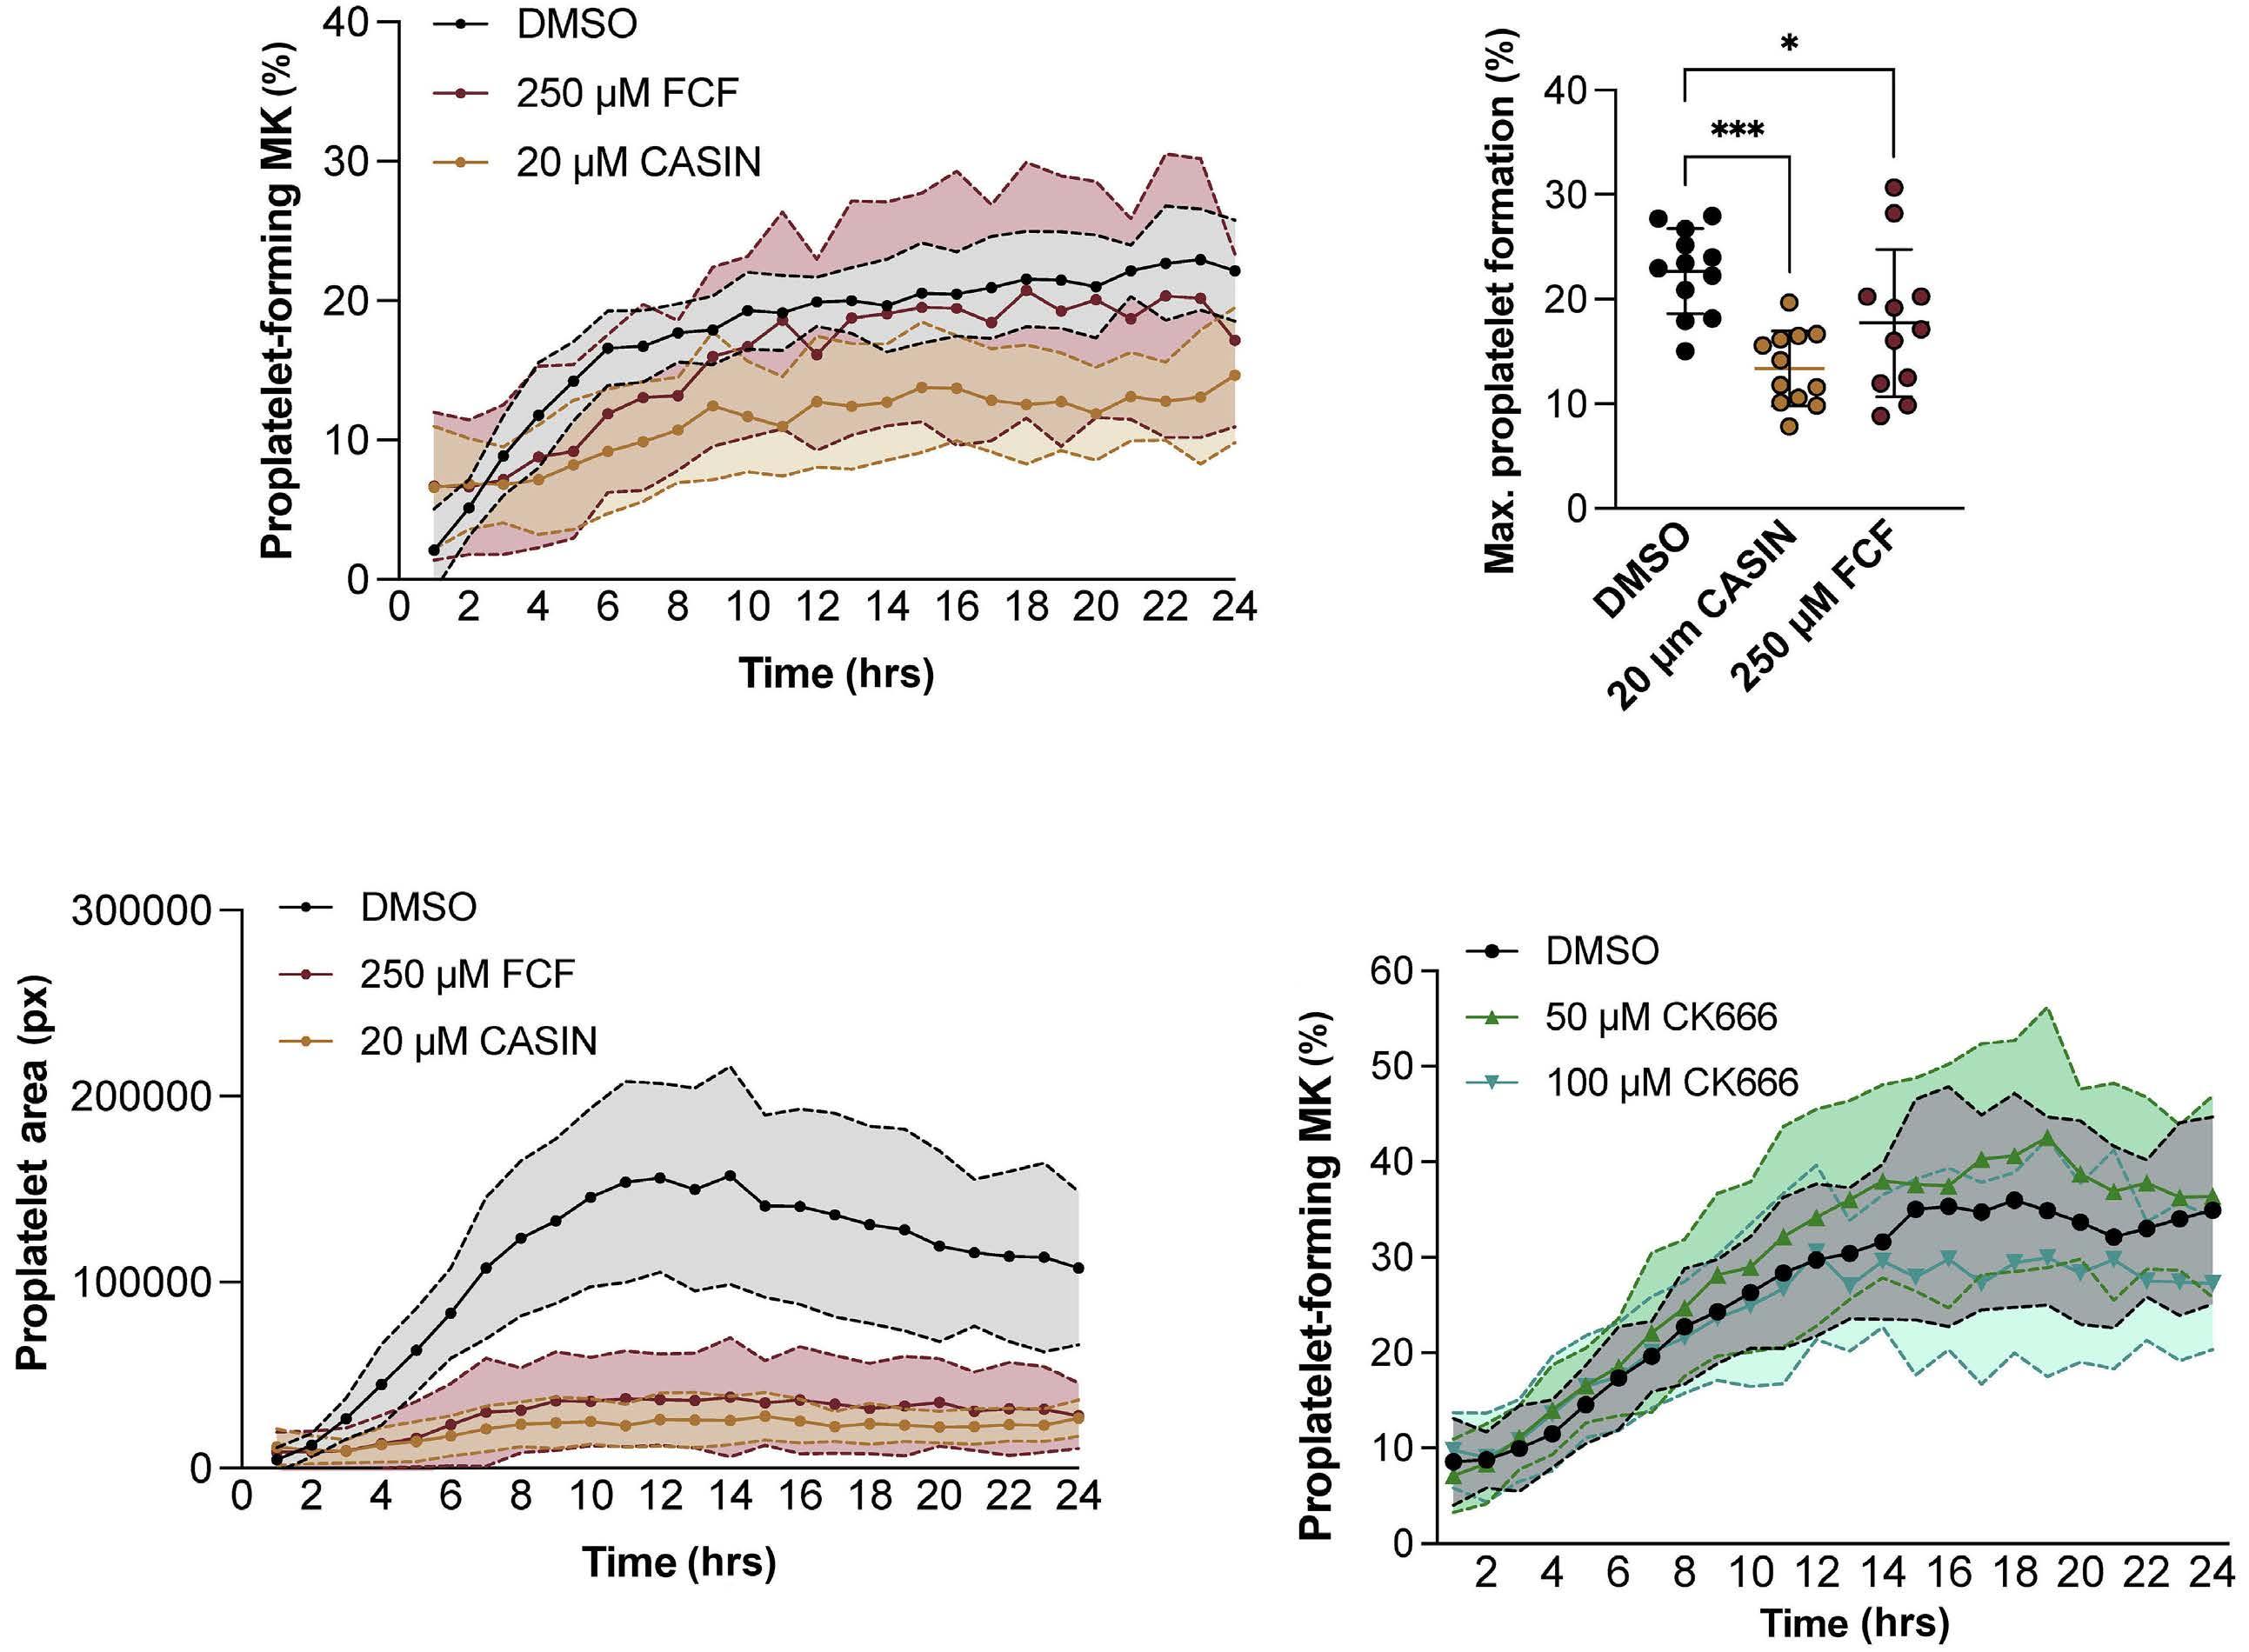
Haematologica | 109 Marzo 2024 920 ARTICLE - Novel role of an actin/septin axis in MK I. Becker et al.
A B C D Continued
on following page.
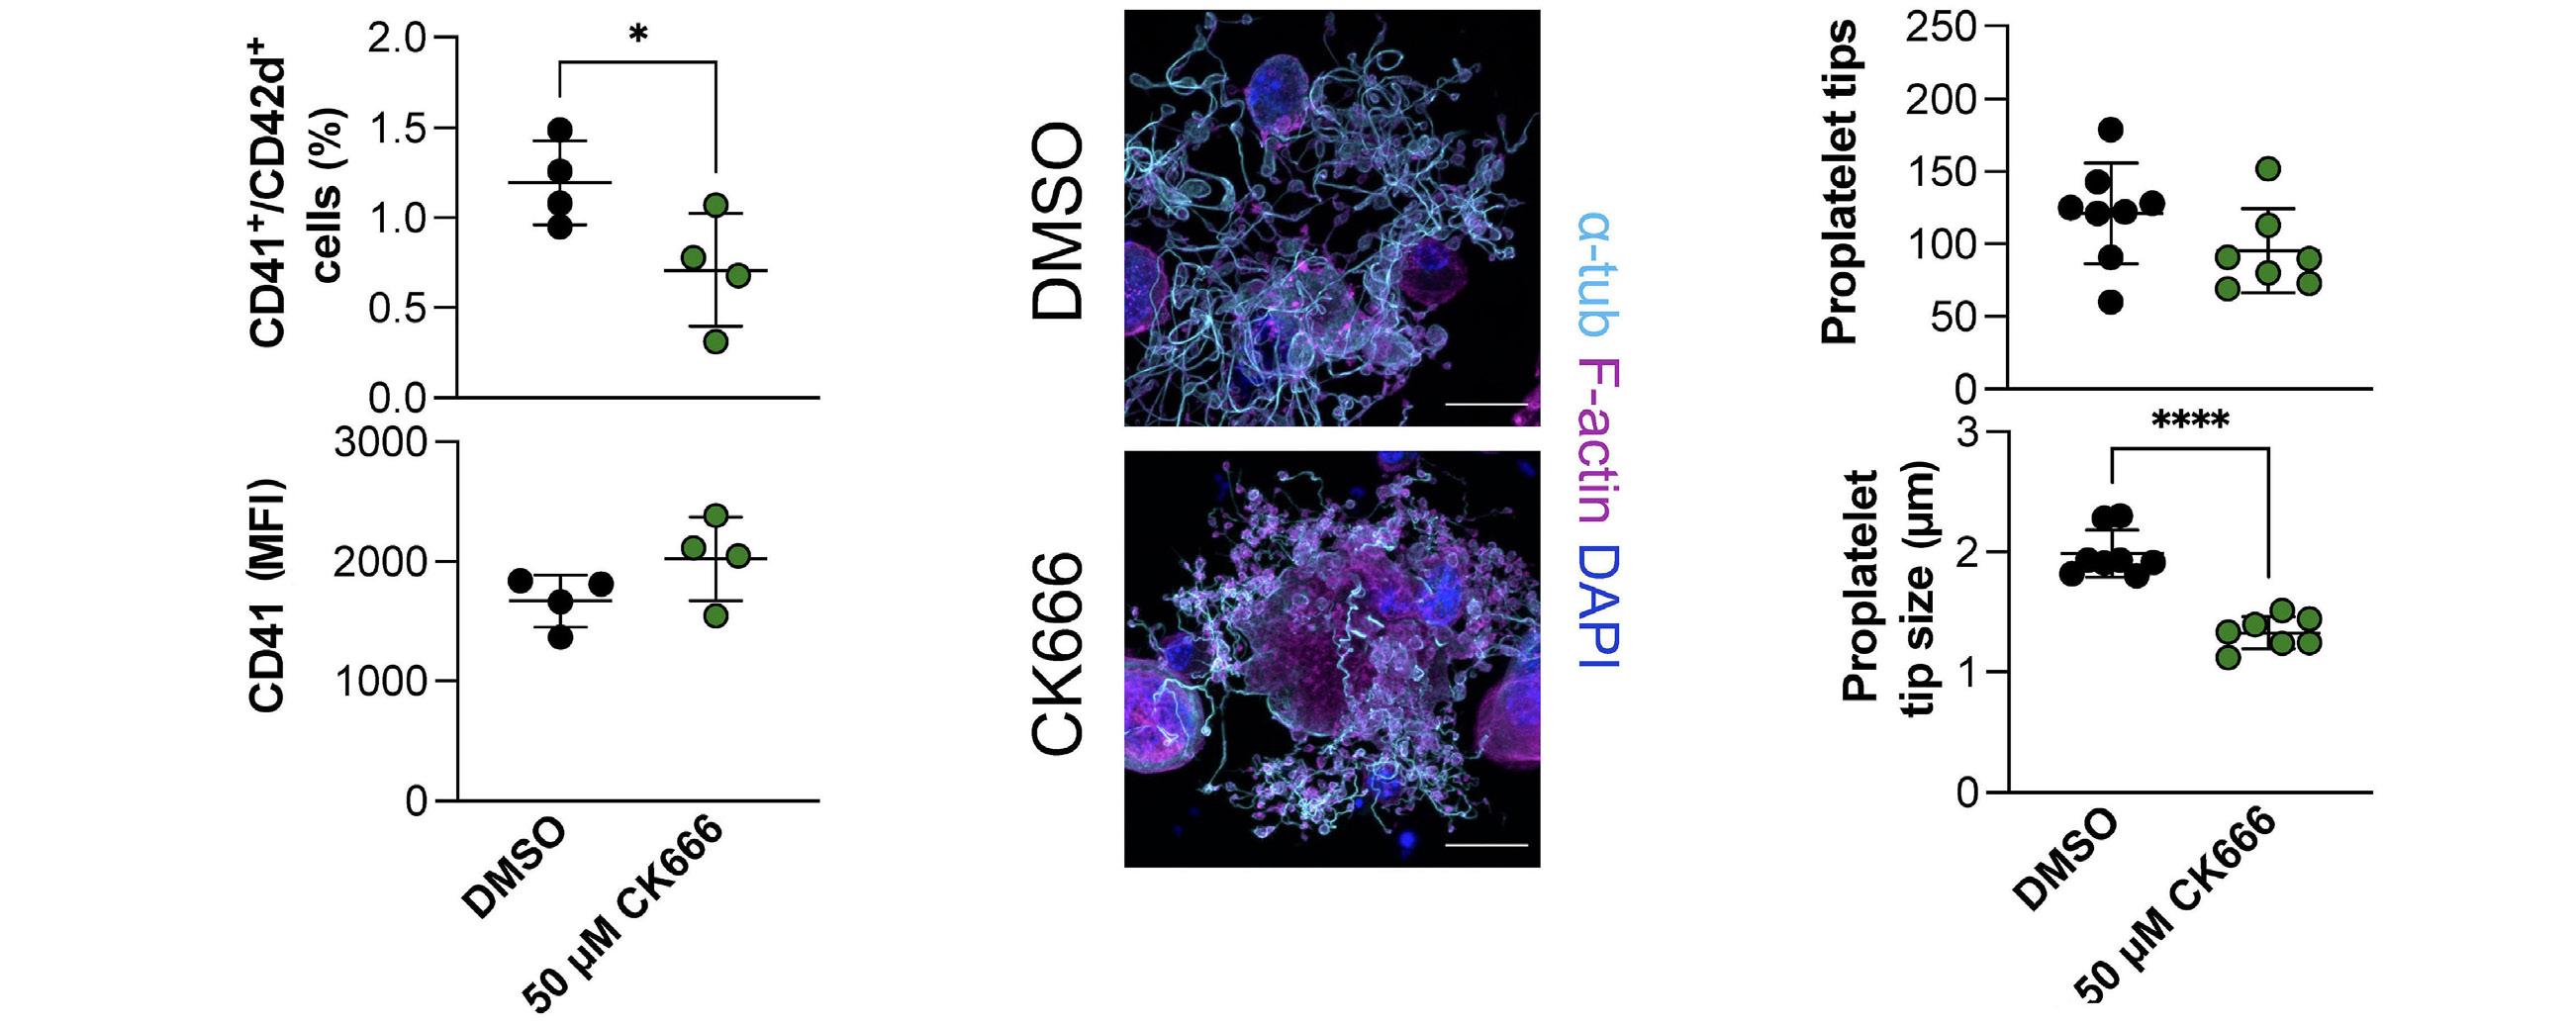
Figure 3. Proplatelet elaboration is dependent on Cdc42/septins/formins but not Arp2/3. (A-C) Fetal liver-derived megakaryocytes (MK) were treated with the indicated concentrations of CASIN, forchlorfenuron (FCF), or vehicle control (DMSO) and imaged every hour for 24 hours (hrs) using an Incucyte imaging system. Percentage of (A and B) proplatelet-forming fetal liver-derived MK and (C) proplatelet area were analyzed using a custom imaging pipeline. N=3 mice. There were 3 technical repeats. Data presented as mean ± standard deviation (SD). One-way ANOVA with Sidak correction for multiple comparisons. (D) Fetal liver-derived MK were treated with the indicated concentrations of the Arp2/3 inhibitor CK666 and imaged for 24 hrs using an Incucyte imaging system. N=3 mice. There were 3 technical repeats. Data presented as mean ± SD. Percentage of (E) CD41/CD42d-positive cells and (F) CD41 mean fluorescence intensity (MFI) in DMSO and CK666-treated bone marrow-derived MK was assessed by flow cytometry after 4 days of culture. Data presented as mean ± SD. Unpaired, two-tailed Student t test. (G) Visualization and (H and I) quantification of proplatelet tip number and size in DMSO- and CK666-treated bone marrow-derived MK. Data presented as mean ± SD. Unpaired, two-tailed Student t test. *P<0.05; ***P<0.001; ****P<0.0001.
(SMIFH2) dose-dependently reduced the percentage of proplatelet-forming MK (Online Supplementary Figure S2A, B). Moreover, proplatelet area was significantly reduced (Online Supplementary Figure S2C), similar to Cdc42/septin inhibition. These findings imply that an Arp2/3-independent actin nucleation pathway involving formins accounts for proplatelet elaboration and movement.
Defective F-actin dynamics underlie reduced proplatelet area upon Cdc42/septin/formin inhibition
Our previous data suggest that Cdc42/septin inhibition interfered with proplatelet elaboration by affecting actin dynamics (Figure 3C). To verify this, we performed immunofluorescence staining for F-actin and α-tubulin on proplatelet-forming MK treated with either 20 µM CASIN or 100 µM FCF (Online Supplementary Figure S2D). Consistent with our kinetic analysis, we found a reduced number of proplatelet tips and an increased tip diameter in MK upon inhibition of Cdc42 or septins (Online Supplementary Figure SE, F). To investigate how septin inhibition affected actin dynamics during proplatelet formation, we quantified actin-rich nodules in proplatelet-forming MK upon FCF treatment (100 µM). While actin nodules were visible in DMSO-treated MK, FCF-treatment attenuated actin rearrangements, resulting in ‘empty’ proplatelet tips (Online Supplementary Figure SG, H), while cortical F-actin structures were preserved. MK stained live with SiR-Actin displayed actin-rich dots and proplatelet were highly motile (Online Supplementary
Video S11), which was abrogated upon treatment with either LatA (Online Supplementary Video S12) or FCF (Online Supplementary Video S13).
Since FCF is a universal septin inhibitor, we next aimed to assess how FCF treatment affected the localization of individual septins (2, 5, 7 and 9) in bone marrow-derived proplatelet-forming MK. While Sept5 predominantly localized to the actin cytoskeleton, Sept2 and 7 localized to both microtubules and F-actin, and Sept9 exclusively localized to microtubules (Figure 4A-D), which was quantified using Costes Pearson coefficients for either F-actin or α-tubulin (Figure 4E, F). While colocalization of Sept5 and 7 with cortical actin structures was preserved (or even enhanced) upon FCF treatment, despite a general decrease in intracellular actin foci as shown above, septin 2, 7 and 9 colocalization to microtubules was disturbed as shown in line plots (Figure 5A-D). Similar differences in staining patterns upon FCF-treatment were observed in murine fetal liver-derived MK (Online Supplementary Figure S3A-F). As previously described in platelets,30 septins that associated with microtubules (2 and 9) formed ring-like structures, which were even more abundant upon treatment of MK with 100 µM FCF (Figure 5E-G), a phenomenon previously also described in fibroblasts treated with CytoD.45 To further investigate the intracellular localization of septins upon cytoskeletal rearrangements, bone marrow-derived MK were allowed to spread on a fibrinogen-coated surface and were imaged by confocal microscopy. Like proplate-
Haematologica | 109 Marzo 2024 921 ARTICLE - Novel role of an actin/septin axis in MK I. Becker et al.
E F G
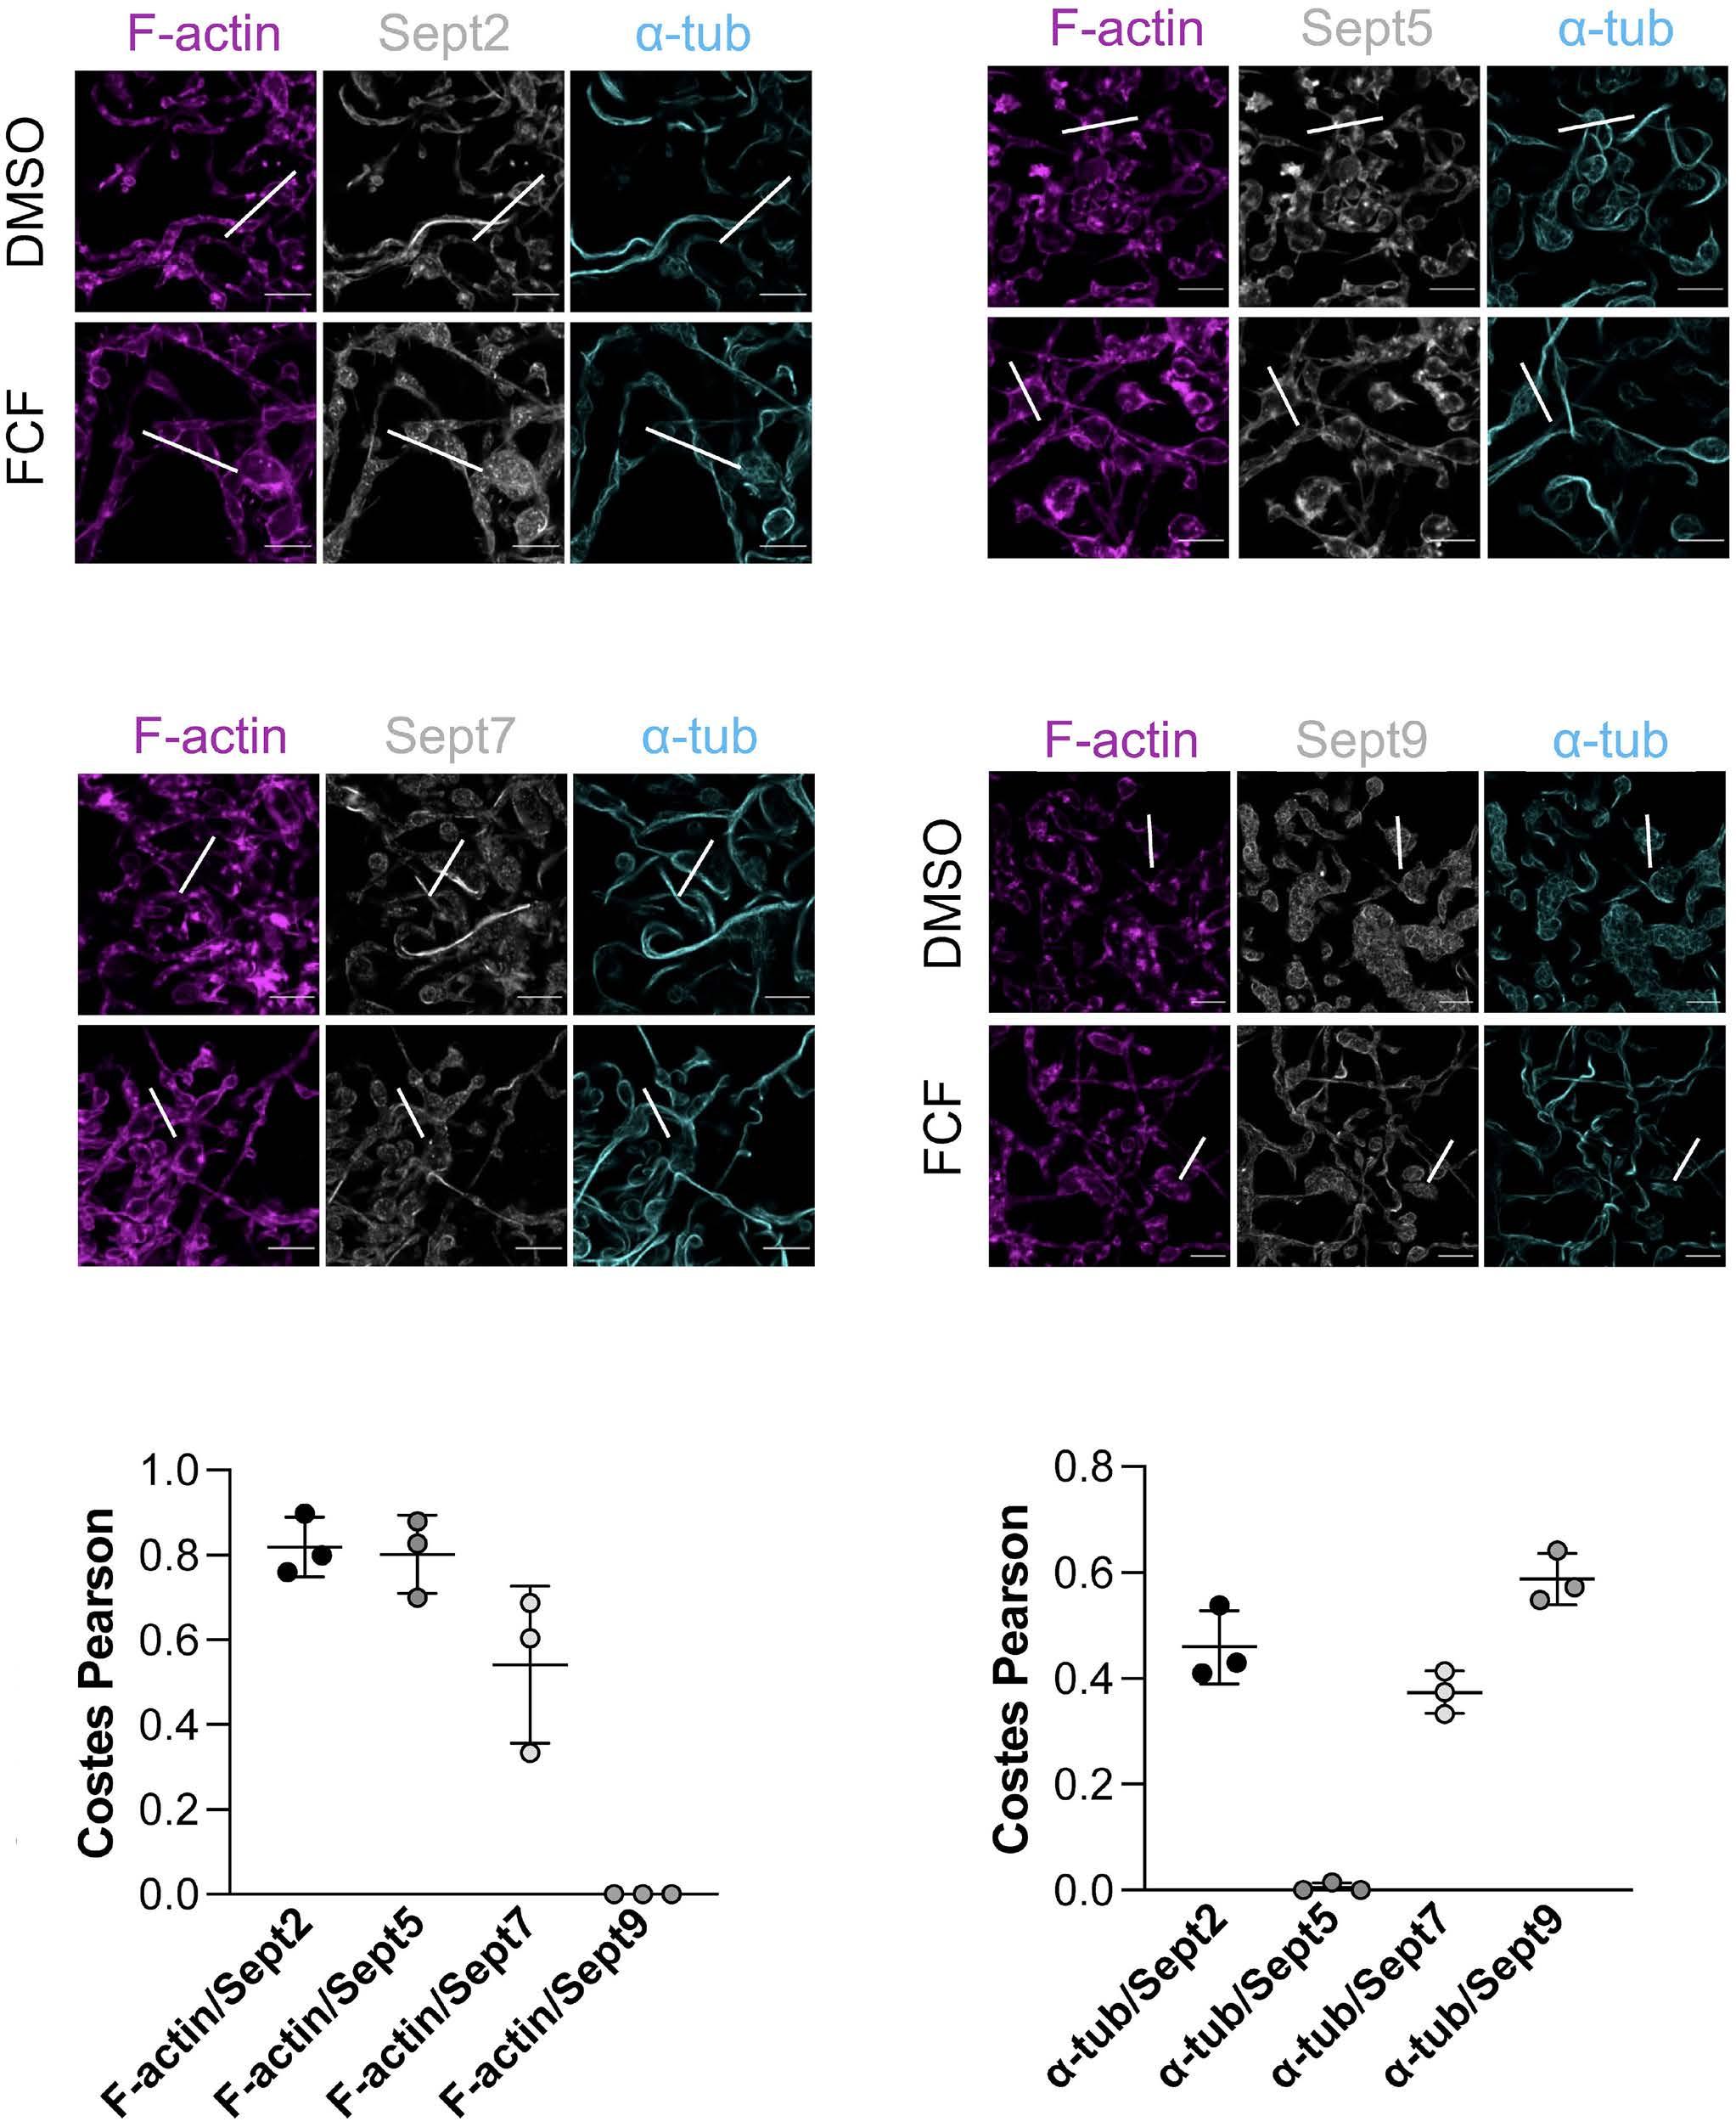
or microtubules. (A-D) Visualization of filamentous (F)-actin, α-tubulin and (A) Sept2, (B) Sept5, (C) Sept7 and (D) Sept9 in bone marrow-derived proplatelet-forming megakaryocytes (MK) upon DMSO or forchlorfenuron (FCF) treatment. Scale bars: 15 µm; insets: 5 µm. Line plots connected to white lines are shown in Figure 5.
and (F)
-tubulin/septins was performed in proplatelet-forming MK. Data presented as mean ± standard deviation. One dot represents one representative cell imaged with super-resolution microscopy at a Zeiss LSM880 (63x; Airyscan module). Costes Pearson: Costes Pearson coefficients.
let-forming MK, Sept2 localized to both microtubules and actin fibers, while Sept5 almost exclusively concentrated to actin structures (Online Supplementary Figure S4A-D). In contrast, while Sept7 appeared to associate more closely to microtubules, Sept9 exclusively localized to microtubules (Online Supplementary Figure S4E-H). In summary, our data reveal that different septins associate with microtubule and F-actin structures, suggesting that they might be capable of bridging forces between the two cytoskeletal compartments.
F-actin/septin forces enhance proplatelet formation under stress
While we show that a Cdc42/septin/F-actin axis is important for proplatelet formation dynamics in vitro, we next wanted to assess the relevance of this machinery in vivo. To investigate how enhanced megakaryocyte activity due to synchronized thrombopoiesis affected the expression of cytoskeletal proteins, we utilized a model of antibody-induced platelet depletion.46 We visualized the actin and microtubule cytoskeleton in femoral cryosections days
Haematologica | 109 Marzo 2024 922 ARTICLE - Novel role of an actin/septin axis in MK I. Becker et al.
A B C D E F
Figure 4. Distinct localization of different septin classes to F-actin
Co-localization analysis for (E) F-actin/septins
α
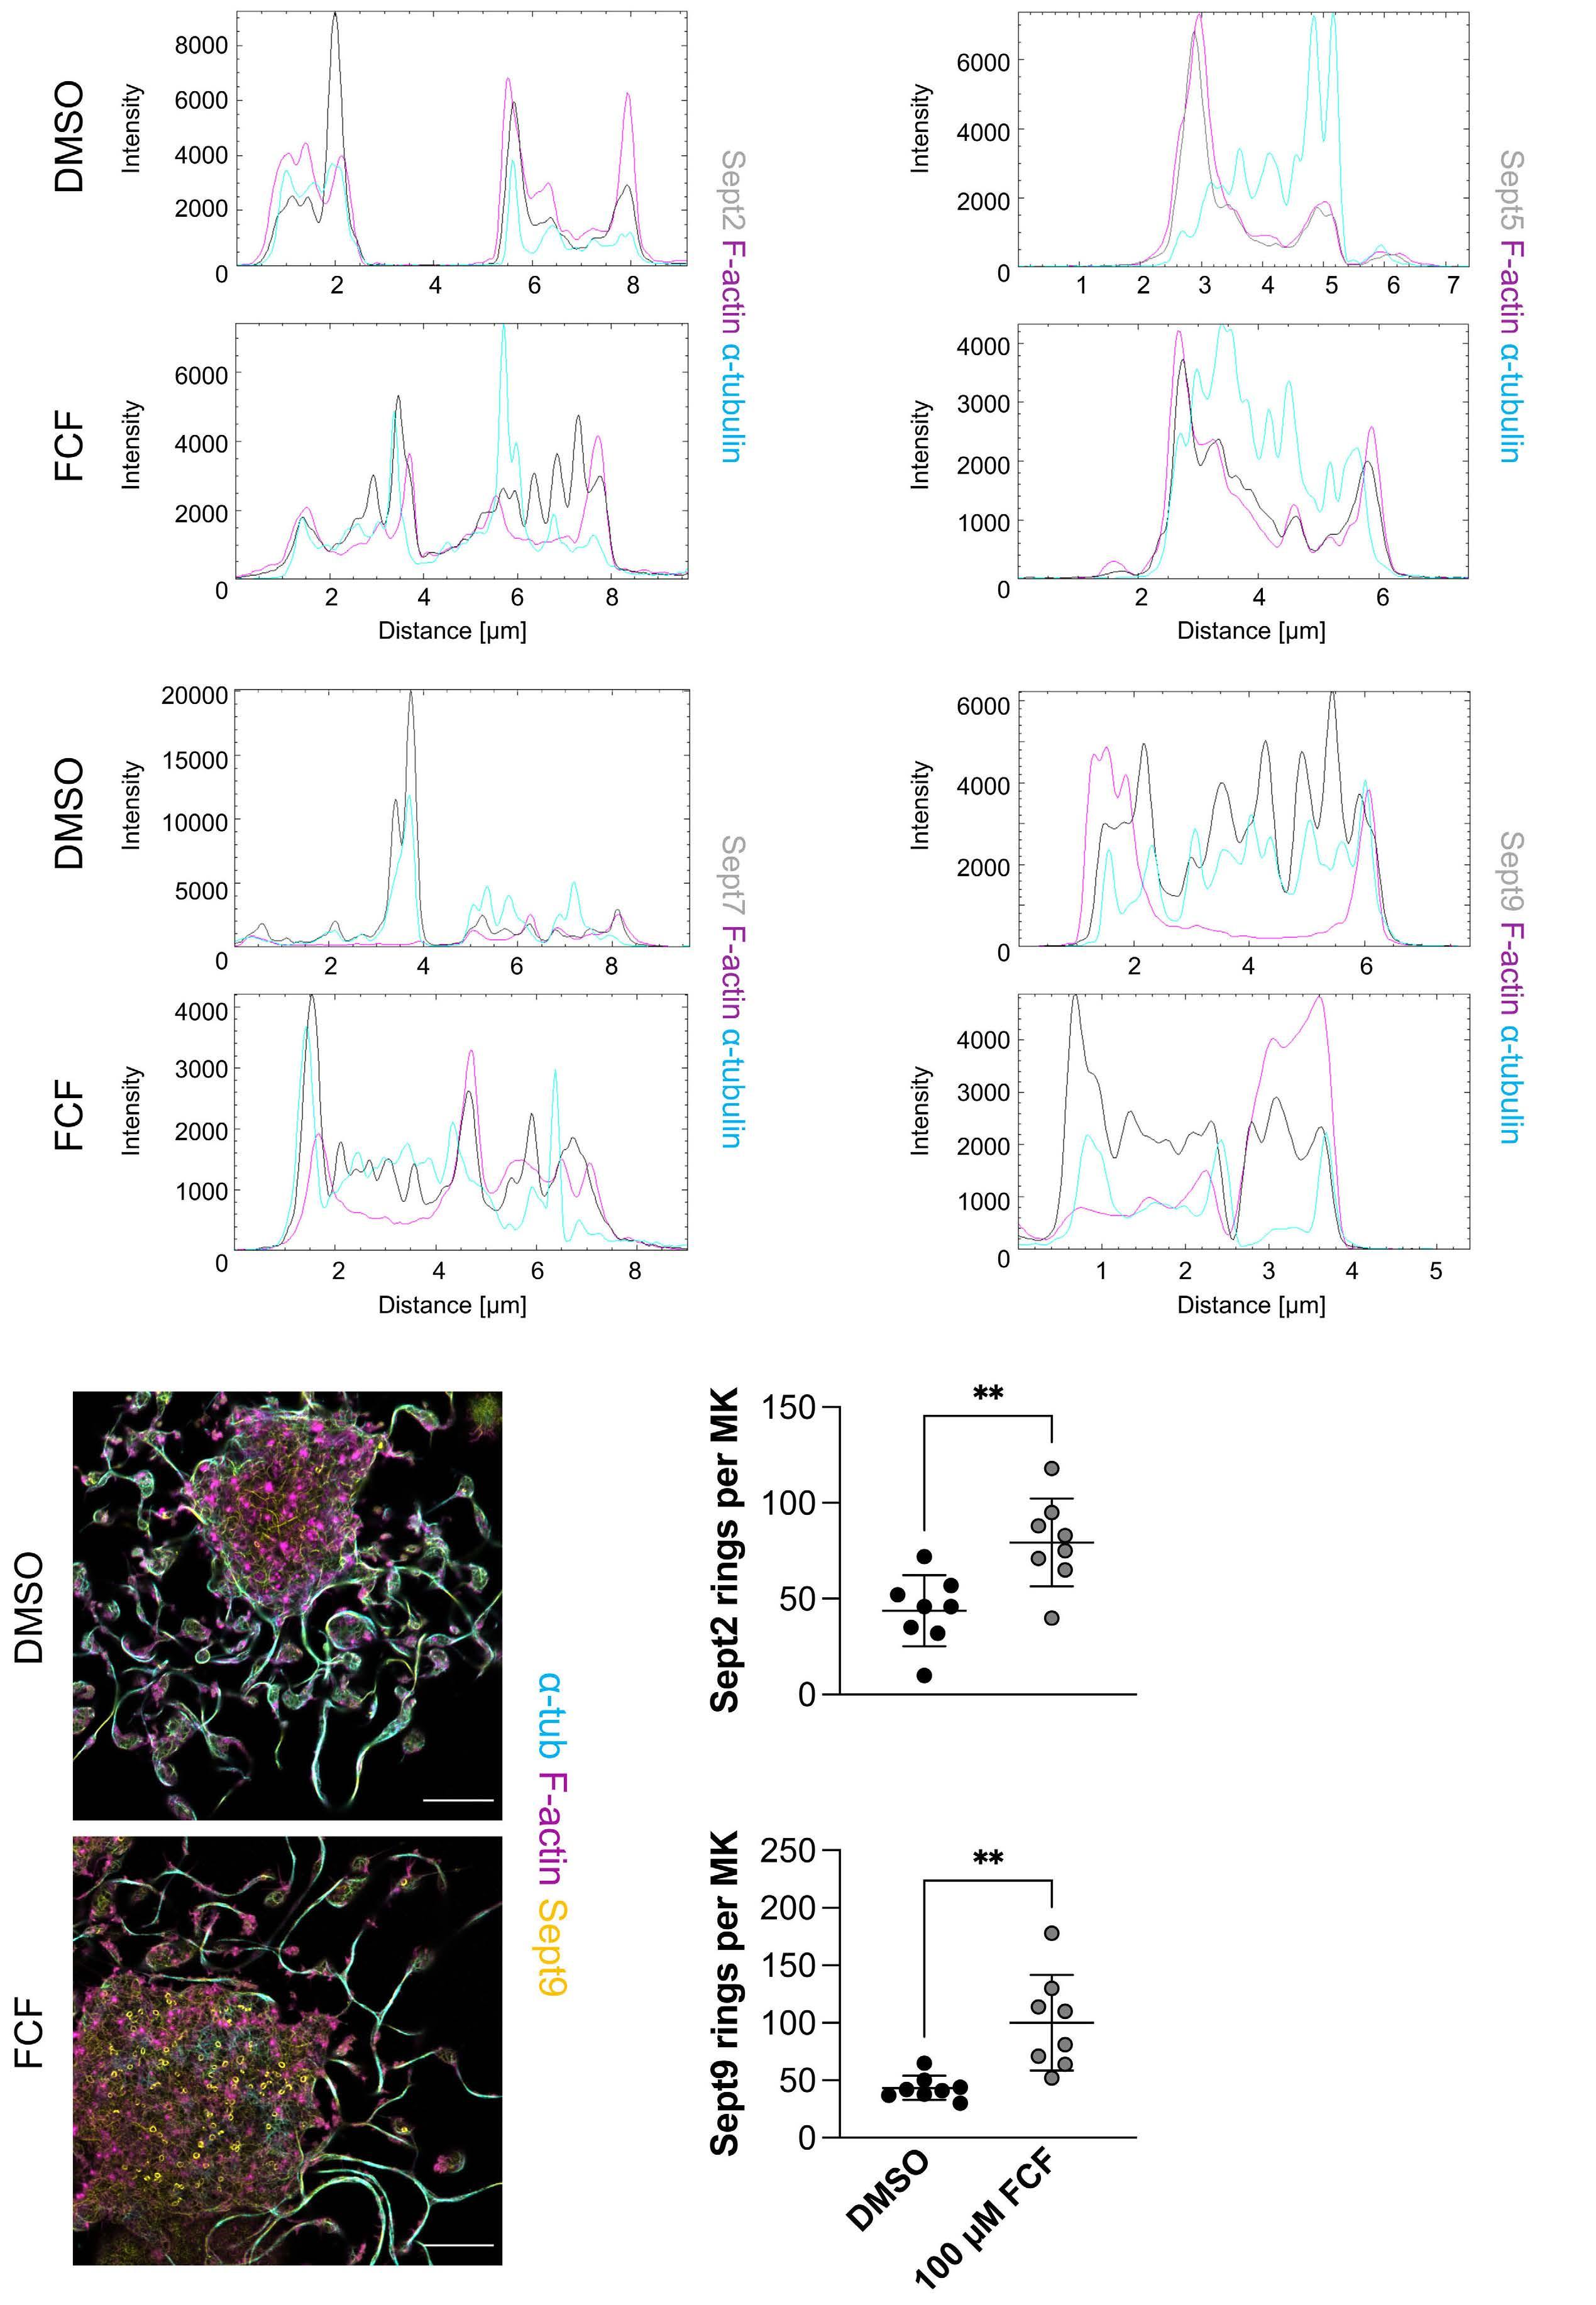
Figure 5. Disruption of septin localization upon septin inhibition. (A-D) Line plots for filamentous (F)-actin, α -tubulin and (A) Sept2, (B) Sept5, (C) Sept7 and (D) Sept9 in bone marrow-derived proplatelet-forming megakaryocytes (MK) upon DMSO or forchlorfenuron (FCF) treatment. (E-G) Septin ring formation in proplatelet-forming MK was (E) visualized and (F and G) quantified in DMSOand FCF-treated cells. Data presented as mean ± standard deviation. N=2. Unpaired, two-tailed Student t test. **P<0.01. One dot represents one cell.
Haematologica | 109 Marzo 2024 923 ARTICLE - Novel role of an actin/septin axis in MK I. Becker et al. A
C
E F G
B
D
(144 hrs) after platelet depletion ( Online Supplementary Figure S5A), when platelet counts began to recover. The significant rise in platelet counts at that timepoint suggests that MK are actively generating platelets at a higher rate, as suggested by other studies.47 Of note, the number of MK was described to be unaltered in platelet-depleted mice.48 F-actin appeared to specifically localize to a cortical ring surrounding the DMS, a phenomenon that was even more apparent in MK derived from platelet-depleted mice, which exhibited a highly increased expression of F-actin overall (Figure 6A, B). In contrast, expression of β1-tubulin was
comparable to the control (Online Supplementary Figure S5B, C). To investigate whether the expression of different septins was also subject to these changes upon enforced platelet generation we stained cryosections for Sept2, 5, 7 and 9. While Sept2 expression was comparable to the control (Figure 6C, D), similar to what we observed for β1-tubulin, we found a marked increase in Sept5 (Figure 6E, F), Sept7 (Figure 6G, H) and Sept9 expression (Figure 6 I, J) upon platelet depletion, suggesting that a palindromic oligomer consisting of these septins might be subject to changes upon challenge. To verify our in vitro observa-
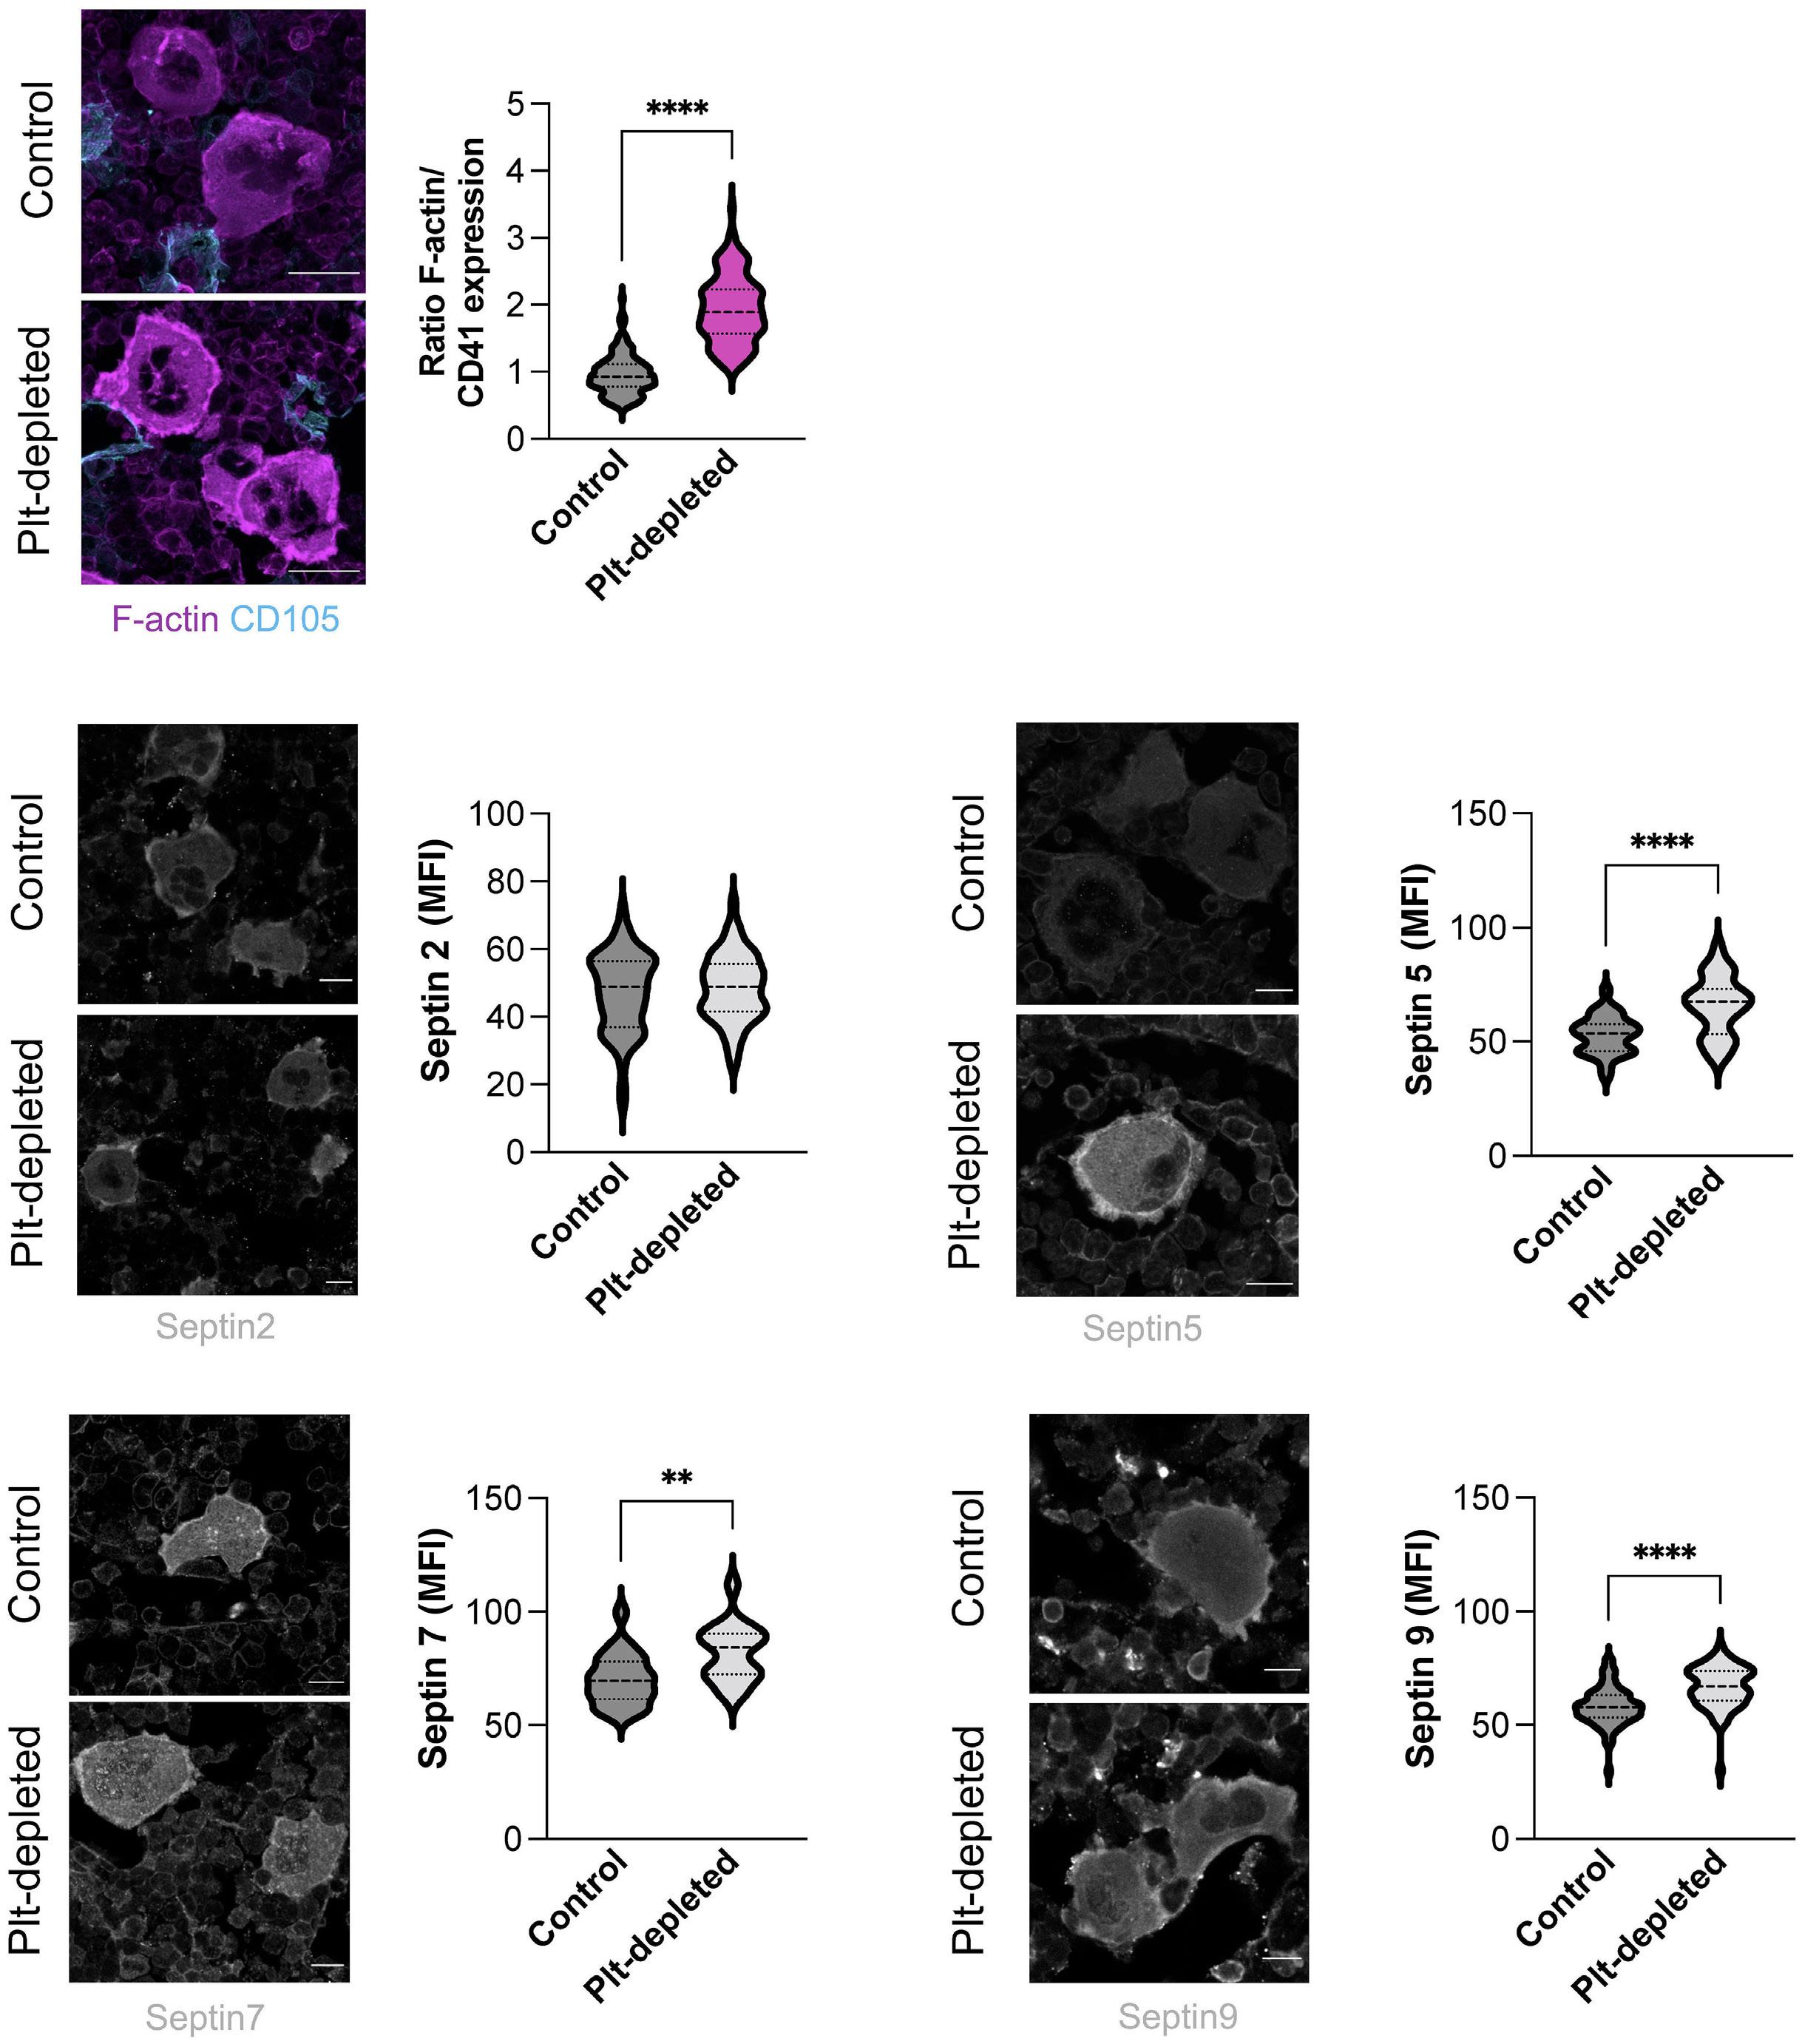
Figure 6. Enhanced thrombopoiesis increases (F)-actin and septin expression in situ. (A and B) Mean fluorescence intensity (MFI) of filamentous (F)-actin was visualized and quantified in femoral cryosections derived from control and platelet (Plt)-depleted mice. N=4 mice. At least 50 cells were counted per group. Data presented as mean ± standard deviation (SD). Unpaired, two-tailed Student t test. (C-J) Mean fluorescence intensity (MFI) of (C and D) Sept2, (E and F) Sept5, (G and H) Sept7, and (I and J) Sept9 was visualized and quantified in femoral cryosections derived from control and platelet-depleted mice. N=3 mice. Three independent experiments. At least 40 cells were counted per mice. Data presented as mean ± SD. Unpaired, two-tailed Student t test. **P<0.01; ****P<0.0001.
Haematologica | 109 Marzo 2024 924 ARTICLE - Novel role of an actin/septin axis in MK I. Becker et al.
A
C D E F G H I J
B
tions, we performed colocalization analysis for F-actin and found the lowest association with Sept2 and Sept9 (Online Supplementary Figure S5D), comparable to what we observed in proplatelet-forming MK. In summary, our findings identify a novel and key role for septins in bridging intracellular actin-microtubule crosstalk in MK, inhibition of which impairs proplatelet formation.
Discussion
How the F-actin cytoskeleton regulates proplatelet formation has been puzzling researchers for decades, since inhibition of actin polymerization has been proposed to both inhibit,14,15 as well as to induce, proplatelet formation.16,17 Although a variety of publications have suggested that F-actin dynamics are important during proplatelet formation, the underlying mechanisms have never fully been elucidated. This is partly due to the use of knockout mice, which, in addition to impaired proplatelet formation, usually also exhibit defective MK maturation due to the important role of F-actin in DMS development. By performing livecell imaging on proplatelet-forming MK, we observed that proplatelet formation was initiated earlier upon inhibition of actin polymerization; however, this early increase later evolved into highly defective proplatelet bead formation and elaboration, resulting in the appearance of stringy, unbeaded proplatelets (Figure 1B-D). We show that a similarly defective proplatelet elaboration can be observed upon inhibition of Cdc42 or the cytoskeletal class of septins. The defects were instigated by impaired intracellular F-actin dynamics, while the cortical actin cytoskeleton and microtubule sliding appeared to be unaffected, suggesting
intracellular F-actin to account for proplatelet elaboration (i.e., the formation of elaborate proplatelet beads).
An early study by Kinoshita et al. elegantly demonstrated that inhibition of actin polymerization using CytoD promotes septin ring formation, since septin filaments dissociated from actin fibers.45 Inhibition of septins using siRNA in turn attenuated intracellular actin filament assembly, while cortical actin and septin structures were mostly unaffected. Our data support these findings and reveal that inhibition of septins similarly induced their dissociation from F-actin or microtubule fibers, thus enhancing septin ring formation in the MK cell body or association with the cortical F-actin cytoskeleton (Figure 5E-G), while promoting aberrant intracellular actin dynamics. This was in line with our observations upon treatment of MK with LatA (Online Supplementary Figure S1A), where cortical F-actin structures were mostly retained. In addition to the preservation of cortical actin and septin structures, LatA treatment only marginally affected microtubule sliding (Figure 1J), which thus appears to be important for the elongation of proplatelet shafts, while intracellular cytoskeletal dynamics are required for the development and movement of proplatelet beads. The formation of septin rings upon septin inhibition was restricted to the microtubule-binding septins 2, 7 and 9. However, previous studies have found different septin classes to form palindromic oligomers,49,50 suggesting that inhibition of one class will inadvertently affect the expression and function of its associated septins. This connection may thus explain the effects on intracellular actin dynamics observed upon septin inhibition. Sept5 was previously shown to associate with Sept7 and 9,30 whose expression was markedly altered upon FCF treatment. At the same time, our in vivo data revealed that
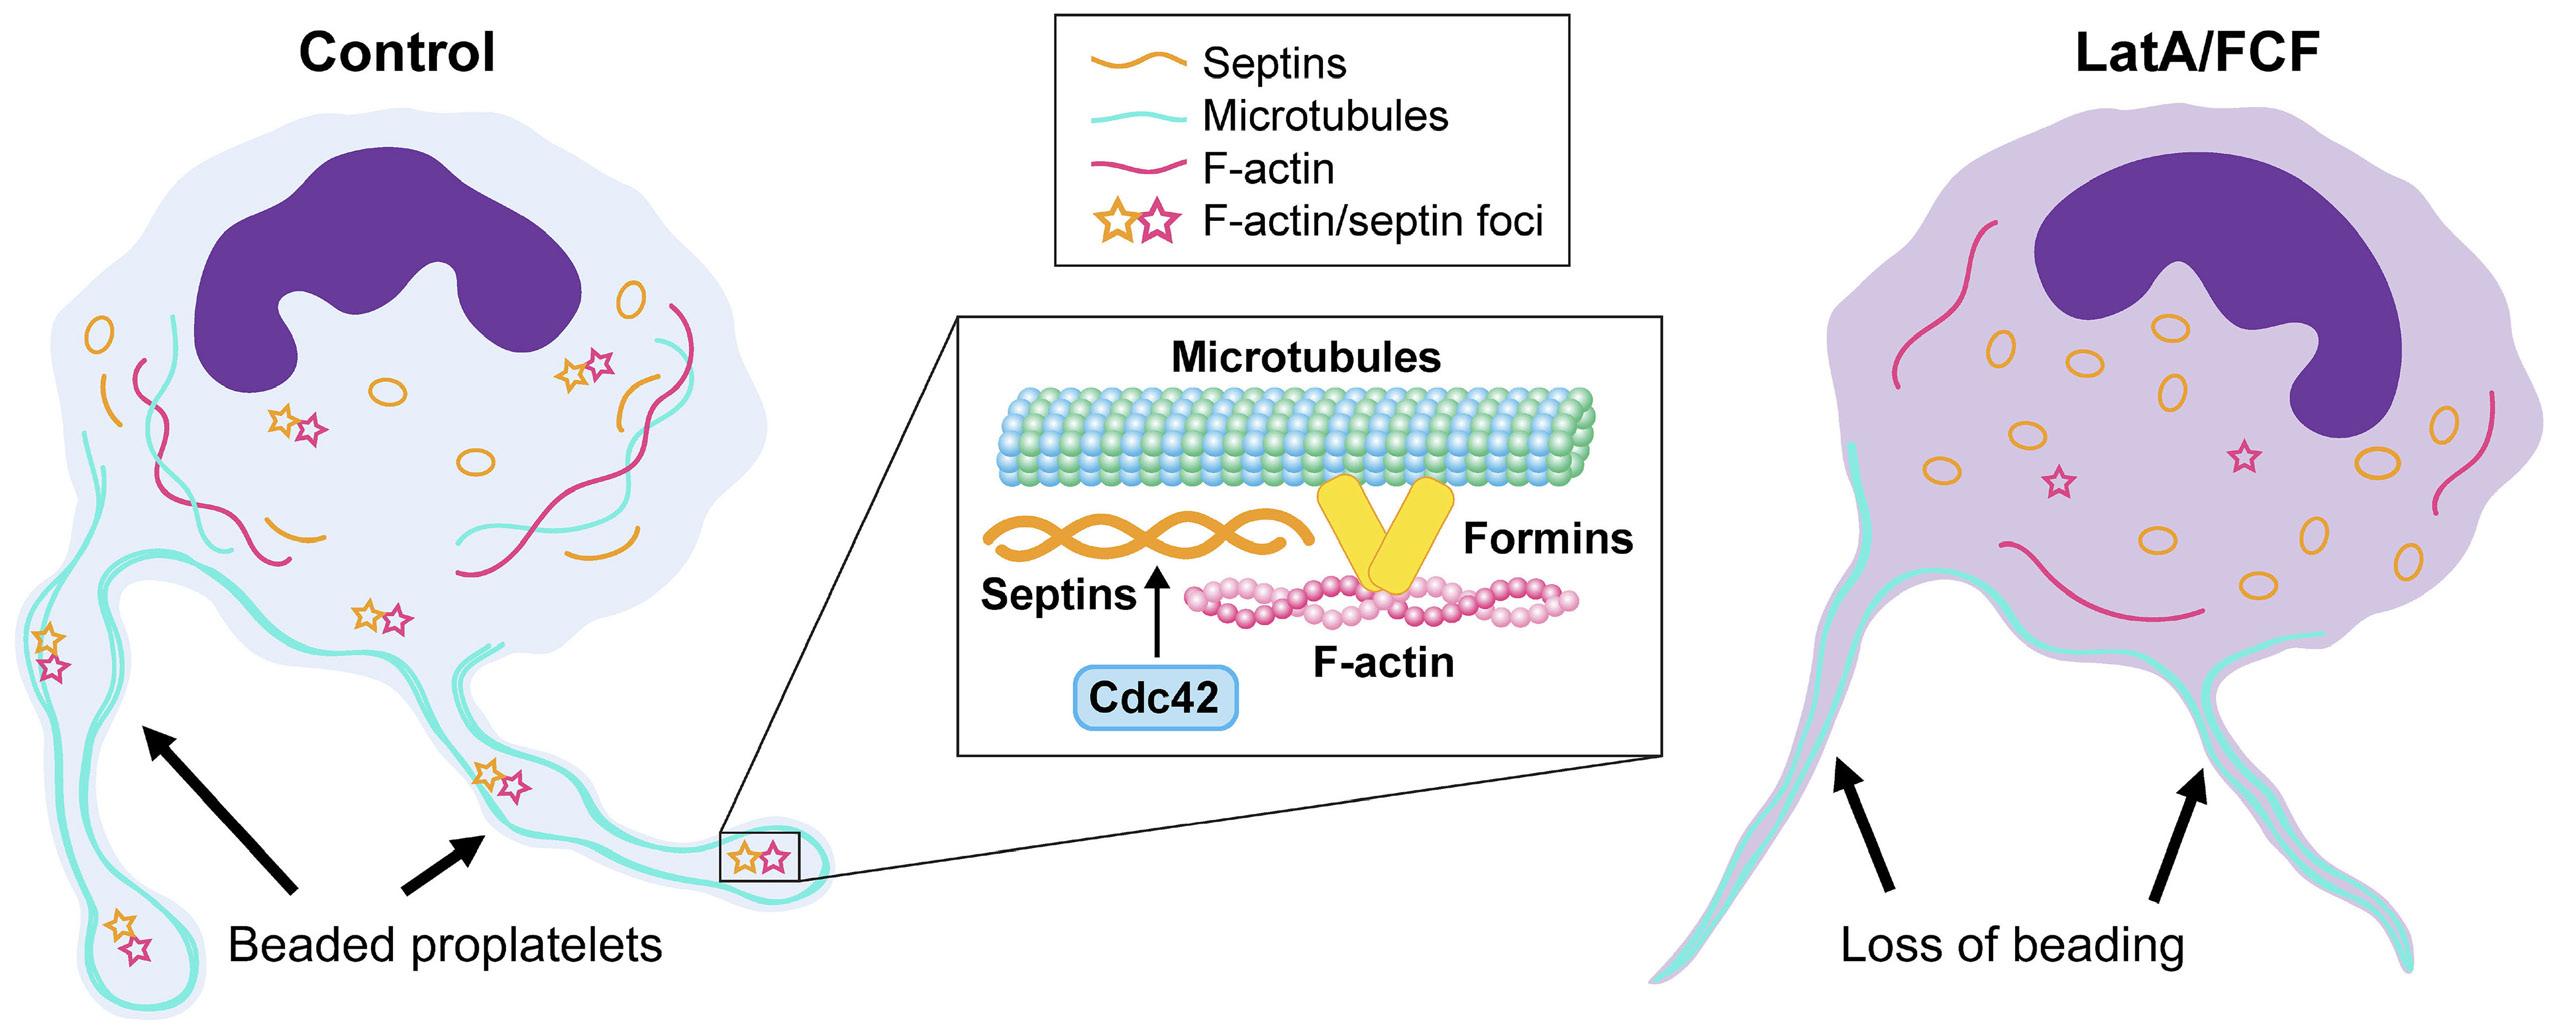
Haematologica | 109 Marzo 2024 925 ARTICLE - Novel role of an actin/septin axis in MK I. Becker et al.
Figure 7. A Cdc42/septin axis regulates F-actin dynamics during proplatelet formation. In control megakaryocytes (MK), intracellular filamentous (F)-actin (magenta) integrates with septins (yellow) and microtubules (cyan). F-actin/septin-rich nodules within proplatelet beads interact with formin proteins and promote proplatelet beading. Arrows point towards proplatelet beads along the proplatelet shaft. Treatment with actin polymerization inhibitors (LatA) or the septin inhibitor forchlorfenuron (FCF) increases septin dispersion/ring formation and impairs transduction of F-actin forces to the elongating proplatelet.
only the expression of these septins is subject to changes in a model of enhanced thrombopoiesis (Figure 6), which indicates that septin oligomers in vivo might consist of a specific array of septins.
In addition to the effects observed on proplatelet formation, septin inhibition also affected MK maturation (Figure 2F, G), which might be attributed to an impaired development of the DMS due to interference with the actin cytoskeleton. However, it might also be explained by the high concentration of FCF generally used in vitro, which could elicit off-target effects on a variety of signaling pathways, as previously suggested.51 Moreover, septins play an essential role in cytokinesis in both yeast as well as mammals,52 which might affect polyploidization. This is in line with a previous study revealing defective endomitosis in MK lacking PAK2, another downstream target of Cdc42.22 Ultimately, only genetic strategies using a CRISPR-approach or Pf4-Cre-mediated gene deletions will answer how septins regulate MK maturation.
A variety of previous studies have described the importance of Cdc42 in MK and platelets.15,21,39 However, while it was shown that the impaired maturation and proplatelet formation observed upon Cdc42 inhibition partially resulted from altered neural WASp (n-WASp) activity,53 we demonstrate that both are also instigated by inhibitory effects on septin polymerization. Strikingly, this impairment in proplatelet formation occurred independent of the Arp2/3 since inhibition of Arp2/3 did not reduce proplatelet formation in vitro (Figure 3D). Platelets derived from Arp2/3- and WASp-deficient mice exhibit an enhanced stability of the cortical microtubule ring,19,54 while microtubule sliding and cortical microtubule bundles were unaffected by either Cdc42 or septin inhibition. Our findings are more reminiscent of an actin network found in neurons, in which intracellular actin foci occurred independent of the cortical actin cytoskeleton,38 similar to what we observed in MK (Online Supplementary Video S10), and were formed independent of Arp2/3.34 This neuronal actin network was subject to formin proteins, inhibition of which severely compromised proplatelet formation as well (Online Supplementary Figure S2A-C). More evidence for this occurring independent of the Arp2/3/WASp pathways comes from the observation that treatment of platelets with a formin inhibitor retained the cortical microtubule ring, while the actin cytoskeleton was highly disrupted.55 The data thus imply that an intracellular cytoskeletal network consisting of F-actin, formins
References
1. Italiano JE Jr, Lecine P, Shivdasani RA, Hartwig JH. Blood platelets are assembled principally at the ends of proplatelet processes produced by differentiated megakaryocytes. J Cell Biol. 1999;147(6):1299-1312.
2. Eckly A, Scandola C, Oprescu A, et al. Megakaryocytes use in vivo podosome-like structures working collectively to penetrate
and septins is responsible for the transduction of forces, which are essential for the formation of beads along the proplatelet shaft (Figure 7).
In summary, our data reveal that septins in MK distinctly associate with the intracellular actin and microtubule cytoskeleton. Inhibition of either septins, formins or their upstream regulator Cdc42 resulted in disrupted F-actin dynamics leading to impaired proplatelet elaboration, as observed upon inhibition of actin polymerization. These data unravel an important role of an intracellular cytoskeletal network in MK and identify a previously unknown role for septins in MK biology.
Disclosures
JEI has financial interest in and is a founder of StellularBio, a biotechnology company focused on making donor-independent platelet-like cells at scale. The interests of JEI are managed by Boston Children’s Hospital. All other authors have no conflicts of interest to disclose.
Contributions
ICB, ARW and JEI are responsible for the study concept. ICB, ARW, BAU, ARS, FF and IT are responsible for the methodology and investigation. JEI supervised the study. ICB and ARW wrote the original draft of the manuscript. ICB, ARW, KX, KRM and JEI are responsible for writing, reviewing and editing the manuscript for publication.
Acknowledgments
We thank Emma Nikols, Daniela Freire, Clementine Payne and Karen Guo for excellent technical assistance as well as Harvey Roweth for proofreading the manuscript. We thank Kristin Johnson for generating the graphical abstract.
Funding
ARW was supported by an F32 postdoctoral fellowship (1F32HL152486-01). ICB is supported by a Walter Benjamin Fellowship of the German Research Foundation (DFG; BE 7766/2-1). JEI is supported by the National Institute of Health National Heart, Lung and Blood Institute (R01HL68130 and R35HL161175).
Data-sharing statement
All data are available upon request from the corresponding author.
the endothelial barrier of bone marrow sinusoids. J Thromb Haemost. 2020;18(11):2987-3001.
3. Schachtner H, Calaminus SD, Sinclair A, et al. Megakaryocytes assemble podosomes that degrade matrix and protrude through basement membrane. Blood. 2013;121(13):2542-2552.
4 Italiano JE Jr, Patel-Hett S, Hartwig JH. Mechanics of
Haematologica | 109 Marzo 2024 926 ARTICLE - Novel role of an actin/septin axis in MK I. Becker et al.
proplatelet elaboration. J Thromb Haemost. 2007;5(Suppl 1):18-23.
5. Thon JN, Montalvo A, Patel-Hett S, et al. Cytoskeletal mechanics of proplatelet maturation and platelet release. J Cell Biol. 2010;191(4):861-874.
6. Bennett C, Lawrence M, Guerrero JA, et al. CRLF3 plays a key role in the final stage of platelet genesis and is a potential therapeutic target for thrombocythemia. Blood. 2022;139(14):2227-2239.
7 Bender M, Thon JN, Ehrlicher AJ, et al. Microtubule sliding drives proplatelet elongation and is dependent on cytoplasmic dynein. Blood. 2015;125(5):860-868.
8. Richardson JL, Shivdasani RA, Boers C, Hartwig JH, Italiano JE Jr. Mechanisms of organelle transport and capture along proplatelets during platelet production. Blood. 2005;106(13):4066-4075.
9 Khan AO, Slater A, Maclachlan A, et al. Post-translational polymodification of beta1-tubulin regulates motor protein localisation in platelet production and function. Haematologica. 2022;107(1):243-259.
10. Strassel C, Magiera MM, Dupuis A, et al. An essential role for alpha4A-tubulin in platelet biogenesis. Life Sci Alliance. 2019;2(1):e201900309.
11. Mbiandjeu S, Balduini A, Malara A. Megakaryocyte cytoskeletal proteins in platelet biogenesis and diseases. Thromb Haemost. 2022;122(5):666-678.
12. Eckly A, Heijnen H, Pertuy F, et al. Biogenesis of the demarcation membrane system (DMS) in megakaryocytes. Blood. 2014;123(6):921-930.
13. Schulze H, Korpal M, Hurov J, et al. Characterization of the megakaryocyte demarcation membrane system and its role in thrombopoiesis. Blood. 2006;107(10):3868-3875.
14 Rojnuckarin P, Kaushansky K. Actin reorganization and proplatelet formation in murine megakaryocytes: the role of protein kinase calpha. Blood. 2001;97(1):154-161.
15. Antkowiak A, Viaud J, Severin S, et al. Cdc42-dependent F-actin dynamics drive structuration of the demarcation membrane system in megakaryocytes. J Thromb Haemost. 2016;14(6):1268-1284.
16. Tablin F, Castro M, Leven RM. Blood platelet formation in vitro. The role of the cytoskeleton in megakaryocyte fragmentation. J Cell Sci. 1990;97( Pt 1):59-70.
17. Avanzi MP, Izak M, Oluwadara OE, Mitchell WB. Actin inhibition increases megakaryocyte proplatelet formation through an apoptosis-dependent mechanism. PLoS One. 2015;10(4):e0125057.
18. Rohatgi R, Ma L, Miki H, et al. The interaction between N-WASP and the Arp2/3 complex links Cdc42-dependent signals to actin assembly. Cell. 1999;97(2):221-231.
19 Paul DS, Casari C, Wu C, et al. Deletion of the Arp2/3 complex in megakaryocytes leads to microthrombocytopenia in mice. Blood Adv. 2017;1(18):1398-1408.
20. Haddad E, Cramer E, Riviere C, et al. The thrombocytopenia of Wiskott Aldrich syndrome is not related to a defect in proplatelet formation. Blood. 1999;94(2):509-518.
21. Heib T, Hermanns HM, Manukjan G, et al. RhoA/Cdc42 signaling drives cytoplasmic maturation but not endomitosis in megakaryocytes. Cell Rep. 2021;35(6):109102.
22. Kosoff RE, Aslan JE, Kostyak JC, et al. Pak2 restrains endomitosis during megakaryopoiesis and alters cytoskeleton organization. Blood. 2015;125(19):2995-3005.
23. Nakos K, Alam MNA, Radler MR, et al. Septins mediate a microtubule-actin crosstalk that enables actin growth on
microtubules. Proc Natl Acad Sci U S A. 2022;119(50):e2202803119.
24. Salameh J, Cantaloube I, Benoit B, Pous C, Baillet A. Cdc42 and its BORG2 and BORG3 effectors control the subcellular localization of septins between actin stress fibers and microtubules. Curr Biol. 2021;31(18):4088-4103.
25. Spiliotis ET, Nakos K. Cellular functions of actin- and microtubule-associated septins. Curr Biol. 2021;31(10):R651-R666.
26. Hall PA, Jung K, Hillan KJ, Russell SE. Expression profiling the human septin gene family. J Pathol. 2005;206(3):269-278.
27. Neubauer K, Zieger B. The mammalian septin interactome. Front Cell Dev Biol. 2017;5:3.
28. Kim OV, Litvinov RI, Mordakhanova ER, Bi E, Vagin O, Weisel JW. Contribution of septins to human platelet structure and function. iScience. 2022;25(7):104654.
29 Blaser S, Horn J, Wurmell P, et al. The novel human platelet septin SEPT8 is an interaction partner of SEPT4. Thromb Haemost. 2004;91(5):959-966.
30 Martinez C, Corral J, Dent JA, Sesma L, Vicente V, Ware J. Platelet septin complexes form rings and associate with the microtubular network. J Thromb Haemost. 2006;4(6):1388-1395.
31. Dent J, Kato K, Peng XR, et al. A prototypic platelet septin and its participation in secretion. Proc Natl Acad Sci U S A. 2002;99(5):3064-3069.
32. Iwase M, Okada S, Oguchi T, Toh-e A. Forchlorfenuron, a phenylurea cytokinin, disturbs septin organization in Saccharomyces cerevisiae. Genes Genet Syst. 2004;79(4):199-206.
33. Neubauer K, Jurk K, Petermann V, Kumm E, Zieger B. Impaired platelet function in Sept8-deficient mice in vitro. Thromb Haemost. 2021;121(4):484-494.
34 Ganguly A, Tang Y, Wang L, et al. A dynamic formin-dependent deep F-actin network in axons. J Cell Biol. 2015;210(3):401-417.
35. Zuidscherwoude M, Green HLH, Thomas SG. Formin proteins in megakaryocytes and platelets: regulation of actin and microtubule dynamics. Platelets. 2019;30(1):23-30.
36. French SL, Vijey P, Karhohs KW, et al. High-content, label-free analysis of proplatelet production from megakaryocytes. J Thromb Haemost. 2020;18(10):2701-2711.
37. Thon JN, Mazutis L, Wu S, et al. Platelet bioreactor-on-a-chip. Blood. 2014;124(12):1857-1867.
38. Xu K, Zhong G, Zhuang X. Actin, spectrin, and associated proteins form a periodic cytoskeletal structure in axons. Science. 2013;339(6118):452-456.
39. Pleines I, Dutting S, Cherpokova D, et al. Defective tubulin organization and proplatelet formation in murine megakaryocytes lacking Rac1 and Cdc42. Blood. 2013;122(18):3178-3187.
40 Versele M, Thorner J. Septin collar formation in budding yeast requires GTP binding and direct phosphorylation by the PAK, Cla4. J Cell Biol. 2004;164(5):701-715.
41. Spindler M, van Eeuwijk JMM, Schurr Y, et al. ADAP deficiency impairs megakaryocyte polarization with ectopic proplatelet release and causes microthrombocytopenia. Blood. 2018;132(6):635-646.
42. Firat-Karalar EN, Welch MD. New mechanisms and functions of actin nucleation. Curr Opin Cell Biol. 2011;23(1):4-13.
43. Sabri S, Foudi A, Boukour S, et al. Deficiency in the WiskottAldrich protein induces premature proplatelet formation and platelet production in the bone marrow compartment. Blood. 2006;108(1):134-140.
44 Stritt S, Nurden P, Turro E, et al. A gain-of-function variant in
Haematologica | 109 Marzo 2024 927 ARTICLE - Novel role of an actin/septin axis in MK I. Becker et al.
DIAPH1 causes dominant macrothrombocytopenia and hearing loss. Blood. 2016;127(23):2903-2914.
45. Kinoshita M, Field CM, Coughlin ML, Straight AF, Mitchison TJ. Self- and actin-templated assembly of mammalian septins. Dev Cell. 2002;3(6):791-802.
46. Nieswandt B, Bergmeier W, Rackebrandt K, Gessner JE, Zirngibl H. Identification of critical antigen-specific mechanisms in the development of immune thrombocytopenic purpura in mice. Blood. 2000;96(7):2520-2527.
47. Heazlewood SY, Ahmad T, Cao B, et al. High ploidy large cytoplasmic megakaryocytes are hematopoietic stem cells regulators and essential for platelet production. Nat Commun. 2023;14(1):2099.
48. Stegner D, van Eeuwijk JMM, Angay O, et al. Thrombopoiesis is spatially regulated by the bone marrow vasculature. Nat Commun. 2017;8(1):127.
49 Dolat L, Hunyara JL, Bowen JR, et al. Septins promote stress fiber-mediated maturation of focal adhesions and renal epithelial motility. J Cell Biol. 2014;207(2):225-235.
50 Martins CS, Taveneau C, Castro-Linares G, et al. Human septins organize as octamer-based filaments and mediate actin-
membrane anchoring in cells. J Cell Biol. 2023;222(3):e202203016.
51. Heasley LR, Garcia G 3rd, McMurray MA. Off-target effects of the septin drug forchlorfenuron on nonplant eukaryotes. Eukaryot Cell. 2014;13(11):1411-1420.
52. Menon MB, Sawada A, Chaturvedi A, et al. Genetic deletion of SEPT7 reveals a cell type-specific role of septins in microtubule destabilization for the completion of cytokinesis. PLoS Genet. 2014;10(8):e1004558.
53. Palazzo A, Bluteau O, Messaoudi K, et al. The cell division control protein 42-Src family kinase-neural Wiskott-Aldrich syndrome protein pathway regulates human proplatelet formation. J Thromb Haemost. 2016;14(12):2524-2535.
54 Bender M, Stritt S, Nurden P, et al. Megakaryocyte-specific Profilin1-deficiency alters microtubule stability and causes a Wiskott-Aldrich syndrome-like platelet defect. Nat Commun. 2014;5:4746.
55. Green HLH, Zuidscherwoude M, Alenazy F, Smith CW, Bender M, Thomas SG. SMIFH2 inhibition of platelets demonstrates a critical role for formin proteins in platelet cytoskeletal dynamics. J Thromb Haemost. 2020;18(4):955-967.
Haematologica | 109 Marzo 2024 928 ARTICLE - Novel role of an actin/septin axis in MK I. Becker et al.
Phase II trials of zilucoplan in paroxysmal nocturnal hemoglobinuria
Paroxysmal nocturnal hemoglobinuria (PNH) is a rare, chronic, clonal hematopoietic stem cell disorder. Uncontrolled complement activation is central in the pathogenesis of PNH.1-3 Approved first-line treatments of PNH are eculizumab and ravulizumab, which inhibit the activity of complement component 5 (C5).1,4-6
Zilucoplan, a novel C5 inhibitor, is a small (3.5 kDa), 15-amino acid macrocyclic peptide that binds to C5 with high affinity and specificity.7 Zilucoplan inhibits complement via a dual mechanism in that it prevents cleavage of C5 into C5a and C5b and binds to the domain of C5 corresponding to C5b, thereby blocking the binding of C5b to C6.7 Zilucoplan prevents activation of the terminal complement pathway and assembly of the membrane attack complex that results in lysis of glycosylphosphatidylinositol-anchored protein-deficient red blood cells (RBC) in PNH.7,8
The efficacy, pharmacodynamics, safety, and tolerability of zilucoplan were evaluated in adult patients with PNH in two phase II 12-week studies (Study 201, NCT03078582; Study 203, NCT03030183) and a long-term extension study (NCT03225287) (Figure 1A, B). Eligibility criteria are summarized in Online Supplementary Table S1. The primary endpoint of the 12-week studies was change from baseline in serum lactate dehydrogenase (LDH) levels. This analysis included ten eculizumab-naïve patients and 19 who had received prior eculizumab treatment (eculizumab-switch cohort) (Figure 1B). All ten eculizumab-naïve patients entered the extension study, two (20.0%) of whom discontinued. In the switch cohort, eight of 19 (42.1%) patients discontinued and 11 (57.9%) entered the extension study; two (10.5%) patients discontinued and nine (47.4%) were still receiving zilucoplan treatment at data cutoff (November 2020).
The patients’ demographics and baseline characteristics are provided in Online Supplementary Table S2. As expected, the eculizumab-naïve cohort had higher baseline LDH and median-free hemoglobin than the switch cohort.
In the eculizumab-naïve cohort, treatment with zilucoplan resulted in consistent, complete, and sustained inhibition of both the classical and alternative complement pathways (Figure 2A), leading to rapid, substantial, and sustained LDH decreases from baseline (median LDH, 378.0 U/L [1.6× upper limit of normal, ULN, of 234 U/L]) (Figure 2B). Of the five patients who required one or more transfusions (irrespective of the number of units) in the 6 months before the start of the study, two (40.0%) became transfusion-independent after zilucoplan treatment initiation (Figure 2C). Zilucoplan treatment led to a consistent decrease of median free hemoglobin (baseline 7.10 mg/dL) at all post-baseline time points (range of the median change, −3.90 to −5.95 mg/dL). Mean changes
from baseline to each post-baseline time point in all other secondary endpoints, including total bilirubin, total hemoglobin, haptoglobin, reticulocytes, and hemoglobinuria were generally small or variable, displaying no clear trend for the naïve cohort (data not shown).
Zilucoplan treatment in the switch cohort led to complete and sustained inhibition of both the classical and alternative complement pathways (Figure 3A). Patients treated in the switch cohort had a median LDH increase of 230.3 U/L from baseline during the primary evaluation period (Figure 3B). In the seven (36.8%) patients who were transfusion-independent, the mean (standard deviation) baseline LDH value was 232.6 (22.6) U/L. After an initial increase in mean LDH that peaked at week 6, values remained consistent at approximately 1.5×ULN in transfusion-independent patients in the switch cohort (Figure 3B).
In transfusion-dependent patients in the switch cohort, the mean baseline LDH value was significantly higher than in the transfusion-independent group. Despite zilucoplan treatment, transfusion-dependent patients in the switch cohort experienced increased mean LDH values that reached their highest levels at week 20 (924.7 U/L) (Figure 3B). Based on the investigators’ medical evaluation, patients with evidence of increased hemolysis discontinued zilucoplan and resumed eculizumab treatment, resulting in stabilization of LDH. Among the 12 transfusion-dependent patients in the switch cohort, including some who had received treatment for less than 6 months, four became transfusion-independent after initiation of zilucoplan (Figure 3C).
Within the switch cohort, patients who discontinued and were considered to have had switch failure had higher reticulocyte counts at baseline than those who were considered switch successes (Figure 3D). At baseline, the switch cohort had a median free hemoglobin of 1.80 mg/dL; variable changes with a median range of 0.00-1.70 mg/dL were observed across all post-baseline time points. Mean changes from baseline to each post-baseline time point in all other secondary endpoints were generally small or variable with no clear trends.
Zilucoplan, which can be administered at home as a subcutaneous, small-volume (<1 mL) injection with a thin (29G) needle, was well tolerated, with >18.6 patient-years of exposure and a mean duration of exposure of 36.4 weeks. In the initial 12-week study period, all patients (n=29) experienced adverse events, of whom 11 (37.9%) had treatment-related adverse events (most common [occurring in >1 patient]: headache [n=4], hemolysis [n=4], dizziness [n=2], fatigue [n=2], and injection site bruising [n=2]). No thrombotic events were observed. During the 12-week study period, treatment-related adverse events occurred in fewer patients in the eculizumab-naïve cohort
Haematologica | 109 Marzo 2024 929 LETTER TO THE EDITOR
(20.0%, n=2/10) than in the switch cohort (47.4%, n=9/19). Four (13.8%) patients experienced serious adverse events (pyrexia and febrile non-hemolytic transfusion reaction [naïve cohort; n=1], urinary tract infection, gastroenteritis, and pyrexia [switch cohort; n=1 each]); none was considered treatment-related. In the long-term extension study (n=19), all patients experienced adverse events, of whom four (21.1%) had treatment-re-
lated adverse events (most common [occurring in >1 patient]: headache [n=2], injection site bruising [n=2]). Treatment-related adverse events occurred at similar frequencies in the naïve (20.0% [n=2/10]) and switch (22.2% [n=2/9]) cohorts. Six (31.6%) patients experienced serious adverse events (anemia [n=2]; deep vein thrombosis [n=1]; headache, nausea, osteoarthritis, and rotator cuff syndrome [n=1]; infectious enterocolitis
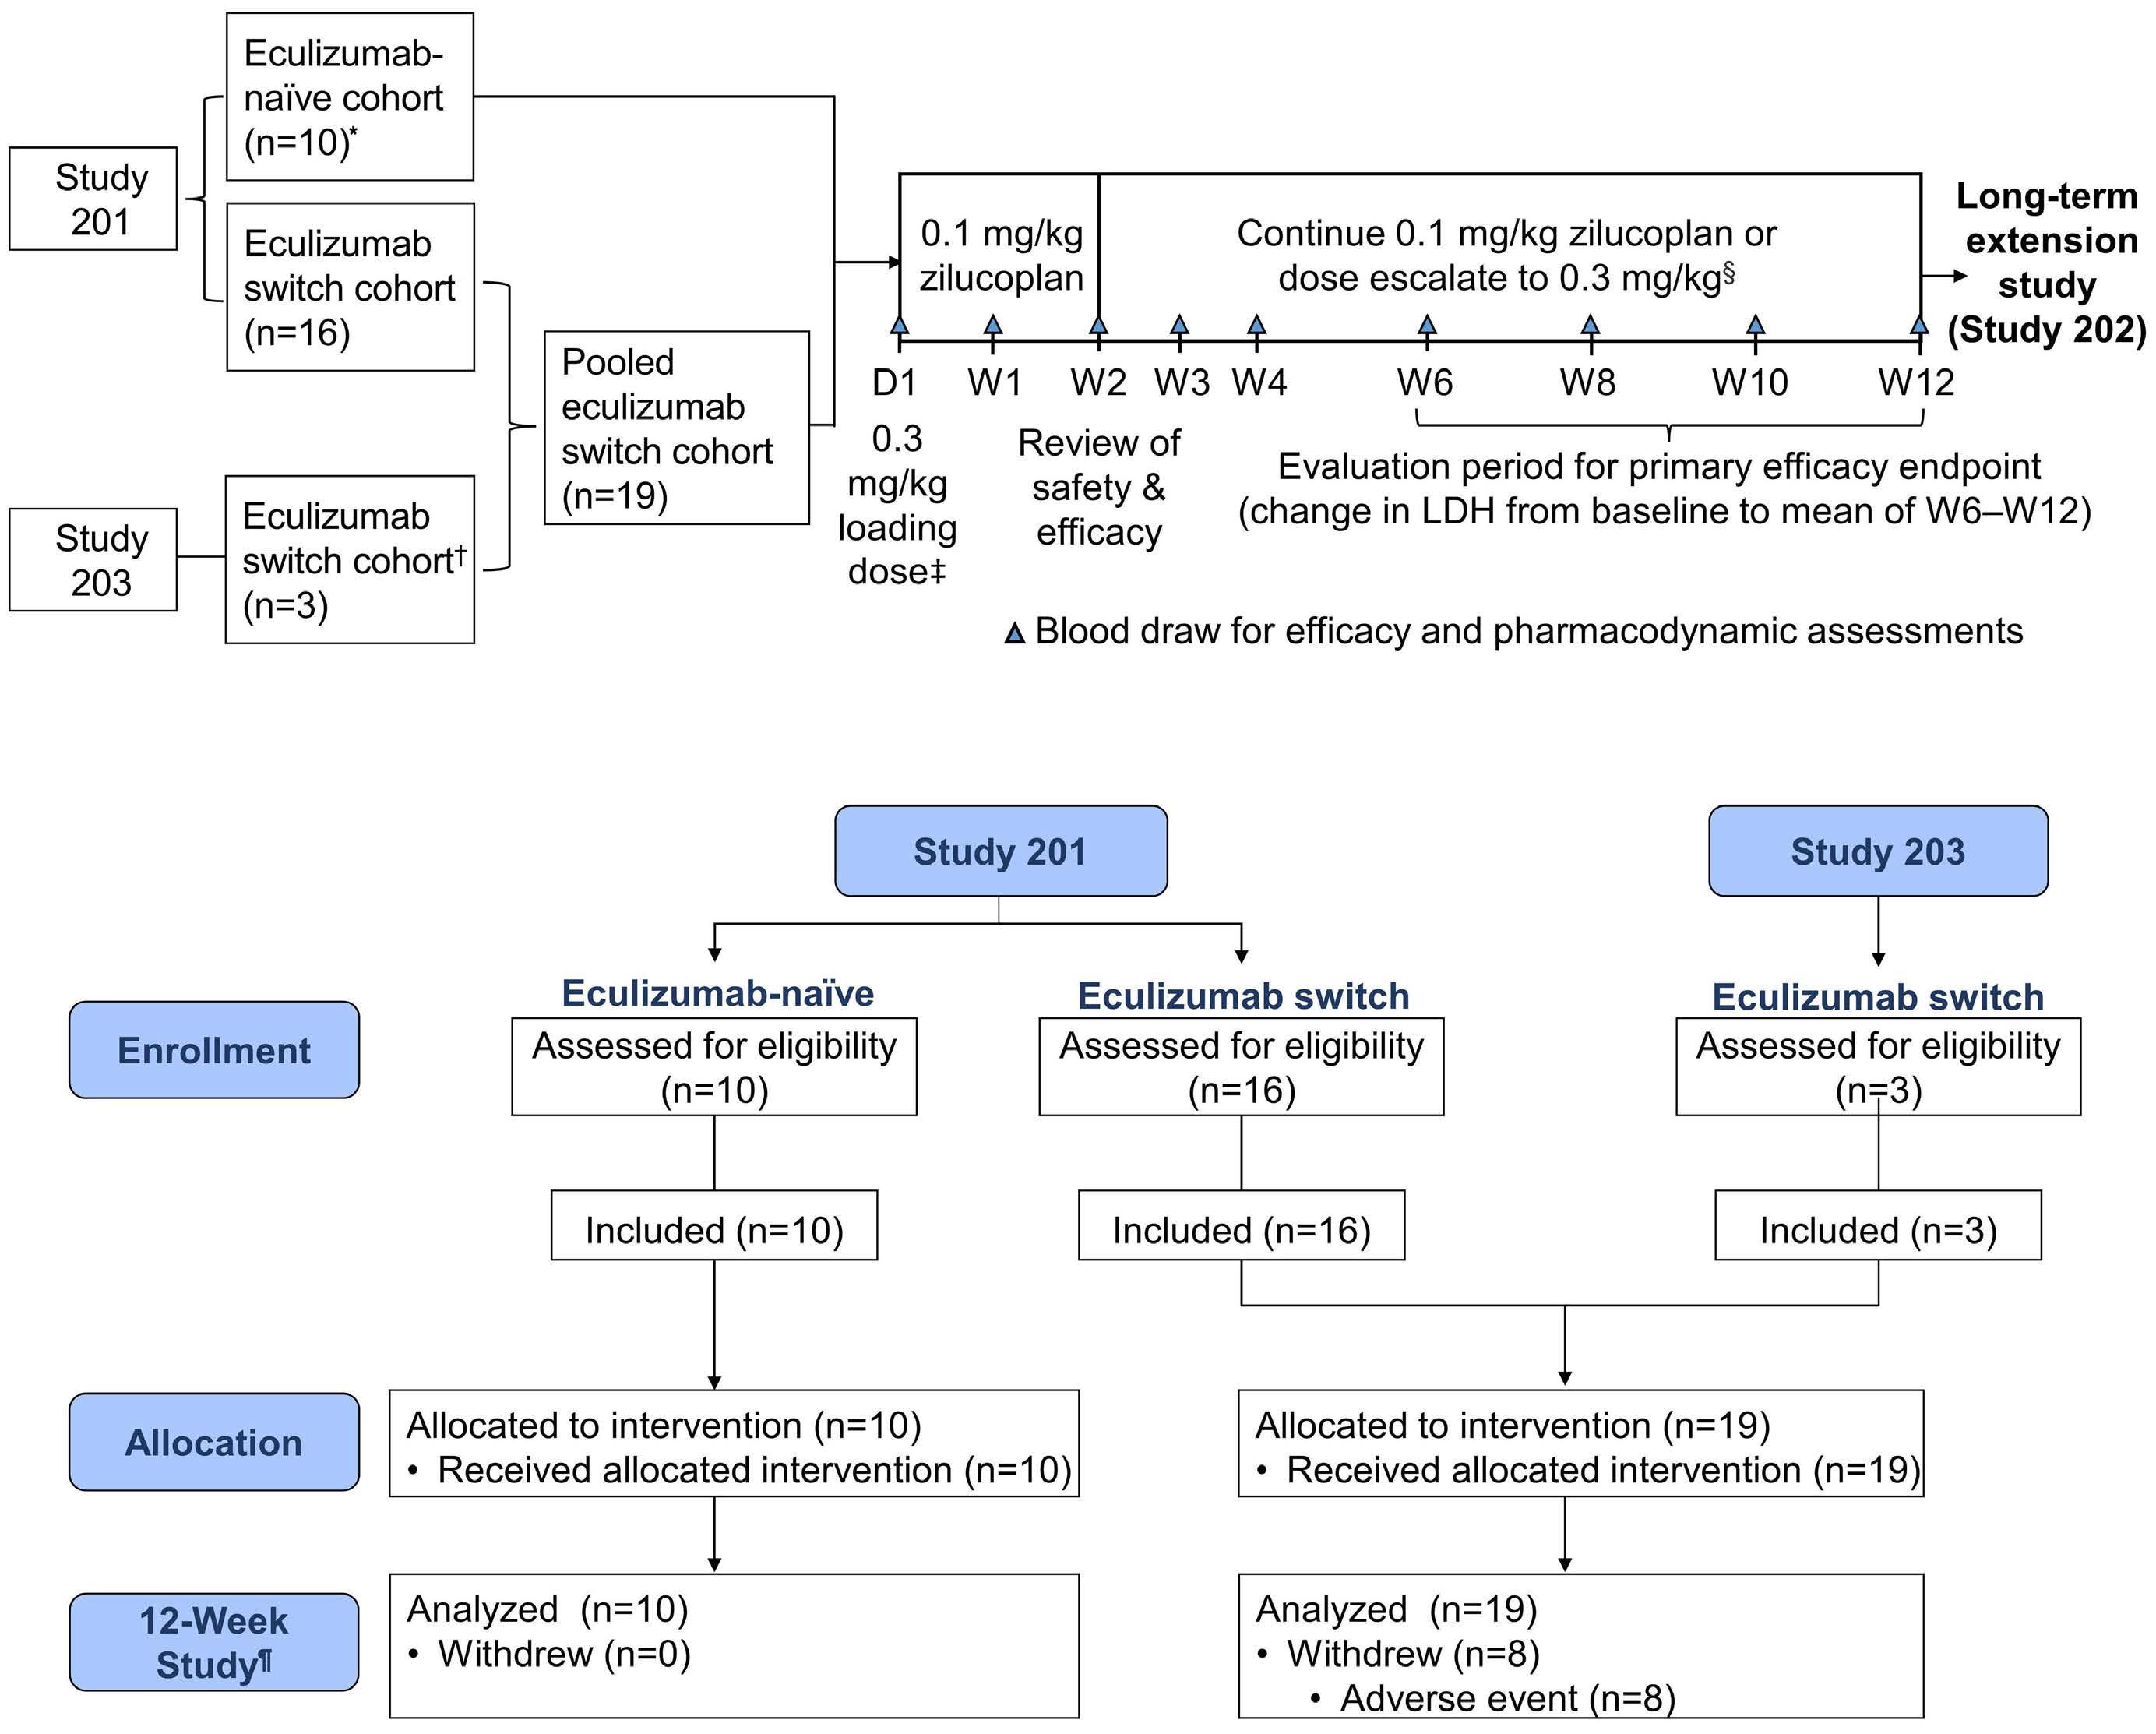
Figure 1. (A) Study designs for Studies 201 and 203 and (B) patients’ flow, illustrated in a CONSORT diagram. The two 12-week, single-arm studies (Study 201; conducted from April 2017 to January 2018, and Study 203; conducted from September 2017 to February 2018) enrolled 26 and three patients, respectively. The analysis includes ten patients from Study 201 who were eculizumab-naïve and 19 who had previously been treated with eculizumab (eculizumab switch cohort; 16 patients from Study 201 and 3 patients from Study 203). All ten patients in the eculizumab-naïve cohort and 11/19 patients in the switch cohort entered the open-label extension study. *The eculizumab-naïve cohort consisted of patients with no prior exposure to eculizumab. †The switch cohort included patients with prior exposure to eculizumab for ≥6 months before screening. On day 1, a single loading dose of 0.3 mg/kg zilucoplan was administered subcutaneously. Thereafter, patients self-injected subcutaneous zilucoplan at home daily for the subsequent 12 weeks. Dose escalation to 0.3 mg/kg daily could be initiated at week 2 if a lactate dehydrogenase level of <1.5 times the upper limit of normal was not achieved or an overt breakthrough episode of hemolysis occurred (assessed via investigator judgement). A dose increase to 0.3 mg/kg was made in ten patients in the eculizumab-naïve cohort and 16 patients in the switch cohort after a median time of 19 days (range, 15-669 days) and 19.5 days (range, 1-57 days), respectively. ‡Blood samples for pharmacodynamics were collected within 1 hour of the administration of the first dose and at 1, 3, and 6 hours after the dose on day 1. §For patients who had a zilucoplan dose increase to 0.3 mg/kg, samples for pharmacodynamics were collected before the new dose, on day 1 of the new dose, and thereafter at scheduled visits. ¶No patients from either study were lost to follow-up. D: day; W: week; LDH: lactate dehydrogenase.
Haematologica | 109 Marzo 2024 930 LETTER TO THE EDITOR
A B
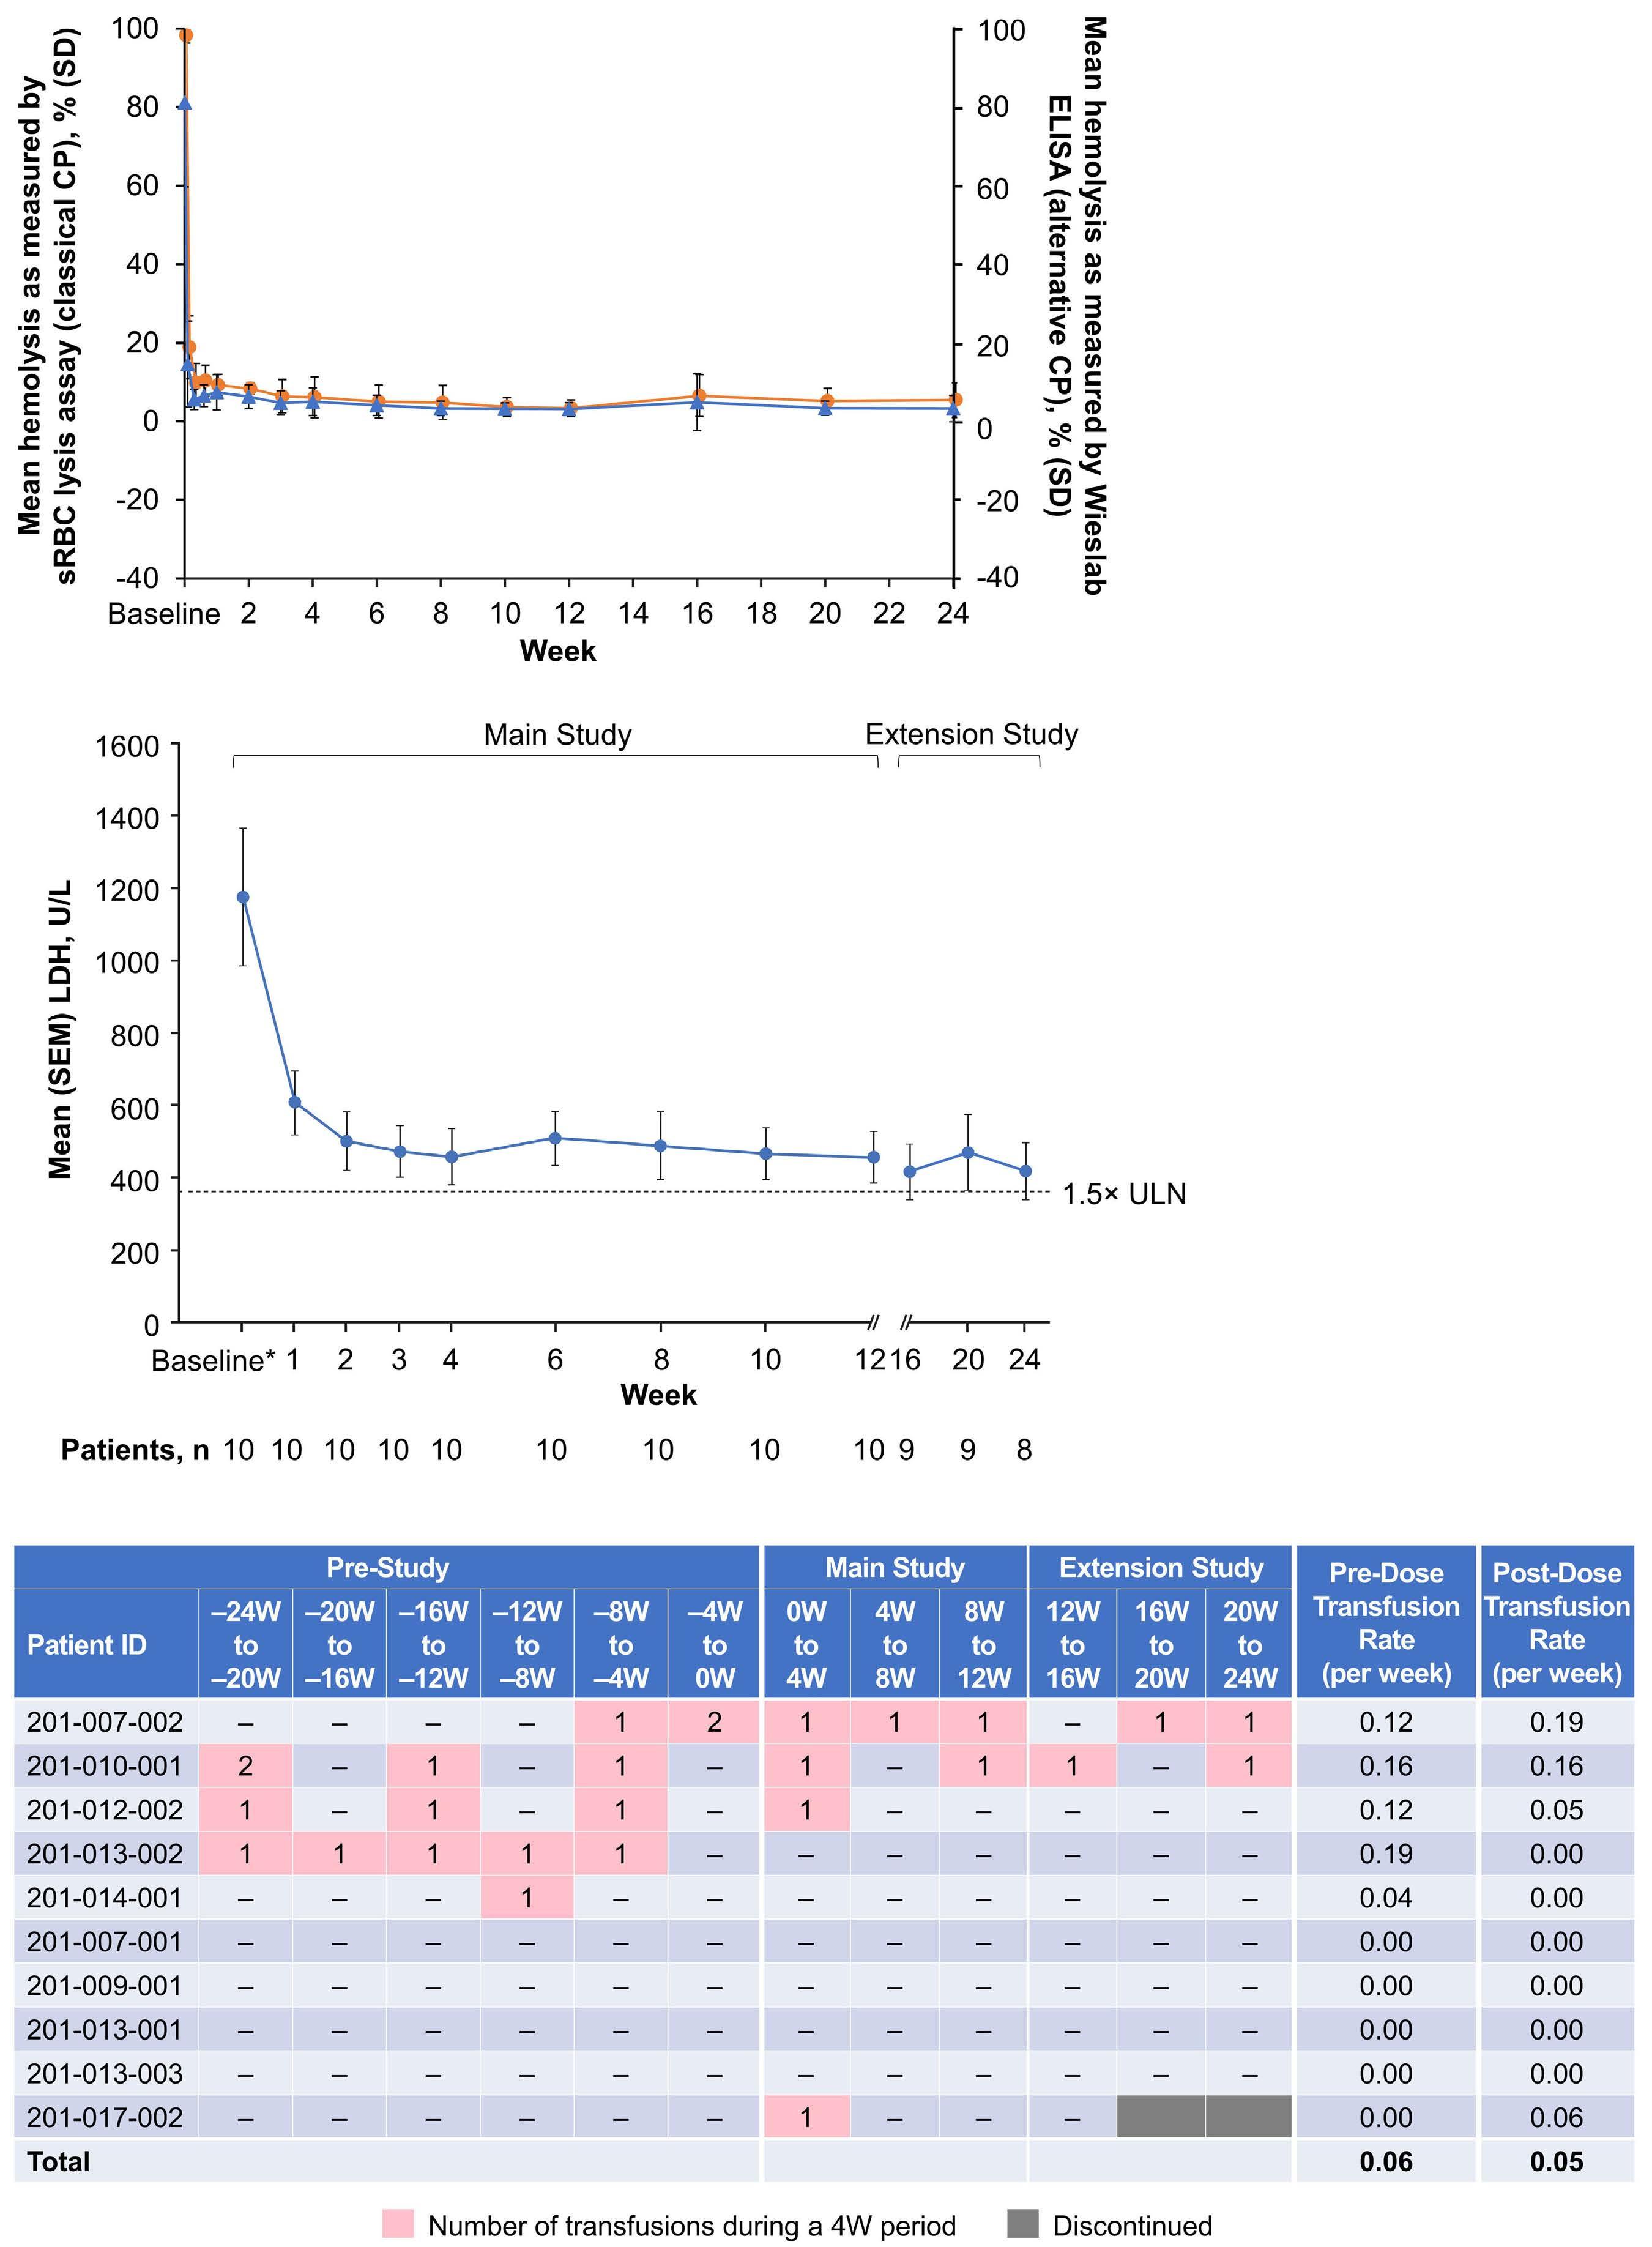
Figure 2. Effect of zilucoplan on patients with paroxysmal nocturnal hemoglobinuria in the eculizumab-naïve cohort. (A-C) Mean complement activity as measured by sheep red blood cell (sRBC) assay (classical complement pathway; left y-axis, orange circles)15 and Wieslab enzyme-linked immunosorbent assay (ELISA) (alternative complement pathway; right y-axis, blue triangles) (A),16 mean lactate dehydrogenase (LDH) levels (B), and transfusion requirements (C) before and after initiation of zilucoplan. Change in serum LDH, sRBC lysis, and Wieslab ELISA at each time point were analyzed using the two-sided Wilcoxon signed-rank test in each cohort. Missing data were not imputed. *Baseline is the average of the screening and day 1 LDH values per patient. sRBC: sheep red blood cell; CP: complement pathway; SD: standard deviation; ELISA: enzyme-linked immunosorbent assay; SEM: standard error of the mean; LDH: lactate dehydrogenase; ULN: upper limit of normal; ID: identity; W: week.
Haematologica | 109 Marzo 2024 931 LETTER TO THE EDITOR
A B C
and tongue hematoma [n=1]; encephalopathy, pneumococcal pneumonia, and suicide attempt [n=1]), of which headache and nausea experienced by one (5.3%) patient were deemed treatment-related.
Twenty-one injection site reactions occurred in 12 (41.4%) patients across the 12-week and extension study periods; all were mild except for one event of moderate severity. Headache was the most common adverse event across all study periods, occurring in 12 (41.4%) patients. No deaths or meningococcal infections occurred during the studies.
To understand the mechanism for switch failure, an experimental analysis was performed in which the impact of treatment on hemolytic protection of commercially sourced type III PNH RBC after complement activation and C3b opsonization was
studied by flow cytometry (Online Supplementary Figure S1). In the absence of complement activation (heat-inactivated sera condition), type III RBC (absence of CD59 expression) accounted for 60% of the total RBC pool in the analyzed PNH donor, while the type II RBC population (partial/reduced CD59 levels) was small in this donor and consequently excluded from further analysis. Low levels of C3b were detected on type III but not type I (high CD59 expression) RBC. Acidification of complement-competent serum resulted in alternative pathway activation and lysis of type III RBC in the absence of C5 inhibition (data not shown). Blocking C5 activation with either eculizumab or zilucoplan resulted in partial protection of type III RBC from lysis and deposition of C3b on the type III RBC. In the presence of both eculizumab and zilucoplan,
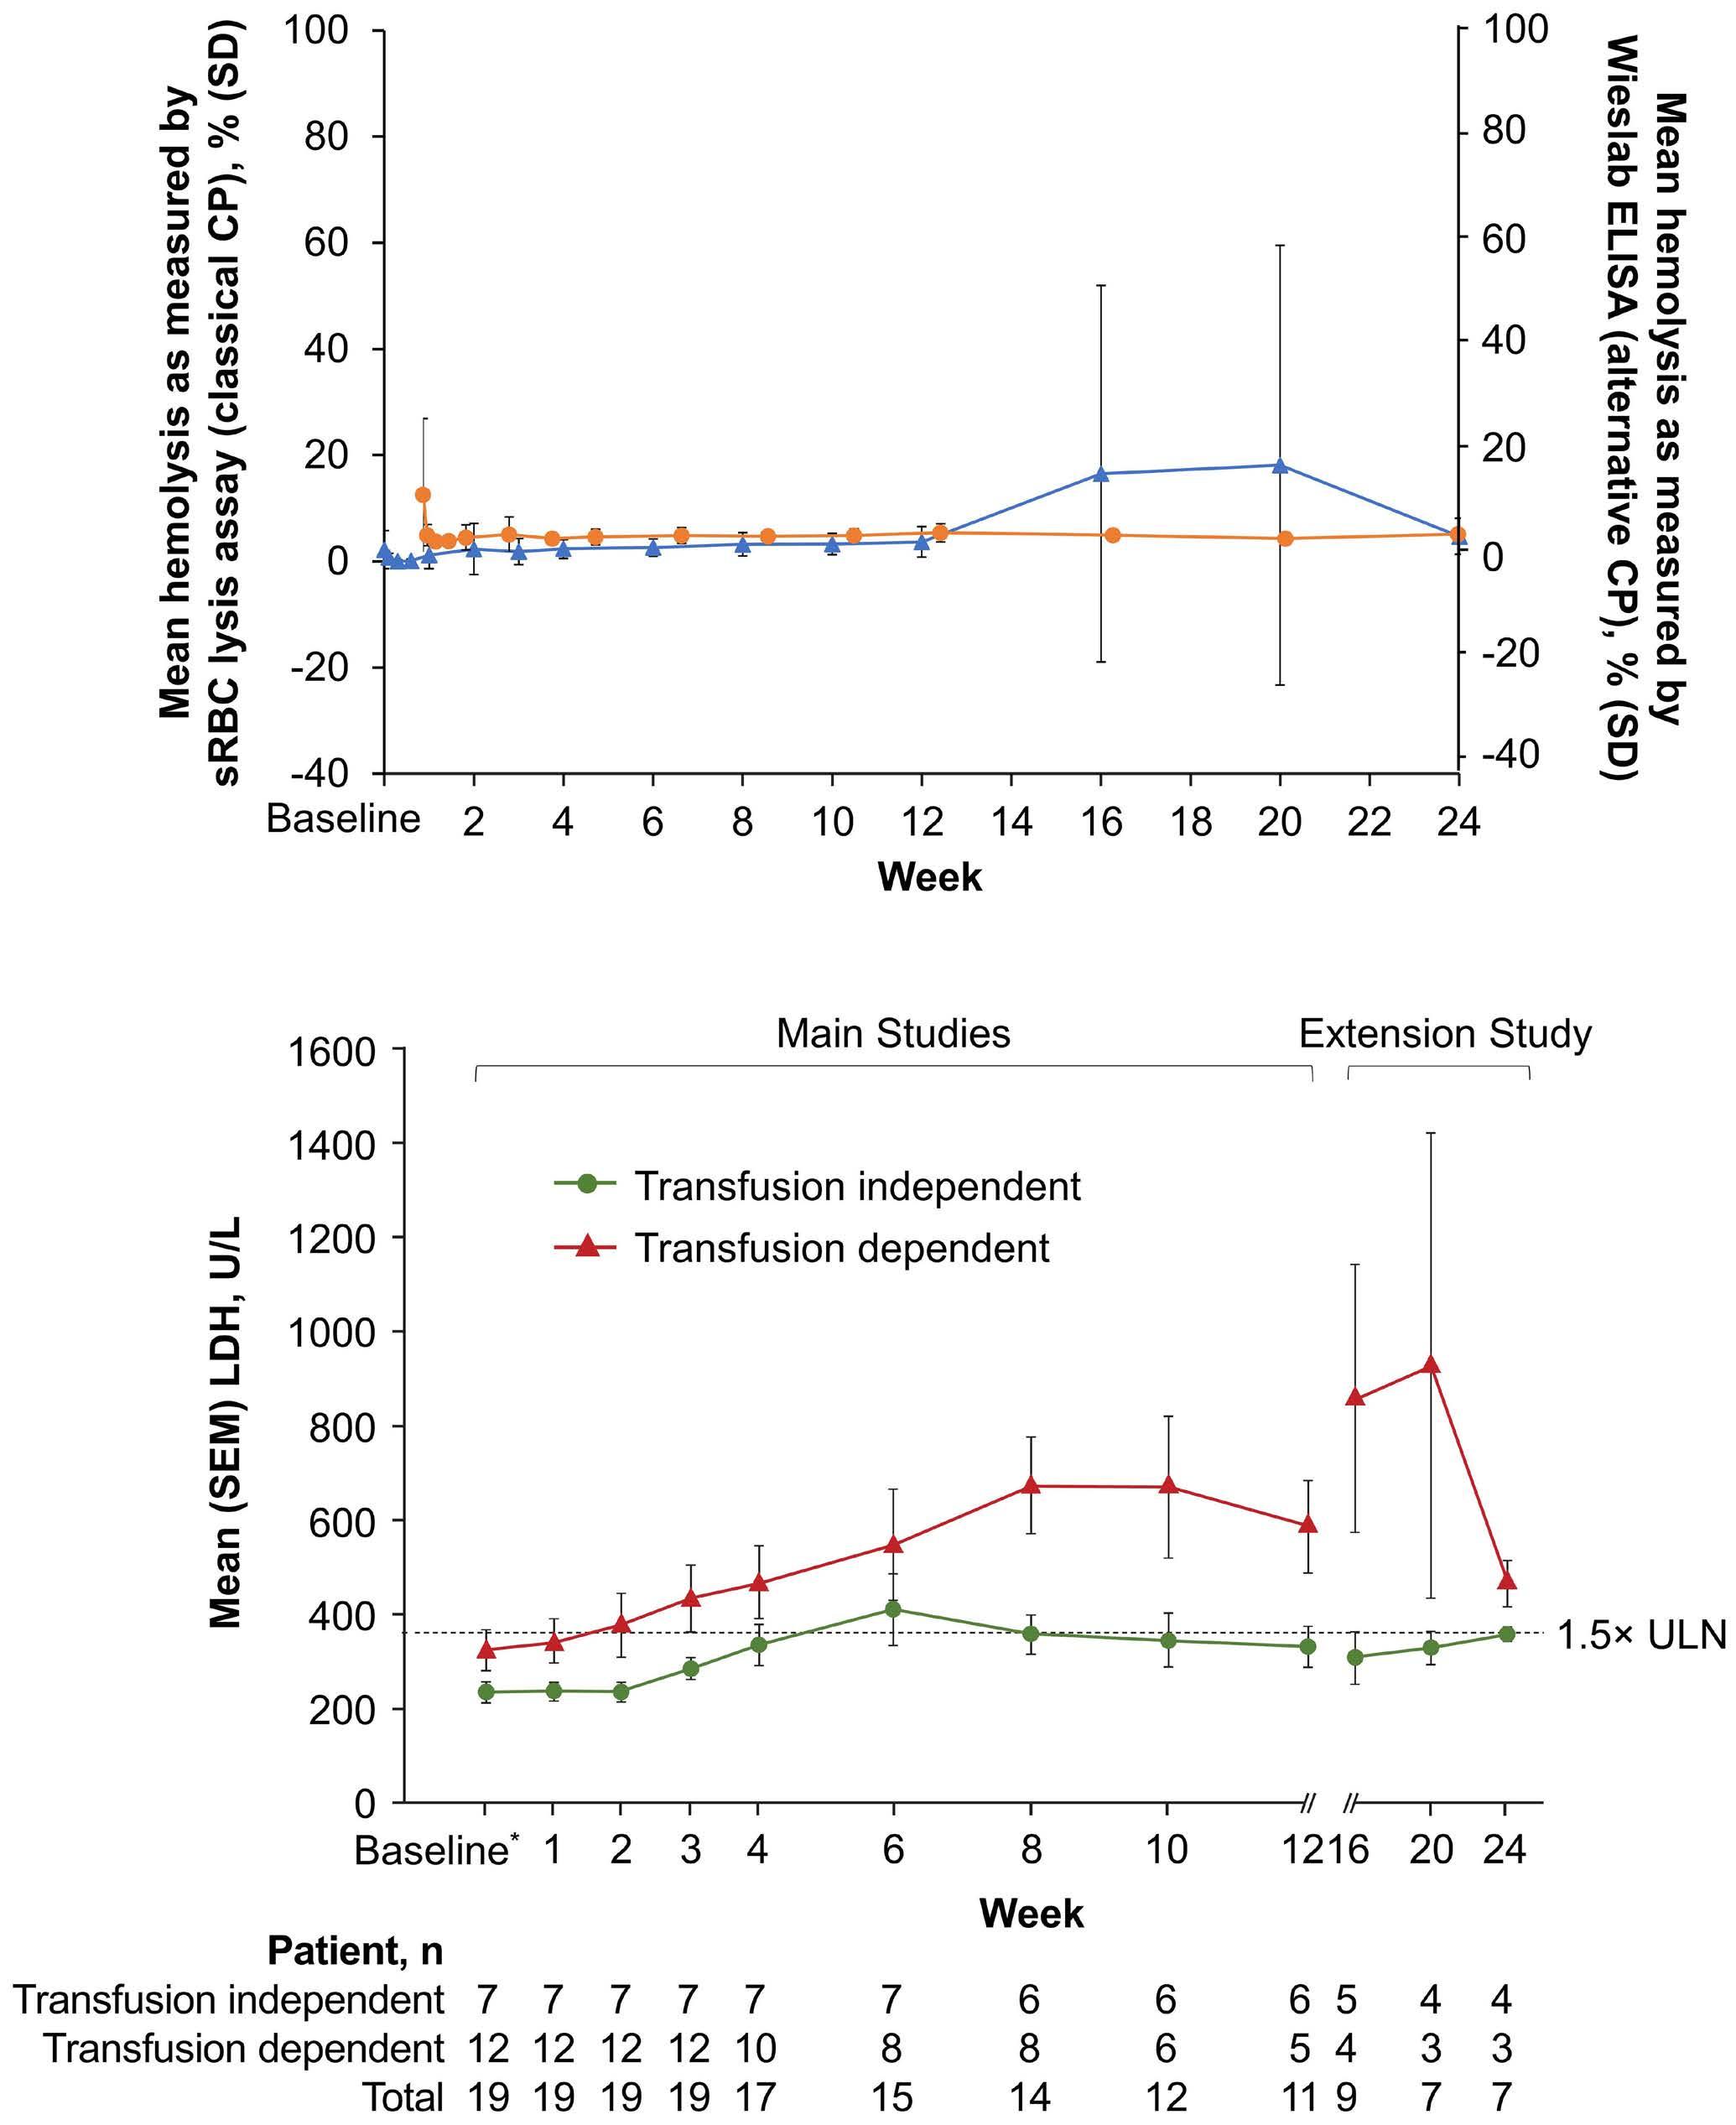
Haematologica | 109 Marzo 2024 932 LETTER TO THE EDITOR
A B
Continued on following page.
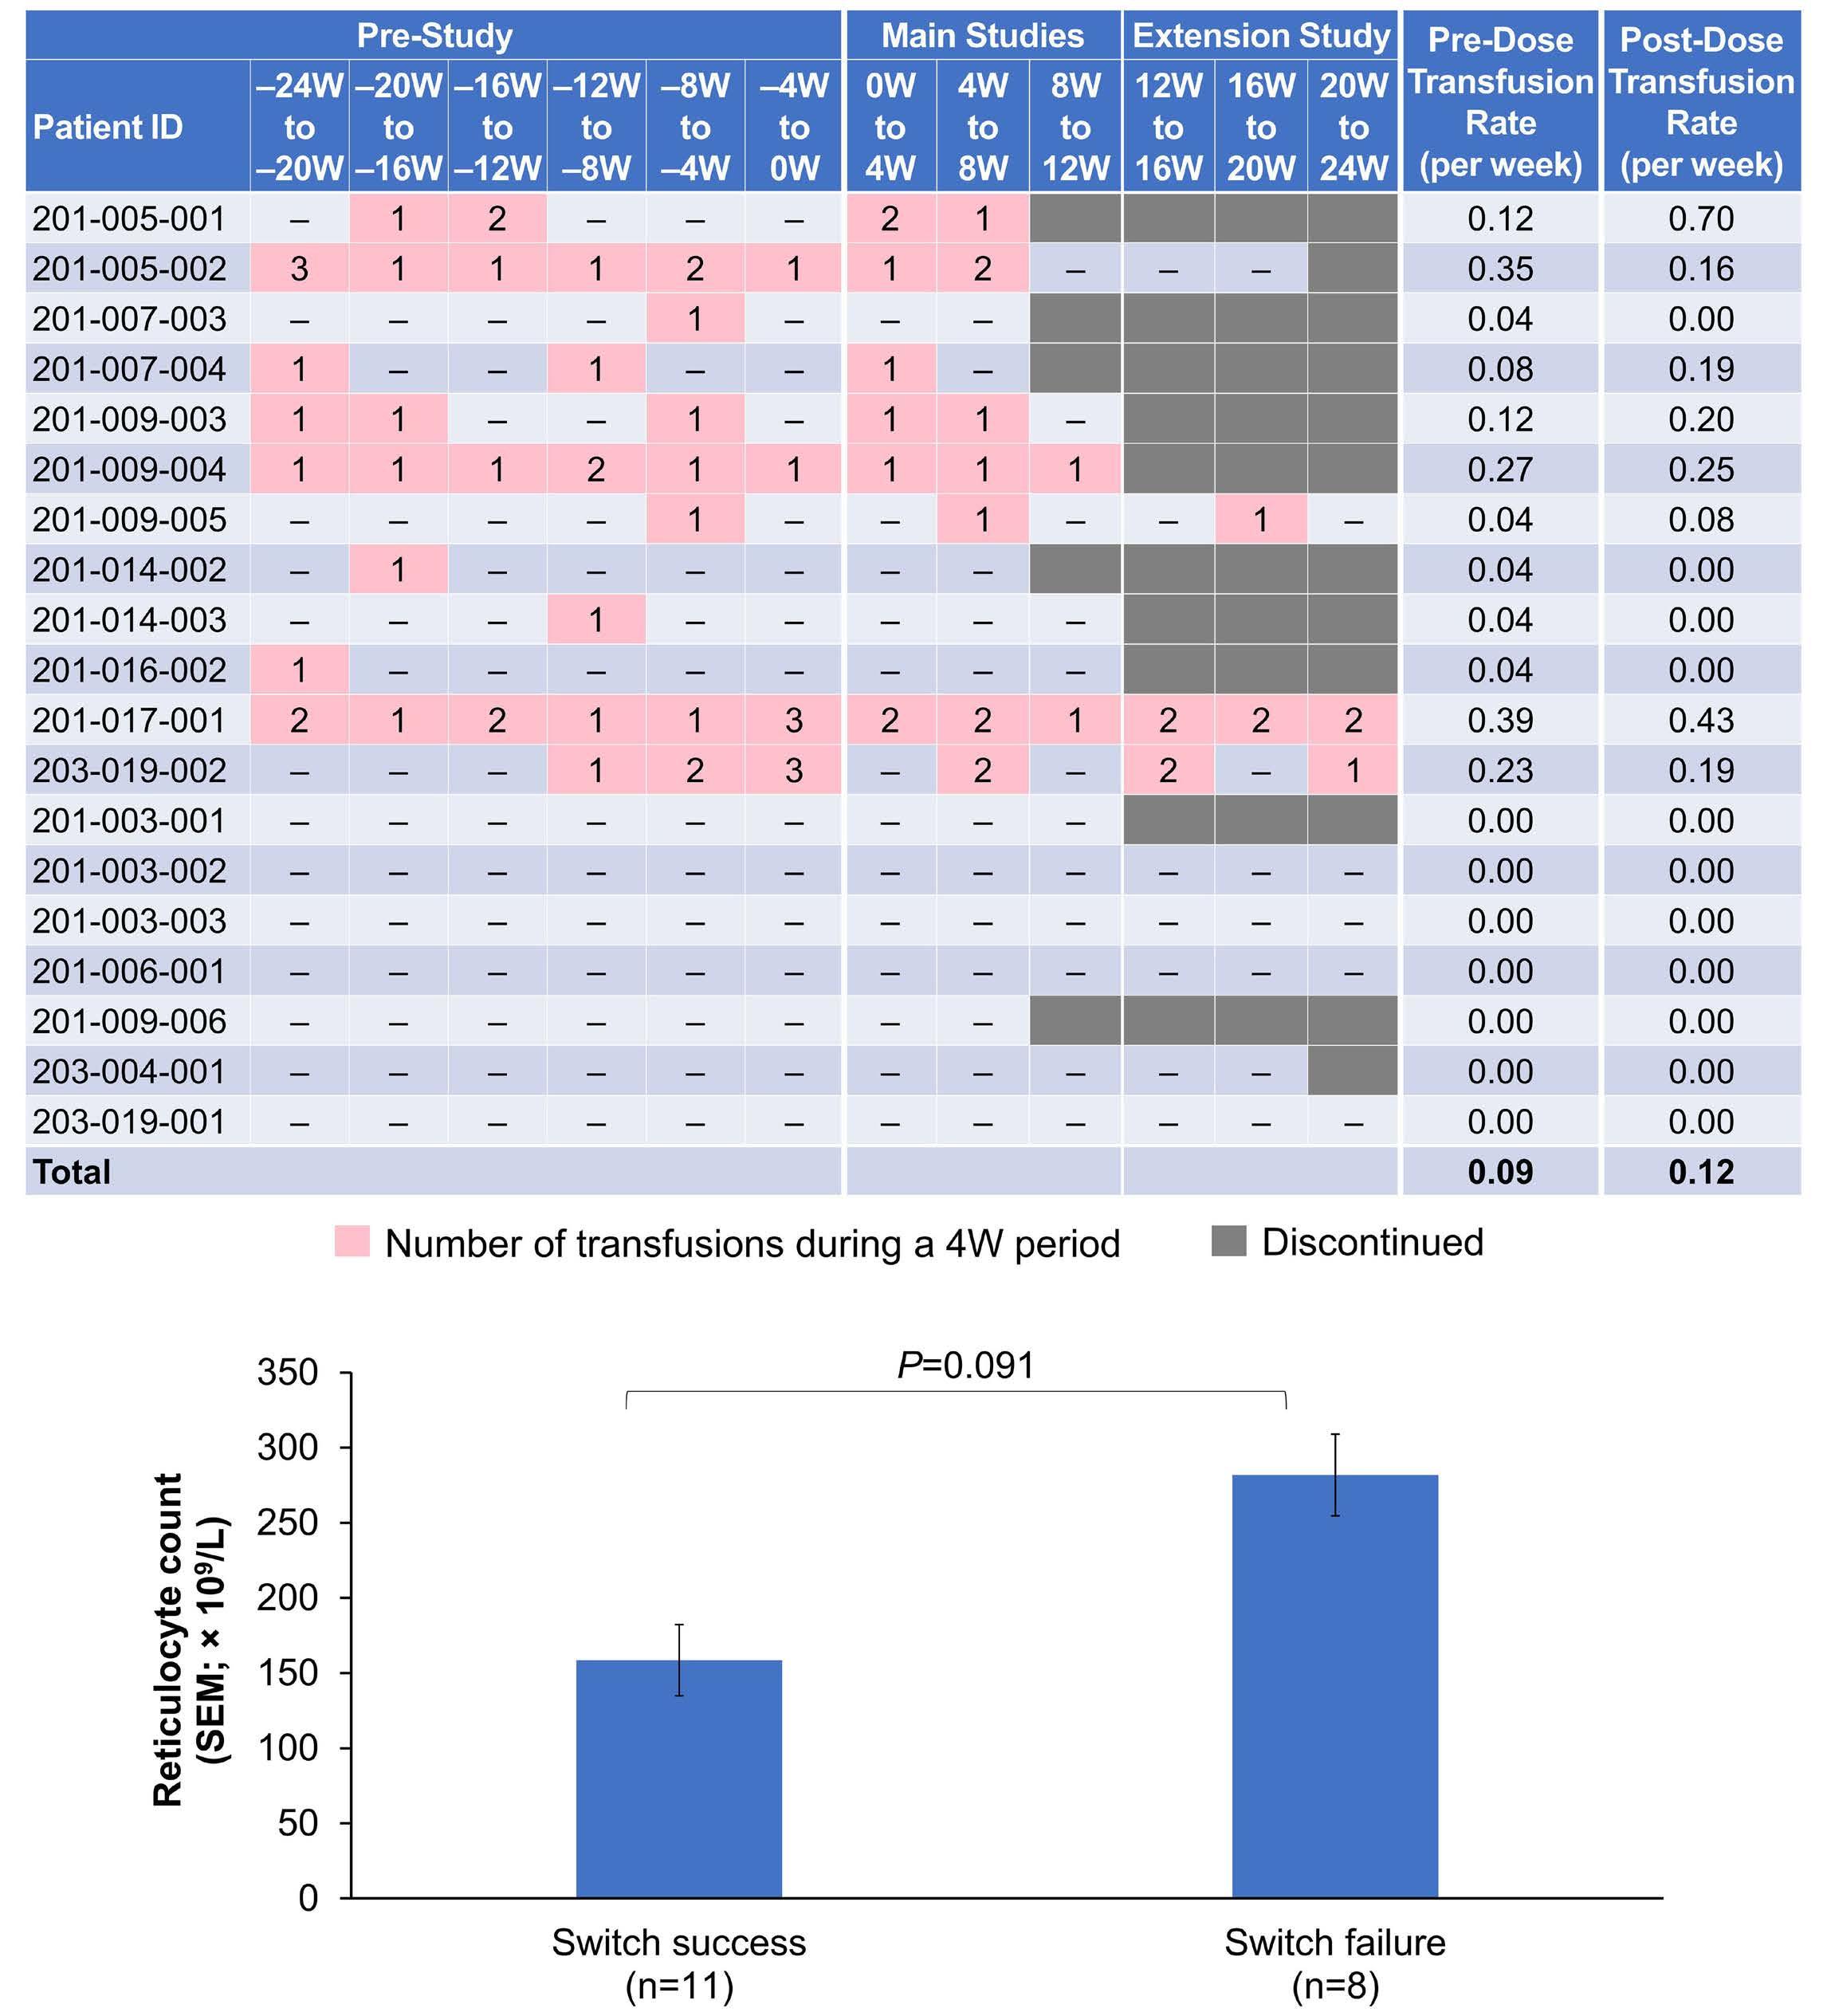
Figure 3. Effect of zilucoplan on patients with paroxysmal nocturnal hemoglobinuria in the eculizumab switch cohort. (A-C) Mean complement activity as measured by sheep red blood cell (sRBC) assay (classical complement pathway; left y-axis, orange circles)15 and Wieslab enzyme-linked immunosorbent assay (ELISA) (alternative complement pathway; right y-axis, blue triangles) (A),16 mean lactate dehydrogenase (LDH) reductions (B), transfusion requirements before and after initiation of zilucoplan (C), and mean counts at baseline in the switch cohort, stratified by switch success (N=8) versus switch failure (N=11; 282×109/L vs. 159×109/L; male upper limit of normal: 130×109/L; female upper limit of normal: 120×109/L) (D). Switch failure was defined as zilucoplan discontinuation during the first 12 weeks; patients could resume eculizumab treatment per individual investigator’s procedures. Changes in serum LDH, sRBC lysis, and Wieslab ELISA at each time point were analyzed using the two-sided Wilcoxon signed-rank test in each cohort. Missing data were not imputed. *Most recent non-missing value obtained immediately before administration of the first dose of zilucoplan; mean (standard deviation) baseline LDH values: transfusion-independent (N=7), 232.6 (22.6) U/L; transfusion-dependent (N=12), 320.8 (44.4) U/L (P=0.0296). sRBC: sheep red blood cell; CP: complement pathway; SD: standard deviation; ELISA: enzyme-linked immunosorbent assay; SEM: standard error of the mean; ULN: upper limit of normal; LDH: lactate dehydrogenase; ID: identity; W: week.
type III RBC were protected from lysis and present at levels similar to those in controls (heat-inactivated serum) (Online Supplementary Figure S1A), and a larger proportion of highly C3b-opsonized type III RBC was generated compared with the proportions following treatment with eculizumab or zilucoplan
alone (Online Supplementary Figure S1B, C). During the switch protocol, eculizumab and zilucoplan are both circulating in the blood at therapeutic concentrations for several days to over a week.9 The combination of eculizumab and zilucoplan enabled the accumulation of high densities of C3b on PNH
Haematologica | 109 Marzo 2024 933 LETTER TO THE EDITOR
C D
type III RBC, an effect not observed in type I RBC. High concentrations of C3b may enable a non-enzymatic cleavage of C5 on the surface of RBC that cannot be inhibited by a C5 inhibitor, including zilucoplan. Prior studies have suggested that a high density of membrane-bound C3b can directly activate C5, leading to membrane attack complex formation without proteolytic cleavage of C5 into C5a and C5b.10,11 These prior analyses demonstrated conformational activation of C5 in the absence of convertases or other enzymes that cannot be inhibited by different individual C5 inhibitors alone.10,11 We hypothesize that after eculizumab washout, densely C3-opsonized RBC bind C5, which then adopts a C5b-like conformation11 that cannot be efficiently inhibited by zilucoplan, resulting in intravascular hemolysis of this cell population (Online Supplementary Figure S1D).
The management of patients with PNH should seek to achieve complete and sustained inhibition of terminal complement. Residual free C5 was associated with an increased risk of breakthrough intravascular hemolysis in patients on other C5 inhibitors.2,3,12,13 Free C5 was not assessed in our trial, but complete complement inhibition was seen using functional assays in the current studies (Figures 2A and 3A) and in other populations (ie., patients with generalized myasthenia gravis).7
In conclusion, in eculizumab-naïve patients with PNH treated with zilucoplan, LDH reductions were similar to those previously reported with eculizumab,4 which agrees with the pharmacodynamic effects of zilucoplan. Despite confirmed complete complement inhibition, transfusion-dependent patients in the switch cohort with high reticulocyte counts failed to respond sufficiently to zilucoplan.
We expand upon the findings of other research groups to provide a rationale for increased intravascular hemolysis in patients who switched from eculizumab to zilucoplan.10,11 This phenomenon is thought to be PNH-specific as a result of the disease-induced absence of glycosylphosphatidylinositol-anchored membrane proteins, including inhibitors of the complement cascade, on RBC. Overall, zilucoplan therapy was safe and well tolerated in patients with PNH.
Despite the cessation of clinical development of zilucoplan in PNH, the efficacy and safety profile of this novel C5 inhibitor in generalized myasthenia gravis,7 along with the flexibility of once-daily, at-home, subcutaneous injections, has established zilucoplan as another potential option in the growing armamentarium of C5 inhibitors.3 It has been suggested that combined treatment targeting different components of the complement cascade might overcome the residual hemolysis seen in a proportion of patients with PNH treated with a C5 inhibitor.2,14
Authors
Austin G. Kulasekararaj,1 Anna-Elina Lehtinen,2 Cecily Forsyth,3 Shreyans Gandhi,1 Morag Griffin,4 Sixten Körper,5 Gabor Mikala,6 Petra Muus,1,4 Ulrik Overgaard,7 Christopher J. Patriquin,8 Humphrey Pullon,9 Yu-Min Shen,10 Ruth Spearing,11 Jeff Szer,12 Guillemette de la Borderie,13
Petra W. Duda,14 Ramin Farzaneh-Far,14 Sharan Ragunathan,14 Camil E. Sayegh,14 Douangsone D. Vadysirisack14 and Hubert Schrezenmeier5
1King’s College Hospital-NHS Foundation Trust, NIHR/Wellcome King’s Clinical Research Facility, London, UK & King’s College London, London, UK; 2Helsinki University Hospital Comprehensive Cancer Center and University of Helsinki, Helsinki, Finland; 3Gosford Hospital, Gosford, New South Wales, Australia; 4St. James’s University Hospital, Leeds, UK; 5University of Ulm, Institute of Transfusion Medicine, and Institute of Transfusion Medicine and Immunogenetics Ulm, Red Cross Blood Transfusion Service Baden-Württemberg-Hessen and University Hospital Ulm, Ulm, Germany; 6Central Hospital of Southern Pest National Institute of Hematology and Infectious Diseases, Budapest, Hungary; 7University Hospital Copenhagen, Copenhagen, Denmark; 8University Health Network, Toronto, Ontario, Canada; 9Waikato Hospital, Hamilton, New Zealand; 10UT Southwestern Medical Center, Dallas, TX, USA; 11Christchurch Hospital, Christchurch, New Zealand; 12Peter MacCallum Cancer Centre & The Royal Melbourne Hospital, Melbourne, Victoria, Australia; 13UCB Pharma, Colombe, France and 14UCB Pharma, Cambridge, MA, USA
Correspondence: H. SCHREZENMEIER - h.schrezenmeier@blutspende.de
https://doi.org/10.3324/haematol.2022.281780
Received: August 5, 2022.
Accepted: July 27, 2023. Early view: August 3, 2023.
Published under a CC BY license
Disclosures
AGK has received speaker bureau, consultancy, and advisory board honoraria and travel expenses from Akari, Alexion Pharmaceuticals, Amgen, Apellis, BioCryst Pharmaceuticals, Celgene/Bristol Myers Squibb, Novartis, Ra Pharmaceuticals/UCB Pharma, Roche, and Sobi. A-EL has received speaking and/or consultant/advisory board honoraria from Alexion Pharmaceuticals. CF has received speaking and advisory board honoraria from Alexion Pharmaceuticals. MG has received speaking and/or advisory board honoraria from Alexion Pharmaceuticals and Sobi, consulted for and participated in an advisory board for BioCryst Pharmaceuticals, Novartis, and Regeneron Pharmaceuticals, and participated in a Medscape educational program funded by an educational grant from Apellis Pharmaceuticals. SK has received speaking and advisory board honoraria from Alexion Pharmaceuticals. GM has received research grant funding from AbbVie and consulting fees, speaking honoraria, and/or travel support from Amgen, Bristol Myers Squibb/Celgene, Janssen-Cilag, Novartis, Sanofi, and Takeda. PM has received lecture fees and travel support from Sobi and participated in an advisory board for Novartis. UO has received speaking and/or advisory board honoraria from Alexion Pharmaceuticals and Sobi. CJP has received speaking and/or advisory board honoraria from Alexion Pharmaceuticals, Apellis Pharmaceuticals, BioCryst Pharmaceuticals, and Sanofi. JS has received speaking and/or advisory board honoraria
Haematologica | 109 Marzo 2024 934 LETTER TO THE EDITOR
from Alexion Pharmaceuticals, Apellis Pharmaceuticals, BioCryst Pharmaceuticals, Novartis, Pfizer, Prevail Therapeutics, and SanofiGenzyme. GdlB, PWD, and SR, are employees of UCB Pharma and own stock and/or hold stock options in the company. CES and DDV are former employees of UCB Pharma and Ra Pharmaceuticals. RF-F is a former employee of Ra Pharmaceuticals. HS has received research funding and honoraria as a speaker in symposia or for service on advisory boards from Alexion Pharmaceuticals, Apellis Pharmaceuticals, Novartis, Ra Pharmaceuticals, Roche, and Sanofi (all to the institution of HS). HP, Y-MS, RS, and SG have no conflicts of interest to disclose.
Contributions
AGK, PM, and HS contributed to the concept and design of the research, were study investigators, and contributed to the analysis of data. A-EL, CF, SG, MG, SK, GM, UO, CJP, HP, Y-MS, and JS were study investigators. RS was a study investigator and contributed to analysis of data. SR performed the mechanistic studies and contributed to the interpretation of data. GdlB, PWD, and RF-F contributed to the interpretation of data. CES and DDV contributed to the design of mechanistic studies and interpretation of data. All authors reviewed and approved the manuscript for submission.
Acknowledgments
The authors would like to acknowledge the following contributors:
Stephen Babcock, MS, of UCB Pharma, for support as Clinical Project
References
1. Hill A, DeZern AE, Kinoshita T, Brodsky RA. Paroxysmal nocturnal haemoglobinuria. Nat Rev Dis Primers. 2017;3:17028.
2. Risitano AM, Marotta S, Ricci P, et al. Anti-complement treatment for paroxysmal nocturnal hemoglobinuria: time for proximal complement inhibition? A position paper from the SAAWP of the EBMT. Front Immunol. 2019;10:1157.
3. Kulasekararaj AG, Brodsky RA, Nishimura JI, Patriquin CJ, Schrezenmeier H. The importance of terminal complement inhibition in paroxysmal nocturnal hemoglobinuria. Ther Adv Hematol. 2022;13:20406207221091046.
4 Hillmen P, Young NS, Schubert J, et al. The complement inhibitor eculizumab in paroxysmal nocturnal hemoglobinuria. N Engl J Med. 2006;355(12):1233-1243.
5. Kulasekararaj AG, Hill A, Rottinghaus ST, et al. Ravulizumab (ALXN1210) vs eculizumab in C5-inhibitor-experienced adult patients with PNH: the 302 study. Blood. 2019;133(6):540-549.
6. Lee JW, Sicre de Fontbrune F, Wong Lee Lee L, et al. Ravulizumab (ALXN1210) vs eculizumab in adult patients with PNH naïve to complement inhibitors: the 301 study. Blood. 2019;133(6):530-539.
7 Howard JF Jr, Bresch S, Genge A, et al. Safety and efficacy of zilucoplan in patients with generalised myasthenia gravis (RAISE): a randomised, double-blind, placebo-controlled, phase 3 study. Lancet Neurol. 2023;22(5):395-406.
8. Hill A, Schrezenmeier H, Hillmen P, et al. RA101495, a subcutaneously-administered peptide inhibitor of complement component 5 (C5), for the treatment of paroxysmal nocturnal hemoglobinuria: phase 2 results. Hemasphere. 2018;2(S1):105.
Manager for the studies; Anita Hill, MD, PhD, formerly of the National Health Service, UK, for work as a study investigator; and Veronica Porkess, PhD, CMPP, of UCB Pharma, for publication and editorial support.
Funding
Studies 201, 202, and 203 were funded by Ra Pharmaceuticals (Cambridge, MA, USA; now a part of UCB Pharma [Brussels, Belgium]). Medical writing and editorial assistance were provided by Jessica Deckman, PhD, CMPP, of The Lockwood Group (Stamford, CT, USA), and funded by UCB Pharma, in accordance with Good Publications Practice (GPP) 2022 guidelines (https://www.ismpp.org/gpp-2022).
Data-sharing statement
Underlying data from this manuscript may be requested by qualified researchers 6 months after product approval in the USA and/or Europe, or global development is discontinued, and 18 months after study completion. Investigators may request access to anonymized individual patient-level data and redacted study documents, which may include: analysis-ready datasets, study protocols, annotated case report forms, statistical analysis plans, dataset specifications, and clinical study reports. Prior to use of the data, proposals need to be approved by an independent review panel at www.Vivli.org and a signed data-sharing agreement will need to be executed. All documents are available in English only, for a prespecified time, typically 12 months, on a password-protected portal.
9. Wijnsma KL, Ter Heine R, Moes D, et al. Pharmacology, pharmacokinetics and pharmacodynamics of eculizumab, and possibilities for an individualized approach to eculizumab. Clin Pharmacokinet. 2019;58(7):859-874.
10 Harder MJ, Kuhn N, Schrezenmeier H, et al. Incomplete inhibition by eculizumab: mechanistic evidence for residual C5 activity during strong complement activation. Blood. 2017;129(8):970-980.
11. Mannes M, Dopler A, Zolk O, et al. Complement inhibition at the level of C3 or C5: mechanistic reasons for ongoing terminal pathway activity. Blood. 2021;137(4):443-455.
12. Brodsky RA, Peffault de Latour R, Rottinghaus ST, et al. Characterization of breakthrough hemolysis events observed in the phase 3 randomized studies of ravulizumab versus eculizumab in adults with paroxysmal nocturnal hemoglobinuria. Haematologica. 2021;106(1):230-237.
13. Hill AV, Valls AG, Griffin M, et al. A subcutaneously administered investigational RNAi therapeutic (ALN-CC5) targeting complement C5 for treatment of PNH and complementmediated diseases: preliminary phase 1/2 study results in patients with PNH. Blood. 2016;128(22):3891.
14 Notaro R, Luzzatto L. Breakthrough hemolysis in PNH with proximal or terminal complement inhibition. N Engl J Med. 2022;387(2):160-166.
15. Costabile M. Measuring the 50% haemolytic complement (CH50) activity of serum. J Vis Exp. 2010;(37):1923.
16. Svar Life Science AB. WIESLAB® complement system alternative pathway: instructions for use. Package insert. Accessed December 2018.
Haematologica | 109 Marzo 2024 935 LETTER TO THE EDITOR
Survival disparities between children and adolescents and young adults for the major subtypes of non-Hodgkin lymphoma in the Netherlands: a large population-based study
Non-Hodgkin lymphoma (NHL) is a relatively common type of cancer in children and adolescents and young adults (AYA).1,2 The most prevalent histological subtypes occurring in both groups are T-lymphoblastic lymphoma (T-LBL), Burkitt lymphoma (BL), diffuse large B-cell lymphoma (DLBCL), and anaplastic large cell lymphoma (ALCL).3,4 AYA with NHL have poorer survival compared with pediatric patients.5-7 The causes for this survival gap may be related to differences in disease biology, treatment, therapy-related toxicities, and sociological and psychosocial factors.3 Although NHL is a heterogeneous disease, subtype-specific survival disparities between children and AYA have solely been reported in a few US population studies.4,5,8,9 Findings may, however, differ for the Netherlands and other highly developed countries with compulsory health insurance and complete coverage of costs related to treatment. In the Netherlands, the age cutoff for treatment at a pediatric oncology center is 18 years. Therefore, we aimed to investigate potential survival disparities between all children (age, 0-17 years) and AYA (age, 18-39 years) diagnosed with NHL in the Netherlands between 1990-2015 for the major histological subtypes occurring in both age groups. Data were retrieved from the nationwide population-based Netherlands Cancer Registry (NCR), which contains basic data regarding patient, tumor, and primary treatment started within 1 year of diagnosis.10 Registration of rituximab use has been complete since 2007. Patients were selected using International Classification of Childhood Cancer (3rd edition) diagnostic groups IIb, IIc, and IIe. The histological subtypes were defined according to the 2008 World Health Organization classification11 using International Classification of Diseases for Oncology (3rd edition) morphology codes: T-LBL - 9727, 9729, 9837; BL - 9687; DLBCL - 9678-9680, 9684, 9688, 9712, 9735, 9737-9738; ALCL - 9714-9715. The NCR data are extensively validated conforming to the comprehensive and standardized list of data quality checks from the European Network of Cancer Registries. Data quality checks were the same for children and AYA.
All analyses were stratified by histological subtype. Survival time was calculated from diagnosis until death or last follow-up (emigration or February 1, 2021). Five-year relative or disease-specific survival was determined by taking the ratio of the patients’ overall survival to the expected survival of an age-, sex-, and calendar year-matched cohort from the general population. Poisson regression was used to test for linear trends in relative survival across the diagnostic periods (1990-1999, 2000-2009, 2010-2015) and to evaluate
the association between age and excess mortality within 5 years of diagnosis while adjusting for patient mix. Patients diagnosed by autopsy were excluded from the survival analyses (n=7). Patients who died on the day of diagnosis were included with a follow-up of 1 day (n=18).
Between 1990-2015, 1,031 children and 4,608 AYA were diagnosed with NHL in the Netherlands. The distribution of the subtypes (i.e., T-LBL, BL, DLBCL, and ALCL) varied considerably, with BL being most common among children (33%) and DLBCL among AYA (41%). Additionally, large differences in initial treatment were observed across the age groups regardless of subtype (Table 1). In 2010-2015, rituximab was given to 67% of AYA with BL and 93% of AYA with DLBCL compared to only 11% and 49% of children, respectively (data not shown).
For T-LBL, 5-year relative survival was 23 percent-points higher in children than AYA (78% vs. 55%; Figure 1A; Online Supplementary Table S1). Survival improved over time by a fairly equal extent in both age groups, reaching 82% in children and 60% in AYA. In 2010-2015, survival progressively worsened with age from 92% in 0-9 year-olds to 54% in 30-39 year-olds (Figure 2A).
Overall, children with BL had a 24 percent-point higher 5-year relative survival than AYA (87% vs. 63%; Figure 1B; Online Supplementary Table S1). The survival gap decreased considerably over time due to the marked survival improvement among AYA from 48% to 79%. Survival of children also increased, albeit more modest from 83% to 90%. In 2010-2015, only survival of 30-39 year-olds remained lagging behind that of the other age groups (67% vs. 88-92%; Figure 2B).
Regarding DLBCL, 5-year relative survival was approximately 75% in children and AYA (Figure 1C; Online Supplementary Table S1). Survival improved significantly over time in both age groups from about 60% to 88%. Detailed analyses did not reveal any survival disparities in 2010-2015 either (Figure 2C).
Five-year relative survival of ALCL was 79% in children, which was not significantly higher than the 72% observed in AYA (Figure 1D; Online Supplementary Table S1). Increasing survival trends were noted, resulting in survival probabilities of 90% in children and 86% in AYA. Moreover, survival did not significantly differ across the more detailed age categories in 2010-2015 (Figure 2D).
Sensitivity analyses using an alternative age cutoff of 15 years to delineate children and AYA retrieved similar results (data not shown).
Haematologica | 109 March 2024 936 LETTER TO THE EDITOR
f Treated with SCT independent of CT, RT or rituximab.
T-LBL: T-lymphoblastic lymphoma; BL: Burkitt lymphoma; DLBCL: diffuse large B-cell lymphoma; ALCL: anaplastic large cell lymphoma; AYA: adolescents and young adults; IQR: interquartile range; CT: chemotherapy; RT: radiation therapy; SCT: stem cell transplantation; ICCC-3: International Classification of Childhood Cancer, 3 rd edition. a BL corresponds to ICCC-3 diagnostic group IIc. b Fisher’s exact test was used instead of Pearson’s χ 2 test when N≤5 in 1 or more categories. c CT only, not treated with RT, rituximab or SCT. d Treated with CT and RT; not treated with rituximab or SCT. e Treated with CT and rituximab independent of RT; not treated with SCT (patients treated with rituximab, who did not receive CT, were also included in this category).
g “Other treatment” encompassed all patients who did receive any type of therapy, but could not be classified in 1 of the other treatment groups, e.g., patients who only received RT or surgery.
Haematologica | 109 March 2024 937 LETTER TO THE EDITOR Characteristics T-LBL BL a DLBCL ALCL Total Children AYA Total Children AYA Total Children AYA Total Children AYA N % N % N % P ( χ 2 ) b N % N % N % P ( χ 2 ) b N % N % N % P ( χ 2 ) b N % N % N % P ( χ 2 ) b Overall 361 205 156 569 341 228 2,061 197 1,864 319 102 217 Period of diagnosis 1990-1999 2000-2009 2010-2015 153 122 86 42.4 33.8 23.8 89 65 51 43.4 31.7 24.9 64 57 35 41.0 36.5 22.4 0.62 221 226 122 38.8 39.7 21.4 137 134 70 40.2 39.3 20.5 84 92 52 36.8 40.4 22.8 0.68 728 849 484 35.3 41.2 23.5 71 77 49 36.0 39.1 24.9 657 772 435 35.3 41.4 23.3 0.80 121 130 68 37.9 40.8 21.3 37 45 20 36.3 44.1 19.6 84 85 48 38.7 39.2 22.1 0.69 Median age at diagnosis in years (IQR) 14 (8-25) 9 (5-12) 27 (21-33)13 (7-27) 8 (5-12) 31 (24-35)31 (24-36) 14 (10-16) 32 (26-36)24 (15-32) 12 (8-15) 29 (24-34)Sex Male Female 274 87 75.9 24.1 143 62 69.8 30.2 131 25 84.0 16.0 0.002 449 120 78.9 21.1 286 55 83.9 16.1 163 65 71.5 28.5 <0.001 1,276 785 61.9 38.1 121 76 61.4 38.6 1,155 709 62.0 38.0 0.88 184 135 57.7 42.3 57 45 55.9 44.1 127 90 58.5 41.5 0.66 Ann Arbor stage I II III IV Unknown 60 65 63 133 40 16.6 18.0 17.5 36.8 11.1 35 43 41 62 24 17.1 21.0 20.0 30.2 11.7 25 22 22 71 16 16.0 14.1 14.1 45.5 10.3 0.04 105 113 96 237 18 18.5 19.9 16.9 41.7 3.2 58 72 76 125 10 17.0 21.1 22.3 36.7 2.9 47 41 20 112 8 20.6 18.0 8.8 49.1 3.5 <0.001 661 513 270 563 54 32.1 24.9 13.1 27.3 2.6 60 49 26 57 5 30.5 24.9 13.2 28.9 2.5 601 464 244 506 49 32.2 24.9 13.1 27.2 2.6 0.98 54 88 74 90 13 16.9 27.6 23.2 28.2 4.1 11 33 25 31 2 10.8 32.4 24.5 30.4 2.0 43 55 49 59 11 19.8 25.4 22.6 27.2 5.1 0.16 Primary treatment CT c CT + RT d CT + rituximab e SCT Other/no treatment/ unknown Other g No treatment Unknown 257 28 0 67 9 0 7 2 71.2 7.8 0.0 18.6 2.5 0.0 1.9 0.6 183 7 0 8 7 0 5 2 89.3 3.4 0.0 3.9 3.4 0.0 2.4 1.0 74 21 0 59 2 0 2 0 47.4 13.5 0.0 37.8 1.3 0.0 1.3 0.0 <0.001 404 30 62 60 13 4 8 1 71.0 5.3 10.9 10.5 2.3 0.7 1.4 0.2 310 9 9 8 5 2 2 1 90.9 2.6 2.6 2.4 1.5 0.6 0.6 0.3 94 21 53 52 8 2 6 0 41.2 9.2 23.3 22.8 3.5 0.9 2.6 0.0 <0.001 822 380 647 62 150 77 63 10 39.9 18.4 31.4 3.0 7.3 3.7 3.1 0.5 133 13 39 3 9 4 5 0 67.5 6.6 19.8 1.5 4.6 2.0 2.5 0.0 689 367 608 59 141 73 58 10 37.0 19.7 32.6 3.2 7.6 3.9 3.1 0.5 <0.001 236 40 4 25 14 8 6 0 74.0 12.5 1.3 7.8 4.4 2.5 1.9 0.0 91 6 0 3 2 0 2 0 89.2 5.9 0.0 2.9 2.0 0.0 2.0 0.0 145 34 4 22 12 8 4 0 66.8 15.7 1.8 10.1 5.5 3.7 1.8 0.0 0.001
Table 1. Characteristics of children (0-17 years old) and adolescents and young adults (18-39 years old) diagnosed with non-Hodgkin lymphoma in the Netherlands between 1990-2015 by the most common subtypes.
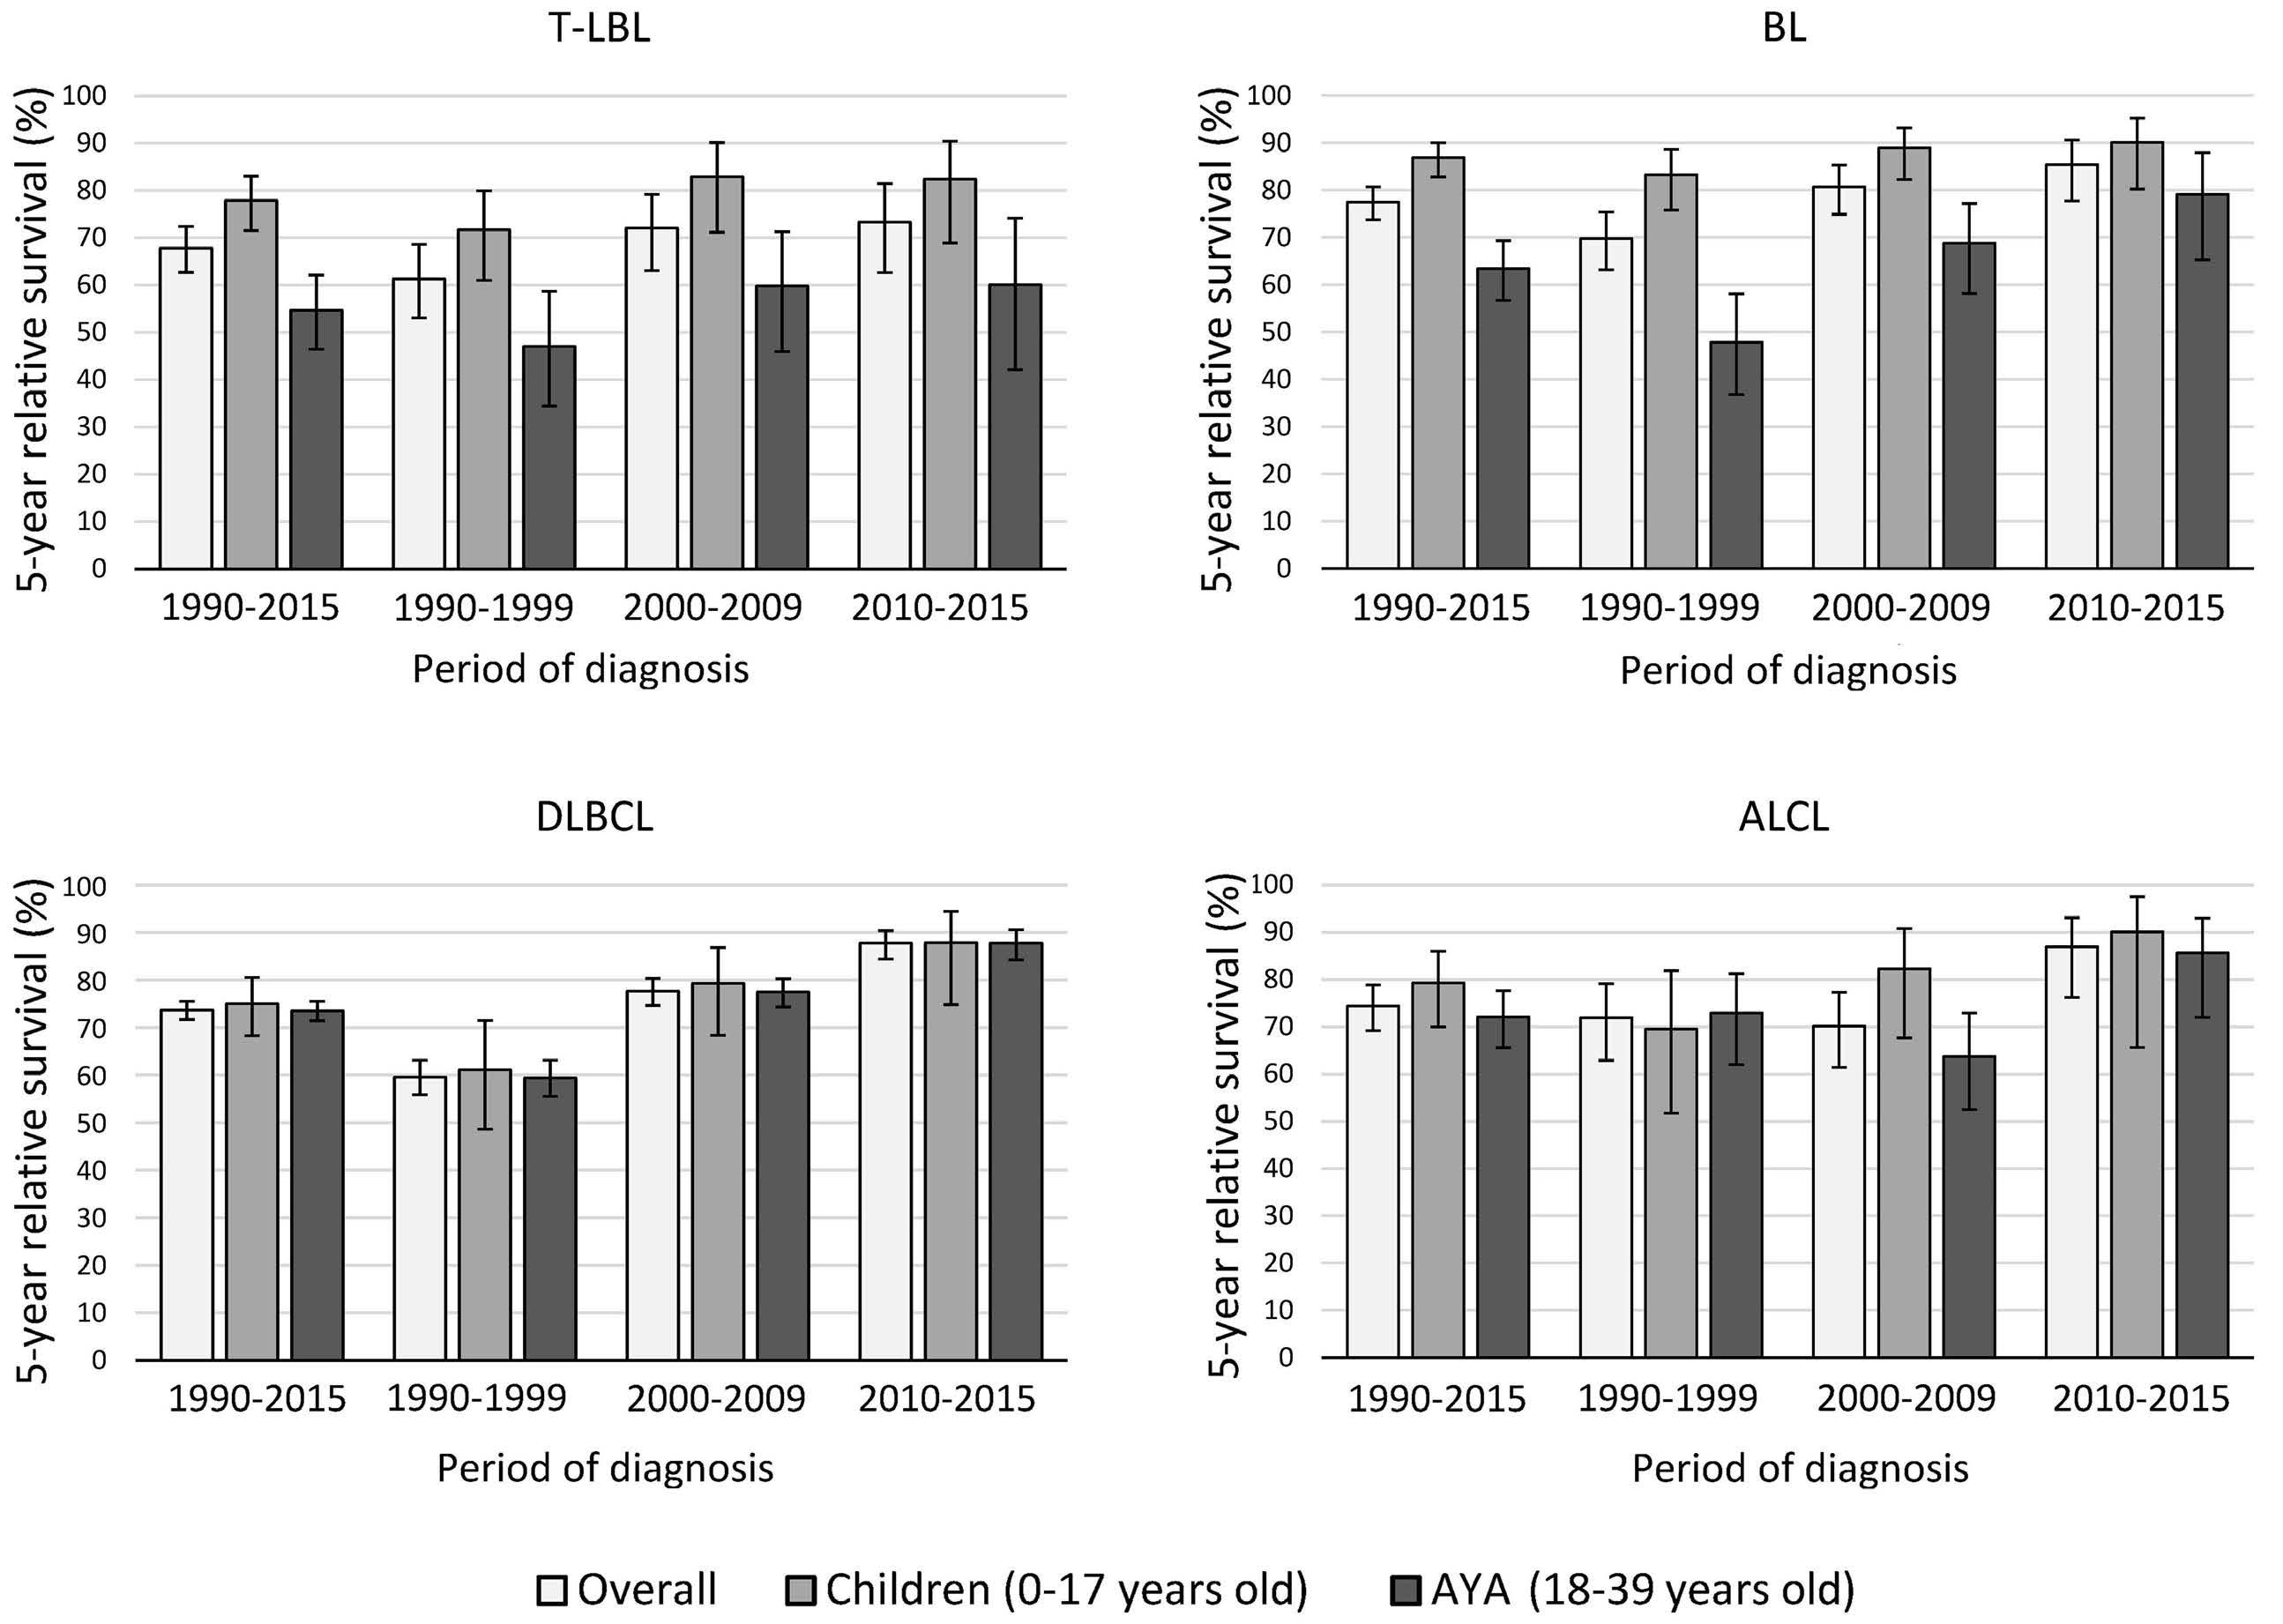
years
1990-2015,
and
of the survival estimates. AYA: adolescents and young adults.
Multivariable regression analyses adjusting for patient mix confirmed the findings for T-LBL, BL, and DLBCL showing a significantly increased excess mortality in AYA compared with children during 1990-2015 for T-LBL and BL, but not DLBCL (Online Supplementary Table S2). Although 5-year relative survival of AYA with ALCL was not significantly lower than that of children in 1990-2015, the multivariable-adjusted excess mortality was significantly increased.
In this Dutch population study spanning 26 years, AYA with T-LBL and BL had a worse prognosis than children. Nonetheless, the survival disadvantage for BL solely persisted for 30-39 year-olds in 2010-2015. AYA with ALCL had an increased excess risk of dying after patient-mix adjustment. Children and AYA with DLBCL had similar outcomes. The inferior prognosis of AYA with T-LBL is in line with US SEER data showing a substantial survival gap between children and AYA with LBL.4 Nowadays, children and AYA with T-LBL in the Netherlands are treated according to intensive acute lymphoblastic leukemia-based chemotherapy regimens. Before 2005, pediatric protocols contained higher doses of non-myelotoxic chemotherapy, were more strictly
timed, and had a longer total duration than adult protocols (Online Supplementary Table S3). One crucial difference that persists is the substantial use of stem cell transplantation (SCT) in AYA in first complete remission, while SCT is reserved for very high-risk patients in pediatric protocols. Biological differences are likely to have contributed to the inferior survival of AYA as well, though the understanding of the molecular characteristics of T-LBL is still limited. Similar to our overall findings, AYA with BL were reported to have inferior survival in the US population.4,5,9 Nonetheless, we showed that worse outcome was restricted to AYA aged 30-39 years in 2010-2015. Children with BL in the Netherlands are treated with risk-adjusted dose-intensive multi-agent chemotherapy. Treatment of adult BL is generally less dose-intensive, though there was no standard first-line therapy during 1990-2015 (Online Supplementary Table S3). As of 2003-2004, rituximab was incorporated into adult regimens, a major step in improving outcomes.12 Rituximab was included in pediatric regimens for mature B-NHL almost 10 years later, and only for high-risk patients.13 A decrease in treatment tolerability with increasing age
Haematologica | 109 March 2024 938 LETTER TO THE EDITOR
A C B D
Figure 1. Five-year relative survival of children (0-17 years old) and adolescents and young adults (18-39
old) diagnosed with the most common subtypes of non-Hodgkin lymphoma in the Netherlands between
overall
by diagnostic period. (A) T-lymphoblastic lymphoma (T-LBL); (B) Burkitt lymphoma (BL); (C ) diffuse large B-cell lymphoma (DLBCL); (D) anaplastic large cell lymphoma (ALCL). The error bars depict 95% confidence intervals
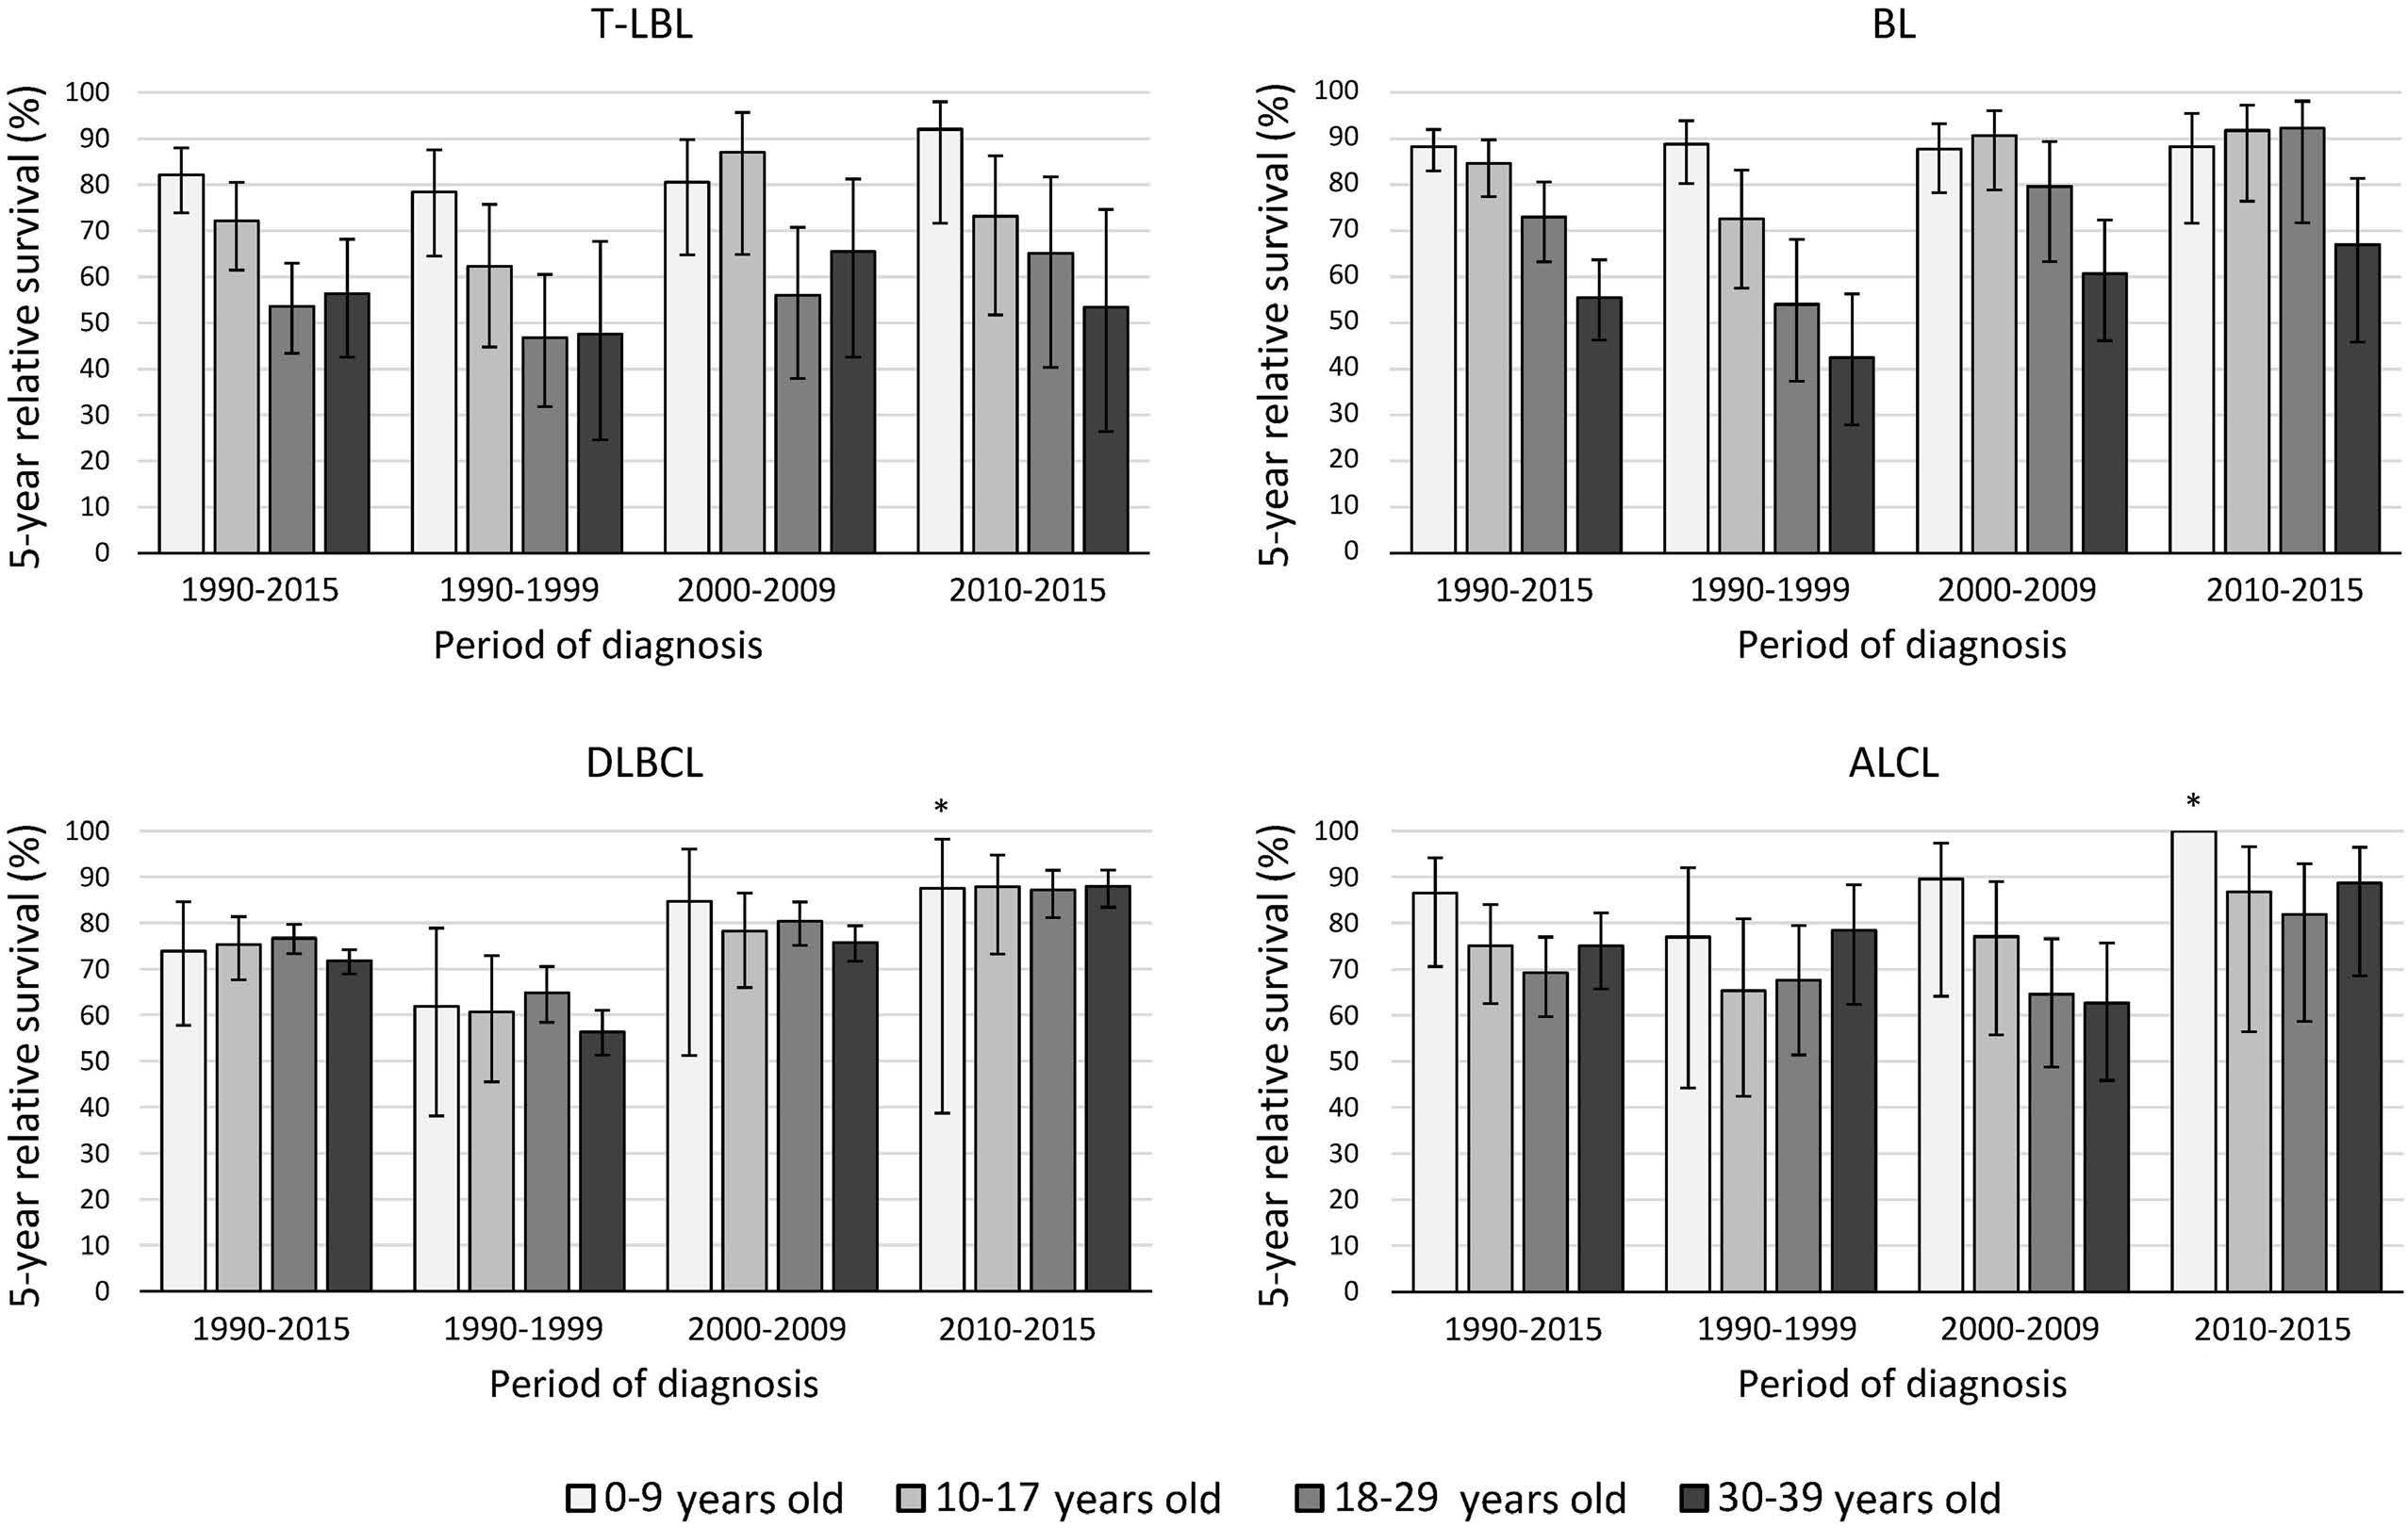
1990-2015, overall and by diagnostic period.
risk <10.
could explain why survival of older AYA with BL continued to lag behind. Furthermore, the study by Burkhardt et al 14 revealed a transition in the mutational profile of BL between the ages of 25 and 40 years.
In contrast to US data,5,8 survival of children and AYA with DLBCL in the Netherlands was comparable. Insurance barriers may negatively affect survival of AYA in the US, while costs of cancer treatments are entirely covered in the Netherlands. Dutch children with DLBCL are treated with the same intensive chemotherapy protocols as pediatric BL patients. Since the early 2000s, less dose-intensive rituximab-containing cyclophosphamide, doxorubicin, vincristine, and prednisone (R-CHOP) protocols have been the standard of care for adult DLBCL (Online Supplementary Table S3). As mentioned above, rituximab just became available for high-risk pediatric mature B-NHL in the latest period of our study. Additionally, central nervous system (CNS) prophylaxis is standard part of pediatric regimens, but is only added to R-CHOP for adult patients at high risk for CNS relapse.3 Although we had no individual details available concerning chemotherapy intensity, based on the commonly used treatment protocols it is likely that AYA with DLBCL received less chemotherapy than children. The similar survival estimates therefore raise the question whether chemotherapy intensity could safely be reduced for children with (early-stage) DLBCL without
impacting cure. Considering the lower risk of acute toxicities and late adverse effects, treatment reduction for pediatric DLBCL should be further studied.
Our findings regarding ALCL were inconclusive, but may indicate a slightly worse outcome for AYA, which would be in agreement with US data.4 Dutch children with ALCL have been treated uniformly since 2000 using a short intensive B-NHL-derived regimen (ALCL99 protocol), while adult treatment generally consisted of CHOP sometimes followed by SCT (Online Supplementary Table S3). Two subgroups of systemic ALCL are distinguished depending on anaplastic lymphoma kinase (ALK) protein expression.11,15 The relative frequency of the less favorable ALK-negative variant increases with age,2,3,15 which might explain the modestly increased excess risk of dying among AYA with ALCL in our study. Unfortunately, ALK expression status was not registered in the NCR before 2014. The population-based nature (i.e., the inclusion of trial and non-trial participants) and relatively large cohort size pose important strengths of our study. More detailed information on treatment, therapy-related toxicities, molecular characteristics, and cause of death would be of value in future investigations.
Studies like ours, comparing survival of children and AYA, may serve as a bridge and point towards aspects of therapy regimens that justify further investigation. Our observation
Haematologica | 109 March 2024 939 LETTER TO THE EDITOR
A C B D
Figure 2. Age-specific 5-year relative survival of children and adolescents and young adults (0-39 years old) diagnosed with the most common subtypes of non-Hodgkin lymphoma in the Netherlands between
(A) T-lymphoblastic lymphoma (T-LBL); (B) Burkitt lymphoma (BL); (C) diffuse large B-cell lymphoma (DLBCL); (D) anaplastic large cell lymphoma (ALCL). The error bars depict 95% confidence intervals of the survival estimates. *N at
that dose-intensively treated children with DLBCL have similar survival as AYA, who are likely to have been treated less intensively, suggests that it might be worth investigating treatment reductions for (early-stage) pediatric DLBCL, while keeping age-related differences in disease biology in mind.
Authors
Maya Schulpen,1 Auke Beishuizen,1 Martine E. D. Chamuleau,2 Avinash G. Dinmohamed,2,3,4 Friederike A. G. Meyer-Wentrup,1 H. Josef Vormoor,1,5 Lotte E. van der Wagen,5 Monique C. Minnema,5 Jan L. C. Loeffen1# and Henrike E. Karim-Kos1,3#
1Princess Máxima Center for Pediatric Oncology, Utrecht; 2Department of Hematology, Cancer Center Amsterdam, Amsterdam UMC, location VU, Amsterdam; 3Department of Research and Development, Netherlands Comprehensive Cancer Organization (IKNL), Utrecht; 4Department of Public Health, Erasmus MC, University Medical Center Rotterdam, Rotterdam and 5Department of Hematology, University Medical Center Utrecht, Utrecht University, Utrecht, the Netherlands
#JLCL and HEKK contributed equally as senior authors.
Correspondence:
H. KARIM-KOS - h.e.karim-kos@prinsesmaximacentrum.nl
https://doi.org/10.3324/haematol.2023.283379
Received: April 19, 2023.
Accepted: August 18, 2023.
Early view: August 31, 2023.
References
1. Izarzugaza MI, Steliarova-Foucher E, Martos MC, Zivkovic S. Non-Hodgkin’s lymphoma incidence and survival in European children and adolescents (1978-1997): report from the Automated Childhood Cancer Information System project. Eur J Cancer. 2006;42(13):2050-2063.
2. Hochberg J, Flower A, Brugieres L, Cairo MS. NHL in adolescents and young adults: a unique population. Pediatr Blood Cancer. 2018;65(8):e27073.
3. Sandlund JT, Martin MG. Non-Hodgkin lymphoma across the pediatric and adolescent and young adult age spectrum. Hematology Am Soc Hematol Educ Program. 2016;2016(1):589-597.
4 Cairo MS, Beishuizen A. Childhood, adolescent and young adult non-Hodgkin lymphoma: current perspectives. Br J Haematol. 2019;185(6):1021-1042.
5. Tai E, Pollack LA, Townsend J, Li J, Steele CB, Richardson LC. Differences in non-Hodgkin lymphoma survival between young adults and children. Arch Pediatr Adolesc Med. 2010;164(3):218-224.
6. Keegan TH, Ries LA, Barr RD, et al. Comparison of cancer survival trends in the United States of adolescents and young adults with those in children and older adults. Cancer.
©2024 Ferrata Storti Foundation
Published under a CC BY-NC license
Disclosures
MCM has received payment for consultancy for Jansen Cilag, BMS, CDR-life, and GSK, all paid to institution. MEDC has received consulting fees from AbbVie and Novartis, also paid to institution. All other authors have no conflicts of interest to disclose.
Contributions
HEKK, AB and JLCL conceived and designed the study. MS did the literature search. HEKK and MS prepared the database and carried out the analysis. MS drafted the manuscript. All authors contributed to the interpretation of the results and critically revised the manuscript. HEKK and MS directly accessed and verified the raw data and take responsibility for the integrity and accuracy of the analyses. All authors had full access to all the data reported in the study and accept responsibility to submit the paper for publication.
Acknowledgments
The authors would like to thank the registration team of the Netherlands Comprehensive Cancer Organization (IKNL) for the collection of data for the Netherlands Cancer Registry.
Data-sharing statement
The data that support the findings of our study are available on request from the Netherlands Cancer Registry. To obtain data of children diagnosed with cancer in the Netherlands since 2014, an additional permission from the Biobank and Data Access Committee of the Princess Máxima Center for Pediatric Oncology is required. Further information is available from the corresponding author.
2016;122(7):1009-1016.
7 Trama A, Botta L, Foschi R, et al. Survival of European adolescents and young adults diagnosed with cancer in 200007: population-based data from EUROCARE-5. Lancet Oncol. 2016;17(7):896-906.
8. Abrahao R, Ribeiro RC, Lichtensztajn DY, Rosenberg AS, Keegan THM. Survival after diffuse large B-cell lymphoma among children, adolescents, and young adults in California, 20012014: A population-based study. Pediatr Blood Cancer. 2019;66(4):e27559.
9 Alvarez E, Le T, Kahn J, Winestone L, Li Q, Keegan T. Comorbidities and socioeconomic status are predictors of survival in children and young adults with Burkitt lymphoma. Leuk Lymphoma. 2021;62(11):2804-2807.
10 Schouten LJ, Hoppener P, van den Brandt PA, Knottnerus JA, Jager JJ. Completeness of cancer registration in Limburg, The Netherlands. Int J Epidemiol. 1993;22(3):369-376.
11. Campo E, Swerdlow SH, Harris NL, Pileri S, Stein H, Jaffe ES. The 2008 WHO classification of lymphoid neoplasms and beyond: evolving concepts and practical applications. Blood.
Haematologica | 109 March 2024 940 LETTER TO THE EDITOR
2011;117(19):5019-5032.
12. Issa DE, Seefat RL, Visser O, et al. Primary therapy and survival in patients with Burkitt lymphoma in the Netherlands: a populationbased study, 1989-2018. Blood. 2021;137(20):2848-2851.
13. Minard-Colin V, Auperin A, Pillon M, et al. Rituximab for highrisk, mature B-cell non-Hodgkin’s lymphoma in children. N Engl J Med. 2020;382(23):2207-2219.
14 Burkhardt B, Michgehl U, Rohde J, et al. Clinical relevance of molecular characteristics in Burkitt lymphoma differs according to age. Nat Commun. 2022;13(1):3881.
15. Wolach O, Ram R. Adolescents and young adults with nonHodgkin’s lymphoma: slipping between the cracks. Acta Haematol. 2014;132(3-4):279-291.
Haematologica | 109 March 2024 941 LETTER TO THE EDITOR
Somatic variant profiling in chronic phase pediatric chronic myeloid leukemia
Clinical and cytogenetic risk factors play a crucial role in therapy stratification of chronic myeloid leukemia (CML). Pathogenic somatic variants beyond the BCR::ABL1 fusion and the ABL1 gene such as mutations in ASXL1 have emerged as a genetic risk factor associated with inferior treatment response and outcome in adult CML.1 Pediatric CML is characterized by distinctive clinical and genetic features.2 However, there are few data on the mutational profile. The aim of this study was to establish the first somatic variant profile of a large and well-characterized cohort of pediatric patients diagnosed with CML in the chronic phase (CMLCP) and to assess clinical correlations.
Based on targeted next-generation sequencing covering 148 leukemia-associated genes, we analyzed 90 children and adolescents with CML-CP who had been enrolled in the German national CML-PAED registry at diagnosis. Fourteen individuals (16%) harbored at least one pathogenic somatic variant. The ASXL1 gene was affected in 6 of these cases. Individuals with pathogenic somatic ASXL1 variants presented with significantly higher initial platelet counts, and, generally, patients harboring a pathogenic somatic variant in ASXL1 and other genes also showed a trend to inferior molecular response under tyrosine kinase inhibitor (TKI) treatment compared to patients without pathogenic variants. Overall, we have uncovered fresh insights into the mutational landscape of childhood CML and identified the presence of pathogenic variants in addition to the BCR::ABL1 fusion to be associated with differing hematologic and response characteristics. However, confirmation of the clinical significance of ASLX1 and other somatic variants requires prospective data from larger numbers of cases with this rare disease in childhood.
All patients included in this study were diagnosed between 2006 and 2022 and enrolled in the German national CMLPAED-II trial and subsequent registry. The CML-PAED trial protocol was conducted in accordance with the Declaration of Helsinki and approved by the institutional ethics boards of the medical faculties of the Technical University Dresden and the Friedrich-Alexander-Universität Erlangen-Nürnberg (EK282 122 006 and EK 236_18 B). The trial was registered at EUDRACT (2007-001339-69) and clinicaltrials. gov (NCT00445822).3 Informed consent was obtained from the patients’ legal representatives and, if applicable, the patients, after providing age-appropriate oral and written information. Diagnostic and response criteria were applied according to European LeukemiaNet (ELN) criteria.4 Sequencing was performed using an IDT custom panel including 148 leukemia-associated genes / gene regions (Online Supplementary Table S1) according to the manufac-
turer´s instructions (Integrated DNA Technologies Inc., IA, USA). DNA samples isolated either from the patients’ initial blood or from bone marrow were sequenced. Variants with a variant allele fraction (VAF) of ≥5% and a depth of ≥500 reads were included in the analysis. All detected variants were classified according to the standards and guidelines of the American College of Medical Genetics and Genomics (ACMG).5 Here, we only report alterations classified as likely pathogenic and pathogenic somatic variants. These will be further summarized and referred to as pathogenic somatic variants.
Characteristics of 90 pediatric patients diagnosed with CML-CP and included in this study are provided in Table 1. Age and sex distribution of patients, as well as the distribution of BCR::ABL1 transcript types and cytogenetic categories, were representative for the overall cohort.3 In 17 individuals (19%), pathogenic variants were identified in the initial sample. Follow-up material collected in molecular response (MR) 2 or better was subsequently analyzed in all of these cases. In 14 patients (16%), the pathogenic variants were undetectable in remission as proof of their somatic nature. In 3 patients, the variants were unchanged in remission and were, therefore, classified as germline. Consequently, at diagnosis of CML-CP, 14 out of 90 patients (16%) carried a total 15 pathogenic somatic variants (Figure 1A). The genes ASXL1, ASXL2, BCOR, GATA2, IKZF1, KDM6A, KMT2D, and TET2 were affected (Figure 1B, Online Supplementary Table S2). Pathogenic somatic variants in ASXL1 were the most frequent and were identified in 6 patients (43%), with one individual harboring two different ASXL1 variants (Figure 1C).
Patients with pathogenic somatic variants in ASXL1 and other genes showed a trend to higher initial leukocyte counts (Figure 2A). Initial platelet counts were significantly elevated in patients carrying pathogenic somatic ASXL1 variants as compared to patients without pathogenic somatic variants in this analysis (P=0.027) (Figure 2B). Assessment of response kinetics exhibited a trend to a delayed cytogenetic response in the subgroup of patients with pathogenic somatic variants in the ASXL1 gene (Figure 2D). Individuals with a pathogenic somatic variant in ASXL1 and other genes also revealed a trend to inferior molecular response characteristics reaching major molecular response and deep molecular response at later time points than patients lacking pathogenic somatic variants (Figure 2E).
According to reports in adult patients, myeloid-leukemia-associated mutations apart from the disease-driving BCR::ABL1 fusion gene and resistance-mediating ABL1 kinase domain variants are found in a considerable proportion of
Haematologica | 109 March 2024 942 LETTER TO THE EDITOR
newly diagnosed individuals with CML, most commonly affecting epigenetic modifier genes such as ASXL1, DNMT3A, and TET2. 6-8 Different retrospective analyses have suggested an inferior response to treatment with TKI in adult patients with CML harboring such lesions.7,9 In large population studies, these variants have also been associated with age-related clonal hematopoiesis of indeterminate potential (CHIP) occurring in 10% of people >65 years of age but only 1% in people aged <50 years.10-12 Pathogenic variants in the ASXL1 gene were linked to worse MR and outcome in adults with CML.1,13 Owing to the rarity of CML in childhood and adolescence, knowledge on pathogenic
somatic variants in pediatric CML is still extremely limited. So far, there has only been one investigation into the mutational landscape in pediatric patients with CML. Ernst and colleagues assessed a cohort of 21 young CML patients including 16 pediatric cases <18 years of age. Four pediatric patients (25%) carried a pathogenic variant in the ASXL1 gene, and the authors concluded that such variants were frequent in children and young adults with CML.14
Based on a total of 90 pediatric patients up to the age of 18 years diagnosed with CML-CP, we here present the first large systematic analysis of the variant profile in childhood CML. Notably, the proportion of patients with an ASXL1 variant
Single
translocation t(9;22)
Treatment response
Median molecular response at 3 months (range)
Unknown
Median molecular response at 6 months (range) Ratio
≤1%)
IS
Unknown
Molecular response at 12 months, median (range)
Ratio BCR::ABL1/ABL1
IS (optimal:
Unknown
Median major molecular response in months (range)
Unknown/not reached until today
Median complete cytogenetic remission in months (range) Unknown/not reached until today
8 (57)
5 (36)
1 (7)
1.2050 (0.0030-43)
6 (43)
3 (21.5)
3 (21.5)
2 (14)
0.3250 (0.0057-3.8)
3 (21.5)
2 (14)
3 (21.5)
6 (43)
9 (6-24)
5 (36)
5 (2-17)
4 (29)
aWithout pathogenic somatic variant, i.e., no variants, (likely) pathogenic germline variants and variants classified as variant of unknown significance (VUS) according to the standards and guidelines of the American College of Medical Genetics and Genomics (ACMG). bWith pathogenic somatic variant, i.e., variants classified as likely pathogenic and pathogenic somatic variants according to the ACMG standards and guidelines. IS: International Score.
Haematologica | 109 March 2024 943 LETTER TO THE EDITOR
Characteristics Total N=90 N (%) aWithout pathogenic somatic variants N=76 N (%) bWith pathogenic somatic variant N=14 N (%) Median age at diagnosis in years (range) 13 (1-18) 13 (1-18) 14 (1-7) Sex Female Male 37 (41) 53 (59) 28 (37) 48 (63) 6 (43) 8 (57) Fusion transcript e13a2 e14a2 e13a2/e14a2 Unknown 30 (33.33) 38 (42.22) 11 (12.22) 11 (12.22) 28 (37) 30 (39) 9 (12) 9 (12) 2 (14) 8 (58) 2 (14) 2 (14)
at diagnosis t(9;22)
Karyotype
Variant
Additional chromosome abnormalities Complex karyotype Unknown 86 (96) 76 (84) 7 (7) 2 (2) 1 (1) 4 (4) 72 (95) 63 (83) 7 (9) 2 (3) 0 (0) 4 (5) 14 (100) 13 (93) 0 (0) 0 (0) 1 (7) 0 (0)
Ratio BCR::ABL1/ABL1 IS (optimal: ≤10%)
IS (warning: >10%)
BCR::ABL1/ABL1 IS (optimal:
(warning: >1-10%) IS (failure: >10%)
≤0.1%) IS (warning: >0.1-1%) IS (failure: >1%)
5.28 (0.11-76) 56 (62) 26 (29) 8 (9) 0.4609 (0-43) 50 (56) 22 (24) 5 (6) 13 (14) 0.0593 (0-3.8) 38 (42) 16 (18) 9 (10)
26
6 (2-20) 24 (27) 4.25 (0.1142-76) 48
21 (28) 7 (9) 0.3400 (0-24) 44 (58) 19 (25) 2 (3) 11 (14) 0.0580 (0-2.85) 35
14 (18) 6
21
12
6
20
6.60 (0.5722-64)
27 (30) 12 (4-48)
(29)
(63)
(46)
(8)
(28)
(4-48) 21 (28%)
(2-20)
(26)
Table 1. Characteristics of pediatric patients in chronic phase chronic myeloid leukemia included in this study.
in our study was lower than in the analysis by Ernst et al. This can be explained by the fact that here we assessed an unselected population-based cohort. Therefore, and based on the significantly larger number of patients, our results are more likely to reflect the true incidence of pathogenic somatic ASXL1 variants in pediatric CML.
The proportion of patients with pathogenic variants in our analysis was <20% and therefore lower than that described for adults with CML who harbor myeloid-leukemia-associated mutations in addition to BCR::ABL1; approximately 30%
of cases at initial diagnosis.6-8 This observation supports the hypothesis that a proportion of additional pathogenic variants found in adult patients with CML can not be disease-associated but are to be attributed to age-related CHIP, which is not present in pediatric individuals.10-12 There was no difference in the actual spectrum of genes found to be mutated in this cohort of pediatric patients with those found in adult patients. Together with the data from adult cohorts1,13 and the single pediatric report to date by Ernst et al., 14 our observation that ASXL1 was also the most fre-
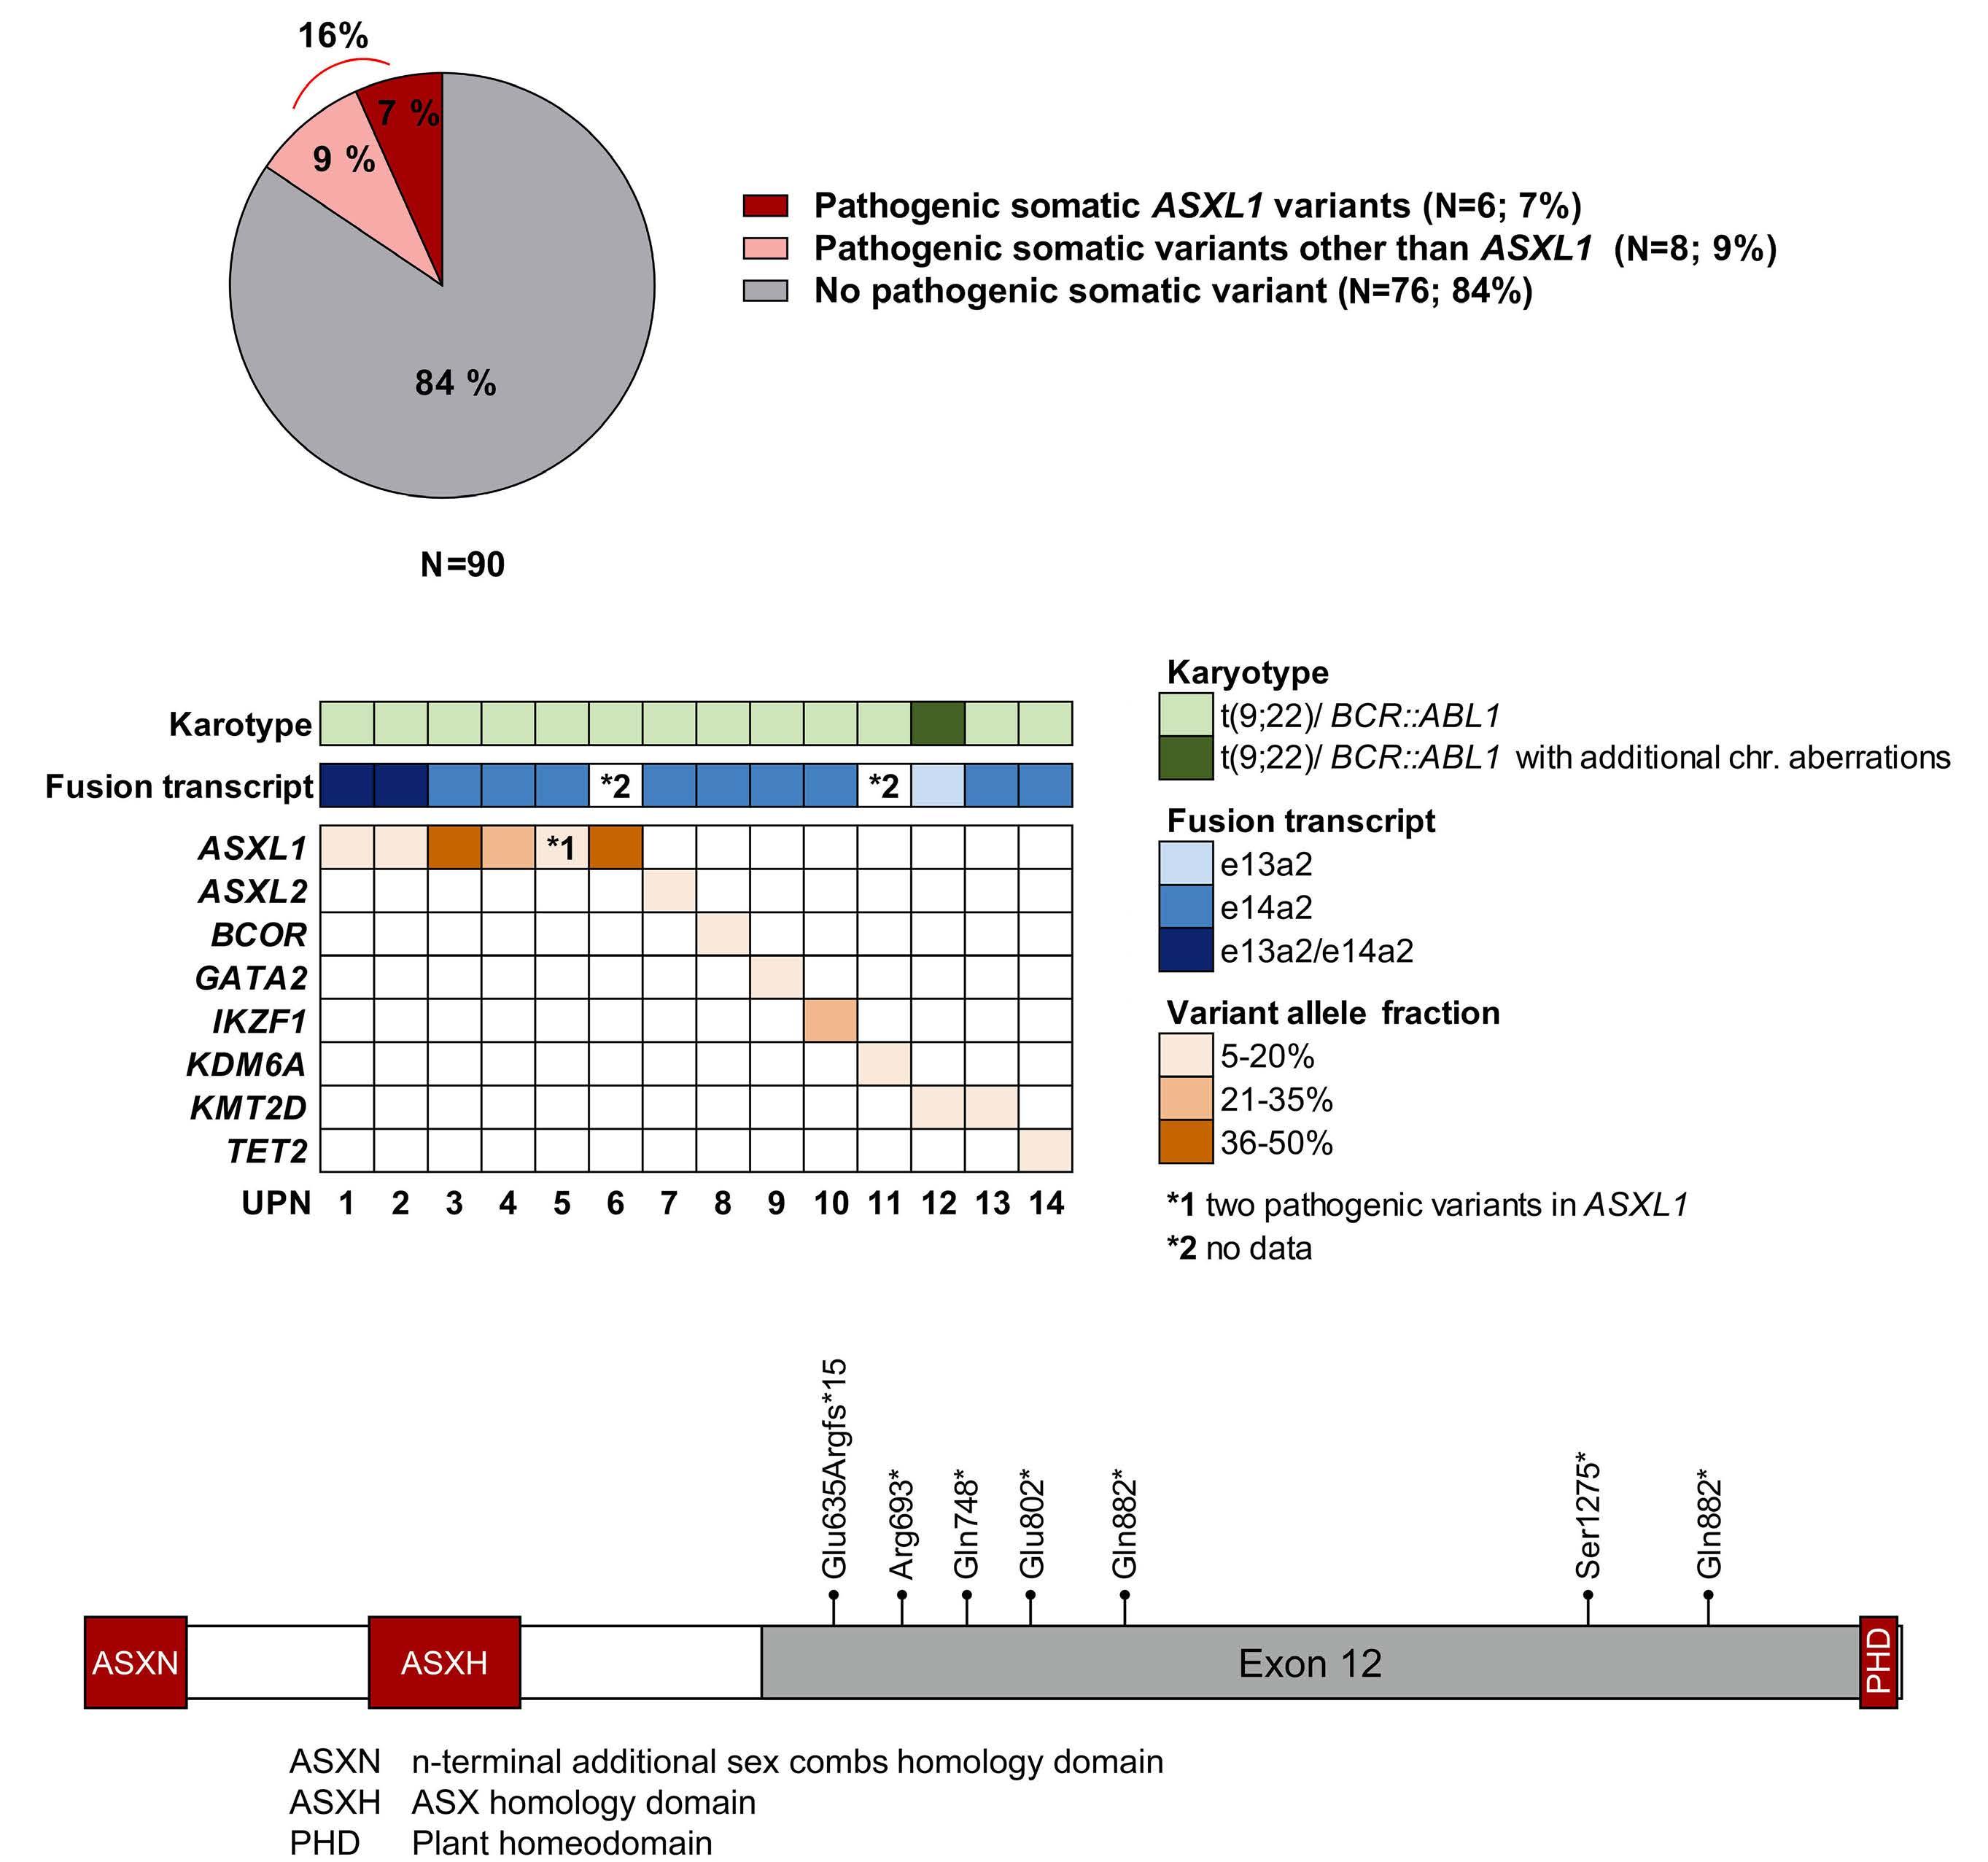
Haematologica | 109 March 2024 944 LETTER TO THE EDITOR
Figure 1. Pathogenic somatic variant landscape. (A) Proportional distribution of patients without pathogenic somatic variants (gray), patients with pathogenic somatic variants in genes other than ASXL1 (light red), and patients with pathogenic somatic variants in ASXL1 (dark red). (B) Pathogenic somatic variants detected in 14 individuals in 8 different genes (lower panel) shown in relation to karyotype and BCR::ABL1 fusion transcript (upper panels). Graduation of variant allele frequency illustrated by color intensity. (C) Localization of pathogenic somatic variants in the ASXL1 gene. chr.: chromosomal.
B
A
C
quently mutated gene in this pediatric study suggests that these gene mutations could be disease-related rather than age-related, and that they might have a functional role in the pathogenesis and progression of CML.
In this analysis, individuals harboring pathogenic somatic ASXL1 variants exhibited higher initial leukocyte and platelet counts. These features could reflect a relative increase in proliferative capacity in this particular subgroup. Moreover, the group of patients carrying pathogenic somatic variants in ASXL1 and other genes also showed a trend to a delayed molecular response as compared to patients lacking pathogenic variants in our screening. This observation suggests that the presence of a pathogenic somatic gene variant in addition to the BCR::ABL1 fusion gene at diagnosis could
represent an adverse prognostic factor associated with a delay in achieving a deep molecular response, thus requiring a prolonged intake of TKI. In children and adolescents, this may compromise growth (a particular TKI side effect in these age groups).2 Based on data derived from adult patients showing a higher effectiveness of second-line TKI such as dasatinib compared to imatinib,15 it appears conceivable that patients carrying such alterations could be candidates for an early switch to second-line TKI therapy; this would promote a fast and deep molecular response, thus enabling rapid withdrawal of treatment and, consequently, the lowest possible incidence of side effects. This current study for the first time provides a detailed insight into the variant profile of pediatric CML-CP. Con-
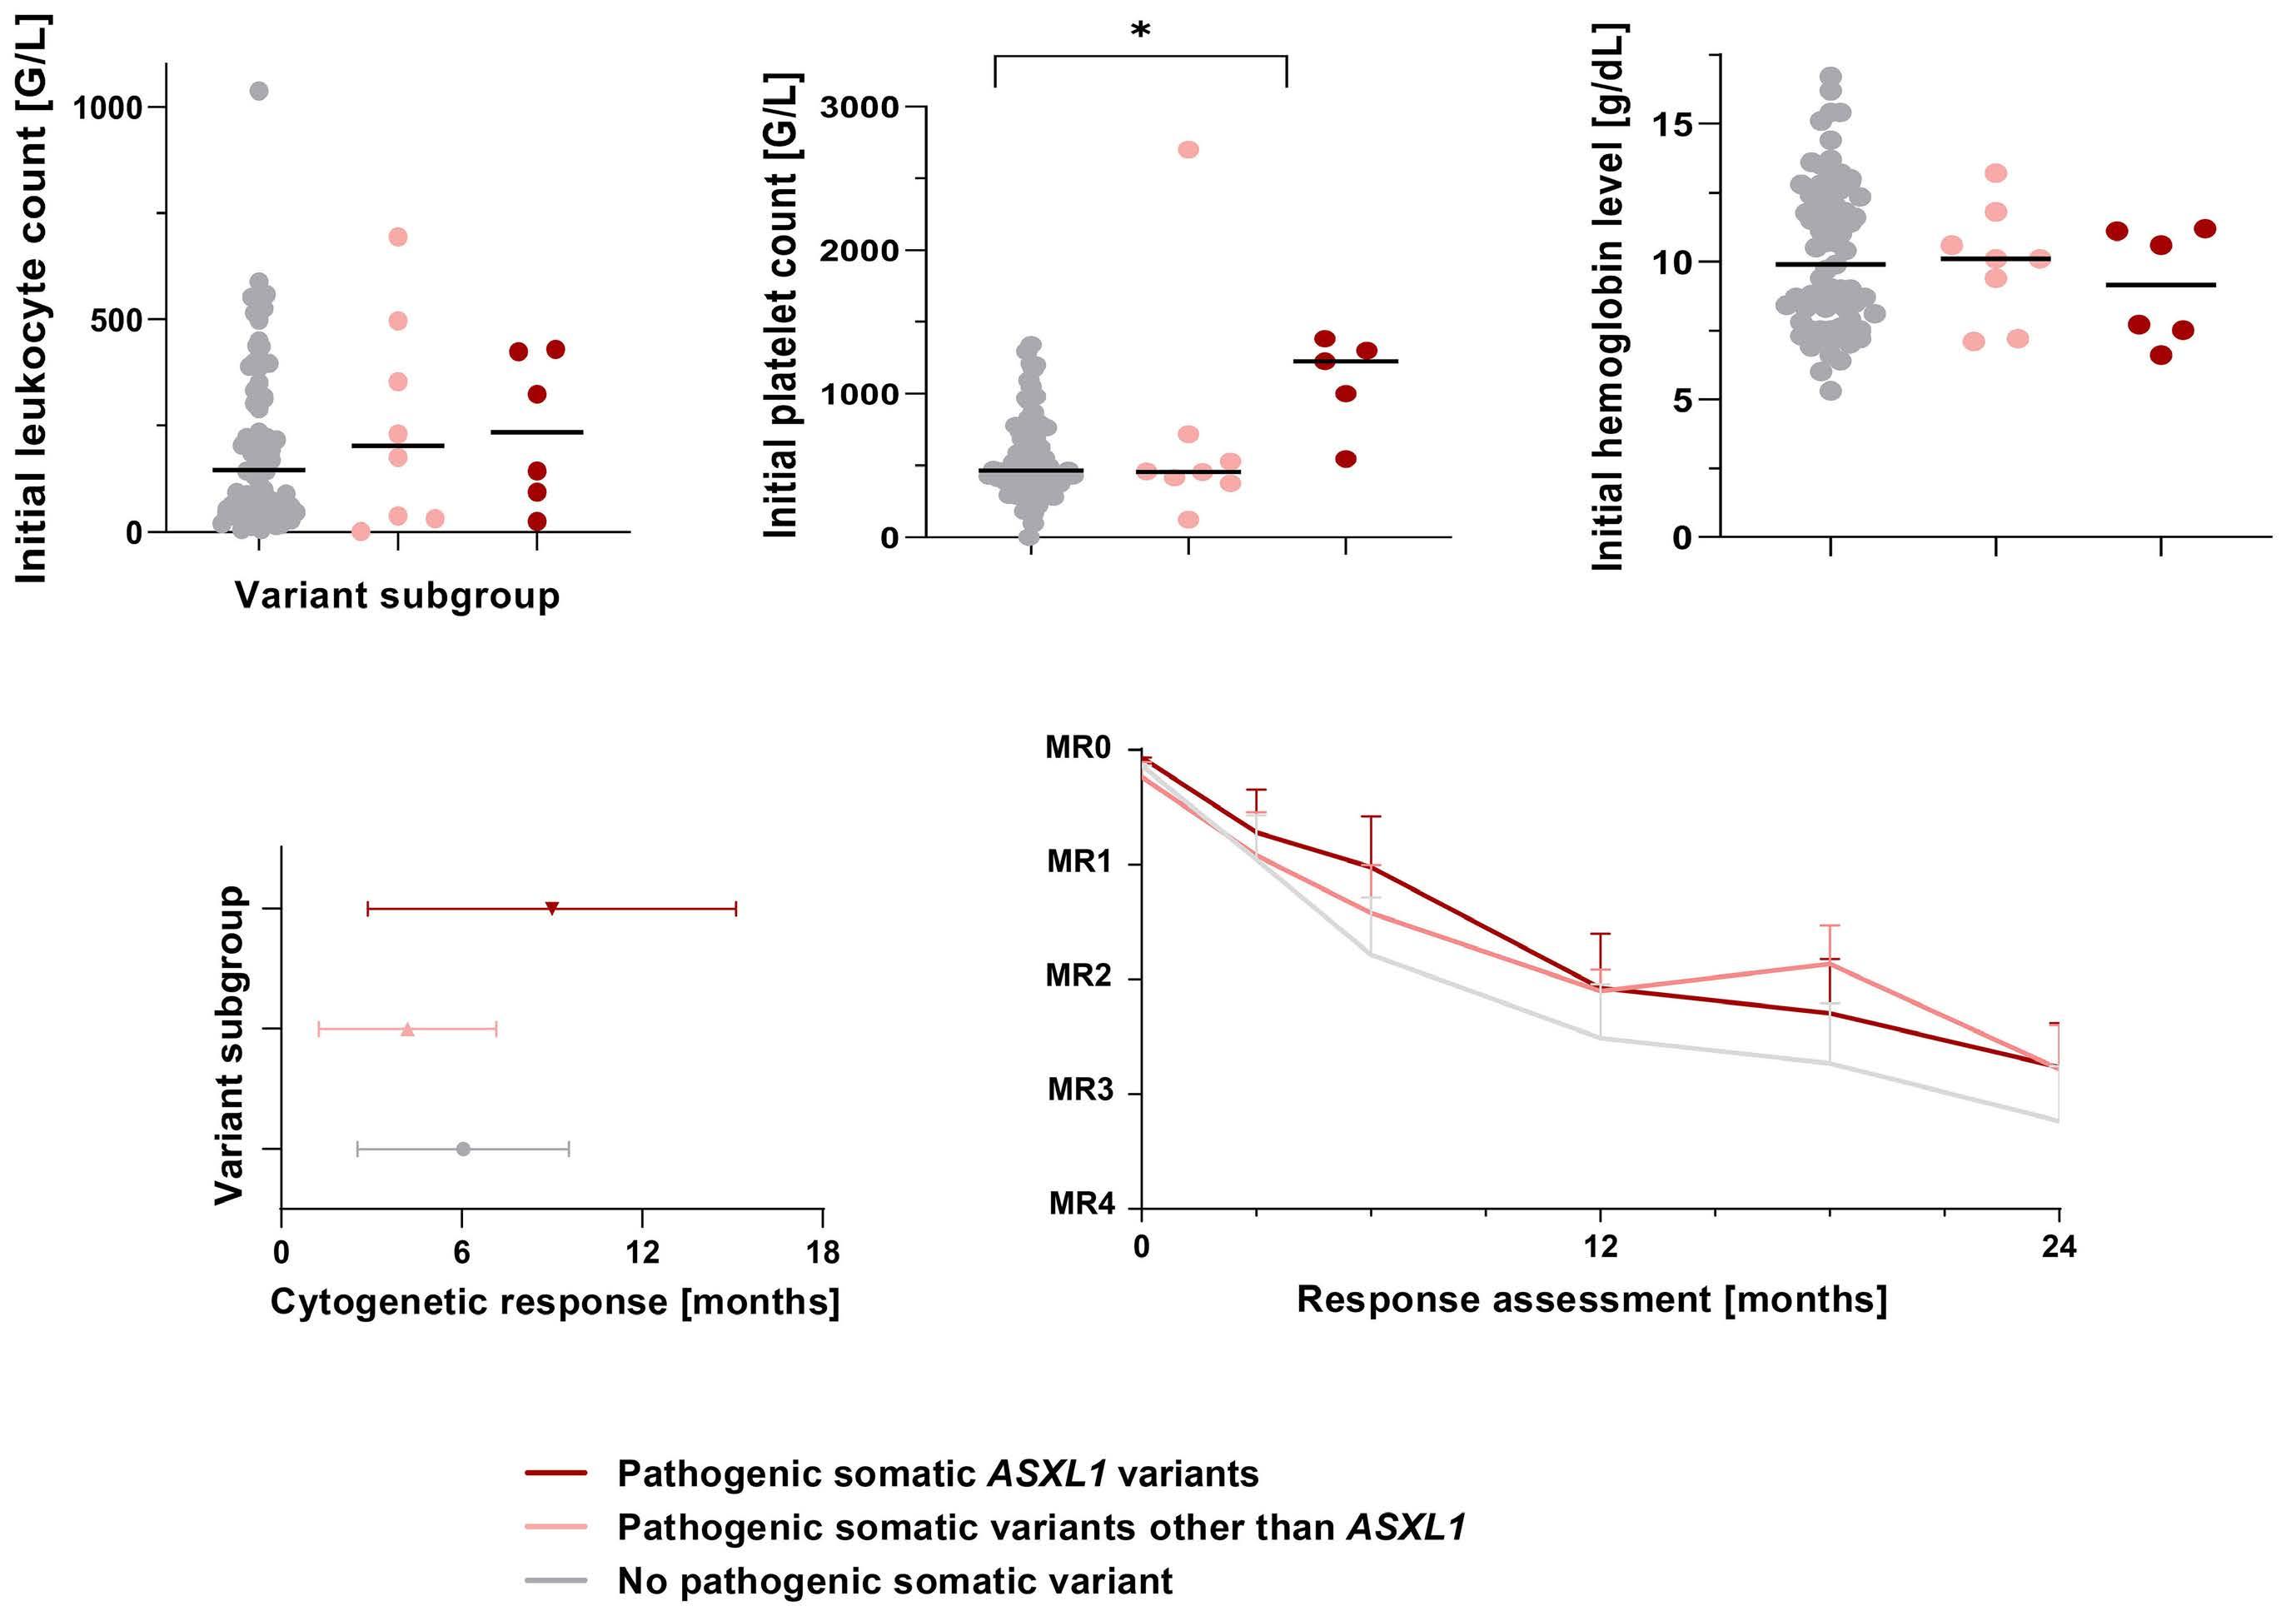
Figure 2. Initial hematologic parameters, time point of cytogenetic response and molecular response over time according to variant subgroup. (A) Initial leukocyte count in patients without pathogenic somatic variants (gray), patients with pathogenic somatic variants in genes other than ASXL1 (light red), and patients with pathogenic somatic variants in ASXL1 (dark red). (B) Initial platelet count in patients without pathogenic somatic variants (gray), patients with pathogenic somatic variants in genes other than ASXL1 (light red), and patients with pathogenic somatic variants in ASXL1 (dark red). (C) Initial hemoglobin level in patients without pathogenic somatic variants (gray), patients with pathogenic somatic variants in genes other than ASXL1 (light red), and patients with pathogenic somatic variants in ASXL1 (dark red). Unpaired one-way ANOVA was used for statistical comparison between the subgroups. (D) Time point of cytogenetic response in patients without pathogenic somatic variants (gray), patients with pathogenic somatic variants in genes other than ASXL1 (light red), and patients with pathogenic somatic variants in ASXL1 (dark red). (E) Initial BCR::ABL1 transcript level and molecular response over time in patients without pathogenic somatic variants (grey), patients with pathogenic somatic variants in genes other than ASXL1 (light red), and patients with pathogenic somatic variants in ASXL1 (dark red).
Haematologica | 109 March 2024 945 LETTER TO THE EDITOR
A B
D E
C
sidering the possible prognostic role of the occurrence of pathogenic somatic variants beyond BCR::ABL1, it highlights the significance and the potential predictive value of variant profiling in pediatric CML. However, the number of pediatric patients with CML-CP assessed in this study is still limited. Therefore, joint international efforts enabling a deep and individual analysis of the potential role and relationship of additional genetic variants in pediatric CML are required.
Authors
Yvonne Lisa Behrens,1 Laura Gaschler,2,3 Ronny Nienhold,4 Thea Reinkens,1 Elke Schirmer,2,3 Sabine Knöβ, 1 Renate Strasser,1 Stephanie Sembill,2,3 Zofia Wotschofsky,2,3 Meinolf Suttorp,5 Manuela Krumbholz,2,3 Brigitte Schlegelberger,1 Markus Metzler,2,3 Gudrun Göhring1#° and Axel Karow2,3#
1Department of Human Genetics, Hannover Medical School, Hannover, Germany; 2Department of Pediatrics and Adolescent Medicine, Friedrich-Alexander-Universität Erlangen-Nürnberg (FAU), Erlangen, Germany; 3Comprehensive Cancer Center Erlangen-EMN (CCC ER-EMN), Erlangen, Germany; 4Department of Pathology and Molecular Pathology, University Hospital Zurich, University of Zurich, Zurich, Switzerland and 5Medical Faculty, Pediatric Hematology and Oncology, Technical University, Dresden, Germany
#GG and AK contributed equally as senior authors.
°Current address: Amedes Genetics, Hannover, Germany.
Correspondence:
A. KAROW - axel.karow@uk-erlangen.de
References
1. Bidikian A, Kantarjian H, Jabbour E, et al. Prognostic impact of ASXL1 mutations in chronic phase chronic myeloid leukemia. Blood Cancer J. 2022;12(10):144.
2. Hijiya N, Schultz KR, Metzler M, Millot F, Suttorp M. Pediatric chronic myeloid leukemia is a unique disease that requires a different approach. Blood. 2016;127(4):392-399.
3. Suttorp M, Schulze P, Glauche I, et al. Front-line imatinib treatment in children and adolescents with chronic myeloid leukemia: results from a phase III trial. Leukemia. 2018;32(7):1657-1669.
4 Hochhaus A, Baccarani M, Silver RT, et al. European LeukemiaNet 2020 recommendations for treating chronic myeloid leukemia. Leukemia. 2020;34(4):966-984.
5. Richards S, Aziz N, Bale S, et al. Standards and guidelines for the interpretation of sequence variants: a joint consensus recommendation of the American College of Medical Genetics and Genomics and the Association for Molecular Pathology. Genet Med. 2015;17(5):405-424.
6. Schmidt M, Rinke J, Schafer V, et al. Molecular-defined clonal
https://doi.org/10.3324/haematol.2023.283800
Received: June 27, 2023.
Accepted: September 1, 2023.
Early view: September 14, 2023.
©2024 Ferrata Storti Foundation
Published under a CC BY-NC license
Disclosures
No conflicts of interest to disclose.
Contributions
YLB, GG and AK designed the research study. YLB, LG, TR, ES, SK, RS, SS and ZW performed the research. YLB, RN, TR, MS, MK, BS, MM, GG and AK analyzed the data. YLB, RN, MS, MK, BS, MM, GG and AK wrote the paper.
Acknowledgments
We would like to thank all patients and their families for their willingness to contribute their highly valuable data for studies on this rare disease. In addition, we thank all nurses and physicians caring for these patients for data acquisition, and for the many productive and personal discussions on patients and treatment options.
Funding
This project was funded by the Deutsche Kinderkrebsstiftung (DKS 2021.21). YLB and GG were supported by the BMBF MyPred consortium (01GM1911A).
Data-sharing statement
The data presented in this study are available only on request from the corresponding author. The data are not publicly available due to privacy and ethical restrictions.
evolution in patients with chronic myeloid leukemia independent of the BCR-ABL status. Leukemia. 2014;28(12):2292-2299.
7 Kim T, Tyndel MS, Kim HJ, et al. Spectrum of somatic mutation dynamics in chronic myeloid leukemia following tyrosine kinase inhibitor therapy. Blood. 2017;129(1):38-47.
8. Branford S, Kim DDH, Apperley JF, et al. Laying the foundation for genomically-based risk assessment in chronic myeloid leukemia. Leukemia. 2019;33(8):1835-1850.
9 Nteliopoulos G, Bazeos A, Claudiani S, et al. Somatic variants in epigenetic modifiers can predict failure of response to imatinib but not to second-generation tyrosine kinase inhibitors. Haematologica. 2019;104(12):2400-2409.
10 Jaiswal S, Fontanillas P, Flannick J, et al. Age-related clonal hematopoiesis associated with adverse outcomes. N Engl J Med. 2014;371(26):2488-2498.
11. Genovese G, Kahler AK, Handsaker RE, et al. Clonal hematopoiesis and blood-cancer risk inferred from blood DNA sequence. N Engl J Med. 2014;371(26):2477-2487.
Haematologica | 109 March 2024 946 LETTER TO THE EDITOR
12. Xie M, Lu C, Wang J, et al. Age-related mutations associated with clonal hematopoietic expansion and malignancies. Nat Med. 2014;20(12):1472-1478.
13. Schonfeld L, Rinke J, Hinze A, et al. ASXL1 mutations predict inferior molecular response to nilotinib treatment in chronic myeloid leukemia. Leukemia. 2022;36(9):2242-2249.
14 Ernst T, Busch M, Rinke J, et al. Frequent ASXL1 mutations in children and young adults with chronic myeloid leukemia. Leukemia. 2018;32(9):2046-2049.
15. Kantarjian H, Shah NP, Hochhaus A, et al. Dasatinib versus imatinib in newly diagnosed chronic-phase chronic myeloid leukemia. N Engl J Med. 2010;362(24):2260-2270.
Haematologica | 109 March 2024 947 LETTER TO THE EDITOR
Outcome heterogeneity of TP53-mutated myeloid neoplasms and the role of allogeneic hematopoietic cell transplantation
TP53 mutations are present in up to 20% of patients with de novo myeloid neoplasms (MN) and nearly 40% with myeloid neoplasm post cytotoxic therapy (MN-pCT). They are frequently associated with a complex karyotype (CK) and poor responses to therapy.1-3 There are currently no effective targeted therapies for TP53-MN. Since standard cytotoxic regimens are seldom successful in achieving remission and may result in significant toxicity, the treatment paradigm has recently shifted to less intensive therapies such as hypomethylating agents (HMA). Even though the overall response rate has improved significantly with HMA alone or in combination with venetoclax, most patients succumb to their disease.4,5 Allogeneic hematopoietic cell transplantation (alloHCT) remains the only curative option for patients with high-risk MN. Even though some patients achieve long-term survival, the outcomes after alloHCT are disappointing.3,6 Thus, it is unclear if the standard of care alloHCT is an appropriate treatment for patients with TP53-MN given potentially serious morbidity and mortality, particularly in older patients.7 We performed a single-center retrospective review of adult patients with TP53-MN evaluated at Johns Hopkins between November 2015 and February 2020. The clinical characteristics are included in Table 1. The clinical next-generation
sequencing (NGS) panel including 59 genes commonly mutated in myeloid malignancies was used to identify TP53 mutations, as previously described (Online Supplementary Table S1).8 We identified 93 patients including 22 with de novo acute myeloid leukemia (AML), 15 with AML, myelodysplasia-related (AML-MR), 23 with myelodysplastic neoplasms (MDS), 29 with MN-pCT, two with myeloproliferative neoplasm (MPN), and two with MDS/MPN. DNA was extracted from diagnostic bone marrow specimens or peripheral blood leukocytes. The identification of somatic variants has been performed as previously described.8 Despite our stringent filtering criteria, the germline origin of some variants could not have been entirely excluded. Overall, 79 of 93 (85%) patients received therapy: 20 (25.3%) were treated with HMA alone, 30 (38.0%) with HMA + venetoclax, ten (12.7%) with HMA + others, 15 (19.0%) with intensive chemotherapy, two (2.5%) with an immunomodulatory drug, one (1.3%) with ivosidenib and one (1.3%) with a JAK2 inhibitor. Twenty-nine (36.7%) patients received non-myeloablative alloHCT with post-transplant cyclophosphamide (Figure 1A).
TP53 variants included missense, truncating, splice-site mutations, and insertions/deletions. Missense variants were more common, and several recurrent mutations were
alloHCT: allogeneic hematopoietic cell transplantation; AML: acute myeloid leukemia; AML-MR: acute myeloid leukemia myelodysplasia-related; MDS: myelodysplastic neoplasms; MPN: myeloproliferative neoplasms; MN-pCT: myeloid neoplasm post cytotoxic therapy.
Haematologica | 109 March 2024 948 LETTER TO THE EDITOR
Variable Overall N=93 alloHCT N=29 Therapy no alloHCT N=50 No therapy N=14 P Age in years, median (range) 67 (59-73) 62 (53-67) 68 (60-73) 76 (70-84) <0.0001 Sex, N (%) F M 38 (40.9) 55 (59.1) 13 (44.8) 16 (55.2) 18 (36.0) 32 (64.0) 7 (50.0) 7 (50.0) 0.54 Diagnosis, N (%) AML AML-MR MDS MDS/MPN overlap MPN MN-pCT (AML) MN-pCT (MDS) 22 (23.7) 15 (16.1) 23 (24.7) 2 (2.2) 2 (2.2) 10 (10.8) 19 (20.4) 8 (27.6) 5 (17.2) 4 (13.8) 2 (6.9) 0 (0) 4 (13.8) 6 (20.7) 13 (26.0) 9 (18.0) 11 (22.0) 0 (0) 2 (4.0) 4 (8.0) 11 (22.0) 1 (7.1) 1 (7.1) 8 (57.1) 0 (0) 0 (0) 2 (14.3) 2 (14.3) 0.31 0.69 0.01 0.21 0.66 0.58 0.94 Cytogenetics, N (%) Complex Non-complex Not available 73 (78.5) 16 (17.2) 4 (4.3) 22 (75.9) 6 (20.7) 1 (3.4) 42 (84.0) 7 (14.0) 1 (2.0) 9 (64.3) 3 (21.4) 2 (14.3) 0.54
Table 1. Clinical characteristics of the TP53-myeloid neoplasm cohort.
Figure 1. TP53-myeloid neoplasm cohort, molecular and cytogenetic characteristics of patients. (A) The study cohort and treatments. (B) Lollipop plot representing the TP53 mutations grouped by the presence or absence of complex karyotype (CK). The amino acid changes are provided for recurring mutations observed in 3 or more patients with CK. (C) Oncoprint representing the gene mutations per patient, the presence of CK and TP53 null phenotypes as determined by multiple mutations, del(17p), and copy neutral loss of heterozygosity (CN-LOH). (D) Distribution of the number of mutations per patient according to CK. TP53 null causes are represented by red and not null by blue dots. (E) Bar-plot representing the relative number of nonTP53 mutations according to CK. The mutated genes with significantly different distribution between CK (blue bars) and non-CK (red bars) are marked with asterisks. DDR: DNA damage response.
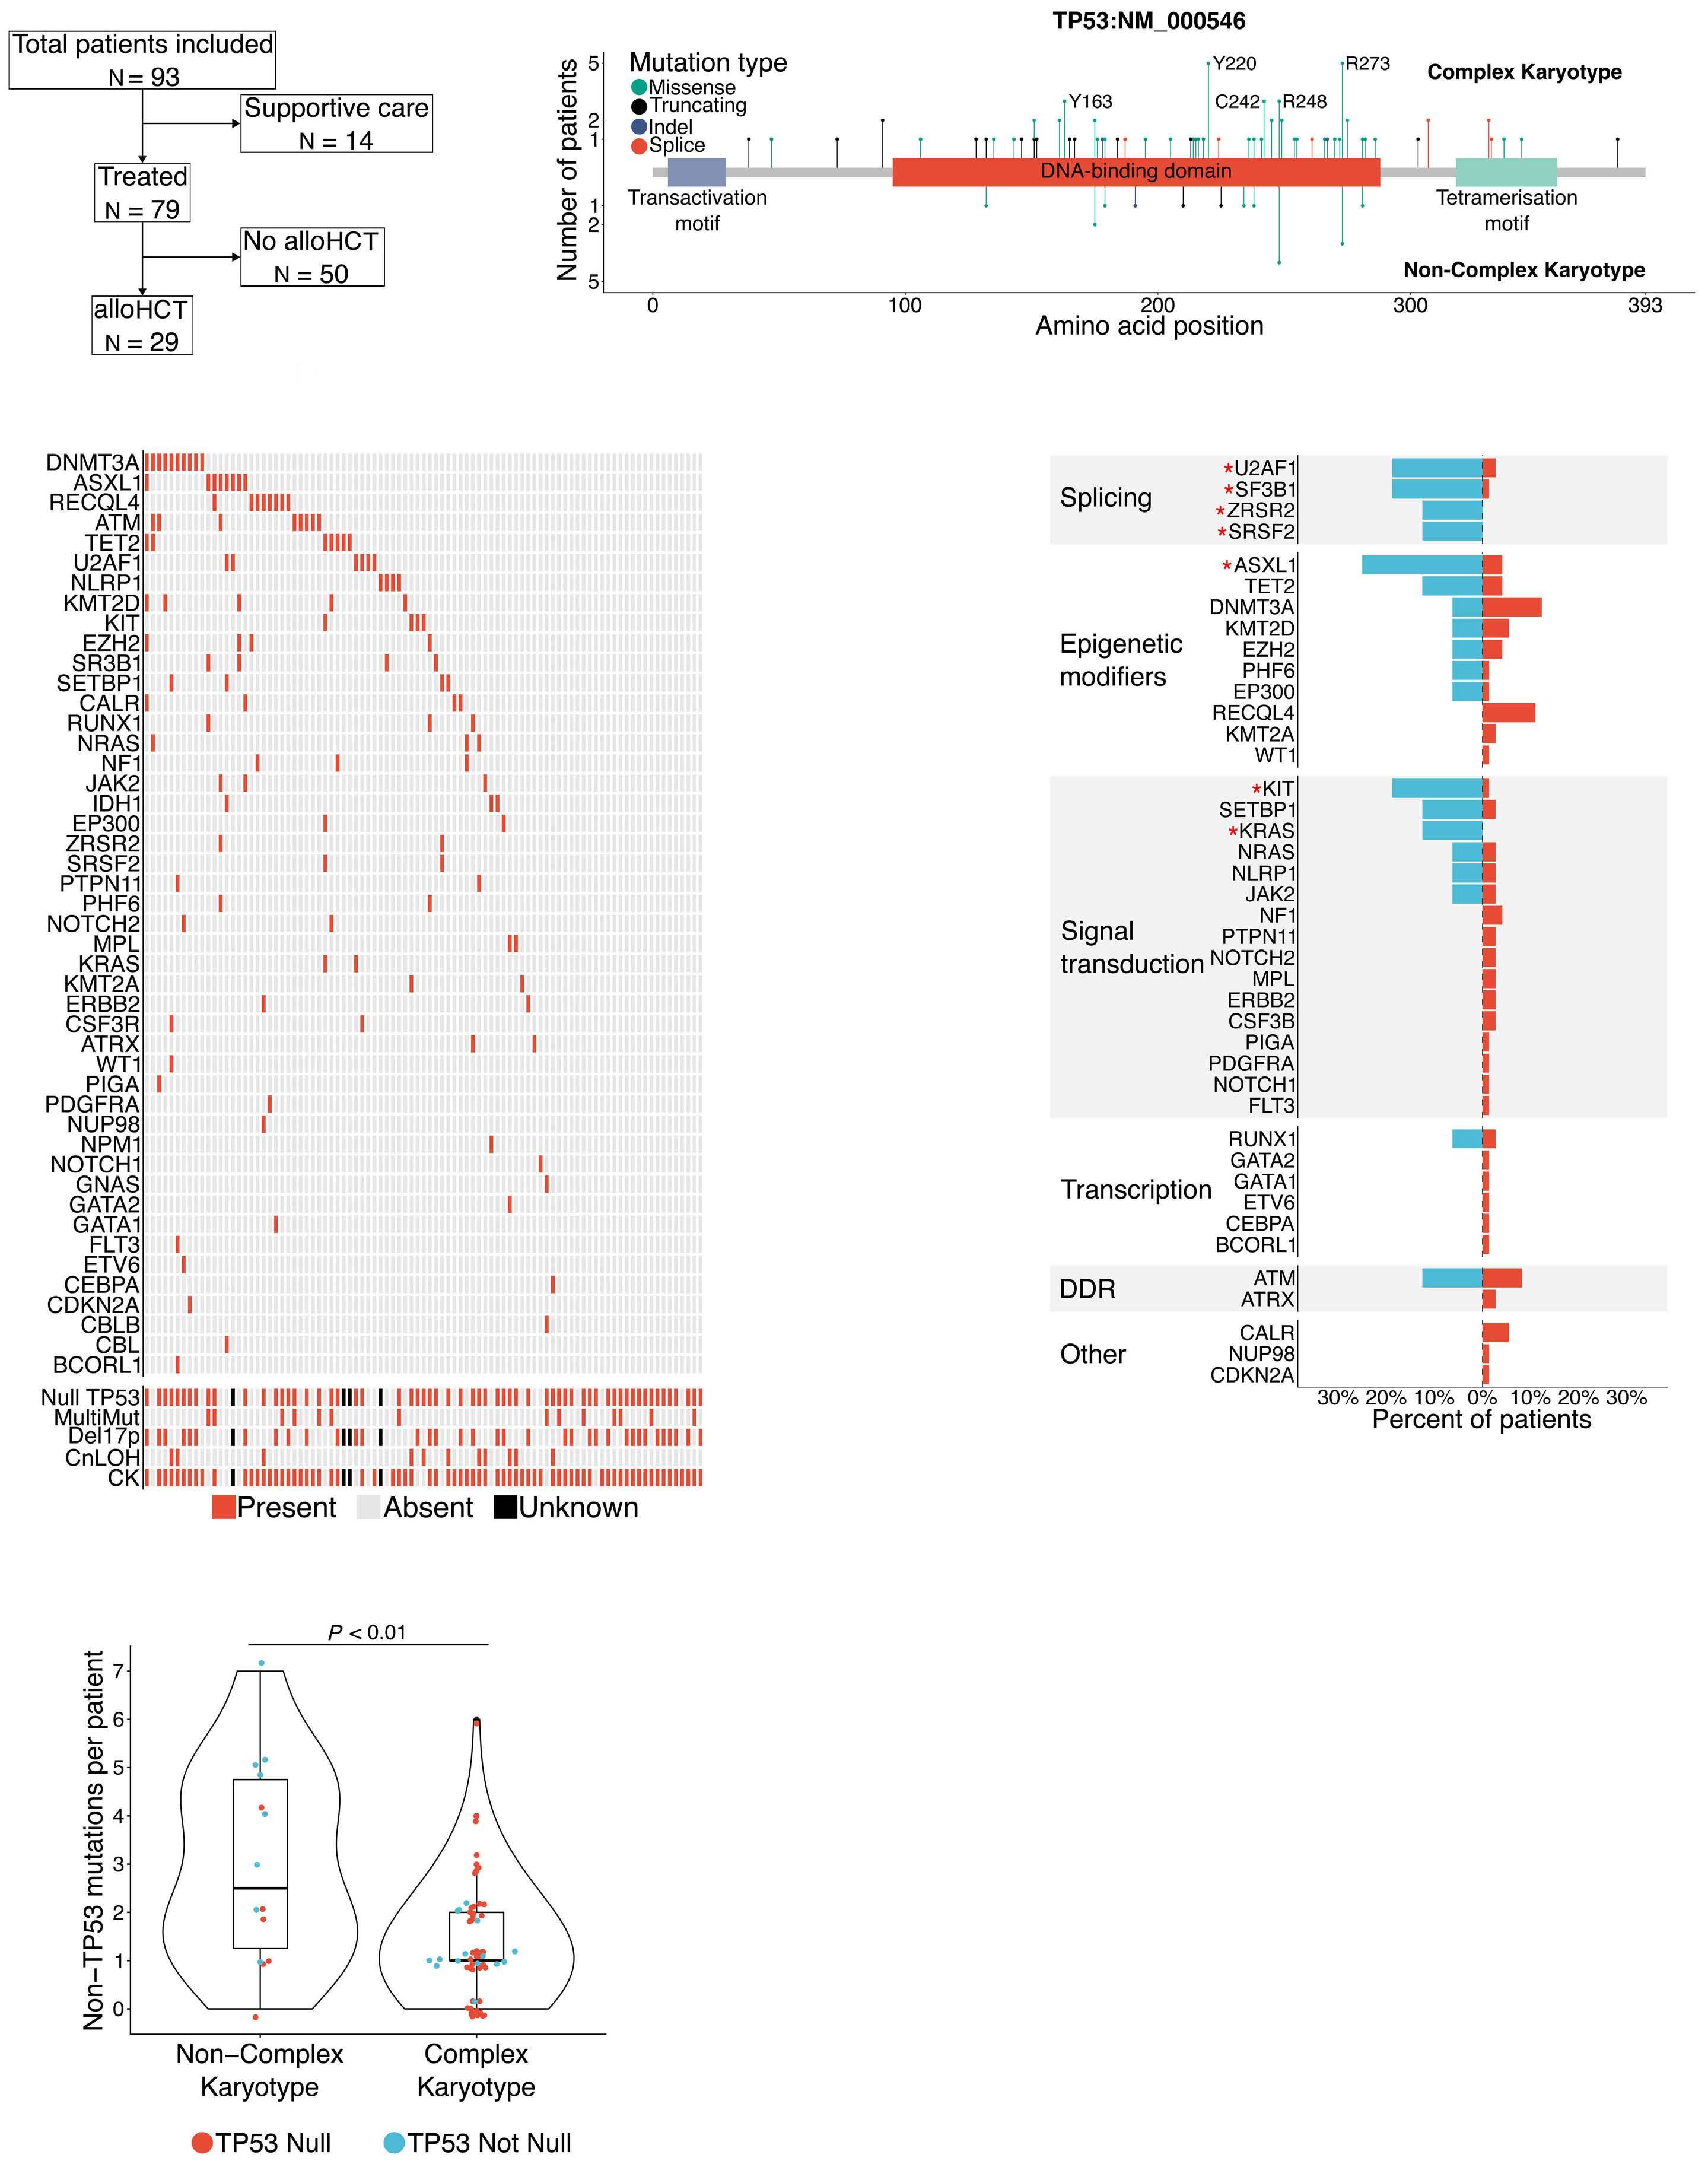
Haematologica | 109 March 2024 949 LETTER TO THE EDITOR
A C D E B
observed, specifically R175, Y220, R248, and R273 (Figure 1B; Online Supplementary Table S2). Karyotype results were available from 89 of 93 (95.7%) patients. Of those, 73 (78.5%) patients had CK. Sixty-two (66.6%) patients had biallelic TP53 aberration (null phenotype): 14 (15.1%) patients with biallelic TP53 mutations, 37 (41.6%) with deletion 17p, and 11 (12.0%) with copy-neutral loss-of-heterozygosity (CNLOH) involving chromosome 17p (Figure 1C). As expected, CK was significantly associated with TP53 null phenotype compared to monoallelic mutations (56/62 [90.3%] vs. 17/26 [65.4%], respectively; P=0.01).
Additional somatic mutations in presumptive cancer driver genes were seen in 65 of 81 (80.2%) of patients with TP53 mutations. DNMT3A, ASXL1, RECQL4, ATM, TET2, and U2AF1 were among the most commonly mutated genes (Figure 1C; Online Supplementary Table S3). The presence of CK was associated with lower mutational burden compared to non-CK patients (P< 0.01; Figure 1D). Next, we sought to determine, whether mutations in genes involved in distinct cellular processes were significantly more common in patients with TP53 and CK. The mutations in genes involved in mRNA splicing and chromatin modifications such as ASXL1 were significantly associated with TP53 and CK (Figure 1E). Even though the outcomes of patients with TP53 mutations are generally poor, some studies report 10-20% long-term survival after alloHCT. We analyzed the outcome of all patients with TP53 mutations, regardless of the
karyotype results. Fourteen of the 93 patients (15%) were offered supportive care only, while remission induction was attempted in 79 (85%) patients. Complete remission or complete remission with incomplete hematological recovery (CR/CRi) was achieved in 25 of 79 (31.6%) patients. Twenty-nine (36.7%) patients received non-myeloablative alloHCT with post-transplant cyclophosphamide; 22 (75.9%) in CR/CRi and seven (24.1%) with residual disease. (Table 1; Figure 1A). The median survival was significantly better in patients treated with alloHCT compared to those who did not proceed to alloHCT (18.9 vs. 4.1 months, respectively; P<0.0001; Figure 2A). A significantly higher CR/CRi rate among alloHCT recipients compared to the non-alloHCT arm may have contributed to the observed difference in survival (75.9% vs. 6.8%, respectively). The median survival was similar between supportive care and therapy-only groups (2.5 vs. 4.1 months; P=0.94; Figure 2A). Since the TP53 null phenotype is almost uniformly associated with genomic instability and CK, we sought to examine the effect of CK on alloHCT outcome. The median overall survival was significantly better in patients with TP53 mutations and non-CK compared to patients with CK (not reached vs. 13.7 months; P=0.01; Figure 2B). We previously showed that mobilized peripheral blood (PB) and a more intensive conditioning regimen with 400 cGy total body radiation (TBI) appeared to be associated with improved outcomes in T-cell lymphomas and myelofibrosis compared to our standard
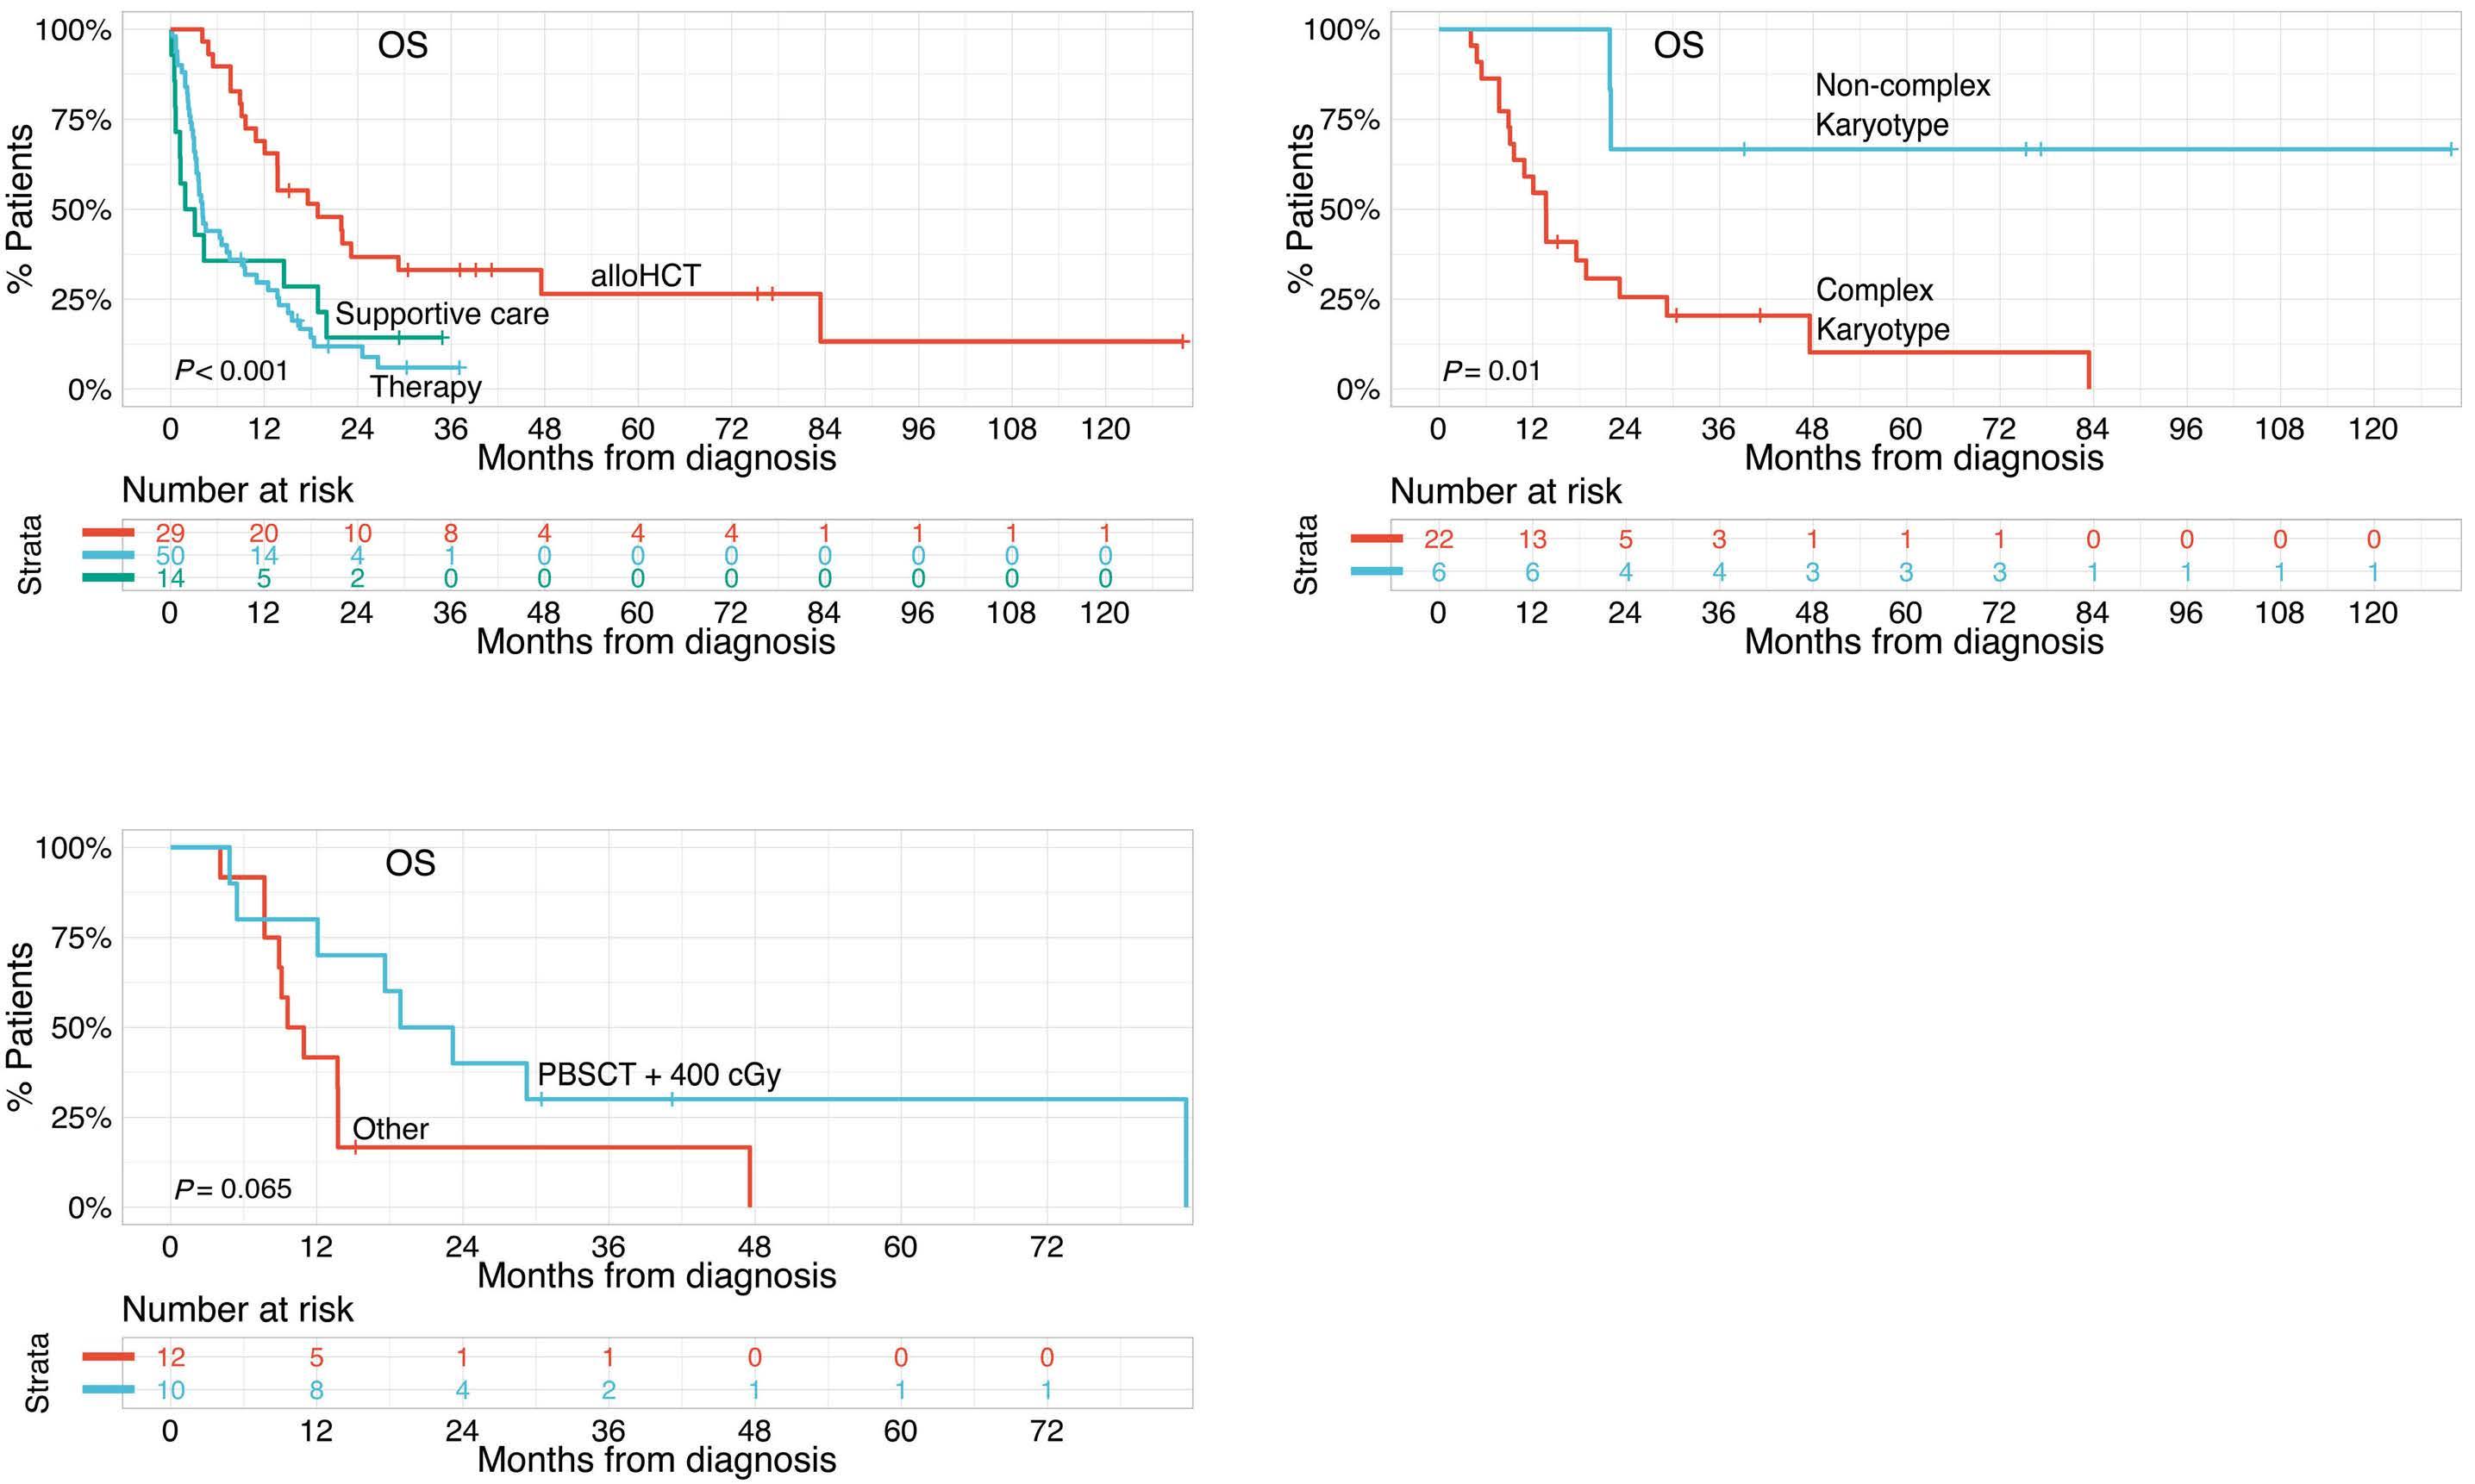
Figure 2. Outcomes of TP53-myeloid neoplasm patients. (A) Overall survival (OS) of all patients with TP53-myeloid neoplasm (MN) treated with supportive care, chemotherapy only, and chemotherapy followed by allogeneic hematopoietic cell transplantation (alloHCT). (B) (OS) of TP53-MN treated with alloHCT according to complex karyotype (CK) status. (C) OS of TP53-MN with CK treated with non-myeloablative conditioning and total body irradiation (TBI) of 400 cGy and mobilized peripheral blood stem cell (PBSC) graft versus other conditioning strategies and graft source combinations (peripheral blood stem cell transplant (PBSCT) + 200 cGy and bone marrow + 400 cGy).
Haematologica | 109 March 2024 950 LETTER TO THE EDITOR
A C B
bone marrow (BM) allografts and 200 cGy TBI.9,10 Thus, we compared the outcome of TP53-CK patients who received PB and 400 cGy to those who received other conditioning strategies. Although not statistically significant, the median overall survival was longer in patients who received PB and 400 cGy (21.0 vs. 10.3 months; P=0.065; Figure 2C). Consistent with prior reports, we observed that TP53-MN is a heterogeneous group of myeloid malignancies characterized by diverse responses to therapies and outcomes.11 Complete loss of TP53 function, and not merely a presence of TP53 somatic variant, appears to mark the highrisk disease. While the presence of one wild-type allele is likely sufficient for an adequate DNA damage response and apoptosis, a null phenotype often leads to genome instability and CK.12 Thus, CK, appears to be an ultimate consequence of a complete loss of TP53 function.13 Although morphological remission can be achieved in TP53MN and CK, relapse is usually inevitable. Since traditional cytotoxic induction chemotherapies rely predominantly on intact DNA damage response pathway to induce apoptosis, low CR rates are not surprising.14 Thus, therapies such as HMA alone or in combination with venetoclax appear to be more effective. With these contemporary and often less toxic approaches, approximately half of the patients will achieve clinically meaningful responses and suitable candidates are often offered consolidation with alloHCT. The reported long-term survival after alloHCT in TP53-MN varies widely between the studies from as high as 25% to under 5%.3,6 This difference is likely due to the biological heterogeneity of TP53-MN.13 Our results demonstrate that the alloHCT outcome greatly depended on the karyotype. Patients with TP53-MN and CK treated with alloHCT had a median OS of 13.7 months while it was not reached in patients with non-CK. Additionally, most patients with TP53 mutations and CK relapsed within 12 months post-alloHCT. Modification of the conditioning regimen and graft source may result in better disease control and augmentation of the antileukemic effect of the graft, respectively.15 Like we previously showed in other high-risk diseases, higher TBI dose and the use of PB allografts may result in longer survival after alloHCT.9,10 Given the poor outcome with a standard alloHCT in patients with TP53-CK, novel approach-
References
1. Weinberg OK, Siddon A, Madanat YF, et al. TP53 mutation defines a unique subgroup within complex karyotype de novo and therapy-related MDS/AML. Blood Adv. 2022;6(9):2847-2853.
2. Rücker FG, Schlenk RF, Bullinger L, et al. TP53 alterations in acute myeloid leukemia with complex karyotype correlate with specific copy number alterations, monosomal karyotype, and dismal outcome. Blood. 2012;119(9):2114-2121.
3. Lindsley RC, Saber W, Mar BG, et al. Prognostic mutations in myelodysplastic syndrome after stem-cell transplantation. N Engl J Med. 2017;376(6):536-547.
es focused either on improving the immune effect of the graft or targeted maintenance therapies will be critical to improving outcomes.
Authors
Sergiu Pasca, Saurav D. Haldar, Alexander Ambinder, Jonathan A. Webster, Tania Jain, W. Brian Dalton, Gabrielle T. Prince, Gabriel Ghiaur, Amy E. DeZern, Ivana Gojo, B. Douglas Smith, Theodoros Karantanos, Cory Schulz, Kristin Stokvis, Mark J. Levis, Richard J. Jones and Lukasz P. Gondek
Division of Hematological Malignancies, Sidney Kimmel
Comprehensive Cancer Center, Johns Hopkins University, Baltimore, MD, USA
Correspondence:
L.P. GONDEK - lgondek1@jhmi.edu
https://doi.org/10.3324/haematol.2023.283886
Received: July 7, 2023
Accepted: September 5, 2023.
Early view: September 21, 2023.
©2024 Ferrata Storti Foundation
Published under a CC BY-NC license
Disclosures
No conflicts of interest to disclose.
Contributions
SP, SDH and LPG designed the study. SP, SDH and AA collected and annotated clinical data. SP and SDH performed variant filtering and analyzed molecular data. JAW, TJ, WBD, GTP, GG, AED, IG, BDS, TK, CS, KS, MJL and RJJ analyzed and interpreted clinical data. SP, SDH, RJJ and LPG wrote and edited the manuscript. All authors critically reviewed the manuscript and approved the final version.
Data-sharing statement
Data are available on request from the corresponding author.
4. Pollyea DA, Pratz KW, Wei AH, et al. Outcomes in patients with poor-risk cytogenetics with or without TP53 mutations treated with venetoclax and azacitidine. Clin Cancer Res. 2022;28(24):5272-5279.
5. Döhner H, Dolnik A, Tang L, et al. Cytogenetics and gene mutations influence survival in older patients with acute myeloid leukemia treated with azacitidine or conventional care. Leukemia. 2018;32(12):2546-2557.
6. Murdock HM, Kim HT, Denlinger N, et al. Impact of diagnostic genetics on remission MRD and transplantation outcomes in
Haematologica | 109 March 2024 951 LETTER TO THE EDITOR
older patients with AML. Blood. 2022;139(24):3546-3557.
7 Versluis J, Lindsley RC. Transplant for TP53-mutated MDS and AML: because we can or because we should? Hematology. 2022;2022(1):522-527.
8. Gondek LP, Zheng G, Ghiaur G, et al. Donor cell leukemia arising from clonal hematopoiesis after bone marrow transplantation. Leukemia. 2016;30(9):1916-1920.
9 Sterling CH, Hughes MS, Tsai H-L, et al. Allogeneic blood or marrow transplantation with post-transplantation cyclophosphamide for peripheral T cell lymphoma: the importance of graft source. Transplant Cell Ther. 2023;29(4):267.e1-267.e5.
10. Jain T, Tsai H-L, DeZern AE, et al. Post-Transplantation cyclophosphamide-based graft-versus-host disease prophylaxis with nonmyeloablative conditioning for blood or marrow transplantation for myelofibrosis. Transplant Cell Ther. 2022;28(5):259.e1-259.e11.
11. Short NJ, Montalban-Bravo G, Hwang H, et al. Prognostic and therapeutic impacts of mutant TP53 variant allelic frequency in
newly diagnosed acute myeloid leukemia. Blood Adv. 2020;4(22):5681-5689.
12. Jasek M, Gondek LP, Bejanyan N, et al. TP53 mutations in myeloid malignancies are either homozygous or hemizygous due to copy number-neutral loss of heterozygosity or deletion of 17p. Leukemia. 2010;24(1):216-219.
13. Bernard E, Nannya Y, Hasserjian RP, et al. Implications of TP53 allelic state for genome stability, clinical presentation and outcomes in myelodysplastic syndromes. Nat Med. 2020;26(10):1549-1556.
14 Papaemmanuil E, Gerstung M, Bullinger L, et al. Genomic classification and prognosis in acute myeloid leukemia. N Engl J Med. 2016;374(23):2209-2221.
15. Hourigan CS, Dillon LW, Gui G, et al. Impact of conditioning intensity of allogeneic transplantation for acute myeloid leukemia with genomic evidence of residual disease. J Clin Oncol. 2020;38(12):1273-1283.
Haematologica | 109 March 2024 952 LETTER TO THE EDITOR
A phase II study of interrupted and continuous dose lenalidomide in relapsed/refractory Hodgkin lymphoma
Newly diagnosed classical Hodgkin lymphoma (cHL) can be cured in approximately 75–85% of patients with systemic or combined-modality frontline therapy. While novel agents such as the anti-CD30 antibody drug conjugate brentuximab vedotin (BV) and immune checkpoint inhibitors (ICI; e.g., nivolumab, pembrolizumab) are highly active in cHL and now often combined with multi-agent chemotherapy,1,2 patients with relapsed or refractory (rel/ref) disease after salvage therapy and autologous stem cell transplantation (ASCT) have few treatment options and experience 5-year median overall survival (OS) of approximately 50%.3 Lenalidomide is an immunomodulatory agent approved for mantle cell, follicular, marginal zone, and diffuse large B-cell lymphomas, which interacts with the ubiquitin E3 ligase cereblon to degrade Ikaros family transcription factors.4 Given multiple immunomodulatory targets in the cHL microenvironment, we hypothesized that lenalidomide would show clinical activity in rel/ref cHL. We previously reported on standard interrupted dosing of lenalidomide (25 mg/d, days 1-21, 28-day cycles) in patients with heavily pretreated rel/ref cHL.5 In that cohort, the International Workshop Criteria (IWC) overall response rate (ORR) was 19% and the disease control rate (DCR; best response of complete response [CR] or partial response [PR], or stable disease [SD] ≥6 months) was 33%. Based on evidence in other malignancies that continuous lenalidomide dosing may increase efficacy,6 we tested a continuous dosing schedule (25 mg/d, days 1-28, 28-day cycles until progression or intolerance) in a separate cohort of patients with rel/ref cHL (clinicaltrials gov. Identifier: NCT00540007). Here we report the data from the continuous dosing cohort in the context of our previously reported findings.
Collectively, 80 patients enrolled (10/2007 to 6/2011) to the two cohorts (Online Supplementary Table S1). Patient eligibility criteria, treatment, and response assessment were previously reported with the interrupted cohort outcomes.5 The study was carried out in accordance with the principles of the Declaration of Helsinki, Good Clinical Practice guidelines, and regulatory and country-specific requirements. Forty-two patients were assigned to the continuous cohort and received daily lenalidomide. Eight patients (2 from the interrupted cohort and 6 from the continuous cohort) were removed from study before receiving two cycles of lenalidomide due to cytopenias (n=2), increased aspartate transaminase/alanine transaminase (n=2), venous thrombosis (n=1), desquamating rash (n=1), consent withdrawal (n=1), and incarceration (n=1), thus were not response-evaluable per protocol. The median number of lenalidomide cycles administered in the interrupted and continuous cohorts was four (range, 1-48) and 3.5 (range, 1-61+), respectively. Median follow-up from enrollment was 16.0 months (range, 0.7-92.7).
Responses were assessed by positron emission tomography/computed tomography (PET/CT) in 45 patients and CT alone in 26 patients. Due to the time period of the study, international Workshop Criteria was used to assess responses, thus estimates of ORR here may be lower than expected if Lugano response criteria had been used. In 72 response-evaluable patients across both cohorts (Table 1), the ORR was 26% (95% confidence interval [CI]: 18-40), and DCR was 43% (95% CI: 34-58). In the continuous cohort (n=36), the ORR was 32% (95% CI: 20-50) and DCR was 49% (95% CI: 30-70), compared to an ORR of 19% (95% CI: 10-37) and DCR of 36% (95% CI: 24-57) in the interrupted
*Patient response was assessed by positron emission tomography/computed tomography in 45 patients and by computed tomography alone in 26 patients. **The International Workshop Criteria were used to assess response; estimates of overall response rate from this study may be lower than would be expected if the Lugano criteria for response had been used. CR: complete response; ORR: overall response rate; PR: partial response; SD: stable disease.
Haematologica | 109 March 2024 953 LETTER TO THE EDITOR
Type of response Entire cohort Response-evaluable patients Interrupted N=38 Continuous N=42 Combined N=80 Interrupted N=36 Continuous N=36 Combined N=72 CR*, N (%) 1 (2.6) 3 (7.2) 4 (5.0) 1 (2.8) 3 (8.3) 4 (5.5) PR*, N (%) 6 (15.7) 9 (21.4) 15 (18.8) 6 (16.6) 9 (25.0) 15 (20.8) SD ≥6 months*, N (%) 6 (13.2) 6 (14.3) 12 (15.0) 6 (16.6) 6 (16.7) 12 (16.7) ORR (CR+PR)**, N (%) 7 (13.2) 12 (28.6) 19 (23.8) 7 (19.4) 12 (32.4) 19 (26.4) Disease control rate** (CR+PR+SD ≥6 months), N (%) 13 (34.2) 18 (42.9) 31 (38.5) 13 (36.1) 18 (48.6) 31 (43.1)
Table 1. Response rates for entire cohort and per protocol response-evaluable patients for interrupted and continuous cohorts.
cohort. Of the 13 patients achieving disease control in the continuous cohort, nine (69%) had progressed after ASCT and three (23%) were refractory to their prior therapy (Online Supplementary Table S2). One patient achieving PR was censored at the time of subsequent ASCT. One patient with SD for 2 months discontinued treatment due to cytopenias prior to a diagnosis of therapy-related acute myeloid leukemia. One patient withdrew due to pregnancy, and another patient achieved a PR lasting 84 months after previously discontinuing treatment due to Cryptococcus infection. In the continuous cohort, median duration of response (DOR) was 8.1 months (range, 4-73), and median time-to-treatment failure (TTF) in patients achieving disease control was 8.3 months (range, 4-73) (Online Supplementary Figure S1A). The previously reported interrupted cohort median DOR was 6 months (range, 4-24) (Online Supplementary Figure S1B), and median TTF in patients achieving disease control was 15 months (range, 4-43).5 Survival was analyzed on an
intention-to-treat basis. Median progression-free survival (PFS) was 3.7 months for both the continuous (95% CI: 1.8-7.7) and interrupted cohorts (95% CI: 1.8-4.6) (Figure 1A). The median OS was 35.9 months (95% CI: 17.7-not estimated [NE]) for the continuous cohort, 19.6 months (95% CI: 15.3-29.0) for the interrupted cohort, and 23.7 months (95% CI: 17.4-35.6) for the entire study population across both cohorts (Figure 1B). Both cohorts had exceptional long-term responders. Two patients receiving interrupted lenalidomide had a TTF of 30 and 46 months. Both patients had received ≥4 prior therapies including ASCT and were refractory to their previous treatment. Two patients on continuous lenalidomide had long-term responses, one for 24 months (CR), having relapsed after three prior treatments including ASCT. The second patient (PR) remained on treatment for 73 months before discontinuation due to Cryptococcus infection. This patient progressed 11 months later and was subsequently treated with multiple therapies
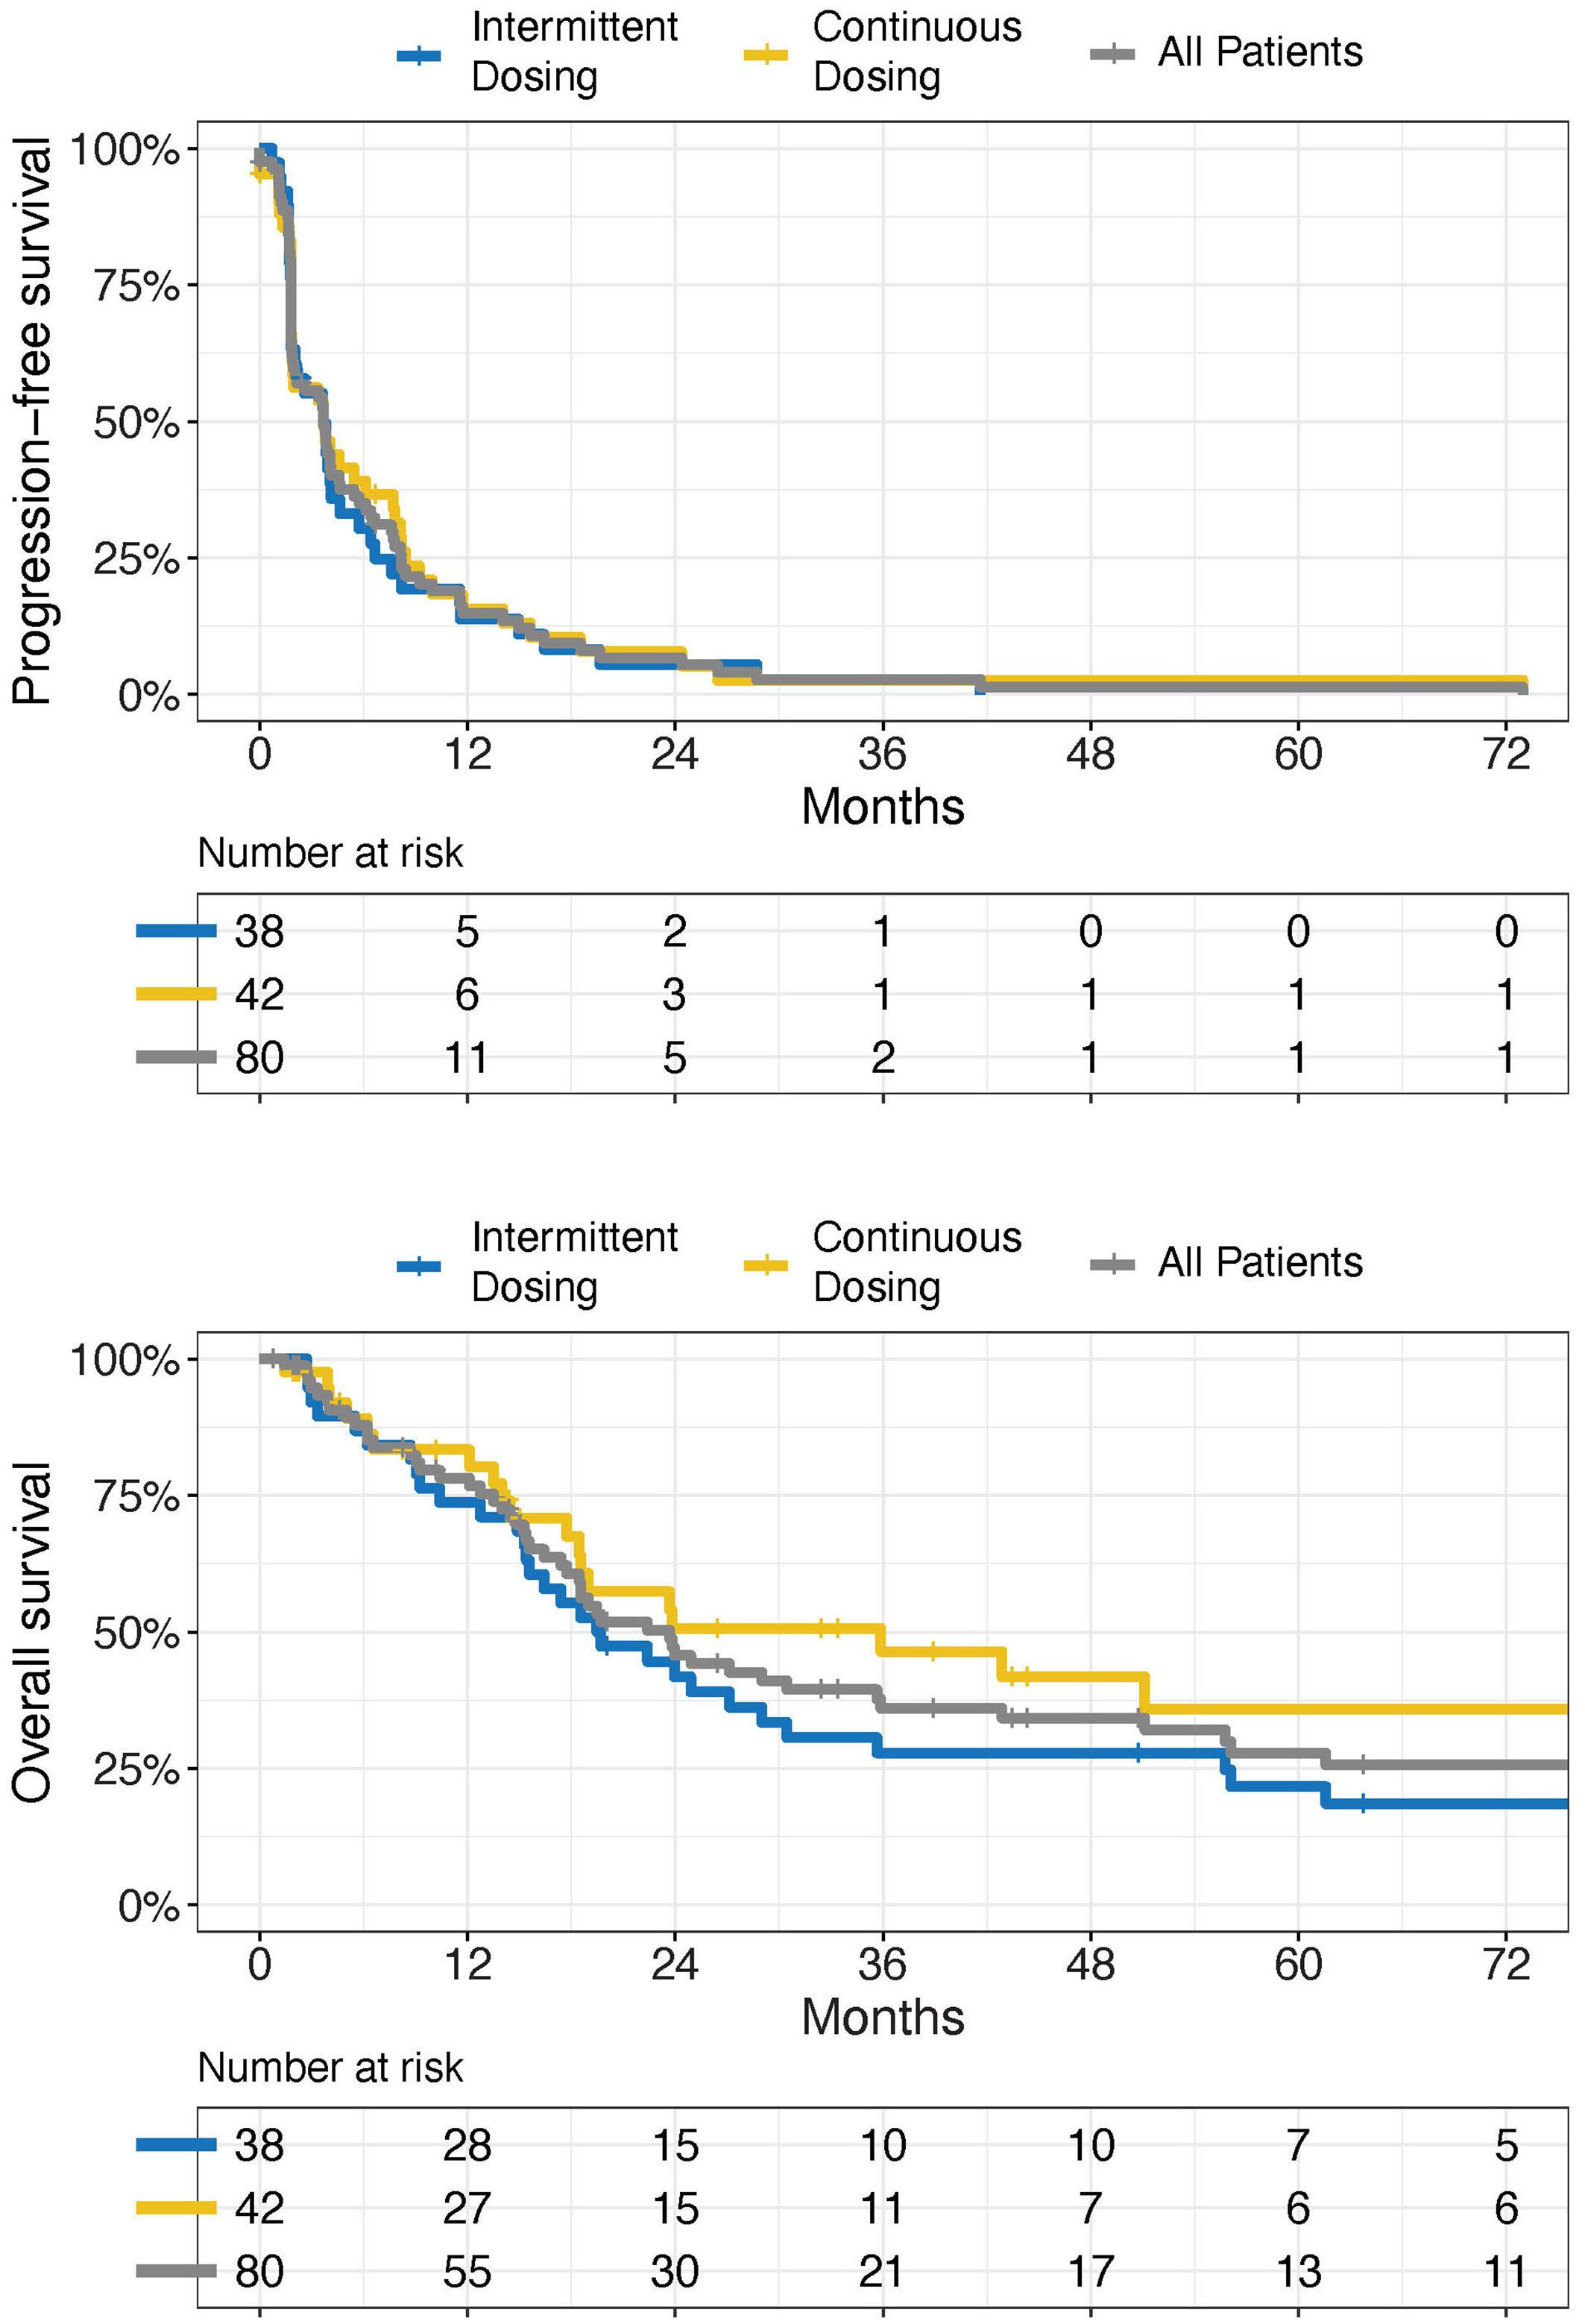
Haematologica | 109 March 2024 954 LETTER TO THE EDITOR
A B
Figure 1. Intention-to-treat survival analysis by cohort. (A) Progression-free survival. (B) Overall survival.
including BV and nivolumab, all of which their disease was refractory to or relapsed again within 12 months. Lenalidomide was generally well-tolerated with both dosing schedules. The most frequent grade 3-4 adverse events (AE) across both cohorts were neutropenia (48%), leukopenia (29%), thrombocytopenia (23%), lymphopenia (23%), and anemia (19%). Grade 3-4 AE frequencies were similar between the dosing cohorts (Table 2). In the continuous cohort, dose reductions occurred due to cytopenias (n=3) and skin ulceration (n=1). Eight patients discontinued treatment for cytopenias (n=4), vertigo (n=1), myelodysplasia (n=1), pregnancy (n=1), or rash (n=1) at a median of 5.7 months (range, 3.6-73.0). In the interrupted cohort, dose reductions (n=7) and treatment discontinuations (n=4) were previously noted.5 The median time on therapy for patients who discontinued was 5.7 months (range, 3.6-71.5). Prior studies in rel/ref cHL explored changes in plasma/ serum levels of CCL17/TARC as a biomarker of response. In the continuous cohort, we observed a trend (P=0.07) of decreasing CCL17/TARC levels from C1D1 to C1D15 in responding patients (Online Supplementary Figure S1C). Data from the combined cohorts revealed significant associations between decreasing CCL17/TARC levels from C1D1 to C1D15 in responding patients (P=0.014), as well as lower CCL17/TARC levels at C1D15 in responding versus C1D15 in non-responding patients (P=0.017) (Online Supplementary Figure S1D). This study represents the largest reported group of patients with rel/ref cHL treated with single-agent lenalidomide, which exhibited an ORR of 26% and DCR of 43% across 72 evaluable patients treated with either interrupted or continuous dosing. Compared to interrupted dosing, continuous dosing resulted in a modest, although not statistically significant, increase in ORR (32% vs. 19%) and DCR (49% vs. 33%). Median PFS was identical at 3.7 months. Both
cohorts had exceptional long-term responders. Eleven patients had previously received BV and either progressed on or within 6 months of discontinuing BV. Three of these patients responded to lenalidomide: one PR (9.3 months) and two CR (10 and 48 months). Thus, in heavily pretreated patients, lenalidomide resulted in modest activity overall, with several exceptional responders.
Compared to interrupted dosing, continuous dosing resulted in modestly more toxicity-related discontinuations (n=8 vs. n=4), particularly due to cytopenias (n=4 vs. n=1). Despite this, there was a similar incidence of grade 3-4 AE overall. Our results indicate that lenalidomide’s efficacy in rel/ref cHL is similar to that reported with other novel single-agent therapies in both the post-ASCT and post-BV setting, including panobinostat, mocetinostat, and AFM13, with lenalidomide exhibiting a favorable toxicity profile.7 Other smaller studies have evaluated interrupted lenalidomide monotherapy in rel/ref cHL. A phase II study of 14 patients (lenalidomide 25 mg/d, days 1-21, 28-day cycles) demonstrated best responses of PR in two patients and stable disease in seven patients.8 A lenalidomide compassionate-use program reported an ORR of 29% (1 CR, 11 PR) in 42 patients treated similarly. Two patients transitioned to continuous lenalidomide without increased toxicity.9 Combining lenalidomide with other therapies is also appealing, as its immunomodulatory effects may enhance partner drugs’ anti-tumor activities. Several ongoing trials combine lenalidomide with chemotherapy or targeted agents. One study of AVD (4-8 cycles) and lenalidomide (5-25 mg/d) as frontline treatment in patients ≥60 years old with cHL reported an 80% ORR and 84% 3-year PFS.10 A phase I/ II study of bendamustine (60 mg/m2, days 1/8/15) plus continuous lenalidomide (10-25 mg/d) in 15 patients with chemorefractory cHL reported a 73% ORR and 8.7-month
Haematologica | 109 March 2024 955 LETTER TO THE EDITOR
Characteristic Grade 3 Grade 4 Grade 3-4 Interrupted Continuous Combined Interrupted Continuous Combined Combined Hematological, N (%) Neutropenia Leukopenia Lymphopenia Thrombocytopenia Anemia 13 (34) 9 (24) 7 (18) 5 (13) 8 (21) 17 (40) 11 (26) 7 (17) 8 (19) 5 (12) 30 (38) 20 (25) 14 (18) 13 (16) 13 (16) 5 (13) 2 (5) 2 (5) 2 (5) 2 (5) 3 (7) 1 (2) 2 (5) 3 (7)8 (10) 3 (4) 4 (5) 5 (6) 2 (3) 38 (48) 23 (29) 18 (23) 18 (23) 15 (19) Non-hematological, N (%) Fatigue Infection without neutropenia ALT AST Bilirubin 3 (8) 2 (5) 1 (3) 3 (8) 1 (3) 3 (7) 3 (7) 2 (5) 1 (2) 1 (2) 6 (8) 5 (6) 3 (4) 4 (5) 2 (3)1 (3)1 (3)-1 (2)1 (1)2 (3) 6 (8) 5 (6) 4 (5) 4 (5) 4 (6) Metabolic/laboratory, N (%) Low potassium Low sodium 2 (5) 1 (3) 3 (7) 3 (7) 5 (6) 4 (5) 1 (3) 1 (3)1(1) 1(1) 6 (8) 5 (6)
Table 2. Grade 3 or 4 adverse events occurring in greater than 5% of patients.
AST: aspartate transaminase; ALT: alanine transaminase.
median PFS.11 A study of the mTOR inhibitor temsirolimus (25 mg intravenously weekly) and lenalidomide (20 mg/d, days 1-21, 28-day cycles) in 20 patients with cHL refractory to or relapsing after BV reported an 80% ORR and 9.2-month median PFS.12 Not all lenalidomide combinations have been as promising. A study of 25 patients with rel/ref cHL receiving lenalidomide (20 mg, days 1-21, 28-day cycles) and panobinostat (15 mg, 3 doses/week) reported a 17% ORR, lower than the expected ORR for either monotherapy,13 as well as significant cytopenias and infections. The checkpoint inhibitors nivolumab and pembrolizumab, approved for treatment of rel/ref cHL, have similar CR rates (16-22%) and ORR (64-70%) in heavily pretreated patients,14 but are likely to be used in first- or second-line combinations moving forward.2,15,16 The combination of lenalidomide and nivolumab is currently under investigation.17 Overall, lenalidomide 25 mg/d administered via interrupted (days 1-21) or continuous (days 1-28) schedule with 28-day cycles has preliminary evidence of clinical efficacy in patients with rel/ref cHL. Lenalidomide was well tolerated by the heavily pretreated patients in both cohorts, and durable responses to lenalidomide monotherapy were observed. Given the single-agent activity and observed toxicities, lenalidomide could be considered in the post-ICI/ BV setting, and future studies of combination approaches including lenalidomide are warranted, especially those incorporating immunotherapy strategies.
Authors
Todd A. Fehniger,1 Marcus P. Watkins,1 Nkiruka Ezenwajiaku,1 Fei Wan,2
David D. Hurd,3 Amanda F. Cashen,1 Kristie A. Blum,4 Andre Goy,5 Timothy S. Fenske,6 Nina D. Wagner-Johnston,1 Kenneth Carson,1 Marilyn J. Siegel,7 David Russler-Germain,1 Stephanie E. Schneider,1 Neha Mehta-Shah,1 Brad Kahl1 and Nancy L. Bartlett1
1Washington University School of Medicine, Division of Oncology, St. Louis, MO; 2Washington University School of Medicine, Division of Biostatistics, St. Louis, MO; 3Wake Forest University School of Medicine, Section of Hematology and Oncology, Winston-Salem, NC; 4Emory University School of Medicine, Department of Hematology and Medical Oncology, Atlanta, GA; 5Hackensack University Medical Center, Division of Lymphoma, Hackensack, NJ; 6Medical College of Wisconsin, Hematology and Oncology Department, Milwaukee, WI and 7Washington University, Mallinckrodt Institute of Radiology, Alvin
References
1. Connors JM, Jurczak W, Straus DJ, et al. Brentuximab vedotin with chemotherapy for stage III or IV Hodgkin’s lymphoma. N Engl J Med. 2018;378(4):331-344.
2. Herrera AF, LeBlanc ML, Castellino SM, et al. SWOG S1826, a randomized study of nivolumab(N)-AVD versus brentuximab vedotin(BV)-AVD in advanced stage (AS) classic Hodgkin lymphoma (HL). J Clin Oncol. 2023;41(Suppl 17):LBA4-LBA4.
J. Siteman Cancer Center, St. Louis, MO, USA
Correspondence:
T.A. FEHNIGER - tfehnige@wustl.edu
N.L. BARTLETT - nbarlet@wustl.edu
https://doi.org/10.3324/haematol.2022.282246
Received: May 2, 2023.
Accepted: September 6, 2023. Early view: September 14, 2023.
©2024 Ferrata Storti Foundation
Published under a CC BY-NC license
Disclosures
TAF and NLB have received research funding from Celgene for this clinical study.
Contributions
TAF and NLB developed the concept and designed the study. TAF, AFC, KAB, TSF, DDH, AG, NW-J and NLB provided study materials or patients. TAF, MJS, SES, MPW, and NE collected and assembled data. TAF, FW, MJS, SES, NLB, MPW, NE, and DR-G analyzed and interpreted data. TAF, MPW, DAR-G, NE, NLN, BK, and NM-S wrote and edited the manuscript. TAF, MPW, DAR-G, NJS, AFC, KAB, TSF, DDH, AG, FW, SES, NW-J, NLB, NE, BK, and NM-S gave the final approval of the mansucript. All authors had access to the primary clinical trial data..
Acknowledgments
We thank all study site personnel as well as the patients and their families for participation in this study.
Funding
This study was supported in part by Celgene/BMS, the ASCO Foundation (to TAF), the Foundation for Barnes-Jewish Hospital Steinback Fund (to NLB), Siteman Cancer Center Team Science Award (P30 CA091842) (to TAF and BK). The authors recognize the support of the Biostatistics Core, Clinical Trials Core, Imaging Response Assessment Team, and Tissue Procurement Core of the Siteman Cancer Center (P30 CA091842) and the Clinical and Translational Science Award (CTSA) grant (UL1 TR000448).
Data-sharing statement
No shared data are available.
3. Badar T, Epperla N, Szabo A, et al. Trends in postrelapse survival in classic Hodgkin lymphoma patients after experiencing therapy failure following auto-HCT. Blood Adv. 2020;4(1):41-54.
4 Gribben JG, Fowler N, Morschhauser F. Mechanisms of action of lenalidomide in B-cell non-Hodgkin lymphoma. J Clin Oncol. 2015;33(25):2803-2811.
Haematologica | 109 March 2024 956 LETTER TO THE EDITOR
5. Fehniger TA, Larson S, Trinkaus K, et al. A phase 2 multicenter study of lenalidomide in relapsed or refractory classical Hodgkin lymphoma. Blood. 2011;118(19):5119-5125.
6. Fehniger TA, Uy GL, Trinkaus K, et al. A phase 2 study of highdose lenalidomide as initial therapy for older patients with acute myeloid leukemia. Blood. 2011;117(6):1828-1833.
7 Watkins MP, Fanale MA, Bartlett NL. SOHO State of the art updates and next questions: Hodgkin lymphoma. Clin Lymphoma Myeloma Leuk. 2018;18(2):81-90.
8. Kuruvilla J, Taylor D, Wang L, Blattler C, Keating A, Crump M. Phase II trial of lenalidomide in patients with relapsed or refractory Hodgkin lymphoma. Blood. 2008;112(11):3052.
9 Boll B, Borchmann P, Topp MS, et al. Lenalidomide in patients with refractory or multiple relapsed Hodgkin lymphoma. Br J Haematol. 2010;148(3):480-482.
10 Boll B, Plutschow A, Burkle C, et al. Doxorubicin, vinblastine, dacarbazine and lenalidomide for older Hodgkin lymphoma patients: final results of a German Hodgkin Study Group (GHSG) phase-I trial. Br J Haematol. 2019;185(1):42-52.
11. Corazzelli G, Saggese M, Pavone V, et al. A phase 1/2 study of lenalidomide and bendamustine (LEBEN) in chemorefractory Hodgkin lymphoma. J Clin Oncol. 2014;32(Suppl 15):8566.
12. Kline J, Rapoport AP, Petrich AM, et al. Phase II study of temsirolimus and lenalidomide in patients with relapsed and
refractory lymphomas: final analysis of NCI 8309. Blood. 2016;128(22):4147.
13. Maly JJ, Christian BA, Zhu X, et al. A phase I/II trial of panobinostat in combination with lenalidomide in patients with relapsed or refractory Hodgkin lymphoma. Clin Lymphoma Myeloma Leuk. 2017;17(6):347-353.
14 Armand P, Engert A, Younes A, et al. Nivolumab for relapsed/ refractory classic hodgkin lymphoma after failure of autologous hematopoietic cell transplantation: extended follow-up of the multicohort single-arm phase II CheckMate 205 Trial. J Clin Oncol. 2018;36(14):1428-1439.
15. Moskowitz A, Shah G, Schöder H, et al. Phase II trial of pembrolizumab plus gemcitabine, vinorelbine, and liposomal doxorubicin (GVD) as second-line therapy for relapsed or refractory classical Hodgkin lymphoma. J Clin Oncol. 2021;39(28):3109-3117.
16. Mei M, Palmer J, Tsai N-C, et al. Nivolumab plus ICE as first salvage therapy in high-risk relapsed/refractory Hodgkin lymphoma. Blood. 2022;140(Suppl 1):774-776.
17 Bond DA, Wei L, Yildiz V, et al. Combination of the PD-1 inhibitor nivolumab and immunomodulatory drug lenalidomide in relapsed Hodgkin and large B-cell lymphoma: results from a phase I/II study. Hematol Oncol. 2023;41(S2):597-598.
Haematologica | 109 March 2024 957 LETTER TO THE EDITOR
Iron deficiency responses and integrated compensations in patients according to hereditary hemorrhagic telangiectasia ACVRL1¸ ENG and SMAD4 genotypes
Severe hemorrhage and anemia in hereditary hemorrhagic telangiectasia (HHT) is a major focus of drug development and repurposing. HHT is not a single disorder, but molecularly heterogenous, and most commonly caused by a single loss-of-function DNA variant in ACVRL1, ENG or SMAD4. As for all individuals in the general population, HHT patients are at risk of developing iron deficiency, anemia and sequelae if iron lost through hemorrhage is not adequately replaced, but as we have published, quantitative examination in over two decades of HHT care emphasizes that exact responses vary between individuals. We hypothesized that one element of variability may reflect the underlying HHT genotype. Here we demonstrate subtle differences that may be important to recognize when designing randomized controlled trials of new HHT therapies, and also for existing management strategies. We show that where. HHT patients were becoming anemic and iron deficient, those with a pathogenic variant in SMAD4 displayed different patterns of compensations compared to those with an ACVRL1 or ENG pathogenic variant. While the study is limited by the rarity of the SMAD4 genotype (currently, only 2.5% of HHT causal variants on the HHT Mutation Database), we explore reasons that may explain a distinctive phenotypic cluster in SMAD4 HHT patients. In order to further stimulate future prospective studies, we outline the potential relevance to HHT symptom burden and complications, rationales for differing iron treatment regimes by HHT genotype, and more broadly suggest that the cohorts provide an opportunity to further clarify relationships involved in iron and circulatory homeostasis.
To provide further detail, HHT is a complex, heritable vasculopathy that is estimated to affect between one in 3,000-8,000 people, and is characterized by nosebleeds (epistaxis), mucocutaneous telangiectasia and visceral arteriovenous malformations (AVM).1,2 In hematological circles, the greatest concern is the management of iron deficiency anemia secondary to HHT bleeding. This was a focus of recent International HHT Guidelines, and is an active area of pharmaceutical development.1 HHT patients develop iron deficiency when dietary iron is inadequate to provide both their usual iron requirements, and to replace additional iron losses due to bleeding from the nose, the gastrointestinal tract, menstruation, blood donation, and other losses as quantified by the hemorrhage-adjusted iron requirement.3 Iron deficiency anemia can have significant consequences for HHT patients and is one of the strongest predictors of mortality in HHT.4 As for any anemia, iron deficiency ane-
mia reduces arterial oxygen content necessitating higher cardiac output to maintain tissue oxygenation, and this is a particular problem in HHT where visceral AVM lower the systemic vascular resistance, also resulting in higher cardiac outputs.2,5 Additional complications associated with iron deficiency and its treatment are reported in HHT, in particular patients with hepatic or pulmonary AVM.1,2 Furthermore, in HHT, ongoing bleeds mean that conventional transfusional support algorithms need to be modified.1 PanHHT genotyping is identifying more variable expressivity in all genotypes than previously expected, including paucity of clinical signs in patients presenting by less conventional routes (e.g., organ-specific AVM rather than clinical genetics, hematology or ENT surgery; AVM/HHT rather than juvenile polyposis gastroenterology).6 That said, there is clear evidence that particular AVM distribution patterns differ between the major HHT genotypes,7 and that SMAD4+/- patients can have additional phenotypes including juvenile polyposis and aortopathy.1,2,7
In order to take a first look at whether there were distinctive iron deficiency indices and responses between the HHT genotypes, with ethical approval (LREC 2000/5764), serial anonymized data were analyzed retrospectively from all genotyped patients with clinical HHT reviewed at a single institution between May 1999 and August 2021 where serum iron, transferrin saturation index (TfSI) and supine/ erect pulse were measured as standard of care. The 426 patients had a median age of 50 (interquartile range [IQR], 39-62) years at the time of their measurements, and 264 (62%) were female (Online Supplementary Table S1). They provided 686 measurements in 246 ENG+/- patients, 166 measurements in 102 ACVRL1+/- patients, 32 measurements in 11 SMAD4+/- patients, and 118 measurements in patients who tested negative for variants in known HHT causal genes (Online Supplementary Table S1). Analyses were conducted using all available measurements, and also in the smaller dataset of first measurements only per patient, where the small number of SMAD4 cases (n=11) impeded statistical comparisons.
First, we examined iron indices across the three genotypes. Overall serum iron ranged from 6-18 µmol/L (median 11), transferrin saturation index (TfSI) from 9-28% (median 18) and ferritin from 14-67 µg/L (median 28). As shown in Figure 1A, serum ferritin was similar in ACVRL1+/, ENG+/and SMAD4+/- patients (median values 31, 25 and 26 µg/L, respectively).
Despite the similar serum ferritin, there were differenc-
Haematologica | 109 March 2024 958 LETTER TO THE EDITOR
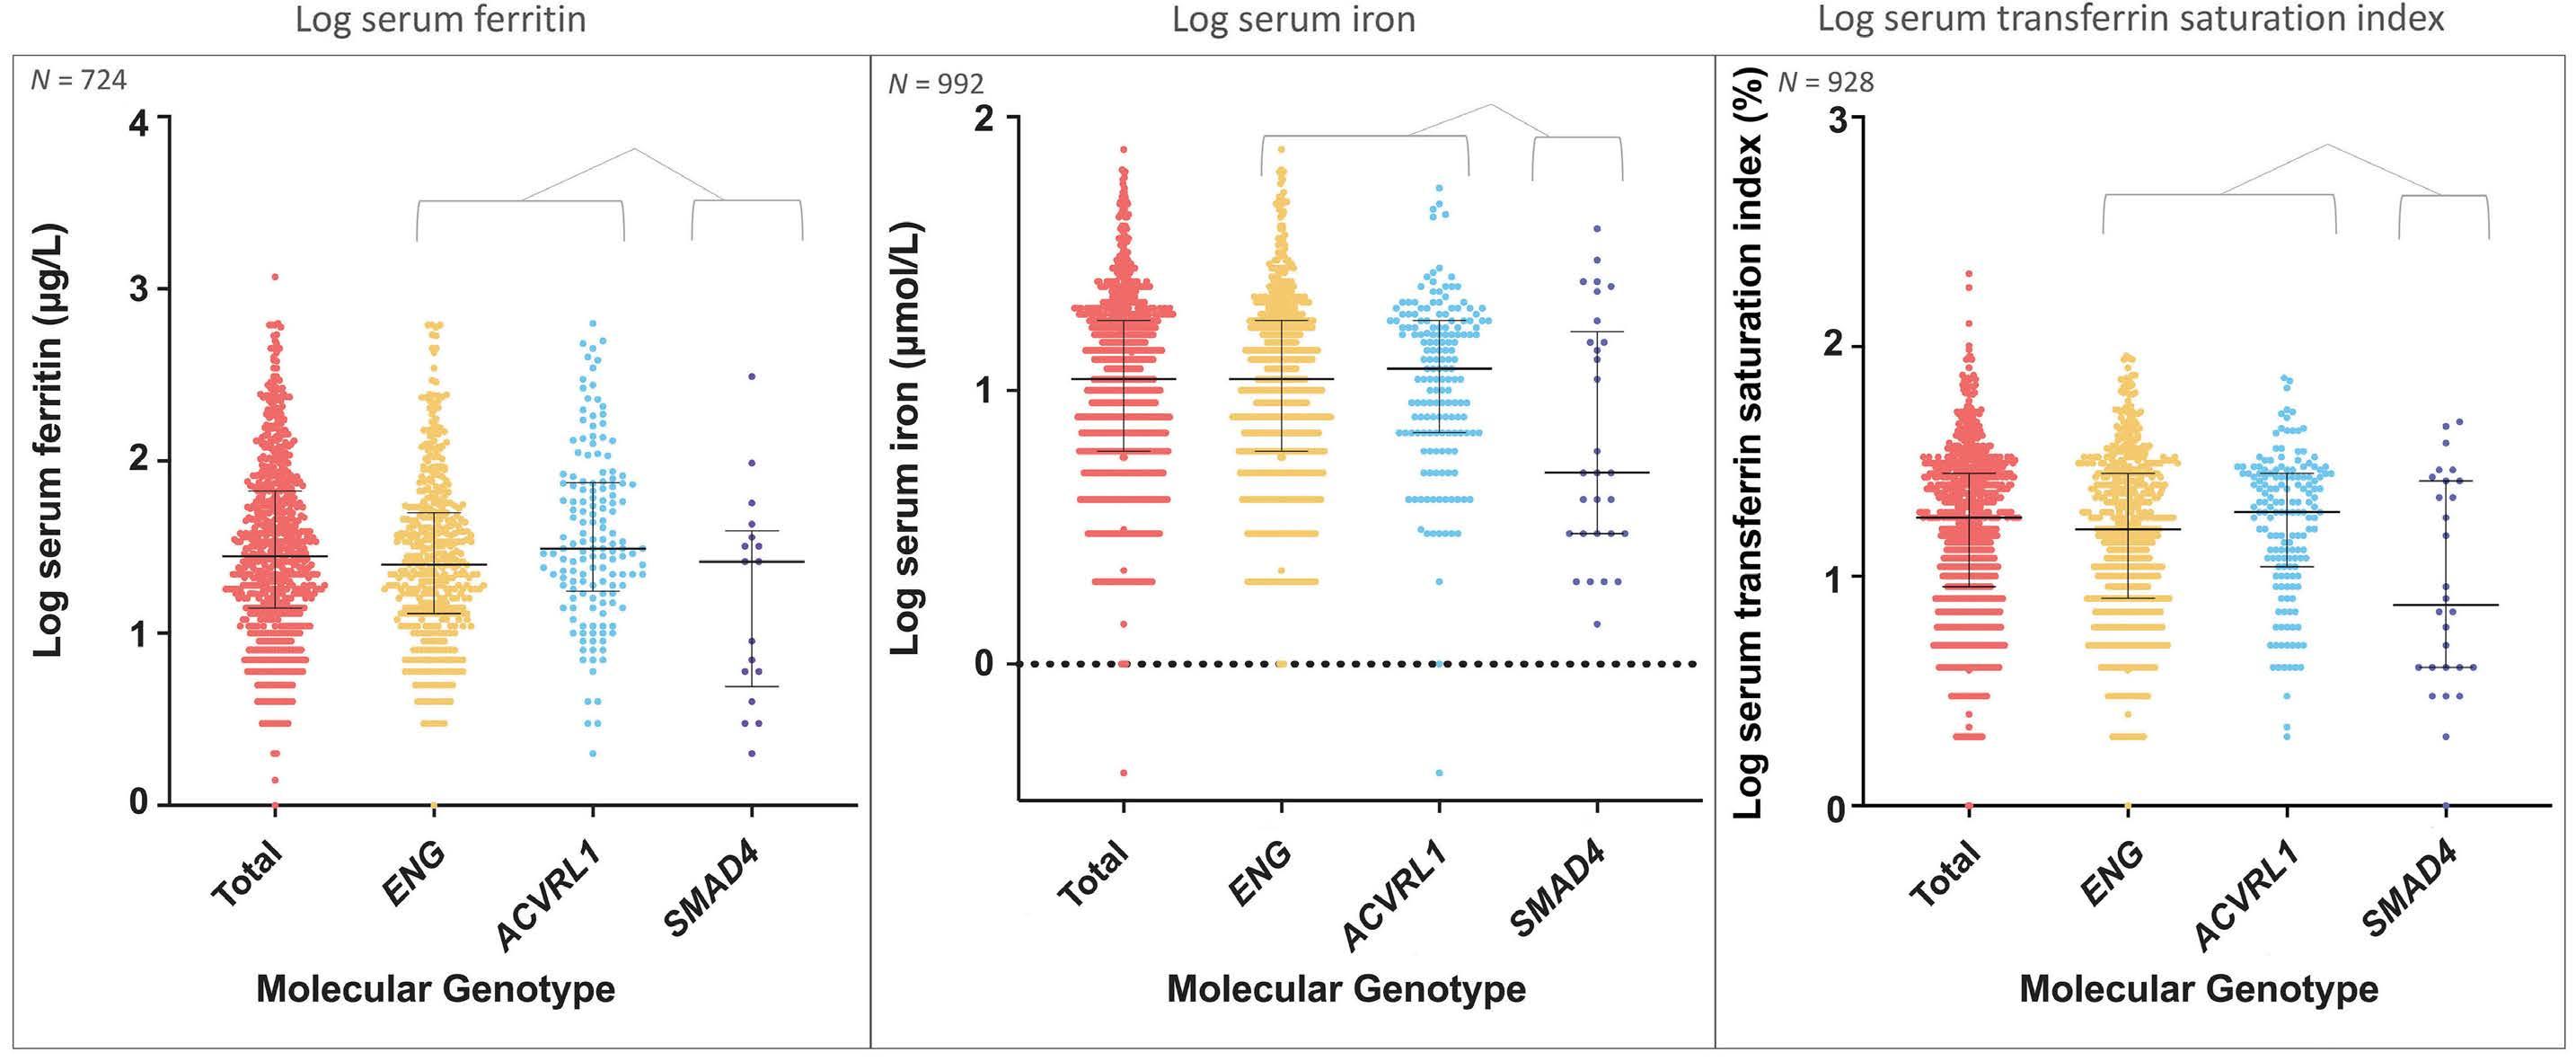
unequal in number mean absolute P values for the indicated comparisons should be viewed with caution, though for relative comparisons, for ferritin, iron and TfSI, P values were 0.08, 0.02 and 0.007 by Spearman’s
es examining serum iron and TfSI. Serum iron was lower in SMAD4+/- patients than in ACVRL1+/- or ENG+/- patients (median values 5, 12 and 11 µmol/L respectively; Figure 1B). Similarly, TfSI was lower in SMAD4+/- than in ACVRL1+/- or ENG+/- patients (median values 7, 19 and 16% respectively; Figure 1C) with similar trends in first-visit measurements (Online Supplementary Figure S2).
Next, we examined distributions of red cell indices. As shown in Figure 2A, there were similar patterns in the relationship between hemoglobin and serum iron levels between the different HHT molecular genotypes. However, red blood cell mean corpuscular volume (MCV) was lower in SMAD4+/- than ACVRL1+/- or ENG+/- (medians 75.1; 89.7; 89.0 fL respectively (Online Supplementary Table S1) and visual comparison suggested this was not fully explained by iron status (Figure 2B). Similar patterns were seen for mean corpuscular hemoglobin concentration (MCHC) overall (Online Supplementay Table S1) and in relationship to serum iron (Figure 2C). Hemoglobin was maintained in the SMAD4+/- patients despite lower hemoglobin content per red cell, by a higher total red cell count compared to ACVRL1+/- and ENG+/- patients (median 5.4; 4.7 and 4.8x10¹²/L respectively (Online Supplementary Table S1; visual comparisons in Figure 2D).
Uniquely, our institution has measured postural changes in the heart rate, alongside SaO2, for more than three decades.8 A higher pulse rate is seen in response to acute blood volume loss through hemorrhage, and in barometric responses to preserve cerebral perfusion on standing with such autonomic response stronger in younger individuals.8,9
We, therefore, examined whether the resting pulse, a crude measure of circulation adjustment relevant to anemia, differed between the genotypes. As expected for HHT patients,8 the pulse rate increased when patients moved from a supine to an erect position (median values 71.9 and 76.3 beats per minute [bpm], Figure 3), and a higher pulse rate on standing was seen in all three molecular genotypes. We had expected the magnitude of the increase to be marginally greater in ENG+/- patients with lower SaO2 due to pulmonary AVM, as we have previously shown with panHHT genotype analyses.8 Instead, the magnitude of pulse increase was almost twice as high in SMAD4+/- than ENG+/ (Figure 3), beyond any increment predicted by their marginally younger age, lower body mass index, or pulmonary AVM status8,9 (Online Supplementary Table S1).
Taken together, the study findings indicate that in the setting of iron deficiency to which SMAD4 patients may be more susceptible through gastrointestinal bleeding and polyps,2,10 physiological compensation mechanisms appeared to differ between HHT molecular genotypes.
The Study has strengths include a unique dataset that allowed for the comparison of multiple indices between the molecular genotypes, and a notably large sample size of genotyped patients given the rarity of the condition, particularly the SMAD4+/- genotype. As described further in the Online Supplementary Appendix, previous studies have predominantly compared ENG+/- and ACVRL1+/- patients, whereas this current study also assessed differences in SMAD4+/- patients. Limitations stem from its observational and retrospective nature, as the results may reflect other demographic differences or
Haematologica | 109 March 2024 959 LETTER TO THE EDITOR
A B C
Figure 1. Comparison of iron indices between hereditary hemorrhagic telangiectasia molecular genotypes. All dataset comparisons of values for hereditary hemorrhagic telangiectasia (HHT) patients by molecular genotype. (A) Serum ferritin. (B) Serum iron. (C) Serum transferrin saturation index (TfSI). Error bars indicate median and interquartile range. Non-independent datasets
rank correlation and Mann Whitney comparing SMAD4 to ENG and ACVRL1 combined.
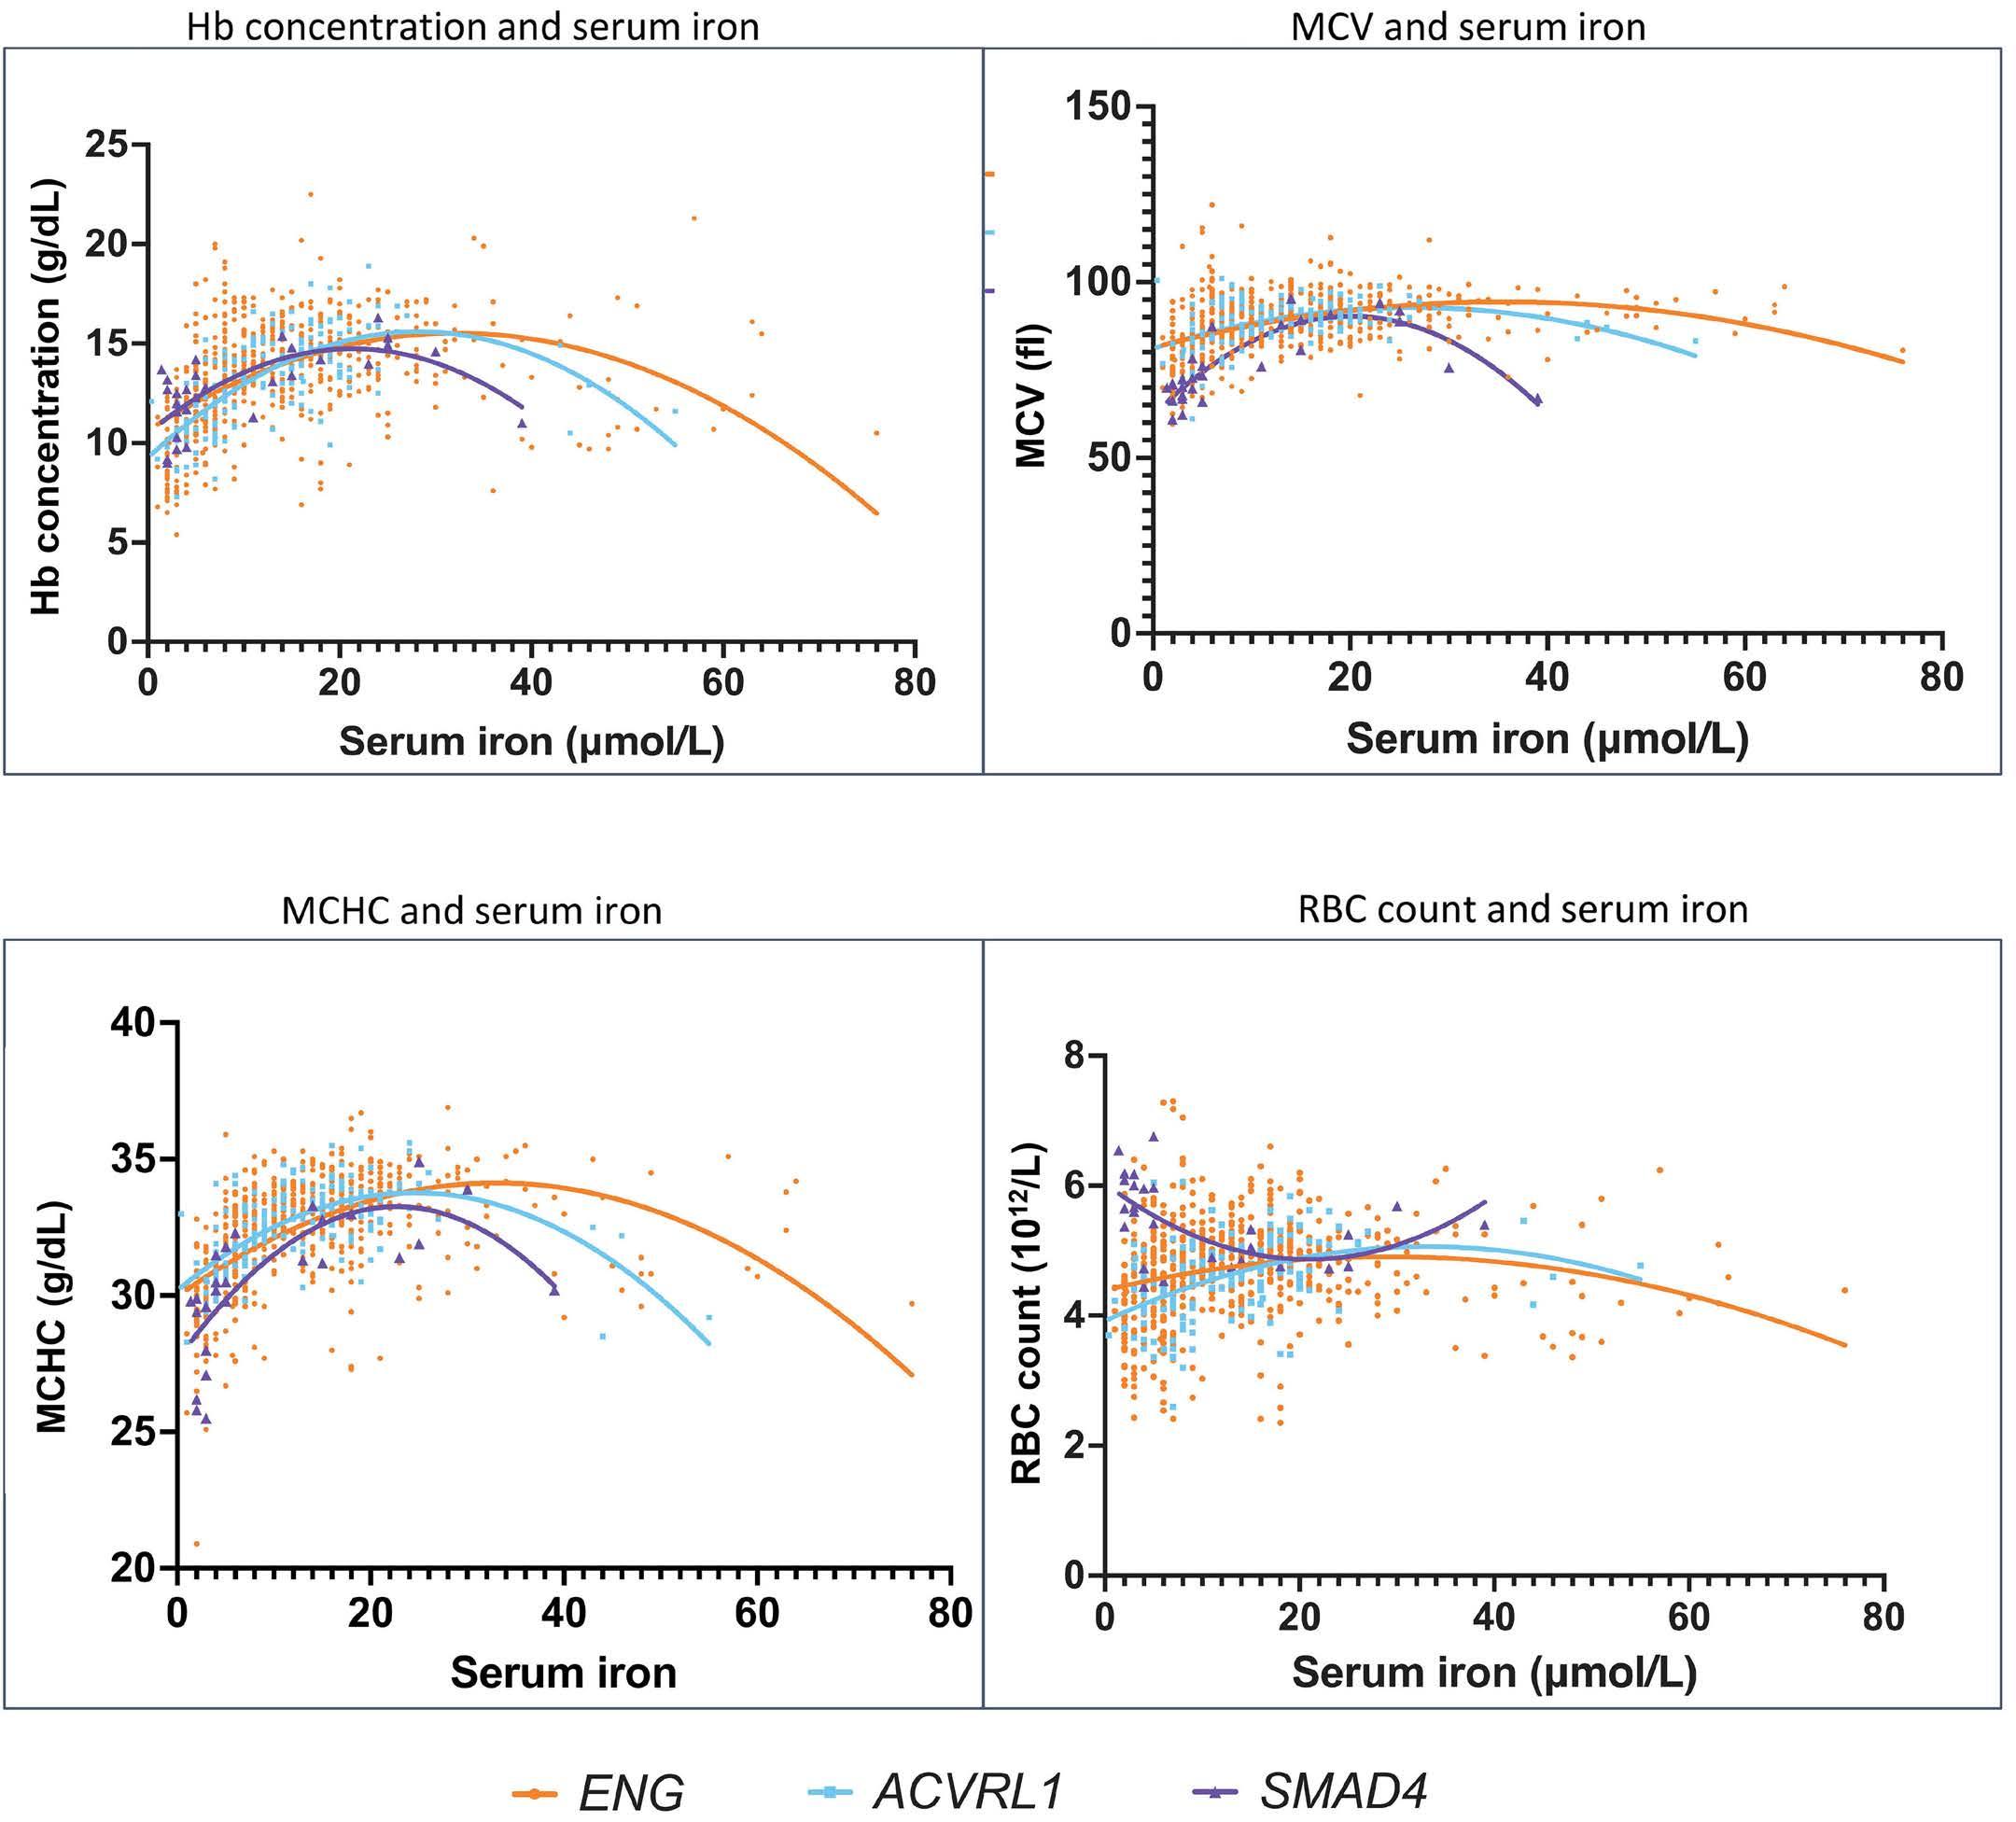
confounders between the HHT molecular genotype cohorts. Furthermore, the small SMAD4 numbers prevented two-way adjustments, thus it is not possible to assign causation to possession of the SMAD4 variant.
That said, the evidence presented begins to point to physiologically different iron homeostasis in SMAD4+/- patients, highlighting new concepts to be considered as HHT management recommendations and clinical trials proceed. The pattern resembles functioning as though the patient is in a more iron-deficient state: despite similar serum ferritin values, SMAD4+/- patients displayed lower serum iron and TfSI than the other HHT molecular genotypes. Furthermore, similar hemoglobin was achieved by a greater number of smaller red cells. SMAD4 regulates hepcidin,11,12 the key regulator of iron homeostasis,11 which is reduced in individuals with active bleeding (via erythroferrone13) and iron deficiency.11 Our previously reported hepcidin dataset3 included only one individual with SMAD4+/-. Their hepcidin:ferritin ratio (1.2 ng/ mL/µg/L) was higher than the other HHT patients (0.2-0.5 [mean 0.3] ng/mL/µg/L), and controls (0.1-1.0 [mean 0.5] ng/ mL/µg/L), but the SMAD4 patient was iron replete, limiting interpretations. Whole-genome sequencing of ACVRL1+/, ENG+/- and SMAD4+/- patients was performed through the
Figure 2. Comparison of the relationship between hemoglobin and red cell indices. Data in patients with confirmed hereditary hemorrhagic telangiectasia (HHT) molecular genotypes; 865 values are plotted on each graph, with quadratic regression lines for the 3 HHT genotypes illustrated for ACVRL1 (blue), ENG (orange) and SMAD4 (purple). (A) Hemoglobin concentration (Hb). (B) Mean corpuscular volume (MCV). (C) Mean corpuscular hemoglobin concentration (MCHC). (D) Red blood cell count (RBC).
100,000 Genomes Project,14 but no hepcidin (HAMP) DNA variants were identified in these individuals, precluding similar analyses to those we have recently performed for hemorrhage susceptibility in HHT.15 Published murine data is of only limited help - while basic erythropoiesis was normal in SMAD4-deficient mice,10 it was not examined during iron-restricted erythropoiesis, nor in the setting of secondary erythrocytosis that compensates for pulmonary AVM-induced low oxygen saturation in order to maintain arterial oxygen content,7,8 and we speculate may be employed differently in the maintenance of hemoglobin in iron-deficient SMAD4+/patients. Future prospective studies will be enhanced by incorporating measurements at the time of iron deficiency. Importantly, and unexpectedly, there were differing magnitudes of response to acute changes to the circulation on standing. Given the separate arterial pathologies observed in SMAD4 patients (e.g., aortic dilatation),1,2 possession of a SMAD4 causal variant is a plausible differential to why the orthostatic pulse discrepancies were observed and further examination is warranted, particularly as this may highlight arterial pathology beyond the expected HHT-specific variables. In conclusion, this study contributes to the growing body of literature that indicating phenotypic differences between
Haematologica | 109 March 2024 960 LETTER TO THE EDITOR
A C B D
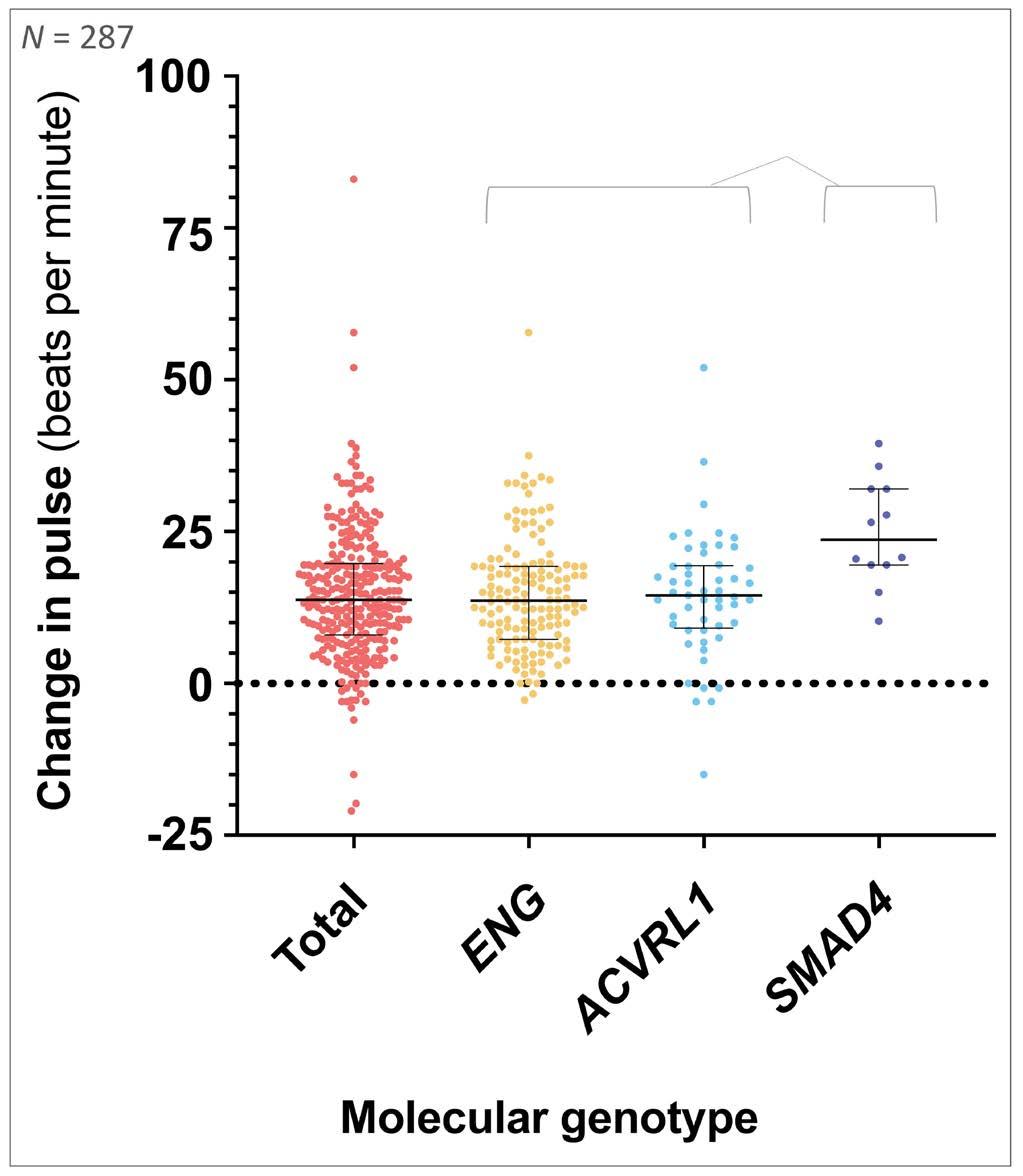
genotypes,
the change in pulse (in beats per minute) between a patient in a supine position and the same patient in an erect position. Data were recorded at 1-minute intervals over a 20-minute period for 10 minutes supine and 10 minutes erect, with the pulse rates recorded as the mean recorded across minutes 7, 8, 9 and 10 in each posture. Error bars indicate median and interquartile range. For the indicated comparisons using first measurements only, the P value was 0.04 by Mann Whitney comparing SMAD4 to ENG and ACVRL1 combined.
HHT molecular genotypes, by demonstrating differences in iron, red cell and hemodynamic indices that SMAD4+/patients may use to in settings of iron deficiency. Future studies should aim to confirm with larger numbers, requiring introduction of routine measurements of iron indices and postural pulse into assessment, and likely multicenter analyses given the sparsity of SMAD4+/- HHT patients and importance of adjusting for confounders in multivariable analyses. Future studies should also evaluate if differences identified in SMAD4+/- patients are associated with a modified symptom burden, for instance, tolerance of standing; elucidate better mechanistic understanding of the relationship between SMAD4 and hepcidin in the setting of iron deficiency to which all HHT patients are prone, and address whether there should be changes to the type of iron deficiency treatment these patients receive.
Authors
Lakshya Sharma,1,2 Fatma Almaghlouth,1 Heidi Mckernan,3 James Springett,3 Hannah C. Tighe,3 Genomics England Research
Consortium4 and Claire L. Shovlin1,2,3
1National Heart and Lung Institute, Imperial College London; 2NIHR Imperial Biomedical Research Center; 3Specialist Medicine, Imperial College Healthcare NHS Trust and 4Genomics England, London, UK
Correspondence:
C.L. SHOVLIN - c.shovlin@imperial.ac.uk
https://doi.org/10.3324/haematol.2022.282038
Received: September 2, 2022.
Accepted: September 12, 2023.
Early view: September 21, 2023.
Published under a CC BY license
Disclosures
No conflicts of interest to disclose.
Contributions
LS performed the analyses, generated the figures and Online Supplementary Appendix and wrote the first draft. FA examined 100,000 Genomes Project data. HM, JS and HCT acquired postural pulse data. The Genomics England Research Consortium sequenced whole genomes for selected patients. CLS reviewed all patients, generated the database, conceived the study, supervised LS, wrote the manuscript and is the guarantor for the study.
Funding
This research received funding from the NIHR Imperial Biomedical Research Center. Part of the research was made possible through access to the data and findings generated by the 100,000 Genomes Project. The 100,000 Genomes Project is managed by Genomics England Limited (a wholly owned company of the Department of Health and Social Care). The 100,000 Genomes Project is funded by the National Institute for Health Research (NIHR) and NHS England. The Wellcome Trust, Cancer Research UK and the Medical Research Council have also funded research infrastructure. The 100,000 Genomes Project uses data provided by patients and collected by the National Health Service as part of their care and support. The views expressed are those of the authors and not necessarily those of funders, the NHS, the NIHR, or the Department of Health and Social Care.
Data-sharing statement
Categorized data that do not risk breaching anonymity may be found in the Online Supplementary Appendix. Primary data from the 100,000 Genomes Project are held in a secure Research Environment, are available to registered users. Please see https:// www.genomicsengland.co.uk/about-gecip/for-gecip-members/ data-and-data-access for further information.
Haematologica | 109 March 2024 961 LETTER TO THE EDITOR
Figure 3. Comparison of orthostatic changes in pulse. Data are shown for all patients in the database (N=286), and separated by confirmed hereditary hemorrhagic telangiectasia (HHT) molecular
showing
References
1. Faughnan ME, Mager JJ, Hetts SW, et al. Second international guidelines for the giagnosis and management of hereditary hemorrhagic telangiectasia. Ann Intern Med. 2020;173(12):989-1001.
2. Shovlin CL, Buscarini E, Sabbà C, et al. The European Rare Disease Network for HHT Frameworks for management of hereditary haemorrhagic telangiectasia in general and speciality care. Eur J Med Genet. 2022;65(1):104370.
3. Finnamore H, Le Couteur J, Hickson M, Busbridge M, Whelan K, Shovlin CL. Hemorrhage-adjusted iron requirements, hematinics and hepcidin define hereditary hemorrhagic telangiectasia as a model of hemorrhagic iron deficiency. PLoS One. 2013;8(10):e76516.
4 Thompson KP, Nelson J, Kim H, et al. Predictors of mortality in patients with hereditary hemorrhagic telangiectasia. Orphanet J Rare Dis. 2021;16(1):12.
5. Anand IS, Chandrashekhar Y, Wander GS, Chawla LS. Endothelium-derived relaxing factor is important in mediating the high output state in chronic severe anemia. J Am Coll Cardiol. 1995;25(6):1402-1407.
6. Anderson E, Sharma L, Alsafi A, Shovlin CL. Pulmonary arteriovenous malformations may be the only clinical criterion present in genetically confirmed hereditary haemorrhagic telangiectasia. Thorax. 2022;77(6):628-630.
7 Shovlin CL, Simeoni I, Downes K, et al. Mutational and phenotypic characterization of hereditary hemorrhagic telangiectasia. Blood. 2020;136(17):1907-1918.
8. Santhirapala V, Williams LC, Tighe HC, Jackson JE, Shovlin CL.
Arterial oxygen content is precisely maintained by graded erythrocytotic responses in settings of high/normal serum iron levels, and predicts exercise capacity: an observational study of hypoxaemic patients with pulmonary arteriovenous malformations. PLoS One. 2014;9(3):e9077.
9 Jarjour IT, Jarjour LK. Low iron storage and mild anemia in postural tachycardia syndrome in adolescents. Clin Auton Res. 2013;23(4):175-179.
10 Pan D, Schomber T, Kalberer CP et al. Normal erythropoiesis but severe polyposis and bleeding anemia in Smad4-deficient mice. Blood. 2007;110(8):3049-3055.
11. Nemeth E, Ganz T. Hepcidin-ferroportin interaction controls systemic iron homeostasis. Int J Mol Sci. 2021;22(12):6493.
12. Wang RH, Li C, Xu X, et al. A role of SMAD4 in iron metabolism through the positive regulation of hepcidin expression. Cell Metab. 2005;2(6):399-409.
13. Srole DN, Ganz T. Erythroferrone structure, function, and physiology: Iron homeostasis and beyond. J Cell Physiol. 2021;236(7):4888-4901.
14. The National Genomics Research and Healthcare Knowledgebase v5, Genomics England. doi:10.6084/m9. figshare.4530893.v5. 2019.
15. Joyce KE, Onabanjo E, Brownlow S, et al. Whole genome sequences discriminate hereditary hemorrhagic telangiectasia phenotypes by non-HHT deleterious DNA variation. Blood Adv. 2022;6(13):3956-3969.
Haematologica | 109 March 2024 962 LETTER TO THE EDITOR
Bone mineral density in adult patients with pyruvate kinase deficiency on long-term mitapivat treatment
Pyruvate kinase (PK) deficiency is a rare, hereditary, chronic hemolytic anemia that is associated with serious complications including reduced bone mineral density (BMD). A recent study revealed that low BMD is highly prevalent in patients with PK deficiency pretreatment. Here, we report the first large-cohort analysis to systematically evaluate BMD over time in patients with PK deficiency receiving long-term mitapivat treatment, using data from clinical studies (clinicaltrials gov. Identifiers: NCT02476916, NCT03548220, NCT03559699, NCT03853798). In our analysis, BMD remained stable or improved in the majority of patients for up to 5.9 years, regardless of age. Given our findings, mitapivat may halt bone loss by decreasing hemolysis, improving erythropoiesis, and stabilizing iron homeostasis in patients with PK deficiency. PK deficiency is caused by mutations in the PKLR gene encoding the red blood cell (RBC)-specific form of the PK enzyme.1 This results in impaired glycolysis, leading to reduced RBC membrane integrity and premature RBC destruction,2 causing multiple complications including iron overload, jaundice, and pulmonary hypertension.2 PK deficiency is also associated with increased risk of reduced BMD, leading to early onset osteopenia and osteoporosis, and bone fractures.3 The rate of osteoporosis was significantly higher among patients with PK deficiency (n=122) than 1,220 age- and sex-matched individuals in the general population (15.6% vs. 0.0%, respectively).4 Systematic dual-energy X-ray absorptiometry (DXA) scanning in a large, pooled-cohort analysis (159 adults) of phase II and III clinical trials of mitapivat treatment in patients with PK deficiency revealed that 43.3% had low or very low BMD at baseline, indicating that decreased BMD is highly prevalent in these patients, occurring to a greater extent than previously reported.5
Although the mechanisms leading to reduced BMD in PK deficiency are not well understood, they may include widening of marrow spaces due to erythroid hyperplasia, iron overload and its treatment, endocrine disruption, and genetic factors.6,7
Mitapivat is a first-in-class, oral allosteric activator of PK, approved by the Food and Drug Administration for the treatment of hemolytic anemia in adults with PK deficiency8 and by the European Medicines Agency for the treatment of adults with PK deficiency.9 Mitapivat has been shown to improve anemia, hemolysis, and erythropoiesis, and decrease transfusion burden.10,11 Although mitapivat has mild aromatase inhibition effects that could potentially affect BMD,12 it may positively influence BMD by reducing ineffective erythropoiesis.10 This highlights the need to assess the impact of long-term mitapivat treatment on BMD.
We report BMD over time in patients (≥18 years old) with PK deficiency receiving long-term mitapivat (>12 months), using pooled data from the phase II DRIVE-PK13 (clinicaltrials gov. Identifier: NCT02476916) study, phase III ACTIVATE10 (clinicaltrials gov. Identifier: NCT03548220) and ACTIVATE-T11 (clinicaltrials gov. Identifier: NCT03559699) studies, and long-term extension (LTE) study (clinicaltrials gov. Identifier: NCT03853798) (Online Supplementary Figure S1). Baseline DXA scans were taken at screening for ACTIVATE and ACTIVATE-T, and at screening or up to 3 months before the first dose for DRIVE-PK. DXA scans were performed every 24 weeks during mitapivat and performed locally for all three studies. Interpretation of scans was conducted locally for DRIVE-PK and centrally for ACTIVATE, ACTIVATE-T, and the LTE.
T-scores and Z-scores, derived from DXA scans at three body locations (total hip, total lumbar spine, and femoral neck [DRIVE-PK]; and total femur [combined neck and total hip], femoral neck, and spine [ACTIVATE and ACTIVATE-T]), were used to classify patients into BMD categories according to standard definitions. T-scores are used to diagnose osteopenia and osteoporosis in men aged ≥50 years and women of non-childbearing potential by comparing BMD with that of an average healthy 30-year-old. Z-scores are used in men aged <50 years and women of childbearing potential and compare BMD with that of a person of the same age and sex. Mean changes from baseline in worst DXA T- and Z-scores to last assessment were assessed for patients receiving osteoporosis medications (started before or after the first dose of mitapivat), and those who did not receive these medications. Overall mean change in BMD over time was evaluated by assessing changes in DXA T- and Z-scores by each of the three body locations from baseline to last available assessment during treatment with mitapivat.
Patients with T-scores ≥-1.0 at all scan locations were categorized as having normal BMD, those with scores <-1.0 to >-2.5 at ≥1 location as having low BMD/osteopenia, and those with scores ≤-2.5 at ≥1 location as having very low BMD/osteoporosis; Z-scores of ≤-2.0 indicated low BMD; Z-scores >-2.0 indicated normal BMD (Figure 1).14
DXA scans from the last available time point were compared with baseline scans to determine if a patient’s baseline DXA score had worsened (decreased from ≥-1.0 to <-1.0 or >-2.5 to ≤-2.5 [T-score] or from >-2.0 to ≤-2.0 [Z-score]), remained stable (stayed in the same T- or Z-score range as at baseline), or improved (increased from ≤-2.5 to >-2.5 or <-1.0 to ≥-1.0 [T-score] or from ≤-2.0 to >-2.0 [Z-score]) while on mitapivat. Proportions of patients with improved, stable, or worsened BMD who received long-term mitapivat
Haematologica | 109 March 2024 963 LETTER TO THE EDITOR
were calculated. At baseline and last assessment, worst DXA T- or Z-score was defined as the worst score across the three specified anatomic locations. All findings are summarized descriptively by age and childbearing status. Of 159 patients enrolled in the clinical studies, 107 received long-term mitapivat (>12 months). Overall, median duration of mitapivat treatment was 22.5 months (range, 12.3-70.7). Overall, 27.1% of patients (n=29) were men aged ≥50 years or women of non-childbearing potential and 72.9% (n=78) were men aged <50 years or women of childbearing potential. Median patient age was 36.0 years (range, 18-78); patient demographics and baseline characteristics are
shown in Online Supplementary Table S1. BMD DXA T- and Z-scores were stable for up to 5.9 years in the majority of patients in this analysis, regardless of age (Figure 2).
At last BMD assessment (data cutoff August 28, 2021 for DRIVE-PK and September 12, 2021 for ACTIVATE and ACTIVATE-T), the majority of patients remained within the same BMD category for worst DXA T-score or DXA Z-score as at baseline (Table 1). Overall, five of five patients with normal baseline DXA T-scores (≥-1.0) remained stable at last assessment with no worsening of BMD. Among 17 patients with baseline T-scores of >-2.5 to <-1.0 (osteopenia),
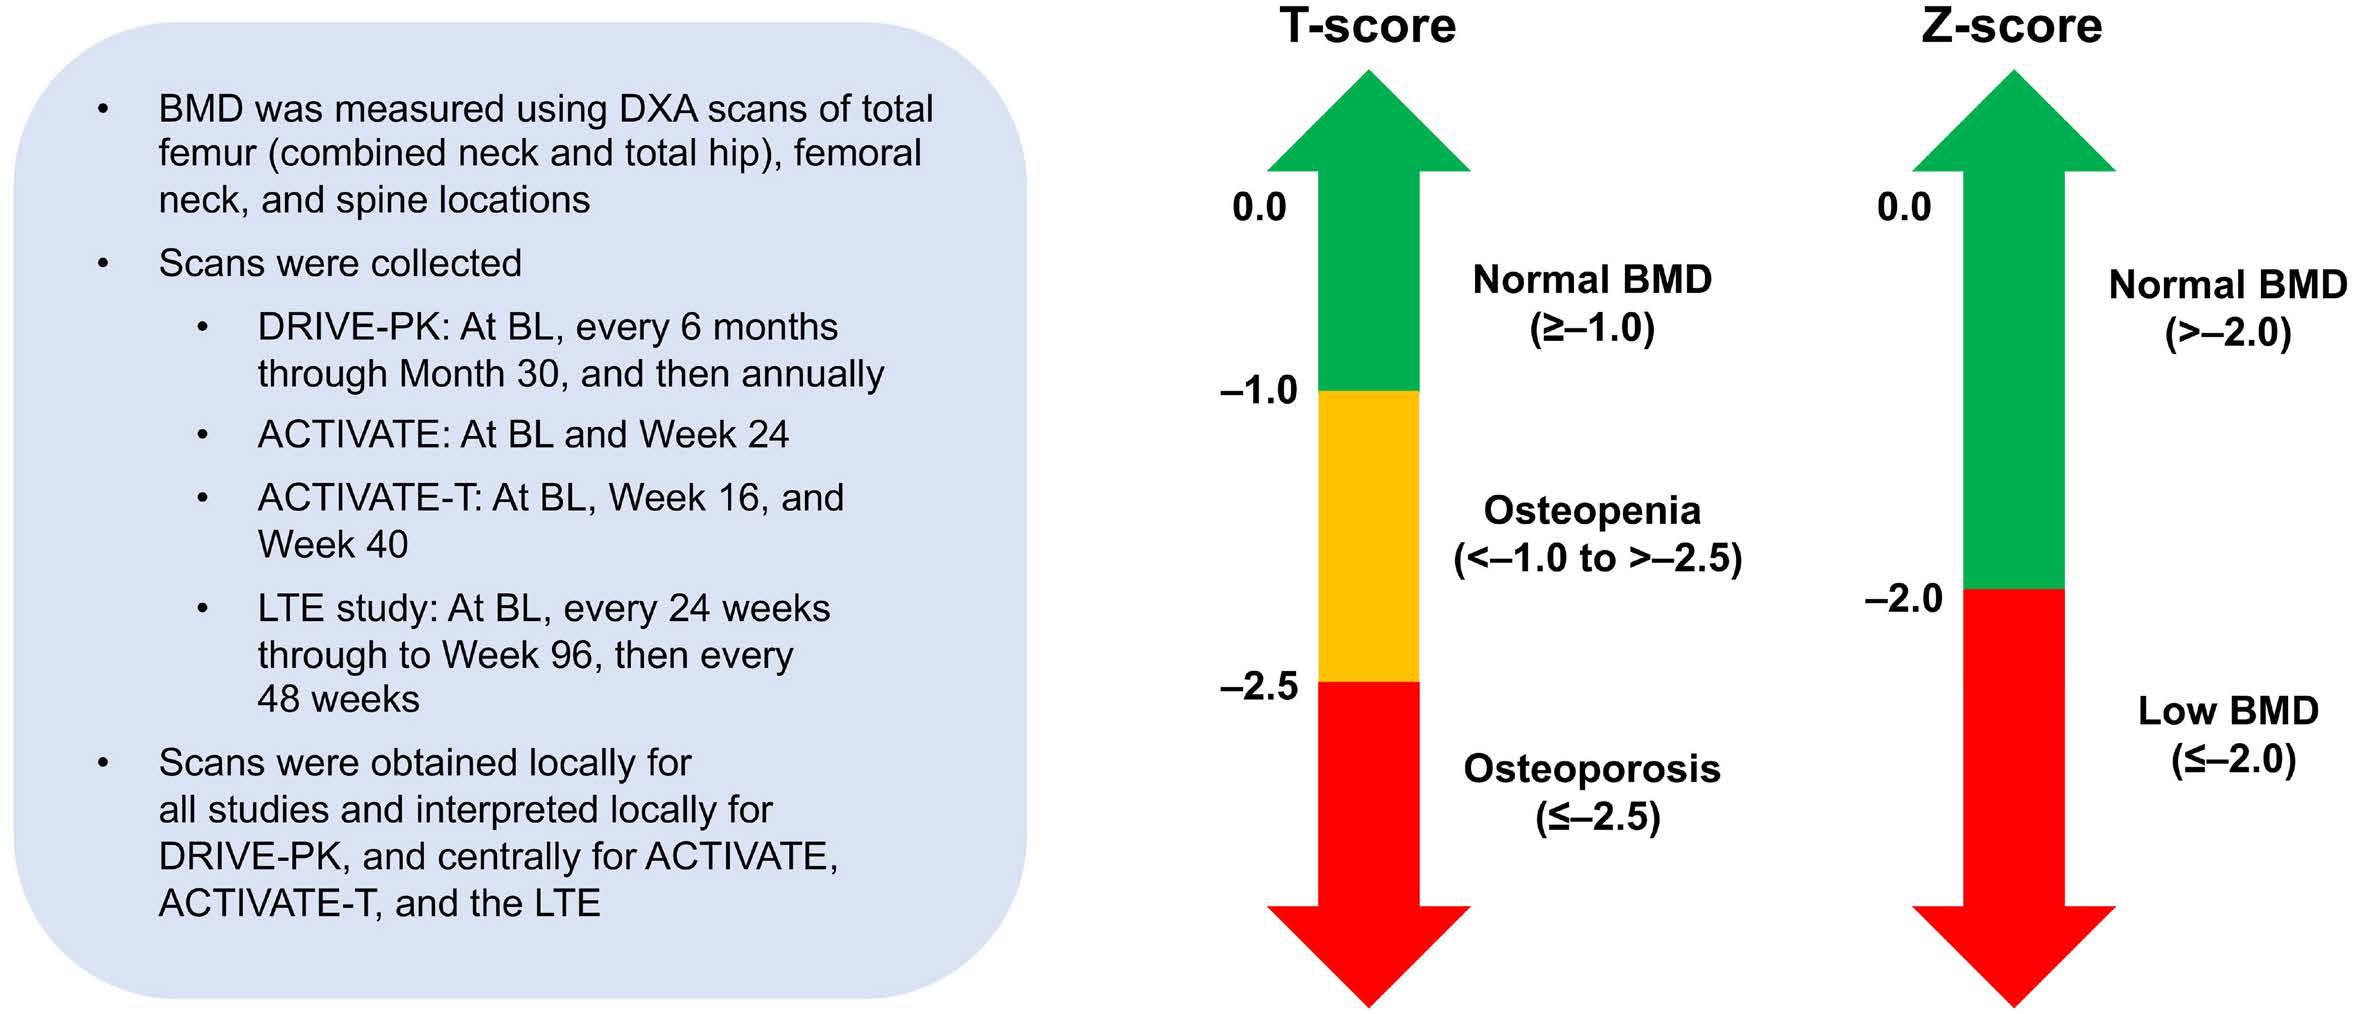
men aged ≥50 years and women of non-childbearing potential treated with mitapivat for >12 months [N=29]*,**) and
DXA Z-score category (in men aged <50 years and women of childbearing potential treated with mitapivat for >12 months [N=77]* ) across body locations from baseline to the last assessment in a pooled analysis* of patients.
*Safety analysis set: patients who received mitapivat for >12 months (365 days); only patients with evaluable post-BL DXA T/Z-scores (as relevant) are included in the analysis. **BL DXA T-score was missing for 1 patient. †improved; °stable; #worsened. BSL: baseline; BMD: bone mineral
Haematologica | 109 March 2024 964 LETTER TO THE EDITOR
Baseline T-score at last assessment N (%) Prior category* Patients N (%) Normal BMD ≥–1.0 Osteopenia >-2.5 to <-1.0 Osteoporosis ≤-2.5 Normal BMD ≥-1.0 5 (17.2) 5 (17.2)° 0# 0# Osteopenia >-2.5 to <-1.0 17 (58.6) 2 (6.9)† 12 (41.4)° 3 (10.3)# Osteoporosis ≤-2.5 6 (20.7) 0† 0† 6 (20.7)° Baseline Z-score at last assessment N (%) Prior category* Patients N (%) Normal BMD >-2.0 Low BMD ≤-2.0 Normal BMD >-2.0 51 (66.2) 46 (59.7)° 5 (6.5)# Low BMD ≤-2.0 26 (33.8) 5 (6.5)† 21 (27.3)°
Figure 1. Dual-energy X-ray absorptiometry T- and Z-score assessments and classifications. BMD: bone mineral density; DXA: dual-energy X-ray absorptiometry; BL: baseline; LTE: long-term extension.
Table 1. Shift of worst DXA T-score category (in
shift of worst
density; DXA: dual-energy X-ray absorptiometry.
T-scores improved (indicating normal BMD) in two patients at last assessment; remained stable in 12; and worsened in three. All six patients with baseline T-scores of ≤-2.5 (osteoporosis) remained in this DXA T-score category at last assessment (Table 1).
Among 51 patients with normal baseline DXA Z-scores of >-2.0, Z-scores remained stable in 46 at last assessment and worsened in five. Of 26 patients with baseline Z-scores ≤-2.0 (low BMD), Z-scores improved in five and remained stable in 21 (Table 1).
Mean (standard deviation) changes in DXA T- and Z-scores from baseline to last assessment during treatment by body location are shown in Online Supplementary Table S2. Change from baseline in worst DXA T- and Z-scores by baseline BMD category to last assessment is shown in Online Supplementary Table S2. Ten patients (9.3%) received anti-osteoporosis medications during mitapivat treatment. The mean changes from baseline in worst DXA
T- and Z-scores at the last assessment for patients receiving these medications and those who did not receive them were similar (Online Supplementary Table S2). In summary, this pooled analysis showed that BMD remained stable or improved in the majority of patients with PK deficiency treated with long-term mitapivat for up to 5.9 years.
Limitations of this analysis include the lack of formal studies defining the optimal diagnostic methods for osteopenia and osteoporosis in patients with PK deficiency. Therefore, this analysis adhered to conventions broadly used in other populations (e.g., thalassemia). In addition, DXA scans for the DRIVE-PK study13 were not read centrally so could be subject to inter-rater variability. Potential bias may result from the worst T- or Z-score analysis, which may not fully reflect the largest magnitude of change. Another limitation was that concomitant medication was not assessed over time, so potential contributory effects
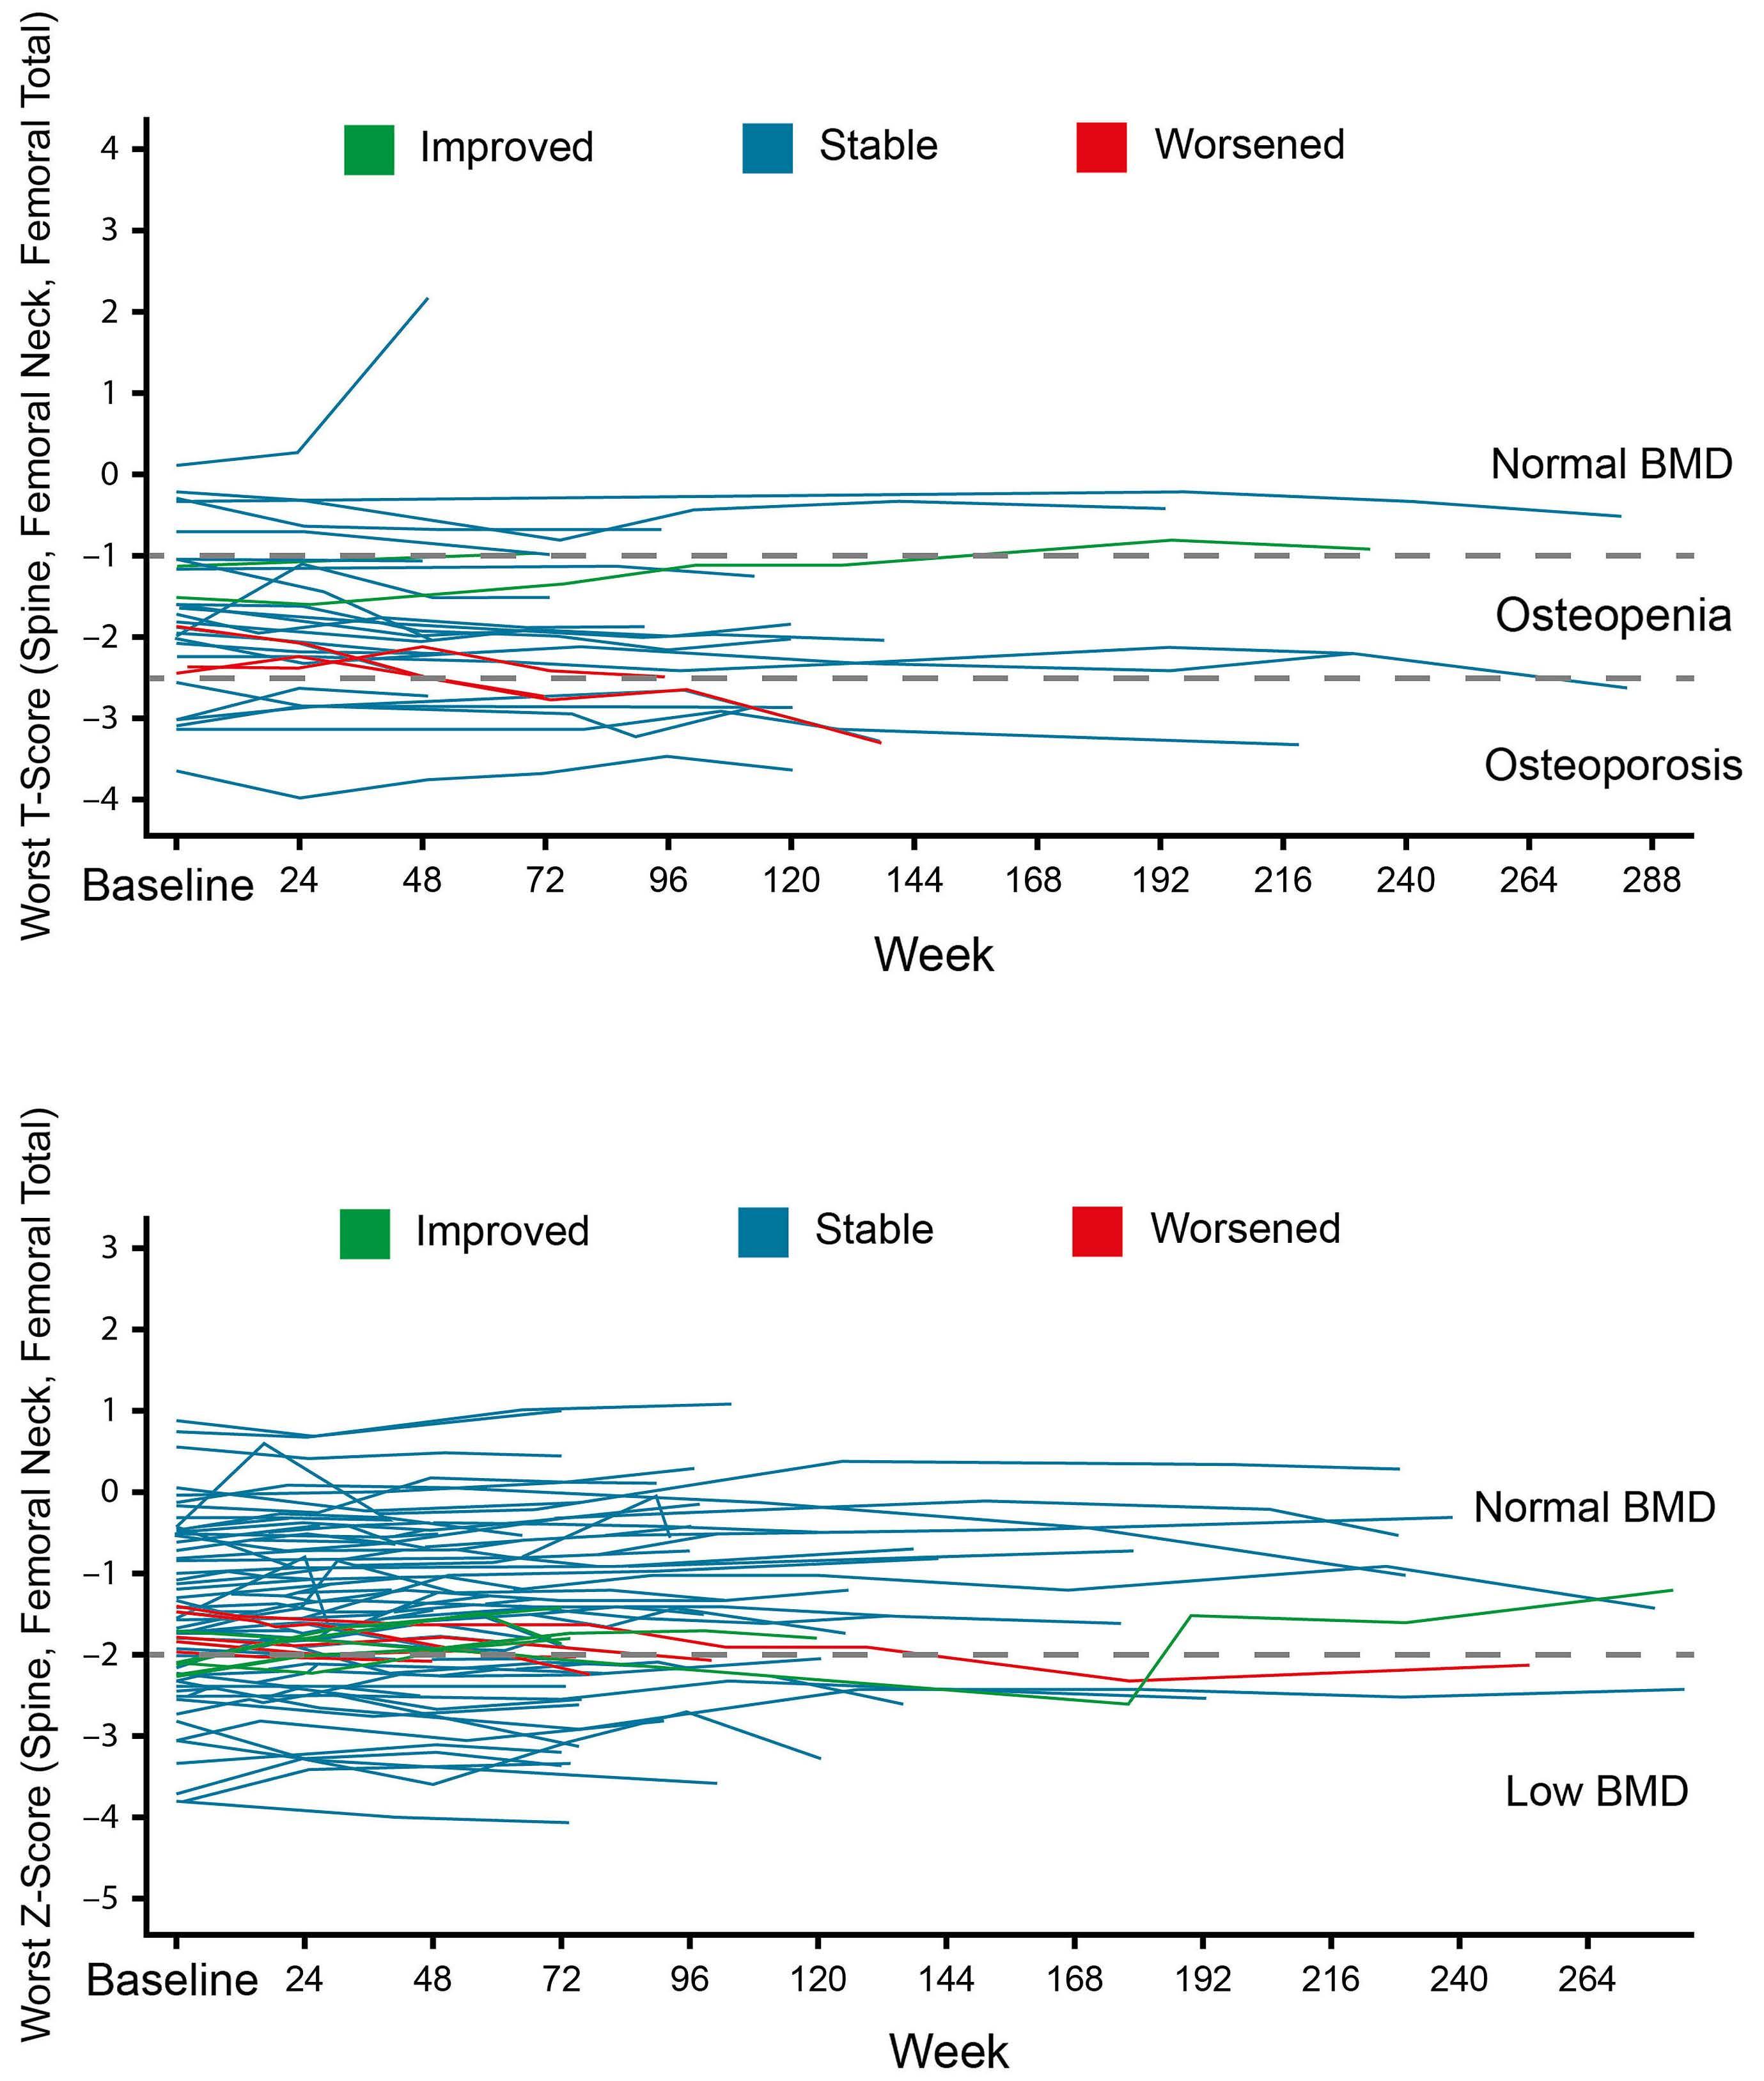
Figure 2. Individual longitudinal plots of worst dual-energy X-ray absorptiometry (DXA) T-score and worst DXA Z-score across body locations. (A) Worst DXA T-score across body locations in a pooled analysis* of patients (men aged ≥50 years and women of non-childbearing potential) treated with mitapivat for >12 months (N=29)**,***,**** and (B) worst DXA Z-score across body locations in a pooled analysis* of patients (men aged <50 years and women of childbearing potential) treated with mitapivat for >12 months (N=77).**,**** *Data pooled from DRIVE-PK (clinicaltrials gov. Identifier: NCT02476916), ACTIVATE (clinicaltrials gov. Identifier: NCT03548220), ACTIVATE-T (clinicaltrials gov. Identifier: NCT03559699), and the LTE (clinicaltrials gov. Identifier: NCT03853798) studies. **Safety analysis set: patients who received mitapivat for >12 months (365 days); only patients with evaluable postbaseline (BL) DXA T- and Z-scores are included in the analysis. ***BL DXA T-score was missing for 1 patient. ****Some patients have up to 12 months of mitapivat treatment but do not have DXA records beyond 24 weeks. BMD: bone mineral density; LTE: long-term extension; DXA: dual-energy X-ray absorptiometry.
Haematologica | 109 March 2024 965 LETTER TO THE EDITOR
on BMD are unknown. Finally, while patients were treated and followed up for up to 5 years, most were treated for a shorter period, and progression of BMD abnormalities usually occurs over years in the general population and in patients with thalassemia syndromes.15,16 While the stability observed here suggests against any major negative impact of potential mitapivat-associated aromatase inhibition on BMD, this needs to be further investigated over a longer time period. BMD will continue to be monitored as part of the ongoing LTE study of mitapivat in adult patients with PK deficiency and is being assessed in two ongoing studies in children (<18 years) with PK deficiency (clinicaltrials gov. Identifier: NCT05175105, NCT05144256).
Given the low baseline BMD in patients with PK deficiency, it is hypothesized that mitapivat may halt bone loss through its mechanism of action by decreasing hemolysis, improving erythropoiesis, and stabilizing iron homeostasis. In support of this mechanism, findings from a study in patients with α- or β-non-transfusion-dependent thalassemia receiving mitapivat have also shown that BMD remains stable over time through 84 weeks.17 BMD will continue to be monitored as part of the ongoing LTE study of mitapivat in adult patients with PK deficiency and is being assessed in two ongoing studies in children (<18 years) with PK deficiency (clinicaltrials gov. Identifier: NCT05175105, NCT05144256).
Authors
Hanny Al-Samkari,1 Rachael F. Grace,2 Andreas Glenthøj,3 Oliver Andres,4 Wilma Barcellini,5 Frédéric Galacteros,6 Kevin H. M. Kuo,7 D. Mark Layton,8 Marta Morado,9 Vip Viprakasit,10 Feng Tai,11 Rolandas Urbstonaitis,11 Jaime Morales,11 Bryan McGee11 and Eduard J. van Beers12
1Division of Hematology, Massachusetts General Hospital, Harvard Medical School, Boston, MA, USA; 2Dana-Farber/Boston Children’s Cancer and Blood Disorder Center, Harvard Medical School, Boston, MA, USA; 3Department of Hematology, Rigshospitalet, Copenhagen, Denmark; 4Department of Pediatrics, University of Würzburg, Würzburg, Germany; 5 Fondazione IRCCS Ca’ Granda Ospedale Maggiore Policlinico, Milan, Italy; 6Unité des Maladies Génétiques du Globule Rouge, CHU Henri-Mondor AP-HP, Créteil, France; 7Division of Hematology, University of Toronto, Toronto, Ontario, Canada; 8Department of Immunology and Inflammation, Hammersmith Hospital, Imperial College Healthcare NHS Foundation Trust, London, UK; 9Hematology Department, Hospital Universitario La Paz, Madrid, Spain; 10Department of Pediatrics, Siriaj Hospital, Mahidol University, Bangkok, Thailand; 11Agios Pharmaceuticals, Inc., Cambridge, MA, USA and 12Center for Benign Hematology, Thrombosis and Hemostasis, Van Creveldkliniek, University Medical Center Utrecht, Utrecht University, Utrecht, the Netherlands
Correspondence:
H. AL-SAMKARI - hal-samkari@mgh.harvard.edu
https://doi.org/10.3324/haematol.2023.282884
Received: February 3, 2023.
Accepted: September 14, 2023.
Early view: September 21, 2023.
Published under a CC BY license
Disclosures
HAS has received consultancy fees from Agios, Argenx, Forma, Moderna, Novartis, Pharmacosmos, Rigel, and Sobi; and research funding from Agios, Amgen, Novartis, Sobi, and Vaderis. RFG has received research funding from Agios, Novartis, and Sobi; and consultancy fees from Agios and Sanofi. AG has received consultancy fees from and is an advisory board member for Agios, Bluebird Bio, Bristol Myers Squibb, Novartis, Novo Nordisk, and Pharmacosmos; and has received research support from Agios, Saniona, and Sanofi. OA has no conflicts of interest to disclose. WB has received honoraria from Agios, Alexion, and Novartis; has received research funding from Agios; and has a board membership or advisory committee for Bioverativ and Incyte. FG has a board membership or advisory committee for Addmedica, Agios, Novartis, Pfizer, and Vertex. KHMK has received consultancy fees from Agios, Alexion, Apellis, Bluebird Bio, Celgene, Novartis, and Pfizer; honoraria from Alexion and Novartis; discloses membership of an entity’s board of directors or advisory committees for Agios and Bioverativ; and has received research funding from Agios and Pfizer. DML has received consultancy fees from Agios and Novartis; and discloses membership of an entity’s board of directors or advisory committees for Agios, Cerus, and Novartis. MM has received honoraria and other grants from Sanofi Genzyme. VV has received consultancy fees, honoraria, research funding, and speaker’s bureau from BristolMyers Squibb; and research funding and consultancy fees from Agios, Ionis Pharmaceuticals and La Jolla Pharmaceuticals. FT, RU, JM, and BM are employees of and shareholders in Agios. EJvanB is an advisory member for Agios; and has received research funding from Agios, Novartis, Pfizer and RR Mechatronics.
Contributions
HAS and EJvanB performed research, interpreted data, wrote, reviewed, and approved the paper. RFG, AG, OA, WB, FG, KHMK, DML, MM, and VV, all performed research, reviewed and approved the paper. FT analyzed data, reviewed and approved the paper. RU, JM, and BM interpreted data, reviewed and approved the paper.
Acknowledgments
The authors would like to thank the patients, their families, and all investigators involved in this study. Medical writing support, including assisting authors with the development of the outline and initial draft and incorporation of comments, was provided by Julie Gray, and editorial support, including figure preparation, formatting, proofreading, and submission, was provided by Thea Sheridon, both of Adelphi Communications Ltd, supported by Agios Pharmaceuticals, Inc. according to Good Publication Practice guidelines (https://www.acpjournals.org/doi/10.7326/M22-1460). The
Haematologica | 109 March 2024 966 LETTER TO THE EDITOR
Sponsor was involved in the study design, collection, analysis, and interpretation of data, as well as data checking of information provided in the manuscript. However, the authors assume ultimate responsibility for the opinions, conclusions, and data interpretation within the manuscript.
Funding
This study was funded by Agios Pharmaceuticals, Inc.
Data-sharing statement
Qualified researchers may request access to related clinical study
References
1. Kung C, Hixon J, Kosinski PA, et al. AG-348 enhances pyruvate kinase activity in red blood cells from patients with pyruvate kinase deficiency. Blood. 2017;130(11):1347-1356.
2. Bianchi P, Fermo E, Glader B, et al. Addressing the diagnostic gaps in pyruvate kinase deficiency: consensus recommendations on the diagnosis of pyruvate kinase deficiency. Am J Hematol. 2019;94(1):149-161.
3. Grace RF, Mark Layton D, Barcellini W. How we manage patients with pyruvate kinase deficiency. Br J Haematol. 2019;184(5):721-734.
4 Boscoe AN, Yan Y, Hedgeman E, et al. Comorbidities and complications in adults with pyruvate kinase deficiency. Eur J Haematol. 2021;106(4):484-492.
5. Al-Samkari H, Grace RF, Glenthøj A, et al. Early-onset reduced bone mineral density in patients with pyruvate kinase deficiency. Am J Hematol. 2023;98(3):e57-e60.
6. Basu S, Kumar A. Hair-on-end appearance in radiograph of skull and facial bones in a case of beta thalassaemia. Br J Haematol. 2009;144(6):807.
7 Rossi F, Perrotta S, Bellini G, et al. Iron overload causes osteoporosis in thalassemia major patients through interaction with transient receptor potential vanilloid type 1 (TRPV1) channels. Haematologica. 2014;99(12):1876-1884.
8. Pyrukynd. Prescribing information. Agios Pharmaceuticals Inc. 2022. Accessed November 21, 2022. https://www.accessdata. fda.gov/drugsatfda_docs/label/2022/216196s000lbl.pdf
9 Pyrukynd. Summary of product characteristics. Agios Pharmaceuticals Inc. 2022. Accessed November 21, 2022. https://
documents. Please send your data-sharing requests to datasharing@ agios.com. The following considerations will be taken into account as part of the review: ability for external researcher to re-identify trial participants such as those of small, rare disease trials or singlecenter trials; language used in data and requested documents (e.g., English or other); informed consent language with respect to allowance for data sharing; plan to re-evaluate safety or efficacy data summarized in the approved product labeling; potential conflict of interest or competitive risk (see http://www.icmje.org/ recommendations/browse/publishing-and-editorial-issues/clinicaltrial-registration.html).
www.agios.com/wp-content/uploads/2022/11/SmPC-EN.pdf
10. Al-Samkari H, Galacteros F, Glenthoj A, et al. Mitapivat versus placebo for pyruvate kinase deficiency. N Engl J Med. 2022;386(15):1432-1442.
11. Glenthøj A, Beers EJv, Al-Samkari H, et al. Mitapivat in adult patients with pyruvate kinase deficiency receiving regular transfusions (ACTIVATE-T): a multicentre, open-label, singlearm, phase 3 trial. Lancet Haematol. 2022;9(10):e724-e732.
12. Al-Samkari H, van Beers EJ. Mitapivat, a novel pyruvate kinase activator, for the treatment of hereditary hemolytic anemias. Ther Adv Hematol. 2021;12:1-11.
13. Grace RF, Rose C, Layton MD, et al. Safety and efficacy of mitapivat in pyruvate kinase deficiency. N Engl J Med. 2019;381(10):933-944.
14. Jeremiah MP, Unwin BK, Greenawald MH, et al. Diagnosis and management of osteoporosis. Am Fam Physician. 2015;92(4):261-268.
15. Lauretani F, Bandinelli S, Griswold ME, et al. Longitudinal changes in BMD and bone geometry in a population-based study. J Bone Miner Res. 2008;23(3):400-408.
16. Wong P, Fuller PJ, Gillespie MT, et al. Thalassemia bone disease: a 19-year longitudinal analysis. J Bone Miner Res. 2014;29(11):2468-2473.
17. Kuo KHM, Layton DM, Lal A, et al. Long-term efficacy and safety of the oral pyruvate kinase activator mitapivat in adults with non–transfusion-dependent alpha-or beta-thalassemia. Blood. 2021;138(Suppl 1):S576.
Haematologica | 109 March 2024 967 LETTER TO THE EDITOR
Engineering a humanized animal model of polycythemia vera with minimal JAK2 V617F mutant allelic burden
Polycythemia vera (PV) is a chronic myeloproliferative neoplasm (MPN) characterized by the overproduction of red blood cells. Over 95% of PV patients’ disease is driven by the JAK2V617F mutation. While JAK2V617F mutant mouse models have provided mechanistic insights into PV biology, most of these models present a mutant cell burden much higher than the variant allele frequency (VAF) of JAK2V617F found in PV patients. Thus, current PV mouse models result in a limited understanding of the earliest stages of PV development including what is the minimal mutant cell burden required for disease manifestation. In order to circumvent these limitations, we developed an engineered model of PV utilizing CRISPR/Cas9 homology-directed repair (HDR) to introduce a JAK2V6717F mutation into the endogenous locus of human CD34+ cells. Xenografting targeted cells into NSGS mice recapitulated human PV pathologies in vivo. We used this tool to address two questions: (i) what is the minimum mutant VAF needed to generate PV pathologies, and (ii) does the developmental context of the cell of origin influence disease trajectory of MPN. This model provides a valuable preclinical tool to test new PV therapies in vivo and an alternative model to study the development and progression of PV when primary patient samples are limited or unavailable. Myeloproliferative neoplasms (MPN) are driven by somatic mutations acquired in hematopoietic stem and progenitor cells (HSPC), characterized by the deviant proliferation of one or more myeloid lineages.1,2 MPN can present as polycythemia vera (PV; excess erythrocytes), essential thrombocythemia (ET; excess platelets), or myelofibrosis (MF; bone marrow fibrosis). The JAK2V617F mutation is a recurrent driver of MPN.3-5 However, the burden of JAK2V617F mutant cells varies widely in patients and can induce clinical phenotypes with very low VAF.6,7 In PV, over 95% of patients have JAK2V617F as the driving pathogenic mutation, but the mutation burden can be below 3% VAF in some patients.8 It is not clear how such a low mutant cell burden can generate MPN pathologies. Current JAK2V617F mouse modeling strategies utilize retroviral transduction,9,10 transgenic alleles,11 or genetic knock-in (KI) models.12,13 However, most of these models yield high JAK2V617F mutational frequencies that do not accurately reflect the clonal trajectory of PV patients. In order to overcome the limitations of mouse models, we recently developed methods to transplant CD34+ cells from MPN patients to generate patient-derived xenografts (PDX). In the case of MF, xenografting patient-derived CD34+ cells is able to propagate the genotypes, phenotypes and key patient pathologies such as reticulin fibrosis in PDX.14 However, attempts to generate PDX from PV patients has been less successful, with poor engraftment and limited numbers of CD34+ cells obtainable
from the blood of these patients. In order to circumvent these issues, here we describe a novel model to study development of human PV employing CRISPR/Cas9 methodology to introduce the JAK2V6717F mutation into the endogenous locus of HSPC obtained from human cord blood (CB) or healthy bone marrow (BM; Online Supplementary Figure S1A). For a pilot feasibility study, CB-derived CD34+ cells were nucleofected with CRISPR/Cas9 reagents to introduce the JAK2V617F (=”VF”) mutation into the endogenous locus. For a negative control, a single-stranded oligo donor nucleotide (ssODN) was designed to introduce a silent mutation at the same amino acid, such that there is no resulting protein change (JAK2V617V =“VV”) but a single base genetic variant that serves as a trackable barcode. This engineered system was tested by xenografting a high input of 80,000 nucleofected CD34+ CB cells. KI efficiency was 13-14% for both VF and VV variants (Online Supplementary Figure S1B). There was high human engraftment in both VF and VV groups in peripheral blood (PB; Online Supplementary Figure S1C) and BM (Online Supplementary Figure S1D). JAK2V617F cells exhibited increased engraftment in the spleen (Online Supplementary Figure S1E), splenomegaly (Online Supplementary Figure S1F) and propagation of the mutation in the BM (Online Supplementary Figure S1G).
In order to model PV driven by low JAK2V617F mutant allele burden, we utilized the KI strategy but with a significantly lower cell input. We also sought to examine how the JAK2V617F mutation can lead to distinct MPN pathologies by testing the hypothesis that developmental context of the cell of origin influences the disease trajectory. CD34+ cells from CB and adult BM (donor ages =32, 39 years) were nucleofected as above (Figure 1A) and 20,000 nucleofected cells were transplanted intra-tibially into sub-lethally irradiated (2.5 Gy) NSGS mice. JAK2V617F and JAK2V617V donor cells were present at low frequencies in the PB of both recipient groups (Figure 1B, C). The myeloid lineage compartment was increased in hCD45+ PB cells in mice that received the JAK2V617F mutant HSPC derived from either BM or CB compared to JAK2V617V controls (Figure 1D). Mice transplanted with JAK2V617F mutant HSPC from both CB and BM donors displayed increased hematocrit, hemoglobin, and platelet counts, suggestive of a PV-like phenotype (Figure 1E). WBC counts were not significantly different (Figure 1E). Flow cytometric discrimination between human- and mouse-derived erythrocytes showed mice receiving VF cells exhibited a higher percentage of human red blood cells (Online Supplementary Figure S2A). Interestingly, between weeks 16 and 24 post-transplant, certain recipients of BM-derived JAK2V617F cells displayed a marked decrease in hematocrit, hemoglobin, and platelet counts (Figure 1E),
Haematologica | 109 March 2024 968 LETTER TO THE EDITOR
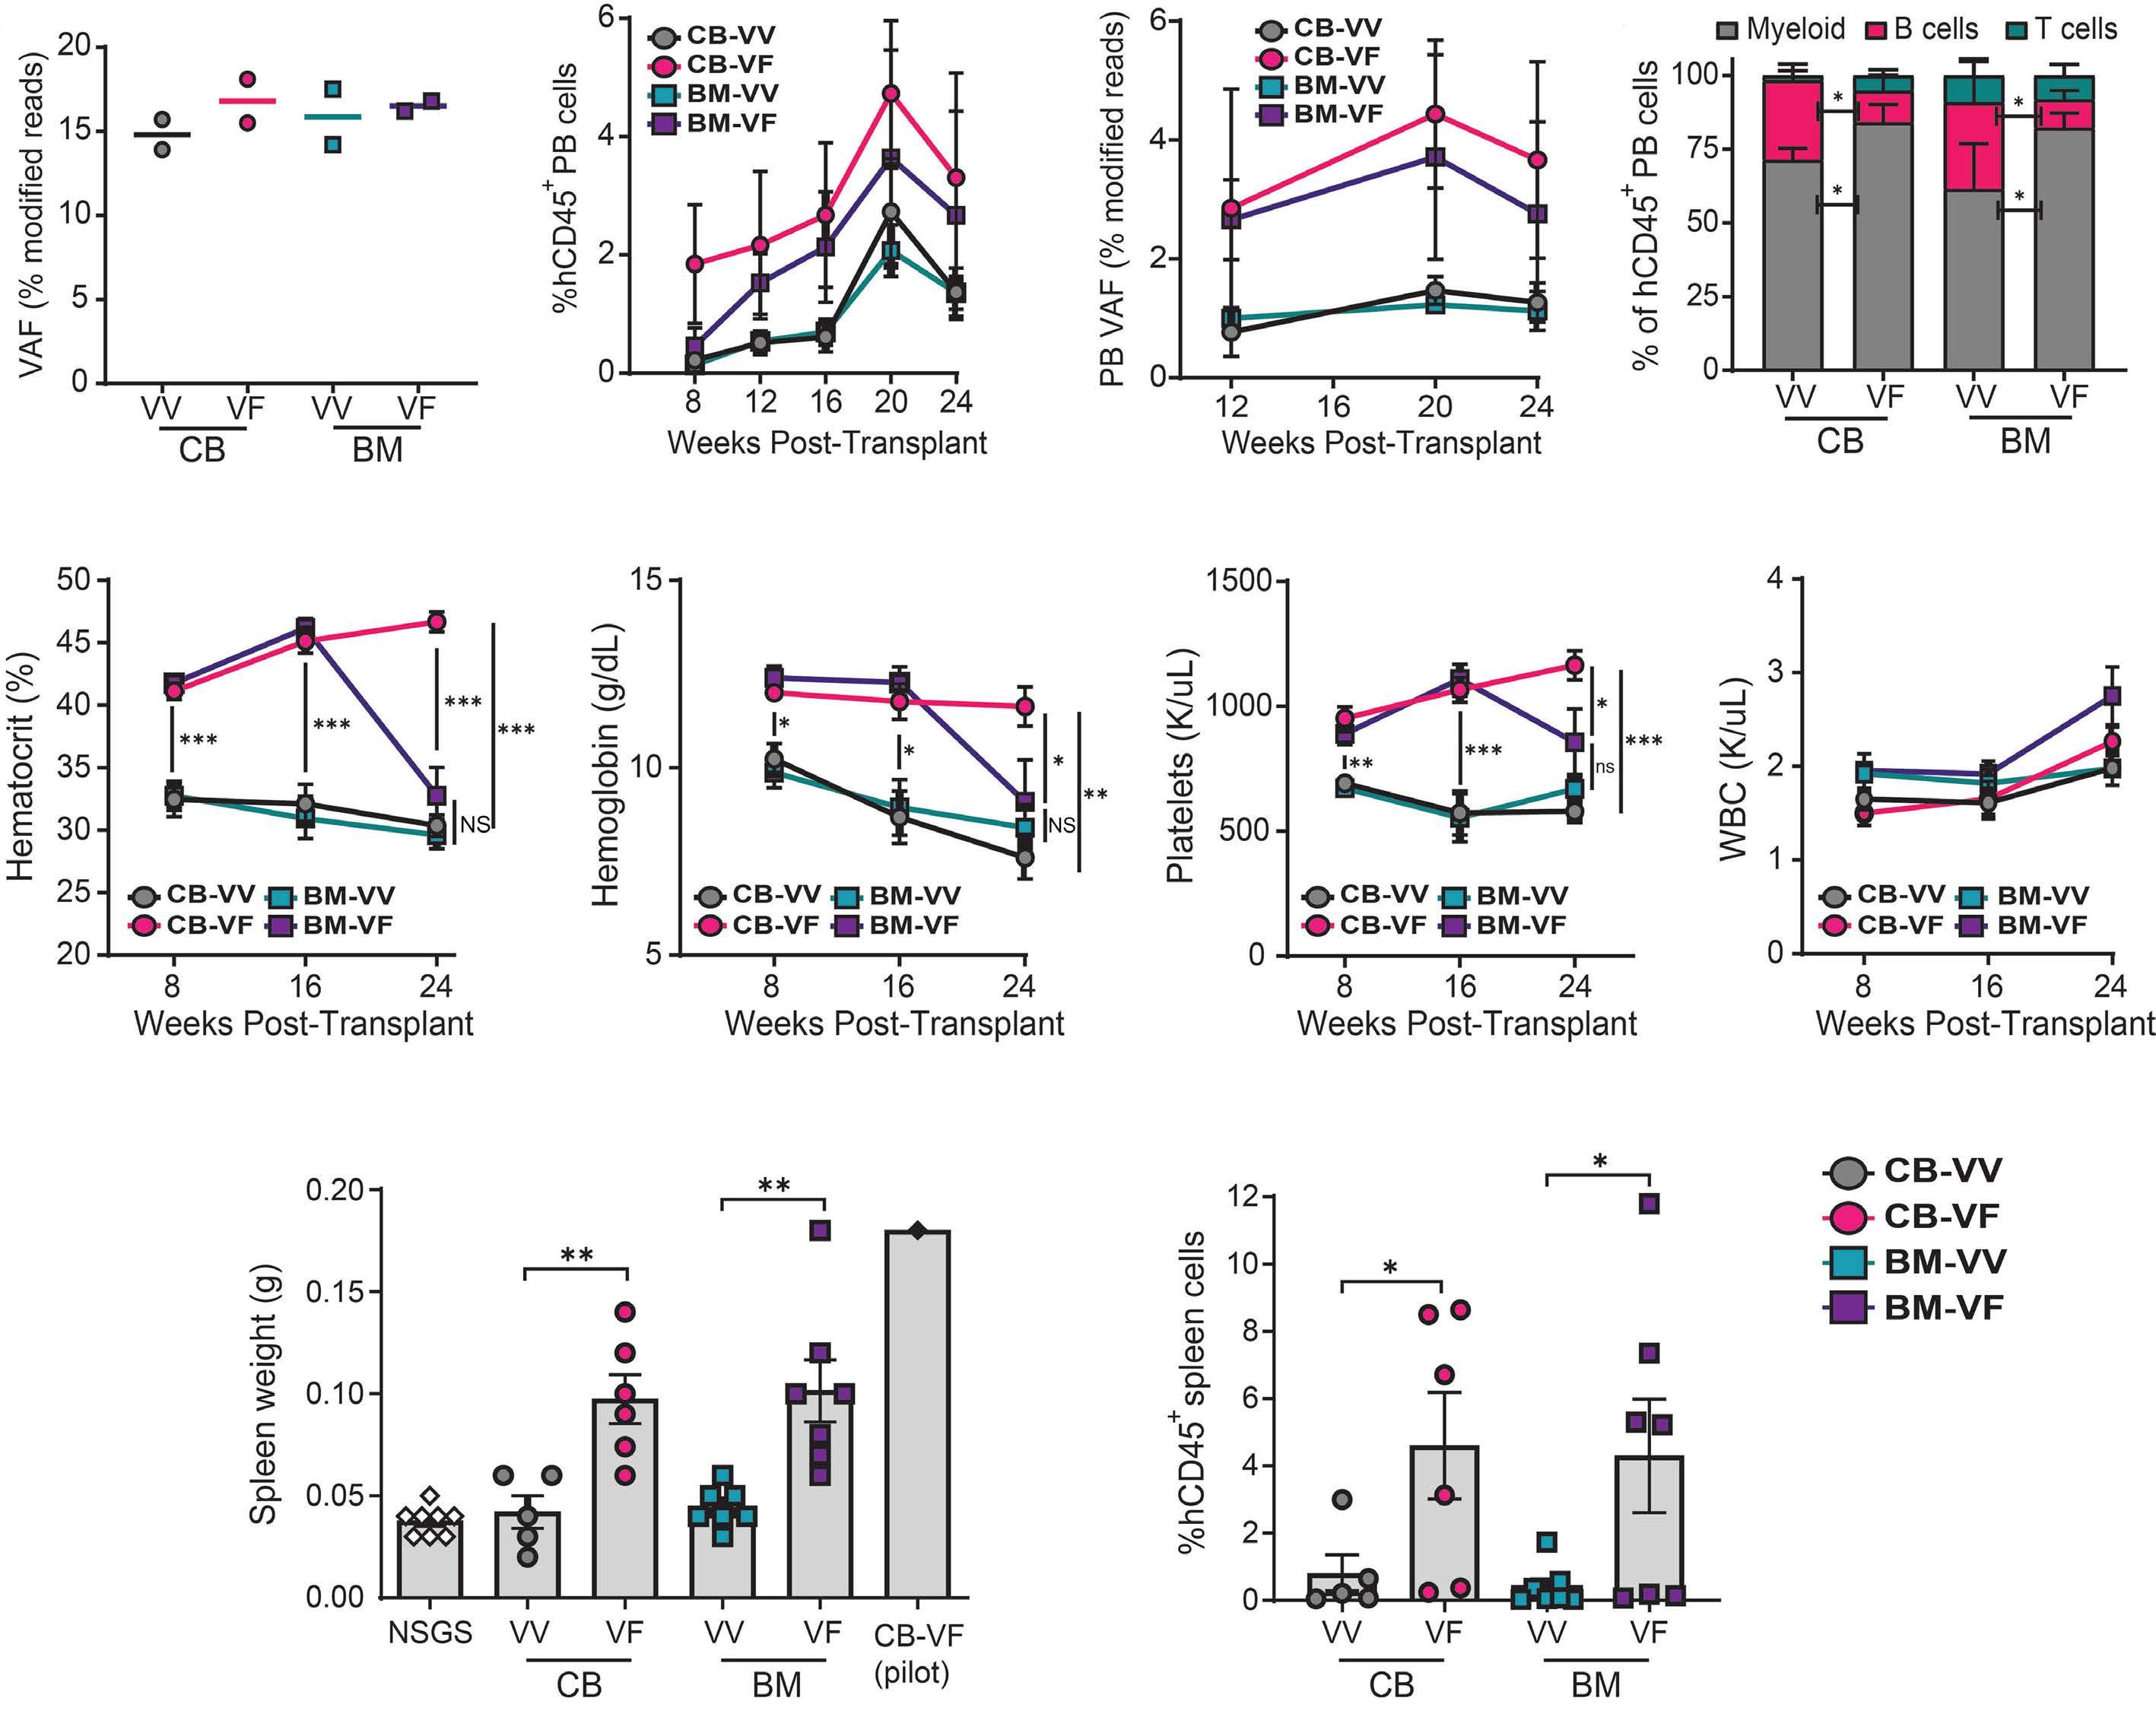
Figure 1. Engineering a humanized model of polycythemia vera. (A) Knock-in efficiency of VF and VV mutations in CD34+ cells of indicated source determined by next-generation sequencing. (B) Engraftment of human cells in the peripheral blood of NSGS mice determined by flow cytometry. (C) Variant allele frequency (VAF) of engineered mutations in the peripheral blood (PB) of NSGS mice determined by digital droplet plolymerase chain reaction. (D) Lineage distribution of engrafted human CD45+ cells in the PB of NSGS mice. (E) Blood counts of indicated recipient groups across the experimental time course. (F) Spleen weights of mice receiving indicated human cells. (G) Engraftment of human cells in the spleens of NSGS mice. N=5-7 mice per group, data are compiled from 2 independent experiments. *P<0.05, **P<0.01, ***P<0.001. Mean ± standard error of the mean values are shown. NSGS: age-matched irradiated non-transplanted mice; WBC: white blood cells; BM: bone marrow; CB: cord blood; VF: JAK2V617F; VV: JAK2V617V.
potentially suggestive of disease progression from PV to MF. Spleen weights and human cell engraftment in the spleen were increased in both JAK2V617F cohorts (Figure 1F, G), representative of the splenomegaly often present in MPN patients.
Human cell engraftment in the BM mirrored that of the PB (Figure 2A), although overall cellularity was increased in CB-derived JAK2V617F recipients (Online Supplementary Figure S2B). Again, the myeloid lineage in the BM was increased in the groups which received JAK2V617F-derived cells (Figure 2B). Parallel flow cytometric analysis on mouse (m)CD45+ BM cells from the same mice showed there were no changes in
mouse blood cell lineages between any cohort, suggesting that any observed effect was driven by transplanted human-derived cells (Online Supplementary Figure S2C). Human HSC (hCD45+, mCD45-, Lineage- [CD3/14/16/19/20/56], CD34+, CD38-, CD45RA-, CD90+; Online Supplementary Figure S2D) were detected in both CB- and BM-derived JAK2V617F cohorts, but not JAK2V617V recipients (Figure 2C), consistent with our prior studies showing that normal human HSC do not self-renew in the inflammatory environment of NSGS BM.14 JAK2V617F-mutant BM cells showed increased phosphorylation of STAT3 and STAT5, a canonical feature of MPN patients (Figure 2D). Thus, in addition to reproducibly
Haematologica | 109 March 2024 969 LETTER TO THE EDITOR
A B C D E F G
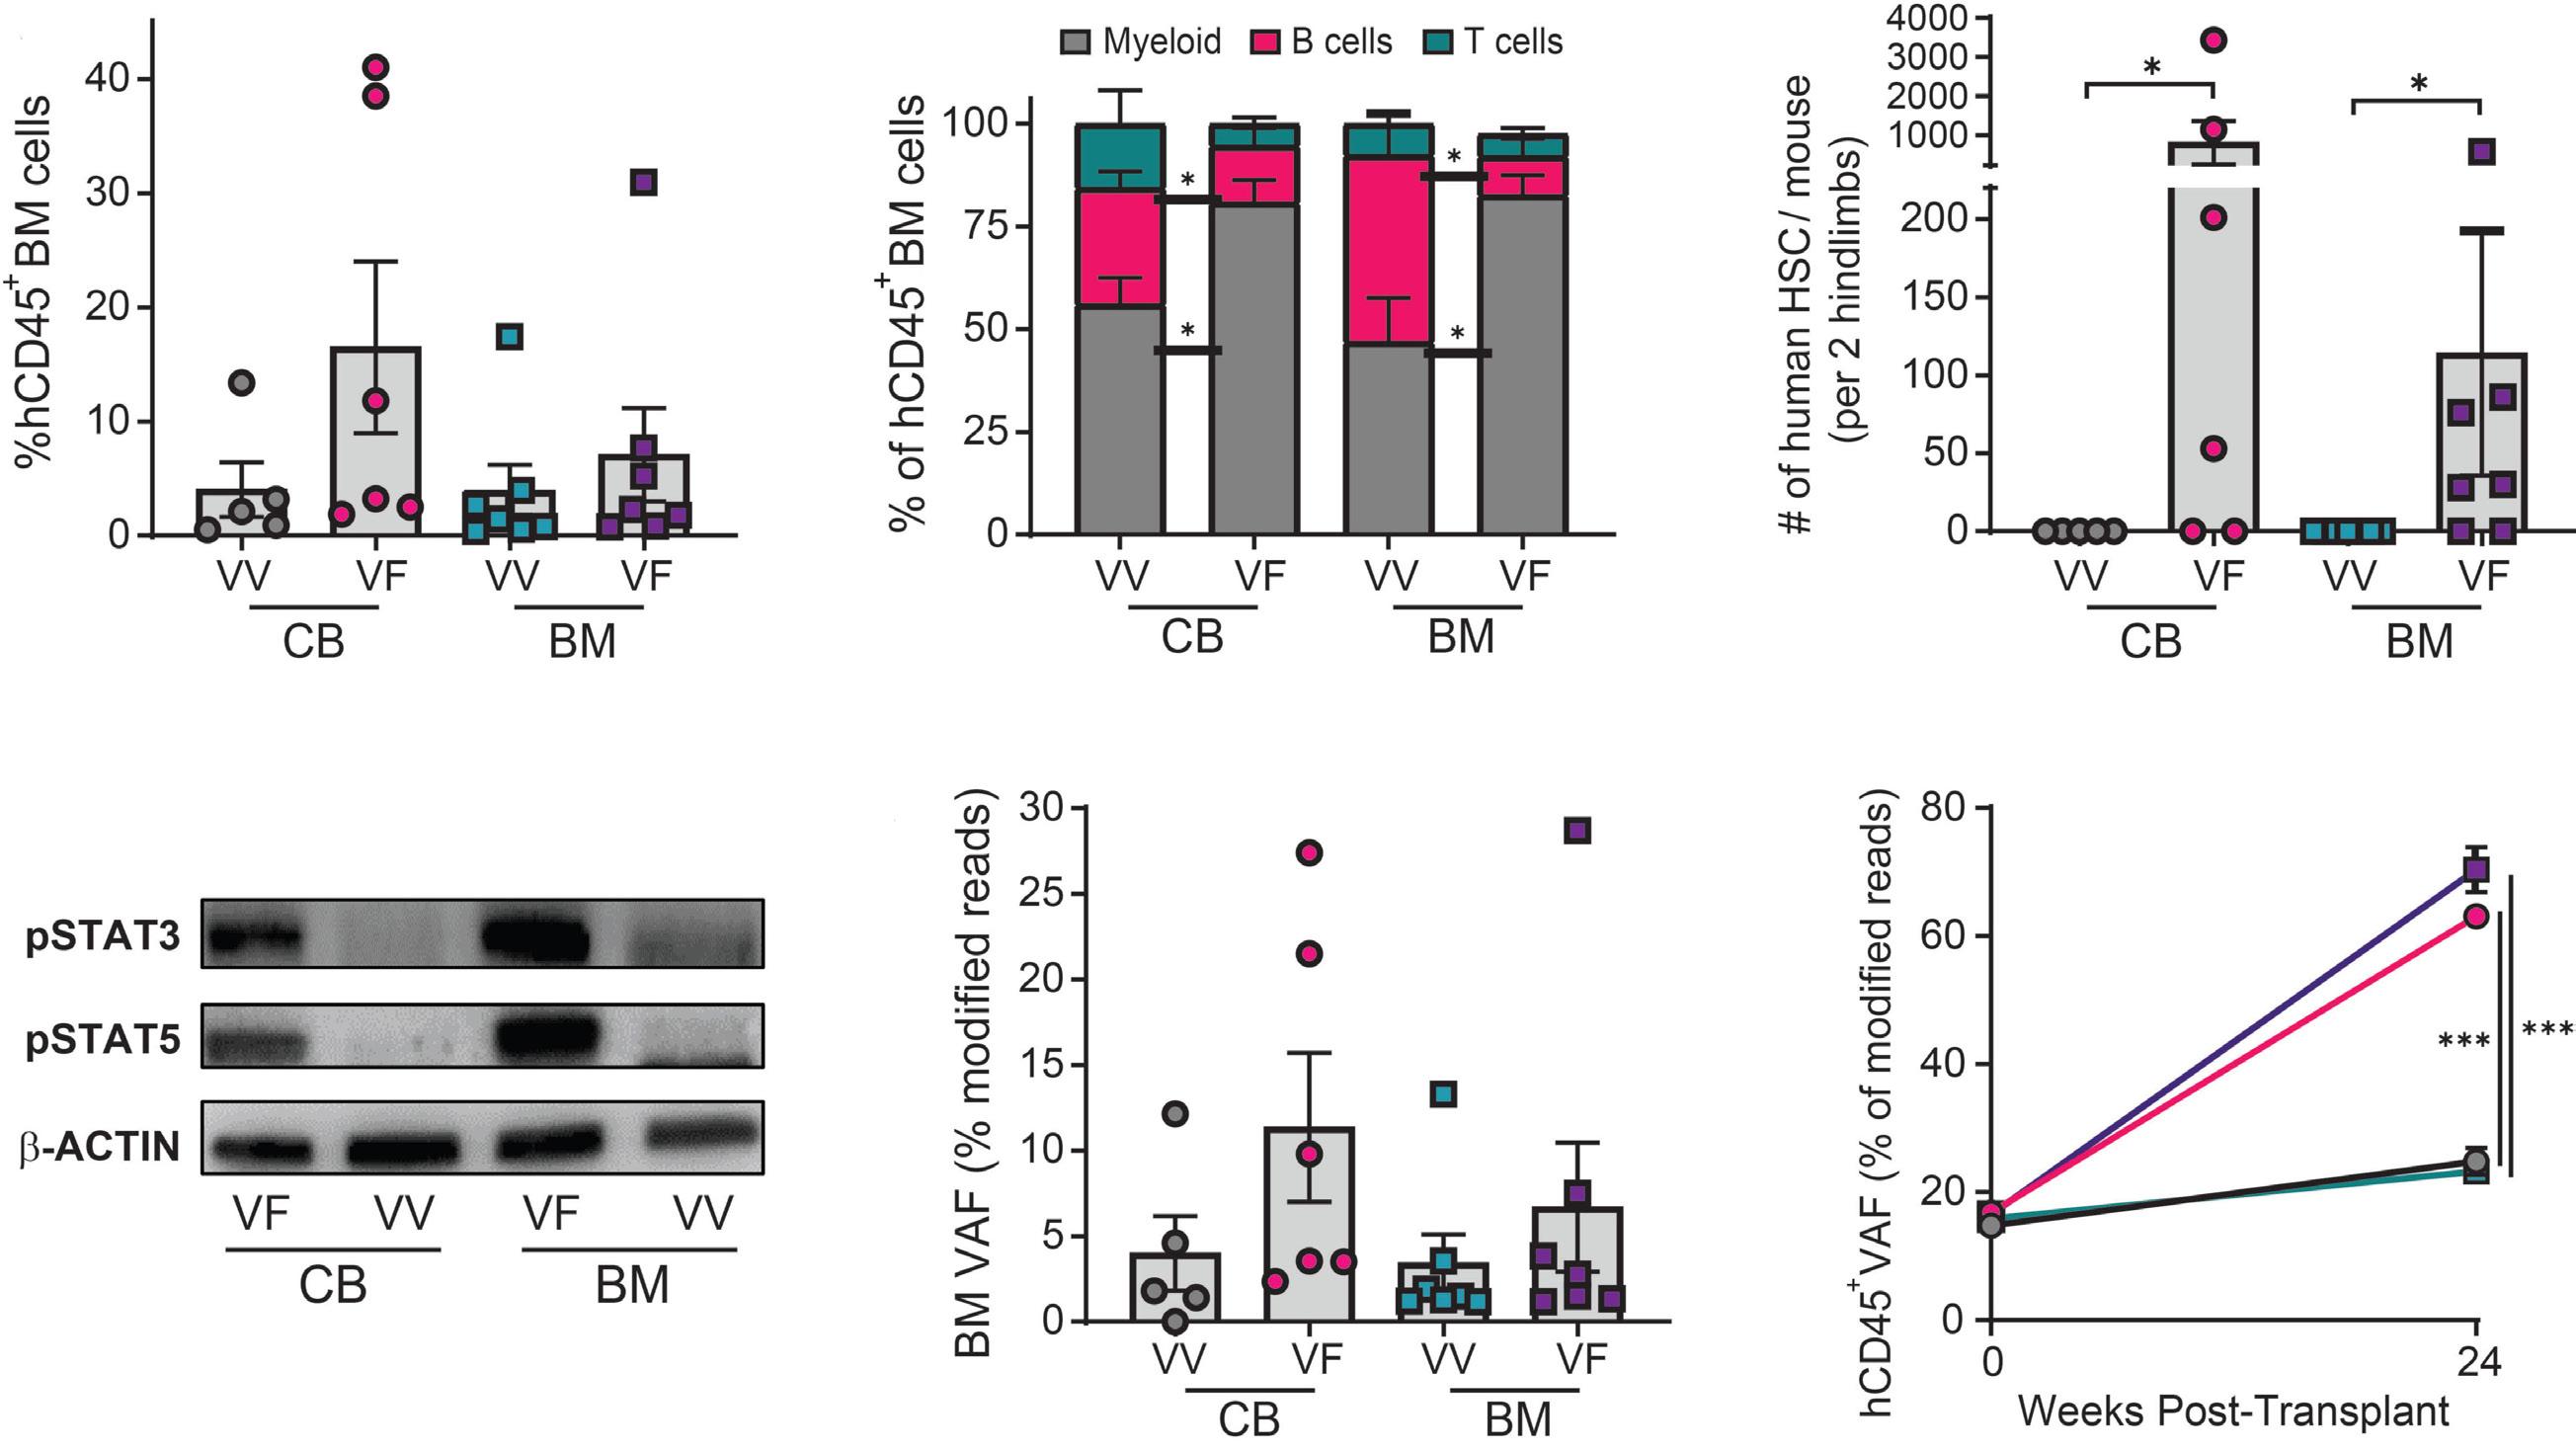
Engraftment
distribution of engrafted human CD45+ cells in the BM of NSGS mice. (C) Absolute number of human hematopoietic stem cells (HSC) in BM of NSGS recipient mice for each donor group. (D) Western blot analysis showing activation of the JAK/STAT pathway in VF targeted cells. (E) Variant allele frequency (VAF) of engineered mutations in BM of NSGS mice determined by digital droplet polymerase chain reaction. (F) VAF of engineered mutations specifically within human cell fractions. N=5-7 mice per group, data are compiled from 2 independent experiments. *P<0.05, ***P<0.001. Mean ± standard error of the mean values are shown. NSGS: age-matched irradiated non-transplanted mice; CB: cord blood; VF: JAK2V617F; VV: JAK2V617V.
generating hallmark MPN pathologies (Online Supplementary Figure S3), this system also produces characteristic molecular features of JAK2V617F-mutant MPN.
Six months post-transplant, VAF was determined by droplet digital polymerase chain reaction (ddPCR) in whole BM and purified hCD45+ cells from the BM of xenografted mice as previously described.15 The VAF of JAK2V617F in whole BM essentially mirrored overall engraftment (Figure 2E). Within the hCD45+ BM cells, the VAF of VV-targeted cells remained relatively consistent over the transplant period. In contrast, there was a significant increase in the VAF of VF-targeted cells (Figure 2F), demonstrating a competitive advantage for JAK2V617F-mutant clones.
Reticulin staining of the BM revealed fibrosis in the majority of recipients of BM-derived VF-edited cells (5/7), which was not observed in recipients of CB-derived cells edited with the JAK2V617F mutation (Figure 3A). No reticulin fibrosis was detected in any recipients of JAK2V617V control cells (Figure 3B). Histopathology showed the BM from VF-targeted recipients displayed increased megakaryocytes (Figure 3C). Several BM-derived JAK2V617F recipients had distinctive histopathology, presenting dysmorphic (hyper-lobated, staghorn, and/or cloud-like nuclei) and/or multinucleated (distinct, multinucleated nuclei amidst increased cytoplasm)
megakaryocytes (Figure 3D). Dysmorphic megakaryocytes were significantly increased in recipients transplanted with JAK2V617F-edited cells from either CB or BM, whereas multinucleated megakaryocytes were almost exclusively associated with BM-derived JAK2V617F cells (Figure 3E). The frequency of multinucleated megakaryocytes strongly correlated with the degree of reticulin fibrosis in the BM (Figure 3F). Moreover, in BM-derived VF recipients, fibrosis grade correlated with decreasing hematocrit and increased spleen weight (Figure 3F). These pathologies are suggestive of disease progression from PV to MF. This engineered system presents a unique opportunity to study the molecular mechanisms that promote MPN that may lead to these distinct disease trajectories. In conclusion, we present an engineered humanized JAK2V617F KI system wherein a minority of mutant HSPC initiate MPN in the background of normal hematopoiesis. A burden of mutant cells at low VAF (<5%) was able to induce classical MPN pathologies in NSGS mice, mimicking early-stage human PV. However, it should be noted that due to differences in the biology of NSGS mice, the MPN pathologies are not precise recapitulations of human patients or some genetic mouse models of MPN derived in C57Bl/6 backgrounds. While hematocrit was elevated in NSGS recipients of VF-edited cells, it was markedly lower than that observed in PV patients.
Haematologica | 109 March 2024 970 LETTER TO THE EDITOR
A B C D E F
Figure 2. Manifestation of polycythemia vera pathologies from a minimal JAK2V617F mutant allele burden. (A)
of human cells in the bone marrow (BM) of NSGS mice. (B) Lineage
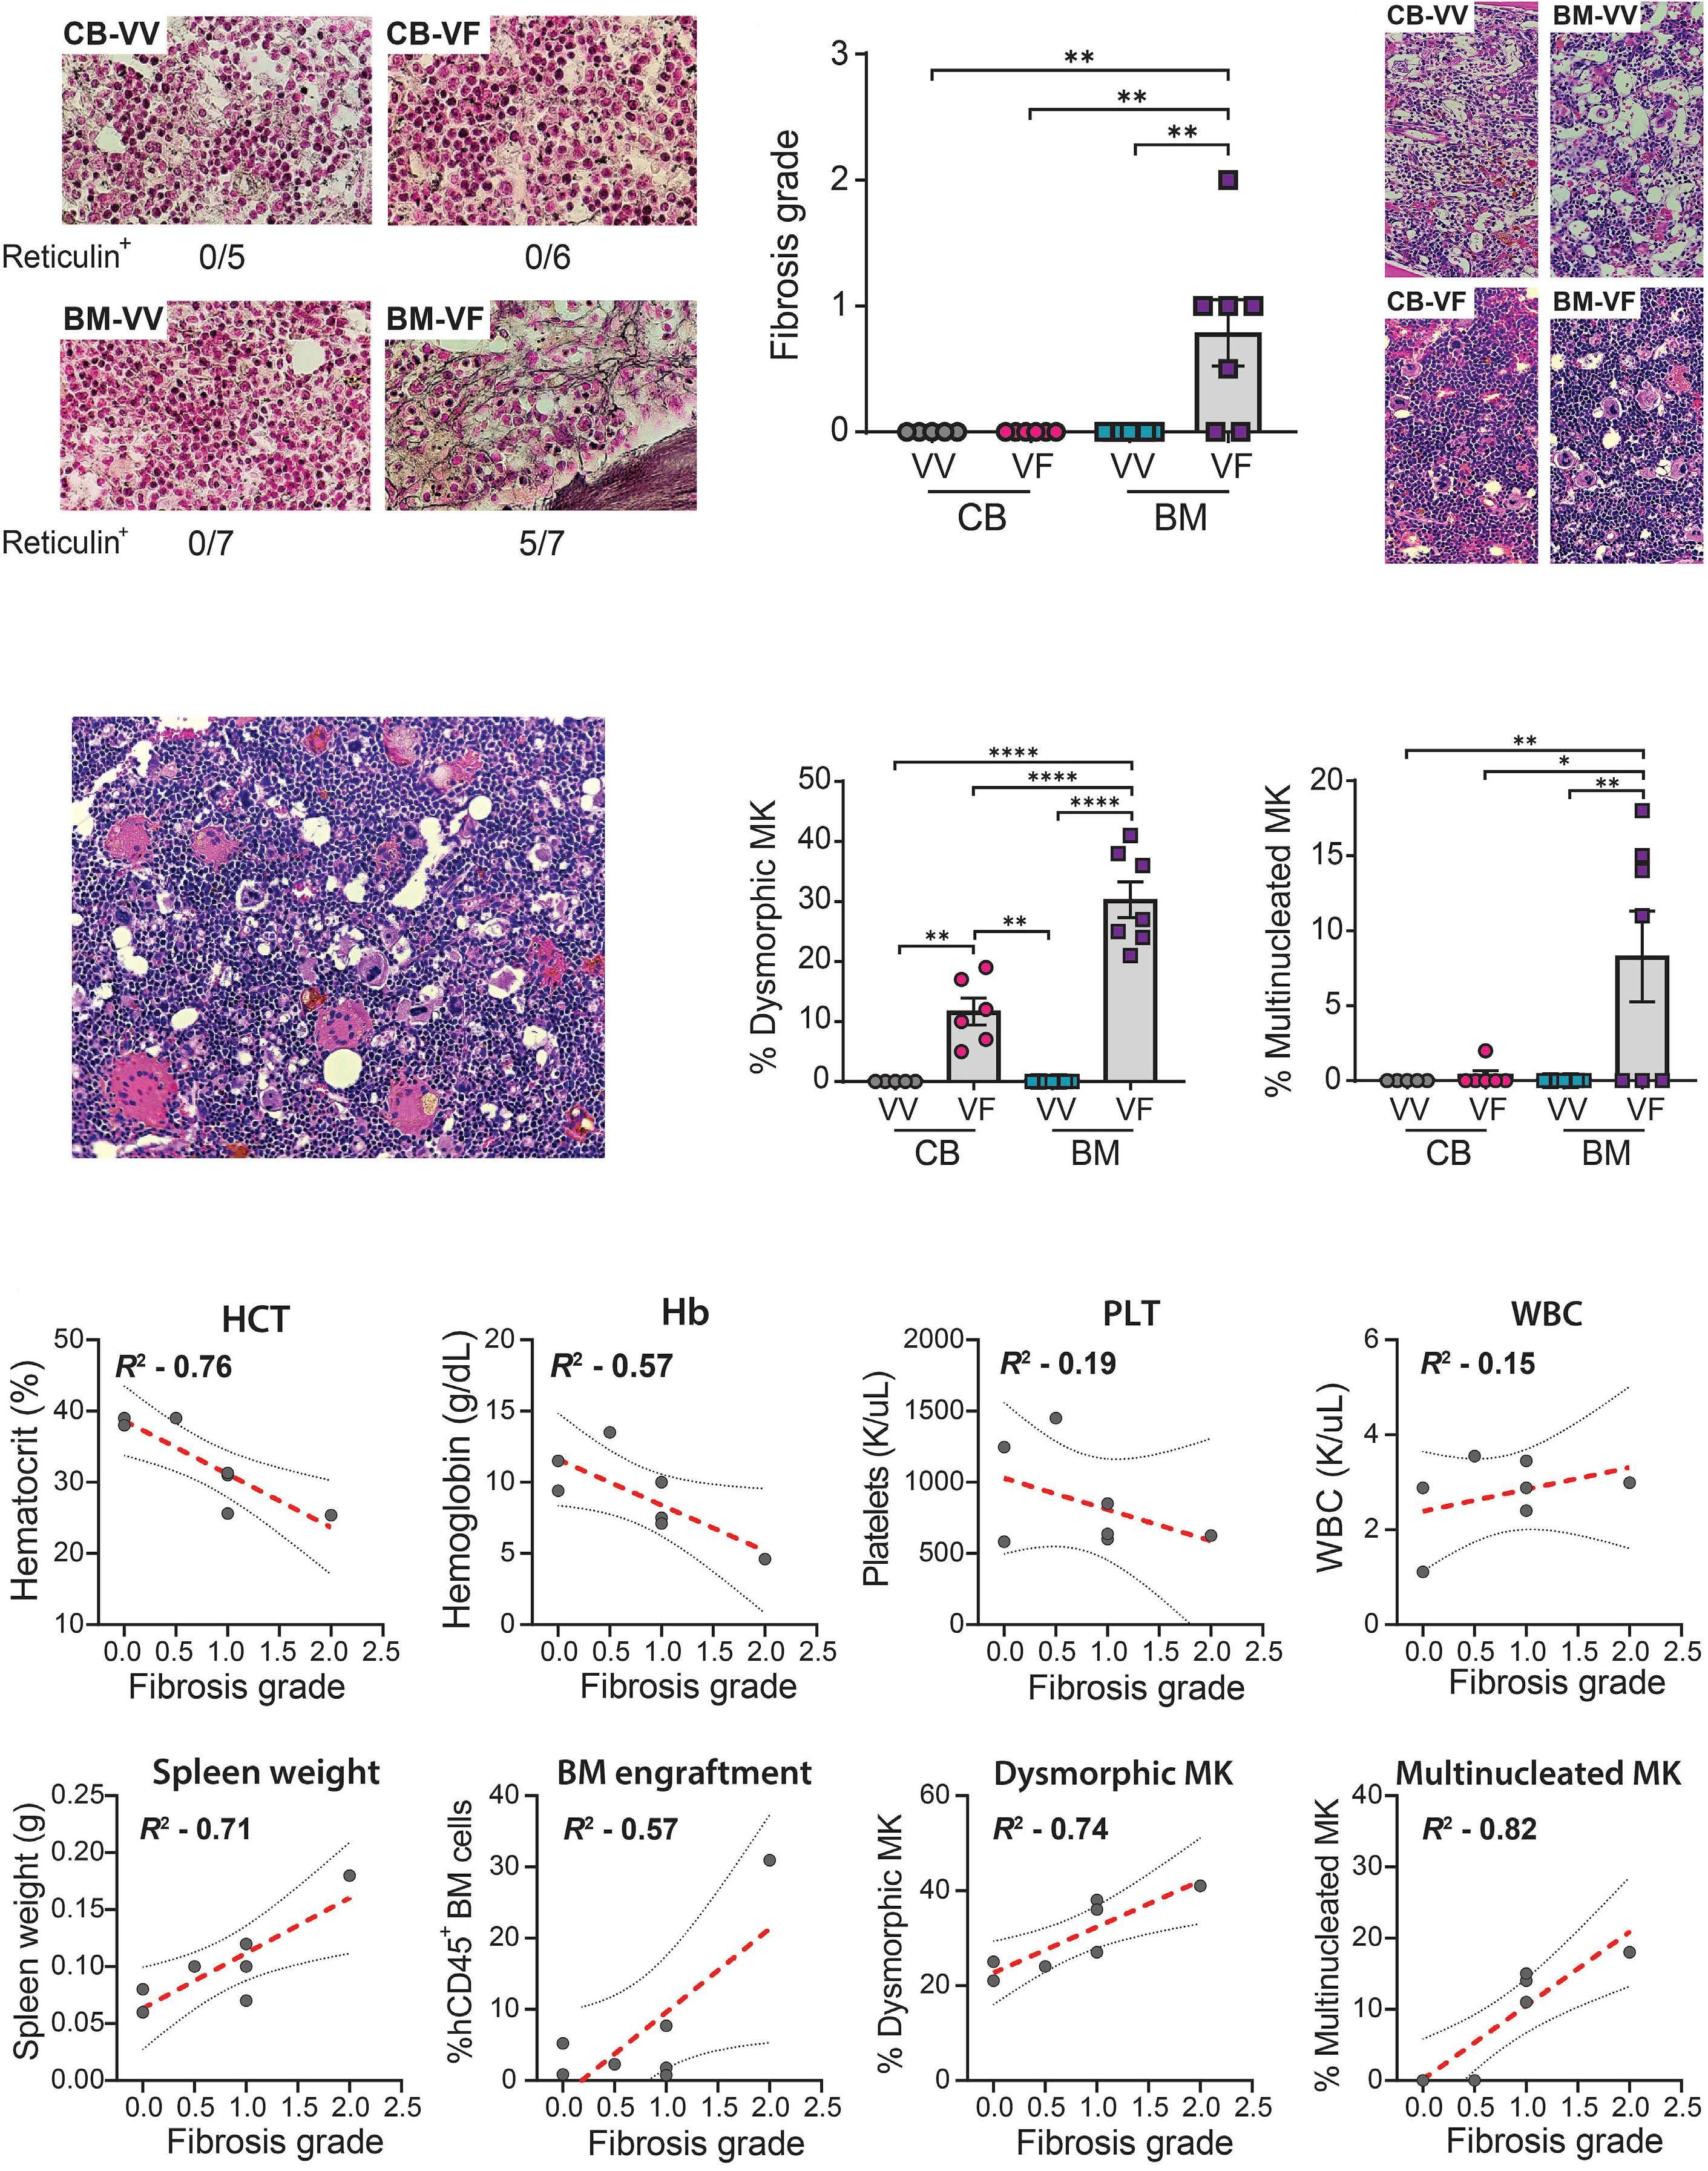
Haematologica | 109 March 2024 971 LETTER TO THE EDITOR Continued on following page. A B C D E F
Figure 3. Histopathology of xenografted mice. (A) Representative bone marrow (BM) sections of NSGS mice from indicated groups showing reticulin staining. (B) Quantification of the degree of reticulin fibrosis in BM of recipient mice from indicated groups. (C) Representative histological images of BM sections of NSGS mice from indicated recipient groups. (D) Histopathology showing multinucleated megakaryocytes (MK) in BM of a mouse receiving BM-derived JAK2V617F targeted cells. (E) Quantification of the percentage of dysmorphic and multinucleated MK in the BM of recipient mice from indicated groups. (F) Correlations of BM reticulin fibrosis grade with pathological parameters (non-linear regression) for recipients transplanted with BM-derived JAK2V617F-targeted cells. Line of best fit (red) and 95% confidence intervals are shown. N=5-7 mice per group, data are compiled from 2 independent experiments. *P<0.05, ***P<0.001. Mean ± standard error of the mean values are shown. NSGS: age-matched irradiated non-transplanted mice; CB: cord blood; HCT: hematocrit; WBC: white blood cells; Hb: hemoglobin; Plt: platelets; MK: megakaryocytes; VF: JAK2V617F; VV: JAK2V617V.
Similarly, while splenomegaly was observed, it was not to the same relative degree that can occur in MPN patients. Despite these limitations, this model represents a robust and reproducible tool for the investigation of JAK2V617F mutant clone fitness and provides a platform for preclinical testing of novel PV interventions. Moreover, the majority of the cohort receiving BM-derived VF-mutated CD34+ cells developed reticulin fibrosis at 6 months. At present, there is no mouse model that reliably models the transformation of PV to MF that we present here in a humanized system.
Authors
Tyler M. Parsons, Aishwarya Krishnan, Wangisa M.B. Dunuwille, Andrew L. Young, Jason Arand, Wentao Han and Grant A. Challen
Division of Oncology, Department of Medicine, Washington University School of Medicine, St. Louis, MO, USA
Correspondence:
G.A. CHALLEN - grantchallen@wustl.edu
https://doi.org/10.3324/haematol.2023.283858
Received: June 30, 2023.
Accepted: September 15, 2023.
Early view: September 28, 2023.
©2024 Ferrata Storti Foundation
Published under a CC BY-NC license
Disclosures
GAC acts as a consultant and received research funding from
References
1. Grabek J, Straube J, Bywater M, Lane SW. MPN: the molecular drivers of disease initiation, progression and transformation and their effect on treatment. Cells. 2020;9(8):1901.
2. Kleppe M, Levine RL. New pieces of a puzzle: the current biological picture of MPN. Biochim Biophys Acta. 2012;1826(2):415-422.
3. Levine RL, Wadleigh M, Cools J, et al. Activating mutation in the tyrosine kinase JAK2 in polycythemia vera, essential
Incyte, Ajax Therapeutics and ReNAgade Therapeutics Management not relevant to this work. ALY acts as a consultant for BioGenerator not relevant to this work. TMP acts as a consultant for Pillar Patient Advocates and the MPN Research Foundation not relevant to this work. The remaining authors have no conflicts of interest to disclose.
Contributions
GAC, TMP and ALY developed the concept and designed the study. TMP, AK, WMBD, WH and JA performed experiments and acquired data. TMP and GAC analyzed data. GAC acquired funding. TMP and GAC carried out project administration and supervised the project.
Acknowledgments
We thank Dr. Marianna Ruzinova (Washington University School of Medicine) for pathological scoring of reticulin fibrosis and all members of the Challen Laboratory for ongoing contributions and critical discussion. We thank the Washington University Musculoskeletal Histology and Morphometry Core for histology, and the Siteman Cancer Center Flow Cytometry core for cell sorting and analysis.
Funding
The Siteman Cancer Center Flow Cytometry core is supported by NIH Cancer Center Support Grant P30CA091842. This work was supported by the National Institutes of Health (HL147978, CA236819 and DK124883) and Research Scholar Grant CSCC-RSG-23-991417-01-CSCC from the American Cancer Society and the Lisa Dean Moseley Foundation (to GAC). TMP is a fellow of the Leukemia and Lymphoma Society. ALY was supported by NIH T32HL007088. GAC is a scholar of the Leukemia and Lymphoma Society.
Data-sharing statement
Data and protocols are available upon request to the corresponding author.
thrombocythemia, and myeloid metaplasia with myelofibrosis. Cancer Cell. 2005;7(4):387-397.
4 Baxter EJ, Scott LM, Campbell PJ, et al. Acquired mutation of the tyrosine kinase JAK2 in human myeloproliferative disorders. Lancet. 2005;365(9464):1054-1061.
5. Kralovics R, Passamonti F, Buser AS, et al. A gain-of-function mutation of JAK2 in myeloproliferative disorders. N Engl J Med. 2005;352(17):1779-1790.
Haematologica | 109 March 2024 972 LETTER TO THE EDITOR
6. Limvorapitak W, Parker J, Hughesman C, McNeil K, Foltz L, Karsan A. No differences in outcomes between JAK2 V617F–positive patients with variant allele fraction < 2% versus 2-10%: a 6-year province-wide retrospective analysis. Clin Lymphoma Myeloma Leuk. 2020;20(9):e569-e578.
7 Moliterno AR, Kaizer H, Reeves BN. JAK2V617F allele burden in polycythemia vera: burden of proof. Blood. 2023;141(16):1934-1942.
8. Perricone M, Polverelli N, Martinelli G, et al. The relevance of a low JAK2 V617F allele burden in clinical practice: a monocentric study. Oncotarget. 2017;8(23):37239-37249.
9. Lacout C, Pisani DF, Tulliez M, Gachelin FM, Vainchenker W, Villeval JL. JAK2V617F expression in murine hematopoietic cells leads to MPD mimicking human PV with secondary myelofibrosis. Blood. 2006;108(5):1652-1660.
10 Wernig G, Mercher T, Okabe R, Levine RL, Lee BH, Gilliland DG. Expression of Jak2V617F causes a polycythemia vera-like disease with associated myelofibrosis in a murine bone marrow
transplant model. Blood. 2006;107(11):4274-4281.
11. Xing S, Wanting TH, Zhao W, et al. Transgenic expression of JAK2V617F causes myeloproliferative disorders in mice. Blood. 2008;111(10):5109-5117.
12. Marty C, Lacout C, Martin A, et al. Myeloproliferative neoplasm induced by constitutive expression of JAK2V617F in knock-in mice. Blood. 2010;116(5):783-787.
13. Mullally A, Lane SW, Ball B, et al. Physiological Jak2V617F expression causes a lethal myeloproliferative neoplasm with differential effects on hematopoietic stem and progenitor cells. Cancer Cell. 2010;17(6):584-596.
14. Celik H, Krug E, Zhang CR, et al. A humanized animal model predicts clonal evolution and therapeutic vulnerabilities in myeloproliferative neoplasms. Cancer Discov. 2021;11(12):3126-3141.
15. Wiley B, Parsons TM, Burkart S, et al. Effect of clonal hematopoiesis on cardiovascular disease in people living with HIV. Exp Hematol. 2022;114:18-21.
Haematologica | 109 March 2024 973 LETTER TO THE EDITOR
Circulating tumor DNA and bone marrow minimal residual disease negativity confers superior outcome for multiple myeloma patients
Multiple myeloma (MM) is a multi-focal genetically heterogeneous clonal plasma cell (PC) malignancy of the bone marrow (BM). BM-based minimal residual disease (MRD) assessment utilizing next generation flow (NGF - EuroFlowTM) has become an important measure of treatment response and a validated predictor of outcome in MM, however, this approach and other single-site BM-derived assays may fail to capture the spatially heterogenous response to treatment evident in some patients. Analysis of blood-based circulating cell-free tumor DNA (ctDNA) has been shown to provide additional information to that provided by conventional disease assessment approaches.1-5 In this study, we investigated if ctDNA molecular response could be utilized as an adjunct to MRD EuroFlowTM and the International Myeloma Working Group (IMWG) response criteria in predicting patient outcomes following secondary salvage therapy. We demonstrated that MM patients manifesting an early molecular response, as defined by a reduction in ctDNA burden, and who also achieved EuroFlowTM MRD negativity (MRD-) had a superior outcome, providing the rationale to evaluate ctDNA in future studies as a non-invasive molecular response marker. MM, a cancer of plasma cells, has a 5-year overall survival (OS) of 48.5% for newly diagnosed (ND) MM patients. Proteasome inhibitors and immunomodulatory drugs, with autologous stem cell transplantation (ASCT) have improved the survival rates, but patients eventually relapse due to the presence of remnant tumor cells (MRD+). While MM invariably relapses, MRD- patients consistently demonstrate more prolonged progression-free survival (PFS) and may represent a group where therapeutic de-escalation or modification can be safely considered.6,7 However, despite this, over time an increasing proportion of MRD- patients relapse. In part, this may be because single-site BM biopsy-based MRD assessment does not capture the spatially heterogenous treatment response of MM patients, suggesting that alternative MRD approaches to identify responsive patients are necessary. Circulating ctDNA analysis is rapidly emerging as an adjunctive approach to single-site BM biopsy for genomic analysis, therapeutic monitoring and defining the underlying biology of resistance in MM.8 Analysis of ctDNA addresses the spatial heterogeneity evident in MM and provides a more robust and risk-free methodology, thereby providing an alternative and a more practical modality to determine disease persistence. In this study, we investigated if alterations in the ctDNA mutational burden based on ultra-sensitive targeted amplicon sequencing (TAS) of 22 MM-relevant genes following treatment (molecular response) could be utilized as
an adjunct to MRD EuroFlowTM and IMWG response criteria to improve the identification of primary refractory patients achieving the best response to secondary salvage therapy. The study population was from the Australasian Leukemia and Lymphoma Group (ALLG) MM17 phase II clinical trial of 50 transplant-eligible NDMM who were refractory, or had a sub-optimal response (SOR), to bortezomib-based first-line induction therapy (ACTRN12615000934549).9 The trial evaluated an intensive salvage approach utilizing a combination of carfilzomib-thalidomide-dexamethasone (KTd) as re-induction (KTd x 4-6 cycles) and as ASCT consolidation (KTd x 2 cycles followed by Td x 10 cycles). Peripheral blood plasma in Streck BCT DNA tubes were obtained as per institutional ethics committee regulations and informed patient consent at study entry (baseline, N=48, 2 patients were excluded due to secondary malignancy and early death) and at cycle 3 day 1 (C3D1, N=46) (Figure 1). Plasma was processed for cell-free DNA as previously described.10 Peripheral blood collected into EDTA tubes was utilized for in vitro isolation of peripheral blood mononuclear and genomic DNA extracted for use as germline control for TAS. A total of 142 samples (N=94 ctDNA and n=48 germline controls) was subject to TAS (Figure 1). One baseline sample failed sequencing and the final analysis cohort consisted of N=141 samples. Bioinformatic analysis was performed with QIAGEN’s CLC Genomics Workbench using the HG38 human reference genome followed by QCI Interpret for variant calling.11 Variant allele frequency (VAF), defined as the relative frequency of a mutated allele at a particular locus and expressed as a fraction or percentage of the overall allelic frequency (mutated + wild-type), was derived for each sample set. Single nucleotide variants (SNV) with a depth of coverage <10 in tumor or plasma samples and failed upstream filtering were excluded. The default filter settings on QCI Interpret for common genetic variants, predicting deleterious and cancer driver variants were employed. SNV and insertion/deletion polymorphisms (INDEL) appearing in the germline control were excluded utilizing the tumor-specific variants setting. Any variants that had an allele frequency of >=0.5% in at least one of the time points were included in the analysis.
Of the N=48 baseline samples, three samples did not have any baseline mutations detected and one sample failed sequencing, so were excluded from analysis (Figure 1). The VAF of mutations at baseline was utilized to calculate a fold change at C3D1. Three patients did not have C3D1 time points collected and were also excluded. Fold-change value was calculated as follows - if VAF of a specific baseline
Haematologica | 109 March 2024 974 LETTER TO THE EDITOR
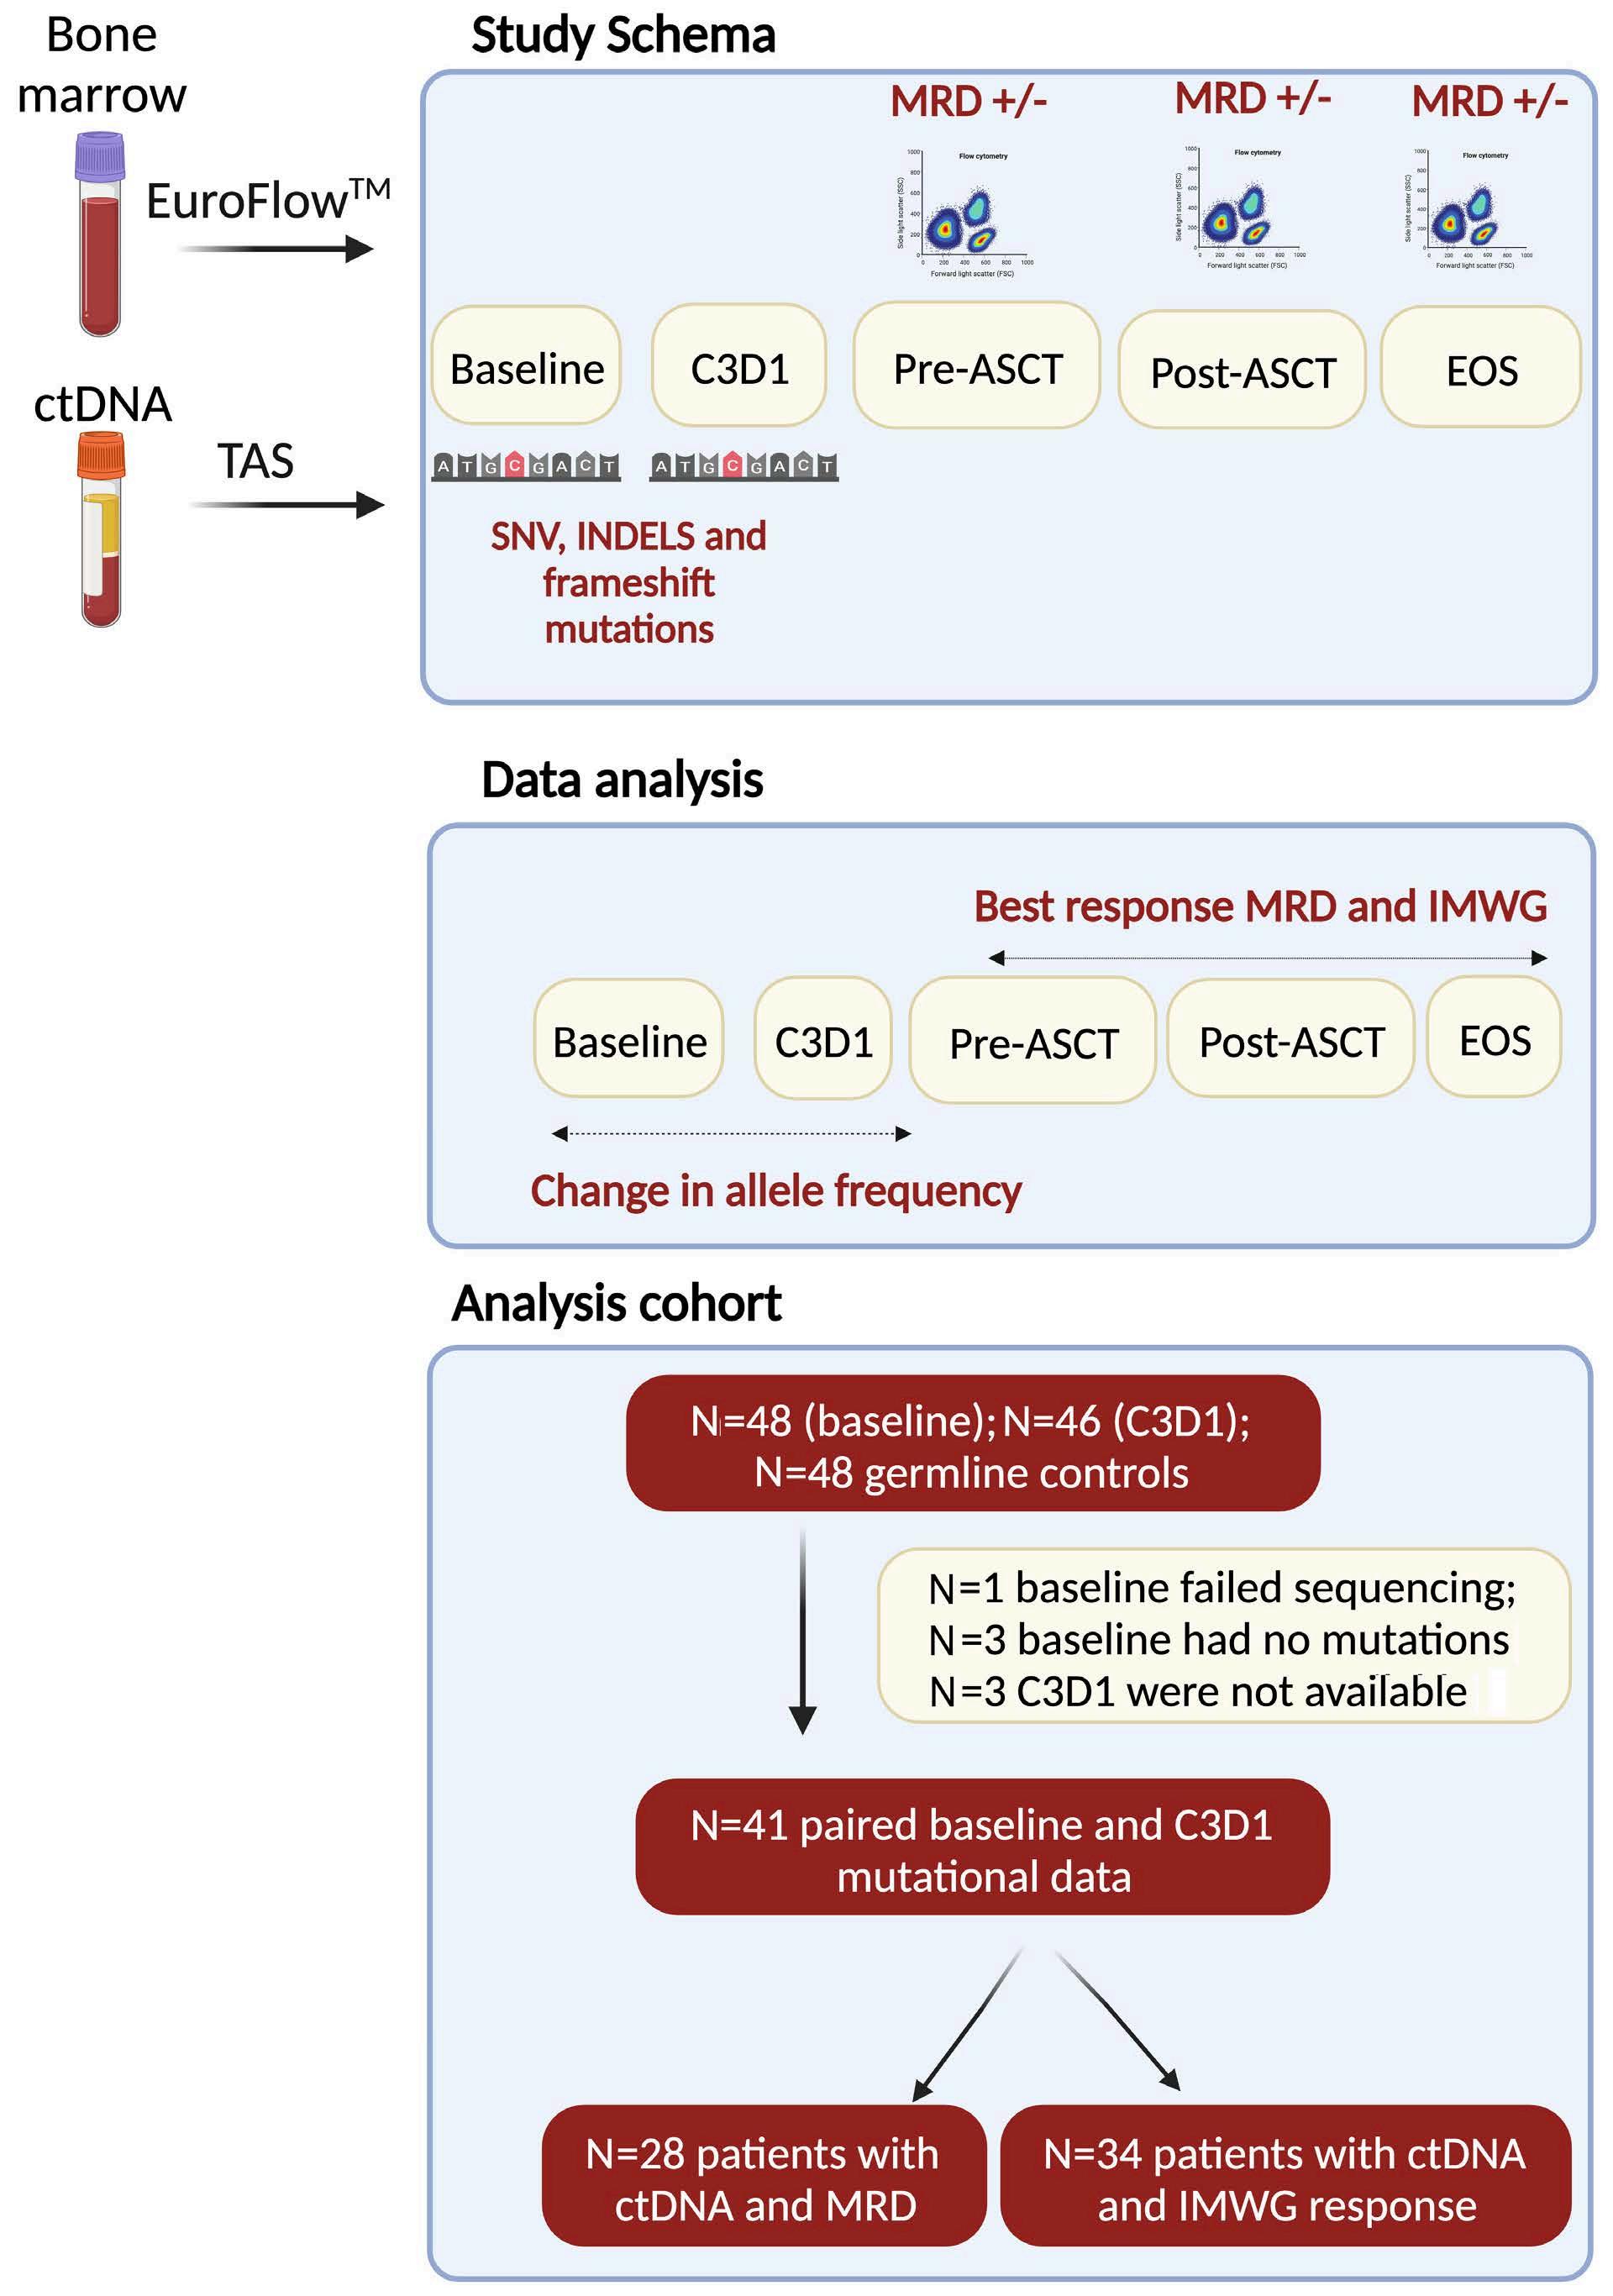
mutation is x and VAF of this mutation at C3D1 mutation is y, fold change is (y-x)/x. A negative fold change was defined as a decrease in VAF (ctDNA fold change negative or ctDNA-) and a positive fold change an increase in VAF (ctDNA fold change positive or ctDNA+) with the average fold change across all mutations calculated for each patient (Figure 1; Online Supplementary Tables S1 and S2). EuroFlow MRD analyses were undertaken as previously described in adherence with the EuroFlow Consortium guidelines.12 MRD analysis was performed pre-ASCT, post-ASCT and at the end of study (EOS) (Figure 1). A total of N=92 MRD assessments were available for analysis. The IMWG response was
Figure 1. Study schema, data analysis and analysis cohort of the study. Study schema: peripheral blood samples from patients enrolled in the ALLG MM17 trial were collected as specific time points indicated. Single nucleotide variants (SNV), deletions, insertions (INDEL) and frameshift mutations were detected with targeted amplicon sequencing (TAS). Minimal residual disease (MRD) analysis was performed at pre-autologous stem cell transplantation (pre-ASCT), post-ASCT and post consolidation time points. Data analysis: International Myeloma Working Group (IMWG) response was defined pre-ASCT, post-ASCT and post-consolidation and the best response achieved along with best MRD response was recorded. The variant allele frequency (VAF) change between baseline and C3D1 samples was utilized to calculate a fold change in VAF with an average reduction as circulating cellfree tumor DNA (ctDNA-) and an average increase as ctDNA+. Analysis cohort: the number of samples utilized for TAS and correlation with IMWG response and/or MRD response is shown. BM: bone marrow; C3D1: cycle 3 day 1 of treatment; EOS: end of study. Figure generated with Biorender.com.
defined pre-ASCT, post-ASCT and post-consolidation. MRD and IMWG response for the purposes of outcome analyses was based on the best response achieved at any of the aforementioned time points (Figure 1; Online Supplementary Table S1). Seven patients had IMWG response criteria missing and out of these four patients had a relapse prior to the pre-ASCT assessment time point, two withdrew due to secondary malignancy and one had unevaluable serum measurements. Statistical analyses were performed using GraphPad Prism 9 (San Diego, CA, USA) and SAS 9.4 (SAS Institute, Inc., Cary, NC, USA). Progression-free survival (PFS) was measured from the date of commencing therapy to
Haematologica | 109 March 2024 975 LETTER TO THE EDITOR
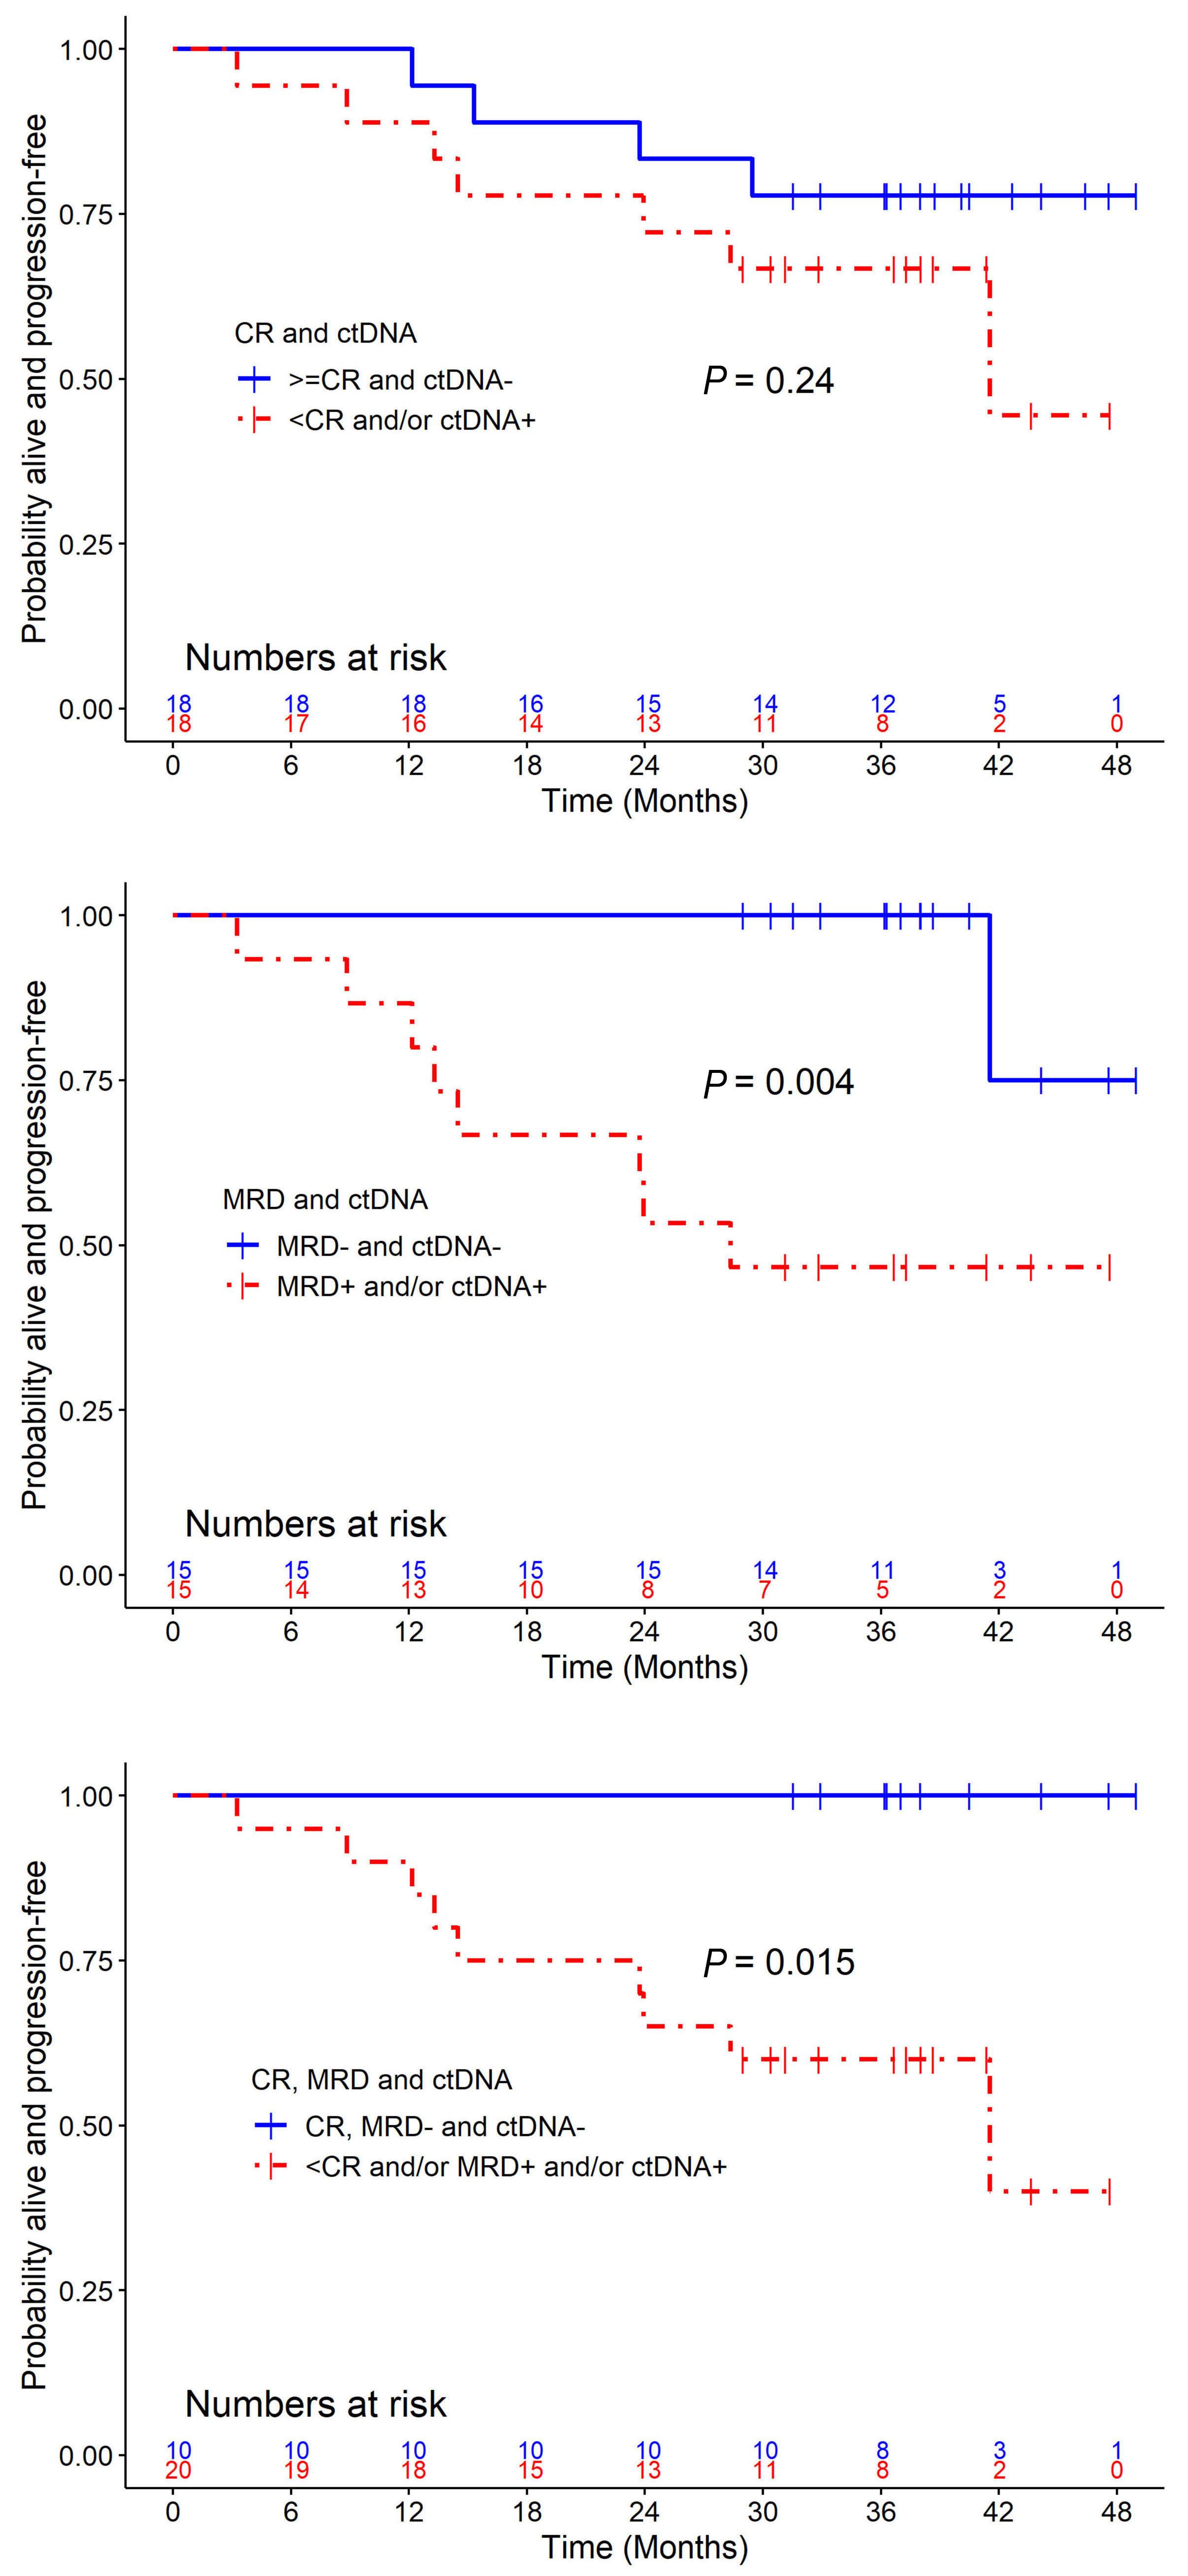
Figure 2. Patients with a circulating cell-free tumor DNA molecular response with minimal residual disease negativity and achieving complete response have a superior outcome. (A) Kaplan-Meier survival analysis for patients with ≥complete response (CR) and negative ctDNAfold change demonstrated no significant differences in progression-free survival (PFS) when compared with patients with <CR and/or circulating cell-free tumor DNA increase or positive fold change from baseline (ctDNA+) (P=0.24; logrank test) (B) Kaplan-Meier survival analysis of patients grouped as negative minimal residual disease (MRD-), reduction or negative fold change from baseline, and (ctDNA-) (MRD- and ctDNA-) or MRD+ and/or ctDNA+ demonstrated markedly superior PFS for patients achieving an early ctDNA molecular response and achieved MRD negativity (P=0.0040, MRD- ctDNA- (median PFS: not reached) versus MRD and/or ctDNA+ (median PFS: 28.4 months). (C) Kaplan-Meier survival analysis combining International Myeloma Working Group response, MRD status and ctDNA response demonstrated that ≥CR, MRD- and ctDNA- patients had superior PFS compared to patients with <CR and/or were MRD+ and/or ctDNA+ (P=0.015; median PFS: not reached vs. 41.5 months).
Haematologica | 109 March 2024 976 LETTER TO THE EDITOR A B C
the date of progression or death from any cause, whichever occurred first. Survival curves, with time in units of months, were plotted to investigate the association of PFS.
Of the N=48 baseline ctDNA samples, 44 patients had one or more mutations identified but of these three did not have a C3D1 time point. A total of 41 patients with complete TAS data were correlated with ‘best’ MRD status, IMWG response and PFS (Figure 1; Online Supplementary Data 1). A total of seven patients had a positive ctDNA fold change (i.e., ctDNA+), while the rest had a ctDNA- fold change. Amongst the ctDNA+ patients, two lacked MRD information and one lacked IMWG response. The remaining patients were not statistically large enough for further analyses. When patients with ≥CR and ctDNA- were compared with patients with <CR and/or ctDNA+ no significant PFS difference was seen (P=0.24; log-rank test; Figure 2A). In contrast MRD-/ ctDNA- patients demonstrated markedly superior PFS when compared to MRD+ and/or ctDNA+ patients, not reached versus 28.4 months (P=0.004), respectively (Figure 2B). Finally combining all three response categories demonstrated that patients who were ≥CR, MRD- and ctDNA- also had a superior PFS compared to patients who were <CR and/ or MRD+ and/or ctDNA+, not reached versus 41.5 months (P=0.015), respectively (Figure 2C). Our results demonstrate that treated MM patients manifesting an early molecular response, as defined by a reduction in ctDNA mutational burden by C3D1, and who also achieve MRD negativity have a superior outcome. These results demonstrate the utility of ctDNA-based early molecular response as a predictor of patient outcome in MM.
Our study employs Streck tubes that prevent cell rupture, ensuring contamination-free ctDNA collection. These tubes are compatible with multi-center studies, stable for 72 hours at ambient temperature, and consistently yield high-quality ctDNA for TAS when following the manufacturer’s recommended standard operating procedures. The ultra-sensitive ctDNA mutational analysis method that we have developed offers real-time insight into minute VAF alterations. Results are available within 1 week of blood collection and the approach sheds light on disease biology as specific mutations are linked to disease progression. In contrast, alternative blood-based methods like circulating tumor cells require a fresh blood sample, intricate enrichment techniques and might not be readily applicable for multi-center studies.13 Similarly, serum based matrix-assisted laser desorption/ Ionization time-of-flight or clonotypic peptide approach could be potentially useful for MRD detection.14 However, these techniques do not capture the biological changes that occur in response to treatment or disease progression. The limitations of our study are the small sample size mandating that larger confirmatory studies be undertaken to validate these observations. If validated, ctDNA would represent a readily accessible analyte for outcome prediction, thus facilitating early intervention and response adaption in MM patients destined to fail treatment.
Au tho rs
Sridurga Mithraprabhu,1,2 John Reynolds,1,2 Hang Quach,3 Noemi Horvath,4 Ian Kerridge,5 Tiffany Khong,1,2 Brian GM Durie6 and Andrew Spencer1,2
1Australian Center for Blood Diseases, Alfred Health - Monash University, Melbourne, Victoria, Australia; 2Department of Malignant Hematology and Stem Cell Transplantation, Alfred Hospital, Melbourne, Victoria, Australia; 3St.Vincent’s Hospital, University of Melbourne, Melbourne, Victoria, Australia; 4Royal Adelaide Hospital, Haematology, Adelaide, South Australia, Australia; 5Royal North Shore Hospital, Haematology, Sydney, New South Wales, Australia and 6Cedars-Sinai Comprehensive Cancer Center, Los Angeles, CA, USA
Correspondence:
A. SPENCER - Andrew.spencer@monash.edu
S. MITHRAPRABHU - Durga.mithraprabhu@monash.edu
https://doi.org/10.3324/haematol.2023.283831
Received: June 25, 2023.
Accepted: September 19, 2023.
Early view: September 28, 2023.
©2024 Ferrata Storti Foundation
Published under a CC BY-NC license
Disclosures
No conflicts of interest to disclose.
Contributions
SM designed the study, performed experiments, analyzed and interpreted data and wrote the manuscript. JR performed statistics and data interpretation. HQ, NH, IK and TK collected samples and clinical data. BD interpreted the data and contributed to presentation. AS designed and established the study, collected samples and clinical data, interpreted data and wrote the manuscript. All authors contributed to editing and approving the manuscript.
Acknowledgments
The authors would like to acknowledge the contribution of the staff and patients at the Malignant Hematology and Stem Cell Transplantation, Alfred Hospital, the staff at the Department of Pathology, Alfred Hospital and the Australasian Leukemia and Lymphoma Group (ALLG) network.
Funding
This study was funded by the International Myeloma Foundation’s Black Swan Research Initiative and philanthropic funding through the Alfred Foundation.
Data-sharing statement
Data will be made available on reasonable request addressed to the corresponding authors.
Haematologica | 109 March 2024 977 LETTER TO THE EDITOR
References
1. Mithraprabhu S, Khong T, Ramachandran M, et al. Circulating tumor DNA analysis demonstrates spatial mutational heterogeneity that coincides with disease relapse in myeloma. Leukemia. 2017;31(8):1695-1705.
2. Oberle A, Brandt A, Voigtlaender M, et al. Monitoring multiple myeloma by next-generation sequencing of V(D)J rearrangements from circulating myeloma cells and cell-free myeloma DNA. Haematologica. 2017;102(6):1105-1111.
3. Rustad EH, Coward E, Skytoen ER, et al. Monitoring multiple myeloma by quantification of recurrent mutations in serum. Haematologica. 2017;102(7):1266-1272.
4 Kis O, Kaedbey R, Chow S, et al. Circulating tumor DNA sequence analysis as an alternative to multiple myeloma bone marrow aspirates. Nat Commun. 2017;8:15086.
5. Mithraprabhu S, Sirdesai S, Chen M, Khong T, Spencer A. Circulating tumor DNA analysis for tumor genome characterisation and monitoring disease burden in extramedullary multiple yeloma. Int J Mol Sci. 2018;19(7):1858.
6. Rawstron AC, Child JA, de Tute RM, et al. Minimal residual disease assessed by multiparameter flow cytometry in multiple myeloma: impact on outcome in the Medical Research Council Myeloma IX Study. J Clin Oncol. 2013;31(20):2540-2547.
7 Rawstron AC, Gregory WM, de Tute RM, et al. Minimal residual disease in myeloma by flow cytometry: independent prediction of survival benefit per log reduction. Blood. 2015;125(12):1932-1935.
8. Mithraprabhu S, Chen M, Savvidou I, Reale A, Spencer A. Liquid
biopsy: an evolving paradigm for the biological characterisation of plasma cell disorders. Leukemia. 2021;35(10):2771-2783.
9 Turner R, Quach H, Horvath N, et al. Response adaptive salvage with KTd and ASCT for functional high-risk multiple myelomaThe Australasian Leukemia and Lymphoma Group (ALLG) MM17 Trial. Br J Haematol. 2023;202(3):530-538.
10 Mithraprabhu S, Morley R, Khong T, et al. Monitoring tumor burden and therapeutic response through analysis of circulating tumor DNA and extracellular RNA in multiple myeloma patients. Leukemia. 2019;33(8):2022-2033.
11. Mithraprabhu S, Reynolds J, Turner R, et al. Circulating tumor DNA analysis predicts relapse and improves risk stratification in primary refractory multiple myeloma. Blood Cancer J. 2023;13(1):25.
12. Turner R, Kalff A, Bergin K, et al. The utility of Euroflow MRD assessment in real-world multiple myeloma practice. Front Oncol. 2022;12:820605.
13. Garces JJ, San-Miguel J, Paiva B. Biological characterization and clinical relevance of circulating tumor cells: opening the Pandora’s box of multiple myeloma. Cancers (Basel). 2022;14(6):1430.
14 Murray DL, Puig N, Kristinsson S, et al. Mass spectrometry for the evaluation of monoclonal proteins in multiple myeloma and related disorders: an International Myeloma Working Group Mass Spectrometry Committee Report. Blood Cancer J. 2021;11(2):24.
Haematologica | 109 March 2024 978 LETTER TO THE EDITOR
Venetoclax salvage therapy in relapsed/refractory multiple myeloma
The BCL2 inhibitor venetoclax has emerged as an effective treatment option for multiple myeloma (MM), the second most common blood cancer. Despite the recent inclusion in European MM treatment guidelines, no approval for this use has yet been granted and the optimal dosage, combination partners and timing of treatment remain under investigation. We analyzed 38 MM patients treated with venetoclax at our institution. Sixty-four percent of them had a t(11;14) and all of them had been heavily pretreated. High-risk features were enriched in the cohort. Patients received either venetoclax alone or in combination with other MM drugs over a median of five cycles. Compared to patients not carrying the translocation, patients harboring t(11;14) had a better overall response rate (ORR), progression-free survival (PFS) and overall survival (OS). Toxicities were manageable, but three patients died under treatment.
Venetoclax is the first precision therapy in MM targeting a primary genetic event. Its clinically exploitable pro-apoptotic effects are particularly present in patients harboring the t(11;14) (q13;q32) (IGH::CCND1 fusion), who account for 15-20% of all MM cases.1 The ORR of MM patients with t(11;14) to venetoclax monotherapy was 86%2 and consequently the phase III BELLINI trial tested venetoclax (800 mg/day)/bortezomib/ dexamethasone versus placebo/bortezomib/dexamethasone in a pretreated population. It found an improved ORR (84 vs. 70%) and PFS (22.4 vs. 11.5 months) for the venetoclax combination.3 Other combination partners tested in clinical trials are pomalidomide,4 carfilzomib,5 selinexor,6 and daratumumab.7 We evaluated 38 MM patients who were treated with venetoclax-based therapy at our institution from November 2017 until June 2022. Patients with del(17p) or TP53 mutation, t(4;14), t(14;16), t(14;20), and amp(1q) were considered high-risk. Revised International Staging System (R-ISS) stage was assessed at initiation of venetoclax treatment. Adverse events were determined according to the Common Terminology Criteria for Adverse Events version 5.0. ORR, OS and PFS were assessed according to the current criteria of the International Myeloma Working Group. t(11;14) status was defined via fluorescence in situ hybridization. The date of data censorship was January 2, 2023. The Ethics Committee of the Medical Faculty of Würzburg waived informed consent (waiver # 20220315 02). For 36/38 patients (95%), fluorescence in situ hybridization analysis was available at therapy initiation. Seventeen patients (47.2%) had high-risk cytogenetics, comprising nine with t(11;14) (41% of all patients positive for this translocation) and eight without t(11;14) (57% of all those without this translocation). Nineteen patients (53%) were in R-ISS stage 3 and were well-balanced with 55% harboring t(11;14). Our cohort was heavily pretreated with a median of seven (range, 2-13)
prior lines of therapy. Six patients suffered from extramedullary disease (EMD) and two from plasma cell leukemia (PCL) (Table 1). Thirty-five patients (92%) had received at least one autograft and three patients (8%) had undergone allogeneic stem cell transplantation before initiation of venetoclax. All patients were refractory to proteasome inhibitors and immunomodulatory drugs, 36/38 patients (95%) were triple-refractory, and 28/38 patients (74%) were penta-refractory prior to starting venetoclax. Three patients (8%) had been pretreated with T-cell redirecting therapies (Online Supplementary Table S1). The median follow-up was 16.7 (range, 3.1-56.4) months. Patients received nine different venetoclax combinations (Online Supplementary Table S2) and doses varied from 100 to 1,200 mg/day. The most prevalent dose in our cohort was 800 mg/day, which was given to 18 patients (47%). Two (5%) patients received 1,200 mg daily for five and two cycles without dose reductions or interruptions being necessary. We did not find any usage of strong CYP3A4 inhibitors in the co-medication history. Venetoclax dosing was higher for patients with t(11;14) at an average of 645.5 mg/day (median 800 mg/day) vs. 507.1 mg/day (600 mg/day) for those without t(11;14). The average duration of therapy was 7.1 months, with a median of 5.1 months.
All patients were evaluable for adverse events. Toxicity-relat-
Haematologica | 109 March 2024 979 LETTER TO THE EDITOR
Demographics N of patients 38 Male/female, N 25/13 Age in years, mean (range) 62 (37-82) ECOG score, years, mean (range) 1.2 (0-3) Extramedullary disease, N 6 Plasma cell leukemia, N 2 Treatment line, median (range) 7.3 (2-13) Cytogenetics N of patients 36 t(11;14), N (%) 22 (61.1) High risk, N (%) 17 (47.2) del17p/TP53-mutated, N (%) 10 (27.8) amp(1q),N (%) 8 (22.2) t(4;14), N (%) 3 (8.3) t(14;16), N (%) 2 (5.6) t(14;20), N 0
ECOG: Eastern Cooperative Oncology
Table 1. Patients’ characteristics.
Group performance scale status.
ed discontinuation of therapy occurred in 5%. We observed three cases (8%) of tumor lysis syndrome during the first cycle of a venetoclax-containing regimen and in all three cases the treatment consisted of venetoclax in combination with daratumumab/carfilzomib/dexamethasone. There were no other predictors, pointing towards treatment intensity as an underlying cause. Of the four cases of transient kidney injury, three were associated with tumor lysis.
No difference in the treatment-associated fatality rate was observed between patients with or without t(11;14) (P=0.79). Importantly, none of the three patients (8%) who developed sepsis – which was fatal in two of them - had been on antibiotic prophylaxis at the time of infection and all of them had neutrophil counts above 1.0 x10⁹/L. In addition, a third patient died unexpectedly and for unknown reasons outside of our institution, resulting in a total of three patients (8%) who died under a venetoclax-containing regimen. Last response assessment showed a very good partial response (VGPR) in all three patients. Generally, the rates of hematologic adverse events grade ≥3 and the treatment-associated mortality rate with 5.3% versus 4.0% infection-related deaths in our cohort are comparable to those of the BELLINI trial. However, while the BELLINI trial found an increased risk of death in patients without t(11;14) and raised significant safety concerns, all severe infectious complications in our study occurred in t(11;14)-positive patients independently of therapy duration. These results advocate for antibiotic prophylaxis and close monitoring of markers of infection in patients receiving venetoclax.
The ORR reached 53% in our cohort (n=20: ORR 59% vs 50% in patients with and without t(11;14), respectively). Remissions were generally deep with nine patients (24%) achieving partial remission, seven patients (18%) experiencing VGPR and four patients (11%) reaching complete remission. Moreover, the disease remained stable for 3 months or longer in seven patients (18%), cumulating in
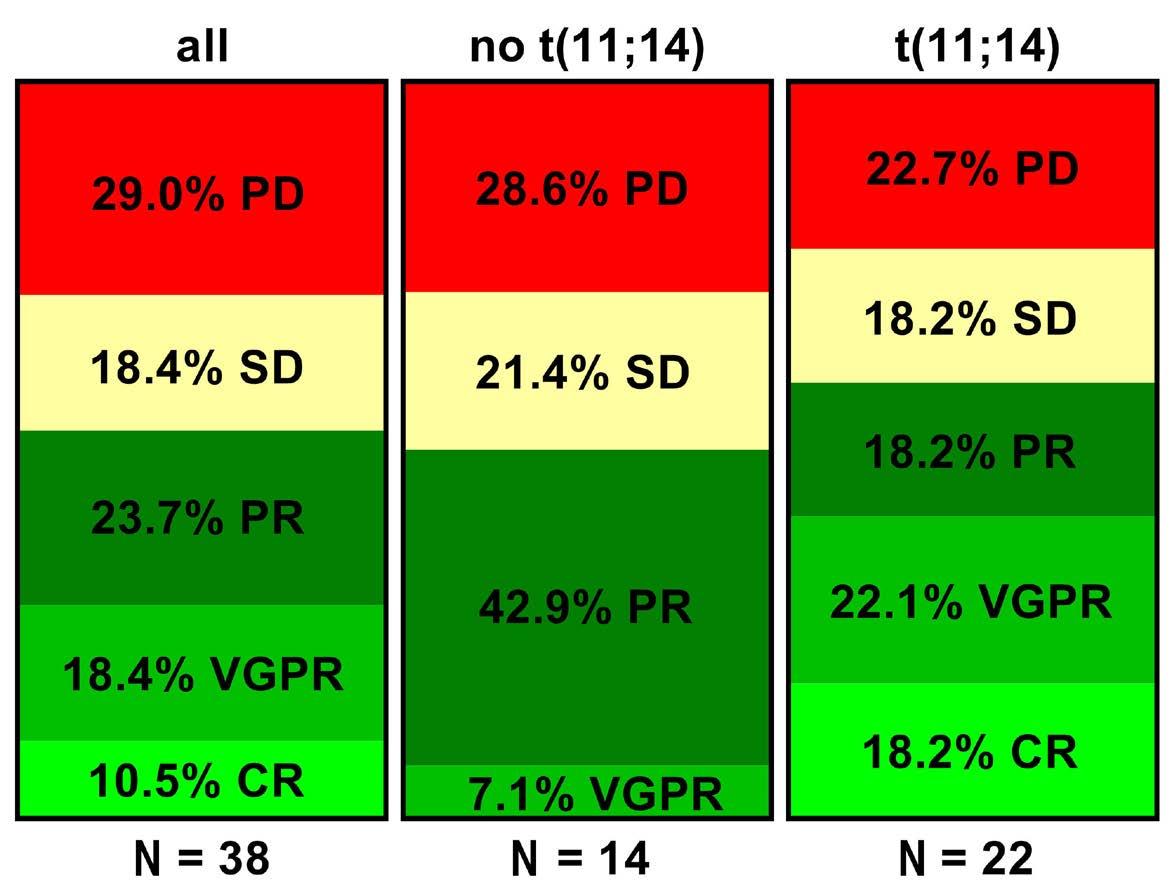
a clinical benefit rate of 71% (Figure 1). Notably, EMD resolved fully in one patient and stabilized in another. Both patients suffering from PCL, one of them with and one without t(11;14), progressed under therapy.
The median PFS for all patients who received venetoclax in their treatment regimens was 5.1 months and was significantly longer in patients harboring the t(11;14) (11.2 vs 4.4 months; P=0.095) (Figure 2). The median OS was 12.7 months for all patients and was not reached in the subgroup with t(11;14) versus 12.8 months in patients without this translocation (P=0.64). In three patients venetoclax therapy was consolidated with an autograft (after 15.1 months in partial remission), one patient received an allograft (after 5.1 months in stringent complete response), and one patient received BCMA-directed chimeric antigen receptor T-cell therapy 12.4 months after stopping venetoclax therapy and was in ongoing partial response at data censorship. At relapse 9 months later, this patient achieved partial response on re-starting venetoclax. Notably, 17 out of the 26 patients (65%) who eventually suffered from progression upon venetoclax-containing therapy were fit for subsequent therapy and eight of them (47%) responded to the salvage regimen.
Patients with high-risk cytogenetics had a lower ORR than patients with standard-risk disease (41 vs . 65%; P =0.38) and significantly shorter median PFS (3.9 vs . 18.1 months; P= 0.025), while median OS did not differ significantly (not reached vs . 12.8 months; P =0.19). Of note, all non-responders had R-ISS stage 3 disease at the time of starting venetoclax treatment. Patients with more than six prior lines of therapy had a lower ORR (36.4%), shorter median OS (207 days vs . not reached; P =0.013) and shorter median PFS (2.8 vs . 17.7; P =0.015). VGPR or better was associated with better PFS (17.9 vs . 8.4 months; P =0.03) and OS (not reached vs . 11.9 months; P =0.1). Venetoclax doses ≥400 mg/day correlated with
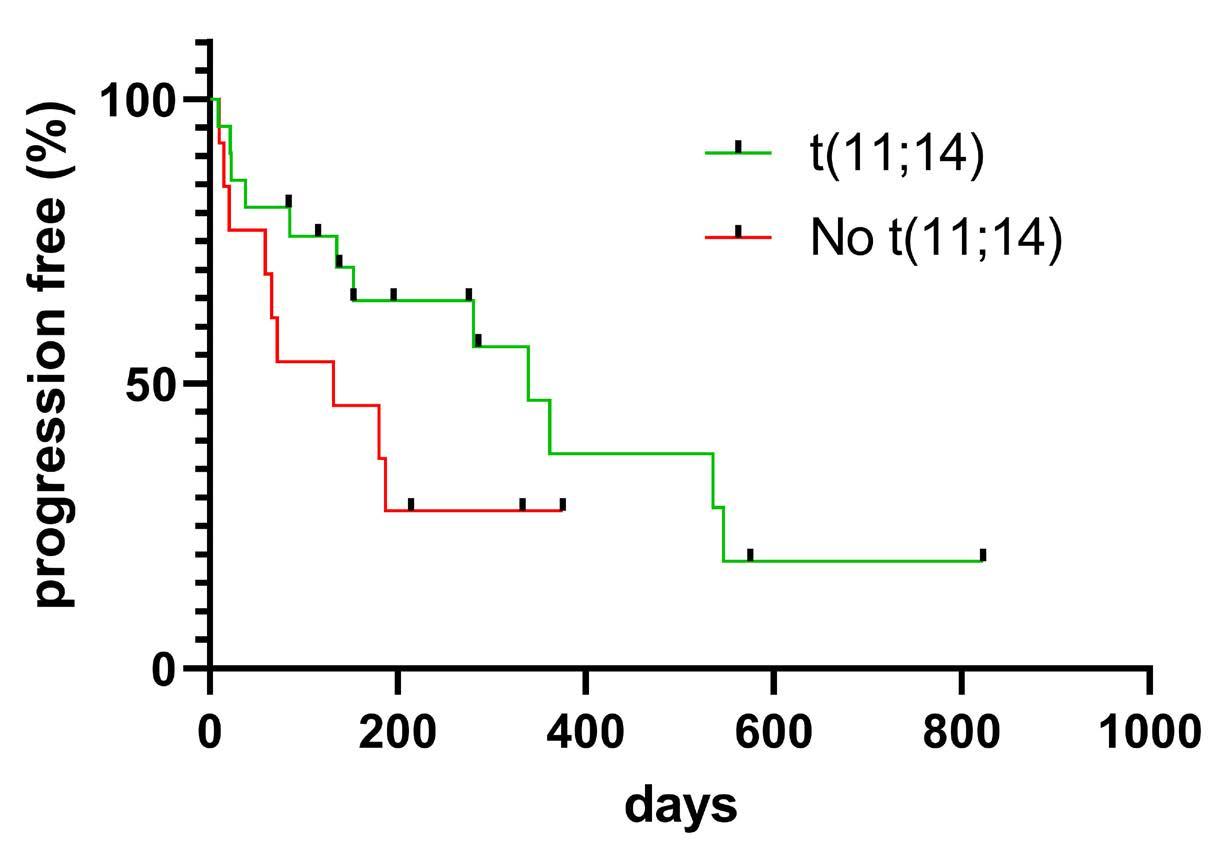
Haematologica | 109 March 2024 980 LETTER TO THE EDITOR
Figure 1. Responses and depth of response under treatment with a venetoclax-containing regimen. Stratification by International Myeloma Working Group criteria. PD: progressive disease; SD: stable disease; PR: partial remission; VGPR: very good partial remission; CR: complete remission.
Figure 2. Progression-free survival of patients treated with a venetoclax-containing regimen, stratified by the presence or absence of t(11;14). Statistical significance: P=0.095. Number of patients at risk: 22 for patients with t(11;14) and 14 for those without t(11;14).
better median PFS (9.3 vs . 2.4 months; P =0.03) at comparable patient distribution (58% t(11;14)-positive patients and 61% t(11;14)-negative patients over 400 mg/ day) but no such relationship could be determined for median OS (17.7 vs . 4.8 months; P =0.22) or ORR (57 vs 50%; P =0.42). Notably, patients with EMD or PCL had an inferior median OS (1.9 vs . 9.3 months; P =0.01) and PFS (3.1 vs . 17.7 months; P =0.01), independently of t(11;14) status. Overall, venetoclax-containing regimens were not able to overcome the negative prognostic impact of high-risk cytogenetics, EMD and PCL, independently of t(11;14) status. With a median PFS of 4.4 and a median OS of 12.8 months, our data are in line with those from other real-world studies that demonstrated lower efficacy of venetoclax in t(11;14)-negative patients, 2,8 and increased PFS, OS and ORR in patients with t(11;14)-positive disease. 9,10 This highlights the importance of t(11;14) for predicting response to venetoclax-containing regimens. An overview of available trials and analyses of venetoclax-containing regimens can be found in Online Supplementary Table S3
In summary, our real-world observational study confirms substantial clinical activity of venetoclax, particularly in t(11;14)-positive disease. Thus, this targeted therapy approach provides an additional and promising treatment option for heavily pretreated MM patients.
Authors
Maximilian J. Steinhardt,1 Marietta Truger,2 Max Bittrich,1 Xiang Zhou,1 Julia Noderer,1 Christine Riedhammer,1 Xianghui Xiao,1 Sophia Gawlas,1 Philipp Weis,1 Florian Eisele,1 Claudia Haferlach,2 Julia Mersi,1 Johannes Waldschmidt,1 Hermann Einsele,1 Leo Rasche1,3 and K. Martin Kortüm1
References
1. Avet-Loiseau H, Li JY, Facon T, et al. High incidence of translocations t(11;14)(q13;q32) and t(4;14)(p16;q32) in patients with plasma cell malignancies. Cancer Res. 1998;58(24):5640-5645.
2. Kumar S, Kaufman JL, Gasparetto C, et al. Efficacy of venetoclax as targeted therapy for relapsed/refractory t(11;14) multiple myeloma. Blood. 2017;130(22):2401-2409.
3. Kumar SK, Harrison SJ, Cavo M, et al. Venetoclax or placebo in combination with bortezomib and dexamethasone in patients with relapsed or refractory multiple myeloma (BELLINI): a randomised, double-blind, multicentre, phase 3 trial. Lancet Oncol. 2020;21(12):1630-1642.
4 Gasparetto C, Bowles KM, Abdallah AO, et al. A phase II study of venetoclax in ccmbination with pomalidomide and dexamethasone in relapsed/refractory multiple myeloma. Clin Lymphoma Myeloma Leuk. 2021;21(11):775-784.
5. Costa LJ, Davies FE, Monohan GP, et al. Phase 2 study of venetoclax plus carfilzomib and dexamethasone in patients with relapsed/refractory multiple myeloma. Blood Adv. 2021;5(19):3748-3759.
1Medizinische Klinik und Poliklinik II, Universitätsklinikum Würzburg, Würzburg; 2MLL Munich Leukemia Laboratory, Munich and 3Mildred Scheel Early Career Center, Universitätsklinikum Würzburg, Würzburg, Germany
Correspondence:
M. KORTÜM - kortuem_m@ukw.de
https://doi.org/10.3324/haematol.2023.283472
Received: May 7, 2023.
Accepted: September 25, 2023.
Early view: October 5, 2023.
©2024 Ferrata Storti Foundation
Published under a CC BY-NC license
Disclosures
No conflicts of interest to disclose.
Contributions
MJS collected and contributed data, designed and performed the analysis and wrote the paper. MT contributed data and conceived the analysis. MB, XZ, JN, FE, and CH contributed data. JM and HE conceived the analysis. JW conceived the analysis and wrote the paper. LR conceived and designed the analysis. KMK conceived and designed the analysis and wrote the paper.
Acknowledgments
LR and KMK are supported by MSNZ, KMK is supported by the Stifterverband.
Data-sharing statement
All data, if not given in this article, are openly available on request.
6. Nguyen N, Chaudhry S, Totiger TM, et al. Combination venetoclax and selinexor effective in relapsed refractory multiple myeloma with translocation t(11;14). NPJ Precis Oncol. 2022;6(1):73.
7 Bahlis NJ, Baz R, Harrison SJ, et al. Phase I study of venetoclax plus daratumumab and dexamethasone, with or without bortezomib, in patients with relapsed or refractory multiple myeloma with and without t(11;14). J Clin Oncol. 2021;39(32):3602-3612.
8. Jelinek T, Popkova T, Duras J, et al. Venetoclax plus bortezomib and dexamethasone in heavily pretreated end-stage myeloma patients without t(11;14): a real-world cohort. Hematol Oncol. 2020;38(3):412-414.
9 Szita VR, Mikala G, Kozma A, et al. Targeted venetoclax therapy in t(11;14) multiple myeloma: real world data from seven Hungarian centers. Pathol Oncol Res. 2022;28:1610276.
10 Basali D, Chakraborty R, Rybicki L, et al. Real-world data on safety and efficacy of venetoclax-based regimens in relapsed/ refractory t(11;14) multiple myeloma. Br J Haematol. 2020;189(6):1136-1140.
Haematologica | 109 March 2024 981 LETTER TO THE EDITOR
Brentuximab vedotin with chemotherapy in adolescents and young adults with stage III or IV classical Hodgkin lymphoma in ECHELON-1
Doxorubicin, bleomycin, vinblastine, and dacarbazine (ABVD) have been used as front-line therapy for classical Hodgkin lymphoma (cHL) for decades. However, current literature suggests a significant minority of patients with stage III/ IV cHL will relapse, with most relapses within 18 months of treatment initiation. The global, phase III ECHELON-1 trial compared brentuximab vedotin (BV), a CD30-directed antibody-drug conjugate, in combination with doxorubicin, vinblastine, and dacarbazine (A+AVD) versus ABVD.1 cHL is most commonly diagnosed in adolescents and young adults (AYA),2,3 defined by the National Cancer Institute (NCI) and multiple international oncology groups as 15-39 years of age (AYAO August Report; https://www.cancer.gov). Relapsed or refractory lymphoma and/or long-term sequelae of treatment (e.g., residual effects of bleomycin pneumonitis, infertility, and second malignancies resulting from treatment) have profound negative impacts. Therefore, an AYA subgroup analysis of ECHELON-1 was conducted. Consistent with the intent-to-treat (ITT) population,1 AYA patients exhibited survival benefit with A+AVD versus ABVD with no new safety signals, including low rates of second malignancies and no apparent effect on fertility. These data underscore clinical benefit of A+AVD for AYA patients aged 18-39 years.
Of 1,334 patients with newly diagnosed stage III or IV cHL enrolled in ECHELON-1, median age was 36 years (range 18-83). In the overall population, A+AVD demonstrated a 6-year progression-free survival (PFS) benefit versus ABVD (Hazard Ratio [HR] 0.68; 95% Confidence Interval [CI]: 0.53-0.86, P=0.0003) independent of disease stage, International Prognostic Score baseline risk, or interim positron emission tomography scan after cycle 2 (PET2) status.1 Significant overall survival (OS) benefit was shown with 6-year estimates of 93.9% versus 89.4% (HR 0.59; 95% CI: 0.40-0.88; P=0.009) with A+AVD versus ABVD. A+AVD also demonstrated favorable long-term safety with low rates of second malignancies. Although not formally assessed, there was no apparent impact on fertility through assessment of pregnancies.1
ECHELON-1 trial design and methodology have been previously reported.1 To examine differences in AYA across age groups, and because eligibility was limited to ≥18 years, subgroups of patients aged 18-39 and 18-29 years were included. Adverse event grading and statistical analysis have been previously reported.4 PFS (time from randomization to disease progression or death due to any cause) per investigator was a prespecified, exploratory endpoint in
the ITT population and was assessed at six years. PET-positivity was defined as a Deauville score of 4 or 5. Except for the prespecified OS analysis in the ITT population, P values are nominal and not adjusted for multiplicity. All patients provided written informed consent. The protocol was approved by individual site institutional review boards and ethics committees as previously described1,4 and was in accordance with the Declaration of Helsinki. This study was registered with clinicaltrials.gov identifier: NCT01712490 (EudraCT N 2011-005450-60).
Adolescents and young adult patients (58% of the ITT population) received either A+AVD (N=396) or ABVD (N=375). Baseline demographics and disease characteristics (Table 1) were similar across subgroups, treatment arms within subgroups, and the overall population.1 In the 18-29 years subgroup, 224/244 (92%) of A+AVD patients were PET2–versus 197/224 (88%) ABVD patients; 16/244 (7%) of A+AVD patients were PET2+ versus 14/224 (6%) ABVD patients. Consistent with the ITT population,1 patients aged 18-39 years exhibited a 6-year PFS benefit with A+AVD (86.4%) versus ABVD (79.4%) (HR 0.636; 95% CI: 0.445-0.908; P=0.012) (Figure 1A). Similar outcomes occurred for ages 18-29 years: 6-year PFS was 87.3% with A+AVD and 80.0% with ABVD (HR 0.604; 95% CI: 0.378-0.965; P=0.033). Numerical PFS benefit was observed with A+AVD versus ABVD independent of PET2 status in the 18-39 year subgroup (Figure 1B). Although sample sizes were small, similar outcomes occurred in the 18-29 years subgroup: A+AVD versus ABVD, PET2– (HR 0.505; 95% CI: 0.297-0.859; P=0.012); A+AVD versus ABVD, PET2+ (HR 1.004; 95% CI: 0.306-3.290; P=0.995). Multivariable Cox regression analysis in patients <60 years of age including treatment arm and age (continuous) interaction, and International Prognostic Score category, region, sex, disease stage, extranodal involvement, and body mass index showed no significant interactions between age and treatment effect (P=0.865).
At a median 71.7 months OS follow-up, 6-year survival estimates were 98.2% with A+AVD and 94.9% with ABVD (HR 0.391; 95% CI: 0.161-0.951; P=0.032) in patients aged 18-39 years (Online Supplementary Table S1), comparing favorably with the ITT population. Use of subsequent systemic therapy including chemotherapy, high-dose chemotherapy and transplant, and immunotherapy was numerically lower in the A+AVD versus ABVD arms (Online Supplementary Table S2). Radiation therapy at any time was used in 10% of patients across arms.
Haematologica | 109 March 2024 982 LETTER TO THE EDITOR
aThe geographic region of the Americas was defined as Brazil, Canada, and the United States. bSouth Africa and Russia are included in Europe. cPatients who present with B symptom for at least one visit before the start of study drug administration. dPositivity defined as Deauville 4 or 5. A+AVD: brentuximab vedotin, doxorubicin, vinblastine, and dacarbazine; ABVD: doxorubicin, bleomycin, vinblastine, and dacarbazine; AYA: adolescent and young adult; BMI: body mass index; ECOG: Eastern Cooperative Oncology Group; IPFP: International Prognostic Factors Project;
Similar to the ITT population,1 overall incidence of febrile neutropenia (FN) was greater with A+AVD versus ABVD (16% vs. 5%). Incidence of FN decreased from 17% (57/343 patients) to 9% (5/53 patients) with A+AVD with use of granulocyte colony-stimulating factor (G-CSF) primary prophylaxis, whereas patients treated with ABVD had similar incidence of FN independent of G-CSF primary prophylaxis (5%). As a result, and per prescribing information label, G-CSF is recommended with A+AVD; current guidelines do not distinguish between younger and older patients. Outcomes with G-CSF primary prophylaxis with A+AVD have been previously reported.5
Incidence of all-grade peripheral neuropathy (PN) for patients aged 18-39 years was 64% (255/396 patients) with A+AVD and 40% (149/368 patients) with ABVD. Approximately 13% of PN with A+AVD treatment were grade 3/4 versus 3% with ABVD, similar to the ITT population (11%; 70/662).4 With A+AVD, 89% (227/255) of patients with PN had either complete resolution (78% [198/255]) or improvement (11% [29/255]) at six years (Figure 2); 33 (13%), 15 (6%), 8 (3%),
and one patient(s) (<1%) had ongoing PN of maximum severity grade 1, 2, 3, or 4, respectively. Assessment of ongoing PN with maximum severity of grade 3/4 was confounded in 7/9 patients treated with A+AVD (3 were lost to follow-up, 3 withdrew from the study, and one died before resolution/improvement); one patient receiving ABVD was lost to follow-up. Proactive management of PN is required to manage long-term effects. With ABVD, 90% (134/149) of patients with PN had either complete resolution (86% [128/149]) or improvement (4% [6/149]).
Similar to the ITT population,1 low rates of second malignancies occurred across arms, with fewer observed with A+AVD versus ABVD (Online Supplementary Table S3). As previously reported,1 no apparent impact on pregnancy rates was observed with A+AVD. Pregnancy occurred in 131 female patients (44 received A+AVD; 26 received ABVD) or partners of male patients (31 received A+AVD; 30 received ABVD).
Considering relapse patterns in cHL, long-term PFS benefit with A+AVD versus ABVD suggests that more AYA patients
Haematologica | 109 March 2024 983 LETTER TO THE EDITOR
Characteristics Age 18-29 years Age 18-39 years A+AVD N=244 ABVD N=224 A+AVD N=396 ABVD N=375 Age in years, median (range) 24 (18-29) 24 (18-29) 27 (18-39) 28 (18-39) BMI, median 23.0 23.3 23.1 24.0 Female, N (%) 112 (46) 99 (44) 188 (47) 155 (41) Region, N (%) Americasa 105 (43) 81 (36) 158 (40) 153 (41) Europeb 118 (48) 118 (53) 202 (51) 187 (50) Asia 21 (9) 25 (11) 36 (9) 35 (9) Ann Arbor stage, N (%) Stage III 96 (39) 88 (39) 143 (36) 150 (40) Stage IV 148 (61) 136 (61) 253 (64) 225 (60) IPFP risk factors, N (%) 0-1 62 (25) 62 (28) 113 (29) 111 (30) 2-3 135 (55) 124 (55) 215 (54) 197 (53) 4-7 47 (19) 38 (17) 68 (17) 67 (18) ECOG Score, N (%) 0 146 (60) 135 (60) 240 (61) 223 (59) 1 93 (38) 81 (36) 145 (37) 138 (37) 2 5 (2) 8 (4) 11 (3) 14 (4) Extranodal disease, N (%) ≥1 Extranodal site 147 (60) 139 (62) 250 (63) 236 (63) None 81 (33) 76 (34) 123 (31) 124 (33) Bone marrow involvement, N (%) 48 (20) 48 (21) 78 (20) 78 (21) B symptomsc, N (%) 146 (60) 134 (60) 244 (62) 226 (60) PET status at cycle 2d, N (%) PET2-positive 16 (7) 14 (6) 24 (6) 28 (7) PET2-negative 224 (92) 197 (88) 366 (92) 324 (86) Unknown or indeterminate 4 (2) 13 (6) 6 (2) 23 (6)
Table 1. Patient demographics and disease characteristics in adolescents and young adults.
PET2: positron emission tomography scan conducted after cycle 2.
will remain relapse-free, yet longer follow-up is needed.6,7 OS benefit similar to the ITT population was also observed despite subsequent treatment options and the high survival rate of AYA patients. These data broadly compare with
escalated BEACOPP outcomes, but potentially without additional second malignancy or infertility risk, particularly in patients who are PET2+ and require more BEACOPP cycles.8-10 Beyond ECHELON-1, the only other recent trial
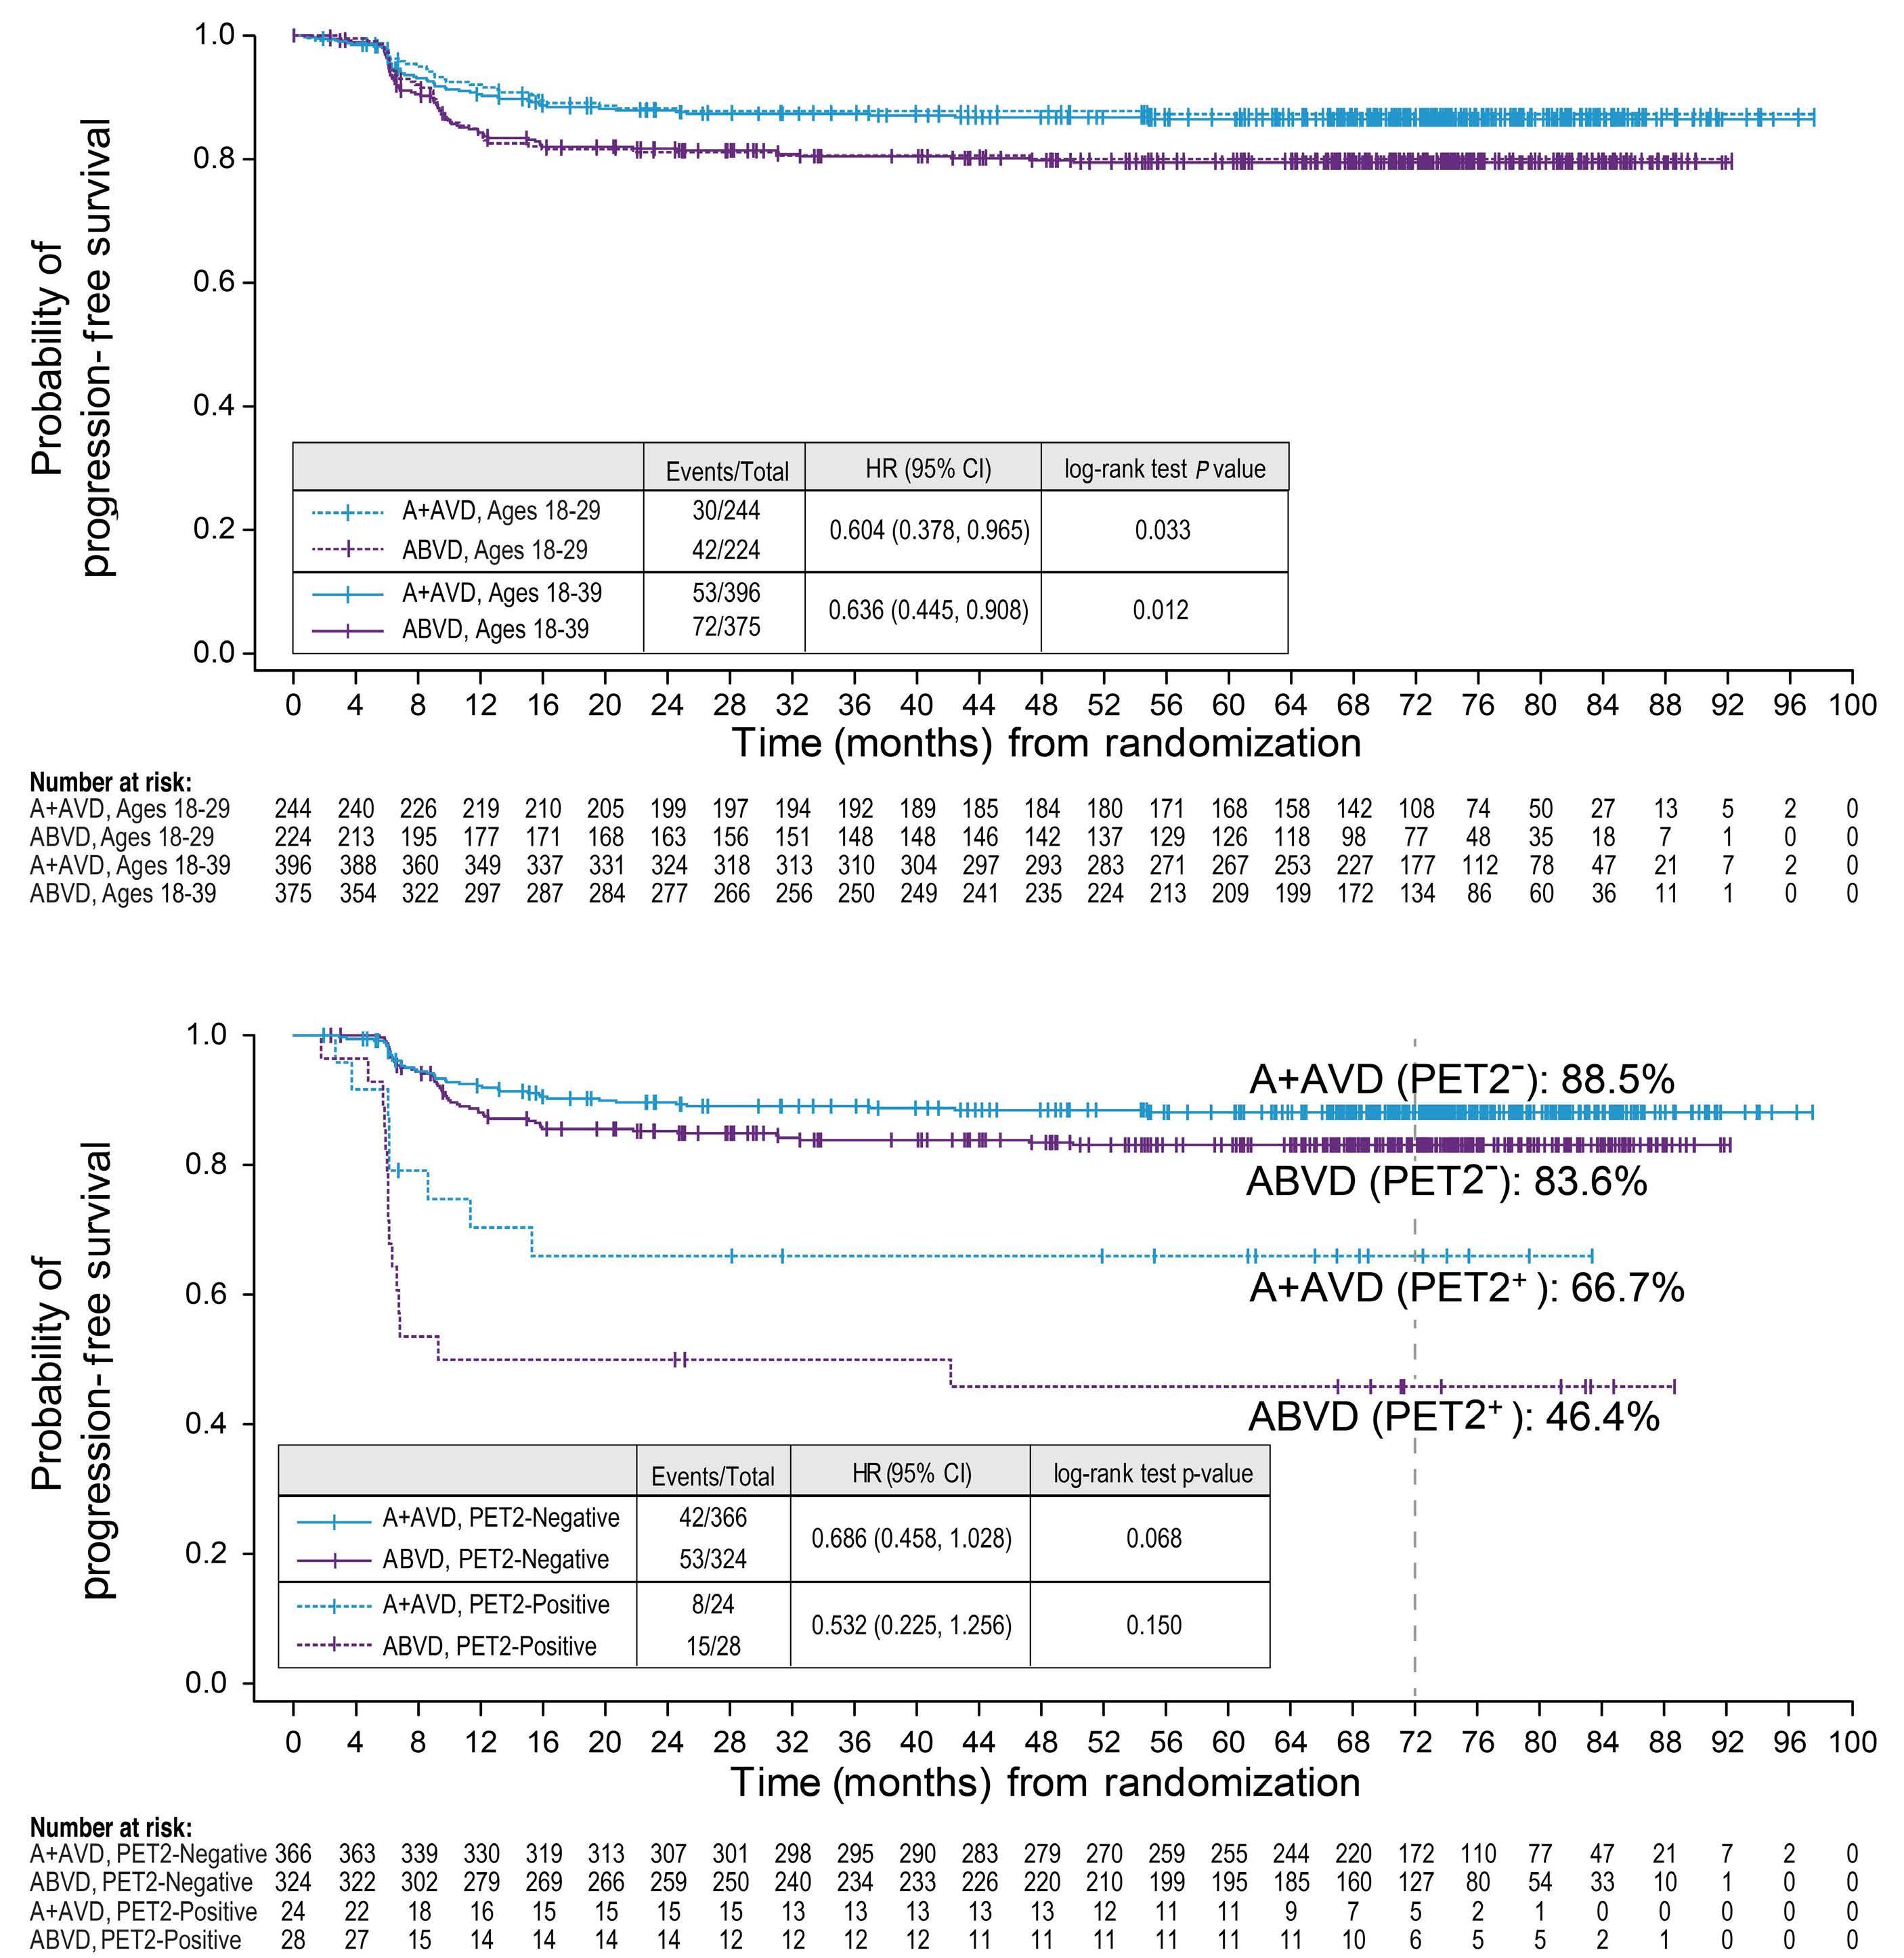
Haematologica | 109 March 2024 984 LETTER TO THE EDITOR
A B
Figure 1. Progression-free survival per investigator in adolescent and young adult patients in ECHELON-1. (A) Progression-free survival (PFS) per investigator by treatment group in patients aged 18-29 years and 18-39 years. (B) PFS per investigator by treatment group and PET2 status in patients aged 18-39 years. Median PFS follow-up was 71.3 months (range 0-97.5) for patients aged 18-29 years and 71.5 months (range 0-97.5) for patients aged 18-39 years. A+AVD: brentuximab vedotin, doxorubicin, vinblastine, and dacarbazine; ABVD: doxorubicin, bleomycin, vinblastine, and dacarbazine; AYA: adolescent and young adult; CI: Confidence Interval; HR: Hazard Ratio; PET2: positron emission tomography scan conducted after cycle 2.
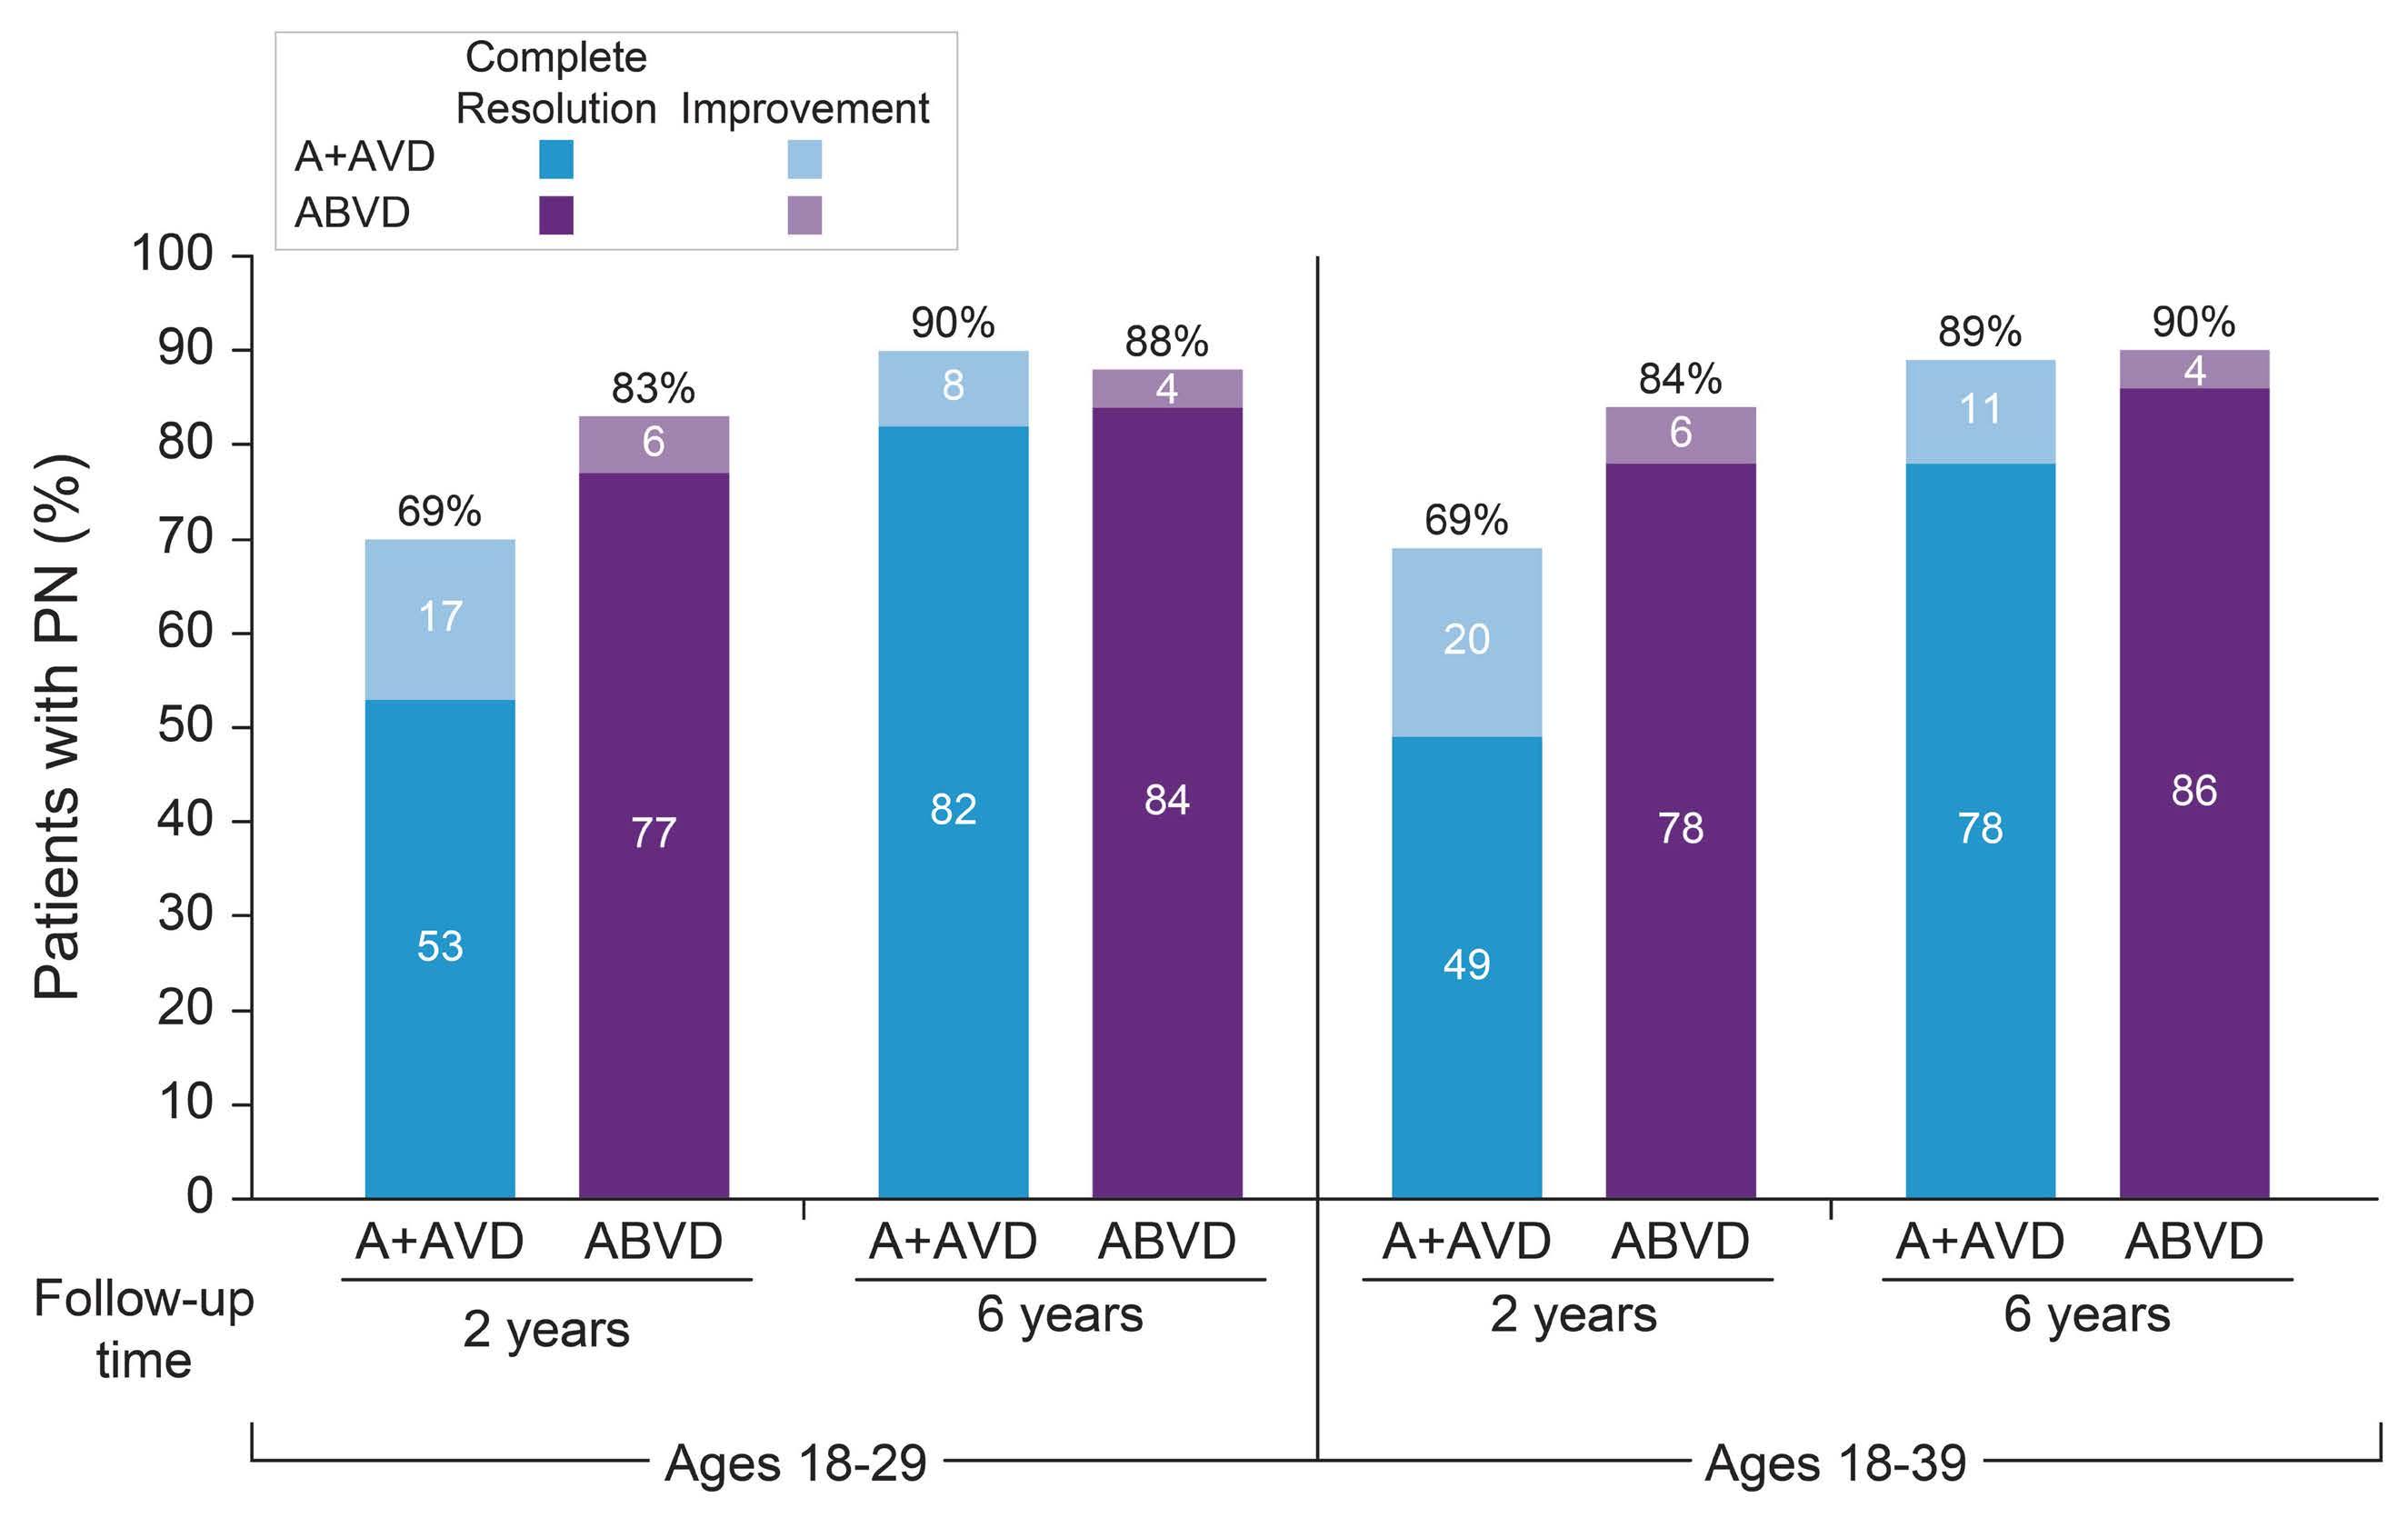
and young
years and 18-39 years. Resolution was defined as event outcome of “resolved” or “resolved with sequelae.” Improvement was defined as “improved by ≥1 grade from worst grade as of the latest assessment.” Percentages are rounded to the nearest integer. A+AVD: brentuximab vedotin, doxorubicin, vinblastine, and dacarbazine; ABVD: doxorubicin, bleomycin, vinblastine, and dacarbazine; CI: Confidence Interval; PN: peripheral neuropathy.
to show OS benefit was the GHSG HD18 trial comparing 4 cycles versus 6 or 8 cycles of escalated BEACOPP.7 With fewer cycles, patients experienced OS benefit, primarily attributed to fewer treatment-related deaths and a lower second malignancy rate.
Other BV-based regimens have been evaluated in pediatric and AYA patients. The HLHR13 trial, which incorporated BV into a standard pediatric chemotherapy regimen, reported a 3-year event-free survival of 97.4% in patients aged ≤18 years with advanced-stage IIB, IIIB, or IV cHL (clinicaltrials.gov identifier: NCT01920932).11 BV-AVEPC (doxorubicin, vincristine, etoposide, prednisone, and cyclophosphamide) versus ABVEPC (doxorubicin, bleomycin, vincristine, etoposide, prednisone, and cyclophosphamide) were evaluated as front-line therapy for patients aged 2-21 years with high-risk (stage IIB with bulk to IVB) disease in a phase III randomized AHOD1331 trial (clinicaltrials.gov identifier: NCT02166463).12 BV-AVEPC was approved by the US Food and Drug Administration for this population based on a 59% risk reduction in events (progression, relapse, second neoplasm, or death) versus ABVE-PC (HR 0.41; 95% CI: 0.25-0.67; P=0.001).12 Moreover, data from ECHELON-1 have supported inclusion of A+AVD as the control arm versus nivolumab + AVD (N+AVD) in the
fully enrolled, AYA inclusive (age ≥12 years) SWOG S1826, a phase III NCI Cooperative Group trial in advanced stage (III/IV) cHL (clinicaltrials.gov identifier: NCT03907488).13 Initial data from S1826 demonstrated strong 3-year PFS with N+AVD but with a short follow-up of 12.1 months; unlike ECHELON-1, OS superiority has not been reached. Furthermore, initial data suggests that N+AVD may perform best for patients aged ≥60 years; this plus data from HOLISTIC suggests the potential benefit of tailoring future treatment approaches based on age.14
ECHELON-1, S1826, and AHOD1331 have demonstrated that bleomycin can be eliminated while maintaining efficacy by adding BV to backbone regimens to reduce chemotherapy-associated AE. Furthermore, SGN35-027 Part B (BV-nivolumab with doxorubicin + dacarbazine) provides strong evidence for additional elimination of vinblastine for front-line advanced-stage cHL, with a high ORR of 95% and CR rate of 89% with median duration of CR of ‘not reached’ at 18.8 months of follow-up. No FN was observed and rates of grade ≥3 PN were 4%. These data support further evaluation in a phase II randomized trial.15 With OS benefit of A+AVD in the AYA subgroup consistent with the overall patient population, this subset analysis
Haematologica | 109 March 2024 985 LETTER TO THE EDITOR
Figure 2. Peripheral neuropathy resolution and improvement at two years and at six years. Percentage of patients with peripheral neuropathy with complete resolution or improvement at two years and at six years are shown for the adolescent
adult (AYA) subgroups 18-29
of ECHELON-1 reinforces clinical benefit of A+AVD versus ABVD for the treatment of AYA patients aged 18-39 with high-risk cHL. Future trials will continue to harmonize management of AYA cHL patients in efforts to minimize late effects without sacrificing long-term efficacy.
Authors
Howland E. Crosswell,1 Ann S. LaCasce,2 Nancy L. Bartlett,3 David J. Straus,4 Kerry J. Savage,5 Pier Luigi Zinzani,6,7 Graham P. Collins,8 Michelle Fanale,9 Keenan Fenton,9 Cassie Dong,10 Harry Miao10 and Andrew P. Grigg11
1Bon Secours Hematology & Oncology, Bon Secours, St. Francis Health System, Greenville, SC, USA; 2Dana-Farber Cancer Institute, Partners Cancer Care, Boston, MA, USA; 3Siteman Cancer Center, Washington University School of Medicine, St Louis, MO, USA; 4Lymphoma Service, Department of Medicine, Memorial Sloan Kettering Cancer Center, New York, NY, USA; 5British Columbia Cancer Agency, Vancouver, British Columbia, Canada; 6IRCCS University Hospital of Bologna, Institute of Hematology “Seràgnoli,” Bologna, Italy; 7Department of Specialized Medicine, Diagnostic and Experimental, University of Bologna, Bologna, Italy; 8Oxford University Hospitals NHS Foundation Trust, Oxford, UK; 9Seagen Inc., Bothell, WA, USA; 10Takeda Development Center Americas Inc. (TDCA), Lexington, MA, USA and 11Department of Clinical Haematology, Austin Hospital, Victoria, Australia
Correspondence:
H.E. CROSSWELL - howland_crosswell@bshsi.org
https://doi.org/10.3324/haematol.2023.283303
Received: May 10, 2023.
Accepted: September 26, 2023.
Early view: October 5, 2023.
©2024 Ferrata Storti Foundation
Published under a CC BY-NC license
Disclosures
HEC served as a consultant for Gilead Sciences, Abbvie, SERVIER, Daiichi Sankyo, and Bristol-Myers Squibb; was an employee of KIYATEC and has equity ownership in KIYATEC, Seagen Inc., and Pfizer. ASL served on advisory boards for Seagen Inc. and Kite Pharma; and served on a speakers bureau for Research to Practice. NLB received research funding from ADC Therapeutics, Autolus, BMS/Celgene, Forty Seven, Gilead/Kite Pharma, Janssen, Merck, Millennium, Pharmacyclics, Roche/Genentech, and Seagen Inc; and served on an advisory board for ADC Therapeutics, Foresight Diagnostics, Kite, Roche/Genentech, and Seagen Inc. KJS served as a consultant for BMS, Seagen Inc., Janssen, and Abbvie; served on a Steering Committee for BeiGene; received research funding from
BMS and institutional research funding from Roche; and served on a Data and Safety Monitoring Committee for Regeneron. PLZ served as a consultant for MSD, EUSA Pharma, and Novartis; served on a speakers bureau for Celltrion, Gilead Sciences, Janssen-Cilag, BMS, Servier, MSD, AstraZeneca, Takeda, Roche, EUSA Pharma, Kyowa Kirin Co., Novartis, Incyte, and Beigene; and served on an advisory board for Secura Bio, Celltrion, Gilead Sciences, Janssen-Cilag, BMS, Servier, Sandoz, MSD, AstraZeneca, Takeda, Roche, EUSA Pharma, Kyowa Kirin Co., Novartis, ADC Therapeutics, Incyte, and Beigene. GPC served on advisory boards for Takeda, Roche, Beigene, ADC Therapeutics, Gilead Sciences, and AstraZeneca; received honoraria from Takeda, Roche, Gilead Sciences, Novartis, BMS, Beigene, ADC Therapeutics, Kyowa Kirin Co., and AstraZeneca; and received research funding from Pfizer, Amgen, Beigene, and BMS. MF and KF are employees of and have equity ownership in Seagen Inc. CD is an employee of Takeda and has equity ownership in Takeda and Seagen Inc. HM is an employee of and has equity ownership in Kite Pharma. DJS and APG have no conflicts of interest to disclose.
Contributions
HEC, ASL, NLB, DJS, KJS, PLZ, GPC, MF, HM and APG participated in data collection. KF and CD accessed and verified the data. HEC, MF and APG interpreted the data and drafted the manuscript. All authors reviewed the manuscript, had access to study data, and accept responsibility for the decision to submit for publication.
Acknowledgments
The authors thank Susan Cottrell, PhD, of Next Medical and Science Writing, LLC, and Amr Y. Eissa, MD, of ICG Medical Inc., who provided medical writing and editorial support with funding from Seagen Inc., in accordance with Good Publication Practice (GPP) guidelines. This study was presented in part at the American Society of Clinical Oncology Virtual Congress; June 4–8, 2021.
Funding
This work was supported by Takeda Development Center Americas Inc. (TDCA), Lexington, MA, USA, and Seagen Inc.
Data-sharing statement
Deidentified patient-level trial data that underlie the results reported in this publication will be made available upon study completion (current est. January 2026) on a case-by-case basis to researchers who provide a methodologically sound proposal. Additional documentation may also be made available. Data availability will begin after approval of the qualified request and end 30 days after receipt of datasets. All requests can be submitted to CTDR@seagen. com and will be reviewed by an internal review committee. Please note that the data sharing policy of this clinical study’s sponsor, Seagen Inc., requires all requests for clinical trial data be reviewed to determine the qualification of the specific request. This policy is available at https://www.seagen.com/healthcare-professionals/ clinical-data-requests and is aligned with BIO’s Principles on Clinical Trial Data Sharing (available at https://www.bio.org/blogs/principlesclinical-trial-data-sharing-reaffirm-commitment).
Haematologica | 109 March 2024 986 LETTER TO THE EDITOR
References
1. Ansell SM, Radford J, Connors JM, et al. Overall survival with brentuximab vedotin in stage III or IV Hodgkin’s lymphoma. N Engl J Med. 2022;387(4):310-320.
2. Aben KK, van Gaal C, van Gils NA, van der Graaf WT, Zielhuis GA. Cancer in adolescents and young adults (15-29 years): a population-based study in the Netherlands 1989-2009. Acta Oncol. 2012;51(7):922-933.
3. Xavier AC, Epperla N, Taub JW, Costa LJ. Excess mortality among 10-year survivors of classical Hodgkin lymphoma in adolescents and young adults. Am J Hematol. 2018;93(2):238-245.
4 Connors JM, Jurczak W, Straus DJ, et al. Brentuximab vedotin with chemotherapy for stage III or IV Hodgkin’s Lymphoma. N Engl J Med. 2018;378(4):331-344. Erratum in: N Engl J Med. 2018;378(9):878.
5. Straus D, Collins G, Walewski J, et al. Primary prophylaxis with G-CSF may improve outcomes in patients with newly diagnosed stage III/IV Hodgkin lymphoma treated with brentuximab vedotin plus chemotherapy. Leuk Lymphoma. 2020;61(12):2931-2938.
6. Hapgood G, Zheng Y, Sehn LH, et al. Evaluation of the risk of relapse in classical Hodgkin lymphoma at event-free survival time points and survival comparison with the general population in British Columbia. J Clin Oncol. 2016;34(21):2493-2500.
7 Radford JA, Eardley A, Woodman C, Crowther D. Follow up policy after treatment for Hodgkin’s disease: too many clinic visits and routine tests? A review of hospital records. BMJ. 1997;314(7077):343-346.
8. Borchmann P, Goergen H, Kobe C, et al. PET-guided treatment in patients with advanced-stage Hodgkin’s lymphoma (HD18): final results of an open-label, international, randomised phase
3 trial by the German Hodgkin Study Group. Lancet. 2017;390(10114):2790-2802.
9 Stephens DM, Li H, Schöder H, et al. Five-year follow-up of SWOG S0816: limitations and values of a PET-adapted approach with stage III/IV Hodgkin lymphoma. Blood. 2019;134(15):1238-1246.
10 Casasnovas O, Racape J, Dechene J, et al. PET-guided strategy improves the safety of BEACOPP-based treatment in advanced Hodgkin lymphoma: prolonged follow-up of the LYSA AHL 2011 phase 3 study [abstract]. Blood. 2020;136(Suppl 1):23-24.
11. Metzger ML, Link MP, Billett AL, et al. Excellent outcome for pediatric patients with high-risk Hodgkin lymphoma treated with brentuximab vedotin and risk-adapted residual node radiation. J Clin Oncol. 2021;39(20):2276-2783.
12. Castellino SM, Pei Q, Parsons SK, et al. Brentuximab vedotin with chemotherapy in pediatric high-risk Hodgkin’s lymphoma. N Engl J Med. 2022;387(18):1649-1660.
13. Herrera AF, LeBlanc M, Castellino SM, et al. Nivolumab(N)-AVD improves progression-free survival compared to brentuximab vedotin(BV)-AVD in advanced stage (AS) classic Hodgkin lymphoma (HL): results of SWOG S1826. Hematol Oncol. 2023;41(S2):33-35.
14 Rodday AM, Parsons SK, Upshaw JN, et al. The Advanced-Stage Hodgkin Lymphoma International Prognostic Index: development and validation of a clinical prediction model from the HoLISTIC Consortium. J Clin Oncol. 2023;41(11):2076-2086.
15. Yasenchak C, Flinn IW, Melear J, et al. P1064: brentuximab vedotin, nivolumab, doxorubicin, and dacarbazine (AN+AD) for advanced-stage classical Hodgkin lymphoma: updated efficacy and safety results from the single-arm phase 2 study. Hemasphere. 2023;7(Suppl):e5881312.
Haematologica | 109 March 2024 987 LETTER TO THE EDITOR
BH3 mimetics in relapsed and refractory adult acute lymphoblastic leukemia: a Campus ALL real-life study
The introduction of pediatric-inspired regimens has improved outcomes remarkably in both B-cell precursor (BCP) acute lymphoblastic leukemia (ALL) and T-ALL, with 5-year overall survival rates approaching 60% in patients <55 years old1 and between 35% and 55% in older patients.2 Nevertheless, disease relapse and chemo-refractoriness (R/R) are still clinical problems, especially in T-ALL, for which very few novel drugs are available, and in BCP-ALL patients who fail to respond to or relapse after chemo-immunotherapy.3
Selective inhibition of BCL-2 with venetoclax and inhibition of BCL-2 and BCL-XL with navitoclax directly releases apoptosis activators from pro-apoptotic proteins, causing permeabilization of the mitochondrial outer membrane, leading to cell death.4 BCL-2 and BCL-XL overexpression has been reported in ALL,5,6 and the pre-clinical and clinical efficacy of BCL-2 family inhibitors (BH3-mimetics) alone7,8 or in combination with targeted agents such as ponatinib9 or inotuzumab ozogamicin10 showed promising results. For these reasons, a compassionate-use program, based on treatment with BH3 mimetics, was started in Italy and was granted by Abbvie (Abbvie, Rome, Italy).
We performed a retrospective multicenter analysis, comprising 28 adult R/R ALL patients treated with venetoclax alone or in association with low-dose navitoclax in the context of the Campus ALL national network. All patients signed consent to participation in the compassionate-use program in agreement with the Helsinki Declaration. According to the national named-used treatment program, R/R ALL patients for whom no other treatment option was available, with bone marrow or extramedullary leukemia, were included, whereas cases with only molecular relapse were not eligible. Combined chemotherapy was allowed.
The venetoclax ramp-up schedule and final dose were at the clinician’s discretion depending on the patient’s concomitant medications and comorbidities, disease burden and previous lines of chemotherapy.
Navitoclax was administered at the recommended 25 mg or 50 mg daily dose, according to body weight (< or >45 kg). Minimal residual disease evaluation was performed by quantitative polymerase chain reaction for IG/TR gene rearrangements or specific fusion transcripts with marker sensitivity up to 10-4 or by flow cytometry. Patients with extramedullary involvement were evaluated by both bone marrow aspirate and total body computed tomography/ positron emission tomography.11 Safety analysis was conducted by grading all toxicities according to National Cancer Institute Common Terminology Criteria for Adverse Events (CTCAE, version 5.0).
Descriptive statistics were carried out; to compare differ-
ences between groups, the χ2 test was used with P values <0.05 deemed statistically significant. Kaplan-Meier and log-rank tests were used to assess survival. For duration of remission, patients who were alive with no disease progression were censored at the last follow-up; likewise, patients alive at the last follow-up were censored for overall survival. The data cut-off was December 1st, 2022. Tests were performed using R (version 4.0, The R Foundation for Statistical Computing 2020).
We collected clinical data from 37 patients with R/R ALL treated at 20 Italian hematology institutions participating in the Campus ALL network from July, 2019 to December, 2022. Nine patients died prior to authorization of nameduse treatmen, while seven started venetoclax and 21 venetoclax-navitoclax (Online Supplementary Figure S1). The median turnaround time for drug supply from application to the named-use program was 19 days (range, 10-42). In the venetoclax-navitoclax cohort, one patient died of progression before completing the first cycle. Within the intention-to-treat population (n=28), six patients (22%) had BCP-ALL and 22 (78%) had T-ALL, as detailed in Table 1, with 75% of patients being <55 years old. Five patients (18%), all with T-ALL, had isolated extramedullary relapse, while 12 patients (43%) had combined bone marrow and extramedullary disease. Patients had undergone a median number of three lines of therapy (range, 1-6) and four of them (14%) had primary refractory disease (all with T-ALL). Allogeneic stem cell transplant had been previously carried out in 11 patients (40%), and most of the BCP-ALL patients had already undergone salvage treatment with blinatumomab and inotuzumab (4 and 5 patients, respectively), with two having also received CD19-directed chimeric antigen receptor T cells. Venetoclax was ramped up from 100 mg to 400 mg daily in 12 patients; three patients started venetoclax 400 mg daily without dose escalation; and the remaining started venetoclax with personalized ramp-up based on the characteristics of the patient and disease and the clinician’s choice. The final daily doses of <400 mg, 400 mg, 600 mg and 800 mg were reached in nine, 15, one and two patients, respectively. Navitoclax was administered at 50 mg and 25 mg daily in 17 patients and four patients, respectively; combination anthracycline- and/or asparaginase- and/or alkaloid-based chemotherapy was utilized in 13 patients (48%), three of seven in the venetoclax cohort and ten of 21 in the venetoclax-navitoclax cohort, respectively (Online Supplementary Table S1). The remaining patients were treated with BH3-mimetics without chemotherapy.
The two cohorts were not significantly different, except for a higher daily dose of venetoclax in the venetoclax mono-
Haematologica | 109 March 2024 988 LETTER TO THE EDITOR
Baseline parameters
Age in years, median (range)
All patients N=28
Patients treated with venetoclaxnavitoclax N=21
Patients treated with venetoclax N=7 P
ALL subtype, N (%)
EM
Salvage
Previous immunotherapy, N (%)
Disease characteristics at the time of starting venetoclax
Platelets x109/L, median (range)
WBC x109/L, median (range)
Distribution of ECOG PS >1, N (%) BM blasts percentage, median (range)
*In the venetoclax single-agent cohort, one patient had multiple lymphoadenopathies, liver and bone localizations, one patient presented with peritoneal localization and multiple lymph nodes. In the venetoclax-navitoclax cohort three patients presented, one each, with bowel, testis and spleen localization. ALL: acute lymphoid leukemia; BCP: B-cell precursor; T-ALL: T-cell acute lymphoid leukemia; ETP-ALL: early T-cell precursor acute lymphoid leukemia; EM: extramedullary; SCT: stem cell transplant; CAR: chimeric antigen receptor; WBC: white blood cells; ECOG PS: Eastern Cooperative Oncology Group Performance Status; BM: bone marrow.
therapy cohort (P=0.001).
The median follow-up was 8.3 months (range, 1.9-23.6); patients received a minimum of one cycle and a maximum of 22. The overall response rate at day 29 was 48%, with a complete response (CR) rate of 33% (9/27 patients), which was higher in the venetoclax-navitoclax cohort than in the venetoclax single-agent cohort (40% vs. 14%, P=0.214). It is noteworthy that five of eight CR patients tested (62%) achieved a state of measurable residual disease negativity (1 CR patient had extramedullary disease only and measurable residual disease monitoring could not therefore be done).
Patients who received associated chemotherapy did not show superior response rates: five of 13 patients achieved a CR (P=0.586). Fourteen patients (52%) did not respond. At the last follow-up, among the nine patients who achieved a CR at the end of cycle 1, three were allografted: one died of acute graft-versus-host disease and two are in continuous CR 14 and 16 months after their transplants. Three patients are on ongoing treatment and in continuous CR after 5, 19 and 20 months; finally, three patients with early T-cell precursor ALL, T-ALL and KMT2A-rearranged BCP-ALL relapsed while on therapy after 2, 3 and 8 months, respectively (Table 2).
Haematologica | 109 March 2024 989 LETTER TO THE EDITOR
Distribution <55 years, N (%) >55 years, N (%) 31 (20-79) 21 (75) 7 (25) 31 (21-79) 15 (71) 6 (29 31 (20-65) 6 (85) 1 (15) 0.449 Male sex, N (%) 21 (75) 16 (76) 5 (71) 0.801
BCP-ALL Philadelphia-chromosome-positive KMT2A fusion T-ALL ETP-ALL 6 (22) 1 (3) 1 (3) 22 (78) 8 (28) 5 (24) 1 (4) 1 (4) 16 (76) 5 (24) 1 (15) 0 0 6 (85) 3 (43) 0.576
leukemia, N (%) Lymph nodes Breast Mediastinum Other combinations* Isolated EM leukemia 17 (61) 9 (32) 8 (28) 5 (18)
(18)
(18) 11 (52) 5 (24) 1 (4) 1 (4) 3 (15) 5 (24) 6 (86) 3 (43) 1 (15) 1 (15) 2 (29) 0 0.344
5
5
regimen, N
1st salvage 2nd salvage ≥3rd salvage Primary refractory Previous treatment lines, median (range) 4 (14) 4 (14) 20 (72) 4 (14) 3 (1-6) 2 (9) 3 (15) 16 (76) 4 (19) 3 (1-6) 2 (29) 1
4
0
(1-6) 0.534
(%)
(15)
(58)
3
Allogeneic SCT Blinatumomab Inotuzumab CD19-CAR T cells 11 (39) 4/6 (66) 5/6 (83) 2/6 (33) 8 (38) 3/5 (60) 4/5 (80) 2/5 (40) 4
1 (15) 1 (15) 0 0.165
(57)
130 (2-382) 3.51 (0.9-48) 8 (28) 15 (0-90) 130 (2-382) 3.51 (0.9-48) 7 (33) 21.5 (0-90) 125 (25-240) 3.51 (2.1-9.6) 1 (15) 10 (5-40) 0.051 0.058 0.334 0.827
Table 1. Baseline patients’ features.
With the caveat of the small sample size, achievement of CR was documented regardless of previous lines of treatment, although no efficacy was observed among patients who had primary refractory disease before enrollment. As detailed in the Online Supplementary Table S1, responses were reported in most ALL subgroups enrolled, including three patients with BCP-ALL and six patients with T-ALL (including 2 with early T-cell precursor ALL), although without significant differences among the groups, given the small numbers of patients. Among five patients with isolated extramedullary leukemia, two were in continuous CR at their last follow up. The median overall survival of 5.05 months (95% confidence interval: 2.39-not reached) with 6- and 12-month overall survivals of 35% and 26.6%, respectively (Figure 1A, B). CR patients had a significantly better survival compared to non-CR cases, with a median overall survival not reached versus 2.3 months (P=0.004) and a 1-year overall survival of 62.5% versus 11%. The median duration of response of the whole cohort was 4.46 months (95% confidence interval: 2.92-not reached), with a significantly better median duration of response for patients achieving a CR compared to those in partial response at day 29: 7.6 months versus 2.62 (P=0.001) (Figure 1C, D).
No early toxic fatal events or unexpected and dose-limiting toxicities were observed: cytopenias were the most common side effects, with grade ≥3 thrombocytopenia documented in six patients (21%), especially in the venetoclax-navitoclax cohort (n=5). Patients in the venetoclax cohort displayed modest cytopenia as the only adverse event, whereas three patients in the venetoclax-navitoclax cohort (11%) developed a bloodstream infection (2/3 of patients treated with
combined chemotherapy). Adverse events were recorded in seven of 11 patients treated with a chemotherapy-free venetoclax-navitoclax regimen. These adverse events, mainly cytopenia, included the case of one patient who experienced pneumonia in the context of progressive disease and one patient with transient increases of transaminase levels. Likewise, chemotherapy-attributable cytopenia was reported in five patients, and one patient had an increase in pancreatic enzymes, probably linked to asparaginase therapy. All adverse events were recorded within the first cycle of treatment and were managed without withdrawal of the study drug (Online Supplementary Table S2).
ALL recurrence radically changes patients’ life expectations, especially those for whom no new therapeutic compounds are available. For the latter, CR rates decrease to 20% and 10% for subsequent salvage therapies after the first, with a 5-year overall survival close to 10%.12 Promising results were found in 47 patients (including 12 children) with R/R ALL treated with the venetoclax-navitoclax combination and chemotherapy. The composite CR rate was 60%, the median duration of response and overall survival were 4.2 months and 7.8 months, respectively.13
Here, we report the outcome of adult patients with R/R ALL of B- and T-lineage treated with one or two BH3-mimetics. Our population was heavily pre-treated, with a significant fraction of patients who had already received anti-CD19 or anti-CD22 targeted therapy. The 1-year overall survival in this cohort was 26.6%, a result better than the reported 1-year overall survival with conventional chemotherapy, which is around 4-10%.14 It is worth noting that patients achieving a CR at the end of the first cycle displayed an improved
*Among responders, one patient with isolated extramedullary leukemia achieved a complete response as assessed by positron emission tomography: measurable residual disease could not be assessed in the subject. Pts: patients; Tx: treatment; MRD: measurable residual disease; alloSCT: allogeneic stem cell transplant; CR: complete response.
Haematologica | 109 March 2024 990 LETTER TO THE EDITOR
Parameter Venetoclax Venetoclax-Navitoclax All patients Pts in the Tx group, N 7 20 27 Efficacy parameters Overall response, N (%) 2 (28) 11 (55) 13 (48) Complete response, N (%) 1 (14) 8 (40) 9 (33) Partial response, N (%) 1 (14) 3 (15) 4 (15) No response, N (%) 5 (71) 9 (45) 14 (52) MRD negativity*, N (%) 0/1 5/7 (71) 5/8 (62) Subsequent alloSCT among CR pts, N (%) 1/1 (100) 2/8 (25) 3/9 (33) Ongoing treatment among CR pts, N (%) 0/1 3/8 (37) 3/9 (33) Duration of Tx in months, median (range) 1.4 (0.9-2.2) 1.5 (1-20) 1.5 (0.9-20)
Table 2. Outcome measures from therapy initiation.
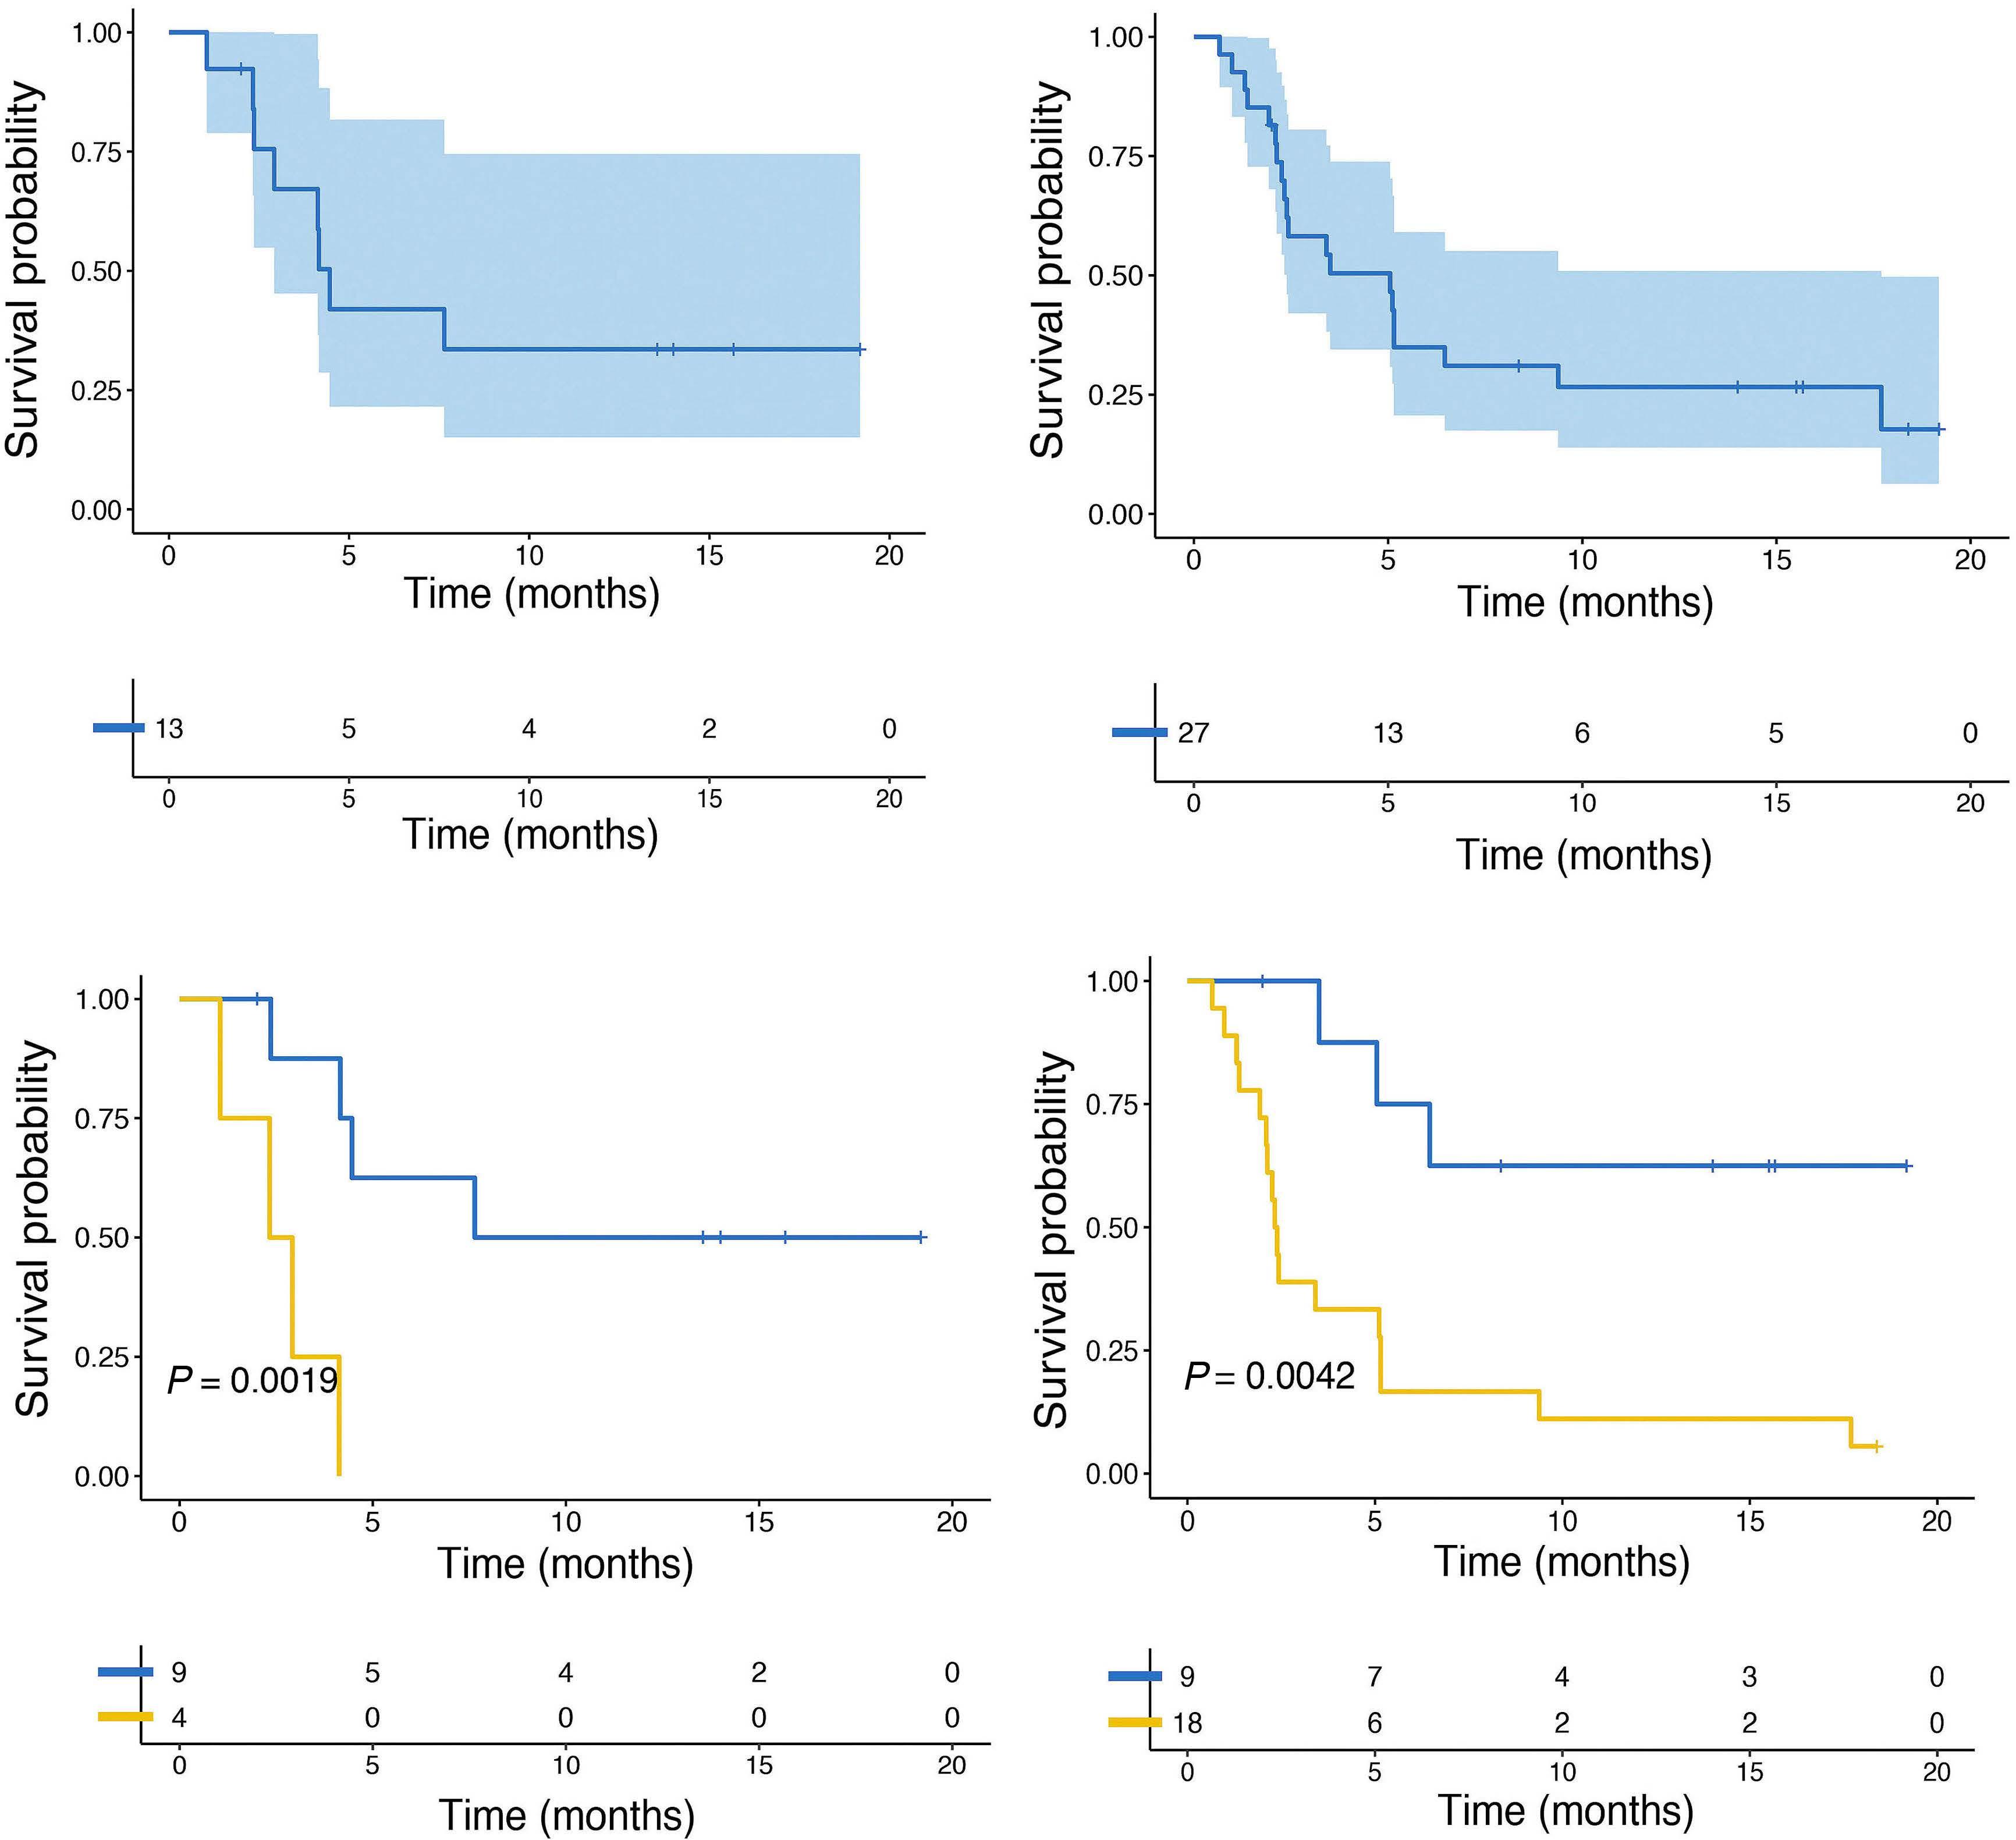
1-year overall survival of 62%, whereas for those achieving only a partial or no response, survival remained dismal. Additional chemotherapy did not improve outcomes. Although not statistically significant, we observed a higher number of CR in the venetoclax-navitoclax cohort, supporting the dual inhibition of BCL-2 and BCL-XL as a synergistic strategy to prevent mechanisms of escape from venetoclax.15 These data are in constrast to those recently reported in a retrospective study of 17 R/R ALL patients, with one out of 13 patients treated with a combination of a BH3 mimetic and chemotherapy achieving CR, although five of them had already been exposed to venetoclax and the therapy schedule differed from ours.16 Moreover, the day 29 (end of first cycle) response represented a crucial timepoint in our survey: indeed, CR - as well as measurable residual disease negativity - was achieved within the first cycle. We registered responses regardless of the prior heavy treatment load.
Toxicity was manageable in our cohort, and occurred during the first cycle, in line with previous reports.13
The limitations of our study are its retrospective nature, the fact that no drug profiling analyses were carried out on primary samples, and the relatively small number of patients; this hampered subgroup analyses, which haven not been reported in any of the most recent clinical reports. At present, venetoclax and navitoclax are being investigated in association with either chemotherapy and monoclonal antibodies in both R/R (NCT05268003, NCT05016947) and frontline settings (NCT05386576, NCT03319901), but the clinical trials are still ongoing and the results have yet to be published. Hopefully, an earlier use of these agents might represent a strategy to improve CR rates and subsequently as a bridge to allogeneic stem cell transplantation for patients predicted to have poor response to standard salvage therapy, such as B-ALL patients relapsing after im-
Haematologica | 109 March 2024 991 LETTER TO THE EDITOR
A B C D
Figure 1. Survival in the whole cohort. (A) Duration of response. (B) Overall survival. Comparison between patients who had obtained complete response and those not in complete response at the day 29 evaluation after starting therapy. (C) Duration of response. (D) Overall survival.
munotherapy or R/R T-ALL patients, especially those with early T-cell precursor disease, for whom improvements are also needed in the frontline setting. From this standpoint, ex vivo drug sensitivity profiling in patients affected by ALL subtypes with typically poor prognosis is currently being investigated to predict response to a set of investigational compounds (NCT04582487). Furthermore, BH3 profiling might be a useful laboratory tool to establish anti-apoptotic protein dependency in individual patients in order to address BH3-mimetic therapy better. In conclusion, BH3 mimetics appear as a promising, orally available and relatively safe new therapeutic strategy in ALL, useful in several disease settings and capable of rescuing patients otherwise considered incurable.
Authors
Francesco Malfona,1 Ilaria Tanasi,2 Matteo Piccini,3 Cristina Papayannidis,4 Vincenzo Federico,5 Valentina Mancini,6 Elisa Roncoroni,7 Elisabetta Todisco,8 Simona Bianchi,1 Giulia Ciotti,9 Patrizia Chiusolo,10 Massimo Gentile,11 Valentina Gianfelici,12 Fabio Giglio,13 Michele Malagola,14 Antonino Mulé,15 Francesco Saraceni,16 Calogero Vetro,17 Francesco Zallio,18 Luca Vincenzo Cappelli,1 Giovanni Pizzolo,2 Robin Foà,1 Massimiliano Bonifacio2# and Sabina Chiaretti1#
1Hematology, Department of Translational and Precision Medicine, Sapienza University, Rome; 2Department of Engineering for Innovation Medicine, Section of Innovation Biomedicine, Hematology Area, University of Verona; 3SOD Ematologia, Università di Firenze, AOU Careggi, Firenze; 4IRCCS Azienda Ospedaliero-Universitaria di Bologna, Istituto di Ematologia “Seràgnoli”, Bologna; 5Hematology and Transplant Unit, Vito Fazzi Hospital, Lecce; 6ASST Grande Ospedale Metropolitano Niguarda, Milano; 7Division of Hematology, Fondazione IRCCS Policlinico San Matteo, Pavia; 8IEO, European Institute of Oncology IRCCS, Milan; 9Onco Hematology, Department of OncologyVeneto Institute of Oncology IOV-IRCCS, Padua; 10Sezione di Ematologia, Dipartimento di Scienze Radiologiche ed Ematologiche, Università Cattolica del Sacro Cuore, Rome; 11Hematology Unit AO of Cosenza, Cosenza, Italy; Department of Pharmacy, Health and Nutritional Sciences, University of Calabria, Rende; 12Department of Hematology-Oncology, Azienda Ospedaliera Pugliese-Ciaccio, Catanzaro; 13Haematology and BMT Unit, IRCCS San Raffaele Scientific Institute, Milan; 14Blood Diseases and Cell Therapies Unit, Bone Marrow Transplant Unit, “ASST-Spedali Civili” Hospital of Brescia, Department of Clinical and Experimental Sciences, University of Brescia, Brescia; 15Division of Onco-Hematology, AO Ospedali Riuniti Villa Sofia-Cervello, Palermo; 16Hematology and Stem Cell Transplant,
References
1. National Cancer Institute. Surveillance, Epidemiology and End Results program (SEER). Acute Lymphocytic Leukemia (ALL). Recent Trends in SEER Relative Survival Rates, 2000-2020.
Ancona University Hospital; 17Hematology and BMT Unit, Azienda Ospedaliero Universitaria Policlinico “G. Rodolico-San Marco”, Catania and 18Hematology Department, SS Antonio & Biagio and C. Arrigo Hospital, Alessandria, Italy.
#MB and SC contributed equally as senior authors.
Correspondence:
S. CHIARETTI - chiaretti@bce.uniroma1.it
https://doi.org/10.3324/haematol.2023.283684
Received: June 6, 2023.
Accepted: September 26, 2023. Early view: October 26, 2023.
©2024 Ferrata Storti Foundation
Published under a CC BY-NC license
Disclosures
No conflicts of interest to disclose.
Contributions
FM took care of patients, analyzed data and wrote the manuscript. IT took care of patients, and analyzed data, MP, CP, VF, VM, ER, ET, SM, GC, PC, MG, VG, FG, MM, AM, FS, CV, and FZ took care of patients, LVC analyzed the data, GP, RF, MB, and SC designed the research and critically revised the manuscript.
Acknowledgments
The authors would like to thank Natalie Cerioli for secretarial assistance in the framework of Campus ALL.
Funding
This work was supported by Abbvie, by supplying venetoclax and navitoclax in accordance with Ministerial Decree 09/07/2017. The authors thank the Associazione Italiana per la Ricerca sul Cancro (AIRC) 5x1000, Special Program Metastases (21198), Milan (Italy), for supporting RF; Progetti di Rilevante Interesse Nazionale (PRIN) Italia, 2017PPS2X4 project, for supporting SC; and Finanziamento Medi Progetti Universitari 2021, for supporting SC (Sapienza University of Rome).
Data-sharing statement
Datasets are maintained in an electronic database at the Department of Translational and Precision Medicine, Sapienza University of Rome; data are available from the corresponding author upon request.
Available at: https://seer.cancer.gov/statfacts/html/alyl.html. Accessed Nov 9, 2023.
2. Wenge DV, Wethmar K, Klar CA, et al. Characteristics and
Haematologica | 109 March 2024 992 LETTER TO THE EDITOR
outcome of elderly patients (>55 years) with acute lymphoblastic leukemia. Cancers (Basel). 2022;14(3):565.
3. Short NJ, Macaron W, Konopleva M, et al. Dismal outcomes of patients with relapsed/refractory Philadelphia chromosomenegative B-cell acute lymphoblastic leukemia after failure of both inotuzumab ozogamicin and blinatumomab. Am J Hematol. 2022;97(6):E201-E204.
4 Souers AJ, Leverson JD, Boghaert ER, et al. ABT-199, a potent and selective BCL-2 inhibitor, achieves antitumor activity while sparing platelets. Nat Med. 2013;19(2):202-208.
5. Benito JM, Godfrey L, Kojima K, et al. MLL-rearranged acute lymphoblastic leukemias activate BCL-2 through H3K79 methylation and are sensitive to the BCL-2-specific antagonist ABT-199. Cell Rep. 2015;13(12):2715-2727.
6. Frismantas V, Dobay MP, Rinaldi A, et al. Ex vivo drug response profiling detects recurrent sensitivity patterns in drug-resistant acute lymphoblastic leukemia. Blood. 2017;129(11):e26-e37.
7. Khaw SL, Suryani S, Evans K, et al. Venetoclax responses of pediatric ALL xenografts reveal sensitivity of MLL-rearranged leukemia. Blood. 2016;128(10):1382-1395.
8. Richard-Carpentier G, Jabbour E, Short NJ, et al. Clinical experience with venetoclax combined with chemotherapy for relapsed or refractory T-cell acute lymphoblastic leukemia. Clin Lymphoma Myeloma Leuk. 2020;20(4):212-218.
9 Leonard JT, Rowley JS, Eide CA, et al. Targeting BCL-2 and ABL/ LYN in Philadelphia chromosome-positive acute lymphoblastic leukemia. Sci Transl Med. 2016;8(354):354ra114.
10 Wintering A, Ishiyama K, Tamaki S, et al. CD22low/Bcl-2high expression identifies poor response to inotuzumab ozogamicin in relapsed/refractory acute lymphoblastic leukemia. Blood Adv. 2023;7(2):251-255.
11. Cheson BD, Fisher RI, Barrington SF, et al. Recommendations for initial evaluation, staging, and response assessment of Hodgkin and non-Hodgkin lymphoma: the Lugano classification. J Clin Oncol. 2014;32(27):3059-3068.
12. Ribera JM, Morgades M, Ciudad J, et al. Chemotherapy or allogeneic transplantation in high-risk Philadelphia chromosome-negative adult lymphoblastic leukemia. Blood. 2021;137(14):1879-1894.
13. Pullarkat VA, Lacayo NJ, Jabbour E, et al. Venetoclax and navitoclax in combination with chemotherapy in patients with relapsed or refractory acute lymphoblastic leukemia and lymphoblastic lymphoma. Cancer Discov. 2021;11(6):1440-1453.
14 Gökbuget N, Dombret H, Ribera JM, et al. International reference analysis of outcomes in adults with B-precursor Ph-negative relapsed/refractory acute lymphoblastic leukemia. Haematologica. 2016;101(12):1524-1533.
15. Seyfried F, Stirnweiß F, Niedermayer A, et al. Synergistic activity of BH3-mimetics by combined targeting of anti-apoptotic regulators in B-cell precursor ALL. Blood. 2021;138(Suppl 1):706.
16. Canaani J, Frisch A, Pollyea DA, et al. Venetoclax-based salvage therapy for adult patients with relapsed/refractory acute lymphoblastic leukemia. Eur J Haematol. 2023;111(3):365-372.
Haematologica | 109 March 2024 993 LETTER TO THE EDITOR
Concurrent peripheral T-cell lymphoma and T-cell lymphoblastic leukemia/lymphoma with identical STIL::TAL1 fusion events
The World Health Organization and the International Lymphoma Study Group have broadly placed neoplasms with T-cell lineage into lymphomas/leukemias with a precursor T-cell phenotype (e.g., T-lymphoblastic leukemia/lymphoma [T-LBLL]) and those with a mature T-cell phenotype (e.g., peripheral T-cell lymphoma [PTCL]).1 The accurate classification of lymphoid neoplasms is vital as it determines the subsequent therapy. Historically, in the context of normal T-cell (thymocyte) development, T-LBLL differentiation stages have been identified based on the expression of cluster differentiation (CD) proteins as early, pro-T, pre-T, cortical T, and mature T.2 Genomic analysis has enabled identifying genetic drivers and signaling pathway alterations associated with different maturational stages of T cell in T-LBLL.3,4
Genetic alterations in T-LBLL are mainly composed of master regulators of T-cell fate and differentiation with genes affected in the encoding of transcription factors (e.g., TAL1/2, LMO1/2, TLX, NKX2-1, BCL11B, HOXA ), along with cooperating abnormalities that influence cell cycle, epigenetic and signal transduction.5
Ectopic expression of TAL1/SCL (transcription factor located on chromosome 1p33) resulting from STIL::TAL1 fusion, deletion, or upstream intergenic non-coding mutations is identified in 11-27% of T-LBLL cases.6,7 STIL::TAL1+ pediatric T-LBLL cases are heterogeneous in terms of their stages of T-cell development. Although not exclusive, certain types of cooperating abnormalities, such as PTEN and PIK3R mutations, are more frequently found in TAL1-positive cases and correlate with late cortical and mature T-cell immunophenotypes.3
PTCL other than anaplastic large-cell lymphoma is rare in pediatric patients and includes PTCL, not otherwise specified (NOS), and mature T/natural killer (NK)-cell neoplasms, characterized by atypical cells with properties of mature T/NK cells.1,8,9 PTCL-NOS can be further sub-classified into those that highly express one of two transcription factors (GATA-3 or T-bet/TBX21) that regulate normal T-cell differentiation.10 A heterogeneous genetic landscape of cooperating mutations further characterizes these subtypes in PTCL-not ortherwise specified.10,11
Relapses often characterize the natural history of malignant hematopoietic diseases after therapy. The neoplastic clone(s) in relapse are often related to the initial clone(s) but might exhibit additional aberrations, clonal selection, transformation, or phenotypic changes. However, the co-existence of two morphologically and phenotypically distinct but genetically related neoplasms of the T-cell lineage at
initial presentation has only been rarely previously reported in T-cell neoplasms. Here, we report on a child presenting with cutaneous T-cell infiltrate diagnosed as PTCL-NOS with concurrent T-LBLL diagnosed in the bone marrow (BM) before the start of therapy. The two tumors shared the same genetic alterations in addition to those uniquely present in each.
The patient was a 10-year-old girl who presented with a single erythematous skin swelling in the mid-back that progressed to an ulcerated mass (6x3 cm) in 3 months. No fever, night sweats, or weight loss were reported. Microscopic evaluation of the lesion showed an atypical infiltrate composed of monotonous cells with a rim of clear cytoplasm, densely clumped chromatin, and small nucleoli. By immunohistochemical stains, the atypical infiltrate was positive for CD2, CD3, CD4 (small subset), CD5, CD8, TIA1, granzyme B, T-cell receptor (TCR)-β, TBX21, GATA3, and negative for CD1a, CD7, CD10, CD20, Pax-5, CD30, CD34, CD56, CD79a, ALK-1, TCR-δ, TdT, and EBER (in situ hybridization) (Figure 1A). The Ki-67 proliferation index was 70%. The overall findings are consistent with PTCL-NOS with CD8+ cytotoxic phenotype. With the expression of TBX21,11 we further subclassified the case as T-bet PTCL subtype. The subsequent positron emission tomography-computed tomography (PET-CT) study for staging showed widespread abnormal uptake in numerous lymph nodes, liver, kidneys, left femur along with a pleural effusion. Complete blood count showed a white blood cell count of 11.23×10⁹/L, hemoglobin of 95 g/L, and platelet count of 280×109/L. The patient also had elevated serum lactate dehydrogenase level (1,959 U/L; reference range, 165–310 U/L). BM examination revealed a hypercellular marrow (>95%) with numerous blasts. Blasts were medium in size with a scant amount of basophilic cytoplasm (some vacuolated), irregular nuclear contours, and inconspicuous nucleoli. By immunohistochemical and multicolor flow cytometry immunophenotyping, blasts were positive for CD1a, CD2, cytoplasmic CD3, CD4 (partial), CD7, CD8 (partial), and TdT and negative for surface CD3, CD79a, TCR-β, and TCR-δ (Figure 1B, C). The conventional karyotyping analysis showed 47,XX,+17[8]/46,XX[12]. These findings are diagnostic for T-LBLL. The patient was treated with standard therapy for acute lymphoblastic leukemia. She became minimal residual disease (MRD)-negative by day 15 of therapy and remains in complete remission. The site of excised skin mass healed without complication, and no other skin lesion was detected.
Whole-genome sequencing (WGS), whole-exome sequencing
Haematologica | 109 March 2024 994 CASE REPORT
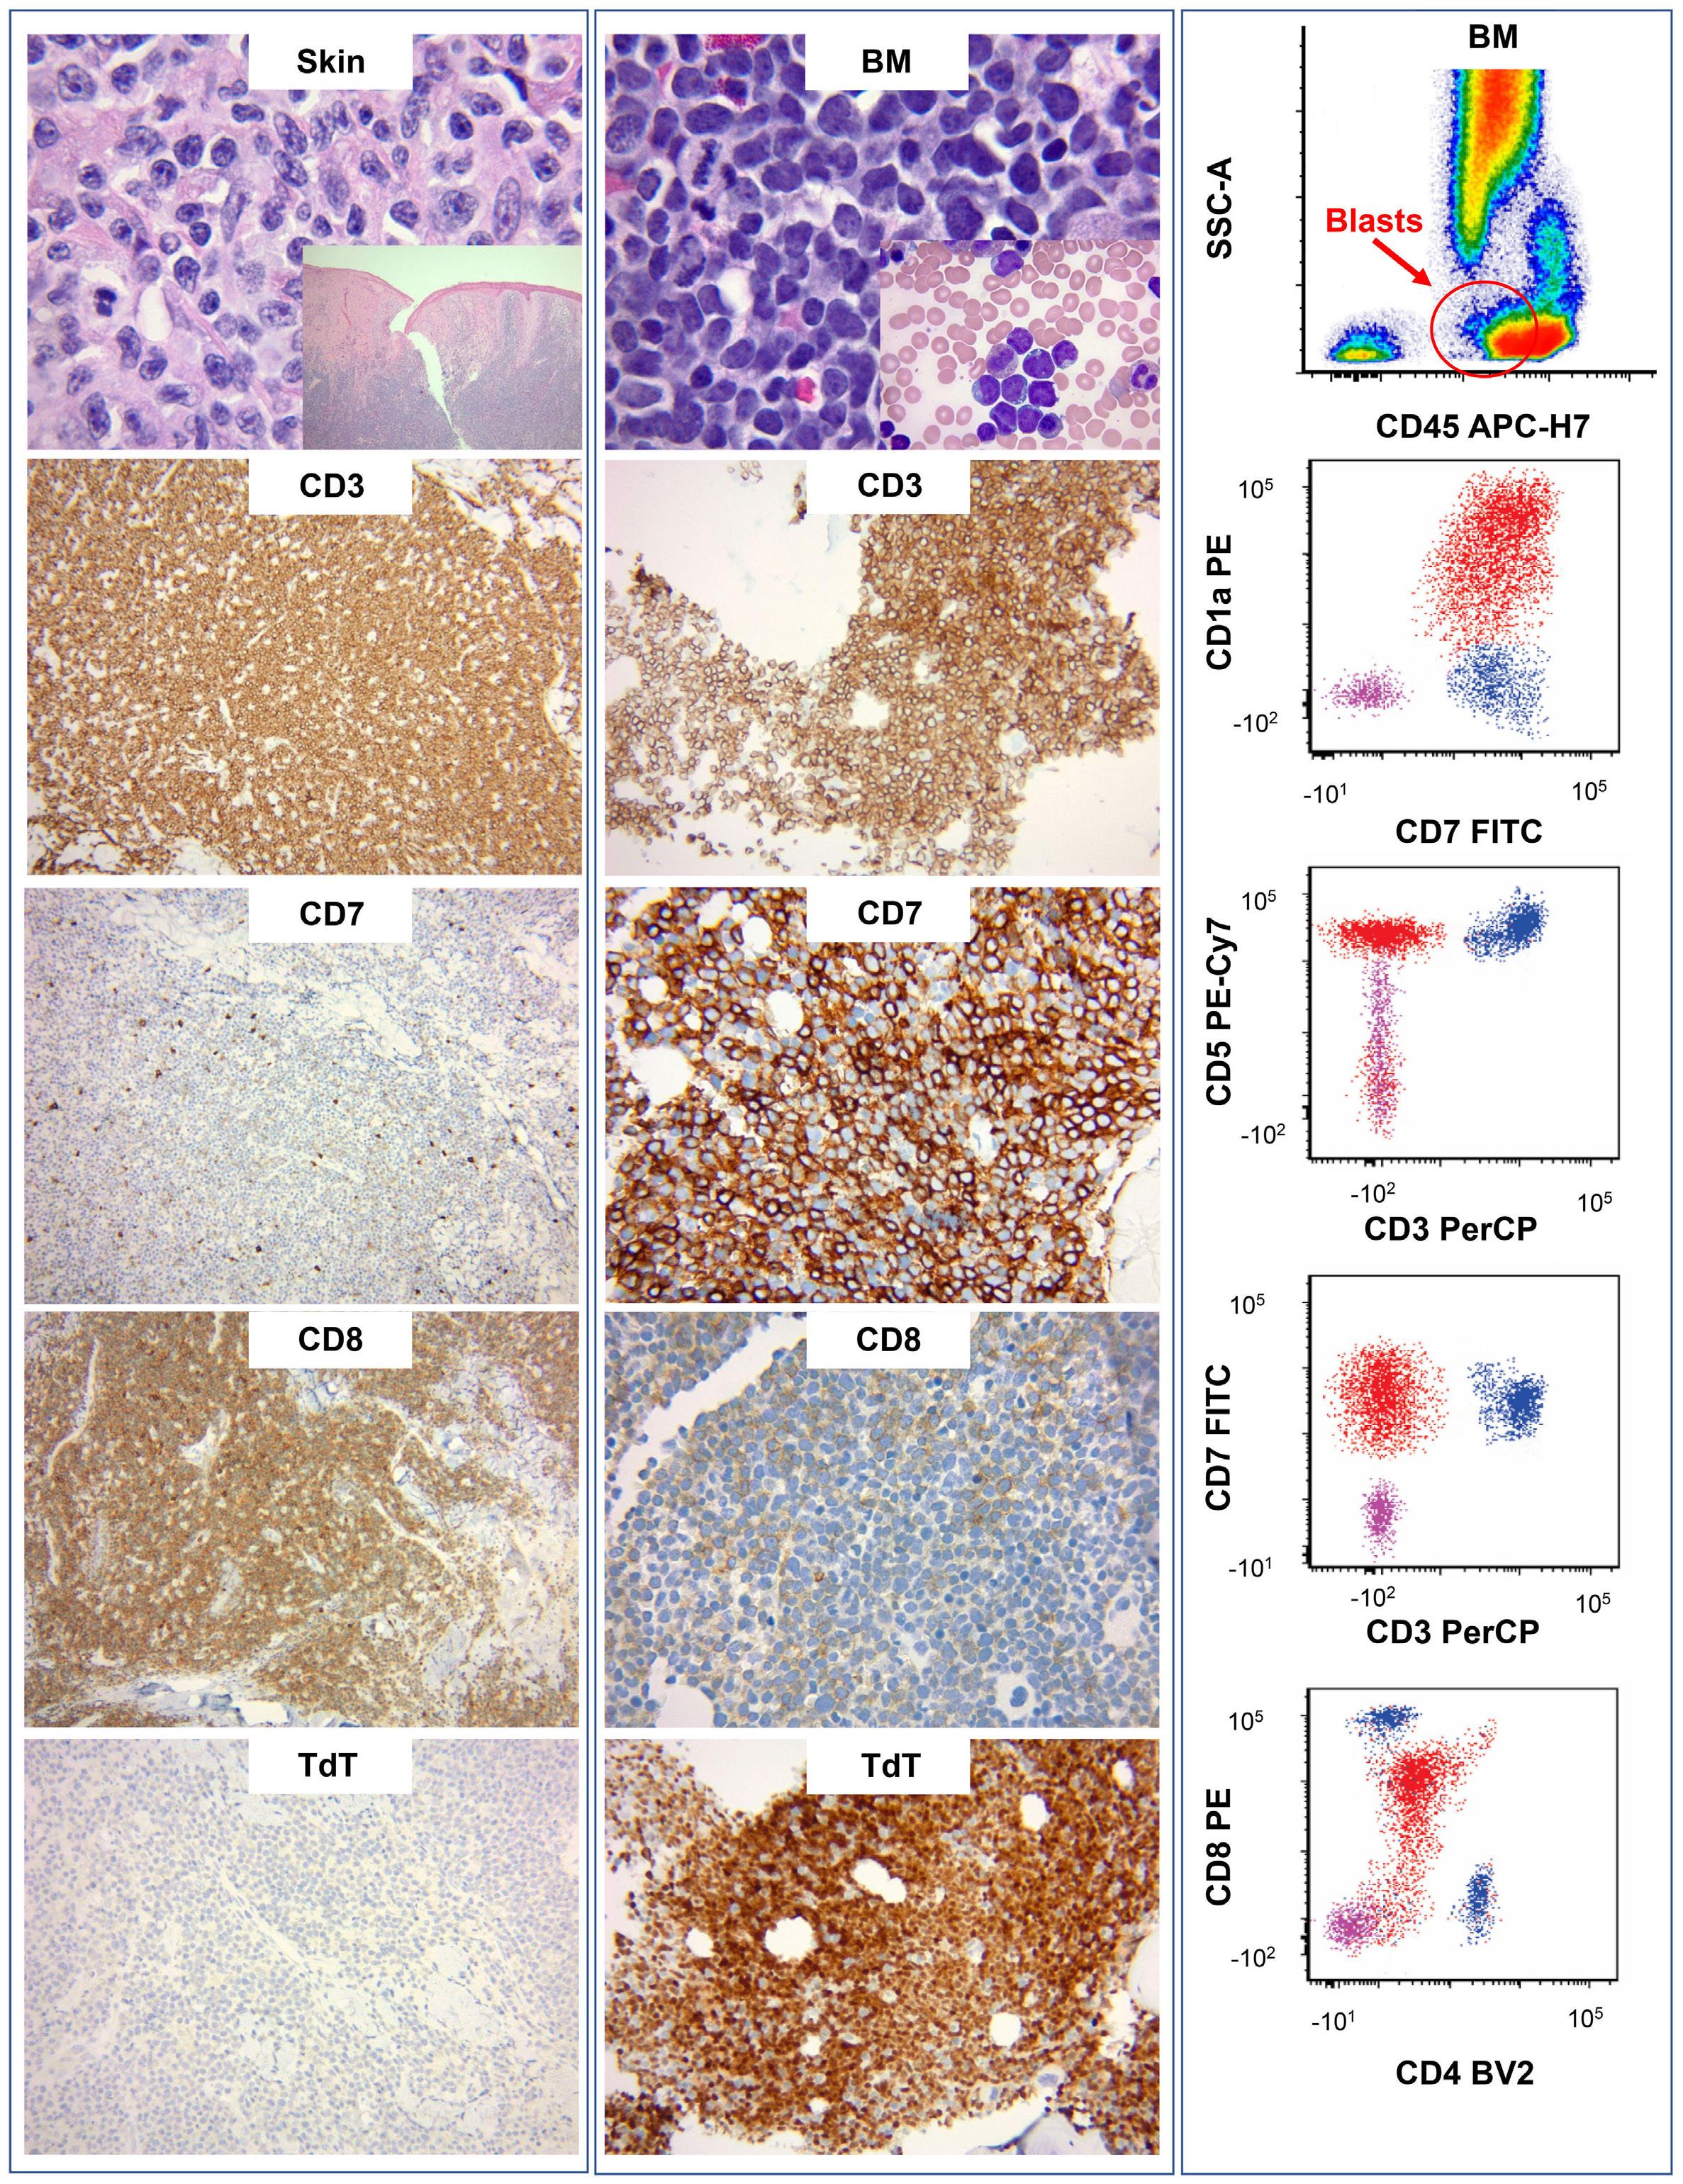
1. Skin and bone marrow tumor morphology and immunophenotype. (A) Skin biopsy shows infiltration of neoplastic lymphoid cells with a rim of clear cytoplasm, densely clumped chromatin, and small nucleoli (hematoxylin and eosin, x1,000; inset, x40). Immunohistochemical analysis shows the neoplastic lymphoid cells are positive for CD3 (x100), and CD8 (x100) and are negative for CD7 (x100), and TdT (x200). (B) Bone marrow (BM) core biopsy shows a hypercellular marrow diffusely infiltrated by blasts (hematoxylin and eosin stain, x1,000). Aspirate shows medium-sized neoplastic cells with blastoid chromatin and occasional small nucleoli (Wright-Giemsa, inset, x1,000; oil). By immunohistochemical analysis, the blasts are positive for CD3 (x200), CD7 (x400), CD8 (x400), and TdT (x200). (C) BM flow cytometry immunophenotyping analysis demonstrates a distinct population of aberrant T cells (red population) expressing CD45 (moderate expression), CD1a (moderate to bright), CD5 (bright with similar intensity to mature lymphocytes highlighted in blue population), and CD7 (bright). CD4 and CD8 are partially expressed.
Haematologica | 109 March 2024 995 CASE REPORT A B C
Figure
(WES), and RNA-sequencing (RNA-seq) were performed on the BM sample along with WES and RNA-seq from formalin-fixed, paraffin-embedded tissue of the skin lesion. The BM and skin tumor specimens shared an identical STIL::TAL1
fusion (Figure 2A). Both samples had additional ‘private’ discrete cooperating mutations. The BM sample included mutations in FBXW7, PIK3CA, KRAS, PTEN, SMARCA4, NOTCH1, BCL11B, and deletion of NOTCH1, CDKN2A, and CDKN2B. A
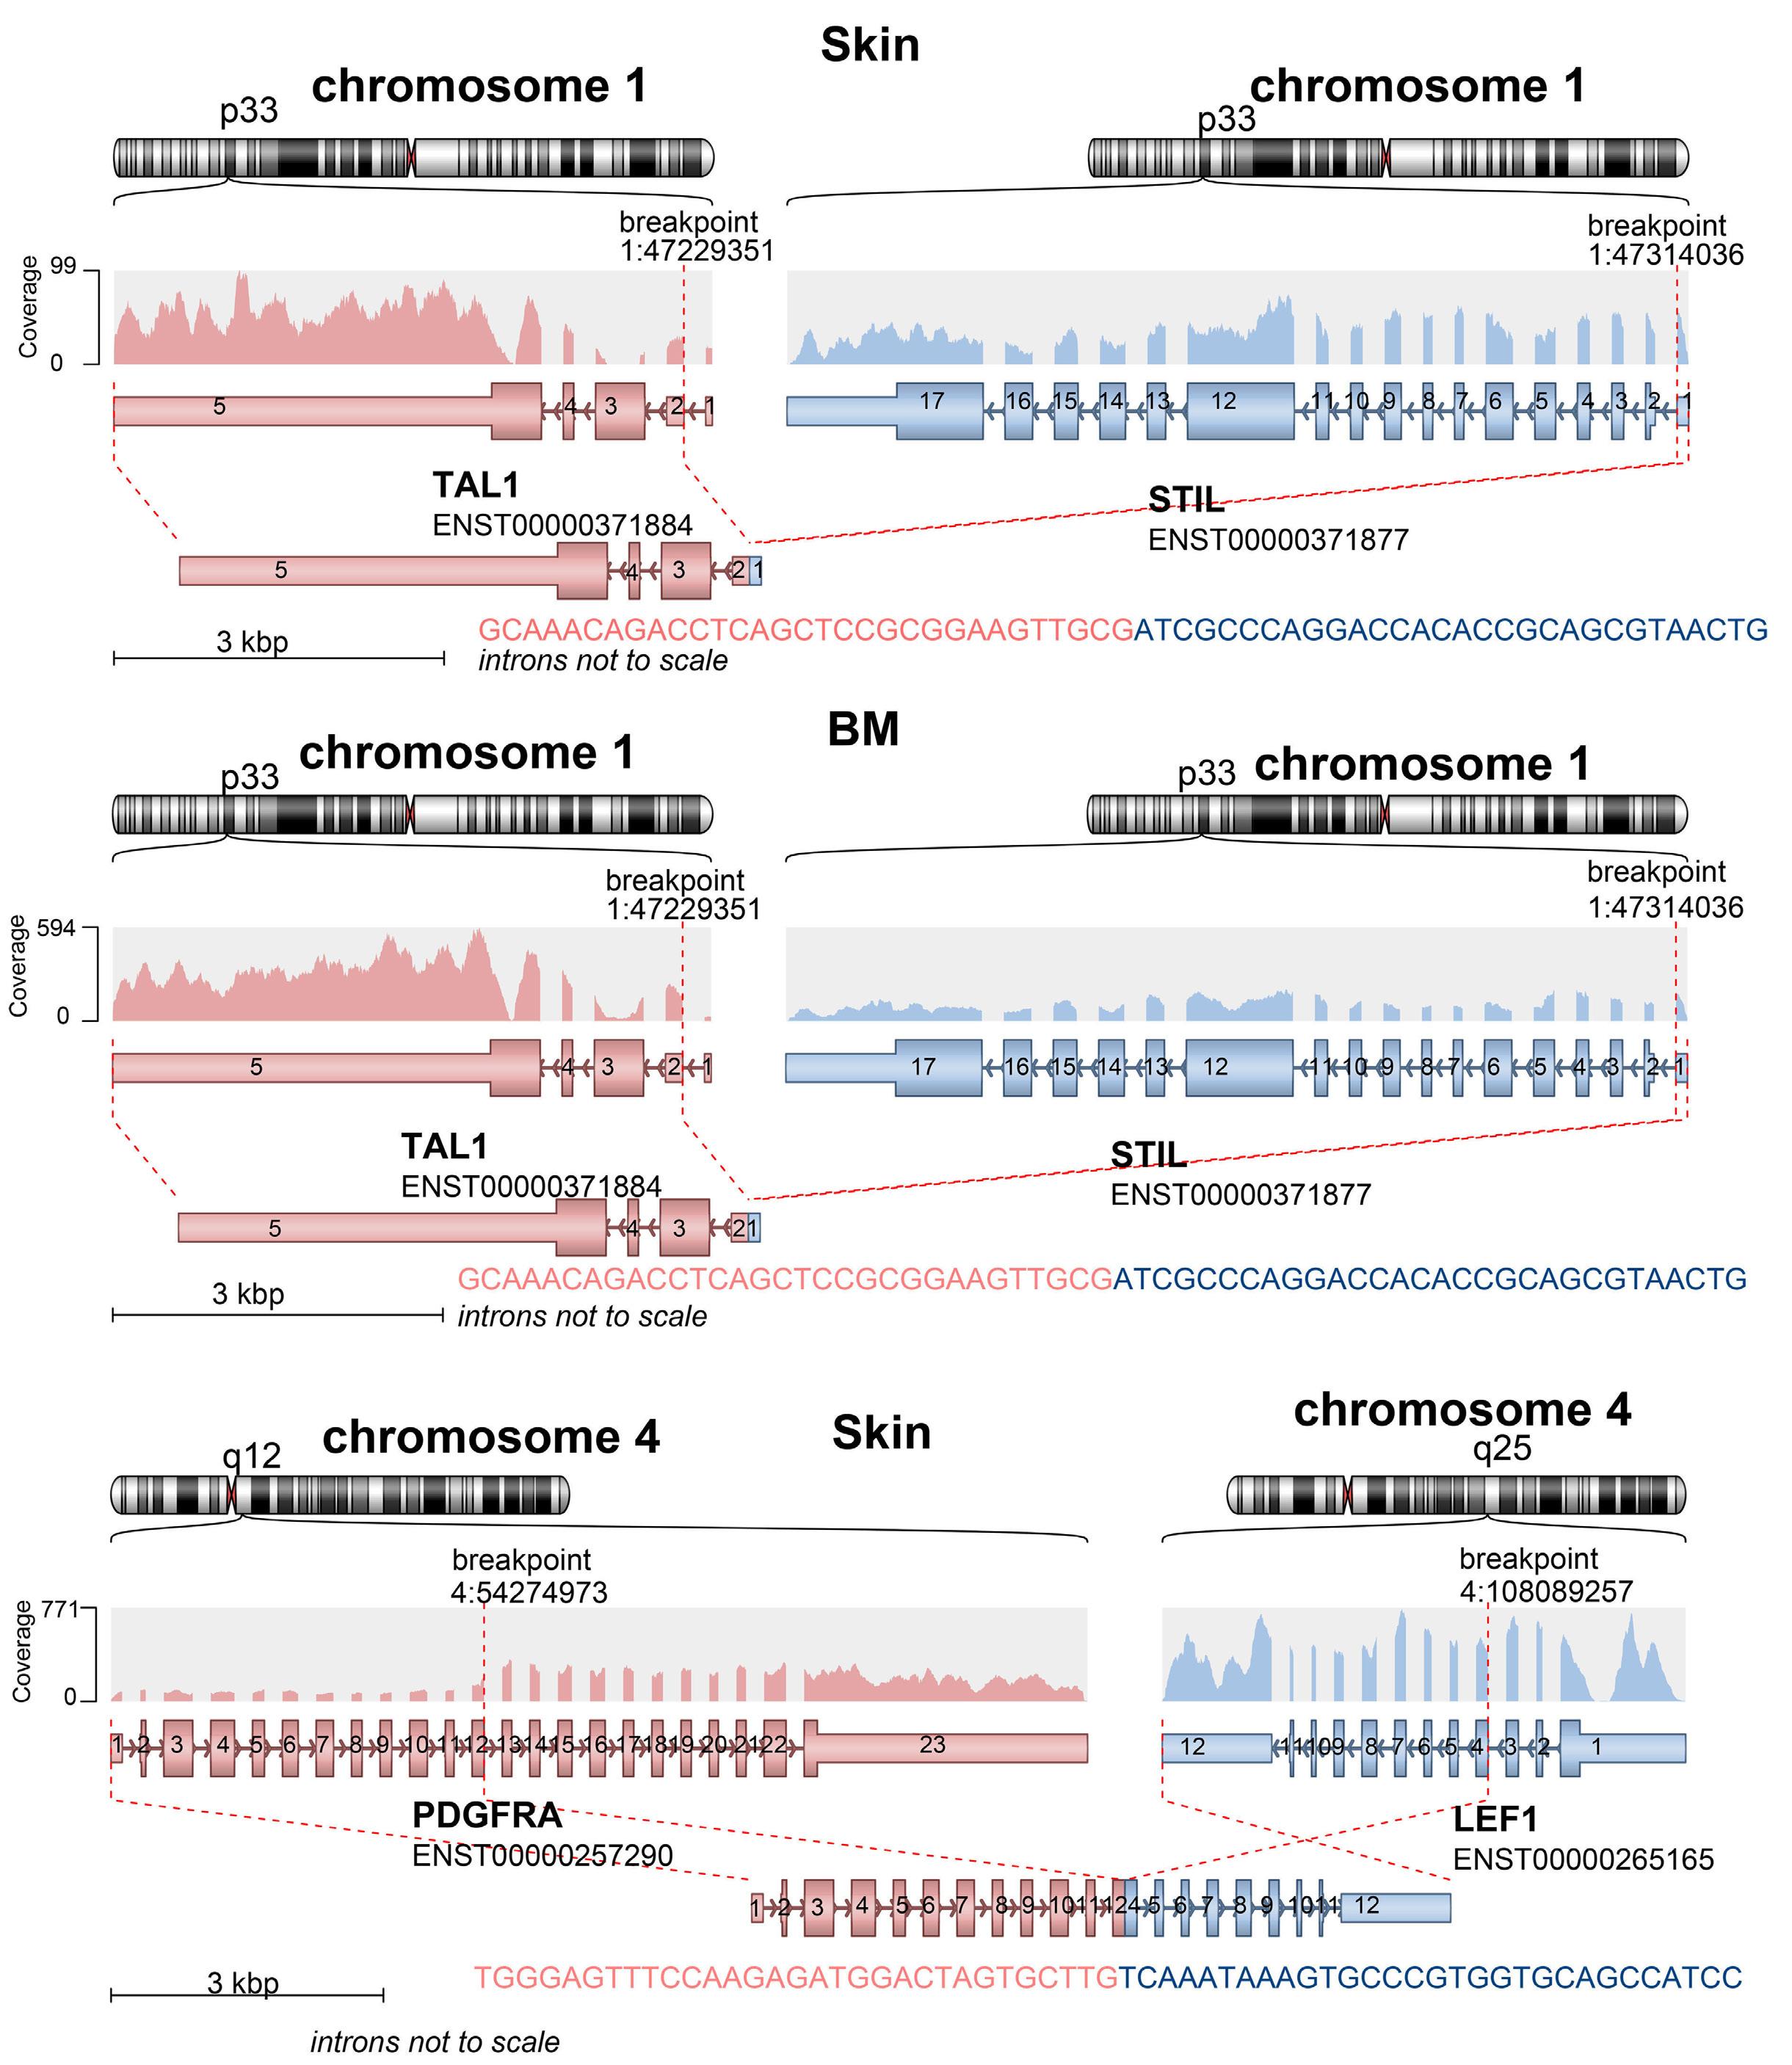
whole-genome
by RNA-sequencing data are
in the figure.
according to the hg38 reference. (B) RNA-sequencing analysis of skin and BM samples demonstrate a novel PDGFRA::LEF1 fusion, identified only in the skin sample, between PDGFRA (exon 13) and LEF1 (exon 3) on chromosome 4. The predicted fusion protein consists of the immunglobulin-like domain of PDGFRA, followed by the intact transmembrane domain and tyrosine kinase domain of PDGFRA. Because the LEF1 gene is on the minus strand of chromosome 4, the creation of this fusion appears to have involved an intrachromosomal inversion. RNA read coverage is shown across the genes involved in the fusion.
Haematologica | 109 March 2024 996 CASE REPORT
B A
Figure 2. Skin and bone marrow tumor clonal history and novel fusion detected in the skin tumor. (A) The same STIL::TAL1 fusion transcripts are identified in both skin and bone marrow (BM) samples. These fusion genes are further confirmed using
sequencing data. For demonstration purposes, only fusion genes detected
presented
Fusion breakpoints are labeled
different FBXW7 mutation was detected in the skin sample along with a structural variant leading to a PDGFRA::LEF1 fusion. Targeted resequencing validated these findings and further highlighted the different FBXW7 mutations in the skin and BM tumors (Figure 3B). By polymerase chain reaction, clonal TCR-g rearrangement peaks were identified and identical in tumor samples from the skin and BM, confirming their shared origin (Figure 3A).
Despite the significant difference in morphology, immunophenotype, and secondary mutations, the tumors from the BM sample (T-LBLL phenotype) and the skin sample (PTCL, mature T-cell phenotype) had common origins, as confirmed by the shared STIL::TAL1 fusion and supported by the identical polymerase chain reaction amplification peaks in TCR clonality analysis. Our genomic characterization suggests the clonal relationship likely reflects a common cell of origin with divergent clonal evolution rather than parallel clonal evolution of diverse and unrelated precursors. In the
absence of a therapeutic effect, it may be hypothesized that the extrinsic factors, such as cellular environment, immune pressure, cytokine stimulation, etc., differentially impact the tumor cells at distinct sites and promote the evolution of the same clone down different lineage trajectories yielding diverse morphology and immunophenotype. STIL::TAL1+ T-LBLL have previously been shown to be driven by reiterative mutations of the same driver genes and resultant parallel clonal evolution in which STIL::TAL1 fusion and CDKN2A loss are both early or truncal events while NOTCH1 and PIK3/AKT/PTEN mutations are secondary and subclonal events in the evolutionary pathway.12 The heterogeneous nature of STIL::TAL1+ T-LBLL cases with respect to their immunophenotype has also been previously demonstrated in which TAL1+ cases clustered into two subgroups: double positive (DP, CD4+ CD8+) T-LBLL cases with a higher surface CD3 expression and a second smaller group with less surface CD3 expression.13 Subsequent evaluation of
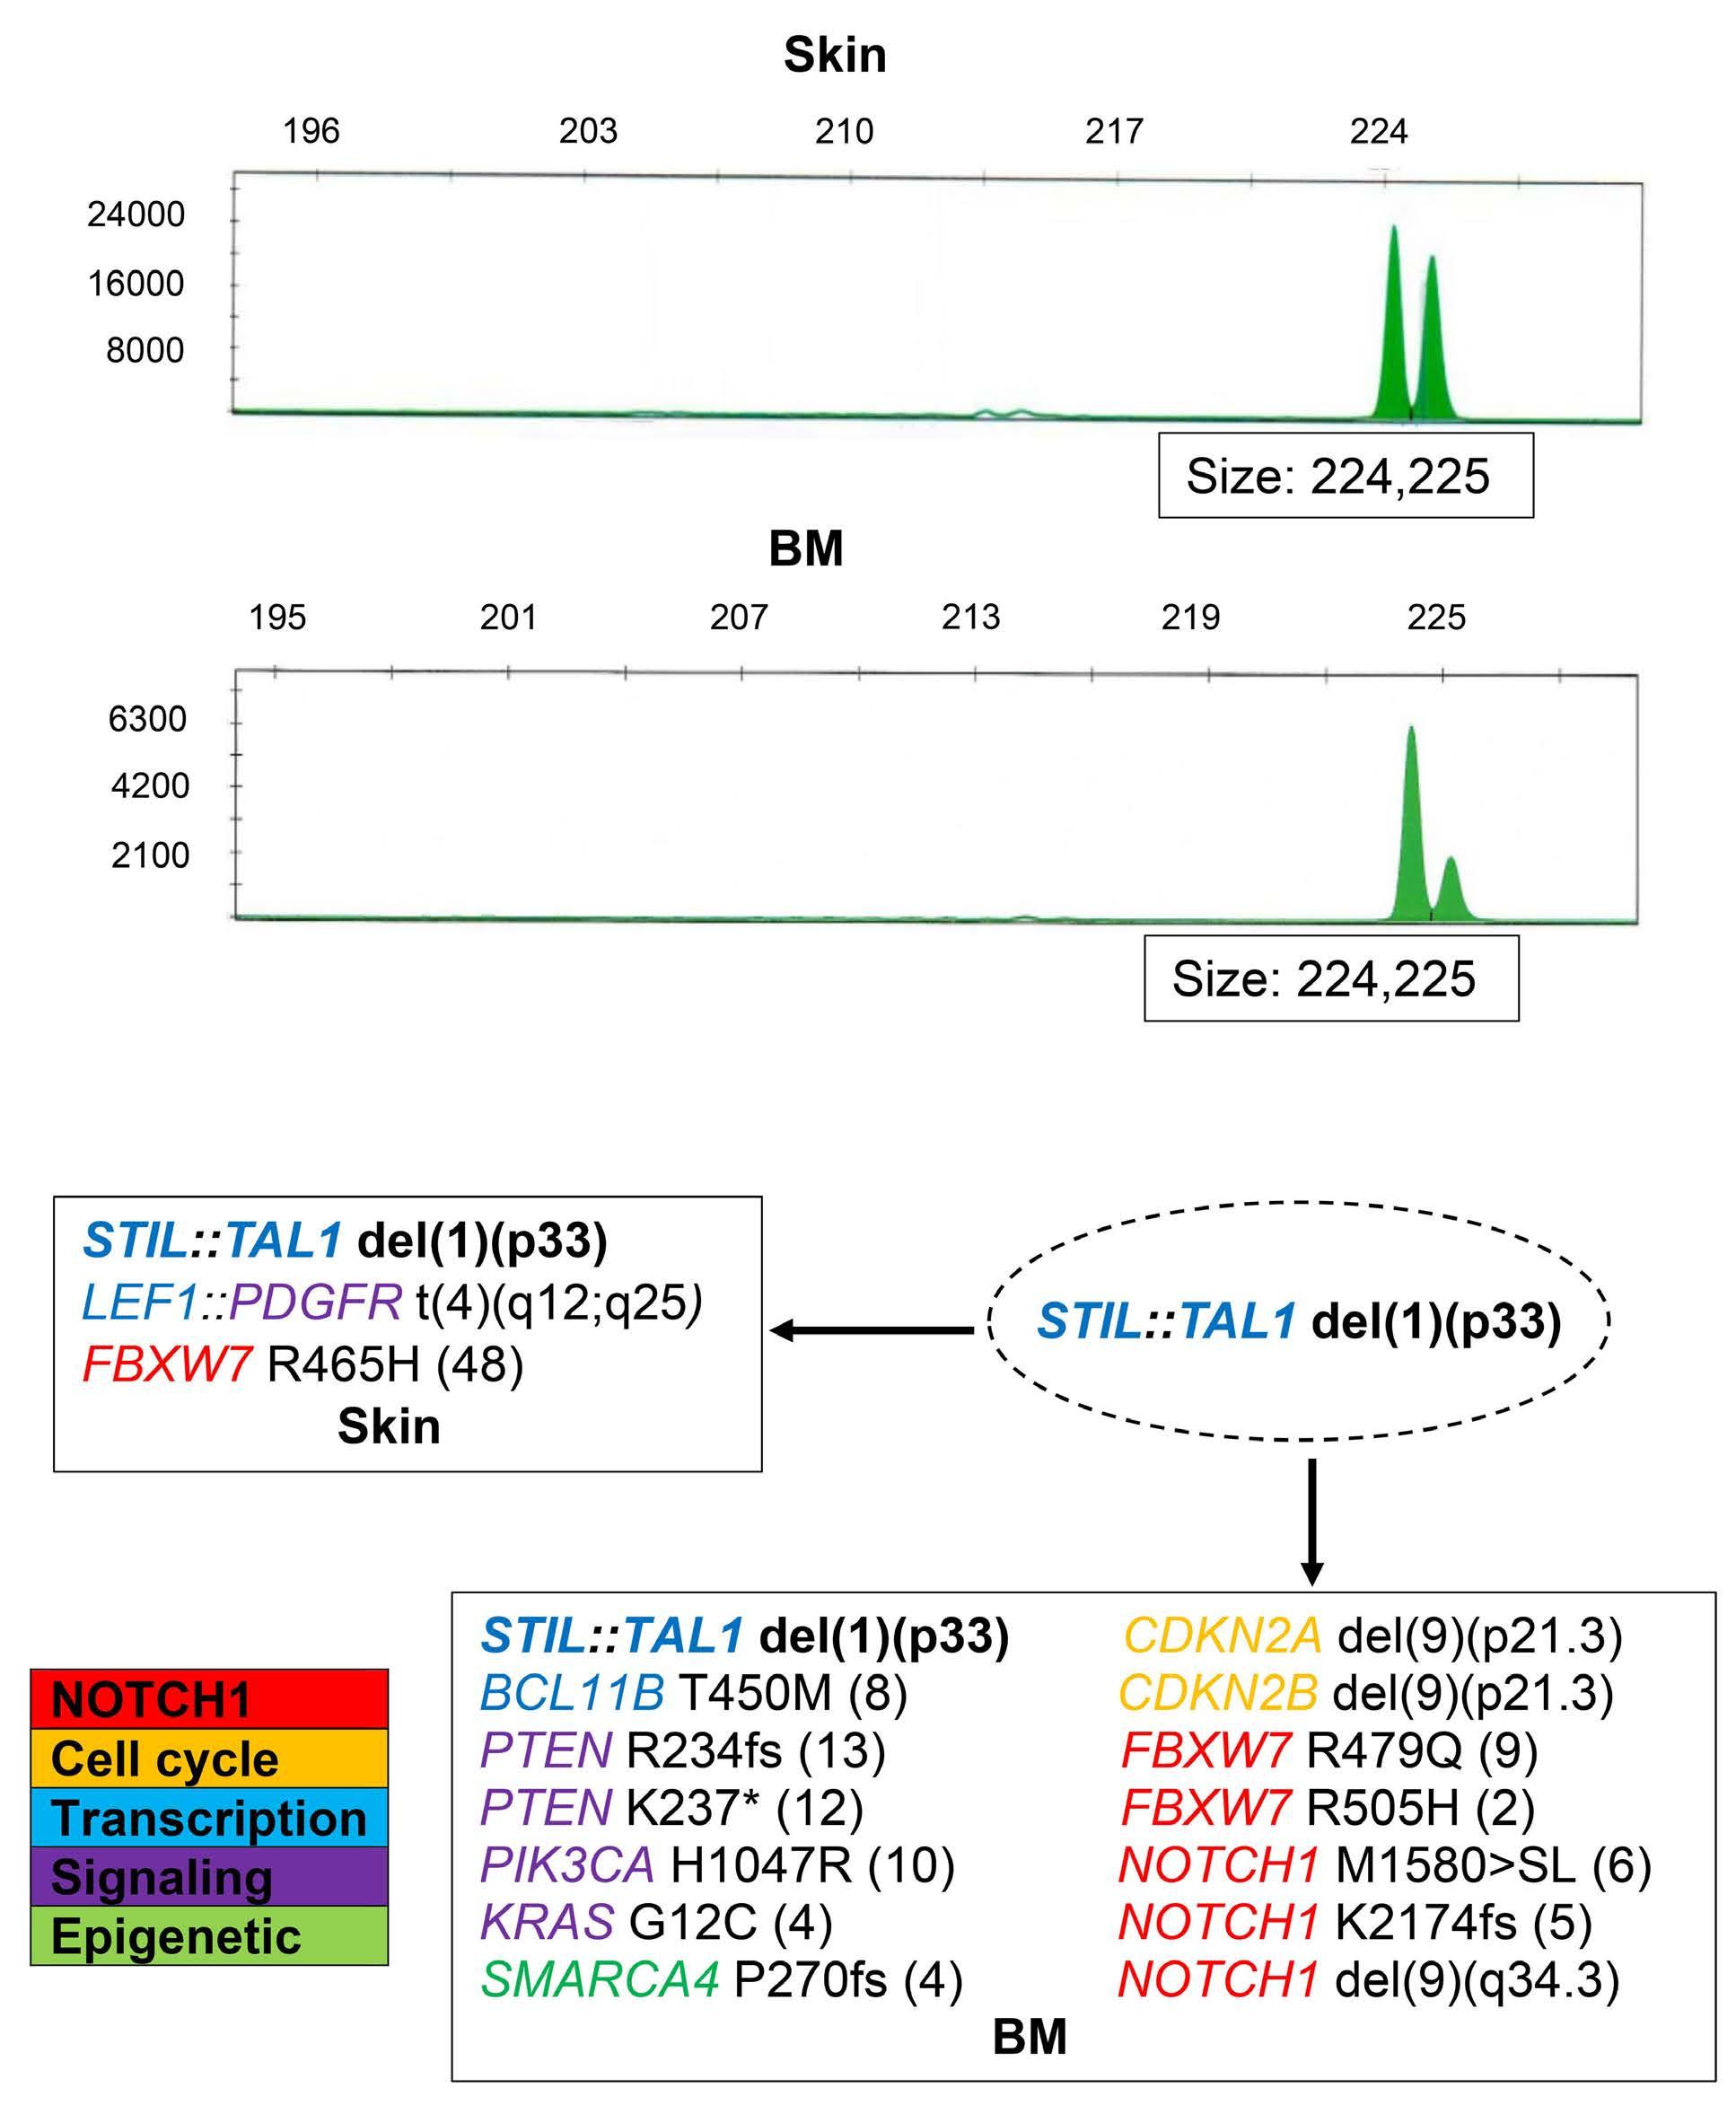
Figure 3. Skin and bone marrow tumor clonal history by T-cell receptor g gene rearrangement studies by polymerase chain reaction and proposed model of the evolutionary pathway. (A) T-cell receptor g gene rearrangement studies by polymerase chain reaction, performed on the skin and bone marrow (BM) tumor samples, reveal a monoclonal rearrangement with identical polymerase chain reaction amplification peaks. (B) Evolutionary pathway from a common progenitor with a common clone containing STIL:: TAL1 event is demonstrated. The molecular alterations in different samples (skin and BM) are highlighted according to the different cellular machineries. The allele frequency of altered genes is represented in parenthesis. The common molecular alteration in skin and BM, STIL::TAL1 del(1)(p33), appears in bold text.
Haematologica | 109 March 2024 997 CASE REPORT
A B
these clusters found the first cluster of T-LBLL cases containing mature T-LBLL (DP, CD4+ CD8+) was enriched with deletions in LEF1, CASP8AP2, and CDKN2A/B in addition to STIL::TAL1 gene fusion.14
Extranodal presentation of this case further adds to the challenges in proper classification and diagnosis. While the incidence rate of all cutaneous T-cell lymphomas in the pediatric age group is low, most cases are within the category of mature T-cell neoplasms. In contrast, skin is infrequently involved by precursor lymphoblastic lymphomas and rarely in T-LBLL.15 There is also limited data on the molecular analysis of T-LBLL cases presenting with the skin lesion.16
In this case, a novel PDGFRA::LEF1 fusion was detected by sequencing analysis in skin sample with a breakpoint within exon 13 of the PDGFRA gene and exon 3 of the LEF1 gene resulting from an intrachromosomal inversion on chromosome 4q, which caused an out-of-frame fusion (Figure 2B). While the significance of this structural variant cannot be determined, there was insufficient evidence to support an activating PDGFRA rearrangement. This alteration spanning over multiple LEF1 exons can potentially disrupt the LEF1 gene, leading to its loss of function. It is hypothesized that LEF1 can play multiple roles in T-cell leukemia as a cooperative tumor suppressor or oncogene.17 As a tumor suppressor (and possible transcriptional repressor of MYC), it is inactivated in approximately 11% of pediatric T-LBLL. Interestingly, LEF1-inactivated T-LBLL has been characterized by the lack of CD34 expression and arrest at a transition from CD8+ immature single positive stage to double positive stage.18 This finding may potentially explain the mature immunophenotype of T-cell infiltrate in the skin sample compared to the BM tumor.18
In summary, this case expands the complexity of cases with STIL::TAL1 fusion to T-cell neoplasms with mature phenotypes. A potential collaborating effect exists between the STIL::TAL1 fusion and gene abnormalities that shape the T-cell neoplasm’s morphologic and immunophenotypic features. Classification and diagnosis of T-cell neoplasms based on morphology and immunophenotypic features alone may be inadequate to fully characterize the ill-defined boundary between mature T-LBLL and PTCL. Primary cutaneous T-cell lymphoma/leukemia is rare in pediatric
References
1. Alaggio R, Amador C, Anagnostopoulos I, et al. The 5th edition of the World Health Organization classification of haematolymphoid tumours: lymphoid neoplasms. Leukemia. 2022;36(7):1720-1748.
2. Shiraz P, Jehangir W, Agrawal V. T-cell acute lymphoblastic leukemia-current concepts in molecular biology and management. Biomedicines. 2021;9(11):1621.
3. Liu Y, Easton J, Shao Y, Maciaszek J, et al. The genomic landscape of pediatric and young adult T-lineage acute
patients, and due to the rarity of these cases, TAL-1/2 is not routinely tested. However, our study draws attention to this rare event, and comprehensive cytogenetic and molecular studies would be indicated in extranodal and cutaneous T-cell infiltrates in pediatric patients.
Authors
Mahsa Khanlari,1 Wei Wang,2 Yen-Chun Liu,1 Lu Wang,1 Jeffrey E. Rubnitz,3 Stephanie Dixon,3 Brent A. Orr,1 Obianuju M. Anelo,4 Zhongshan Cheng,5 Vidya Balagopal1 and Jeffery M. Klco1
1Department of Pathology, St. Jude Children’s Research Hospital, Memphis, TN; 2Department of Hematopathology, MD Anderson Cancer Center, Houston, TX; 3Department of Oncology, St. Jude Children’s Research Hospital, Memphis, TN; 4Department of Pathology, University of Tennessee Health Science Center, TN and 5Center for Applied Bioinformatics, St. Jude Children’s Research Hospital, Memphis, TN, USA
Correspondence: M. KHANLARI - mahsa.khanlari@stjude.org
https://doi.org/10.3324/haematol.2023.283585
Received: May 23, 2023.
Accepted: September 18, 2023. Early view: September 28, 2023.
©2024 Ferrata Storti Foundation
Published under a CC BY-NC license
Disclosures
No conflicts of interest to disclose.
Contributions
All authors wrote and approved the final version of the manuscript. ZC and VB performed molecular research and data analysis.
Data-sharing statement
The data that support the findings of this study are available from the corresponding author upon reasonable request.
lymphoblastic leukemia. Nat Genet. 2017;49(8):1211-1218.
4 Khanam T, Sandmann S, Seggewiss J, et al. Integrative genomic analysis of pediatric T-cell lymphoblastic lymphoma reveals candidates of clinical significance. Blood. 2021;137(17):2347-2359.
5. Tan TK, Zhang C, Sanda T. Oncogenic transcriptional program driven by TAL1 in T-cell acute lymphoblastic leukemia. Int J Hematol. 2019;109(1):5-17.
6. Mansur MB, Emerenciano M, Brewer L, et al. SIL-TAL1 fusion gene negative impact in T-cell acute lymphoblastic leukemia
Haematologica | 109 March 2024 998 CASE REPORT
outcome. Leuk Lymphoma. 2009;50(8):1318-1325.
7 D’Angio M, Valsecchi MG, Testi AM, et al. Clinical features and outcome of SIL/TAL1-positive T-cell acute lymphoblastic leukemia in children and adolescents: a 10-year experience of the AIEOP group. Haematologica. 2015;100(1):e10-e13.
8. Hutchison RE, Laver JH, Chang M, et al. Non-anaplastic peripheral T-cell lymphoma in childhood and adolescence: a Children’s Oncology Group study. Pediatr Blood Cancer. 2008;51(1):29-33.
9 Ravichandran N, Uppuluri R, Vellaichamy Swaminathan V, et al. Management of peripheral T-cell lymphoma in children and adolescents including STAT 3 mutation hyper-IgE syndrome: one size does not fit all. J Pediatr Hematol Oncol. 2022;44(4):e849-e854.
10 Heavican TB, Bouska A, Yu J, et al. Genetic drivers of oncogenic pathways in molecular subgroups of peripheral T-cell lymphoma. Blood. 2019;133(15):1664-1676.
11. Amador C, Greiner TC, Heavican TB, et al. Reproducing the molecular subclassification of peripheral T-cell lymphoma-NOS by immunohistochemistry. Blood. 2019;134(24):2159-2170.
12. Furness CL, Mansur MB, Weston VJ, et al. The subclonal complexity of STIL-TAL1+ T-cell acute lymphoblastic leukaemia. Leukemia. 2018;32(9):1984-1993.
13. Ferrando AA, Neuberg DS, Staunton J, et al. Gene expression signatures define novel oncogenic pathways in T cell acute lymphoblastic leukemia. Cancer Cell. 2002;1(1):75-87.
14 Noronha EP, Marques LVC, Andrade FG, et al. The profile of immunophenotype and genotype aberrations in subsets of pediatric T-cell acute lymphoblastic leukemia. Front Oncol. 2019;9:316.
15. Kempf W, Kazakov DV, Belousova IE, Mitteldorf C, Kerl K. Paediatric cutaneous lymphomas: a review and comparison with adult counterparts. J Eur Acad Dermatol Venereol. 2015;29(9):1696-1709.
16. Vezzoli P, Novara F, Fanoni D, et al. Three cases of primary cutaneous lymphoblastic lymphoma: microarray-based comparative genomic hybridization and gene expression profiling studies with review of literature. Leuk Lymphoma. 2012;53(10):1978-1987.
17 Carr T, McGregor S, Dias S, et al. Oncogenic and tumor suppressor functions for lymphoid enhancer factor 1 in E2a(-/-) T acute lymphoblastic leukemia. Front Immunol. 2022;13:845488.
18. Gutierrez A, Sanda T, Ma W, et al. Inactivation of LEF1 in T-cell acute lymphoblastic leukemia. Blood. 2010;115(14):2845-2851.
Haematologica | 109 March 2024 999 CASE REPORT
An unusual case of thalassemia intermedia with inheritable complex repeats detected by single-molecule optical mapping
A 3.5-year-old female presented with mild anemia and was preliminarily diagnosed with thalassemia intermedia (TI) based on blood testing confirming microcytic, hypochromic anemia and abnormal amounts of hemoglobin (HGB, Hb) constituents. Longitudinal hematological measurements of the proband revealed HGB concentrations of 87-107 g/L (reference interval [RI]: 110-150 g/L), mean corpuscular volume of 57.8-62.1 fL (RI: 82-100 fL), mean corpuscular hemoglobin of 18.1-19.0 pg (RI: 27-34 pg), Hb A 2 of 1.6-1.9% (RI: 2.5-3.5%), and Hb F of 2.9-10.2% (RI: <2%) (Figure 1A, B). Other biochemical and blood routine parameters, including the ferritin levels, and counts of white blood cells, lymphocytes, neutrophils, monocytes and platelets were within normal ranges. Upon examination, the patient was pale, but with neither indications of thalassemic face nor hepatosplenomegaly. The patient did not receive prior transfusion therapy. The research protocol for this study was designed and implemented in accordance with the principles of the Declaration of Helsinki. This study was approved by the Ethics Committee of NanFang Hospital of Southern Medical University. Written informed consent was obtained for each participant.
We first conducted conventional molecular diagnosis for detecting thalassemia genes including Sanger sequencing, gap-polymerase chain reaction (gap-PCR), and multiplex ligation-dependent probe amplification (MLPA).1 The results revealed no thalassemia-causative point mutations on HBA1/2 or HBB genes. Gap-PCR analysis of known α -thalassemia deletions revealed maternal inheritance of a heterozygous Southeast Asian type deletion (--SEA , SEA deletion) (Figure 1B, C). However, the heterozygous SEA deletion alone is insufficient to explain the TI phenotype of the patient, prompting further investigations of other molecular defects involved in imbalanced production of globin chains. Thus, further characterization of α - and β -globin copy number variations (CNV) responsible for the TI phenotype was carried out.
MLPA was performed using SALSA MLPA KIT P140-B2 HBA/P102 HBB (MRC-Holland, Amsterdam, Holland) according to the manufacturer’s instructions. There was no copy number abnormality of the β -globin clusters in the proband. However, the results of the α -globin clusters were intriguing, as signaling of probes targeting the SEA deletion region decreased by about 50% for the proband (except for HBA2 gene) and II-2, confirming a heterozygous SEA deletion, in agreement with
the gap-PCR results. The signal intensity of the HBA2 region was significantly increased by about 6-12-fold for the proband (III-1), father (II-1), and grandmother (I-2), suggesting the presence of highly expanded HBA2 gene repeats, composed of multiple 4.2-kb fragments (Figure 1D). Chromosomal microarray analysis was performed on II-1 in accordance with the manufacturer’s protocol by CytoScan 750K array (Affymetrix, Santa Clara, CA, USA), and no other abnormalities were detected within the probe coverage range.
Droplet digital PCR (ddPCR) is a new generation PCR technique for absolute quantification of a target DNA template. CNV of the α -globin cluster were identified by ddPCR using three specific probes targeting three non-homologous regions (UP-HBA-FAM, 4.2-HBA-FAM, and 3.7-HBA-FAM) (Figure 1E) with the QX200 ddPCR system (Bio-Rad Laboratories, Hercules, CA, USA). The copy numbers of I-2, II-1, and the proband (III-1) detected with the 4.2-HBA-FAM probe were 23.18±1.26, 24.53±1.74, and 23.05±1.05 respectively. The results of the other two probes in the family members were consistent with former genotypes. The duplications in this pedigree were inferred as 22-26 repeats of 4.2-kb (Figure 1F).
In order to elucidate the structure of the 4.2-kb repeats, SMRTbell Express Template Prep Kit 2.0 was employed to prepare a library from sample II-1, followed by continuous long read sequencing using the Sequel IIe platform (Pacific Biosciences, San Diego, CA, USA). Total bases yield was 1,210 Gb and unique molecular yield was 228 Gb, with an average sequencing depth of 76X and average read length of 50 kb. Four representative long reads covering the left flanking and five full anti-4.2 repeats (read 1), eight full anti-4.2 repeats (read 2), 12 full anti-4.2 repeats and the right flanking (read 3), as well as wildtype allele (read 4) were displayed in integrative genomics viewer plot (Figure 1G). The anti-4.2 repeats occurred head-to-tail at the α -globin locus and the left and right breakpoints were delineated to be chr16:169454-170793 (X2 box) and chr16:173711-175048 (X1 box), respectively. However, due to repeat length limitation and lack of specific SNP for gene assembly in the region of repeats, even long-read sequencing could not identify the exact number of anti-4.2 repeats.
Globin analysis of red blood cells found no significant differences in α / β -globin levels among the II-1, II-2, and normal controls, while the proband had lower α / β -globin levels than SEA deletion carriers (Figure 1H). Quantita-
Haematologica | 109 March 2024 1000 CASE REPORT
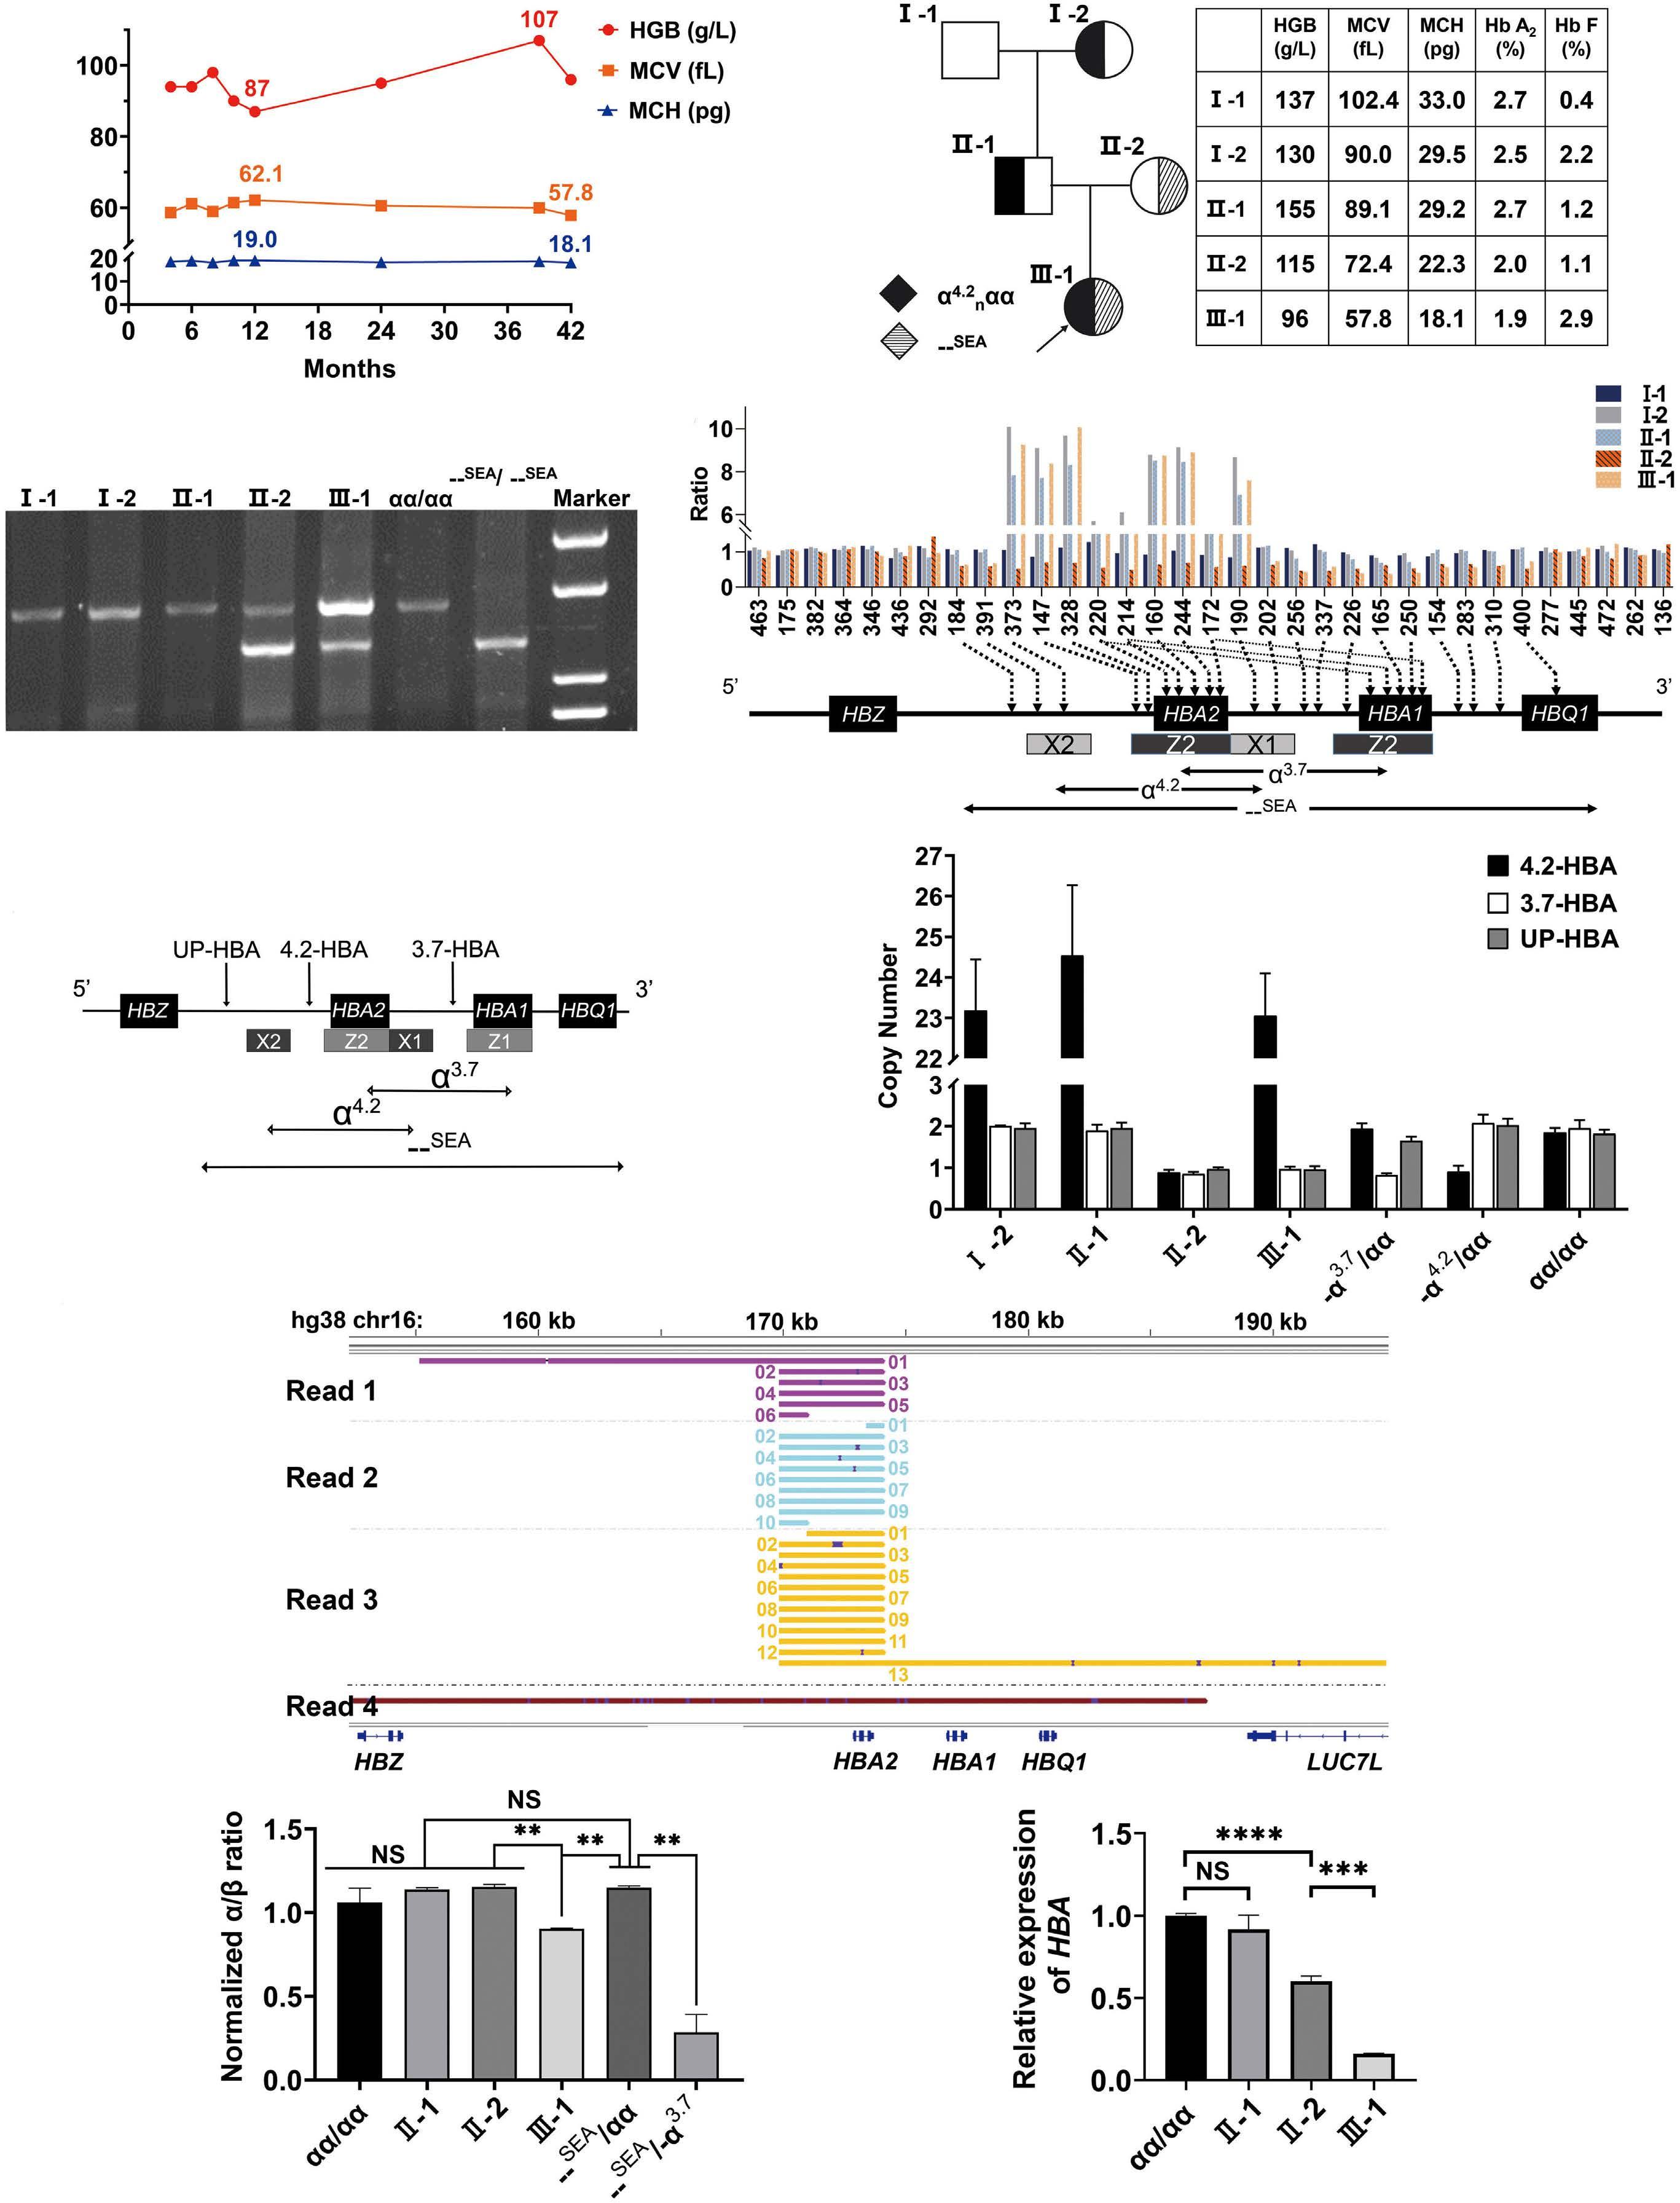
Haematologica | 109 March 2024 1001 CASE REPORT
A B C D E F G H I
Continued on following page.
1. Hematological and molecular data of the pedigree. (A) Longitudinal hematological features of the proband. The highest and lowest values are labeled on the figure. (B) Pedigree of the investigated family with copy number variations of the α-globin cluster. The proband is indicated by the arrow. (C) The Southeast Asian type deletion (--SEA, SEA deletion) detected in the proband (III-1) and mother (II-2) by agarose gel electrophoresis and gap-polymerase chain reaction (gap-PCR). (D) The multiplex ligation dependent probe amplification (MLPA) results targeting α-globin cluster among the family members. The histogram shows duplication of the 4.2-kb fragment for I-2, II-1, and III-1. II-2 and III-1 both carried the SEA deletion. The targeting regions of each specific probe are indicated below. (E) Targeting regions of the droplet digital PCR (ddPCR) probes. (F) The copy number values of the 4 family members as determined by ddPCR. Normal controls, -α3.7/αα and -α4.2/αα samples were tested using 2 biological and 2 analytical repeats. Samples from 4 family members were tested using 2 analytical repeats. (G) Representative reads from long-read sequencing of II-1. The allele with anti-4.2 repeats (read 1/2/3) and wild-type allele (read 4). Raw reads were aligned to hg38, cut at positions chr16:169454 and chr16:173711, and then displayed in integrative genomics viewer plot from left to right and from top to bottom. (H) The ratios of α- to β-globin chains were calculated by reversed-phase high performance liquid chromatograph (LC-20AT, Shimadzu Corporation, Kyoto, Japan). Normal controls, SEA deletion carriers and HbH diseases samples were tested using 2 biological and 2 analytical repeats. Samples from II-1, II-2, and III-1 were tested using 2 analytical repeats. There were no significant differences in α/β ratios among the 4 groups (normal controls, II-1, II-2, and SEA deletion carriers). The α/β ratios of III-1 were significantly lower than those of II-1, II-2 and the SEA deletion carriers, but higher than the HbH diseases samples. (I) Real-time quantitative PCR (RT-qPCR) for assessing the α-globin mRNA level. α-globin mRNA was slightly decreased in II-1 with no significance, decreased by 50% in II-2, while more decreased in III-1.
tive real time PCR (RT-qPCR) showed that compared to normal controls, α -globin mRNA was slightly decreased in II-1 with no significance, decreased by 50% in II-2, while more decreased in III-1 (Figure 1I).
Single-molecule optical mapping technology (Bionano Genomics, San Diego, CA, USA) was used to further deconstruct the sequence structure to determine the exact size of the complex repeats of the proband (III-1), I-2, and II-1. First, high molecule weight genomic DNA was isolated using the Bionano Prep Blood and Cell Culture DNA Isolation Kit. Second, 1 µ g of DNA was nicked, labeled, repaired and stained with NLRS kit to fluorescently label DNA at the Nb. BssSI recognition motif CACGAG. Third, the labeled DNA was loaded into the flow cell of the Saphyr Chip. On average, 494 (range, 486-500) Gb of data per sample were collected. An average of 12.2 (range, 11.78-12.67) labels per 100 kb, and the average mapping rate was 76.9% (range, 75.0-78.8%), equating to an average effective coverage depth of 122.78X (range, 120.25-124.34X). Fourth, raw DNA molecules were filtered based on a minimum length of 150 kb and a minimum of nine labeled sites per molecule. Filtered single molecules were assembled in to consensus genome maps with Bionano Solve v3.2.1 using RefAligner module. The hg19 reference genome maps was obtained by in silico Nt.BssSI digestion of reference genome sequence. Finally, the structure variants were called by aligning consensus genome maps to reference genome maps. We determined the allelic configuration of the proband, which was composed of the 24 extra tandem duplications of the 4.2-kb in Allele-1 and the SEA deletion in Allele-2 (Figure 2A). This duplication variant is designated as α 24 repeats αα , namely, adding 24 extra copies of α- globin gene to the normal two α -globin genes in one chromosome. For the proband, the specific genotype of the α -globin gene was --SEA/ α 24 repeats αα . I-2 and II-1 harbored 24 extra α -globin genes ( αα / α 24 repeats αα ), which included a 100-kb repeat sequence adjacent to the normal 4.2-kb allele
(Figure 2B, C), the same as that of the proband. Typically, tandem duplications and increased copy numbers are frequent somatic alterations in various cancer. 2 In the present study, this unusual tandem duplication, which extended over 100 kb, was inherited over three generations of the family. α -globin gene triplication ( ααα / αα ) is generally common, while quadruplication ( αααα / αα ) or more copy numbers are quite rare. Duplication of α -globin genes is attributable to unequal crossover between misaligned homologous segments in the α -globin gene cluster during meiosis, which is always benign and exerts no obvious influence on hematological parameters when found in isolation, rendering it barely detectable in clinical practice. The cases with co-inheritance of α -globin gene duplication and one β -thalassemia mutation would exacerbate the imbalance in α and β -globin chains, leading to TI phenotype. 3,4
We report an extremely rare, inheritable complex repeats of HBA2 within the human α -globin cluster by single-molecule optical mapping. Due to the long repeat fragments and the existence of highly homologous sequences, MLPA, ddPCR, PacBio sequencing fail to elucidate the characteristics of CNV/structural variation (SV) in this pedigree. In single molecule ordered restriction maps, we found that the pattern of the Nb.BssSI-based labels covering HBA2 , was repeated additional 24 times, indicating a 100-kb repeat sequence adjacent to the normal HBA2 . Among the current molecular diagnostic techniques, single-molecule optical mapping is unrivaled for deciphering highly repetitive regions and detecting the genome structure variations. It utilizes very long reads, up to megabases, by eliminating the need to break DNA molecules into short fragments and subsequent amplification. Currently, single-molecule optical mapping is predominantly applied for genome assembly and detection of large structure variation. In the field of molecular diagnosis, it is useful to identify and characterize gene duplications, deletions and genomic rearrangements,
Haematologica | 109 March 2024 1002 CASE REPORT
Figure
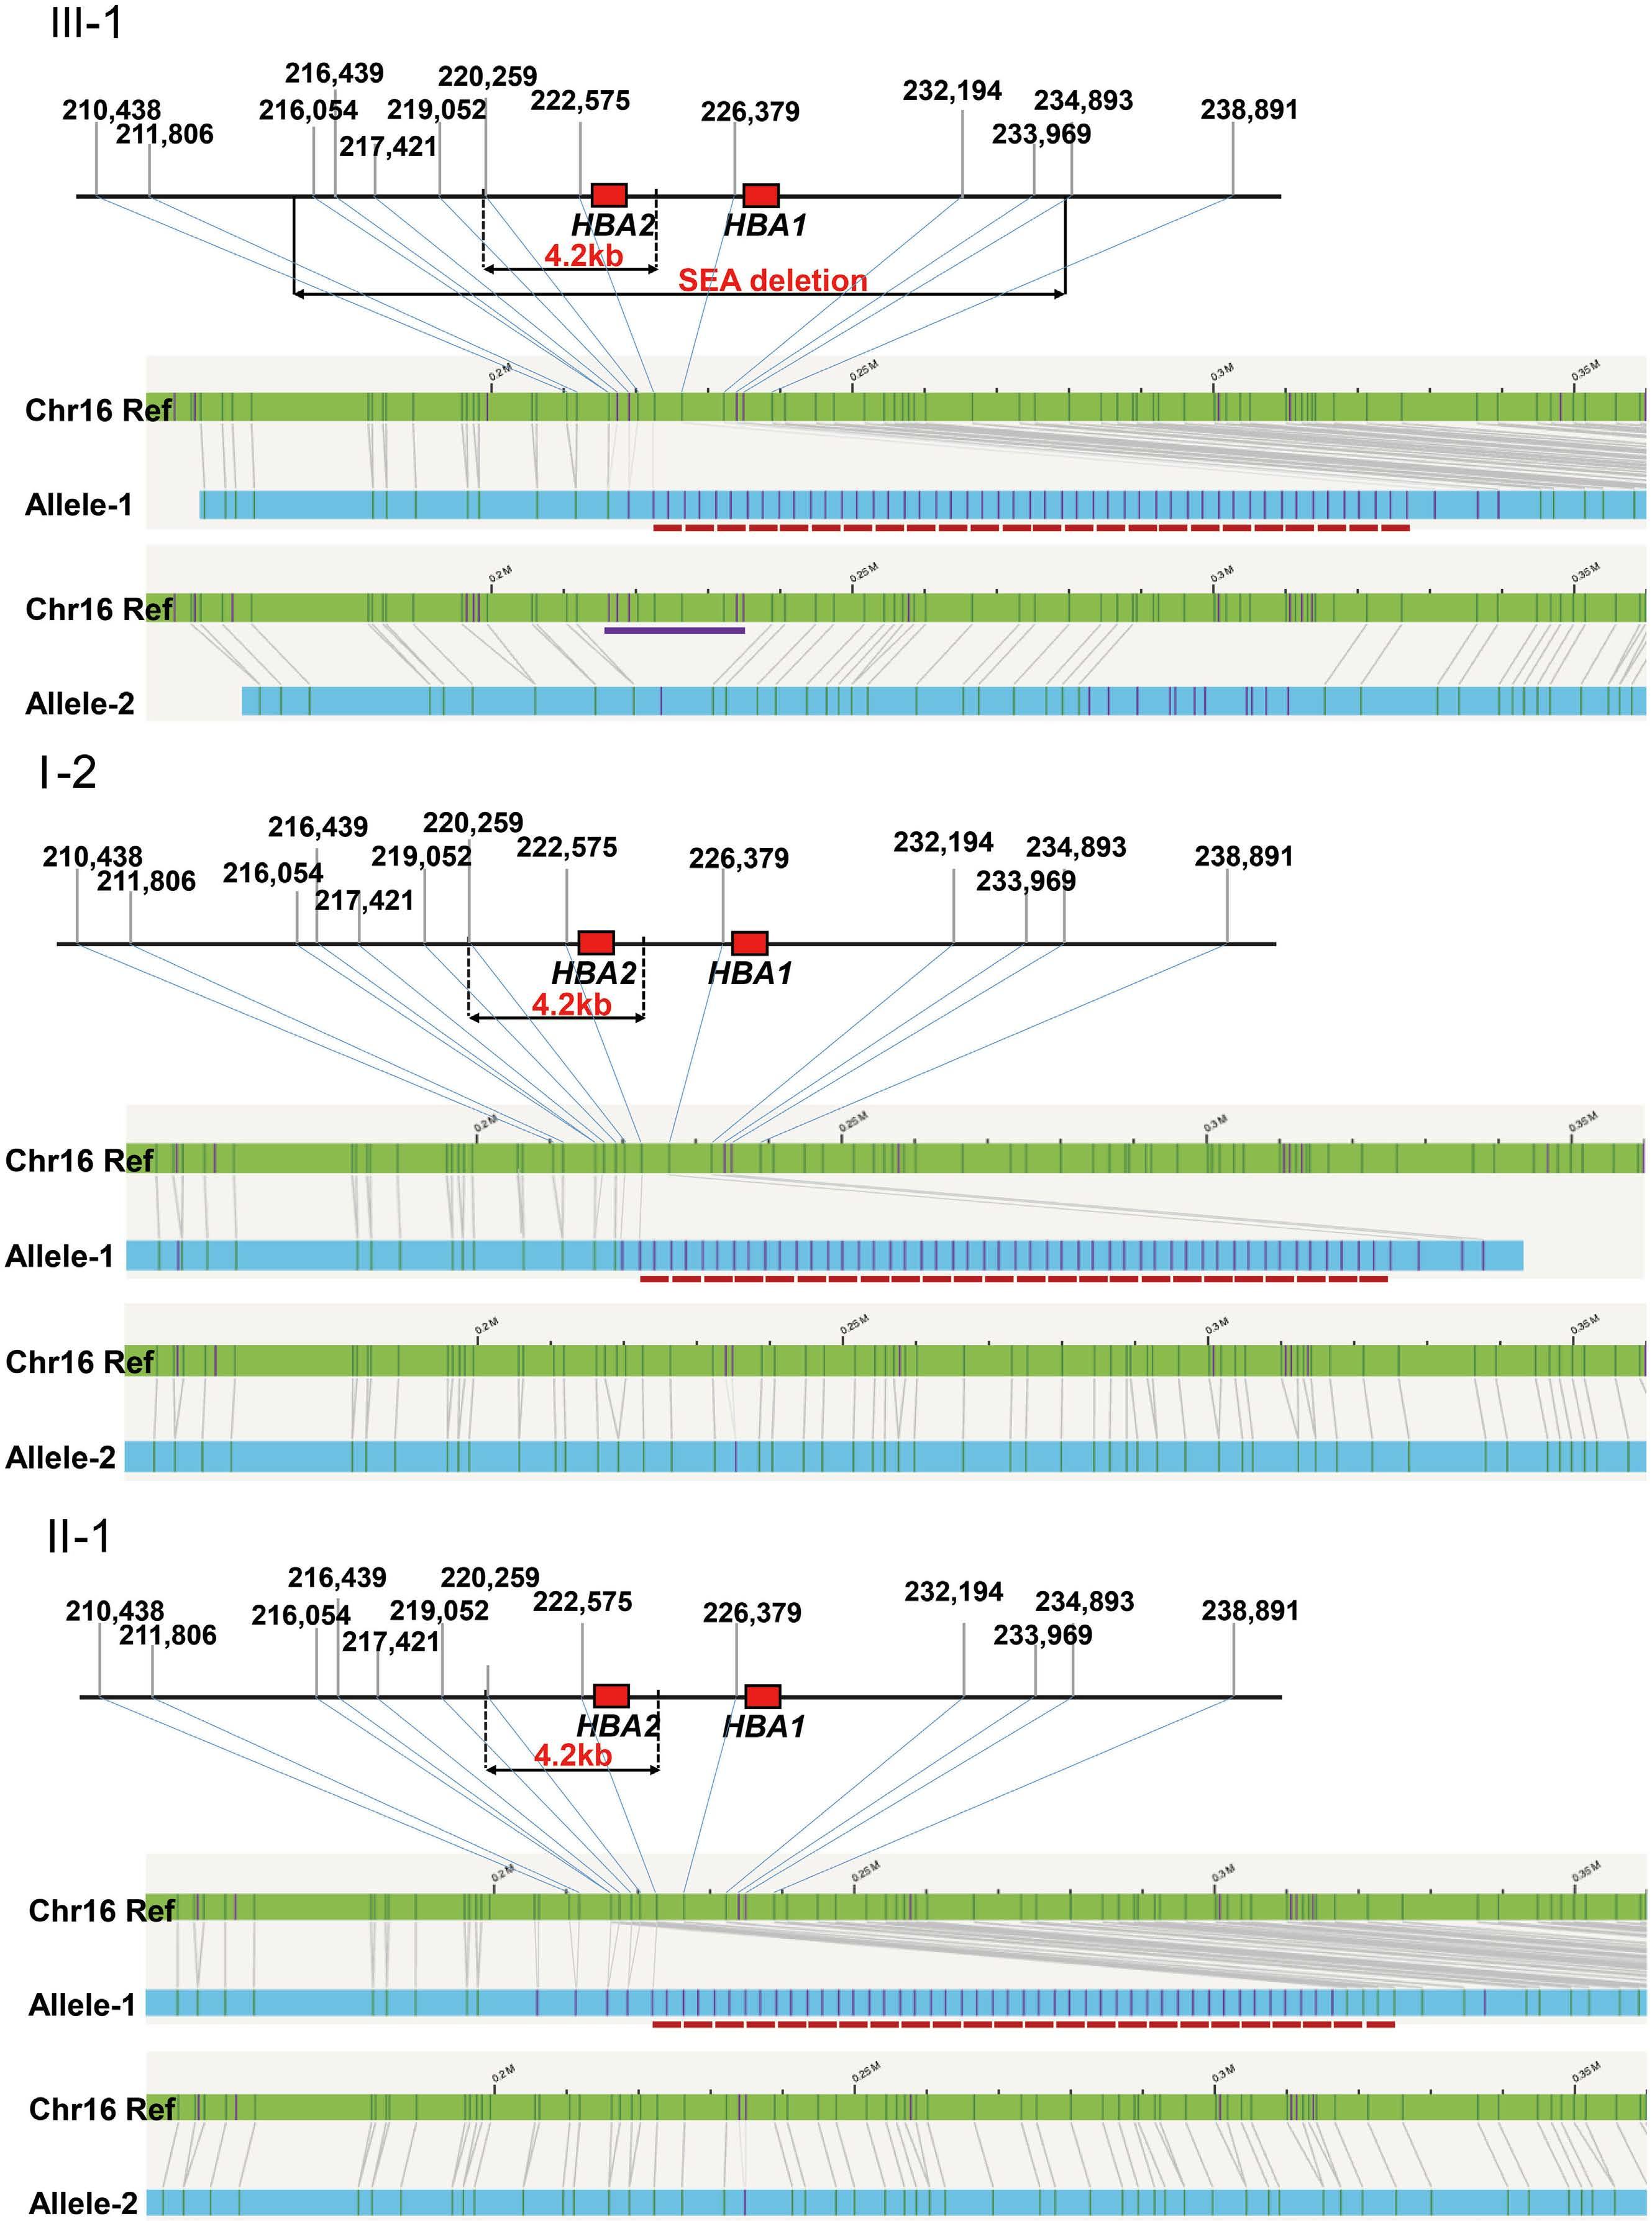
Continued on following page.
Haematologica | 109 March 2024 1003 CASE REPORT
A B C
α
3
α3.7 , -α4.2
the each panel. The α-globin cluster reference maps (green) aligned to the 2 alleles maps (blue) are indicted by horizontal boxes. The vertical lines within boxes are label sites. Matching labels between alleles from samples and reference genome maps are connected by gray lines. In Allele-1, the distance between the 2 labels, 222,575 and 226,379, was much larger than that of the reference genome, indicating sequence insertion. The pattern of label 220,259 to label 222,575 was amplified with extra 24 regular repeats compared to reference genome. The 24 extra tandem duplications of the 4.2-kb segment in Allele-1 are indicated by red dotted lines. In Allele-2 of the proband (A), the distance between the 2 labels, 211,806 and 234,893, was shorter than that of the reference genome, indicating sequence deletion. The SEA deletion region in Allele-2 is indicated by a purple line. Coordinates are based on human genome build GRCh37/hg19.
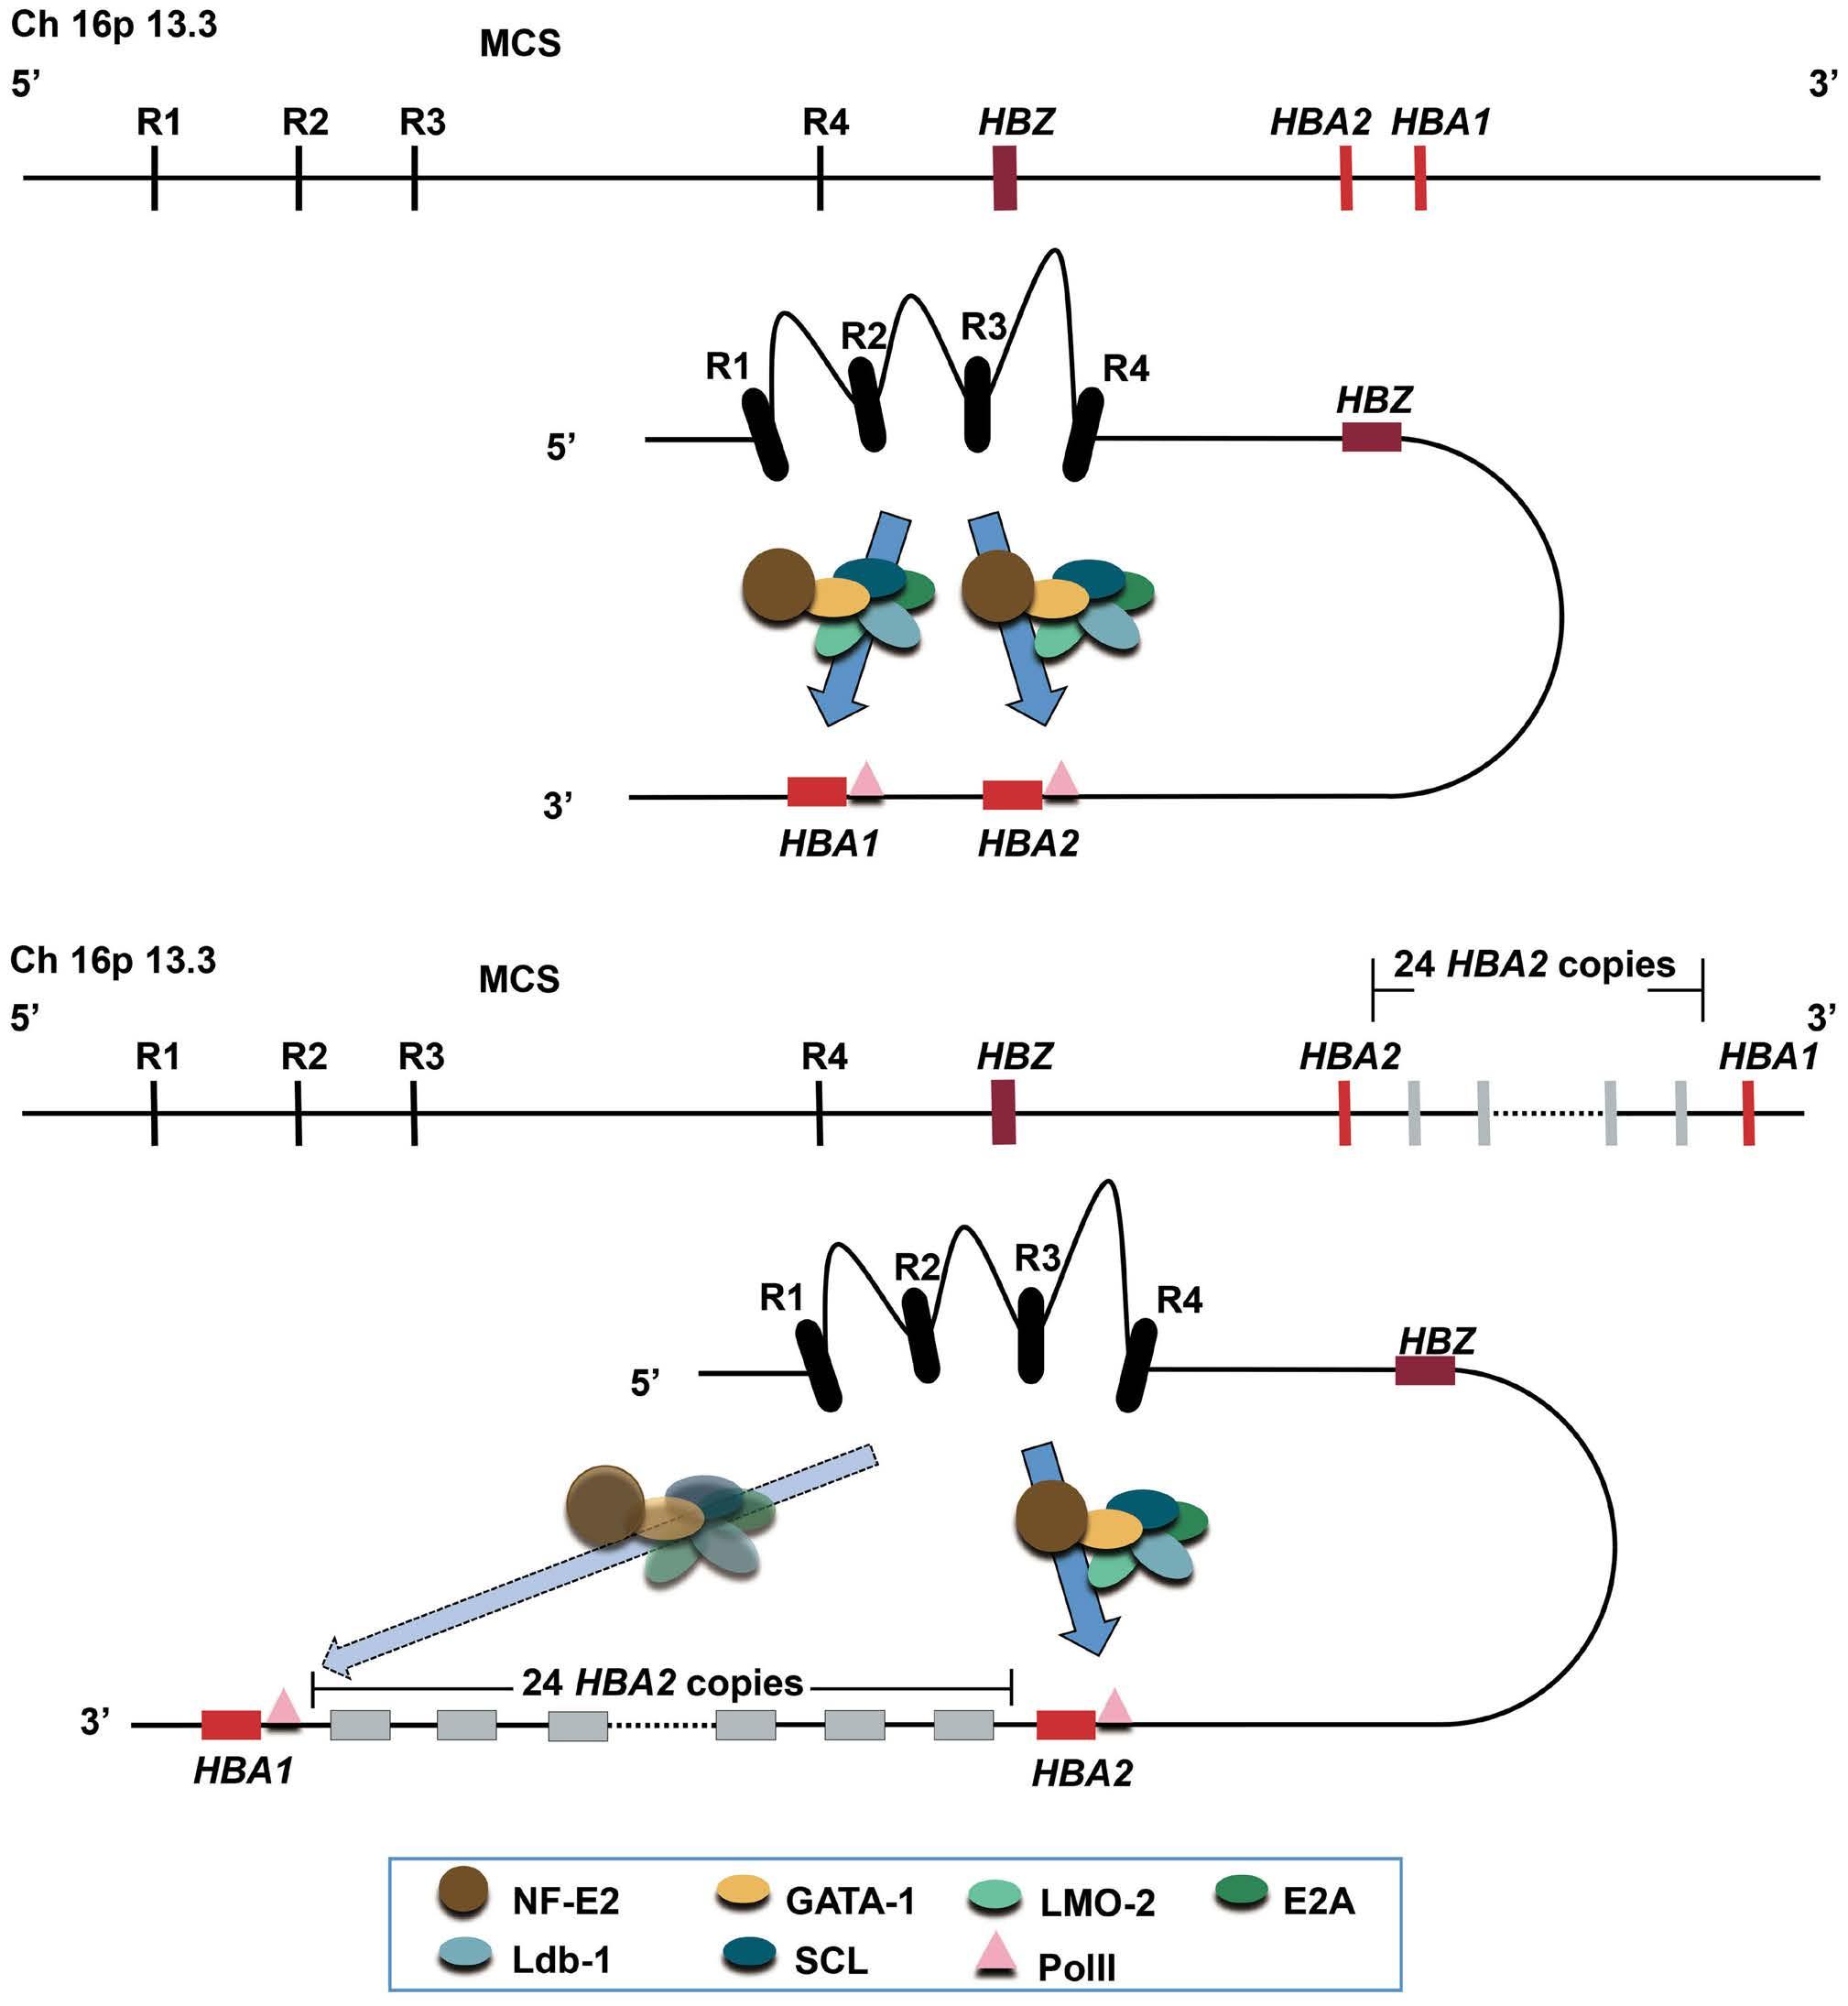
Figure 3. A hypothetical model to explain that the tandemly repeated copies of HBA2 inhibit the normal α-globin expression. (A) The α-globin locus in human, including HBZ, HBA2, HBA1 and 4 multispecies conserved sequences (MCS R1-4)) associated with erythroid-specific DNase1 hypersensitive sites (HS) (upper panel). Normally, HS contact α-globin gene promoters via chromatin looping, facilitated by the erythroid-specific transcription factors and proteins, activates high-level transcription of the cis-linked α-globin genes (bottom panel). (B) The inheritable complex repeats detected in this study, inserted 24 extra α-globin genes between HBA2 and HBA1 (upper panel). The repeats largely extend the distance between the HS and HBA1 by approximately 100 kb, diminish HS/HBA1 contacts, thus the HBA1 expression is impaired.
ranging in size from kilobases to megabases. 5 The addition of this new molecular diagnostic technique might be beneficial to identify potentially pathogenic CNV/SV, similar to this study.
A large increase in the copy number of the α -globin gene was initially assumed to produce excess of α -globin chains, resulting in thalassemic phenotypes due to imbalanced globin chain synthesis, although this effect
Haematologica | 109 March 2024 1004 CASE REPORT
Figure 2. Characterization of the duplications by single-molecule optical mapping technology. Single-molecule optical mapping analysis of the proband (A), I-2 (B) and II-1 (C). Schematic representation showing the locations of
-globin genes and the region of
copy number variations (-
, --SEA) are present above
B
A
was not observed in this pedigree. I-2 and II-1 had extra 24 heterozygous repeats of the α -globin genes, showing normal hematological manifestations. Analysis of red blood cells found no differences in the α / β -globin ratio of II-1, II-2, and normal controls (Figure 1H), suggesting no linear relationships of globin expression with the gene copy number and that the extra repeats of the α -globin gene were inactive. Tandem duplications often produce tandemly arrayed genes which are usually non-functional, similar to pseudogenes.6 In this study, the SEA deletion was likely the cause of microcytic hypochromic anemia and low Hb A 2 of the proband, but her anemia burden was likely greater than that of the general SEA deletion carriers, as reflected by the much lower HGB, mean corpuscular volume and mean corpuscular hemoglobin levels. Notably, the α -globin mRNA and α/β -globin ratio of the proband were all lower than those of the SEA deletion carriers (Figure 1H, I), suggesting tandemly repeated copies of HBA2 , in turn, inhibit the normal α -globin expression, which might be related to the long-range looping interactions of distant functional elements with the α -globin genes upon gene activation. Normally, functional elements, characterized by the presence of DNAse I hypersensitive sites (HS) located 53 to 68 kb upstream of HBA2 , form loop structures with downstream globin genes, which are necessary for α -globin genes expression (Figure 3A).7 In this regulatory loop, the α -globin genes expression level is determined by looping efficiency, which depends on the flexibility of chromatin fiber, the distance between HS and α -globin gene promoters. For the proband, insertion of non-functional tandem duplications before HBA1 would largely extend the distance between the distant functional elements and HBA1 by approximately 100 kb, which could have decreased HBA1 transcription (Figure 3B). 8-10 There are normally four α -globin genes arranged as linked pairs ( αα/αα ), whereas one of the four genes is impaired, the overall α -globin production is practically unchanged, such as in I-2 and II-1. However, in the proband, both α -globin genes on the same chromosome were deleted, and HBA1 expression on the other chromosome were decreased at the same time. This would be obvious functional change brought about by these two defects, and thereby lead to imbalanced α/β ratio and a milder TI. However, we did not detect the presence of HbH in proband’s peripheral blood, which might due to its low levels below the detection limit of the capillary electrophoresis system.11 This case report highlights the important role of structural organization of the globin locus in gene activity, which would provide a new clue to investigate the distal enhancer and globin gene promoter communication during erythroid development. Moreover, it is important to consider the possibility of more intricate underlying mechanisms, such as methylation-induced silencing, which warrants further investigation, but it is hindered
by the current limited sample availability.
Au tho rs
Qianqian Zhang,1,2* Peng Lin,1,2* Aiping Mao, 3 Yongqiong Liu,1 Xuan Shang,1 Xiaofeng Wei,1 Yuezhen Li, 3 Bin Lin 4 and Xiangmin Xu 1
1Innovation Center for Diagnostics and Treatment of Thalassemia, Nanfang Hospital; Department of Medical Genetics, School of Basic Medical Sciences, Southern Medical University, Guangzhou, Guangdong; 2Dongguan Maternal and Child Health Care Hospital, Postdoctoral Innovation Practice Base of Southern Medical University, Prenatal Diagnosis Center, Dongguan Maternal and Child Health Care Hospital, Dongguan, Guangdong; 3Department of TGS Research and Development, Berry Genomics Corporation, Beijing and 4Guangzhou Jiexu Gene Technology Co., Ltd., Guangzhou, Guangdong, China
*QZ and PL contributed equally as first authors.
Correspondence: X. XU - xixm@smu.edu.cn
https://doi.org/10.3324/haematol.2023.282902
Received: February 9, 2023.
Accepted: September 20, 2023. Early view: September 28, 2023.
©2024 Ferrata Storti Foundation
Published under a CC BY-NC license
Disclosures
No conflicts of interest to disclose.
Contributions
QZ and YQ-L collected samples and guided diagnosis. PL, YQ-L and XW performed molecular experiments. AM and YZ-L performed optical mapping, PacBio sequencing, data analysis and interpretation. BL conducted the chromosomal microarray analysis. QZ and PL developed the figures. QZ, PL and AM wrote the paper. BL, XS and XX revised the manuscript. XW provided administrative support. XX supervised the study.
Funding
This work was supported by research funding from National Natural Science Foundation of China (to XX; grant U20A20353), National Key Research and Development Program of China (to XX; grants 2018YFA0507800 and 2018YFA0507803).
Data-sharing statement
Data are available upon reasonable request addressed to the corresponding author.
Haematologica | 109 March 2024 1005 CASE REPORT
References
1. Vijian D, Wan Ab Rahman WS, et al. Molecular detection of alpha thalassemia: a review of prevalent techniques. Medeni Med J. 2021;36(3):257-269.
2. Chiba K, Shiraishi Y, Nagata Y, et al. Genomon ITDetector: a tool for somatic internal tandem duplication detection from cancer genome sequencing data. Bioinformatics. 2015;31(1):116-118.
3. Shang X, Xu XM. Update in the genetics of thalassemia: what clinicians need to know. Best Pract Res Clin Obstet Gynaecol. 2017;39:3-15.
4 Shang X, Peng ZY, Ye YH, et al. Rapid targeted next-generation sequencing platform for molecular screening and clinical genotyping in subjects with hemoglobinopathies. EBioMedicine. 2017;23:150-159.
5. Mantere T, Neveling K, Pebrel-Richard C, et al. Optical genome mapping enables constitutional chromosomal aberration detection. Am J Hum Genet. 2021;108(8):1409-1422.
6. Wagner A. The fate of duplicated genes: loss or new function?
Bioessays. 1998;20(10):785-788.
7 Baù D, Sanyal A, Lajoie BR, et al. The three-dimensional folding of the α-globin gene domain reveals formation of chromatin globules. Nat Struct Mol Biol. 2011;18(1):107-114.
8. Shimotsuma M, Matsuzaki H, Tanabe O, et al. Linear distance from the locus control region determines epsilon-globin transcriptional activity. Mol Cell Biol. 2007;27(16):5664-5672.
9. Fraser P. Transcriptional control thrown for a loop. Curr Opin Genet Dev. 2006;16(5):490-495.
10 Voon HP, Vadolas J. Controlling alpha-globin: a review of alphaglobin expression and its impact on beta-thalassemia. Haematologica. 2008;93(12):1868-1876.
11. Greene DN, Pyle AL, Chang JS, et al. Comparison of sebia capillarys flex capillary electrophoresis with the BioRad variant II high pressure liquid chromatography in the evaluation of hemoglobinopathies. Clin Chim Acta. 2012;413(15-16):1232-1238.
Haematologica | 109 March 2024 1006 CASE REPORT
Tucidinostat restores CCR4 expression in adult T-cell leukemia/lymphoma
Adult T-cell leukemia/lymphoma (ATLL) is a hematological malignancy that develops from human T-lymphotropic virus type 1 (HTLV-1)-infected T cells.1 ATLL quickly acquires therapy-resistance to cytotoxic chemotherapeutic agents, and its prognosis is still dismal.2 Whereas allogeneic hematopoietic stem cell transplantation may lead to long-term remission, its indication is limited due to high non-relapse mortality and higher age of the patients.3 Ninety percent of ATLL cells express a chemokine receptor 4 (CCR4),4 and mogamulizumab, the monoclonal antibody targeting CCR4, effectively depletes ATLL cells through antibody-dependent cellular cytotoxicity.5 Next-generation sequencing of HTLV-1-infected cells recently revealed genomic instability of ATLL,6 which made its epigenetics a therapeutic target. The histone deacetylase (HDAC) inhibitor tucidinostat7 and the enhancer of Zeste homolog 1/2 (EZH1/2) dual inhibitor valemetostat8 have been approved for clinical use against relapsed or refractory ATLL in Japan. However, as our experience of their use is still limited, their modes of function and interaction still need careful investigation. A concern has been raised that HDAC inhibitors might interfere the effects of mogamulizumab, because vorinostat downregulated CCR4 expression in ATLL and peripheral T-cell lymphoma through inhibition of the HDAC2 pathway.9 However, it is unclear whether these results can be obtained with other HDAC inhibitors and are reproducible in the patients. At this point, we experienced an ATLL case in which CCR4 expression was conversely restored during treatment by tucidinostat.
A man in his 70s was admitted due to general malaise and body weight loss. Peripheral blood count revealed elevated white blood cells (9.2×10⁹/L), 72% of which were abnormal lymphocytes with characteristic nucleus morphology and a phenotype of CD3dimCD4+CD25+CADM1+(cell adhesion molecule 1+)CD7-CCR4+. Computed tomography scan revealed systemic lymphadenopathy and hepatosplenomegaly, and blood test showed elevated soluble interleukin (IL)-2 receptor of 69,727 U/mL, hypercalcemia of 11.5 mg/dL and renal dysfunction. Southern blot analysis of peripheral blood showed monoclonal integration of HTLV-1 provirus, which made the diagnosis of acute type ATLL. Six courses of modified lymphoma study group-15 chemotherapy (mLSG15; VCAP-AMP-VECP) with mogamulizumab achieved complete response, and abnormal lymphocytes in peripheral blood disappeared. However, skin tumors grew at the back of the left knee joint shortly after the treatment. It was pathologically diagnosed involvement of ATLL, and local irradiation was initially performed. Irradiation was successful, but skin eruption and tumors appeared on the
bilateral hips and left ankle one after another. Since local therapy could not control tumor progression, resumption of systemic chemotherapy was considered. As his ATLL cells were negative for CD30, brentuximab vedotin, an anti-CD30 antibody-drug conjugate, was not indicated. Therefore, tucidinostat was given at 40 mg/day twice a week. All the lymph nodes stopped growing and some of them shrank. The maximum treatment response was partial response, but the lymph nodes showed regrowth 3 months later. Then he was treated with other salvage chemotherapy with dexamethasone, etoposide, ifosfamide, and carboplatin (DeVIC), followed by mogamulizumab.
In the meantime, CCR4 expression on ATLL cells in peripheral blood was sequentially analyzed by flow cytometry HAS-flow method focusing on ATLL cells10 (Figure 1). Notably, whereas CADM1+ cells were negative for CCR4 at the start of tucidinostat, their CCR4 expression showed clonal restitution for 3 months after starting tucidinostat. However, its expression was again downregulated simultaneously with resistance to tucidinostat. As CCR4 expression was partially seen on CADM1+ cells on day 90, mogamulizumab was given again in combination with DeVIC, which resulted in partial response. Once the treatment seemed to be successful, the disease kept recurring, and each time, local irradiation, and other drugs such as lenalidomide were tried to control the disease, but the tumor eventually led to his death.
CCR4 expression on T cells is modulated through inflammatory signaling11 or gene mutation, which might be associated with the response to mogamulizumab. Whereas vorinostat might down-regulate CCR4 expression,9 our case showed restored CCR4 expression during the treatment of tucidinostat, which may potentiate the effects of second mogamulizumab treatment. Vorinostat and tucidinostat have slightly different points of action on HDAC. That is, vorinostat acts on HDAC1/2/3/6, whereas tucidinostat acts on HDAC1/2/3/10.12 HDAC6 and 10 are included in the same class 2b, but naturally their intracellular functions are different. Differences in selectivity by HDAC inhibitor may be also important factor in their effects on CCR4 expression in tumor cells. Given that HTLV-1 carriers contain several different clones with HTLV-1 in developing ATLL,13 epigenetics and CCR4 expression may be different among these clones. Therefore, their behavior would be different for each clone in response to HDAC inhibitors. CCR4 expression might be modulated even in a single case, which should be considered at treating ATLL. Whereas CCR4 expression on tumor cells may not be associated with the response to mogamulizumab,14 it is still important given
Haematologica | 109 March 2024 1007 CASE REPORT
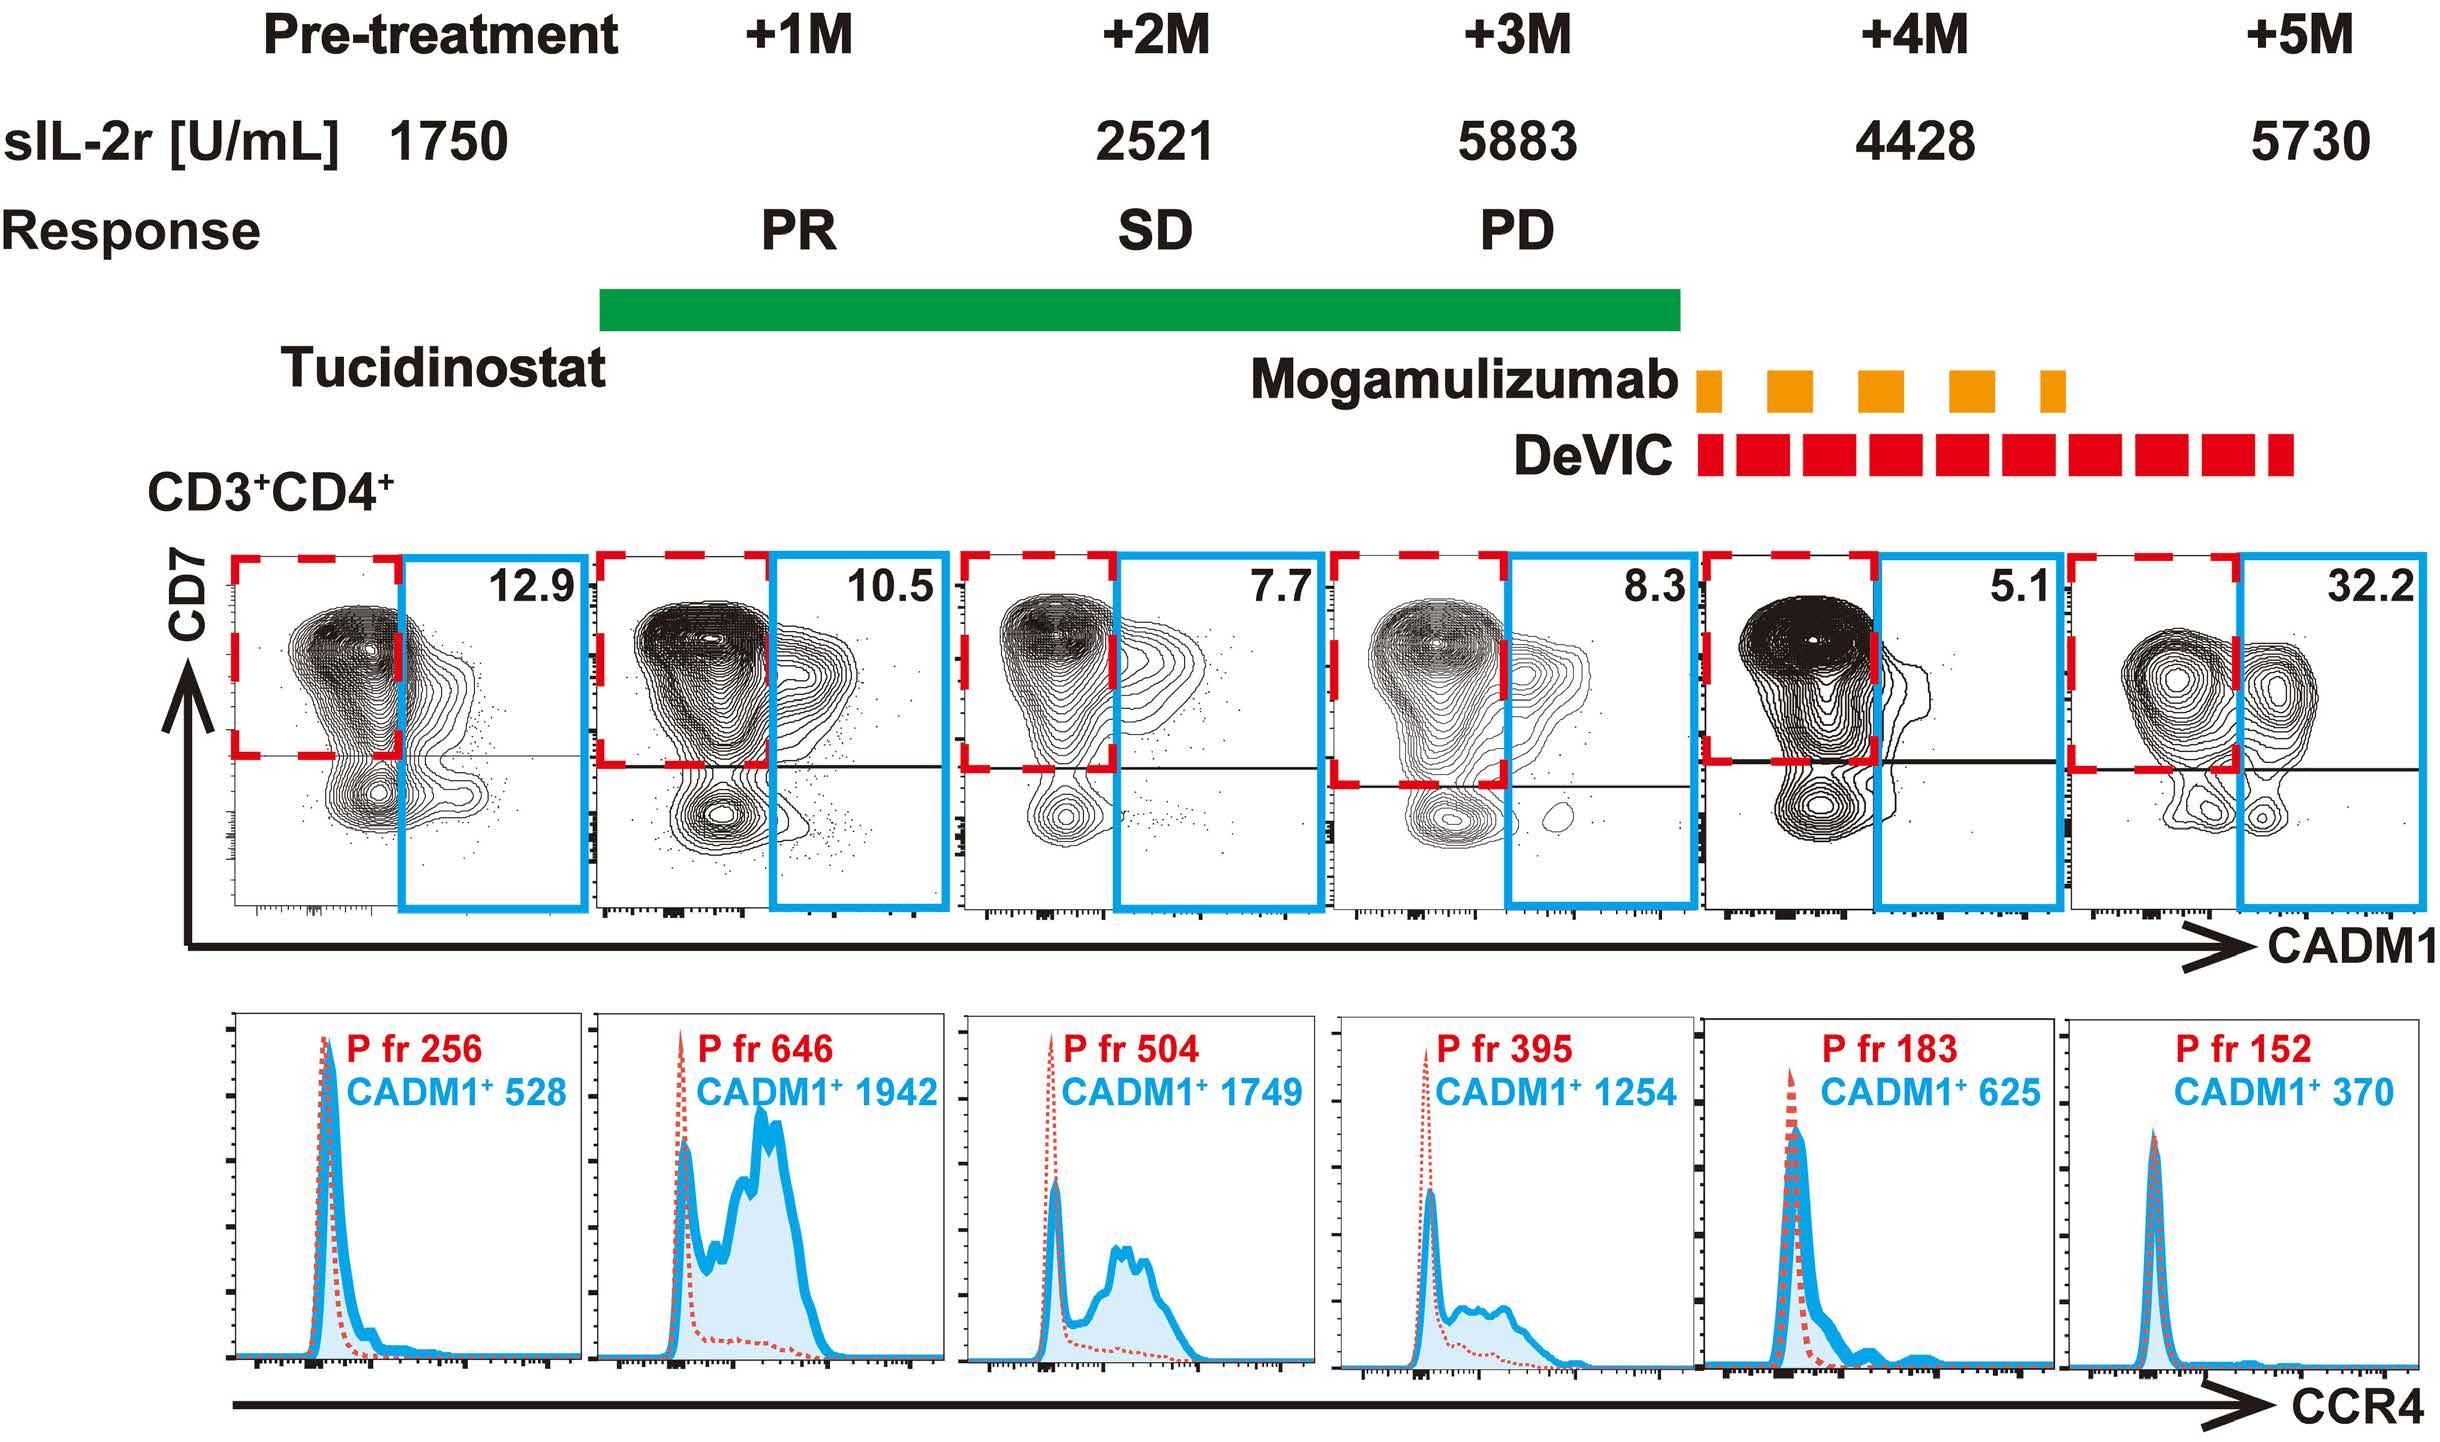
T-cell
(ATLL) cells was sequentially analyzed by flow cytometry, and schema of treatment courses and clinical responses with soluble interleukin 2 receptor (sIL-2r) is shown. (B) Freshly isolated peripheral blood mononuclear cells from the patient were stained for CD3, CD4, CD7, cell adhesion molecule 1 (CADM1), and CCR4. Scattergrams of CADM1/CD7 gating on CD3+CD4+ T cells are shown in upper row, and histograms of CCR4 gating on CADM1-CD7+ (P fraction) and CADM1+ cells are shown in bottom row. Mean fluorescence intensity (MFI) of CCR4 was compared between P fraction (CADM1-CD7+, dashed rectangle) and CADM1+ fraction (solid rectangle) within CD3+CD4+ lymphocytes. Specimen collection and use were conducted in accordance with Kyoto University’s comprehensive consent form (G0697), which was ethically reviewed and approved by Kyoto University Hospital and Hyogo Prefectural Amagasaki General Medical Center (AGMC). Peripheral blood was collected at AGMC with the patient’s consent. Utilized anti-CCR4 antibody derived from a clone #205410 (R&D systems). PR: partial response; SD: stable disease; PD: progressive disease.
that the indication of mogamulizumab is limited to CCR4+ ATL.5 Treatment strategies for maintaining CCR4 expression on ATLL cells may be beneficial, provided there are no underlying genomic mutations that render the expression ineffective.
Previous literature highlights that HDAC inhibitors may have a minimal impact on the responses of mogamulizumab in cutaneous T-cell lymphoma,15 suggesting that HDAC inhibition might not interfere mogamulizumab’s in vivo activity. While the connection between CCR4 expression on tumor cells and the effects of mogamulizumab might not be linear, it is crucial to consider this relationship because mogamulizumab was firstly approved for CCR4-positive ATL in Japan.5 Hence, strategies that maintain CCR4 expression in ATLL cells are preferred. Kitadate et al. suggested that HDAC inhibitors might decrease CCR4 expression in ATLL cells,9 but our case raises the need for further studies, particularly focusing on the effects of inhibiting HDAC 6 and 10. By understanding these specific effects on CCR4 expression, clinicians can personalize their approach and select the most appropriate HDAC inhibitors to enhance or maintain CCR4 expression in ATLL cells.
Authors
Takahito Kawata,1,2 Takuya Shimizu,2 Takero Shindo,2 Kensuke Fujiwara,1 Suguru Morimoto1 and Mitsumasa Watanabe1
1Department of Hematology, Hyogo Prefectural Amagasaki General Medical Center, Amagasaki and 2Department of Hematology/ Oncology, Kyoto University Graduate School of Medicine, Kyoto, Japan
Correspondence:
T. SHINDO - takeros@kuhp.kyoto-u.ac.jp
https://doi.org/10.3324/haematol.2023.283266
Received: April 5, 2023.
Accepted: September 25, 2023.
Early view: October 5, 2023.
©2024 Ferrata Storti Foundation
Published under a CC BY-NC license
Haematologica | 109 March 2024 1008 CASE REPORT
A B
Figure 1. Tucidinostat restores CCR4 expression in adult T-cell leukemia/lymphoma. (A) Chemokine receptor 4 (CCR4) expression on adult
leukemia/lymphoma
Disclosures
No conflicts of interest to disclose.
Contributions
TK managed the patient, acquired samples, and wrote the manuscript. KF, SM managed the patient. T. Shimizu performed the
References
1. Uchiyama T, Yodoi J, Sagawa K, et al. Adult T-cell leukemia: clinical and hematologic features of 16 cases. Blood. 1977;50(3):481-492.
2. Tsukasaki K, Hermine O, Bazarbachi A, et al. Definition, prognostic factors, treatment, and response criteria of adult T-cell leukemia-lymphoma: a proposal from an international consensus meeting. J Clin Oncol. 2009;27(3):453-459.
3. Muranushi H, Shindo T, Hishizawa M, et al. GVHD-free, relapsefree survival provides novel clues for optimizing allogeneicHSCT for adult T-cell leukemia/lymphoma. Bone Marrow Transplant. 2021;56(1):155-166.
4. Ishida T, Utsunomiya A, Iida S, et al. Clinical significance of CCR4 expression in adult T-cell leukemia/lymphoma: its close association with skin involvement and unfavorable outcome. Clin Cancer Res. 2003;9(10 Pt 1):3625-3634.
5. Ishida T, Joh T, Uike N, et al. Defucosylated anti-CCR4 monoclonal antibody (KW-0761) for relapsed adult T-cell leukemia-lymphoma: a multicenter phase II study. J Clin Oncol. 2012;30(8):837-842.
6. Kataoka K, Nagata Y, Kitanaka A, et al. Integrated molecular analysis of adult T cell leukemia/lymphoma. Nat Genet. 2015;47(11):1304-1315.
7 Utsunomiya A, Izutsu K, Jo T, et al. Oral histone deacetylase inhibitor tucidinostat (HBI-8000) in patients with relapsed or refractory adult T-cell leukemia/lymphoma: phase IIb results. Cancer Sci. 2022;113(8):2778-2787.
8. Izutsu K, Makita S, Nosaka K, et al. An open-label, single-arm phase 2 trial of valemetostat for relapsed or refractory adult
analysis and wrote the manuscript. T. Shindo designed the research, conceived the concept, and wrote the manuscript. MW managed the patient and supervised the analysis.
Data-sharing statement
Data are available and please contact the corresponding author.
T-cell leukemia/lymphoma. Blood. 2023;141(10):1159-1168.
9 Kitadate A, Ikeda S, Abe F, et al. Histone deacetylase inhibitors downregulate CCR4 expression and decrease mogamulizumab efficacy in CCR4-positive mature T-cell lymphomas. Haematologica. 2018;103(1):126-135.
10. Kobayashi S, Nakano K, Watanabe E, et al. CADM1 expression and stepwise downregulation of CD7 are closely associated with clonal expansion of HTLV-I-infected cells in adult T-cell leukemia/lymphoma. Clin Cancer Res. 2014;20(11):2851-2861.
11. D’Ambrosio D, Iellem A, Bonecchi R, et al. Selective upregulation of chemokine receptors CCR4 and CCR8 upon activation of polarized human type 2 Th cells. J Immunol. 1998;161(10):5111-5115.
12. Ho TCS, Chan AHY, Ganesan A. Thirty years of HDAC inhibitors: 2020 insight and hindsight. J Med Chem. 2020;63(21):12460-12484.
13. Firouzi S, Farmanbar A, Nakai K, et al. Clonality of HTLV-1infected T cells as a risk indicator for development and progression of adult T-cell leukemia. Blood Adv. 2017;1(15):1195-1205.
14 Kim YH, Bagot M, Pinter-Brown L, et al. Mogamulizumab versus vorinostat in previously treated cutaneous T-cell lymphoma (MAVORIC): an international, open-label, randomised, controlled phase 3 trial. Lancet Oncol. 2018;19(9):1192-1204.
15. Horwitz S, Zinzani PL, Bagot M, et al. Lack of impact of type and extent of prior therapy on outcomes of mogamulizumab therapy in patients with cutaneous T cell lymphoma in the MAVORIC trial. Leuk Lymphoma. 2021;62(13):3109-3118.
Haematologica | 109 March 2024 1009 CASE REPORT
List of the reviewers who in 2023 generously made an essential contribution to the high scientific quality of Haematologica
Miguel Abboud
Omar Abdel-Wahab
Oussama Abla
Pau Abrisqueta
Sophia Adamia
Tom Adamkiewicz
Sandra Susanibar Adaniya
Diego Adrianzen Herrera
Anjali Advani
Puneet Agarwal
Pasquale Agosti
Nadine Susan Aguilera
Matthew Ahearne
Domenico Albano
Juan Alderuccio
Ibrahim Aldoss
Thomas B Alexander
Kauskot Alexandre
Stefan Alig
Mahmoud Aljurf
Slimane Allali
Karel Allegaert
Abdulkareem Almomen
Hanny Al-Samkari
Othman Al-Sawaf
Catalina Amador
Jennifer E Amengual
Faiz Anwer
Tomohiro Aoki
Frederick R Appelbaum
Jane Apperley
Yasuyuki Arai
Luca Arcaini
Marie-Laure Arcangeli
Philippe Armand
Mary Armanios
Donald M Arnold
Bertrand Arnulf
Sarit Assouline
Jon Christopher Aster
Ehab Atallah
Sylvain Audia
Holger Werner Auner
Igor Aurer
Hervé Avet-Loiseau
Abraham Avigdor
Irit Avivi
Yesim Aydinok
Francis A Ayuk
Samah Babiker
Jodie L Babitt
Veronika Bachanova
Ulrike Bacher
K Bachmaier
Emmanuel Bachy
Andrea Bacigalupo
Barbara Jane Bain
Alessandra Balduini
Amaris Balitsky
Rahul Banerjee
Versha Banerji
Aniket Bankar
Yael Bar On
Joao Barata
Wilma Barcellini
Giovanni Barosi
Paul M Barr
Nancy Bartlett
André Baruchel
Shlomit-Barzilai-Birenboim
Renato Bassan
Francesca Basso-Valentina
Kebede Begna
Rafael Bejar
Meral Beksac
Richard J Bende
Zsuzsanna Bereczky
Sigbjorn Berentsen
Jason Berman
Francesco Bernardi
Kathrin M Bernt
Luca Bertamini
Francesco Bertoni
Karin Beutel
Ofrat Beyar-Katz
Ravi Bhatia
Paola Bianchi
Giada Bianchi
Efraim Bilavsky
Andrea Biondi
James S Blachly
Igor Blau
Piers Blombery
Alexander Boardman
Ana Boban
Csaba Bödör
Stefan K Bohlander
Lawrence H Boise
Niccolò Bolli
Adrian Bomford
Katherine Borden
Arndt Borkhardt
Beat Bornhauser
Gautam Borthakur
Jean P Bourquin
David Boutboul
Heidrun Boztug
Andrew R Branagan
Majorie Brand
Susan Branford
Elizabeth A Brem
Emery Bresnick
John Brewin
Dafna Brik Simon
Annamaria Brioli
Annemiek Broijl
Catherine Broome
Valentine Brousse
Jennifer R Brown
Austin Brown
Claudia Bruedigam
Tim H Brümmendorf
Julie Bruneau
Patrick M Brunner
Benedetto Bruno
Barbara Buldini
Marina Burgos da Silva
Michael Burke
Birgit Burkhardt
Cathy Burton
Mark Bustoros
Megan Bywater
Jo Caers
Mitchell S Cairo
Rodrigo T Calado
Rodney Camire
Joerg Cammenga
Elias Campo
Vincent Camus
Jose A Cancelas
Alan Cantor
Jean-Claude Carel
Holger Cario
Carmelo Carlo-Stella
Sylvain Carras
Martin Carroll
William L Carroll
Guillaume Cartron
Caterina Casari
Giancarlo Castaman
Haematologica | 109 March 2024 1010
Jorge J Castillo
Elisabetta Castoldi
Helene Cavé
Michele Cavo
Prantar Chakrabarti
Steven M Chan
Luke KL Chan
Linda Chan
Hong Chang
Kajal Chaudhry
Dharminder Chauhan
Julio Chavez
Chan Yoon Cheah
Sai-Juan Chen
Vivien M Chen
Baoyu Chen
Yunfeng Cheng
Laurence C Cheung
Y Jeffrey Chiang
Sabina Chiaretti
Roberto Chiarle
Shigeru Chiba
Dai Chihara
Timothy Chlon
Michael Y Choi
Sung Choi
Satheesh Chonat
Stefan O Ciurea
Emmanuelle Clappier
Barnaby Clark
Jacqueline Cloos
Thomas TC Cluzeau
Michel Cogné
Jonathon B Cohen
Matthew Collin
Raffaella Colombatti
Nicola Conran
Adela Constantinescu-Bercu
Valentino Conter
James R Cook
Jan Cools
Mhairi Copland
Paul Coppo
Mlynarczyk Coraline
Raul Cordoba
Seth Corey
Daniel Coriu
JJ Cornelissen
Javier Corral
Jill Corre
Jorge Cortes
FF Costa
Luciano Jose Costa
Marta Crespo
John D Crispino
Jennifer L Crombie
Nick Cross
Merlin Crossley
Michael Crump
Brian Curtis
Kate Cwynarski
Bouthania Dabaja
Saurabh Dahiya
Paola Dal Cin
Jesmond Dalli
Frederik Damm
Christine Damm-Welk
Debbie Daniels
Alexey Danilov
Giovanni D’Arena
Frederic Davi
Faith E Davies
Andrew John Davies
Julio Davila Valls
Richard Eric Davis
Erica De Candia
Raimondo De Cristofaro
Lucia De Franceschi
Daphne de Jong
Kim De Keersmaecker
Javier de la Rubia
Laurence de Leval
Mariane de Montalembert
Valerio De Stefano
Kim De Veirman
Silvia Deaglio
Eric Deconinck
Michael Deininger
Jan MA Delabie
Michel Delforge
Ruud Delwel
Selami Demirci
Monique den Boer
Chris Derderian
Enrico Derenzini
Amar Desai
Susan DeWolf
Amy DeZern
Binod Dhalkal
Mengyang Di
Christian Andrea Di Buduo
Irene Díaz-Moreno
Maribel Diaz-Ricart
Michael J Dickinson
Daan Dierickx
Sascha Dietrich
Laura W Dillon
Danai Dima
Jordan D Dimitrov
Meletios A Dimopoulos
Courtney D DiNardo
Angela Dispenzieri
Ahmet Dogan
Jeanette Karin Doorduijn
Adrienne Dorrance
Michael Doubek
Sinisa Dovat
Peter Dreger
Martin Dreyling
Yigal Dror
Ming Du
Wei Du
Delfim Duarte
Sydney Dubois
Carlo Dufour
Pierre-Yves Dumas
Jennifer Dunlap
Kieron Dunleavy
Nicolas Duployez
Jan Peter Dutz
Adam S DuVall
Michael N Dworzak
Martin JS Dyer
Mary Eapen
William Eaton
Gustaf Edgren
Claire M Edwards
Dimitar Efremov
Alexander Egle
Grégory Ehx
Sara El Hoss
Wassim El Nemer
Eric Eldering
Tarec Christoffer El-Galaly
Ronit Elhasid
Sarah Elitzur
Fredrik Ellin
Pablo Engel
Narendranath Epperla
Kolja Eppert
Zachary Epstein-Peterson
Miriam Erlacher
Ehud Even-Or
Andrew M Evens
Fabrizio Fabris
Anna Falanga
Lorenzo Falchi
Michela Faleschini
Brunangelo Falini
Pedro Farinha
Amir T Fathi
Bruno Fattizzo
Tate Feeney
Chris fegan
David J Feith
Haematologica | 109 March 2024 1011
Pierre Fenaux
Falko Fend
Annika Fendler
Xingmin Feng
Hui Feng
Weiying Feng
Scott K Ferguson
Hugo F Fernandez
Carlos Fernández de Larrea
Sebastian Fernandez-Pol
Alessandra Ferrajoli
Gerardo Ferrara
Samuele Ferrari
Ivan Ferrer Vicens
Andres Ferreri
Simone Ferrero
Michaela Feuring-Buske
Adele K Fielding
Nicholas B Figura
Marie-Dominique Filippi
Karin E Finberg
Anna-Maria Fink
Ute Fischer
Courtney Fitzhugh
Christian Flotho
Antonia Follenzi
Rafael Fonseca
Francesco Forconi
Gianluca Forni
Christopher P Fox
Lucy C Fox
Chris Fraser
Jan Frayne
Kathleen Freson
Anna Maria Frezza
Matthew J Frigault
David A Fruman
Stephan Fuhrmann
Takuya Fukushima
Maria Teresa Fulciniti
Yusuke Furukawa
Nico Gagelmann
Carl Arnold Goesta CA Gahrton
Giuseppe Gaipa
Nurit Gal Mark
Shreyans Gandhi
Naseema Gangat
Arnold Ganser
Chezi Ganzel
Jacqueline S Garcia
Miriam Garcia
Irene Garcia-Cadenas
Valentin García-Gutiérrez
Guillermo Garcia-Manero
Ricardo García-Muñoz
Moshe E Gatt
Philippe Gaulard
Francesca Gay
Paul S Gaynon
Roni Gefen
Massimo Gentile
Lindsey A George
Alina S Gerrie
Cedric Ghevaert
Paolo Ghia
Gabriel Ghiaur
Paola Ghione
Samit Ghosh
Vincenzo Giambra
Oded Gilad
Fiorina Giona
Sergio Giralt
Gaetano Giuffrida
Nicola Giuliani
Bertil Glader
Siobhan Glavey
Andreas Glenthøj
Eliane Gluckman
Bertrand Godeau
James Godfrey
Nicola Goekbuget
Adam Goldfarb
David Gómez-Almaguer
Patricia Gomez-Bougie
Wilson Gonsalves
Lallindra V Gooneratne
Mahasweta Gooptu
Victor R Gordeuk
Leo Gordon
Lia Gore
Stephen Gottschalk
Gaurav Goyal
Steven Grant
Mel F Greaves
Michael R Green
Hildegard Greinix
Jolanta Grembecka
Rosalie Griffin
Jean-Christophe R GRIS
Giuseppe Gritti
Zhaohui Gu
François Guilhot
Annamaria Gulla
Ronit Gurion
Olga Guryanova
Alejandro Gutierrez
Fredrik HSchjesvold
John Haanen
Claudia Haferlach
Torsten Haferlach
Fredrick B Hagemeister
Roman Hajek
Nada Hamad
Mehdi Hamadani
Michal Hameiri
Nadjib Hammoudi
Doris K Hansen
Jean-Luc Harousseau
Matthew Harper
Christine J Harrison
Claire Harrison
Paul Harrison
Simon Harrison
Monique A Hartley-Brown
Daigo Hashimoto
Henrik Hasle
Hans Carl Hasselbalch
Robert Hasserjian
Hani Hassoun
Brad Haverkos
Eliza A Hawkes
TKY Hayashi
Mette D Hazenberg
Ibrahim C Haznedaroglu
Meenakshi Hegde
Rüdiger Hehlmann
Florian H Heidel
Olaf Heidenreich
Krista M Heinonen
Andrea Henden
Israel Henig
Charles Herbaux
Cédric Hermans
Emil Hermansen
Sylvie Hermouet
Daniel Herranz
Alex F Herrera
Oshrat Hershkovitz-Rokah
Mark Hertzberg
Sebastian Herzog
Elizabeth Hexner
Mats Heymann
Teru Hideshima
Douglas R Higgs
Inken Hilgendorf
Brian Hill
Laura Hilton
JK Hitzler
Devendra Keshaorao Hiwase
Daniel J Hodson
Marc S Hoffmann
Steven Holland
Ernst Holler
Sarah A Holstein
Richard T Hoppe
Haematologica | 109 March 2024 1012
Bradford S Hoppe
Benjamin D Horne
Netanel Horowitz
Steven Horwitz
Dirk Hose
Nasheed M Hossain
Eva Hoster
Gang Huang
Zan Huang
Kai Hübel
Krystalyn E Hudson
Stephen Hunger
Katherine Hyde
Gloria Iacoboni
Ilaria Iacobucci
Raheel Iftikhar
Gerald Illerhaus
Brandon Stuart Imber
Racquel Innis-Shelton
Achille Iolascon
Javeed Iqbal
Ruxandra Maria Irimia
Takashi Ishida
Kenji Ishitsuka
Jo Ishizawa
Alessandro Isidori
Prioty Islam
Joseph Italiano
Raphael Itzykson
Swaminathan P Iyer
Graham Jackson
David Jacobsohn
Caron A Jacobson
Susana Jacobus
Elad Jacoby
Nicolas Jacquelot
Elaine Jaffe
Pudur Jagadeeswaran
Preetesh Jain
Nitin Jain
Michael Jain
Tania Jain
Sakshi Jasra
Irmela Jeremias
Mats Jerkeman
Helena E Jernberg Wiklund
Anand D Jeyasekharan
Chng Wee Joo
Michael B Jordan
Craig T Jordan
Nisha S Joseph
Edith Julia
Lars Kaestner
Walter Kahr
Martin F Kaiser
Manali Kamdar
Junne Kamihara
Christopher Kanakry
Prashant Kapoor
Rick Kapur
Marina Karakantza
Judith E Karp
Kennosuke Karube
Gjl Kaspers
Efstathios Kastritis
Keisuke Kataoka
Antonis Kattamis
Jonathan L Kaufman
Sabine Kayser
Colm Keane
David Kent
Wolfgang Kern
Alka Khadwal
Abdullah Khan
Joseph Khoury
Alexander Kiani
Won Seog Kim
Rebecca King
Adam S Kittai
Wolfram Klapper
Jeffery M Klco
Catherine Klersy
Justin Kline
Elizabeth S Klings
Amy D Klion
Jan-Henning Klusmann
Stefan Knop
Berengere Koehl
Rory R Koenen
Jiwon Koh
Ulrike Köhl
Anders Kolb
Tadakazu Kondo
Felix Korell
Daniela Krause
Aviva C Krauss
Arne de Kreuk
Robert Kridel
Gergely Kriván
Gabriela Krivdova
Nicolaus Kröger
Jan Krönke
Matthew Ku
Terufumi Kubo
Eitan Kugler
Michael WM Kühn
Andrea Kuhnl
Austin G Kulasekararaj
Andreas Kulozik
Shaji Kumar
Anita Kumar
Rajat Kumar
Ajay Kumar
Shekhar Kumar
Ralf Küppers
Daniel Kurnik
Mineo Kurokawa
John Kuruvilla
John Kuruvilla
Janet L Kwiatkowski
Charalampia Kyriakou
Ann S LaCasce
Sébastien Lacroix-Desmazes
Deepesh P Lad
Juan José Lahuerta
Ashutosh Lal
Michelle Lambert
Ola Landgren
Steven Lane
Andrew Lane
Florian Langer
Anton Langerak
Gabrielle Lapping-Carr
Noa Lavi
Arnon Lavie
Alan Lazarus
Christine S M Lee
Michelle Lee
Monika Lejman
Xavier Leleu
François Lemonnier
Peter J Lenting
Lorenzo Leoncini
Marcel M Levi
Lisa B Leypoldt
Shaoguang Li
Peng Li
Renhao Li
Chi Kong Li
Jiang Li
Jane Liesveld
Megan Lim
Brian K Link
Goldberg Lior
Daniel B Lipka
Andrej Lissat
Yan Liu
Li-gen Liu
Rong Liu
Per Ljungman
Franco Locatelli
Mónica López-Guerra
Enrico Lopriore
Maria L Lozano
Rui Lu
Haematologica | 109 March 2024 1013
Michael Lübbert
Heinz Ludwig
Sanne Lugthart
Efrat Luttwak
Lucio Luzzatto
Andrew Lytle
Clarisse M Machado
Libor Macurek
Johnny Mahlangu
Hideki Makishima
Michael Makris
alessandro malara
Florent Malard
Fabio Malavasi
Sebastien Malinge
Salomon Manier
Pier Mannuccio Mannucci
Roberto Marasca
Enrica Marchi
Maurizio Margaglione
Marco Marietta
David Marks
Rolf Marschalek
Rodrigo Martino
Kimberly Martinod
Maria-Victoria Mateos
Kosei Matsue
Masao Matsuoka
Brya Matthews
Francesco Maura
Matthew J Maurer
Richard T Maziarz
Georgia J McCaughan
Shannon R McCurdy
Patrick T McGann
Pamela McKay
Donal McLornan
Mary Frances McMullin
Caroline McNamara
Kevin O McNerney
Robert Jr Means
Cristina Mecucci
L Jeffrey Medeiros
Neha Mehta-Shah
Heng Mei
Matthew Mei
Christopher Melani
Ari Melnick
Avital Mendelson
Simón Méndez-Ferrer
Pietro Merli
Giampaolo Merlini
Reid W Merryman
Sachith Mettananda
Lüder Hinrich Meyer
Maurizio Miano
Orli Michaeli
Shonali Midha
Anna Rita Migliaccio
Aleksandar Mijovic
George Mikhaeel
Joseph R Mikhael
Frederic Millot
Ken Mills
Michael D Milsom
Alice S Mims
Roberto Mina
Mark D Minden
Monique C Minnema
Constantine Mitsiades
Moshe Mittelman
Hiroaki Miyoshi
Clifton Craig Mo
M Mohty
Remco J Molenaar
Thierry Molina
Patrizia Mondello
Pau Montesinos
Trisha Moodley
Jose Maria Moraleda
Antonio Morales-Hernandez
Jerome Moreaux
Eugenio Morelli
LM Morton
Alison Moskowitz
Adrián Mosquera Orgueira
Donia M Moujalled
Marek Mraz
Lori Muffly
Ann Mullaly
Stephen P Mulligan
Charles G Mullighan
Khaled M Musallam
Daniel Musher
Pellegrino Musto
Kasiani Myers
Omar Nadeem
Bertrand Nadel
Ferran Nadeu
Arnon Nagler
Nobuaki Nakano
Satish Nandakumar
Mariasanta Napolitano
Amina Nardo-Marino
Loretta J Nastoupil
Katherine Nathanson
Alessandro Natoni
Antoine Néel
Elizabeta Nemeth
Antonino Neri
Micha Nethe
Samuel Y Ng
Heyu Ni
Kim Nichols
Leo Nicolai
Carsten U Niemann
Charlotte Niemeyer
Lars Nitschke
Alex Niu
Franklin Njoku
Ikuo Nobuhisa
Josep F Nomdedeu
Ajay K Nooka
Mehdi Nouraie
Ariela Noy
Marcio Nucci
Erfan Nur
Mario Nuvolone
Peter J O’Gorman
Enrique Ocio
Elizabeth O’Donnell
Kristen M O’Dwyer
Vivian Oehler
Yishai Ofran
Michinori Ogura
Hiroto Ohguchi
Jessica Okosun
Adam Olszewski
Olalekan Oluwole
Choon Kiat Ong
Robert AJ Oostendorp
Stephen Samuel Opat
Sofia Origanti
Valentin Ortiz-Maldonado
Shinya Osone
Jad Othman
Megan Othus
German Ott
Carolyn Owen
Ingrid Pabinger
Thomas Pabst
Vered Padler-Karavani
Elyse Page
Jerome Paggetti
Giovanni Palladini
Marzia Palma
Jing Pan
Jing Pan
Qiang Pan-Hammarström
Nicki Panoskaltsis
Jens P Panse
Kostas Pantopoulos
Helen Papadaki
Vassilios Papadakis
Christina Papayannidis
Haematologica | 109 March 2024 1014
Simrit Parmar
Jakob Passweg
Anand A Patel
Sweta Patel
Mrinal Patnaik
Christopher Jordan Patriquin
Emma de Patter
Jiri Pavlu
Charlotte Pawlyn
Lydia H Pecker
Regis Peffault de Latour
Xiaolei Pei
Jonathan Peled
Olaf Penack
Frederic Pendino
Jun Peng
Andrea Pepper
Andrew Perkins
Salvatore Perrone
Aurore Perrot
Duska Petranovic
James D Phelan
Tycel Phillips
Pier-Paolo Piccaluga
Andrea Piccin
Joseph Pidala
Rob Pieters
Pasquale Pignatelli
Yana Pikman
Stefano A Pileri
John Pimanda
Erich Piovan
Miguel A Piris
Serge Pissard
Anna Pistocchi
Marco Pizzi
Christoph Plass
Leonidas C Platanias
Uwe Platzbecker
Isabelle Plo
Gian Marco Podda
Keith Pohl
Daniel A Pollyea
Alastair W Poole
Rakesh Popat
Pierluigi Porcu
Kimmo Porkka
Graca Porto
Olga Pozdnyakova
Sonam Prakash
Widanalage Sanjay Prasad
Kathleen P Pratt
Josef Prchal
Anuja P Premawardena
Susan E Prockop
Ching-Hon Pui
Vinod Pullarkat
Michael A Pulsipher
Muzaffar Qazilbash
Wenbin Qian
Lugui Qiu
M Edward Quach
David Qualls
Charles T Quinn
Anne Quinquenel
Leticia Quintanilla-Fend
Marc S Raab
Minke AE Rab
Karen R Rabin
Ron Rabinowicz
Gordana Raca
Markus Raderer
Dejan Radeski
John A Radford
Jerald P Radich
Massimo Radin
Margaret V Ragni
Ron Ram
Alessandro Rambaldi
Carlos Almeida Ramos
Raajit Rampal
Alan G Ramsay
A Koneti Rao
Armin Rashidi
Hana Raslova
Michael Rauh
Farhad Ravandi
Anish K Ray
Christian Recher
Vishnu V Reddy
Gil Redelman-Sidi
Eduardo M Rego
Christopher R Reilly
Dirk Reinhardt
Raul Ribeiro
Josep-Maria Ribera
Vincent Ribrag
Melissa A Richard
Paul G Richardson
Joshua Richter
Michael A Rieger
Anita Rijneveld
Ingo Ringshausen
Antonio Maria Risitano
David S Ritchie
Alfredo Rivas Delgado
Susana Rives
Irene Roberts
John D Roberts
Andrew Roberts
Gail J Roboz
Francesco Rodeghiero
Scott Rodig
Neil Rodrigues
Paula Rodriguez-Otero
Lindsey E Roeker
Christoph Röllig
Margo Renee Rollins
Domenica Ronchetti
Mark Roschewski
Steven T Rosen
Richard Rosenquist
David Ross
Davide Rossi
Lisa Giulino Roth
John Charles Rotondo
Gael Roue
Philippe Rousselot
Alicia Rovo
Jacob M Rowe
Grant Rowe
Noemi Roy
Jia Ruan
Jeffrey Rubnitz
Frank G Rücker
Nigel Russell
Lisa J Russell
Sarah Rutherford
Emma Rybalka
Vaskar Saha
Antonio Salar Silvestre
Gilles Salles
Isabelle Salles-Crawley
David A Sallman
Leonardo Salmena
Mehmet K Samur
Jesus F San Miguel
Vaishali Sanchorawala
Takaomi Sanda
Kristen Sanfilippo
Stefanie Sarantopoulos
Shayna Sarosiek
Koji Sasaki
Ernestina Saulle
Kerry Savage
Bipin Savani
Angela Maria Savino
Anna Savoia
Hamid Sayar
Lydia Scarfo
Florian Scherer
Denis Martin Schewe
Charles A Schiffer
Aaron Schimmer
Christoph Schmid
Haematologica | 109 March 2024 1015
Elisabeth Schorb
Reuven Schore
Martin Schrappe
Thomas Schroeder
Andre C Schuh
Jan Jacob Schuringa
Jurg Schwaller
David William Scott
Marie Scully
Omid Seidizadeh
John Semple
Graham Serjeant
Marcelo Martin Serra
Gregorio Serra
Sabina Sevcikova
John Seymour
Keren Shachrur
Nirali N Shah
Gunjan L Shah
NIrav Shah
Urvi A Shah
Farrukh Shah
Panicos Shangaris
Akshay Sharma
Vivien A Sheehan
Shuhong Shen
Weifeng Shen
Guomin Shen
Keren Shichrur
Fuji Shigeo
Haruko Shima
Avichai Shimoni
Ryosuke Shirasaki
Liran Shlush
Nicholas J Short
Jake Shortt
Roni Shouval
David Sibon
Reiner Siebert
Quinlan Sievers
Laura Silvestri
Paolo Simioni
Giorgia Simonetti
Abhay Singh
Deepak Singhal
Sergio Siragusa
Shireen Sirhan
Sigrid S Skånland
Susan L Slager
Stephen D Smith
Jeffery Smith
Lubomir Sokol
Eric Solary
Joo Y Song
Pieter Sonneveld
Jacob D Soumerai
Paul Spagnuolo
Lena Specht
Logan Spector
Adam Sperling
Martin Stanulla
Simon J Stanworth
Daniel T Starczynowski
Christian Steidl
Eytan M Stein
Orna Steinberg-Shemer
Raphael Steiner
Polina Stepensky
Adam Stewart
Elliot Stieglitz
Paolo Strati
Jasmin Straube
Sabine Strehl
John Strouboulis
Lucille Stuani
Pierre Sujobert
Prithu Sundd
Anna Sureda
Sophie Susen
Srividya Swaminathan
Brian Sworder
David B Sykes
Tomasz Szczepański
Jeff Szer
Natasha Szuber
Tom Taghon
Eisuke Takami
Masahiro Takeyama
Keiyo Takubo
Martin S Tallman
Constantine Tam
Ahmad M Tarawah
Sarah K Tasian
Eugen Tausch
Isao Tawara
Naomi Taylor
Justin Taylor
Ayalew Tefferi
Marco Tembrink
Hugo ten Cate
Elisa ten Hacken
Toshiki Terao
Aittokallio Tero
Evangelos Terpos
Carolina Terragna
Hein Than
Gita Thanarajasingam
Swee Lay Thein
Alexandre Theocharides
Christian Thiede
Daniel Thomas
Carrie Thompson
Sauer Tim
Ing Soo Tiong
Marilyn Tirard
Ibrahim Tohidi-Esfahani
Pallawi Torka
Zuzana Tothova
Tomomi Toubai
Cyrille Touzeau
Annalisa Trama
Douglas Tremblay
Steven P Treon
Marie-Berengere Troadec
Eirini Trompouki
Judith Trotman
Yolanda Tseng
Leon Muepu Malaika Tshilolo
Hong Tu
Dominik Turkiewicz
Hiroshi Ureshino
Celalettin Ustun
Tiziana Vaisitti
Peter Valent
PJ Valk
Eduard J van Beers
Niels WCJ van de Donk
Arjan A van de Loosdrecht
Eric Van den Neste
Bert A van der Reijden
Jan A van Laar
Frank N van Leeuwen
Richard Van Wijk
Kate Vandyke
Deepak Vangala
Alessandro Maria Vannucchi
Antiopi Varelias
Adriano Venditti
Charles P Venditti
Girish Venkataraman
Diego Villa
Christelle Vincent-Fabert
Carlo Visco
Valeria Visconte
Andrea Visentin
Adrián Viteri Noël
Meike Vogler
Jan Voorberg
Peter Voorhees
Ajay Vora
Josef H Vormoor
Josephine Vos
Maria Teresa Voso
Hanna Wabnitz
Elvin Wagenblast
Haematologica | 109 March 2024 1016
Björn Engelbrekt Wahlin
Johannes M Waldschmidt
Larry A Walker
Sa A Wang
Eunice S Wang
Huaquan Wang
Russell E Ware
Alan J Warren
Ralph Wäsch
Toshiki Watanabe
Viktoria Weber
Andrew H Wei
Qing Wei
Oliver Weigert
Daniel J Weisdorf
Sheila Weitzman
Andrew Weng
Lisa Westerberg
Jason R Westin
Ashley Whitechurch
William Wierda
Adrian Wiestner
Michael E Williams
Owen Williams
Wyndham Wilson
Klas G Wiman
Matthias Wirth
Marcin Wlodarski
M Woelfl
Wilhelm Woessmann
Johann Wojta
Ofir Wolach
Myles S Wolf
Daniel Wolff
Henry Wood
Carolien M Woolthuis
Bas Wouters
Catherine Wu
Zhijie Wu
Jianming Wu
Zhijian Xiao
Zhuoer Xie
Stephanie Xie
Mina Xu
Mariko Yabe
Joanne Yacobovich
Adhulraheem Yacoub
Kazuhito Yamamoto
Jun J Yang
Cai-Guang Yang
Asaf D Yanir
Shuang Ye
Dana Yehudai
Allen Eng Juh Eng Juh Yeoh
Moshe Yeshurun
Meidan Ying
Meira Yisraeli Salman
Kwee L Yong
Agnes Yong
Ken He Young
Ryan Young
Loic Ysebaert
Xue-Zhong Yu
Jiyang Yu
Elena Zamagni
Renato Zambello
Robert Zeiser
Thorsten Zenz
Fenghuang Zhan
Jing Zhang
Lei Zhang
Jiwang Zhang
Ji Zhang
Haojian Zhang
Xiao-Bing Zhang
Rongli Zhang
Li Zhang
Tao Zhen
Junke Zheng
Guoguang Zheng
Shiying Silvia Zheng
Boris Zhivotovsky
Hao Zhou
Guang-Biao Zhou
Menglei Zhu
Eline AM Zijtregtop
James C Zimring
Massimo Zucchetti
CM Zwaan
Sonja Zweegman
Jeffrey Zwicker
Haematologica | 109 March 2024 1017
Haematologica | 109 March 2024 1018

haematologica.org ISSN 0390 - 6078
Journal of the Ferrata Storti Foundation
