

Journal of the Ferrata Storti Foundation VOL. 109 MAY 2024 haematologica.org ISSN 0390 - 6078
Reasons for publishing in

Much cited Journal

Impact Factor 2022: 10.1
CiteScore 2022: 13.3
Fast review process

Submission ® 1st decision (submit to peer review or quick rejection): 3 days
Submission ® 2nd decision for peer-reviewed papers (accept, reject or make changes): 24 days
Low publication cost
The publisher is a non-profit Foundation that keeps the cost for authors as low as possible
Journal of the Ferrata - Storti Foundation
h aematologica
Editor-in-Chief
Jacob M. Rowe (Jerusalem)
Deputy Editors
Carlo Balduini (Pavia), Jerry Radich (Seattle)
Associate Editors
Michael Deininger (Milwaukee), Shai Izraeli (Tel Aviv), Pier Mannuccio Mannucci (Milan), Jessica Okosun (London), Pavan Reddy (Ann Arbor), David C. Rees (London), Paul G. Richardson (Boston), Francesco Rodeghiero (Vicenza), Gilles Salles (New York), Kerry Savage (Vancouver), Aaron Schimmer (Toronto), Richard F. Schlenk (Heidelberg)
Statistical Consultant
Catherine Klersy (Pavia)
AI Consultant
Jean Louis Raisaro (Lausanne)
Editorial Board
Walter Ageno (Varese), Sarit Assouline (Montreal), Andrea Bacigalupo (Roma), Taman Bakchoul (Tübingen), Pablo Bartolucci (Créteil), Katherine Borden (Montreal), Marco Cattaneo (Milan), Corey Cutler (Boston), Kate Cwynarski (London), Ahmet Dogan (New York), Mary Eapen (Milwaukee), Francesca Gay (Torino), Ajay Gopal (Seattle), Alex Herrera (Duarte), Martin Kaiser (London), Marina Konopleva (Houston), Nicolaus Kröger (Hamburg), Austin Kulasekararaj (London), Shaji Kumar (Rochester), Ann LaCasce (Boston), Matthew J. Mauer (Rochester) Neha Mehta-Shah (St. Louis), Moshe Mittelman (Tel Aviv), Alison Moskowitz (New York), Yishai Ofran (Haifa), Farhad Ravandi (Houston), John W. Semple (Lund), Liran Shlush (Toronto), Sarah K. Tasian (Philadelphia), Pieter van Vlieberghe (Ghent), Ofir Wolach (Haifa), Loic Ysebaert (Toulouse)
Managing Director
Antonio Majocchi (Pavia)
Editorial Office
Lorella Ripari (Office & Peer Review Manager), Simona Giri (Production & Marketing Manager), Paola Cariati (Graphic Designer), Giulia Carlini (Graphic Designer), Debora Moscatelli (Graphic Designer), Igor Poletti (Graphic Designer), Diana Serena Ravera (Peer Review), Laura Sterza (Account Administrator), Andrew Sturgeon (Peer Review)
Assistant Editors
Luca Arcaini (Scientific Consultant), Luk Cox (Graphic Artist), Britta Dost (English Editor), Anne Freckleton (English Editor), Rosangela Invernizzi (Scientific Consultant), Marianna Rossi (Scientific Consultant), Massimo Senna (Information Technology), Rachel Stenner (English Editor)
Haematologica | 109 May 2024
Brief information on Haematologica
Haematologica (print edition, pISSN 0390-6078, eISSN 1592-8721) publishes peer-reviewed papers on all areas of experimental and clinical hematology. The journal is owned by a non-profit organization, the Ferrata Storti Foundation, and serves the scientific community following the recommendations of the World Association of Medical Editors (www. wame.org) and the International Committee of Medical Journal Editors (www.icmje.org).
Haematologica publishes Editorials, Original articles, Review articles, Perspective articles, Editorials, Guideline articles, Letters to the Editor, Case reports & Case series and Comments. Manuscripts should be prepared according to our guidelines (www.haematologica.org/information-for-authors), and the Uniform Requirements for Manuscripts Submitted to Biomedical Journals, prepared by the International Committee of Medical Journal Editors (www.icmje.org).
Manuscripts should be submitted online at http://www.haematologica.org/.
Conflict of interests. According to the International Committee of Medical Journal Editors (http://www.icmje. org/#conflicts), “Public trust in the peer review process and the credibility of published articles depend in part on how well conflict of interest is handled during writing, peer review, and editorial decision making”. The ad hoc journal’s policy is reported in detail at www.haematologica.org/content/policies.
Transfer of Copyright and Permission to Reproduce Parts of Published Papers. Authors will grant copyright of their articles to the Ferrata Storti Foundation. No formal permission will be required to reproduce parts (tables or illustrations) of published papers, provided the source is quoted appropriately and reproduction has no commercial intent. Reproductions with commercial intent will require written permission and payment of royalties.
Subscription. Detailed information about subscriptions is available at www.haematologica.org. Haematologica is an open access journal and access to the online journal is free. For subscriptions to the printed issue of the journal, please contact: Haematologica Office, via Giuseppe Belli 4, 27100 Pavia, Italy (phone +39.0382.27129, fax +39.0382.394705, E-mail: info@haematologica.org).
Rates of the printed edition for the year 2022 are as following:
Institutional: Euro 700
Personal: Euro 170
Advertisements. Contact the Advertising Manager, Haematologica Office, via Giuseppe Belli 4, 27100 Pavia, Italy (phone +39.0382.27129, fax +39.0382.394705, e-mail: marketing@haematologica.org).
Disclaimer. Whilst every effort is made by the publishers and the editorial board to see that no inaccurate or misleading data, opinion or statement appears in this journal, they wish to make it clear that the data and opinions appearing in the articles or advertisements herein are the responsibility of the contributor or advisor concerned. Accordingly, the publisher, the editorial board and their respective employees, officers and agents accept no liability whatsoever for the consequences of any inaccurate or misleading data, opinion or statement. Whilst all due care is taken to ensure that drug doses and other quantities are presented accurately, readers are advised that new methods and techniques involving drug usage, and described within this journal, should only be followed in conjunction with the drug manufacturer’s own published literature.
Direttore responsabile: Prof. Carlo Balduini; Autorizzazione del Tribunale di Pavia n. 63 del 5 marzo 1955. Printing: Press Up, zona Via Cassia Km 36, 300 Zona Ind.le Settevene - 01036 Nepi (VT)
Associated with USPI, Unione Stampa Periodica Italiana. Premiato per l’alto valore culturale dal Ministero dei Beni Culturali ed Ambientali
Haematologica | 109 May 2024
Table of Contents
Volume 109, Issue 5: May 2024
About the Cover
Image taken from the editorial by R. Wäsch and M. Engelhardt in this issue.
Landmark Paper in Hematology
1313 New bullets in the fight against cancer
O.Wolach et al.
https://doi.org/10.3324/haematol.2024.285334
Editorials
1315 Unveiling amphiregulin: a blood-based biomarker for graft-versus-host disease risk assessment and monitoring
S.W. Choi et al.
https://doi.org/10.3324/haematol.2023.284148
1317 Unlocking the therapeutic potential of targeting MALT1 in B-cell acute lymphoblastic leukemia
Samiksha and L.N. Chan
https://doi.org/10.3324/haematol.2023.284237
1320 In search for cure of multiple myeloma
R.Wäsch and M. Engelhardt
https://doi.org/10.3324/haematol.2023.284292
1323 Routine consolidation of early stage primary bone lymphoma with radiation therapy does not improve outcomes
M.S. Hoffmann
https://doi.org/10.3324/haematol.2023.284303
1325 ToTAL1y degraded - rapid dTAG proteolysis of TAL1 in T-cell acute lymphoblastic leukemia
J.R. Costa and M.R. Mansour
https://doi.org/10.3324/haematol.2023.284447
1328 Sickle cell disease, pregnancy, and COVID-19 in France: plus ça change
L.H. Pecker and J. Federspiel
https://doi.org/10.3324/haematol.2023.284457
1331 Intensive induction in older patients with acute myeloid leukemia: an initial struggle with later rewards?
Y.Ofran
https://doi.org/10.3324/haematol.2023.284780
Review Articles
1334 Emicizumab: the hemophilia A game-changer
P.E. Alcedo Andrade et al.
https://doi.org/10.3324/haematol.2022.282099
Haematologica | 109 May 2024 I
Articles
Acute Lymphoblastic Leukemia
1348 Profiling the activity of the para-caspase MALT1 in B-cell acute lymphoblastic leukemia for potential targeted therapeutic application
F.M. Safa et al.
https://doi.org/10.3324/haematol.2023.283178
Acute Lymphoblastic Leukemia
1359 Regulatory mechanisms and context-dependent roles of TAL1 in T-cell acute lymphoblastic leukemia
J.Z.L. Ong et al.
https://doi.org/10.3324/haematol.2023.283450
Acute Lymphoblastic Leukemia
1373 Targeting hyperactive platelet-derived growth factor receptor-β signaling in T-cell acute lymphoblastic leukemia and lymphoma
S. De Coninck et al.
https://doi.org/10.3324/haematol.2023.283981
Acute Lymphoblastic Leukemia
1385 Impact of inotuzumab ozogamicin on outcome in relapsed or refractory acute B-cell lymphoblastic leukemia patients prior to allogeneic hematopoietic stem cell transplantation and risk of sinusoidal obstruction syndrome/venous occlusive disease
S. Kayser et al.
https://doi.org/10.3324/haematol.2023.284310
Hematopoiesis
1393 Differential transcriptional control of hematopoiesis in congenital and cyclic neutropenia patients harboring ELANE mutations
A. Zeidler et al.
https://doi.org/10.3324/haematol.2023.284033
Hodgkin Lymphoma
1403 Overall survival and causes of death in elderly patients with Hodgkin lymphoma: a Norwegian population-based case-control study
K. Lia et al.
https://doi.org/10.3324/haematol.2023.283721
Iron Metabolism & its Disorders
1413 Compliance and clinical benefit of deferasirox granule and dispersible tablet formulation in pediatric patients with transfusional iron overload: in a randomized, open-label, multicenter, phase II study
A.T. Taher et al.
https://doi.org/10.3324/haematol.2023.283133
Myelodysplastic Syndromes
1426 ASXL1 mutations are associated with a response to alvocidib and 5-azacytidine combination in myelodysplastic neoplasms
V. Riabov et al.
https://doi.org/10.3324/haematol.2023.282921
Non-Hodgkin Lymphoma
1439 Outcomes of limited stage primary bone diffuse large B-cell lymphoma in the rituximab era: a multicenter, retrospective study
A. Rezazadeh et al.
https://doi.org/10.3324/haematol.2023.283210
Non-Hodgkin Lymphoma
1445 SH2 domain-containing inositol 5-phosphatases support the survival of Burkitt lymphoma cells by promoting energy metabolism
F. Mayr et al.
https://doi.org/10.3324/haematol.2023.283663
Haematologica | 109 May 2024 II
Non-Hodgkin Lymphoma
1460 Effect of delayed cell infusion in patients with large B-cell lymphoma treated with chimeric antigen receptor T-cell therapy
A.P. Jallouk et al.
https://doi.org/10.3324/haematol.2023.284453
Plasma Cell Disorders
1469 Autologous-allogeneic versus autologous tandem stem cell transplantation and maintenance therapy with thalidomide for multiple myeloma patients under 60 years of age: a prospective, phase II study
N. Kröger et al.
https://doi.org/10.3324/haematol.2023.282920
Plasma Cell Disorders
1480 Impact of race and ethnicity on early mortality in multiple myeloma: a SEER analysis
J.X Wei et al.
https://doi.org/10.3324/haematol.2023.283304
Plasma Cell Disorders
1487 Multiplex immunohistochemistry elucidates increased distance between cytotoxic T cells and plasma cells in relapsed myeloma, and identifies Lag-3 as the most common checkpoint receptor on cytotoxic T cells of myeloma patients
S. Ninkovic et al.
https://doi.org/10.3324/haematol.2023.283344
Plasma Cell Disorders
1501 Pharmacologic targeting of the p62 ZZ domain enhances both anti-tumor and bone-anabolic effects of bortezomib in multiple myeloma
S. Marino et al.
https://doi.org/10.3324/haematol.2023.283787
Plasma Cell Disorders
1514 Factors associated with refractoriness or early progression after idecabtagene vicleucel in patients with relapsed/refractory multiple myeloma: US Myeloma Immunotherapy Consortium real world experience
H. Hashmi et al.
https://doi.org/10.3324/haematol.2023.283888
Plasma Cell Disorders
1525 A prospective, multicenter study on hematopoietic stem-cell mobilization with cyclophosphamide plus granulocyte colony-stimulating factor and ‘on-demand’ plerixafor in multiple myeloma patients treated with novel agents
R. Mina et al.
https://doi.org/10.3324/haematol.2023.284023
Red Cell Biology & its Disorders
1535 Impaired hemoglobin clearance by sinusoidal endothelium promotes vaso-occlusion and liver injury in sickle cell disease
T.W. Kaminski et al.
https://doi.org/10.3324/haematol.2023.283792
Letters
1551 The role of the mineralocorticoid receptor in steroid-induced cytotoxicity in pediatric acute lymphoblastic leukemia
A.M. van Hulst et al.
https://doi.org/10.3324/haematol.2023.282928
1557 Amphiregulin as a biomarker for monitoring life-threatening acute graft-versus-host disease: secondary analysis of two prospective clinical trials
S. Holtan et al.
https://doi.org/10.3324/haematol.2023.283215
Haematologica | 109 May 2024 III
Case Reports
1562 A study of 28 pregnant women with sickle cell disease and COVID-19: elevated maternal and fetal morbidity rates
L. Joseph et al.
https://doi.org/10.3324/haematol.2023.283300
1566 Social deprivation independently impacts clinical outcomes in patients with chronic lymphocytic leukemia
G. Fegan et al.
https://doi.org/10.3324/haematol.2023.283527
1570 MicroRNA and long non-coding RNA analysis in IgM monoclonal gammopathies reveals epigenetic influence on cellular functions and oncogenesis
K. Chohan et al.
https://doi.org/10.3324/haematol.2023.283927
1576 Acute myeloid leukemia-driven IL-3-dependent upregulation of BCL2 in non-malignant hematopoietic stem and progenitor cells increases venetoclax-induced cytopenias
D. J. Fowler-Shorten et al.
https://doi.org/10.3324/haematol.2023.283944
1582 Deciphering the molecular complexity of the IKZF1plus genomic profile using Optical Genome Mapping
J.L. Lühmann et al.
https://doi.org/10.3324/haematol.2023.284115
1588 Home time among older adults with acute myeloid leukemia by therapy intensity
C.E. Jensen et al.
https://doi.org/10.3324/haematol.2023.284133
1593 Use of the Second Revision of the International Staging System for prognostic stratification of multiple myeloma patients in real-world clinical practice and the importance of sub-groups, including age
Y. Uesugi et al.
https://doi.org/10.3324/haematol.2023.284173
1598 Limited utility of Mayo 2012 cardiac staging system for risk stratification of patients with advanced cardiac AL amyloidosis - analysis of a uniformly treated cohort of 1,275 patients
J. Khwaja et al.
https://doi.org/10.3324/haematol.2023.284348
1603 Efficacy of combined low-dose ruxolitinib and cyclosporine in murine immune bone marrow failure
X. Feng et al.
https://doi.org/10.3324/haematol.2023.284358
1608 Autologous hematopoietic cell transplantation for T-cell prolymphocytic leukemia: a retrospective study on behalf of the Chronic Malignancies Working Party of the EBMT
J. Drozd-Sokolowska et al.
https://doi.org/10.3324/haematol.2023.284359
1614 Rituximab plus cyclophosphamide and dexamethasone versus bortezomib plus cyclophosphamide and dexamethasone in newly diagnosed symptomatic Waldenström macroglobulinemia: a randomized controlled trial
W. Xiong et al.
https://doi.org/10.3324/haematol.2023.284588
1619 MAF translocation remains a strong prognostic factor despite concurrent chromosomal abnormalities
Y. Liu et al.
https://doi.org/10.3324/haematol.2023.284666
1624 B-cell acute lymphoblastic leukemia and juvenile xanthogranuloma in a patient with ETV6 thrombocytopenia and leukemia predisposition syndrome: novel clinical presentation and perspective
H. Newman et al.
https://doi.org/10.3324/haematol.2023.284151
Haematologica | 109 May 2024 IV
New bullets in the fight against cancer
Ofir Wolach
Institute of Hematology, Davidoff Cancer Center, Rabin Medical Center, Petah Tikva, Israel
E-mail: owolach@gmail.com
https://doi.org/10.3324/haematol.2024.285334
©2024 Ferrata Storti Foundation
Published under a CC BY-NC license


TITLE Imatinib compared with interferon and low-dose cytarabine for newly diagnosed chronic-phase chronic myeloid leukemia.
AUTHORS
JOURNAL
O’Brien SG, Guilhot F, Larson RA, et al; IRIS Investigators.
The New England Journal of Medicine. 2003;348(11):994-1004. doi: 10.1056/NEJMoa022457.
“There is new ammunition in the war against cancer. These are the bullets”. This dramatic headline was devoted to STI571, later known as imatinib, on the cover of Time magazine in May 2001.1
The ‘bench to bedside’ journey of tyrosine kinase inhibitors (TKI) for chronic myeloid leukemia (CML) started in 1960 with the initial report, by Nowell and Hungerford, of a ‘minute chromosome abnormality’ unique to chronic granulocytic leukemia. This was followed by the characterization of the ‘Philadelphia-chromosome’ by Janet Rowley and the BCR-ABL fusion gene by others as the pivotal genetic event causing CML, and culminated with the development of STI571, the first targeted therapy for this disease. CML, once incurable without allogeneic transplantation and a potentially fatal myeloid neoplasm, has become a disease that entails a near-normal lifespan for patients with an oral, and possibly time-limited therapy. It took almost two decades of efforts pioneered by Dr. Lydon and Dr. Matter in collaboration with Dr. Druker and many others until the first clinically effective and tolerable BCR-ABL inhibitor was developed. In the early phase trials, STI571 was administered to patients with advanced CML with excellent results in those with chronic-phase disease in whom interferon-α had failed. These results led to the first, accelerated approval by the Food and Drug Administration of a TKI for this indication.2
In the International Randomized Study of Interferon versus STI571 (IRIS), 1,106 patients with newly diagnosed CML were randomized to receive STI571 or low-dose cytarabine in combination with interferon, which was the standard of care at that time. Imatinib outperformed the control treatment arm in all outcome measures assessed: complete hematologic response (95.3% vs. 55.5%, respectively), rates of major cytogenetic response (87.1% vs. 34.7%), rates of complete
cytogenetic response (76.2% vs. 14.5%), progression-free survival (92.1% vs. 73.5%) and freedom from progression to accelerated-phase or blast-crisis CML (96.7% vs. 91.5%) with excellent tolerability (Figure 1). The crossover design of this study enabled patients in the low-dose cytarabine plus interferon arm to receive effective salvage with STI571 at failure or intolerance, and blunted the overall survival effect between the study groups (Figure 1).3 Subsequent analyses of the IRIS trial informed the molecular roadmap for response assessment in CML and paved the way for the principles of modern management of this disease. The development of imatinib marked the dawn of targeted therapies in hematology. It was among the first TKI developed for hematologic malignancies and was to be followed by many others over the years.
Newer generations of TKI are now available for patients with CML and Philadelphia-positive acute lymphoblastic leukemia. Inhibitors against other targets such as JAK2 inhibitors for the treatment of myeloproliferative neoplasms, FLT3 inhibitors for acute myeloid leukemia and inhibitors of Bruton tyrosine kinase for lymphoma and chronic lymphocytic leukemia have transformed the therapeutic landscape of hematologic malignancies.
In parallel to the astonishing progress and promise entailed in these targeted therapies, time and experience also taught us the limitations and challenges of utilizing TKI on a large scale in hematology. Over the years we learned that monotherapy with a TKI may not suffice for the treatment of aggressive clonally complex disorders. The financial burden of these drugs is a great challenge and limits access in environments with poor resources. The journey of TKI and targeted therapies is ongoing and I eagerly look forward to new magic bullets in the fight against cancer.
Haematologica | 109 May 2024 1313 LANDMARK PAPER IN HEMATOLOGY O. Wolach

Figure 1. Study design and selected results of the international trial of imatinib treatment for chronic myeloid leukemia. CML: chronic myeloid leukemia;IFN: interferon; Ara-C: cytarabine; combination therapy: cytarabine plus inteferon-α Figure adapted with permission from Figures 1 and 2 of the paper by O’Brien et al.3
Disclosures
OW has received research support from AbbVie; has received speaker honoraria from AbbVie, Astellas, and No -
References
1. Time cover. May 28, 2001. https://content.time.com/time/ covers/0,16641,20010528,00.html.
2. Deininger M, Buchdunger E, Druker BJ. The development of imatinib as a therapeutic agent for chronic myeloid leukemia. Blood. 2005;105(7):2640-2653.
vartis; and has an advisory role with AbbVie, Astellas, Novartis, Pfizer, Medison, Stemline, and Teva.
3. O’Brien SG, Guilhot F, Larson RA, et al. Imatinib compared with interferon and low-dose cytarabine for newly diagnosed chronic-phase chronic myeloid leukemia. N Engl J Med. 2003;348(11):994-1004.
Haematologica | 109 May 2024 1314 O. Wolach LANDMARK PAPER IN HEMATOLOGY
Unveiling amphiregulin: a blood-based biomarker for graft-versus-host disease risk assessment and monitoring
Correspondence: S.W. Choi
Received: September 20, 2023.
Accepted: October 5, 2023.
Early view: October 12, 2023.
https://doi.org/10.3324/haematol.2023.284148
Over recent decades, our understanding of the genesis and pathophysiology of acute graft-versus-host disease (GvHD) has advanced significantly. However, a key challenge has remained in the field: for clinicians to predict GvHD-related mortality accurately based on symptom severity alone. The severity of symptoms often does not reflect the mortality risk associated with acute GvHD adequately, particularly because of the intricate dynamics of the body’s response to therapy and the dual nature of the beneficial graft-versus-leukemia effect. In the quest to address these key clinical dilemmas, a new era of leveraging blood-based biomarkers emerged as a promising avenue for non-invasive risk assessment and monitoring of acute GvHD.1 In the early 1990s, the focus rested primarily on pro-inflammatory cytokine markers as potential indicators of GvHD (e.g., TNF, IL-2R). Entering into the 2000s, sophisticated ‘-omics’ techniques, such as comprehensive profiling of plasma proteomes, substantially accelerated the ability to identify markers with heightened sensitivity and specificity. The first validated blood-based biomarkers for acute GvHD were combined into a four-marker panel (IL-2Rα, TNFR1, IL-8, and HGF).2 Since then, biomarkers took center stage, including Reg3α, 3 ST2,4 and amphiregulin (AREG).5 This enhanced marker identification has not only enriched the grading criteria for acute GvHD but has also paved the way for risk stratification strategies. Notably, standardized grading criteria and risk stratification methods, such as the Minnesota GvHD Risk Score6 and Ann Arbor Biomarker Score,7 have become instrumental in assessing GvHD severity and prognosis. These advancements underscore the dynamic evolution of our diagnostic capabilities, further deepening insights into the underlying mechanisms of GvHD. Nonetheless, predicting disease onset and subsequent disease course, including response to treatment, remains a grand challenge in medicine, limiting the full potential of personalized medicine. Given the complex dynamic systems involved, detection of disease at its earliest, pre-symptom
stage is often complicated by changes occurring over time based on new, ongoing data about the disease process. The once “snapshot” paradigm of measurement in the transplant field has evolved through analysis of frequent, non-invasive blood samples obtained longitudinally at designed timepoints within a framework of robust biorepositories or multicenter clinical trials with well-annotated clinical data. Analyzing samples derived from the Chronic GvHD Consortium and Mount Sinai Acute GvHD International Consortium,8 followed by Blood and Marrow Transplant Clinical Trials Network 0302 and 0802 studies, Holtan and colleagues validated initial AREG biomarker investigations by confirming the prognostic significance of this protein in acute GvHD.9 They have now comprehensively evaluated the utility of AREG as a monitoring biomarker in two recent clinical trials.10 The first trial investigated urinary-derived human chorionic gonadotropin/epidermal growth factor (uhCG/EGF) in supportive care for high-risk acute GvHD patients enrolled in a single-center setting (NCT02525029). The second trial, known as the REACH1 study, involved patients with steroid-refractory acute GvHD enrolled in a multicenter setting (NCT02953678).
A key observation from the study by Holtan et al., published in this issue of Haematologica, 10 was the consistency of the performance of AREG across different measurement platforms. The correlation of AREG levels between enzyme-linked immunosorbent assay and microfluidic immunoassay platforms demonstrated a high degree of agreement, highlighting the potential feasibility of the implementation in clinical laboratories. The analyses yielded several notable findings. In patients achieving a complete response at day 28 of uhCG/EGF therapy, AREG levels exhibited a significant decrease from baseline to day 56 (mean, 98 vs. 32 pg/ mL, P=0.006). Conversely, AREG levels remained relatively stable in patients with partial or no response to hCG/EGF treatment. The identification of a specific AREG cutoff (≥212 pg/mL) at study baseline provided a valuable tool for
Haematologica | 109 May 2024 1315 EDITORIAL
sungchoi@umich.edu
Ferrata Storti Foundation Published under a CC BY-NC license
©2024
Sung Won Choi
University of Michigan, Michigan Medicine, Blood and Marrow Transplantation Program, Ann Arbor, MI, USA
risk assessment. Patients with AREG levels exceeding this threshold faced a markedly higher risk of rapid mortality within a median of 62 days.
Interestingly, similar trends in the data were observed in the REACH1 study. Patients who achieved a complete response experienced a substantial decrease in AREG levels from baseline to day 56 (mean, 174.7 vs. 63.6 pg/ mL, P=0.007). This trend also extended to patients treated with ruxolitinib who showed a very good partial response or partial response. In contrast, patients with progressive disease did not have any significant changes in AREG levels over time. Multivariate analyses further highlighted the importance of response at day 28 and baseline AREG as independent predictors of survival in both cohorts. In the uhCG/EGF study, patients with high baseline AREG faced a 4.2-fold increased risk of mortality, while those treated with ruxolitinib and had high baseline AREG had a 2.7-fold elevated risk of death.
Using these two study cohorts, Holtan and colleagues established a universal AREG cutoff of ≥330 pg/mL, unveiling AREG as a potential early mortality risk assessment tool. This finding has particular relevance in clinical scenarios in which interpreting response may be challenging due to confounding variables, such as medication side effects, gastrointestinal infections, or other dietary alterations. The investigation by Holtan and colleagues further delved into the complex dynamics of AREG, shedding light on its diverse physiological roles. First described in 1988 as a signaling molecule, AREG belongs to the EGF protein family and is integral to cellular processes, such as growth, differentia-
References
1. Paczesny S, Levine JE, Braun TM, Ferrara JL. Plasma biomarkers in graft-versus-host disease: a new era? Biol Blood Marrow Transplant. 2009;15(1 Suppl):33-38.
2. Paczesny S, Krijanovski OI, Braun TM, et al. A biomarker panel for acute graft-versus-host disease. Blood. 2009;113(2):273-278.
3. Ferrara JL, Harris AC, Greenson JK, et al. Regenerating isletderived 3-alpha is a biomarker of gastrointestinal graft-versushost disease. Blood. 2011;118(25):6702-6708.
4 Vander Lugt MT, Braun TM, Hanash S, et al. ST2 as a marker for risk of therapy-resistant graft-versus-host disease and death. N Engl J Med. 2013;369(6):529-539.
5. Holtan SG, Khera N, Levine JE, et al. Late acute graft-versushost disease: a prospective analysis of clinical outcomes and circulating angiogenic factors. Blood. 2016;128(19):2350-2358.
6. MacMillan ML, DeFor TE, Holtan SG, Rashidi A, Blazar BR, Weisdorf DJ. Validation of Minnesota Acute Graft-versus-Host Disease Risk Score. Haematologica. 2020;105(2):519-524.
7. Levine JE, Braun TM, Harris AC, et al. A prognostic score for acute graft-versus-host disease based on biomarkers: a multicentre study. Lancet Haematol. 2015;2(1):e21-29.
tion, and survival. Produced by epithelial cells, fibroblasts, as well as immune cells, AREG binds to the EGF receptor on target cells, and has been shown to be a key player in type 2-mediated resistance and tolerance, including in murine GvHD biology.11 Although elevated AREG levels are noted during acute GvHD, tissue expression patterns have varied. Recent evidence hinted at the involvement of immune cells in circulating AREG production during acute GvHD. Alloreactive CD4 T cells, for example, were found to upregulate AREG expression during murine GvHD. These findings, coupled with the observed correlation between circulating AREG and cell-bound AREG on various immune cell subsets suggest a complex interplay between immune cells and AREG.12
In conclusion, the study by Holtan et al. unveils AREG’s role as a biomarker that closely aligns with risk stratification and clinical response monitoring in life-threatening acute GvHD. Being able to measure AREG levels reliaby across different measurement platforms holds promise for rapid adoption across institutions in which hematopoietic cell transplants are being performed. The integration of correlative biomarkers into the framework of clinical trial design represents a significant advancement in the field. Future research endeavors should validate these findings in real-time as well as examine AREG in different settings, such as haploidentical transplants, which may further improve our understanding of this biomarker’s performance.
Disclosures
No conflicts of interest to disclose.
8. Holtan SG, Verneris MR, Schultz KR, et al. Circulating angiogenic factors associated with response and survival in patients with acute graft-versus-host disease: results from Blood and Marrow Transplant Clinical Trials Network 0302 and 0802. Biol Blood Marrow Transplant. 2015;21(6):1029-1036.
9 Holtan SG, DeFor TE, Panoskaltsis-Mortari A, et al. Amphiregulin modifies the Minnesota Acute Graft-versus-Host Disease Risk Score: results from BMT CTN 0302/0802. Blood Adv. 2018;2(15):1882-1888.
10 Holtan SG, El Jurdi N, Rashidi A, et al. Amphiregulin as a monitoring biomarker for life-threatening acute graft-versushost disease: secondary analysis of two prospective clinical trials. Haematologica. 2024;109(5)1557-1561.
11. Bruce DW, Stefanski HE, Vincent BG, et al. Type 2 innate lymphoid cells treat and prevent acute gastrointestinal graftversus-host disease. J Clin Invest. 2017;127(5):1813-1825.
12. Holtan SG, Shabaneh A, Betts BC, et al. Stress responses, M2 macrophages, and a distinct microbial signature in fatal intestinal acute graft-versus-host disease. JCI Insight. 2019;5(17):e129762.
Haematologica | 109 May 2024 1316 EDITORIAL S.W. Choi
Unlocking the therapeutic potential of targeting MALT1 in B-cell acute lymphoblastic leukemia
Correspondence: L.N. Chan chanl3@ccf.org
Received: October 17, 2023
Accepted: October 24, 2023.
Early view: November 2, 2023.
https://doi.org/10.3324/haematol.2023.284237
©2024
Despite recent advances in treatments, the development of drug resistance and relapse, particularly among adults remain major challenges in B-cell acute lymphoblastic leukemia (B-ALL). The survival rates of relapsed B-ALL in children and adults are low, with over 50% of patients succumbing to the disease.1,2 Therefore, there is a pressing need to identify new therapeutic opportunities to improve clinical outcomes and reduce disease recurrence. In this issue of Haematologica, Safa et al. identified a non-canonical function of the para-caspase mucosa-associated lymphoid tissue lymphoma translocation protein 1 (MALT1) which has the potential to be leveraged for therapeutic intervention in B-ALL.3
MALT1 is a protease and scaffold protein. Upon activation of the B-cell receptor (BCR), MALT1 and B-cell lymphoma-10 (BCL10) are recruited to caspase recruitment domain family member 11 (CARD11) to form the CARD11-BCL10-MALT1 (CBM) complex. Through proteolytic cleavage, MALT1 mediates the inactivation of inhibitors of NF-kB, including TNFAIP3/A20, and the activation of proteins that promote NF-kB activity, including BCL10, CYLD, RelB. Pre-clinical studies have demonstrated the efficacy and feasibility of inhibiting BCR-driven MALT1 activity in multiple B-cell malignancies. For instance, MALT1 is constitutively active in chronic lymphocytic leukemia, and treatment with an irreversible MALT1 protease inhibitor (MI-2) inhibited the proteolytic activity of MALT1 and consequently abrogated BCR and NF- κ B signaling, inducing apoptosis in chronic lymphocytic leukemia cells. 4 Reflecting a role of MALT1 protease activity and subsequent NF- κ B activation in the pathogenesis of activated B-cell-like diffuse large B-cell lymphoma (ABC-DLBCL), MALT1 inhibitors selectively killed ABC-DLBCL cells in vitro and induced tumor suppression of xeno-transplanted ABC-DLBCL i n vivo . 5 Additionally, MALT1 is constitutively activated in subsets of mantle cell lymphoma which depend on MALT1 activity for sur-
vival.6 While MALT1 expression was previously found to be upregulated in primary B-ALL cells,7 its role in B-ALL biology and the therapeutic potential of targeting MALT1 in B-ALL have not been established.
In this issue of Haematologica, we read how Safa et al. sought to address the role of MALT1 in B-ALL and investigate the consequences of its inhibition. Using MI-2 and the MALT1 blocking peptide Z-VRPR-fmk, the authors show that MALT1 plays a crucial role in the survival of B-ALL cells, independent of their cell of origin or the presence or absence of the Philadelphia chromosome. Furthermore, treatment of MALT1-dependent B-ALL cells with MI-2 induced apoptosis, mainly in cycling cells. The authors also assessed the proteolytic activity of MALT1 by measuring its ability to cleave its substrates. Contrary to expectation, low or no MALT1 activity was detected in pro and pre B-ALL cell lines sensitive to MALT1 inhibition. Altogether, these findings revealed an unexpected, protease-independent role for MALT1 in pro and pre B-ALL.
To further elucidate the mechanistic contribution of MALT1 independent of BCR signaling in B-ALL, the authors performed gene expression profiling of B-ALL cells following treatment with MI-2 and identified a significant inhibitory effect on MYC-regulated gene signatures. Importantly, MI-2 treatment reduced protein levels of MYC in multiple MALT1-dependent B-ALL cell lines. Previous studies showed that phosphorylation of MYC at threonine-58 and serine-62 is required for its ubiquitination mediated by FBXW7, resulting in its proteasomal degradation.8,9 Notably, Safa et al. demonstrated the upregulation of FBXW7 in B-ALL cells following MI-2 treatment. In addition, increases in FBXW7 expression were associated with concomitant MYC downregulation. Taken together, this study demonstrates that MYC stabilization through MALT1 is independent of its protease activity in pro and pre B-ALL and is likely achieved through a negative impact on FBXW7 (Figure 1).
Haematologica | 109 May 2024 1317 EDITORIAL
Ferrata Storti Foundation Published under a CC BY-NC license
Samiksha1 and Lai N. Chan1,2
1Department of Cancer Biology, Lerner Research Institute, Cleveland Clinic and 2Department of Molecular Medicine, Cleveland Clinic Lerner College of Medicine, Case Western Reserve University School of Medicine, Cleveland, OH, USA
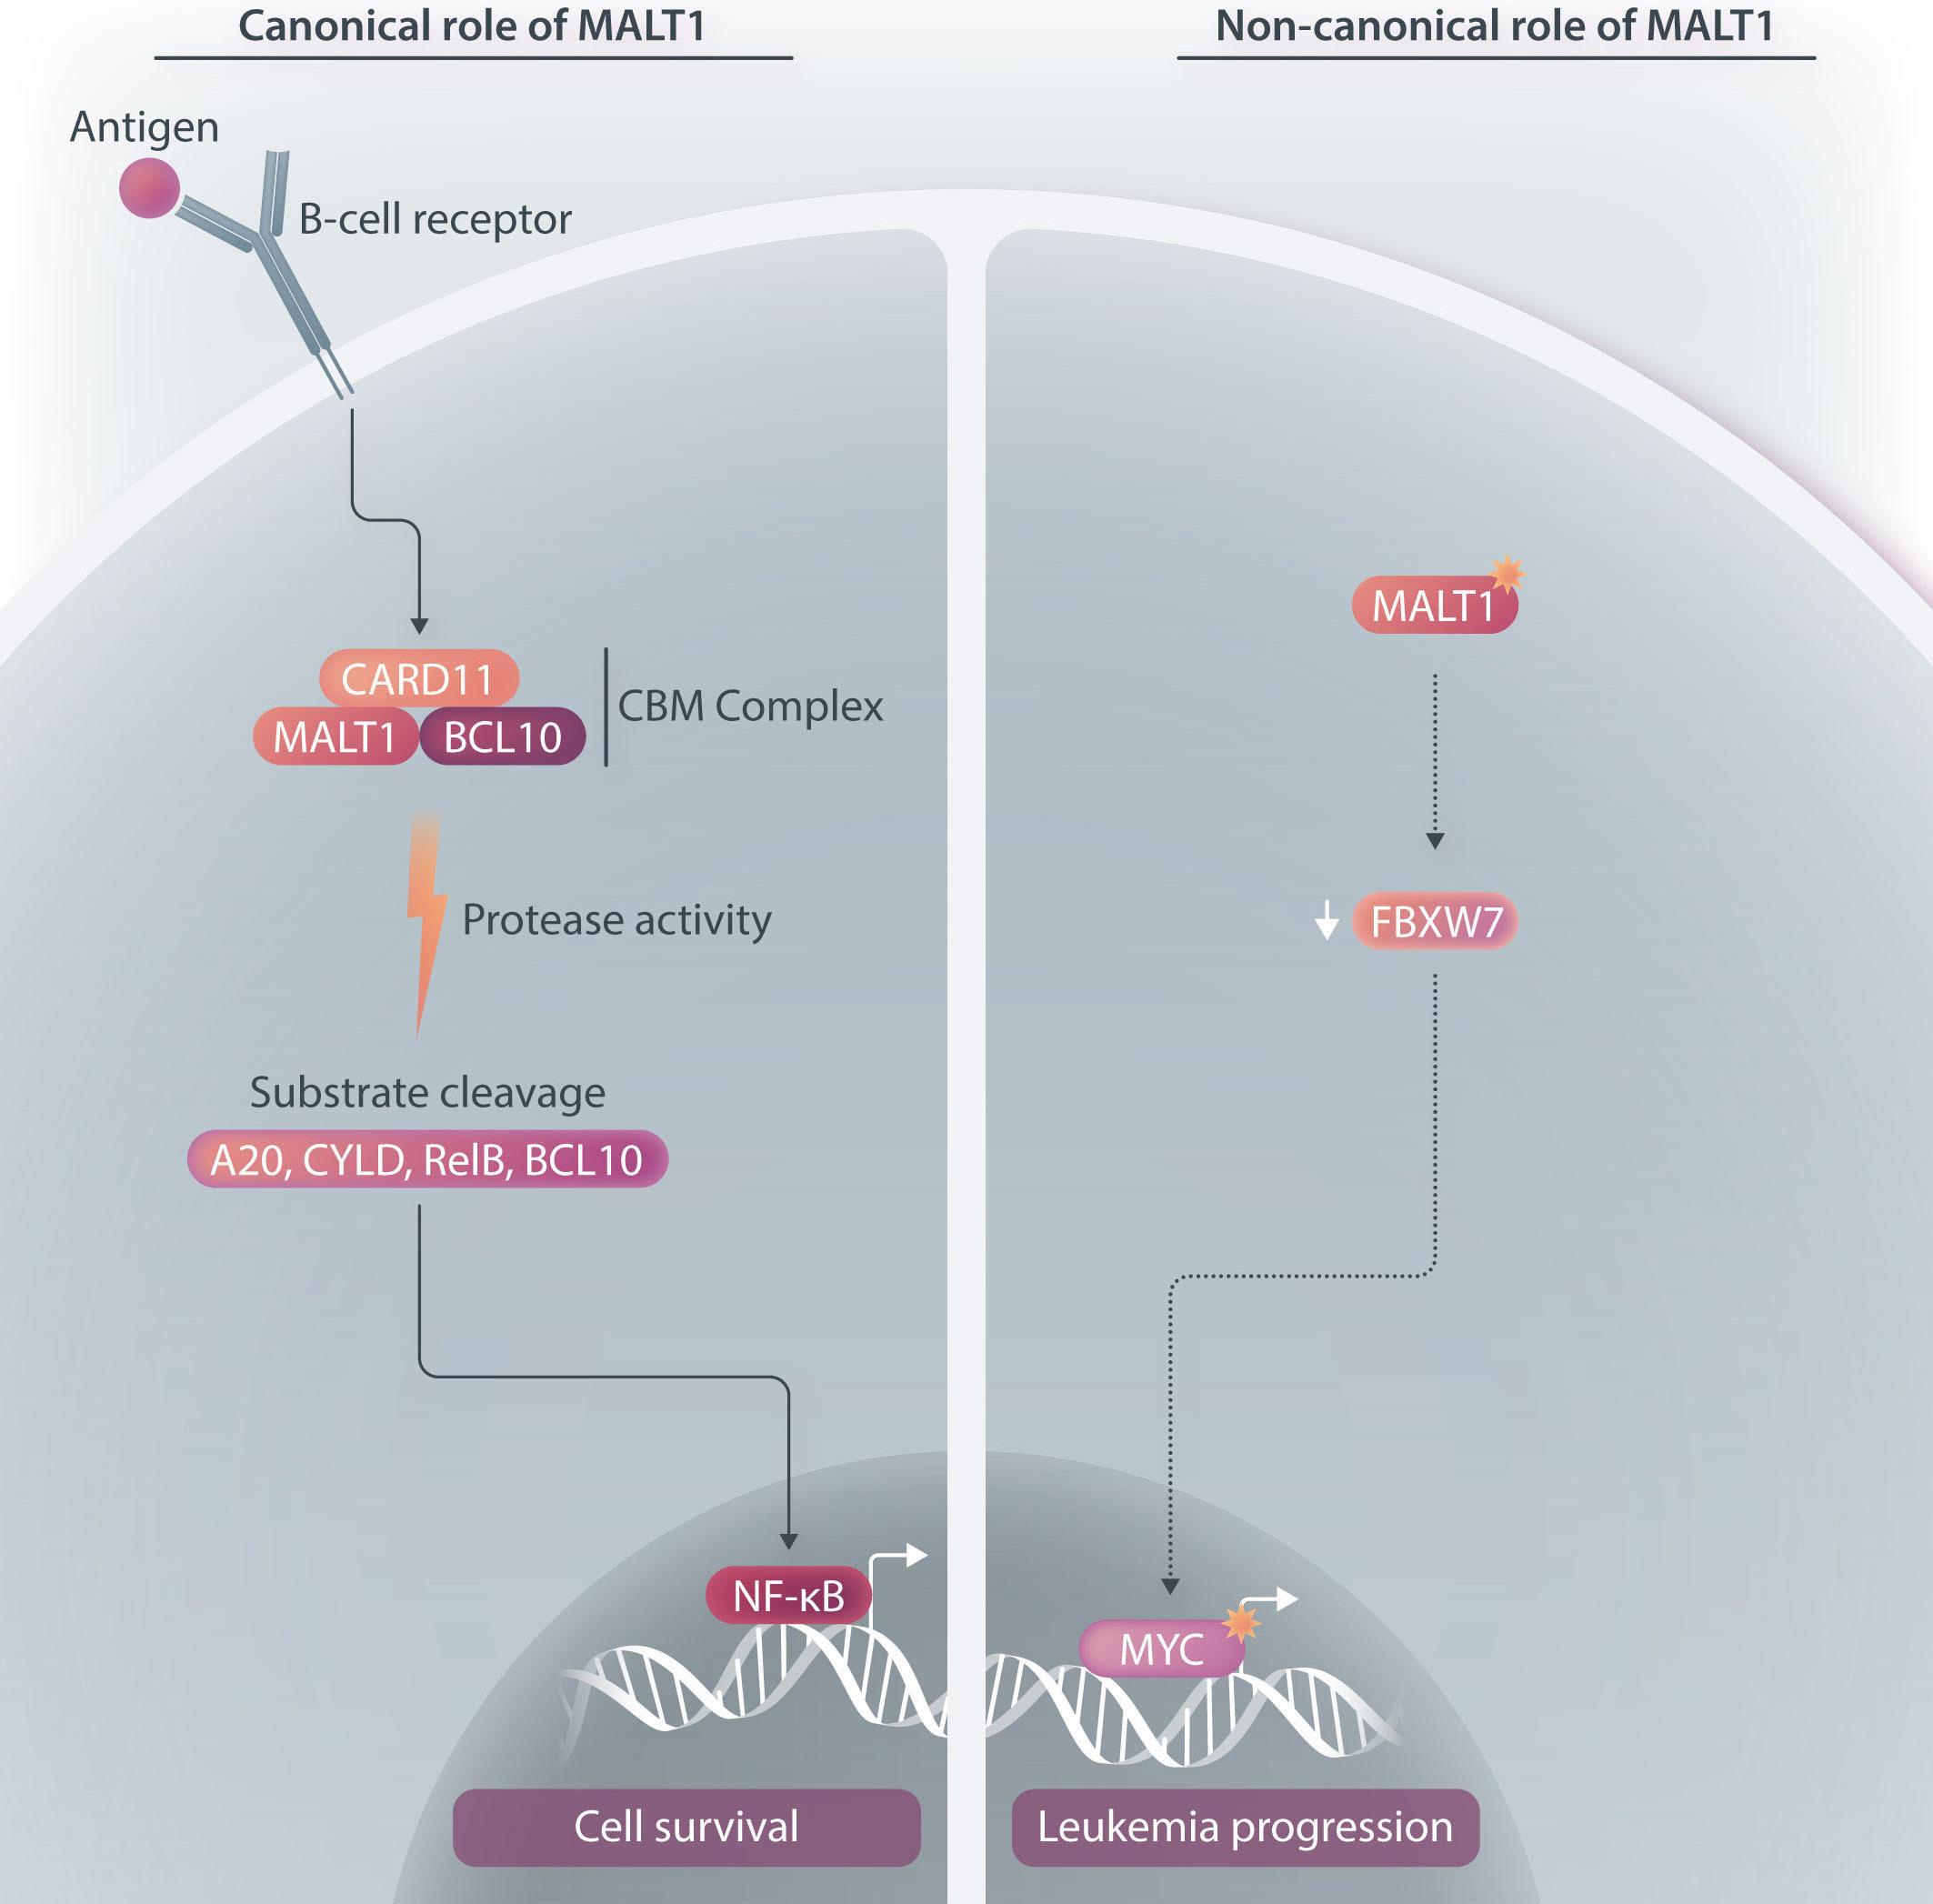
Figure 1. The canonical and non-canonical functions of MALT1 in B-cell malignancies. (Left) Canonical role of MALT1. Upon stimulation of the B-cell receptor (BCR), MALT1, a protease and scaffold protein, and BCL10 are recruited to CARD11 to form the CARD11-BCL10-MALT1 (CBM) complex. Through its protease activity, MALT1 mediates the inactivation of inhibitors of NF-κB, including A20, and the activation of positive regulators of NF-κB activity, including BCL10, CYLD, RelB. Consequently, the NF-κB signaling pathway is activated. BCR-driven MALT1 protease activity has been shown to be essential for the pathogenesis of chronic lymphocytic leukemia, activated B-cell-like diffuse large B-cell lymphoma, and subsets of mantle cell lymphoma. (Right) Non-canonical role of MALT1. Previous studies have shown that MALT1 expression was upregulated in primary B-cell acute lymphoblastic leukemia (B-ALL) cells. Pro and pre B-ALL cells have low or undetectable MALT1 protease activity but depend on MALT1 survival. Mechanistic studies revealed that MALT1 mediates survival of B-ALL cells through stabilization of MYC, and this is likely dependent on the downregulation of FBXW7 which mediates MYC degradation.
In summary, this study revealed a distinct function of MALT1 in pro and pre B-ALL compared to B-cell malignancies arising from later stages of B-cell development. Specifically, it shows that MALT1 plays a non-canonical, protease-independent role in B-ALL biology. The shift from this non-canonical role of MALT1 in B-ALL to its canonical, protease-dependent role of MALT1 in mature B-cell malignancies suggests that activation of the protease activity of MALT1 requires a fully developed BCR. MALT1 inhibitors are currently under evaluation in several clinical trials (clinicaltrials.gov identifiers: NCT04876092, NCT03900598,
NCT05144347) for treating non-Hodgkin’s lymphoma. The insights gained from this study provide a strong rationale for pursuing MALT1 as a therapeutic target in B-ALL and supporting the clinical development of MALT1 inhibitors in treating this disease.
Disclosures
No conflicts of interest to disclose.
Contributions
Both authors contributed equally.
Haematologica | 109 May 2024 1318 EDITORIAL Samiksha and L.N. Chan
References
1. Gökbuget N, Dombret H, Ribera JM, et al. International reference analysis of outcomes in adults with B-precursor Ph-negative relapsed/refractory acute lymphoblastic leukemia. Haematologica. 2016;101(12):1524-1533.
2. Hunger SP and Raetz EA. How I treat relapsed acute lymphoblastic leukemia in the pediatric population. Blood. 2020;136(16):1803-1812.
3. Safa FM, Rasmussen T, Fontan L, et al. Profiling the activity of the para-caspase MALT1 in b-cell acute lymphoblastic leukemia for potential targeted therapeutic application. Haematologica. 2024;109(5):1348-1358.
4 Saba NS, Wong DH, Tanios G, et al. MALT1 inhibition is efficacious in both naïve and ibrutinib-resistant chronic lymphocytic leukemia. Cancer Res. 2017;77(24):7038-7048.
5. Fontan L, Yang C, Kabaleeswaran V, et al. MALT1 small molecule
inhibitors specifically suppress ABC-DLBCL in vitro and in vivo. Cancer Cell. 2012; 11,22(6):812-824.
6. Dai B, Grau M, Juilland M, et al. B-cell receptor-driven MALT1 activity regulates MYC signaling in mantle cell lymphoma. Blood. 2017;129(3):333-346.
7 Xu Y, Hu J, Wang X, et al. Overexpression of MALT1-A20-NF-κB in adult B-cell acute lymphoblastic leukemia. Cancer Cell Int. 2015;15:73.
8. Welcker M, Orian A, Jin J, et al. The Fbw7 tumor suppressor regulates glycogen synthase kinase 3 phosphorylationdependent c-MYC protein degradation. Proc Natl Acad Sci. 2004;101(24):9085-9090.
9 Chakravorty D, Banerjee K, Mapder T, Saha S. In silico modeling of phosphorylation dependent and independent c-MYC degradation. BMC Bioinformatics. 2019;20(1):230.
Haematologica | 109 May 2024 1319 EDITORIAL Samiksha and L.N. Chan
In search for cure of multiple myeloma
Ralph Wäsch and Monika Engelhardt
Multiple myeloma (MM) is typically considered as an incurable disease, despite the ongoing improvements and the stunning developments of novel therapeutic approaches, the most recent being bispecific antibodies and chimeric antigen receptor (CAR) T cells. Some patients may still experience long-term remission beyond 15 years (although such cases are rare), and one may consider these patients as cured. One option, which offers the potential for such long-term remission, is allogeneic stem cell transplantation (allo-SCT). Its immunological effects and allogeneic T-cell response against myeloma cells is one key event also currently being used in other T-cell-directed therapeutics in the autologous setting that are receiving much attention. Nevertheless, many physicians treating myeloma consider allo-SCT too toxic because of the immunosuppression, bearing the risk of subsequent infections and the hazard of graft-versus-host disease (GvHD), all of which result in a potentially high non-relapse mortality (NRM). Given this, allo-SCT is not routinely performed in MM patients. Indeed, early studies with myeloablative conditioning had shown high NRM rates of 40-60%, these having decreased to 10-15% in recent years.1-4 An improved approach to separate toxicities to achieve a lower NRM than with allo-SCT alone seemed to be a tandem-transplantation approach. This uses first a myeloablative high-dose chemotherapy with autologous SCT (auto-SCT) for deep myeloma remission induction, then followed by a reduced-intensity conditioning with allo-SCT to introduce the graft-versus-myeloma (GvM) effect. This results in a much lower NRM.4 In addition, such an approach may not necessarily impair patients’ quality of life (QoL), rather than improving QoL in those being in long-term remission. At our center, we had indeed assessed this in 109 consecutive allo-SCT MM patients using the Revised-Myeloma Comorbidity Index (R-MCI; www.myelomacomorbidityindex.org) with a dynamic assessment of the five individual R-MCI comorbidity factors of organ function (lung, renal and general constitution [Karnofsky performance status, KPS]), age and frailty.2 We compared the R-MCI repeatedly in allo-SCT
Correspondence: R. Wäsch
ralph.waesch@uniklinik-freiburg.de
Received: October 20, 2023.
Accepted: November 8, 2023. Early view: November 16, 2023.
https://doi.org/10.3324/haematol.2023.284292
©2024 Ferrata Storti Foundation
versus non-allo-SCT MM patients diagnosed and treated at our center. In a prospective cohort of 280 MM patients, the median R-MCI and KPS were 4 and 80%, similar to a retrospective cohort of 1,054 MM patients with 5 and 70%, respectively.5 In line with this, the median R-MCI and KPS of our allo-SCT cohort were 4 and 80% at initial diagnosis (ID), which improved prior to allo-SCT and at last follow-up to 3 and 90%, respectively.2 The single comorbidity factor assessment of all five R-MCI factors in our allo-cohort demonstrated that the estimated glomerular filtration rate decreased with advancing patients’ age, but lung and frailty impairment did not whereas the KPS increased and patients’ aged from a median of 51 years at ID to 60 years at last follow-up. Formally, the R-MCI improvement from 4 to 3 before allo-SCT and remaining at 3 at last follow-up even implicated a shift from intermediate-fit (R-MCI 4-6) to fitter patients (R-MCI 0-3). Similar results were obtained with a quadruple combination5 or recent use of bispecific antibody treatment with teclistamab in relapsed/refractory MM patients;6 here, the QoL likewise improved with treatment response. In our allo-SCT patients, the R-MCI before and after SCT remained at 3, bearing in mind patients’ aging by almost a decade, which even underestimated our allo-SCT patients’ QoL improvement.2
Retrospective studies indicate that it is best to perform allo-SCT in young, fit patients and those with high-risk disease early in the disease course.3 In this issue of Haematologica, Kröger and colleagues report on a prospective phase II study comparing autologous tandem SCT (auto-TSCT) with autologous-allogeneic tandem SCT (allo-TSCT).7 SCT was followed by a 2-year intended thalidomide maintenance as upfront treatment for MM, which had not been performed in similar studies before. However, thalidomide discontinuation occurred frequently due to toxicity in both arms. Immunomodulatory drugs (IMiD) can be especially useful after allo-SCT, since they may induce GvHD and therefore presumably enhance GvM. (Today, lenalidomide or pomalidomide are used as IMiD rather than thalidomide due to their non- or much lesser polyneuropathy potential.)
Haematologica | 109 May 2024 1320 EDITORIAL
Published
under a CC BY-NC license
Department of Hematology, Oncology and Stem Cell Transplantation, Medical CenterUniversity of Freiburg, Faculty of Medicine, University of Freiburg, Freiburg, Germany
Studies in this setting using IMiD before day +100 have even been stopped due to GvHD aggravation,7 while reinforcing their potential when used at a sufficient interval beyond day +100.
In this ambitious multicenter study from 20 centers in Germany, 217 MM patients were included between 2008 and 2014, with a total of 178 patients who underwent the second SCT (allo N=132 [74%] and auto N=46 [26%]). Although allo-TSCT reduced the rate of recurrence and progression, the difference in progression-free survival (PFS) was marked but not significant with 43% for allo-TSCT and 21% for auto-TSCT after eight years (P=0.10). The 8-year overall survival (OS) was comparable with 52% for allo-TSCT and 50% for auto-TSCT, indicating that NRM did outweigh the lower relapse rate after allo-TSCT. Indeed, NRM was 13% after allo-TSCT and 2% after auto-TSCT at eight years after treatment (P=0.04), while relapse was reduced almost by half: 44% versus 77% (P=0.002), respectively.
Unfortunately, the study was not sufficiently powered with substantially fewer patients in the auto-TSCT arm than required: 46 instead of 74 patients. If an allogeneic donor was available, patients received allo-TSCT. This led to a lower number in the auto-TSCT arm than anticipated, due to improved availability of matched-unrelated donors and possibly also due to less MM patients (and treating physicians) who were willing to go forward to the second auto-SCT for the tandem-approach. With this much lower number of auto-TSCT, the observed 22% difference in PFS at eight years did not reach significance (P=0.1), also because the overall rate of relapse after auto-TSCT was lower than anticipated.
Therefore, the study was still unable to answer the question as to whether allogeneic transplantation offers any advantage in the treatment of myeloma. However, it again showed long-term benefit in some patients, indicating that it would be important to conduct further studies.
Haematologica | 109 May 2024 1321 EDITORIAL R. Wäsch and M. Engelhardt
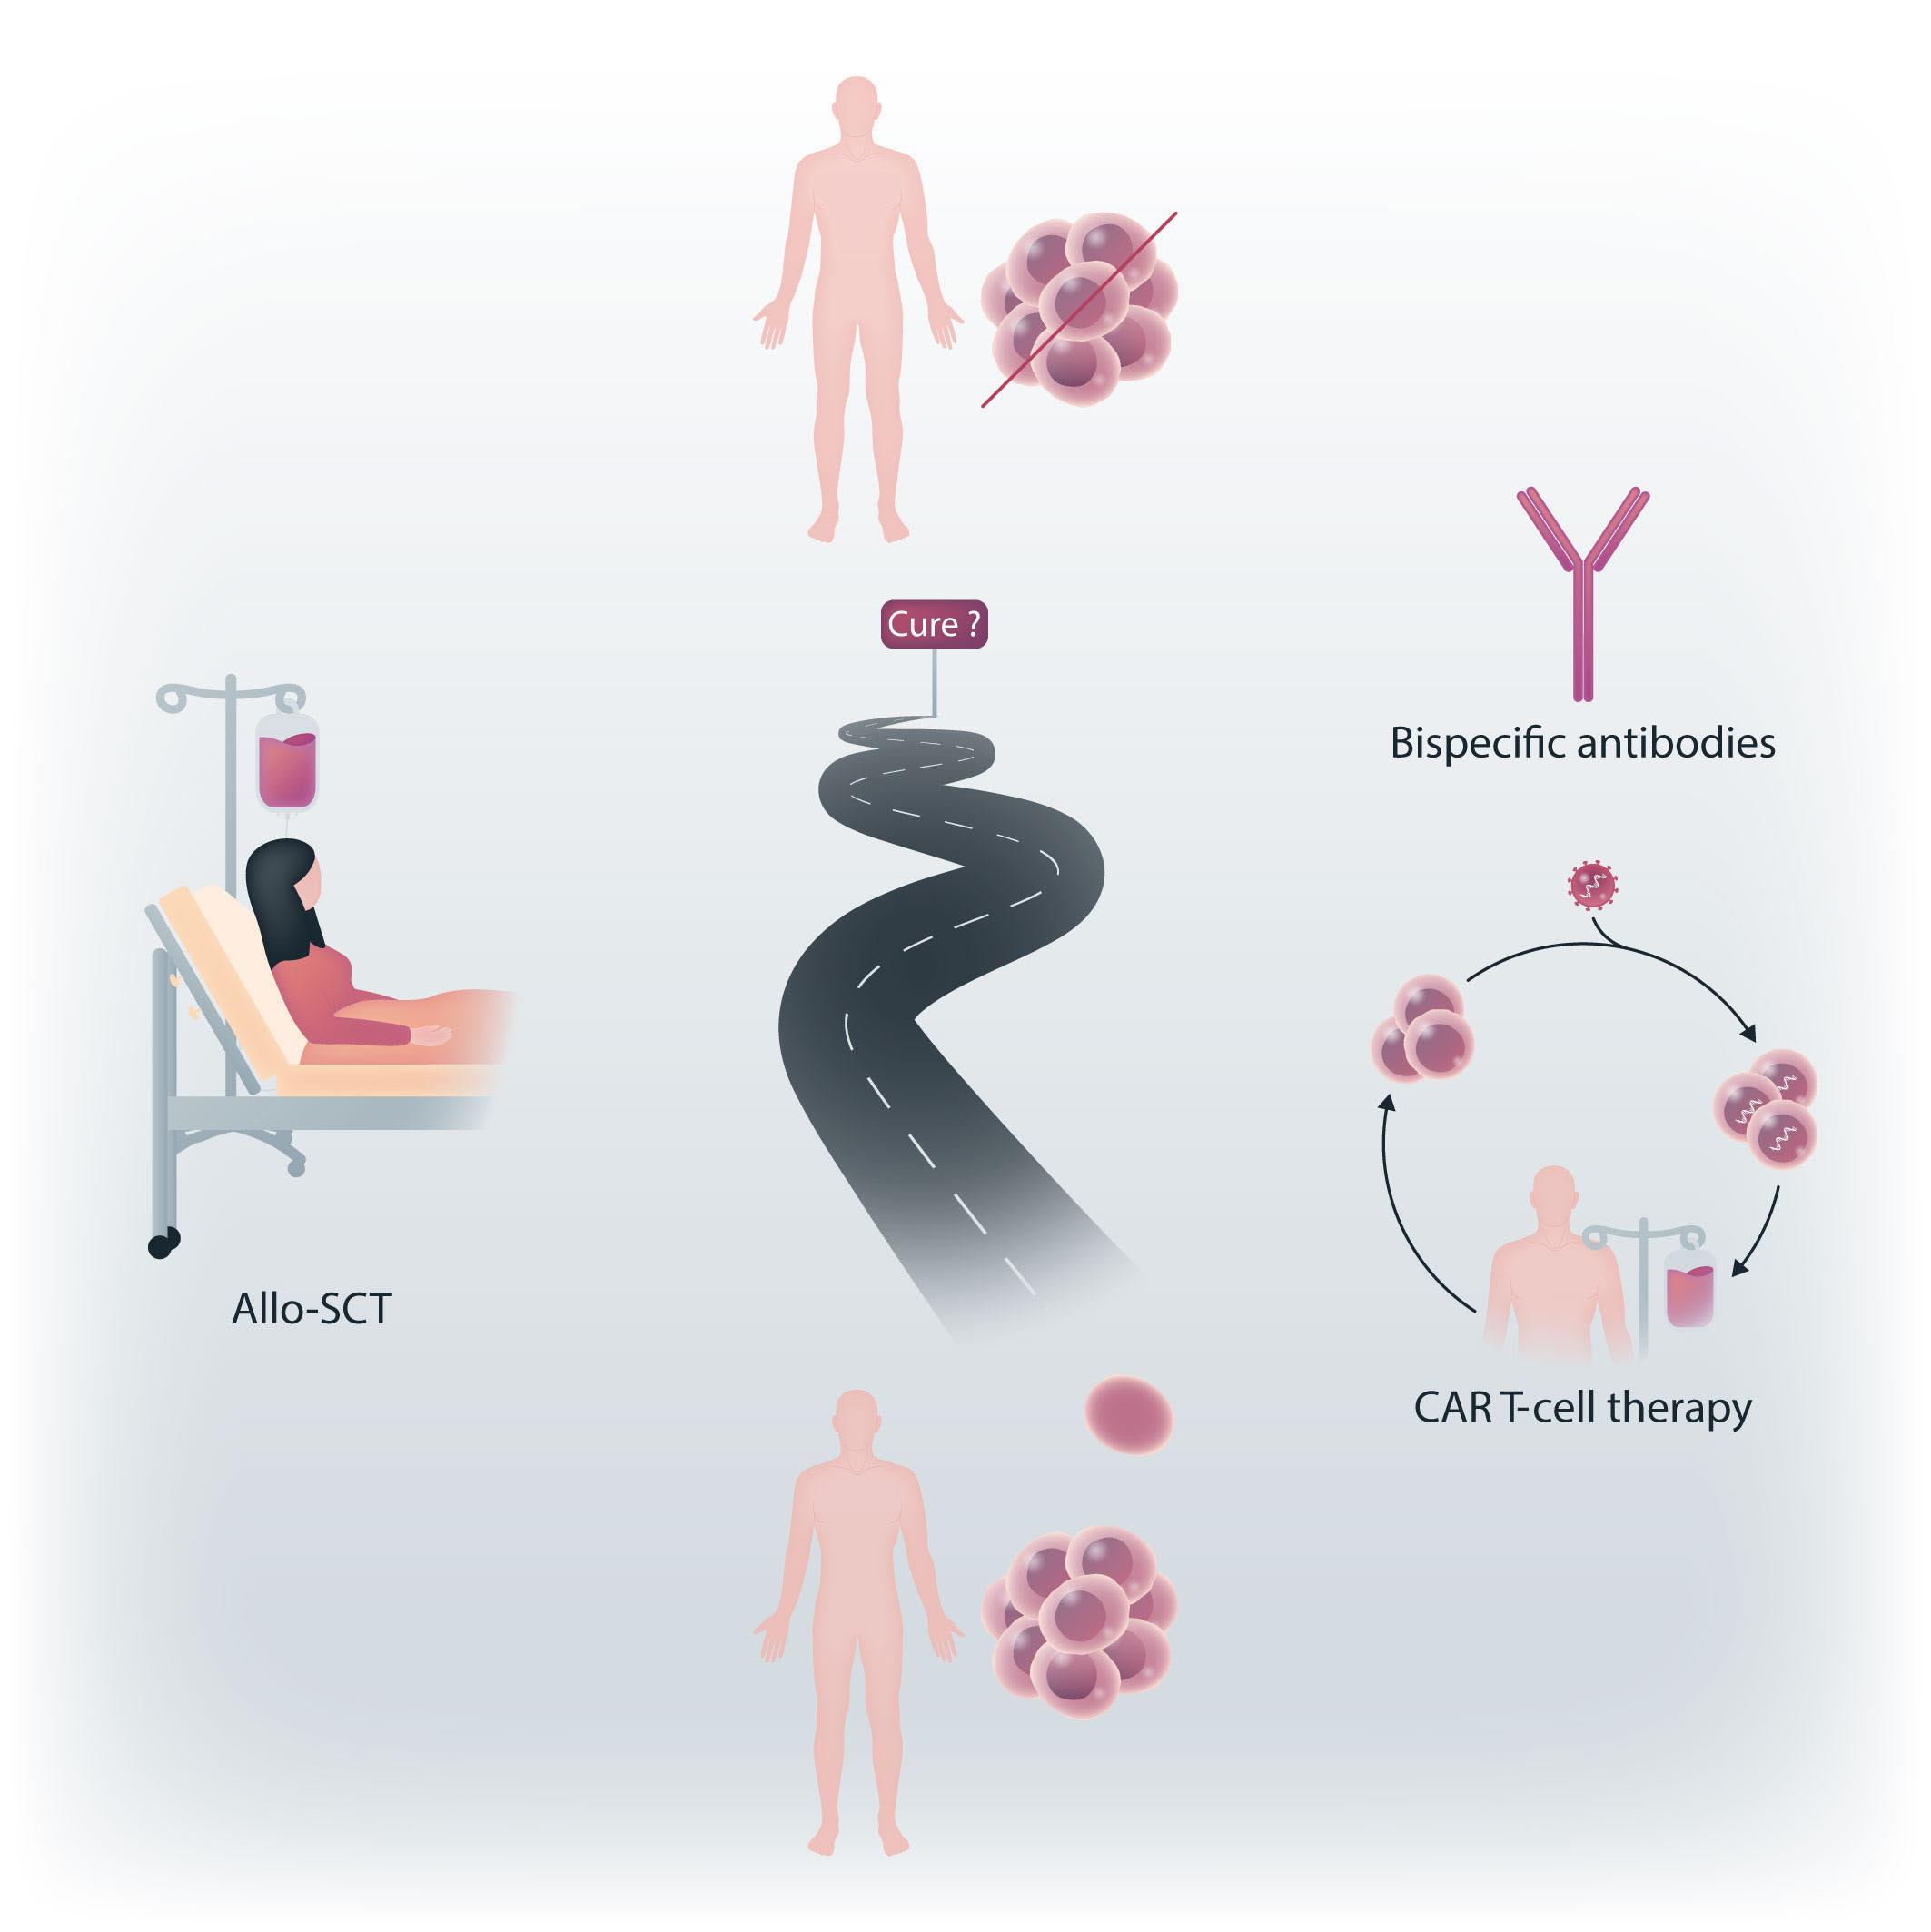
Figure 1. The long way in the search for myeloma cure. The current promising alternatives to allogeneic stem cell transplantation (alloSCT) are chimeric antigen receptor (CAR) T cells and bispecific antibodies, or a combination of these options.
Unfortunately, in the study, the significance of allo-SCT for patients with high-risk (HR) features (i.e. HR-cytogenetics and <50-years of age) remained unsolved due to a low number of patients and the maintenance use of thalidomide, which is outdated and was expectedly of short duration. Nevertheless, multicenter allo-SCT trials are rare, and the reduced rate of MM recurrence or progression by 23% after four years and by 33% at eight years was gratifying. The authors themselves suggest that the 13% NRM after allo-TSCT, although in line with other studies including unrelated donors, is still too high for allo-TSCT to be recommended for all patients, regardless of the lower incidence of relapse. Prof. Kröger is currently performing a large, randomized, multicenter phase III study to compare allo-SCT with standard triple relapse therapies in myeloma to provide even better answers, and this study has been encouraged by German health authorities.
Therefore, until more recent studies provide up-to-date answers, the results of the phase II study on allo-TSCT versus auto-TSCT in this issue of Haematologica suggest both options as feasible, even though the study failed to reach its primary endpoint of improved PFS of 20% at four years with allo-SCT. Not unusual for clinical trials, insufficient patient numbers were accrued, and although the allo-TSCT arm fared better in PFS (43% vs. 21%), the OS was identical (52% vs. 50%), due to the TRM (13% vs. 2%) which
References
1. Gahrton G, Svensson H, Cavo M, et al. Progress in allogenic bone marrow and peripheral blood stem cell transplantation for multiple myeloma: a comparison between transplants performed 1983-93 and 1994-8 at European Group for Blood and Marrow Transplantation centres. Br J Haematol. 2001;113(1):209-216.
2. Greil C, Engelhardt M, Ihorst G, et al. Allogeneic transplantation of multiple myeloma patients may allow long-term survival in carefully selected patients with acceptable toxicity and preserved quality of life. Haematologica. 2019;104(2):370-379.
3. Greil C, Engelhardt M, Finke J, Wäsch R. Allogeneic stem cell transplantation in multiple myeloma. Cancers (Basel). 2021;14(1):55.
4. Maloney DG, Molina AJ, Sahebi F, et al. Allografting with nonmyeloablative conditioning following cytoreductive autografts for the treatment of patients with multiple myeloma. Blood. 2003;102(9):3447-3454.
5. Waldschmidt JM, Keller A, Ihorst G, et al. Safety and efficacy of
needs further improvement. Before other large studies provide final results, allo-SCT is still rarely performed in young, fit and/or high-risk MM patients. Further prospective trials should be designed with combinations of newer drugs that allow profound cytoreduction before allo-SCT, enhance the efficacy of GvM through immunomodulatory effects after transplantation, and thus lead to long-term disease control and survival even in high-risk MM patients. Subsequent trials and newer CAR T cells and bispecifics emerge as attractive anti-MM options, with even more novel agents and therapies to be developed in the ever-growing field of MM care. Currently, the myeloma community is extremely enthusiastic about including CAR T-cell therapies and bispecifics in earlier treatment lines in the continued search for cure or very long-lasting remission in a more substantial fraction of MM patients (Figure 1).
Disclosures
RW reports honoraria and consultancy from Abbvie, Amgen, BMS, Janssen, Kite/Gilead, Novartis, Pfizer, Sanofi, and Takeda. ME reports honoraria and consultancy from Amgen, BMS, GSK, Janssen, Pfizer, Sanofi, Takeda, all unrelated to this article.
Contributions
Both authors contributed equally.
vorinostat, bortezomib, doxorubicin and dexamethasone in a phase I/II study for relapsed or refractory multiple myeloma (VERUMM study: vorinostat in elderly, relapsed and unfit multiple myeloma). Haematologica. 2018;103(10):e473-e479.
6. Dieterle MP, Mostufi-Zadeh-Haghighi G, Kus JW, et al. Safe and successful teclistamab treatment in very elderly multiple myeloma (MM) patients: a case report and experience from a total of three octogenarians. Ann Hematol. 2023;102(12):3639-3641.
7 Kröger N, Wulf GG, Hegenbart U, et al. Autologous-allogeneic versus autologous tandem stem cell transplantation and maintenance therapy with thalidomide for patients with multiple myeloma and age <60 years: a prospective phase II-study. Haematologica. 2024;109(5):1469-1479.
8. Kneppers E, van der Holt B, Kersten MJ, et al. Lenalidomide maintenance after nonmyeloablative allogeneic stem cell transplantation in multiple myeloma is not feasible: results of the HOVON 76 Trial. Blood. 2011;118(9):2413-2419.
Haematologica | 109 May 2024 1322 EDITORIAL R. Wäsch and M. Engelhardt
Routine consolidation of early stage primary bone lymphoma with radiation therapy does not improve outcomes
Marc S. Hoffmann
Since the discovery that radiation therapy could be delivered with curative intent to a subset of patients with lymphoma, such therapy has been an important part of the management of lymphoproliferative disorders. However, with improvements in systemic therapy and recognition of long-term adverse effects,1 radiation therapy has played an ever smaller role in the treatment of diffuse large B-cell lymphoma (DLBCL). As an example, in the large, randomized MInT study that accrued over 800 patients and helped to establish that the addition of rituximab to cyclophosphamide, doxorubicin, vincristine and prednisone chemotherapy (R-CHOP) chemotherapy improved survival, radiation therapy was given as protocol-planned consolidation therapy to all sites of extranodal and bulky disease.2 In contrast, essentially all modern studies in the treatment of advanced stage DLBCL consider administration of radiation therapy to be an event denoting progression. We
Study (ref)
ECOG 14843
SWOG 87364,5
SWOG 00146
SWOG 10017
FLYER8
Correspondence:
M. S. Hoffmann mhoffmann@kumc.edu
Received: October 17, 2023.
Accepted: November 3, 2023. Early view: November 16, 2023.
https://doi.org/10.3324/haematol.2023.284303
©2024 Ferrata Storti Foundation
have moved from planned consolidative radiation therapy to delivering radiation therapy more selectively. One area of ongoing controversy regarding the role of radiation therapy in DLBCL management is in the setting of limited stage disease. Table 1 summarizes outcomes from selected, prospective studies in early stage DLBCL which form the basis for current treatment recommendations.3-8 These existing data can leave the treating physician in a quandary regarding optimal treatment for an individual patient with early stage DLBCL. If a patient otherwise meets criteria for the FLYER study but is 68 years old, do those data apply? Would a patient with stage II disease and a primary mass measuring 10.5 cm be eligible for combined modality therapy (CMT) or is that patient obligated to have a longer course of systemic therapy? Does the site of disease matter?
Enter the study by Rezazadeh et al., published in this is-
Critical inclusion criteria
Stage I bulky (>10 cm)
Stage I-E, II or II-E
Stage I, stage I (bulky, ≥10 cm)
Stage II (non-bulky, <10 cm)
Stage I, I-E
Stage II, II-E (<10 cm)
IPI of at least 1
Stage I regardless of bulk Stage II non-bulky (<10 cm)
Stage I or stage II non-bulky (<7.5 cm) IPI = 0
Critical outcomes
Addition of RT to CHOP x 8 improved PFS but not OS
CHOP x 3 → RT equivalent to CHOP x 8
R-CHOP x 3 → RT 2-yr PFS was 84%
R-CHOP x 4 5-yr PFS of 87% in pts with CR on interim PET/CT after 3 cycles
R-CHOP x 4 → R x 2
non-inferior to R-CHOP x 6 with 3-yr PFS of 96%
ECOG: Eastern Cooperative Oncology Group; RT: radiation therapy; CHOP: cyclophosphamide, doxorubicin, vincristine and prednisone; PFS: progression-free survival; OS: overall survival; SWOG: Southwest Oncology Group; IPI: International Prognostic Index; R-CHOP: rituximab plus CHOP; yr: year; pts: patients; CR: complete response; PET: positron emission tomography; CT: computed tomography; ref: reference.
Haematologica | 109 May 2024 1323 EDITORIAL
Published
a CC BY-NC
under
license
Division of Hematologic Malignancies and Cellular Therapeutics, University of Kansas Cancer Center, Kansas City, KS, USA
Table 1. Outcomes in selected prospective studies in early stage diffuse large B-cell lymphoma.
sue of Haematologica. 9 The authors analyzed 112 patients with stage I-E or stage II-E primary bone lymphoma in the post-rituximab era who were treated at 13 academic centers between 2005-2019. Stage II-E patients were only included if they had loco-regional adenopathy amenable to radiation therapy in a single field. Overall and relapse-free survival outcomes were obtained with multivariate analysis comparing radiotherapy versus no radiotherapy and also comparing <36 Gy or ≥36 Gy radiotherapy. The results were clear: there was no significant difference in overall or progression-free survival between the two arms. Additionally, higher doses of radiotherapy (≥36 Gy) were not associated with improved outcomes compared to doses <36 Gy. Not surprisingly, given the choices between regimens, patients in the CMT arm of the study received fewer doses of systemic therapy compared to patients in the arm receiving chemotherapy alone (4.5 vs. 5.6 cycles, respectively). The only group that appeared to potentially benefit from CMT was formed of the six patients in that arm who achieved a partial response after induction therapy. Regrettably disease bulk was not reported. The study by Rezazadeh provides the best available data regarding outcomes of patients with early stage primary bone lymphoma in the post-rituximab era. As the authors duly note in their conclusion, rituximab use was limited in previously published literature and is therefore not reflective of modern practice. While the sample size at first glance appears somewhat small (112 patients), early stage primary bone lymphomas constitute a rare presentation of DLBCL and we are unlikely to see larger studies. Given the generally favorable outcomes there has been little appetite in industry to study limited stage DLBCL and retrospective datasets will guide therapy choices. Indeed, it is a testament to the
References
1. Armitage JO. Early stage Hodgkin lymphoma. N Engl J Med. 2010;363(7):653-662.
2. Pfreundschuh M, Kuhnt E, Trümper L, et al. CHOP-like chemotherapy with or without rituximab in young patients with good-prognosis diffuse large-B-cell lymphoma: 6-year results of an open-label randomised study of the MabThera International Trial (MInT) Group. Lancet Oncol. 2011;12(11):1013-1022.
3. Horning SJ, Weller E, Kim K, et al. Chemotherapy with or without radiotherapy in limited-stage diffuse aggressive nonHodgkin’s lymphoma: Eastern Cooperative Oncology Group study 1484. J Clin Oncol. 2004;22(15):3032-3038.
4 Miller TP, Dahlberg S, Cassady JR, et al. Chemotherapy alone compared with chemotherapy plus radiotherapy for localized intermediate- and high-grade non-Hodgkin’s lymphoma. N Engl J Med. 1998;339(1):21-26.
5. Miller TP, Leblanc M, Spier C, et al. CHOP alone compared to CHOP plus radiotherapy for early stage aggressive nonHodgkin’s lymphomas: update of the Southwest Oncology Group (SWOG) randomized trial. Blood. 2001;98(11 Pt 1):724a.
6. Persky DO, Unger JM, Spier CM, et al. Phase II study of rituximab plus three cycles of CHOP and involved-field
paucity of data that, in spite of Food and Drug Administration approval of rituximab as an addition to CHOP in 2006, we are only now, in 2023, seeing post-rituximab era datasets. So how should we incorporate these data into clinical practice? First, routine consolidation with radiation in early stage primary bone lymphoma does not appear to improve outcomes in patients who achieve a complete response with systemic therapy. Second, doses of radiation >36 Gy are not more effective than lower doses and consequently should be avoided. Finally, the greater exposure to chemotherapy in the systemic therapy arm suggests that giving a sufficient number of doses of chemotherapy may be necessary to achieve adequate results.
These data enable treating physicians to use radiation more selectively in the management of early stage primary bone lymphoma. Patients who present with disease in a field with low risk of short- and long-term toxicity, such as a distal extremity lesion, may be preferentially managed with CMT to lessen chemotherapy exposure. Additionally, in a patient who presents with disease transformation from a low-grade follicular lymphoma, CMT may be preferred because of the durable remissions of the low-grade component of disease seen with radiation therapy.10 In contrast, in patients who may require post-treatment surgical interventions, whose fields will include gastrointestinal or mucosal surfaces, and in younger patients at higher risk of secondary malignancies, an approach with systemic therapy alone may be preferred.
Disclosures
MSH has provided consultancy services for ADC Therapeutics, Abbvie, Janssen, Pharmacyclics, BeiGene, and AstraZeneca.
radiotherapy for patients with limited-stage aggressive B-cell lymphoma: Southwest Oncology Group study 0014. J Clin Oncol. 2008;26(14):2258-2263.
7 Persky DO, Li H, Stephens DM, et al. Positron emission tomography-directed therapy for patients with limited-stage diffuse large B-cell lymphoma: results of Intergroup National Clinical Trials Network Study S1001. J Clin Oncol. 2020;38(26):3003-3011.
8. Poeschel V, Held G, Ziepert M, et al. Four versus six cycles of CHOP chemotherapy in combination with six applications of rituximab in patients with aggressive B-cell lymphoma with favourable prognosis (FLYER): a randomised, phase 3, noninferiority trial. Lancet. 2019;394(10216):2271-2281.
9 Rezazadeh A, Szabo A, Khurana A, et al. Outcomes of limited stage primary bone diffuse large B-cell lymphoma in the rituximab era: a multicenter, retrospective study. Haematologica. 2024;109(5):1439-1444.
10. Tobin JWD, Rule G, Colvin K, et al. Outcomes of stage I/II follicular lymphoma in the PET era: an international study from the Australian Lymphoma Alliance. Blood Adv. 2019;3(19):2804-2811.
Haematologica | 109 May 2024 1324 EDITORIAL M.S. Hoffmann
ToTAL1y degraded - rapid dTAG proteolysis of TAL1 in T-cell acute lymphoblastic leukemia
Joana R. Costa1 and Marc R. Mansour1,2
1UCL Cancer Institute, University College London and 2Department of Developmental Biology and Cancer, UCL Great Ormond Street Institute of Child Health, London, UK
Correspondence: M.R. Mansour m.mansour@ucl.ac.uk
Received: November 27, 2023.
Accepted: December 1, 2023.
Early view: December 14, 2023.
https://doi.org/10.3324/haematol.2023.284447
©2024

In the current issue of Haematologica, Ong and colleagues interrogate the regulatory mechanisms of TAL1 in T-cell acute lymphoblastic leukemia (T-ALL) cells by taking advantage of the very powerful dTAG degradation system.1,2 TAL1, together with GATA3 and LMO2, are among a select group of master transcription factors (TF) that orchestrate normal thymocyte development.3 When such TF are dysregulated through chromosomal translocation or somatic mutation, thymocytes undergo differentiation arrest, often, but not always, at a developmental time point where these genes are not normally expressed. TAL1, for instance, is usually downregulated after the double-positive stage of thymic development. In T-ALL, chromosomal lesions, such as the ~80 kb deletion that juxtaposes the ubiquitously active STIL promoter to TAL1, 4 or the TAL1 neo-enhancer mutations that create binding sites for MYB,5 lead to its continuous overexpression during thymic development and differentiation arrest at the post-cortical stage. Class-defining lesions, such as those affecting TAL1, TLX1, TLX3 and MEF2C, define their gene expression program and are typically not seen together in the same T-ALL. Ong and colleagues offer a credible rationale for why this is the case.
TAL1 relies on secondary hits in signaling pathways to lead to full transformation to T-ALL. For instance, in mouse models of Tal1-induced T-ALL, three-quarters of tumors harbored activating-mutations in Notch1, 6 suggesting cooperativity between these two factors. However, the molecular crosstalk between NOTCH1 and TAL1 has not been fully elucidated.
Up to now, studies interrogating the transcriptional program induced by TF oncogenes in T-ALL have mainly used small-interference RNA (siRNA) or short-hairpin RNA (shRNA) knockdown approaches.5,7 Despite their validity, the knockdown achieved by these tools is often slow and incomplete, prone to off-target effects, and relies on electroporation or viral transduction that can induce indirect gene expression changes. Instead, Ong and colleagues introduced a mutant
FKBP12 sequence in-frame to the 3’ of TAL1 using CRISPR/ Cas9. On the addition of dTAG, a heterobifunctional small molecule capable of binding to both mutant FKBP12 and the E3 ligase system, TAL1 is rapidly degraded within 2 hours, giving the opportunity to analyze the kinetics and dynamics of direct TAL1 target genes with minimal cell manipulation.
By employing acute protein degradation of TAL1 for a period of 2-72 hours in Jurkat T-ALL cells, the authors classified three subsets of TAL1 target genes: i) group A genes that show the most rapid and dynamic downregulation on TAL1 depletion, i.e., are positively regulated by TAL1, ii) group B genes that exhibit less extreme downregulation and whose expression reaches a plateau, and iii) group C genes that are upregulated on TAL1 depletion i.e., negatively regulated by TAL1. Whereas genes belonging to group A comprise the oncogenic TAL1 signature and are likely to be direct TAL1 targets, genes that belong to group B were partially dependent on TAL1, and group C genes, most likely represent indirect negative targets. The latter include genes such as RAG1, RAG2 and PTCRA, which are known to be positively regulated by E-proteins, highlighting the antagonism that can occur with TAL1 at specific loci.7
Utilizing ATAC sequencing, chromatin immunoprecipitation (ChIP) sequencing and H3K27ac high-throughput ChIP (HiChIP), the authors further characterized the chromatin features of each subgroup, thus inferring the regulatory mechanisms of TAL1. By taking as an example the ALDH1A2 and SIX6 gene loci, group A genes that show a lack of chromatin accessibility in hematopoietic stem cells or normal T cells, chromatin loops at enhancers were lost upon TAL1 degradation. Importantly, the role of TAL1 in chromatin loop formation has only been addressed in erythroid cells where TAL1 mediates the interaction between the γ-globin gene and its enhancer through LDB1.8 The authors then explored whether TAL1 or LMO1 alone, or together, were sufficient to establish an open chromatin state in TAL1-negative
Haematologica | 109 May 2024 1325 EDITORIAL
Ferrata Storti Foundation Published under a CC BY license

Figure 1. Schematic representation of TAL1 target genes as demonstrated by dTAG-induced TAL1 depletion. Target genes are classified into group A, group B and group C genes. Group A genes are directly dependent on TAL1 and regulated via chromatin looping. Group B genes are partially dependent on TAL1 and require additional transcription factors. Group C genes are indirectly repressed by TAL1 via inhibition of E2A activity. TF: transcription factor.
HBP-ALL cells. Only when TAL1 and LMO1 were expressed together was there significant upregulation of target genes, highlighting the cooperativity between these two factors, with relevance to the observation that T-ALL patients often have activating lesions in both TAL1 and LMO1/2.9 A subset of these genes were direct TAL1 target genes identified by the dTAG approach, including, ALDH1A2 and SIX6 gene, which exhibited gain of chromatin accessibility by ATAC sequencing and a dramatic increase of mRNA expression. In contrast, group B genes, that include members of the previously recognized transcriptional regulatory circuit, such as MYB and RUNX1, were characterized by dense chromatin interactions with only marginal reductions in chromatin loops upon TAL1 depletion. This finding most likely reflects a more intricate pattern of regulation of
group B genes, where in addition to TAL1, other factors are likely to play a role. Focusing on the GIMAP locus, a known TAL1 and NOTCH1 target,10 a reduction of chromatin loops was achieved by the combination of TAL1 degradation and NOTCH1 inhibition. These findings indicate that one regulatory factor can compensate for the loss of another, but the loss of both has a severe effect.
Lastly, the authors tested the functionality of TAL1 in HBPALL cells, a TAL1-negative cell line of the TLX3 subgroup. Combined overexpression of TAL1 and LMO1 resulted in cell proliferation arrest concomitant with downregulation of NOTCH1 target genes, including MYC. Overexpression of MYC partially rescued cells from proliferative arrest. Although a previous study where TLX3 was overexpressed in TAL1-positive cell lines did not interrogate cell proliferation11 the results
Haematologica | 109 May 2024 1326 EDITORIAL J.R. Costa and M.R. Mansour
indicate that TF oncogenes that define the molecular T-ALL subtypes may have antagonistic effects, thus explaining the fact that TLX1/3 translocations and TAL1 activating lesions are mutually exclusive in T-ALL. These findings underscore the cell context-dependent nature of TAL1 in T-ALL, acting cooperatively with NOTCH1 in one cell type and inhibiting the NOTCH1 downstream program in another.
Overall, the study from Ong and colleagues provides a comprehensive view of the TAL1-induced transcriptional program and addresses context-dependent roles of TAL1
References
1. Ong JZL, Tan TK, Wang L, Tan SH, Sanda T. Regulatory mechanisms and context-dependent roles of TAL1 in T-cell acute lymphoblastic leukemia. Haematologica. 2024;109(5):1359-1372.
2. Nabet B, Roberts JM, Buckley DL, et al. The dTAG system for immediate and target-specific protein degradation. Nat Chem Biol. 2018;14(5):431-441.
3. Kueh HY, Rothenberg EV. Regulatory gene network circuits underlying T cell development from multipotent progenitors. Wiley Interdiscip Rev Syst Biol Med. 2012;4(1):79-102.
4 Aplan PD, Lombardi DP, Ginsberg AM, Cossman J, Bertness VL, Kirsch IR. Disruption of the human SCL locus by “illegitimate” V-(D)-J recombinase activity. Science. 1990;250(4986):1426-1429.
5. Mansour MR, Abraham BJ, Anders L, et al. Oncogene regulation. An oncogenic super-enhancer formed through somatic mutation of a noncoding intergenic element. Science. 2014;346(6215):1373-1377.
6. O’Neil J, Calvo J, McKenna K, et al. Activating Notch1 mutations in mouse models of T-ALL. Blood. 2006;107(2):781-785.
that can further provide a rationale for improved targeted therapies. Importantly, this is the first study where TAL1-mediated chromatin looping is recognized as a mechanism that sustains gene activation in T-ALL.
Disclosures
No conflicts of interest to disclose.
Contributions
Both authors contributed equally.
7 Sanda T, Lawton LN, Barrasa MI, et al. Core transcriptional regulatory circuit controlled by the TAL1 complex in human T cell acute lymphoblastic leukemia. Cancer Cell. 2012;22(2):209-221.
8. Yun WJ, Kim YW, Kang Y, Lee J, Dean A, Kim A. The hematopoietic regulator TAL1 is required for chromatin looping between the β-globin LCR and human γ-globin genes to activate transcription. Nucleic Acids Res. 2014;42(7):4283-4293.
9 Rahman S, Magnussen M, León TE, et al. Activation of the LMO2 oncogene through a somatically acquired neomorphic promoter in T-cell acute lymphoblastic leukemia. Blood. 2017;129(24):3221-3226.
10. Liau WS, Tan SH, Ngoc PCT, et al. Aberrant activation of the GIMAP enhancer by oncogenic transcription factors in T-cell acute lymphoblastic leukemia. Leukemia. 2017;31(8):1798-1807.
11. Botten GA, Zhang Y, Dudnyk K, et al. Structural variation cooperates with permissive chromatin to control enhancer hijacking-mediated oncogenic transcription. Blood. 2023;142(4):336-351.
Haematologica | 109 May 2024 1327 EDITORIAL J.R. Costa and M.R. Mansour
Sickle cell disease, pregnancy, and COVID-19 in France: plus ça change
Lydia H. Pecker1,2 and Jerome Federspiel3,4
1Division of Hematology, Department of Medicine, Johns Hopkins University School of Medicine, Baltimore, MD; 2Department of Gynecology and Obstetrics, Johns Hopkins University School of Medicine, Baltimore, MD; 3Division of Maternal Fetal Medicine, Department of Obstetrics and Gynecology, Duke University School of Medicine, Durham, NC and 4Department of Population Health Sciences, Duke University School of Medicine, Durham, NC, USA
Correspondence: L.H. Pecker lpecker1@jhmi.edu
Received: November 23, 2023.
Accepted: November 29, 2023.
Early view: December 7, 2023.
https://doi.org/10.3324/haematol.2023.284457
©2024 Ferrata Storti Foundation
In this issue of Haematologica, Joseph and colleagues report outcomes of 28 pregnant individuals with sickle cell disease (SCD) diagnosed with coronavirus disease 2019 (COVID-19) whose data were collected in a French registry.1 This is the first report addressing pregnancy outcomes in people with SCD and COVID-19 infection. This population of patients is exceedingly vulnerable as both pregnancy and COVID-19 infection are associated with increased morbidity and mortality in individuals with SCD.2,3 Despite methodological limitations, the results suggest that the concurrence of SCD and COVID-19 produces synergistic hazards in pregnancy. The combination appears particularly perilous for the unvaccinated. In the study by Joseph et al., 11 subjects with COVID-19 were hospitalized and only subjects who were unvaccinated required intensive care (5/11, 45%). The lone reported death in this series occurred in a 19-year-old subject with hemoglobin SC disease who was unvaccinated.
These attention-grabbing data underscoring the importance of COVID-19 vaccination for pregnant people with SCD nevertheless leave some unanswered questions. Was the subject who suffered a miscarriage vaccinated? What was the indication for COVID-19 testing among those treated as outpatients? How many cases occurred before the COVID vaccine or antiviral agents became available in France? Is the low rate of antiviral treatments explained by lack of availability or clear indication for use? Did the severe outcomes occur early in the pandemic before evidence-based management strategies and clear risks to pregnant people emerged?
Clearly, COVID-19 vaccination is essential for pregnant people with SCD. The overall COVID-19 vaccination rate in the cohort was low (30%). For the 16 subjects who had the alpha variant of COVID-19, the vaccine may have been unavailable at the time of infection. Whether there are racial disparities in vaccine uptake in France is unknown because federal law prohibits the collection of these data.
In the USA, most pregnant people with SCD are Black.2 In the general population of pregnant people who are Black, COVID-19 vaccination rates are a disturbing 30%, consistent with the report from France.4 However, the contemporary vaccination rate of individuals with SCD who receive care in specialized SCD centers in the USA may be as high as 70%.5 Additional data are needed to appraise outcomes of COVID-19 vaccination uptake among pregnant people with SCD, to address intersectional disparities that may exist, and develop evidence-based strategies to encourage vaccination.
Respiratory symptoms are common in all pregnant people as pregnancy progresses and pulmonary complications are a significant feature of SCD, and SCD pregnancy.2 It is thus unsurprising that compared to the non-hospitalized patients, hospitalized subjects with COVID-19 had more advanced gestational age (14 vs. 28 weeks; P=0.234). In addition, compared to the non-hospitalized subjects, hospitalized subjects were more likely to have a history of acute chest syndrome (1 vs. 8; P=0.039). Possibly, broader use of prophylactic chronic transfusions would have affected outcomes. British SCD Pregnancy Guidelines and American SCD Transfusion Guidelines indicate that a history of acute chest syndrome is an eligibility criterion for prophylactic transfusions in pregnancy.6,7 In this study, overall, chronic prophylactic transfusion use was low (n=6), with no difference in use of a chronic transfusion program between those who were and were not hospitalized (3 vs 3). Only three of 11 hospitalized subjects received chronic transfusions in pregnancy; whether they were among the eight with a history of acute chest syndrome is unknown. There is evidence that chronic transfusions reduce pulmonary complications in pregnant women with SCD. A meta-analysis of observational studies of transfusion for pregnancy in women with SCD identified that chronic transfusions significantly reduced pulmonary complications during pregnancy (odds ratio=0.23; 95% confidence inter-
Haematologica | 109 May 2024 1328 EDITORIAL
Published under a CC BY-NC license

Figure 1. COVID-19 may be particularly hazardous to people with sickle cell disease and pregnancy because of associated changes to the immune system, multiple thrombosis risks and compromised pulmonary function. Given the risks, potential modifying interventions warrant consideration.
val: 0.11-0.50).8 A recently published single-center, cohort study again demonstrated protective effects of transfusion on pulmonary complications in pregnancy in SCD.9 Acute chest syndrome was among the SCD crises included as primary outcomes in the phase III hydroxyurea trial for adults with SCD and secondary outcomes in the phase III hydroxyurea trial for children with SCD. Reduction in acute chest syndrome was among the reasons for approval of hydroxyurea for both populations. Yet evidence of reduced SCD crises, including acute chest syndrome, in chronically transfused pregnant people with SCD has not yet widely shifted clinical practice even in resource-rich settings and despite alarming evidence of stagnant and poor pregnancy outcomes for this population.2 Multiple plausible mechanisms may explain why pregnant people with SCD are at increased risk of adverse outcomes in pregnancy (Figure 1). As any small study does, this cohort study raises more questions than answers. Until definitive answers arrive, multidisciplinary expertise for people with SCD who are pregnant may save lives and inform care.2 Such care will integrate the unique strengths of maternal-fetal medicine and sickle cell experts. At a minimum, this care will include education and information about COVID-19 vaccination, individualized assessment of the need for antiviral medications in pregnant people with SCD who develop COVID-19 infection, tailor anticoagulation to address the triple thrombotic threat of SCD, pregnancy and COVID-19 infection, individualize
pain management, and appraise indications for chronic transfusion therapy. This will ultimately optimize both inpatient and outpatient care.
The COVID-19 pandemic presented novel risks for morbidity and mortality in pregnant people with SCD. Effective COVID-19 vaccines and therapies now exist and are complemented by evidence-based guidelines regarding their use.10 Studying COVID-19 outcomes in SCD pregnancies is essential so that as new infectious threats emerge – as they also have with H1N1 influenza, severe acute respiratory syndrome, and Middle East respiratory syndrome – optimal management strategies can be rapidly defined and deployed. Underlying this is the enduring need for robust research to optimize the management of pregnancy in SCD. As the saying goes, the more things change, the more they stay the same
Disclosures
LHP is a consultant to Novo Nordisk and Global Blood Therapeutics (now Pfizer), co-founder of the Sickle Cell Reproductive Health Education Directive, and is on the Medical Advisory Committee of the Foundation for Women and Girls with Blood Disorders. JF has no conflicts of interest to disclose.
Contributions
LHP and JF interpreted the paper, wrote the manuscript and designed the figure together.
Haematologica | 109 May 2024 1329 EDITORIAL L.H. Pecker and J. Federspiel
Funding
LHP is supported by the National Heart, Lung, and Blood Institutes of the National Institutes of Health under awards K23HL146841 and NIH/NHLBI U01 HL156620-01, the American Society of Hematology, Doris Duke Charitable Foundation Grant #2020147, and the Mellon Foundation. JF is supported
References
1. Joseph L, De Luna G, Bernit E, et al. A study of 28 pregnant women with sickle cell disease and COVID-19: elevated maternal and fetal morbidity rates. Haematologica. 2024;109(5):1562-1565.
2. Early ML, Eke AC, Gemmill A, Lanzkron S, Pecker LH. Severe maternal morbidity and mortality in sickle cell disease in the National Inpatient Sample, 2012-2018. Jama Netw Open. 2023;6(2):e2254552.
3. Singh A, Brandow AM, Panepinto J. COVID-19 Outcomes in individuals with sickle cell disease and sickle cell trait compared to Blacks without sickle cell disease or trait. Blood. 2020;136(Suppl 1):54-56.
4 Shephard HM, Manning SE, Nestoridi E, et al. Inequities in COVID-19 vaccination coverage among pregnant persons, by disaggregated race and ethnicity - Massachusetts, May 2021-October 2022. MMWR Morb Mortal Wkly Rep. 2023;72(39):1052-1056.
5. Friedman E, Minniti C, Campbell S, Curtis S. COVID19 vaccination in adults with sickle cell disease is not associated with increases in rates of pain crisis. Hematology.
by the Eunice Kennedy Shriver National Institute of Child Health and Human Development of the National Institutes of Health under award K12HD103083. The content of this editorial is solely the responsibility of the authors and does not represent the official views of the National Institutes of Health.
2022;27(1):742-744.
6. Oteng-Ntim E, Pavord S, Howard R, et al. Management of sickle cell disease in pregnancy. A British Society for Haematology guideline. Br J Haematol. 2021;194(6):980-995.
7. Chou ST, Alsawas M, Fasano RM, et al. American Society of Hematology 2020 guidelines for sickle cell disease: transfusion support. Blood Adv. 2020;4(2):327-355.
8. Malinowski AK, Shehata N, D’Souza R, et al. Prophylactic transfusion for pregnant women with sickle cell disease: a systematic review and meta-analysis. Blood. 2015;126(21):2424-2435; quiz 2437.
9 Sobczyk O, Gottardi E, Lefebvre M, et al. Evaluation of a prophylactic transfusion program on obstetric outcomes in pregnant women with sickle cell disease: a single centre retrospective cohort study. Eur J Obstet Gynecol Reprod Biol. 2023;290:103-108.
10 COVID-19 Treatment Guidelines Panel. Coronavirus disease 2019 (COVID-19) treatment guidelines. National Institutes of Health. https://www.covid19treatmentguidelines.nih.gov/. Accessed November 21, 2023.
Haematologica | 109 May 2024 1330 EDITORIAL L.H. Pecker and J. Federspiel
Intensive induction in older patients with acute myeloid leukemia: an initial struggle with later rewards?
Yishai Ofran
Correspondence: Y. Ofran
Received: January 16, 2024.
Accepted: January 25, 2024.
Early view: February 1, 2024.
https://doi.org/10.3324/haematol.2023.284780
Sustained remission is a realistic goal of therapy in older adults presenting with acute myeloid leukemia (AML). Despite the fact that no prospective comparison has demonstrated its superiority, the use of an azacitidine-venetoclax combination has become popular even among patients who were previously considered “fit” and would have been offered intensive chemotherapy.1,2 The high burden of potentially associated devastating adverse events, as well as the unpleasant side effects (e.g., anorexia and alopecia) swayed people away from intensive chemotherapy, particularly considering existing alternatives. It seems that with non-intensive regimens, the risks of tumor lysis syndrome, acute kidney injury and severe infections are sightly lessened. However, many patients with AML are already neutropenic at diagnosis and at risk of infections or other complications due to the leukemia, regardless of therapy. One popular consideration supporting the azacitidine-venetoclax combination over intensive chemotherapy in patients of advanced age is the benefit of the amount of time spent at home (“home stay”) compared to the prolonged admission to hospital that is essential following intensive chemotherapy induction.
In this issue of Haematologica, Jensen and colleagues from the University of North Carolina publish a simple but provocative analysis questioning the common wisdom that the azacitidine-venetoclax combination is associated with a longer home stay than intensive chemotherapy.3 Apparently, calculating the burden of all hospital visits and stays for any leukemia-associated reason, as well as the need for repeated subsequent cycles of azacitidine infusions, leads to a surprising insight. The actual numbers are not in favor of what seems obvious when only the first month following the diagnosis is considered. Reviewing Jensen’s data, it is important to separate patients treated with palliative aims from those who were targeting remission. For the purpose of the current discussion, data regarding patients with AML who were offered azacitidine alone or supportive care are excluded, on the assumption that palliation was the main
goal of therapy in these cases. Assuming that patients treated with intensive chemotherapy or the azacitidine-venetoclax combination shared a goal of achieving sustained remission and a lasting period with good quality of life, prolonged home stay was desired for patients in both groups. Surprisingly, and counterintuitively, the data reveal an enormous difference in the length of home stay between the two groups. The mean time patients treated with intensive chemotherapy stayed at home was 7.6 months longer (13.1 vs. 5.5 months) than the home stay of patients assigned to azacitidine-venetoclax. Similar results were reported even when an age-adjusted model was applied, with a 2.4-fold difference in favor of intensive chemotherapy. Moreover, despite identical remission rates, survival with intensive chemotherapy was significantly longer with a median overall difference of more than a year (19.9 vs. 7.7 months) compared to survival with azacitidine-venetoclax. In conclusion, in older adults with AML, accepting some loss of time at home upfront, right after diagnosis, should be carefully considered in many patients as a worthwhile ultimate investment that is a feature of intensive chemotherapy induction. This will often be rewarded when reaching a sustained remission with a prolonged home-time with lesser need for repeat hospital visits. Of note, the feasibility of long-term remission in older adults treated with intensive chemotherapy was demonstrated in a prospective ECOG-ARIN study, E2906. In this prospective trial allogeneic stem cell transplantation was utilized in only 26% of patients and the median disease-free survival of FLT3-wildtype patients (in whom the rate of allogeneic stem cell transplantation was even lower) reached 24 months.4
The work by Jensen et al. is a call for physicians to re-evaluate the way they present treatment options to patients debating which route of induction to take (Figure 1). A frequently heard argument guiding treatment selection is to favor home stay over hospitalization. While this is definitely an important parameter essential for good quality of life, the whole anticipated life period should be considered globally, not only
Haematologica | 109 May 2024 1331 EDITORIAL
yofran@szmc.org.il
Foundation Published under a CC BY-NC license
©2024 Ferrata Storti
Department of Hematology, Shaare Zedek Medical Center and Faculty of Medicine, Hebrew University of Jerusalem, Jerusalem, Israel
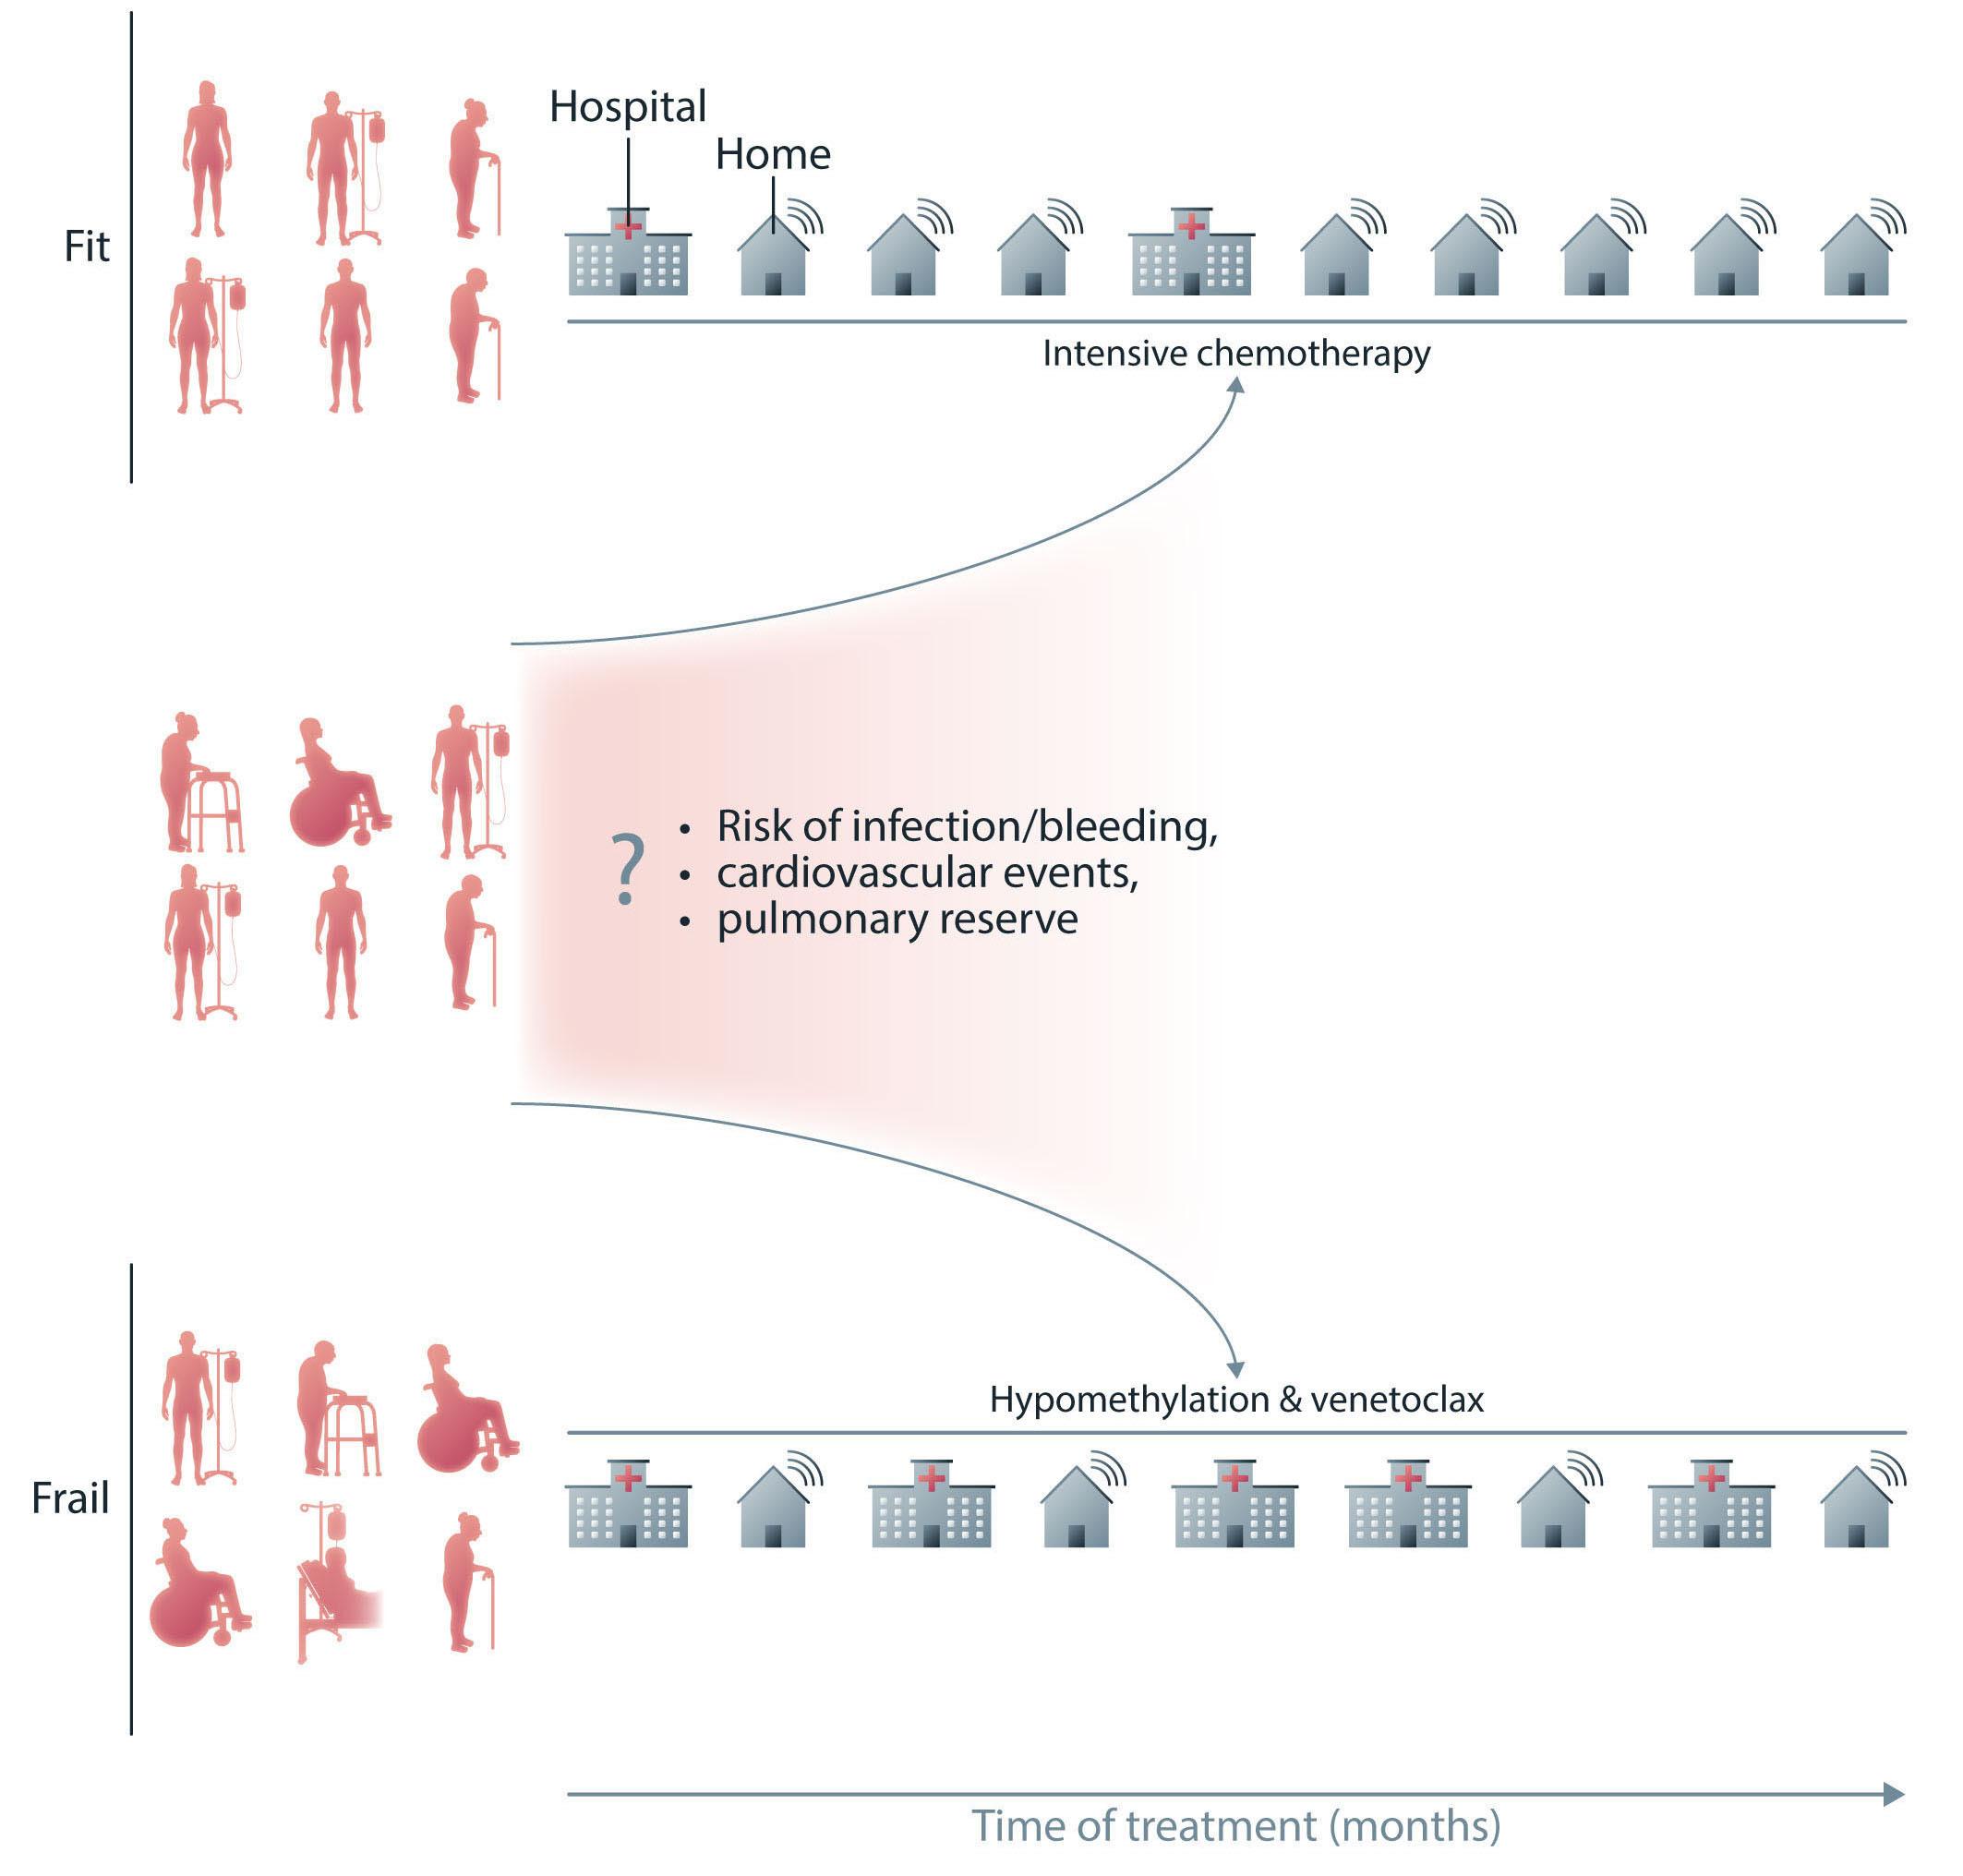
Figure 1. Time at home during treatment for acute myeloid leukemia. Fitness for intensive chemotherapy in patients with comorbidities is multifactorial and remaining time at home may serve as one of the arguments for or against a certain treatment. Contrary to the immediate period of induction, in the long run, intensive chemotherapy is associated with longer home stay than treatment with a combination of hypomethylation and venetoclax.
the first month of treatment. The burden of adverse events during remission, considering the required repeat cycles of azacitidine infusions and the often-resulting cytopenia, must not be neglected.
Notably, former research5 by the same group, highlights how surprising and worthwhile is a discussion on their current findings. Preliminary assumptions on anticipated outcome may lead to misjudgment and suboptimal clinical decisions. In their former research, the authors asked patients for their views regarding home stay and demonstrated that patients greatly appreciate the value of home stay. Patients even declared that they are “willing to accept some reduction in treatment efficacy in exchange for increased home time” but as physicians our duty is to provide our patients the whole landscape of short- and long-term data regarding home-time so that they, and us, can make the best educated decision. Intensive chemotherapy is not easy, particularly in older
adults. Yet, the outcome with intensive chemotherapy has improved significantly over the years with a reduction of induction mortality and morbidity due to improvements in supportive care. The quality of life recorded within the E2906, a recent, large, prospective study of intensive chemotherapy in patients 60 years and older, confirmed that the patients experienced significant improvement in quality of life after recovering from nadir.6 The current, important study by Jensen et al. emphasizes the importance of systematically collecting data even on what may apparently look obvious. With a wide perspective supported by comparative data, the jury are still out, not only concerning efficacy, but also regarding the burden of adverse influence on quality of life between intensive and non-intensive therapies for AML.
Disclosures
No conflicts of interest to disclose.
Haematologica | 109 May 2024 1332 EDITORIAL Y. Ofran
References
1. Löwenberg B, Ossenkoppele GJ, van Putten W, et al. High-dose daunorubicin in older patients with acute myeloid leukemia. N Engl J Med. 2009;361(13):1235-1248.
2. Wetzler M, Mrózek K, Kohlschmidt J, et al. Intensive induction is effective in selected octogenarian acute myeloid leukemia patients: prognostic significance of karyotype and selected molecular markers used in the European LeukemiaNet classification. Haematologica. 2014;99(2):308-313.
3. Jensen CE, Deal AM, Wardell AC, Heiling HM, Beke KE, Richardson DR. Home time among older adults with acute myeloid leukemia by therapy intensity. Haematologica. 2024;109(5):1588-1592.
4 Foran JM, Sun Z, Paietta E, et al. FLT3-ITD mutations are
prevalent and significantly impact outcome after intensive therapy in elderly adults with acute myeloid leukemia (AML): analysis of the North American Intergroup E2906 phase III trial in patients age ≥ 60 years. Blood. 2018;132(Suppl 1):3995.
5. Richardson DR, Crossnohere NL, Seo J, et al. Age at diagnosis and patient preferences for treatment outcomes in AML: a discrete choice experiment to explore meaningful benefits. Cancer Epidemiol Biomarkers Prev. 2020;29(5):942-948.
6. Foran JM, Chen L, Luger SM, et al. Older adults with acute myeloid leukemia (AML) experience improvement in healthrelated quality of life (HRQoL) scores with intensive therapy: prospective study from ECOG-ACRIN (EA) E2906 phase 3 trial. Blood. 2023;142(Suppl 1):594.
Haematologica | 109 May 2024 1333 EDITORIAL Y. Ofran
Emicizumab: the hemophilia A game-changer
Pedro E. Alcedo Andrade,1 Pier Mannuccio Manucci2 and Craig M. Kessler1
1Georgetown University Medical Center, Lombardi Comprehensive Cancer Center, Washington, DC, USA and 2Fondazione IRCCS Ca’ Granda, Ospedale Maggiore Policlinico, Angelo Bianchi Bonomi, Hemophilia and Thrombosis Center, Milan, Italy
Abstract
Correspondence: C.M. Kessler
Received: August 14, 2023.
Accepted: October 26, 2023. Early view: November 2, 2023.
https://doi.org/10.3324/haematol.2022.282099 ©2024
In hemophilia, the unmet needs regarding adherence to prophylaxis and lack of effective long-term prophylaxis regimens, especially in patients with inhibitors, led to the production of emicizumab, the first non-factor medicine for subcutaneous administration in patients with severe and moderate hemophilia A with or without factor VIII inhibitors. This review describes the research steps behind the development of this game-changing medication as well as its success in the prophylaxis of bleeding episodes, as witnessed by the results of pivotal clinical trials but also by real-life use in the frame of a still expanding global market. We also discuss potential and actual adverse events and the nuances related to clinical use, such as laboratory monitoring, development of neutralizing antidrug antibodies, risk of thrombosis/hypercoagulability and role in the management of surgical operations. The potential of emicizumab to prevent bleeding in other congenital and acquired coagulation disorders is also outlined.
Introduction
The history of hemophilia A (HA) treatment has been marked by solid innovation and progress, intended to improve the quality of life of individuals with this bleeding disorder. Emicizumab has contributed in a major way to this revolution as the first of the non-clotting factor options currently available to prevent hemorrhagic events in patients with congenital and acquired HA, with and without alloantibody inhibitors. Prophylaxis strategies to prevent bleeding are considered the standard of care in HA.1 The benefits of prophylaxis were confirmed by the sentinel randomized, prospective, multicenter trials by Lessinger et al. for patients with inhibitors and by Manco-Johnson et al. for inhibitor-free patients.2,3 Both studies demonstrated that, compared to on-demand therapy, prophylaxis with infusions of anti-inhibitor complex bypassing activity concentrates, or of recombinant factor VIII (rFVIII), prevents joint damage and decreases the frequency of bleeding in joints and other sites in individuals with severe HA with or without inhibitors. The main impediments to success of such regimens have been adherence to the demands of predominantly twice weekly intravenous protocols for factor administration and the availability over time of functional venous accesses for the infusions. With the development and introduction of the recombinant, humanized, bispecific FVIII-mimetic procoagulant antibody, emicizumab,
into the therapeutic armamentarium, the subcutaneous administration of hemostatic agents has improved adherence with equivalent safety and efficacy profiles compared to recombinant and plasma-derived concentrates for HA with or without inhibitors.
This review describes the history and pharmacology behind the development of emicizumab, the drug’s initial success for prophylaxis against bleeds associated with alloantibodies neutralizing FVIII, its subsequent usefulness in prophylaxis regimens to prevent bleeds due to HA without inhibitors, and its potential use in other bleeding disorders. The review also discusses complications and the nuances associated with the use of emicizumab, such as laboratory monitoring, development of specific neutralizing antidrug antibodies, and thrombotic/hypercoagulability potential, and shows why this game-changing medication continues to capture an ever-expanding global market share among the hemostatic agents commercially available for the prevention of hemorrhagic episodes in subjects with HA.
Development
The evolution of emicizumab as a therapeutic procoagulant reflects the convergence of intellectual insight
Haematologica | 109 May 2024 1334 SPOTLIGHT REVIEW ARTICLE
kesslerc@gunet.georgetown.edu
Ferrata Storti Foundation Published under a CC BY-NC license
into the molecular mechanisms of thrombin generation mediated through activated factor VIII (FVIIIa) with the prowess of the pharmaceutical industry to innovate and bioengineer a molecular “linker”. The concept of binding activated factor IX (FIXa) to factor X (FX) via a bispecific antibody to function as the FVIII cofactor was ascribed by Kitazawa and Shima to Dr. Kunihiro Hattori.4 He and his research group at Chugai Pharmaceutical Co., Ltd. (Chugai) appreciated that the distance between the FIXaand FX-binding sites of FVIIIa on a phospholipid template would be similar to that between the two antigen-binding sites of human IgG. Thus began the era of FVIII-mimetic therapy. Translating the concept of FVIII mimetics into a practical biopharmaceutical was a monumental and momentous task, 5-9 summarized in Figure 1.
Dosing
Using population pharmacokinetic modeling and model-based simulations derived from phase I and II trials, the minimal emicizumab plasma concentrations expected to achieve zero bleeds over a 1-year period in at least 50% of patients were determined 10 and applied to formulate the dosing regimens employed in the pivotal phase III HAVEN trials: a subcutaneous loading dose of 3 mg/kg once weekly for a total of 4 weeks and three different subcutaneous maintenance doses starting at week 5: these doses were 1.5 mg/kg once every week, 3 mg/kg once every 2 weeks and 6 mg/kg once every 4 weeks. All regimens have shown comparable efficacy and similar side-effect profiles.

Figure 1. Development of emicizumab. Over 2,400 engineered monoclonal IgG molecules were tested and methodically modified and optimized to minimize non-specific binding and immunogenicity and to maximize physicochemical stability and their activated factor VIII-cofactor activity, leading to the development of ACE910, subsequently named emicizumab. In vivo studies were developed using primate models of acquired hemophilia A, in which bleeding events were successfully treated and prevented, and a once-weekly subcutaneous dosing provided the rationale for a prophylaxis protocol in people with hemophilia A. The first in-human study, started in 2013, was designed as a randomized and placebo-controlled, phase I trial using a single subcutaneous dose of emicizumab in healthy volunteers and demonstrated efficacy, high bioavailability from subcutaneous administration, without evidence of hypercoagulability. These findings were corroborated in short-term and long-term extension studies (12 weeks to 33.3 months, respectively) of weekly subcutaneous administration to patients with severe hemophilia A over 12 years old with or without inhibitors, which showed a decrease in annualized bleeding rate close to zero, regardless of the presence of inhibitors, and four cases of antidrug antibodies, which were non-neutralizing and did not cause changes in treatment.
Haematologica | 109 May 2024 1335 REVIEW ARTICLE - The development and use of emicizumab P.E. Alcedo Andrade et al.
Pivotal clinical trials: establishing efficacy and safety
In the era of very effective FVIII replacement therapies resulting in a median annualized bleeding rate close to zero in most individuals with severe HA, the development of neutralizing anti-FVIII inhibitors has emerged as the highest priority complication of repeated exposure to FVIII products. This immune response to exogenous FVIII occurs in an estimated 20-40% of individuals with severe HA and 3-13% of those with mild-to-moderate HA,11,12 and is associated with increased cost of care, mortality and morbidity, including a higher rate of bleeding, more disability and decreased quality of life.13 Historically, the treatment and prevention of bleeding episodes in patients with FVIII inhibitors was achieved with administration of bypassing agents such as activated prothrombin complex concentrates (aPCC) and recombinant activated factor VII (rFVIIa). In practice, these products provided adequate hemostatic efficacy, although this was temporary and cumbersome to maintain, and less effective than FVIII replacement in patients without inhibitors.14 Thus, the promise of emicizumab as a convenient-to-administer, subcutaneous, non-factor FVIIIa mimetic with durable effectiveness was greatly anticipated when the HAVEN 1 15 and 2 16 clinical trials were launched. These phase III studies assessed the efficacy, safety, and pharmacokinetics of once-weekly subcutaneous emicizumab prophylaxis in patients with severe HA and FVIII inhibitors and led to the approval of emicizumab-kxwh by the US Food and Drug Administration (FDA) on November 16, 2017. Subsequent studies were designed to broaden the scope of emicizumab use, including patients without inhibitors (HAVEN 3 and 4),17,18 patients of the Asia-Pacific region (HAVEN 5),19 those with non-severe HA (HAVEN 6) 20 and infants (HAVEN 7). 21 Different dosing regimens were evaluated and showed the versatility of the drug. These results led to the US FDA and European Medicines Agency (EMA) approvals in 2018 of the multiple prescribing options for the use of emicizumab for prophylaxis in individuals with HA with or without FVIII inhibitors. Results are summarized in Table 1.
The positive results from these clinical trials, as well as the convenient dosing and administration regimens, have led to a rapid uptake for emicizumab in the international HA treatment marketplace. Since 2018, emicizumab is being used by over 12,500 patients 22 and generated $3.6 billion in sales in 2022 as the 34 th best-selling pharmaceutical of 2022. 23 Its availability in developing nations is also well-established following distribution of 2,528,730 mg by the World Federation of Haemophilia to 806 patients in Africa, Latin America, Asia, and Eastern Europe. Of these individuals, 55% were under 12 years old and 64% were non-inhibitor patients. 22
Practical therapeutic concerns and questions
Laboratory testing
As the use of emicizumab has increased, so too has the desire to have a routine laboratory assay available to monitor safety and efficacy. This would allow for individualization of dosing and lower costs. However, emicizumab interferes with clotting-based assays, while assays using immunological or chromogenic techniques are not affected24,25 (Table 2). Global coagulation testing techniques have been proposed to estimate the hemostatic potential of emicizumab. Thrombin generation assays and thromboelastography have been the most used platforms in this area.26-28 Although these assays may reflect changes from baseline coagulation potential following emicizumab, they do not provide “true FVIII equivalence” in vivo and, in fact, a thrombin generation assay may overestimate thrombin levels in plasma specimens in the presence of emicizumab, since the assay is not modulated by the presence of naturally occurring circulating thrombin inhibitors, such as α2 macroglobulin.28 Thus, thrombin-generation assays may lead to overconfidence and faulty clinical decision-making regarding the hemostatic response to emicizumab. It has been suggested that thrombin generation assays may be best used to limit the occurrence of adverse thromboembolic events when other procoagulant medications are administered to treat breakthrough bleeds in individuals on maintenance emicizumab regimens.26 This was poignantly apparent in the HAVEN 1 study, in swhich five patients experienced thromboembolic events when emicizumab was combined with multiple high doses of aPCC. In vitro plasma spiking studies corroborated the marked synergistic effects on thrombin generation assays when aPCC was added to emicizumab.29 However, despite suggestions that there is a direct correlation between the clinical bleeding phenotype of patients with hemophilia and their thrombin generation capacity, real-world experience with emicizumab has challenged this in sporadic clinical instances.30 Would measurement of emicizumab concentrations in plasma provide a more accurate FVIII equivalence? Extensive in vitro studies have not been able to establish true FVIII equivalence for emicizumab, probably due to the different modes of action to activate FX and to the vagaries in the methods of the biochemical assays.28 Kitazawa et al. approached this issue by developing a primate bleeding model of acquired HA.31 Using rFVIII as the FVIII calibrator, the therapeutic emicizumab level of about 55 mg/mL had an estimated FVIII equivalence activity level of 10-20%.28 The HAVEN 1 study demonstrated a steady-state mean emicizumab level of 55 mg/mL (range, 35-70 mg/mL). Even though emicizumab assays are becoming more available commercially, it is anticipated that their use will be somewhat limited, perhaps to confirm a patient’s adherence to prophylaxis and for confirmation of the presence of neutralizing anti-emicizumab antibodies.
Haematologica | 109 May 2024 1336 REVIEW ARTICLE - The development and use of emicizumab P.E. Alcedo Andrade et al.
Adverse events associated with emicizumab administration
Injection site reactions/hypersensitivity
Thus far, the administration of emicizumab has been remarkably routine and uneventful. Gelbenegger et al. summarized the adverse events recorded in all the HAVEN clinical trials.32 The most frequently observed adverse events were local injection site reactions (erythema, pain, and pruritus), which were reported in 26.1% of treated participants. The reactions were mild to moderate in severity and resolved without treatment in over 90% of cases. Anaphylaxis was extremely rare. There were two
Table 1. Summary of results from the HAVEN clinical trials.
3
adult cases of rhabdomyolysis, which occurred following intense physical exercise.
Thromboembolic complications/thrombotic microangiopathy
The most concerning of the adverse events reported with emicizumab during clinical trials has been the occurrence of thromboembolic events and thrombotic microangiopathy, as summarized in Table 1. Critically, these complications were associated with concomitant replacement therapy with aPCC at cumulative doses over 100 U/kg/day for more than 1 day. An updated summary of thromboembolic events documented 37 additional cases of non-aPCC-related events
7# 2022
(≤12 months old) without inhibitors
QW,
mg/kg Q2W, or
mg/kg Q4W (N=73)
3 mg/kg QW x 4, followed by
mg/kg Q2W (N=54)
*The reduced annualized bleeding rate was preserved in the subsequent 24-week emicizumab prophylaxis period beyond the initial 24-week observation period.80 ^Antidrug antibodies were detected in 12.5% of the predominantly Chinese participants, compared to 3.4% in HAVEN 1-4 trials with predominantly Caucasian participants. $Included 71% with moderate severity and 29% with mild hemophilia A. #Currently underway: results are from an interim analysis. Long-term assessment over a 7-year period is planned. ABR: annualized bleeding rate; 95% CI: 95% confidence interval; SAE: serious adverse events; ADA: antidrug antibodies; Ref: reference; QW: once weekly; TMA: thrombotic microangiopathy; CST: cavernous sinus thrombosis; Q2W: every 2 weeks; Q4W: every 4 weeks; TE: thromboembolic events.
Haematologica | 109 May 2024 1337 REVIEW ARTICLE - The development and use of emicizumab P.E. Alcedo Andrade et al.
Study Population Doses ABR median (95% CI) Zero bleed rate, N (%) SAE ADA Ref HAVEN
2017 Adults and adolescents (≥12 years old) with inhibitors
1
QW x
followed by 1.5 mg/kg QW (N=35) No prophylaxis (N=18) 2.9* (1.7-5.0) 23.3 (12.3-43.9) 22 (63) 1 (6) 2 TMA 1 CST 1 superficial thrombophlebitis None 15 HAVEN 2 2019 Children (<12 years old) with inhibitors 3 mg/kg QW x 4, No TMA, no TE 4 patients: 2 neutralizing, 2 nonneutralizing 16 followed by: 1.5 mg/kg QW (N=68) 0.3 (0.17-0.50) 50 (76.9) 3 mg/kg Q2W (N=10) 0.2 (0.03-1.72) 9 (90) 6 mg/kg Q4W (N=10) 2.2 (0.69-6.81) 6 (60) HAVEN 3 2018 Adults and adolescents (≥12 years old) without inhibitors 3 mg/kg QW x 4, No TMA, no TE None 17 followed by: 1.5 mg/kg QW (N=36) 1.5 (0.9-2.5) 18 (50) 3 mg/kg Q2W (N=35) 1.3 (0.8-2.3) 14 (40) No prophylaxis (N=18) 38.2 (22.9-63.83) 0 HAVEN 4 2019 Adults and adolescents with or without inhibitors 3 mg/kg QW x 4, followed by 6 mg/kg 4.5 (3.1-6.6) 23 (56) No TMA, no TE 2 patients: 2 nonneutralizing 18 HAVEN 5 2022 Adults and adolescents (≥12 years old) with or without inhibitors in the Asia-Pacific region 3 mg/kg QW x 4, No TMA, no TE 8 patients:^ 1 neutralizing, 7 nonneutralizing 19 followed by: 1.5 mg/kg QW (N=29) 1.0 (0.53-1.85) 19 (65.5) 6 mg/kg Q4W (N=27) 1.0 (0.5-1.84) 15 (55.6) No prophylaxis (N=14) 27
1 (17.1) HAVEN 6 2023 Adults and adolescents (≥12 years old) with non-severe HA without inhibitors$ 3
QW
4, followed by: 1.5 mg/kg
6
0.9 (0.55-1.52) 48 (67) No TMA 1 grade 1 thrombosed hemorrhoid 2 patients: 2 neutralizing 20 HAVEN
Infants
mg/kg
4,
(13.29-54.91)
mg/kg
x
3
3
1.9
23 (42.6) No TMA, no TE None 21
(1.35-2.68)
Table 2. Interference of emicizumab with coagulation assays.
Affected by emicizumab
aPTT
aPTT-based single-factor assays: FVIII, FIX, FXI, FXII, protein C, protein S, APC resistance
Bethesda assay (clotting based) for FVIII inhibitors
Lupus anticoagulant
Not affected by emicizumab
Chromogenic assays: FVIII (bovine substrate based), FIX, FXI, FXII, protein C, protein S, anti-FXa activity
Activated clotting time
Bethesda assay for FVIII inhibitors (bovine substrate based)
Prothrombin time
Thrombin time
Fibrinogen
VWF antigen and VWF:RCo activity
D-dimer
Genetic tests of coagulation factors (e.g., factor V Leiden, prothrombin 20210 mutation)
aPTT: activated partial thromboplastin time; FVIII: factor VIII; FIX: factor IX; FXI: factor XI; FXII: factor XII; APC: activated protein C; FXa: activated factor X; VWF: von Willebrand factor; RCo: ristocetin cofactor.
accumulated from post-marketing reports and registries as of May, 2021.33 Of these, 92% occurred in patients with pre-existing cardiovascular or thrombotic risk factors, including age over 50; 17 (45.9%) occurred in patients with inhibitors, and seven (18.9%) were associated with thrombotic occlusion of a central venous access device. Only six of the 30 individuals with non-thromboembolic events not related to a central venous access device discontinued their emicizumab prophylaxis. There were four deaths in this cohort: two patients with myocardial infarction and two elderly individuals over 70 years old with pneumonia and disseminated intravascular coagulation. Robust real-world and long-term experience with emicizumab is summarized in Table 3.34-39 No pediatric participants have experienced thromboembolic events in the HAVEN trials and no pediatric deaths have been reported in the HAVEN series. In contrast, the real-world use of emicizumab has been associated with the death of an Israeli child, who died after developing a central venous access device-related thrombosis.30
Undoubtedly, with the rapid worldwide uptake of emicizumab prophylaxis regimens in HA, additional reports of thrombotic morbidity and mortality will emerge. The use of registries will be critical to monitor the safety of this and other non-factor replacement strategies. It also highlights the fact that emicizumab may not be the optimal treatment strategy for all individuals with HA with or without inhibitors and that careful selection of patients will be necessary to achieve favorable risk/benefit outcomes. The black box warnings required by the FDA in the drug’s package insert serve as a reminder that the use of emicizumab may carry both known and unanticipated risks.
Antidrug antibodies
Emicizumab was associated with the development of antidrug antibodies in 5.1% of patients (34/668) who participated in the HAVEN 1-4 clinical trials.40 Most patients did not experience a change in emicizumab plasma concentrations or an increase in bleeding events; however, neutralizing antibodies were detected in <1% of cases
and were presumed to be responsible for decreasing the plasma concentration of emicizumab and its subsequent loss of efficacy. The analysis of these antidrug antibodies indicate that there are at least two mechanisms by which they can reduce emicizumab’s efficacy: by inhibiting the direct binding of emicizumab to its targets on either the FXa or FX Fab regions or by binding to the Fc region of emicizumab and thus increasing its clearance from plasma.41,42 It should be noted that antidrug antibodies do not affect the efficacy of FVIII replacement or bypassing therapies to prevent or reverse hemorrhagic events. The development of an anti-emicizumab antibody should be suspected when a patient experiences an increased frequency of breakthrough bleeds after having demonstrated a previously low annualized bleeding rate with emicizumab. Confirmation of neutralizing antidrug antibodies can be approached simply by demonstrating a newly prolonged aPTT and lowered one-stage FVIII or chromogenic FVIII activity with human reagents, since the aPTT should be normal and the FVIII activities high in emicizumab-treated patients. FVIII activity determined chromogenically with bovine substrate will also be very decreased.
Breakthrough bleeding
In the pooled analysis of HAVEN 1-4 trials, there were rare breakthrough bleeds, either spontaneous or traumatic, while on emicizumab prophylaxis regimens. Over 90% of the participants had no recorded breakthrough target joint hemarthroses during up to 144 weeks of emicizumab administration. Thus, the small number of breakthrough bleeding events and improved bleeding control overall led to reduced joint morbidity; the longer the emicizumab was used, the healthier the joint became.40 This concept was challenged by an Israeli cohort included in Table 3, in which all spontaneous bleeds occurred in previous target joints. Perhaps a hint into the mechanism of spontaneous breakthrough bleeds despite adequate hemostatic levels of emicizumab and in the absence of antidrug antibodies lies in the integrity of the fibrin clot which forms after
Haematologica | 109 May 2024 1338 REVIEW ARTICLE - The development and use of emicizumab P.E. Alcedo Andrade et al.
Table 3. Real-world experience on emicizumab safety.
1, 2017 - May
1, 2017 -December 31, 2020
antibody, 1 FVIII alloantibody inhibitor recurrence, 1 No TE
4^ (0.4)
infarct, 2
thrombosis, 1 SMAT, 1
(5.7), adverse events
(1.9), non-compliance
*Associated temporally with administration of activated prothrombin complex concentrate 1 month after discontinuation of emicizumab. ^One myocardial infarct and one thrombosis of a central vein access device occurred in two 78-year-old individuals who received recombinant activated factor VII, factor VIII and activated prothrombin complex concentrate along with emicizumab. One myocardial infarct and one superior mesenteric artery thrombosis occurred in younger individuals (32 years and 53 years) who received emicizumab alone. +No thromboembolic events or thrombotic microangiopathy even among the five individuals over 70 years of age, or the nine individuals who had at least two cardiovascular risk factors each. #Odds of spontaneous bleeding increased by a factor of 1.029 (P=0.034) for every year of the patients’ age. Patients with significantly higher annualized bleding rate were part of a group of elderly patients with a median age of 62.4 years, concomitantly treated with antiplatelet agents. SAE: serious adverse events; Ref: reference; FVIII: factor VIII; TE: thromboembolic events; TMA: thrombotic microangiopathy; ATHN: American Thrombosis and Hemostasis Network; EUHASS: European Haemophilia Safety Surveillance; CVAD: central venous access device; SMAT: superior mesenteric artery thrombosis; ABR: annualized bleeding rate.
thrombin is generated in plasma by emicizumab. Shimonishi et al. analyzed the structure of fibrin clots induced by a prothrombin/aPTT trigger reagent in the presence of emicizumab (50 mg/mL, i.e., the clinically therapeutic concentration) and showed that the fibrin structure was comparable to that of ~12% FVIII.43 Similarly, fibrin clots generated in the presence of 100 mg/mL emicizumab had a structure equivalent to 20-30% FVIII. These in vitro studies indicate improved clot structure with emicizumab in HA plasma but do not provide information regarding clot stability. Fibrin clots formed in HA plasma have been demonstrated to be more fragile and weaker compared to normal control fibrin clots and appear to be more susceptible to fibrinolysis. Thus, the FVIII activity equivalence conveyed by therapeutic plasma levels of emicizumab may not accurately reflect hemostatic adequacy in all clinical scenarios.
The preferred treatments for breakthrough bleeding include infusions of rFVIIa concentrates to bypass allogeneic FVIII neutralizing antibody inhibitors and of rFVIII concentrates in the absence of FVIII inhibitors. The success of the latter strategy is based on the premise that the binding affinities
of exogenously administered FVIII for both FIXa and FX are considerably higher than those of emicizumab (low-to-high nanomolar range vs. micromolar range), thus allowing for a competitive advantage to FVIII for FXa generation. Furthermore, FVIIIa activity in the tenase complex is modulated by circulating natural anticoagulants, i.e., activated protein C, and by spontaneous dissociation of the A2 domain, thus limiting the degree of FXa generation. This helps to prevent the development of hypercoagulability.44
The use of aPCC can be considered as a less optimal alternative to treat breakthrough bleeds in the presence of a FVIII inhibitor, and extreme caution is necessary to avoid creating a hypercoagulable state; dose modulation is critical (see previous discussion).
Uncertain treatment scenarios, strategies, and benefits
Emicizumab in males over 50 years
older males with severe HA
Haematologica | 109 May 2024 1339 REVIEW ARTICLE - The development and use of emicizumab P.E. Alcedo Andrade et al.
old The safety
emicizumab in
Cohort N of patients Follow-up period SAE, N (%) Treatment discontinuation N (%) Breakthrough bleeds N (%) Ref Birmingham Children’s Hospital 52 March 1, 2018June 15, 2021 Total
Headache,
Major bleeding,
Antidrug
3
1
12 (23) 34 Hemophilia Center of Western Pennsylvania 42 November
31, 2019 Postoperative TMA* Post-surgical
4/10 NR 14 (33) 44% of these were hemarthroses 35 ATHN 7 152 Through August 2021 None NR NR 36 EUHASS 985 January
Total
Myocardial
CVAD
NR NR 37 Israeli National Hemophilia Center 70 18-month follow up None+36 (51) spontaneous bleeds 43 (61) traumatic bleeds 4 (5.7) significantly higher ABR# 38,39
of
4 (7.6)
1
1
bleeds
with or without allogeneic FVIII antibody inhibitors has been a topic of concern because the drug’s mechanism of action is to maintain a continuous in vivo procoagulant environment.
Elderly individuals with severe HA were significantly underrepresented in the HAVEN 1, 3, 4, and STASEY clinical trials. Of a total of 504 patients in the overall study population, 70 were aged 50 to 64 years and 22 were ≥65 years. There was no difference in efficacy or safety in elderly individuals compared to the younger participants in the clinical trials. The real-world experience with emicizumab therapy in individuals over 50 years of age is somewhat limited but growing rapidly. An Israeli cohort of patients older than 50 years showed the efficacy of emicizumab, with 41% of elderly individuals experiencing an annualized bleeding rate of zero, but safety concerns remain39 (Table 3).
Emicizumab in previously untreated patients and for immune tolerance induction strategies
The National Hemophilia Foundation of the USA and the World Federation of Haemophilia have both endorsed emicizumab as an important therapeutic option to achieve primary prophylaxis in infants with severe HA. It is recommended that primary prophylaxis is initiated at any time after birth (≤2 years old or even before the first clinical bleed), given the increased risks of developing potentially life-threatening spontaneous and traumatic intracranial hemorrhages without the initiation of primary prophylaxis.
Accumulating data from the HAVEN 7 clinical trial and single institution experience have generated data to support the prophylactic efficacy and safety of emicizumab in infants. Results have shown a high percentage of zero treated bleeds and no neutralizing antidrug antibodies have been observed thus far. In addition, no deaths, no thromboembolic events, no thrombotic microangiopathy and no anti-emicizumab neutralizing antibodies have been reported.21 One infant experienced major bleeding after circumcision while on emicizumab, and this episode was associated with suboptimal levels of thrombin generation despite administration of emicizumab.45 Prospective and longitudinal real-world clinical safety and laboratory data in previously untreated patients are being collected. The emergence of emicizumab as an easily administered subcutaneous procoagulant has provided a viable alternative to achieve and maintain the benefits of primary prophylaxis while mitigating many of the pitfalls of traditional FVIII replacement. Practically, primary prophylaxis using exogenous intravenous FVIII replacement at least two or three times weekly is delayed until the child is active and walking at around 12-15 months of age (ideally before the first bleed but most commonly after the first few bleeds have occurred) when traumatic bleeds are most likely to prevail, and venous access is more available. However, this approach has been associated with the development of allogeneic FVIII neutralizing inhibitory antibodies in at
least 30% of previously untreated patients on primary prophylaxis.46 FVIII inhibitors develop very rarely after the patient reaches 50 exposure days of exogenous FVIII administration. Venous access challenges, maintaining adherence to the prophylaxis protocol over time, and the financial and personal burdens of family caregivers are all additional potential potent impediments to the success of primary prophylaxis.
Primary prophylaxis based on emicizumab alone can theoretically be initiated before the first bleed and simplify the prophylaxis process in previously untreated patients. However, some treaters worry that this strategy would simply delay the emergence of FVIII inhibitors and may complicate future surgery or other bleeding scenarios in which FVIII administration will be necessary. Clinical trials are underway to compare the incidence of inhibitor development in children who receive emicizumab alone versus combined with concurrent FVIII replacement.
Emicizumab prophylaxis is also being studied as a component of immune tolerance induction regimens to determine the rate of inhibitor recurrence if concurrent FVIII replacement is discontinued after immune tolerance has been successfully induced. The reader is referred to a very thoughtful and comprehensive discussion of the debate on immune tolerance induction and treatment decision-making pertinent to previously untreated or minimally treated patients in the era of emicizumab.47
Emicizumab for surgery
Patients who were planned to undergo surgery were excluded from the pivotal clinical trials (HAVEN 1-4), and perioperative management was at the discretion of the individual investigators. There was no specific guidance (per protocol) on surgical management provided by the sponsors and even after regulatory approval of emicizumab by the FDA and EMA, package inserts have provided no re-commendations for how to achieve, monitor, and maintain adequate hemostasis and FVIII/bypass product replacement during surgical procedures. ( https://www. hemlibra-hcp.com) Recently, the manufacturer issued a physician/healthcare procedure (https://www.emicizumabinfo.com) which summarizes the most relevant published surgical experiences with emicizumab.
It is crucial to remember that emicizumab prophylaxis provides for incrementally increased hemostasis, which is equivalent to modifying a bleeding phenotype from severe to mild HA. However, emicizumab does not completely normalize hemostasis. Thus, for major surgery it is prudent in the context of a pre-existing emicizumab prophylaxis regimen to provide adjunctive procoagulant therapy with either exogenous FVIII (in the absence of an inhibitor) or with a bypassing agent (aPCC or rFVIIa) in the presence of a neutralizing allogeneic FVIII antibody inhibitor. Doses of aPCC should not exceed 50 U/kg body weight due to the potential development of thromboses
Haematologica | 109 May 2024 1340 REVIEW ARTICLE - The development and use of emicizumab P.E. Alcedo Andrade et al.
or thrombotic microangiopathy. If prolonged perioperative and postoperative treatment with aPCC is anticipated to be necessary following elective major surgery, it may be necessary to discontinue emicizumab several months prior to the operation (the elimination half-life of emicizumab is approximately 30 days). For minor surgical interventions in the context of emicizumab prophylaxis, additional procoagulant therapies may not be necessary to achieve or maintain adequate hemostasis, but patients should be closely monitored for clinical bleeding.48 These recommendations are based on evidence from clinical trials and real-world experience, summarized in Table 4.49-52 Standardized management as proposed by Castaman et al. would be ideal, but the optimal strategies remain to be determined. Most treaters agree that aPCC should be avoided in surgical scenarios to reduce thromboembolic events or thrombotic microangiopathic complications.
Emicizumab in acquired hemophilia A
Even though acquired HA is a rare bleeding disorder (1 cases per 1-3 million population), the high mortality from hemorrhagic complications which occur in patients with
this condition emphasizes the importance of effective treatments for bleeding control and for subsequent eradication of the FVIII neutralizing autoantibody by means of immunosuppression. Current treatment options to manage acquired HA include FVIII bypassing agents (rFVIIa and aPCC) and recombinant porcine (rp) FVIII.53
Anecdotal case reports and limited case series have described the use of emicizumab in patients with acquired HA. The usual scenario has involved administration of emicizumab to prevent recurrent bleeding events, following the initial use of rpFVIII, rFVIIa or aPCC to control the acute bleed. Dosing schemes for emicizumab for both loading and maintenance strategies have varied and the timing of the use of adjunctive immunosuppressive therapies to eradicate the inhibitor have not been standardized.54-57 The growing evidence of clinical benefit prompted a prospective, multicenter, single-arm, phase III clinical trial (AGEHA) in Japan to investigate the safety, efficacy, pharmacokinetics, and pharmacodynamics of emicizumab in acquired HA. Emicizumab efficacy was associated with a remarkable reduction in annualized bleeding rate from 66.4 to zero for all major bleeds. Patients received emicizumab
Table 4. Outcomes after surgical procedures in patients receiving emicizumab.
215 total
HAVEN 1-4 trials
Israeli National Hemophilia Center pediatric cohort
196 (91%) without preventive treatment were neither complicated by bleeding nor required replacement therapies
56 total 17 (53%) without preventive treatment were neither complicated by bleeding nor required replacement therapies
16 total
3 (18%) without preventive treatment were neither complicated by bleeding nor required replacement therapies
18 total* 15 (83%) treated preemptively of which 12 (80%) were neither complicated by bleeding nor required replacement therapies
22 total^ 18 (82%) treated preemptively of which 6 (33%) were neither complicated by bleeding nor required replacement therapies
Careggi University Hospital, Florence, Italy
48 total 11 (23%) without preventive treatment were neither complicated by bleeding nor required replacement therapies
27 total# All treated pre-emptively of which 23 (85%) were neither complicated by bleeding nor required replacement therapies
*Comprised five arthroplasties (27.8%), four synovectomies (22.2%) and nine others (50%), including reconstruction of femoral orthopedic hardware, open reduction of fracture, appendectomy, epidural injection, cholecystectomy, incisional hernia repair, and tonsillectomy. ^Comprised 13 arthroplasties (59%) and nine others (41%), including hemorrhoid operations, coronarography, sigmoidectomy, colostomy, laparotomy, and polypectomy. #Comprised nine arthroplasties (33%) and 18 others (67%), including lower extremity amputation, bone biopsy, arterial embolization, partial nephrectomy, transurethral prostate resection, hernia repair, ureteral catheter placement, splenectomy, cleft palate correction, muscular pseudotumor resection, and turbinate reduction. The protocol consisted of two or three boluses of 90 mg/kg recombinant activated factor VII (rFVIIa) every 3 hours at the beginning of the surgery until wound suturing, followed by 90 mg/kg rFVIIa for up to 20 days (for major orthopedic surgery) or 5-7 days (for other operations). Ref: reference; TE: thromboembolic events; TMA: thrombotic microangiopathy; ADA: antidrug antibodies; FVIII: factor VIII.
Haematologica | 109 May 2024 1341 REVIEW ARTICLE - The development and use of emicizumab P.E. Alcedo Andrade et al.
Major procedures Outcomes Ref
Cohort Minor procedures
No TE, TMA, ADA, recurrent anti-FVIII antibody inhibitor, deaths 49 STASEY
No TE, TMA 50
- - 51
- 52
6 mg/kg subcutaneously on day 1, 3 mg/kg on day 2, and then 1.5 mg/kg once weekly from day 8 thereafter until FVIII activity exceeded 50 IU/dL without the need for exogenous coagulation factor products to treat bleeding events. All received immunosuppressive therapy. There was one asymptomatic deep vein thrombosis,58 which was attributed to emicizumab, and which was detected 9-11 days after receiving three doses of FXIII concentrate (Fibrogammin). The patient had not received any bypassing treatments. In addition, another patient developed a non-neutralizing antidrug antibody, which did not affect plasma half-life. No onset of thrombotic microangiopathy was observed. The optimal dosing regimen and duration of treatment with emicizumab for acquired HA remain to be elucidated. An important aspect to consider is that the long half-life of emicizumab can maintain a therapeutic effect while immunosuppression achieves low levels of inhibitor. On the other hand, once FVIII levels increase, patients might have an increased risk of thrombosis and emicizumab should be discontinued. There are two ongoing, prospective, open-label, clinical trials, being conducted in parallel in the USA (NCT05345197) and Germany (NCT04188639), which will examine the efficacy of prophylactic emicizumab administered on a scheduled basis to prevent bleeds in patients with acquired HA.
Clinical unknowns
Emicizumab and bone health
There is a direct relationship in severe HA (and hemophilia B) between joint and bone health. Severely decreased FVIII (<5% of normal) will predispose the joint to spontaneous
and traumatic bleeds, and recurrent bleeds into the joint will cause synovial hypertrophy, cartilage deterioration, bone destruction, motion limitation and pain. Hemophilic arthropathy can be greatly impeded, if not prevented, by maintaining persistently adequate hemostasis with prophylaxis regimens with replacement of FVIII or the use of non-factor replacement strategies.
Another important consequence of severe FVIII deficiency is the development of reduced bone mineral density, which leads to abnormal bone remodeling, gait disturbance, osteopenia, and ultimately osteoporosis. This may be responsible for the increased bone fracture rate observed in individuals with severe hemophilia. Findings from FVIII-deficient mouse models suggest that decreased thrombin generation and unbalanced FVIII-von Willebrand factor complex formation may impede the osteoblastic activity needed for normal bone formation.59,60 There is a current prospective clinical trial (NCT04131036) to examine bone and joint health over a 3-year period in patients with severe HA treated with emicizumab versus clotting factor prophylaxis. Biomarkers and bone density will also be assessed. Data from patients enrolled in the HAVEN 3 trial did not show significant differences in markers of bone remodeling, cartilage degradation or synthesis, questioning the need for FVIII exposure, but longer follow up may be required.61
With this and any other of the potential physiological roles FVIII may have,60 the question arises as to whether individuals with severe HA who are being treated with emicizumab exclusively for its procoagulant properties will benefit incompletely from or be devoid of the long term non-hemostatic properties of FVIII. This may be most critical in the pre-adolescent years.
Emicizumab enhanced FIX activities almost 10-fold in mild/moderate severity HB samples with wildtype FIX protein.
Hemophilia B
Reversal of therapeutic anticoagulation effects
Ref: reference; FIX: factor IX; HB: hemophilia B; aPPT: activated partial thromboplastin time; FXI: factor XI; VWD: von Willebrand disease; HA: hemophilia A; Xa: activated factor X; IIa: activated factor II. Condition
Therapeutic amounts of emicizumab corrected the deficient thrombin generation in vitro in samples from subjects with mild/moderate severity HB.
Emicizumab shortened the aPTT in severe FXI-deficient plasma samples.
Emicizumab modestly enhanced thrombin generation potential in FXI-deficient plasma in a dose dependent manner.
Spiking type 3 VWD plasma with high emicizumab concentrations significantly increased the peak heights of thrombin generation assays.
Emicizumab improved thrombus formation under both high and low shear conditions in samples from patients with type 2N WVD.
Off-label use, case reports.
Pilot multicenter, prospective, open-label study of emicizumab prophylaxis in severe VWD and concomitant VWD/HA patients at least 2 years old (NCT05500807).
In vitro studies demonstrated that emicizumab shortened the aPTT in normal non-coagulopathic plasma samples spiked with unfractionated heparin.
Emicizumab corrected the prolonged aPTT and attenuated thrombin generation in pooled normal plasma samples spiked with apixaban (direct anti-Xa) or argatroban (direct anti-IIa).
Haematologica | 109 May 2024 1342 REVIEW ARTICLE - The development and use of emicizumab P.E. Alcedo Andrade et al.
Table 5. Potential uses of emicizumab beyond hemophilia A.
Evidence Ref
63,64
Factor XI deficiency
65 von Willebrand disease
66-70
24,71
Additional clinical applications
The unique procoagulant properties and safety profile of emicizumab have led to the desire to determine whether this drug would be effective at reversing or preventing bleeding induced by other coagulopathies. Yada and Nogami have speculated that any bleeding disorder that has a small amount of activated factor IX available to bind to emicizumab in vivo might be amenable to the procoagulant benefits of increased thrombin generation by the drug62 (Figure 2). Potential uses of emicizumab beyond HA are summarized in Table 5.24,63-71
Concluding remarks
The development of extended half-life rFVIII products certainly represented a substantial progress in the treatment
of HA. Nevertheless, although improvement in annualized bleeding rate has been achieved with regular injections, only a minority of patients gain absolute bleeding control or zero bleeds,72 highlighting the need for alternative therapies. Emicizumab has revolutionized HA management. Its main advantages include subcutaneous administration and the possibility of up to monthly injections, which can improve adherence. Results from clinical trials and real-world data are encouraging, showing efficacy and achievement of zero bleeds in a substantial proportion of patients. Hence, indications for the use of emicizumab will probably be expanded to patients with moderate HA, infants with severe HA, and other coagulopathies, including von Willebrand disease and acquired HA.
However, many questions remain unanswered. The main concern, based on results from the HAVEN trials, is the risk of thromboembolic events and thrombotic microangiopathy. Yet post-marketing surveillance programs have
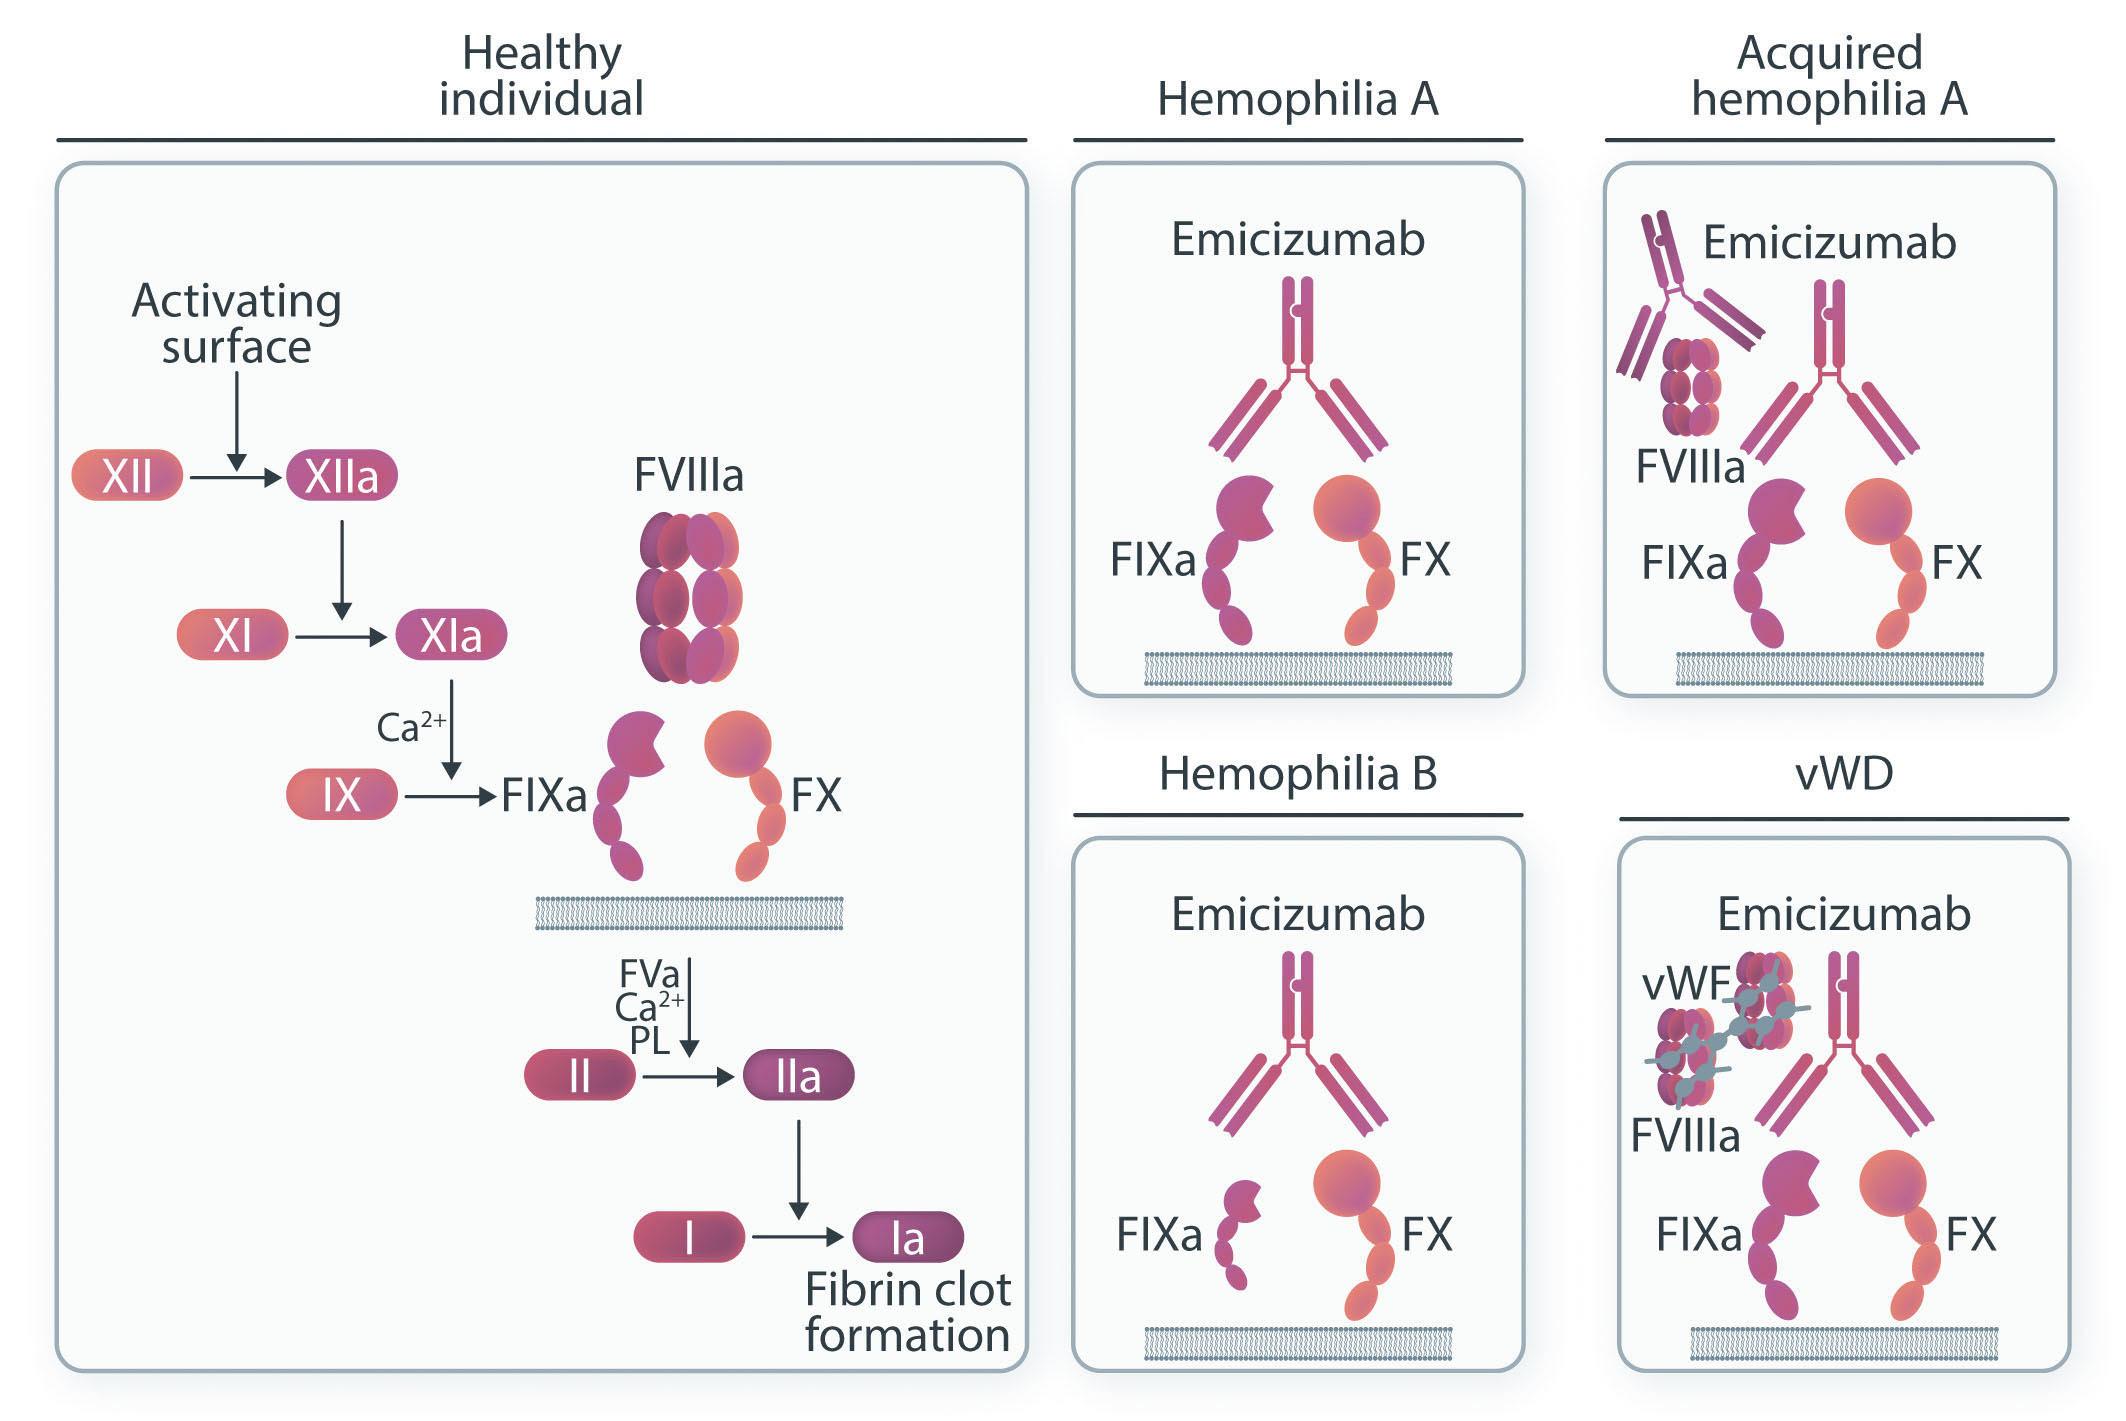
Figure 2. Procoagulant properties of emicizumab. Activated factor VIII (FVIIIa) is a cofactor of the intrinsic tenase complex, along with activated factor IX (FIXa) and factor X (FX). Once FX is activated, the prothrombinase complex is formed along with activated factor V (FVa) and factor II (FII aka prothrombin), which leads to thrombin generation. Emicizumab is a humanized monoclonal antibody, directed to FIXa and FX, which restores missing FVIIIa function in the tenase complex in patients with hemophilia A allowing for thrombin generation and restoring hemostasis. Emicizumab has also shown efficacy in patients with acquired hemophilia A, in whom FVIIIa function is impaired by the presence of an autoantibody. In vitro studies have shown that even small amounts of FIXa are enough to guarantee effective hemostasis, making emicizumab a potential treatment option for patients with mild and moderate hemophilia B. In patients with von Willebrand disease, particularly type 3, levels of both von Willebrand factor and FVIII are markedly reduced because von Willebrand factor prevents degradation and clearance of FVIII. It is therefore reasonable that emicizumab, in the presence of FIXa, could restore hemostasis in patients with von Willebrand disease. Before the intrinsic tenase complex is formed, FIX is activated by FXIa. In vitro studies have shown that emicizumab restores thrombin generation in FXI-deficient plasma, but it is unclear if this is due to residual FIXa levels, which are required for the procoagulant effect of emicizumab. PL: phospholipids; vWD: von Willebrand disease; vWF: von Willebrand factor.
Haematologica | 109 May 2024 1343 REVIEW ARTICLE - The development and use of emicizumab P.E. Alcedo Andrade et al.
shown that risk mitigation strategies, including judicious use of other therapies, such as aPCC, are effective.33 Another area of uncertainty is the management of breakthrough bleeding, which a minority of patients experience. Similarly, more data are needed regarding the management of patients undergoing surgical procedures, and regarding the risks of thrombosis and bleeding in elderly individuals using emicizumab concomitantly with antiplatelet and/or anticoagulant agents.
The pursuit of the ideal treatment for HA continues. The success of emicizumab has led to the development of a new generation of FVIII-mimetic bispecific antibodies, NXT007 and Mim8, which are currently in phase I/II studies.73,74 Betting on the benefits of using FVIII, a new extended half-life rFVIII molecule was created by fusing a dimeric Fc fragment and two XTEN polypeptides to B-domain-deleted rFVIII to achieve a longer circulating half-life. In addition, the D’D3 domain of von Willebrand factor (the physiological FVIII binding site), was appended to the fusion FVIII-Fc molecule in order to circumvent the limitations to prolonging plasma half-life extension imposed by FVIII- von Willebrand factor complex formation, as occurs with all previously available commercial FVIII replacement products.75 Efanesoctocog alfa (BIVV001) has been shown to achieve adequate FVIII plasma activity levels with weekly infusions, resulting in a
77% reduction in the mean annualized bleeding rate, resolution of bleeding episodes in most patients, and improvement in pain and quality of life.76 A long-term safety and efficacy evaluation is planned (NCT04644575). Advantages of efanesoctocog alfa include its use to treat breakthrough bleeding episodes and in the perioperative setting with a simplified weekly regimen.
To rebalance hemostasis, new treatment options are being explored. Fitusiran, a small interfering RNA that decreases hepatic synthesis of antithrombin, has shown a significant decrease in annualized bleeding rate with the advantage of monthly subcutaneous administration, making it a promising product.77 Concizumab, a monoclonal anti-tissue factor pathway inhibitor (TFPI) antibody has also shown comparable results, as far as concerns annualized bleeding rate, with once-daily subcutaneous administration.78 However, thromboembolic events seen in the early phases of development of these products remain a source of concern and longer follow-up is needed. Marstacimab is another anti-TFPI monoclonal antibody with the advantage of weekly subcutaneous dosing. It has shown promising results after 1 year of follow-up and is currently in a phase III study.79 A summary of available treatments is shown in Table 6. Finally, efforts to find a cure for patients with HA continue. Although gene therapy is beyond the scope of this review, it
Recombinant FVIII
alfa pegol (Adynovi/Adynovate)
alfa (Altuviiio)
(Hemlibra)
to Fc, 2 XTEN polypeptides and D’D3 VWF domain
Non-factor products
FVIIImimetic monoclonal antibody
FVIII: factor VIII; IV: intravenous; VWF: von Willebrand factor; SC: subcutaneous; TFPI: tissue factor pathway inhibitor; siRNA: small interfering RNA.
Haematologica | 109 May 2024 1344 REVIEW ARTICLE - The development and use of emicizumab P.E. Alcedo Andrade et al.
Product Manufacturer Structure/ mechanism of action Route of administration Frequency of administration Plasma half-life
products Efmoroctocog alfa (Elocta/Eloctate) Sobi Fc-fusion IV 3-5 days interval 19 hours Rurioctocog
Baxalta/Takeda PEGylated IV 2 times per week 14-16 hours Damoctocog alfa pegol (Jivi) Bayer PEGylated IV 2 times per week 19 hours Turoctocog alfa pegol
Novo Nordisk GlycoPEGylated IV 3-5 days interval 18-19 hours Efanesoctocog
Sobi/Sanofi Fusion
IV Weekly 43 hours
(Esperoct)
Emicizumab
Genentech,
Bi-specific
SC Every 1, 2 or 4 weeks 30 days Concizumab (Alhemo) Novo Nordisk Anti-TFPI monoclonal antibody SC Daily 38 hours Fitusiran Sanofi siRNA targeting antithrombin SC Monthly 3-5 hours Marstacimab Pfizer Anti-TFPI monoclonal antibody SC Weekly 33-65 hours
Roche
Table 6. Available treatment options for patients with hemophilia A, including extended half-life recombinant factor VIII products and non-factor related products.
might be a feasible option in the future. Limitations include variable durability of effectiveness, inability to predict the extent of FVIII incremental response, hepatotoxicity, development of antibodies against the vector, availability in children, and the cost of gene therapy acquisition. With multiple treatment options available, it is an exciting time for the hemophilia field. Patients and providers will face challenging decisions when choosing the optimal therapy, especially considering that head-to-head comparisons between emicizumab and other treatments are unlikely to be done. Emicizumab has certainly been a game-changer, with robust data showing its safety and efficacy, but the game has not ended. If gene therapy is also approved in children, this will probably be the ideal option for children and young adults who are more likely to look for a cure. Extended half-life FVIII products with improved pharmacokinetics that guarantee better adherence to treatment will continue to be critical in the management of patients with cardiovascular and thromboembolic risk factors, as
References
1. Srivastava A, Santagostino E, Dougall A, et al. WFH guidelines for the management of hemophilia, 3rd edition. Haemophilia. 2020;26 (Suppl 6):1-158.
2. Leissinger C, Gringeri A, Antmen B, et al. Anti-inhibitor coagulant complex prophylaxis in hemophilia with inhibitors. N Engl J Med. 2011;365(18):1684-1692.
3. Manco-Johnson MJ, Abshire TC, Shapiro AD, et al. Prophylaxis versus episodic treatment to prevent joint disease in boys with severe hemophilia. N Engl J Med. 2007;357(6):535-544.
4 Kitazawa T, Shima M. Emicizumab, a humanized bispecific antibody to coagulation factors IXa and X with a factor VIIIacofactor activity. Int J Hematol. 2020;111(1):20-30.
5. Muto A, Yoshihashi K, Takeda M, et al. Anti-factor IXa/X bispecific antibody (ACE910): hemostatic potency against ongoing bleeds in a hemophilia A model and the possibility of routine supplementation. J Thromb Haemost. 2014;12(2):206-213.
6. Muto A, Yoshihashi K, Takeda M, et al. Anti-factor IXa/X bispecific antibody ACE910 prevents joint bleeds in a long-term primate model of acquired hemophilia A. Blood. 2014;124(20):3165-3171.
7 Shima M, Hanabusa H, Taki M, et al. Factor VIII-mimetic function of humanized bispecific antibody in hemophilia A. N Engl J Med. 2016;374(21):2044-2053.
8. Shima M, Hanabusa H, Taki M, et al. Long-term safety and efficacy of emicizumab in a phase 1/2 study in patients with hemophilia A with or without inhibitors. Blood Adv. 2017;1(22):1891-1899.
9 Uchida N, Sambe T, Yoneyama K, et al. A first-in-human phase 1 study of ACE910, a novel factor VIII-mimetic bispecific antibody, in healthy subjects. Blood. 2016;127(13):1633-1641.
10 Yoneyama K, Schmitt C, Kotani N, et al. A pharmacometric approach to substitute for a conventional dose-finding study in rare diseases: example of phase III dose selection for emicizumab in hemophilia A. Clin Pharmacokinet. 2018;57(9):1123-1134.
11. Gouw SC, van der Bom JG, Ljung R, et al. Factor VIII products and inhibitor development in severe hemophilia A. N Engl J Med. 2013;368(3):231-239.
12. Peyvandi F, Mannucci PM, Garagiola I, et al. A randomized trial of
well as patients with breakthrough bleeds and in the perioperative setting. Replacement products, which reset hemostatic balance by interfering with the inhibitory and modulatory mechanisms of normal coagulation pathways, e.g., antithrombin and TFPI, are bringing further innovation to the field. HA therapies have joined the era of precision medicine.
Disclosures
PEAA has no conflicts of interest to disclose. PMM has received honoraria for lectures at educational symposia from Roche, Takeda and Werfen. CMK has received funds from Bayer, Genentech, Novo Nordisk and Octapharma and is a member of advisory boards for Bayer, CSL, Genentech, Octapharma, Pfizer, Biomarin, Sangamo and Takeda.
Contributions
PEAA, PMM and CMK contributed equally to writing and editing this manuscript.
factor VIII and neutralizing antibodies in hemophilia A. N Engl J Med. 2016;374(21):2054-2064.
13. Earnshaw SR, Graham CN, McDade CL, Spears JB, Kessler CM. Factor VIII alloantibody inhibitors: cost analysis of immune tolerance induction vs. prophylaxis and on-demand with bypass treatment. Haemophilia. 2015;21(3):310-319.
14 DiMichele DM, Hoots WK, Pipe SW, Rivard GE, Santagostino E. International workshop on immune tolerance induction: consensus recommendations. Haemophilia. 2007;13(Suppl 1):1-22.
15. Oldenburg J, Mahlangu JN, Kim B, et al. Emicizumab prophylaxis in hemophilia A with inhibitors. N Engl J Med. 2017;377(9):809-818.
16. Young G, Liesner R, Chang T, et al. A multicenter, open-label phase 3 study of emicizumab prophylaxis in children with hemophilia A with inhibitors. Blood. 2019;134(24):2127-2138.
17. Mahlangu J, Oldenburg J, Paz-Priel I, et al. Emicizumab prophylaxis in patients who have hemophilia A without inhibitors. N Engl J Med. 2018;379(9):811-822.
18. Pipe SW, Shima M, Lehle M, et al. Efficacy, safety, and pharmacokinetics of emicizumab prophylaxis given every 4 weeks in people with haemophilia A (HAVEN 4): a multicentre, openlabel, non-randomised phase 3 study. Lancet Haematol. 2019;6(6):e295-e305.
19 Yang R, Wang S, Wang X, et al. Prophylactic emicizumab for hemophilia A in the Asia-Pacific region: a randomized study (HAVEN 5). Res Pract Thromb Haemost. 2022;6(2):e12670.
20 Negrier C, Mahlangu J, Lehle M, et al. Emicizumab in people with moderate or mild haemophilia A (HAVEN 6): a multicentre, openlabel, single-arm, phase 3 study. Lancet Haematol. 2023;10(3):e168-e177.
21. Pipe SW, Collins P, Dhalluin C, et al. Emicizumab prophylaxis for the treatment of infants with severe hemophilia A without factor VIII inhibitors: results from the interim analysis of the HAVEN 7 study. Blood. 2022;140 (Suppl 1):457-459.
22. Mahlangu J, Iorio A, Kenet G. Emicizumab state-of-the-art update. Haemophilia. 2022;28 (Suppl 4):103-110.
23. Buntz B. The 50 best-selling pharmaceuticals of 2022: COVID-19
Haematologica | 109 May 2024 1345 REVIEW ARTICLE - The development and use of emicizumab P.E. Alcedo Andrade et al.
vaccines poised to take a step back. Drug Discovery & Development 2023. https://www.drugdiscoverytrends.com/50-of2022s-best-selling-pharmaceuticals/. Accessed May 15, 2023.
24. Adamkewicz JI, Chen DC, Paz-Priel I. Effects and interferences of emicizumab, a humanised bispecific antibody mimicking activated factor VIII cofactor function, on coagulation assays. Thromb Haemost. 2019;119(7):1084-1093.
25. Adamkewicz JI, Kiialainen A, Paz-Priel I. Effects and interferences of emicizumab, a humanized bispecific antibody mimicking activated factor VIII cofactor function, on lupus anticoagulant assays. Int J Lab Hematol. 2020;42(2):e71-e75.
26. Dargaud Y, Lienhart A, Janbain M, et al. Use of thrombin generation assay to personalize treatment of breakthrough bleeds in a patient with hemophilia and inhibitors receiving prophylaxis with emicizumab. Haematologica. 2018;103(4):e181-e183.
27. Kizilocak H, Yukhtman CL, Marquez-Casas E, et al. Management of perioperative hemostasis in a severe hemophilia A patient with inhibitors on emicizumab using global hemostasis assays. Ther Adv Hematol. 2019;10:2040620719860025.
28. Lenting PJ. Laboratory monitoring of hemophilia A treatments: new challenges. Blood Adv. 2020;4(9):2111-2118.
29. Hartmann R, Feenstra T, Valentino L, Dockal M, Scheiflinger F. In vitro studies show synergistic effects of a procoagulant bispecific antibody and bypassing agents. J Thromb Haemost. 2018;16(8): 1580-1591
30 Barg AA, Budnik I, Avishai E, et al. Emicizumab prophylaxis: prospective longitudinal real-world follow-up and monitoring. Haemophilia. 2021;27(3):383-391.
31. Kitazawa T, Igawa T, Sampei Z, et al. A bispecific antibody to factors IXa and X restores factor VIII hemostatic activity in a hemophilia A model. Nat Med. 2012;18(10):1570-1574.
32. Gelbenegger G, Schoergenhofer C, Knoebl P, Jilma B. Bridging the missing link with emicizumab: a bispecific antibody for treatment of hemophilia A. Thromb Haemost. 2020;120(10):1357-1370.
33. Howard M, McKinley D, Sanabria F, Ko RH, Nissen F. Evaluation of the safety of emicizumab prophylaxis in persons with hemophilia A: an updated summary of thrombotic events and thrombotic microangiopathies. Blood. 2021;138(Suppl 1):3186.
34 Hassan E, Jonathan L, Jayashree M. Real-world experience on the tolerability and safety of emicizumab prophylaxis in paediatric patients with severe haemophilia A with and without FVIII inhibitors. Haemophilia. 2021;27(6):e698-e703.
35. Ebbert PT, Xavier F, Seaman CD, Ragni MV. Emicizumab prophylaxis in patients with haemophilia A with and without inhibitors. Haemophilia. 2020;26(1):41-46.
36. Buckner T, Daoud N, Croteau SE, et al. ATHN 7: a natural history cohort study of the safety, effectiveness, and practice of treatment for people with hemophilia-demographics and preliminary results [abstract]. Res Pract Thromb Haemost. https:// abstracts.isth.org/abstract/athn-7-a-natural-history-cohort-studyof-the-safety-effectiveness-and-practice-of-treatment-forpeople-with-hemophilia-demographics-and-preliminary-results/. Accessed May 15, 2023.
37. Nissen F, Jiang Y, Hiew HJ, et al. Real-world safety of emicizumab: interim analysis of the European Haemophilia Safety Surveillance (EUHASS) database. Blood. 2022;140(Suppl 1):469-470.
38. Levy-Mendelovich S, Brutman-Barazani T, Budnik I, et al. Realworld data on bleeding patterns of hemophilia A patients treated with emicizumab. J Clin Med. 2021;10(19):4303.
39 Misgav M, Brutman-Barazani T, Budnik I, et al. Emicizumab prophylaxis in haemophilia patients older than 50 years with cardiovascular risk factors: real-world data. Haemophilia.
2021;27(2):253-260.
40 Callaghan MU, Negrier C, Paz-Priel I, et al. Long-term outcomes with emicizumab prophylaxis for hemophilia A with or without FVIII inhibitors from the HAVEN 1-4 studies. Blood. 2021;137(16):2231-2242.
41. Kaneda M, Kawasaki R, Matsumoto N, et al. Detailed analysis of anti-emicizumab antibody decreasing drug efficacy, using plasma samples from a patient with hemophilia A. J Thromb Haemost. 2021;19(12):2938-2946.
42. Valsecchi C, Gobbi M, Beeg M, et al. Characterization of the neutralizing anti-emicizumab antibody in a patient with hemophilia A and inhibitor. J Thromb Haemost. 2021;19(3):711-718.
43. Shimonishi N, Nogami K, Ogiwara K, et al. Emicizumab improves the stability and structure of fibrin clot derived from factor VIIIdeficient plasma, similar to the addition of factor VIII. Haemophilia. 2020;26(3):e97-e105.
44 Lenting PJ, Denis CV, Christophe OD. Emicizumab, a bispecific antibody recognizing coagulation factors IX and X: how does it actually compare to factor VIII? Blood. 2017;130(23):2463-2468.
45. Barg AA, Avishai E, Budnik I, et al. Emicizumab prophylaxis among infants and toddlers with severe hemophilia A and inhibitors-a single-center cohort. Pediatr Blood Cancer. 2019;66(11):e27886.
46. Kempton CL, Meeks SL. Toward optimal therapy for inhibitors in hemophilia. Blood. 2014;124(23):3365-3372.
47. Glonnegger H, Andresen F, Kapp F, et al. Emicizumab in children: bleeding episodes and outcome before and after transition to emicizumab. BMC Pediatr. 2022;22(1):487.
48. Wieland I. Emicizumab for all pediatric patients with severe hemophilia A. Hamostaseologie. 2022;42(2):104-115.
49 Santagostino E Oldenburg J, Chang T, et al. Surgical experience from four phase III studies (HAVEN 1-4) of emicizumab in persons with haemophilia A (PwHA) with or without FVIII inhibitors abstract. https://academy.isth.org/isth/2019/melbourne/273889/ elena.santagostino.surgical.experience.from.four.phase.iii. studies.28haven.1-429.html?f=listing%3D3%2Abrowseby%3D8%2A sortby%3D1%2Amedia%3D1. Accessed June 1, 2023.
50 Castaman G, Windyga J, Alzahrani H, et al. Surgical experience from the phase III STASEY trial of emicizumab prophylaxis in persons with hemophilia A with FVIII inhibitors: final analysis. Blood. 2021;138(Suppl 1):344.
51. Barg AA, Livnat T, Budnik I, et al. Emicizumab treatment and monitoring in a paediatric cohort: real-world data. Br J Haematol. 2020;191(2):282-290.
52. Castaman G, Linari S, Pieri L, et al. Safe and successful surgical outcome in persons with hemophilia A with and without inhibitors treated with emicizumab: a large, single center, real-world experience. J Clin Med. 2023;12(6)2317.
53. Kruse-Jarres R, Kempton CL, Baudo F, et al. Acquired hemophilia A: updated review of evidence and treatment guidance. Am J Hematol. 2017;92(7):695-705.
54 Hansenne A, Hermans C. Emicizumab in acquired haemophilia A: about two clinical cases and literature review. Ther Adv Hematol. 2021;12:20406207211038193.
55. Knoebl P, Thaler J, Jilma P, et al. Emicizumab for the treatment of acquired hemophilia A. Blood. 2021;137(3):410-419.
56. Pezeshkpoor B, Sereda N, Berkemeier A, et al. Neutralizing antiemicizumab antibodies in a patient with acquired hemophilia A [abstract]. https://abstracts.isth.org/abstract/neutralizing-antiemicizumab-antibodies-in-a-patient-with-acquiredhemophilia-a/. Accessed May 18, 2023.
57 Poston JN, Al-Banaa K, von Drygalski A, et al. Emicizumab for the treatment of acquired hemophilia A: a multicenter US case series.
Haematologica | 109 May 2024 1346 REVIEW ARTICLE - The development and use of emicizumab P.E. Alcedo Andrade et al.
Blood. 2021;138(Suppl 1):496.
58. Shima M, Amano K, Ogawa Y, et al. A prospective, multicenter, open-label phase III study of emicizumab prophylaxis in patients with acquired hemophilia A. J Thromb Haemost. 2023;21(3):534-545.
59. Baud’huin M, Duplomb L, Teletchea S, et al. Factor VIII-von Willebrand factor complex inhibits osteoclastogenesis and controls cell survival. J Biol Chem. 2009;284(46):31704-31713.
60. Samuelson Bannow B, Recht M, Negrier C, et al. Factor VIII: long-established role in haemophilia A and emerging evidence beyond haemostasis. Blood Rev. 2019;35:43-50.
61. Kiialainen A, Niggli M, Kempton CL, et al. Effect of emicizumab prophylaxis on bone and joint health markers in people with haemophilia A without factor VIII inhibitors in the HAVEN 3 study. Haemophilia. 2022;28(6):1033-1043.
62. Yada K, Nogami K. Novel insights and new developments regarding coagulation revealed by studies of the anti-factor IXa (activated factor IX)/factor X bispecific antibody, emicizumab. Arterioscler Thromb Vasc Biol. 2020;40(5):1148-1154.
63. Ogiwara K, Minami H, Nogami K, et al. Anti-FIXa/FX bispecific antibody (emicizumab) enhances plasma procoagulant activity in hemophilia B in the presence of very low level of factor IX.Res Pract Thromb Haemost: Res Pract Thromb Haemost. 2017;1(Suppl 1):1438-1451.
64. Chau J, Sternberg A, Pishko A, et al. Improved procoagulant activity of hemophilia B causing dysfunctional factor IX variants with factor VIII mimetics [abstract]. https://abstracts.isth.org/ abstract/improved-procoagulant-activity-of-hemophilia-bcausing-dysfunctional-factor-ix-variants-with-factor-viiimimetics/. Accessed June 14, 2023.
65. Minami H, Nogami K, Yada K, et al. Emicizumab, the bispecific antibody to factors IX/IXa and X/Xa, potentiates coagulation function in factor XI-deficient plasma in vitro. J Thromb Haemost. 2019;17(1):126-137.
66. Barg AA, Avishai E, Budnik I, et al. The potential role of emicizumab prophylaxis in severe von Willebrand disease. Blood Cells Mol Dis. 2021;87:102530.
67. Barg AA, Kenet G, Livnat T, et al. The potential role of emicizuamb prophylaxis in severe von Willebrand disease. Blood. 2020;136(Suppl 1):20.
68. Shanmukhaiah C, Jijina F, Kannan S, et al. Efficacy of emicizumab in von Willebrand disease (VWD) patients with and without alloantibodies to von Willebrand factor (VWF): report of two cases and review of literature. Haemophilia. 2022;28(2):286-291.
69 Thomas VM, Abou-Ismail MY, Lim MY. Off-label use of emicizumab in persons with acquired haemophilia A and von Willebrand disease: a scoping review of the literature. Haemophilia. 2022;28(1):4-17.
70. Yaoi H, Shida Y, Kitazawa T, Shima M, Nogami K. Activated factor VIII-mimicking effect by emicizumab on thrombus formation in type 2N von Willebrand disease under high shear flow conditions. Thromb Res. 2021;198:7-16.
71. Tripodi A, Chantarangkul V, Padovan L, et al. Effect of emicizumab on global coagulation assays for plasma supplemented with apixaban or argatroban. J Thromb Thrombolysis. 2020;49(3):413-419.
72. Mannucci PM. Recombinant FVIII: the milestone of modern hemophilia treatment. Haematologica. 2023;108(5):1201-1202.
73. Kjellev SL, Østergaard H, Greisen PJ, et al. Mim8 - a nextgeneration FVIII mimetic bi-specific antibody - potently restores the hemostatic capacity in hemophilia A settings in vitro and in vivo. Blood. 2019;134(Suppl_1):96.
74. Yamaguchi K, Soeda T, Sato M, et al. Pharmacology and pharmacokinetics of NXT007; emicizumab-based engineered FIXa/ FX bispecific antibody with improved properties. Blood. 2020;136(Suppl 1):19.
75. Konkle BA, Shapiro AD, Quon DV, et al. BIVV001 fusion protein as factor VIII replacement therapy for hemophilia A. N Engl J Med. 2020;383(11):1018-1027.
76. von Drygalski A, Chowdary P, Kulkarni R, et al. Efanesoctocog alfa prophylaxis for patients with severe hemophilia A. N Engl J Med. 2023;388(4):310-318.
77. Kenet G, Nolan B, Zulfikar B, et al. A phase 3 study (ATLAS-PPX) to evaluate efficacy and safety of fitusiran, an siRNA therapeutic, in people with haemophilia A or B who have switched from prior factor or bypassing agent prophylaxis [abstract]. https://abstracts.isth.org. abstract/a-phase-3-study-atlas-ppx-to-evaluate-efficacy-andsafety-of-fitusiran-an-sirna-therapeutic-in-people-withhaemophilia-a-or-b-who-have-switched-from-prior-factor-orbypassing-agent-prophylaxis/. Accessed June 16, 2023.
78. Shapiro AD, Angchaisuksiri P, Astermark J, et al. Long-term efficacy and safety of subcutaneous concizumab prophylaxis in hemophilia A and hemophilia A/B with inhibitors. Blood Adv. 2022;6(11):3422-3432.
79 Mahlangu J, Lamas JL, Morales JC, et al. Long-term safety and efficacy of the anti-tissue factor pathway inhibitor marstacimab in participants with severe haemophilia: phase II study results. Br J Haematol. 2023;200(2):240-248.
80 Mancuso ME, Callaghan MU, Kruse-Jarres R, et al. Emicizumab prophylaxis in adolescent/adult patients with hemophilia A previously receiving episodic or prophylactic bypassing agent treatment: updated analyses from the HAVEN 1 study. Blood. 2017;130(Suppl 1):1071.
Haematologica | 109 May 2024 1347 REVIEW ARTICLE - The development and use of emicizumab P.E. Alcedo Andrade et al.
Profiling the activity of the para-caspase MALT1 in B-cell acute lymphoblastic leukemia for potential targeted therapeutic application
Firas M. Safa,1 Terri Rasmussen,1 Lorena Fontan,2 Min Xia,2 Ari Melnick,2 Adrian Wiestner,3 Patricia Lobelle-Rich,1 Jan A. Burger,4 Yara Mouawad,1 Hana Safah,1 Erik K Flemington5 and Nakhle S. Saba1
1Section of Hematology and Medical Oncology, Deming Department of Medicine, Tulane University, New Orleans, LA; 2Department of Medicine, Division of Hematology & Medical Oncology, Weill Cornell Medical College, New York, NY; 3Hematology Branch, National Heart, Lung, and Blood Institute, NIH, NHLBI, Bethesda, MD; 4Department of Leukemia, The University of Texas MD Anderson Cancer Center, Houston, TX and 5Tulane Cancer Center, Tulane University, New Orleans, LA, USA
Abstract
Correspondence: N. Saba nsaba@tulane.edu
Received: March 23, 2023.
Accepted: September 19, 2023.
Early view: September 28, 2023.
https://doi.org/10.3324/haematol.2023.283178
B-cell acute lymphoblastic leukemia (B-ALL) remains a hard-to-treat disease with a poor prognosis in adults. Mucosa-associated lymphoid tissue lymphoma translocation protein 1 (MALT1) is a para-caspase required for B-cell receptor (BCR)-mediated NF-κB activation. Inhibition of MALT1 in preclinical models has proven efficacious in many B-cell malignancies including chronic lymphocytic leukemia, mantle cell lymphoma and diffuse large B-cell lymphoma. We sought to examine the role of MALT1 in B-ALL and determine the biological consequences of its inhibition. Targeting MALT1 with both Z-VRPR-fmk and MI-2 efficiently kills B-ALL cells independent of the cell-of-origin (pro, pre, mature) or the presence of the Philadelphia chromosome, and spares normal B cells. The mechanism of cell death was through apoptotic induction, mostly in cycling cells. The proteolytic activity of MALT1 can be studied by measuring its ability to cleave its substrates. Surprisingly, with the exception of mature B-ALL, we did not detect cleavage of MALT1 substrates at baseline, nor after proteasomal inhibition or following activation of pre-BCR. To explore the possibility of a distinct role for MALT1 in B-ALL, independent of signaling through BCR, we studied the changes in gene expression profiling following a 24-hour treatment with MI-2 in 12 B-ALL cell lines. Our transcriptome analysis revealed a strong inhibitory effect on MYC-regulated gene signatures, further confirmed by Myc protein downregulation, concomitant with an increase in the Myc degrader FBXW7. In conclusion, our evidence suggests a novel role for MALT1 in B-ALL through Myc regulation and provides support for clinical testing of MALT1 inhibitors in B-ALL.
Introduction
The dramatic improvement in B-cell acute lymphoblastic leukemia (B-ALL) outcomes with intensive therapy in children has resulted in a 5-year disease-free survival of 75-80% but drops to 25-40% in adults. Moreover, the outcome of patients following disease relapse is very poor, with an overall response rate (ORR) as low as 25-30% with classic chemotherapy.1,2 Despite the promising improvement in ORR with the novel agents blinatumomab (ORR 44%) and inotuzumab ozogamicin (ORR 80.7%), the duration of remission is short, resulting in a very short median overall survival of less than eight months for both drugs.1,2 Similarly, the chimeric antigen receptor (CAR) T-cell therapy tisagenlecleucel resulted in an ORR of 81% in children and young adults; however, 50% relapsed within a year of therapy.3 In keeping with an improvement in overall
outcome, compared to classic chemotherapy, blinatumomab, inotuzumab ozogamicin, and tisagenlecleucel were granted approval by the US Food and Drug Administration (FDA) for the treatment of relapsed B-ALL. Thus, identifying alternative targets addresses an unmet need in B-ALL.
Elements of the B-cell receptor (BCR) pathway have become viable targets for therapeutic applications using small molecule inhibitors. As an example, the Bruton’s tyrosine kinase (BTK) inhibitor ibrutinib, which is the most extensively studied example to date, has transformed the therapeutic approach in a myriad of B-cell malignancies, such as in chronic lymphocytic leukemia (CLL), mantle cell lymphoma (MCL), marginal zone lymphoma (MZL), and Waldenström’s macroglobulinemia (WM). The high rates of clinical response to BCR pathway inhibition in CLL match well with genetic and functional data on the role of BCR signaling in this disease,
Haematologica | 109 May 2024 1348 - Acute Lymphoblastic Leukemia ARTICLE
©2024 Ferrata Storti Foundation Published under a CC BY-NC license
and in WM, where the hallmark MYD88 mutation activates BTK-dependent signaling.4,5 Similarly, ibrutinib’s clinical efficacy in MZL is based on antigen-mediated BCR activation caused by chronic infections (e.g., hepatitis C virus, Helicobacter pylori), as well as antigen-independent activation through acquired genetic alterations (e.g., API2-MALT1 fusion and TNFAIP3 loss of function).6,7 In contrast, the response in MCL was more surprising.8 However, our data indicate a central role for BCR activation in the development and progression of this lymphoma.9
While elements of, and signaling through, BCR are well-defined, those of precursor BCR (pre-BCR) remain ill-characterized. In B-ALL, early data suggest that signaling through pre-BCR is ongoing, and is likely altered and linked to disease biology.10 Moreover, we have previously demonstrated in B-ALL that targeting PKCβ, a critical element of the preBCR, with the small molecule inhibitor enzastaurin inhibits pre-BCR signaling resulting in apoptosis and cell cycle arrest through alteration of the WNT/β-catenin pathway.11 Similarly, our collaborators demonstrated that ibrutinib suppresses proliferation of B-ALL in vitro and in vivo, by targeting two components of the pre-BCR signaling pathway, BTK and BLK.12 Interestingly, by gene expression analysis, MALT1 was found to be up-regulated in primary B-ALL cells compared to the normal control, and is coupled with a stronger NFκB activity.13 Notably, the chemical compounds MI-2 (C19H17Cl3N4O3) and the highly selective MALT1 blocking peptide Z-VRPR-fmk bind to and suppress the protease activity of MALT1 through irreversibly inhibiting cleavage of MALT1 substrates in activated B-cell-like diffuse large B-cell lymphoma (ABC-DLBCL).14,15 We have recently characterized the efficacy and downstream effects of targeting MALT1 with MI-2 in CLL. We showed that MALT1 is constitutively active in CLL and can be effectively inhibited by MI-2, resulting in reduced BCR and NF-κB signaling. Importantly, MI-2 remained highly effective against CLL cells harboring mutations conferring ibrutinib-resistance.16
An alternative, less characterized role for MALT1, has been proposed through the activation of MYC signaling. Dai and colleagues demonstrated that MALT1 pharmacological inhibition and knockout in MCL, resulted in MYC downregulation. However, the mechanism by which MALT1 contributes to Myc stability remains ill-defined.17
The possible therapeutic role of MALT1 in ALL has not been investigated. We hypothesize that MALT1 is critical for B-ALL survival and that its inhibition could have anti-leukemic activity in ALL. Further, given the emerging role for Myc in B-ALL, we hypothesize that MALT1 inhibition could be effective in targeting Myc indirectly through effects on Myc stabilizers.18-22
Methods
Patients and samples
Following written informed consent, and in accordance with
the Declaration of Helsinki and under the oversight of the Institutional Review Board at Tulane University (New Orleans, LA, USA; N M0600) peripheral blood samples were obtained from patients with treatment-naïve or relapsed ALL, as well as from patients with various blood cancers presenting with a leukemic phase. Peripheral blood mononuclear cells (PBMC) were isolated using density gradient centrifugation with lymphocyte separation medium (ICN Biomedicals). Fresh cells were subjected to CD19 selection using magnetic beads yielding purity >96% (Miltenyi Biotec).
A total of 23 cell lines representing the wide spectrum of ALL biology (Online Supplementary Table S1) and TMD8 controls were kindly provided by Dr. Burger’s group at MD Anderson Cancer Center or purchased from ATCC and DSMZ and expanded in vitro. All cell lines were authenticated by short tandem repeat profiling and tested for mycoplasma contamination (Labcorp; Burlington, NC, USA).
Reagents
MI-2 was purchased from MedChemExpress (MCE). The irreversible polyamino-acid MALT1 inhibitor Z-VRPR-fmk (Z-ValArg-Pro-DL-Arg-FMK) was purchased from Tocris. Reagents were dissolved in their respective solvents (DMSO for MI-2 or diH2O for Z-VRPR-fmk) and aliquoted in microtubes to be then stored at -80°C.
Cell viability assay
CellTiter 961 AQueous One Solution Reagent (Promega) MTS dye reduction assay was used to quantify cell viability. Assay details are provided in the Online Supplementary Appendix
Immunoblot
Immunoblot experiments were carried out as previously described.16 Primary and secondary antibodies used are detailed in the Online Supplementary Appendix
GloSensor assay
GloSensor assay was used to quantify the enzymatic activity of MALT1 as previously described.15,23 In brief, the pGloSensor plasmid was custom designed to have 2 luciferase domains linked by the MALT1 proteolytic substrate sequence of RelB, MALT1-GloSensor reporter (Promega). Cleavage of the linker sequence by MALT1 allows conformational changes promoting a large increase in luciferase activity.
Flow cytometry
Cells were stained with anti-Annexin V or with propidium iodide (PI) as previously described,11,16 following treatment with various concentrations of MI-2 or DMSO (control). Cells were then analyzed by flow cytometry as previously described.11,16 FloJo was used for analysis of flow cytometry results.
RNA sequencing and gene expression analysis
RNA and cDNA were prepared using the High Capacity cDNA RT Kit (Applied Biosystems). Total RNA was extracted from
Haematologica | 109 May 2024 1349 ARTICLE - Targeting MALT1 in B-ALL F.M. Safa et al.
MI-2-treated and untreated ALL cell lines using the RNeasy kit (Qiagen) then subjected to RNA sequencing as previously described.16 RNA sequencing data have been deposited in GEO under accession number GSE221273.
Statistical analysis
Student t test (paired or unpaired), Fisher’s exact test, and one-way analysis of variance were used to assess differences between groups. All P values were two-sided; P≤0.05 was considered statistically significant. Analyses were performed using GraphPad Prism (GraphPad Software Inc.) and JMP software (SAS Institute).
Results
MALT1 plays a critical role in B-cell acute lymphoblastic leukemia cell survival
We obtained freshly collected PBMC from patients with various blood cancers presenting with a leukemic phase and determined the anti-tumor activity of MALT1 inhibition using serial concentrations of MI-2 for 48 hours (h). Samples tested were from patients with B-ALL (N=9), CLL (N=24), T-prolymphocytic leukemia (T-PLL, N=6), chronic myeloid leukemia (CML, N=4), as well as normal B cells collected from 6 volunteers. Surprisingly, B-ALL samples showed the highest sensitivity to MI-2, followed by CLL. Normal B cells, T-PLL and CML, were relatively resistant to cell killing by MI-2 (Figure 1A). To further confirm the efficacy of MALT1 inhibition against ALL, we used the highly selective MALT1 blocking peptide Z-VRPR-fmk to treat 3 CD19-selected primary ALL cells and 23 ALL cell lines representing the disease spectrum. Z-VRPR-fmk at 50 mM resulted in a significant reduction in viability of the patient-derived samples following a 96-h single treatment (Figure 1B) and in most of our B-ALL cell lines following 3 treatments over nine days (Figure 1C). Z-VRPR-fmk is a large molecule that requires a high concentration and a long incubation time to ensure cell penetration. The concentration and incubation times we used are consistent with those used across the literature.24 Notably, the cell killing in B-ALL was independent of the cell-of-origin (pro, pre, mature), or the presence or absence of the Philadelphia chromosome. The sensitivity of B-ALL contrasts with that of the T-ALL cell lines that were all resistant to MALT1 inhibition (Figure 1C). Further, we noted the same pattern of sensitivity when all cell lines were treated with MI-2 for 48 h, as demonstrated by the statistically significant correlation between the percentage of Z-VRPR-fmk-induced growth inhibition and the half maximal inhibitory concentration (IC50) of MI-2 (r=0.72, P<0.0001) (Figure 1D).
MALT1-dependent cell lines possess a protease active or inactive MALT1 in B-cell acute lymphoblastic leukemia
The proteolytic activity of MALT1 can be studied by measuring its ability to cleave its substrates. Known MALT1
substrates include CYLD, HOIL, RelB, A20, Bcl10, Roquin, and Regnase. In CLL, we found that MALT1 is constitutively active through its protease function, likely as part of BCR signaling, as evident by the presence of MALT1’s substrate cleavage.16 As an example, we measured cleaved CYLD as the degree of MALT1 activity.16,25 We used immunoblotting with an antibody specific for the C-terminal (C-ter) region of CYLD, to detect full length CYLD (120 kDa) and the C-ter cleaved product (CYLDC-ter ~70KDa). In B-ALL, we sought to determine whether the anti-leukemic effect observed with MALT1 inhibition correlates with the proteolytic activity of MALT1. Surprisingly, despite the expression of MALT1 in all ALL cell lines and primary cells, substrate cleavage was not detected in most samples, including the most sensitive to MALT1 inhibition (Figure 2A-D). More specifically, none of the pro or pre B-ALL cell lines showed active MALT1 protease activity. This proteolytic activity remained absent after proteasomal inhibition (to protect cleaved products from proteasomal degradation) or following crosslinking of preBCR with anti-IgM in pre B-ALL (Online Supplementary Figure S1). In contrast, mature B-ALL displayed a pattern similar to MCL and DLBCL, where two groups were identified: a group with active MALT1 protease and sensitive to MALT1 inhibition (BALL-1, GA-10, 2F7), and a second group with inactive MALT1 protease and resistant to MALT1 inhibition (TANOUE, RAJI, RAMOS) (Figures 1C, 2C). The effect of MALT1 inhibition on substrate cleavage was further confirmed by a reduction of the cleaved fractions of the substrates CYLD, RelB and Regnase following a 12-h incubation with Z-VRPR-fmk in the MALT1-dependent cell line 2F7, contrary to the MALT1 independent cell line RAJI where cleavage did not occur (Figure 2E). We did not observe any proteolytic activity in the tested T-ALL cell lines (data not shown), all of which were resistant to MALT1 inhibition (Figure 1C). In patient-derived samples, we detected a similar pattern in CD19 selected lymphoblasts derived from patients with B-ALL where substrate cleavage was absent in most samples (Figure 2D).
The contrast between sensitivity to MALT1 inhibition and absence of proteolytic activity suggests either a protease-independent role for MALT1 or a weak enzymatic activity below the immunoblot detection level. To investigate a possible ongoing low proteolytic activity for MALT1, we used the previously described MALT1-specific GloSensor reporter assay in a set of MI-2 sensitive cell lines (RS4;11, KASUMI-2, RCH-ACV, NALM-6, KOPN-8 and BALL-1). The MALT1 GloSensor assay uses a split luciferase method, in which the luciferase activity is triggered by MALT1-induced cleavage resulting in luminescence. This luciferase activity is highly specific and a surrogate for MALT1 endogenous proteolytic function. Unsurprisingly, BALL-1 showed the highest activity with more than a 6-fold increase in bioluminescence, compared to the rest of the tested cell lines, where a low or no activity was detected (Figure 2F). These results highly suggest a novel, protease-independent role for MALT1 in B-ALL.
Haematologica | 109 May 2024 1350 ARTICLE - Targeting MALT1 in B-ALL F.M. Safa et al.
MYC signaling is activated by MALT1 independently of BCR signaling
Our transcriptome analysis in CLL cells treated with MI-2 revealed the expected downregulation of NF-κB target genes, confirmed by decreased levels of nuclear p50, and select NF-κB regulated molecules, in particular Bcl-xL.16 On the other hand, the high sensitivity of most pro and pre B-ALL to MALT1 inhibition contrasts with the absence of a canonical substrate cleavage and suggests a potentially novel role for
this protease in B-ALL. Similarly, the high sensitivity of 2 ibrutinib-resistant cell lines RS4;11 and 697 (as determined by Dr. Burger’s group)12 to Z-VRPR-fmk and MI-2 implicates a distinct role for MALT1 in these cell lines, arguably independent of BTK and of signaling through BCR. To explore this possibility, we used RNA sequencing to determine the changes in gene expression profiling (GEP) in 12 cell lines (pro and pre B) following an 8-h treatment with MI2. Out of 19,428 tested genes, there were 1,036 whose
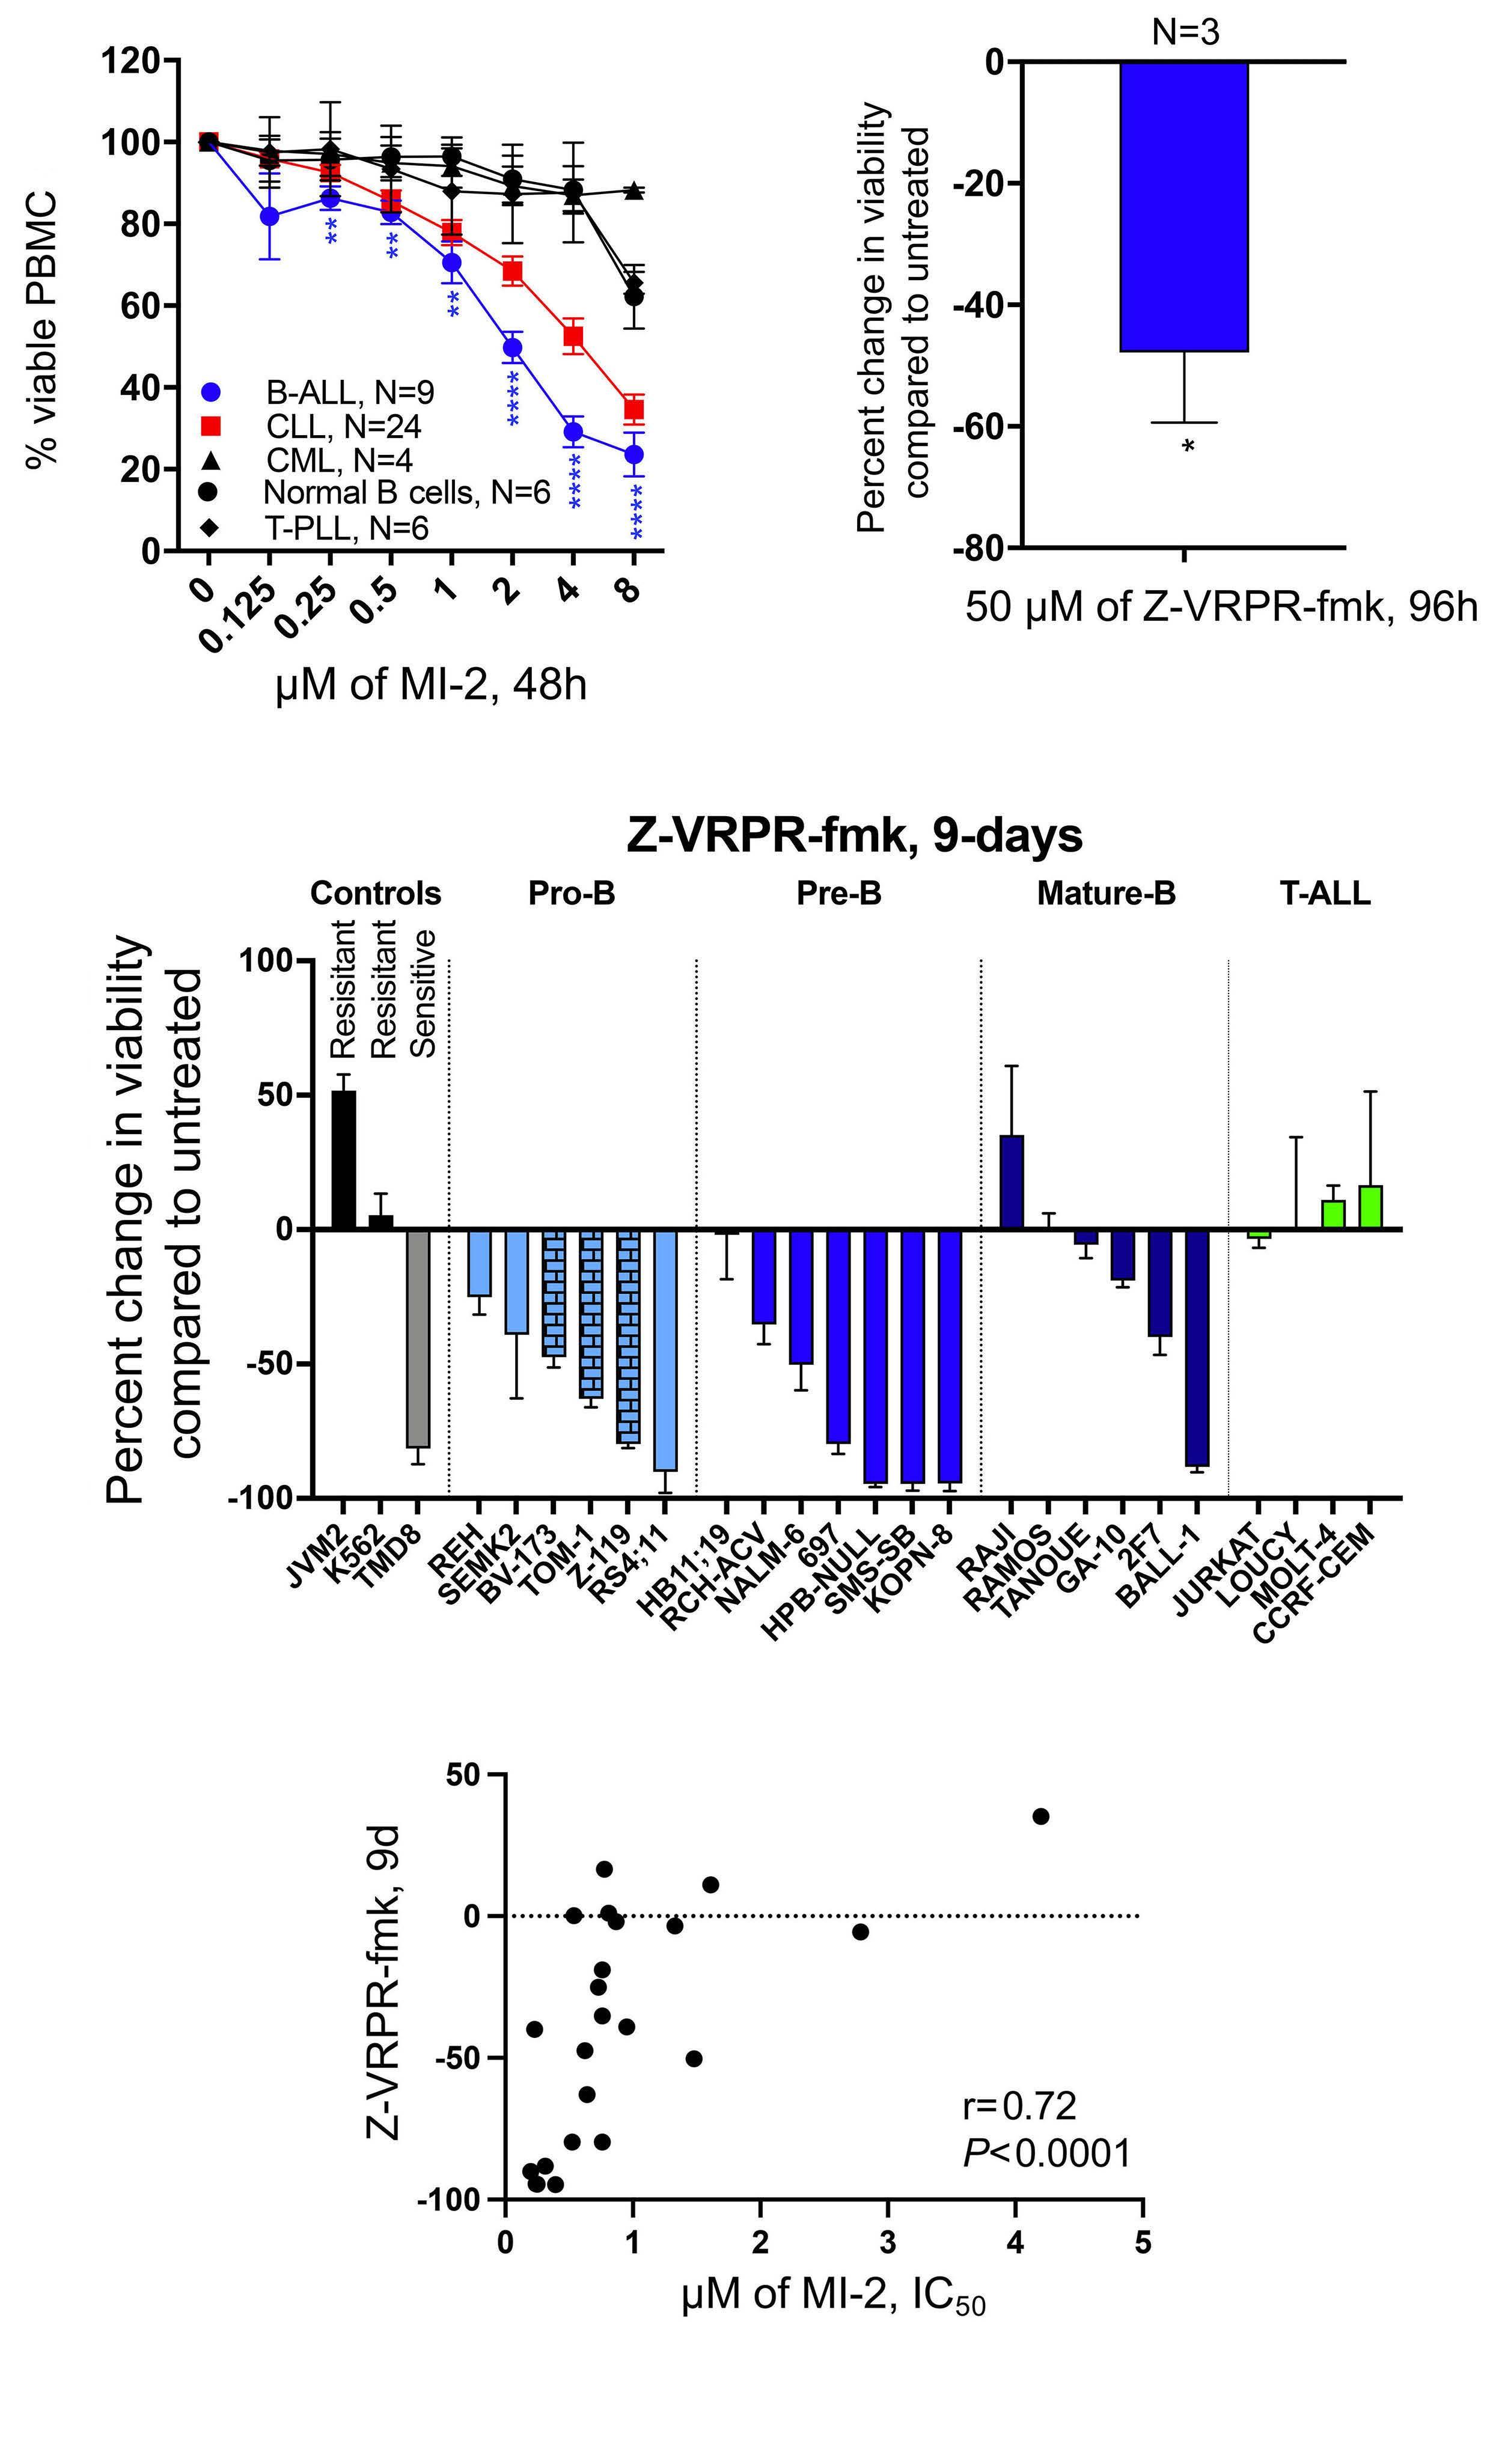
Figure 1. Targeting mucosa-associated lymphoid tissue lymphoma translocation protein 1 efficiently kills B-cell acute lymphoblastic leukemia cells. (A) Peripheral blood mononuclear cells (PBMC) from patients with B-cell acute lymphoblastic leukemia (B-ALL), T-cell acute lymphoblastic leukemia (T-ALL), chronic myeloid leukemia (CML), chronic lymphocytic leukemia (CLL), or from healthy individuals were subjected to treatment with increasing doses of MI-2 for 48 hours (h). Cell viability was quantified using an MTS assay and is shown as percentage of the untreated control. (B) CD19-selected primary B-ALL cells collected from 3 patients were treated with the highly selective mucosa-associated lymphoid tissue lymphoma translocation protein 1 (MALT1) inhibitor Z-VRPR-fmk at 50 mM for 96 h. Cell viability was quantified using an MTS assay and is shown as a percentage of untreated control. (C) Waterfall plot showing percent changes in cell viability from baseline, quantified using an MTS assay, following a 9-day (9d) treatment with 50 mM Z-VRPR-fmk. Cells were split every three days. A total of 23 ALL cell lines tested representing the disease spectrum. Positive (TMD8) and negative (K562 and JVM2) controls are shown. (D) Correlation between percent change in cell viability following treatment with Z-VRPR-fmk as shown in (C), and the half maximal inhibitory concentration (IC50) for MI-2 of B-ALL cell lines. T-PLL: T-cell prolymphocytic leukemia. *P<0.05. Error bars represent Standard Error of Mean. Columns with a brick pattern identify Philadelphia chromosome-positive cell lines.
1351 ARTICLE - Targeting MALT1 in B-ALL F.M. Safa et al.
C B A D
expression changed ≥2-fold at false detection rate (FDR) <0.1 (275 down- and 761 up-regulated) (Figure 3A, Online Supplementary Table S2). Gene Set Enrichment Analysis
(GSEA) identified 13 Oncogenic Signature gene sets at FDR <1%, and a normalized enrichment score (NES) ≥1.70, all of which were down-regulated by MI-2. Interestingly, BCR
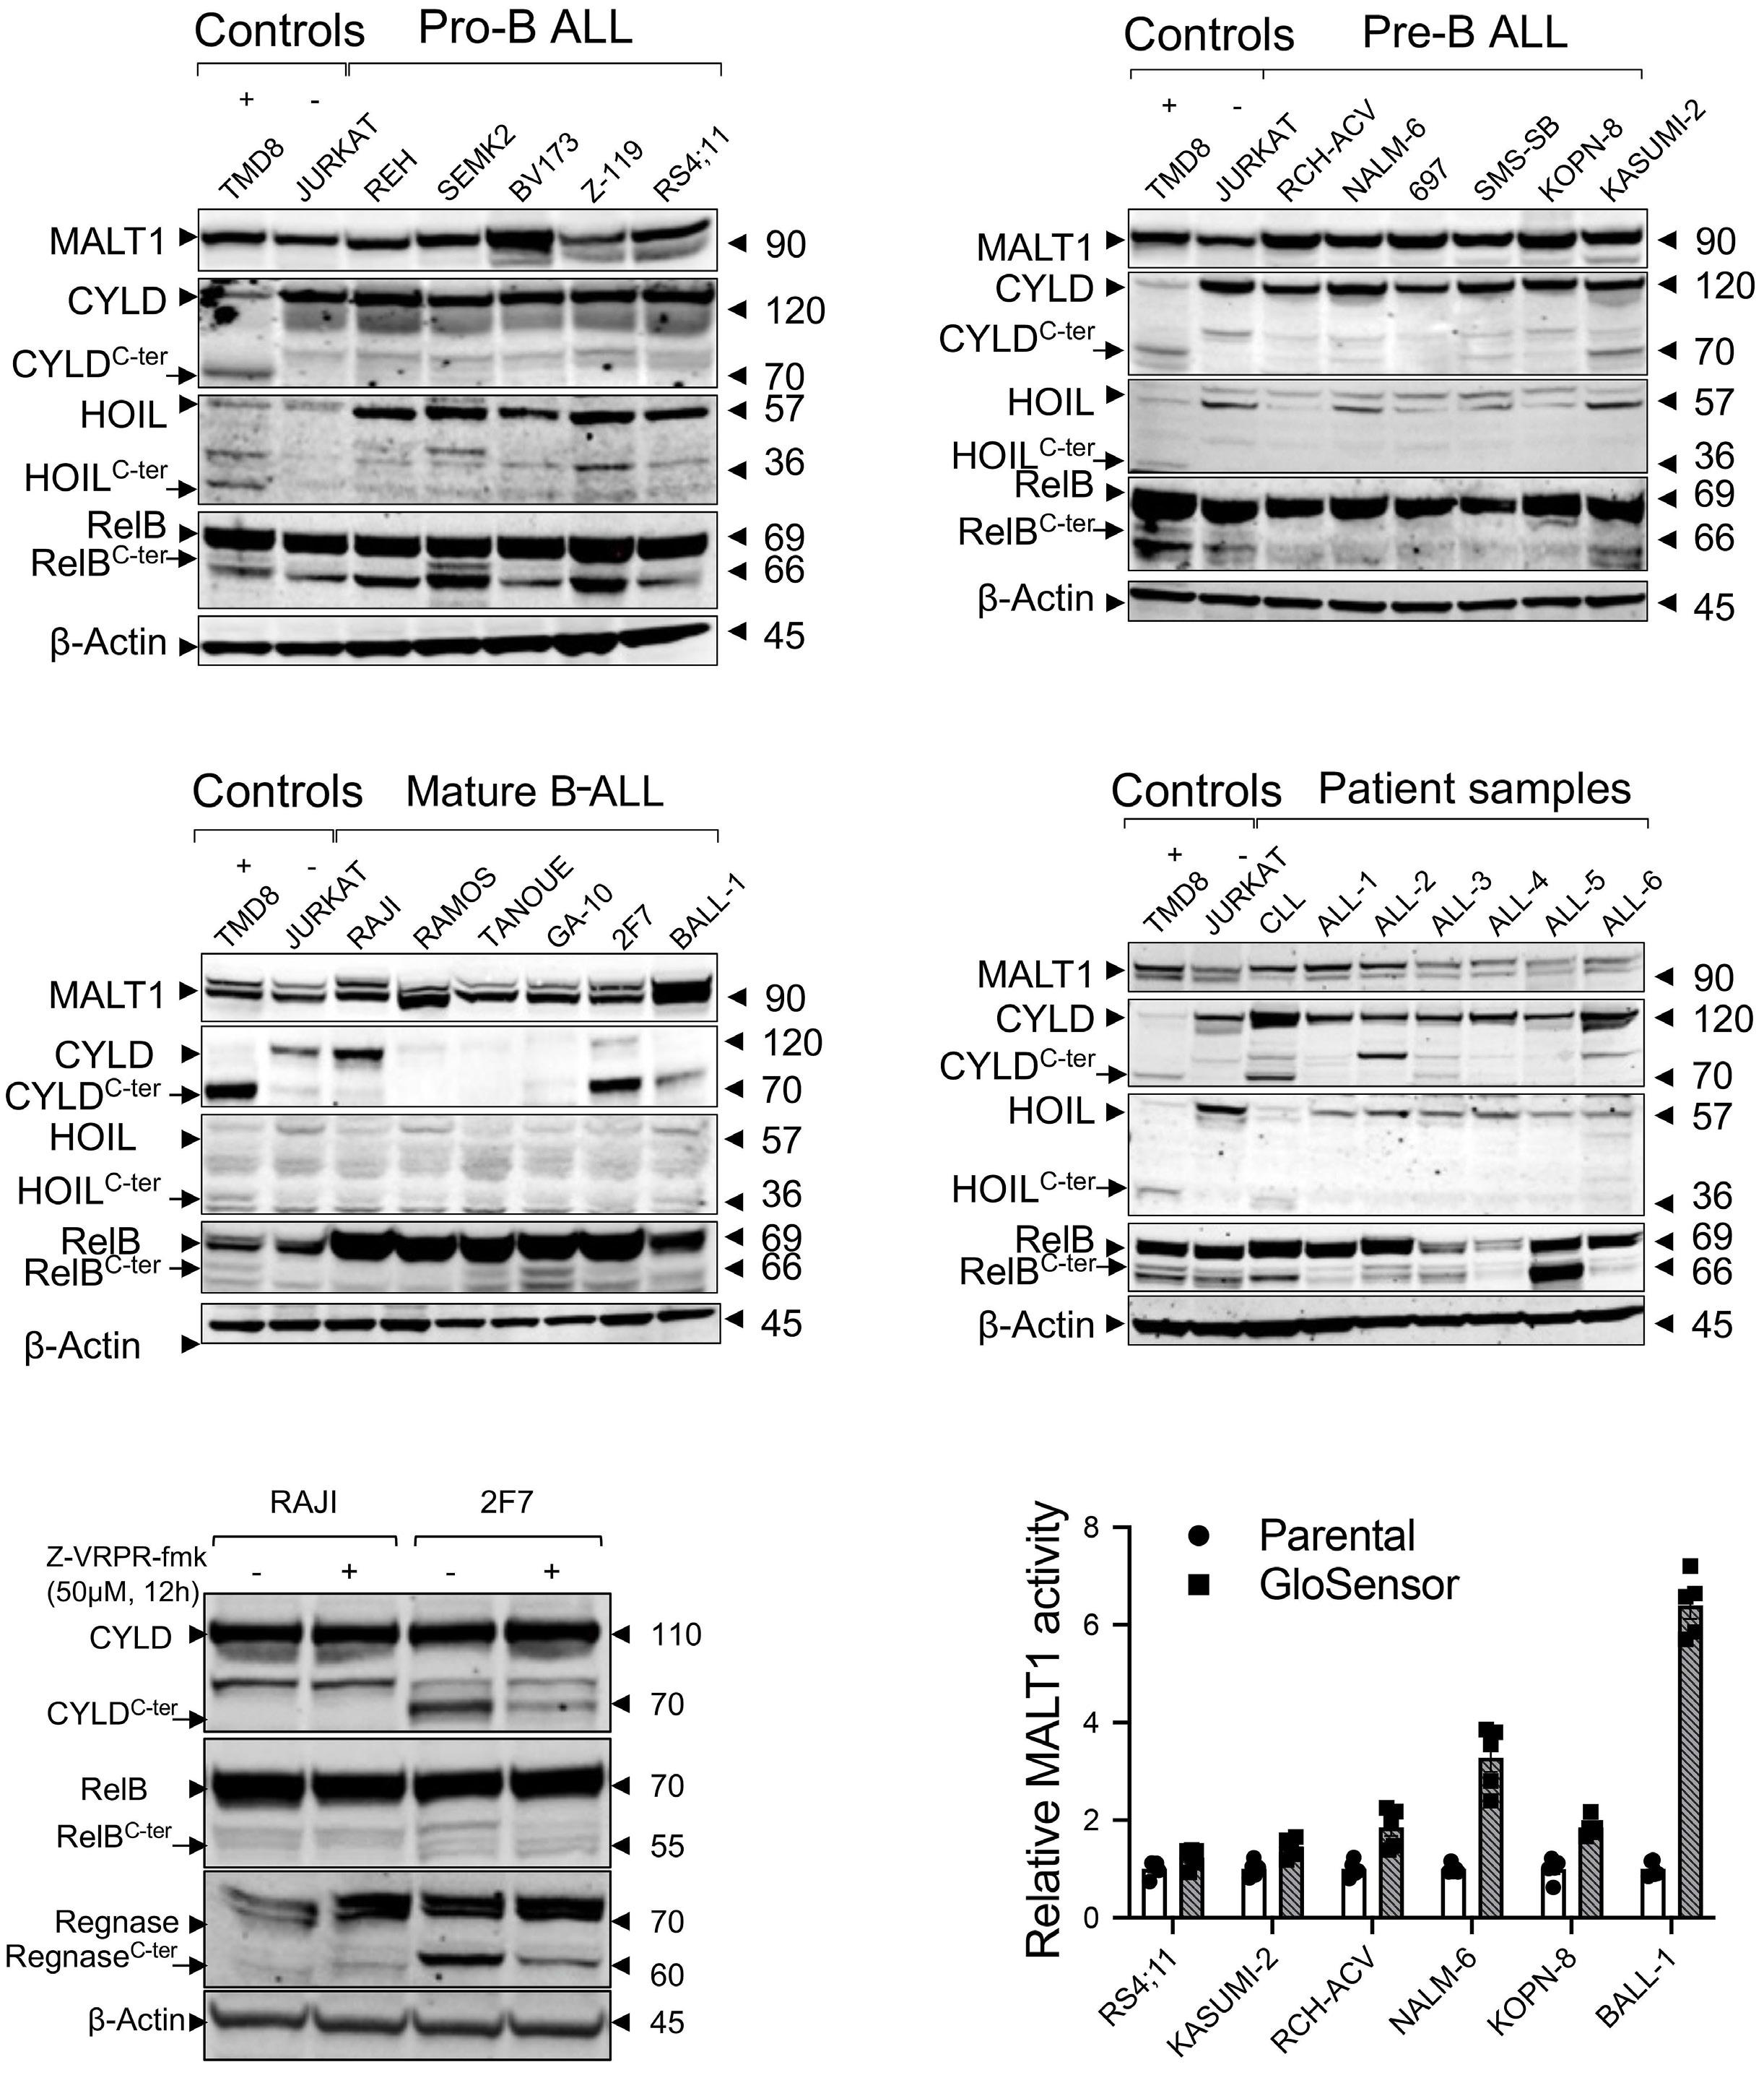
Figure 2. Mucosa-associated
lymphoma translocation protein 1 protease activity in B-cell acute lymphoblastic leukemia cell lines and primary samples. Immunoblot analysis showing expression of mucosa-associated lymphoid tissue lymphoma translocation protein 1 (MALT1) and its substrates (CYLD, HOIL, RelB) in (A) 5 pro B-cell acute lymphoblastic leukemia (B-ALL) cell lines; (B) 6 pre-B-ALL cell lines; (C) 6 mature B-ALL cell lines; (D) CD19-selected primary samples representing 6 B-ALL and one chronic lymphocytic leukemia sample. TMD8 and JURKAT were used as positive and negative controls, respectively, for substrate cleavage. (E) Immunoblot analysis showing inhibition of CYLD, RelB, and Regnase cleavage by MALT1 following a 12-h treatment with Z-VRPR-fmk in the mature B-ALL cell line 2F7. RAJI is shown as a negative control. (F) Cell-based reporter GloSensor assay showing intrinsic MALT1 proteolytic activity in the cell lines is shown. C-ter : cleaved substrates.
Haematologica | 109 May 2024 1352 ARTICLE - Targeting MALT1 in B-ALL F.M. Safa et al.
A C E B D F
lymphoid tissue
and NF-κB regulated gene signatures were not identified by GSEA as being significantly affected by MI-2. Instead, MYC-regulated gene signatures were strongly represented (5 out of 15 gene sets, including the top 2 affected signatures, strongest at NES of -2.45 and FDR of 0.00) (Figure 3B, C). Moreover, the MYC gene was found to be more than 3.5-fold down-regulated by MI-2. Most of the up-regulated genes were apoptotic/oxidative stress-related genes or pseudogenes such as JUN, CEBP-B and SLAM-7 (Figure 3A). In B-ALL, Myc is not a known target for MALT1. To investigate whether MALT1 contributes to Myc stability, we measured Myc protein expression in whole-cell lysates following treatment with increment concentration of MI-2 for 8 h. We observed a striking reduction of Myc in the tested sensitive cell lines (Z-119, RS4;11, RCH-ACV, SMS-SB, and KOPN-8), an unchanged expression in the sensitive mature cell line BALL-1 (Online Supplementary Figure S2), and an increase in the resistant cell line RAJI (Figure 3D). These findings suggest a previously unrevealed effect of MALT1 on Myc in pro and pre B-ALL, but not in mature B-ALL. Interestingly, RAJI carries a mutation in Myc at the threonine-58 residue which prohibits Myc phosphorylation at this site. 26 Phosphorylation of Myc at threonine-58 and serine-62 is required for its ubiquitination by FBXW7 and subsequent proteasomal degradation.27 FBXW7, with its 3 isoforms α, β and γ, is a component of a ubiquitin ligase complex responsible for the degradation of a number of oncoproteins such as c-Jun, Cyclin E, mTOR and Myc.28 Thus FBXW7 isoforms were examined by immunoblot in the 2 sensitive cell lines RS4;11 and BALL-1 following treatment with 1 mM of MI-2 and sampled at regular intervals for immunoblot analysis. Our results showed that the expression of all 3 isoforms of FBXW7 are enhanced following MALT1 inhibition with MI-2 (Figure 3E). While the upregulation of FBXW7 in the pro B-ALL cell line RS4;11 is concordant with a marked downregulation of Myc, we did not observe the same trend in mature B-ALL cell line BALL-1, in which Myc expression seems to be independent of MALT1 (Figure 3D, E, Online Supplementary Figure S2). These results highly suggest that FBXW7 is a new potential substrate for MALT1 and link RAJI resistance to increased Myc stability, which is shielded from MALT1 inhibition through a mutated threonine-58.
Our transcriptome data showed a marked downregulation of MYC mRNA levels in most of the MI-2-treated cell lines (Figure 3A, Online Supplementary Figure S3A). Nevertheless, 3 of the cell lines with available MYC mRNA and protein expression data, that showed the least downregulation of MYC mRNA following MI-2 treatment (KOPN8, no change; SMS-SB, 3-fold change; RCH-ACV, 3.4-fold change) (Online Supplementary Figure S3A), showed a near complete depletion of Myc protein following MI-2 treatment (Figure 3D). Signaling through pre-BCR activates BCL6, which transcriptionally represses MYC.29 While our gene expression data show a marked decrease in the pre-BCR component VPREB1 and BCL6 following treatment with MI-2 (Online Supple-
mentary Figure S3B, C), our analysis for the corresponding proteins did not yield significant changes in VPREB1 nor BCL6, as measured by flow cytometry and western blot, respectively (Online Supplementary Figure S3D, E).
Collectively, these data suggest a direct effect of MALT1 on MYC/FBXW7 protein axis, rather than indirectly through effects on pre-BCR and BCL6.
MI-2 restores apoptosis and causes cell cycle arrest in B-cell acute lymphoblastic leukemia cells
Finally, we sought to determine the mechanism of cell killing with MI-2 in ALL cells.
To assess cytotoxicity against B-ALL cell lines, we measured the cell viability by flow cytometry using Annexin-V following exposure to MI-2 for 48 h. We observed a dose-dependent increase in apoptosis as evident by the increase in the Annexin-V-positive fraction in the MALT1-dependent cell lines RS4;11, KOPN-8 and BALL-1, but not in the resistant RAJI cell line (Figure 4A). Apoptotic induction was further confirmed by the increase in PARP cleavage in the sensitive cell lines, but not in RAJI (Figure 4B).
Next, we assessed the effect of MALT1-inhibition on cell cycle progression by PI staining and flow cytometry. The results demonstrated a significant inhibition of cell cycle progression in the sensitive cell lines RS4;11, KOPN-8 and BALL-1 after a 48-h treatment at 0.5 and 1 mM (Figure 4C). By comparison, cell cycle progression in RAJI was not affected. Notably, the reduction in the cycling population (S/ G2/M) was associated with an equivalent increase in the subG0 fraction, and a nearly unchanged G0/G1 fraction. This pattern of cell cycle changes, coupled with a strong apoptotic induction, indicate that the mechanism of MI2 killing is through induction of apoptosis selectively in cycling cells.
Discussion
Forty percent of patients diagnosed with ALL in 2020 died.30 Death rate dramatically increases with age, with the majority of those older than 65 years succumbing to their disease. Thus, novel therapeutic strategies are needed to improve survival, particularly in those who suffer a disease relapse. The oncogenic role of BCR or its precursor, pre-BCR, in the biology of B-ALL has been the subject of intense focus in the field.31-34 We and our collaborators have shown that targeting elements of the BCR pathway such as BTK, PI3Kδ, and PKCb is effective in vitro on a variety of B-ALL cell lines and primary samples.11,35,36 While small molecule inhibitors of the BCR signaling pathway have transformed the way we treat B-cell malignancies, their role in B-ALL remains limited without a significant therapeutic application (clinicaltrials. gov identifiers: NCT02129062, terminated; NCT02404220, terminated; NCT01396499, terminated; NCT03267186, active; NCT02997761, active; NCT04803123, active). Hence,
Haematologica | 109 May 2024 1353 ARTICLE - Targeting MALT1 in B-ALL F.M. Safa et al.
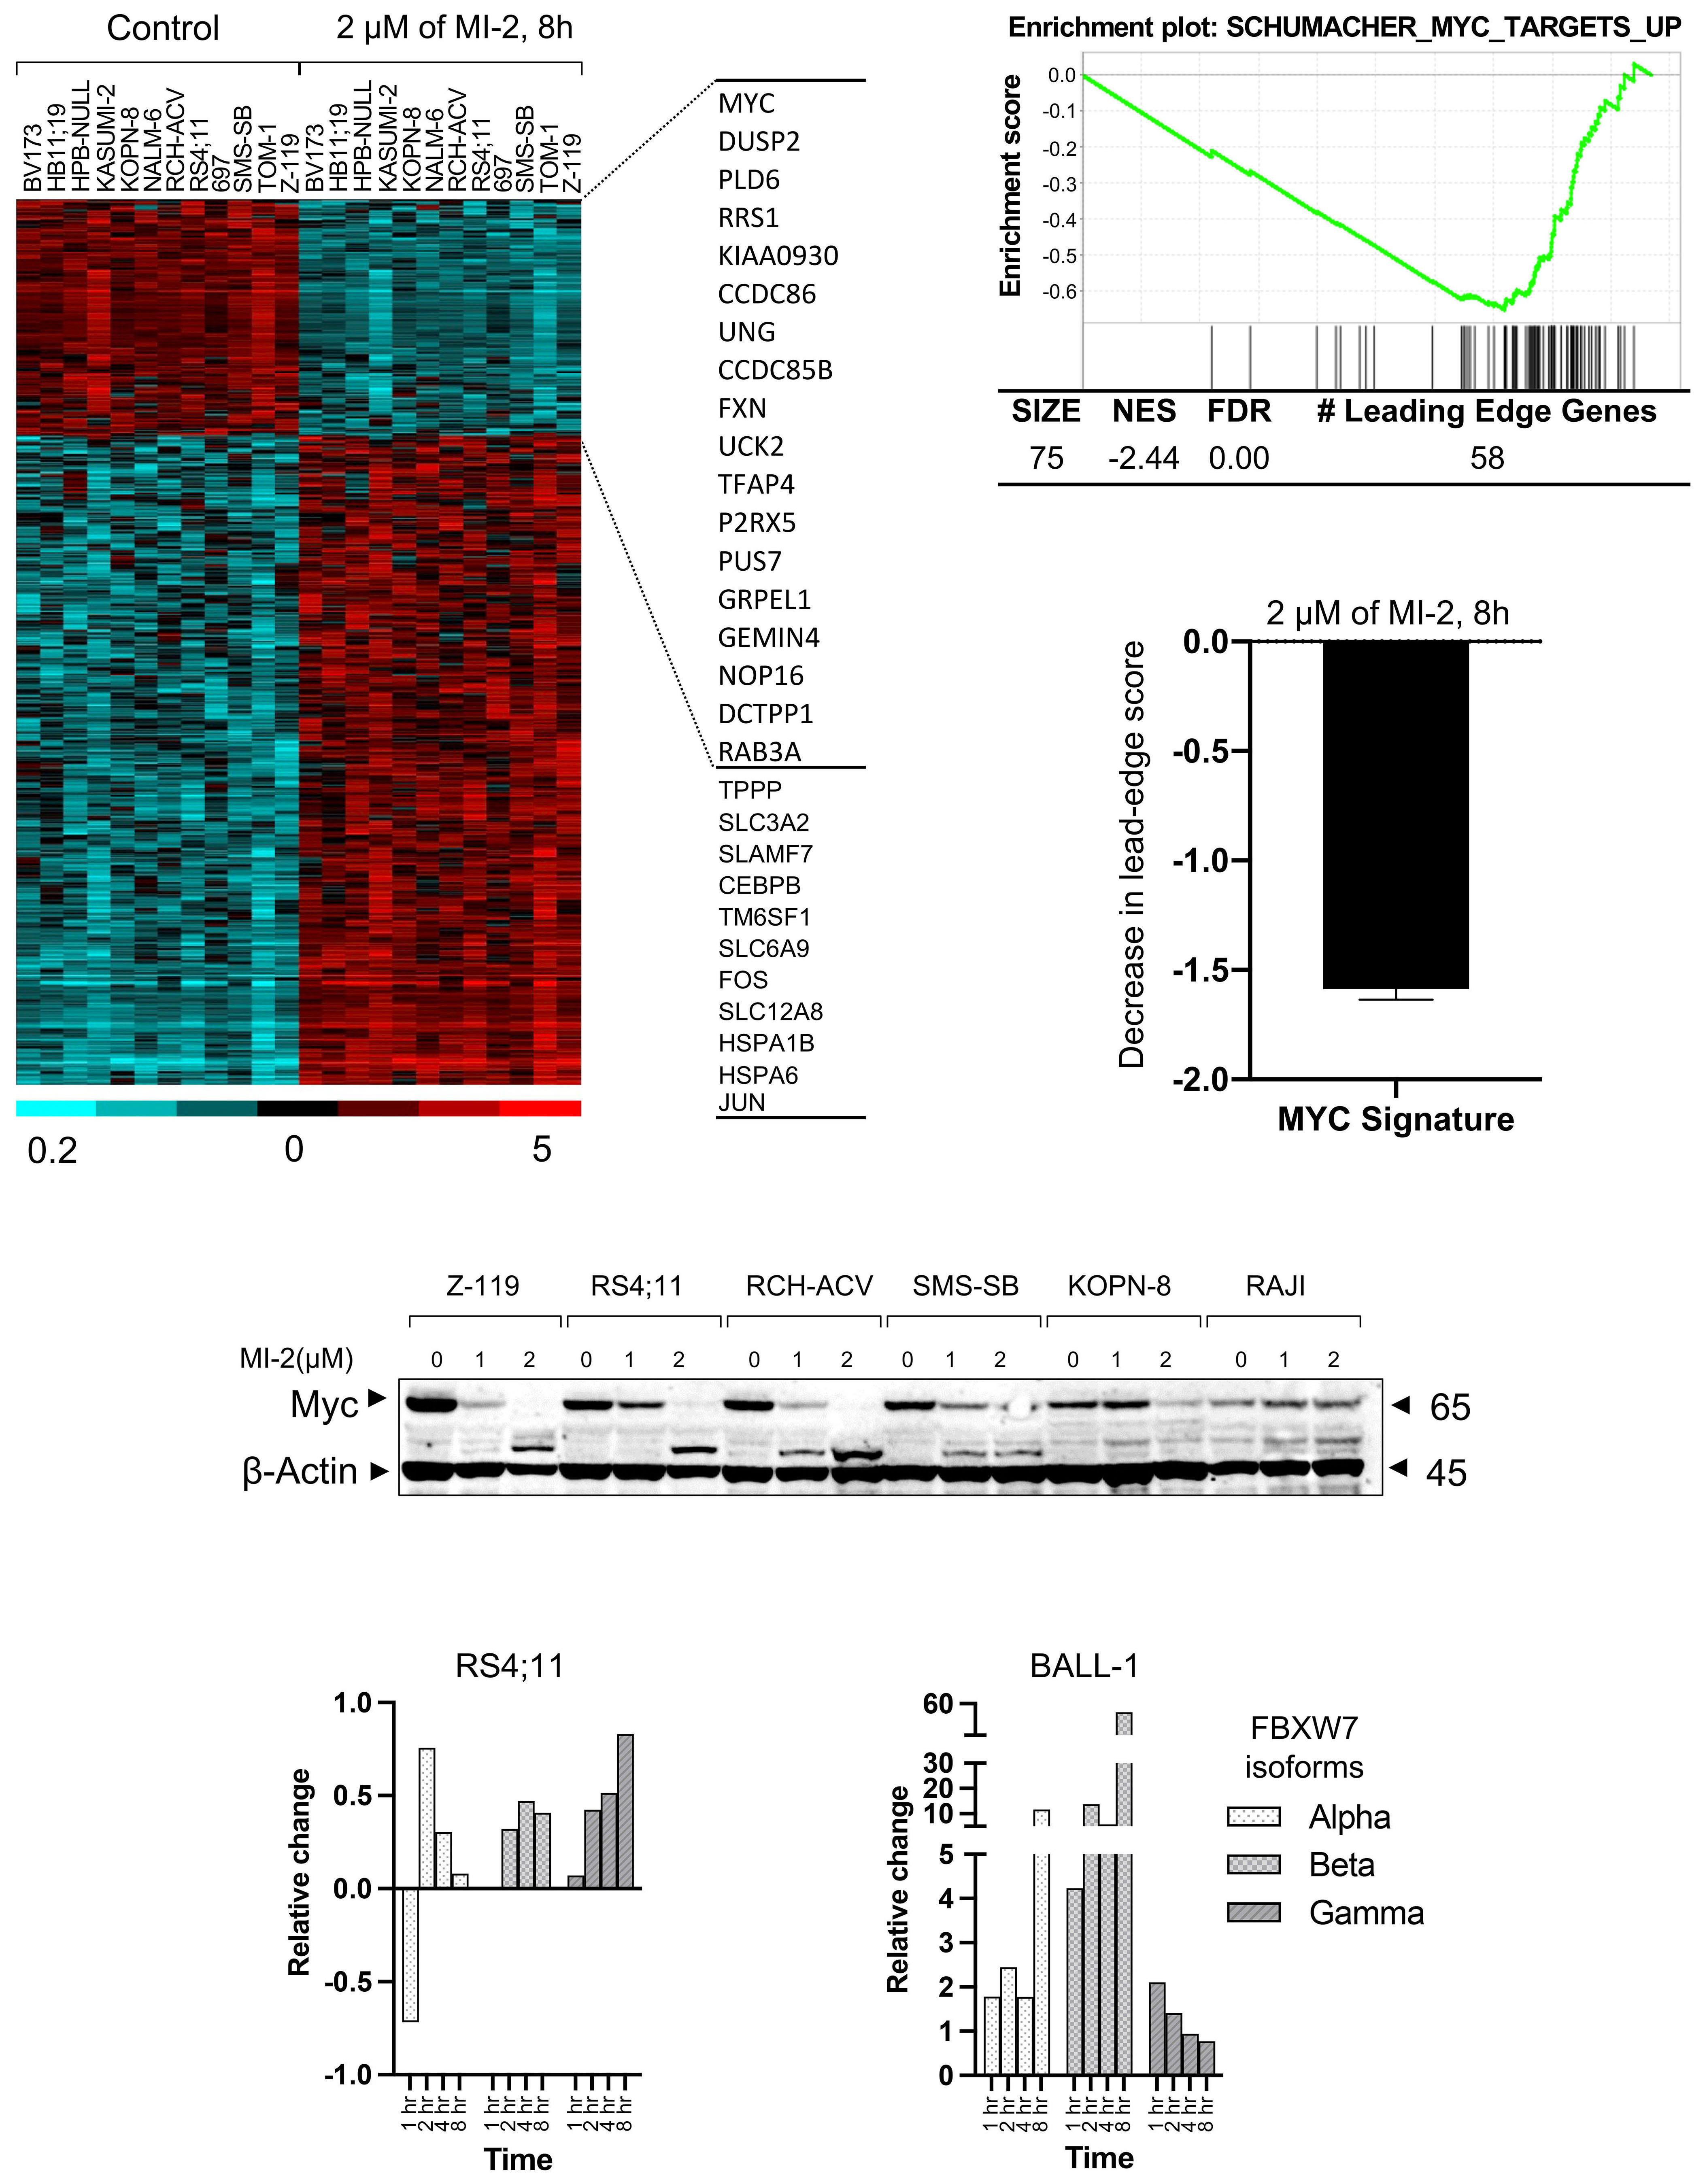
Haematologica | 109 May 2024 1354 ARTICLE - Targeting MALT1 in B-ALL F.M. Safa et al. A D E B C
Continued on following page.
Figure 3. Mucosa-associated lymphoid tissue lymphoma translocation protein 1 regulates MYC signaling in B-cell acute lymphoblastic leukemia. (A) RNA gene expression analysis of 12 B-cell acute lymphoblastic leukemia (B-ALL) cell lines treated with 2 mM of MI-2 for 8 hours (h) was performed by RNA sequencing. The heatmap represents 1,036 whose expression changed ≥ 2-fold at FDR < 0.1 (275 down- and 761 up-regulated). Gene expression is median centered and scaled as indicated. Each column represents a sample, and each row represents a gene. Gene symbols highlight select genes. (B) An enrichment plot representing the inhibitory effect of MI-2 on the most affected MYC gene set as identified by gene set enrichment analysis. (C) Decrease in the signature score of the MYC gene set shown in (B) computed as the average of the mRNA expression level of the leading edge genes of MI-2–treated samples minus the corresponding control. The leading edge genes represent the genes of this MYC gene set most significantly differentially expressed in the experimental data, as determined by gene set enrichment analysis. (D) Immunoblot showing Myc expression changes in whole cell lysates following 0-2 mM MI-2 treatment for 8 h. (E) Quantification of FBXW7 isoforms changes (relative change/Actin) following treatment with 1 mM MI-2 for 1-8 h. FDR: false discovery rate; NES: normalized enrichment score; MALT1: mucosa-associated lymphoid tissue lymphoma translocation protein 1.
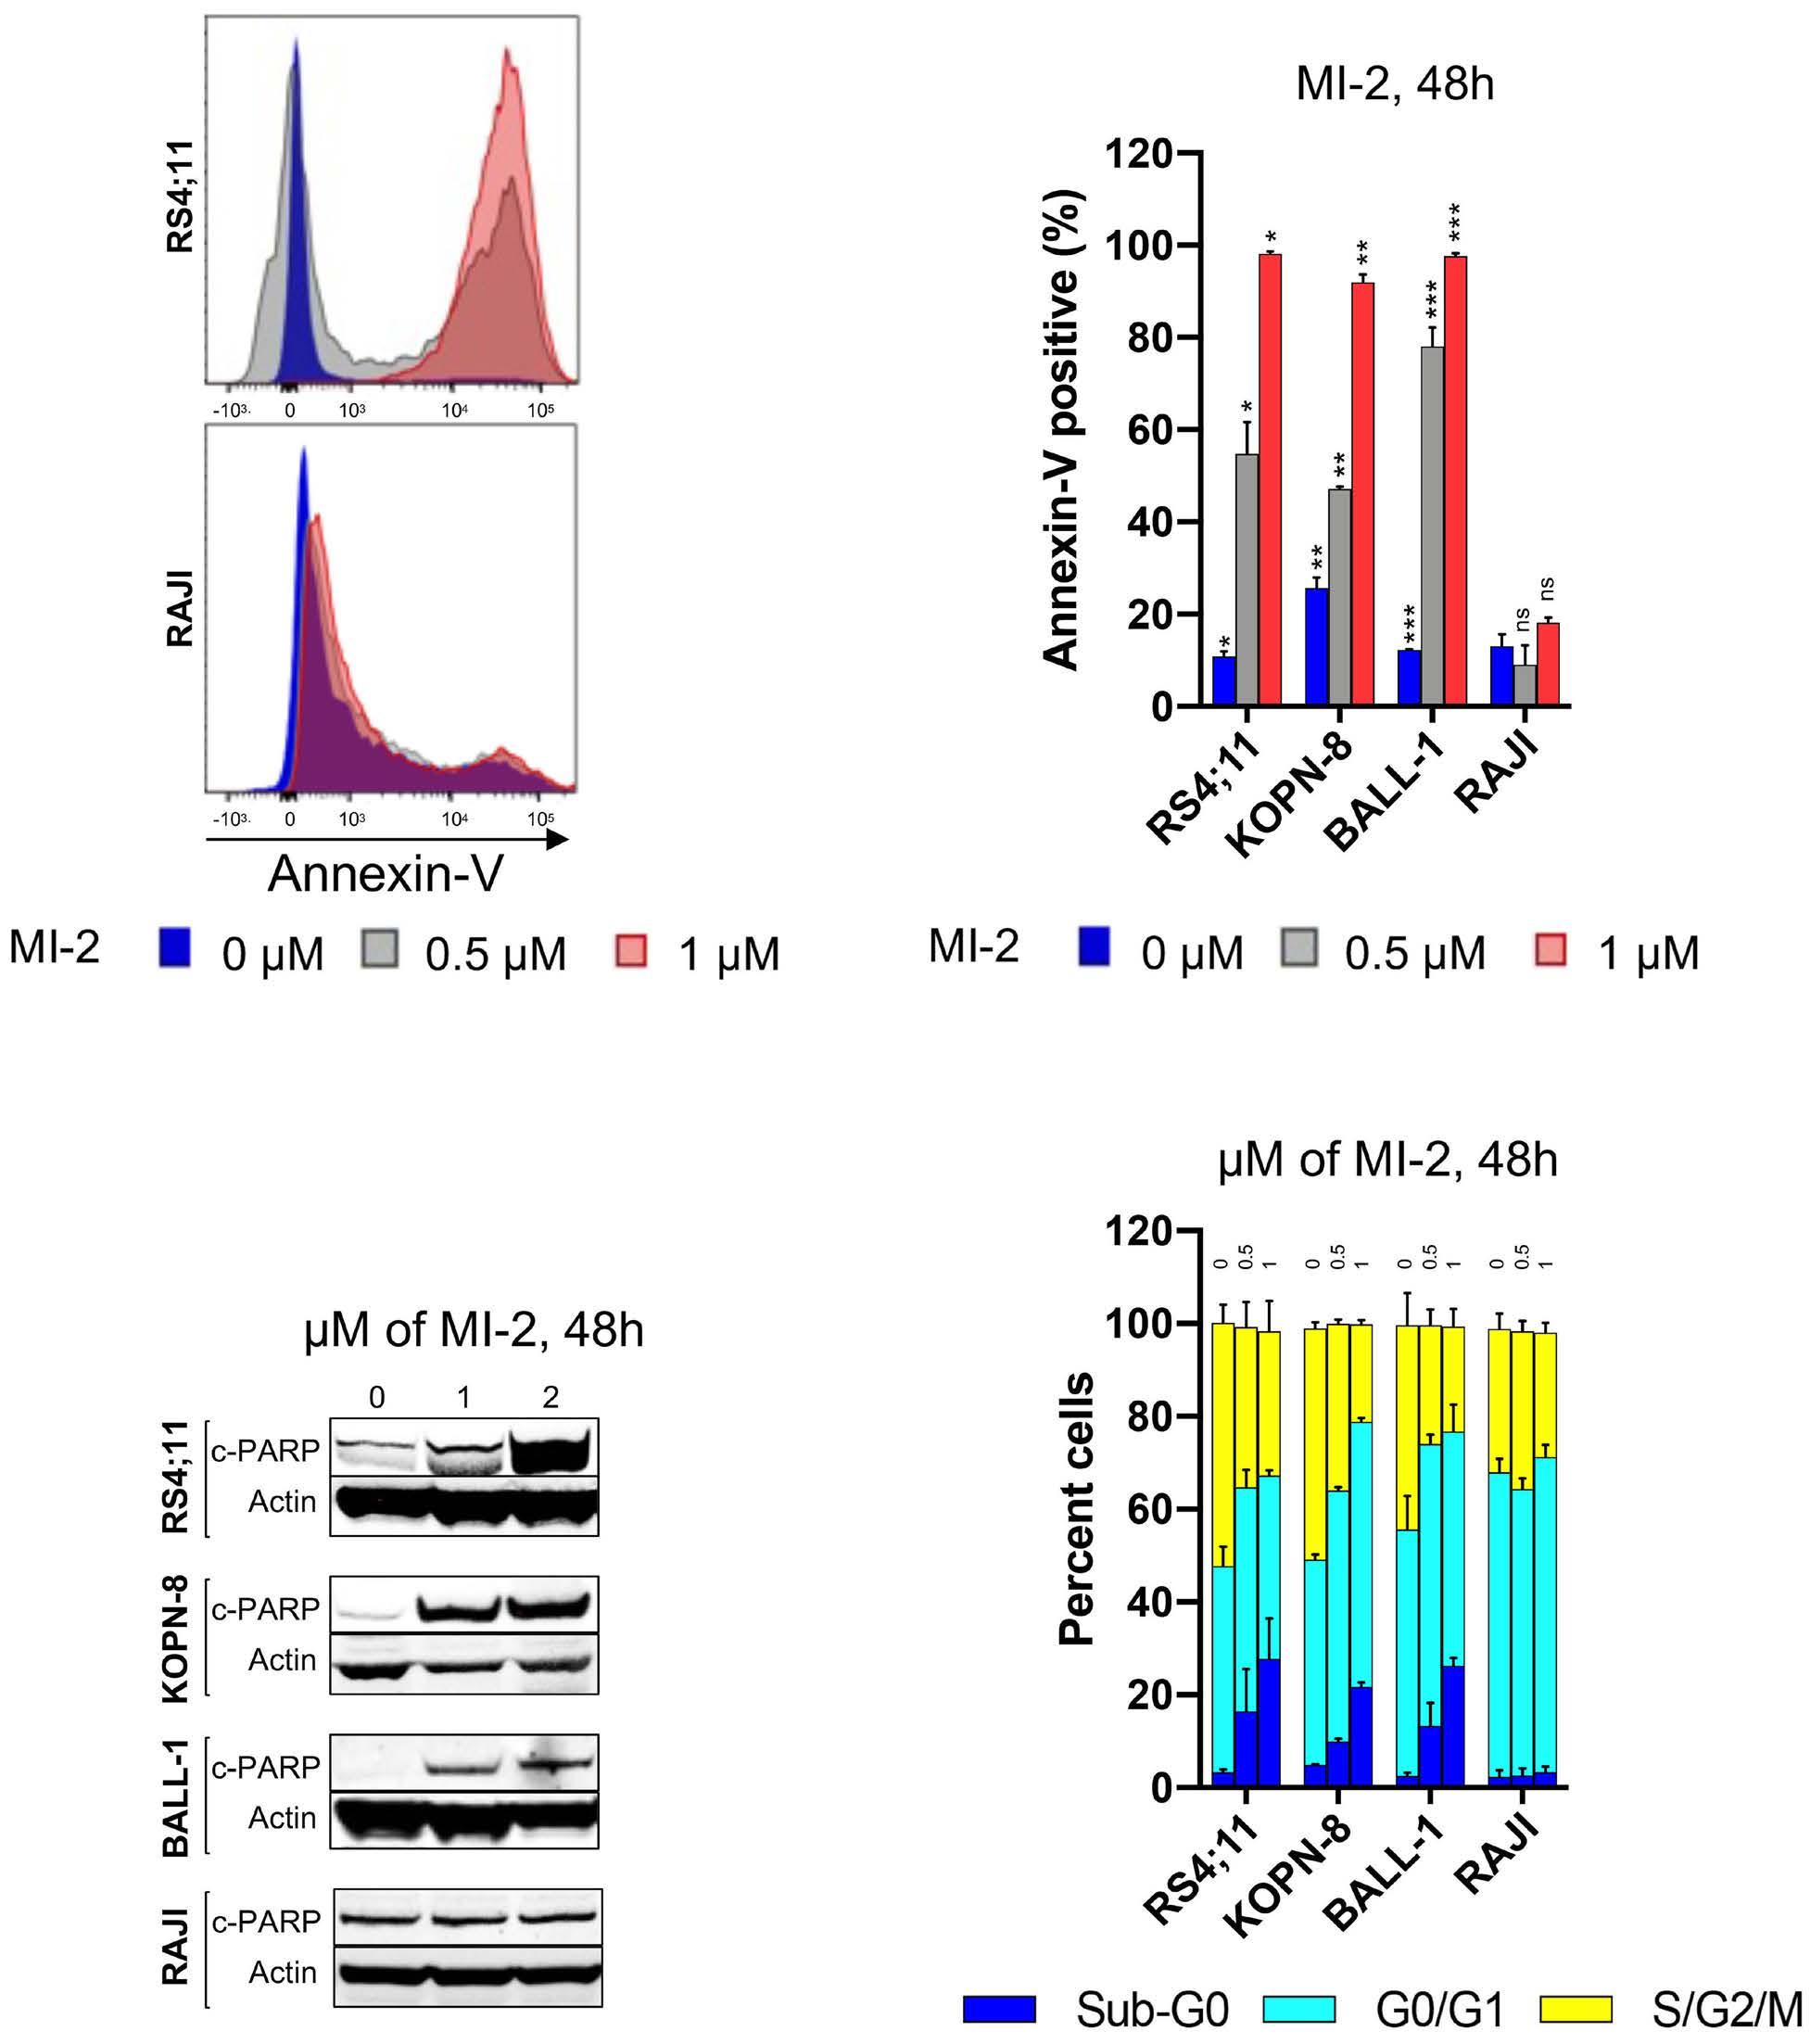
there is a crucial need to further understand the role of this pathway and each of its components in B-ALL biology. Here, we show for the first time that MALT1 is critical for B-ALL survival, and that its inhibition is highly efficacious in killing leukemic cells despite MALT1’s proteolytic activity being detected only in a small subset of this disease. Targeting MALT1 was also equally effective against B-ALL cells regardless of the cell of origin or the presence of
Figure 4. MI-2 induces apoptosis and cell cycle arrest in B-cell acute lymphoblastic leukemia cell lines. (A) Apoptotic induction quantified by flow cytometry using Annexin-V staining in the shown cell lines following treatment with 0-1 mM of MI-2 for 48 hours (h). (B) Immunoblot showing the change in expression of c-PARP in B-cell acute lymphoblastic leukemia (B-ALL) cell lines following treatment with 0-2 mM of MI-2 for 48 h. (C) Changes in cell cycle quantified by flow cytometry using propidium iodide staining in the shown cell lines following treatment with 0-1 mM of MI-2 for 48 h. *P<0.05, **P< 0.01, ***P<0.001. ns: not significant. Error bars represent Standard Error of Mean.
the Philadelphia chromosome.
In B-cell non-Hodgkin lymphoma (NHL), triggering the BCR pathway can be achieved by either antigenic stimulation or through oncogenic mutations that confer an antigen-independent NF- κ B activation.14,16,17 Within this pathway, MALT1 connects signaling through BCR to NF- κ B activation. We have shown that, in CLL, MALT1 is constitutively activated, likely through antigen stimulation, and
Haematologica | 109 May 2024 1355 ARTICLE - Targeting MALT1 in B-ALL F.M. Safa et al.
A C B D
is turned off by MI-2.16 In MCL and DLBCL,14,17 two groups were identified: a group with active MALT1 protease and sensitive to MALT1 inhibition, and a second group with inactive MALT1 protease and resistance to MALT1 inhibition. We observed a similar pattern of a two-group split based on MALT1’s protease activity and sensitivity to inhibition in mature B-ALL. Whereas pro and pre B-ALL were sensitive to MALT1 inhibition despite an apparent protease-dead MALT1. Unlike other B-cell malignancies, where the canonical activity of MALT1 pivots around NF-κ B, the role of MALT1 in the biology of pro and pre B-ALL is likely through a potentiation of Myc signaling. MALT1 has been shown to stabilize Myc in MCL, and that function was found to
be tightly correlated with MALT1’s protease activity.17 In contrast, our data highly suggest that Myc stabilization through MALT1 is independent of its protease activity in pro and pre B-ALL, and is achieved rather through a negative impact on FBXW7. The impact on Myc irrespective of the proteolytic activity of MALT1 highly suggests a non-enzymatic, or scaffolding, non-canonical activity of this protease, or to a lesser extent, an unappreciated proteolytic activity against a distinct set of substrates compared to those identified in B-cell NHL. On the other hand, the reduction of the classic substrate cleavage (CYLD, RelB, and Regnase) in mature B-ALL following MALT1 inhibition is consistent with current knowledge, and impli-
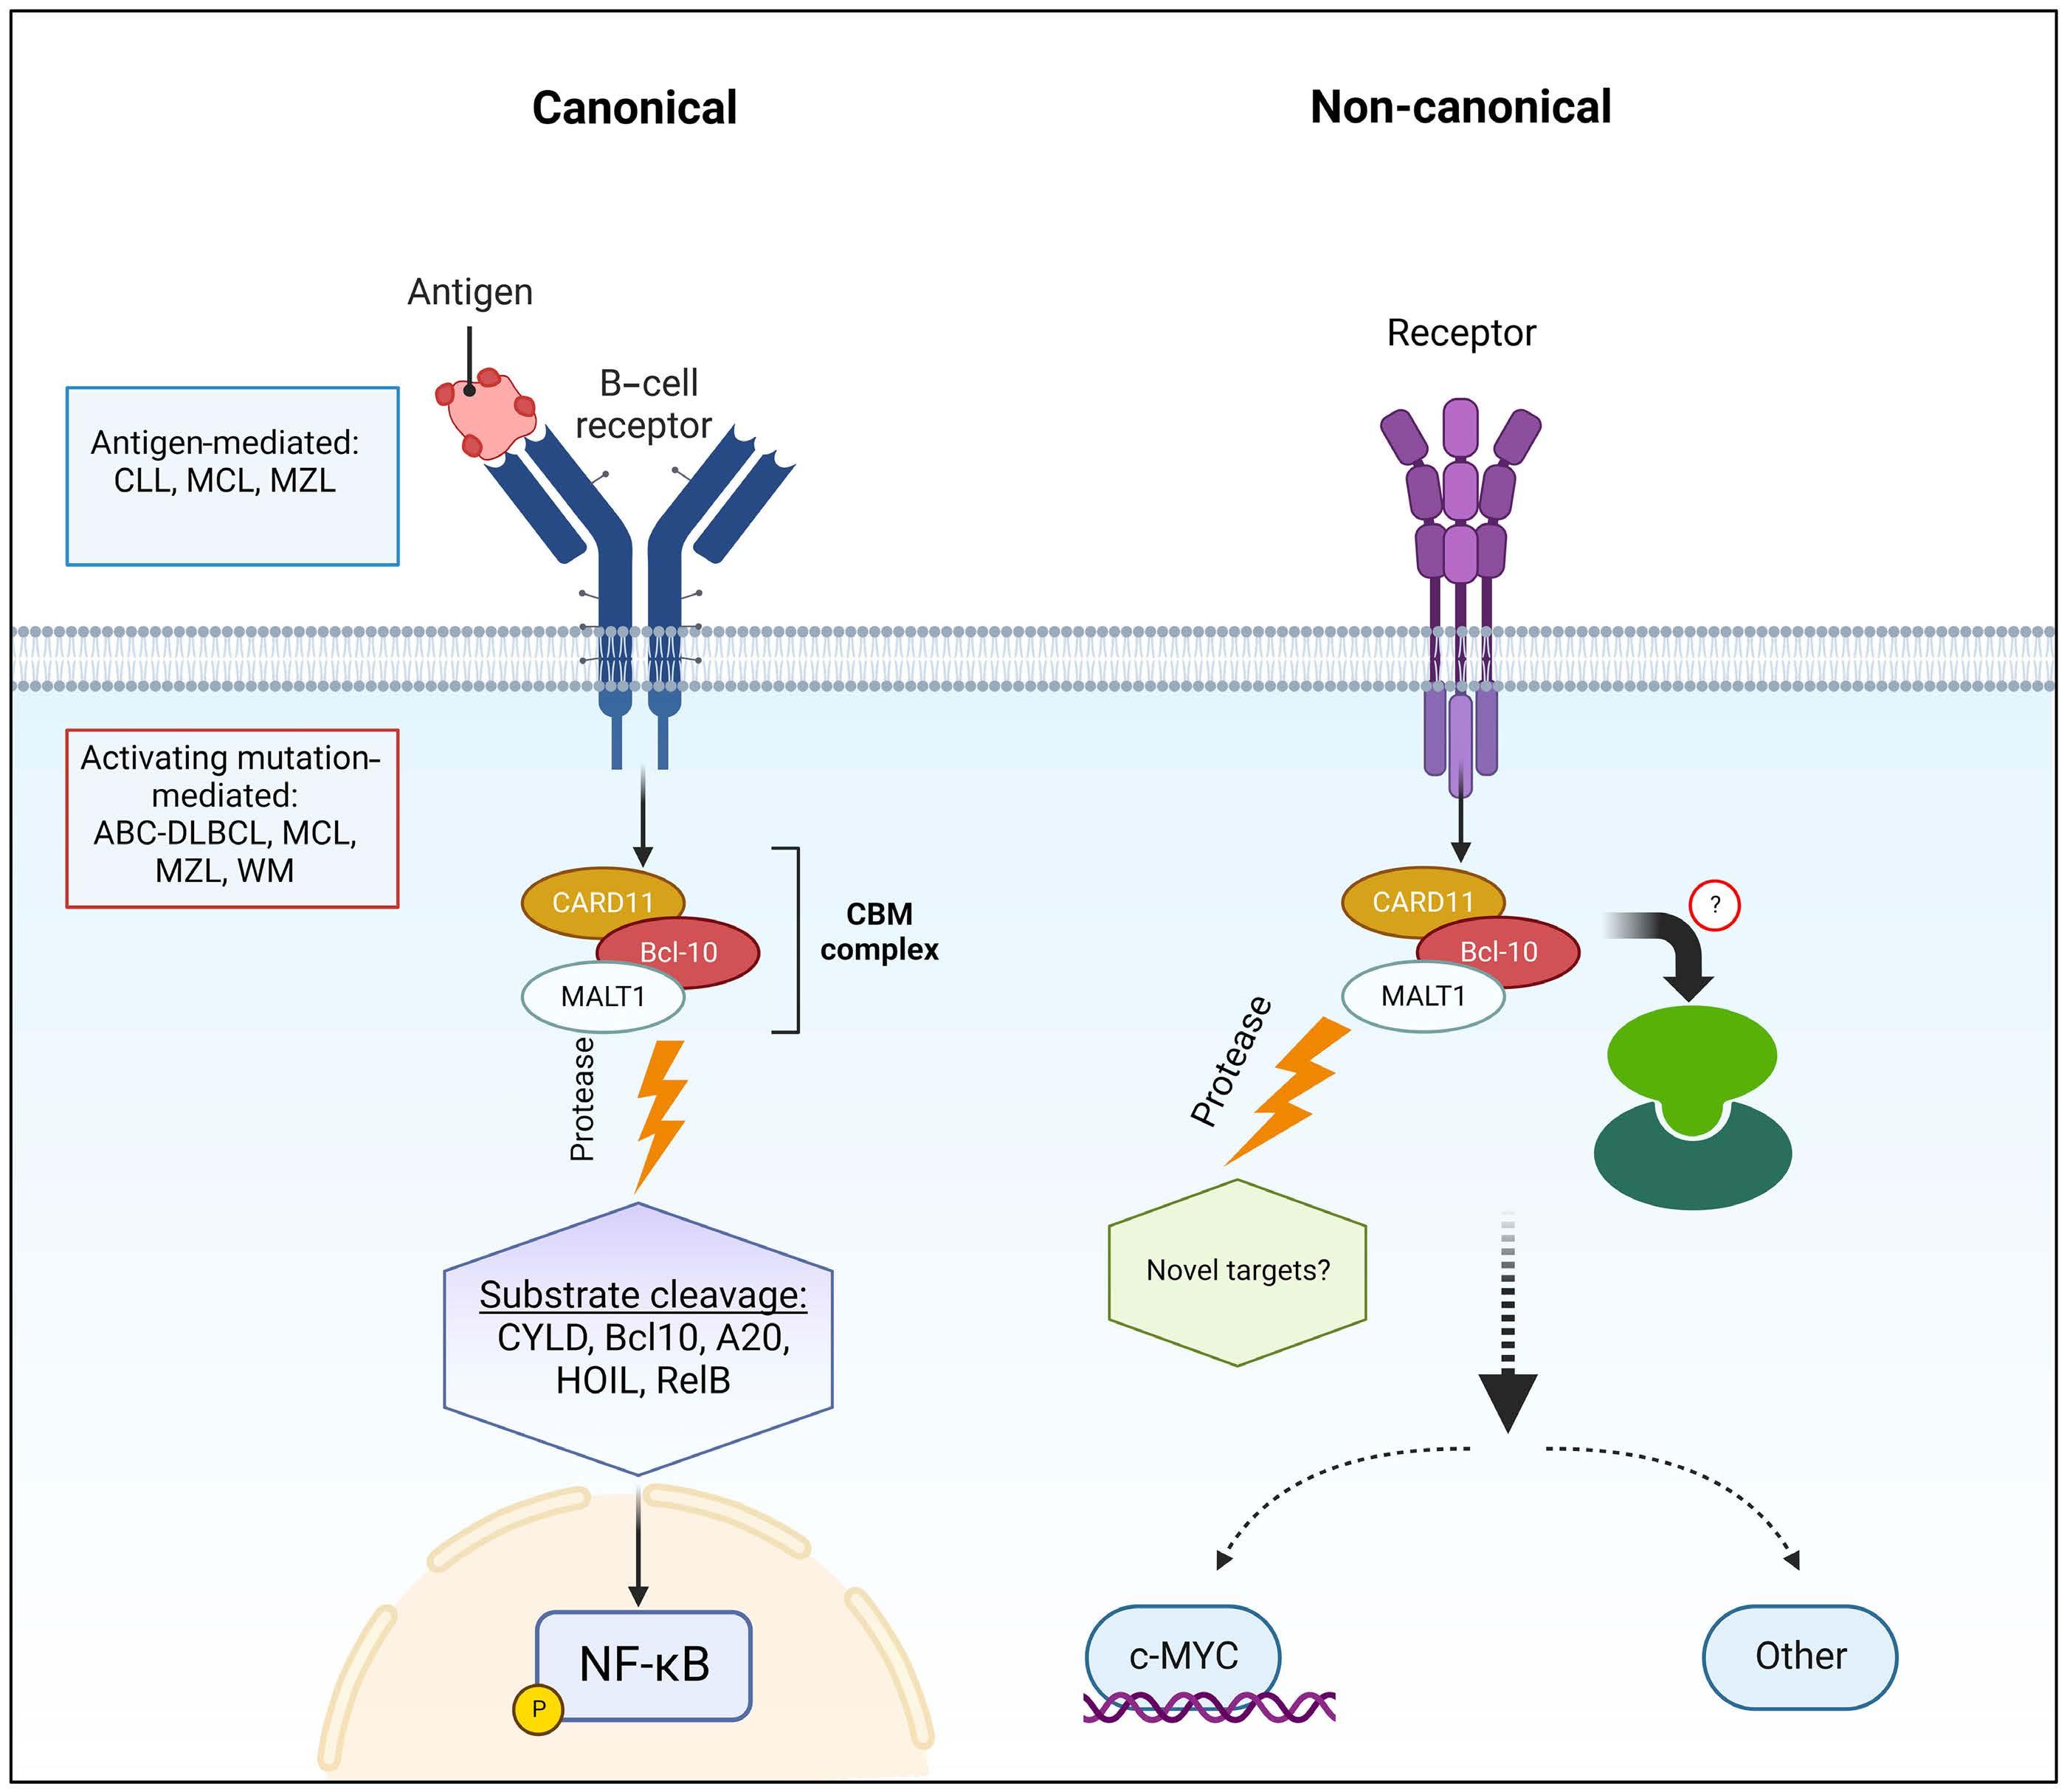
Figure 5. Canonical and non-canonical mucosa-associated lymphoid tissue lymphoma translocation protein 1-dependent pathways in B-cell acute lymphoblastic leukemia. CLL: chronic lymphocytic leukemia; MCL: mantle cell lymphoma; MZL: marginal zone lymphoma; ABC-DLBCL: activated B-cell-like diffuse large B-cell lymphoma; WM: Waldenström’s macroglobulinemia; MALT1: mucosa-associated lymphoid tissue lymphoma translocation protein 1.
Haematologica | 109 May 2024 1356 ARTICLE - Targeting MALT1 in B-ALL F.M. Safa et al.
cates, at least in part, a canonical role for MALT1 in Myc regulation in mature B-ALL. Moreover, the discordance between pro/pre B-ALL and mature B-ALL regarding the effect of MALT1 on Myc highly suggests that a switch in MALT1 signaling from non-canonical to canonical occurs at the mature B-cell level in which a BCR pathway is fully differentiated. These findings support the view that a canonical MALT1 effect is contingent of a fully developed BCR pathway (Figure 5).
MI-2 is selectively toxic for B-ALL cells, while sparing non-malignant B cells. MI-2 is also ineffective against CML, T-PLL, and T-ALL underscoring a potential exclusive role for MALT1 in B-cell malignancies among blood cancers. The observed inefficacy of MI-2 in T-ALL, coupled with the absence of MALT1 protease activity contrast with a previous report where MI-2 resulted in apoptosis and inhibition of NF-κB activation in 2 T-ALL cell lines. No further analysis was performed on MALT1’s substrates to investigate the presence or absence of the proteolytic activity of MALT1.37 In CLL, MI-2 triggers significant apoptosis, which contrasts with the mechanism of cell growth inhibition seen with BCR inhibitors, particularly ibrutinib where little apoptosis is seen even at high concentrations.38-40 Similarly, apoptotic induction was the main mechanism of MI-2’s cell killing in B-ALL, while ibrutinib’s toxic effects were through inhibition of cell proliferation rather than apoptosis.12 Interestingly, we noted a relative killing selectivity in cycling cells further implicating Myc, a potent driver of cell cycle progression, in B-ALL biology and this underscores the MALT1-Myc interplay in this disease. In conclusion, these data identify MALT1 as a promising therapeutic candidate in B-ALL. Akin to NHL (NCT04876092, NCT03900598, NCT04859777, NCT05144347), MALT1 inhibitors should be investigated in clinical trials for patients with B-ALL.
References
1. Kantarjian H, Stein A, Gökbuget N, et al. Blinatumomab versus chemotherapy for advanced acute lymphoblastic leukemia. N Engl J Med. 2017;376(9):836-847.
2. Kantarjian HM, DeAngelo DJ, Stelljes M, et al. Inotuzumab ozogamicin versus standard therapy for acute lymphoblastic leukemia. N Engl J Med. 2016;375(8):740-753.
3. Maude SL, Laetsch TW, Buechner J, et al. Tisagenlecleucel in children and young adults with B-cell lymphoblastic leukemia. N Engl J Med. 2018;378(5):439-448.
4 Herishanu Y, Perez-Galan P, Liu D, et al. The lymph node microenvironment promotes B-cell receptor signaling, NFkappaB activation, and tumor proliferation in chronic lymphocytic leukemia. Blood. 2011;117(2):563-574.
5. Treon SP, Tripsas CK, Meid K, et al. Ibrutinib in previously treated Waldenstrom’s macroglobulinemia. N Engl J Med. 2015;372(15):1430-1440.
6. Suarez F, Lortholary O, Hermine O, Lecuit M. Infectionassociated lymphomas derived from marginal zone B cells: a
Disclosures
No conflicts of interest to disclose.
Contributions
NSS, FS, TR, PALR and YM performed experiments. NSS, FS and TR designed the research, analyzed the results, made the figures, and wrote the manuscript. NSS collected patients’ information and contributed to the analysis of results. MX, LF and AM performed and analyzed the results of the GloSensor assay. NSS, FS, TR, AW, PALR, AW and HS contributed to the study design and to manuscript writing. All authors have read and approved the final manuscript.
Acknowledgments
We thank our patients for participating and donating the blood and tissue samples to make this research possible. We thank Melody Baddoo and the members of the Cancer Genetics Program - COBRE core at Tulane University for assistance with gene expression profiling and RNA sequencing analysis. We thank Ekaterina Kim for providing cell lines used in this project. We thank Prescott Deininger for his helpful advice. We also thank the Louisiana Cancer Research Center (LCRC) bio-specimen core for their help in blood sample collection and processing.
Funding
This work was funded by the Ladies Leukemia League Inc., of the Gulf South Region and the Intramural Research Program of the National Heart, Lung, and Blood Institute, NIH (grant n. ZIA HL002346-13; primary recipient, A. Wiestner).
Data-sharing statement
RNA sequencing data supporting this publication are available from the GEO repository under the accession number GSE221273. https://www.ncbi.nlm.nih.gov/geo/
model of antigen-driven lymphoproliferation. Blood. 2006;107(8):3034-3044.
7 Bertoni F, Rossi D, Zucca E. Recent advances in understanding the biology of marginal zone lymphoma. F1000Res. 2018;7:406.
8. Wang ML, Rule S, Martin P, et al. Targeting BTK with ibrutinib in relapsed or refractory mantle-cell lymphoma. N Engl J Med. 2013;369(6):507-516.
9. Saba NS, Liu D, Herman SE, et al. Pathogenic role of B-cell receptor signaling and canonical NF-kappaB activation in mantle cell lymphoma. Blood. 2016;128(1):82-92.
10. Kohrer S, Havranek O, Seyfried F, et al. Pre-BCR signaling in precursor B-cell acute lymphoblastic leukemia regulates PI3K/ AKT, FOXO1 and MYC, and can be targeted by SYK inhibition. Leukemia. 2016;30(6):1246-1254.
11. Saba NS, Angelova M, Lobelle-Rich PA, Levy LS. Disruption of pre-B-cell receptor signaling jams the WNT/beta-catenin pathway and induces cell death in B-cell acute lymphoblastic leukemia cell lines. Leuk Res. 2015;S0145-2126(15):30355-30356.
Haematologica | 109 May 2024 1357 ARTICLE - Targeting MALT1 in B-ALL F.M. Safa et al.
12. Kim E, Hurtz C, Koehrer S, et al. Ibrutinib inhibits pre-BCR(+) B-cell acute lymphoblastic leukemia progression by targeting BTK and BLK. Blood. 2017;129(9):1155-1165.
13. Xu Y, Hu J, Wang X, et al. Overexpression of MALT1-A20-NFkappaB in adult B-cell acute lymphoblastic leukemia. Cancer Cell Int. 2015;15:73.
14 Fontan L, Yang C, Kabaleeswaran V, et al. MALT1 small molecule inhibitors specifically suppress ABC-DLBCL in vitro and in vivo. Cancer Cell. 2012;22(6):812-824.
15. Fontan L, Qiao Q, Hatcher JM, et al. Specific covalent inhibition of MALT1 paracaspase suppresses B cell lymphoma growth. J Clin Invest. 2018;128(10):4397-4412.
16. Saba NS, Wong DH, Tanios G, et al. MALT1 inhibition is efficacious in both naïve and ibrutinib-resistant chronic lymphocytic leukemia. Cancer Res. 2017;77(24):7038-7048.
17 Dai B, Grau M, Juilland M, et al. B-cell receptor-driven MALT1 activity regulates MYC signaling in mantle cell lymphoma. Blood. 2017;129(3):333-346.
18. Allen A, Gill K, Hoehn D, et al. C-myc protein expression in B-cell acute lymphoblastic leukemia, prognostic significance? Leuk Res. 2014;38(9):1061-1066.
19 Ge Z, Guo X, Li J, et al. Clinical significance of high c-MYC and low MYCBP2 expression and their association with Ikaros dysfunction in adult acute lymphoblastic leukemia. Oncotarget. 2015;6(39):42300-42311.
20 Sheikh-Zeineddini N, Safaroghli-Azar A, Salari S, Bashash D. C-Myc inhibition sensitizes pre-B ALL cells to the anti-tumor effect of vincristine by altering apoptosis and autophagy: proposing a probable mechanism of action for 10058-F4. Eur J Pharmacol. 2020;870:172821.
21. Folgiero V, Sorino C, Pallocca M, et al. Che-1 is targeted by c-Myc to sustain proliferation in pre-B-cell acute lymphoblastic leukemia. EMBO Rep. 2018;19(3):e44871.
22. Wossning T, Herzog S, Kohler F, et al. Deregulated Syk inhibits differentiation and induces growth factor-independent proliferation of pre-B cells. J Exp Med. 2006;203(13):2829-2840.
23. Xia M, David L, Teater M, et al. BCL10 mutations define distinct dependencies guiding precision therapy for DLBCL. Cancer Discov. 2022;12(8):1922-1941.
24. Rebeaud F, Hailfinger S, Posevitz-Fejfar A, et al. The proteolytic activity of the paracaspase MALT1 is key in T cell activation. Nat Immunol. 2008;9(3):272-281.
25. Ginster S, Bardet M, Unterreiner A, et al. Two antagonistic MALT1 auto-cleavage mechanisms reveal a role for TRAF6 to unleash MALT1 activation. PLoS One. 2017;12(1):e0169026.
26. Bahram F, von der Lehr N, Cetinkaya C, Larsson LG. c-Myc hot spot mutations in lymphomas result in inefficient ubiquitination and decreased proteasome-mediated turnover. Blood. 2000;95(6):2104-2110.
27. Yada M, Hatakeyama S, Kamura T, et al. Phosphorylationdependent degradation of c-Myc is mediated by the F-box
protein Fbw7. EMBO J. 2004;23(10):2116-2125.
28. Welcker M, Clurman BE. FBW7 ubiquitin ligase: a tumour suppressor at the crossroads of cell division, growth and differentiation. Nat Rev Cancer. 2008;8(2):83-93.
29 Nahar R, Ramezani-Rad P, Mossner M, et al. Pre-B cell receptormediated activation of BCL6 induces pre-B cell quiescence through transcriptional repression of MYC. Blood. 2011;118(15):4174-4178.
30. National Cancer Institute SRP. Surveillance,Epidemiology, and End Results (SEER) Program]. National Cancer Institute, Surveillance Research Program. https://seer.cancer.gov/ seertools/hemelymph/51f6cf58e3e27c3994bd540e/. Accessed September 6, 2023.
31. Young RM, Staudt LM. Targeting pathological B cell receptor signalling in lymphoid malignancies. Nat Rev Drug Discov. 2013;12(3):229-243.
32. Rickert RC. New insights into pre-BCR and BCR signalling with relevance to B cell malignancies. Nat Rev Immunol. 2013;13(8):578-591.
33. Kohrer S, Havranek O, Seyfried F, et al. Pre-BCR signaling in precursor B-cell acute lymphoblastic leukemia regulates PI3K/ AKT, FOXO1 and MYC, and can be targeted by SYK inhibition. Leukemia. 2016;30(6):1246-1254.
34. Muschen M. Rationale for targeting the pre-B-cell receptor signaling pathway in acute lymphoblastic leukemia. Blood. 2015;125(24):3688-3693.
35. Kim E, Koehrer S, Rosin NY, et al. Activity of Bruton’s tyrosine kinase (BTK) inhibitor ibrutinib (PCI-32765) in B-cell acute lymphoblastic leukemia (B-ALL). Blood. 2012;120(21):2569.
36. Kim E, Koehrer S, Wang Z, et al. The PI3K delta inhibitor idelalisib interferes with pre-B cell receptor signaling in acute lymphoblastic leukemia (ALL): a new therapeutic concept. Blood. 2013;122(21):2632.
37. Wang R, Zhang H, Xu J, et al. MALT1 Inhibition as a therapeutic strategy in T-cell acute lymphoblastic leukemia by blocking Notch1-induced NF-kappaB activation. Front Oncol. 2020;10:558339.
38. Herman SE, Gordon AL, Hertlein E, et al. Bruton tyrosine kinase represents a promising therapeutic target for treatment of chronic lymphocytic leukemia and is effectively targeted by PCI-32765. Blood. 2011;117(23):6287-6296.
39 Hoellenriegel J, Coffey GP, Sinha U, et al. Selective, novel spleen tyrosine kinase (Syk) inhibitors suppress chronic lymphocytic leukemia B-cell activation and migration. Leukemia. 2012;26(7):1576-1583.
40. Herman SE, Gordon AL, Wagner AJ, et al. Phosphatidylinositol 3-kinase-delta inhibitor CAL-101 shows promising preclinical activity in chronic lymphocytic leukemia by antagonizing intrinsic and extrinsic cellular survival signals. Blood. 2010;116(12):2078-2088.
Haematologica | 109 May 2024 1358 ARTICLE - Targeting MALT1 in B-ALL F.M. Safa et al.
Regulatory mechanisms and context-dependent roles of TAL1 in T-cell acute lymphoblastic leukemia
Jolynn Zu Lin Ong,1 Tze King Tan,1 Lu Wang,1 Shi Hao Tan1 and Takaomi Sanda1,2,3
1Cancer Science Institute of Singapore, National University of Singapore, Singapore; 2Department of Medicine, Yong Loo Lin School of Medicine, National University of Singapore, Singapore and 3Department of Hematology and Oncology, Nagoya City University Graduate School of Medical Sciences, Nagoya, Japan
Abstract
Correspondence: T. Sanda takaomi_sanda@u.nus.edu
Received: April 30, 2023.
Accepted: October 10, 2023.
Early view: October 19, 2023.
https://doi.org/10.3324/haematol.2023.283450
©2024 Ferrata Storti Foundation Published under a CC BY-NC
T-cell acute lymphoblastic leukemia (T-ALL) is an aggressive malignancy derived from thymic T-cell precursors. Approximately 40-60% of T-ALL cases exhibit aberrant overexpression of the TAL1 oncogenic transcription factor. Here, we provide a comprehensive view of the TAL1-induced transcriptional program in human T-ALL cells using a rapid protein degradation system coupled with integrative approaches. Our study demonstrates that TAL1 targets can be classified into several groups, each of which exhibits unique gene expression kinetics, chromatin features, and regulatory mechanisms. Group A genes are highly dependent on TAL1, many of which are not expressed in normal T cells or TAL1-negative T-ALL cells, representing an oncogenic TAL1 signature. The TAL1 complex predominantly activates group A genes. TAL1’s effect is not replaceable with its regulatory partners GATA3 or RUNX1. In contrast, group B genes, many of which are generally expressed across different T-ALL subgroups, exhibit densely-connected chromatin-chromatin interactions and demonstrate the collaborative roles played by TAL1 with other transcription factors. Interestingly, TAL1 cooperates with NOTCH1 to regulate gene expression in TAL1-positive T-ALL cells, whereas it potentially antagonizes the NOTCH1-MYC pathway and leads to lethality in TAL1-negative/TLX3-positive cells, demonstrating the context-dependent roles of TAL1.
Introduction
TAL1 is an essential regulator of hematopoiesis that plays crucial roles in the maintenance of hematopoietic stem cells (HSC) and progenitor cells as well as in the specification and maturation of erythro-megakaryocyte lineage.1-3 During normal T-cell development, TAL1 and its binding partner LMO2 are silenced, which enables the formation of E-protein dimers (e.g., E2A and HEB), which facilitate the expression of genes required for T-cell differentiation, such as RAG recombinases (RAG1 and RAG2) and pre-T-cell receptor subunit (PTCRA).4,5 This stage-specific regulation of TAL1, LMO2 and E-proteins is important for T-cell development.
TAL1 and LMO2 have also been implicated as oncogenes in T-cell acute lymphoblastic leukemia (T-ALL), a malignancy derived from immature T cells.6,7 TAL1 is ectopically overexpressed in 40-60% of human T-ALL, while LMO2 or a functionally-redundant protein, LMO1, is often overexpressed with TAL1. TAL1 forms a complex with the E-pro-
teins, LMO1/2 and GATA3 in T-ALL cells. Overexpression of TAL1 and LMO1/2 or inhibition of E-proteins activity leads to blocked differentiation and initiation of T-cell leukemogenesis in mouse models.8,9 Thus, one of the main oncogenic mechanisms of TAL1 involves the induction of differentiation arrest. On the other hand, TAL1 can also induce a unique set of genes in human T-ALL, such as ALDH1A2, 10 which has not been observed in mouse models. Notably, in many human T-ALL cases, the expression of TAL1 is driven by genetic mutations in an enhancer that can be activated by TAL1 and its regulatory partners (GATA3 and RUNX1) via an autoregulatory loop, forming the core regulatory circuit (CRC).11,12
Another prevalent oncogenic transcription factor in T-ALL is NOTCH1. The NOTCH pathway is constitutively activated due to activating mutations of NOTCH1 and/or inactivating mutations of FBXW7, which is observed in over 50% of T-ALL.13 NOTCH1 transcriptionally induces the expression of the MYC oncogene,14 thereby promoting cell proliferation, metabolism and survival. In the Tal1 transgenic mouse,
Haematologica | 109 May 2024 1359 - Acute Lymphoblastic Leukemia ARTICLE
license
Notch1 mutations were frequently observed in T-ALL cells,15 suggesting that there is a selective advantage to acquire Notch1 mutation for the clones initiated by Tal1 and thus these two factors cooperate in the transformational process. TAL1 and NOTCH1 regulate different sets of genes, but they share the same targets, such as GIMAP, in T-ALL cells.16 However, the relationship and roles of TAL1 and NOTCH1 in the regulation of shared targets have not been fully elucidated.
Additionally, it has been established that the expression of TAL1 and LMO1/2 identifies a specific subgroup of T-ALL cells that is distinct from other subgroups expressing TLX1, TLX3 or HOXA or early T-cell progenitor (ETP)-ALL.7,17-19 These T-ALL subgroups exhibit distinct mutational landscapes and different gene expression signatures (called “Type A abnormalities”).17 Each of these subgroups also shows preferential relationship of a specific signaling pathway (called “Type B abnormalities”, e.g., PI3K-AKT with TAL1, and JAK-STAT with TLX3) and is also associated with a specific differentiation stage (e.g., late cortical stage with TAL1). These relationships suggest that TAL1 may require a specific cellular context and collaborating partners to exert oncogenicity.
In this study, we provide a comprehensive view of the TAL1-induced transcriptional program and mechanisms in human T-ALL cells using an integrative approach. TAL1 targets can be classified into several groups, each of which exhibits unique chromatin features and regulatory mechanisms.
Methods
Cell samples
Human T-ALL cell lines were cultured in RPMI-1640 medium (BioWest) supplemented with 10% fetal bovine serum (BioWest) in a humidified incubator containing 5% CO2 at 37°C.
dTAG-mediated depletion and gene overexpression
The degradation tag (dTAG) system was established following methods described previously.20 TAL1 and LMO1 cDNA were overexpressed by lentivirus or retrovirus infection in T-ALL cells. Detailed methodologies can be found in the Online Supplementary Appendix and Online Supplementary Table S1.
Cell growth assay
The cells were seeded into 96-well plates and cell viability was measured based on luminescence observed via a CellTiter Glo assay (Promega) using a Promega GloMax-Multi plate reader (Promega).
Western blot analysis
Cell pellets were lysed in RIPA buffer (Cell Signaling Technology) supplemented with a protease inhibitor cocktail
(Roche). Proteins were separated by sodium dodecyl sulfate-polyacrylamide gel electrophoresis and transferred onto a polyvinylidene difluoride membrane (Bio–Rad). Bound antibodies were visualized using ECL Prime Western blotting reagents (GE Healthcare) with an ImageQuant LAS500 imager (GE Healthcare).
Quantitative reverse-transcription polymerase chain reaction
Total RNA was extracted using a NucleoSpin RNA Extraction Kit (Macherey-Nagel) and converted into cDNA using an EvoScript Reverse Transcriptase Kit (Roche). The mRNA expression levels were measured using Power SYBR Green PCR Master Mix (Roche) in a QuantStudio5 Real-Time PCR System (Thermo Fisher Scientific). Design and Analysis software 2.4.3 was used to analyze data. The primer sequences are listed in Online Supplementary Table S2.
Sequencing analyses
Detailed methodologies and dataset availability can be found in the Online Supplementary Appendix and Online Supplementary Tables S3-5.
RNA sequencing
Total RNA was extracted using QIAzol lysis reagent (Qiagen) and cleaned using an RNeasy Kit (Qiagen). RNA samples were treated with TuRBO DNase (Ambion). Strand-specific library construction and sequencing of 100 bp paired-end reads on the DNBSEQ platform were performed by BGI Genomics.
Cut-and-run assay
Cut-and-run sequencing was performed utilizing a Cutana Cut-and-Run assay kit (EpiCypher). Cells were incubated with CUTANA pA/G-Mnase and chromatin fragments were purified utilizing a Cutana DNA purification kit. Libraries were generated using a NEBNext Ultra II DNA Library Prep Kit and sequenced on an Illumina NovaSeq at GENEWIZ Azenta Life Sciences.
Chromatin immunoprecipitation sequencing
HA-Tag chromatin immunoprecipitation (ChIP) sequencing was performed as previously described.21
Hi-chromatin immunoprecipitation sequencing
Crosslinked cells were lysed in Hi-C buffer, sonicated and immunoprecipitated with H3K27ac antibody (Abcam). PCR library amplification was performed on DNA tagmented with Tn5 enzyme (Nextera). Library was sequenced with 100X100 paired-end reads on the DNBseq platform by BGI Genomics.
4C-sequencing
4C-sequencing was performed according to a protocol described previously.22
Haematologica | 109 May 2024 1360 ARTICLE - Regulatory mechanisms of TAL1 in T-ALL J.Z.L. Ong et al.
ATAC sequencing
ATAC sequencing was performed according to protocols described previously.23 The amplified library was purified with AMPure XP beads (Beckman Coulter) and sequenced on an Illumina NovaSeq at GENEWIZ Azenta Life Sciences.
Statistical analysis and reproducibility
All statistical analyses were performed using GraphPad Prism software. P value less than 0.05 was considered statistically significant. Student’s two-tailed t test was used for experiments with equal sample sizes.
Results
TAL1 differentially regulates gene expression in human T-cell acute lymphoblastic leukemia cells
In order to profile the overall pattern of gene regulation induced by TAL1, we first established a degradation tag (dTAG) system using a representative T-ALL cell line (Jurkat), in which the target protein was fused to a FKBP12F36V domain20 (Figure 1A). The addition of dTAG-13 small-molecule can induce the interaction of the FKBP12F36V-TAL1 fusion protein and the CRBN E3 ligase complex, leading to ubiquitination and protein degradation. This system shows several advantages in terms of kinetics and degree of depletion compared to shRNA- or CRISPR/sgRNA-mediated gene knockout/knockdown which typically take a few days to produce an effect. Hence, we used the dTAG system to analyze short-term effects after complete depletion of TAL1. Successful knock-in of FKBP12F36V into the C-terminus of the TAL1 gene was validated by genomic polymerase chain reaction (PCR) (Online Supplementary Figure S1A). Complete TAL1 protein degradation was observed after treatment with dTAG-13 within 2 hours and persisted for 72 hours (Figure 1B). Cell viability was not affected in a short-term culture over 5 days (Online Supplementary Figure S1B); thus, the non-specific effects resulting from cell death were considered minimal. This result also suggests that although TAL1 serves as an oncoprotein by initiating the transformational process, it is not the sole driver in the transformed cells because Type B abnormalities can also sustain cell survival and proliferation. In order to identify the mRNA kinetics of direct TAL1 targets, we then performed a RNA-sequencing analysis at different time points after dTAG-13 treatment. Differential expression analysis (P<0.05, log2-fold change 0.3) revealed that TAL1 depletion affected a small number of genes at 1-72 hours, instead of globally regulating transcription (Figure 1C; Online Supplementary Table S6). TAL1 deletion also did not affect the status of RNA polymerase II phosphorylation (Online Supplemental Figure S1C). From this analysis, we observed changes in gene expression for several known TAL1 targets. For instance, ALDH1A2, NKX3-1, miR-223, ARID5B and GIMAP family genes, which had been demonstrated to be directly regulated by TAL1,10,16,24-26
were significantly downregulated at multiple time points, confirming that FKBP12F36V-tagged TAL1 protein retains original function. Importantly, we found two distinct patterns of gene expression changes among the downregulated gene pool, termed “group A” and “group B” genes (Figure 1C-E). Group A genes, including ALDH1A2, PI16 and SIX6, showed a rapid response to TAL1 degradation, with some targets significantly downregulated within 4 hours (log2fold change ≤-0.7 and P<0.05) (Figure 1D). The magnitude of the downregulation of the group A genes was also more pronounced, with a decrease exceeding 50% within 72 hours, and was further downregulated in a time-dependent manner. Gene expression changes were independently validated using quantitative reverse-transcription PCR (qRT-PCR) (Online Supplementary Figure S1D). In contrast, group B genes, including RUNX1, GIMAP2 and MYB, did not show the rapid or high degree of gene downregulation as the group A genes (-0.7< log2-fold change <-0.3, P<0.05) (Figure 1E). Additionally, the expression level of the group B genes remained unchanged at several time points. This result indicated that group A gene expression was highly dependent on TAL1, while group B gene expression was regulated in a different manner.
In addition, we identified “group C” genes as those that were upregulated after TAL1 degradation (log2-fold change ≥0.3, P<0.05) (Figure 1F). These genes showed slower kinetics during expression changes: they were upregulated more significantly after 24 hours, and many were further upregulated throughout 72 hours. These findings suggested that group C gene expression was indirectly regulated by TAL1. This group included RAG1, RAG2 and PTCRA, which has been known to be positively regulated by E-proteins and thus negatively regulated by TAL1.27,28
TAL1 predominantly induces the expression of a set of genes that are normally silenced in T cells
In order to analyze whether group A, B and C genes exhibit different features during transcriptional regulation, we utilized ATAC-sequencing and ChIP-sequencing methods to analyze chromatin and epigenetic states as well as the DNA binding of transcription factors in T-ALL and normal hematopoietic cells. We selected representative genes from each group for downstream analyses.
We first focused on group A genes. Given that their expression was found to be highly reliant on TAL1 expression, we assumed that TAL1 is the dominant factor affecting the initial or multiple processes in transcriptional regulation. Interestingly, ATAC-sequencing data revealed that the chromatin status at many group A gene loci, such as ALDH1A2 and SIX6, was not open in normal hemtopoeitic stem cell (HSC), progenitors or T-cell compartments (Figure 2A; Online Supplementary Figure S2A). Two transcriptional start sites (TSS) of PI16 gene showed a different pattern: TSS 2 was open in HSC and multi-potent progenitor (MPP) while TSS1 was open in common lymphoid progenitor (CLP)
Haematologica | 109 May 2024 1361 ARTICLE - Regulatory mechanisms of TAL1 in T-ALL J.Z.L. Ong et al.
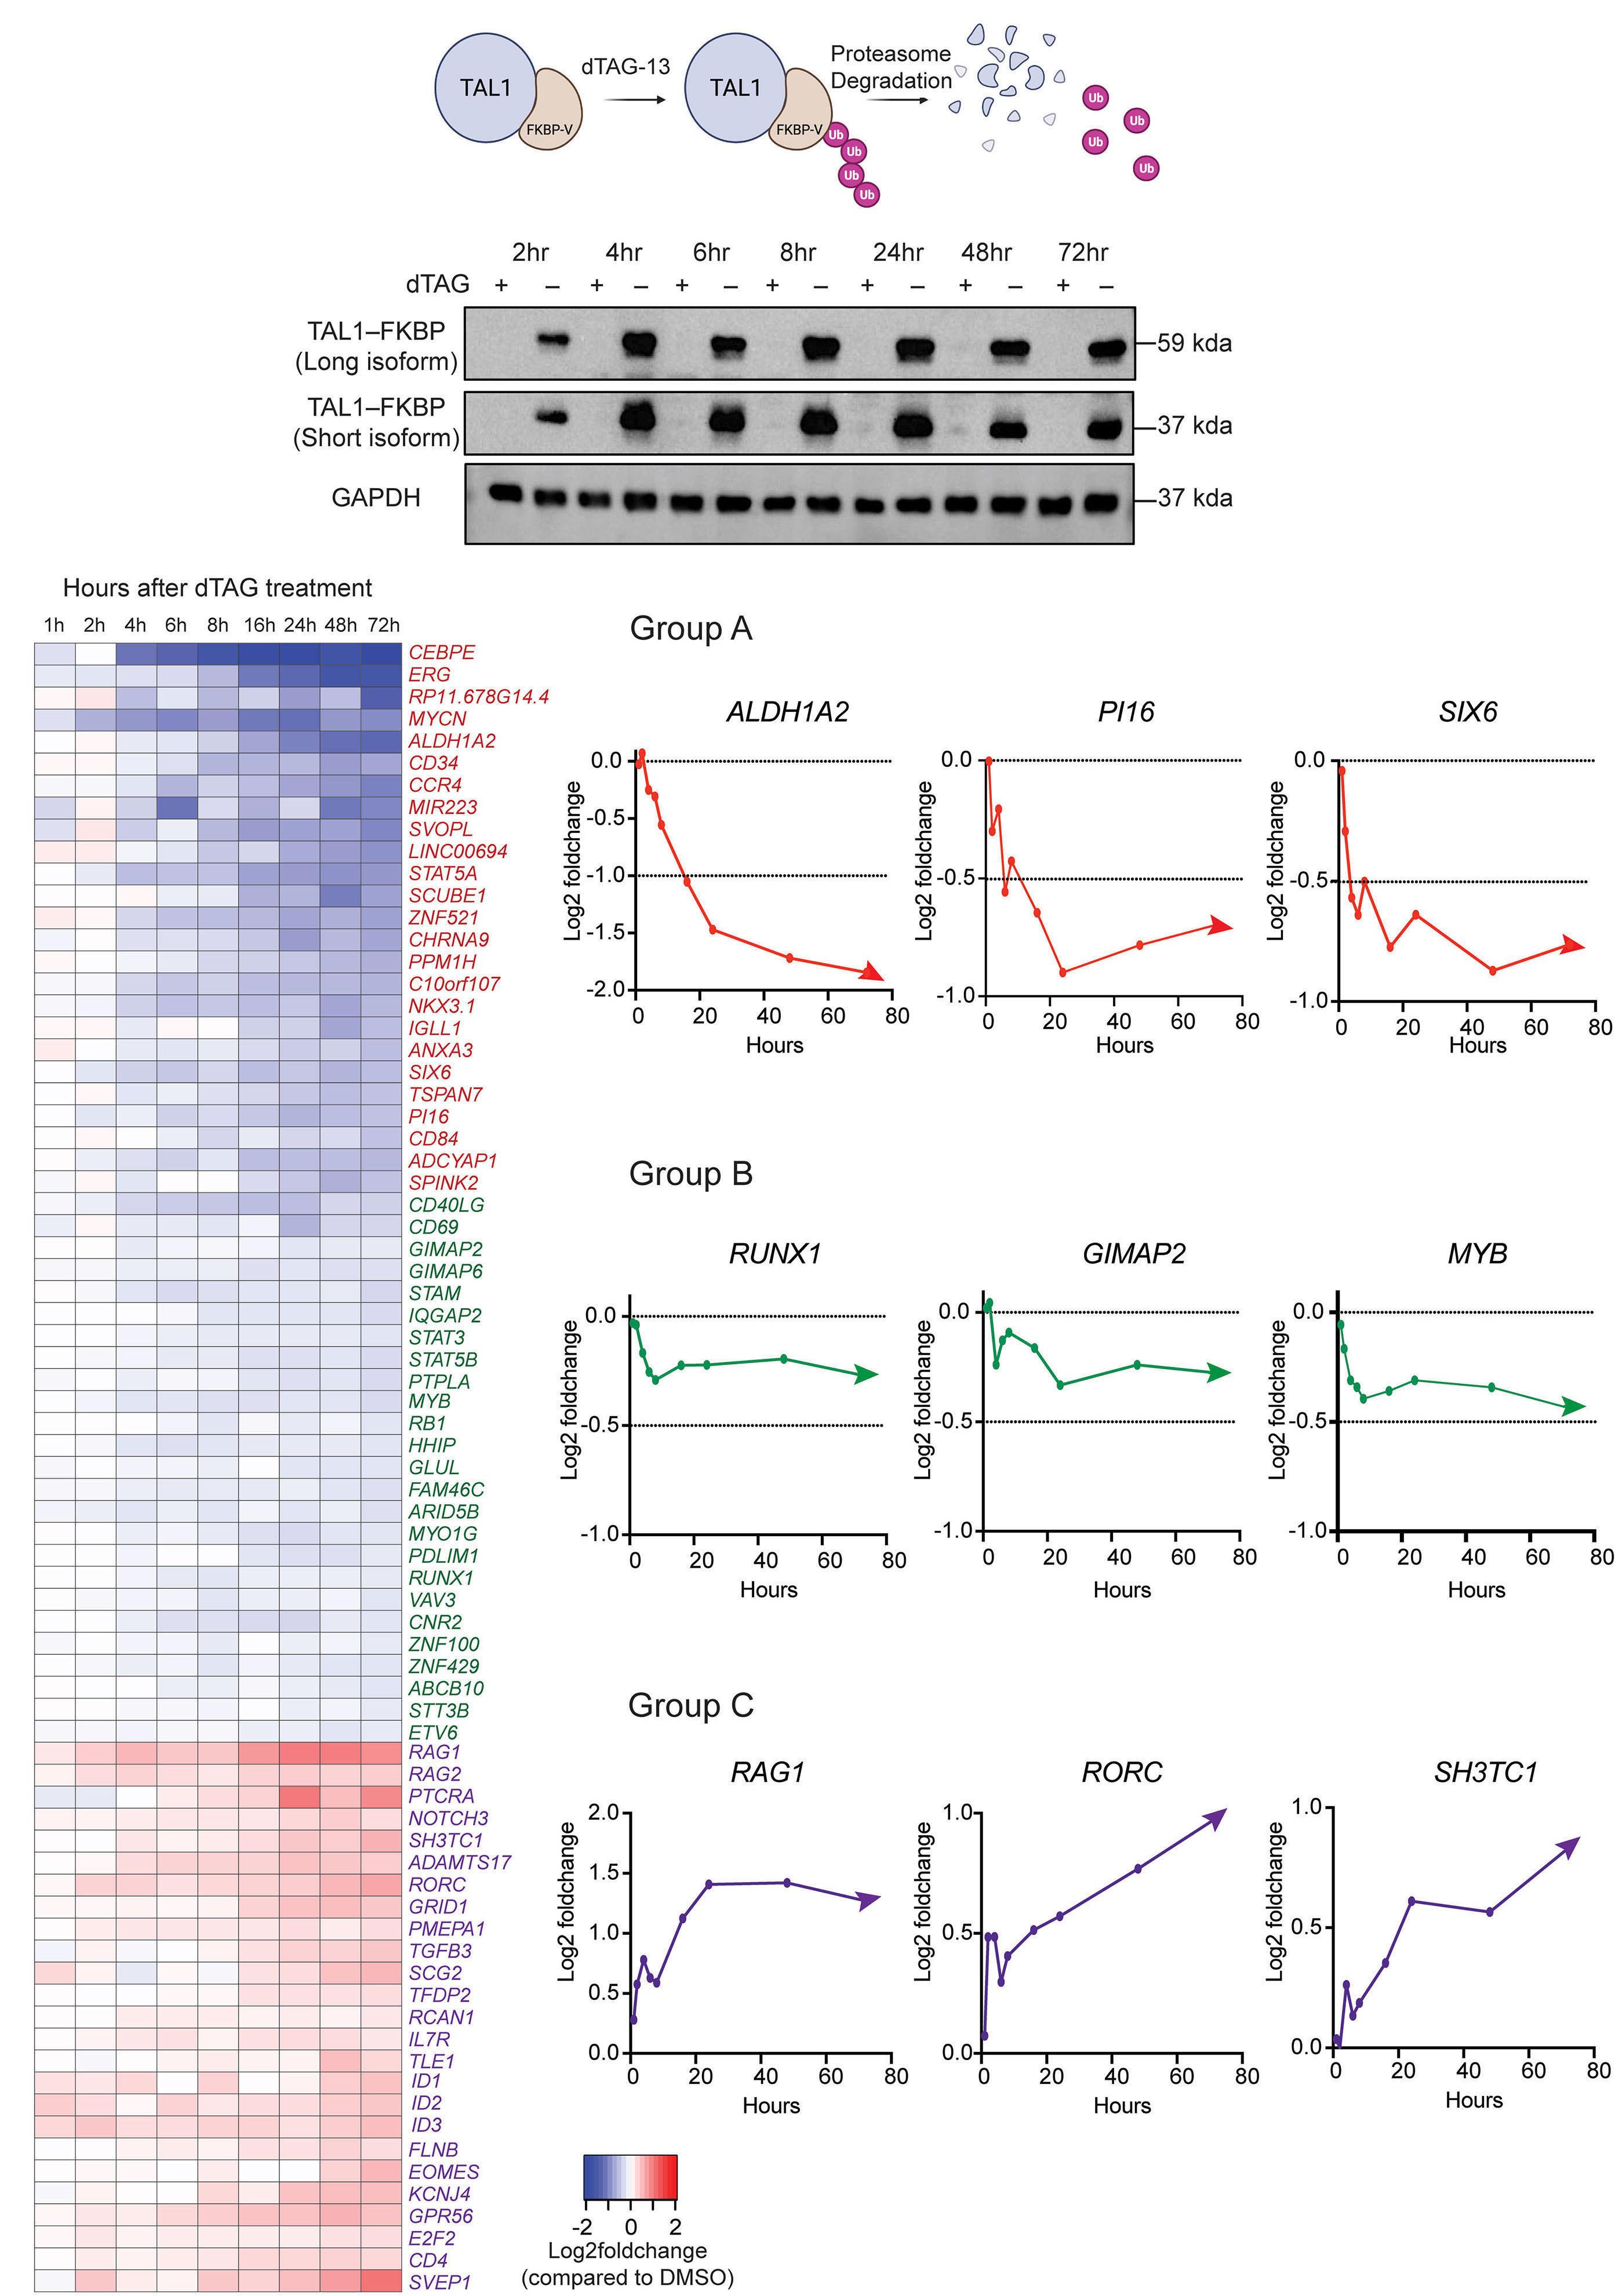
Continued on following page.
Haematologica | 109 May 2024 1362 ARTICLE - Regulatory mechanisms of TAL1 in T-ALL J.Z.L. Ong et al. A B C D E F
Figure 1. TAL1 differentially regulates gene expression in human T-cell acute lymphoblastic leukemia cells. (A) Illustration of the degradation tag (dTAG) system established for the TAL1 protein in the Jurkat cell line. The addition of the dTAG-13 molecule allows the dimerization of the TAL1-FKBP12F36V chimeric protein to the CRBN E3 ubiquitin ligase complex to promote ubiquitination and subsequent degradation by the proteasome. (B) TAL1-FKBP12F36V Jurkat cells treated with 1 mM dTAG-13 at different time points (2, 4, 6, 8, 24, 48, and 72 hours). Whole-cell lysates were collected and subjected to immunoblot analysis using antibodies specific to HA-tag and GAPDH (the loading control). A protein mobility shift of 15 kDa was observed for both long and short TAL1 isoforms after FKBP12F36V domain addition. (C) Heatmap representing the mRNA expression levels of 75 representative genes identified by RNA sequencing that were significantly down- or upregulated by dTAG-13 treatment compared to dimethyl sulfoxide (DMSO)-treated cells at each time point. Genes were further stratified into group A (red), group B (green) and group C (purple) genes, which showed distinct mRNA kinetics. Group A genes included significantly downregulated genes with decreased gene expression changes over time; a log2-fold change ≤-0.7 and P<0.05 at 72 hours were the threshold values. Red line graphs of specific group A genes (e.g., ALDH1A2, PI16 and SIX6) are displayed on the right (D). Group B genes were downregulated with gene expression changes plateauing over time; a -0.7< log2-fold change <-0.3 and P<0.05 and P≤0.05 at 72 hours were the threshold values. Green line graphs of specific group B genes (e.g., RUNX1, GIMAP2 and MYB) are displayed on the right (E). Group C genes included significantly upregulated genes; a log2-fold change >0.3 and P<0.05 at 72 hours were the threshold values. Purple line graphs of specific group C genes (e.g., RAG1, RORC and SH3TC1) are displayed on the right (F).
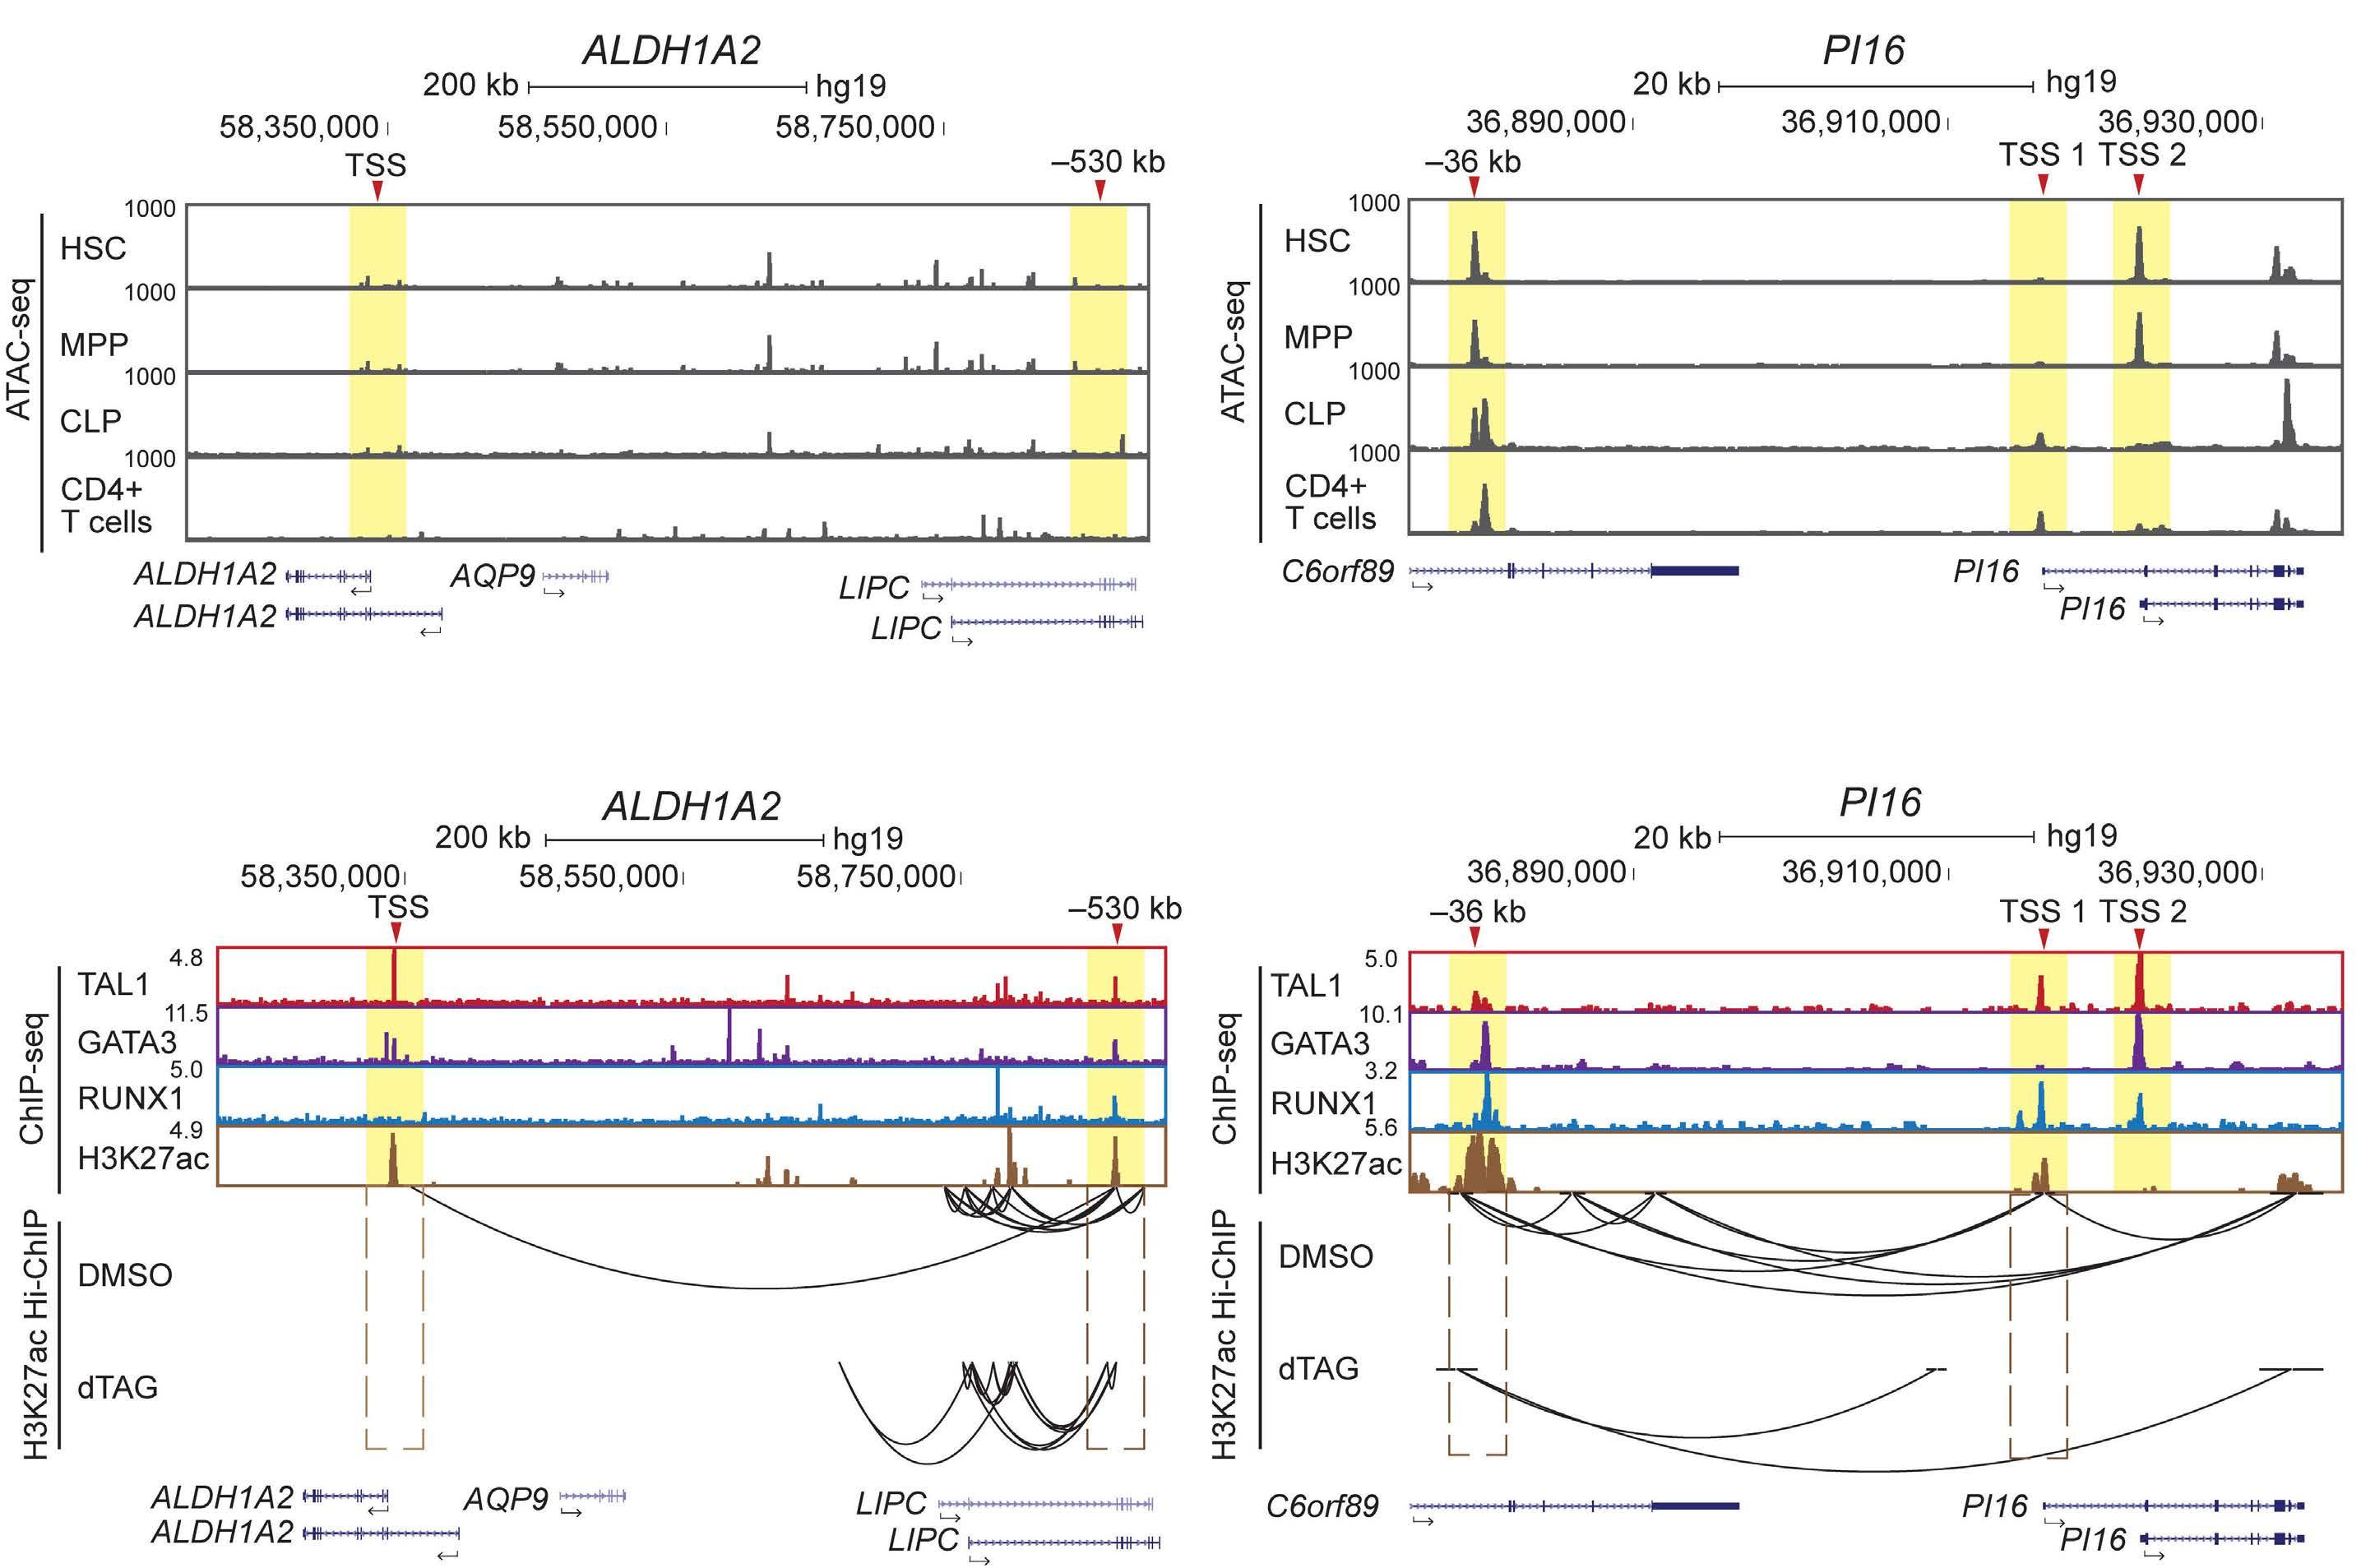
Figure 2. TAL1 induces the expression of a set of genes that are normally silenced in T cells. (A) ATAC-sequencing tracks of hematopoietic stem cells (HSC), multipotent progenitors (MPP), common lymphoid progenitor (CLP) and CD4 + T cells, showing magnification of the ALDH1A2 and PI16 loci. The ATAC-sequencing dataset was previously reported.33 (B) Chromatin immunoprecipitation (ChIP) sequencing tracks of the TAL1, GATA3, RUNX1 transcription factors and activating histone mark H3K27ac (top) in the Jurkat cell line; the ALDH1A2 (left) and PI16 (right) loci are magnified. The ChIP-sequencing dataset was previously reported.12 H3K27ac Hi-ChIP was performed after dimethyl sulfoxide (DMSO) treatment and dTAG treatment for 24 hours to evaluate changes in chromatin loop formation (bottom). For (A) and (B), yellow highlighting indicates the genomic region of interest: where the TAL1 transcription factor binds in baseline Jurkat cell line. For the ALDH1A2 locus, the transcription start site (TSS) of the shorter isoform and the -530 kb putative enhancer region are highlighted. For the PI16 locus, the TSS of both isoforms and the -36 kb putative enhancer regions are highlighted.
Haematologica | 109 May 2024 1363 ARTICLE - Regulatory mechanisms of TAL1 in T-ALL J.Z.L. Ong et al.
A B
and CD4+ T cells. The same elements were co-occupied by TAL1, GATA3 and RUNX1 and associated with an active histone mark (H3K27ac) in T-ALL cells (Figure 2B; Online Supplementary Figure S2B). Moreover, these genes were not expressed in normal T cells based on the Gene Expression Commons database29 (Online Supplementary Figure S2C), indicating that their expression in T cells was aberrant. On the other hand, the chromatin at some regulatory elements of group A gene, such as CD34, ZNF521 and MYCN, was open, and these genes were expressed in T-ALL cells and normal HSC but not in lymphoid progenitor or T-cell compartments (Online Supplementary Figure S2D, E). This result suggests that these genes were physiological targets of TAL1 in HSC but were ectopically expressed in T cells when TAL1 was abnormally overexpressed. Correspondingly, many group A genes were expressed only in TAL1-positive T-ALL cell lines, not in TAL1-negative cases (Online Supplementary Figure S2F).
In order to further analyze the effect of TAL1 on chromatin-chromatin interactions, we performed a H3K27ac HiChIP analysis before and after TAL1 degradation. In fact, the loss of active chromatin interactions at putative enhancers (bound by TAL1) of gene promoters was observed at the ALDH1A2, PI16 and SIX6 loci (yellow, Figure 2B; Online Supplementary Figure S2B). Validation of the SIX6 locus via the 4C-sequencing also showed the loss of chromatin–chromatin interactions (Online Supplementary Figure S2G). Together, these results indicate that the expression of many group A genes was predominantly regulated by TAL1 via direct enhancer binding and chromatin looping. Their expression is an oncogenic signature of TAL1 expression.
The TAL1 complex alters chromatin accessibility of group A genes in T-cell acute lymphoblastic leukemia cells
Because group A genes were normally silenced but were induced after TAL1 expression, we hypothesized that TAL1 may affect chromatin opening. Thus, we overexpressed TAL1 and/or its binding partner, LMO1, in a TAL1-negative cell line (HPB-ALL) under a doxycycline (Dox)-inducible system (Figure 3A). The HPB-ALL cell line was chosen because it expresses other regulatory partners (E2A, HEB, GATA3 and RUNX1). We also confirmed that many group A genes were not expressed in HPB-ALL cells at the baseline (Online Supplementary Table S7). Notably, the RNA-sequencing analysis after overexpression of either TAL1 or LMO1 alone showed the upregulation of only 24 or four genes based on the same cutoff values, while the combined overexpression of these two factors upregulated a total of 2,046 genes (Figure 3B). This result supports the fact that TAL1 works in complex with LMO1 and GATA3 in T-ALL cells. Among upregulated genes, we shortlisted 20 genes that were downregulated by dTAG TAL1 deletion in Jurkat cells; this list included many groups A
and B genes, such as ALDH1A2, PI16, GIMAP, RUNX1, MYB and ZNF521 (Online Supplementary Table S8).
Importantly, we observed an increase in chromatin accessibility at the TAL1-bound regions of the ALDH1A2, PI16, and SIX6 loci in two independent overexpression clones (yellow, Figure 3C; Online Supplementary Figure S3A). Similarly, the chromatin of the regulatory elements at other group A gene loci, including CD34, ZNF521 and MYCN, was opened after TAL1 and LMO1 were overexpressed (Online Supplementary Figure S3B, left). The increase in chromatin accessibility was accompanied by a significant increase in the mRNA expression of ALDH1A2, PI16 and ZNF521 (Figure 3D; Online Supplemental Figure S3B, right). These data indicate that the TAL1 complex opened the closed chromatin. Notably, when the TAL1 complex bound only the enhancer but not the promoter (e.g., SIX6, CD34 and MYCN loci), the chromatin of the promoter was still closed, and thus, no increase in mRNA expression was observed even though the enhancer chromatin had been opened (Online Supplementary Figure S3B, right). This result indicates that both enhancer and promoter regions need to be accessible to be actively transcribed.
TAL1 promotes the expression of a set of genes that are highly expressed in different T-cell acute lymphoblastic leukemia subgroups
Next, we focused on group B genes (e.g., GIMAP family genes, RUNX1, and MYB) whose expression is partially dependent on TAL1. In contrast to that of the group A genes, the ATAC-sequencing profile revealed that group B gene locus chromatin was open in normal HSC and in T cells, regardless of whether TAL1 was expressed (Figure 4A, B; Online Supplementary Figure S4A, B). Moreover, these genes were expressed in normal hematopoietic cells ( Online Supplementary Figure S4C), although some of them were expressed at low levels in T cells in the double-negative (DN) or double-positive (DP) stage. These genes were expressed in TAL1-positive and -negative cases, including TLX1/3- or HOXA-positive subgroups (Online Supplementary Figure S4D). Consistently, many of the group B gene loci were also accessible, and these genes were expressed in the TAL1-negative HPB-ALL cell line (Figure 4C; Online Supplementary Figure S4E). These results indicated that group B genes represent the general T-ALL gene expression signature, although their expression is positively controlled by TAL1.
Notably, the genetic regions of group B genes are composed of densely-connected chromatin-chromatin interactions, in contrast to group A genes, as indicated in the same Hi-ChIP dataset (Figure 4B; Online Supplementary Figure S4B). This difference was not due to the distance or gene number within the same domain (e.g., see the ALDH1A2 and RUNX1 loci; they were both scaled to 200 kb). Additionally, at GIMAP and RUNX1 gene loci, high level of active histone
Haematologica | 109 May 2024 1364 ARTICLE - Regulatory mechanisms of TAL1 in T-ALL J.Z.L. Ong et al.
mark (H3K27ac) forming super-enhancers were observed, indicating that chromatin at these gene loci was widely open and epigenetically activated. Importantly, the rate of chromatin looping was only slightly reduced after TAL1 depletion and was not completely lost. Together, although TAL1 bound to and increased the expression of group B
genes, the expression of group B genes can still be maintained, in contrast to group A genes.
TAL1 and NOTCH1 coordinately regulate GIMAP genes
This result prompted us to hypothesize that other transcription factors, in addition TAL1, that are expressed in
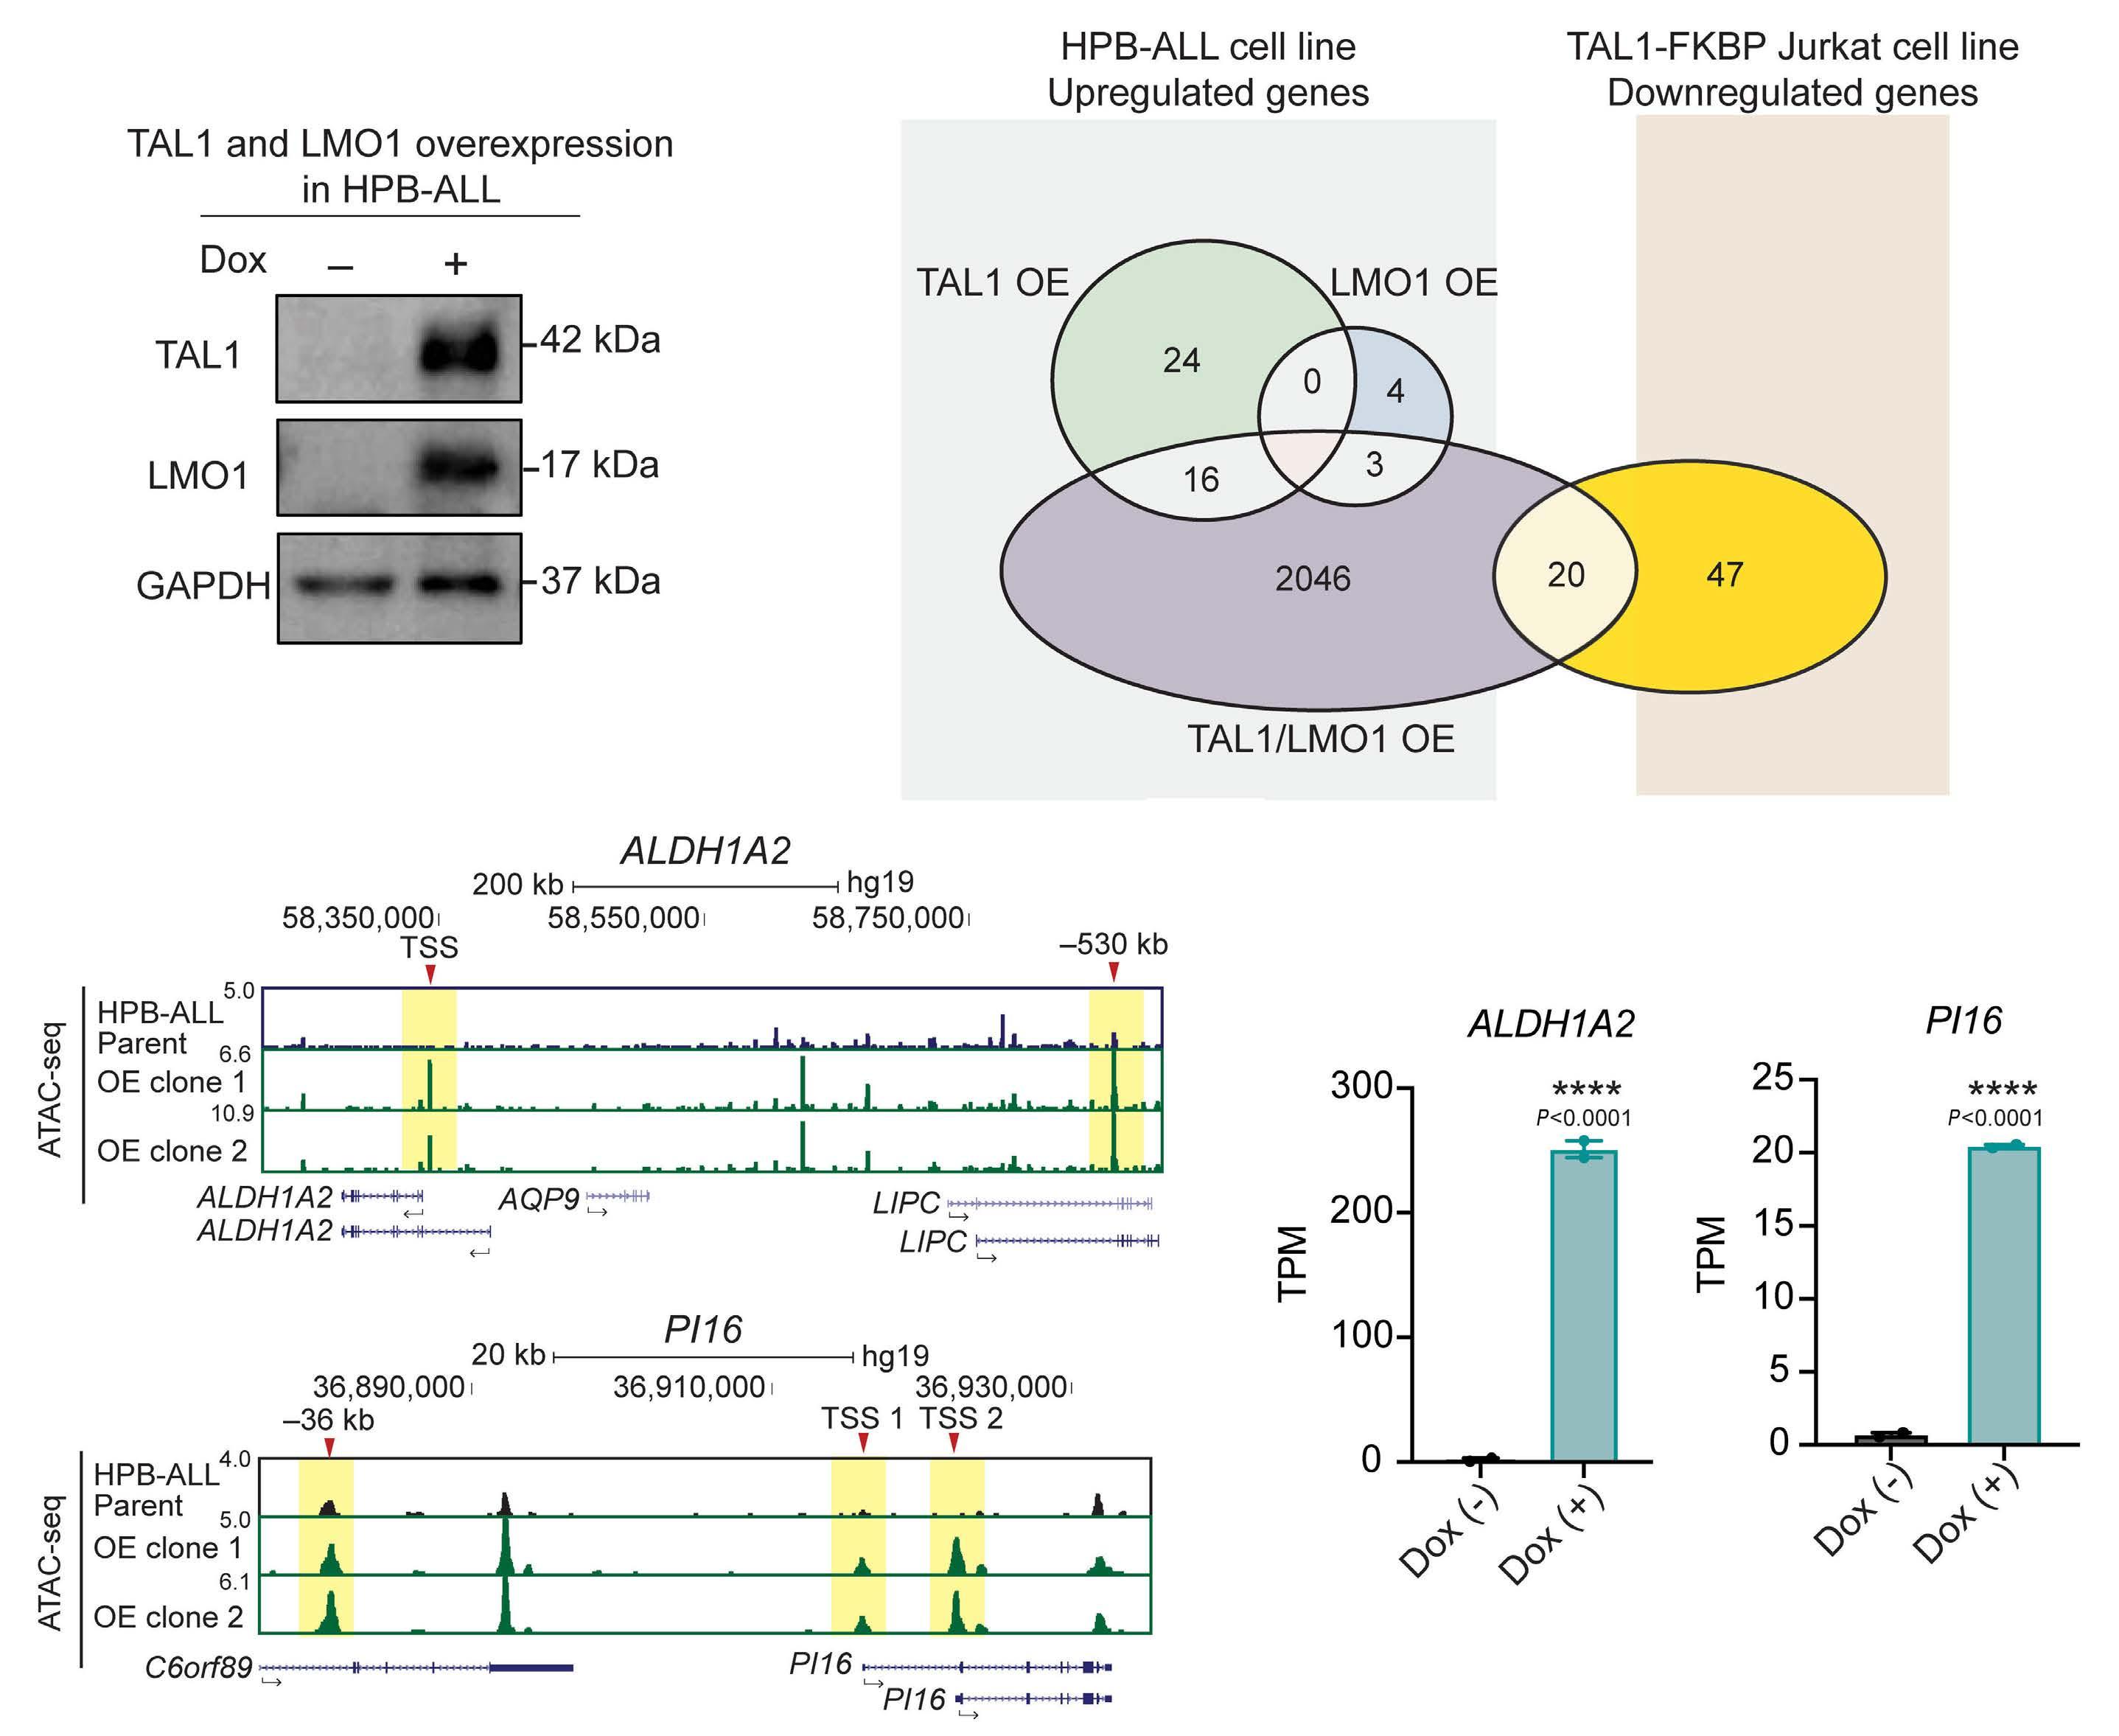
Figure 3. The TAL1 complex alters chromatin accessibility in T-cell acute lymphoblastic leukemia cells. (A) HPB-ALL cells were stably transduced with cDNA of the TAL1 and LMO1 coding regions with a doxycycline (Dox)-inducible system. Whole-cell lysates were collected after 48 hours of Dox treatment and subjected to immunoblot analysis using antibodies specific to TAL1, LMO1 and GAPDH (the loading control). The blots are representative of N=3. (B) Venn diagram analysis showing significantly upregulated (log2-fold change ≥0.7, P<0.05) genes between HPB-ALL cells after TAL1 was overexpressed (TAL1 OE, green circle), LMO1 was overexpressed (LMO1 OE, blue circle), and TAL1/LMO1 were overexpressed in combination (TAL1/LMO1 OE, purple circle) after 48 hours of Dox induction and significantly downregulated (log2-fold change ≤-0.3, P<0.05) genes in TAL1-FKBP12F36V Jurkat cells after 48 hours of 1 mM dTAG treatment. (C) ATAC-sequencing tracks of the ALDH1A2 (top) and PI16 (bottom) loci in the basal-state HPB-ALL cell line (black) and TAL1/LMO1 overexpression in the HPB-ALL cells, displayed as 2 independent clones (green). Yellow highlighting indicates the genomic region of interest: where the TAL1 transcription factor binds in the baseline Jurkat cell line. For the ALDH1A2 locus, the TSS of the shorter isoform and the -530 kb enhancer region are highlighted. For the PI16 locus, the TSS of both isoforms and the -36 kb putative enhancer regions are highlighted. (D) ALDH1A2 and PI16 mRNA expression measured by RNA sequencing in Dox (-) and Dox (+) TAL1-/LMO1-overexpressing HPB-ALL cells. ****P<0.0001 by Student’s t test compared to Dox (-) cells. TPM: transcripts per million.
Haematologica | 109 May 2024 1365 ARTICLE - Regulatory mechanisms of TAL1 in T-ALL J.Z.L. Ong et al.
A B C D
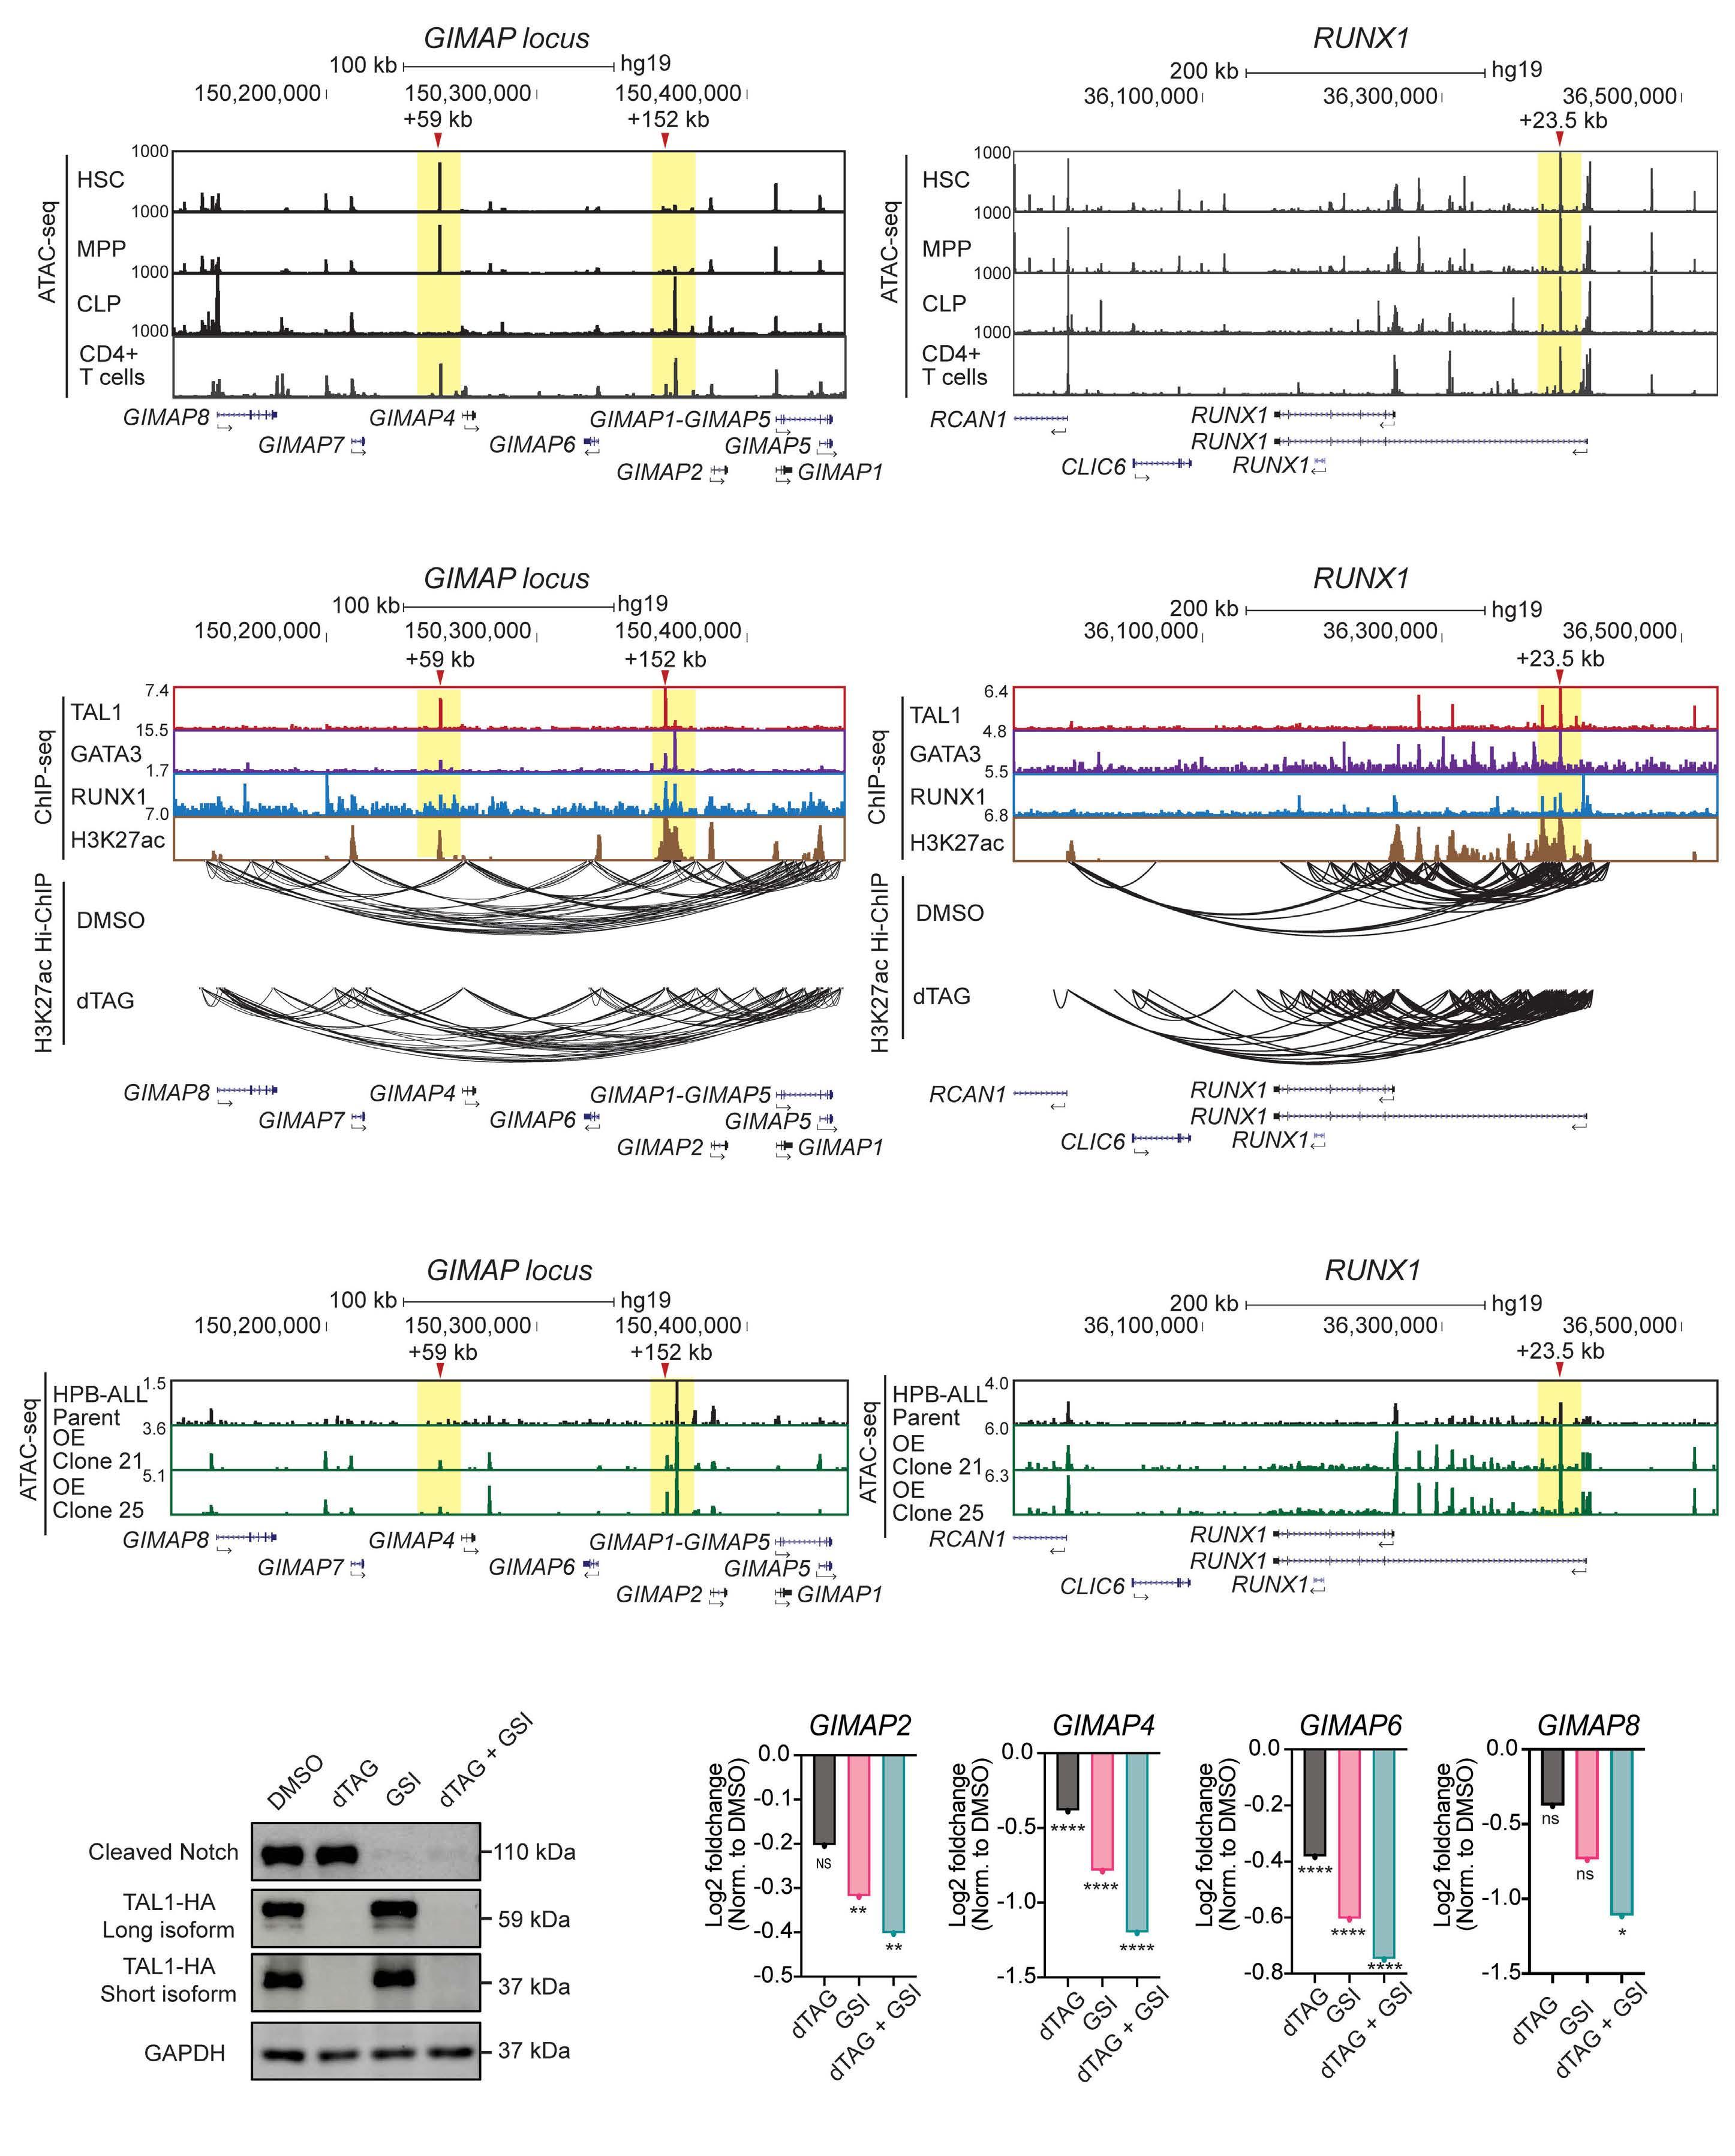
Continued on following page.
Haematologica | 109 May 2024 1366 ARTICLE - Regulatory mechanisms of TAL1 in T-ALL J.Z.L. Ong et al. A B C D E
Figure 4. TAL1 promotes the expression of a set of genes that are highly expressed in different T-cell acute lymphoblastic leukemia cell subgroups. (A) ATAC-sequencing tracks of hematopoietic stem cells (HSC), multipotent progenitors (MPP), common lymphoid progenitors (CLP) and CD4+ T cells; the GIMAP family and RUNX1 loci are magnified. The ATAC-sequencing dataset was previously reported.33 (B) Chromatin immunoprecipitation (ChIP)-sequencing tracks of the TAL1, GATA3, and RUNX1 transcription factors and activating histone mark H3K27ac (top) in the Jurkat cell line; the GIMAP family (left) and RUNX1 (right) loci are magnified. The ChIP-sequencing dataset was previously reported.12 H3K27ac Hi-ChIP was performed after dimethyl sulfoxide (DMSO) treatment and dTAG treatment to evaluate changes in active chromatin loop formation (bottom). (C) ATAC-sequencing tracks of the basal-state HPB-ALL cells (black) and TAL1/LMO1 overexpression in the HPB-ALL cells, displayed as 2 independent clones (green). For (A), (B) and (C), yellow highlighting indicates the genomic region of interest: where the TAL1 transcription factor binds in the baseline Jurkat cell line. For the GIMAP family locus, the +59 kb and +152 kb enhancer regions (with respect to GIMAP7) are highlighted. For the RUNX1 locus, the +23.5 kb enhancer region is highlighted. (D) TAL1-FKBP12F36V Jurkat cells were treated with either DMSO, dTAG, GSI or dTAG + GSI for 24 hours. Whole-cell lysates were collected and subjected to immunoblot analysis using antibodies specific for cleaved notch, HA-tag and GAPDH (the loading control). The blots are representative of N=3. (E) The mRNA expression of several GIMAP family genes (GIMAP2, GIMAP4, GIMAP6, and GIMAP8) was measured by RNA sequencing after dTAG, GSI or dTAG + GSI treatment in biological duplicates. Error bars: the mean ± standard error of the mean; NS: not significant; *P<0.05, **P<0.01, ***P<0.001, ****P<0.0001 by Student’s two-tailed t test compared to control cells.
T-ALL cells, may regulate group B gene expression. In this regard, the GIMAP gene locus had been demonstrated to be activated by NOTCH1 in T-ALL cells.16,30 Hence, we focused on this locus as a representative example.
In order to analyze the contribution of each factor, we inhibited NOTCH1 activity using a γ-secretase inhibitor (GSI) with or without TAL1 depletion. We confirmed the status of TAL1 expression and the activated form of NOTCH1 (Figure 4D). In this setting, we found that inhibition of either TAL1 (by dTAG-13) or NOTCH1 (by GSI) resulted in the partial downregulation of multiple GIMAP genes while combination treatment further downregulated their expression (Figure 4E). This result was independently validated by qRT-PCR (Online Supplementary Figure S4F). Correspondingly, we performed a 4C-sequencing analysis for different treatment conditions, and the results demonstrated that inhibition of either TAL1 or NOTCH1 alone was not sufficient to reduce chromatin–chromatin interactions, while dual inhibition resulted in a marked reduction (Online Supplementary Figure S4G). Hence, in this instance, both TAL1 and NOTCH1 independently contributed to the expression of GIMAP genes and did not require each other. This mechanism is ideal for sustaining the activation status after the loss of one factor and to prevent the complete loss of targets that are required for T-ALL cells. Of note, the majority of group B genes, including RUNX1, MYB and ARID5B, were not downregulated by either GSI alone or in combination treatment with dTAG, suggesting that NOTCH1 was not the only transcription factor that sustained the expression of group B genes and that other factors may be involved.
Transcriptional activity of GATA3 and RUNX1 depends on TAL1
TAL1 regulates downstream targets in conjunction with its regulatory partners, RUNX1 and GATA3, which forms the CRC.12 Independent validation via shRNA knockdown of GATA3 or RUNX1 resulted in the downregulation of many groups A and B genes (Figure 5A). This result indicates that GATA3 and RUNX1 also positively regulate the same target genes in the presence of TAL1, thus showing coordination
among three factors. However, it remains unclear whether their functions are redundant or whether their activities depend on TAL1.
In order to address these possibilities, we performed a cutand-run assay with GATA3 and RUNX1 proteins before and after TAL1 depletion. Interestingly, GATA3 and RUNX1 still bound to many of the group A and B gene loci (Figure 5B), even if TAL1 was depleted and thus target mRNA expression was reduced. The binding of GATA3 to several gene loci was validated by ChIP-qPCR (Online Supplementary Figure S5A). This suggests that DNA bindings of GATA3 or RUNX1 alone is not sufficient to induce the transcription of TAL1 targets. In contrast, knockdown of GATA3 or RUNX1 in the presence of TAL1 resulted in downregulation of the same targets (Figure 5A). Hence, the transcriptional activity of GATA3 and RUNX1 depends on the presence of TAL1.
TAL1 induces lethality via the inhibition of the NOTCH1 pathway in TAL1-negative/TLX3-positive T-cell acute lymphoblastic leukemia cells
Previous studies have shown that TAL1 is usually not expressed together with other Type A abnormality (i.e., TLX1, TLX3, and HOXA), showing an exclusive relationship.7,17,19 This outcome suggests either functional redundancy or potential synthetic lethality when these genes are expressed together. In order to gain an understanding of the mechanism, we utilized HPB-ALL cells, which belong to the TLX3 subgroup and performed functional and gene expression analyses after overexpressing TAL1 and/or LMO1, as described above (Figure 3A). Interestingly, overexpression of either TAL1 or LMO1 did not affect cell proliferation, but their combined overexpression significantly reduced growth rates (Figure 6A). The same result was confirmed in two other TAL1-negative cell lines, DND-41 and KOPT-K1 (Online Supplementary Figure S6A). DND-41 has been verified to expresses TLX3. KOPT-K1 has a high LMO2 baseline expression and thus overexpression of TAL1 alone could produce a significant arrest in cell proliferation. A cell cycle analysis using propidium iodide staining revealed profound G1-phase arrest (Figure 6B), while Annexin-V staining con-
Haematologica | 109 May 2024 1367 ARTICLE - Regulatory mechanisms of TAL1 in T-ALL J.Z.L. Ong et al.
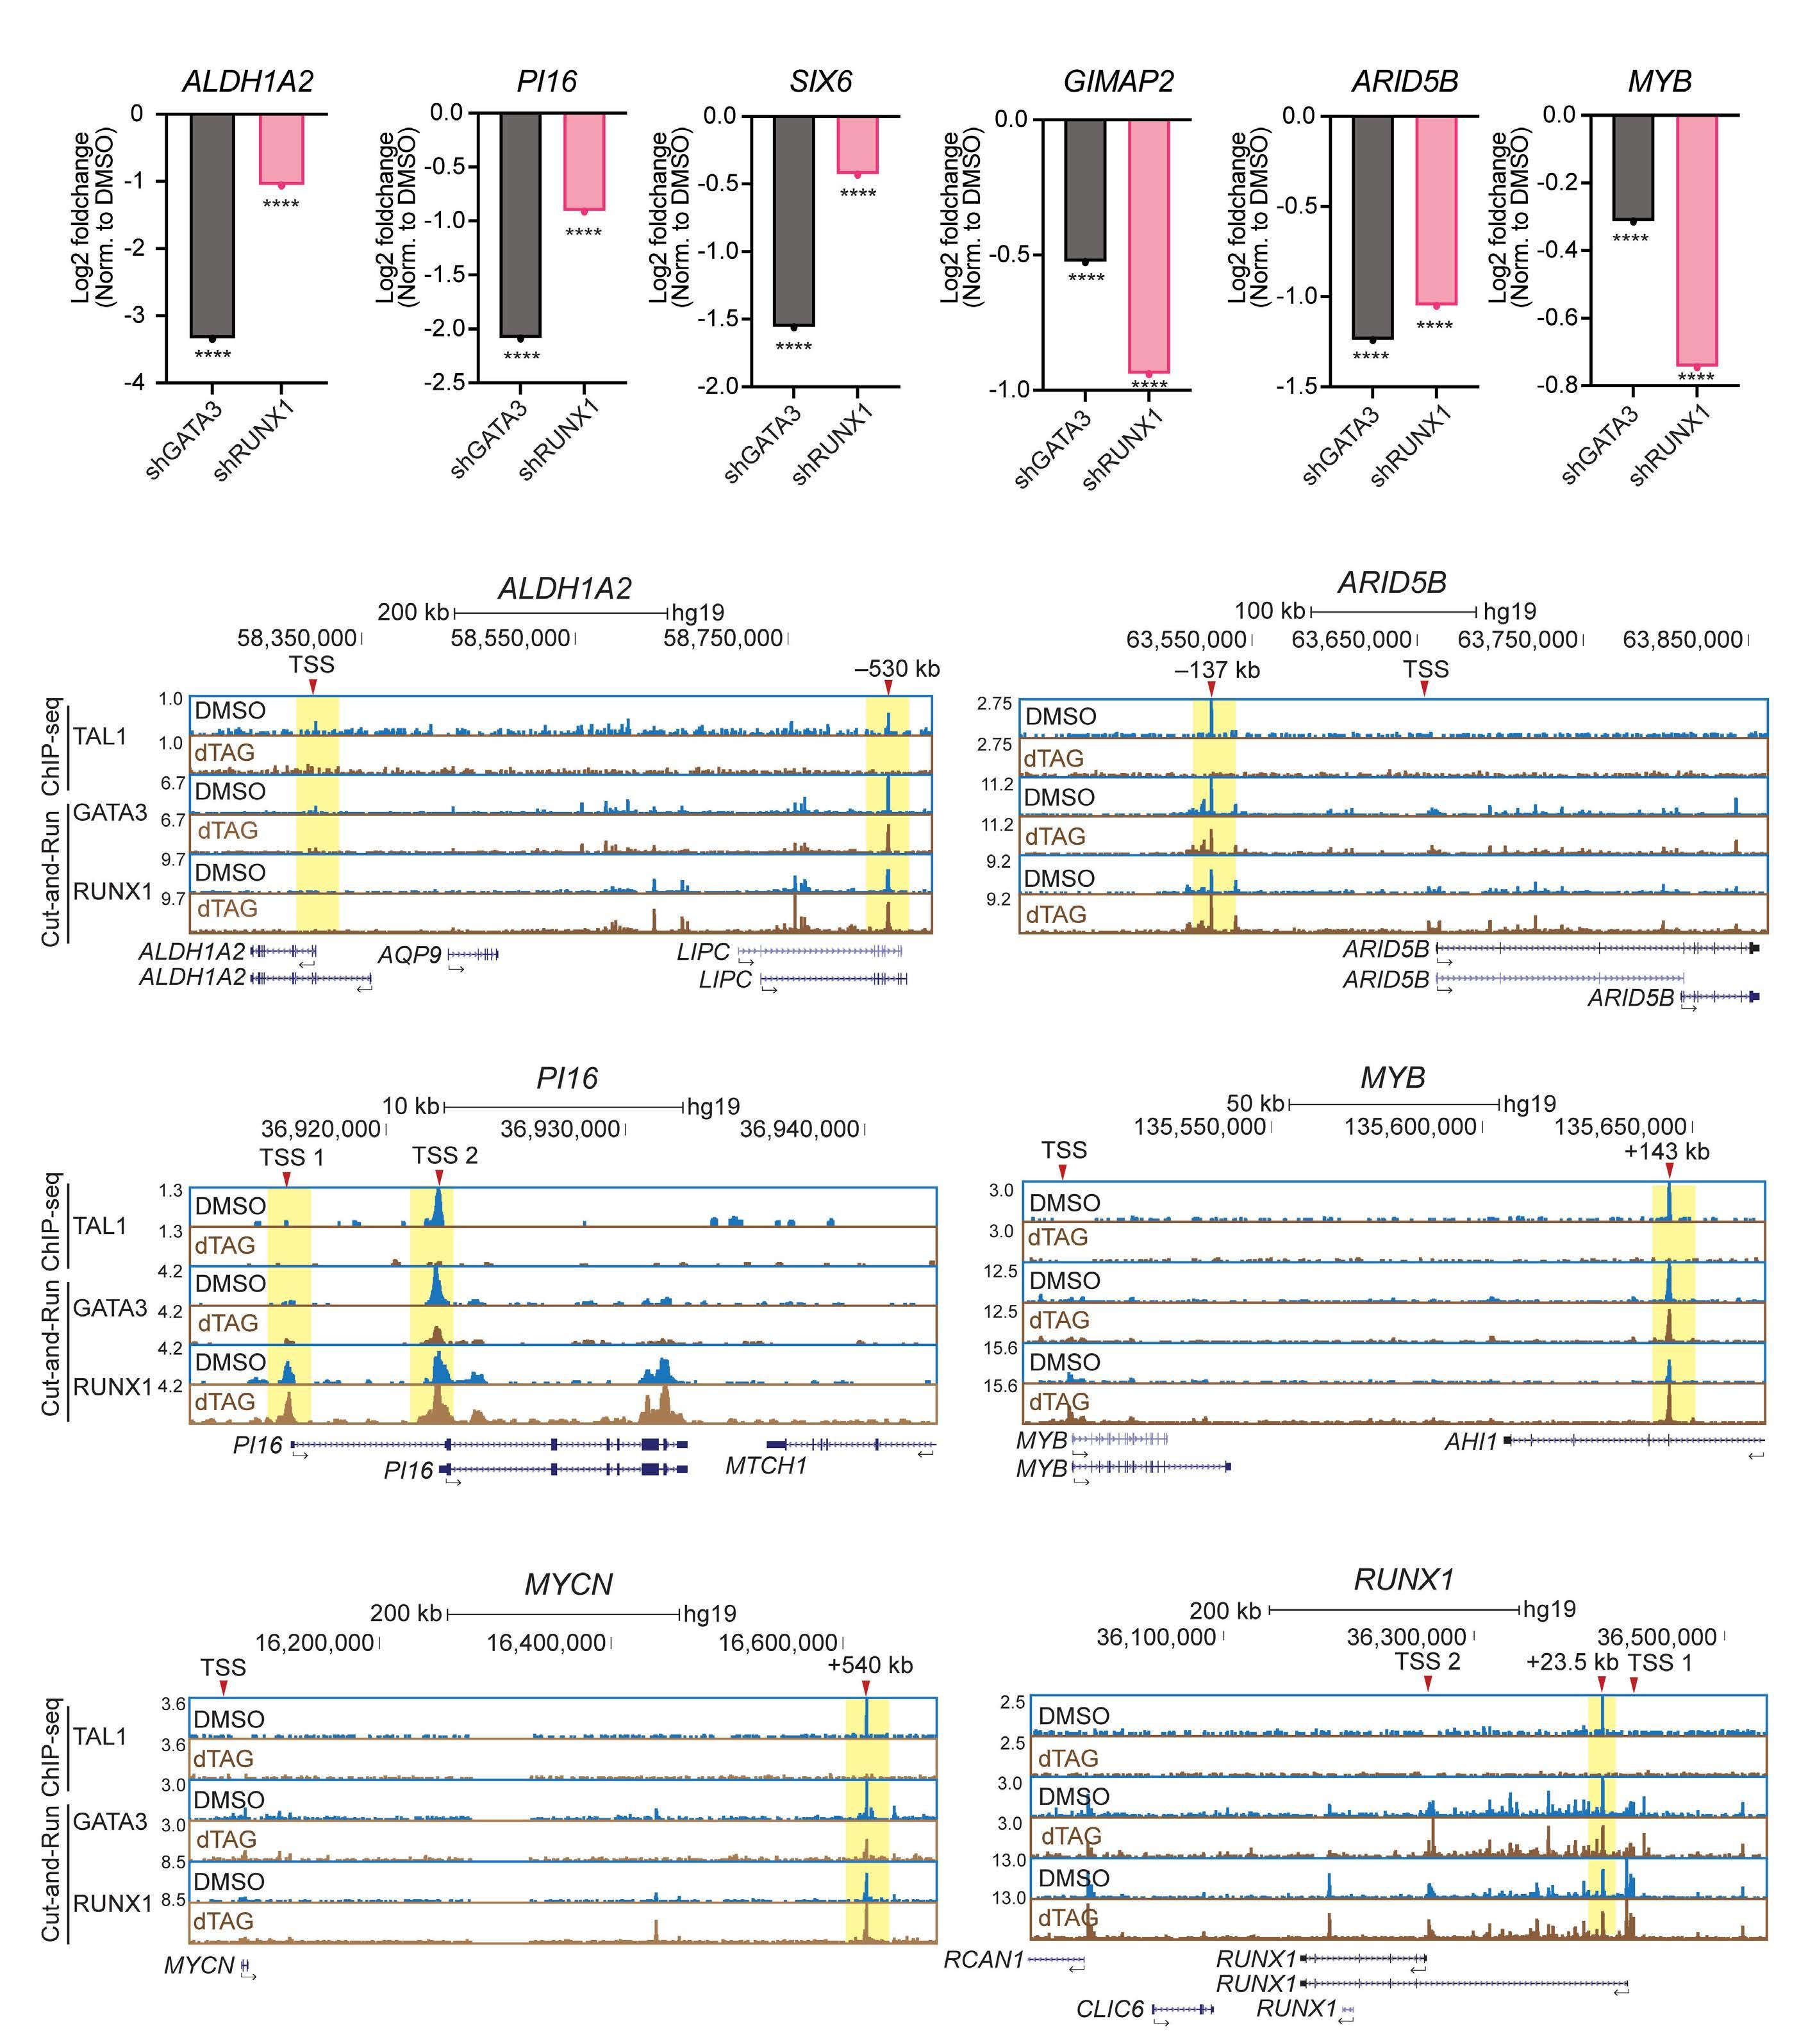
Figure 5. Transcriptional activity of GATA3 and RUNX1 depends on TAL1. (A) mRNA expression of ALDH1A2, PI16, SIX6, GIMAP2, ARID5B and MYB as measured by RNA sequencing after 72 hours of small hairpin RNA (shRNA) genetic knockdown of GATA3 (black bar) and RUNX1 (pink bar) in biological duplicates. ****P<0.001 by Student’s two-tailed t test compared to control cells. (B) Chromatin immunoprecipitation (ChIP)-sequencing and cut-and-run tracks for ALDH1A2, PI16, MYCN, ARID5B, MYB and RUNX1 loci. A ChIP-sequencing assay was performed for TAL1-FKBP12F36V Jurkat cells treated with dimethyl sulfoxide (DMSO) or dTAG for 24 hours, using antibodies specific to TAL1. A cut-and-run assay was performed for TAL1-FKBP12F36V Jurkat cells treated with DMSO or dTAG for 24 hours, using antibodies specific to GATA3 and RUNX1. Yellow highlighting indicates the genomic region of interest: where the TAL1 transcription factor binds in the baseline Jurkat cell line. TAL1 binding was abolished after 1 mM dTAG treatment.
Haematologica | 109 May 2024 1368 ARTICLE - Regulatory mechanisms of TAL1 in T-ALL J.Z.L. Ong et al.
A B
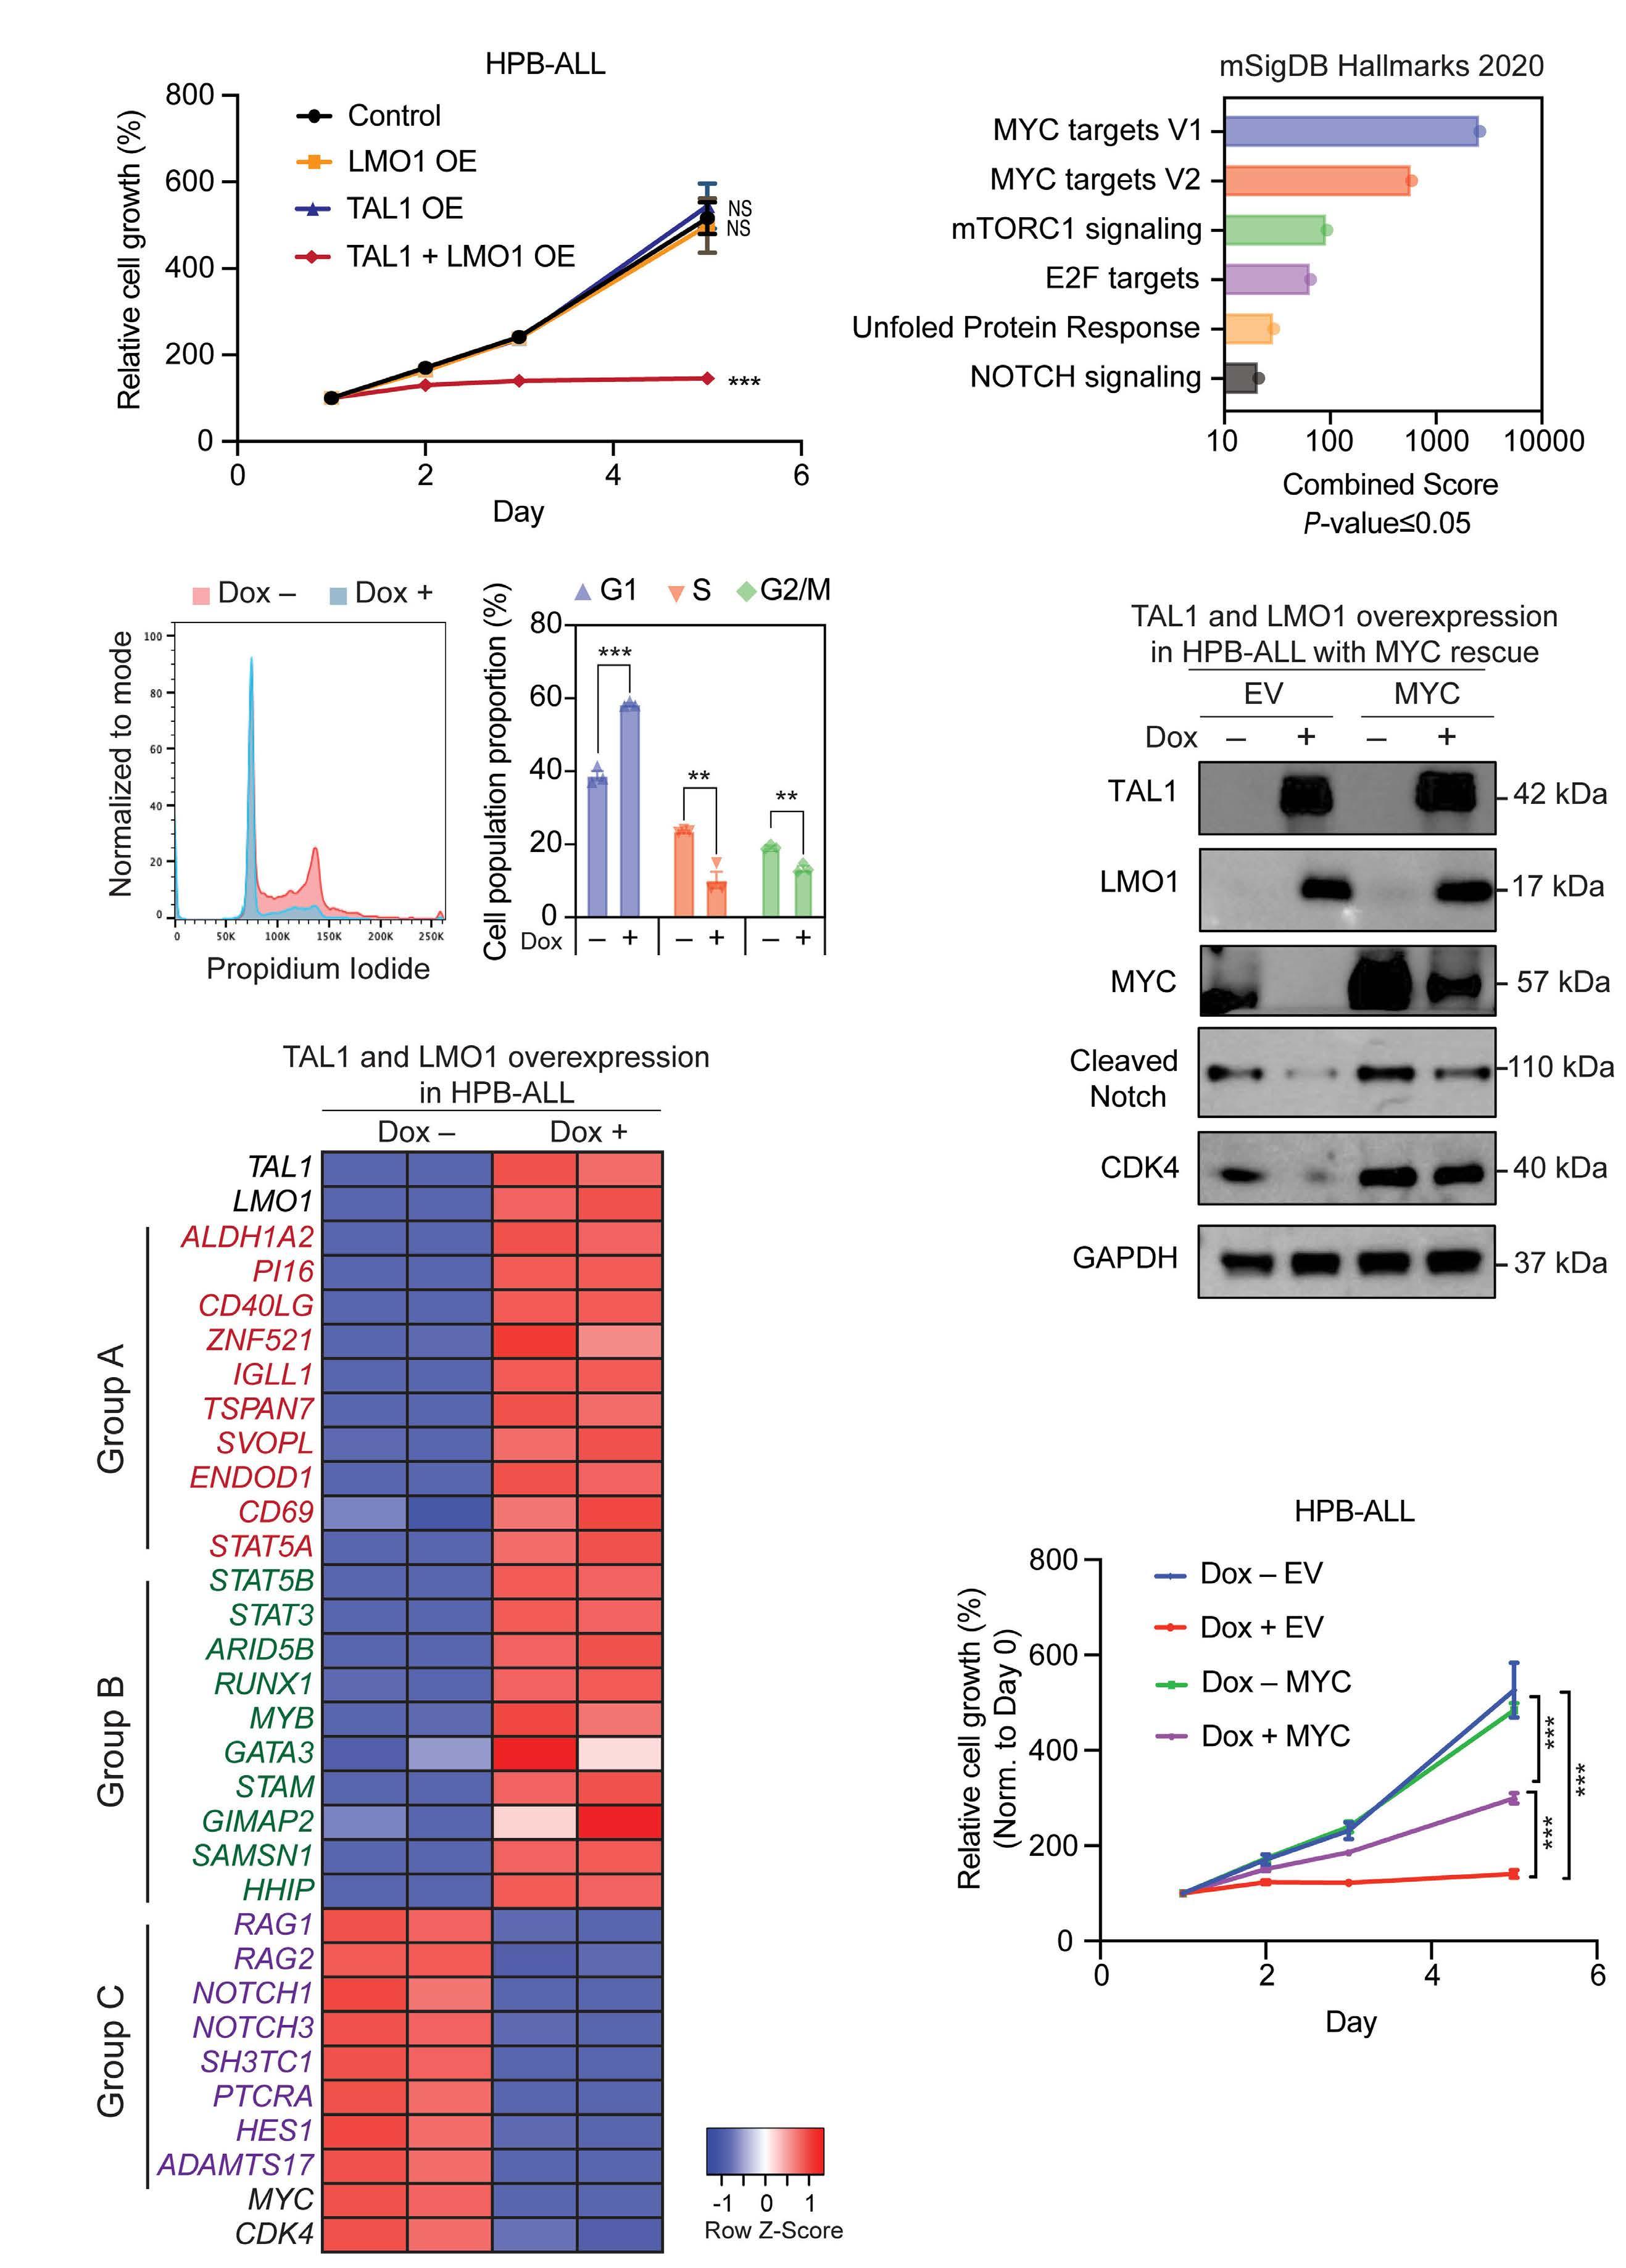
Continued on following page.
Haematologica | 109 May 2024 1369 ARTICLE - Regulatory mechanisms of TAL1 in T-ALL J.Z.L. Ong et al. A D E F B C
Figure 6. TAL1 induces lethality via the inhibition of the NOTCH1 pathway in TAL1-negative/TLX3-positive T-cell acute lymphoblastic leukemia cells. (A) Relative growth (%) of HPB-ALL cells overexpressing TAL1, LMO1 or TAL/LMO1 measured 1, 2, 3 and 5 days after doxycycline (Dox) treatment using a Cell TiterGlo luminescence assay kit; N=3. Error bars: the mean ± standard error of the mean (SEM); NS: not significant; ***P<0.001 by Student’s two-tailed t test compared to Dox (-) control cells. (B) Cell cycle analysis using propidium iodide performed with Dox (-) versus Dox (+) TAL1-/LMO1-overexpressing HPB-ALL cells. Representative flow cytometry plot (left) and cell population proportions (%) at the corresponding cell cycle stages (right); N=3. Error bars: the mean ± SEM; **P<0.01, ***P<0.001 by Student’s two-tailed t test compared to Dox (-) cells. (C) Heatmaps representing the mRNA expression of 10 representative significantly upregulated group A and B genes and 10 representative significantly downregulated group C genes after TAL1/LMO1 are overexpressed, as measured by RNA sequencing. The heatmap data are based on biological duplicates. (D) Gene Ontology analysis (mSigDB Hallmarks 2020) performed with significantly downregulated genes after TAL1/LMO1 was overexpressed in HPB-ALL cells. Significantly enriched pathways (P<0.05) are displayed in a bar chart in descending order of the combined scores. (E) HPB-ALL cells after Dox-induced TAL1/LMO1 overexpression were stably transduced with either an empty vector (EV) or the cDNA carrying the MYC gene. Whole-cell lysates were collected 48 hours after Dox treatment to induce TAL1/LMO1 overexpression and then subjected to immunoblot analysis using antibodies specific for TAL1, LMO1, MYC, cleaved NOTCH, CDK4 and GAPDH (loading control). The blots are representative of N=3. (F) Relative growth (%) of HPB-ALL cells after Dox-induced TAL1/LMO1 overexpression and transduction with either an EV or MYC plasmid. Cell growth was measured 1, 2, 3 and 5 days after Dox induction using a CellTiter Glo luminescence assay kit; ***P<0.001 by Student’s two-tailed t test compared to Dox (-) cells.
firmed that the cell proliferation was not reduced due to the induction of apoptosis (Online Supplementary Figure S6B). These results indicated that TAL1 exhibits lethality in the context of TAL1-negative/TLX3-positive T-ALL when overexpressed with LMO1/LMO2.
Next, we analyzed RNA-sequencing data to identify the gene expression changes underlying this phenotypic change. As described earlier, many group A and B genes (e.g., ALDH1A2 and GIMAP) were significantly upregulated after TAL1 and LMO1 were overexpressed, while group C gene expression (e.g., RAG1 and RAG2) was downregulated (Figures 3B and 6C; Online Supplementary Table S9). These results indicate that these genes were regulated by TAL1 in TLX3-positive T-ALL, regardless of whether the cells underwent proliferation arrest.
Importantly, we observed that many genes involved in the NOTCH pathway, such as NOTCH1, NOTCH3, PTCRA, HES1 and SH3TC1, was significantly downregulated after TAL1/LMO1 were overexpressed (Figure 6C, D; Online Supplementary Table S9). The expression of direct targets of NOTCH1, including MYC and CDK4, which promote cell proliferation, was also significantly downregulated. This result was validated in DND-41 and KOPT-K1 cells (Figure 6E; Online Supplementary Figure S6C). Additionally, stable overexpression of MYC partially restored the cell proliferation rate as well as the CDK4 expression level in HPB-ALL cells after TAL1 overexpression (Figure 6E, F). Cleaved NOTCH1 protein was also slightly upregulated by MYC overexpression due to transcriptional upregulation of NOTCH1 mRNA (Online Supplementary Figure S6D). These results indicated that the growth-suppressing effect induced by TAL1/LMO1 overexpression was due to the downregulation of NOTCH1-MYC pathway while they can induce their own targets (i.e., group A and B genes). These effects were marked contrast to that in TAL1-positive T-ALL cells, in which TAL1 collaborated with NOTCH1. Moreover, forced expression of TAL1 and LMO1 affected the expression of differentiation markers in HPB-ALL cells, as demonstrated by downregulation of CD4, CD3 and CD1 and upregulation
of CD8a (Online Supplementary Figure S6E). Although the resulted immunophenotype does not represent a typical differentiation stage of T cells, our data indicates that TAL1 overexpression affects cell differentiation status.
Discussion
Since the discovery of TAL1 from chromosomal translocation in T-ALL cells,31 its roles in T-cell leukemogenesis have been extensively studied. Early studies with mouse models demonstrated that TAL1 exerted oncogenic effects via the inhibition of E-proteins,8,9 as confirmed with our study on group C genes, which included many E-protein targets. This mechanism primarily results in differentiation arrest of developing thymocytes, which may eventually lead to the acquisition of additional abnormalities such as activating mutations of NOTCH1. However, several questions remain unanswered.
In this study, we reviewed the transcription targets driven by TAL1 using a protein degradation system, revisiting known mechanisms and highlighting novel mechanisms. First, we found that two groups of genes are positively regulated by TAL1, and each group is characterized by unique features. Group A genes are highly dependent on the activity of TAL1, and many of them are not expressed in normal T cells or TAL1-negative T-ALL cells, thus representing the oncogenic signature of TAL1. Importantly, closed chromatin at many of Group A loci were opened by overexpression of TAL1 and LMO1. Previously, Ferrando’s group implicated GATA3 as a pioneer factor in T-ALL.32 Thus, one possible hypothesis is that when GATA3 forms a complex with TAL1 via LMO1, it is recruited to target gene loci and changes the chromatin status to ectopically induces gene expression.
In contrast, group B genes represent a more general gene expression signature of T-ALL and are not solely dependent on TAL1. For example, the GIMAP gene locus shows densely-connected chromatin-chromatin interactions that are also regulated by NOTCH1. Inhibition of TAL1 or NOTCH1
Haematologica | 109 May 2024 1370 ARTICLE - Regulatory mechanisms of TAL1 in T-ALL J.Z.L. Ong et al.
alone did not fully block the expression of group B genes, but the combined inhibition of these two factors strongly downregulated their expression. TAL1 and NOTCH1 equally contributed to the expression of GIMAP genes. Hence, group B genes demonstrate the collaborative roles of TAL1 with other transcription factors, which is likely required to sustain the gene expression program in the maintenance or progression of T-ALL cells.
Our study also suggested a functional relationship among CRC members. When TAL1 was rapidly depleted, binding of GATA3 and RUNX1 was mostly unchanged at target gene loci, while knockdown of each of them led to the downregulation of target genes. These results indicate that although CRC members share target genes and positively regulate them, GATA3 and RUNX1 activities may depend on TAL1, and thus cannot replace TAL1. Thus, TAL1 plays a dominant role among CRC members, which is different from the relationship between TAL1 and NOTCH1. Another long-standing question about T-ALL is why the expression of Type A abnormalities (e.g., TAL1 and TLX3) is exclusively observed (see introduction for the definition).
Our study demonstrated that the induction of TAL1 and its downstream targets is potentially lethal in the presence of TLX3. TAL1 overexpression in TLX3-positive T-ALL cells induced group A genes but inhibited NOTCH1-MYC pathway, although TAL1 collaborated with NOTCH1 in TAL1-positive
References
1. Porcher C, Swat W, Rockwell K, Fujiwara Y, Alt FW, Orkin SH. The T cell leukemia oncoprotein SCL/tal-1 is essential for development of all hematopoietic lineages. Cell. 1996;86(1):47-57.
2. Shivdasani RA, Mayer EL, Orkin SH. Absence of blood formation in mice lacking the T-cell leukaemia oncoprotein tal-1/SCL. Nature. 1995;373(6513):432-434.
3. Souroullas GP, Salmon JM, Sablitzky F, Curtis DJ, Goodell MA. Adult hematopoietic stem and progenitor cells require either Lyl1 or Scl for survival. Cell Stem Cell. 2009;4(2):180-186.
4 Yui MA, Rothenberg EV. Developmental gene networks: a triathlon on the course to T cell identity. Nat Rev Immunol. 2014;14(8):529-545.
5. Hosokawa H, Rothenberg EV. How transcription factors drive choice of the T cell fate. Nat Rev Immunol. 2021;21(3):162-176.
6. Aifantis I, Raetz E, Buonamici S. Molecular pathogenesis of T-cell leukaemia and lymphoma. Nat Rev Immunol. 2008;8(5):380-390.
7 Belver L, Ferrando A. The genetics and mechanisms of T cell acute lymphoblastic leukaemia. Nat Rev Cancer. 2016;16(8):494-507.
8. O’Neil J, Shank J, Cusson N, Murre C, Kelliher M. TAL1/SCL induces leukemia by inhibiting the transcriptional activity of E47/HEB. Cancer Cell. 2004;5(6):587-596.
9 Draheim KM, Hermance N, Yang Y, Arous E, Calvo J, Kelliher MA. A DNA-binding mutant of TAL1 cooperates with LMO2 to cause T cell leukemia in mice. Oncogene. 2011;30(10):1252-1260.
10 Zhang C, Amanda S, Wang C, et al. Oncorequisite role of an
T-ALL cells. These results also suggest that TLX3-positive cells are highly dependent on the NOTCH1/MYC pathway. Altogether, our study indicates that the roles of TAL1 and NOTCH1 depend on the cellular context.
Disclosures
No conflicts of interest to disclose.
Contributions
JZLO and LW performed the experiments. TKT conducted the bioinformatics analyses. SHT and TS supervised the study. JZLO and TS wrote the manuscript.
Funding
This research is supported by the Singapore Ministry of Education (MOE-000061-00); the National Medical Research Council of the Singapore Ministry of Health (MOH-00020800); Japan Society for the Promotion of Science (18K19960); and the National Research Foundation Singapore and the Singapore Ministry of Education under its Research Centers of Excellence initiative.
Data-sharing statement
All sequencing dataset have been deposited in the Gene Expression Omnibus database under the accession number GSE225941.
aldehyde dehydrogenase in the pathogenesis of T-cell acute lymphoblastic leukemia. Haematologica. 2021;106(6):1545-1558.
11. Mansour MR, Abraham BJ, Anders L, et al. An oncogenic superenhancer formed through somatic mutation of a noncoding intergenic element. Science. 2014;346(6215):1373-1377.
12. Sanda T, Lawton LN, Barrasa MI, et al. Core transcriptional regulatory circuit controlled by the TAL1 complex in human T cell acute lymphoblastic leukemia. Cancer Cell. 2012;22(2):209-221.
13. Weng AP, Ferrando AA, Lee W, et al. Activating mutations of NOTCH1 in human T cell acute lymphoblastic leukemia. Science. 2004;306(5694):269-271.
14. Herranz D, Ambesi-Impiombato A, Palomero T, et al. A NOTCH1driven MYC enhancer promotes T cell development, transformation and acute lymphoblastic leukemia. Nat Med. 2014;20(10):1130-1137.
15. O’Neil J, Calvo J, McKenna K, et al. Activating Notch1 mutations in mouse models of T-ALL. Blood. 2006;107(2):781-785.
16. Liau WS, Tan SH, Ngoc PCT, et al. Aberrant activation of the GIMAP enhancer by oncogenic transcription factors in T-cell acute lymphoblastic leukemia. Leukemia. 2017;31(8):1798-1807.
17 Liu Y, Easton J, Shao Y, et al. The genomic landscape of pediatric and young adult T-lineage acute lymphoblastic leukemia. Nat Genet. 2017;49(8):1211-1218.
18. Ferrando AA, Neuberg DS, Staunton J, et al. Gene expression signatures define novel oncogenic pathways in T cell acute lymphoblastic leukemia. Cancer Cell. 2002;1(1):75-87.
19 Yeoh EJ, Ross ME, Shurtleff SA, et al. Classification, subtype
Haematologica | 109 May 2024 1371 ARTICLE - Regulatory mechanisms of TAL1 in T-ALL J.Z.L. Ong et al.
discovery, and prediction of outcome in pediatric acute lymphoblastic leukemia by gene expression profiling. Cancer Cell. 2002;1(2):133-143.
20 Nabet B, Roberts JM, Buckley DL, et al. The dTAG system for immediate and target-specific protein degradation. Nat Chem Biol. 2018;14(5):431-441.
21. Wong RWJ, Ngoc PCT, Leong WZ, et al. Enhancer profiling identifies critical cancer genes and characterizes cell identity in adult T-cell leukemia. Blood. 2017;130(21):2326-2338.
22. Krijger PH, Geeven G, Bianchi V, Hilvering CR, de Laat W. 4C-seq from beginning to end: a detailed protocol for sample preparation and data analysis. Methods. 2020;170:17-32.
23. Buenrostro JD, Wu B, Chang HY, Greenleaf WJ. ATAC-seq: a method for assaying chromatin accessibility genome-wide. Curr Protoc Mol Biol. 2015;109(1):21.
24. Mansour MR, Sanda T, Lawton LN, et al. The TAL1 complex targets the FBXW7 tumor suppressor by activating miR-223 in human T cell acute lymphoblastic leukemia. J Exp Med. 2013;210(8):1545-1557.
25. Kusy S, Gerby B, Goardon N, et al. NKX3. 1 is a direct TAL1 target gene that mediates proliferation of TAL1-expressing human T cell acute lymphoblastic leukemia. J Exp Med. 2010;207(10):2141-2156.
26. Leong WZ, Tan SH, Ngoc PCT, et al. ARID5B as a critical downstream target of the TAL1 complex that activates the
oncogenic transcriptional program and promotes T-cell leukemogenesis. Gen Dev. 2017;31(23-24):2343-2360.
27. Murre C. Helix-loop-helix proteins and lymphocyte development. Nat Immunol. 2005;6(11):1079-1086.
28. Kee BL. E and ID proteins branch out. Nat Rev Immunol. 2009;9(3):175-184.
29 Seita J, Sahoo D, Rossi DJ, et al. Gene Expression Commons: an open platform for absolute gene expression profiling. PLoS One. 2012;7(7):e40321.
30 Wang H, Zou J, Zhao B, et al. Genome-wide analysis reveals conserved and divergent features of Notch1/RBPJ binding in human and murine T-lymphoblastic leukemia cells. Proc Natl Acad Sci U S A. 2011;108(36):14908-14913.
31. Begley CG, Aplan PD, Davey MP, et al. Chromosomal translocation in a human leukemic stem-cell line disrupts the T-cell antigen receptor delta-chain diversity region and results in a previously unreported fusion transcript. Proc Natl Acad Sci U S A. 1989;86(6):2031-2035.
32. Belver L, Yang AY, Albero R, et al. GATA3-controlled nucleosome eviction drives MYC enhancer activity in T-cell development and leukemia. Cancer Discov. 2019;9(12):1774-1791.
33. Corces MR, Buenrostro JD, Wu B, et al. Lineage-specific and single-cell chromatin accessibility charts human hematopoiesis and leukemia evolution. Nat Genet. 2016;48(10):1193-1203.
Haematologica | 109 May 2024 1372 ARTICLE - Regulatory mechanisms of TAL1 in T-ALL J.Z.L. Ong et al.
Targeting hyperactive platelet-derived growth factor receptor- β signaling in T-cell acute lymphoblastic leukemia
and lymphoma
Stien De Coninck,1,2 Renate De Smedt,1,2 Béatrice Lintermans,1,2 Lindy Reunes,1,2,3 Hansen J. Kosasih,4,5 Alexandra Reekmans,1,2 Lauren M. Brown,4,5 Nadine Van Roy,2,6,7 Bruno Palhais,1,2,3 Juliette Roels,1,2 Malaika Van der Linden,2,8 Jo Van Dorpe,2,8 Panagiotis Ntziachristos,2,3 Frederik W. van Delft,9 Marc R. Mansour,10 Tim Pieters,2,3 Tim Lammens,2,11,12 Barbara De Moerloose,2,12 Charles E. de Bock,4,5# Steven Goossens2,13# and Pieter Van Vlierberghe1,2#
1Lab of Normal and Malignant Hematopoiesis, Department of Biomolecular Medicine, Ghent University, Ghent, Belgium; 2Cancer Research Institute Ghent (CRIG), Ghent, Belgium; 3Department of Biomolecular Medicine, Ghent University, Ghent, Belgium; 4Children’s Cancer Institute, Lowy Cancer Research Centre, UNSW Sydney, Kensington, New South Wales, Australia; 5School of Clinical Medicine, UNSW Medicine and Health, UNSW Sydney, Sydney, New South Wales, Australia; 6Lab for Translational Oncogenomics and Bioinformatics, Department of Biomolecular Medicine, Ghent University, Ghent, Belgium; 7Pediatric Precision Oncology Lab, Department of Biomolecular Medicine, Ghent University, Ghent, Belgium; 8Department of Pathology, Ghent University and Ghent University Hospital, Ghent, Belgium; 9Wolfson Childhood Cancer Research Centre, Newcastle University Centre for Cancer, Newcastle upon Tyne, UK; 10Department of Developmental Biology and Cancer, Institute of Child Health, University College London, London, UK; 11Department of Internal Medicine and Pediatrics, Ghent University, Ghent, Belgium; 12Department of Pediatric Hematology-Oncology and Stem Cell Transplantation, Ghent University Hospital, Ghent, Belgium and 13Unit for Translational Research in Oncology, Department of Diagnostic Sciences, Ghent University, Ghent, Belgium
#CEdB, SG and PVV contributed equally as senior authors.
Abstract
Correspondence: S. Goossens steven.goossens@ugent.be
Received: August 17, 2023.
Accepted: November 2, 2023.
Early view: November 9, 2023.
https://doi.org/10.3324/haematol.2023.283981
T-cell acute lymphoblastic leukemia (T-ALL) and T-cell lymphoblastic lymphoma (T-LBL) are rare aggressive hematologic malignancies. Current treatment consists of intensive chemotherapy leading to 80% overall survival but is associated with severe toxic side effects. Furthermore, 10-20% of patients still die from relapsed or refractory disease providing a strong rationale for more specific, targeted therapeutic strategies with less toxicities. Here, we report a novel MYH9::PDGFRB fusion in a T-LBL patient, and demonstrate that this fusion product is constitutively active and sufficient to drive oncogenic transformation in vitro and in vivo. Expanding our analysis more broadly across T-ALL, we found a T-ALL cell line and multiple patient-derived xenograft models with PDGFRB hyperactivation in the absence of a fusion, with high PDGFRB expression in TLX3 and HOXA T-ALL molecular subtypes. To target this PDGFRB hyperactivation, we evaluated the therapeutic effects of a selective PDGFRB inhibitor, CP-673451, both in vitro and in vivo and demonstrated sensitivity if the receptor is hyperactivated. Altogether, our work reveals that hyperactivation of PDGFRB is an oncogenic driver in T-ALL/T-LBL, and that screening T-ALL/T-LBL patients for phosphorylated PDGFRB levels can serve as a biomarker for PDGFRB inhibition as a novel targeted therapeutic strategy in their treatment regimen.
Introduction
T-cell acute lymphoblastic leukemia (T-ALL) and T-cell lymphoblastic lymphoma (T-LBL) are aggressive subtypes
of leukemia affecting the T-cell lineage. Since T-ALL and T-LBL patients have similar immunophenotypic, morphological and molecular genetic features, they are considered the same disease according to the World Health Organiza-
Haematologica | 109 May 2024 1373 - Acute Lymphoblastic Leukemia ARTICLE
©2024 Ferrata Storti Foundation Published under a CC BY-NC license
tion.1 They are distinguished based on the infiltration into the bone marrow (BM); T-LBL cases have less than 25%, while T-ALL cases have more than 25% lymphoblasts in their diagnostic BM.2 Patients can be classified into different molecular genetic subtypes based on the aberrant expression of specific oncogenic transcription factors, such as LYL1, TLX1, TLX3, HOXA, NKX2-1, TAL1 or LMO2 3,4 Current T-ALL/T-LBL treatment protocols consist of intensive chemotherapy followed by hematopoietic stem cell transplantation (HSCT) in high-risk or relapsed cases.2,5 Treatment intensification resulted in improved overall survival (OS) rates for pediatric patients, nowadays reaching 80%.6 However, OS rates remain low for adult patients (only 40%) with limited salvage options for refractory disease.2,7 In addition, due to associated short- and long-term toxic side effects, the limit of tolerability for this intensified chemotherapy has been reached. Therefore, to improve the outcomes of patients with T-ALL/T-LBL, new targets for the development of more effective therapeutic strategies with less adverse side effects must be identified. Protein kinase inhibitors are currently being investigated as targeted therapy for T-ALL/T-LBL, specifically in cases harboring activating kinase mutations.8 Activating mutations in the IL7R-JAK-STAT pathway are present in 20-30% of T-ALL cases9 and found to be sensitive to the Janus kinase (JAK) inhibitor ruxolitinib.10 The NUP214::ABL1 fusion is the most common ABL1 aberration in T-ALL and sensitive to the broad spectrum kinase inhibitor dasatinib.11 Interestingly, high expression of the lymphocytic-specific kinase LCK is also found in T-ALL/T-LBL and can be used as a biomarker of dasatinib sensitivity.12-14
Platelet-derived growth factor receptor B (PDGFRB) is a member of the class III tyrosine kinase receptors. The extracellular part of the receptor has 5 immunoglobulin-like domains that can bind PDGF, the receptor ligands. In the absence of ligand, the receptor is inactive.15 Upon ligand binding, PDGFR monomers dimerize, bringing the cytoplasmic tyrosine kinase domains into proximity, resulting in autophosphorylation of the receptor dimer. The phosphorylated receptor-receptor-complex is internalized and downstream signaling of PI3K/AKT, RAS/MAPK and JAK/STAT is activated, promoting cellular proliferation, differentiation, survival and migration.16 Multiple translocations involving the PDGFRB locus have been reported in T-ALL/T-LBL including ETV6::PDGFRB, 17 DOCK2::PDGFRB, 18 and AGGF1::PDGFRB.19 These fusions are all characterized by the 3’ PDGFRB kinase domain placed under the control of their 5’ fusion partner which favors dimerization resulting in ligand-independent constitutive activation.15,20 In this study, we report a novel MYH9::PDGFRB fusion in a pediatric T-LBL patient. We demonstrate that enforced expression is sufficient to transform cells to cytokine-independent growth in vitro and drive leukemia in vivo. Our study also implicates ectopic activation of PDGFRB as a more general oncogenic event in the absence of a chro-
mosomal translocation in T-ALL/T-LBL and investigated the therapeutic potential of targeting this hyperactive PDGFRB in T-LBL/T-ALL using a selective PDGFRB inhibitor, CP-673451.
Methods
Detection and amplification of MYH9::PDGFRB fusion
The MYH9::PDGFRB fusion transcript was identified by Targeted Locus Amplification according to a previously described protocol.21 Details and complete coding sequence of identified fusion product can be found in the Online Supplementary Appendix.
Expression plasmid and retrovirus production
The full length MYH9::PDGFRB fusion transcript was cloned into a pMIGII-IRES-GFP (MSCV) expression plasmid. Retrovirus production using HEK293T cells and transduction of Ba/F3 cells was performed as previously described.22 Details are provided in the Online Supplementary Appendix
Syngeneic bone marrow transplant
Lineage negative cells were isolated from the BM of 6-8 week old C57BL/6JAusB mice (Australian Bioresources, Australia) using the EasySepTM Mouse Hematopoietic Progenitor Cell Isolation Kit (#19856, StemcellTM Technologies) according to the manufacturer’s instructions. Retroviral vectors encoding the MSCV-MYH9::PDGFRB-IRES-GFP were transduced into hematopoietic stem and progenitor cells (HSPC) and then 1 million transduced cells were injected into the tail veins of sublethally irradiated (6 Gy) C57BL/ 6JAusB female recipients. Blood samples were taken at regular time points and analyzed on a BC5000 Hematology Analyzer (Mindray) and flow cytometry (MACSQuant® VYB, Miltenyi Biotec) to determine the evolution in white blood cells (WBC) and GFP+ cell counts, respectively. Mice were sacrificed when the WBC counts exceeded 600x109/L and/ or ethical end point criteria were reached. Animal experiments were approved by the UNSW animal care and ethics committee (ACEC number: 23/11B).
Cell lines and patient samples
Cell lines (CTV-1, SEM, Jurkat, MOLT-16, DND-41, HEK293T) were purchased from the DSMZ repository (Braunschweig, Germany) and cultured in RPMI 1640 medium supplemented with 10% fetal bovine serum (FBS) at 37°C with 5% CO2. Ba/F3 cells were maintained in 10% RPMI and 10 ng/mL recombinant murine interleukin-3 (PeptroTech). Primary T-ALL cells for in vitro and in vivo CP-673451 treatment were acquired by informed consent from the Department of Pediatric Hematology-Oncology at Ghent University Hospital. T-ALL patient-derived xenograft (PDX) samples were obtained from the laboratory of Prof. Richard B. Lock as described,23 with details found on PedcBioPortal (PedcBio-
Haematologica | 109 May 2024 1374 ARTICLE - Targeting activated PDGFRB in T-ALL and T-LBL S. De Coninck et al.
Portal KidsFirst (kidsfirstdrc.org)) depository.24 Whole exome sequencing data of these PDX models is publicly available on PedcBioPortal in the PPTC, Maris, 2019 database and annotated as ETP1=T-ALL6; ETP3=T-ALL7; ETP6=T-ALL9.
Cell viability assays
Viable cells were counted using MACSQuant VYB Flow Cytometer (Miltenyi Biotec). Alternatively, CellTiter-Glo (Promega) assay was performed at indicated time points followed by measurement of luminescence using Glomax Discover Microplate Reader (Promega). Ratios of either cell numbers or signal from metabolically active cells in CP-673451 to DMSO were plotted to calculate IC50 values.
In vivo treatment of T-ALL patient-derived xenograft model with CP-673451
NSG-SGM3 (#013062, The Jackson Laboratory) 10-week old female mice (N=12) were intravenously injected with 2x10⁶ PDX cells. At regular timepoints, % hCD45 (130-114569, Miltenyi Biotec) was measured using flow cytometry (BD LSR II Flow Cytometer) in peripheral blood (PB). After evidence of leukemic cell engraftment, mice were randomly divided into vehicle treatment (90% PEG300, 10% N-methylpyrrolidone) (N=5) and CP-673451-treatment (Bio-Connect) (N=7). CP-673451 was administered daily via intraperitoneal injection at a dose of 20 mg/kg (5 days on / 2 days off; total of 10 administration doses). During the experiment, leukemic burden was evaluated via %hCD45 in PB. Experiments were performed according to the ethical guidelines under UGent regulations, with approval of the ethical committee for laboratory animal experimentation of the Faculty of Medicine and Health Sciences.
Statistical analysis
Statistical power was calculated before every experiment (80% statistical power, α=0.05). The Shapiro-Wilk test was used to check for normality of data. Results are expressed as mean ± standard deviation where appropriate. Kaplan-Meier curves were used for the survival of mouse BM tranplants (BMT). For the comparison of 2 groups, an unpaired t test with Welch’s correction or Mann-Whitney test was used. GraphPad Prism 9 (GraphPad Software Inc., La Jolla, CA, USA) was used to analyze the data. For detailed methodology, see the Online Supplementary Methods.
Results
A novel MYH9::PDGFRB fusion gene identified in a T-cell lymphoblastic lymphoma patient can transform Ba/F3 cells to cytokine-independent growth
A 7-year old boy was diagnosed with T-LBL with 12% lymphoblasts found in the BM. (Additional clinical details are provided in the Online Supplementary Appendix). Array
Comparative Genomic Hybridization (aCGH) was performed on a diagnostic sample and revealed a series of chromosomal imbalances, including gains and deletions (Online Supplementary Figure S1A). A chromosomal aberration was detected with potential partial loss of the 5q32 region, involving the PDGFRB locus. Using PDGFRB as a viewpoint, targeted locus amplification in combination with next generation sequencing identified a fusion between MYH9 (Chr22) and PDGFRB (Chr5), in which the extracellular domain of PDGFRB is replaced by the motor domain of MYH9 which is a member of the P-loop NTPase fold family (Figure 1A, Online Supplementary Figure S1B).25 Compared to healthy samples, increased PDGFRB protein levels were detected in both diagnostic and relapse samples of this T-LBL patient, using immunohistochemistry with a specific anti-PDGFRB antibody detecting the carboxyterminal fragment of the protein (Figure 1B). Unfortunately, no live cells were available from this patient.
We next sought to evaluate the oncogenic potential of the identified MYH9::PDGFRB fusion gene using IL-3 dependent mouse pro-B Ba/F3 cells. The full length MYH9::PDGFRB cDNA was amplified and cloned into the retroviral MSCVIRES-GFP expression plasmid and then used to stably transduce Ba/F3 cells. In the absence of IL-3, expression of MYH9::PDGFRB was sufficient to drive cytokine-independent proliferation (Figure 1C). Expression of MYH9::PDGFRB was confirmed at the protein level as well as the constitutive activation of PDGFRB as reflected by high levels of phosphorylation of PDGFRB (Y751) (Online Supplementary Figure S2A). CP-673451 is a commercially available selective PDGFRB inhibitor, which can prevent phosphorylation of the wild-type PDGFRB receptor in the presence of PDGFBB ligand activation (Online Supplementary Figure S2B). We tested whether CP-673451 could also inhibit hyperactivation of the MYH9::PDGFRB fusion. Ba/F3 cells transduced with MYH9::PDGFRB were highly sensitive to CP-673451 (IC50=9.448 nM) compared to the activating JAK3(M511I) mutant control (no PDGFRB, Online Supplementary Figure S2A) that was resistant to CP-673451 (Figure 1D). Treatment also resulted in complete loss of PDGFRB (Y751) phosphorylation (pPDGFRB) and concomitant decrease in downstream STAT5 (Y694) phosphorylation (Figure 1E, F).
MYH9::PDGFRB drives acute leukemia in a murine bone marrow transplant model
Having established that MYH9::PDGFRB can transform pro-B Ba/F3 cells to cytokine-independent growth in vitro, we next used a syngeneic BM transplant model to determine whether the fusion product was also able to transform HSPC in vivo (Figure 2A). HSPC isolated from C57BL/6JAusB donor mice were retrovirally transduced with a vector expressing the MYH9::PDGFRB fusion or the EBF1::PDGFRB fusion, a well-described fusion gene in Philadelphia-like B-cell acute lymphoblastic leukemia.26 Transduced cells were injected into sublethally irradiated female C57BL/6JAusB mice and
Haematologica | 109 May 2024 1375 ARTICLE - Targeting activated PDGFRB in T-ALL and T-LBL S. De Coninck et al.
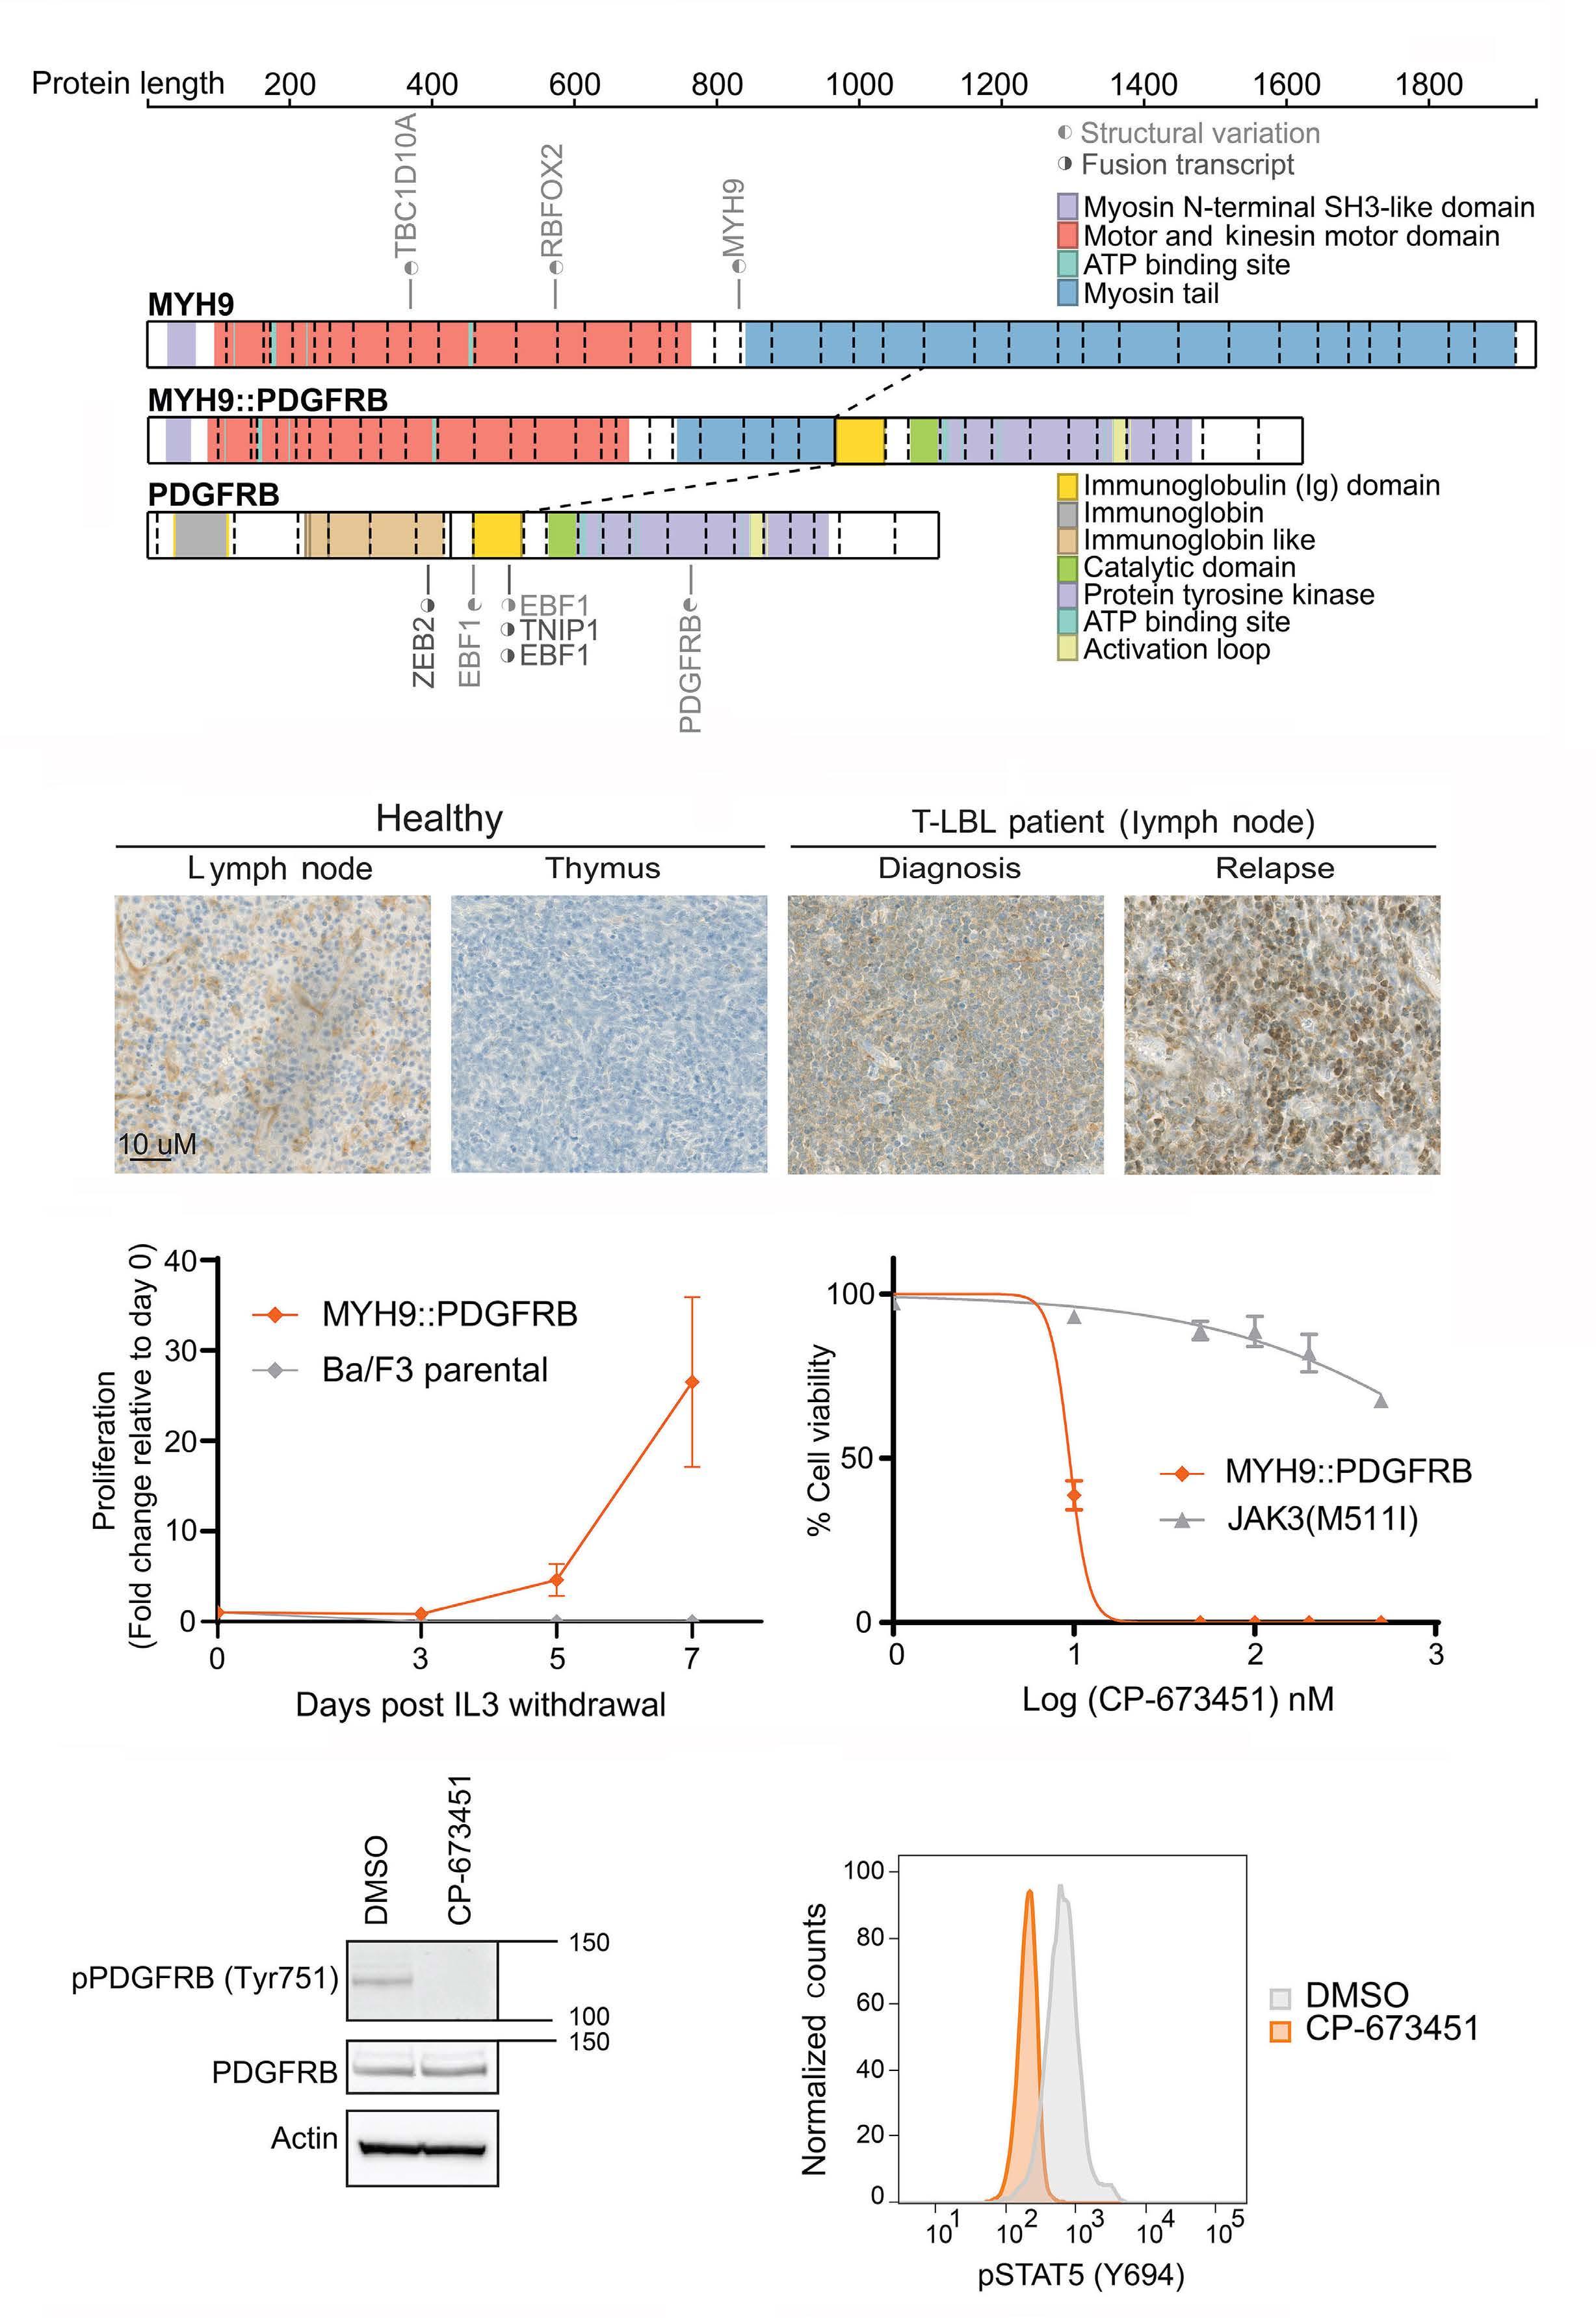
Continued on following page.
Haematologica | 109 May 2024 1376 ARTICLE - Targeting activated PDGFRB in T-ALL and T-LBL S. De Coninck et al.
A B C D E F
Figure 1. A novel MYH9::PDGFRB fusion gene identified in a T-cell lymphoblastic lymphoma patient can transform Ba/F3 cells to cytokine-independent growth. (A) Schematic representation of the novel MYH9::PDGFRB fusion gene identified in a case of pediatric T-cell lymphoblastic lymphoma (T-LBL). The fusion gene consists of exon 1-25 from MYH9 (chromosome 22) linked to exon 10-23 from PDGFRB (chromosome 5). The fusion retains the motor domain and part of the myosin tail from MYH9 and the protein tyrosine kinase domain of PDGFRB. Figure was made using ProteinPaint (SJ-15-0021, St. Jude). (B) Immunohistochemistry for PDGFRB was performed on lymph nodes from the same T-LBL case with the MYH9::PDGFRB fusion gene. Expression of PDGFRB in both diagnostic and relapse sample is compared to healthy tissue (lymph node and thymus). (C) Proliferation of Ba/ F3 cells with or without MYH9::PDGFRB expression following 7 days after IL-3 withdrawal. Proliferation was measured using cell counts. Data show mean ± SEM (Standard Error of Mean) (N=3). (D) Cell viability of Ba/F3 cells expressing MYH9::PDGFRB and JAK3(M511I) treated for 72 hours with the PDGFRB inhibitor CP-673451 (MYH9::PDGFRB IC 50=9.448 nM). Cell viability was measured using cells counts. Data show mean±SEM (N=3). (E) Phosphorylation of PDGFRB (pPDGFRB) at Y751 analyzed using western blotting. MYH9::PDGFRB expressing Ba/F3 cells were treated with 0 or 1 mM CP-673451 for one hour. (F) STAT5 phosphorylation (pSTAT5 (Y694)) flow cytometry analysis of MYH9::PDGFRB expressing Ba/F3 cells treated with DMSO vehicle control or 1 mM CP-673451 for one hour.
monitored over time for the development of leukemia. A fraction of the transduced HSPC were also kept in culture ex vivo, in the absence of cytokines. The GFP+ MYH9::PDGFRB transduced HSPC had a survival advantage compared to non-transduced GFP- cells ex vivo (Online Supplementary Figure S3A). In vivo, the recipient mice initially had an expansion of GFP+ cells characterized by a moderate increase in WBC (Online Supplementary Figure S3B). Five out of 6 MYH9::PDGFRB mice developed either a myeloid (N=3) or T-cell (N=2) proliferative malignancy (Figure 2B, Online Supplementary Table S1), characterized by enlarged spleens and/or thymi (Figure 2C). Immunophenotyping via flow cytometry was performed on infiltrated organs (BM, spleen, thymus), with mice displaying enlarged spleens without thymoma characterized by a major Gr1+CD11b+ myeloid clone, while mice with enlarged spleen and thymoma showed a major single positive CD8 and double positive CD4/CD8 lymphoid clone (Figure 2D; gating strategy illustrated in Online Supplementary Figure S3C).
This is in contrast to the EBF1::PDGFRB mice, of which none of the mice developed leukemia (Figure 2B, Online Supplementary Table S2). Cause of death of these EBF1::PDGFRB mice was unclear. While some of these mice rapidly lost body weight and reached predetermined experimental endpoints, we observed no signs of leukemia or overt pathology at secondary sites, including spleen, liver, or lymph nodes.
Increased PDGFRB expression in T-cell acute lymphoblastic leukemia compared to normal T cells and thymocytes
We next hypothesized that ectopic activation of PDGFRB might occur more generally within T-ALL/T-LBL cases, potentially even in the absence of chromosomal translocations. We first investigated mRNA expression levels of PDGFRB in normal T cells. PDGFRB is expressed at early immature stages in normal T-cell development and decreases after β-selection (Figure 3A). In contrast, analysis of T-ALL patient samples showed robust PDGFRB expression across all subtypes, with significantly higher levels in the TLX3 and HOXA subgroups (Figure 3B). We also screened
a panel of T-ALL cell lines for PDGFRB protein levels using western blot analysis. PDGFRB protein levels correlated nicely with PDGFRB RNA levels. High PDGFRB levels were observed in the T-ALL cell lines CTV-1 and DND-41 alongside the SEM BCP-ALL cell line (Figure 3C). However, only CTV1 and SEM showed phosphorylation and activation of the receptor (Figure 3C). We then extended our analysis to a panel of available T-ALL/T-LBL PDX samples and identified 5 out of 12 with high PDGFRB protein levels: 4 T-ALL PDX and 1 T-LBL. All but one also showed phosphorylation of the receptor (Figure 3D). Whole exome sequencing of PDX samples did not reveal any PDGFRB point mutation that could explain the phosphorylation status of the receptor.
PDGFRB receptor phosphorylation status determines sensitivity to the inhibitor CP-673451
We next determined whether PDGFRB + T-ALL cell lines DND-41 and CTV-1 were sensitive to the selective PDGFRB inhibitor CP-673451. Only CTV-1 was sensitive (IC50 = 230 nM) whilst DND-41 was resistant (IC50 >500 nM), similar to T-ALL cell lines without PDGFRB expression (Figure 4A). Due to limited ex vivo proliferating capacity of some of the PDX samples, we could only use 6 T-ALL/T-LBL PDX for ex vivo drug sensitivity determination. Unfortunately, only one of these ex vivo cultured PDX showed expression and activation of the PDGFRB receptor, T-ALL1 PDX. As was observed for CTV-1, only the T-ALL1 PDX sample with PDGFRB activation was highly sensitive to CP-673451 (T-ALL1 IC50 <5 nM) (Figure 4B). For the other T-ALL PDX with activated PDGFRB that could not be assayed in ex vivo proliferation experiments, downregulation of pPDGFRB after acute PDGFRB inhibition (1 hour, 1 m M CP-673451) was confirmed by western blotting (Online Supplementary Figure S4A). Inhibition of PDGFRB was also associated with loss of downstream signaling, indicated by loss of phosphorylation of PDGFRB (Tyr751), pSTAT3 (Tyr705), pSTAT5 (Tyr694), pGSK3 β (Ser9), and pAKT (Ser473) (Figure 4C, Online Supplementary Figure S4B).
The CTV-1 cell line is resistant to dexamethasone, a key component of induction therapy for T-ALL/T-LBL.7,27-29 The T-LBL patient with MYH9::PDGFRB fusion identified in this
Haematologica | 109 May 2024 1377 ARTICLE - Targeting activated PDGFRB in T-ALL and T-LBL S. De Coninck et al.
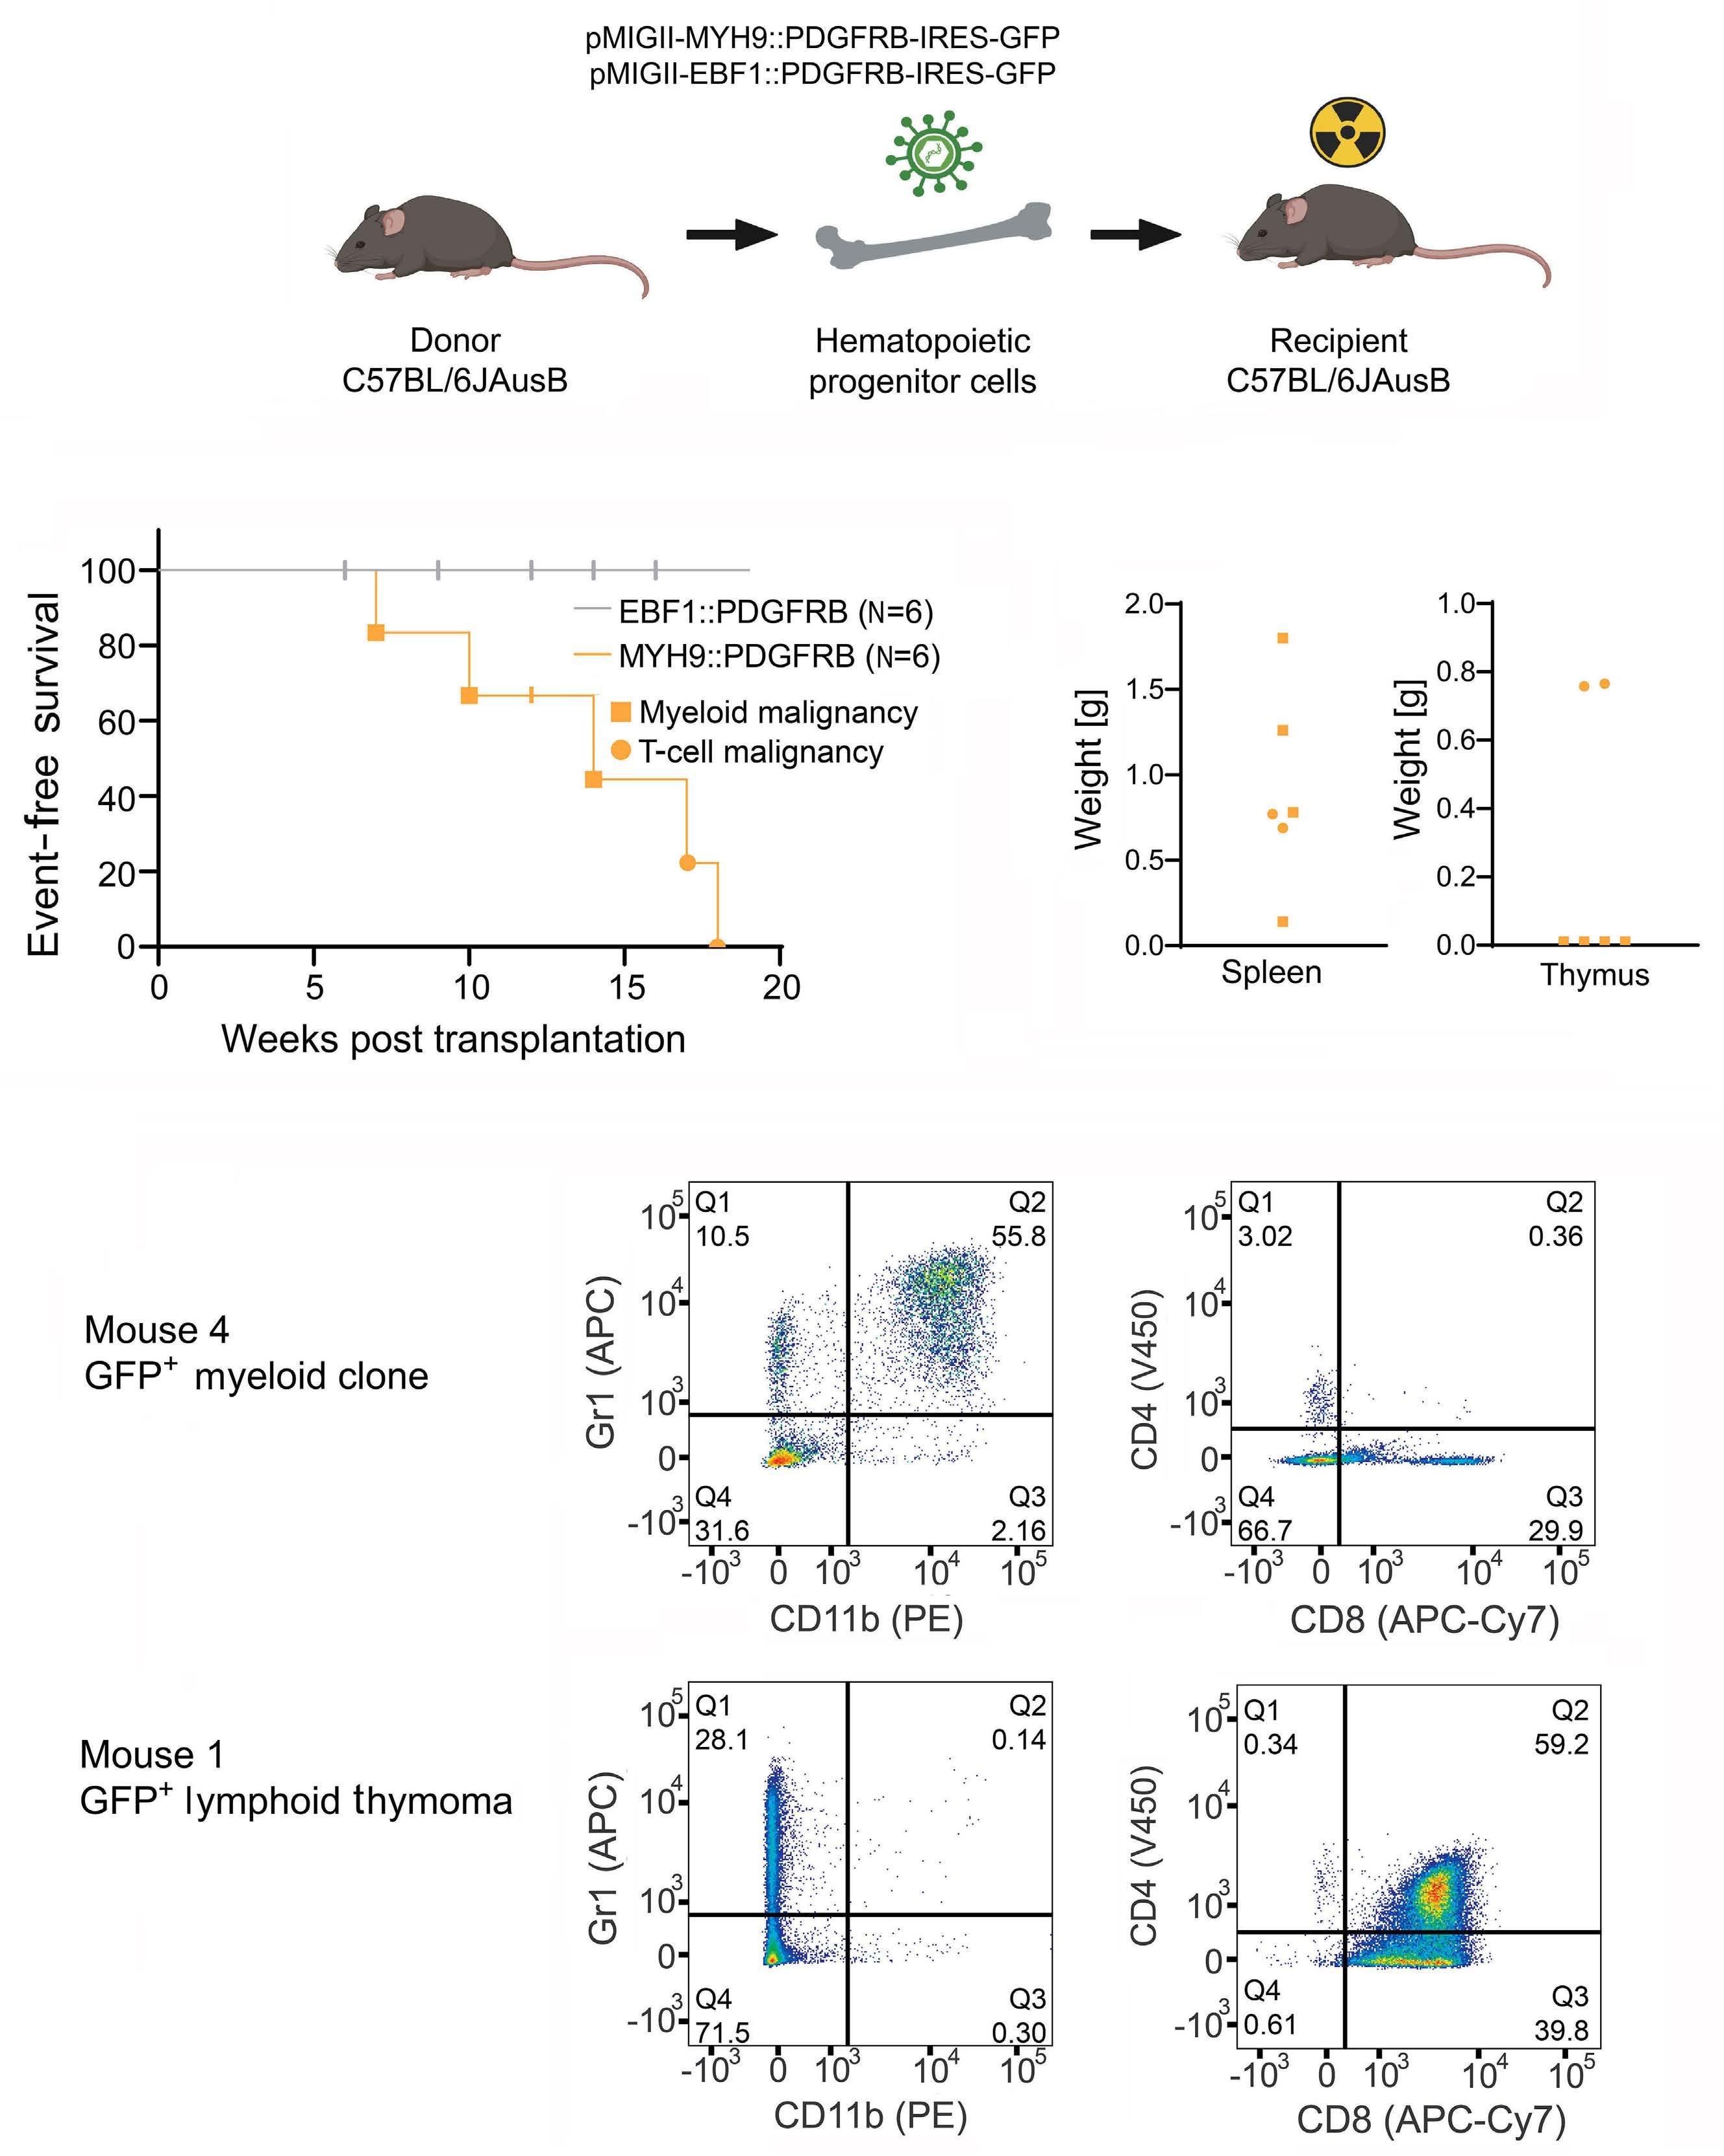
Figure 2. MYH9::PDGFRB drives acute leukemia in a murine bone marrow transplant model. (A) Schematic overview of syngeneic bone marrow transplant model. Created with BioRender.com (B) Kaplan-Meier event-free survival curve of MYH9::PDGFRB (N=6) /EBF1::PDGFRB mice (N=6). (C) Weight of spleen and thymus from MYH9::PDGFRB mice that reached event. (D) Immunophenotyping by flow cytometry of GFP+ cells from infiltrated organs. Representative figures for myeloid clone (spleen from mouse 4) and lymphoid thymoma (thymus from mouse 1).
Haematologica | 109 May 2024 1378 ARTICLE - Targeting activated PDGFRB in T-ALL and T-LBL S. De Coninck et al.
A B D C
study also showed a poor corticosteroid response. Therefore, we next tested whether CP-673451 could act synergistically with dexamethasone. Treatment of CP-673451 in combination with dexamethasone in CTV-1 resulted in strong synergism (Mean Bliss score = 14.66) (Figure 4D).
Taken together, these results show that inhibition of active PDGFRB, alone or in combination with glucocorticoids, results in reduced cell viability in a T-ALL cell line.
Selective inhibition of PDGFRB in vivo results in significant leukemia growth delay
Finally, we evaluated the in vivo potential of PDGFRB inhibition using CP-673451 as a new therapeutic strategy in T-ALL/T-LBL. NSG-SGM3 mice were injected intravenously with T-ALL1 PDX samples with hyperactive PDGFRB signaling. After leukemia initiation, mice were randomized in two groups and treated for two weeks (5 days on / 2 days off)
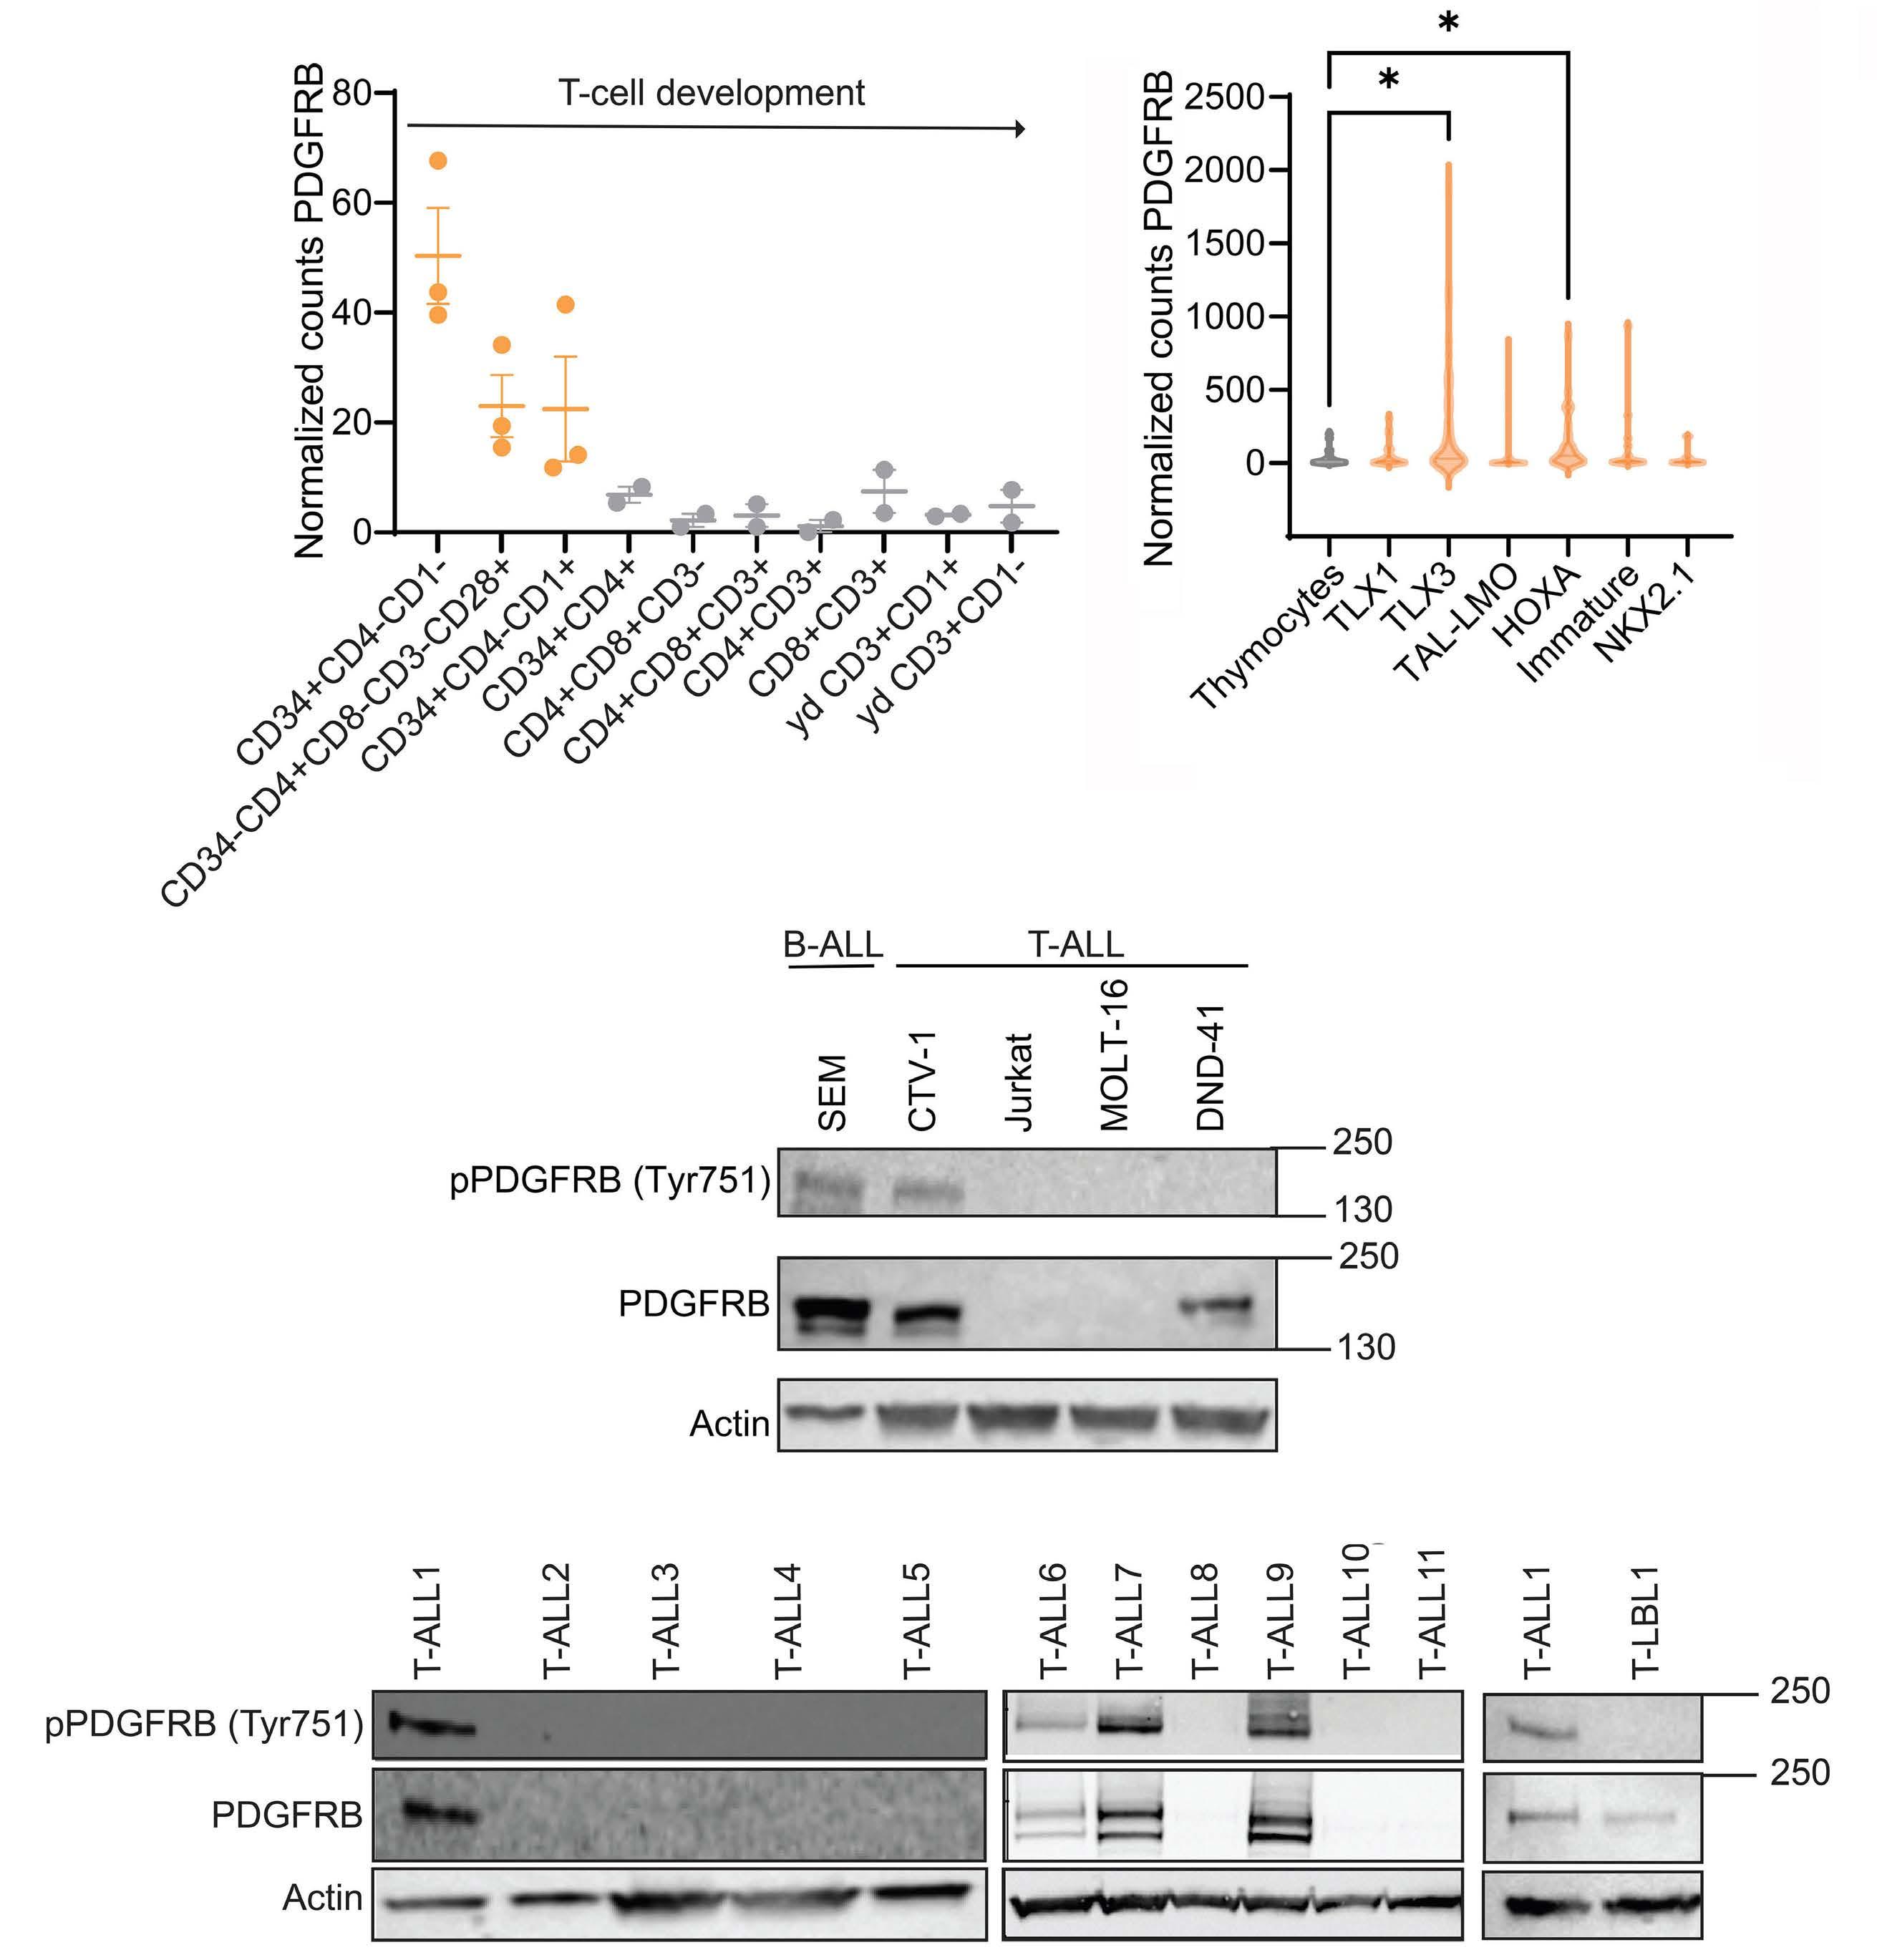
Figure 3. Increased PDGFRB expression in T-cell acute lymphoblastic leukemia compared to normal T cells and thymocytes. (A) Normalized counts of PDGFRB RNA expression in normal T-cell subsets (23 samples). (B) Normalized counts of PDGFRB RNA expression in normal thymocytes versus T-cell acute lymphoblastic leukemia (T-ALL) subgroups (292 samples). (C) (p)PDGFRB (Tyr751) western blot analysis of a panel of T-ALL and B-cell acute lymphoblastic leukemia (B-ALL) cell lines. (D) (p)PDGFRB (Tyr751) western blot analysis of a panel of T-ALL/T-cell lymphoblastic lymphoma (T-LBL) patient-derived xenograft samples. *P<0.05.
Haematologica | 109 May 2024 1379 ARTICLE - Targeting activated PDGFRB in T-ALL and T-LBL S. De Coninck et al.
A B C D
with CP-673451 (20 mg/kg) or vehicle alone (90% PEG300, 10% N-methylpyrrolidone). Mice were sacrificed at the end of the 2-week treatment. PDGFRB inhibition caused a significant delay in leukemia progression and leukemic burden as evaluated by the percentage of hCD45+ cells in PB (Figure 5A) (P<0.01) and BM (Figure 5B) (P<0.0001), as
by spleen weight (Figure 5C) (P<0.0001). The treatment was well tolerated, with no significant differences in loss in body weight between vehicle and treatment group (Online Supplementary Figure S5). These results compellingly show the therapeutic potential of PDGFRB inhibition in T-ALL/TLBL patients with PDGFRB hyperactivation.
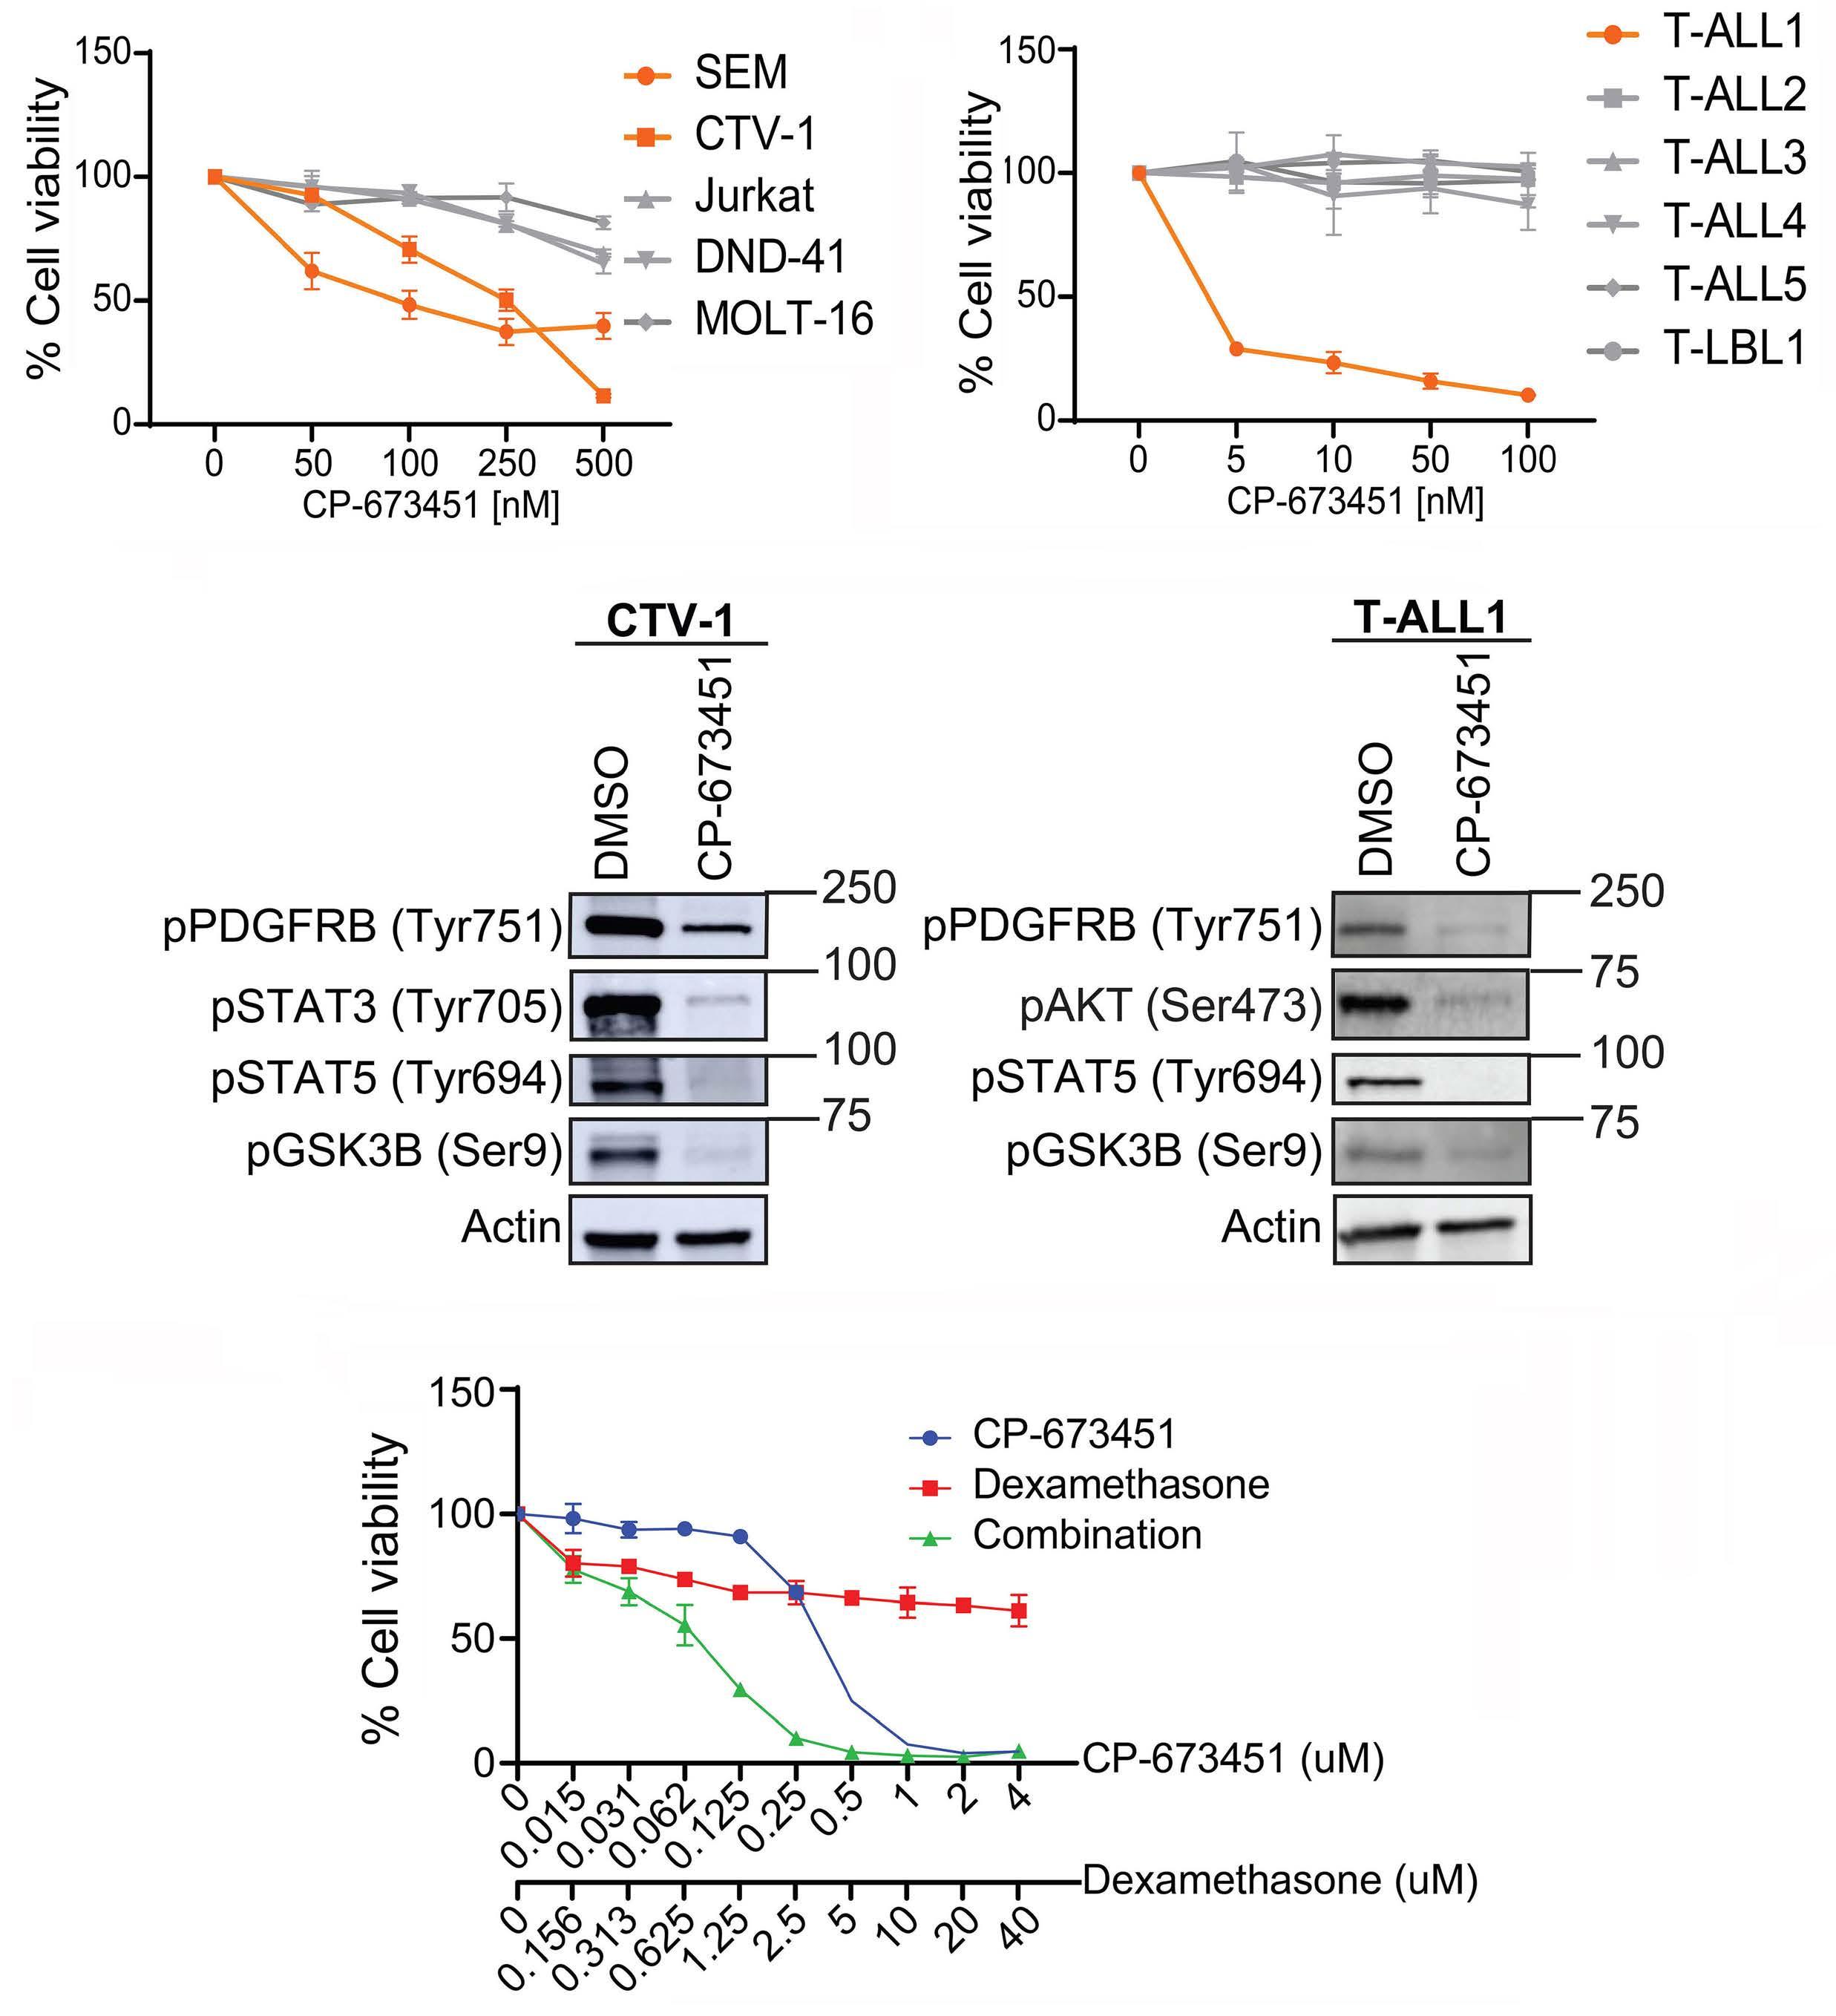
Figure 4. PDGFRB receptor phosphorylation status determines sensitivity to the inhibitor CP-673451. (A) Cell viability assay of a panel of T-cell acute lymphoblastic leukemia (T-ALL) and B-cell acute lymphoblastic leukemia (B-ALL) cell lines treated with CP673451 (0, 50, 100, 250, 500 nM) for 72 hours. Data show mean±Standard Error of Mean (SEM) (N=3). (B) Cell viability assay of a panel of T-ALL/T-cell lymphoblastic lymphoma (T-LBL) patient-derived xenograft (PDX) samples treated with CP-673451 (0, 5, 10, 50, 100 nM) for 72 hours. Data show mean±SEM (N=3). (C) Western blot analysis on CTV-1 and T-ALL1 treated with 0, 10 (TALL-1) or 500 nM (CTV-1) CP-673451 for 72 hours. (D) Cell viability assay on CTV-1 treated with CP-673451 (0 - 0.015 - 0.031 - 0.062 - 0.1250.25 - 0.5 - 1 - 2 - 4 μM) and/or dexamethasone (0 - 0.156 - 0.312 - 0.625 - 1.25 - 2.5 - 5 - 10 - 20 - 40 mM) for 72 hours. Data show mean±SEM (N=3).
Haematologica | 109 May 2024 1380 ARTICLE - Targeting activated PDGFRB in T-ALL and T-LBL S. De Coninck et al.
D C B A
Discussion
Identifying genetic drivers of T-ALL remains a priority for the development of novel targeted therapeutic strategies, especially for those patients with relapsed or refractory disease. In this study, we identified a novel MYH9::PDGFRB fusion gene in a relapsed chemo-resistant T-LBL patient. MYH9 is an evolutionary conserved gene located on chromosome 22 and encodes for the myosin-9 protein, which forms the heavy chain of the cytoplasmic non-muscle myosin IIA3 (NMM IIA).30 MYH9 is an actin binding molecular motor and is involved in cell adhesion, migration, as well as signal transduction.31 It is the only myosin class II protein that is highly expressed in T cells and has been linked to T-cell motility,32 as well as immunological synapses and T-cell activation.33 Fusions involving MYH9 have been found in other disorders and include MYH9::FLT3, 34 MYH9::ROS1, 35 and MYH9::USP6 36 Similarly, PDGFRB fusion proteins have been described in myeloid disorders and myeloid leukemia15,20,37,38 and, indeed, aberrant expression of this receptor tyrosine kinase has been described in several cancer entities.39,40 In our study, we demonstrate that this new MYH9::PDGFRB fusion has oncogenic capacity both in vitro to drive cytokine-independent growth and in vivo to drive leukemia using a BMT model. Mechanistically, PDGFRB fusions require oligomerization domains present in the fusion partners for their constitutive activation.26 In the MYH9::PDGFRB fusion described here, exons 1-25 of MYH9 are retained, which includes the coiled coil regions on the myosin tail that are speculated to promote dimerization within the cytoplasm rather than at the plasma membrane.30 However, our in vivo BM transplant model also supports a model where the fusion partner of PDGFRB provides an important cellular context in addition to oligomerization, with
B
marked differences in leukemogenic potential between EBF1::PDGFRB and MYH9::PDGFRB fusions, with only the latter resulting in mice developing a mixed phenotype proliferative disorder/leukemia. Of note, an alternative activation mechanism for a PDGFRB fusion was also recently demonstrated with an out of frame CD74::PDGFRB fusion resulting in the expression of a ‘loose’ kinase that equally caused leukemic transformation.38 Besides the reported rare PDGFRB translocations and fusion products, recurrent activating point mutations in PDGFRB have not been described in T-ALL/T-LBL patients. Nevertheless, we observed that 4 out of the 12 (33%) analyzed PDX samples have hyperactive PDGFRB signaling. More research will be necessary to resolve how the pathway is activated in these patients. Based on our RNA expression data ( data not shown ), we did not observe autocrine expression of PDGF ligands in T-ALL cell lines, T-ALL patients, or PDX samples. Also, the ex vivo effects of PDGFRB inhibition were observed in the absence of paracrine stimulation. Of note, we have generated transgenic mice with conditional overexpression of the wild-type PDGFRB receptor. Although gain of Pdgfrb expression was confirmed at the RNA and protein level, this was not sufficient to hyperactivate the pathway ( Online Supplementary Figure S6 ). When intercrossed with Pten conditional knockout mice, a spontaneous T-ALL mouse model, also no effects of wild-type PDGFRB overexpression were seen on T-ALL latency. Our combined results indicate that hyperactivation of the PDGFRB pathway in T-ALL is cell-intrinsic and independent of the presence of ligands. Possible mechanisms of activation include crosstalk between other signaling pathways such as NRP1,41 downregulation of PDGFRB inhibitors,42 and upregulation of the dephosphorylator SHP-2.43
We show that the PDGFRB is active via phosphorylation
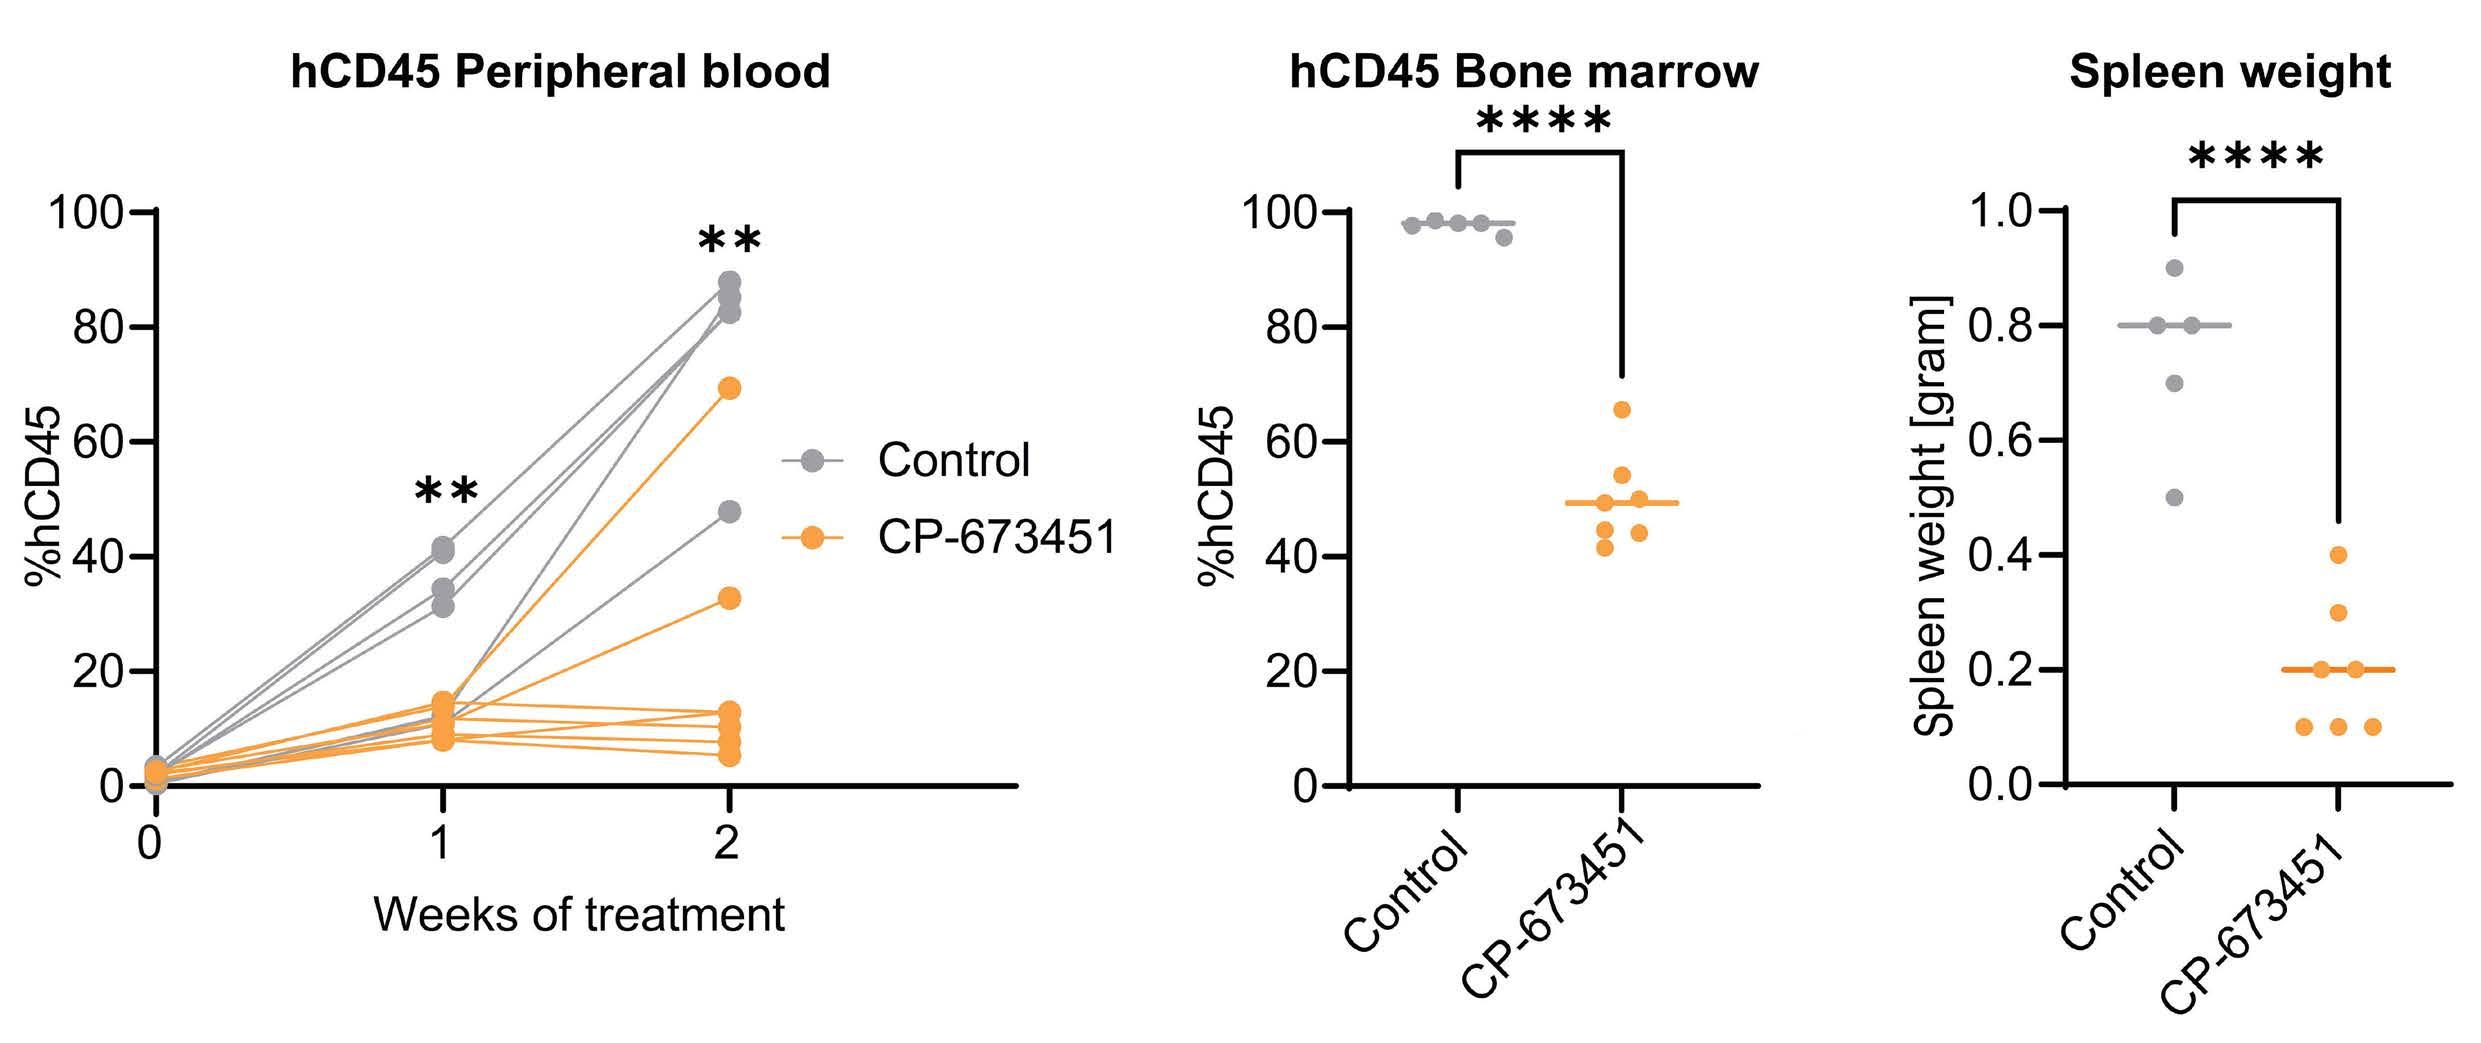
Figure 5. Selective inhibition of PDGFRB in vivo results in significant leukemia growth delay. (A) % hCD45+ cells in peripheral blood at start of treatment (week 0), 1 and 2 weeks after start of treatment analyzed using flow cytometry. (B) % hCD45+ cells in bone marrow at end of treatment (2 weeks) analyzed using flow cytometry. (C) Spleen weight at end of treatment (2 weeks). **P<0.01, ****P<0.0001.
Haematologica | 109 May 2024 1381 ARTICLE - Targeting activated PDGFRB in T-ALL and T-LBL S. De Coninck et al.
A
C
at residue 751 in 4 T-ALL PDX samples and is decreased upon treatment with the PDGFRB inhibitor CP-673451. Evaluation of the pPDGFRB levels on primary patient material may be an efficient biomarker to predict sensitivity towards CP-673451. In the clinic, patients with PDGFRB rearrangements have been found to be refractory to conventional chemotherapy providing support for using PDGFRB inhibitors in the clinic.17-19 In general, the multikinase inhibitors sunitinib and dasatinib have been used to block PDGFRB, but these also block SRC family kinases (SRC, LCK, YES, FYN), c-KIT and EPHA2, and can, therefore, cause unwanted side effects such as cardiac toxicity.44,45 CP-673451 is a selective PDGFRB inhibitor with a 10-fold higher selectivity for PDGFRB than PDGFRA. It is also >200-fold more selective for PDGFRB compared to other tyrosine kinase receptors including C-KIT, VEGFR2, EGFR and SRC. The adenine group of CP-673451 binds the ATP binding pocket of PDGFRB and prevents enzymatic activation upon ligand binding.46 This inhibitor has already been shown to be effective in several types of cancers, including lung cancer,47,48 sarcoma, 39 and glioblastoma.49 Here we showed that CP-673451 was able to slow leukemic growth in vitro but only on cells that had active pPDGFRB present. We provide evidence that CP-673451 was able to slow leukemia growth of a PDX in vivo as a single agent. However, the small molecule CP-673451 is still considered a tool compound and requires improved pharmacokinetics prior to its potential use for PDGFRB inhibition in T-ALL/T-LBL patients. Other less selective but clinically approved PDGFRB inhibitors, such as imatinib, could be used to rapidly translate our research results into clinical applications.
Although we do see a significant therapeutic effect of PDGFRB inhibition on the in vivo leukemic burden, 2 out of the 6 CP-673451 treated PDX animals showed increased leukemia progression at the end of the two weeks of treatment. Potentially, these leukemic animals rapidly acquire resistance to the monotherapy, and this would suggest that PDGFRB inhibition would best be combined with other T-ALL therapeutics, e.g., glucocorticoids or L-asparaginase. Indeed, glucocorticoid resistance remains a major problem in T-ALL/T-LBL patients, and we showed here that CP-673451 was also able to restore glucocorticoid sensitivity.
Using phosphoproteomics to identify activated signaling pathways in T-ALL has recently been suggested as a profiling strategy to identify targeted kinase inhibitor therapies. 50 Our data indicate that phosphorylation of PDGFRB may be a feature of a subgroup of T-ALL, potentially in the absence of activating fusions. This lends further support to the idea that phosphoproteomic analysis of patient samples could identify targetable kinases and combi -
nation treatment strategies, 51 particularly as preclinical testing of new, specific, small molecule inhibitors have promising activity in T-ALL samples. 52 Our study shows that PDGFRB activation can be therapeutically targeted by the PDGFRB inhibitor CP-673451 in T-ALL/T-LBL. In addition, our work suggests that phosphorylated PDGFRB could serve as a valuable biomarker to identify patients that could benefit from PDGFRB inhibition.
Disclosures
No conflicts of interest to disclose.
Contributions
SDC, RDS, CEdB, SG and PVV are responsible for study concept. BP is responsible for methodology. SDC is responsible for formal analysis. SDC, RDS, BL, LR, HJK, AR, JR and MvdL are responsible for the investigation. LB, NVR, JV, RBL, PN, FvD, MM, TP, TL and BDM are responsible for resources. SDC is responsible for data curation. SDC, TL, CEdB and SG wrote the original draft. SDC, RDS, BL, LR, HJK, AR, LB, NVR, BP, MVdL, JV, RBL, PN, FvD, MM, TL, BDM, CEdB and SG wrote, reviewed and edited the manuscript. SDC and BP are responsible for visualization. CEdB, SG and PVV supervised the study. SDC, SG and PVV are responsible for project administration. SG and PVV are responsible for funding acquisition. All authors have read and agreed to the published version of the manuscript.
Acknowledgments
We would like to thank Professor Richard B. Lock for providing T-ALL PDX samples. We also thank Prof. Paul Ekert and Prof. Kris Gevaert for constructive discussions and proofreading the manuscript.
Funding
The Van Vlierberghe, Goossens and Ntziachristos laboratories are supported by the Research Foundation Flanders (FWO-G0F4721N, SBO-S002322N), Ghent University, a Flanders interuniversity consortium grant (BOF23/IBF/042) and Cancer Research Institute Ghent (CRIG) partnership grant. The computational resources and services used in this work were provided by the VSC (Flemish Supercomputers Center), funded by the Research Foundation-Flanders (FWO). MRM is funded by the Great Ormond Street Childrens Charity. The de Bock laboratory is supported by the Children’s Cancer Institute Team Leader funds, UNSW RIS grant RG213825-C, NHMRC Ideas grant APP1181666. This work was supported in part by vzw Kinderkankerfonds (grant to TL).
Data-sharing statement
Data related to the study are available on request.
Haematologica | 109 May 2024 1382 ARTICLE - Targeting activated PDGFRB in T-ALL and T-LBL S. De Coninck et al.
References
1. Lepretre S, Graux C, Touzart A, Macintyre E, Boissel N. Adult T-type lymphoblastic lymphoma: treatment advances and prognostic indicators. Exp Hematol. 2017;51:7-16.
2. Burkhardt B, Mueller S, Khanam T, Perkins SL. Current status and future directions of T-lymphoblastic lymphoma in children and adolescents. Br J Haematol. 2016;173(4):545-559.
3. Iacobucci I, Mullighan CG. Genetic basis of acute lymphoblastic leukemia. J Clin Oncol. 2017;35(9):975-983.
4. JE YL, Shao Y, Maciaszek J, et al. The genomic landscape of pediatric and young adult T-lineage acute lymphoblastic leukemia. Nat Genet. 2017;49(8):1211-1220.
5. Jabbour E, O’Brien S, Konopleva M, Kantarjian HM. New insights into the pathophysiology and therapy of adult acute lymphoblastic leukemia. Cancer. 2015;121(15):2517-2528.
6. Hofmans M, Suciu S, Ferster A, et al. Results of successive EORTC-CLG 58 881 and 58 951 trials in paediatric T-cell acute lymphoblastic leukaemia (ALL). Br J Haematol. 2019;186(5):741-753.
7 Bassan R, Bourquin JP, DeAngelo DJ, Chiaretti S. New approaches to the management of adult acute lymphoblastic leukemia. J Clin Oncol. 2018;36(35):3504-3519.
8. Cordo V, van der Zwet JCG, Canté-Barrett K, Pieters R, Meijerink JPP. T-cell acute lymphoblastic leukemia: a roadmap to targeted therapies. Blood Cancer Discov. 2021;2(1):19-31.
9. Girardi T, Vicente C, Cools J, De Keersmaecker K. The genetics and molecular biology of T-ALL. Blood Cancer Discov. 2017;129(9):1113-1123.
10. Maude SL, Dolai S, Delgado-Martin C, et al. Efficacy of JAK/STAT pathway inhibition in murine xenograft models of early T-cell precursor (ETP) acute lymphoblastic leukemia. Blood Cancer Discov. 2015;125(11):1759-1767.
11. Graux C, Cools J, Melotte C, et al. Fusion of NUP214 to ABL1 on amplified episomes in T-cell acute lymphoblastic leukemia. Nat Genet. 2004;36(10):1084-1089.
12. Quintás-Cardama A, Tong W, Manshouri T, et al. Activity of tyrosine kinase inhibitors against human NUP214-ABL1-positive T cell malignancies. Leukemia. 2008;22(6):1117-1124.
13. Deenik W, Beverloo HB, van der Poel-va Luytgaarde SCPAM, et al. Rapid complete cytogenetic remission after upfront dasatinib monotherapy in a patient with a NUP214-ABL1positive T-cell acute lymphoblastic leukemia. Leukemia. 2009;23(3):627-629.
14 Shi Y, Beckett MC, Blair HJ, et al. Phase II-like murine trial identifies synergy between dexamethasone and dasatinib in T-cell acute lymphoblastic leukemia. Haematologica. 2021;106(4):1056-1066.
15. Demoulin JB, Montano-Almendras CP. Platelet-derived growth factors and their receptors in normal and malignant hematopoiesis. Am J Blood Res. 2012;2(1):44-56.
16. Rogers MA, Fantauzzo KA. The emerging complexity of PDGFRs: activation, internalization and signal attenuation. Biochem Soc Trans. 2020;48(3):1167-1176.
17. Shah KP, Carrol CM, Mosse C, Yenamandra A, Borinstein SC. Sustained remission in a patient with PDGFR-beta-rearranged T-lymphoblastic lymphoma and complete remission with dasatinib. Pediatr Blood Cancer. 2020;67(1):e28026.
18. Heilmann AM, Schrock AB, He J, et al. Novel PDGFRB fusions in childhood B- and T-acute lymphoblastic leukemia. Leukemia. 2017;31(9):1989-1992.
19 Zabriskie MS, Antelope O, Verma AR, et al. A novel AGGF1-
PDGFRb fusion in pediatric T-cell acute lymphoblastic leukemia. Haematologica. 2018;103(2):87-91.
20. Di Giacomo D, Quintini M, Pierini V, et al. Genomic and clinical findings in myeloid neoplasms with PDGFRB rearrangement. Ann Hematol. 2022;101(2):297-307.
21. de Vree PJP, de Wit E, Yilmaz M, et al. Targeted sequencing by proximity ligation for comprehensive variant detection and local haplotyping. Nat Biotechnol. 2014;32(10):1019-1025.
22. Van Thillo Q, De Bie J, Seneviratne JA, et al. Oncogenic cooperation between TCF7-SPI1 and NRAS(G12D) requires β-catenin activity to drive T-cell acute lymphoblastic leukemia. Nat Commun. 2021;12(1):4164.
23. Lock RB, Liem N, Farnsworth ML, et al. The nonobese diabetic/ severe combined immunodeficient (NOD/SCID) mouse model of childhood acute lymphoblastic leukemia reveals intrinsic differences in biologic characteristics at diagnosis and relapse. Blood. 2002;99(11):4100-4108.
24. Townsend EC, Murakami MA, Christodoulou A, et al. The public repository of xenografts enables discovery and randomized phase II-like trials in mice. Cancer Cell. 2016;29(4):574-586.
25. Fernandez-Prado R, Carriazo-Julio SM, Torra R, Ortiz A, PerezGomez MV. MYH9-related disease: it does exist, may be more frequent than you think and requires specific therapy. Clin Kidney J. 2019;12(4):488-493.
26. Welsh SJ, Churchman ML, Togni M, Mullighan CG, Hagman J. Deregulation of kinase signaling and lymphoid development in EBF1-PDGFRB ALL leukemogenesis. Leukemia. 2017;32(1):38-48.
27. De Smedt R, Morscio J, Goossens S, Van Vlierberghe P. Targeting steroid resistance in T-cell acute lymphoblastic leukemia. Blood Rev. 2019;38:100591.
28. Inaba H, Mullighan CG. Pediatric acute lymphoblastic leukemia. Haematologica. 2020;105(11):2524-2539.
29 Marks DI, Rowntree C. Management of adults with T-cell lymphoblastic leukemia. Blood. 2017;129(9):1134-1142.
30 Pecci A, Ma X, Savoia A, Adelstein RS. MYH9: structure, functions and role of non-muscle myosin IIA in human disease. Gene. 2018;664:152-167.
31. Asensio-Juárez G, Llorente-Gonzalez C, Vicente-Manzanares M. Linking the landscape of MYH9-related diseases to the molecular mechanisms that control non-muscle myosin II-A function in cells. Cells. 2020;9(6):1458.
32. Jacobelli J, Chmura SA, Buxton DB, Davis MM, Krummel MF. A single class II myosin modulates T cell motility and stopping, but not synapse formation. Nat Immunol. 2004;5(5):531-538.
33. Kumari S, Vardhana S, Cammer M, et al. T lymphocyte myosin IIA is required for maturation of the immunological synapse. Front Immunol. 2012;3:230.
34 Clark EE, Walton M, Chow LML, Boyd JT, Yohannan MD, Arya S. Disseminated juvenile xanthogranuloma with a novel MYH9FLT3 fusion presenting as a blueberry muffin rash in a neonate. AJP Rep. 2023;13(1):e5-e10.
35. Tsuda T, Takata N, Hirai T, Masaki Y, Ishizawa S, Taniguchi H. Rare MYH9-ROS1 fusion gene-positive lung adenocarcinoma showing response to entrectinib treatment: a case study. Case Rep Oncol. 2022;15(1):376-381.
36. Pižem J, Matjašic A, Zupan A, Luzar B, Šekoranja D, Dimnik K. Fibroma of tendon sheath is defined by a USP6 gene fusionmorphologic and molecular reappraisal of the entity. Mod Pathol. 2021;34(10):1876-1888.
37. Andrae J, Gallini R, Betsholtz C. Role of platelet-derived growth
Haematologica | 109 May 2024 1383 ARTICLE - Targeting activated PDGFRB in T-ALL and T-LBL S. De Coninck et al.
factors in physiology and medicine. Genes Dev. 2008;22(10):1276-1312.
38. Sadras T, Jalud FB, Kosasih HJ, et al. Unusual PDGFRB fusion reveals novel mechanism of kinase activation in Ph-like B-ALL. Leukemia. 2023;37(4):905-909.
39. Ehnman M, Missiaglia E, Folestad E, et al. Distinct effects of ligand-induced PDGFRα and PDGFRβ signaling in the human rhabdomyosarcoma tumor cell and stroma cell compartments. Cancer Res. 2013;73(7):2139-2149.
40 Mazzu YZ, Hu Y, Shen Y, Tuschl T, Singer S. miR-193b regulates tumorigenesis in liposarcoma cells via PDGFR, TGFβ, and Wnt signaling. Sci Rep. 2019;9(1):3197.
41. Rizzolio S, Tamagnone L. Neuropilins as signaling hubs, controlling tyrosine kinases and other cell surface receptors. In: The neuropilins: role and function in health and disease; 2017: p. 23-39. https://doi.org/10.1007/978-3-319-48824-0_3 Accessed August 2023.
42. Chen D, Li Y, Mei Y, et al. miR-34a regulates mesangial cell proliferation via the PDGFR-β/Ras-MAPK signaling pathway. Cell Mol Life Sci. 2014;71(20):4027-4042.
43. Pandey P, Khan F, Upadhyay TK, Seungjoon M, Nyeo Park M, Kim B. New insights about the PDGF/PDGFR signaling pathway as a promising target to develop cancer therapeutic strategies. Biomed Pharmacother. 2023;161:114491.
44. Liu Y, Li Y, Wang Y, et al. Recent progress on vascular endothelial growth factor receptor inhibitors with dual targeting capabilities for tumor therapy. J Hematol Oncol. 2022;15(1):89.
45. Chintalgattu V, Rees ML, Culver JC, et al. Coronary microvascular pericytes are the cellular target of sunitinib malate induced cardiotoxicity. Sci Transl Med. 2013;5(187):187ra69.
46. Roberts WG, Whalen PM, Soderstrom E, et al. Antiangiogenic and antitumor activity of a selective PDGFR tyrosine kinase inhibitor, CP-673,451. Cancer Res. 2005;65(3):957-966.
47. Yin L, He J, Xue J, et al. PDGFR-β inhibitor slows tumor growth but increases metastasis in combined radiotherapy and Endostar therapy. Biomed Pharmacother. 2018;99:615-621.
48. Xi Y, Chen M, Liu X, Lu Z, Ding Y, Li D. CP-673451, a platelet-derived growth-factor receptor inhibitor, suppresses lung cancer cell proliferation and migration. Onco Targets Ther. 2014;7:1215-1221.
49 Lane R, Cilibrasi C, Chen J, et al. PDGF-R inhibition induces glioblastoma cell differentiation via DUSP1/p38MAPK signalling. Oncogene. 2022;41(19):2749-2763.
50 Cordo V, Meijer MT, Hagelaar R, et al. Phosphoproteomic profiling of T cell acute lymphoblastic leukemia reveals targetable kinases and combination treatment strategies. Nat Commun. 2022;13(1):1048.
51. van der Zwet JCG, Cordo V, Canté-Barrett K, Meijerink JPP. Multi-omic approaches to improve outcome for T-cell acute lymphoblastic leukemia patients. Adv Biol Regul. 2019;74:100647.
52. Yoshimura S, Panetta JC, Hu J, et al. Preclinical pharmacokinetic and pharmacodynamic evaluation of dasatinib and ponatinib for the treatment of T-cell acute lymphoblastic leukemia. Leukemia. 2023;37(6):1194-1203.
Haematologica | 109 May 2024 1384 ARTICLE - Targeting activated PDGFRB in T-ALL and T-LBL S. De Coninck et al.
Impact of inotuzumab ozogamicin on outcome in relapsed or refractory acute B-cell lymphoblastic leukemia patients prior to allogeneic hematopoietic stem cell transplantation and risk of sinusoidal obstruction syndrome/venous occlusive disease
Sabine Kayser,1,2 Chiara Sartor,3 Fabio Giglio,4,5 Alessandro Bruno,4 Jonathan Webster,6 Patrizia Chiusolo,7,8 Francesco Saraceni,9 Selene Guerzoni,9 Lara Pochintesta,10 Erika Borlenghi,11 Giovanni Marconi,12 Irene Zacheo,12 Marco Cerrano,13 Prassede Salutari,14 Francesco Restuccia,14 Mariachiara Abbenante,15 Mark J. Levis,6 Richard F. Schlenk2,16# and Cristina Papayannidis17#
1Institute of Transfusion Medicine and Immunology, Medical Faculty Mannheim, Heidelberg University, German Red Cross Blood Service Baden-Württemberg-Hessen, Mannheim, Germany; 2NCT Trial Center, National Center of Tumor Diseases, German Cancer Research Center (DKFZ), Heidelberg, Germany; 3Istituto di Ematologia “Seràgnoli”, Bologna, Italy; 4Hematology and Bone Marrow Transplantation Unit, IRCCS San Raffaele Scientific Institute, Milano, Italy; 5Onco-Hematology Division, IEO European Institute of Oncology IRCCS, Milano, Italy; 6Sidney Kimmel Comprehensive Cancer Center, Johns Hopkins University, Baltimore, MD, USA; 7Sezione di Ematologia, Dipartimento di Scienze Radiologiche ed Ematologiche, Università Cattolica del Sacro Cuore, Roma, Italy; 8Dipartimento di Diagnostica per Immagini, Radioterapia Oncologica ed Ematologia, Fondazione Policlinico A. Gemelli IRCCS, Roma, Italy; 9Department of Hematology and Bone Marrow Transplantation, Azienda OspedalieroUniversitaria delle Marche, Ancona, Italy; 10Hematology and Bone Marrow Transplant (BMT) Unit, “Guglielmo da Saliceto” Piacenza Hospital, Piacenza, Italy; 11Department of Hematology, ASST Spedali Civili, Brescia, Italy; 12Hematology Unit, IRCCS Istituto Romagnolo Per Lo Studio Dei Tumori (IRST) “Dino Amadori”, Meldola, Italy; 13Department of Oncology, Division of Hematology, Presidio Molinette, AOU Città della Salute e della Scienza, Torino, Italy; 14Azienda USL di Pescara, Pescara, Italy; 15Hematology Unit, IRCCS “Casa Sollievo della Sofferenza”, San Giovanni Rotondo, Foggia, Italy; 16Department of Internal Medicine V, University Hospital Heidelberg, Heidelberg, Germany and 17IRCCS Azienda OspedalieroUniversitaria di Bologna, Istituto di Ematologia “Seràgnoli”, Bologna, Italy
#RFS and CP contributed equally as senior authors.
Abstract
Correspondence: S. Kayser s.kayser@dkfz-heidelberg.de
Received: September 25, 2023.
Accepted: November 24, 2023. Early view: December 7, 2023.
https://doi.org/10.3324/haematol.2023.284310
©2024 Ferrata Storti Foundation
Published under a CC BY-NC license
We evaluated 58 patients with relapsed or refractory (r/r) acute B-lymphoblastic leukemia (B-ALL; median age 42.5 years; range, 16-69 years), treated with inotuzumab ozogamicin (INO) between 2016-2022 and who received an allogeneic hematopoietic stem cell transplantation (allo-HCT) consecutively. Forty-seven (81%) of the 58 patients were heavily pretreated receiving intensive chemotherapy +/- tyrosine kinase inhibitor, blinatumomab in 24 (41%) and allo-HCT at first-line in 11 (19%) patients. Complete remission rate prior to allo-HCT was 84%. Median follow-up was 30.5 months and median overall survival (OS) measured from start of INO was 11.2 months. One- and 2-year OS rates were 50% (95% confidence interval [CI]: 38.4-56.1) and 36.7% (95% CI: 25.5-52.9), respectively. Sinusoidal obstruction syndrome/venous occlusive disease (SOS/ VOD) after allo-HCT occurred in 17 (29%) patients. Of those, nine (53%) patients died due to SOS/VOD and multi-organ failure. Two had received >2 INO cycles (3 cycles, 5 cycles, N=1, each), all others ≤2 INO cycles prior to allo-HCT. Logistic regression analysis revealed conditioning with double alkylators (P=0.038) and allo-HCT during first-line therapy (P=0.050)
Haematologica | 109 May 2024 1385 - Acute Lymphoblastic Leukemia ARTICLE
as significant risk factors for SOS/VOD and in trend allo-HCT ≤60 days from last INO application (P=0.07), whereas number of INO cycles before allo-HCT and time between last INO application and allo-HCT were not significant. Relapse/progressive disease occurred in 20 (34%) patients. Of those, five (25%) patients are still alive, whereas 15 succumbed of their disease. Treatment with INO seems to be an effective approach with successful bridge-to-transplant. However, risk of SOS/VOD is high, necessitating continuous monitoring and recognition of SOS/VOD risk factors.
Introduction
Refractory/relapsed (r/r) B-cell acute lymphoblastic leukemia (B-ALL) in adults has a dismal prognosis, with less than 10% of patients being long-term survivors.1 At present, allogeneic hematopoietic stem cell transplantation (allo-HCT) is considered the only curative option for patients with r/r B-ALL with best outcomes achieved after effective salvage re-induction therapy and transplantation in complete remission (CR) without measurable residual disease (MRD).2,3 The role of novel immune-based chimeric antigen receptor (CAR) T-cell infusions in this setting has remained undefined.4-6 Although conventional salvage chemotherapy is capable of inducing CR rates of 18% to 44% in patients with r/r B-ALL,7-13 antibody-based strategies using inotuzumab ozogamicin (INO) or blinatumomab have been proved to be more effective.14,15 INO is a humanized anti-CD22 monoclonal antibody conjugated to the potent cytotoxic agent calicheamicin, which was developed as a targeted therapy for B-cell malignancies.16,17 Upon binding to CD22 and internalization, calicheamicin is off-set and binds to the DNA, thereby leading to double-strand breaks and apoptosis.16,17 The phase III INO-VATE trial demonstrated superior efficacy of INO as compared to standard of care (SoC) treatment for r/r B-ALL, inducing CR or CR with incomplete hematological recovery (CRi) in 80.7% versus 29.4% of the patients (P<0.001), respectively.15 Additionally, the rate of MRD negativity (0.01% marrow blasts assessed at a central laboratory with the use of multicolor, multiparameter flow cytometry) in patients with CR/CRi was significantly higher after treatment with INO as compared to SoC (78.4% vs. 28.1%; P<0.001). After INO treatment, 41% of patients proceeded directly to allo-HCT as compared to 11% after SoC (P<0.001). Median progression-free survival was significantly longer after INO as compared to SoC (5.0 months vs. 1.8 months; P<0.001). Median overall survival (OS) was 7.7 months after INO as compared to 6.2 months after SoC, and the 2-year OS rates were 23% versus 10%, respectively.15 Taken together, deep remissions with MRD-negative status can be achieved with INO treatment in patients with r/r B-ALL. Nevertheless, remissions are not durable, necessitating further consolidation approaches, such as allo-HCT. Sinusoidal obstruction syndrome (SOS), previously known as veno-occlusive disease (VOD), is a potentially life-threatening complication of allo-HCT.18 Rates of SOS/VOD may be further increased after pretreatment with INO.19 Within
the INO-VATE trial, the most frequent grade 3 or higher non-hematologic adverse events after INO were liver-related.15 Of the 77 patients who received INO and proceeded to allo-HCT, 17 (22%) had SOS/VOD; of those, five events were fatal. Of 32 patients who received SoC and proceeded to HSCT, one (3%) experienced SOS/VOD that was ongoing at the time of death due to septic shock.20
The objectives of our study were to characterize a series of adult r/r B-ALL patients and evaluate outcome after treatment with INO with a particular focus on risk of SOS/VOD.
Methods
Information on 58 patients (adolescent N=1; adult N=57) (median age, 42.5 years; range, 16-69 years) with histologically confirmed r/r B-ALL, who were treated with INO between 2016 and 2022 within a compassionate use program (N=7) or in-label after approval by the Food and Drug Administration (FDA) or the European Medical Agency (EMA) (N=51) was collected from eleven institutions in the US and Europe. All 58 patients were CD22-positive at relapse/progressive disease.
Participating centers were chosen upon network relationships of the first and last author. Detailed case report forms (including information on baseline characteristics, chemotherapy, allo-HCT, response, and survival) were collected from all participating centers. Inclusion criteria were adult r/r B-ALL patients and treatment with INO prior to allo-HCT. All patients who fulfilled these criteria were included by the participating institutions. Chromosome banding was performed using standard techniques, and karyotypes were described according to the International System for Human Cytogenetic Nomenclature.21 Flow cytometry and quantitative polymerase chain reaction (qPCR) of leukemia-specific rearrangements of BCR::ABL1 transcript levels were used to monitor MRD. Data collection and analyses were approved by the Institutional Review Boards of the participating centers.
Statistical analyses
Comparisons of patient characteristics were performed with the Kruskal-Wallis rank sum test for continuous variables and Fisher’s exact test for categorical variables. In order to identify prognostic variables with respect to occurrence of SOS/VOD after allo-HCT logistic regression models were used. The median follow-up time was computed using
Haematologica | 109 May 2024 1386 ARTICLE - Outcome of r/r B-ALL after INO prior to allo-HCT S. Kayser et al.
the reverse Kaplan-Meier estimate.22 The Kaplan-Meier method was used to estimate the distribution of OS. 23 OS was calculated from start of INO treatment until last follow-up or death. Confidence interval (CI) estimation for survival curves was based on the cumulative hazard function using Greenwood’s formula for variance estimation. Log-rank tests were employed to compare survival curves between groups. Cumulative incidences of relapse (CIR) and death (CID) and their standard errors were computed according to the method described by Gray24 and included only patients attaining complete remission. CIR and CID were calculated from achievement of CR after start of INO treatment until relapse or death. In patients proceeding to allo-HCT without achieving a CR or CRi (N=10), the date of transplant was set per definition as start date to calculate CIR and CID. In addition to the univariable tests, an exploratory Cox regression analysis was performed to evaluate prognostic variables on OS measured from the date of allo-HCT including the following covariates: age, sex, allo-HCT during first-line therapy, prior treatment with blinatumomab, time from treatment with INO to allo-HCT (dichotomized ≤50 days vs. >50 days), number of INO cycles before allo-HCT (dichotomized ≤2 cycles vs. >2 cycles), remission status at allo-HCT (dichotomized CR/CRi vs. noCR), conditioning regimen (myeloablative vs. RIC), donor type (matched unrelated donor/matched related donor vs. other including haplo-identical and cord blood). Backward selection applying a stopping rule based on P values was used in the multivariable Cox regression model to exclude redundant or unnecessary variables.25 All statistical analyses were performed with the statistical software environment R, version 3.3.1, using the R packages rms including hmisc, lattice, ggplot2 and Formula and survival.26
Results
Patient characteristics
At the time of r/r B-ALL, median white blood cell and platelet counts were 5.9x10⁹/L (range, 0.2-127x109/L) and 104.5x10⁹/L (range, 6-400x109/L), respectively. Median blast cell count in bone marrow was 30% (range, 0-98%). Twenty (34%) patients were female; ECOG was 0 in 32 (55%), 1 in 16 (28%), 2 in two (3%) patients and missing in eight (14%) patients (Table 1). Twelve (23%) of 52 patients had extramedullary disease (missing data, N=6).
Genetics
Cytogenetic analysis at the time of diagnosis of ALL was available in 48 (83%) patients. Of those, 16 patients displayed a t(9;22)(q34;q11), 13 patients had a normal karyotype, 13 were complex (≥3 abnormalities), 27 and six had other abnormalities.
At relapse, cytogenetic analysis was available in 23 patients (40%). Seven patients displayed a t(9;22), eight had
Table 1. Patient characteristics at the time point of relapsed/ refractory acute lymphoblastic leukemia.
Total patients N=58
LDH: lactate dehydrogenase; BM: bone marrow; ECOG PS: Eastern Cooperative Oncology Group performance status; WBC: white blood cell count.
a normal karyotype, three were complex and five had other abnormalities. One patient with a normal karyotype at diagnosis showed a clonal evolution to a complex karyotype (trisomy 14, trisomy 21 and an additional X-chromosome). Two patients with prior t(9;22) displayed a normal karyotype at relapse. In those patients with t(9;22) at diagnosis but without cytogenetic analysis at relapse (N=8), BCR::ABL was confirmed by PCR. Of the 13 patients with a complex karyotype at diagnosis, two were still complex, three had a normal karyotype, two displayed other, new abnormalities (trisomy 5; KMT2 rearrangement, N=1, each) and six were not analyzed.
Prior treatment
One (2%) of the 58 patients was previously treated with tyrosine kinase inhibitor (TKI) for chronic myeloid leukemia and progressed to BCR::ABL positive blast cell crisis of B-lymphoid lineage. Forty-seven (81%) of the 58 patients were heavily pretreated receiving intensive chemotherapy +/- TKI, whereas 11 (19%) received TKI +/- glucocorticoids. Overall, blinatumomab was administered in 24 (41%) patients. Of those, two patients received blinatumomab at first line and achieved CR (blinatumomab + dasatinib for
Haematologica | 109 May 2024 1387 ARTICLE - Outcome of r/r B-ALL after INO prior to allo-HCT S. Kayser et al.
Characteristic Value % or range Sex: Female, N 20 34 Median age in years 42.5 16-69 Median WBC x109/L missing, N 5.9 10 0.2-127Median platelets x109/L missing, N 104.5 10 6-400Median hemoglobin, g/dL missing, N 11.8 10 6.6-15.6Median LDH, U/L missing, N 327 12 119-3,665Median BM blasts, % missing, N 30 7 0-98ECOG PS, N 0 ≤ 2 missing 34 18 6 59 31 10 Cytogenetics, N normal t(9;22) complex other missing 13 17 14 6 11 21 28 23 10 18
BCR::ABL positive ALL, N=1; sequential chemotherapy and blinatumomab, LAL2317 trial; clinicaltrials gov. Identifier: NCT03367299; N=1). Three patients were primary refractory after first-line chemotherapy. Of those, two achieved CR after blinatumomab, whereas one patient was refractory after salvage with blinatumomab. Finally, in five patients blinatumomab was given to achieve MRD negativity after first-line chemotherapy. In 14 patients blinatumomab was given at relapse prior to INO. Of those, 11 were refractory and three achieved CR.
Treatment with inotuzumab ozogamicin
INO was dosed at 0.8 mg/m2 body surface area (BSA) and applied as an intravenous infusion over 1 hour on day 1 and at 0.5 mg/m2 of BSA on days 8 and 15. Once the patients had achieved CR, the dose on day 1 of each consecutive cycle was reduced to 0.5 mg/m2 BSA. Up to six INO cycles (≤2 cycles, N=52; 3-4 cycles, N=4; 5-6 cycles, N=2) were administered according to the previously approved regimen. The patient with BCR::ABL positive blast cell crisis of B-lymphoid lineage received TKI in addition to INO. Extramedullary disease response assessment was performed by computed tomography (CT) or positron emission tomography-computed tomography (PET-CT). SOS/VOD was assessed according to previously defined clinical criteria and diagnosed by the treating investigator.15
Response
Response assessment was performed in 53 (91%) patients after the first INO cycle. Of those, 39 (74%) patients achieved CR, five (9%) a partial remission (PR), whereas nine (17%) were refractory (RD). Prior to allo-HCT, 49 (84%) achieved CR, four (7%) PR and four (7%) had RD. Two patients not achieving a response to INO achieved CR at the date of allo-HCT, one after 1.5 cycles binatumumab and one after two cycles HyperCVAD. One (2%) patient relapsed prior to allo-HCT. This patient received high-dose Ara-C and mitoxantrone as well as two cycles blinatumomab and achieved CR again. Thus, at time of allo-HCT 49 patients were in CR. Four patients received blinatumomab (1 cycle, N=3, 2 cycles, N=1) as treatment of MRD prior to allo-HCT. Of those, one was MRD-negative prior to allo-HCT. One patient received maintenance in CR with vincristine, methotrexate (MTX) and 6-mercaptopurine prior to allo-HCT.
Measurable residual disease response
MRD data after INO prior to allo-HCT were available in 44 (90%) of 49 responding patients. Of those, 26 (59%) were MRD-negative, 16 (36%) were MRD-positive and two (5%) had non-quantifiable but detectable MRD below 0.01%.
Allogeneic hematopoietic stem cell transplantation and maintenance after allogeneic hematopoietic stem cell transplantation
Twenty-five (43%) patients received myeloablative and
33 (57%) reduced-intensity conditioning. Furthermore, conditioning regimen consisted of double alkylators in 17 patients (29%). Type of donor were matched-related siblings in 11 (19%), matched-unrelated in 22 (38%), and haplo-identical/cord blood in 25 (43%) patients, respectively. Time between INO and allo-HCT was in median 50 days (range, 25-374 days).
Overall, maintenance after allo-HCT was performed in seven patients. Of those, three patients were BCR::ABL MRD-positive and were treated with either ponatinib (N=2) or dasatinib (N=1). Additionally one patient with MRD-positive disease prior to allo-HCT received three cycles blinatumomab and three DLI infusions due to progression of MRD after allo-HCT. One patient who was BCR::ABL MRD-negative prior to allo-HCT received maintenance with ponatinib as relapse prevention. Two patients received one cycle blinatumomab as maintenance therapy after allo-HCT. Both were MRD-negative pretransplant and at the time of blinatumomab maintenance.
Survival
Median follow-up was 30.5 months (95% CI: 25.7-42.5) and median OS measured from start of INO was 11.2 months (95% CI: 7.59-37.1; Figure 1). One-year and 2-years OS rates were 50% (95% CI: 38.4-56.1) and 36.7% (95% CI: 25.5-52.9), respectively. In univariable Cox regression analysis age as a continuous variable had no impact on OS (P=0.98). This was also true when using 60 years as cutoff (P=0.81). Prior to allo-HCT, 52 patients received ≤2, four patients 3-4 INO cycles and two patients 5-6 INO cycles.
Relapse/progressive disease occurred in 20 (34%) patients. Of those, five (25%) patients are still alive, whereas 15 succumbed of their disease.
Twenty-one patients died in remission (cause of death: SARS-CoV2 infection, N=2; graft-versus-host disease, N=2; multi-organ failure, N=4; septic infection, N=4; SOS/VOD, N=9) and 17 are in ongoing CR leading to a CIR of 35.0% (95% CI: 21.9-48.1) and CID of 37.6% (95% CI: 24.6-50.1; Figure 2) after 2 years.
Our cohort included also six patients with central nervous system (CNS) involvement at diagnosis, all of whom received CNS treatment with MTX, cytarabine and dexamethasone until CR. Of those, only one had CNS involvement at relapse. This patient received CNS radiation. Additionally, seven patients had a CNS involvement at relapse, which was treated with high-dose MTX and high-dose Ara-C (N=1), intrathecal MTX, cytarabine and dexamethasone and/or radiation (N=6).
A multivariable model evaluating OS after allo-HCT revealed number of INO cycles >2 (hazard ratio [HR]=0.220; 95% CI: 0.047-1.039; P=0.056), remission at date of allo-HCT (HR=0.544; 95% CI: 0.249-1.190; P=0.128), allo-HCT during first line therapy (HR=2.351; 95% CI: 0.962-5.744; P=0.061) and pretreatment with blinatumomab (HR=2.190; 95% CI: 1.078-4.449; P=0.030) in the final model after limited
Haematologica | 109 May 2024 1388 ARTICLE - Outcome of r/r B-ALL after INO prior to allo-HCT S. Kayser et al.
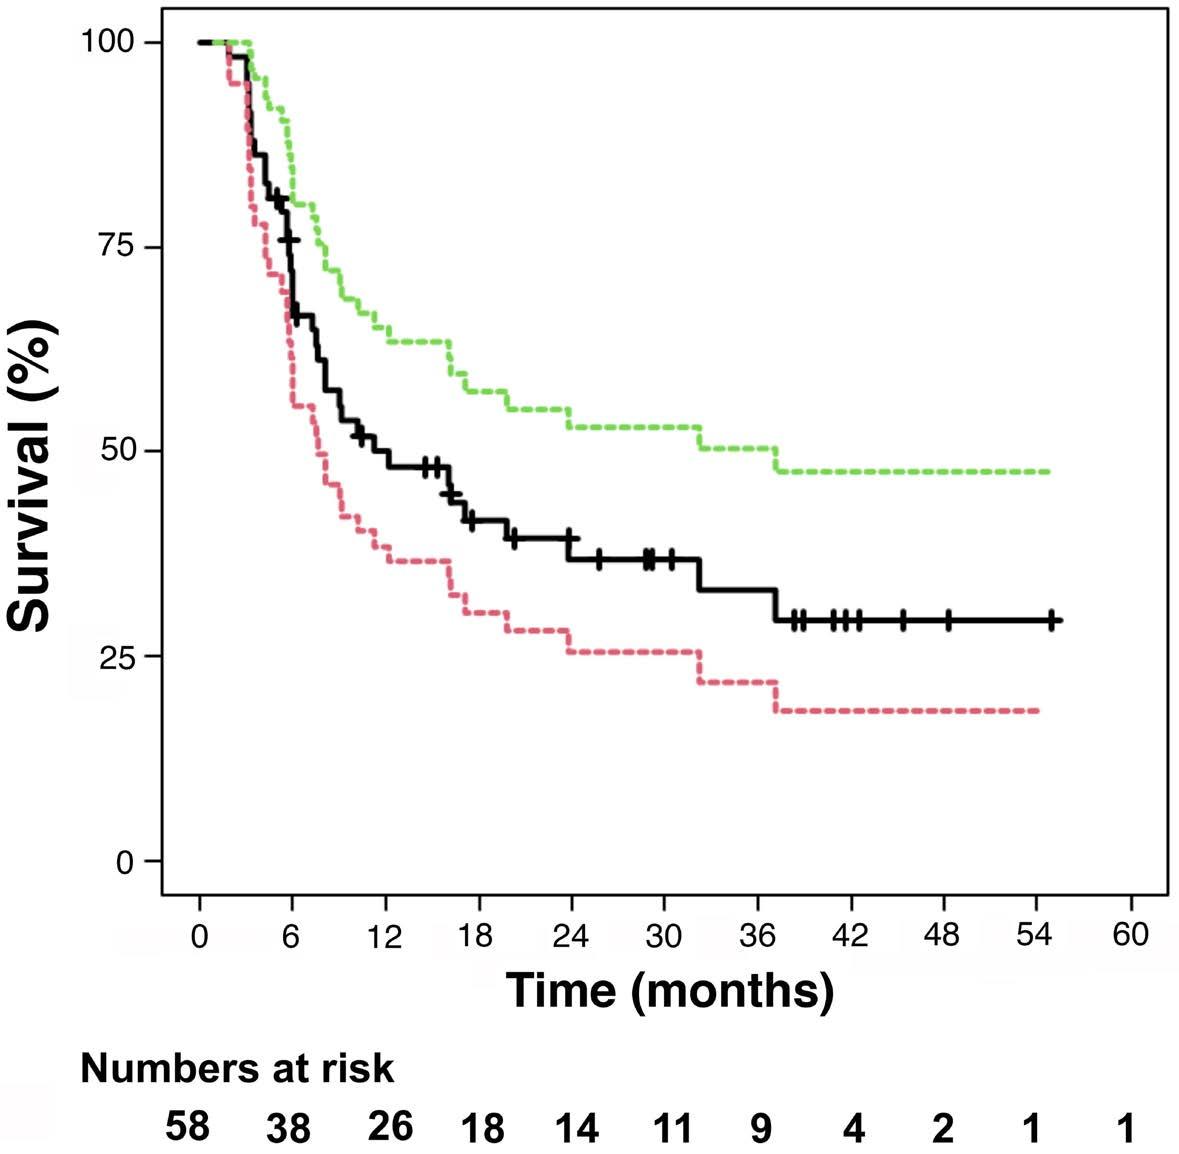
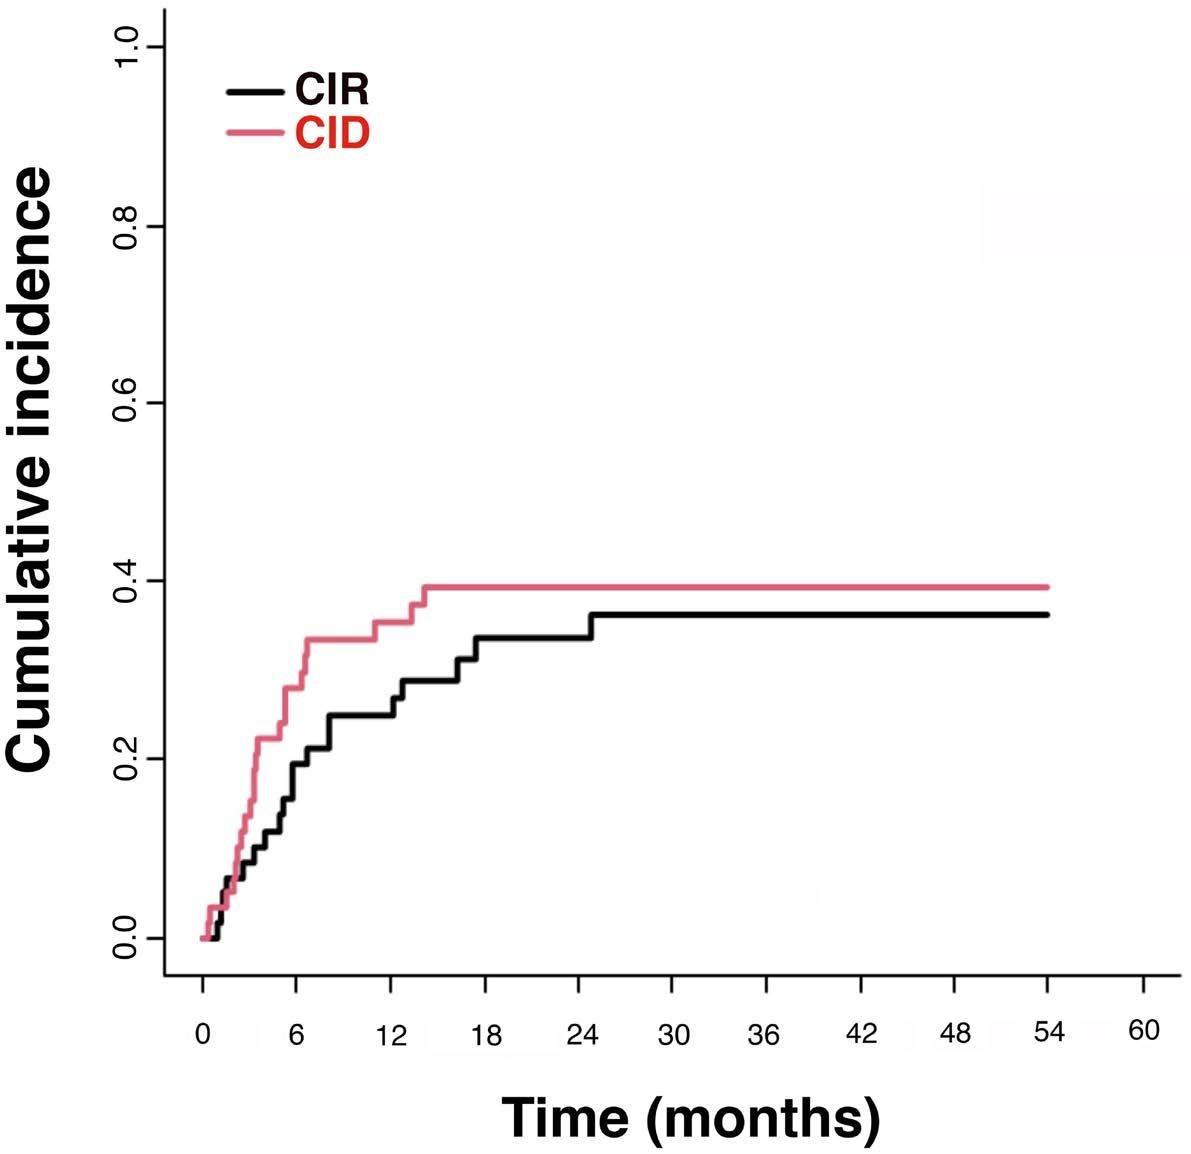
Figure 2. Cumulative incidence of relapse and cumulative incidence of death. Cumulative incidence of relapse (CIR) and cumulative incidence of death (CID) included only patients achieving complete remission.
backward selection, whereas time interval between start INO and allo-HCT, sex, type of conditioning regimen, donor type and age were excluded.
Sinusoidal obstruction syndrome/venous occlusive disease
SOS/VOD after allo-HCT occurred in 17 (29%) patients. Of those, nine (53%) patients died due to VOD with multi-organ failure. One had received five INO cycles and another one three INO cycles, all other received ≤2 INO cycles prior to allo-HCT. Seven (28%) of the 25 patients with myeloablative conditioning experienced SOS/VOD which was fatal in two patients. In comparison, SOS/VOD occurred in ten (30%) of 33 patients after reduced-intensity conditioning and was fatal in seven patients. Regarding conditioning regimen consisting of double alkylators, SOS/VOD occurred in eight (50%) of 16 patients, which was fatal in five patients. In contrast, SOS/VOD occurred in nine (21%) of 42 patients not treated with double alkylators as conditioning regimen, which was fatal in four patients.
SOS/VOD occurred in median after 61 days (range, 25-126 days) after last INO application and after 13 days (range, 5-42 days) after allo-HCT (Table 2).
In univariable logistic regression analysis risk factors for SOS/VOD were conditioning with double alkylators (OR, 3.67; 95% CI: 1.08-12.50; P=0.038), allo-HCT during firstline therapy (OR, 3.97; 95% CI: 1.00-15.39; P=0.050) and in trend allo-HCT ≤60 days from last INO application (OR, 4.74, 95% CI: 0.91-24.65, P=0.07), whereas more than two INO cycles before allo-HCT (P=0.82) was not significant. Further variables, such as age, sex, donor, dose intensity of conditioning or remission status before allo-HCT had
no impact in univariable assessment.
Discussion
The occurrence of SOS/VOD is a potentially life-threatening complication of allo-HCT28 with a mortality rate of up to 84.3%.29 Moreover, the risk of SOS/VOD following allo-HCT is even increased after INO exposure leading to the recommendation that patients being bridged to allo-HCT be treated with two or fewer cycles of INO (3 cycles if necessary to achieve an MRD-negative CR/CRi).19,20,30 In our cohort, SOS/VOD occurred in 17 (29%) patients and was fatal in nine (53%), which is higher than that reported from the INO-VATE trial, particularly the rate of fatal outcome.15 Such a higher occurrence might be explained, at least in part, by the real-life setting of this study, where INO was administered in a time window in which guidelines on SOS/ VOD prevention and management in patients treated with this antibody were not yet available19 and involved physicians were still on a learning curve.
A large number of our patients (81%) were heavily pretreated including allo-HCT at first-line therapy in 19% of the patients. Our real-life data confirm the detrimental effect of double alkylator conditioning for patients undergoing allo-HCT previously treated with INO, a feature that we now recognize as one of the most important risk factors for the development of SOS/VOD in this treatment setting.20,31 In addition, we also identified allo-HCT during first-line therapy and in trend allo-HCT ≤60 days after INO as risk factors for SOS/VOD. In contrast to previous data more than two INO cycles before allo-HCT was not significant.15
Haematologica | 109 May 2024 1389 ARTICLE - Outcome of r/r B-ALL after INO prior to allo-HCT S. Kayser et al.
Figure 1. Overall survival of relapsed/refractory patients with B-acute lymphoblastic leukemia after treatment with inotuzumab ozogamicin. Green and red dotted lines indicate upper and lower 95% confidence interval.
Table 2. Clinical characteristics of the patients with occurrence of sinusoidal obstruction syndrome/venous occlusive disease after allogeneic hematopoietic stem cell transplantation.
Allo-HCT: allogeneic hematopoietic stem cell transplantation; INO: inotuzumab ozogamicin; SOS/VOD: sinusoidal obstruction syndrome/venous occlusive disease, M: male; F: female; ECOG PS: Eastern Cooperative Oncology Group performance status.
However, one limitation of this study is the fact that in our cohort only a small fraction of the patients had received ≥3 INO cycles prior to allo-HCT.
While the rate of SOS/VOD after myeloablative and reduced intensity conditioning was comparable in our cohort, the rate of fatal SOS/VOD outcome was higher in patients after reduced intensity conditioning, which contrasts previous data.18 If prophylactic treatment with defibrotide, as recommended in the pediatric setting,32 might have reduced the rate of VOD, remains elusive.31,33
The CR/CRi rate in our cohort was higher than that reported from the INO-VATE trial (84% as compared to 73.8%)34 and other real-world data.35 However, in our cohort, the MRD-negative rate was lower as compared to that of the INO-VATE trial. This might be related to the fact that in our study, MRD was evaluated either by flow cytometry or PCR for BCR::ABL with a threshold of 0.01% to 0.0001% as compared to that of the INO-VATE trial, where MRD was measured by flow cytometry with a threshold of 0.01% bone marrow blasts.15
In contrast to recently published data,36 we observed a negative effect of previous blinatumomab exposure, which might be related to an exhaustion of CD3 lymphocyte effector T cells.
Although our study included only patients who went on to allo-HCT after INO, the higher CR/CRi rate did not translate to a longer median OS as compared to that from the INO-
VATE trial (11.2 months vs. 12.6 months),34 mainly caused by a high rate of CIR and CID. Despite an MRD positivity rate of 36% (N=16), maintenance after allo-HCT was performed in our study in only seven patients, mainly due to acute graft-versus-host disease or relapse. If maintenance therapy after allo-HSCT, e.g., with blinatumomab, might be beneficial, as shown after treatment with blinatumomab in MRD-positive patients prior to allo-HSCT,37 remains elusive and needs to be evaluated in a larger cohort, ideally in a prospective trial.
Treatment with INO seems to be an effective approach with successful bridge-to-transplant, but further consolidation approaches, such as chimeric antigen receptor T cells or advanced bi-specific antibodies are warranted to prolong OS.
Our analysis has several limitations. Since this is a retrospective, non-randomized cohort analysis no direct comparison to outcome of r/r B-ALL after standard of-care chemotherapy treatment was feasible. However, since a large fraction of the patients (81%) were heavily pretreated with intensive chemotherapy ± TKI including prior allo-HCT in 19% of the patients, standard-of-care chemotherapy would have likely failed to induce a remission. In addition, retrospectively collected data have serious limitations since the factors for allocating patients to allo-HCT, such as co-morbidities, individual assessment of the treating physician, choice of conditioning, and availability of a do-
Haematologica | 109 May 2024 1390 ARTICLE - Outcome of r/r B-ALL after INO prior to allo-HCT S. Kayser et al.
Patient N Age in years Sex ECOG PS Grade of SOS/ VOD Allo-HCT at first line N of INO cycles Days of SOS/VOD occurence after last INO application Myeloablative conditioning Dual alkylators for conditioning Days of SOS/ VOD occurence after allo-HCT 1 56 F 1 1 No 2 71 Yes Yes 25 2 46 M 0 1 No 2 126 Yes No 42 3 46 F 0 2 Yes 3 76 No No 27 4 28 M 1 4 No 2 45 Yes No 17 5 30 M 1 3 No 1 58 Yes No 10 6 43 M 1 4 Yes 2 61 No Yes 5 7 36 F 1 4 No 1 40 Yes Yes 9 8 58 M 0 5 Yes 2 59 Yes Yes 11 9 28 F 0 5 Yes 1.67 25 No Yes 10 10 54 M 1 5 No 5 44 No No 18 11 28 M 1 5 No 2 104 No No 14 12 40 M 1 5 Yes 2 118 No No 34 13 49 F 1 5 No 1 73 Yes No 11 14 31 M 0 5 No 2 35 No Yes 8 15 36 F 0 5 Yes 2 70 No Yes 9 16 56 M 0 5 No 2 35 No Yes 13 17 23 M 0 3 No 1 61 No No 13
nor, remain unknown, and this needs to be taken into account when evaluating the value of allo-HCT in our series. Furthermore, data on patients treated with INO without allo-HCT were not part of our analysis.
Conclusions
Treatment with INO seems to be an effective approach with successful bridge-to-transplant. However, further consolidation approaches, such as chimeric antigen receptor T cells or advanced bi-specific antibodies are warranted to prolong OS. In addition, risk of SOS/VOD is not negligible, necessitating continuous monitoring, recognition of SOS/VOD risk factors, such as double alkylating agents as conditioning regimen prior to allo-HCT and guidelines application to mitigate its incidence.38 In particular, the addition of a second alkylating agent into the conditioning regimen must be avoided.
Disclosures
No conflicts of interest to disclose.
References
1. Hoelzer D, Bassan R, Dombret H, et al. Acute lymphoblastic leukaemia in adult patients: ESMO clinical practice guidelines for diagnosis, treatment and follow-up. Ann Oncol. 2016;27(Suppl 5):v69-82.
2. Spinelli O, Peruta B, Tosi M, et al. Clearance of minimal residual disease after allogeneic stem cell transplantation and the prediction of the clinical outcome of adult patients with highrisk acute lymphoblastic leukemia. Haematologica. 2007;92(5):612-618.
3. Schrappe M. Detection and management of minimal residual disease in acute lymphoblastic leukemia. Hematology Am Soc Hematol Educ Program. 2014;2014(1):244-249.
4 Davila ML, Riviere I, Wang X, et al. Efficacy and toxicity management of 19-28z CAR T cell therapy in B cell acute lymphoblastic leukemia. Sci Transl Med. 2014;6(224):224ra225.
5. Cruz CR, Micklethwaite KP, Savoldo B, et al. Infusion of donorderived CD19-redirected virus-specific T cells for B-cell malignancies relapsed after allogeneic stem cell transplant: a phase 1 study. Blood. 2013;122(17):2965-2973.
6. Jacoby E. The role of allogeneic HHCT after CAR T cells for acute lymphoblastic leukemia. Bone Marrow Transplant. 2019;54(Suppl 2):810-814.
7. Kantarjian HM, Thomas D, Ravandi F, et al. Defining the course and prognosis of adults with acute lymphocytic leukemia in first salvage after induction failure or short first remission duration. Cancer. 2010;116(24):5568-5574.
8. Thomas DA, Kantarjian H, Smith TL, et al. Primary refractory and relapsed adult acute lymphoblastic leukemia: characteristics, treatment results, and prognosis with salvage therapy. Cancer. 1999;86(7):1216-1230.
9 Oriol A, Vives S, Hernández-Rivas JM, et al. Outcome after relapse of acute lymphoblastic leukemia in adult patients included in four consecutive risk-adapted trials by the PETHEMA Study Group. Haematologica. 2010;95(4):589-596.
10 Tavernier E, Boiron JM, Huguet F, et al. Outcome of treatment
Contributions
SK and CP were responsible for the concept of this paper, contributed to the literature search data collection, contributed patients, analyzed and interpreted data, and critically revised the manuscript. RFS was responsible for the concept of this paper, analyzed and interpreted data, and wrote the manuscript. CS, FG, AB, JW, PC, FS, SG, LP, EB, GM, IZ, MC, PS, FR, MA, and MJL contributed patients and critically revised the manuscript. All authors reviewed and approved the final manuscript.
Acknolwledgments
We acknowledge publication support from the University of Heidelberg.
Data-sharing statement
Questions regarding data sharing should be addressed to the corresponding author.
after first relapse in adults with acute lymphoblastic leukemia initially treated by the LALA-94 trial. Leukemia. 2007;21(9):1907-1914.
11. Gökbuget N, Stanze D, Beck J, et al. Outcome of relapsed adult lymphoblastic leukemia depends on response to salvage chemotherapy, prognostic factors, and performance of stem cell transplantation. Blood. 2012;120(10):2032-2041.
12. Specchia G, Pastore D, Carluccio P, et al. FLAG-IDA in the treatment of refractory/relapsed adult acute lymphoblastic leukemia. Ann Hematol. 2005;84(12):792-795.
13. O’Brien S, Schiller G, Lister J, et al. High-dose vincristine sulfate liposome injection for advanced, relapsed, and refractory adult Philadelphia chromosome negative acute lymphoblastic leukemia. J Clin Oncol. 2013;31(6):676-683.
14 Kantarjian H, Stein A, Gokbuget N, et al. Blinatumomab versus chemotherapy for advanced acute lymphoblastic leukemia. N Engl J Med. 2017;376(9):836-847.
15. Kantarjian HM, DeAngelo DJ, Stelljes M, et al. Inotuzumab ozogamicin versus standard therapy for acute lymphoblastic leukemia. N Engl J Med. 2016;375(9):740-753.
16. DiJoseph JF, Armellino DC, Boghaert ER, et al. Antibodytargeted chemotherapy with CMC-544: a CD22-targeted immunoconjugate of calicheamicin for the treatment of B-lymphoid malignancies. Blood. 2004;103(5):1807-1814.
17 Shor B, Gerber HP, and Sapra P. Preclinical and clinical development of Inotuzumab-ozogamicin in hematological malignancies. Mol Immunol. 2015;67(2 Pt A):107-116.
18. Mohty M, Malard F, Abecassis M, et al. Sinusoidal obstruction syndrome/veno-occlusive disease: current situation and perspectives-a position statement from the European Society for Blood and Marrow Transplantation (EBMT). Bone Marrow Transplant. 2015;50(6):781-789.
19. Kebriaei P, Cutler C, de Lima M, et al. Management of important adverse events associated with inotuzumab ozogamicin: expert panel review. Bone Marrow Transplant. 2018;53(4):449-456.
Haematologica | 109 May 2024 1391 ARTICLE - Outcome of r/r B-ALL after INO prior to allo-HCT S. Kayser et al.
20 Kantarjian HM, DeAngelo DJ, Advani AS, et al. Hepatic adverse event profile of inotuzumab ozogamicin in adult patients with relapsed or refractory acute lymphoblastic leukaemia: results from the open-label, randomised, phase 3 INO-VATE study. Lancet Haematol. 2017;4(8):e387-e398
21. Mitelman F: ISCN: an International System for human cytogenetic nomenclature. S. Karger: Basel, Switzerland; 1995.
22. Schemper M, Smith TL. A note on quantifying follow-up in studies of failure time. Control Clin Trials. 1996;17(4):343-346.
23. Kaplan E, Meier P. Nonparametric estimation from incomplete observations. J Am Stat Assoc. 1958;53(282):457-481.
24. Gray RJ. A class of k-sample tests for comparing the cumulative incidence of a competing risk. Ann Stat. 1988;16(3):1141-1154.
25. Harrell FE. Regression modeling strategies: with applications to linear models, logistic regression, and survival analysis. New York: Springer; 2001.
26. R Development Core Team. R: a language and environment for statisticalaa computing. R Foundation for Statistical Computing: Vienna, Austria, 2022. https://www.R-project.org. Accessed June 23, 2022.
27. Bassan R, Spinelli O, Oldani E, et al. Improved risk classification for risk-specific therapy based on the molecular study of minimal residual disease (MRD) in adult acute lymphoblastic leukemia (ALL). Blood. 2009;113(18):4153-4162.
28. Johnson DB, Savani BN. How can we reduce hepatic venoocclusive disease-related deaths after allogeneic stem cell transplantation? Exp Hematol. 2012;40(7):513-517.
29 Coppell JA, Richardson PG, Soiffer R, et al. Hepatic venoocclusive disease following stem cell transplantation: incidence, clinical course, and outcome. Biol Blood Marrow Transplant. 2010;16(2):157-168.
30 Marks DI, Kebriaei P, Stelljes M, et al. Outcomes of allogeneic stem cell transplantation after inotuzumab ozogamicin treatment for relapsed or refractory acute lymphoblastic leukemia. Biol Blood Marrow Transplant. 2019;25(9):1720-1729.
31. Giglio F, Xue E, Greco R, et al. Defibrotide prophylaxis of sinusoidal obstruction syndrome in adults treated with inotuzumab ozogamicin prior to hematopoietic stem cell transplantation. Front Oncol. 2022;12:933317.
32. Corbacioglu S, Cesaro S, Faraci M, et al. Defibrotide for prophylaxis of hepatic veno-occlusive disease in paediatric haemopoietic stem-cell transplantation: an open-label, phase 3, randomised controlled trial. Lancet. 2012;379(9823):1301-1309.
33. Cheuk DK, Chiang AK, Ha SY, Chan GC. Interventions for prophylaxis of hepatic veno-occlusive disease in people undergoing haematopoietic stem cell transplantation. Cochrane Database Syst Rev. 2015;(5):CD009311.
34 Kantarjian HM, DeAngelo DJ, Stelljes M, et al. Inotuzumab ozogamicin versus standard of care in relapsed or refractory acute lymphoblastic leukemia: final report and long-term survival follow-up from the randomized, phase 3 INO-VATE study. Cancer. 2019;125(14):2474-2487.
35. Badar T, Szabo A, Wadleigh M, et al. Real-world outcomes of adult B-cell acute lymphocytic leukemia patients treated with inotuzumab ozogamicin. Clin Lymphoma Myeloma Leuk. 2020;20(8):556-560.
36. Fracchiolla NS, Sciumè M, Papayannidis C, et al. Blinatumomab and inotuzumab ozogamicin sequential use for the treatment of relapsed/refractory acute lymphoblastic leukemia: a real-life campus All study. Cancers (Basel). 2023;15(18):4623.
37. Gökbuget N, Zugmaier G, Dombret H, et al. Curative outcomes following blinatumomab in adults with minimal residual disease B-cell precursor acute lymphoblastic leukemia. Leuk Lymphoma. 2020;61(11):2665-2673.
38. Mohty M, Malard F, Alaskar AS, et al. Diagnosis and severity criteria for sinusoidal obstruction syndrome/veno-occlusive disease in adult patients: a refined classification from the European society for blood and marrow transplantation (EBMT). Bone Marrow Transplant. 2023;58(7):749-754.
Haematologica | 109 May 2024 1392 ARTICLE - Outcome of r/r B-ALL after INO prior to allo-HCT S. Kayser et al.
Differential transcriptional control of hematopoiesis in congenital and cyclic neutropenia patients harboring ELANE mutations
Alexander Zeidler,1* Natalia Borbaran-Bravo,1* Benjamin Dannenmann,1 Malte Ritter,1 Masoud Nasri,1 Maksim Klimiankou,1 Sergey Kandabarau,1 Azadeh Zahabi,1 Josef König,2 Cornelia Zeidler,3 Julia Skokowa1 and Karl Welte1,4
1Department of Oncology, Hematology, Clinical Immunology, and Rheumatology, University Hospital Tübingen, Tübingen, Germany; 2Hematology and Oncology, Ordensklinikum Elisabethinen, Linz, Austria; 3Department of Oncology, Hematology, Immunology and Bone Marrow Transplantation, Hannover Medical School, Hannover, Germany and 4Department of Pediatric Hematology and Oncology, University Children’s Hospital Tübingen, Tübingen, Germany
*AZ and NB-B contributed equally as first authors.
Abstract
Correspondence: K. Welte
karl.welte@med.uni-tuebingen.de
Received: August 7, 2023.
Accepted: October 10, 2023.
Early view: October 19, 2023.
https://doi.org/10.3324/haematol.2023.284033
Mutations in the ELANE gene, encoding the neutrophil elastase (NE) protein, are responsible for most cyclic neutropenia (CyN) cases and approximately 25% of congenital neutropenia (CN) cases. In CN and in CyN, a median of 2.8% of CD34+ cells were early CD49f+ hematopoietic stem cells (eHSC) that did not express ELANE and thus escape from the unfolded protein response (UPR) caused by mutated NE. In CyN, the CD49f+ cells respond to granulocyte colony-stimulating factor (G-CSF) with a significant upregulation of the hematopoietic stem cell-specific transcription factors, C/EBPα, MLL1, HOXA9, MEIS1, and HLF during the ascending arm of the cycle, resulting in the differentiation of myeloid cells to mature neutrophils at the cycle peak. However, NE protein released by neutrophils at the cycle’s peak caused a negative feedback loop on granulopoiesis through the proteolytic digestion of G-CSF. In contrast, in CN patients, CD49f+ cells failed to express mRNA levels of HSC-specific transcription factors mentioned above. Rescue of C/EBPα expression in CN restored granulopoiesis.
Introduction
Cyclic neutropenia (CyN) and severe congenital neutropenia (CN) are autosomal-dominant inherited disorders of hematopoiesis that markedly differ in disease severity.1 Mutations in the ELANE gene are considered largely responsible for most cases of CyN and CN. Because several identical ELANE mutations have been identified in both groups of patients,2 genotyping alone is insufficient to establish a clinical diagnosis. CyN is characterized by regular oscillations of peripheral blood neutrophils from nearly normal to severely low counts, generally within 21-day cycles. Absolute neutrophil count (ANC) at nadir is often less than 200/mm3 and is associated with fever, mouth ulcers, pharyngitis, sinusitis, and in some cases more severe infections with gram-negative bacteria.3 By contrast, CN is characterized by recurrent, severe infections that develop in the first months of life, with ANC persistently less than 200/mm3 1,4 The availability of recombinant human granulocyte colony-stimulating factor
(G-CSF) for clinical use in CN since 1987 and its successful application to CyN patients has changed the outcome for these patients, providing a markedly improved quality of life.4-7 However, during the course of the disease, 53% of CN patients who harbor ELANE mutations and 17% of CyN patients acquire mutations in the gene for the G-CSF receptor, CSF3R 1,8 Together with subsequently acquired mutations in, e.g., RUNX1, CSF3R mutations precede the development of myelodysplastic syndrome (MDS) or acute myeloid leukemia (AML).8-11 The risk of developing leukemia in CN is considered to be 20%.10 In CyN patients, G-CSF treatment does not abrogate the cycling of neutrophil counts but increases the amplitude of neutrophil counts during the cycle, leading to a shorter period of severe neutropenia and a reduction in the cycle length from 21 days to approximately 14 days.5 This suggests an influence of G-CSF on the neutrophil cycling pathomechanism. There are reported cases of AML also in CyN patients.11
Recently, we and others reported that inhibition of the
Haematologica | 109 May 2024 1393 - Hematopoiesis ARTICLE
©2024 Ferrata Storti Foundation
Published under a CC BY-NC license
proliferation and differentiation of hematopoietic stem and progenitor cells (HSPC) from CN patients harboring ELANE mutations is caused by an enhanced unfolded protein response (UPR) in the endoplasmic reticulum (ER) instigated by misfolded mutant NE protein.1,12 This enhanced UPR is also recapitulated in induced pluripotent stem cells (iPSC) derived from CN patients with ELANE mutations.13,14 However, the UPR does not equally affect all cells, for instance, the least primed early HSC (eHSC) expressing CD49f (integrin-α6)15 escape from the damage since they do not express ELANE 16
Most CD34+ cells are lineage-restricted progenitors, and true self-renewing CD49f+ eHSC are rare.17,18 CD49f plays an important, conserved role in stem cell biology that has been reaffirmed by its importance in maintaining the self-renewal of stem cells in more than 30 tissues.19
The transcriptional control of differentiation from eHSC to primed myeloid cells is mainly regulated by C/EBPα. 20,21 Knockout of the cebpa gene or its 137 kb upstream enhancer in mice showed two major findings: (i) neutropenia in bone marrow (BM) and peripheral blood (PB); (ii) decrease in long-term HSC (LT-HSC) numbers.22 In co-immunoprecipitation experiments, Collins et al. showed that C/EBPα is an essential collaborator of HOXA9 and MEIS1.23 In addition, C/EBPα regulates the expression of the histone H3 lysine 4 (H3K4) methyltransferase MLL1, which, in turn, coordinates self-renewal, proliferation, and lineage-specific gene expression in HSC.24 MLL1 dynamically and selectively regulates Hox gene expression.25 Thus, C/EBPα induces the expression of HOXA9/MEIS1 and subsequent proliferation and differentiation of HSC directly or indirectly via MLL1. Combining gene expression analysis with genome-wide assessment of C/EBPα binding and epigenetic configurations, Hasemann et al. showed that C/EBPα modulates the epigenetic states of genes important for HSC function.26 Another study also demonstrated that C/EBPα positively regulates HSC self-renewal, protects adult HSC from apoptosis, and maintains their quiescent state.27
In one of our earlier studies on the pathomechanism of CN, we demonstrated that the expression of C/EBPα is greatly reduced in the arrested promyelocytes of CN patients but normal in CyN patients.28 We found that C/EBPα is directly regulated by the transcription factor lymphoid enhancer-binding factor 1 (LEF-1).28 The significant reduction of C/EBPα in CN has been confirmed in iPSC derived from CN patients.13,29
The targets of C/EBPα, HOXA9 and MEIS1, are homeodomain transcription factors that are co-expressed in the most primitive eHSC subpopulation (i.e., CD49f+). Their expression induce robust self-renewal of eHSC and expansion of the HSC pool.30-32 Diminished HOXA9 function results in a reduction in multilineage long-term repopulating ability and diminished numbers of peripheral blood leukocytes in mice,33 whereas overexpression of HOXA9 in bone marrow cells induces stem cell expansion.34 HOXA9 might be the primary physiological determinant of HSC self-renewal.35
Using single-cell transcriptomes of HSPC from cord blood, adult bone marrow, and fetal liver to search for human HSC markers with self-renewal capacity, Lehnertz et al. identified the master transcription factor HLF as one of the most selectively expressed genes in human HSC and proposed HLF as the defining gene of the human HSC state.36 Giladi et al. also identified HLF as the most highly enriched transcription factor in HSC.37 Here, we demonstrate that the defective expression of C/ EBPα, its targets MLL1, HOXA9, MEIS1, and HLF in CN but not in CyN discriminate between both disorders. During the ascending arm of the CyN cycle, G-CSF induced the proliferation of CD49f+ eHSC and their differentiation into more mature CD34+CD49f- cells, which respond to the transcription factor C/EBPα to differentiate into neutrophils. Moreover, during the downward arm of the cycle, NE released from neutrophils at the peak of the cycle causes negative feedback through proteolytic digestion of G-CSF, again causing neutropenia.
Methods
Patient samples
Five healthy donors, 13 CyN harboring ELANE mutations, and 13 ELANE-CN patients were used (Online Supplementary Table S1). All patients were treated with subcutaneous injections of Neupogen. BM samples of CN and CyN patients were collected in accordance with an annual follow-up recommendation of the SCNIR and the EHA.38 The study was conducted under the approval of the Ethical Board of the Medical Faculty, University of Tübingen. Written informed consent was obtained from all participants.
Isolation of human CD34+ cells
Human CD34+ cells were isolated from BM mononuclear cells using Ficoll gradient centrifugation followed by magnetic bead separation using EasySepTM human CD34+ selection kit II (STEMCELL Technologies, #17856).
Multicolor fluorescence-activated cell sorting analysis
Cells were washed with ice-cold phosphate-buffered saline (PBS) and stained with corresponding antibodies in PBS containing 2% fetal bovine serum and 0.02% sodium azide. We used: mouse anti-human CD38 (BD, #563964), mouse anti-human CD34 (BD, #348811), rat anti-human CD49f (BD, #563271), mouse anti-human CD90 (BD, #562685), and mouse anti-human CD45RA (BD, #560673). For intracellular NE protein analysis, cells were subsequently fixed and permeabilized using the Fix&Perm kit (Nordic Mubio, #GAS-002FOC), followed by incubation with a rabbit anti-human NE (abcam, #ab131260) antibody for 15 minutes (min) at room temperature, and subsequent incubation with a goat polyclonal secondary antibody to rabbit IgG-H&L (Alexa Fluor 488) (abcam, #ab150077) for 15 min at room
Haematologica | 109 May 2024 1394 ARTICLE - CEBPA in cyclic versus congenital neutropenia A. Zeidler et al.
temperature. Cells were fixed with 0.5% paraformaldehyde and measured using a BD LSRFortessa. Additional methods are available in the Online Supplementary Appendix.
Results
Dynamic cycle-dependent expression of C/EBPα and its target genes in hematopoietic stem cells from cyclic neutropenia patients
We first measured the percentage of CD34+CD49f+ early
HSC in the BM of CN (N=3), CyN (N=8) and healthy donors’ (HD) cord blood (CB) cells (N=6) by flow cytometry. Since the percentages of CD49f+ cells from CB CD34+ cells are comparable to the percentages of CD34+CD49f+ cells from the BM of children and young adults39 we used them for comparison. We observed a median of 2.8% (range, 1.2-4.6%) and 2.8% (range, 1.7-7.3%) CD34+CD49f+ eHSC in CN and CyN patients` BM, respectively. HD CB cells contained 7.3% (range, 3.4-9.3%) CD34+CD49f+ eHSC. In CyN patients the percentage of CD49f+ cells was independent of the granulocyte cycle stage (Figure 1A).
We further evaluated possible cycle-dependent changes
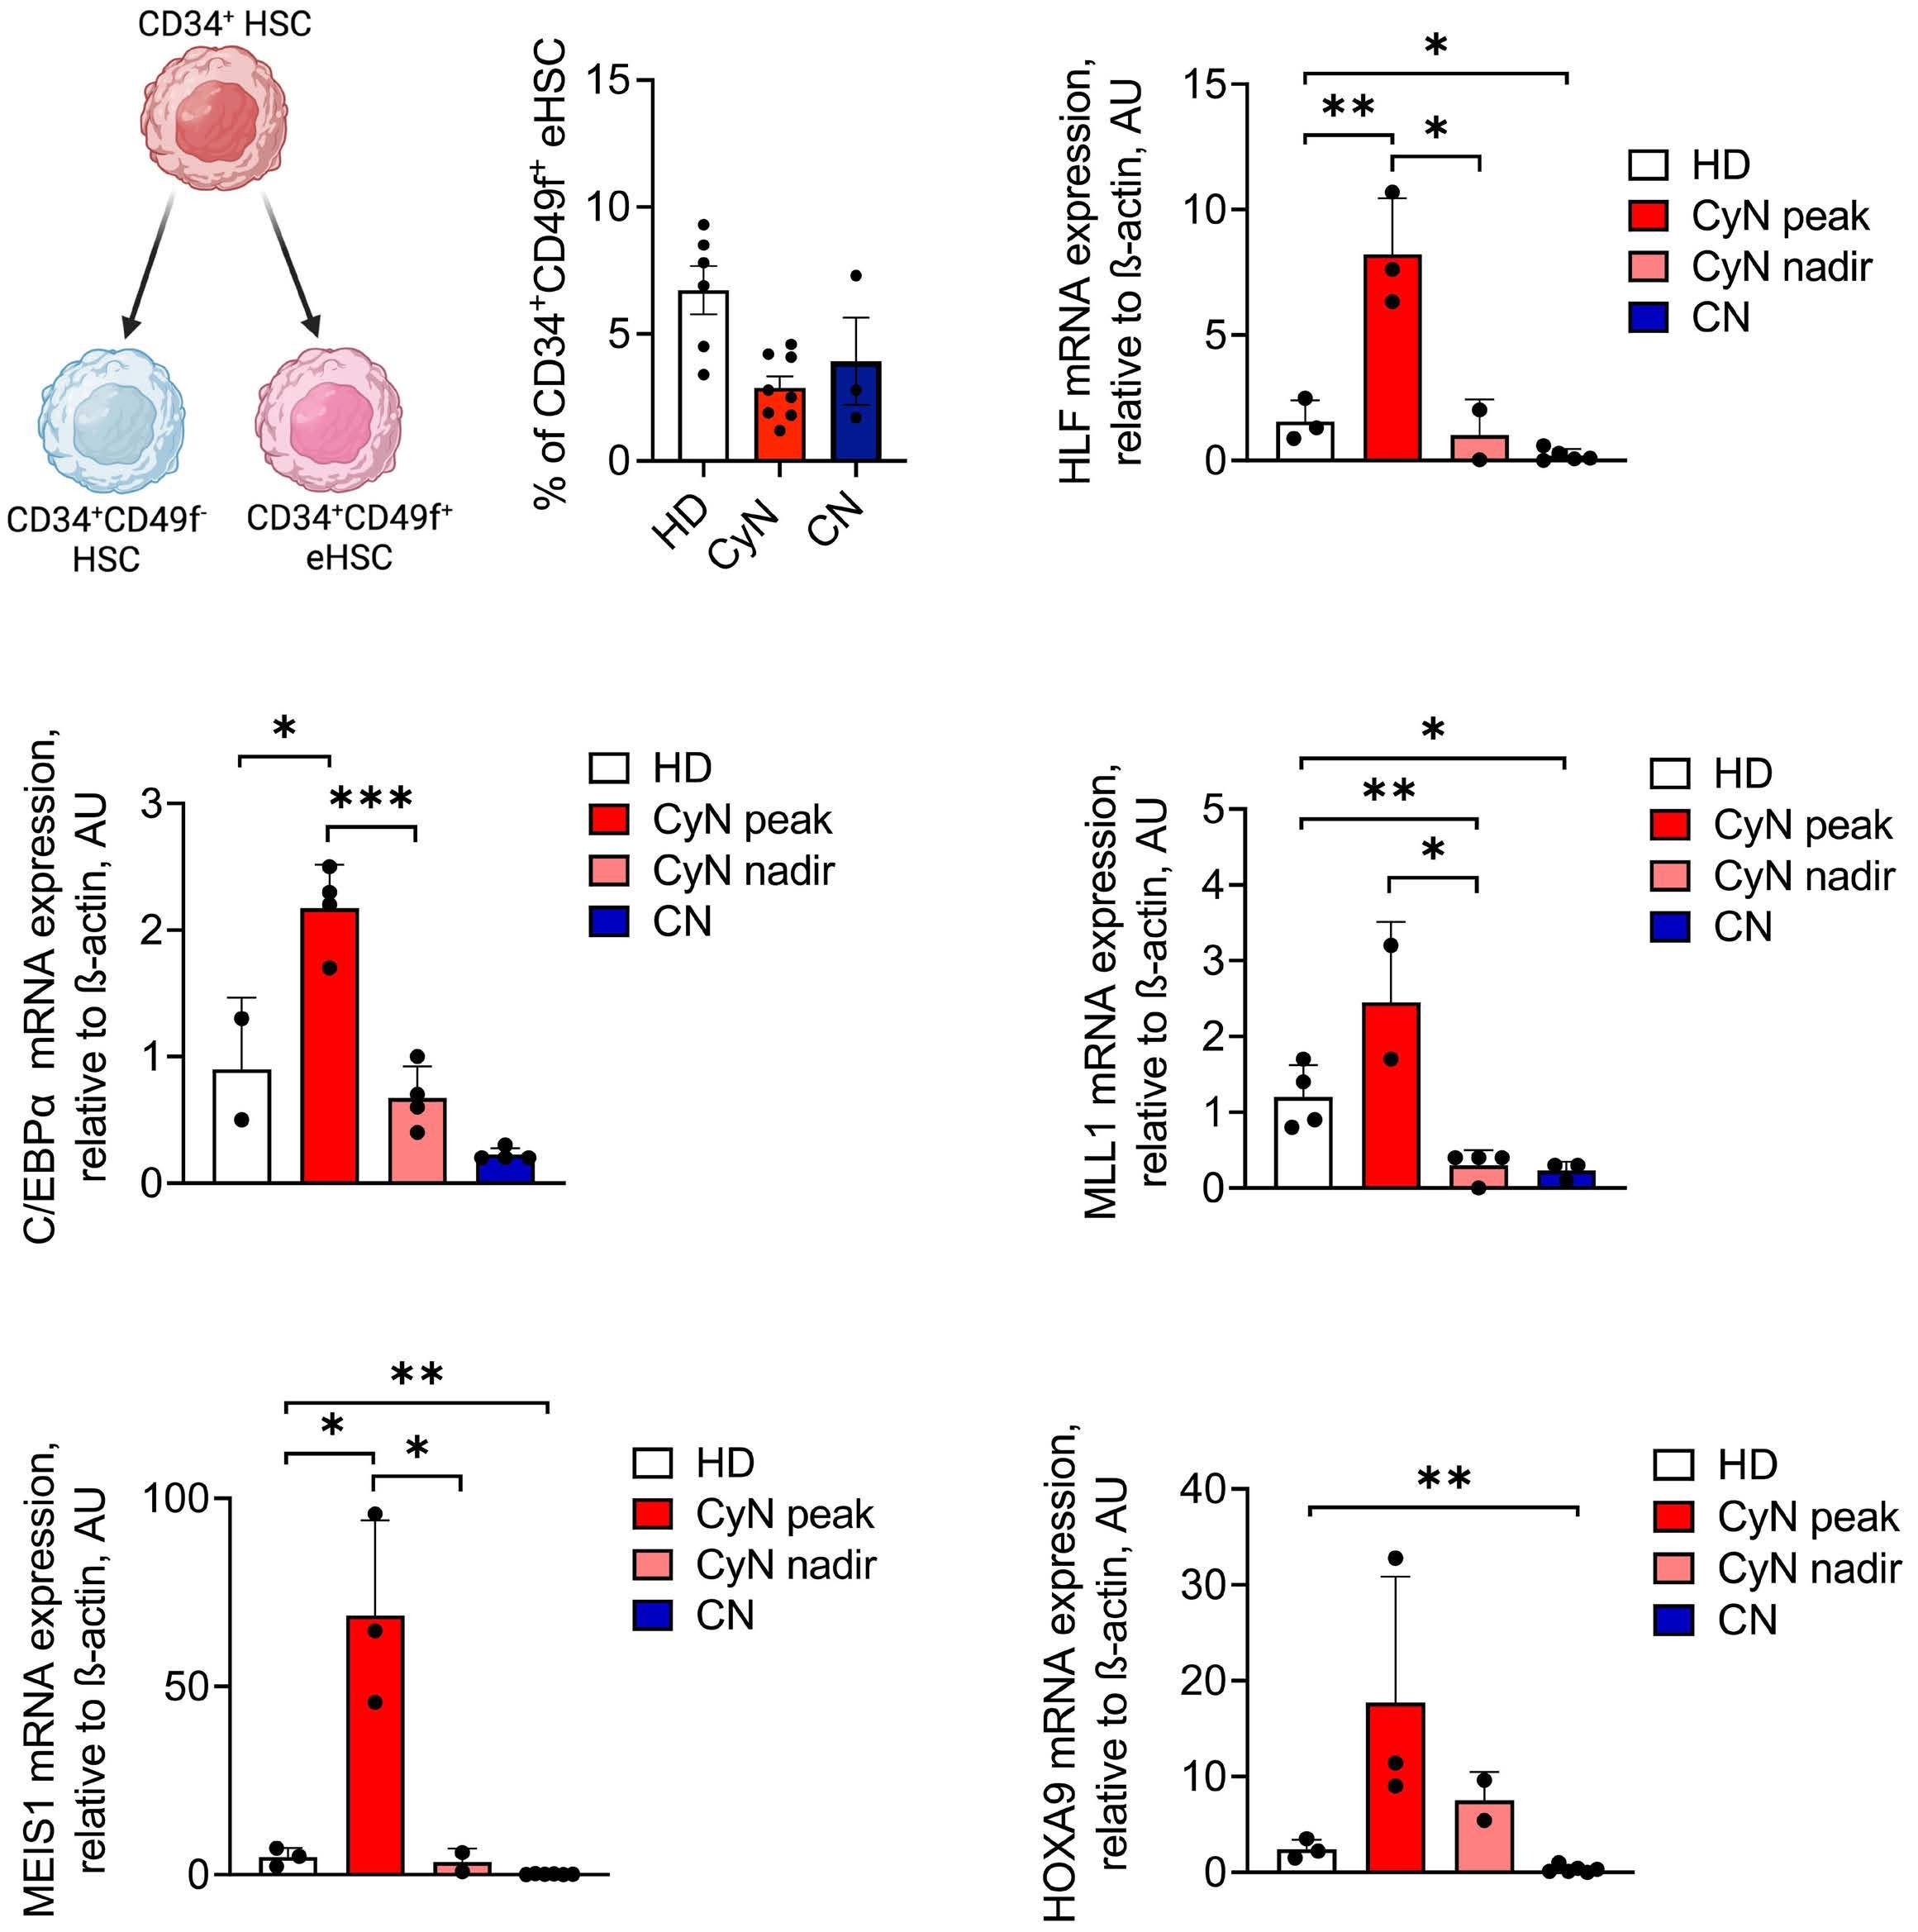
Figure 1. Cycle-dependent dynamics of transcription factors expression in hematopoietic stem and progenitor cells of cyclic neutropenia patients. (A) Left: schema of early CD49f+ hematopoietic stem cell (eHSC) specification, where eHSC with self-renewal capacity, but not more committed HSC, express the CD49f marker. Right: percentage of CD34+CD49f+ cells as assessed by fluorescence-activated cell sorting. Mean ± standard error of the mean are shown. (B, C) mRNA expression of the indicated genes in CD34+ bone marrow cells from healthy individuals (HD), cyclic neutropenia (CyN) patients at peak and nadir of neutrophil counts, and congenital neutropenia (CN) patients, measured by quantitative real-time polymerase chain reaction. Data were normalized to β-actin and are represented as mean ± standard deviation in duplicates. Unpaired t test, *P<0.05, **P<0.01; ***P<0.001.
Haematologica | 109 May 2024 1395 ARTICLE - CEBPA in cyclic versus congenital neutropenia A. Zeidler et al.
A C B
in mRNA expression levels of the stemness marker HLF as well as the transcription factor C/EBPα and its target genes MEIS1, HOXA9, and MLL1, in CD34+ HSPC of CyN and CN patients, and healthy individuals. We found that HLF mRNA levels were upregulated at the CyN peak of neutrophil counts, as compared to CyN nadir where HLF levels were comparable to healthy individuals. In CN, HLF expression was significantly downregulated as compared to healthy individuals (Figure 1B; Online Supplementary Table S2). C/ EBPα mRNA expression was also upregulated at the peak of the cycle and reduced to the levels of healthy individuals at the nadir of the cycle. As already published, we observed almost no C/EBPα expression in CN patients (Figure 1C). Next, we aimed to assess C/EBPα activity during the CyN cycle by measuring the expression of its target genes. Using the UCSC Genome Browser and data from the ReMap Atlas of regulatory regions,40 we confirmed previous reports that showed C/EBPα binding to the promoters and upstream regulatory regions of HLF, MEIS1, and MLL1 (Online Supplementary Figure S1A). In the context of HOXA9 regulation by C/EBPα, it is known that C/EBPα acts as part of a multiprotein complex that contains HOXA9 to promote HOXA9 mRNA expression in an autocrine manner.41 We found that mRNA levels of all selected factors were strongly upregulated at the peak of the cycle in CyN compared to healthy individuals and were only moderately expressed at the nadir (Figure 1C). In CN, expression of all these factors was diminished when compared to healthy controls (Figure 1C).
Early CD49f+ hematopoietic stem cells lack ELANE mRNA and neutrophil elastase protein expression
Knowing that CyN and CN patients harbor ELANE mutations, and that mutated elastase protein may damage hematopoiesis, we evaluated at which stage of hematopoietic differentiation ELANE mRNA and protein are expressed in physiological conditions in healthy individuals. We found the absence of NE protein expression in bone marrow CD49f+ eHSC of three HD (Figure 2A). Single-cell RNA-sequencing analysis of CD34+ HSC from two HD revealed that only 10%
of CD49f+ (ITGA6+) eHSC co-expressed ELANE mRNA (58/560 cells), 90% of the cells express either ELANE or ITGA6, but not both (Figure 2B). The discrepancy in the ELANE mRNA and NE protein expression levels can be explained by different kinetics and efficiencies of ELANE mRNA transcription and NE protein translation. The most important finding is that NE protein is absent in CD49f+CD34+ cells.
Granulocytic differentiation of cyclic neutropenic induced pluripotent stem cells is comparable to healthy donor cells We further generated induced pluripotent stem cells (iPSC) from peripheral blood mononuclear cells (PBMNC) of three ELANE-CyN patients. iPSC showed reliable expression levels of mRNA (SOX2, NANOG, and DNMT3A) and cell surface proteins (TRA-1-60 and SSEA4) that are markers of pluripotency (Online Supplementary Figure S2A, B; data not shown). They also had the potential to spontaneously differentiate into ectoderm and endoderm (Online Supplementary Figure S2C). We applied ELANE-CN iPSC, already available in the laboratory,14,29 to compare their hematopoietic and granulocytic differentiation potential between CN and CyN using the embryoid body (EB) based hematopoietic differentiation.42 Flow cytometry analysis of iPSC-derived hematopoietic cells obtained at day 14 of differentiation revealed that the majority of HSC were early HSC (CD34+CD43+) in CN iPSC (Figure 3A), which corresponded to up to 50% CD49f+ eHSC in CyN and HD iPSC (Figure 3B). On day 28 of differentiation, the percentage of mature neutrophils was severely reduced in iPSC derived from CN patients while, interestingly, the proportion of neutrophils produced by CyN iPSC was comparable to HDr iPSC (Figure 3C). The mRNA expression levels of C/EBPα and MEIS1 in iPSC-derived HSC collected on day 14 of differentiation recapitulated the results obtained from primary HSC. C/EBP α levels were severely downregulated in HSC derived from CN iPSC as compared to CyN HSC (Figure 3D). MEIS1 levels were markedly higher in CyN HSC as compared to CN and HD HSC (Figure 3E, left). Intriguingly, HOXA9 expression in iPSC-derived HSC was very low in all samples (Figure 3E)
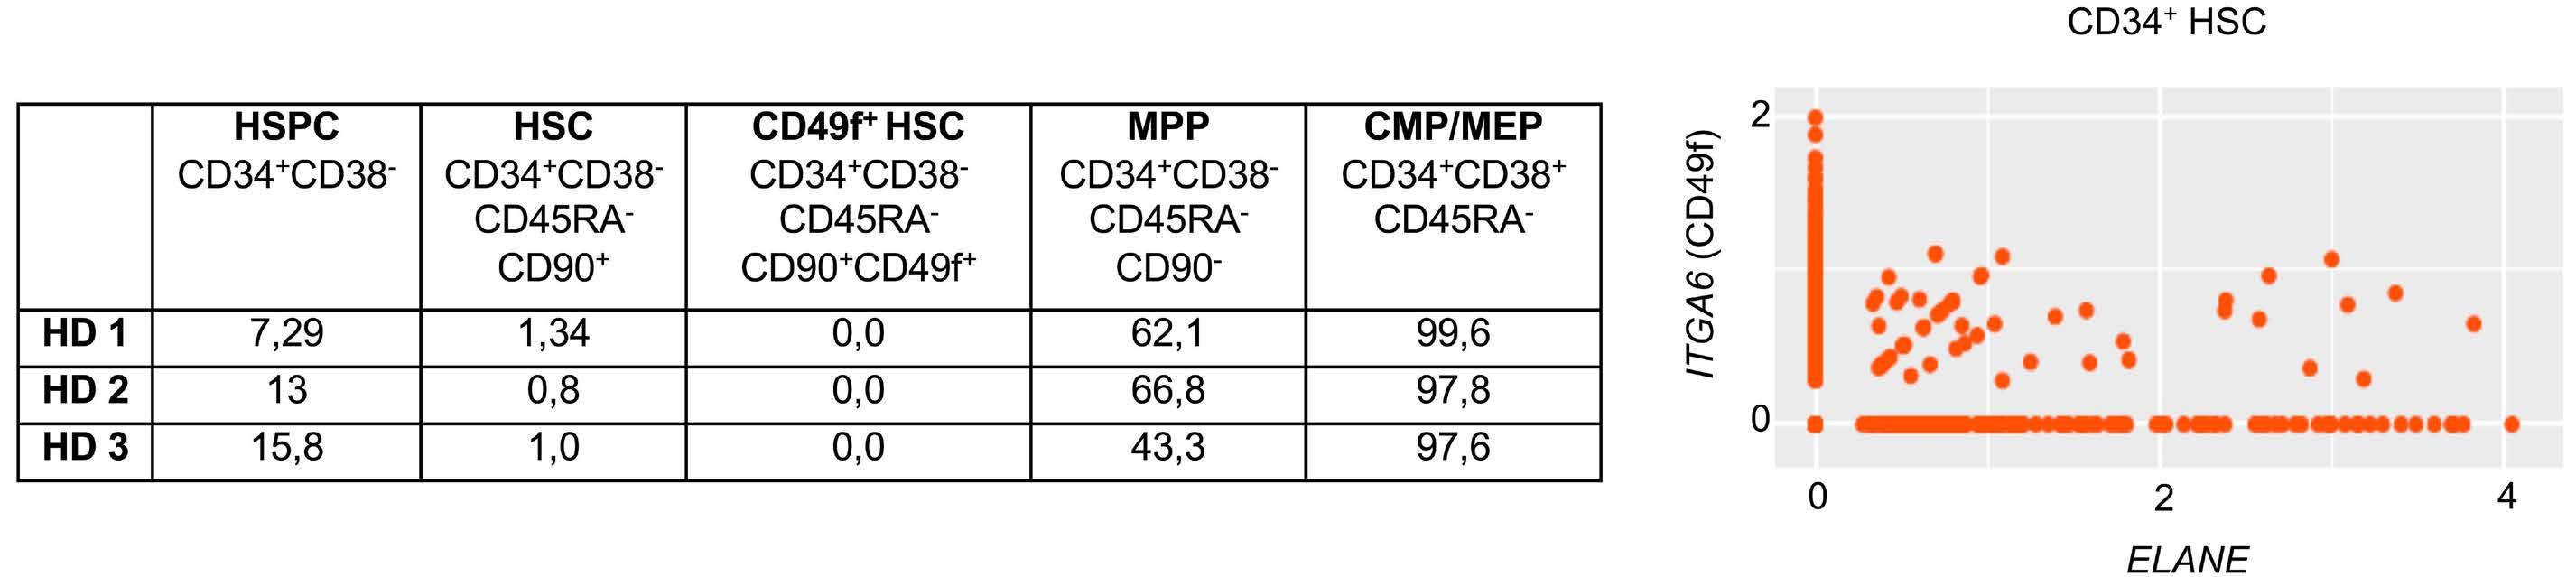
Figure 2. ELANE mRNA and protein expression in hematopoietic stem cell subsets. (A) Percentage of neutrophil elastase (NE) expressed in different human stem and progenitor cell subsets in the bone marrow of 3 healthy donors (HD) measured by flow cytometry. (B) Co-expression plot of ITGA6 (y-axis) and ELANE (x-axis) expression in single CD34+ hematopoietic stem cells (HSC) from 2 HD. Values plotted were normalized to read counts. MPP: multipotent progenitors; CMP: common myeloid progenitors; MEP: megakaryocytic-erythroid progenitors.
Haematologica | 109 May 2024 1396 ARTICLE - CEBPA in cyclic versus congenital neutropenia A. Zeidler et al.
A B
and more than ten times lower than in primary cells from e.g., CyN patients (Figure 1E). This is in agreement with reports from other laboratories, that HOXA9 expression in iPSC or in ESC is very low.43 Therefore, it is hard to make
any solid conclusions based on these data. However, there is a clear difference in the expression levels of C/EBPα, and MEIS1 and thus myeloid differentiation between CyN and CN iPSC.
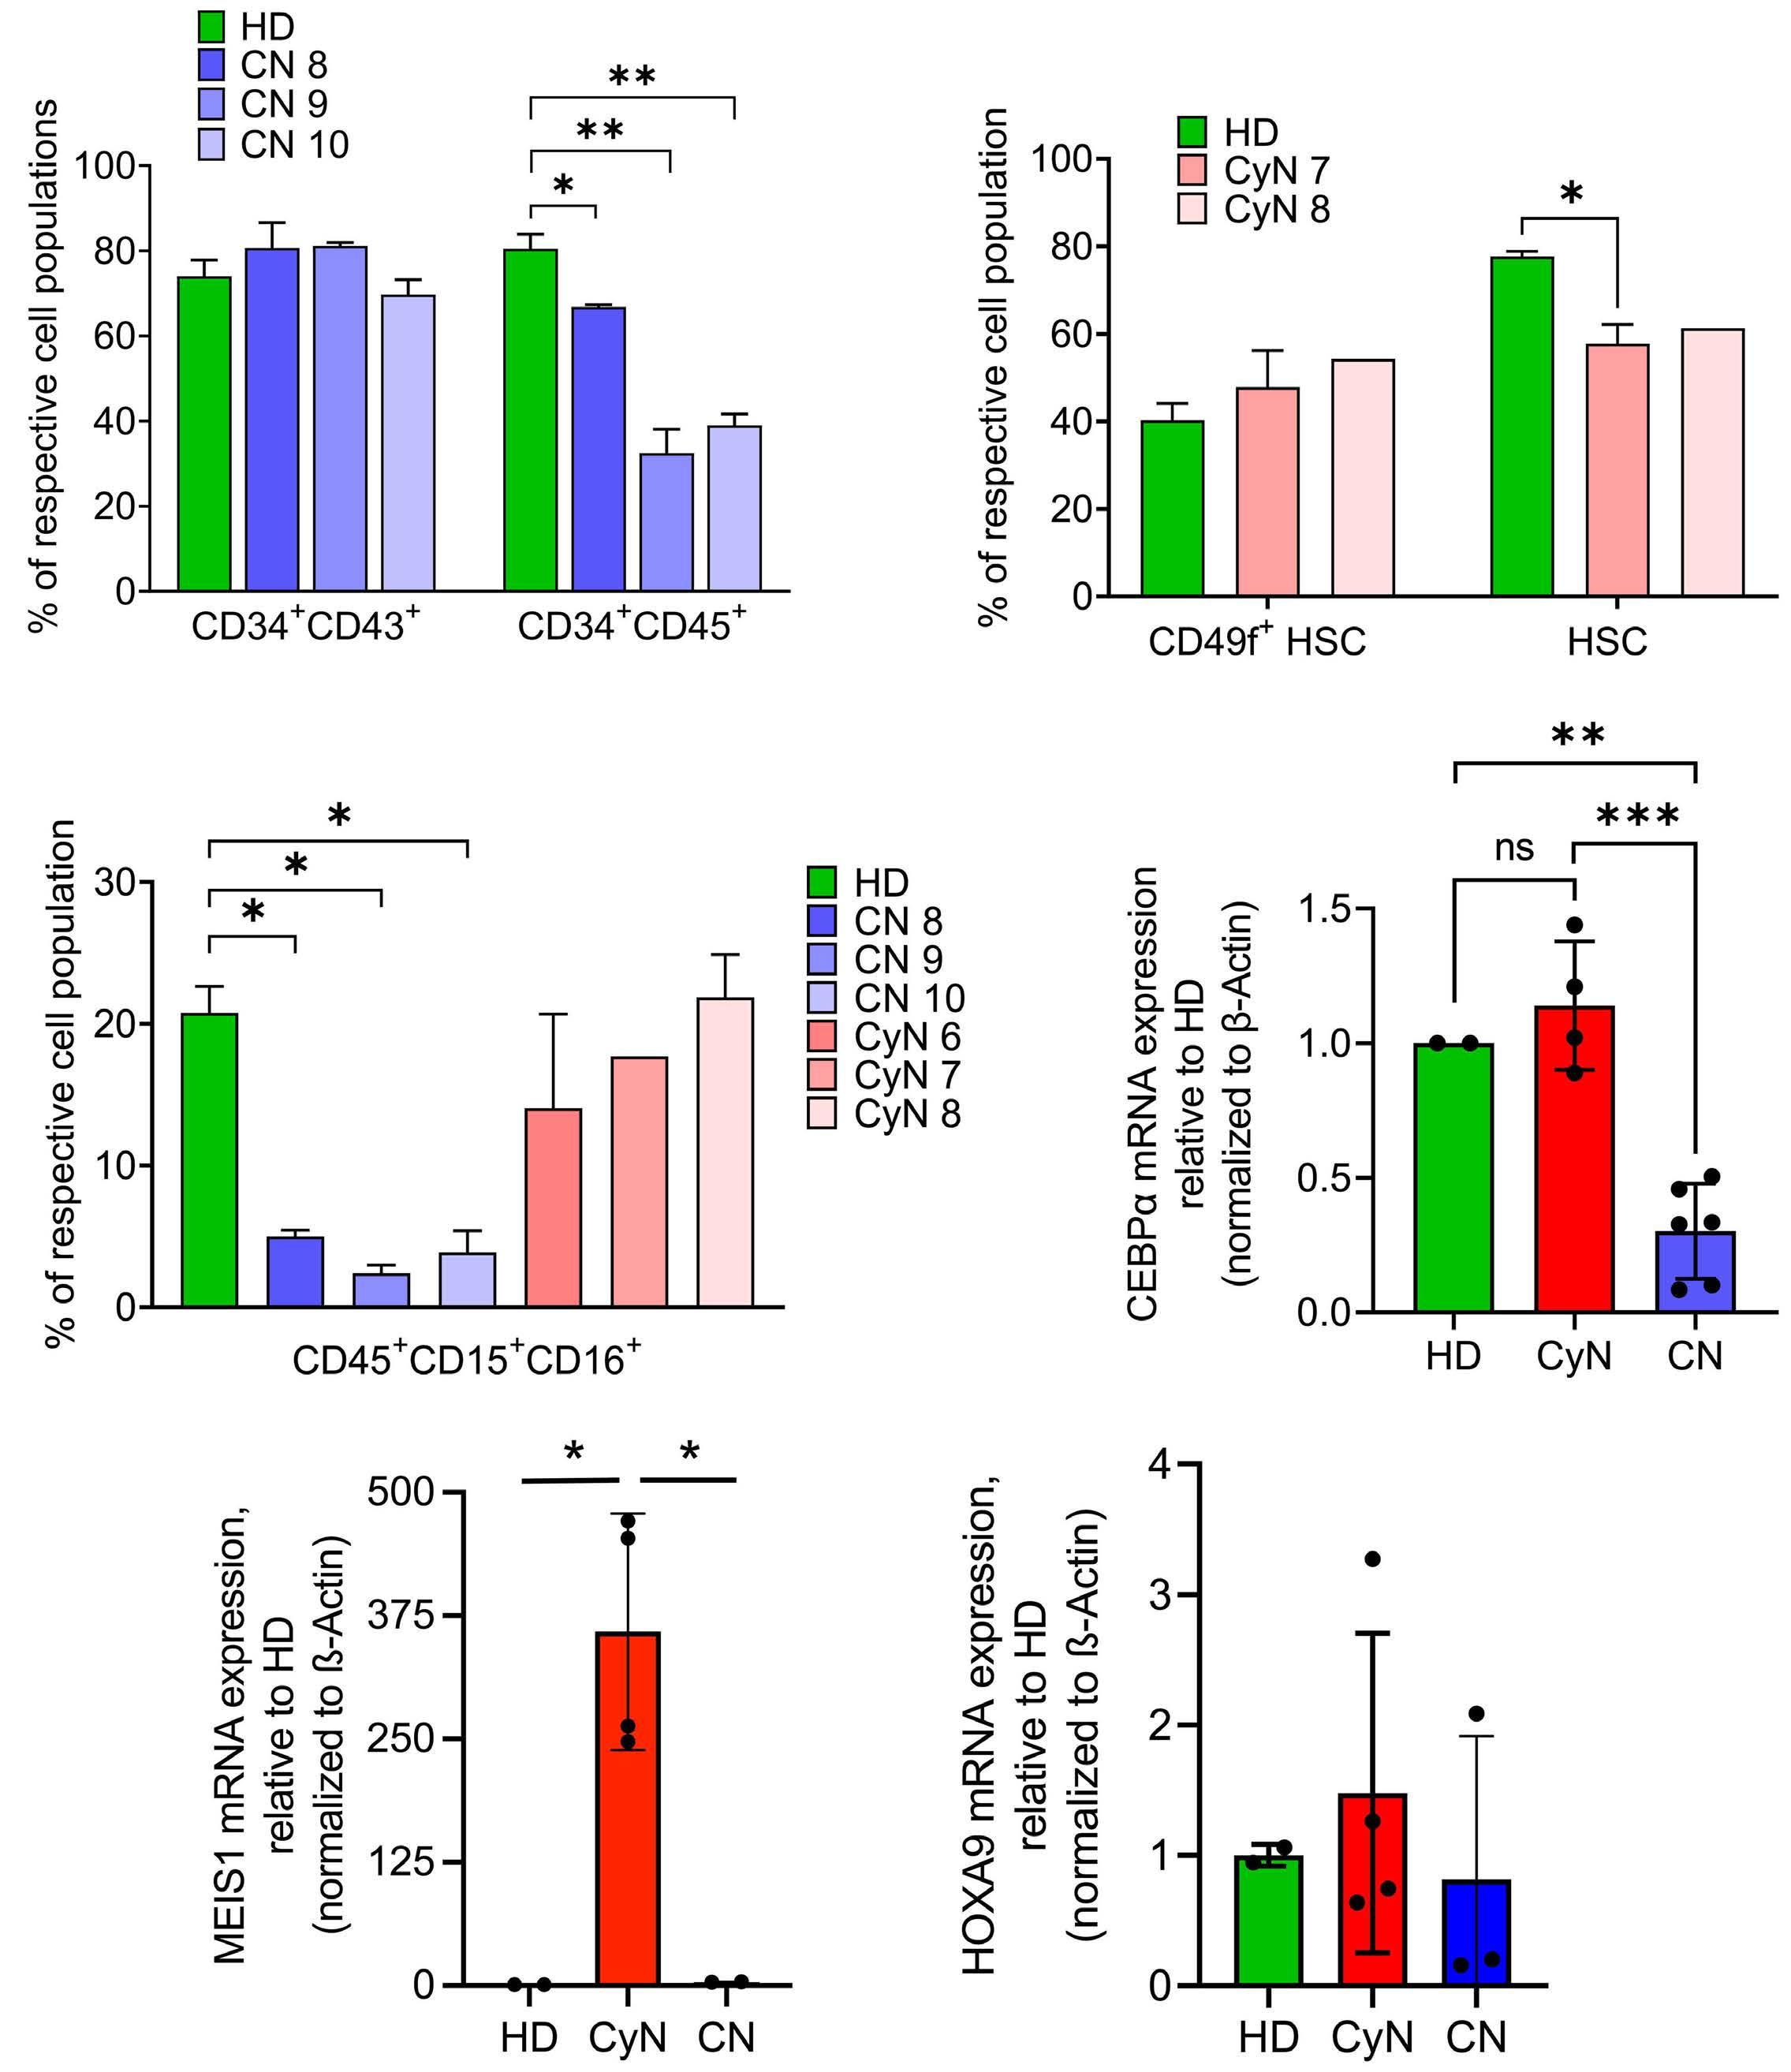
Figure 3. Evaluation of granulocytic differentiation of induced pluripotent stem cells derived from congenital neutropenia and cyclic neutropenia patients harboring ELANE mutations. (A) Evaluation of early hematopoietic differentiation of induced pluripotent stem cells derived (iPSC) derived from 1 healthy donor (HD) and 3 congenital neutropenia (CN) patients using flow cytometry. Data are represented as mean ± standard deviation (SD) from 2 independent experiments, in duplicates; unpaired t test, *P<0.05; **P<0.01. (B) Evaluation of early hematopoietic differentiation of iPSC derived from 1 healthy donor (HD) and 2 cyclic neutropenia (CyN) patients using flow cytometry. Data are represented as mean ± SD from 2 independent experiments, in duplicates, Unpaired t test, *P<0.05. (C) Granulocytic differentiation of iPSC generated from 1 HD, 3 CN and 3 CyN patients. The percentage of CD45+CD15+CD16+ neutrophils was assessed by flow cytometry of suspension cells on day 28 of embryoid body-based differentiation. Data are represented as mean ± SD from 2 independent experiments, each in duplicates. Unpaired t test, *P<0.05. (D, E) Relative mRNA expression of C/EBPα (D), MEIS1 and HOXA9 (E) in CD34+ cells derived from iPSC of CyN patients and CN patients to HD cells measured by quantitative real-time polymerase chain reaction. Data were normalized to β-actin and are represented as mean ± SD in duplicates. Unpaired t test, *P<0.05.
Haematologica | 109 May 2024 1397 ARTICLE - CEBPA in cyclic versus congenital neutropenia A. Zeidler et al.
A C E B D
Rescue with C/EBPα restored defective granulopoiesis in primary hematopoietic stem cells of two ELANE congenital neutropenia patients
We next tested whether restoration of the diminished C/ EBPα expression in primary CD34+ HSPC of CN patients harboring ELANE mutations would affect their granulocytic differentiation in vitro. We used an RFP+-lentiviral vector to overexpress C/EBPα in CD34+ HSPC obtained from three ELANE-CN patients and then differentiated transduced cells to neutrophils in liquid culture (Figure 4A). After 14 days of differentiation, we found a reduction in granulocyte-monocyte progenitor cells (GMP/MB: RFP+CD45+CD33high), while promyelocytes/myelocytes (PM/MY: RFP+CD45+CD33DIMCD16-) and band cells/polymorphonuclear neutrophils (BC/PMN: RFP+CD45+CD33DIMCD16+) were markedly higher in C/EBPα transduced cells as compared to RFP control (Figure 4B; Online Supplementary Figure S3A). Cytospin morphology of one ELANE-CN patient confirmed the improved granulocytic differentiation in C/EBPα transduced cells, as compared to RFP control (Figure 4C).
Strong correlation of cyclic neutrophil elastase plasma levels with absolute neutrophil count in a cyclic neutropenia patient
Finally, we investigated whether the cyclic behavior of
NE protein expression is also observed in CyN plasma. We collected blood samples from one CyN patient over three cycles and assessed NE values using a NE-specific enzyme-linked immunosorbent assay (ELISA). This assay revealed a dramatic difference in NE levels according to the phase of the cycle, with high expression during the cycle peak and very low levels at the cycle nadir (Figure 5A). NE protein levels strongly correlated with ANC during the cycles (Figure 5A, B). The NE levels in the plasma of three healthy individuals not treated with G-CSF were 66.98+1.94 ng/mL and of three individuals treated with 5 mg/kg/day of G-CSF for 3 days were 374.3+123.0 ng/mL (Figure 5A). In order to prove the cycle-dependent correlation between NE levels and ANC, more patients should be analyzed in the future.
Discussion
By searching for the different pathomechanisms of CN and CyN, we found that C/EBPα expression discriminates between CN and CyN. C/EBPα, one of the key factors in granulopoiesis,20 was greatly reduced in CN, but not in CyN. In addition to C/EBPα, mRNA expression levels of its target genes MLL1, MEIS1, HOXA9, and HLF were substantially decreased, or even absent, in CD34+ cells from CN patients
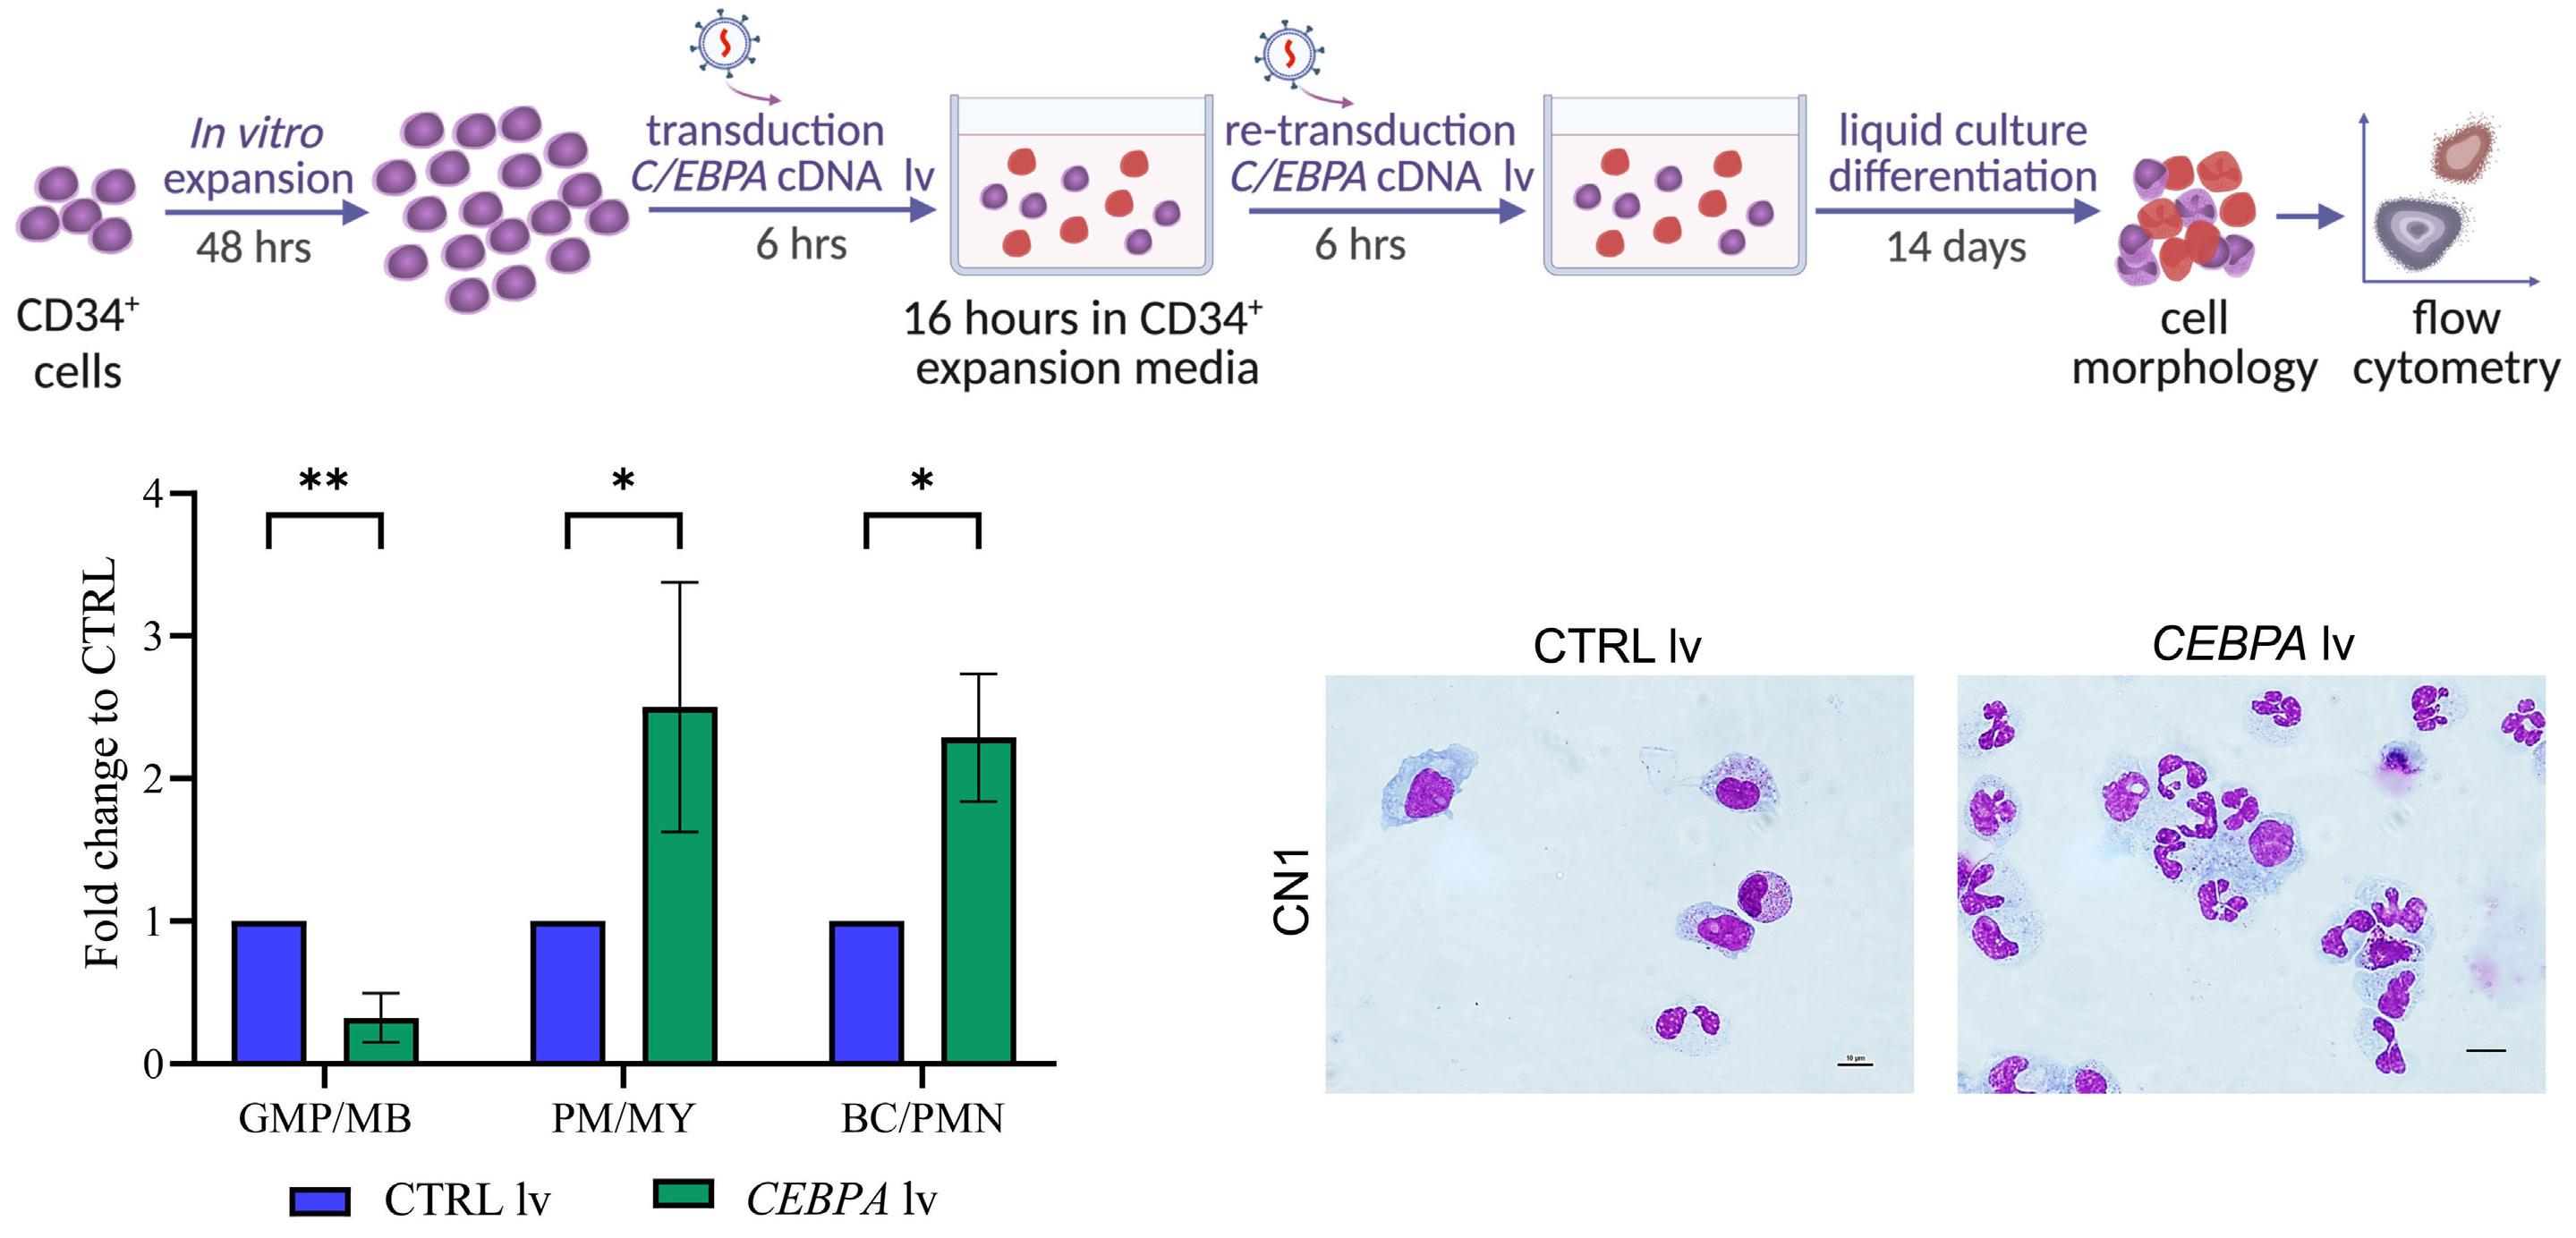
Figure 4. Ectopic expression of C/EBPα rescues neutrophilic differentiation of CD34+ hematopoietic stem and progenitor cells of congenital neutropenia patients. (A) Schematic of the experimental procedure: CD34+ hematopoietic stem and progenitor cells (HSPC) of 3 ELANE congenital neutropenia (CN) patients were expanded in vitro, transduced with lentivirus particles containing C/EBPα cDNA or a control (CTRL) virus with the red fluorescent marker RFP, and differentiated in liquid culture for 14 days. (B) Flow cytometry analysis of granulocyte-monocyte progenitors/myeloblasts (GMP/MB; RFP+CD45+CD33high), promyelocytes/myelocytes (PM/MY; RFP+CD45+CD33DIMCD16-) and band cells/polymorphonuclear cells (BC/PMN; RFP+CD45+CD33DIMCD16+) at day 14 of differentiation. Data are represented as fold-change increase to control RFP transduced cells and as mean ± standard deviation, in duplicates. Unpaired t test, *P<0.05, **P<0.01. (C) Representative images of May-Grunwald-Giemsa-stained preparations of differentiated cells on day 14 of culture (60X magnification, scale bars =10 mm).
Haematologica | 109 May 2024 1398 ARTICLE - CEBPA in cyclic versus congenital neutropenia A. Zeidler et al.
A B C
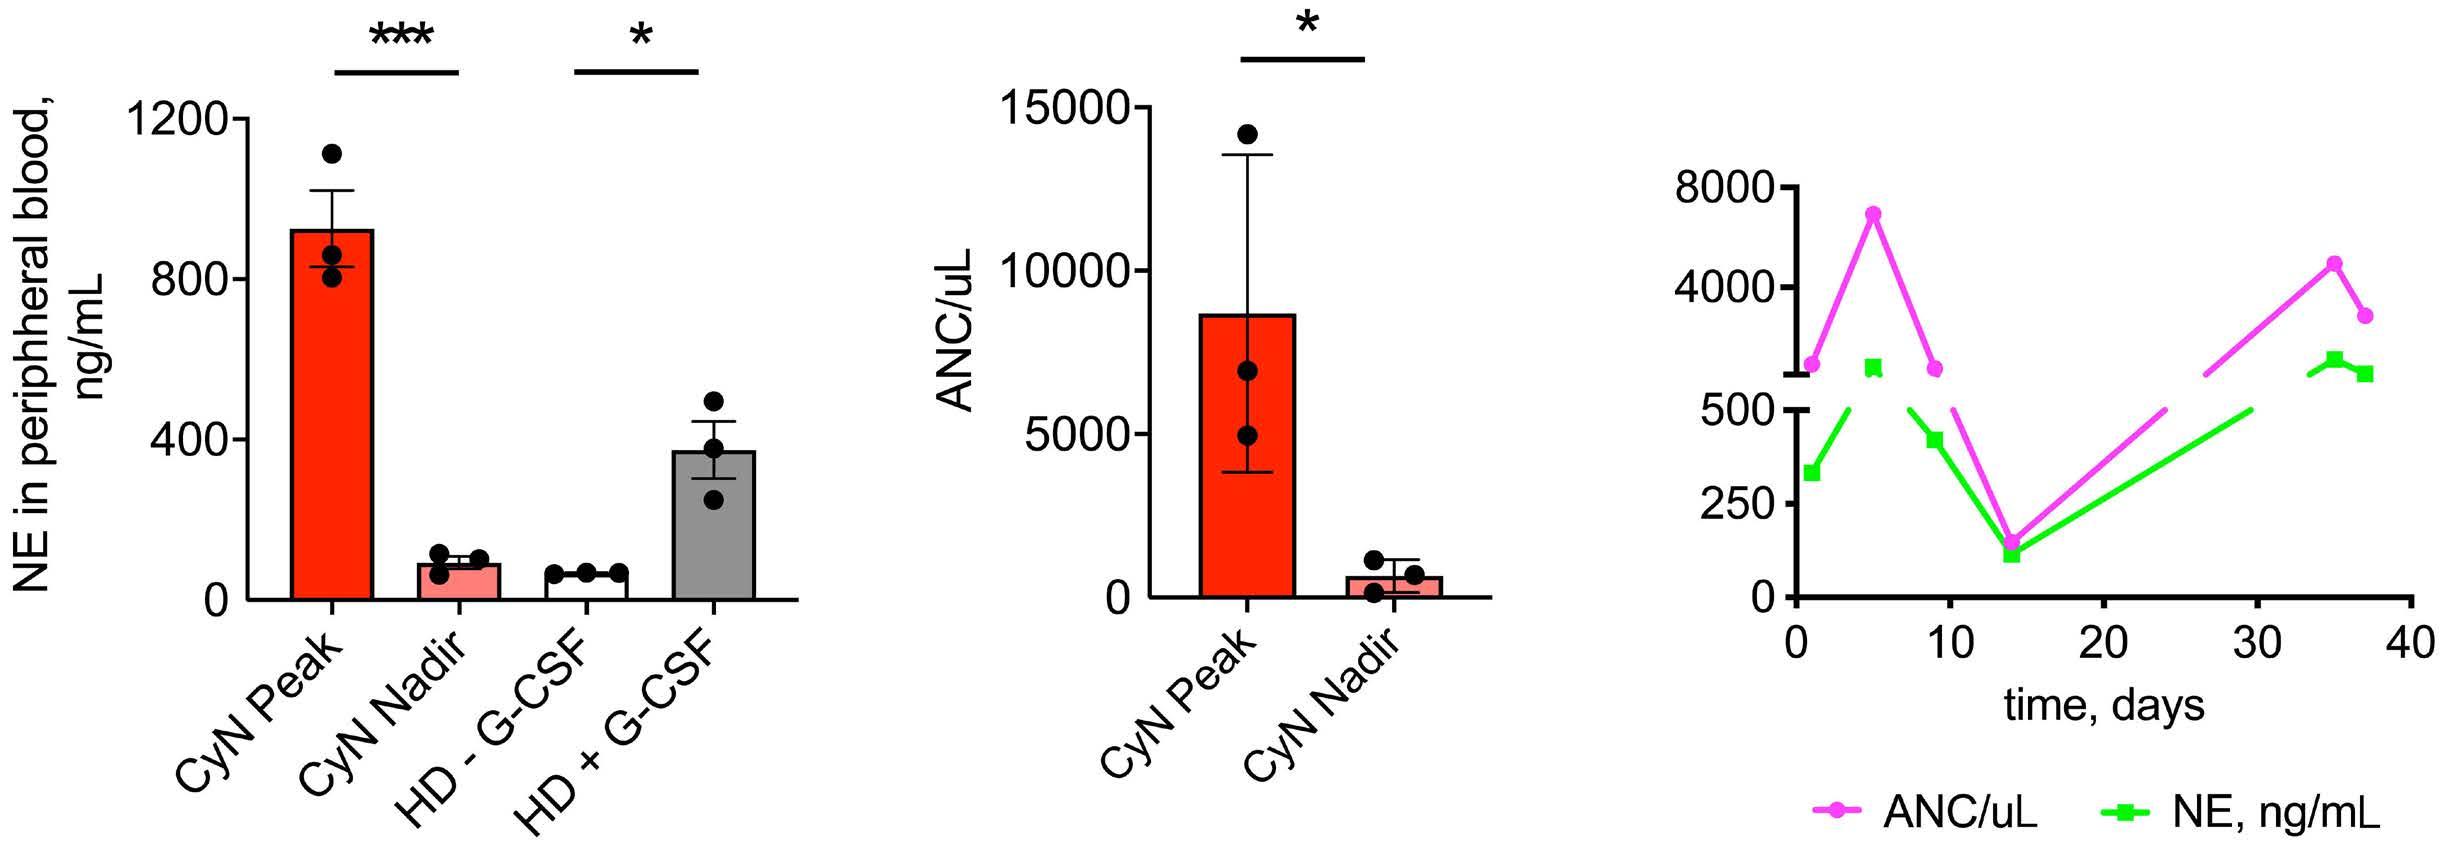
Figure 5. Correlation of neutrophil elastase plasma levels and absolute neutrophil count in cyclic neutropenia cycle. (A) Neutrophil elastase (NE) plasma levels (left panel) assessed by enzyme-linked immunosorbant assay and absolute neutrophil counts (ANC) (right panel) in peripheral blood at peaks and nadirs of neutrophil cycles of 1 cyclic neutropenia (CyN) patient over 3 cycles. NE plasma levels were also evaluated in healthy donors (HD) treated or not with recombinant human granulocyte colony-stimulating factor (rhG-CSF). Data are represented as mean ± standard deviation. Unpaired t test, *P<0.05, ***P<0.001. (B) Time course of NE levels and ANC in 1 CyN patient.
compared with CD34+ cells from healthy controls (Figure 1C). Indeed, self-renewal, proliferation, and differentiation of HSC are dependent on the epigenetic activation, e.g,. by histone-acetylation of transcription factors such as C/EBPα, the C/EBPα-target genes MLL1, MEIS1, and HOXA923-25,30,31,33,35 and HLF, all of them abrogated in CN. We need to emphasize, that we were able to acquire a relatively small number of patient samples for this investigation and further studies should be performed on large patient cohorts. The severely diminished expression of HSC-specific transcription factors CEBPA and MEIS1 in CN, as compared to CyN, could be recapitulated and confirmed in iPSC established from these group of patients. Intriguingly, HOXA9 was expressed at least ten times lower in iPSC-derived HSC than in primary CD34+ cells. The low expression of HOXA9 in iPSC or in ESC was already reported by others43 supporting our data in Figure 3E. Ramos-Meja et al. identified HOXA9 as the most downregulated gene in hESC-derived HSPC as compared with CB-derived CD34+ cells, HOXA9 expression was 60-fold lower in differentiating day 15 EB than in CBCD34+ cells. The principal problem of low HOXA9 expression in iPSC cells was not the subject of our study. The low expression of C/EBPα in iPSC derived from CN patients was already reported.13
In contrast to CN patients, at the peak of the cycle, CD34+ cells from CyN patients, which included CD49f+ eHSC, expressed C/EBPα, MLL1, MEIS1, HOXA9, and HLF at levels significantly higher than those in healthy controls (Figure 1B, C). Increased expression of these stem-cell-specific transcription factors during the ascending arm of the neutrophil cycle in CyN induces self-renewal, proliferation, and differentiation of CD49f+ eHSC, which give rise to more mature HSC, myeloid progenitor cells, and mature neutrophils. The high expression of HLF at the peak of the cycle (Figure 1B) ensures the high self-renewal capacity of the CD49f+ eHSC
in CyN and can be used as a biomarker for the presence of self-renewing, naïve HSC. Indeed, HLF is one of the most selectively expressed genes in human HSC with self-renewal capacity and the defining factor of the human HSC state.36,37 Intriguingly, the same ELANE mutation can cause CN and CyN. We demonstrated that the UPR-induced inhibition of proliferation and differentiation of HSC reported in CN is incomplete in CyN16 reflecting the fact that some eHSC escape from UPR-related damage. In this study, we showed that these escaper cells are CD34+CD49f+ eHSC. The asymmetrical self-renewal of CD34+CD49f+ eHSC gives rise to equal numbers of CD49f+ eHSC and committed CD34+CD49f- HSC that differentiate to progenitor cells and ultimately to mature neutrophils.17 CD49f+ cells are eHSC with the capacity for self-renewal that only exist at low frequencies within the CD34+ cell population.15,16 The CD49f+ escaper cells in CN and in CyN are not affected by UPR, since they do not express ELANE but respond to G-CSF.15,46 Indeed, single-cell RNA-sequencing analyses of individual CD34+ cells revealed that ELANE is not co-expressed with integrin α6 (CD49f antigen), indicating that CD49f+ eHSC do not express ELANE (Figure 2B). Additionally, we found no NE protein in CD49f+ eHSC by FACS analysis (Figure 2A). Avellino et al. also reported that ELANE is not expressed in LT-HSC,22 further supporting our hypothesis that escaper eHSC are not affected by the UPR. In CN, CD49f+ eHSC are not capable of asymmetric division, proliferation, and differentiation due to the lack of hematopoiesis-specific transcription factors, C/EBPα, MLL1, MEIS1, HOXA9, and HLF. However, rescue of C/EBPα expression by ectopic expression of C/EBPα, cDNA in CD34+ cells of three ELANE CN patients led to strongly improved differentiation to neutrophils in vitro, confirming the crucial role of C/ EBPα in the pathomechanism of CN and in discriminating between CN and CyN. During the downward arm of the cycle, there is a decrease
Haematologica | 109 May 2024 1399 ARTICLE - CEBPA in cyclic versus congenital neutropenia A. Zeidler et al.
A B
in HSC-specific transcription factor expression caused by negative feedback mediated by an inhibitor/s released by mature neutrophils at the peak of the cycle. Early reports suggested that, in CyN, disruption of such an autoregulatory feedback loop would explain cycling.45,46 Horwitz et al. favored a feedback model in which mature neutrophils elaborate an inhibitor of myelopoiesis whose concentration depends upon the number of neutrophils present.47 Indeed, we were able to demonstrate that the concentration of NE in CyN correlates with the number of neutrophils in one CyN patient (Figure 5A, B), suggesting that the NE released from neutrophils at the peak of the cycle is a strong candidate mediator of the negative feedback loop. This correlation needs to be confirmed by the evaluation of more patients in the future. NE is already known to provide feedback regulation of granulopoiesis through direct proteolytic action on G-CSF and the G-CSF receptor.48,49 We further demonstrated that treatment with NE digests human recombinant G-CSF.50 Li and Horwitz hypothesized that the CN phenotype is unlikely to result from haploinsufficiency in the proteolytic activity of mutated NE toward native substrates.51 Their study also proposed the “chalone” hypothesis, in which neutrophils homeostatically regulate their production by inhibiting granulopoiesis. Efforts to track down the chalone led to the purification of NE protein.52 The relatively high numbers of neutrophils at the peak of the cycle release NE causing proteolytic digestion of G CSF. Intriguingly, in CN, levels of NE in mature neutrophils and in plasma were decreased, whereas in CyN they were comparable to healthy individuals,53 which is dependent on the cycle stage (Figure 5A, B). Therefore, there is a sufficient amount of proteolytically active NE in the plasma of CyN patients, especially at the peak of the cycle, to promote the digestion of G-CSF. Indeed, Watari et al. showed G-CSF levels below the detection limit at the peak of the cycle and 165 pg/mL at the nadir of the cycle in a patient with CyN.54
The lack of biologically active G-CSF at the peak leads to a decrease in the expression of transcription factors in CD49f+ eHSC (escaper cells), which is normally triggered by G-CSF. The amount of NE released by neutrophils at the peak is sufficient to abrogate the proliferation and differentiation of CD49f+ eHSC. Moreover, the majority of NE-expressing, more mature CD34+CD49f- cells are affected by the UPR.
In healthy individuals, the NE protein released by neutrophils and the degree of proteolytic digestion of G-CSF is not sufficient to completely block the proliferation of the relatively high number of CD34+ cells but instead functions only as an autoregulatory feedback loop for granulopoiesis.
At the nadir of the cycle, high UPR activity in CD34+ cells containing CD49f+ eHSC, as measured by elevated ATF6, BiP, and PERK expression,16 again leads to the damage of the newly generated NE-expressing CD34+ HSPC. Because of its low release at the nadir attributable to the low neutrophil counts, NE no longer affects G-CSF levels, and thus G-CSF is available for the induction of proliferation and differentiation of the remaining CD49f+ eHSC during the ascending arm
of the cycle. The reduction in the cycle length from 21 to 14 days upon G-CSF therapy might be attributable to G-CSF-induced increases in the proliferation of CD49f+ eHSC during the ascending arm of the cycle. Indeed, CD49f+ eHSC can respond to treatment with G-CSF.46 Therefore, the cycling of neutrophils is caused by cycling G-CSF-triggered transcriptional activities of CD49f+ eHSC, which are not affected by the UPR. Therefore, high levels of the stem cell factors, HLF, C/EBPα, MLL1, HOXA9, and MEIS1, at the peak of the cycle induce proliferation and self-renewal of HSC which differentiate to progenitor cells and neutrophils.
In CN, G-CSF is unable to induce the proliferation of CD34+ cells because they are impacted by the UPR and the CD49f+ cells fail to express stem cell-specific transcription factors. This disables the generation of sufficient numbers of HSC and neutrophils. CN patients require treatment with high dosages of G-CSF to overcome this UPR-mediated block of granulocytic differentiation. How much G-CSF is required to produce more than 1,000 neutrophils/mL is, therefore, most likely dependent on the degree to which G-CSF is degraded by NE.
In summary, by searching for different molecular pathomechanisms of CyN and CN, we identified that C/EBPα expression and its targets HLF, MLL1, MEIS1, and HOXA9, in CD34+ HSC discriminate between CN and CyN. Whereas in CN patients, expression of these factors was defective or absent, in CyN we observed a cycle-dependent increase in the expression of these five factors, leading to the self-renewal, proliferation, and differentiation of CD49f+ eHSC. Ectopic expression of C/ EBPα in CN rescued the differentiation to neutrophils. In CyN, CD49f+ eHSC within the CD34+ cell population escape UPR damage because they do not express ELANE. This reveals the high transcriptional activity of CD49f+ eHSC (escaper cells) in response to G-CSF at the peak of the cycle, which ensures their differentiation to sufficient neutrophil numbers. However, the neutrophils at the peak of the cycle release NE causing proteolytic digestion of G CSF leading to a lack of biologically active G-CSF and a subsequent decrease in the expression of transcription factors in CD49f+ eHSC (escaper cells). On the basis of these findings, we propose that the therapeutic options for patients suffering from CN or CyN would be either to inhibit the mutated NE activity with, for example, an elastase inhibitor,55 or to delete or correct the ELANE gene using gene therapy.56 Another approach could be to treat CN patients with a newly designed G-CSF that is resistant to proteolytic digestion by NE.50
Disclosure
No conflicts of interest to disclose.
Contributions
KW designed the study. KW and JS supervised the experimentation and wrote the manuscript. AZ and NB-B performed main experiments and analyzed the data. MR performed FACS analysis. BD, AZa and MN assisted with iPSC experiments. MK and SK performed scRNA-seq data analysis. MK performed
Haematologica | 109 May 2024 1400 ARTICLE - CEBPA in cyclic versus congenital neutropenia A. Zeidler et al.
prediction of C/EBPα binding to target genes. KH assisted with qRT-PCR and FACS. CZ and JK provided patients material.
Acknowledgments
We thank K. Hähnel and R. Bernhard for their excellent technical support.
Funding
This work was supported by the Intramural Fortüne program of the Medical Faculty of the UKT (to MK, AZ), Madeleine
References
1. Skokowa J, Dale DC, Touw IP, Zeidler C, Welte K. Severe congenital neutropenias. Nat Rev Dis Primers. 2017;3:17032.
2. Makaryan V, Zeidler C, Bolyard AA, et al. The diversity of mutations and clinical outcomes for ELANE-associated neutropenia. Curr Opin Hematol. 2015;22(1):3-11.
3. Dale DC, Welte K. Cyclic and chronic neutropenia. Cancer Treat Res. 2011;157:97-108.
4 Bonilla MA, Dale D, Zeidler C, et al. Long-term safety of treatment with recombinant human granulocyte colonystimulating factor (r-metHuG-CSF) in patients with severe congenital neutropenias. Br J Haematol. 1994;88(4):723-730.
5. Hammond WP, Price TH, Souza LM, Dale DC. Treatment of cyclic neutropenia with granulocyte colony-stimulating factor. N Engl J Med. 1989;320(20):1306-1311.
6. Bonilla MA, Gillio AP, Ruggeiro M, et al. Effects of recombinant human granulocyte colony-stimulating factor on neutropenia in patients with congenital agranulocytosis. N Engl J Med. 1989;320(24):1574-1580.
7. Dale DC, Bolyard A, Marrero T, et al. Long-term effects of G-CSF therapy in cyclic neutropenia. N Engl J Med. 2017;377(23):2290-2292.
8. Klimiankou M, Uenalan M, Kandabarau S, et al. Ultra-sensitive CSF3R deep sequencing in patients with severe congenital neutropenia. Front Immunol. 2019;10:116.
9 Skokowa J, Steinemann D, Katsman-Kuipers JE, et al. Cooperativity of RUNX1 and CSF3R mutations in severe congenital neutropenia: a unique pathway in myeloid leukemogenesis. Blood. 2014;123(14):2229-2237.
10. Rosenberg PS, Zeidler C, Bolyard AA, et al. Stable long-term risk of leukaemia in patients with severe congenital neutropenia maintained on G-CSF therapy. Br J Haematol. 2010;150(2):196-199.
11. Klimiankou M, Mellor-Heineke S, Klimenkova O, et al. Two cases of cyclic neutropenia with acquired CSF3R mutations, with 1 developing AML. Blood. 2016;127(21):2638-2641.
12. Nustede R, Klimiankou M, Klimenkova O, et al. ELANE mutantspecific activation of different UPR pathways in congenital neutropenia. Br J Haematol. 2016;172(2):219-227.
13. Nayak RC, Trump LR, Aronow BJ, et al. Pathogenesis of ELANEmutant severe neutropenia revealed by induced pluripotent stem cells. J Clin Invest. 2015;125(8):3103-3116.
14. Dannenmann B, Zahabi A, Mir P, et al. Human iPSC-based model of severe congenital neutropenia reveals elevated UPR and DNA damage in CD34+ cells preceding leukemic transformation. Exp Hematol. 2019;71:51-60.
Schickedanz Kinderkrebsstiftung (to JS, KW, MK, MN), DFG (to JS, AZ), BMBF (to JS, KW, CZ, SK), and the COST Action European Network for Innovative Diagnosis and Treatment of Chronic Neutropenias (EuNet-INNOCHRON) (to KW, CZ, MK, JS). We acknowledge the support by the Open Access Publishing Fund of the University of Tübingen.
Data-sharing statement
All data are available on request from the corresponding author.
15. Velten L, Haas SF, Raffel S, et al. Human haematopoietic stem cell lineage commitment is a continuous process. Nat Cell Biol. 2017;19(4):271-281.
16. Mir P, Klimiankou M, Findik B, et al. New insights into the pathomechanism of cyclic neutropenia. Ann N Y Acad Sci. 2020;1466(1):83-92.
17 Notta F, Doulatov S, Laurenti E, Poeppl A, Jurisica I, Dick JE. Isolation of single human hematopoietic stem cells capable of long-term multilineage engraftment. Science. 2011;333(6039):218-221.
18. Belluschi S, Calderbank EF, Ciaurro V, et al. Myelo-lymphoid lineage restriction occurs in the human haematopoietic stem cell compartment before lymphoid-primed multipotent progenitors. Nat Commun. 2018;9(1):4100.
19. Krebsbach PH, Villa-Diaz LG. The role of integrin α6 (CD49f) in stem cells: more than a conserved biomarker. Stem Cell Dev. 2017;26(15):1090-1099.
20. Radomska HS, Huettner CS, Zhang P, Cheng T, Scadden DT, Tenen DG. CCAAT/enhancer binding protein alpha is a regulatory switch sufficient for induction of granulocytic development from bipotential myeloid progenitors. Mol Cell Biol. 1998;18(7):4301-4314.
21. Iida S, Watanabe-Fukunaga R, Nagata S, Fukunaga R. Essential role of C/EBPalpha in G-CSF-induced transcriptional activation and chromatin modification of myeloid-specific genes. Genes Cells. 2008;13(4):313-327.
22. Avellino R, Mulet-Lazaro R, Havermans M, et al. Induced cellautonomous neutropenia systemically perturbs hematopoiesis in Cebpa enhancer-null mice. Blood Adv. 2022;6(5):1406-1419.
23. Collins C, Wang J, Miao H, et al. C/EBPalpha is an essential collaborator in Hoxa9/Meis1-mediated leukemogenesis. Proc Natl Acad Sci U S A. 2014;111(27):9899-9904.
24. Artinger EL, Mishra BP, Zaffuto KM, et al. An MLL-dependent network sustains hematopoiesis. Proc Natl Acad Sci U S A. 2013;110(29):12000-12005.
25. Milne TA, Briggs SD, Brock HW, et al. MLL targets SET domain methyltransferase activity to Hox gene promoters. Mol Cell. 2002;10(5):1107-117.
26. Hasemann MS, Lauridsen FK, Waage J, et al. C/EBPalpha is required for long-term self-renewal and lineage priming of hematopoietic stem cells and for the maintenance of epigenetic configurations in multipotent progenitors. PLoS Genet. 2014;10(1):e1004079.
27. Ye M, Zhang H, Amabile G, et al. C/EBPa controls acquisition and maintenance of adult haematopoietic stem cell quiescence. Nat Cell Biol. 2013;15(4):385-394.
28. Skokowa J, Cario G, Uenalan M, et al. LEF-1 is crucial for neutrophil granulocytopoiesis and its expression is severely
Haematologica | 109 May 2024 1401 ARTICLE - CEBPA in cyclic versus congenital neutropenia A. Zeidler et al.
reduced in congenital neutropenia. Nat Med. 2006;12(10):1191-1197.
29 Dannenmann B, Klimiankou M, Oswald B, et al. iPSC modeling of stage-specific leukemogenesis reveals BAALC as a key oncogene in severe congenital neutropenia. Cell Stem Cell. 2021;28(5):906-922.
30 Calvo KR, Knoepfler PS, Sykes DB, Pasillas MP, Kamps MP. Meis1a suppresses differentiation by G-CSF and promotes proliferation by SCF: potential mechanisms of cooperativity with Hoxa9 in myeloid leukemia. Proc Natl Acad Sci U S A. 2001;98(23):13120-13125.
31. Pineault N, Helgason CD, Lawrence HJ, Humphries RK. Differential expression of Hox, Meis1, and Pbx1 genes in primitive cells throughout murine hematopoietic ontogeny. Exp Hematol. 2002;30(1):49-57.
32. Argiropoulos B, Yung E, Humphries RK. Unraveling the crucial roles of Meis1 in leukemogenesis and normal hematopoiesis. Genes Dev. 2007;21(22):2845-2849.
33. Lawrence HJ, Christensen J, Fong S, et al. Loss of expression of the Hoxa-9 homeobox gene impairs the proliferation and repopulating ability of hematopoietic stem cells. Blood. 2005;106(12):3988-3994.
34 Thorsteinsdottir U, Mamo A, Kroon E, et al. Overexpression of the myeloid leukemia-associated Hoxa9 gene in bone marrow cells induces stem cell expansion. Blood. 2002;99(1):121-129.
35. Argiropoulos B, Humphries RK. Hox genes in hematopoiesis and leukemogenesis. Oncogene. 2007;26(47):6766-6776.
36. Lehnertz B, Chagraoui J, MacRae T, et al. HLF expression defines the human hematopoietic stem cell state. Blood. 2021;138(25):2642-2654.
37. Giladi A, Paul F, Herzog Y, et al. Single-cell characterization of haematopoietic progenitors and their trajectories in homeostasis and perturbed haematopoiesis. Nat Cell Biol. 2018;20(7):836-846.
38. Fioredda F, Skokowa J, Tamary H, et al. The European Guidelines on Diagnosis and Management of Neutropenia in Adults and Children: a consensus between the European Hematology Association and the EuNet-INNOCHRON COST action. Hemasphere. 2023;7(4):e872.
39 Hammond CA and Eaves C. Postnatal conservation of human blood- and marrow-specific CD34+ hematopoietic phenotypes. Exp Hematol. 2022;109:18-26.
40 Cheneby J, Menetrier Z, Mestdagh M, et al. ReMap 2020: a database of regulatory regions from an integrative analysis of human and arabidopsis DNA-binding sequencing experiments. Nucleic Acids Res. 2020;48(D1):D180-D188.
41. Huang Y, Sitwala K, Bronstein J, et al. Identification and characterization of Hoxa9 binding sites in hematopoietic cells. Blood. 2012;119(2):388-398.
42. Dannenmann B, Nasri M, Welte K, Skokowa J. CRISPR/Cas9 genome editing of human-induced pluripotent stem cells followed by granulocytic differentiation. Methods Mol Biol. 2020;2115:471-483.
43. Ramos-Mejía V, Navarro-Montero O, Ayllon V, et al. HOXA9 promotes hematopoietic commitment of human embryonic stem cells. Blood. 2014;124(20):3065-3075.
44 Knapp DJ, Hammond CA, Aghaeepour N, et al. Distinct signaling programs control human hematopoietic stem cell survival and proliferation. Blood. 2017;129(3):307-318.
45. Morley A. Cyclic hemopoiesis and feedback control. Blood Cells. 1979;5(2):283-296.
46. von Schulthess GK, Mazer NA. Cyclic neutropenia (CN): a clue to the control of granulopoiesis. Blood. 1982;59(1):27-37.
47. Horwitz MS, Duan Z, Korkmaz B, Lee HH, Mealiffe ME, Salipante SJ. Neutrophil elastase in cyclic and severe congenital neutropenia. Blood. 2007;109(5):1817-1824.
48. Hunter MG, Druhan LJ, Massullo PR, Avalos BR. Proteolytic cleavage of granulocyte colony-stimulating factor and its receptor by neutrophil elastase induces growth inhibition and decreased cell surface expression of the granulocyte colonystimulating factor receptor. Am J Hematol. 2003;74(3):149-155.
49 El Ouriaghli F, Fujiwara H, Melenhorst JJ, Sconocchia G, Hensel N, Barrett AJ. Neutrophil elastase enzymatically antagonizes the in vitro action of G-CSF: implications for the regulation of granulopoiesis. Blood. 2003;101(5):1752-1758.
50 Skokowa J, Hernandez Alvarez B, Coles M, et al. A topological refactoring design strategy yields highly stable granulopoietic proteins. Nat Commun. 2022;13(1):2948.
51. Li FQ, Horwitz M. Characterization of mutant neutrophil elastase in severe congenital neutropenia. J Biol Chem. 2001;276(17):14230-14241.
52. Horwitz M, Benson KF, Duan Z, et al. Role of neutrophil elastase in bone marrow failure syndromes: molecular genetic revival of the chalone hypothesis. Curr Opin Hematol. 2003;10(1):49-54.
53. Skokowa J, Fobiwe JP, Dan L, Thakur BK, Welte K. Neutrophil elastase is severely down-regulated in severe congenital neutropenia independent of ELA2 or HAX1 mutations but dependent on LEF-1. Blood. 2009;114(14):3044-3051.
54. Watari K, Asano S, Shirafuji N, et al. Serum granulocyte colonystimulating factor levels in healthy volunteers and patients with various disorders as estimated by enzyme immunoassay. Blood. 1989;73(1):117-122.
55. Makaryan V, Kelley ML, Fletcher B, Bolyard AA, Aprikyan AA, Dale DC. Elastase inhibitors as potential therapies for ELANEassociated neutropenia. J Leukoc Biol. 2017;102(4):1143-1151.
56. Skokowa J. Circumventing mutation to nix neutropenia. N Engl J Med. 2021;384(20):1956-1958.
Haematologica | 109 May 2024 1402 ARTICLE - CEBPA in cyclic versus congenital neutropenia A. Zeidler et al.
Overall survival and causes of death in elderly patients with Hodgkin lymphoma: a Norwegian population-based case-control study
Kjersti Lia,1,2 Rasmus R.K. Jørgensen,3,4 Bente L.Wold,5 Øystein Fluge,6 Unn-Merete Fagerli,7 Hanne Bersvendsen,8 Idun B. Bø,9 Sameer Bhargava10,11 and Alexander Fosså5,12
1Vestre Viken, Bærum Hospital, Department of Oncology, Gjettum, Norway; 2Faculty of Medicine, University of Oslo, Oslo, Norway; 3Clinical Cancer Research Centre, Aalborg University Hospital, Department of Hematology, Aalborg, Denmark; 4Department of Clinical Medicine, Aalborg University, Aalborg, Denmark; 5Oslo University Hospital, Department of Oncology, Oslo, Norway; 6Haukeland University Hospital, Department of Oncology, Bergen, Norway; 7St. Olavs Hospital, Department of Oncology, Trondheim, Norway; 8University Hospital of North Norway, Department of Oncology, Tromsø, Norway; 9Stavanger University Hospital, Department of Hematology, Stavanger, Norway; 10Cancer Registry of Norway, Majorstuen, Oslo, Norway; 11Akershus University Hospital, Department of Oncology, Lørenskog, Norway and 12KG Jebsen Centre for B-cell Malignancies, University of Oslo, Oslo, Norway
Abstract
Correspondence: K. Lia kjerli@vestreviken.no
Received: June 11, 2023.
Accepted: October 19, 2023.
Early view: October 26, 2023.
https://doi.org/10.3324/haematol.2023.283721
Elderly Hodgkin lymphoma (HL) patients are poorly characterized and under-represented in studies. In this national population-based study, we investigated cause-specific survival using competing-risk analysis in elderly HL patients compared to the normal population. Patients ≥60 years of age diagnosed between 2000-2015 were identified by the Cancer Registry of Norway, and records were reviewed in detail and compared to data from the Norwegian Cause of Death Registry for patients and cancer-free controls. Of 492 patients, 81 (17%) were ineligible for treatment directed specifically towards HL, mostly because of an underlying other lymphoma entity, whereas 74 (15%) and 337 (69%) were treated with palliative or curative intent, respectively. Median overall survival in patients ineligible for assessment of HL-directed therapies was 0.5 years (95% Confidence Interval [CI]: 0.4-0.6), and for palliatively and curatively treated patients 0.8 (0.4-1.2) and 9.1 (7.5-10.7) years, respectively. After correction of discrepancies in registry data, with 359 deaths, 108 (30%) died of HL, the most common cause of death. In curatively treated patients, treatment-related mortality was 6.5% and the risk difference of dying from HL compared to controls was 28% (95% CI: 23-33%) after ten years. These numbers indicate disease control in a majority of elderly patients eligible for curative treatment, compared to risk differences for death from HL of 59% (48-71%) and 42% (31-53%) after ten years in the palliative and ineligible groups, respectively. There was an increased risk of dying from hematologic malignancies other than HL in all groups, but not from other competing causes of death, showing no excess mortality from long-term treatment complications.
Introduction
Hodgkin lymphoma (HL) is one of the most common lymphoma entities in younger adults, but a second peak in incidence occurs in elderly patients.1-3 Currently 20-25% of HL patients are >60 years at presentation, a proportion that may rise with increasing life expectancy in most Western populations. HL is one of the most curable cancers in younger patients with 5-year relative survival rates of around 90%.4 For elderly HL patients, however, the outcome after treatment remains inferior to that in younger patients, probably because of poorer tolerance to modern
intensive chemotherapy, different disease biology, and more comorbidities.5-8 As a consequence, elderly patients are frequently excluded from clinical trials and the optimal therapy for first-line treatment for the elderly is poorly defined.2 Because of inferior outcome, the majority of deaths from HL in the modern era occur in the elderly patients.9 Trials specifically recruiting elderly HL patients have been difficult to perform and are probably subject to selection bias.10 Therefore, HL patients >60 years of age remain poorly characterized in terms of demographic and clinical factors at presentation, as do choice of treatment and outcome outside selected and small studies.11-15 As the
Haematologica | 109 May 2024 1403 - Hodgkin Lymphoma ARTICLE
©2024 Ferrata Storti Foundation Published under a CC BY-NC license
human lifespan increases, cancer will disproportionately affect the elderly, and malignant disorders in this age group will become increasingly important in oncology.16
To our knowledge, few have attempted to describe in detail the whole scope of elderly HL patients in a population-based manner. Here, we aim to combine population-based identification of patients from the Cancer Registry of Norway (CRN) and individual patient record review to describe demographic and clinical characteristics at presentation, treatment choice, and outcome in a comprehensive cohort of HL patients diagnosed in the modern era between 2000 and 2015. To better address the higher risk of death from other diseases common in elderly individuals, we compare survival and causes of death to a matched normal population using competing risk analysis. A large, unbiased selection of patients with relevant individual data may provide important knowledge about this cohort of patients and aid improvement of current practice, as well as planning of future studies.
Methods
Study design
Patients with HL diagnosed from January 1995 to December 2015 and aged >60 years at diagnosis were identified through the CRN (Online Supplementary Methods). Clinical data were retrieved on diagnosis, treatment, and follow-up from medical records at local and regional hospitals and from general practitioners by the co-authors aided by study nurses.
Patients were divided into three groups based on treatment given.
1) Patients ineligible for HL treatment had other concomitant severe diseases, such as other cancers, cardiovascular disease (CVD) or dementia that precluded any treatment directed specifically at HL, had died before the diagnostic biopsy was reviewed, or HL was diagnosed at autopsy. Patients with a previous or simultaneous diagnosis of another lymphoproliferative disease, mostly chronic lymphocytic leukemia (CLL) or a non-Hodgkin lymphoma (NHL, referred to as mixed lymphomas) could receive treatment targeting both disease categories.
2) Patients treated with palliative intent either received no chemotherapy (steroids or palliative radiotherapy allowed) or chemotherapy directed at HL at doses <50% of the dose of central drugs in recommended regimens.
3) All other patients (i.e., those treated with curative intent) received typical regimens directed towards HL at >50% dose of central drugs or curatively intended radiation therapy. The most likely cause of death was concluded from medical records and specified using the International Classification for Disease (ICD-10).17 Death occurring during and up to three months after the last antineoplastic treatment and not due to progression of HL, was deemed treatment-re-
lated mortality (TRM).
The Norwegian Cause of Death Registry (DAAR) provided date and cause of death for patients and 10 cancer-free controls, matched on age, sex and community of residence at the time of HL diagnosis. Causes of death in DAAR are specified using ICD-10 at the level of the immediate and the underlying cause of death. Inconsistencies regarding improbable deaths from hematologic diseases other than HL in the patients were observed and corrected.
The study was approved by the Norwegian Regional Committees for Medical and Health Research Ethics (REK 2016/1202) and Data Protection Officers at all participating hospitals, and performed according to the Declaration of Helsinki.
Statistical analysis
Overall survival (OS) for patients and controls was estimated from date of diagnosis or matching, respectively, to death of any cause, or censored at last date of follow-up (December 31st 2021). Cause-specific survival (CSS) in patients was estimated from diagnosis to death of HL, censored for other causes of death or date of last follow-up. OS and CSS were analyzed by Kaplan-Meier statistics, and groups compared using the log-rank test.
Cumulative incidence functions (CIF) for different causes of death (grouped as HL, hematologic malignancies other than HL, other cancers, dementia, CVD, infections or all other causes) were calculated from date of diagnosis to death from the respective cause using the Aalen-Johansen estimator and compared using Gray’s test. Risk differences between patients and controls were calculated for each competing event at 2, 5, and 10 years with 95% Confidence Intervals (CI) (Online Supplementary Methods and Online Supplementary Table S1).
Results
Patients’ characteristics
Through the CRN, we identified 561 patients with HL >60 years of age in Norway from the time period 1995-2015 ( Online Supplementary Figure S1 ). In addition, 17 were identified from the Lymphoma Registry of Oslo University Hospital. After initial attempts to retrieve data, we excluded all 86 patients diagnosed between 1995 to 1999, due to insufficient data in a larger number of patients from these years. The final study population thus consisted of 492 patients diagnosed from 2000-2015. Eighty-one (17%) patients were ineligible for the analysis of outcomes after HL treatment, due to either presence of mixed lymphoma (N=54), HL diagnosed after death or at autopsy (N=13), severe comorbidity precluding HL treatment (N=7), and incomplete patient data (N=7). Mixed lymphoma was defined as previous or concomitant presence of a second malignant lymphoproliferative disease other than HL. Of the 54 cases
Haematologica | 109 May 2024 1404 ARTICLE - Survival in elderly Hodgkin lymphoma patients K. Lia et al.
(11% of all patients), 20 had preceding diagnosis of a NHL or myeloma, 14 cases were diagnosed as a transformation of CLL, and 14 cases showed presence of two separate lymphoma entities at diagnosis. Six cases remained difficult to classify as either HL or another lymphoma after review and were not treated as HL. Seventy-four (15%) of the patients were treated with palliative intent and 337 (69%) received treatment with intent to cure.
Median age of the whole cohort was 71 years (range 6094), and 58% were male (Online Supplementary Table S2).
Median age in the ineligible group and in palliatively and curatively treated patients was 73 years (range 61-94), 81 years (range 61-94), and 69 years (range 60-90), respectively. Data concerning patient-, disease- and treatment-related variables were missing in a larger proportion of the ineligible cases, and a formal comparison was made for the palliative and curative groups only. Patients in the curatively treated group were significantly younger, had better performance status, were more often fully independent in personal activities of daily living, and had a lower burden of comorbidities at the time of diagnosis of HL. For disease-related parameters, curatively treated patients more often had nodular lymphocyte predominant HL (NLPHL), more often had stage I or II disease, and less often had B symptoms. A total of 89% of biopsies were reviewed at university hospitals: 84% of biopsies from palliatively and 90% from the curatively treated patients.
Nineteen of the palliatively treated patients did not receive any lymphoma-directed chemotherapy due to frailty, age, and/or patient choice. The remaining patients were treated with palliatively intended chemotherapy, either anthracyline-free regimens or dose-reduced CHOP (cyclophosphamide, doxorubicin, vincristine, prednisolone). Radiotherapy was part of the palliative treatment in 14
of the patients. The majority of patients included in the curatively treated group had multi-agent chemotherapy. The most common first-line regimen was CHOP (74%), followed by ABVD (doxorubicin, bleomycin, vinblastine, dacarbazine; 20%). Seventeen patients had curatively intended radiotherapy as their sole first-line treatment, and 14 of these had NLPHL.
Overall survival
The median follow-up for all patients still alive at end of study was 10.4 years (95% Cl: 6.0-22.0). During the course of follow-up, 359 (73%) patients in the study population died. Of them, there were 74 (91%) deaths in the ineligible groups, 73 (99%) in the palliative group, and 212 (63%) in the curative group. Median OS for ineligible, palliatively and curatively treated patients were 0.5 (95% Cl: 0.4-0.6), 0.8 (0.4-1.2), and 9.1 (7.5-10.7) years, respectively, significantly lower in the ineligible and palliative group compared to the curative group (P<0.001 for both comparisons) (Figure 1). The 2- and 5-year OS rates were 27% (95% Cl: 19-39%) and 20% (13-31%) for the ineligible group, 23% (15-35%) and 9% (5-19%) for the palliative group, and 80% (76-84%) and 64% (59-70%) for the curative group.
Median OS was lower compared to controls for all patients and for each of the groups (P<0.01 for all comparisons) (Figure 2). For the ineligible and palliatively treated patients, median OS was 0.5 and 0.8 compared to 8.3 and 11.9 years in the respective control populations. For the curatively treated patients, the median survival for the study group was 9.1 years, compared to 14.2 years for the matched population. CSS at 2, 5, and 10 years for curatively treated patients were 83.4%, 76.2%, and 69.4%, respectively, considerably higher than for the other subgroups (Online Supplementary Table S3 and Online Supplementary
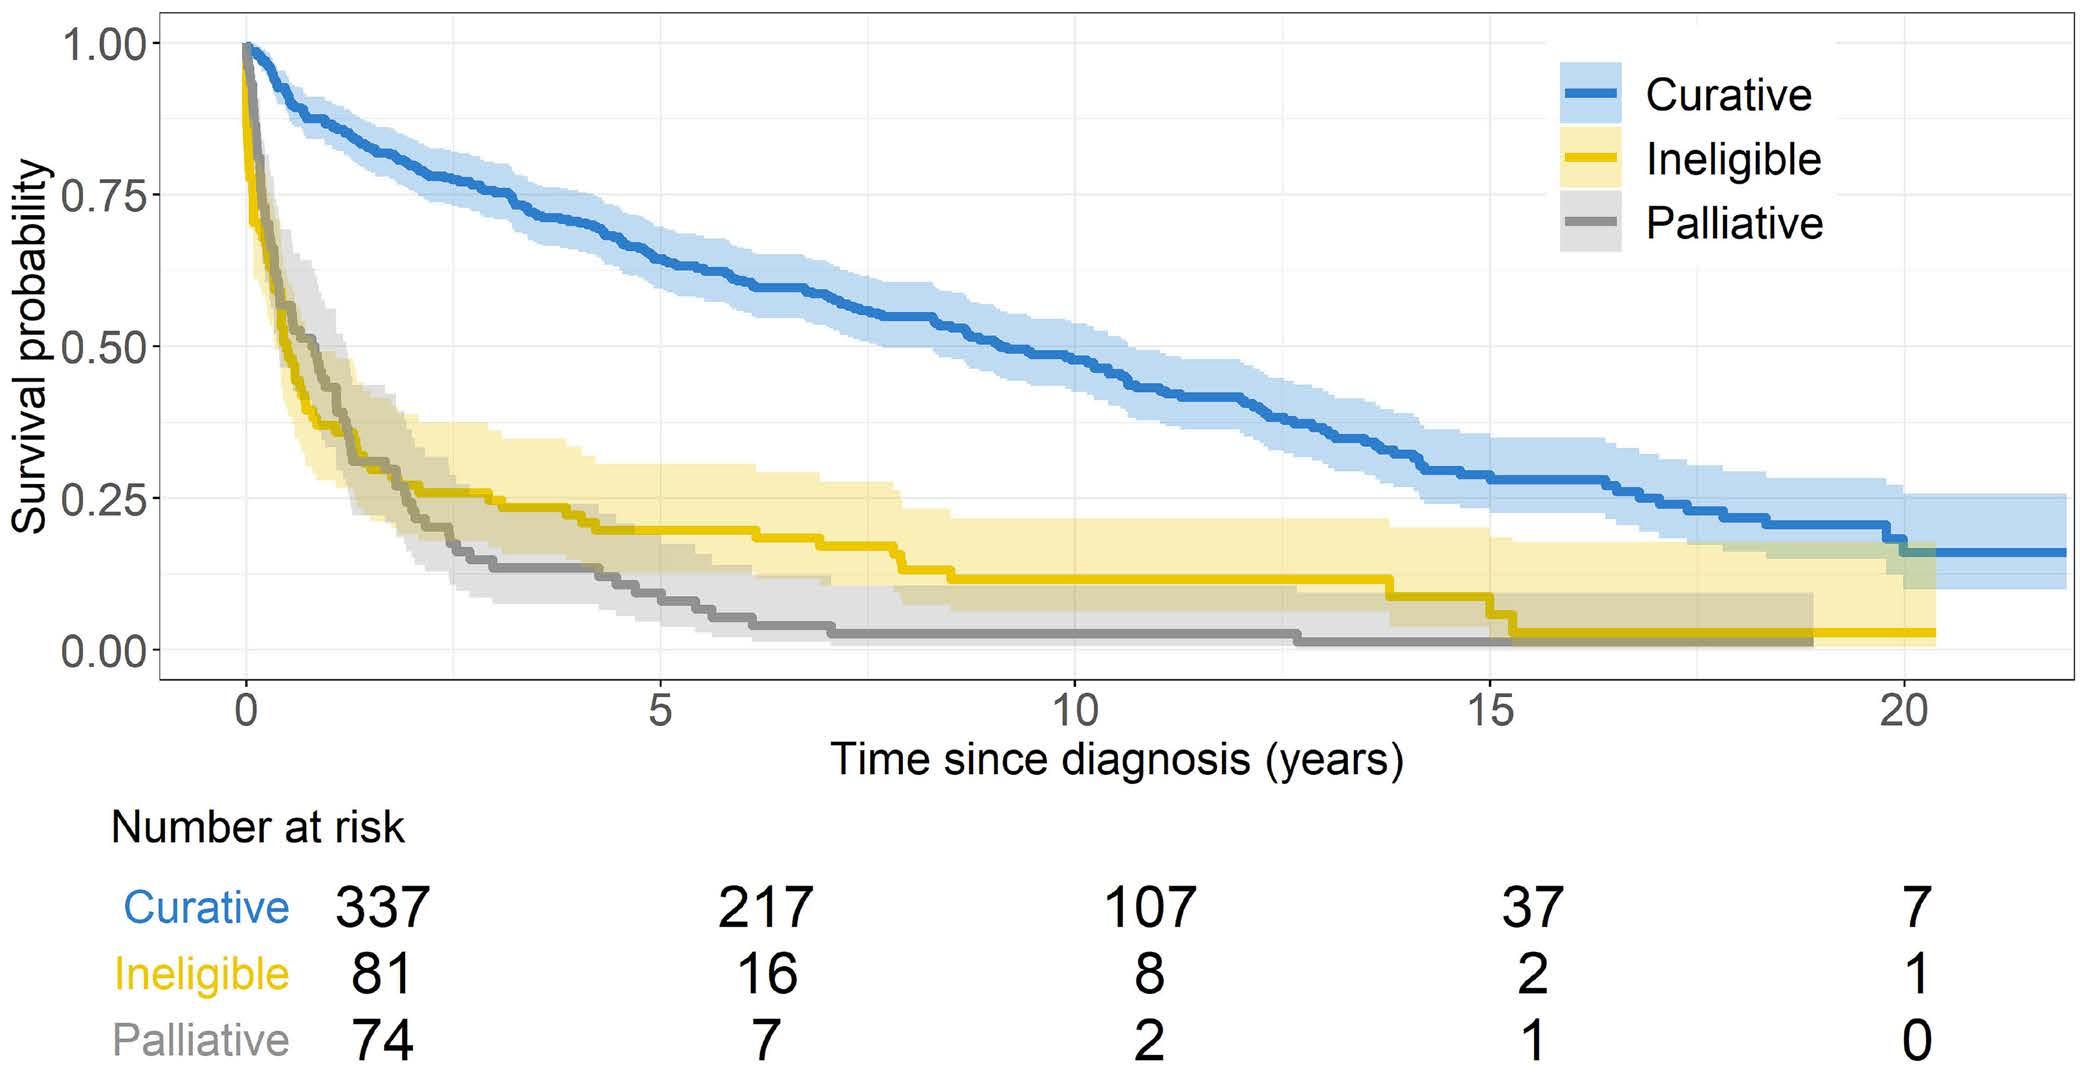
Haematologica | 109 May 2024 1405 ARTICLE - Survival in elderly Hodgkin lymphoma patients K. Lia et al.
Figure 1. Overall survival according to treatment groups. Overall survival was analyzed by Kaplan-Meier statistics and groups compared using the log-rank test. Overall survival was significantly lower in the ineligible and palliative group compared to the curative group (P<0.001 for both comparisons).
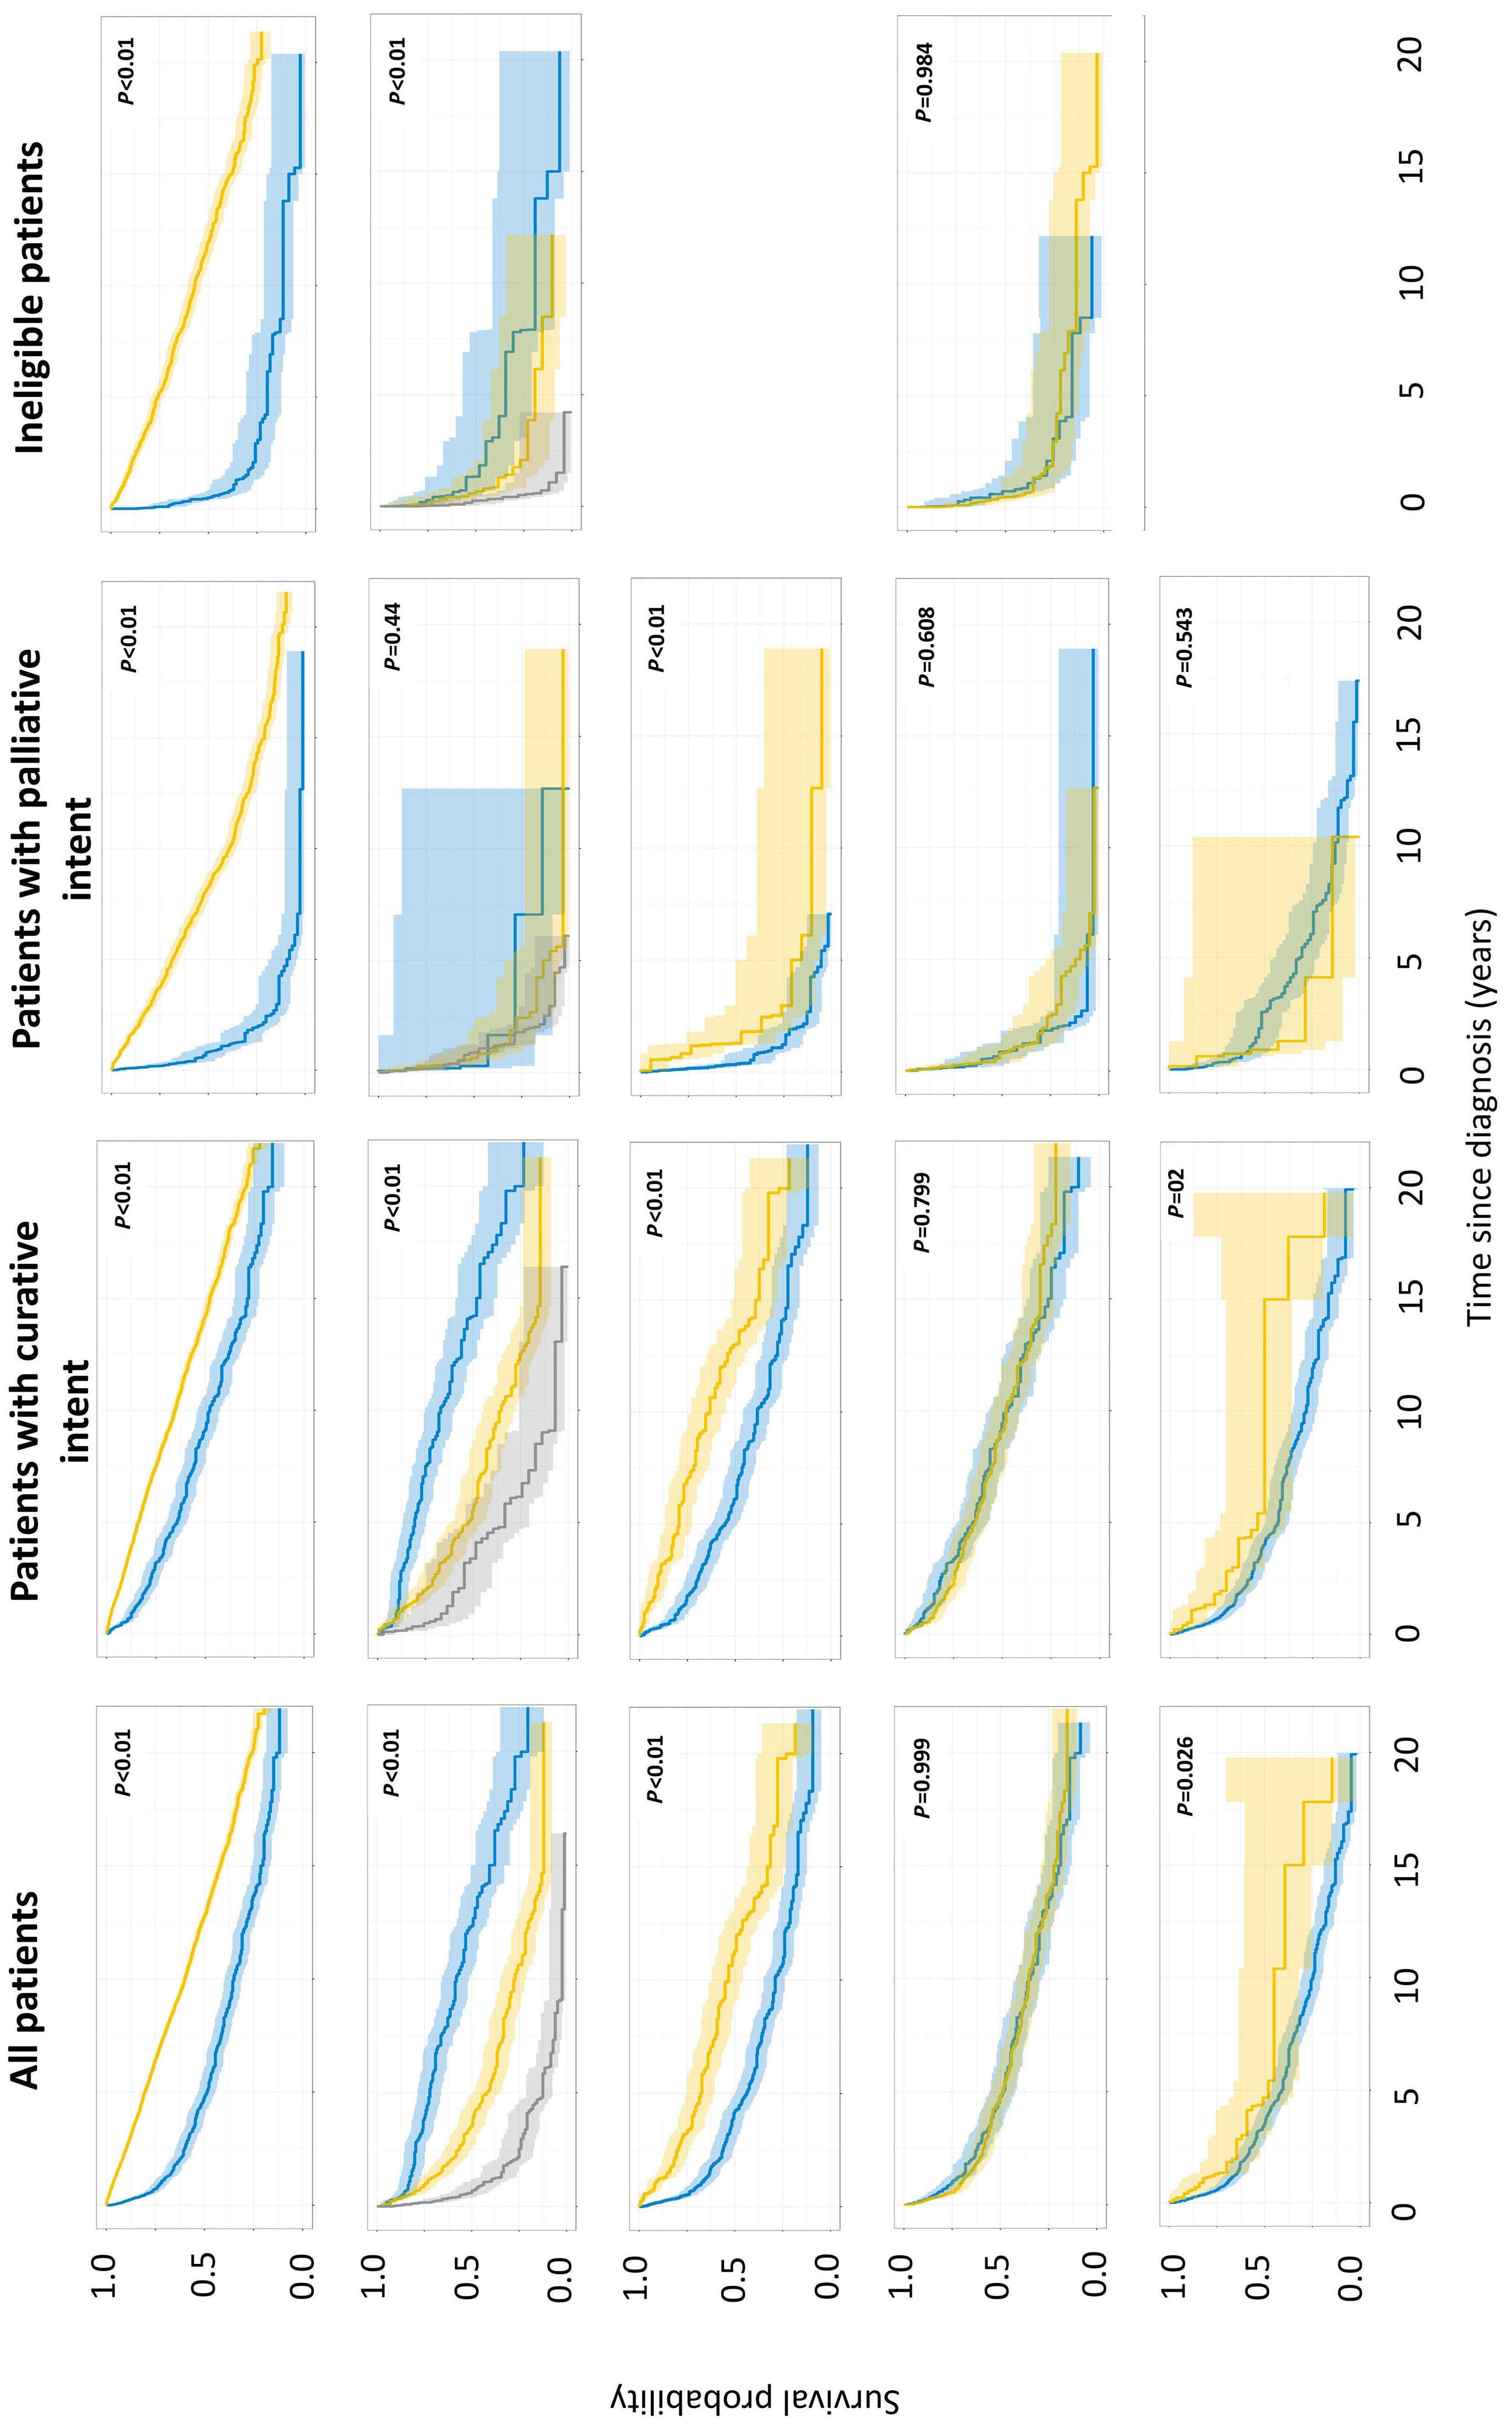
Figure 2. Overall survival in elderly Hodgkin lymphoma patients and controls. (A) Overall survival of patients (blue line) and matched cancer-free controls (yellow line). (B) Overall survival by age group at diagnosis with 60-69 years (blue line), 70-79 years (yellow line) and ≥80 years (gray line). (C) Overall survival by stage with early stage (I-IIA; yellow line) and advanced stage (IIB-IV, blue line). Staging incomplete in most patients in the ineligible group. (D) Overall survival by sex with male patients (yellow line) and female patients (blue line). (E) Overall survival by histological subgroup with Nodular Lymphocyte Predominant Hodgkin Lymphoma (yellow line) and Classical Hodgkin Lymphoma (blue line). Overall survival was analyzed by Kaplan-Meier statistics and groups compared using the log-rank test.
Haematologica | 109 May 2024 1406 ARTICLE - Survival in elderly Hodgkin lymphoma patients K. Lia et al.
A B D E C
Figure S2).
Younger age, early stage disease, and NLPHL histology were significantly associated with better survival in all patients and in the groups with sufficient data for analysis (P<0.01) (Figure 2). Sex was not associated with survival in all patients combined nor in any of the groups.
Causes of death
With 359 deaths, the frequency of different causes, as extracted from records or underlying or immediate causes of death from DAAR, is shown in Table 1. From records, 108 (30% of all deaths) were assigned to HL, 28 (8%) to TRM, and 223 (44%) to all other causes combined. There was inadequate information in the records regarding cause of death in 18% of the patients. After correction for ambiguities concerning type of hematologic malignancy (see Online Supplementary Methods for details), DAAR reported a higher proportion of deaths attributed to HL, both for all patients combined (49 vs. 30%) and in the three groups. DAAR reported death from hematologic malignancies other than HL at a similar level in all patients as compared to record-based data, but with differences between the three groups: 27%, 7%, and 6% of deaths in the ineligible, palliative and curative groups, compared to 38%, 1%, and <1% in the record-based review. Accepting that unknown causes and TRM are not valid entries on death certificates, the proportions of patients dying from other cancers, dementia, CVD, infections, and other causes combined were similar when based on patient records and DAAR. Individual patient data on causes of death from records seemed to match better with the underlying cause from DAAR than with the immediate cause ( Online Supplemen-
tary Figure S3). For HL as the underlying cause of death, 82% were classified as either HL (51%), TRM (13%), or unknown (18%) in the record-based review. Eighteen percent of deaths with HL as the underlying cause in DAAR were differently classified by review of records, mostly as other hematologic malignancies (6%) and CVD (5%). Concerning other causes of death, the best agreement on an individual patient basis was seen for other hematologic malignancies, other cancers, and CVD, all with an approximate 50% agreement between the underlying cause from DAAR and review of records.
Competing risk analysis
Using the corrected underlying cause of death from DAAR, CIF estimates for the marginal probability for each competing event in the whole patient population, and separately in the ineligible, palliative and curative groups, were compared to the matched population (Figure 3). The differences in calculated cumulative incidences compared to controls at 2, 5, and 10 years for each competing cause of death are shown in Table 2. The risk of dying from HL rises from 16% at two years to 28% after ten years for the curatively treated patients, compared to 59% and 42% after ten years in the ineligible and palliative groups, respectively. Overall, and in all three groups, the risk of dying from another hematologic malignancy was higher than in the normal population, with the highest difference seen for the ineligible patients; 20% and 23% at two and five years, respectively. The risk of death from CVD, dementia, and other causes was significantly lower in the whole cohort of patients, whereas the risk of dying from other cancers or infections was similar to the normal population.
Categorical data are described with numbers and proportions. Groups of patients are compared by Fisher Exact test as two independent groups. aDAAR: The Norwegian Cause of Death Registry. bP-values for comparison of DAAR and patients records for the given cause versus all other different causes of death.
Haematologica | 109 May 2024 1407 ARTICLE - Survival in elderly Hodgkin lymphoma patients K. Lia et al.
All patients N=492 Ineligible group N=81 Palliative group N=74 Curative group N=337 Number of deaths, all causes, N (%) 359 (73.0) 74 (91.4 ) 73 (98.6) 212 (62.9) Cause of death DAARa Patient records Pb DAAR Patient records DAAR Patient records DAAR Patient records Hodgkin lymphoma 175 (48.7) 108 (30.1) <0.001 34 (46.0) 15 (20.3) 44 (60.3) 37 (50.7) 97 (45.8) 56 (26.4) Other hematologic malignancies 38 (10.6) 30 (8.4) 0.31 20 (27.0) 28 (37.8) 5 (6.8) 1 (1.4) 13 (6.1) 1 (0.5) Other cancers 39 (10.7) 45 (12.5) 0.49 3 (4.1) 5 (6.8) 8 (11.0) 8 (11.0) 28 (13.2) 32 (15.1) Other causes 30 (8.4) 20 (5.6) 0.14 5 (6.8) 1 (1.4) 8 (11.0) 3 (4.1) 17 (8.0) 16 (7.5) Dementia 9 (2.5) 4 (1.1) 0.16 0 (0) 0 (0) 0 (0) 0 (0) 9 (4.2) 4 (1.9) Cardiovascular diseases 39 (10.7) 38 (10.6) 0.90 4 (5.4) 4 (5.4) 5 (6.8) 6 (8.2) 30 (14.2) 28 (13.2) Infections 29 (8.1) 21 (5.8) 0.24 8 (10.8) 4 (5.4) 3 (4.1) 5 (6.8) 18 (8.5) 12 (5.7) Treatment-related mortality - 28 (7.8) - - 1 (1.4) - 5 (6.8) - 22 (10.4) Unknown causes - 65 (18.1) - - 16 (21.6) - 8 (11.0) - 41 (19.3)
Table 1. Causes of death according to Norwegian Cause of Death Registry and patient records.
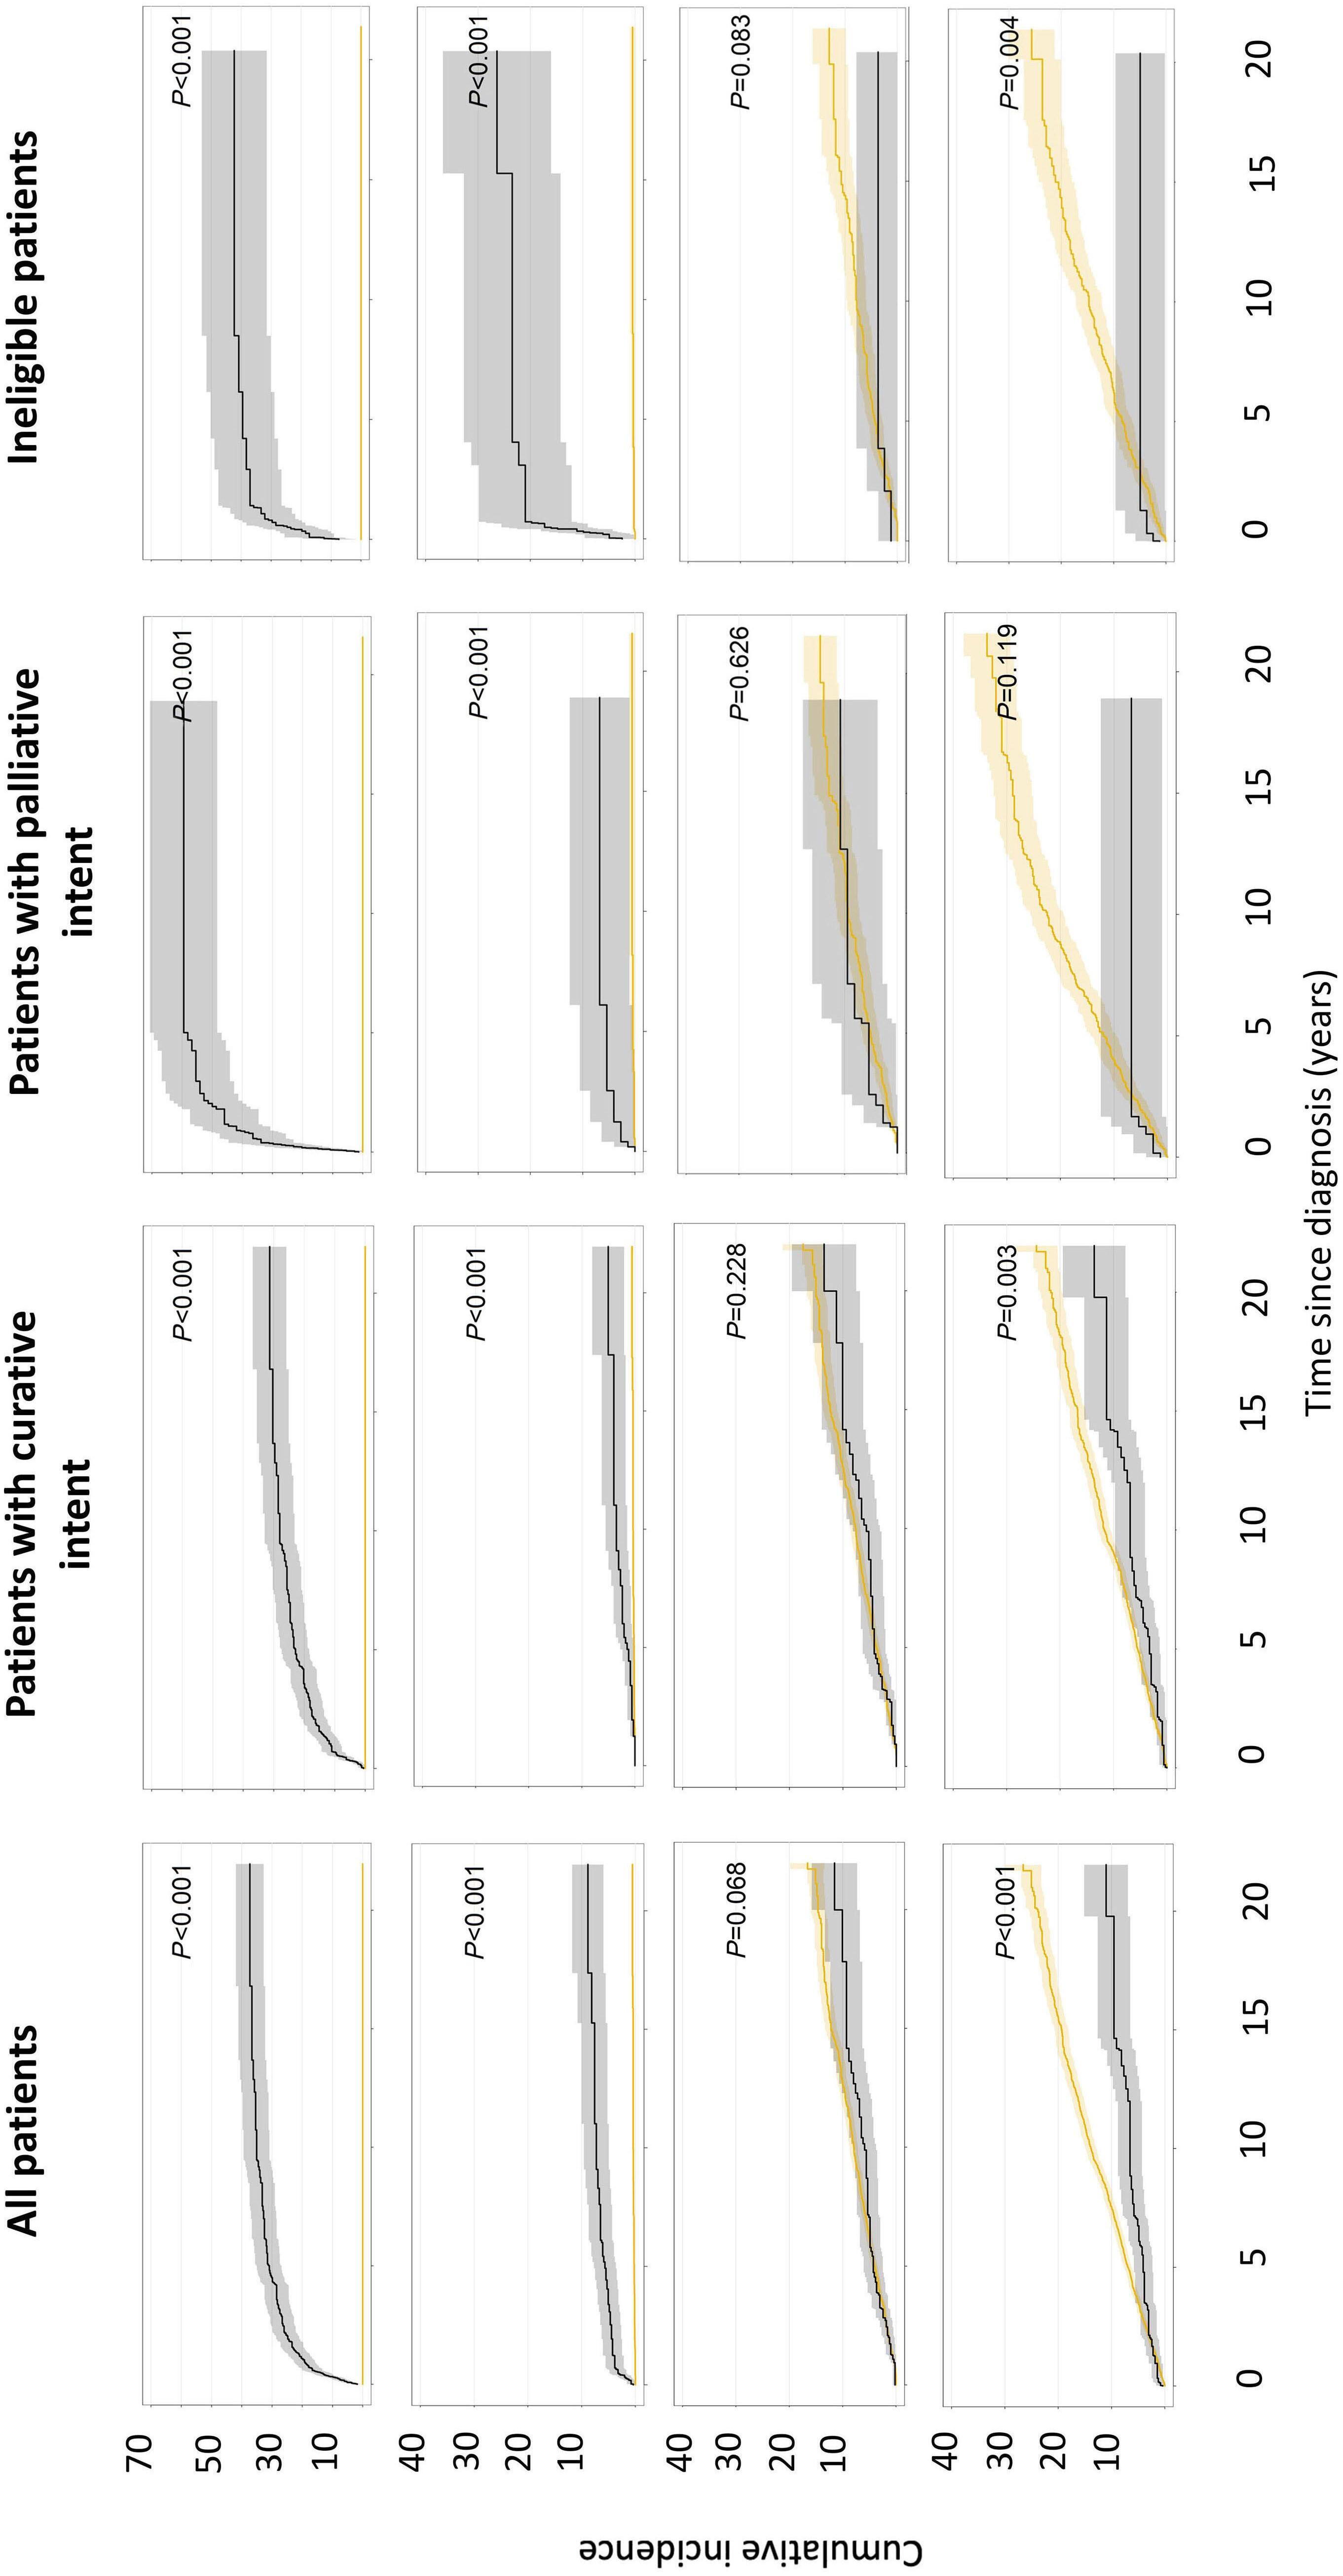
Figure 3. Cumulative incidence functions for competing causes of death in elderly Hodgkin lymphoma patients (black lines) and controls (yellow lines). (A) Death from Hodgkin lymphoma. (B) Death from other hematologic malignancies. (C) Death from other cancers. (D) Death from cardiovascular diseases cumulative incidence rates for different causes of death were calculated from date of diagnosis to death from the respective cause using the Aalen-Johansen estimator and compared using Gray’s test.
Haematologica | 109 May 2024 1408 ARTICLE - Survival in elderly Hodgkin lymphoma patients K. Lia et al. A B C D
Discussion
Using individual patient records, we report a population-based retrospective analysis of all patients diagnosed with HL at ≥60 years of age in Norway between 2000-2015. For curatively treated patients, OS at two and five years was 80% and 64%, with 26% and 10% of deaths attributed to HL or TRM, respectively. Compared to the general population, and correcting for competing causes of death, the cumulative incidence of death from HL at five years in curatively treated patients was 23%, compared to 58% for palliatively treated patients. Furthermore, patients with HL had an elevated risk of dying from other hematologic malignancies in the years after diagnosis, but not from other causes, indicating low, long-term excess mortality from treatment. To improve outcome for elderly patients, better understanding of the heterogeneity of this cohort in terms of disease biology, clinical presentation, and treatment options appears to be
important.5,6,8,18,19 In addition, patients’ frailty and comorbidities are associated with choice of treatment and one-year all-cause mortality.20-22 By review of individual records, we found 30% of deaths in the whole cohort occurring from HL, and 48% of these were seen in the 32% of patients that could not receive curatively intended treatment. Competing risk analysis demonstrates that death from HL is a proportionately larger problem in patients not receiving curative treatment, with a cumulative incidence of death from HL in the two groups either not eligible for typical HL treatment or receiving palliative treatment only of 37.0-50.0% and 39.558.1% at two and five years, respectively. To prevent deaths from HL in the elderly, more focus should be put on the patients who never receive curative treatment, who account for approximately one-third of the population in our cohort. Several reports demonstrate improved outcomes in recent decades for patients with HL >60 years of age, and most of this improvement is probably seen for the curatively
Cumulative incidence rates for different causes of death were calculated from date of diagnosis to death from the respective cause using the Aalen-Johansen estimator. Risk differences between patients and controls were calculated for each competing event at two, five, and ten years with 95% Confidence Intervals (CI).
Haematologica | 109 May 2024 1409 ARTICLE - Survival in elderly Hodgkin lymphoma patients K. Lia et al.
Table 2. Differences in calculated cumulative incidences of Cause of Death Registry for patients compared to controls.
of
Time, years All patients Patients treated with curative intent Patients treated with palliative intent Ineligible patients Risk difference 95% CI P Risk difference 95% CI P Risk difference 95% CI P Risk difference 95% CI P Hodgkin lymphoma 2 24.8 21.0-28.6 <0.01 16.3 12.4-20.3 <0.01 50 38.6-61.4 <0.01 37.0 26.5-47.6 <0.01 5 30.9 26.8-35.0 22.8 18.3-27.3 58.1 46.9-69.4 39.5 28.9-50.2 10 35.1 30.8-39.4 28.0 23.1-32.9 59.5 48.3-70.7 42.3 31.5-53.1 Other hematologic malignancies 2 4.3 2.5-6.2 <0.01 0.5 -0.4-1.3 <0.01 3.9 -0.6-8.4 <0.01 20.8 11.9-29.6 <0.01 5 5.5 3.4-7.5 1.3 0.0-2.6 5.0 -0.2-10.2 23.1 13.9-32.3 10 6.8 4.5-9.2 3.1 1.1-5.2 6.2 0.5-11.9 23.0 13.7-32.2 Other cancers 2 0.0 -1.1-1.1 0.07 -0.4 -1.4-0.7 0.23 2.2 -2.4-6.8 0.63 -0.3 -2.8-2.3 0.08 5 0.2 -1.6-2.1 0.4 -1.8-2.6 0.4 -5.0-5.8 -0.6 -5.0-3.7 10 -2.0 -4.3-0.3 -2.0 -4.7-0.7 0.2 -6.9-7.2 -4.1 -8.6-0.5 Other causes 2 -0.2 -1.5-1.1 <0.01 -1.2 -2.2 to -0.3 <0.01 6.1 -0.7-12.9 0.39 -1.6 -4.3-1.1 0.11 5 -1.6 -3.2-0.0 -2.5 -4.0 to -0.9 3.9 -3.4-11.2 -3.1 -5.9 to -0.3 10 -4.9 -7.1-2.7 -5.6 -7.9 to -3.3 -3.8 -11.3-3.8 -3.2 -8.5-2.1 Dementia 2 -0.6 -0.8 to -0.4 <0.01 -0.2 -0.4-0.1 0.37 -1.49 -2.4 to -0.6 0.06 -1.1 -1.8 to -0.4 0.03 5 -0.9 -1.5 to -0.2 -0.2 -1.0-0.7 -2.8 -4.0 to -1.6 -2.0 -2.9 to -1.0 10 -1.3 -2.5-0.0 0.1 -1.6-1.9 -5.2 -6.8 to -3.5 -3.3 -4.53 to -2.0 Cardiovascular diseases 2 -0.2 -1.7-1.3 <0.01 -1.0 -2.3-0.2 <0.01 1.6 -4.3-7.6 0.12 1.7 -3.1 to -6.6 <0.01 5 -2.9 -4.8 to -1.0 -2.2 -4.3 to -0.2 -5.3 -11.5-0.9 -3.5 -8.6-1.6 10 -7.3 -9.8 to -4.9 -4.8 -7.8 to -1.8 -15.7 -22.2 to -9.2 -9.8 -15.1 to -4.5 Infections 2 0.9 -0.4-2.2 0.33 -0.2 -1.0-0.7 0.72 0.8 -3.0-4.6 0.16 5.6 -0.2-11.3 0.88 5 0.2 -1.3-1.7 -0.2 -1.6-1.2 -0.4 -5.1-4.3 2.5 -3.4-8.4 10 -1.5 -3.3-0.4 -1.3 -3.1-0.6 -4.7 -9.7-0.3 0.6 -5.9-7.0
Cause
death
treated patients.15,23 With differences in patient selection and definitions of curatively intended treatment, CSS was 76% at five years in our cohort, comparable to the 85% reported for patients treated between 2000 and 2017 in 15 Swiss referral centers.19 Also, Surveillance Epidemiology and End Result (SEER) data show that CSS is higher in patients treated with more intensive regimens.24 In the presence of competing risks of death, the cumulative incidence function may prevent the bias seen in the complement of the Kaplan-Meier survival function and may better estimate patients’ prognosis.25,26 In our data, this is reflected in the lower competing risk of dying of HL compared to DSS in all groups, but with greater differences compared to DSS for those not treated with curative intent (Table 1 and Online Supplementary Table S3).
Treatment-related mortality is generally higher for older patients with HL, presumably related to age itself, poor performance status at diagnosis, underlying comorbidities, and reduced organ function.16,27-29 Using a broad definition of TRM, we found a rate of 5.7% in all patients combined and 6.5% in the curatively treated patients. This is in line with the 5% TRM reported in a population-based study in British Columbia, Canada, also in the modern era, but the latter study provided no clear definition of TRM.28 Prospective studies of combination chemotherapy in elderly HL patients have reported rates ranging from 7% to 18%.14,15,27,30 Regimens that include novel drugs, such as brentuximab vedotin or programmed cell death protein-1 inhibitors are also studied in selected elderly patients. Of note, the BCAP trial by the Nordic and German Hodgkin study groups, substituting vincristine with brentuximab vedotin in CHOP, reported TRM at 2%.31 The Echelon-1 trail provided a subanalysis of patients >60 years of age, encompassing 181 of the original study population of 1,334 adults with a rate of TRM of 4%.32 Data from the elderly cohort of the GHSG HD21 study, evaluating BrECADD, are still awaited. With 10% and 26% of the deaths in curatively treated patients resulting from TRM and HL, respectively, less toxic but equally effective novel treatments would likely benefit survival, especially in those eligible for curative treatment. With improved lymphoma treatment, increased mortality from causes other than HL, e.g., CVD, other cancers, and infections, has been a major concern in younger patients.18,28 More recent treatment protocols hold promise to reduce non-cause mortality in adult HL patients in general.30,33 In a study based on the SEER database, Gao et al 34 demonstrated a higher cumulative incidence of death from causes other than HL in patients >60 years of age compared to younger patients. However, as older individuals have a naturally higher risk of dying from a variety of causes, comparison to young patients alone, even with competing risk approaches, may not be fully informative. In our cohort, treatment with contemporary chemotherapy regimens and limited use of radiotherapy did not lead to an increased long-term risk of death neither from other cancers, CVD
nor infections compared to the more relevant general elderly population. In another SEER study including elderly HL patients, Dores et al. 35 reported significantly elevated standardized mortality rates from both heart disease, pulmonary disease, infections, myeloid malignancies and solid neoplasms. However, in a population mostly treated with ABVD, the excess risk seemed to decrease with time and, after one year, was noticeable only in patients with advanced disease. The reasons for these discrepancies may relate to differences in background risk of cardiac disease, more frequent use of ABVD in the SEER cohort, and the larger sample size of the latter study. Furthermore, morbidity from adverse effects may be a problem; we plan to assess the intermediate- or long-term prevalence of the abovementioned conditions in older survivors of HL as part of the current national project.
In our cohort of elderly patients, we show elevated risk of dying from hematologic malignancies other than HL compared to the general population. This increase in risk is most pronounced in the group of patients ineligible for typical HL treatment. In the latter group, 20 of 74 deaths were related to hematologic malignancies other than HL, 13 of which were due to NHL and 4 to CLL. This group comprised a high number of cases with mixed lymphoproliferative diseases at diagnosis: 54 of 81 patients. In their study of elderly classical HL patients, Cheng et al. 28 excluded 69 out of 893 patients (7.7%) due to other underlying CLL, small lymphocytic leukemia, or other NHL. To the best of our knowledge, similarly high rates of mixed lymphoproliferative disorders in younger patients with HL have not been reported. Both the high occurrence of multiple lymphoma entities at diagnosis and death from other hematologic malignances may be a matter of chance as the incidence of other lymphoproliferative diseases and myeloid neoplasia increases sharply with age.9 This can not, however, explain the increased risk of death in patients with HL compared to the general population, and may suggest a different biology of some cases of HL in elderly patients. For patients with such mixed lymphomas, defining better treatment options that encompass complex entities seems warranted, and our data show that some may become long-term survivors. For deaths from myeloid neoplasia occurring after treatment, both pre-existing myelodysplasia and effects of chemotherapy, especially alkylating agents, may be involved.
In general, assessing causes of death is difficult, especially retrospectively, and the quality of registry data may vary.36,37 The latter may be particularly relevant in rare and potentially curable malignant diseases, where uncertainties about diagnostic codes for different lymphoproliferative diseases and unclear remission status at time of death may reduce the accuracy of information on death certificates. We observed such possible discrepancies in two ways. First, a proportion of patients were registered as dying from different hematologic diseases without any prior diagnosis other than HL, either by the CRN or record review.
Haematologica | 109 May 2024 1410 ARTICLE - Survival in elderly Hodgkin lymphoma patients K. Lia et al.
These deaths were most commonly registered in DAAR as C85.9, i.e., NHL without further specification. The opposite, i.e., death from HL in the absence of a prior diagnosis in the CRN, did not occur in the general population. We believe such discrepant classification of HL patients by DAAR results from uncertainties about the exact lymphoma entity at the time of death, details that are not always known to the physician signing the death certificate. For our analysis, we therefore reclassified such cases as deaths from HL. Secondly, there were a number of discrepancies between the assumed cause of death as assessed by record review and both the underlying or immediate cause of death from DAAR. Reassuringly, most cases of TRM and unknown causes from chart reviews were classified by DAAR as HL as the underlying cause of death. Furthermore, approximately 50% agreement was seen for other hematologic malignancies (after corrections had been made; see above), CVD, and second cancers. Compared to the report from Goa et al., 34 we report a similar distribution of HL as the underlying cause of death (52.2% of all deaths in patients >60 years of age compared to our 48.7%), but different rates of death from CVD (20.0% vs. 10.7%), secondary neoplasms (6.0% vs. 10.7%), and infections (4.1% vs. 8.1%). Comparison across studies is difficult; Goa et al 34 included patients diagnosed between 1983 and 2005, most of whom were probably treated with now outdated protocols. The marked drop in mortality for CVD observed for the general Norwegian population over the last three decades may also explain some of these discrepancies.38 Corresponding numbers in the British Columbia cohort treated since 2000, where 160 deaths had occurred in the 327 patients treated with curative intent, were 49.4% for deaths from HL (including deaths from immediate treatment toxicity), 19.4% for secondary malignancies (including other hematologic malignancies), and 8.8% for CVD, all possibly more representative comparators to our data.28 The optimal treatment for elderly patients with HL remains controversial with no established standard of care. Norwegian recommendations have advocated CHOP for most patients, and ABVD for selected patients 60-70 years of age.14 For early stages, both with or without risk factors, the use of radiotherapy to sites involved by lymphoma has been standard.14 For advanced disease, only residual disease or areas of initial bulk routinely received irradiation.
References
1. Cancer Registry of Norway. Norwegian Registry of Lymphoid Malignancies. https://www.kreftregisteret.no/en/The-Registries/ clinical-registries/norwegian-registry-of-lymphoidmalignancies/ Accessed June 2, 2023.
2. Ansell SM. Hodgkin lymphoma: a 2020 update on diagnosis, risk-stratification, and management. Am J Hematol. 2020;95(8):978-989.
3. Mathas S, Hartmann S, Küppers R. Hodgkin lymphoma: pathology and biology. Semin Hematol. 2016;53(3):139-147.
It is encouraging that OS is better in early stages, with no increased long-term risk of death from either CVD or secondary cancers in the whole cohort. Altogether, OS of our curative cohort was similar to the equally large and also population-based study from British Columbia, both with a 5-year OS rate of 60%, treated with ABVD.28 Concerns have been raised about exaggerated risks of pulmonary toxicity from bleomycin in the elderly. Five patients in our cohort (7% of those treated with ABVD in the curative group) died of pulmonary toxicity possibly associated with bleomycin. Recent Nordic data suggest that ABVD/AVD may be superior to CHOP for patients with advanced stages, but no randomized comparison has ever been undertaken.39
Our retrospective study is one of the largest population-based studies evaluating older patients with HL, including matched controls from the general population. With the high coverage of CRN, selection bias was minimized. Despite being retrospective in nature, access to individual patient records from multiple health-care resources has allowed retrieval of detailed data, with data on causes of death from DAAR, competing risk analysis of patients, and controls being examined together for the first time.
Disclosures
No conflicts of interest to disclose.
Contributions
KL and AF are responsible for study conception and design. KL, BLW, ØF, UMF, HB, IBB and AF are responsible for data collection and assembly. KL, RRKJ and AF are responsible for data analysis and interpretation. KL, RRKF and AF created the figures and tables. SB and AF supervised the study. KL and AF wrote the manuscript. All authors contributed to writing the manuscript, and reviewed and approved the final version.
Acknowledgments
Parts of this study were funded by a grant from Takeda. KL: poster presentation at Lugano ICML-17.
Data-sharing statement
The data supporting the findings of this study are available from the corresponding author upon reasonable request.
4 Eichenauer DA, Engert A, André M, et al. Hodgkin’s lymphoma: ESMO Clinical Practice Guidelines for diagnosis, treatment and follow-up. Ann Oncol. 2014;25(Suppl 3):iii70-75.
5. Bachanova V, Connors JM. Hodgkin lymphoma in the elderly, pregnant, and HIV-infected. Semin Hematol. 2016;2016;53(3):203-208.
6. Sjöberg J, Halthur C, Kristinsson SY, et al. Progress in Hodgkin lymphoma: a population-based study on patients diagnosed in Sweden from 1973-2009. Blood. 2012;119(4):990-996.
Haematologica | 109 May 2024 1411 ARTICLE - Survival in elderly Hodgkin lymphoma patients K. Lia et al.
7 Stark GL, Wood KM, Jack F, et al. Hodgkin’s disease in the elderly: a population-based study. Br J Haematol. 2002;119(2):432-440.
8. Walker A, Schoenfeld ER, Lowman JT, Mettlin CJ, MacMillan J, Grufferman S. Survival of the older patient compared with the younger patient with Hodgkin’s disease. Influence of histologic type, staging, and treatment. Cancer. 1990;65(7):1635-1640.
9 Jagadeesh D, Diefenbach C, Evens AM. XII. Hodgkin lymphoma in older patients: challenges and opportunities to improve outcomes. Hematol Oncol. 2013;31(Suppl 1):69-75.
10 Engert A, Ballova V, Haverkamp H, et al. Hodgkin’s lymphoma in elderly patients: a comprehensive retrospective analysis from the German Hodgkin’s Study Group. J Clin Oncol. 2005;23(22):5052-5060.
11. Böll B, Bredenfeld H, Goergen H, et al. Phase 2 study of PVAG (prednisone, vinblastine, doxorubicin, gemcitabine) in elderly patients with early unfavorable or advanced stage Hodgkin lymphoma. Blood. 2011;118(24):6292-6298.
12. Böll B, Görgen H, Fuchs M, et al. ABVD in older patients with early-stage Hodgkin lymphoma treated within the German Hodgkin Study Group HD10 and HD11 trials. J Clin Oncol. 2013;31(12):1522-1529.
13. Halbsguth TV, Böll B, Borchmann P, Diehl V. The unique characteristics and management of patients over 60 years of age with classic Hodgkin lymphoma. Curr Hematol Malig Rep. 2011;6(3):164-171.
14 Kolstad A, Nome O, Delabie J, Lauritzsen G, Fossa A, Holte H. Standard CHOP-21 as first line therapy for elderly patients with Hodgkin’s lymphoma. Leuk Lymphoma. 2007;48(3):570-576.
15. Proctor SJ, Wilkinson J, Jones G, et al. Evaluation of treatment outcome in 175 patients with Hodgkin lymphoma aged 60 years or over: the SHIELD study. Blood. 2012;119(25):6005-6015.
16. Proctor SJ, White J, Jones GL. An international approach to the treatment of Hodgkin’s disease in the elderly: launch of the SHIELD study programme. Eur J Haematol. 2005;75(s66):63-67.
17 World Health O. International statistical classification of diseases and related health problems. 10th revision, 5th ed, 2016 ed. Geneva: World Health Organization; 2015.
18. Proctor SJ, Taylor P, Mackie M, et al. A numerical prognostic index for clinical use in identification of poor-risk patients with Hodgkin’s disease at diagnosis. Leuk Lymphoma. 1992;7(Suppl):17-20.
19. Moccia AA, Aeppli S, Güsewell S, et al. Clinical characteristics and outcome of patients over 60 years with Hodgkin lymphoma treated in Switzerland. Hematol Oncol. 2021;39(2):196-204.
20. Carter J, David KA, Kritharis A, Evens AM. Current treatment options for older patients with Hodgkin lymphoma. Curr Treat Options Oncol. 2020;21(5):42.
21. Rodday AM, Hahn T, Kumar AJ, et al. First-line treatment in older patients with Hodgkin lymphoma: a Surveillance, Epidemiology, and End Results (SEER)-Medicare populationbased study. Br J Haematol. 2020;190(2):222-235.
22. Kumar AJ, Nelson J, Rodday AM, et al. Development and validation of a prediction model for 1-year mortality among older adults with Hodgkin Lymphoma who receive dose-intense chemotherapy. J Geriatr Oncol. 2021;12(8):1233-1239.
23. Böll B, Görgen H. The treatment of older Hodgkin lymphoma patients. Br J Haematol. 2019;184(1):82-92.
24. Rodday AM, Hahn T, Kumar AJ, et al. Association of treatment intensity with survival in older patients with Hodgkin lymphoma. JAMA Netw Open. 2021;4(10):e2128373.
25. Austin PC, Lee DS, Fine JP. Introduction to the analysis of survival data in the presence of competing risks. Circulation. 2016;133(6):601-609.
26. Berry SD, Ngo L, Samelson EJ, Kiel DP. Competing risk of death: an important consideration in studies of older adults. J Am Geriat Soc. 2010;58(4):783-787.
27. Evens AM, Hong F, Gordon LI, et al. The efficacy and tolerability of adriamycin, bleomycin, vinblastine, dacarbazine and Stanford V in older Hodgkin lymphoma patients: a comprehensive analysis from the North American intergroup trial E2496. Br J Haematol. 2013;161(1):76-86.
28. Cheng PTM, Villa D, Gerrie AS, et al. The outcome of older adults with classic Hodgkin lymphoma in British Columbia. Blood Adv. 2022;6(22):5924-5932.
29. Kiserud C, Loge J, Fosså A, Holte H, Cvancarova M, Fosså S. Mortality is persistently increased in Hodgkin’s lymphoma survivors. Eur J Cancer. 2010;46(9)1632-1639.
30. Favier O, Heutte N, Stamatoullas-Bastard A, et al. Survival after Hodgkin lymphoma: causes of death and excess mortality in patients treated in 8 consecutive trials. Cancer. 2009;115(8):1680-1691.
31. Boell B, Fosså A, Goergen H, et al. B-CAP (brentuximab vedotin, cyclophosphamide, doxorubicin and predniso(lo)Ne) in older patients with advanced-stage Hodgkin lymphoma: results of a phase II intergroup trial by the German Hodgkin Study Group (GHSG) and the Nordic Lymphoma Group (NLG). Blood. 2018;132(Suppl 1):926.
32. Evens AM, Connors JM, Younes A, et al. Older patients (aged ≥60 years) with previously untreated advanced-stage classical Hodgkin lymphoma: a detailed analysis from the phase III ECHELON-1 study. Haematologica. 2022;107(5):1086-1094.
33. Provencio M, Millán I, España P, et al. Analysis of competing risks of causes of death and their variation over different time periods in Hodgkin’s disease. Clin Cancer Res. 2008;14(16):5300-5305.
34 Gao J, Chen Y, Wu P, et al. Causes of death and effect of noncancer-specific death on rates of overall survival in adult classic Hodgkin lymphoma: a populated-based competing risk analysis. BMC Cancer. 2021;21(1):955.
35. Dores GM, Curtis RE, Dalal NH, Linet MS, Morton LM. Causespecific mortality following initial chemotherapy in a population-based cohort of patients with classical Hodgkin lymphoma, 2000-2016. J Clin Oncol. 2020;38(35):4149-4162.
36. Pedersen AG, Ellingsen CL. Data quality in the causes of death registry. Tidsskr Nor Laegeforen. 2015;135(8):768-770.
37. Foss Abrahamsen A, Egeland T, Hansen S, Langholm R, Holte H, Kvaløy S. Hodgkin’s disease in a national and hospital population: trends over 20 years. Eur J Cancer. 1997;33(14):2380-2383.
38. Norwegian Institute of Public Health. Cardiovascular disease in Norway. https://www.fhi.no/en/op/hin/health-disease/ cardiovascular-disease-in-norway---/ Accessed April 25, 2023.
39 Övergaard N, Lia K, Asdahl P, et al. T082: AVD - a possible golden standard in the first-line treatment of older classical Hodgkin lymphoma patients. Hemasphere. 2022;6(Suppl):37-38.
Haematologica | 109 May 2024 1412 ARTICLE - Survival in elderly Hodgkin lymphoma patients K. Lia et al.
Compliance and clinical benefit of deferasirox granule and dispersible tablet formulation in pediatric patients with transfusional iron overload: in a randomized, open-label, multicenter, phase II study
Ali T. Taher,1 Yasser Wali,2 Maria Cecilia Cruz,3 Pimlak Charoenkwan,4 Yesim Aydinok,5 Olena Werner,6 Sameera Govindaraju,7 Fabian Romen6 and Vip Viprakasit8
1American University of Beirut Medical Center, Beirut, Lebanon; 2Sultan Qaboos University Hospital, Muscat, Oman; 3Philippine Children’s Medical Center, Quezon City, Republic of the Philippines; 4Faculty of Medicine, Chiang Mai University, Chiang Mai, Thailand; 5Ege University, Faculty of Medicine, Izmir, Turkey; 6Novartis Pharma AG, Basel, Switzerland; 7Novartis Healthcare Pvt Ltd, Hyderabad, India and 8Faculty of Medicine, Siriraj Hospital, Mahidol University, Bangkok, Thailand
Abstract
Correspondence: A.T. Taher ataher@aub.edu.lb
Received: March 30, 2023.
Accepted: October 13, 2023.
Early view: October 19, 2023.
https://doi.org/10.3324/haematol.2023.283133
©2024 Ferrata Storti Foundation
Published under a CC BY-NC license
CALYPSO (clinicaltrials gov. Identifier: NCT02435212), a randomized, open-label, multicenter, phase II study evaluated the compliance, clinical benefits, and safety of deferasirox granules and dispersible tablets (DT) in pediatric patients with iron overload. Iron chelation therapy-naive and iron chelation therapy-pretreated patients aged 2 to <18 years with transfusion-dependent anemias were enrolled. Patients were randomized 1:1 to deferasirox granules or DT for 48 weeks, stratified by age group and prior iron chelation therapy. In this study, the co-primary objectives are to evaluate compliance and change from baseline in serum ferritin after 24 weeks for both formulations in iron chelation therapy-naive patients. In total, 224 patients, mostly with β-thalassemia major (63.4%), were randomized to granules (N=112) or DT (N=112). Primary analysis was conducted when 96 iron chelation therapy-naive patients had completed 24 weeks of treatment/discontinued early; least squares mean (LSM) compliance in the deferasirox granules and DT groups, was 86.8% and 84.3% (difference 2.6%; P=0.360) respectively, while least squares mean change from baseline in serum ferritin was +4.8 and -171.5 ng/mL (difference: 176.4 ng/mL; P=0.255). Slight differences were observed in the observer/patient-reported outcome scores between the granule and dispersible-tablet groups and the overall scores indicate good adherence, satisfaction/preference, fewer concerns and good palatability with both deferasirox formulations. Safety analyses (N=221) found that the most frequently observed adverse events (granules and DT) were increased urine protein/creatinine ratio (>0.5 mg/mg; 24.5% and 34.2%), upper respiratory tract infection (28.2% and 29.7%), and pyrexia (26.4% and 23.4%). In iron chelation therapy-naive patients, mean compliance and change from baseline in serum ferritin with both deferasirox formulations were not significantly different. The safety profile was comparable between granule and DT formulations, and was consistent with the general safety profile of deferasirox.
Introduction
In pediatric patients with transfusion-dependent hemoglobinopathies, such as thalassemia and sickle cell disease, iron chelation therapy (ICT) is an important part of supportive care owing to the risk and consequences of iron overload, including hypogonadism, growth retardation, organ dysfunction, cardiomyopathy and arrhythmias, and increased mortality.1-4 Currently, three main iron chelators
are commonly used: deferoxamine, deferiprone, and deferasirox. The once-daily oral deferasirox dispersible-tablet (DT) formulation, available since 2005, has a well-defined safety and efficacy profile in pediatric patients with transfusional iron overload5-7 and offers an alternative option with greater compliance over parenteral deferoxamine.8-10 However, the DT formulation has been associated with compliance issues due to palatability and gastrointestinal (GI) tolerability, which are important factors for appropri-
Haematologica | 109 May 2024 1413 - Iron Metabolism & its Disorders ARTICLE
ate administration and compliance with ICT, particularly in pediatric patients.10,11 Compliance with ICT can have an impact on iron overload-related consequences, organ dysfunction, and survival.12-14
Deferasirox film-coated tablet (FCT) and granule formulations were developed to improve palatability, tolerability, and patient compliance. Both formulations contain the same active substance as the DT formulation (strength-adjusted to maintain comparable DT dosage), but are lactose and sodium lauryl suphate-free and can be taken with a light meal.15 Granules (sprinkled onto soft food, e.g., yogurt) are convenient for pediatric patients unable to swallow the FCT.15
The phase II CALYPSO study (clinicaltrials gov. Identifier: NCT02435212) was designed to evaluate the compliance and clinical benefit of deferasirox granules and deferasirox DT, in addition to assessing palatability/treatment satisfaction and safety in pediatric patients with transfusional iron overload.
Methods
Study design
CALYPSO is a randomized, open-label, multicenter (37 sites in 17 countries), two-arm, phase II study (Online Supplementary Figure S1). The study was initiated on October 21, 2015. The key changes that occurred after the commencement of the study are listed in the Online Supplementary Table S1. ICT-naive and ICT-pretreated patients aged 2 to <18 years with transfusion-dependent anemias and a history of transfusion of ~20 packed red blood cell units and serum ferritin (SF) level >1,000 ng/mL at screening visits 1 and 2, requiring ICT owing to iron overload, were enrolled. Patients were randomized 1:1 to receive treatment with deferasirox DT or deferasirox granules for a 48-week core treatment phase. Randomization was stratified based on age (2 to <10 years or 10 to <18 years) and prior ICT (yes/ no). Patients who benefit from the granules or DT in the core phase may continue to the optional extension phase where the patients would be provided with granules for up to 5 years or until they have local access to the granules or FCT.
Deferasirox is available in three dosing strengths for each formulation (DT: 125, 250, and 500 mg; granules: 90, 180, and 360 mg); dose calculations are based on the patient’s weight. The deferasirox granules’ dose was strength-adjusted owing to higher bioavailability compared to DT. ICT-naive patients started on deferasirox DT 20 mg/kg/day or granules 14 mg/kg/day, with adjustment after 4 weeks based on SF levels. ICT-pretreated patients underwent a 5-day chelation washout period prior to commencement of study treatment. Their starting dose corresponded to their closest prewashout dose, with adjustments every 3 months as needed.
This study was conducted in accordance with the Good Clinical Practice guidelines and the Declaration of Helsinki and was approved by independent ethics committee or institutional review board at participating sites ( Online Supplementary Table S2). Patients (or parents/guardians) provided written informed consent prior to enrollment.
Outcomes
The primary objective of the study is to evaluate deferasirox granules or DT formulations on patient compliance and change from baseline in SF levels over 24 weeks of treatment in ICT-naive patients during the core phase. The co-primary endpoints are patient compliance (using stick pack/tablet count) and change from baseline in SF levels, both evaluated over 24 weeks of treatment in ICT-naive patients with deferasirox granules or DT formulations. Secondary endpoints include change from baseline in SF levels and compliance after 48 weeks in ICT-naive, ICT-pretreated patients and all patients; patient/observer-reported outcome (PRO/ObsRO) assessments using questionnaires for domain scores for treatment satisfaction (modified Satisfaction with Iron Chelation Therapy [mSICT]) and palatability in all patients; compliance using a daily PRO/ ObsRO questionnaire, assessing the rate of dosing instruction deviations (doses missed or not taken at the same time every day); and overall safety (adverse events [AE], laboratory values, vital signs, physical, ophthalmological, audiometric, cardiac, and growth and development evaluations). Pre-dose and post-dose pharmacokinetic (PK) data are also assessed to support the assessment of compliance and exposure-response relationships for measures of safety and effectiveness. In this article, we report the primary and secondary outcomes in pediatric patients with iron overload.
Statistical analysis
Descriptive statistics were used to summarize the continuous data. Intention-to-treat principle was used to analyze the results. Co-primary endpoints (patient compliance and change from baseline in SF levels) were evaluated using ANCOVA model in ICT-naive patients where significant results (at a one-sided 5% level) had to be shown for both endpoints for the trial to meet the primary objective. The data from the completed core phase (data cutoff of January 18, 2021) were summarized. Secondary efficacy endpoints were assessed in ICT-naive, ICT-pretreated, and all randomized patients during the core phase; patients in each of these three analyses sets who received at least one dose of study drug were included in the safety analysis. Patients with at least one evaluable pre-dose or 3 hours post-dose PK concentration (deferasirox) were included in the PK analysis set. Descriptive analysis was used to analyze adverse events. Further details are described in the Online Supplementary Appendix
Haematologica | 109 May 2024 1414 ARTICLE - Deferasirox granules and deferasirox DT (CALYPSO) A.T. Taher et al.
Results
The primary analysis was performed when approximately 96 randomized ICT-naive patients had completed 24 weeks of treatment/discontinued early (data cutoff of May 31, 2018). The primary endpoint and PK assessments used this data cutoff.
Additional analyses were conducted at the end of the core phase (data cutoff of January 18, 2021). The data for secondary endpoints and safety assessments from all patients who completed or discontinued the treatment in the core phase used this data cutoff.
Patient disposition and demographics
A total of 224 patients (overall patient population) were randomized into deferasirox DT or granules treatment arms (N=112 in each treatment arm). When stratified by prior ICT treatment, the overall patient population was divided into ICT-naive (N=108; 54 in each treatment arm) and ICT-pretreated patients (N=116; 58 in each treatment arm). The safety analysis included 221 patients (DT: N=111; granules: N=110); three patients were randomized and not treated. The reasons for not receiving treatment include protocol deviation, consent withdrawal prior to treatment initiation, and lost to follow-up. Patient disposition for the overall patient population at the end of the core phase is shown in Figure 1. Overall, 186 patients (83.0%) completed the core phase, and 38 patients (17.0%) discontinued. Treatment discontinuation was reported in 11.6% and 22.3% of patients receiving deferasirox granules and DT, respectively. The main reasons for discontinuation in both arms were AE and withdrawal by parent/guardian. The main reasons for parent/guardian withdrawal included the inability or difficulty to comply with study visit/procedures schedules, wish to change to another iron chelator and/ or combination therapy, personal reasons or decision to discontinue treatment.
The majority of patients in the overall, ICT-naive, and ICT-pretreated patient populations were aged between 2 and <10 years (81.7%, 92.6%, and 71.6%, respectively). The median age of patients in the overall, ICT-naive, and ICT-pretreated patient populations was 5 (range, 2-16), 2 (range, 2-13), and 7.5 (range, 2-16) years. The majority (63.4%) of patients in the overall population had β-thalassemia major as the underlying condition for transfusion (Table 1).
Deferasirox exposure for core phase
In the overall patient population, the majority of patients in both treatment groups (90.0% and 78.4% in the deferasirox granules and deferasirox DT groups, respectively) had study drug exposure of ≥44 weeks, and the median duration of exposure was similar in deferasirox granules and deferasirox DT groups (337 and 336 days respectively). The mean (standard deviation [SD]) deferasirox doses re-
ceived were 18.0 (4.1) and 25.1 (6.7) mg/kg/day in patients receiving granules and DT, respectively (Table 2).
In the ICT-naive patients, an exposure of ≥44 weeks was observed in 94.2% and 79.6% of patients in the deferasirox granules and deferasirox DT groups, respectively, and the median duration of exposure was similar in the deferasirox granules (337.0 days) and deferasirox DT groups (336.5 days).
Efficacy and safety results for the ICT-pretreated patient population are described in the Online Supplementary Appendix
Efficacy
Co-primary endpoint
Based on the ANCOVA model, the least squares mean (LSM) compliance after 24 weeks for ICT-naive patients in the deferasirox granules (N=54) and deferasirox DT (N=54) groups, respectively, was 86.8% (standard error [SE]: 3.0; 95% confidence interval [CI]: 80.9-92.8) and 84.3% (SE: 3.1; 95% CI: 78.2-90.4) (Figure 2A). The difference between the treatment groups was not statistically significant (2.6% [SE: 2.8; 95% CI: -3.0 to 8.2; P=0.360]).
The LSM (SE) changes from baseline in SF after 24 weeks for ICT-naive patients in the deferasirox granules and deferasirox DT groups, respectively, were 4.8 ng/mL (SE: 170.6; 95% CI: -333.6 to 343.3) and -171.5 ng/mL (SE: 174.4; 95% CI: -517.4 to 174.4) (Figure 2B). The difference between the treatment groups was not statistically significant (176.4 ng/ mL [SE: 153.9; 95% CI: -129.0 to 481.7; P=0.255]).
The study objective based on the co-primary endpoints of patient compliance and change from baseline in SF in the ICT-naive patients after 24 weeks of treatment was therefore not met. The results of the compliance and SF changes from baseline analyses repeated in the overall patient population were similar to those of the ICT-naive patients (Figure 2).
After stratification by baseline SF levels (≤1,500, >1,5002,500, and >2,500 ng/mL; Online Supplementary Figure S2) in ICT-naive patients, mean SF changes from baseline to the end of the treatment core phase were comparable between both treatment groups. A similar pattern was observed in the overall patient population.
Secondary efficacy endpoints
Figure 3A shows the mean compliance for deferasirox granules and deferasirox DT for the ICT-naive and overall populations after 48 weeks. After 48 weeks, the mean (SD) compliance in the ICT-naive, ICT-pretreated and overall populations, respectively, was 94.8% (11.9%), 90.4% (12.7), and 92.5% (12.5%) for deferasirox granules (N=52, N=58, and N=110, respectively), and 91.6% (14.4%), 87.1% (18.0), and 89.2% (16.4%) for deferasirox DT (N=54, N=58 and N=112, respectively).
Figure 3B shows the mean change from baseline in SF for deferasirox granules and deferasirox DT for all patient
Haematologica | 109 May 2024 1415 ARTICLE - Deferasirox granules and deferasirox DT (CALYPSO) A.T. Taher et al.
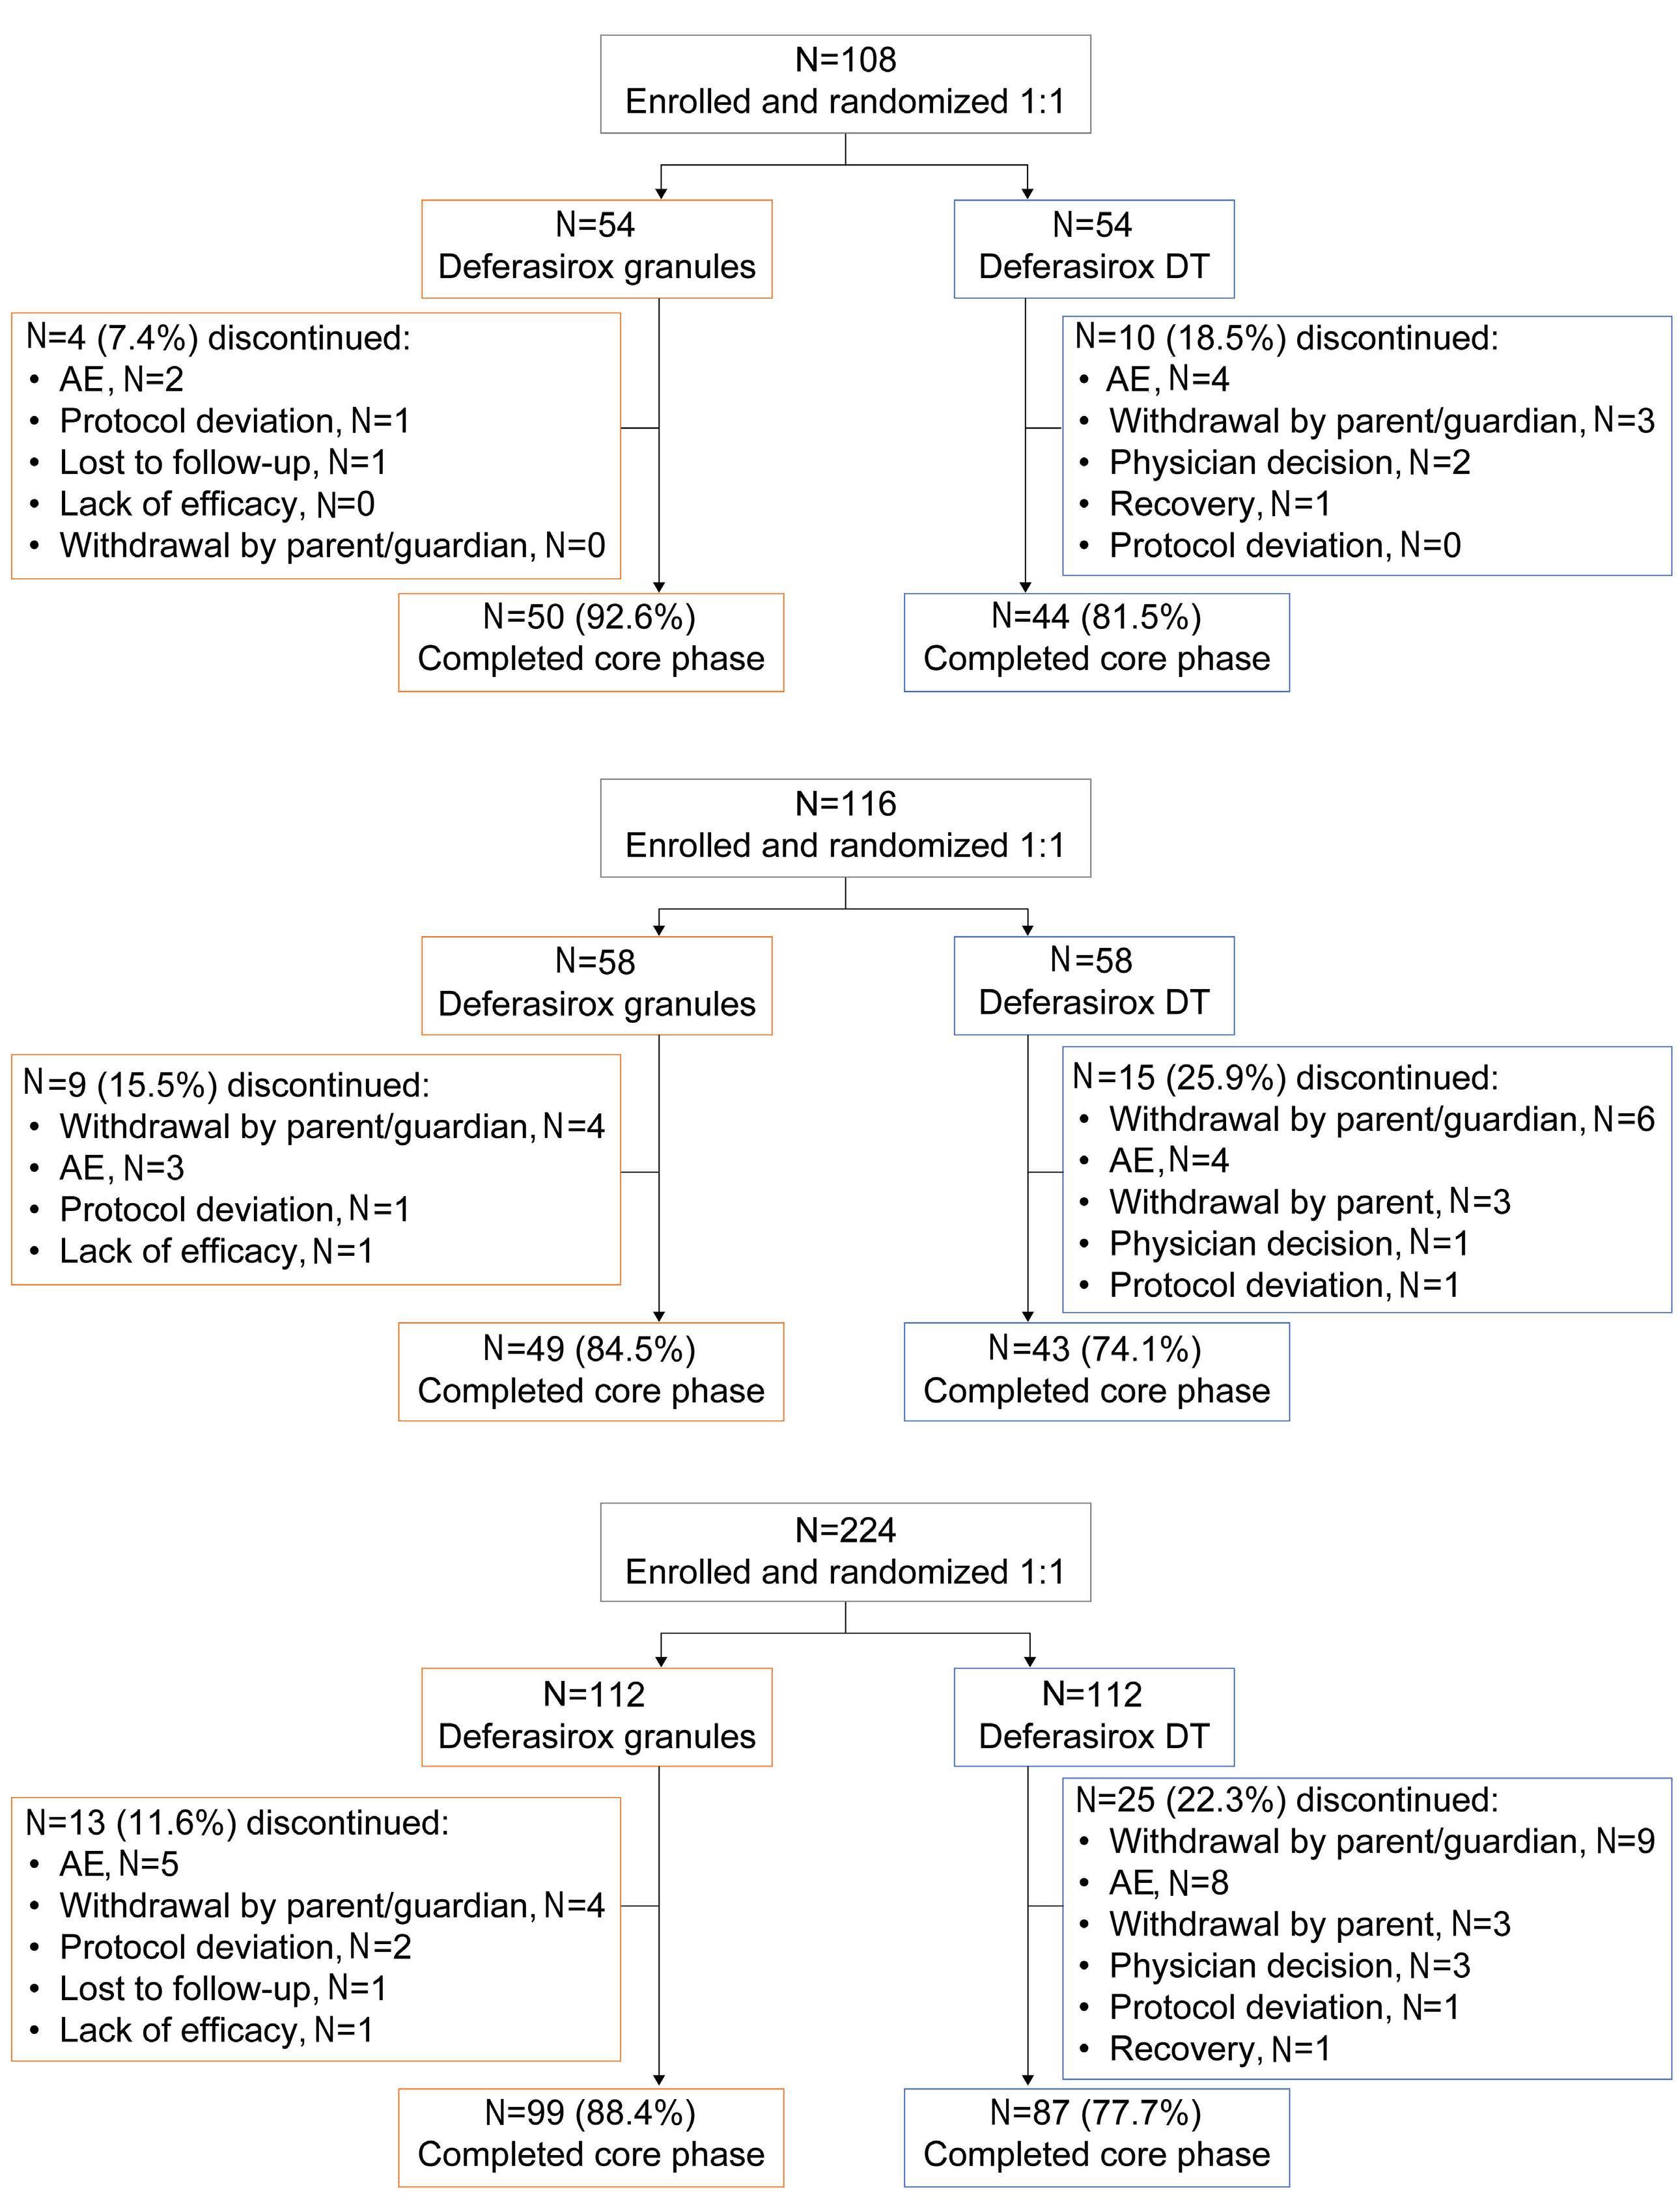
Figure 1. Patient disposition. (A) Iron chelation therapy-naive (ICT-naive)*; (B) ICT-pretreated**; (C) all patients***. Based on January 18, 2021 cutoff date; *2 patients were randomized and not treated; **1 patient was randomized and not treated; ***3 patients were randomized and not treated. AE: adverse event; DT: dispersible tablet; ICT: iron chelation therapy.
Haematologica | 109 May 2024 1416 ARTICLE - Deferasirox granules and deferasirox DT (CALYPSO) A.T. Taher et al.
A B C
Table 1. Patient demographics and baseline characteristics.
*Including red cell aplasia; †N values: 48, 51, and 99 for deferasirox granules, deferasirox DT, and overall, respectively. DFX: deferasirox; DT: dispersible tablet; GRAN: granules; ICT: iron chelation therapy.
populations after end of treatment (EOT)-core. After EOTcore, mean (SD) changes from baseline in SF with deferasirox granules and deferasirox DT, respectively, were 317.0 (834.8) ng/mL and 305.8 (1,026.8) ng/mL in the ICT-naive patients (N=46 and N=47, respectively), 215.7 (936.7) ng/mL and 207.7 (1,084.7) ng/mL in the ICT-pretreated patients (N=50 and N=52, respectively) and 264.3 (886.1) ng/mL and 254.2 (1,053.4) ng/mL in the overall population (N=96 and N=99, respectively).
PRO/ObsRO questionnaires
The mSICT questionnaire domain scores by both ObsRO and PRO for the overall population are presented in Online Supplementary Table S3. Higher scores for adherence
and satisfaction/preference indicate worse adherence and satisfaction/preference, while higher scores for concerns indicate fewer concerns. Mean (SD) scores for adherence and satisfaction/preference at EOT-core were 6.8 (2.6) by ObsRO caregiver and 3.1 (0.9) by PRO respectively with deferasirox granules and 7.5 (2.5) by ObsRO and 4.8 (2.2) by PRO respectively with deferasirox DT, indicating better adherence and satisfaction/preference with granules versus DT. Mean scores for concerns with deferasirox granules and deferasirox DT at EOT-core were 4.6 (0.8) and 4.0 (1.2) by ObsRO caregiver, respectively, indicating fewer concerns with granules versus DT (Online Supplementary Table S3). The palatability questionnaire has a minimum score of 0 and a maximum score of 11, with a higher score represent-
Haematologica | 109 May 2024 1417 ARTICLE - Deferasirox granules and deferasirox DT (CALYPSO) A.T. Taher et al.
ICT-naive
N (%) ICT-pretreated
All patients, N (%) DFX GRAN N=54 DFX DT N=54 Overall N=108 DFX GRAN N=58 DFX DT N=58 Overall N=116 DFX GRAN N=112 DFX DT N=112 Overall N=224 Median age in years (range) 2.0 (2.0-13.0) 2.0 (2.0-13.0) 2.0 (2.0-13.0) 8.0 (4.0-10.0) 7.0 (5.0-10.0) 7.5 (4.0-10.0) 4.5 (2.0-15.0) 5.0 (2.0-16.0) 5.0 (2.0-16.0) Sex Male Female 29 (53.7) 25 (46.3) 29 (53.7) 25 (46.3) 58 (53.7) 50 (46.3) 27 (46.6) 31 (53.4) 29 (50.0) 29 (50.0) 56 (48.3) 60 (51.7) 56 (50.0) 56 (50.0) 58 (51.8) 54 (48.2) 114 (50.9) 110 (49.1) Race White Asian Black/African American Other Missing 25 (46.3) 19 (35.2) 4 (7.4) 6 (11.1) 0 25 (46.3) 19 (35.2) 5 (9.3) 4 (7.4) 1 (1.9) 50 (46.3) 38 (35.2) 9 (8.3) 10 (9.3) 1 (0.9) 27(46.6) 25 (43.1) 4(6.9) 2(3.4)32 (55.2) 19 (32.8) 6(10.3) 1(1.7)59(50.9) 44 (37.9) 10(8.6) 3(2.6)52 (46.4) 44 (39.3) 8 (7.1) 8 (7.1) 0 57 (50.9) 38 (33.9) 11 (9.8) 5 (4.5) 1 (0.9) 109 (48.7) 82 (36.6) 19 (8.5) 13 (5.8) 1 (0.4) Median time since diagnosis in years (range) 1.9 (0.0-13.0) 2.1 (0.4-8.1) 2.0 (0.0-13.0) 5.86 (1.4-13.9) 6.46 (0.1-16.0) 6.26 (0.1-16.0) 3.6 (0.0-13.9) 3.6 (0.1-16.0) 3.6 (0.0-16.0) Underlying condition
(%) β-thalassemia major 29 (53.7) 36 (66.7) 65 (60.2) 38 (65.5) 39 (67.2) 77 (66.4) 67 (59.8) 75 (67.0) 142 (63.4) Sickle cell 8 (14.8) 6 (11.1) 14 (13.0) 4 (6.9) 5 (8.6) 9 (7.8) 12 (10.7) 11 (9.8) 23 (10.3) Hemoglobin E-disorder 3 (5.6) 4 (7.4) 7 (6.5) 9 (15.5) 8 (13.8) 17 (4.7) 12 (10.7) 12 (10.7) 24 (10.7) Hemolytic anemia 2 (3.7) 2 (3.7) 4 (3.7) 1 (1.7) 1 (1.7) 2 (1.7) 3 (2.7) 3 (2.7) 6 (2.7) β-thalassemia intermedia 1 (1.9) 2 (3.7) 3 (2.8) 0 1 (1.7) 1 (0.9) 1 (0.9) 3 (2.7) 4 (1.8) DiamondBlackfan anemia* 1 (1.9) 1 (1.9) 2 (1.8) 1 (1.7) 1 (1.7) 2 (1.7) 2 (1.8) 2 (1.8) 4 (1.8) Fanconi’s anemia 1 (1.9) 0 1 (0.9) - - - 1 (0.9) 0 1 (0.4) Sideroblastic anemia 1 (1.9) 0 0 - - - 1 (0.9) 0 1 (0.4) Other 8 (14.8) 3 (5.6) 11 (10.2) 5 (8.6) 3 (5.2) 8 (6.9) 13 (11.6) 6 (5.4) 19 (8.5) Prior ICT 2 (3.7) 0 2 (1.9) 57 (98.3) 58 (100.0) 115 (99.1) 59 (52.7) 58 (51.8) 117 (52.2) DFX prior to study Yes No Missing 2 (3.7) 52 (96.3)0 54 (100.0)2 (1.9) 106 (98.1)41 (70.7) 17 (29.3)38 (65.5) 20 (34.5)79 (68.1) 37 (31.9)43 (38.4) 16 (14.3) 53 (47.3) 38 (33.9) 20 (17.9) 54 (48.2) 81 (36.2) 36 (16.1) 107 (47.8) Median time since last ICT† in years (range) 6.81 (4.5-9.1) 0 6.81 (4.5-9.1) 0.73 (0.0-8.6) 1.31 (0.0-9.5) 0.91 (0.0-9.5) 0.8 (0.0-9.5) 1.3 (0.0-9.5) 0.9 (0.0-9.5)
patients,
patients,
N (%)
for transfusion, N
ing better palatability. Mean palatability scores by ObsRO with deferasirox granules and deferasirox DT at EOT-core were 10.9 (1.0) and 9.0 (3.1), respectively, indicating better palatability with granules versus DT (Online Supplementary Table S4). Supportive analysis, conducted to check the
robustness of the results obtained from the mSICT and palatability ObsRO questionnaires, concurs with these results (using data from the overall patient population; Figure 4 and ICT-naive and ICT-pretreated data in Online Supplementary Figures S3 and S4).
Cumulative actual dose, mg/kg
DFX: deferasirox; DT: dispersible tablet; GRAN: granules; ICT: iron chelation therapy; SD: standard deviation.
Haematologica | 109 May 2024 1418 ARTICLE - Deferasirox granules and deferasirox DT (CALYPSO) A.T. Taher et al. Exposure variable ICT-naive patients, N (%) ICT-pretreated patients, N (%) All patients, N (%) DFX GRAN N=52 DFX DT N=54 DFX GRAN N=58 DFX DT N=57 DFX GRAN N=110 DFX DT N=111 Average planned dose, mg/kg/day Mean (SD) 16.7 (3.22) 22.8 (5.39) 19.5 (4.61) 27.7 (7.1) 18.2 (4.2) 25.3 (6.8) Median (range) 15.7 (10.0-23.5) 21.4 (8.6-35.2) 18.6 (10.5-28.0) 28.2 (10.0-40.0) 17.8 (10.0-28.0) 23.6 (8.6-40.0) Average planned dose category, mg/kg/day <15 DT/<10.5 granule 1 (1.9) 3 (5.6) 0 2 (3.5) 1 (0.9) 5 (4.5) 15 to <25 DT/10.5 to <17.5 granule 32 (61.5) 37 (68.5) 18 (31.0) 19 (33.3) 50 (45.5) 56 (50.5) 25 to <35 DT/17.5 to <24.5 granule 19 (36.5) 13 (24.1) 30 (51.7) 26 (45.6) 49 (44.6) 39 (35.1) ≥35 DT/≥24.5 granule 0 1 (1.9) 10 (17.2) 10 (17.5) 10 (9.1) 11 (9.9) Average actual dose, mg/kg/day Mean (SD) 16.7 (3.15) 22.9 (5.73) 19.1 (4.51) 27.2 (6.9) 18.0 (4.1) 25.1 (6.7) Median (range) 16.2 (10.5-24.4) 22.5 (7.7-37.8) 18.7 (10.2-28.8) 27.9 (8.7-39.4) 17.5 (10.2-28.8) 24.0 (7.7-39.4) Average actual dose category, mg/kg/day <15 DT/<10.5 granule 0 3 (5.6) 1 (1.7) 4 (7.0) 1 (0.9) 7 (6.3) 15 to <25 DT/10.5 to <17.5 granule 34 (65.4) 37 (68.5) 21 (36.2) 18 (31.6) 55 (50.0) 55 (49.6) 25 to <35 DT/17.5 to <24.5 granule 18 (34.6) 12 (22.2) 26 (44.8) 28 (49.1) 44 (40.0) 40 (36.0) ≥35 DT/≥24.5 granule 0 2 (3.7) 10 (17.2) 7 (12.3) 10 (9.1) 9 (8.1)
Mean (SD) Median (range) 104.1 (75.71) 83.2 (12.4-351.5) 142.0 (149.50) 90.3 (17.9-886.1) 159.6 (150.90) 97.9 (10.2-698.8) 220.6 (221.16) 178.9 (20.6-1,495.3) 133.4 (123.9) 93.0 (10.2-698.8) 182.3 (192.9) 129.8 (17.9-1,495.3) Percentage of planned dose taken 75.8 (19.91) 71.7 (23.46) 65.9 (24.03) 64.1 (19.76) 70.6 (22.6) 67.8 (21.9) Mean (SD) 72.0 63.9 62.3 60.1 67.2 62.6 Median (range) (40.6-114.9) (35.3-123.8) (27.1-116.6) (23.0-106.1) (27.1-116.6) (23.0-123.8) Days on treatment Mean (SD) 332.4 (45.02) 303.6 (84.9) 308.3 (80.0) 290.8 (95.5) 319.7(66.6) 297.0 (90.3) Median (range) 337.0 (27-370) 336.5 (14-378) 336 (8-366) 336 (7-355) 337.0 (8-370) 336.0 (7-378) Exposure categories <4 weeks 1 (1.9) 1 (1.9) 2 (3.4) 3 (5.3) 3 (2.7) 4 (3.6) 4 weeks to <12 weeks 0 2 (3.7) 0 1 (1.8) 0 3 (2.7) 12 weeks to <20 weeks 0 2 (3.7) 3 (5.2) 2 (3.5) 3 (2.7) 4 (3.6) 20 weeks to <28 weeks 0 2 (3.7) 1 (1.7) 2 (3.5) 1 (0.9) 4 (3.6) 28 weeks to <36 weeks 0 1 (1.9) 1 (1.7) 4 (7.0) 1 (0.9) 5 (4.5) 36 weeks to <44 weeks 2 (3.8) 3 (5.6) 1 (1.7) 1 (1.8) 3 (2.7) 4 (3.6) ≥44 weeks 49 (94.2) 43 (79.6) 50 (86.2) 44 (77.2) 99 (90.0) 87 (78.4) Total patient years Mean (SD) 0.9 (0.12) 0.8 (0.23) 0.8 (0.22) 0.8 (0.26) 0.9 (0.2) 0.8 (0.2) Median (range) 0.9 (0.1-1.0) 0.9 (0.0-1.0) 0.9 (0.0-1.0) 0.9 (0.0-1.0) 0.9 (0.0-1.0) 0.9 (0.0-1.0)
Table 2. Exposure to deferasirox.
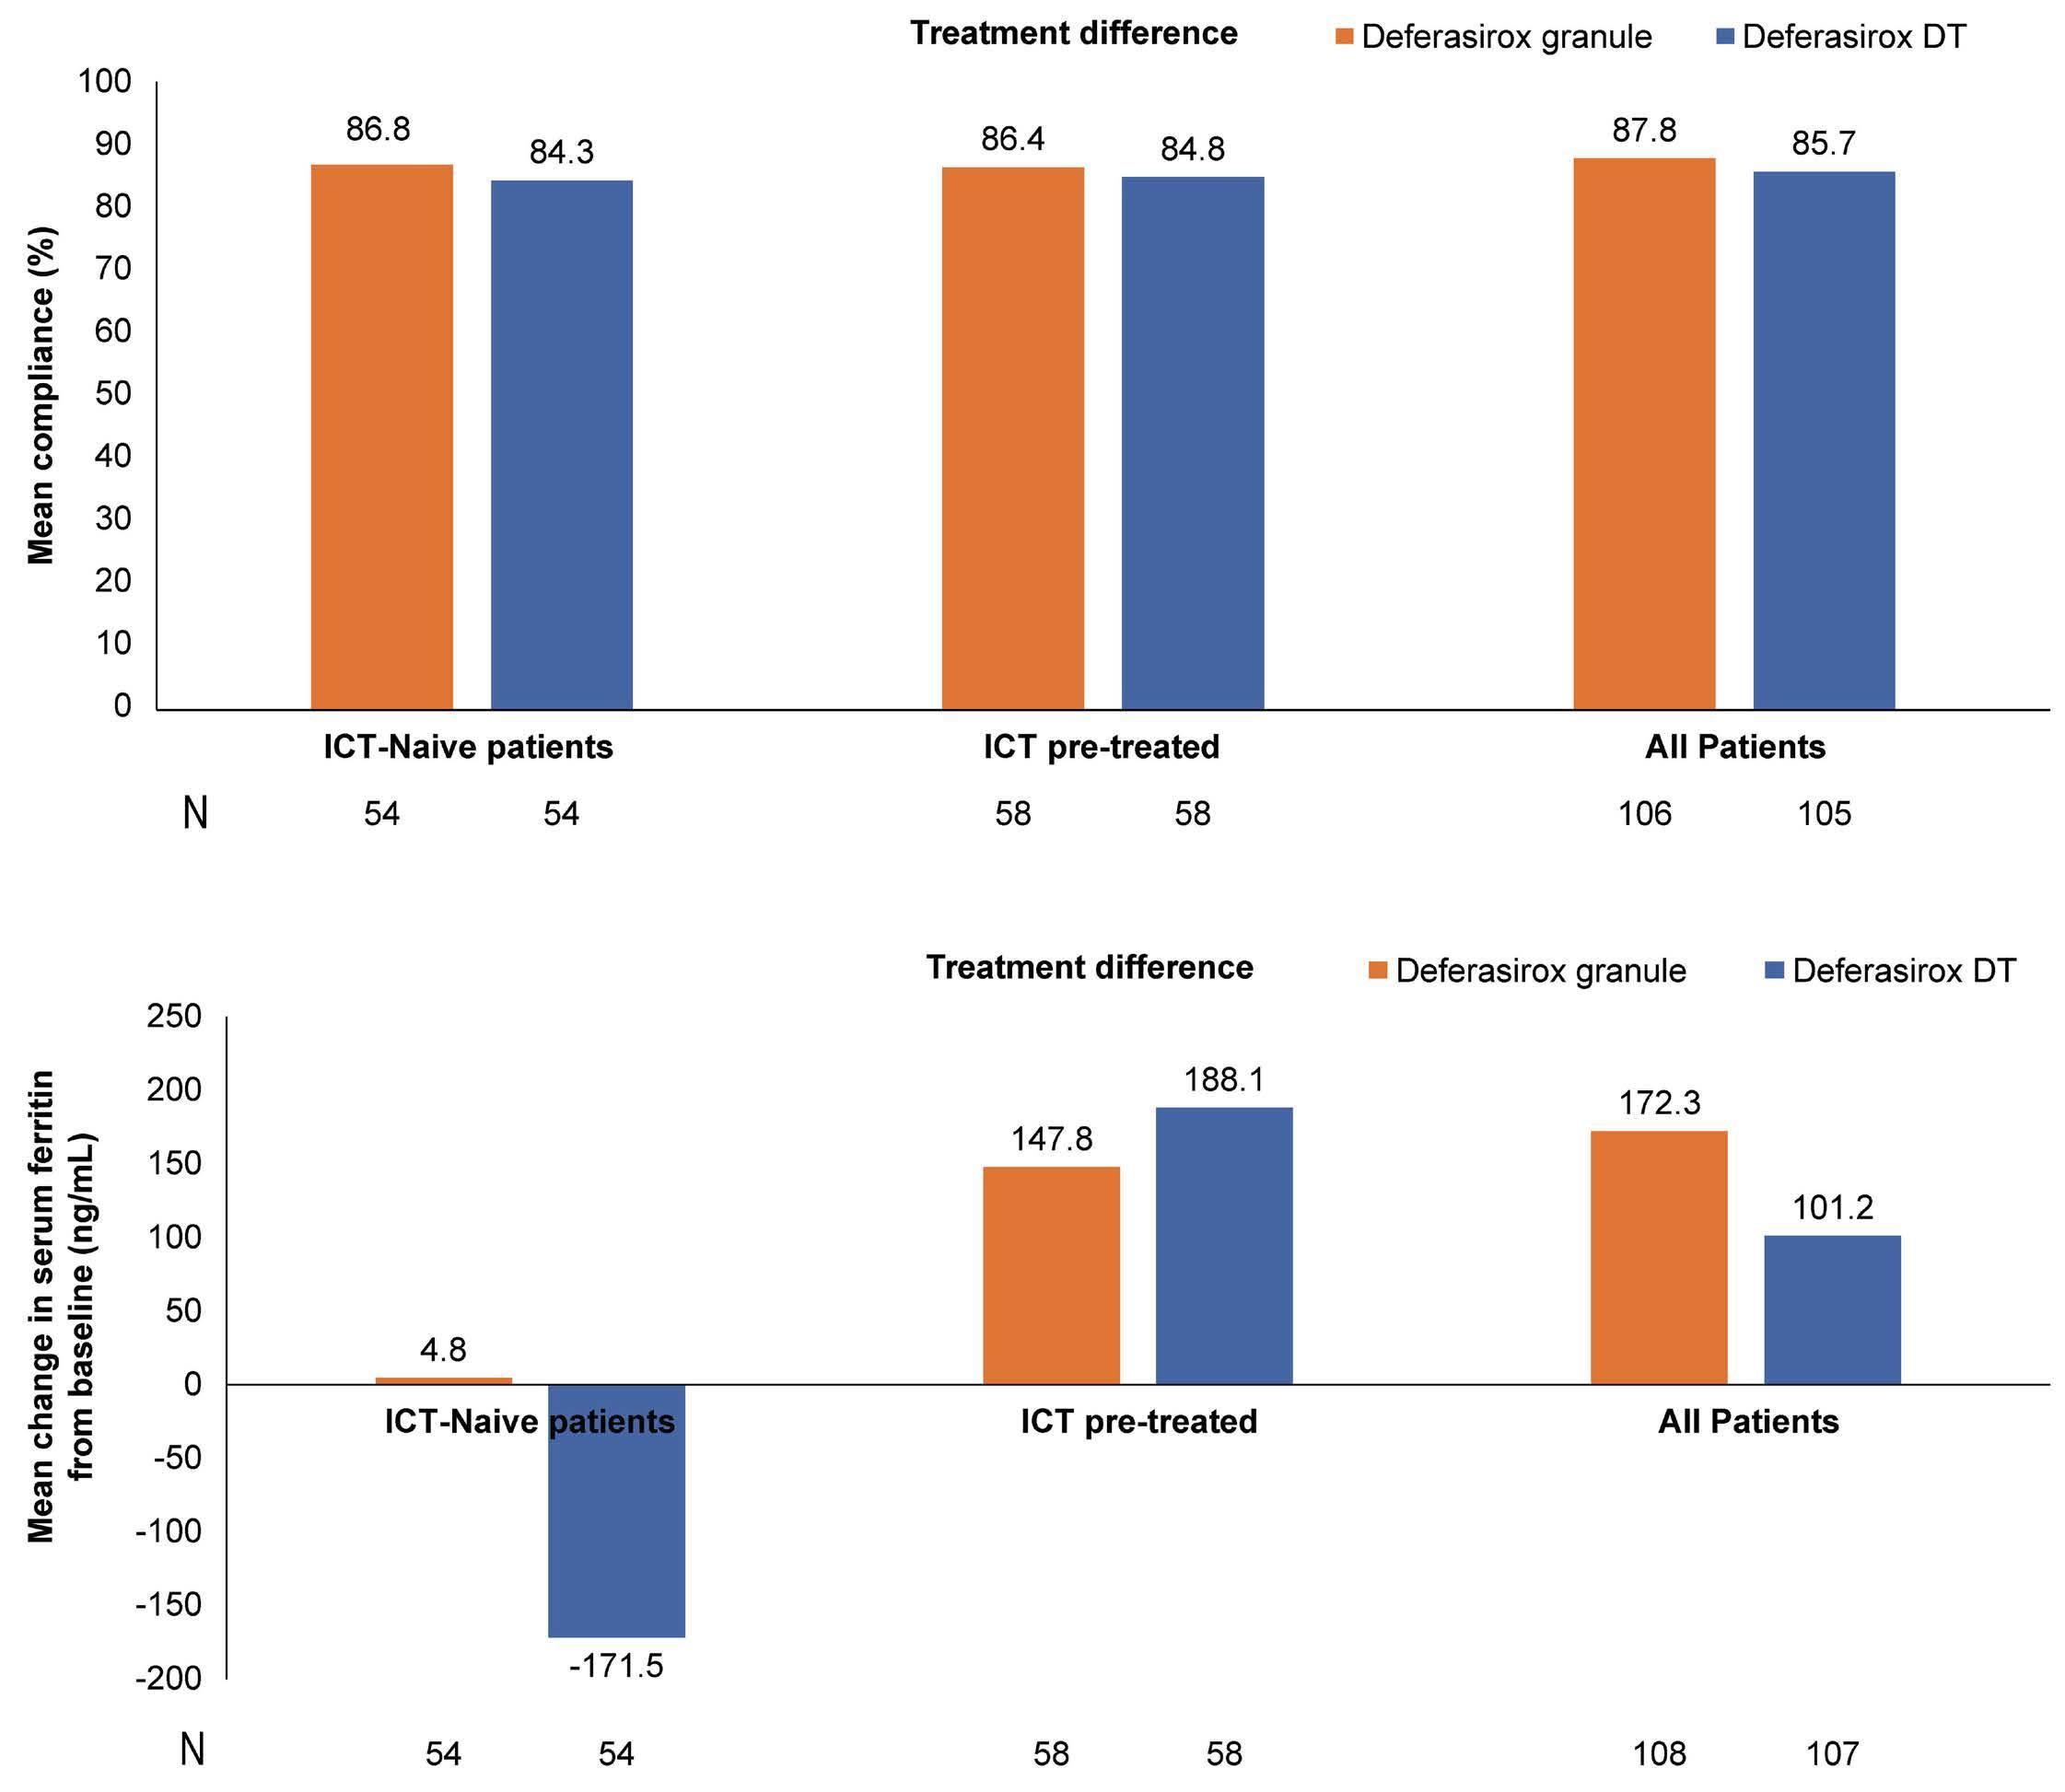
For the compliance ObsRO diary, the weekly dose violation rate indicated overall lower mean weekly violation rates from week 1 to week 48 in the defarasirox DT arm compared with defarasirox granules (mean weekly dose violation rate range for weeks 1 to 48, 7.8 to 18.8 and 13.7 to 27.8, respectively). For the compliance PRO diary, the results should be interpreted with caution due to the low number of patients completing the questionnaire (Online Supplementary Figure S5).
Pharmacokinetic analysis
As there were fewer than 12 patients with an evaluable PK profile, no PK parameters were derived. Geometric means (CV% geo-mean) of dose-adjusted pre-dose data for deferasirox granules and deferasirox DT, respectively, were 1.4 mmol/L (235.4%) and 2.9 mmol/L (369.5%) at week 1, 17.7 mmol/L (106.5%) and 16.9 mmol/L (148.2%) at week 25, and 19.8 mmol/L (119.1%) and 28.2 mmol/L (141.7%) at week 45 (Online Supplementary Figure S6). Pre-dose PK analysis was used to support the assessment
of compliance. Predicted steady-state pre-dose concentrations from a power model (using the log-transformed weight-adjusted dose and treatment group as fixed effects and patient as a random effect) were used to derive differences between predicted and observed concentration values. The mean differences between the deferasirox granules and DT groups were comparable (-6.9 and -9.3, respectively). However, the variance of the differences in the deferasirox granules and DT groups were 700.6 and 1,370.9, respectively. Higher compliance is expected to lead to lower variability of differences between the predicted and observed concentrations; as such, the higher variance of difference in deferasirox DT arm than in deferasirox granules arm suggested better compliance in deferasirox granules arm. At low predose concentrations, SF change from baseline increased over time and at high pre-dose concentrations, SF change from baseline decreased over time. Increases in pre-dose concentrations and time were associated with an increase in serum creatinine, urinary protein/creatinine ratio (UPCR) and a decrease in creatinine clearance from baseline.
Haematologica | 109 May 2024 1419 ARTICLE - Deferasirox granules and deferasirox DT (CALYPSO) A.T. Taher et al.
A B
Figure 2. Co-primary endpoints for iron chelation therapy-naive, iron chelation therapy-pretreated patients and overall patient populations at 24 weeks. (A) Compliance. (B) Change from baseline in serum ferritin*. *Based on ANCOVA analysis showing least squares mean change in serum ferritin from baseline to 24 weeks. DT: dispersible tablet; ICT: iron chelation therapy.
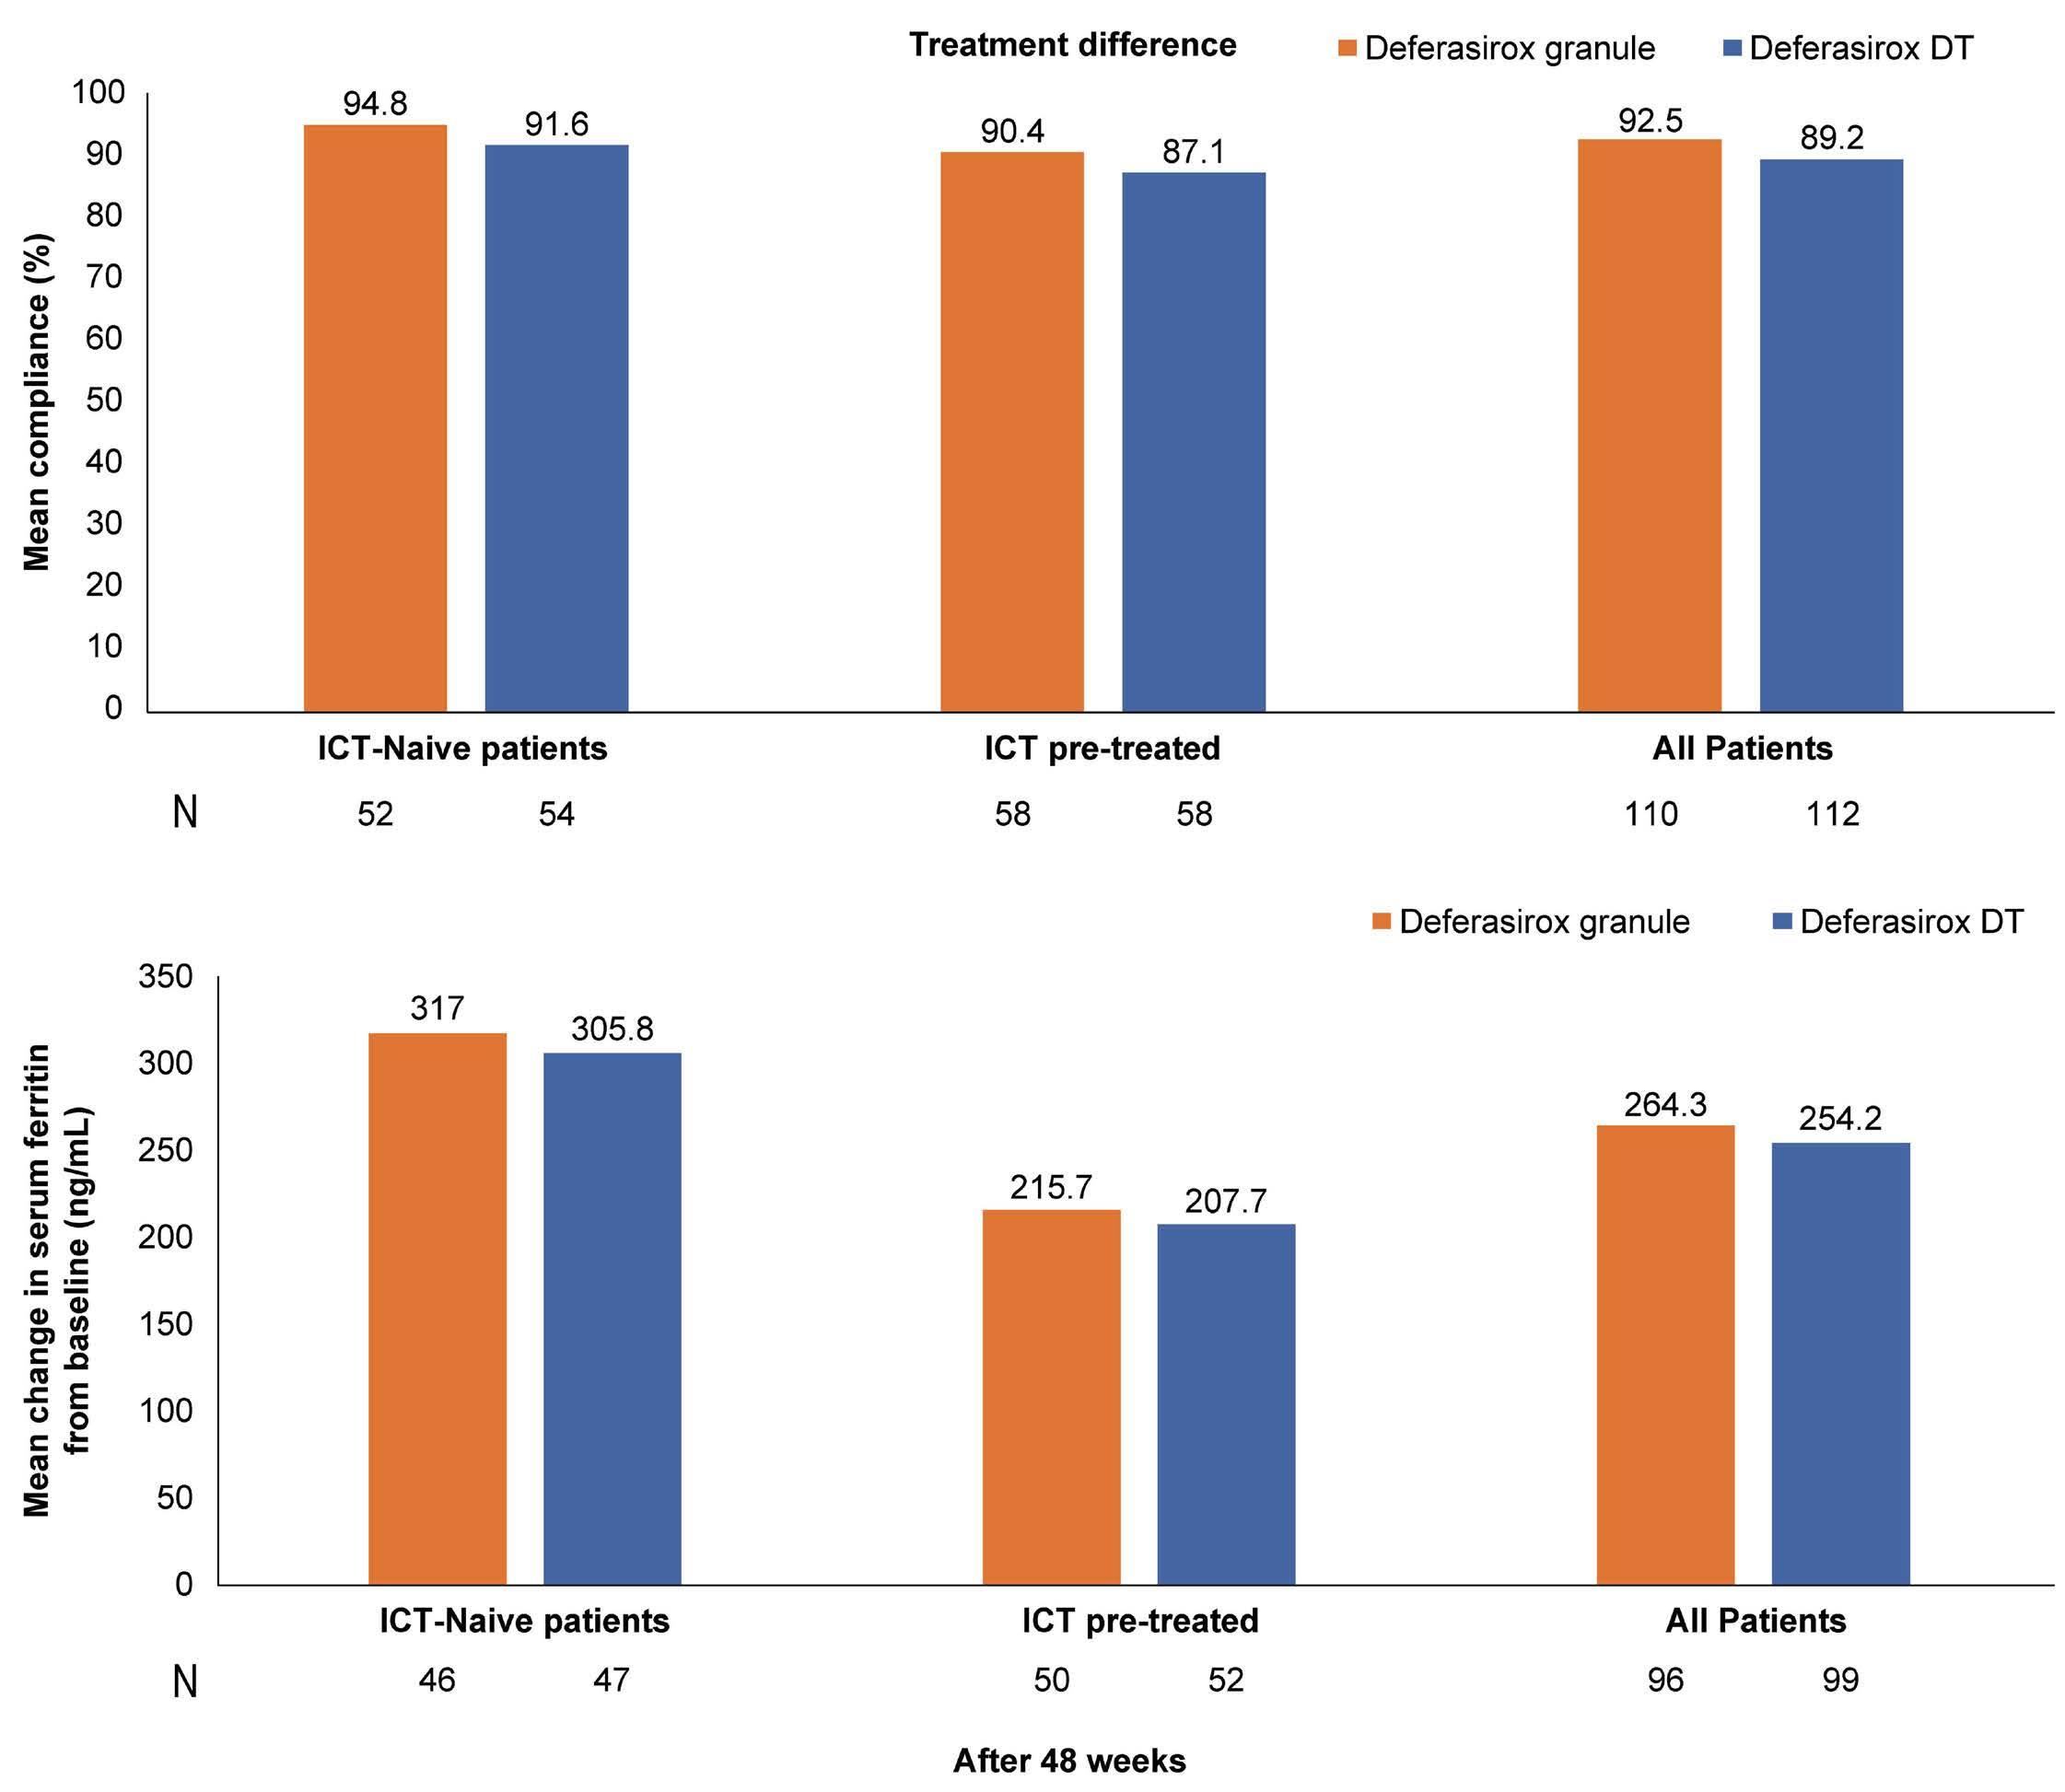
Safety
An overview of safety for the overall patient population is shown in Table 3. The incidence of overall AE was similar in the two treatment groups (97.3% in the deferasirox DT group vs. 90.9% in the deferasirox granules group). The most commonly (≥ 20%) reported AE (by PT) in either of the treatment groups (in deferasirox DT group or the deferasirox granules group respectively) in the core phase were: upper respiratory tract infection (29.7% vs. 28.2%), pyrexia (23.4% vs. 26.4%), and urine protein/creatinine ratio increased (34.2% vs. 24.5%). The number of patients who had experienced AE suspected to be study drug related were similar in both treatment groups (57.7% and 52.7%) in the core phase. All AE suspected to be study drug-related were reported in <10% of the patients (in either of the treatment groups) with the exception of urine protein/creatinine ratio increased (27.9% in deferasirox DT group vs. 20.0% in deferasirox granules group) and ALT increased (7.2% in deferasirox DT group vs. 10.9% in deferasirox granules group) in the core phase. Overall, the incidence of SAE (regardless of study drug relationship) was similar in
both treatment groups (20.7% vs. 24.5%) in the core phase. All SAE were reported in either one or two patients, with the exception of pyrexia (3.6% in both treatment groups), sickle cell anemia with crisis (4.5% vs. 2.7%), pneumonia (2.7% vs. 0.9%) and bronchitis (2.7% vs. 0) in the deferasirox DT and the deferasirox granules groups, respectively. No deaths were reported with either of the two treatments (Table 4).
In ICT-naive patients, the overall incidence of AE in the granules and DT groups was 90.4% and 100%, respectively. The most commonly reported AE in the deferasirox granules and deferasirox DT groups, respectively, were pyrexia (28.8% and 20.4%), upper respiratory tract infection (32.7% and 25.9%), and UPCR increased (21.2% and 24.1%). The profile was similar across treatment groups, as no AE were observed with a difference of >10%.
In the overall patient population, 32.7% and 41.4% of patients in the deferasirox granules and DT groups, respectively, experienced GI disorder AE. Vomiting (deferasirox granules, 8.2%; deferasirox DT, 13.5%) and diarrhea (deferasirox granules, 8.2%; deferasirox DT, 12.6%) were the most common GI AE in the
Haematologica | 109 May 2024 1420 ARTICLE - Deferasirox granules and deferasirox DT (CALYPSO) A.T. Taher et al.
A B
Figure 3. Summary of overall compliance and absolute change from baseline in serum ferritin. (A) Mean compliance after 48 weeks. (B) Mean change in serum ferritin from baseline after 48 weeks*. *Based on observed mean change in serum ferritin from baseline to 48 weeks. DT: dispersible tablet; ICT: iron chelation therapy.
overall patient population (Table 4). In the ICT-naive patients, 28.8% and 35.2% of patients in the deferasirox granules and DT groups, respectively, experienced GI disorder AE. Diarrhea (deferasirox granules, 5.8%; deferasirox DT, 11.1%), abdominal pain (deferasirox granules, 9.6%; deferasirox DT, 1.9%), and vomiting (deferasirox granules, 7.7%; deferasirox DT, 7.4%) were the most common GI AE in the ICT-naive patients. The incidence of AE leading to study drug discontinuation, regardless of study drug relationship, was low and similar in both treatment groups in the overall patient population (deferasirox granules, 4.5%; deferasirox DT, 7.2%) (Online Supplementary Table S5). In ICT-naive patients, the incidence of AE leading to study drug discontinuation, regardless of study drug relationship, was low in both treatment groups (deferasirox granules, 3.8%; deferasirox DT, 7.4%). The AE leading to study drug discontinuation were upper GI hemorrhage and transaminases increases in the deferasirox granules group and vomiting, blood creatinine increases, conjugated bilirubin increases, and proteinuria in the deferasirox DT group. Details of safety are covered in Online Supplementary Tables S5-S9
Discussion
CALYPSO is a randomized, open-label, phase II study comparing the compliance and clinical benefit of two different deferasirox formulations (granules and DT) in pediatric patients with transfusion-dependent anemia requiring chelation
therapy because of transfusional iron overload. The study did not meet its primary objective. No statistically significant difference was observed in compliance and SF change from baseline between granules and DT after 24 weeks. There was no improved compliance and clinical benefit in terms of changes in SF over time with granules.
This study was designed to show a difference of 10% between the two treatment groups and given the high compliance rate observed in the deferasirox DT group (84.3%), this objective was challenging to achieve. The ICT-naive patient population included mostly very young children (median age 2 years) who had limited capacity to decide treatment administration and required parental assistance. It has been previously shown that compliance with ICT in thalassemia patients is highest in children, followed by adolescents and adults aged 35 years and older. Thus, the high compliance in children most likely reflects parental adherence.16 A similar observation was made in the overall patient population, which also included a young population (median age 5 years). Increases in SF were observed after 24 weeks and 48 weeks; the mean SF levels were found to be slightly increased during the core phase (i.e., approximately 1 year) and were similar between the two treatment arms at the end of the treatment core phase. However, a consistent decrease in mean SF values was observed with continuous deferasirox treatment beyond the core phase and during the extension phase. Earlier studies have reported a similar pattern of slight increase or maintenance of SF levels at 24 weeks with an
Patients with multiple events in the same category were counted only once in that category. Patients with events in more than 1 category were counted once in each of those categories. AE: adverse event; DFX: deferasirox; DT: dispersible tablet; GRAN: granules; ICT: iron chelation therapy; SAE: serious adverse event.
Haematologica | 109 May 2024 1421 ARTICLE - Deferasirox granules and deferasirox DT (CALYPSO) A.T. Taher et al.
.
ICT-naive patients, N (%) ICT-pretreated patients, N (%) All patients, N (%) Category DFX GRAN N=52 DFX DT N=54 DFX GRAN N=58 DFX DT N=57 DFX GRAN N=110 DFX DT N=111 All AE Severe AE All AE Severe AE All AE Severe AE All AE Severe AE All AE Severe AE All AE Severe AE AE 47 (90.4) 18 (34.6) 54 (100) 14 (25.9) 53 (91.4) 15 (25.9) 54 (94.7) 20 (35.1) 100 (90.9) 33 (30.0) 108 (97.3) 34 (30.6) Suspected AE 25 (48.1) 7 (13.5) 22 (40.7) 3 (5.6) 33 (56.9) 8 (13.8) 42 (73.7) 11 (19.3) 58 (52.7) 15 (13.6) 64 (57.7) 14 (12.6) SAE 14 (26.9) 9 (17.3) 13 (24.1) 10 (18.5) 13 (22.4) 7 (12.1) 10 (17.5) 8 (14.0) 27 (24.5) 16 (14.5) 23 (20.7) 18 (16.2) Suspected SAE 1 (1.9) 1 (1.9) 0 0 2 (3.4) 2 (3.4) 2 (3.5) 2 (3.5) 3 (2.7) 3 (2.7) 2 (1.8) 2 (1.8) AE leading to study drug discontinuation 2 (3.8) 2 (3.8) 4 (7.4) 1 (1.9) 3 (5.2) 1 (1.7) 4 (7.0) 4 (7.0) 5 (4.5) 3 (2.7) 8 (7.2) 5 (4.5) AE requiring dose adjustment and/or interruption 24 (46.2) 7 (13.5) 32 (59.3) 8 (14.8) 29 (50.0) 8 (13.8) 37 (64.9) 15 (26.3) 53 (48.2) 15 (13.6) 69 (62.2) 23 (20.7) AE requiring additional therapy 39 (75.0) 11 (21.2) 44 (81.5) 11 (20.4) 43 (74.1) 9 (15.5) 41 (71.9) 10 (17.5) 82 (74.5) 20 (18.2) 85 (76.6) 21 (18.9) AE of special interest 30 (57.7) 12 (23.1) 27 (50.0) 5 (9.3) 35 (60.3) 9 (15.5) 41 (71.9) 13 (22.8) 65 (59.1) 21 (19.1) 68 (61.3) 18 (16.2)
Table 3. Incidence of adverse events.
Table 4. Overall incidence of common (>10%) adverse events.
AE: adverse event; ALT: alanine aminotransferase; AST: aspartate aminotransferase; DFX: deferasirox; DT: dispersible tablet; GRAN: granules; ICT: iron chelation therapy; UPCR: urinary protein/creatinine ratio.
initial dose of deferasirox DT 20 mg/kg; this was attributed to the disproportionately low initial doses given to regularly transfused patients with moderate iron overload.17,18 The PRO analyses were performed using PRO/ObsRO scores from the mSICT questionnaire and palatability scores. The study results indicated that the adherence and satisfaction/preference scores were numerically lower (indicates better) and the concerns score higher (indicates fewer) with granules versus DT. The palatability scores were numerically higher (indicates better) with granules versus DT. These results were further confirmed by supportive analysis. However, due to the small number of patients old enough/ able to complete PRO questionnaires (N=41, 18.3%), PRO data should be interpreted with caution. Despite slight differences between deferasirox granules and DT arms in the ObsRO/PRO scores for adherence, satisfaction/preference (ObsRO only), concerns, and palatability, the overall scores for both formulations were closer to the lower score range for adherence and satisfaction/preference and the higher score range for concerns and palatability. This indicates overall good adherence, satisfaction/preference, fewer concerns, and good palatability with both deferasirox formulations.
A similar, yet limited, observation was reported in a retrospective study by Higashino et al. (5 adult patients).19 Patient satisfaction was higher for deferasirox granules than for deferasirox DT considering all four assessed items (for handiness: 85±6 vs. 40±17 mm, P=0.001; ease of administration: 64±28 vs. 27±12 mm, P=0.037; administration timing: 90±6 vs 21±17 mm, P<0.001; and taste: 66±19 vs. 39±10 mm, P=0.033, using a 100-mm visual analog scale for all 4 items).19 In the ECLIPSE study, the PRO analyses indicated that overall satisfaction scores were higher with deferasirox FCT compared with deferasirox DT.20 The FCT formulation, similar to the granule formulation, was developed to improve palatability, tolerability, and patient compliance.
The pre-dose PK exposure analysis demonstrated a lower variance of the differences between predicted and observed concentration values in the deferasirox granules group compared with the deferasirox DT group, indicating better compliance with granules.
In the present study, a higher proportion of patients in the overall patient population in the deferasirox DT group experienced GI AE compared with the deferasirox granules group (41.4% vs. 32.7%). As deferasirox granules can be taken with a light meal, and also lack the excipients lac-
Haematologica | 109 May 2024 1422 ARTICLE - Deferasirox granules and deferasirox DT (CALYPSO) A.T. Taher et al.
ICT-pretreated,
(%) All
DFX GRAN N=52 DFX DT N=54 DFX GRAN N=58 DFX DT N=57 DFX GRAN N=110 DFX DT N=111 All AE Severe AE All AE Severe AE All AE Severe AE All AE Severe AE All AE Severe AE All AE Severe AE UPCR increased 11 (21.2) 2 (3.8) 13 (24.1) 1 (1.9) 16 (27.6) 2 (3.4) 25 (43.9) 3 (5.3) 27 (24.5) 4 (3.6) 38 (34.2) 4 (3.6) Upper respiratory tract infection 17 (32.7) 0 14 (25.9) 0 14 (24.1) 0 19 (33.3) 0 31 (28.2) 0 33 (29.7) 0 Pyrexia 15 (28.8) 2 (3.8) 11 (20.4) 0 14 (24.1) 2 (3.4) 15 (26.3) 2 (3.5) 29 (26.4) 4 (3.6) 26 (23.4) 2 (1.8) ALT increased 7 (13.5) 5 (9.6) 5 (9.3) 0 13 (22.4) 3 (5.2) 10 (17.5) 7 (12.3) 20 (18.2) 8 (7.3) 15 (13.5) 7 (6.3) Bilirubin conjugated increased 5 (9.6) 0 5 (9.3) 0 7 (12.1) 0 11 (19.3) 0 12 (10.9) 0 16 (14.4) 0 Vomiting 4 (7.7) 0 4 (7.4) 0 5 (8.6) 0 11 (19.3) 0 9 (8.2) 0 15 (13.5) 0 Cough 6 (11.5) 0 5 (9.3) 0 8 (13.8) 0 7 (12.3) 0 14 (12.7) 0 12 (10.8) 0 Diarrhea 3 (5.8) 0 6 (11.1) 0 6 (10.3) 0 8 (14.0) 0 9 (8.2) 0 14 (12.6) 0 Nasopharyngitis 6 (11.5) 0 7 (13.0) 1 (1.9) 5 (8.6) 0 6 (10.5) 0 11 (10.0) 0 13 (11.7) 1 (0.9) AST increased 5 (9.6) 1 (1.9) 3 (5.6) 0 7 (12.1) 2 (3.4) 8 (14.0) 1 (1.8) 12 (10.9) 3 (2.7) 11 (9.9) 1 (0.9) Abdominal pain 5 (9.6) 0 1 (1.9) 0 7 (12.1) 0 3 (5.3) 0 12 (10.9) 0 4 (3.6) 0 Pharyngitis 5 (9.6) 1 (1.9) 1 (1.9) 0 6 (10.3) 0 2 (3.5) 0 11 (10.0) 1 (0.9) 3 (2.7) 0
ICT-naive
patients,
N (%)
N
patients, N (%)
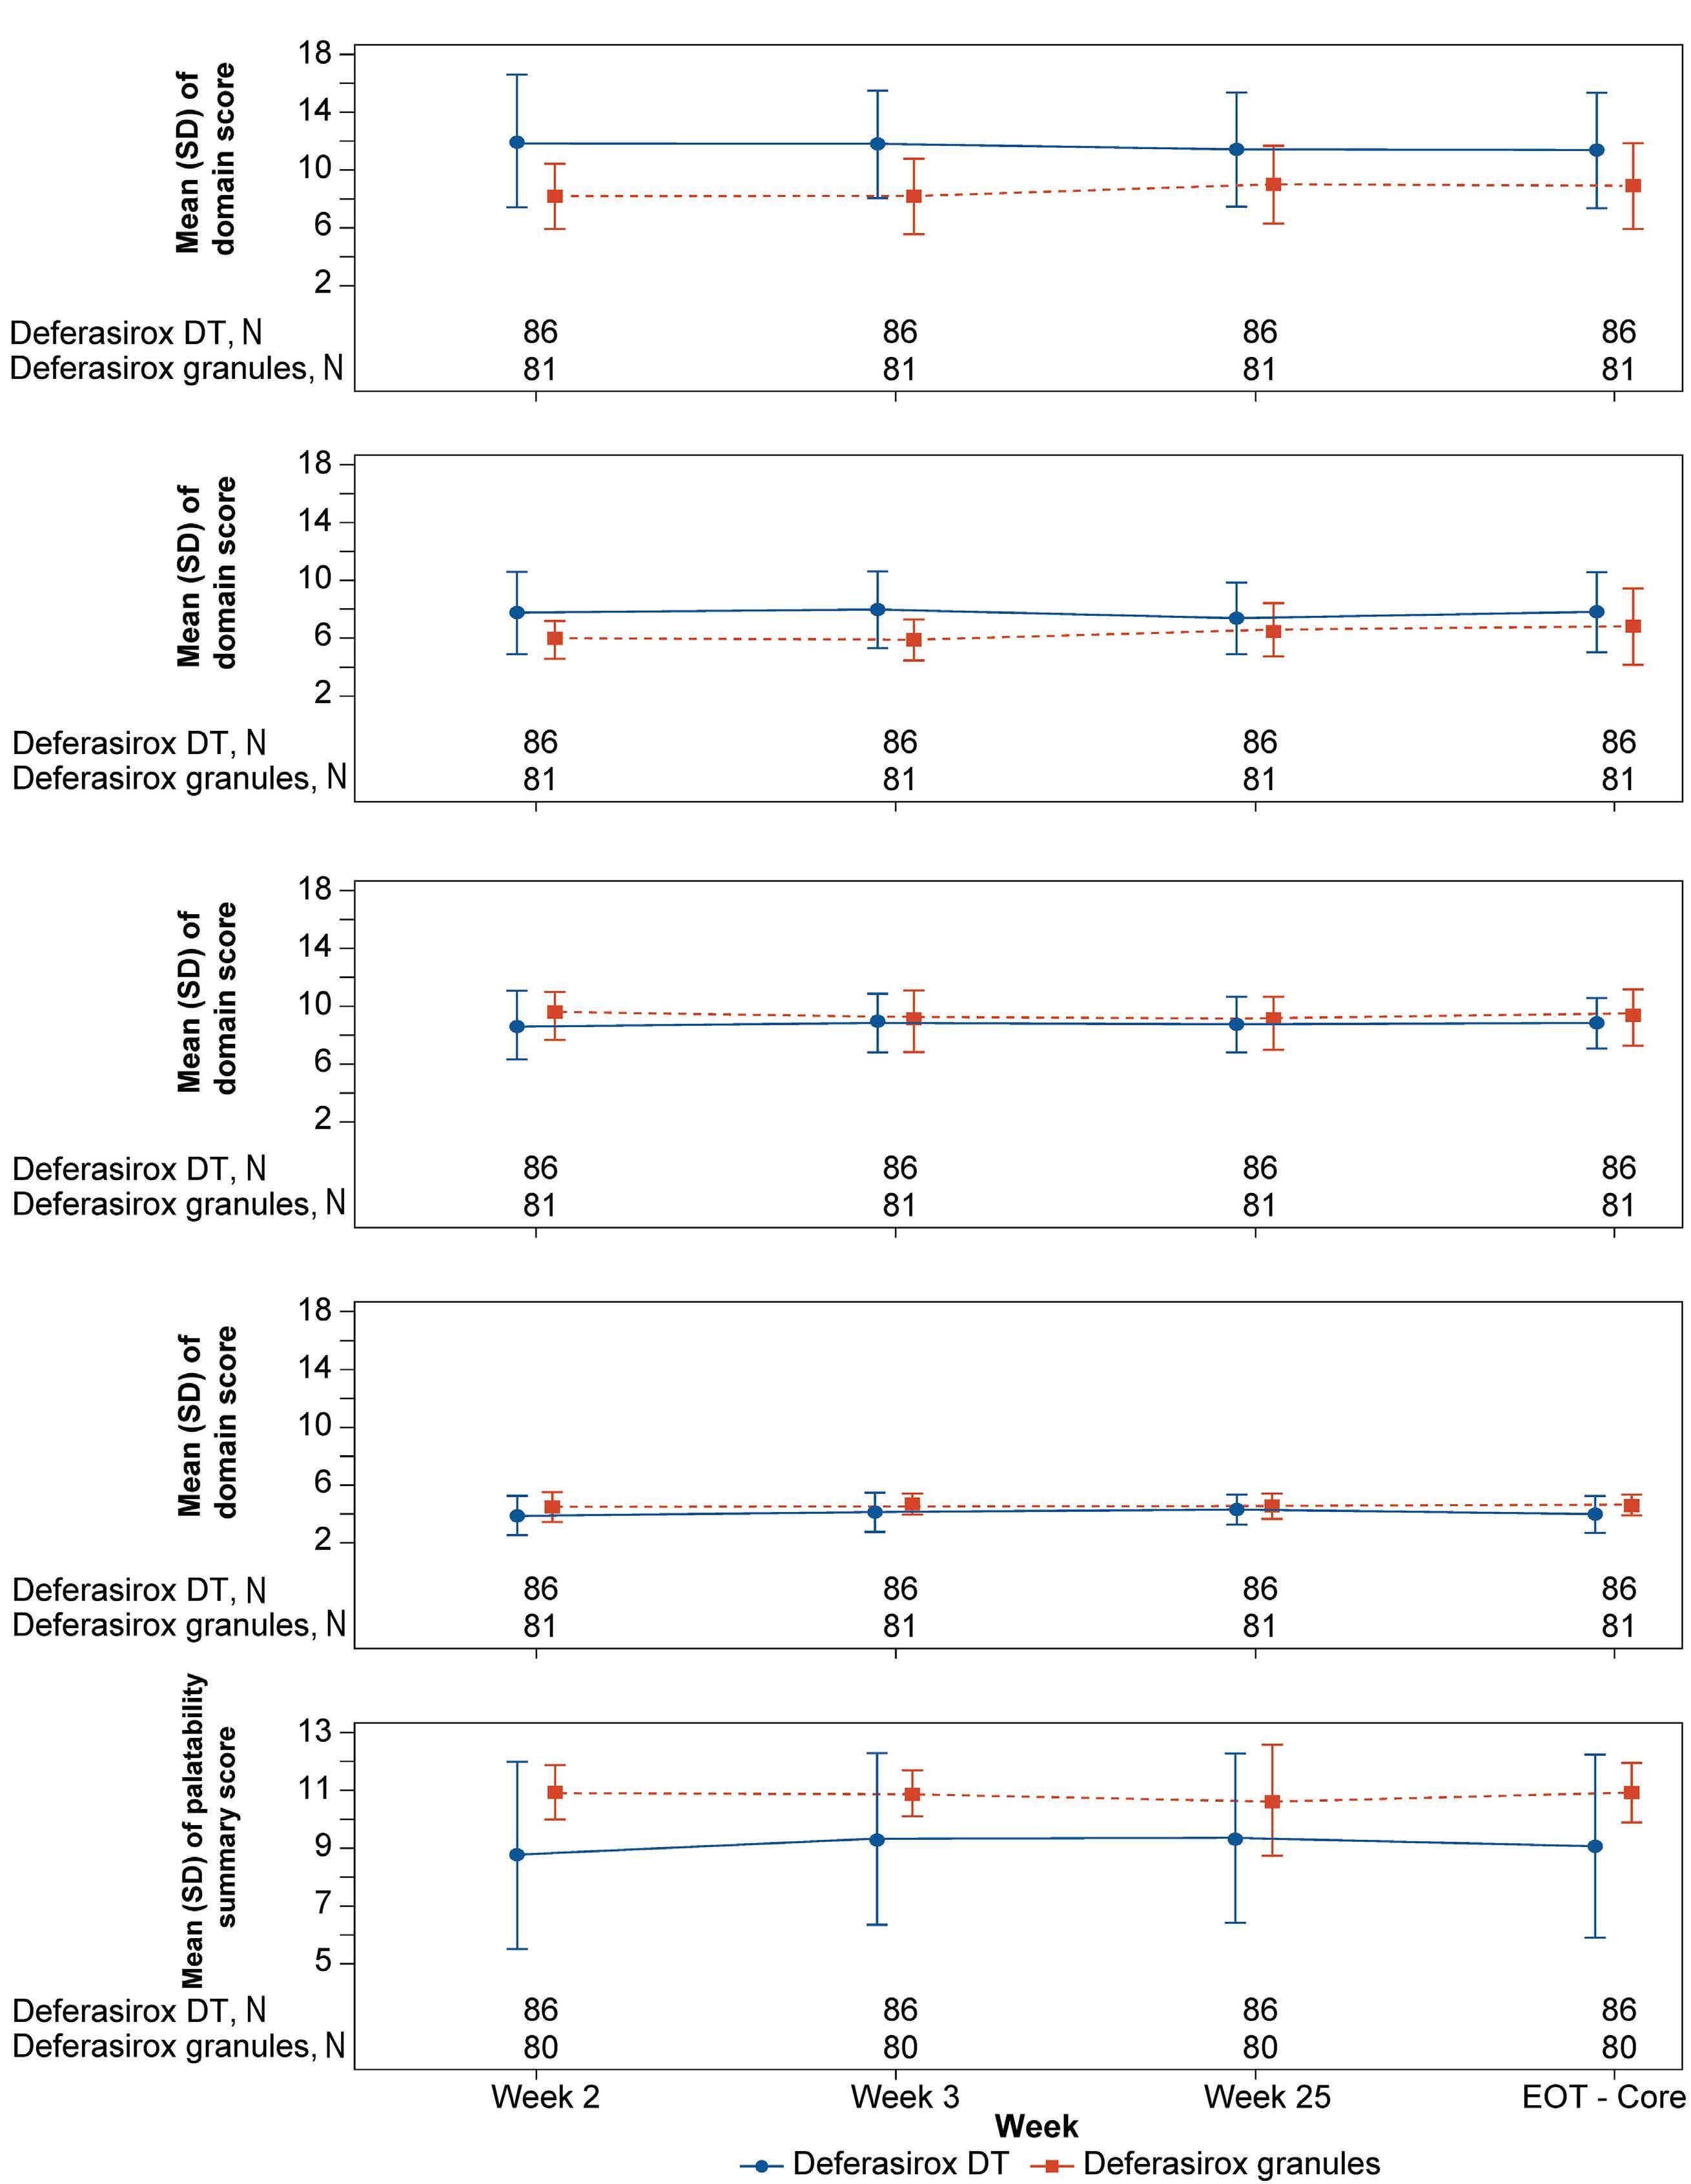
Figure 4. PRO/ObsRO questionnaires (all patients). (A) Modified SICT ObsRO (child adherence). (B) Modified SICT ObsRO (caregiver adherence). (C) Modified SICT ObsRO (child concerns). (D) Modified SICT ObsRO (caregiver concerns). (E) Palatability ObsRO. DT: dispersible tablet; ObsRO: observer-reported outcome; PRO: patient-reported outcome; SICT: satisfaction iron chelation therapy.
Haematologica | 109 May 2024 1423 ARTICLE - Deferasirox granules and deferasirox DT (CALYPSO) A.T. Taher et al.
A B C D E
tose and sodium lauryl sulfate, both found in the original DT formulation and possibly implicated in GI AE, it was expected that deferasirox granules would show improved GI tolerability. The present study results suggest that the GI tolerability profile may be improved with granules compared with DT, which could be because of the change in excipients and/or the ability to take the medicine with a light meal. However, long-term study data are required to confirm this observation.
One patient on deferasirox DT experienced acquired Fanconi syndrome, leading to discontinuation of the drug. There are earlier reports of development of this AE in deferasirox-treated patients, with cessation of deferasirox leading to prompt recovery.21,22 Overall, the safety profile was comparable between deferasirox granules and deferasirox DT and consistent with previous studies; no new safety signals were observed.
In conclusion, the study did not meet its primary objective. In ICT-naive patients, mean compliance and change from baseline in SF with deferasirox granules and DT formulations were not significantly different. No new safety signals were identified in this study and the study treatments were well tolerated.
Disclosures
ATT received research funding and is a consultant for Novartis Pharmaceuticals, BMS, Ionis Pharmaceuticals, Vifor, Imara, and Agios. YW received research grants from Novartis Oncology to conduct the trial. MCC is a speaker for Novartis and is the principal investigator for the CALYPSO trial. PC received research grant funding from Novartis Pharmaceuticals. YA is a consultant for Silence Therapeutics, CRISPR Therapeutics/Vertex, and BMS; a speaker for Novartis and Cerus; received research grants from Novartis, Ionis, Imara, Agios, Resonance Health, and BMS, and honoraria from
References
1. Fernandes JL, Fabron A, Jr., Verissimo M. Early cardiac iron overload in children with transfusion-dependent anemias. Haematologica. 2009;94(12):1776-1777.
2. Gordan R, Wongjaikam S, Gwathmey JK, Chattipakorn N, Chattipakorn SC, Xie LH. Involvement of cytosolic and mitochondrial iron in iron overload cardiomyopathy: an update. Heart Fail Rev. 2018;23(5):801-816.
3. Saliba AN, Harb AR, Taher AT. Iron chelation therapy in transfusion-dependent thalassemia patients: current strategies and future directions. J Blood Med. 2015;6:197-209.
4 Vichinsky E, Butensky E, Fung E, et al. Comparison of organ dysfunction in transfused patients with SCD or beta thalassemia. Am J Hematol. 2005;80(1):70-74.
5. Novartis Pharma AG. Exjade® (deferasirox) [Prescribing information]. U.S. Food and Drug Administration. https://www. accessdata.fda.gov/drugsatfda_docs/label/2009/021882s006lbl. pdf. Revised April 2009. Accessed August 2023.
6. Aydinok Y, Unal S, Oymak Y, et al. Observational study
Chiesi. OW, SG and FR are employees of Novartis. VV received research funding from Novartis, BMS, and Agios.
Contributions
All authors met the International Council of Medical Journal Editors’ criteria for authorship and all those who met those criteria are listed as authors. All authors contributed to the conceptualization, design, acquisition, analysis and interpretation of data, and development of this manuscript. All authors approved the final manuscript for submission. All authors had full access to all the data in the study and had final responsibility for the decision to submit for publication.
Acknowledgments
The authors thank Bhavana Muddana, M.Pharm and Rohit Bhandari, PhD of Novartis Healthcare Pvt. Ltd., India, Richard Gordan, PhD of Novartis Pharmaceuticals Corporation, USA, for providing medical writing and editorial assistance in accordance with Good Publication Practice (GPP3) guidelines, which was funded by Novartis Pharmaceuticals Corporation.
Funding
This study was sponsored by Novartis Pharmaceutical Corporation.
Data-sharing statement
Novartis is committed to sharing with qualified external researchers, access to patient-level data, and supporting clinical documents from eligible studies. These requests are reviewed and approved by an independent review panel on the basis of scientific merit. All data provided are anonymized to respect the privacy of patients who have participated in the trial in line with the applicable laws and regulations. The availability of trial data is according to the criteria and process described on www.clinicalstudydatarequest.com.
comparing long-term safety and efficacy of Deferasirox with Desferrioxamine therapy in chelation-naive children with transfusional iron overload. Eur J Haematol. 2012;88(5):431-438.
7 Vichinsky E, El-Beshlawy A, Al Zoebie A, et al. Long-term safety and efficacy of deferasirox in young pediatric patients with transfusional hemosiderosis: results from a 5-year observational study (ENTRUST). Pediatr Blood Cancer. 2017;64(9):e26507.
8. Osborne RH, De Abreu Lourenco R, Dalton A, et al. Quality of life related to oral versus subcutaneous iron chelation: a time trade-off study. Value Health. 2007;10(6):451-456.
9 Delea TE, Sofrygin O, Thomas SK, Baladi JF, Phatak PD, Coates TD. Cost effectiveness of once-daily oral chelation therapy with deferasirox versus infusional deferoxamine in transfusion-dependent thalassaemia patients: US healthcare system perspective. Pharmacoeconomics. 2007;25(4):329-342.
10 Haghpanah S, Zarei T, Zahedi Z, Karimi M. Compliance and
Haematologica | 109 May 2024 1424 ARTICLE - Deferasirox granules and deferasirox DT (CALYPSO) A.T. Taher et al.
satisfaction with deferasirox (Exjade(R)) compared with deferoxamine in patients with transfusion-dependent betathalassemia. Hematology. 2014;19(4):187-191.
11. Vichinsky E. Clinical application of deferasirox: practical patient management. Am J Hematol. 2008;83(5):398-402.
12. Gabutti V, Piga A. Results of long-term iron-chelating therapy. Acta Haematol. 1996;95(1):26-36.
13. Delea TE, Edelsberg J, Sofrygin O, et al. Consequences and costs of noncompliance with iron chelation therapy in patients with transfusion-dependent thalassemia: a literature review. Transfusion. 2007;47(10):1919-1929.
14 Modell B, Khan M, Darlison M. Survival in beta-thalassaemia major in the UK: data from the UK Thalassaemia Register. Lancet. 2000;355(9220):2051-2052.
15. Novartis Pharmaceuticals Corporation. JADENU® (deferasirox) [Prescribing Information]. U.S. Food and Drug Administration. https://www.accessdata.fda.gov/drugsatfda_docs/ label/2020/207968s009lbl.pdf. Revised July 2020. Accessed August 2023.
16. Trachtenberg F, Vichinsky E, Haines D, et al. Iron chelation adherence to deferoxamine and deferasirox in thalassemia. Am J Hematol. 2011;86(5):433-436.
17 Cappellini MD, Cohen A, Piga A, et al. A phase 3 study of deferasirox (ICL670), a once-daily oral iron chelator, in patients with beta-thalassemia. Blood. 2006;107(9):3455-3462.
18. Taher A, El-Beshlawy A, Elalfy MS, et al. Efficacy and safety of deferasirox, an oral iron chelator, in heavily iron-overloaded patients with beta-thalassaemia: the ESCALATOR study. Eur J Haematol. 2009;82(6):458-465.
19 Higashino S, Yasu T, Momo K, Kuroda S. Effects of formulation changes for deferasirox from dispersible tablets to granules in patients with red blood cell transfusion-induced iron overload. Am J Ther. 2019;26(6):e728-e730.
20 Taher AT, Origa R, Perrotta S, et al. New film-coated tablet formulation of deferasirox is well tolerated in patients with thalassemia or lower-risk MDS: Results of the randomized, phase II ECLIPSE study. Am J Hematol. 2017;92(5):420-428.
21. Chuang GT, Tsai IJ, Tsau YK, Lu MY. Transfusion-dependent thalassaemic patients with renal Fanconi syndrome due to deferasirox use. Nephrology (Carlton). 2015;20(12):931-935.
22. Yacobovich J, Stark P, Barzilai-Birenbaum S, et al. Acquired proximal renal tubular dysfunction in beta-thalassemia patients treated with deferasirox. J Pediatr Hematol Oncol. 2010;32(7):564-567.
Haematologica | 109 May 2024 1425 ARTICLE - Deferasirox granules and deferasirox DT (CALYPSO) A.T. Taher et al.
ASXL1 mutations are associated with a response to alvocidib and 5-azacytidine combination in myelodysplastic neoplasms
Vladimir Riabov,1 Qingyu Xu,1 Nanni Schmitt,1 Alexander Streuer,1 Guo Ge,2 Lyndsey Bolanos,3 Mark Wunderlich,3 Johann-Christoph Jann,1 Alina Wein,1 Eva Altrock,1 Marie Demmerle,1 Sanjay Mukherjee,4 Abdullah Mahmood Ali,4 Felicitas Rapp,1 Verena Nowak,1 Nadine Weimer,1 Julia Obländer,1 Iris Palme,1 Melda Göl,1 Ahmed Jawhar,5 Ali Darwich,5 Patrick Wuchter,6 Christel Weiss,7 Azra Raza,4 Jason M. Foulks,8 Daniel T. Starczynowski,3,9 Feng-Chun Yang,2 Georgia Metzgeroth,1 Laurenz Steiner,1 Mohamad Jawhar,1 Wolf-Karsten Hofmann1 and Daniel Nowak1
1Department of Hematology and Oncology, Medical Faculty Mannheim, Heidelberg University, Mannheim, Germany; 2Department of Cell Systems & Anatomy, University of Texas Health Science Center at San Antonio, San Antonio, TX, USA; 3Division of Experimental Hematology and Cancer Biology, Cincinnati Children’s Hospital Medical Center, Cincinnati, OH, USA; 4Myelodysplastic Syndromes Center, Columbia University Irving Medical Center, Columbia University, New York, NY, USA; 5Department of Orthopedic Surgery, Medical Faculty Mannheim, Heidelberg University, Mannheim, Germany; 6Institute of Transfusion Medicine and Immunology, German Red Cross Blood Service Baden-Württemberg-Hessen, Medical Faculty Mannheim, Heidelberg University, Mannheim, Germany; 7Department of Medical Statistics, Biomathematics and Information Processing, Medical Faculty Mannheim, Heidelberg University, Mannheim, Germany; 8Sumitomo Pharma Oncology, Inc., Lehi, UT, USA and 9University of Cincinnati Cancer Center, Cincinnati, OH USA
Abstract
Correspondence: D. Nowak
daniel.nowak@medma.uni-heidelberg.de V. Riabov
vladimir.ryabov@medma.uni-heidelberg.de
Received: February 9, 2023.
Accepted: October 24, 2023.
Early view: November 2, 2023.
https://doi.org/10.3324/haematol.2023.282921
©2024 Ferrata Storti Foundation Published under
Inhibitors of anti-apoptotic BCL-2 family proteins in combination with chemotherapy and hypomethylating agents (HMA) are promising therapeutic approaches in acute myeloid leukemia (AML) and high-risk myelodysplastic syndromes (MDS). Alvocidib, a cyclin-dependent kinase 9 (CDK9) inhibitor and indirect transcriptional repressor of the anti-apoptotic factor MCL-1, has previously shown clinical activity in AML. Availability of biomarkers for response to the alvocidib + 5-azacytidine (5-AZA) could also extend the rationale of this treatment concept to high-risk MDS. In this study, we performed a comprehensive in vitro assessment of alvocidib and 5-AZA effects in N=45 high-risk MDS patients. Our data revealed additive cytotoxic effects of the combination treatment. Mutational profiling of MDS samples identified ASXL1 mutations as predictors of response. Further, increased response rates were associated with higher gene expression of the pro-apoptotic factor NOXA in ASXL1-mutated samples. The higher sensitivity of ASXL1 mutant cells to the combination treatment was confirmed in vivo in ASXL1Y588X transgenic mice. Overall, our study demonstrated augmented activity for the alvocidib + 5-AZA combination in higher-risk MDS and identified ASXL1 mutations as a biomarker of response for potential stratification studies.
Introduction
Myelodysplastic syndromes (MDS) are a group of heterogeneous clonal diseases of hematopoietic stem cells leading to cytopenia and an increased risk of developing secondary acute myeloid leukemia (sAML). Treatment with the hypomethylating agent (HMA) 5-azacytidine (5-AZA) is standard-of-care for higher-risk MDS patients that extends overall survival.1 However, only approximately 50% of patients initially respond to the therapy and the
development of secondary resistance is almost certain.1,2 Therefore, combination of 5-AZA with drugs that facilitate differentiation or apoptosis of high-risk MDS hematopoietic stem cells and progenitors (HSPC) is a potential therapeutic approach.
In high-risk MDS, anti-apoptotic members of the BCL-2 family show a higher expression level compared to lowrisk MDS and healthy bone marrow (BM).3 This leads to decreased rates of apoptosis or resistance to apoptosis.4 Inhibitors of anti-apoptotic BCL-2 family members in com-
Haematologica | 109 May 2024 1426 - Myelodysplastic Syndromes ARTICLE
a CC BY-NC license
bination with 5-AZA have recently shown potent activity against AML and high-risk MDS. It was demonstrated that venetoclax, a highly selective BCL-2 inhibitor, and 5-AZA act synergistically to eliminate AML cells in vitro and display synergistic antitumor activity in AML patients in vivo. 5,6 Besides, selective inhibitors of the anti-apoptotic protein MCL-1 alone or in combination with venetoclax showed broad cytotoxicity against primary low- and highrisk MDS cells.7
Alvocidib (Flavopiridol) is a broad inhibitor of cyclin-dependent kinases (CDK), including CDK1, CDK2, CDK4, CDK6, CDK7 and CDK9.8 Previous studies indicated that the cytotoxic effects of alvocidib are primarily mediated via inhibition of CDK7 and CDK9.8,9 Mechanistically, CDK7 and CDK9 inhibition by alvocidib repressed transcriptional elongation mediated by RNA polymerase II resulting in the downregulation of its target genes.8,10 One of the primary proposed alvocidib target genes is the RNA polymerase II-dependent gene MCL-1 due to the fast turnover of its RNA and protein.11 In MCL-1-dependent hematologic malignancies, downregulation of MCL-1 expression through inhibition of CDK9 was reported to induce apoptosis of leukemic blasts.10,12 Alvocidib alone or in combination therapies has previously shown clinical activity in hematologic malignancies.13,14 Encouraging anti-leukemic effects of alvocidib in combination with cytarabine/mitoxantrone or cytarabine/daunorubicin were reported in phase I and II studies of AML.14,15 Recently, the effects of alvocidib in combination with HMA decitabine or 5-AZA had been investigated in a phase Ib/II study in patients with high-risk MDS (clinicaltrials gov. Identifier: NCT03593915). However, this study was terminated for reasons of company strategy and not powered to identify biomarkers associated with the response to alvocidib and 5-AZA + alvocidib combination. Therefore, the aim of our study was to characterize potential biomarkers of response to alvocidib + 5-AZA combination treatment in MDS, which was not previously assessed in preclinical models or clinical trials. We report that the increased sensitivity of primary MDS samples to the alvocidib or alvocidib + 5-AZA treatment in vitro is associated with the presence of ASXL1 mutations. These results were further confirmed in Asxl1Y588X transgenic mice. Higher cytotoxic effects of alvocidib in ASXL1-mutant samples correlated with elevated expression of MCL-1 interacting pro-apoptotic factor NOXA. These novel insights suggest that the stratification of patients based on ASXL1 mutational status may be beneficial for the selection of particularly eligible patients into clinical trials with this drug combination.
Methods
Routine protocols are described in detail in the Online Supplementary Appendix.
Myelodysplastic syndromes patient and healthy control samples
Samples of MDS patients (N=45) were obtained from diagnostic BM aspirations. Patient characteristics are presented in Table 1. Individual patient data, including patient ID are presented in the Online Supplementary Table S1. Hematopoietic cells from age-matched hematologically healthy controls (HC, N=15), median 69 years (range, 4792) were obtained from bone specimen after femur endoprosthesis surgery. All patients and HC provided written informed consent and all interventions were performed in accordance with the Declaration of Helsinki. Human material in this study was used following institutional review board approval by the Medical Ethics Committee II of the Medical Faculty Mannheim, University of Heidelberg, Germany and Columbia University’s institutional review board-approved tissue repository (IRB-AAAF2693).
In vivo experimental procedures
The development of leukemia in the Asxl1Y588X transgenic (Tg) mice used in this study takes about 12 months.16 For the tumor transfer assay, 3×10 6 splenic cells from 12-month-old C57BL/6 Asxl Y588X Tg mice with myeloid leukemia were injected into sublethally irradiated (6.0 Gy) CD45.1 + B6.SJL-Ptprca Pepcb/BoyJ wild-type (WT) recipients through tail veins. Seven weeks after the tumor
2016, N
WHO: World Health Organization; MDS-MLD: myelodysplastic syndromes with multilineage dysplasia; MDS-RS-MLD: MDS with ring sideroblasts and MLD; MDS-EB: MDS with excess blasts; MDS/MPN-U: myelodysplastic/myeloproliferative neoplasm, unclassifiable; CMML: chronic myelomonocytic leukemia; N/A: not applicable; sAML: secondary acute myeloid leukemia; AML-MRC: AML with myelodysplasia-related changes; IPSS-R: Revised International Prognostic Scoring System; CPSS: CMML-specific prognostic scoring system.
Haematologica | 109 May 2024 1427 ARTICLE - Biomarkers of alvocidib + 5-AZA response in MDS V. Riabov et al.
Parameters N=45 Median age in years (range) 73 (43-90) Sex, N Male Female 34 11 WHO-subtype
MDS-MLD MDS-RS-MLD MDS-EB1 MDS-EB2 MDS/MPN-U CMML-2 AML-MRC sAML 6 1 10 20 3 1 2 2 IPSS-R, N Intermediate High Very high N/A (sAML, AML-MRC) 5 23 12 4 CPSS, N High 1
Table 1. Clinical parameters of patients.
transfer, mice were treated with 1 mg/kg 5-AZA intraperitoneally (i.p.) on days 1-3 (once daily, qd) every other week. Alvocidib was administered i.p. at a dose of 2.5 mg/kg or 5 mg/kg on day 5 (once weekly, qw) in the weeks when 5-AZA was applied. Mice were sacrificed 11 weeks after the tumor transfer and the percentage of CD45.1+ and CD45.2+ cells in the BM was assessed by flow cytometric analysis. All animal experiments were done in accordance with the guidelines of the University of Texas Health San Antonio Animal Care and Use Facility. In xenotransplantation experiments, 1x10⁶ MDS-L cells17 were injected intravenously (i.v.) into busulfan-conditioned NOD.Cg-Prkdcscid Il2rgtm1Wjl Tg (CMV-IL3,CSF2,KITLG)1Eav/MloySzJ (NSGS) mice as previously described.18 Following engraftment (on day 14), 5-AZA (0.5 mg/kg on days 1-4), alvocidib (5 mg/kg on day 5), or the combination of both were administered i.p. for the duration of the experiment. In order to determine the effects of drugs on leukemic burden, blood samples were collected from all mice 21 and 50 days post-transplantation and percentage of human CD45+ MDS-L cells in mouse blood was assessed using flow cytometry. Animals were bred and housed in the Association for Assessment and Accreditation of Laboratory Animal Care-accredited animal facility of Cincinnati Children’s Hospital Medical Center. Xenograft experiments were approved by the Cincinnati Children’s Hospital IACUC (protocol #2020-0073). All experiments conform to the regulatory standards of the Institutional Animal Care and Use Committee (IACUC) and adhere to IACUC-approved protocols.
Hematopoietic stem and progenitor cell culture and cell viability assays
Human hematopoietic stem and progenitor cells (HSPC) were expanded for 5 days in StemSpan™ SFEM II medium (Stem Cell Technologies, 09655) containing StemSpan™ Myeloid Expansion Supplement (Stem Cell Technologies, 02693) before treatment with alvocidib for 24 hours (h), 5-AZA for 48 h or sequential combination of 5-AZA for 48 h followed by alvocidib for 24 h. CellTiter-Glo (CTG) and Annexin V apoptosis assays were used as cell viability readouts and described in details in the Online Supplementary Appendix
Results
The treatment combination of alvocidib + 5-AZA exerts additive cytotoxic effects on myelodysplastic syndromes cells in vitro and in vivo
In order to determine alvocidib and 5-AZA concentrations for drug combination studies, dose-response experiments using CD34+ cells isolated from the BM of high-risk MDS patients (N=16) and HC (N=12) were performed. CD34 + cells were expanded for 5 days in StemSpan™ SFEM II
medium containing StemSpan™ Myeloid Expansion Supplement and subjected to CTG cell viability assay after 24 h of incubation with alvocidib or 48 h of incubation with 5-AZA. Of note, the sensitivity of MDS cells to alvocidib and especially 5-AZA was more heterogeneous as compared to HC (Figure 1A; Online Supplementary Figure S1 ). In order to assess the effects of the alvocidib + 5-AZA combination on the viability of CD34+ MDS HSPC, median IC30 concentrations for MDS samples were tested in CTG assays. The cells were sequentially treated with 5-AZA for 48 h followed by alvocidib treatment for 24 h in line with the sequential dosing schedule of Ib/II MDS study (clinicaltrials gov. Identifier: NCT03593915) and our previous data.19 The combination treatment had a statistically significant additive cytotoxic effect on CD34+ cells from high-risk MDS patients (Figure 1B), which was also observed in apoptosis assays (Figure 1C). Of note, the cytotoxic effects of alvocidib + 5-AZA were more pronounced against MDS cells as compared to healthy HSPC (Figure 1D). Similarly, the percentage of late apoptotic and dead cells was significantly higher in MDS samples as compared to HC (Figure 1D). In order to check, whether the potential presence of clonal hematopoiesis of indeterminate potential (CHIP) mutations in HC sensitizes CD34+ cells to alvocidib + 5-AZA treatment, we performed myeloid deep panel sequencing of N=9 available HC MNC samples. There were no detectable mutations in eight of nine HC samples, whereas one HC had an acquired DNMT3A mutation (variant allele frequency [VAF] =33%), which was confirmed by Sanger sequencing ( Online Supplementary Table S2; Online Supplementary Figure S2 ). This mutated sample (labeled in dark red color in Figure 1F, G) was not an outlier in HC control group based on its sensitivity to the combination treatment (ROUT outlier test, Q=1%).
We next tested the activity of alvocidib + 5-AZA in NSGS mice engrafted with MDS-L cells. Similar to our in vitro studies, the combination treatment resulted in an accelerated reduction of the leukemic burden compared to single substances (Figure 1E). In order to address the issue of the substance combination toxicity in vivo, we collected data about body weight changes during the treatment. We also assessed the impact of single agents and their combination on the hematological parameters in NSGS mice transplanted with MDS-L cells. Our data showed that both single agents and their combination did not affect mouse body weights during the 37 days of treatment ( Online Supplementary Figure S3A ). Both 5-AZA and alvocidib moderately decreased white blood cell (WBC) counts with marginal statistical significance (Online Supplementary Figure S3B ). However, there was no aggravated negative effect of the combination treatment on the WBC levels as compared to the single substances. As expected, 5-AZA decreased red blood cell (RBC) and hemoglobin values in treated mice. However, alvocidib did not show toxic effects on erythroid cells. Moreover, toxic
Haematologica | 109 May 2024 1428 ARTICLE - Biomarkers of alvocidib + 5-AZA response in MDS V. Riabov et al.
effects of 5-AZA were not exacerbated by alvocidib (Online Supplementary Figure S3C, D ). Alvocidib insignificantly increased platelet levels in treated mice. However, these
were not further increased after combination treatment (Online Supplementary Figure S3E). In summary, in vivo data showed an overall favorable toxicity profile of alvo-
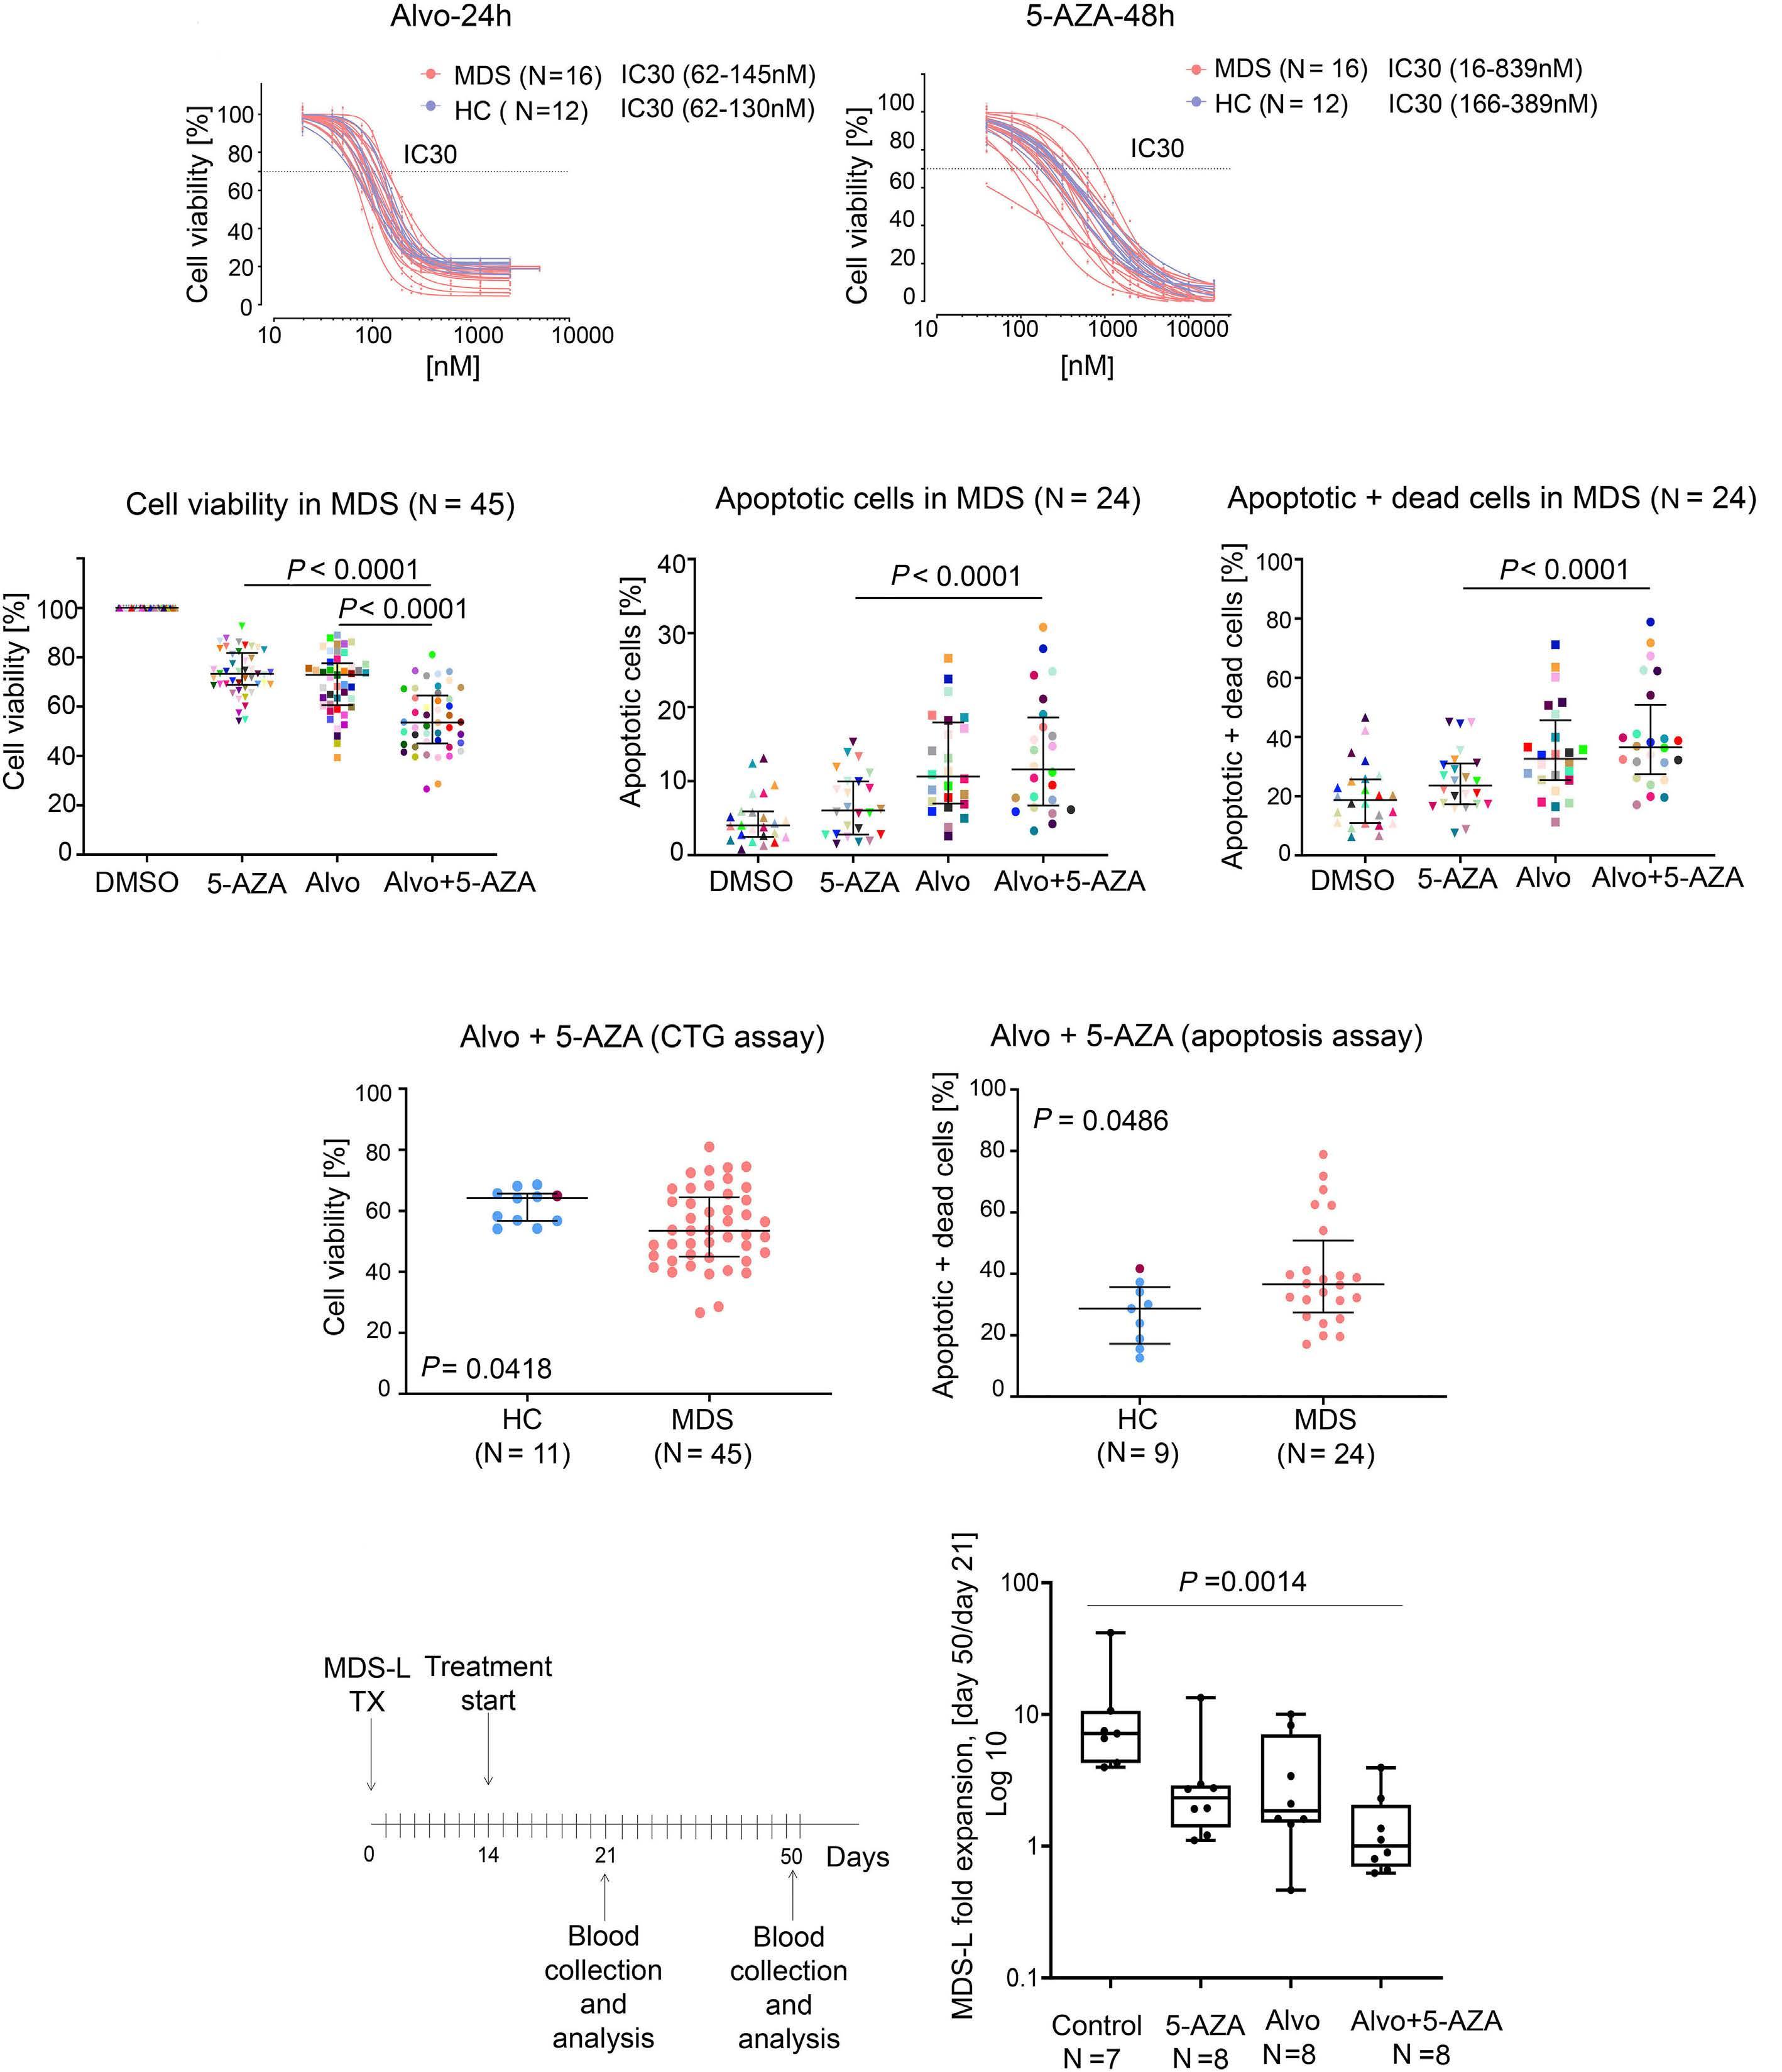
on following page.
Haematologica | 109 May 2024 1429 ARTICLE - Biomarkers of alvocidib + 5-AZA response in MDS V. Riabov et al.
A B C D E
Continued
Figure 1. The combination of alvocidib and 5-AZA exhibited an additive effect on the cell viability in human high-risk myelodysplastic syndromes samples. (A) Dose response curves were generated after alvocidib (Alvo) treatment for 24 hours (h) (left panel) and 5-azacytidine (5-AZA) treatment for 48 h (right panel) for N=16 myelodysplastic syndromes (MDS) patients and N=12 hematologically healthy controls (HC). Cell viability was measured using CTG assay. (B) Cell viability (CTG assay) was measured in N=45 MDS patient samples based on mean cell viability (IC30) concentrations of both drugs; median ± interquartile range (IQR), Friedman test with Dunn’s multiple comparisons. (C) The percentages of apoptotic cells (left panel) and apoptotic + dead cells (right panel) were measured using Annexin V assay in N=24 MDS patient samples; median ± IQR; Friedman test with Dunn’s multiple comparisons. (D) Cell viability (CTG assay, left panel) and percentages of apoptotic + dead cells (right panel) were compared after alvocidib + 5-AZA treatment in N=45 MDS patients versus N=11 HC; median ± IQR, Mann-Whitney U test. HC sample with DNMT3A W305fs frameshift mutation is labeled in dark red color. (E) MDS-L xenotransplantation experimental design and fold change in MDS-L expansion in blood between day 50 and day 21 of treatment of NSGS mice injected with MDS-L cells. Expansion fold change = % MDS-L cells at day 50 / % MDS-L cells at day 21. Expansion fold changes are presented as log10 transformed values. Box plots show medians ± IQR; whiskers indicate minimum and maximum; Kruskal-Wallis test with Dunn’s multiple comparisons. TX: xenotransplantation; DMSO: dimethyl sulfoxide.
cidib + 5-AZA combination in mice.
ASXL1 mutations are associated with increased sensitivity to alvocidib and alvocidib + 5-AZA combination treatment in high-risk myelodysplastic syndromes
Since responses to the alvocidib + 5-AZA combination were markedly heterogeneous among MDS samples, we aimed to identify biomarkers predictive of higher sensitivity to the single substances or the combination of both. First, we correlated the response with the clinical parameters of the MDS patients. There was no significant association between patient survival and response to alvocidib or alvocidib + 5-AZA ex vivo treatment (Online Supplementary Figure S4). Responses to alvocidib and the combination treatment were not associated with patient age, sex, BM blasts, previous therapy, karyotype, IPSS-R, or hemoglobin levels (Online Supplementary Figure S5). Next, we assessed whether heterogeneity in response to alvocidib and combination treatment could be explained by the differences in the MCL-1 dependency of MDS samples. We first compared sensitivity of in vitro expanded CD34+ cells from N=9 high-risk MDS patients to MCL-1, BCL-2 and BCL-xL mimetics and found the most pronounced responses to highly specific MCL-1 mimetic S-63845 compared to BCL-2 and BCL-xL mimetics in eight of nine analyzed samples. This result further suggested MCL-1 inhibition as a plausible target in high-risk MDS (Online Supplementary Figures S6, S7 and S8). However, when we defined responders and non-responders based on the mean cell viability (IC30) in the CTG assays, both of the groups were sensitive to MCL-1 mimetic (Online Supplementary Figure S8). In order to determine the association of MCL-1 dependency with alvocidib and alvocidib + 5-AZA response, BM MNC of MDS patients were incubated with T-MS1 peptide, a highly selective MCL-1 antagonist.20 In MCL-1-dependent samples, this results in mitochondrial depolarization and apoptotic priming, which can be detected using a cationic dye that specifically accumulates in polarized mitochondria. Correlation of MCL-1 dependency with cell viability after alvocidib and combination treatment assessed in CTG assay revealed a reversed association between these
parameters, suggesting that MCL-1-dependent samples were more sensitive to the alvocidib and combination treatment. The association was more pronounced in the combination treatment (Spearman r=-0.37, P=0.1119), but did not reach significance (Online Supplementary Figure S9 ). Overall, the results of apoptosis assay with BH3 mimetics and MCL-1 dependency assay did not predict the response of high-risk MDS samples to alvocidib and alvocidib + 5-AZA treatments. Therefore, to identify other potential biomarkers of response to alvocidib + 5-AZA, we performed myeloid panel sequencing of the most frequently mutated genes in MDS (N=67 genes) in BM MNC patient samples and associated the presence of somatic mutations with the treatment sensitivity. Forty-four of 45 patients (98%) carried mutations in at least one or more of these genes (Figure 2A). ASXL1 (39% of patients), TET2 (32%) and RUNX1 (32%) were the most frequently mutated genes in the studied cohort (Figure 2A). When the patient samples were distributed into responder and non-responder groups based on the mean cell viability (IC30) in the CTG assays, the frequency of several mutations, including ASXL1, EZH2, TET2, RUNX1, ZRSR2 and STAG2 was higher in responder groups in both alvocidib and alvocidib + 5-AZA treatments arms (Figure 2B, C). We also associated the presence of mutations with cell viability after alvocidib and alvocidib + 5-AZA treatment as a continuous variable (Figure 3A, B). Higher sensitivity to alvocidib treatment was found in MDS samples with ASXL1 ( P =0.0100), ZRSR2 ( P =0.0035), EZH2 ( P =0.0020), TET2 (P=0.0252) and STAG2 (P=0.0104) mutations (Figure 3A). Interestingly, SF3B1, but not SRSF2 mutations were associated with reduced sensitivity to alvocidib treatment (Online Supplementary Figure S10). Higher sensitivity to the combination treatment was associated with the presence of mutations in ASXL1 (P=0.0037), ZRSR2 (P=0.0068) and EZH2 (P=0.0193) genes (Figure 3B). Of note, the presence of these mutations did not sensitize MDS samples to 5-AZA treatment alone (Figure 3C). In order to assess the effect of potential confounders, multivariable analysis was performed with sex, age, IPSS-R, ASXL1, ZRSR2 , TET2 , RUNX1 , EZH2 and STAG2 mutations as co-variables. Only ASXL1 mutations were found to be independently associated with
Haematologica | 109 May 2024 1430 ARTICLE - Biomarkers of alvocidib + 5-AZA response in MDS V. Riabov et al.
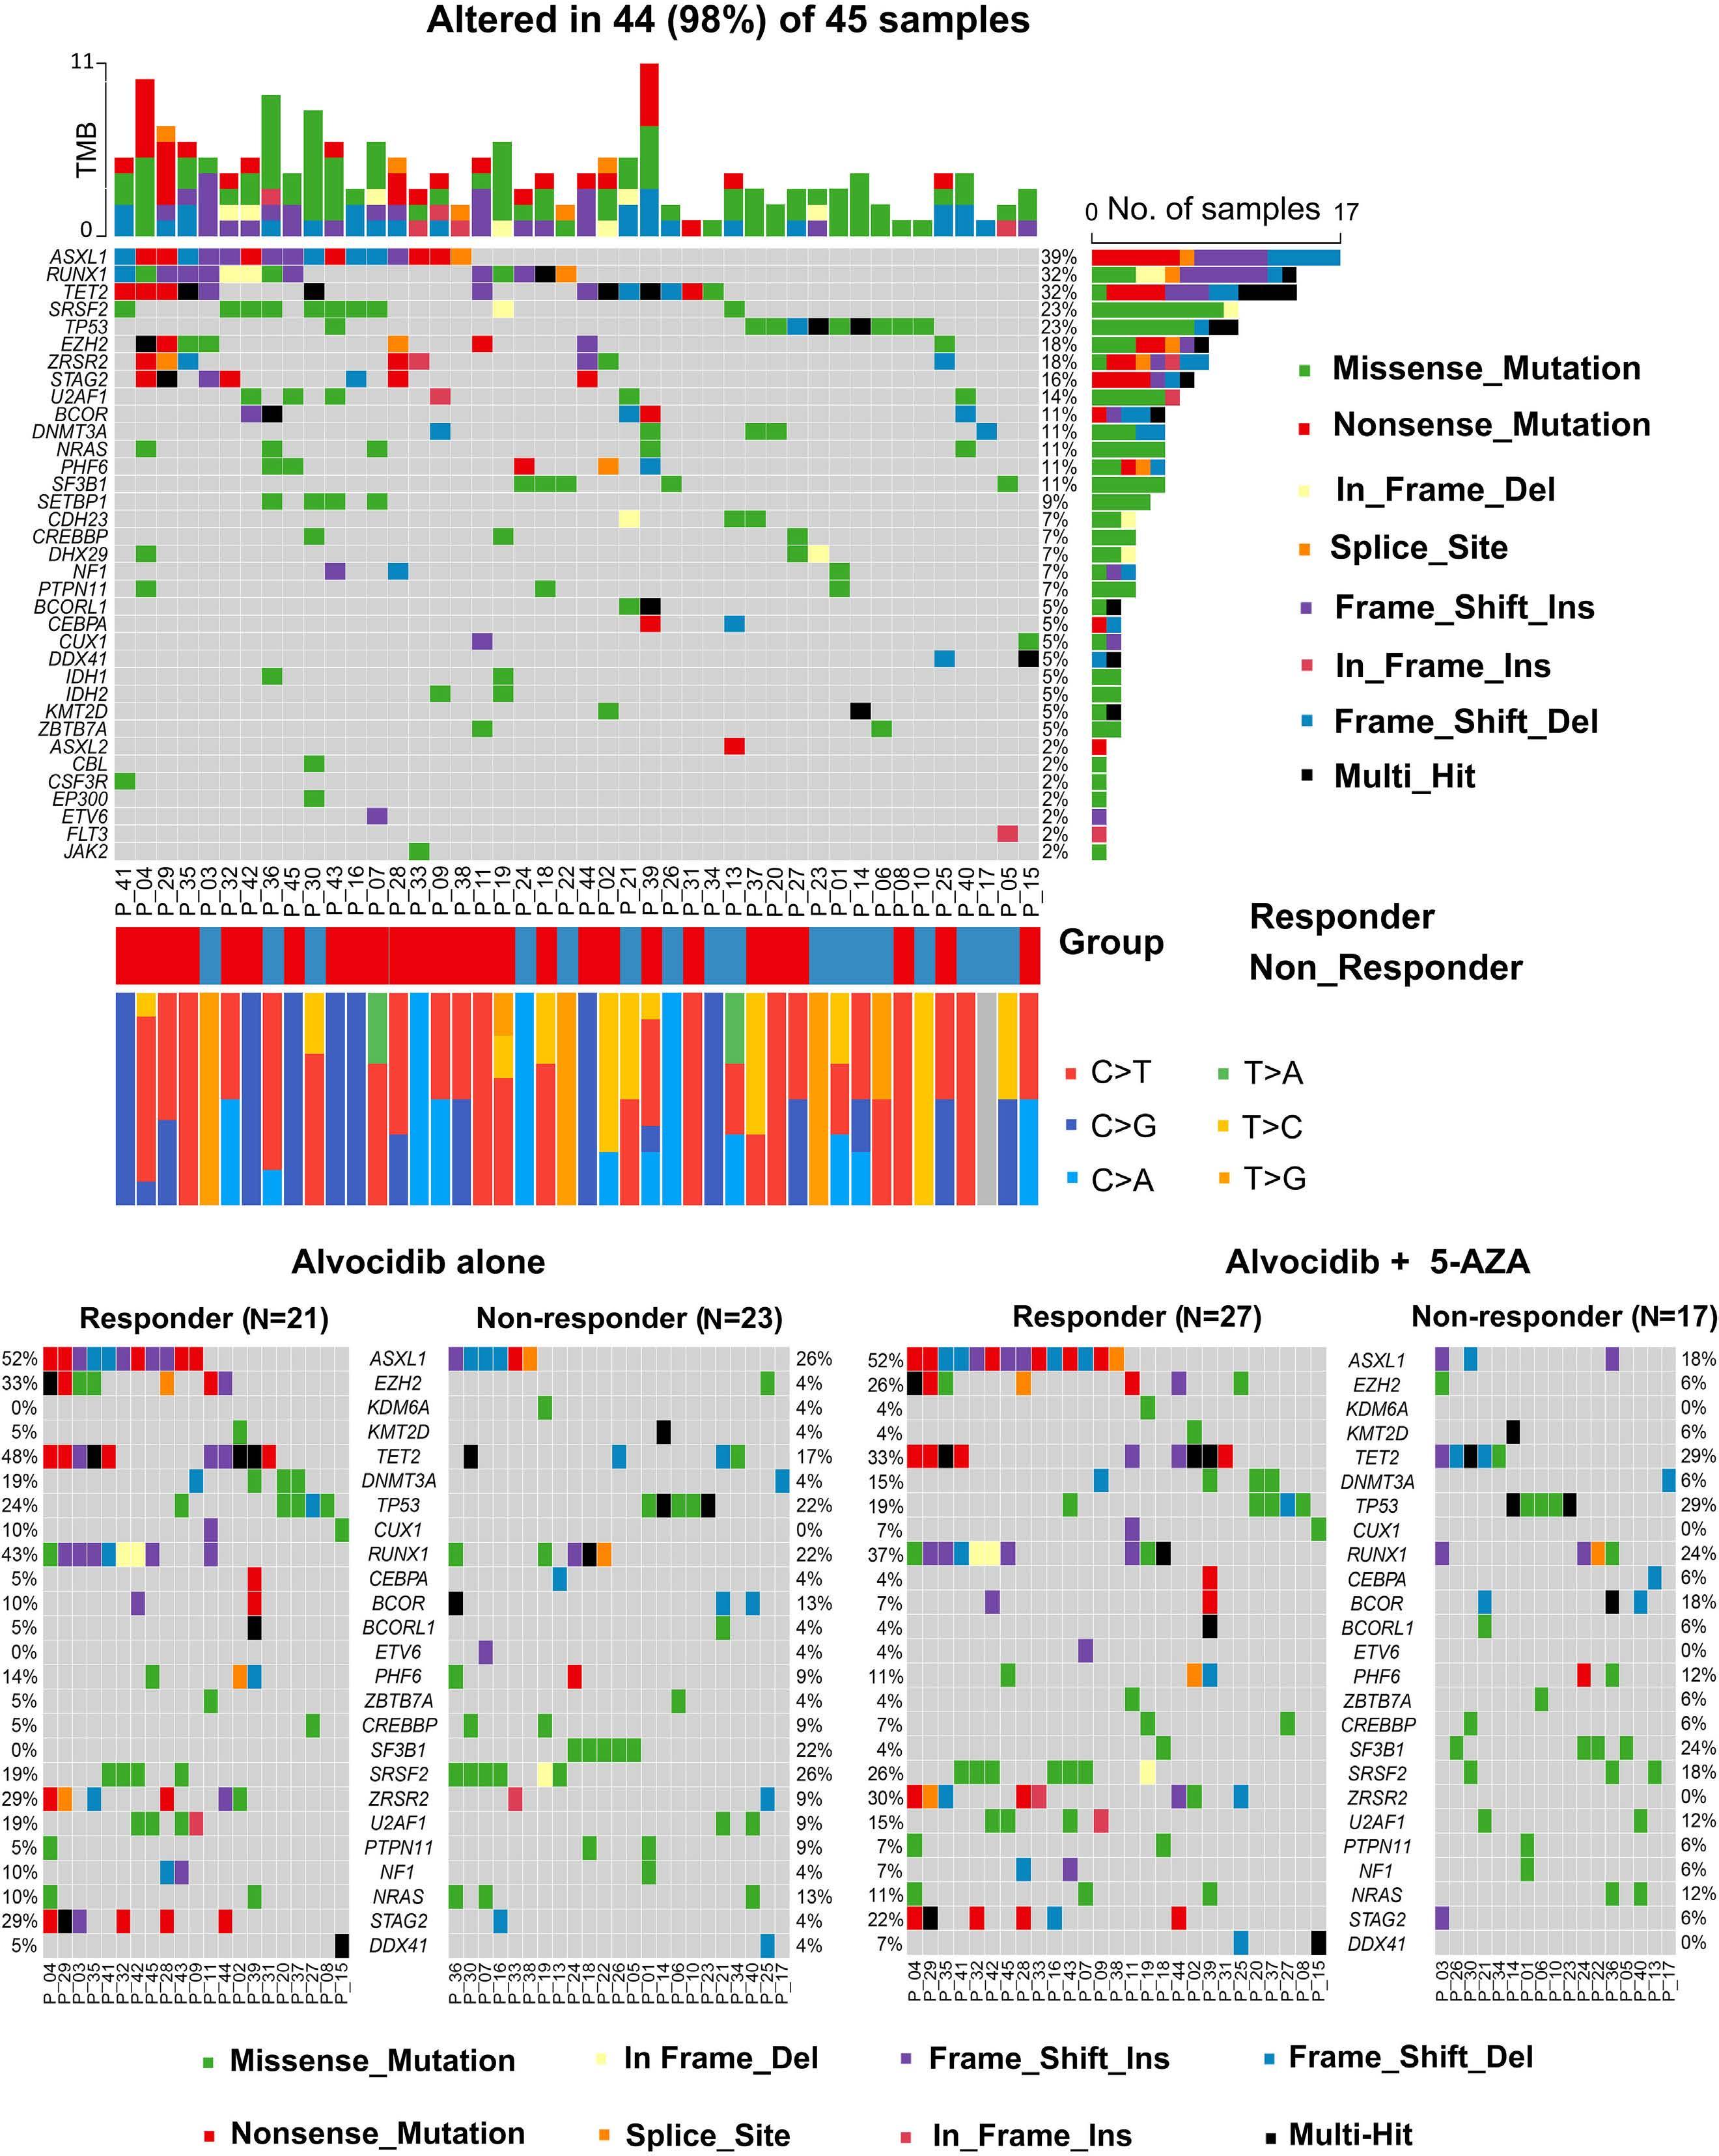
Figure 2. Mutational profiles in alvocidib and alvocidib + 5-AZA treated samples. (A) Bone marrow (BM) mononuclear cells (MNC) of myelodysplastic syndromes (MDS) patients (N=40) were subjected to myeloid panel deep sequencing. The mutational data for other N=5 MDS samples were obtained from the medical records. The mutations in MDS-associated genes were found in N=44 patients and presented as oncoplot. (B, C) MDS patients (N=44) were distributed into responder and non-responder groups based on the mean cell viability after alvocidib treatment (B) and alvocidib + 5-azacytidine (5-AZA) treatment (C) in CTG assay. Individual mutations for responders versus non-responders are presented as co-oncoplots. Del: deletion; Ins: insertion.
Haematologica | 109 May 2024 1431 ARTICLE - Biomarkers of alvocidib + 5-AZA response in MDS V. Riabov et al.
A B C
higher response to alvocidib + 5-AZA treatment, showing relative risk 0.058 with 95% confidence interval: 0.0040.815 (P=0.035; Tables 2 and 3; Figure 3D). Therefore, in the subsequent experiments we focused on the role of ASXL1 mutations in the alvocidib + 5-AZA sensitivity.
The Asxl1588X mutation confers sensitivity to alvocidib and alvocidib + 5-AZA combination treatment in a murine myelodysplastic syndromes model In order to study the association between specific mutations and sensitivity of MDS cells to alvocidib and combination treatment in vivo, we utilized a recently established Vav1 promoter-driven Asxl1Y588X Tg mouse model expressing the analogous protein product of the mutant ASXL1Y591X , frequently seen in human patients.16 In order to check the sensitivity of BM cells from WT and Asxl1 Y588XTg mice to alvocidib treatment, whole BM cells were treated with several concentrations of alvocidib and 5-AZA for 8 hours (h) and subjected to cell viability assessment using CTG assay (Figure 4A). Cytotoxic effects of alvocidib were more pronounced in Asxl1Y588XTg cells as compared to WT cells in all tested concentrations. The effects of 5-AZA were comparable in WT and Asxl1Y588XTg cells. Higher sensitivity to alvocidib resulted in higher cytotoxicity of alvocidib + 5-AZA combination for Asxl1Y588X cells (Figure 4A). Next, we
asked whether alvocidib + 5-AZA treatment preferentially targeted malignant over healthy hematopoiesis in vivo. For this, WT mice carrying CD45.1 alleles were reconstituted with 3×10⁶ splenic cells from 12-month-old Asxl1Y588X Tg leukemic mice carrying the CD45.2 allele. Seven weeks after reconstitution with leukemic cells, mice were treated with 5-AZA and alvocidib + 5-AZA according to the treatment schedule shown in Figure 4B. Flow cytometry assessment of BM before and after treatment revealed a statistically significant decrease of CD45.2+ cells in the BM of mice treated with the alvocidib + 5-AZA combination (P=0.0156). This effect did not reach significance in mice treated with 5-AZA as a single agent (P=0.1563) (Figure 4C, upper panel). At the same time, the proportion of healthy CD45.1+ BM cells increased after the treatment with alvocidib + 5-AZA combination, although this effect did not reach significance ( P =0.1094) (Figure 4C, lower panel). Histological analyses of BM cells after alvocidib + 5-AZA combination treatment showed a decrease in the percentage of immature blasts and improved development of mature BM cells compared to single 5-AZA treatment (P=0.0391) reflecting the fact that this combination favors eradication of leukemic donor cells in transplanted mice (Figure 4D). In addition, this result also suggested that the combination treatment could have a direct differen-
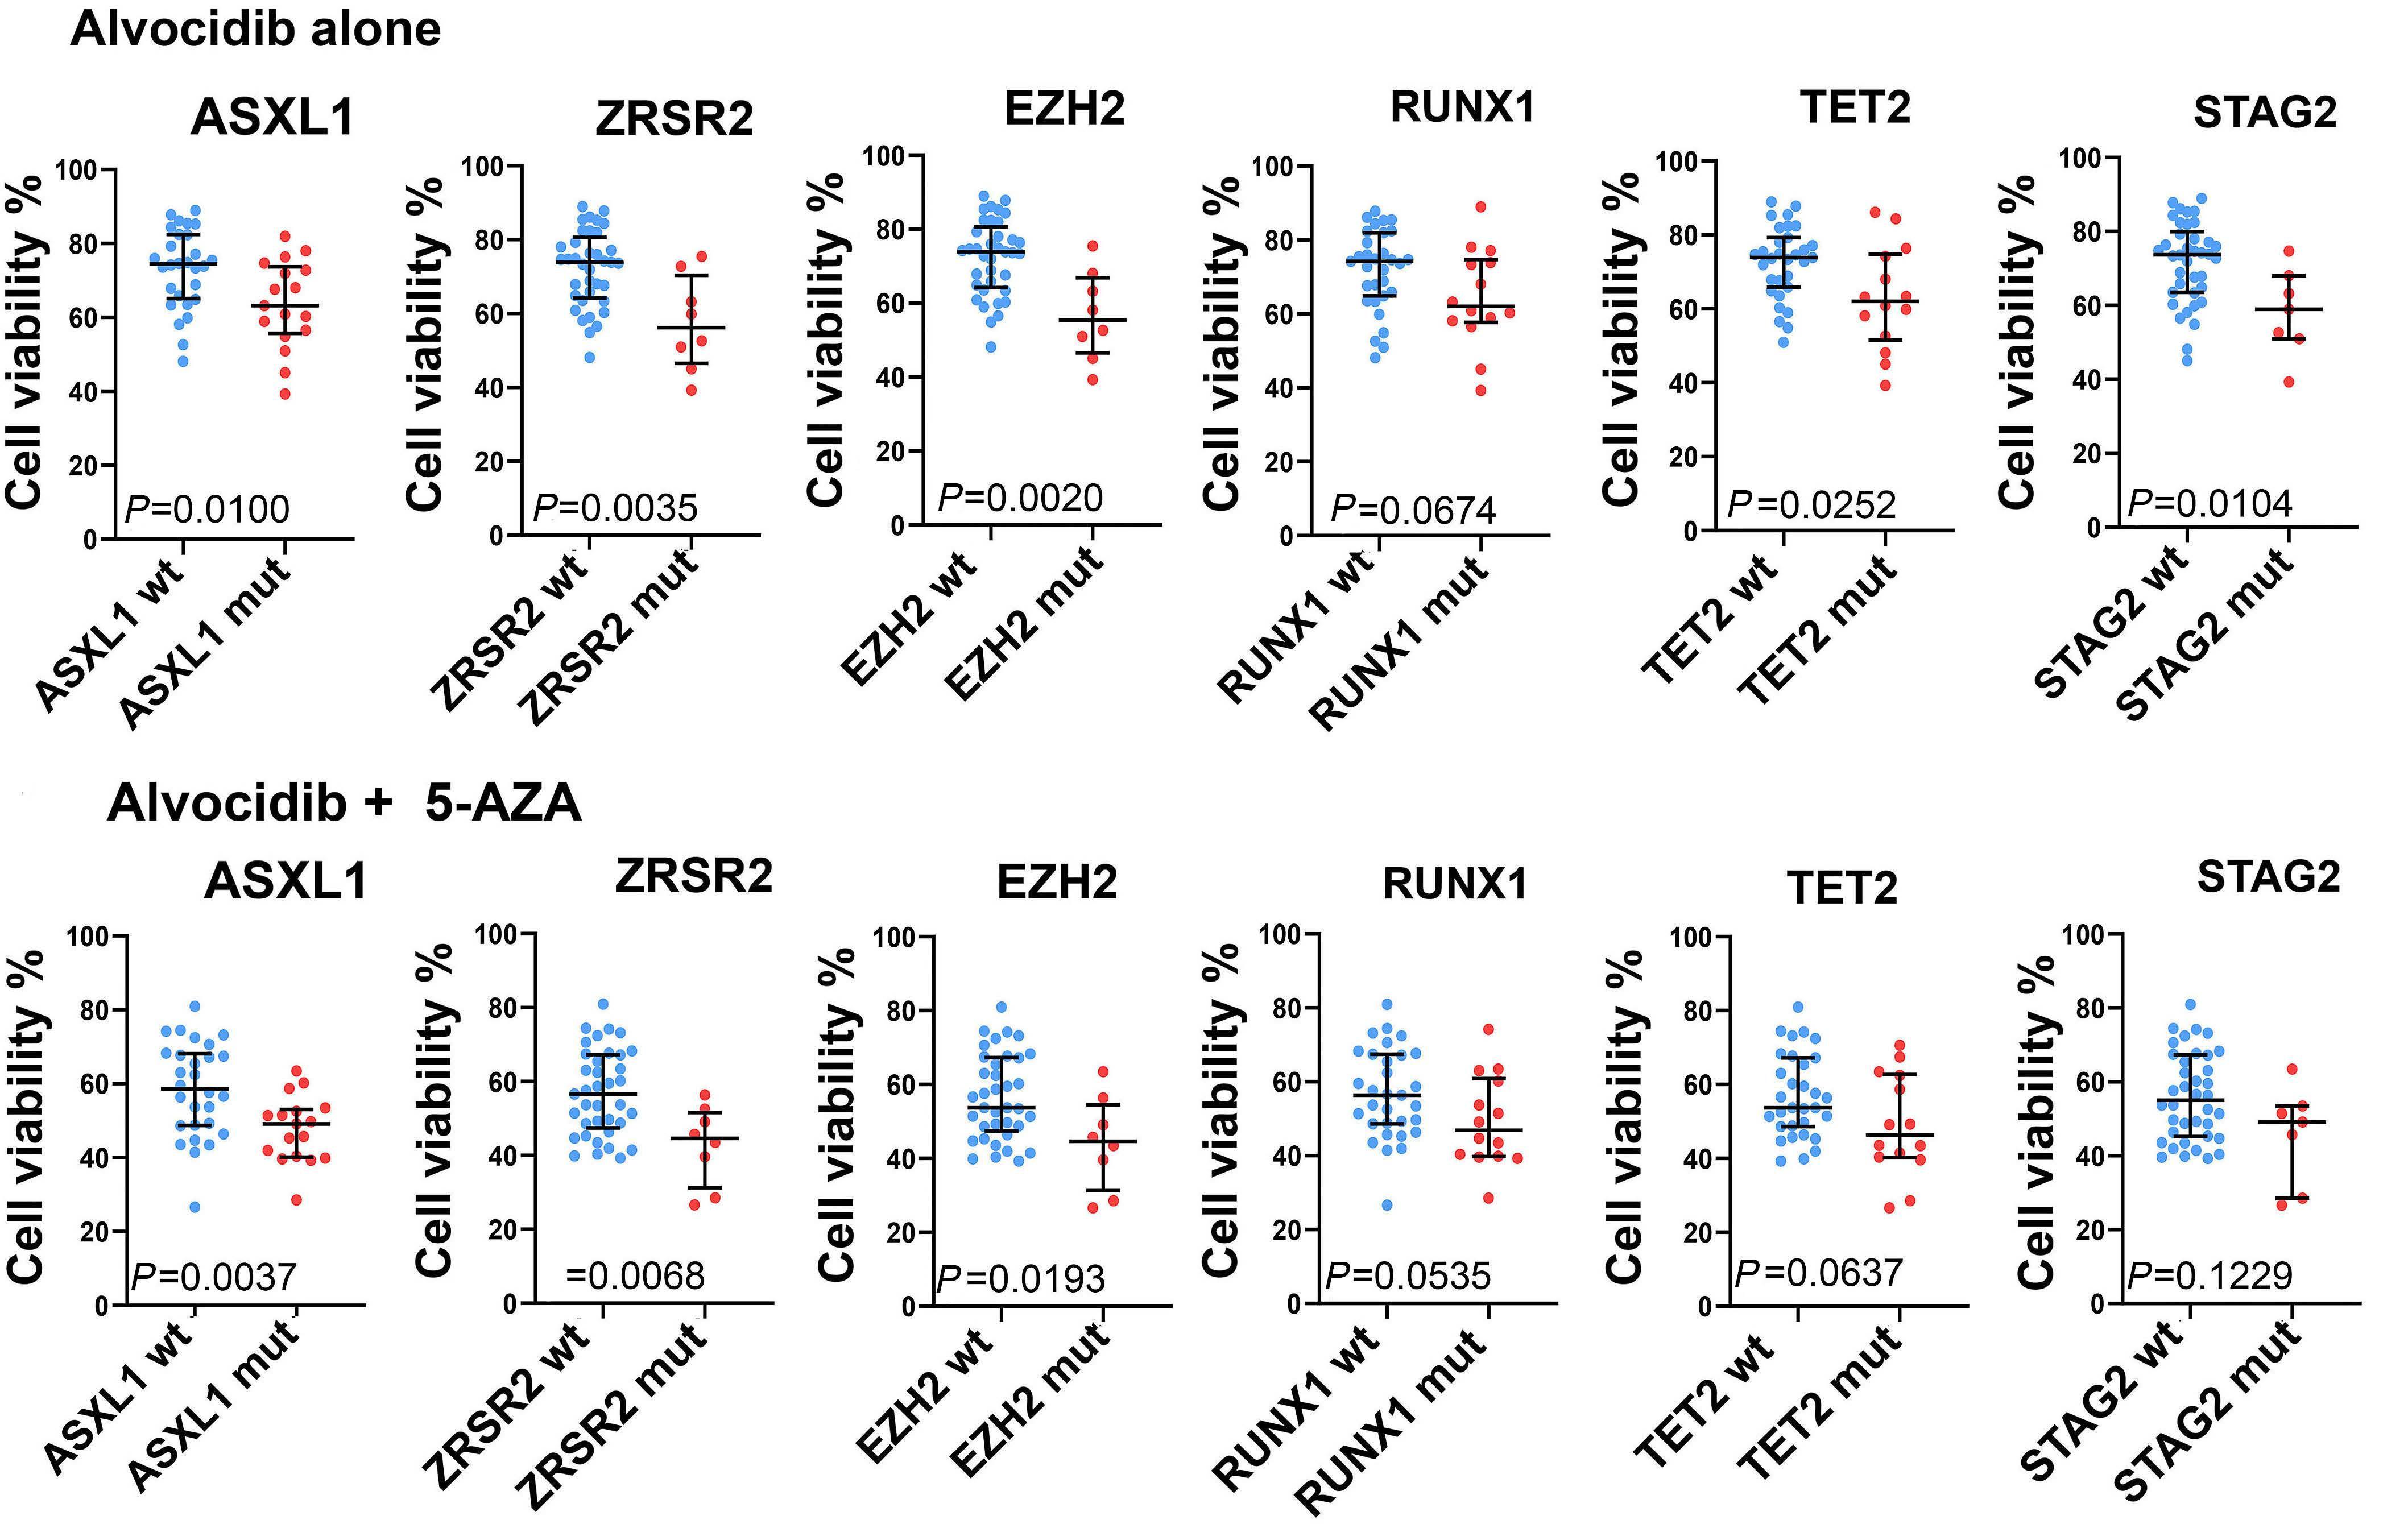
Haematologica | 109 May 2024 1432 ARTICLE - Biomarkers of alvocidib + 5-AZA response in MDS V. Riabov et al.
Continued on following page. B A
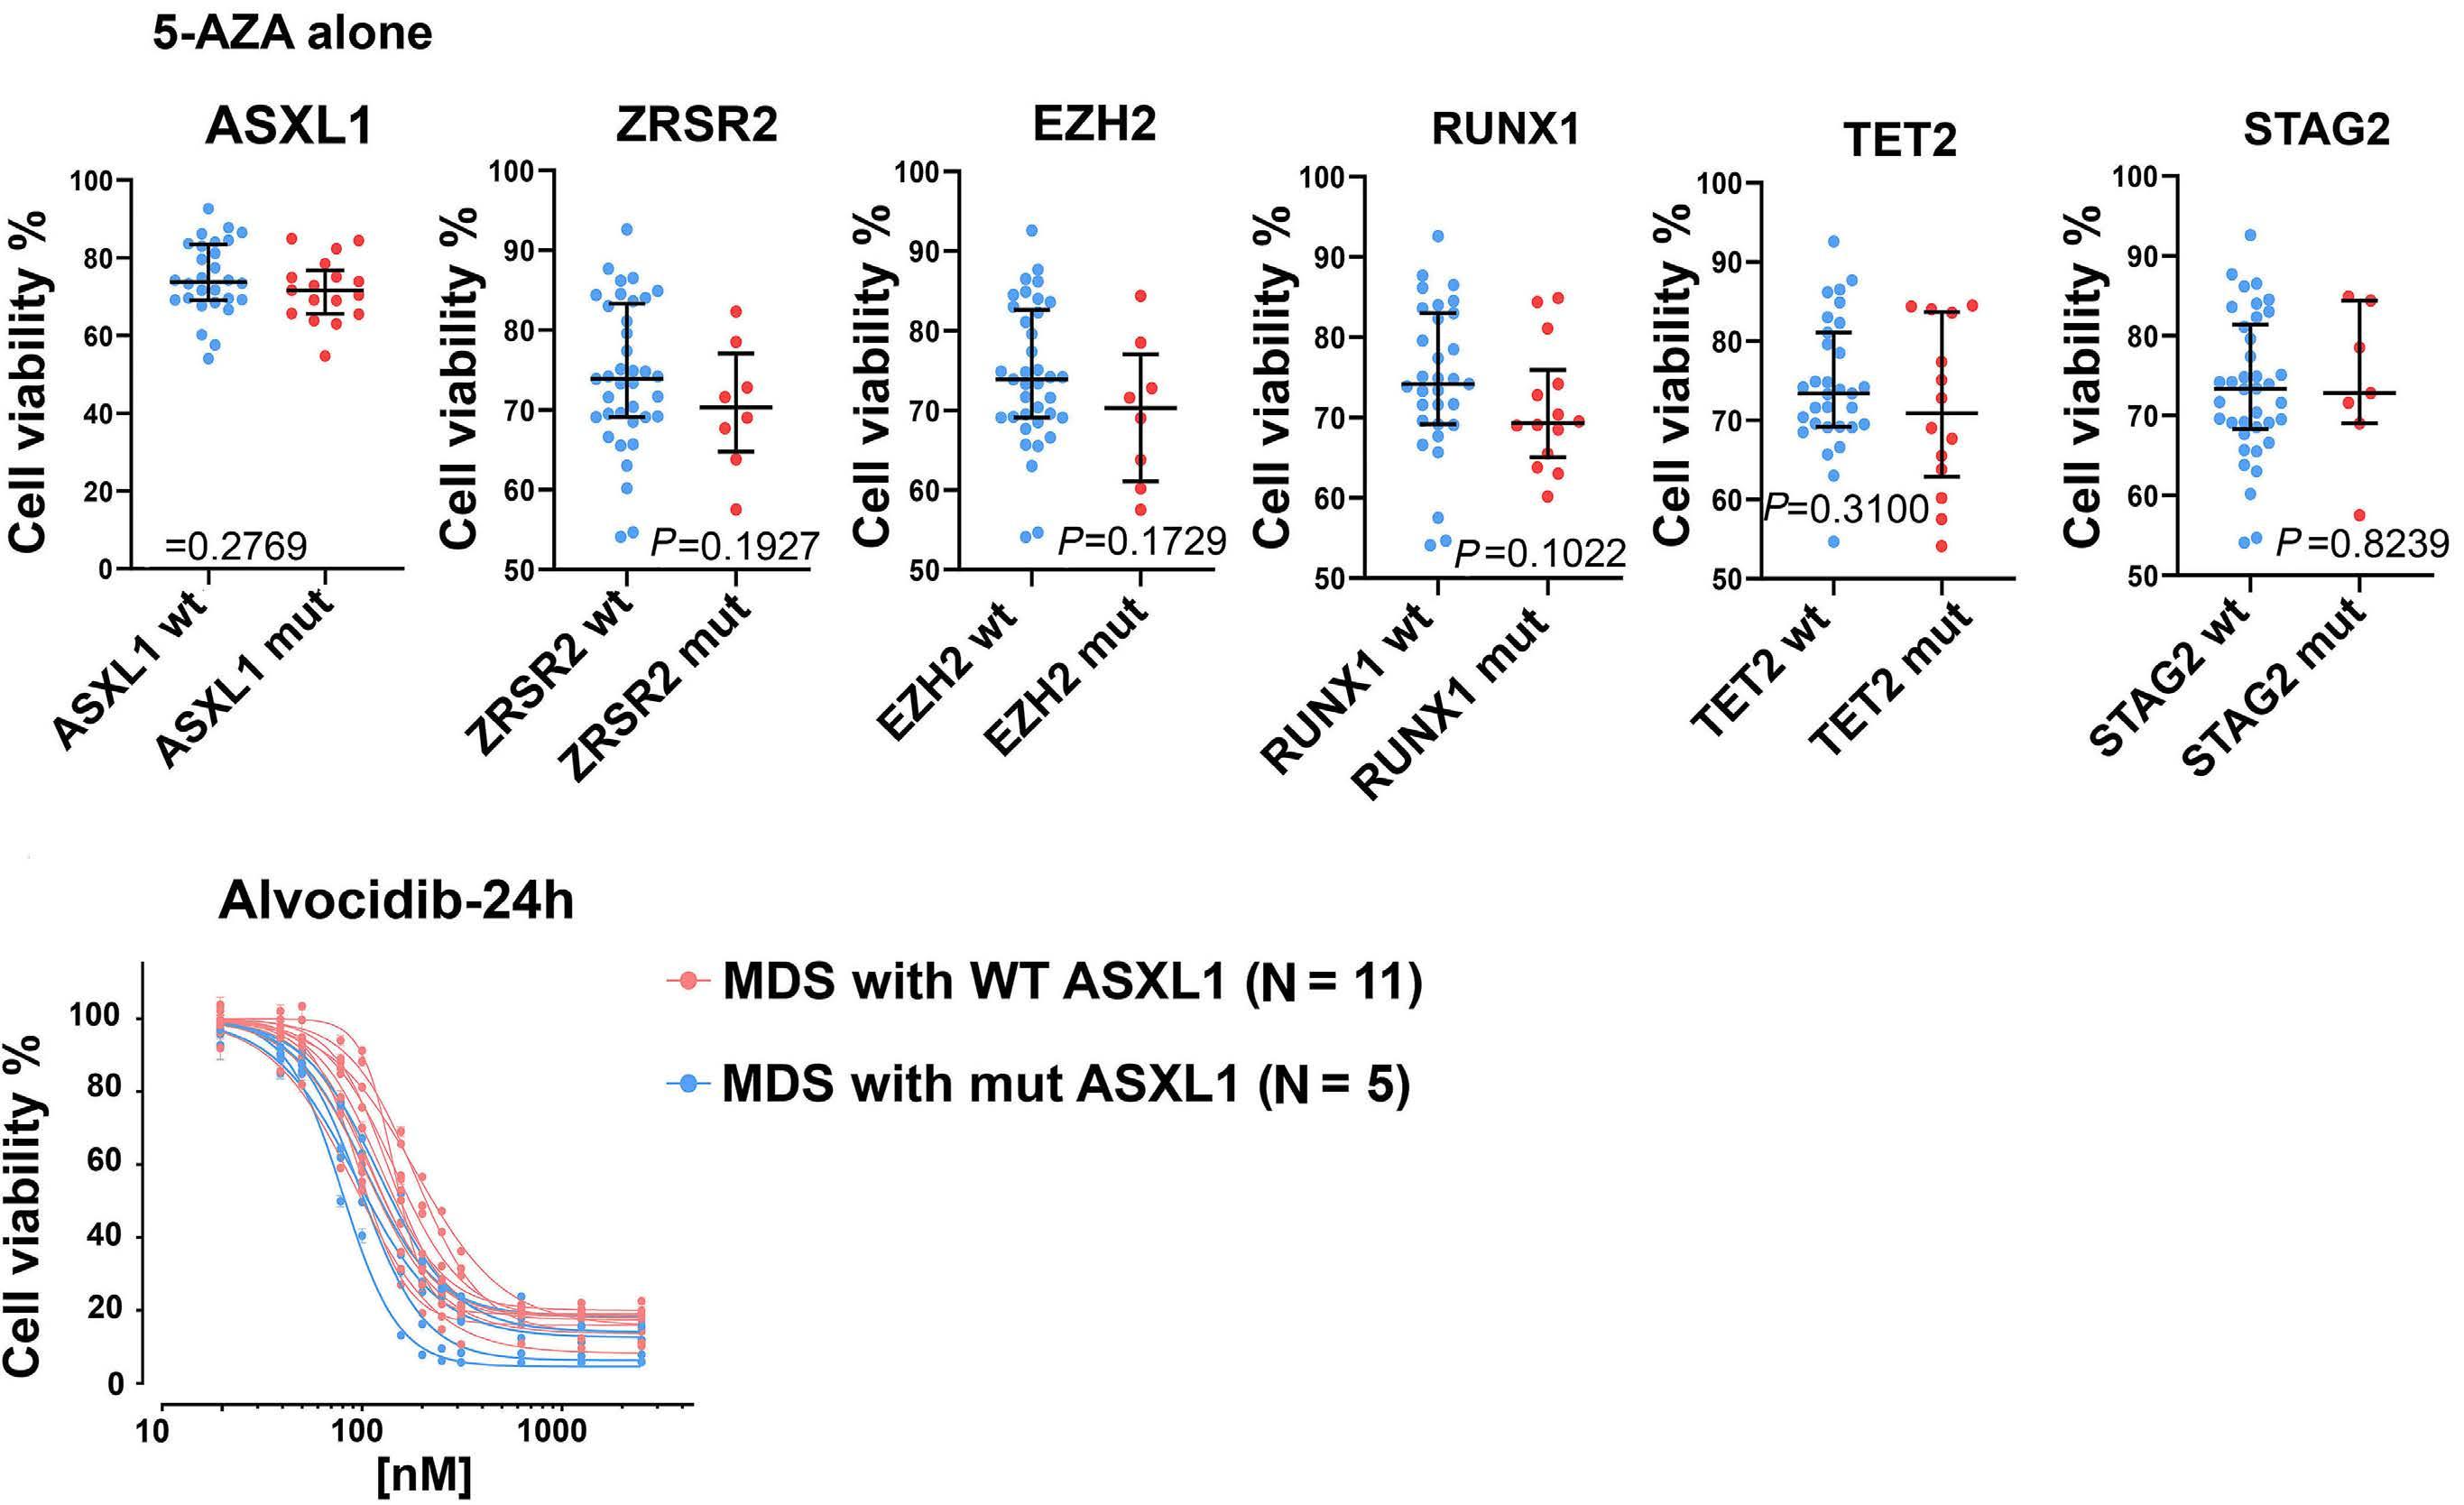
Figure 3. ASXL1 mutations are associated with increased sensitivity to alvocidib and alvocidib + 5-AZA treatment. (A-C) The association of cell viability (IC30) in CTG assay with the presence of specific mutations for N=45 myelodysplastic syndromes (MDS) samples; median ± interquartile range (IQR), Mann-Whitney U test. (D) Dose response curves after 24 hours of alvocidib treatment were generated for N=11 ASXL1 wild-type (WT) and N=5 ASXL1 mutant (mut) patient samples (CTG assay).
CI: confidence interval; IPSS-R: Revised International Prognostic Scoring System; int: intermediate.
tiating effect on CD34 + MDS cells. In order to test this hypothesis, we performed colony-forming unit (CFU) assays after treatment of primary non-expanded CD34 + cells from N=5 MDS patients (P_32, P_4, P_7, P_39 and P_35) with single agents or their combination. The patient numbers in CFU assay corresponded to patient numbers provided in Figure 2A-C and Online Supplementary Table S1 . We determined myeloid and erythroid differentiation of CD34 + cells after CFU assay using flow cytometry ( Online Supplementary Figure S11 for gating strategy). Our data showed that in all analyzed patients,
CD34 + cells were skewed towards myeloid differentiation as assessed by the percentages of CD45 + CD33 + cells ( Online Supplementary Figure S12A ). Only a small proportion of CD45 - CD235 + erythroid cells was present after CFU assay in four of five MDS patients ( Online Supplementary Figure S12B ). Predominant myeloid and inefficient erythroid differentiation of analyzed samples is an expected result since all of these MDS patients had a high-risk disease. However, in patient P_39 (AMLMRC, ASXL1 WT status) we observed decrease in the percentage of myeloid cells in response to alvocidib
Haematologica | 109 May 2024 1433 ARTICLE - Biomarkers of alvocidib + 5-AZA response in MDS V. Riabov et al. Logistic model Relative risk 95% CI (lower) 95% CI (upper) P Age ≥70 vs. <70 years 1.350 0.208 8.758 0.753 Male vs. female 0.476 0.054 4.168 0.503 IPSS-R Very high vs. int/high 0.211 0.022 1.998 0.175 ASXL1 0.261 0.041 1.678 0.157 TET2 0.169 0.016 1.813 0.142 RUNX1 0.200 0.022 1.807 0.152 EZH2 0.145 0.002 12.195 0.393 ZRSR2 0.784 0.037 16.648 0.875 STAG2 1.339 0.047 37.833 0.864
Table 2. Multivariable analyses for alvocidib treatment.
C D
and combination treatment. Concomitantly, this was associated with increase in erythroid differentiation. Significant decrease in myeloid differentiation in response to the alvocidib + 5-AZA treatment was also observed in P_35 (MDS/MPNu, ASXL1 MUT status). Over-
Table 3. Multivariable analyses for alvocidib + 5-AZA treatment.
all, in addition to cytotoxic effects this result suggests potential differentiating effects of the combination treatment in those patient samples where mutated or residual non-mutated CD34 + cells are still capable of multilineage differentiation.
5-AZA: 5-azacytidine; CI: confidence interval; IPSS-R: Revised International Prognostic Scoring System; int: intermediate.
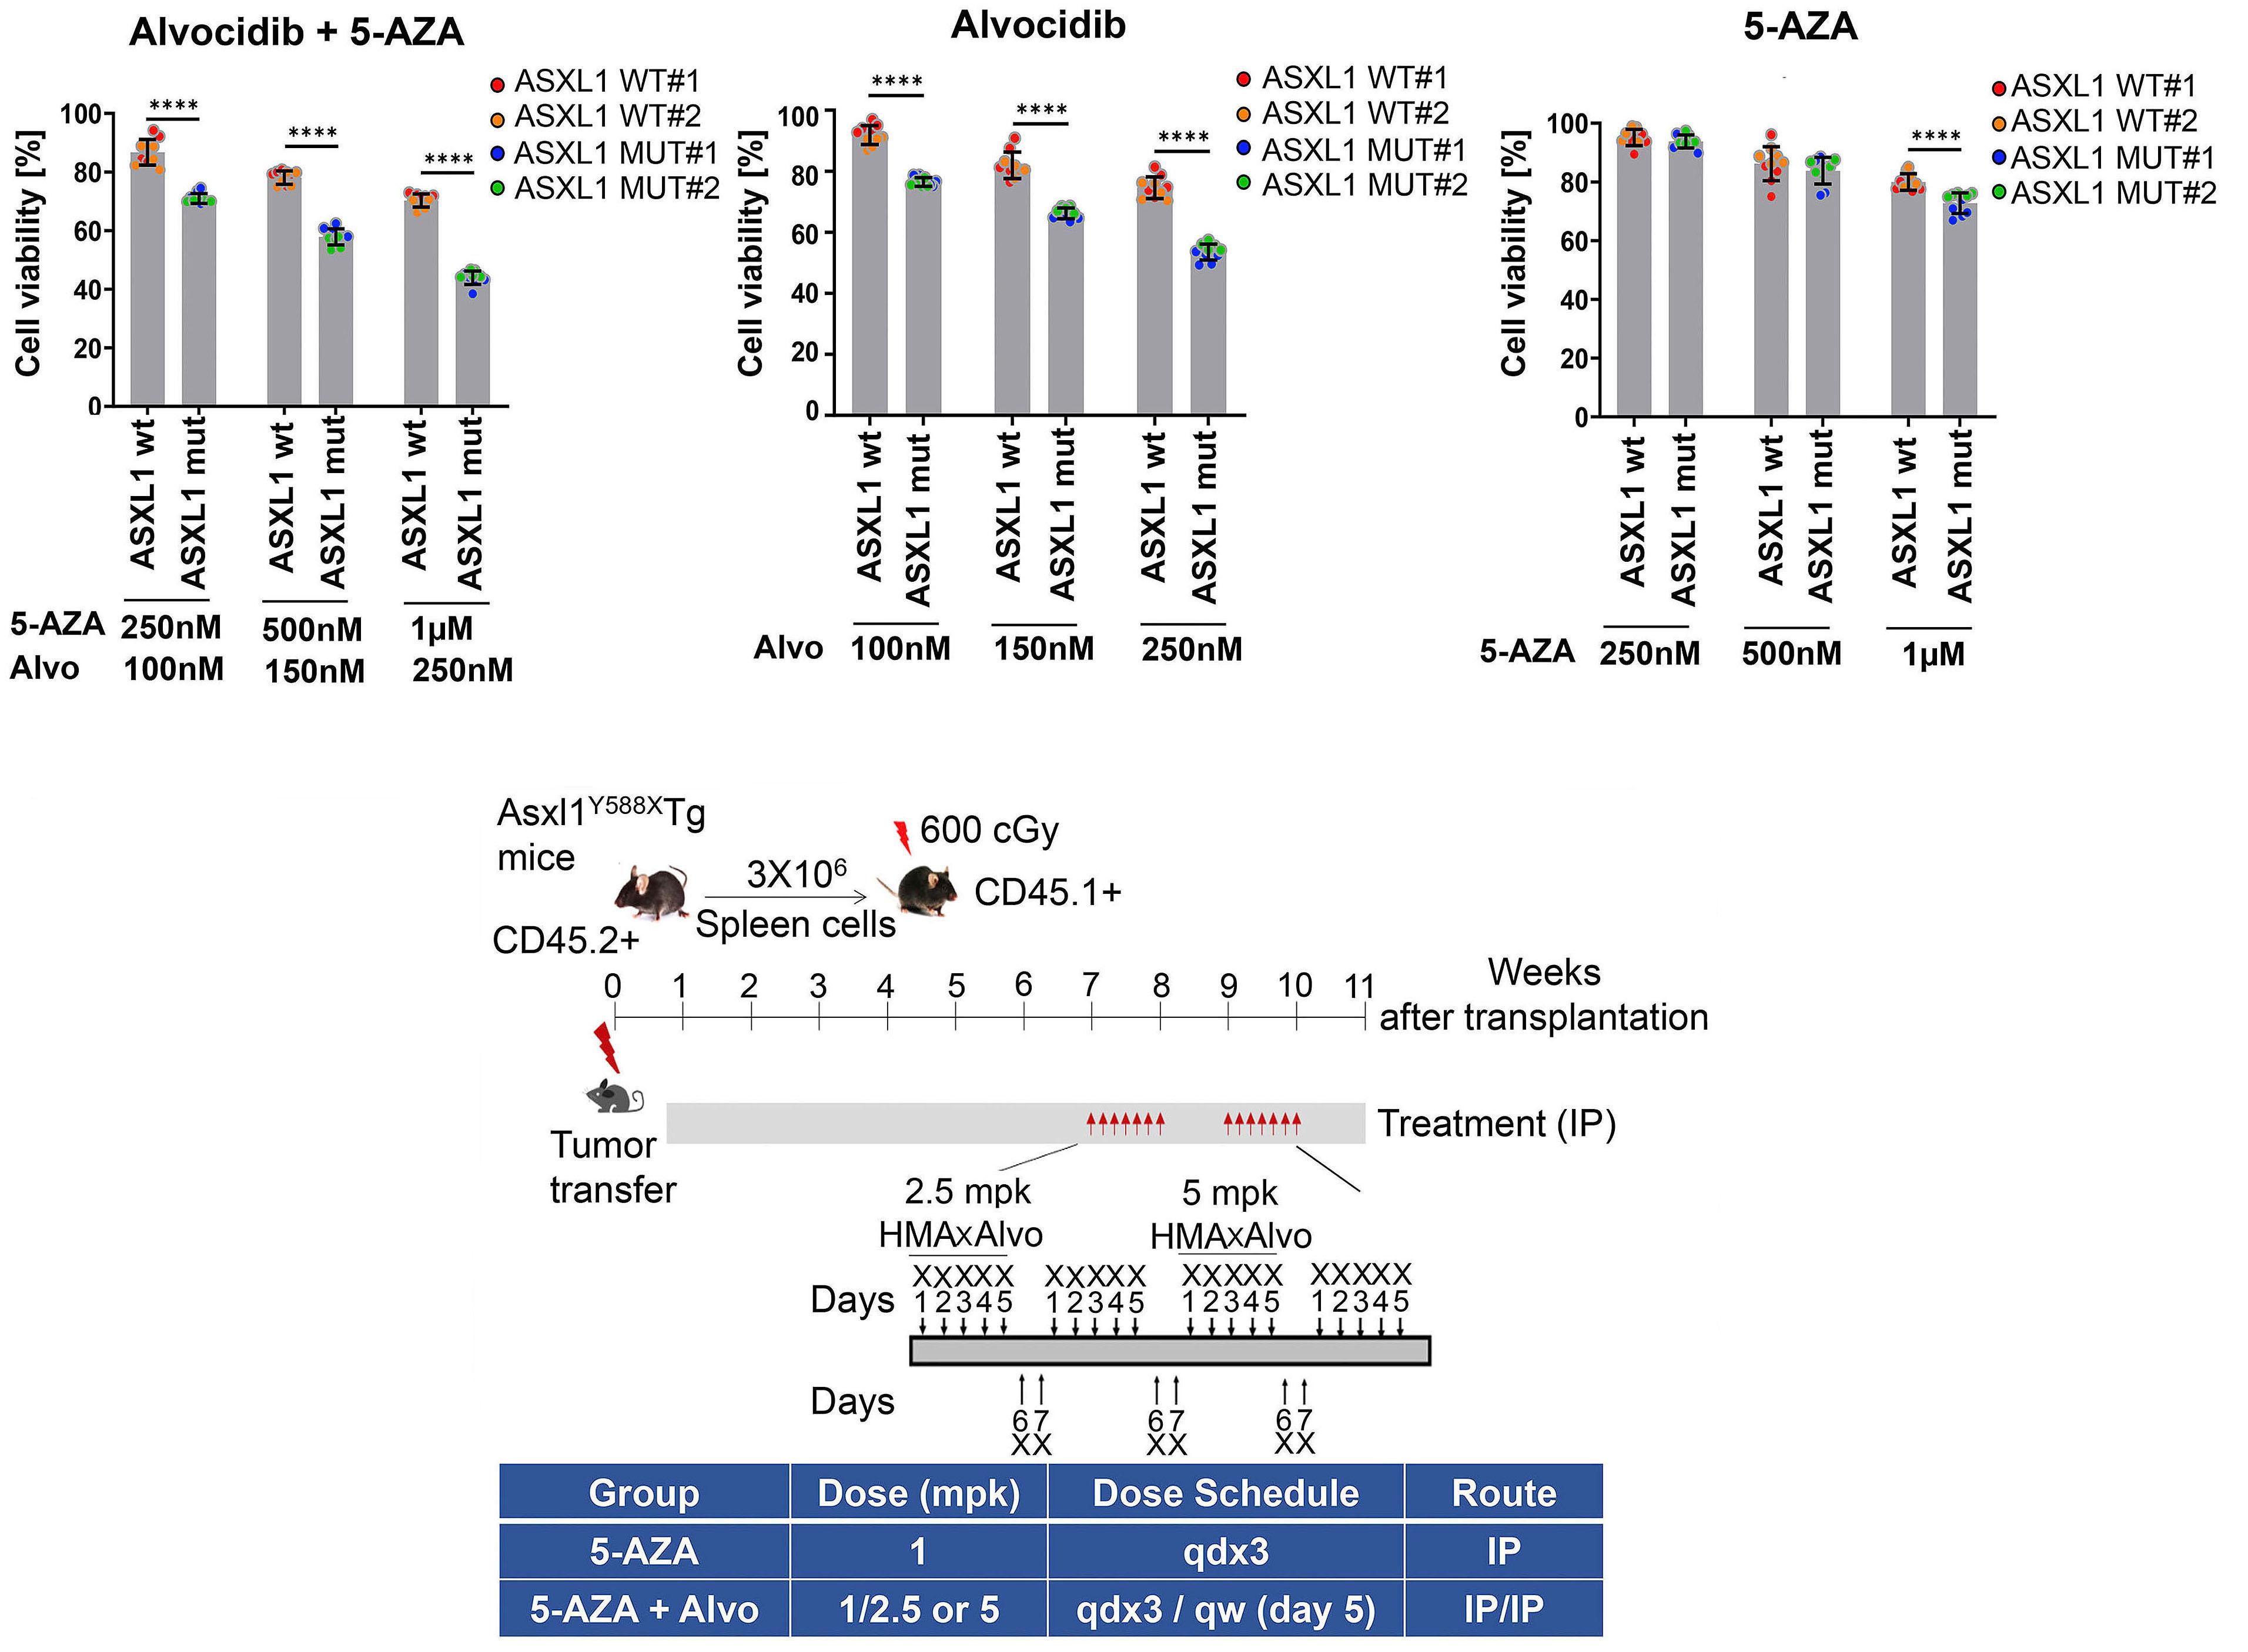
Haematologica | 109 May 2024 1434 ARTICLE - Biomarkers of alvocidib + 5-AZA response in MDS V. Riabov et al.
Logistic model Relative risk 95% CI (lower) 95% CI (upper) P Age ≥70 vs. <70 years 2.617 0.352 19.425 0.347 Male vs. female 2.857 0.212 38.478 0.429 IPSS-R Very high vs. int/high 0.138 0.015 1.239 0.077 ASXL1 0.058 0.004 0.815 0.035 TET2 2.587 0.060 110.653 0.620 RUNX1 0.087 0.005 1.383 0.084 EZH2 1.974 0.007 543.378 0.812 ZRSR2 0.000 0.000 - 0.998 STAG2 6.377 0.110 370.146 0.371
Continued
A
on following page.
B
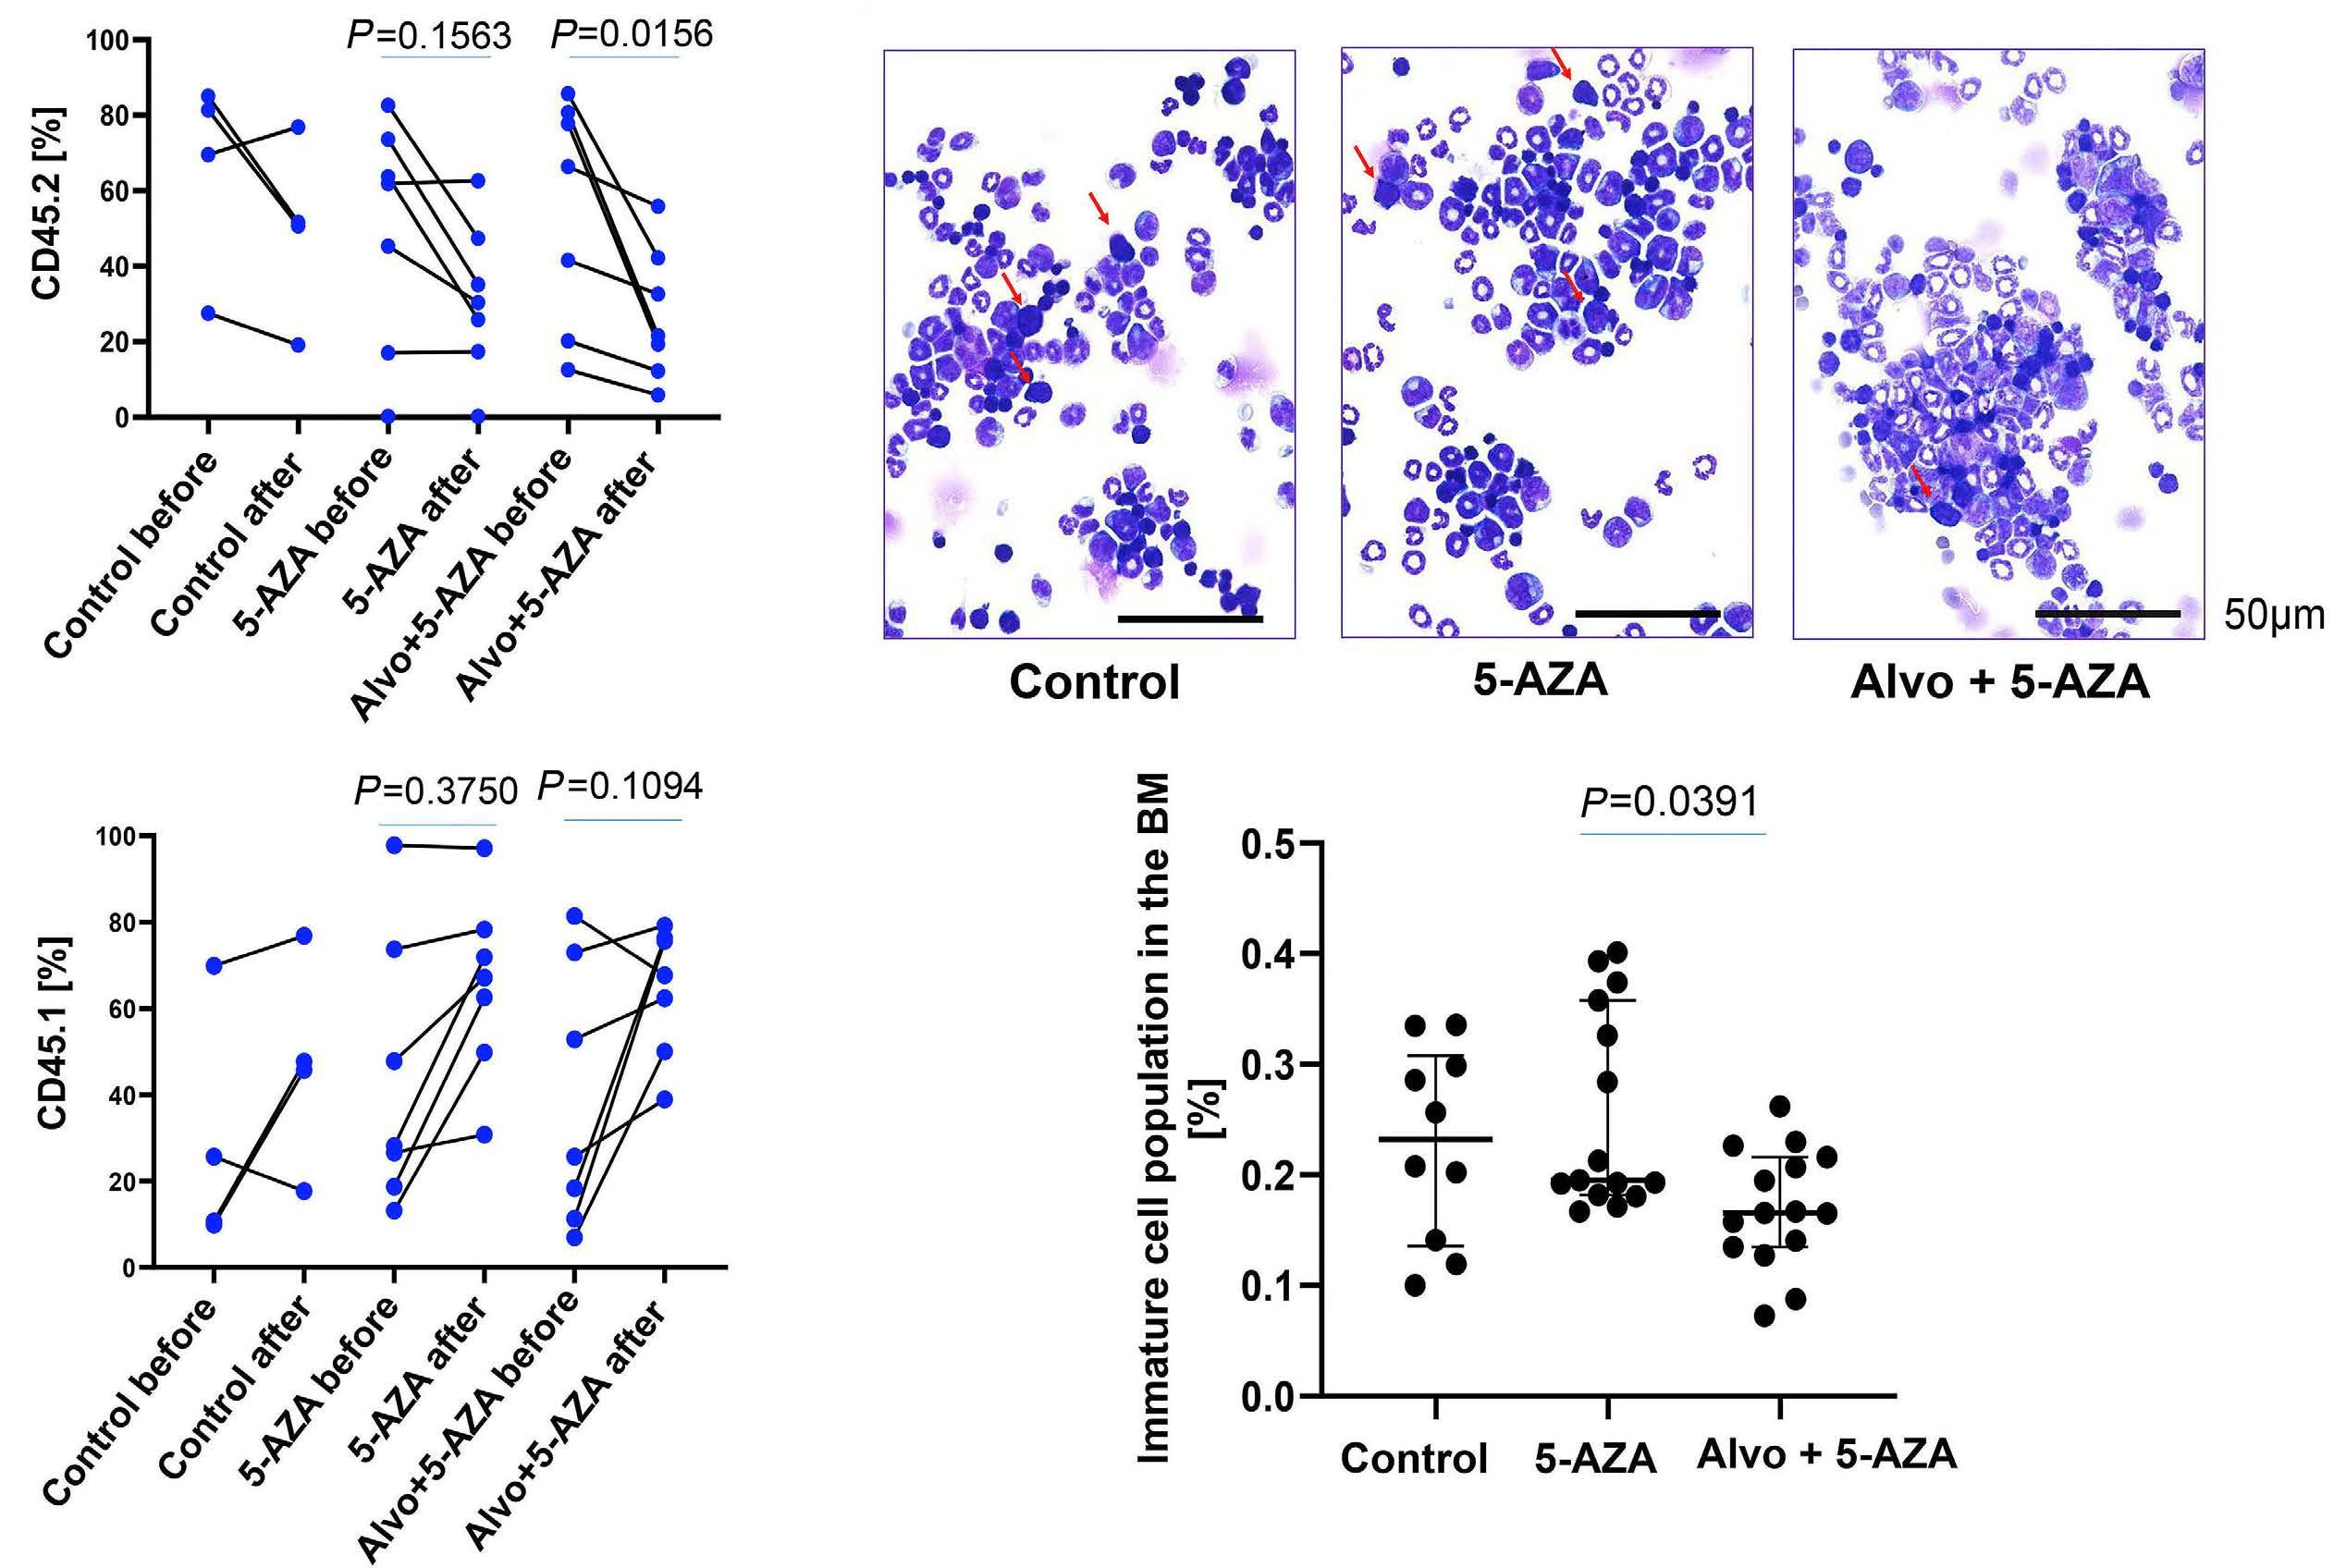
Figure 4. Asxl1 mutation sensitizes myelodysplastic syndromes cells to alvocidib and alvocidib + 5-AZA treatment in a mouse model. (A) Bone marrow (BM) mononuclear cells (MNC) from N=2 wild-type (WT) and N=2 Asxl1Y588X transgenic (Tg) mice were treated with alvocidib (Alvo), 5-azacytidine (5-AZA) or alvocidib + 5-AZA for 8 hours (h). Cell viability was determined using CTG assay; data are combined for N=2 mice and N=5 replicates for each mouse and presented as mean ± standard deviation (SD); unpaired Student’s t test. (B) Experimental design for in vivo assessment of alvocidib + 5-AZA combination in Asxl1Y588X Tg mice. (C) The percentages of CD45.1+ (healthy recipient mice) and CD45.2+ cells (Asxl1Y588X Tg leukemic donor mice) in the bone marrow (BM) were analyzed by flow cytometry after treatment with 5-AZA and alvocidib + 5-AZA. The data for individual mice before and after treatment are shown; Wilcoxon matched-pairs signed rank test. (D) Histological analysis of BM cytospins at the treatment endpoint in recipient CD45.1+ mice; median ± interquartile range; Kruskal-Wallis test with Dunn’s multiple comparisons. Arrows on the histological images indicate immature blasts. IP: intraperitoneal.
ASXL1 mutations are associated with elevated expression of pro-apoptotic factor NOXA
In order to elucidate possible molecular alterations in ASXL1- mutated HSPC that sensitize them to alvocidib treatment, we assessed the expression of anti-apoptotic factor MCL-1 and the pro-apoptotic factor NOXA. The interaction of NOXA and MCL-1 was previously reported to result in proteasomal degradation of MCL-1, which sensitizes AML cells to apoptotic stimuli. 21,22 We found that although the expression of the MCL-1 gene was not altered in ASXL1-mutated HSPC, the expression of the NOXA gene was significantly increased in ASXL1-mutated HSPC as compared to non-mutated HSPC (P=0.0012; Figure 5).
Discussion
HMA, including 5-AZA, are first-line treatments in highrisk MDS patients. Those patients who do not respond or
become resistant to HMAs currently have few therapeutic options. In this study, we found that the CDK9 inhibitor alvocidib and 5-AZA exerted additive cytotoxic effects on primary CD34+ MDS cells. The cytotoxic responses of MDS samples to the alvocidib and alvocidib + 5-AZA treatment combination were heterogeneous. This heterogeneity in primary CD34+ MDS progenitor cells is expected and was shown previously by our own group and others for 5-AZA treatment.23,24 So far, no robust biomarkers to predict this differential response to 5-AZA have been discovered. Our analysis of the responses to 5-AZA and alvocidib combination revealed that the sensitivity of MDS cells to these drugs was only partially associated with MCL-1 dependency of CD34+ HSPC/blasts. Deeper insights into potential biomarkers of response using myeloid panel sequencing of CD34+ cells from MDS samples and functional data from transgenic mouse models suggested ASXL1 mutations to be a candidate biomarker associated with alvocidib + 5-AZA sensitivity. Of note, although MCL-1 expression in
Haematologica | 109 May 2024 1435 ARTICLE - Biomarkers of alvocidib + 5-AZA response in MDS V. Riabov et al.
C D
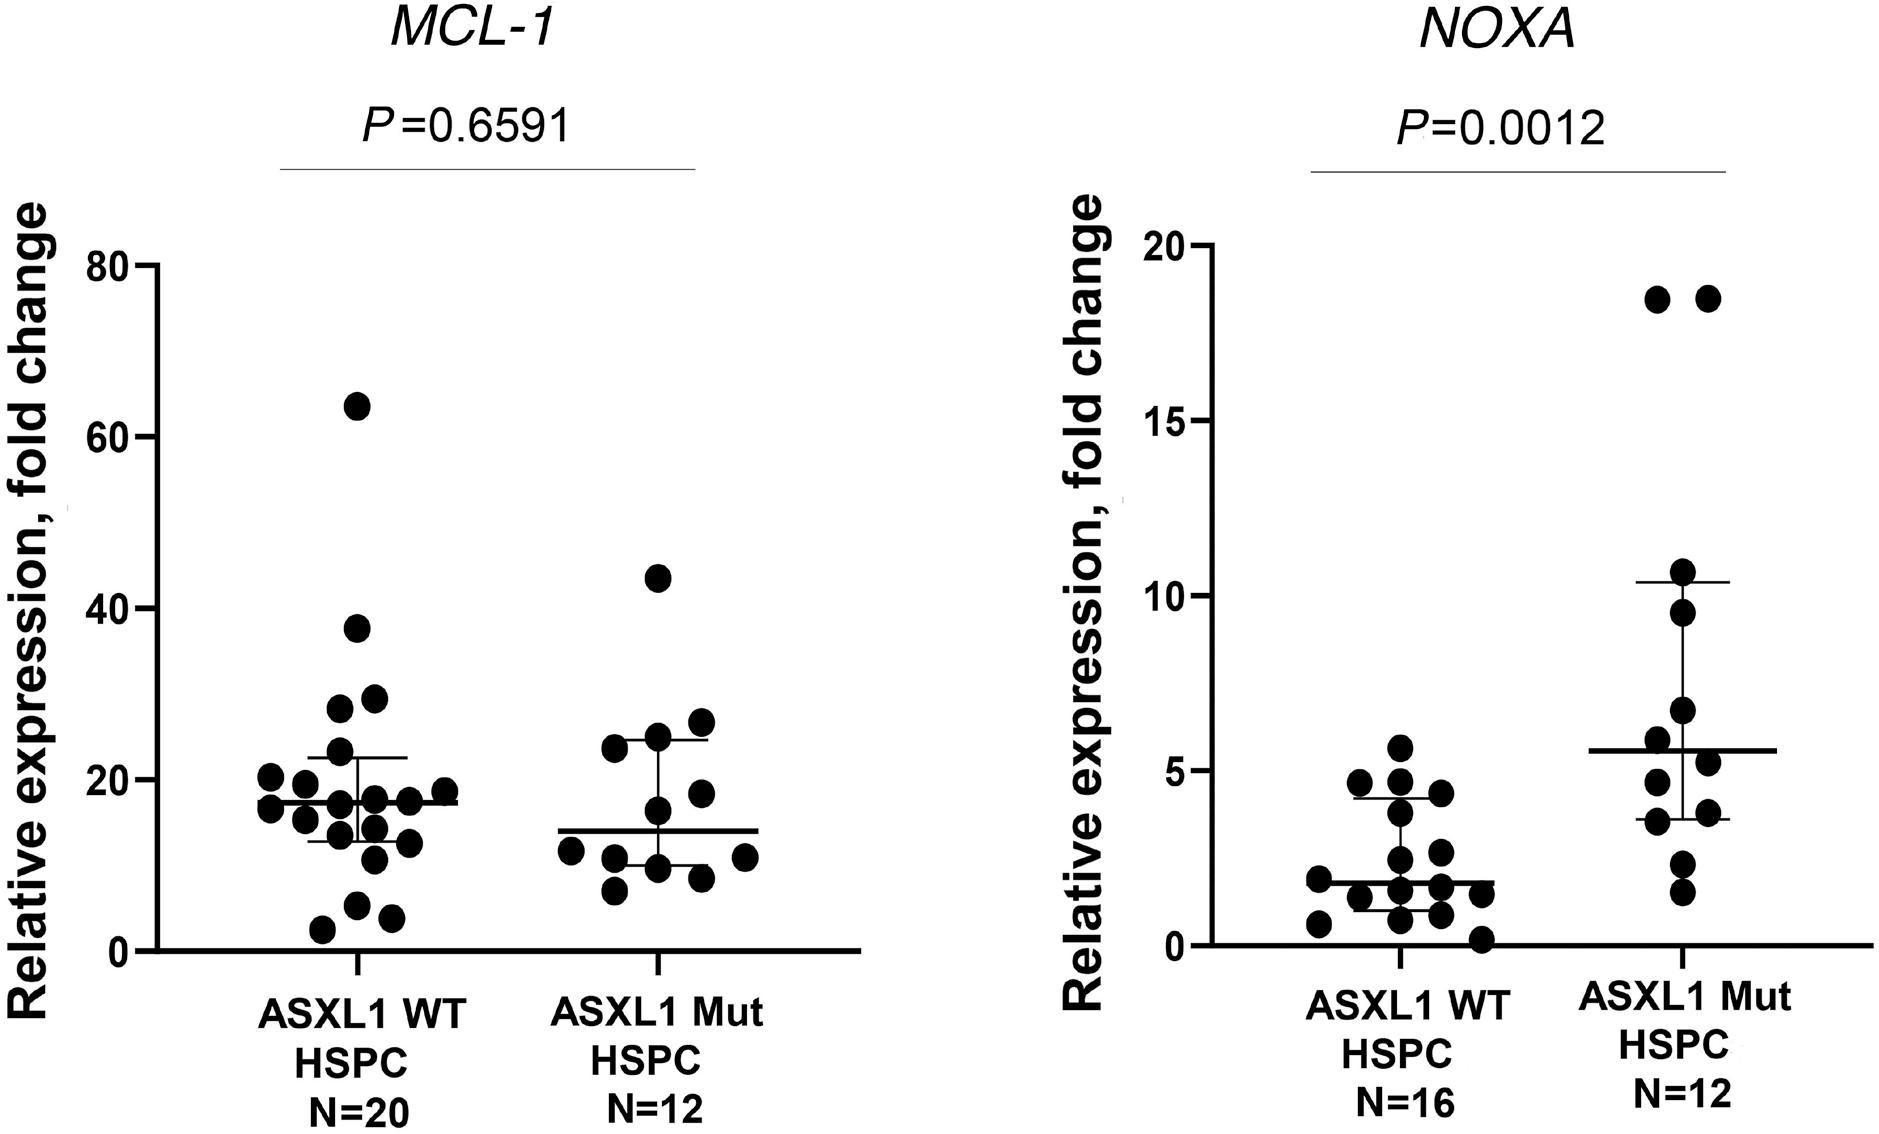
WT and ASXL1 samples was comparable, the expression of MCL-1 antagonist NOXA was significantly increased in ASXL1-mutated samples.
The rationale to perform sequential treatment of MDS samples using 5-AZA followed by alvocidib was based on previous reports demonstrating the ability of 5-AZA to induce the expression of pro-apoptotic MCL-1 interacting protein NOXA after short treatment times of 24-48 h.5,19,25 Subsequent sequential application of alvocidib for 6-24 h could further inhibit MCL-1 protein expression sensitizing 5-AZA pretreated samples to the combination therapy by skewing the balance toward pro-apoptotic effects of NOXA.19 However, our in vitro experimental data revealed that there were only weak and non-significant correlations between MCL-1 dependency and cytotoxic effects of alvocidib or alvocidib + 5-AZA in higher-risk MDS patient samples. Interestingly, biomarker-driven phase II clinical trials of alvocidib in combination with cytarabine and mitoxantrone in relapsed/refractory AML reported that the composite complete remission (CR) rates were the highest in highly MCL-1 -dependent patients (≥40%) (clinicaltrials gov. Identifier: NCT02520011).26 However, the association of CR with increasing MCL-1 dependency was not observed presumably due to a limited size of the patient cohort.27 To the best of our knowledge and despite the fact that alvocidib is a non-specific inhibitor of CDK, MCL-1 is the only currently proposed biomarker of alvocidib response. In the light of this data, we aimed to identify additional biomarkers potentially predictive of response to alvocidib or the alvocidib + 5-AZA combination. By correlating mutational profiles of analyzed patient samples with the cell viability in CTG assays, we found ASXL1 mutations to be an independent predictor of increased drug combination cytotoxic activity in a multivariable analysis. Next, we used a previously generated and characterized Asxl1Y588X mouse model to validate the involvement of Asxl1 muta-
Figure 5. ASXL1 mutant myelodysplastic syndromes hematopoietic stem and progenitor cells overexpress NOXA. The expression of MCL-1 and NOXA genes was assessed in hematopoietic stem and progenitor cells (HSPC) of ASXL1 wild-type (WT) and ASXL1-mutated (mut) patients using real-time quantitative polymerase chain reaction; median ± interquartile range, Mann-Whitney U test. Outlier values were removed using GraphPad Prism 8.4.3 software (ROUT method with Q factor =1%).
tions in alvocidib and alvocidib + 5-AZA sensitivity.16 These mice were reported to develop a spectrum of myeloid malignancies, including MDS, MPN and AML. They have shorter survival compared to WT littermates and abnormal blood counts including thrombocytosis, anemia and lymphopenia. Some of the mice show dysplastic features in blood, BM, and spleen cells, including hyposegmented neutrophils with fine nuclear bridging, aberrant nuclear structure, and Howell-Jolly bodies in the erythrocytes. Interestingly, increased activity of alvocidib and alvocidib + 5-AZA combination against Asxl1-mutated cells as well as specific elimination of Asxl1-mutated cells from the BM by this drug combination was further confirmed in Asxl1Y588X mice and CD45.1 recipient mice transplanted with splenic cells of Asxl1 Y588X mice. It is important to mention that 12-month-old Asxl1 Y588X mice used for transplantation had AML disease. Therefore, together with our data on the MDS-L mouse model and in vitro data on MDS primary samples, the current data suggest that this combination may be effective in both high-risk MDS and AML in preclinical settings. A possible limitation in our murine transplantation experiments is that BM-derived AML donor cells could behave differently as compared to spleen derived AML cells due to differences in the microenvironments of the source tissues. In this study, we only transplanted spleen derived cells but did not compare these with BM-derived cells.
Interestingly, a previous study16 and our current data show that the activities of both alvocidib and ASXL1 converge on the RNA polymerase II regulation. Mutant ASXL1 protein activates pTEFb (CDK9/cyclin T1) complex that further activates RNA polymerase II, while alvocidib represses RNA polymerase II activity via CDK9 inhibition. In addition, it was previously reported that the loss of ASXL1 triggers an apoptotic response in healthy HSPC.28 In this study, we observed higher expression of pro-apoptotic NOXA in
Haematologica | 109 May 2024 1436 ARTICLE - Biomarkers of alvocidib + 5-AZA response in MDS V. Riabov et al.
human MDS HSPC with ASXL1 mutations. Since NOXA and NOXA-derived peptides are the most selective antagonists of MCL-1 that decrease its half-life and stability,29 the overexpression of NOXA may potentiate inhibiting effects of alvocidib on the MCL-1 expression in ASXL1-mutated MDS. In this study, we also observed significant associations of ZRSR2 and EZH2 mutations with both alvocidib and alvocidib + 5-AZA sensitivity. However, before elucidating the underlying mechanism, their direct involvement in the drug sensitivity needs to be studied in knock-in/ knockout cellular systems or transgenic models for myeloid neoplasms.
It should also be noted that the long-term effects of the treatment with 5-AZA + alvocidib observed in vivo in MDS-L xenografted model may also involve reprogramming of BM microenvironment. Indeed, direct modulatory effects of 5-AZA were previously reported on the BM mesenchymal stromal cell compartment.23 Therefore, potential effects of alvocidib and its combination with HMA on the BM microenvironment should be addressed in the future mechanistic studies.
In summary, our study provides preclinical support for the use of alvocidib in combination with 5-AZA for higher-risk MDS. ASXL1 mutations should be analyzed as potential stratification markers to select for highly responsive patients in further clinical evaluation.
Disclosures
This study was funded by research support of Sumitomo Pharma Oncology, Inc., Lehi, UT, USA. JMF is an employee of Sumitomo Pharma Oncology, Inc. DTS serves on the scientific advisory board at Kurome Therapeutics; is a consultant for Kymera Therapeutics, Kurome Therapeutics, Captor Therapeutics, and Tolero Therapeutics; has equity in Kurome Therapeutics. AR is a consultant for Taiho Pharmaceuticals and Epizyme. AMA is a consultant for VOR Biopharma and received funding from VOR Biopharma and Actinium Pharmaceuticals. All other authors have no conflicts of interest to disclose.
Contributions
VR and DN designed and conducted the study, analyzed
References
1. Fenaux P, Mufti GJ, Hellstrom-Lindberg E, et al. Efficacy of azacitidine compared with that of conventional care regimens in the treatment of higher-risk myelodysplastic syndromes: a randomised, open-label, phase III study. Lancet Oncol. 2009;10(3):223-232.
2. Silverman LR, Demakos EP, Peterson BL, et al. Randomized controlled trial of azacitidine in patients with the myelodysplastic syndrome: a study of the cancer and leukemia group B. J Clin Oncol. 2002;20(10):2429-2440.
3. Parker JE, Mufti GJ, Rasool F, et al. The role of apoptosis,
the data and wrote manuscript draft. QX performed experiments and analyzed the data. NS, GG, AW, LB, MW and MD performed experimental studies. AS and J-CJ performed bioinformatics analysis. EA, FR and JMF contributed to the study design. VN, NW, JO, and IP provided technical assistance for sample workup, cell culture, and molecular analyses. AJ and AD provided primary material from healthy controls. CW performed statistical analysis of the data. DTS and F-CY designed and conducted the study. SM, AMA, AR, GM, LS, MJ, and PW provided material from patients and clinical data. DN and W-KH supervised the study and provided research infrastructure.
Acknowledgments
The authors gratefully acknowledge the support of Stefanie Uhlig, operating the Mannheimer FlowCore Facility.
Funding
This work was supported by the “Forum Gesundheitsstandort Baden-Württemberg, Projektvorhaben „Identifizierung und Nutzung molekularer und biologischer Muster für die individuelle Krebsbehandlung“ BW 4-5400/136/1 (to DN), funding from the HW & J Hector Foundation (Weinheim) (project M83) (to DN), the Deutsche Forschungsgemeinschaft (DFG) (N 817/5-2, FOR2033, NICHEM) (to DN), the German Cancer Aid Foundation (Deutsche Krebshilfe, 70113953) (to DN), the Gutermuth Foundation (to DN), the Dr. Rolf M. Schwiete Foundation (Mannheim) (to DN), the Wilhelm Sander Foundation (2020.089.1) (to J-CJ), NIH/NCI (CA172408; to F-CY) and Evan’s Foundation (to F-CY). This work was supported by the Health + Life Science Alliance Heidelberg Mannheim and received state funds approved by the State Parliament of Baden-Württemberg. DN is an endowed Professor of the German José-Carreras-Foundation (DJCLSH03/01). PW received research funding by the German Red Cross Blood Service Baden-Württemberg-Hessen. QX was supported by the China Scholarship Council.
Data-sharing statement
The datasets generated during and/or analyzed during the current study are available from the corresponding author on reasonable request.
proliferation, and the Bcl-2-related proteins in the myelodysplastic syndromes and acute myeloid leukemia secondary to MDS. Blood. 2000;96(12):3932-3938.
4. Parker JE, Fishlock KL, Mijovic A, et al. ‘Low-risk’ myelodysplastic syndrome is associated with excessive apoptosis and an increased ratio of pro-versus anti-apoptotic bcl-2-related proteins. Br J Haematol. 1998;103(4):1075-1082.
5. Jin S, Cojocari D, Purkal JJ, et al. 5-Azacitidine induces NOXA to prime AML cells for venetoclax-mediated apoptosis. Clin Cancer Res. 2020;26(13):3371-3383.
Haematologica | 109 May 2024 1437 ARTICLE - Biomarkers of alvocidib + 5-AZA response in MDS V. Riabov et al.
6. Mei M, Aldoss I, Marcucci G, Pullarkat V. Hypomethylating agents in combination with venetoclax for acute myeloid leukemia: update on clinical trial data and practical considerations for use. Am J Hematol. 2019;94(3):358-362.
7 Fischer MA, Song Y, Gbyli R, et al. MCL1 dependence across MDS subtypes and dual inhibition of MCL1 and BCL2 in MISTRG6 mice. bioRxiv. 2020:2020.06.05.133090. doi: https://doi. org/10.1101/2020.06.05.133090 [preprint, not peer-reviewed].
8. Chen R, Keating MJ, Gandhi V, Plunkett W. Transcription inhibition by flavopiridol: mechanism of chronic lymphocytic leukemia cell death. Blood. 2005;106(7):2513-2519.
9. Yeh YY, Chen R, Hessler J, et al. Up-regulation of CDK9 kinase activity and Mcl-1 stability contributes to the acquired resistance to cyclin-dependent kinase inhibitors in leukemia. Oncotarget. 2015;6(5):2667-2679.
10 Boffo S, Damato A, Alfano L, Giordano A. CDK9 inhibitors in acute myeloid leukemia. J Exp Clin Cancer Res. 2018;37(1):36.
11. Tibes R, Bogenberger JM. Transcriptional silencing of MCL-1 through cyclin-dependent kinase inhibition in acute myeloid leukemia. Front Oncol. 2019;9:1205.
12. Yin T, Lallena MJ, Kreklau EL, et al. A novel CDK9 inhibitor shows potent antitumor efficacy in preclinical hematologic tumor models. Mol Cancer Ther. 2014;13(6):1442-1456.
13. Lin TS, Heerema NA, Lozanski G, et al. Flavopiridol (alvocidib) induces durable responses in relapsed chronic lymphocytic leukemia (CLL) patients with high-risk cytogenetic abnormalities. Blood. 2008;112(11):46.
14 Zeidner JF, Karp JE. Clinical activity of alvocidib (flavopiridol) in acute myeloid leukemia. Leuk Res. 2015;39(12):1312-1318.
15. Zeidner JF, Lee DJ, Frattini M, et al. Phase I study of alvocidib followed by 7+3 (cytarabine + daunorubicin) in newly diagnosed acute myeloid leukemia. Clin Cancer Res. 2021;27(1):60-69.
16. Yang H, Kurtenbach S, Guo Y, et al. Gain of function of ASXL1 truncating protein in the pathogenesis of myeloid malignancies. Blood. 2018;131(3):328-341.
17 Nakamura S, Ohnishi K, Yoshida H, et al. Retrovirus-mediated gene transfer of granulocyte colony-stimulating factor receptor (G-CSFR) cDNA into MDS cells and induction of their differentiation by G-CSF. Cytokines Cell Mol Ther. 2000;6(2):61-70.
18. Rhyasen GW, Wunderlich M, Tohyama K, et al. An MDS xenograft model utilizing a patient-derived cell line. Leukemia.
2014;28(5):1142-1145.
19 Matsumura Y, Tyagi E, Pathi S, et al. CDK9 inhibition combined with hypomethylating agents target MCL-1 dependency in MDS and AML. Cancer Res. 2021;81(Suppl 13):1959.
20 Foight GW, Ryan JA, Gullá SV, Letai A, Keating AE. Designed BH3 peptides with high affinity and specificity for targeting Mcl-1 in cells. ACS Chem Biol. 2014;9(9):1962-1968.
21. Arai S, Varkaris A, Nouri M, et al. MARCH5 mediates NOXAdependent MCL1 degradation driven by kinase inhibitors and integrated stress response activation. Elife. 2020;9:e54954.
22. Chiou JT, Huang NC, Huang CH, et al. NOXA-mediated degradation of MCL1 and BCL2L1 causes apoptosis of daunorubicin-treated human acute myeloid leukemia cells. J Cell Physiol 2021;236(11):7356-7375.
23. Wenk C, Garz AK, Grath S, et al. Direct modulation of the bone marrow mesenchymal stromal cell compartment by azacitidine enhances healthy hematopoiesis. Blood Adv. 2018;2(23):3447-3461.
24. Xu Q, Streuer A, Jann JC, et al. Inhibition of lysyl oxidases synergizes with 5-azacytidine to restore erythropoiesis in myelodysplastic and myeloid malignancies. Nat Commun. 2023;14(1):1497.
25. Cojocari D, Smith BN, Purkal JJ, et al. Pevonedistat and azacitidine upregulate NOXA (PMAIP1) to increase sensitivity to venetoclax in preclinical models of acute myeloid leukemia. Haematologica. 2022;107(4):825-835.
26. Zeidner JF, Lin TL, Vigil CE, et al. A prospective biomarker analysis of alvocidib followed by cytarabine and mitoxantrone in MCL-1-dependent relapsed/refractory acute myeloid leukemia. Blood Cancer J. 2021;11(10):175.
27. Zeidner JF, Lee DJ, Fine G, et al. Zella 201: a biomarker-guided phase II study of alvocidib followed by cytarabine and mitoxantrone in MCL-1 dependent acute myeloid leukemia (AML): results of newly diagnosed high-risk exploratory arm. Blood. 2020;136(Suppl 1):48-50.
28. Hilgendorf S, Folkerts H, Schuringa JJ, Vellenga E. Loss of ASXL1 triggers an apoptotic response in human hematopoietic stem and progenitor cells. Exp Hematol. 2016;44(12):1188-1196.
29 Guikema JE, Amiot M, Eldering E. Exploiting the pro-apoptotic function of NOXA as a therapeutic modality in cancer. Expert Opin Ther Targets. 2017;21(8):767-779.
Haematologica | 109 May 2024 1438 ARTICLE - Biomarkers of alvocidib + 5-AZA response in MDS V. Riabov et al.
Outcomes of limited stage primary bone diffuse large B-cell lymphoma in the rituximab era: a multicenter, retrospective study
Alexandra Rezazadeh,1 Aniko Szabo,1 Arushi Khurana,2 David J. Inwards,2 Matthew A. Lunning,3 Nancy L. Bartlett,4 Paolo F. Caimi,5 Thomas D. Rodgers,6 Paul M. Barr,6 Sayan Mullick Chowdhury,7 Narendranath Epperla,7 Hiruni Mendries,8 Brian T. Hill,8 Timothy S. Oh,9 Reem Karmali,9 Julie E. Chang,10 Gaurav Goyal,11 Benjamin M. Parsons,12 Krista M. Isaac,13 Craig A. Portell,13 Kathleen Monahan,1 Malika Siker,1 David M. King1 and Timothy S. Fenske1
1Medical College of Wisconsin, Milwaukee, WI; 2Mayo Clinic, Rochester, MN; 3University of Nebraska, Lincoln, NE; 4Washington University, St. Louis, MO; 5Case Western, Cleveland, OH; 6University of Rochester, Rochester, NY; 7Ohio State University, Mansfield, OH; 8Cleveland Clinic, Cleveland, OH; 9Northwestern University, Evanston, IL; 10University of WisconsinMadison, Madison, WI; 11University of Alabama-Birmingham, Birmingham, AL; 12Gundersen Health System, Wisconsin, WI and 13University of Virginia, Charlottesville, VA, USA
Abstract
Correspondence: T.S. Fenske tfenske@mcw.edu
Received: April 7, 2023.
Accepted: October 13, 2023.
Early view: October 19, 2023.
https://doi.org/10.3324/haematol.2023.283210
Primary bone diffuse large B-cell lymphoma is a rare variant of extranodal non-Hodgkin lymphoma historically treated with induction chemotherapy followed by consolidative radiation therapy (RT). It remains unknown whether RT confers additional benefit following rituximab-based chemoimmunotherapy (CIT) induction in patients with limited stage disease. We conducted a multicenter, retrospective analysis of patients treated between 2005 and 2019 using rituximab-based CIT regimens with or without consolidative RT to discern whether consolidative RT adds benefit in patients with stage I-II disease that could be encompassed in one radiation field. A total of 112 patients were included: 78 received CIT and radiation (RT group), and 34 received CIT alone (no RT group). The overall survival at 10 years was 77.9% in the RT group and 89.0% in the no RT group (P=0.42). The relapse-free survival at 10 years was 73.5% in the RT group and 80.3% in the no RT group (P=0.88). Neither improved overall survival nor relapse-free survival was associated with the addition of consolidative RT. Subgroup analysis of patients only achieving a partial response after CIT suggests that these patients may benefit from consolidative RT.
Introduction
Primary bone diffuse large B-cell lymphoma (DLBCL) is a variant of extranodal non-Hodgkin lymphoma (NHL) that is relatively rare, accounting for 3-15% of extranodal NHL and less than 1% of all NHL.1,2 It has been previously defined as single or multifocal lymphomatous lesion(s) in the bone, without lymph node or visceral disease. This can make classification of the disease challenging when there is adjacent soft tissue involvement or regional lymph node disease.1
Current staging systems utilize the Lugano Modification of the Ann Arbor Staging System, with the classification into three stages as follows: stage I-E constitutes a single bony lesion without nodal involvement; stage II-E constitutes a single bony lesion plus at least one adjacent or regional lymph node;multi-focal bony disease (with or without nodal disease) is classified as stage IV.3
Patients with primary bone DLBCL often present with pain
and swelling of the affected area of the skeleton, with B symptoms being less prevalent.1 Patients may present with pathological fractures with the femur being the most common site of disease.2 The median age of disease onset is during the fifth decade of life, and this form of lymphoma is slightly more common in men than in women.2,4
From the time lymphoma of the bone was first described in 1939 until the mid-20th century, the cornerstone of treatment was radiation therapy.5 Chemotherapy regimens were then introduced in the 1970s and used in combination with radiation, often referred to as combined modality therapy (CMT). Traditional regimens were typically CHOP (cyclophosphamide, doxorubicin, vincristine, prednisone), or CHOP-like. For limited stage DLBCL in general, a standard-of-care regimen was ultimately established with the Southwest Oncology Group (SWOG) study S8736, which showed that three cycles of CHOP followed by RT produced superior progression-free survival and overall survival (OS) rates compared to those achieved
Haematologica | 109 May 2024 1439 - Non-Hodgkin Lymphoma ARTICLE
©2024 Ferrata Storti Foundation
Published under a CC BY-NC license
with eight cycles of CHOP alone.6 With the advent of rituximab in the late 1990s and subsequent trials7-9 illustrating its efficacy in improving OS and disease-free survival when added to traditional chemotherapy regimens for systemic DLBCL, it gradually became standard of care for the treatment of all DLBCL. Notably, SWOG S0014 showed that rituximab plus CHOP for three cycles and involved-field RT in patients with limited stage DLBCL was a safe regimen, with a 2-year progression-free survival rate of 84%.10
Specifically for primary bone DLBCL, earlier studies showed that CMT was superior to RT, with improvements in OS and relapse-free survival (RFS).11-13 Other non-randomized/retrospective studies suggested that the inclusion of RT may improve outcomes.14-16 However, this literature has significant limitations in that many of the studies were completed prior to the rituximab era, some included patients with advanced stage disease, and most included multiple NHL subtypes because of the rarity of primary bone DLBCL. The inclusion of patients with advanced stage disease complicates interpretation of the findings, since patients with advanced disease often have non-synchronous bony lesions and bulky disease for which RT could provide a palliative rather than survival benefit, and often times RT is not consistently directed to the primary lesion.15
In the rituximab era, for limited stage DLBCL in general, some studies have aimed to eliminate RT in selected patients. For example, SWOG S1001 omitted RT in patients who were negative for disease according to an interim positron emission tomography (PET) assessment and demonstrated that these patients had similar outcomes to those with interim PET-positive disease receiving RT.17 A similar PET-directed retrospective study was conducted in British Columbia and showed congruent results.18 The FLYER study is another radiation-free regimen that examined whether less chemotherapy could be safely administered to patients with aggressive B-cell NHL 18-60 years of age who had non-bulky (<7.5 cm), limited stage disease (stage I-II), and found that four cycles of CHOP plus rituximab (R-CHOP) was not inferior to six cycles and was less toxic.19 However, extrapolating the results of these PET-directed studies of limited stage DLBCL to primary bone DLBCL presents a unique challenge in several regards. First, interpretating PET findings in the setting of bone healing and sclerosis after treatment can be difficult. Second, only a small proportion of the patients included in these studies had primary bone DLBCL. Therefore, we sought to investigate the utility of consolidative RT in the rituximab era in patients with primary bone DLBCL.
We performed a multicenter, retrospective study to analyze outcomes of patients with limited stage (stage I-E and stage II) primary bone DLBCL, comparing those who received CIT plus RT (RT group) to those who received CIT alone (no RT group) in order to determine whether the addition of radiation confers benefit. We also evaluated the subgroup of patients achieving a partial response (PR) after CIT, to determine if that group may benefit from consolidative RT. Our study
included patients from multiple academic medical centers in the USA, focusing only on those who were treated with rituximab-based CIT.
Methods
We conducted a multicenter, retrospective analysis of outcomes in a modern cohort of patients who underwent treatment for primary bone DLBCL using chemotherapy regimens in the rituximab era either with or without consolidative RT.
We obtained initial Institutional Review Board approval at the main site, then obtained subsequent approval at partnering sites, some of which required data use agreements per individual institutional policy. Data were collected from patients treated between 2005 and 2019 in 13 academic medical centers in the USA. Each center generated a list of participants using the inclusion and exclusion criteria outlined below. Data were collected independently at each center using the center’s already existing electronic medical records. The coordinating center provided a data sheet for data entry as well as a similar data sheet with identifying information removed to be used for correspondence with the coordinating center. All de-identified data were aggregated and analyzed at the coordinating center.
Eligible patients were 18 years of age or older and had stage I-E or stage II-E primary bone DLBCL. Stage II patients were only included if they had loco-regional lymph node involvement that could be encompassed in a single radiation field. Patients had histologically confirmed primary DLBCL and high-grade B-cell lymphoma according to the individual institutions’ records. Independent or centralized pathological verification of the diagnosis was not performed since all specimens had already undergone review by an expert hematopathologist. Imaging response was reviewed at each institution; there was no centralized imaging review. Response was classified according to the Lugano lymphoma response criteria. Patients with stage IV disease were excluded, as were those with post-transplant lymphoproliferative disorder.
Chi-square analysis was used to compare categorical variables. The Wilcoxon rank-sum test was used for continuous and ordinal measures. Survival curves were estimated using the Kaplan-Meier method and the groups were compared via the log-rank test. Multivariable analysis by Cox regression was used for OS and RFS comparing the RT group versus the no RT group and doses of RT <36 Gy versus ≥36 Gy.
Analyses were performed using SAS 9.4 (SAS Institute, Cary, NC, USA). The RT-based groups were defined on observed treatment as no intent-to-treat information was available. However, any immortal time bias was expected to be low as no deaths were observed during the treatment period. Patients were followed for survival from the time of diagnosis to death or last follow up by any provider. Follow up was administratively censored at 10 years due to the low number of patients under follow up after that time.
Haematologica | 109 May 2024 1440 ARTICLE - Outcomes of limited stage primary bone DLBCL A. Rezazadeh et al.
Results
Patients’ characteristics
The demographic information and baseline characteristics of the patients included in the analysis are listed in Table 1. A total of 112 patients were included and divided into those who received CIT and radiation (RT group, 78 patients) and those who received CIT only (no RT group, 34 patients). The groups were balanced for characteristics such as age, gender, B symptoms, elevated lactate dehydrogenase, National Comprehensive Cancer Network International Prognostic Index (NCCN-IPI) score, and stage I versus II disease. Clinical features at the time of diagnosis, such as fracture, bone pain, and cord compression occurred at similar rates in the two groups. There was, however, a statistically significant difference noted between the groups with regard to number of chemotherapy cycles, with the RT group receiving a mean number of 4.5 cycles and the no RT group receiving a mean number of 5.6 cycles (P<0.001). Most patients (92%) had low or low-intermediate IPI risk disease.
Clinical outcomes
There was no difference in OS between the RT and no RT groups (Figure 1A). The 10-year OS rate for the RT group was 77.9% versus 89.0% for the no RT group (P=0.42). Similarly, there was no difference in RFS between these groups, with a 10-year RFS of 73.5% for the RT group versus 80.3% for the no RT group (P=0.88) (Figure 1B). Lymphoma was only a cause of death in a minority of cases: two of the nine cases in the RT group, and neither of the two cases in the no RT group. The median follow up was 66.3 months in all patients, being 70.4 months in the RT group and 65.0 months in the no RT group (Table 1).
Eight patients achieved a PR with CIT. Of these patients, six were subsequently treated with RT, five of whom then converted to a complete response (CR). The median duration of response for these patients was 49 months (range, 12-71.5 months).
Analysis of radiation dose received
The RT group was further stratified based on dose of radiation received. There was no difference in OS between those
Table 1. Demographics, treatment, and follow-up results of the total 112 patients and these patients divided according to whether they received chemoimmunotherapy followed by radiotherapy (RT group) or chemoimmunotherapy alone (no RT group).
NCCN-IPI: National Comprehensive Cancer Network International Prognostic Index; LDH: lactate dehydrogenase; DLBCL: diffuse large B-cell lymphoma; W: Wilcoxon rank sum test¸ C: χ2 test; +: exact test; NA: not applicable; SD: standard deviation.
Haematologica | 109 May 2024 1441 ARTICLE - Outcomes of limited stage primary bone DLBCL A. Rezazadeh et al.
Characteristics All patients N=112 RT group N=78 No RT group N=34 P Sex, N (%) Females Males 57 (50.9) 55 (49.1) 40 (51.3) 38 (48.7) 17 (50.0) 17 (50.0) 1.000C+ Age at diagnosis in years, median (range) 58.0 (18.0-86.0) 55.0 (20.0-86.0) 58.5 (18.0-86.0) 0.420W NCCN-IPI risk group, N (%) Low-risk, 0-1 Low-intermediate risk, 2-3 High-intermediate risk, 4-5 Unknown 74 (71.8) 28 (27.2) 1 (1.0) 9 49 (70) 21 (30) 0 (0) 8 25 (71.5) 7 (21.2) 1 (3.0) 1 0.801W B symptoms, N (%) 7 (6.3) 3 (3.8) 4 (12.1) 0.193C+ Elevated LDH, N (%) 30 (30.6) 25 (36.8) 5 (16.7) 0.047C Fracture at presentation, N (%) 18 (16.1) 15 (19.2) 3 (8.8) 0.168C Bone pain at presentation, N (%) 100 (90.9) 70 (92.1) 30 (88.2) 0.721C+ Cord compression at presentation, N (%) 7 (6.3) 6 (7.7) 1 (2.9) 0.437C+ Pathology with DLBCL, N (%) 110 (98.2) 76 (97.4) 34 (100.0)Pathology with aggressive B-cell lymphoma, not otherwise specified, N (%) 2 (1.8) 2 (2.6) 0 (0.0) 0.010C+ Disease stage, N (%) I II 89 (79.5) 23 (20.5) 64 (82.1) 14 (17.9) 25 (73.5) 9 (26.5) 0.305C Radiotherapy dose group, N (%) ≥36 Gy <36 Gy 57 (52.8) 17 (15.7) 57 (77.0) 17 (23.0)NA N of chemotherapy cycles, mean (±SD) 4.8 (±1.4) 4.5 (±1.4) 5.6 (±1.1) <0.001 Follow up in months, median (range) 66.3 (6.9-120.0) 70.4 (8.3-120.0) 65.0 (6.9-120.0) 0.745W
who received ≥36 Gy compared to those who received <36 Gy (Figure 1C). The 10-year OS for the ≥36 Gy group was 75.1%, compared to 90.9% for the <36 Gy group (P=0.77). Similarly, there was no difference in RFS between these groups, with a 10-year RFS rate of 70.9% for the ≥36 Gy group and 85.6% for the <36 Gy group (P=0.84) (Figure 1D).
Discussion
In this study, we did not find an OS or RFS benefit associated with the addition of RT to CIT in patients with stage I and localized stage II primary bone DLBCL. In addition, among the patients who received RT, there was no improvement in outcomes for those who received higher doses of RT (≥36 Gy). Among patients achieving a PR to CIT, five out of six pa-
tients who then went on to receive consolidative RT achieved a CR, suggesting that RT may be particularly useful in this subgroup of patients. The 10-year OS rate in all groups was greater than 70%, illustrating that, overall, patients with this disease have favorable outcomes with modern therapy. Several previous studies have examined CMT for primary bone DLBCL. For example, the IELSG-14 study conducted by Bruno-Ventre et al. in 2014 was a retrospective analysis of 161 patients with limited stage primary bone DLBCL. The authors found that anthracycline-based chemotherapy conferred a more favorable prognosis compared to that of treatment with RT alone, and that the addition of radiation in doses greater than 36 Gy was not beneficial.20 This study also found that chemotherapy followed by RT resulted in better outcomes compared to RT followed by chemotherapy. Of note, most patients in that study were treated in the pre-rituximab era.
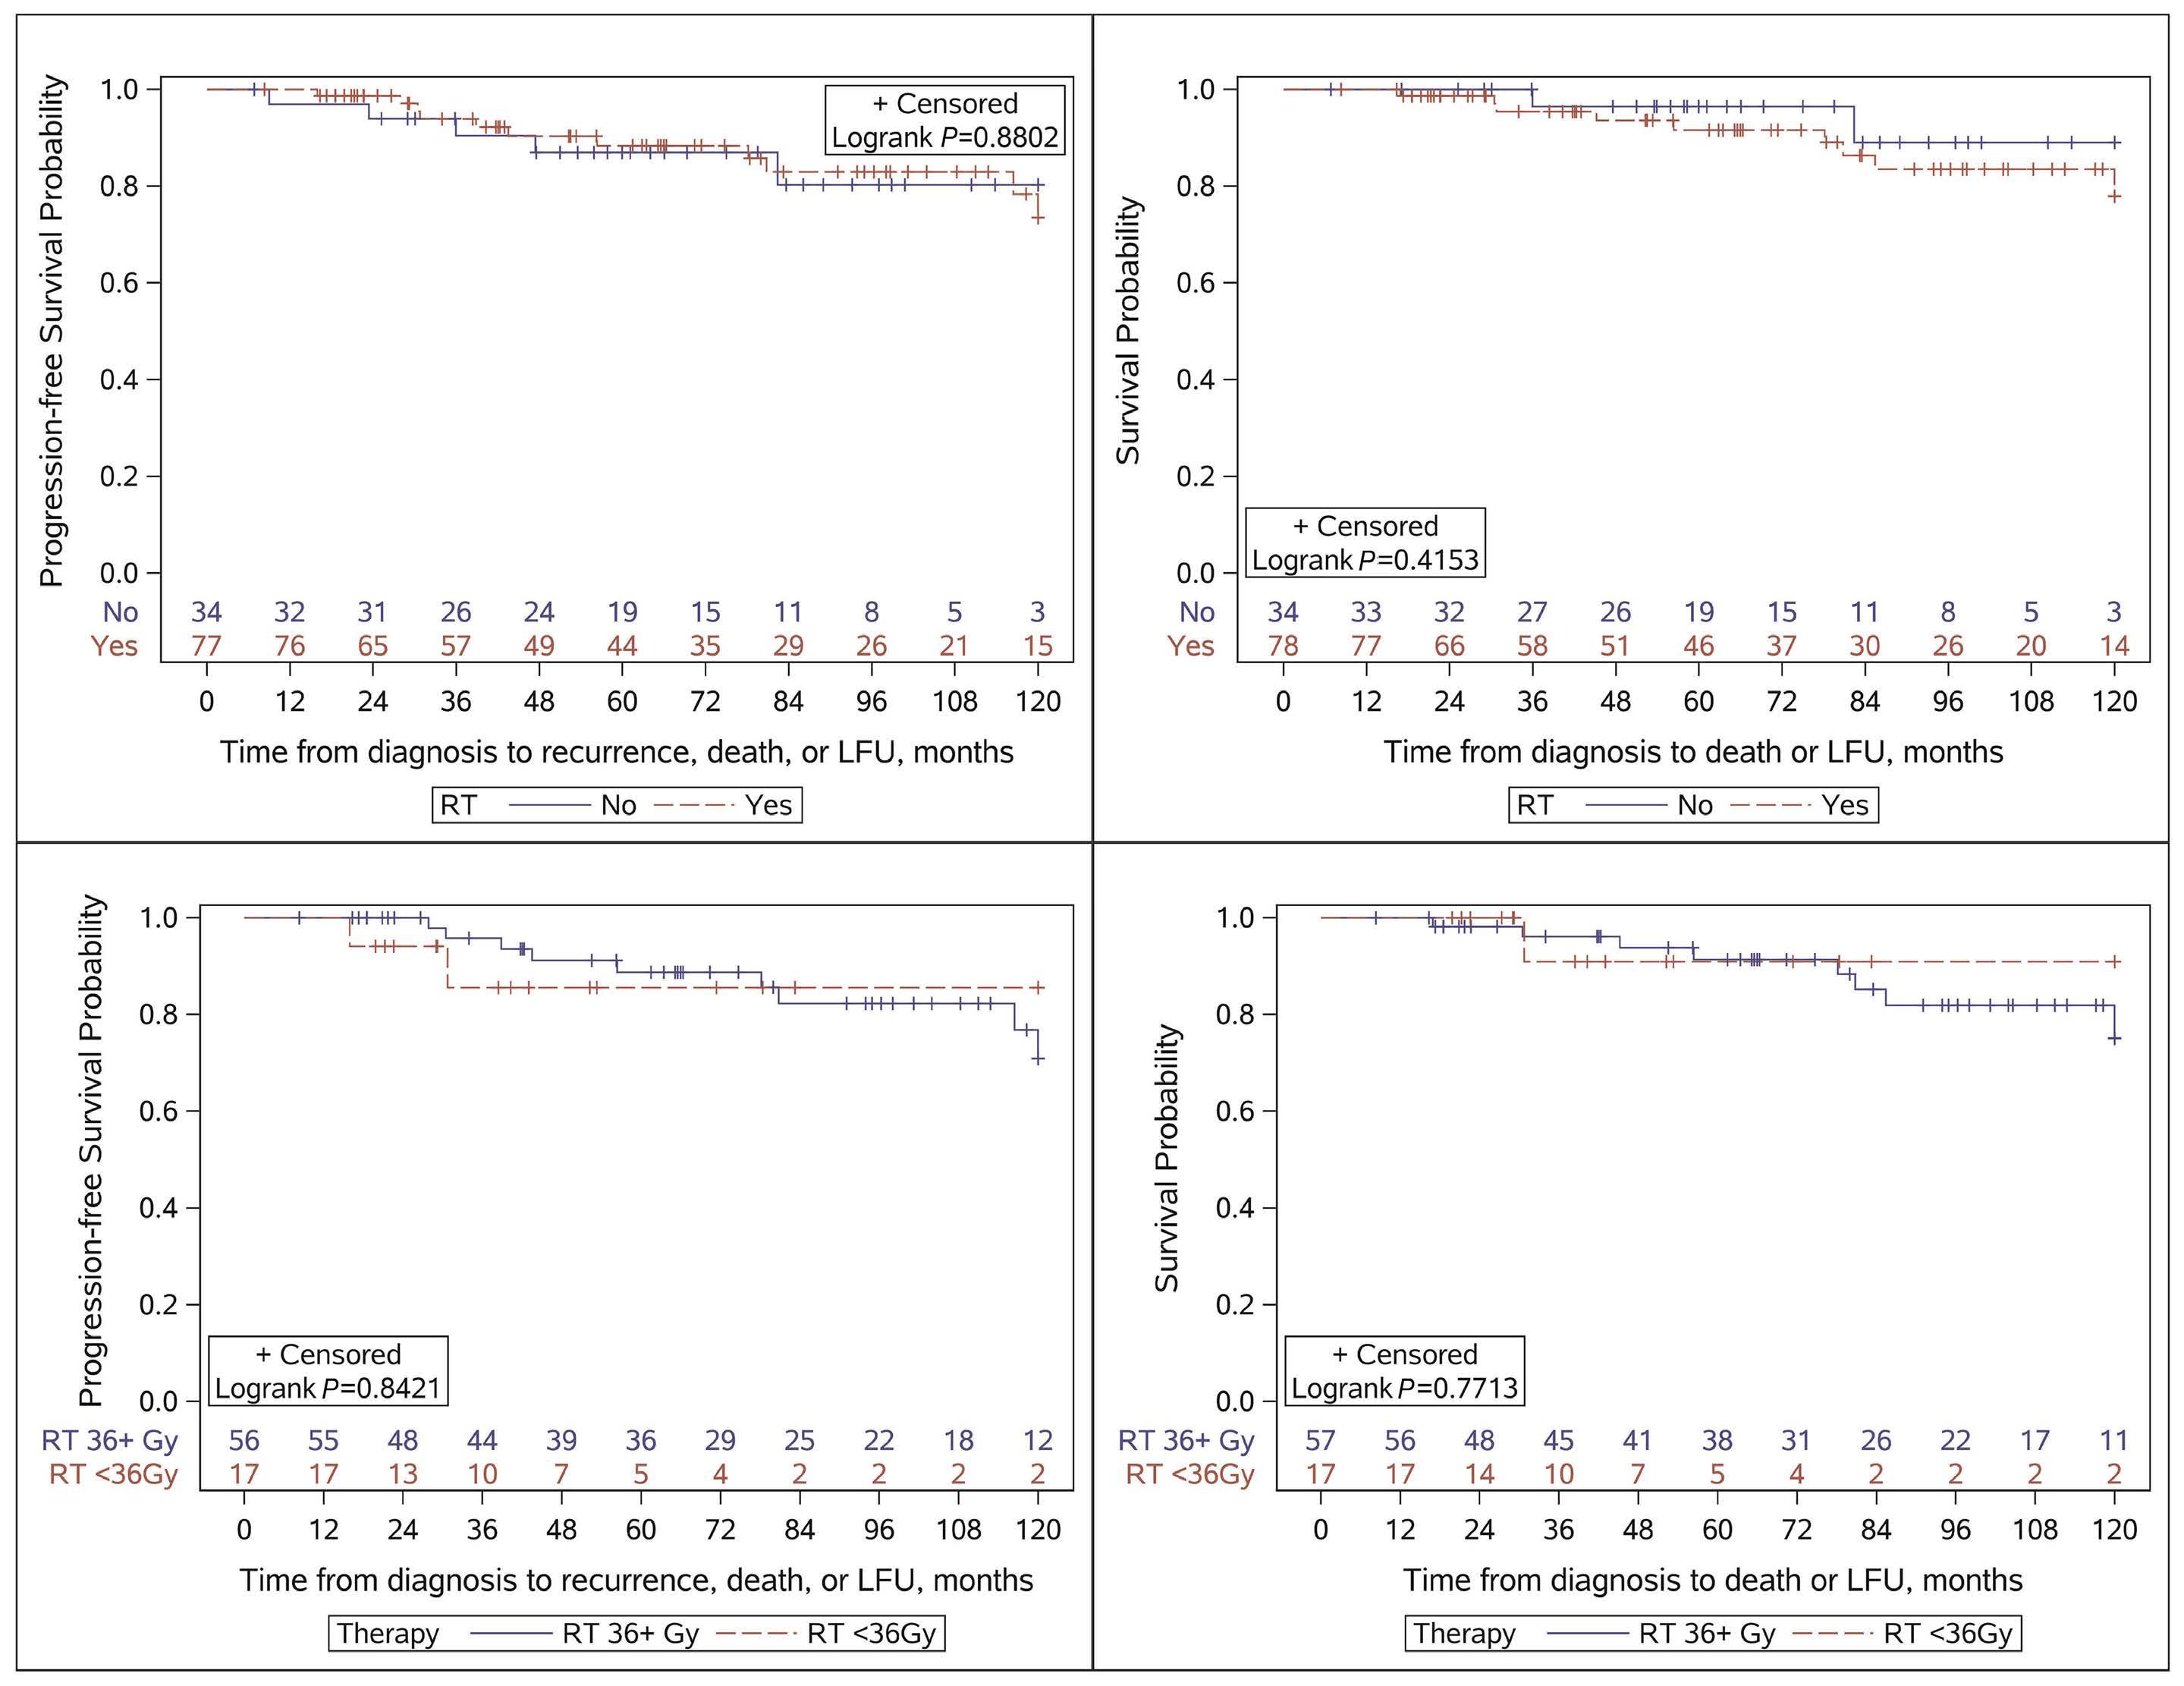
Figure 1. Kaplan-Meier curves of primary outcomes of relapse-free survival and overall survival. (A) Relapse-free survival of patients divided according to whether they did or did not receive radiation therapy (RT). (B) Overall survival of patients divided according to whether they did or did not receive RT. (C) Relapse-free survival of patients who received ≥36 Gy RT and those who received <36 Gy. (D) Overall survival of patients who received ≥36 Gy RT and those who received <36 Gy. LFU: last follow up.
Haematologica | 109 May 2024 1442 ARTICLE - Outcomes of limited stage primary bone DLBCL A. Rezazadeh et al.
A C B D
A multicenter, retrospective study conducted by the Rare Cancer Network in 2011 which examined patients with stage I and II primary bone lymphoma (78% DLBCL) revealed that CMT, as well as doses of radiation greater than 40 Gy, resulted in improved prognosis by univariate analyses.16 However, only 28% of patients received rituximab-based CIT, with 60% receiving chemotherapy, and 12% receiving radiation alone. A prospective Australian study of primary bone NHL (97% DLBCL) was conducted by Christie et al. in 2011. In their study, patients received three cycles of CHOP followed by 45 Gy of radiation, regardless of response to chemotherapy, and had a 5-year OS of 90% and a rate of local disease control of 72%.21 It should be noted that this study closed early as rituximab became more readily available and, over the entire time of study accrual, only 19% of patients received rituximab in addition to their chemotherapy. Overall, although these studies utilized varying radiation doses, all generally suggest a benefit of CMT in patients largely treated without rituximab. Current guidelines for RT of limited stage DLBCL recommend doses of 30-36 Gy if patients achieve a CR after CIT, and higher doses of 40-50 Gy for those who achieve a PR.22 Multiple studies have been conducted to further examine the benefits of increased doses of RT. For example, Lee et al. conducted a retrospective study that included patients with stage I/II-IV DLBCL and osseous involvement, with the aim of determining whether higher doses of RT are beneficial, and found that 20-30 Gy are sufficient for those who achieve a CR and higher doses should be reserved for those who attain a PR.23 Tao et al. found no difference in OS or progression-free survival in patients who received 36 Gy compared to those who received 30-35 Gy.14 Both of these studies included patients prior to the rituximab era and with stage I-IV disease, thus the findings are not completely comparable to those of our study. It is important to note that consolidative RT does not come without risks, including those of gastrointestinal/ mucosal toxicity, secondary malignancies, and dental-related toxicities for lesions located in the head and neck region.15,23 At some of the centers in our study, it was common practice to administer RT if patients had a PR after CIT, thus exemplifying variability in practice across institutions. Based on this mode of practice, it is possible that patients who do not attain a CR (and therefore perhaps have more intrinsically aggressive disease) could obtain some benefit from RT. Indeed, our data revealed that, of the six patients who only achieved a PR with CIT and then went on to receive RT, 83% achieved a CR. This suggests that consolidative RT may confer benefit in patients who only achieve a PR with CIT induction. This study has some limitations, in part due to its retrospective design. For example, we were not able to ascertain the reason why patients received or did not receive RT, or why some patients received higher doses of RT. This could have introduced a provider bias regarding which patients were selected to receive RT. Furthermore, the study spans a relatively long timeframe; various aspects of care such as RT techniques and supportive care have evolved during that
period, potentially affecting outcomes. To conclusively answer the question of whether consolidative RT confers benefit in some patients (or perhaps just in patients achieving PR after CIT), a prospective randomized trial would need to be conducted; however, this would be challenging given the low incidence of primary bone DLBCL.
In conclusion, patients with limited stage primary bone DLBCL treated in the rituximab era have excellent outcomes overall. The addition of radiation does not appear to improve these outcomes in general, although we cannot rule out that a subset of patients (e.g., those achieving PR with CIT) may benefit from consolidative radiation.
Disclosures
AR is a consultant for MJH Life Sciences. MAL is a consultant for Kite, Celgene, Verastem, Janssen, Myeloid Therapeutics, AstraZeneca, Acrotech, ADC Therapeutics, Legend, Spectrum, Beigene, Daiichi Sankyo, TG Therapeutics, Novartis, Kyowa Kirin, Karyopharm, and Abbvie. NLB has received research funding from ADC Therapeutics, Seagen, Autolus, Bristol Meyers Squibb, Celgene, Forty Seven, Genentech, Janssen, Kite, Merck, Millenium, and Pharmacyclics; and is a consultant for ADC Therapeutics, Roche/Genentech, and Seagen. PFC is a consultant for ADC Therapeutics, Kite, Verastem, Seattle Genetics, and Amgen Therapeutics; has received honoraria from TG Therapeutics, royalties from XaTek; and research funding from ADC Therapeutics and Genentech. TDR is a consultant for MJH Lifesciences. PMB is a consultant for Abbvie, Bristol Meyers Squibb, TG Therapeutics, Seattle Genetics, Morphosys, Gilead, Janssen, Beigene, AstraZeneca, and Genentech. NE is a consultant for Merck, ADC Therapeutics, Ipsen, Lilly, and Novartis; is a speaker for Beigene, Incyte, and Novartis; and has received research funding from Beigene. BT provides consultancy services for and has received honoraria from AbbVie, Genentech, Pfizer, Kite, Karyopharm, AstraZeneca, Beigene, Epizyme, Incyte/Morphosys, Novartis, and Celgene (BMS); has received research funding from AbbVie, Genentech, Kite, Karyopharm, Beigene, Incyte/Morphosys, Novartis, and Celgene (BMS); and has received travel expenses from Kite. RK is a consultant for Kite, BMS/Celgene/Juno, BeiGene, Morphosys, Epizyme, Karyopharm, Janssen/Pharmacyclics, EUSA, Genentech, and Roche; is a speaker for Kite, BeiGene, and Morphosys; and has received research funding from Kite and BMS/Celgene/Juno. CAP has received research funding from Abbvie, BeiGene, Merck, Kite, SeaGen, Targeted Oncology, Xencor, AstraZeneca, Genentech, TG Therapeutics, and VelosBio; and has received honoraria from Aptitude Health, BeiGene, Merck, Kite, Morphosys, Targeted Oncology, Pharmacyclics, and TG Therapeutics. TSF is a consultant for AbbVie/Pharmacyclics, Adaptive Biotechnologies, Lilly/ LOXO, MorphoSys, SeaGen, and TG Therapeutics; and is speaker for AstraZeneca, Beigene, Kite (Gilead), MorphoSys, SeaGen, and TG Therapeutics. AS, AK, DJI, SMC, HM, TSO, JEC, CG, BMP, KMI, KM, MS, and DMK have no conflicts of interest to disclose.
Haematologica | 109 May 2024 1443 ARTICLE - Outcomes of limited stage primary bone DLBCL A. Rezazadeh et al.
Contributions
AR collected on-site data, collated the data from the sites, and wrote the paper. AS analyzed the results and made the figures. AK, DJI, MAL, NLB, PFC, TDR, PMB, SMC, NE, HM, BT, TSO, RK, JEC, GG, BMP, KMI, and CAP contributed data from individual sites and contributed to the manuscript. KM assisted in planning the study and collated data from the sites. MS and DMK contributed data from the main site
References
1. Messina C, Christie D, Zucca E, Gospodarowicz M, Ferreri AJ. Primary and secondary bone lymphomas. Cancer Treat Rev. 2015;41(3):235-246.
2. Choi JY, Hahn JS, Suh CO, Yang WI. Primary lymphoma of bone-survival and prognosis. Korean J Intern Med. 2002;17(3):191-197.
3. Yohannan B, Rios A. Primary diffuse large B-cell lymphoma of the bone. J Hematol 2023;12(2):75-81.
4 de Leval L, Braaten KM, Ancukiewicz M, et al. Diffuse large B-cell lymphoma of bone: an analysis of differentiationassociated antigens with clinical correlation. Am J Surg Pathol. 2003;27(9):1269-1277.
5. Dubey P, Ha CS, Besa PC, et al. Localized primary malignant lymphoma of bone. Int J Radiat Oncol Biol Phys. 1997;37(5):1087-1093.
6. Miller TP, Dahlberg S, Cassady JR, et al. Chemotherapy alone compared with chemotherapy plus radiotherapy for localized intermediate- and high-grade non-Hodgkin’s lymphoma. N Engl J Med. 1998;339(1):21-26.
7 Coiffier B, Lepage E, Briere J, et al. CHOP chemotherapy plus rituximab compared with CHOP alone in elderly patients with diffuse large-B-cell lymphoma. N Engl J Med. 2002;346(4):235-242.
8. Feugier P, Van Hoof A, Sebban C, et al. Long-term results of the R-CHOP study in the treatment of elderly patients with diffuse large B-cell lymphoma: a study by the Groupe d’Etude des Lymphomes de l’Adulte. J Clin Oncol. 2005;23(18):4117-4126.
9 Habermann TM, Weller EA, Morrison VA, et al. Rituximab-CHOP versus CHOP alone or with maintenance rituximab in older patients with diffuse large B-cell lymphoma. J Clin Oncol. 2006;24(19):3121-3127.
10. Persky DO, Unger JM, Spier CM, et al. Phase II study of rituximab plus three cycles of CHOP and involved-field radiotherapy for patients with limited-stage aggressive B-cell lymphoma: Southwest Oncology Group study 0014. J Clin Oncol. 2008;26(14):2258-2263.
11. Beal K, Allen L, Yahalom J. Primary bone lymphoma: treatment results and prognostic factors with long-term follow-up of 82 patients. Cancer. 2006;106(12):2652-2656.
12. Fidias P, Spiro I, Sobczak ML, et al. Long-term results of combined modality therapy in primary bone lymphomas. Int J Radiat Oncol Biol Phys. 1999;45(5):1213-1218.
13. Barbieri E, Cammelli S, Mauro F, et al. Primary non-Hodgkin’s lymphoma of the bone: treatment and analysis of prognostic
and contributed to the manuscript. TSF designed the study, interpreted the results, and co-authored the paper.
Data-sharing statement
The data that support the findings of this study are available from the corresponding author, TSF, upon reasonable request.
factors for stage I and stage II. Int J Radiat Oncol Biol Phys. 2004;59(3):760-764.
14. Tao R, Allen PK, Rodriguez A, et al. Benefit of consolidative radiation therapy for primary bone diffuse large B-cell lymphoma. Int J Radiat Oncol Biol Phys. 2015;92(1):122-129.
15. Ma S, Zhang Y, Li Z, et al. Role of radiation therapy differs between stages in primary bone large B-cell lymphoma in rituximab era: a population-based analysis. Front Oncol. 2020;10:1157.
16. Cai L, Stauder MC, Zhang YJ, et al. Early-stage primary bone lymphoma: a retrospective, multicenter Rare Cancer Network (RCN) study. Int J Radiat Oncol Biol Phys. 2012;83(1):284-291.
17 Persky DO, Li H, Stephens DM, et al. Positron emission tomography-directed therapy for patients with limited-stage diffuse large B-cell lymphoma: results of Intergroup National Clinical Trials Network Study S1001. J Clin Oncol. 2020;38(26):3003-3011.
18. Freeman CL, Savage KJ, Villa DR, et al. Long-term results of PET-guided radiation in patients with advanced-stage diffuse large B-cell lymphoma treated with R-CHOP. Blood. 2021;137(7):929-938.
19 Poeschel V, Held G, Ziepert M, et al. Four versus six cycles of CHOP chemotherapy in combination with six applications of rituximab in patients with aggressive B-cell lymphoma with favourable prognosis (FLYER): a randomised, phase 3, noninferiority trial. Lancet. 2019;394(10216):2271-2281.
20 Bruno-Ventre M, Ferreri AJ, Gospodarowicz M, et al. Clinical features, management, and prognosis of an international series of 161 patients with limited-stage diffuse large B-cell lymphoma of the bone (the IELSG-14 study). Oncologist. 2014;19(3):291-298.
21. Christie D, Dear K, Le T, et al. Limited chemotherapy and shrinking field radiotherapy for osteolymphoma (primary bone lymphoma): results from the trans-Tasman Radiation Oncology Group 99.04 and Australasian Leukaemia and Lymphoma Group LY02 prospective trial. Int J Radiat Oncol Biol Phys. 2011;80(4):1164-1170.
22. National Comprehensive Cancer Network. B Cell Lymphomas. Version 5.2023. https://www.nccn.org/professionals/physician_ gls/pdf/b-cell.pdf. Accessed July 24, 2023.
23. Lee JW, Prosnitz LR, Stefanovic A, Kelsey CR. Are higher doses of consolidation radiation therapy necessary in diffuse large B-cell lymphoma involving osseous sites? Adv Radiat Oncol. 2019;4(3):507-512.
Haematologica | 109 May 2024 1444 ARTICLE - Outcomes of limited stage primary bone DLBCL A. Rezazadeh et al.
SH2 domain-containing inositol 5-phosphatases support the survival of Burkitt lymphoma cells by promoting energy metabolism
Florian Mayr,1 Vanessa Kruse,1 Dominik C. Fuhrmann,2 Sebastian Wolf,3 Jens Löber,4 Saed Alsouri,1 Nadia Paglilla,1 Kwang Lee,5 Björn Chapuy,4 Bernhard Brüne,2 Thorsten Zenz,6 Björn Häupl,3,7,8,9 Thomas Oellerich3,7,8,9 and Michael Engelke1
1Institute for Cellular and Molecular Immunology, University Medical Center Göttingen, Göttingen, Germany; 2Institute for Biochemistry I, Faculty of Medicine, Johann Wolfgang Göthe University Frankfurt, Frankfurt, Germany; 3Department of Hematology/Oncology, Johann Wolfgang Göthe University, Frankfurt, Germany; 4Department of Hematology, Oncology and Cancer Immunology, Charité, Campus Benjamin Franklin, Berlin, Germany; 5Translational Medical Oncology, German Cancer Research Center and National Center for Tumor Diseases, Heidelberg, Germany; 6Department of Medical Oncology and Hematology, University Hospital Zurich, Zurich, Switzerland; 7German Cancer Consortium (DKTK), Germany; 8German Cancer Research Center (DKFZ), Heidelberg, Germany and 9Frankfurt Cancer Institute, Johann Wolfgang Göthe University Frankfurt, Frankfurt, Germany
Abstract
Correspondence: M. Engelke
michael.engelke@med.uni-goettingen.de
Received: June 2, 2023.
Accepted: October 26, 2023.
Early view: November 2, 2023.
https://doi.org/10.3324/haematol.2023.283663
Burkitt lymphoma cells (BL) exploit antigen-independent tonic signals transduced by the B-cell antigen receptor (BCR) for their survival, but the molecular details of the rewired BL-specific BCR signal network remain unclear. A loss of function screen revealed the SH2 domain-containing 5`-inositol phosphatase 2 (SHIP2) as a potential modulator of BL fitness. We characterized the role of SHIP2 in BL survival in several BL cell models and show that perturbing SHIP2 function renders cells more susceptible to apoptosis, while attenuating proliferation in a BCR-dependent manner. Unexpectedly, SHIP2 deficiency did neither affect PI3K survival signals nor MAPK activity, but attenuated ATP production. We found that an efficient energy metabolism in BL cells requires phosphatidylinositol-3,4-bisphosphate (PI(3,4)P2), which is the enzymatic product of SHIP proteins. Consistently, interference with the function of SHIP1 and SHIP2 augments BL cell susceptibility to PI3K inhibition. Notably, we provide here a molecular basis of how tonic BCR signals are connected to energy supply, which is particularly important for such an aggressively growing neoplasia. These findings may help to improve therapies for the treatment of BL by limiting energy metabolism through the inhibition of SHIP proteins, which renders BL cells more susceptible to the targeting of survival signals.
Introduction
Burkitt lymphoma (BL) derives from germinal center B cells and represents a clinically aggressive non-Hodgkin lymphoma. Currently, BL is treated with intensive chemotherapy that result in high cure rates in younger patients. Treatment options for elderly patients are more challenging with lower cure rates and particularly problematic in areas with limited medical infrastructure, emphasizing the need for more targeted therapeutic options. The hallmark of BL is a translocation of the MYC oncogene into an immunoglobulin locus leading to augmented MYC expression.1 In order to counterbalance the apoptosis-sensitizing effect of c-Myc, the majority of BL subtypes employ
the tonic signaling network of the B-cell antigen receptor (BCR), which is transduced in the absence of antigen binding and usually ensures the survival of mature B cells.2,3 Accordingly, BL cell fitness depends on the expression of the BCR and its co-receptor CD19.4
Genetic analyses revealed that a substantial part of BL cells exhibits mutations in the genes encoding the transcription factor TCF3 or its inhibitor ID3, leading to a complex rewiring of tonic BCR signals.5,6 In germinal center B cells, TCF3 is the key regulator of the centroblast program, which apparently is utilized by BL cells.7,8 TCF3 represses the expression of the SHP1 coding gene, which is an important negative regulator and dephosphorylates BCR effectors such as the tyrosine kinase Syk.2 Syk has been shown to be required
Haematologica | 109 May 2024 1445 - Non-Hodgkin Lymphoma ARTICLE
©2024 Ferrata Storti Foundation
Published under a CC BY-NC license
for BL-specific tonic BCR signaling and the destabilization of Syk by inhibition of the chaperone HSP90 limits BL cell survival.9
Since the TCF3-induced changes in the tonic BCR signal network result in augmented phosphatidylinositol 3-kinase (PI3K) activity, which facilitates activation of the AKT-mTOR survival pathway, a pivotal role of PI3K signals in BL-specific signaling was suggested and experimentally validated.2,10 While cell line and murine models confirm the importance of PI3K, a recent study indicates that AKT activity is not the main driver of BL survival, suggesting that an exact regulation of tonic PI3K signals is required in BL cells.11
Downstream of the BCR, PI3K activity can be counterbalanced by the SH2-containing inositol 5-phosphatases SHIP1 and 2, which dephosphorylate phosphatidylinositol trisphosphate (PIP3) and disrupt plasma membrane docking sites for BCR effectors such as Bruton’s tyrosine kinase (BTK).12 While SHIP1 is required to adjust the efficiency of BCR signals in B-cell activation,13 little is known about the role of SHIP proteins in tonic BCR signaling, except that both SHIP1 and SHIP2 are constitutively active in BL cells.14
A comprehensive mass spectrometry analysis of the phospho-proteome in BL cell lines revealed a complex tonic BCR signal network, which goes far beyond PI3K-dependent pathways.14 It also includes proteins that are involved in metabolism, which is consistent with findings that BL cells undergo a metabolic shift towards aerobic glycolysis to maintain their energy status.15 One-carbon metabolism may also play an important role in BL cells, since it is upregulated in comparison to diffuse large B-cell lymphoma cells.16 SHMT2, a protein of the mitochondrial glycine biosynthetic pathway, indirectly influences tonic BCR signaling in BL cells by controlling the TCF3-driven survival program.17 However, little is known about how tonic BCR signaling initiates the required metabolic changes in BL cells.
Here, we report that SHIP1 and SHIP2 contribute to the fitness of BL cells by a previously unknown mechanism. While having no significant impact on PI3K signaling, SHIP proteins sustain the energy metabolism in BL cells. Inhibition or interference with SHIP expression renders BL cells more sensitive to inhibition of tonic BCR signals, which might give rise to new options for combinatorial therapies of BL.
Methods
Cell culture, proliferation, and apoptosis assays
Ramos (DSMZ ACC603), DG75 (DSMZ ACC83), Daudi (DSMZ ACC78) and Raji (DSMZ ACC319) cells were cultivated in RPMI-1640 GlutaMax (Gibco) containing penicillin/streptomycin, 50 mM β-mercaptoethanol and 1-20% fetal calf serum depending on the application. The XTT proliferation assay (Biozol) was performed accord-
ing to the manufacturer’s protocol and analyzed with an enzyme-linked immunosorbant assay plate reader (Powerwave340, BioTek). For cell counting, cells were seeded at constant densities in 48-well plates and the number of living cells or GFP-positive cells was determined by flow cytometry.
Annexin V-APC/7-AAD assays (Biolegend) were carried out according to the manufacturers protocol. BH3-profiling was conducted as published18,19 and details can be obtained from the Online Supplementary Appendix Stable isotope labeling with amino acids in cell culture (SILAC) and subsequent mass spectrometric analysis was performed as published.17 Details can be obtained from the Online Supplementary Appendix.
Antibodies and flow cytometry
All primary and secondary antibodies are listed in the Online Supplementary Appendix. For flow cytometry analysis either FACS Celesta or LSRII, and FlowJo Version 10.6.2 (BD) was used.
Cell staining
A total of 106 cells were stained on ice for 20-30 minutes (min) and washed with phosphate-buffered saline (PBS). For intracellular labeling cells were fixed in Cytofix buffer (BD) diluted 1:2 with serum-free RPMI1640 (Gibco) for 15 min at 37°C and centrifuged at 450 rpm. Cells were resuspended in 200 mL 1x Perm/Wash buffer I (BD) containing 2% bovine serum albumin and incubated for 10 min at room temperature (RT), followed by 1:1 dilution with Perm/Wash buffer I and further 10 min incubation. Cells were stained in 100 mL 1x Perm/Wash I + primary antibody for 45 min at RT, centrifuged at 450 rpm and washed.
Glucose uptake
Cells were starved for 60 min at 37°C in RPMI1640 without glucose (Gibco™), followed by addition of 2-NBDG (100 mM; Thermo Scientific). Glucose uptake was stopped by the addition of ice-cold 1x PBS at indicated time points, washed and incubated for 20 min with 5 mg/mL 7-AAD.
Seahorse assay
On poly-D-lysine (PDL)-coated Seahorse 96-well cell culture plates 3x10⁴ cells were seeded in XF RPMI medium containing 10 mM glucose and 2 mM glutamine (Agilent). Plates were centrifuged at 300 rpm for 1 min and cells were incubated for 30 min in a non-CO2 incubator at 37°C. Metabolic parameters were measured on a Seahorse XFe 96 extracellular flux analyzer (Agilent). In order to analyze the ATP production rate, 2.5 mM oligomycin and 500 nM rotenone together with antimycin A were sequentially added to the cells (Cayman Chemicals). Data were processed using Wave Desktop (Version 2.6.0.31) and ATP rates were calculated using the Seahorse Analytics online tool (Version March 2022).
Haematologica | 109 May 2024 1446 ARTICLE - SHIP support the metabolism and survival of BL F. Mayr et al.
Immunoblotting and western blot analysis
Cleared cellular lysates (CCL) were obtained by incubating cells on ice in lysis buffer (50 mM Tris/HCl pH 7.5, 150 mM NaCl, 1 mM EDTA, 1% NP40, 1 mM Na 3VO 4, 5 mM NaF, 0.1% sodium deoxycholate, 5 mM β -glycerophosphate, 10 mM N-ethylmaleimide, 1:50 protease inhibitor cocktail). CCL were subjected to SDS-PAGE and blotted on nitrocellulose membranes. Membranes were developed in enhanced chemiluminescence solution using ChemoStarECL (Intas).
Imaging flow cytometry
For imaging flow cytometry, we resuspended cells in Krebs-Ringer buffer (10 mM HEPES, pH 7.4; 140 mM NaCl; 4 mM KCl; 1 mM MgCl2; 10 mM glucose; 1 mM CaCl2) and collected data with an Amnis ImageStream X MKII. IDEAS (Version 6.2) software (Amnis) was used for analysis and cells with plasma membrane-localized signal were identified by using Homogeneity and Entropy parameters.
Results
SHIP2 supports the proliferation of Burkitt lymphoma cells
We aimed at identifying those tonic BCR components that support the survival of BL cells with a focus on PI3K-related proteins and reassessed a recently performed shRNA-based “drop-out” screen of different BL cell lines.20
As highlighted in Figure 1A, targeting expression of the SHIP2-encoding gene INPPL1 (P=0.019) was identified as one of the first BCR-proximal effectors in rank 151 of genes with relevance for BL fitness and has a similar significance as PAX5 (P=0.004), which was reported as one of the most critical among the 5,045 included genes.
We sought to corroborate these findings and treated different BL cell lines with the small molecule inhibitor AS1949490, which has been shown to be SHIP2-specific.21
In order to consider the diversity among BL, we chose tonic BCR signal-dependent BL cell lines of different entities, such as Daudi,22 which represent endemic BL, and Ramos23 as well as DG75,24 which derive from patients with sporadic BL. The surface BCR (sBCR)-negative BL cell line Raji (Online Supplementary Figure S1F) served as control. We evaluated the cell proliferation with an XTT assay after treatment with increasing inhibitor concentrations and the values of three independent experiments were normalized to solvent controls. As depicted in Figure 1B, all BCR-dependent BL cell lines exhibit an attenuated growth under SHIP2 inhibition in a dose-dependent manner starting at 5 mM, while Raji control cells appear to be unaffected up to 20 mM, implying that SHIP2 supports BL fitness in a BCR-dependent manner.
In order to further examine the SHIP2 function in BL-specific survival signaling, we targeted the SHIP2-encoding gene INPPL1 in Daudi, Ramos, DG75, and Raji control cells
by using the CRISPR/Cas9 method (Online Supplementary Figure S1A). We confirmed successful targeting and flow cytometry revealed unaffected sBCR expression (Online Supplementary Figure S1B-E). In order to exclude off-target and further clonal effects, we reconstituted the SHIP2-deficient cell lines with constructs encoding for a citrine-tagged version of SHIP2 (Online Supplementary Figure S1D). The results of XTT assays as well as cell counting (Figures 1C and D, respectively) confirmed compromised growth in the absence of SHIP2 in all sBCR-positive cell lines. Reconstitution of SHIP2-deficiency significantly improved the proliferation of Ramos and DG75 cells, thereby excluding off-target effects of the employed sgRNA, while in Daudi cells the expression of CitSHIP2 partly rescued cell proliferation. Inducible downregulation of SHIP2 expression in Ramos cells by tetracycline-dependent expression of three different shRNA confirmed these results ( Online Supplementary Figure S1G). Notably, the proliferation of two independent INPPL1-/- clones of sBCR-deficient Raji cell lines was unaffected (Figure 1 E), further indicating that the supportive role of SHIP2 for the BL cell fitness is part of the tonic BCR signal network.
Burkitt lymphoma cells are more sensitive to apoptosis in the absence of SHIP2
In order to assess if SHIP2-deficiency renders BL cells more sensitive to programmed cell death, we stained the generated cell lines with Annexin V/7-AAD, which revealed a significant increase of total apoptosis in the absence of SHIP2 expression in Daudi and Ramos cells (Figure 2A; Online Supplementary Figures S2A, B). Since DG75 cells lack expression of the pro-apoptotic proteins BAX and BAK, an Annexin V-based assay is not possible.26,27 Therefore, we complemented the apoptosis analyses by intracellular staining for active caspase-3, which confirmed the higher sensitivity to apoptosis in all three SHIP2-deficient cell lines (Figure 2B; Online Supplementary Figures S2A, C). We employed BH3 profiling in our Daudi cell lines to identify the molecular details of the augmented apoptosis in the absence of SHIP2. Here, BH3-peptides are used to induce apoptosis and the sensitivity to certain peptides correlates with the involved apoptotic pathways.27,28 Apoptosis was determined according to the cytochrome c release, in which DMSO and alamethicin served as negative and positive controls, respectively. As shown in Figure 2C, SHIP2-deficient Daudi cells are markedly more sensitive to the apoptosis-inducing BIM peptide, thereby confirming their increased susceptibility to apoptosis. Moreover, in the absence of SHIP2 all BH3 peptides that inhibit specific anti-apoptotic proteins induce more cytochrome c release compared to parental or reconstituted cells. These data imply that SHIP2 deficiency does not affect a specific pathway, such as the FS-1-sensitive BFL-1 pathway, which is important for the survival of B cells,29 but renders BL cells in general more susceptible to apoptosis.
Haematologica | 109 May 2024 1447 ARTICLE - SHIP support the metabolism and survival of BL F. Mayr et al.
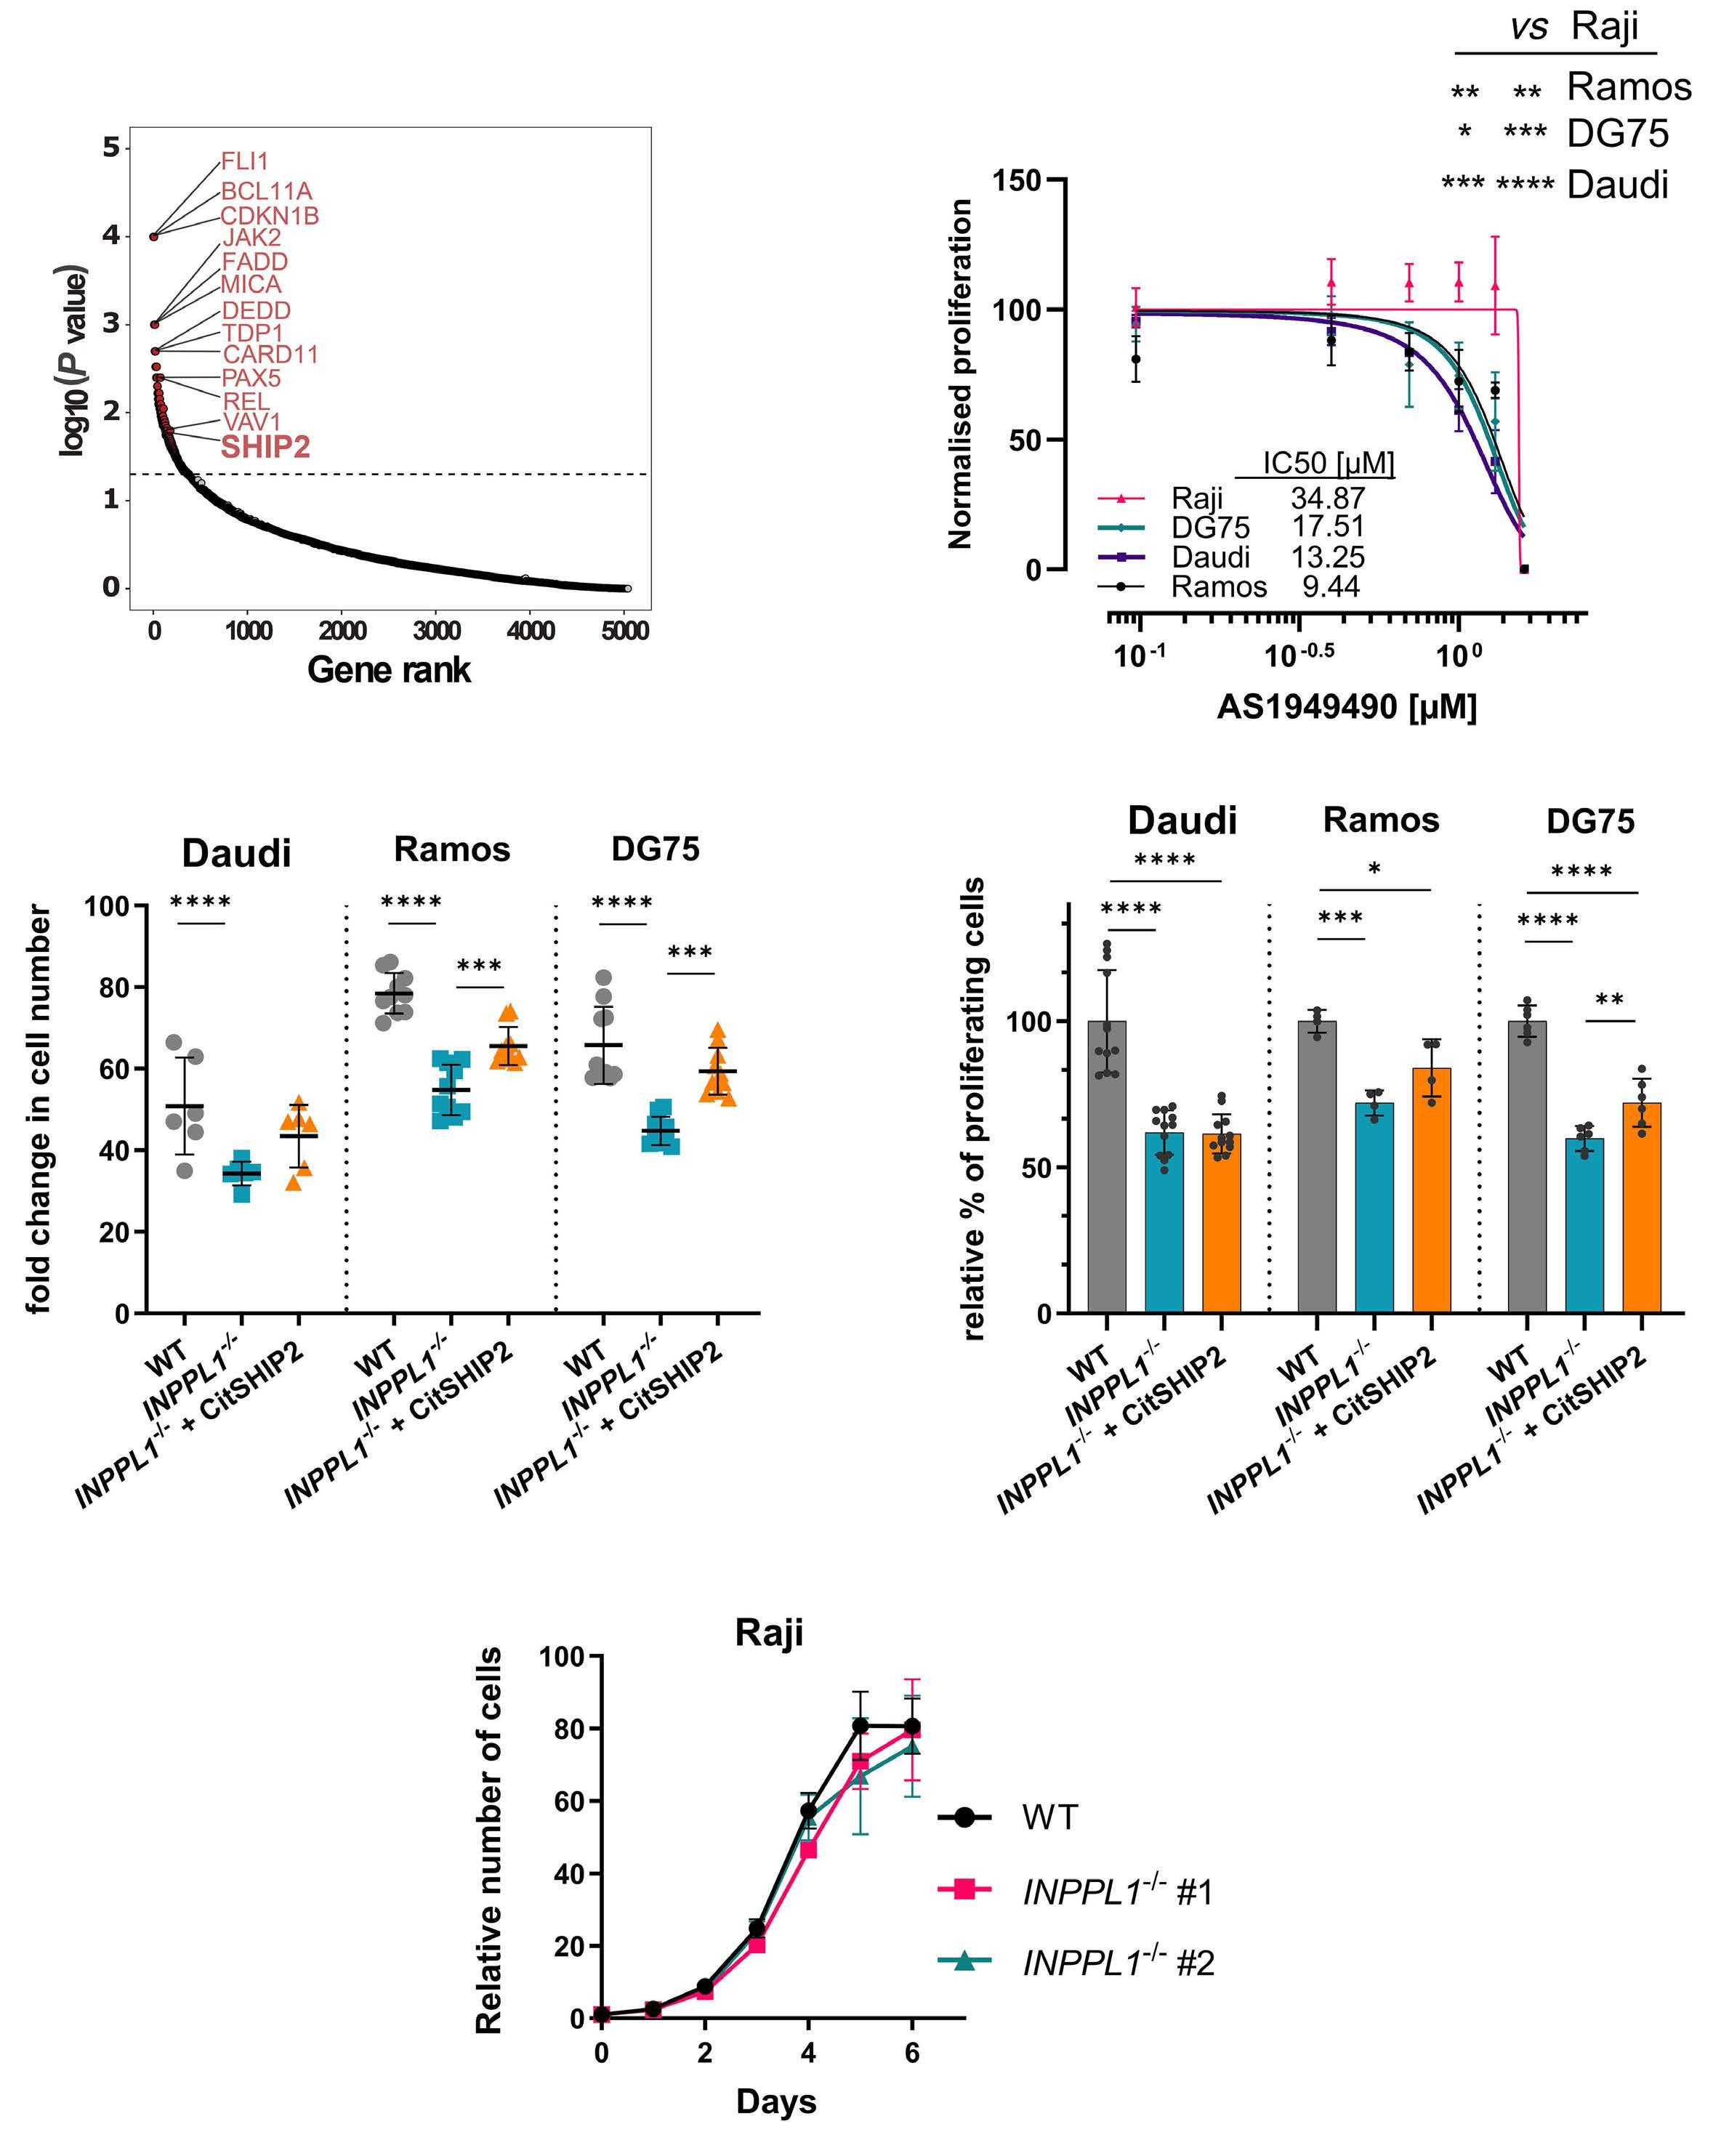
Figure 1. SHIP2 supports the proliferation of Burkitt lymphoma cells. (A) Data revealed from a previous short hairpin RNA (shRNA) screen in N=8 different Burkitt lymphoma (BL) cell lines are reassessed and plotted according to their significance for BL fitness (y-axis) and their rank among the 5,045 genes (x-axis).20 Highlighted are the top relevant genes together with SHIP2. (B) Dose-response curve of BL cell lines treated with increasing concentrations of AS1949490. The proliferation was assessed by XTT after 24-hour treatment and data were normalized to respective vehicle controls. Half-maximal inhibitory concentration (IC50) values were calculated using GraphPad Prism 10. (C) Cell counting of SHIP2-negative and CitSHIP2-reconstituted BL cell lines. Living cells were counted on day 7 (Daudi) or day 4 (Ramos/DG75) and normalized to day 0. (D) XTT proliferation assay of SHIP2-negative and CitSHIP2-reconstituted cells confirmed the cell counting assay. Proliferation was obtained by XTT assay after day 4 (Daudi) or day 1 (Ramos/DG75). Data was normalized to respective wild-type (WT) controls and the significance was calculated by oneway ANOVA. (E) Cell counting of Raji INPPL1-/- cells revealed no difference in proliferation in surface B-cell receptor (BCR)-negative cells. Cell count on each day was normalized to day 0. Significance was calculated using one-way ANOVA. If not indicated otherwise experiments were performed N≥3. Error bars indicate the standard deviation. Significance is indicated by *P<0.05, **P<0.01, ***P<0.001, ****P<0.0001.
Haematologica | 109 May 2024 1448 ARTICLE - SHIP support the metabolism and survival of BL F. Mayr et al.
A C B D E
SHIP2 is not involved in the regulation of major tonic B-cell receptor signaling pathways
Based on the evidence that SHIP2 contributes to BL cell fitness, we analyzed the involved tonic BCR signal processes. Since PI3K-dependent signals are believed to be pivotal for BL survival and SHIP2 opposes PI3K activity, we first analyzed the activity of the PI3K effector AKT by determining the phosphorylation at the regulatory residue S473 in resting cells (Online Supplementary Figure S3A).
However, western blot analyses and flow cytometry of intracellularly stained cells revealed only marginal changes in SHIP2-deficient cells (Figure 3A, B) or after SHIP2 inhibition (Online Supplementary Figure S3B, C). In order to test for further downstream signaling that may support BL cells, we determined phosphorylation levels of the MAPK JNK, ERK, and p38 in Daudi and Ramos cells (Figure 3C-E). These nalyses revealed a mild decrease of phospho-JNK signals in SHIP2-deficient Daudi cells, while in Ramos cells MAPK
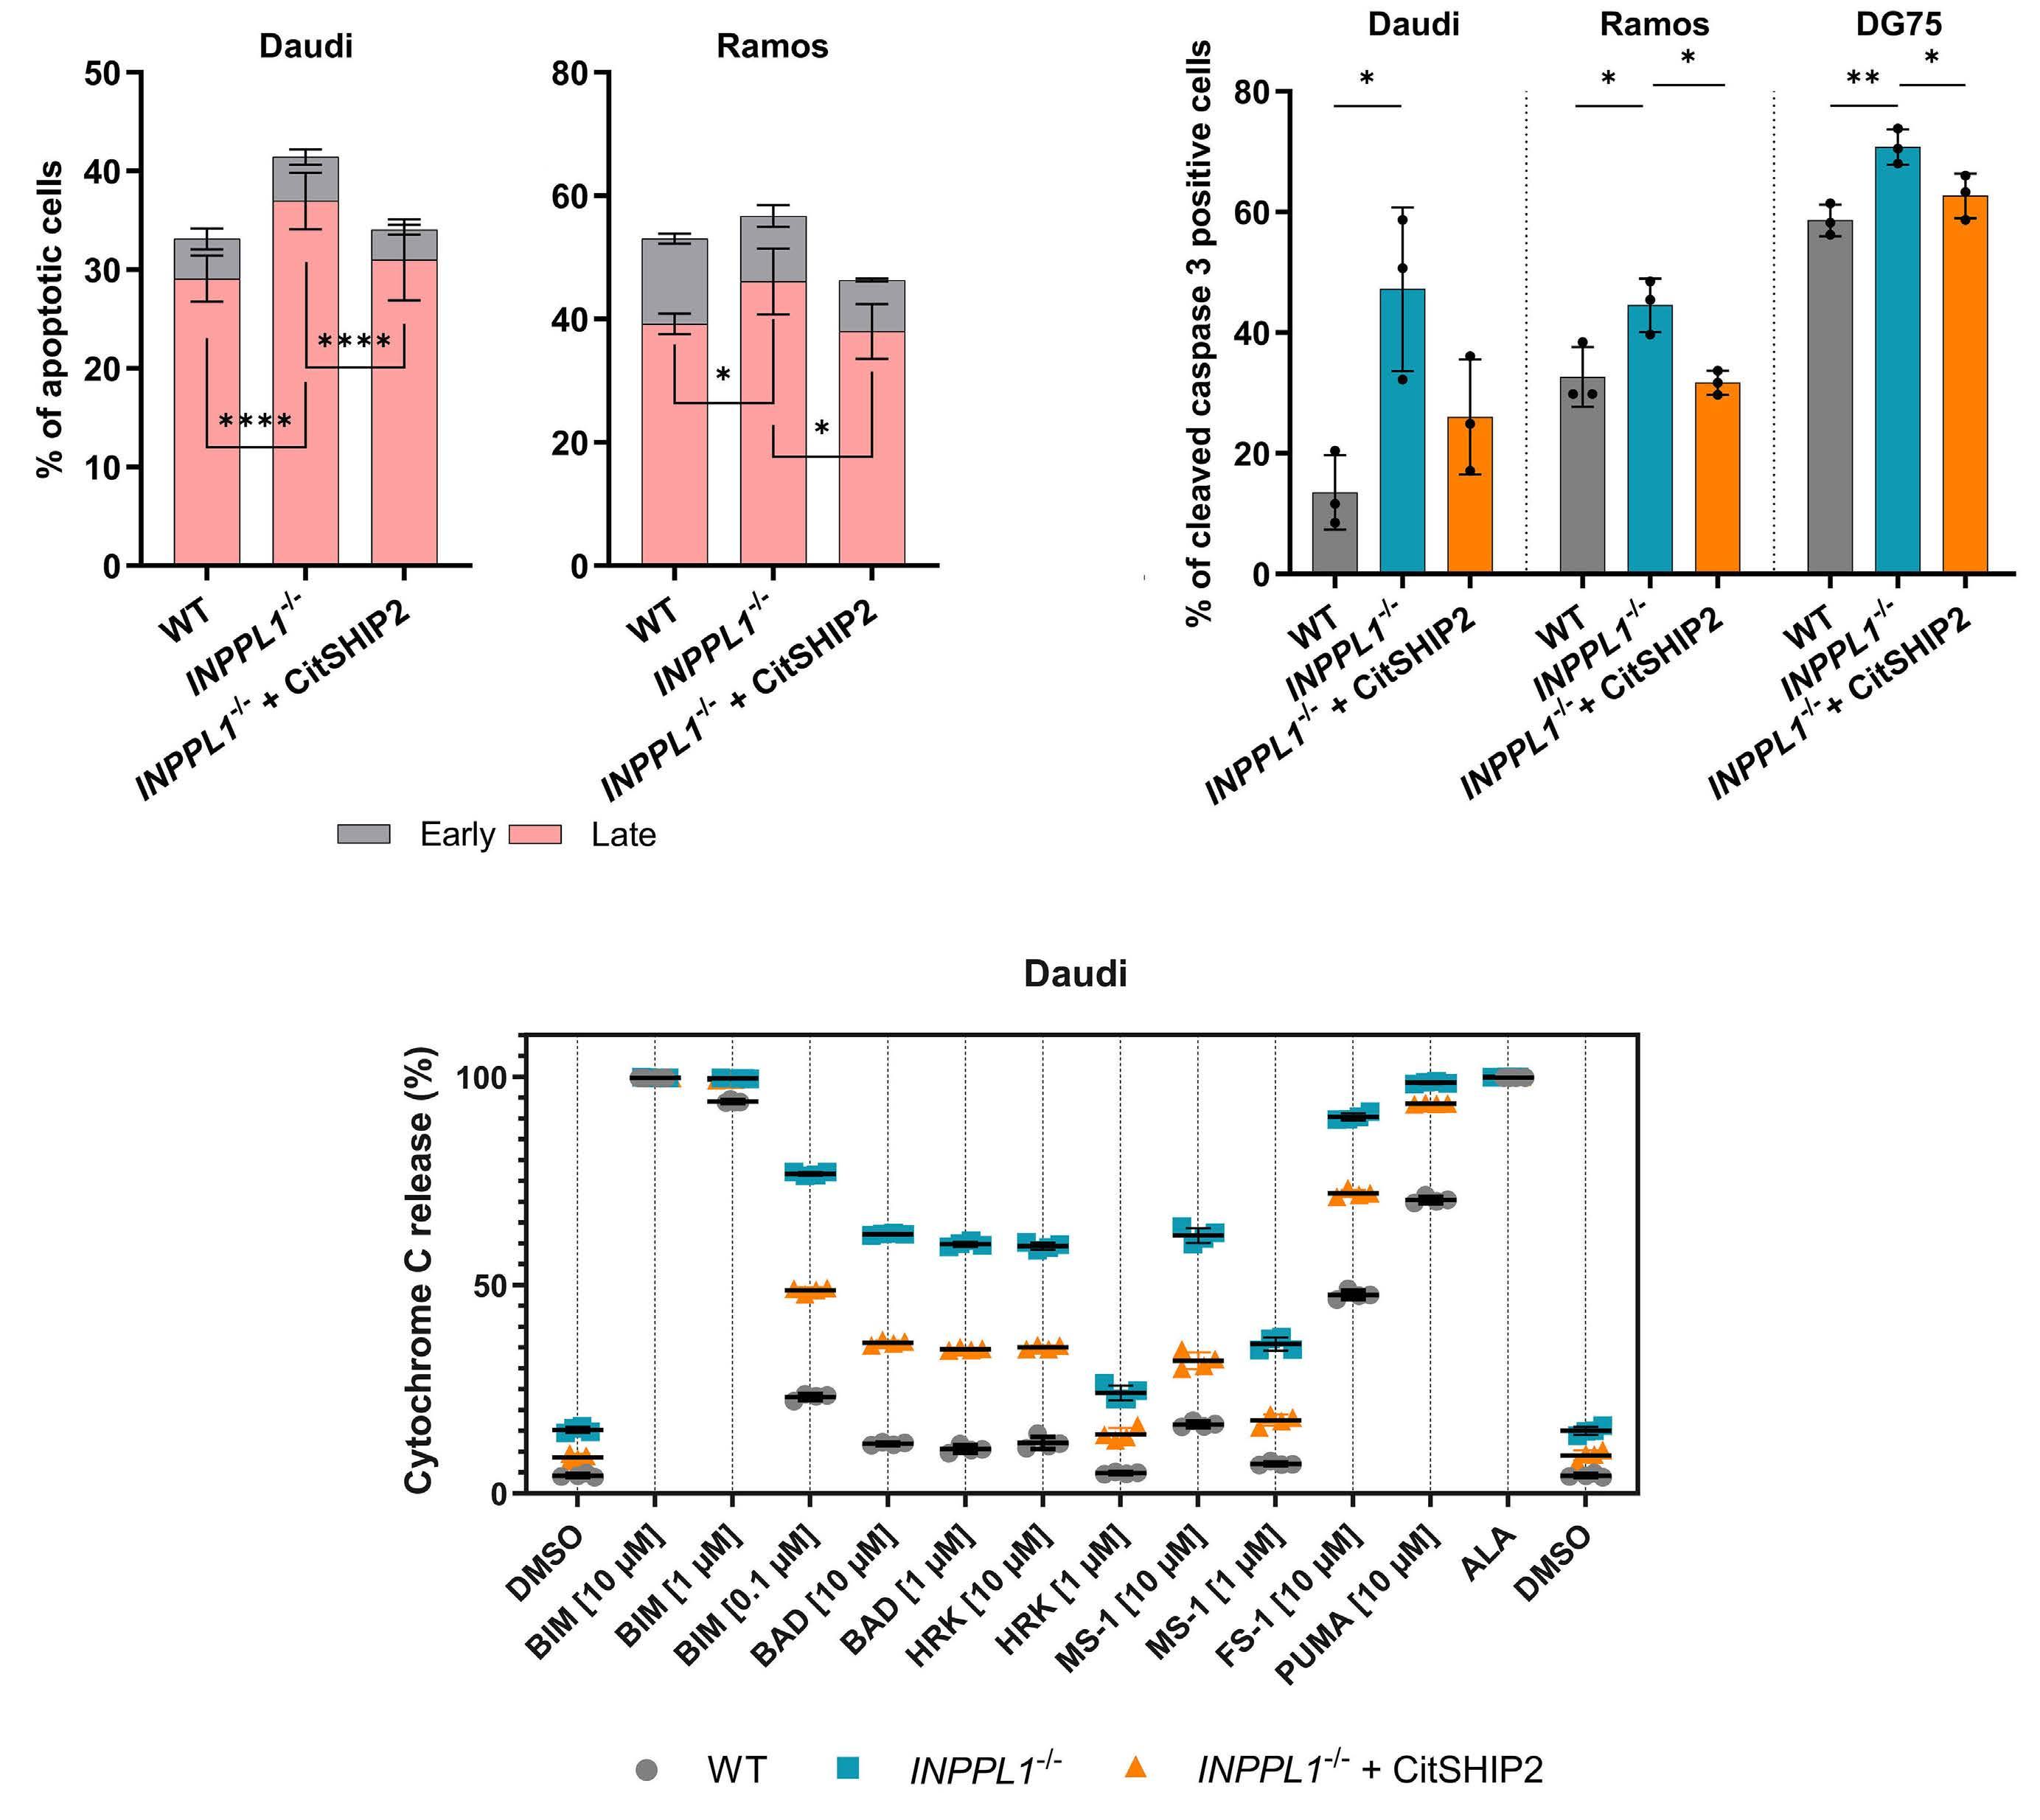
Figure 2. Burkitt lymphoma cells are more sensitive to apoptosis in the absence of SHIP2. (A) Apoptosis assay of Daudi and Ramos parental, SHIP2-negative and CitSHIP2-expressing cells as indicated by Annexin V/7-AAD staining. Apoptosis was induced by cultivation in 1% fetal calf serum medium prior to measurement for 2 or 3 days for Ramos and Daudi, respectively. Significance is calculated by two-way-ANOVA. (B) Cells, including the DG75 cell lines, were treated the same way as (A) followed by intracellular staining for cleaved caspase 3. Significance is calculated by one-way ANOVA. (C) BH3 profiling of Daudi wild-type (WT), SHIP2-deficient and CitSHIP2-expressing cells to assess the sensitivity to apoptosis. Cells were cultivated in medium containing 10% fetal calf serum prior to profiling. The displayed graph is 1 representative replicate and statistical analyses was performed by two-way ANOVA. If not indicated otherwise experiments were performed N≥3. Error bars indicate the standard deviation. Significance is indicated by *P<0.05, **P<0.01, ***P<0.001, ****P<0.0001.
Haematologica | 109 May 2024 1449 ARTICLE - SHIP support the metabolism and survival of BL F. Mayr et al.
A C B
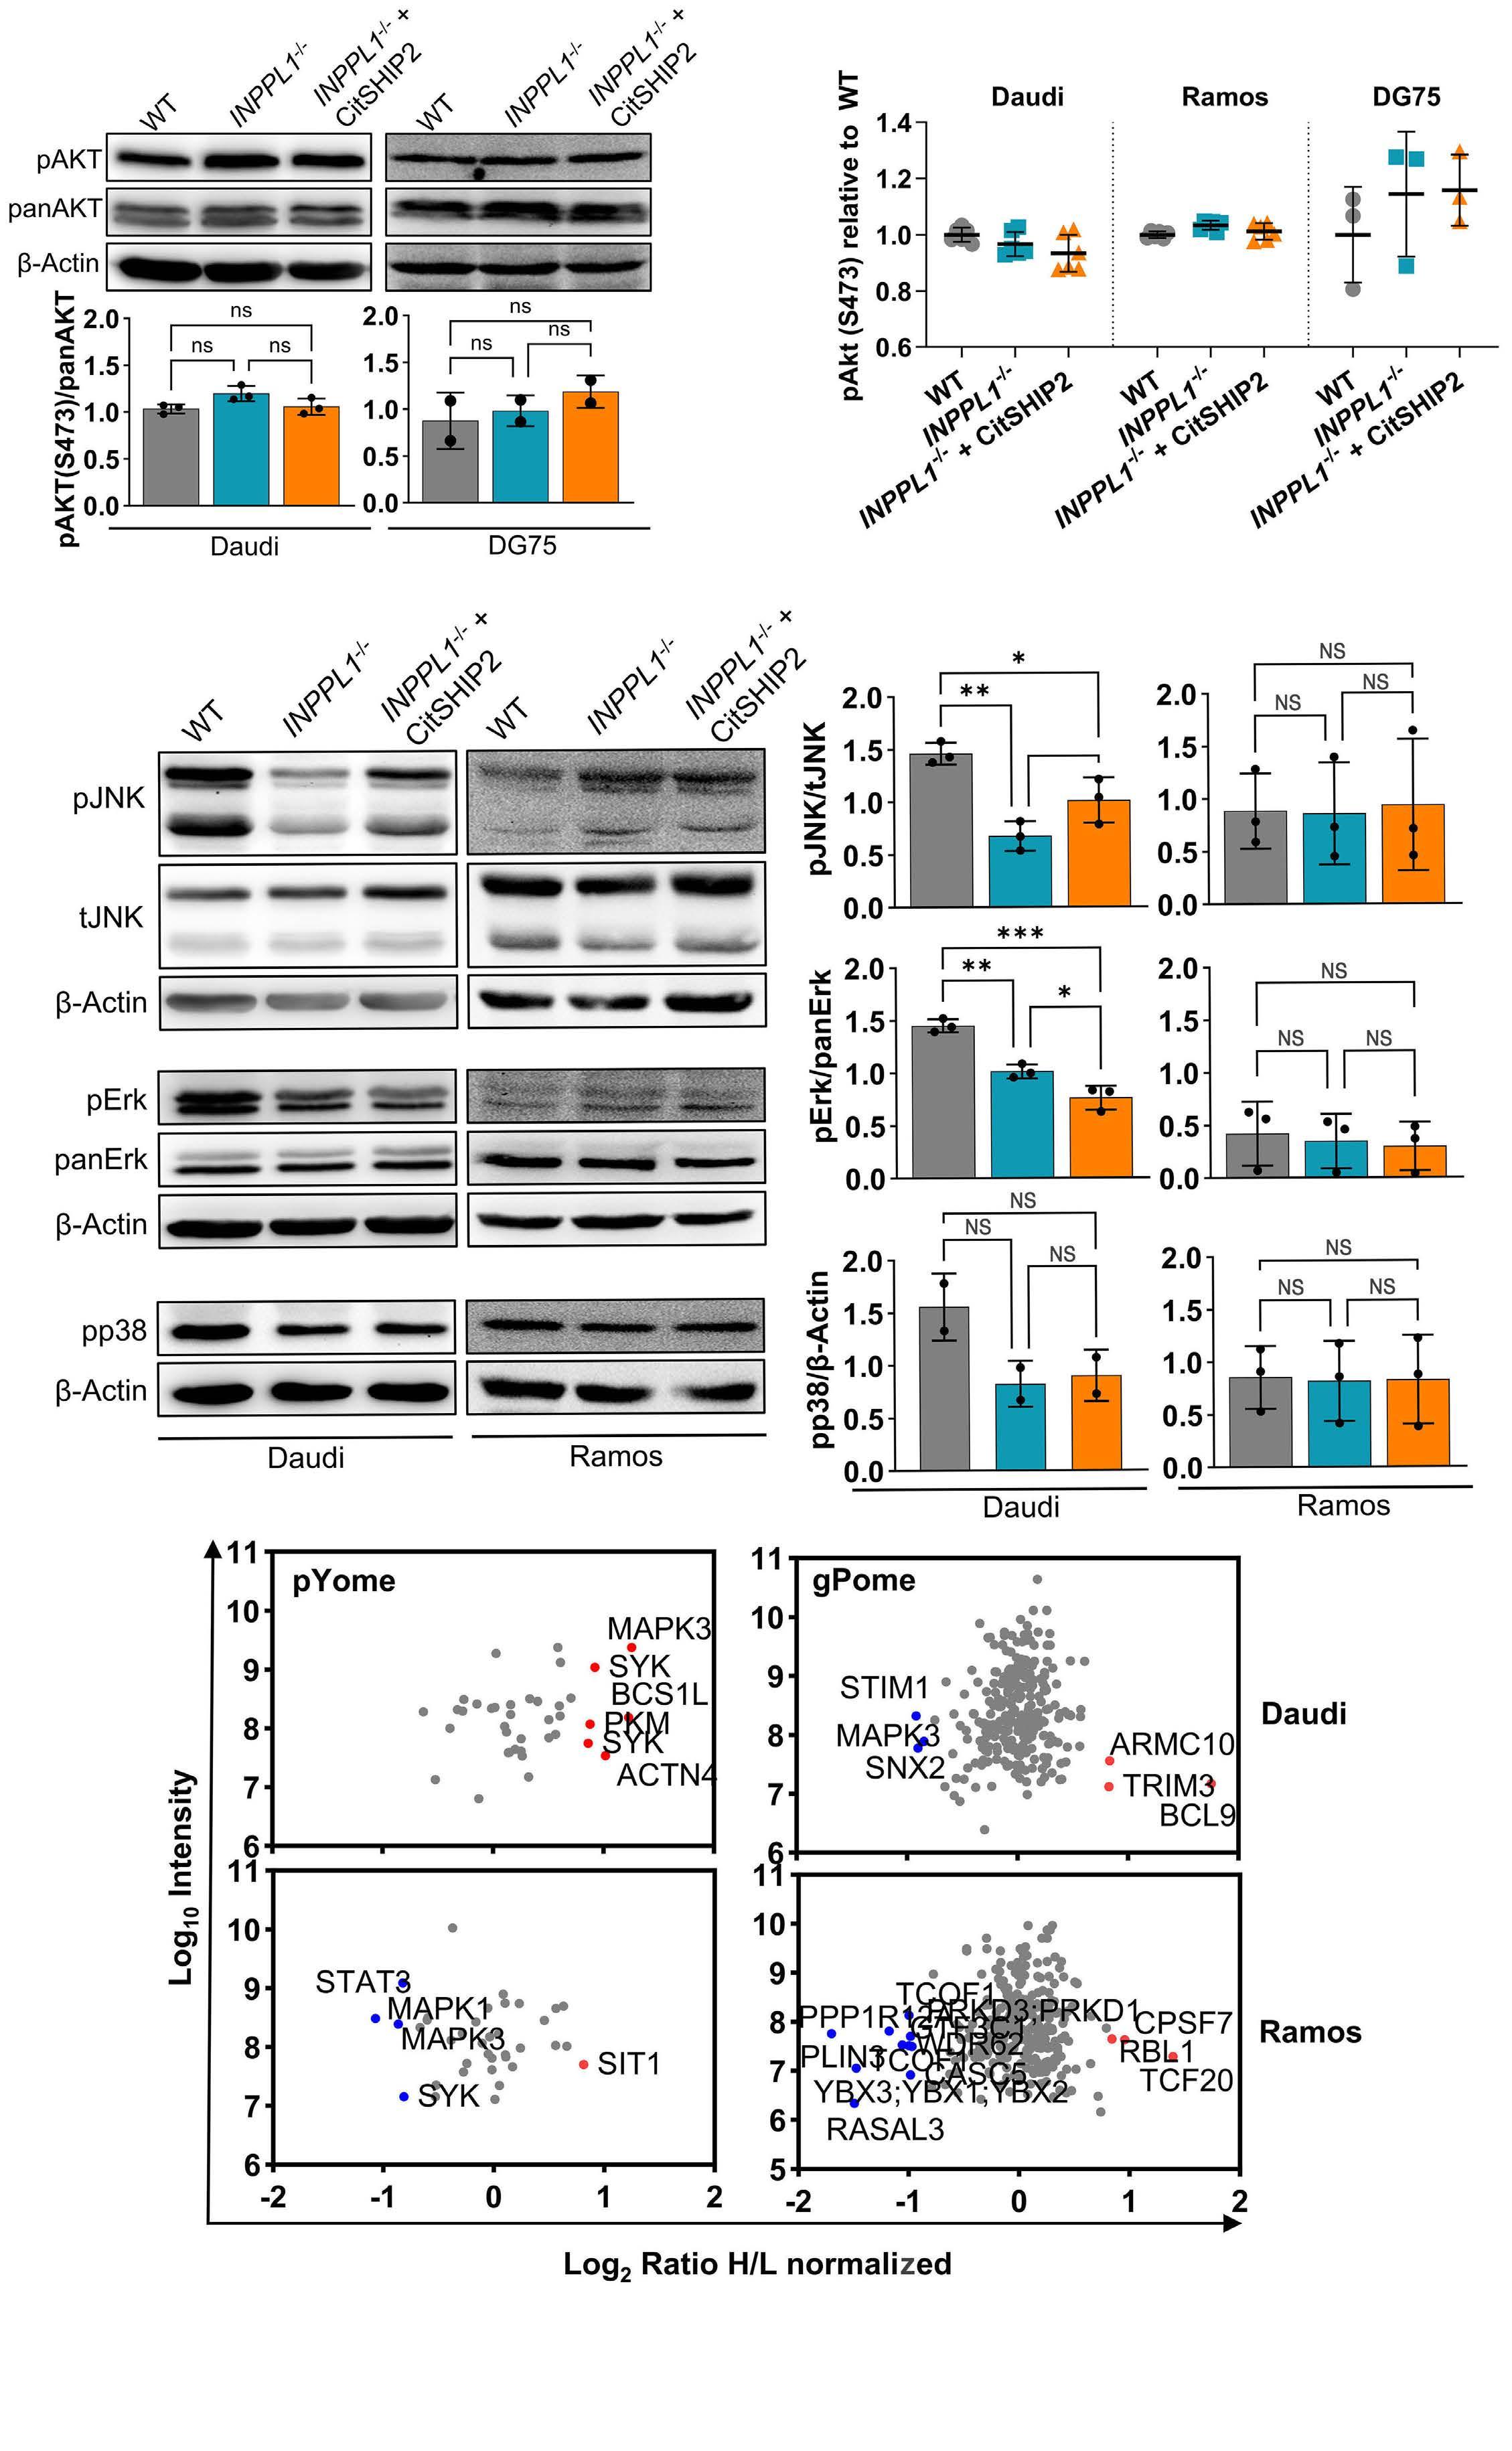
Figure 3. SHIP2 is not involved in the regulation of major tonic B-cell receptor signaling pathways. (A) Western blot analysis of phospho-Akt S473 in Daudi and DG75 cell lines. (B) Intracellular staining for phospho-Akt S473 in the Daudi, Ramos and DG75 cell lines. (C-E) Western blot analysis revealing the phosphorylation levels of phospho-JNK T183/Y185, phospho-Erk T202/Y204 and phospho-p38 T180/Y182 upon loss of SHIP2. Quantification of blots was performed using ImageJ. Normalization was carried Continued on following page.
Haematologica | 109 May 2024 1450 ARTICLE - SHIP support the metabolism and survival of BL F. Mayr et al.
A B C D E F
out either to β-actin or the non-phosphorylated protein levels. (F) Phosphoproteomic analysis of the phosphorylation of tonic B-cell receptor (BCR) signaling contributors upon loss of SHIP2. The global phosphatome (gPome) and tyrosine-phosphatome (pYome) of SHIP2-deficient Ramos and Daudi cells were compared to reconstituted cells in a stable isotope labeling with amino acids in cell culture (SILAC) approach and the resulting data was queried for known phosphosites involved in tonic BCR signaling. Blue and red dots resemble proteins with significantly augmented and attenuated phosphorylation sites, respectively, in the absence of SHIP2. Data shown consists of single SILAC measurements. If not indicated otherwise experiments were performed N≥3. Error bars indicate the standard deviation. Significance was calculated by one-way ANOVA and is indicated by *P<0.05, ** P<0.01, ***P<0.001, ****P<0.0001.
phosphorylation remained unaltered or appeared to be a clonal feature, because reconstitution did not re-establish the phosphorylation levels to those of parental cells.
In order to confirm that pivotal tonic BCR-dependent processes were not affected by SHIP2, we utilized a comprehensive mass spectrometry-based phosphoproteome analysis. For this purpose, we performed stable isotope labeling with amino acids in cell culture (SILAC) allowing for quantitative mass spectrometry. The obtained data set (Online Supplementary Tables S1-4) was aligned with the published BL-related global and tyrosine-based tonic BCR phosphoproteomes.14 The changes in the identified tonic BCR effectors according to SHIP2 expression are depicted in Figure 3F. While we identified some SHIP2-dependent tonic BCR effector phosphorylation, this regulation is not consistent among Daudi (upper panel) and Ramos cells (lower panel). Notably, this approach did not reveal regulators or effectors of PI3K signaling.
Lack of SHIP2 function augments Burkitt lymphoma cell sensitivity to inhibition of survival signals
Since we could not identify any impact of SHIP2 on PI3-kinase-dependent survival signaling, we examined how SHIP2-deficient BL cells respond to inhibition of PI3K-dependent processes. Daudi and especially Ramos cells showed sensitivity to the selective PI3K inhibitor copanlisib in a dose-dependent manner, while DG75 cells were only mildly affected (Figure 4A). XTT-based proliferation measurements (Figure 4B) as well as cell counting (Figure 4C) revealed that SHIP2-deficient Daudi and Ramos cells were markedly more sensitive to copanlisib than their WT and reconstituted counterparts, while in the more resistant DG75 cells these differences were less pronounced. Correspondingly, in Daudi and Ramos cells the absence of SHIP2 causes augmented proportions of apoptotic cells after copanlisib treatment (Figure 4D; Online Supplementary Figure S4A, B). Consistently, the combined inhibition of PI3K and SHIP2 caused a more efficient reduction of BL cell proliferation compared to copanlisib only treatment (Figure 4E). In DG75 cells, supposedly due to their lower sensitivity, this effect, however, was moderate. In all analyzed cell lines, we did not observe an additional effect of SHIP2 inhibition on pAKT levels (Online Supplementary Figure S4D). Notably, we did not observe the strong sensitizing effect of SHIP2 deficiency after AKT inhibition (Online Supplementary Figure S4C). These data imply that the SHIP2 function in BL survival is beyond the regulation of
PI3K signaling, and that SHIP2 deficiency renders BL cells more sensitive to the inhibition of tonic BCR survival signals.
SHIP2 is required for an efficient energy supply in Burkitt lymphoma cells
In order to assess the PI3K-independent role of SHIP2 in BL fitness, we analyzed the proteome of SHIP2-deficient and reconstituted BL cell lines. The generated data (Online Supplementary Table S5) were aligned with the STRING database to assign the identified proteins to their respective KEGG pathways (Figure 5A). This approach revealed a mildly reduced abundance of several cell cycle regulators (green dots/spots) in SHIP2-deficient cells, which, however, does not correlate with changes in the cell cycle of the different Daudi and Ramos cell lines (Online Supplementary Figure S5A, B). We also found a slightly altered abundance of proteins involved in energy metabolism (red dots) in the absence of SHIP2 (Figure 5A). This prompted us to analyze the plasma membrane expression of the glucose transporters GLUT1 and GLUT4, which were unaltered in SHIP2-deficient Daudi and Ramos cells when compared to reconstituted cells (Figure 5B). Consistently, the glucose uptake was almost identical in INPPL1-/- and parental cells, indicating a role of SHIP2 independent of glucose supply (Figures 5C; Online Supplementary Figure S5C). Therefore, we tested apoptosis rates in cells that were treated with the competitive glycolysis inhibitor 2-DG, which abrogates energy metabolism early in glycolysis.30 Under these conditions, SHIP2 deficiency did not increase apoptosis rates of Ramos cells, which indicates a role of SHIP2 in the energy metabolism of BL cells downstream of glucose-6-phosphate production (Figure 5D). In order to assess this effect in more detail, we utilized a Seahorse assay to determine the rates of ATP production in the different BL cell lines. This approach revealed a significant decrease in glycolytic and mitochondrial ATP production in all SHIP2-deficient BL cell lines while the mitochondrial mass remained unaltered (Figure 5E; Online Supplementary Figure S5D). Expression of CitSHIP2 largely re-established ATP production, albeit in Daudi cells the reconstitution was marginal. These data imply that SHIP2 is required for efficient ATP production of BL cells.
The enzymatic SHIP2 product PI(3,4)P2 contributes to Burkitt lymphoma cell fitness
In order to assess, if the SHIP2 enzymatic product phosphatidylinositol-3,4-bisphosphate (PI(3,4)P2) is responsible for its energy supporting role, we employed a GFP-tagged
Haematologica | 109 May 2024 1451 ARTICLE - SHIP support the metabolism and survival of BL F. Mayr et al.
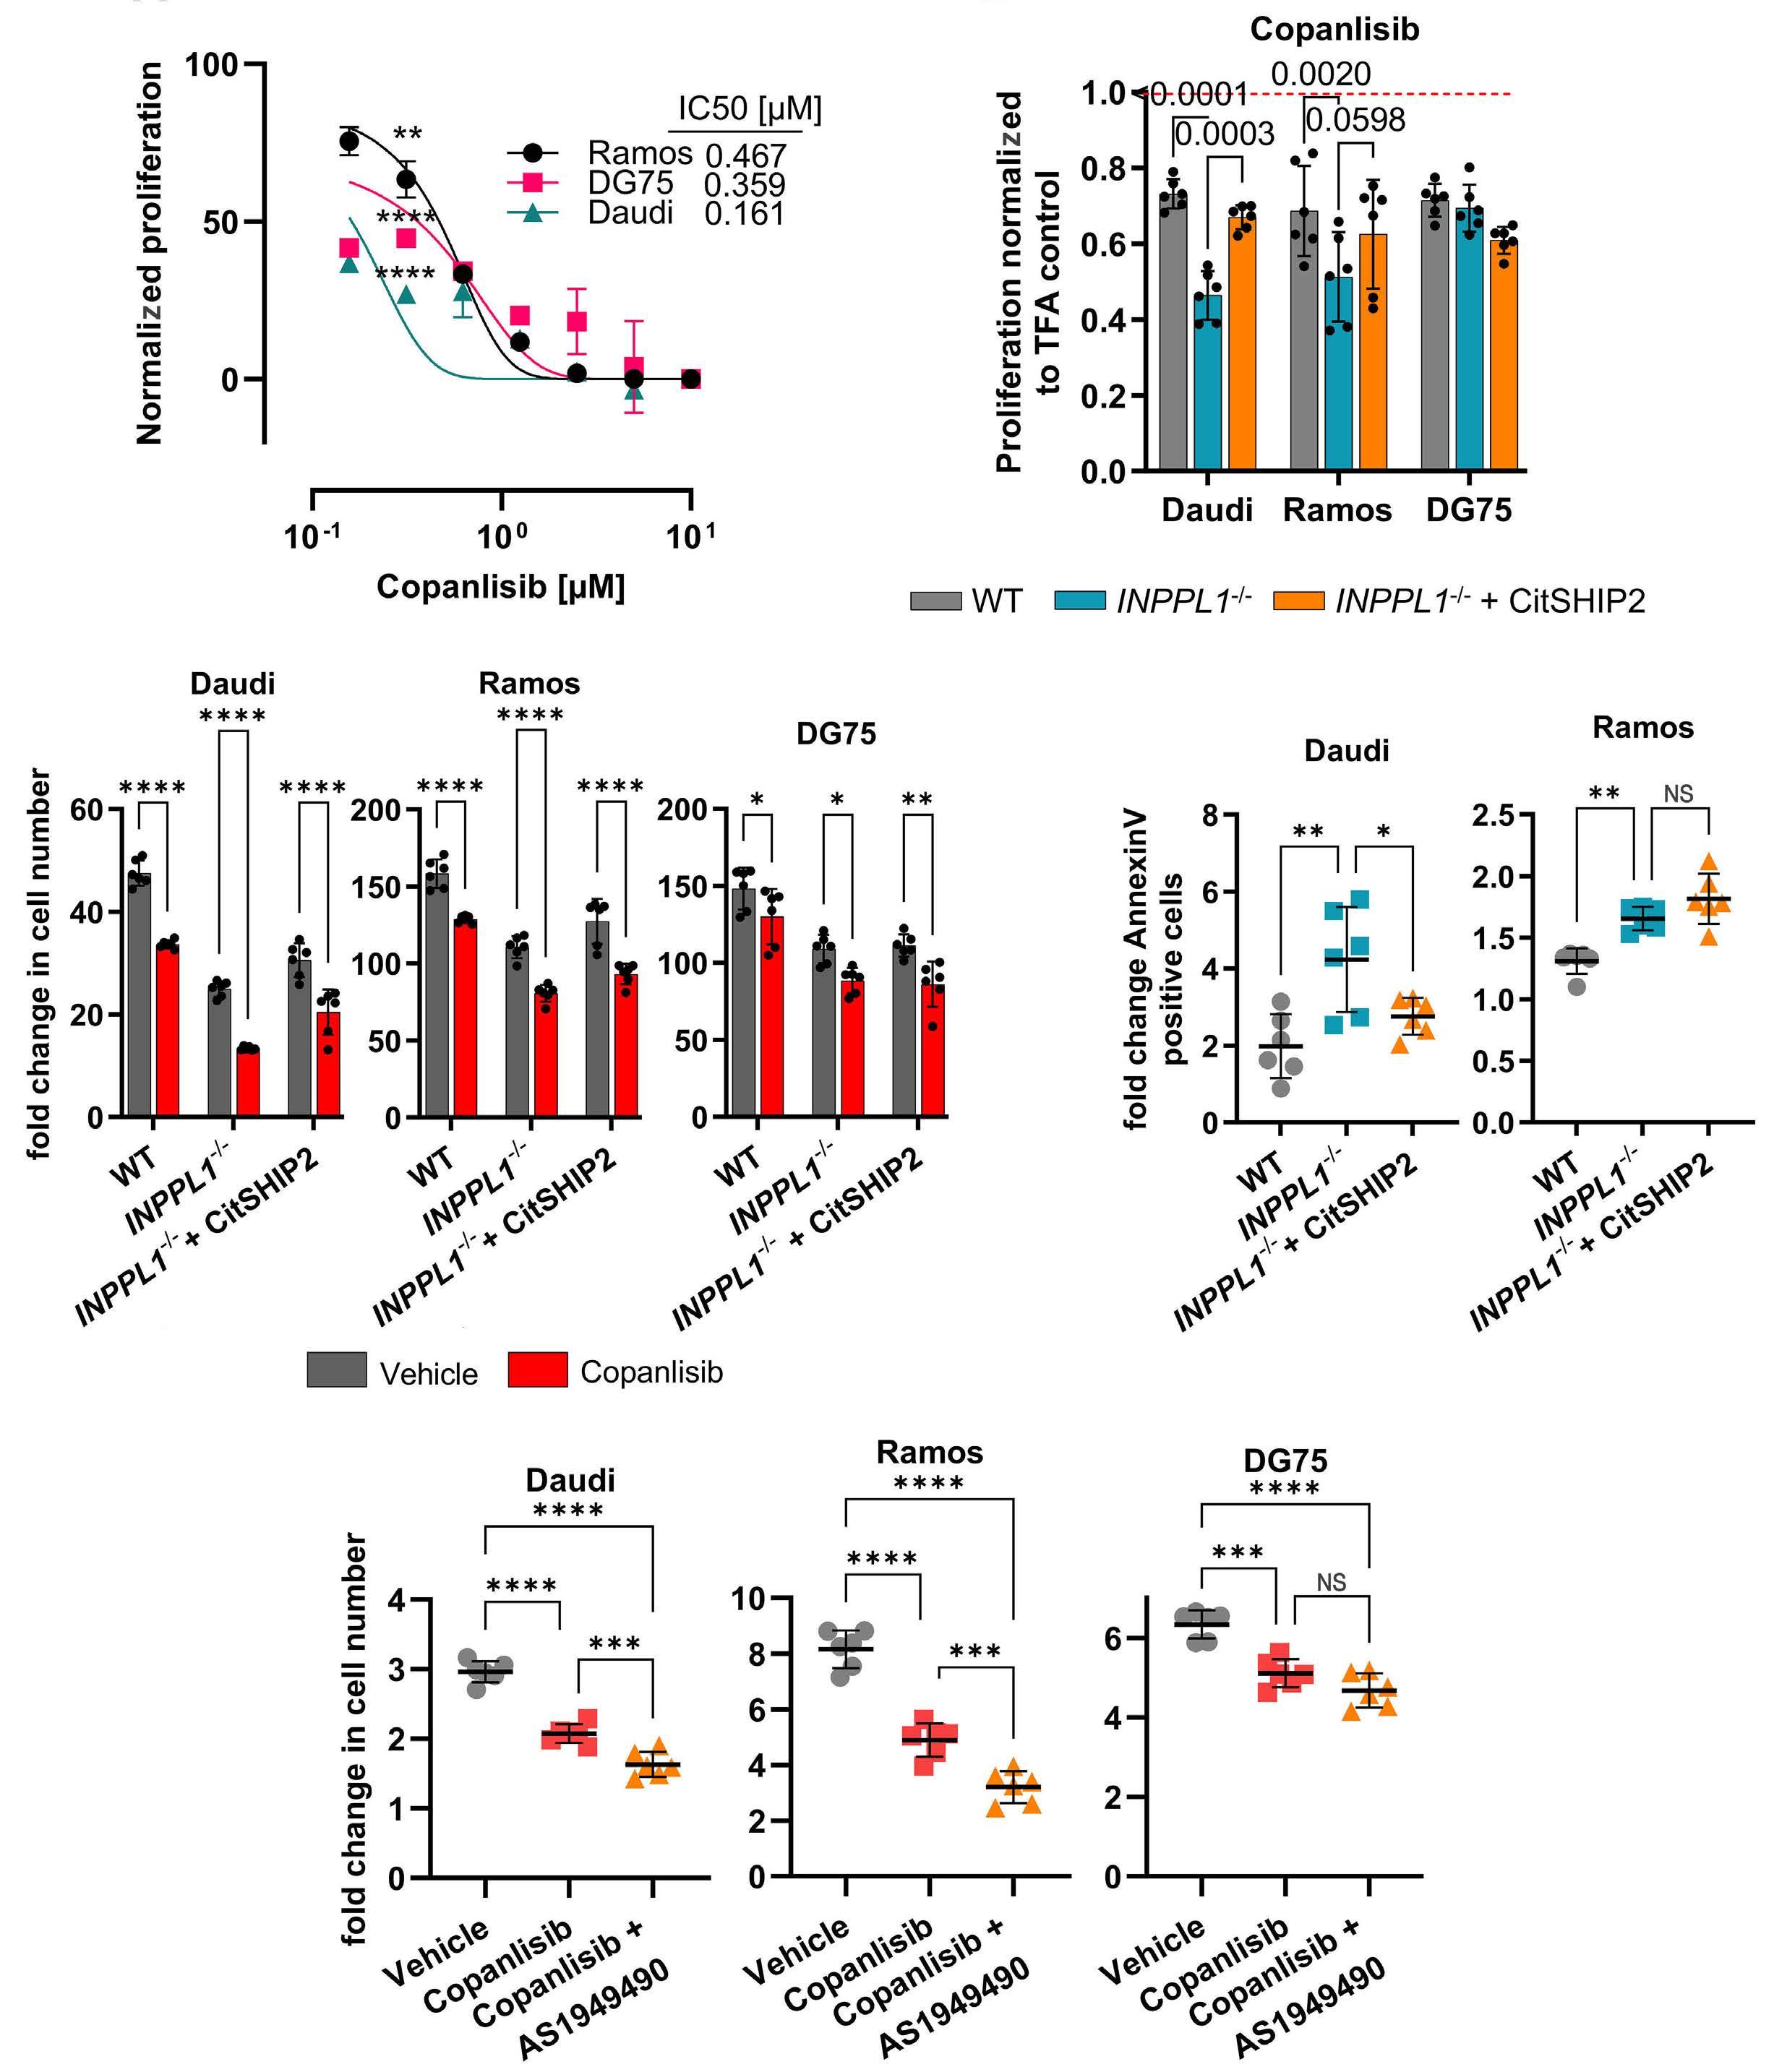
Figure 4. Lack of SHIP2 function augments Burkitt lymphoma cell sensitivity to inhibition of survival signals. (A) Dose-response curve of Burkitt lymphoma (BL) cell lines treated with increasing concentrations of copanlisib for 24 hours (h) followed by determination of proliferation by XTT assay. The proliferation is given by normalization to the vehicle control. The statistics indicate the significant difference between treated and control cells. Half maximal inhibitory concentration (IC50) values were calculated using GraphPad Prism 10. (B) Proliferation of Daudi, Ramos and DG75 cell lines after treatment with copanlisib. The proliferation was assessed by XTT assay after 24-h treatment with 200 nM copanlisib. Treated cells were normalized to the respective solvent control of each cell line. (C) Cell counting experiment with the same set up as in (B). Living cells were counted on day 7 (Daudi) or day 4 (Ramos/DG75) and normalized to day 0. Treatment with 200 nM copanlisib was started 1 day prior to read-out. (D) Apoptosis assay of Daudi and Ramos cell lines after treatment with copanlisib. The cells were stained with Annexin V after treatment with 200 nM copanlisib for 24 h; 5% trifluoroacetate (TFA) was used as vehicle control (A-D). (E) Cell counting experiment in Daudi, Ramos and DG75 cell lines to assess the effects of copanlisib/AS1949490 combination. Cells were treated for 48 h either with 200 nM copanlisib or a combination of copanlisib and 5 mM AS1949490 followed by normalization to day 0. A respective mixture of 5% TFA and dimethyl sulfoxide (DMSO) served as vehicle control. If not indicated otherwise experiments were performed N≥3. Error bars indicate the standard deviation. Significance was calculated by two-way ANOVA and is indicated by *P<0.05, **P<0.01, ***P<0.001, ****P<0.0001.
Haematologica | 109 May 2024 1452 ARTICLE - SHIP support the metabolism and survival of BL F. Mayr et al.
A C E D B
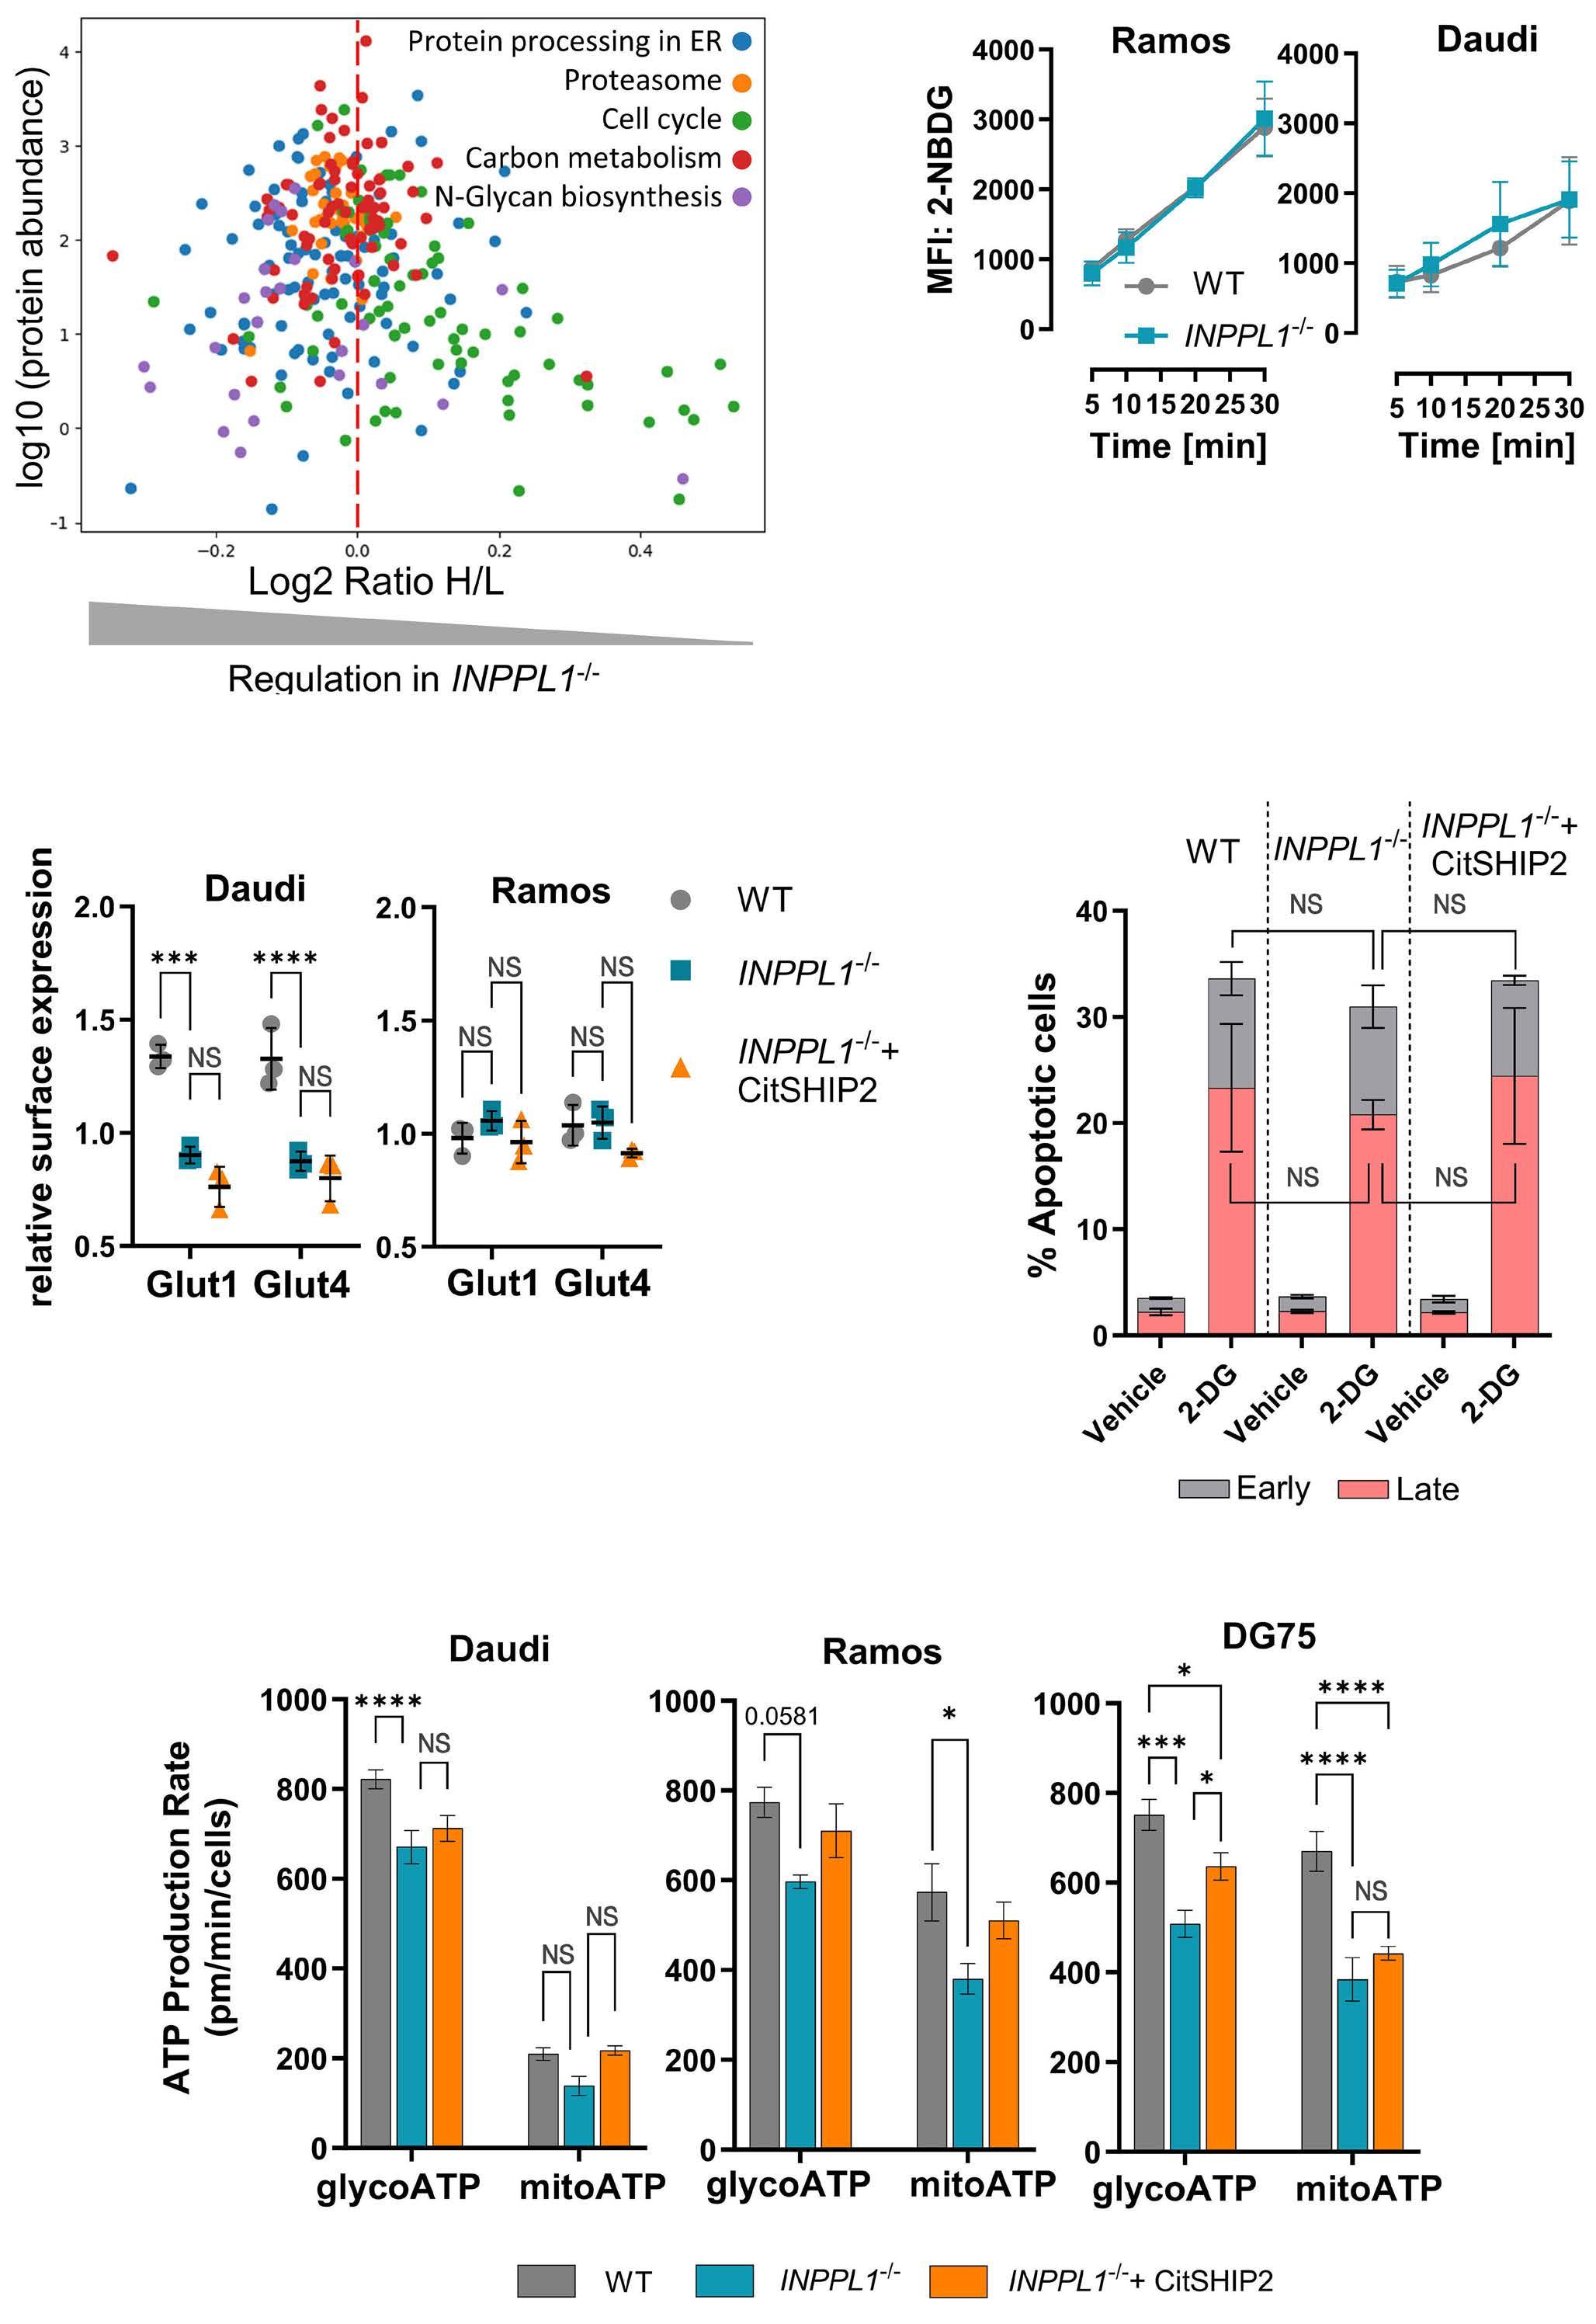
Figure 5. SHIP2 is required for an efficient energy supply in Burkitt lymphoma cells. (A) Stable isotope labeling with amino acids in cell culture (SILAC) mass spectrometry of Ramos INPPL1-/- and reconstituted cells followed by cross referencing with the STRING database. The significantly altered KEGG pathways were extracted. Each point represents a changed abundance of a protein involved in the indicated pathway. The log2 ratio H/L on the x-axis indicates the protein abundance in SHIP2-deficient compared to reconstituted cells with the dotted line indicating a ratio of 1. The y-axis indicates the typical protein abundance in the human body as given by the STRING database. (B) The glucose uptake of Daudi and Ramos wild-type (WT) and SHIP2-deficient cells was measured by incubation with 2-NBDG for indicated time points followed by counterstain with 7-AAD to exclude dead cells. (C) Surface staining for GLUT1 and GLUT4 on Daudi and Ramos cell lines. (D) Apoptosis levels of Ramos cell lines after treatment with the glycolysis inhibitor 2-DG. Cells were subjected to Annexin V/7-AAD staining to distinguish between apoptotic phases after 24-hour treatment with 10 mM 2-DG. ddH2O was used as vehicle control. (E) Seahorse assay was performed to determine the ATP production rate in Daudi, Ramos and DG75 cell lines. If not indicated otherwise experiments were performed N≥3. Error bars indicate the standard deviation. Significance was calculated by two-way-ANOVA and is indicated by *P<0.05, **P<0.01, ***P<0.001, ****P<0.0001. MFI: median fluorescence intensity.
Haematologica | 109 May 2024 1453 ARTICLE - SHIP support the metabolism and survival of BL F. Mayr et al. E A C B D
tandem TAPP1-PH domain (GFP-2x-TAPP1-PH)31 and imaging flow cytometry to show that plasma membrane PI(3,4)P2 is reduced in the absence of SHIP2 (Figure 6A, B). Because of the strong and specific binding of the TAPP1-PH protein to
PI(3,4)P2 it may obstruct binding motifs for proteins that support energy metabolism. Consistently, expression of the tandem TAPP1-PH domain in Ramos, DG75, and also the sBCR-deficient Raji WT cells led to a significant growth
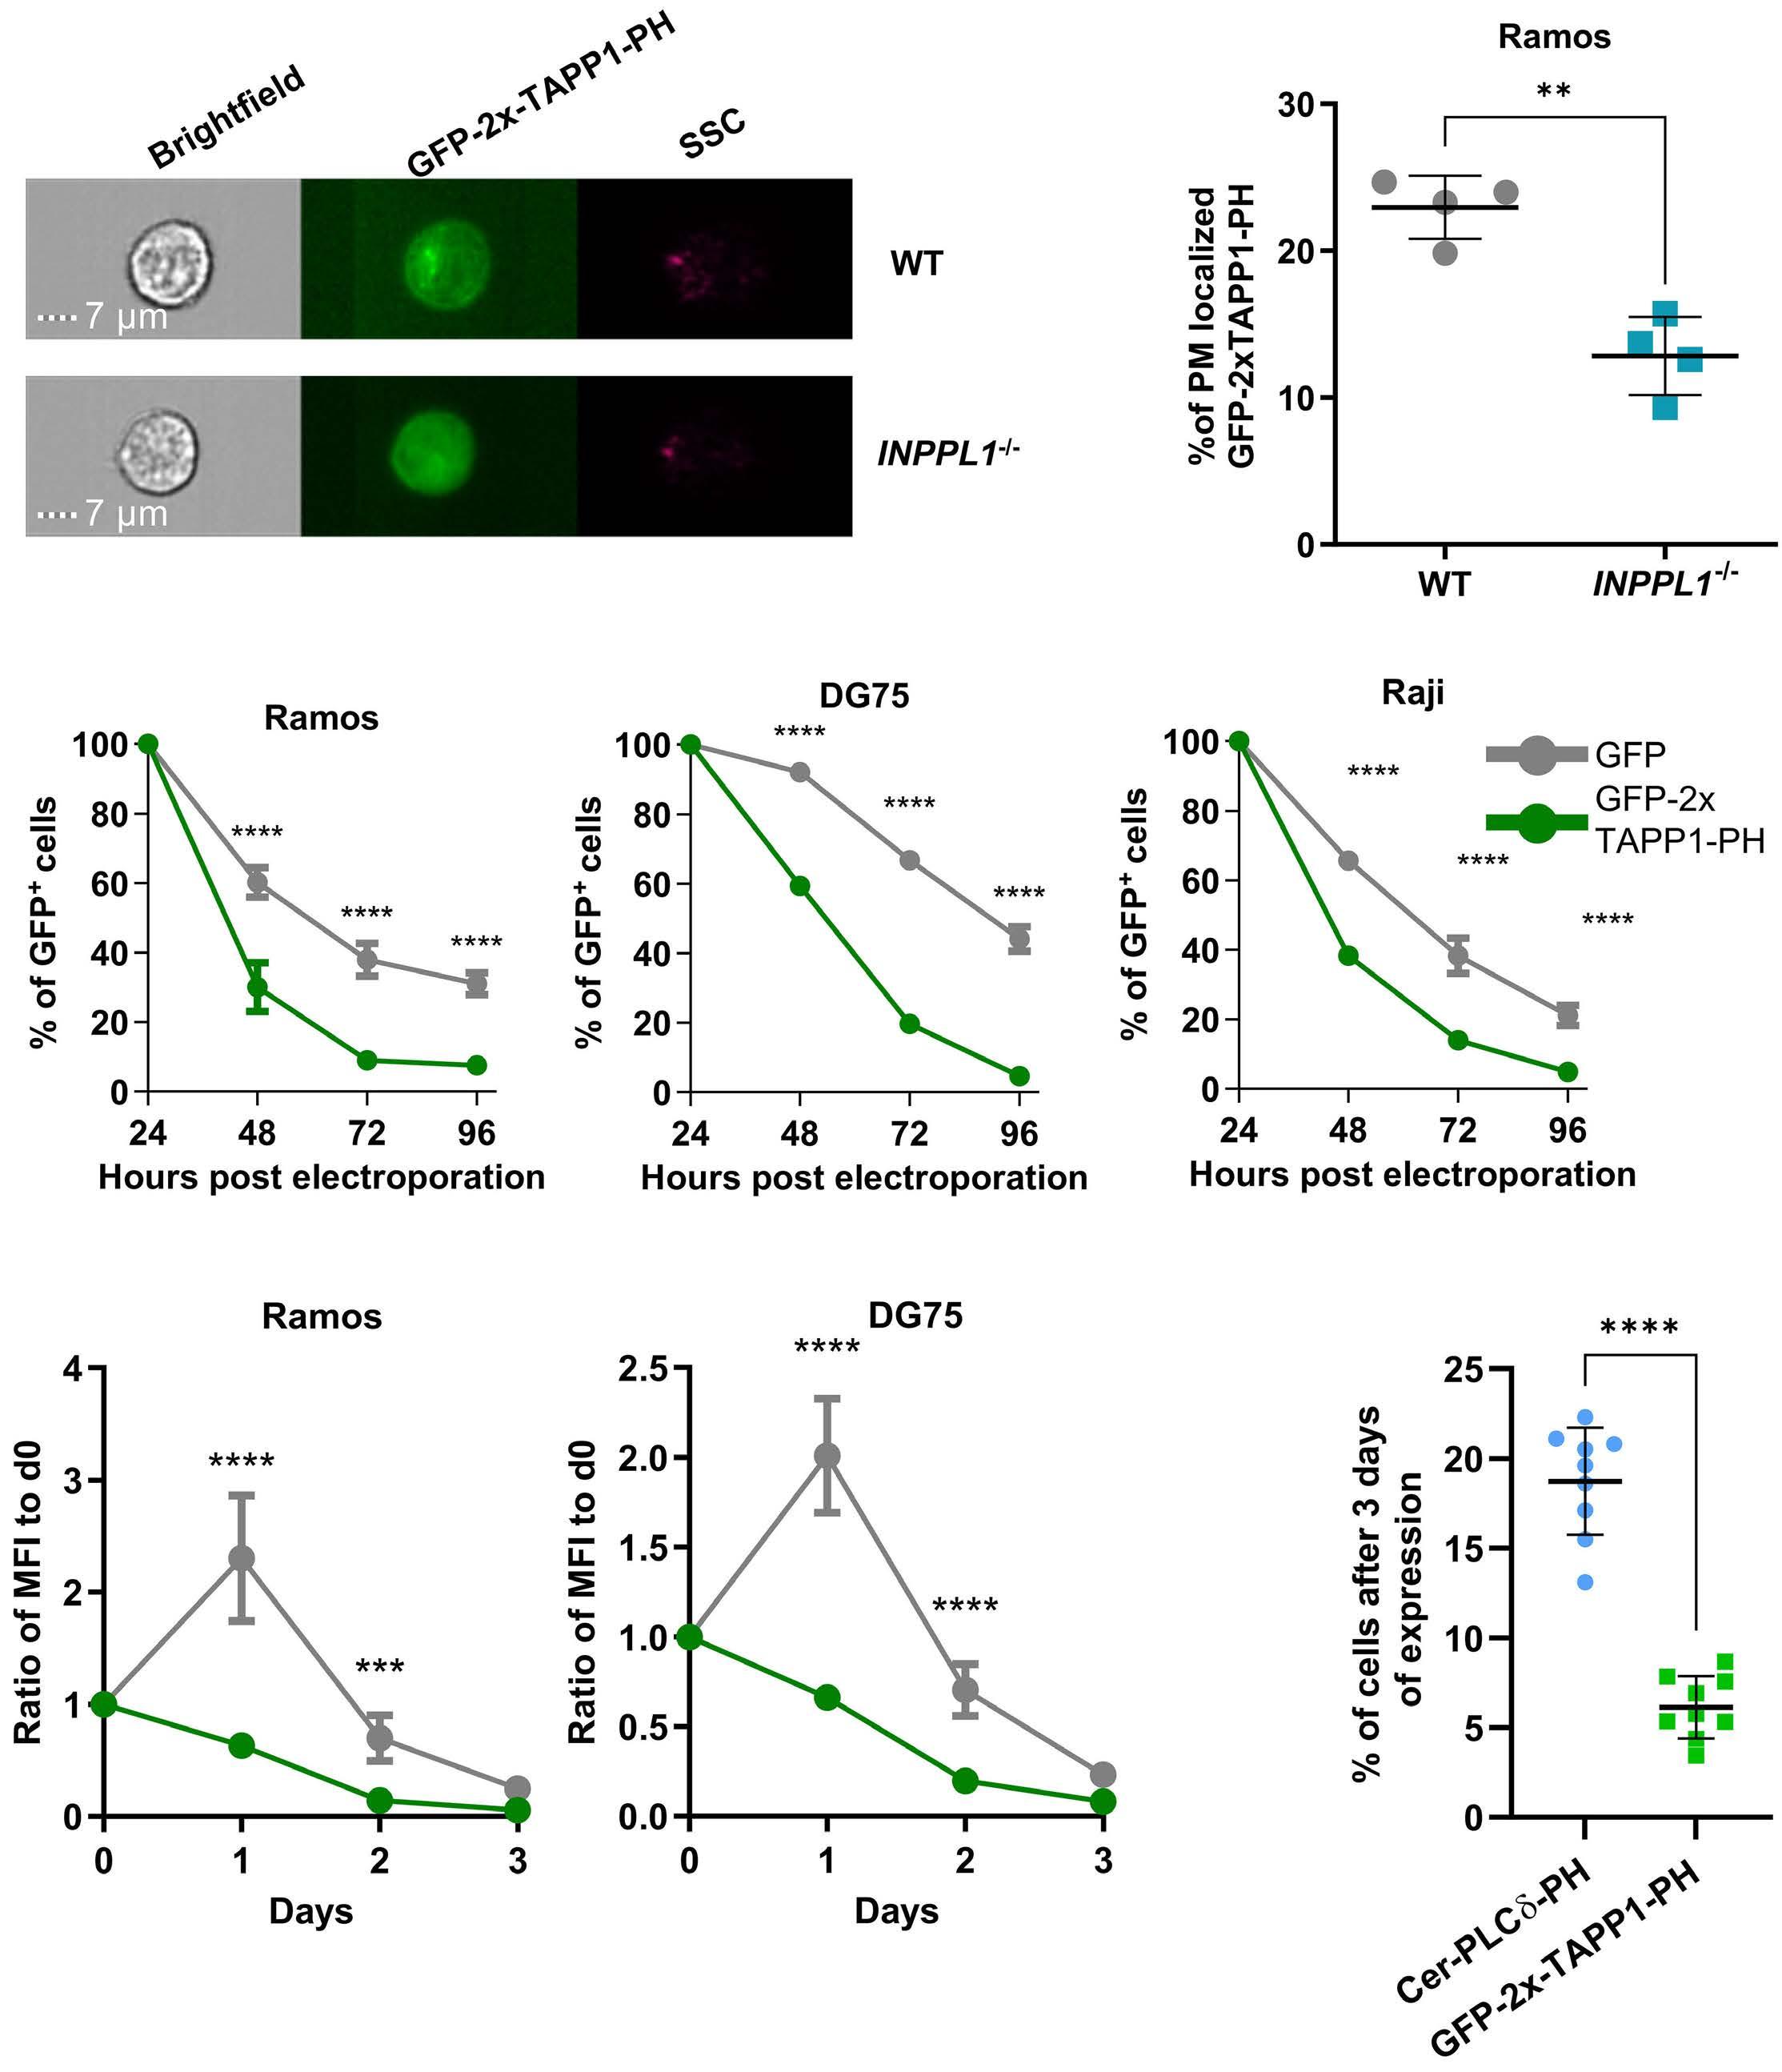
Figure 6. The enzymatic SHIP2 product PI(3,4)P2 contributes to Burkitt lymphoma cell fitness. (A, B) Percentage of plasma membrane-localized GFP-2xTAPP1-PH31 in Ramos wild-type (WT) and SHIP2-deficient cells. Constitutively expressing Ramos cells were analyzed by imaging flow cytometry. Statistical analysis was conducted using an unpaired student t test. (C) Constitutive expression of GFP-2xTAPP1-PH in Ramos, DG75 and Raji WT cells. Cells were electroporated with a plasmid encoding either GFP-2xTAPP1-PH or GFP as control followed by analysis of their GFP signal at indicated time points and normalization to the baseline at 24 h after electroporation. (D) Repeat of the experimental setup of (C) but with an induced expression of GFP-2xTAPP1-PH or GFP in Ramos and DG75 WT cells to exclude effects based on electroporation. The cells were induced on day 0 (d0) followed by washing and tracking over the next 3 days. (E) Competitive growth assay of Ramos WT cells expressing either GFP-2xTAPP1-PH or Cer-PLCδ-PH. Cells were mixed in a 1:1 ratio and expression of both constructs was induced on day 0 followed by washing. The percentage of GFP-positive or cerulean-positive cells was determined by fluoresecence-activated cell sorting at day 3. Statistical analysis was performed by twoway-ANOVA. If not indicated otherwise experiments were performed N≥3. Error bars indicate the standard deviation. Significance was calculated by two-way ANOVA and is indicated by *P<0.05, **P<0.01, ***P<0.001, ****P<0.0001. MFI: median fluorescence intensity.
Haematologica | 109 May 2024 1454 ARTICLE - SHIP support the metabolism and survival of BL F. Mayr et al.
A C D E B
disadvantage in comparison to GFP controls (Figure 6C; Online Supplementary, Figures S6A-C). This toxic effect was also observed after inducible expression of GFP-2x-TAPP1-PH when compared to either GFP (Figure 6D) or the PH domain of PLCδ, which is specific for PI(4,5)P2 (Figure 6 E), thereby excluding an impact of the transfection procedure and general stability of PH domains, respectively. Hence, blocking PI(3,4)P2 motifs interferes with BL cell fitness, strongly implying a role of this phosphoinositide in energy metabolism.
SHIP1 and 2 contribute to Burkitt lymphoma cell fitness in an additive manner
The importance of PI(3,4)P2 is further corroborated by the fact that inhibition of SHIP1, which is the second producer of this PI in B cells, markedly attenuated Ramos cell proliferation, also in the absence of SHIP2 (Online Supplementary Figure S7A). In order to confirm this finding, we inducibly expressed two different short hairpin (sh) RNA that, while not significantly affecting AKT phosphorylation (Online Supplementary Figure S7B), efficiently reduce SHIP1 levels (gene INPP5D) in WT and SHIP2-deficient Daudi and Ramos cells compared to non-targeted (NTC) control shRNA-expressing cells (Online Supplementary Figure S7C). Since GFP is induced together with the shRNA, we monitored GFP-positive cells for up to day 6. As shown in Figure 7A, interference with SHIP1 expression significantly reduced the proliferation of WT and SHIP2-deficient BL cells, which substantiates the contribution of PI(3,4)P2 to the fitness of BL cells. Consistently, the compromised SHIP1 expression renders BL cells more sensitive to PI3K inhibition, leading to severe proliferation defects and elevated apoptosis rates in INPPL1-/-/SHIP1-low BL cells (Figure 7B-E). Compared to their Ramos counterparts (Figure 7C, E) this effect is mild in SHIP2-deficient Daudi cells, since their survival is already severely abrogated (Figures 7B, D). We observed similar sensitivity increases to inhibition of PI3K-dependent effectors and INPPL1-/-/SHIP1-low cells almost completely stopped proliferation under inhibition of mTORC1 and PDK1, while the effect of two AKT inhibitors was moderate (Online Supplementary Figure S7D-G). Consistent with these findings, SHIP1-downregulation attenuated ATP production in a similar manner as SHIP2 deficiency. We did not observe additive effects in INPPL1-/-/SHIP1-low BL cells, indicating a minimal rate of ATP production that can be measured with the SeaHorse assay in BL cells. Collectively, these data provide evidence that the production of PI(3,4)P2 by SHIP proteins contributes to BL fitness by refining their energy metabolism. Hence, interference with SHIP function renders cells more sensitive to the inhibition of survival signals.
Discussion
Since a substantial proportion of BL employ a reprogramming of the tonic BCR signaling network for their survival,
the molecular details of the dysregulated processes may provide opportunities for a targeted treatment of this aggressive B-cell lymphoma. Here, we show that the inositol 5-phosphatases SHIP1 and 2 contribute to BL fitness by coupling tonic BCR signals to efficient energy metabolism. In the absence of SHIP2 activity or after silencing of SHIP1 expression, BL cell lines representing different entities exhibit attenuated proliferation and augmented sensitivity to apoptosis. Notably, the increased susceptibility to apoptosis is not based on interference with specific anti-apoptotic proteins, such as BFL1, which has been reported to be pivotal for B-cell survival.29 This is supported by our BH3 profiling assay, which revealed an in general augmented sensitivity to all BH3 peptides. Silencing SHIP1 expression in the absence of SHIP2 expression further compromises proliferation and markedly enhances apoptosis rates. While we cannot exclude that also other signaling pathways integrate SHIP proteins, the fact that the sBCR-negative BL cell line Raji32 is not affected by SHIP2 deficiency suggests the supportive function of SHIP proteins for BL cell fitness to be part of the tonic BCR signaling network. Both SHIP proteins have been shown to be part of the tonic BCR signaling network in BL cells14 and in particular SHIP1 is a well described BCR effector protein,33 which argues in favor of this conclusion. Despite this being the first study showing an oncogenic role of SHIP proteins for B-cell lymphoma, SHIP proteins have been reported as promotors of several types of tumors. High SHIP2 levels correlate with poor prognosis in breast cancer,34 non-small cell lung cancer,35 and laryngeal squamous cell carcinoma.36 Inhibition of SHIP1 and 2 compromise the survival of multiple myeloma cells.37 SHIP proteins are opposing the enzymatic function of PI3K, which was shown to be a main driver of BL cell survival10 and initiates a number of pro-survival and anti-apoptotic processes, including an augmented energy metabolism through its pivotal effector AKT.38 Accordingly, AKT is frequently dysregulated in a number of human cancers.39 Since the pleckstrin-homology (PH) domain of AKT and its activating kinase PDK1 both bind to PIP3, SHIP may be considered as an inhibitor of AKT-dependent signals. On the other hand, many PIP3-binding PH domains including those of PDK1 and AKT also bind the SHIP product PI(3,4) P240-42 Henceforth, the full activation of AKT can correlate with PI(3,4)P2 levels, indicating that SHIP protein function is even required for an efficient activation of AKT.43,44 Moreover, the AKT family members 1 and 2, which both have been shown to be important in B-cell survival and activation, have distinct affinities to PI(3,4)P2, which may result in a complex and SHIP-dependent activation pattern of AKT proteins.45 However, we did not find any SHIP-dependent alterations in AKT-activating effectors, AKT activity, or AKT-dependent downstream processes within the tonic BCR signal network of the cell models used in this study. Although this finding might be counterintuitive, there is evidence in the literature that BL cell survival does not rely
Haematologica | 109 May 2024 1455 ARTICLE - SHIP support the metabolism and survival of BL F. Mayr et al.
on enhanced AKT activity. In CRISPR/Cas9-based “dropout” screening approaches, BL cell lines turned out to be insensitive to AKT deficiency, which is in contrast to BCR-dependent diffuse large B-cell lymphoma (DLBCL) cells.17,46 Moreover, a recent study showed that primary BL cells are sensitive to augmented AKT signals and BL survival requires an exactly controlled AKT activity.11 Hence, the fact that the supportive function of SHIP proteins for BL cells does not correlate with altered AKT activity
is consistent. Other PIP3-regulated BCR processes, such as the recruitment of PLCγ2 and the Ras GEF SOS, which could support cell proliferation through the activation of MAPK, are according to our data unlikely to be involved in SHIP-dependent survival signals in BL cells.
Instead of augmenting AKT or MAPK-dependent BCR signals, SHIP proteins appear to be required for efficient energy metabolism in BL cells. The provisioning of energy is an important aspect of BL cell fitness, because of their aggres-
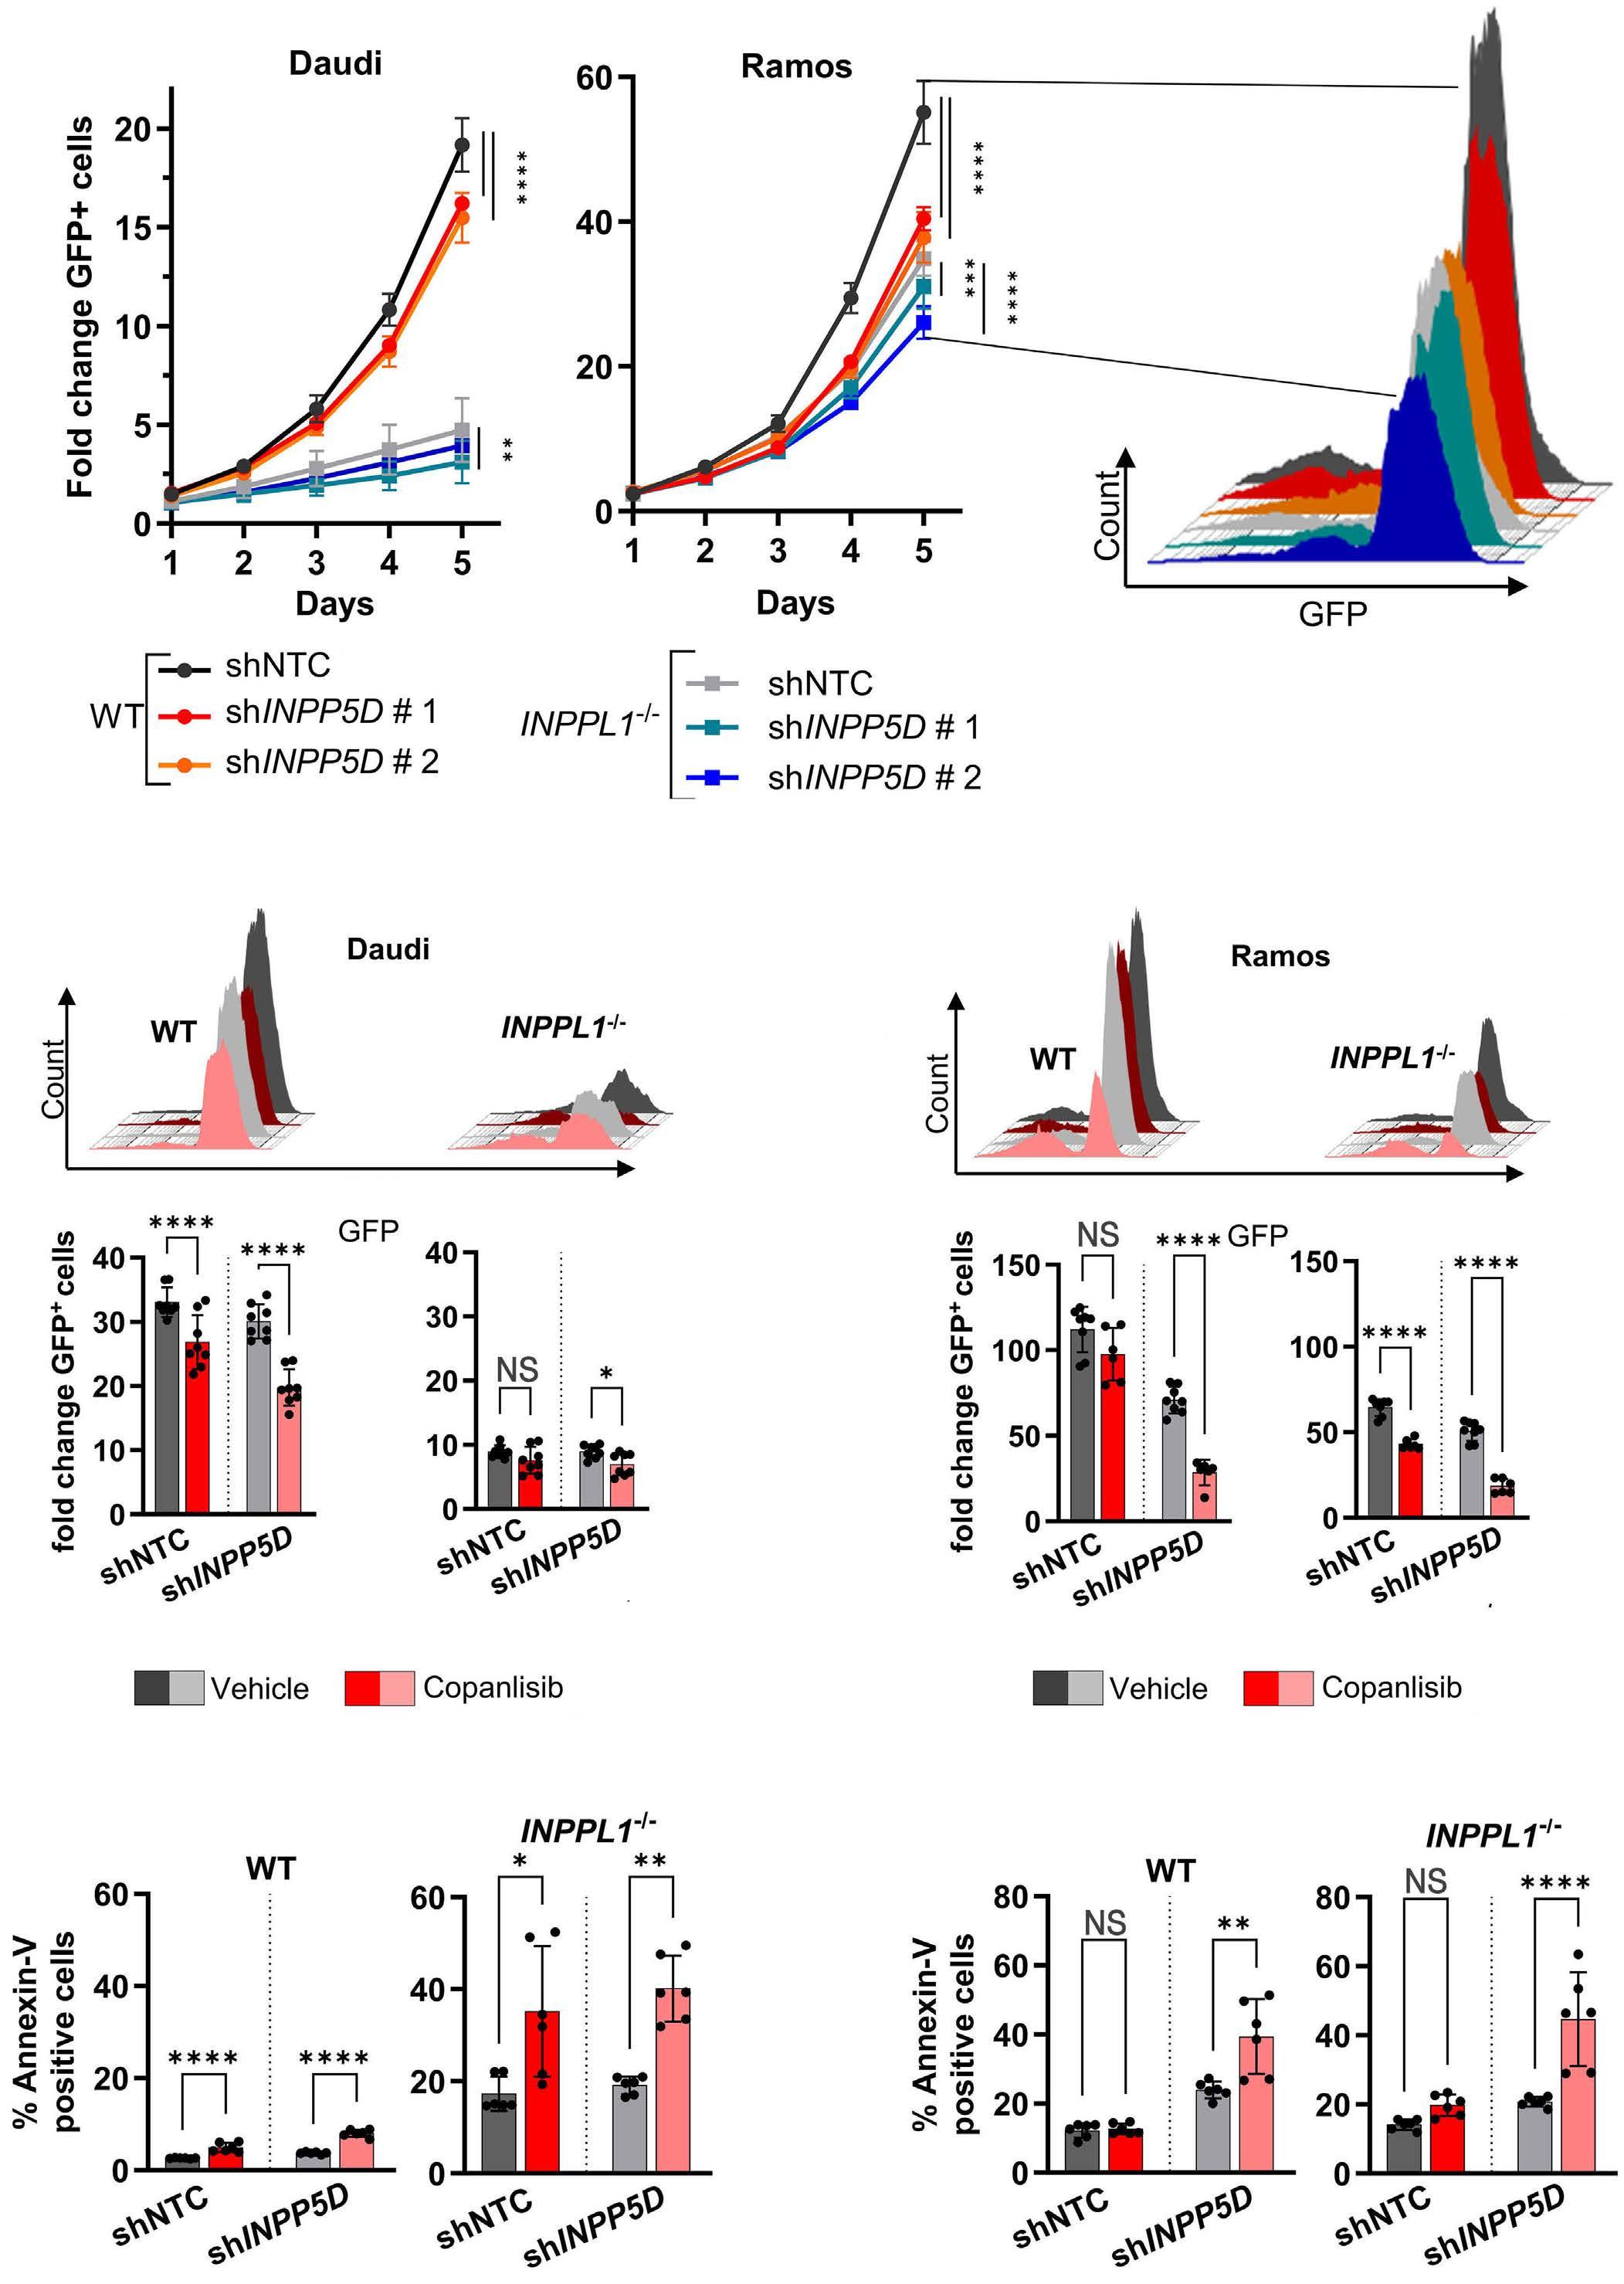
Continued on following page.
Haematologica | 109 May 2024 1456 ARTICLE - SHIP support the metabolism and survival of BL F. Mayr et al. A B D C E
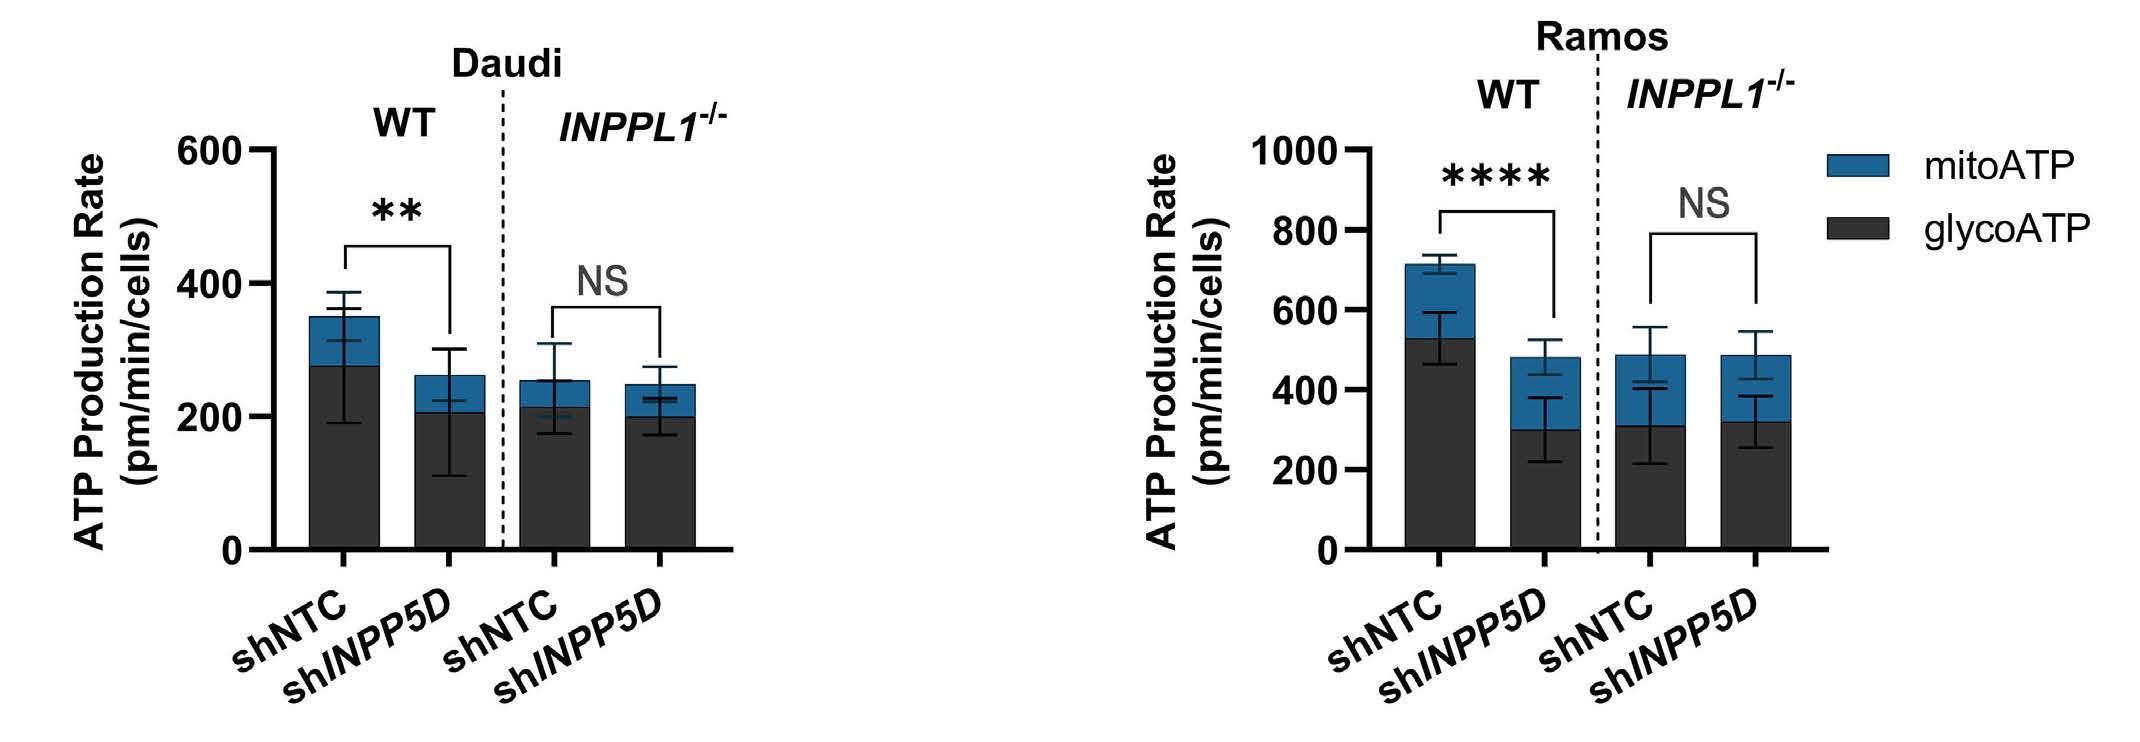
Figure 7. SHIP1 and 2 contribute to Burkitt lymphoma cell fitness in an additive manner. (A) Induction of short hairpin RNA (shRNA) targeting INPP5D (shINPP5D) or the non-targeting control (shNTC) in Ramos and Daudi wild-type (WT) and INPPL1-/- cells. Since GFP is expressed together with shRNA, the proliferation was assessed by monitoring the increase of GFP-positive cells over 5 days followed by normalization to day 0. The histogram represents the final read out after day 5 in Ramos WT cells. Effect of copanlisib on the proliferation of Daudi (B) and Ramos (C) WT and SHIP2-deficient cells expressing either the control or shINPP5D. The histograms represent the respective levels of GFP-positive cells after 6 days of shINPP5D induction and 2 days treatment with 200 nM copanlisib. The number of GFP-positive cells was normalized to day 0. The same cells were subjected to Annexin V staining to assess the levels of apoptosis (D, E). Seahorse assay of Daudi (F) and Ramos (G) WT and SHIP2-deficient cells after downregulation of SHIP1. Shown are the glycolytic and mitochondrial ATP production rates after 5 days of shINPP5D induction. The depicted significances refer to the glycolytic ATP production rate. If not indicated otherwise experiments were performed N≥3. Error bars indicate the standard deviation. Significance was calculated by two-way ANOVA and is indicated by *P<0.05, **P<0.01, ***P<0.001, ****P<0.0001.
sively proliferating nature. In all studied BL cell models, we found a significantly attenuated production of ATP mainly in the cytosol in the absence of SHIP2 and after down-regulation of SHIP1. While the similar impact of both PI(3,4)P2 producers in the tonic BCR signaling network on the ATP production is consistent, we did not observe additive effects in INPPL1-/-/SHIP1-low BL cells. This finding might suggest a minimal ATP production rate in BL cells that is required to be measured by a Seahorse assay, thereby indicating that the observed SHIP-dependent reduction of cellular ATP is substantial for these cells. Currently, it is unclear how tonic BCR signals are connected to the efficiency of energy metabolism, particularly in an AKT-independent manner. According to our findings, the supportive effect of SHIP proteins relies on their enzymatic product PI(3,4)P2, which is evident by the fact that the expression of the PI(3,4) P2-blocking tandem TAPP1 PH domains causes a marked survival disadvantage to BL cells. Consistently, SHIP1 contributes to BL cell fitness in a manner, which is additive to SHIP2. As also Raji cells, which are insensitive to SHIP2 inhibition or deficiency, did not tolerate GFP-2x-TAPP1-PH, PI(3,4)P2 may have a more general function in energy metabolism, while SHIP proteins produce this phosphoinositide as a part of tonic BCR signaling. It has been shown in other cell models that PI(3,4)P2 is involved in the trafficking of vesicles thereby altering the plasma membrane abundance of glucose transporters,47 but we could neither correlate SHIP2 activity to the plasma membrane abundance of GLUT1 and GLUT4 nor to the influx of glucose. Notably, under inhibition of glycolysis downstream of glucose-6-phosphate production by 2-DG,30 SHIP2 does not have a supportive function in BL cells, which argues against an indirect impact and implies that PI(3,4)P2 is directly supporting the
efficiency of downstream energy-providing processes. In general, BL cells have metabolic features that are related to their overexpression of MYC, such as an increased glucose consumption and increased supply of glucose-derived carbon to the TCA cycle.48 Moreover BL cells with rewired tonic BCR signaling are susceptible to the inhibition of the one carbon metabolism17,49 and the direct comparison of the metabolome of B-cell lymphoma cells revealed that in BL cells components of one carbon metabolism are more abundant compared to DLBCL cells.16 Our mass spectrometry analysis does not reveal any significant links between SHIP protein function and these BL-typical energy metabolism processes and hence, the molecular details of how PI(3,4)P2 couples tonic BCR signals to a more efficient ATP production remain to be elucidated. Due to their role in the energy metabolism, interference with SHIP function not only impairs the fitness of BL cells, but also renders them more sensitive to the inhibition of PI3K-related survival signals. Inhibition of PI3K in SHIP2-deficient and SHIP1-silenced BL cells almost completely blocks their survival. The inhibition of PI3K effectors such as PDK1 and mTORC2, which both have been reported to be important for BL survival,17 is more efficient in the absence of SHIP activity. Hence, targeting SHIP function may be suitable for combinatorial therapies, which appear to be required for the targeted treatment of cancers, since adaptation processes are less probable compared to single-drug therapies. For example, the BTK inhibitor ibrutinib, which is approved for the treatment of mantle cell lymphoma, chronic lymphatic leukemia, and marginal zone lymphoma, has been shown to be associated with the development of resistance.50 A study about the treatment of DLBCL with ibrutinib revealed that a combination with other drugs such as lenalidomide leads
Haematologica | 109 May 2024 1457 ARTICLE - SHIP support the metabolism and survival of BL F. Mayr et al.
F G
to markedly better prognosis.51 For the treatment of BL, it might be beneficial to combine the inhibition of tonic BCR survival signals, such as PI3K, with SHIP protein inhibition. Because of its ubiquitous expression, inhibition of SHIP2 might cause more side effects than the inhibition of SHIP1, which is mainly found in cells of hematopoietic origin. In our BL cell models, interference with either SHIP protein was effective, which opens the opportunity of testing different SHIP inhibitors for the treatment of BL.
Disclosures
No conflicts of interest to disclose.
Contributions
ME conceived, designed and supervised the study. FM performed most of the experiments and contributed to the study design. VK performed experiments and contributed to the study design. DF and SW performed the Seahorse assay. JL conducted BH3 profiling. SA and NP contributed to data acquisition and provided technical support. BH performed
References
1. Taub R, Kirsch I, Morton C, et al. Translocation of the c-myc gene into the immunoglobulin heavy chain locus in human Burkitt lymphoma and murine plasmacytoma cells. Proc Natl Acad Sci U S A. 1982;79(24):7837-7841.
2. Schmitz R, Young RM, Ceribelli M, et al. Burkitt lymphoma pathogenesis and therapeutic targets from structural and functional genomics. Nature. 2012;490(7418):116-120.
3. Lam K-P, Kühn R, Rajewsky K. In vivo ablation of surface immunoglobulin on mature B cells by inducible gene targeting results in rapid cell death. Cell. 1997;90(6):1073-1083.
4 He X, Kläsener K, Iype JM, et al. Continuous signaling of CD79b and CD19 is required for the fitness of Burkitt lymphoma B cells. EMBO J. 2018;37(11):e97980.
5. Richter J, Schlesner M, Hoffmann S, et al. Recurrent mutation of the ID3 gene in Burkitt lymphoma identified by integrated genome, exome and transcriptome sequencing. Nat Genet. 2012;44(12):1316-1320.
6. Love C, Sun Z, Jima D, et al. The genetic landscape of mutations in Burkitt lymphoma. Nat Genet. 2012;44(12):1321-1325.
7 Hsu L-Y, Lauring J, Liang H-E, et al. A conserved transcriptional enhancer regulates RAG gene expression in developing B cells. Immunity. 2003;19(1):105-117.
8. Beck K, Peak MM, Ota T, Nemazee D, Murre C. Distinct roles for E12 and E47 in B cell specification and the sequential rearrangement of immunoglobulin light chain loci. J Exp Med. 2009;206(10):2271-2284.
9 Walter R, Pan K-T, Doebele C, et al. HSP90 promotes Burkitt lymphoma cell survival by maintaining tonic B-cell receptor signaling. Blood. 2017;129(5):598-608.
10 Sander S, Calado DP, Srinivasan L, et al. Synergy between PI3K signaling and MYC in Burkitt lymphomagenesis. Cancer Cell. 2012;22(2):167-179.
11. Gehringer F, Weissinger SE, Möller P, Wirth T, Ushmorov A. Physiological levels of the PTEN-PI3K-AKT axis activity are required for maintenance of Burkitt lymphoma. Leukemia. 2020;34(3):857-871.
mass spectrometry analyses. FM, VK, DF, JL, KL, BC, BB, TZ, BH, TO, and ME analyzed and interpreted data. ME and FM wrote the manuscript and all other co-authors reviewed it.
Acknowledgments
We want to thank Christophe Erneux for providing the SHIP2 cDNA as well as Nico Krösinger and Martine Pape for their help in bioinformatics and mass spectrometry analyses, respectively.
Funding
This work was supported by the German Cancer Aid (grant no. 70113537) and the German Research foundation (grant no. EN-833/1-1 and EN-833/3-1). JL was supported by the José Carreras Leukemia Foundation (DJCLS 02FN/2021).
Data-sharing statement
For original data or protocols, please contact the corresponding author. Phosphoproteomic and proteomic data are included in the Online Supplementary Appendix.
12. Liu C, Miller H, Hui KL, et al. A balance of Bruton’s tyrosine kinase and SHIP activation regulates B cell receptor cluster formation by controlling actin remodeling. J Immunol. 2011;187(1):230-239.
13. Neumann K, Oellerich T, Heine I, Urlaub H, Engelke M. Fc gamma receptor IIb modulates the molecular Grb2 interaction network in activated B cells. Cell Signal. 2011;23(5):893-900.
14 Corso J, Pan K-T, Walter R, et al. Elucidation of tonic and activated B-cell receptor signaling in Burkitt’s lymphoma provides insights into regulation of cell survival. Proc Natl Acad Sci U S A. 2016;113(20):5688-5693.
15. Bagaloni I, Visani A, Biagiotti S, et al. Metabolic switch and cytotoxic effect of metformin on Burkitt lymphoma. Front Oncol. 2021;11:661102.
16. Schwarzfischer P, Reinders J, Dettmer K, et al. Comprehensive metaboproteomics of Burkitt’s and diffuse large B-cell lymphoma cell lines and primary tumor tissues reveals distinct differences in Pyruvate content and metabolism. J Proteome Res. 2017;16(3):1105-1120.
17 Wilke AC, Doebele C, Zindel A, et al. SHMT2 inhibition disrupts the TCF3 transcriptional survival program in Burkitt lymphoma. Blood. 2022;139(4):538-553.
18. Ryan J, Montero J, Rocco J, Letai A. iBH3: simple, fixable BH3 profiling to determine apoptotic priming in primary tissue by flow cytometry. Biol Chem. 2016;397(7):671-678.
19 Bojarczuk K, Wienand K, Ryan JA, et al. Targeted inhibition of PI3Kα/δ is synergistic with BCL-2 blockade in genetically defined subtypes of DLBCL. Blood. 2019;133(1):70-80.
20 Hüllein J, Słabicki M, Rosolowski M, et al. MDM4 is targeted by 1q gain and drives disease in Burkitt lymphoma. Cancer Res. 2019;79(12):3125-3138.
21. Suwa A, Yamamoto T, Sawada A, et al. Discovery and functional characterization of a novel small molecule inhibitor of the intracellular phosphatase, SHIP2. Br J Pharmacol. 2009;158(3):879-887.
Haematologica | 109 May 2024 1458 ARTICLE - SHIP support the metabolism and survival of BL F. Mayr et al.
22. Klein E, Klein G, Nadkarni JS, Nadkarni JJ, Wigzell H, Clifford P. Surface IgM-kappa specificity on a Burkitt lymphoma cell in vivo and in derived culture lines. Cancer Res. 1968;28(7):1300-1310.
23. Klein G, Giovanella B, Westman A, Stehlin JS, Mumford D. An EBV-genome-negative cell line established from an American Burkitt lymphoma; receptor characteristics. EBV infectibility and permanent conversion into EBV-positive sublines by in vitro infection. Intervirology. 1975;5(6):319-334.
24. Ben-Bassat H, Goldblum N, Mitrani S, et al. Establishment in continuous culture of a new type of lymphocyte from a “Burkitt like” malignant lymphoma (line D.G.-75). Int J Cancer. 1977;19(1):27-33.
25. Ierano C, Chakraborty AR, Nicolae A, et al. Loss of the proteins Bak and Bax prevents apoptosis mediated by histone deacetylase inhibitors. Cell Cycle. 2013;12(17):2829-2838.
26. Brahmbhatt H, Uehling D, Al-Awar R, Leber B, Andrews D. Small molecules reveal an alternative mechanism of Bax activation. Biochem J. 2016;473(8):1073-1083.
27. Deng J, Carlson N, Takeyama K, Dal Cin P, Shipp M, Letai A. BH3 profiling identifies three distinct classes of apoptotic blocks to predict response to ABT-737 and conventional chemotherapeutic agents. Cancer Cell. 2007;12(2):171-185.
28. Del Gaizo Moore V, Letai A. BH3 profiling--measuring integrated function of the mitochondrial apoptotic pathway to predict cell fate decisions. Cancer Lett. 2013;332(2):202-205.
29 Sochalska M, Schuler F, Weiss JG, Prchal-Murphy M, Sexl V, Villunger A. MYC selects against reduced BCL2A1/A1 protein expression during B cell lymphomagenesis. Oncogene. 2017;36(15):2066-2073.
30 Brown J. Effects of 2-deoxyglucose on carbohydrate metablism: review of the literature and studies in the rat. Metabolism. 1962;11:1098-1112.
31. Román-Fernández Á, Roignot J, Sandilands E, et al. The phospholipid PI(3,4)P2 is an apical identity determinant. Nat Commun. 2018;9(1):5041.
32. Engelberts PJ, Voorhorst M, Schuurman J, et al. Type I CD20 antibodies recruit the B cell receptor for complement-dependent lysis of malignant B cells. J Immunol. 2016;197(12):4829-4837.
33. Helgason CD, Kalberer CP, Damen JE, et al. A dual role for Src homology 2 domain-containing inositol-5-phosphatase (SHIP) in immunity: aberrant development and enhanced function of b lymphocytes in ship -/- mice. J Exp Med. 2000;191(5):781-794.
34 Zhou J, Di M, Han H. Upregulation of SHIP2 participates in the development of breast cancer via promoting Wnt/β-catenin signaling. Onco Targets Ther. 2019;12:7067-7077.
35. Fu M, Fan W, Pu X, et al. Elevated expression of SHIP2 correlates with poor prognosis in non-small cell lung cancer. Int J Clin Exp Pathol. 2013;6(10):2185-2191.
36. Zhou X, Liu Y, Tan G. Prognostic value of elevated SHIP2
expression in laryngeal squamous cell carcinoma. Arch Med Res. 2011;42(7):589-595.
37. Fuhler GM, Brooks R, Toms B, et al. Therapeutic potential of SH2 domain-containing inositol-5’-phosphatase 1 (SHIP1) and SHIP2 inhibition in cancer. Mol Med. 2012;18(1):65-75.
38. Manning BD, Cantley LC. AKT/PKB signaling: navigating downstream. Cell. 2007;129(7):1261–74.
39 Revathidevi S, Munirajan AK. Akt in cancer: mediator and more. Semin Cancer Biol. 2019;59:80-91.
40 Currie RA, Walker KS, Gray A, et al. Role of phosphatidylinositol 3,4,5-trisphosphate in regulating the activity and localization of 3-phosphoinositide-dependent protein kinase-1. Biochem J. 1999;337(Pt 3):575-583.
41. Levina A, Fleming KD, Burke JE, Leonard TA. Activation of the essential kinase PDK1 by phosphoinositide-driven transautophosphorylation. Nat Commun. 2022;13(1):1874.
42. Ebner M, Lučić I, Leonard TA, Yudushkin I. PI(3,4,5)P3 engagement restricts Akt activity to cellular membranes. Mol Cell. 2017;65(3):416-431.
43. Alessi DR, James SR, Downes CP, et al. Characterization of a 3-phosphoinositide-dependent protein kinase which phosphorylates and activates protein kinase B alpha. Curr Biol. 1997;7(4):261-269.
44 Stephens L, Anderson K, Stokoe D, et al. Protein kinase B kinases that mediate phosphatidylinositol 3,4,5-trisphosphatedependent activation of protein kinase B. Science. 1998;279(5351):710-714.
45. Liu S-L, Wang Z-G, Hu Y, et al. Quantitative lipid imaging reveals a new signaling function of phosphatidylinositol-3,4bisphophate: isoform- and site-specific activation of Akt. Mol Cell. 2018;71(6):1092-1104.
46. Schmitz R, Wright GW, Da Huang W, et al. Genetics and pathogenesis of diffuse large B-cell lymphoma. N Engl J Med. 2018;378(15):1396-1407.
47. Falasca M, Hughes WE, Dominguez V, et al. The role of phosphoinositide 3-kinase C2alpha in insulin signaling. J Biol Chem. 2007;282(38):28226-28236.
48. Le A, Lane AN, Hamaker M, et al. Glucose-independent glutamine metabolism via TCA cycling for proliferation and survival in B cells. Cell Metab. 2012;15(1):110-121.
49. D’Avola A, Legrave N, Tajan M, et al. PHGDH is required for germinal center formation and is a therapeutic target in MYCdriven lymphoma. J Clin Invest. 2022;132(9):e153436.
50. George B, Chowdhury SM, Hart A, et al. Ibrutinib resistance mechanisms and treatment strategies for B-cell lymphomas. Cancers (Basel). 2020;12(5):1328.
51. Ren L, Li L, Zhang L, et al. Ibrutinib in patients with relapsed or refractory diffuse large B-cell lymphoma: a retrospective study. Indian J Hematol Blood Transfus. 2022;38(1):42-50.
Haematologica | 109 May 2024 1459 ARTICLE - SHIP support the metabolism and survival of BL F. Mayr et al.
Effect of delayed cell infusion in patients with large B-cell lymphoma treated with chimeric antigen receptor T-cell therapy
Andrew P. Jallouk,1,2 Naishu Kui,3 Ryan Sun,3 Jason R. Westin,1 Raphael E. Steiner,1 Ranjit Nair,1 Loretta J. Nastoupil,1 Luis E. Fayad,1 Ajlan Al Zaki,1 Misha Hawkins,1 Sherry Adkins,1 Mansoor Noorani,1 Kaberi Das,4 Jared Henderson,1 Elizabeth J. Shpall,5 Partow Kebriaei,5 Jeremy Ramdial,5 Christopher R. Flowers,1 Sattva S. Neelapu,1 Sairah Ahmed1,5# and Paolo Strati1#
1Department of Lymphoma and Myeloma, the University of Texas MD Anderson Cancer Center, Houston, TX; 2Division of Hematology/Oncology, Vanderbilt University Medical Center, Nashville, TN; 3Department of Biostatistics, the University of Texas MD Anderson Cancer Center, Houston, TX; 4Department of Leukemia, the University of Texas MD Anderson Cancer Center, Houston, TX and 5Department of Stem Cell Transplantation and Cellular Therapy, the University of Texas MD Anderson Cancer Center, Houston, TX, USA
#SA and PS contributed equally as senior authors.
Abstract
Correspondence: S. Ahmed SAhmed3@mdanderson.org
P. Strati pstrati@mdanderson.org
Received: October 12, 2023.
Accepted: November 23, 2023. Early view: November 30, 2023.
https://doi.org/10.3324/haematol.2023.284453
©2024 Ferrata Storti Foundation
Complications occurring after lymphodepleting chemotherapy (LDC) may delay chimeric antigen receptor (CAR) T-cell infusion. The effect of these delays on clinical outcomes is unclear. We performed a retrospective analysis of 240 patients with relapsed/refractory large B-cell lymphoma treated with standard-of-care axicabtagene ciloleucel (axi-cel) and identified 40 patients (16.7%) who had delay in axi-cel infusion. Of these, 85% had delay due to infection. At time of LDC initiation, patients with delayed infusion had lower absolute neutrophil count (P=0.006), lower platelets (P=0.004), lower hemoglobin (P<0.001) and higher C-reactive protein (P=0.001) than those with on-time infusion. Patients with delayed infusion had lower day 30 overall response rates (59.0% vs. 79.4%; P=0.008) and shorter median progression-free survival (PFS) (3.5 vs. 8.2 months; P=0.002) and overall survival (7.8 vs. 26.4 months; P=0.046) than those with on-time infusion. The association with PFS was maintained on multivariate analysis. There was also an association between extent of delay and survival, with shorter median PFS in patients who had delays of 2-5 days (1.8 vs. 8.2 months; P=0.001) and >5 days (4.6 vs. 8.2 months; P=0.036), but not 1 day (5.7 vs. 8.2 months; P=0.238). Following propensity score matching, patients with delayed infusion continued to have shorter median PFS (3.5 vs. 6.0 months; P=0.015). Levels of pro-inflammatory cytokines on day of infusion were significantly higher in patients with delayed infusion. Together, these findings suggest that delays in CAR T-cell administration after initiation of LDC are associated with inferior outcomes. Further studies are needed to guide strategies to improve efficacy in such patients.
Introduction
Prior to chimeric antigen receptor (CAR) T-cell infusion, a conditioning regimen of lymphodepleting chemotherapy (LDC) is typically administered. This LDC regimen is critical for CAR T-cell efficacy and functions through multiple mechanisms, including alterations in circulating cytokine levels and effects on recipient lymphocytes, myeloid-derived suppressor cells (MDSC) and other regulatory cells.1-4 While the importance of LDC is well-established, the optimal dose and timing of LDC have not been conclusively determined and guidelines for LDC administration in the
clinical setting vary by product and indication. The guidelines for axicabtagene ciloleucel (axi-cel) are most stringent, dictating that fludarabine and cyclophosphamide be administered on days -5, -4 and -3 prior to CAR T-cell infusion.5 In contrast, the guidelines for lisocabtagene maraleucel (liso-cel) and tisagenlecleucel (tisa-cel) provide a range of acceptable infusion dates, with liso-cel infusion recommended to occur 2-7 days after LDC completion and tisa-cel infusion recommended to occur 2-11 days after LDC completion for diffuse large B-cell lymphoma and 2-6 days after LDC completion for follicular lymphoma.6,7 Despite best efforts, clinical and logistical complications
Haematologica | 109 May 2024 1460 - Non-Hodgkin Lymphoma ARTICLE
Published
a CC BY-NC license
under
occurring after LDC administration may delay CAR T-cell infusion. The effect of these delays on clinical outcomes is unclear and no guidelines are available regarding how long of a delay is permissible before additional LDC is required. Previous studies have reported that longer time from leukapheresis to cell infusion (vein-to-vein time) is associated with worse outcomes following axi-cel therapy.8 However, vein-to-vein time includes product manufacturing time as well as logistical delays preceding LDC and is not a sensitive measure to assess the impact of delays after LDC on CAR T-cell efficacy. Thus, we performed a single-center retrospective study to examine the impact of delays in cell infusion after LDC administration on clinical outcomes and cytokine levels in large B-cell lymphoma (LBCL) patients treated with axi-cel.
Methods
Patient selection and assessment
This is a retrospective cohort analysis of 240 consecutive patients with relapsed or refractory LBCL treated with standard-of-care (SOC) axi-cel at our institution between January 2018 and December 2021. SOC was defined as administration of commercial product outside of a clinical trial. The study was approved by the Institutional Review Board of MD Anderson Cancer Center and conducted in accordance with our institutional guidelines and the principles of the Declaration of Helsinki. Delayed cell infusion was defined as axi-cel infusion occurring ≥ 6 days after the initiation of LDC (i.e., after the originally scheduled day 0) and the extent of delay was calculated accordingly (e.g., axi-cel infusion the day following the originally scheduled day 0 represents a 1-day delay). Baseline characteristics for all patients were collected on the day of initiation of LDC. Cytokine release syndrome (CRS) and immune effector cell-associated neurotoxicity syndrome (ICANS) were graded for up to 30 days after axi-cel infusion, according to the CARTOX grading system from January 2018 to April 2019, and according to ASTCT criteria from May 2019 onward.9,10 Performance status was defined according to the Eastern Cooperative Oncology Group (ECOG).11 Response status was determined by the Lugano 2014 classification.12
Quantification of cytokine levels
Cytokine levels were quantified by immunoassay of plasma samples from the day of axi-cel infusion collected prior to cell infusion. Quantification was performed using MSD V-Plex Cytokine Panel 1 Human and Proinflammatory Panel 1 Human kits (Meso Scale Diagnostics, Rockville, MD).
Statistical methods
Association between categorical variables was evaluated using a χ2 test or Fisher’s exact test. Differences in continuous variables between patient groups were evaluated by
the Mann-Whitney U test (2 groups) or Kruskal-Wallis test (3 or more groups). For cytokine analyses, false discovery rate (FDR) q values were calculated to account for multiple comparisons. Progression-free survival (PFS) was defined as the time from the start of axi-cel infusion to progression of disease, death, or last follow-up (whichever occurred first). Overall survival (OS) was defined as the time from the start of axi-cel infusion to death or last follow-up. PFS and OS were calculated for all patients in the study and for subgroups of patients using Kaplan-Meier estimates and were compared between subgroups using the log-rank test. Only factors significant (P≤0.05) on univariate analysis were included in multivariate models. Propensity score matching of patients with on-time infusion to those with delayed infusion was performed based on variables which differed significantly between the two groups. A propensity score was calculated using logistic regression and patients with on-time infusion were matched 3:1 with patients who had delayed infusion. Statistical analyses were completed using SPSS 24, GraphPad Prism 8, and R version 4.1.1.
Results
Two hundred and forty patients with relapsed or refractory LBCL received SOC axi-cel between January 2018 and December 2021. Of these, 40 (16.7%) had a delay in axi-cel infusion, defined as infusion occurring ≥6 days following initiation of LDC. The extent of infusion delay in these patients is shown in Figure 1. The reasons for delay included concern for active infection (e.g., fever, pneumonia, sepsis) in 34 patients (85%), need for disease-related procedures (e.g., thoracentesis, radiation therapy) in three patients (7.5%), and logistical reasons in three patients (7.5%). Baseline characteristics at time of LDC initiation in patients with on-time and delayed cell infusion are shown in Table 1. On univariate analysis, patients with delayed cell infusion had lower absolute neutrophil count (ANC; P=0.006), lower platelets (P=0.004), lower hemoglobin (P<0.001) and
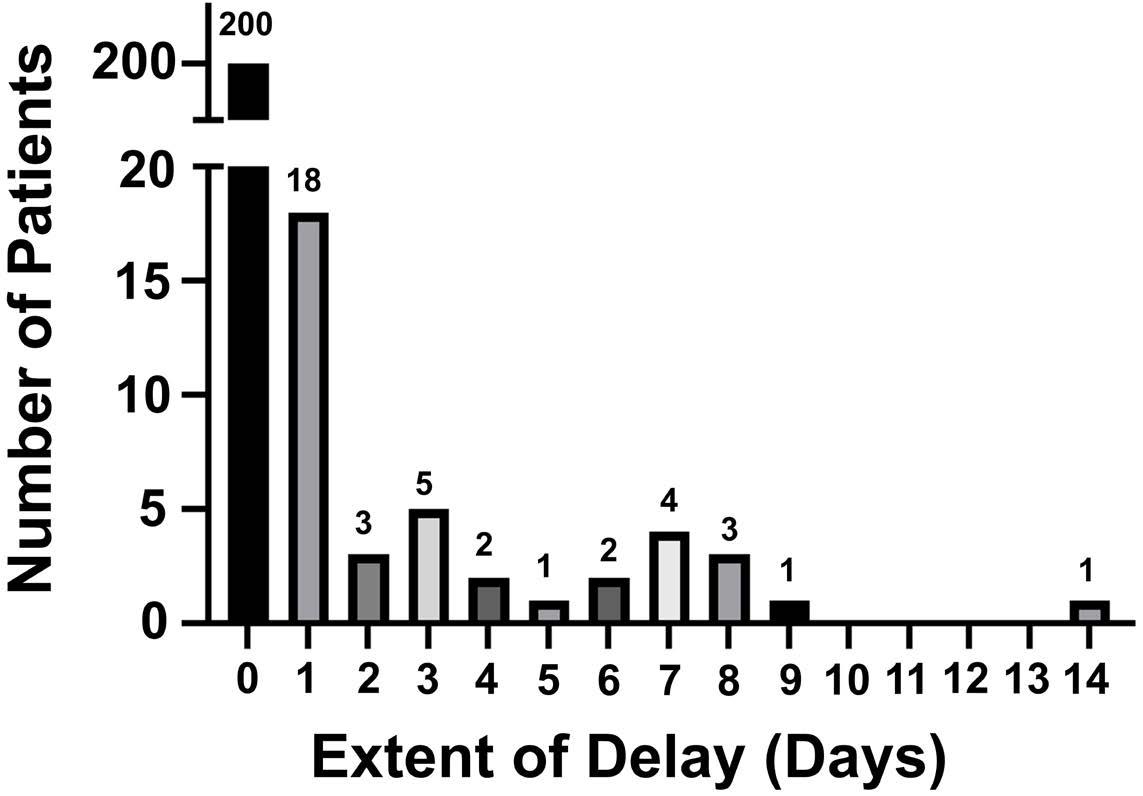
Haematologica | 109 May 2024 1461 ARTICLE - Delayed CAR T-cell Infusion A.P. Jallouk et al.
Figure 1. Extent of infusion delay in patients receiving axicabtagene ciloleucel.
*Cutoff values derived from CAR-HEMATOTOX score.22 ECOG: European Cooperative Oncology Group; IPI: International Prognostic Index; LDH: lactate dehydrogenase; UNL: upper limit of normal; ANC: absolute neutrophil count; Plt: platelets; Hgb: hemoglobin; CRP: C-reactive protein; CrCl: creatinine clearance; LDC: lymphodepleting chemotherapy; Flu: fludarabine; Cy: cyclophosphamide; SCT: stem cell transplant.
higher C-reactive protein (CRP; P=0.001) than patients with on-time cell infusion. On multivariate analysis, low ANC (P=0.025) and elevated CRP (P=0.037) remained associated with infusion delay. No difference in baseline ferritin levels was noted between the two groups (P=0.378). At the time of CAR T-cell infusion, median absolute lymphocyte count (ALC) was 30 cells/mL (range, 0-1,900) in patients with ontime infusion and 0 cells/mL (range, 0-100) in patients with delayed cell infusion, demonstrating a lack of significant lymphocyte recovery by the time of cell infusion in both populations.
Patients with delayed cell infusion had similar rates of any-grade CRS (90% vs. 93.5%), grade 3-4 CRS (12.5% vs. 8.0%), any-grade ICANS (65% vs. 64.5%) and grade 3-4 ICANS (42.5% vs. 39.5%) compared to patients with ontime cell infusion (Figure 2A). However, there was a trend toward increased rate of grade 3-4 cytopenias at day 30 in patients with delayed cell infusion compared to those with on-time cell infusion (74.3% vs. 58.0%; P=0.09). Patients with delayed cell infusion had a significantly lower day 30 overall response rate (59.0% vs. 79.4%; P=0.008) and numerically lower complete response rate (43.6% vs. 54.3%) than those with on-time cell infusion (Figure 2B).
After a median follow-up of 25.7 months (95% confidence interval [CI]: 22.6-28.8), patients with delayed infusion had significantly shorter median PFS (3.5 vs. 8.2 months; P=0.002) and OS (7.8 vs. 26.4 months; P=0.046) compared to those with on-time infusion. The majority of deceased patients in both groups had disease recurrence/progression documented as their cause of death (Online Supplementary Table S1).
An association between extent of delay and survival was observed, with significantly shorter median PFS in patients who had delay of 2-5 days (1.8 vs. 8.2 months; P=0.001) and >5 days (4.6 vs. 8.2 months; P=0.036) but no significant difference in median PFS for patients with a delay of 1 day (5.7 vs. 8.2 months; P=0.238) compared to those with on-time infusion (Figure 3). Patients with a delay of 2-5 days also had significantly shorter median OS (6.6 vs. 25.6 months; P=0.003) compared to those with on-time infusion. The association between delayed infusion and shorter PFS was maintained on multivariate analysis including age, International Prognostic Index score, lactate dehydrogenase (LDH) and CRP (hazard ratio [HR]=1.567; 95% CI: 1.045-2.351; P=0.03). When comparing patients with a delay of 1 day, 2-5 days, and >5 days, the only differences in baseline charac-
Haematologica | 109 May 2024 1462 ARTICLE - Delayed CAR T-cell Infusion A.P. Jallouk et al.
Characteristic Overall population N=240 On-time cell infusion N=200 Delayed cell infusion N=40 P Age in years, median (range) 60 (18-85) 59 (18-84) 63 (24-85) 0.961 Male, N (%) 161 (67.1) 135 (67.5) 26 (65.0) 0.854 ECOG 2-4, N (%) 39 (16.3) 31 (15.5) 8 (20.0) 0.485 IPI score 3-5, N (%) 132 (55.0) 105 (52.5) 27 (67.5) 0.116 LDH U/L >UNL, N (%) 160 (66.7) 129 (64.5) 31 (77.5) 0.142 ANC <120x109/L*, N (%) 35 (14.6) 23 (11.5) 12 (30.0) 0.006 Plt <75x109/L*, N (%) 57 (23.8) 40 (20.0) 17 (42.5) 0.004 Hgb <9.0 g/dL*, N (%) 68 (28.3) 47 (23.5) 21 (52.5) <0.001 CRP >3.0 mg/dL*, N (%) 100 (41.7) 74 (37.0) 26 (65.0) 0.001 Ferritin >2,000 ng/mL*, N (%) 46 (19.2) 36 (18.0) 10 (25.0) 0.378 CrCl mL/mi, median (range) 86 (15-152) 86 (15-152) 88 (25-141) 0.827 LDC dose reduced, N (%) 31 (12.9) 24 (12.0) 7 (17.5) 0.437 Total Flu dose mg/m2, median (range) 90 (45-90) 90 (45-90) 90 (45-90) 0.191 Total Cy dose mg/m2, median (range) 1,500 (900-1,500) 1,500 (900-1,500) 1,500 (1,000-1,500) 0.052 Prior therapies ≥3, N (%) 195 (81.3) 159 (79.5) 36 (90.0) 0.181 Bridging therapy use, N (%) 126 (52.5) 105 (52.5) 21 (52.5) 1.0 Refractory disease, N (%) 185 (77.1) 155 (77.5) 30 (75.0) 0.837 Previous autologous SCT, N (%) 50 (20.8) 39 (19.5) 11 (27.5) 0.287 Previous allogeneic SCT, N (%) 4 (1.7) 2 (1.0) 2 (5.0) 0.130
Table 1. Baseline characteristics of overall populations.
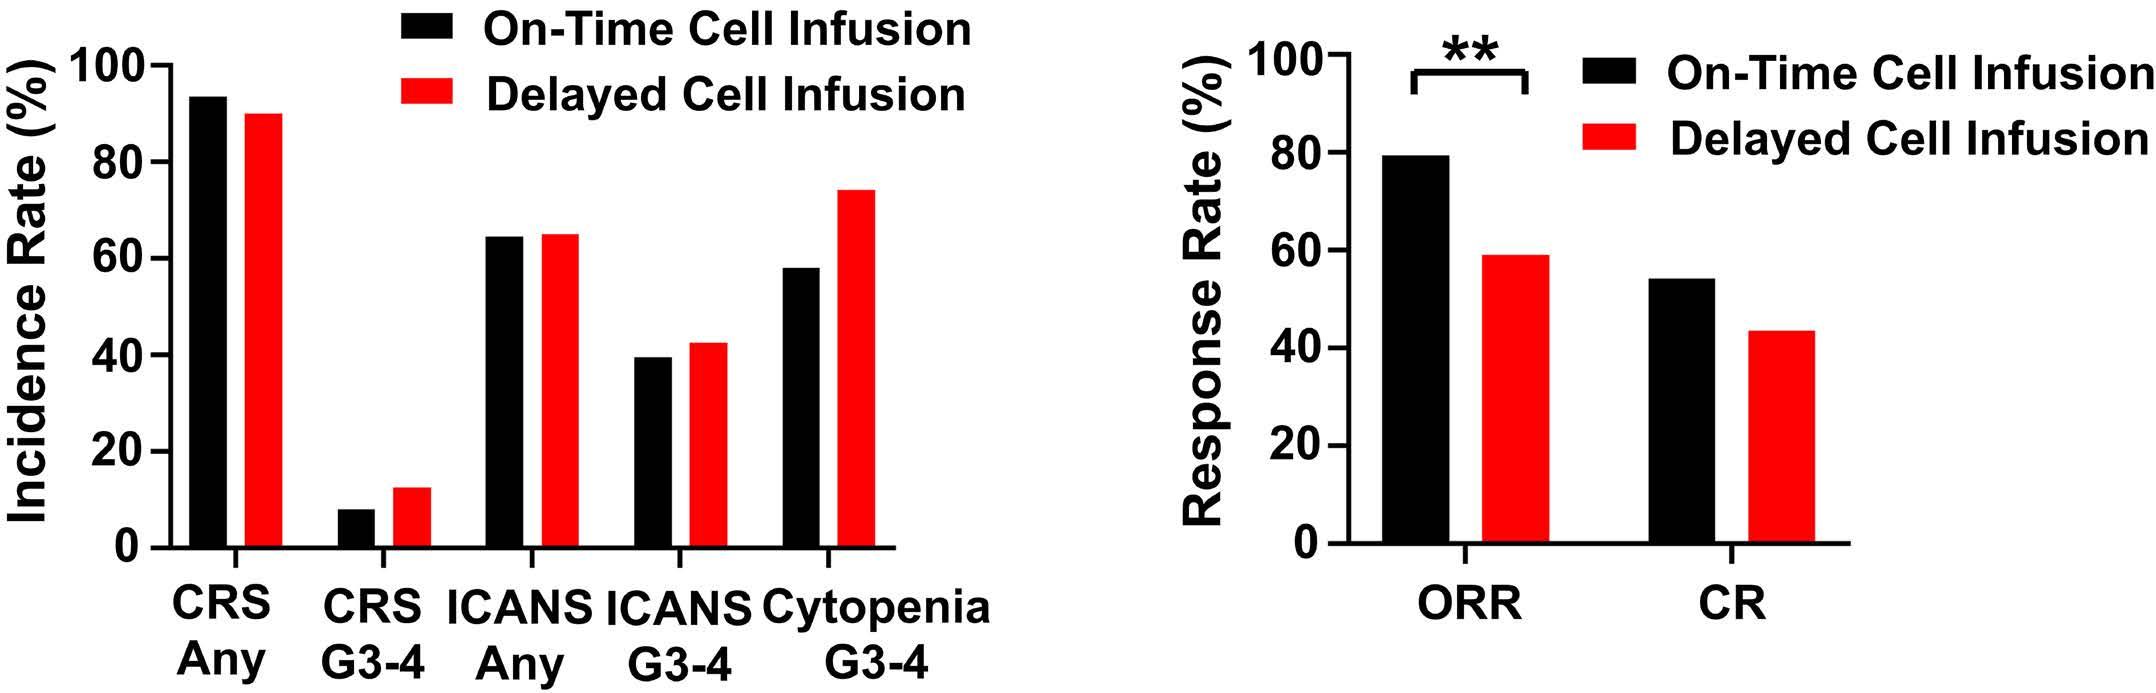
Figure 2. Toxicity and response rates of patients with on-time (N=200) and delayed (N=40) cell infusion. (A) Toxicity of patients with on-time and delayed cell infusion. (B) Response rates of patients with on-time and delayed cell infusion. CRS: cytokine release syndrome; ICANS: immune effector cell-associated neurotoxicity syndrome; ORR: overall response rate; CR: complete response; **P<0.01
teristics were that patients with a delay of >5 days were more likely to have low ANC (P=0.010) and patients with a delay of 1 day were more likely to have a prior autologous stem cell transplant (P=0.027) than patients in the other two groups (Online Supplementary Table S2). Concern for infection remained the predominant reason for infusion delay in all three groups (Online Supplementary Table S3). All logistical delays resulted in only 1 day infusion delay and all delays >5 days were due to infection. As the baseline characteristics of patients with delayed
infusion were noted to differ from those with on-time infusion, propensity score matching was performed based on variables which differed significantly between the two groups: baseline ANC, platelets, hemoglobin and CRP. No significant differences in the characteristics of the matched cohorts were identified (Table 2). In the matched cohorts, patients with delayed infusion had significantly shorter median PFS (3.5 vs. 6.0 months; P=0.015) and a trend towards shorter OS (7.8 vs. 23.9 months; P=0.194) compared to those with on-time infusion (Figure 4).
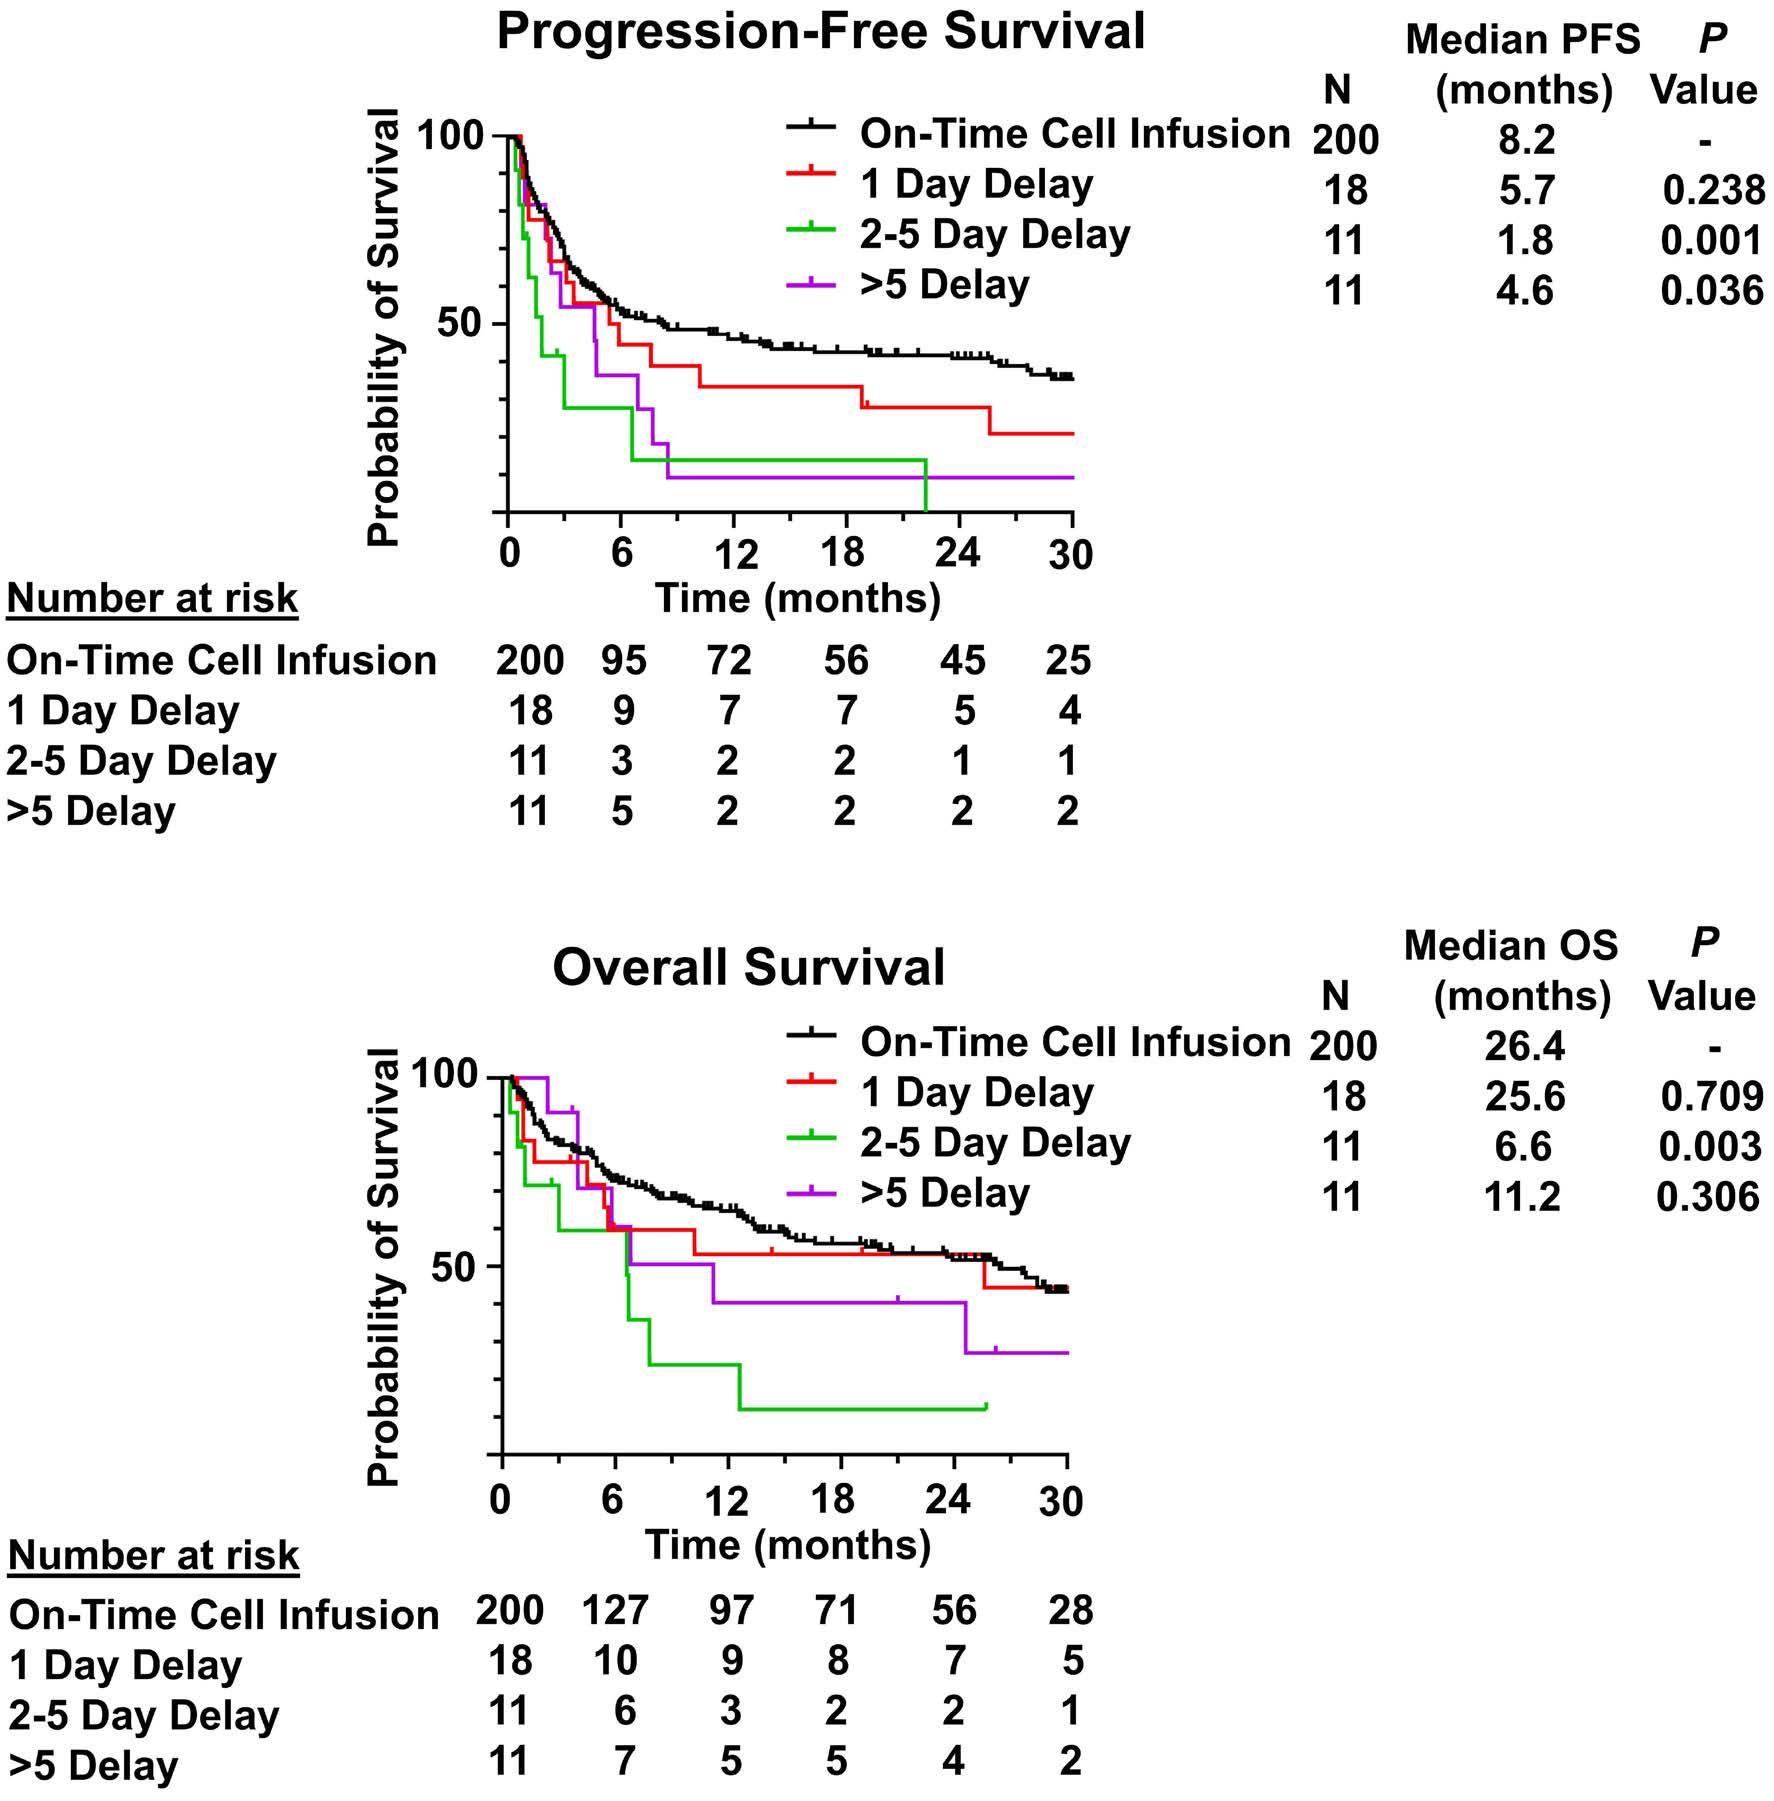
Figure 3. Progression-free and overall survival of all patients with on-time and delayed cell infusion. (A) Progression-free survival (PFS) of all patients with on-time and delayed cell infusion. (B) Overall survival (OS) of all patients with on-time and delayed cell infusion.
Haematologica | 109 May 2024 1463 ARTICLE - Delayed CAR T-cell Infusion A.P. Jallouk et al.
A B
A B
*Cutoff values derived from CAR-HEMATOTOX score.22 ECOG: European Cooperative Oncology Group; IPI: International Prognostic Index; LDH: lactate dehydrogenase; UNL: upper limit of normal; ANC: absolute neutrophil count; Plt: platelets; Hgb: hemoglobin; CRP: C-reactive protein; CrCl: creatinine clearance; LDC: lymphodepleting chemotherapy; Flu: fludarabine; Cy: cyclophosphamide; SCT: stem cell transplant.
In order to further investigate the impact of delayed cell infusion on biological factors known to influence CAR T-cell efficacy, plasma cytokine levels on the day of cell infusion from 41 patients (15 with delayed infusion [6 with 1 day delay, 6 with 2-5 day delay and 3 with >5 day delay], 26 with on-time infusion) were measured and compared between groups (Figure 5). Levels of pro-inflammatory cytokines, such as tumor necrosis factor-α (TNF-α), TNF-β, interferon-γ (IFN-γ), interleukin-1β (IL-1β), IL-2, IL-5, IL-6, IL-7 and ferritin were significantly higher in patients with delayed cell infusion than in patients with on-time cell infusion (q<0.05). In contrast, levels of IL-12p70 and vascular endothelial growth factor (VEGF) were significantly lower in patients with delayed cell infusion (q<0.05).
Discussion
In this study, we showed that delays in cell infusion occurring after initiation of LDC were associated with inferior outcomes in patients receiving standard-of-care axi-cel for LBCL. These delays were relatively common, occurring in 16.7% of patients in our institutional cohort, and were
most frequently due to concern for infection. Despite infection being the most common reason for delay, the most common cause of death for patients with either ontime or delayed infusion remained disease recurrence/ progression. Unlike previous studies that examined the association between vein-to-vein time and outcomes,8 our study focused on the time period between initiation of LDC and cell infusion. This period excludes the time required for CAR T-cell manufacturing as well as logistical delays in obtaining the CAR T-cell product and scheduling CAR T-cell administration. Instead, this relatively short period represents a time in which patients are actively receiving chemotherapy and in which unexpected clinical deterioration may force providers to decide whether to proceed with CAR T-cell infusion under suboptimal conditions or delay until the patient’s clinical status improves. Little evidence has been available regarding the consequences associated with either strategy. Our study is the first to show that patients with delayed cell infusion have inferior survival outcomes.
Due to the retrospective nature of this study, it is difficult to determine how much of this difference in outcomes is driven by differences in the baseline characteristics of our
Haematologica | 109 May 2024 1464 ARTICLE - Delayed CAR T-cell Infusion A.P. Jallouk et al.
Characteristic Total patients, N=136 On-time cell infusion N=96 Delayed cell infusion N=40 P Age in years, median (range) 61 (18-84) 63 (24-85) 0.513 Male, N (%) 70 (72.9) 26 (65.0) 0.410 ECOG 2-4, N (%) 14 (14.6) 8 (20.0) 0.451 IPI score 3-5, N (%) 54 (56.3) 27 (67.5) 0.254 LDH U/L >UNL, N (%) 64 (66.7) 31 (77.5) 0.227 ANC <12x109/L*, N (%) 18 (18.8) 12 (30) 0.175 Plt <75x109/L*, N (%) 25 (26.0) 17 (42.5) 0.069 Hgb <9.0 g/dL*, N (%) 36 (37.5) 21 (52.5) 0.128 CRP >3.0 mg/dL*, N (%) 48 (50.0) 26 (65.0) 0.132 Ferritin >2,000 ng/mL*, N (%) 25 (26.0) 10 (25.0) 0.899 CrCl mL/min, median (range) 84 (27-152) 88 (25-141) 0.850 LDC dose reduced, N (%) 13 (13.5) 7 (17.5) 0.599 Total Flu dose mg/m2, median (range) 90 (60-90) 90 (45-90) 0.297 Total Cy dose mg/m2, median (range) 1,500 (900-1,500) 1,500 (1,000-1,500) 0.076 Prior therapies ≥3, N (%) 77 (80.2) 36 (90.0) 0.213 Bridging therapy use, N (%) 53 (55.2) 21 (52.5) 0.851 Refractory disease, N (%) 76 (79.2) 30 (75.0) 0.652 Previous autologous SCT, N (%) 18 (18.8) 11 (27.5) 0.260 Previous allogeneic SCT, N (%) 0 (0) 2 (5.0) 0.085
Table 2. Baseline characteristics of matched populations.
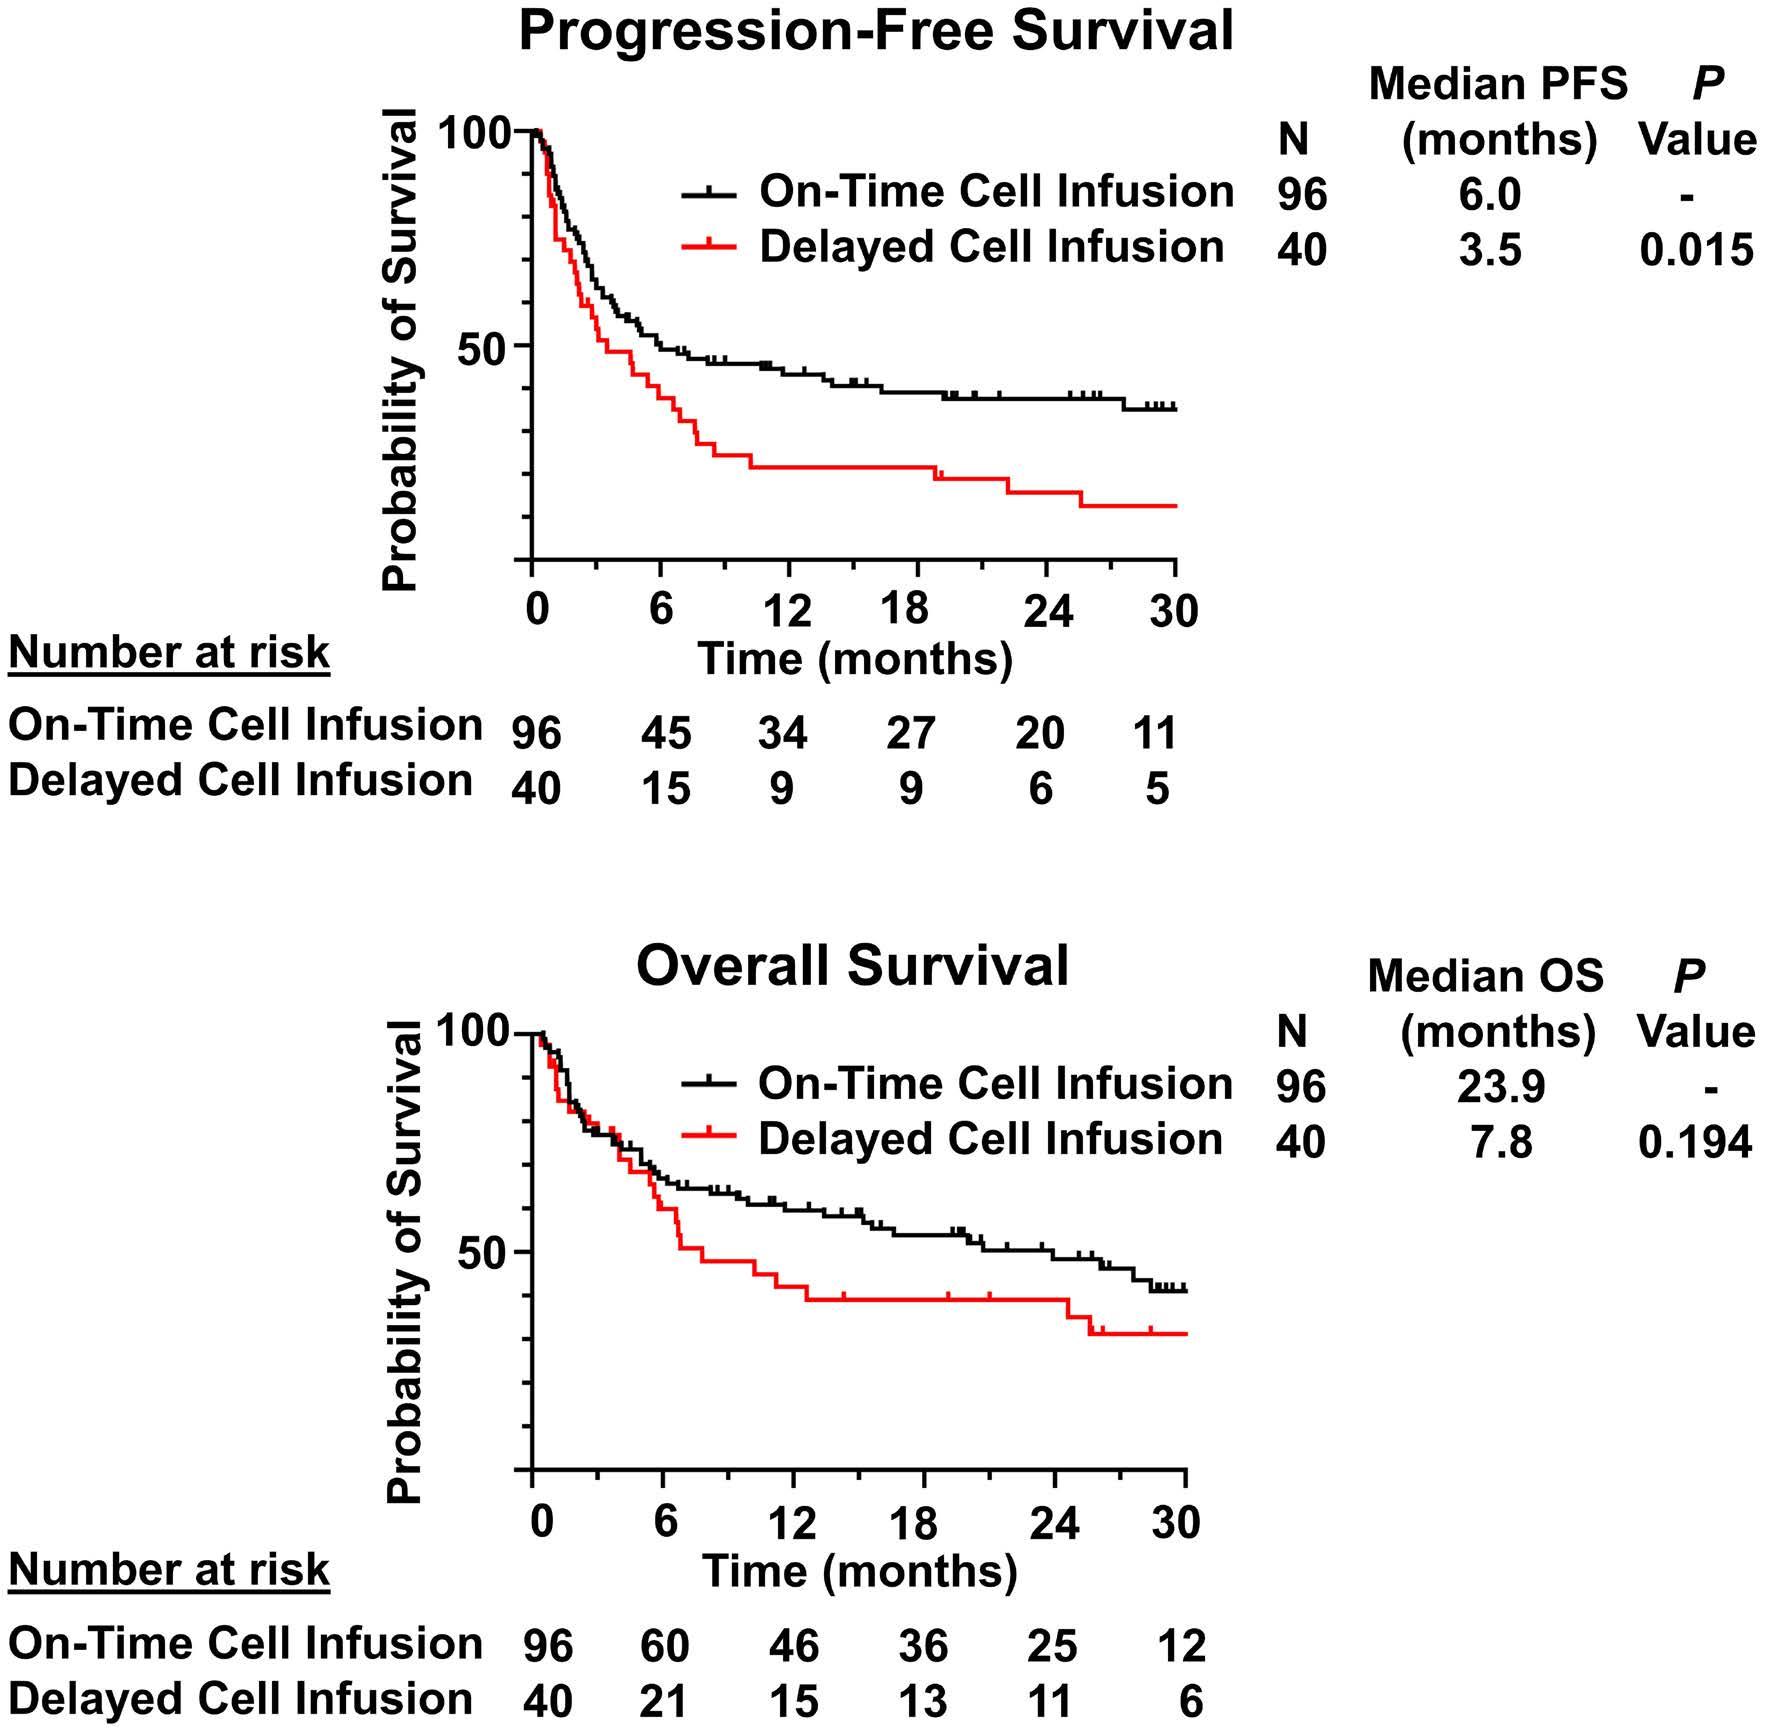
study populations. Previous studies examining the impact of bridging therapy prior to CAR T-cell administration have faced similar challenges as patients requiring bridging therapy typically have more aggressive disease, which predisposes them to worse outcomes.13,14 In our case, there were no differences in disease-related characteristics such as IPI score, elevated LDH, use of bridging therapy or refractory disease between patients with on-time and delayed infusion. Instead, patients with delayed cell infusion had lower ANC, lower platelets, lower hemoglobin and higher CRP at time of LDC initiation compared to those with ontime infusion. These findings are consistent with a pro-inflammatory state and compromised bone marrow function which could predispose patients to develop infections which, in turn, lead to CAR T-cell infusion delays. In order to adjust for these differences, we conducted a propensity score matched analysis based on these variables which continued to demonstrate shorter PFS in patients receiving delayed cell infusion. While prospective data are still needed, this finding suggests that the inferior outcomes noted in this patient population are not entirely due to differences in their baseline characteristics.
Our study also identified an association between extent of delay and survival, with significantly shorter median PFS noted in patients who had delay of 2-5 days and >5 days, but not delay of 1 day. These results must be interpreted with caution given the small number of patients involved.
Figure 4. Progression-free and overall survival of propensity score matched cohorts. (A) Progression-free survival (PFS) of propensity score matched cohorts. (B) Overall survival (OS) of propensity score matched cohorts.
This limitation also complicates efforts to understand the differences between these subgroups. For instance, although the general characteristics of each subgroup were broadly similar, only the 1-day delay group contained patients with logistical delays. Nevertheless, only three patients were delayed for this reason and 77% of the patients in this subgroup were delayed due to concern for infection. Similarly, patients with delays >5 days were more likely to have low ANC than patients in the other two subgroups but patients with delays of 1 day and 2-5 days had similar rates of low baseline ANC. The limitations of subgroup analysis are especially important to note with our cytokine analysis, where sample availability has further decreased the number of patients in each group. For these reasons, we are unable to draw any conclusions regarding differences in cytokine levels among these subgroups. Nevertheless, it remains possible that time-dependent changes in cytokine profiles may impact CAR T-cell efficacy. The time course of cytokine changes induced by LDC is particularly important given the disparate recommendations for timing of CAR T-cell administration by product.5-7 Larger studies are needed to elucidate the relationship between timing of CAR T-cell infusion, systemic cytokine milieu, and clinical outcomes.
Our analysis of plasma cytokine levels on the day of cell infusion demonstrated significantly higher levels of pro-inflammatory cytokines (e.g., TNF-α, TNF-β, IFN-γ, IL-1β, IL-2,
Haematologica | 109 May 2024 1465 ARTICLE - Delayed CAR T-cell Infusion A.P. Jallouk et al.
A B
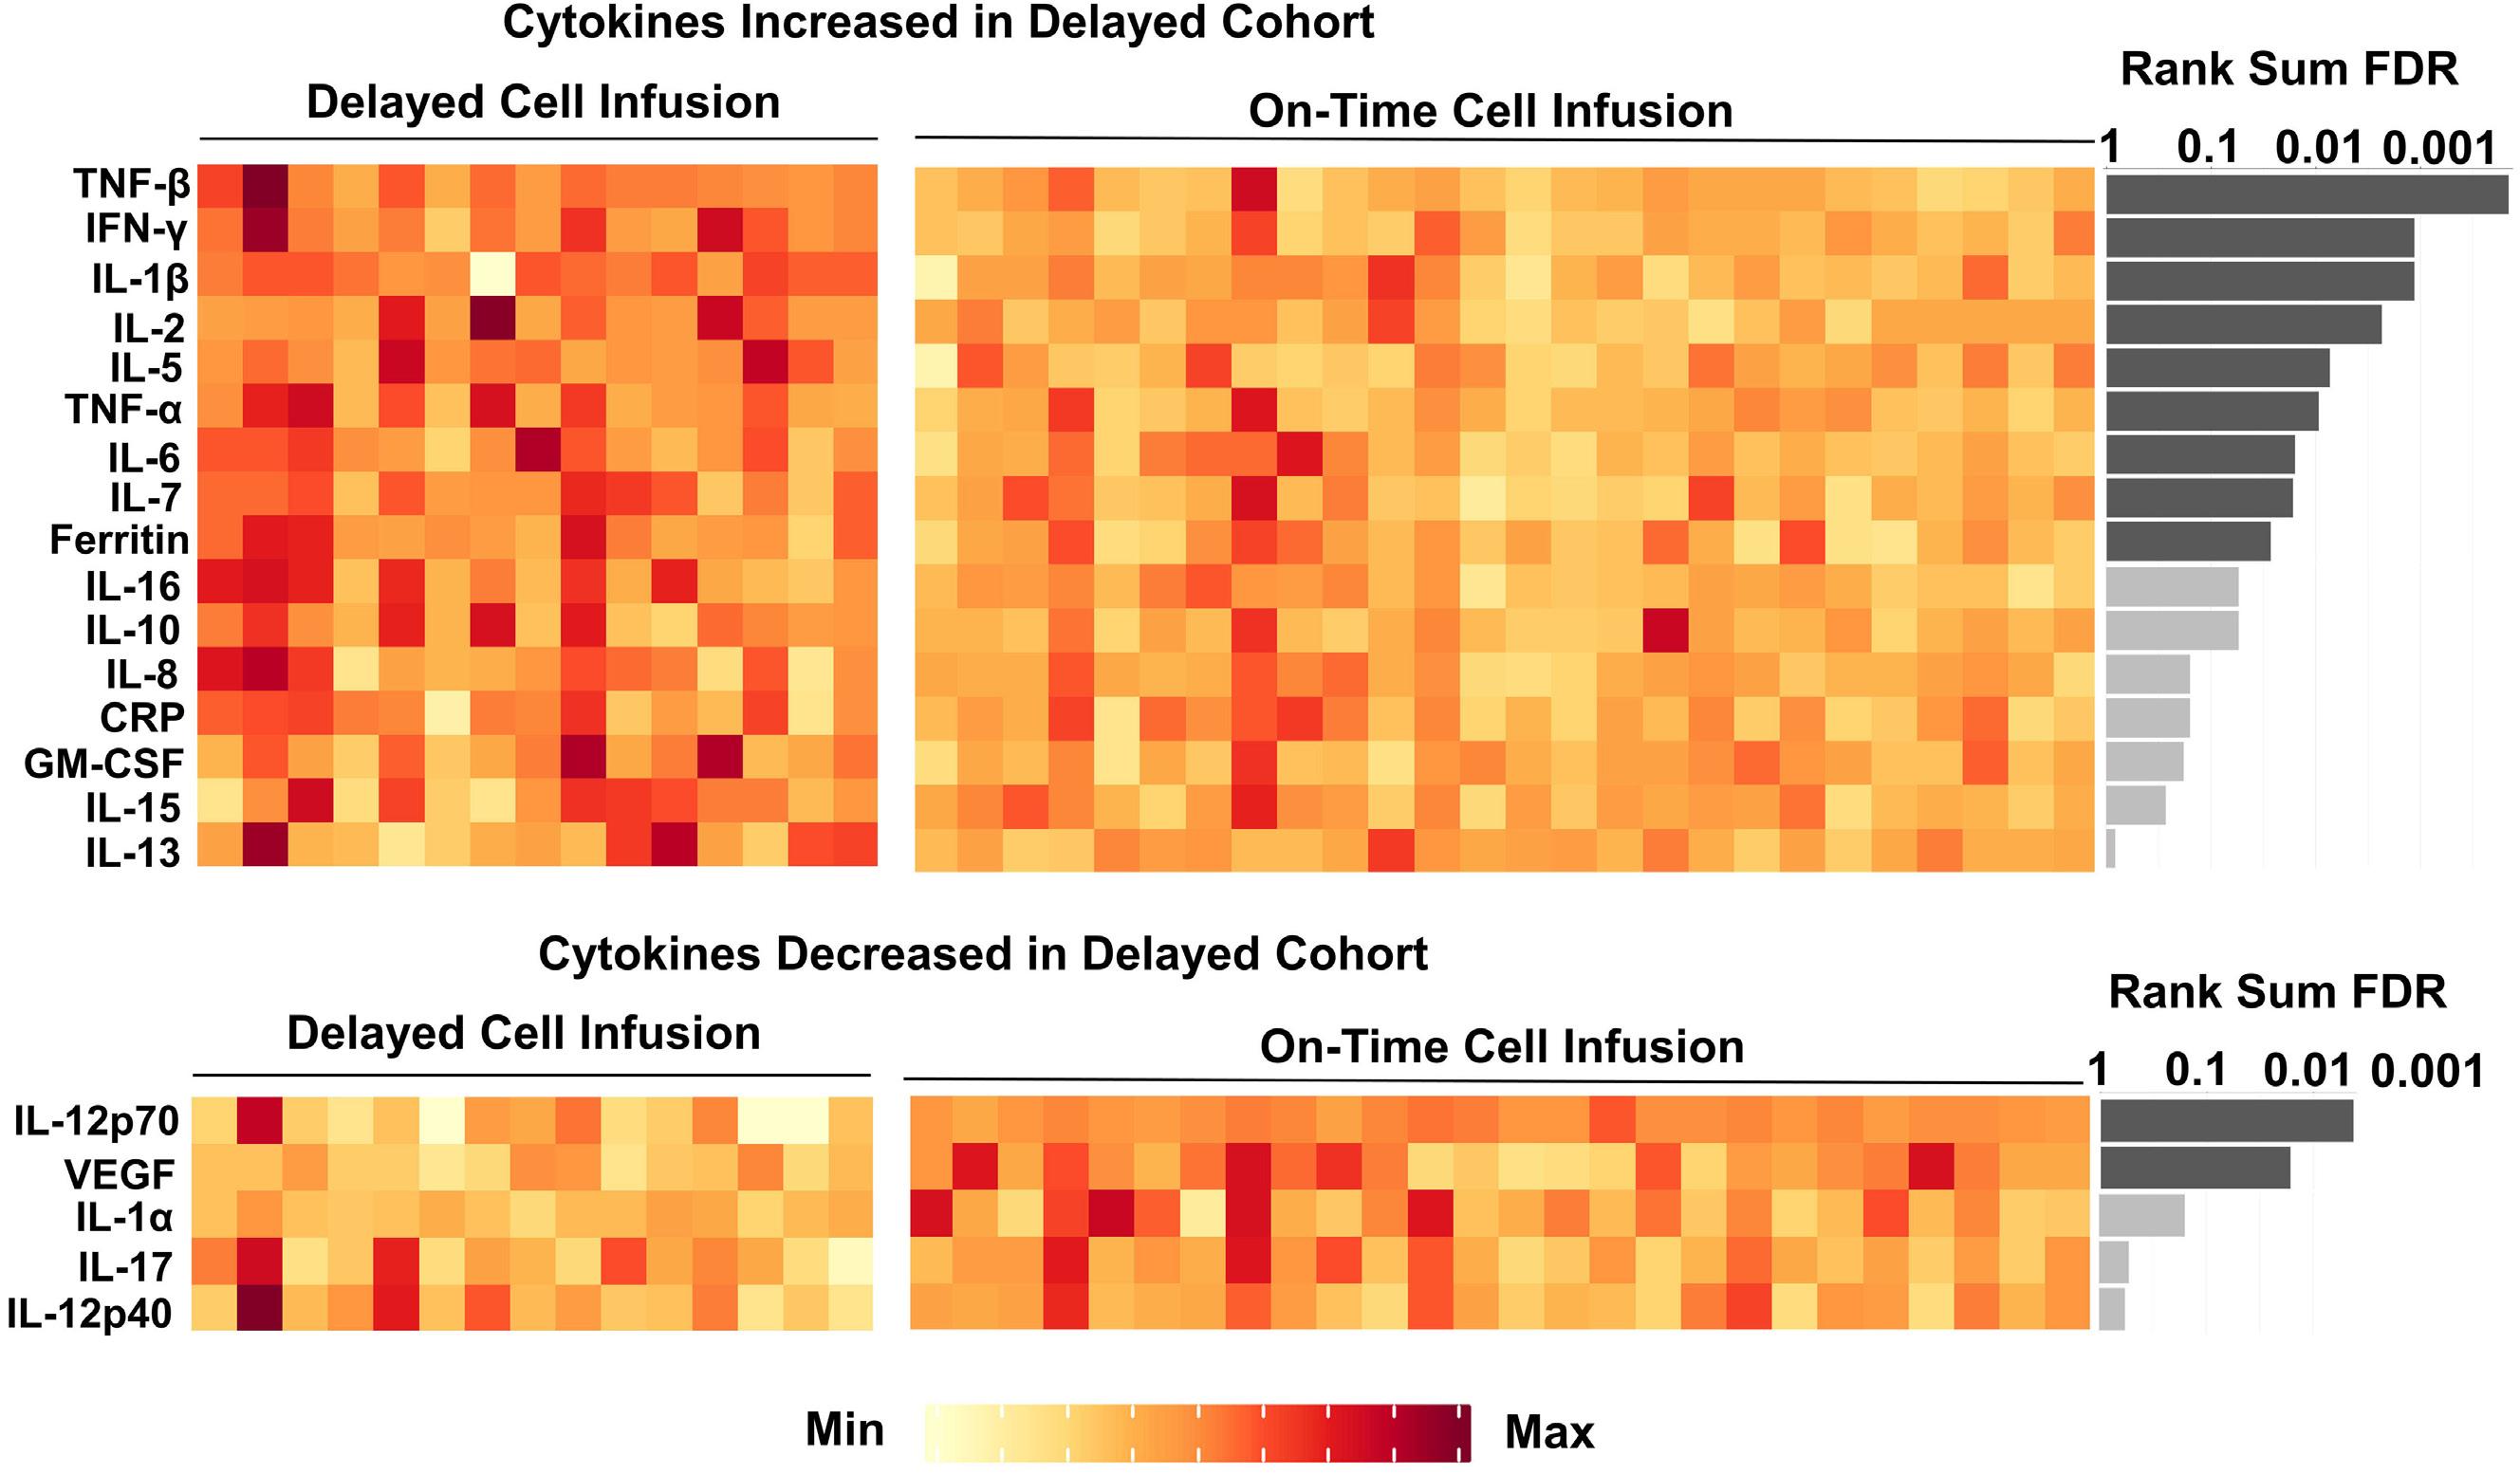
Figure 5. Cytokine levels on the day of axi-cel infusion in patients with delayed (N=15) and on-time (N=26) cell infusion. Each column represents a single patient. Significance level was tested by Mann-Whitney U test. False discovery rate (FDR) q value was calculated for multiple testing correction. Dark grey bars are statistically significant at a level of q<0.05. Light grey bars are not statistically significant at a level of q<0.05.
IL-5, IL-6, IL-7, ferritin) in patients with delayed cell infusion compared to those with on-time infusion. These results are suggestive of a systemic pro-inflammatory state and are consistent with the finding that most infusion delays were due to concern for infection. Although some cytokines, such as IL-7, have been shown to improve CAR T-cell function in isolation, pro-inflammatory states manifested by high levels of plasma IL-6 and ferritin have previously been associated with poor CAR T-cell expansion and lower durable response rates after administration of axi-cel.4,15 Multiple mechanisms have been proposed to explain this association, including increased numbers of circulating MDSC and increased intra-tumoral expression of immune checkpoint ligands driven by inflammatory signaling pathways. In particular, macrophages and the cytokines they produce play a complex role in determining CAR T-cell efficacy.16 Macrophage gene expression within the tumor microenvironment has been closely tied to intra-tumoral IFN signaling, and the presence of high numbers of intra-tumoral macrophages has been associated with poor CAR T-cell expansion, impaired tumor infiltration and inferior outcomes with a variety of CAR T-cell products.4,17,18 Due to the key role IFN-γ plays in inflammatory signaling, several groups have examined the impact of IFN-γ blockade on CAR T-cell efficacy and toxicity. Although large-scale clinical trials have not yet been performed, preclinical da-
ta and case reports suggest that IFN-γ blockade with the antibody emapalumab may ameliorate CAR T-cell toxicity without compromising efficacy.19-21 Furthermore, systemic pro-inflammatory states and IFN-γ signaling in particular have been associated with the development of prolonged cytopenia after CAR T-cell therapy.22,23 This finding may explain the trend toward increased rates of grade 3-4 cytopenias at day 30 in patients receiving delayed cell infusion. Given the increased level of circulating IFN-γ in patients with delayed cell infusion, the impact of IFN-γ blockade in these patients would be another interesting area to explore. In the event of unavoidable delays, it is important to carefully consider whether to proceed with cell infusion immediately or to further delay infusion until all active issues have resolved and the patient is able to receive another course of LDC. Although our data suggest that delays in cell infusion are associated with inferior outcomes, proceeding with cell infusion in the setting of active infection has also been associated with poor outcomes and is not recommended.24-26 Further studies are needed to inform this decision-making process, which will require consideration of the reason for delay as well as the patient’s clinical characteristics, disease course and laboratory findings. Additional studies are also needed to determine whether delayed cell infusion has a similar impact on outcomes
Haematologica | 109 May 2024 1466 ARTICLE - Delayed CAR T-cell Infusion A.P. Jallouk et al.
with other CAR T-cell products or lymphodepleting agents (such as bendamustine). Furthermore, as novel conditioning strategies and interventions targeting inflammatory pathways (such as IFN-γ blockade) are developed, their application in patients experiencing unavoidable delays in cell infusion would be a promising area of investigation. We acknowledge multiple limitations of this study, including its single-center and retrospective nature, its focus on a single CAR T-cell product and lymphodepleting regimen, the small size of certain subgroups, and the lack of data regarding CAR T-cell expansion and natural killer cell reconstitution.
In conclusion, our data suggest that delays in axi-cel infusion following administration of LDC, particularly those lasting ≥2 days, are associated with inferior survival outcomes and increased pro-inflammatory milieu. Further studies are needed to guide management of this patient population and determine whether additional conditioning strategies or other interventions directed at improving CAR T-cell function in these patients would be beneficial.
Disclosures
APJ is a consultant for Kite-Gilead. PS is a consultant for Kite-Gilead, Roche-Genentech, Hutchinson MediPharma, ADC Therapeutics, Incyte Morphosis and TG Therapeutics; and received research funds from Sobi Pharmaceuticals, Astrazeneca-Acerta, ALX Oncology and ADC Therapeutics. RES has received research funding from Seagen, BMS, Rafael Pharmaceuticals and GSK. SA received research funding from Seattle Genetics, Merck, Xencor, and Tessa Therapeutics and has membership on Tessa Therapeutic’s advisory committee. SSN received research support from Kite/Gilead, BMS, Allogene, Precision Biosciences, Adicet Bio, and Sana Biotechnology; served as advisory board member/consultant for Kite/Gilead, Merck, Sellas Life Sciences, Athenex, Allogene, Incyte, Adicet Bio, BMS, Bluebird Bio, Fosun Kite,
References
1. Neelapu SS. CAR-T efficacy: is conditioning the key? Blood. 2019;133(17):1799-1800.
2. Hirayama AV, Gauthier J, Hay KA, et al. The response to lymphodepletion impacts PFS in patients with aggressive non-Hodgkin lymphoma treated with CD19 CAR T cells. Blood. 2019;133(17):1876-1887.
3. Strati P, Jallouk AP, Sun R, et al. Impact of conditioning chemotherapy on lymphocyte kinetics and outcomes in LBCL patients treated with CAR T-cell therapy. Leukemia. 2022;36(11):2669-2677.
4 Jain MD, Zhao H, Wang X, et al. Tumor interferon signaling and suppressive myeloid cells are associated with CAR T-cell failure in large B-cell lymphoma. Blood. 2021;137(19):2621-2633.
5. YESCARTA (axicabtagene ciloleucel) package insert: https:// www.fda.gov/media/108377/download. Accessed Aug 15, 2023.
6. BREYANZI (lisocabtagene maraleucel) package insert: https://
Sana Biotechnology, Caribou, Astellas Pharma, Morphosys, Janssen, Chimagen, ImmunoACT, Orna Therapeutics, Takeda, Synthekine, and Carsgen; has stock options from Longbow Immunotherapy, Inc; and has intellectual property related to cell therapy.
Contributions
APJ, NK and RS analyzed data, and wrote the paper. JW, RES, RN, LJN, LEF, AAZ, EJS, PK, JR, CF, SSN, SA and PS provided clinical care to patients and co-authored the paper. MH, SA and MN collected clinical data and co-authored the paper. APJ, KD, JH and SSN performed correlative studies and co-authored the paper. SA and PS designed the study, analyzed the data, provided clinical care to patients, and wrote the paper.
Funding
This research was supported in part by the University of Texas MD Anderson Cancer Center support grant from the National Institutes of Health (P30 CA016672) and by the University of Texas MD Anderson Cancer Center B-cell Lymphoma Moonshot (SSN). PS salary is supported by the Lymphoma Research Foundation Career Development Award, the Leukemia Lymphoma Society Scholar in Clinical Research Career Development Program, the Sabin Fellowship Award, and by an R21 NIH grant. APJ is supported by a Conquer Cancer Foundation Young Investigator Award, a Lymphoma Scientific Research Mentoring program grant from the Lymphoma Research Foundation, and a training grant from the National Institutes of Health (T32 CA009666). The MD Anderson Lymphoma Tissue Bank was utilized in this study and is supported by KW Cares.
Data-sharing statement
De-identified data are available upon request by e-mail to the corresponding authors.
www.fda.gov/media/145711/download. Accessed Aug 15, 2023
7 KYMRIAH (tisagenlecleucel) package insert: https://www.fda. gov/media/107296/downloaded. Accessed Aug 15, 2023
8. Locke F, Hu ZH, Siddiqi T, et al. Real-world impact of time from leukapheresis to infusion (vein-to-vein time) in patients with relapsed or refractory (r/r) large B-cell lymphoma (LBCL) treated with axicabtagene ciloleucel. Blood. 2022;140(Suppl 1):7512-7515.
9 Neelapu SS, Tummala S, Kebriaei P, et al. Chimeric antigen receptor T-cell therapy - assessment and management of toxicities. Nat Rev Clin Oncol. 2018;15(1):47-62.
10 Lee DW, Santomasso BD, Locke FL, et al. ASTCT consensus grading for cytokine release syndrome and neurologic toxicity associated with immune effector cells. Biol Blood Marrow Transplant. 2019;25(4):625-638.
11. Oken MM, Creech RH, Tormey DC, et al. Toxicity and response
Haematologica | 109 May 2024 1467 ARTICLE - Delayed CAR T-cell Infusion A.P. Jallouk et al.
criteria of the Eastern Cooperative Oncology Group. American J Clin Oncol. 1982;5(6):649.
12. Cheson BD, Fisher RI, Barrington SF, et al. Recommendations for initial evaluation, staging, and response assessment of Hodgkin and non-Hodgkin lymphoma: the Lugano Classification. J Clin Oncol. 2014;32(27):3059-3067.
13. Amini L, Silbert SK, Maude SL, et al. Preparing for CAR T cell therapy: patient selection, bridging therapies and lymphodepletion. Nat Rev Clin Oncol. 2022;19(5):342-355.
14 Pinnix CC, Gunther JR, Dabaja BS, et al. Bridging therapy prior to axicabtagene ciloleucel for relapsed/refractory large B-cell lymphoma. Blood Adv. 2020;4(13):2871-2883.
15. Locke FL, Rossi JM, Neelapu SS, et al. Tumor burden, inflammation, and product attributes determine outcomes of axicabtagene ciloleucel in large B-cell lymphoma. Blood Adv. 2020;4(19):4898-4911.
16. Al Zaki A, McCurry D, Strati P. CAR T-cells and macrophages in large B-cell lymphoma: impact on toxicity and efficacy. Leuk Lymphoma. 2023;64(4):808-815.
17 Reiss DJ, Do T, Kuo D, et al. Multiplexed immunofluorescence (IF) analysis and gene expression profiling of biopsies from patients with relapsed/refractory (R/R) diffuse large B cell lymphoma (DLBCL) treated with lisocabtagene maraleucel (liso-cel) in transcend NHL 001 reveal patterns of immune infiltration associated with durable response. Blood. 2019;134(Suppl 1):202.
18. Yan Z-X, Li L, Wang W, et al. Clinical efficacy and tumor microenvironment influence in a dose-escalation study of anti-CD19 chimeric antigen receptor T cells in refractory B-cell non-Hodgkin’s lymphoma. Clin Cancer Res. 2019;25(23):6995-7003.
19 Bailey SR, Vatsa S, Larson RC, et al. Blockade or deletion of IFNγ
reduces macrophage activation without compromising CAR T-cell function in hematologic malignancies. Blood Cancer Discov. 2022;3(2):136-153.
20 Manni S, Del Bufalo F, Merli P, et al. Neutralizing IFNγ improves safety without compromising efficacy of CAR-T cell therapy in B-cell malignancies. Nat Commun. 2023;14(1):3423.
21. Rainone M, Ngo D, Baird JH, et al. Interferon-γ blockade in CAR T-cell therapy–associated macrophage activation syndrome/ hemophagocytic lymphohistiocytosis. Blood Adv. 2023;7(4):533-536.
22. Rejeski K, Perez A, Sesques P, et al. CAR-HEMATOTOX: a model for CAR T-cell–related hematologic toxicity in relapsed/ refractory large B-cell lymphoma. Blood. 2021;138(24):2499-2513.
23. Strati P, Li X, Deng Q, et al. Prolonged cytopenia following CD19 CAR T cell therapy is linked with bone marrow infiltration of clonally expanded IFNγ-expressing CD8 T cells. Cell Rep Med. 2023;4(8):101158.
24. Hill JA, Li D, Hay KA, et al. Infectious complications of CD19targeted chimeric antigen receptor–modified T-cell immunotherapy. Blood. 2018;131(1):121-130.
25. Grupp S, Hu Z-H, Zhang Y, et al. Tisagenlecleucel chimeric antigen receptor (CAR) T-cell therapy for relapsed/refractory children and young adults with acute lymphoblastic leukemia (ALL): real world experience from the Center for International Blood and Marrow Transplant Research (CIBMTR) and Cellular Therapy (CT) Registry. Blood. 2019;134(Suppl 1):2619.
26. Cordeiro A, Bezerra ED, Hirayama AV, et al. Late events after treatment with CD19-targeted chimeric antigen receptor modified T cells. Biol Blood Marrow Transplant. 2020;26(1):26-33.
Haematologica | 109 May 2024 1468 ARTICLE - Delayed CAR T-cell Infusion A.P. Jallouk et al.
Autologous-allogeneic versus autologous tandem stem cell transplantation and maintenance therapy with thalidomide for multiple myeloma patients under 60 years of age: a prospective, phase II study
Nicolaus Kröger,1 Gerald Wulf,2 Ute Hegenbart,3 Andreas Burchert,4 Matthias Stelljes,5 Nico Gagelmann,1 Arne Brecht,6,7 Martin Kaufmann,8 Lutz Müller,9 Arnold Ganser,10 Dominik Wolf,11,12 Wolfgang Bethge,13 Martin Bornhäuser,14 Michael Kiehl,15 Eva-Maria Wagner,16 Christoph Schmid,17 Hans Christian Reinhardt,18 Guido Kobbe,19 Hans Salwender,20 Thomas Heinicke,21 Martin Kropff,22 Marion Heinzelmann,1 Francis Ayuk,1 Lorenz Trümper,2 Andreas Neubauer,4 Andreas Völp,23 Evgeny Kluychnikov,1 Stefan Schönland3 and Christine Wolschke1
1University Medical Center, Hamburg, Germany; 2University Hospital, Göttingen, Germany; 3University Hospital, Heidelberg, Germany; 4University Hospital, Marburg, Germany; 5Department of Medicine A, Hematology, Oncology, and Pneumology, University Hospital, Münster, Germany; 6DKD HELIOS Hospital, Wiesbaden, Germany; 7HELIOS Dr. Horst Schmidt Hospital, Wiesbaden, Germany; 8Robert Bosch Hospital, Stuttgart, Germany; 9University Hospital, Halle, Germany; 10Medical School, Hannover, Germany; 11Internal Medicine 3, University Hospital, Bonn, Germany; 12Department of Hematology and Oncology, Comprehensive Cancer Center Innsbruck (CCCI), Medical University Innsbruck (MUI), Innsbruck, Austria; 13University Hospital, Tübingen, Germany; 14University Hospital, Dresden, Germany; 15Frankfurt/Oder Hospital, Frankfurt/Oder, Germany; 16University Hospital, Mainz, Germany; 17University Hospital, Augsburg, Germany; 18University Hospital, Essen, Germany; 19University Hospital, Düsseldorf, Germany; 20Asklepios Hospital Altona, Hamburg, Germany; 21University Hospital, Magdeburg, Germany; 22Osnabrück Hospital, Osnabrück, Germany and 23Psy Consult, Hamburg, Germany
Abstract
Correspondence: N. Kröger nkroeger@uke.de
Received: February 11, 2023.
Accepted: November 2, 2023.
Early view: November 9, 2023.
https://doi.org/10.3324/haematol.2023.282920
©2024 Ferrata
The role of autologous-allogeneic tandem stem cell transplantation (alloTSCT) followed by maintenance as upfront treatment for multiple myeloma is controversial. Between 2008 and 2014 a total of 217 multiple myeloma patients with a median age of 51 years were included by 20 German centers within an open-label, parallel-group, multicenter clinical trial to compare alloTSCT to autologous tandem transplantation (autoTSCT) followed by 2 years of maintenance therapy with thalidomide (100 mg/day) in both arms with respect to relapse/progression-free survival (PFS) and other relevant outcomes. A total of 178 patients underwent a second transplant (132 allogeneic, 46 autologous). PFS at 4 years after the second transplant was 47% (95% CI: 38-55%) for alloTSCT and 35% (95% CI: 21-49%) for autoTSCT (P=0.26). This difference increased to 22% at 8 years (P=0.10). The cumulative incidences of non-relapse mortality and of relapse at 4 years were 13% (95% CI: 8-20%) and 2% (95% CI: 0.3-2%) (P=0.044) and 40% (95% CI: 33-50%) and 63% (95% CI: 50-79%) (P=0.04) for alloTSCT and autoTSCT, respectively. The difference for relapse/progression increased to 33% (alloTSCT: 44%, autoTSCT: 77%) at a median follow-up of 82 months (P=0.002). Four-year overall survival was 66% (95% CI: 57-73%) for alloTSCT and 66% (95% CI: 50-78%) for autoTSCT (P=0.91) and 8-year overall survival was 52% and 50% (P=0.87), respectively. In conclusion, alloTSCT followed by thalidomide maintenance reduced the rate of recurrence or progression during a follow-up period of up to 10 years but failed to improve PFS significantly. This study was registered with ClinicalTrials.gov (NCT00777998).
Introduction
Multiple myeloma is the second most frequent hema-
tologic malignancy and is considered to be an incurable disease. Novel agents which have been introduced into the treatment of multiple myeloma, such as proteasome
Haematologica | 109 May 2024 1469 - Plasma Cell Disorders ARTICLE
Storti Foundation Published under a CC BY-NC license
inhibitors, immunomodulatory agents, monoclonal antibodies and, more recently, chimeric antigen receptor T cells, have substantially improved overall survival (OS) and are included as induction, consolidation, and maintenance therapy in the context of autologous stem cell transplantation (SCT) in younger patients. However, despite high numbers of complete and measurable residual disease-negative remissions, the vast majority of patients will eventually relapse.
Allogeneic SCT carries the potential benefit of a graft- versus-myeloma effect resulting in a lower risk of relapse in comparison to that following autologous SCT but with the risk of higher morbidity and transplant-related mortality.1-3
To lessen toxicity, reduced-intensity or non-myeloablative conditioning regimens have been introduced and have resulted in a decreased mortality rate in comparison to that associated with standard myeloablative conditioning.4-6 To increase antimyeloma efficacy, sequential autologous-allogeneic tandem stem cell transplantation (alloTSCT) was introduced and investigated in several prospective studies in comparison to autologous-autologous stem cell transplantation (autoTSCT).7-14 While in nearly all of the studies higher complete remission rates and lower relapse incidences were observed after the autologous-allogeneic approach, only two studies showed significantly improved event-free and OS rates due to the generally higher non-relapse mortality.9,12 A recently published analysis with individual patients’ data from four of these trials showed a significantly improved progression-free survival (PFS) as well as OS after alloTSCT after a median follow-up of 10 years.15
Despite these results allogeneic SCT as in the autologous-allogeneic tandem approach has not become standard of care in the treatment of younger myeloma patients and none of the studies has included maintenance therapy after allogeneic SCT. Here we report early and long-term results of a prospective, multicenter study of autoTSCT versus reduced-intensity alloTSCT, both followed by maintenance therapy with thalidomide for 2 years.
Methods
Major inclusion criteria were myeloma stage II or III according to Salmon and Durie staging system, age between 18 and 60 years, and a maximum of eight cycles of chemotherapy prior to registration independently of the response. Response was assessed according to the International Myeloma Working Group criteria. Major exclusion criteria were severe renal, hepatic, pulmonary, or cardiac diseases, and preceding autologous SCT.
The study was an open-label, parallel-group, multicenter clinical trial designed to compare outcomes (PFS and OS) after alloTSCT or autoTSCT followed by 2 years of maintenance therapy with thalidomide (100 mg/day) in both
arms. The patients could have received a maximum of eight induction cycles and escalating prophylactic donor lymphocyte infusions were allowed after alloTSCT. Patients received an autologous peripheral blood SCT followed by allogeneic peripheral blood SCT if a matched related or unrelated donor was available; otherwise, or if they declined the allogeneic transplant, they received a second autologous peripheral blood SCT. This happened in only two patients. The patients’ characteristics are presented in Table 1. Appropriate donors were defined as a HLA-identical sibling or a 10/10 or 9/10 HLA-compatible unrelated donor.
The study had an observation period of 48 months, counting from the second SCT. A long-term follow-up of disease status and patients’ survival covered a period of 10 years with a median follow-up of 82 months.
The primary endpoint was PFS, defined as the absence of relapse, progression or death from any cause, at 4 years after TSCT. Major secondary endpoints were cumulative incidence of relapse, disease-related mortality, non-relapse mortality and OS, all at 4 years, in both arms.
The study was approved by the “Ärztekammer Hamburg” Ethics Committee.
Statistics
Relapse-free/PFS and OS were compared between the treatment groups using Kaplan-Meier survival analysis. Confidence intervals for treatment group risk differences were determined using the Greenwood method.16 Confirmatory testing for 4-year PFS was performed in the full analysis set (i.e., the patients who underwent TSCT) using a log-rank test and a two-sided type I error level of α=0.05. For relapse/progression, disease-related mortality and non-relapse mortality were analyzed as competing risks. Exploratory post-hoc Cox regression analysis was used for subgroup analysis and for determining the influence of recipient age (≤ median vs. > median), sex, myeloma classification, Salmon & Durie stage at baseline (I or II vs. III), cytogenetic risk (del17p or t4;14 vs. other), maximum response to induction (complete remission vs. other), disease status before the second SCT (complete remission vs. other), Eastern Cooperative Oncology Group grade before the second SCT (0 vs. >0), in addition to type of TSCT, on relapse/PFS and OS. In the multiple Cox models investigating the influence of the different covariates, type of TSCT was always included (forced entry) whereas significant other co-variates were selected using backward elimination. Indicated P values are two-sided and are intended for descriptive interpretation except for the primary endpoint. All confidence intervals (CI) have a coverage of 95%.
The sample size was calculated on the basis of relapse-free/PFS at 4 years, assuming 48-month event rates of 50% for alloTSCT and of 70% for autoTSCT. A total sample size of 185 patients (111 for alloTSCT and 74 for
Haematologica | 109 May 2024 1470 ARTICLE - Allo- versus auto-TSCT with thalidomide in MM N. Kröger et al.
Table 1. Characteristics of the patients in the full analysis set.
response after induction, N (%)
between 1st and 2nd SCT in days, median (range)
performance status at 1st SCT, N (%)
*As determined by fluorescence in situ hybridization. Auto-Allo: autologous-allogeneic; TSCT: tandem stem cell transplantation; Auto-Auto: autologous-autologous; VAD: vincristine, doxorubicin and dexamethasone; ThalDex: thalidomide and dexamethasone; BorDex: bortezomib and dexamethasone; BorCyDex: bortezomib, cytarabine and dexamethasone; SCT: stem cell transplantation; ECOG: Eastern Cooperative Oncology Group.
autoTSCT) was estimated to provide at least 80% power to reject the null hypothesis in a log-rank test model.
Results
Patients’ characteristics and transplants
Between October 2008 and July 2013, a total of 217 pa-
tients with stage II/III multiple myeloma were recruited into the trial in 20 centers in Germany. The median number of induction chemotherapy cycles was three in both arms. Two-hundred and eight patients underwent a first autologous transplant after conditioning with melphalan 200 mg/m2. A second transplant was performed in 178 patients, who were analyzed for efficacy (full analysis set) and safety. Reasons for withdrawal before the second SCT are shown
Haematologica | 109 May 2024 1471 ARTICLE - Allo- versus auto-TSCT with thalidomide in MM N. Kröger et al.
Characteristics All patients N=178 Auto-Allo TSCT N=132 Auto-Auto TSCT N=46 Age in years, median (range) 52 (26-61) 51 (26-61) 53 (34-61) Sex, N (%) Male Female 101 (57) 77 (43) 74 (56) 58 (44) 27 (59) 19 (41) Multiple myeloma
(%) IgG IgA IgM IgD Light chain only Missing data 92 (52) 39 (22) 2 (1) 2 (1) 40 (22) 3 (2) 70 (53) 26 (20) 2 (2) 2 (2) 31 (22) 1 (1) 22 (48) 13 (28) 0 (0) 0 (0) 9 (20) 2 (4) International Staging System stage, N (%) I II III Missing data 49 (28) 43 (24) 33 (19) 53 (30) 33 (25) 32 (24) 27 (21) 40 (30) 16 (35) 11 (24) 6 (13) 13 (28) Extramedullary disease at diagnosis, N (%) No Yes Missing data 134 (75) 19 (11) 25 (14) 97 (74) 14 (11) 21 (16) 37 (80) 5 (11) 4 (9) Cytogenetics,* N (%) Del17p or t(4;14) Missing data 32 (18) 50 (28) 24 (18) 37 (28) 8 (17) 13 (28) Time between diagnosis and study inclusion in months, median (range) 5 (1-118) 4 (1-118) 5 (1-47) N of induction cycles, median (range) 3 (1-8) 3 (1-8) 3 (3-8) Induction chemotherapy, N (%) VAD ThalDex BorDex BorCyDex Plus radiotherapy Other 12 (7) 2 (1) 49 (27) 68 (38) 3 (2) 44 (25) 11 (8) 2 (2) 40 (30) 46 (35) 3 (2) 30 (23) 1 (2) 0 (0) 9 (20) 22 (48) 0 (0) 14 (30) Best
Complete remission Partial remission Stable disease Progressive disease Missing data 16 (9) 136 (76) 6 (3) 4 (2) 16 (9) 13 (11) 99 (75) 4 (3) 4 (3) 12 (9) 3 (7) 37 (80) 2 (4) 0 (0) 4 (9)
84 (49-209) 84 (49-209) 82 (53-204) ECOG
0 1 2 Missing data 80 (45) 70 (39) 4 (2) 24 (14) 60 (46) 49 (37) 3 (2) 20 (15) 20 (44) 21 (46) 1 (2) 4 (9)
subtype, N
Time
in Figure 1. The second transplant was either allogeneic (n=132) or autologous (n=46). The allogeneic transplants were performed after conditioning with melphalan 140 mg/ m2, fludarabine 150 mg/m2, and anti-T-lymphocyte globulin (Grafalon®, Fa Neovii, Switzerland) 60 mg/kg for those from matched unrelated donors and 30 mg/kg for those from HLA-identical siblings, divided into three doses given on days -3, -2, and -1. The conditioning regimen prior to a second autologous SCT was melphalan 200 mg/m2. Seventy-nine patients (59.8%) received stem cells from an HLA-identical sibling and 53 (40.2%) from a matched unrelated donor, including four mismatched unrelated donors. One-hundred and eighteen patients of those receiving a second SCT (alloTSCT: 87, 66% of 132; autoTSCT: 31, 67% of 46) were alive at their individual endpoint of the original 48-month protocol. One-hundred and five patients (alloTSCT: n=78 [59%]; autoTSCT: n=27 [59%]) survived at the individual end of the long-term follow-up, with a follow-up duration of up to 124 months (last patient last seen alive). The patients’ characteristics are summarized in Table 1.
Time-to-event endpoints
Cumulative event rates for time-to-event endpoints are presented in Table 2.
For PFS, treatment group event rates were similar during the first 1.5 years after the second SCT whereas increasingly lower rates were observed in the alloTSCT group (as compared to the autoTSCT group) as the follow-up progressed, with event rate differences of 12% at month 48 and of 22% at 8
years. The median PFS was 40.1 months (95% CI: 26.9-53.3 months) for alloTSCT and 29.8 months (29.8-37.7 months) for autoTSCT. However, treatment group differences at 48 months (primary endpoint) and at 8 years did not reach the nominal level of being statistically significant. The treatment group differences in PFS were mainly driven by significantly lower incidences of myeloma relapse and progression in the alloTSCT group, with cumulative incidence rate differences of 23% at month 48 (P=0.011) and of 33% at 8 years (P=0.002) (Figure 2A). Moreover, mortality following relapse or progression was also lower in the alloTSCT arm (Figure 2B). The cumulative incidence of non-relapse mortality at 4 years was lower after autoTSCT at 2% (95% CI: 0.3-2%) versus 13% (95% CI: 8-20%) after alloTSCT (P=0.01) (Figure 2C).
The mean OS was 82.2 months (95% CI: 73.5-90.8 months) for patients who underwent alloTSCT and 80.1 months (95% CI: 75.7-94.2 months) for those who underwent autoTSCT (Figure 2D).
Graft-versus-host disease
Any grade of acute graft-versus-host disease (GvHD) after allogeneic SCT was observed in 38% of the patients, and was grade 1 in 17%, grade 2 in 15% and grade 3 in 6%. GvHD after donor lymphocyte infusion (DLI) was observed in 55% (95% CI: 47-64%) of the patients, a rate only slightly higher than in those who did not receive DLI. Chronic GvHD was assessed during the first 4 years of the follow-up; the cumulative incidence at month 48 was 61% (95% CI: 54-70%),
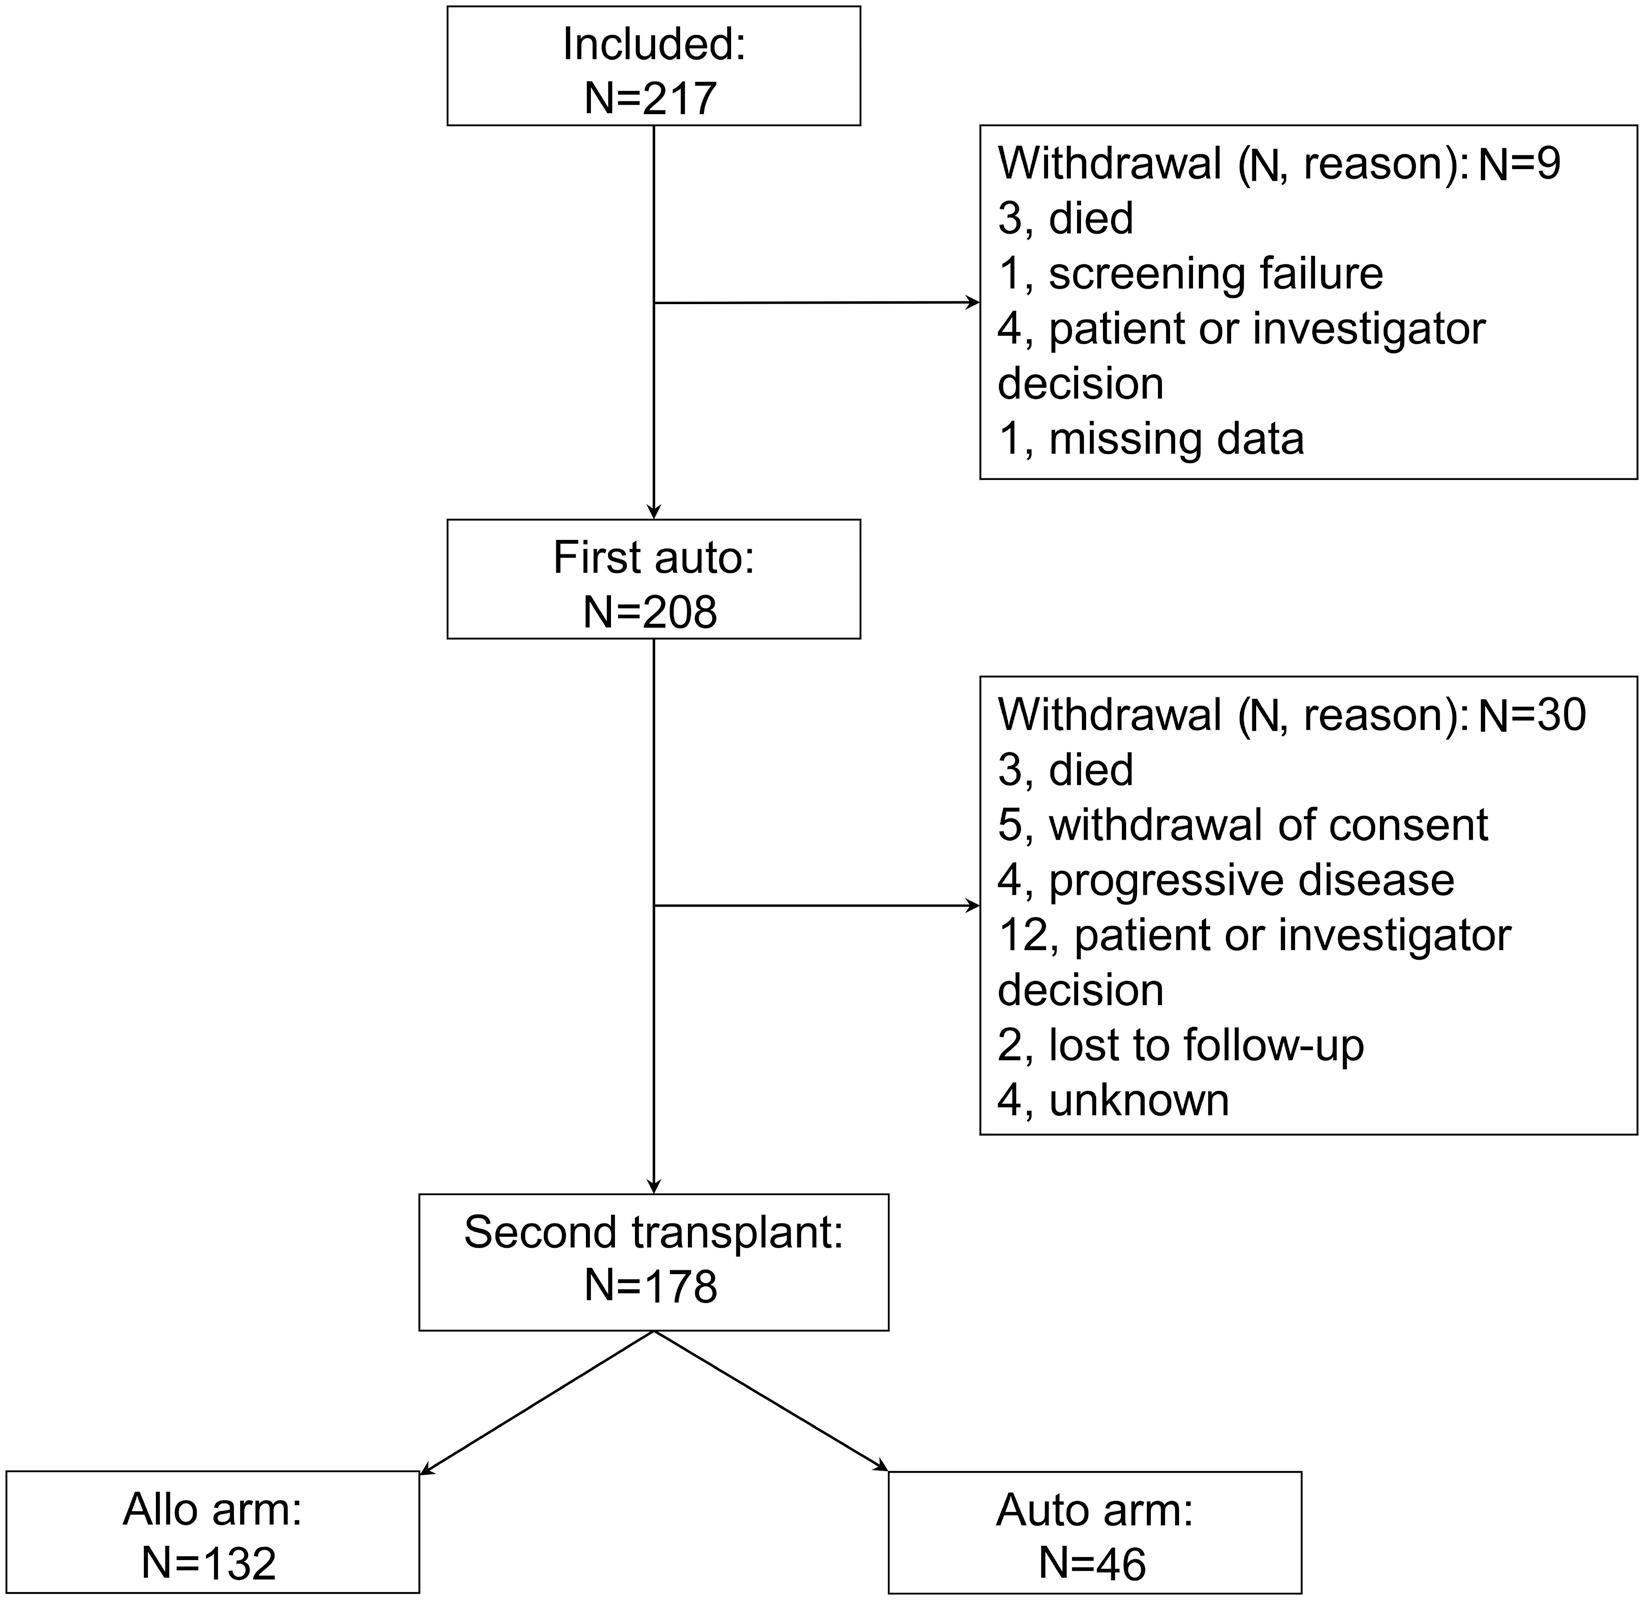
Figure 1. A
the patients’ disposition in the trial. Auto: autologous stem cell transplantation. Allo: allogeneic stem cell transplantation.
Haematologica | 109 May 2024 1472 ARTICLE - Allo- versus auto-TSCT with thalidomide in MM N. Kröger et al.
CONSORT diagram of
and the last case of a first occurrence of chronic GvHD was observed at 26 months after the second SCT. No obvious increase in GvHD was seen after thalidomide treatment.
Thalidomide maintenance
According to protocol thalidomide 100 mg/day was to be given in both arms from day 120 after the second transplant (whether allogeneic or autologous) for a maximum of 2 years unless progression or intolerable toxicity occurred.
Thirty-two patients (24%) in the alloTSCT arm and eight patients (17%) in the autoTSCT arm did not receive any thalidomide in accordance with either the patients’ wishes or physicians’ decision, or because they did not survive until or progressed before the scheduled start of the treatment.
Twenty-one percent of patients in the alloTSCT group received thalidomide for at least 700 days and 55% received
Table 2. Results after the second transplantation.
Responses and outcomes
to engraftment in days, median (IQR)
Best response after 2nd SCT, N (%)
Disease status at end of the 48 month study, N (%)
Outcomes, % (95% CI)
(death in remission)
the drug for less than 700 days, compared to 24% and 59%, respectively, in the autoTSCT group. About 77% of the patients in both groups who were administered thalidomide received an initial daily dose of 100 mg while the remaining patients started at a dose of 50 mg/day. The maintenance dose for all patients except four in the alloTSCT group and one in the autoTSCT group was also 100 mg/day in accordance with the study protocol. Among those receiving any dose of thalidomide, 44% in the alloTSCT arm and 53% in the autoTSCT arm stopped the drug because of toxicity. Across both treatment groups, patients receiving thalidomide had a longer mean PFS (69.0 months, compared to 60.8 months for all patients) and mean OS (91.0 months vs. 81.8 months for all patients). The results are, however, likely biased by the fact that relapse, progression or mortality occurring before the start of thalidomide administration
*Includes patients who died in remission. Auto-Allo: autologous-allogeneic; TSCT: tandem stem cell transplantation; Auto-Auto: autologous-autologous; IQR: interquartile range; SCT: stem cell transplantation; 95% CI: 95% confidence interval.
Haematologica | 109 May 2024 1473 ARTICLE - Allo- versus auto-TSCT with thalidomide in MM N. Kröger et al.
Auto-Allo TSCT N=132 Auto-Auto TSCT N=46 P Responses Time
Leukocytes >1x10⁹/L Platelets >50x109/L 17 (14-22) 18 (13-29) 12 (11-16) 11 (10-15) <0.001 <0.001
Complete remission* Partial remission* Stable disease Progressive disease Missing data 93 (71) 27 (21) 1 (1) 5 (4) 6 (5) 25 (54) 14 (30) 1 (2) 4 (9) 2 (4) 0.029
Complete remission* Partial remission* Stable disease Progressive disease Missing data 47 (36) 20 (15) 1 (1) 54 (41) 10 (8) 9 (20) 7 (15) 0 (0) 28 (61) 2 (4) 0.019
Relapse-/progression-free survival At month 48 At end of follow-up 47 (38-55) 43 (34-51) 35 (21-49) 21 (9-36) 0.26 0.10 Relapse/progression* At month 48 End of follow-up 40 (33-50) 44 (36-54) 63 (50-79) 77 (64-92) 0.01 0.002 Disease-related mortality* At month 48 At end of follow-up 21 (15-30) 35 (26-47) 32 (21-50) 47 (32-69) 0.15 0.09 Non-relapse mortality
At month 48 At end of follow-up 13 (8-20) 13 (8-20) 2 (0.3-15) 2 (0.3-15) 0.04 0.04 Overall survival At month 48 At end of follow-up 66 (57-73) 52 (41-62) 66 (50-78) 50 (32-67) 0.90 0.86
decreased PFS and OS in the full analysis set but not in the subset of patients who received thalidomide.
Donor lymphocyte infusion
Prophylactic DLI could be given according to a local inves-
tigator’s discretion in an escalating fashion after stopping immunosuppressive medication and in the absence of signs of GvHD. Fifty-eight patients (50.4%) in the alloTSCT group received between one and six DLI. Of those 58 patients, 35 received between one and three DLI and 23 received
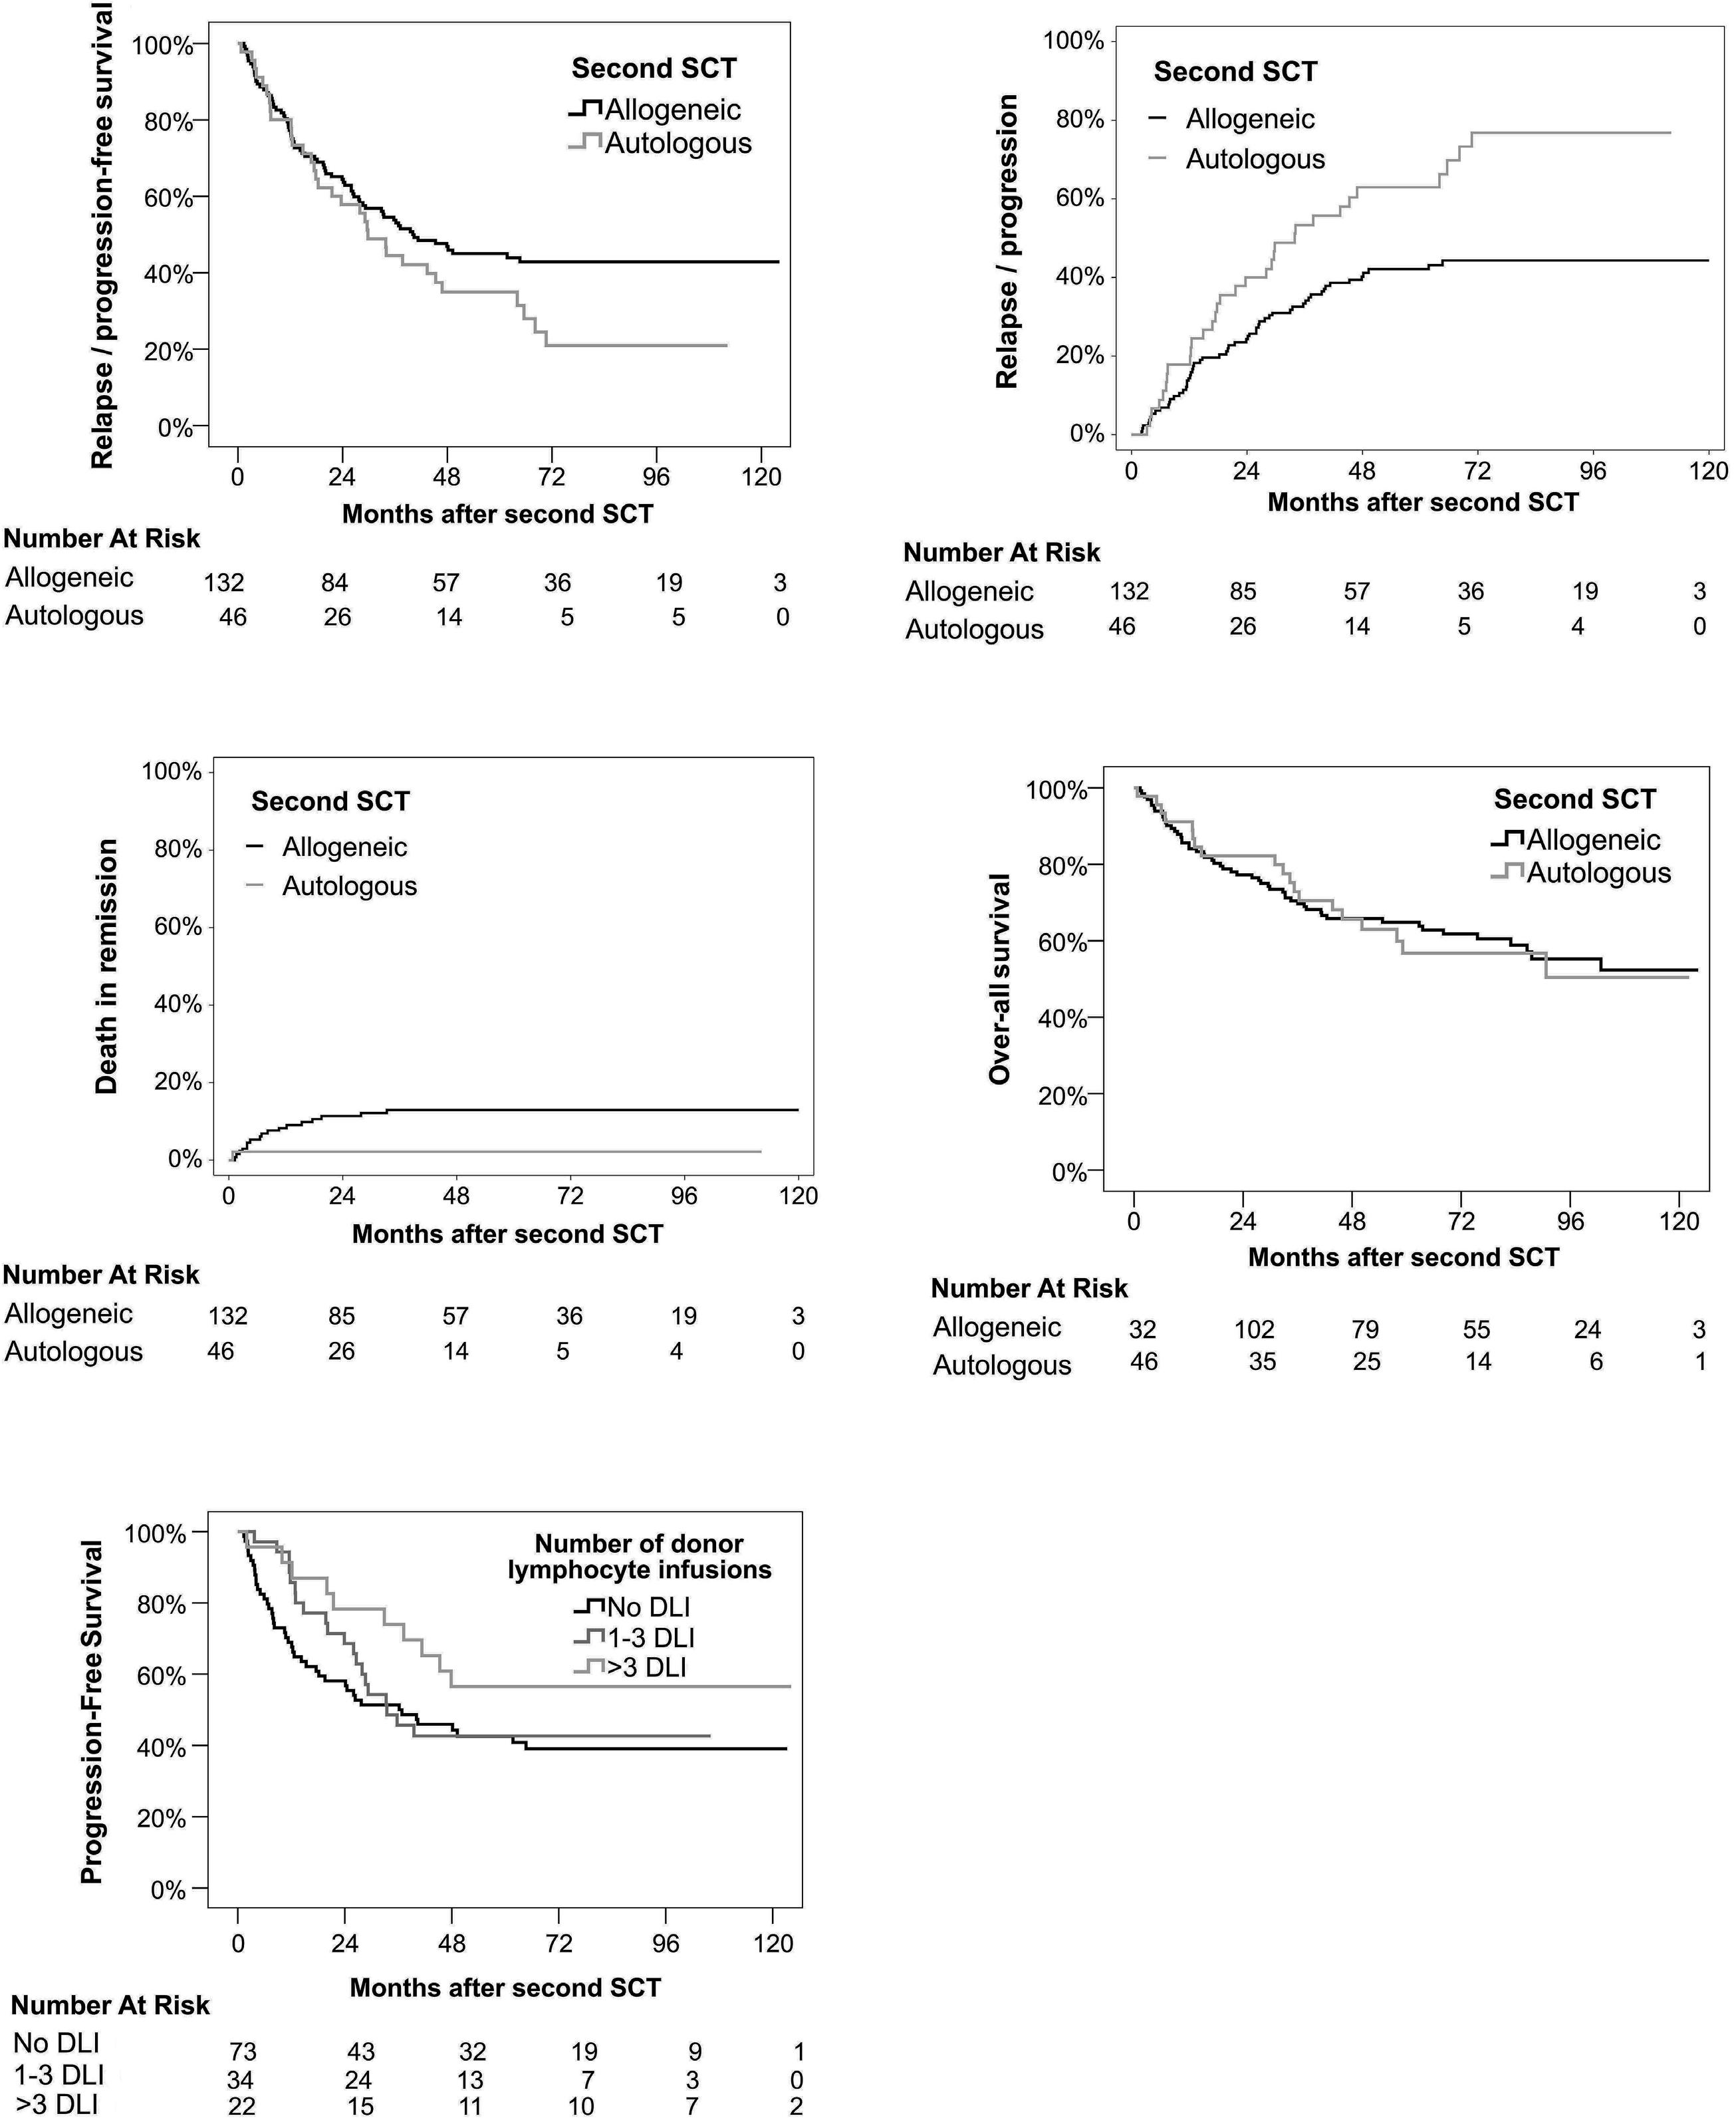
Figure 2. Outcomes after autologous-allogeneic versus autologous-autologous tandem stem cell transplantation followed by 2 years of thalidomide maintenance therapy in patients with newly diagnosed multiple myeloma. (A) Relapse/progression-free survival. (B) Cumulative incidence of relapse or progression. (C) Cumulative incidence of non-relapse mortality. (D) Overall survival. (E) Landmark analysis of progression-free survival according to whether the patients received no, one to three, or more than three prophylactic donor lymphocyte infusions. SCT: stem cell transplant; DLI: donor lymphocyte infusions.
Haematologica | 109 May 2024 1474 ARTICLE - Allo- versus auto-TSCT with thalidomide in MM N. Kröger et al.
A C E D B
more than three DLI. In a subgroup analysis of the alloTSCT group, the 6-year PFS rates of patients who did not receive DLI, patients who received one to three DLI, and patients who received more than three DLI were 39% (95% CI: 2751%), 43% (95% CI: 27-59%), and 57% (95% CI: 37-77%), respectively (P=0.24) (Figure 2E)
Treatment effects in subsets of patients
The effects of alloTSCT or autoTSCT in subsets of patients defined by various covariates were compared in a series of Cox regression analyses whose main results are presented in Figure 3A (PFS) and 3B (OS). For both outcomes, none of the covariates investigated showed a significant interaction with the type of TSCT. For PFS, trends for autoTSCT were observed for disease status before the second SCT, while patients with active multiple myeloma, those aged 52 years or less and patients with high-risk cytogenetics had a more favorable outcome with alloTSCT.
Covariates of relapse/progression-free and overall survival
Figure 4 presents the main results for the final step of the multivariate Cox regression analyses for PFS and OS. Accounting for all covariates in the final models, an allo-
geneic graft as the second SCT improved PFS by 38% and OS by 15% (point estimates) even though the associated coefficients were not statistically significant. For PFS, complete remission after induction treatment was a significant positive prognostic factor while high-risk cytogenetics and delayed start of thalidomide treatment (or none at all) were associated with poor outcome. The latter two covariates were also prognostic factors for poor OS whereas complete remission before the second SCT was associated with improved OS. No difference in OS was noted between recipients of grafts from HLA-identical siblings or matched unrelated donors (P=0.6)
Engraftment, remission, and disease status after the second transplant
The median period to leukocyte as well as platelet engraftment was significantly shorter after autoTSCT (Table 2). No graft failure was observed. For best response after the second SCT as well as for disease status at the end of the 48-month clinical trial period, the proportions of patients in complete remission were greater after alloTSCT. Across all categories of response, treatment group differences were statistically significant favoring alloTSCT, as also shown in Table 2. During the post-trial follow-up
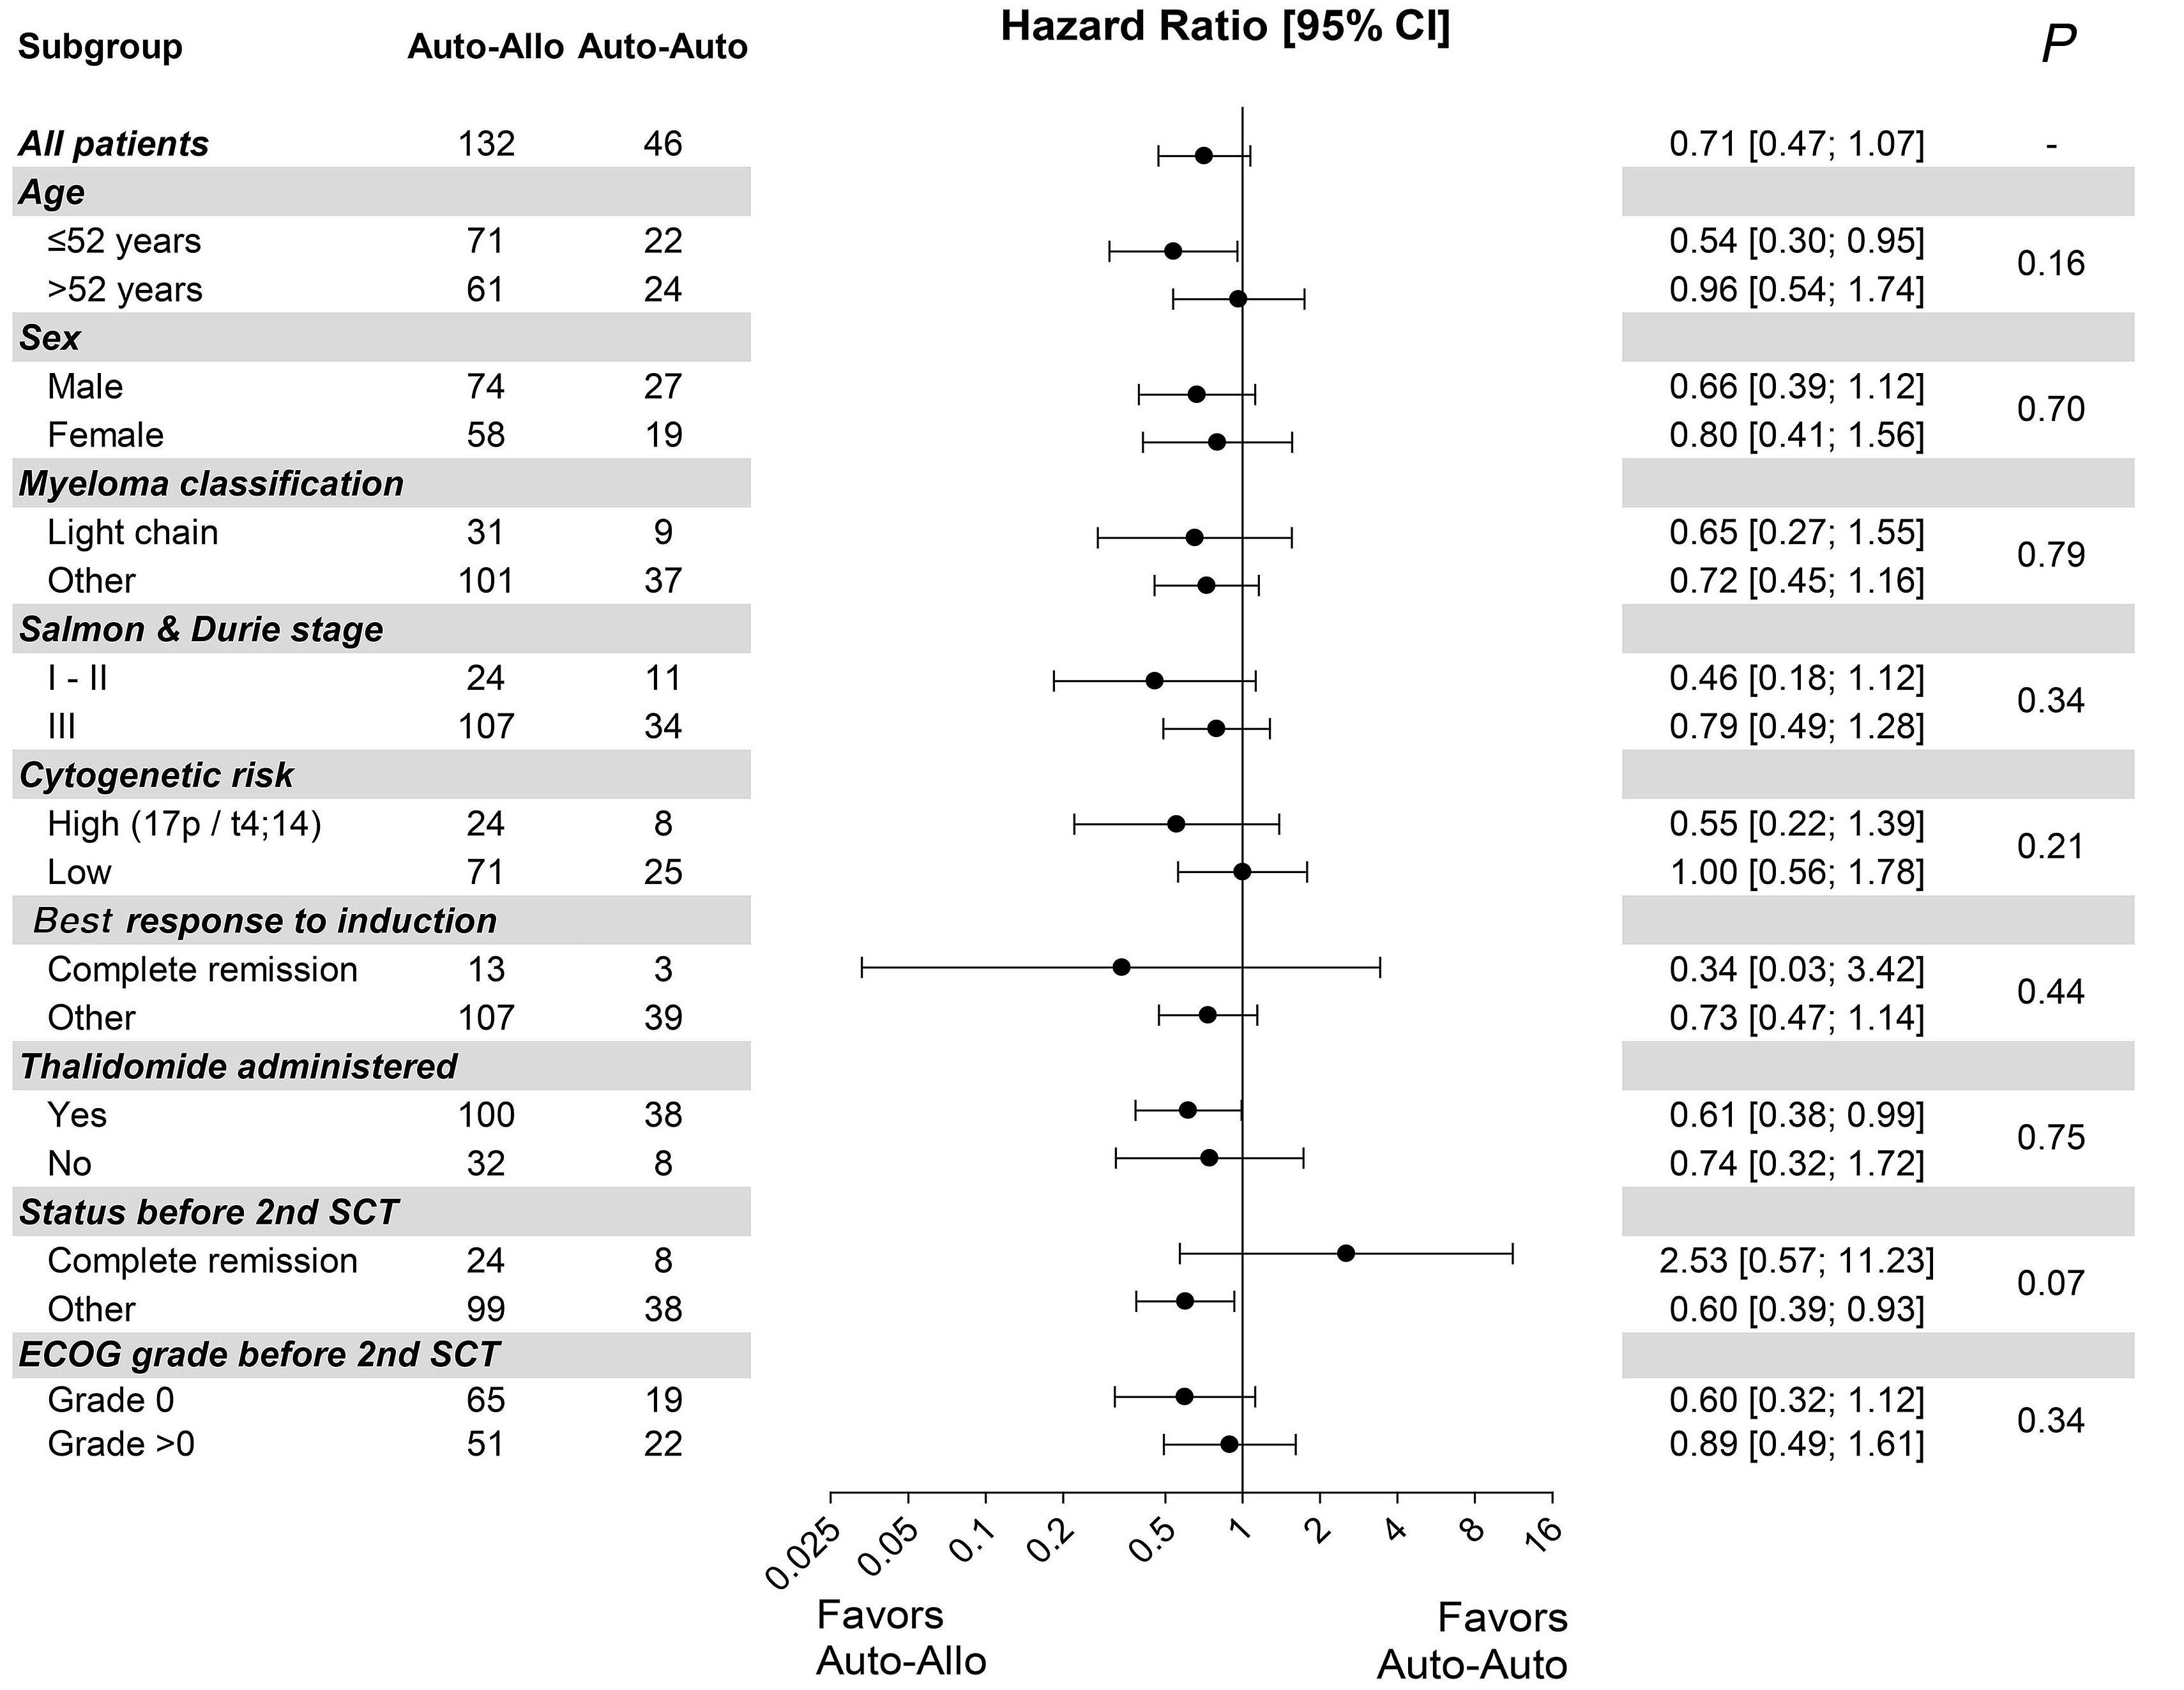
Haematologica | 109 May 2024 1475 ARTICLE - Allo- versus auto-TSCT with thalidomide in MM N. Kröger et al.
Continued on following page. A
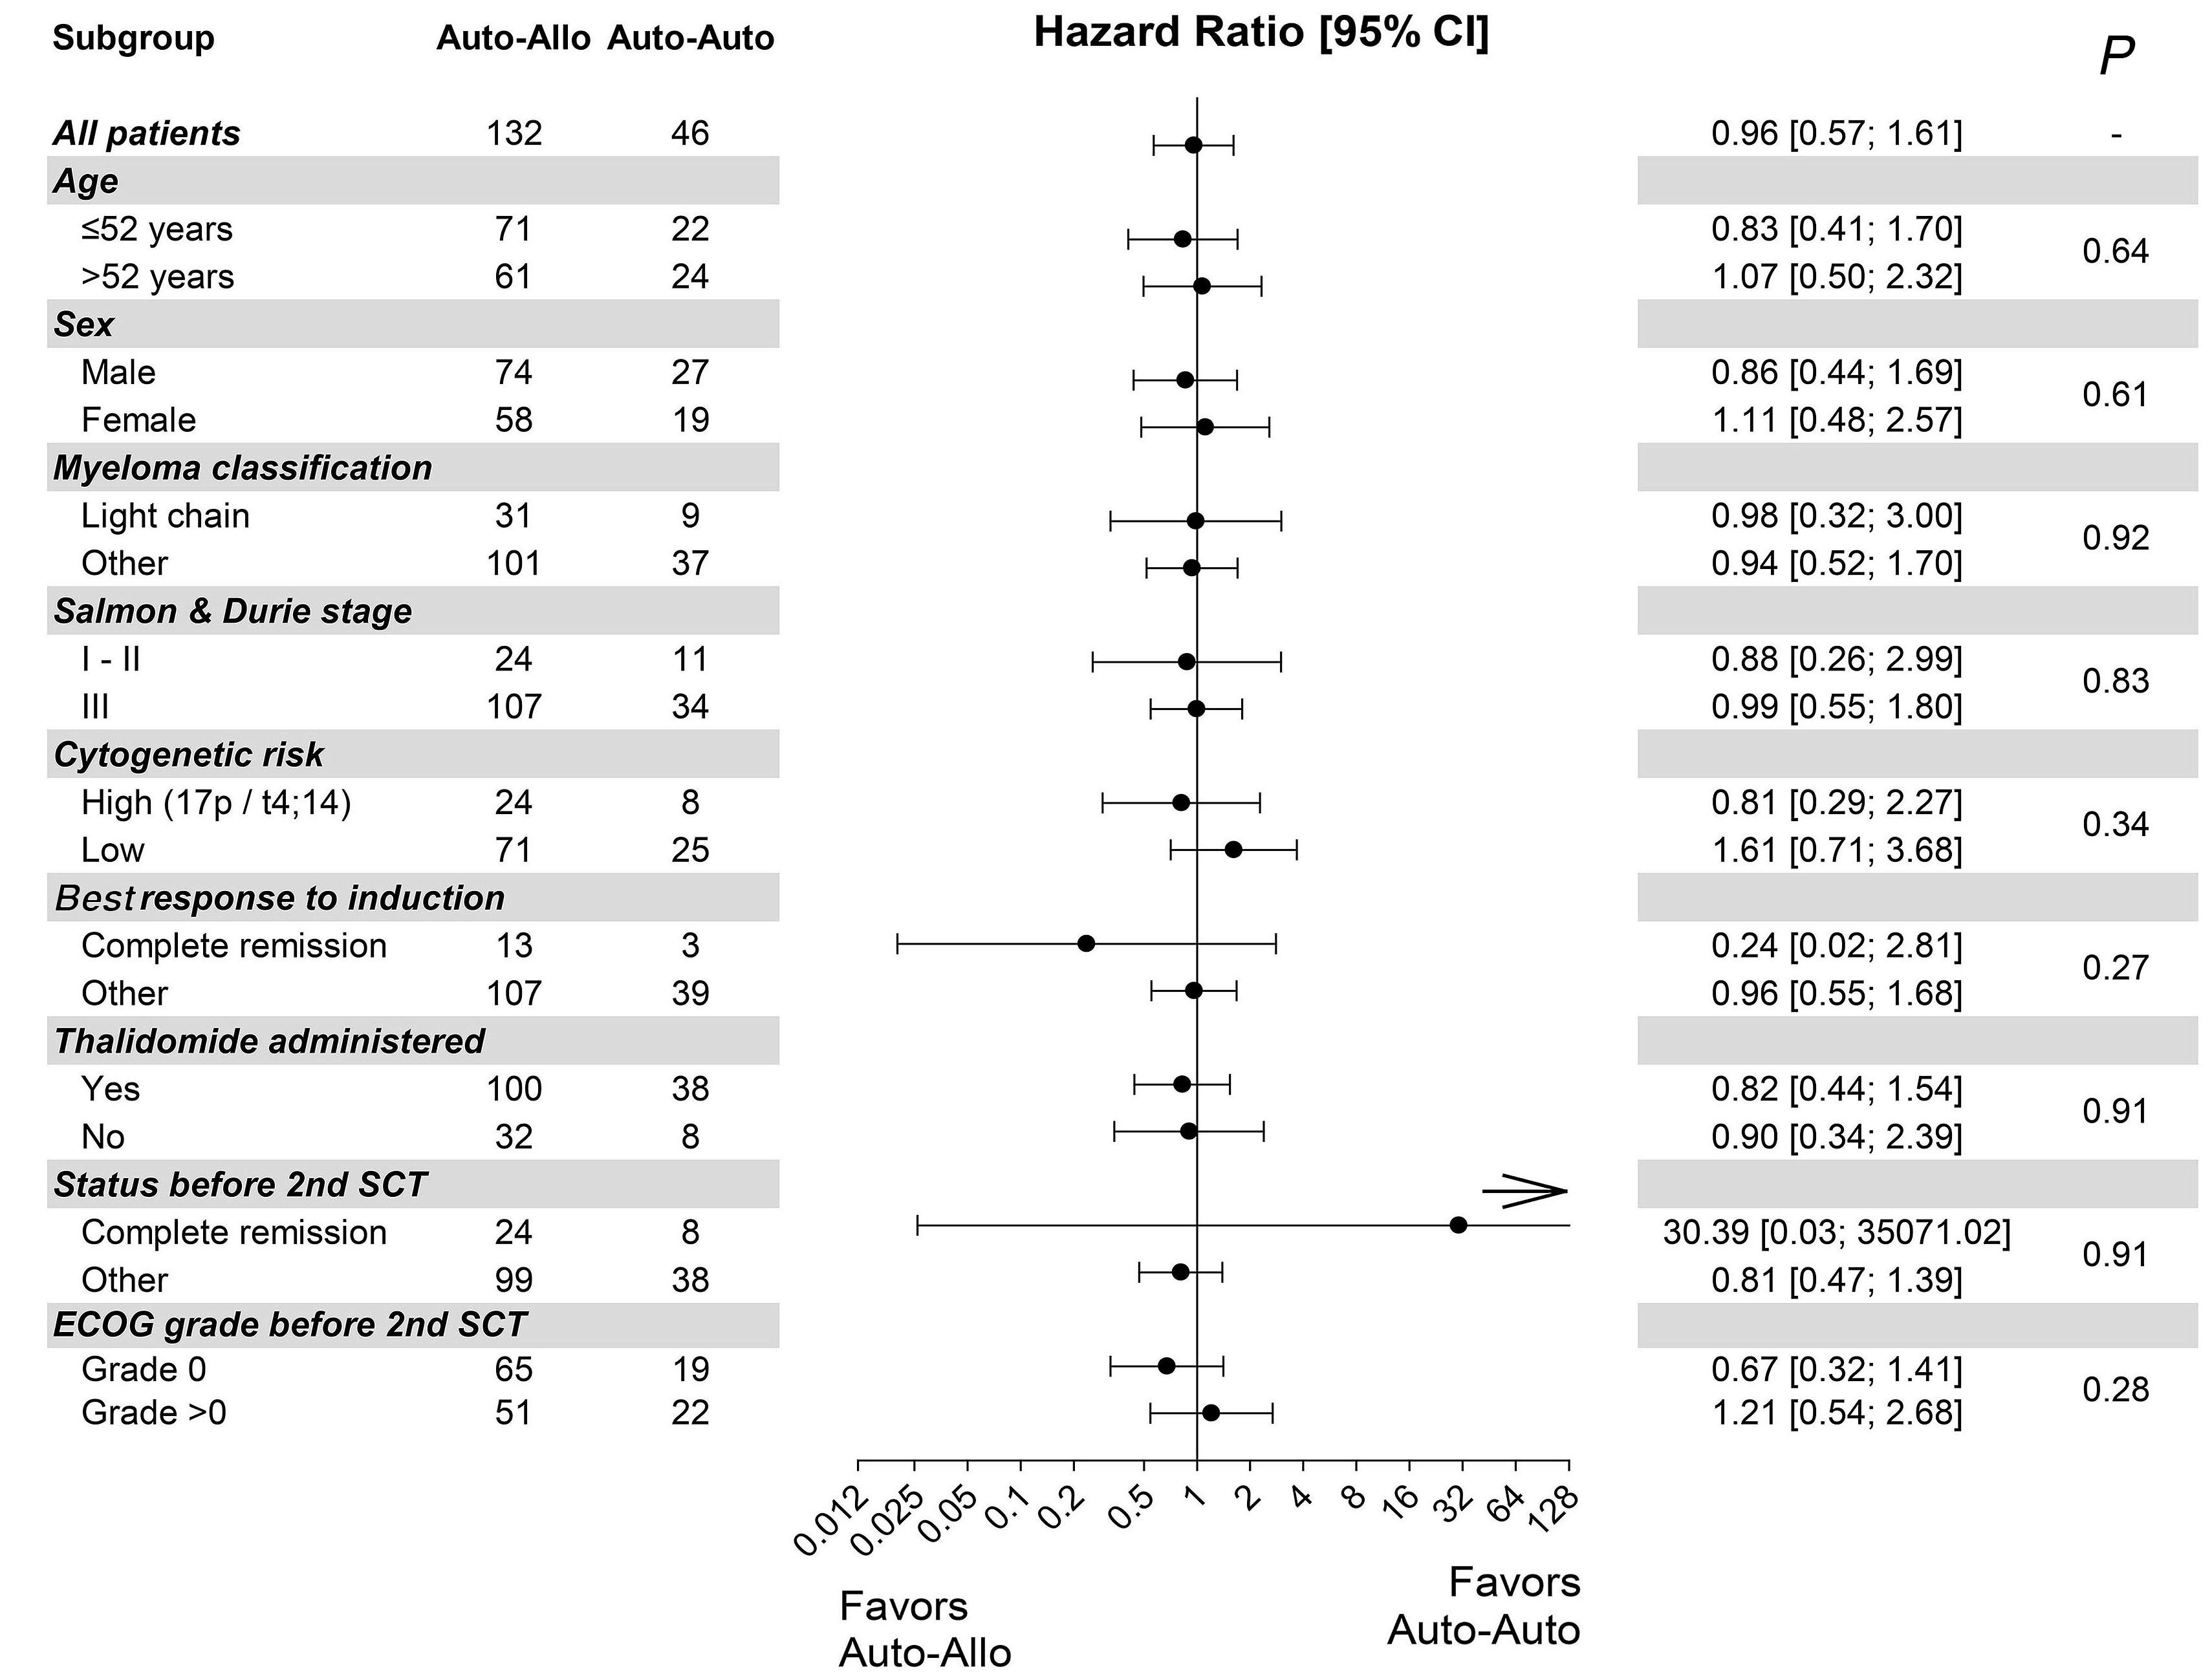
Figure 3. Subgroup survival hazard ratios for patients with multiple myeloma who underwent autologous-allogeneic or autologous-autologous tandem stem cell transplantation. P values for treatment by covariate interactions are shown. (A) Relapse/ progression-free survival. (B) Overall survival. Auto-Allo: autologous-allogeneic tandem stem cell transplantation; Auto-Auto: autologous-autologous stem cell transplantation; SCT: stem cell transplantation; ECOG: Eastern Cooperative Oncology Group.
period, the proportion of progression-free patients at 8 years was about twice as high in the alloTSCT group as in the autoTSCT group.
Discussion
Allogeneic SCT can induce molecular remission in about 50% of cases, as determined by highly sensitive patient-specific allele-specific oligonucleotide primers.17-19 This can result in long-term freedom from disease and eventually in cure.20 However, due to high therapy-related mortality, myeloablative conditioning allogeneic SCT has not become standard care of treatment, not even in younger patients or patients with high-risk features.20 The separation of a graft-versus-myeloma effect and high-dose chemotherapy-related tumor killing by combining autologous SCT followed by reduced-intensity allografting has raised interest in investigating allogeneic SCT in myeloma patients, with the hope of similar efficacy of myeloablative conditioning but less therapy-related toxicity and mortality.4-6,8 Mean-
while results of prospective studies comparing tandem autologous-allogeneic approaches with single or tandem autologous SCT have been published,7,9-14,21 but the findings have been contradictory.
Despite lower non-relapse mortality after reduced-intensity conditioning than after myeloablative conditioning, in all studies non-relapse mortality was higher after allogeneic SCT, but due to a lower relapse incidence in two studies a significant benefit regarding PFS and OS was reported.9,12,13
A long-term follow-up of individual patients’ data from four prospective trials has shown a significant benefit for PFS and OS in patients who underwent allogeneic SCT.15 Importantly, due to the higher early mortality after allogeneic SCT and the lower relapse rate, long-term follow-up is needed to see differences, and in most studies the Kaplan-Meier curves cross at about 3 years.
In none of the mentioned studies was maintenance therapy included, although this has become the standard of care after autologous SCT.22-24
In the present study we aimed to show that alloTSCT, including transplants from matched unrelated donors, and tha-
Haematologica | 109 May 2024 1476 ARTICLE - Allo- versus auto-TSCT with thalidomide in MM N. Kröger et al.
B
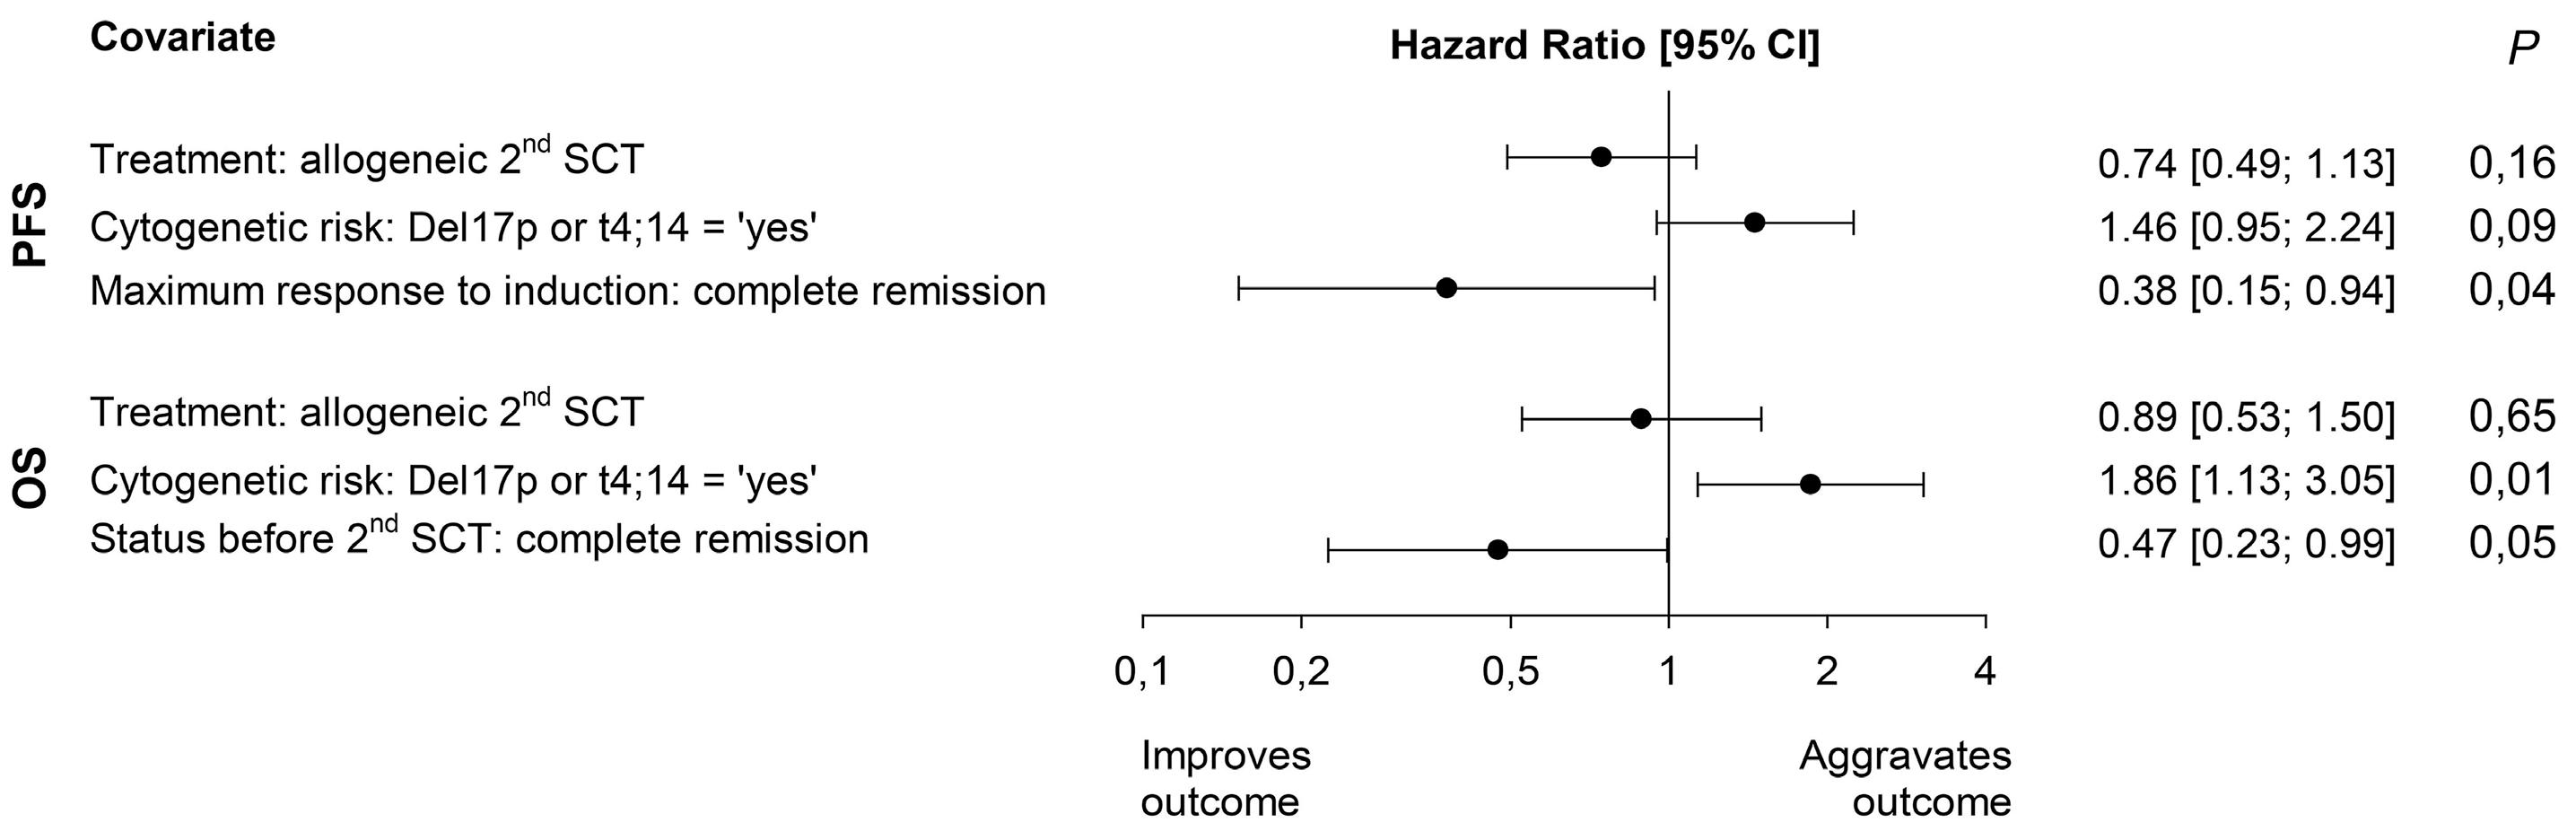
Figure 4. Covariates of relapse/progression-free and overall survival – predictors in the final step of multivariate Cox regression models. 95% CI: 95% confidence interval; SCT: stem cell transplantation; PFS: progression-free survival; OS: overall survival.
lidomide maintenance therapy as well as DLI would result in an improved PFS in comparison to tandem autologous transplantation followed by thalidomide maintenance. The well-documented graft-versus-myeloma effect delivered by DLI1,2 and the capacity to enhance remission status after allograft25 by combining DLI with immunomodulatory drugs26,27 were the rationale for this post-transplant therapy after allografting, further encouraged by the likewise well-documented effect of immunomodulatory drugs after autografting.28 Overall, the incidence of acute GvHD was 38% and only 6% experienced grade 3 acute GvHD. Notably the risk of GvHD was not obviously higher after DLI and thalidomide and the best PFS was seen in patients who received more than three DLI. Similarly to other studies, premature discontinuation of thalidomide due to toxicity was noted in 44% of the patients after allografting and in 53% after autologous transplantation. However, those patients who received thalidomide, regardless of the duration of the treatment, had a longer PFS compared to those not given thalidomide, but this might be biased by the fact that some patients progressed, relapsed or died before the scheduled start of thalidomide – these cases were necessarily counted as ‘failures’ in the non-thalidomide subset.
Overall, the study failed to demonstrate its hypothesized primary endpoint which was a 20% improved PFS at 4 years by alloTSCT. At 4 years, the difference in PFS was only 12%. However, after the long-term follow-up at 8 years, the difference was 22% and no further relapses occurred after 5 years in the alloTSCT arm. The observed 22% difference in PFS after 8 years did not reach statistical significance because of a lower number of patients who received a second autograft as planned and the overall rate of relapse after autoTSCT was lower than anticipated. In the study proposal we expected about 60% of the patients to receive allografts and 40% autografts, but in fact 74% of the participants received an allograft and only 26% received an
autograft due to greater availability of matched unrelated donors, which reduced the statistical power substantially. The non-relapse mortality of 13% after alloTSCT is in line with that in other studies including unrelated donors but it is still too high to be able to recommend alloTSCT for all patients regardless of the lower incidence of relapse. A major factor for improved outcome was complete remission after induction chemotherapy, whereas detection of del17p or t4;14 by fluorescence in situ hybridization was predictive of a worse outcome. Even if no statistical significance for alloTSCT was seen in patients with high-risk cytogenetics and aged less than 52 years, in a similar and recently published, prospective trial, also including matched unrelated donors, a benefit was reported for patients harboring del17p who received alloTSCT. In our study the number of patients was too low to draw a meaningful conclusion on whether patients with high-risk cytogenetics will benefit more from allogeneic SCT.14 While maintenance therapy after autologous SCT is standard treatment, more studies are needed to investigate post-transplant maintenance therapies after allografting in myeloma. Given that all the patients in our study were scheduled to receive thalidomide, the impact of this maintenance therapy on PFS or OS cannot be determined.
What is the current role of allogeneic SCT in myeloma – if any? There has been rapid development of novel agents, especially antibodies and more recently chimeric antigen receptor-T cells, which induce high rates of minimal residual disease-negative complete remissions with less toxicity and mortality compared to allografting. A recently published report of real-world evidence from the European Society of Blood and Marrow Transplantation documented decreased use of allogeneic SCT as upfront treatment in myeloma in more recent years, but an increasing use as salvage therapy after failure of an autograft. This analysis also showed that if allogeneic SCT is performed after multiple lines of pretreatment, long-term survival is unlikely.29
Haematologica | 109 May 2024 1477 ARTICLE - Allo- versus auto-TSCT with thalidomide in MM N. Kröger et al.
Unfortunately, clinical studies including allogeneic SCT are very rare, but according to the current data, which suggest long-term benefits in some patients, the scientific community should not abandon allogeneic transplants, and a prospective comparison between allogeneic SCT and approved triple therapies in patients with relapsed multiple myeloma is ongoing in Germany, supported by health authorities in that country.
In summary, alloTSCT, as compared to autoTSCT, reduced the rate of recurrence or progression of multiple myeloma by 23% at 4 years and by 33% at 8 years. During the same period, alloTSCT was also associated with an approximately one-third reduction of disease-related mortality, from 30% to 21%. However, the advantage in PFS after alloTSCT did not reach statistical significance.
Disclosures
NK has received research grants and honoraria (for lectures and advisory board participation) from Neovii and Novartis; honoraria (for lectures and advisory board participation) from Sanofi, Amgen, and Gilead/Kite; research grants and honoraria (for advisory board participation) from Jazz; research grants and honoraria from Celgene/BMS and Riemser; and honoraria (for lectures) from AOP Pharma. GW has received consultancy fees and honoraria for lectures, presentations, and manuscript writing from Gilead Sciences, Novartis, Takeda, and Clinigen; and has received travel/meeting attendance support from Medac. UH has received honoraria for talks and advisory board participation, financial support for congress participation and financial sponsorship of an amyloidosis registry from Janssen; honoraria for talks and advisory board participation, and financial support for congress participation from Pfizer and Prothena; and honoraria for talks from Alnylam and Akcea. AB has received grants or contracts and honoraria for lectures, presentations and manuscript writing from Incyte; and has received consultancy fees, and honoraria for lectures, presentations, and manuscript writing from AOP Health, Novartis, BMS, and Gilead. NG and LM have received travel/meeting attendance support from Neovi. MK has received travel/meeting attendance support from Janssen; and honoraria from Kite/Gilead for advisory board participation. MB has received consultancy fees and honoraria for lectures, presentations, and
References
1. Aschan J, Lonnqvist B, Ringden O, Kumlien G, Gahrton G. Graft-versus-myeloma effect. Lancet. 1996;348(9023):346.
2. Tricot G, Vesole DH, Jagannath S, Hilton J, Munshi N, Barlogie B. Graft-versus-myeloma effect: proof of principle. Blood. 1996;87(3):1196-1198.
3. Gahrton G, Tura S, Ljungman P, et al. Allogeneic bone marrow transplantation in multiple myeloma. European Group for Bone Marrow Transplantation. N Engl J Med. 1991;325(18):1267-1273.
4. Kroger N, Schwerdtfeger R, Kiehl M, et al. Autologous stem cell
manuscript writing from Jazz Pharmaceuticals; and travel/ meeting attendance support from Gilead. CS has received consultancy fees and honoraria for lectures, presentations, and manuscript writing from Novartis, Jazz, and Neovii; consultancy fees and honoraria for lectures, presentations, manuscript writing, and advisory board participation from Pfizer; and travel/meeting attendance support from Abbvie. HCR has received consultancy/lecture fees from AbbVie, Roche, Janssen-Cilag, Novartis, Vertex, and Merck; has received consultancy/lecture fees, and research funding from AstraZeneca; has received research funding from Gilead; and is a co-founder of CDL Therapeutics GmbH. GK has received consultancy fees, honoraria for lectures and advisory board participation, and research funding from BMS/Celgene. HS has received payment for presentations from Abbvie, Amgen, BMS/Celgene, Chugai, GSK, Janssen, Oncopeptides, Pfizer, Roche, Sanofi, Sebia, Stemline, TAD, and Takeda; and has received travel/meeting attendance support from Amgen, BMS/Celgene, Janssen, and Sanofi. AN has received honoraria for presentations from Medupdate. AV has received grants from and has contracts with UKE. SS declared that research support and honoraria for lectures/presentations, and advisory board participation were given to his institution by Janssen, Prothena, Neuroimmune, Sanofi, Takeda, and Pfizer; he has received honoraria for advisory board participation from Telix, and travel/meeting attendance support from Janssen, Prothena, Celgene, Jazz, and Binding Site. MS, AB, AG, DW, WB, MK, EMW, TH, MK, MH, FA, LT, EK, and CW have no conflicts of interest to disclose.
Contributions
NK, CW, and SS conceived and designed the study. NK also wrote the manuscript. All the authors gave their final approval of the manuscript and are accountable for all aspects of the work.
Funding
The study was supported by a research grant from BMS (formerly Celgene and Pharmion, Germany).
Data-sharing statement
The data supporting the findings of this study are available upon request to the author for correspondence.
transplantation followed by a dose-reduced allograft induces high complete remission rate in multiple myeloma. Blood. 2002;100(3):755-760.
5. Maloney DG, Molina AJ, Sahebi F, et al. Allografting with nonmyeloablative conditioning following cytoreductive autografts for the treatment of patients with multiple myeloma. Blood. 2003;102(9):3447-3454.
6. Crawley C, Iacobelli S, Bjorkstrand B, Apperley JF, Niederwieser D, Gahrton G. Reduced-intensity conditioning for myeloma:
Haematologica | 109 May 2024 1478 ARTICLE - Allo- versus auto-TSCT with thalidomide in MM N. Kröger et al.
lower nonrelapse mortality but higher relapse rates compared with myeloablative conditioning. Blood. 2007;109(8):3588-3594.
7 Garban F, Attal M, Michallet M, et al. Prospective comparison of autologous stem cell transplantation followed by dose-reduced allograft (IFM99-03 trial) with tandem autologous stem cell transplantation (IFM99-04 trial) in high-risk de novo multiple myeloma. Blood. 2006;107(9):3474-3480.
8. Kroger N, Sayer HG, Schwerdtfeger R, et al. Unrelated stem cell transplantation in multiple myeloma after a reduced-intensity conditioning with pretransplantation antithymocyte globulin is highly effective with low transplantation-related mortality. Blood. 2002;100(12):3919-3924.
9 Bruno B, Rotta M, Patriarca F, et al. A comparison of allografting with autografting for newly diagnosed myeloma. N Engl J Med. 2007;356(11):1110-1120.
10 Rosinol L, Perez-Simon JA, Sureda A, et al. A prospective PETHEMA study of tandem autologous transplantation versus autograft followed by reduced-intensity conditioning allogeneic transplantation in newly diagnosed multiple myeloma. Blood. 2008;112(9):3591-3593.
11. Krishnan A, Pasquini MC, Logan B, et al. Autologous haemopoietic stem-cell transplantation followed by allogeneic or autologous haemopoietic stem-cell transplantation in patients with multiple myeloma (BMT CTN 0102): a phase 3 biological assignment trial. Lancet Oncol. 2011;12(13):1195-1203.
12. Bjorkstrand B, Iacobelli S, Hegenbart U, et al. Tandem autologous/reduced-intensity conditioning allogeneic stem-cell transplantation versus autologous transplantation in myeloma: long-term follow-up. J Clin Oncol. 2011;29(22):3016-3022.
13. Gahrton G, Iacobelli S, Bjorkstrand B, et al. Autologous/ reduced-intensity allogeneic stem cell transplantation vs autologous transplantation in multiple myeloma: long-term results of the EBMT-NMAM2000 study. Blood. 2013;121(25):5055-5063.
14 Knop S, Engelhardt M, Liebisch P, et al. Allogeneic transplantation in multiple myeloma: long-term follow-up and cytogenetic subgroup analysis. Leukemia. 2019;33(11):2710-2719.
15. Costa LJ, Iacobelli S, Pasquini MC, et al. Long-term survival of 1338 MM patients treated with tandem autologous vs. autologous-allogeneic transplantation. Bone Marrow Transplant. 2020;55(9):1810-1816.
16. Greenwood M. A report of the natural duration of cancer. H. M. Stationery Office, London, UK. 1926.
17 Corradini P, Voena C, Tarella C, et al. Molecular and clinical remissions in multiple myeloma: role of autologous and allogeneic transplantation of hematopoietic cells. J Clin Oncol. 1999;17(1):208-215.
18. Martinelli G, Terragna C, Zamagni E, et al. Molecular remission after allogeneic or autologous transplantation of hematopoietic
stem cells for multiple myeloma. J Clin Oncol. 2000;18(11):2273-2281.
19 Ladetto M, Ferrero S, Drandi D, et al. Prospective molecular monitoring of minimal residual disease after non-myeloablative allografting in newly diagnosed multiple myeloma. Leukemia. 2016;30(5):1211-1214.
20 Kroger N, Einsele H, Wolff D, et al. Myeloablative intensified conditioning regimen with in vivo T-cell depletion (ATG) followed by allografting in patients with advanced multiple myeloma. A phase I/II study of the German Study-group Multiple Myeloma (DSMM). Bone Marrow Transplant. 2003;31(11):973-979.
21. Giralt S, Costa LJ, Maloney D, et al. Tandem autologousautologous versus autologous-allogeneic hematopoietic stem cell transplant for patients with multiple myeloma: long-term follow-up results from the Blood and Marrow Transplant Clinical Trials Network 0102 trial. Biol Blood Marrow Transplant. 2020;26(4):798-804.
22. Gay F, Jackson G, Rosinol L, et al. Maintenance treatment and survival in patients with myeloma: a systematic review and network meta-analysis. JAMA Oncol. 2018;4(10):1389-1397.
23. Attal M, Lauwers-Cances V, Marit G, et al. Lenalidomide maintenance after stem-cell transplantation for multiple myeloma. N Engl J Med. 2012;366(19):1782-1791.
24. McCarthy PL, Owzar K, Hofmeister CC, et al. Lenalidomide after stem-cell transplantation for multiple myeloma. N Engl J Med. 2012;366(19):1770-1781.
25. Kroger N, Kruger W, Renges H, et al. Donor lymphocyte infusion enhances remission status in patients with persistent disease after allografting for multiple myeloma. Br J Haematol. 2001;112(2):421-423.
26. Kroger N, Shimoni A, Zagrivnaja M, et al. Low-dose thalidomide and donor lymphocyte infusion as adoptive immunotherapy after allogeneic stem cell transplantation in patients with multiple myeloma. Blood. 2004;104(10):3361-3363.
27. Wolschke C, Stubig T, Hegenbart U, et al. Postallograft lenalidomide induces strong NK cell-mediated antimyeloma activity and risk for T cell-mediated GvHD: results from a phase I/II dose-finding study. Exp Hematol. 2013;41(2):134-142.e3.
28. Spencer A, Prince HM, Roberts AW, et al. Consolidation therapy with low-dose thalidomide and prednisolone prolongs the survival of multiple myeloma patients undergoing a single autologous stem-cell transplantation procedure. J Clin Oncol. 2009;27(11):1788-1793.
29 Sobh M, Michallet M, Gahrton G, et al. Allogeneic hematopoietic cell transplantation for multiple myeloma in Europe: trends and outcomes over 25 years. A study by the EBMT Chronic Malignancies Working Party. Leukemia. 2016;30(10):2047-2054.
Haematologica | 109 May 2024 1479 ARTICLE - Allo- versus auto-TSCT with thalidomide in MM N. Kröger et al.
Impact of race and ethnicity on early mortality in multiple myeloma: a SEER analysis
John X. Wei,1 Aditi Shastri,2 R. Alejandro Sica,2 Ioannis Mantzaris,2 Noah Kornblum,2 Urvi Shah,3 Murali Janakiram,4 Kira Gritsman,2 Amit Verma,2 Mendel Goldfinger,2 Dennis Cooper2 and Nishi Shah2
1Department of Medicine, Montefiore/Albert Einstein College of Medicine, New York, NY; 2Division of Hematologic Malignancies, Department of Medical Oncology, Montefiore/Albert Einstein College of Medicine, New York, NY; 3Myeloma Service, Department of Medicine, Memorial Sloan Kettering Cancer Center, New York, NY and 4Division of Hematologic Malignancies, City of Hope National Medical Center, Duarte, CA, USA
Abstract
Correspondence: N. Shah nisshah@montefiore.org
Received: April 12, 2023.
Accepted: October 17, 2023.
Early view: October 26, 2023.
https://doi.org/10.3324/haematol.2023.283304
©2024
Over the past two decades, there have been significant advances in the treatment of multiple myeloma which has led to an improvement in overall survival.1,2 However, a notable proportion of patients continue to experience early mortality (EM), defined as 2 years from the time of diagnosis. This raises the possibility that improvements in myeloma survival have not extended equally to all groups. Using the latest data drawn from the Surveillance Epidemiology and End Results database of patients in the United States spanning 2000-2019, we study impact of important sociodemographic factors on EM. Through regression modeling, we demonstrate that patients diagnosed from 2000-2005, of older age, male sex, and of certain racial minority status (non-Hispanic Black and Hispanic) have higher odds of EM. Of these factors, minority status contributed to worse 2-year overall survival as well. We evaluate whether income, as a surrogate to access to care, could potentially explain this finding, but find that race has a distinct relationship with EM that is not modified by income. This is further reinforced by subgroup analysis. After characterizing groups vulnerable to EM, we examine reasons for these disparities and potential avenues to address them.
Introduction
Early mortality (EM), defined as patients dying within a certain period of disease diagnosis, is a concern across hematologic malignancies. For leukemias, such as acute myeloid leukemia (AML), patients typically present acutely in oncologic emergencies and a significant proportion of death occurs within the first few months; 2-month EM has been noted as high as 11%.3,4 In lymphomas, such as the diffuse large B-cell lymphoma (DLBCL) population, reports have ranged from 15.7% within 90 days of diagnosis at one institution to 23% within 100 days at another.5,6 For multiple myeloma (MM), advances in therapies over the past 20 years have contributed substantially to improved overall survival (OS), but improvement has not been uniform. The heterogeneity of outcomes in MM is well known with survival for patients ranging from a few months to more than 10 years.7-11 In the context of this heterogeneity, a significant portion of patients with MM experiencing EM have been identified, but this population is still poorly defined. For instance, definitions of EM vary significantly
across studies, ranging from 2 months to 2 years.12 The issue of EM in MM patients is problematic with some studies showing mortality as high as 20% within 6 months.2,12,13 Both clinical and sociodemographic factors have been identified as contributors. The clinical factors have been encapsulated in the latest Revised International Staging System for MM, which risk stratifies patients by high-risk genetic features and serum markers.11 However, sociodemographic factors remain less defined. Previous population-level studies have noted factors including race and sex.2,12,13 Studies have attributed worse OS to certain minority groups, mostly non-Hispanic Blacks (NHB). The reasoning behind racial disparities is controversial and has been attributed to confounding, possibly by other sociodemographic factors including differences in access to care.14-19
A better understanding of the sociodemographic factors contributing to EM in MM will improve risk stratification at a population level, a concept explored in oncologic follow-up care.20 This has broad implications for improving care and allocation of resources to the highest risk groups. We aim to study sociodemographic characteristics that contribute
Haematologica | 109 May 2024 1480 - Plasma Cell Disorders ARTICLE
Published under a CC BY-NC license
Ferrata Storti Foundation
to 2-year mortality, with a focus on race-ethnicity and evaluate potential interactions with income.
Methods
Data was obtained from the Surveillance Epidemiology and End Results (SEER) registry, a public database sponsored by the National Cancer Institute that collects cancer statistics from across the United States. We accessed SEER Research Plus Data 17 Registries (2000-2019) via the SEER*Stat 8.4.0 platform. Cases were selected by filtering for the following criteria: histologic type (international Classification of Disease [ICD]-03=9,732-9,733), microscopically confirmed diagnosis, and age at diagnosis between 18-99 years old. We excluded cases with incomplete data, such as unknown age or follow-up survival months. Patients of Native American and unknown race-ethnicity were also excluded given the small sample sizes. All data analysis for this study was performed in RStudio 4.1.2.
Logistic regression was performed to assess relationship with EM, defined as survival less than or equal to 2 years. We used 2 years as the cut-off to account for the increasing median survival with new therapeutics over the years. Of the information available in the dataset, we selected age, sex, race-ethnicity, year of diagnosis, and income as variables of interest and EM was the primary outcome of this study. Patients were stratified by age into quartiles, by year of diagnosis into three cohorts (2000-2005, 2006-2011, and 2012-2017), and by income into two levels (<$70,000, ≥$70,000). In order to better evaluate the relationship between race-ethnicity and income, interaction was assessed, along with analysis of EM in racial and income subgroups. For the final regression models, the first quartile age group
(18-58 years), male sex, non-Hispanic White (NHW) race, yearly income <$70,000, and year of diagnosis cohort between 2000-2005 were utilized as reference groups. Cox proportional hazards regression was utilized to assess the relationship between the predictors identified in the EM models and OS. Analysis was conducted on both the total cohort and a left-truncated cohort. Left truncation was undertaken with the criteria of survival >2 years to assess relationship of variables with survival after the EM time point. Hazard ratios (HR) and associated 95% confidence intervals (CI) were calculated with HR=<1 indicating reduced mortality.
Results
We identified 77,374 MM patients in SEER registry diagnosed from 2000-2019 (Figure 1; Table 1). There were more males than females (55.8% vs. 44.2%). Most patients were NHW (64.2%), but there was a sizable non-White (Hispanic, NHB, Asian) population (35.8%). The age-adjusted incidence was greatest in the NHB group at 14 per 100,000. The distribution of age was skewed to the third and fourth quartiles. Of all MM patients diagnosed in this period, 36% of patients died in the first 2 years.
Female patients with MM had lower odds of experiencing EM (odd ratio [OR]=0.89; range, 0.86-0.92; P≤0.01) than males (Table 2). Minorities, including NHB and Hispanics, had higher odds of experiencing EM (OR=1.10; range, 1.041.15; P≤0.01 vs. OR=1.21; range, 1.14-1.28; P≤0.01). Older age was also associated with increased EM while higher income was clearly associated with decreased odds of EM. Overall, the odds of EM decreased relative to the reference 2000-2005 period. The integration of the race-ethnicity
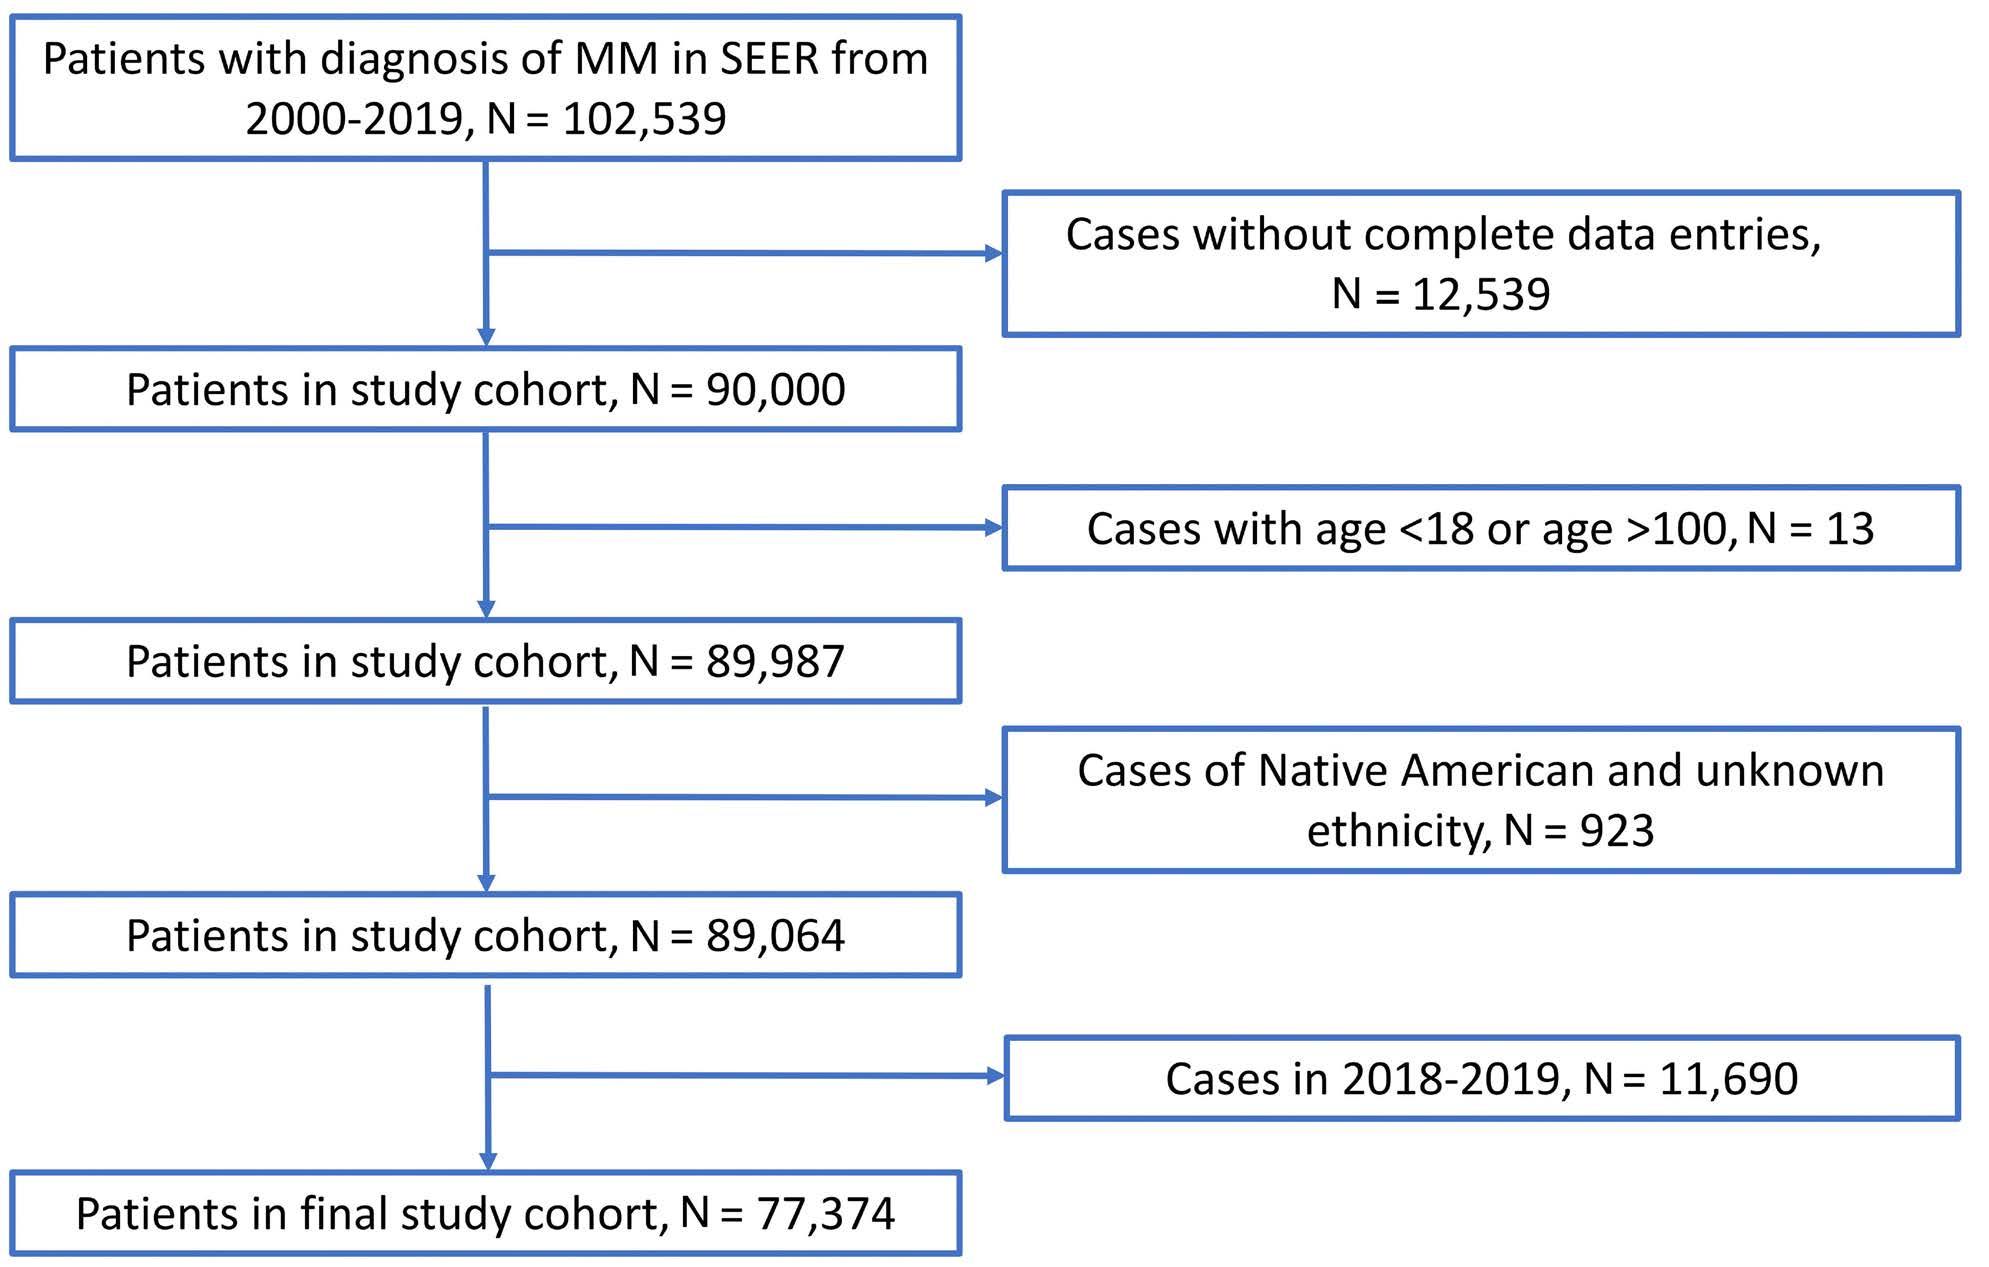
Figure 1. CONSORT diagram. The generation of the final study sample is detailed. MM: multiple myeloma; SEER: Surveillance Epidemiology and End Results database.
Haematologica | 109 May 2024 1481 ARTICLE - Race-ethnicity and early mortality in myeloma J.X Wei et al.
Table 1.
from 2000-2017, N=77,374.
Age quartiles, range in years
18-58
59-67
68-76
77-99
*Not available (NA) from Surveillance Epidemiology and End Results database (SEER) data import. NHW: non-Hispanic White; NHB: non-Hispanic Black.
and income interaction term did not yield any significance. Analysis of EM in the income-based and racial subgroups
were mostly consistent with the whole cohort analysis, but notably odds of EM among Hispanic and Asian females
Haematologica | 109 May 2024 1482 ARTICLE - Race-ethnicity and early mortality in myeloma J.X Wei et al.
incidence rate per 100,000 (range) Count (%) Sex Male Female 8.4 (8.3-8.5) 5.4 (5.4-5.5) 43,181 (55.8) 34,193 (44.2) Race NHW NHB Hispanic Asian 6.1 (6.1-6.2) 14 (13.8-14.3) 6.4 (6.3-6.6) 4.3 (4.1-4.4) 49,653 (64.2) 14,293 (18.5) 8,960 (11.6) 4,494 (5.8)
Age-adjusted
Q1,
Q2,
Q3,
Q4,
NA NA NA NA 17,854 (23.1) 18,788 (24.3) 20,613 (26.6) 20,119 (26.0) Diagnosis interval 2000-2005 2006-2011 2012-2017 6.2 (6.1-6.3) 6.6 (6.5-6.7) 7.2 (7.1-7.3) 20,858 (27.0) 24,966 (32.3) 31,550 (40.7) Median income in US $ <70,000 >70,000 * * 45,821 (59.2) 31,553 (40.8)
Characteristics and distribution of patients diagnosed with multiple myeloma
OR multivariate 95% CI P OR univariate 95% CI P Sex Male Female Ref 0.89 0.86-0.92 <0.01 Ref 0.94 0.91-0.97 <0.01 Race NHW NHB Hispanic Asian Ref 1.10 1.21 1.16 1.04-1.15 1.14-1.28 1.04-1.29 <0.01 <0.01 <0.01 Ref 0.94 1.01 0.94 0.90-0.97 0.97-1.06 0.88-1.00 <0.01 0.63 0.07 Age quartiles, range in years Q1, 18-58 Q2, 59-67 Q3, 68-76 Q4, 77-99 Ref 1.31 2.01 4.23 1.25-1.37 1.92-2.10 4.05-4.43 <0.01 <0.01 <0.01 Ref 1.26 1.94 4.01 1.20-1.32 1.85-2.02 3.84-4.20 <0.01 <0.01 <0.01 Diagnosis interval 2000-2005 2006-2011 2012-2017 Ref 0.68 0.59 0.66-0.71 0.56-0.61 <0.01 <0.01 Ref 0.70 0.60 0.67-0.72 0.58-0.63 <0.01 <0.01 Median income in US $ <70,000 ≥70,000 Ref 0.81 0.78-0.85 <0.01 Ref 0.87 0.85-0.90 <0.01 Interaction ethnicity and income in US $ NHB* ≥70,000 Hispanic* ≥70,000 Asian* ≥70,000 1.07 1.09 0.91 0.98-1.16 0.98-1.20 0.80-1.05 0.2 0.11 0.2 - - -
OR: odds ratio; CI: confidence interval; Ref: reference; NHW: non-Hispanic White; NHB: non-Hispanic Black; NA: not available; *P<0.01.
Table 2. Logistic regression of total cohort. Odds of early mortality, defined as ≤2 years, were examined through multivariate and univariate logistic regression.
were similar to males respectively. Hispanics and NHB in higher income category continued to have higher odds of EM as compared to NHW (Table 3).
Total cohort OS analysis with the variables derived from EM analysis (sex, race, age, and income) paralleled findings of logistic regression. Females had better median OS than males (46 months vs. 43 months) and had significantly decreased risk for mortality (HR=0.89-0.93; P<0.01) (Table 4). Among different race-ethnicities, median OS appeared similar across minorities at 48 months, higher than NHW at 43 months. However, the risk for mortality was greatest amongst Hispanic and NHB minorities. By age quartiles, there was a consistent decrease in OS with increasing age, accompanied by higher risk of mortality as well. And like the logistic regression analysis, the data demonstrated improved OS with higher income. Notably median survival was highest in the ≥$70,000 bracket at 48 months. On examination of the left-truncated cohort, significant relationships highlighted in the total cohort were maintained among all variables aside from race, where NHB and Hispanic status was no longer associated with worse survival.
Discussion
Using data from the latest SEER publication we have identified risk factors independently associated with increased EM in patients with MM: increased age, male sex, early years of diagnosis (2000-2005), lower income (<$70,000), and NHB/Hispanic race-ethnicity status.
Our observation of age being associated with higher odds of EM is consistent with literature that reports worse survival outcomes across multiple cancer types.21 Older adults are disproportionately affected by a range of social, economic, and health factors. In our study, we account for a number of these social and economic factors, but still see a difference among age groups. We believe this difference is likely reflective of underlying health characteristics, such as higher rates of comorbidity, immune exhaustion, and frailty among older adults. These characteristics are known to contribute negatively to treatment outcomes and may be of particular importance in MM.22,23
For disparities between sexes, it has been shown that the incidence of MM is higher in males than females, but females still undergo higher frequency of autologous stem
Table 3. Odds of early mortality, defined as ≤2 years, were examined by race-ethnicity and income subgroups of interest.
Subgroups OR (95% CI)
OR: odds ratio; CI: confidence interval; Ref: reference; NHW: non-Hispanic White; NHB: non-Hispanic Black;
not available; DX: diagnosis; *P<0.01.
Haematologica | 109 May 2024 1483 ARTICLE - Race-ethnicity and early mortality in myeloma J.X Wei et al.
Income $ <$70,000 Income $ ≥$70,000 NHW NHB Hispanic Asian Sex Male Female Ref 0.89 (0.86-0.93)* Ref 0.88 (0.84-0.92)* Ref 0.92 (0.88-0.95)* Ref 0.76 (0.71-0.81)* Ref 0.94 (0.86-1.02) P=0.2 Ref 0.91 (0.80-1.04) P=0.2 Race NHW NHB Hispanic Asian Ref 1.09 (1.04-1.15)* 1.20 (1.13-1.27)* 1.15 (1.04-1.28)* Ref 1.18 (1.10-1.27)* 1.32 (1.22-1.44)* 1.06 (0.98-1.16) P=0.2 NA NA NA NA NA NA NA NA NA NA NA NA NA NA NA NA Age quartiles, range in years Q1, 18-58 Q2, 59-67 Q3, 68-76 Q4, 77-99 Ref 1.31 (1.24-1.39)* 1.99 (1.88-2.11)* 4.10 (3.87-4.35)* Ref 1.29 (1.20-1.39)* 2.03 (1.89-2.19)* 4.42 (4.13-4.76)* Ref 1.38 (1.29-1.47)* 2.18 (2.05-2.31)* 4.69 (4.42-4.97)* Ref 1.16 (1.06-1.28)* 1.79 (1.62-1.97)* 3.46 (3.12-3.84)* Ref 1.31 (1.16-1.48)* 1.85 (1.64-2.08)* 3.61 (3.18-4.10)* Ref 1.38 (1.14-1.68)* 2.00 (1.66-2.41)* 4.14 (3.44-4.99)* DX interval 2000-2005 2006-2011 2012-2017 Ref 0.71 (0.67-0.74)* 0.60 (0.57-0.63)* Ref 0.65 (0.61-0.69)* 0.57 (0.54-0.61)* Ref 0.68 (0.65-0.72)* 0.59 (0.56-0.62)* Ref 0.66 (0.60-0.72)* 0.54 (0.50-0.59)* Ref 0.69 (0.62-0.78)* 0.64 (0.57-0.71)* Ref 0.72 (0.61-0.86)* 0.60 (0.51-0.70)* Median income in US $ <70,000 ≥70,000 NA NA NA NA Ref 0.81 (0.78-0.85)* Ref 0.86 (0.79-0.93)* Ref 0.89 (0.81-0.97) P=0.013 Ref 0.75 (0.66-0.85)*
NA:
Analysis of full cohort was conducted with variables utilized in EM analysis. OS: overall survival: HR: hazard ratio; CI confidence interval; TC: truncated; Ref: reference; NHW: non-Hispanic White; NHB: non-Hispanic Black.
cell transplantation.24 As we noted for age, this is likely multifactorial with biologic and behavioral components. Biologically, there are differences in innate and adaptive immune systems between men and women. Men have higher frequencies of regulatory T cells, which have been associated with adverse clinical features in MM.24 In terms of behavior, women tend to have healthier attitudes and better social support networks, especially in adherence and choice of therapy. Though our model does not account for biologic and behavioral differences among men and women, we do note an interesting finding that differences between sexes disappear in analysis of EM for Hispanic and Asian subgroups, a phenomenon which could benefit from further study.
Our study examines EM in a cohort spanning two decades, during which there have been several major pharmaceutical developments in myeloma care. Our results are consistent with these developments improving EM. The proteasome inhibitor bortezomib was granted accelerated approval by the Food and Drug Adminstration in 2003 followed by full approval in 2005, and then the immunemodulatory drugs (IMiD), thalidomide (Thalomid) and lenalidomide (Revlimid) were approved in 2006, followed by pomalidomide (Pomalyst) in 2010, with the first monoclonal antibodies (daratumumab and elotuzumab) approved in 2015.25,26 In our analysis, EM odds subsequently fell in 2006-2011 and 2012-2017, which aligns with the introduction of the next generation proteasome inhibitors, including ixazomib and carfilzomib, both approved during this time, as well as with bortezomib, the IMiD, and monoclonal antibodies. Access to the latest therapy and care was an important
consideration that led us to include income status in the model. Those of lower socioeconomic status have been shown to be less likely to attend cancer screening programs or access the latest clinical trials resulting in poorer outcomes.21 For our cohort, we see higher odds of EM in the group of patients with median income <$70,000, which is consistent with the literature.
We sought to better understand the nature of disparities in outcomes between minorities and NHW. It has been suggested that worse survival outcomes in minorities may be a result of confounding with social factors, such as access to appropriate care.14-19 Our results show that NHB and Hispanics have higher odds of EM than Whites. We note that this is an independent association after accounting for income, a variable often tied to access to care. We assessed the cross-section between income and race through an interaction term but noted no significant relationship. Furthermore, the subgroup EM analysis was consistent between the two income groups. Our results would support the notion that the disparities between minorities and NHW are beyond that of access to care tied to socioeconomic status. There may be further merit in evaluating biologic differences. The incidence of MM is higher in NHB, which is supported by our study. Minorities may have higher rates of comorbidities contributing; it has been noted that NHB have higher rates of renal disease, diabetes, and liver disease in the VHA Central Cancer Registry.27 Differences in cytogenetics and molecular mutations have also been documented in NHB, such as higher frequencies of BCL7A, BRWD3, and AUTS2 mutations, and lower frequencies of TP53 and IRF4 mutations.28 An
Haematologica | 109 May 2024 1484 ARTICLE - Race-ethnicity and early mortality in myeloma J.X Wei et al.
Median OS in months HR 95% CI P Left truncated median OS in months TC HR TC 95% CI TC P Sex Male Female 43 46 Ref 0.91 Ref 0.89-0.93 <0.01 81 85 Ref 0.91 Ref 0.88-0.93 <0.01 Race NHW NHB Hispanic Asian 43 48 48 48 Ref 1.03 1.05 0.98 Ref 1.01-1.05 1.02-1.08 0.95-1.02 0.011 <0.01 0.4 81 88 87 85 Ref 1.01 1.03 1.01 Ref 0.98-1.04 0.99-1.07 0.95-1.06 0.6 0.2 0.8 Age quartiles, range in years Q1, 18-58 Q2, 59-67 Q3, 68-76 Q4, 77-99 87 64 41 20 Ref 1.36 2.02 3.47 Ref 1.32-1.40 1.96-2.07 3.38-3.56 <0.01 <0.01 <0.01 128 96 73 54 Ref 1.42 2.13 3.50 Ref 1.37-1.47 2.06-2.21 3.37-3.63 <0.01 <0.01 <0.01 Median income in US $ <70,000 >70,000 42 48 Ref 0.90 Ref 0.88-0.92 <0.01 81 86 Ref 0.93 Ref 0.90-0.95 <0.01
Table 4. Cox proportional hazards regression analysis.
important area of study in this setting is also Duffy null status and its impact on outcome.29,30 Additionally, through left-truncation survival analysis, examining only the cohort of patients who have survived past the 2-year mark we were able to see that NHB and Hispanic status were no longer associated with worse survival than NHW after the 2-year point. This would suggest that minority status exclusively contributes to worse OS in the 2-year period from diagnosis. We see that EM status is of particular concern for minorities and that more needs to be done for this group; tailored approaches as a future direction remain key as exemplified by the results from the DETERMINATION trial, where a large representation of NHB patients (approximately 20%) did not show significant advantage to early transplant compared to delayed transplant utilizing triplet induction.31,32
As for possible interventions to improve outcomes for minorities, increased representation in clinical trials is an important consideration. Inclusion is important to ensure generalizability of trials for new pharmaceuticals.33 Minorities are underrepresented in clinical trials for MM therapeutics.34 Some reasons for this underrepresentation include language and cultural barriers and distrust of the medical system. Applying minority recruitment goals to studies can directly help address this issue. Additionally, outreach initiatives, such as making screening information available in local shops and making educational materials more accessible in video-form rather than written-form may be useful for patients.35 These populational strategies can complement other more patient-specific approaches being developed; considering cytogenetic differences among races noted above, there have been attempts to evaluate specific genetic factors as laboratory parameters including next generation sequencing and high sensitivity flow cytometry to identify high risk patients.36 These patients at risk of EM may need to be treated more aggressively such as recommended by the Myeloma Optimum trial as well as the GMMG-Concept trial.37,38
Ultimately, the topic of EM in myeloma is important to investigate. In our study, we have identified sociodemographic groups of patients that are prone to EM. We have also identified a particularly vulnerable subset of minorities (Hispanics and NHB) in which EM within the first 2 years of diagnosis is the primary contributor to worse survival outcomes. This relationship was not confounded by income,
References
1. Legarda MA, Cejalvo MJ, de la Rubia J. Recent advances in the treatment of patients with multiple myeloma. Cancers (Basel). 2020;12(12):3576.
2. Kumar SK, Rajkumar SV, Dispenzieri A, et al. Improved survival in multiple myeloma and the impact of novel therapies. Blood. 2008;111(5):2516-2520.
a common proxy for access to care. We have explored the etiology of these disparities and potential solutions, but further investigation is required. Given the observational nature of our study and the SEER database, we cannot establish cause-effects relationships between the factors investigated and EM/OS. There is also the possibility of unaccounted confounding, which we attempted to minimize through screening of variables during the generation of the logistic regression models. We do not have information on disease-specific variables, such cytogenetics, fluorescent in situ hybridization, next generation sequencing for these patients as well as data on their treatment such as use of novel agents, transplantation, and maintenance therapy. It would be valuable to further investigate changes in EM with a different data set with more complete information on risk factors at diagnosis as well as treatment. This could help us refine our understanding of the populations prone to EM in MM and guide treatment choices as well as future public health and investigational endeavors to improve outcome.
Disclosures
AS discloses consultancy for Janssen, committee membership of Rigel Pharmaceutical and Kymera Therapeutics; honoraria from NACE; research funding from Kymera Therapeutics. NS discloses honoraria from MashUpMD, MJH Lifescience, ACC and Stelexis Therapeutics; consultancy for MJH Lifesciences, Janssen, Sanofi, Janakiram-Janssen, Verma-Janssen, Novartis, Bakx Therapeutics and Curis; research funding from Bristol Myers Squibb, Janakiram-Janssen, Verma-Janssen, Eli Lilly, Medpacto, Ionctura, Prelude, BMS and Curis; equity holdership of Stelexis Therapeutics and Bakx Therapeutics.
Contributions
The authors confirm contribution to the paper as follows: study conception and design by NS and JXW. Data collection by JXW. Analysis and interpretation of results by JXW, AS, RAS, IM, NK, US, MJ, KG, AV, MG, DC and NS. Draft manuscript preparation by NS, JXW and DC. All authors reviewed the results and approved the final version of the manuscript.
Data-sharing statement
All data can be obtained through SEER: https://seer.cancer. gov/data-software/
3. Hahn A, Giri S, Yaghmour G, Martin MG. Early mortality in acute myeloid leukemia. Leuk Res. 2015;39(5):505-509.
4. Reville PK, Nogueras González GM, Ravandi F, et al. Predictors of early mortality, response, and survival in newly diagnosed acute myeloid leukemia (AML) using a contemporary academic cohort. Blood. 2020;136(Suppl 1):44-45.
Haematologica | 109 May 2024 1485 ARTICLE - Race-ethnicity and early mortality in myeloma J.X Wei et al.
5. Kim K, Jorge VM, Tiu A, et al. Early mortality after diagnosis of diffuse large B-cell lymphoma : a retrospective, single urbancommunity hospital study. Blood. 2019;134(Suppl 1):5335.
6. Maddox JM. Predicting Early mortality in diffuse large B-cell non-Hodgkin lymphoma. Blood. 2016;128(22):5411.
7 Joshua DE, Bryant C, Dix C, Gibson J, Ho J. Biology and therapy of multiple myeloma. Med J Aust. 2019;210(8):375-380.
8. Shah UA, Mailankody S. Emerging immunotherapies in multiple myeloma. BMJ. 2020;370:m3176.
9 Perrot A, Corre J, Avet-Loiseau H. Risk stratification and targets in multiple myeloma: from genomics to the bedside. Am Soc Clin Oncol Educ Book. 2018;(38):675-680.
10 Hsu P, Lin TW, Gau JP, et al. Risk of early mortality in patients with newly diagnosed multiple myeloma. Medicine. 2015;94(50):e2305.
11. Greipp PR, Miguel JS, Durie BGM, et al. International Staging System for multiple myeloma. J Clin Oncol. 2005;23(15):3412-3420.
12. McQuilten Z, Wellard C, Moore E, et al. Predictors of early mortality in multiple myeloma: results from the Australian and New Zealand Myeloma and Related Diseases Registry (MRDR). Br J Haematol. 2022;198(5):830-837.
13. Charliński G, Tyczyńska A, Małecki B, et al. Risk factors and causes of early mortality in patients with newly diagnosed multiple myeloma in a “real-world” study: experiences of the Polish Myeloma Group. Pol Arch Intern Med. 2021;131(6):527-534.
14 Rusli E, Diao L, Liu C, et al. Racial differences in multiple myeloma survival and treatment using pooled clinical trial and real-world electronic medical record data. Blood. 2020;136(Suppl 1):9.
15. Costa LJ, Brill IK, Omel J, Godby K, Kumar SK, Brown EE. Recent trends in multiple myeloma incidence and survival by age, race, and ethnicity in the United States. Blood Adv. 2017;1(4):282-287.
16. Marinac CR, Ghobrial IM, Birmann BM, Soiffer J, Rebbeck TR. Dissecting racial disparities in multiple myeloma. Blood Cancer J. 2020;10(2):1-8.
17. Pulte ED, Nie L, Gormley N, et al. Survival of ethnic and racial minority patients with multiple myeloma treated with newer medications. Blood Adv. 2018;2(2):116-119.
18. Pulte D, Redaniel MT, Brenner H, Jeffreys M. Changes in survival by ethnicity of patients with cancer between 1992-1996 and 2002-2006: is the discrepancy decreasing? Ann Oncol. 2012;23(9):2428-2434.
19 Ailawadhi S, Aldoss IT, Yang D, et al. Outcome disparities in multiple myeloma: a SEER-based comparative analysis of ethnic subgroups. Br J Haematol. 2012;158(1):91-98.
20 Watson EK, Rose PW, Neal RD, et al. Personalised cancer follow-up: risk stratification, needs assessment or both? Br J Cancer. 2012;106(1):1-5.
21. Dharmarajan KV, Presley CJ, Wyld L. Care disparities across the health care continuum for older adults: lessons from multidisciplinary perspectives. Am Soc Clin Oncol Educ Book. 2021;41:1-10.
22. Goede V. Frailty and cancer: current perspectives on assessment and monitoring. Clin Interv Aging. 2023;18:505-521.
23. Derhovanessian E, Solana R, Larbi A, Pawelec G. Immunity, ageing and cancer. Immun Ageing. 2008;5(1):11.
25. Kazandjian D, Landgren O. A look backward and forward in the regulatory and treatment history of multiple myeloma: approval of novel-novel agents, new drug development, and longer patient survival. Semin Oncol. 2016;43(6):682-689.
26. Landgren O, Iskander K. Modern multiple myeloma therapy: deep, sustained treatment response and good clinical outcomes. J Intern Med. 2017;281(4):365-382.
27. Schoen MW, Carson KR, Luo S, Sanfilippo KM. Outcomes in multiple myeloma based on comorbidities and race. Blood. 2019;134(Suppl 1):383.
28. Derman BA, Jasielec J, Langerman SS, Zhang W, Jakubowiak AJ, Chiu BCH. Racial differences in treatment and outcomes in multiple myeloma: a multiple myeloma research foundation analysis. Blood Cancer J. 2020;10(8):1-7.
29 Merz LE, Story CM, Osei MA, et al. Absolute neutrophil count by Duffy status among healthy Black and African American adults. Blood Adv. 2023;7(3):317-320.
30 Van Alsten SC, Aversa JG, Santo L, et al. Association between ABO and Duffy blood types and circulating chemokines and cytokines. Genes Immun. 2021;22(3):161-171.
31. Richardson PG, Jacobus SJ, Weller EA, et al. Triplet therapy, transplantation, and maintenance until progression in myeloma. N Engl J Med. 2022;387(2):132-147.
32. Hassoun H, Jacobus SJ, Voorhees PM, et al. Response rates and outcomes in newly-diagnosed multiple myeloma (NDMM) patient subgroups receiving RVD±ASCT plus lenalidomide maintenance until progression in the phase 3 DETERMINATION trial. In Paris, France: 49th Annual Meeting of the European Society for Blood and Marrow Transplantation; 2023. https:// ebmt2023.abstractserver.com/program/#/details/ presentations/1746 Accessed September 20, 2023.
33. Niranjan SJ, Wenzel JA, Martin MY, et al. Perceived institutional barriers among clinical and research professionals: minority participation in oncology clinical trials. JCO Oncol Pract. 2021;17(5):e666-e675.
34 Kanapuru B, Fernandes LL, Fashoyin-Aje LA, et al. Analysis of racial and ethnic disparities in multiple myeloma US FDA drug approval trials. Blood Adv. 2022;6(6):1684-1691.
35. Sharrocks K, Spicer J, Camidge DR, Papa S. The impact of socioeconomic status on access to cancer clinical trials. Br J Cancer. 2014;111(9):1684-1687.
36. Oberle A, Brandt A, Voigtlaender M, et al. Monitoring multiple myeloma by next-generation sequencing of V(D)J rearrangements from circulating myeloma cells and cell-free myeloma DNA. Haematologica. 2017;102(6):1105-1111.
37. Kaiser M, Hall A, Smith I, et al. Extended intensified post-ASCT consolidation with daratumumab, bortezomib, lenalidomide and dexamethasone (Dara-VRd) for ultra-high risk (UHiR) newly diagnosed myeloma (NDMM) and primary plasma cell leukemia (pPCL): the UK Optimum/Muknine Trial. Blood. 2022;140(Suppl 1):1833-1835.
24. Derman BA, Langerman SS, Maric M, Jakubowiak A, Zhang W, Chiu BCH. Sex differences in outcomes in multiple myeloma. Br J Haematol. 2021;192(3):e66-e69.
38. Weisel K, Besemer B, Haenel M, et al. Isatuximab, carfilzomib, lenalidomide, and dexamethasone (Isa-KRd) in patients with high-risk newly diagnosed multiple myeloma: planned interim analysis of the GMMG-Concept trial. Blood. 2022;140(Suppl 1):1836-1838.
Haematologica | 109 May 2024 1486 ARTICLE - Race-ethnicity and early mortality in myeloma J.X Wei et al.
Multiplex immunohistochemistry elucidates increased distance between cytotoxic T cells and plasma cells in relapsed myeloma, and identifies Lag-3 as the most common checkpoint receptor on cytotoxic T cells of myeloma patients
Slavisa Ninkovic,1,2,3 Louise E Purton,2,3 Simon J Harrison4,5 and Hang Quach1,2
1Department of Haematology, St. Vincent’s Hospital Melbourne, Melbourne; 2Faculty of Medicine, University of Melbourne, St. Vincent’s Hospital, Melbourne; 3Stem Cell Regulation Unit, St. Vincent’s Institute of Medical Research, Melbourne; 4Clinical Haematology, Peter MacCallum Cancer Centre and The Royal Melbourne Hospital, Melbourne and 5Sir Peter MacCallum Department of Oncology, University of Melbourne, Parkville, Victoria, Australia
Abstract
Correspondence: S. Ninkovic slavisa.ninkovic@svha.org.au
Received: May 18, 2023.
Accepted: October 12, 2023.
Early view: October 19, 2023.
https://doi.org/10.3324/haematol.2023.283344
©2024 Ferrata Storti Foundation
Published under a CC BY-NC license
A dysfunctional immune tumor microenvironment facilitates disease progression in multiple myeloma (MM). Using multiplex immunohistochemistry (mIHC), we describe the quantitative and qualitative changes in CD3+CD8+ cytotoxic T cells and assess their proximity to malignant plasma cells (PC) in patients with monoclonal gammopathy of undetermined significance (MGUS), and newly diagnosed (ND) and relapsed and/or refractory (RR) MM. Formalin-fixed, paraffin-embedded trephine sections from patients with MGUS (N=32), NDMM (N=65), and RRMM (N=59) were sequentially stained for CD138, CD3, CD8, and checkpoint receptors (CPR) Tim-3, Lag-3, and PD-1. The Halo® image analysis platform was used for cell segmentation and phenotyping, facilitating enumeration of cytotoxic T cells and analysis of proximity to PC. The percentage of CD8+ cytotoxic T cells in proximity to PC is greater in patients with NDMM than patients with RRMM (at 50 mm distance, 90.8% vs. 81.5%; P=0.038). There is a trend for more CD3+ T cells in MGUS (P=0.08) but no difference was observed in the prevalence of CD8+ cytotoxic T cells (P=0.48). Lag-3 is the most common CPR expressed on cytotoxic T cells in myeloma (P<0.0001), while PD-1 is the most common CPR on CD8- T cells of patients with MGUS and RRMM. Our study is the first to report on the spatial relationship between T cells and PC using mIHC on FFPE bone marrow trephine sections from patients with PC dyscrasia. The proximity of T cells to PC during early stages of MM, and overexpression of Lag-3, validate the move of immune therapeutic strategies, including T-cell engagers and checkpoint inhibitors, to upfront treatment or in early-line treatment of MM.
Introduction
Multiple myeloma (MM) is an incurable malignancy, preceded by the precursor condition monoclonal gammopathy of undetermined significance (MGUS). Despite recent advances in treatment strategies, MM is characterized by recurrent relapses with progressively shorter duration of response and treatment-free intervals. Dysregulation and dysfunction of the immune tumor microenvironment (iTME) is one of the key pillars in myeloma pathogenesis and progression, with
many recently approved anti-myeloma therapies specifically targeting the immune system.1-3
Qualitative and quantitative alterations of the T-cell repertoire contributing to disease progression are in part characterized by an early increase in cytotoxic CD3+CD8+ T cells.4 Cytotoxic T cells isolated from patients with MGUS exert vigorous anti-tumor-specific responses to autologous myeloma cells, but overstimulation and chronic tumor-associated antigen exposure leads to T-cell exhaustion.5-7 Exhaustion is, in part, characterized by expression of inhibitory check-
Haematologica | 109 May 2024 1487 - Plasma Cell Disorders ARTICLE
point receptors including programmed death receptor-1 (PD-1), T-cell immunoglobulin 3 (Tim-3), lymphocyte activation gene-3 (Lag-3), and T-cell immunoglobulin and ITIM domains (TIGIT).8-11 Recent studies exploring the immune dysfunction as a contributing factor to disease relapse have consistently shown an association between higher levels of PD-1, Tim-3, Lag-3 or TIGIT and disease outcomes.9,11-15 Therapeutic targeting of inhibitory checkpoint receptors with monoclonal antibodies is in various stages of pre-clinical and clinical development, with targeting of the PD-1/PD-L1 axis being examined most extensively. The combination of pembrolizumab, an anti-PD-1 monoclonal antibody (mAb), with standard-of-care anti-myeloma immunomodulatory (IMiD) drugs lenalidomide or pomalidomide, achieved a 44% or 60% overall response rate (ORR) in relapsed/refractory (RR) patients. However, patients treated with this novel combination had a shorter progression-free survival (PFS) and higher treatment-related deaths, resulting in the suspension of clinical trials of the anti-PD-1 and IMiD combination.16-18
An alternative approach to re-invigorate the iTME is to bring cytotoxic T cells and plasma cells (PC) into physical proximity with the use of bispecific mAb. These so-called T-cell engagers are capable of binding two different antigens: one specific to T cells and the other a tumor-associated antigen present on malignant PC.3 Previous studies have demonstrated a link between T-cell and malignant cell proximity with response to immunotherapy in patients with solid tumors like melanoma, yet little is known about the spatial relationship between cytotoxic T cells and PC in myeloma.19-21 Recent studies, often using flow cytometry, mass cytometry by timeof-flight (CyTOF) or single cell RNA sequencing (scRNA-seq), have enriched our understanding of iTME characteristics in patients with myeloma and precursor conditions.22-24 While scRNA-seq and CyTOF can be very informative, they depend on the assessment of individual cells isolated from the bone marrow aspirate (BMA), making it impossible to comment on the BM architecture or the spatial relationships between PC and various components of the iTME. Using multiplex immuno-fluorescence histochemistry (mIHC), a technique that preserves BM architecture while allowing the simultaneous detection of up to six antigens, we aimed to improve our understanding and describe the iTME in the trephine of patients with MGUS, and ND and RR MM. Specifically, we focused on cytotoxic T cells as defined by cell membrane co-expression of CD3 and CD8 and the expression pattern of inhibitory checkpoint receptors, Tim-3, Lag-3, and PD-1. In addition, we set out to describe the spatial relationship between cytotoxic T cells and malignant PC in these three patient cohorts.
Methods
Patient selection
Patients with a diagnosis of MGUS or MM were identified
following review of the St. Vincent’s Hospital Melbourne (SVHM) BM pathology database from January 2016 to September 2019 inclusive. Diagnostic biopsies were performed as part of standard work-up of suspected PC dyscrasia, while patients in the RR cohort had biopsies performed prior to any subsequent anti-myeloma therapy. Stored formalin-fixed, paraffin-embedded (FFPE) BM trephine (BMT) blocks were retrieved for use in this study, and up to ten 3mm-thick consecutive sections were obtained from patients with MGUS (N=32), NDMM (N=65), and RRMM (N=59). Retrospective data including patient demographics, diagnostic BMA, and BMT PC burden, MM disease characteristics, prior treatment, and response history and survival were extracted from institutional medical records. This study was approved by the SVHM Human Research Ethics Committee in accordance with National Health and Medical Research Council Act 1992 and the National Statement on Ethical Conduct in Human Research 2007 (updated July 2018; approval number LRR 081/19).
Multiplex immunohistochemistry OpalTM workflow, image acquisition, and data analysis
Formalin-fixed, paraffin-embedded sections were subject to deparaffinization and rehydration by serial passage through changes of xylene and graded ethanol followed by heat-induced epitope retrieval (HIER) using a Leica Bond Max Autostainer (Leica Biosystems). Slides were incubated with an anti-human primary antibody, in order of staining: rabbit monoclonal anti-Lag-3 (D2G40/1:400/Cell Signalling Technology, CST), mouse monoclonal anti-CD8 (C8-144B/1:400/ CST), rabbit monoclonal anti-CD3 (CD3 epsilon/1:400/CST), rabbit monoclonal anti-PD-1 (D4W2J/1:200/CST), mouse monoclonal anti-CD138 (1:800/Dako Cell Signalling), and rabbit monoclonal anti-Tim-3 (D5D5R/1:400/CST). This was followed by an endogenous tissue peroxidase block with 0.3% hydrogen peroxide and subsequent application of polymeric HRP-conjugated secondary antibody (Leica Biosystems). The immunofluorescent signal was facilitated by application of the OpalTM 7-color fluorescent IHC kit (Akoya Biosciences) with application of the fluorophore-conjugated Tyramide Signal Amplification (TSA; Akoya Biosciences) at a 1:100 dilution (in order of staining: 650, 570, 690, 620, 520, 540). Following Opal-TSA signal deposition, slides were again subjected to HIER, resulting in stripping of tissue-bound primary/secondary antibody complexes with preservation of the tyrosine-residue bound Opal-TSA signal. This process was repeated until all six markers of interest were labeled, followed by a nuclear DAPI counterstain.
Digital, fluorescent images were acquired using the Vectra® 3.0 Automated Quantitative Pathology Imaging System (Akoya Biosciences). Using a set of positive control library slides for each Opal fluorophore, acquired images were spectrally unmixed with inForm® Tissue Analysis Software (v2.4.8; Akoya Biosciences). Halo® Image Analysis Platform (v3.2.1; Indica Labs®) was used for all subsequent stages
Haematologica | 109 May 2024 1488 ARTICLE - Proximity of cytotoxic T cells and plasma cells in MM S. Ninkovic et al.
of image analysis. Machine-learned tissue segmentation into BM and fat spaces was followed by cell segmentation using nuclear DAPI staining. Detection of a cell membrane (CM) primary antibody signal, in addition to DAPI nuclear staining, allowed for cell phenotyping. Thresholds for positive detection of signals were reviewed in at least five x40 magnification fields for each marker individually for all imaged slides. Cells expressing CM CD138 were identified as PC; all others were classed as non-PC. Expression of CD3 (lymphocytes), CD3 and CD8 (cytotoxic T cells), and checkpoint receptors (TIM-3, LAG-3 or PD-1) allowed for identification of various subsets of T lymphocytes (e.g., Tim-3, CD3, and CD8 co-localization was representative of a cytotoxic T cell expressing the checkpoint receptor Tim-3). An algorithm that considers the percentage of positively stained cells and the fluorescence intensity (low, medium, and high) was applied resulting in an H-score, i.e., a semi-quantitative measure of biomarker intensity. Proximity and nearest neighbor analysis were used to assess the spatial relationship between immune and plasma cells.
Survival definitions and statistical analysis
Overall survival (OS) and PFS were defined as the time from diagnosis (MGUS patients) or initial treatment (ND and RR patients) until death from any cause for OS and disease progression or death from any cause for PFS. Descriptive statistics are presented where appropriate. Normal distribution of data was assessed with the Anderson-Dar-
ling test with subsequent application of unpaired t test or Mann-Whitney test, as appropriate, for comparisons between two groups. Differences between the three cohorts were analyzed with the ordinary one-way ANOVA or Kruskal-Wallis test as appropriate. All comparisons and all comparative tests were two-tailed with probability values below 0.05 considered statistically significant. Survival rates were estimated using the Kaplan-Meier method. All statistical analyses were performed using GraphPad Prism (v9.2.0 for macOS; GraphPad Software).
Results
Patients’ characteristics and treatment outcomes
Patients’ and key disease characteristics are shown in Table 1. Treatment and outcomes in the NDMM and RRMM cohorts are shown in Table 2. Applying the MGUS risk stratification model which considers serum monoclonal protein (MP) level and subtype along with presence of abnormal serum free light chain (SFLC) ratio, patients were stratified into low (N=7), intermediate-low (N=14), intermediate-high (N=10), and high (N=1) risk for progression to MM.25 At a median follow-up time of 2.07±1.26 years post-BM biopsy, 5 patients had progressed to myeloma and 2 had died. Of the 65 ND patients, 6 had smouldering MM not requiring immediate treatment. First-line therapy was heterogeneous with various combinations of proteosome inhibitor (PI),
Table 1. Patients’ and disease characteristics in patients with monoclonal gammopathy of undetermined significance, newly diagnosed multiple myeloma, and relapsed and/or refractory multiple myeloma.
BMBx: bone marrow biopsy; M-protein: monoclonal protein; MGUS: monoclonal gammopathy of undetermined significance; NDMM: newly diagnosed multiple myeloma; RRMM: relapsed and/or refractory multiple myeloma; SD: standard deviation; SFLC: serum free light chain. *Ordinary one-way ANOVA or Kruskal-Wallis tests as appropriate with corresponding Tukey’s or Dunn’s multiple comparisons tests where significance was detected between groups and where: 1 = MGUS, 2 = NDMM, and 3 = RRMM cohort.
Haematologica | 109 May 2024 1489 ARTICLE - Proximity of cytotoxic T cells and plasma cells in MM S. Ninkovic et al.
Characteristics MGUS NDMM RRMM P N of patients 32 65 59 Median age at time of BMBx in years (range) 74.2 (26.6-87.8) 69.3 (30.5-89.8) 68.8 (34.0-86.2) 0.8025 Gender, N Male Female 16 16 40 25 39 20 0.3201 M-protein subtype, N IgA IgG IgM or IgD None 6 22 1 3 10 46 0 9 6 32 1 20 0.0443 M-protein level, g/L, mean ± SD 11.0±9.0 32.2±20.6 27.5±30.1 <0.0001* 1 vs. 2 < 0.0001 1 vs. 3 < 0.0006 2 vs. 3 = 0.4000 Involved
286±361 1,193±1,879 998±1,755 0.0301* 1 vs. 2 = 0.0253 1 vs. 3 = 0.0990 2 vs. 3 > 0.9999
– uninvolved SFLC difference, mean ± SD
Table 2. Treatment and outcomes of newly diagnosed and relapsed and/or refractory multiple myeloma patients.
NDMM, N=65
RRMM, N=59
NDMM: newly diagnosed multiple myeloma; RRMM: relapsed and/or refractory multiple myeloma; PI: proteasome inhibitor; IMiD: immunomodulatory drug; mAb: monoclonal antibody; BCMA: B-cell maturation antigen; ADC: antibody drug conjugate; BITE: bispecific T-cell engager; MR: minor response; SD: stable disease; PR: partial response; VGPR: very good partial response; CR: complete response; PD: progressive disease.
ImiD, and/or anti-CD38 mAb delivered (Table 2). Thirty-one patients (47.7%) had an upfront autologous stem cell transplant (autoSCT). ORR was 79.7%, while 6 patients (10.2%) had stable disease (SD) or a minor response (MR) as their best response to first-line therapy. Six patients progressed while on first-line therapy. At a median follow-up of 2.28±1.08 years, 32 patients had progressed for a median PFS of 2.25 years, while 9 patients had died; the median OS was not reached.
Median time between MM diagnosis and BM biopsy (BMBx) utilized for mIHC assessment in the RR cohort was 4.94±3.25 years. A median of 2 (range 1-9) prior lines of therapy were given, with 89.9% of the cohort previously exposed to PI and 54.2% exposed to IMiD. Thirty-four patients (57.6%) had had a previous autoSCT. Treatment was heterogeneous with nine different regimens used (Table 2). Four patients did not receive treatment: 3 due to poor performance status, one due to patient preference. The ORR was 61% with suboptimal response (SD or MR) in 11.9% of patients while 27.2% progressed during therapy. At a median follow-up of 2.43 years, 45 patients had experienced disease progression for a median PFS of 1.08 years, while 23 patients had died, for a 5-year OS of just over 50%.
Multiplex immunohistochemistry is feasible on FFPE bone marrow trephine sections
Figure 1 demonstrates the performance of the individual primary antibody-fluorophore combinations on the exact same section of trephine tissue (Figure 1A-F) and illustrates a representative image (Figure 1G) of the merged 6-plex mIHC stain on a patient with myeloma.
Plasma cell percentage assessed by multiplex immunohistochemistry correlates to plasma cell percentage reported by diagnostic pathology
In clinical practice, the BMA PC percentage (%) is based on a manual, minimum 100 nucleated cell differential count, while the BMT PC burden is based on a visual estimation of anti-CD138 chromogenic IHC. Across the 156 samples assessed in this study, a matched-measures, one-way ANOVA demonstrated differences in the PC% reported by aspirate, CD138 IHC, and mIHC (Online Supplementary Table S1). On Dunn’s multiple comparisons test, the difference was significant only between the aspirate and CD138 IHC, and the aspirate and mIHC groups (P<0.0001, respectively). There was no difference in PC burden as estimated by standard anti-CD138 IHC and mIHC in this study (P=0.9654). Spearman correlation coefficient between the aspirate
Haematologica | 109 May 2024 1490 ARTICLE - Proximity of cytotoxic T cells and plasma cells in MM S. Ninkovic et al.
Treatment, N (%) PI 31 (47.6) 8 (13.6) IMiD 16 (24.6) 4 (6.8) PI + IMiD 6 (9.2) 5 (8.5) PI + mAb 2 (3.1) 18 (30.5) IMiD + mAb 1 (1.5) 3 (5.1) PI + IMiD + mAb 3 (4.6) 0 mAb 0 3 (5.1) Anti-BCMA ADC + IMiD 0 1 (1.7) Anti-BCMA ADC + PI 0 7 (11.9) Anti-BCMA BITE 0 6 (10.2) No treatment 6 (9.2) 4 (6.8) Best response
(%) MR/SD 6 (10.2) 7 (11.9) PR 18 (30.5) 15 (25.4) VGPR 20 (33.9) 9 (15.3) CR 9 (15.3) 12 (20.3) PD 6 (10.2) 16 (27.2)
to therapy, N
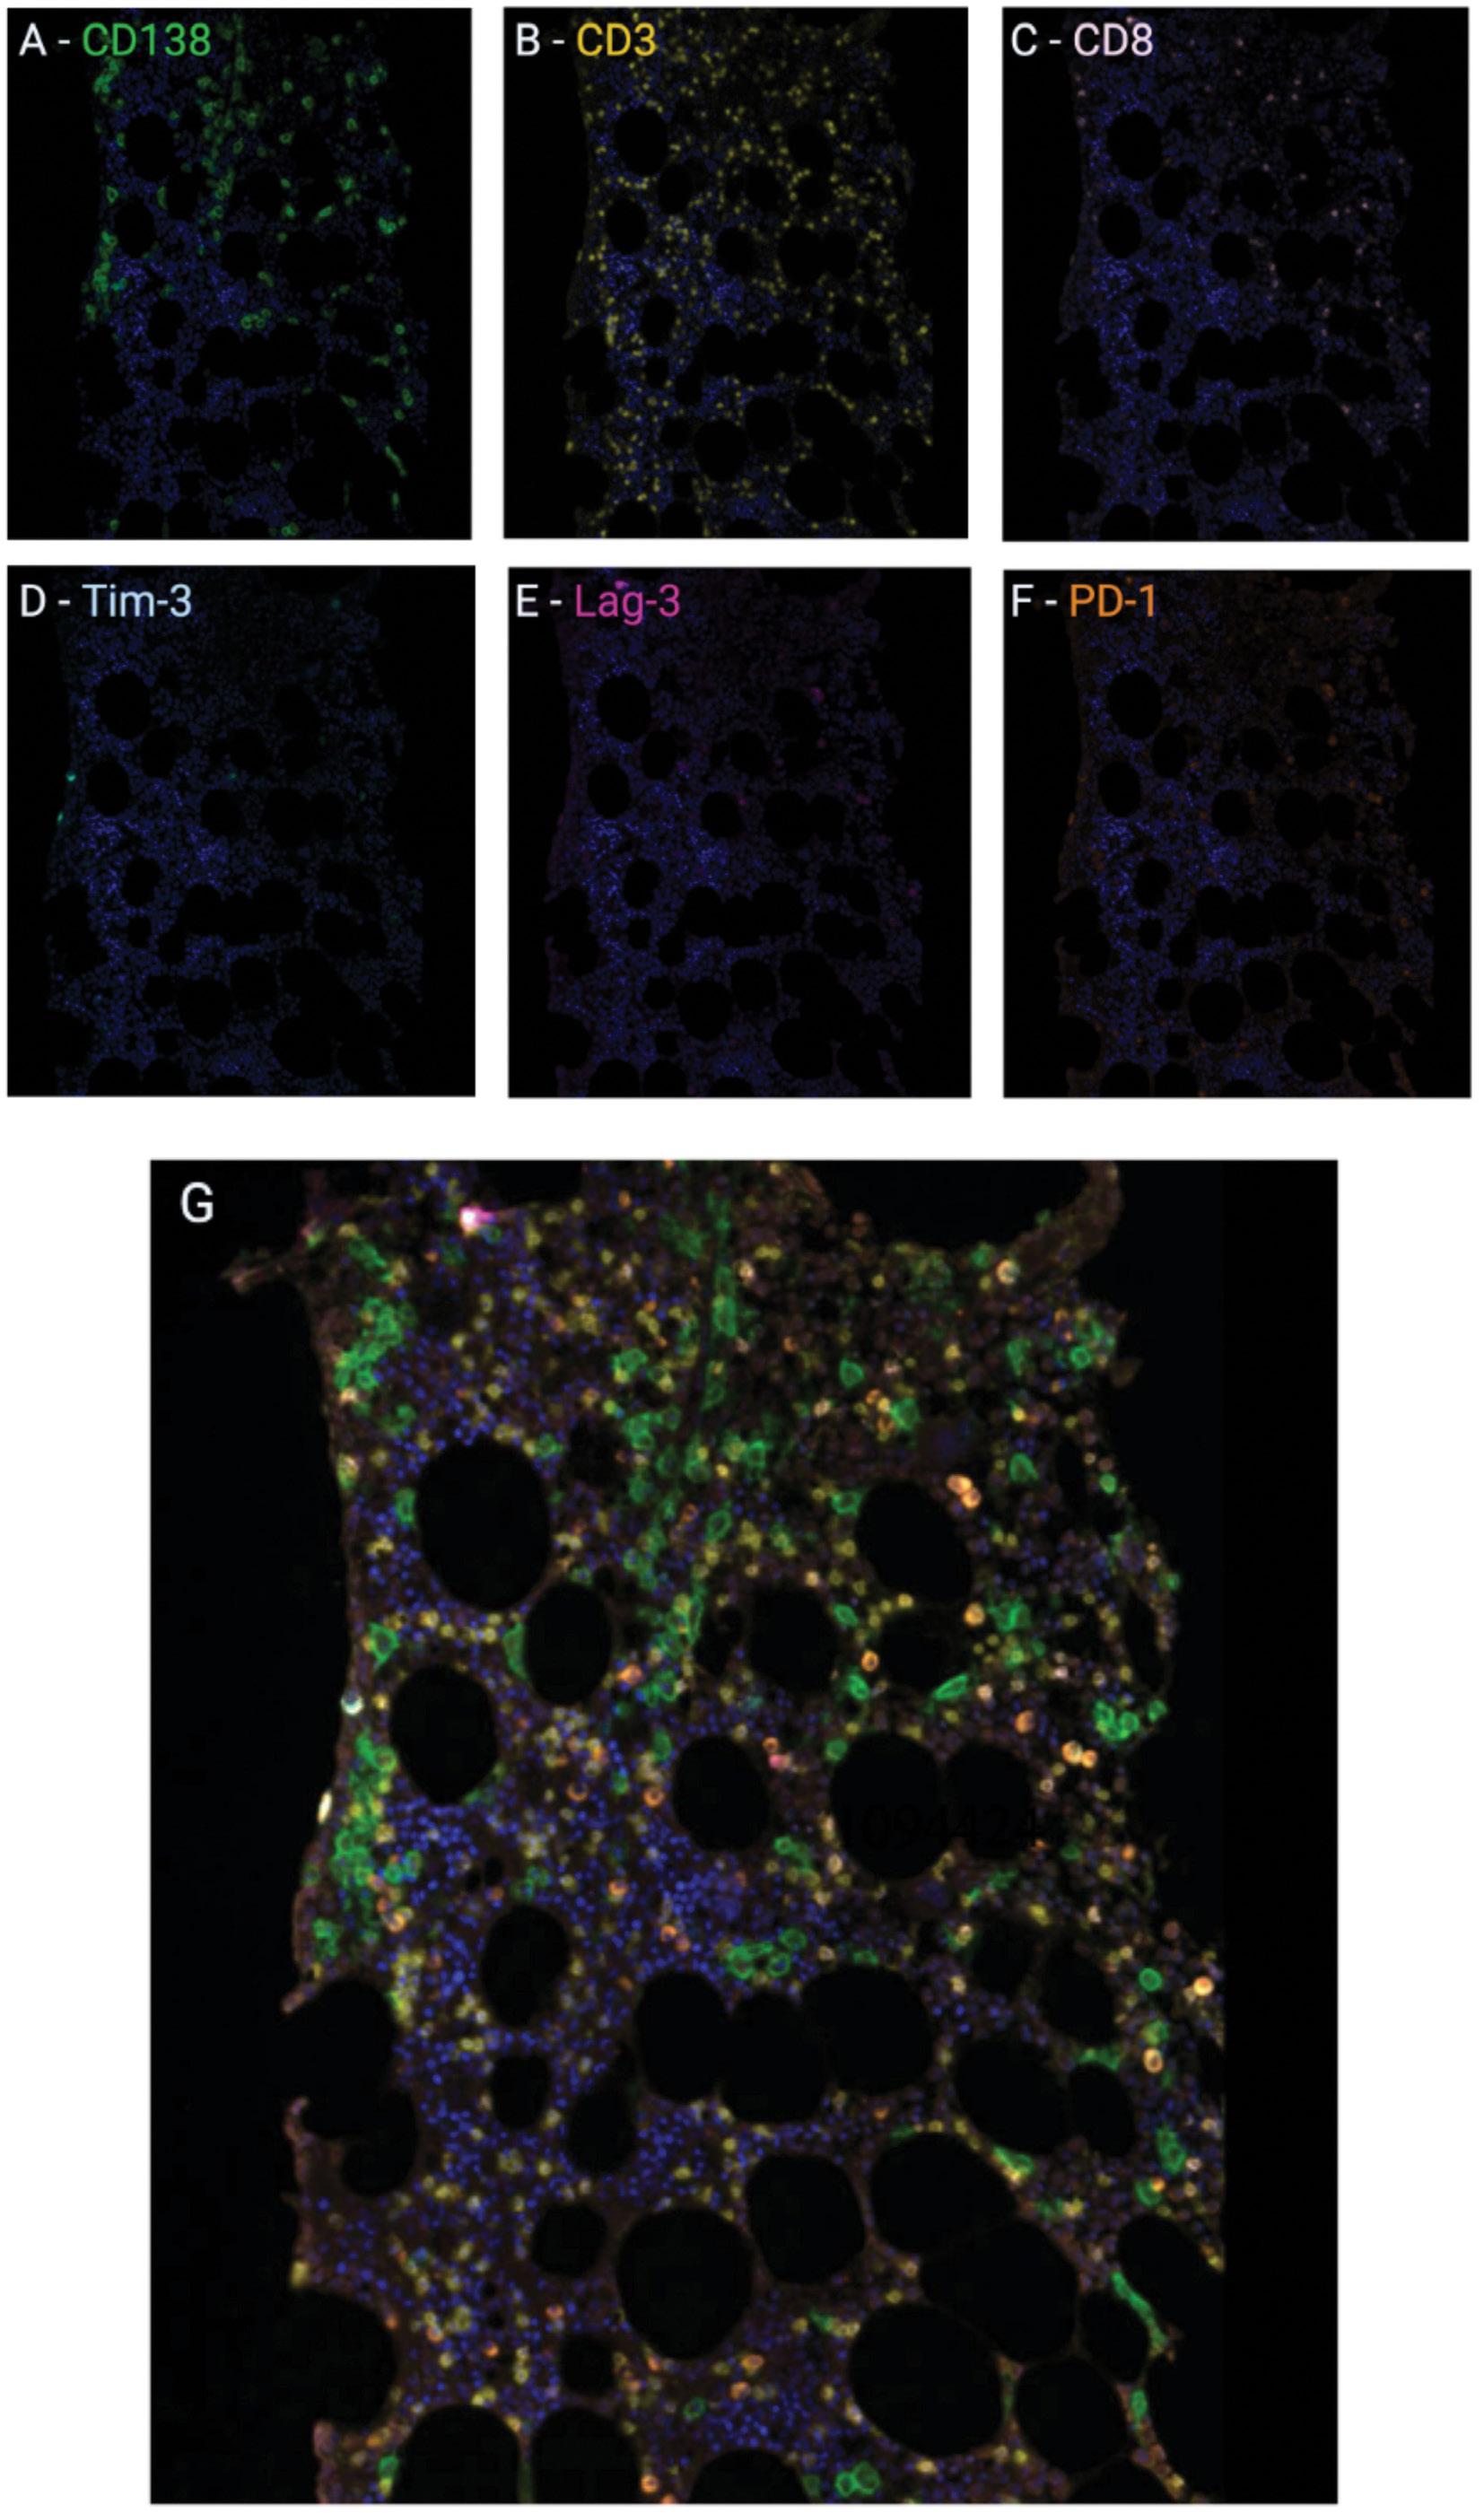
and CD138 measures was 0.83, 0.72 between aspirate and mIHC, and 0.79 between the two IHC-based techniques.
T cell to plasma cell ratio is highest in patients with monoclonal gammopathy of undetermined significance
Table 3 summarises findings from the mIHC analysis. There was no difference in BM cellularity, extent of fat space, or the total number of cells assessed per trephine across the three cohorts. As expected, the PC burden was higher in patients with NDMM (35.3±25.1%) and RRMM (30.1±26.2%) when compared to patients with MGUS (11.6±7.8%) (P<0.0001).
Figure 1. Multiplex immunohistochemistry. A formalin-fixed, paraffin-embedded section of bone marrow trephine was sequentially stained with primary antibody and immunofluorescent OpalTM fluorophore combinations. (A-F) CD138 = green; CD3 = yellow; CD8 = blush pink; Tim-3 = light blue; Lag-3 = pink, PD-1 = orange, followed by DAPI nuclear counterstain (dark blue) resulting in the merged 6-plex multiplex immunohistochemistry image shown in (G).
There was a trend towards an increase in CD3+ T cells in proportion to overall BM cellularity in patients with MGUS (13.9±9.5%) compared with NDMM (11.0±5.9%) or RRMM (11.1±7.7%) patients (P=0.08), with almost a third of all CD3+ lymphocytes co-expressing CD8 in all three patient groups (Figure 2). There was no discernible difference in the overall prevalence of CD3+CD8+ cytotoxic T cells. The T-cell/ PC and Tcyt/PC ratio was highest in patients with relapsed disease and MGUS, but there was no statistically significant difference when comparing these ratios in patients with ND and RR myeloma.
Haematologica | 109 May 2024 1491 ARTICLE - Proximity of cytotoxic T cells and plasma cells in MM S. Ninkovic et al.
A D E G F B C
Lag-3+ cytotoxic T cells are more prevalent than Tim-3 or PD-1+ T cells within the bone marrow tumor microenvironment
The percentages of all nucleated cells within the BM trephine expressing the checkpoint receptors Tim-3, Lag-3, or PD-1 were similar between the three cohorts of patients, as was their co-expression on both CD3+CD8+ and CD3+CD8T cells (Figure 3). In ND patients, Tim3 was expressed on
Table 3. Summary of multiplex immunohistochemistry results.
3.45±5.31%, Lag3 on 6.18±6.17%, and PD-1 on 4.13±7.52% of cytotoxic CD3+CD8+ T cells and there was no significant difference in expression compared to relapsed patients. Of the three assessed checkpoint receptors, Lag3 was the most commonly found receptor on cytotoxic T cells in all patient groups (Table 4, Figure 3). PD-1, however, was the most common checkpoint receptor on CD8- T cells in patients with relapsed myeloma or MGUS.
CD3 and CD8 expression, %
CD3+T cells (as % of all nucleated cells)
CD3+ CD8+ T cells, (as % of all nucleated cells)
Proportion of CD3+ cells co-expressing CD8
T-cell-to-plasma cell ratio
Tim3 expression, %
cells
Tim3+ CD3+ CD8+ T cells
CD3+ CD8- T cells
Lag3 expression, %
cells
CD3+ CD8+ T cells
CD3+ CD8- T cells
Tcyt expressing Lag3
PD-1 expression, %
cells
CD3+ CD8+ T cells
CD3+ CD8- T cells
Tcyt expressing PD1
Absolute number of CD3+ CD8+ T cells within a specified distance from PC
25 mm
50 mm
100 mm
on following page.
Haematologica | 109 May 2024 1492
S. Ninkovic et al.
ARTICLE - Proximity of cytotoxic T cells and plasma cells in MM
Continued
Characteristics MGUS N=32 NDMM N=65 RRMM N=59 P BM cellularity, % 47.0±11.7 52.1±17.0 53.46±15.1 0.1984 Fat space, % 35.7±12.0 37.1±17.0 33.5±12.9 0.4050 Total N of nucleated cells assessed 31,549±20,270 39,723±27,853 33,537±26,472 0.4225 Plasma cells, % 11.6±7.8 35.3±25.1 30.1±26.2 <0.0001* 1 vs. 2 < 0.0001 1 vs. 3 = 0.0014 2 vs. 3 = 0.2511 Non-plasma cells, % 88.4±7.8 63.9±24.8 69.9±26.2 <0.0001* 1 vs. 2 < 0.0001 1 vs. 3 = 0.0014 2 vs. 3 = 0.2511
13.9±9.5 4.3±3.3 30.1±13.6 11.0±5.9 3.5±3.0 33.3±19.3 11.1±7.7 3.8±3.5 34.5±15.7 0.0807 0.4679 0.4881
CD3+
1.97±2.24 0.73±1.19 1.65±3.95 <0.0001* 1 vs. 2 < 0.0001 1 vs. 3 < 0.0001 2 vs. 3 = 0.6846 CD3+
ratio 0.65±0.93 0.23±0.44 0.66±1.82 <0.0001* 1 vs. 2 < 0.0001 1 vs. 3 = 0.0011 2 vs. 3 = 0.4565
T cell/PC ratio
CD8+ T cell/PC
Tim3+
Tim3+
%
2.3±2.4 0.08±0.07 0.31±0.35 2.35±2.30 3.4±4.2 0.13±0.25 0.56±0.89 3.45±5.31 2.8±4.3 0.12±0.23 0.49±0.97 2.89±3.51 0.4683 0.4895 0.7606 0.7439
Tcyt expressing Tim3
Lag3+
Lag3+
%
5.5±4.1 0.35±0.43 0.76±1.18 8.03±5.69 6.1±7.7 0.25±0.38 0.83±1.44 6.18±6.17 4.4±.59 0.27±0.35 0.53±0.83 7.79±8.81 0.2367 0.1343 0.6276 0.1569
Lag3+
PD-1+
PD-1+
PD-1+
%
3.5±4.2 0.16±0.28 0.98±1.16 2.73±3.63 5.4±8.2 0.15±0.30 0.92±1.45 4.13±7.52 3.0±3.6 0.13±0.24 0.99±1.76 3.33±5.61 0.5906 0.9355 0.2600 0.7846
Within
Within
901.7±1,602 1,222±1,984 1,406±2,089 1,215±1,989 1,379±2,093 1,464±2,163 896.7±1,227 1,129±1,935 1,330±2,750 0.3905 0.5139 0.4960
Within
Proportion of CD3+ CD8+ T cells within a specified distance from PC, %
BM: bone marrow; MGUS: monoclonal gammopathy of undetermined significance; N: number; NDMM: newly diagnosed multiple myeloma; RRMM: relapsed and/or refractory multiple myeloma. Values represent mean ± Standard Deviation (SD). *Ordinary one-way ANOVA or Kruskal-Wallis tests as appropriate with corresponding Tukey’s or Dunn’s multiple comparisons tests where significance was detected between groups and where: 1 = MGUS, 2 = NDMM, and 3 = RRMM cohort.
Cytotoxic T cells are in closer proximity to plasma cells in patients with newly diagnosed disease
The percentage of cytotoxic T cells located within a 25 m m radius away from a PC was highest in patients with NDMM including smouldering myeloma (79.3±22%) when compared to patients with MGUS (54.7±21.2) or relapsed (68.2±28.8) disease (P<0.0001) (Figure 4C). This significant difference was maintained at both the 50 m m and 100 m m distance where almost 97% of cytotoxic T cells were within 100 m m of a PC in the trephine of ND patients. The average distance to a PC for each cytotoxic T cell was greater in patients with MGUS (38.1±28.3 mm) than patients with relapsed (30±27.6 mm; P=0.1305) or ND (23.5±32.1 mm) myeloma (P<0.0001). The average number of cytotoxic T cells within a 100 m m radius of a PC was highest in patients with MGUS (1.77 ±0.65 vs. 1.60±1.27 [ND] vs. 1.62±1.33 [RR]; P<0.001). The percentage of plasma cells with only a single cytotoxic T cell within a 100 m m radius was lowest in ND patients (11.5±11.5 vs. 25.6±15.8 [MGUS] vs. 16.5±20.6 [RR]; P<0.0001).
Poor response to first-line therapy is associated with higher plasma cell burden
To further explore the relationships between the tumor and the microenvironment, we stratified each cohort of patients and performed several sub-group analyses. (See Online Supplementary Table S2 for a summary of the mIHC data from these subgroup analyses). In the MGUS cohort, a comparison of patients at low/intermediate risk of progression to myeloma (N=21) with those at intermediate-high/ high risk of progression showed no discernible differences in the iTME components assessed. There was no difference in cytotoxic T-cell or checkpoint receptor expression between patients who had an objective response to firstline therapy (N=41) compared with those that progressed within 12 months or had a suboptimal response (<PR; N=18). Comparing the worst (<PR; N=12) with the best (>CR; N=9) responders, those responding poorly to first-line therapy had a higher PC% (40.0±21.7% vs. 19.0±14.5%; P=0.022), and a higher proportion of CD3+CD8+ T cells within 25 mm (88.7±10.2% vs. 64.7±17.9%; P=0.001), 50 mm, and 100 mm of
Haematologica | 109 May 2024 1493 ARTICLE - Proximity of cytotoxic T cells and plasma cells in MM S. Ninkovic et al.
Characteristics MGUS N=32 NDMM N=65 RRMM N=59 P
Within 25 mm 54.7±21.2 79.3±22.0 68.2±28.8 <0.0001* 1 vs. 2 < 0.0001 1 vs. 3 = 0.0068 2 vs. 3 = 0.0860 Within 50 mm 77.6±19.5 90.8±15.8 81.5±23.9 <0.0001* 1 vs. 2 < 0.0001 1 vs. 3 = 0.0489 2 vs. 3 = 0.0385 Within 100 mm 92.8±12.7 96.9±9.2 92.3±16.8 0.0007* 1 vs. 2 = 0.0004 1 vs. 3 = 0.0342 2 vs. 3 = 0.406 Average distance to PC
each Tcyt, mm 38.1±28.3 23.5±32.1 30.0±27.6 <0.0001* 1 vs. 2 < 0.0001 1 vs. 3 = 0.0094 2 vs. 3 = 0.1305 Average number of Tcyt within 100 mm of
PC 1.77±0.65 1.60±1.27 1.62±1.33 0.0010 1 vs. 2 < 0.0018 1 vs. 3 = 0.0024 2 vs. 3 > 0.9999 Average distance to Tcyt for each PC, mm 50.9±27.1 76.6±67.5 97.7±219.3 0.2510 Proportion of unique plasma cells, % 25.6±15.8 11.5±11.5 15.0±17.5 <0.0001* 1 vs. 2 < 0.0001 1 vs. 3 = 0.0002 2 vs. 3 = 0.8437 Proportion of unique Tcyt, % 58.3±20.4 80.3±20.1 73.5±24.9 <0.0001* 1 vs. 2 < 0.0001 1 vs. 3 = 0.0023 2 vs. 3 = 0.3218
for
a
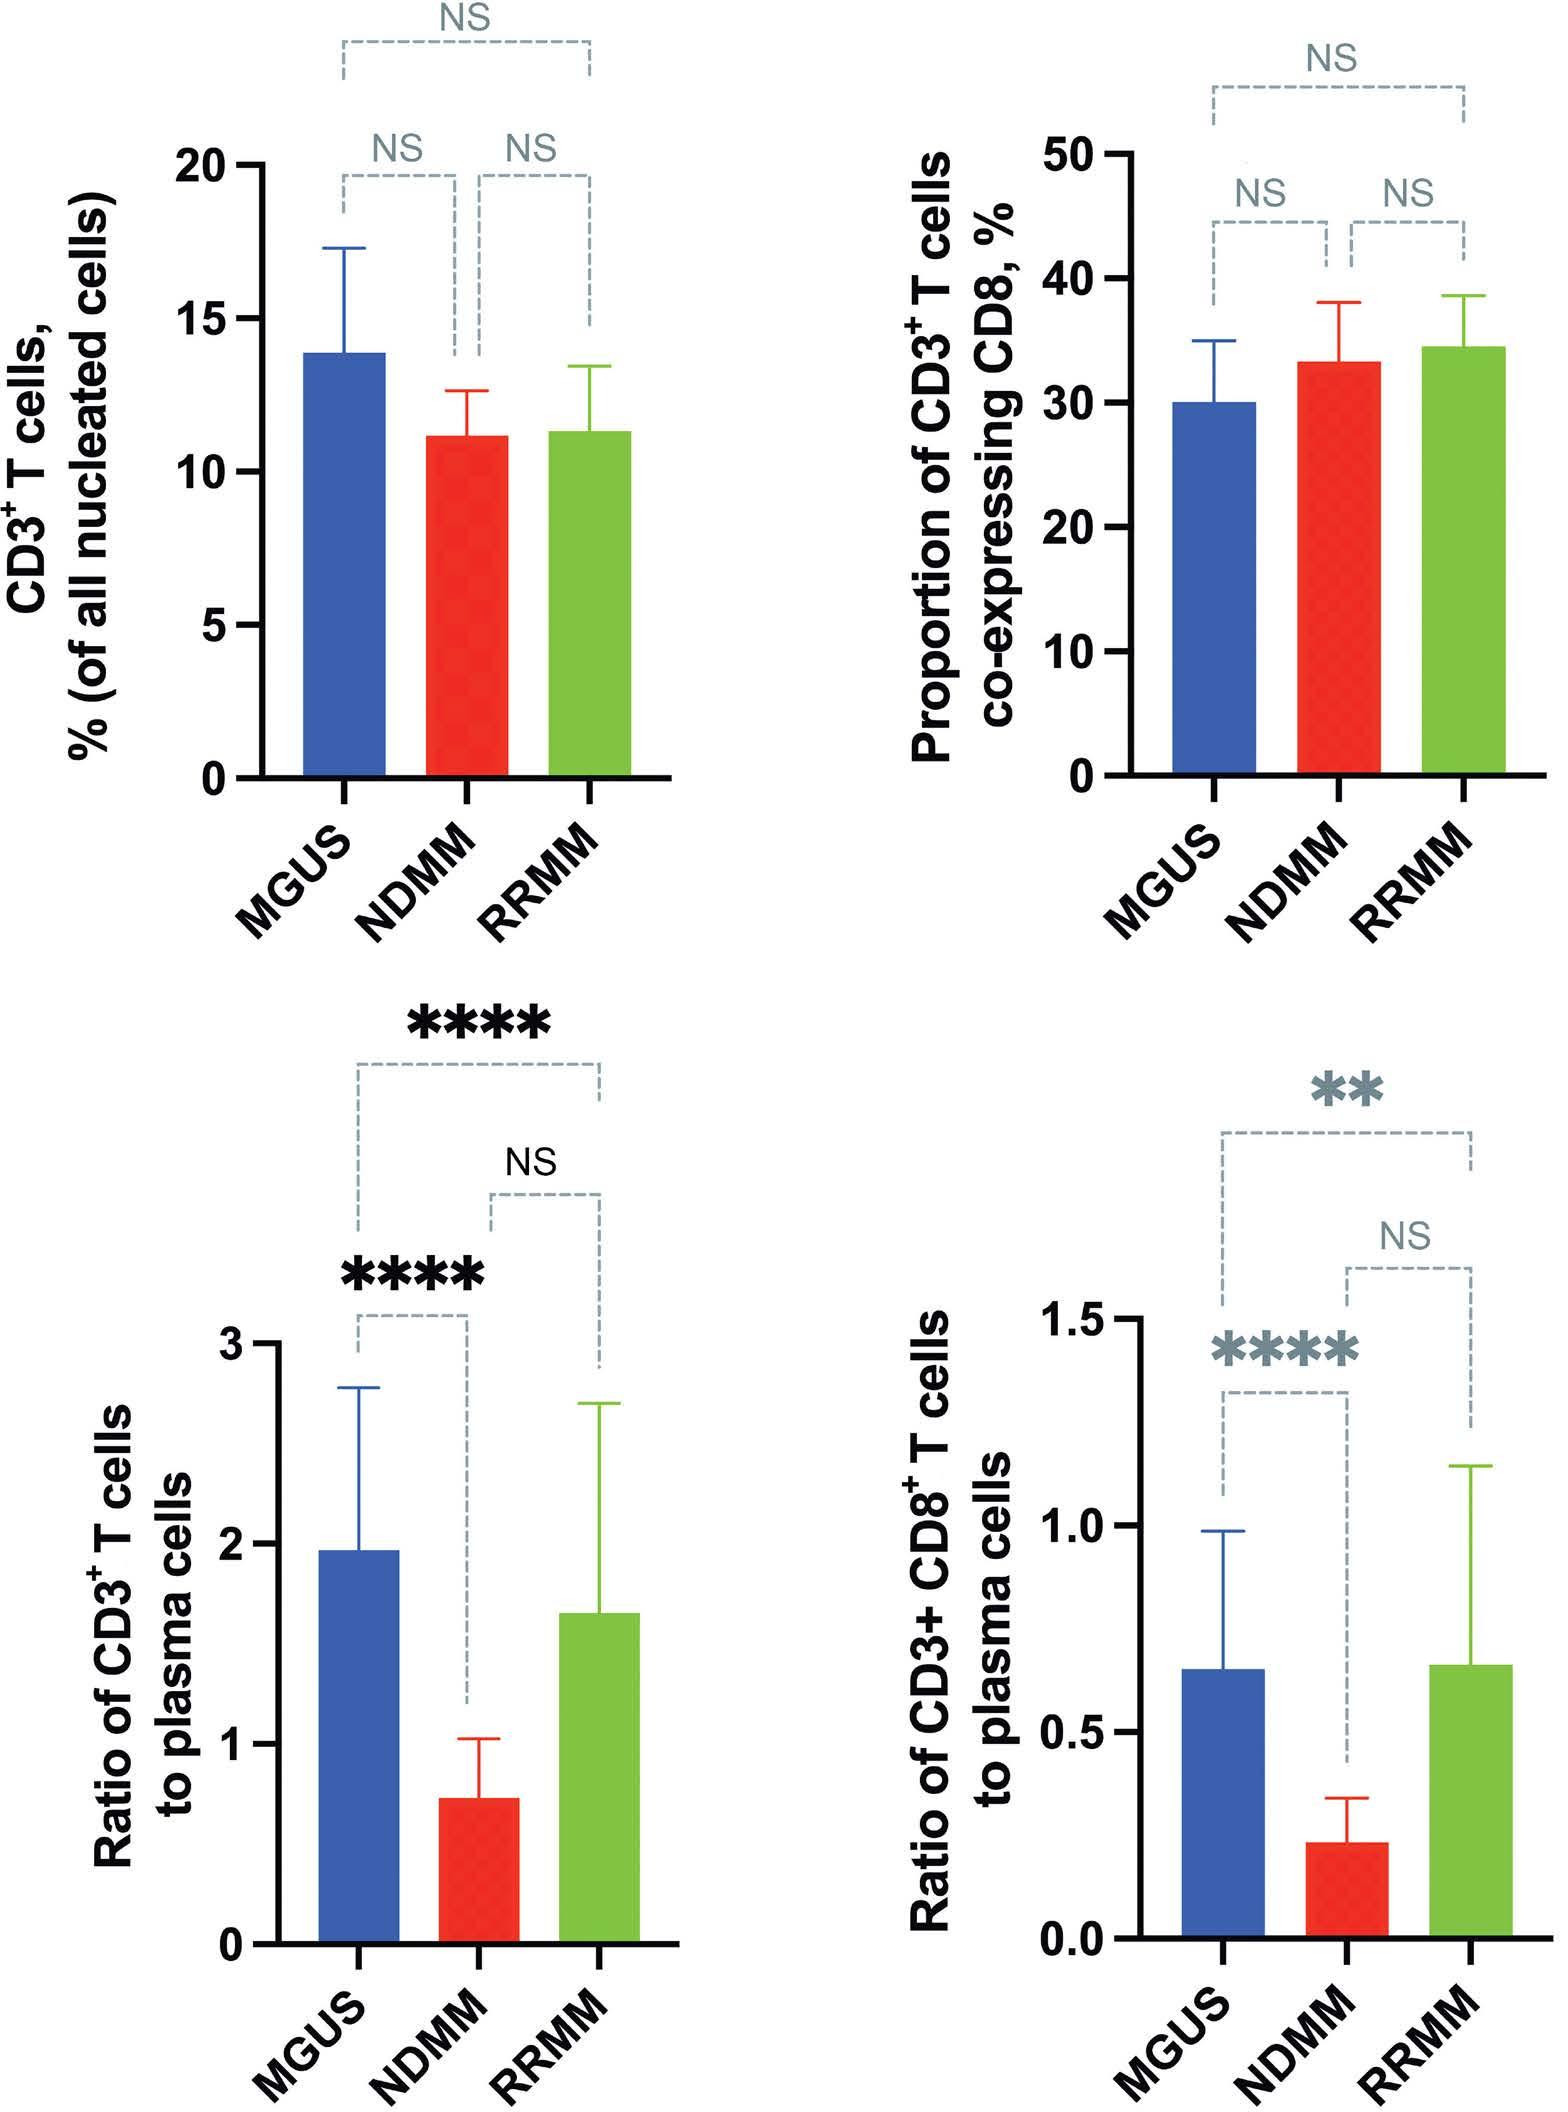
Figure 2. Increased CD3+ and CD3+CD8+ T cell to plasma cell ratio in patients with monoclonal gammopathy of undetermined significance. Multiplex immunohistochemistry demonstrates no difference in the proportion of CD3+ T cells or cytotoxic T cells between monoclonal gammopathy of undetermined significance (MGUS), and newly diagnosed (ND) and relapsed/refractory (RR) multiple myeloma (MM) patients (A and B), although the ratio of both CD3+ and cytotoxic T cells to plasma cells is highest in patients with MGUS (C and D). Values represent mean ±95% Confidence Interval. Pairwise comparisons: **P<0.01, ****P<0.0001, ns: not significant.
a PC. Prior autoSCT was not associated with a difference in iTME, while less heavily pre-treated patients (1 prior line of therapy; N=22) had a higher proportion of cytotoxic T cells expressing Lag-3 than patients with >3 prior lines of therapy (N=14; 0.41±0.43% vs. 0.13±0.14%; P=0.025).
Discussion
Using mIHC, we are the first to report on the precise spatial distribution and relationship between immune cells and malignant PC within the BM of patients with MGUS, and ND and RR MM. Assessing a large cohort of trephine biopsies, we confirm previous reports that mIHC is a feasible and accurate application of quantitative pathology that can be used to assess the BM TME.26
In general, malignant PC tend to aggregate in small clusters or larger sheets of PC, occasionally overwhelming the BM. In the context of spatial heterogeneity being a hallmark of myeloma, and to avoid selection bias, we assessed the entire trephine available for each case. Each slide was assessed blinded with no discernible difference in the total BM area or number of cells assessed across the three cohorts. Estimation of the PC burden by mIHC is comparable to that reported by CD138 IHC used in standard diagnostic pathology and, in line with previous reports, PC quantification is consistently greater by either immunostaining method than by aspirate differential count.27,28 Of interest, several patients in the MGUS cohort had an mIHC-derived PC% that would surpass the diagnostic criteria for myeloma, and while some patients diagnosed with MGUS may, indeed, have smouldering myeloma, when comparing the
Haematologica | 109 May 2024 1494 ARTICLE - Proximity of cytotoxic T cells and plasma cells in MM S. Ninkovic et al.
A C D B
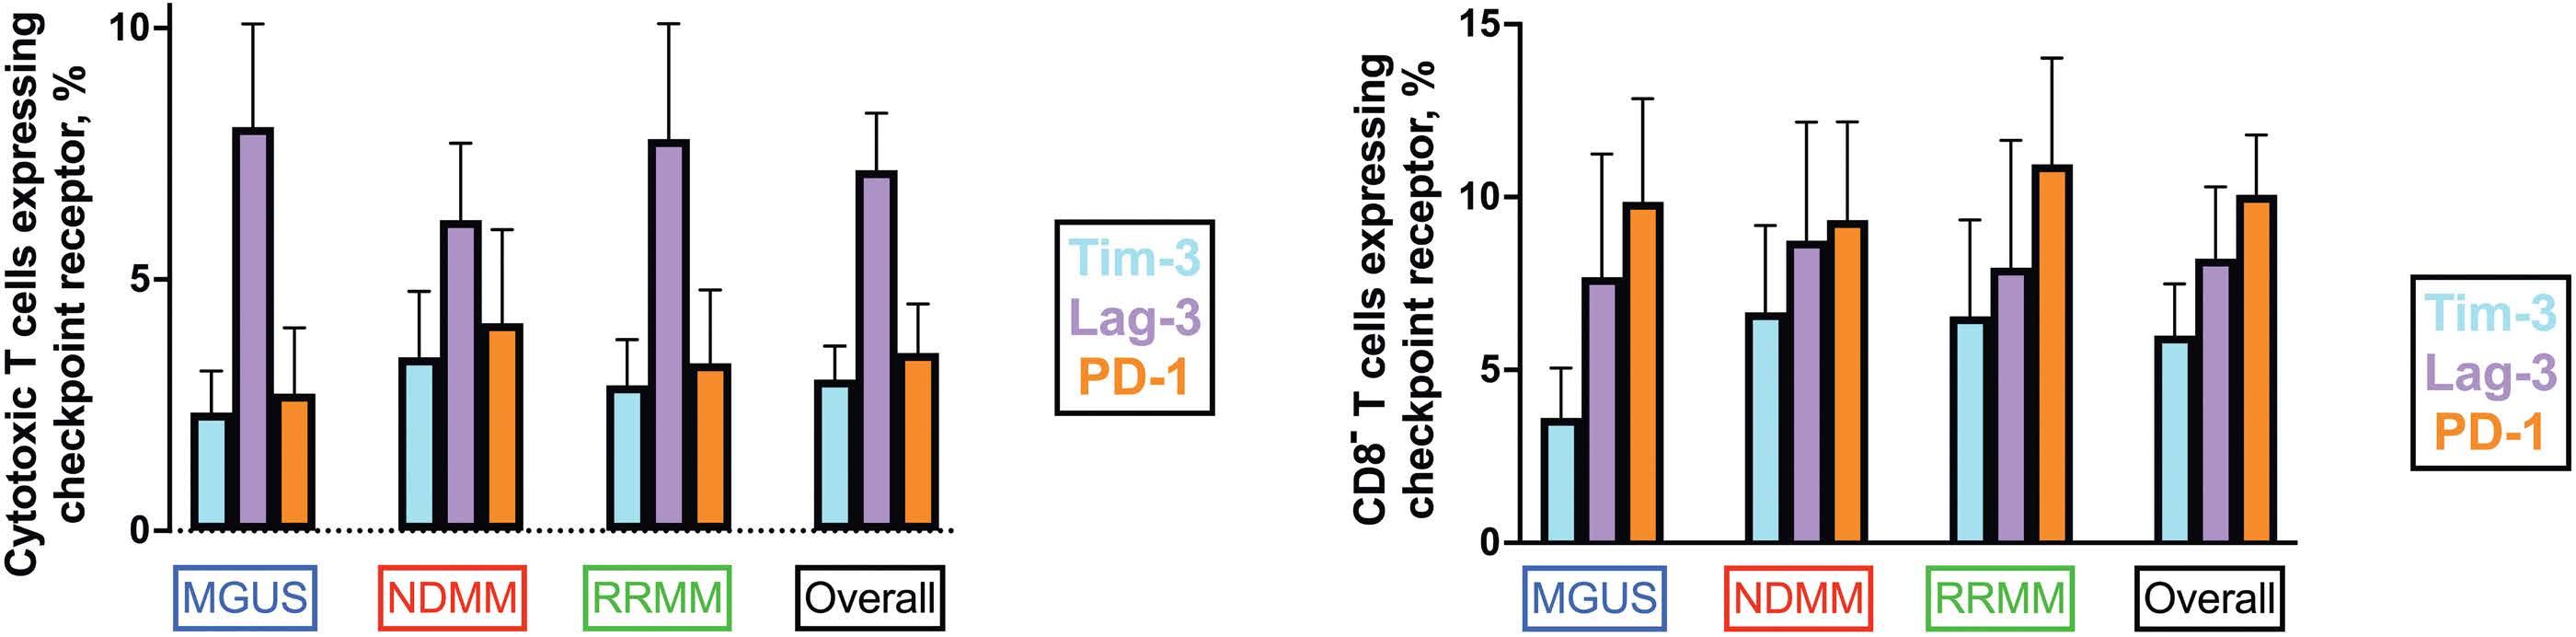
Figure 3. Checkpoint receptor expression on CD8+, cytotoxic T cells, and CD8- T cells in patients with monoclonal gammopathy of undetermined significance, and newly diagnosed and relapsed/refractory multiple myeloma. Shown are the percentages of (A) cytotoxic T cells and (B) CD8- T cells expressing the assessed checkpoint receptors Tim-3 (light blue), Lag-3 (blush pink), or PD-1 (orange) across the three cohorts of patients assessed. Values represent mean±95% Confidence Interval. MGUS: monoclonal gammopathy of undetermined significance; MM: multiple myeloma; ND: newly diagnosed; RR: relapsed/refractory.
PC% by trephine CD138 IHC and mIHC there was no difference between the two techniques (6.5±2.6% vs. 11.6±7.8%; P=0.313).29 For the purpose of this study, and in keeping with guidelines according to which MM diagnosis is based on the BMA, no patients diagnosed with MGUS were reclassified to MM. We do, however, present a subgroup analysis of the MGUS cohort based on PC% (<10% vs. ≥10%) by mIHC (Online Supplementary Table S3). MGUS patients who by mIHC had ≥10% PC in the BMT, had a significantly higher number of CD3+ T cells, a trend towards higher CD3+CD8+ T cells, and increased Lag3+CD3+CD8+ T cells and significantly higher PD1+CD3+CD8- T cells than MGUS patients with <10% PC by mIHC. The most intriguing finding was the higher number of T cells and Lag-3+ cytotoxic T cells, possibly indicative of an early immune response, and this should be further explored in future studies powered to address whether mIHC may predict the risk of progression to symptomatic myeloma.
With this multiplex panel, we set out to describe the dysregulated immune system by first assessing for quantitative changes in CD3+ and CD3+CD8+ cytotoxic T cells at various stages of the disease process and immune competency. The observed trend for a greater proportion of T cells expressing CD3 in the MGUS cohort may, in part, be representative of an anti-tumor response seen during the early stages of immune surveillance.30 While our study did not show any difference in the proportion of cytotoxic T cells across MGUS, and ND and RR MM patients, we show that, in all three cohorts, approximately a third of all T cells co-express CD3 and CD8. BM infiltration with CD3+ T cells and CD8+ cytotoxic T cells as a fraction of the PC burden within the BM is significantly higher in patients with MGUS compared to ND and relapsed myeloma. While this may be due to a higher PC burden in the latter cohorts (which is consistent with previous reports of T-cell expansion in patients with MGUS), this finding is indicative of a relatively more pronounced immune landscape in this patient population.31
To assess for cytotoxic T-cell exhaustion, we examined the expression of three checkpoint receptors: Tim-3, Lag-3, and PD-1. In addition to suppressing cytotoxic T-cell function, these checkpoints are present on, and modulate the function of, CD4+ helper T cells, regulatory T cells, and natural killer cells, among others.32-34 Comprehensive molecular and phenotypic profiling of peripheral blood T cells isolated from patients with myeloma following an autoSCT not only demonstrates persistent checkpoint expression, but recognizes Lag-3 and PD-1 as potential immune biomarkers for identifying patients at higher risk of relapse.9,35 Comparing the three cohorts of patients, we found no difference in the proportion of nucleated cells expressing Tim-3, Lag-3, or PD-1 on their cell surface, nor their prevalence on CD8+ or CD8- T cells. The similar expression pattern in both the ND and RR cohort indicates the potential of checkpoint receptor inhibition in both the treatment naïve and the relapsed setting. Lag-3 was more prominent on cytotoxic T cells, suggesting Lag-3 inhibition may be effective in MM and may have synergistic potential with PD-1, which is over-expressed on CD8- T cells. However, interestingly, Lag3 was consistently the most prevalent checkpoint receptor on cytotoxic T cells of patients with MGUS, and ND and RR myeloma while PD-1 is more pronounced on CD8- T cells. In addition, within the relapsed cohort of patients, those with fewer prior lines of therapy had a higher proportion of cytotoxic T cells expressing Lag-3 compared with the heavily pre-treated patients. Thus, our data suggest that early therapeutic modulation of Lag-3 may be associated with more pronounced augmentation and restoration of cytotoxic T-cell function than may be achieved with anti-Tim-3 or anti-PD-1 blockade alone or if delivered after several lines of therapy. Targeting of Lag-3 may also provide the added benefit of dampening the immunosuppressive effect of Lag-3 expressing regulatory T cells.32 A recent study examining the pre- and post-transplant, transcriptional profile of peripheral blood T cells demonstrated an increase in Lag-3, specifically in the CD4+ T-cell subset,
Haematologica | 109 May 2024 1495 ARTICLE - Proximity of cytotoxic T cells and plasma cells in MM S. Ninkovic et al.
A B
Table 4. Tim-3, Lag-3, and PD-1 expression by multiplex immunohistochemistry.
Checkpoint receptor expression, % of all nucleated cells
Proportion of cytotoxic T cells expressing checkpoint receptor of interest, %
Proportion of CD8- lymphocytes expressing checkpoint receptor of interest,
MGUS: monoclonal gammopathy of undetermined significance; N: number; NDMM: newly diagnosed multiple myeloma; RRMM: relapsed and/ or refractory multiple myeloma. Values represent % of bone marrow cells identified; mean ± Standard Deviation (SD). *Kurskal-Wallis one-way ANOVA for non-parametric data with corresponding Dunn’s multiple comparisons tests shown where: 1 = Tim-3, 2 = Lag-3, and 3 = PD-1 expression.
and adverse outcomes.9 Therapeutic targeting of Lag-3 has been shown to enhance T-cell proliferation and their anti-myeloma activity.14 Indeed, monoclonal antibodies against all three checkpoint receptors are at diverse stages of pre-clinical and clinical development, with some studies even assessing combination therapy aimed at overcoming the upregulation of non-targeted checkpoints as a means of a potential mechanism of resistance.34,36-38
While many have published and reviewed on the quantitative and qualitative changes observed within the T-cell repertoire of patients with PC dyscrasias, using mIHC, our study is unique in allowing us to comment on the spatial relationships between the tumor and the immune cells.5,6,22,39-41 At 5 mm intervals, we examined the distribution of cytotoxic T cells within a 100 mm radius of each PC. The difference in the absolute number of cytotoxic
Haematologica | 109 May 2024 1496 ARTICLE - Proximity of cytotoxic T cells and plasma cells in MM S. Ninkovic et al.
PD-1 P
Tim3 Lag3
MGUS, N=32 2.3±2.4 5.5±4.1 3.5±4.2 0.0024* 1 vs. 2 = 0.0053 1 vs. 3 > 0.9999 2 vs. 3 = 0.0121 NDMM, N=65 3.6±4.5 6.1±7.7 5.4±8.2 0.3432 RRMM, N=59 3.2±5.3 4.3±6.0 3.3±4.5 0.0687 Combined, N=156 3.2±4.5 5.4±6.5 4.2±6.3 0.0024* 1 vs. 2 = 0.0023 1 vs. 3 > 0.9999 2 vs. 3 = 0.0484
MGUS, N=32 2.4±2.3 8.0±5.7 2.7±3.6 <0.0001 1 vs. 2 = 0.0003 1 vs. 3 = 0.7270 2 vs. 3 < 0.0001 NDMM, N=65 3.5±5.3 6.2±6.2 4.1±7.5 0.0048 1 vs. 2 = 0.0130 1 vs. 3 > 0.9999 2 vs. 3 = 0.0149 RRMM, N=59 2.9±3.5 7.8±8.8 3.3±5.6 <0.0001 1 vs. 2 = 0.0025 1 vs. 3 >0.9999 2 vs. 3 = 0.0001 Combined, N=156 3.0±4.2 7.2±7.2 3.5±6.2 <0.0001 1 vs. 2 < 0.0001 1 vs. 3 > 0.9999 2 vs. 3 < 0.0001
MGUS, N=32 3.6±4.0 7.7±9.9 9.9±8.3 0.0059 1 vs. 2 > 0.9999 1 vs. 3= 0.0058 2 vs. 3 = 0.0720 NDMM, N=65 6.7±10.0 8.7±13.6 9.3±11.3 0.1740 RRMM, N=59 6.5±10.7 8.0±14.1 7.9±14.0 0.0292 1 vs. 2 > 0.9999 1 vs. 3= 0.0626 2 vs. 3 = 0.0656 Combined, N=156 6.0±9.4 8.2±13.1 10.1±10.9 <0.0001 1 vs. 2 > 0.9999 1 vs. 3= 0.0001 2 vs. 3 = 0.0027
%

Figure 4. Nearest neighbor and proximity analysis. (A) Whole slide scan overview of bone marrow trephine and HaloTM spatial analysis plot illustrating plasma cells (blue), cytotoxic T cells within 100 mm (red) and greater than 100 mm (green) away from a plasma cell. Cytotoxic T-cell heat map demonstrating (B) the absolute number and (C) the proportion of cytotoxic T cells at 5 mm intervals within a 100 mm radius of plasma cells in the three patient groups. MGUS: monoclonal gammopathy of undetermined significance; MM: multiple myeloma; ND: newly diagnosed; RR: relapsed/refractory.
T cells in proximity to PC was similar between the three cohorts, although the proportion of all cytotoxic T cells within the 25 mm, 50 mm, and 100 mm radius was higher in ND than in relapsed patients, while a still smaller fraction was in proximity to PC in patients with MGUS. While this
may be secondary to higher PC burden in myeloma, both NDMM and RRMM patients have a higher PC% than MGUS patients (11.6±7.8%) with no difference between NDMM and RRMM patients (35.3±25.1% vs. 30.1±26.2; P=0.2511). Nevertheless, the proportion of cytotoxic T cells within
Haematologica | 109 May 2024 1497 ARTICLE - Proximity of cytotoxic T cells and plasma cells in MM S. Ninkovic et al.
A B C
50 mm in the NDMM and RRMM cohorts differed (90.8±15.8 vs. 81.5±23.9; P=0.0385), suggesting that PC burden is not the main determinant of the plasma cell/cytotoxic T-cell spatial relationship.
We assessed the spatial relationship between plasma cells and cytotoxic T cells in a bi-directional manner. The average distance from each PC to a cytotoxic T cell is more dependent on the degree and pattern of PC infiltration, while the T cell to PC relationship is more dependent on active migration of cytotoxic T cells and a function of the immune system. The average distance from each PC to a cytotoxic T cell in ND patients was 76.6 mm, reflective of the propensity of PC to aggregate in clusters within the BM. In one ND patient, the average distance from each cytotoxic T cell to a PC was 23.5 mm, which is just greater than the average size of a PC (14-20 mm).42 The average distance between cytotoxic T cells and PC increased to 30.0 mm in relapsed patients, and was significantly greater in patients with MGUS (38.1 mm), suggesting more active migration of cytotoxic T cells towards PC. In addition, ND patients had the lowest percentage of unique PC (i.e., PC with only a single cytotoxic T cell within a 100 mm radius), and conversely, the highest number of unique cytotoxic T cells. Together these findings suggest that the proximity of cytotoxic T cells to PC in ND patients may be reflective of a more robust immune response during the early stages of the disease process as opposed to later stages of myeloma. Others have demonstrated that the response to checkpoint-directed immunotherapy in patients with metastatic melanoma may be predicted by the density and proximity of immune cells to melanoma cells.19 In our cohort of newly diagnosed patients, comparing those achieving complete response or, even better, with those failing to achieve at least a partial response, the percentage of all cytotoxic T cells with proximity to PC was significantly greater in patients failing to respond. The myeloma treatment landscape is rapidly evolving, with a steady input of immune-based therapies, and it remains imperative to enhance our understanding of the spatial relationship between cytotoxic T cells and PC at various stages of the disease process in order to better understand what may predict response to these new therapeutics. Our study identifies mIHC as a feasible method, and future studies should serially track the iTME composition and spatial relationships in a cohort of uniformly treated patients at baseline, after a pre-defined period of treatment, and at the time of disease progression.
The major drawback of mIHC is the inherent limitation to six markers within a single panel, which does not allow a more detailed exploration of the intricate relationships between the tumor and the microenvironment. Analysis of consecutive FFPE sections with additional panels would partially overcome this shortcoming; however, emerging reports on the use of high-throughput imaging mass cytometry assessing up to 40 markers while also preserving
spatial architecture are promising.43,44 While we examined a large cohort of patients, we ensured that all samples assessed were from the same institution, having undergone the exact same fixation and decalcification process. Nevertheless, there is considerable variation in the age of sections, which may introduce variability in staining performance and tissue integrity. The marked heterogeneity of treatment regimens in both the upfront and relapsed setting makes identification of biomarkers of response to therapy difficult, and interpretation of some of the pre-specified subgroup analyses were limited by the small sample size. Importantly, mIHC does not provide information concerning the functional status of the iTME and we did not assess whether the pattern of BM infiltration (diffuse vs. nodular) is a potential biomarker that may impact the ability of T cells to access PC.
In conclusion, our study is the first to report on the spatial relationship of cytotoxic CD8+ T cells and PC using mIHC on FFPE BM trephine sections from patients with PC dyscrasias. The demonstrated proximity of cytotoxic T cells to malignant PC during the early stages of MM should be further explored as a potential biomarker of response to T-cell engagers, with the hypothesis that closer proximity may translate to improved efficacy. We also show a higher proportion of cytotoxic T cells expressing Lag-3 in patients with early, as opposed to late, relapsed myeloma. This supports the need for further investigation of Lag-3 inhibition in myeloma, possibly in combination with PD-1 inhibition, given its overexpression on CD8- T cells. Future studies should examine additional markers (including other checkpoint receptors) and the impact on other immune T-cell subsets and on serial sections. Ideally, such studies should track changes in the microenvironment in individual patients after treatment, with the aim of identifying robust biomarkers of response and resistance, and to facilitate sequencing of therapies in an ever-growing therapeutic landscape.
Disclosures
SJH reports consulting or advisory roles for Celgene, Hoffman-La Roche AG, Genetech USA, HaemaLogiX, Janssen Global Services, Novartis, and research support from HaemaLogiX and Janssen Global Services. HQ reports consulting or advisory roles for Amgen, Antegene, Bristol-Myers Squibb/ Celgene, Celgene, GSK, Janssen-Cilag, Karyopharm Therapeutics, Pfizer, Roche, and Sanofi, and research support from Amgen, Bristol-Myers Squibb/Celgene, Celgene, GSK, Karyopharm Therapeutics, and Sanofi. SN and LEP have no conflicts of interest to disclose.
Contributions
All authors designed the study. SN applied for research governance approval, identified eligible patients, collated retrospective clinical data, reviewed, and analyzed multiplex images, correlated image and clinical data, performed
Haematologica | 109 May 2024 1498 ARTICLE - Proximity of cytotoxic T cells and plasma cells in MM S. Ninkovic et al.
statistical analyses, prepared figures and tables, and wrote the initial draft manuscript. LEP, SJH and HQ supervised the study and critically reviewed the manuscript. All authors reviewed and approved the final version for publication.
Acknowledgments
The authors would like to acknowledge the expertise and assistance of Dr. Rejhan Idrizi from the Centre for Advanced Histology & Microscopy (CAHM), Peter MacCallum Cancer Centre, Victoria, Australia.
References
1. Cohen AD. Myeloma: next generation immunotherapy. Hematology. 2019;2019(1):266-272.
2. Ninkovic S, Quach H. Shaping the treatment paradigm based on the current understanding of the pathobiology of multiple myeloma: an overview. Cancers. Cancers (Basel). 2020;12(11):3488.
3. Soekojo CY, Ooi M, De Mel S, Chng WJ. Immunotherapy in multiple myeloma. Cells. 2020;9(3):601.
4 Dosani T, Carlsten M, Maric I, Landgren O. The cellular immune system in myelomagenesis: NK cells and T cells in the development of myeloma and their uses in immunotherapies. Blood Cancer J. 2015;5(7):e306.
5. Raitakari M, Brown RD, Sze D, et al. T-cell expansions in patients with multiple myeloma have a phenotype of cytotoxic T cells. Br J Haematol. 2000;110(1):203-209.
6. Pessoa De Magalhaes RJ, Vidriales M-B, Paiva B, et al. Analysis of the immune system of multiple myeloma patients achieving long-term disease control by multidimensional flow cytometry. Haematologica. 2013;98(1):79-86.
7 Zelle-Rieser C, Thangavadivel S, Biedermann R, et al. T cells in multiple myeloma display features of exhaustion and senescence at the tumor site. J Hematol Oncol. 2016;9(1):e321.
8. Tan J, Chen S, Huang J, et al. Increased exhausted CD8(+) T cells with programmed death-1, T-cell immunoglobulin and mucin-domain-containing-3 phenotype in patients with multiple myeloma. Asia Pac J Clin Oncol. 2018;14(5):e266-e274.
9 Lucas F, Pennell M, Huang Y, et al. T cell transcriptional profiling and immunophenotyping uncover LAG3 as a potential significant target of immune modulation in multiple myeloma. Biol Blood Marrow Transplant. 2020;26(1):7-15.
10 Kwon M, Kim CG, Lee H, et al. PD-1 Blockade reinvigorates bone marrow CD8(+) T cells from patients with multiple myeloma in the presence of TGFβ inhibitors. Clin Cancer Res. 2020;26(7):1644-1655.
11. Guillerey C, Harjunpää H, Carrié N, et al. TIGIT immune checkpoint blockade restores CD8(+) T-cell immunity against multiple myeloma. Blood. 2018;132(16):1689-1694.
12. Batorov EV, Aristova TA, Sergeevicheva VV, et al. Quantitative and functional characteristics of circulating and bone marrow PD-1- and TIM-3-positive T cells in treated multiple myeloma patients. Sci Rep. 2020;10(1):20846.
13. Kreiniz N, Eiza N, Tadmor T, et al. The involvement of LAG3+ plasma cells in the development of multiple myeloma. Blood. 2022;140(Suppl 1):7112-7113.
14 Bae J, Accardi F, Hideshima T, et al. Targeting LAG3/GAL-3 to overcome immunosuppression and enhance anti-tumor
Funding
This work was supported by the Australian Government Research Training and Program Scholarship (to SN) and a Victorian Cancer Agency Grant (to HQ).
Data-sharing statement
Original data and protocol(s) may be obtained upon written request.
immune responses in multiple myeloma. Leukemia. 2022;36(1):138-154.
15. Minnie SA, Kuns RD, Gartlan KH, et al. Myeloma escape after stem cell transplantation is a consequence of T-cell exhaustion and is prevented by TIGIT blockade. Blood. 2018;132(16):1675-1688.
16. Mateos MV, Orlowski RZ, Ocio EM, et al. Pembrolizumab combined with lenalidomide and low-dose dexamethasone for relapsed or refractory multiple myeloma: phase I KEYNOTE-023 study. Br J Haematol. 2019;186(5):e117-e121.
17 Badros A, Hyjek E, Ma N, et al. Pembrolizumab, pomalidomide, and low-dose dexamethasone for relapsed/refractory multiple myeloma. Blood. 2017;130(10):1189-1197.
18. Mateos M-V, Blacklock H, Schjesvold F, et al. Pembrolizumab plus pomalidomide and dexamethasone for patients with relapsed or refractory multiple myeloma (KEYNOTE-183): a randomised, open-label, phase 3 trial. Lancet Haematol. 2019;6(9):e459-e469.
19. Gide TN, Silva IP, Quek C, et al. Close proximity of immune and tumor cells underlies response to anti-PD-1 based therapies in metastatic melanoma patients. OncoImmunology. 2020;9(1):1659093.
20 Li F, Li C, Cai X, et al. The association between CD8+ tumorinfiltrating lymphocytes and the clinical outcome of cancer immunotherapy: a systematic review and meta-analysis. EClinicalMedicine. 2021;41:101134.
21. Fu T, Dai L-J, Wu S-Y, et al. Spatial architecture of the immune microenvironment orchestrates tumor immunity and therapeutic response. J Hematol Oncol. 2021;14(1):98.
22. Zavidij O, Haradhvala NJ, Mouhieddine TH, et al. Single-cell RNA sequencing reveals compromised immune microenvironment in precursor stages of multiple myeloma. Nat Cancer. 2020;1(5):493-506.
23. Wang J, Hu Y, Hamidi H, et al. Immune microenvironment characteristics in multiple myeloma progression from transcriptome profiling. Front Oncol. 2022;12:948548.
24. Dhodapkar KM, Cohen AD, Kaushal A, et al. Changes in bone marrow tumor and immune cells correlate with durability of remissions following BCMA CAR T therapy in myeloma. Blood Cancer Discov. 2022;3(6):490-501.
25. Bird J, Behrens J, Westin J, et al. UK Myeloma Forum (UKMF) and Nordic Myeloma Study Group (NMSG): guidelines for the investigation of newly detected M-proteins and the management of monoclonal gammopathy of undetermined significance (MGUS). Br J Haematol. 2009;147(1):22-42.
26. Walters DK, Jelinek DF. Multiplex immunofluorescence of bone
Haematologica | 109 May 2024 1499 ARTICLE - Proximity of cytotoxic T cells and plasma cells in MM S. Ninkovic et al.
marrow core biopsies: visualizing the bone marrow immune contexture. J Histochem Cytochem. 2020;68(2):99-112.
27. Ng AP, Wei A, Bhurani D, Chapple P, Feleppa F, Juneja S. The sensitivity of CD138 immunostaining of bone marrow trephine specimens for quantifying marrow involvement in MGUS and myeloma, including samples with a low percentage of plasma cells. Haematologica. 2006;91(7):972-975.
28. Joshi R, Horncastle D, Elderfield K, Lampert I, Rahemtulla A, Naresh KN. Bone marrow trephine combined with immunohistochemistry is superior to bone marrow aspirate in follow-up of myeloma patients. J Clin Pathol. 2008;61(2):213-216.
29 Rajkumar SV, Dimopoulos MA, Palumbo A, et al. International Myeloma Working Group updated criteria for the diagnosis of multiple myeloma. Lancet Oncol. 2014;15(12):e538-e548.
30 Mittal D, Gubin MM, Schreiber RD, Smyth MJ. New insights into cancer immunoediting and its three component phaseselimination, equilibrium and escape. Curr Opin Immunol. 2014;27:16-25.
31. Pérez-Andres M, Almeida J, Martin-Ayuso M, et al. Characterization of bone marrow T cells in monoclonal gammopathy of undetermined significance, multiple myeloma, and plasma cell leukemia demonstrates increased infiltration by cytotoxic/Th1 T cells demonstrating a squed TCR-Vβ repertoire. Cancer. 2006;106(6):1296-1305.
32. Camisaschi C, Casati C, Rini F, et al. LAG-3 expression defines a subset of CD4(+)CD25(high)Foxp3(+) regulatory T cells that are expanded at tumor sites. J Immunol. 2010;184(11):6545-6551.
33. Ruffo E, Wu RC, Bruno TC, Workman CJ, Vignali DAA. Lymphocyte-activation gene 3 (LAG3): the next immune checkpoint receptor. Semin Immunol. 2019;42:101305.
34 Wolf Y, Anderson AC, Kuchroo VK. TIM3 comes of age as an inhibitory receptor. Nat Rev Immunol. 2020;20(3):173-185.
35. Chung DJ, Pronschinske KB, Shyer JA, et al. T-cell exhaustion in multiple myeloma relapse after autotransplant: optimal timing of immunotherapy. Cancer Immunol Res. 2016;4(1):61-71.
36. Andrews LP, Marciscano AE, Drake CG, Vignali DAA. LAG3 (CD223) as a cancer immunotherapy target. Immunol Rev. 2017;276(1):80-96.
37. Salik B, Smyth MJ, Nakamura K. Targeting immune checkpoints in hematological malignancies. J Hematol Oncol. 2020;13(1):111.
38. Tawbi HA, Schadendorf D, Lipson EJ, et al. Relatlimab and nivolumab versus nivolumab in untreated advanced melanoma. N Engl J Med. 2022;386(1):24-34.
39. Bryant C, Suen H, Brown R, et al. Long-term survival in multiple myeloma is associated with a distinct immunological profile, which includes proliferative cytotoxic T-cell clones and a favourable Treg/Th17 balance. Blood Cancer J. 2013;3(9):e148.
40 Favaloro J, Brown R, Aklilu E, et al. Myeloma skews regulatory T and pro-inflammatory T helper 17 cell balance in favor of a suppressive state. Leuk Lymphoma. 2014;55(5):1090-1098.
41. Dhodapkar MV, Krasovsky J, Osman K, Geller MD. Vigorous premalignancy-specific effector T cell response in the bone marrow of patients with monoclonal gammopathy. J Exp Med. 2003;198(11):1753-1757.
42. Allen HC, Sharma P. Histology, Plasma Cells. In: StatPearls. [Internet]: Treasure Island (FL); StatPearls Publishing. https:// www.ncbi.nlm.nih.gov/books/NBK556082/ Accessed January 24, 2022.
43. Ijsselsteijn ME, van der Breggen R, Farina Sarasqueta A, Koning F, de Miranda NFCC. A 40-marker panel for high dimensional characterization of cancer immune microenvironments by imaging mass cytometry. Front Immunol. 2019;10:2534.
44. Le Rochais M, Hemon P, Pers JO, Uguen A. Application of highthroughput imaging mass cytometry hyperion in cancer research. Front Immunol. 2022;13:859414.
Haematologica | 109 May 2024 1500 ARTICLE - Proximity of cytotoxic T cells and plasma cells in MM S. Ninkovic et al.
Pharmacologic targeting of the p62 ZZ domain enhances both anti-tumor and bone-anabolic effects of bortezomib in
multiple myeloma
Silvia Marino,1 Daniela N. Petrusca,1 Ryan T. Bishop,2 Judith L. Anderson,1 Hayley M. Sabol,3 Cody Ashby,4 Justin H. Layer,1 Annamaria Cesarano,1 Utpal P. Davé,1 Fabiana Perna,1 Jesus Delgado-Calle,3,5 John M. Chirgwin1,6 and G. David Roodman1,6
1Department of Medicine, Division of Hematology/Oncology, Indiana University School of Medicine, Indianapolis, IN; 2Department of Tumor Biology, H. Lee Moffitt Cancer Research Center and Institute, Tampa, FL; 3Department of Physiology and Cell Biology, University of Arkansas for Medical Sciences, Little Rock, AR; 4Department of Biomedical Informatics, University of Arkansas for Medical Sciences, Little Rock, AR; 5Winthrop P. Rockefeller Cancer Institute, University of Arkansas for Medical Sciences, Little Rock, AR and 6Research Service, Roudebush Veterans Administration Medical Center, Indianapolis, IN, USA
Abstract
Correspondence: S. Marino
SMarino@uams.edu
Received: July 10, 2023.
Accepted: November 7, 2023.
Early view: November 16, 2023.
https://doi.org/10.3324/haematol.2023.283787
Multiple myeloma (MM) is a malignancy of plasma cells whose antibody secretion creates proteotoxic stress relieved by the N-end rule pathway, a proteolytic system that degrades N-arginylated proteins in the proteasome. When the proteasome is inhibited, protein cargo is alternatively targeted for autophagic degradation by binding to the ZZ-domain of p62/ sequestosome-1. Here, we demonstrate that XRK3F2, a selective ligand for the ZZ-domain, dramatically improved two major responses to the proteasome inhibitor bortezomib (Btz) by increasing: i) killing of human MM cells by stimulating both Btz-mediated apoptosis and necroptosis, a process regulated by p62; and ii) preservation of bone mass by stimulating osteoblast differentiation and inhibiting osteoclastic bone destruction. Co-administration of Btz and XRK3F2 inhibited both branches of the bimodal N-end rule pathway exhibited synergistic anti-MM effects on MM cell lines and CD138+ cells from MM patients, and prevented stromal-mediated MM cell survival. In mice with established human MM, co-administration of Btz and XRK3F2 decreased tumor burden and prevented the progression of MM-induced osteolytic disease by inducing new bone formation more effectively than either single agent alone. The results suggest that p62-ZZ ligands enhance the anti-MM efficacy of proteasome inhibitors and can reduce MM morbidity and mortality by improving bone health.
Introduction
Multiple myeloma (MM) is the second most common hematological malignancy. It affects the elderly and causes skeletal destruction, leading to bone pain and disability.1,2 First-line therapies rely on several classes of drugs, including proteasome inhibitors (PI) such as bortezomib (Btz), which are the mainstay of MM therapy. However, the development of PI resistance remains a major clinical problem that requires switching to different treatment regimens.3 Bone complications occur in 80% of MM patients, leading to severe morbidity and increased mortality. Current treatments for MM bone disease are limited to anti-resorptives, which neither inhibit tumor growth nor increase new bone.1 PI stimulate new bone formation,4-7 but the effect is transient, allowing the persistence of bone lesions, which often do not heal even during remission.8 Thus, ways to increase the anti-MM
efficacy of PI are needed to improve therapeutic responses, disease-free survival, and bone health in MM patients.9 MM cells secrete abundant monoclonal immunoglobulins, a process requiring assembly of light and heavy chains (HC) during biosynthesis in the endoplasmic reticulum (ER), where HC bind to heat shock protein (HSPA5, also known as GRP78 and BiP) until combined with light chains.10 HSPA5 cycles out of the ER with proteotoxic cargo (such as excess HC) and is N-terminally, N-Arginine modified.11 The N-end rule pathway12 then determines binding to the UBR1 ubiquitin ligase, which targets the cargo to the proteasome for degradation.13,14 Inhibition of the proteasome induces the alternative second N-end rule pathway by increasing the expression of p62 (SQTSM/sequestosome-1), a multidomain protein scaffold that regulates autophagy, NFκB signaling, necroptosis, and other pathways.15,16 We previously identified the ZZ-domain of p62 as an important regulator of both
Haematologica | 109 May 2024 1501 - Plasma Cell Disorders ARTICLE
©2024 Ferrata Storti Foundation
Published under a CC BY-NC license
autophagy and signaling pathways in MM and bone cells.17-19 Ligand binding to the ZZ-domain triggers a conformational switch leading to oligomerization and formation of a liquid phase-separated state that leads to autophagy, RIPK1 binding to the ZZ-domain, which regulates necroptotic cell death,20 and conformational changes of the ZZ and TBS domains, which affect TRAF6 and NFκB signaling, important regulators of cell survival and bone cell activity.21-23 We developed a small molecule ligand of the ZZ-domain, XRK3F2, that decreased osteoclast formation and activity17 and reversed MM-epigenetic suppression of osteoblast differentiation.18 XRK3F2 as a single agent induced local new bone formation in MM-bearing mice but did not reduce tumor burden.17 In this manuscript, we reasoned that XRK3F2 blocks only one of the two branches of the bimodal N-end rule degradation pathway and should be much more effective as an anti-MM agent when combined with a proteasome inhibitor. We report that XRK3F2 amplifies the response to Btz in MM cells by preventing Btz-induced p62 accumulation and triggering simultaneous induction of multiple death pathways. Further, mice with established MM treated with XRK3F2-Btz combination exhibit decreased tumor growth and reduced bone destruction at doses where single agents were ineffective. Collectively, our data show that XRK3F2 boosts both the anti-tumor and bone-anabolic effects of PI and provides a strong rationale for developing a new therapeutic regimen based on co-administration of XRK3F2 and Btz to treat MM.
Methods
Antibodies
and compounds
All antibodies and compounds are described in the Online Supplementary Appendix.
Human primary CD138+ and bone marrow stromal cell purification and multiple myeloma cell lines
Patient studies were approved by the Indiana University School of Medicine IRB and CD138+ MM cells were isolated as previously described.24 Human MM cell lines were purchased from ATCC (Manassas, VA, USA) (MM.1S; NCI-H929; RPMI8226) or generously provided by Dr L. Stancato (U266), Dr K. Anderson (KMS-11), and Dr N. Giuliani (JJN3) and cultured in RPMI with 10% fetal calf serum/1% penicillin/ streptavidin. Cell line authentication was routinely examined for proper morphology, population doubling, and paraprotein production. HS-5 human stromal cell lines were obtained from ATCC and were cultured in DMEM with 10% fetal calf serum/1% penicillin/streptavidin. All cells were cultured under 37⁰C and 5% CO2 conditions.
Cell viability and apoptosis/necroptosis assays
MM cells were incubated with suboptimal concentrations of XRK3F2 and Btz (below their 24 hour [h] half-maximal inhibitory concentration [IC50]; Online Supplementary Table
S1) alone or in combination for 24 h ± inhibitors of necroptosis, apoptosis, or autophagy. Cell viability was quantified by alamarBlue® Cell Viability assays from ThermosFisher Scientific (Waltham, MA, USA), according to the manufacturer’s protocol. The combined effects of XRK3F2 and Btz on MM cells were evaluated for synergism versus additivity by combination index (CI) analysis.25 A CI less than 1.0 indicates synergism and a CI of 1 indicates additive activity. Lactate dehydrogenase (LDH Cytotoxicity Assay Kit, Thermo Scientific Pierce, 88953) and human high mobility group B (HMGB1, NBP2-62766, Novusbio, Centennial, CO) protein were assayed as markers of necroptosis in cell supernatant and serum, respectively.26
Mouse model of human multiple myeloma
Immune-deficient 6-8-week-old Fox Chase SCID (C.B.-17 SCID/SCID) mice Charles River Laboratories (Wilmington, NC) were injected intratibially with 1x10⁵ human JJN3 myeloma cells in 20 mL of phosphate-buffered saline. Mice were handled in accordance with the Guide for the Care and Use of Laboratory Animals, under a protocol approved by the Indiana University School of Medicine IACUC. After 3 weeks mice were treated with either XRK3F2 (27 mg/kg, 5 times per week [5xweek]), Btz (0.25 mg/kg/2xweek), XRK3F2Btz (27 mg/kg/5xweek plus 0.25 mg/kg/2xweek), or vehicle intraperitoneally (IP) for 2 additional weeks when the mice were euthanized. The sample size was calculated based on a previous study.17 Details are provided in the Online Supplementary Appendix
Bioinformatic analyses of publicly available datasets
Gene expression data for RIPK3, RIPK1, SQSTM1 (p62), and MLKL were obtained from the MMRF Researcher Gateway using version IA18 and analyzed as described in the Online Supplementary Appendix
Statistical analysis
One- or two-way analysis of variance was performed to determine differences between experimental groups. Post hoc comparisons were accomplished via Tukey’s and Bonferroni’s tests, with statistical significance set a priori at P≤0.05. All statistics were performed using GraphPad Prism 9.3.1, and data are presented as means ± standard deviation. Isobologram analysis was performed using the CalcuSyn software program (Biosoft).
Results
XRK3F2 increases the anti-multiple myeloma efficacy of Btz in vitro and in vivo
In order to examine whether targeting p62 potentiates the anti-MM effects of PI, we tested the effects of the small molecule ligand of the p62 ZZ-domain, XRK3F2, on MM cell viability as a single agent and in combination with Btz.
Haematologica | 109 May 2024 1502 ARTICLE - Targeting p62 increases PI efficacy in myeloma S. Marino et al.
Both agents were used at concentrations lower than their IC50 (Online Supplementary Table S1). Human MM cells with WT p53 (MM.1S and NCI-H929; Figure 1A; Online Supplementary Figure 1A) were more sensitive to Btz than those with mutant p53 (JJN3, RPMI-8226, U266; Figure 1B; Online Supplementary Figure S1B, C) or lacking p53 (KMS-11; Figure 1C). Combined treatment significantly reduced MM cell viability compared to either drug alone, independent of p53 status. In order to determine the cause of the decreased MM cell viability, we examined apoptosis in MM1.S cells after 6-hour treatment. Btz alone or combined with XRK3F2 caused significant apoptosis compared to control (Online Supplementary Figure S1D). The combination increased the percentage of Annexin V/propidium iodide double-positive cells compared to Btz alone, suggesting increased necrotic cell death. Chou-Talalay analysis showed that XRK3F2-Btz combination had synergistic anti-MM activity against all MM cell lines, with CI values <1. Similar results were obtained in CD138+ cells from four relapsed MM patients (Figure 1D). Because the tumor microenvironment (TME) dictates MM cell responses to therapy, we next tested if XRK3F2 overcomes the prosurvival effects of stromal cells on MM cells treated with Btz. Co-culture with stromal cells protected JJN3 MM cells from Btz-induced apoptosis (Figure 1E). In contrast, co-administration of XRK3F2 hampered this protection and resulted in apoptotic levels similar to those in MM cells treated with Btz and cultured alone.
Further, we tested the in vivo anti-MM efficacy of single-agent versus co-administration of XRK3F2 and Btz in an established xenograft mouse model of human MM (Figure 1F).27
Three weeks after, JJN3-injected mice, exhibited detectable serum levels of the tumor biomarker human κ light chain, compared to saline-injected mice, indicative of active tumor growth. After 2 weeks, mice bearing MM treated with vehicle exhibited an 8-fold increase in tumor growth. Similar tumor progression was observed in mice receiving single agents. In contrast, the combination therapy reduced tumor burden by 50% compared to vehicle-treated mice and 24% compared to Btz only (Figure 1F; Online Supplementary Figure S2A). Dying tumor cells release high-mobility group box 1 protein (HMGB1). Treatment with low doses of XRK3F2 alone or combined with Btz, but not Btz alone, significantly increased serum human HMGB1 (8-fold and 13-fold increase, respectively; Online Supplementary Figure S2B). None of the groups lost weight indicating limited toxicity of single agent and combination treatments (Online Supplementary Figure S2C). Together, these in vitro and in vivo results support that XRK3F2-Btz combination decreases tumor growth by activating multiple MM cell death pathways.
XRK3F2 blocks the activation of NFκB and autophagicsurvival mechanisms in multiple myeloma cells Among the multi-domain functions of p62, regulation of NFκB signaling plays a pivotal role in promoting tumor growth and tumor-tumor microenvironment (TME) crosstalk to establish
a favorable microenvironment for tumor progression.28 Additionally, NFκB is the main coordinator of TNF-α signaling, a well-established prosurvival and proliferation factor for MM cells and osteoclasts found in the MM bone marrow microenvironment.29-31 In MM, Btz increase p62 levels and activate NFκB by downregulating p65-inhibitor IκBα. 32
XRK3F2 treatment prevented NFκB activation triggered by Btz, as shown by a time-dependent reduction in IκBα (Online Supplementary Figure S3A). Moreover, XRK3F2 inhibited TNFα-induced IκBα and NFκBp65 phosphorylation (Online Supplementary Figure S3B) and prevented nuclear translocation of NFκBp65 (Online Supplementary Figure S3C) after 5 and 30 minutes respectively, thereby counteracting the prosurvival effects of NFκB activation caused by Btz. These results suggest that XRK3F2 may prevent the NF-κB-dependent protumorigenic effect of Btz, an effect needed especially in relapsed, Btz-resistant MM patients.
Btz increases p62 levels by inducing de novo p62 expression and preventing its degradation. In agreement with the previous studies,33 we found that Btz increased levels of p62 mRNA 8-fold and protein (Figure 2D; Online Supplementary Figure S2D) independent of autophagy since changes in LC3I-LC3II conversion were not found in Btz-treated cells. Btz-induced p62 mRNA expression was reduced by XRK3F2. Ligands binding to p62-ZZ stimulate p62 oligomerization and autophagy.34 XRK3F2 alone or in combination with Btz increased LC3I-LC3II conversion in MM.1S, indicating induction of autophagy (Figure 2D, left panel). Pretreatment of MM cells with bafilomycin A1 (Baf), which disrupts autophagic flux, further increased LC3II/LC3I ratio and p62 protein levels compared to XRK3F2 alone or XRK3F2-Btz combination (Figure 2D, right panel). Furthermore, autophagy blockade by Baf treatment further amplified the negative effects of XRK3F2 and Btz on MM cell viability (Figure 2A; Online Supplementary Figure S4A), indicating that the autophagy-induced by targeting p62-ZZ domain in MM cells was not the pathway responsible for MM cell death.
XRK3F2 and Btz combination treatment activates multiple cell death pathways in multiple myeloma cells We previously reported that high doses of XRK3F2 triggered caspase 3 cleavage in MM.1S cells.17 Here, we found that in MM.1S cells, co-administration of 5mM XRK3F2 and 3 nM Btz strongly activated caspase-8 and caspase-3 (Figure 2E, left panel). In contrast, we only detected partial activation of caspases by Btz alone and no activation by XRK3F2 at the concentration used. To test if the increased cell death seen with the combination therapy was due to apoptosis, we used the pan-caspase inhibitor Q-VD-OPh (QVD) and the caspase-3 inhibitor Z-DEVD-FMK (Z-DEV). QVD and Z-DEV completely blocked Btz-induced cleavage of caspase-8 and 3 (Figure 2E, F, right panels). In addition, QVD or Z-DEV fully prevented the decrease in cell viability induced by Btz (Figure 2B, C; Online Supplementary Figure S4B, C) but enhanced the anti-MM effects of XRK3F2. QVD and Z-DEV only par-
Haematologica | 109 May 2024 1503 ARTICLE - Targeting p62 increases PI efficacy in myeloma S. Marino et al.
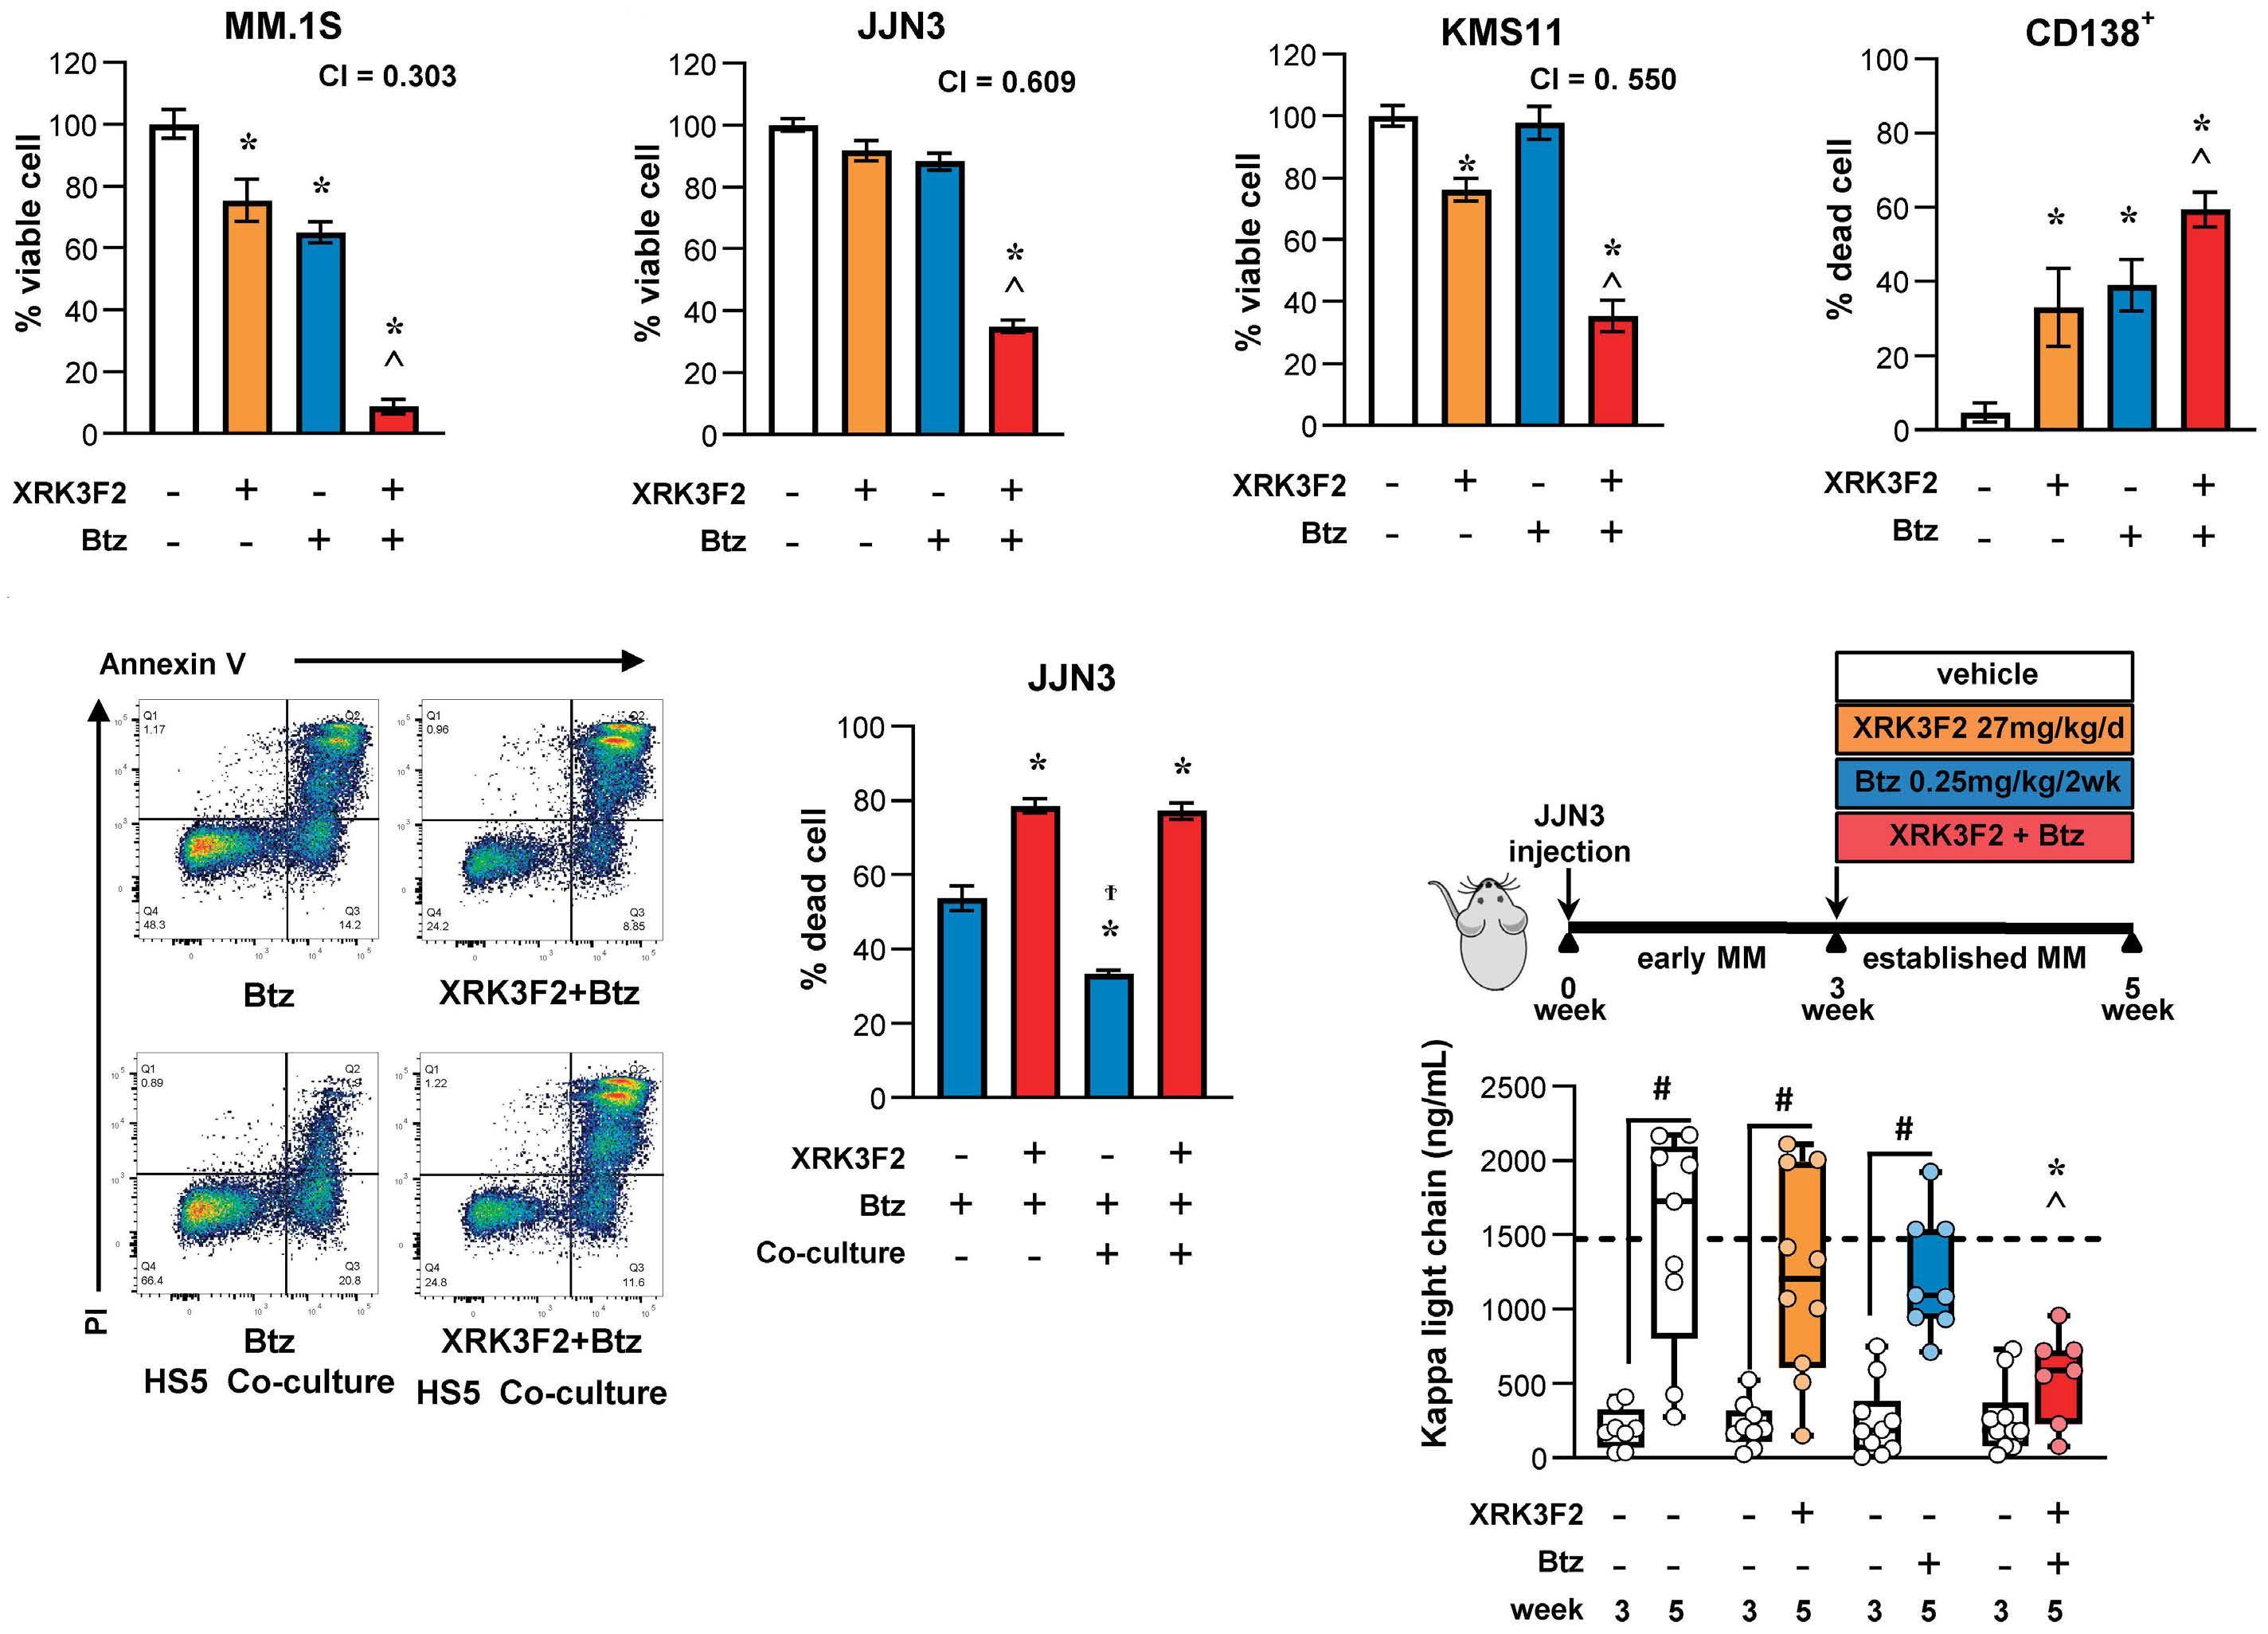
Figure 1. Combination of low doses of XRK3F2 and bortezomib synergistically increases multiple myeloma cell death in vitro and inhibits tumor growth in vivo. (A) MM.1S; (B) JJN3; (C) KMS-11 and (D) primary CD138+ cells were treated for 24 hours (h) with XRK3F2 (5 mM), bortezomib (Btz) (3 nM), or combined XRK3F2-Btz (5 mM/3 nM). Multiple myeloma (MM) cell viability was evaluated by alamarBlue assay and is reported as percent versus dimethyl sulfoxide (DMSO) vehicle control. Combination index (CI) of less than 1 indicates synergy. MM cell death was evaluated by (D) Trypan blue uptake assays or by Annexin V/propidium iodide (PI) staining MM:HS5 cell-to-cell co-cultures after 24 h of treatment (E). Data are presented as bars, means ± standard deviation (N=4-6/group). *P<0.05 versus vehicle, ^P<0.05 versus XRK3F2 or Btz alone by one-way ANOVA with post hoc Tukey’s correction. (F) In vivo experimental design (105 JJN3 MM cells injected intratibially). Serum levels of the JJN3 tumor biomarker human κ light chain after in vivo treatment with XRK3F2 (27 mg/kg/5 times per week [5xweek]), Btz (0.25 mg/kg/2xweek) or XRK3F2-Btz combination. Data are presented as box & whiskers plots where each dot represents a mouse N=7-10/group. #P<0.05 versus 3 weeks; *P<0.05 versus JJN3-vehicle and ^P<0.05 versus JJN3-XRK3F2 or Btz alone by one-way ANOVA with post hoc Tukey’s correction. The horizontal dotted line indicates the mean value for vehicle-treated mice bearing JJN3 tumors.
tially blocked caspase 8 and 3 cleavage by XRK3F2-Btz and partially reduced the effects of the combination on MM cell viability. These findings suggest that XRK3F2-Btz combination inhibits MM viability by activating both caspase-dependent and independent-cell death pathways.
XRK3F2 increases sensitivity to protease inhibitors by induction of necroptosis
In addition to binding ligand proteins for autophagic degradation, the p62-ZZ domain is also a scaffold for necroptosome formation by binding RIPK1, which forms a complex with RIPK3 and mixed lineage kinase domain-like effector
(MLKL).20 Inhibition of RIPK1 binding using necrostatin-1 (Nec-1) prevented cell death induced by XRK3F2, but not by Btz, in MM cell lines (Figure 3A; Online Supplementary Figure S4D) and CD138+ cells from MM patients (Figure 3B) by preventing the loss of plasma membrane integrity, measured by the LDH release after 16-h culture (Figure 3C). Nec-1 also prevented cell death induced by XRK3F2-Btz combination, inhibiting both necroptosis and RIPK1-dependent apoptosis. Nec-1 did not affect basal autophagy (Online Supplementary Figure S4E), suggesting that RIPK1 kinase activity is not required to suppress autophagy. Upon treatment with XRK3F2, RIPK3 co-immunoprecipitated with RIPK1, and
Haematologica | 109 May 2024 1504 ARTICLE - Targeting p62 increases PI efficacy in myeloma S. Marino et al.
A E F B C D
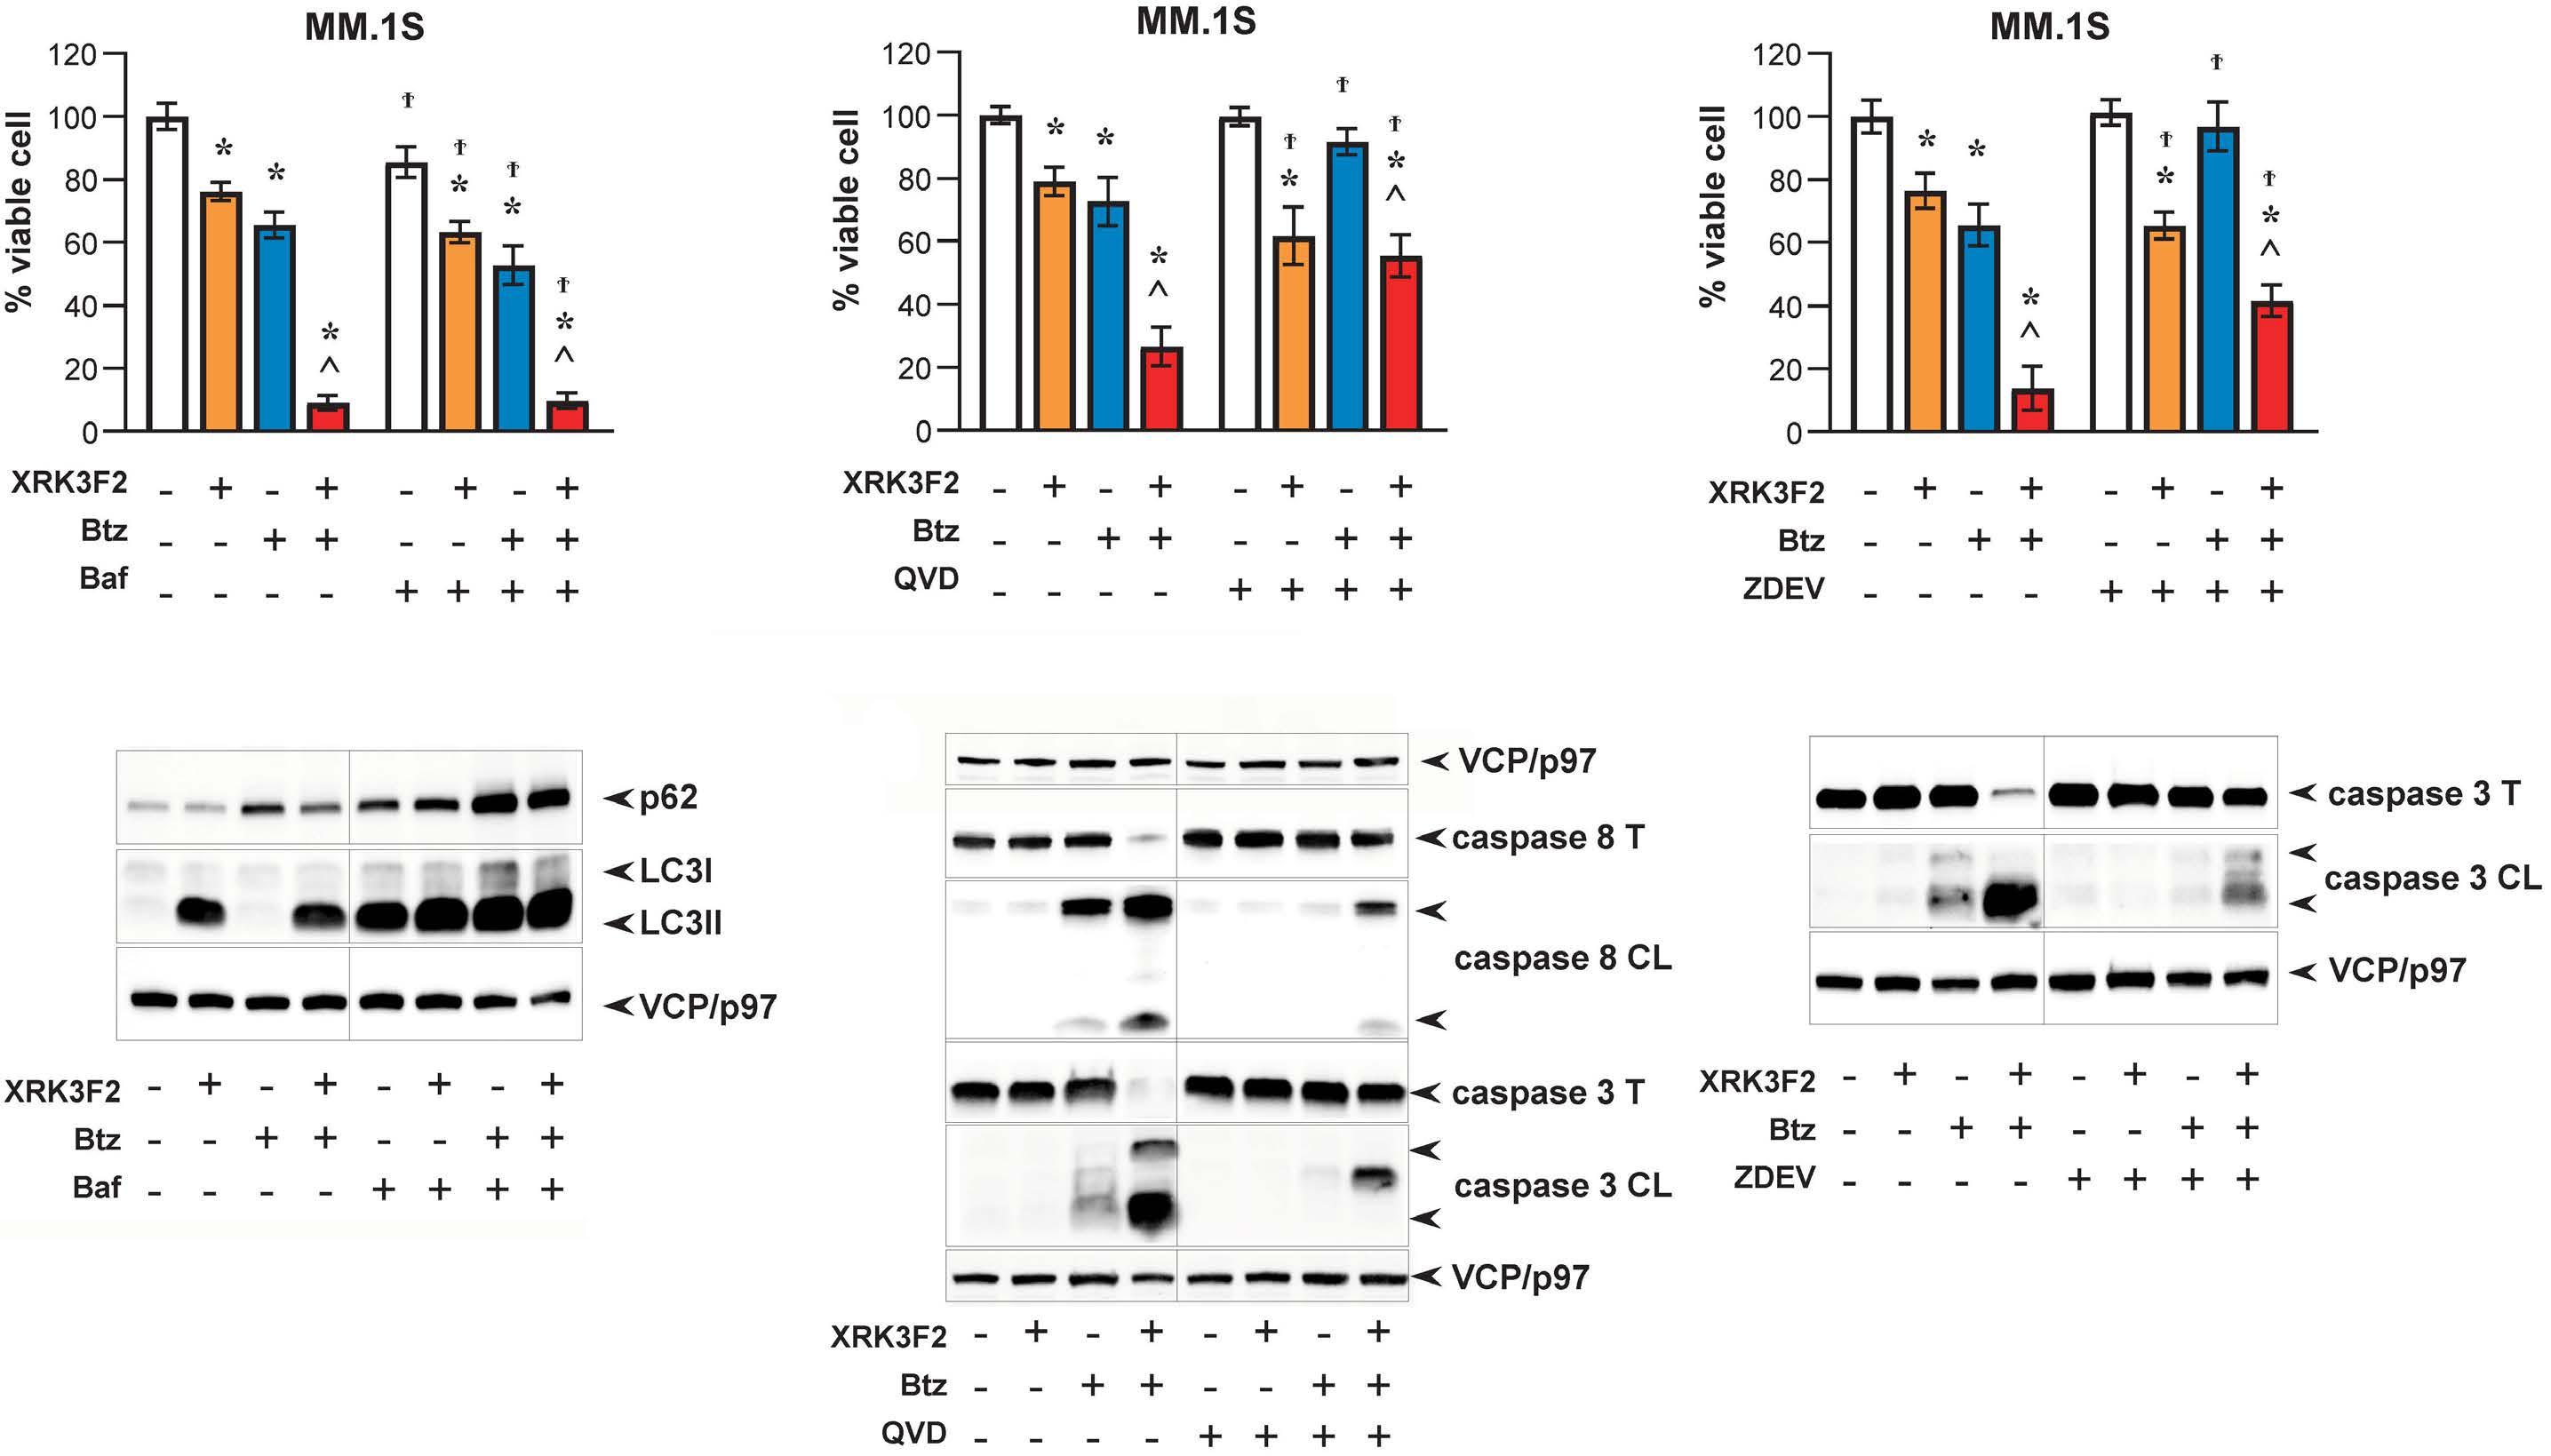
Figure 2. XRK3F2 plus bortezomib combination activates multiple death pathways and overcomes apoptosis resistance in multiple myeloma. MM.1S cells treated with XRK3F2 (5 μM), bortezomib (Btz) (3 nM), or combined XRK3F2-Btz (5 μM/3 nM) for 24 hours in the presence or absence of autophagy inhibitor Bafilomycin A1 (Baf, 40 nM) (A, D), Pan caspase OPH inhibitor Q-VD (QVD, 20 μM) (B, E), or caspase-3 inhibitor Z-DEVD-FMK (Z-DEV, 20 μM) (C, F). Cell viability was evaluated using alamarBlue assays and is reported as percent versus dimethyl sulfoxide (DMSO) vehicle control (A-C). Analysis of autophagic flux and apoptosis were assessed by immunoblotting by LC3I-LC3II conversion (D) and for cleavage of caspase 8 and 3 (E, F). Data are presented as bars, means ± standard deviation (N=4-6/group). *P<0.05 versus vehicle, ^P<0.05 versus XRK3F2 or Btz alone and ^P<0.05 versus control versus Baf/QVD/ZDEV culture by two-way ANOVA with post hoc Bonferroni’s correction.
the association was increased by inhibition of apoptosis (Figure 3D, top). XRK3F2-stimulated MLKL phosphorylation at S358 and consequent cell death in MM cells (Figure 3D, bottom). Inhibiting RIPK3 or MLKL phosphorylation with GSK872 (RIPK3 kinase inhibitor) or necrosulfonamide (NSA, an MLKL inhibitor), blocked XRK3F2-induced cell death induced (Figure 3E). Taken together, these results suggest that XRK3F2 treatment leads to induction of necroptosis and synergizes with Btz-mediated apoptosis increasing MM cell death via concurrent activation of multiple death pathways (Figure 3F).
p62 and RIPK3 expression levels inversely correlated with multiple myeloma disease progression
In order to investigate the significance of p62, RIPK1, RIPK3, and MLKL expression in MM patients, publicly available datasets containing normal, monoclonal gammopathy of unknown significance (MGUS), high-risk smoldering MM (SMM), and newly diagnosed MM patients35 were analyzed. We found that p62 (SQSTM1) expression increased at the mRNA level across disease stages with active MM plas-
ma cells (PC) expressing higher p62 levels compared to premalignant MGUS PC (P=0.0092; Figure 4A). Further, we observed expression of SQSTM1 in MM cells regardless of International Staging System (ISS) disease stage (Online Supplementary Figure S5). RIPK1, RIPK3 and MLKL mRNA were all expressed in MM cells albeit RIPK3 and MLKL mRNA levels were significantly reduced in MM patients with active disease compared to MGUS (P=0.0206 for RIPK3; P=0.022 for MLKL) and healthy PC (P=0.0097 for RIPK3; P=0.0336 MLKL; Figure 4C, D). No significant differences were observed for RIPK1 (Figure 4B). Further, we confirmed these findings in immunoblots from primary CD138+ selected cells from MM patients and MM cell lines (Figure 4E; Online Supplementary Figure S6). We observed that p62 was strongly expressed at the protein level in the majority of primary MM cells (10/11 MM patients samples; Figure 4E). RIPK3 and MLKL proteins were detected in 100% (11/11) or 82% (9/11) of the primary CD138+ cells from MM patients although their level varied. These data suggest that p62 upregulation and RIPK3/MLKL downregulation correlate with MM disease progression.
Haematologica | 109 May 2024 1505 ARTICLE - Targeting p62 increases PI efficacy in myeloma S. Marino et al.
A D E F B C
Low RIPK3 expression at diagnoses correlates with reduced survival and response to bortezomib-based therapies in multiple myeloma patients
In order to evaluate the impact of the expression of RIPK3, MLKL, and p62 on clinical outcomes for MM patients, we employed the MMRF-CoMMpass (IA18) dataset. Newly diagnosed MM patients (NDMM) with low expression RIPK3 exhibited lower overall survival (OS) (Figure 5A; P=0.00084) and progression-free survival (PFS) (P=0.013) than those with higher expression. We observed similar OS and PFS trends in NDMM patients with low MLKL expression or high p62
expression; however, the results did not reach statistical significance (Online Supplementary Figure S7A, B). Next, we examined if clinical responses to Btz-based therapies correlate with RIPK3 or p62 expression. Among patients receiving Btz-based therapies, those with lower expression of RIPK3 exhibited worse OS (Figure 5B; P=0.00032) and PFS (P=0.017) than those with higher RIPK3 expression. Similar, non-significant trends were observed in Btz-treated patients with low MLKL expression (Online Supplementary Figure S7C). In contrast, OS was better in MM patients receiving Btz-based therapy with lower p62 expression (Figure
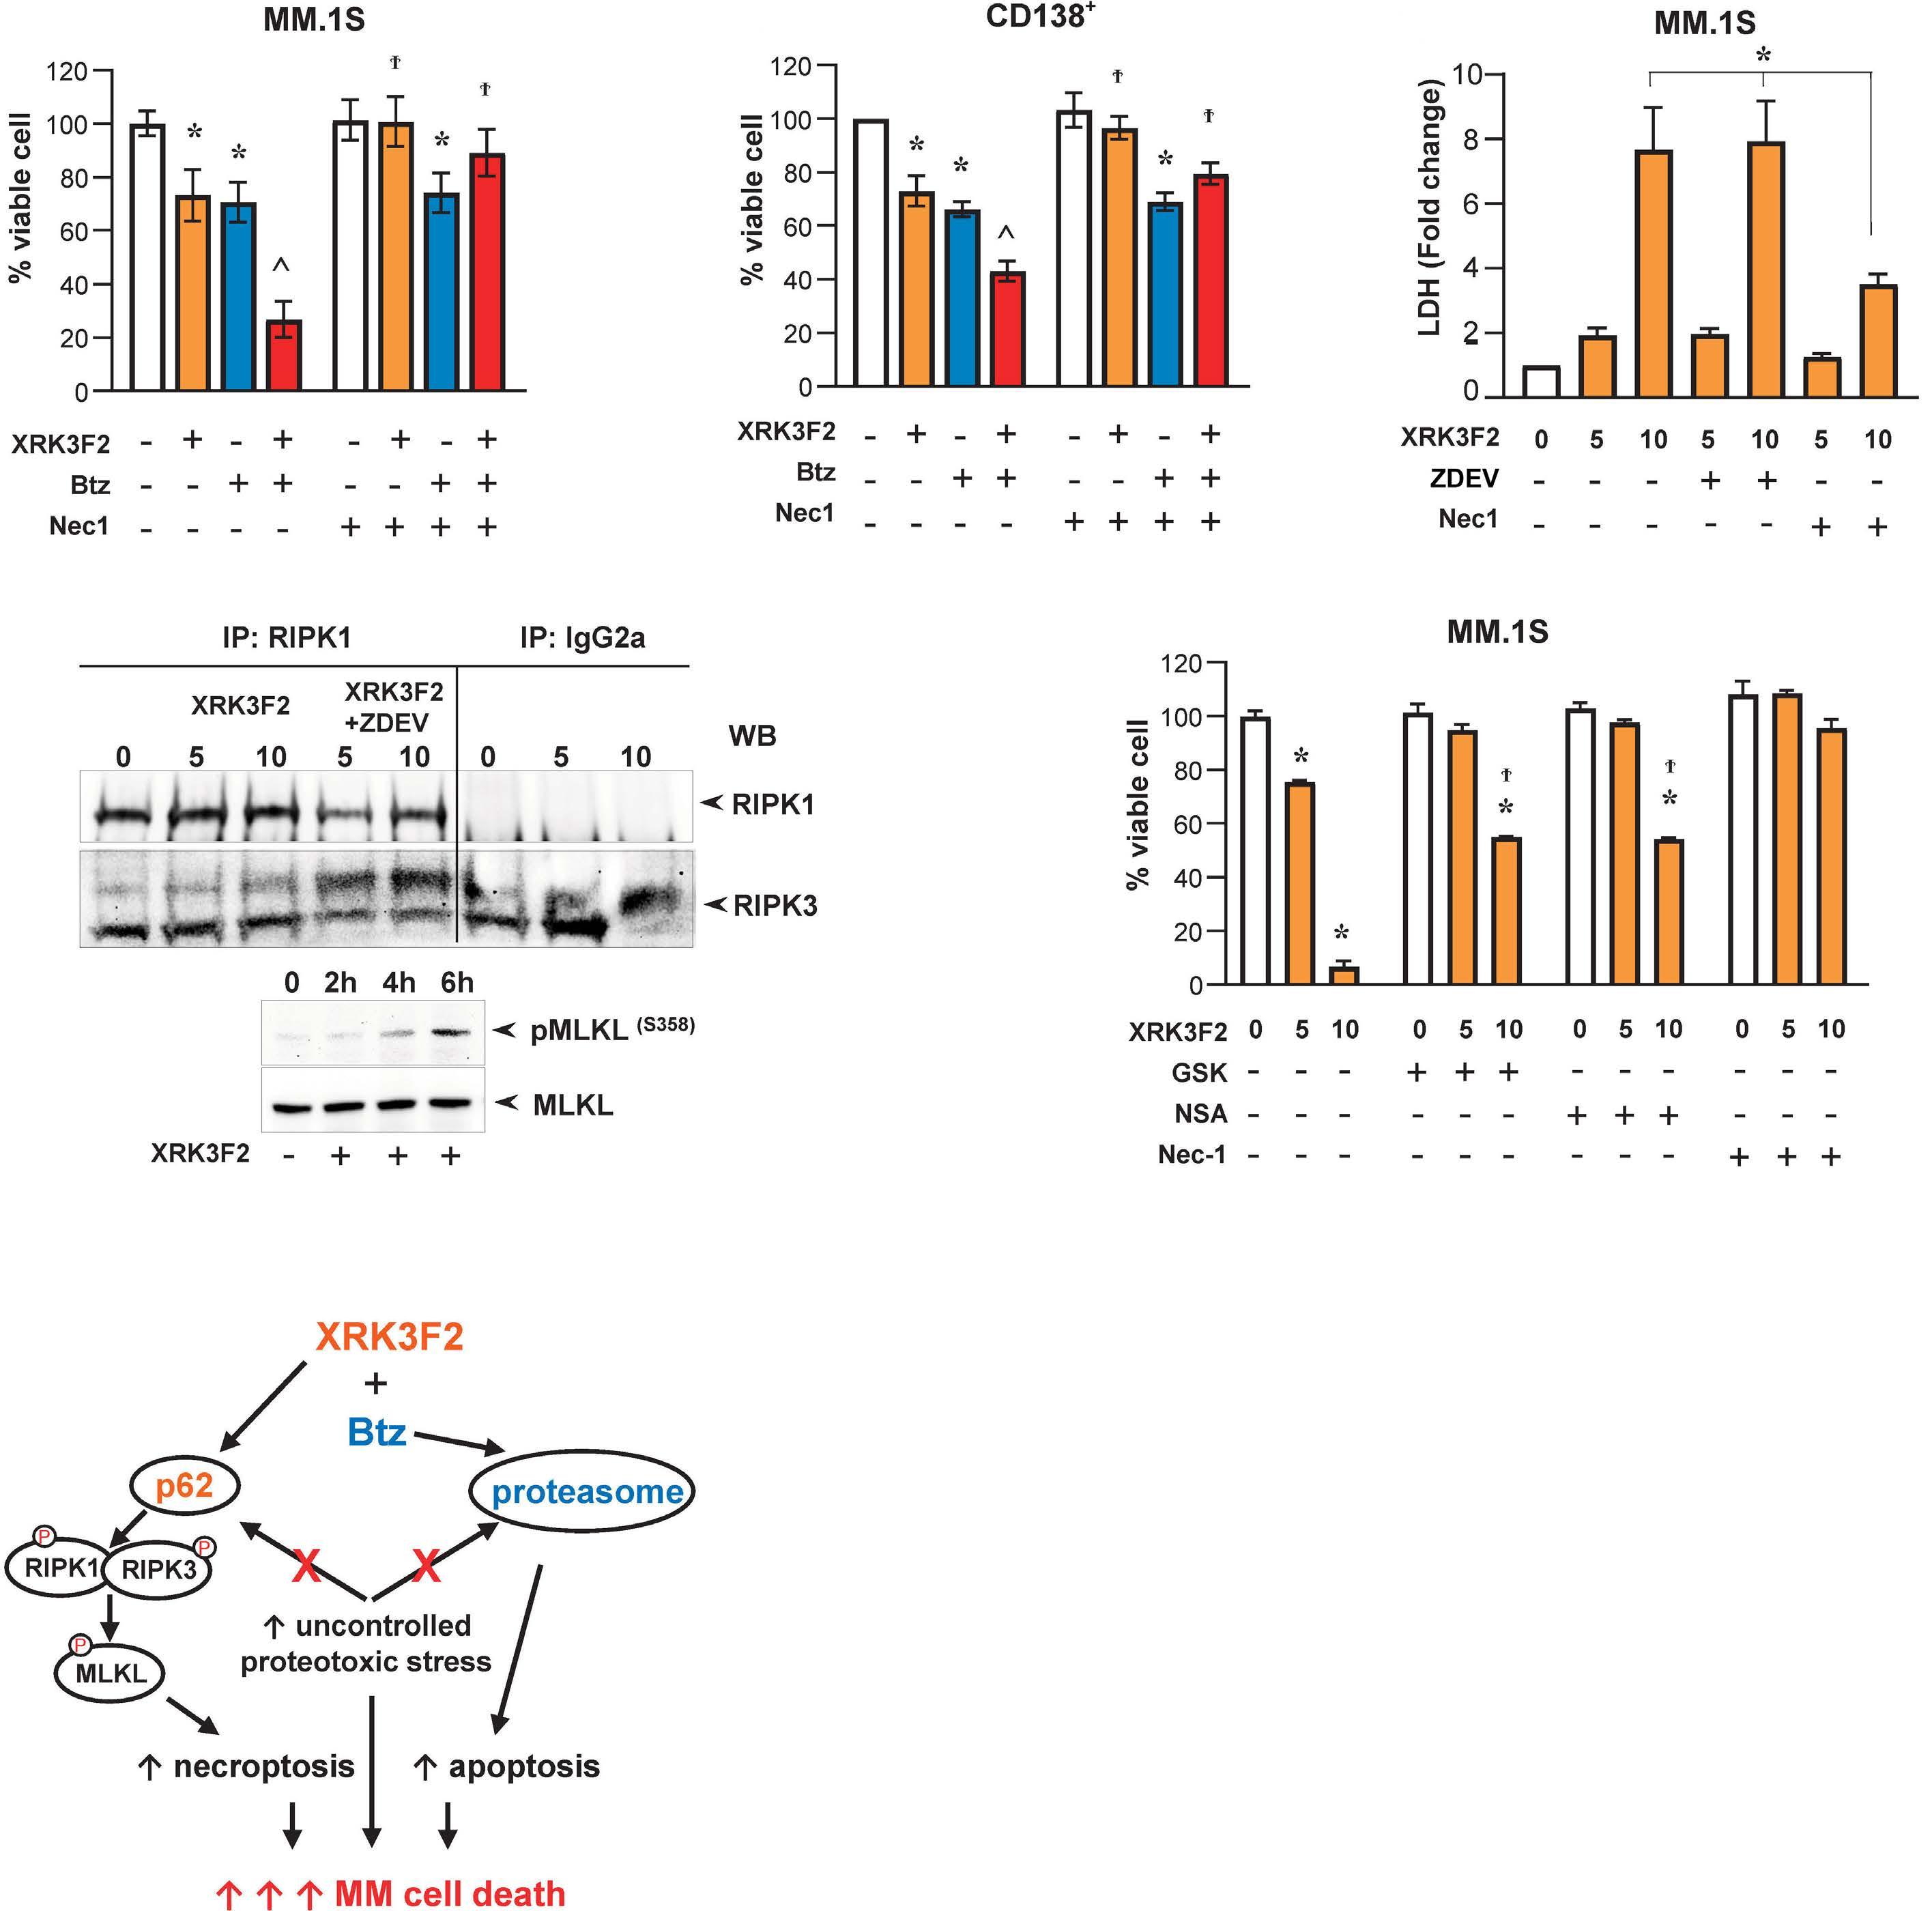
Figure 3. XRK3F2 induces caspase-independent necroptotic cell death. (A) MM.1S and (B) CD138+ human multiple myeloma (MM) cells were treated with XRK3F2 (5 mM), bortezomib (Btz) (3 nM), or combined XRK3F2-Btz (5 mM/3 nM) for 24 hours (h) in the presence or absence of RIP1 kinase inhibitor Necrostatin-1 (Nec-1, 60 mM) and viability assayed by alamarBlue assay and is reported as percent versus dimethyl sulfoxide (DMSO) vehicle control. (C) MM.1S cells were treated with 0, 5 or 10 mM XRK3F2 for 16 h ± 20 mM Z-DEV or 60 mM Nec-1 followed by lactate dehydrogenase (LDH) release analysis. (D) MM.1S cells were treated with 5 or 10 mM XRK3F2 for 4 h ± 20 mM Z-DEV and RIPK1-RIPK3 binding assessed by immunoprecipitation (IP) using anti-RIPK1 antibody or IgG2a control (top panel). MM.1S cells were treated with 10 mM XRK3F2 for 2, 4, and 6 h, and MLKL phosphorylation at Ser 358 was assessed by western blotting (WB) (bottom panel). (E) MM.1S cells were treated with 0, 5 or 10 mM XRK3F2 for 24 h in the presence or absence of RIP3 kinase inhibitor GSK872 (GSK, 3 mM), MLKL inhibitor necrosulfonamide (NSA, 1 mM) and 60 mM Nec-1. Cell viability was evaluated by alamarBlue and reported as percent versus DMSO vehicle control. Data are presented as bars, means ± standard deviation (N=4-6/group). *P<0.05 versus vehicle, ^P<0.05 versus XRK3F2 or Btz alone, and ϯP<0.05 control versus Nec-1/GSK/NSA culture by two-way ANOVA with post hoc Bonferroni’s correction. (F) Schematic representation of XRK3F2Btz combination mechanisms of action.
Haematologica | 109 May 2024 1506 ARTICLE - Targeting p62 increases PI efficacy in myeloma S. Marino et al.
A D F E B C
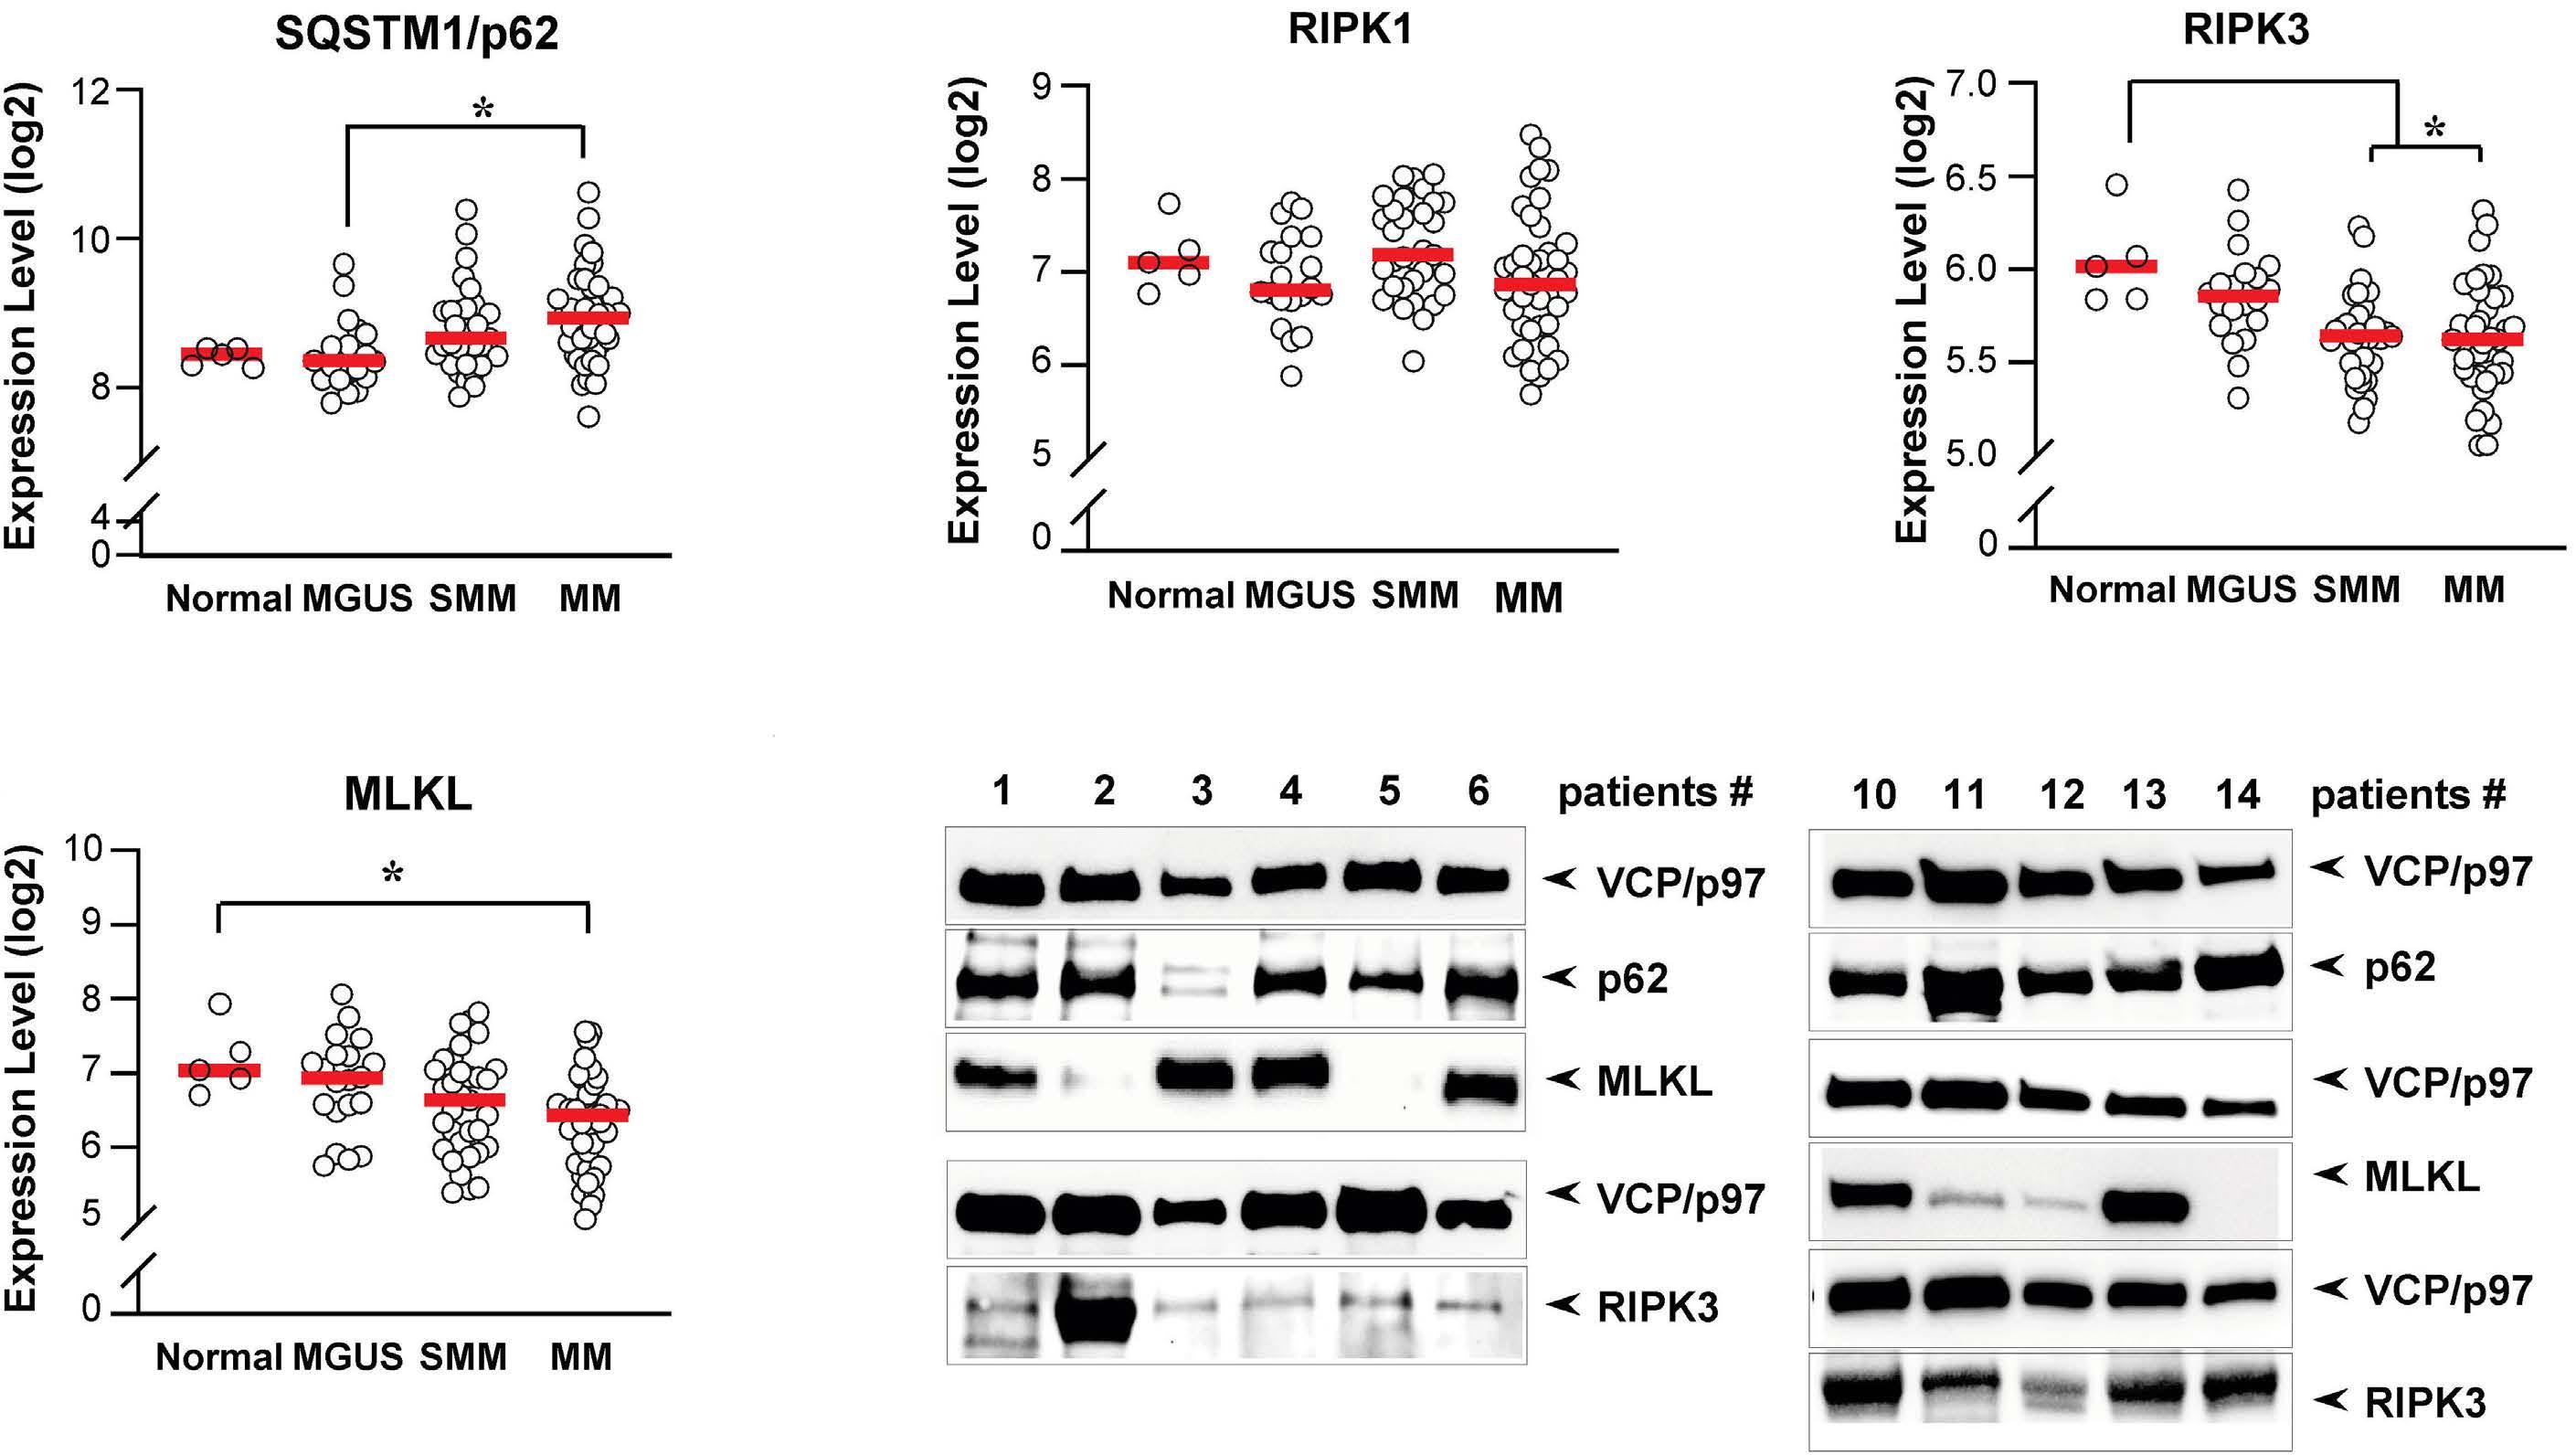
Figure 4. High p62 and low RIPK3 expression in patients correlates with disease progression. Transcriptome analysis of the GDS4968 data set showing the mRNA expression levels in of (A) p62, (B) RIPK1, (C) RIPK3 and (D) MLKL in CD138+ primary cells of multiple myeloma (MM) patients in different stages of the disease monoclonal gammopathy of undetermined significance (MGUS), smoldering MM, or MM and normal plasma cells (N). (E) p62, RIPK3, and MLKL protein expression levels were evaluated by immunoblotting in cell lysates of primary CD138+ plasma cells from MM patients (#1, 6, 13 newly diagnosed; #2 autologous stem cell transplant; #3, 5, 10, 14 progressive disease; #4, 12 refractory; #11 relapsed; Online Supplementary Table S2) using VCP/p97 as loading control.
5C; P=0.013); although PFS was not affected. Collectively, these results highlight the relevance of the N-rule pathway in clinical responses in MM patients and suggest that modulating RIPK3 and MLKL activities with XRK3F2 can be exploited to improve clinical outcomes in MM patients.
XRK3F2 and Btz combination prevents bone destruction and stimulates bone formation in a human xenograft mouse model of established multiple myeloma disease MM patients frequently have severe osteolysis leading to increased morbidity and mortality. Whilst PI have been shown to transiently increase bone formation, MM-induced lesions rarely repair. We previously showed that XRK3F2 as a single agent induced cortical bone formation in a syngeneic mouse model of MM.17 Here, we investigated the effects of XRK3F2 in combination with Btz on an immunodeficient mouse model of human MM bone disease. Three weeks after, JJN3-injected mice showed overt osteolytic lesions in the injected tibias, indicative of established bone disease. No lesions were observed in saline-injected mice. Bone destruction was observed in mice treated with XRK3F2 or Btz alone, while the combination significantly preserved bone mass and reduced the number of osteo-
lytic lesions compared with vehicle or single agent-treated mice (Figure 6A). Both Btz alone and XRK3F2-Btz combination decreased the serum levels of the bone resorption marker CTX compared to vehicle-treated mice. However, only the combination therapy significantly restored serum levels of bone formation marker P1NP to level observed in tumor-naïve mice (Figure 6B). JJN3-injected mice had ~38% decreased cortical bone volume/total volume (BV/ TV), measured at the fibular-tibia junction, compared to saline-injected animals. XRK3F2-Btz co-administration mitigated the progression of bone disease by preserving cortical BV/TV (Figure 6C, D). We also performed bone architectural analysis of contralateral tibiae of mice receiving XRK3F2-Btz combination treatment. These bones displayed increased trabecular BV/TV (50%), thickness, Tb.Th (7%), number, Tb.N (45%), and decreased spacing, Tb.Sp (19%), compared to non-MM bearing mice that received vehicle (Figure 7A). Next, we determined the effects of XRK3F2 on osteoblast differentiation and bone-forming activity. Treatment of pre-osteoblastic MC3T3-MC4 cells with XRK3F2-Btz combination increased Runx2, Osterix, and Atf4 mRNA expression levels compared to vehicle or single treatment (Figure 7B). The combination, but not the
Haematologica | 109 May 2024 1507 ARTICLE - Targeting p62 increases PI efficacy in myeloma S. Marino et al.
A B C D E
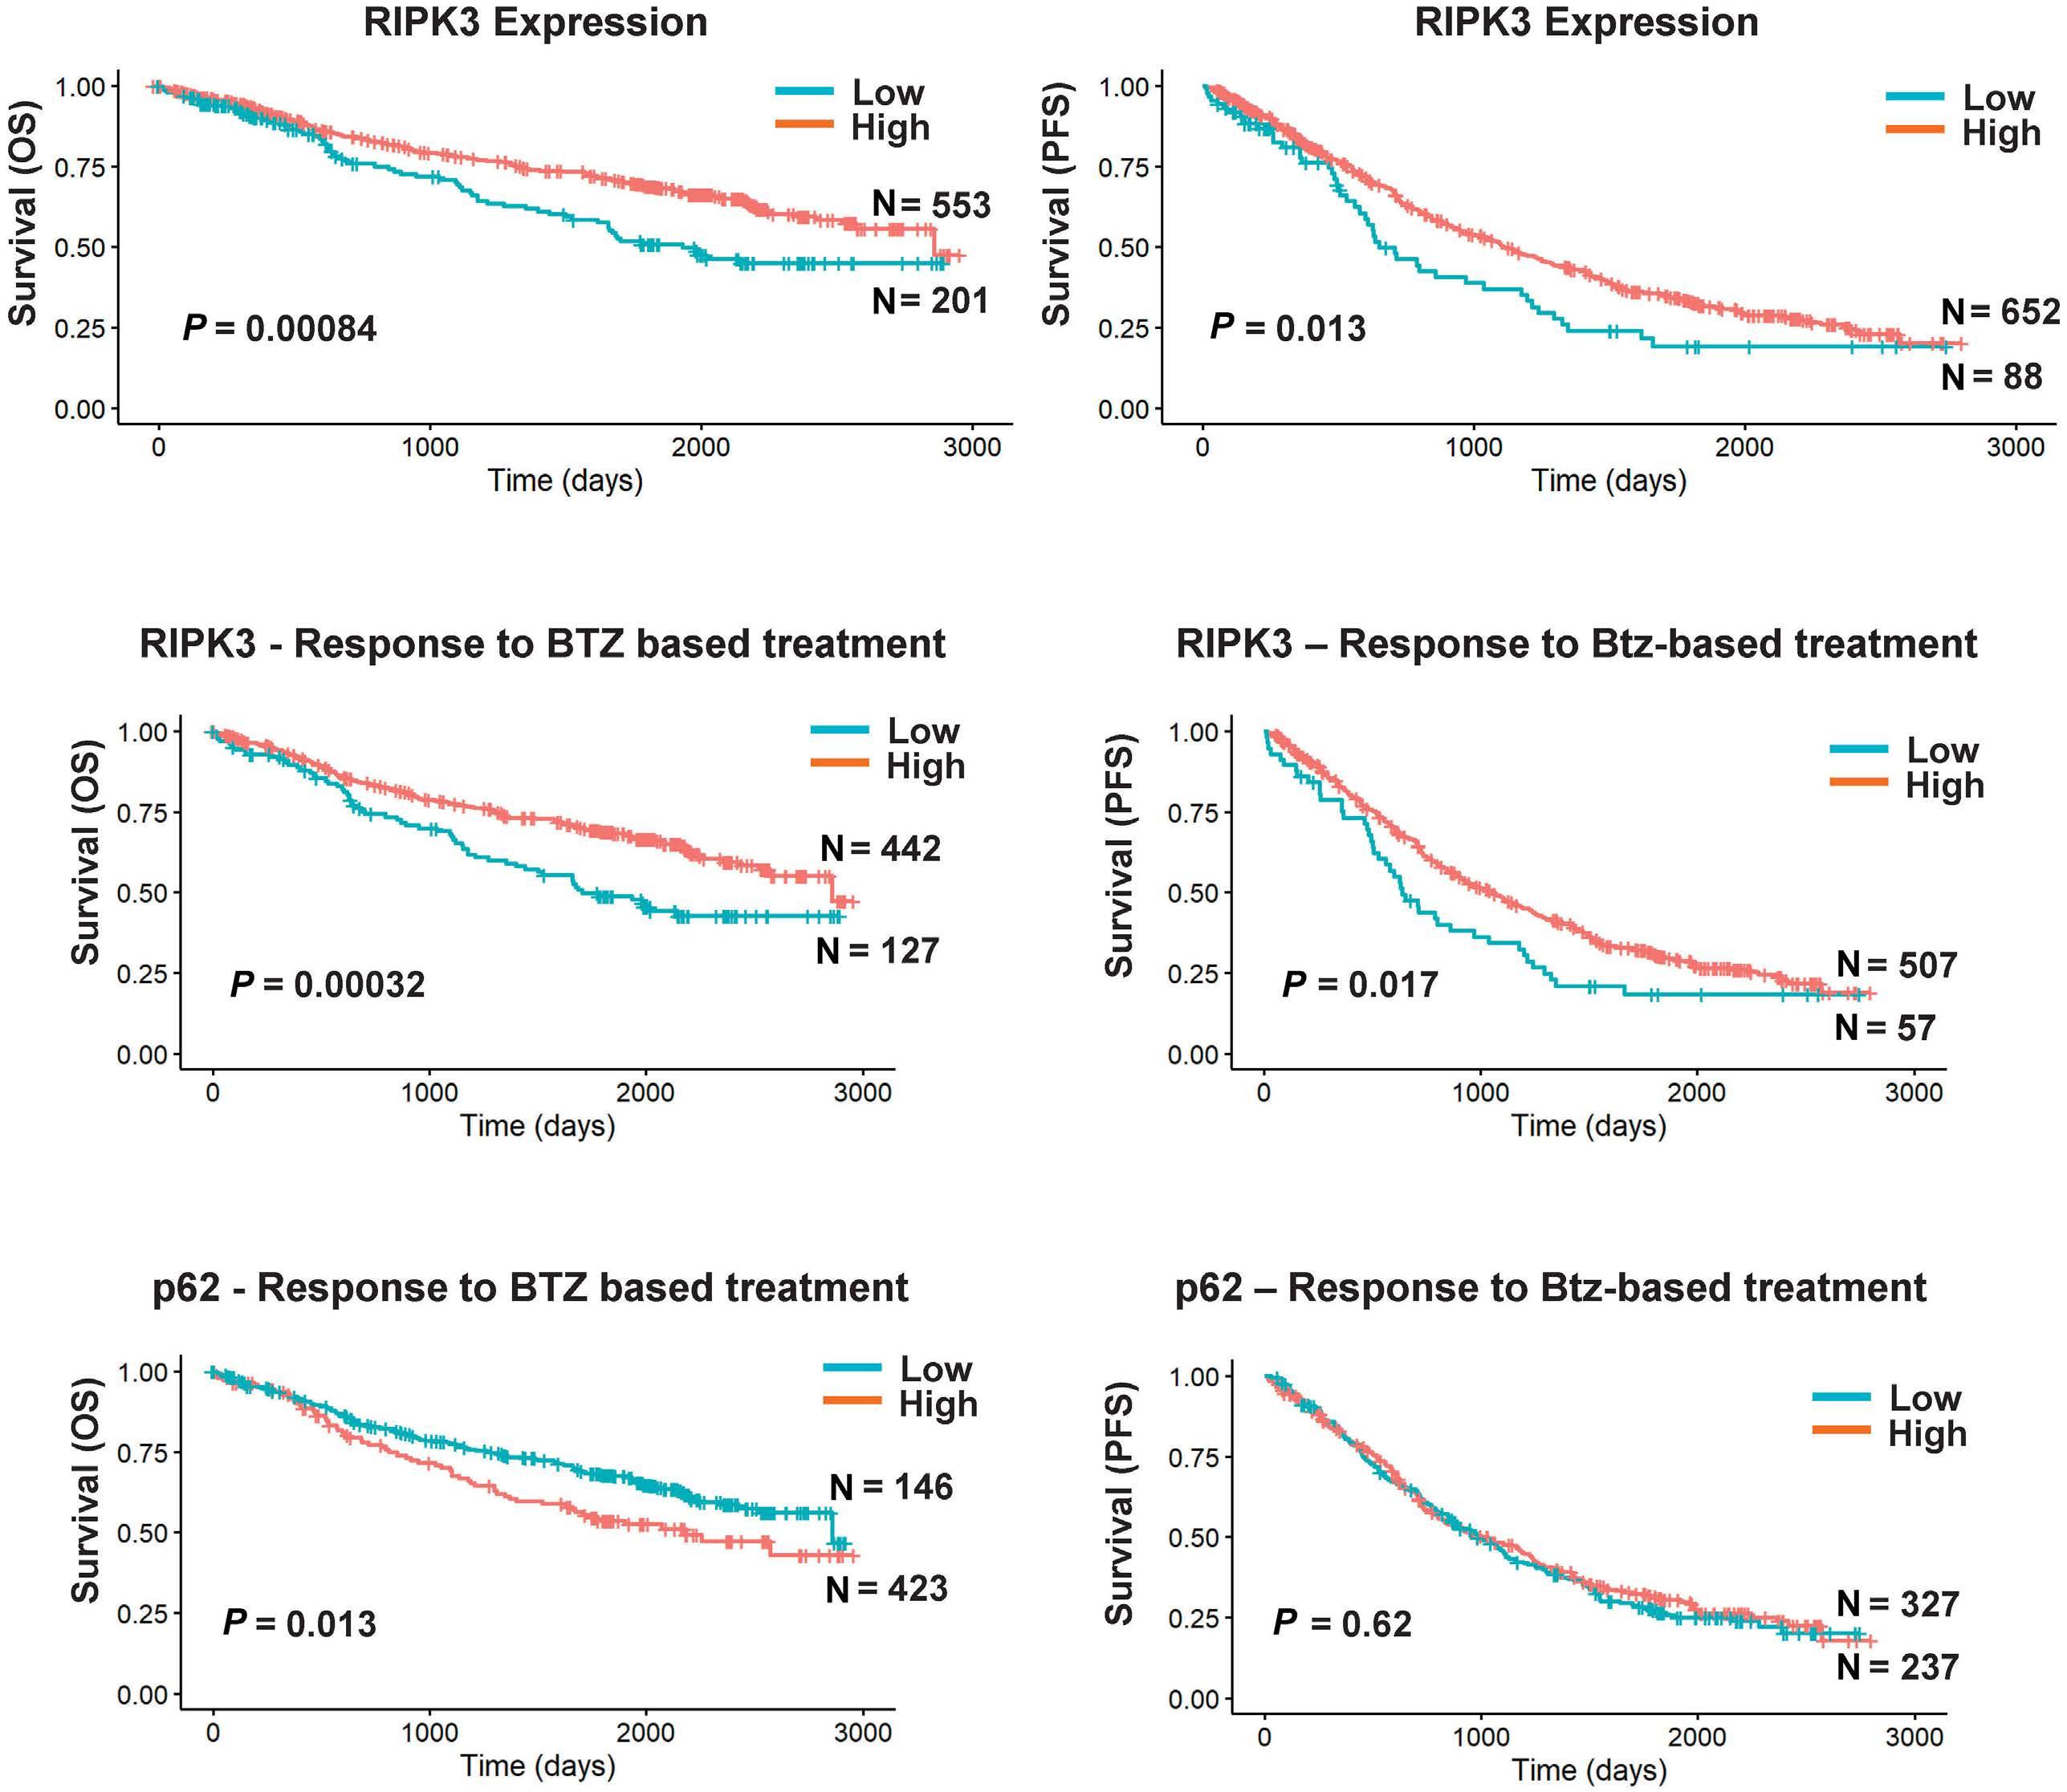
Figure 5. Low RIPK3 correlates with reduced survival and response to bortezomib-based treatment in multiple myeloma patients. Impact of gene expression on overall survival (OS) and progression-free survival (PFS) in patients from the MMRF CoMMpass cohort. (A) OS (left panel) and PFS (days, right panel) in patients with low and high RIPK3 expression. (B) OS (left panel) and OS (days, right panel) in response to bortezomib (Btz)-based therapies in patients with high and low RIPK3 expression. (C) OS (left panel) and PFS (days, right panel) in response to Btz-based therapies in patients with high and low p62 expression.
single agents, also blocked the inhibitory effects of TNFα on osteoblast differentiation by restoring Runx2 mRNA expression (Figure 7C). XRK3F2-Btz combination but not Btz alone, significantly increased matrix production and mineral deposition of primary bone marrow stromal cells, without affecting viability (Figure 7D). These findings support that XRK3F2 in combination with Btz stimulates bone formation by promoting osteoblast differentiation and activity.
Discussion
MM cells subjected to sustained proteasomal inhibition, as occurs during Btz therapy, rely on p62-mediated autophagic degradation to reduce the proteotoxic load derived from
excessive immunoglobulin (Ig) HC synthesis.33,36 Excess Ig HC bound to HSPA5 is proteotoxic and induces all three ER stress response regulators: IRE1α, ATF6α, and PERK.10 HSPA5, with its bound cargo, is exported from the ER to the cytoplasm,11 where it provides a bimodal degron for cellular elimination.15 N-Arg bearing substrates are eliminated by either the proteasome following UBR1-catalyzed ubiquitylation or autophagy following binding to the ZZ domain of p62. In the presence of proteasomal inhibition, N-terminally argininylated peptides bind to the p62 ZZ-domain with micromolar affinity and trigger p62 oligomerization37 and autophagy.22 Thus, in the presence of PI, p62 provides an alternate pathway for cargo degradation.15 We developed XRK3F2 by molecular modeling of the ZZ-domain,17 and Cha-Molstad et al. 37 next showed that XRK3F2
Haematologica | 109 May 2024 1508 ARTICLE - Targeting p62 increases PI efficacy in myeloma S. Marino et al.
A B C
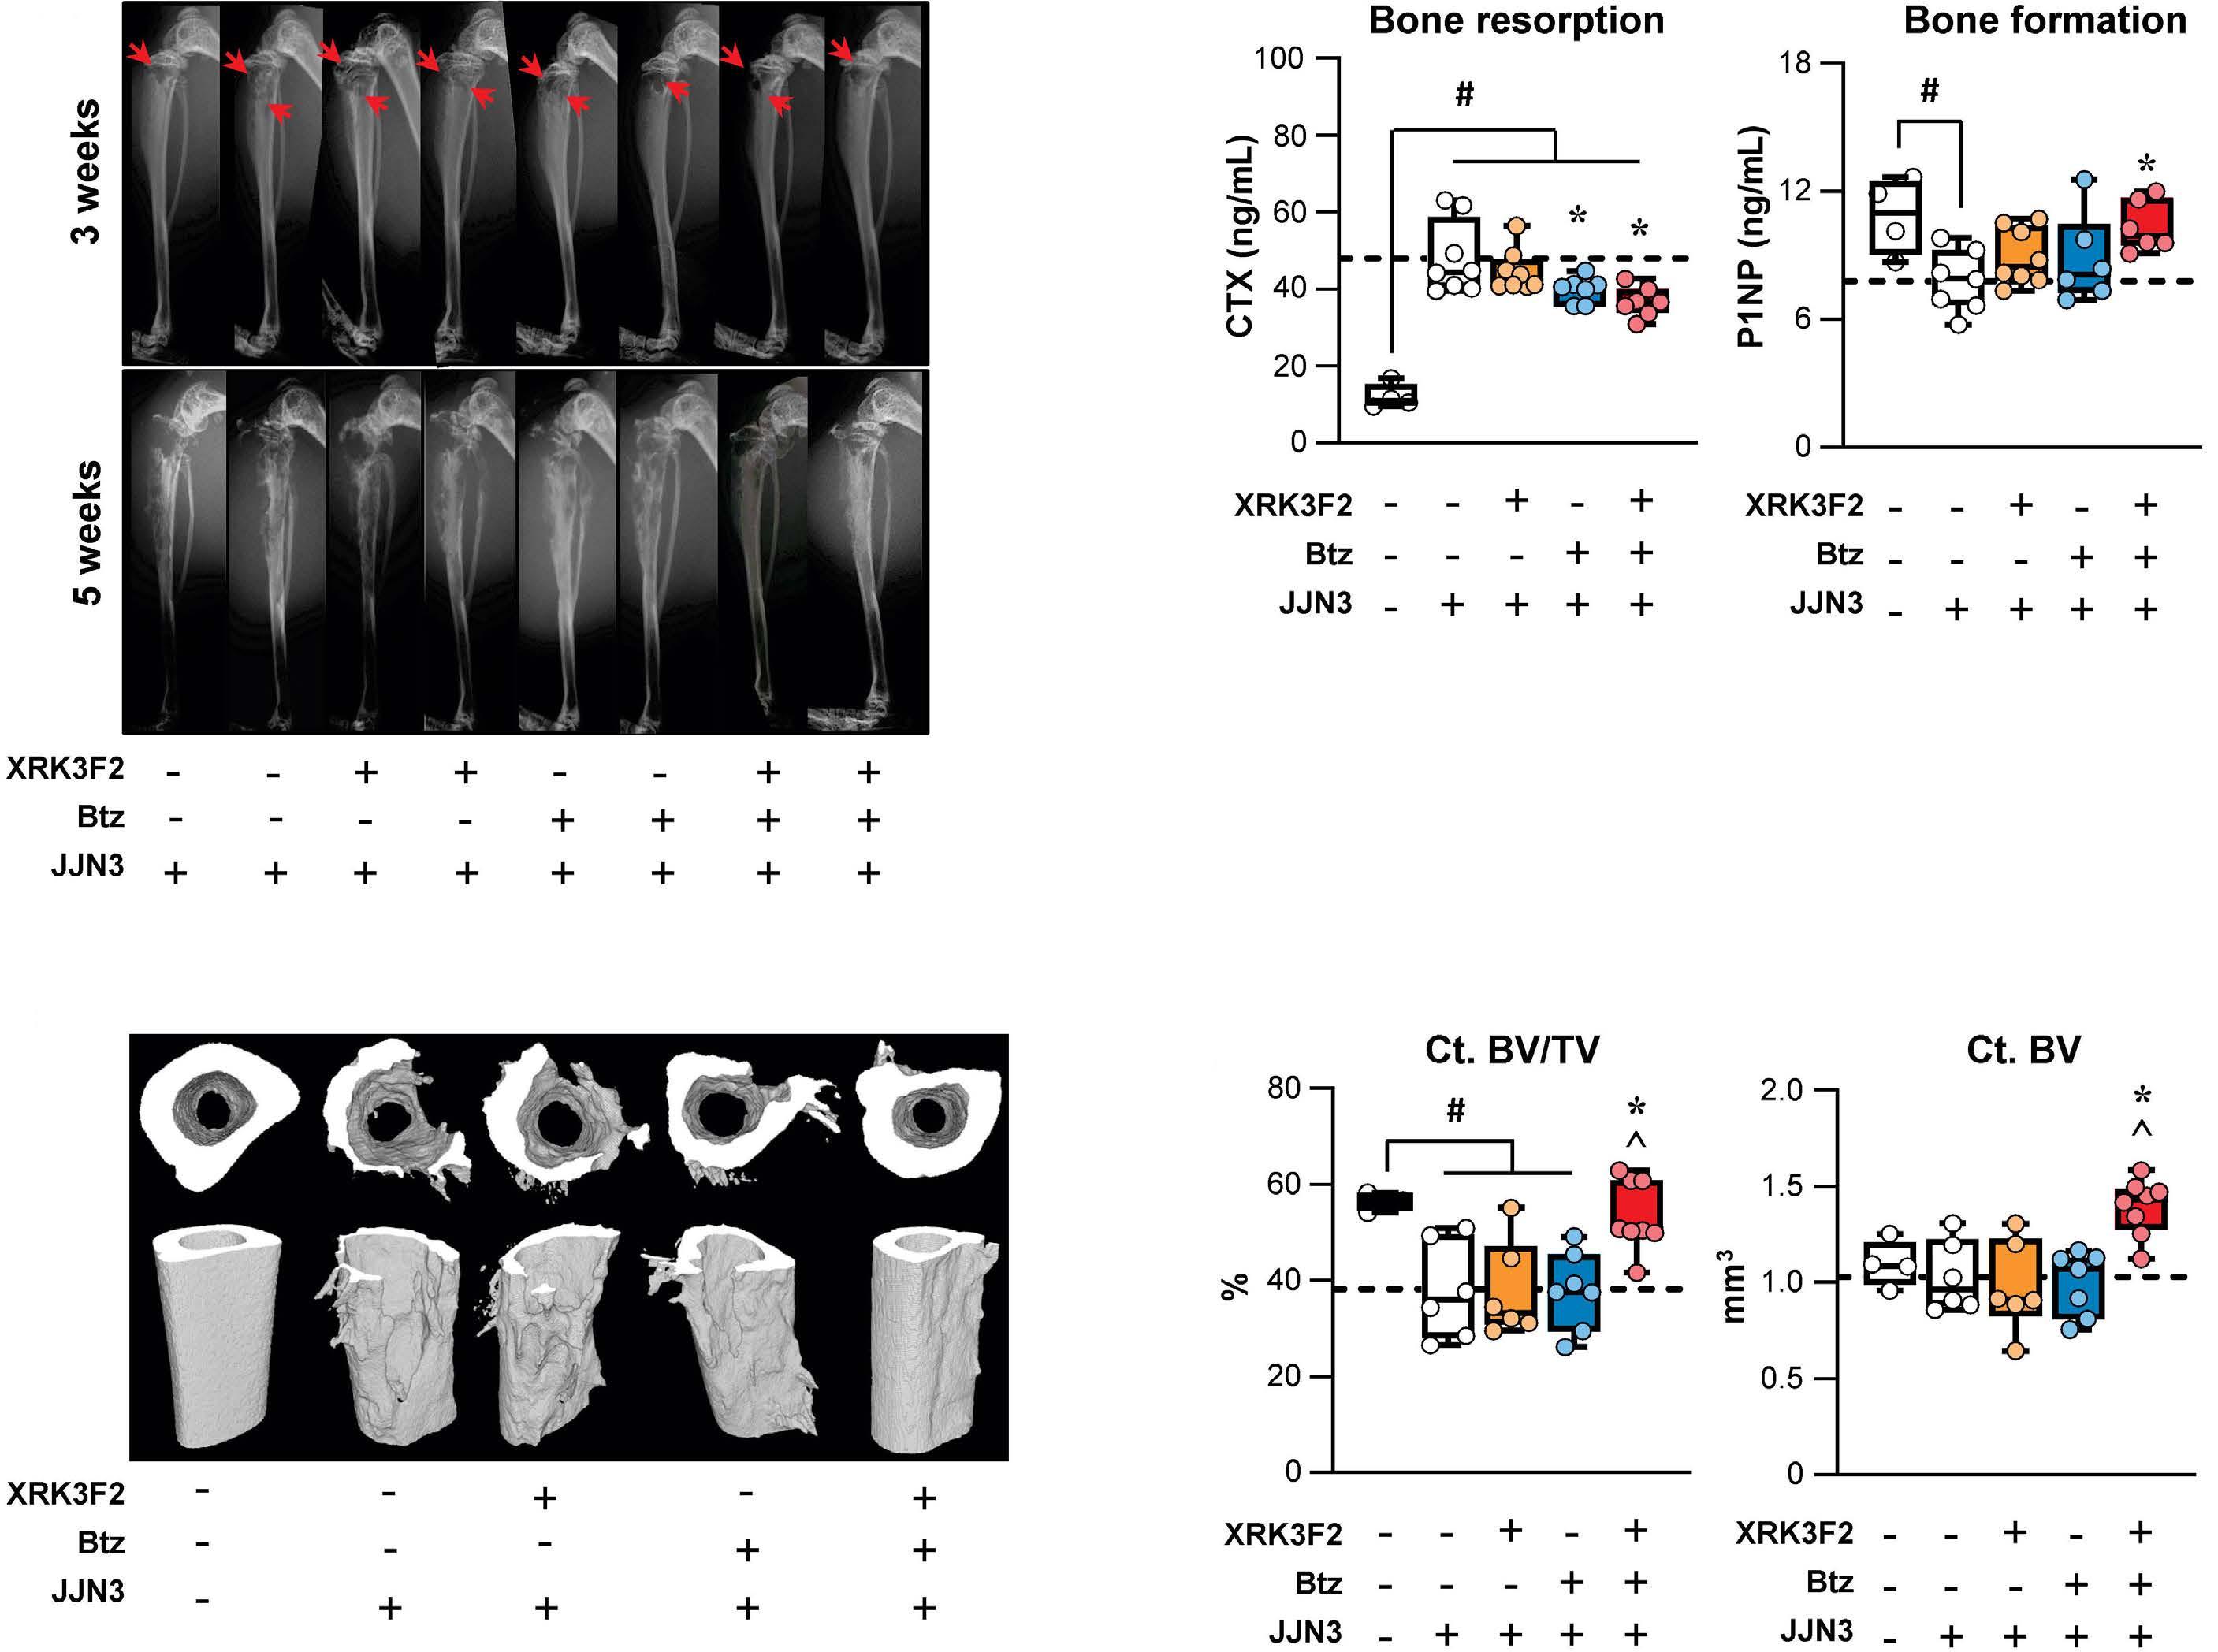
Figure 6. XRK3F2 plus bortezomib combination decreases osteolysis and protects from bone disease progression in mice with established multiple myeloma bone disease. (A) Representative X-rays images of tibiae 3 weeks after JJN3 cell inoculation and 5 weeks after treatment with vehicle (0.01 mL/g in 15% hydroxyl propyl β-cyclodextrin in saline/daily), XRK3F2 (27 mg/kg/5 times per week [5xweek]), bortezomib (Btz) (0.25 mg/kg/2xweek) and XRK3F2-Btz (27 mg/kg/5xweek plus 0.25 mg/kg/2xweek, respectively) for 2 weeks. (B) Bone resorption (CTX, left panel) and bone formation (P1NP, right panel) markers were evaluated by enzyme-linked immunosorbant assay. (C) Representative reconstructed micro-computed tomography (CT) images and (D) analysis of bone microarchitecture of cortical bone of the distal tibia (CT cortical bone volume/tissue volume [BV/TV]; CT BV). Data are presented as box and whiskers plots where each dot represents a mouse N=7-10/group. #P<0.05 versus saline-injected mice; *P<0.05 versus JJN3-vehicle and ^P<0.05 versus JJN3-XRK3F2 or Btz alone by one-way ANOVA. The horizontal dotted line indicates the mean value for vehicle-treated mice bearing JJN3 tumors.
binds to the arginyl-peptide binding site and triggers p62 oligomerization. XRK3F2 functions as a ligand rather than an inhibitor of p62, triggering ineffectual autophagy in the absence of cargo. Thus, the combination of a PI, such as Btz, with XRK3F2 blocks both proteolytic pathways for N-end rule degradation, allowing cytoplasmic accumulation of proteotoxic cargo, such as Ig HCn bound to HSPA5 and subjects MM cells to uncontrolled proteotoxic stress and consequent cell death. Here we demonstrate in vitro and in vivo that co-administration of suboptimal concentrations of Btz and XRK3F2 synergistically killed MM cells. XRK3F2-Btz combination-induced cell death not only was incompletely prevented by blocking apoptosis or autophagy
but was increased when caspase activation was prevented. These findings are in line with recent evidence showing that apoptosis and necroptosis are tightly connected and can cross-regulate each other.38 Several recent studies suggested that autophagy is implicated in caspase-independent cell death.39,40 The significant reduction in cell death induced upon RIP1 kinase inhibition supports necroptosis as a second mechanism of cell death induced by the XRK3F2Btz combination in both MM cell lines and primary CD138+ MM cells. Furthermore, selective pharmacological inhibition of MLKL and RIP3 kinase prevented XRK3F2-induced MM cell death, implying that the viability rescue seen by necroptosis inhibition was not due to off-target effects of
Haematologica | 109 May 2024 1509 ARTICLE - Targeting p62 increases PI efficacy in myeloma S. Marino et al.
A C D B
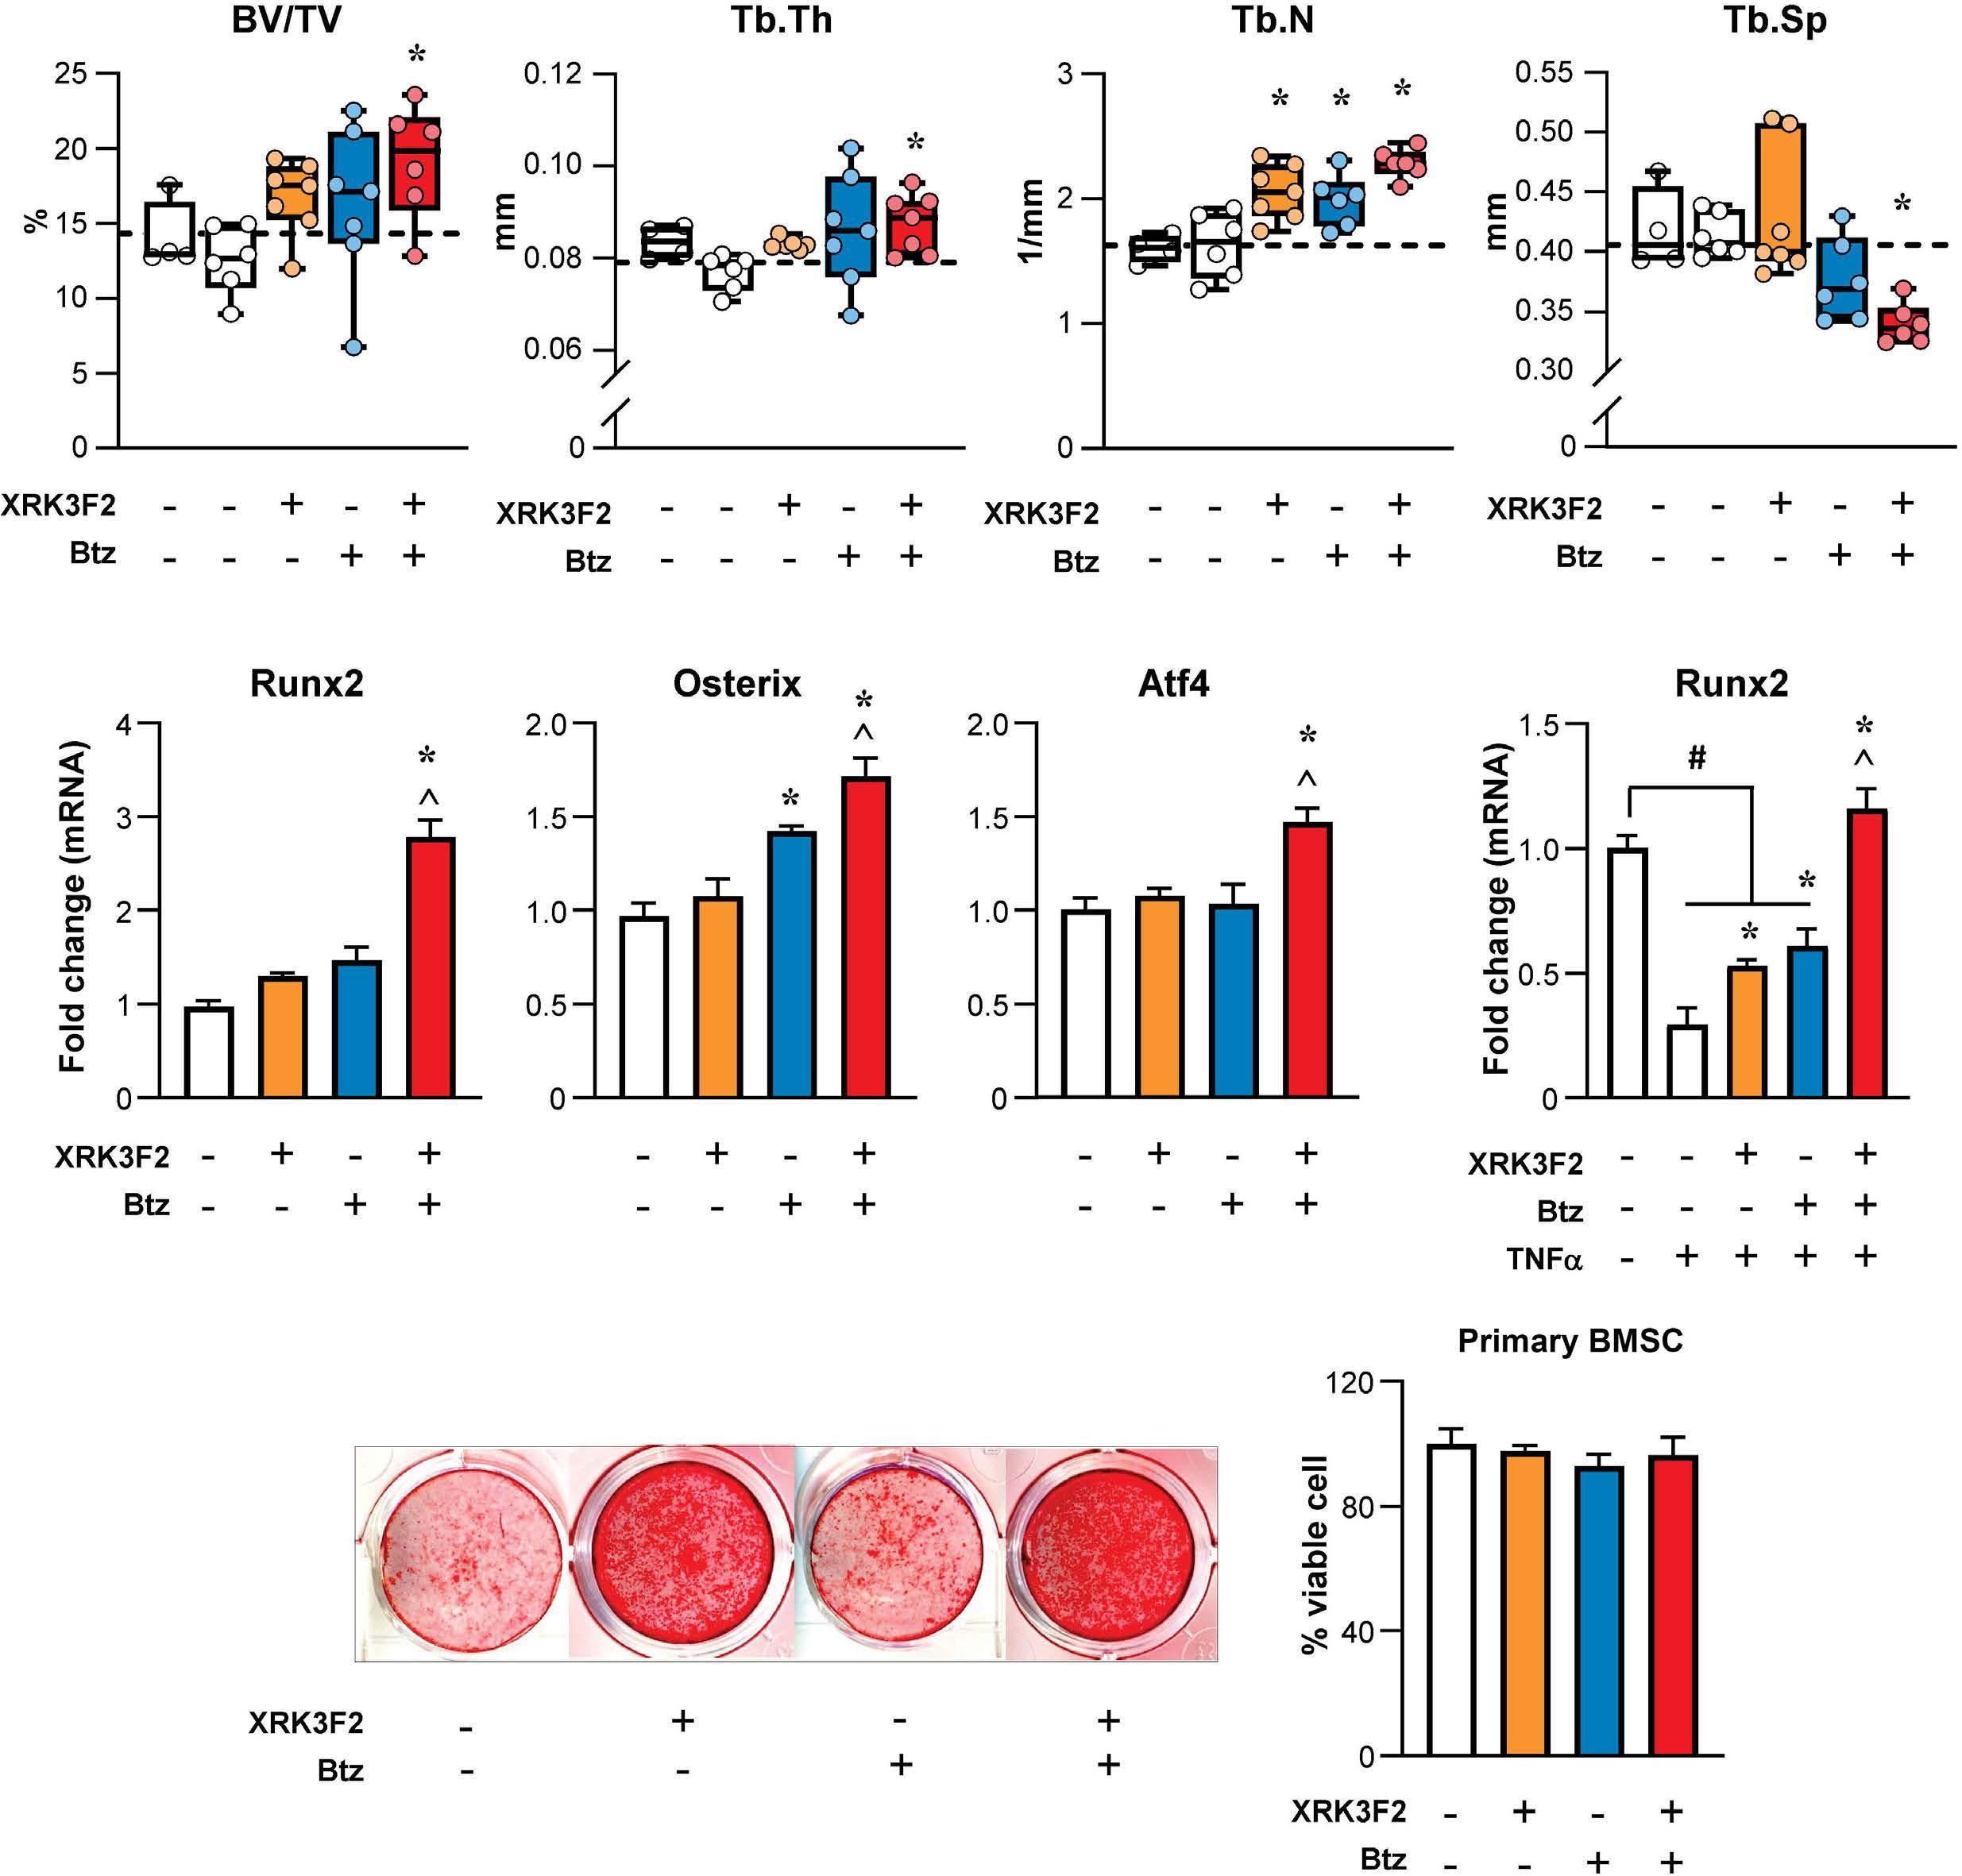
Figure 7. XRK3F2 treatment increases the bone anabolic effects of bortezomib in mice. Analysis of bone microarchitecture of trabecular bone of the contralateral proximal tibia of mice treated with vehicle (0.01 mL/g in 15% hydroxyl propyl β-cyclodextrin in saline/daily), XRK3F2 (27 mg/kg/ 5 times per week [5xweek]); bortezomib (Btz) (0.25 mg/kg/2xweek) and XRK3F2-Btz (27 mg/ kg/5xweek plus 0.25 mg/kg/2xweek, respectively) for 2 weeks. (A) Trabecular cortical bone volume/tissue volume (BV/TV), trabecular thickness (Tb.Th), trabecular number (Tb.N), trabecular separation (Tb.Sp). mRNA expression of (B) Runx2, Osterix, Atf4 MC3T3-MC4 clones treated for 48 hours (h) with XRK3F2 (100 nM), Btz (2 nM), or combined XRK3F2-Btz (100 nM/2 nM). (C) mRNA expression of Runx2 in MC3T3-MC4 pre-exposed to 100 ng/mL of TNFα and treated as above and expressed as fold change versus vehicle-treated control. (D) Alizarin red staining and viability of primary bone marrow stromal cells (BMSC) cultured treated with XRK3F2 (100 nM), Btz (2nM), or combined XRK3F2/Btz (100 nM/2 nM) for 28 days or 48 h respectively. Data are presented as bars, means ± standard deviation (N=4-6/group). *P<0.05 versus vehicle, ^P<0.05 versus XRK3F2 or Btz alone by one-way ANOVA.
Nec1.41 Several studies have shown that triggering necroptosis in cancer cells can increase chemotherapeutic drug responses (reviewed in42). Consistent with the relevant role of this pathway in MM, we found that p62 expression was higher, while RIPK3 and MLKL expression levels were lower, in MM patients compared to MGUS patients, and downregulation of RIPK3 correlated with poor clinical outcomes and responses to Btz-based therapies. These results are consistent with the increase in p62 expression and loss
expression or mutation of components of the necrosome found in other malignancies, and their correlation with poor prognosis.43,44
TME plays a central role in MM onset and progression and interactions between MM and cells of the BM transform the marrow into an ideal niche for the migration, proliferation, and survival of MM cells.45 Adhesion to stromal cells and release of cytokines from them have been shown to decrease the efficacy of chemotherapy on MM
Haematologica | 109 May 2024 1510 ARTICLE - Targeting p62 increases PI efficacy in myeloma S. Marino et al.
A B D C
cells by activating prosurvival pathways. We previously showed that XRK3F2 prevented co-culture-induced TNF α upregulation in both 5TGM1 cells and BMSC following co-culture and in BMSC, these effects required p62.17
Here, although we cannot exclude the contribution of XRK3F2-mediated changes in TNF α production by BMSC, we show that XRK3F2-Btz combination similarly increased MM cell death regardless of the presence or absence of stromal cells. These results suggest that, in the context of Btz therapy, targeting p62, bypasses the prosurvival and chemoprotective effects of stromal cells for MM cells, making them more susceptible to the pro-apoptotic actions of Btz.
The combination also inhibited the protumoral activation of NF κ B and TNF α , crucial factors for the survival and progression of MM and bone cell activity, through additional activities of multiple domains of the p62 scaffold protein.
Most patients with MM suffer skeletal complications characterized by osteolytic bone destruction and inhibited bone formation 1,46 which may persist unhealed during years of remission. Although Btz decreased tumor burden, Btz-treated mice still presented extensive bone lesions. These could be due to the aggressiveness of the mouse model of established bone disease, and/or the suboptimal dose of Btz (0.25 mg/kg/2xweek) used. Nonetheless, even at higher doses, other groups showed that Btz reduces MM burden but was insufficient to reduce osteolytic lesions as a single agent.9,47 Importantly, while PI can promote transient bone formation, they do not effectively inhibit osteoclasts as single agents.7
We previously found that XRK3F2 inhibited osteoclasts, stimulated new bone formation, and increased osteoblast Runx2.17,18 Here, we found that the combination of XRK3F2 with Btz preserved bone mass in an aggressive mouse model of established human MM bone disease. Further, the combination therapy increased bone mass after only 2 weeks in the contralateral, tumor-free leg. The anabolic action of combination therapy is supported by increased expression of genes associated with mineralization ( Runx2 , Osterix , and Atf4 ) and overcoming the suppression of Runx2 by TNF α in osteoblasts.
The detailed mechanism of the positive effects on bone by XRK3F2-Btz remains to be clarified. Activation of ER stress, while killing MM cells, increases osteoblast activity. This activity may involve the XBP1 splicing branch of the tripartite ER stress response, which we have shown is important in both MM and bone cells.48 XBP1 can affect Btz sensitivity independently of HSPA5, although HSPA5 plays an important role in MM 49 and stimulates osteoblastic mineralization.50 Our observations are compatible with both HSPA5- and XBP1-dependent mechanisms, which merit further research.
Overall, XRK3F2 provides a multifunctional supplement to proteasome inhibition for treating MM. It synergizes
with Btz to kill MM cells by activating necroptosis, while positively suppressing bone destruction with actions on ER stress and proteolytic degradation pathways. XRK3F2 represents a first-in-class ligand for the ZZ-domain of p62, a clinically important multifunctional scaffold protein. XRK3F2 interferes with autophagy and NF κ B signaling and activates necroptosis, identifying the ZZ-domain as an important, druggable target for the improved treatment of myeloma bone disease.
Disclosures
No conflicts of interest to disclose.
Contributions
Conceptualization, formal analysis, supervision, investigation, methodology, funding acquisition, writing of original draft, project administration, writing review, and editing by SM. Formal analysis, investigation, methodology, writing review, and editing by DNP. Formal analysis, investigation, methodology writing review, and editing by RTB. Investigation and methodology by JLA, HMS and AC. Investigation, methodology and resources by CA. Formal analysis, investigation and methodology by JHL. Critical manuscript reviewing by UPD. Provision of patient samples by FP. Formal analysis, investigation, methodology, resources, writing review, and editing by J-DC. Conceptualization, supervision, writing of original draft, writing review, and editing by JMC. Conceptualization, resources, supervision, formal analysis, funding acquisition, writing original draft, project administration, writing review, and editing by GDR. All authors read and approved the final manuscript.
Acknowledgments
Synthesis and purification of XRK3F2 was done by the Chemical Genomics Core Facility (CGCF) at Indiana University School of Medicine. Cell death analysis was assisted by the Flow Cytometry Resource Facility (FCRF) of the IU Simon Comprehensive Cancer Center. The CoMMpass data used in this study were generated as part of the Multiple Myeloma Research Foundation Personalized Medicine Initiatives (https://research.themmrf.org and www. themmrf.org).
Funding
This work was supported by a Junior Faculty ASH Scholar Award by the American Society of Hematology (to SM); the National Institutes of Health (NCI R01CA241677 to GDR and JMC, NCI R01CA209882 to GDR and JDC, NCI R37CA251763 to JDC, KL2 TR003108 to CA, NCI F31CA284655 to HMS); the Veteran Administration (VA Merit 2I01CX000623-05 to GDR), and the Arkansas COBRE program (NIGMS P20GM125503 to JDC). The content is solely the responsibility of the authors and does not represent the official views of the National Institutes of Health or the US Department of
Haematologica | 109 May 2024 1511 ARTICLE - Targeting p62 increases PI efficacy in myeloma S. Marino et al.
Veterans Affairs.
Data-sharing statement
The IA15 datasets used for the analyses described in this work were downloaded from the Multiple Myeloma Research Foundation CoMMpass study (www.themmrf.org) research-
References
1. Marino S, Petrusca DN, Roodman GD. Therapeutic targets in myeloma bone disease. Br J Pharmacol. 2021;178(9):1907-1922.
2. van de Donk N, Pawlyn C, Yong KL. Multiple myeloma. Lancet. 2021;397(10272):410-427.
3. Dima D, Jiang D, Singh DJ, et al. Multiple myeloma therapy: emerging trends and challenges. Cancers (Basel). 2022;14(17):4082.
4 Garrett IR, Chen D, Gutierrez G, et al. Selective inhibitors of the osteoblast proteasome stimulate bone formation in vivo and in vitro. J Clin Invest. 2003;111(11):1771-1782.
5. Oyajobi BO, Garrett IR, Gupta A, et al. Stimulation of new bone formation by the proteasome inhibitor, bortezomib: implications for myeloma bone disease. Br J Haematol. 2007;139(3):434-438.
6. Giuliani N, Morandi F, Tagliaferri S, et al. The proteasome inhibitor bortezomib affects osteoblast differentiation in vitro and in vivo in multiple myeloma patients. Blood. 2007;110(1):334-338.
7 Mukherjee S, Raje N, Schoonmaker JA, et al. Pharmacologic targeting of a stem/progenitor population in vivo is associated with enhanced bone regeneration in mice. J Clin Invest. 2008;118(2):491-504.
8. Marino S, Roodman GD. Multiple myeloma and bone: the fatal interaction. Cold Spring Harb Perspect Med. 2018;8(8):a031286.
9 Tao J, Srinivasan V, Yi X, et al. Bone-targeted bortezomib inhibits bortezomib-resistant multiple myeloma in mice by providing higher levels of bortezomib in bone. J Bone Miner Res. 2022;37(4):629-642.
10. van Anken E, Bakunts A, Hu CA, Janssens S, Sitia R. Molecular evaluation of endoplasmic reticulum homeostasis meets humoral immunity. Trends Cell Biol. 2021;31(7):529-541.
11. Shim SM, Choi HR, Sung KW, et al. The endoplasmic reticulumresiding chaperone BiP is short-lived and metabolized through N-terminal arginylation. Sci Signal. 2018;11(511):eaan0630.
12. Varshavsky A. The N-end rule pathway and regulation by proteolysis. Protein Sci. 2011;20(8):1298-1345.
13. Cha-Molstad H, Sung KS, Hwang J, et al. Amino-terminal arginylation targets endoplasmic reticulum chaperone BiP for autophagy through p62 binding. Nat Cell Biol. 2015;17(7):917-929.
14 Kwon DH, Park OH, Kim L, et al. Insights into degradation mechanism of N-end rule substrates by p62/SQSTM1 autophagy adapter. Nat Commun. 2018;9(1):3291.
15. Yoo YD, Mun SR, Ji CH, et al. N-terminal arginylation generates a bimodal degron that modulates autophagic proteolysis. Proc Natl Acad Sci U S A. 2018;115(12):E2716-e2724.
16. Kumar AV, Mills J, Lapierre LR. Selective autophagy receptor p62/SQSTM1, a pivotal player in stress and aging. Front Cell Dev Biol. 2022;10:793328.
17 Teramachi J, Silbermann R, Yang P, et al. Blocking the ZZ domain of sequestosome1/p62 suppresses myeloma growth
er gateway. The GDS4968 dataset used for the analyses described in this work was downloaded from NCBI’s Gene Expression Omnibus (GEO) is a public archive. The datasets used and analyzed to support the conclusions of this article are available from the corresponding author upon reasonable request.
and osteoclast formation in vitro and induces dramatic bone formation in myeloma-bearing bones in vivo. Leukemia. 2016;30(2):390-398.
18. Adamik J, Silbermann R, Marino S, et al. XRK3F2 inhibition of p62-ZZ domain signaling rescues myeloma-induced GFI1-driven epigenetic repression of the Runx2 gene in pre-osteoblasts to overcome differentiation suppression. Front Endocrinol (Lausanne). 2018;9:344.
19 Hiruma Y, Honjo T, Jelinek DF, et al. Increased signaling through p62 in the marrow microenvironment increases myeloma cell growth and osteoclast formation. Blood. 2009;113(20):4894-4902.
20 Goodall ML, Fitzwalter BE, Zahedi S, et al. The autophagy machinery controls cell death switching between apoptosis and necroptosis. Dev Cell. 2016;37(4):337-349.
21. Hennig P, Fenini G, Di Filippo M, Karakaya T, Beer HD. The pathways underlying the multiple roles of p62 in inflammation and cancer. Biomedicines. 2021;9(7):707.
22. Komatsu M. p62 bodies: Phase separation, NRF2 activation, and selective autophagic degradation. IUBMB Life. 2022;74(12):1200-1208.
23. Marino S, Bishop RT, Logan JG, Mollat P, Idris AI. Pharmacological evidence for the bone-autonomous contribution of the NFκB/β-catenin axis to breast cancer related osteolysis. Cancer Lett. 2017;410:180-190.
24. Petrusca DN, Mulcrone PL, Macar DA, et al. GFI1-dependent repression of SGPP1 increases multiple myeloma cell survival. Cancers (Basel). 2022;14(3):772.
25. Chou TC. Drug combination studies and their synergy quantification using the Chou-Talalay method. Cancer Res. 2010;70(2):440-446.
26. Shlomovitz I, Zargarian S, Erlich Z, Edry-Botzer L, Gerlic M. Distinguishing necroptosis from apoptosis. Methods Mol Biol. 2018;1857:35-51.
27. Sabol HM, Ferrari AJ, Adhikari M, et al. Targeting notch inhibitors to the myeloma bone marrow niche decreases tumor growth and bone destruction without gut toxicity. Cancer Res. 2021;81(19):5102-5114.
28. Moscat J, Diaz-Meco MT. p62 at the crossroads of autophagy, apoptosis, and cancer. Cell. 2009;137(6):1001-1004.
29 Jourdan M, Tarte K, Legouffe E, et al. Tumor necrosis factor is a survival and proliferation factor for human myeloma cells. Eur Cytokine Netw. 1999;10(1):65-70.
30 Hayden MS, Ghosh S. Regulation of NF-κB by TNF family cytokines. Semin Immunol. 2014;26(3):253-266.
31. Novack DV. Role of NF-κB in the skeleton. Cell Res. 2011;21(1):169-182.
32. Hideshima T, Ikeda H, Chauhan D, et al. Bortezomib induces canonical nuclear factor-kappaB activation in multiple myeloma cells. Blood. 2009;114(5):1046-1052.
33. Milan E, Perini T, Resnati M, et al. A plastic SQSTM1/p62-
Haematologica | 109 May 2024 1512 ARTICLE - Targeting p62 increases PI efficacy in myeloma S. Marino et al.
dependent autophagic reserve maintains proteostasis and determines proteasome inhibitor susceptibility in multiple myeloma cells. Autophagy. 2015;11(7):1161-1178.
34. Zhang Y, Mun SR, Linares JF, et al. ZZ-dependent regulation of p62/SQSTM1 in autophagy. Nat Commun. 2018;9(1):4373.
35. Lopez-Corral L, Corchete LA, Sarasquete ME, et al. Transcriptome analysis reveals molecular profiles associated with evolving steps of monoclonal gammopathies. Haematologica. 2014;99(8):1365-1372.
36. Sha Z, Schnell HM, Ruoff K, Goldberg A. Rapid induction of p62 and GABARAPL1 upon proteasome inhibition promotes survival before autophagy activation. J Cell Biol. 2018;217(5):1757-1776.
37. Cha-Molstad H, Yu JE, Feng Z, et al. p62/SQSTM1/ Sequestosome-1 is an N-recognin of the N-end rule pathway which modulates autophagosome biogenesis. Nat Commun. 2017;8(1):102.
38. Bertheloot D, Latz E, Franklin BS. Necroptosis, pyroptosis and apoptosis: an intricate game of cell death. Cell Mol Immunol. 2021;18(5):1106-1121.
39 Goodall ML, Cramer SD, Thorburn A. Autophagy complexes cell death by necroptosis. Oncotarget. 2016;7(32):50818-50819.
40 Feldmann F, Schenk B, Martens S, Vandenabeele P, Fulda S. Sorafenib inhibits therapeutic induction of necroptosis in acute leukemia cells. Oncotarget. 2017;8(40):68208-68220.
41. Cho Y, McQuade T, Zhang H, Zhang J, Chan FK. RIP1-dependent and independent effects of necrostatin-1 in necrosis and T cell activation. PLoS One. 2011;6(8):e23209.
42. Gong Y, Fan Z, Luo G, et al. The role of necroptosis in cancer biology and therapy. Mol Cancer. 2019;18(1):100.
43. Sánchez-Martín P, Saito T, Komatsu M. p62/SQSTM1: ‘Jack of all trades’ in health and cancer. FEBS J. 2019;286(1):8-23.
44 Najafov A, Chen H, Yuan J. Necroptosis and cancer. Trends Cancer. 2017;3(4):294-301.
45. Neumeister P, Schulz E, Pansy K, Szmyra M, Deutsch AJ. Targeting the microenvironment for treating multiple myeloma. Int J Mol Sci. 2022;23(14):7627.
46. Bernstein ZS, Kim EB, Raje N. Bone disease in multiple myeloma: biologic and clinical implications. Cells. 2022;11(15):2308.
47. Wallington-Beddoe CT, Bennett MK, Vandyke K, et al. Sphingosine kinase 2 inhibition synergises with bortezomib to target myeloma by enhancing endoplasmic reticulum stress. Oncotarget. 2017;8(27):43602-43616.
48. Xu G, Liu K, Anderson J, et al. Expression of XBP1s in bone marrow stromal cells is critical for myeloma cell growth and osteoclast formation. Blood. 2012;119(18):4205-4214.
49 Ninkovic S, Harrison SJ, Quach H. Glucose-regulated protein 78 (GRP78) as a potential novel biomarker and therapeutic target in multiple myeloma. Expert Rev Hematol. 2020;13(11):1201-1210.
50 Ravindran S, Gao Q, Ramachandran A, et al. Stress chaperone GRP-78 functions in mineralized matrix formation. J Biol Chem. 2011;286(11):8729-8739.
Haematologica | 109 May 2024 1513 ARTICLE - Targeting p62 increases PI efficacy in myeloma S. Marino et al.
Factors associated with refractoriness or early progression after idecabtagene vicleucel in patients with relapsed/ refractory multiple myeloma:
US Myeloma Immunotherapy Consortium real world experience
Hamza Hashmi,1 Doris K. Hansen,2 Lauren C. Peres,2 Omar Castaneda Puglianini,2 Ciara Freeman,2 Gabriel De Avila,2 Surbhi Sidana,3 Leyla Shune,4 Douglas W. Sborov,5 James Davis,1 Charlotte Wagner,5 Mehmet H. Kocoglu,6 Shebli Atrash,7 Peter Voorhees,7 Gary Simmons,8 Christopher Ferreri,9 Nilesh Kalariya,9 Larry D. Anderson Jr,10 Aimaz Afrough,10 Danai Dima,11 Jack Khouri,11 Joseph McGuirk,4 Frederick L. Locke ,2 Rachid Baz,2 Krina K. Patel9 and Melissa Alsina2
1Medical University of South Carolina, Charleston, SC; 2H. Lee Moffitt Cancer Center & Research Institute, Tampa, FL; 3Stanford University School of Medicine, Stanford, CA; 4The University of Kansas Medical Center, Kansas City, KA; 5The University of Utah Huntsman Cancer Institute, Salt Lake City, UT; 6University of Maryland Marlene and Stewart Greenebaum Comprehensive Cancer Center, Baltimore, MD; 7Levine Cancer Institute, Charlotte, NC; 8Virginia Commonwealth University Massey Cancer Center, Richmond, VA; 9The University of Texas MD Anderson Cancer Center, Houston, TX; 10UT Southwestern Harold C. Simmons Comprehensive Cancer Center, Dallas, TX and 11Cleveland Clinic, Cleveland, OH, USA
Abstract
Correspondence: H. Hashmi hashmih@musc.edu
M. Alsina melissa.alsina@moffitt.org
Received: July 7, 2023.
Accepted: October 9, 2023.
Early view: October 19, 2023.
https://doi.org/10.3324/haematol.2023.283888
©2024 Ferrata Storti Foundation
Published under a CC BY-NC license
While response rates and survival outcomes have been very promising for idecabtagene vicleucel (ide-cel), a proportion of patients do not respond or relapse early after this B-cell maturation antigen (BCMA) targeted chimeric antigen receptor (CAR) T-cell therapy. Understanding the characteristics of these patients is important for patient selection and development of novel strategies to improve outcomes. We evaluated factors associated with early progression (progression or death due to myeloma ≤3 months after CAR T-cell infusion) in patients treated with standard of care ide-cel at 11 US academic centers. Among 211 patients that received ide-cel, 43 patients had a progressive event ≤3 months of infusion. Patients with a history of extramedullary disease, prior BCMA targeted therapy, elevated ferritin at lymphodepletion, use of bridging therapy, Hispanic ethnicity, plasma cell leukemia and t(4;14) were more likely to progress ≤3 months of infusion (P<0.05). Of these risk factors for early progression identified in univariate analyses, history of extramedullary disease, prior BCMA targeted therapy, elevated ferritin at lymphodepletion, plasma cell leukemia, and t(4;14) were associated with worse progression-free survival (PFS) in multivariable analysis. Presence of three or more of these factors had a significant negative impact on PFS (P<0.001; median PFS for ≥3 factors, 3.2 months vs. 0 factors, 14.1 months). This study helps identify patients at high risk of early progression after CAR T-cell therapy who may benefit from specific interventions pre and post CAR T-cell therpy to improve outcomes.
Introduction
Patients with relapsed/refractory multiple myeloma (RRMM) to all three classes of drugs including immunomodulatory agents (IMiD), proteasome inhibitors (PI), and anti-CD38 monoclonal antibodies have poor prognosis with a median progression-free survival (PFS) of 3 to 4 months and an overall survival (OS) ranging from 5.6 to 13 months.1,2 For these RRMM patients, the B-cell maturation antigen (BCMA) targeted chimeric antigen receptor (CAR) T-cell therapy idecabtagene vicleucel (ide-cel) has demonstrated remarkable
efficacy and reasonable safety leading to approval from the Food and Drug Agency in March 2021 for commercial use in patients with ≥4 prior lines of therapy including an IMiD, PI, and anti-CD38 monoclonal antibody.3 In the pivotal phase II KarMMa trial, patients infused with ide-cel demonstrated an overall response rate (ORR) of 73%, ≥ complete response (CR) rate of 33%, median PFS of 8.6 months, and median OS of 24.8 months.4 The US Myeloma CAR T consortium has previously published real-world outcomes for patients with RRMM treated with commercially available standard of care (SOC) ide-cel.5 A majority of the patients receiving
Haematologica | 109 May 2024 1514 - Plasma Cell Disorders ARTICLE
ide-cel in the analysis did not meet the eligibility criteria of the KarMMa trial; however, efficacy and safety outcomes were fairly comparable between the real-world and clinical trial settings. While response rates and survival outcomes have been very promising, a proportion of patients do not respond or relapse early after ide-cel. In the KarMMA trial, lower CAR T-cell dose and less than very good partial response (VGPR) were factors associated with inferior PFS.3 However, lower CAR T-cell doses used in earlier cohorts of the trial are not reflective of the higher target cell dose administered with the commercial product in clinical practice. Similarly, depth of response determined after administration of CAR T-cell therapy is not an actionable predictor of progression for CAR T. A multivariate analysis of the depth of response identified immunglobulin (Ig)G heavy chain, high serum BCMA, and elevated prothrombin time-international normalized test as negative correlates of complete remission (CR)/stringent CR, and high vector copy number as a positive correlate of CR/sCR.6 In the CARTITUDE-1 trial that led to the commercial approval of a second BCMA targeted CAR T-cell therapy for RRMM in February 2022; advanced stage disease, high-risk cytogenetics and high tumor burden were associated with shortened duration of response (DOR).7,8 Identification of risk factors associated with early progression after CAR T-cell therapy in the real-world setting is important to help guide patient selection and development of novel strategies to improve outcomes, as well as to spare patients who would not derive benefit from this treatment, its potential toxicities, and costs of therapy. To this end, we evaluated factors associated with early progression (≤3 months after CAR T-cell infusion) for patients treated with SOC ide-cel.
Methods
Study treatment and data collection
This was a multicenter retrospective analysis of patients with RRMM who received SOC ide-cel from April 1, 2021, to May 1, 2022, at one of 11 US medical centers. Institutional review board approval was obtained independently by each center.
Following leukapheresis, patients were observed or received bridging treatment with chemotherapy or radiation therapy at the discretion of the treating physician. Lymphodepleting chemotherapy was administered on days -5 through -3 with SOC cyclophosphamide 300 mg/m2 and fludarabine 30 mg/ m2 or renally-dose adjusted per institutional guidelines. Cytokine release syndrome (CRS) and immune-effector cell-associated neurotoxicity syndrome (ICANS) were graded as per the American Society for Transplantation and Cellular Therapy criteria.9 Hematologic toxicities were graded as per Common Terminology Criteria for Adverse Events, Version 5.0. Response to therapy was assessed by each institution as per International Myeloma Working Group
criteria.10 Supportive care measures including infectious disease prophylaxis, use of growth factors, and treatment of CRS and ICANS were managed per institutional guidelines. For this analysis, early progression was defined as a progressive event or death due to myeloma that occurred ≤3 months from infusion. Because of this, we excluded any patient that did not have an event and did not reach 3 months of follow-up time as we cannot be certain whether they did or did not progress ≤3 months of infusion. Any patient that died ≤3 months due to other causes (not myeloma) were included in the cohort of patients that did not progress ≤3 months from infusion. We investigated differences in patient, disease, and CAR T-cell therapy related characteristics as well as safety and efficacy by early progression using χ2 or Kruskal-Wallis tests.
Two survival outcomes were considered, OS and PFS. OS was calculated as the time between the date of CAR T-cell infusion and date of death from any cause or last contact. PFS was calculated as the time between the date of CAR T-cell infusion and date of progression, death (any cause), or last contact. We performed multivariable Cox proportional hazard regression to examine the association of the risk factors associated with early progression at P<0.05 with OS and PFS. We additionally created a variable summing the early progression risk factors that remained statistically significant in the multivariable analyses and examined the association of this variable (0, 1, 2, or ≥3 factors) with OS and PFS using Kaplan-Meier survival curves, log-rank tests, and Cox proportional hazard regression models. All statistical tests were two-sided and P values of <0.05 were considered statistically significant. Statistical analyses were conducted using R version 4.2.2.
Results
Patients and treatment
As of May 1, 2022, 215 patients had received ide-cel and 211 patients had at least 3 months follow-up available, with a median follow-up of 9.9 months. Of those, 43 patients experienced a progressive event (progression or death due to myeloma), ≤3 months post CAR T-cell therapy, and were considered the early progression cohort, in contrast to the cohort of patients who did not progress within 3 months of CAR T-cell therapy (N=168), which served as the comparison cohort for the analysis (Figure 1).
Patient baseline characteristics are presented in Table 1 stratified by early progression. Similar to patients who did not progress within 3 months of CAR T-cell therapy, the median age of patients that progressed ≤3 months was 61 years and 65% were male. However, there were a significantly higher number of Hispanic patients in the early progression cohort (23% vs. 7.1%; P=0.03). There were no significant differences in Eastern Cooperative Oncology Group performance status (ECOG PS) ≥2 at time of lym-
Haematologica | 109 May 2024 1515 ARTICLE - Predictors of progression after CAR T for myeloma H. Hashmi et al.
phodepletion (24% vs. 15%; P=0.14), Revised International Staging System (R-ISS) stage III disease (29% vs. 27%; P=0.4), penta-refractory disease (47% vs. 42%; P=0.6) or median number of prior lines of therapy (7 vs. 6; P=0.075), between the two cohorts. A higher proportion of patients in the early progression cohort compared to the cohort that did not progress ≤3 months had received prior BCMA targeted therapy (40% vs. 21%; P=0.01), had history of extramedullary disease (EMD) (60% vs. 41%; P=0.02), and received bridging therapy (88% vs. 74%; P=0.04). High-risk cytogenetics defined by the presence of t(4;14), or t(14;16), or deletion (17p) on fluorescence in situ hybridization (FISH) were present in 42% of patients in the early progression cohort and 30% of patients in the comparison cohort (P=0.2). While this difference, and the presence of t(14;16) and deletion (17p), did not reach statistical significance, a higher number of patients in the early progression cohort had t(4:14) (21% vs. 8.9 %; P=0.04). Although the total number of patients with plasma cell leukemia that received CAR T-cell therapy were low (N=12, 6%), half of them experienced early progression. There were no differences in most baseline laboratory values between the two cohorts, including serum albumin, β2 microglobulin, lactate dehydrogenase, blood counts or C-reactive protein. However, a higher proportion of patients in the early progression cohort had ferritin levels above the upper limit of normal at the time of lymphodepletion (400 ng/mL; 60% vs. 39%; P=0.01). In summary, patients with Hispanic ethnicity, presence of t(4;14) on FISH prior to CAR T-cell therapy, plasma cell leukemia, prior use of BCMA therapy, history of extramedullary disease, use of bridging therapy, and elevated ferritin at lymphodepletion were more likely to have progressed early (≤3 months).
Safety
Adverse events for each cohort are summarized in Table 2A, B. The median duration of hospitalization for the early progression cohort was 9 days (range, 5-69), and five patients (12%) required intensive care unit level of care for toxicity management during their inpatient stay, similar
to the comparison cohort. The overall incidence of CRS for the early progression cohort was 67% and lower than in the comparison cohort, where the overall incidence of CRS was 89% (P<0.001), resulting in a smaller proportion of patients receiving tocilizumab in the early progression cohort (44% vs. 76%; P<0.001). There were no differences in median time to onset of maximum grade CRS, or grade 3-4 CRS events between the cohorts, as shown in Table 2A. In terms of ICANS, there were no differences in the incidence of all grades (20% vs. 19%; P>0.9) and grade ≥2 (15% vs. 9.3%; P=0.4) events between the cohorts. Similarly, there were no differences in rates of infection or grade ≥3 cytopenias between the cohorts on day 30 and day 90 post CAR T-cell infusion, but interestingly, a higher number of patients recovered to grade 2 or lower neutropenia by day 30 in the early progression cohort than the comparison cohort (78% vs. 59%; P=0.03). In contrast, as shown in Table 2B, there was more anemia (any grade) at days 30 and 90 amongst patients with early progression.
Efficacy
As expected, given the analysis being performed, patients in the early progression cohort had a significantly lower best ORR (42% vs. 93%), best ≥ VGPR (19% vs. 81%), best ≥ CR (7% vs. 60%), and best minimal residual disease (MRD) negative (10-5) CR (2.3% vs. 42%), than patients who did not have a progressive event ≤3 months from infusion (Figure 2). Median PFS for this cohort was understandably short at 1.9 months (95% confidence interval [CI]: 1.4-2.7) versus 10.7 months (95% CI: 9.0-12.2) (P<0.0001) for the comparison cohort, and this was also reflected in an inferior OS (median estimate 7.3 months [95% CI: 6.5-9.9] versus not reached [NR]; P<0.0001) compared to the comparison cohort (Figure 3).
Of the variables associated with progression in univariate analysis at P<0.05 (i.e., Hispanic ethnicity, presence of t(4;14) on FISH prior to CAR T-cell theraphy, plasma cell leukemia, prior use of BCMA therapy, history of EMD, use of bridging therapy, and elevated ferritin at lymphodepletion),
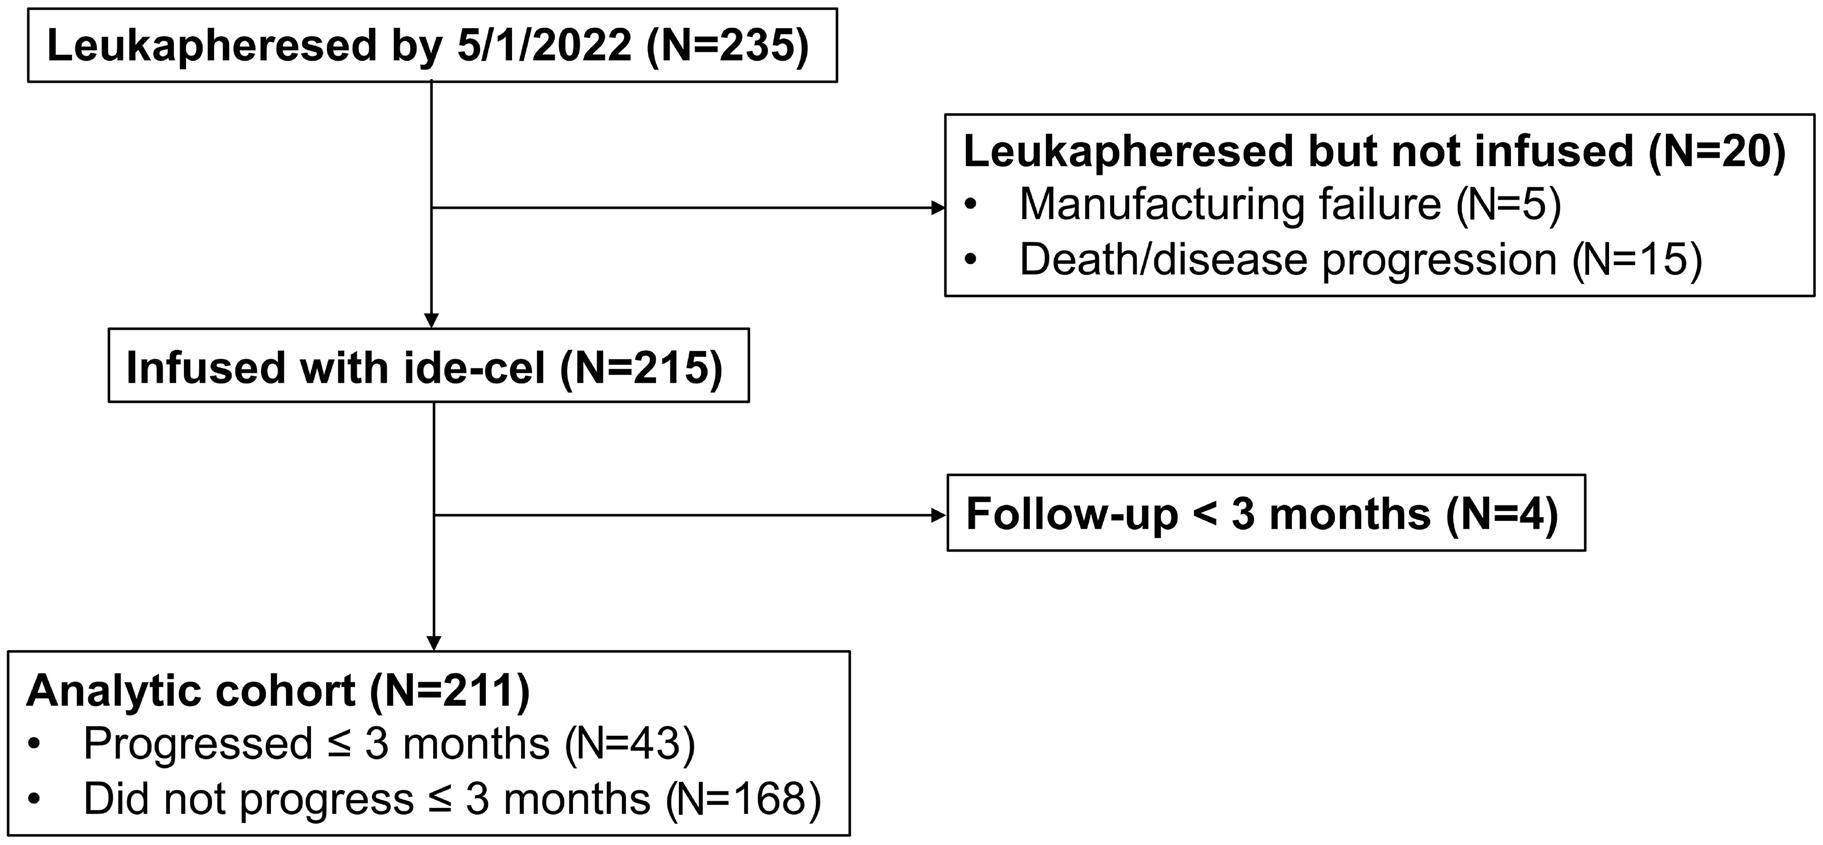
Haematologica | 109 May 2024 1516 ARTICLE - Predictors of progression after CAR T for myeloma H. Hashmi et al.
Figure 1. Consort diagram of study inclusion. Ide-cel: idecabtagene vicleucel.
Table 1. Baseline characteristics overall and by early progression.
did not meet criteria for KarMMa1
ECOG: Eastern Cooperative Oncology Group performance; RISS: Revised International Staging System; LD: lymphodepletion; IQR: inter quartile range; BCMA: B-cell maturation antigen; CRP: C-reactive protein; B2M: β-2 microglobulin; LDH: lactate dehydrogenase; ULN: upper limit of normal.
Haematologica | 109 May 2024 1517 ARTICLE - Predictors of progression after CAR T for myeloma H. Hashmi et al.
Characteristic Study cohorts P Overall N=211 Progressed ≤3 months N=43 Did not progress ≤3 months N=168 Patient age in years, median (range) [IQR] 64.0 (36.0-83.0) [57.0-69.0] 61.0 (43.0-78.0) [55.5-66.5] 65.0 (36.0-83.0) [58.0-69.0] 0.090 Male sex, N (%) 127 (60) 28 (65) 99 (59) 0.5 Race and ethnicity, N (%) Hispanic Non-Hispanic Black Other Non-Hispanic White 22 (10) 36 (17) 8 (3.8) 145 (69) 10 (23) 5 (12) 1 (2.3) 27 (63) 12 (7.1) 31 (18) 7 (4.2) 118 (70) 0.030 Plasma cell leukemia, N (%) 12 (6) 6 (14) 6 (4) 0.018 Extramedullary disease, N (%) 95 (45) 26 (60) 69 (41) 0.023 High marrow burden (>=50%), N (%) Unknown 58 (30) 17 13 (35) 6 45 (29) 11 0.4 ECOG at LD of 0-1, N (%) Unknown 169 (83) 8 31 (76) 2 138 (85) 6 0.14 R-ISS stage at CAR T infusion, N (%) I II III Unknown 37 (23) 82 (50) 44 (27) 48 5 (14) 20 (57) 10 (29) 8 32 (25) 62 (48) 34 (27) 40 0.4 High-risk cytogenetics, N (%) Unknown 60 (33) 27 16 (42) 5 44 (30) 22 0.2 t(4;14) at Infusion, N (%) Unknown 21 (11) 27 8 (21) 6 13 (8.9) 21 0.046 Deletion 17p at infusion, N (%) Unknown 40 (21) 21 10 (26) 4 30 (20) 17 0.4 t(4;16) at infusion, N (%) Unknown 7 (4) 27 1 (3) 6 6 (4) 21 >0.9 Bridging therapy, N (%) 162 (77) 38 (88) 124 (74) 0.044 N of prior lines of therapy, median (range) [IQR] 6.0 (3.0-19.0) [5.0-9.0] 7.0 (4.0-18.0) [5.0-9.5] 6.0 (3.0-19.0) [5.0-8.0] 0.075 > 4 prior lines of therapy, N (%) 180 (85) 40 (93) 140 (83) 0.11 Prior treatment with BCMA-targeted therapy, N (%) 52 (25) 17 (40) 35 (21) 0.011 Triple-refractory, N (%) 176 (83) 36 (84) 140 (83) >0.9 Penta-refractory, N (%) 90 (43) 20 (47) 70 (42) 0.6 Baseline ferritin, median (range) [IQR] 345.0 (9.0-27,260.0) [124.5-959.5] 635.0 (15.4-4,960.0) [228.5-1,704.5] 283.5 (9.0-27,260.0) [116.0-752.8] 0.013 Ferritin >ULN at LD (400 ng/mL), N (%) 91 (43) 26 (60) 65 (39) 0.010 Baseline CRP, median (range) [IQR] 0.9 (0.0-286.0) [0.4-3.7] 1.5 (0.1-84.4) [0.4-7.6] 0.8 (0.0-286.0) [0.4-3.4] 0.3 Baseline B2M, median (range) [IQR] Unknown 3.0 (0.7-15.3) [2.4-4.6] 64 3.1 (1.6-13.5) [2.5-4.9] 8 3.0 (0.7-15.3) [2.3-4.6] 56 0.6 Patient
pre-CAR T, N (%) 160 (76) 37 (86) 123 (73) 0.079 Albumin pre-infusion, median (range) [IQR] 3.6 (1.7-4.8) [3.2-4.0] 3.6 (2.1-4.7) [3.3-4.0] 3.7 (1.7-4.8) [3.2-3.9] 0.7 LDH pre-infusion, median (range) [IQR] Unknown 216.5 (78.0-1,597.0) [173.2-275.0] 1 217.0 (93.0-1,597.0) [177.0-295.0] 0 216.0 (78.0-1,408.0) [173.0-266.5] 1 0.7
Table 2. SAFETY: Incidence and severity of cytokine release syndrome, immune cell effector associated neurotoxicity syndrome and cytopenias overall and by early progression.
Haematologica | 109 May 2024 1518 ARTICLE - Predictors of progression after CAR T for myeloma H. Hashmi et al.
Characteristic Study cohorts P Overall N=211 Progressed ≤3 months N=43 Did not progress ≤3 months N=168 Any CRS, N (%) 179 (85) 29 (67) 150 (89) <0.001 CRS grade, N (%) No CRS Grade 1 or 2 Grade ≥3 32 (15) 173 (82) 6 (2.8) 14 (33) 27 (63) 2 (4.7) 18 (11) 146 (87) 4 (2.4) 0.001 Relative day of max. CRS (relative to infusion), median (range) [IQR] 1.0 (0.0-21.0) [1.0-2.0] 1.0 (0.0-13.0) [1.0-2.0] 1.0 (0.0-21.0) [1.0-2.0] 0.4 Any ICANS, N (%) Unknown 39 (19) 10 8 (20) 3 31 (19) 7 >0.9 ICANS grade, N (%) No ICANS Grade 1 or 2 Grade ≥3 Unknown 162 (81) 26 (13) 13 (6.5) 10 32 (80) 3 (7.5) 5 (12) 3 130 (81) 23 (14) 8 (5.0) 7 0.2 Relative day of max. ICANS (relative to infusion), median (range) [IQR] 3.0 (0.0-36.0) [2.0-4.0] 4.0 (0.0-24.0) [1.5-9.0] 3.0 (0.0-36.0) [2.0-4.0] 0.4 Length of hospital stay (total days including readmission), median (range) [IQR] 9.0 (5.0-69.0) [8.0-14.0] 9.0 (5.0-69.0) [8.0-13.5] 9.0 (5.0-68.0) [8.0-14.0] 0.7 ICU admission, N (%) 18 (8.5) 5 (12) 13 (7.7) 0.4 Tocilizumab, N (%) 146 (69) 19 (44) 127 (76) <0.001 Steroid use, N (%) 57 (27) 10 (23) 47 (28) 0.5 Anakinra use, N (%) 9 (4) 5 (12) 4 (2) 0.02 Infection, N (%) 68 (32) 15 (35) 53 (32) 0.7 Day 30 cytopenia Anemia, N (%) Any grade Grade ≥3 Unknown 168 (82) 38 (18) 5 38 (95) 6 (15) 3 130 (78) 32 (19) 2 0.015 0.5 Thrombocytopenia, N (%) Any grade Grade ≥3 Unknown 182 (88) 92 (45) 5 38 (95) 16 (40) 3 144 (87) 76 (46) 2 0.2 0.5 Neutropenia, N (%) Any grade Grade ≥3 Unknown 136 (66) 76 (37) 6 21 (52) 9 (22) 3 115 (70) 67 (41) 3 0.039 0.033
90 cytopenia Anemia, N (%) Any grade Grade ≥3 Unknown 113 (63) 15 (8.3) 31 19 (83) 3 (13) 20 94 (60) 12 (7.6) 11 0.035 0.4 Thrombocytopenia, N (%) Any grade Grade ≥3 Unknown 114 (63) 41 (23) 31 18 (78) 7 (30) 20 96 (61) 34 (22) 11 0.11 0.3 Neutropenia, N (%) Any grade Grade≥ 3 Unknown 68 (38) 24 (13) 32 9 (39) 5 (22) 20 59 (38) 19 (12) 12 >0.9 0.2 CRS: cytokine release syndrome; ICANS: immune cell effector associated neurotoxicity syndrome; IQR: interquartile range; ICU: intensive care unit.
Day
multivariable analysis showed that patients with history of EMD (hazard ratio [HR] =1.71, 95% CI: 1.16-2.51), prior BCMA targeted therapy (HR=1.64, 95% CI: 1.08-2.50), elevated ferritin at lymphodepletion (HR=1.95, 95% CI: 1.33-2.88), plasma cell leukemia (HR=4.27, 95% CI: 2.06-8.87) and t(4;14) (HR=1.82; 95% CI: 1.07-3.09) were associated with worse PFS (Table 3). Similarly, patients with EMD (HR=1.69, 95% CI: 1.00-2.86), elevated ferritin at lymphodepletion (HR=2.56, 95% CI: 1.514.35), plasma cell leukemia (HR=3.97, 95% CI: 1.66-9.46) were associated with worse OS (Table 3). Taking into account the early progression risk factors associated with PFS in the multivariable analysis (history of EMD, prior BCMA targeted therapy, elevated ferritin at lymphodepletion, plasma cell leukemia, and t(4;14)), patients with a higher number of these risk factors had inferior PFS (P< 0.001; ≥3 risk factors, 3.2 months vs. 2 risk factors, 4.6 months vs. 1 risk factor, 9.6 months vs. 0 risk factors, 14.1 months; Figure 4A). A similar pattern was observed for the association of the number of early progression risk factors with OS (P<0.001; Figure 4B).
Discussion
To our knowledge, this is the largest study of RRMM patients receiving ide-cel in the real-world setting evaluating factors
associated with early progression or failure of CAR T-cell therapy. While patient and disease related characteristics predictive of early progression have been an area of interest in pivotal trials of CAR T-cell therapy,4-7 there have been no clearly established measurable and potentially actionable or modifiable risk factors associated with early progression after CAR T-cell therapy for myeloma.
In the pivotal trial evaluating ide-cel in RRMM, a lower cell dose and less than VGPR as best response were associated with an inferior PFS.3 There was no difference in outcomes among patients with high-risk features, including advanced stage disease, extramedullary myeloma, and high-risk cytogenetics. This could be related to the relatively small number of patients included in the trial. In a subgroup analysis of phase II KarMMa trial participants,6 elevated serum BCMA levels at baseline and presence of EMD were negatively associated with attainment of CR/sCR post CAR T-cell therapy. However, serum soluble BCMA assays are not readily available and hence their utility in routine clinical practice remains unclear. On the contrary, in the CARTITUDE 1 trial; ISS stage III disease, high-risk cytogenetics, EMD and high tumor burden were associated with shortened duration of response and a lower PFS and OS,8 similar to the results reported in our study. A recent meta-analysis of 17 studies including 723 patients with RRMM that received
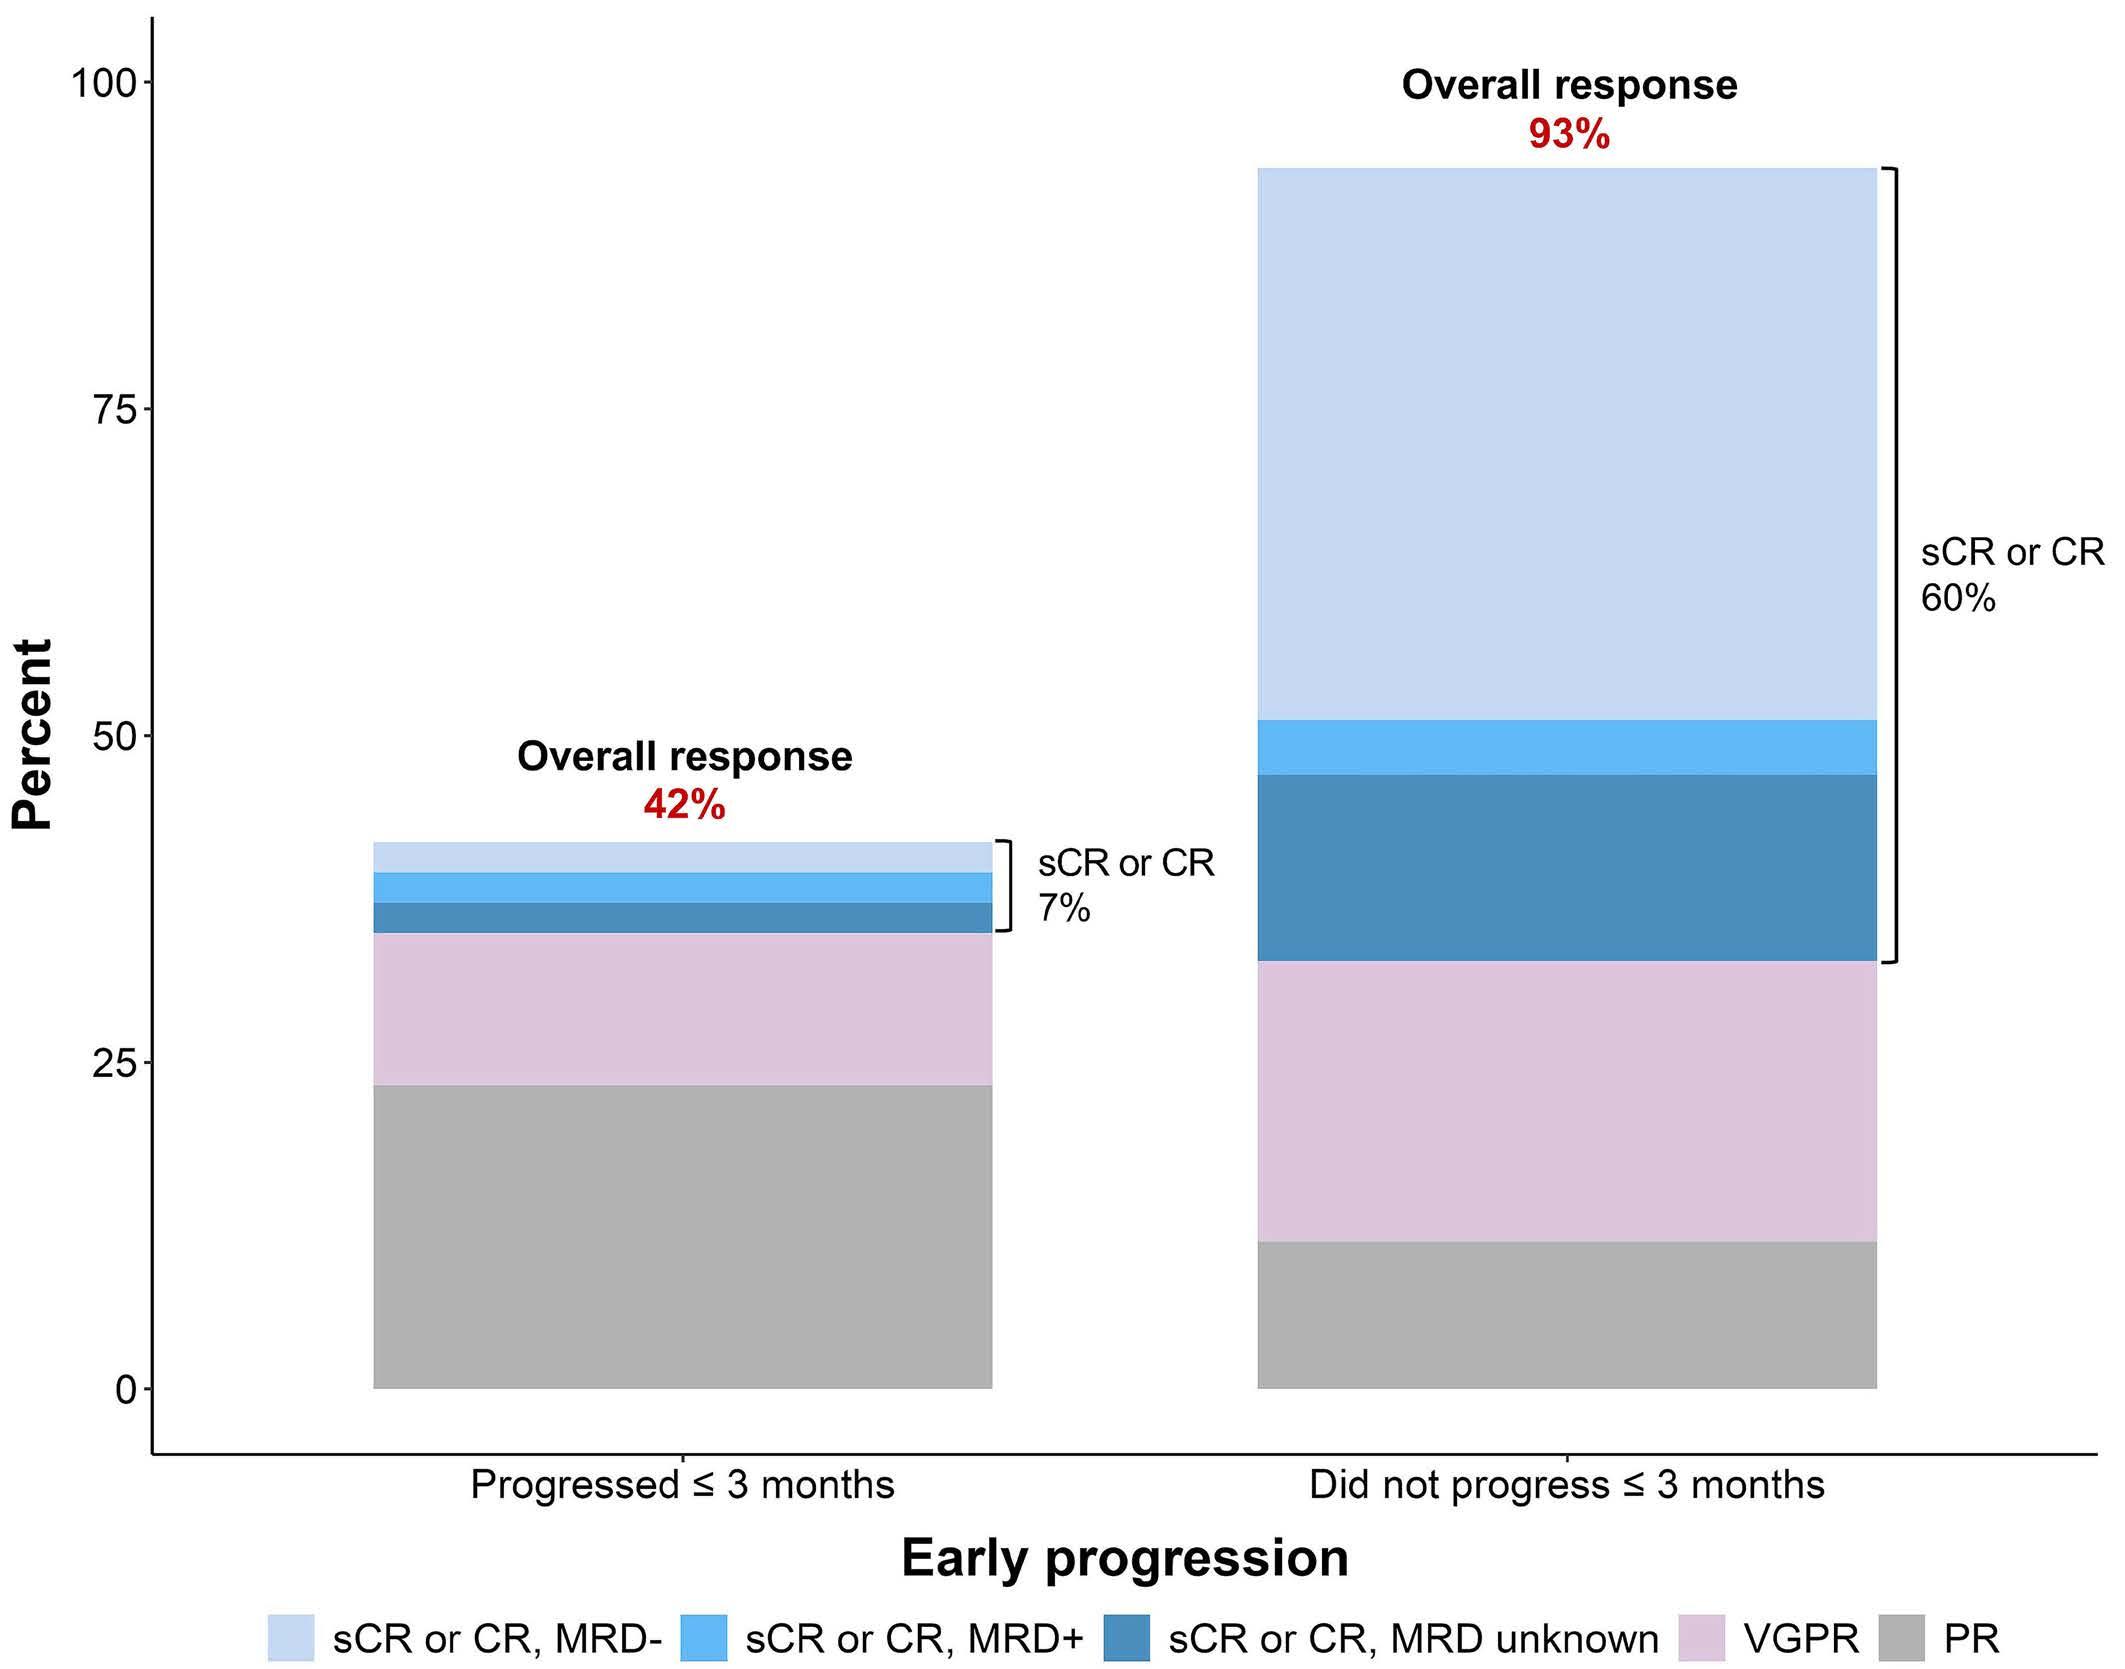
Figure 2. Best response by early progression. Any patient who was not evaluable by International Myeloma Working Group criteria or was missing a response but reached day 30 was considered as a partial response (PD) response. CR: complete response; sCR: stringent complete response; VGPR: very good partial response; MRD: minimal residual disease.
Haematologica | 109 May 2024 1519 ARTICLE - Predictors of progression after CAR T for myeloma H. Hashmi et al.
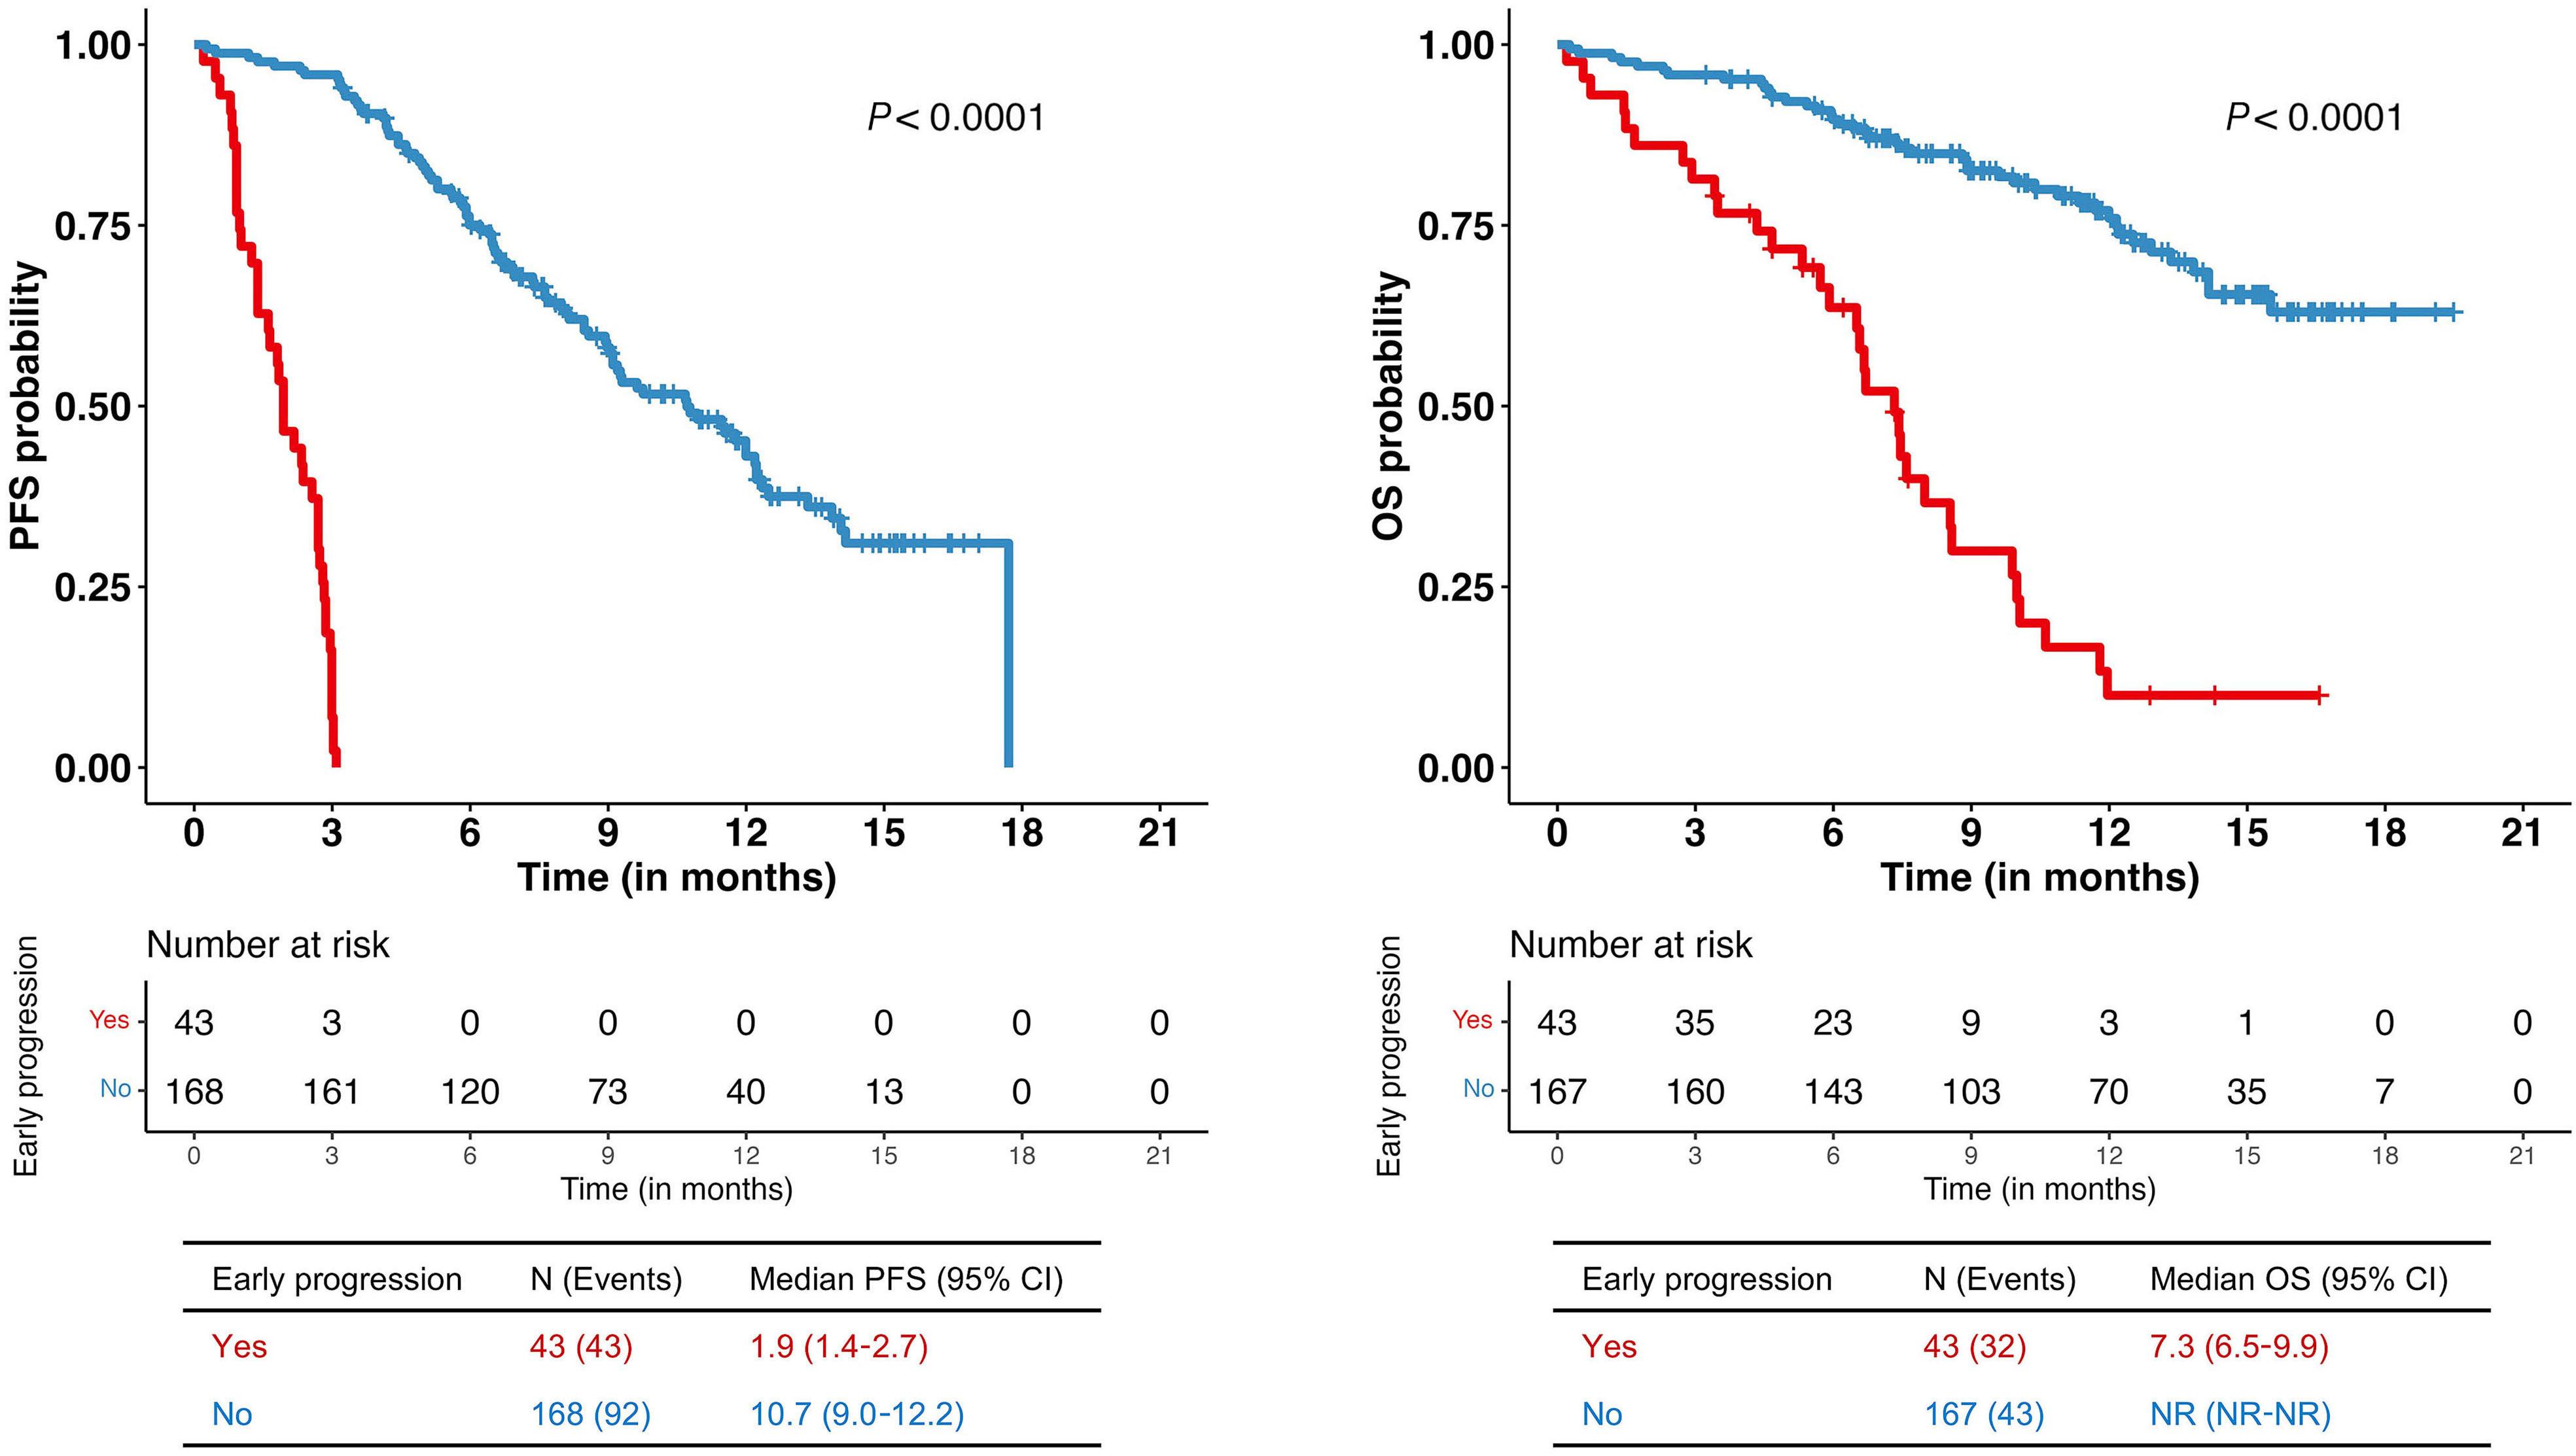
Figure 3. Survival analysis by early progression. (A) Kaplan-Meier survival curve of progression-free survival (PFS) by early progression. (B) Kaplan-Meier survival curve of overall survival (OS) by early progression. The P value is from a log-rank test of the association of early progression with PFS and OS. CI: confidence interval, NR: not reached.
Table 3. Multivariable analysis of the association of early progression risk factors with progression-free survival and overall survival.
HR: hazard ratio; CI: confidence interval; BCMA: B-cell maturation antigen; Ref.: referent; LD: lymphodepletion chemotherapy; ULN: upper limit of normal.
Haematologica | 109 May 2024 1520 ARTICLE - Predictors of progression after CAR T for myeloma H. Hashmi et al.
A B Early progression risk factors PFS OS N (N event) HR (95% CI) P N (N event) HR (95% CI) P Prior BCMA therapy No Yes 135 (79) 49 (38) 1.00 Ref. 1.64 (1.08-2.50) 0.02 134 (42) 49 (23) 1.00 Ref. 1.56 (0.90-2.71) 0.1 Extramedullary disease No Yes 100 (53) 84 (64) 1.00 Ref. 1.71 (1.16-2.51) 0.006 99 (28) 84 (37) 1.00 Ref. 1.69 (1.00-2.86) 0.048 Baseline ferritin at LD Normal ≥ULN 100 (53) 84 (64) 1.00 Ref. 1.95 (1.33-2.88) <0.001 100 (22) 83 (43) 1.00 Ref. 2.56 (1.51-4.35) <0.001 Bridging therapy No Yes 40 (19) 144 (98) 1.00 Ref. 1.42 (0.84-2.38) 0.2 40 (6) 143 (59) 1.00 Ref. 2.23 (0.94-5.26) 0.07 Race and ethnicity Non-Hispanic White Non-Hispanic Black Hispanic Other 126 (81) 33 (21) 19 (12) 6 (3) 1.00 Ref. 1.48 (0.90-2.46) 1.15 (0.60-2.17) 0.56 (0.18-1.81) 0.1 0.7 0.3 126 (45) 32 (12) 19 (7) 6 (1) 1.00 Ref. 1.45 (0.75-2.79) 1.45 (0.61-3.25) 0.27 (0.04-2.04) 0.3 0.4 0.2 Plasma cell leukemia No Yes 175 (108) 9 (9) 1.00 Ref. 4.27 (2.06-8.87) <0.001 174 (58) 9 (7) 1.00 Ref. 3.97 (1.66-9.46) 0.002 t(4;14) at infusion No Yes 163 (98) 21 (19) 1.00 Ref. 1.82 (1.07-3.09) 0.03 162 (52) 21 (13) 1.00 Ref. 1.58 (0.80-3.11) 0.2
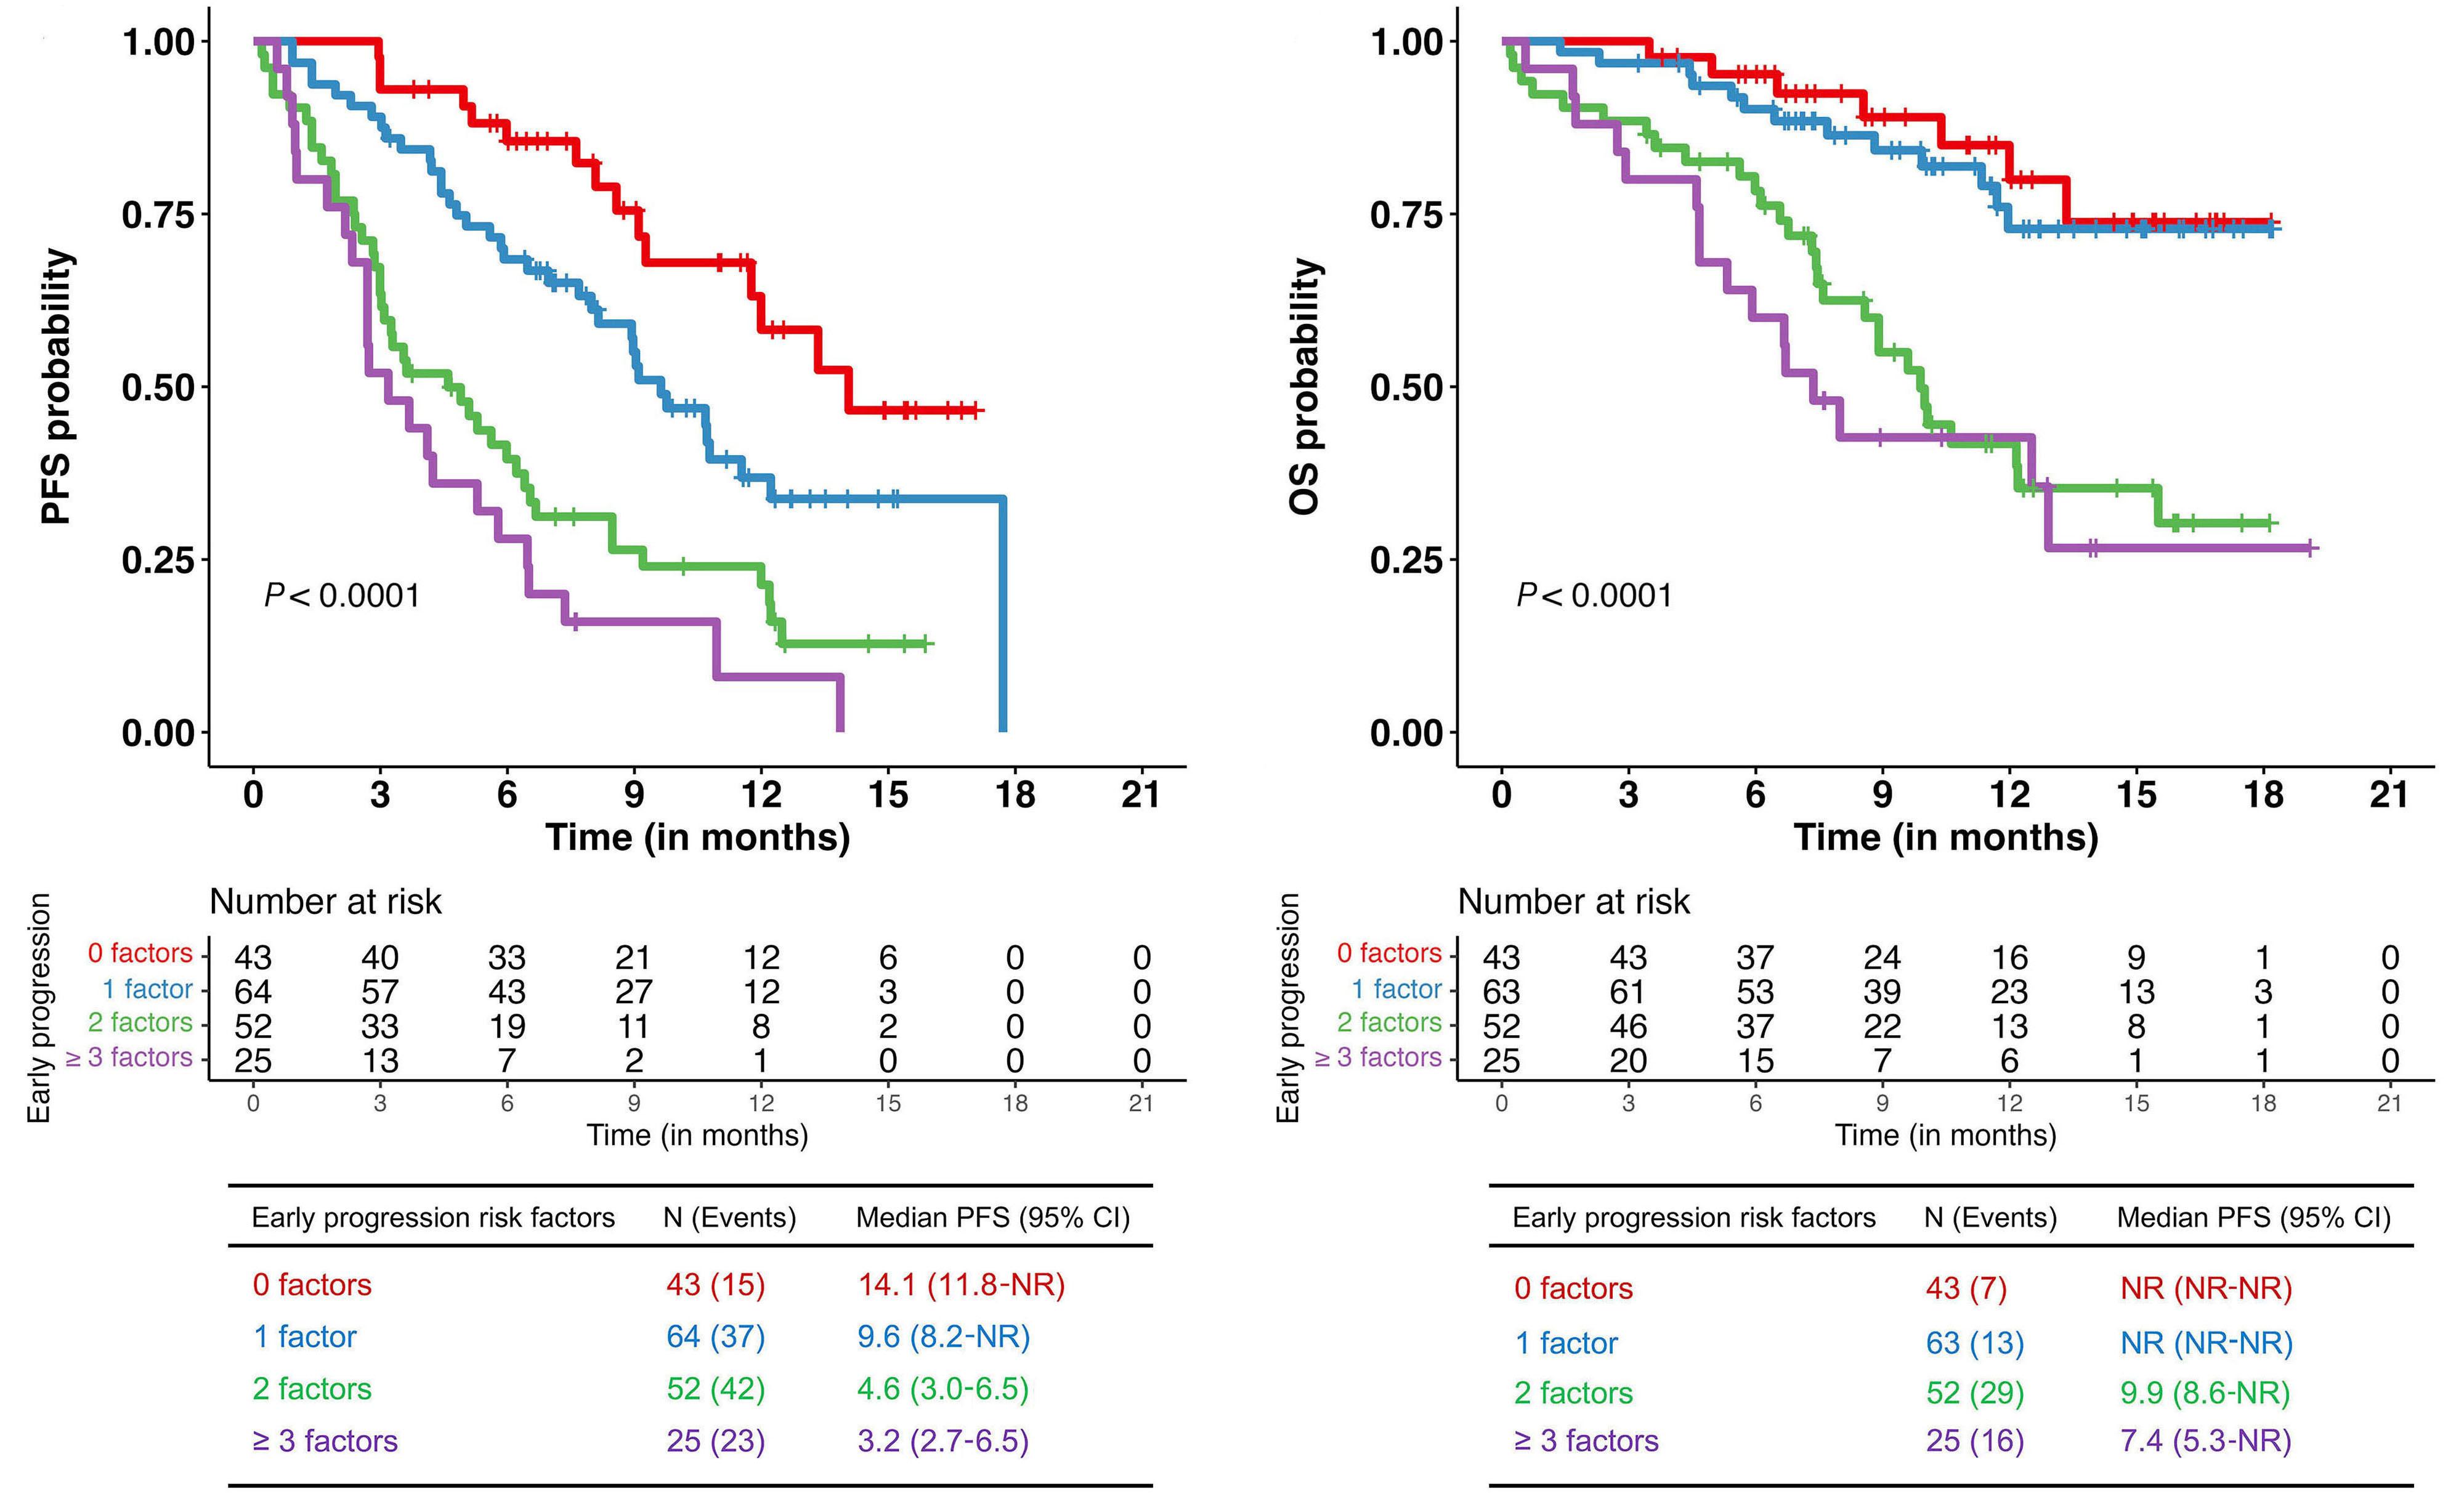
Figure 4. Survival analysis by number of early progression risk factors. (A) Kaplan-Meier survival curve of progression-free survival (PFS) by number of early progression risk factors. (B) Kaplan-Meier survival curve of overall survival (OS) by number of early progression risk factors. Early progression risk factors included prior B-cell maturation antigen therapy, extramedullary disease, baseline ferritin, plasma cell leukemia, and t(4;14). The P value is from a log-rank test examining the association of the number of early progression risk factors (0, 1, 2, ≥3 factors) with PFS and OS. CI: confidence interval; NR: not reached.
BCMA targeted CAR T-cell therapy revealed that the high risk cytogenetics and presence of EMD at the time of CAR T-cell infusion were associated with worse outcomes.11 While our analysis identified several patient and disease related factors associated with early progression, we focused on risk factors that had a statistically significant impact on PFS in the multivariable analysis. Hispanic ethnicity was one of these risk factors where when compared to the other racial and ethnic groups, Hispanic patients were more likely to progress early. However, race and ethnicity were not associated with PFS or OS after adjusting for other early progression risk factors in the multivariable analysis. These findings may be due to the small number of Hispanic patients in our study or differences in highrisk features across race and ethnicity.12 Presence of t(4;14) cytogenetic abnormality as well as plasma cell leukemia were considered inherent part of disease biology and not modifiable risk factors prior to CAR T-cell infusion. It remains important that these risk factors are identified as early as time of initial consultation and leukapheresis for CAR T-cell therapy. This will not only offer prognostic information for the patients undergoing treatment but also help plan consolidation/maintenance strategies.
In two of the previous studies from this consortium,13 it was shown that prior BCMA targeted therapy was associated with inferior depth and duration of response. One study also showed that with a shorter duration of exposure to the prior BCMA targeted therapy and a significantly longer time from the last BCMA targeted therapy exposure to leukapheresis as well as ide-cel infusion, patients seemed to achieve better outcomes with ide-cel as a sequential therapy. In the present study, the median time to ide-cel infusion from last exposure to BCMA targeted therapy was 202.5 days (range, 16-1,118) for all patients, 201 days (range, 32-425) for those with early progression, and 238 days (range, 16-1,118) for those without early progression. These inferior outcomes seen in patients with prior BCMA exposure could potentially be explained by emergence of clones with loss of BCMA leading to acquired resistance to retreatment with BCMA targeted therapy, as postulated in a previously reported case.14 Loss of BCMA expression in these patients could not be confirmed due to the retrospective nature of the study. While it seems prudent to avoid exposure to BCMA targeted therapy as the last line of therapy prior to CAR T-cell infusion, it is not always possible to avoid exposure to other BCMA targeted therapy for
Haematologica | 109 May 2024 1521 ARTICLE - Predictors of progression after CAR T for myeloma H. Hashmi et al.
A B
triple class refractory myeloma patients in need of urgent therapy. Hence, exposure to alternative non BCMA therapies after BCMA targeted cellular therapy and before ide-cel, as a ‘BCMA free treatment interval,’ may help mitigate the negative impact of prior BCMA targeted therapy exposure. There also remains a need for future research to explore techniques for sensitive and deep sequencing of BCMA locus prior to sequential BCMA targeted therapies. Elevated ferritin at the time of lymphodepletion, after bridging therapy and before CAR-T cell infusion, is a marker of systemic inflammation. It has been previously shown that a high tumor burden is associated with worse efficacy outcomes among patients with large cell lymphoma.15 Similarly, high metabolic tumor volume was found to be associated with an increased risk of CAR T-cell therapy specific adverse events and inferior outcomes in patients with RRMM receiving CAR T-cell therapy.16 These patients with high metabolic tumor volume have immune dysregulation characterized by significantly higher levels of serum inflammatory markers and tumor interferon signaling.17 This leads to poor CAR T-cell expansion and persistence explaining inferior outcomes in comparison to patients who had a lower baseline state of inflammation.17 While we did not collect samples for measurement of specific inflammatory cytokines, tumor microenvironment, and metabolic tumor volumes; this deleterious state of inflammation as measured by serum ferritin level prior to lymphodepletion may have utility as a predictive marker of early disease progression.
With an improvement in OS in the era of novel therapeutics, there is an increasing incidence of EMD for MM, especially at the time of relapse. Based on meta-analysis by Blade et al., high-risk cytogenetics and EMD have been associated with worse outcomes after CAR T-cell therapy for RRMM18 and our study also confirms the negative impact of EMD on post CAR T-cell therpy outcomes. The underlying pathophysiology is complex and may be explained by systemic inflammation and a more suppressive tumor microenvironment associated with large and highly avid tumors on positron emission tomography. Based on one reported study,19 prior EMD remains the predominant site of post CAR T-cell therapy relapse, raising the possibility of EMD as site of immunological sanctuary susceptible to tumor relapse. Tumor-driven inhibition of T-cell function, whether it be T cells collected for manufacture or the CAR T cells themselves after infusion, adds to the effector: target disparity because large tumors as seen in EMD require the highest expansion of CAR T for deep and durable responses. While this indeed highlights the need for more effective bridging therapy including radiotherapy for maximum debulking prior to CAR T-cell infusion, this novel goal of effective disease control may not be attainable in many patients. Investigating the mechanisms of CAR T-cell trafficking and exhaustion in patients with EMD will be essential to optimizing responses to CAR T cells and may
identify factors leading to the rare responses to therapy as seen in our study.
Univariable analysis showed that patients who did not receive bridging therapy had better outcomes. The need for bridging therapy is dependent on disease status (response to last line of therapy, disease burden, site of disease, and rate of progression) prior to CAR T-cell therapy that dictates how long the patient can wait after leukapheresis and before CAR T-cell infusion without clinically significant disease progression impairing organ function.20 For patients with low disease burden, absence of EMD as well as low baseline systemic inflammatory state as measured by ferritin, bridging therapy may not be necessary. However, this represents a minority of patients, and given that bridging therapy did not have a significant impact on PFS in the multivariable analysis, the decision needs to be carefully evaluated on an individual basis. Plasma cell leukemia is a rare and aggressive plasma cell disorder associated with dismal prognosis despite frontline multiagent chemoimmunotherapy and hematopoietic stem cell transplantation.17
Enrollment of these patients in clinical trials is not always feasible partly due to the relative paucity of specific studies on plasma cell leukemia due to aggressive disease biology and poor prognosis, highlighting the critical need for prospective trials for this especially challenging high-risk subgroup. Although the number of patients who received SOC ide-cel was small, it is important to highlight that at least half of them did not experience early progression despite aggressive disease biology. Further exploration of the role of immunotherapies (CAR T cells, bispecific T-cell engagers, antibody-drug conjugates) with dedicated clinical trials in the treatment landscape of plasma cell leukemia as well as inclusion of these patients in MM clinical trials is much needed and eagerly awaited. Presence of t(4;14), but not any other high-risk cytogenetic abnormalities, was predictive of early progression after CAR T-cell therapy. This could again be related to a small number of patients with individual high-risk cytogenetic abnormalities as well as more than 10% of the patients with missing information on cytogenetic abnormalities prior to CAR T-cell infusion. Further research is needed to confirm these findings and elucidate potential causes of cytogenetic differences in CAR T-cell therapy response in larger sample sizes of diverse and high risk RRMM patients treated with SOC ide-cel. The study also revealed the interesting finding that patients who had early progression experienced a lower incidence of CRS and early recovery from cytopenias. This could be explained by the less robust expansion of CAR T cells and immunological reactivity leading to compromised efficacy. While presence of extramedullary disease and elevated ferritin at lymphodepletion may appear as actionable risk factors prior to CAR T-cell therapy, in real-world practice there are no effective measures that can truly modify these risk factors just in time prior to CAR T and overcome the poor prognosis associated with them. However, these risk
Haematologica | 109 May 2024 1522 ARTICLE - Predictors of progression after CAR T for myeloma H. Hashmi et al.
factors do allow us to identify patients for more applicable post CAR T interventions including close surveillance for relapse, initiation of salvage therapy at the earliest signs of disease progression and consideration of maintenance therapy in future clinical trials. Moreover, use of CAR T-cell therapy in the earlier lines of therapy where patients are not as heavily pretreated, have relatively lower disease burden, and are more likely to be BCMA-naïve are likely to mitigate the negative influence of some of these risk factors of early progression after CAR T-cell therapy.
Limitations of our study include its retrospective design, small sample size, and response assessment dependent on investigator discretion. Due to the retrospective nature of a multicenter study, some of the more informative predictors of progression after CAR T-cell therapy including serum BCMA levels10 and metabolic tumor volume13 could not be measured or reported. Despite the largest real-world experience of CAR T-cell therapy for RRMM, a small number of patients had a progressive event, and it remains possible that some of the predictors of early progression could not reach a statistically significant impact on outcomes. Future studies with SOC ide-cel in RRMM should focus on mechanisms of relapse, sequential treatment with other BCMA and non BCMA targeted agents, long-term outcomes including risk of infections and need for de-escalation/cessation of therapy based on quality of response, as well as comparative analyses of the safety and efficacy of other BCMA targeted bispecifics.
Conclusion
Per this multicenter retrospective study, prior use of BCMA therapy, presence of EMD, elevated ferritin at lymphodepletion, plasma cell leukemia, and t(4;14) are potential predictors of early progression after CAR T-cell therapy for RRMM. Presence of three or more of these factors negatively impacted PFS and OS.
Disclosures
HH reports consulting or advisory role for Janssen, Bristol-Myers Squibb, Sanofi; speakers’ bureau for Sanofi, GlaxoSmithKline, and Karyopharm. SS reports consulting or advisory role for Janssen, Bristol-Myers Squibb, Magenta Therapeutics, Sanofi, Takeda, Pfizer and Legend Biotech; research funding from Janssen, Magenta Therapeutics, Allogene Therapeutics, Bristol-Myers Squibb and Novartis. LCP reports research funding from Bristol-Myers Squibb. DWS reports consulting or advisory role for Sanofi, GlaxoSmithKline, Bristol-Myers Squibb, Legend Biotech, Janssen, and Skyline Diagnostics; research funding from Janssen, BioLineRx, Sanofi, Bristol-Myers Squibb, Amgen, Cantex Pharmaceuticals, Pfizer, and Gilead Sciences. SA reports honoraria from Janssen; research funding from GlaxoSmithKline, Amgen, Karyopharm Therapeutics, Janssen, Bristol-Myers Squibb; honoraria from Janssen. CF reports consulting or advisory role for Sanofi; stock/other ownership in Affimed Therapeutics. PV reports consulting or advisory role for Oncopeptides, Abbvie/Genentech, Karyopharm Therapeu-
tics, Bristol-Myers Squibb, Secura Bio, Pfizer, Sanofi, Janssen, GlaxoSmithKline; research funding from Abbvie, Janssen, GlaxoSmithKline, and TeneoBio; travel, accommodations, and expenses from Sanofi. RB reports consulting or advisory role for Bristol-Myers Squibb, Abbvie, Janssen, GlaxoSmithKline, Takeda, and Pfizer; research funding from Bristol-Myers Squibb, Abbvie, Karyopharm, and Janssen; member of independent response assessment committee for GlaxoSmithKline. JK reports honoraria from OncLive. MA reports consulting or advisory role for Bristol-Myers Squibb and Janssen; speaker’s bureau for Janssen; honoraria from Janssen. JM reports honoraria from Kite Pharma, Juno Therapeutics, Allovir, Magenta Therapeutics, and EcoR1 Capital; speakers bureau for Kite/Gilead; research funding from Novartis, Fresenius Biotech, Astellas Pharma, Bellicum Pharmaceuticals, Novartis, Gamida Cell, Pluristem Therapeutics, Kite Pharma, and AlloVir; Honoraria from Kite, AlloVir, Juno Therapeutics, and Magenta Therapeutics; travel, accommodations, expenses from Kita Pharma. FLL reports a scientific advisory role for Allogene, Amgen, Bluebird Bio, BMS/Celgene, Calibr, Cellular Biomedicine Group, GammaDelta Therapeutics, Iovance, Kite Pharma, Janssen, Legend Biotech, Novartis, Sana, Takeda, Wugen and Umoja; research funding from Kite Pharma (institutional), Allogene (institutional), Novartis (institutional), Blue-Bird Bio (institutional), CERo Therapeutics (institutional), and BMS (institutional); patents, royalties, and other intellectual property including several patents held by the institution in his name (unlicensed) in the field of cellular immunotherapy; consulting roles for Cowen, EcoR1, Emerging Therapy Solutions, and Gerson Lehrman Group (GLG); and education or editorial activity for Aptitude Health, ASH, BioPharma Communications CARE Education, Clinical Care Options Oncology, Imedex, and Society of Immunotherapy of Cancer. KKP reports consulting or advisory role for Bristol-Myers Squibb, Janssen, Pfizer, Arcellx, and Karyopharm Therapeutics; research funding from Bristol-Myers Squibb, Poseida Therapeutics, Takeda, Janssen, Cellectis, Nektar, Abbvie/Genentech, Precision Biosciences, and Allogene Therapeutics; travel, accommodations, and expenses from Bristol-Myers Squibb. DKH reports research funding from Bristol-Myers Squibb, Janssen, and Adaptive Biotech and consulting or advisory role for Bristol-Myers Squibb, Janssen, and Pfizer. MA reports research funding from Bristol-Myers Squibb, and honoraria from Janssen and Bristol-Myers Squibb. The remaining authors have no conflicts of interest to disclose.
Contributions
HH, LCP, MA were involved in conception, data collection, data analysis, manuscript writing, and manuscript revision. DKH, OCP, CF, GDA, SS, LS, DWS, JD, CW, MHK, SA, PV, GS, CG, NK, LDA, AA, DD, JK, JM, FL, RB and KKP were involved in data collection and critical review for the manuscript.
Data-sharing statement
The investigators agree to share the de-identified data upon reasonable request addressed to the corresponding authors.
Haematologica | 109 May 2024 1523 ARTICLE - Predictors of progression after CAR T for myeloma H. Hashmi et al.
References
1. Gandhi UH, Cornell RF, Lakshman A, et al. Outcomes of patients with multiple myeloma refractory to CD38-targeted monoclonal antibody therapy. Leukemia. 2019;33(9):2266-2275.
2. Mikhael J. Treatment options for triple-class refractory multiple myeloma. Clin Lymphoma Myeloma Leuk. 2020;20(1):1-7.
3. Munshi NC, Anderson LD, Jr., Shah N, et al. Idecabtagene vicleucel in relapsed and refractory multiple myeloma. N Engl J Med. 2021;384(8):705-716.
4 Larry D. Anderson J, Munshi NC, Shah N, et al. Idecabtagene vicleucel (ide-cel, bb2121), a BCMA-directed CAR T cell therapy, in relapsed and refractory multiple myeloma: updated KarMMa results. J Clin Oncol. 2021;39(Suppl 15):8016.
5. Hansen DK, Sidana S, Peres LC, et al. Idecabtagene vicleucel for relapsed/refractory multiple myeloma: real-world experience from the Myeloma CAR T Consortium. J Clin Oncol. 2023;41(11):2087-2097.
6. Shah N, Munshi NC, Berdeja JG, et al. Baseline correlates of complete response to idecabtagene vicleucel (ide-cel, bb2121), a BCMA-directed CAR T cell therapy in patients with relapsed and refractory multiple myeloma: subanalysis of the KarMMa Trial. Blood. 2021;138(Suppl 1):1739.
7 Berdeja JG, Madduri D, Usmani SZ, et al. Ciltacabtagene autoleucel, a B-cell maturation antigen-directed chimeric antigen receptor T-cell therapy in patients with relapsed or refractory multiple myeloma (CARTITUDE-1): a phase 1b/2 open-label study. Lancet. 2021;398(10297):314-324.
8. Martin T, Usmani SZ, Berdeja JG, et al. Ciltacabtagene autoleucel, an anti–B-cell maturation antigen chimeric antigen receptor T-cell therapy, for relapsed/refractory multiple myeloma: CARTITUDE-1 2-year follow-up. J Clin Oncol. 2023;41(6):1265-1274.
9 Lee DW, Santomasso BD, Locke FL, et al. ASTCT consensus grading for cytokine release syndrome and neurologic toxicity associated with immune effector cells. Biol Blood Marrow Transplant. 2019;25(4):625-638.
10. Kumar S, Paiva B, Anderson KC, et al. International Myeloma Working Group consensus criteria for response and minimal residual disease assessment in multiple myeloma. Lancet
Oncol. 2016;17(8):e328-e346.
11. Gagelmann N, Ayuk FA, Klyuchnikov E, Wolschke C, Berger SC, Kröger N. Impact of high-risk disease on efficacy of CAR-T cell therapy for multiple myeloma: a meta-analysis of 723 patients. Haematologica. 2023;108(10):2799-2802.
12. Peres LC, Oswald LB, Dillard C, et al. Racial and ethnic differences in clinical outcomes among multiple myeloma patients treated with CAR T therapy. Blood. 2022;140(Suppl 1):623-625.
13. Ferreri CJ, Hildebrandt MAT, Hashmi H, et al. Real-world experience of patients with multiple myeloma receiving ide-cel after a prior BCMA-targeted therapy. Blood Cancer J. 2023;13(1):117
14 Samur MK, Fulciniti M, Aktas Samur A, et al. Biallelic loss of BCMA as a resistance mechanism to CAR T cell therapy in a patient with multiple myeloma. Nat Commun. 2021;12(1):868.
15. Locke FL, Rossi JM, Neelapu SS, et al. Tumor burden, inflammation, and product attributes determine outcomes of axicabtagene ciloleucel in large B-cell lymphoma. Blood Adv. 2020;4(19):4898-4911.
16. Villanueva R, Hansen DK, Tonseth RP, et al. High metabolic tumor volume Is associated with higher toxicity and decreased efficacy of BCMA CAR-T cell therapy in multiple myeloma. Blood. 2022;140(Suppl 1):10402-10404.
17 Jain MD, Faramand R, Staedtke V, et al. The lymphoma tumor microenvironment influences toxicity after CD19 CAR T cell therapy. Blood. 2019;134(Suppl 1):4105.
18. Bladé J, Beksac M, Caers J, Jurczyszyn A, et al. Extramedullary disease in multiple myeloma: a systematic literature review. Blood Cancer J. 2022;12(3):45.
19. Richard S, Lancman G, Rossi A, et al. Extramedullary relapse post CAR-T. Blood. 2022;140(Suppl 1):4301-4302.
20 Jain MD, Jacobs MT, Nastoupil LJ, et al. Characteristics and outcomes of patients receiving bridging therapy while awaiting manufacture of standard of care axicabtagene ciloleucel CD19 chimeric antigen receptor (CAR) T-cell therapy for relapsed/ refractory large B-cell lymphoma: results from the US Lymphoma CAR-T Consortium. Blood. 2019;134(Suppl 1):245.
Haematologica | 109 May 2024 1524 ARTICLE - Predictors of progression after CAR T for myeloma H. Hashmi et al.
A prospective, multicenter study on hematopoietic stemcell mobilization with cyclophosphamide plus granulocyte colony-stimulating factor and ‘on-demand’ plerixafor in multiple myeloma patients treated with novel agents
Roberto Mina,1 Maria Teresa Petrucci,2 Francesca Bonello,3 Velia Bongarzoni,4 Riccardo Saccardi,5 Giuseppe Bertuglia,1 Andrea Mengarelli,6 Andrea Spadaro,7 Chiara Lisi,2 Paola Curci,8 Roberto Massimo Lemoli,9,10 Stelvio Ballanti,11 Rita Floris,12 Luca Cupelli,13 Patrizia Tosi,14 Attilio Olivieri,15 Delia Rota-Scalabrini,3 Clotilde Cangialosi,16 Chiara Nozzoli,5 Barbara Anaclerico,4 Francesca Fazio,2 Benedetto Bruno,1 Katia Mancuso,17,18 Paolo Corradini,19 Giuseppe Milone7 and Mario Boccadoro20
1Division of Hematology, AOU Città della Salute e della Scienza di Torino, University of Torino and Department of Molecular Biotechnology and Health Sciences, University of Torino, Torino; 2Hematology, Department of Translational and Precision Medicine, Azienda Ospedaliera Policlinico Umberto I, Sapienza University of Rome, Rome; 3Medical Oncology Department, Candiolo Cancer Institute, FPO-IRCCS, Candiolo; 4U.O.C. Ematologia, Azienda Ospedaliera “San Giovanni/Addolorata”, Roma; 5Cellular Therapy and Transfusion Medicine Unit, Careggi University Hospital, Florence; 6Hematology and Stem Cell Transplant Unit, IRCCS Regina Elena National Cancer Institute, Rome; 7Division of Hematology, AOU Policlinico, University of Catania, Catania; 8Unit of Hematology and Stem Cell Transplantation, AOUC Policlinico, Bari; 9Clinic of Hematology, Department of Internal Medicine (DiMI), University of Genoa, Genova; 10IRCCS Policlinico San Martino, Genova; 11Sezione di Ematologia e Immunologia Clinica, Ospedale Santa Maria della Misericordia, località Sant’Andrea delle Fratte, Perugia; 12S.C. Ematologia e CTMO, Ospedale Oncologico “A. Businco”, Cagliari; 13Department of Hematology, S. Eugenio Hospital, Rome; 14Hematology Unit, Infermi Hospital, Rimini; 15Clinica di Ematologia, Azienda Ospedaliero Universitaria delle Marche, Ancona; 16U.O.C. Ematologia, A.O. Ospedali Riuniti Villa Sofia-Cervello, Palermo; 17IRCCS Azienda Ospedaliero-Universitaria di Bologna, Istituto di Ematologia “Seràgnoli”, Bologna; 18Dipartimento di Scienze Mediche e Chirurgiche, Università di Bologna, Bologna; 19Fondazione IRCCS Istituto Nazionale dei Tumori Milano, Università di Milano, Milano and 20Department of Molecular Biotechnology and Health Sciences, University of Torino, Torino, Italy
Abstract
Correspondence: R. Mina roberto.mina@unito.it
Received: September 13, 2023.
Accepted: November 7, 2023.
Early view: November 16, 2023.
https://doi.org/10.3324/haematol.2023.284023
©2024 Ferrata Storti Foundation
Published under a CC BY-NC license
High-dose melphalan plus autologous stem cell transplantation (ASCT) is a standard of care for transplant-eligible patients with newly diagnosed multiple myeloma (NDMM), and adequate hematopoietic stem cell (HSC) collection is crucial to ensure hematologic recovery after ASCT. In this prospective, observational study we evaluated HSC mobilization with granulocyte colony-stimulating factor (G-CSF), cyclophosphamide, and ‘on-demand’ plerixafor (in patients with <20×106 CD34+ cells/L after at least 4 days of G-CSF or failing to collect ≥1×10⁶ CD34+ cells/kg after the first apheresis) in NDMM patients treated with novel agent-based induction therapy. The primary endpoint was the rate of poor mobilizers (patients collecting <2×10⁶ CD34+ cells/kg or requiring plerixafor rescue to reach an adequate HSC harvest). Secondary endpoints included the rate of patients collecting ≥2×10⁶ CD34+ cells/kg after plerixafor administration and the identification of factors predicting mobilization failure or plerixafor need. Overall, 301 patients (median age 60 years) were enrolled. Two hundred and eighty-seven of 301 (95%) and 274 of 301 (93%) patients collected ≥2×10⁶ and ≥4×10⁶ CD34+ cells/kg, respectively, with a
Haematologica | 109 May 2024 1525 - Plasma Cell Disorders ARTICLE
median of 9.9×10⁶ CD34+ cells/kg collected. Poor mobilizers were 48 of 301 (16%): 34 of 301 (11%) required plerixafor rescue, and 14 of 301 (5%) failed HSC collection regardless of plerixafor. Thirty-four of 38 (90%) patients receiving plerixafor collected ≥2×10⁶ CD34+ cells/kg. Bone marrow plasmacytosis at diagnosis >60% (odds ratio [OR]=4.14), lenalidomide use (OR=4.45), and grade 3-4 hematologic toxicities during induction (OR=3.53) were independently associated with a higher risk of mobilization failure or plerixafor need. Cyclophosphamide plus G-CSF and ‘on-demand’ plerixafor is an effective strategy in NDMM patients treated with novel agents, resulting in a high rate of HSC collection and high HSC yield (clinicaltrials gov. identifier: NCT03406091).
Introduction
Treatment intensification with high-dose melphalan (HDM) and autologous stem cell transplantation (ASCT) after multi-drug, novel agent-based induction therapy currently represents the standard of care for transplant-eligible (TE) patients with newly diagnosed multiple myeloma (NDMM).1 Based on the results of the randomized, phase III STAMINA and EMN02/HO95 studies, tandem autologous transplant can be offered to patients with high-risk cytogenetics.1-3 At relapse, salvage ASCT proved to be beneficial when incorporated into a novel agent-based salvage strategy and is therefore a potential option for patients who experienced a prolonged remission after upfront ASCT.4,5 The hematologic recovery after myeloablative chemotherapy depends on the dose of stem cell progenitors infused, while the minimum collection goal to ensure adequate bone marrow (BM) recovery is 2×10⁶ CD34+ cells/kg for a single transplant. Therefore, a collection goal of at least 4-5×10⁶ CD34+ cells/kg is necessary to proceed to ASCT and ensure the possibility of a tandem transplant in highrisk patients or a salvage transplant at relapse.1,6 Standard stem cell mobilization strategies include steadystate mobilization with granulocyte colony-stimulating factor (G-CSF) only or conventional chemotherapy (mainly cyclophosphamide 2-4 g/m2) plus G-CSF.7,8 Despite the use of both strategies, up to 15-20% of NDMM patients fail to collect a minimum number of hematopoietic stem cells (HSC) to proceed to ASCT.7
Plerixafor is a CXC chemokine receptor 4 (CXCR4) antagonist that prompts the release of HSC from the BM in the peripheral blood (PB) by disrupting the interaction between CXCR4 and chemokine stromal cell-derived factor-1α (SDF-1α). Plerixafor is approved for HSC mobilization in MM and lymphoma patients, as it demonstrated to increase the efficiency of HSC mobilization, with a higher CD34+ cell yield, lower failure rates, and a reduced number of aphereses.9,10 Approximately 50-70% of NDMM patients who underwent mobilization with G-CSF only, and 10-20% of patients who underwent chemo-mobilization required the use of plerixafor for successful HSC collection.11-15 The wide use of novel agents such as lenalidomide and anti-CD38 monoclonal antibodies (mAb; e.g., daratumumab and isatuximab) during the induction phase may impact stem cell collection.16 A French study showed that the use
of plerixafor was four times higher with the administration of lenalidomide upfront, as compared with thalidomide.17 Furthermore, a recent analysis of the MASTER and GRIFFIN trials showed that the incorporation of daratumumab into induction treatment resulted in an approximately 2-fold increase in the rate of patients requiring plerixafor, as compared with daratumumab-free regimens.18
Different strategies concerning the use of plerixafor for stem cell mobilization have been developed and adopted by different institutions, from its ‘on-demand’ or ‘just-in-time’ use (plerixafor administered according to a risk-adapted strategy based on either the number of PB CD34+ cells before the apheresis or the first CD34+ stem cell yield)19-21 to a ‘pre-emptive’ strategy in patients at high risk of stemcell mobilization failure.18
Data regarding the efficacy of plerixafor as rescue medication during HSC mobilization with chemotherapy plus G-CSF in the era of novel agents are limited, and few prospective studies, mainly conducted before the implementation of lenalidomide and anti-CD38 mAb in the induction treatment of NDMM patients, have systematically assessed factors influencing HSC mobilization.
Here we present the results of a prospective, multicenter, observational study conducted to evaluate HSC mobilization with cyclophosphamide plus G-CSF and ‘on-demand’ plerixafor in NDMM patients treated with novel agent-based induction regimens and to identify predictive factors for poor mobilization and the need for plerixafor administration.
Methods
Study design and participants
MOZOBL06877 (clinicaltrials gov. identifier: NCT03406091) is a multicenter, prospective, observational study conducted in 17 Italian centers between November 2015 and January 2021. This study enrolled TE NDMM patients aged 18 years or older, who received induction therapy containing novel agents, and underwent HSC mobilization with cyclophosphamide (2-4 g/m2) plus G-CSF (5-10 mcg/kg/day) and ‘on-demand’ plerixafor as per local policy. Patients with relapsed and/or refractory (RR) MM, patients who underwent mobilization with chemotherapy other than cyclophosphamide or with G-CSF only, and patients who had failed a previous mobilization attempt were not eligible for
Haematologica | 109 May 2024 1526 ARTICLE - Cyclophosphamide-G-CSF-on-demand plerixafor in MM R. Mina et al.
enrollment in this study.
We collected data on baseline patient and disease characteristics (including age, sex, MM isotype and stage, cytogenetic risk detected by fluorescent in situ hybridization [FISH], percentage of BM plasma cells, BM function, and renal function), type and duration of induction therapy, response rates and grade 3-4 hematologic adverse events (AE) during the induction phase, and time to stem cell mobilization. We also collected details concerning mobilization strategy, number of PB CD34+ cells on the first day of counting and before and after plerixafor administration, total number of CD34+ harvested cells, number of apheresis days, plerixafor use (number of administrations, dose delivered, reasons for administration), and occurrence of AE during the mobilization phase and up to 30 days after the end of apheresis.
The study protocol was approved by the independent ethics committees or institutional review boards at each of the participating centers. All patients gave written, informed consent before participating in the study, which was conducted in accordance with the Declaration of Helsinki and the International Conference on Harmonization Good Clinical Practice Guideline. This study is registered as clinicaltrials gov. identifier: NCT03406091
Stem cell mobilization and harvesting
HSC were mobilized with intravenous cyclophosphamide at the dose of 2-4 g/m2 at day 0, followed by G-CSF at 5-10 mcg/kg/day starting from day +5 until the end of HSC harvesting. According to the label and institutional practice, ‘on-demand’ plerixafor could be administered in patients with <20×106 CD34+ cells/L after at least 4 consecutive days of G-CSF or in patients failing to collect ≥1×10⁶ CD34+ cells/ kg after the first apheresis day. Plerixafor was administered at the dose of 240 mcg/kg/day (or 160 mcg/kg/day in case of renal impairment) as a subcutaneous injection 6-11 hours prior to the initiation of the subsequent apheresis, for up to 5 days until the HSC harvest target was reached. Collection failure was defined as a CD34+ stem cell collection <2×10⁶ CD34+ cells/kg.
Endpoints: definition and assessment
The primary endpoint was to determine the rate of poor-mobilizing patients, defined as the rate of patients collecting <2×10⁶ CD34+ cells/kg or who required ‘on-demand’ plerixafor to reach an adequate HSC harvest. Secondary endpoints included the rate of patients who collected ≥2×10⁶ or ≥4×10⁶ CD34+ cells/kg overall, with and without ‘on-demand’ plerixafor; the rate of patients who received ‘on-demand’ plerixafor; the HSC collection ‘rescue rate’ of plerixafor, defined as the rate of patients receiving plerixafor who collected ≥2×10⁶ CD34+ cells/kg; the increase in the levels of CD34+ cells after plerixafor administration; the number of CD34+ cells/kg collected per apheresis with and without plerixafor; the identification of factors
predicting a poor mobilization and the need for plerixafor administration; and the rate of grade 3-4 non-hematologic AE during mobilization.
Statistical analysis
All enrolled patients who underwent HSC mobilization with cyclophosphamide plus G-CSF and ‘on-demand’ plerixafor were included in this analysis. Discrete variables were reported as numbers and percentages. Continuous variables were summarized using median and interquartile range (IQR). The Fisher’s exact test was adopted to compare categorical variables and the Kruskal-Wallis test to compare continuous variables between groups.
A univariate analysis of factors associated with poor mobilization was performed. Starting from the variables with a P value (P)<0.05 in univariate analysis, a multivariate logistic model was identified through a backward selection based on the minimization of the Akaike information criterion. The final logistic regression model was used to estimate odds ratios (OR), 95% confidence intervals (CI), and P. All reported P were two-sided; the conventional value of 5% was adopted as significance level.
High-risk cytogenetics were defined as the presence of at least one of the following cytogenetic abnormalities detected by FISH: del(17p), t(4;14), or t(14;16).22 Disease assessment at the end of the induction phase was evaluated according to the International Myeloma Working Group response criteria.23 Incidence, categories, and severity of AE were reported according to the Common Terminology Criteria for Adverse Events Version 4.0. Cytopenia at diagnosis was defined as at least one of the following values: hemoglobin <10 g/dL, absolute neutrophil count (ANC) <1×10⁹/L, or platelets <100x109/L. Data were analyzed using R (Version 4.2.1).24
Results
Patient characteristics
Between November 2015 and January 2021, 303 TE NDMM patients were enrolled in this study, 301 of whom underwent HSC mobilization with cyclophosphamide at 2-4 g/ m2 plus G-CSF and were included in the analysis. Two patients were excluded from the analysis: one due to disease progression before HSC mobilization, and one because HSC was performed with G-CSF only, thus not meeting the inclusion criteria for enrollment.
The median age at diagnosis was 60 years (IQR, 55-64), and 142 patients (47%) were older than 60 years of age (Table 1). Among the evaluable patients (N=224), 59 (26%) had Revised International Staging System (R-ISS) stage I disease, 151 (67%) R-ISS II, and 14 (6%) R-ISS III. Highrisk cytogenetic abnormalities were detected in 43 of 158 (27%) patients with available FISH data. At diagnosis, the median value of BM plasma cells was 50% (IQR, 29-70%),
Haematologica | 109 May 2024 1527 ARTICLE - Cyclophosphamide-G-CSF-on-demand plerixafor in MM R. Mina et al.
risk assessed by FISH, N (%)
*High risk was defined as the presence of del(17p) or t(4;14) or t(14;16).
**Cytopenia was defined as Hb <10 g/dL or ANC <1×10⁹/L or PLT <100x109/L. ANC: absolute neutrophil count; del, deletion; FISH, fluorescence in situ hybridization; Hb: hemoglobin; IQR: interquartile range; ISS: International Staging System; PLT:, platelets; R-ISS: Revised International Staging System; t: translocation.
with >60% in 35% of patients <100×109/L.
The majority of patients received bortezomib-based induction therapy (N=266, 88%), mostly bortezomib-thalidomide-dexamethasone (VTd; N=241, 80%; Table 2). Lenalidomide was part of the induction regimen in 29 patients (10%), carfilzomib in 21 (7%), and daratumumab in ten (3%).
Patients received a median number of five induction cycles (IQR, 4-6) before proceeding to HSC mobilization. At the end of the induction phase, 79 patients (27%) achieved a partial response (PR), 167 (56%) a very good partial response (VGPR), and 47 (16%) a complete response (CR) or better. Twenty-seven patients (9%) experienced ≥1 grade 3-4 hematologic toxicities during induction.
The median time from diagnosis to stem cell mobilization was 6 months (IQR, 5-8), while the median time from the end of induction to cyclophosphamide administration was 30 days (IQR, 20-47).
Before mobilization, the median values of ANC, hemoglobin, and platelets were 3.1×10⁹/L (IQR, 2.34-4.32), 12.9 g/dL (IQR, 11.9-13.6), and 238.5×10⁹/L (IQR, 204-295.75), respectively.
Cyclophosphamide was administered at the dose of 2 g/ m2 in 144 patients (48%), 3 g/m2 in 73 (24%), and 4 g/m2 in 84 (28%).
Patient characteristics, induction details, and response rates before HSC mobilization are summarized in Table 2.
Hematopoietic stem cell mobilization
Overall, 287 of 301 (95%) patients collected ≥2×10⁶ CD34+ cells/kg, 253 (84%) without plerixafor administration, while 34 (11%) with ‘on-demand’ plerixafor administration (Figure 1).
Fourteen of 301 (5%) patients failed to collect ≥2×10⁶ CD34+ cells/kg; among them, four (1%) received ‘on-demand’ plerixafor, while ten (4%) did not. Regarding the primary endpoint, 48 patients (16%) were considered poor mobilizers: 14 (5%) due to HSC mobilization failure (HSC collection <2×10⁶ CD34+ cells/kg) and 34 (11%) due to the need for ‘on-demand’ plerixafor.
‘On-demand’ plerixafor was administered to 38 patients (13%): to 25 due to a pre-apheresis count of <20×106 CD34+ cells/L and to 13 due to a CD34+ stem-cell yield <1×10⁶/kg after the first apheresis. The median number of plerixafor doses administered was 1 (range, 1-3). Thirty-five (92%) patients received 0.24 mg/kg of plerixafor, while three (8%) received 0.16 mg/kg.
Among patients who received plerixafor, 34 of 38 successfully collected ≥2×10⁶ CD34+ cells/kg, while four of 38 failed HSC mobilization, resulting in an overall ‘HSC collection rescue rate’ of 90%.
Overall, patients collected a median of 9.9×10⁶ CD34+ cells/ kg (IQR, 7.7-12.8); the median HSC yield was 10.2×10⁶ CD34+ cells/kg (IQR, 8.3-13.2) in patients who did not require plerixafor and 6.5×10⁶ CD34+ cells/kg (IQR, 4.6-9.6) in those who received ‘on-demand’ plerixafor.
Among patients who did not require plerixafor (N=253), 244 (95%) collected >4×10⁶ CD34+ cells/kg, while eight (5%) collected between 2×10⁶ and 4×10⁶ CD34+ cells/kg. In the plerixafor group (N=34), 30 (88%) patients collected >4×10⁶ CD34+ cells/kg, while four (12%) between 2×10⁶ and 4×10⁶ CD34+ cells/kg. Patients who received lenalidomide-based (N=23) or daratumumab-based (N=10) induction regimens collected a median of 6.4×10⁶ and 9.75×10⁶ CD34+ cells/kg, respectively. Poor mobilizers were respectively ten (43%) and four (40%) in the lenalidomide and daratumumab groups, of whom seven (30%) and four (40%) required plerixafor administration, while three (13%) and none failed to collect ≥2×10⁶ CD34+ cells/kg in the two groups, respectively. As expected, among patients who successfully collected
Haematologica | 109 May 2024 1528 ARTICLE - Cyclophosphamide-G-CSF-on-demand plerixafor in MM R. Mina et al.
Age in years Median (IQR) ≤60, N (%) >60, N (%) 60 (55-64) 159 (53) 142 (47) Sex, N (%) Female Male 131 (44) 170 (56) Isotype, N (%) IgG IgA Bence–Jones Other Missing 191 (64) 62 (21) 33 (11) 13 (44) 2 Bone marrow plasma cells % Median % (IQR) ≤60, N (%) >60, N (%) Missing, N 50 (29-70) 183 (65) 97 (35) 21 ISS stage, N (%) I II III 174 (58) 83 (28) 44 (15) R-ISS stage, N (%) I II III Missing 59 (26) 151 (67) 14 (6) 77 Cytogenetic
Standard High* Missing 115 (73) 43 (27) 143 Cytopenia at diagnosis**, N (%) No Yes Missing 255 (85) 44 (15) 2
N=301
Table 1. Patient demographics and baseline characteristics.
Table 2. Induction treatment, disease response, and patient characteristics before hematopoietic stem cell mobilization.
after induction, N (%)
Grade 3-4 hematologic toxicity during induction, N
Pre-mobilization ANC
(IQR) ×109/L
N (%)
9/L N (%)
Pre-mobilization Hb
(IQR) g/dL
g/dL N (%)
Pre-mobilization PLT count
Median (IQR) ×109/L
N (%)
9/L N (%)
dose, N (%)
*This group includes unspecified bortezomib-based regimens, such as the following regimens: Vd (bortezomib-dexamethasone), VCd (bortezomib-cyclophosphamide-dexamethasone), and PAD (bortezomib-doxorubicin-dexamethasone). ANC: absolute neutrophil count; CR: complete response; DVCd: daratumumab-bortezomib-cyclophosphamide-dexamethasone; DVRd: daratumumab-bortezomib-lenalidomide-dexamethasone; Hb: hemoglobin; IQR, interquartile range; KCd, carfilzomib-cyclophosphamide-dexamethasone; KRd: carfilzomib-lenalidomide-dexamethasone; ORR: overall response rate; PD: progressive disease; PLT: platelets; PR: partial response; sCR: stringent complete response; SD: stable disease; VGPR: very good partial response; VRd: bortezomib-lenalidomide-dexamethasone; VTd: bortezomib-thalidomide-dexamethasone.
HSC (N=287), the median number of CD34 + cells/L on the first day of counting was higher in those who did not require plerixafor (70.9×10 6; IQR, 33.7-124.6), as compared with those rescued with ‘on-demand’ plerixafor (16×10 6; IQR, 7-29.5). However, an approximately 3-fold increase in the median number of CD34 + cells/L was observed after plerixafor administration, from 17.5×10 6 (IQR, 10.827.6) to 58.3×10 6 (IQR, 34.2-100.2) CD34 + cells/L. The median number of aphereses was 1 (IQR, 1-2) in patients who did not require plerixafor and 2 (IQR, 1-2) in the ‘on-demand’ plerixafor group, while the median number of CD34 + cells/kg collected per apheresis with and without plerixafor was 7.06×10 6 CD34 + cells/kg (IQR, 4.64-11.3) in patients who did not require plerixafor and 3.5×10 6 CD34 + cells/kg (IQR, 2.15-5.3) in patients rescued with plerixafor. The main outcomes of HSC mobilization and collection are summarized in Table 3.
Predictors of poor mobilization
In univariate analysis, baseline BM plasmacytosis >60% of total BM cells (OR=3.96, 95% CI: 2.0-7.7; P <0.001), lenalidomide-based induction regimens (OR=5.48, 95% CI: 2.43-12.36; P <0.001), daratumumab-based induction regimens (OR=6.31, 95% CI: 2.74-15.5; P =0.03), occurrence of a grade 3-4 hematologic toxicity during induction (OR=6.31, 95% CI: 2.74-14.54; P <0.001), low pre-mobilization ANC <2.5×10 9/L (OR=2.78, 95% CI: 1.49-5.26; P =0.001), and hemoglobin levels <12 g/dL (OR=2.08, 95% CI: 1.09-4; P =0.03) were associated with an increased risk of mobilization failure or the need for plerixafor administration ( Online Supplementary Table S1 in the Online Supplementary Appendix ). In multivariate analysis, BM plasmacytosis >60% of total BM cells (OR=4.14, 95% CI: 1.98–8.67; P <0.001), lenalidomide-based induction regimens (OR=4.45, 95% CI: 1.69-11.72; P =0.002), and occurrence of a grade 3-4 hematologic toxicity during induction (OR=3.53, 95% CI: 1.32-9.44; P =0.012) were independently associated with a higher risk of mobilization failure or the need for plerixafor administration. Patients exposed to daratumumab showed a trend of being at higher risk of mobilization failure, although not statistically significant in multivariate analysis (OR=2.17, 95% CI: 0.39-12.11; P =0.37; Table 4).
Safety of hematopoietic stem cell mobilization
Overall, during the observation period, 16 (5%) patients experienced any-grade, non-hematologic AE, of which the most frequent ones were bone pain (2%), nausea and vomiting (1%), and infections (2%), while worsening/ exacerbation of peripheral neuropathy was reported in 1% of patients. Only two (1%) patients experienced a grade 3 infection. No grade 4-5 AE were observed. No differences in the rates of AE were observed between patients who received plerixafor and those who did not ( Online Supplementary Table S2 ).
Haematologica | 109 May 2024 1529 ARTICLE - Cyclophosphamide-G-CSF-on-demand plerixafor in MM R. Mina et al.
N=301 Induction regimen, N (%) VTd VRd KRd KCd DVRd DVCd Other bortezomib-based regimens* 241 (80) 4 (1) 20 (7) 1 (1) 7 (2) 3 (1) 25 (8) N of induction cycles Median (IQR) ≤4, N (%) >4, N (%) Missing, N 5 (4-6) 148 (49) 151 (51) 2 Response
ORR ≥VGPR sCR/CR VGPR PR SD PD Missing 293 (99) 214 (72) 47 (16) 167 (56) 79 (27) 3 (1) 1 (<1) 4
No Yes Missing 273 (91) 27 (9) 1
(%)
Median
<2.5x10⁹/L
≥2.5x10
Missing, N 3.1 (2.34-4.32) 10 (3) 281 (97) 10
Median
<12
≥12
N (%) Missing, N 12.9
78 (27) 216 (73) 7
g/dL
(11.9-13.6)
Missing,
238.5
14 (5) 280 (95) 7 Cyclophosphamide
2 g/m2 3 g/m2 4 g/m2 144 (48) 73 (24) 84 (28)
<150x109/L
≥150x10
N
(204-295.75)
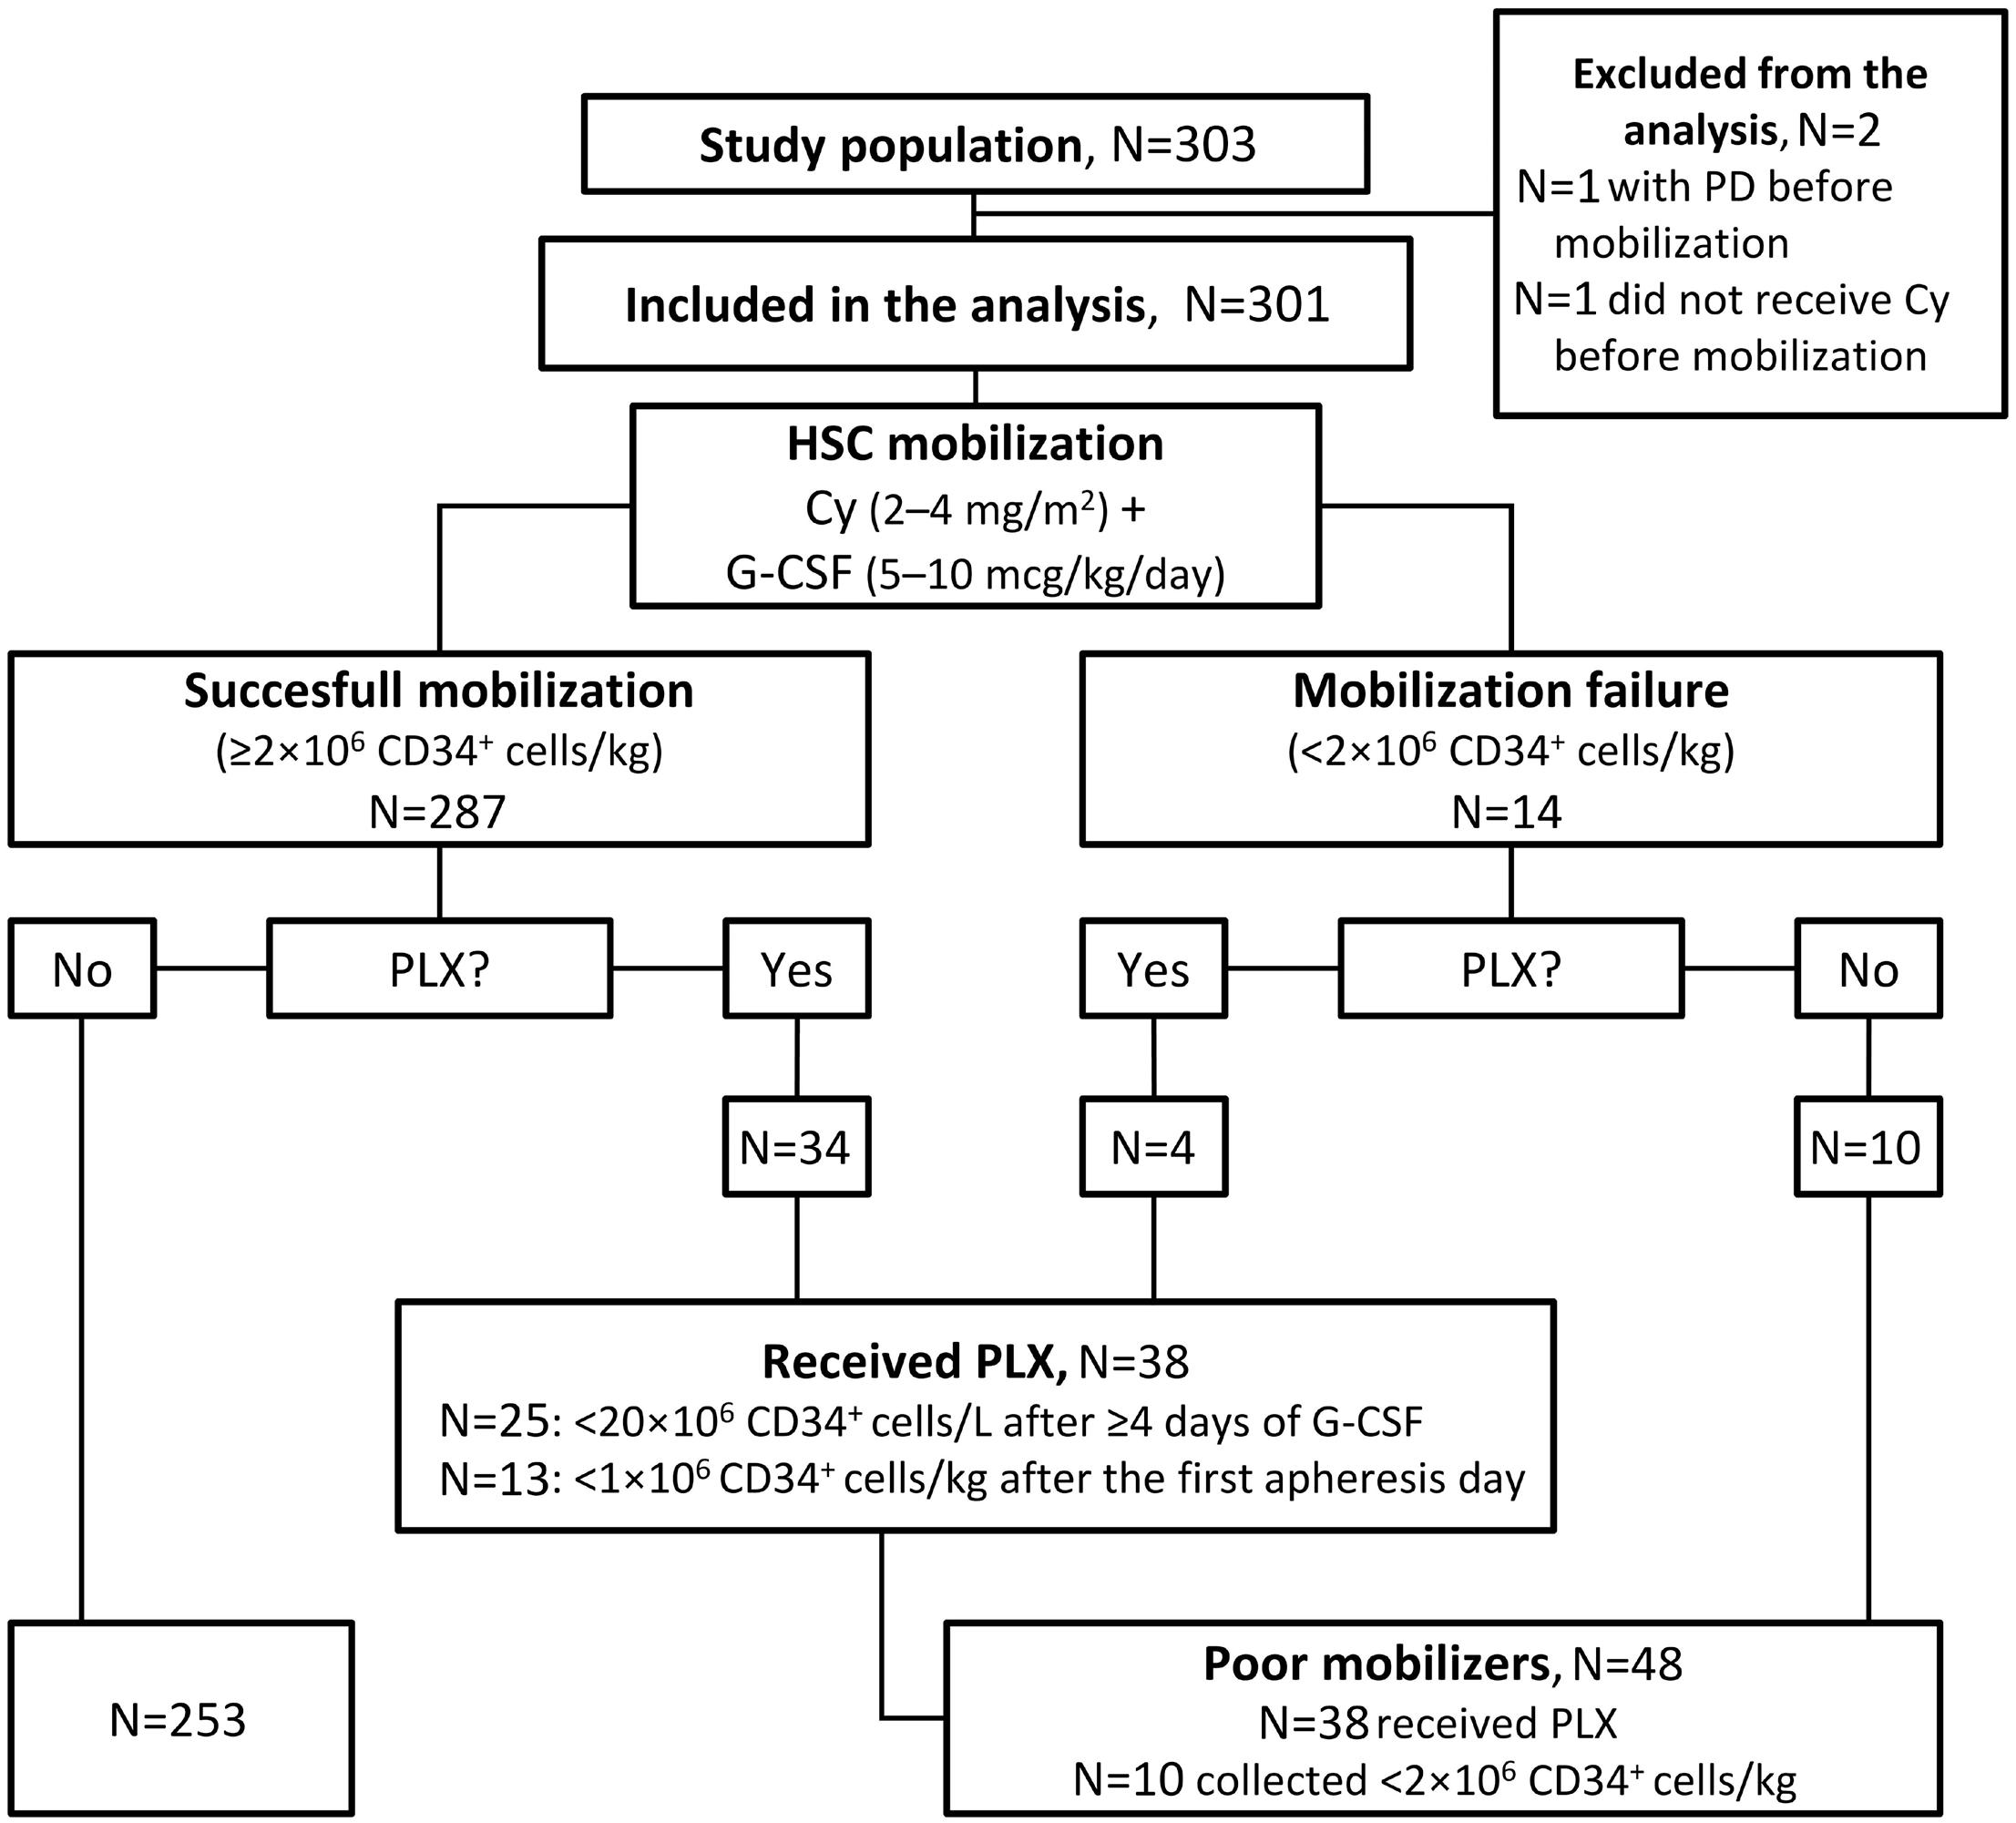
Discussion
In the era of multi-drug, novel agent-based induction regimens, HDM followed by ASCT remains a standard approach for TE patients. Currently, tandem autologous transplant is recommended by the EHA-ESMO guidelines in patients with high-risk disease and is being investigated in clinical trials enrolling high-risk patients,25 while salvage transplant at relapse is recommended in patients with a long duration of remission from a prior transplant.1 In this light, an optimal collection of autologous HSC is essential to allow patients to proceed to a single or double transplant, in compliance with the initial treatment plan and in order to preserve the possibility of a salvage transplant at relapse. HSC mobilization strategies have evolved over time and currently include a steady-state approach with G-CSF alone or in combination with chemotherapy (e.g., high-dose cyclophosphamide), with plerixafor administered either pre-emptively in patients with a high risk of stem cell mobilization failure or as a rescue drug in those who have failed to meet the stem cell target. As induction therapies for TE NDMM patients have rapidly evolved, with the incorporation of agents that can potentially impact stem cell mobiliza-
Figure 1. Study flowchart. Cy: cyclophosphamide; G-CSF: granulocyte colony-stimulating factor; HSC: hematopoietic stem cell; PD: progressive disease; PLX: plerixafor.
tion (e.g., the immunomodulatory agent lenalidomide and the mAb targeting CD38 daratumumab), the efficiency of stem cell mobilization strategies and their ability to meet the optimal CD34+ target need to be reassessed.
In this large, prospective study we evaluated 301 patients treated with novel agent-based triplets and quadruplets (including lenalidomide, carfilzomib, and daratumumab) who underwent stem cell mobilization with cyclophosphamide (2-4 g/m2) plus G-CSF and ‘on-demand’ plerixafor, to assess the risk of poor mobilization, the need for plerixafor administration, and its efficacy as a rescue agent. This mobilization strategy resulted in a high rate (95%) of patients who successfully collected HSC at first attempt.
The need for plerixafor administration, either due to a low CD34+ cell count before apheresis or a low HSC yield after the first day of collection, was low (11% of the overall population), and ‘on-demand’ plerixafor confirmed to be a highly effective rescue strategy, allowing a successful HSC collection in 90% of patients receiving it.
Before the availability of plerixafor, the rate of mobilization failures in MM patients undergoing chemotherapy-based mobilization varied between 5% and 40%.15,16,26-31 In a large study of 1,384 MM patients enrolled in different clinical tri-
Haematologica | 109 May 2024 1530 ARTICLE - Cyclophosphamide-G-CSF-on-demand plerixafor in MM R. Mina et al.
Table 3. Mobilization and harvesting outcomes in patients with successful hematopoietic stem-cell collection.
CD34+×106 cells/L on the first count day
CD34+×106 cells/L before plerixafor administration
CD34+×106 cells/L after plerixafor administration
Total of CD34+×106 cells/kg
(IQR)
collection,* N of pts (%)
(IQR) CD34+ cells/kg ×106
*Suboptimal collection: total HSC collected 2-4×10⁶ CD34+ cells/kg. **Optimal collection: total HSC collected over 4×10⁶ CD34+ cells/kg. ***HSC collection per apheresis day was assessed as the median of total CD34+ cells collected per apheresis session. IQR: interquartile range; pts: patients; HSC: hematopoietic stem cell.
Table 4. Multivariate model for predictors of hematopoietic stem cell mobilization failure or plerixafor use.
ANC: absolute neutrophil count; CI: confidence interval; OR: odds ratio; PC: plasma cells; Hb: hemoglobin.
als and mobilized with cyclophosphamide (3-4 g/m2) plus G-CSF, Musto et al. reported a mobilization failure rate of 21%, including 12.4% of patients failing to collect ≥2×10⁶ CD34+ cells/kg and 8.4% with a sub-optimal collection (25×106 CD34+ cells/kg).16
Dugan et al. published a first report regarding the safety and efficacy of plerixafor plus chemotherapy and G-CSF in 44 patients with MM and non-Hodgkin lymphoma.32 The addition of plerixafor to various chemotherapy regimens and G-CSF led to a median 2-fold increase in the number of circulating CD34+ cells and to an increase in the HSC yield. Our results confirmed the efficacy of ‘on-demand’ plerixa-
for in rescuing patients at high risk of mobilization failure, limiting its rate to 5% and therefore comparing favorably to the data reported by Musto et al.16
Our study also confirmed the results of a retrospective study by Johnsrud et al. of 398 MM patients undergoing HSC mobilization with either cyclophosphamide (4 g/m2) plus G-CSF or G-CSF alone and ‘on-demand’ plerixafor.15 The mobilization failure rate was approximately 5% in both groups, and the rate of patients requiring plerixafor in the cyclophosphamide group (12%) was similar to that in our study (11%). Of note, in our study, compared to that by Johnsrud et al., we observed similar rates of patients Parameters
Haematologica | 109 May 2024 1531 ARTICLE - Cyclophosphamide-G-CSF-on-demand plerixafor in MM R. Mina et al.
Mobilizing patients N=287 Patients without plerixafor administration N=253 Patients with plerixafor administration N=34
Median (IQR) 60.05 (25.4-112.8) 70.9 (33.7-124.6) 16 (7-29.5)
Median (IQR) - - 17.5 (10.75-25.6)
Median (IQR) - - 58.3 (34.2-100.2)
Median
Suboptimal
Optimal collection,** N of
(%) 9.9 (7.7-12.8) 12 (4) 274 (96) 10.2 (8.3-13.2) 8 (3) 244 (97) 6.5 (4.6-9.6) 4 (12) 30 (88) N of apheresis
1 day, N of pts (%) 2 days, N of pts (%) 3 days, N of pts (%) 4 days, N of pts (%) 155 (55) 102 (36) 20 (7) 4 (1) 142 (57) 86 (35) 15 (6) 4 (2) 13 (38) 16 (47) 5 (15) 0 HSC collection per apheresis day*** Median
6.5 (4.3-10.79) 7.06 (4.64-11.3) 3.5 (2.15-5.3)
pts
days
Parameters OR (95% CI) P Bone marrow PC at diagnosis, >60% vs. ≤60% 4.14 (1.98-8.67) <0.001 Lenalidomide-based induction, yes vs. no 4.45 (1.69-11.72) 0.002 Daratumumab-based induction, yes vs. no 2.17 (0.39-12.11) 0.37 Grade 3-4 hematologic toxicity during induction, yes vs. no 3.53 (1.32-9.44) 0.012 Pre-mobilization ANC, <2.5x10⁹/L vs. ≥2.5x10⁹/L 1.92 (0.91-4) 0.081 Pre-mobilization Hb, <12 g/dL vs. ≥12 g/dL 1.92 (0.91-4) 0.084
who collected ≥2×10⁶ CD34+ cells/kg (95% in both studies) or >4×10⁶ CD34+ cells/kg (90% and 94%, respectively) and of plerixafor administration (11% and 12%), despite a lower average dose of cyclophosphamide in our study. These results are clinically meaningful, as higher doses of cyclophosphamide are associated with higher rates of febrile neutropenia.33,34
A steady-state mobilization with G-CSF is an effective and appealing strategy compared with a chemotherapy-based approach, particularly due to the availability of plerixafor. Retrospective and prospective studies showed the feasibility and efficacy of HSC mobilization with G-CSF only plus ‘on-demand’ plerixafor in MM patients receiving 3-4 drug induction regimens.15,18
The proportion of patients who successfully collected the minimum number of HSC required to proceed to ASCT was similar in our study (95%) and in the phase II GRIFFIN and MASTER trials (94% and 100%), where patients received G-CSF only plus plerixafor.15,18 However, the median stem cell yields obtained with G-CSF only in the GRIFFIN (8.3×10⁶ CD34+ cells/kg) and MASTER (6×10⁶ CD34+ cells/kg) studies were lower than that obtained in our study with cyclophosphamide plus G-CSF (9.9×10⁶ CD34+ cells/kg), and fewer patients in the GRIFFIN (85%) and MASTER (80%) studies achieved an optimal collection of HSC than in our study (90%), despite a significantly higher use of plerixafor than in our study (72% and 97% vs. 11%). Although crossstudy comparisons are limited by differences in induction treatments and collection goals, the results observed with cyclophosphamide and G-CSF in our study compared favorably with those observed with G-CSF only in terms of stem cell yield, optimal collection rates, and days of apheresis and plerixafor administration, thus providing an effective mobilization option for patients in whom a high HSC yield is planned (e.g., in case of tandem or salvage transplant) or for those who are at high risk of mobilization failure due to the presence of multiple risk factors.
We evaluated baseline and premobilization factors that could potentially be associated with a higher risk of mobilization failure or the need for plerixafor administration in the context of a cyclophosphamide plus G-CSF mobilization. In our study, BM infiltration >60% at diagnosis (OR=4.14), the occurrence of grade 3-4 hematologic toxicities during induction (OR=3.53), and lenalidomide-based induction (OR=4.45) were independently associated with a higher risk of mobilization failure or the need for plerixafor administration. Lenalidomide-based induction therapy was correlated with a negative impact on HSC collection in several studies,15-17,35,36 and the results of our study confirmed this evidence.
Randomized clinical studies investigating standard induction triplets with or without the anti-CD38 mAb daratumumab in NDMM patients showed higher use of plerixafor and lower stem cell yields in patients receiving daratumumab, regardless of the mobilization strategy adopted.37 In the
phase III CASSIOPEIA study, patients underwent HSC mobilization with cyclophosphamide and G-CSF: a higher use of plerixafor (22% vs. 8%) and lower HSC yields (6.7×10⁶ vs. 10×106 CD34+ cells/kg) were observed in the daratumumab versus non-daratumumab arms.12 Similarly, in the phase II GRIFFIN trial, in which a steady-state mobilization with G-CSF plus either upfront or rescue plerixafor was adopted, higher rates of plerixafor administration (72% vs. 55%) and lower HSC yields (8.3×10⁶ vs. 9.4×10⁶ CD34+ cells/kg) were observed in the daratumumab versus non-daratumumab arms. In both trials, however, >95% patients were able to proceed to and complete ASCT. In line with these results, in our study upfront daratumumab was associated with a higher risk of mobilization failure or need for plerixafor administration (OR=2.17), although this was not statistically significant in multivariate analysis, possibly due to the small number of patients in the daratumumab group.
To account for this limitation and further investigate the impact of daratumumab on HSC mobilization, a retrospective study comparing the efficacy and efficiency of stem cell collection with G-CSF plus ‘on-demand’ plerixafor in a large series of patients treated with or without daratumumab is currently ongoing.
In our study, we did not observe new safety concerns associated with ‘on-demand’ plerixafor administration. The rate of grade 3-4 AE was low (1%), possibly because the majority of patients (72%) received intermediate doses of cyclophosphamide (2-3 g/m2), which have already been associated with a lower risk of AE compared with higher doses. These data also confirm the safety of such mobilization strategy.21
A limitation of this study is the lack of data regarding transplantation and engraftment. However, several studies compared engraftment outcomes in patients whose HSC were collected with or without plerixafor, showing no differences in terms of engraftment, neutrophil recovery, and platelet recovery in both groups.9,10,15
In conclusion, we confirmed that HSC mobilization with cyclophosphamide plus G-CSF and ‘on-demand’ plerixafor is an effective mobilization strategy also in the era of novel agent-based induction treatments (including lenalidomide, carfilzomib, and daratumumab), resulting in a high rate of successful HSC collection and high HSC yields.
Disclosures
RM has received honoraria from Janssen, Celgene, Takeda, and Amgen; has served on advisory boards for Janssen, Celgene, Takeda, Bristol Myers Squibb, Amgen, and Pfizer; has received consultancy fees from Janssen, Takeda, and Sanofi. MTP has received honoraria from and served on the advisory boards for Celgene–Bristol Myers Squibb, Janssen-Cilag, Takeda, Amgen, Sanofi, GlaxoSmithKline, Pfizer, and Menarini. RS has received honoraria from Novartis, Gilead, and Mallinckrodt. RML has served on advisory boards for Stemline, Menarini, and Jazz Pharma. SB has received
Haematologica | 109 May 2024 1532 ARTICLE - Cyclophosphamide-G-CSF-on-demand plerixafor in MM R. Mina et al.
honoraria from Bristol Myers Squibb, Sanofi, and Janssen. FF has received honoraria from Janssen-Cilag, Takeda, Amgen, and GlaxoSmithKline. KM has received honoraria from Celgene, Takeda, Amgen, Sanofi, and Janssen. During the past 3 years, PC has received honoraria (for consultancy, participation in advisory role, or lectures) from AbbVie, ADC Therapeutics (DSMB), Amgen, Celgene, Daiichi Sankyo, Gilead/Kite, GlaxoSmithKline, Incyte, Janssen, Kyowa Kirin, Nerviano Medical Science, Novartis, Pfizer, Roche, Sanofi, SOBI, and Takeda; has received support for travel and accomodation from AbbVie, Amgen, Bristol Myers Squibb, Celgene, Gilead/Kite, Janssen, Novartis, Roche, and Takeda. MB has received honoraria from Sanofi, Celgene, Amgen, Janssen, Novartis, Bristol Myers Squibb, and AbbVie; has served on advisory boards for Janssen and GlaxoSmithKline; has received research funding from Sanofi, Celgene, Amgen, Janssen, Novartis, Bristol Myers Squibb, and Mundipharma. All other authors have no conflicts of interest to disclose.
Contributions
RM, FB, BB, and MB substantially contributed to the conception and design of this article. All authors substantially contributed to the acquisition, analysis, or interpretation of data for this article and accessed and verified the underlying data. RM, FB, and GB drafted this article. All authors reviewed this article critically for important intellectual content. All authors finally approved the version to be published. All authors agreed to be accountable for all aspects of the work in ensuring that questions related to the accuracy or
References
1. Dimopoulos MA, Moreau P, Terpos E, et al. Multiple myeloma: EHA-ESMO clinical practice guidelines for diagnosis, treatment and follow-up†. Ann Oncol. 2021;32(3):309-322.
2. Cavo M, Gay F, Beksac M, et al. Autologous haematopoietic stem-cell transplantation versus bortezomib-melphalanprednisone, with or without bortezomib–lenalidomide–dexamethasone consolidation therapy, and lenalidomide maintenance for newly diagnosed multiple myeloma (EMN02/ HO95): a multicentre, randomised, open-label, phase 3 study. Lancet Haematol. 2020;7(6):e456-e468.
3. Hari P, Pasquini MC, Stadtmauer EA, et al. Long-term follow-up of BMT CTN 0702 (STaMINA) of postautologous hematopoietic cell transplantation (autoHCT) strategies in the upfront treatment of multiple myeloma (MM). J Clin Oncol. 2020;38(Suppl 15):8506.
4 Goldschmidt H, Baertsch MA, Schlenzka J, et al. Salvage autologous transplant and lenalidomide maintenance vs. lenalidomide/dexamethasone for relapsed multiple myeloma: the randomized GMMG phase III trial ReLApsE. Leukemia. 2021;35(4):1134-1144.
5. Cook G, Ashcroft AJ, Cairns DA, et al. The effect of salvage autologous stem-cell transplantation on overall survival in patients with relapsed multiple myeloma (final results from BSBMT/UKMF Myeloma X Relapse [Intensive]): a randomised, open-label, phase 3 trial. Lancet Haematol. 2016;3(7):e340-e351.
integrity of any part of the work are appropriately investigated and resolved.
Acknowledgments
We are grateful to all patients, caregivers, nurses, physicians, and data managers of the participating centers.
Funding
The MOZOBL06877 study was partially supported by Sanofi investigation funds and was sponsored by the Foundation European Myeloma Network (EMN) Italy ONLUS (Torino, Italy).
Data-sharing statement
After the publication of this article, data collected for this analysis and related documents (including the study protocol) will be made available to others upon reasonably justified request, which needs to be written and addressed to the attention of the corresponding author. The sponsor of the MOZOBL06877 study, the Foundation European Myeloma Network (EMN) Italy ONLUS (Torino, Italy), via the corresponding author, is responsible to evaluate and eventually accept or refuse every request to disclose data and their related documents, in compliance with the ethical approval conditions, in compliance with applicable laws and regulations, and in conformance with the agreements in place with the involved subjects, the participating institutions, and all the other parties directly or indirectly involved in the participation, conduct, development, management and evaluation of this analysis.
6. Giralt S, Stadtmauer EA, Harousseau JL, et al. International myeloma working group (IMWG) consensus statement and guidelines regarding the current status of stem cell collection and high-dose therapy for multiple myeloma and the role of plerixafor (AMD 3100). Leukemia. 2009;23(10):1904-1912.
7 Giralt S, Costa L, Schriber J, et al. Optimizing autologous stem cell mobilization strategies to improve patient outcomes: consensus guidelines and recommendations. Biol Blood Marrow Transplant. 2014;20(3):295-308.
8. Mohty M, Ho AD. In and out of the niche: perspectives in mobilization of hematopoietic stem cells. Exp Hematol. 2011;39(7):723-729.
9 DiPersio JF, Micallef IN, Stiff PJ, et al. Phase III prospective randomized double-blind placebo-controlled trial of plerixafor plus granulocyte colony-stimulating factor compared with placebo plus granulocyte colony-stimulating factor for autologous stem-cell mobilization and transplantation for patients with non-Hodgkin’s lymphoma. J Clin Oncol. 2009;27(28):4767-4773.
10 DiPersio JF, Stadtmauer EA, Nademanee A, et al. Plerixafor and G-CSF versus placebo and G-CSF to mobilize hematopoietic stem cells for autologous stem cell transplantation in patients with multiple myeloma. Blood. 2009;113(23):5720-5726.
11. Voorhees PM, Kaufman JL, Laubach J, et al. Daratumumab, lenalidomide, bortezomib, and dexamethasone for transplant-
Haematologica | 109 May 2024 1533 ARTICLE - Cyclophosphamide-G-CSF-on-demand plerixafor in MM R. Mina et al.
eligible newly diagnosed multiple myeloma: the GRIFFIN trial. Blood. 2020;136(8):936-945.
12. Hulin C, Offner F, Moreau P, et al. Stem cell yield and transplantation in transplant-eligible newly diagnosed multiple myeloma patients receiving daratumumab + bortezomib/ thalidomide/dexamethasone in the phase 3 CASSIOPEIA study. Haematologica. 2021;106(8):2257-2260.
13. Gay F, Musto P, Rota-Scalabrini D, et al. Carfilzomib with cyclophosphamide and dexamethasone or lenalidomide and dexamethasone plus autologous transplantation or carfilzomib plus lenalidomide and dexamethasone, followed by maintenance with carfilzomib plus lenalidomide or lenalidomide alone for patients with newly diagnosed multiple myeloma (FORTE): a randomised, open-label, phase 2 trial. Lancet Oncol. 2021;22(12):1705-1720.
14 Rosiñol L, Hebraud B, Oriol A, et al. Integrated analysis of bortezomib-lenalidomide-dexamethasone vs bortezomibthalidomide-dexamethasone in transplant-eligible newly diagnosed myeloma. Clin Lymphoma, Myeloma Leuk. 2019;19(10):1-2.
15. Johnsrud A, Ladha A, Muffly L, et al. Stem cell mobilization in multiple myeloma: comparing safety and efficacy of cyclophosphamide +/- plerixafor versus granulocyte colonystimulating factor +/- plerixafor in the lenalidomide era. Transplant Cell Ther. 2021;27(7):590.e1-590.e8.
16. Musto P, Simeon V, Grossi A, et al. Predicting poor peripheral blood stem cell collection in patients with multiple myeloma receiving pre-transplant induction therapy with novel agents and mobilized with cyclophosphamide plus granulocyte-colony stimulating factor: results from a Gruppo Italiano Malattie EMatologiche dell’Adulto Multiple Myeloma Working Party study. Stem Cell Res Ther. 2015;6(1):64.
17 Laurent V, Fronteau C, Antier C, et al. Autologous stem-cell collection following VTD or VRD induction therapy in multiple myeloma: a single-center experience. Bone Marrow Transplant. 2021;56(2):395-399.
18. Chhabra S, Callander N, Watts NL, et al. Stem cell mobilization yields with daratumumab- and lenalidomide-containing quadruplet induction therapy in newly diagnosed multiple myeloma: findings from the MASTER and GRIFFIN Trials. Transplant Cell Ther. 2023;29(3):174.e1-174.e10.
19. Clark RE, Bell J, Clark JO, et al. Plerixafor is superior to conventional chemotherapy for first-line stem cell mobilisation, and is effective even in heavily pretreated patients. Blood Cancer J. 2014;4(10):e255.
20 Costa LJ, Alexander ET, Hogan KR, Schaub C, Fouts T V, Stuart RK. Development and validation of a decision-making algorithm to guide the use of plerixafor for autologous hematopoietic stem cell mobilization. Bone Marrow Transplant. 2011;46(1):64-69.
21. Milone G, Martino M, Spadaro A, et al. Plerixafor on-demand combined with chemotherapy and granulocyte colonystimulating factor: significant improvement in peripheral blood stem cells mobilization and harvest with no increase in costs. Br J Haematol. 2014;164(1):113-123.
22. Sonneveld P, Avet-Loiseau H, Lonial S, et al. Treatment of multiple myeloma with high-risk cytogenetics: a consensus of the International Myeloma Working Group. Blood. 2016;127(24):2955-2962.
23. Kumar S, Paiva B, Anderson KC, et al. International Myeloma Working Group consensus criteria for response and minimal residual disease assessment in multiple myeloma. Lancet Oncol. 2016;17(8):e328-e346.
24. R Core Team. R: a language and environment for statistical computing (Version 4.2.1) [software]. Vienna, Austria: R Foundation for Statistical Computing; 2021.
25. Weisel K, Besemer B, Haenel M, et al. Isatuximab, carfilzomib, lenalidomide, and dexamethasone (Isa-KRd) in patients with high-risk newly diagnosed multiple myeloma: planned interim analysis of the GMMG-Concept Trial. Blood. 2022;140(Suppl 1):1836-1838.
26. Alegre A, Tomas JF, Martinez-Chamorro C, et al. Comparison of peripheral blood progenitor cell mobilization in patients with multiple myeloma: high-dose cyclophosphamide plus GM-CSF vs G-CSF alone. Bone Marrow Transplant. 1997;20(3):211-217.
27. Bensinger W, DiPersio JF, McCarty JM. Improving stem cell mobilization strategies: future directions. Bone Marrow Transplant. 2009;43(3):181-195.
28. Pavone V, Gaudio F, Console G, et al. Poor mobilization is an independent prognostic factor in patients with malignant lymphomas treated by peripheral blood stem cell transplantation. Bone Marrow Transplant. 2006;37(8):719-724.
29. Gertz MA, Wolf RC, Micallef INM, Gastineau DA. Clinical impact and resource utilization after stem cell mobilization failure in patients with multiple myeloma and lymphoma. Bone Marrow Transplant. 2010;45(9):1396-1403.
30 Mazumder A, Kaufman J, Niesvizky R, Lonial S, Vesole D, Jagannath S. Effect of lenalidomide therapy on mobilization of peripheral blood stem cells in previously untreated multiple myeloma patients. Leukemia. 2008;22(6):1280-1282.
31. D’Addio A, Curti A, Worel N, et al. The addition of plerixafor is safe and allows adequate PBSC collection in multiple myeloma and lymphoma patients poor mobilizers after chemotherapy and G-CSF. Bone Marrow Transplant. 2011;46(3):356-363.
32. Dugan MJ, Maziarz RT, Bensinger WI, et al. Safety and preliminary efficacy of plerixafor (Mozobil) in combination with chemotherapy and G-CSF: an open-label, multicenter, exploratory trial in patients with multiple myeloma and nonHodgkin’s lymphoma undergoing stem cell mobilization. Bone Marrow Transplant. 2010;45(1):39-47.
33. Milone G, Conticello C, Leotta S, et al. Plerixafor on-demand in association with low-dose cyclophosphamide and G-CSF in the mobilization of patients with multiple myeloma: high effectiveness, low toxicity, and affordable cost. Leuk Res Rep. 2020;14:100227.
34 Hamadani M, Kochuparambil ST, Osman S, et al. Intermediatedose versus low-dose cyclophosphamide and granulocyte colony-stimulating factor for peripheral blood stem cell mobilization in patients with multiple myeloma treated with novel induction therapies. Biol Blood Marrow Transplant. 2012;18(7):1128-1135.
35. Kumar S, Dispenzieri A, Lacy MQ, et al. Impact of lenalidomide therapy on stem cell mobilization and engraftment postperipheral blood stem cell transplantation in patients with newly diagnosed myeloma. Leukemia. 2007;21(9):2035-2042.
36. Costa LJ, Abbas J, Hogan KR, et al. Growth factor plus preemptive (‘just-in-time’) plerixafor successfully mobilizes hematopoietic stem cells in multiple myeloma patients despite prior lenalidomide exposure. Bone Marrow Transplant. 2012;47(11):1403-1408.
37. Lemonakis K, Tatting L, Lisak M, et al. Impact of daratumumabbased induction on stem cell collection parameters in Swedish myeloma patients. Haematologica. 2023;108(2):610-614.
Haematologica | 109 May 2024 1534 ARTICLE - Cyclophosphamide-G-CSF-on-demand plerixafor in MM R. Mina et al.
Impaired hemoglobin clearance by sinusoidal endothelium promotes vaso-occlusion and liver injury in sickle cell disease
Tomasz W. Kaminski,1*° Omika Katoch,1*° Ziming Li,1 Corrine B. Hanway,1 Rikesh K. Dubey,1° Adekunle Alagbe,1 Tomasz Brzoska,1 Hong Zhang,2 Prithu Sundd,1,3,4° Gregory J. Kato,5 Enrico M. Novelli1,6 and Tirthadipa Pradhan-Sundd1,6°
1Pittsburgh Heart, Lung and Blood Vascular Medicine Institute, University of Pittsburgh School of Medicine, Pittsburgh, PA; 2BioMagis Inc., San Diego, CA; 3Department of Bioengineering, University of Pittsburgh, Pittsburgh, PA; 4Division of Pulmonary Allergy and Critical Care Medicine, Department of Medicine, University of Pittsburgh School of Medicine, Pittsburgh, PA and 5CSL Behring, King of Prussia, PA and 6Division of Hematology/Oncology, Department of Medicine, University of Pittsburgh School of Medicine, Pittsburgh, PA, USA
*TWK and OK contributed equally as first authors.
°Current address: Versiti Blood Research Institute and Medical College of Wisconsin, Milwaukee, WI, USA
Abstract
Correspondence: Tirthadipa Pradhan-Sundd tip9@pitt.edu
tpradhan@versiti.org
Received: June 21, 2023.
Accepted: November 2, 2023.
Early view: November 9, 2023.
https://doi.org/10.3324/haematol.2023.283792
Sickle cell disease (SCD) is a monogenic disorder that affects 100,000 African-Americans and millions of people worldwide. Intra-erythrocytic polymerization of sickle hemoglobin (HbS) promotes erythrocyte sickling, impaired rheology, ischemia and hemolysis, leading to the development of progressive liver injury in SCD. Liver-resident macrophages and monocytes are known to enable the clearance of HbS; however, the role of liver sinusoidal endothelial cells (LSEC) in HbS clearance and liver injury in SCD remains unknown. Using real-time intravital (in vivo) imaging in mice liver as well as flow cytometric analysis and confocal imaging of primary human LSEC, we show for the first time that liver injury in SCD is associated with accumulation of HbS and iron in the LSEC, leading to senescence of these cells. Hemoglobin uptake by LSEC was mediated by micropinocytosis. Hepatic monocytes were observed to attenuate LSEC senescence by accelerating HbS clearance in the liver of SCD mice; however, this protection was impaired in P-selectin-deficient SCD mice secondary to reduced monocyte recruitment in the liver. These findings are the first to suggest that LSEC contribute to HbS clearance and HbS-induced LSEC senescence promotes progressive liver injury in SCD mice. Our results provide a novel insight into the pathogenesis of hemolysis-induced chronic liver injury in SCD caused by LSEC senescence. Identifying the regulators of LSEC-mediated HbS clearance may lead to new therapies to prevent the progression of liver injury in SCD.
Introduction
Sickle cell disease (SCD) is an autosomal recessive genetic disorder that affects approximately 100,000 Americans and millions of people worldwide.1 A point mutation in the β-globin gene (β6Glu→Val) promotes intra-erythrocytic hemoglobin-S (HbS) polymerization in SCD, leading to erythrocyte dehydration, increased membrane stiffness with a characteristic sickle-shape, and hemolysis.1 As a result of altered morphology and impaired rheology of sickle erythrocytes, patients with SCD experience several clinical complications, such as acute systemic painful va-
so-occlusive episodes, acute chest syndrome, stroke, and chronic organ damage,2-5 which contribute to a significantly reduced life expectancy and quality of life.6,7 Sickle red blood cells are prematurely cleared from the circulation by reticulo-endothelial macrophages.8-10 Recent evidence suggests that liver sinusoidal endothelial cells (LSEC) support the tethering of damaged erythrocytes to hepatic sinusoids, leading to sequestration and subsequent clearance of these cells by intraluminal liver macrophages (Küpffer cells).11,12 Using quantitative liver intravital microscopy (qLIM),12 as well as flow cytometric analysis and confocal imaging of primary human and mouse LSEC, we show for the first time that
Haematologica | 109 May 2024 1535 - Red Cell Biology & its Disorders ARTICLE
Published
a CC BY-NC license
©2024 Ferrata Storti Foundation
under
chronic liver injury in SCD mice is associated with micropinocytosis-mediated uptake of HbS in the LSEC, leading to LSEC senescence. We also show that LSEC senescence is enhanced in the absence of tissue-resident leukocytes (as seen in P-selectin-deficient SCD mice) due to increased intake of HbS resulting in exacerbated liver injury. Our results reveal novel insights into the hepatic hemoglobin clearance pathway as well as the pathogenesis of hemolysis-driven chronic liver injury caused by HbS-induced LSEC senescence in SCD.
Methods
Animals
Townes SCD mice (SS, homozygous for Hbatm1(HBA)Tow, homozygous for Hbbtm2(HBG1,HBB*)Tow) and non-sickle control (AS) mice (AS, homozygous for Hbatm1(HBA)Tow, compound heterozygous for Hbbtm2(HBG1,HBB*)Tow/Hbbtm3(HBG1,HBB)Tow)14 were obtained from Jackson Laboratories (Bar Harbor, ME, USA) and housed in a specific pathogen-free animal facility at the University of Pittsburgh (Pittsburgh, PA, USA). Littermate AS mice have been used widely as control mice in several prior studies focused on SCD pathophysiology.15-17 Littermate Townes AS and SCD mice were used as the control and SCD mice, respectively, in all experiments. Townes SCD mice were bred to Selp−/− mice to generate P-selectin-deficient SCD (SCD; Selp−/−) mice using the breeding strategy described by Bennewitz et al 18 All animal experiments were approved by the Institutional Animal Care and Use Committee at the University of Pittsburgh. Five or more mice were assessed at all given timepoints.
Analysis of liver biopsies from patients with sickle cell disease
This study was approved by the local Institutional Review Board (University of Pittsburgh) and conducted in accordance with the Declaration of Helsinki and National Institutes of Health guidelines for using human specimens. De-identified needle biopsy specimens of liver from SCD patients and age-matched healthy control humans were retrospectively reviewed for associated pathology and liver disease. Samples were obtained for light microscopy using standard procedures.19
Human and mice primary liver sinusoidal endothelial cell cultures
Human primary endothelial cells were obtained from iXCell Biotechnology (San Diego, CA, USA). LSEC were cultured with endothelial cell growth medium (iXCell Biotechnology) based on the vendor’s protocol. Mouse primary endothelial cells (C57BL/6 Mouse Liver Sinusoidal Endothelial Cells) were obtained from Accegen (Fairfield, NJ, USA).
Flow cytometry
Human or murine LSEC were treated with 2 mM of fluorescein isothiocyanate-tagged hemoglobin (Sigma, Carlsbad,
CA, USA) or ferrous stabilized human HbS protein (Sigma) by adding the stimulus in the culture media. The cells were then detached by 0.25% trypsin (Sigma) followed by one wash. The surfaces of the detached cells were stained with Alexa 647 CD31 (Abcam, Waltham, Boston, USA) or phycoerythrin-CD31 (BioLegend, San Diego, CA, USA), and calcium-free apoptotic-dead cell tag 488 (BioMagis, San Diego, CA, USA catalog n. 302104) or calcium-free apoptotic-dead cell tag Atto 647 (BioMegis) for 15 minutes at room temperature in the dark followed by one wash. Next the cells were stained with iFluor 647 Anti-Hb Rabbit pAb antibody (BioMegis) at room temperature in the dark after fixation with 4% paraformaldehyde and permeabilization by 0.25% Triton X-100. The cells were analyzed with a NovoCyte Penteon flow cytometer (Beckman). The data shown were gated on live cells.
Blocking micropinocytosis and endocytosis in primary liver sinusoidal endothelial cells
To block micropinocytosis we used nystatin (50 mg/mL) for about 30 minutes, as described elsewhere.20 Cells were exposed to latrunculin A (0.24 mM/L) for 2 hours to block endocytosis.21
Statistical analysis
All comparisons between two groups were deemed statistically significant if the P value of an unpaired two-tailed Student t test was less than 0.05 (*P<0.05; **P<0.01).
Further information
Additional methods used in this study are standard and are described in the Online Supplementary Supporting Information. Online Supplementary Tables S1, S2 and S3 summarize the antibodies used for immunohistochemistry, western blotting, and intravital imaging, respectively. Online Supplementary Table S4 lists the primers employed in this study, while Online Supplementary Table S5 presents the cell culture reagents used in the in vitro assays.
Results
Liver sinusoidal endothelial cells exhibit senescence in mice with sickle cell disease
Previously, we showed that SCD mice manifest liver senescence and hepatobiliary injury under baseline conditions.19
To further confirm the type of liver cell undergoing senescence, we used multiphoton excitation which enabled in vivo real-time fluorescence microscopy of the intact liver in live mice (Figure 1A). The method of qLIM is described elsewhere.22 Texas red-dextran and AF488-P21 antibodies
(Online Supplementary Table S3) were administered intravascularly to visualize the blood flow in liver sinusoids and identify senescent cells in SCD (SS) and control (AS) mice, respectively (Figure 1A, upper panel; Online Supplementary
Haematologica | 109 May 2024 1536 ARTICLE - Sickle hemoglobin clearance by liver endothelium T.W. Kaminski et al.
Movies S1 and S2). As shown in Figure 1A, P21-positive cells were localized close to the hepatic sinusoids resembling endothelial cell structures, suggestive of endothelial cell senescence. In contrast, control (AS) mice did not show accumulation of P21-positive senescent cells close to the liver sinusoids (Figure 1A, upper panel; Online Supplementary Movies S3 and S4). Moreover, staining with the endothelial cell marker CD31 and cell senescence marker P21 showed significant co-localization in the SCD mice liver compared to that in control mice liver (Figure 1B, quantified in Online Supplementary Figure S1A).
As endothelial cells are the predominant non-hepatocyte cell type in the liver,23 we analyzed the mRNA and protein
expression of markers of senescence in non-hepatocytes isolated from the liver24 of control and SCD mice. As shown in Figure 1C, non-hepatocytes from SCD mice had significantly higher expression of senescence markers, detected by quantitative real-time polymerase chain reaction (qRTPCR) (P21, P16 and P53 expression) (Online Supplementary Table S4) and demonstrated by western blot (P53 and P21 expression). When examined by transmission electron micrography, LSEC from SCD mice contained dark inclusions (which are detected in senescent cells as signs of DNA damage), which were not present in LSEC from control (AS) mice (Figure 1D). Finally, immunohistochemistry staining revealed greater accumulation of SA-β-galactosidase
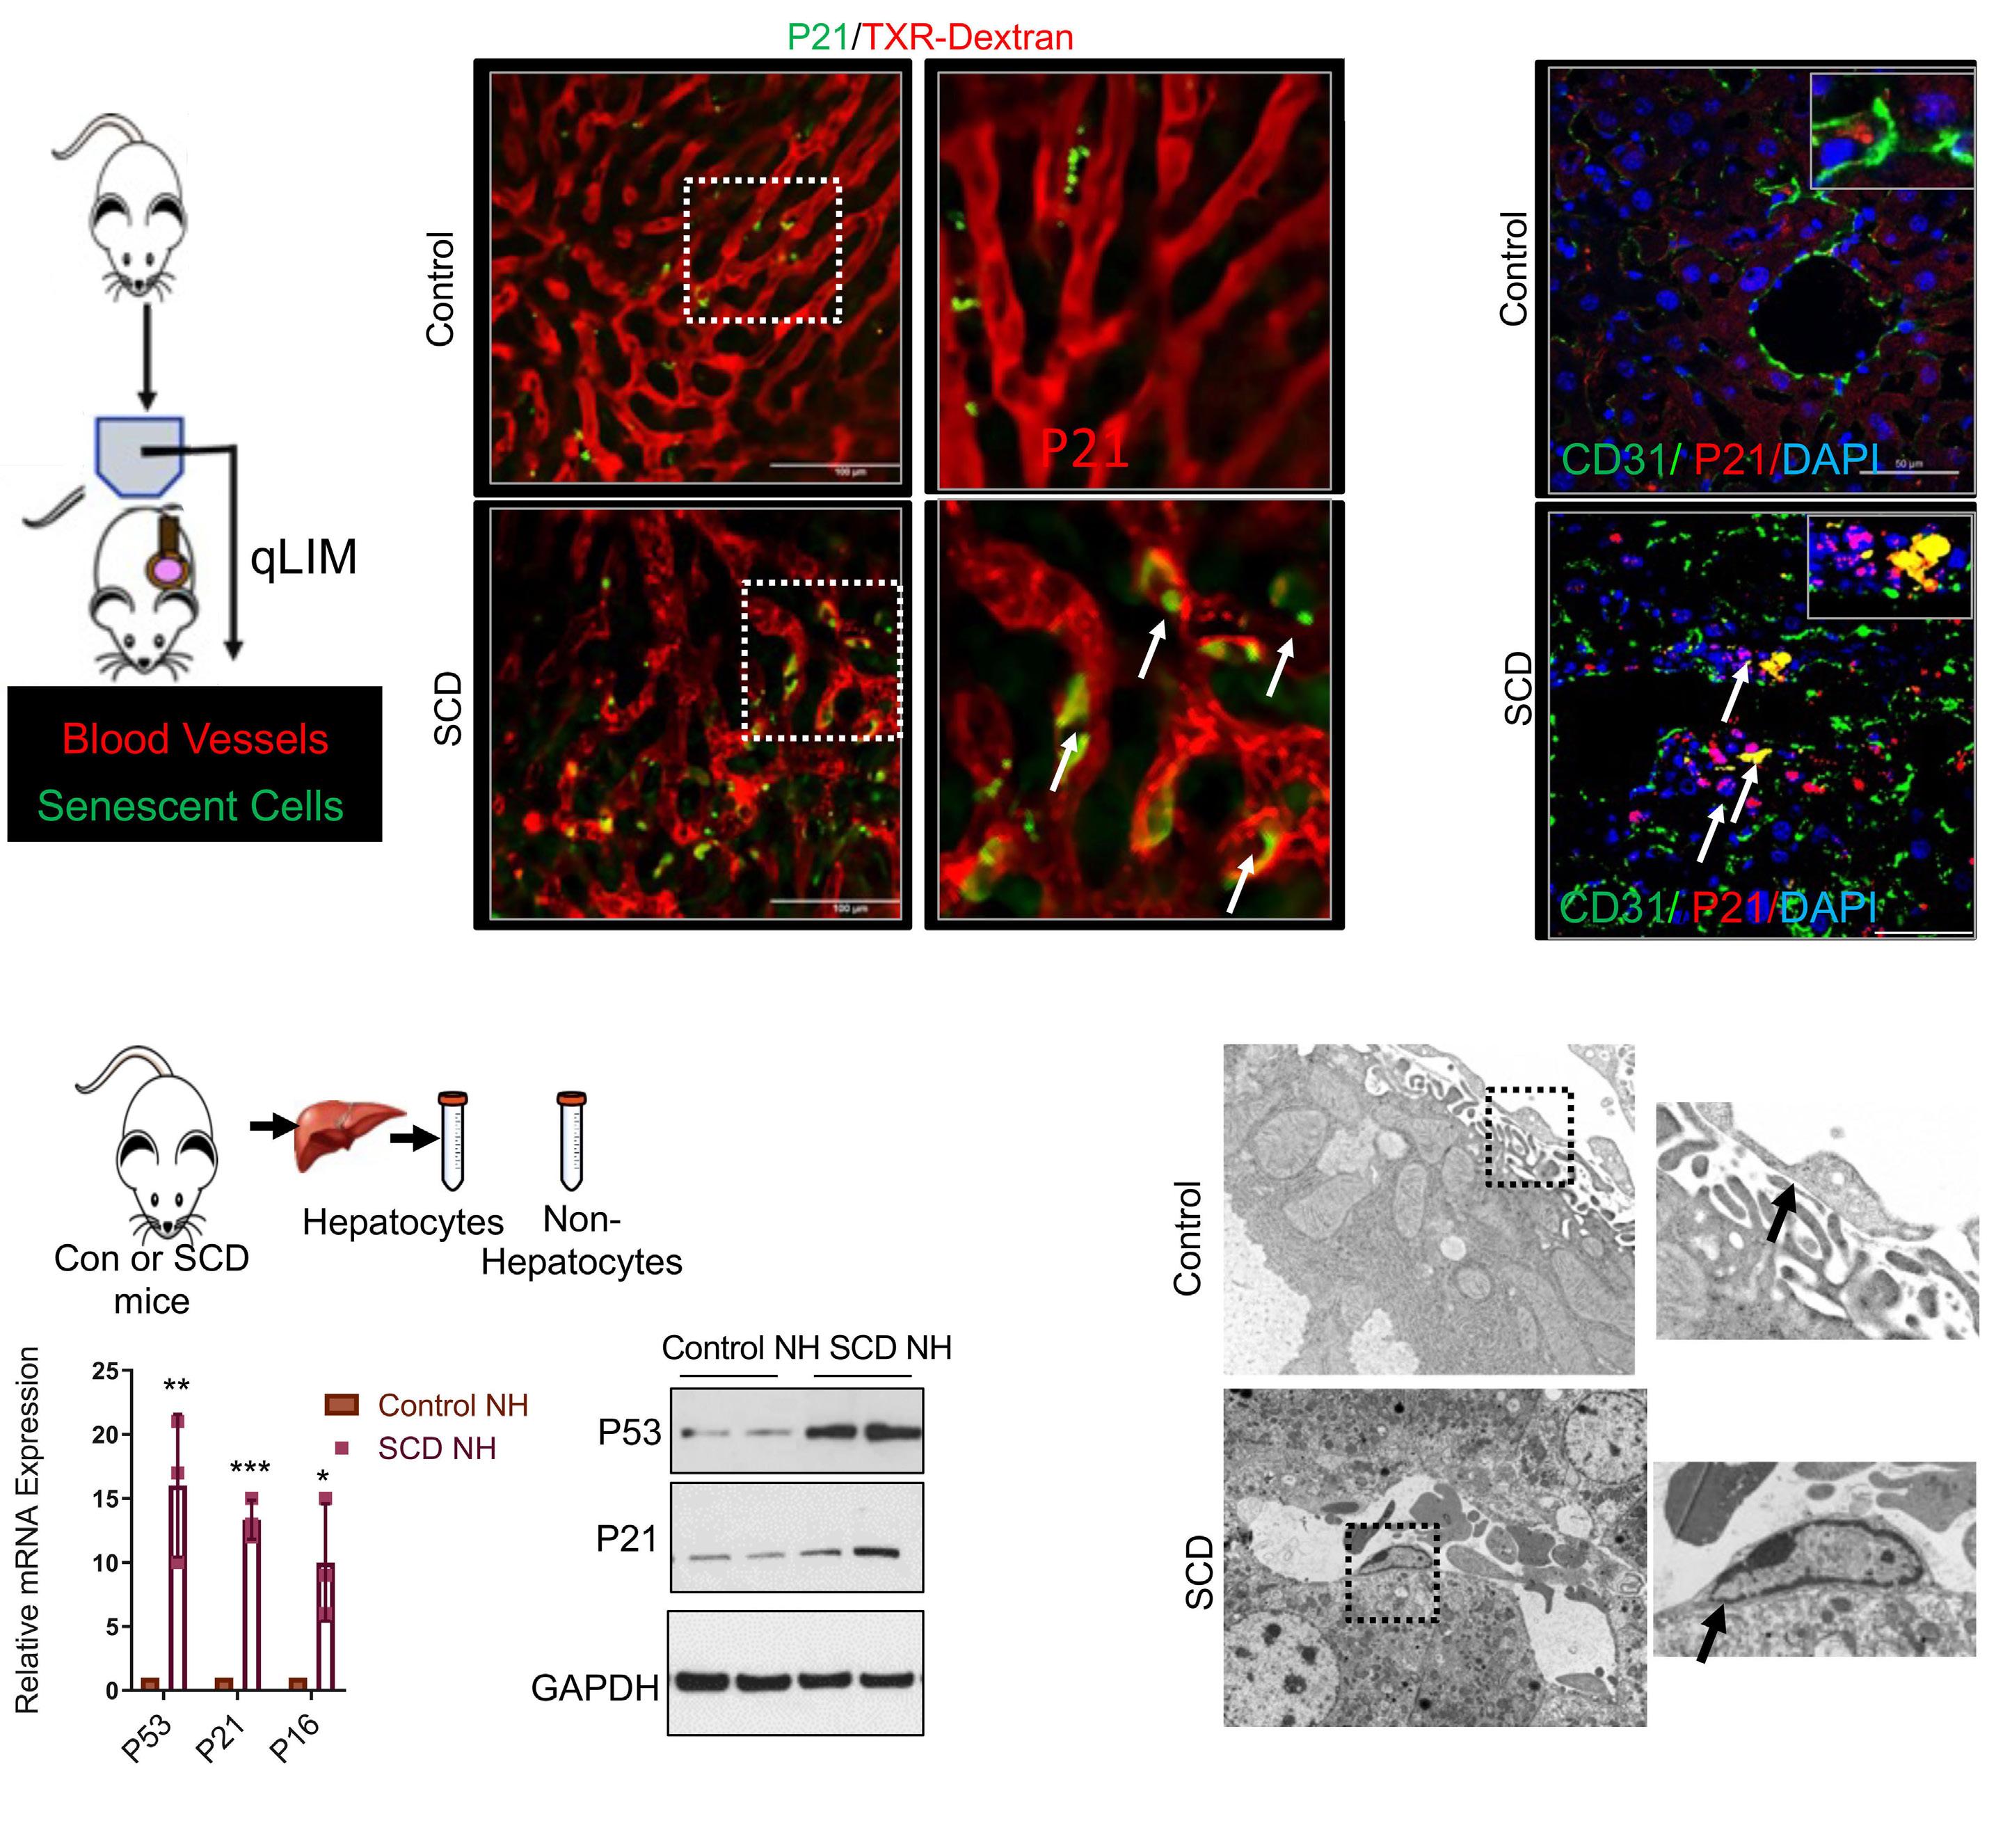
Haematologica | 109 May 2024 1537 ARTICLE - Sickle hemoglobin clearance by liver endothelium T.W. Kaminski et al.
A C D B Continued on following page.
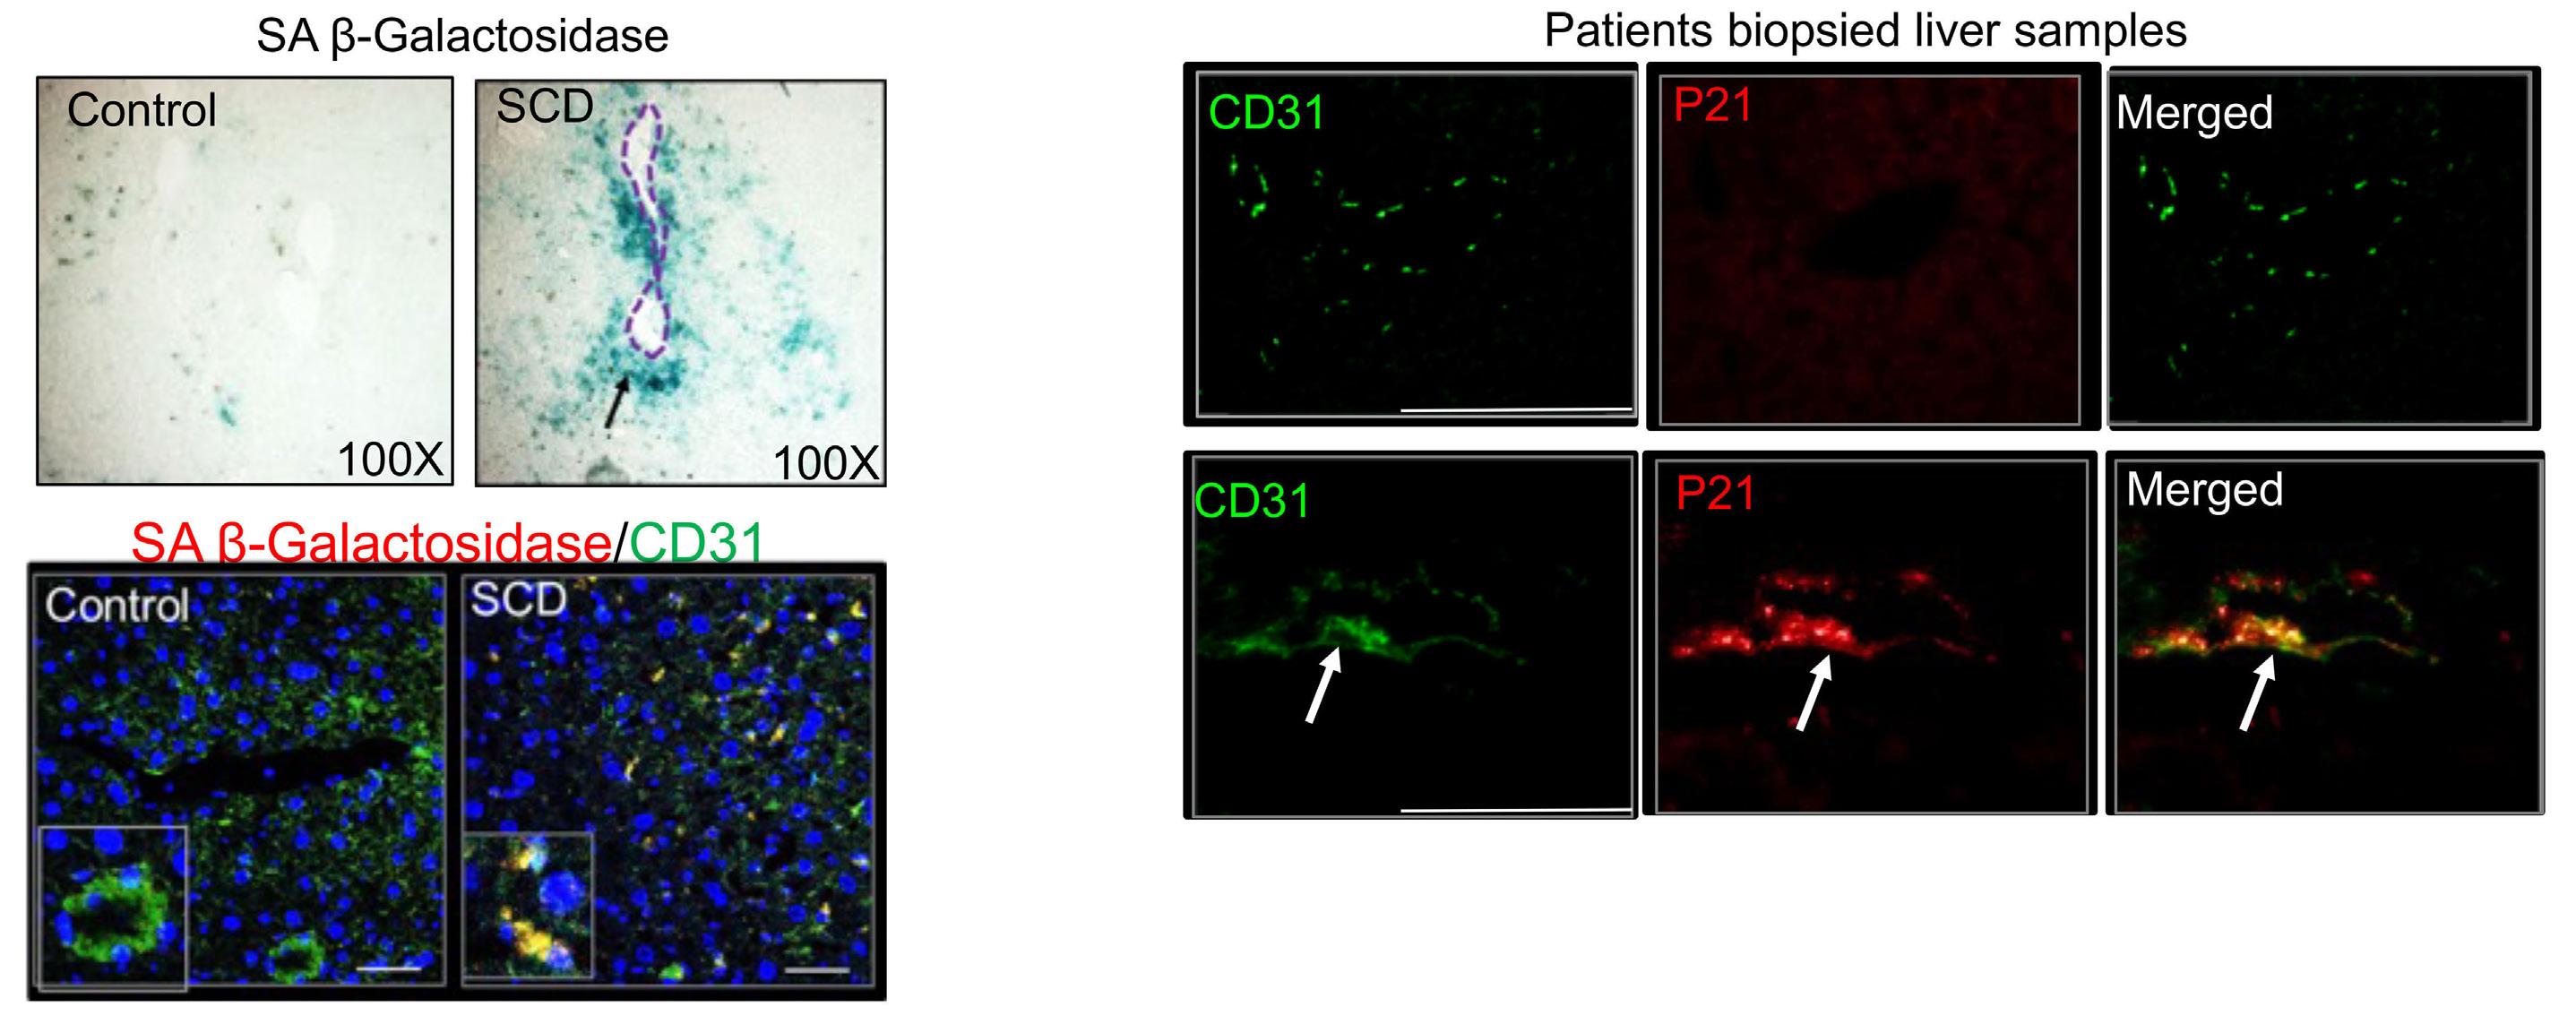
Figure 1. Liver sinusoidal endothelial cells exhibit senescence in sickle cell disease liver. (A) Schematic diagram of quantitative liver intravital microscopy (qLIM) imaging of mice using Texas Red-dextran and AF488-P21 antibody. Representative qLIM images of sickle cell disease (SCD) liver injected with Texas Red-dextran and AF488-P21 antibody. The arrows indicate the presence of P21 in endothelial cell-like structures. The images on the right are zoomed in views of the areas in the dotted boxes. (B) Representative immunofluorescent images of P21 reveal significant co-localization with CD31 in SCD mouse liver compared to that in control mouse liver. (C) Schematic diagram of non-hepatocyte isolation from control and SCD mouse liver. The lower left panel shows quantitative real-time polymerase chain reaction analysis of control and SCD mouse liver, demonstrating increased expression of senescent markers P53, P21 and P16 in SCD non-hepatocytes as compared with control non-hepatocytes. *P<0.05 **P=0.05 and ***P=0.01. The lower right panel shows a western blot for P53 and P21 antibodies, demonstrating increased expression in SCD non-hepatocytes compared with the expression in control non-hepatocytes. (D) Representative transmission electron micrographs of control and SCD mouse livers showing the presence of electron-dense liver sinusoidal endothelial cells (LSEC) in SCD liver which was not seen in control liver tissue. (E) The upper panels are representative images of SA-β-galactosidase staining in control and SCD liver tissue (the dotted circle marks a portal triad of liver which surrounds LSEC). The lower panels are representative images of control and SCD mouse liver tissue showing co-localization of SA-β-galactosidase with the LSEC marker CD31. (F) Representative images of liver biopsies from age-matched control human and SCD patients showing enhanced co-localization of P21 with the LSEC marker CD31 in SCD patients. Scale bar 50 mm. DAPI: 4’,6-diamidino-2-phenylindole; Con: control; NH: non-hepatocytes; GAPDH: glyceraldehyde-3-phosphate dehydrogenase.
(a marker of senescence) around LSEC in SCD mice liver than in control (AS) mice liver (Figure 1E, upper panel). This was further validated by increased co-localization of the endothelial cell marker CD31 and cell senescence marker SA-β galactosidase in the liver of SCD mice as compared to control mice liver (Figure 1E, lower panel). Finally, we also found significant co-localization of the cell senescence marker P21 and endothelial cell marker CD31 in biopsied liver tissue sections from SCD patients compared to that in healthy human liver tissue sections (Figure 1F). Taken together, these data suggest that LSEC undergo senescence in both SCD mice and SCD patients’ biopsied liver tissue sections.
Liver sinusoidal endothelial cell senescence in sickle cell disease mice is associated with hepatic sequestration of red blood cells and accumulation of hemoglobin-heme-iron in the endothelial cells Next, we explored whether LSEC senescence is caused by increased red blood cell sequestration in the hepatic sinusoids. Scanning electron micrography revealed the presence of a significantly higher number of erythrocytes
in SCD hepatic sinusoids than in control (AS) liver sinusoids (Figure 2A, upper panel; Online Supplementary Figure S1B), suggestive of hepato-sinusoidal erythrocyte retention/red blood cell sequestration. Damaged erythrocytes can release hemoglobin, which is cleared in the liver by tissue-resident Küpffer cells10 and monocyte-derived macrophages.25 Recent studies have also suggested a possible role for endothelial cells in hemoglobin clearance.10,26,27 We hypothesized that entrapped sickled erythrocytes are hemolyzed in the hepatic sinusoids to release hemoglobin, which is internalized by both LSEC and Küpffer cells/monocytes in the liver. Western blot analysis showed significantly greater accumulation of hemoglobin in the SCD mouse liver tissue than in control (AS) mouse liver (Figure 2A, lower panel). We next examined hemoglobin localization in SCD liver using a fluorescent tagged normal hemoglobin antibody, Hb-AF647. As shown in Figure 2C, hemoglobin localized mostly to Küpffer cells in the control liver. In a few cases, LSEC-specific localization of hemoglobin was also seen, suggesting a role of LSEC in hemoglobin clearance. Remarkably, hemoglobin localization was significantly enhanced in Küpffer cells as well as in LSEC in SCD mice liver compared to that in control (AS)
Haematologica | 109 May 2024 1538 ARTICLE - Sickle hemoglobin clearance by liver endothelium T.W. Kaminski et al.
E F
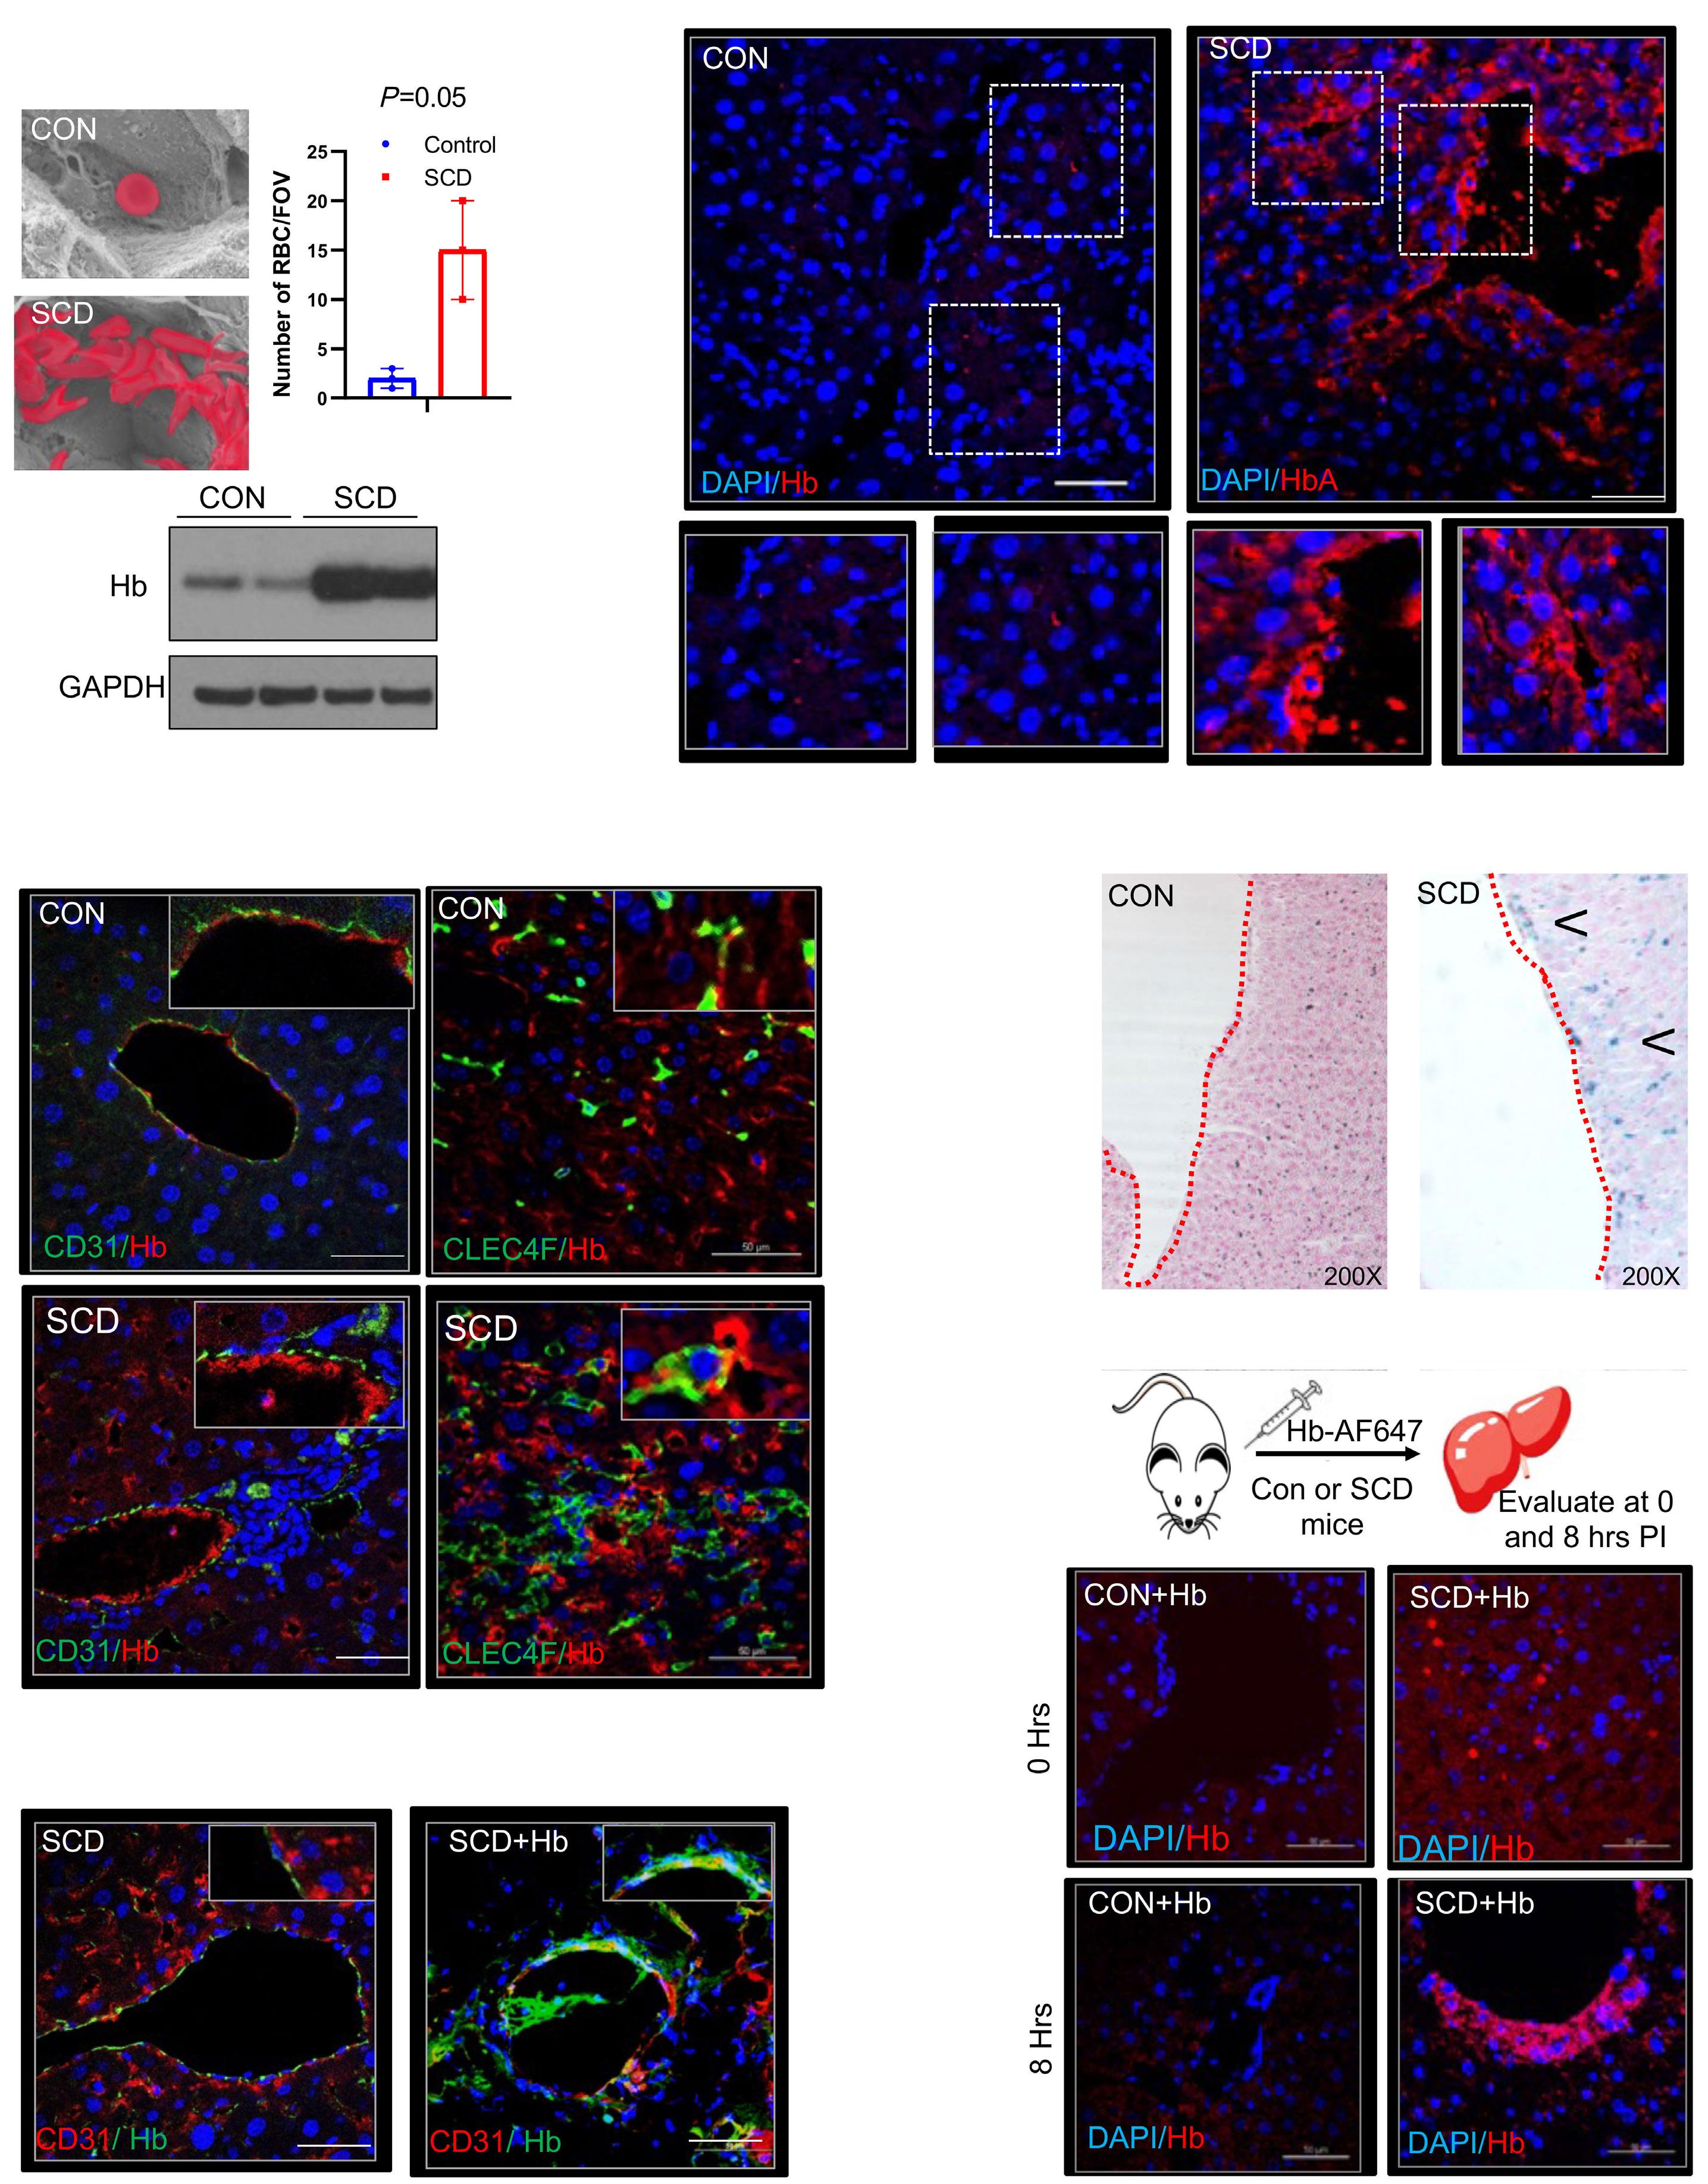
Haematologica | 109 May 2024 1539 ARTICLE - Sickle hemoglobin clearance by liver endothelium T.W. Kaminski et al. A B C F E D Continued
on following page.
Figure 2. Liver sinusoidal endothelial cell senescence is associated with prolonged retention of sickled erythrocytes in hepatic sinusoids and accumulation of hemoglobin in the liver sinusoidal endothelial cells. (A) Upper panel: representative scanning electron micrographs showing entrapment of erythrocytes in liver sinusoids of sickle cell disease (SCD mice compared to that in control mice, quantified in the bar graph to the right. Lower panel: western blot analysis showing increased expression of hemoglobin in SCD mouse liver compared to that in control mouse liver. (B) Representative immunofluorescence images of hemoglobin-AF647 showing enhanced expression of hemoglobin in SCD mouse liver compared to control mouse liver. Hemoglobin expression was also enriched in liver sinusoidal endothelial cells (LSEC) of SCD mice. Zoomed images of the dotted regions are shown below. (C) Representative immunofluorescence images show strong co-localization of hemoglobin with the LSEC marker CD31 and Küpffer cell marker CLEC4F in SCD liver. (D) Representative immunohistochemistry images of Perls Prussian blue staining show accumulation of iron in LSEC (arrow) of SCD liver at baseline which was not seen in control liver. (E) Schematic showing the experimental design to examine hemoglobin trafficking in SCD liver. Representative immunofluorescence images for hemoglobin-AF647 reveal increased expression of hemoglobin in LSEC of SCD mice at 8 hours after injection which was not seen in control (AS) mice liver. (F) Representative immunofluorescence images showing co-localization of hemoglobin and CD31 in SCD liver tissue, which further confirms increased hemoglobin in the LSEC of SCD liver. Scale bar 50 mm. CON: control; RBC: red blood cells; FOV: field of view; Hb: hemoglobin; DAPI: 4’,6-diamidino-2-phenylindole; hrs: hours; PI: post-injection.
mice liver (Figure 2C). Additionally, we found significantly greater co-localization of AF647-anti-hemoglobin antibody with the Küpffer cell marker CLEC4F and LSEC marker CD31 (Online Supplementary Table S1) in SCD compared to control (AS) mice liver (Figure 2C; Online Supplementary Figure S1C).
Further supporting increased uptake of HbS in SCD liver, when we examined hepatic iron accumulation, we could see that along with hepatocytes and Küpffer cells, LSEC were also positive for iron staining in SCD mice liver (Figure 2D, arrow). Finally, we examined whether hemoglobin clearance in the liver of SCD mice is delayed due to LSEC senescence. We injected hemoglobin tagged with AF647 via a tail vein and evaluated the amount of tagged hemoglobin in SCD and control mice liver 8 hours after the injection (Figure 2E). In control mice liver tissue, we found very few AF647-tagged hemoglobin puncta 8 hours after the injection (Figure 2E). However, we found greater accumulation of hemoglobin in the LSEC of SCD mice liver, which is suggestive of delayed hemoglobin clearance (Figure 2F). Collectively, our data suggest that LSEC senescence is associated with sinusoidal erythrocyte retention and increased hemoglobin and iron accumulation in LSEC of SCD mice.
Micropinocytosis promotes hemoglobin uptake by liver sinusoidal endothelial cells
To further characterize LSEC-mediated hemoglobin uptake, we assessed hemoglobin accumulation in vitro in cultured primary LSEC. Flow cytometry analysis was applied to evaluate hemoglobin binding to human primary LSEC, using CD31 as a marker for LSEC and hemoglobin/HbS (Online Supplementary Table S5) as markers for hemoglobin (Figure 3A). Interestingly, we found strong co-localization of hemoglobin and HbS with CD31 (Figure 3A) in primary human LSEC, confirming the uptake of hemoglobin/HbS by LSEC. As LSEC had not previously been linked to hemoglobin scavenging, we performed additional image analysis to confirm the internalization of hemoglobin by primary LSEC. Figure 3B shows that, with time, hemoglobin accumulation increased in LSEC, confirming hemoglobin uptake. To quantify the percentage of hemoglobin bound or not bound to
LSEC, hemoglobin was added to a suspension of LSEC, and the number of hemoglobin-positive cells was determined after 0-30 minutes of incubation. As shown in Figure 3B, we found strong enhancement of hemoglobin staining in LSEC with time. Confocal imaging also showed hemoglobin localization within CD31-positive primary LSEC after the administration of hemoglobin (Online Supplementary Figure S1D). Additionally, to assess whether other cell types may also take up hemoglobin or whether this is an LSEC-specific process, we tested the capacity of human lung microvascular endothelial cells to bind hemoglobin. Flow cytometric analysis (Online Supplementary Figure S1E, upper panel) as well as confocal imaging (Online Supplementary Figure S1E, lower panel) revealed that human primary lung endothelial cells could also take up hemoglobin. Next, we examined the potential mechanism by which LSEC internalize hemoglobin. Endothelial cells are known to take up diverse biomolecules via the process of micropinocytosis.28 Thus, we first blocked micropinocytosis using nystatin in a human liver endothelial cell line. Blocking micropinocytosis29 with nystatin significantly decreased hemoglobin and CD31 co-localization in primary human LSEC (Figure 3C; Online Supplementary Figure S1F). Since micropinocytosis is defined as receptor-mediated endocytosis of molecules into a cell,29 we used latrunculin-A to inhibit endocytosis30 in human LSEC. Interestingly, latrunculin-A also inhibited the uptake of hemoglobin by LSEC (Figure 3D, Online Supplementary Figure S1F). However, compared to nystatin, latrunculin-A was not as effective at blocking hemoglobin internalization (Online Supplementary Figure S1F). Taken together, our data suggest that micropinocytosis is the mechanism by which human LSEC internalize hemoglobin.
Accumulation of HbS and iron induces liver sinusoidal endothelial cell senescence
As LSEC senescence in SCD is associated with the accumulation of HbS/iron in LSEC, we hypothesized that senescence of these cells in the SCD liver could also be induced by the accumulation of sickle Hb/iron in LSEC. To examine the effect of iron in promoting LSEC senescence, we administered SCD mice a low dose of iron dextran intra-
Haematologica | 109 May 2024 1540 ARTICLE - Sickle hemoglobin clearance by liver endothelium T.W. Kaminski et al.
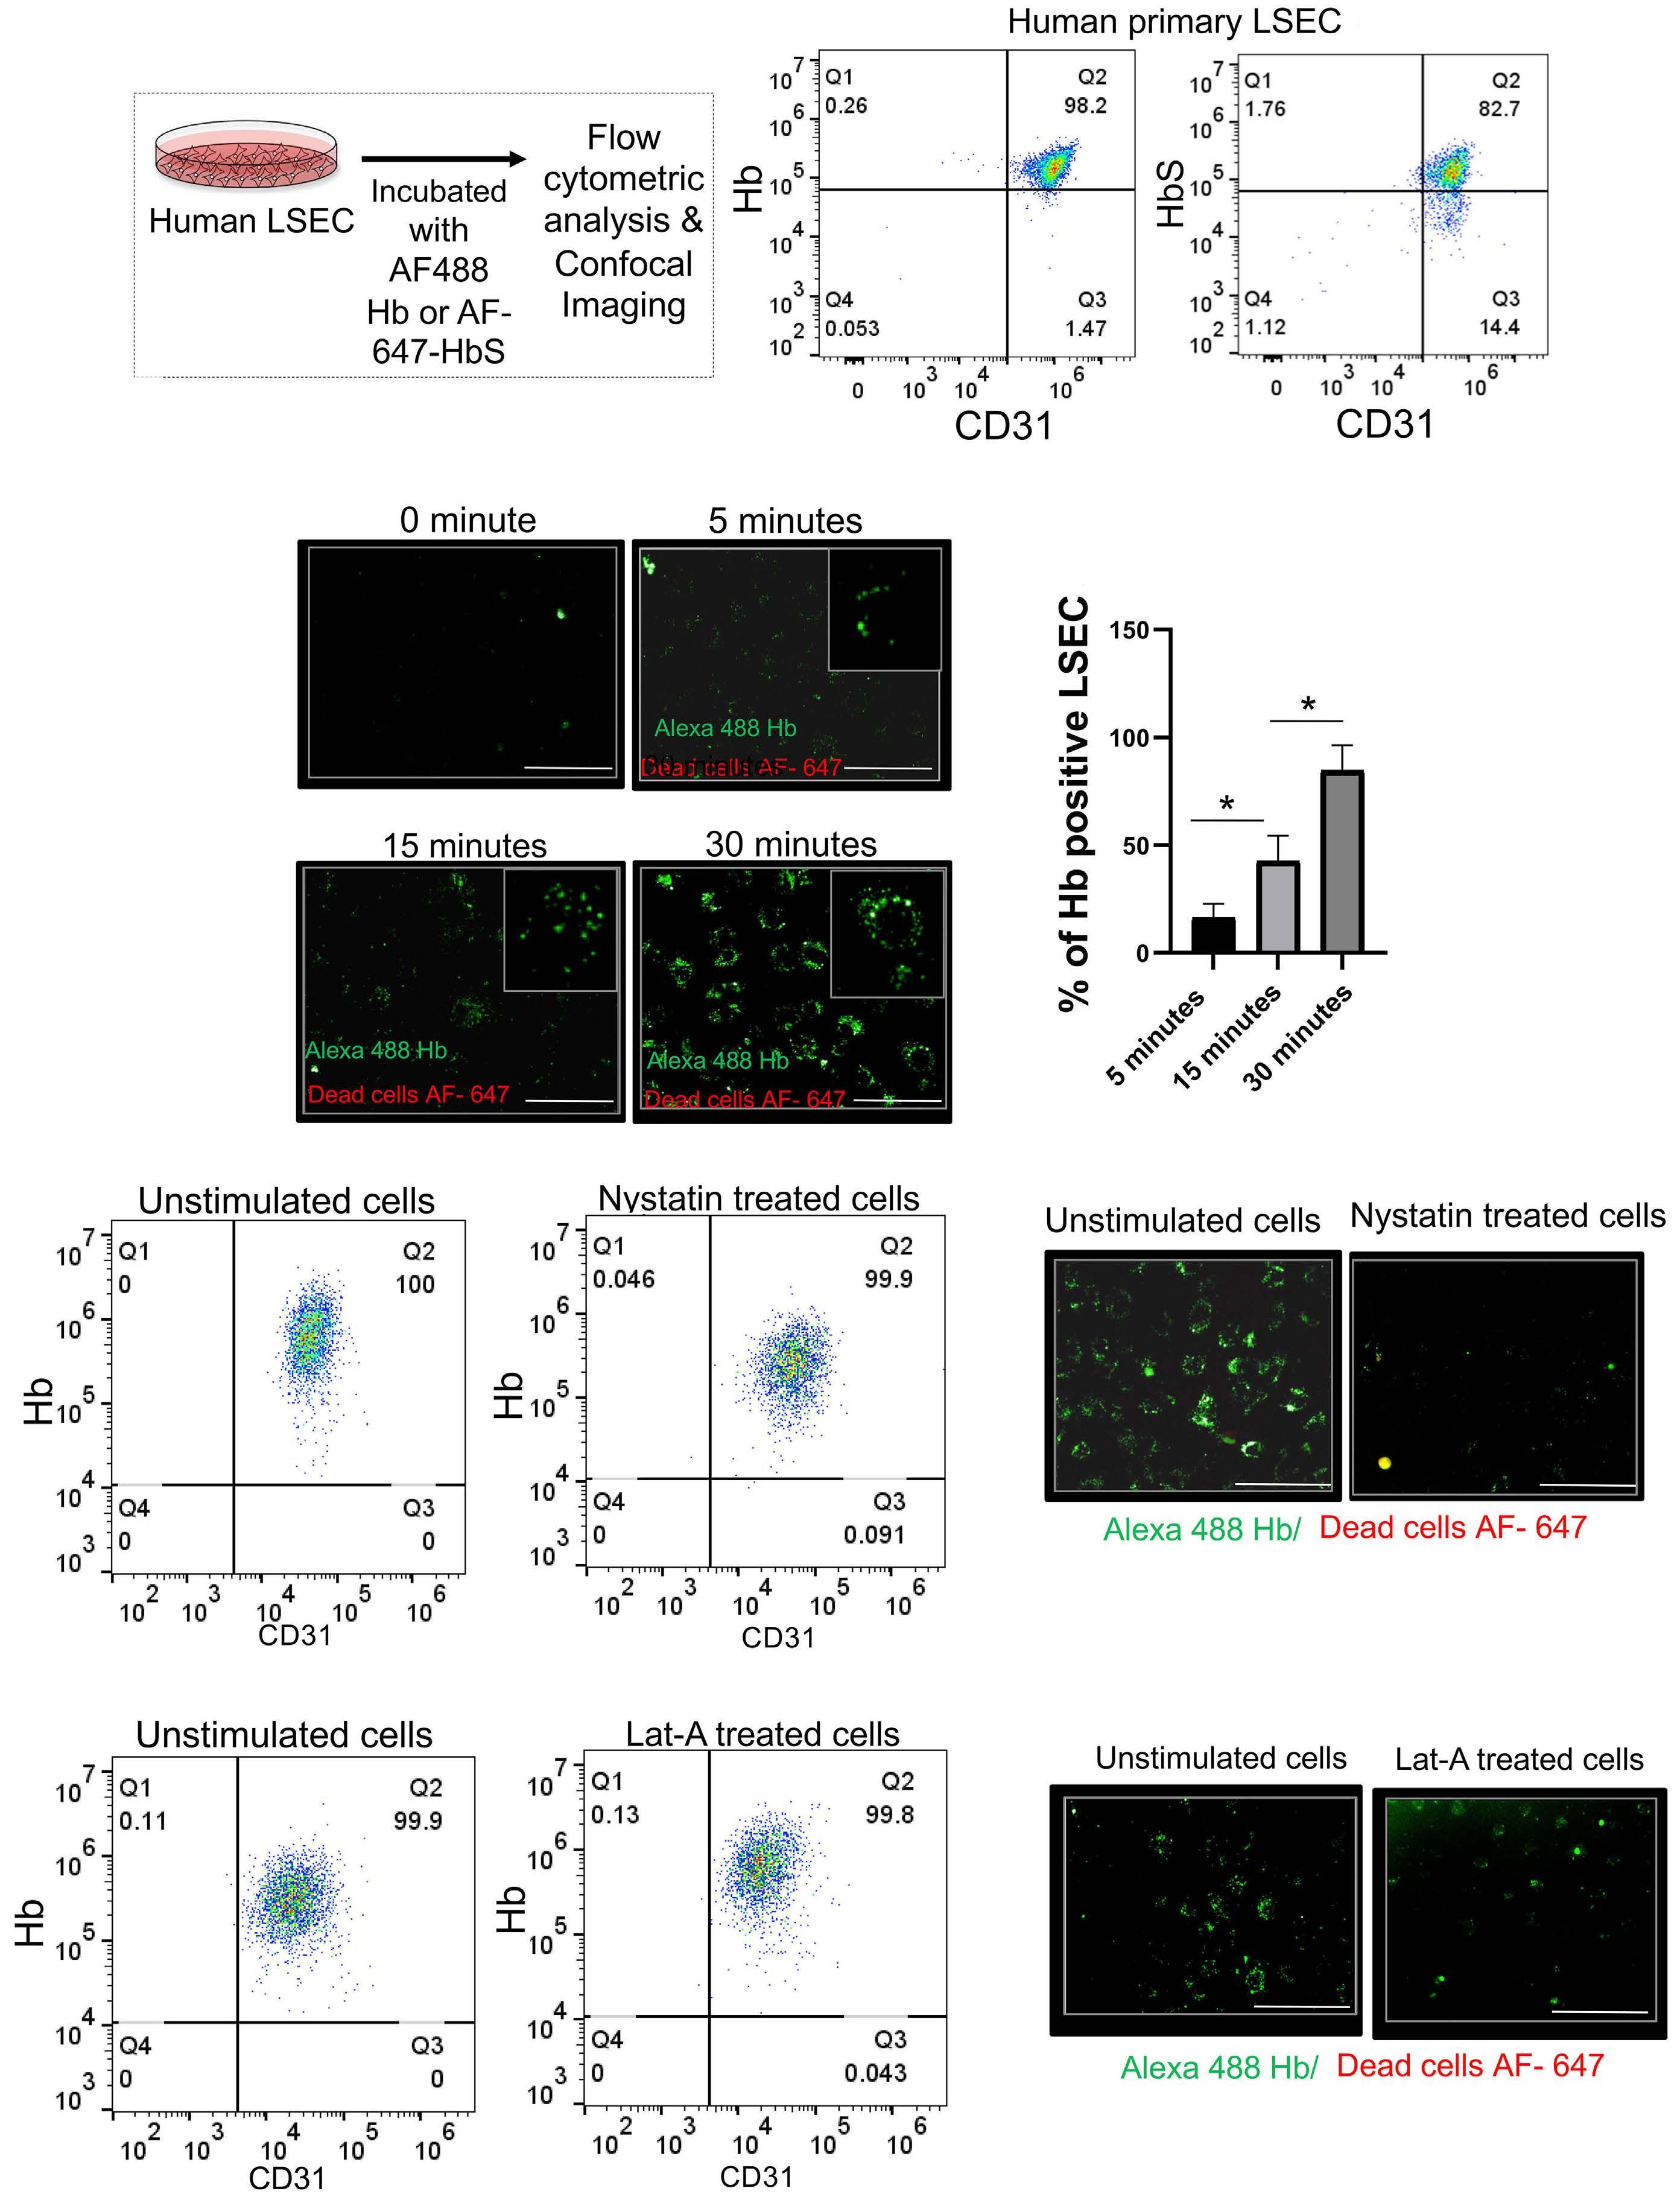
Haematologica | 109 May 2024 1541 ARTICLE - Sickle hemoglobin clearance by liver endothelium T.W. Kaminski et al. A B C D
Continued on following page.
Figure 3. In-vitro characterization reveals that micropinocytosis is the predominant mechanism of human liver sinusoidal endothelial cell-mediated hemoglobin intake. (A) Schematic diagram of the experimental design for flow cytometry of human primary liver endothelial cells. The right panel shows the flow cytometry analysis of CD31, normal hemoglobin and HbS in human primary liver endothelial cells. (B) Left panel: representative immunofluorescence images showing hemoglobin intake by primary human liver sinusoidal endothelial cells (LSEC) at 0, 5, 15 and 30 minutes after hemoglobin administration. The insets show zoomed in images. Right panel: a bar graph of the percentages of hemoglobin-positive LSEC at different time points. (C) Left panel: flow cytometry analysis of CD31 and hemoglobin in human primary liver endothelial cells with or without nystatin stimulation. Right panel: representative immunofluorescence images of hemoglobin intake by primary human LSEC with or without nystatin stimulation. (D) Left panel: flow cytometry analysis of CD31 and hemoglobin in human primary liver endothelial cells with or without latrunculin-A stimulation. Right panel: representative immunofluorescence images of hemoglobin intake by primary human LSEC with or without latrunculin-A stimulation. *P<0.05. Hb: hemoglobin; Lat-A: latrunculin-A.
peritoneally for up to 3 weeks (Figure 4A). Iron dextran administration increased the level of hepatic iron in SCD mice liver, as seen by western blot for the iron storage protein ferritin (Figure 4A, middle panel) and Perls Prussian blue staining for iron (Figure 4A, right panel). We found strong enrichment of iron in LSEC after iron dextran treatment (Figure 4A, endothelial cells surround the red dotted area). qRT-PCR (Figure 4B, left panel) and western blot analysis (Figure 4B, middle panel; Online Supplementary Table S2) for markers of senescence revealed a significant increase in LSEC senescence in the liver of iron dextran-treated SCD mice compared to that in untreated SCD mice. Additionally, exogenous iron exacerbated LSEC senescence based on the finding of increased co-localization of the LSEC marker CD31 and senescence marker P21 in iron dextran-treated versus untreated SCD mice (Figure 4B, right panel). Finally, iron dextran significantly increased the serum levels of markers of liver injury (alanine and aspartate transaminases) compared to those in untreated SCD mice (Online Supplementary Figure S2A) and resulted in exacerbated endothelial injury which correlated with the accumulation of iron in LSEC detected by staining with Prussian blue (Online Supplementary Figure S2B).
To assess the effect of HbS in promoting LSEC senescence, we treated primary human LSEC with normal hemoglobin and with HbS for up to 1 hour (Figure 4C). Interestingly, LSEC showed significant apoptosis after 1 hour of HbS treatment (Figure 4C, D; Online Supplementary Figure S2C), which was not observed after hemoglobin treatment. As hemoglobin auto-oxidation and subsequent heme release are more rapid from HbS than from HbA,31 we hypothesized that once internalized, HbS is more rapidly broken down to heme and iron, causing increased oxidative stress. To confirm our hypothesis, we performed qRT-PCR and analyzed the expression of markers of oxidative stress (NAD[P]H quinone dehydrogenase, glutathione peroxidase 1, superoxide dismutase and glutathione S transferase mu), senescence (P21 and P53), and iron overload (ferritin) following HbA and HbS internalization by LSEC. Remarkably, as shown in Figure 4E and Online Supplementary Figure S2D, HbS administration caused an increase in the expression of oxidative stress markers, senescence markers and ferritin as compared to HbA treatment. In addition, we used confocal imaging to examine the fluorescence intensity of HbS and HbA after
internalization. As shown in Online Supplementary Figure S2E, HbS intensity waned more rapidly over time compared to HbA intensity, indicating a faster rate of degradation of HbS following internalization. Overall, these findings indicate that HbS/iron build-up accelerates LSEC senescence in SCD. Furthermore, these results demonstrate a potential difference in the degradation rates of HbS and HbA within LSEC.
Absence of hepatic leukocytes exacerbates the senescence of liver sinusoidal endothelial cells in sickle cell disease
Liver-resident leukocytes (monocytes, Küpffer cells, and monocyte-derived [transient] macrophages) are the primary cells known to be responsible for hemoglobin clearance in the liver.32 Previously we19 and others33 showed increased expression of leukocytes (monocytes and macrophages) in SCD mouse liver, a phenomenon significantly reduced in SCD mice following P-selectin deletion (SCD; Selp-/- mice).34 Interestingly, we have also found that chronic P-selectin deficiency in SCD mice exacerbates overall liver senescence and injury.34 Thus, we hypothesized that the increased liver damage seen in SCD; Selp-/- mice is most likely due to enhanced LSEC senescence. To confirm increased LSEC senescence in SCD; Selp-/- mice, we used qLIM in live animals. As shown in Figure 5A, AF488-P21 antibody staining was strongly enriched in SCD; Selp-/- mouse liver compared to SCD mouse liver (Online Supplementary Movies S5 and S6). Moreover, the endothelial cell marker CD31 co-localized strongly with the cell senescent marker P21 in SCD; Selp-/- liver compared to SCD mouse liver (Figure 5B; Online Supplementary Figure S3A). P-selectin deficiency also led to an increase in hemoglobin (Figure 5C, D) and iron accumulation (Figure 5E) within LSEC of SCD mice, which was evidenced by the greater co-localization of hemoglobin than in untreated SCD mice (Figure 5C, upper panel) with the endothelial cell marker CD31 (Figure 5D; Online Supplementary Figure S3B). Immunofluorescence of the monocyte marker CD11b showed reduced expression in SCD; Selp-/- mouse liver as compared to that in SCD mouse liver (Online Supplementary Figure S3C). Recent evidence suggests that stressed erythrophagocytosis (as seen in hemolytic disorders) results in massive leukocyte infiltration in the liver, predominantly by monocytes that convert
Haematologica | 109 May 2024 1542 ARTICLE - Sickle hemoglobin clearance by liver endothelium T.W. Kaminski et al.

Figure 4. Accumulation of hemoglobin/iron in liver sinusoidal endothelial cells predominantly drives senescence in sickle cell disease liver. (A) Left panel: schematic of iron dextran administration to control and sickle cell disease (SCD) mice. Middle panel: western blot analysis of ferritin showing increased expression after iron dextran treatment in SCD mouse liver compared to control and SCD mouse liver at baseline. Right panel: representative immunohistochemistry images of Perls Prussian blue staining show accumulation of iron in liver sinusoidal endothelial cells (LSEC) of SCD mice at baseline; the accumulation was further increased in iron dextran-treated SCD mice. (B) Left panel: quantitative real-time polymerase chain reaction (qRT-PCR) analysis of P21, P16 and P53 showing increased expression of these markers in SCD liver after iron dextran treatment. Middle panel: western blot analysis of P53 showing increased expression in SCD liver after iron dextran treatment. Right panel: representative immunofluorescence images exhibiting stronger co-localization of P53 with CD31 in SCD liver after iron dextran treatment than at baseline. (C) Flow cytometry analysis of dead cells at baseline and 1 hour after hemoglobin and HbS treatment in primary human LSEC. (D) Bar graphs showing CD31 expression at baseline and 0.5 and 1 hours after HbS treatment. (E) qRT-PCR analysis of markers of oxidative stress in LSEC showing increased expression after HbS treatment compared to that after HbA treatment. *P<0.05; **P=0.05; ***P=0.01. Scale bar 50 mm. Con: control; IP: intraperitoneal; GAPDH: glyceraldehyde-3-phosphate dehydrogenase; ID: iron dextran; DAPI: 4’,6-diamidino-2-phenylindole; FITC-H: fluorescein isothiocyanate pulse height; Hb: hemoglobin; hr: hour; NQO1: NAD(P)H quinone dehydrogenase; GPX 1: glutathione peroxidase 1; SOX: superoxide dismutase; GSTm: glutathione S transferase mu.
Haematologica | 109 May 2024 1543 ARTICLE - Sickle hemoglobin clearance by liver endothelium T.W. Kaminski et al.
A B C D E
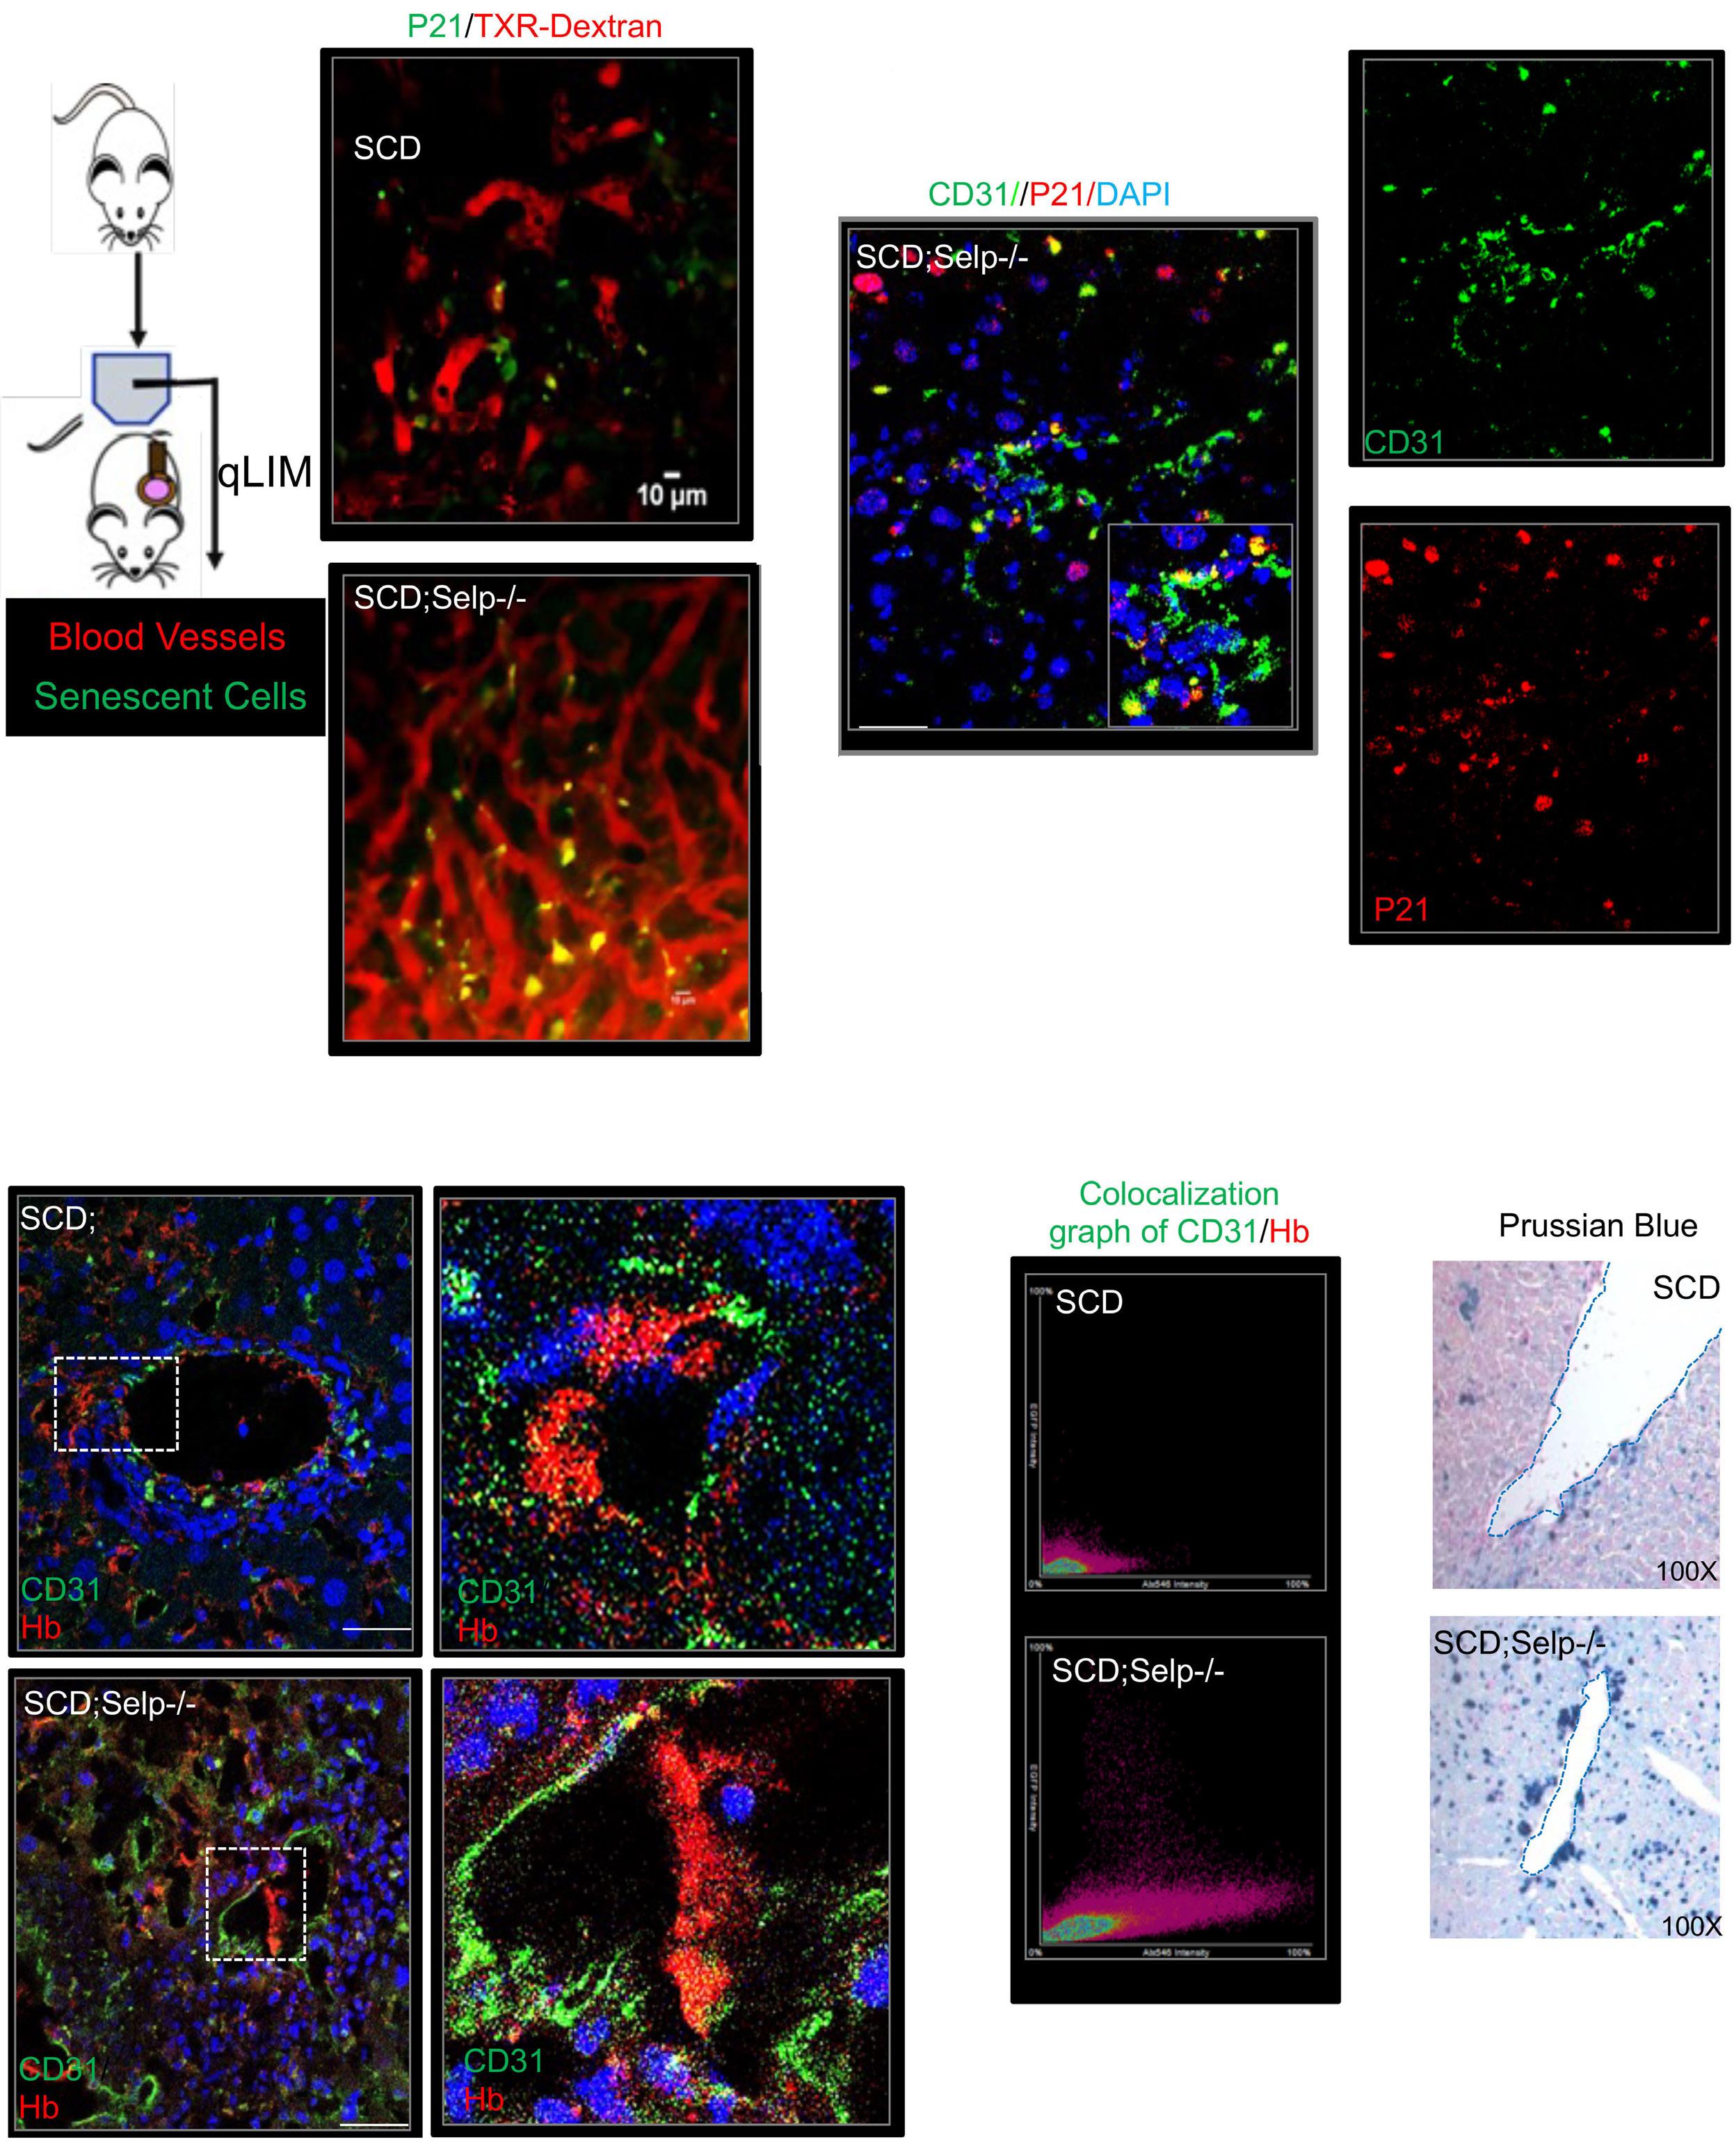
Figure 5. P-selectin-depleted mice with sickle cell disease show exacerbated liver sinusoidal endothelial cell senescence due to impaired hemoglobin clearance. (A) Schematic diagram of quantitative liver intravital microscopy (qLIM) imaging of mice using Texas red-dextran and AF488-P21 antibody. Representative qLIM images of liver tissue from sickle cell disease (SCD) mice and P-selectin-deficient SCD; Selp-/- mice injected with Texas red-dextran and AF488-P21 antibody. (B) Immunofluorescence image of P21 exhibits strong co-localization with CD31 in SCD; Selp-/- mouse liver. (C) Representative immunofluorescence images showing double staining of hemoglobin and CD31 in SCD and SCD; Selp-/- liver. Zoomed in images of the dotted box are shown. (D) Scatter plot showing the co-localized distribution pattern of CD31 (green) and hemoglobin (red) in SCD and SCD; Selp-/- mouse liver. (E) Representative immunohistochemistry images for Perls Prussian blue staining show accumulation of iron in liver sinusoidal endothelial cells of SCD mouse liver at baseline, which is enhanced in SCD; Selp-/- mouse liver. Scale bar 50 mm. TXR: Texas red; DAPI: 4’,6-diamidino-2-phenylindole; Hb: hemoglobin.
Haematologica | 109 May 2024 1544 ARTICLE - Sickle hemoglobin clearance by liver endothelium T.W. Kaminski et al.
A C D E B
into tissue-resident macrophages (also known as monocyte-derived macrophages).25 As we saw significant loss of monocytes in SCD; Selp-/- mice, we hypothesized that LSEC senescence is directly linked to loss of hepatic monocytes and monocyte-derived macrophages. To test this hypothesis, we sought to deplete monocytes and macrophages from SCD mouse liver. In order to selectively deplete monocytes, we used a low dose of clodronate liposome (10% of the normal dose), as previously described.35,36 As expected, we observed a strong reduction of the monocyte marker CD11b in the liver after clodronate liposome treatment (Figure 6A). Interestingly, we found that the depletion of hepatic monocytes in SCD mice by clodronate liposomes led to an increase in the total number of erythrocytes sequestered in hepatic sinusoids, as shown by scanning electron micrography (Figure 6B; Online Supplementary Figure S3D), which was associated with exacerbated liver senescence, evidenced by increased mRNA (Figure 6C, left panel) and protein expression (Figure 6C, middle panel) of markers of senescence. Loss of hepatic monocytes also led to increased co-localization of CD31 and P53 (Figure 6C, right panel) as well as an increase in hemoglobin accumulation, as shown by the higher level of hemoglobin than in untreated SCD mice (Figure 6D) and the greater co-localization of hemoglobin with the endothelial cell marker CD31 (Figure 6D; Online Supplementary Figure S3E).
We hypothesized that exacerbated LSEC senescence can promote vaso-occlusion and damage-associated molecular pattern (DAMP)-associated chronic liver injury. As we found more pronounced LSEC senescence in clodronate-treated SCD mouse liver, we analyzed liver injury in these animals compared to that in untreated SCD mice. We found a significant increase in serum alanine aminotransferase and aspartate transaminase in clodronate-treated SCD mice as compared to that in untreated SCD mice, which is indicative of exacerbated liver injury in clodronate-treated SCD mice (Online Supplementary Figure. S3F). Furthermore, sinusoidal congestion and increased liver injury were more pronounced in clodronate-treated SCD mice than in untreated ones, as shown by staining hepatic tissue with hematoxylin and eosin (Figure 6E). Sirius red and α-smooth muscle actin (α-SMA) staining (Figure 6E) revealed more collagen deposition and activated myofibroblasts in the clodronate-treated SCD mouse livers than in untreated ones, suggesting more severe liver fibrosis in the clodronate-treated animals. As shown by qLIM (Figure 6F), SCD mice manifested loss of blood flow in several regions of the liver at baseline due to sinusoidal vaso-occlusion.19 Following treatment with clodronate liposomes, SCD mice showed a further increase in areas with vaso-occlusion (Figure 6F; Online Supplementary Figure S4A, Online Supplementary Movies S7 and S8). Depletion of hepatic Küpffer cells (Online Supplementary Figure S4B) also resulted in similar enhancement of hepatic senescence (Online Supplementary Figure S4C, D) and exacerbated liver injury (Online Supplementary Figure
S4E). Collectively, our data suggest that exacerbated LSEC senescence and delayed HbS/red blood cell clearance are associated with increased vaso-occlusion, tissue damage and elevated levels of liver enzymes in monocyte-depleted SCD mice.
Discussion
Sickle red blood cells are prematurely cleared from the circulation by reticulo-endothelial macrophages.8-10 This process occurs primarily in the spleen until age-induced splenic dysfunction develops,37 which eventually results in the liver and bone marrow becoming the primary sites for hemoglobin clearance. In the liver, tissue-resident Küpffer cells as well as monocyte-derived macrophages promote hemoglobin clearance.38 Cell-free HbS released following intravascular hemolysis in SCD is scavenged by plasma haptoglobin, which chaperones it to the liver for CD163-dependent clearance by macrophages.39 However, chronic hemolysis in SCD results in depletion of plasma haptoglobin, leading to HbS clearance in the liver through a relatively less efficient process involving direct binding of hemoglobin to CD163 on macrophages.12,40,41 Cell-free hemoglobin released following intravascular hemolysis in SCD is also known to promote endothelial dysfunction in diverse organs by scavenging nitric oxide, promoting the generation of reactive oxygen species, and activating toll like receptor-4-dependent upregulation of pro-inflammatory and prothrombotic adhesion molecules on the surface of endothelial cells.42-44 Remarkably, our current study is the first to show that LSEC also contribute to the clearance of hemoglobin through micropinocytosis and that internalization of hemoglobin and iron leads to LSEC senescence. Cellular senescence is a state of irreversible growth arrest, which can be induced by a stress response to diverse cellular stimuli.45 LSEC senescence, a relatively novel concept, was recently found to be associated with sepsis and inflammatory liver diseases.46 However, the mechanism driving LSEC senescence remains poorly understood. Previous studies proposed that the senescent phenotype is a consequence of de-differentiation or loss of phenotype.47 Based on the data presented herein, we propose that intracellular accumulation of HbS and its rapid degradation are inducers of LSEC senescence. Prior research has demonstrated that hemoglobin auto-oxidation and subsequent heme release occur more rapidly from sickle hemoglobin (HbS) than from HbA,31 which could indicate rapid degradation of HbS after its internalization. Our findings also demonstrated increased oxidative stress and iron accumulation after HbS treatment, indicating a fast breakdown of HbS or alterations in its structure after internalization. Additionally, the potential for HbS to undergo polymerization in vitro upon internalization is worth considering and requires further investigation.
Haematologica | 109 May 2024 1545 ARTICLE - Sickle hemoglobin clearance by liver endothelium T.W. Kaminski et al.
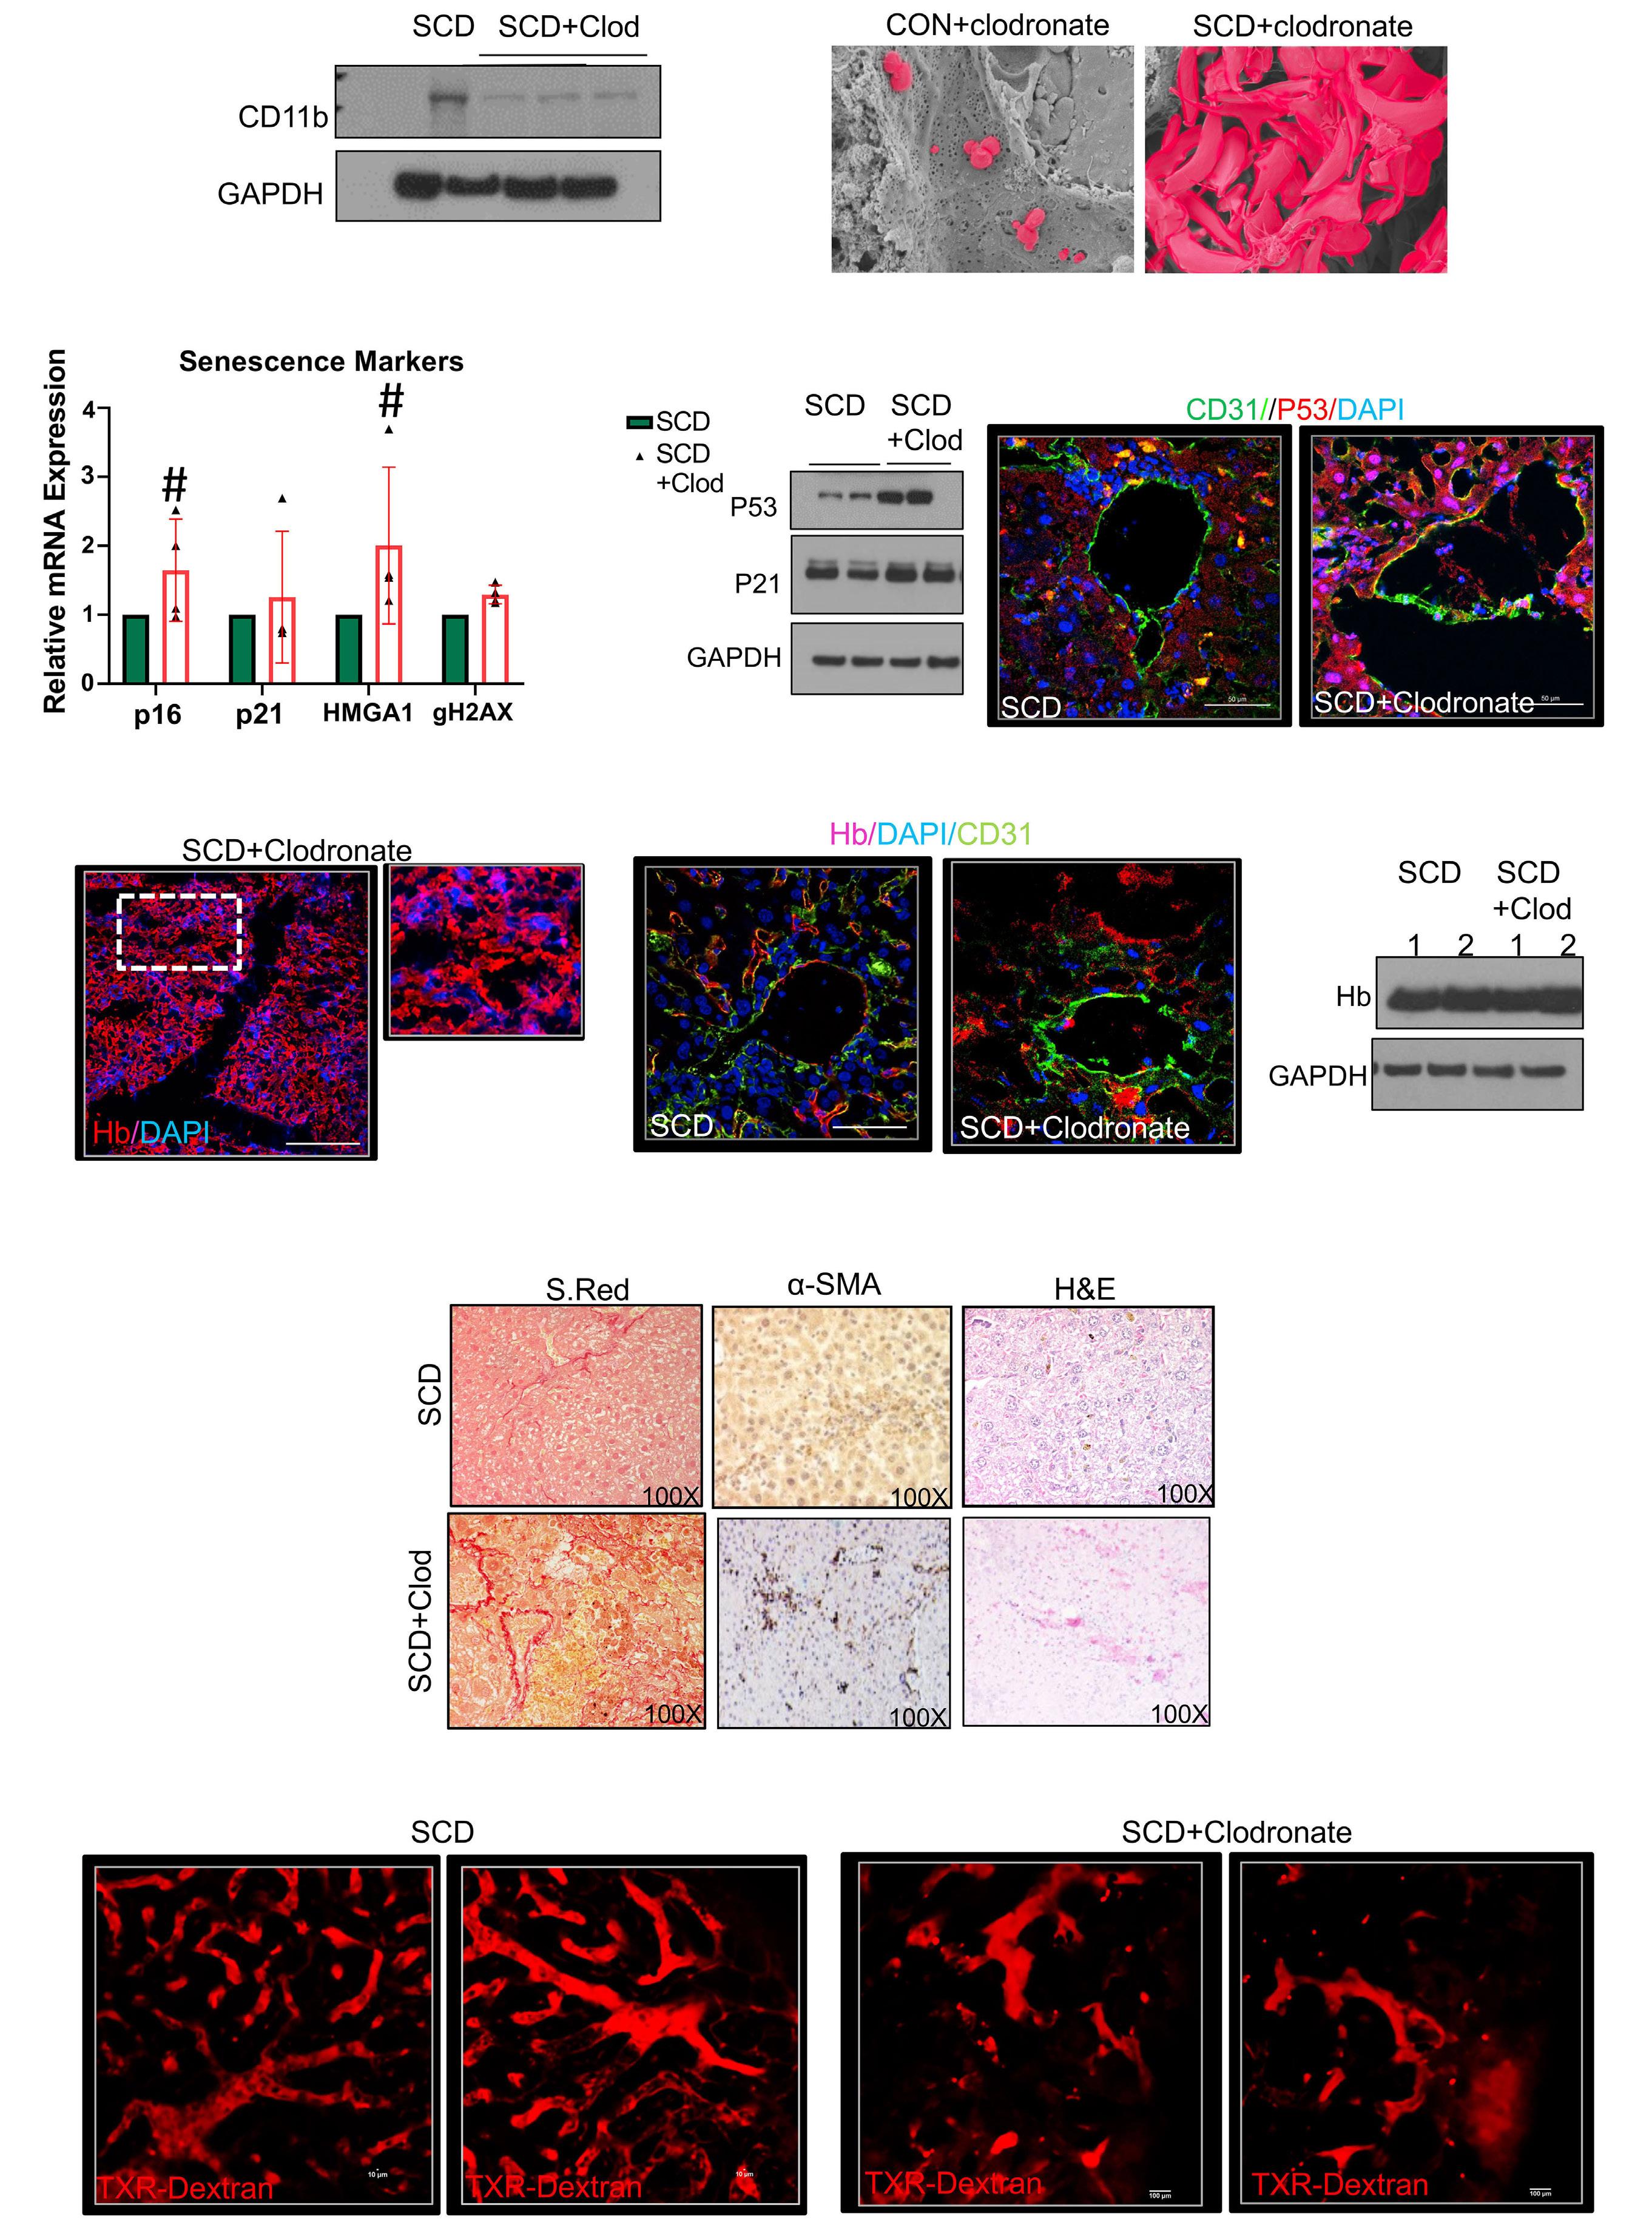
Haematologica | 109 May 2024 1546 ARTICLE - Sickle hemoglobin clearance by liver endothelium T.W. Kaminski et al. Continued
A C D F E B
on following page.
Figure 6. Loss of hepatic monocytes exacerbates liver sinusoidal endothelial cell senescence in sickle cell disease. (A) Western blot analysis of CD11b showing reduced expression in sickle cell disease (SCD) liver after clodronate-liposome treatment. (B) Representative scanning electron micrographs showing increased entrapment of erythrocytes in SCD liver after clodronate treatment. (C) Quantitative real-time polymerase chain reaction analysis of P21 and P16 shows increased expression in SCD liver after clodronate-liposome treatment. #P=0.04. Middle panel: western blot analysis of P21 and P53 showing increased expression in SCD liver after clodronate-liposome treatment. Right panel: representative immunofluorescence images displaying strong co-localization of CD31 and P53 in SCD liver after clodronate-liposome treatment compared with SCD liver at baseline. (D) Representative immunofluorescence images showing a strong increase in hemoglobin staining intensity in SCD liver tissue after clodronate treatment. Middle panel: western blot analysis of hemoglobin showing increased expression in SCD liver after clodronate-liposome treatment. Right panel: representative immunofluorescence images showing strong co-localization of hemoglobin and CD31 in SCD liver after clodronate-liposome treatment. (E) Representative images of tissues stained with hematoxylin and eosin show increased parenchymal injury in SCD liver after clodronate treatment compared to that in SCD liver alone (100X). Representative Sirius red (100X) and α-smooth muscle actin (100X) immunohistochemistry images demonstrate increased liver fibrosis in SCD+clodronate liver compared to SCD liver alone. (F) Representative quantitative liver intravital microscopy images of two different fields of view of SCD and clodronate-liposome-treated SCD liver injected with Texas red-dextran. Loss of blood flow (dark area devoid of red staining) is seen in SCD liver and is exacerbated in SCD liver treated with clodronate. Original magnification, ×10. Scale bar 50 mm. GAPDH: glyceraldehyde-3-phosphate dehydrogenase; Clod: clodronate; CON: control; DAPI: 4’,6-diamidino-2-phenylindole; Hb: hemoglobnin; S. Red: Sirius red; α-SMA: alpha smooth muscle actin; H&E: hematoxylin and eosin; TXR: Texas red.
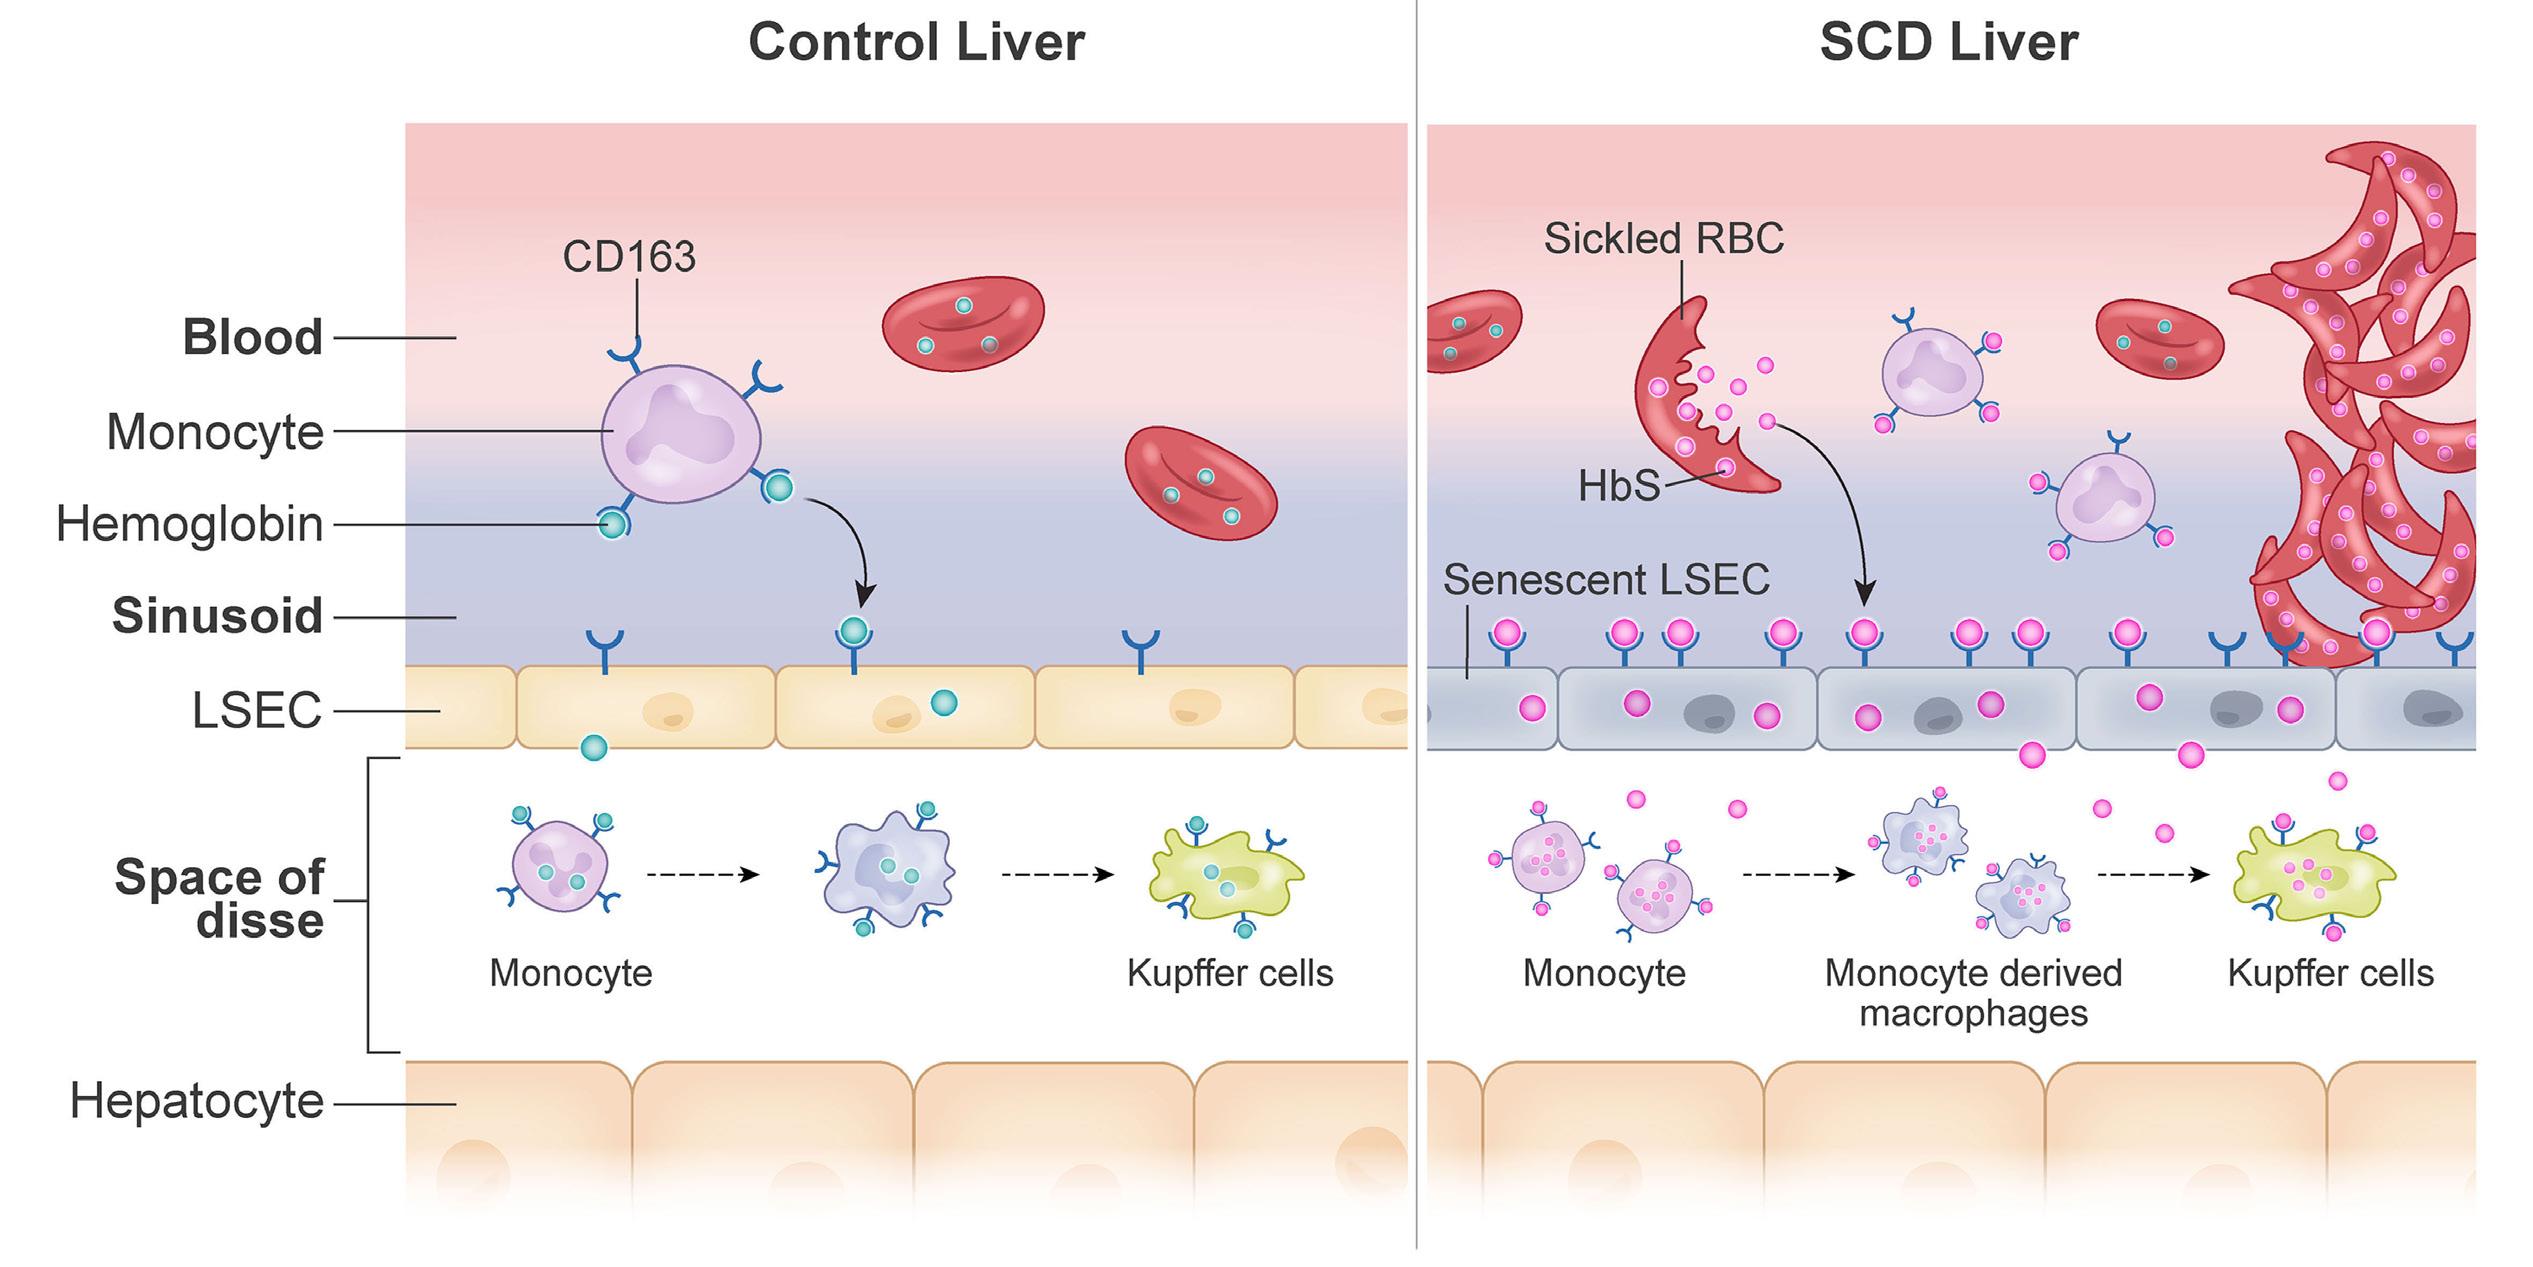
A BFigure 7. Impaired hemoglobin clearance by sinusoidal endothelium promotes vaso-occlusion and liver injury in sickle cell disease. Schematic diagram showing hemoglobin clearance in normal and sickle cell disease (SCD) liver. (A) In normal liver, the main cells responsible for hemoglobin clearance are hepatic Küpffer cells. Normal hemoglobin can also be endocytosed by liver sinusoidal endothelial cells (LSEC) and cleared without affecting LSEC viability. (B) In SCD liver, stressed, aged sickle erythrocytes accumulate in the hepatic sinusoids, where they are subsequently eliminated by hepatic leukocytes. Due to the continuous accumulation of sickle erythrocytes, their sequestration and hemolysis, hepatic macrophages and monocytes are activated to clear hemoglobin and iron released from these erythrocytes. LSEC participate actively in hepatic hemoglobin clearance in order to prevent the prolonged accumulation of hemoglobin and the associated tissue damage. Nonetheless, HbS/iron accumulation promotes LSEC senescence, resulting in delayed clearance, retention of HbS/iron, and increased liver injury. RBC: red blood cell.
Our findings suggest that the following sequence of events contributes to LSEC senescence in SCD mouse liver (Figure 7A, B). First, sickle erythrocytes are sequestered in hepatic sinusoids, thereby promoting hepatic ischemia followed by intravascular hemolysis. Second, hepatic macrophages and monocytes are activated to clear HbS, and iron released by the lysed erythrocytes, but the amount of HbS/ iron released in SCD overwhelms the hepatic monocyte/ macrophage-dependent clearance mechanism, leading to participation of LSEC in hepatic HbS/iron clearance
through micropinocytosis. However, accumulation of HbS/ iron in the LSEC leads to senescence of these cells, which in turn further promotes sinusoidal ischemia, liver injury and liver fibrosis. It will be interesting to examine whether non-SCD mouse models of other diseases characterized by intravascular hemolysis (e.g., thalassemia, sepsis) exhibit LSEC senescence.
Studies over the last few decades have focused on understanding the multifaceted pathophysiology associated with HbS polymerization and have led to the identification of
Haematologica | 109 May 2024 1547 ARTICLE - Sickle hemoglobin clearance by liver endothelium T.W. Kaminski et al.
many new therapeutic targets in SCD, such as P-selectin. P-selectin is an adhesion molecule present on endothelial cells and platelets48 which promotes erythrocyte-leukocyte-platelet-endothelial adhesion, leading to vaso-occlusion in SCD.49,50 We34 and others16 have shown that monocytes recruited to the liver attenuate hepatic damage in SCD mice by promoting hemoglobin and iron recycling. Our current findings suggest that genetic deletion of P-selectin in SCD mice worsens liver injury by impairing hemoglobin and iron clearance in the liver, which is secondary to reduced recruitment of monocytes caused by the absence of P-selectin. Crizanlizumab, a humanized monoclonal P-selectin-blocking antibody, is the first targeted therapy approved by the US Food and Drug Administration for the prevention of vaso-occlusive pain episodes in SCD patients.51 Although our current findings suggest that genetic (chronic) absence of P-selectin activity exacerbates liver injury in SCD mice, it remains to be determined whether chronic therapy with crizanlizumab might also increase the risk of liver injury in patients with SCD by promoting LSEC senescence. Unfortunately, biomarkers of liver injury were not reported in the paper on the crizanlizumab phase II clinical trial, and they are not routinely measured in clinical practice after crizanlizumab infusions. Thus, although no clinically significant liver injury has been reported after crizanlizumab treatment, it remains to be determined whether subtle alterations of liver indices may occur following P-selectin blockade in humans. Regardless of this limitation, our findings highlight the importance of monitoring liver function in patients on chronic crizanlizumab therapy.
Our study does have a few limitations that warrant further investigation in the future. First, the current study suggests that HbS is responsible for promoting senescence in LSEC by inducing a senescence-associated secretory phenotype (SASP) in the microenvironment; however, the cause-and-effect relationship between these pathological events and the signaling pathways affected remain to be elucidated. Second, we have shown that LSEC can promote hemoglobin clearance. However, it remains to be determined which scavenger receptor contributes specifically to HbS clearance by LSEC. Similarly, there are multiple micropinocytosis pathways of endocytic uptake, but which pathway promotes HbS uptake by LSEC in SCD and why LSEC are inefficient at degrading HbS remain to be de-
References
1. Sundd P, Gladwin MT, Novelli EM. Pathophysiology of sickle cell disease. Annu Rev Pathol. 2019;14:263-292.
2. Wang Q, Zennadi R. The role of RBC oxidative stress in sickle cell disease: from the molecular basis to pathologic implications. Antioxidants (Basel). 2021;10(10):1608.
3. Lacaille F, Allali S, Montalembert M De. The liver in sickle cell disease. J Pediatr Gastroenterol Nutr. 2021;23(2):177-189.
4 Kyrana E, Rees D, Lacaille F, et al. Clinical management of sickle
termined. Notwithstanding these limitations, the current study is the first to show that LSEC promote hemoglobin clearance in SCD mouse liver and that HbS-induced LSEC senescence is associated with chronic liver injury in SCD. These findings suggest that attenuating LSEC senescence by using senolytics52 or mitigating HbS/iron accumulation in LSEC could potentially ameliorate chronic liver injury in SCD.
Disclosures
HZ works at BioMagis. PS has received funds from CSL Behring, Novartis, and IHP Therapeutics. GJK works at CSL Behring. EMN is a consultant for Novo Nordisk and Chiesi. All other authors declare that they have no conflicts of interest to disclose.
Contributions
TWK, OK, ZL, RD, CH, AA, HZ, and TP-S conducted the experiments. HZ, TK, OK, and TP-S analyzed the data. GJK, TB, and PS provided important reagents or resources. TP-S wrote the manuscript with suggestions from and consultation with EM-N and PS.
Acknowledgments
The authors thank Pittsburgh Center for Biological Imaging (CBI-PITT), Dr. Donna Stolz, Dr. Simon Watkins, Dr. Jesus Tejero, Dr. Ramakrishna Ungalara, Jonathan Frank, Mara Sullivan, Laura Nelson, and X Zhang for their technical assistance in this study.
Funding
This work was supported by National Institutes of Health (NIH), National Institute of Diabetes and Digestive and Kidney Diseases grant K01NIH-NIDDK125617, an American Society of Hematology Junior Faculty Scholar Award (to TP-S), NIH, National Heart, Lung, and Blood Institute grants R01HL128297 and R01HL141080 (to PS); American Heart Association (AHA) grant 18TPA34170588 (to PS); and an AHA postdoctoral fellowship AHA828786 (to TWK).
Data-sharing statement
All data related to this study are shared through this manuscript. For further information please contact the corresponding author.
cell liver disease in children and young adults. Arch Dis Child. 2020;106(4):315-320.
5. Ross AS, Graeme-Cook F, Cosimi AB, et al. Combined liver and kidney transplantation in a patient with sickle cell disease. Transplantation. 2002;73(4):605-608.
6. Galloway-Blake K, Reid M, Walters C, et al. Clinical factors associated with morbidity and mortality in patients admitted with sickle cell disease. West Indian Med J. 2014;63(7):711-716.
Haematologica | 109 May 2024 1548 ARTICLE - Sickle hemoglobin clearance by liver endothelium T.W. Kaminski et al.
7 Ware RE, de Montalembert M, Tshilolo L, et al. Sickle cell disease. Lancet. 2017;390(10091):311-323.
8. George A, Pushkaran S, Konstantinidis DG, et al. Erythrocyte NADPH oxidase activity modulated by Rac GTPases, PKC, and plasma cytokines contributes to oxidative stress in sickle cell disease. Blood. 2013;121(11);2099-2107.
9 Franco RS, Lohmann J, Silberstein EB, et al. Time-dependent changes in the density and hemoglobin F content of biotinlabeled sickle cells. J Clin Invest. 1998;101(12):2730-2740.
10 Lutz HU, Bogdanova A. Mechanisms tagging senescent red blood cells for clearance in healthy humans. Front Physiol. 2013;4:387.
11. Lee SJ, Park SY, Jung MY, et al. Mechanism for phosphatidylserine-dependent erythrophagocytosis in mouse liver. Blood. 2011;117(19):5215-5223.
12. Thomsen JH, Etzerodt A, Svendsen P, et al. The haptoglobinCD163-heme oxygenase-1 pathway for hemoglobin scavenging. Oxid Med Cell Longev. 2013;2013:523652.
13. Pradhan-Sundd T, Vats R, Russell JO, et al. Dysregulated bile transporters and impaired tight junctions during chronic liver injury in mice. Gastroenterology. 2018;155(4):1218-1232.
14 Wu LC, Sun CW, Ryan TM, et al. Correction of sickle cell disease by homologous recombination in embryonic stem cells. Blood. 2006;108(4):1183-1188.
15. Vats R, Brzoska T, Bennewitz MF, et al. Platelet extracellular vesicles drive inflammasome-IL-1β-dependent lung injury in sickle cell disease. Am J Respir Crit Care Med. 2020;201(1):33-46.
16. Liu Y, Zhong H, Bao W, et al. Patrolling monocytes scavenge endothelial adherent sickle red blood cells in sickle cell disease. Blood. 2018;134(7):579-590.
17 Pradhan-Sundd T, Kato GJ, Novelli EM. Molecular mechanisms of hepatic dysfunction in sickle cell disease: lessons from Townes mouse model. Am J Physiol Cell Physiol. 2022;323(2):C494-C504.
18. Bennewitz MF, Tutuncuoglu E, Gudapati S, et al. P-selectindeficient mice to study pathophysiology of sickle cell disease. Blood Adv. 2020;4(2):266-273.
19 Vats R, Liu S, Zhu J, et al. Impaired bile secretion promotes hepatobiliary injury in sickle cell disease. Hepatology. 2020;72(6):2165-2181.
20 Anzinger JJ, Chang J, Xu Q, et al. Native low-density lipoprotein uptake by macrophage colony-stimulating factor-differentiated human macrophages is mediated by macropinocytosis and micropinocytosis. Arterioscler Thromb Vasc Biol. 2010;30(10):2022-2031.
21. Braet F, De Zanger R, Jans D, et al. Microfilament-disrupting agent latrunculin A induces an increased number of fenestrae in rat liver sinusoidal endothelial cells: comparison with cytochalasin B. Hepatology. 1996;24(3):627-635.
22. Vats R, Kaminski TW, Pradhan-Sundd T. Intravital imaging of hepatic blood biliary barrier in live mice. Curr Prot. 2021;1(10):e256.
23. Racanelli V, Rehermann B. The liver as an immunological organ. Hepatology. 2006;43(2 Suppl 1):S54-62.
24. Elvevold K, Kyrrestad I, Smedsrød B. Protocol for isolation and culture of mouse hepatocytes (HCs), Kupffer cells (KCs), and liver sinusoidal endothelial cells (LSEC) in analyses of hepatic drug distribution. Methods Mol Biol. 2012;2434:385-402.
25. Theurl I, Hilgendorf I, Nairz M, et al. On-demand erythrocyte disposal and iron recycling requires transient macrophages in the liver. Nat Med. 2016;22(8):945-951.
26. Chang R, Castillo J, Zambon AC, et al. Brain endothelial erythrophagocytosis and hemoglobin transmigration across
brain endothelium: implications for pathogenesis of cerebral microbleeds. Front Cell Neurosci. 2018;12:279.
27. Fens MHAM, van Wijk R, Andringa G, et al. A role for activated endothelial cells in red blood cell clearance: implications for vasopathology. Haematologica. 2012;97(4):500-508.
28. Oh N, Park JH. Endocytosis and exocytosis of nanoparticles in mammalian cells. Int J Nanomedicine. 2014;9(Suppl 1):51-63.
29. Cao H, Chen J, Awoniyi M, et al. Dynamin 2 mediates fluidphase micropinocytosis in epithelial cells. J Cell Sci. 2007;120(Pt23):4167-4177.
30. Richards DA, Rizzoli SO, Betz WJ. Effects of wortmannin and latrunculin A on slow endocytosis at the frog neuromuscular junction. J Physiol. 2004;557(Pt 1):77-91.
31. Browne P, Shalev O, Hebbel RP. The molecular pathobiology of cell membrane iron: the sickle red cell as a model. Free Radic Biol Med. 1998;24(6):1040-1048.
32. Klei TRL, Meinderts SM, van den Berg TK, et al. From the cradle to the grave: the role of macrophages in erythropoiesis and erythrophagocytosis. Front Immunol. 2017;8:73.
33. Vinchi F, Da Silva MC, Ingoglia G, et al. Hemopexin therapy reverts heme-induced proinflammatory phenotypic switching of macrophages in a mouse model of sickle cell disease. Blood. 2016;127(4):473-486.
34. Vats R, Kaminski TW, Ju E-M, et al. P-selectin deficiency promotes liver senescence in sickle cell disease mice. Blood. 2021;137(19):2676-2680.
35. Liu Y, Zhong H, Bao W, et al. Patrolling monocytes scavenge endothelial-adherent sickle RBCs: a novel mechanism of inhibition of vaso-occlusion in SCD. Blood. 2019;134(7):579-590.
36. Biburger M, Aschermann S, Schwab I, et al. Monocyte subsets responsible for immunoglobulin G-dependent effector functions in vivo. Immunity. 2011;35(6):932-944.
37. George A, Conneely SE, Mangum R, et al. Splenic complications in sickle cell disease: a retrospective cohort review. Blood. 2021;108(4):1158-1162.
38. Terpstra V, Van Berkel TJC. Scavenger receptors on liver Kupffer cells mediate the in vivo uptake of oxidatively damaged red blood cells in mice. Blood. 2000;95(6):2157-2163.
39. Schaer DJ, Schaer CA, Buehler PW, et al. CD163 is the macrophage scavenger receptor for native and chemically modified hemoglobins in the absence of haptoglobin. Blood. 2006;107(1):373-380.
40 Gbotosho OT, Kapetanaki MG, Kato GJ. The worst things in life are free: the role of free heme in sickle cell disease. Front Immunol. 2021;11:561917.
41. Santiago RP, Guarda CC, Figueiredo CVB, et al. Serum haptoglobin and hemopexin levels are depleted in pediatric sickle cell disease patients. Blood Cells Mol Dis. 2018;72:34-36.
42. Sundd P, Gladwin MT, Novelli EM. Pathophysiology of sickle cell disease. Ann Rev Pathol. 2019;14:263-292.
43. Ghosh S, Adisa OA, Chappa P, et al. Extracellular hemin crisis triggers acute chest syndrome in sickle mice. J Clin Invest. 2013;123(11):4809-4820.
44 Belcher JD, Chen C, Nguyen J, et al. Heme triggers TLR4 signaling leading to endothelial cell activation and vaso-occlusion in murine sickle cell disease. Blood. 2014;123(3):377-390.
45. Kuilman T, Michaloglou C, Mooi WJ, et al. The essence of senescence. Genes Dev. 2010;24(22):2463-2479.
46. Hutchins NA, Chung CS, Borgerding JN, et al. Kupffer cells protect liver sinusoidal endothelial cells from Fas-dependent apoptosis in sepsis by down-regulating gp130. Am J Pathol. 2013;182(3):742-754.
47. Koudelkova P, Weber G, Mikulits W. Liver sinusoidal endothelial
Haematologica | 109 May 2024 1549 ARTICLE - Sickle hemoglobin clearance by liver endothelium T.W. Kaminski et al.
cells escape senescence by loss of p19ARF. PLoS One. 2015;10(11):e0142134.
48. Matsui NM, Borsig L, Rosen SD, et al. P-selectin mediates the adhesion of sickle erythrocytes to the endothelium. Blood. 2001;98(6):1955-1962.
49 Vats R, Tutuncuoglu E, Pradhan-Sundd T, et al. Tandem P-selectin glycoprotein ligand immunoglobulin prevents lung vaso-occlusion in sickle cell disease mice. Exp Hematol. 2020;84:1-6.
50 Vats R, Li Z, Ju EM, et al. Intravital imaging reveals inflammation as a dominant pathophysiology of age-related hepatovascular changes. Am J Physiol Cell Physiol. 2022;322(3):C508-C520.
51. Ataga KI, Kutlar A, Kanter J, et al. Crizanlizumab for the prevention of pain crises in sickle cell disease. N Engl J Med. 2017;376(5):429-439.
52. Kirkland JL, Tchkonia T. Senolytic drugs: from discovery to translation. J Int Med. 2020;288(5):518-536.
Haematologica | 109 May 2024 1550 ARTICLE - Sickle hemoglobin clearance by liver endothelium T.W. Kaminski et al.
The role of the mineralocorticoid receptor in steroidinduced cytotoxicity in pediatric acute lymphoblastic leukemia
Glucocorticoids, e.g. prednisone and dexamethasone, were among the first classes of drugs used in the treatment of childhood acute lymphoblastic leukemia (ALL) and are still regarded as cornerstone drugs in ALL therapy.1 Glucocorticoids can bind and activate the glucocorticoid receptor (GR, encoded by the NR3C1 gene) and the mineralocorticoid receptor (MR, encoded by the NR3C2 gene). The cytotoxic effect of glucocorticoids seems to be exerted mainly through the GR, and clinical as well as in vitro steroid resistance (a poor prognostic factor for the survival of patients with ALL) are related to NR3C1 aberrations.2,3 NR3C2 mutations have been less frequently studied and the role of the MR in steroid cytotoxicity therefore remains unclear.
Synthetic glucocorticoids differ in their ability to activate the GR and MR. Prednisone has a high affinity for both receptors, whereas dexamethasone only has strong potency to activate the GR.4 Hydrocortisone, i.e. the naturally occurring hormone cortisol, can bind both receptors, with a greater affinity for the MR.4 Interestingly, hydrocortisone seems to potentiate the cytotoxic effect of both prednisolone and dexamethasone in steroid-sensitive ALL cells.5 Moreover, hydrocortisone appeared to be as potent as dexamethasone or prednisolone in cytotoxicity assays.5 Since hydrocortisone has far fewer side effects compared to dexamethasone or prednisone and could conceivably be used as an alternative therapy when dexamethasone toxicity is too high, it would be of interest to investigate the cytotoxic effect of hydrocortisone. The purpose of the present study was therefore to establish the role of the MR in steroid-induced cytotoxicity in patients with ALL and to evaluate the antileukemic activity of hydrocortisone.
To compare the differential cytotoxic effects of dexamethasone, prednisolone and hydrocortisone via the GR or the MR in leukemic cells, we generated bulk-transduced Reh cells with a doxycycline-inducible DDK-tagged NR3C1 or NR3C2 construct, respectively. Gateway multisite recombination (Invitrogen) was used for gateway cloning of lentiviral expression vectors as previously described.2 The inducibility of the NR3C1 or NR3C2 constructs was assessed through flow cytometry following intracellular DDK staining (Online Supplementary Figure S1A). We selected two clones per cell line (RehNR3C1-A, RehNR3C1-B, RehNR3C2-A and RehNR3C2-B), of which clones A were used primarily. Doxycycline exposure induced the expression of DDK-tagged NR3C1 or DDK-tagged NR3C2 proteins in Reh parental cells that lack a functional GR and MR (Figure 1A). Hydrocortisone and dexamethasone treatment further enhanced protein expression and correspondingly
showed strong induction of BIM (Figure 1A). Next, we studied the expression of NR3C1 and NR3C2 in both cell line models upon treatment with dexamethasone or hydrocortisone. For normalized expression levels, the expression of non-doxycycline-induced cells in the absence of steroid treatment was set at one. Doxycycline exposure induced NR3C1 construct expression in the RehNR3C1 cell line (Figure 1B, left panels). Dexamethasone and hydrocortisone enhanced endogenous NR3C1 and NR3C2 expression levels, signifying that NR3C2 is a target gene of NR3C1. In RehNR3C2, doxycycline exposure induced expression of NR3C2, which was enhanced by hydrocortisone and to a lesser extent by dexamethasone (Figure 1B, right panels). In contrast to its effect on RehNR3C1 cells, hydrocortisone treatment particularly induced NR3C1 expression in RehNR3C2 cells. Expression of known NR3C1 transcriptional target genes BIM, GILZ and FKBP5 was also strongly induced by hydrocortisone and dexamethasone in RehNR3C1 cells, whereas strong transcriptional upregulation of these genes was predominantly achieved by hydrocortisone treatment in RehNR3C2 cells (Figure 1C). Since Reh cells do not have a functional NR3C1 allele, these results demonstrated that induction of GR-regulated target genes can also be achieved through activation of the MR, and especially through exposure to hydrocortisone. The strong induction of BIM by hydrocortisone treatment in RehNR3C2 cells (Figure 1A, C) is of interest since BIM mediates steroid-induced apoptosis of lymphoid cells.7 The induction of BIM by hydrocortisone and to lesser extents by dexamethasone and prednisolone in RehNR3C2 cells indicates that the MR may play a role in steroid-induced cytotoxicity. We examined the cytotoxic effects of steroid treatment in NR3C1- or NR3C2-expressing Reh cells using a methylthiazolyldiphenyl-tetrazolium bromide (MTT) cell viability assay. In the absence of doxycycline, RehNR3C1 and RehNR3C2 cells were completely refractory to dexamethasone, prednisolone or hydrocortisone treatment (Figure 2A, Online Supplementary Figure S1B). Doxycycline-induced NR3C1 or NR3C2 expression sensitized Reh cells to all three steroids. Hydrocortisone was the most potent steroid in both RehNR3C1 and RehNR3C2 cells. Furthermore, the cytotoxic effect induced by dexamethasone was comparable in cells expressing GR or MR. These results show that hydrocortisone can cause significant steroid-induced cell death of leukemic cells, through both MR and GR. Despite the (relative) lack of transcriptional upregulation of target genes, dexamethasone induces significant steroid-induced death of RehNR3C2 cells. To verify the role of the MR in steroid-induced cell death, we
Haematologica | 109 May 2024 1551 LETTER TO THE EDITOR
treated RehNR3C1 and RehNR3C2 cells with RU28318, a specific MR antagonist.8 RU28318 treatment in RehNR3C2 cells completely inhibited the cytotoxic potential of the MR following steroid treatment, but not the GR potential in RehNR3C1 cells (Figure 2B). To study the potential clinical relevance of these observations, we first determined the relative expression of
NR3C1 and NR3C2 in 278 primary ALL patients’ samples.9 The relative expression of NR3C1 was higher than that of NR3C2 (Figure 3A) and patients with an ETV6-RUNX1 fusion gene had the highest NR3C2 expression, as described before.5 As proof of concept, we treated one ALL patient-derived xenograft model and two primary patients’ samples that
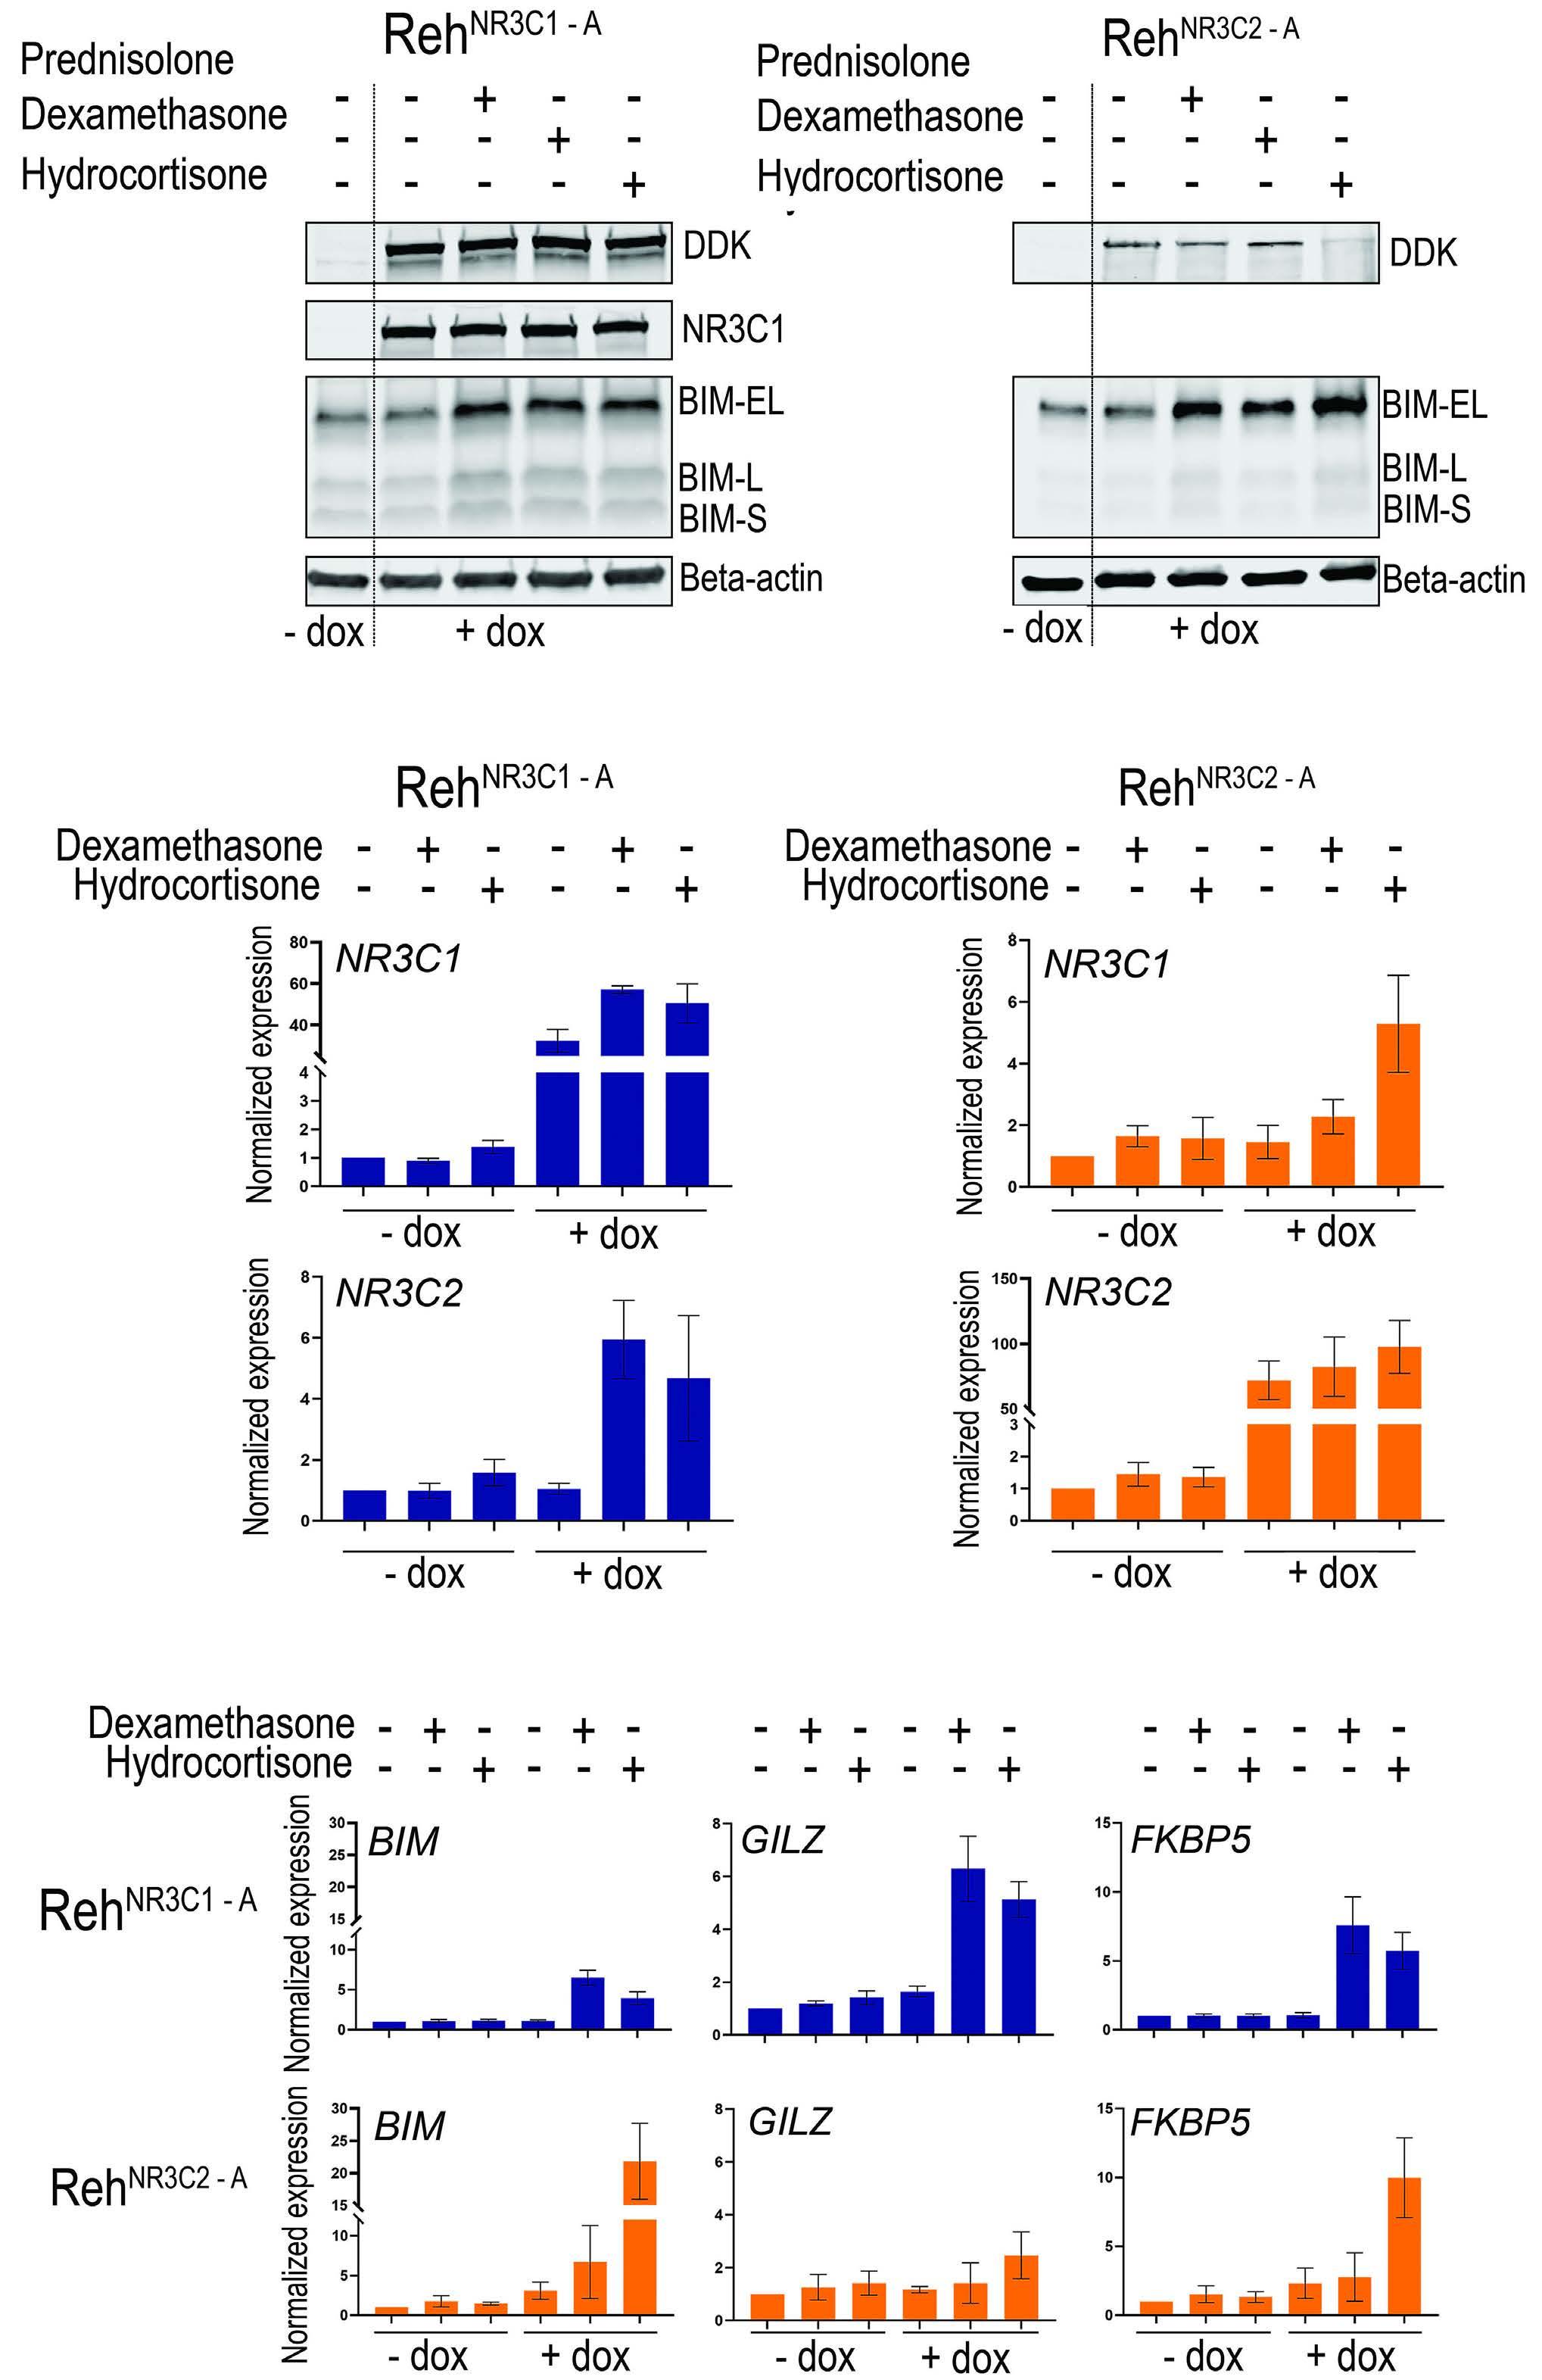
Figure 1. Hydrocortisone can induce expression of NR3C1 and NR3C2 via both the glucocorticoid receptor and the mineralocorticoid receptor. (A) Western blot analysis of DDK, NR3C1 and BIM in Reh cell lines that were transfected with either doxycycline-inducible DDK-tagged NR3C1 or NR3C2 constructs, after treatment with prednisone, dexamethasone or hydrocortisone, as indicated. (B) Transcriptional steroid response of Reh cell lines transfected with doxycycline-inducible NR3C1 or NR3C2 constructs. After doxycycline induction, cells were treated with 0.16 mM dexamethasone or 0.032 mM (RehNR3C1) or 0.0028 mM (RehNR3C2) hydrocortisone. Expression of NR3C1 (upper panels) and NR3C2 (lower panels) was measured in both cell lines, as was (C) the expression of BIM, GILZ and FKBP5, target genes of the glucocorticoid receptor and the mineralocorticoid receptor. Dox: doxycycline.
Haematologica | 109 May 2024 1552 LETTER TO THE EDITOR
A B C
harbored the ETV6-RUNX1 fusion gene with different concentrations of steroids in combination with RU28318. Viability was determined by amino staining and cytotoxicity was calculated as area under the curve (AUC) values. In contrast to Reh cells, we only observed a modest, not statistically significant decrease in steroid sensitivity after treatment with RU28318 (Figure 3B).
Furthermore, we studied the association between NR3C1 and NR3C2 expression and event-free survival in a subgroup of 131 ALL patients for whom outcome data were available (informed consent compliant with the biobanking procedure in the Princess Máxima Center [MEC-2016-739]). The levels of MR and GR expression were categorized as low or high, with the median as the cutoff value.10 Event-free survival was estimated using the Kaplan-Meier methodology and the effect of prognostic factors on event-free survival was estimated with Cox proportional hazard regression models. In a univariable Cox regression, we did not find significant associations between either NR3C1 expression (hazard ratio=0.96, 95% confidence interval: 0.40-2.30) or NR3C2 expression (hazard ratio=0.57, 95% confidence interval: 0.241.33), and any of 25 observed events (Online Supplementary Table S1). Event-free survival was also not statistically significantly different between patients with high or low NR3C1 and NR3C2 expression (Online Supplementary Figure S2A). Together, these findings indicate that, even though MR made
a pronounced contribution in our cell line models, the role of the MR in steroid-induced cytotoxicity in ALL patients appears to be limited.
In contrast to previous studies,4,11,12 we found that hydrocortisone seemed to be more efficient in inducing cell death than was either prednisolone or dexamethasone in both RehNR3C1 and RehNR3C2 cell line models. This may be related to the high expression of NR3C1 and NR3C2 in our models compared to the expression in patient-derived xenografts or patients’ samples (Online Supplementary Figure S2B). Nevertheless, the inter-patient variability in steroid sensitivity is high, with cytotoxicity values sometimes varying more than 1,000-fold among patients’ samples.11,12 It therefore cannot be excluded that certain patients may benefit from hydrocortisone treatment, especially when dexamethasone-induced side effects occur.
Patients with the ETV6-RUNX1 fusion gene have high NR3C1 and NR3C2 expression (Figure 3A), as well as an excellent prognosis.13 We speculated that the MR contributes to this superior survival, but our experiments only showed a minimal shift in cell toxicity curves after the addition of RU28318 to two primary ALL patients’ samples and one patient-derived xenograft model with the ETV6-RUNX1 fusion gene. An explanation for the difference between these samples and our experimental setting may be a lower expression or less transcriptional activity of NR3C2 compared to NR3C1 in

Figure 2. Hydrocortisone is the most potent steroid in NR3C1- and NR3C2-overexpressing cells. (A) Cell toxicity screening of RehNR3C1 (left) and RehNR3C2 (right) cells with (color) and without (gray-scales) doxycycline induction and after treatment with prednisolone, dexamethasone or hydrocortisone. Steroid sensitivity was determined with an MTT assay. Data represent biological triplicates, with standard deviations. (B) Cell toxicity screening of doxycycline-induced RehNR3C1 (upper panels) and RehNR3C2 (lower panels) with and without 4 mM RU28318 (mineralocorticoid receptor antagonist) treatment in combination with prednisolone, dexamethasone or hydrocortisone. RU28318 treatment in RehNR3C2 cells reversed the acquired steroid sensitivity. Dox: doxycycline; pred: prednisolone; dexa: dexamethasone; hydro: hydrocortisone; RU: RU28318.
Haematologica | 109 May 2024 1553 LETTER TO THE EDITOR
A B
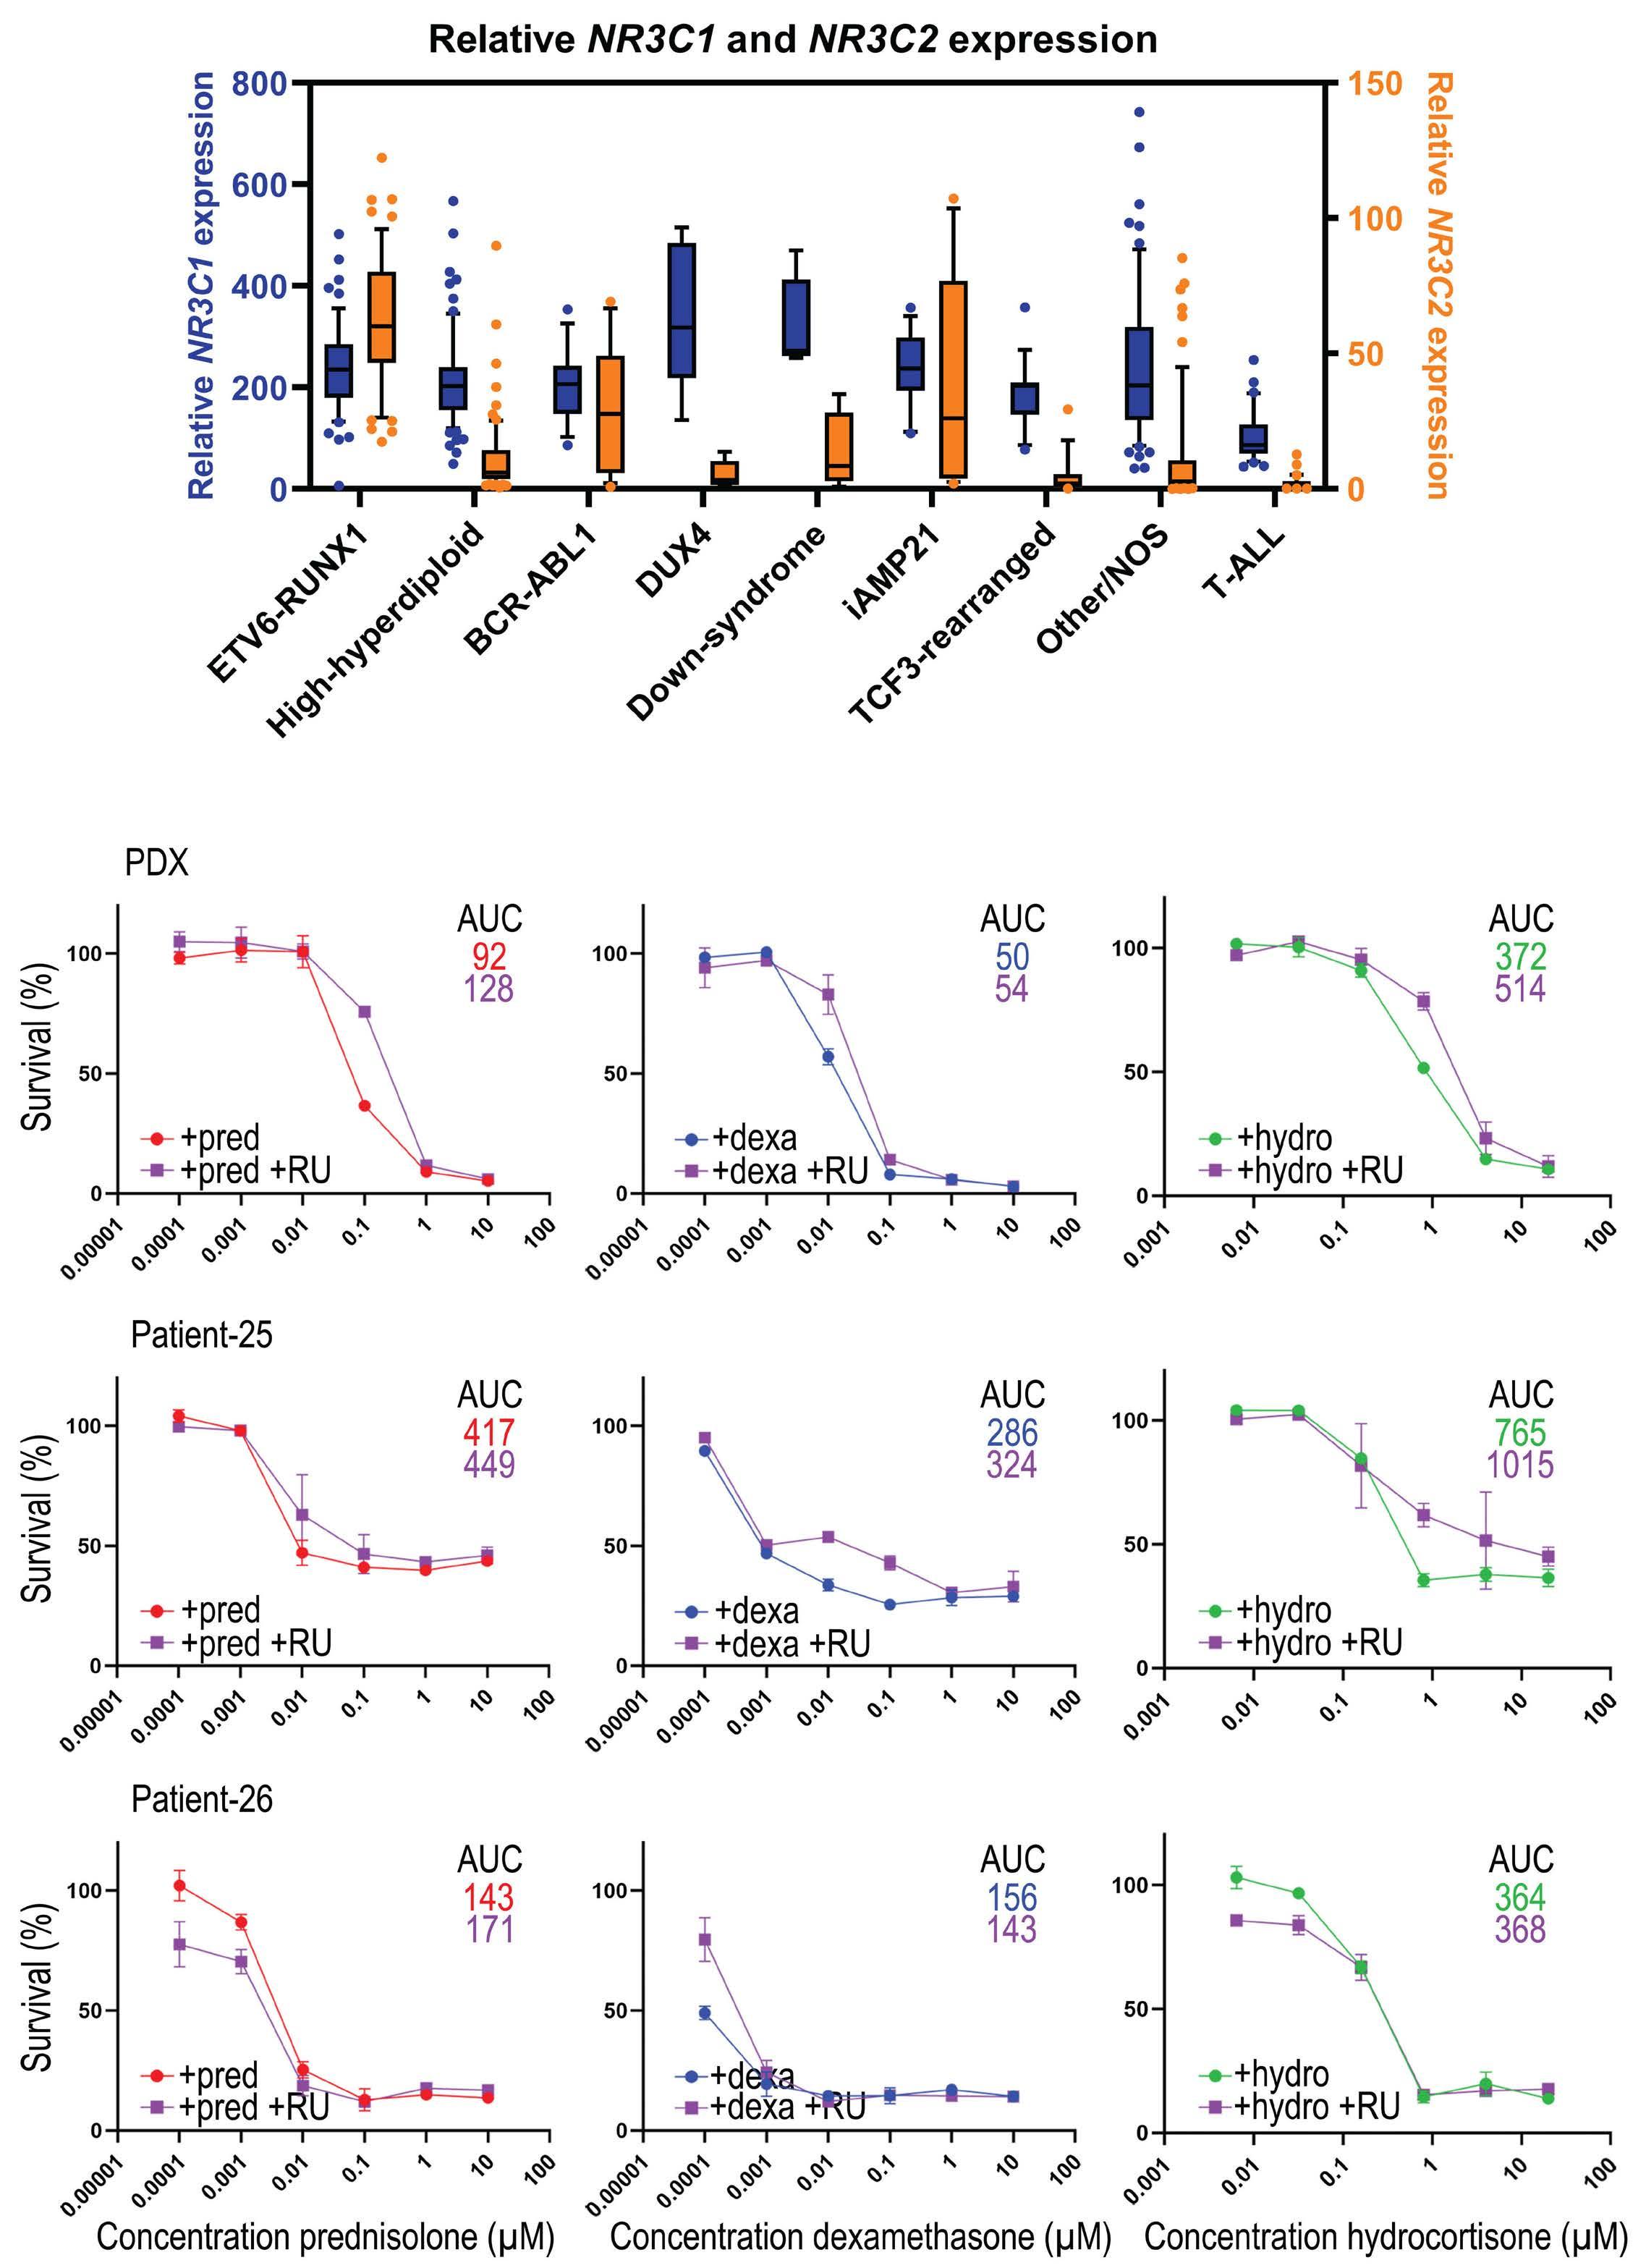
Figure 3. NR3C2 expression in patients is relatively low. (A) Relative expression of NR3C1 (blue) and NR3C2 (orange) in 279 primary samples from patients with acute lymphoblastic leukemia, dissected according to genetic background. (B) Cell toxicity screening of two primary patients’ samples and one patient-derived xenograft sample, all harboring the ETV6-RUNX1 fusion gene. Toxicity screening was performed using amino staining and data represent technical duplicates with standard deviations. Samples were treated with prednisolone, dexamethasone or hydrocortisone, in the presence or absence of 4 mM RU28318 (a mineralocorticoid receptor antagonist). Area under the curve values were calculated using Prism software version 9.3.0 from GraphPad and statistically tested with a two-sided t test. iAMP21: intrachromosomal amplification of chromosome 21; NOS: not otherwise specified; T-ALL: T-cell acute lymphoblastic leukemia; PDX: patient-derived xenograft; AUC: area under the curve; pred: prednisolone; RU: RU28318; dexa: dexamethasone; hydro: hydrocortisone.
Haematologica | 109 May 2024 1554 LETTER TO THE EDITOR
A B
patients’ leukemic cells (Online Supplementary Figure S2B) or the presence of other more dominant factors (genetic and/or cellular) in these patients. Due to the lack of a functional NR3C2 antibody, we were unable to test this at the protein level. Moreover, no genes have been identified to be specifically regulated by either NR3C1 or NR3C2, preventing more specific transcriptional analyses.4,14 The contribution of the MR in steroid-induced cytotoxicity in our patients does, therefore, remain unclear.
In our cohort of ALL patients (n=131), we did not find an association between NR3C1 or NR3C2 mRNA expression levels and event-free survival. This may be partially explained by the relatively short median follow-up of our cohort (median 26.1 months, 95% confidence interval: 23.8-28.4) and the relatively small sample size. It is however conceivable that other crucial processes play a more dominant role in relapse, such as chemotherapy-induced mutations.15
In conclusion, in experimental models of ALL, the MR (NR3C2) strongly induces steroid-induced cell death and hydrocortisone is a potent steroid to initiate this process. Although the cytotoxic contribution of the MR in leukemic patients’ samples appears to be minimal, hydrocortisone may still be considered as a potential antileukemic agent, especially for those patients who suffer from severe dexamethasone-induced side effects.
Authors
Annelienke M. van Hulst,1* Jordy C.G. van der Zwet,1* Jessica G.C.A.M. Buijs-Gladdines,1 Willem K. Smits,1 Marta Fiocco,1-3 Rob Pieters,1 Frank N. van Leeuwen,1 Marry M. van den Heuvel-Eibrink,1,4 Erica L.T. van den Akker5 and Jules P.P. Meijerink1°
1Princess Maxima Center for Pediatric Oncology, Utrecht; 2Mathematical Institute, Leiden University, Leiden; 3Department of Biomedical Data Science, Medical Statistics, Leiden University Medical Center, Leiden; 4Child Health, UMCU-Wilhelmina Children’s Hospital, Utrecht and 5Pediatric Endocrinology, Erasmus MC- Sophia Children’s Hospital, Rotterdam, the Netherlands
*AvH and JvdZ contributed equally as first authors.
°Current address: Acerta-Pharma (AstraZeneca), Oss, the Netherlands
References
1. Inaba H, Pui C-H. Glucocorticoid use in acute lymphoblastic leukaemia. Lancet Oncol. 2010;11(11):1096-1106.
2. van der Zwet JCG, Smits W, Buijs-Gladdines JGCAM, Pieters R, Meijerink JPP. Recurrent NR3C1 aberrations at first diagnosis relate to steroid resistance in pediatric T-cell acute lymphoblastic leukemia patients. Hemasphere. 2021;5(1):e513.
3. Liu H, Li Z, Qiu F, et al. Association between NR3C1 mutations and glucocorticoid resistance in children with acute lymphoblastic leukemia. Front Pharmacol. 2021;12:634956.
Correspondence:
M. VAN DEN HEUVEL-EIBRINK - m.m.vandenheuvel-eibrink@ prinsesmaximacentrum.nl
A. M. VAN HULST - a.vanhulst@prinsesmaximacentrum.nl
https://doi.org/10.3324/haematol.2023.282928
Received: February 10, 2023. Accepted: January 2, 2024. Early view: January 11, 2024.
©2024 Ferrata Storti Foundation
Published under a CC BY-NC license
Disclosures
No conflicts of interest to disclose.
Contributions
AMvH and JCGvdZ designed the study, performed the experiments and wrote the manuscript. ELTvdA, MMvdHE and JM conceptualized the study and acquired funding. AMvH and MF performed statistical analyses. JBG and WS performed the experiments. RP, FNvL, MvdHE and ELTvdA provided critical input and wrote the manuscript. JPPM designed and supervised the study and wrote the manuscript. All authors read and approved the final version of the manuscript.
Acknowledgments
The authors would like to thank Patrick P.C. Kemmeren and Lennart A. Kester for the RNA-sequencing results and for providing a detailed description of the RNA-sequencing methods. We would also like to thank Hester de Groot-Kruseman for her help with the patients’ survival outcomes data.
Funding
This study was sponsored by grants from the “Kinderen Kankervrij” Foundation, KiKa-219 (to JCGvdZ), KiKa-92 and KiKa-295 (to WKS), and KiKa-268 (to AMvH).
Data-sharing statement
The data that support the findings of this study are available on request from the author for correspondence, MvdHE.
4 Grossmann C, Scholz T, Rochel M, et al. Transactivation via the human glucocorticoid and mineralocorticoid receptor by therapeutically used steroids in CV-1 cells: a comparison of their glucocorticoid and mineralocorticoid properties. Eur J Endocrinol. 2004;151(3):397-406.
5. Warris LT, van den Heuvel-Eibrink MM, Aries IM, et al. Hydrocortisone does not influence glucocorticoid sensitivity of acute lymphoblastic leukemia cells. Haematologica. 2015;100(4):e137-139.
Haematologica | 109 May 2024 1555 LETTER TO THE EDITOR
6. van der Zwet JCG, Buijs-Gladdines J, Cordo V, et al. MAPK-ERK is a central pathway in T-cell acute lymphoblastic leukemia that drives steroid resistance. Leukemia. 2021;35(12):3394-3405.
7 O’Connor L, Strasser A, O’Reilly LA, et al. Bim: a novel member of the Bcl-2 family that promotes apoptosis. EMBO J. 1998;17(2):384-395.
8. Perroteau I, Netchitailo P, Delarue C, et al. The effect of the antimineralocorticoid RU 28318 on aldosterone biosynthesis in vitro. J Steroid Biochem. 1984;20(4A):853-856.
9 Hehir-Kwa JY, Koudijs MJ, Verwiel ETP, et al. Improved gene fusion detection in childhood cancer diagnostics using RNA sequencing. JCO Precis Oncol. 2022;6:e2000504.
10 Lu J, Hu F, Zhou Y. NR3C2-related transcriptome profile and clinical outcome in invasive breast carcinoma. Biomed Res Int. 2021:2021:9025481.
11. Kaspers GJL, Veerman AJP, PoppSnijders C, et al. Comparison
of the antileukemic activity in vitro of dexamethasone and prednisolone in childhood acute lymphoblastic leukemia. Med Pediatr Oncol. 1996;27(2):114-121.
12. Styczynski J, Wysocki M, Balwierz W, et al. In vitro comparative antileukemic activity of various glucocorticoids in childhood acute leukemia. Neoplasma. 2002;49(3):178-183.
13. Forestier E, Heyman M, Andersen MK, et al. Outcome of ETV6/ RUNX1-positive childhood acute lymphoblastic leukaemia in the NOPHO-ALL-1992 protocol: frequent late relapses but good overall survival. Br J Haematol. 2008;140(6):665-672.
14 van Weert L, Buurstede JC, Sips HCM, et al. Identification of mineralocorticoid receptor target genes in the mouse hippocampus. J Neuroendocrinol. 2019;31(8):e12735.
15. Li B, Brady SW, Ma X, et al. Therapy-induced mutations drive the genomic landscape of relapsed acute lymphoblastic leukemia. Blood. 2020;135(1):41-55.
Haematologica | 109 May 2024 1556 LETTER TO THE EDITOR
Amphiregulin as a biomarker for monitoring lifethreatening acute graft-versus-host disease: secondary analysis of two prospective clinical trials
Patients with life-threatening acute graft-versus-host disease (GvHD) often have severe symptoms related to organ/tissue damage, although the severity of the symptoms does not universally reflect the risk of acute GvHD-related mortality.1,2 Biomarkers can serve as complementary, non-invasive measurements of acute GvHD risk.3,4 Using blood samples from established repositories, including samples from the Chronic GvHD Consortium and the Blood and Marrow Transplant Clinical Trials Network (BMT CTN) 0302 and 0802, we previously demonstrated that circulating amphiregulin (AREG) levels can be used to risk-stratify patients at the onset of acute GvHD.5,6 AREG is a protein that belongs to the epidermal growth factor (EGF) family. It is a signaling molecule that plays a key role in cell growth, differentiation, and survival. AREG is produced by a variety of cells, including epithelial cells, fibroblasts, and immune cells, and it binds to the EGF receptor (EGFR) on the surface of target cells.7
In the present study, we assess AREG as a monitoring biomarker when measured during two prospective studies, a University of Minnesota (UMN) trial testing urinary-derived human chorionic gonadotropin/epidermal growth factor (uhCG/EGF) in supportive care for patients with Minnesota high-risk acute GvHD in the first-line setting or patients with acute GvHD receiving second-line therapy (NCT02525029), and in patients with steroid-refractory acute GvHD receiving ruxolitinib in the REACH1 study (NCT02953678).
Plasma samples were collected and cryopreserved longitudinally on study visit days 7, 14, 28, and 56 from patients enrolled in both the uhCG/EGF study (n=51) and REACH1 (n=60). All study participants signed informed consent documents approved by the respective Institutional Review Boards indicating consent for collection of blood samples and data
in accordance with the Declaration of Helsinki. In samples collected during uhCG/EGF treatment, AREG was measured using an enzyme-linked immunosorbent assay (ELISA; R&D Systems, Minneapolis, MN, USA), and suppression of tumorigenicity 2 (ST2) and regenerating islet-derived 3-alpha (Reg3a) were measured using a multiplex Luminex-based array (R&D Systems) at the Cytokine Reference Laboratory at UMN. Plasma samples from REACH1 were analyzed for concentrations of AREG, ST2, and REG3a using the microfluidic ProteinSimple Ella platform (Bio-Techne, San Jose, CA, USA) at Incyte Laboratories. The correlation of AREG levels measured by the AREG ELISA and microfluidic immunoassay was determined using the Pearson correlation coefficient with log-transformed values from a subset of samples (n=47), tested at Incyte Laboratories The correlation of AREG values between the platforms was very strong (r=0.89, P<0.001) (Online Supplementary Figure S1). Biomarker concentrations were compared between response groups using nonparametric one-way analysis of variance (Kruskal-Wallis test). Patients who died before day 28 of the study were considered non-responders. Analyses of changes of biomarker levels from baseline to subsequent study days were performed using nonparametric matched pairs analysis from the baseline value with Bonferroni correction for multiple testing. Statistical significance for the longitudinal analyses was thus declared at P=0.0125. Biomarker cutoff values relevant for survival at study baseline were identified using recursive partitioning, dichotomizing groups according to values that show the maximum difference in survival, with a difference of P=0.05 by the log-rank test determined to be statistically significant. The recursive partitioning was performed within each trial for dichotomization within the
uhCG/EGF: urinary-derived human chorionic gonadotropin/epidermal growth factor; MAGIC: Mount Sinai Acute GVHD International Consortium; GvHD: graft-versus-host disease.
Haematologica | 109 May 2024 1557 LETTER TO THE EDITOR
Characteristic uhCG/EGF,
Ruxolitinib, N=60 Age in years, median (range) 55 (2-72) 52 (18-73) Male, N (%) 39 (75) 31 (52) MAGIC acute GvHD grade, N (%) II III IV 11 (21) 29 (52) 12 (27) 22 (36.7) 24 (40.0) 14 (23.3) Ann Arbor 1 biomarkers, N (%) 7 (14) 1 (2) Ann Arbor 2 biomarkers, N (%) 11 (21) 8 (13) Ann Arbor 3 biomarkers, N (%) 34 (65) 51 (85)
N=52
Table 1. Patients’ baseline characteristics.
individual study populations, as well as with the combined cohort to identify a value of AREG that would be informative across both platforms. Ann Arbor scores were calculated according to the formula published by Levine et al. 4 The baseline characteristics of the participants in the clinical trials are shown in Table 1. The majority of patients enrolled on both studies had grade III/IV acute GvHD (79% for uhCG/ EGF and 63.3% for REACH1) and an Ann Arbor 3 biomarker score (65% for uhCG/EGF and 85% for REACH1) at the start of the study, predicting a high risk of mortality in these patients with acute GvHD. In patients treated with uhCG/EGF who had a complete response at day 28 of therapy, AREG decreased 3-fold from baseline to day 56 (mean, 98 vs. 32 pg/mL; P=0.006) (Figure 1A). AREG levels did not change significantly over time in patients with a partial response or no response to uhCG/EGF. A baseline AREG >212 pg/mL was associated with a rapidly fatal course, with a median survival of 62 days; P=0.006) (Figure 1B). Across the entire range of baseline AREG values in the UMN study (6.3-821.4 pg/mL), the risk ratio for death was 10.9 (95% confidence
interval [95% CI]: 1.9-49.7; P=0.009). The biomarker patterns were similar in REACH1. In those patients achieving a complete response, AREG levels decreased 2.8-fold from baseline to day 56 (mean, 174.7 vs. 63.6 pg/mL; P=0.007) (Figure 1C). AREG levels also decreased 2.0-fold over time in patients treated with ruxolitinib who had a very good partial response or partial response to treatment (mean baseline AREG concentration was 288.2 vs. 146.1 pg/mL at day 56; P=0.017) but there was no change over time in patients with progressive disease. Patients on REACH1 with a baseline AREG >336 pg/mL had a rapidly fatal course, with a median survival of 74 days (P=0.005) (Figure 1D). Across the entire range of baseline AREG values in REACH1 (34.6-1,654 pg/mL), the risk ratio for death was 7.7 (95% CI: 1.7-29.5; P=0.01). In multivariate analyses, only response at day 28 and baseline AREG with the cutoff determined by recursive partitioning were independent predictors of survival in both cohorts (Figure 2A, B). Patients treated with uhCG/EGF with high baseline AREG levels had a 4.17-fold increased risk of death, and patients treated with ruxolitinib and a high
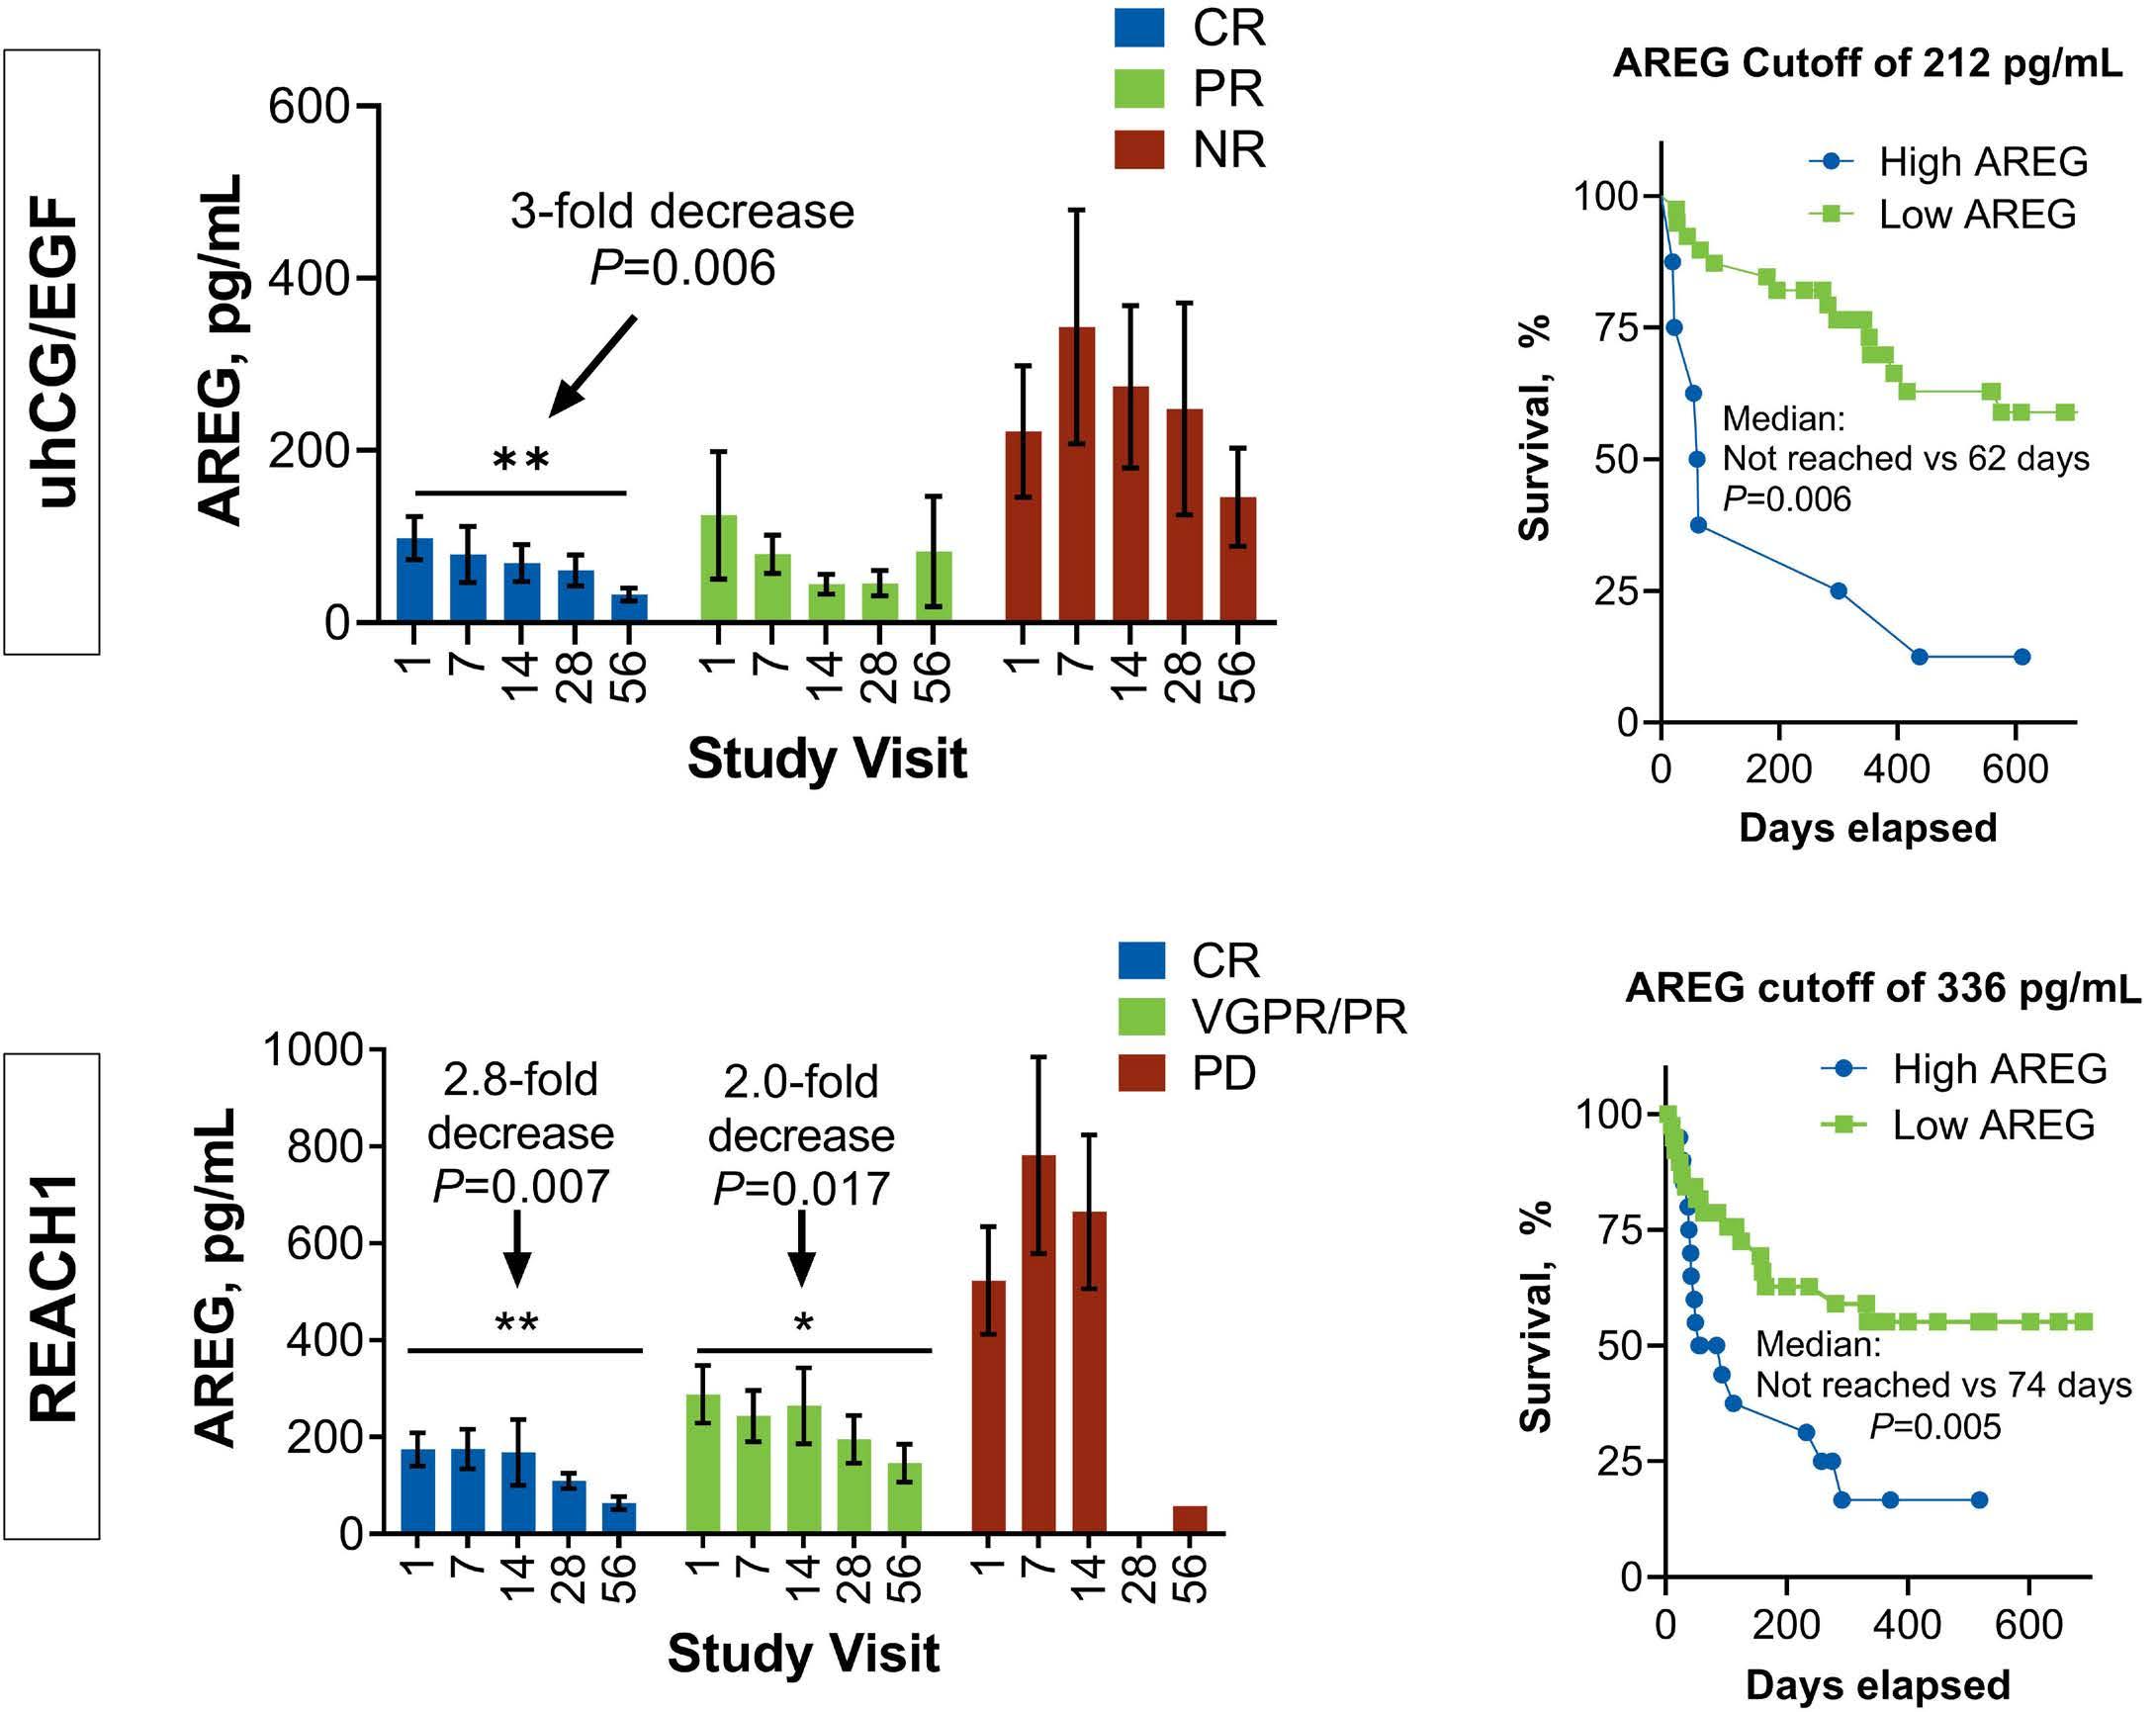
Figure 1. Amphiregulin levels can stratify clinically high-risk patients at study baseline and decrease over time in patients who respond to graft-versus-host disease therapy. (A, C) Longitudinally measured plasma amphiregulin (AREG) levels are shown by treatment response for patients from the uhCG/EGF study (A) and REACH1 study (C). (B, D) The optimal AREG cutoff for survival in each study is shown for patients from the University of Minnesota urinary-derived human chorionic gonadotropin/epidermal growth factor study (B) and REACH1 study (D). uhCG/EGF: urinary-derived human chorionic gonadotropin/epidermal growth factor; CR: complete response; PR: partial response; NR: no response; VGPR: very good partial response; PD: progressive disease.
Haematologica | 109 May 2024 1558 LETTER TO THE EDITOR
A B C D
baseline AREG had a 2.72-fold increased risk of death. When combining the cohorts to find a cutoff of AREG that is useful across the two platforms, an AREG level of 330 pg/mL or greater identified patients at high risk of early mortality (Online Supplementary Figure S1B, C).
Using samples collected during two prospective clinical trials on two different measurement platforms, we conclude that AREG is a useful monitoring biomarker for patients with life-threatening acute GvHD. AREG levels were higher in REACH1 than in the UMN uhCG/EGF study (baseline median, 170 pg/mL vs. 53.6 pg/mL, respectively; P<0.001), which could reflect differences in assays, severity of illness, or both.
We suspect differences are due to severity of acute GvHD, especially considering the very high proportion of patients with Ann Arbor 3 biomarkers in REACH1. Of note, significant biomarker changes did not occur within the first week, and ST2 and REG3a levels did not show statistically significant changes during the course of the study (Online Supplementary Figure S2), making the value of early biomarkers in the first 1-2 weeks of therapy uncertain. Our analysis shows that between AREG, ST2, and REG3a, AREG levels track clinical response most closely. AREG concentrations may therefore be the most useful biomarker to assess for potential GvHD flares in the context of clinical events in which response is
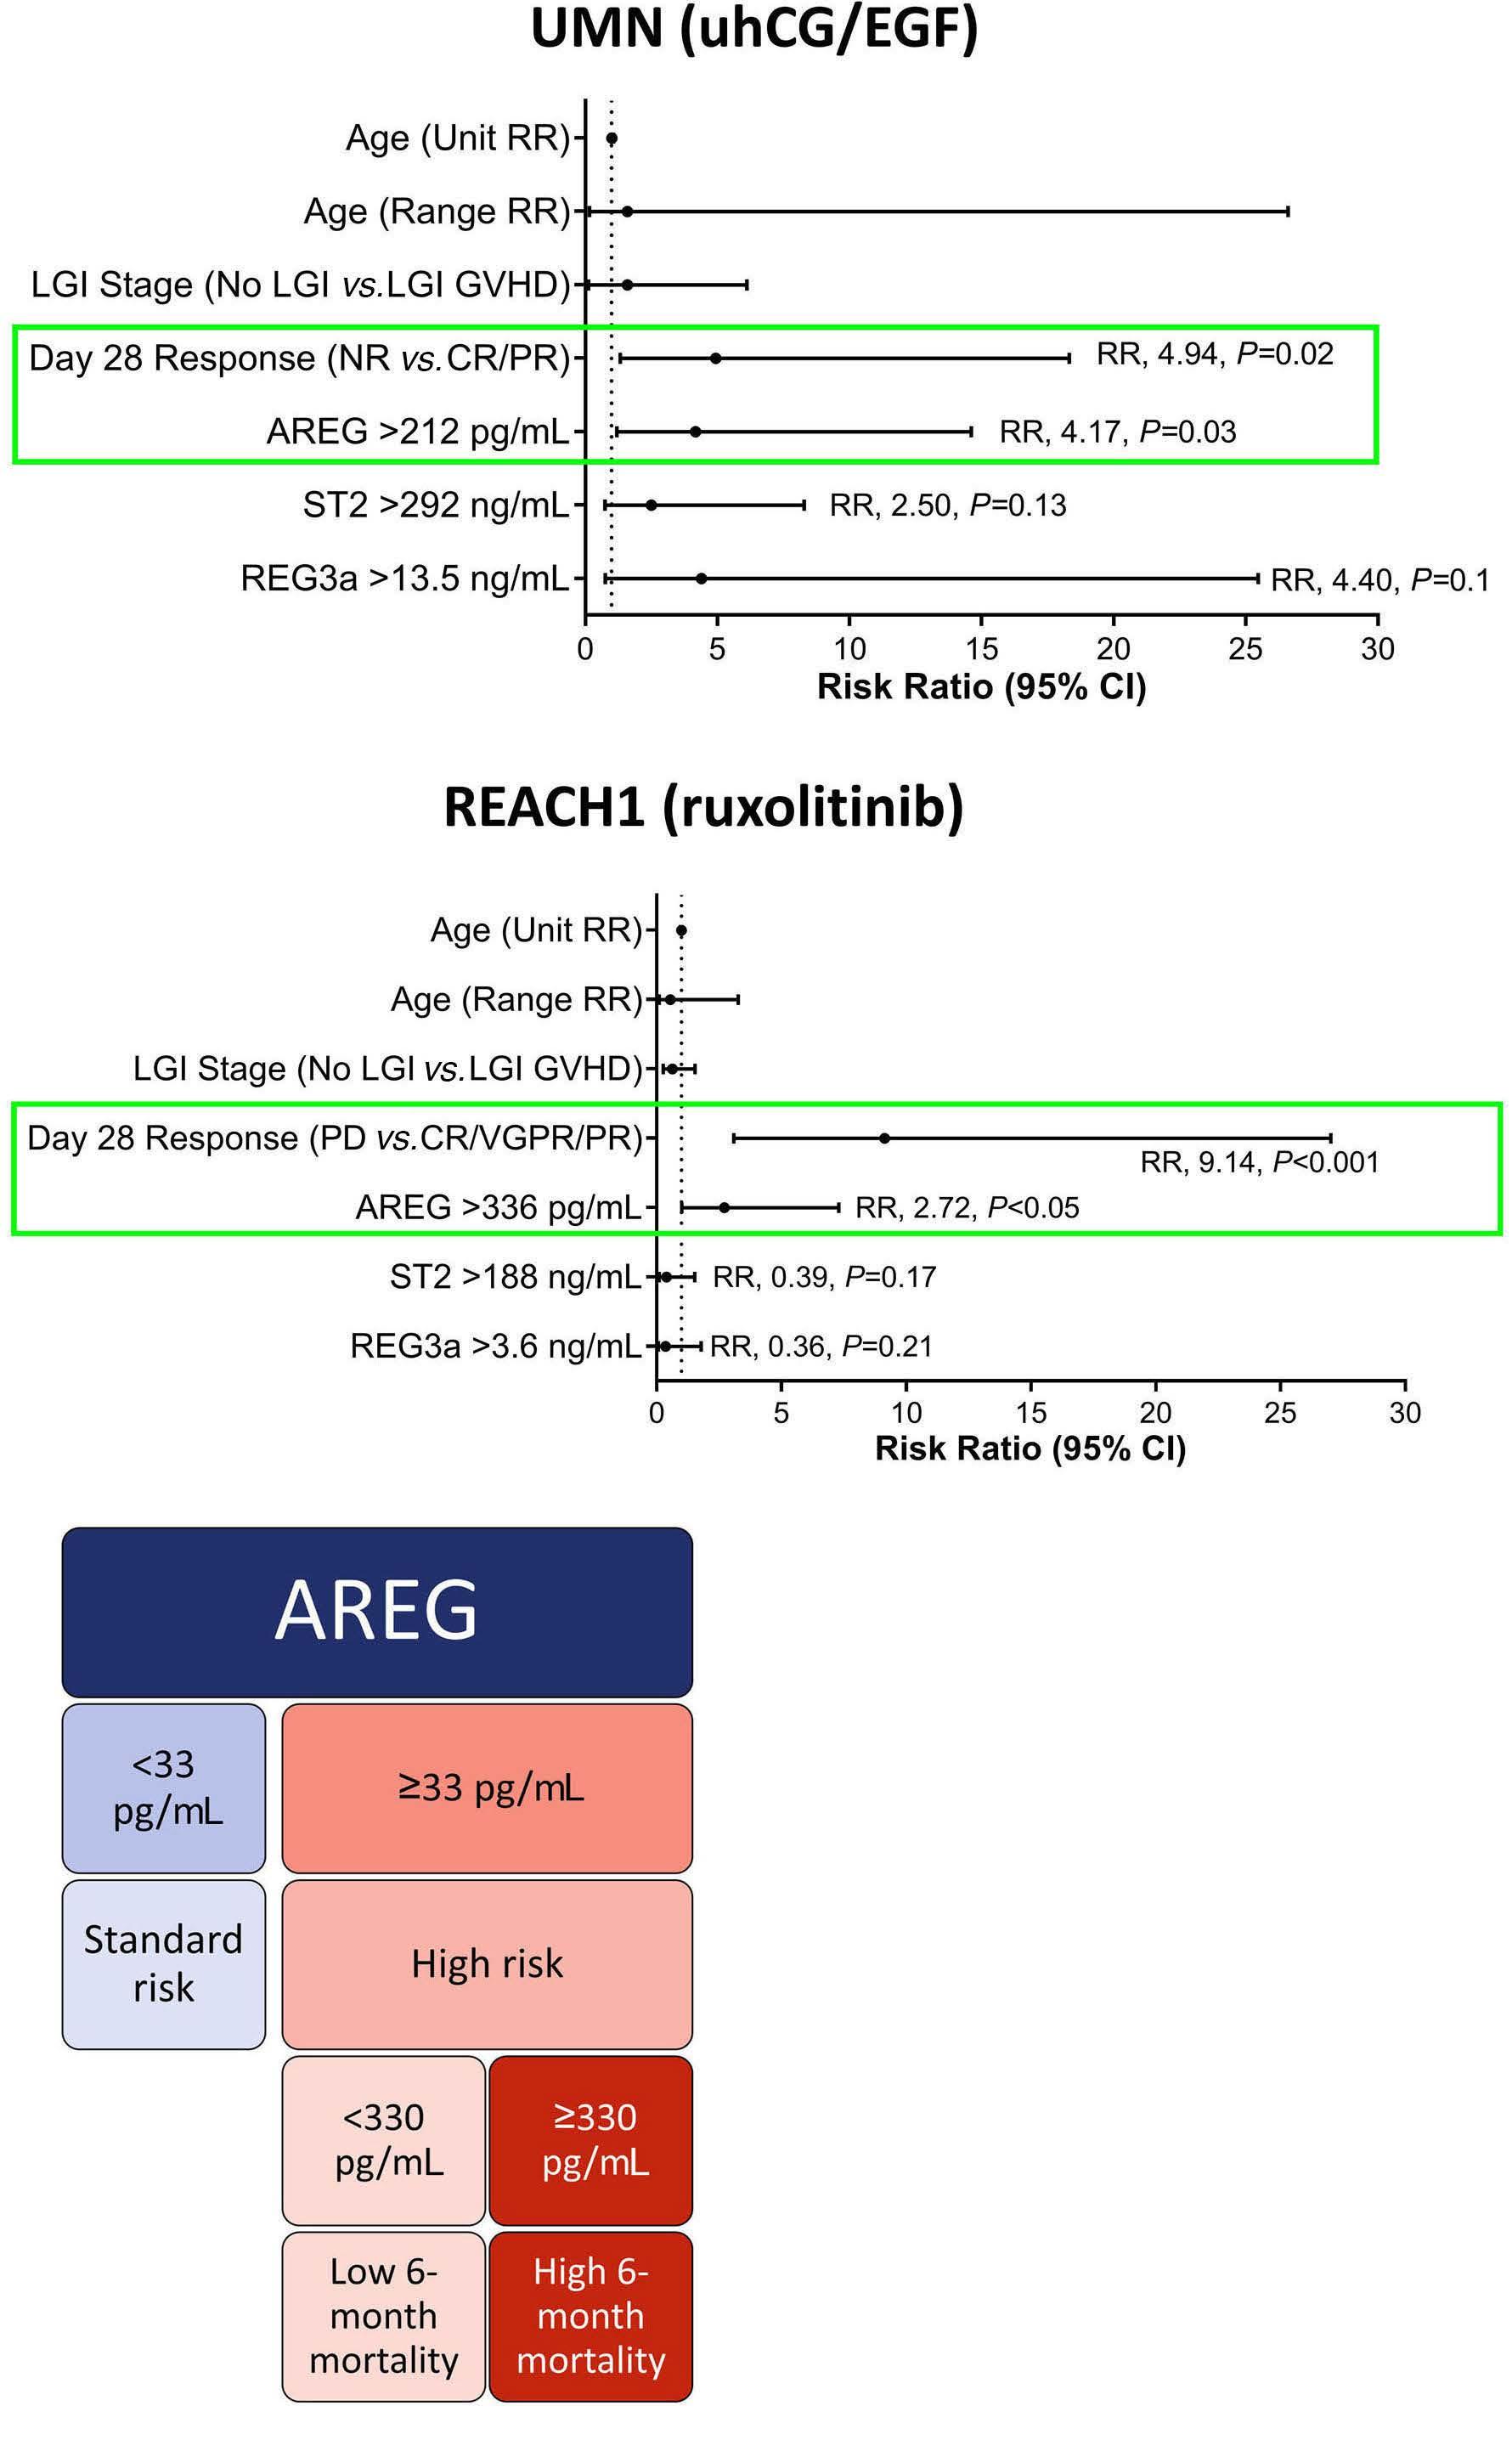
Figure 2. Only amphiregulin levels at study baseline and the day 28 response assessment are independent predictors of survival in multivariate analyses. (A, B) The results of the multivariate analysis for the University of Minnesota urinary-derived human chorionic gonadotropin/ epidermal growth factor study (A) and for the REACH1 study (B) are shown. (C) A proposed framework for using plasma amphiregulin (AREG) levels as a graft-versus-host disease biomarker in the first- and second-line acute graft-versushost disease setting. UMN: University of Minnesota; uhCG/EGF: urinary-derived human chorionic gonadotropin/epidermal growth factor; RR: risk ratio; LGI: lower gastrointestinal tract; GVHD: graft-versus-host disease; NR: no response; CR: complete response; PR: partial response; ST2: suppression of tumorigenicity 2; Reg3a: regenerating islet-derived 3-alpha; 95% CI: 95% confidence interval; PD: progressive disease; VGPR: very good partial response.
Haematologica | 109 May 2024 1559 LETTER TO THE EDITOR
A B C
difficult to assess, such as when medication side effects, gastrointestinal infections, or dietary changes make clinical staging difficult to interpret. A proposed framework for using AREG measurements to supplement clinical staging is shown in Figure 2C.
AREG has been implicated in a number of physiological processes, including tissue repair, wound healing, pregnancy, and cancer.8 AREG is increased in the circulation during acute GvHD,5,6 although its tissue expression is more complex. Increased AREG protein expression in cutaneous acute GvHD is associated with a high mortality risk, although skin AREG expression does not correlate with serum AREG values.9 In contrast to the skin, gastrointestinal AREG protein expression is high during normal conditions but decreases during acute GvHD or inflammatory bowel disease. Gastrointestinal expression of AREG also does not correlate with serum AREG concentration.10 AREG mRNA expression is significantly higher in the rectosigmoid mucosa of patients with lower gastrointestinal tract acute GvHD compared to that in healthy controls, suggesting it may still reflect a stress or damage response to inflammation even though protein expression decreases.11
While we had previously hypothesized that AREG in the circulation may come from damaged tissues, recent evidence from mice and humans suggests that it may also be produced by circulating immune cells during acute GvHD. Ito et al. recently showed that alloreactive CD4 T cells upregulate AREG expression during murine GvHD. AREG-deficient donor T cells caused less mucosal damage, spared intestinal stem cells, and reduced mortality compared to wild-type donor T cells.12 We have also recently observed that high peripheral blood mononuclear cell expression of AREG mRNA is associated with a low likelihood of response to acute GvHD therapy, although the specific cell subset that was associated with this observation could not be determined with our bulk cell analysis.13 T cells may indeed be a contributor to circulating AREG based upon work showing marked upregulation of AREG after T-cell receptor stimulation.14 In our phase II study of uhCG/EGF, we found a positive correlation between circulating AREG and cell-bound AREG on CD4+ and CD8+ central memory T cells, CD4+ effector memory T cells, double-positive T cells, and plasmablasts.15 Further work to determine the peripheral blood cellular source of AREG is needed.
In summary, circulating AREG serves as a blood biomarker that most closely tracks with longitudinal clinical response, as measured in two prospective clinical trials of life-threatening acute GvHD. AREG can be tested reliably on different platforms, making it feasible to assay in hospital clinical laboratories. Measuring AREG levels could offer a supplementary tool for assessing mortality risk when acute GvHD first appears, even within clinically high-risk subsets. It may also help to distinguish between potential acute GvHD flare-ups and other clinical conditions that might confuse the diagnosis (please refer to our case report for a pertinent,
real-world clinical example).16 However, further research is required to confirm these findings. In the future, circulating AREG should be studied in other T-cell inflammatory contexts to determine its specificity for acute GvHD activity versus other conditions.
Authors
Shernan G. Holtan,1 Najla El Jurdi,1 Armin Rashidi,1,2 Brian C. Betts,1 Connor Demorest,3 John P. Galvin,4 Margaret L. MacMillan,5 Daniel J. Weisdorf,1 Angela Panoskaltsis-Mortari5 and Michael A. Pratta4
1University of Minnesota, Adult Blood and Marrow Transplant & Cell Therapy Program, Minneapolis, MN; 2Fred Hutchinson Cancer Center, Seattle, WA; 3Biostatistics Core, Masonic Cancer Center, University of Minnesota, Minneapolis, MN; 4Incyte Corporation, Wilmington, DE and 5University of Minnesota, Pediatric Blood and Marrow Transplant & Cell Therapy Program, Minneapolis, MN, USA
Correspondence:
S. HOLTAN - sgholtan@umn.edu
https://doi.org/10.3324/haematol.2023.283215
Received: April 17, 2023.
Accepted: September 5, 2023. Early view: September 14, 2023.
©2024 Ferrata Storti Foundation
Published under a CC BY-NC license
Disclosures
SGH has received research support from Incyte Corporation and Vitrac Therapeutics and serves as a clinical trial adjudicator for CSL Behring. BCB holds a patent (WO2015120436A2) related to CD4+ T-cell pSTAT3 as a marker and therapeutic target of acute GvHD and holds a provisional patent (WO2017058950A1) related to the use of JAK inhibitors for rejection and GvHD prevention. Neither BCB nor his institution has received payment related to claims described in the JAK/STAT3 patents. He holds a patent for CD83 CAR T-cell use in immunology and oncology. BCB, UMN, and Moffitt Cancer Center have received licensing revenue related to this IP. MLM has received support from FATE and Incyte Corporation and served as a consultant to Equilium. DW has received research support from FATE and Incyte Corporation. MP and JG are employees of and shareholders in Incyte Corporation. NEJ, AR, CD, and AP-M have no conflicts of interest to disclose.
Contributions
SGH designed the study, provided samples, performed analyses, and wrote the manuscript, NEJ, AR, BCB, JPG, MLM, DJW, and APM supervised sample analysis and edited the manuscript, CD performed analyses, MAP provided samples, performed analyses, and edited the manuscript.
Haematologica | 109 May 2024 1560 LETTER TO THE EDITOR
Acknowledgments
The authors are grateful to Mr. Michael Ehrhardt in the University of Minnesota Cytokine Reference Laboratory for his laboratory analysis.
Funding
Funding for laboratory analysis of UMN blood samples was provided by grants (Regenerative Medicine Minnesota and UMN BRAINS award to SGH). Funding for laboratory analysis of blood samples from REACH1 was provided by Incyte Corporation. Biostatistical analysis
References
1. Zeiser R, Blazar BR. Acute graft-versus-host disease - biologic process, prevention, and therapy. N Engl J Med. 2017;377(22):2167-2179.
2. Holtan SG, Yu J, Choe HK, et al. Disease progression, treatments, hospitalization, and clinical outcomes in acute GVHD: a multicenter chart review. Bone Marrow Transplant. 2022;57(10):1581-1585.
3. Srinagesh HK, Levine JE, Ferrara JLM. Biomarkers in acute graft-versus-host disease: new insights. Ther Adv Hematol. 2019;10:2040620719891358.
4. Levine JE, Braun TM, Harris AC, et al. A prognostic score for acute graft-versus-host disease based on biomarkers: a multicentre study. Lancet Haematol. 2015;2(1):e21-29.
5. Holtan SG, Khera N, Levine JE, et al. Late acute graft-versushost disease: a prospective analysis of clinical outcomes and circulating angiogenic factors. Blood. 2016;128(19):2350-2358.
6. Holtan SG, DeFor TE, Panoskaltsis-Mortari A, et al. Amphiregulin modifies the Minnesota Acute Graft-versus-Host Disease Risk Score: results from BMT CTN 0302/0802. Blood Adv. 2018;2(15):1882-1888.
7 Singh SS, Chauhan SB, Kumar A, et al. Amphiregulin in cellular physiology, health, and disease: potential use as a biomarker and therapeutic target. J Cell Physiol. 2022;237(2):1143-1156.
8. Zaiss DMW, Gause WC, Osborne LC, Artis D. Emerging functions of amphiregulin in orchestrating immunity, inflammation, and tissue repair. Immunity. 2015;42(2):216-226.
9 Schultz B, Miller DD, DeFor T, et al. High cutaneous amphiregulin expression predicts fatal acute graft-versus-host
was supported by National Institutes of Health grant P30 CA77598 utilizing the Biostatistics Core of the Masonic Cancer Center, University of Minnesota and the Center for Advancing Translational Sciences of the National Institutes of Health award number UL1TR002494.
Data-sharing statement
Reasonable requests for data may be sent to the author for correspondence (SGH).
disease. J Cutan Pathol. 2022;49(6):532-535.
10 Amin K, Yaqoob U, Schultz B, et al. Amphiregulin in intestinal acute graft-versus-host disease: a possible diagnostic and prognostic aid. Mod Pathol. 2019;32(4):560-567.
11. Holtan SG, Shabaneh A, Betts BC, et al. Stress responses, M2 macrophages, and a distinct microbial signature in fatal intestinal acute graft-versus-host disease. JCI Insight. 2019;5(17):e129762.
12. Ito T, Takashima S, Calafiore M, et al. Donor-derived amphiregulin drives CD4+ T cell expansion and promotes tissue pathology after experimental allogeneic BMT. Blood. 2022;140 (Suppl 1):1152–1153.
13. Holtan SG, Hoeschen AL, Cao Q, et al. Facilitating resolution of life-threatening acute GVHD with human chorionic gonadotropin and epidermal growth factor. Blood Adv. 2020;4(7):1284-1295.
14. Qi Y, Operario DJ, Georas SN, Mosmann TR. The acute environment, rather than T cell subset pre-commitment, regulates expression of the human T cell cytokine amphiregulin. PLoS One. 2012;7(6):e39072.
15. Holtan SG, Hoeschen A, Cao Q, et al. Phase II, open-label clinical trial of urinary-derived human chorionic gonadotropin/ epidermal growth factor for life-threatening acute graft-versushost disease. Transplant Cell Ther. 2023;29(8):509.e1-509.e8.
16. Newell LF, Holtan SG. Acute GVHD: think before you treat. Hematology Am Soc Hematol Educ Program. 2021;2021(1):642-647.
Haematologica | 109 May 2024 1561 LETTER TO THE EDITOR
A study of 28 pregnant women with sickle cell disease and COVID-19: elevated maternal and fetal morbidity rates
Coronavirus disease 2019 (COVID-19) is known to be more severe during pregnancy and might increase the risk of adverse maternal and fetal outcomes. Several risk factors for severe COVID-19 have been identified, including older maternal age, being overweight/obese, non-white ethnicity, and comorbidities such as hypertension, diabetes, and lung diseases.1,2 In the initial phase of the pandemic, COVID-19 was found to be less severe than expected in patients with homozygous sickle cell disease (SCD). In our recent, large study in France we found an elevated rate of severe complications among SCD patients with an SC genotype or those aged over 45 years.3,4 Furthermore, maternal and fetal outcomes are worse (with more vaso-occlusive crises, preterm deliveries, preeclampsia, and thromboembolic events) in pregnant women with SCD than in the general population of pregnant women.5 In contrast, little is known about the impact of COVID-19 on pregnant women with SCD. Here, we report on our clinical experience with 28 SCD pregnant women infected with severe acute respiratory syndrome coronavirus-2 (SARS-CoV-2).
On March 10, 2020, we invited all physicians at French SCD reference centers to prospectively register all SCD patients (including pregnant women) with COVID-19 (as confirmed by reverse transcriptase polymerase chain reaction testing of nasal swabs). The present analysis of de-identified patients’ data was approved by a local institutional review board. In line with French legislation on retrospective studies of routine clinical practice, participants were not required to give their written, informed consent. However, all participants were given information about the study’s objectives and procedures by telephone or by e-mail.
We used the Mann-Whitney test to analyze quantitative variables (expressed as the median [range]) and the Fisher exact test to analyze categorical variables. The statistical analyses were performed using GraphPad Prism software (version 9, GraphPad Software, La Jolla, CA, USA).
Twenty-eight pregnant women (median age [range]: 26.9 years [19.0-43.0]) were included by ten centers between January 1, 2020, and February 25, 2022 (Table 1). The COVID-19 occurred during predominance of the alpha variant in 16 cases, during predominance of the delta variant in one, and during the omicron peak in 11 (P=0.2847). There were 18 (64%) women with SS genotypes, seven with (25%) SC genotypes, two (7%) with Sβ+ genotypes, and one (4%) with a Sβ0 genotype. At the time of the diagnosis of COVID-19, 16 patients were admitted to hospital and 12 were not. The median age was similar in the inpatients (28.2 years [19.0-39.1]) and outpatients (26.9 years [19.0-43.0]). There were no intergroup differences in body mass index, prevalence of hypertension, or of diabetes mellitus. Of the 16 inpatients, ten had an SS genotype, five had an SC
genotype, and one had an Sβ0 genotype. Overall, there was no difference in the likelihood of hospital admission between the SS/Sβ0 (57.9%) and SC (71.4%) SC/Sβ+ subgroups (P=0.2811). A history of acute chest syndrome was more frequent among the inpatients than among the outpatients (8 vs. 1; P=0.039). There was no difference between inpatients and outpatients with regard to hemoglobin concentration, hydroxycarbamide prescription before pregnancy, prescription of a transfusion program, transfusion in the 60 days before the infection, and COVID-19 vaccination status (Table 1).
The duration of pregnancy at the time of the COVID-19 diagnosis was significantly longer among the inpatients, being a median of 28 weeks of gestation (WG) [5-37] in these patients compared to 14 WG [2-30] among the outpatients (P=0.034).
The signs and symptoms of COVID-19 were quite similar to those described in the general population and did not differ when comparing the two groups (data not shown). Three patients experienced acute chest syndrome during their time in hospital, and two of eight patients who had undergone computed tomography presented the typical tomographic signs of COVID-19. Eight inpatients (50%) required a transfusion (n=5) or a manual exchange (n=3). Three inpatients received specific treatment for severe COVID-19 (a steroid [n=2] or tocilizumab [n=1).
The admissions were prompted by vaso-occlusive events (n=7; vaso-occlusive crises and/or acute chest syndrome) or induced deliveries (n=3) with a positive polymerase chain reaction test on admission and no specific symptoms of COVID-19.
In addition, five patients were hospitalized for symptomatic COVID-19 without vaso-occlusive events on admission. Data were not available for one patient.
Five of the 16 inpatients (31%) were admitted to an intensive care unit (ICU); none of these five patients had been vaccinated. The median length of stay in the ICU was 8 days [3-30], and the median time interval between disease onset and admission to the ICU was 1 day [1-14] (Table 1). Three of these five patients had an SS genotype, and two had an SC genotype. Two patients (1 HbSS and 1 HbSC) required mechanical ventilation, and one of the latter required extracorporeal membrane oxygenation; both recovered without sequelae. One 19-year-old woman with an SC genotype died in a context of acute respiratory distress syndrome (initial acute chest syndrome, complicated by ventilator-acquired pneumonia), bone marrow necrosis, and multiorgan failure around 20 days after admission for a vaso-occlusive crisis related to the SARS-COV-2 infection.
Data on pregnancy outcomes were available for 23 of the 28 patients. We noted one miscarriage at 7 WG, 12 preterm births (1 extremely preterm, 3 very preterm, 3 moderate preterm,
Haematologica | 109 May 2024 1562 LETTER TO THE EDITOR
N (%) ACS, total during life, median (range)
N (%) Diabetes, N (%)
Hydroxycarbamide, N (%)
Transfusion program, N (%)
Previous COVID-19, N (%)
patient, N (%)
N
BMI: body mass index; ACS: acute chest syndrome; COVID-19: coronavirus disease 2019; WG: weeks of gestation; NA: not applicable; VOE: vaso-occlusive events; ICU: Intensive Care Unit.
and 5 late preterm) and only ten births (43.5%) at term (≥37 WG). Fifteen patients (65%) had a Cesarean section: the indications were elective Cesarean section (details not provided, n=7), pre-eclampsia or “hemolysis, elevated liver enzymes and low platelets” (HELLP) syndrome (n=3), acute fatty liver of pregnancy (n=1), fetal heart rate abnormality (n=3), and placenta previa (n=1). The obstetric complications notably included pre-eclampsia in three patients, HELLP syndrome in one, and posterior reversible encephalopathy syndrome in another (Table 2).
During pregnancy, the known changes in the immune system and cardiopulmonary physiology are likely to have an impact on the risk of severe infectious diseases, including COVID-19, especially in at-risk populations, such as women with SCD. Our present results highlight the elevated maternal and fetal morbidity rates in 28 infected pregnant women with SCD –especially when the infection occurred during the second and third trimesters. Although not statistically significant, the risk of hospital admission for SC women with COVID-19 appeared to be very high (71%). The only death concerned a
unvaccinated woman with an SC genotype; Arlet et al. had already highlighted the elevated mortality rate associated with the HbSC genotype.3 Studies of the general population have revealed an elevated ICU admission rate among pregnant women with COVID-19 (odds ratio: 2.13) and a greater risk of death (adjusted risk ratio: 1.7-1.8), when compared with that of nonpregnant women of reproductive age.6,7 These risks appear to be higher still in women with SCD and depend on the variant of SARS-CoV-2. The severity of COVID-19 is also related to the variant: in the general population, the hospital admission and ICU admission rates are higher for those infected with alpha and delta variants than for those with the omicron variant (Table 1).8 Although we noted that all the patients admitted to the ICU were unvaccinated, our small sample size prevented us from drawing conclusions about the efficacy of vaccination.
Given the present study’s registry-based design, asymptomatic and non-severe cases of COVID-19 in women with SCD might have been underreported; hence, the impact of vaccination and consequences of COVID-19 might have been
Haematologica | 109 May 2024 1563 LETTER TO THE EDITOR
Inpatients Outpatients P Patients, N (%) 16 (100) 12 (100)Genotype, N (%) SS/S-β0 SC/S-β+ 11 (68.8) 5 (31.2) 8 (66.7) 4 (33.3) 1.000 Age in years, median (range) 28.2 (19.0-39.1) 26.4 (20.0-43.0) 0.4166 BMI, kg/m², median (range) 25 (18-34) 21 (16-31) 0.1488 History ACS,
Hypertension,
Table 1. Characteristics of the study participants.
Vaccinated
8 (50) 0.5 (0-4.0) 2 (12.5) 1 (6.3) 5 (31.3) 3 (18.8) 1 (6.3) 5 (31.3) 1 (8.3) 0 (0-3) 0 0 4 (33.3) 3 (25.0) 2 (16.7) 4 (33.3) 0.039 0.0355 0.4921 1.0001.000 0.5604 1.000 WG at COVID-19 onset, median (range) 28 (7-37) 14 (5-30) 0.0234 WG at delivery, median (range) 36 (29-38) 38 (7-42) 0.4111 Type of delivery, N (%) Cesarean section Vaginal 11 (68.6) 4 (25.0) 4 (33.3) 4 (33.3)Preeclampsia, N (%) 1 (2.3) 2 (16.7)COVID-19 period 10/03/2020 to 25/02/2022 23/02/2020 to 29/03/2022Variant period, N (%) Alpha Delta Omicron 10 (62.5) 1 (6.3) 5 (31.3) 6 (50.0) 0 6 (50.0) 0.7022 1.000 0.441 Length of hospital stay in days, median (range) 6 (1-54) NAVOE during hospitalization,
(%) ACS Vaso-occlusive crisis 2 (12.5) 6 (37.5) NA NAPatients in ICU, N (%) 5 (31.3) NALength of stay in the ICU in days, median (range) 8 (3-30) NA -
Table
*Death. Extremely preterm: 22WG to 27WG+6d; Very preterm: 28WG to 31WG+6d; Moderately preterm: 32WG to 34WG+6d; Late preterm: 35WG to 36WG+6d; Term: ≥37WG; GA: gestational age; COVID-19: coronavirus disease 2019: WG: weeks of gestation; d: days; ICU: Intensive Care Unit; LOS: length of stay; IUGR: intrauterine growth retardation; FHR: fetal heart rate; HELLP: hemolysis, elevated liver enzymes and low platelets; HMD: hyaline membrane disease; PROM: premature rupture of membranes.
overestimated. In contrast to other studies, the small size of our subgroups prevented us from substantiating the harmful influence of the SC genotype. In our cohort, the incidence of obstetric complications (especially preeclampsia) was strikingly high – even for an SCD population. COVID-19 is reportedly associated with a higher incidence of preeclampsia in women in the general population (11%)9,10 and preeclampsia is also more frequent in women with SCD.5 The risks of maternal mortality and morbidity are substantial in SCD, both in the SS and SC genotypes.5 In a recent study of data extracted from the French National Healthcare Data System (Système National des Données de Santé) between 2013 and 2020, we estimated that the incidence of preeclampsia was 9.6% in pregnant women with SCD and 1.7% in pregnant women in the general population. Not unexpectedly, the concomitant presence of two risk factors (SCD and COVID-19) is harmful and might explain the two occurrences of rare, severe complications of pregnancy (HELLP syndrome and one posterior reversible encephalopathy syndrome) in our study. Preterm deliveries were also more frequent in our cohort than in pregnant women with SCD in general; these deliveries were directly linked to COVID-19 in three inpatients (10.7% of the study population) and concomitant with COVID-19 in another inpatient (3.6%). The frequency of preterm delivery is nearly three times higher among women with SCD (~20%)11 than in the general population. Interestingly, the preterm birth rate among women infected by SARS-COV-2 in the general population (11%) is substantially lower than the value in our cohort (54%).12 We noted a correspondingly high incidence of
Cesarean sections, around 65% in our cohort, compared with 30% to 40% in pregnant women with SCD in the literature.13 The literature data in this field are very limited: we found only one retrospective report on good fetal outcomes in a small (n=8) cohort of women with SCD and COVID-19.14
The severity of COVID-19 among women with SCD appears to be linked to destabilization of the latter, rather than a direct effect of the SARS-CoV-2 infection: acute chest syndrome was the main aggravation of SCD, and no cases of severe respiratory disease linked to COVID-19 were observed. We found that the proportion of SCD women vaccinated against COVID-19 was low: around 31%. It is well known that there is a reluctance among SCD patients to be vaccinated. In our SCD cohort from a sickle cell center in Paris, only 48.9% were vaccinated against COVID-19; this is much lower than the value of 72.3% observed for the age group 18-39 years in the general population.15 During pregnancy, a fear of harming the fetus might add to ethnic and cultural factors, resulting in an estimated vaccination rate around 65.7%, which is lower than that in the general population.16
In conclusion, our results emphasize the need to monitor and manage COVID-19 during pregnancy carefully, particularly in women with SCD. The fact that the only death in our cohort concerned a woman with the SC genotype might be a warning sign. Vaccination should be especially recommended in these women, who are particularly at risk of severe obstetric and fetal complications. The COVID-19 pandemic is not over and so the possible impacts of future variants must be closely monitored.
Haematologica | 109 May 2024 1564 LETTER TO THE EDITOR
Period of delivery Inpatients, N=16 Outpatients, N=12 GA at COVID-19 diagnosis (WG+d) ICU Genotype LOS in hospital (d) GA at delivery (WG+d) Obstetric
Fetal
GA at COVID-19 diagnosis
Genotype GA at
Obstetric
Fetal outcomes <22 WG - - - - - - - 5 S-β+ 7 MiscarriageExtremely preterm - - - - - - - 8 SS 27 + 4IUGR, FHR anomaly Very preterm 28* 30 28 Yes Yes Yes SC SC SS 20 53 54 29 + 6 31 33 + 5HMD - 17 SS 31 - FHR anomaly Moderately preterm 7 32 No No SS SC 5 4 33 + 6 34 + 5HMD PROM 6 SC 35 + 5 -Late preterm 34 35 26 7 Yes No No No SS S-β0 SS SC 14 16 2 NP 35 35 + 5 36 + 1 36 + 4 HELLP- - - - -Term 28 37 34 27 10 No No No Yes No SS SS SS SS SS 3 13 7 6 1 37 37 37 + 1 38 38 + 5FHR anomaly FHR anomalyIUGR2 15 27 30 27 SS SC S-β+ SS SS 38 + 2 39 39 + 1 39 + 1 42 - -
2. Obstetric and fetal outcomes among inpatients and outpatients.
outcomes
outcomes
(WG+d)
delivery (WG+d)
outcomes
Authors
Laure Joseph,1 Gonzalo De Luna,2 Emmanuelle Bernit,3 Pierre Cougoul,4 Aline Santi,5 Benoit Faucher,6 Anoosha Habibi,7 Alain Garou,8 Gylna Loko,9 Sarah Mattioni,5 Sandra Manceau,1 Jean Benoit Arlet10 and François Lionnet5
1Biotherapy Department, French National Sickle Cell Disease Referral Center, Clinical Investigation Center, Hôpital Necker, Labex GR-Ex, Assistance-Publique Hôpitaux de Paris, Paris; 2Unité des Maladies Génétiques du Globule Rouge and Etablissement Français du Sang, Hôpital Henri Mondor, Assistance-Publique Hôpitaux de Paris, Créteil; 3Antilles-Guyane Reference Center for Sickle-Cell Disease, Thalassemia and Other Red Blood Cell Disorders, Pointe à Pitre, Guadeloupe; 4Institut Universitaire du Cancer Toulouse Oncopole, Médecine Interne, Toulouse; 5Department of Internal Medicine, Reference Center of Sickle Cell Anemia, University Hospital Center of Tenon, Sorbonne University, Assistance-Publique Hôpitaux de Paris, Paris; 6Department of Internal Medicine, Aix Marseille Université, Assistance-Publique Hôpitaux de Marseille, Hôpital de la Timone, Marseille; 7Sickle Cell Referral Center, Department of Internal Medicine, Henri-Mondor University Hospital, AssistancePublique Hôpitaux de Paris, U-PEC, Créteil; 8Sickle Cell Referral Center, Centre Hospitalier de Mayotte, Mayotte; 9Sickle Cell Referral Center, Martinique Hospital, Martinique and 10Internal Medicine Department, French National Sickle Cell Disease Referral Center,
References
1. Jamieson DJ, Rasmussen SA. An update on COVID-19 and pregnancy. Am J Obstet Gynecol. 2022;226(2):177-186.
2. Vouga M, Favre G, Martinez-Perez O, et al. Maternal outcomes and risk factors for COVID-19 severity among pregnant women. Sci Rep. 2021;11(1):13898.
3. Arlet J-B, Lionnet F, Khimoud D, et al. Risk factors for severe COVID-19 in hospitalized sickle cell disease patients: a study of 319 patients in France. Am J Hematol. 2022;97(3):E86-E91.
4 Arlet J-B, de Luna G, Khimoud D, et al. Prognosis of patients with sickle cell disease and COVID-19: a French experience. Lancet Haematol. 2020;7(9):e632-e634.
5. Oteng-Ntim E, Meeks D, Seed PT, et al. Adverse maternal and perinatal outcomes in pregnant women with sickle cell disease: systematic review and meta-analysis. Blood. 2015;125(21):3316-3325.
6. Zambrano LD, Ellington S, Strid P, et al. Update: characteristics of symptomatic women of reproductive age with laboratoryconfirmed SARS-CoV-2 infection by pregnancy status - United States, January 22-October 3, 2020. MMWR Morb Mortal Wkly Rep. 2020;69(44):1641-1647.
7. Rozo N, Valencia D, Newton SM, et al. Severity of illness by pregnancy status among laboratory-confirmed SARS-CoV-2 infections occurring in reproductive-aged women in Colombia. Paediatr Perinat Epidemiol 2022;36(4):456-465.
8. Menni C, Valdes AM, Polidori L, et al. Symptom prevalence, duration, and risk of hospital admission in individuals infected with SARS-CoV-2 during periods of omicron and delta variant dominance: a prospective observational study from the ZOE
Georges Pompidou European Hospital, Assistance Publique-Hôpitaux de Paris, Paris, France.
Correspondence:
L. JOSEPH - laure.joseph@aphp.fr
https://doi.org/10.3324/haematol.2023.283300
Received: April 11, 2023.
Accepted: October 13, 2023.
Early view: October 19, 2023.
©2024 Ferrata Storti Foundation
Published under a CC BY-NC license
Disclosures
The authors have no conflicts of interests to disclose.
Contributions
All authors followed up patients, interpreted data, revised the manuscript for critical content, and approved the final manuscript. SMan analyzed the data.
Data-sharing statement
The datasets used and/or analyzed during the current study are available from the corresponding author on reasonable request.
COVID Study. Lancet. 2022;399(10335):1618-1624.
9 Di Mascio D, Khalil A, Saccone G, et al. Outcome of coronavirus spectrum infections (SARS, MERS, COVID-19) during pregnancy: a systematic review and meta-analysis. Am J Obstet Gynecol MFM. 2020;2(2):100107.
10 Mendoza M, Garcia-Ruiz I, Maiz N, et al. Pre-eclampsia-like syndrome induced by severe COVID-19: a prospective observational study. BJOG. 2020;127(11):1374-1380.
11. Oakley LL, Mitchell S, von Rege I, et al. Perinatal outcomes in women with sickle cell disease: a matched cohort study from London, UK. Br J Haematol. 2022;196(4):1069-1075.
12. Mullins E, Perry A, Banerjee J, et al. Pregnancy and neonatal outcomes of COVID-19: the PAN-COVID study. Eur J Obstet Gynecol Reprod Biol. 2022;276:161-167.
13. Boafor TK, Olayemi E, Galadanci N, et al. Pregnancy outcomes in women with sickle-cell disease in low and high income countries: a systematic review and meta-analysis. BJOG. 2016;123(5):691-698.
14 Kolanska K, Vasileva R, Lionnet F, et al. Sickle cell disease and COVID-19 in pregnant women. J Gynecol Obstet Hum Reprod 2022;51(3):102328.
15. Joseph L, Corbasson A, Manceau S, et al. Safety of coronavirus disease 2019 vaccines in 213 adult patients with sickle cell disease. Br J Haematol. 2023;200(5):563-567.
16. Huré M, Peyronnet V, Sibiude J, et al. [SARS-Cov-2 vaccine’s acceptance among pregnant women-A cross-sectional survey]. Gynecol Obstet Fertil Senol. 2022;50(11):712-720.
Haematologica | 109 May 2024 1565 LETTER TO THE EDITOR
Social deprivation independently impacts clinical outcomes in patients with chronic lymphocytic leukemia
Data from the Surveillance, Epidemiology, and End Results (SEER) database shows that chronic lymphocytic leukemia (CLL) patients with higher social economic status have better outcomes but the reasons underlying this observation remain undetermined.1
This single center study (ethical approval granted by South East Wales Research Ethics Committee -02/4806) of 665 prospectively diagnosed participants between August 2005 and December 2019 i.e., prior to the Covid-19 pandemic, included 413 (62.1%) males and 252 (37.9%) females who were overwhelmingly white Caucasian (98%). There were two (20052010) and then a single specialist consultant (2010-2019) managing primary, secondary and tertiary patients through two specialist CLL clinics. Patients were diagnosed according to the five-parameter immunophenotyping scoring system.2
Prognostic markers included clinical stage, lymphocyte doubling time (LDT), CD38 expression, β-2 microtubulin (B2M), immunoglobulin heavy-chain gene variable region (IGHV) mutation status at diagnosis with cytogenetic analysis (fluorescence in situ hybridization) routinely performed prior to treatment initiation. Patients were managed in accordance with the prevailing national/international guidelines with all eligible patients offered access to all licensed drugs and various open clinical trials, Online Supplementary Table S1 3
The Welsh Government’s Welsh Index of Multiple Deprivation (WIMD - last update 2019) provides a weighted (%) relative deprivation scoring system derived from eight domainsincome (22%), employment (22%), health (15%), education (14%), access to services (10%), housing (7%), community safety (5%) and physical environment (5%), https://www.gov. wales/sites/default/files/statistics-and-research/2020-06/ welsh-index-multiple-deprivation-2019-results-report.pdfproviding each individual household with a deprivation score. Patients were assigned into categories of relative deprivation based on quartiles with Cox regression for univariate and multivariable analyses used for primary outcomes, Pearson’s χ2 for relative deprivation and prognostic markers and Mann-Whitney U test for age. Analysis was conducted in Stata version 17. The Kaplan-Meier plots were generated using R version 4.2.1. The median age at diagnosis was 67 years with the overwhelming majority of patients (87.3%) presenting with early-stage disease (stage A/A0) and good prognostic markers: lymphocyte doubling time (LDT) >12 months (85.7%), low CD38 expression (66.7%), low B2M (70.7%), mutated IGHV genes (70.1%) and no adverse cytogenetics (78.9%), Table 1. In keeping with the published literature, age, stage, LDT, CD38, IGHV status and B2M at diagnosis were all identified as poor prognostic markers as was adverse cytogenetics (11q and/or 17p deletions). The likelihood of a poorer outcome was predicted
by level of deprivation independently and after adjusting for other explanatory covariates, Online Supplementary Table S1 There was significantly better overall survival with the least deprived having improved survival compared to the most deprived group (2nd most deprived hazard ratio [HR]=0.85, 95% confidence interval [CI]: 0.59-1.25, P=0.413; 2nd least deprived HR=0.8, 95% CI: 0.52-1.22, P=0.294; least deprived HR=0.59, 95% CI: 0.42-0.82, P=0.002), Figure 1.
Progression-free survival (PFS) and time-to-first treatment (TTFT) showed no statistically significant difference between the various deprivation quartiles (P=0.084 and P=0.23, respectively) and the most deprived versus the least deprived quartile (P=0.087 and P=0.236, respectively). However, analyzing just those patients requiring treatment, survival from the time of first treatment, was significantly worse in the more deprived when comparing the four quartiles (P<0.001), Figure 2. The overall cohort had a median age at diagnosis of 67 years, but those with advanced-stage disease (stages B or C) presented at a significantly earlier age (60 vs. 67 years, P<0.001), Online Supplementary Table S2. Although there was no substantial difference in age at diagnosis for patients presenting with early-stage disease (65 vs. 67 years - most vs. least deprived, P=0.153) across deprivation quartiles, the least deprived group with advanced-stage disease presented 10 years younger (57 vs. 67 years; P=0.074), Online Supplementary Table S2. Interestingly, the age at diagnosis for the most deprived is almost identical whether they presented with early- or advanced-stage disease (65 vs. 67 years, P=0.835) whereas there was a significant 10-year difference in the least deprived quartile (67 vs. 57 years, P=<0.001), Online Supplementary Table S2. On average, the most deprived patients presenting with advanced-stage disease showed a median survival of 10.5 years from diagnosis whereas the least deprived lived 15 years, Online Supplementary Table S2
Analyzing only the 263 patients who died, as expected advanced-stage disease was associated with significantly earlier death (81 vs. 71 years, P<0.001) with earlier death also associated with increasing deprivation (P=0.052). The most deprived quartile early-stage patients died 1.5 years earlier (P=0.077) but the age of death for advanced-stage disease was similar (P=0.529), Online Supplementary Table S2.
There were no significant differences in the baseline characteristics of the four deprivation quartile groups in age at presentation, LDT and CD38 expression but less deprived patients presented with earlier stage (stage A/A0) disease (P=0.051) - least deprived 90.9% versus most deprived 82.9%. There was also some albeit weak evidence for higher B2M levels in the more deprived quartile groups compared to the least deprived (P=0.067), Table 1. Somewhat surprisingly, in
Haematologica | 109 May 2024 1566 LETTER TO THE EDITOR
the least deprived quartile, there were fewer patients with adverse cytogenetics (P=0.054). There was also some scant evidence that the two most deprived quartiles had a higher frequency of unmutated IGHV genes (31/89 - 34.8% vs. 35/132 - 26.5%, P=0.185), Table 1.
Sixteen clinical therapeutic trials were open during 2005-2019 with 87 patients (38.2% of 228 patients requiring treatment) eligible and offered entry into a therapeutic clinical trial but
ten declined. There was no significant difference in the offering of clinical trials by clinicians or trial entry across the four WIMD quartiles (P=0.917), Online Supplementary Table S3. This is the first study to assess not only the impact of deprivation on CLL outcomes but explore the possible underlying reasons. The major advantages of this single center study, is that all patients were managed in a free universal health care system, in specialist CLL clinics, according to national
Adverse cytogenetics: deletion of 11q and/or 17p; Binet stage at diagnosis: stage A0 no lymphadenopathy, stage A lymphadenopathy <3 sites, stage B: 3 or more lymphoid site enlargements, stage C: hemoglobin <10 g/dL and/or platelets <100x109/L; B2M: β-2 microglobulin; LDT: lymphocyte doubling time; IGVH: immunoglobulin heavy chain gene variable region.
Haematologica | 109 May 2024 1567 LETTER TO THE EDITOR
Prognostic markers Most deprived N (%) Second most deprived N (%) Second least deprived N (%) Least deprived N (%) Total N (%) Age in years quartiles χ2(9)=3.0802, P=0.961 <55 28 (22.8) 27 (19.7) 19 (20.0) 52 (16.9) 126 (19.0) 55-64 31 (25.2) 31 (22.6) 24 (25.3) 82 (26.7) 168 (25.4) 65-74 35 (28.5) 45 (32.8) 27 (28.4) 96 (31.3) 203 (30.7%) ≥75 29 (23.6) 34 (24.8) 25 (26.3) 77 (25.1) 165 (24.9) Total 123 (100) 137 (100) 95 (100) 307 (100) 662 (100) Stage at diagnosis χ2(6)=12.5161, P=0.051 Stage A/A0 102 (82.9) 114 (83.2) 83 (87.4) 278 (90.8) 577 (87.3) Stage B 13 (10.6) 11 (8.0) 4 (4.2) 19 (6.2) 47 (7.1) Stage C 8 (6.5) 12 (8.8) 8 (8.4) 9 (2.9) 37 (5.6) Total 123 (100) 137 (100) 95 (100) 306 (100) 661 (100) CD38 χ2(3)=3.0638, P=0.382 CD38 <20% 69 (61.6) 86 (68.3) 51 (62.2) 188 (69.4) 394 (66.7) CD38 ≥20% 43 (38.4) 40 (31.7) 31 (37.8) 83 (30.6) 197 (33.3) Total 112 (100) 126 (100) 82 (100) 271 (100) 591 (100) LDT χ2(3)=3.3796, P=0.337 <12 months 18 (17.8) 11 (9.8) 10 (12.3) 41 (15.4) 80 (14.3) ≥12 months 83 (82.2) 101 (90.2) 71 (87.7) 225 (84.6) 480 (85.7) Total 101 (100) 112 (100) 81 (100) 266 (100) 560 (100) B2M χ2(3)=7.1663, P=0.067 <3.5 mg/L 56 (61.5) 70 (69.3) 45 (67.2) 176 (75.9) 347 (70.7) ≥3.5 mg/L 35 (38.5) 31 (30.7) 22 (32.8) 56 (24.1) 144 (29.3) Total 91 (100) 101 (100) 67 (100) 232 (100) 491 (100) Adverse cytogenetics χ2(3)=7.6300, P=0.054 No 33 (80.5) 42 (66.7) 34 (85.0) 100 (82.6) 209 (78.9) Yes 8 (19.5) 21 (33.3) 6 (15.0) 21 (17.4) 56 (21.1) Total 41 (100) 63 (100) 40 (100) 121 (100) 265 (100) IGVH mutation status χ2(3)=2.9748,
<0.98 33 (70.2) 25 (59.5) 23 (74.2) 74 (73.3) 155 (70.1) ≥0.98 14 (29.8) 17 (40.5) 8 (25.8) 27 (26.7) 66 (29.9) Total 47 (100) 42 (100) 31 (100) 101 (100) 221 (100)
Table 1. Prognostic marker frequency in the deprivation quartiles.
P=0.396
guidelines with patients having access to global clinical trials, by a maximum of two specialists as type of care (primary, secondary or tertiary center) and access to specialists and clinical trials are known to impact CLL patient survival.4 This study shows for the first time that deprivation leads to more advanced-stage disease at presentation and worse survival once therapy is initiated leading to a significantly worse overall survival and a possible link between deprivation and the well-established and very important CLL prognostic markers of high B2M and adverse cytogenetics (11q and 17p deletions).
Why deprivation should impact the stage and age at presentation is unknown. Given the age at diagnosis for the most deprived is almost identical whether they presented with early- or advanced-stage disease (65 vs. 67 years) and that the least deprived group with advanced-stage disease presented 10 years younger (57 vs. 67 years) than the most deprived group, strongly suggests deprivation for whatever reason(s) leads to delayed presentation. Higher risk lifestyle behaviors e.g., smoking, obesity leading to other symptomatic illnesses increase with deprivation.5-9 Comorbidities are very common in CLL patients and may mimic the vague symptoms of CLL and hence reassure the patient there is not another pathology, leading to a delay in presentation.10 Alternatively, deprivation may increase fear of cancer or its treatments, alter the willingness of patients to take time off work to have their symptoms investigated, or perhaps may lead to inequalities in accessing health care, all of which would contribute to advanced-stage disease at presentation.5-9
Why deprivation should lead to worse overall clinical outcomes and worse outcomes once therapy has been initiated is also unknown. Comorbidities e.g., heart or lung disease etc. may contribute to a worse outcome once therapy is required by reducing the choices of available therapies or by reducing the duration or doses of therapy a patient may be able to tolerate. Furthermore, deprivation has been shown to impact patient compliance e.g., not attending hospital (routinely or urgently when unwell with infections) due to concerns about missing work and/or travel costs.5-9 Deprivation is not routinely formally assessed in CLL patients requiring treatment but given the significant impact deprivation has on overall survival and survival from treatment, increased medical staff awareness, additional patient education and increased attention to any potential compliance issues an individual patient may have, may improve outcomes. The higher B2M and the frequency of adverse cytogenetics may be due to more advanced-stage disease at presentation but the trend for deprivation to impact the frequency of unmutated IGHV genes (34.8% vs. 26.5%) perhaps suggests alternative possibilities that warrant larger studies to assess if deprivation alters the frequency of clinically impactful stereotypes (especially those associated with 11q and/or 17p deletions) or driver mutations.10-12 For example, we know that as in other parts of the world, in Wales deprivation directly impacts air quality and that poor air
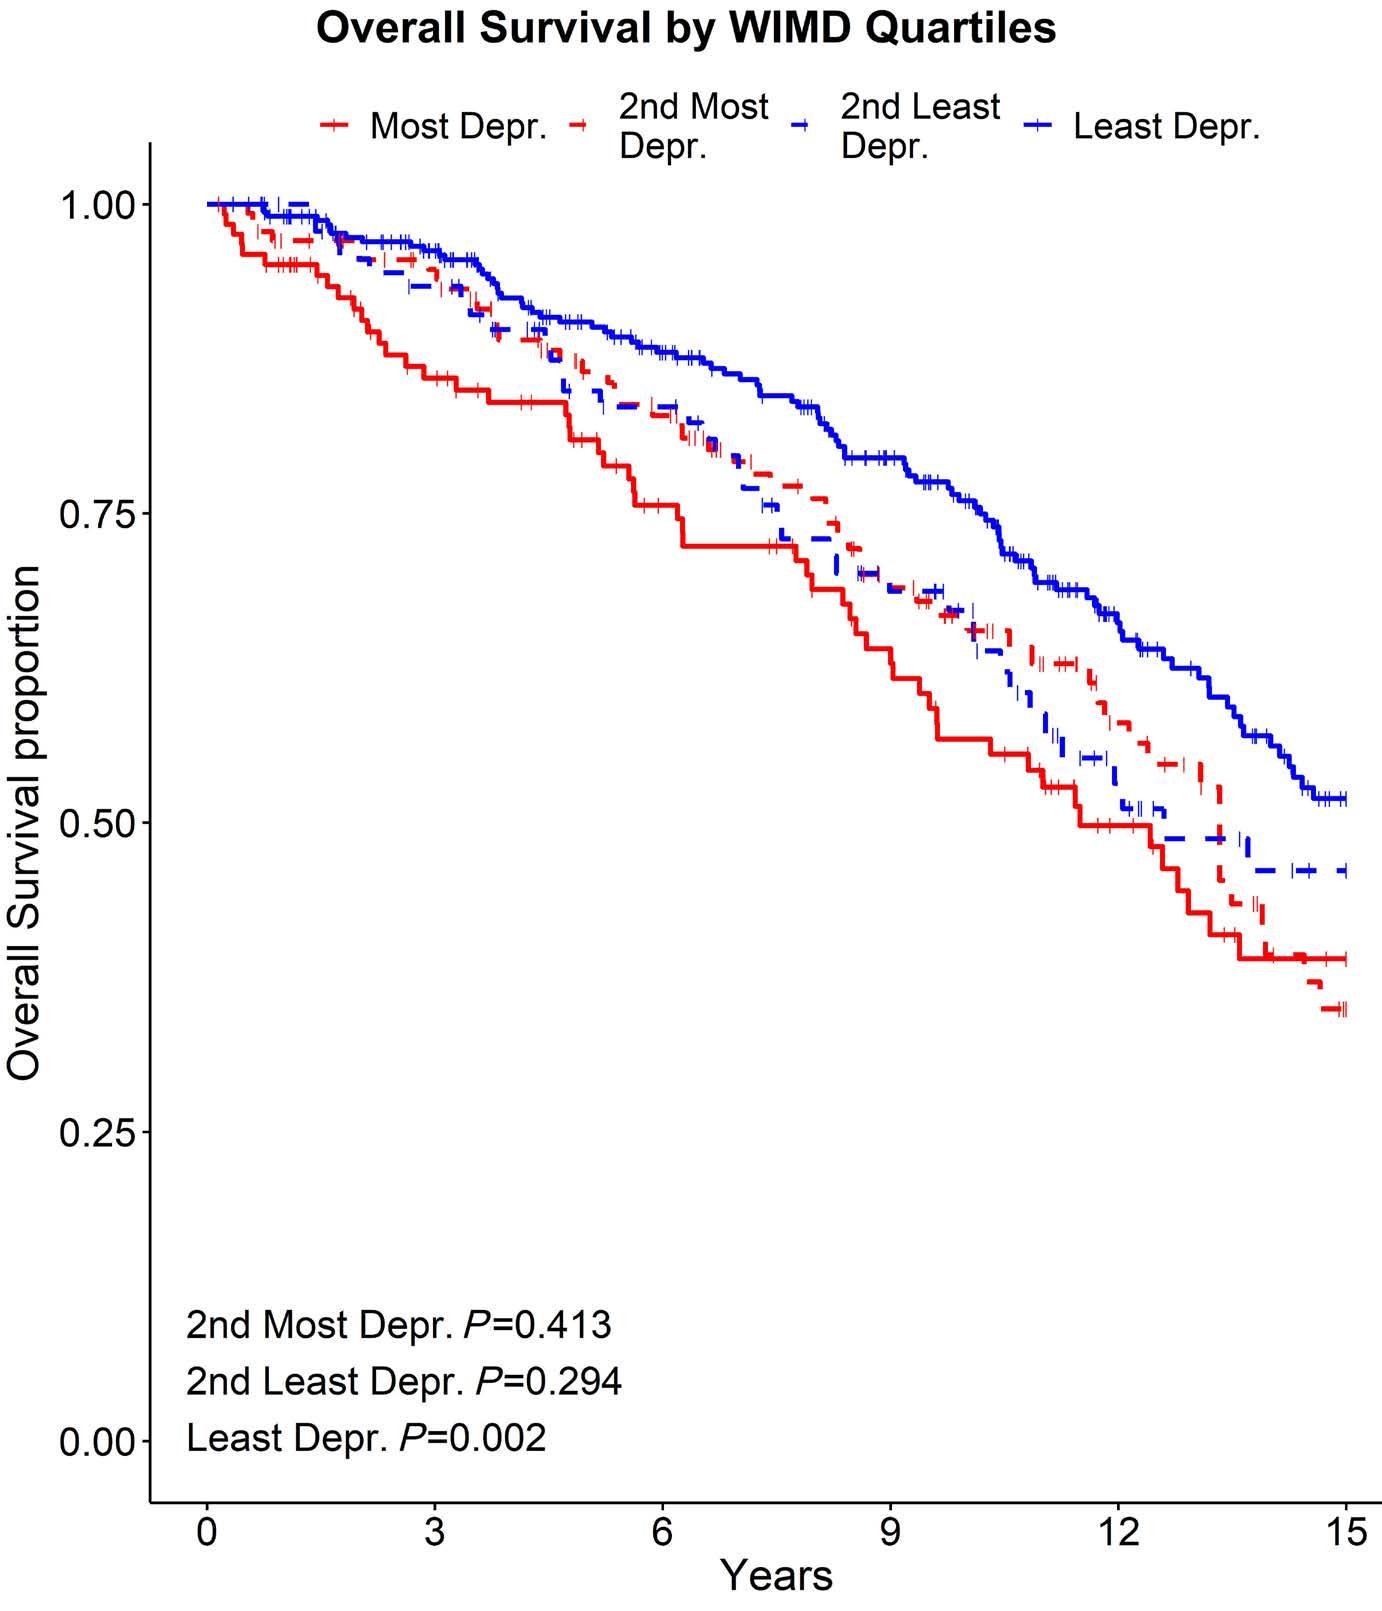
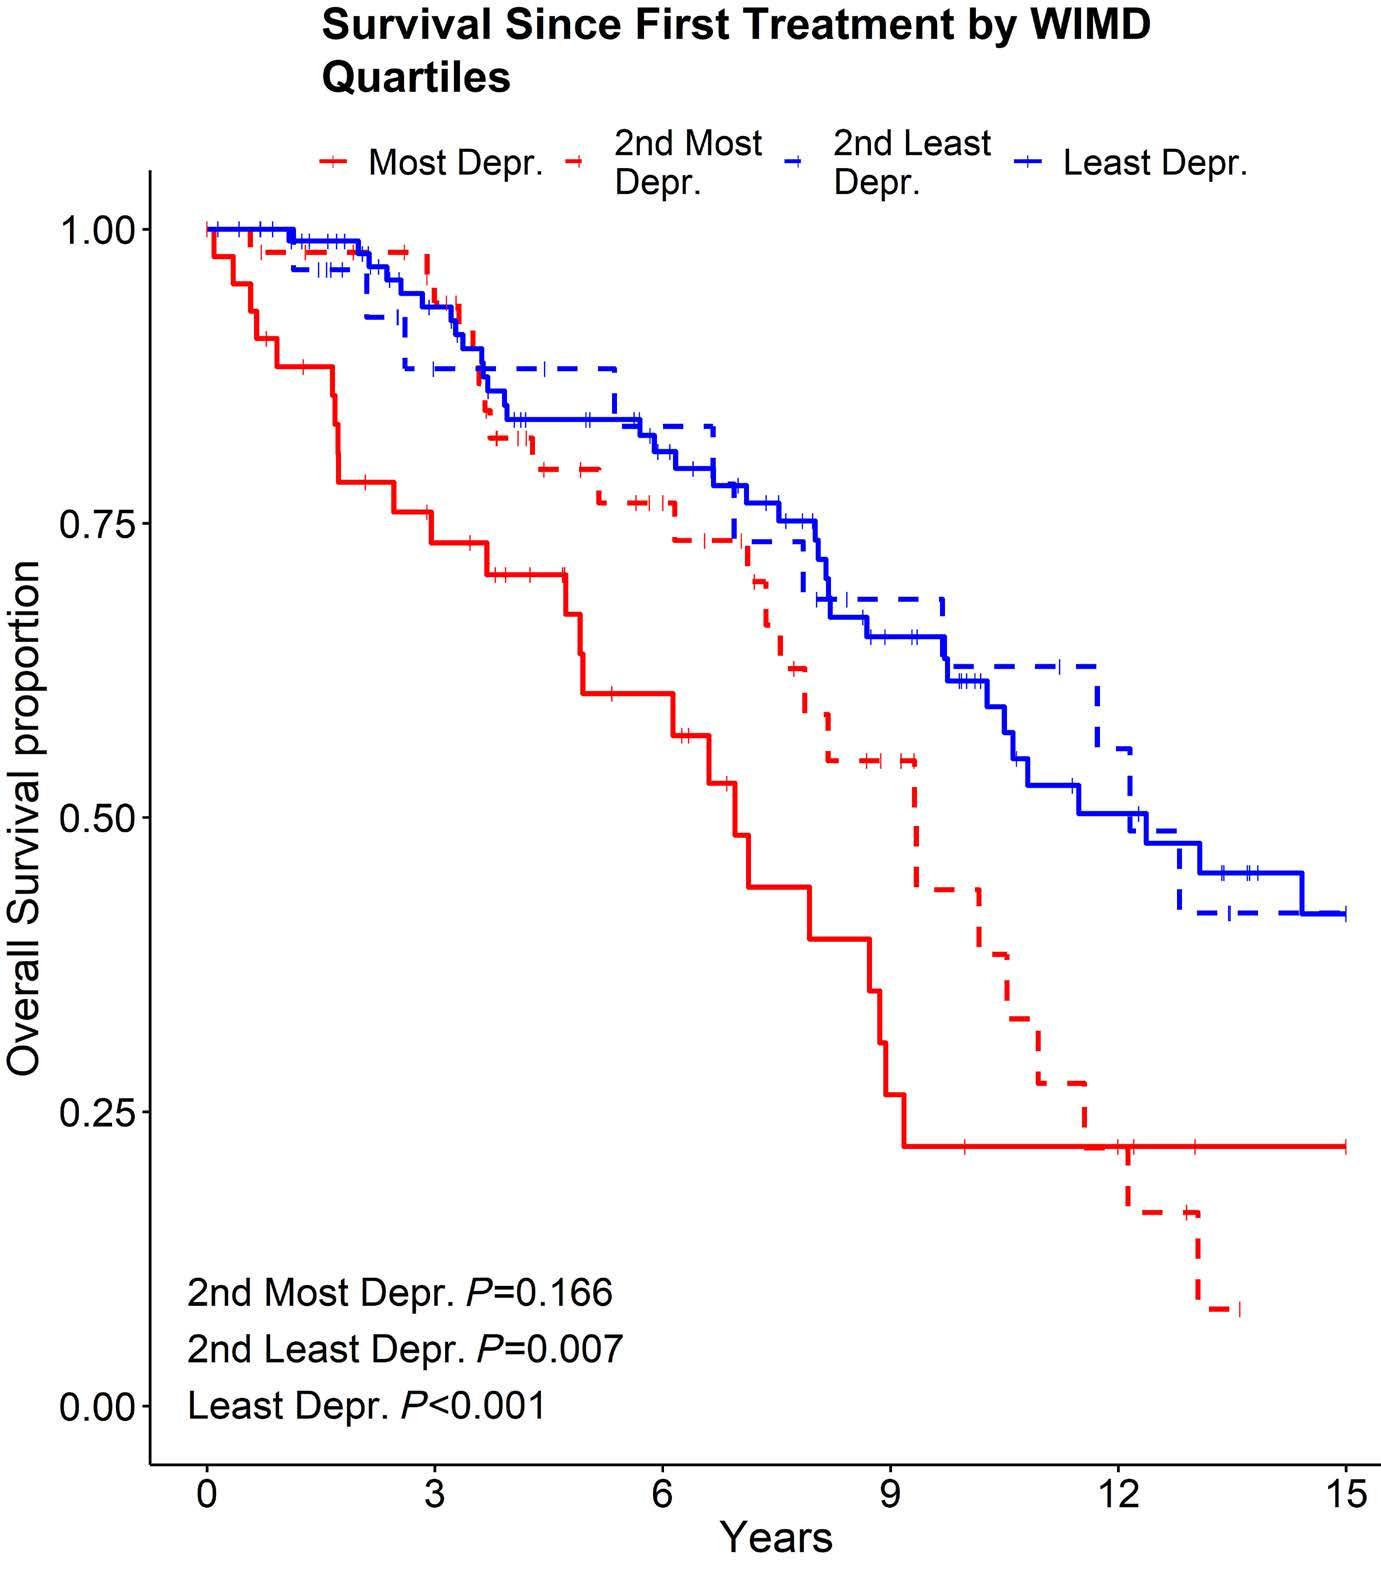
Haematologica | 109 May 2024 1568 LETTER TO THE EDITOR
Figure 1. Overall survival between four quartile deprivation groups. WIMD: Welsh Index of Multiple Deprivation; Depr.: deprived.
Figure 2. Survival since time of first treatment between four quartile deprivation groups. WIMD: Welsh Index of Multiple Deprivation; Depr.: deprived.
quality can alter driver mutation expression.13,14 Finally, medical staff bias can also not be ruled out although this seems unlikely given that TTFT and access/participation into clinical trials is not significantly different between the deprivation groups.15
Great strides are being made in the treatment and outcomes of CLL patients with B-cell receptor and BCL-2 inhibitors, but if we wish to improve overall survival in all our CLL communities, then further research aimed at understanding and addressing the clinical impacts of social deprivation will be essential.
Authors
Gregory Fegan,1 Daniel Tod,1 Abigail Downing,2 Nagah Elmusharaf,2 Christopher Pepper3 and Christopher Fegan4
1Swansea Trial Unit, Swansea University Medical School, Singleton Park, Swansea; 2Department of Hematology, University Hospital of Wales, Heath Park, Cardiff; 3Brighton and Sussex Medical School, University of Sussex, Brighton and 4Institute of Cancer and Genetics, School of Medicine, Cardiff University, Heath Park, Cardiff, UK
Correspondence:
C. FEGAN - Fegancd1@cardiff.ac.uk
https://doi.org/10.3324/haematol.2023.283527
References
1. Nabhan C, Aschebrook-Kilfoy B, Chiu BC, et al. The impact of race, ethnicity, age and sex on clinical outcome in chronic lymphocytic leukemia: a comprehensive surveillance, epidemiology, and end results analysis in the modern era. Leuk Lymphoma. 2014;55(12):2778-2784.
2. Moreau EJ, Matutes E, A’Hern RP, et al. Improvement of the chronic lymphocytic leukemia scoring system with the monoclonal antibody SN8 (CD79b). Am J Clin Pathol. 1997;108(4):378-382.
3. Schuh AH, Parry-Jones N, Appleby N, et al. Guideline for the treatment of chronic lymphocytic leukaemia: a British Society for Haematology Guideline. Br J Haematol. 2018;182(3):344-359.
4 Shanafelt TD, Kay NE, Rabe KG, et al. Hematologist/oncologist disease-specific expertise and survival: lessons from chronic lymphocytic leukemia (CLL)/small lymphocytic lymphoma (SLL). Cancer. 2012;118(7):1827-1837.
5. McCutchan GM, Wood F, Edwards A, Richards R, Brain KE. Influences of cancer symptom knowledge, beliefs and barriers on cancer symptom presentation in relation to socioeconomic deprivation: A systematic review. BMC Cancer. 2015;15:1000.
6. Brown KF, Rumgay H, Dunlop C, et al. The fraction of cancer attributable to modifiable risk factors in England, Wales, Scotland, Northern Ireland, and the United Kingdom in 2015. Br J Cancer. 2018;118(8): 1130-1141.
7 Quaife SL, Winstanley K, Robb KA, et al. Socioeconomic inequalities in attitudes towards cancer: an international cancer benchmarking partnership study. Eur J Cancer Prev. 2015;24(3):253-260.
Received: May 19, 2023.
Accepted: January 15, 2024.
Early view: January 25, 2024.
©2024 Ferrata Storti Foundation
Published under a CC BY-NC license
Disclosures
No conflicts of interest to disclose.
Contributions
GF and DT analyzed data and wrote the manuscript. AD provided data. NE wrote the manuscript. CP analyzed samples, provided data and wrote the manuscript. CF conceived and devised study, contributed patient and clinical data, analyzed data and wrote the manuscript.
Funding
This study was sponsored by Cardiff University with support from Swansea University (to GF and TD) and Cancer Research Wales (to CF) with financial support from a donation from J. Parker.
Data-sharing statement
The datasets generated during and/or analyzed during the current study are not publicly available as they contain personal patient information but are available from the corresponding author on reasonable request.
8. Macleod U, Mitchell ED, Burgess C, Macdonald S, Ramirez AJ. Risk factors for delayed presentation and referral of symptomatic cancer: evidence for common cancers. Br J Cancer. 2009;101(Suppl 2):S92-S101.
9 Thurmes P, Call T, Slager S, et al. Comorbid conditions and survival in unselected, newly diagnosed patients with chronic lymphocytic leukemia. Leuk Lymphoma. 2008;49(1):49-56.
10. Stamatopoulos K, Belessi C, Moreno C. Over 20% of patients with chronic lymphocytic leukemia carry stereotyped receptors: pathogenetic implications and clinical correlations. Blood. 2007;109(1):259-270.
11. Jaramillo S, Agathangelidis A, Schneider C, et al. Prognostic impact of prevalent chronic lymphocytic leukemia stereotyped subsets: analysis within prospective clinical trials of the German CLL Study Group (GCLLSG). Haematologica. 2020;105(11):2598-2607.
12. Landau DA, Wu CJ. Chronic lymphocytic leukemia: molecular heterogeneity revealed by high-throughput genomics. Genome Med. 2013;5(5):47.
13. Horton A, Jones SJ, Brunt H. Air pollution and public health vulnerabilities, susceptibilities and inequalities in Wales, UK. J Public Health (Oxf). 2023;45(2):432-441.
14 Hill W, Lim EL, Weeden CE, et al. Lung adenocarcinoma promotion by air pollutants. Nature. 2023;616(7955):159-167.
15. Sharrocks K, Spicer J, Camidge DR, Papa S. The impact of socioeconomic status on access to cancer clinical trials. Br J Cancer. 2014; 111(9):1684-1687.
Haematologica | 109 May 2024 1569 LETTER TO THE EDITOR
MicroRNA and long non-coding RNA analysis in IgMmonoclonal gammopathies reveals epigenetic influence on cellular functions and oncogenesis
Waldenström macroglobulinemia (WM) is a rare non-Hodgkin lymphoma that is often preceded by an IgM monoclonal gammopathy of undetermined significance (IgM-MGUS).1 The factors underlying the malignant progression between these IgM-monoclonal gammopathies are poorly understood, and the majority of attention has focused on protein-coding genes. One aspect that remains underexplored is the influence of the non-coding genome. Two families of non-protein-coding RNA that have been implicated in regulating an array of disease processes are microRNA (miRNA, miR) and long non-coding RNA (lncRNA).2,3 The primary aim of this study was to determine the role of non-coding RNA, specifically miRNA and lncRNA, in IgM-gammopathies and the pathways and genes they may regulate. This study demonstrated that miRNA and lncRNA are highly differentially expressed between IgM-gammopathies and normal controls and specifically between WM and IgM-MGUS. Furthermore, pathway analysis showed miRNA-based epigenetic regulation of multiple cellular pathways including cell signaling and immune response in IgM-gammopathies. This study included prospectively collected bone marrow samples from 28 subjects (17 with WM, 6 with IgM-MGUS, 5 controls]. WM was defined as ≥10% bone marrow involvement by lymphoplasmacytic lymphoma and a serum IgM monoclonal protein of any size as per Mayo Stratification of Macroglobulinemia and Risk-Adapted Therapy (mSMART) guidelines.1 Patients were included after treatment if at least 6 months had passed between the last therapy and sample collection with symptoms indicating active disease. IgM-MGUS was defined as <10% bone marrow involvement by lymphoplasmacytic lymphoma, a serum IgM monoclonal protein <3 g/dL, and no signs/symptoms of active WM. Selection for CD19+ and/or CD138+ B cells was conducted. No clonality testing was performed. Next, total RNA was extracted, and analyses of miRNA, lncRNA and messenger RNA (mRNA) were performed.4 Differential expression between groups was evaluated and defined to be present if the fold-change in mRNA was >1 or <-1 and the fold-change in miRNA/lncRNA was >0.5 or <-0.5, with a false discovery rate <0.05. Subsequently, miRNA-mRNA target analysis was performed and differentially expressed miRNA-mRNA pairs with a correlated biological expression (i.e., either upregulated miRNA experimentally predicted to regulate downregulated mRNA or vice versa) were selected. Ingenuity Pathway Analysis was used to determine whether canonical pathways were implicated. LncRNA were further analyzed by assessing the nearest protein-coding gene or antisense
protein-coding gene.
The baseline characteristics of the cohort are demonstrated in Table 1. Significant differences were seen in miRNA expression data and Figure 1 illustrates the comparisons between IgM-gammopathies and normal controls and between WM and IgM-MGUS. Online Supplementary Figure S1 shows the miRNA differential analysis between IgM-MGUS and controls and between WM and controls. In the comparisons of WM to IgM-MGUS and IgM-gammopathies to controls, there were 18 miRNA that were commonly differentially expressed. Of these miRNA, five were found to be in the same direction of expression (4 upregulated, 1 downregulated), while 13 demonstrated opposite expression patterns. Several miRNA that have been previously implicated in WM were also demonstrated to be differentially expressed in our cohort, including miR-155 and miR-192.5,6 Next, miRNA-based pathway analysis revealed several aspects of oncogenesis that were implicated when comparing both IgM-gammopathies to controls and WM to IgM-MGUS. These included cell signaling, metabolism, cytoskeleton, migration and adhesion, proliferation, immune response, and cell cycle regulation pathways (Figure 1A, B). A few pathways are discussed below, and a comprehensive analysis of implicated pathways along with underlying miRNA-mRNA pairs of interest is included in Online Supplementary Table S1.
In the assessment of miRNA-based pathways in IgM-gammopathies compared to normal controls, upregulation of signaling pathways, including STAT3, PI3K/AKT, JAK2 and RAC, was observed. Several of these pathways have been previously implicated in the pathogenesis of WM.7-9 Upregulation of the STAT3 gene was found to be commonly dysregulated, which is a predicted target of downregulated miRNA, including miR-20B and miR-223. Additional genes implicated in these signaling pathways included BCL2 which was observed to be upregulated, and potentially epigenetically targeted by miR-16, miR-17, miR-181 and miR-34, all downregulated. Of note, BCL2 is a regulator of mitochondrial apoptotic pathways and is a critical gene in WM pathogenesis induced through signaling of the MYD88 and CXCR4 activating mutations.10
Comparing WM to IgM-MGUS, significant inactivation of multiple inflammatory and cytokine signaling pathways was observed. A pathway of interest was interferon signaling. Interferons are cytokines that have important roles in the regulation of biological processes, inflammation and tumorigenesis.11 Underlying the interferon pathway was downregulation of multiple interferon-induced genes (IFIT1,
Haematologica | 109 May 2024 1570 LETTER TO THE EDITOR
Table 1. Clinical characteristics of all the patients with IgM-gammopathy who provided blood samples and a comparison between patients with Waldenström macroglobulinemia and IgM-monoclonal gammopathy of undetermined significance.
Sample collection to 1st treatment in months, median (range)
All values are for the time of sample collection. The group of IgM-gammopathies contained all samples from patients with Waldenström macroglobulinemia (WM) and immunoglobulin M-monoclonal gammopathy of undetermined significance (IgM-MGUS). MYD88 and CXCR4 mutational data were available for 20 patients (15 with WM, 5 with IgM-MGUS). Only patients with WM progressed to first treatment after sample collection (N=10). Patients who received treatment prior to sample collection were censored from the calculation of time to treatment. N: number; BM: bone marrow; FLC: free light chain; Dx: diagnosis; FU: follow up.
IFIT3, IFITM1) and STAT1. The most notable targets of these interferon-induced genes were miR-32, miR-146, and miR155, all of which were upregulated. Additionally, underlying multiple inflammatory signaling and cytokine pathways was upregulation of miR-146a, miR-150, and miR-194, all targets of STAT1, observed to be downregulated. Notably, miR-146a has previously been shown to be an inhibitor of inflammatory cytokines, including interleukin-6.12 STAT family proteins play a crucial role in the transmission of interferon-stimulated genes and cytokine signal transduction.11 Downregulation of multiple cytokine signaling pathways involved in inflammation and the tumor microenvironment, along with targeting of the STAT family, indicates a possible miRNA-based negative feedback loop to down-modulate inflammatory cytokine signaling in WM compared to IgM-MGUS.
Previously, our group published a multi-omics analysis demonstrating distinct pathway activationas well as metabolomic and clinical features in each of the clinical clusters of monoclonal gammopathies analyzed (C1, C2, C3).4 MiRNA analysis performed on these clusters revealed a distinct expression profile in each group (Figure 2A-C). Assessing the expression of miRNA of interest, we found that miR-155 was upregulated in C1 and downregulated in C2. miR-155 has previously been demonstrated to regulate WM cell proliferation and growth. This observation corresponds with our findings of patients in C1 having a more aggressive
phenotype. In addition, we saw downregulation of miR-125 in C1, compared to upregulation in C2. miR-125a acts via the nuclear factor-κB pathway and has been shown to be a tumor suppressor in B-cell malignancies.13 Pathway analysis additionally revealed alterations in immune response, cytokine signaling, cell cycle, senescence, and metabolism with opposite trends in C1 as compared to C2. These pathways overlapped with our previously published data based on protein expression.4
Next, assessment of lncRNA expression comparing WM and IgM-MGUS revealed 62 differentially expressed targets (24 upregulated, 38 downregulated) (Figure 2D). Several lncRNA found to be differentially expressed have been previously implicated in other malignancies (Online Supplementary Table S2). Our analysis next focused on lncRNA found to be in proximity of or antisense to coding genes. Here, we found a number of targets that regulate transcription and cell cycle regulation. Notable lncRNA included ENSG00000274987, which was found to be upregulated; this is the antisense lncRNA to KRAS, the gene that codes for the protein K-RAS, a GTPase implicated in B-cell proliferation and cell signaling, which is commonly dysregulated in lymphoid malignancies.14 Additionally, several nearest or antisense genes to lncRNA were also differentially expressed on mRNA analysis between WM and IgM-MGUS (Online Supplementary Table S2). This in-
Haematologica | 109 May 2024 1571 LETTER TO THE EDITOR
Parameter IgM-gammopathies N=23 WM N=17 IgM-MGUS N=6 P Age at diagnosis in years, median (range) 63 (46-88) 61 (46-76) 70 (52-88) 0.29 Male sex, N (%) 15 (65) 11 (65) 4 (67) 0.93 Hemoglobin, g/dL, median (range) 12.7 (9.8-16.2) 12.7 (9.8-15.8) 12.3 (10.5-16.2) 0.81 Platelets, x109/L, median (range) 235 (95-512) 235 (96-512) 240 (95-338) 0.80 β2 microglobulin, mg/mL, median (range) 3.1 (1.4-5.9) 2.9 (1.4-5.9) 3.2 (2.5-5.0) 0.39 IgM, mg/dL, median (range) 1,340 (173-10,000) 1,460 (173-10,000) 533 (283-2,810) 0.16 BM involvement, %, median (range) 20 (0-80) 35 (5-80) 3.5 (0-5) <0.001 Abnormal FLC ratio, N (%) 6 (26) 4 (27) 2 (40) 1.00 MYD88 mutated, N (%) 14 (70) 11 (73) 3 (60) 0.57 CXCR4 mutated, N (%) 3 (15) 3 (20) 0 0.28 Dx to last FU in months, median (range) 80 (20-281) 87 (20-152) 47 (26-281) 0.62
1 (0-2) 1 (0-2) - -
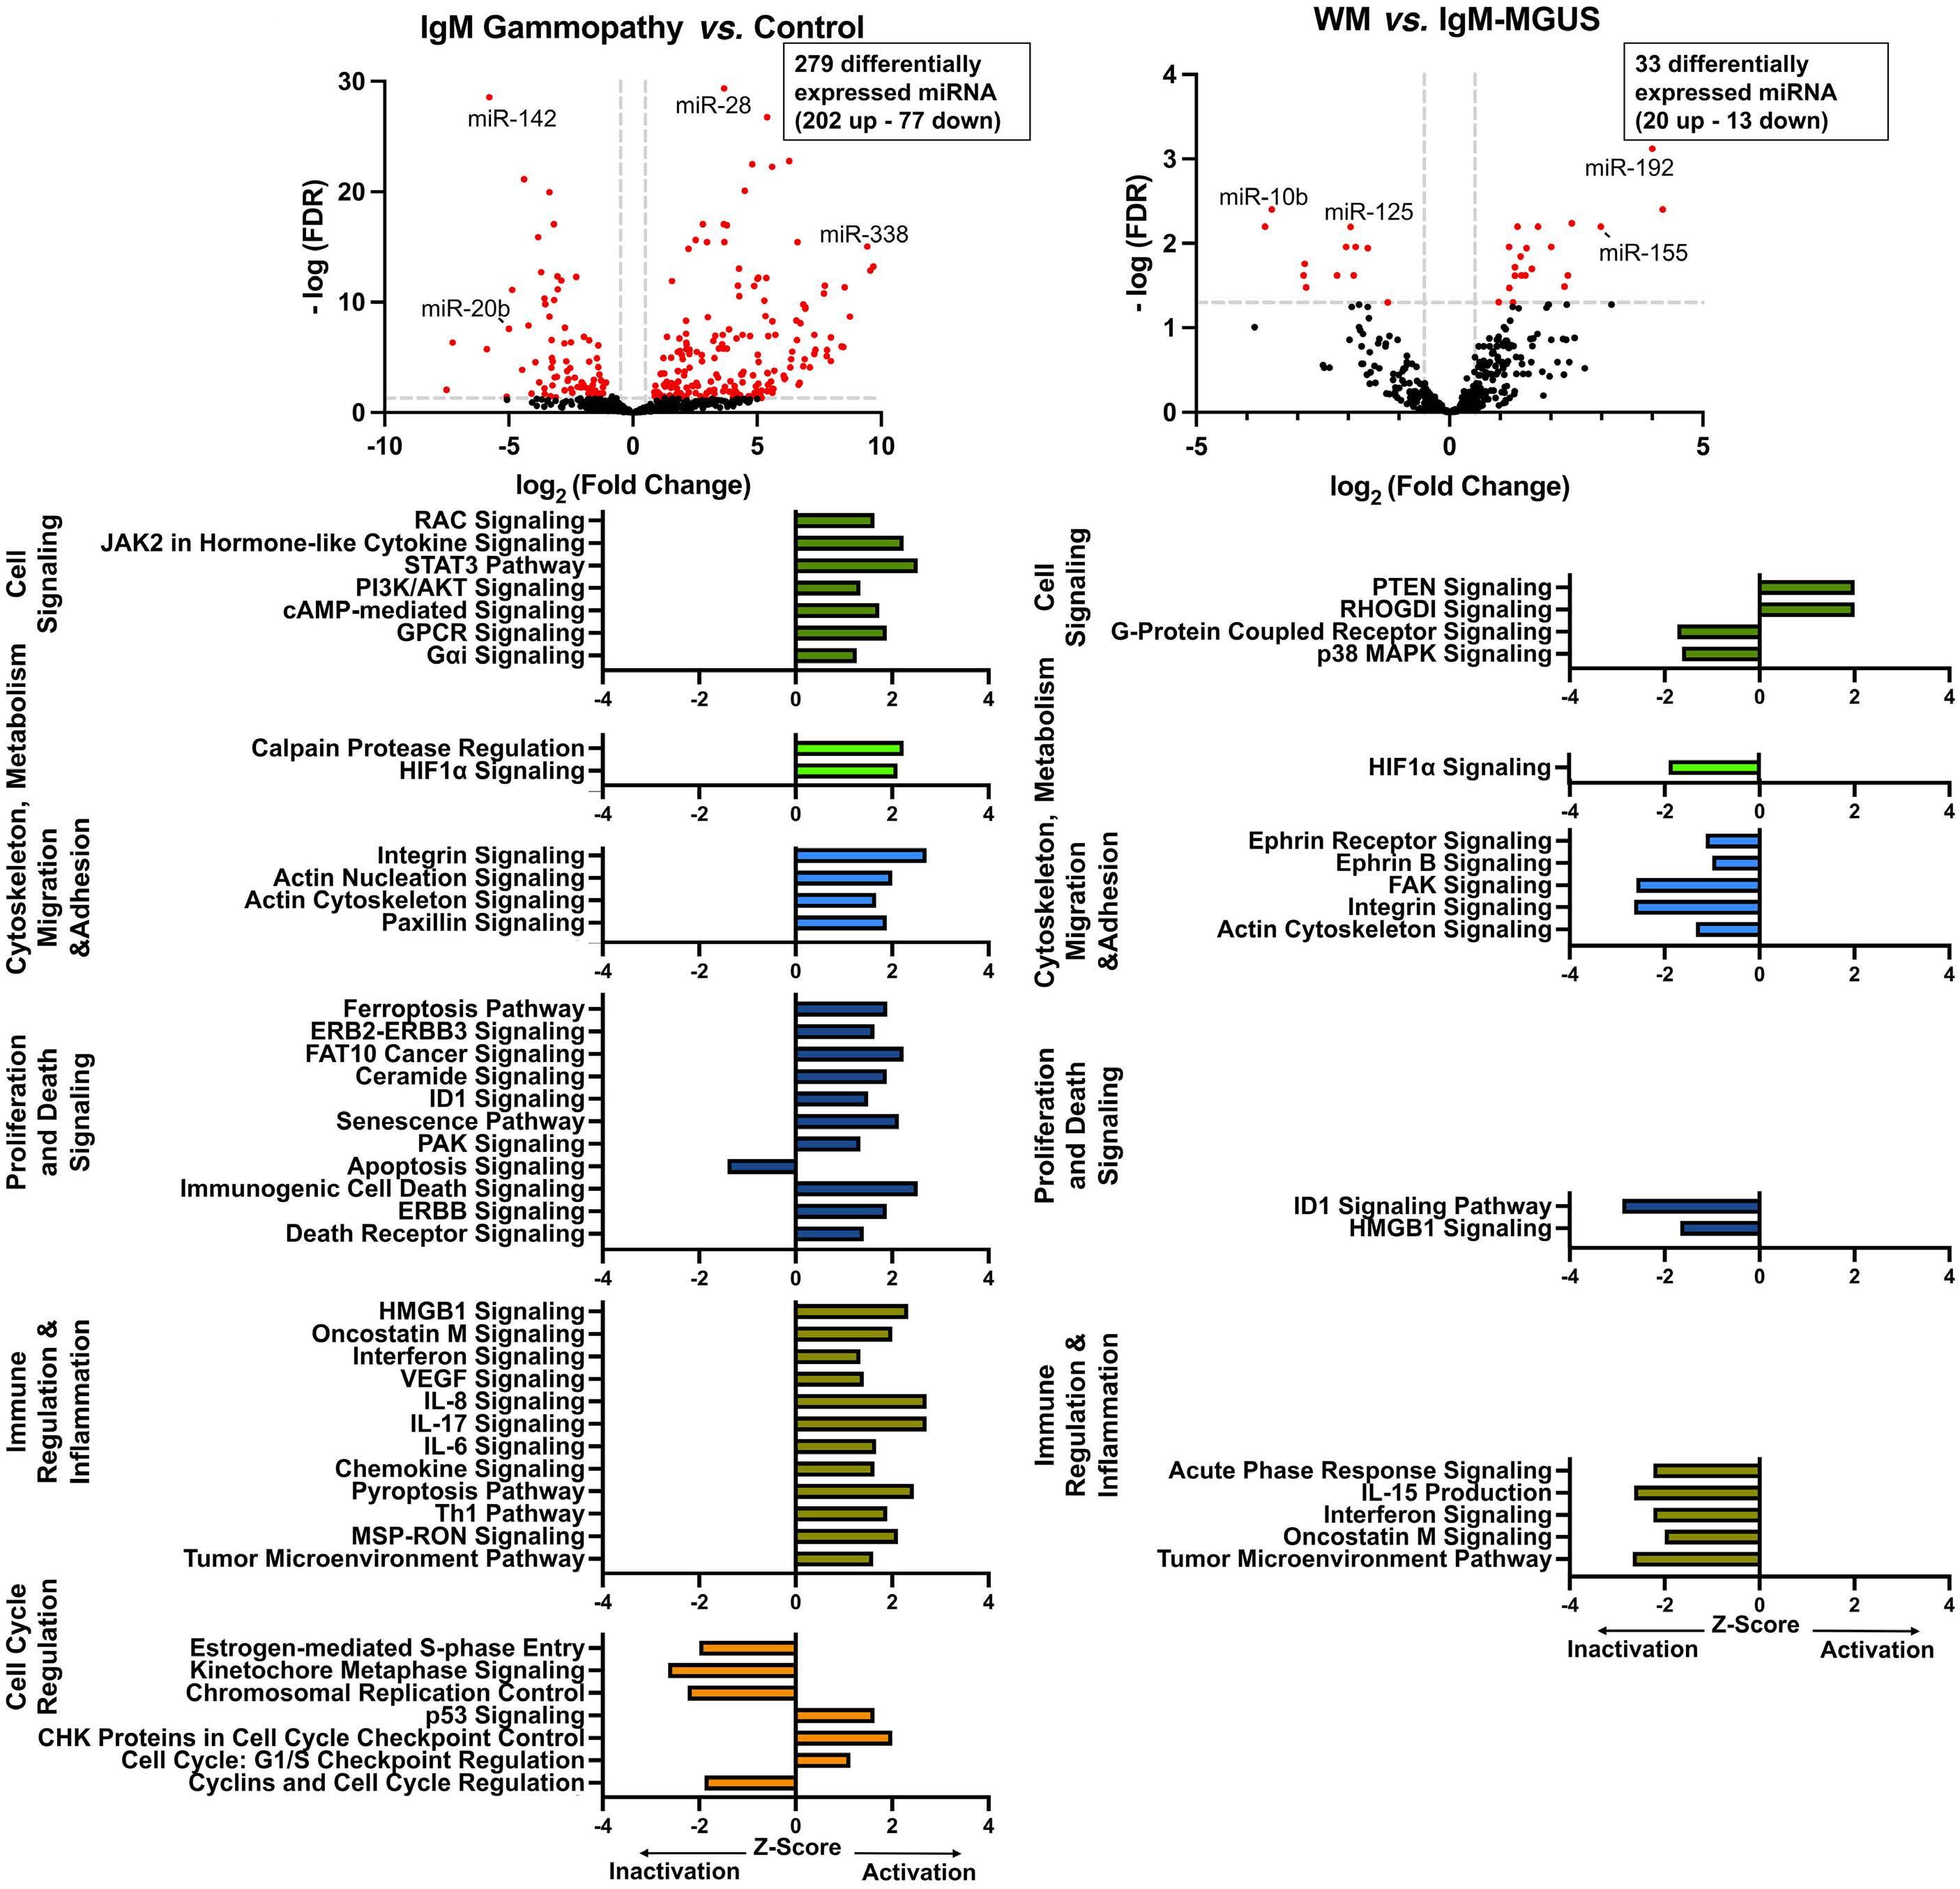
Figure 1. MicroRNA expression and pathway analysis in IgM-gammopathies. (A) IgM-gammopathy compared to control samples, (B) Waldenström macroglobulinemia compared to IgM-monoclonal gammopathy of undetermined significance (B). Dotted lines on the volcano plot indicate significance thresholds for fold change and false discovery rate. Red markers indicate differentially expressed microRNA (miRNA). Black markers indicate non-differentially expressed miRNA. Figure created using GraphPad Prism. FDR: false discovery rate; miR: microRNA; IgM: immunoglobulin M; WM: Waldenström macroglobulinemia; MGUS: monoclonal gammopathy of undetermined significance.
cluded ENSG00000229418, which is the antisense lncRNA to the gene DNTT, observed to be downregulated in WM (fold change: -3.6; false discovery rate <0.005) compared to IgM-MGUS. DNA nucleotidylexo-transferase (DNTT) is a DNA polymerase expressed in immature B and T lymphoid cells and has been implicated in WM in relation to V(D)J recombination.15
With the increasing recognition of non-coding genomics driving progression in lymphoid malignancies, the current study offers one of the first comprehensive analyses of both miRNA and lncRNA in IgM-gammopathies. The miRNA analysis comparing IgM-gammopathies to normal controls revealed that a significant number of miRNA were differentially expressed, and diverse cellular functions were
Haematologica | 109 May 2024 1572 LETTER TO THE EDITOR
A B
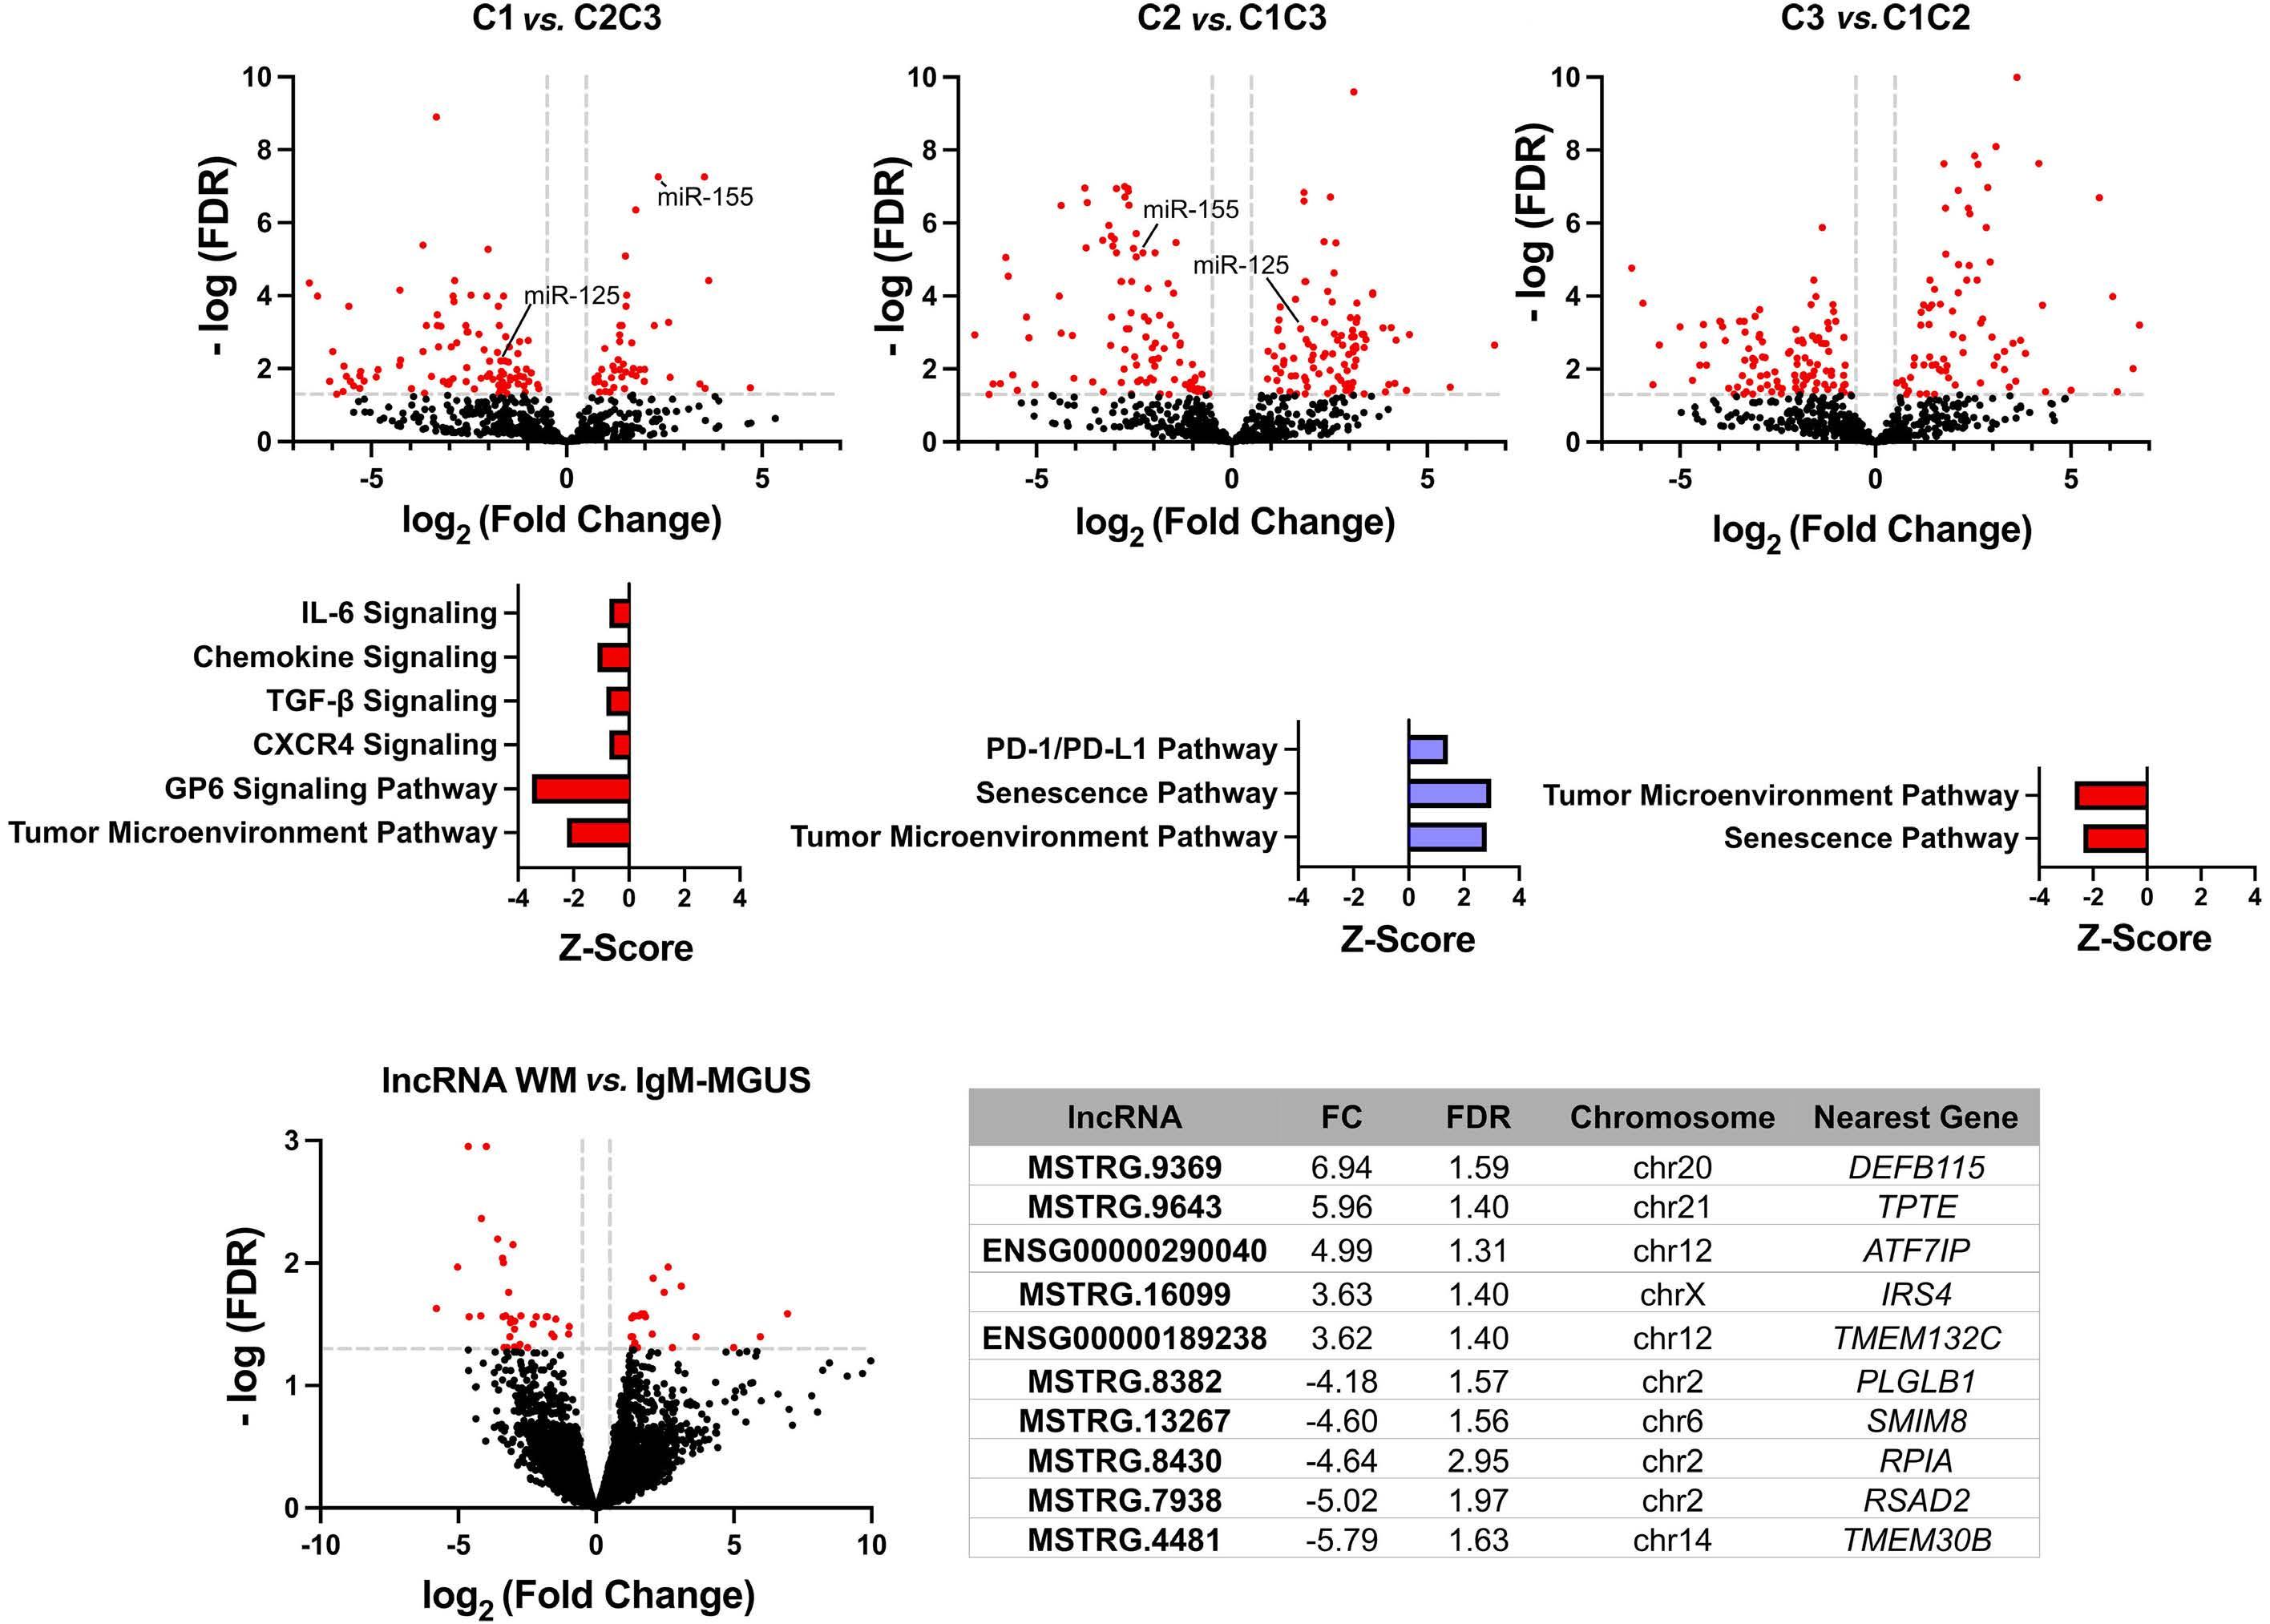
Figure 2. MicroRNA analysis by cluster and long non-coding RNA analysis comparing Waldenström macroglobulinemia to IgM-monoclonal gammopathy of undetermined significance. (A-C) MicroRNA (miRNA) expression analysis by cluster with pathway analysis and (D) long non-coding RNA (lncRNA) expression data comparing Waldenström macroglobulinemia to IgM-monoclonal gammopathy of undetermined significance with the top ten dysregulated lncRNA. The cluster pathways demonstrated were based only on concordant pathway analysis as compared to previously published protein-based pathway data. Dotted lines on the volcano plot indicate thresholds for significance for fold change and false discovery rate. Red markers indicate differentially expressed miRNA/lncRNA. Black markers indicate non-differentially expressed miRNA/lncRNA. The table listing the top ten dysregulated lncRNA also presents the corresponding fold change, false discovery rate, chromosomal location and nearest gene. Figure created using GraphPad Prism. miR: microRNA; WM: Waldenström macroglobulinemia; IgM: immunoglobulin M; MGUS: monoclonal gammopathy of undetermined significance; FDR: false discovery rate.
seen to be potentially epigenetically mediated through miRNA-based pathways. These included signaling pathways such as PI3K/AKT/mTOR, and the JAK/STAT pathway, which are the source of important therapeutic targets in WM.7-9 Thus, miRNA may serve as important novel targets for therapy or may play an adjunctive role with currently available therapies targeting oncogenic pathways. Extending our previous multi-omics analysis which revealed three distinct clusters in IgM-gammopathies, the miRNA analysis of these clusters revealed that each cluster has a unique non-coding expression profile, highlighting their biological differences. Further exploration of how to better classify IgM-gammopathies based on biological differences, including both miRNA and lncRNA into this framework, may allow for
better molecular differentiation of IgM-gammopathies and, ultimately, a more individualized patient approach. Currently, there are no reliable biological models to predict the progression from IgM-MGUS to marginal zone lymphoma, multiple myeloma, chronic lymphocytic lymphoma or WM. In this study, given that several differentially expressed miRNA and lncRNA were identified by comparing WM to IgM-MGUS, non-coding RNA may serve a novel predictive role. Future large prospective analyses with long-term follow-up should be conducted to assess whether non-coding genomic signatures may help to indicate a higher risk of progression to malignancy. Additionally, by expanding our understanding of key non-coded RNA differences between IgM-MGUS and WM, these findings offer the potential to
Haematologica | 109 May 2024 1573 LETTER TO THE EDITOR
A D B C
recognize novel therapeutic targets which may halt or slow the malignant progression between these two diseases. Overall, we report the key miRNA and lncRNA differences underlying both IgM-MGUS and WM and explore the role of non-coding RNA in the regulation of cellular pathways in IgM-gammopathies. Further investigation of non-coding RNA of interest with functional studies will certainly be needed to help to determine their exact biological roles. As an underexplored area of pathogenesis which likely drives many of the aberrantly regulated pathways, non-coding genomics will certainly provide novel therapeutic targets, help to classify patients better based on disease biology, and improve risk stratification for purposes of prognostication.
Authors
Karan Chohan,1* Jonas Paludo,2* Surendra Dasari,3 Patrizia Mondello,2 Joseph P. Novak,2 Jithma P. Abeykoon,2 Kerstin Wenzl,2 Zhi-Zhang Yang,2 Shahrzad Jalali,2 Jordan E. Krull,2 Esteban Braggio,4 Michelle K. Manske,2 Aneel Paulus,5 Craig B. Reeder,4 Sikander Ailawadhi,5 Asher Chanan-Khan,5 Prashant Kapoor,2 Robert A. Kyle,2 Morie A. Gertz,2 Anne J. Novak2 and Stephen M. Ansell2
1Department of Medicine, Mayo Clinic, Rochester, MN; 2Division of Hematology, Mayo Clinic, Rochester, MN; 3Department of Health Sciences Research, Mayo Clinic, Rochester, MN; 4Division of Hematology and Medical Oncology, Mayo Clinic, Scottsdale, AZ and 5Division of Hematology and Oncology, Mayo Clinic, Jacksonville, FL, USA
*KC and JP contributed equally as first authors
Correspondence:
S.M. ANSELL - ansell.stephen@mayo.edu
References
1. Kapoor P, Ansell SM, Fonseca R, et al. Diagnosis and management of Waldenström macroglobulinemia: Mayo Stratification of Macroglobulinemia and Risk-Adapted Therapy (mSMART) guidelines 2016. JAMA Oncol. 2017;3(9):1257-1265.
2. O’Brien J, Hayder H, Zayed Y, Peng C. Overview of microRNA biogenesis, mechanisms of actions, and circulation. Front Endocrinol (Lausanne). 2018;9:402.
3. Statello L, Guo CJ, Chen LL, Huarte M. Author correction: Gene regulation by long non-coding RNAs and its biological functions. Nat Rev Mol Cell Biol. 2021;22(2):159.
4. Mondello P, Paludo J, Novak JP, et al. Molecular clusters and tumor-immune drivers of IgM monoclonal gammopathies. Clin Cancer Res. 2023;29(5):957-970.
5. Bouyssou JM, Liu CJ, Bustoros M, et al. Profiling of circulating exosomal miRNAs in patients with Waldenström macroglobulinemia. PLoS One. 2018;13(10):e0204589.
6. Roccaro AM, Sacco A, Chen C, et al. microRNA expression in the
https://doi.org/10.3324/haematol.2023.283927
Received: July 13, 2023.
Accepted: November 27, 2023. Early view: December 7, 2023.
©2024 Ferrata Storti Foundation
Published under a CC BY-NC license
Disclosures
SMA receives research funding from Bristol-Myers Squibb, Seattle Genetics, Affimed Therapeutics, Regeneron, Trillium Therapeutics, AI Therapeutics, and ADC Therapeutics. All remaining authors (KC, JP, SD, PM, JPN, JPA, KW, ZY, SJ, JEK, EB, MKM, AP, CBR, SA, AC, PK, RAK, MAG, and AJN) declare that they have no competing conflicts of interest to disclose.
Contributions
KC, JP, SD, and SMA designed this study, analyzed/interpreted the data, and wrote the manuscript. PM, JPN, JPA, KW, ZY, SJ, JEK, EB, MKM, AP, CBR, SA, AC, PK, RAK, MAG, and AJN, interpreted the data and assisted in writing the manuscript. All authors provided final approval of the manuscript and are accountable for all aspects of the work.
Funding
This study was supported by research funding from the BINK Foundation, and International Waldenström Macroglobulinemia Foundation (IWMF) to SMA and the Mayo Clinic.
Data-sharing statement
RNA data are available at GEO under the accession numbers GSE232994 and GSE232995. For additional data on the patients, please contact the corresponding author.
biology, prognosis, and therapy of Waldenström macroglobulinemia. Blood. 2009;113(18):4391-4402.
7 Ghobrial IM, Gertz M, Laplant B, et al. Phase II trial of the oral mammalian target of rapamycin inhibitor everolimus in relapsed or refractory Waldenström macroglobulinemia. J Clin Oncol. 2010;28(8):1408-1414.
8. Ansell SM, Grote D, Elsawa SF, et al. Inhibition of the Jak/Stat pathway downregulates immunoglobulin production and induces cell death in Waldenström macroglobulinemia. Blood. 2009;114(22):1691-1691.
9. Tomowiak C, Poulain S, Herbaux C, et al. Obinutuzumab and idelalisib in symptomatic patients with relapsed/refractory Waldenström macroglobulinemia. Blood Adv. 2021;5(9):2438-2446.
10 Gaudette BT, Dwivedi B, Chitta KS, et al. Low expression of pro-apoptotic Bcl-2 family proteins sets the apoptotic threshold in Waldenström macroglobulinemia. Oncogene.
Haematologica | 109 May 2024 1574 LETTER TO THE EDITOR
2016;35(4):479-490.
11. Schneider WM, Chevillotte MD, Rice CM. Interferon-stimulated genes: a complex web of host defenses. Annu Rev Immunol. 2014;32:513-545.
12. Zhou C, Zhao L, Wang K, et al. MicroRNA-146a inhibits NFkappaB activation and pro-inflammatory cytokine production by regulating IRAK1 expression in THP-1 cells. Exp Ther Med. 2019;18(4):3078-3084.
13. Kim SW, Ramasamy K, Bouamar H, Lin AP, Jiang D, Aguiar RC. MicroRNAs miR-125a and miR-125b constitutively activate the
NF-kappaB pathway by targeting the tumor necrosis factor alpha-induced protein 3 (TNFAIP3, A20). Proc Natl Acad Sci U S A. 2012;109(20):7865-7870.
14 Vendramini E, Bomben R, Pozzo F, et al. KRAS and RAS-MAPK pathway deregulation in mature B cell lymphoproliferative disorders. Cancers (Basel). 2022;14(3):666.
15. Hunter ZR, Yang G, Xu L, Liu X, Castillo JJ, Treon SP. Genomics, signaling, and treatment of Waldenström macroglobulinemia. J Clin Oncol. 2017;35(9):994-1001.
Haematologica | 109 May 2024 1575 LETTER TO THE EDITOR
Acute myeloid leukemia-driven
IL-3-dependent
upregulation of
BCL2
in non-malignant hematopoietic stem and progenitor cells increases venetoclax-induced cytopenias
The BH3 mimetic venetoclax, in combination with lowdose cytarabine, decitabine or azacitidine, has shown clinical efficacy in newly diagnosed acute myeloid leukemia (AML) patients over 75 years of age or those ineligible for intensive induction chemotherapy.1,2 This has been a significant advance, particularly in the treatment of older AML patients who historically have been difficult to treat. 3-5
Venetoclax selectively inhibits the BCL2 protein which is over-expressed in AML to activate intrinsic apoptosis of AML cells. However, this treatment regime is associated with higher incidences of cytopenias, including clinically relevant neutropenia, febrile neutropenia and thrombocytopenia. 2,6 The underlying cause of cytopenia in the context of venetoclax-treated AML patients remains unexplained. Here, we show that AML drives IL-3-dependent upregulation of BCL2 in non-malignant hematopoietic stem and progenitor cells (HSPC), which is targeted by venetoclax and causes cytopenias. To model AML in vivo , we have previously used the syngeneic AML mouse model in which the MN1 oncogene is over-expressed in progenitor cells.7,8 All in vivo work in this study followed the institutional and national guidelines for the care and use of laboratory animals in accordance with UK Home Office regulations and the 1986 Animal Scientific Procedures Act. To determine if this model recapitulates the clinical cytopenias associated with venetoclax treatment, MN1 cells were engrafted into non-conditioned female C57BL/6 mice and 100 mg/ kg venetoclax or vehicle control were administered for seven consecutive days by oral gavage (Figure 1A). Blood and bone marrow (BM) samples were taken following sacrifice of mice and analyzed on BD FACSymphonyTM A1 (BD Biosciences, Berkshire, UK).
Flow cytometry analysis demonstrated that monocytes and neutrophils as well as B and T cells are depleted in venetoclax-treated MN1 engrafted mice compared to vehicle control-treated MN1-engrafted mice (Figure 1B and Online Supplementary Figure S1A). B- and T-cell depletion was also observed in control mice treated with venetoclax, but monocyte and neutrophil counts were not reduced (Figure 1C). We next investigated the effect of venetoclax on non-malignant HSPC in the BM, specifically hematopoietic stem cell (HSC), multipotent progenitor (MPP) and LSK (Lin- Sca1+ CD117+) populations ( Online Supplementary Figure S1B). HSC, MPP and LSK populations were all depleted by venetoclax in MN1-engrafted mice compared to vehicle control-treated MN1-engrafted mice (Figure 1D).
Further, we assessed the BCL2 expression profile in non-malignant LSK in the presence of AML. MN1 cells were injected into non-conditioned female C57BL/6 mice. At day 14, LSK were FACS purified from the BM (Figure 2A). Real-time qPCR analysis determined that LSK in MN1-engrafted mice exhibit increased BCL2 gene expression compared to control mice (Figure 2B). Elevated BCL2 protein expression was confirmed in LSK in MN1-engrafted mice relative to control mice using flow cytometry (Figure 2C). To determine the mechanism for increased BCL2 expression, these findings were modeled in vitro by co-culturing LSK with either MN1 or MEIS1/ HOXA9 AML subtypes. MEIS1/HOXA9 cells were retrovirally generated and labeled with mCherry, as previously described.7,8 Real-time qPCR analysis confirmed that LSK have significantly elevated BCL2 gene expression under AML co-culture conditions (Figure 2D). This was further confirmed at the protein level using flow cytometry for BCL2 ( Online Supplementary Figure S1C ). To determine if a secretory factor from AML is responsible for inducing BCL2 upregulation in LSK, we cultured LSK with cell-free conditioned media from MN1 cells (Figure 2E). Real-time qPCR confirmed that BCL2 is up-regulated in LSK treated with AML-conditioned media (Figure 2F) and demonstrates that an AML-mediated secretory factor is triggering BCL2 overexpression in LSK.
Previous research has suggested roles for interleukins (IL-) 1, 3 and 6 and tumor necrosis factor (TNF) 9-12 as inducers of BCL2 transcription in different cell types 11 (Figure 3A). Therefore, to investigate the mechanism, BCL2 expression was assessed in LSK treated with IL-3, IL-6, IL-1 β and TNF by real-time qPCR. Notably, results showed that BCL2 was significantly up-regulated in LSK in response to an IL-3 stimulus (Figure 3B), but not IL6, IL-1b or TNF. Studies have previously shown that IL-3 levels are increased in the serum of patients with AML.13 Furthermore, IL-3 has been shown to directly affect HSPC function, driving proliferation and differentiation but impairing long-term repopulation and self-renewal potential.14,15 IL-3, therefore, appears to play a role both in AML disease pathogenesis and in normal HSPC function. In this paper, we focus on the impact of IL-3 on BCL2 expression and the subsequent influence of venetoclax on HSPC function rather than the overall impact of IL-3 on HSPC function, which is beyond the scope of this paper. To determine the effect of IL-3 inhibition on BCL2 expression, LSK cultured with MN1-conditioned media were
Haematologica | 109 May 2024 1576 LETTER TO THE EDITOR
treated with IL-3 neutralizing antibody MP2-8F8 (Bio X Cell, NH, USA). Real-time qPCR analysis confirmed that IL-3 neutralization prevents upregulation of BCL2 in LSK cultured in MN1-conditioned media (Figure 3C). BCL2 gene
expression was also reduced in MN1 and MEIS1/HOXA9 cells treated with IL-3 neutralizing antibody (Figure 3D), suggesting that the effect of IL-3 inhibition on BCL2 expression is non-specific. Despite this, blocking IL-3
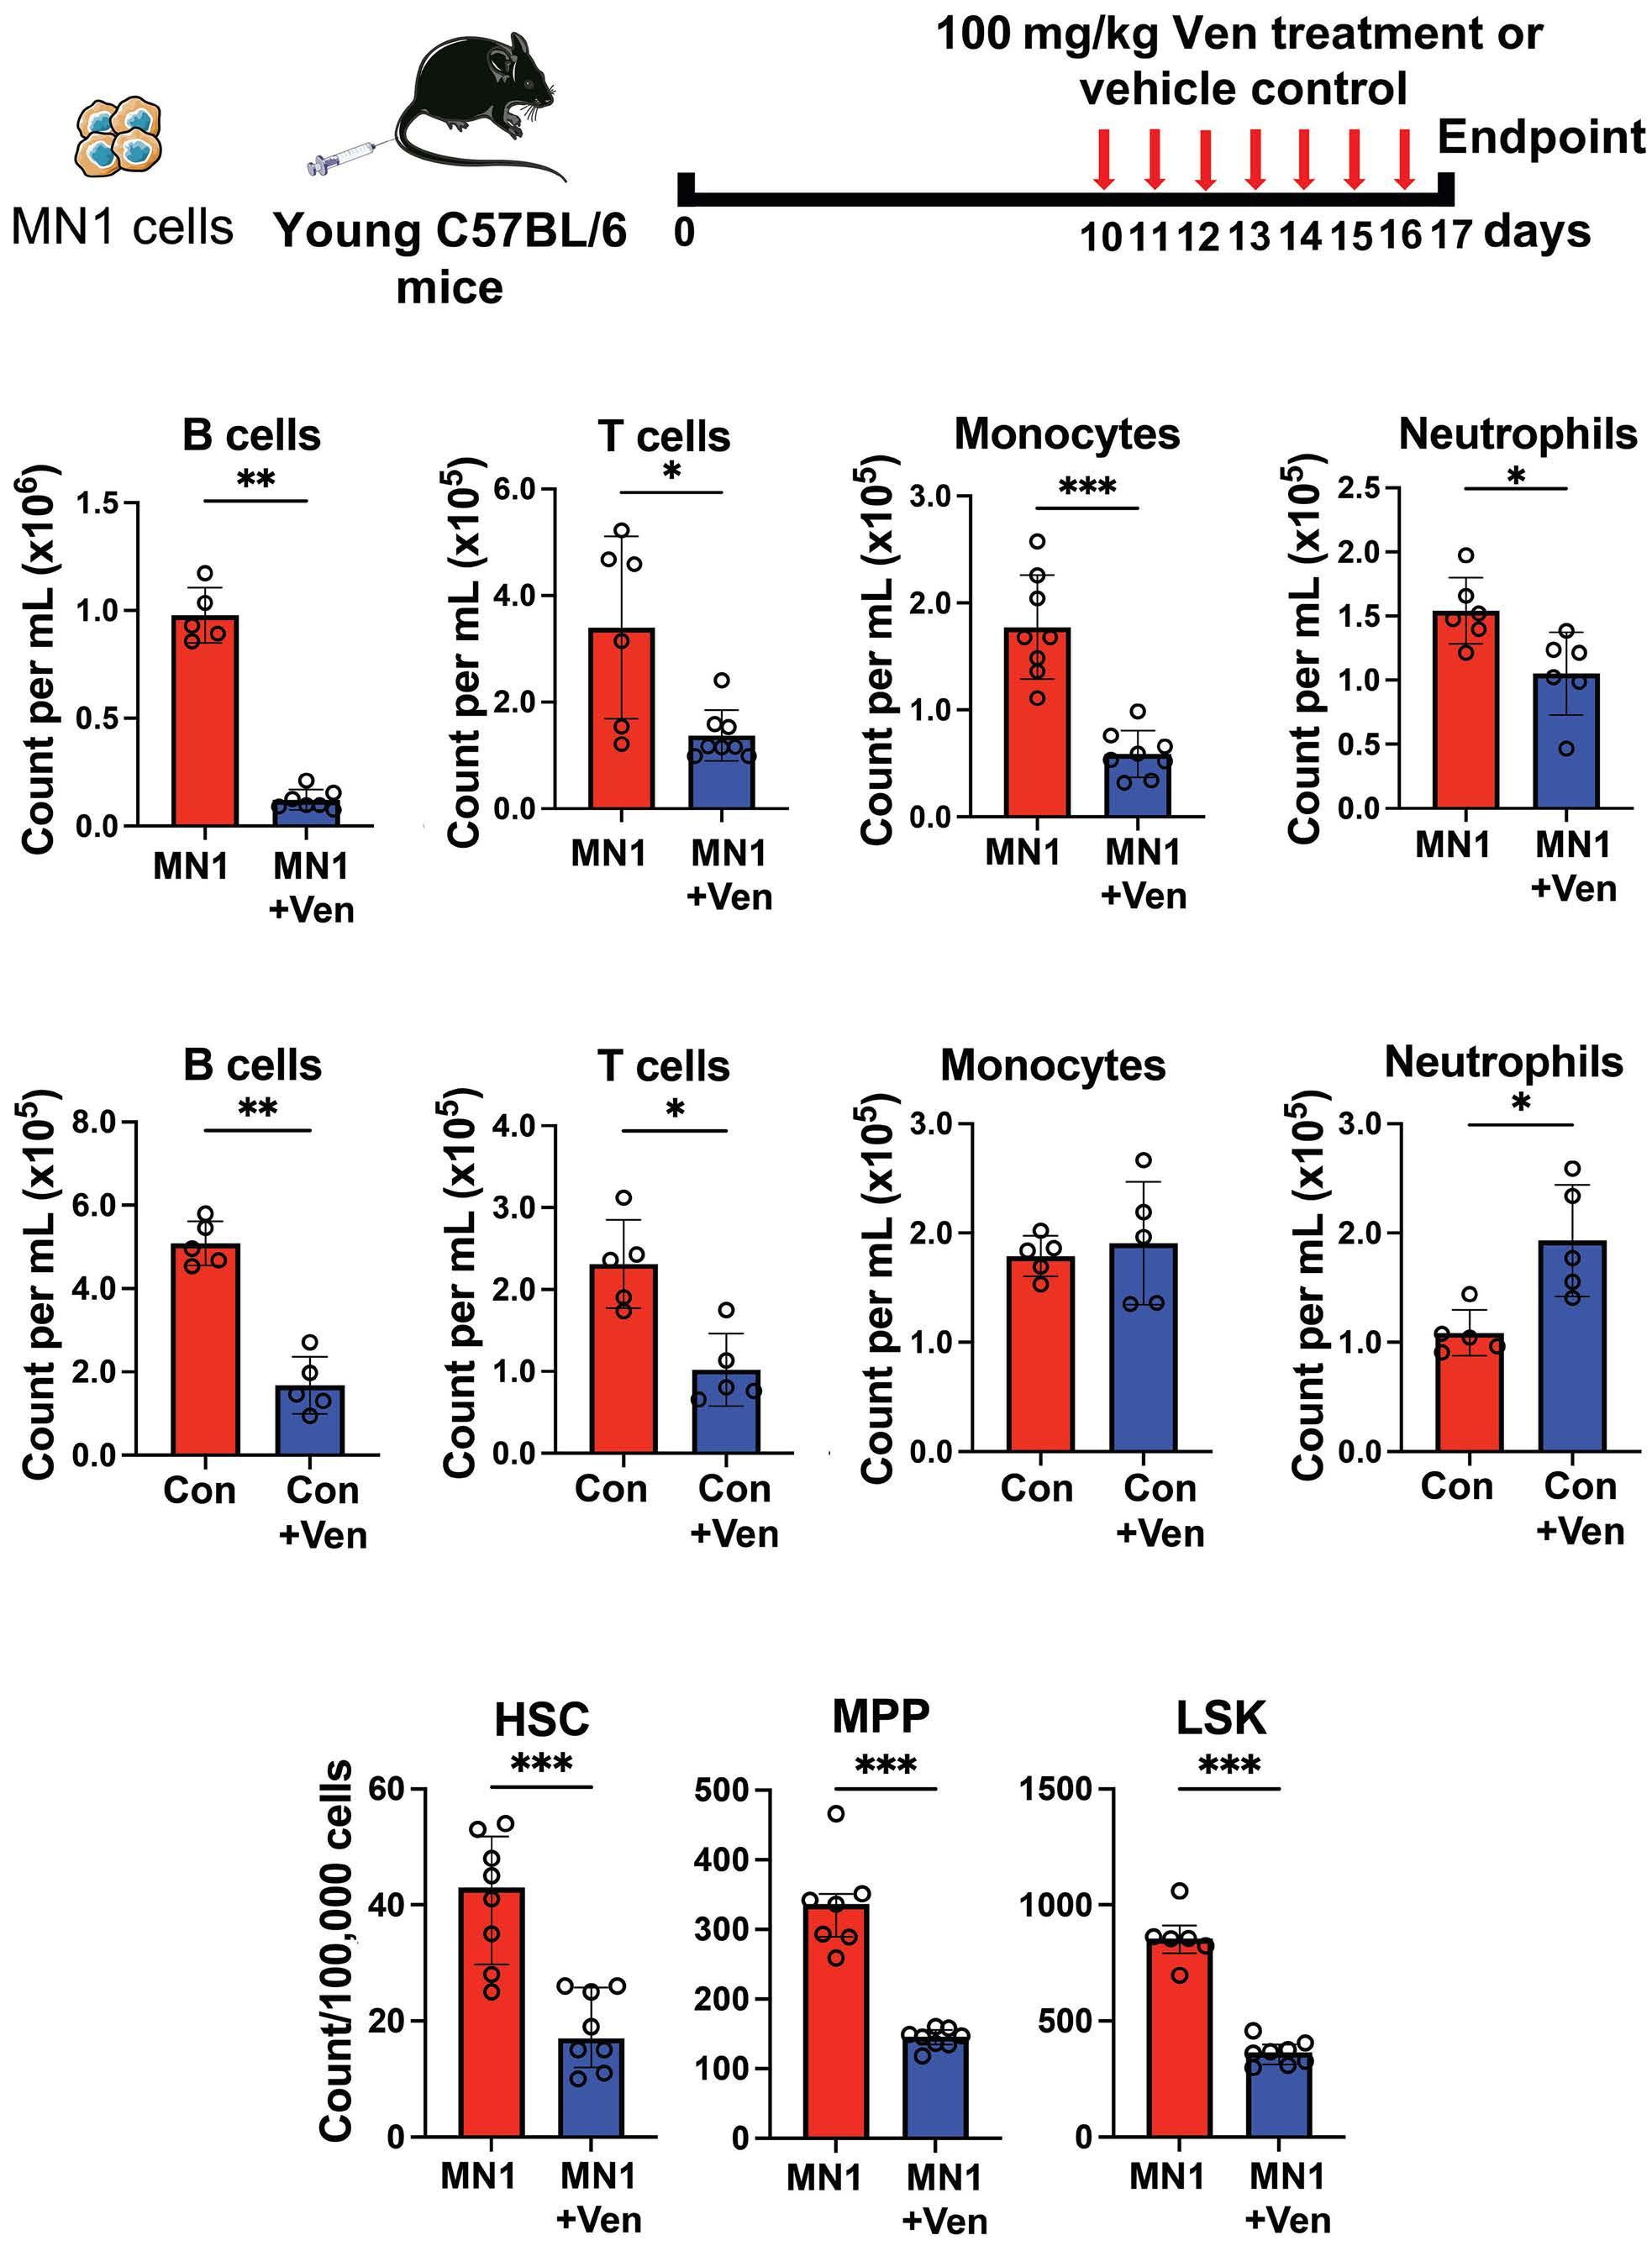
Figure 1. Venetoclax treatment causes depletion of neutrophils and monocytes in acute myeloid leukemia-engrafted mice. (A) Experimental schematic. MN1 cells were retrovirally generated and subsequently tagged with GFP to allow distinction from non-malignant cells, as previously described.7,8 2.5x10⁶ MN1 cells were injected into 12-14-week old female non-conditioned C57BL/6 mice. At day 10, 100 mg/kg venetoclax (Ven) or vehicle control was administered by oral gavage for seven days. Peripheral blood (PB) and bone marrow (BM) were assessed by flow cytometry following sacrifice. (B) Cell counts for B cells, T cells, monocytes and neutrophils per mL of PB in MN1-engrafted mice treated with Ven (N=8) compared to acute myeloid leukemia (AML) control mice (N=8). (C) Cell counts as above but in control mice with Ven treatment (N=5) and without (N=5). (D) Cell counts per 100,000 BM cells for hematopoietic stem cell (HSC), multipotent progenitor (MPP) and LSK (Lin- Sca1+ CD117+) in MN1-engrafted mice treated with Ven (N=8) compared to AML control mice (N=8). All data in (B-D) are represented as median + interquartile range. *P<0.05, **P<0.01, ***P<0.001 by Mann-Whitney U test.
Haematologica | 109 May 2024 1577 LETTER TO THE EDITOR
A B C D
does not make AML cells resistant to BCL2 inhibition ( Online Supplementary Figure S1D ). Next, to determine if IL-3 treatment results in post-translational changes in BCL2 in LSK, both total and phosphorylated BCL2 protein levels were measured by flow cytometry. Results
demonstrate that both total and phosphorylated BCL2 levels are increased to similar levels after IL-3 treatment ( Online Supplementary Figure S1E ). Of note, venetoclax was found to have no direct effect on BCL2 expression in mature hematopoietic lineages in the presence of AML,
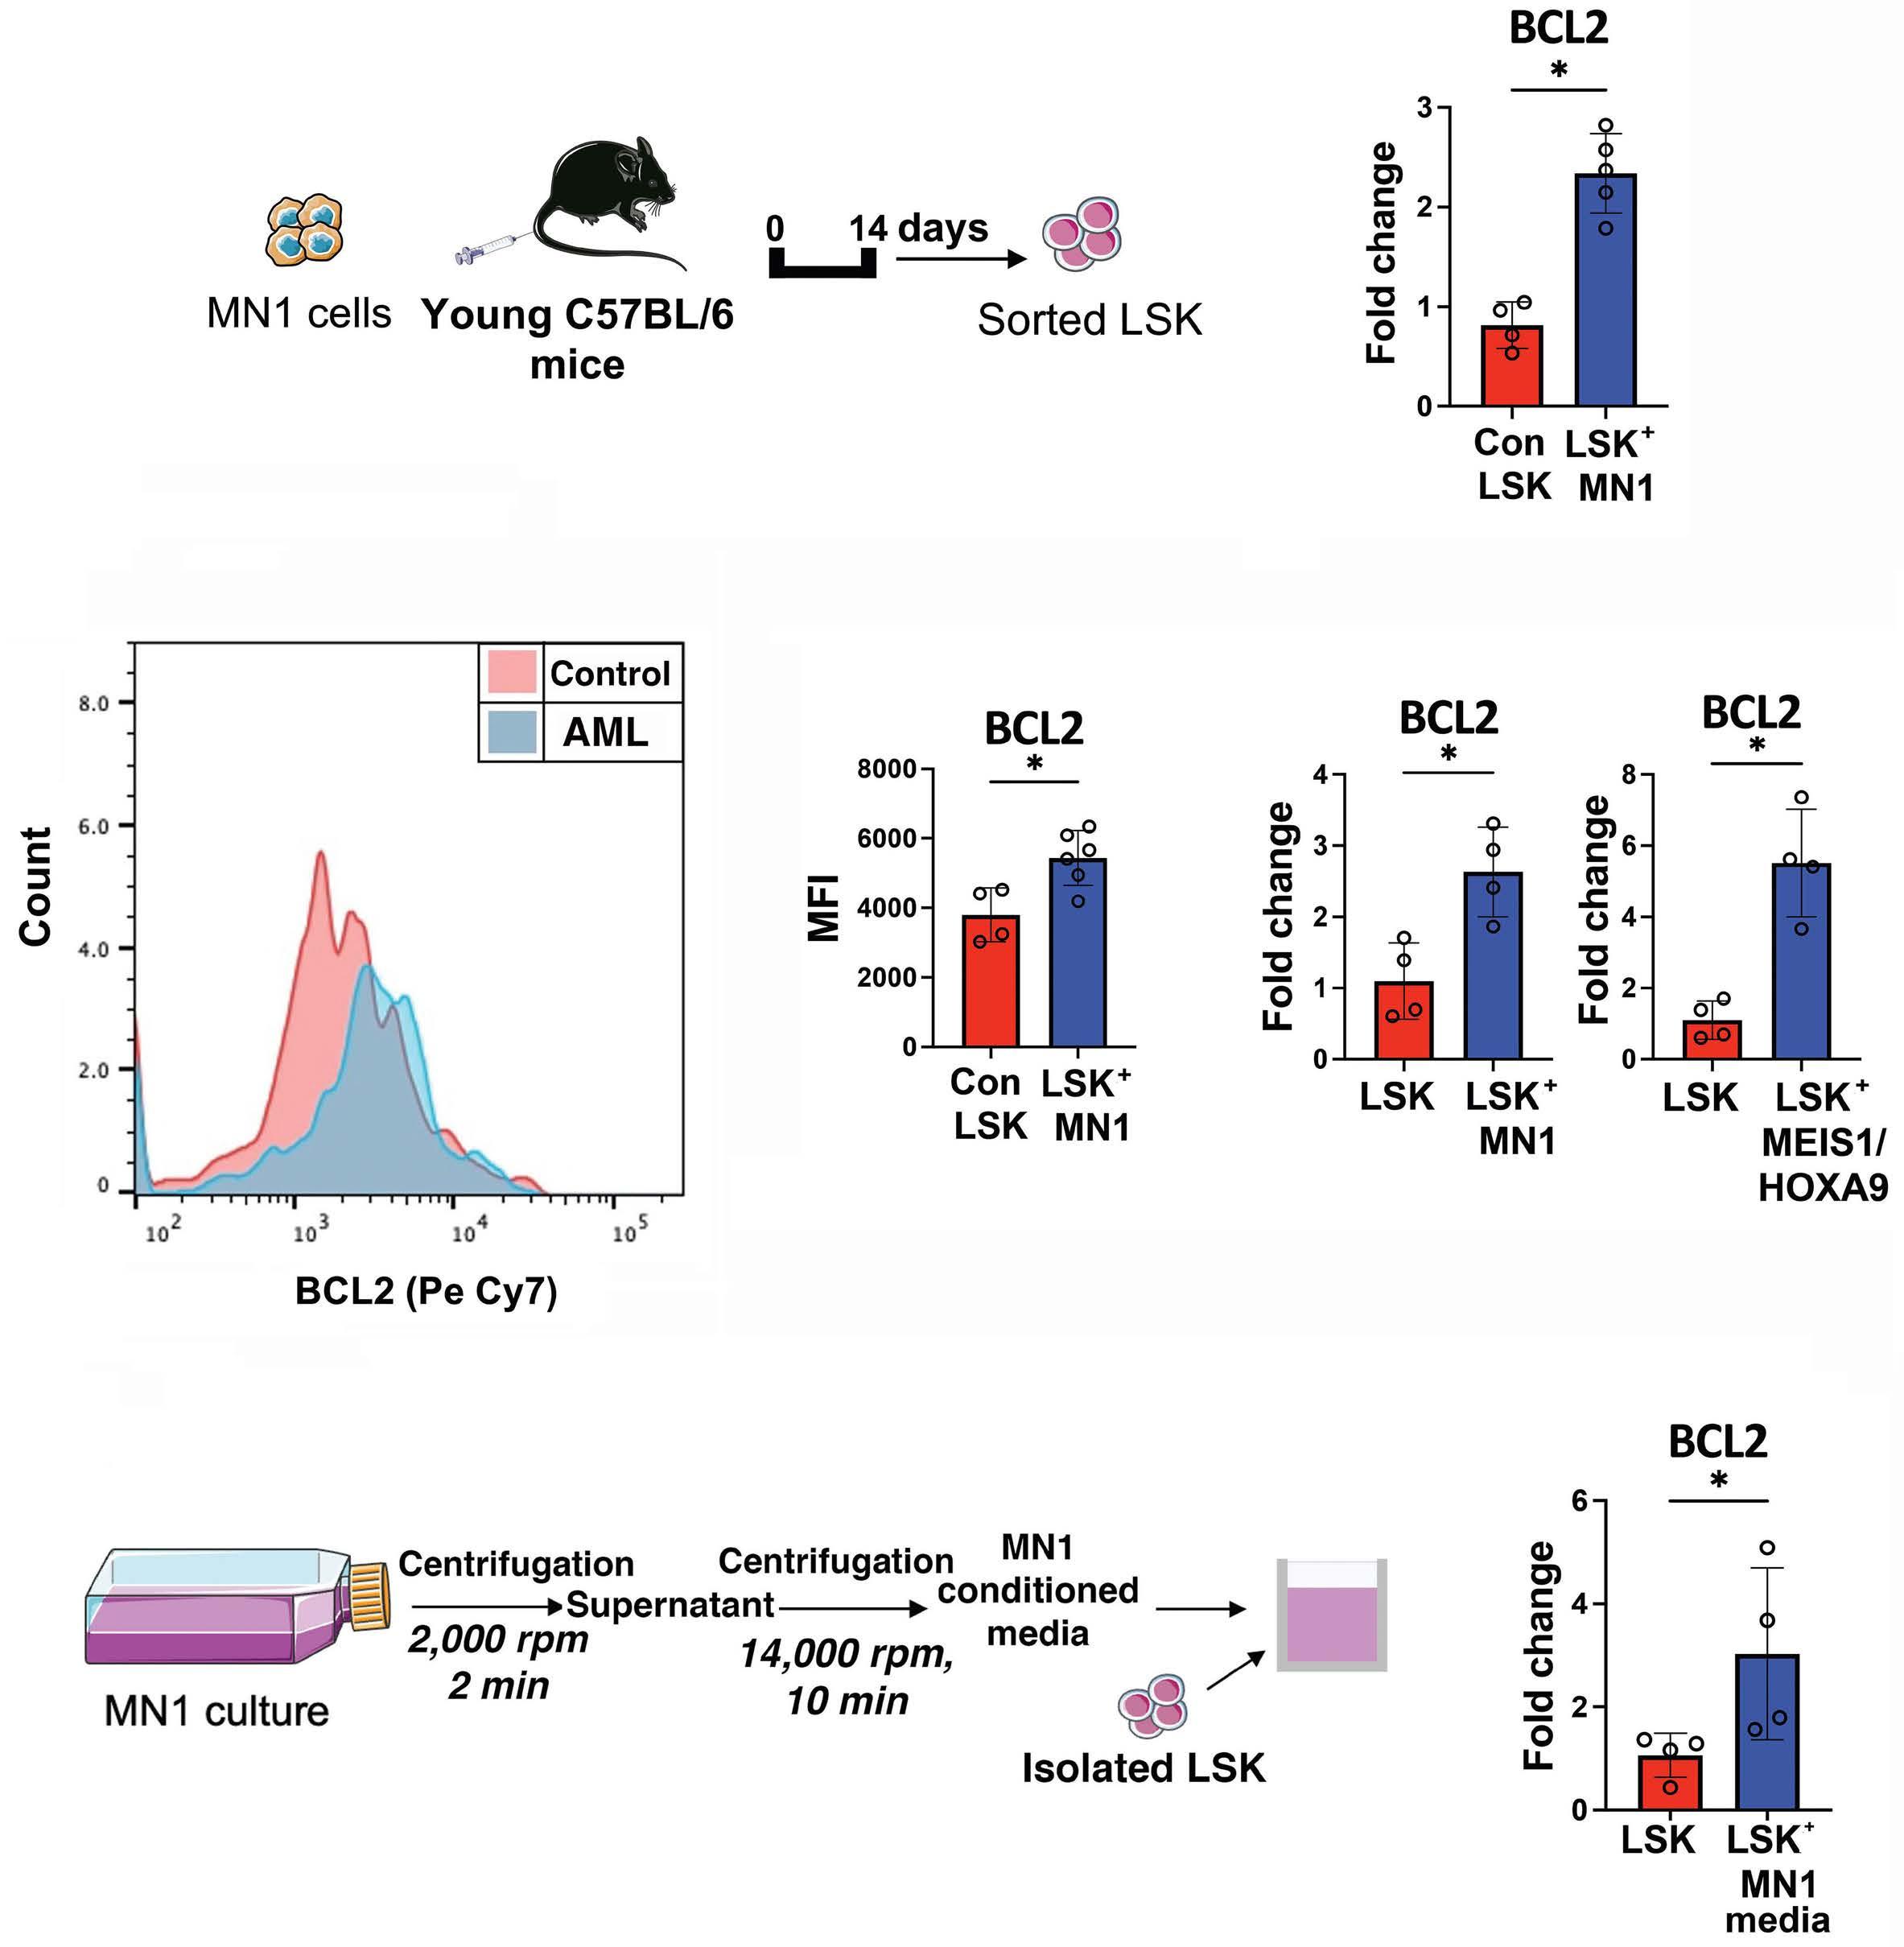
Figure 2. Acute myeloid leukemia drives an upregulation of BCL2 in non-malignant Lin- Sca1+ CD117+. (A) Experimental schematic. 2.5x10⁶ MN1 cells were injected into 12-14-week old female non-conditioned C57BL/6 mice. Lin- Sca1+ CD117+ (LSK) cells were sorted by FACS on day 14. (B) Real-time qPCR assessed BCL2 gene expression in LSK in MN1-engrafted mice (N=5) compared to control mice (N=5). qPCR assay was performed with the SYBR-green technology (PCR Biosystems, UK)8 on QuantStudio 5 PCR system using BCL2 (Mm_Bcl2_vb.1_SG QuantiTect Primer Assay, GeneGlobe ID QT01057224) and GAPDH (Mm_Gapdh_3_SG QuantiTect Primer Assay, GeneGlobe ID QT01658692) primers from Qiagen. (C) BCL2 protein level in LSK quantified by mean fluorescence intensity (MFI) in MN1-engrafted mice (N=6) and control mice (N=6) using flow cytometry. (D) LSK were isolated from bone marrow (BM) of young C57BL/6 mice and 5x10⁴ cells were co-cultured in transwells with either MN1 or MEIS1/HOXA9 cells for 48 hours (hr) in Dulbecco’s Modified Eagle’s Medium (DMEM) supplemented with 10% fetal bovine serum (FBS), 1% penicillin streptomycin (Pen-Strep). Real-time qPCR assessed BCL2 gene expression in LSK co-cultured with acute myeloid leukemia (AML) cells (N=4) compared to LSK-only controls (N=4). (E) Schematic for cell-free conditioned media extraction from MN1 cells. Isolated LSK were cultured with MN1-conditioned media for 48 hr. (F) Real-time qPCR assessed BCL2 gene expression in LSK with MN1-conditioned media (N=4) versus LSK-only controls (N=4). All data in (B-D) and (F) are represented as median + interquartile range.
*P<0.05 by Mann-Whitney U test. min: minutes.
Haematologica | 109 May 2024 1578 LETTER TO THE EDITOR
A C E D F B
suggesting that the observed cytopenias are driven by changes in the HSPC (Online Supplementary Figure S1F). Finally, to assess the effect of IL-3 inhibition on cytopenias secondary to venetoclax treatment in vivo, mice were engrafted with MN1 cells and treated with 100 mg/kg venetoclax and 50 μg/kg IL-3 neutralizing antibody daily for seven days (Figure 3E). Results show that both monocyte and neutrophil counts recovered in AML-engrafted
mice treated with both venetoclax and IL-3 neutralizing antibody compared to venetoclax only treated-mice (Figure 3F). Taken together, we show that AML induces an IL-3-dependent upregulation of BCL2 in HSPC, which in turn increases HSPC sensitivity to venetoclax and causes cytopenias. Understanding of this mechanism could provide insight for a treatment strategy with venetoclax to reduce the incidence of cytopenias observed in AML patients.
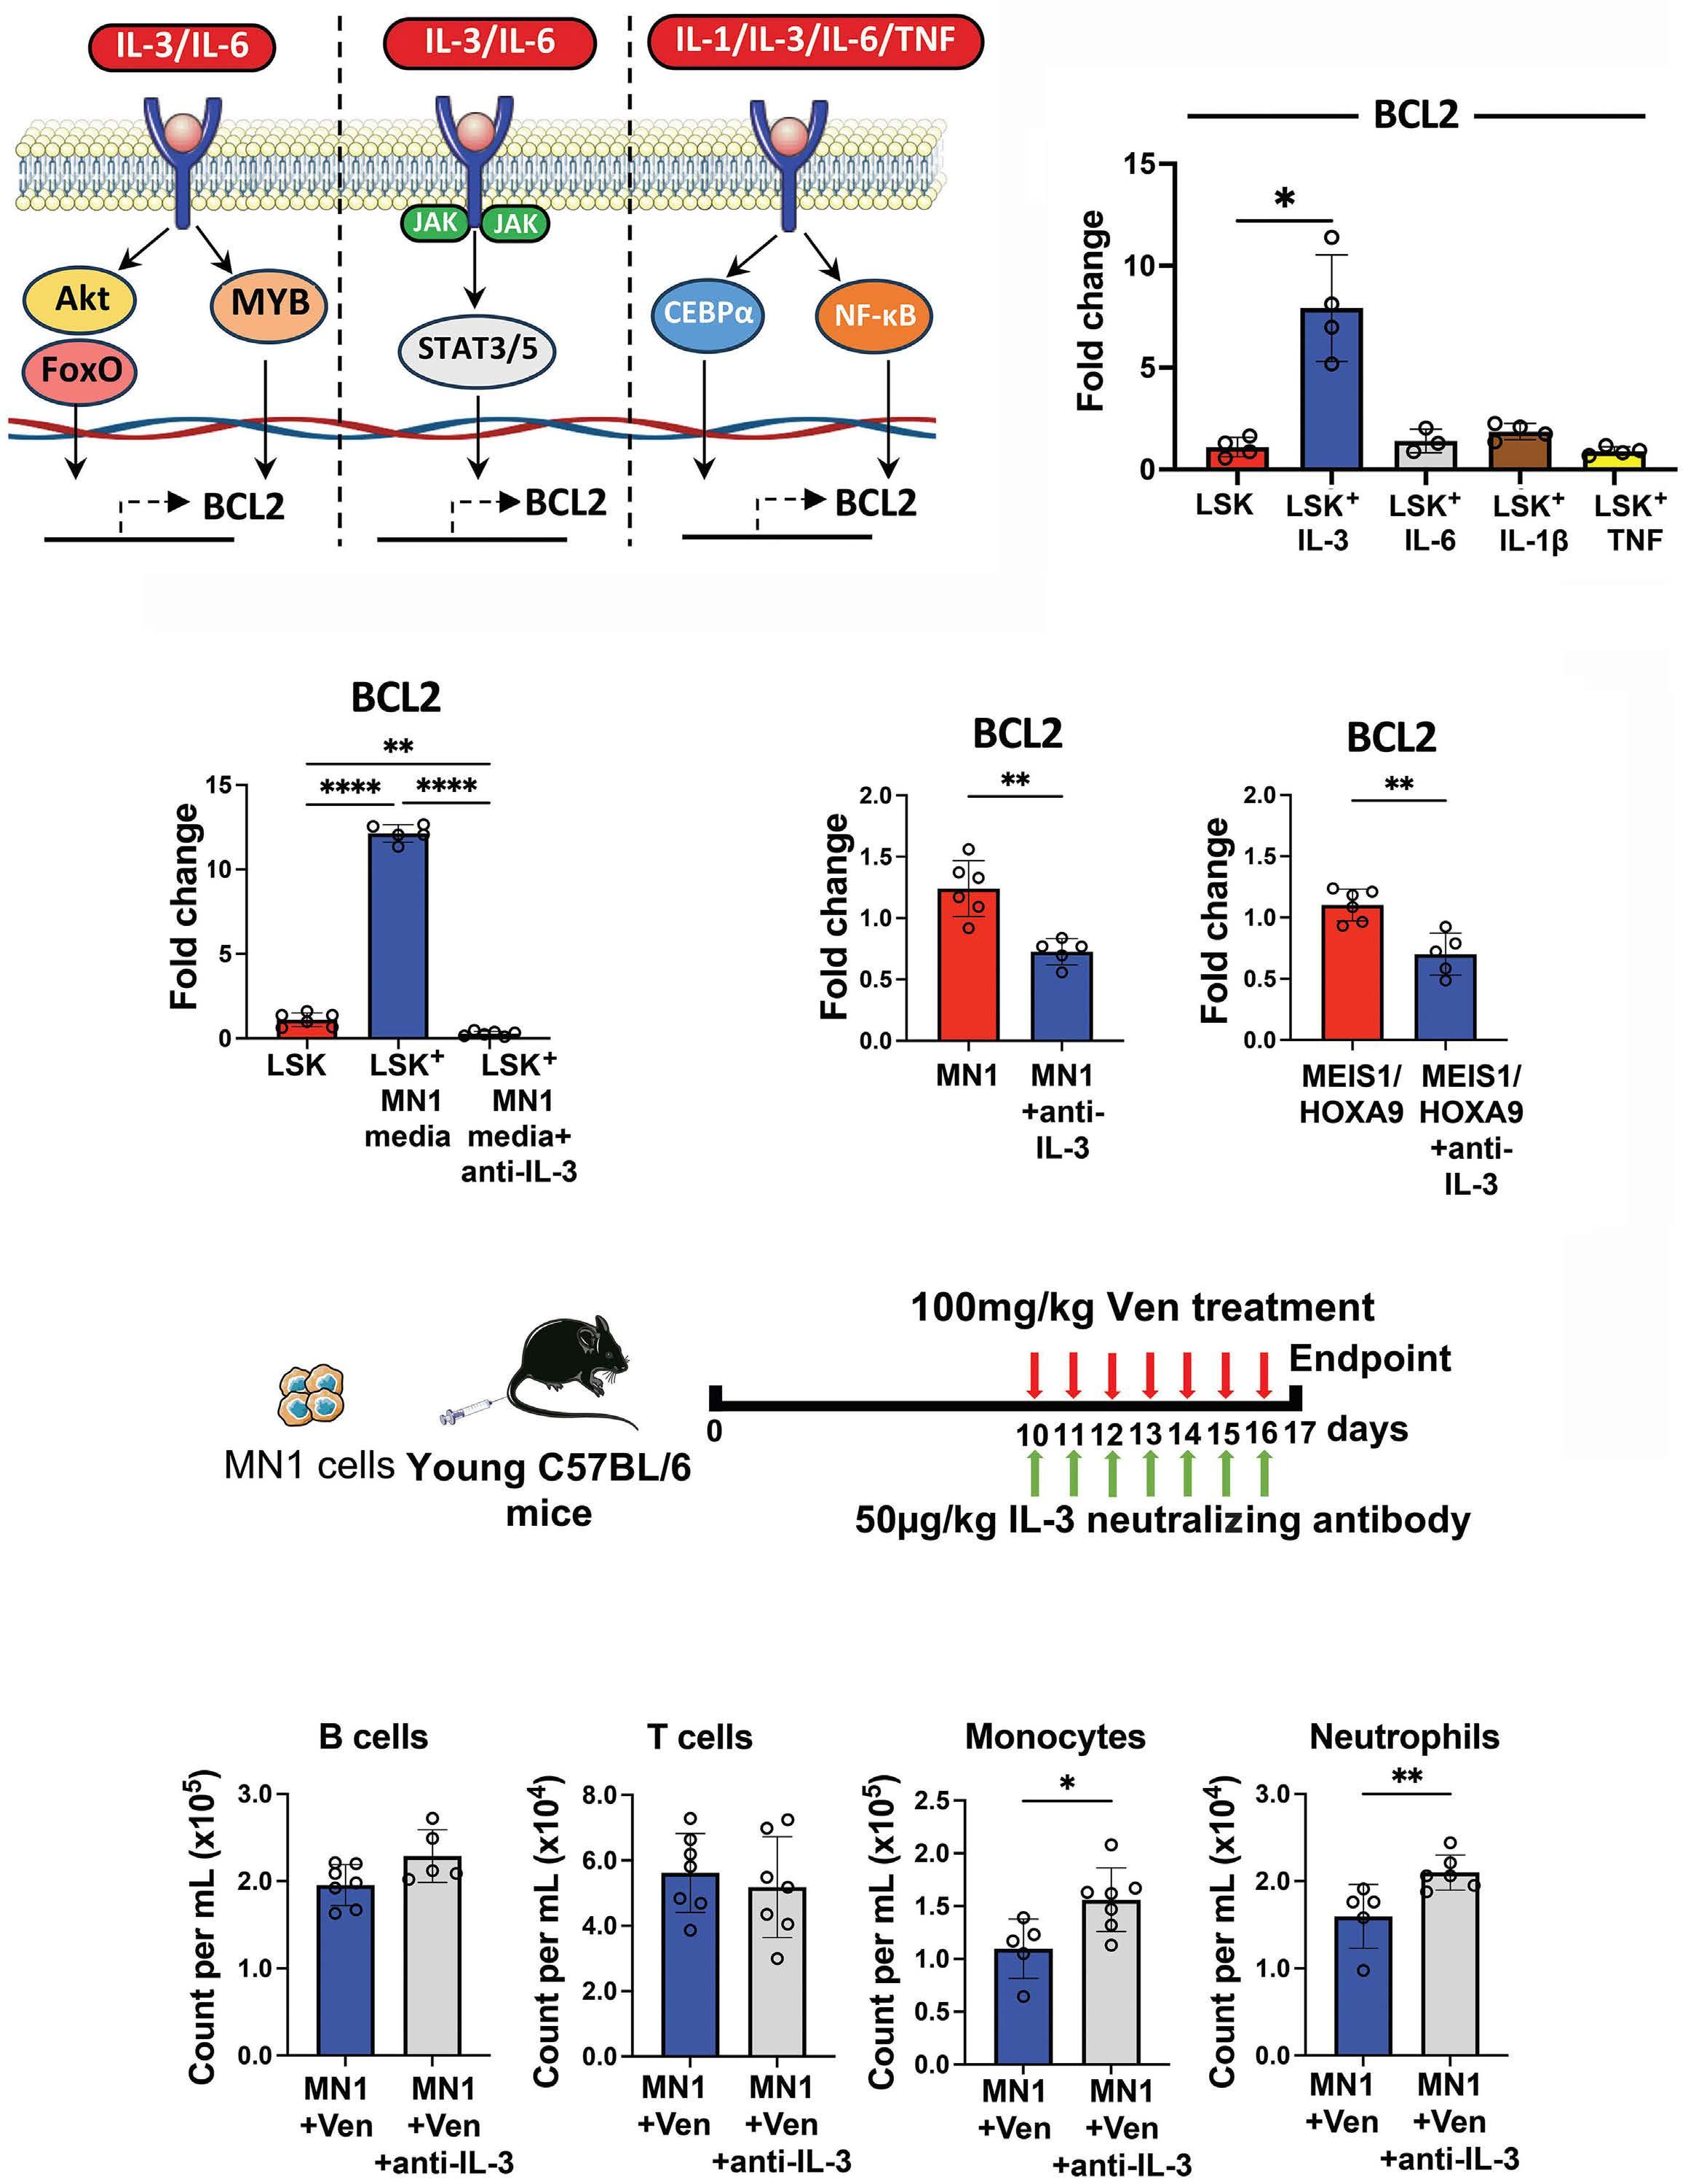
Continued on following page.
Haematologica | 109 May 2024 1579 LETTER TO THE EDITOR
A C E F D B
Figure 3. Acute myeloid leukemia drives an IL-3-mediated overexpression of BCL2 in non-malignant Lin- Sca1+ CD117+ which is reversed by IL-3 neutralization, and restores neutrophil and monocyte counts in combination with venetoclax in acute myeloid leukemia-engrafted mice. (A) Schematic depicting potential mechanisms for BCL2 transcription in non-malignant Lin- Sca1+ CD117+ (LSK). (B) 5x10⁴ LSK were cultured in DMEM supplemented with 10% fetal bovine serum (FBS) and 1% penicillin streptomycin (PenStrep), and treated with 100 ng/mL IL-3, IL-6, IL-1β or TNF for 24 hours (hr). Real-time qPCR assessed BCL2 gene expression in treated LSK (N=4) compared to non-treated LSK (N=4). (C) 5x10⁴ LSK were next cultured with MN1-conditioned media and treated with 5 mg/mL anti-IL-3 (IL-3 neutralizing antibody MP2-8F8; Bio X Cell, NH, USA) for 48 hr. Real-time qPCR assessed BCL2 gene expression in LSK cultured with MN1-conditioned media and anti-IL-3 antibody (N=6), LSK cultured with MN1-conditioned media only (N=6) and LSK-only controls (N=6). (D) 3x10⁵ MN1 and MEIS1/HOXA9 cells were treated with 5 μg/mL anti-IL-3 for 48 hr. Real-time qPCR assessed BCL2 gene expression in anti-IL-3-treated AML cells (N=5) compared to non-treated AML cells (N=6). (E) Experimental schematic. 2.5x10⁶ MN1 cells were injected into 12-14-week old male non-conditioned C57BL/6 mice. At day 10, 100 mg/kg venetoclax (Ven) was administered by oral gavage alongside 50 mg/kg anti-IL-3 by intraperitoneal injection, both daily for seven days. Peripheral blood (PB) was assessed by flow cytometry following sacrifice. (F) Cell counts for B cells, T cells, monocytes and neutrophils per mL of PB in MN1-engrafted mice treated with Ven plus anti-IL-3 antibody (N=7) compared to Ven only (N=7). All data in (B-D) and (F) are represented as median + interquartile range. *P<0.05, **P<0.01, ****P<0.0001 by Mann-Whitney U test or Kruskal-Wallis test for multiple comparisons.
Authors
Dominic J. Fowler-Shorten,1° Rebecca S. Maynard,1° Katherine Hampton,1° Annalisa Altera,1° Matthew Markham,1° Martha Ehikioya,1° Edyta E. Wojtowicz,2 Kristian M. Bowles,1,3#° Stuart A. Rushworth1#° and Charlotte Hellmich1,3#°
1Norwich Medical School, University of East Anglia; 2Earlham Institute, Norwich Research Park and 3Department of Haematology, Norfolk and Norwich University Hospital NHS Trust, Norwich, UK
#SAR and CH contributed equally as senior authors.
°Current address: Centre for Metabolic Health, Norwich Medical School, University of East Anglia, Norwich, UK
Correspondence:
C. HELLMICH - c.hellmich@uea.ac.uk
S.A. RUSHWORTH - s.rushworth@uea.ac.uk
https://doi.org/10.3324/haematol.2023.283944
Received: July 19, 2023.
Accepted: December 28, 2023. Early view: January 4, 2024.
©2024 Ferrata Storti Foundation
Published under a CC BY license

References
1. DiNardo CD, Pratz K, Pullarkat V, et al. Venetoclax combined with decitabine or azacitidine in treatment-naive, elderly patients with acute myeloid leukemia. Blood. 2019;133(1):7-17.
2. Wei AH, Montesinos P, Ivanov V, et al. Venetoclax plus LDAC for newly diagnosed AML ineligible for intensive chemotherapy: a phase 3 randomized placebo-controlled trial. Blood. 2020;135(24):2137-2145.
3. Wang ES. Treating acute myeloid leukemia in older adults. Hematology Am Soc Hematol Educ Program. 2014;2014(1):14-20.
4 Almeida AM, Ramos F. Acute myeloid leukemia in the older
Disclosures
No conflicts of interest to disclose.
Contributions
DJF-S, SAR, KMB and CH designed the research. DJF-S, SAR, CH, RSM, KH, AA, MM, ME and EEW performed the in vivo experiments. DJF-S performed the in vitro experiments, interpreted the data, performed statistical analysis, and produced the figures. DJF-S, SAR and CH wrote the paper.
Acknowledgments
The authors thank the team at the Disease Modelling Unit at the University of East Anglia for support with the in vivo work. Schematic figures were partly produced using Servier Medical Art, provided by Servier, licensed under a Creative Commons Attribution 3.0 unported license.
Funding
This work was supported by a Wellcome Trust Clinical Research Fellowship (220534/Z/20/Z) (to CH), the Medical Research Council project (MR/T02934X/1) (to SAR), a Sir Henry Welcome Postdoctoral Fellowship (213731/Z/18/Z) (to EEW), and the Biotechnology and Biological Sciences Research Council, part of UK Research and Innovation’s Core Capability (grant BB/CCG1720/1).
Data-sharing statement
Detailed data available on request.
adults. Leuk Res Rep. 2016;6:1-7.
5. Dennis M, Copland M, Kaur H, et al. Management of older patients with frailty and acute myeloid leukaemia: a British Society for Haematology good practice paper. Br J Haematol. 2022;199(2):205-221.
6. DiNardo CD, Jonas BA, Pullarkat V, et al. Azacitidine and venetoclax in previously untreated acute myeloid leukemia. N Engl J Med. 2020;383(7):617-629.
7 Abdul-Aziz AM, Sun Y, Hellmich C, et al. Acute myeloid leukemia induces protumoral p16INK4a-driven senescence in the bone
Haematologica | 109 May 2024 1580 LETTER TO THE EDITOR
marrow microenvironment. Blood. 2019;133(5):446-456.
8. Moore JA, Mistry JJ, Hellmich C, et al. LC3-associated phagocytosis in bone marrow macrophages suppresses acute myeloid leukemia progression through STING activation. J Clin Invest. 2022;132(5):1-16.
9 Simonart T, Van Vooren JP. Interleukin-1 beta increases the BCL-2/BAX ratio in Kaposi’s sarcoma cells. Cytokine. 2002;19(6):259-266.
10. Rinaudo MS, Su K, Falk LA, Halder S, Mufson RA. Human interleukin-3 receptor modulates bcl-2 mRNA and protein levels through protein kinase C in TF-1 cells. Blood. 1995;86(1):80-88.
11. Sepulveda P, Encabo A, Carbonell-Uberos F, Minana MD. BCL-2 expression is mainly regulated by JAK/STAT3 pathway in human CD34+ hematopoietic cells. Cell Death Differ. 2007;14(2):378-380.
12. Genestier L, Bonnefoy-Berard N, Rouault JP, Flacher M, Revillard JP. Tumor necrosis factor-alpha up-regulates Bcl-2 expression and decreases calcium-dependent apoptosis in human B cell lines. Int Immunol. 1995;7(4):533-540.
13. Elbaz O, Shaltout A. Implication of granulocyte-macrophage colony stimulating factor (GM-CSF) and interleukin-3 (IL-3) in children with acute myeloid leukaemia (AML); malignancy. Hematology. 2001;5(5):383-388.
14. Nitsche A, Junghahn I, Thulke S, et al. Interleukin-3 promotes proliferation and differentiation of human hematopoietic stem cells but reduces their repopulation potential in NOD/SCID mice. Stem Cells. 2003;21(2):236-244.
15. Tajer P, Cante-Barrett K, Naber BAE, et al. IL3 has a detrimental effect on hematopoietic stem cell self-renewal in transplantation settings. Int J Mol Sci. 2022;23(21):1-8.
Haematologica | 109 May 2024 1581 LETTER TO THE EDITOR
Deciphering the molecular complexity of the IKZF1plus genomic profile using Optical Genome Mapping
Acute lymphoblastic leukemia (ALL) is the most frequent pediatric cancer. Genetic stratification is one of the hallmarks of the advancement of therapeutic intervention in pediatric B-cell precursor ALL (BCP-ALL) and led to an improved overall survival of >90%.1-3 Despite these advancements, a proportion of patients still face challenges such as relapse or therapy-related toxicities.2 Deletions targeting the lymphoid transcription factor IKAROS Family Zinc Finger 1 (IKZF1) occur in approximately 15% of pediatric B-ALL and have been associated with adverse outcome and as a predictor of relapse.3-6 Moreover, when IKZF1 deletion co-occurred with at least one additional deletion in CDKN2A, CDKN2B (homozygous deletion only), PAX5, or PAR1 (P2RY8::CRLF2) in the absence of ERG deletion, so-called IKZF1plus patients showed a very poor prognosis in the AIEOP-BFM ALL 2000 trial.7 The prognosis of IKZF1plus was, however, dependent on measurable minimal residual disease (MRD), arguing for other leukemic drivers.7 To systematically assess the underlying genetic complexity of IKZF1-deleted BCP-ALL, we performed a retrospective genome-wide analysis utilizing Optical Genome Mapping (OGM), enabling the detection of all kinds of numerical and structural variants (SV) in one approach. Ultra-high molecular weight DNA was extracted from frozen peripheral blood or bone marrow cells from pediatric BCR::ABL1-negative BCP-ALL patients with either IKZF1 deletion (IKZF1del) or IKZF1plus profile within the AIEOPBFM ALL 2000 and 2009 trials (Online Supplementary Table S1). We show here that half of the patients displayed additional favorable or unfavorable prognostic markers, including ETV6::RUNX1, high hyperdiploidy (HeH), iAMP21, and gene fusions. Of interest, ETV6::RUNX1 and HeH were absent in IKZF1plus patients. Importantly, when excluding patients positive for ETV6::RUNX1, HeH, or iAMP21, a similar event-free survival (EFS) was observed for both groups, questioning the prognostic relevance of the IKZF1plus profile.
A total of 142 patients were included in this study and OGM (Bionano Genomics) was performed as previously described (Figure 1A).8 Informed consent was obtained from all patients involved in the study or from their legal representatives. The study was conducted according to the guidelines of the Declaration of Helsinki, and approved by Hannover Medical School Ethics Committee (N. 8657_BO_K_2019, 11/03/2020).
Conclusive results were obtained from 138 patients which were 98.2% (1,171/1,193) concordant to pre-existing multiplex ligation-dependent probe amplification (MLPA) data with respect to IKZF1, PAX5, CDKN2A, CDKN2B, PAR1, BTG1, EBF1, ETV6 and RB1 copy number status. For the detection of P2RY8::CRLF2, originating from an ~300 kbp deletion in the subtelomeric PAR1 region on chromosome X and Y, which is
not completely resolved in the hg19 reference, the reference genomes hg38 or CHM13 (T2T) were used for mapping, resulting in improved resolution (Online Supplementary Figure S1). According to our data, 3 patients had to be excluded from further analysis: one due to a t(9;22)(q34.12;q11.23) resulting in BCR::ABL1 fusion, and 2 HeH patients for whom OGM did not confirm an IKZF1 deletion. Furthermore, 5 patients were reclassified due to the identification of an additional small deletion in PAX5 (exon 6-7), a previously undescribed intragenic ERG deletion, or because no deletion in PAX5, CDKN2A/B, or PAR1 could be detected. Overall, 94.9% (131/138) of the patients showed concordance regarding the IKZF1del/plus definition. The final cohort consisted of 135 patients, including 71 classified as IKZF1del and 64 classified as IKZF1plus (Figure 1A).
In 52.6% (71/135) of the BCP-ALL patients in this study, genetic alterations with (putative) prognostic impact were present in addition to IKZF1del/plus (Figure 1B). HeH, ETV6::RUNX1, or iAMP21 were detected in 18 patients. Patients with HeH and ETV6::RUNX1 were exclusively found in the IKZF1del group. In 39.3% (53/135) of the cases, an additional alteration leading to a gene fusion was detected and validated on transcript level (Figure 1B; Online Supplementary Table S2). Gene fusions were found in both subgroups and grouped into ABL-class, CRLF2, JAK2, PAX5, ZNF384, and other fusions (Figure 1A). The CRLF2 group consisted only of P2RY8::CRLF2 fusions, which by definition allocated these patients to the IKZF1plus subgroup. Five patients with PAX5::JAK2 fusions were allocated to the JAK2 group. We detected simple and complex SV that led gene fusions on a transcript level (Online Supplementary Table S1); for example, a simple inv(1)(q24.2q25.2) (Figure 2A), a derivative chromosome 1 including three inversions (Figure 2B), and a complex chromosome 1 involving a duplication and insertion (Figure 2C), that all led to RCSD1::ABL2 fusions. In the last case, an ~150 kbp segment containing exon 1-3 of RSCD1 was inserted in inverted orientation in between an ~150 kbp duplicated segment containing ABL2 exon 5-12. Similar to the findings by Stanulla et al., 7 a dismal 5-year EFS for patients with IKZF1plus was observed compared to IKZF1del and IKZF1WT (Figure 3A). The cumulative incidence of relapse (CIR) was increased in IKZF1plus patients (Figure 3B). Interestingly, the differences in 5-year EFS of IKZF1plus and IKZF1del were no longer seen when HeH, ETV6::RUNX1, and iAMP21 were excluded from the analysis (0.61±0.06 vs 0.70±0.06) (Figure 3C). This can be explained by the fact that no patient with HeH or ETV6::RUNX1 experienced adverse events and these were found exclusively in the IKZF1del group. However, IKZF1plus patients were still more likely to
Haematologica | 109 May 2024 1582 LETTER TO THE EDITOR
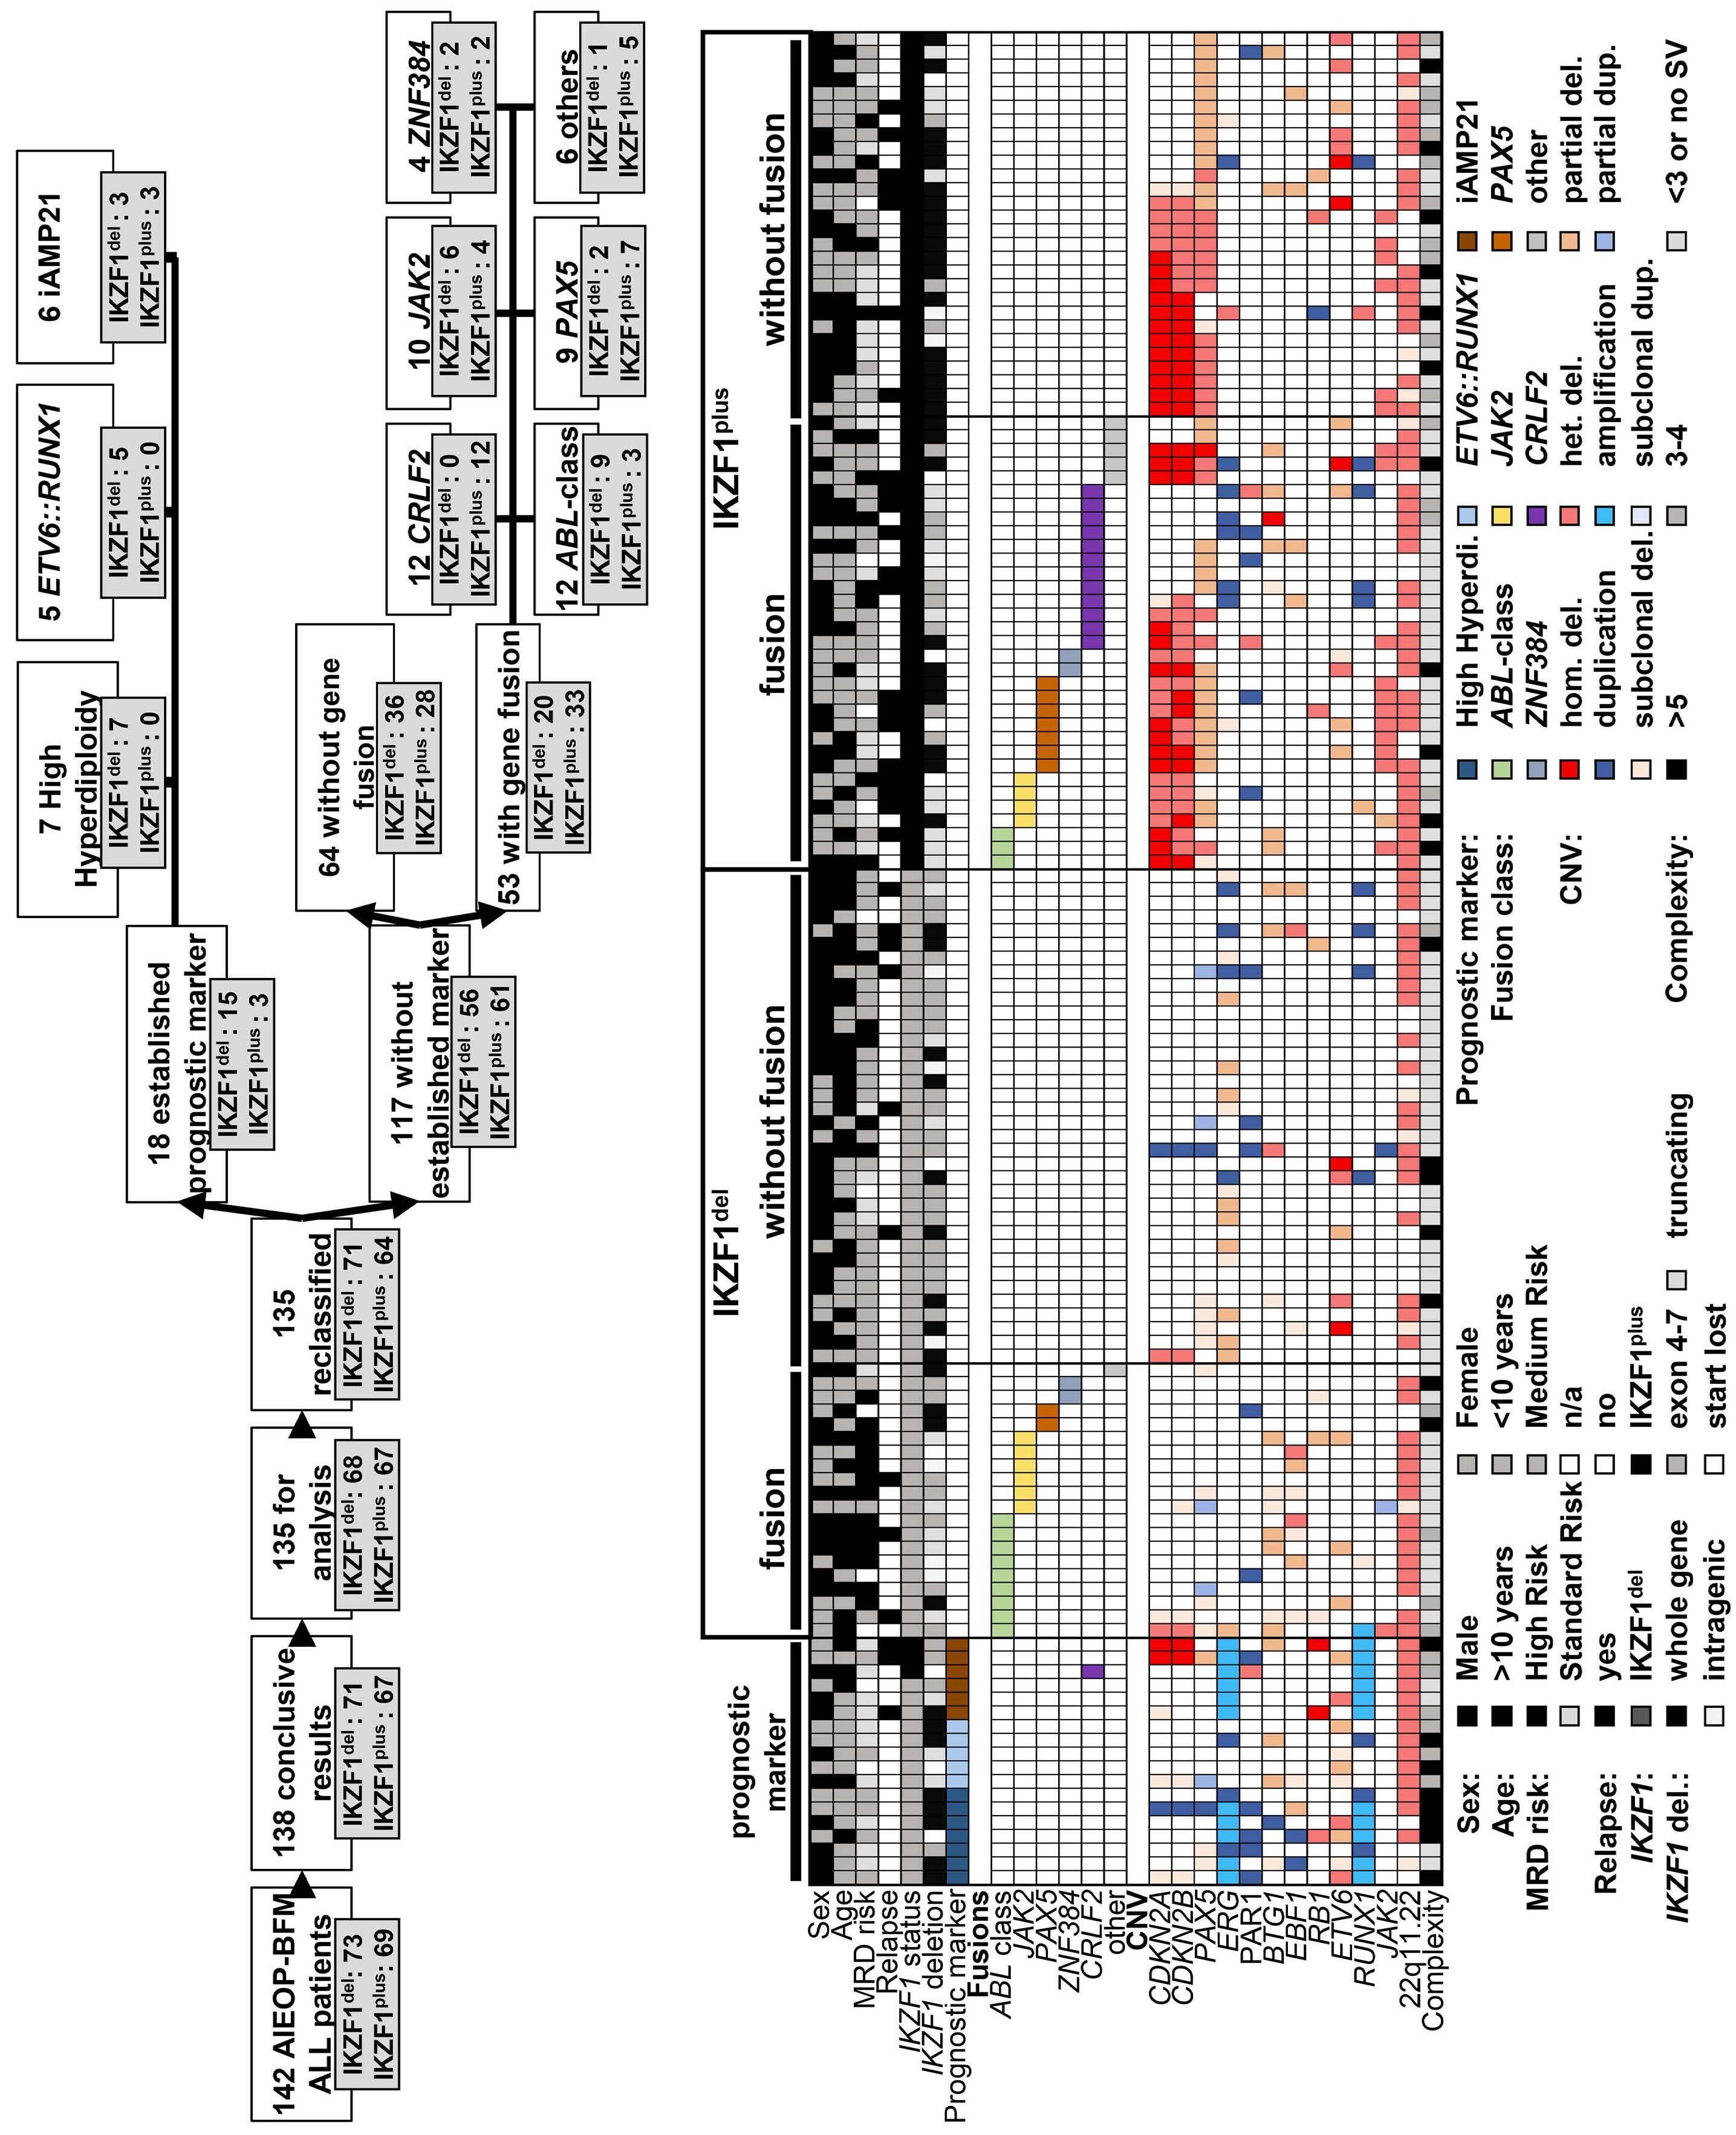
Continued on following page.
Haematologica | 109 May 2024 1583 LETTER TO THE EDITOR A B
Figure 1. Overview and Optical Genome Mapping results of the analyzed cohort. (A) A total of 142 patients from the AIEOP-BFM ALL 2000/2009 trials were enrolled. Conclusive results were obtained from 138 patients; 3 patients were excluded. Based on the Optical Genome Mapping (OGM) findings, 5 patients were reclassified. An established prognostic marker (high hyperdiploidy, ETV6::RUNX1 or iAMP21) was identified in 18 patients and a gene fusion was discovered in 53 patients. (B) Heatmap of OGM results of the 135 analyzed IKZF1del and IKZF1plus patients. Patients were grouped into those with a prognostic marker (high hyperdiploidy, ETV6::RUNX1, iAMP21), IKZF1del with or without gene fusion and IKZF1plus with or without gene fusion. MRD: minimal residual disease; CNV: copy number variation; HR: high risk; MR: medium risk; SR: standard risk; n/a: not available; hom. del.: homozygous deletion; het. del.: heterozygous deletion; dup.: duplication; SV: structural variant.
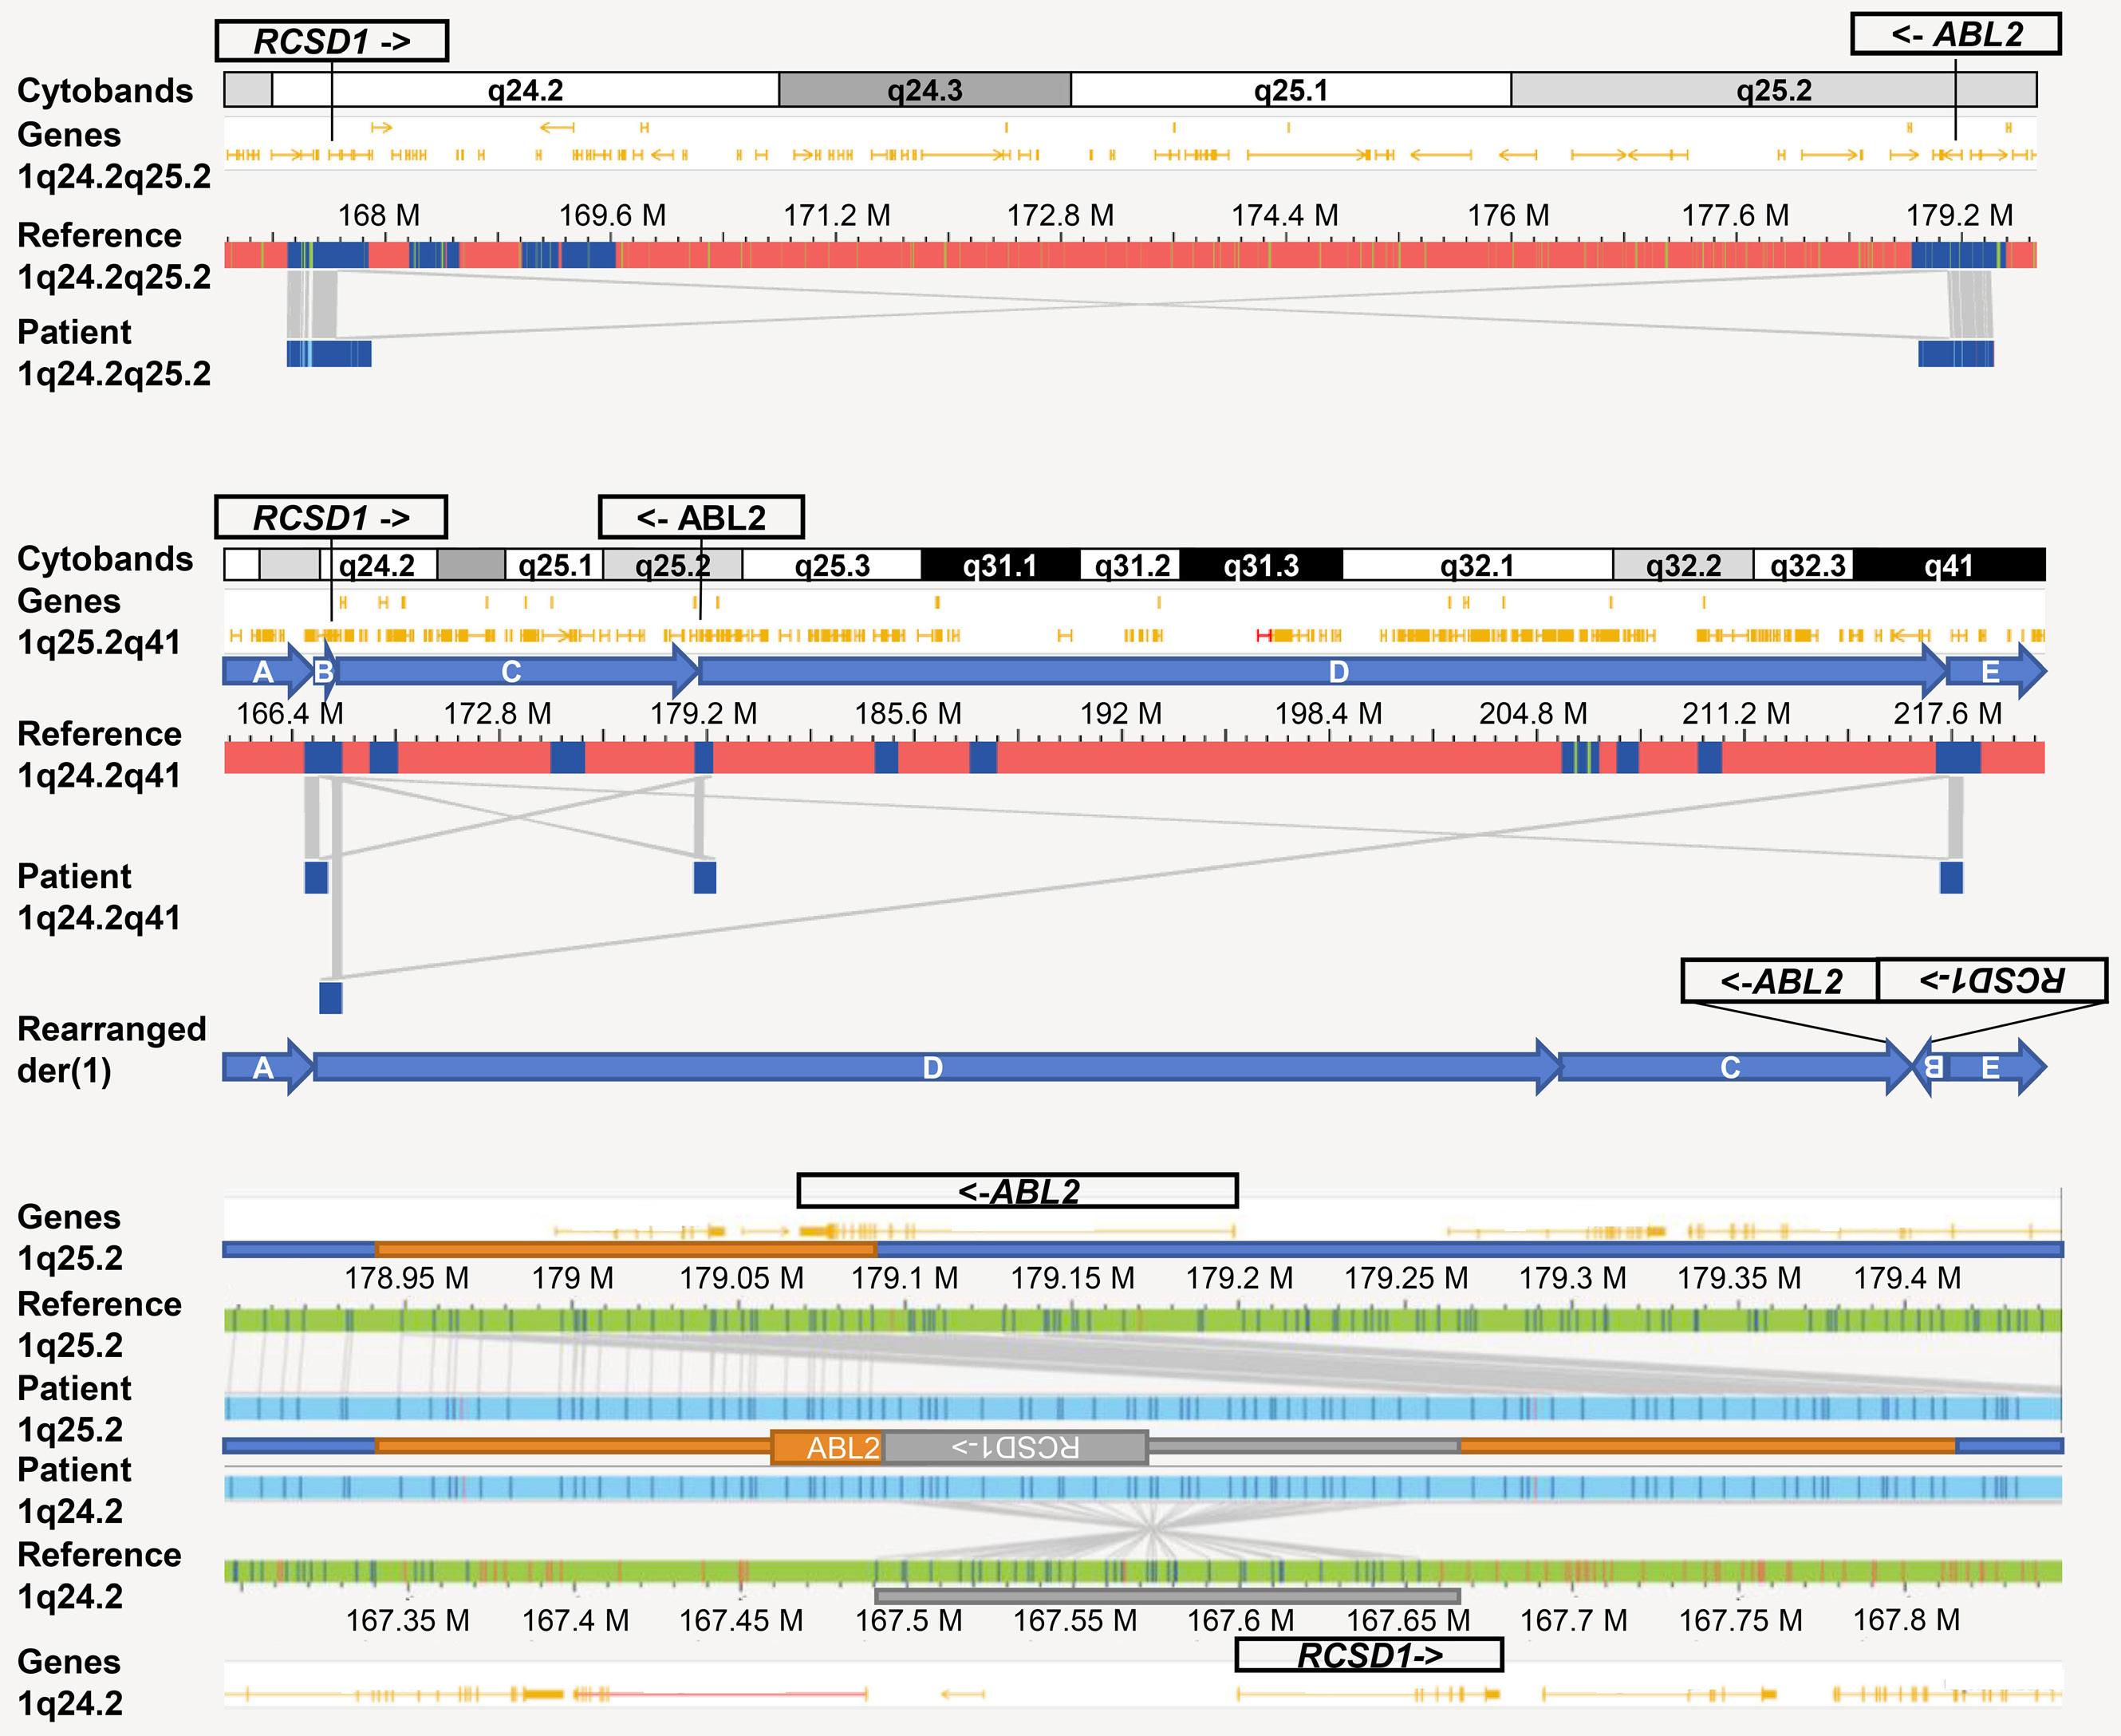
Figure 2. RCSD1::ABL2 fusion resulting from three distinct structural variants detected by Optical Genome Mapping. (A) Simple inversion inv(1)(q24.2q25.2) with breakpoints in RCSD1 and ABL2. Upper track: cytobands. Second track: genes. Third track: reference genome chromosome 1q24.2-q25.2. Lower track: patient maps indicating inversion with breakpoints in q24.2 and q25.2. (B) Derivative chromosome 1 containing three inversions: der(1)inv(1)(q24.2q25.2)inv(1)(q24.2q41)inv(1)(q25.2q41). Upper track: cytobands. Second track: genes (orange) and segments according to genomic breakpoints (blue). Third track: reference genome chromosome 1q24.2-q41. Fourth track: patient maps indicating inversions. The bottom track shows a schematic representation of the inverted segments. (C) Complex event comprising an ~150 kbp duplication and an ~150 kbp insertion in inverted direction: der(1)dup(1) (q25.2q25.2)ins(1;1)(q25.2;q24.2q24.2). The references for chromosome 1q25.2 (upper bar) and 1q24.2 (lower bar) are shown in green and the corresponding patient maps in light blue. The duplicated region with a breakpoint in ABL2 is depicted in orange, while the inserted segment with a breakpoint in RCSD1 is represented in gray.
experience a relapse (Figure 3D). In 45.3% (53/117) of patients without an established marker (HeH, ETV6::RUNX1, and iAMP21), a gene fusion was detected by OGM. Patients
with a gene fusion had a statistically significant inferior 5-year EFS compared to patients without a fusion (0.56±0.07 vs. 0.73±0.06), while the CIR was just slightly increased
Haematologica | 109 May 2024 1584 LETTER TO THE EDITOR
A B C
Figure 3. Kaplan-Meier plots for event-free survival and relapse incidence in IKZF1del and IKZF1plus patients. (A) 5-year event-free survival (EFS) and (B) 5-year relapse incidence (CIR) of IKZF1del and IKZF1plus patients compared with 845 ALL-BFM 2000 patients with no IKZF1 deletion (IKZF1WT). (C) 5-year EFS and (D) 5-year CIR of IKZF1del and IKZF1plus patients when patients with high hyperdiploidy (HeH), ETV6::RUNX1, and iAMP21 were excluded from the analysis. (E) 5-year EFS and (F) 5-year CIR of IKZF1del and IKZF1plus patients when patients with HeH, ETV6::RUNX1, iAMP21 and gene fusions were excluded from the analysis. (G) 5-year EFS and (H) 5-year CIR of IKZF1del/plus patients (without HeH, ETV6::RUNX1, iAMP21) with a gene fusion compared to patients without a gene fusion. (I) 5-year EFS and (J) 5-year CIR for the different fusion subgroups: ABL-class, CRLF2, JAK2, PAX5, ZNF384 and other fusions.
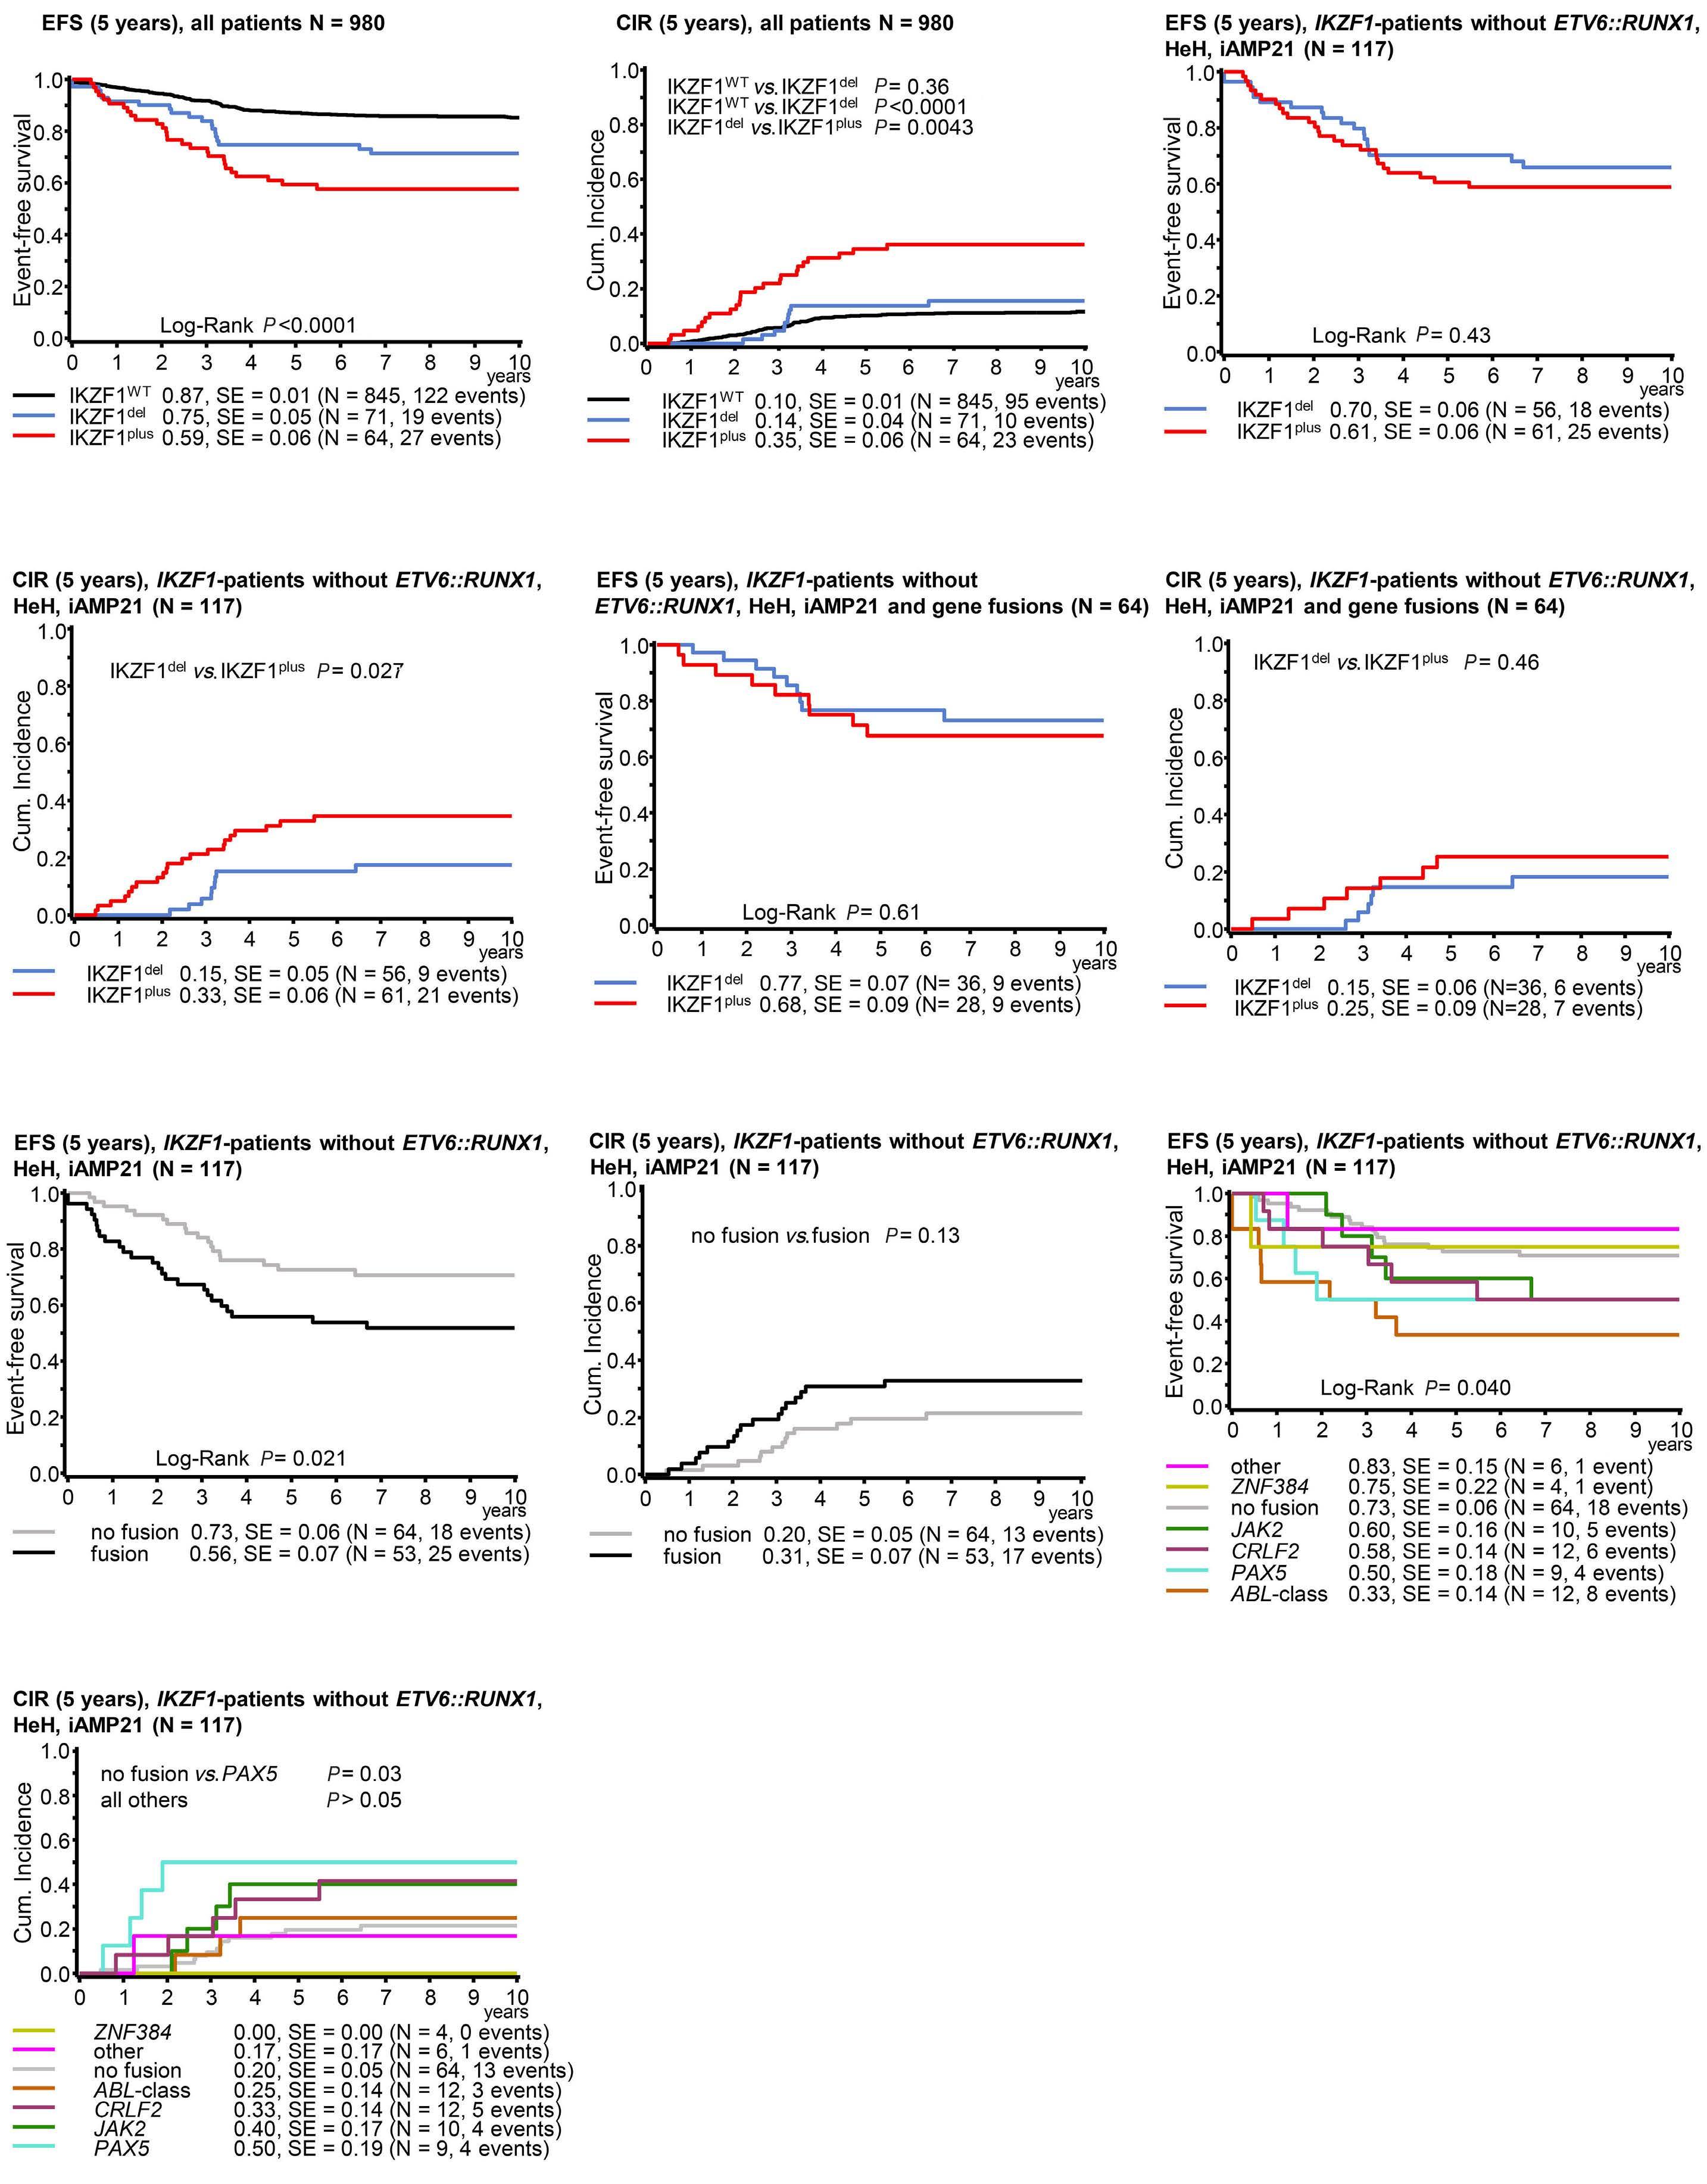
Haematologica | 109 May 2024 1585 LETTER TO THE EDITOR A D G J B E H C F I
(0.31±0.07 vs. 0.20±0.05) (Figure 2G, H). A particularly dismal EFS was observed in patients with ABL-class, PAX5, and CRLF2 fusions (Figure 3 I, J). Patients with other or no fusions had the most favorable outcomes. Due to the limited number of samples in each group, no conclusions could be drawn from the stratification of fusion subgroups for IKZF1del and IKZF1plus
To evaluate the genuine prognostic relevance of the IKZF1plus profile relative to patients solely harboring an IKZF1 deletion, we analyzed the outcome omitting those patients harboring HeH, ETV6::RUNX1, iAMP21, and gene fusions (Figure 3E, F).
The disparity in 5-year EFS between IKZF1plus and IKZF1del was then negligible (0.68±0.09 vs. 0.77±0.09). In addition, the observed tendency for a higher likelihood of relapse in the IKZF1plus group (0.25±0.09 vs. 0.15±0.06) did not reach statistical significance.
Among the 36 IKZF1del and 28 IKZF1plus patients without known prognostic markers (HeH, ETV6::RUNX1, iAMP21, gene fusion excluded), 4 IKZF1del and 11 IKZF1plus were categorized MRD standard risk, 25 IKZF1del and 12 IKZF1plus as medium risk, and 5 IKZF1del and 4 IKZF1plus as high risk. For 3 patients, MRD data was unavailable. Given the restricted sample size within each group, a statistical analysis of EFS and CIR was not conducted.
Consistent with recent studies comparing OGM to conventional cytogenetic techniques, a high overall concordance was achieved when comparing the OGM results to the existing MLPA data. 8,9 With the introduction of the IKZF1 plus profile, the prognostic impact of the IKZF1 deletion and accompanying lesion in BCR::ABL1 -negative BCP-ALL patients was further refined.7 In this study, we used OGM to perform a genome-wide evaluation of aneuploidies and SV in 97 patients from the AIEOP-BFM ALL 2000 trial, on which the IKZF1 plus profile had initially been established, and 45 patients with IKZF1 del/plus from the subsequent AIEOP-BFM ALL 2009 trial. Within this cohort, distinct classes of gene fusions were detected in 28.2% of IKZF1del cases and 51.6% of IKZF1plus cases. Consistent with existing literature, patients harboring a gene fusion, specifically BCR::ABL1 -like fusions ( ABL -class, CRLF2 , and JAK2 fusions), exhibited an inferior 5-year EFS, suggesting their potential function as leukemic drivers.10 IKZF1 deletions are frequently observed in BCR::ABL1 /-like B-ALL, which aligns with the finding that the majority of the detected fusions were classified as BCR::ABL1-like.6,10,11 Interestingly, the 12 patients who carried favorable prognostic markers (HeH, ETV6::RUNX1 ) were exclusively found in the IKZF1del subgroup and did not experience adverse events. It has recently been reported that an IKZF1 deletion negatively affected the prognosis in patients with HeH but not in those with ETV6::RUNX1 12 When patients with HeH, ETV6::RUNX1, and also the unfavorable iAMP21 were excluded from the analysis, the poor prognostic value of the IKZF1 deletion became more pronounced, and the difference in EFS between IKZF1del and IKZF1plus diminished. Furthermore,
when the newly detected gene fusions were excluded from the analysis as well, the prognostic value of IKZF1 plus and IKZF1 del became comparable but still inferior to IKZF1WT (EFS 0.68±0.09 vs . 0.77±0.07 vs . 0.87±0.01). IKZF1 lesions could have an independent prognostic effect, as it has been demonstrated that IKZF1 is implicated in multiple pathways essential for lymphoid cell differentiation and represents a potential therapeutic target.13 These findings align with previous studies, which have reported modest non-statistically significant differences between IKZF1 del and IKZF1 plus, but have confirmed the prognostic value of the deletion itself.14,15 However, it is important to note that this cohort is limited, consisting of a small sample size, and only aneuploidies, CNV and SV were analyzed. Moreover, single nucleotide variants affecting, for example, the Ras and JAK-STAT pathways that are often subclonal were not investigated.1,3 Nevertheless, the sample size of IKZF1 del/plus was comparable to that of the initial study.7 Our findings demonstrate that the prognostic relevance of the IKZF1plus profile is not as pronounced as previously anticipated when the patients are genetically better characterized, but that the IKZF1 deletion itself still exerts a negative prognostic effect.
Authors
Jonathan L. Lühmann,1 Martin Zimmermann,2 Winfried Hofmann,1 Anke K. Bergmann,1 Anja Möricke,3 Gunnar Cario,3 Martin Schrappe,3 Brigitte Schlegelberger,1 Martin Stanulla2 and Doris Steinemann1
1Department of Human Genetics, Hannover Medical School, Hannover; 2Pediatric Hematology and Oncology, Hannover Medical School, Hannover and 3Department of Pediatrics I, ALL-BFM Study Group, Christian-Albrechts University Kiel and University Medical Center Schleswig-Holstein, Kiel, Germany
Correspondence:
D. STEINEMANN - Steinemann.Doris@mh-hannover.de
https://doi.org/10.3324/haematol.2023.284115
Received: August 18, 2023.
Accepted: November 22, 2023.
Early view: November 30, 2023.
©2024 Ferrata Storti Foundation
Published under a CC BY-NC license
Disclosures
No conflicts of interest to disclose.
Contributions
MSt and DS are responsible for study concept. JLL, MZ, WH, AKB, MSt and DS are responsible for study validation. JLL, MZ and DS are
Haematologica | 109 May 2024 1586 LETTER TO THE EDITOR
responsible for the formal analysis. JLL, MSt and DS are responsible for the investigation. MZ, WH, AKB, AM, GC, MSc, BS, MSt and DS provided resources. JLL, MZ, MSt and DS are responsible for data curation. JLL wrote the original draft. JLL, MZ, WH, MSc, BS, MSt and DS wrote, reviewed and edited the paper. JLL and MZ are responsible for visualization. MSt, BS and DS supervised the study.
References
1. Inaba H, Mullighan CG. Pediatric acute lymphoblastic leukemia. Haematologica. 2020;105(11):2524-2539.
2. Möricke A, Zimmermann M, Valsecchi MG, et al. Dexamethasone vs prednisone in induction treatment of pediatric ALL: results of the randomized trial AIEOP-BFM ALL 2000. Blood. 2016;127(17):2101-2112.
3. Brady SW, Roberts KG, Gu Z, et al. The genomic landscape of pediatric acute lymphoblastic leukemia. Nat Genet. 2022;54(9):1376-1389.
4 Mullighan CG, Su X, Zhang J, et al. Deletion of IKZF1 and prognosis in acute lymphoblastic leukemia. N Engl J Med. 2009;360(5):470-480.
5. Kuiper RP, Waanders E, Van Der Velden VHJ, et al. IKZF1 deletions predict relapse in uniformly treated pediatric precursor B-ALL. Leukemia. 2010;24(7):1258-1264.
6. Mullighan CG, Miller CB, Radtke I, et al. BCR-ABL1 lymphoblastic leukaemia is characterized by the deletion of Ikaros. Nature. 2008;453(7191):110-114.
7 Stanulla M, Dagdan E, Zaliova M, et al. IKZF1plus defines a new minimal residual disease-dependent very-poor prognostic profile in pediatric B-cell precursor acute lymphoblastic leukemia. J Clin Oncol. 2018;36(12):1240-1249.
8. Lühmann JL, Stelter M, Wolter M, et al. The clinical utility of optical genome mapping for the assessment of genomic aberrations in acute lymphoblastic leukemia. Cancers (Basel). 2021;13(17):4388.
9. Neveling K, Mantere T, Vermeulen S, et al. Next-generation
JLL and DS are responsible for project administration. MSt and DS are responsible for funding acquisition.
Data-sharing statement
For original data, please contact Steinemann.Doris@mh-hannover.de
cytogenetics: comprehensive assessment of 52 hematological malignancy genomes by optical genome mapping. Am J Hum Genet. 2021;108(8):1423-1435.
10 Roberts KG, Li Y, Payne-Turner D, et al. Targetable kinaseactivating lesions in Ph-like acute lymphoblastic leukemia. N Engl J Med. 2014;371(11):1005-1015.
11. Owattanapanich W, Rujirachun P, Ungprasert P, Buaboonnam J, Techavichit P. Prevalence and clinical outcome of Philadelphialike acute lymphoblastic leukemia: systematic review and meta-analysis. Clin Lymphoma Myeloma Leuk. 2020;20(1):e22-e29.
12. Østergaard A, Enshaei A, Pieters R, et al. The prognostic effect of IKZF1 deletions in ETV6 :: RUNX1 and high hyperdiploid childhood acute lymphoblastic leukemia. Hemasphere. 2023;7(5):e875.
13. Conserva MR, Redavid I, Anelli L, et al. IKAROS in acute leukemia: a positive influencer or a mean hater? Int J Mol Sci. 2023;24(4):3282.
14 Kicinski M, Arfeuille C, Grardel N, et al. The prognostic value of IKZF1plus in B-cell progenitor acute lymphoblastic leukemia: results from the EORTC 58951 trial. Pediatr Blood Cancer. 2023;70(6):e30313.
15. Braun M, Pastorczak A, Sędek Ł, et al. Prognostic significance of IKZF1 deletions and IKZF1plus profile in children with B-cell precursor acute lymphoblastic leukemia treated according to the ALL-IC BFM 2009 protocol. Hematol Oncol. 2022;40(3):430-441.
Haematologica | 109 May 2024 1587 LETTER TO THE EDITOR
Home time among older adults with acute myeloid leukemia by therapy intensity
This study quantified home time (HT) among older adults (age ≥60 years) with acute myeloid leukemia (AML) following diagnosis. The approval of venetoclax for AML introduced clinical equipoise into treatment decision-making for many older adults between high-intensity regimens versus venetoclax with a hypomethylating agent. Published remission rates with these regimens are similar,1 although survival for older adults with AML remains poor, with fewer than 40% living for a year following diagnosis.2 Our findings show that high-intensity, anthracycline-based treatment is associated with greater mean HT compared to less intensive treatment in this cohort.
We conducted a retrospective, observational study of adults aged ≥60 years diagnosed with AML from 2015 to 2020 utilizing medical records from University of North Carolina (UNC) Health. Data from 12 other regional health systems were available via electronic health record exchanges. Individuals were included if they received first-line therapy with a hypomethylating agent (deemed low-intensity therapy), hypomethylating agent plus venetoclax (intermediate-intensity), or anthracycline-based therapy (high-intensity). Individuals who received any leukemia care not reflected in the available records were excluded. The UNC institutional review board approved the study.
The primary outcome was cumulative HT following diagnosis. A day was counted toward HT if an individual was not hospitalized and did not utilize emergency department or ambulatory oncology services. Days on which a patient was hospitalized, seen in an emergency department, or seen in an oncology clinic were considered “contact days.” HT was summed for each individual and quantified in terms of months.
Secondary outcomes included overall survival, treatment response, quality-adjusted HT, and the proportion of days at home and not engaged in care. Overall survival was calculated as days from diagnosis to death or last follow-up alive. Individuals achieving a best response of morphological complete remission, complete remission with incomplete hematologic recovery, or a morphological leukemia-free state were considered to have achieved remission.3 To calculate quality-adjusted HT, we applied published utility values for treatment-related health states in AML.4 Disease risk was assessed according to European LeukemiaNet 2017 criteria.3
Descriptive statistics are provided as medians with interquartile ranges (IQR) or frequencies. Associations between categorical variables and therapy regimens were evaluated via Monte Carlo simulated Fisher exact tests. Total HT and quality-adjusted HT are presented as means and medians
for the overall cohort and stratified by first-line treatment. Comparisons among treatment groups were made via Poisson regression models, considering HT as a count, with robust variance estimation and a log link function. Models were adjusted for age at diagnosis. We conducted sensitivity analyses restricted to 2 and 4 years of follow-up to assess the impact of the small number of long-term survivors. The Kaplan-Meier method and Cox proportional hazards models were used to evaluate associations between overall survival and other variables.
The full cohort included 197 individuals. Their median age was 71 years (range, 60-95), with a plurality in the 60- to 69-year-old age band (43.7%) (Table 1). The majority of the cohort was white (79.4%) and there was a predominance of males (58.4%), mirroring national AML incidence data.2
The majority had adverse-risk AML (59.0%), followed by intermediate-risk (28.2%) and favorable-risk disease (12.8%). Seventy-five individuals (38.1%) received anthracycline-based treatment, 58 (29.4%) received venetoclax-containing regimens, and 64 (32.5%) received monotherapy with a hypomethylating agent. The median age of patients was lowest in the high-intensity group (65 years vs. 72.5 years in the low-intensity group and 75 years in the intermediate-intensity group; P<0.0001). Other demographics and European LeukemiaNet risk were similar across groups (P>0.05 for all associations).
The median survival of the full cohort was 9.8 months (95% confidence interval [95% CI]: 7.6-12.5). Increasing age was associated with increased mortality risk, with the hazard ratio for mortality being 1.36 (1.10-1.69) per 10 years of age. Race, sex, and European LeukemiaNet risk were not significantly associated with mortality. The high-intensity treatment group had a longer median overall survival at 19.9 months (9.1-30.4) versus 7.4 months (2.8-11.9) for the low-intensity group or 7.7 months (3.3-11.0) for the intermediate-intensity group (P=0.0003) (Table 2). After adjustment for age, the survival advantage associated with high-intensity therapy remained statistically significant (adjusted hazard ratio=0.50 [0.32-0.79]; P=0.003). The median overall survival did not differ significantly between the low- and intermediate-intensity treatment groups.
Individuals receiving high-intensity therapy had a greater initial burden of care days (Figure 1), related to receipt of inpatient chemotherapy. During the first 30 days, mean days at home were 4, 14, and 12 for the high-intensity, intermediate-intensity, and low-intensity treatment groups, respectively. Over the full study period, mean HT for the cohort was 9.1 months (95% CI: 7.4-10.7), with a median of 4.4 (IQR: 1.1-12.5) (Table 2). Mean HT was longest in the
Haematologica | 109 May 2024 1588 LETTER TO THE EDITOR
high-intensity group at 13.1 months (95% CI: 9.9-16.4) versus 7.6 months (95% CI: 4.8-10.4) in the low-intensity group and 5.5 months (95% CI: 4.0-7.1) in the intermediate-intensity group. The proportion of days at home during each month
following diagnosis rose over time in each group (Online Supplementary Table S1).
In the age-adjusted model, average total HT for those receiving high-intensity treatment was estimated to be 1.76
First-line treatment, N (%)
ELN 2017 risk, N (%)
High intensity indicates anthracycline-based therapy, intermediate intensity indicates treatment with venetoclax and a hypomethylating agent and low intensity indicates hypomethylating agent monotherapy. Missing data not available in records: race (3 subjects), employment status (30 subjects), marital status (3 subjects), rurality (3 subjects), household income (3 subjects), and European LeukemiaNet risk (2 subjects). *Comparison between categorical variables assessed via Monte Carlo simulated Fisher exact test. HMA: hypomethylating agent; ELN: European LeukemiaNet.
High intensity indicates anthracycline-based therapy, intermediate intensity indicates treatment with venetoclax and a hypomethylating agent and low intensity indicates hypomethylating agent monotherapy. *Statistically significant difference in models adjusted for age. CI: confidence interval; HT: home time; IQR: interquartile range.
Haematologica | 109 May 2024 1589 LETTER TO THE EDITOR
Variable All patients N=197 Low-intensity group N=64 Intermediate-intensity group N=58 High-intensity group N=75 P* Demographics Age group, N (%) 60-69 years 70-79 years 80-89 years ≥90 years 86 (43.7) 81 (41.1) 25 (12.7) 5 (2.5) 15 (23.4) 37 (57.8) 8 (12.5) 4 (6.3) 12 (20.7) 28 (48.3) 17 (29.3) 1 (1.7) 59 (78.7) 16 (21.3) 0 (0.0) 0 (0.0) <0.0001-Race, N (%) White Black or African-American Other 154 (79.4) 31 (16.0) 9 (4.6) 48 (77.4) 12 (19.4) 2 (3.2) 47 (81.0) 10 (17.2) 1 (1.7) 59 (79.7) 9 (12.2) 6 (8.1) 0.390-Sex, N (%) Female Male 82 (41.6) 115 (58.4) 25 (39.1) 39 (60.9) 26 (44.8) 32 (55.2) 31 (41.3) 44 (58.7) 0.827Disease
and treatment
HMA HMA + venetoclax Anthracycline-based 64 (32.5) 58 (29.4) 75 (38.1) 64 (32.5)-58 (29.4)-75 (38.1)--
Favorable Intermediate Adverse 25 (12.8) 55 (28.2) 115 (59.0) 7 (11.3) 17 (27.4) 38 (61.3) 6 (10.3) 19 (32.8) 33 (56.9) 12 (16.0) 19 (25.3) 44 (58.7) 0.805-
Table 1. Demographic and disease characteristics of older adults with acute myeloid leukemia.
Variable All patients Low-intensity group Intermediate-intensity group High-Intensity group Overall survival in months, median (95% CI) 9.9 (7.7-12.7) 7.4 (2.8-11.9) 7.7 (3.3-11.9) 19.9 (9.1-30.4)* Total HT in months, mean (95% CI) 9.1 (7.4-10.7) 7.6 (4.8-10.4) 5.5 (4.0-7.1) 13.1 (9.9-16.4)* Total HT in months, median (IQR) 4.4 (1.1-12.5) 3.8 (0.6-9.3) 3.3 (1.1-7.7) 5.9 (2.4-21.4) Quality-adjusted HT in months, mean (95% CI) 5.6 (4.4-6.9) 3.3 (1.7-4.8) 3.3 (2.1-4.4) 9.4 (6.7-12.1)* Quality-adjusted HT in months, median (IQR) 2.0 (0.3-6.2) 1.0 (0.2-3.8) 1.3 (0.3-5.4) 3.7 (0.9-15.0)
Table 2. Months of survival and home time by therapy intensity.
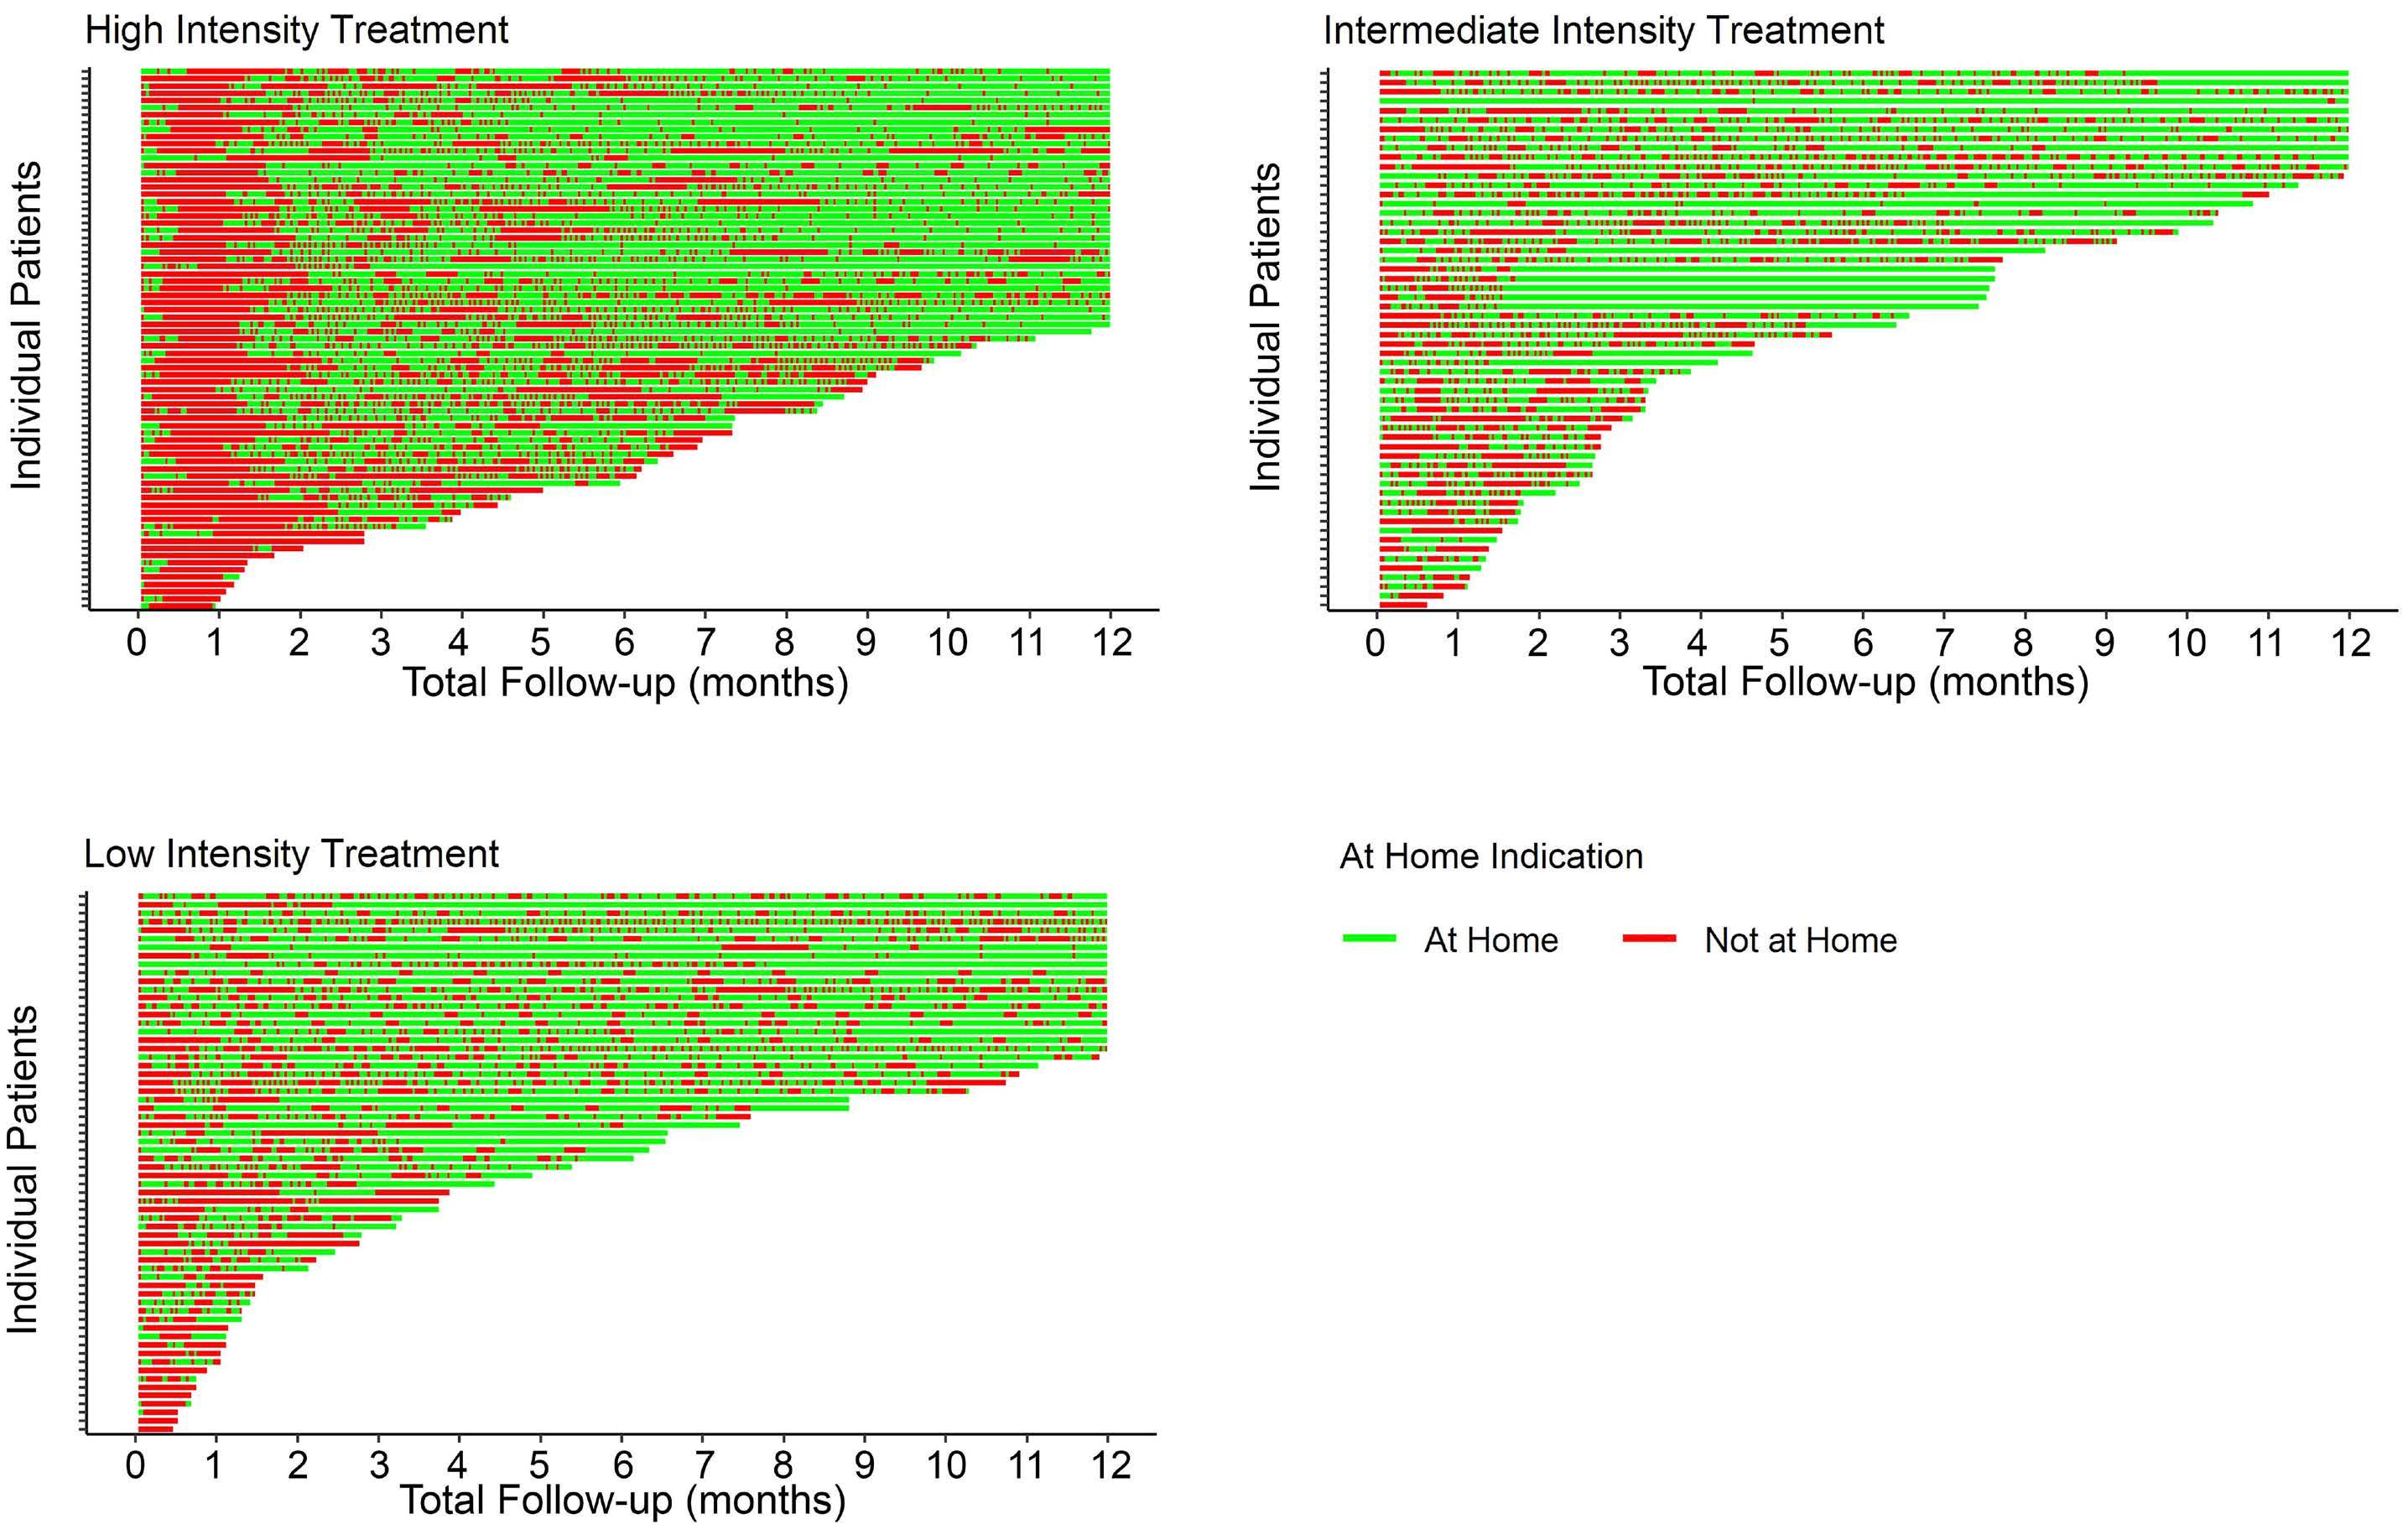
times (1.10-2.82) that of the low-intensity group (P=0.018) and 2.43 times (1.57-3.75) that of the intermediate-intensity group (P<0.0001). Intermediate-intensity treatment was not associated with a significant difference in HT compared to low-intensity treatment (P=0.166). The advantage for the high-intensity group persisted in sensitivity analyses restricted to 2 or 4 years.
The nature of contact days differed between treatment groups. Inpatient hospitalization accounted for most contact days among the high-intensity group (62% [57-67%]). Among the low- and intermediate-intensity groups, outpatient clinic or infusion visits accounted for the greatest number of contact days (50% [41-59%] and 57% [49-65%], respectively).
Remission rates were higher among the high-intensity (57.3%) and intermediate-intensity (56.1%) groups than in the low-intensity group (19.7%). Survival was longer for individuals achieving remission. Among the 87 patients who achieved remission with first-line therapy, the median overall survival was 19.9 months (11.0-41.0) compared to 3.8 months (2.7-8.3) among the 106 who did not enter remission. Remission status could not be confirmed for four individuals. Among individuals who achieved remission, the proportion of days spent at home was 0.35 (0.31-0.39) prior to achieving remission versus 0.71 (0.67-0.75) following remission.
intermediate intensity indicates venetoclax with a hypomethylating agent and low intensity indicates hypomethylating agent monotherapy.
We adjusted HT for quality to reflect variable quality of life experienced at different points in treatment.4 Mean quality-adjusted HT was greatest in the high-intensity group at 9.4 months (6.7-12.1) versus 3.3 months (1.7-4.8) in the low-intensity group and 3.3 months (2.1-4.4) in the intermediate-intensity group. In a model adjusted for age, the average total quality-adjusted HT for those receiving high-intensity treatment was estimated to be 2.61 times (1.41-4.82) that of those with low-intensity treatment (P=0.0022) and 2.58 times (1.58-4.22) that of those given intermediate-intensity treatment (P=0.0002). Intermediate-intensity treatment was not associated with a significant difference in quality-adjusted HT compared to low-intensity treatment (P=0.97).
Overall, high-intensity treatment was associated with a greater initial burden of care days; however, the high-intensity group had significantly greater mean HT and quality-adjusted HT compared to the low-intensity and intermediate-intensity groups. In the long-run, high-intensity treatment may yield more HT for patients despite upfront hospitalization.
We have previously published data regarding HT among older adults with AML receiving azacitidine or venetoclax-containing treatment regimens.5 We found that HT was similar between patients treated with either regimen. A separate analysis of SEER-Medicare data among older adults with
Haematologica | 109 May 2024 1590 LETTER TO THE EDITOR
Figure 1. Swimmer plots of home days versus contact days in the year following a diagnosis of acute myeloid leukemia, stratified by treatment intensity. High intensity indicates anthracycline-based therapy,
AML suggested that higher intensity treatment regimens were associated with fewer days at home compared to lower intensity regimens after accounting for frailty.6 In the current study, we evaluated HT among older adults treated with a broader array of therapy intensities. HT is a topic increasingly recognized in recent literature. Recent analyses have shown that women with newly diagnosed metastatic breast cancer or adults with newly diagnosed metastatic pancreatic cancer spend approximately 10% of their days engaged in care.7,8 In this context, the time commitment faced by patients in the current study is striking. Older adults with AML spend over 4 times as many days engaged in oncology care compared to these patients with advanced solid tumors. HT for patients with hematologic malignancies has otherwise not been routinely reported outside of the context of hospice care,9 although Gupta and colleagues recently described home days versus contact days among participants in an international clinical trial for relapsed/refractory non-Hodgkin lymphomas.10
Our study has limitations. First, it was conducted at a single center with a relatively small sample, which may limit its generalizability. Second, our study was retrospective, and we were unable to control for potential confounders that influence treatment selection and HT. Importantly, we did not collect data on patients’ comorbidities or psychosocial support, which may impact both HT and treatment selection. While Eastern Cooperative Oncology Group performance status was abstracted, extensive missingness in this variable precluded its use in analyses. Our study also equates inpatient and outpatient contact days in the primary outcome. Finally, our study did not account for patients’ preferences and values, which are critical factors in shared decision-making.
Older adults with AML spend a tremendous amount of time - roughly 40% of days - engaged in care. The current study provides new data on HT among this population. Our findings suggest that high-intensity treatment may be associated with greater HT and quality-adjusted HT, despite the initial burden of care with high-intensity therapy. Future research should focus on identifying factors that influence treatment selection and HT in this population and developing interventions to optimize this outcome.
Authors
Christopher E. Jensen,1,2 Allison M. Deal,3 Alexis C. Wardell,3 Hillary M. Heiling,2,3 Konan E. Beke1 and Daniel R. Richardson1,3
References
1. Jaramillo S, Schlenk RF. Update on current treatments for adult acute myeloid leukemia: to treat acute myeloid leukemia intensively or non-intensively? That is the question.
1University of North Carolina School of Medicine; 2University of North Carolina Gillings School of Global Public Health and 3Lineberger Comprehensive Cancer Center, University of North Carolina, Chapel Hill, NC, USA
Correspondence:
C.E. JENSEN - christopher.jensen@unchealth.unc.edu
https://doi.org/10.3324/haematol.2023.284133
Received: October 18, 2023.
Accepted: December 12, 2023. Early view: December 21, 2023.
©2024 Ferrata Storti Foundation
Published under a CC BY-NC license
Disclosures
None of the authors has a relevant conflict of interest. CEJ reports research funding (from Conquer Cancer and AbbVie) outside the submitted work. DRR reports research funding (from Conquer Cancer and the Palliative Care Research Cooperative Group) outside the submitted work.
Contributions
CEJ and DRR conceptualized the study and identified the study cohort. CEJ and KEB extracted data from charts. CEJ, AMD, ACW, HMH, and DRR designed the data analysis. AMD and ACW performed the data analysis. All authors contributed to interpretation of the results. CEJ drafted the manuscript. All authors reviewed the final manuscript.
Funding
The project described was supported by the National Center for Advancing Translational Sciences (NCATS) of the National Institutes of Health (NIH) through grant award number UL1TR002489 and by a National Research Service Award Post-Doctoral Traineeship from the Agency for Healthcare Research and Quality sponsored by The Cecil G. Sheps Center for Health Services Research at The University of North Carolina at Chapel Hill through grant award number T32HS000032. The content is solely the responsibility of the authors and does not necessarily represent the official views of the NIH.
Data-sharing statement
Due to the inclusion of specific dates, the underlying data for the study consists largely of protected health information, which the authors are not authorized to share outside their institution. Aggregate, de-identified data can be made available upon request to the corresponding author.
Haematologica. 2023;108(2):342-352.
2. Acute myeloid leukemia: SEER stat fact sheets: 2019. Surveillance, Epidemiology, and End Results Program (SEER).
Haematologica | 109 May 2024 1591 LETTER TO THE EDITOR
Cancer Stat Facts: Leukemia - Acute Myeloid Leukemia (AML). 2023. https://seer.cancer.gov/statfacts/html/amyl.html. Accessed October 2023.
3. Döhner H, Estey E, Grimwade D, et al. Diagnosis and management of AML in adults: 2017 ELN recommendations from an international expert panel. Blood. 2017;129(4):424-447.
4 Stein EM, Yang M, Guerin A, et al. Assessing utility values for treatment-related health states of acute myeloid leukemia in the United States. Health Qual Life Outcomes. 2018;16(1):193.
5. Jensen CE, Heiling HM, Beke KE, et al. Time spent at home among older adults with acute myeloid leukemia receiving azacitidine- or venetoclax-based regimens. Haematologica. 2023;108(4):1006-1014.
6. Richardson DR, Zhou X, Jensen CE, et al. Time at home among older adults with acute myeloid leukemia based on treatment
intensity: a SEER-Medicare analysis. J Clin Oncol. 2022;40(16_suppl):6586.
7 Rocque GB, Williams CP, Ingram SA, et al. Health care-related time costs in patients with metastatic breast cancer. Cancer Med. 2020;9(22):8423-8431.
8. Bange EM, Doucette A, Gabriel PE, et al. Opportunity costs of receiving palliative chemotherapy for metastatic pancreatic ductal adenocarcinoma. JCO Oncol Pract. 2020;16(8):e678-e687.
9. Cheung MC, Croxford R, Earle CC, Singh S. Days spent at home in the last 6 months of life: a quality indicator of end of life care in patients with hematologic malignancies. Leuk Lymphoma. 2020;61(1):146-155.
10 Gupta A, Hay AE, Crump M, et al. Contact days associated with cancer treatments in the CCTG LY 12 trial. Oncologist. 2023;28(9):799-803.
Haematologica | 109 May 2024 1592 LETTER TO THE EDITOR
Use
of the Second Revision of
the
International Staging System
for prognostic stratification of multiple myeloma patients in real-world clinical practice and the importance of sub-groups, including age
The Second Revision of the Revised International Staging System (R2-ISS) for multiple myeloma (MM)1 is a recent update of the R-ISS2 for the purpose of further risk stratification of R-ISS stage II, by adding gain of 1q (1q+) using interphase fluorescence in situ hybridization (iFISH) as proposed by the European Myeloma Network (EMN). To assess the utility of the R2-ISS in real-world clinical practice, we retrospectively reviewed 218 patients who were diagnosed at Kameda Medical Center from January 2014 to August 2022. All analyses performed in our study were in accordance with the ethical standards of the institutional and/or national research committee and the 1964 Helsinki Declaration and its later amendments or comparable ethical standards. The study was approved by the institutional review board of Kameda Medical Center. Patients signed informed consent for their data and photographs to be published. Of the 218 patients in the study, 18 patients were excluded because iFISH data for classification by R2-ISS were not available (11 patients) or they were untreated (7 patients); the remaining 200 consecutive MM patients had received treatments for MM and had complete data for calculating the R2-ISS. iFISH analysis was performed at a commercially available laboratory (SRL Inc., Tokyo, Japan) on whole bone marrow cells before June 2015 and on purified plasma cells after that date. Table 1 compares our cohort and the EMN training cohort. Median age of our patients was 74 years, which is 14 years older than that of the EMN cohort but is more consistent with the current age of real-world myeloma patients globally, and especially in Japan. 3-5 Furthermore, 32% and 43% of patients had elevated lactate hydrogenase (LDH) and ISS stage III, respectively, compared to 25% and 16% in the EMN cohort. The frequencies of del17p, t(4;14), and 1q + were 8%, 10% and 29% in our cohort and 12%, 12% and 37% in the EMN cohort with a marginally higher frequency seen in the latter. According to R2-ISS, our cohort had fewer stage I and II and more stage III and IV disease. Importantly, the proportion of patients with a 1q + did not differ significantly between the two groups. In terms of treatment, more patients received proteasome inhibitors and CD38 antibody-based treatment, and fewer patients underwent autologous stem cell transplantation (autoSCT). With a median follow-up of 31.5 months (range, 0-108 months), the median progression-free survival
(PFS) was 46 months (95% Confidence Interval, 36-67 months) and the median overall survival (OS) was not reached (NR) in our entire cohort ( Online Supplemen -
Table 1. Comparison of patient characteristics between our cohort and the training cohort of the European Myeloma Network.
autoSCT: autologous stem cell transplant; EMN: European Myeloma Network; IMiD; immunomodulatory drugs; IQR: interquartile range; ISS: International Staging System; LDH: lactate dehydrogenase; MoAb: monoclonal antibody; N: number; PI: proteosome inhibitor; R-ISS: Revised-International Staging System; R2-ISS: Second Revision of Revised International Staging System; TE: transplant eligible.
Haematologica | 109 May 2024 1593 LETTER TO THE EDITOR
Our cohort (N=200) EMN (N=2,226) Study period 2014-2022 2005-2016 Age in years Median (IQR) ≤65, N (%) >65, N (%) 74 (30-91) 49 (25) 151 (75) 60 (54-65) 1,720 (77) 506 (23) Sex, N (%) Male 104 (52) 1,271 (57) ISS, N (%) I II III 47 (24) 67 (34) 86 (43) 839 (37) 845 (38) 551 (25) R-ISS, N (%) I II III 32 (16) 125 (63) 43 (22) 597 (27) 1,372 (62) 257 (12) R2-ISS, N (%) I II III IV 28 (14) 47 (24) 97 (49) 28 (14) 423 (19) 690 (31) 913 (41) 200 (9) Elevated LDH, N (%) 63 (32) 363 (16) del(17p), N (%) t(4;14), N (%) 1q+, N (%) gain+ amp+ 15 (7.5) 19 (9.5) 59 (29) 49 (24) 10 (5) 258 (12) 277 (12) 820 (37)Treatment, N (%) IMiD IMiD-PI PI CD38-MoAb containing AutoSCT 7 (3.5) 79 (40) 82 (41) 32 (16) 75 (38) 506 (23) 1,485 (67) 235 (11) 0 TE: 1,855 (83)
tary Figure S1 ). The Kaplan-Meier curves of PFS and OS according to stage in R2-ISS are shown in Figure 1A and B, respectively. In R2-ISS, the median PFS was NR, 37, 44, and 30 months for stages I, II, III and IV, and median OS was NR for stage I-III and 80 months for stage IV. Patients with stage I in R2-ISS appeared to have better
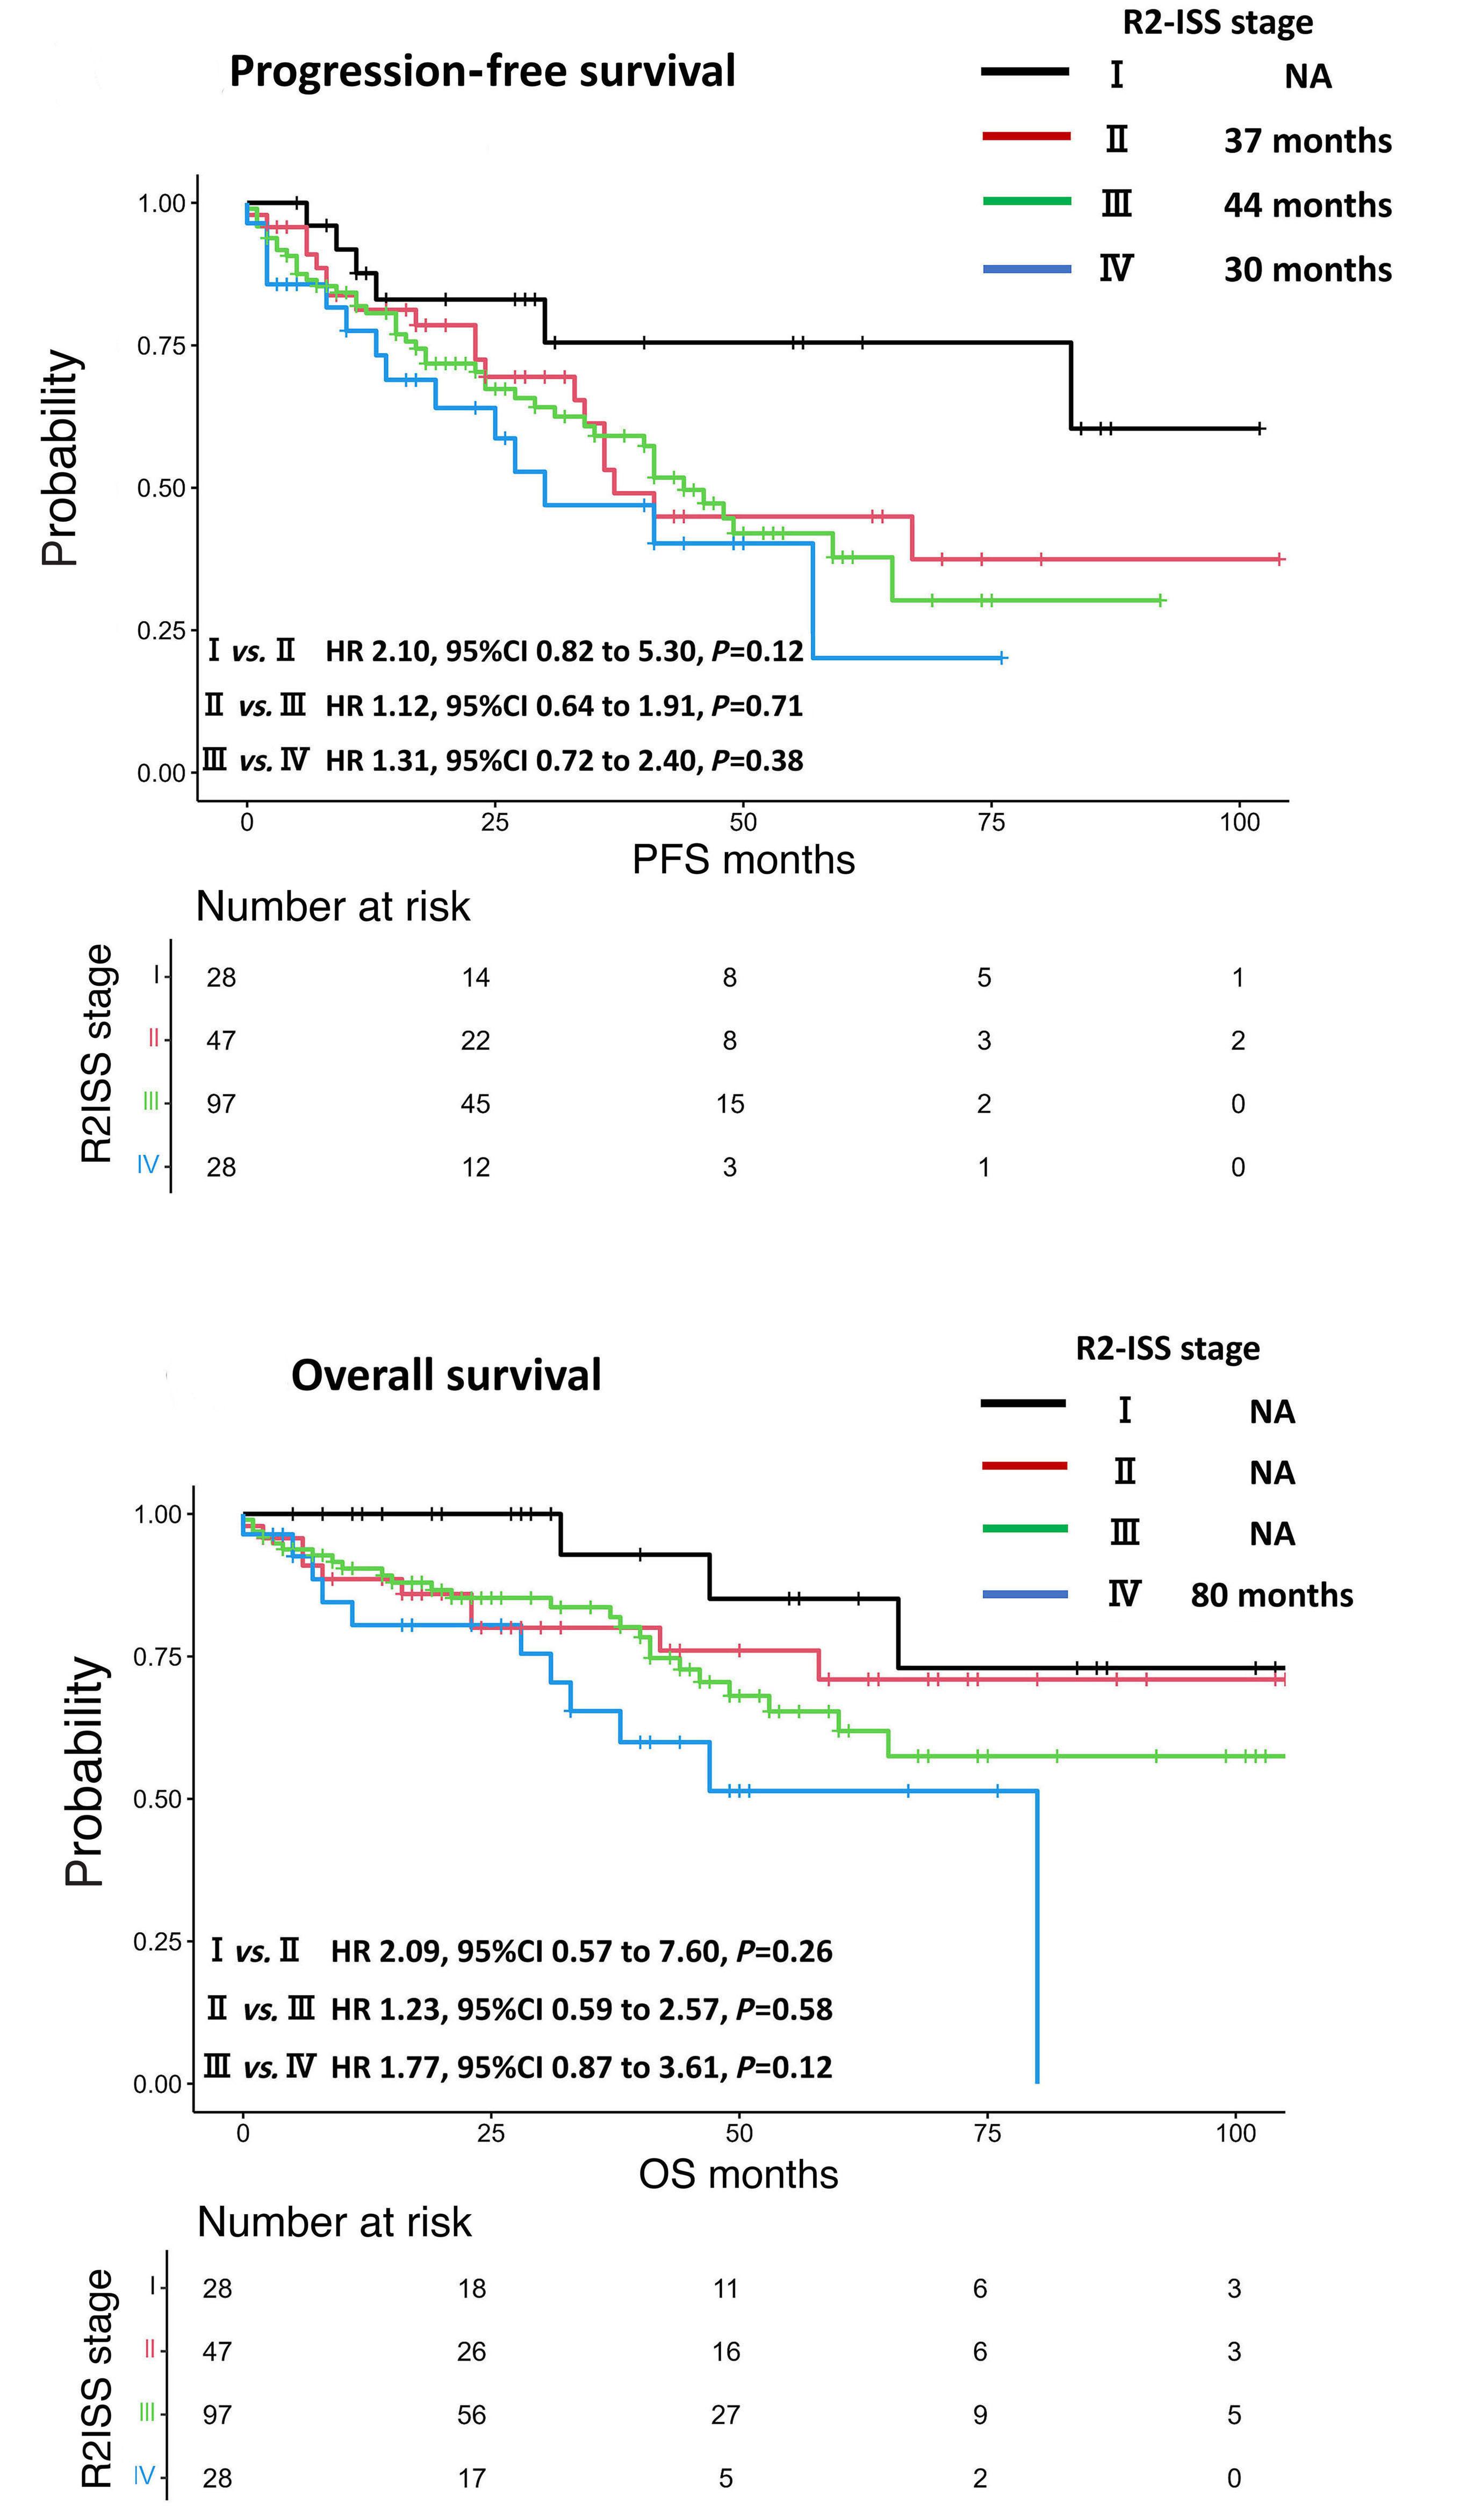
PFS than all other groups, although this did not prove to be statistically significant upon analysis. Similarly, patients with stage IV in R2-ISS tended to have worse OS than those with stage III; however, the differences were also not statistically significant. We obtained similar results through subgroup analysis, specifically within Continued on following page.
Haematologica | 109 May 2024 1594 LETTER TO THE EDITOR
A B
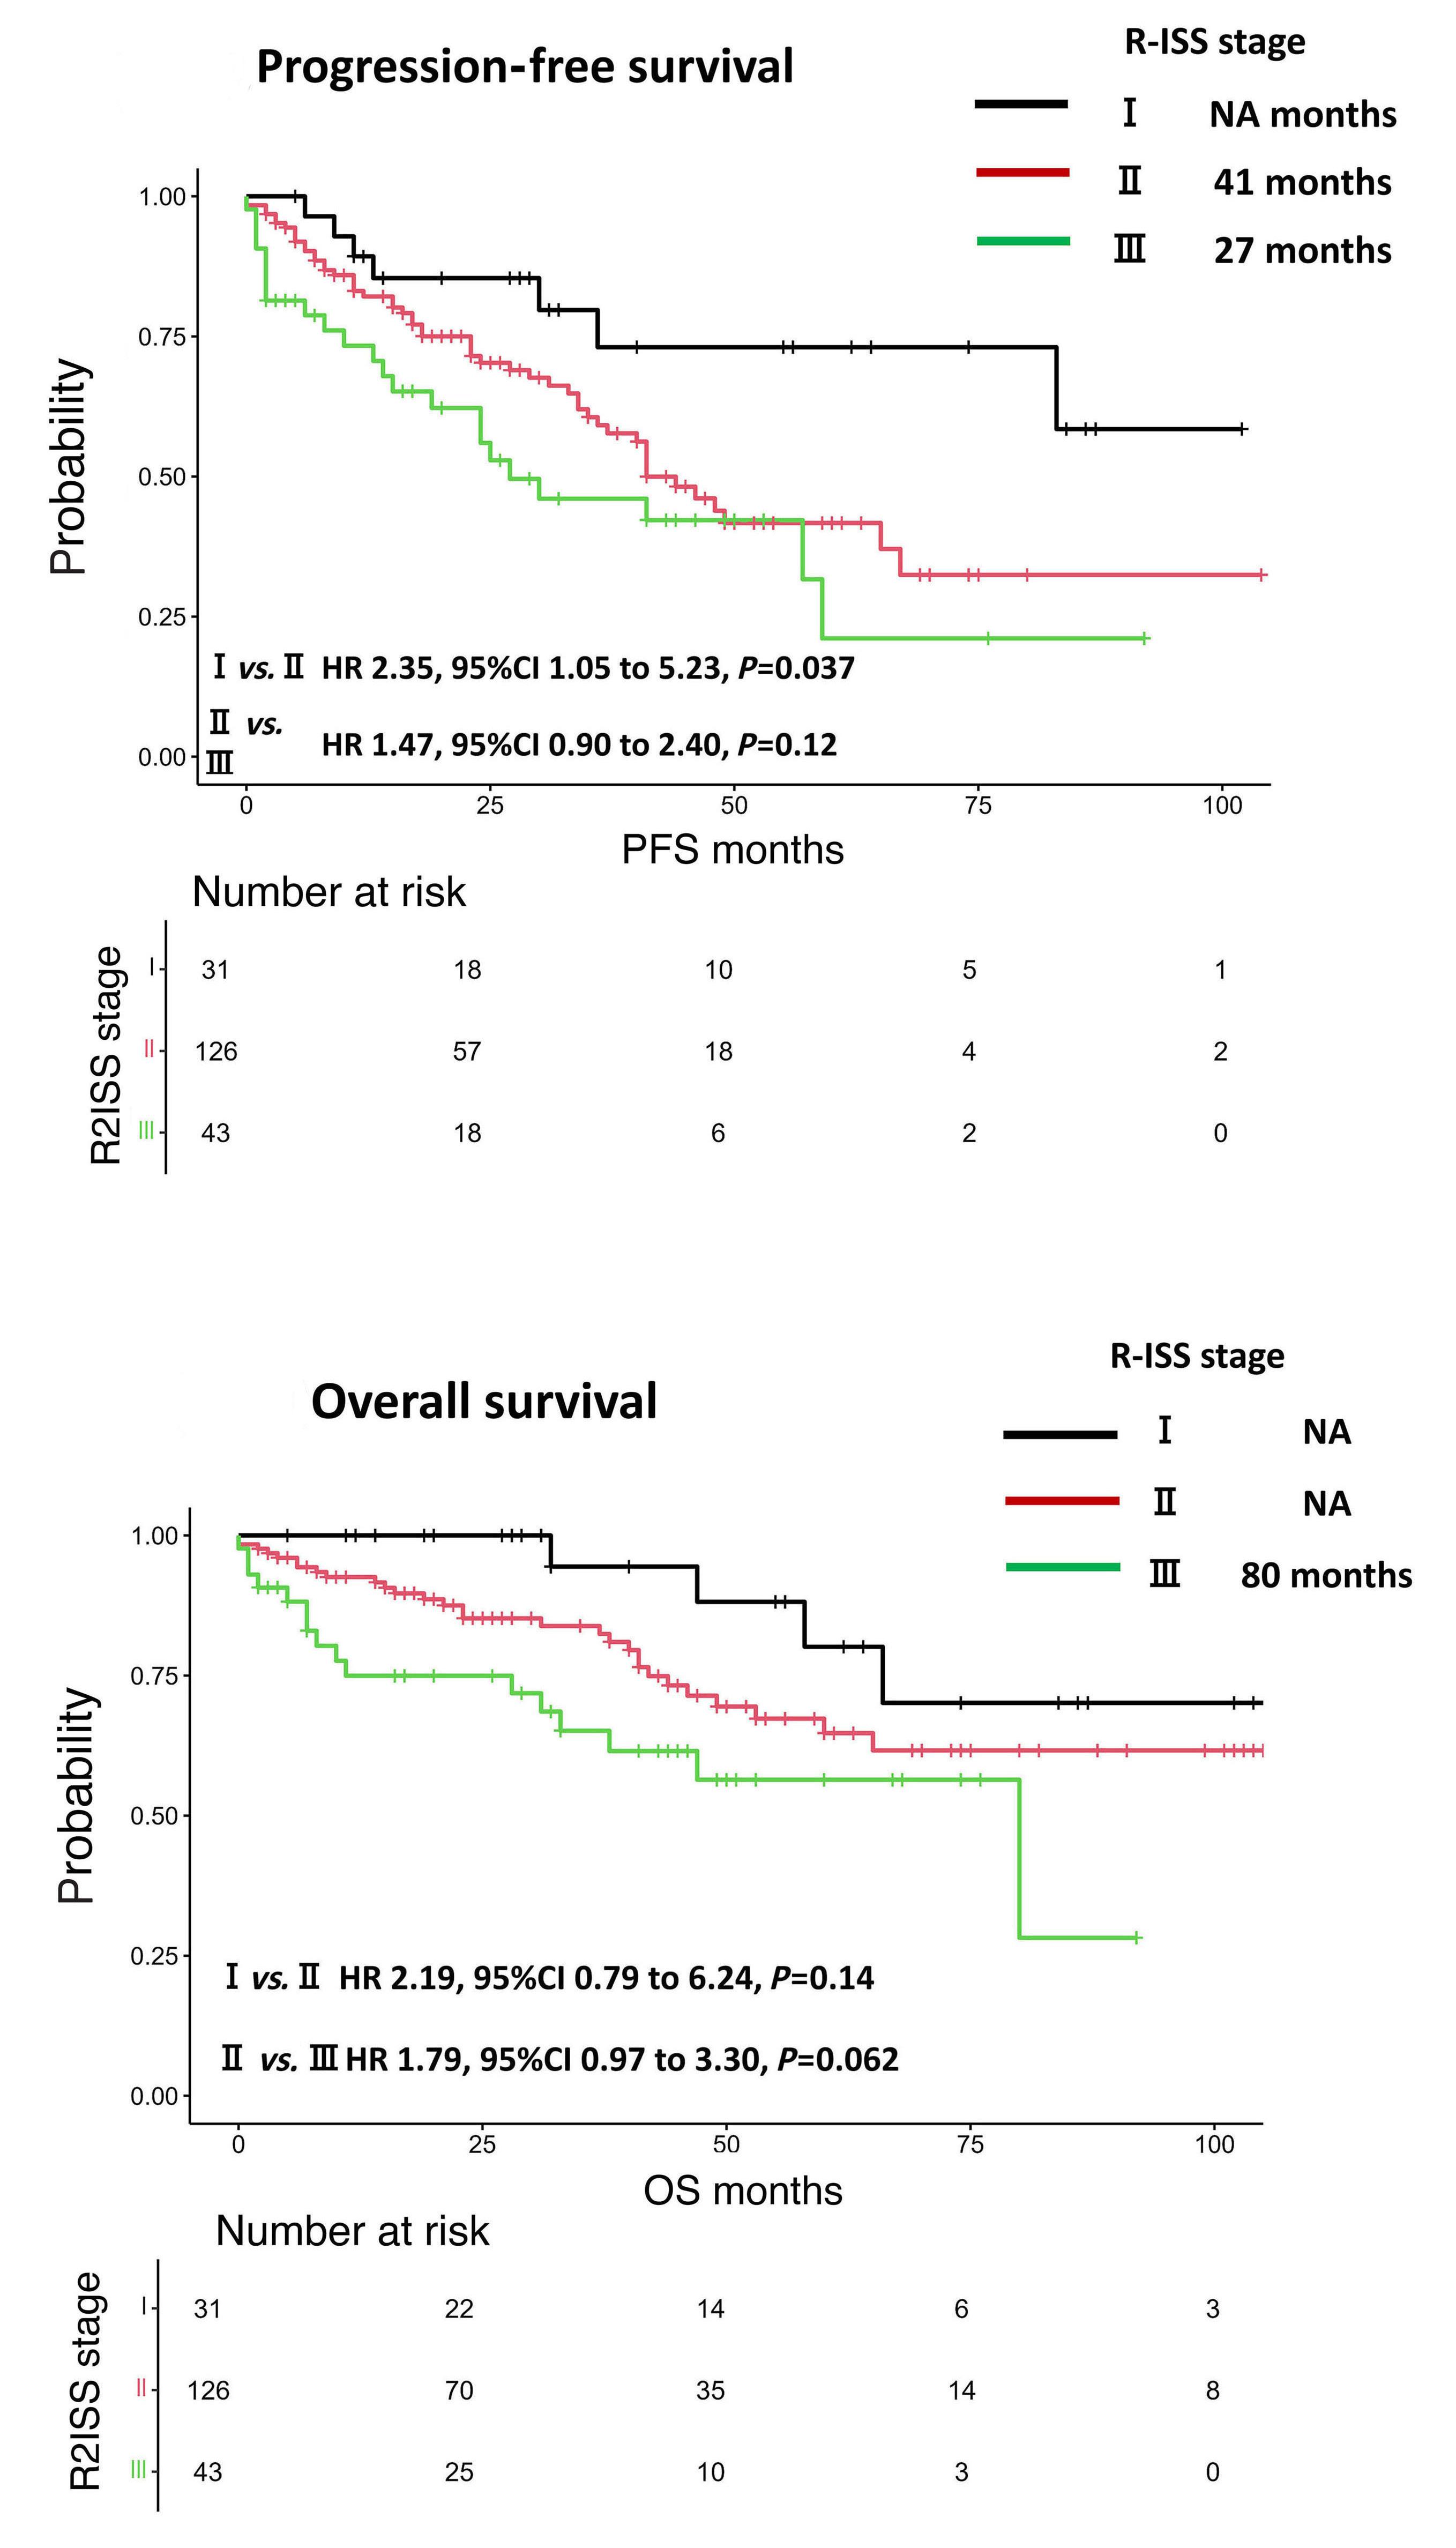
Figure 1. Survival outcomes in our cohort. Kaplan-Meier survival curves according to the Second Revision of the Revised International Staging System (R2-ISS) (A) progression-free survival (PFS) and (B) overall survival (OS), and to the Revised-International Staging System (R-ISS) (C) PFS and (D) OS.
the transplant eligible and transplant ineligible groups ( Online Supplementary Figure S2 ). Regardless of age or
transplant eligibility, by R2-ISS, our cohort did not divide into four clear groups. In our cohort, patients with R-ISS
Haematologica | 109 May 2024 1595 LETTER TO THE EDITOR
C D
stage II could be divided between 33% R2-ISS stage II and 64% with stage III, but unlike the EMN cohort, there were no significant differences in PFS or OS between these two groups. Conversely, the Kaplan-Meier survival curves based on the R-ISS showed that median PFS was 41 and 27 months in stage II and III patients, and were not clearly distinguishable; however, those patients with stage I had a significantly better OS rate. In terms of OS, the survival curves of the three groups were clearly separated with median survival NR in stages I-II and 54 months in stage III, respectively. Importantly, stages II and III also had significantly different survival estimates.
(Figure 1C, D)
We next examined the distribution of patients classified with the ISS, R-ISS, LDH, and cytogenetic abnormalities when reclassified with the R2-ISS ( Online Supplementary Table S1 ). Among the 67 patients classified ISS stage II, 35 (52%), 29 (43%), and 3 (4.5%) were reclassified to R2-ISS II, III, IV, respectively; of the 86 patients with ISS stage III, 61 (71%) and 25 (29%) were reclassified to R2-ISS III and IV, respectively. Of the 125 patients with R-ISS stage II, 43 (34%), 78 (62%), and 4 (3.2%) were reclassified as R2-ISS stage II, III, and IV.
These differences between our cohort and the EMN cohort may be explained in part by the differences in the age of the patients and the treatments they consequently received. Myeloma is a disease of the elderly and the median age of 60 years in the EMN cohort differs from that of patients in general clinical practice globally. 3-5 In addition to being significantly older, our cohort had more stage III patients in the ISS stage and more stage III and IV patients in the R2-ISS than in the EMN cohort. Despite these differences, patients in our cohort appeared to have a better OS, although with the shorter observation period this requires further confirmation and follow up. However, this may be due to the EMN cohort being enriched for patients from clinical trials conducted from 2005-2016, when there were few effective agents such as CD38 antibodies, carfilzomib, ixazomib and pomalidomide. In fact, our study aligns more with other recent studies. For example, a sub-analysis of the MAIA trial using daratumumab, lenalidomide, and dexamethasone revealed a PFS of 28 months in R-ISS stage III patients over 70 years of age,6 which is almost comparable to our report. In addition, a subgroup analysis of the ALCYONE trial 7 documented a PFS of 32.9 months for patients with R-ISS stage III in the daratumumab, bortezomib, melphalan, and prednisone arm in frail patients who were not eligible for transplantation. These findings emphasize the importance of considering cohorts of patients exposed to the current and more effective new drugs in order to accurately reflect myeloma treatment outcomes. R2-ISS incorporates information on 1q + to further refine risk stratification, and we believe it should be regarded as one of several factors to be taken into account. Other
critical considerations include patient age, co-morbidities, and overall health status, as well as the availability of newer agents and treatment modalities. Risk classifications that do not use cohorts of patients exposed to the various effective new drugs currently in use may not, therefore, best reflect current treatment outcomes. Limitations of this study include its single institution context and the relatively short follow-up period, but it does include a substantial number of patients, as our center serves a very large region in Japan. While there are few reports about Asian genetic polymorphism, the relation between polymorphism and outcome is unclear. Moreover, Asian clinical and cytogenetic profiles (except age) showed trends similar to the Western studies. 8 Another factor is that treatment interruptions are common in socially vulnerable, frail and older patients. 9 However, the fact that many of our patients are receiving new treatments developed within the last decade provides a major strength to this analysis and reinforces the real-world nature of our cohort.
Given the evolution of myeloma treatment over the last decade, the prognosis of MM has changed dramatically, and nearly half of the newly diagnosed MM patients under 70 years of age are expected to survive more than 10 years. The proposed R2-ISS classification may be useful for identifying homogeneous risk groups in clinical trials. It can certainly be challenging to handle real-world data accurately because the heterogeneity of treatments and relatively short observation periods might obscure the true impact of each risk factor. However, evaluating only data of prospective studies might be inadequate to better reflect current practice, available therapy, and outcome.10 Therefore, we suggest that any future modifications to the R2-ISS should be derived and evaluated using real-world data as well as from prospective studies. Moreover, this is especially relevant as we better understand the effect of age and other factors on the heterogeneity of treatment effects in the era of novel therapy, as illustrated by the OCEAN study where age impacted on outcome across both arms of this pivotal phase III study.11
In summary, subgroup considerations such as age may be one of several significant aspects that each clinician should bear in mind in interpreting clinical trial data and applying these findings to real-world practice. In the modern era, in which the population is aging, there are increasing numbers of older and potentially frailer patients who would not meet rigorous eligibility criteria for clinical trials and thus the impact of novel agents on their long-term outcomes may be more difficult to translate, whilst this group nonetheless constitutes an ethical and societal priority. The insights gained from these additional assessments should in turn individualize patient care when referring to data derived from clinical trials and our most up-to-date and clinically relevant staging systems, so further improving outcome.12
Haematologica | 109 May 2024 1596 LETTER TO THE EDITOR
Authors
Yuka Uesugi, Daisuke Ikeda, Ami Fukumoto, Rikako Tabata, Daisuke Miura, Kentaro Narita, Masami Takeuchi and Kosei Matsue
Division of Hematology/Oncology, Kameda Medical Center, Kamogawa, Chiba, Japan
Correspondence:
Y. UESUGI - y-uesugi@med.showa-u.ac.jp
https://doi.org/10.3324/haematol.2023.284173
Received: September 1, 2023.
Accepted: November 22, 2023.
Early view: November 30, 2023.
References
1. D’Agostino M, Cairns DA, Lahuerta JJ, et al. Second Revision of the International Staging System (R2-ISS) for Overall Survival in Multiple Myeloma: a European Myeloma Network (EMN) report within the HARMONY project. J Clin Oncol. 2022;40(29):3406-3418.
2. Palumbo A, Avet-Loiseau H, Oliva S, et al. Revised International Staging System for Multiple Myeloma: a Report from International Myeloma Working Group. J Clin Oncol. 2015;33(26):2863-2869.
3. Phekoo KJ, Schey SA, Richards MA, et al. A population study to define the incidence and survival of multiple myeloma in a National Health Service Region in UK. Br J Haematol. 2004;127(3):299-304.
4 Kristinsson SY, Landgren O, Dickman PW, Derolf AR, Björkholm M. Patterns of survival in multiple myeloma: a population-based study of patients diagnosed in Sweden from 1973 to 2003. J Clin Oncol. 2007;25(15):1993-1999.
5. Rosko A, Giralt S, Mateos M-V, Dispenzieri A. Myeloma in elderly patients: when less is more and more is more. Am Soc Clin Oncol Educ Book. 2017;37:575-585.
6. Facon T, Cook G, Usmani SZ, et al. Daratumumab plus lenalidomide and dexamethasone in transplant-ineligible newly diagnosed multiple myeloma: frailty subgroup analysis of MAIA. Leukemia. 2022;36(4):1066-1077.
©2024 Ferrata Storti Foundation Published under a CC BY-NC license
Disclosures
No conflicts of interest to disclose.
Contributions
YU and KM conceived and designed the study, collected data, performed the statistical analysis, wrote the manuscript, and provided patient care. DI, AF, RT, DM, KN and MT collected the data and provided patient care. All authors reviewed and approved the manuscript.
Data-sharing statement
The datasets generated during and/or analyzed during the current study are available from Yuka Uesugi or Kosei Matsue on reasonable request.
7 Mateos M-V, Dimopoulos MA, Cavo M, et al. Daratumumab plus bortezomib, melphalan, and prednisone versus bortezomib, melphalan, and prednisone in transplant-ineligible newly diagnosed multiple myeloma: frailty subgroup analysis of ALCYONE. Clin Lymphoma Myeloma Leuk. 2021;21(11):785-798.
8. Kim K, Lee JH, Kim JS, et al. Clinical profiles of multiple myeloma in Asia-an Asian Myeloma Network study. Am J Hematol. 2014;89(7):751-756.
9. Terao T, Tsushima T, Miura D, Narita K, Takeuchi M, Matsue K. Social frailty predicts worse outcomes in patients with multiple myeloma: a novelty in an old approach. EJHaem. 2020;1(1):103-112.
10. Richardson PG, San Miguel JF, Moreau P, et al. Interpreting clinical trial data in multiple myeloma: translating findings to the real-world setting. Blood Cancer J. 2018;8(11):109.
11. Schjesvold FH, Dimopoulos M-A, Delimpasi S, et al. Melflufen or pomalidomide plus dexamethasone for patients with multiple myeloma refractory to lenalidomide (OCEAN): a randomised, head-to-head, open-label, phase 3 study. Lancet Haematol. 2022;9(2):e98-110.
12. Terpos E, Mikhael J, Hajek R, et al. Management of patients with multiple myeloma beyond the clinical-trial setting: understanding the balance between efficacy, safety and tolerability, and quality of life. Blood Cancer J. 2021;11(2):40.
Haematologica | 109 May 2024 1597 LETTER TO THE EDITOR
Limited utility of Mayo 2012 cardiac staging system for risk stratification of patients with advanced cardiac AL amyloidosis -
analysis
of a uniformly treated cohort of 1,275 patients
Systemic light chain (AL) amyloidosis is a rare incurable disorder caused by extracellular deposition of misfolded light chain protein fibrils causing organ dysfunction. Cardiac involvement is present in approximately two thirds of cases at diagnosis. Survival depends largely on the severity of cardiac involvement as well as hematologic response to treatment.1,2 Two validated cardiac staging systems, Mayo 2012 (stage I-IV)3 and the European modification of the standard Mayo 2004 staging system (stage I-IIIb),4,5 stratify patients according to different thresholds of biomarkers of disease involvement. The Mayo 2012 model divides patients based on three biomarkers: high-sensitivity troponin T <40 ng/L, NT-proBNP <1,800 pg/mL, and difference between involved and uninvolved serum free light chain (dFLC) <180 mg/L. The European modification of Mayo 2004 stratifies patients based on two biomarkers: high-sensitivity troponin T <50 ng/L and NT-proBNP <332 ng/L with stage III sub-classified into two sub-stages using NT-proBNP at 8,500 ng/L cutoff. Patients included in these original models were not treated with a uniform induction chemoimmunotherapy protocol and treated with regimens such as oral melphalan dexamethasone, which are now rarely used. There is a need to re-assess the predictive performance and robustness of these staging systems with current treatment approaches. We report here the comparison of cardiac staging in a large cohort of 1,275 patients with AL amyloidosis uniformly treated with bortezomib-containing regimens in the first-line setting from the ALchemy study. Patients enrolled in a prospective observational study at the United Kingdom National Amyloidosis Center treated with bortezomib-based regimens from 2010-2019 were analyzed. Diagnosis of AL amyloidosis was confirmed by histology and typed with immunohistochemistry or mass spectrometry, or if not available, for patients with biopsy confirmed amyloidosis and cardiac involvement alone, if they also had a negative DPD-Tc99m bone scan. Written consent was obtained from all patients in accordance with the Declaration of Helsinki. Hematologic responses were assessed by investigators as per consensus criteria.6 Overall survival (OS) was defined as time from diagnosis to death from any cause or last follow-up. OS estimates were generated using the Kaplan-Meier method and groups were compared using Cox regression and the log-rank test. Outcomes were stratified according to Mayo 2012 and the European modified clas-
sification. Discrimination of models was evaluated using Harrell’s C concordance statistic, estimating the proportion of all pairs sampled whose predicted outcomes follow the order of the observed outcomes. Sensitivity and specificity analysis were performed at 6 months, 1 year, 2 years and 5 years. Statistical analyses were conducted using STATA v18 (STATAcorp, Texas).
One thousand two hundred and seventy-five patients (755 male, 520 female) were included. Median age at presentation was 67 years (range, 29-89), with a median of two involved organs (range, 1-5); 812 (64%) had cardiac involvement, 892 (70%) renal and 154 (12%) liver involvement. All patients were treated with first-line bortezomib-based therapy: bortezomib-cyclophosphamide-dexamethasone in 1,190 (93%); bortezomib-dexamethasone in 48 [4%]; bortezomib-thalidomide-dexamethasone in 21 [2%] and 16 other bortezomib combinations. None were treated with a daratumumab-based combination or autologous stem cell transplant (ASCT) upfront; 95 (7%) had autologous stem cell transplant (ASCT) at a subsequent line of therapy. Patients were classified by Mayo 2012 staging as: stage I, II, III, IV in 199 (16%), 329 (26%), 413 (32%) and 334 (26%) cases, respectively and by European modified staging as: stages I, II, IIIa and IIIb in 219 (17%), 436 (34%), 424 (33%) and 196 (15%), respectively.
The median follow-up was 76 months (95% confidence interval [CI]: 72-79), estimated median OS was 82 months (95% CI: 65-110) and 3-year OS was 60% (95% CI: 57-63).
Whilst both Mayo 2012 and European modification models were predictive of OS, the European modification discernibly discriminated those with the poorest outcomes (Figure 1A, B). Median OS by European staging for stage I, II, IIIa, IIIb was: not reached (NR), NR, 36 and 7 months respectively, compared with Mayo 2012 stage I, II, III, IV: NR, 137, 37, and 26 months respectively. European stage II, IIIa, IIIb had a hazard ratio (HR) for death of: 2.24 (95% CI: 1.61-3.12), 4.13 (95% CI: 2.99-5.69) and 8.22 (95% CI: 5.8611.52), respectively. Mayo stage II, III, IV had a HR of: 2.26 (95% CI: 1.57-3.26), 4.18 (95% CI: 2.97-5.90) and 5.33 (95% CI: 3.77-7.53), respectively (Table 1).
Both staging systems were able to re-divide stages of the other system, identifying patients with better or worse outcomes. The proportions and median OS are reported according to each stage of the European modified staging systems and sub-grouped further by the Mayo 2012
Haematologica | 109 May 2024 1598 LETTER TO THE EDITOR
NTproBNP 8,500 ng/L threshold.
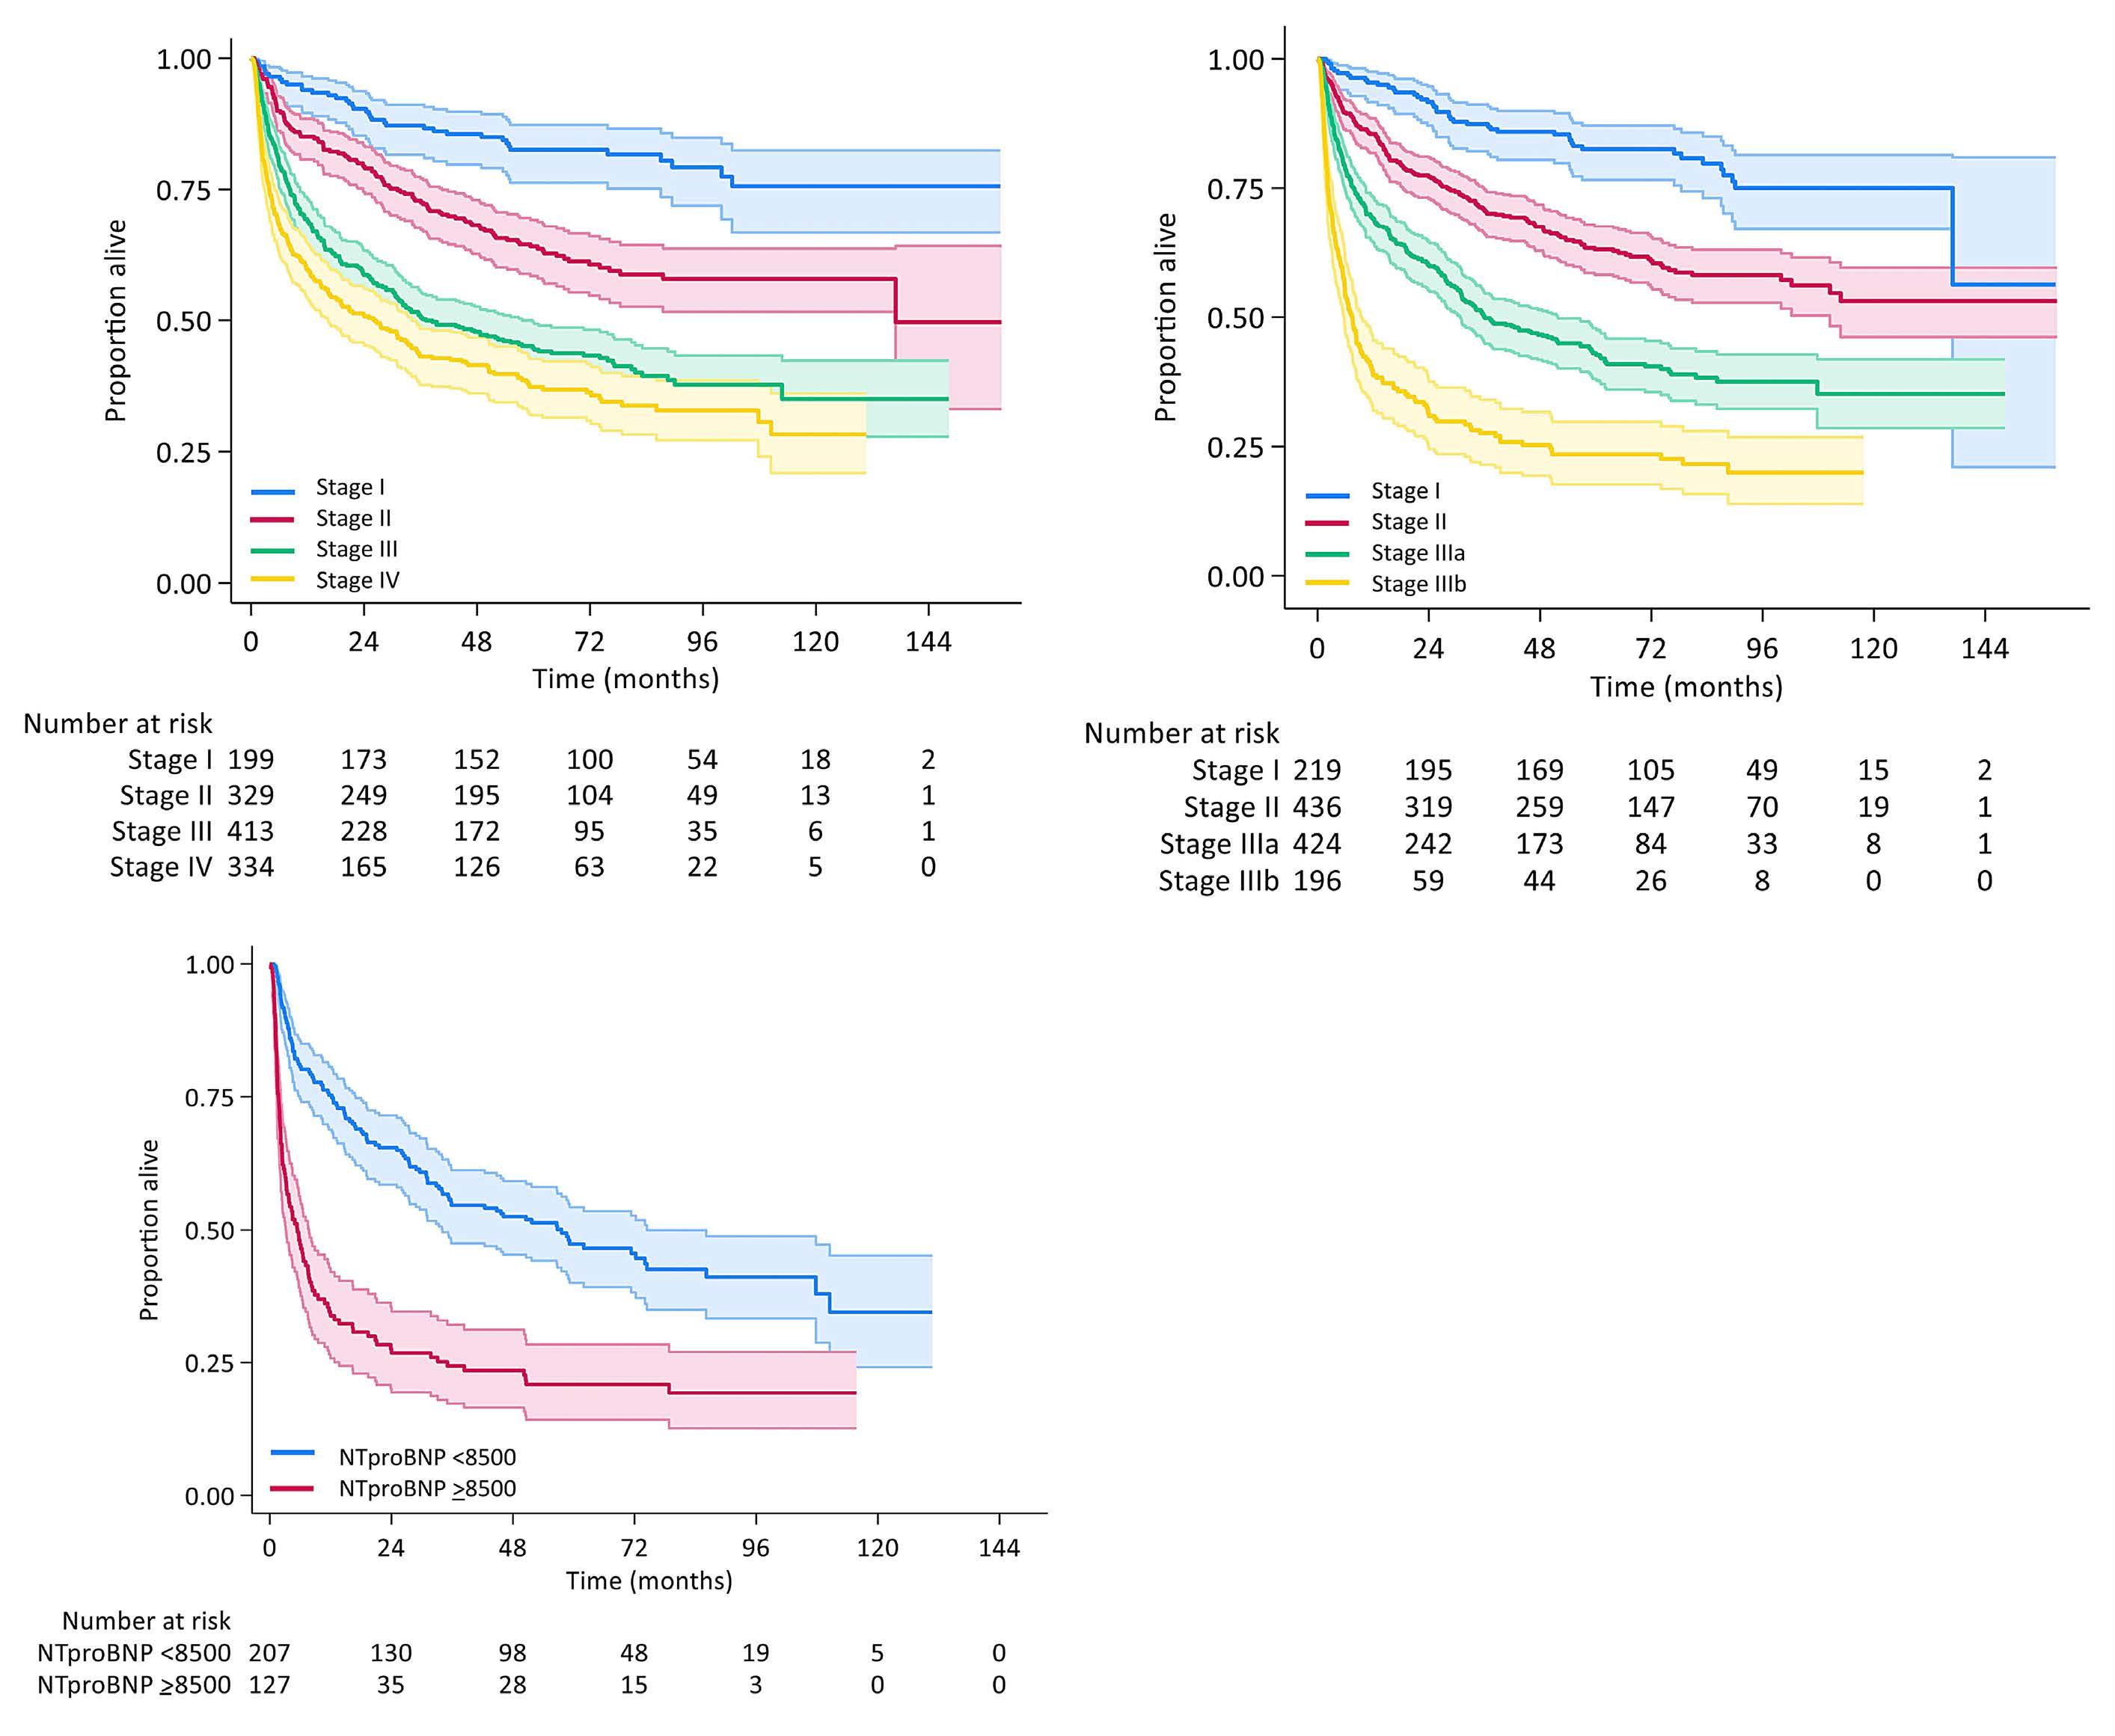
staging system (Table 2). Fifty-nine (18%), 153 (46%) and 122 (37%) of Mayo 2012 stage IV were European stage II, IIIa and IIIb, respectively. Strikingly, median OS in those with Mayo IV ranged from 5-74 months when stratified by European staging. Median OS of those with Mayo IV with NT-proBNP ≥8,500 ng/L compared with those <8,500 ng/L was 58 months (95% CI: 34-86) versus 5 months (94% CI: 3-8) (log-rank P<0.001) (Figure 1C). There was no interaction of dFLC with European stage (P=0.31). The values of Harrell’s C were 0.64 (95% CI: 0.62-0.66) and 0.68 (95% CI: 0.66-0.70) for Mayo and European models, indicating the models correctly ordered survival times for pairs of patients 64% and 68% of the time, respectively. Sensitivity and specificity at 6 months, 1 year and 5 years time points were 46.3%/78.3%, 41.6%/79.1% and 35.5%/81.8% for Mayo IV and 38.9%/89.8%, 37.0%/92.0% and 25.5%/93.3% for European IIIb (Online Supplementary Table S1). Current treatments in AL amyloidosis are aimed at elimi-
nating the underlying plasma cell clone with anti-plasma cell therapies to reduce the production of light chains.
The seminal ANDOMEDA trial lead to global approval of daratumumab-cyclophosphamide-bortezomib-dexamethasone (dara-VCD) in the management of newly diagnosed patients with AL amyloidosis showing superior responses to those treated with standard cyclophosphamide-bortezomib-dexamethasone.7 Dara-VCD is now considered the standard of care for patients with European modified stage I-IIIa. However, patients with advanced cardiac involvement (stage IIIb) were excluded and therefore are treated with alternative approaches or dose attenuation.
The European modification was derived from 346 patients with Mayo stage III disease from four European centers (UK, Italy, Germany, Greece) from 2001-2010. The most frequent regimen was oral melphalan-dexamethasone (44%) followed by thalidomide combination (28%) with only 23 (7%) patients receiving a bortezomib combination. The
Haematologica | 109 May 2024 1599 LETTER TO THE EDITOR
A B C
Figure 1. Overall survival by staging system. (A) Overall survival by Mayo 2012 staging. (B) Overall survival by European modified staging. (C) Mayo IV stratified by
*Log-rank test for trend. P<0.001 for all levels European stage I v II, II v IIIa, IIIa v IIIb; Mayo I v II, II v III, III v IV (P=0.0019). OS: overall survival; CI: confidence interval; HR: hazard ratio, NR: not reached.
Table 2. Comparison of Mayo 2012 and European modification staging systems.
OS: overall survival; CI: confidence interval; NR: not reached.
chemotherapy regimens used in the total of 810 patients that the Mayo 2012 model was based varied, including 583 without upfront ASCT or clinical trials, and then separately with 303 patients with high dose chemotherapy and ASCT upfront and 103 patients enrolled in clinical trials of lenalidomide-dexamethasone, cyclophosphamide-lenalidomide-dexamethasone and pomolidomide-dexamethasone.3 EMN23, the largest retrospective observational study of patients with systemic AL amyloidosis, showed changes in treatment regimens delivered over the last decade in Europe.8 Bortezomib-based regimens are now the standard first-line treatment with only rare patients treated with alkylators alone or immunomodulatory agent-based regimens. Improved outcomes were observed in all stages, except for patients with cardiac European stage IIIb disease with a median OS around 5 months. This remains an area of unmet need.
With two different staging systems in use for risk stratification of AL amyloidosis, there is potential for stage to be confounder. It is often assumed that European stage IIIb and Mayo 2012 stage IV denote the same or similar groups of patients from a prognostic perspective with the former being widely used in Europe and latter in the USA. This has become increasing crucial as there is increasing clinical trial focus on this poor risk group of patients. International consensus guidelines recommend the enrollment of all eligible
patients into clinical trials9 and therefore it is essential that clinical trial endpoints are robust and meaningful. Post hoc analysis of the phase III VITAL study suggested improved outcomes in the Mayo stage IV subgroup with the anti-fibril antibody, birtamimab.10 Further results in phase III trials of anti-fibril antibodies are awaited (CAEL101-301 clinicaltrials gov. identifier: NCT04504825 in European modification stage IIIb patients; AFFIRM-AL clinicaltrials gov. identifier: NCT04973137 in Mayo stage IV patients).
Our data demonstrates that advanced stage cardiac involvement remains a prognostic predictor of adverse outcomes. In our cohort of bortezomib-treated patients, the European modification was more discriminatory for poorer outcome, as reported elsewhere with heterogenous treatment regimens.11,12 In our cohort, the European modification had a higher concordance probability and stage IIIb had a greater specificity at all time points (6 months, 1 year, 2 years, 5 years) compared with Mayo IV. This implies most patients classified as high risk by stage IIIb will have an event by that point and lead to a higher positive predictive value for death. Those with European IIIb have the poorest outcomes despite modern treatment of recent decades8 and still represent the true unmet treatment need. Even Mayo 2012 stage IV patients are further discriminated by NT-proBNP < or >8,500 ng/L threshold. This is particularly critical in clinical trials to correctly identify the high-risk
Haematologica | 109 May 2024 1600 LETTER TO THE EDITOR
N Median OS (95% CI) HR (95% CI) P* Mayo 2012 Stage I 199 NR Reference <0.001 Stage II 329 137 (137-NR) 2.26 (1.57-3.26) Stage III 413 37 (31-58) 4.18 (2.97-5.90) Stage IV 334 26 (16-34) 5.33 (3.77-7.53) European modification Stage I 219 NR (137-NR) Reference <0.001 Stage II 436 NR (111-NR) 2.24 (1.61-3.12) Stage IIIa 424 36 (31-52) 4.13 (2.99-5.69) Stage IIIb 196 7 (6-10) 8.22 (5.87-11.53)
Table 1. Overall survival by staging system.
Mayo I Mayo II Mayo III Mayo IV European N Median OS 95% CI N Median OS 95% CI N Median OS 95% CI N Median OS 95% CI Entire group - NR - - 137 137-NR - 37 31-58 - 26 16-34 Stage I 125 NR - 80 137 NR 14 83 25-NR - -Stage II 74 NR 102-NR 159 NR NR 144 77 49-NR 59 74 45-NR Stage IIIa - - - 90 46 31-62 181 30 19-60 153 43 29-62 Stage IIIb - - - - - - 74 11 8-24 122 5 3-8
patients. The importance in clinical practice is to avoid inappropriate or unnecessary alternative treatment approaches in those that are not truly high risk. Although specificity is poor and sensitivity low, the higher sensitivity of Mayo IV implies its ability to identify more patients who have an event - this may still reflect the impact of the high dFLC and the clonal biology which is not captured in the European modification. The needs to be further explored and may be critical to trial designs where maintenance or longer term treatment approaches are studied. It has been suggested that the Mayo 2012 staging system predicts late survival more accurately and the European modification predicts early mortality; the current data confirm these observations. The Mayo system gives equal weighting to plasma cell burden (dFLC) and each cardiac biomarker. The relative importance of cardiac organ function may reduce over time in those that survive beyond the critical 6-12 months. A 3-year landmark analysis showed an increase in relative likelihood of correct survival prediction for Mayo 2012 versus European modification of 7% (N=457), but only 3.5% at 1-year landmark (N=688) and overall the European staging system had an increase of 3% for the entire cohort when compared with Mayo (N=1,005).13 Our current analysis raises serious concerns regarding interchangeability of the staging systems and impact of therapies on the reliability of the models. The Mayo 2012 staging, utilizing additional dFLC, did not discriminate the most advanced disease as well suggesting that treatment markedly impacts the predictive capability of cardiac staging systems. Amyloidogenic light chains in amyloidosis have been shown to induce cell stressors which are highly sensitive to proteasome inhibition, more so than those produced by myeloma plasma cells.14 In the era of bortezomib-treated patients with more effective therapy,8 the dFLC appears less prognostic. This may be a significant factor in the performance of staging systems. Given the results of ANDROMEDA, daratumumab-based treatments may have an even greater impact in ameliorating the adverse prognostic significance of high presenting dFLC.
Limitations of this study include the lack of complete datasets for all patients at baseline. Our data represents a UK population uniformly treated and should be replicated in other populations. These data should be taken into consideration when using cardiac staging systems in the clinic as well as for clinical
References
1. Manwani R, Cohen O, Sharpley F, et al. A prospective observational study of 915 patients with systemic AL amyloidosis treated with upfront bortezomib. Blood. 2019;134(25):2271-2280.
trial design. Additionally, functional data from echocardiography and cardiac magnetic resonance imaging are important for assessing patients outcomes in AL amyloidosis. There is a need to update AL staging incorporating these new observations.
Authors
Jahanzaib Khwaja,1 Sriram Ravichandran,1,2 Joshua Bomsztyk,2 Oliver Cohen,2 Darren Foard,2 Ana Martinez-Naharro,2 Lucia Venneri,2 Marianna Fontana,2 Philip N. Hawkins,2 Julian Gillmore,2 Helen J. Lachmann,2 Shameem Mahmood,1,2 Carol Whelan,2 Amy A. Kirkwood3 and Ashutosh Wechalekar1,2
1University College London Hospital; 2National Amyloid Center, Royal Free London Hospital and 3Cancer Research UK & UCL Cancer Trials Center, UCL Cancer Institute, University College London, London, UK
Correspondence:
J. KHWAJA - j.khwaja@nhs.net
https://doi.org/10.3324/haematol.2023.284348
Received: September 22, 2023.
Accepted: January 2, 2024.
Early view: January 11, 2024.
©2024 Ferrata Storti Foundation
Published under a CC BY-NC license
Disclosures
AW discloses honoraria from GSK, Alexion, Attralus, and Janssen; and discloses travel support from Takeda. All other authors have no conflicts of interest to disclose.
Contributions
AW and JK designed the study and wrote the paper. JK and AAK performed statistical analysis. All contributors participated in data collection and reviewed the paper.
Data-sharing statement
The data that support the findings of this study are available on request from the corresponding author. The data are not publicly available due to privacy or ethical restrictions.
2. Godara A, Toskic D, Albanese J, et al. Involved free light chains <10 mg/L with treatment predict better outcomes in systemic light-chain amyloidosis. Am J Hematol. 2021;96(1):E20-E23.
3. Kumar S, Dispenzieri A, Lacy MQ, et al. Revised prognostic staging system for light chain amyloidosis incorporating cardiac biomarkers and serum free light chain measurements. J Clin Oncol. 2012;30(9):989-995.
4 Wechalekar AD, Schonland SO, Kastritis E, et al. A European
Haematologica | 109 May 2024 1601 LETTER TO THE EDITOR
collaborative study of treatment outcomes in 346 patients with cardiac stage III AL amyloidosis. Blood. 2013;121(17):3420-3427.
5. Palladini G, Sachchithanantham S, Milani P, et al. A European collaborative study of cyclophosphamide, bortezomib, and dexamethasone in upfront treatment of systemic AL amyloidosis. Blood. 2015;126(5):612-615.
6. Palladini G, Schönland SO, Sanchorawala V, et al. Clarification on the definition of complete haematologic response in lightchain (AL) amyloidosis. Amyloid. 2021;28(1):1-2.
7 Kastritis E, Palladini G, Minnema MC, et al. Daratumumab-based treatment for immunoglobulin light-chain amyloidosis. N Engl J Med. 2021;385(1):46-58.
8. Palladini G, Schönland S, Merlini G, et al. The management of light chain (AL) amyloidosis in Europe: clinical characteristics, treatment patterns, and efficacy outcomes between 2004 and 2018. Blood Cancer J. 2023;13(1):19.
9 Wechalekar AD, Cibeira MT, Gibbs SD, et al. Guidelines for non-transplant chemotherapy for treatment of systemic AL
amyloidosis: EHA-ISA working group. Amyloid. 2023;30(1):3-17.
10 Gertz MA, Cohen AD, Comenzo RL, et al. Birtamimab plus standard of care in light chain amyloidosis: the phase 3 randomized placebo-controlled VITAL trial. Blood. 2023;142(14):1208-1218.
11. Dittrich T, Benner A, Kimmich C, et al. Performance analysis of AL amyloidosis cardiac biomarker staging systems with special focus on renal failure and atrial arrhythmia. Haematologica. 2019;104(7):1451-1459.
12. Vaxman I, Kumar SK, Buadi F, et al. Outcomes among newly diagnosed AL amyloidosis patients with a very high NT-proBNP: implications for trial design. Leukemia. 2021;35(12):3604-3607.
13. Muchtar E, Therneau TM, Larson DR, et al. Comparative analysis of staging systems in AL amyloidosis. Leukemia. 2019;33(3):811-814.
14 Oliva L, Orfanelli U, Resnati M, et al. The amyloidogenic light chain is a stressor that sensitizes plasma cells to proteasome inhibitor toxicity. Blood. 2017;129(15):2132-2142.
Haematologica | 109 May 2024 1602 LETTER TO THE EDITOR
Efficacy of combined low-dose ruxolitinib and cyclosporine in murine immune bone marrow failure
Immune aplastic anemia (AA) is a bone marrow failure (BMF) syndrome characterized by pancytopenia and hypocellular bone marrow (BM) due to hematopoietic stem and progenitor cell (HSPC) destruction by activated T cells.1 Immunosuppressive therapy (IST) with anti-thymocyte globulin (ATG) and cyclosporine A (CsA), with eltrombopag, a thrombopoietin agonist, is first line treatment for severe AA patients who are older or lack a fully matched sibling donor for stem cell transplant.1 However, ATG requires hospitalization and is preferably administered at specialized centers, as it can cause significant infusion reactions and other toxicities. Therefore, development of a low-risk oral therapy is a key goal of BMF research. Targeting the JAK pathways has proven efficacious in many diseases, in particular immune-mediated and inflammatory disorders.2,3 Among JAK inhibitors, ruxolitinib (RUX) is an orally-administrated selective ATP-competitive JAK1/2 kinase inhibitor, currently licensed to treat primary myelofibrosis (PMF)4 and graft-versus-host disease (GVHD).2,3 We reported that RUX successfully treats BMF in mice by reversing cytopenias, resulting in prolonged survival and little toxicity, likely due to its suppression of T-cell activation and proliferation, reduction in inflammatory cytokines, and expansion of regulatory T cells (Treg).5 In our initial experiments, RUX was administered as either a food additive or via gavage at a standard dose equivalent to ~60 mg/kg;6 prior dosing in mice in other disease models has ranged from 30-90 mg/ kg. However, RUX causes cytopenias in PMF and GVHD, potentially limiting its use in BMF patients. In our animal work, RUX did induce mild anemia in normal mice although neutrophils (NEU) and platelets (PLT) were unaffected in a 2-week short-term toxicity study.5 Herein, we have further assessed long-term RUX hematoxicity in normal mice. All animal studies were approved by the Animal Care and Use Committee at the National Heart, Lung, and Blood Institute. RUX-chow was first administered to achieve a dose of ~60 mg/kg (full dose). Extended feeding in normal CByB6F1 mice for 4 and 12 weeks moderately decreased white blood cells (WBC), red blood cells (RBC), hemoglobin (HGB), and lymphocytes (LYM), but did not affect NEU or PLT (Online Supplementary Figure S1A, B; Figure 1A). Reduction in proportions of peripheral blood CD4+ and CD8+ T cells were also seen (Online Supplementary Figure S1B; Figure 1A). In contrast to the high rates of thrombocytopenia in PMF and GVHD patients treated with RUX,2-4 we did not observe a reduction of PLT in normal mice after extended RUX treatment. Previously we had also observed that in BMF mice, PLT in animals receiving RUX recovered rapidly compared with untreated mice.5 Our observations are in agreement
with a report that RUX may stimulate CD41/CD42b expression and megakaryocyte differentiation in human K562 and Meg-01 cells in vitro and augment PLT production in vivo in an irradiation mouse model.7 Of interest, WBC (both NEU and LYM) and HGB returned to normal levels after RUX withdrawal, indicating that RUX-associated hematopoietic side-effects are transient. RUX reduced CD8+ more than CD4+ T cells in blood (Online Supplementary Figure S1B; Figure 1A). RUX reduced total BM cell numbers at 10 weeks (Online Supplementary Figure S1C) and 16 weeks (Figure 1B) but did not affect Lin-Sca-1+CD117+ cells (KSL), myeloid progenitor cells (MP), or lymphoid progenitor cells (CLP). RUX did not affect the in vitro function of HSPC evidenced by colony forming unit (CFU) assay (Online Supplementary Figure S1D; Figure 1C), similar to our earlier observations in the short-term study, indicating that RUX hematoxicity in mice is relatively mild and reversible.5 Most importantly, RUX-treated donor BM cells showed normal ability to engraft lethally irradiated recipient mice at different dilutions in an irradiation protection assay (Online Supplementary Figure S1E; Figure 1D). In the long-term toxicity study, Lin-CD117+ cells from RUX-treated and normal donor BM cells had comparable molecular features, displaying similar transcriptome distribution in multidimensional scaling plot (Figure 1E), further confirming minimal impact on HSPC by RUX. In an attempt to reduce the dose and therefore toxicity of RUX while also retaining efficacy, we treated BMF mice with a combination of CsA and low-dose RUX. To allow for dose reduction of RUX, gavage rather than chow was used. CByB6F1 mice were pre-irradiated with 5 Gys total body irradiation (TBI) followed by injection of 5×10⁶ lymph node (LN) cells from C57BL/6 donors to induce BMF8 (Figure 2A). Both CsA and RUX were administered at low doses: CsA at 25 mg/kg (insufficient for the treatment of murine immune BMF9) and RUX 15 mg/kg twice daily gavage (BID, below typical therapeutic doses of 30-90 mg/kg BID in mice10,11) to keep stable drug concentration because RUX has a short terminal half-life of approximately 3 hours. Using low-dose RUX or CsA monotherapy as controls, we found that RUX and CsA combined therapy significantly improved WBC, NEU, RBC, and PLT 2 weeks after BMF initiation (Figure 2B). combined-therapy but neither monotherapy reduced blood CD4+ and CD45R+ cells; all treatment groups had decreased blood CD8+ T cells relative to BMF mice, with RUX and CsA combined therapy group having the lowest frequencies of CD8+ T cells (Figure S2A). Combined therapy also reduced Fas expression and apoptosis of blood non-T cells (Online Supplementary Figure S2A). Combined therapy increased residual BM cells (RBM, excluding T cells), suppressed CD4+
Haematologica | 109 May 2024 1603 LETTER TO THE EDITOR
and CD8+ T cells, reduced RBM apoptosis, and increased RBM viability (Figures 2C), when compared to BMF mice with or without monotherapy with RUX or CsA. Furthermore, combined therapy reduced expression of PD-1, FasL, CD25, and CD38 in BM CD4+ and CD8+ T cell, while RUX or CsA monotherapy reduced these activation and functional markers only in CD4+ but not in CD8+ T cells (Online Supplementary Figure S2B). Thus, low-dose RUX and CsA combined therapy effectively suppressed T-cell activation and alleviated immune-mediated BM destruction. In a long-term survival study, we monitored animals for 12 weeks: all untreated BMF mice died within 3 weeks, and 90% of BMF mice in the low-dose RUX or CsA monotherapy groups were dead by 12 weeks. In contrast, 70% (7/10) of mice in the low-dose RUX and CsA combination therapy
group survived to the end of the 12-week study (Figure 2D). The surviving mice had similar NEU, RBC, and PLT counts to normal control CByB6F1 mice (Online Supplementary Figure S2C). Despite having lower total BM cells (Online Supplementary Figure S2C) and a lower proportion and total number of myeloid progenitors (MP; Online Supplementary Figure S2D), the mice who received RUX and CsA had a higher proportion and total number of KSL cells (Online Supplementary Figure S2D) with normal CFU frequencies in the BM (Online Supplementary Figure S2E). Thus, low-dose RUX and CsA combined therapy augmented hematopoietic recovery and significantly increased animal survival with restored HSPC functionality. Findings from our study are compatible with reports showing that combined therapy of RUX and other agents may enhance therapeutic efficacy.12-14
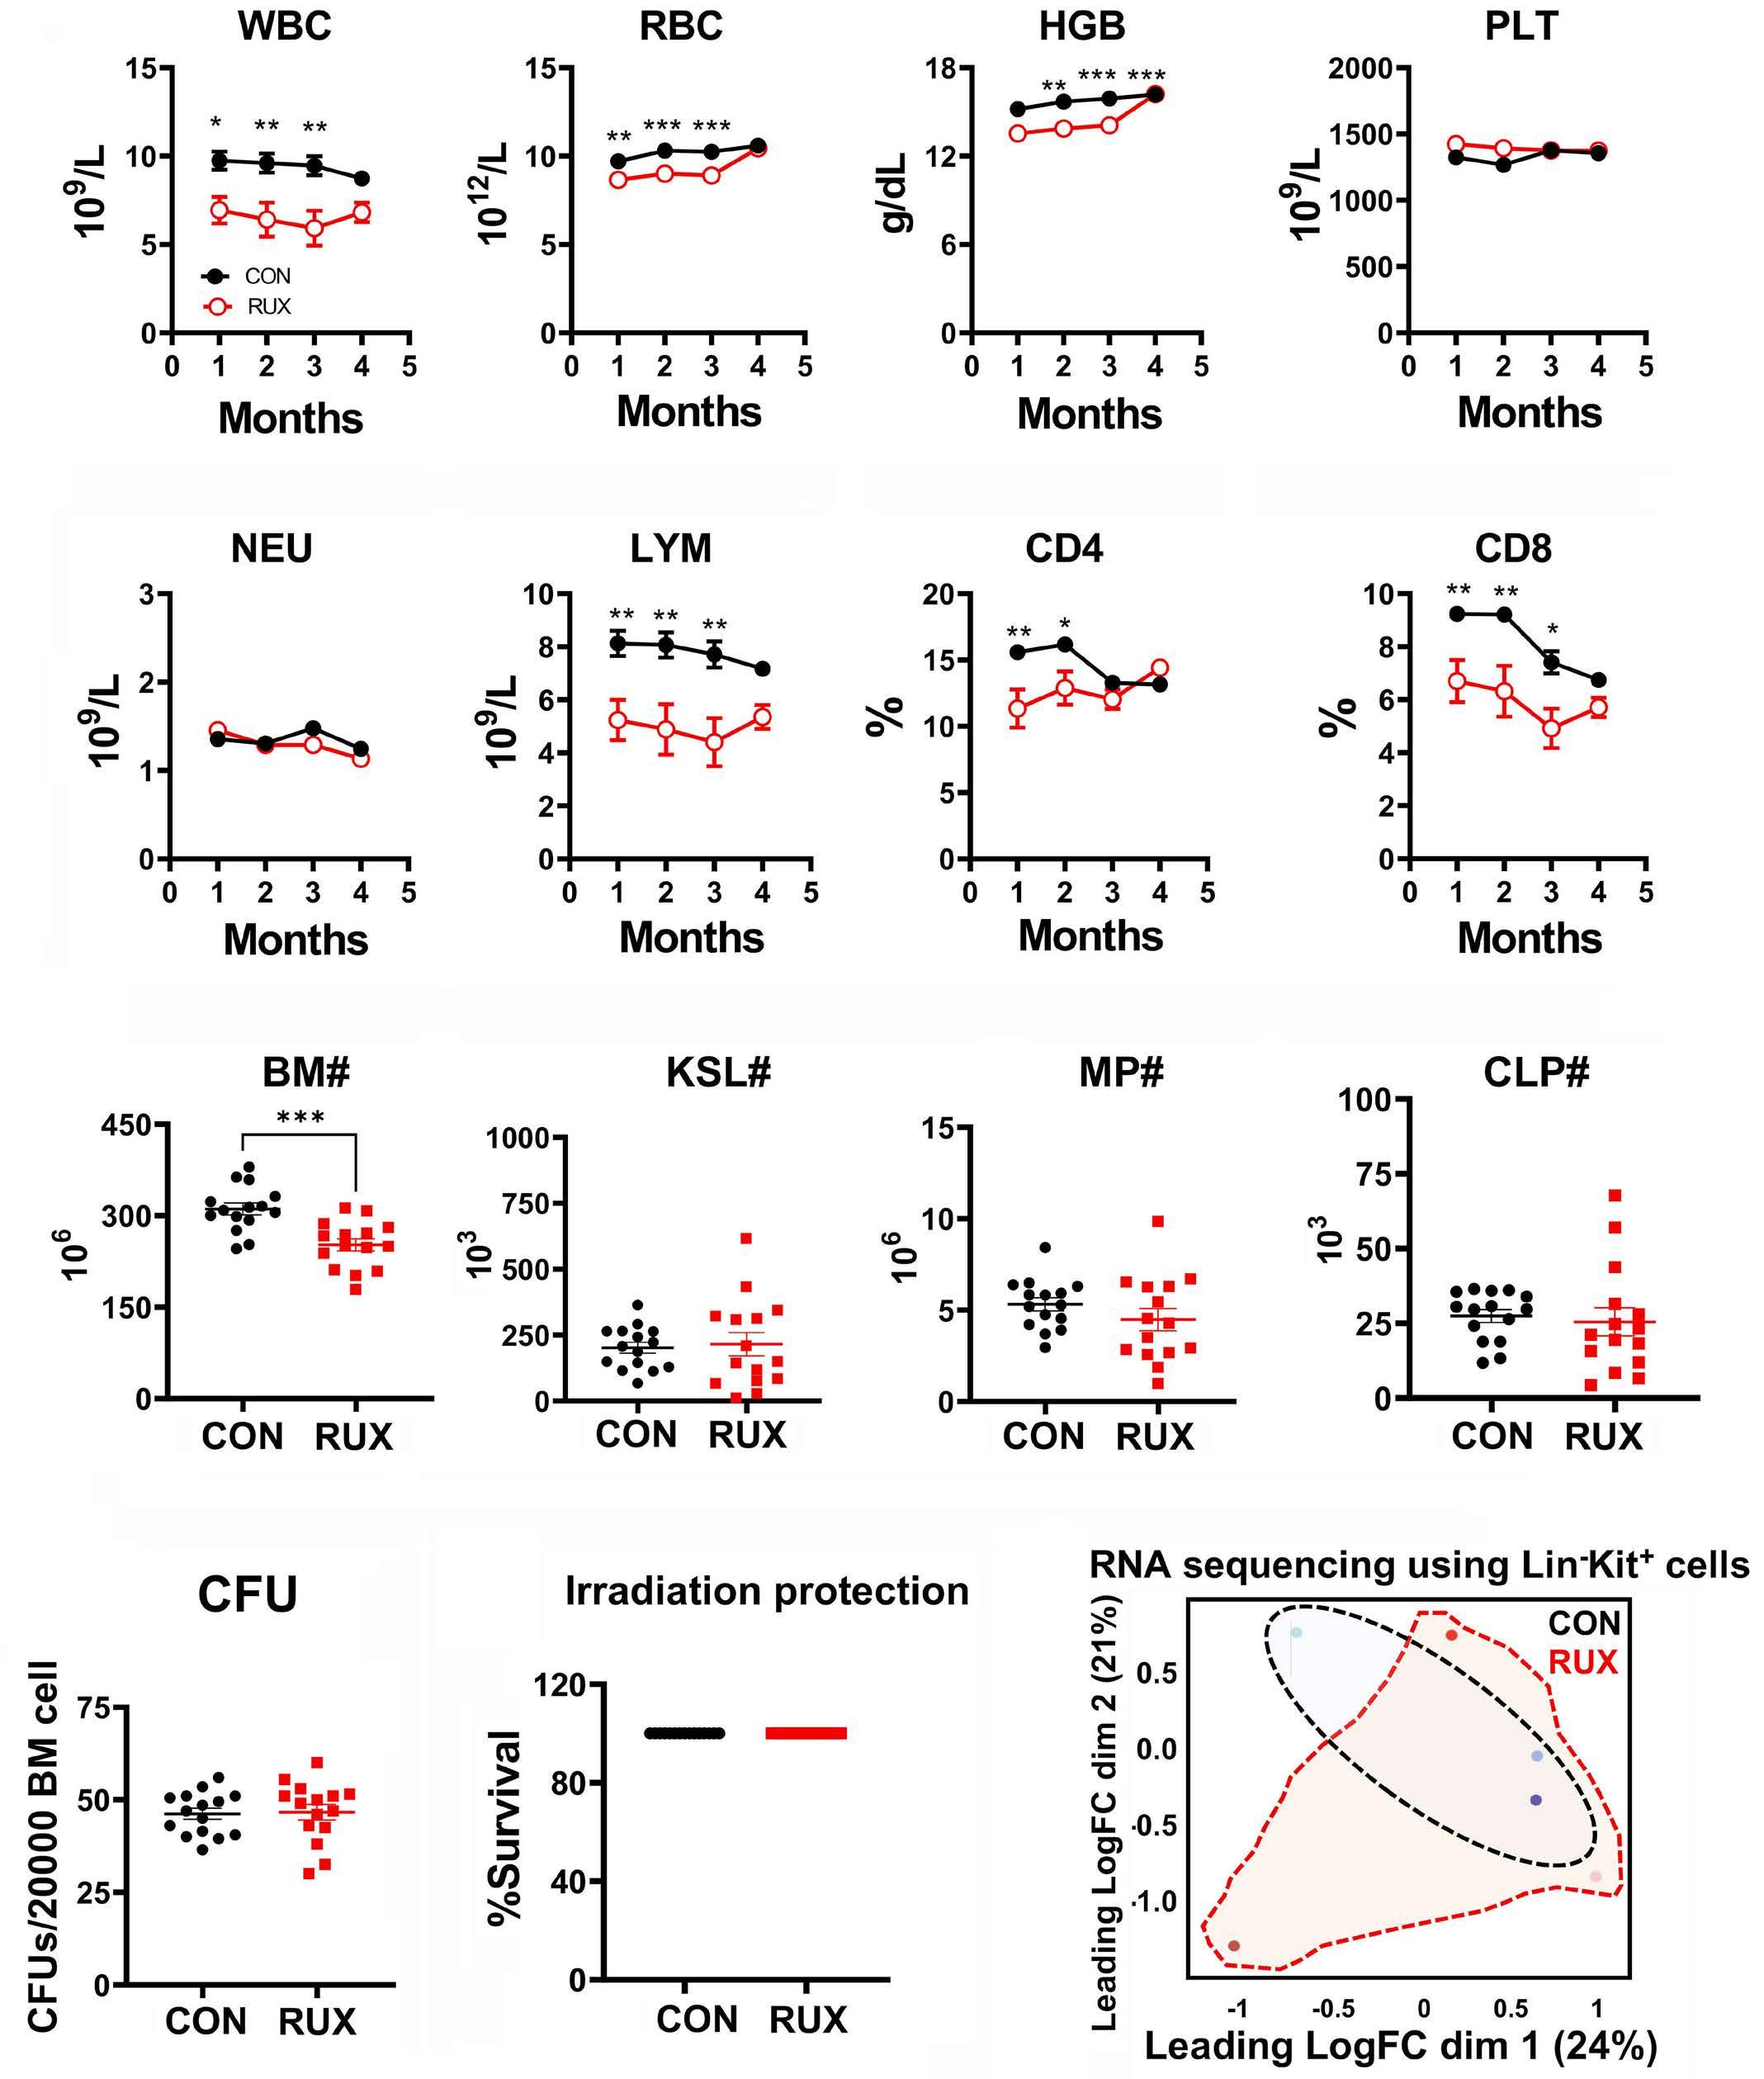
Figure 1. Hematoxicity of ruxolitinib in normal mice. (A) Peripheral white blood cell (WBC), neutrophil (NEU), red blood cell (RBC), hemoglobin (HGB), platelet (PLT), lymphocyte (LYM) counts and CD4 and CD8 percentages during 16 weeks. (B) Total bone marrow (BM) cell numbers, Lin-Sca-1+CD117+ (KSL), myeloid progenitor (MP), and common lymphoid progenitor cell (CLP) numbers in the BM at 16 weeks. (C) Colony forming unit (CFU) assay with BM cells at 16 weeks. (D) Irradiation protection assay with ruxolitinib (RUX)-treated or normal control (CON) donor BM cells at 16 weeks at 1:128 dilution to transplant into lethally irradiated CByB6F1 recipient mice. Survival of recipients was monitored and recorded for 30 days. (E) RNA sequencing: multidimensional scaling plot of LinCD117+ cells from RUX-treated mice at 16 weeks and from CON mice. Data are available under GEO series accession number GSE240867. *P<0.05; **P<0.01; ***P<0.001; ****P<0.0001. LogFC: log fold change.
Haematologica | 109 May 2024 1604 LETTER TO THE EDITOR
A B C D E
In order to determine molecular changes in T cells post therapies, BM CD8+ and CD4+ T cells from untreated BMF mice and those treated for 2 weeks were subjected to RNA sequencing (Figure 3). Transcriptomes of BM CD8+ T cells
of combination therapy mice had a distinct distribution from low-dose RUX or CsA monotherapy groups; both monotherapy groups overlapped while all three treatment groups separated from untreated BMF group in the
Figure 2. Therapeutic effects of lowdose ruxolitinib, ruxolitinib, and ruxolitinib plus ruxolitinib combination on murine immune bone marrow failure. (A) In order to induce bone marrow failure (BMF), 8-week old female CByB6F1 mice were pre-irradiated at 5 Gys total body irradiation (TBI) and infused with 5×10⁶ lymph node (LN) cells/ mouse from C57BL/6 female donors. BMF mice were untreated (BMF), or were treated with low-dose ruxolitinib (RUX, 15 mg/kg gavage twice daily, 5 days/ week for 2-3 weeks, Incyte Corporation, Wilmington, DE) or low-dose cyclosporine A (CsA, 25 mg/kg i.p. once daily, 5 days/week for 2 weeks, Perrigo, Minneapolis, MN) monotherapy, or RUX and CsA combination therapy (RUX+CsA). All treatments started at day 3 following LN infusion. Animals were bled and euthanized at 2 weeks for cellular analyses, or were kept for 12 weeks to monitor survival. (B) Mice were bled at day 14 after LN cell infusion to analyze white blood cells (WBC), neutrophils (NEU), red blood cells (RBC), and platelets (PLT). (C) In one study (N=5, 8, 8, 10 for BMF, CsA, RUX, and RUX+CsA groups), mice were euthanized at day 14 and BM cells were extracted from bilateral tibiae and femurs to analyze BM cell counts, residual BM cell counts (RBM, BM cells excluding T cells), and proportions of CD4+ T cells, CD8+ T cells, apoptosis and viability of RBM. (D) In another study (N=5, 7, 8, and 10 for BMF, CsA, RUX, and RUX+CsA groups), mice were monitored for 12 weeks after 3-week treatment to record animal survival. *P<0.05; **P<0.01; ***P<0.001; ****P<0.0001.
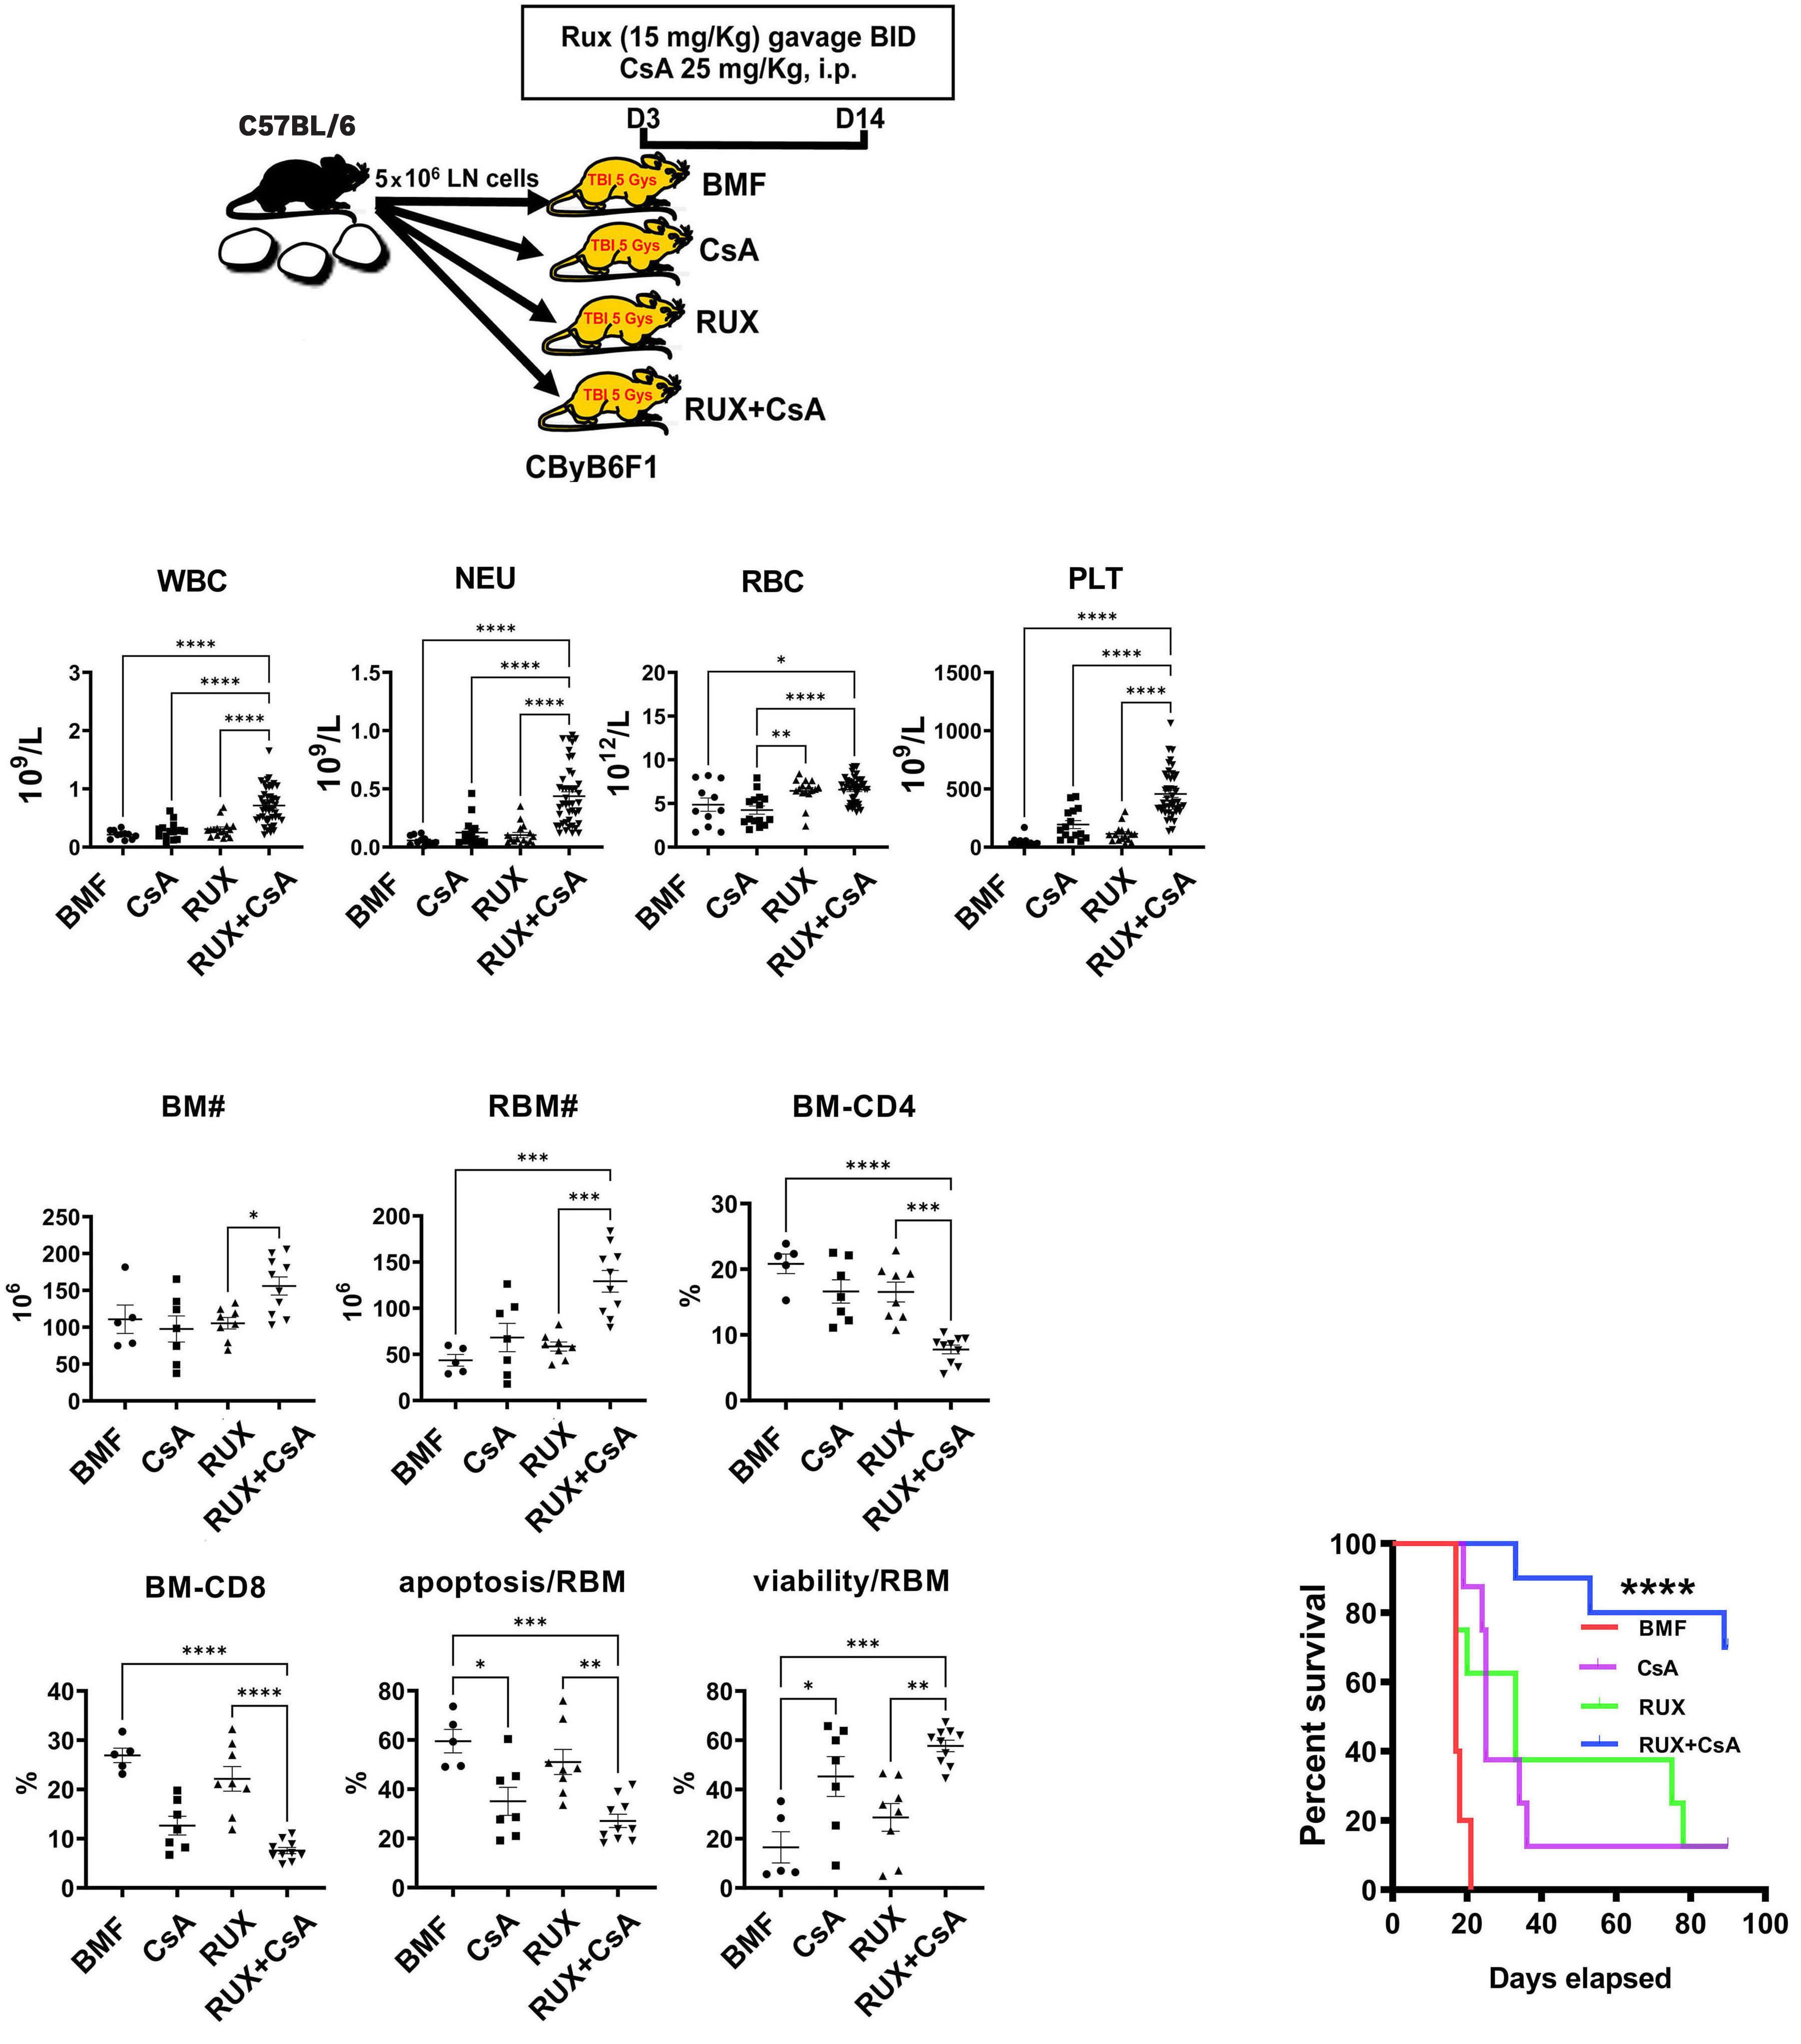
Haematologica | 109 May 2024 1605 LETTER TO THE EDITOR
A B C D
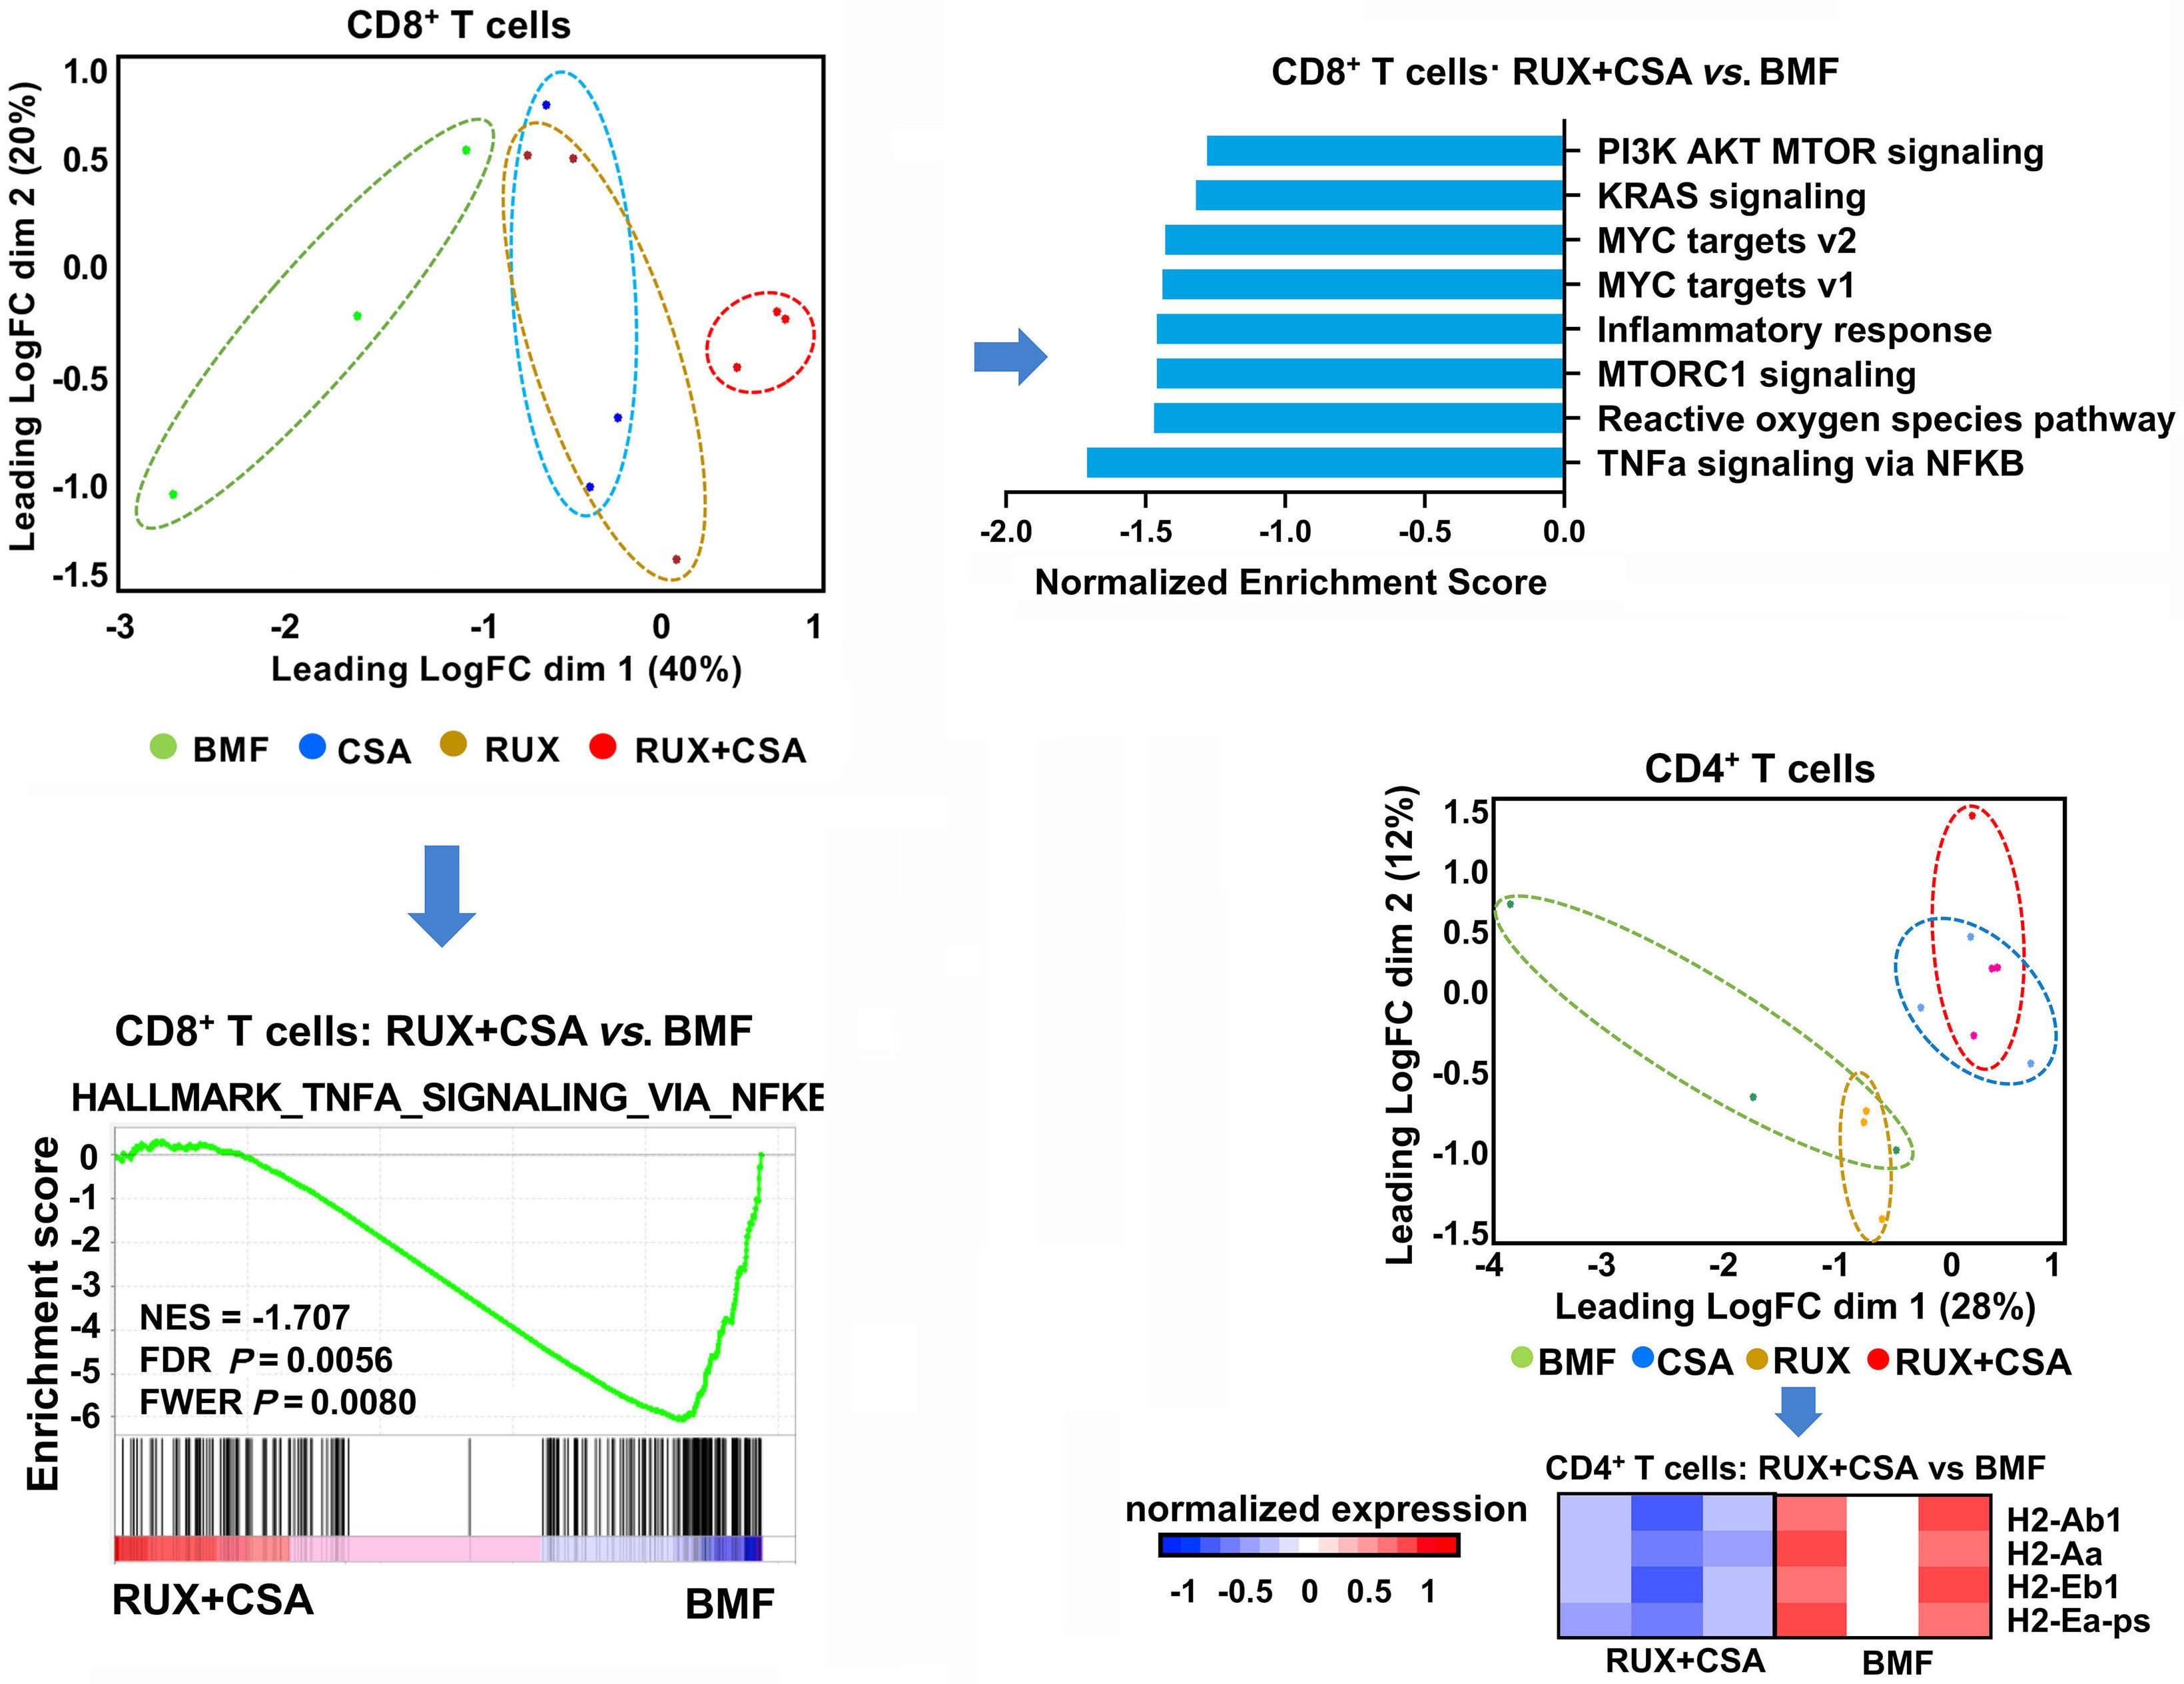
Figure 3. RNA sequencing of bone marrow T cells from untreated and treated bone marrow failure mice. Bone marrow (BM) CD4+ and CD8+ T cells were sorted from mice (N=5, 8, 8, 10 for bone marrow BM failure [BMF], cyclosporine A [CsA], ruxolitinib [RUX], and RUX+CsA groups) at 2 weeks, and pooled into 3 samples/group. RNA was extracted from pooled samples and applied to RNA sequencing. (A) CD8+ transcriptome distribution of untreated BMF, RUX, CsA, and RUX+CsA-treated BMF mice in multidimensional scale plot. (B) Top gene sets identified by Genomatrix Generanker to be downregulated in BM infiltrated CD8+ T cells from RUX+CsA-treated mice, compared to those from untreated BMF control mice. (C) Gene set enrichment analysis of CD8+ T cells in RUX+CsA versus untreated BMF. NES: normalized enrichment score. (D) CD4+ transcriptome distribution of untreated BMF, RUX, CsA, and RUX+CsA-treated BMF mice in multidimensional scale plot, and heat map of MHC-II genes downregulated in BM infiltrated CD4+ T cells from RUX+CsA-treated versus untreated BMF control mice. A red-blue color scale depicts gene expression levels (red indicates high, blue low). Data are available under GEO series accession number GSE240867.
multidimensional scaling plot (Figure 3A). Pathway analysis revealed immune activation and proliferation pathways related to the pathogenesis of BMF to be suppressed in CD8+ T cells of mice receiving combination therapy, compared with untreated BMF mice, such as PI3K, AKT, mTOR signaling, KRAS signaling, MYC targets, inflammatory response, and TNFα signaling pathways (Figure 3B). Gene set enrichment analysis also demonstrated that TNFα signaling in CD8+ T cells in combination therapy was suppressed (Figure 3C). In the multidimensional scaling plot of CD4+ T cells, transcriptome distribution of combination therapy overlapped with CSA monotherapy. Although no enriched pathways were found in BM CD4+ T cells, MHC-II gene expression that was previously found to be elevated in BMF15 was suppressed by combination therapy (Figure 3D), suggesting inhibition of T-cell activation, consistent with flow cytometry results. In summary, RUX hematoxicity is mild and reversible in
normal mice, mainly affecting red blood cells. Low-dose RUX and CsA combination therapy in BMF mice prolonged survival and resulted in sustained improvements in peripheral blood counts when compared to low-dose RUX or CsA monotherapy. Findings from this pre-clinical study support an approach to combine lower doses of RUX with CsA in patients to minimize hematologic toxicity.
Authors
Xingmin Feng, Ash Lee Manley, Zhijie Wu, Haoran Li, Shouguo Gao, Jibran Durrani, Nidhi Aggarwal, Hiroki Mizumaki, Jichun Chen, Neal S. Young# and Emma M. Groarke#
Hematology Branch, National Heart, Lung, and Blood Institute, National Institutes of Health, Bethesda, MD, USA
Haematologica | 109 May 2024 1606 LETTER TO THE EDITOR
A B C
D
#NSY and EMG contributed equally as senior authors.
Correspondence:
X. FENG - fengx2@nhlbi.nih.gov
https://doi.org/10.3324/haematol.2023.284358
Received: September 29, 2023.
Accepted: December 18, 2023. Early view: December 28, 2023.
©2024 NIH (National Institutes of Health)
Disclosures
Ruxolitinib was provided by Incyte Corporation, the manufacturers of ruxolitinib. Incyte did not have any input into the study design, data analysis, or presentation of results. NIH has a cooperative research and development with Novartis. The other authors have no conflicts of interest to disclose.
References
1. Young NS. Aplastic Anemia. N Engl J Med. 2018;379(17):1643-1656.
2. Zeiser R, von Bubnoff N, Butler J, et al. Ruxolitinib for glucocorticoid-refractory acute graft-versus-host disease. N Engl J Med. 2020;382(19):1800-1810.
3. Zeiser R, Polverelli N, Ram R, et al. Ruxolitinib for glucocorticoid-refractory chronic graft-versus-host disease. N Engl J Med. 2021;385(3):228-238.
4. Harrison C, Kiladjian JJ, Al-Ali HK, et al. JAK inhibition with ruxolitinib versus best available therapy for myelofibrosis. N Engl J Med. 2012;366(9):787-798.
5. Groarke EM, Feng X, Aggarwal N, et al. Efficacy of JAK1/2 inhibition in murine immune bone marrow failure. Blood. 2023;141(1):72-89.
6. Huarte E, Peel MT, Verbist K, et al. Ruxolitinib, a JAK1/2 inhibitor, ameliorates cytokine storm in experimental models of hyperinflammation syndrome. Front Pharmacol. 2021;12:650295.
7. Yang S, Tang X, Wang L, et al. Targeting TLR2/Rac1/cdc42/JNK pathway to reveal that ruxolitinib promotes thrombocytopoiesis. Int J Mol Sci. 2022;23(24):16137.
8. Chen J, Lipovsky K, Ellison FM, Calado RT, Young NS. Bystander destruction of hematopoietic progenitor and stem cells in a mouse model of infusion-induced bone marrow failure. Blood. 2004;104(6):1671-1678.
9 Knospe WH, Steinberg D, Gratwohl A, Speck B. Experimental
Contributions
XF and JC designed research, performed experiments, analyzed data and wrote the paper. ALM, ZW, JD, NA, and HM performed experiments and analyzed results. HL, ZW, and SG analyzed RNAseq data. NSY and EMG designed research, analyzed data and edited the paper.
Acknowledgments
Flow cytometry analysis and sorting were performed in NHLBI flow cytometry core.
Funding
This research was supported by intramural funding from the National Heart, Lung, and Blood Institute (NHLBI).
Data-sharing statement
RNA sequencing data are available under GEO series accession number GSE240867.
immunologically mediated aplastic anemia (AA) in mice: cyclosporin A fails to protect against AA. Int J Cell Cloning. 1984;2(4):263-271.
10 Das R, Guan P, Sprague L, et al. Janus kinase inhibition lessens inflammation and ameliorates disease in murine models of hemophagocytic lymphohistiocytosis. Blood. 2016;127(13):1666-1675.
11. Spoerl S, Mathew NR, Bscheider M, et al. Activity of therapeutic JAK 1/2 blockade in graft-versus-host disease. Blood. 2014;123(24):3832-3842.
12. Gagliardi TA, Milner J, Cairo MS, Steinberg A. Concomitant ruxolitinib and ibrutinib for graft-versus-host disease (GVHD): the first reported use in pediatric patients. Cureus. 2022;14(9):e29195.
13. Joly JA, Vallee A, Bourdin B, et al. Combined IFN-gamma and JAK inhibition to treat hemophagocytic lymphohistiocytosis in mice. J Allergy Clin Immunol. 2023;151(1):247-259.
14 Rai S, Grockowiak E, Hansen N, et al. Inhibition of interleukin1beta reduces myelofibrosis and osteosclerosis in mice with JAK2-V617F driven myeloproliferative neoplasm. Nat Commun. 2022;13(1):5346.
15. Erie AJ, Samsel L, Takaku T, et al. MHC class II upregulation and colocalization with Fas in experimental models of immunemediated bone marrow failure. Exp Hematol. 2011;39(8):837-849.
Haematologica | 109 May 2024 1607 LETTER TO THE EDITOR
Autologous hematopoietic cell transplantation for T-cell prolymphocytic leukemia: a retrospective study on behalf of the Chronic Malignancies Working Party of the EBMT
T-cell prolymphocytic leukemia (T-PLL) is a rare subtype of mature T-cell non-Hodgkin lymphoma1,2 with poor prognosis. Recently, the first consensus criteria have been proposed by the T-PLL International Study Group (TPLL-ISG)3 to allow a systematic approach to diagnosis, treatment, and response assessment.
Treatment of T-PLL is challenging. Alemtuzumab, an anti-CD52 monoclonal antibody, administered intravenously4 is considered the mainstay of first-line treatment. Alemtuzumab is associated with objective response rates (ORR) over 90%, but with short duration of response and a progression-free survival (PFS) of between 8 and 11 months.3
Therefore, despite the high ORR, it is recommended to offer consolidative treatment to all eligible patients. Allogeneic hematopoietic cell transplantation (allo-HCT) is considered the gold standard for this indication although it is associated with only modest long-term disease control.5-7
Autologous hematopoietic cell transplantation (auto-HCT) is cited as a possible option8,9 but this vague recommendation for auto-HCT is a result of extremely scarce data for this potential therapeutic choice.10,11
The current study aimed to study outcomes after auto-HCT using data from the European Group for Blood and Marrow Transplantation (EBMT), an organization comprising over 600 transplant centers, mainly from Europe. EBMT centers commit to obtain informed consent according to the local regulations applicable at the time in order to report pseudonymized data. Patients diagnosed with T-PLL who underwent their first auto-HCT between 2000 and 2019 were selected for the study. Data to verify the diagnosis, as well as clarification on treatment pre- and post-auto-HCT and cause of death, were requested from participating centers. T-cell prolymphocytic leukemia was diagnosed based on the TPLL-ISG consensus criteria.3 In our study, the diagnosis could be verified for patients for whom additional confirmatory data were provided by the participating centers.
The primary objective was to assess overall survival (OS). The secondary objectives were to examine PFS (the time between auto-HCT and relapse/progression of disease or death), relapse incidence (RI), non-relapse mortality (NRM), cause of death, incidence of second primary malignancies (SPM), and response to treatment. Response to treatment at day 100 was assessed according to TPLL-ISG recommendations.3 We separately analyzed a subset of patients for whom data were available to ascertain that these were patients who obtained a response to first-line
alemtuzumab and who proceeded to consolidation with auto-HCT (the post-alemtuzumab consolidation group). A second, smaller subset consisted of those patients in the post-alemtuzumab consolidation group who had received alemtuzumab as monotherapy (the post-alemtuzumab monotherapy consolidation group).
Median follow-up was calculated using the reverse Kaplan-Meier estimator. The Kaplan-Meier estimator was used for OS and PFS, and the crude cumulative incidence estimator was used for the competing events: RI together with NRM, and SPM. The log-rank test was used to assess differences between groups in OS and PFS, and Gray’s test was used to assess differences in RI and NRM according to sex, age, disease status, and Karnofsky performance status, year of auto-HCT, total body irradiation (TBI), and number of pre-treatment lines. All statistical tests were two-sided and P<0.05 was considered statistically significant. All analyses were performed in R version 4.2.2 using ‘survival’, ‘cmprsk’, and ‘prodlim’ packages.
Forty-two patients were initially identified. Additional confirmatory data were obtained for 21 of these patients, among whom 19 fulfilled the diagnostic criteria for T-PLL. Two patients were excluded based on immunophenotype. Thus, 40 T-PLL patients from 31 centers form the “whole group” for this analysis (Table 1). In 25 of these 40 patients, detailed information on pretreatment was available (Figure 1). Twenty-four patients of these 25 (96%) had been exposed to alemtuzumab before auto-HCT. Twenty patients (80%) had received only one line of previous therapy.
In the 20 patients for whom auto-HCT was used as firstline consolidation, one patient received fludarabine and cyclophosphamide rather than alemtuzumab. Thus, the “post-alemtuzumab first-line consolidation group”, as defined above, consisted of 19 patients, including 15 patients who received alemtuzumab as monotherapy (the “post-alemtuzumab monotherapy first-line consolidation group”). In these 15 patients, the median interval between start of first-line alemtuzumab and auto-HCT was 8.1 (interquartile range [IQR] 6.1-9.2) months.
Data on mobilization were available for 13 patients. Twelve (92%) patients required only one mobilization attempt, while one (8%) required 2 mobilization attempts. The first mobilization was performed solely with granulocyte colony stimulating factor (G-CSF) in 7 (54%) patients, with G-CSF and plerixafor in one (8%) patient. In other patients, hematopoietic cells were collected after chemotherapy and G-CSF, i.e., cyclophosphamide in 4 (31%) and DHAP in one
Haematologica | 109 May 2024 1608 LETTER TO THE EDITOR
Table 1. Patients’ and T-cell prolymphocytic leukemia characteristics at diagnosis and at auto-hematopoietic cell transplantation.
15
between start of the first pretreatment and auto-HCT, median (IQR); 15 missing
The characteristics are provided for all patients, for the subset of the post-alemtuzumab consolidation group of patients, and for the smallest subset of the post-alemtuzumab monotherapy consolidation group of patients (see Figure 1). Patient-, disease-, and transplant-related variables are expressed as median and interquartile range (IQR) for continuous variables and frequencies for categorical variables. *More than one category possible for each patient, hence percentages do not add up to 100%. (Percentage calculated as the percentage among patients with an abnormal karyotype). auto-HCT: autologous hematopoietic cell transplantation; CR: complete remission; HCT-CI: hematopoietic cell transplantation comorbidity index; IQR: interquartile range; KPS: Karnofsky performance status; N: number; PR: partial remission; WBC: white blood cells.
Haematologica | 109 May 2024 1609 LETTER TO THE EDITOR Whole group Post-alemtuzumab consolidation group Post-alemtuzumab monotherapy consolidation group N (%) N (%) N (%) Total 40 (100) 19 (100) 15 (100) Sex Male 23 (58) 11 (58) 8 (53) Female 17 (42) 8 (42) 7 (47) Age at diagnosis in years, median (IQR) 61 (50.3-66.2) 64 (60-68) 65 (61-68) Year of diagnosis, median (IQR) 2009 (2006-2013) 2012 (2007-2014) 2012 (2007-2015) WBC count at diagnosis, x109/L, median, (IQR); 22 missing 56.6 (24-232.8) 62 (51-237) 58 (52-204) Cytogenetics; 19 missing Normal karyotype 5 (24) 3 (21) 2 (18) Abnormal karyotype 16 (76) 11 (79) 9 (82) Specific abnormalities* abn14q23 9 (56) 6 (55) 4 (44) abnXq28 2 (12.5) 2 (18) 1 (11) neither abn14q23 nor abnXq28 5 (31) 4 (36) 4 (44) abn11q22.3 4 (25) 2 (18) 1 (11) complex karyotype 9 (56) 7 (64) 5 (56) Age at auto-HCT in years, median (IQR) 62 (53-67) 66 (61-69) 66 (62-69) <65 24 (60) 9 (47) 7 (47) 65-70 12 (30) 7 (37) 6 (40) ≥70 4 (10) 3 (16) 2 (13) KPS at auto-HCT; 8 missing ≤80 7 (22) 3 (16) 2 (13) 90 or 100 25 (78) 16 (84) 13 (87) HCT-CI; 14 missing low risk, 0 14 (54) 8 (47) 6 (46) intermediate risk, 1-2 5 (19) 3 (18) 2 (15) high risk, ≥3 7 (27) 6 (35) 5 (38) Year of auto-HCT Before 2010 17 (42) 6 (32) 5 (33) 2010-2019 23 (58) 13 (68) 10 (67) Interval in months diagnosis – auto-HCT, median (IQR) 8.8 (6.4-17.7) 9 (7.3-16.9) 9.7 (7.7-16.9) Disease stage at auto-HCT CR 27 (67) 11 (58) 9 (60) PR 10 (25) 6 (32) 4 (27) Stable disease 2 (5) 2 (10) 2 (13) Relapse / progression 1 (3) N of previous lines of therapy; 15 missing 1 20 (80) 19 (100) 15 (100) 2 5 (20) Alemtuzumab before auto-HCT;
missing 24 (96) 19 (100) 15 (100) Months
7.4 (6-11.8) 7.4 (6.1-9.2) 8.1 (6.1-9.2)
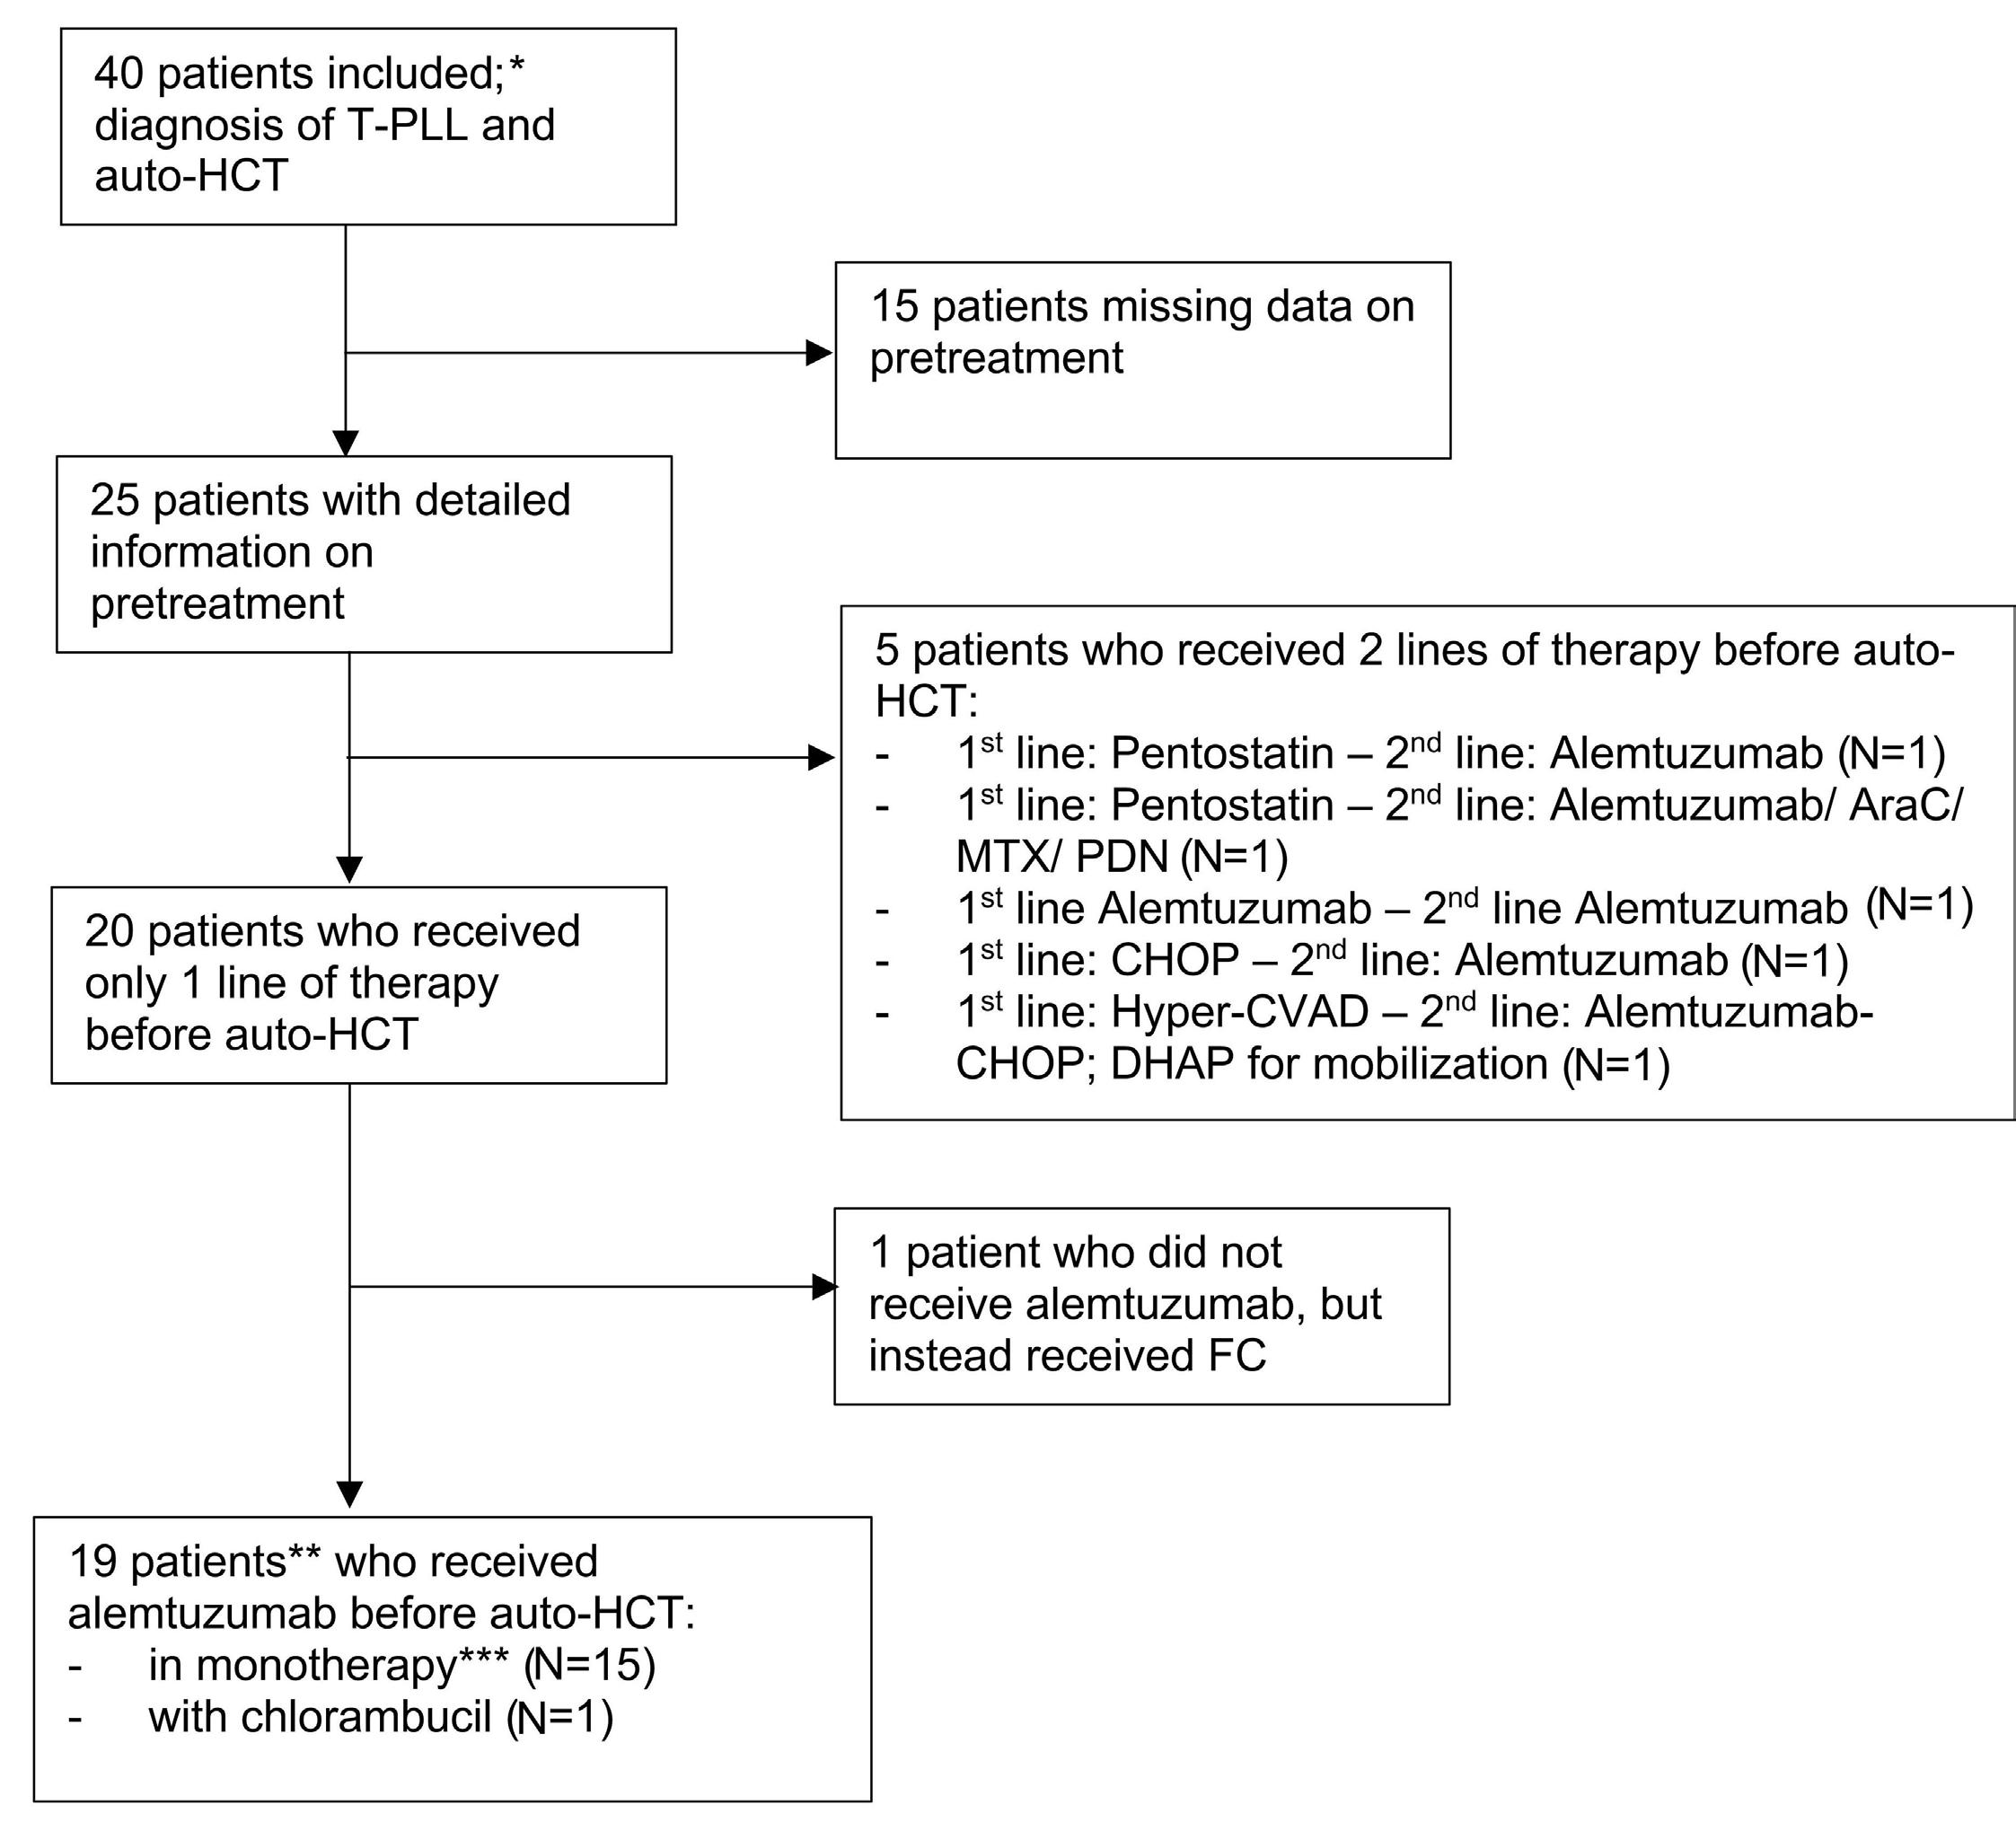
AraC: cytarabine; CHOP: cyclophosphamide/ doxorubicine/ vincristine/ prednisone; DHAP: dexamethasone/ cisplatin/ cytarabine; FC: fludarabine/ cyclophosphamide; Hyper-CVAD: cyclophosphamide/ doxorubicin/ vincristine/ dexamethasone; MTX: methotrexate; PDN: prednisone. *Whole group. **Post-alemtuzumab first-line consolidation group. ***Post-alemtuzumab monotherapy consolidation group. auto-HCT: autologous hematopoietic cell transplantation; N: number; T-PLL: T-cell prolymphocytic leukemia.
(8%). Median time to mobilization from the initiation of alemtuzumab treatment was 25 weeks (range, 15-81).
Information on conditioning was available for 37 patients. Most received chemotherapy-based conditioning: BEAM (N=22, 59%), BEAC (N=6, 16%), and FEAM (N=3, 8%). In 3 patients, alemtuzumab was incorporated into the conditioning regimen. Four (10%) patients received TBI (10.4-13 Gy). Engraftment was achieved in all evaluated patients.
For the whole group of evaluable patients (N=34), the ORR at 100 days post auto-HCT was 88% (95% Confidence Intervals [CI]: 72-97%). Importantly, 7 out of 34 patients (21%) improved their response after auto-HCT to complete remission (CR), while one (3%) partial remission (PR) patient experienced direct progression post transplantation.
With a median follow-up of 87.7 months (IQR, 41.7-89.9), the 4-year OS, PFS, cumulative RI, and NRM estimates were 34% (95% CI: 19-50%), 29% (95% CI: 14-44%), 66% (95% CI:
50-81%), and 5% (95% CI: 0-12%), respectively (Figure 2A-D).
For the post-alemtuzumab first-line consolidation group (N=19), the ORR at 100 days was 85% (95% CI: 65-96%). OS, PFS, and cumulative RI estimates after four years were: 39% (16-63%), 34% (11-56%), and 66% (44-89%), respectively; there was no NRM (Figure 2A-D) in this group.
For the post-alemtuzumab monotherapy consolidation group (N=15), the 4-year OS and PFS were 47% (95% CI: 21-72%) and 37% (95% CI: 11-63%), respectively. Online
Supplementary Table S1 shows probabilities of OS and PFS, and cumulative incidences of RI and NRM at two years after auto-HCT for the evaluated prognostic factors. None of these were significantly associated with analyzed outcomes in univariable analyses. Only 3 patients who died before relapse were observed during follow-up.
The most frequently reported cause of death among the 29 patients with data available on the cause of death
Haematologica | 109 May 2024 1610 LETTER TO THE EDITOR
Figure 1. Flow diagram depicting the number of patients with different types of treatment before autologous hematopoietic cell transplantation.
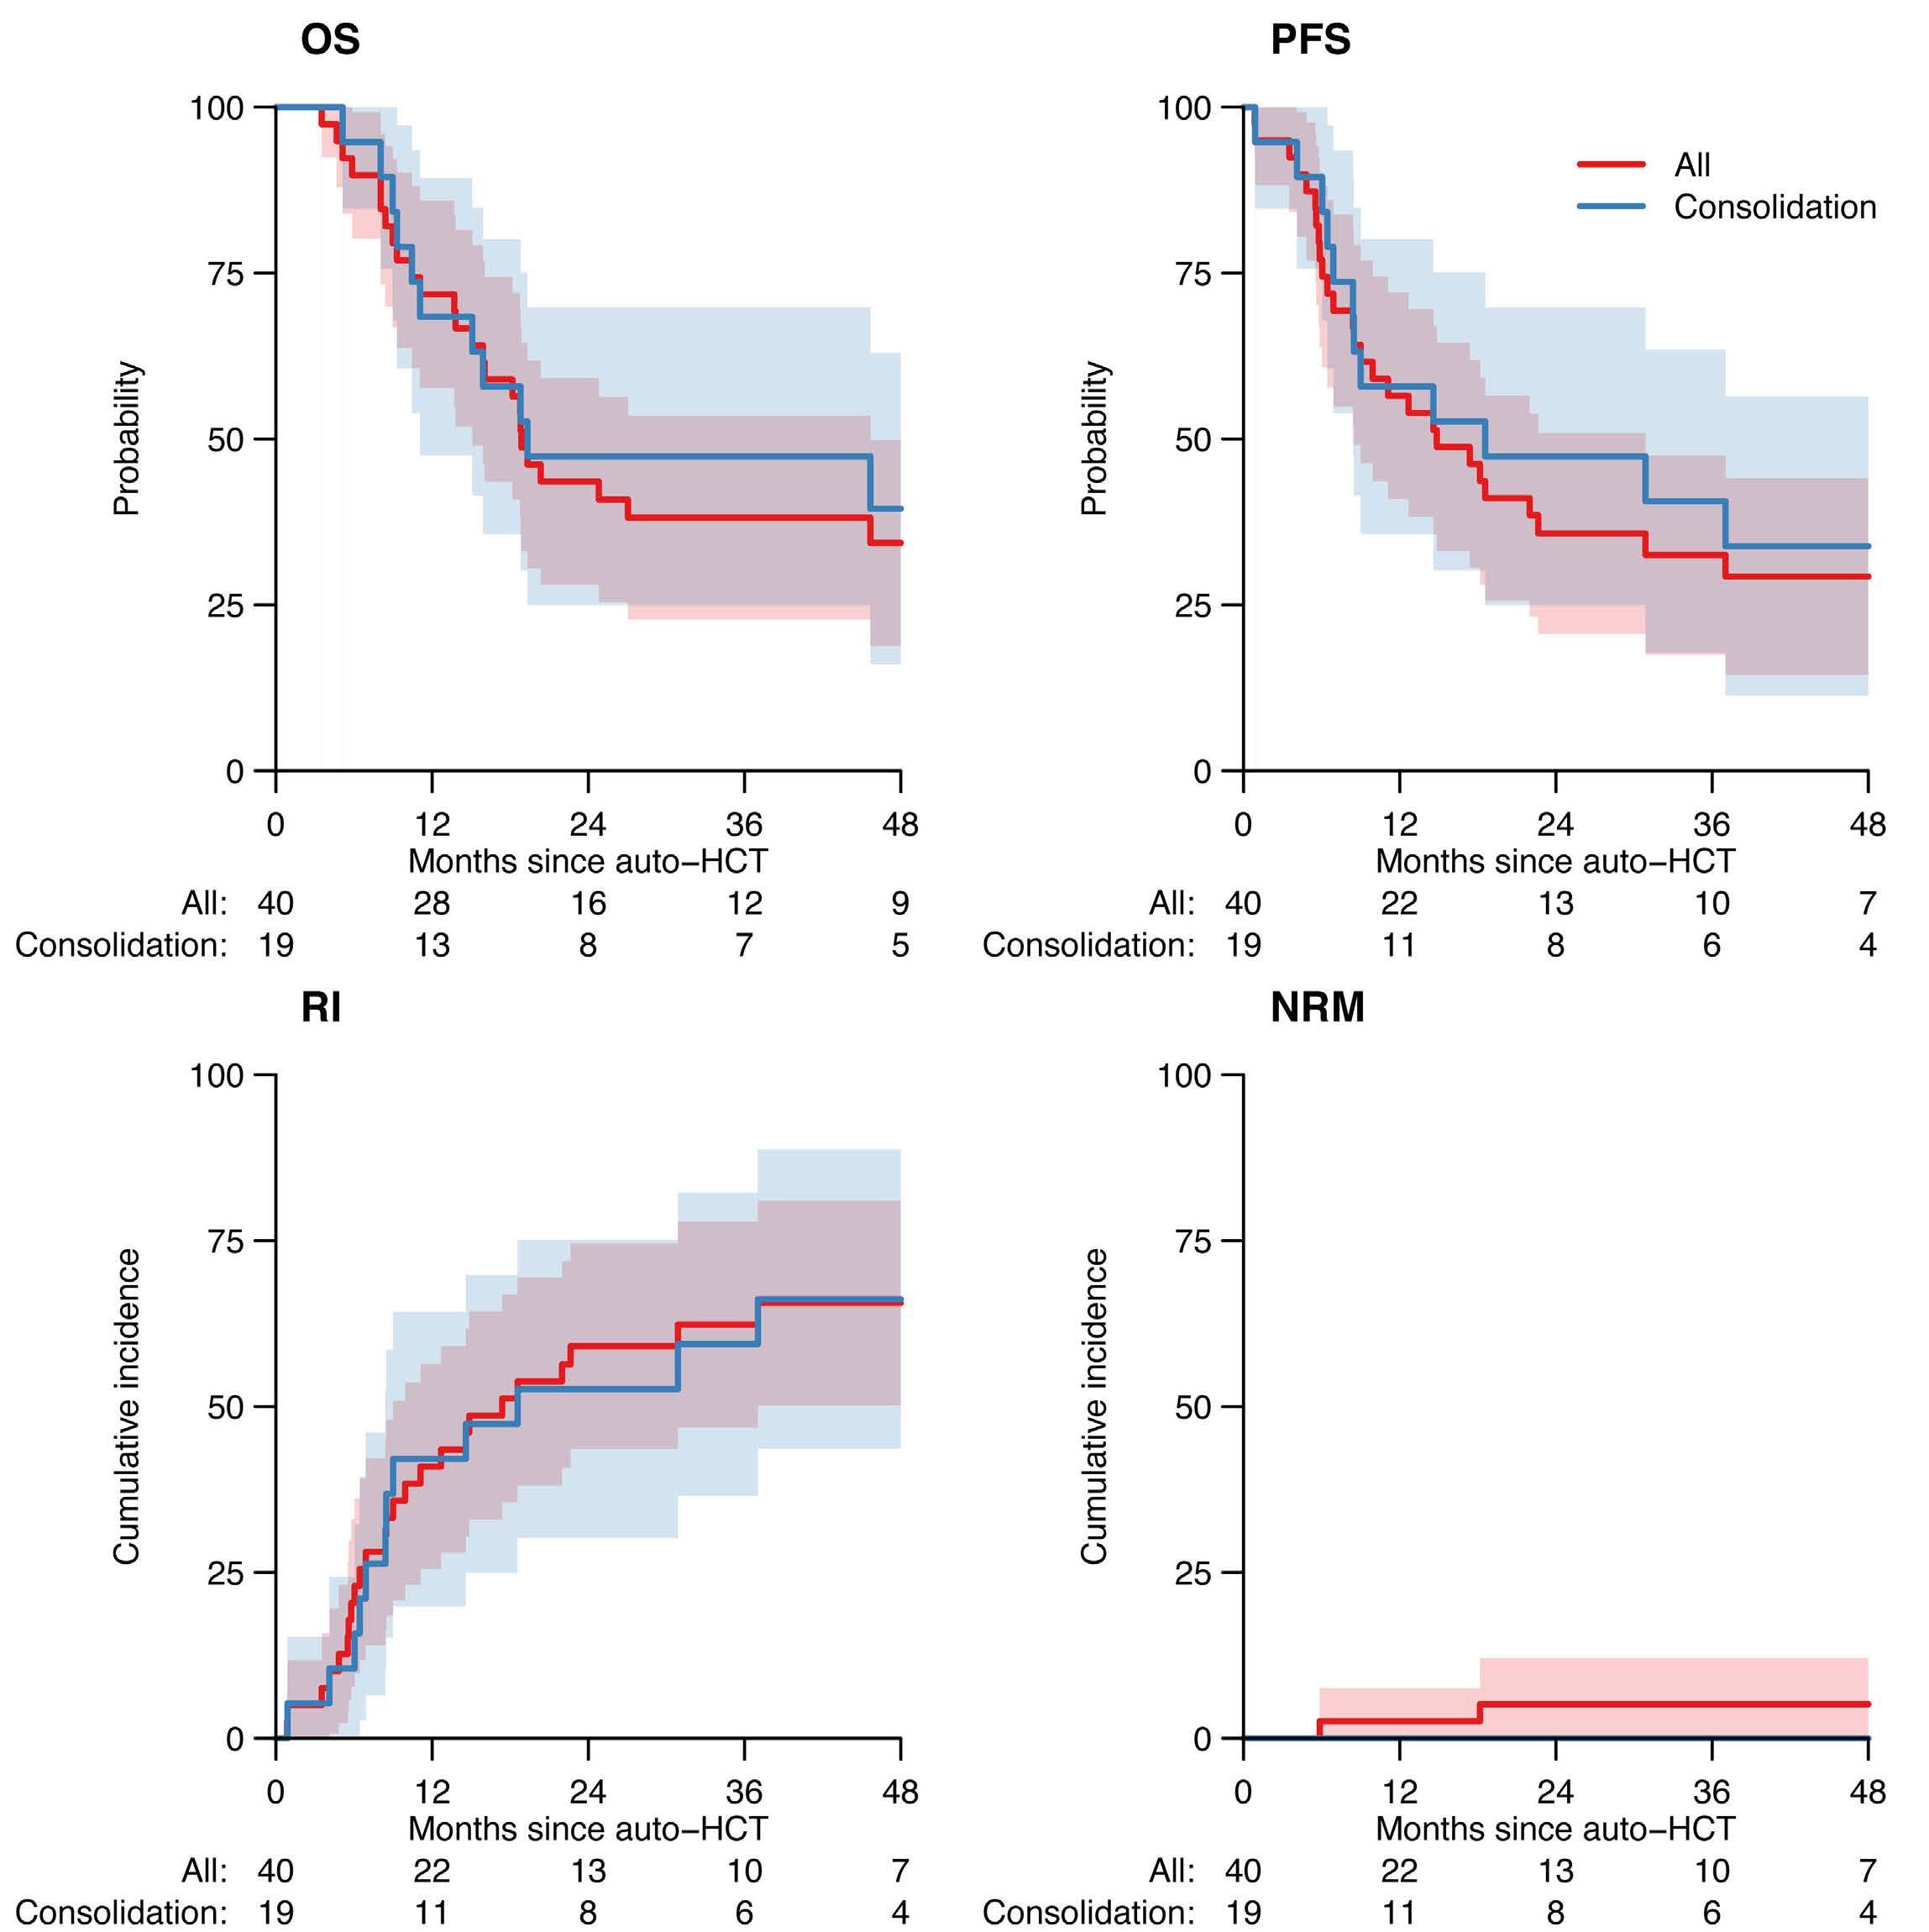
Figure 2. Outcome after autologous hematopoietic cell transplantation. (A) Overall survival (OS), (B) progression-free survival (PFS), (C) relapse incidence (RI), and (D) non-relapse mortality (NRM) of patients undergoing autologous hematopoietic cell transplantation (auto-HCT). Shaded areas represent 95% Confidence Intervals. Figures below the graph are the number of patients at risk. “Consolidation” patients (blue line) are patients with available detailed data receiving auto-HCT as a consolidation of response after first-line alemtuzumab (either in monotherapy or in combination). This group is a subset of “All” patients representing the whole group (red line). Hence the groups cannot be compared using a statistical test.
was relapse / progression (N=16), followed by infection (N=5), secondary malignancy (N=3), and other causes of death (N=5). In the whole group, 31 patients had data on SPM status available; the 4-year cumulative incidence of SPM was 19% (4-34%). Among the whole group of patients (N=40), there were 25 patients with data available on post-auto-HCT therapy. The cumulative incidence of having received post-auto-HCT treatment at four years was 73% (95% CI: 56-91%). Alemtuzumab was given in 62% of patients who had received post-auto-HCT therapy. In 7 patients, an allo-HCT was recorded after auto-HCT (Online Supplementary Table S2).
To summarize, this retrospective study analyzed the outcomes of 40 T-PLL patients treated with auto-HCT. Unfortunately, we were not able to answer the question as to why patients with T-PLL underwent auto-HCT instead of allo-HCT as it was not part of the data collection. As a large majority of patients received BEAM-like conditioning regimens, the effect of TBI-based conditioning on outcome after auto-HCT cannot be assessed. Further research is needed to answer the question of the role of TBI in HCT for T-PLL. While it is well-known that T-PLL is refractory to conventional chemotherapy, it was surprising to find that high-dose chemotherapy followed by auto-HCT was effective
Haematologica | 109 May 2024 1611 LETTER TO THE EDITOR
A B C D
in T-PLL. ORR at +100 days for the whole group of evaluable patients post auto-HCT was 88%. Response after auto-HCT had improved to CR in 7 out of 34 (21%) evaluable patients. Among patients transplanted in CR, all patients retained their response after treatment. For the entire cohort, efficacy of this approach was highlighted but also showed that improvements were required; 4-year OS was 34%, 4-year PFS 29%, 4-year RI 66%, and 4-year NRM 5% (Figure 2). These are important findings, ensuring that, at least in the short term, auto-HCT appears safe and efficacious confirming its potential for future therapeutic strategies.
Relapse or progression constituted the most prevalent cause of death in the whole cohort of patients. The occurrence of SPM in T-PLL patients was surprisingly high with a 4-year cumulative incidence of SPM of 19% (but with wide Confidence Intervals). It cannot be verified whether this is the result of the T-PLL treatment, or an inherent feature of T-PLL. We were not able to find any information on SPM in T-PLL in papers published so far.3,8,10,12,13 When compared to reported results of allo-HCT performed for T-PLL, the outcomes of auto-HCT seem to be comparable, or only slightly worse5-7,14-15 (Online Supplementary Table S3). Limitations of the study are those applicable to retrospective, registry-based studies, including missing data, lack of precise information on pre-treatment and diagnostic verification in all subjects. Nevertheless, this is the first study to report a significant number of patients, and it does suggest that high-dose therapy followed by auto-HCT is a valid therapeutic option in the treatment of T-PLL with acceptable efficacy and low toxicity. Even if it probably does not represent a curative strategy, until new approaches are found, auto-HCT can be proposed as consolidation to extend response duration, especially after alemtuzumab.
Authors
Joanna Drozd-Sokolowska,1 Luuk Gras,2 Linda Koster,3 Rodrigo Martino,4 María Queralt Salas,5 Urpu Salmenniemi,6 Teresa Zudaire,7 Lucrecia Yañez,8 Mar Bellido,9 Matthew Collin,10 Martin Kaufmann,11 Piotr Kozlowski,12 Xavier Poiré,13 Christelle Ferra,14 Antònia Sampol,15 Keith M. O. Wilson,16 Anne Cairoli,17 Tobias Gedde-Dahl,18 Eric Deconinck,19 Milena Mirabile,20 Felipe Suarez,21 Kavita Raj,22 Michel van Gelder,23 Ibrahim Yakoub-Agha,24 Olivier Tournilhac25 and Donal P. McLornan22
1Central Clinical Hospital, The Medical University of Warsaw, Warsaw, Poland; 2EBMT Statistical Unit, Leiden, the Netherlands; 3EBMT Leiden Study Unit, Leiden, the Netherlands; 4Hospital Santa Creu i Sant Pau, Barcelona, Spain; 5Hematology Department (ICHMO), Hospital Clinic de Barcelona, Barcelona, Spain; 6Department of Hematology, Helsinki University Hospital Comprehensive Cancer Center, Helsinki, Finland; 7Unidad de Ensayos Clínicos de Hematología Pabellón A, Pamplona, Spain; 8Hospital U. Marqués de Valdecilla, Santander, Spain; 9University
Medical Center Groningen (UMCG), Groningen, the Netherlands; 10Adult HSCT Unit, RVI Newcastle, Newcastle, UK; 11Robert Bosch Krankenhaus, Stuttgart, Germany; 12Örebro University Hospital, Örebro, Sweden; 13Cliniques Universitaires St. Luc, Brussels, Belgium; 14ICO-Hospital Universitari Germans Trias i Pujol, Badalona, Spain; 15Hospital Son Espases, IDISBA, Palma de Mallorca, Balearic Islands, Spain; 16University Hospital of Wales, Cardiff, UK; 17Centre Hospitalier Universitaire Vaudois, Lausanne, Switzerland; 18Oslo University Hospital, Rikshospitalet, Oslo, Norway; 19Université de Franche-Comté, CHU Besançon, EFS, INSERM, UMR RIGHT, F-25000 Besançon, France; 20Hematology Unit, Ospedale di Civitanova Marche, Macerata, Italy; 21Adult Hematology, Hôpital Necker-Enfants Malades, AP-HP, Centre Université Paris Cité, Paris, France; 22University College London Hospitals NHS Trust, London, UK; 23University Hospital Maastricht, Maastricht, the Netherlands; 24CHU de Lille, Université de Lille, INSERM U1286, Infinite, 59000, Lille, France and 25CHU Estaing, Clermont-Ferrand University Hospital, Clermont-Ferrand, France
Correspondence:
J. DROZD-SOKOLOWSKA - jdrozd@wum.edu.pl
https://doi.org/10.3324/haematol.2023.284359
Received: September 24, 2023.
Accepted: January 2, 2024. Early view: January 11, 2024.
©2024 Ferrata Storti Foundation
Published under a CC BY-NC license
Disclosures
No conflicts of interest to disclose.
Contributions
JDS, OT, LG, DML, IYA and LK were involved in study design, analysis and drafting the paper. All other co-authors contributed data to the study, critically revised the paper, and approved the final version.
Acknowledgments
We are indebted to all centers participating in the EBMT database, and especially those who contributed to this retrospective analysis.
Data-sharing statement
The final analysis dataset will be available upon specific request to the Chronic Malignancies Working Party Chair.
Appendix
Additional contributing centers: Corrado Tarella, European Institute of Oncology, Milano, Italy; Ben Carpenter, University College London Hospital, London, UK; Charles Crawley, Addenbrookes Hospital, Cambridge, UK; Dries Deeren, AZ Delta, Roeselare, Belgium; Giovanni Grillo, ASST Grande Ospedale Metropolitano
Haematologica | 109 May 2024 1612 LETTER TO THE EDITOR
Niguarda, Milano, Italy; Maija Itäla-Remes, Turku University Hospital, Turku, Finland; Patrick Medd, University Hospitals Plymouth NHS Trust, Plymouth, UK; Maria del Mar Perera Alvarez, Hospital de Gran Canaria Dr Negrin, Las Palmas, Spain; Péter
References
1. Alaggio R, Amador C, Anagnostopoulos I, et al. The 5th edition of the World Health Organization Classification of Haematolymphoid Tumours: Lymphoid Neoplasms. Leukemia. 2022;36(7):1720-1748.
2. Swerdlow SH, Campo E, Pileri SA, et al. The 2016 revision of the World Health Organization classification of lymphoid neoplasms. Blood. 2016;127(20):2375-2390.
3. Staber PB, Herling M, Bellido M, et al. Consensus criteria for diagnosis, staging, and treatment response assessment of T-cell prolymphocytic leukemia. Blood. 2019;134(14):1132-1143.
4 Dearden CE, Khot A, Else M, et al. Alemtuzumab therapy in T-cell prolymphocytic leukemia: comparing efficacy in a series treated intravenously and a study piloting the subcutaneous route. Blood. 2011;118(22):5799-5802.
5. Wiktor-Jedrzejczak W, Drozd-Sokolowska J, Eikema DJ, et al. EBMT prospective observational study on allogeneic hematopoietic stem cell transplantation in T-prolymphocytic leukemia (T-PLL). Bone Marrow Transplant. 2019;54(9):1391-1398.
6. Wiktor-Jedrzejczak W, Dearden C, de Wreede L, et al. Hematopoietic stem cell transplantation in T-prolymphocytic leukemia: a retrospective study from the European Group for Blood and Marrow Transplantation and the Royal Marsden Consortium. Leukemia. 2012;26(5):972-976.
7 Murthy HS, Ahn KW, Estrada-Merly N, et al. Outcomes of allogeneic hematopoietic cell transplantation in T cell prolymphocytic leukemia: a contemporary analysis from the Center for International Blood and Marrow Transplant Research. Transplant Cell Ther. 2022;28(4):187.e10.
8. Dearden C. Management of prolymphocytic leukemia. Hematology Am Soc Hematol Educ Program. 2015;2015:361-367.
Reményi, Dél-pesti Centrumkórház, Budapest, Hungary; Carlos Solano Vercet, Hospital Clínico de Valencia, Valencia, Spain; Eva Maria Wagner-Drouet, University Medical Center Mainz, Mainz, Germany.
9. Horwitz SM, Ansell S, Ai WZ, et al. T-cell prolymphocytic leukemia (TPLL-1). In: T-Cell Lymphomas. NCCN Clinical Practice Guidelines in Oncology (NCCN Guidelines®). Version 1.2023. Jan 5, 2023. https://www.nccn.org/professionals/physician_gls/ pdf/t-cell.pdf.
10 Dearden CE, Matutes E, Cazin B, et al. High remission rate in T-cell prolymphocytic leukemia with CAMPATH-1H. Blood. 2001;98(6):1721-1726.
11. Krishnan B, Else M, Tjonnfjord GE, et al. Stem cell transplantation after alemtuzumab in T-cell prolymphocytic leukaemia results in longer survival than after alemtuzumab alone: a multicentre retrospective study. Br J Haematol. 2010;149(6):907-910.
12. Jain P, Aoki E, Keating M, et al. Characteristics, outcomes, prognostic factors and treatment of patients with T-cell prolymphocytic leukemia (T-PLL). Ann Oncol. 2017;28(7):1554-1559.
13. Rose A, Zhang L, Jain AG, et al. Delineation of clinical course, outcomes, and prognostic factors in patients with T-cell prolymphocytic leukemia. Am J Hematol. 2023;98(6):913-921.
14 Guillaume T, Beguin Y, Tabrizi R, et al. Allogeneic hematopoietic stem cell transplantation for T-prolymphocytic leukemia: a report from the French society for stem cell transplantation (SFGM-TC). Eur J Haematol. 2015;94(3):265-269.
15. Yamasaki S, Nitta H, Kondo E, et al. Effect of allogeneic hematopoietic cell transplantation for patients with T-prolymphocytic leukemia: a retrospective study from the Adult Lymphoma Working Group of the Japan Society for Hematopoietic Cell Transplantation. Ann Hematol. 2019;98(9):2213-2220.
Haematologica | 109 May 2024 1613 LETTER TO THE EDITOR
Rituximab plus cyclophosphamide and dexamethasone versus bortezomib plus cyclophosphamide and dexamethasone in newly diagnosed symptomatic Waldenström macroglobulinemia:
a randomized controlled trial
Waldenström macroglobulinemia (WM) is a rare B-cell lymphoma characterized by the production of monoclonal immunoglobulin M (IgM) and infiltration of the bone marrow and other organs by IgM-producing clonal lymphocytes, lymphoplasmacytic cells, and plasma cells.1 Although there is a general consensus on the diagnosis and treatment of WM, the regimens used for patients remain heterogeneous.2 Due to the lack of prospective randomized clinical trials, there is no standard first-line therapy. The clinical manifestations of WM include features of both lymphoma and myeloma, such as lymphadenopathy and secretion of monoclonal IgM proteins. Its biological characteristics are also defined by the dual characteristics of lymphoma and myeloma. For example, the tumor cells express both CD20 and CD38, and abnormalities in the nuclear factor kappa-B (NF-κB) signaling pathway are important for its pathogenesis.3 Rituximab-based regimens are most frequently used in WM patients.2,4 Bortezomib, a proteasome inhibitor, can inhibit NF-κB signaling in WM cells, and bortezomib monotherapy has produced a 26% response rate.5,6
Rituximab- or bortezomib-based regimens are routinely used for untreated WM patients in China.7 Prospective clinical trials have shown that a combination of rituximab and bortezomib can achieve a high response rate and long-term responses.8 However, the combination of these two drugs seemed not improve patients’ survival.9 A comparison between rituximab-based and bortezomib-based regimens is still lacking. We therefore initiated a randomized, controlled phase III trial to compare the activity of rituximab, cyclophosphamide, and dexamethasone (RCD) with that of bortezomib, cyclophosphamide, and dexamethasone (BCD) in newly diagnosed patients with WM. The trial complied with the ethical principles set forth in the Declaration of Helsinki and the International Conference on Harmonization Good Clinical Practice Guidelines. Patients provided informed consent in accordance with the Declaration of Helsinki. The protocol was reviewed and approved by the Institute of Hematology and Blood Disease Hospital review board before implementation (IIT2015005-EC-2) and registered at ClinicalTrials.gov (NCT02844322).
The eligible patients were randomly assigned in a 1:1 ratio to receive six cycles of either RCD (rituximab 375 mg/m2
on day 8; cyclophosphamide 500 mg/m2 on days 1, 8, and 15; and dexamethasone 20 mg on days 1, 2, 8, 9, 15, 16, 22, and 23) or BCD (bortezomib 1.6 mg/m2 administered by subcutaneous injection on days 1, 8, and 15 of the 28-day cycle; cyclophosphamide 500 mg/m2 on days 1, 8, and 15; and dexamethasone 20 mg on days 1, 2, 8, 9, 15, 16, 22, and 23). Patients with less than a minor response after three cycles of treatment were allowed to cross over to the other treatment group. After crossing to the other group, an additional three cycles were given if a minor response or better was achieved. Otherwise, the patient was withdrawn from the study. The key inclusion and exclusion criteria for patients are presented in Online Supplementary Table S1. The primary endpoint was progression-free survival assessed by investigators. The key secondary endpoints were the overall response, complete response, and very good partial response rates.
Between March 1, 2016 and November 29, 2020, 40 patients were randomly assigned to receive RCD or BCD. Two patients did not undergo follow-up after receiving two courses of treatment, so the final analysis was performed on 38 patients. The baseline characteristics of the two groups were well balanced (Table 1). The median age was 62 years (range, 36-73) and 60 years (range, 35-75) in the RCD and BCD groups, respectively. The median baseline IgM was 3,200 mg/dL (range, 210-12,100) and 3,800 mg/dL range, 138-10,400), respectively. Four patients in the RCD group and three patients in the BCD group had undergone plasmapheresis.
One patient (5.3%) in the RCD group and three (15.8%) in the BCD group achieved a complete response. Seven patients (36.8%) in the RCD group had a very good partial response compared with only two patients (10.5%) in the BCD group. Nine patients each in the RCD and BCD groups achieved a partial response. The overall response rate was the same in both groups (89.5% vs. 89.5%; P=1.000). The major response rate was higher in the RCD group than in the BCD group (89.5% vs. 73.7%; P=0.209). The proportion of patients who achieved a very good partial response or better was also higher in the RCD group than in the BCD group (42.1% vs. 26.3%; P=0.305) (Figure 1A). The median times to first and best responses were, respectively, 1 month (range, 1-7) and 4 months (range, 1-9) in the BCD
Haematologica | 109 May 2024 1614 LETTER TO THE EDITOR
group and 2 months (range, 1-4) and 5 months (range, 1-9) months in the RCD group.
The median follow-up time was 55 months (range, 12-76).
Five patients in the RCD group and 13 in the BCD group progressed. One patient in the RCD group and six in the BCD group died. The treatments after progression and the causes of death are shown in Online Supplementary Table S2. One patient in the BCD group experienced a histological transformation to diffuse large B-cell lymphoma 10 months after treatment. The estimated 5-year progression-free survival rate in the RCD group was 69.4% (95% confidence interval [95% CI]: 35%-88%), which was significantly higher than the rate of 35.5% (95% CI: 15%-57%) observed in the BCD group (P=0.009). The median progression-free survival in the BCD group was 33.0 months (95% CI: 15.7-50.3), which was shorter than in the RCD group (not reached, hazard
Table
ratio [HR]=0.324, 95% CI: 0.121-0.774, P=0.009) (Figure 1B). Seventeen patients in each group achieved at least a minor response. The median duration of response in the RCD group was not reached, and was longer than the 32.0 months (95% CI: 15.6-48.4) observed in the BCD group (HR= 0.2117, 95% CI: 0.069-0.649; P=0.007) (Figure 1C). At the end of follow-up, 73.7% of the patients in the RCD group were still in remission as compared to 31.6% of the patients in the BCD group.
The estimated 5-year overall survival rate was 88.9% (95% CI: 43%-98%) in the RCD group and 71.3% (95% CI: 44%87%) in the BCD group (P=0.034). The median overall survival was not reached and was 70 months in the RCD and BCD groups, respectively. The hazard ratio for death was 0.154 (95% CI: 0.050-0.964) (Figure 1D).
Minimal residual disease (MRD) and cellular components
at baseline
≤11 g/dL, N (%)
count ≤100x109/L, N (%)
≤1.5x10⁹/L, N (%)
hemoglobin (range), g/dL
Bone marrow infiltration
cellularity (range), %
cellularity detected by flow
(range), %
β2 microglobulin level
RCD: rituximab, cyclophosphamide, dexamethasone; BCD: bortezomib, cyclophosphamide, dexamethasone; IgM: immunoglobulin M; ISSWM: International Staging System for Waldenström Macroglobulinemia; ANC: absolute neutrophil count.
Haematologica | 109 May 2024 1615 LETTER TO THE EDITOR
Characteristics RCD N=19 BCD N=19 Total N=38 Age Median (range), years ≥65 years old, N (%) 62 (36-73) 7 (36.8) 60 (35-75) 4 (21.1) 62 (35-75) 11 (28.9) Gender, N (%) Male Female 13 (68.4) 6 (31.6) 10 (52.6) 9 (47.4) 23 (60.5) 15 (39.5) ISSWM, N (%) Low Intermediate High 3 (15.8) 8 (42.1) 8 (42.1) 3 (15.8) 9 (47.4) 7 (36.8) 6 (15.8) 17 (44.7) 15 (39.5) IgM level Median (range),
≥4,000 mg/dL, N (%) 3,200 (210-12,100) 7 (36.8) 3,800 (138-10,400) 9 (47.4) 3,655 (138-12,100) 16 (42.1) Cytopenia
Hemoglobin
Platelet
ANC
Median
17 (89.5) 6 (31.6) 2 (10.5) 8 (4.9-13.4) 17 (89.5) 6 (31.6) 2 (10.5) 7.9 (4.5-12.5) 34 (89.5) 12 (31.6) 4 (10.5) 7.9 (4.5-13.4)
Median
Median
cytometry
60.5 (7.5-86.5) 13.5 (0.2-80.6) 48 (27.5-86.0) 15.8 (1.1-74.4) 57 (7.5-86.5) 14.8 (0.2-80.6)
1. Characteristics of the patients in the two groups at the time of starting treatment.
mg/dL
Median (range), mg/L Elevated, N (%) 3.2 (1.9-7.5) 15 (78.9) 3.7 (2.5-8.0) 17 (89.5) 3.6 (1.9-8.0) 32 (84.2) Lactate dehydrogenase level Median (range), U/L Elevated, N (%) 149 (69-470) 2 (10.5) 164 (94-569) 4 (22.2) 154 (69-569) 6 (15.8) Extramedullary disease, N (%) Splenomegaly Hepatomegaly Adenopathy 8 (42.1) 4 (21.1) 7 (36.8) 9 (47.4) 6 (31.6) 9 (47.4) 17 (44.7) 10 (26.3) 16 (42.1) B symptoms, N (%) 6 (31.6) 8 (42.1) 14 (36.8)
were assessed by multiparameter flow cytometry. MRD negativity was defined as a clonal malignant cell count of <10−4 (0.01%). After treatment, six patients in the RCD group and four in the BCD group were MRD-negative. All patients who achieved a complete response were MRD-negative. The residual cellular components of bone marrow were analyzed in patients who achieved a partial or very good partial response. Before treatment, all patients who achieved a partial or very good partial response had both monotypic plasmacytosis and monotypic B cells. Eleven patients in the RCD group who achieved a partial or very good partial response were MRD-positive. Among these patients, six (54.5%) patients only retained abnormal plasma cells and no abnormal B lymphocytes, and one patient had only abnormal B lymphocytes and no plasma cells. In comparison, in the BCD group, ten patients who achieved
a partial or very good partial response were MRD-positive. However, only one patient had abnormal plasma cells and absent abnormal B lymphocytes (10%). Nine patients had both abnormal plasma cells and B lymphocytes (Online Supplementary Figure S1A). Comparisons of the percentages of abnormal B lymphocytes and plasma cells before and after treatment in the RCD and BCD groups are illustrated in Online Supplementary Figure S1B, C.
As shown in Table 2, the most common adverse event of any grade in both groups was hematologic toxicity. The grades of both hematologic and non-hematologic adverse events were similar between the two groups. Serious hematologic adverse events (≥grade 3) were experienced by 15.8% and 21.2% of patients in the RCD and BCD groups, respectively. Common non-hematologic adverse events in the RCD group included non-infectious fever (26.3%),
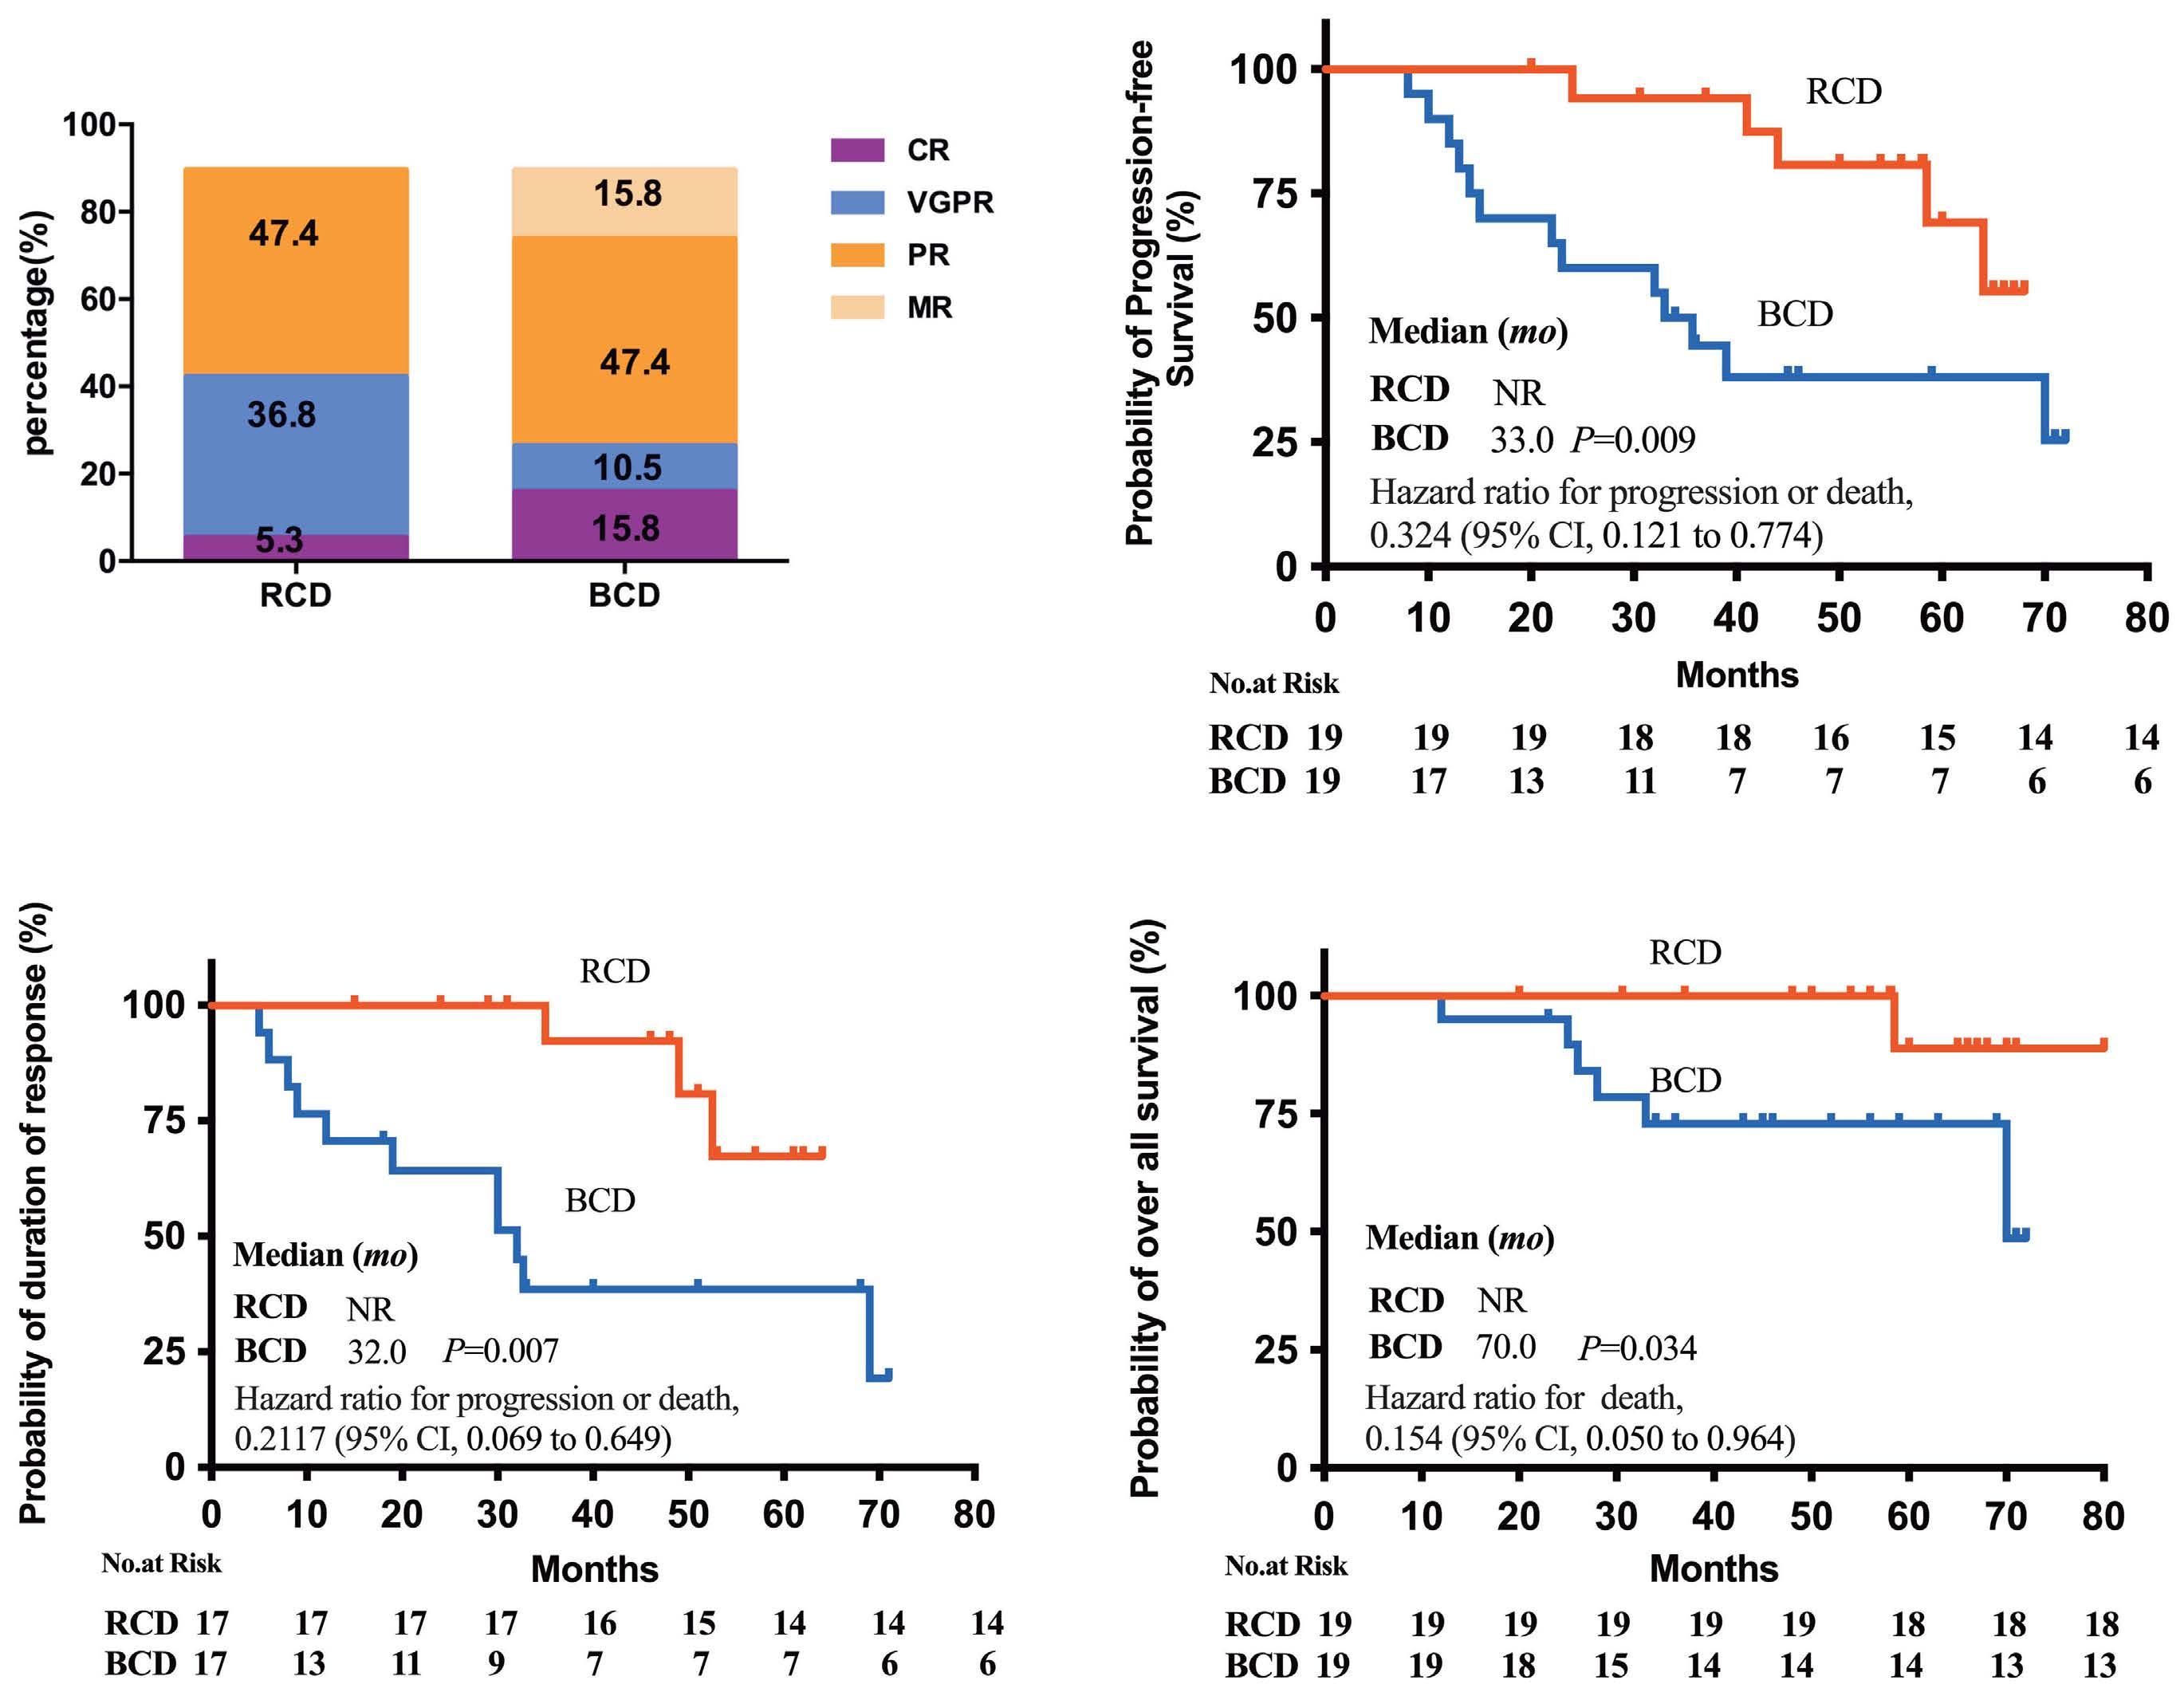
Figure 1. The response rate and Kaplan-Meier analysis of progression-free survival, duration of response and overall survival. (A) The best response rates in the two treatment groups. (B) Kaplan-Meier analysis of progression-free survival. (C) Kaplan-Meier analysis of duration of response. (D) Kaplan-Meier analysis of overall survival. The tick marks indicate censoring of data. RCD: rituximab, cyclophosphamide, dexamethasone; BCD: bortezomib, cyclophosphamide, dexamethasone; CR: complete response; VGPR: very good partial response; PR: partial response; MR: minor response: mo: months; NR: not reached; 95% CI: 95% confidence interval.
Haematologica | 109 May 2024 1616 LETTER TO THE EDITOR
A B C D
Table 2. Overview of treatment-emergent adverse events in the two groups.
Events, N (%) of patients
RCD, N=19
Non-hematologic adverse events
RCD: rituximab, cyclophosphamide, dexamethasone; BCD: bortezomib, cyclophosphamide, dexamethasone.
pneumonia (21.1%), and hyperglycemia (15.8%). Common non-hematologic adverse events in the BCD group included peripheral neuropathy (26.3%), pneumonia (21.2%), herpes zoster (10.5%), and flatulence (10.5%). Only one patient in each group experienced grade 3 or higher non-hematologic adverse events.
There are very few randomized trials and limited data comparing different treatment regimens for WM. Here, for the first time, we demonstrated that the rituximab-based regimen, RCD, was superior to the bortezomib-based regimen in terms of both progression-free survival and overall survival . RCD is an active and safe choice for the first-line treatment of WM. In our study, the complete and overall response rates were 5.3% and 89.5%, respectively, in the RCD group, which was similar to the findings of Dimopoulos et al 4 BCD is a recommended treatment for multiple myeloma but is rarely used for WM. Small cohort studies (15 patients and 34 patients) showed that the major response rate was 53%10 and 74%,11 with the median progression-free survival being 18.6 months. These results are consistent with those of our study. The longer progression-free survival of patients treated with RCD compared to those treated with BCD may contribute to the strong MRD elimination achieved by rituximab. In the RCD group, six out of 11 patients had eliminated the monoclonal B-cell components after treatment. However, only one of the ten patients in the BCD group had eliminated the monoclonal B-cell components. This was consistent with the findings of a previous study showing that a rituximab-based regimen eliminated monotypic B cells in ten of 41 patients.12 This study does have some limitations. The small sample size limited further analysis of patients and might have led to biased observations. The overall survival benefit found in
BCD, N=19
the RCD group might also be the result of biased observations, given the small sample size. The results need to be confirmed by further expanding the sample size. However, this study is important for low-resource settings, in which the cost of combining rituximab and bortezomib would be prohibitive, and could impact practice in low-resource countries. It demonstrated that anti-plasma cell therapy alone may not be sufficient to remove tumor cells adequately in WM. In conclusion, this randomized comparison demonstrated that rituximab-based RCD is superior to bortezomib-based BCD for newly diagnosed WM.
Authors
Wenjie Xiong,1,2* Rui Lyu,1,2* Ying Yu,1,2 Tingyu Wang,1,2 Yuting Yan,1,2 Yi Wang,1,2 Wei Liu,1,2 Gang An,1,2 Shuhui Deng,1,2 Yan Xu,1,2 Weiwei Sui,1,2 Wenyang Huang,1,2 Dehui Zou,1,2 Jianxiang Wang,1,2 Lugui Qiu1,2# and Shuhua Yi1,2#
1State Key Laboratory of Experimental Hematology, National Clinical Research Center for Blood Diseases, Haihe Laboratory of Cell Ecosystem, Institute of Hematology & Blood Diseases Hospital, Chinese Academy of Medical Sciences & Peking Union Medical College, Peking and 2Tianjin Institutes of Health Science, Tianjin, China
*WX and RL contributed equally as first authors.
#SY and LQ contributed equally as senior authors.
Correspondence:
QIU - qiulg@ihcams.ac.cn
YI - yishuhua@ihcams.ac.cn
Haematologica | 109 May 2024 1617 LETTER TO THE EDITOR
L.
S.
All grades Grade ≥3 All grades Grade ≥3 Hematologic adverse events Neutropenia Thrombocytopenia 18 (94.7) 17 (89.5) 3 (15.8) 3 (15.8) 2 (10.5) 1 (5.8) 18 (94.7) 15 (78.9) 10 (52.6) 4 (21.2) 3 (15.8) 2 (10.5)
Pneumonia Infectious fever Upper respiratory infection Non-infectious fever Hyperglycemia Hypertension Peripheral neuritis Rash Herpes zoster Flatulence Diarrhea Edema Nausea and vomiting Epistaxis 12 (63.2) 4 (21.1) 3 (15.8) 1 (5.3) 5 (26.3) 3 (15.8) 1 (5.3) 0 1 (5.3) 0 1 (5.3) 1 (5.3) 1 (5.3) 0 0 1 (5.3)0 01 (5.3) 0 0 0 0 0 0 0 0 0 14 (73.7) 4 (21.1) 3 (15.8) 3 (15.8) 0 2 (10.5) 2 (10.5) 5 (26.3) 1 (5.3) 2 (10.5) 2 (10.5) 2 (10.5) 1 (5.3) 1 (5.3) 1 (5.3) 1 (5.3)0 0 0 1 (5.3) 0 0 0 0 0 0 0 0 0
https://doi.org/10.3324/haematol.2023.284588
Received: November 14, 2023.
Accepted: January 2, 2024.
Early view: January 11, 2024.
©2024 Ferrata Storti Foundation
Published under a CC BY-NC license
Disclosures
No conflicts of interest to disclose.
Contributions
SY and LQ designed the study. WX and RL analyzed the data, performed statistical analyses, and wrote the manuscript. YY, TW,
References
1. Gertz MA. Waldenström macroglobulinemia: 2019 update on diagnosis, risk stratification, and management. Am J Hematol. 2019;94(2):266-276.
2. Leblond V, Kastritis E, Advani R, et al. Treatment recommendations from the Eighth International Workshop on Waldenström’s Macroglobulinemia. Blood. 2016;128(10):1321-1328.
3. Treon SP, Xu L, Guerrera ML, et al. Genomic landscape of Waldenström macroglobulinemia and its impact on treatment strategies. J Clin Oncol. 2020;38(11):1198-1208.
4. Dimopoulos MA, Anagnostopoulos A, Kyrtsonis M-C, et al. Primary treatment of Waldenström macroglobulinemia with dexamethasone, rituximab, and cyclophosphamide. J Clin Oncol. 2007;25(22):3344-3349.
5. Ghobrial IM, Xie W, Swaminathan, et al. Phase II trial of weekly bortezomib in combination with rituximab in untreated patients with Waldenström macroglobulinemia. Am J Hematol. 2010;85(9):670-674.
6. Chen CI, Kouroukis CT, White D, et al. Bortezomib is active in patients with untreated or relapsed Waldenström’s macroglobulinemia: a phase II study of the National Cancer Institute of Canada Clinical Trials Group. J Clin Oncol. 2007;25(12):1570-1575.
7. Cao XX, Yi SH, Jiang ZX, et al. Treatment and outcome patterns of patients with Waldenström’s macroglobulinemia: a large, multicenter retrospective review in China. Leuk Lymphoma.
YY, and YW collected data. WL, GA, SD, YX, WS, WH, and DZ acquired data and managed patients. JW and LQ suggested revisions. LQ and SY revised the manuscript critically and approved the final version.
Funding
This work was supported by grants from the National Nature Science Foundation of China (82370197, 81970187, 82170193, and 81920108006) and the Chinese Academy of Medical Sciences Innovation Fund for Medical Sciences (2022-I2M-1-022).
Data-sharing statement
The datasets generated and analyzed during the current study are not publicly available because of applicable privacy laws but are available from the corresponding author upon reasonable request.
2021;62(11):2657-2664.
8. Gavriatopoulou M, García-Sanz R, Kastritis E, et al. BDR in newly diagnosed patients with WM: final analysis of a phase 2 study after a minimum follow-up of 6 years. Blood. 2017;129(4):456-459.
9 Buske C, Dimopoulos MA, Grunenberg A, et al. Bortezomibdexamethasone, rituximab, and cyclophosphamide as first-line treatment for Waldenström’s macroglobulinemia: a prospectively randomized trial of the European Consortium for Waldenström’s Macroglobulinemia. J Clin Oncol. 2023;41(14):2607-2616.
10 Noonan HLK, Paba-Prada C, Treon SP, Castillo JJ, Ghobrial IM. Cyclophosphamide, bortezomib, and dexamethasone combination in Waldenström macroglobulinemia. Am J Hematol. 2015;90(6):E122-123.
11. Uppal E, Khwaja J, Rismani A, Kyriakou C, D’Sa S. Real world data on bortezomib-based therapy in Waldenström macroglobulinaemia: effective even in multiply treated patients including prior BTK-inhibitors. Hemasphere. 2022;6(Suppl):1037-1038.
12. Barakat FH, Jeffrey ML, Wei EX, Sergej K, Lin P, Jorgensen JL. Residual monotypic plasma cells in patients with Waldenström macroglobulinemia after therapy. Am J Clin Pathol. 2011;135(3):365-373.
Haematologica | 109 May 2024 1618 LETTER TO THE EDITOR
MAF translocation remains a strong prognostic factor despite concurrent chromosomal abnormalities
Despite notable advancements in treatments of multiple myeloma (MM) contributing to enhanced overall survival (OS), this progress has not proven beneficial for high-risk patients, constituting an unmet medical need.1 The t(14;16) and t(14;20), identified in approximately 6% of newly diagnosed MM patients, result in upregulation of the c-MAF and MAFB proto-oncogenes, respectively. The t(14;16) has been incorporated into the Revised International Staging System (R-ISS) as a high-risk chromosomal abnormality (HRCA).2 However, the adverse prognostic significance of t(14;16) has been questioned due to its rarity and frequent co-existence with concurrent chromosomal abnormalities.3-5 Moreover, the Second Revision of the International Staging System (R2-ISS) did not categorize t(14;16) as a stand-alone marker of high-risk disease.6 Despite the lack of large databases, available studies support t(14;20) as an adverse factor with equal prognostic implication as the t(14;16).7,8 The Arkansas group found that the MAF translocation group (defined as the MF group), which includes the t(14;16) and t(14;20), resulted in dysregulation of common downstream targets and was associated with early relapse.9 In order to evaluate the prognostic value of t(14;16)/t(14;20) and contribute valuable insights regarding its association with other chromosomal abnormalities, we conducted a retrospective analysis of 830 newly diagnosed multiple myeloma (NDMM) patients, diagnosed between January 2013 and June 2021 in China, comprising 34 with t(14;16), four with t(14;20) and 792 without t(14;16) or t(14;20). Patients were sourced from the MM database of the National Longitudinal Cohort of Hematological Diseases (NICHE; clinicaltrials gov. Identifier: NCT04645199). Written informed consent was obtained from all patients. The study was in compliance with the Declaration of Helsinki and was approved by the Ethics Committee of the Institute of Hematology and Blood Diseases Hospital, Chinese Academy of Medical Science & Peking Union Medical College. The interphase fluorescence in situ hybridization (iFISH) and next-generation sequencing (NGS) in this study have been previously described.10 Data on the immunophenotype were collected using a Cytomics FC 500 flow cytometer and FACSCanto flow cytometer and the CellQUEST program. We performed propensity score matching (PSM) to achieve balanced comparison groups. Each patient’s propensity score was estimated using a multivariate logistic regression model, and a 1:4 group matching was conducted using the nearest-neighbor matching method without replacement. All P values were two-tailed, with a significance level of <0.05. SPSS 20.0 software and R program (version 3.6.3) were used for database construction and statistical analysis.
A total of 82.9% (29/35) of t(14;16)/t(14;20)-positive patients presented at diagnosis with at least one other HRCA, including gain/amp(1q21) (73.0% vs. 40.9%; P<0.001), del(17p) (21.1% vs. 9.8%; P=0.048), del(1p32) (5.6% vs. 5.4%; P=1.000). Of note, among patients with t(14;16)/t(14;20), the combined presence of 1q21+ often had a copy number ≥4 (43.2% vs. 11.9%). In addition, the positive group had a slightly higher percentage of TP53 mutation (22.2% vs. 7.3%; P=0.151). The incidence of TP53 bi-allelic inactivation was also higher (11.1% vs. 3.2%; P=0.278), albeit constrained by a small sample size (Online Supplementary Table S1). We delineate a specific immunophenotypic profile of t(14;16)/t(14;20)-positive MM cells. In the positive group, only five of 37 patients (13.5%) had positive expression of CD56, which was significantly lower than that in the negative group (P<0.001). The absence of CD56 is often observed in plasma cell leukemia and extramedullary disease.11 These data suggest that MAF may confer a more aggressive biology to MM cells, potentially elucidating the slightly higher proportion of peripheral blood plasma cells and extramedullary disease observed in our study. In fact, it has been reported that extramedullary relapse appear to occur more frequently in patients with t(14;16).12
Five hundred sixty-seven patients undergoing standard treatment10 with available follow-up status were selected for survival analysis. The median follow-up period was 29.5 months, ending on January 31, 2023. Patients with t(14;16)/t(14;20) had inferior progression-free survival (PFS) (median PFS 16.7, 95% confidence interval [CI]: 8.2-25.1 months vs. 55.0, 95% CI: 45.5-64.4; P<0.001) and OS (median OS 36.0, 95% CI: 15.5-56.5 vs. not reached [NR], 95% CI: NR-NR; P<0.001) compared to those without t(14;16)/t(14;20) (Figure 1A, B). After multivariate analysis, t(14;16)/t(14;20) retained its role as an independent adverse prognostic factor for PFS (hazard ratio [HR]= 2.38, 95% CI: 1.49-3.80; P<0.001) and OS (HR=2.09, 95% CI: 1.17-3.74; P=0.013) (Online Supplementary Table S2). After PSM, 109 patients (28 carrying with t(14;16)/t(14;20), and 81 without) were matched. All these features became well balanced and comparable between the two groups (all P>0.050) (Online Supplementary Table S3). As depicted in Online Supplementary Table S3, the matched cohort represents a population of highrisk MM. After PSM, the t(14;16)/t(14;20)-positive group still exhibited inferior PFS (median PFS 22.6 months vs. 48.0 months; P=0.011) and OS (median OS 36.0 vs. 65.8 months; P=0.002) compared to non-t(14;16)/t(14;20) group (Figure 1C, D). Similar conclusions were drawn from a multivariate analysis after PSM (Online Supplementary Table S2). Subsequently, we evaluated the prognostic significance
Haematologica | 109 May 2024 1619 LETTER TO THE EDITOR
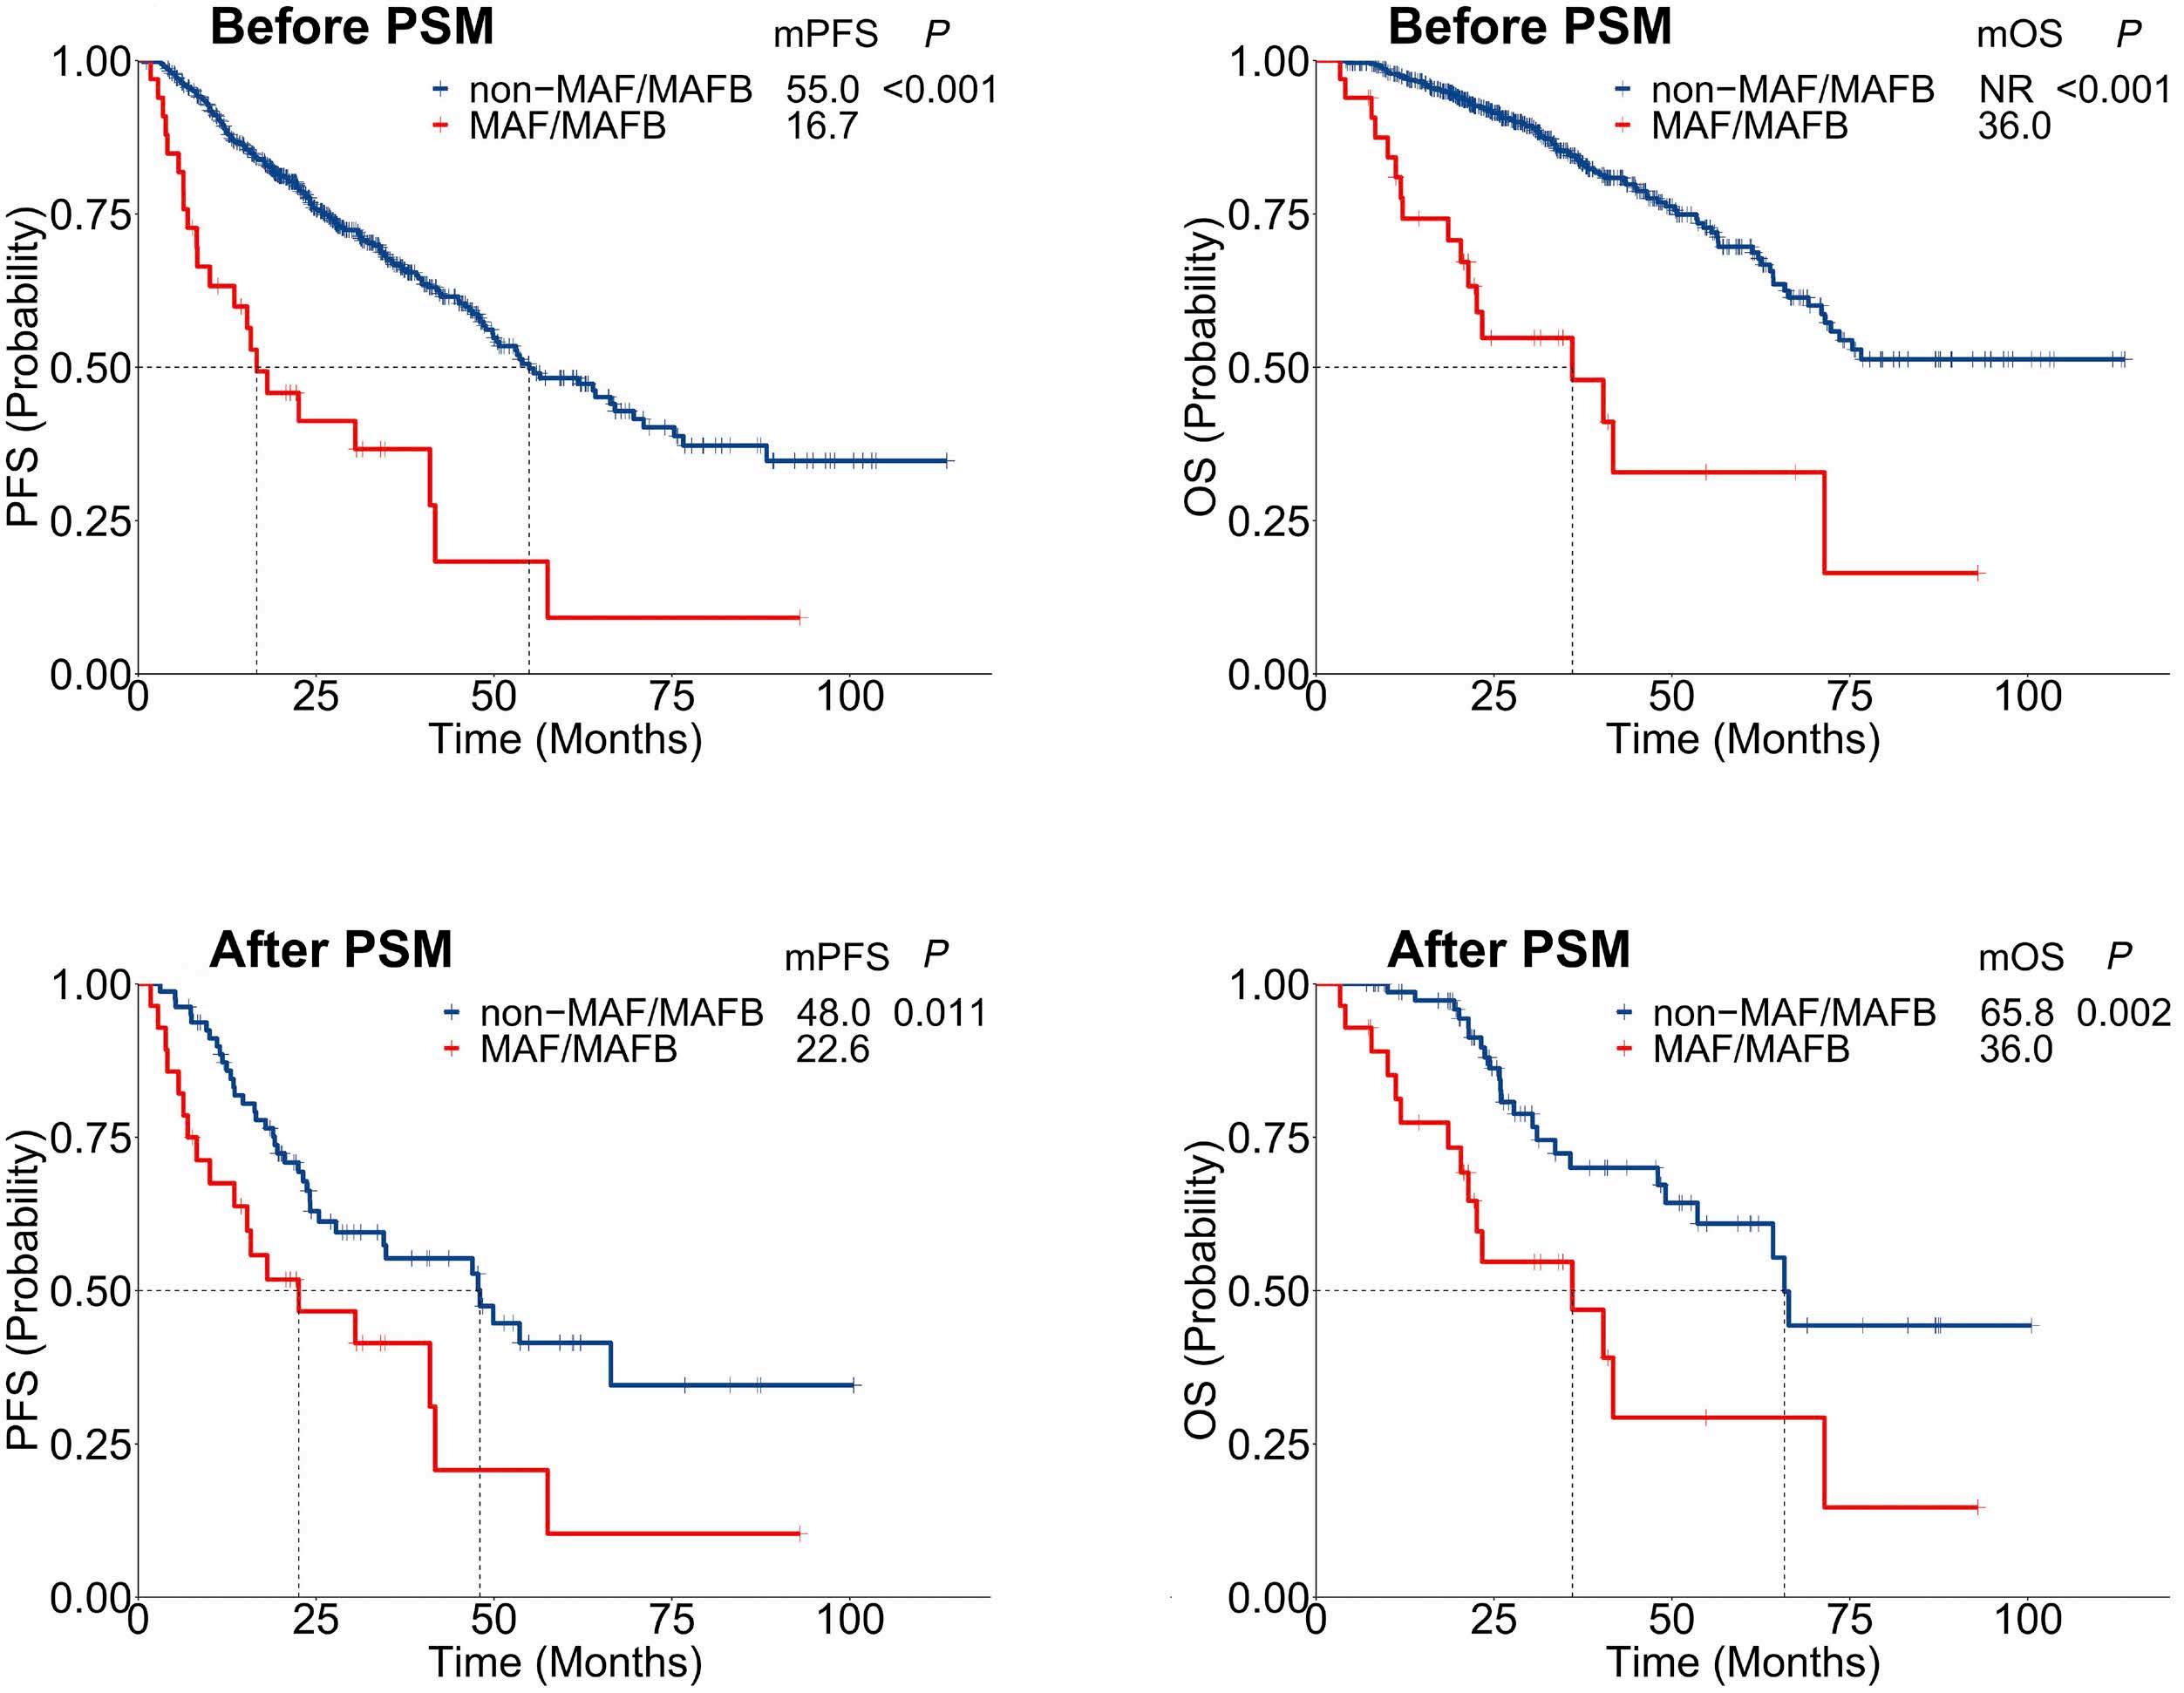
Figure 1. Prognostic significance of t(14;16)/t(14;20). Survival outcomes of newly diagnosed multiple myleoma (MM) patients according to the status of t(14;16)/t(14;20) before propensity score matching (PSM) (A, B) and after PSM (C, D). mPFS: median progression-free survival; mOS: median overall survival; MAF/MAFB: t(14;16)/t(14;20).
of t(14;16)/t(14;20) and additional HRCA. While only five patients in the cohort without HRCA had t(14;16)/t(14;20), they still had a lower OS (NR vs. 36.0 months; P=0.003).
For patients with more than one HRCA, indicating a highrisk group, t(14;16)/t(14;20) conferred a significantly shorter median PFS (15.8 vs. 49.8 months; P<0.001) and inferior median OS (40.4 months vs. 71.5; P< 0.001) (Figure 2A, B).
Even with more than two HRCA, t(14;16)-positive patients (N=5) had a significantly shorter median PFS (8.3 months vs. 47.0; P=0.031) and inferior median OS (12.2 months vs. 54.4; P=0.240) compared to negative group (N=37). For patients with del(17p), the presence of t(14;16)/t(14;20) would not worsen the survival outcome for both PFS and OS (P=0.434; P=0.838). But among gain/amp(1q21)-positive patients, the median PFS in patients with and without t(14;16)/t(14;20) was 15.3 and 49.8 months (P<0.001); and the median OS of the two subgroups was 23.4 and 72.3 months (P< 0.001), respectively (Figure 2C-F).
The R2-ISS staging did not incorporate t(14;16) because its rarity and non-significant for PFS in a multivariate analysis,6 but our data show that the inclusion of t(14;16)/t(14;20) in
the R2-ISS enables a more precise risk stratification and facilitates subsequent personalized therapeutic interventions. Particularly in the R2-ISS stage Ⅲ, the presence of t(14;16)/t(14;20) resulted in a division of the survival curves of PFS and OS into two significantly distinct survival curves (P<0.001) (Figure 3).
Our study has several limitations. First, the limited number of t(14;16)/t(14;20) patients may introduce potential bias, especially in subgroup analysis. Second, our study is a real-world observational study, and treatments are not homogeneous. However, results obtained from real-world studies are more aligned with the practical application in clinical settings, potentially offering greater clinical value. Thirdly, the lack of data on new drugs related to CD38 monoclonal antibodies necessitates further exploration in the future.
Our data support that MAF translocation remains a strong prognostic factor despite concurrent chromosomal abnormalities, emphasizing the importance of incorporating it into the risk stratification system. A recent study identified 169 NDMM patients with t(14;16) among 5,141 patients
Haematologica | 109 May 2024 1620 LETTER TO THE EDITOR
A C D B
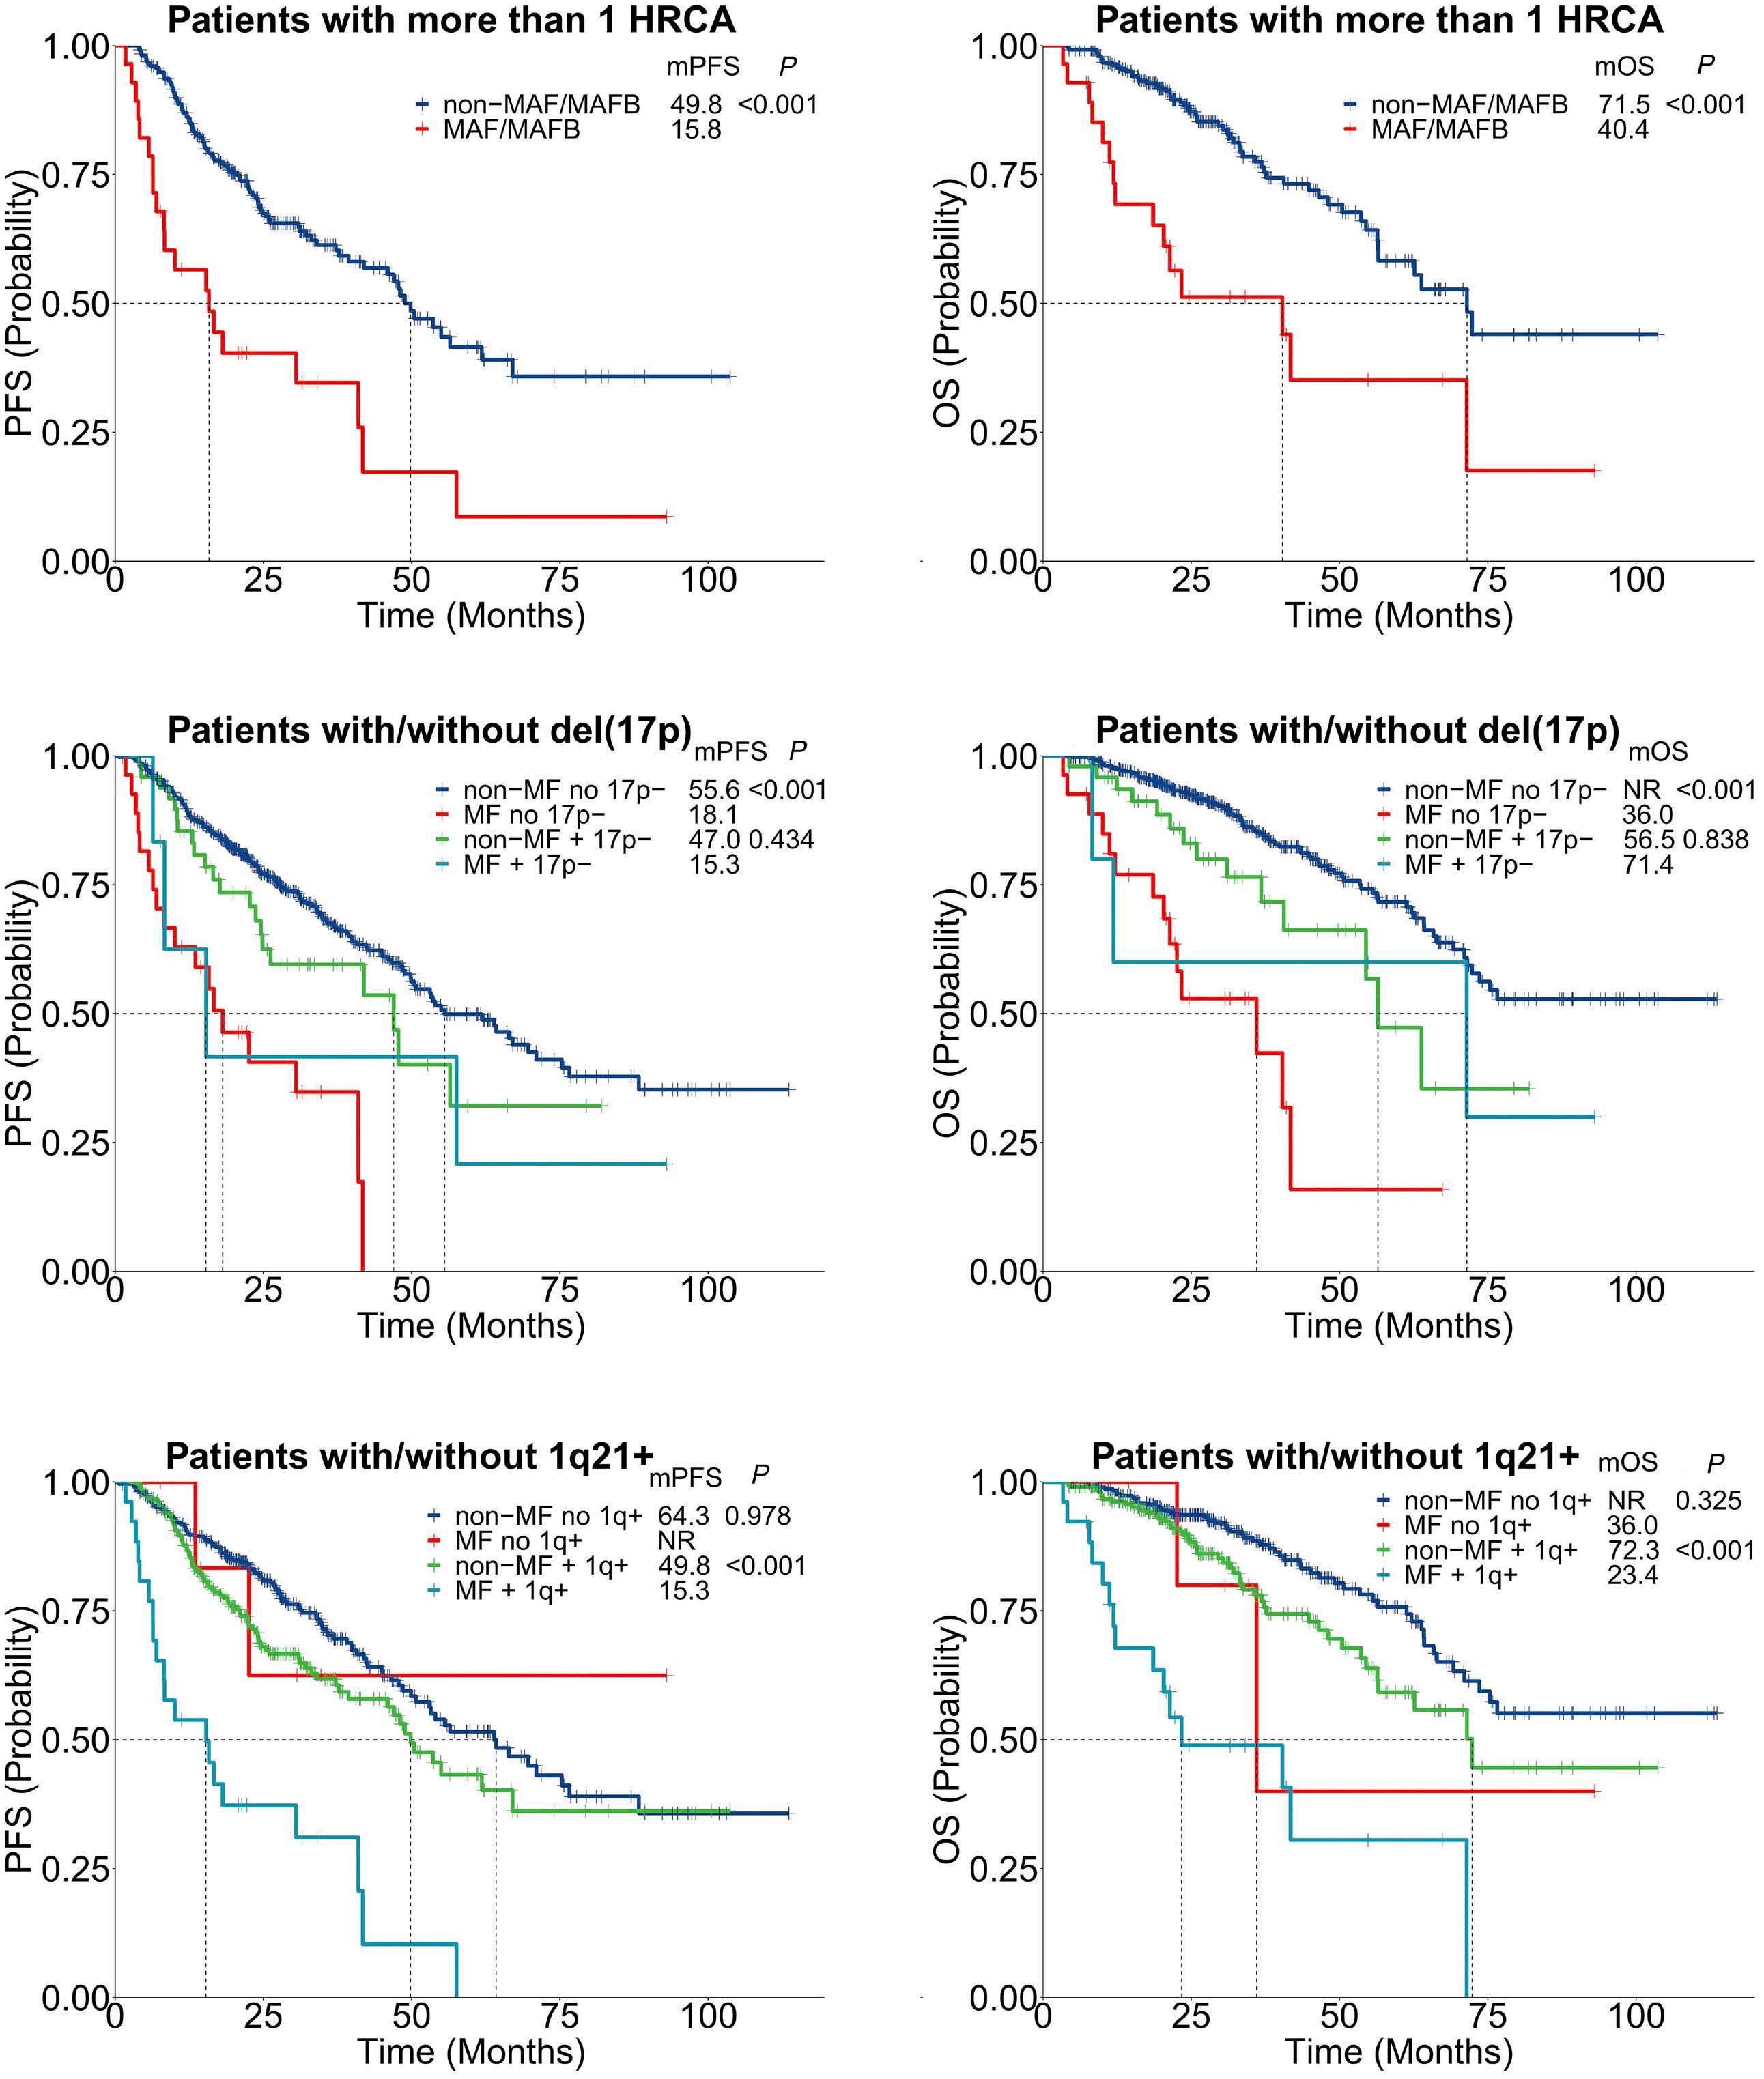
Figure 2. Prognostic significance of t(14;16)/t(14;20) and additional high-risk chromosomal abnormality. (A, B) Kaplan-Meier survival curves of progression-free survival (PFS) and overall survival (OS) of patients with more than 1 high-risk chromosomal abnormality (HRCA) according to the status of t(14;16)/t(14;20). (C, D) Patients were grouped according to the status of del(17p) and/or t(14;16)/t(14;20). (E, F) Patients were grouped according to the status of gain/amp(1q21) and/or t(14;16)/t(14;20). HRCA: high-risk chromosomal abnormality, including del(17p), del(1p32), gain/amp(1q21); MF, MAF/MAFB: t(14;16)/t(14;20); mPFS: median PFS; mOS: median OS.
and highlighted that the presence of t(14;16) exacerbated the prognosis in patients with del(17p) or gain/amp1q,13
confirming its role in intensifying disease aggressiveness among other high-risk patients. Patients with MAF trans-
Haematologica | 109 May 2024 1621 LETTER TO THE EDITOR
A C E F D B

Figure 3. Addition of t(14;16)/t(14;20) to the Second Revision of the International Staging System staging. Kaplan-Meier survival curves of progression-free survival (PFS) (A, B) and overall survival (OS) (C, D) of patients with the Second Revision of the International Staging System (R2-ISS) stage III or IV according to the status of t(14;16)/t(14;20). MF, MAF/MAFB: t(14;16)/t(14;20);mPFS: median PFS; mOS: median OS.
location may represent an ultra high-risk population. The rapid progression precludes subsequent access to novel regimens, prompting us to consider highly active regimen to prolong disease remission.
Authors
Yuntong Liu,1,2* Rui Lv,2* Wenqiang Yan,1,2 Jingyu Xu,1,2 Huishou Fan,1,2 Lingna Li,1,2 Jian Cui,1,2 Chenxing Du,1,2 Shuhui Deng,1,2 Weiwei Sui,1,2 Dehui Zou,1,2 Yan Xu,1,2 Lugui Qiu1,2 and Gang An1,2
1State Key Laboratory of Experimental Hematology, National Clinical Research Center for Blood Diseases, Haihe Laboratory of Cell Ecosystem, Institute of Hematology & Blood Diseases Hospital, Chinese Academy of Medical Sciences & Peking Union Medical College and 2Tianjin Institutes of Health Science, Tianjin, China
*YL and RL contribued equally as first authors.
Correspondence:
G. AN - angang@ihcams.ac.cn
L. QIU - qiulg@ihcams.ac.cn
https://doi.org/10.3324/haematol.2023.284666
Received: November 15, 2023.
Accepted: January 4, 2024.
Early view: January 18, 2024.
References
1. Cowan AJ, Green DJ, Kwok M, et al. Diagnosis and management of multiple myeloma: a review. JAMA. 2022;327(5):464-477.
2. Palumbo A, Avet-Loiseau H, Oliva S, et al. Revised International
©2024 Ferrata Storti Foundation
Published under a CC BY-NC license
Disclosures
No conflicts of interest to disclose.
Contributions
YL, RL and GA analyzed data, interpreted results, and drafted the manuscript. WY, HF, JX, LL, and JC collected data and performed patient follow-up. CD, SD, and YX acquired data and managed patients. SD, WS and YX suggested revisions. DZ, LQ, and GA designed the research and approved the final version.
Acknowledgments
We thank all MM patients who participated in this study.
Funding
This work was supported by the National Natural Science Foundation of China (82270218, and U22A20291), the International Cooperation Projects of National Natural Science Foundation (81920108006), and the Chinese Academy of Medical Sciences Innovation Fund for Medical Sciences (2022-I2M-1-022, 2021-I2M-1041, 2021-I2M-C&T-B-079).
Data-sharing statement
The datasets generated and/or analyzed during the current study are available from the corresponding author at angang@ihcams.ac. cn upon reasonable request.
Staging System for Multiple Myeloma: a report from International Myeloma Working Group. J Clin Oncol. 2015;33(26):2863-2869.
Haematologica | 109 May 2024 1622 LETTER TO THE EDITOR
B A
3. Avet-Loiseau H, Malard F, Campion L, et al. Translocation t(14;16) and multiple myeloma: is it really an independent prognostic factor? Blood. 2011;117(6):2009-2011.
4 Goldman-Mazur S, Jurczyszyn A, Castillo JJ, et al. A multicenter retrospective study of 223 patients with t(14;16) in multiple myeloma. Am J Hematol. 2020;95(5):503-509.
5. Mina R, Joseph NS, Gay F, et al. Clinical features and survival of multiple myeloma patients harboring t(14;16) in the era of novel agents. Blood Cancer J. 2020;10(4):40-43.
6. D’Agostino M, Cairns DA, Lahuerta JJ, et al. Second Revision of the International Staging System (R2-ISS) for overall survival in multiple myeloma: a European Myeloma Network (EMN) report within the HARMONY project. J Clin Oncol. 2022;40(29):3406-3418.
7. Goldman-Mazur S, Jurczyszyn A, Castillo JJ, et al. Different MAF translocations confer similar prognosis in newly diagnosed multiple myeloma patients. Leuk Lymphoma. 2020;61(8):1885-1893.
8. Ross FM, Chiecchio L, Dagrada G, et al. The t(14;20) is a poor prognostic factor in myeloma but is associated with long-term
stable disease in monoclonal gammopathies of undetermined significance. Haematologica. 2010;95(7):1221-1225.
9 Zhan F, Huang Y, Colla S, et al. The molecular classification of multiple myeloma. Blood. 2006;108(6):2020-2028.
10 Yan Y, Qin X, Liu J, et al. Clonal phylogeny and evolution of critical cytogenetic aberrations in multiple myeloma at singlecell level by QM-FISH. Blood Adv. 2022;6(2):441-451.
11. Narita T, Inagaki A, Kobayashi T, et al. t(14;16)-positive multiple myeloma shows negativity for CD56 expression and unfavorable outcome even in the era of novel drugs. Blood Cancer J. 2015;5(2):e285-e288.
12. Nooka A, Kastritis E, Kaufman JL, et al. Clinical characteristics and outcomes of myeloma patients exhibiting translocation (14;16): an ultra-high-risk group of myeloma patients. Blood. 2017;130(Suppl 1):1822.
13. Schavgoulidze A, Perrot A, Cazaubiel T, et al. Prognostic impact of translocation t(14;16) in multiple myeloma according to the presence of additional genetic lesions. Blood Cancer J. 2023;13(1):160-162.
Haematologica | 109 May 2024 1623 LETTER TO THE EDITOR
B-cell acute lymphoblastic leukemia and juvenile xanthogranuloma in a patient with ETV6 thrombocytopenia and leukemia predisposition syndrome: novel clinical presentation and perspective
ETV6-thrombocytopenia predisposition syndrome is a rare cancer predisposition with varying penetrance, which portends increased risk of hematologic malignancy. Here we present the unusual case of a patient with a novel pathogenic variant in ETV6 who developed both B-cell acute lymphoblastic leukemia (B-ALL) and an intracranial non-Langerhans cell histiocytic neoplasm.
Case
A 7-year-old Hispanic girl with fever and leg pain was diagnosed with standard-risk B-ALL. Diagnostic leukemia karyotype revealed hyperdiploid ALL with favorable trisomies (55, XX, +X, +4, +10, del(12)(p11.2), +add(12)(p13),+14, +add(17)(q25),+18,+20,+21[4]/46,XX[18]). She was treated on the Children’s Oncology Group (COG) clinical trial AALL09321 with negative minimal residual disease (MRD) at the end of induction. Unfortunately, 10 months off therapy she experienced a combined bone marrow and central nervous system relapse. Chromosomal microarray redemonstrated hyperdiploid ALL with similar trisomies as observed at diagnosis. She was subsequently treated on COG AALL1331,2 randomized to the low-risk arm with blinatumomab. 3 She underwent whole brain radiation therapy (1,800 cGY) administered in ten fractions at month 12, with total duration of relapsed ALL therapy of 2 years.
At age 15, she presented to our Emergency Department with 2 weeks of headache and right eye pain, as well as fever and myalgias. Her vital signs and physical exam were reassuring, notable only for a baseline non-reactive right pupil and disconjugate gaze. Laboratory studies revealed a normal complete blood count, including normal platelet count of 180x109/L. A head computerized tomography scan and subsequent magnetic resonance imaging (MRI) demonstrated a well-circumscribed area of hyperattenuation within the left temporal lobe (1.7x1.4x1.4 cm) with surrounding edema and regional mass effect (Figure 1A). The patient subsequently underwent a bone marrow biopsy and lumbar puncture, revealing no evidence of recurrent leukemia. Temporal lobe biopsy demonstrated sheets of histiocytic cells, including frequent giant cell forms with occasional Touton-type giant cells. Immunohistochemical stains showed that the histiocytic cells expressed CD68, CD163 and Factor XIII and were associated with a low Ki67 proliferation index (<5%). A diagnosis of intraparenchymal juvenile xanthogranuloma (JXG) was rendered. Next-generation sequencing (NGS) analysis of the tumor detected ARHGEF2::NTRK1 fusion (Figure 2), which has been previously reported in other central nervous system (CNS) tumors.4 A skeletal survey revealed no bony disease. Tumor/normal (blood) NGS panel of 238 cancer genes5 demonstrated a
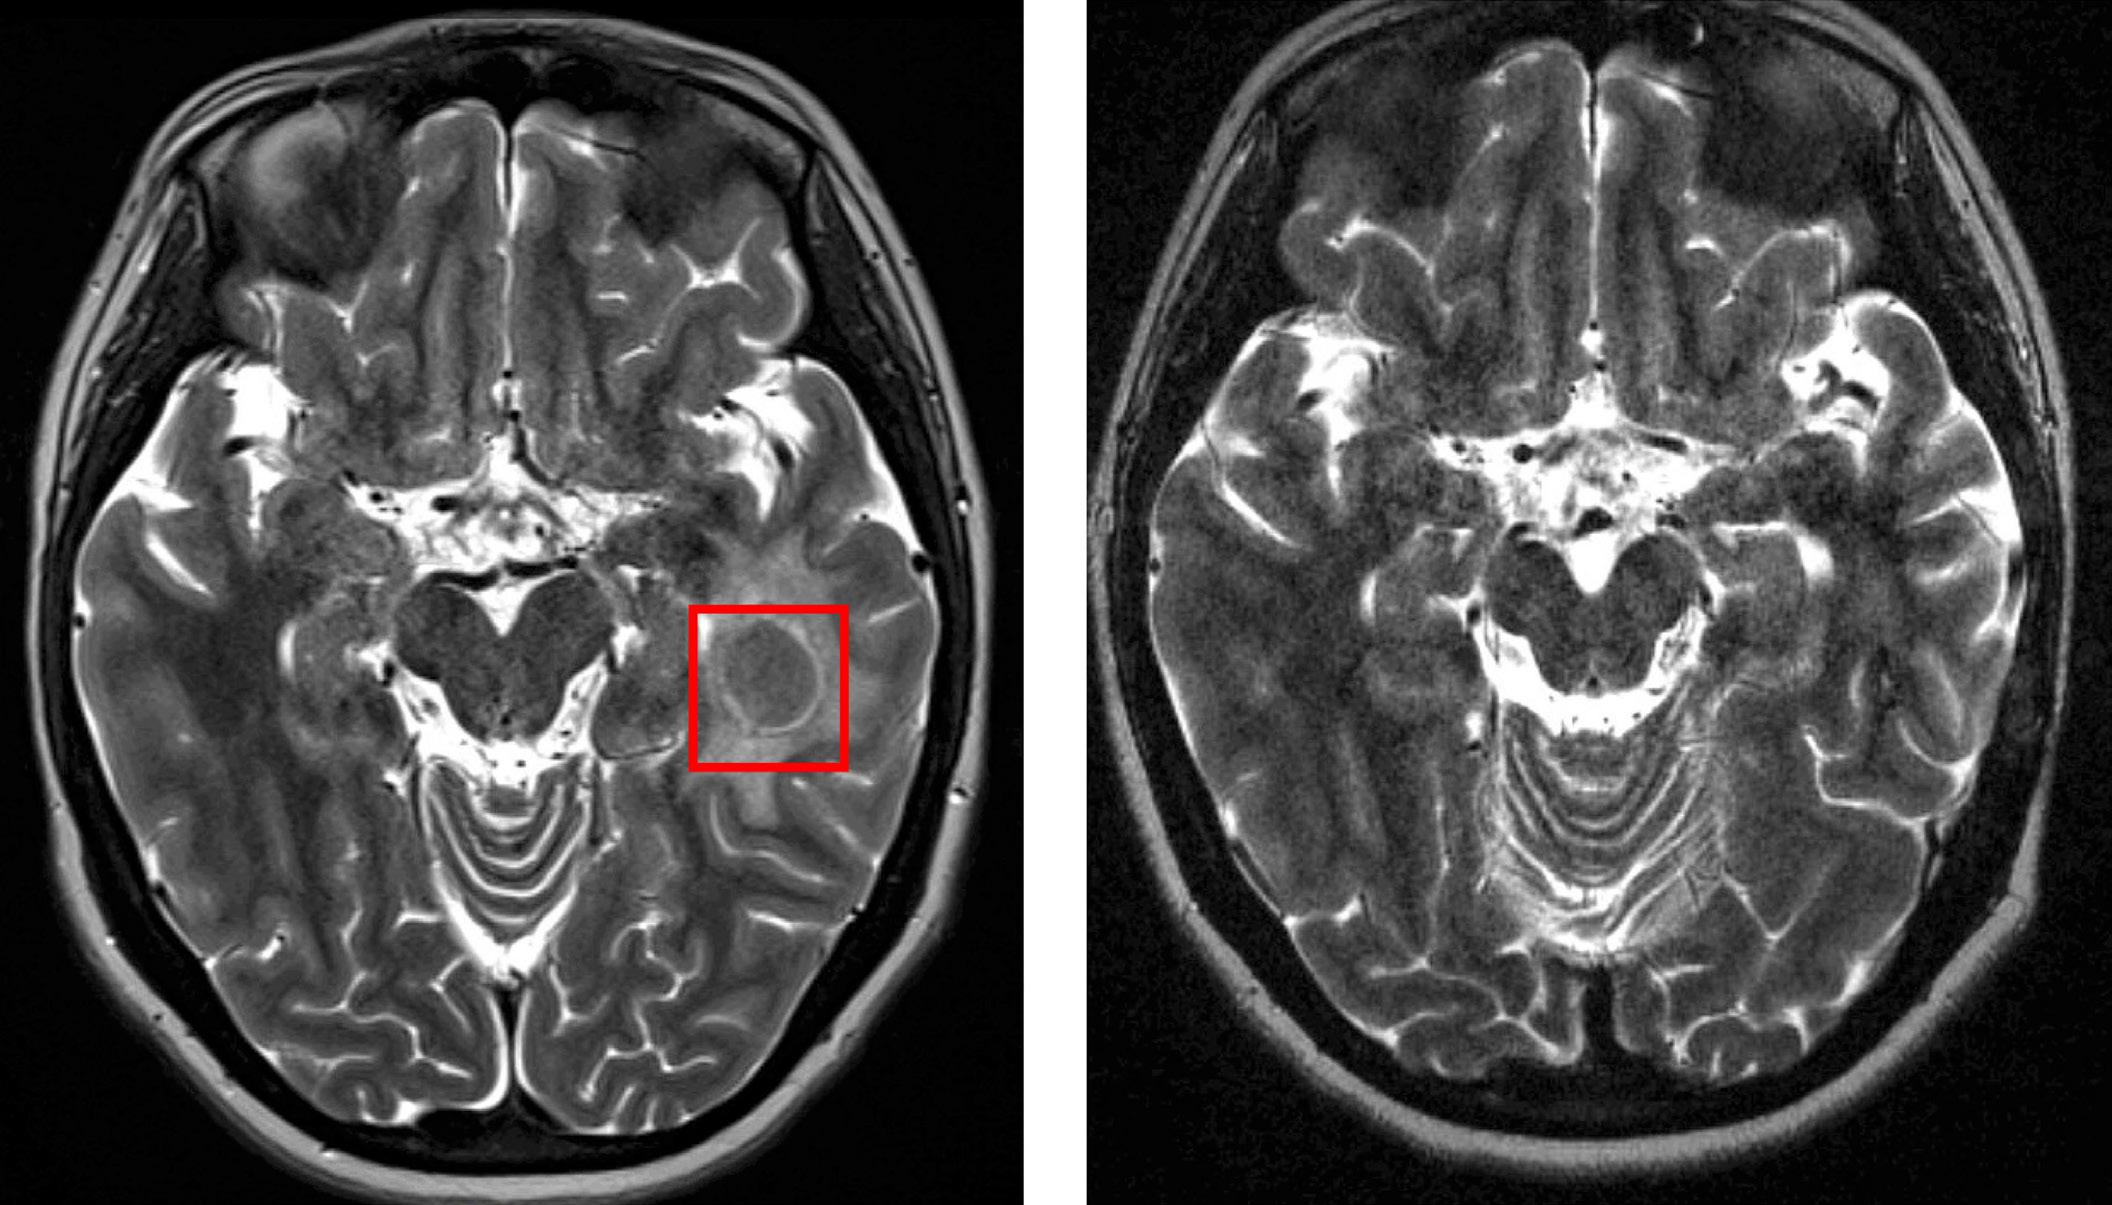
Figure 1. Magnetic resonance imaging of patient’s intraparenchymal juvenile xanthogranuloma before and after initiation of larotrectinib. (A) Magnetic resonance imaging at time of diagnosis. (B) Follow-up magnetic resonance imaging 10 months after initiation of larotrectinib.
Haematologica | 109 May 2024 1624 CASE REPORT
A B
germline pathogenic nonsense variant in both tumor and blood specimens: ETV6 c.1062C>A (p.Tyr354*) with variant allele frequencies of 0.49 and 0.40, respectively.
Given the targetable NTRK1 fusion, the patient was initiated on larotrectinib for JXG therapy given data on rapid, durable responses and safety of larotrectinib in TRK fusion-positive CNS tumors.6 She was initiated on standard adult dosing (100 mg twice daily), but due to a common side effect of generalized body aches was transitioned to three times daily dosing (75/50/75 mg) which was well tolerated. Within 2 months she had improvement in headaches and on follow-up MRI 10 months after drug initiation there was significant decrease in mass size with reduction of surrounding signal abnormality (Figure 1B).
The patient had no known family history of hematologic malignancies, thrombocytopenia, immune dysregulation, or other childhood cancers. However, cascade testing was performed for the identified pathogenic ETV6 variant and revealed that this variant was inherited from her father and is also carried by her younger sister, neither of whom have been diagnosed with cancer or experienced bleeding symptoms.
Germline pathogenic variants in ETV6 have been described in multiple kindreds of patients with ALL.7,8 The ETV6 gene is located on chromosome 12p13.2 and encodes the essential hematopoietic transcriptional repressor erythroblast transformation specific variant 6 (ETV6) protein, which functions primarily as a transcriptional repressor and is essential for bone marrow hematopoiesis and thrombopoiesis.9 The ETV6 protein has two highly conserved DNA-binding domains, PNT and ETS, and the majority of
reported germline variants are missense mutations within these domains, although nonsense and frameshift variants are also observed. This patient’s nonsense variant in exon 6 results in a premature stop codon predicted to cause an absent or truncated protein product, indicating pathogenicity. Many ETV6 pathogenic variants are thought to exhibit dominant-negative activity by dimerizing with wild-type ETV6 and sequestering in the cytoplasm;8 however, some experiments have demonstrated truncating and missense variants lose transcriptional repressor function, but have minimal dimerization effect.10 To our knowledge, the specific alteration in our patient has not been previously reported.
ETV6 -related predisposition was initially recognized in pedigrees as an autosomal-dominant condition of thrombocytopenia and leukemia preponderance.7 Many families demonstrate complete penetrance of thrombocytopenia, although individuals with normal platelet counts have been reported, as seen in our patient. Among individuals with ETV6 variants with associated thrombocytopenia, bleeding phenotype is variable; some patients experiencing bleeding even with normal platelet counts and others have no bleeding despite thrombocytopenia.11
Approximately 30% of individuals with ETV6 germline pathogenic variants will develop hematologic malignancy, with B-ALL being the most common.11 Other malignancies include myelodysplastic syndrome and acute myeloid leukemia. There are also case reports of individuals developing solid tumors under age 50.
Unselected analysis of pooled pediatric ALL cohorts demonstrated approximately 0.5-1% incidence of germline
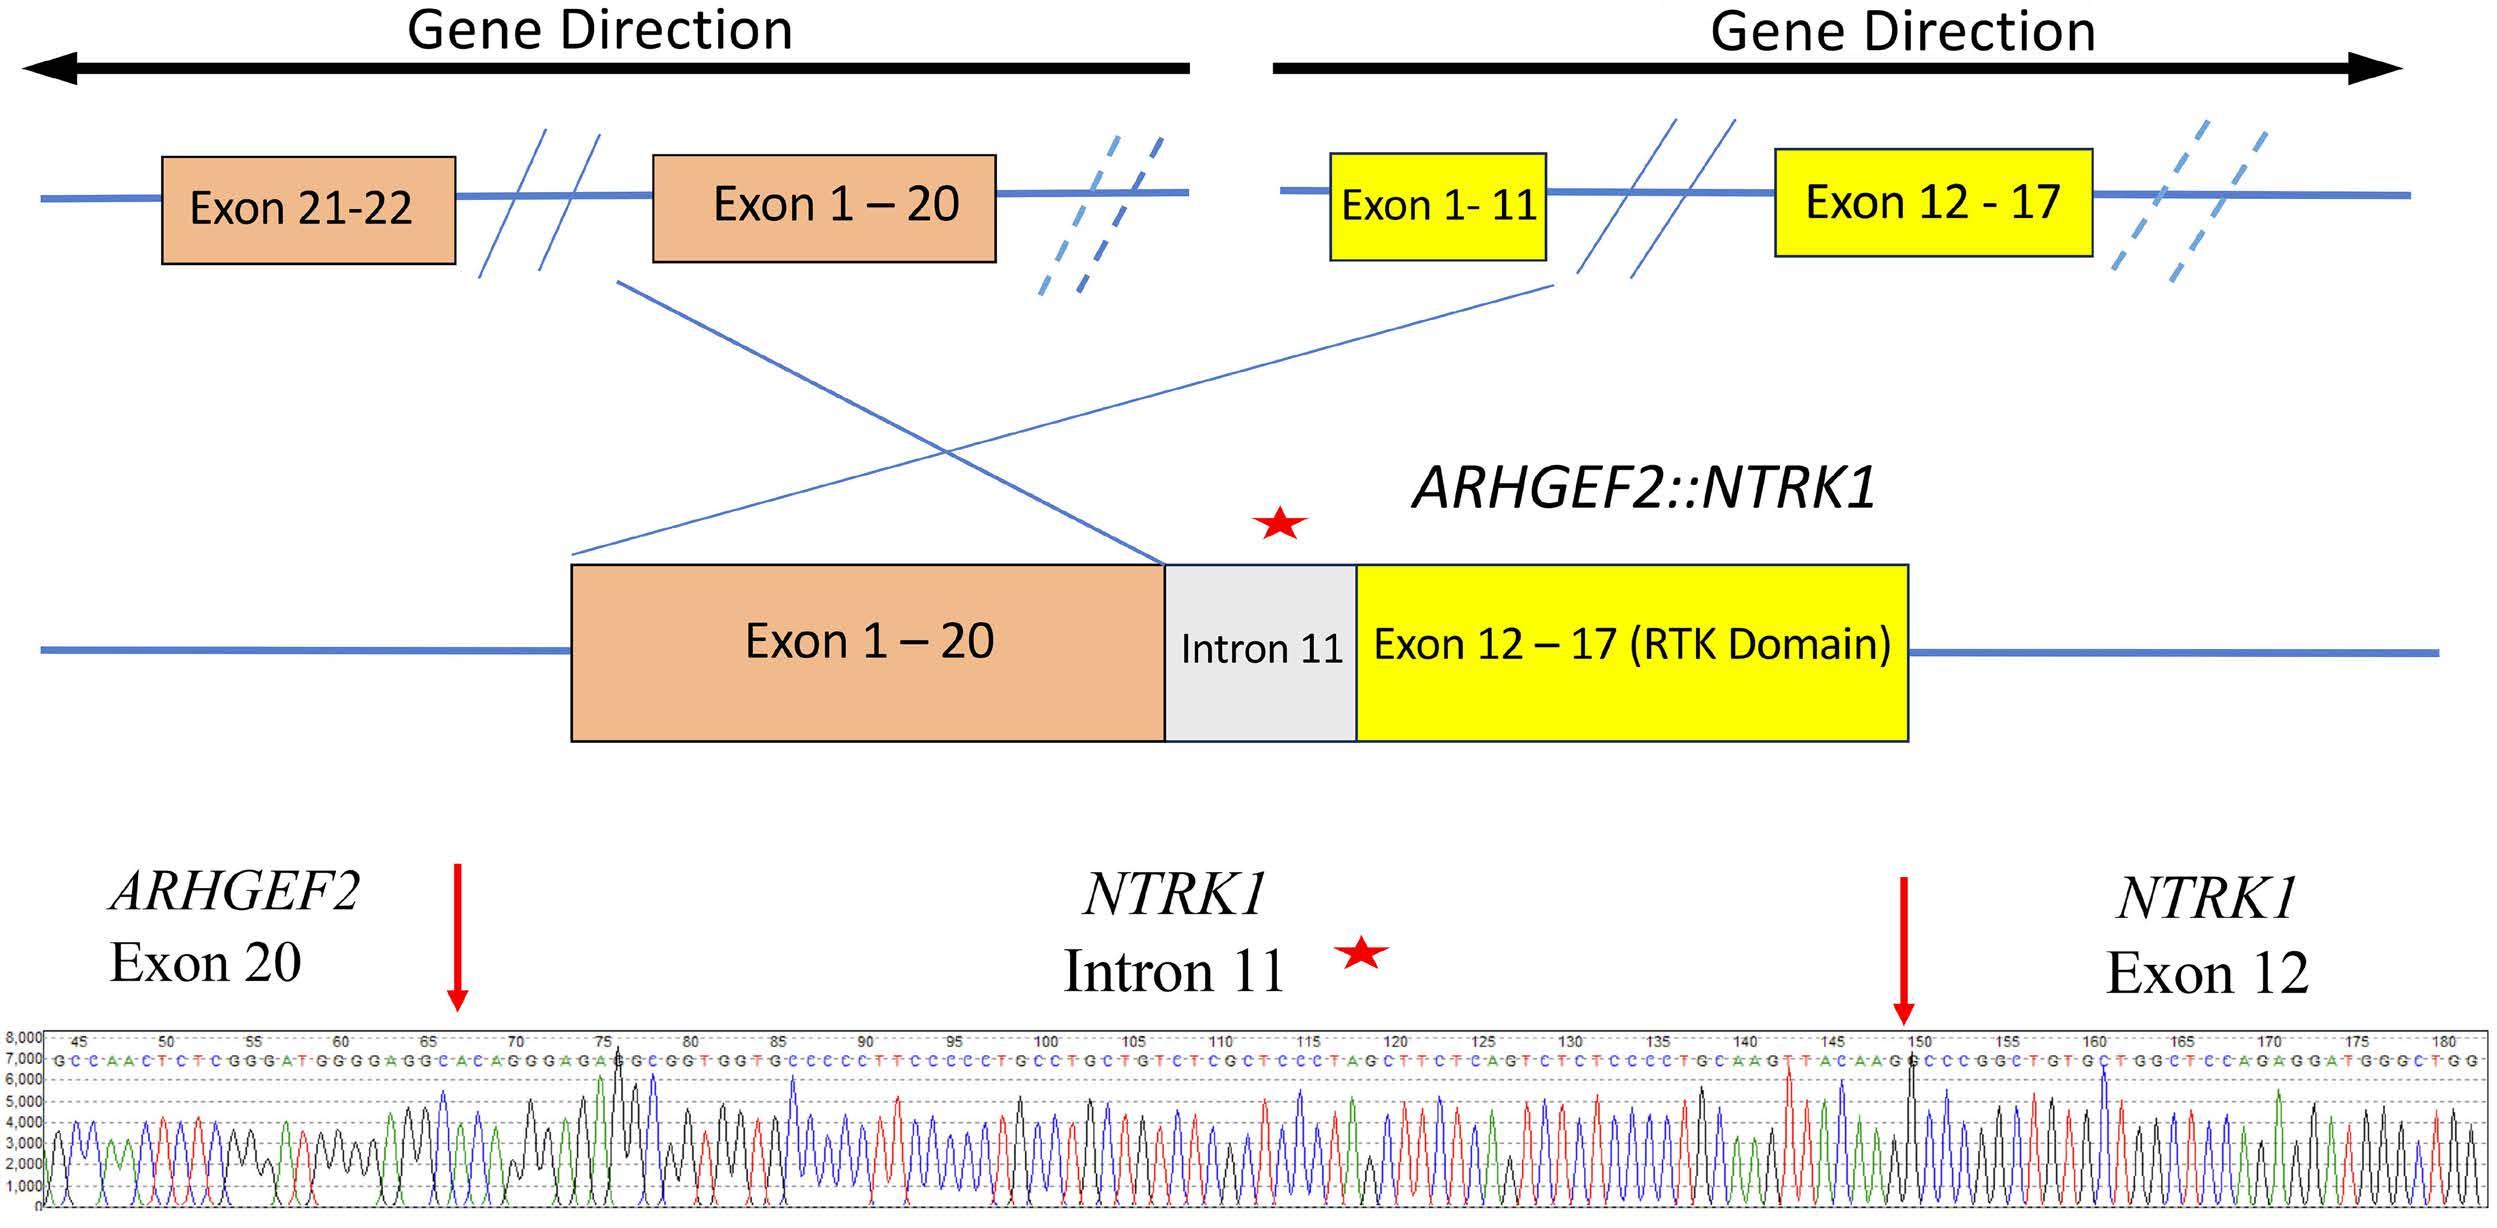
Figure 2. Schematic of ARHGEF2::NTRK1 fusion. Top: local inversion or inverted fusion event resulted in the ARHGEF2::NTRK1 fusion. Dashed lines represent possible alternative inverted fusion events. A portion of intron 11 sequence was included in the fusion product (red star). Bottom: Sanger sequencing confirmation results on cDNA showing the fusion gene sequence near the junction point. The red arrows indicate the junction point.
Haematologica | 109 May 2024 1625 CASE REPORT
pathogenic ETV6 variants.10,12 Affected children are generally older at the time of diagnosis compared to children without germline ETV6 predisposition, and demonstrate an overrepresentation of hyperdiploid karyotype which was observed in this patient. There is no observed association with end-induction MRD or relapse risk, although further research is warranted.
To our knowledge, this is the first case report of a patient with a pathogenic germline ETV6 variant presenting with a xanthogranulomatous neoplasm. There is a single case report of a patient with disseminated JXG involving skin and bone marrow, concurrent with severe hemophagocytic lymphohistiocytosis during therapy for B-ALL; however, this patient had no identified germline predisposition.13 JXG are rare, benign tumors composed of non-Langerhans cell histiocytes. They often manifest as cutaneous lesions but can involve any organ system. Intracranial disease is only observed in about 7% of cases.14 JXG have previously been described in patients with Noonan Syndrome with PTPN11 pathogenic variants, and in Neurofibromatosis Type 1. Additionally, there are reports of histiocytic tumors co-occurring with B-ALL and T-ALL with shared B-cell and/or T-cell receptor gene rearrangements, suggesting a shared clonal cell of origin.15 There was insufficient tissue available on our patient’s JXG to perform gene rearrangement studies. It is possible the pathogenic ETV6 variant described may contribute to JXG pathogenesis, and this risk may have been amplified by exposure to whole brain radiation 3.5 years prior to JXG presentation. However, the JXG may also be unrelated to her cancer predisposition syndrome.
This case adds to the growing literature describing leukemia predisposition in children with ETV6 predisposition syndrome. We add the unique finding of intracranial non-Langerhans cell histiocytic neoplasm with NTRK1 fusion in a patient with a prior history of B-ALL. Germline predisposition is thought to account for approximately 1015% of childhood cancers. As paired tumor/normal testing with NGS becomes more prevalent, this percentage is likely to increase over time. Here we highlight a patient whose predisposition went undiagnosed with somatic testing alone and required paired diagnostics. Providers should have a particularly high index of suspicion and consider
References
1. Angiolillo AL, Schore RJ, Kairalla JA, et al. Excellent outcomes with reduced frequency of vincristine and dexamethasone pulses in standard-risk B-lymphoblastic leukemia: results from Children’s Oncology Group AALL0932. J Clin Oncol. 2021;39(13):1437-1447.
2. Brown PA, Ji L, Xu X, et al. A Randomized phase 3 trial of blinatumomab vs. chemotherapy as post-reinduction therapy in low risk (LR) first relapse of B-acute lymphoblastic leukemia (B-ALL) in children and adolescents/young adults (AYAs): a
germline testing in children and adolescents presenting with multiple independent neoplasms.
Authors
Haley Newman,1 Suzanne P. MacFarland,1,2 Garrett M. Brodeur,1,2 Timothy Olson,1,2 Deepa Bhojwani,3,4 Jamie Stokke,3,4 Alexandra E. Kovach,4,5 Mary Egan Clark,1 Minjie Luo,6 Marilyn Li,2,6 Amish Shah1,2 and Stephen P. Hunger1,2
1Division of Oncology, Department of Pediatrics, Children’s Hospital of Philadelphia, Philadelphia, PA; 2Center for Childhood Cancer Research, Children’s Hospital of Philadelphia, Philadelphia, PA; 3Cancer and Blood Disease Institute, Children’s Hospital Los Angeles, Los Angeles, CA; 4Keck School of Medicine of University of Southern California, Los Angeles, CA; 5Department of Pathology and Laboratory Medicine, Children’s Hospital Los Angeles, Los Angeles, CA and 6Department of Pathology and Laboratory Medicine, Children’s Hospital of Philadelphia, Philadelphia, PA, USA
Correspondence: H. NEWMAN - newmanh@chop.edu
https://doi.org/10.3324/haematol.2023.284151
Received: August 23, 2023.
Accepted: November 22, 2023.
Early view: November 30, 2023.
©2024 Ferrata Storti Foundation
Published under a CC BY-NC license
Disclosures
No conflicts of interest to disclose.
Contributions
All authors contributed to the writing and editing of this case report.
Data-sharing statement
Original de-identified data is available upon request by contacting the corresponding author.
report from Children’s Oncology Group study AALL1331. Blood. 2021;138(Suppl 1):363.
3. Hogan LE, Brown PA, Ji L, et al. Children’s Oncology Group AALL1331: phase III trial of blinatumomab in children, adolescents, and young adults with low-risk B-cell ALL in first relapse. J Clin Oncol. 2023;41(25):4118-4129.
4 Kurozumi K, Nakano Y, Ishida J, et al. High-grade glioneuronal tumor with an ARHGEF2-NTRK1 fusion gene. Brain Tumor Pathol. 2019;36(3):121-128.
Haematologica | 109 May 2024 1626 CASE REPORT
5. Surrey LF, MacFarland SP, Chang F, et al. Clinical utility of custom-designed NGS panel testing in pediatric tumors. Genome Med. 2019;11(1):32.
6. Doz F, van Tilburg CM, Geoerger B, et al. Efficacy and safety of larotrectinib in TRK fusion-positive primary central nervous system tumors. Neuro Oncol. 2022;24(6):997-1007.
7 Zhang MY, Churpek JE, Keel SB, et al. Germline ETV6 mutations in familial thrombocytopenia and hematologic malignancy. Nat Genet. 2015;47(2):180-185.
8. Noetzli L, Lo RW, Lee-Sherick AB, et al. Germline mutations in ETV6 are associated with thrombocytopenia, red cell macrocytosis and predisposition to lymphoblastic leukemia. Nat Genet. 2015;47(5):535-538.
9 Wang LC, Swat W, Fujiwara Y, et al. The TEL/ETV6 gene is required specifically for hematopoiesis in the bone marrow. Genes Dev. 1998;12(15):2392-2402.
10 Nishii R, Baskin-Doerfler R, Yang W, et al. Molecular basis of
ETV6-mediated predisposition to childhood acute lymphoblastic leukemia. Blood. 2021;137(3):364-373.
11. Di Paola J, Porter CC. ETV6-related thrombocytopenia and leukemia predisposition. Blood. 2019;134(8):663-667.
12. Moriyama T, Metzger ML, Wu G, et al. Germline genetic variation in ETV6 and risk of childhood acute lymphoblastic leukaemia: a systematic genetic study. Lancet Oncol. 2015;16(16):1659-1666.
13. Pawińska-Wa Sikowska K, Cwiklinska M, Wyrobek E, et al. Disseminated juvenile Xanthogranuloma and hemophagocytic lymphohistiocytosis developed during treatment of acute lymphoblastic leukemia: case report. Front Oncol. 2020;10:921.
14. McClain KL, Bigenwald C, Collin M, et al. Histiocytic disorders. Nat Rev Dis Primers. 2021;7(1):73.
15. Feldman AL, Minniti C, Santi M, Downing JR, Raffeld M, Jaffe ES. Histiocytic sarcoma after acute lymphoblastic leukaemia: a common clonal origin. Lancet Oncol. 2004;5(4):248-250.
Haematologica | 109 May 2024 1627 CASE REPORT
Haematologica | 109 May 2024 1628 CASE REPORT


haematologica.org ISSN 0390 - 6078
Journal of the Ferrata Storti Foundation
