haematologica


VOL. 108 MAY 2023 Journal of the Ferrata Storti Foundation ISSN 0390 - 6078 haematologica.org
J/"#,-#%3,0%&'()*#5*-K%*-%%
4'+5%+*$/1%6,'0-")%
78&"+$%!"+$,0%9:9;<%;;=:>%%% %?*$/@+,0/%9:9;<%;;=A%%%
!"#$%0/B*/C%&0,+/##%
@'(8*##*,-%→%;#$%1/+*#*,-<%;D%1"E#%

!"#$%&'()*+"$*,-%

."&/0#%*##'/1%2'#$%"3$/0%"++/&$"-+/
F,C%&'()*+"$*,-%+,#$%

G5/%&'()*#5/0%*#%"%-,-H&0,3*$% %!,'-1"$*,-%$5"$%I//&#%$5/%% %+,#$%3,0%"'$5,0#%"#%),C%"#%&,##*()/%
6,'0-")%,3%$5/%!/00"$"H%@$,0$*%!,'-1"$*,-%
h aematologica
haematologica
Editor-in-Chief
Jacob M. Rowe (Jerusalem)
Deputy Editors
Carlo Balduini (Pavia), Jerry Radich (Seattle)
Associate Editors
Shai Izraeli (Tel Aviv), Steve Lane (Brisbane), Pier Mannuccio Mannucci (Milan), Pavan Reddy (Houston), David C. Rees (London), Paul G. Richardson (Boston), Francesco Rodeghiero (Vicenza), Gilles Salles (New York), Kerry Savage (Vancouver), Aaron Schimmer (Toronto), Richard F. Schlenk (Heidelberg), Sonali Smith (Chicago)
Statistical Consultant
Catherine Klersy (Pavia)
Editorial Board
Walter Ageno (Varese), Sarit Assouline (Montreal), Andrea Bacigalupo (Roma), Taman Bakchoul (Tübingen), Pablo Bartolucci (Créteil), Katherine Borden (Montreal), Marco Cattaneo (Milan), Corey Cutler (Boston), Kate Cwynarski (London), Mary Eapen (Milwaukee), Francesca Gay (Torino), Ajay Gopal (Seattle), Alex Herrera (Duarte), Martin Kaiser (London), Marina Konopleva (Houston), Johanna A. Kremer Hovinga (Bern), Nicolaus Kröger (Hamburg), Austin Kulasekararaj (London), Shaji Kumar (Rochester), Ann LaCasce (Boston), Anthony R. Mato (New York), Matthew J. Mauer (Rochester), Neha Mehta-Shah (St. Louis), Moshe Mittelman (Tel Aviv), Alison Moskowitz (New York), Yishai Ofran (Haifa), Farhad Ravandi (Houston), John W. Semple (Lund), Liran Shlush (Toronto), Sara Tasian (Philadelphia), Pieter van Vlieberghe (Ghent), Ofir Wolach (Haifa), Loic Ysebaert (Toulouse)
Managing Director
Antonio Majocchi (Pavia)
Editorial Office
Lorella Ripari (Office & Peer Review Manager), Simona Giri (Production & Marketing Manager), Paola Cariati (Graphic Designer), Giulia Carlini (Graphic Designer), Debora Moscatelli (Graphic Designer), Igor Poletti (Graphic Designer), Marta Fossati (Peer Review), Diana Serena Ravera (Peer Review), Laura Sterza (Account Administrator)
Assistant Editors
Britta Dost (English Editor), Rachel Stenner (English Editor), Anne Freckleton (English Editor), Rosangela Invernizzi (Scientific Consultant), Marianna Rossi (Scientific Consultant), Massimo Senna (Information Technology), Luk Cox (Graphic Artist)
Haematologica | 108 - May 2023
Brief information on Haematologica
Haematologica (print edition, pISSN 0390-6078, eISSN 1592-8721) publishes peer-reviewed papers on all areas of experimental and clinical hematology. The journal is owned by a non-profit organization, the Ferrata Storti Foundation, and serves the scientific community following the recommendations of the World Association of Medical Editors (www.wame.org) and the International Committee of Medical Journal Editors (www.icmje.org).

Haematologica publishes Editorials, Original articles, Review articles, Perspective articles, Editorials, Guideline articles, Letters to the Editor, Case reports & Case series and Comments. Manuscripts should be prepared according to our guidelines (www.haematologica.org/information-for-authors), and the Uniform Requirements for Manuscripts Submitted to Biomedical Journals, prepared by the International Committee of Medical Journal Editors (www.icmje.org).
Manuscripts should be submitted online at http://www.haematologica.org/.
Conflict of interests. According to the International Committee of Medical Journal Editors (http://www.icmje.org/#conflicts), “Public trust in the peer review process and the credibility of published articles depend in part on how well conflict of interest is handled during writing, peer review, and editorial decision making”. The ad hoc journal’s policy is reported in detail at www.haematologica.org/content/policies.
Transfer of Copyright and Permission to Reproduce Parts of Published Papers. Authors will grant copyright of their articles to the Ferrata Storti Foundation. No formal permission will be required to reproduce parts (tables or illustrations) of published papers, provided the source is quoted appropriately and reproduction has no commercial intent. Reproductions with commercial intent will require written permission and payment of royalties.
Subscription. Detailed information about subscriptions is available at www.haematologica.org. Haematologica is an open access journal and access to the online journal is free. For subscriptions to the printed issue of the journal, please contact: Haematologica Office, via Giuseppe Belli 4, 27100 Pavia, Italy (phone +39.0382.27129, fax +39.0382.394705, E-mail: info@haematologica.org).
Rates of the printed edition for the year 2022 are as following:
Institutional: Euro 700
Personal: Euro 170
Advertisements. Contact the Advertising Manager, Haematologica Office, via Giuseppe Belli 4, 27100 Pavia, Italy (phone +39.0382.27129, fax +39.0382.394705, e-mail: marketing@haematologica.org).
Disclaimer. Whilst every effort is made by the publishers and the editorial board to see that no inaccurate or misleading data, opinion or statement appears in this journal, they wish to make it clear that the data and opinions appearing in the articles or advertisements herein are the responsibility of the contributor or advisor concerned. Accordingly, the publisher, the editorial board and their respective employees, officers and agents accept no liability whatsoever for the consequences of any inaccurate or misleading data, opinion or statement. Whilst all due care is taken to ensure that drug doses and other quantities are presented accurately, readers are advised that new methods and techniques involving drug usage, and described within this journal, should only be followed in conjunction with the drug manufacturer’s own published literature.
Direttore responsabile: Prof. Carlo Balduini; Autorizzazione del Tribunale di Pavia n. 63 del 5 marzo 1955. Printing: Press Up, zona Via Cassia Km 36, 300 Zona Ind.le Settevene - 01036 Nepi (VT)
Associated with USPI, Unione Stampa Periodica Italiana. Premiato per l’alto valore culturale dal Ministero dei Beni Culturali ed Ambientali
Haematologica | 108 - May 2023
Table of Contents Volume 108, Issue 5: May 2023
About the Cover
Image taken from the Editorial by Gower and Tikhonova in this issue.
Landmark Paper in Hematology
1201 Recombinant FVIII: the milestone of modern hemophilia treatment
Pier Mannuccio Mannucci
https://doi.org/10.3324/haematol.2023.282874
Editorials
1203 “ASXL1”-erating inflammation and bone marrow fibrosis in myeloproliferative neoplasms
Hélène F.E. Gleitz and Rebekka K. Schneider
https://doi.org/10.3324/haematol.2022.281634
1205 HOXA9/MEIS1 targets in leukemia: reinforced signaling networks and therapeutic opportunities
Xinyue Zhou and Rui Lu
https://doi.org/10.3324/haematol.2022.281779
1208 Idiopathic splanchnic vein thrombosis: is it really idiopathic?
Giovanni Barosi
https://doi.org/10.3324/haematol.2022.281998
1210
Under the surface: scratching the acute lymphoblastic leukemia niche
Mark Gower and Anastasia N. Tikhonova
https://doi.org/10.3324/haematol.2022.282191
1213 One disease, many faces
Shaji Kumar
https://doi.org/10.3324/haematol.2022.281417
1216 The name counts: the case of 'congenital amegakaryocytic thrombocytopenia'
Carlo L. Balduini
https://doi.org/10.3324/haematol.2022.282024
1220 The real risk of secondary non-Hodgkin lymphoma following classical Hodgkin lymphoma
Ahmet Dogan
https://doi.org/10.3324/haematol.2022.281700
Review Articles
1222 Animal models of Diamond-Blackfan anemia: updates and challenges
Y.Lucy Liu et al.
https://doi.org/10.3324/haematol.2022.282042
1232 Biosimilars in rare diseases: a focus on paroxysmal nocturnal hemoglobinuria
Austin Kulasekararaj et al.
https://doi.org/10.3324/haematol.2022.281562
Haematologica | 108 - May 2023 I
Articles
1244 Acute Lymphoblastic Leukemia
B- and T-cell acute lymphoblastic leukemias evade chemotherapy at distinct sites in the bone marrow
Malwine J. Barz
https://doi.org/10.3324/haematol.2021.280451
1259 Acute Lymphoblastic Leukemia
TAL1 activation in T-cell acute lymphoblastic leukemia: a novel oncogenic 3’ neo-enhancer
Charlotte Smith et al.
https://doi.org/10.3324/haematol.2022.281583
1272 Acute Lymphoblastic Leukemia
Venetoclax and dinaciclib elicit synergistic preclinical efficacy against hypodiploid acute lymphoblastic leukemia
Holly Pariury et al.
https://doi.org/10.3324/haematol.2022.281443
1284 Acute Myeloid Leukemia
Signal peptide-CUB-EGF-like repeat-containing protein 1-promoted FLT3 signaling is critical for the initiation and maintenance of MLL-rearranged acute leukemia
Binay K. Sahoo et al.
https://doi.org/10.3324/haematol.2022.281151
1300 Bone Marrow Failure
Effects of nandrolone decanoate on telomere length and clinical outcome in patients with telomeropathies: a prospective trial
Diego V. Clé et al.
https://doi.org/10.3324/haematol.2022.281808
1313 Chronic Lymphocytic Leukemia
A novel next-generation sequencing capture-based strategy to report somatic hypermutation status using genomic regions downstream to immunoglobulin rearrangements
Neil McCafferty et al.
https://doi.org/10.3324/haematol.2022.281928
1322 Coagulation & its Disorders
The IgG-degrading enzyme, Imlifidase, restores the therapeutic activity of FVIII in inhibitor-positive hemophilia A mice
Melissa Bou-Jaoudeh et al.
https://doi.org/10.3324/haematol.2022.281895
1335 Iron Metabolism & its Disorders
Duality of Nrf2 in iron-overload cardiomyopathy
Enrica Federti et al.
https://doi.org/10.3324/haematol.2022.281995
1349 Hodgkin Lymphoma
Pathology review identifies frequent misdiagnoses in recurrent classic Hodgkin lymphoma in a nationwide cohort: implications for clinical and epidemiological studies
Max V. Boot et al.
https://doi.org/10.3324/haematol.2022.280840
1359 Myeloproliferative Disorders
ASXL1 mutations accelerate bone marrow fibrosis via EGR1-TNFA axis-mediated neoplastic fibrocyte generation in myeloproliferative neoplasms
Zhongxun Shi et al.
https://doi.org/10.3324/haematol.2021.280320
Haematologica | 108 - May 2023 II
1374 Plasma Cell Disorders
Heterogeneity in long-term outcomes for patients with Revised International Staging System stage II, newly diagnosed multiple myeloma
Anaïs Schavgoulidze et al.
https://doi.org/10.3324/haematol.2021.280566
1385 Platelet Biology & its Disorders
Defective binding of ETS1 and STAT4 due to a mutation in the promoter region of THPO as a novel mechanism of congenital amegakaryocytic thrombocytopenia
Valeria Capaci et al.
https://doi.org/10.3324/haematol.2022.281392
1394 Platelet Biology & its Disorders
Targeting a thrombopoietin-independent strategy in the discovery of a novel inducer of megakaryocytopoiesis, DMAG, for the treatment of thrombocytopenia
Long Wang et al.
https://doi.org/10.3324/haematol.2022.282209
Letters
1412 Pirtobrutinib and venetoclax combination overcomes resistance to targeted and chimeric antigen receptor T-cell therapy in aggressive mantle cell lymphoma
Yang Liu et al.
https://doi.org/10.3324/haematol.2022.282031
1417 Thrombin formation via the intrinsic coagulation pathway and von Willebrand factor reflect disease severity in COVID-19
Matthias H. Busch et al.
https://doi.org/10.3324/haematol.2022.281693
1423 Predictors of response to venetoclax plus hypomethylating agent therapy and survival in blast-phase myeloproliferative neoplasm
Naseema Gangat et al.
https://doi.org/10.3324/haematol.2022.282019
1429 Pirtobrutinib results in reversible platelet dysfunction compared to ibrutinib and acalabrutinib
Alexander P. Bye et al.
https://doi.org/10.3324/haematol.2022.281402
1436 Sex differences in progression of kidney disease in sickle cell disease
Kenneth I. Ataga et al.
https://doi.org/10.3324/haematol.2022.281677
1442 Combination therapy with crizotinib and vinblastine for relapsed or refractory pediatric ALK-positive anaplastic large cell lymphoma
Fabian Knörr et al.
https://doi.org/10.3324/haematol.2022.281896
1447 Clonal hematopoiesis by DNMT3A mutations as a common finding in idiopathic splanchnic vein thrombosis
Giovanna Carrà et al.
https://doi.org/10.3324/haematol.2022.281705
Case Report
1450 Leon's helmet
Hugo Gonzalez et al.
https://doi.org/10.3324/haematol.2022.281125
Haematologica | 108 - May 2023 III
Recombinant FVIII: the milestone of modern hemophilia treatment
 Pier Mannuccio Mannucci
E-mail: piermannuccio.mannucci@policlinico.mi.it

https://doi.org/10.3324/haematol.2023.282874
©2023 Ferrata Storti Foundation
Published under a CC BY-NC license
AUTHORS White GC 2nd, McMillan CW, Kingdon HS, Shoemaker CB.
JOURNAL The New England Journal of Medicine. 1989;320(3):166-170. PMID: 2492083.

On January 19, 1989, the Medical Intelligence section of the New England Journal of Medicine reported the first use of recombinant factor VIII (FVIII) in two patients with severe hemophilia A (HA).1 This article represents a landmark in its field because it marks two distinct periods of hemophilia care. The first started in the 1970s, when the availability of FVIII concentrates manufactured from human plasma offered the first efficacious form of replacement therapy in bleeding disorders. However, this success story of the 1970s was followed by the mayhem of the 1980s, when many patients with hemophilia developed the acquired immune deficiency syndrome (AIDS) that had been transmitted by concentrates manufactured from pooled human plasma, leading to a dramatic death toll.
The scientific research community reacted promptly with the identification of human immunodeficiency virus (HIV) as the cause of AIDS, the development of diagnostic methods, and the demonstration of the efficacy of heating to inactivate HIV in plasma-derived concentrates and so to ensure once again safety.
Another strategy that was pursued was to tackle the problem of bloodborne infections by means of DNA technologies that, at that time, were developing at a fast pace. In this framework, it was a monument to ingenuity that, in November 1984, Nature published four articles in the same issue, authored by scientists from such biotechnology giants as Genentech and Genetics Institute, on the cloning of the huge FVIII gene, and the structure and se-
Fondazione IRCCS Ca’ Granda Ospedale Maggiore Policlinico, Angelo Bianchi Bonomi Hemophilia and Thrombosis Center, Milan, Italy
TITLE Use of recombinant antihemophilic factor in the treatment of two patients with classic hemophilia.
Haematologica | 108 May 2023 1201 LANDMARK PAPER IN HEMATOLOGY P.M. Mannucci
Figure 1. Clearance studies of plasma-derived or recombinant factor VIII performed at the beginning of treatment in Patients 1 and 2. Figure adapted with permission from White et al. N Engl J Med 1989.
quence of this complex and labile coagulation factor. John Maddox, the editor of Nature, applauded FVIII gene cloning as “a technical triumph without parallel”,2 considering that, at the time, only such relatively simple molecules as insulin and human growth hormone were being manufactured for clinical use by recombinant DNA technology. It took a few more years to bring recombinant FVIII to the bedside. The two pioneer biotechnology companies partnered with pharmaceutical companies involved in hemophilia care for the large-scale manufac turing of recombinant FVIII: Genentech with Bayer, Genetics Institute with Baxter Healthcare. The fiercely competitive race to the first clinical use of recombinant FVIII was won by Genetics Institute and Baxter, who were able to supply White et al.1 with enough product to safely and successfully treat bleeding in two patients with severe HA and HIV positivity (Figure 1). The Baxter product was authorized for sale by the US Food and Drug Administration with the proprietary name of Recombinate® in December 1992, and Bayer Kogenate® in early 1993. These products, and others that subsequently became
References
1. White GC 2nd, McMillan CW, Kingdon HS, Shoemaker CB. Use of recombinant antihemophilic factor in the treatment of two patients with classic hemophilia. N Engl J Med. 1989;320(3):166-170.
2. Maddox J. Who will clone a chromosome? Nature. 1984;312(5992):306.
available in the 1990s, represent a pivotal moment in hemophilia care, and mark a substantial shift in the therapeutic approach: from the use of replacement therapy only in the event of bleeding episodes or before invasive procedures, to prevention by means of the continuous administration of FVIII, a regimen that, until then, had been unrealistic because of the perceived poor safety and limited availability of plasmatic products.
The wider implementation of prophylaxis in the 1990s reached a climax in 2007, when the publication of a randomized clinical trial3 provided concrete evidence that this treatment regimen was superior to episodic treatment of bleeding, a huge achievement in such a rare disease as hemophilia. These advances, and the amazing further progress that has materialized over the last ten years,4 have offered people with hemophilia, at least in high-income countries, a life expectancy similar to that of the general male population.4
Disclosure
3. Manco-Johnson MJ, Abshire TC, Shapiro AD, et al. Prophylaxis versus episodic treatment to prevent joint disease in boys with severe hemophilia. N Engl J Med. 2007;357(6):535-544
4. Mannucci PM. Hemophilia treatment innovation: fifty years of progress and more to come. J Thromb Haemost. In press.
Haematologica | 108 May 2023 1202 LANDMARK PAPER IN HEMATOLOGY P.M. Mannucci
No conflicts of interest to disclose.
“ASXL1”-erating inflammation and bone marrow fibrosis in myeloproliferative neoplasms
Hélène F.E. Gleitz1,2 and Rebekka K. Schneider1,2,3,*
1Department of Developmental Biology, Erasmus Medical Center, Rotterdam, the Netherlands; 2Oncode Institute, Erasmus Medical Center, Rotterdam, the Netherlands and 3Department of Cell Biology, Faculty of Medicine, Institute for Biomedical Engineering, Rheinisch-Westfälische Technische Hochschule (RWTH) Aachen University, Aachen, Germany.
In this issue of Haematologica, Shi et al. report on a critical role of ASXL1 mutations in driving bone marrow fibrosis via a EGR1-TNFA axis in both murine models and patients with primary myelofibrosis.1
Additional sex combs like 1 (ASXL1) mutations are among the most common molecular biological abnormalities in patients with primary myelofibrosis, but the effect of these mutations on prognosis remains controversial. Recent studies demonstrated that ASXL1 mutations alone are not detrimental but confer a worse prognosis when associated with a mutation in TP53 or high-risk genes.2 In line with these findings, it was demonstrated that ASXL1 mutations are early driver events in primary myelofibrosis but might be acquired later in the disease course of secondary myelofibrosis.3 This raises the question of the effect of ASXL1 mutations on hematopoietic stem and progenitor cells. In their study, Shi et al. sought to shed light on the mechanism of aberrant lineage differentiation and transcription deregulation related to ASXL1 mutations in myeloproliferative neoplasms (MPN), using patients’ biopsies and the hematopoietic-specific VavCre-driven murine model named Asxl1-/- Jak2VF.
In their article, Shi and colleagues1 once again confirm that ASXL1 mutations, regardless of the “MPN driver” mutation, are associated with a more severe disease phenotype (e.g., larger spleens, higher fibrosis grades, lower hemoglobin) and higher monocyte frequency but do not specifically differentiate between primary myelofibrosis and secondary myelofibrosis or additional mutations. The hematopoietic-specific Jak2VF murine model with deletion of Asxl1 represents a model for early acquisition of ASXL1 mutations comparable to ASXL1 being an early event in primary myelofibrosis.3 In line with their own and earlier clinical data, Shi et al. demonstrate that loss of Asxl1 triggers earlier onset of fibrosis and a generally more severe phenotype and also induces a differentiation bias towards the monocyte/macrophage lineage. Monocytosis in patients with primary myelofibrosis was previously associated with inferior survival4 and could be explained by a more severe
Correspondence: R.K. Schneider
reschneider@ukaachen.de
Received: August 17, 2022.
Accepted: August 19, 2022.
Early view: August 25, 2022.
https://doi.org/10.3324/haematol.2022.281634
©2023 Ferrata Storti Foundation
Published under a CC BY-NC license
inflammatory state. As ASXL1 mutations were associated with monocytosis in patients and the murine model, the authors explored the hypothesis of monocyte-derived fibrocytes contributing to more severe fibrosis. Fibrocytes are still only very broadly defined as spindle-shaped cells expressing markers of both hematopoietic cells (CD34, CD43, CD45, CD68, LSP-1, and major histocompatibility complex class II) and stromal cells (collagen I, collagen III, and fibronectin) and have been associated with primary myelofibrosis.5 Shi et al. show an association of an increased frequency of fibrocytes in patients carrying an ASXL1 mutation when compared to controls but functional evidence of active extracellular matrix production of these cells contributing to fibrosis still remains to be demonstrated. Surprisingly, the authors did not find a significant difference in Gli1+ and LepR+ staining in their relatively small cohort of patients (n=4 ASXL1mut vs. n=8 ASXL1WT) which were previously reported to expand as fibrosis-driving cells in response to a MPN clone.6,7 This might be due to the fact that both are known to be expressed at low levels and are difficult to detect by immunofluorescence without signal amplification. Another critical point is the preparation of tissue, specifically fixation and decalcification, which have significant impact on bone marrow staining. Recent work by van Egeren and colleagues8 just described a population of CD34– bone marrow monocytes using single-cell RNA sequencing and found that the JAK2 mutation increased expression of intermediate monocyte genes and the fibrocyte-associated surface protein SLAMF7 in these cells. It would now be interesting to explore if there is also an association with ASXL1 co-mutations.
Shi et al. sought to dissect transcriptional differences upon co-mutation/loss of Asxl1 in their murine model. Using bulk RNA sequencing of the heterogeneous population of cKit+ hematopoietic stem and progenitor cells, the authors show that inflammation-related pathways such as Nfkb, TNFa and IL-17, are upregulated in Asxl1-/- Jak2VF bone marrow ckit+ cells and confirmed higher serum levels of TNFb in ASXL1 mutant patients and
Haematologica | 108 May 2023 1203 EDITORIAL H.F.E. Gleitz and R.K. Schneider
Asxl1-/- Jak2VF mice. Given the strong association they observed between the double mutants/co-mutations, it would have been of particular interest to determine the effect of the co-mutation on CD14+ monocytes, for example, and not only progenitor cells. Interestingly, Shi and colleagues observed and validated the upregulation of Egr1 in LSK, GMP and monocytes of Asxl1-/- Jak2VF mice. This is an interesting link to fibrosis as Egr1 expression was described in solid organ fibrosis to be induced by fibrogenic (pro-inflammatory) stimuli and to regulate the expression of extracellular matrix components, matrix remodeling enzymes and fibrogenic cytokines such as TGF-b, leading to myofibroblast differentiation. Shi et al. further leveraged RNA sequencing, assay for transposaseaccessible chromatin (ATAC) sequencing and chromatin immunoprecipitation sequencing to investigate the transcriptional and epigenetic alterations in Asxl1-/- Jak2VF double mutants and highlight increased chromatin accessibility associated with increased levels of histone marks on enhancers, also specifically on the Egr1 locus.
References
1. Shi Z, Liu J, Zhao Y, et al. ASXL1 mutations accelerate bone marrow fibrosis via EGR1-TNFA axis-mediated neoplastic fibrocyte generation in myeloproliferative neoplasms. Haematologica. 2023;108(5):1359-1373.
2. Paz DL, Riou J, Verger E, et al. Genomic analysis of primary and secondary myelofibrosis redefines the prognostic impact of ASXL1 mutations: a FIM study. Blood Adv. 2021;5(5):1442-1451.
3. Guglielmelli P, Coltro G, Mannelli F, et al. ASXL1 mutations are prognostically significant in PMF, but not MF following essential thrombocythemia or polycythemia vera. Blood Adv. 2022;6(9):2927-2931.
4. Boiocchi L, Espinal-Witter R, Geyer JT, et al. Development of monocytosis in patients with primary myelofibrosis indicates an accelerated phase of the disease. Mod Pathol. 3013;26(2):204-212.
5. Verstovsek S, Manshouri T, Pilling D, et al. Role of neoplastic monocyte-derived fibrocytes in primary myelofibrosis. J Exp Med. 2016;213(9):1723-1740.
This is a strong point towards a role of EGR1 in more advanced fibrosis.
Recent pivotal studies have transformed our understanding of mutation acquisition in MPN9,10 and the timing of acquisition of an ASXL1 mutation in MPN patients seems to be crucial for the phenotype. This raises the question of what role the timing of ASXL1 mutations in MPN has on disease and fibrosis initiation and progression, and if similar pathways and genes are activated. The “ASXL1-erating” effect on fibrosis kinetics in MPN was clearly demonstrated and it will be interesting to see in the future the functional effect of an EGR1/TNFa axis which could potentially act as a point of therapeutic intervention.
Disclosures
No conflicts of interest to disclose.
Contributions
HG and RKS wrote and edited the manuscript.
6. Schneider RK, Mullally A, Dugourd A, et al. Gli1+ mesenchymal stromal cells are a key driver of bone marrow fibrosis and an important cellular therapeutic target. Cell Stem Cell. 2017;20(6):785-800.e8.
7. Decker M, Martinez-Morentin L, Wang G, et al. Leptin-receptorexpressing bone marrow stromal cells are myofibroblasts in primary myelofibrosis. Nat Cell Biol. 2017;19(6):677-688.
8. van Egeren D, Kamaz B, Liu S, et al. Transcriptional differences between JAK2-V617F and wild-type bone marrow cells in patients with myeloproliferative neoplasms. Exp Hematol. 2022;107:14-19.
9. van Egeren D, Escabi J, Nguyen M, et al. Reconstructing the lineage histories and differentiation trajectories of individual cancer cells in myeloproliferative neoplasms. Cell Stem Cell. 2021;28(3):514-523.e9.
10. Williams N, Lee J, Mitchell E, et al. Life histories of myeloproliferative neoplasms inferred from phylogenies. Nature. 2022;602(7895):162-168.
Haematologica | 108 May 2023 1204 EDITORIAL H.F.E. Gleitz and R.K. Schneider
HOXA9/MEIS1 targets in leukemia: reinforced signaling networks and therapeutic opportunities
Xinyue Zhou1,2 and Rui Lu1,2
1Department of Medicine, Division of Hematology/Oncology, University of Alabama at Birmingham Heersink School of Medicine and 2O’Neal Comprehensive Cancer Center, University of Alabama at Birmingham Heersink School of Medicine, Birmingham, AL, USA
Correspondence: R. Lu
ruilu1@uabmc.edu
Received: August 17, 2022.
Accepted: August 19, 2022.
Early view: August 25, 2022.
https://doi.org/10.3324/haematol.2022.281779
©2023 Ferrata Storti Foundation
Published under a CC BY-NC license
In this issue of Haematologica, Sahoo et al. demonstrate that a novel target of HOXA9 and MEIS1, SCUBE1, is critically involved in the development of MLL-rearranged (MLL-r) acute myeloid leukemia (AML).1 The MLL fusion protein predominantly activates the oncogenic transcription factor HOXA9 and its cofactor MEIS1 to drive leukemogenesis.2 A deeper understanding of the gene regulatory networks governed by HOXA9 and MEIS1 will improve our knowledge of MLL-r leukemia pathobiology and offer new therapeutic strategies. The study by Sahoo et al. revealed that SCUBE1 is required for both initiation and maintenance of MLL-r AML by promoting activation of the FLT3-LYN signaling axis. The authors also developed an antibody-drug conjugation-based strategy to target SCUBE1-expressing leukemic cells for specific and effective inhibition of leukemia growth.
Overexpression of transcription factor HOXA9 and its cofactor MEIS1 is a hallmark of MLL-r AML and many other subtypes of AML.2 MLL gene translocation is found in approximately 10% of AML patients and is associated with poor response to treatment and reduced overall survival.3 The MLL fusion protein drives leukemia development through direct activation of pro-leukemic transcription factors such as HOXA9 and MEIS1.2 While progresses have been made in inhibiting HOXA9 and MEIS1 transcription by targeting the MLL complex proteins,4 it is equally important to identify the transcriptional targets controlled by HOXA9 and MEIS1 to identify novel therapeutic strategies. Previous genomics and transcriptomics studies identified several transcriptional targets regulated by HOXA9 and MEIS1, including genes encoding transcription factor LMO2, antiapoptotic factor BCL2, and receptor tyrosine kinase FLT3.5-8 These HOXA9 and MEIS1 targets and their associated signaling pathways have been linked to leukemia transformation and expansion through various mechanisms (Figure 1). To date, the potential interactions and crosstalk among HOXA9 and MEIS1 targets remain largely unexplored.
By analyzing SCUBE1 expression in AML cell lines and
primary AML samples, Sahoo and colleagues found that SCUBE1 is highly expressed in MLL-r AML cells, but not in normal hematopoietic stem and progenitor cells, peripheral blood cells, or leukemic cells that lack the MLL gene rearrangement. High SCUBE1 expression was associated with shorter survival of AML patients, implying a potentially oncogenic role of SCUBE1. To understand the mechanism by which SCUBE1 is upregulated in MLL-r AML, the authors examined whether SCUBE1 is activated directly by the MLL fusion protein or indirectly by MLL downstream factors such as HOXA9 and MEIS1. While the authors did not find significant enrichment of MLL fusion protein at the SCUBE1 locus by interrogating previously published MLL-AF9 chromatin immunoprecipitation sequencing data, they identified two putative HOXA9/MEIS1 co-bound sites located at distal regulatory regions of the SCUBE1 gene. Using chromatin immunoprecipitation assay, luciferase reporter assay, and shRNA-mediated knockdown of HOXA9 and MEIS1, the authors further confirmed that SCUBE1 is a target that is transcriptionally activated by HOXA9 and MEIS1. Their data collectively suggest that SCUBE1 is a novel target of HOXA9 and MEIS1 with elevated expression in MLL-r AML. To assess the functional role of SCUBE1 in leukemia development, Sahoo and colleagues then performed a series of in vitro and in vivo experiments using both human and murine MLL-r AML models. In human MLL-r AML, knockdown of SCUBE1 resulted in decreased cell survival in vitro and reduced leukemic cell engraftment in vivo. In mice, while SCUBE1 overexpression was not sufficient to drive oncogenic transformation of hematopoietic progenitor cells, depletion of murine Scube1 in hematopoietic progenitor cells significantly impaired the initiation of MLL-AF9-mediated leukemia. By using a Scube1 conditional knockout mouse model, the authors further assessed the role of Scube1 in maintaining MLL-r AML development in vivo. Tamoxifenmediated acute depletion of Scube1 significantly delayed leukemic progression and prolonged the survival of recipient mice bearing MLL-AF9 leukemia. Together,
Haematologica | 108 May 2023 1205 EDITORIAL X. Zhou and R. Lu
these data strongly suggest that SCUBE1 plays an essential role in both the initiation and maintenance of MLL-r leukemia.
To determine the potential signaling pathways associated with SCUBE1 in leukemia, the authors performed an unbiased proteomic proximity labeling and mass spectrometry analysis, through which they identified that the cell surface SCUBE1 protein is associated with receptor tyrosine kinase FLT3 and its direct signaling component LYN. More specifically, the authors found that the spacer region and the CUB domain of SCUBE1 primarily interact with the ligand-binding extracellular Iglike domains of FLT3 and FLT3L. Gain-of-function and loss-of-function studies further demonstrated that SCUBE1 plays a role in activating FLT3-LYN signaling, potentially through acting as a co-receptor to facilitate FLT3L binding to FLT3. Lastly, Sahoo et al. generated a SCUBE1-targeting antibody-drug conjugate which links an internalizable anti-SCUBE1 monoclonal antibody to a
proteolytically cleavable valine-citrulline linker and an anti-microtubule cytotoxic agent. This antibody-drug conjugate was able to selectively kill SCUBE1-expressing MLL-r leukemia cells but not the SCUBE1-negative leukemic cells in vitro, as well as inhibit MLL-r leukemia growth in xenograft models. Together, their results highlight SCUBE1 as a novel activator of FLT3 signaling pathway and a potential therapeutic target in MLL-r AML. Taken together, the findings of Sahoo and colleagues revealed important roles of SCUBE1, a new transcriptional target of HOXA9/MEIS1, in the initiation and maintenance of MLL-r leukemia. Intriguingly, SCUBE1 binds to another HOXA9/MEIS1 target FLT3 and facilitates activation of FLT3 signaling, implying a reinforced signaling network downstream of HOXA9 and MEIS1. A recent discovery that HOXA9 directly activates cyclin-dependent kinase CDK6 and its cognate cyclin CCND1 further supports this possibility.7 Further studies are needed to systematically identify HOXA9 and MEIS1 targets and to investigate the

Haematologica | 108 May 2023 1206 EDITORIAL X. Zhou and R. Lu
Figure 1. Transcription targets of HOXA9 and MEIS1 and their associated pathways in leukemia. P: phosphorylation; HSC: hematopoietic stem cells.
potential crosstalk among their associated signaling pathways. Recent advances in targeted inducible protein degradation and CRISPR screens may offer opportunities to discover immediate HOXA9/MEIS1 target genes and to perform unbiased functional evaluations, respectively.9,10 In addition, because HOXA9 and MEIS1 are highly expressed in many other non-MLL-r leukemia subtypes,2 understanding the role of SCUBE1 and other HOXA9/
References
1. Sahoo BK, Lin Y-C, Tu C-F, et al. Signal peptide-CUB-EGF-like repeat-containing protein 1-promoted FLT3 signaling is critical for the initiation and maintenance of MLL-rearranged acute leukemia. Haematologica. 2023;108(5):1288-1299.
2. Collins CT, Hess JL. Deregulation of the HOXA9/MEIS1 axis in acute leukemia. Curr Opin Hematol. 2016;23(4):354-361.
3. Meyer C, Kowarz E, Hofmann J, et al. New insights to the MLL recombinome of acute leukemias. Leukemia. 2009;23(8):1490-1499.
4. Aryal S, Zhang Y, Wren S, Li C, Lu R. Molecular regulators of HOXA9 in acute myeloid leukemia. FEBS J. 2023;290(2):321-339.
5. Collins CT, Hess JL. Role of HOXA9 in leukemia: dysregulation, cofactors and essential targets. Oncogene. 2016;35(9):1090-1098.
6. Huang Y, Sitwala K, Bronstein J, et al. Identification and
MEIS1 targets may have broader implications in other hematologic malignancies.
Disclosures
No conflicts of interest to disclose.
Contributions
XZ and RL both contributed to this editorial.
characterization of Hoxa9 binding sites in hematopoietic cells. Blood. 2012;119(2):388-398.
7. Zhong X, Prinz A, Steger J, et al. HoxA9 transforms murine myeloid cells by a feedback loop driving expression of key oncogenes and cell cycle control genes. Blood Adv. 2018;2(22):3137-3148.
8. de Bock CE, Demeyer S, Degryse S, et al. HOXA9 cooperates with activated JAK/STAT signaling to drive leukemia development. Cancer Discov. 2018;8(5):616-631.
9. Röth S, Fulcher LJ, Sapkota GP. Advances in targeted degradation of endogenous proteins. Cell Mol Life Sci. 2019;76(14):2761-2777.
10. Shalem O, Sanjana NE, Zhang F. High-throughput functional genomics using CRISPR-Cas9. Nat Rev Genet. 2015;16(5):299-311.
Haematologica | 108 May 2023 1207 EDITORIAL X. Zhou and R. Lu
Idiopathic splanchnic vein thrombosis: is it really idiopathic?
Giovanni Barosi
Splanchnic vein thrombosis (SVT) occurring in association with a clonal myeloproliferative neoplasm (MPN) is puzzling and difficult to manage for doctors who care for patients with myeloid disorders as well as those who care for patients with thromboembolic diseases. The phenotype of myeloproliferation is frequently that of a latent disease making diagnosis of an SVT-associated MPN challenging. Furthermore, the benefit of using cytoreductive agents is unproven, making therapy uncertain.
In this issue of Haematologica, Carrà and colleagues provide a new piece of the puzzle.1 They report 15 consecutive cases of idiopathic SVT presenting with mutations involving one or more of the 30 myeloid genes of their next-generation sequencing panel. In seven cases, the authors found clonal hematopoiesis of uncertain potential (CHIP), i.e., acquired somatic mutations in leukemia-associated driver genes in individuals without underlying hematologic malignancies.
Even though Carrà’s data mirror those recently published by Magaz et al. in 74 patients with idiopathic SVT,2 the reported results have different points of interest. The first is that the authors, after setting the variant allele frequency threshold as >2%, reported a CHIP prevalence of 46% (95% confidence interval: 21%-73%), which is the highest ever reported. CHIP occurs in about 10% of healthy people after the age of 70 and in about 5% under 65 years old. This means the prevalence of CHIP in Carrà’s study is nearly 10fold higher than that expected in the general population of comparable age. This figure is higher than the 37.8% prevalence of CHIP in the study by Magaz et al. in idiopathic SVT, and the 25% prevalence in people with solid cancers.3 These figures, even though obtained in small numbers of patients, support a role of CHIP in idiopathic SVT.
A second concept of clinical interest is that SVT-associated CHIP contrasts with the dominant notion that CHIP is linked to cardiovascular diseases, possibly related to pro-inflammatory interactions between clonal-derived leukocytes and vascular endothelial cells. Considerable data indicate risks of coronary heart disease and stroke are higher in people with CHIP than in those without CHIP.4 The clinical rel-
Correspondence: G. Barosi barosig@smatteo.pv.it
Received: September 14, 2022. Accepted: September 14, 2022. Early view: October 13, 2022.
https://doi.org/10.3324/haematol.2022.281998
©2023 Ferrata Storti Foundation
Published under a CC BY-NC license
evance of these results is certified by the fact that specialized CHIP clinics with multidisciplinary teams of oncologists, hematologists and cardiologists have been recommended.5
Recently, a relationship between CHIP and risk of venous thromboembolism has been suggested. This suggestion was originated by a study testing whether individuals with JAK2V617F-positive CHIP had a population of clonal neutrophils primed to produce neutrophil extracellular traps implicated in the pathogenesis of venous thrombosis. In a large case-control cohort (10,893 individuals), the authors documented that JAK2V617F-mutant CHIP was powerfully associated with major venous thrombotic events.6 Subsequent studies reported discordant results. In 11,695 patients with solid cancers no significant association between any CHIP mutations, including JAK2V617F, and risk of thrombotic events was evidenced.3 However, a pilot retrospective observational study of 61 subjects with unprovoked pulmonary embolism reported 20% CHIP-associated somatic mutations.7
The studies by Carrà et al. and Magaz et al. provide evidence that CHIP is a risk factor for venous thromboembolism. Since the study by Magaz et al. did not include patients with JAK2V617F, whether the risk of venous thromboembolism is associated with mutations in specific genes, and whether these patients are exposed to a higher risk of recurrence are important questions that need to be addressed in large multicenter series.
The third feature of interest of Carrà’s paper is the high frequency of JAK2V617F considered part of the CHIP-associated mutations. Three of the seven patients (43%) with CHIP had JAK2V617F mutations, together with three patients with DNMT3A mutations and one with an EZH2 mutation. CHIPassociated mutations occur in many different genes, the most frequent of which are epigenetic regulators (DNMT3A, TET2 and ASXL1), which account for approximately 70% of the mutations, followed by mutations in RNA splicing genes (SF3B1, U2AF1) and signaling, such as JAK2 8
The extraordinarily high frequency of JAK2V617F among the CHIP-associated mutations in SVT subjects opens the
Center for the Study of Myelofibrosis, IRCCS Policlinico S. Matteo Foundation, Pavia, Italy
Haematologica | 108 May 2023 1208 EDITORIAL G. Barosi
question on how to differentiate MPN-specific mutations from CHIP-associated ones. A similar question was raised by Steemsa et al. for CHIP in the normal population when the authors claimed that detection of a myelodysplastic syndrome (MDS)-associated somatic mutation in a cytopenic patient without other evidence of MDS causes diagnostic uncertainty.9
Carrà et al. claimed that their subjects lacked a myeloid disorder because bone marrow biopsies were inconsistent with a World Health Organization (WHO)-defined MPN. However, diagnosing a MPN in someone with SVT is challenging. The authors themselves noted that the patients had increased bone marrow cellularity, an increased erythroid component, and occasional hyperplasia of megakaryocytes with dysplasia. These data raise the suspicion of an early MPN.
We recently described a new subtype of MPN frequently associated with SVT.10 The disorder is characterized by normal blood cell concentration, no signs of disease activity, with megakaryocyte hyperplasia and dysplasia, which we termed clonal megakaryocyte dysplasia with normal blood
References
1. Carrà G, Giugliano E, Camerlo S. et al. Clonal hematopoiesis by DNMT3A mutations as a common finding in idiopathic splanchnic vein thrombosis- Haematologica. 2023;108(5):1447-1449.
2. Magaz M, Alvarez-Larrán A, Colomer D, et al. Next-generation sequencing in the diagnosis of non-cirrhotic splanchnic vein thrombosis. J Hepatol. 2021;74(1):89-95.
3. Dunbar A, Bolton KL, Devlin SM, et al. Genomic profiling identifies somatic mutations predicting thromboembolic risk in patients with solid tumors. Blood. 2021;137(15):2103-2113.
4. Jaiswal S, Natarajan P, Silver AJ, et al. Clonal hematopoiesis and risk of atherosclerotic cardiovascular disease. N Engl J Med. 2017;377(2):111-121.
5. Bolton KL, Zehir A, Ptashkin RN, et al The clinical management of clonal hematopoiesis: creation of a clonal hematopoiesis clinic. Hematol Oncol Clin North Am. 2020;34(2):357-367.
values. Here we emphasize that our dataset contains other MPN currently considered MPN-unclassifiable in the 2016 WHO classification of myeloid disorders. Many of these people have idiopathic thromboses (often SVT) and bone marrow histology showing minimal changes of megakaryocytes that deserve to be more precisely and usefully classified.
In their discussion, Carrà et al. propose that CHIP is a clue to the pathophysiopathology of SVT and a new, easily identifiable risk factor for SVT recurrence. I suggest that a more careful study of bone marrow histology in people with SVT, especially of megakaryocytes, is likely to identify new patients with MPN-associated SVT and consistently address them to a differential strategy of cure.
Disclosures
No conflicts of interest to disclose.
Acknowledgments
The author thanks Robert P. Gale for his comments on the manuscript and for his help with revising it.
6. Wolach O, Sellar RS, Martinod K, et al. Increased neutrophil extracellular trap formation promotes thrombosis in myeloproliferative neoplasms. Sci Transl Med. 2018;10(436):eaan8292.
7. Soudet S, Jedraszak G, Evrard O, et al. Is hematopoietic clonality of indetermined potential a risk factor for pulmonary embolism? TH Open. 2021;5(3):e338-e342.
8. Kusne Y, Xie Z, Patnaik MM. Clonal hematopoiesis: molecular and clinical implications. Leuk Res. 2022;113:106787.
9. Steensma DP, Bejar R, Jaiswal S, et al. Clonal hematopoiesis of indeterminate potential and its distinction from myelodysplastic syndromes. Blood. 2015;126(01):9-16
10. Barosi G, Rosti V, Massa M, et al. Clonal megakaryocyte dysplasia with normal blood values is a distinct myeloproliferative neoplasm. Acta Haematol. 2022;145(1):30-37.
Haematologica | 108 May 2023 1209 EDITORIAL G. Barosi
Under the surface: scratching the acute lymphoblastic leukemia niche
Mark Gower1 and Anastasia N. Tikhonova1,2,3
1Princess Margaret Cancer Center, University of Toronto, University Health Network; 2Department of Medical Biophysics, University of Toronto and 3Department of Immunology, University of Toronto, Toronto, Ontario, Canada
Correspondence: A.N. Tikhonova anastasia.tikhonova@uhnresearch.ca
Received: November 23, 2022.
Accepted: December 13, 2022.
Early view: December 22, 2022.
https://doi.org/10.3324/haematol.2022.282191
©2023 Ferrata Storti Foundation
Published under a CC BY-NC license
In this issue of Haematologica, Barz et al. use three-dimensional (3D) imaging to pinpoint the localization of xenografted primary B-cell progenitor acute lymphoblastic leukemia (BCP-ALL) and T-cell ALL (T-ALL) cells in the bone marrow (BM) before and after chemotherapy.1 Despite significant improvements in chemotherapy regimens for ALL treatment, many children and up to 50% of adults will relapse and succumb to the disease.2 Largescale genomic studies of diagnostic, remission and relapsed disease have led to two major theories of relapse: (i) that rare chemotherapeutic resistant subclones exist at diagnosis and are selected by therapy3 or (ii) that leukemic cells develop resistance to therapy during treatment.4 Alternatively, some patients are refractory to treatment at diagnosis and fail to reach remission. Additionally, it is becoming increasingly appreciated that niches can offer protection from treatment in a wide range of cancers.
Indeed, prior in vivo5-7 mouse and patient-derived xenograft (PDX) models of ALL have identified specific niche factors,5 cell populations,6 and proximity to the endosteum7 as important for T-ALL and BCP-ALL survival before or after therapy. However, using time-lapse imaging of the niche before and after chemotherapy, Hawkins et al.8 challenged the notion of a specific tissue localization of chemotherapeutic-resistant cells by demonstrating that T-ALL cells remain motile in the niche before and after treatment. To investigate the distribution of primary cells in the bone, the authors employed 3D microscopy to image the cells’ localization before, during, and after chemotherapy.
First, the team established PDX models in NSG mice from nine genetically heterogeneous BCP-ALL and five T-ALL samples engineered to express luciferase for live tracking of disease burden. Engraftment of immunodeficient miceby human ALL cells, does not require conditioning thus ensuring that the niche is unharmed before engraftment. Bioluminescence imaging confirmed ALL localization to the proximal and distal metaphyses of the BM at 1 day after transplantation. Impressively, the authors estab-
lished a 28-day model of induction chemotherapy including dexamethasone, doxorubicin, and vincristine, three of the mainstays of the human induction therapy regimen. The induction regimen successfully reduced disease burden in all xenograft models, while leaving detectable minimal residual disease (MRD) to allow imaging of postchemotherapy ALL cell localization.
Next, the team used 3D confocal imaging of clarified femur to reveal the BM localization of BCP-ALL, T-ALL and CD34+ healthy cord blood hematopoietic stem and progenitor cells in the absence of treatment to compare the localization of healthy and leukemic cells. While both subtypes of ALL cluster alongside sinusoidal cells, BCP-ALL cells were observed closer to BM sinusoids and T-ALL cells more scattered throughout the BM with some in closer vicinity to bone endosteal regions. Importantly, hematopoietic stem and progenitor cells displayed overlapping but distinct localizations compared to ALL cells, suggesting that distinct niche factors are required for these populations, which could be exploited for therapeutic benefit.
After chemotherapy treatment, residual BCP-ALL localized closely with sinusoids, whereas T-ALL cells were scattered throughout the niche, but with more cells found in the bone endosteal region. Interestingly, at later stages of leukemic cell engraftment and/or after the 28-day chemotherapy regimen, BM sinusoids were remodelled to a denser, swollen phenotype when compared to those of untreated and un-engrafted animals. Excitingly, the vascular changes were reversed within as little as 4 days after chemotherapy, suggesting that the vascular niche can bounce back from prolonged stress to support normal hematopoiesis. Follow-up experiments should address the ability of this compartment to support normal hematopoietic output upon remission.
Next, the group demonstrated that residual cells were capable of recapitulating primary disease after serial transplantation into secondary hosts. To test if chemotherapy selected for subclones with greater resistance to treatment, the authors transplanted MRD cells into secondary
Haematologica | 108 May 2023 1210 EDITORIAL M. Gower and A.N. Tikhonova
Figure 1. Characterizing the B-cell precursor and T-cell acute lymphoblastic leukemia niches before and after induction therapy. Patient-derived xenografts were established in NSG mice and allowed to engraft for 4-11 days prior to threedimensional imaging of clarified bone marrow from the femur. B-cell precursor acute lymphoblastic leukemia (BCP-ALL) and Tcell acute lymphoblastic leukemia (T-ALL) cells were both found in close proximity to sinusoids, but T-ALL cells were also found close to the endosteum. After a model induction therapy regimen including vincristine, doxorubicin, and dexamethasone, residual BCP-ALL and T-ALL cells did not localize to or concentrate in new areas of the niches.

immunodeficient hosts and observed no delay in engraftment or response to the induction regimen in vivo. Two interpretations can be drawn, either niche interactions, rather than cell-intrinsic changes, drive chemotherapy resistance in this model, or the therapeutic regimen implemented is insufficient to kill all cells regardless of resistance mechanisms.
Finally, the authors aimed to identify whether cells survived chemotherapy by remaining dormant. To address this question, transplanted xenograft cells were pre-labeled with CFSE, a fluorescent dye whose signal dilutes out over multiple cell divisions, and mice were treated short-term (3 days) or with the full induction regimen prior to imaging and flow cytometry analysis to identify CFSE label-retaining
cells (LRC). Three days after treatment initiation cells in chemotherapy-treated mice showed slightly higher CFSE retention than those in untreated mice. In contrast to the findings of Ebinger et al., who identified LRC residing proximal to the endosteum after treatment,7 the authors found that no LRC could be harvested from the BM after induction therapy, indicating that cells continued to proliferate during therapy. Imaging following short-term treatment demonstrated that CFSEhigh cells were not found closer to the endosteum than CFSElow cells. Overall, similar to results reported by Hawkins et al., 8 the authors were unable to identify a population of dormant MRD cells or a tissue localization supporting MRD cells after chemotherapy. The authors utilized a comprehensive 3D imaging approach
Haematologica | 108 May 2023 1211 EDITORIAL M. Gower and A.N. Tikhonova
to study the BM microenvironment of BCP-ALL and T-ALL, demonstrating unique tissue localization of cells from each disease. Furthermore, this works brings into question prior work that demonstrated that residual ALL cells survive chemotherapy by remaining dormant.7 However, since the current and prior studies model induction therapy differently, the difference in findings could be dependent on the chemotherapeutic agents used. It would be interesting to determine whether LRC reside in peripheral organs such as the spleen and central nervous system after treatment, since the authors noted that residual cells were found in these tissues. Work by Cahu et al. identified the adipose-rich tail BM niche as a reservoir for chemotherapeutic-resistant ALL cells.6 Overall, the thought-provoking
References
1. Barz MJ, Behrmann L, Capron D, et al. B- and T-cell acute lymphoblastic leukemias evade chemotherapy at distinct sites in the bone marrow. Haematologica. 2023;108(5):1244-1258.
2. Palomero T, Ferrando A. Therapeutic targeting of NOTCH1 signaling in T-cell acute lymphoblastic leukemia. Clin Lymphoma Myeloma. 2009;9 Suppl 3(Suppl 3):S205-S210.
3. Mullighan CG. Molecular genetics of B-precursor acute lymphoblastic leukemia. J Clin Invest. 2012;122(10):3407-3415.
4. Li B, Brady SW, Ma X, et al. Therapy-induced mutations drive the genomic landscape of relapsed acute lymphoblastic leukemia. Blood. 2020;135(1)41-55.
work by Barz et al. provides a beautifully detailed 3D view of primary human ALL cells in the BM niche and challenges the notion that specific BM niches promote dormancy to drive chemotherapy resistance. Future studies should seek to build on this research by determining the functional interactions between ALL cells and the niche that are required for leukemic progression and therapy resistance.
Disclosures
No conflicts of interest to disclose.
Contributions
MG and ANT co-wrote the manuscript.
5. Pitt LA, Tikhonova AN, Hu H, et al. CXCL12-producing vascular endothelial niches control acute T cell leukemia maintenance. Cancer Cell. 2015;27(6):755-768.
6. Cahu X, Calvo J, Poglio S, et al. Bone marrow sites differently imprint dormancy and chemoresistance to T-cell acute lymphoblastic leukemia. Blood Adv. 2017;1(20)1760-1772.
7. Ebinger S, Özdemir EZ, Ziegenhain C, et al. Characterization of rare, dormant, and therapy-resistant cells in acute lymphoblastic leukemia. Cancer Cell. 2016;30(6):849-862.
8. Hawkins ED, Duarte D, Akinduro O, et al. T-cell acute leukaemia exhibits dynamic interactions with bone marrow microenvironments. Nature. 2016;538(7626):518-522.
Haematologica | 108 May 2023 1212 EDITORIAL M. Gower and A.N. Tikhonova
One disease, many faces
Shaji Kumar
Disease staging has been an integral component of cancer management and has traditionally been intended to serve two purposes – patient prognostication and making decisions regarding management. In hematologic malignancies, staging systems were initially designed more for predicting outcomes and were less focused on guiding treatment. The original Durie-Salmon staging system for multiple myeloma (MM) was developed for measuring ‘tumor burden’ and served primarily as a prognostic tool (Table 1).1 Subsequently Greipp and colleagues developed the International Staging System (ISS) which was rapidly accepted by the field given its simplicity using easily available laboratory variables – serum albumin and serum b2-microglobulin.2 It divided patients into three relatively equal groups with different survival, making it an essential prognostic tool in the clinic and was also rapidly integrated into clinical trials allowing comparisons across trials. Since the introduction of the ISS, a deeper understanding of disease biology and development of new therapeutics has led to a 3- to 4-fold improvement in survival in MM, highlighting the heterogeneity in outcomes, with genetic alterations emerging as the main driver of these differences.3 Given these, it became clear that any risk stratification system will have to account for tumor genetics. The Revised International Staging System (RISS) integrated high-risk abnormalities, i.e., t(4;14), t(14;16), and del(17p), as well as serum lactate dehydrogenase level, another marker of high risk, into the ISS (Table 1).4 With increasing appreciation of the spectrum of high-risk genetic abnormalities in MM it became clear that the RISS had many flaws – not accounting for all the high-risk markers (chromosome 1q abnormalities, 1p deletion, mutations involving the TP53 gene, etc.) and not accounting for the cumulative effect of multiple high-risk abnormalities, among others. The RISS was also rather lopsided, with over half of the patients in stage 2, obscuring the heterogeneity among them.
During the past decade we have developed a better understanding of the spectrum of recurrent abnormalities including trisomies of the odd numbered chromosomes and translocations involving the IgH region on chromosome 14 with recurrent partner chromosomes (4, 6, 11, 16, and 20), referred to as primary abnormalities, and many other
Correspondence: S. Kumar
Kumar.Shaji@mayo.edu
Received: September 1, 2022. Accepted: September 22, 2022. Early view September 29, 2022.
https://doi.org/10.3324/haematol.2022.281417
©2023 Ferrata Storti Foundation
Published under a CC BY-NC license
changes such as del(17p), del(1p), 1q gain, 1q amplification, and chromosome 13 abnormalities, all of which are considered to be secondary abnormalities acquired during clonal evolution.5 While trisomies (hyperdiploidy) are associated with a better outcome, the high-risk abnormalities resulted in a shorter survival, with different abnormalities demonstrating varying impact. In addition, molecular profiling approaches using RNA expression in myeloma cells have led to the development of several expression signatures.6 More recently, whole-genome sequencing approaches have identified a set of recurrent mutations that appear to increase in frequency with disease evolution and introduced another layer of complexity to prognostication. All these developments lead to an important question – can these additional disease characteristics enable better assessment of disease outcomes, and more importantly can they help us make therapeutic decisions?
The work published in this issue of Haematologica by Schavgoulidze and colleagues looks into this question.7 The authors specifically examined the reclassification between the ISS and RISS, homing in on RISS stage 2 patients and demonstrating how this group can be segregated further. There have been other recent efforts to integrate known prognostic factors, further calibrating the system using different weights for the prognostic factors based on their observed impact on outcomes. The authors had previously described a prognostic index score.8 Six cytogenetic abnormalities were identified as statistically relevant and the prognostic index score was computed as: 0.4 × t(4;14) + 1.2 × del(17p) 0.3 × trisomy 5 + 0.3 × trisomy 21 + 0.5 × 1q gain + 0.8 × del(1p32). The score placed patients into three groups with different survival outcomes, also accounting for the good prognostic markers, an approach that other models had failed to incorporate. Recently, there have been two other large efforts to improve upon the existing approaches. The European Harmony project proposed a second revision of the ISS (R2-ISS) utilizing individual data from 10,843 patients with newly diagnosed MM enrolled in 16 clinical trials. A value was assigned to each risk feature according to its impact on overall survival (ISS-III: 1.5 points; ISS-II: 1 point; del(17p): 1 point; high lactate dehydrogenase: 1
Division of Hematology, Department of Internal Medicine, Mayo Clinic, Rochester, MN, USA
Haematologica | 108 May 2023 1213 EDITORIAL S. Kumar
• Serum albumin >3.5 g/dL
• Serum albumin >3.5 g/dL
• Serum b 2 -microglobulin <3.5 mg/L
• Serum b 2 -microglobulin <3.5 mg/L
1
Total score =1.5-2.5
All of the following:
del 17p = 1
High LDH = 1
or
score =2
score ≥ 3 Total score =3-5
Ill
I nor
Neither stage
Total
• Serum b 2 -microglobulin >5.5 mg/L
• AND one of the following (a) High-risk cytogenetics (t(4;14), t(14;16),del(17p))
(b) Elevated serum LDH level
• Hemoglobin concentration >10.5 g/dL
• Serum calcium value normal or ≤ 12 mg/dL
• X-ray studies of bone showing normal
bone structure (scale 0) or solitary bone plasmacytoma only
lgA value <3 g/dL
Neither
• Serum b 2 -microglobulin >5.5 mg/L
• Serum calcium value >12 g/dL
• High M-component production rate
lgG value >7 g/dLlgA value >5 g/dL
Urine light chains >12 g/24 hours
4 NA NA NA Total
Haematologica | 108 May 2023 1214 EDITORIAL S. Kumar
Stage Durie & Salmon International Staging System (ISS) Revised International Staging System (RISS) Mayo Additive Staging System (MASS) Second Revision of the International Staging System (R2-ISS)
1
Total
Total score =0
score =0
Factors
Factors scored ISS II =1
scored ISS III = 1
• No high-risk cytogenetic features ISS III = 1.5 del 17p = 1
LDH level t(4;14)
t(14;16) =
High LDH = 1
1q+ = 1 t(4;14) = 1
• Low M-component production rate 1q+ = 1
• Normal serum
-
IgG value <5 g/dL
-
Urine light chains <4 g/24 hours
stage
Total
2 Total
Neither stage I nor stage Ill
stage I nor stage Ill
score =1
score =0.5-1
A-No renal failure (creatinine ≤ 2 mg/dL)
B-Renal failure (creatinine >2 mg/dL) 3
• Hemoglobin concentration <8.5 g/dL
• X-ray studies of bone showing >3 Iytic bone lesions
Table 1. Staging systems for multiple myeloma.
LDH: lactate dehydrogenase; NA: not applicable.
point; and 1q+: 0.5 points).9 Patients were stratified into four risk groups according to the total additive score: R2ISS-I (19.2%, 0 points), R2-ISS-II (30.8%, 0.5-1 points), R2ISS-III (41.2%, 1.5-2.5 points), and R2-ISS-IV (8.8%, 3-5 points). Investigators from the Mayo Clinic took a similar approach and developed a simple additive staging system by assigning 1 point to each of the following high-risk abnormalities – high-risk IgH translocations [t(4;14), t(14;16)], 1q gain/amplification, chromosome 17 abnormality [(del)17p/monosomy 17], ISS-III, and lactate dehydrogenase above the upper limit of normal.10 Patients were allocated to three groups in the presence of 0, 1 or 2 risk factors, resulting in a model that divided the patients into nearly equal groups with different outcomes. Other have explored integration of specific mutations to the RISS. While these new approaches incorporate the major genetic abnormalities into the prognostic models, the incremental improvement, as highlighted by the C-statistic, has been minimal. As a result, the current systems including the recently developed ones are only able to define 60% of the variability we see in patients’ outcomes. As Schavgoulidze and colleagues highlight in their discussion further refinements of the systems to attain more specifi-
References
1. Durie BG, Salmon SE. A clinical staging system for multiple myeloma. Correlation of measured myeloma cell mass with presenting clinical features, response to treatment, and survival. Cancer. 1975;36(3):842-854.
2. Greipp PR, San Miguel J, Durie BG, et al. International Staging System for multiple myeloma. J Clin Oncol. 2005;23(15):3412-3420.
3. Binder M, Nandakumar B, Rajkumar SV, et al. Mortality trends in multiple myeloma after the introduction of novel therapies in the United States. Leukemia. 2022;36(3):801-808.
4. Palumbo A, Avet-Loiseau H, Oliva S, et al. Revised International Staging System for multiple myeloma: a report from International Myeloma Working Group. J Clin Oncol. 2015;33(26):2863-2869.
5. Kumar SK, Rajkumar SV. The multiple myelomas - current concepts in cytogenetic classification and therapy. Nat Rev Clin Oncol. 2018;15(7):409-421.
6. Shaughnessy JD Jr, Zhan F, Burington BE, et al. A validated gene
city will depend on the identification of other novel prognostic factors. Importantly, these efforts do not necessarily improve our treatment approaches. While several studies have shown that patients with high-risk genetic abnormalities may benefit from more intense therapies, offering a higher likelihood of getting to a state of negative measurable residual disease, as well as more intense maintenance approaches given for longer periods, they do not necessarily enable tailoring of therapy based on the underlying biology. This is important as we develop targeted therapies that appear to be more effective in certain molecular types, as with venetoclax in t(11;14) myeloma. Future efforts should not only be directed at developing systems that can define the outcomes with more specificity, but also allow us to make treatment decisions. It is possible that no one system may be sufficient, and we may have to settle for a risk stratification system for prognostication and an additional molecular classification that guides therapeutic decisions. Clearly, more work remains to be done.
Disclosures
expression model of high-risk multiple myeloma is defined by deregulated expression of genes mapping to chromosome 1. Blood. 2007;109(6):2276-2284.
7. Schavgoulidze A, Lauwers-Cances V, Perrot A, et al. Heterogeneity in long-term outcomes for patients with Revised International Staging System stage II, newly diagnosed multiple myeloma. Haematologica. 2023;108(5):1374-1384.
8. Perrot A, Lauwers-Cances V, Tournay E, et al. Development and validation of a cytogenetic prognostic index predicting survival in multiple myeloma. J Clin Oncol. 2019;37(19):1657-1665.
9. D'Agostino M, Cairns DA, Lahuerta JJ, et al. Second Revision of the International Staging System (R2-ISS) for overall survival in multiple myeloma: a European Myeloma Network (EMN) report within the HARMONY project. J Clin Oncol. 2022;40(29):3406-3418.
10. Abdallah NH, Binder M, Rajkumar SV, et al. A simple additive staging system for newly diagnosed multiple myeloma. Blood Cancer J. 2022;12(1):21.
flicts of interest to disclose.
No con
Haematologica | 108 May 2023 1215 EDITORIAL S. Kumar
The name counts: the case of 'congenital amegakaryocytic thrombocytopenia'
Carlo L. Balduini
In this issue of Haematologica, Capaci et al. describe a young Palestinian patient with inherited thrombocytopenia and severely reduced bone marrow megakaryocytes due to a homozygous mutation (c.-323C>T) in the promoter region of the gene for thrombopoietin (THPO).1 This report adds further information on the etiology and treatment of this recently identified form of amegakaryocytic thrombocytopenia and provides new insights into the mechanisms of THPO transcription.
Recent advances in the understanding of the etiology of inherited thrombocytopenias have revealed that mutations in several genes may be responsible for the reduc-
Correspondence: C. Balduini carlo.balduini@unipv.it
Received: September 16, 2022.
Accepted: October 5, 2022.
Early view: October 13, 2022.
https://doi.org/10.3324/haematol.2022.282024
©2023 Ferrata Storti Foundation
Published under a CC BY-NC license
tion or absence of bone marrow megakaryocytes.2 The resulting diseases share the shortage of megakaryocytes but, due to their different etiologies, differ for the other associated clinical features, have different clinical courses and prognoses, and require specific therapeutic approaches (Table 1). Thus, each gene causes a specific disease and it would be desirable for this to be highlighted by the name given to the illness. Unfortunately, this is not always so, and disorders with different clinical features and causative genes have the same name. This has led to misunderstandings and uncertainties both in clinical practice and in scientific reports. The aim of this editorial is
Table 1. Essential features of the five inherited thrombocytopenias presenting with congenital amegakaryocytic thrombocytopenia. New names have been recently proposed for four of these disorders.
Thrombocytopenia absent radius syndrome (TAR) New proposed name CAMT-MPL CAMT-THPO CTRUS-HOXA11 MECOM-associated syndrome (MECOM-AS)
*Spontaneous improvement of pancytopenia reported in one patient. °Central nervous system defects have been reported, but they were probably secondary to brain hemorrhages during intrauterine life. AR: autosomal recessive; AD: autosomal dominant; HSCT: hematopoietic stem cell transplantation; THPO-RA: thrombopoietin-receptor agonists
Ferrata-Storti Foundation, University of Pavia, Pavia, Italy
Causative gene MPL THPO HOXA11 MECOM RBM8A Current name of the disorder(s) Congenital amegakaryocytic thrombocytopenia (CAMT) Congenital amegakaryocytic thrombocytopenia with radio ulnar synostosis (CTRUS)
TAR Inheritance AR AR AD AD AR Reduced/absent megakaryocytes at birth All patients All patients All patients All patients All patients Progression to bone marrow failure All patients All patients Most patients All patients* No, platelet count rises over time Radio-ulnar synostosis No No All patients Most patients No Bilateral radial aplasia No No No No Yes Other defects No° No Some patients Some patients Many patients Serum thrombopoietin High Low High High High Treatment HSCT THPO-RA (no HSCT!) HSCT HSCT Supportive
May 2023 1216 EDITORIAL C. Balduini
Haematologica | 108
to illustrate this matter briefly and comment on the recent proposals for more effective names to be assigned to the inherited thrombocytopenias with reduced bone marrow megakaryocytes.
The first patient with a congenital essential thrombocytopenia was described in 1929 by Greenwald and Sherman.3 Seventy years later a series of papers4,5 concluded that many, but not all patients with this clinical picture had biallelic mutations in the gene MPL, which encodes the THPO receptor. This form of inherited thrombocytopenia received the name of congenital amegakaryocytic thrombocytopenia (CAMT). Large case series revealed that the prognosis of affected patients is very poor, because all patients are destined to die either from hemorrhage or from the severe bone marrow aplasia that always arises in the first years of life.2 The only hope of reaching adulthood is offered by hematopoietic stem cell transplantation.
The name CAMT is also used for the recently discovered inherited thrombocytopenia caused by biallelic THPO mutations.6-8 Similarly to patients with CAMT due to MPL mutations, subjects with mutated THPO also present with
Figure 1. The spectrum of inherited thrombocytopenias with defective bone marrow megakaryocytes. Mutations of five different genes cause congenital amegakaryocytic thrombocytopenia in the context of clinical phenotypes peculiar to each etiopathogenetic mechanism. The only three names in use today for these diseases are therefore unable to properly describe the five diseases, and new names have been proposed that include the defective gene to emphasize that etiological differences result in clinically relevant differences.
CAMT which evolves towards bone marrow aplasia. However, they do not benefit from hematopoietic stem cell transplantation because the scarcity of megakaryocytes does not result from a defect of progenitor cells, but is instead caused by the inability of liver cells to produce THPO (as evidenced by the fact that serum THPO levels are low in this condition whereas they are elevated in all other forms of CAMT). Indeed, the outcome of hematopoietic stem cell transplantation was poor due to failure of engraftment in all patients with THPO mutations who underwent this treatment. Instead, and not surprisingly, the THPO-receptor agonists romiplostim or eltrombopag have proven very effective in quickly increasing platelet count and also making pancytopenia disappear in cases in which it had already been established. Another difference that may be relevant for the diagnostic process and genetic counseling is the mode of transmission, in that some subjects with monoallelic THPO mutations have mild thrombocytopenia, while those with monoallelic MPL mutations always have a normal phenotype. Based on these considerations, Germeshausen and Ballmaier proposed that names of the affected genes are added as suf-

Haematologica | 108 May 2023 1217 EDITORIAL C. Balduini
fixes to CAMT to emphasize that CAMT from MPL or THPO mutations differs in some relevant respects.2 The authors of the article that prompted this editorial have adhered to this recommendation and use the terms CAMT-MPL and CAMT-THPO in their paper. Besides MPL and THPO, abnormalities in the genes HOXA119 and MECOM10 can also cause congenital thrombocytopenia due to megakaryocyte shortage and a propensity to bone marrow aplasia, in these cases variably associated with radio-ulnar synostosis and/or other malformations. If patients develop signs of bone marrow failure, there is an indication for hematopoietic stem cell transplantation. Regardless of the affected gene, the name radio-ulnar synostosis with amegakaryocytic thrombocytopenia (RUSAT) or congenital amegakaryocytic thrombocytopenia with radio-ulnar synostosis (CTRUS) has been used for both conditions. The main difference between the disorders caused by HOXA11 and MECOM is that the very few patients with HOXA11 mutations reported so far all have proximal radio-ulnar synostosis, but only some of them have the hematologic phenotype. In contrast, all subjects with MECOM mutations have the hematologic phenotype but some of them do not present radio-ulnar synostosis and are therefore at risk of being misdiagnosed with CAMT-THPO or CAMT-MPL. Moreover, the spectrum of possible malformations caused by MECOM is broader than that caused by HOXA11. Based on these differences, the names CTRUS-HOXA11 and MECOM-associated syndrome (MECOM-AS) have been proposed by Germeshausen et al.11 Thrombocytopenia-absent radius syndrome (TAR) is a further genetic disorder characterized by congenital thrombocytopenia with reduced bone marrow megakaryocytes, in this case always associated with bilateral radial aplasia and sometimes with other congenital defects. It is caused by compound heterozygosity for a null mutation involving the RBM8A gene and one or two low-frequency noncoding single-nucleotide polymorphisms in RBM8A on the other allele12 (Figure 1). In contrast to the disorders with amegakaryocytic thrombocytopenia mentioned
References
1. Capaci V, Adam E, Bar-Joseph I, Faleschini M, Pecci A, Savoia A. Defective binding of ETS1 and STAT4 due to a mutation in the promoter region of THPO as a novel mechanism of congenital amegakaryocytic thrombocytopenia. Haematologica. 2023;108(5):1385-1393.
2. Germeshausen M, Ballmaier M. Congenital amegakaryocytic thrombocytopenia - not a single disease. Best Pract Res Clin Haematol. 2021;34(2):101286.
3. Greenwald HM, Sherman I. Congenital essential thrombocytopenia. Am J Dis Child. 1929;38(6):1242-1251.
4. Muraoka K, Ishii E, Tsuji K, et al. Defective response to thrombopoietin and impaired expression of c-mpl mRNA of bone marrow cells in congenital amegakaryocytic thrombocytopenia. Br J Haematol. 1997;96(2):287-292.
above, TAR never progresses to bone marrow failure, but instead tends to improve spontaneously because the platelet count usually begins to rise after the first year of life and sometimes even normalizes. Hematopoietic stem cell transplantation is not therefore indicated and the therapy is supportive in anticipation of the spontaneous improvement of the thrombocytopenia. Of note, one patient with TAR needing surgery had her platelet count normalized by the THPO-receptor agonist romiplostim.13 Recognizing that a CAMT is due to TAR does therefore have important practical consequences, but fortunately the diagnosis is easy because the association of congenital thrombocytopenia with bilateral radial aplasia is pathognomonic of this condition. The name TAR is therefore appropriate because it well describes this disease with very peculiar characteristics.
The case of CAMT exemplifies well how the advancement of knowledge about hereditary diseases has increased the number of known causative genes and has revealed that what we once considered a single disease actually consists of multiple disorders with clinically relevant differences. Although trying to change the name of long-known diseases risks creating more harm than good, I believe that Germeshausen and Ballmaier's proposal for including the causative gene in the name of some CAMT is to be accepted because it tidies up a complex matter that in the past has been subject to misunderstandings. The observation that the names of the many new forms of inherited thrombocytopenia discovered in recent years make mention of the defective gene testifies that this idea is shared by those who deal with these diseases. The time in which the name of an inherited thrombocytopenia was that of whoever discovered it or was derived from one of the features of the first described patients is ending. It is possible that other diseases identified long ago will have their names changed in the future.
Disclosures
No conflicts of interest to disclose.
5. Ballmaier M, Germeshausen M, Schulze H, et al. c-mpl mutations are the cause of congenital amegakaryocytic thrombocytopenia. Blood. 2001;97(1):139-146.
6. Dasouki MJ, Rafi SK, Olm-Shipman AJ, et al. Exome sequencing reveals a thrombopoietin ligand mutation in a Micronesian family with autosomal recessive aplastic anemia. Blood. 2013;122(20):3440-3449.
7. Seo A, Ben-Harosh M, Sirin M, et al. Bone marrow failure unresponsive to bone marrow transplant is caused by mutations in thrombopoietin. Blood 2017;130(7):875-880.
8. Pecci A, Ragab I, Bozzi V, et al. Thrombopoietin mutation in congenital amegakaryocytic thrombocytopenia treatable with romiplostim. EMBO Mol Med. 2018;10(1):63-75.
9. Thompson AA, Nguyen LT. Amegakaryocytic thrombocytopenia
Haematologica | 108 May 2023 1218 EDITORIAL C. Balduini
and radio-ulnar synostosis are associated with HOXA11 mutation. Nat Genet. 2000;26(4):397-398.
10. Niihori T, Ouchi-Uchiyama M, Sasahara Y, et al. Mutations in MECOM, encoding oncoprotein EVI1, cause radioulnar synostosis with amegakaryocytic thrombocytopenia. Am J Hum Genet. 2015;97(6):848-854.
11. Germeshausen M, Ancliff P, Estrada J, et al. MECOM-associated syndrome: a heterogeneous inherited bone marrow failure syndrome with amegakaryocytic thrombocytopenia. Blood Adv.
2018;2(6):586-596.
12. Albers CA, Paul DS, Schulze H, et al. Compound inheritance of a low-frequency regulatory SNP and a rare null mutation in exonjunction complex subunit RBM8A causes TAR syndrome. Nat Genet. 2012;44(4):435-439, S1-2.
13. Gallastegui N, Dudkiewicz PB, Jy W. Romiplostim (Nplate®) and Oprelvekin (Neumega®) correct thrombocytopenia in TAR syndrome (thrombocytopenia with absent radii). Blood. 2017;130(Suppl 1):4953.
Haematologica | 108 May 2023 1219 EDITORIAL C. Balduini
The real risk of secondary non-Hodgkin lymphoma following classical Hodgkin lymphoma
Ahmet Dogan Memorial Sloan-Kettering Cancer Center, New York, NY, USA
Classical Hodgkin lymphoma (CHL) is a B-cell lineage lymphoid malignancy. The majority of the patients are diagnosed between 15 and 30 years of age, followed by another peak in adults aged ≥ 55 years. Most cases of CHL are curable by modern treatments.1 However, therapeutic modalities such as radiotherapy and chemotherapy used to achieve this high rate of cure have side effects in the long term, especially in young patients. 2 The leading causes of long-term toxicity caused by therapy include cardiovascular disease and secondary malignancies such as breast cancer and therapy-related myeloid neoplasms. In addition, case control and registry studies suggest that CHL patients may have familial predisposition and germline susceptibility to develop additional lymphoid malignancies. 3 Previous studies, including a large cohort study with long-term and complete follow-up, showed that the risk of developing a secondary non-Hodgkin lymphoma (NHL) was increased significantly up to 13-fold in CHL patients compared to that in the general population.4
In this issue of Haematologica, Boot et al. re-assess this risk based on an in-depth pathology review of a nationwide cohort of patients with CHL in the Netherlands.5 The study was designed to review the accuracy of pathological diagnosis of NHL following CHL. The cohort was restricted to 2,669 patients with CHL diagnosed between 2006-2013 for whom the initial diagnosis of CHL could be confirmed by review of pathology reports. Fifty-four of these 2,669 cases of CHL (2%) had a subsequent diagnosis of NHL. The expert pathology review was restricted to the 54 cases for which both the original CHL diagnosis and subsequent NHL diagnosis were available.
The review confirmed the CHL diagnosis and subsequent NHL in 25 cases. Interestingly, six of the cases were biologically, and very likely clonally, related to the original CHL such as primary mediastinal large B-cell lymphoma and mediastinal gray zone lymphoma, suggesting that these would be best considered relapses of the same neoplastic disorder rather that unrelated secondary neoplasms.6 Eighteen of the 19 remaining cases were differ-
Correspondence: A. Dogan dogana@mskcc.org
Received: September 14, 2022.
Accepted: October 7, 2022.
Early view: October 20, 2022.
https://doi.org/10.3324/haematol.2022.281700
©2023 Ferrata Storti Foundation
Published under a CC BY-NC license
ent histologies of NHL, presumably representing true secondary malignancies.
In 29 out of 54 cases, the initial diagnosis of CHL was not confirmed. The wrong diagnoses included common mimics of CHL such as Epstein-Barr virus (EBV)-positive Hodgkinlike cells frequently seen in peripheral T-cell lymphomas and EBV-associated large B-cell lymphomas, CD30-expressing T-cell lineage neoplasms such as anaplastic large cell lymphoma, and CD30-positive immunoblasts which can be seen in reactive/inflammatory conditions. As a result of revisions of original pathological diagnoses, the authors calculated that, in the cohort they studied, the standardized incidence ratio of developing NHL after CHL was significantly lower, at 3.61 (95% confidence interval: 2.29-5.42; P=0.002) compared to 7.79 (95% confidence interval: 5.78-10.3) based on original data.
The study highlights the significance of high quality pathology data and expert review in large scale epidemiological studies, especially in the context of secondary malignancies. As such studies have important implications for surveillance guidelines for patients with a prior cancer diagnosis, rigorous methods to address the quality of pathology data are essential.
Secondly, the findings stress the importance of obtaining biopsies for pathology work-up at relapse in CHL, as these may reveal not only phenotypic shift, as exemplified by cases diagnosed as primary mediastinal large B-cell lymphoma or gray zone lymphoma, but also other distinct histologies which may become apparent in relapse biopsies, such as T-cell lymphomas or EBV-driven B-cell lymphomas. The authors point out that the misdiagnoses were associated with a number of clinicopathological features including advanced age, generalized lymphadenopathy at presentation (stage III/IV disease) and the presence of EBV infection. Such features, in suspected relapse of CHL, should prompt comprehensive work-up with histopathological examination to address the diagnostic pitfalls highlighted in this study.
Some of important issues remain unanswered by the study. No expert review of the cases diagnosed as CHL (n=2,615)
Haematologica | 108 May 2023 1220 EDITORIAL A. Dogan
without a subsequent diagnosis of NHL was performed. Of these, 289 cases relapsed with CHL. The relapsed CHL cases showed clinicopathological features similar to those of patients misdiagnosed as CHL but actually represented other NHL. Although the rate of misdiagnosis of CHL is low, around 6-7%,7 it is likely that, given the size of the cohort, 150 cases may have been misdiagnosed without expert review. Therefore, it is difficult to establish a more accurate estimate of the incidence of NHL in CHL patients without broader pathology review either focusing on relapsed cases, or ideally, all cases diagnosed as CHL. In a small subset of the cases additional material for review and additional workup was not available; the expert review was restricted to
References
1. Brice P, Kerviler E de, Friedberg JW. Classical Hodgkin lymphoma. Lancet. 2021;398(10310):1518-1527.
2. van Leeuwen FE, Ng AK. Long-term risk of second malignancy and cardiovascular disease after Hodgkin lymphoma treatment. Hematology Am Soc Hematol Educ Program. 2016;2016(1):323-330.
3. Cerhan JR, Slager SL. Familial predisposition and genetic risk factors for lymphoma. Blood. 2015;126(20):2265-2273.
4. Schaapveld M, Aleman BMP, van Eggermond AM, et al. Second cancer risk up to 40 years after treatment for Hodgkin’s lymphoma. N Engl J Med. 2015;373(26):2499-2511.
pathology report review, which may undermine the findings. With the caveats above, Boot et al. make an important contribution to the field not only by showing the importance of thorough pathology assessment for epidemiological studies of lymphoid neoplasms but also by emphasizing the pitfalls in the diagnosis of CHL and their clinical significance.
Disclosures
AD declares consultancy for Incyte, Loxo, and EUSA Pharma as well as research support from Roche and Takeda.
Funding
No support was received for this editorial.
5. Boot MV, Schaapveld M, Broek E van den, et al. Pathology review identifies frequent misdiagnoses in recurrent classic Hodgkin lymphoma in a nationwide cohort: implications for clinical and epidemiological studies. Haematologica. 2023;108(5):1349-1358.
6. Sarkozy C, Hung SS, Chavez EA, et al. Mutational landscape of gray zone lymphoma. Blood. 2021;137(13):1765-1776.
7. Laurent C, Baron M, Amara N, et al. Impact of expert pathologic review of lymphoma diagnosis: study of patients from the French Lymphopath Network. J Clin Oncol. 2017;35(18):2008-2017.
Haematologica | 108 May 2023 1221 EDITORIAL A. Dogan
Animal models of Diamond-Blackfan anemia: updates and challenges
Correspondence: K.M.
kmsakamo@stanford.edu
Sakamoto
Received: September 5, 2022. Accepted: November 10, 2022. Early view: November 17, 2022.
https://doi.org/10.3324/haematol.2022.282042
©2023 Ferrata Storti Foundation
Published under a CC BY-NC license

Abstract
Diamond-Blackfan anemia (DBA) is a ribosomopathy that is characterized by macrocytic anemia, congenital malformations, and early onset during childhood. Genetic studies have demonstrated that most patients carry mutations in one of the 20 related genes, most of which encode ribosomal proteins (RP). Treatment of DBA includes corticosteroid therapy, chronic red blood cell transfusion, and other forms of immunosuppression. Currently, hematopoietic stem cell transplantation is the only cure for DBA. Interestingly, spontaneous remissions occur in 10-20% of transfusion-dependent DBA patients. However, there is no consistent association between specific mutations and clinical manifestations. In the past decades, researchers have made significant progress in understanding the pathogenesis of DBA, but it remains unclear how the ubiquitous RP haploinsufficiency causes the erythroid-specific defect in hematopoiesis in DBA patients, and why there is a difference in penetrance and spontaneous remission among individuals who carry identical mutations. In this paper, we provide a comprehensive review of the development of DBA animal models and discuss the future research directions for these important experimental systems.
Introduction
Diamond-Blackfan anemia (DBA) is a rare congenital hypoplastic anemia that manifests as moderate or severe macrocytic anemia associated with short stature, physical anomalies involving bone development, and a predisposition to malignancies.1-5 More than 90% of patients are diagnosed during their first year of life (median age 12 weeks).6 Elevated erythrocyte adenosine deaminase activity is found in more than 75% of DBA patients. Many DBA patients are dependent on corticosteroids or red blood cell transfusion. However, chronic life-long exposure to these treatments often leads to intolerance.1,7,8 Currently, hematopoietic stem cell transplantation is the only curative therapy.6,9
Erythroid failure in DBA patients is characterized by a significant reduction of erythroid precursors/progenitors in bone marrow, specifically, a blockade between the burst-forming unit-erythroid (BFU-E) and colony-forming unit-erythroid (CFU-E) stages or between the erythropoietin-independent and erythropoietin-de pendent stages of erythroid development.10,11 The mutant genes that encode ribosomal proteins (RP) are responsible for the
defect in ribosomal biogenesis in most DBA patients, directly affecting the synthesis of hemoglobin and the process of erythropoiesis. As a consequence, erythrocyte maturation is arrested leading to a toxic elevation of heme.7 In 2019, Ulirsch et al.12 described the genetic landscape of DBA. Heterozygous mutations in one of the 16 RP genes or three non-RP genes are found in approximately 70-80% of DBA patients.1,7,12-14 Mutations in RPS19, RPL5, RPS26, RPL11, RPL35a, RSL10, RPS24, and RPS17 have been identified in 70% of DBA patients. Mutations in GATA1 and TSR2 (encoding a chaperone protein of eS26/RPS26) have also been detected in DBA patients.15-17 HEATR3 was reported to be associated with uL5 (RPL11) and uL18 (RPL5).18 Recently, O'Donohue et al.13 reported homozygous missense and splice site variants on HEATR3 in six DBA patients from four distinct families, in which all parents are heterozygous for the variants found in their symptomatic children. A complete list of DBA-associated mutant genes that have been reported in patients is provided in Online Supplementary
Table S1
Although DBA patients share the unifying macrocytic anemia, they show a high degree of clinical heterogeneity, with disease severity and responsiveness to therapies
Y. Lucy Liu,1 Aya Shibuya,1 Bertil Glader,1,2 Mark C. Wilkes,1 Maria Barna3 and Kathleen M. Sakamoto1
1Department of Pediatrics, 2Department of Pathology, and 3Department of Genetics, Stanford University, Stanford, CA, USA
Haematologica | 108 May 2023 1222 REVIEW ARTICLE
varying among patients. Notably, spontaneous remissions occur in 10-20% of transfusion-dependent DBA patients by the age of 25 years, even in those who have never been independent of transfusions.7,19-21 In addition, asymptomatic family members of DBA patients with RPS7 or RPL15 mutations have been reported, and an identical mutant RP gene was detected in blood cells from a patient with DBA both prior to and after remission.22-24 To date, there is no obvious link to specific genetic mutations, gender, and treatment for the patients who attain remission or those who remain symptomatic with asymptomatic family members.25,26 Major unresolved questions in DBA remain how a ubiquitous RP deficiency is responsible for the erythroid-specific defect in hematopoiesis and why there is different penetrance among individuals or family members who carry the identical genetic mutation.
The molecular mechanism underlying the association between ribosome insufficiency and erythroid failure in DBA patients is not fully understood to date. It is well accepted that activation of p53 and dysregulated GATA1 contribute to the pathogenesis in DBA.15,16,27-30 Dysregulation of cell cycle progression, apoptosis, and heme have also been linked to DBA.31-33 Nemo-like kinase (NLK), a serine-threonine protein kinase, was reported to be hyperactive in erythroid progenitors from RPS19 and RPL11 knockdown human hematopoietic stem and progenitor cells.34 Recently, Wilkes et al.35 reported that upregulated microRNA (miRNA), miR-34 and miR-30, are associated with the downregulation of SATB1, a global chromatin organizer and transcriptional factor, in a preclinical model of DBA, suggesting that epigenetics may play an important role in the pathogenesis of DBA.
DBA provides a unique disease model for studying how RP deficiency has an impact on ribosome biogenesis and subsequent protein translation. However, because of the essential role of these proteins in fundamental cellular processes, it has been historically challenging to develop animal models that faithfully recapitulate the complete pathogenesis of DBA. Despite these challenges, since the first reviews on murine and zebrafish models of DBA, which were published in 2011 by McGowan and Taylor,36,37 research has advanced rapidly and is unraveling the pathogenesis of DBA. In this review, we focus on the murine models of DBA that recapitulate the hematologic features of DBA patients. We provide a comprehensive picture of recent progress and challenges in the development of animal models of DBA.
Zebrafish models
Several valuable zebrafish mutant lines have been developed, with data from these models providing many important insights into the role of RP defects in the
regulation of erythropoiesis in DBA patients. Specifically, knockdown of rps19 in zebrafish recapitulates the hematopoietic and developmental phenotypes of DBA, including failure of erythropoiesis with severe anemia, cell cycle arrest, and increased apoptosis, as well as upregulation of p53.28,38,39 Bibikova et al.40 reported that gata1 expression was downregulated in rps19-deficient zebrafish, and that a tumor necrosis factor-a inhibitor, etanercept, could rescue the erythroid and developmental defects. Knockdown of rpl11 in zebrafish leads to morphological defects in the brain, head, and eyes, and pericardial edema.29 Danilova et al.41 characterized the molecular and cellular impact of uL5 (rpl11) deficiency. The rpl11 mutant zebrafish had anemia, decreased hematopoietic stem cells, and activation of the Tp53 pathway with altered expression of genes involved in cell cycle arrest (cdkn1a and ccng1) and apoptosis (bax and puma). Taylor et al.42 reported that the hematopoietic defects caused by mutant rps29 depend on p53 activation. Moreover, they observed abnormal regulation of metabolic pathways with a shift from glycolysis to aerobic respiration, including upregulation of genes involved in gluconeogenesis, decreased biosynthesis, and increased catabolism. Nucleotide metabolism was also affected in the rps29-knockdown model because of upregulation of adenosine deaminase (ADA) and xanthine dehydrogenase/oxidase.38,43 Although no RPL18 mutations have been reported in DBA patients, mutant rpl18 causes maturation arrest of red blood cells in zebrafish, due to increased p53 activation and JAK2STAT3 activation.44 Thus, in zebrafish models, researchers have successfully recapitulated maturation arrest of red blood cells, growth retardation, decreased globin synthesis, increased adenosine deaminase and apoptosis, and p53 activation, which are observed in DBA patients.28 The advantage of zebrafish models is that they are relatively easy to establish and can be used for studying developmental hematopoiesis, which is difficult in mouse models. Zebrafish models provide a useful tool for in vivo drug screening to identify possible DBA therapeutics. Oyarbide et al.45 published an excellent review covering these aspects in 2019.
Mouse models harboring the mutations found in patients with Diamond-Blackfan anemia
Rps19 (eS19)
RPS19 (eS19) is the most frequently mutated gene in DBA patients, being found in 25% of them. This gene has been intensively studied in both human cells and mouse models, allowing valuable insights into all aspects of DBA caused by the RPS19 mutation.
Haematologica | 108 May 2023 1223 REVIEW ARTICLE - Animal models of Diamond-Blackfan anemia Y.L. Liu et al.
RNA interference (RNAi) exploits an endogenous mechanism of gene regulation that can be adapted to target and suppress specific genes in vivo. 46 Short hairpin (sh)RNA containing a specific sequence homologous to a target RNA transcript is embedded within a natural miRNA backbone; upon delivery to the cell, shRNA is processed to form short interfering (si)RNA which can bind to a target RNA and functionally inactivate it.47 shRNA can silence transcripts without modifying the genomic locus, thus they can be reversible. Using transgenic RNAi, Jaako et al.48 engineered a mouse model containing shRNA, which could be regulated by doxycycline, targeting the Rps19 transcript, thereby creating an inducible regulation of Rps19 expression in adult mice. They demonstrated that Rps19-deficient mice developed macrocytic anemia along with leukocytopenia and viable platelet counts. The severity of the disease phenotype was correlated with loss of Rps19 expression and could be rescued by overexpression of Rps19 or inactivation of Trp53. They also demonstrated that chronic eS19 deficiency caused irreversible exhaustion of hematopoietic stem cells and impaired proliferation and apoptosis in hematopoietic progenitors, resulting in bone marrow failure.
Matsson et al.49 described mice in which they engineered constitutive disruption of the Rps19 gene by deletion of the 5’ untranslated region and exons 1 to 4. Whereas zygotes homozygous for the knockout (Rps19-/-) could not develop to normal blastocysts leading to embryonic lethality, heterozygous mice with a single copy of wildtype Rps19 (Rps19+/-) maintained normal ribosomal/extra-ribosomal functions. Interestingly, no erythrocyte abnormality was detected in the Rps19+/- mice. Kubik-Zahorodna et al.50 reported that homozygous mice with an Arginine 67 deletion (Arg67del) in eS19 had growth retardation, macroscopic skeletal deformation, hydrocephalus, and behavioral defects without obvious hematologic abnormalities, whereas heterozygous mice had no phenotype. Devlin et al. 51 described transgenic mouse models with either a constitutive or Prion-Cre-mediated conditional missense mutation at the highly conserved amino acid 62 of eS19 (RPS19R62W). They demonstrated that the constitutive mutation was embryonic lethal, but the conditional RPS19R62W mutation exerted a dominant negative effect which manifested with many, but not all, of the pathological features of human DBA, including growth retardation, mild anemia with reduced numbers of erythroid progenitors, and significant inhibition of terminal erythroid maturation.
Xenotransplantation of CD34+ cells from DBA patients with RPS19 haploinsufficiency into sublethally irradiated immunocompromised non-obese diabetic/severe combined immunodeficient- b 2 microglobulin null mice provided conclusive evidence that RPS19 mutation is the cause of the disease phenotype in DBA patients.43 Additionally, Fly-
gare et al. and Zivny et al.52,53 reported that overexpression of RPS19 in DBA CD34+ cells with RPL19 mutation improved engraftment and erythropoiesis.
Rpl11 (uL5)
Heterozygous loss-of-function mutations in the RPL11 (uL5) gene are found in 5-20% of DBA patients.1 MorgadoPalacin et al.54 described transgenic mouse models with a Cre-mediated conditional knockout of exons 3 and 4 of Rpl11. When using a ubiquitous Cre recombinase (Tg.pCAGCre) which was constitutively expressed at early stages of development, they could not produce any Rpl11+/D pups, suggesting that a single copy of Rpl11 is not sufficient to support embryonic development. When they induced Rpl11 deletion in adult mice with Rpl11loxP/loxP and a ubiquitous tamoxifen-inducible Cre recombinase (Tx-Cre), they found that complete deletion of Rpl11 (Rpl11D/D) in adult mice (1.5 months old) was lethal (survival time <8 weeks after deletion). Furthermore, when compared to their wildtype littermates, adult mice with Rpl11 haploinsufficiency (Rpl11+/D) had lower red blood cell counts and macrocytosis because of a significant decrease in erythroblasts in bone marrow. It was shown that partial loss of Rpl11 impairs erythroid maturation, reduces p53 responses, and increases cMYC levels. The data also recapitulated the Cdkn1a and Bax molecular defects observed in some DBA patients. The authors concluded that diploid Rpl11 is required for embryonic development, and that partial loss of Rpl11 in adult mice causes non-lethal DBA-like anemia and increases susceptibility to cancer.54
Using a mouse model with Rpl11+/loxP Tx-Cre, Doty et al.55 recently collected data from single-cell analysis of erythropoiesis in adult mice with Rpl11+/D. They found that the transcriptional pathways regulated by GATA1, GATA1-target genes, and genes involved in mitotic spindle formation were significantly downregulated in adult mice with Rpl11+/D, as observed in DBA patients.15 They also reported that Rpl11 haploinsufficiency uniquely caused upregulation of several mitochondrial genes, p53 and CDKN1 pathway genes, as well as DNA damage checkpoint genes.55
Rpl5 (uL18) and Rps24 (eS24)
RPL5 (uL18) is one of the most commonly mutated RP genes found in DBA patients (7%).1 In 2016, Kazerounian et al.56 reported two mouse models with conditional knockout of Rpl5 or Rps24 (eS24). A pGK-gb2 Loxp/FRT-flanked neomycin cassette was inserted into either Rpl5 or Rps24, resulting in deletion of exons 1-8 for Rpl5 and exons 2-3 for Rps24. They demonstrated that homozygous deletion of Rpl5 or Rps24 was embryonic lethal. Heterozygous Rpl5 and Rps24 mice were born normal and did not develop any sign of disease, including anemia. Real-time quantitative polymerase chain reaction (qPCR) and immunoblot analysis demonstrated no significant reduction of Rpl5 and
Haematologica | 108 May 2023 1224 REVIEW ARTICLE - Animal models of Diamond-Blackfan anemia Y.L. Liu et al.
Rps24 expression, suggesting that one copy of wildtype Rpl5 and Rps24 is sufficient to prevent the development of anemia. However, some older mice with heterozygous deletion of Rpl5 or Rps24 developed soft tissue sarcoma after the age of 17 months. Although the incidence was low, the authors concluded that prolonged RP deficiency may increase the risk of cancer, as observed in some DBA patients. Later, Kazerounian et al.57 described a mouse model in which doxycycline could be used to regulate Rpl5-targeting shRNA to induce downregulation of Rpl5 expression. They suggested that mice with inducible Rpl5targeting shRNA recapitulate the major features of DBA, including mild anemia, reticulocytopenia, and bone marrow erythroblastopenia.
Recently, Yu et al.58 reported a mouse model with an intronic ENU-induced mutation in the Rpl5 gene (Rpl5Skax23Jus/+), which alters the sixth nucleotide in intron 1 (c.3+6C>T). Rpl5Skax23-Jus/+ mice had a profound delay in erythroid maturation and increased mortality at embryonic day (E) 12.5, which improved by E14.5. Macrocytic anemia and cardiac defects were observed in newborn mice with Rpl5+/-. Penetrance of a kinky tail phenotype was 100%. Most of the diseased mice died within 3 weeks after birth due to severe pancytopenia or ventricular septal defect. However, the anemia observed at birth in Rpl5+/- mice was, surprisingly, resolved completely in adult mice that survived to 7 weeks,58 suggesting that epigenetic regulation may play an important role in spontaneous remission observed in DBA patients.
Rps7 (eS7)
Watkins-Chow et al.59 reported a mouse model with ENUinduced mutations in the Rps7 (eS7) gene (Rps7Mtu and Rps7Zma). Although the mutant mice did not show any defects in hematopoiesis, Rps7 haploinsufficiency caused decreased mouse size, abnormal skeletal morphology, mid-ventral white spotting, and eye malformations, phenotypes that also occur in mice with haploinsufficiency for other RP subunits. In addition, significant apoptosis occurred in the central nervous system along with subtle behavioral phenotypes, suggesting that eS7 is particularly important for central nervous system development. The data reported by Sato et al.60 also suggest that RPS7 deficiency contributes to the pathogenesis of DBA indirectly through other mechanisms, such as protein-protein interactions in ribosome assembly.
Rps20 (uS10)
Recently, a missense mutation in RPS20 (uS10) was reported in patients with DBA.14 However, mice with heterozygous Rps20 mutation showed only dark skin.61
Gata1
GATA1 is an essential hematopoietic transcription factor in
early hematopoietic stem and progenitor cells for the specification of erythropoiesis, as well as in megakaryocytes and eosinophils.62 Although GATA1 mutations are found in <1% of DBA patients, it has been reported that a reduction of GATA1 expression is observed at early hematopoietic stem and progenitor cell stages in uncultured bone marrow cells from DBA patients with diverse RP gene mutations,15,16,40,63 suggesting that GATA1 deficiency may be a second hit in some patients with RP gene mutations. In humans and mice, GATA1 and Gata1 are located on the X chromosome, and RP haploinsufficiency impairs the translation of GATA1 mRNA.15,16 Fujiwara et al.64 reported that mouse embryos lacking Gata1 died at approximately E11.5 because of maturation arrest of erythroid progenitors. Female heterozygotes (Gata1+/-) were born pale due to random X chromosome inactivation. Interestingly, those mice recovered during the neonatal period, presumably as a result of in vivo selection for progenitors able to express Gata1. Later Gutiérrez et al.65 described mouse models with inducible Gata1 deletion using conditional Gata1 knockout mediated by either interferon-Cre recombinase (Mx-Cre) or Tx-Cre. They found that Mx-Cre-mediated Gata1 deletion, although not producing anemia, caused maturation arrest of erythroid cells at the proerythroblast stage, thrombocytopenia, and excessive proliferation of megakaryocytes in spleens from adult Gata1-null mice. TxCre-mediated Gata1 deletion caused depletion of the erythroid compartment in both bone marrow and spleen, resulting in severe anemia in adult mice. Furthermore, formation of both early and late erythroid progenitors was significantly reduced in adult bone marrow in the absence of Gata1. 65
Mouse models with molecular defects not found in patients with DiamondBlackfan anemia but relevant to its pathogenesis
Despite extensive efforts to sequence all genes coding RP in affected individuals, molecular lesions remain elusive in approximately 20-25% of cases of DBA, and the correlation between genotype and phenotype is not clear in DBA.1 Therefore, in efforts to develop mouse models mimicking the clinical features or pathogenesis of DBA in humans, researchers have explored the impact of other proteins with known roles in the maturation of erythrocytes, accumulation of heme, and bone development.
Rps14 (uS11)
The Rps14 (uS11) mutation, like the 5q deletion, has never been reported in DBA patients. In an attempt to mimic 5q deletion in mice, Barlow et al.66 investigated mice engin-
Haematologica | 108 May 2023 1225 REVIEW ARTICLE - Animal models of Diamond-Blackfan anemia Y.L. Liu et al.
eered with LIM domain only 2 (Lmo2)-Cre and Cd74+/loxNid67+/lox (containing the Rps14 gene for uS11, Cd74+/D Nid67+/D) and reported that haploinsufficiency of the CD74Nid67 interval caused a DBA-like phenotype, including macrocytic anemia, thrombocytopenia, and hypocellularity in bone marrow, which was associated with increased p53 expression and apoptosis, as observed in DBA samples.27 They also demonstrated that deletion of Trp53 completely restored the populations of hematopoietic stem cells, common myeloid progenitors, megakaryocyte-erythrocyte progenitors and granulocyte/macrophage progenitors, and reversed the dysplasia in bone marrow of mice carrying Cd74+/D Nid67+/D .
Flvcr
Feline leukemia virus subgroup C receptor (FLVCR) is a heme export protein, and delayed globin synthesis leads to excess heme in DBA patients.67 Although a DBA-causative mutation in the FLVCR1 gene has never been identified in DBA families,68 Keel et al.69 reported mouse models with constitutive Flvcr +/- and inducible Flvcr mutations (Flvcr+/flox;Mx-cre). They demonstrated that Flvcr-null mice lack definitive erythropoiesis and have craniofacial and limb deformities, while deletion of Flvcr in the neonatal period causes severe macrocytic anemia with proerythroblast maturation arrest, resembling the clinical features of DBA patients. Later, the same group reported the data from single-cell analyses of mice with Flvcr deletion.70 They demonstrated that the heme-GATA1 feedback loop regulates red cell differentiation and that deletion of Flvcr1 causes high levels of intracellular heme, which decreases GATA1 and expression of GATA1-target genes, as well as mitotic spindle genes in late stage erythroid cells (CD71+Ter119lo-hi). Their data suggest that excessive heme may be responsible for the progression of RP imbalance and prematurely lower GATA1, and may impede mitosis in patients in the late stages of DBA.
Rps6 (eS6)
Mouse embryos with haploinsufficiency of Rps6 (Rps6+/D) are small and die at gastrulation; genetic inactivation of p53 bypasses this checkpoint, prolonging the embryonic development until E12.5, at which point the embryos likely die from anemia.71 Two groups reported their observations in mice with inducible Rps6 deletion using conditional Rps6 knockout mediated by Mx-Cre. 72,73 Regardless of the timing of deletion, induced in either the neonatal period (5-7 days after birth) or in adulthood (7-9 weeks), mice with Rps6+/D exhibited robust macrocytic anemia, granulocytopenia, lymphopenia, and progressive thrombocytosis. Elevated levels of erythroid ADA (eADA) were also observed in these mice, a finding present in >80% of DBA patients. McGowan et al.72 demonstrated that deletion of Trp53 rescued the red blood cell counts and burst-forming
unit-erythroid or mature erythroid precursors in Rps6deficient mice, a finding that was also reported by Tiu et al., 30 collectively confirming that p53 plays an important role in the pathogenesis of DBA. In particular, Tiu et al.30 characterized limb development defects upon Rps6 deletion during the development of the limb bud mesenchyme; these defects are similar to the congenital birth defects found in DBA patients, including radial hypoplasia and defects in digit formation. They also observed a decrease in translation, specifically of transcripts controlling limb development, upon Rps6 deletion. This decrease could be rescued by knockdown of either p53 and/or the repressor of cap binding protein, 4E-BP1. 4E-BP1 represses the essential eukaryotic initiation factor eIF4E. Strikingly, it was also observed in cells with Rps19- and Rps14knockdown that the selective translation phenomena was driven by upregulation of p53 and 4E-BP1, suggesting a common pathway via the p53-4EBP1-eIF4E axis by which selective changes in translation occur upon ribosome perturbation.30
Other mutations
Mouse models with mutations in Rpl24 (eL24)74 and Rpl27a (eL27) have been described.75 These animals had nonhematologic phenotypes (Table 1).
Conclusions and future directions
Most molecular defects in DBA patients, are caused by haploinsufficiency in one of the RP genes.1,12 In 2005, DBA was recognized as the first ribosomopathy in humans.76 Ribosomopathies broadly comprise two categories: disorders caused by single-copy mutations in specific RP, and disorders associated with defects in ribosome biogenesis factors. The phenotypic patterns among different ribosomopathies are divergent but often share some overlapping features, including effects on bone marrow-derived cell lineages and skeletal tissues. It is unknown how the phenotypic diversity among the ribosomopathies is regulated. The common tissue specificities of the different ribosomopathies are very challenging to reconcile with the ubiquitous requirement for ribosomes in all cells.77
Due to the limited numbers of bone marrow cells in DBA patients, studies on the critical roles of ribosomes in protein biosynthesis have been very challenging. Researchers have successfully recapitulated the macrocytic anemia and growth retardation of DBA patients in zebrafish and mouse models with engineered mutations of Rps19, Rpl11, Rpl5, Rps24, Rps7, Rps14, and Gata1 (Table 1). Other animal models with mutant genes not found in DBA patients, such as Rps6 and Flvcr, have advanced our understanding
Haematologica | 108 May 2023 1226 REVIEW ARTICLE - Animal models of Diamond-Blackfan anemia Y.L. Liu et al.
RP: ribosomal protein; DOX: doxycycline; na: not available; CNS: central nervous system; PND: post natal day; eADA: erythroid adenosine deaminase; GI: gastrointestinal.
of how ribosome dysfunction affects erythropoiesis and contributes to the pathogenesis of DBA. Haploinsufficiency of Rpl11 and Rpl5 in mice also produces manifestations resembling the clinical features of DBA. While in some models the RP composition of ribosomes varies,78 Khajuria et al.63 recently reported that in hematopoietic cells, RP haploinsufficiency did not demonstrate an altered ribosome composition. Rather, the impaired lineage commitment, a characteristic of hematopoiesis in DBA patients, arises from reduced cellular levels of ribosomes, suggest-
ing that ribosome levels are rate-limiting and selectively regulate translation and lineage commitment in human hematopoiesis.
DBA patients with RP gene mutations were identified as being exclusively heterozygous. From mouse models, we learned that homozygous RP gene mutations are embryonic lethal, and fetuses with heterozygous deletions occurring in early development cannot survive to birth, such as homozygous Rps19 fetuses and heterozygous Rpl11
tuses.49,54 This suggests that gene dosage and the timing
fe-
Gene (RP) Defect in patients Alteration Mechanism Age (mut. induced) Characteristics Reference Anemia Other systems Author Year Rps19 (eS19) Yes Del. exons 1-4 +/- Constitutive No Growth Matsson et al.49 2004 Rps19R62W +/-(DN) Fetal (Prion-Cre) Yes Growth Devlin et al.51 2010 shRNA M2-rtTA >4 weeks (DOX) Yes Growth Jaako et al.48 2011 Dsk3 +/Dsk3 Constitutive Yes Dark skin McGowan et al.72 2011 Arg67del -/- Constitutive No Growth, behavior Kubik-Zahorodna et al.50 2016 na Xenograft na Yes na Flygare et al.52 2008 Rpl11 (uL5) Yes Del. exons 3-4 +/loxP 5-8 weeks (Tg.UbC-CreERT2) Yes GI Morgado-Palacin et al.54 2015 Rpl5 (uL18) Yes shRNA ColA1/rtTA 5-6 weeks (TRE) Yes na Kazerounian et al.57 2019 Intron 1 Skax23m1 Jus/+ Constitutive Yes Bone, heart Yu et al.58 2021 Del. exons 1-8 +/loxP Embryonic (pGK-gb2 Loxp/FRT) No Soft tissue sarcoma Kazerounian et al.56 2016 Rps24 (eS24) Yes Del. exons 2-3 +/loxP Embryonic (pGK-gb2 Loxp/FRT) No Soft tissue sarcoma Kazerounian et al.56 2016 Rps14 (uS11) Yes Del. Cd74 to Nid67 +/loxP Embryonic (Lmo2-Cre) Yes na Barlow et al.66 2010 Rps7 (eS7) Yes Rps7Mtu, Rps7Zma +/- Constitutive No Growth, eye, CNS Watkins-Chow et al.59 2013 Rps20 (uS10) Yes Dsk4 +/Dsk4 Constitutive No Dark skin McGowan et al.61 2008 GATA1 Yes Del. exons 2-6 loxP 8-10 weeks (Mx1-Cre) No na Gutiérrez et al.65 2008 8-10 weeks (Tx-Cre) Yes na Flvcr na Del. exon 3 loxP/loxP PND 7,9,11 (Mx1-Cre) Yes Bone (limb), heart Keel et al.69 2008 Rps6 (eS6) na Del. exons 3-5 +/loxP PND 5-7 (Mx1-Cre) Yes eADA Keel et al.73 2012 7-9 weeks (Mx1-Cre) Yes eADA, dark skin McGowan et al.72 2011 Fetal (Prix/Msx2-Cre) Yes Bone (limb) Tiu et al.30 2021 Rpl24 (eL24) na Intron 1 +/Bst Constitutive No Belly spot and tail kinks Oliver et al.74 2004 Rpl27a (eL27) na IVS4-15A > G +/- Constitutive No Sooty foot ataxia Terzian et al.75 2011
Table 1. Mouse models with Diamond-Blackfan anemia-associated mutations.
Haematologica | 108 May 2023 1227 REVIEW ARTICLE - Animal models of Diamond-Blackfan anemia Y.L. Liu et al.
of mutation hits play critical roles in recapitulating the clinical manifestations of DBA patients. Although each of the reported mouse models has various limitations in recapitulating the phenotype observed in DBA patients, such as the presence of a combination of anemia and physical anomalies, the models suggest that the complexity of haploinsufficiency of various RP depends on tissue specificity, resulting in varying disease severity in children with DBA. In the past decades, we have learnt much about the genetic changes in DBA,12 but we know very little about the role of epigenetics in the pathogenesis of DBA. It is striking that most DBA patients are diagnosed during their first year of life, when epigenetic regulation is required for developmental hematopoiesis, as the neonate adapts to normoxia and rapid growth. However, this age specificity and the dynamics of developmental hematopoiesis have been underappreciated in most of the reported DBA mouse models.
Spontaneous remissions occur in 10-20% of transfusiondependent DBA patients, and some DBA patients experience periods of anemia remission and relapse as a result of unknown mechanisms.24 Additionally, asymptomatic family members of DBA patients with RPS7 or RPL15 mutation have been reported, and the mutation persisted in the blood cells from a DBA patient after remission.22-24 Furthermore, female mice with Gata1+/- were born pale due to the random inactivation of the X chromosome bearing the normal allele, but recovered during the neonatal period, presumably as a result of in vivo selection for progenitors able to express Gata1. 64 Recently, it was reported that the severe anemia and cardiac defects in young mice with Rpl5+/- could resolve spontaneously in surviving adults.58 Collectively, these data suggest that epigenetic regulation may contribute to the pathogenesis of DBA. Fetal hematopoietic stem cells may follow various tracks to migrate into adult hematopoiesis based on the status of the hematopoiesis switch at which the RP mutations occur. In addition, the effects of mutant RP on the assembled ribosome and subsequent translation likely dictate the spectrum and severity of the disease. Previous reports suggest that ribosome levels are rate-limiting and selectively regulate translation and lineage commitment in human hematopoiesis.63 Therefore, insufficient ribosomes most likely alter the dynamics of hematopoiesis during development in early childhood. Elevated fetal hemoglobin levels are often detected in DBA patients.6 It has been reported that Pten deficiency in mice sustains fetallike hematopoiesis at an age at which the fetal-to-adulthematopoiesis switch should be completed,79 and the timing of Pten deficiency determines the disease severity
in mice with juvenile leukemia.80 Recently, Strahm et al.81 reported favorable outcomes of hematopoietic stem cell transplantation in children and adolescents with DBA, suggesting the benefit of correcting the molecular defects at an early stage of development. Emerging data support the idea that developmental hematopoiesis plays critical roles in pediatric hematopoietic disorders. Therefore, understanding the molecular mechanisms of fetal-toadult hematopoiesis will be key for future efforts to mimic DBA in mouse models. In the future, investigation of the timing of mutations in different developmental stages may help to uncover how developmental hematopoiesis contributes to the pathogenesis of DBA, particularly in pediatric patients.
Disclosures
No conflicts of interest to disclose.
Contributions
YLL designed the original lay out, conducted the literature search, created the tables, and wrote the manuscript. AS conducted the literature search for the Online Supplementary Table, and edited the manuscript. BG, MCW, and MB edited the manuscript. KMS designed the original layout and edited the manuscript. All authors approved the final version of the manuscript.
Acknowledgments
The authors would like to thank Dr. Anupama Narla for her helpful suggestions and comments while planning the manuscript. We also thank Dr. Rhonda Perriman for her critical editing of the final version of the manuscript.
Funding
KMS is supported by the NIH/R01 DK107286, Department of Defense Bone Marrow Failure Program (BM180024), DBA Foundation, SPARK program in Translational Research, Stanford Maternal Child Health Research Institute, and California Institute of Regenerative Medicine (CIRM 12475). MB is a New York Stem Cell Foundation Robertson Investigator and is supported by the New York Stem Cell Foundation and National Institutes of Health grant R01HD086634. MCW and AS are supported by the NIDDK T32 Training in Pediatric Nonmalignant Hematology and Stem Cell Biology (DK098132-06A1). MCW is also supported by K01 (DK123140), a Maternal Child Health Research Institute fellowship (1111239-442-JHACT), and Instructor K Award (1258512-700WAGZG).
Data-sharing statement
There are no data to share.
Haematologica | 108 May 2023 1228 REVIEW ARTICLE - Animal models of Diamond-Blackfan anemia Y.L. Liu et al.
References
1. Da Costa LM, Marie I, Leblanc TM. Diamond-Blackfan anemia. Hematology Am Soc Hematol Educ Program. 2021;2021(1):353-360.
2. Alter BP, Giri N, Savage SA, et al. Cancer in the National Cancer Institute inherited bone marrow failure syndrome cohort after fifteen years of follow-up. Haematologica. 2018;103(1):30-39.
3. Lipton JM, Alter BP. Heritable cancer: rounding up the not so usual suspects. Pediatr Blood Cancer. 2017;64(2):219-220.
4. Lipton JM, Federman N, Khabbaze Y, et al. Osteogenic sarcoma associated with Diamond-Blackfan anemia: a report from the Diamond-Blackfan Anemia Registry. J Pediatr Hematol Oncol. 2001;23(1):39-44.
5. Vlachos A, Rosenberg PS, Atsidaftos E, et al. Incidence of neoplasia in Diamond Blackfan anemia: a report from the Diamond Blackfan Anemia Registry. Blood. 2012;119(16):3815-3819.
6. Da Costa L, Leblanc T, Mohandas N. Diamond-Blackfan anemia. Blood. 2020;136(11):1262-1273.
7. Da Costa L, Narla A, Mohandas N. An update on the pathogenesis and diagnosis of Diamond-Blackfan anemia. F1000Res. 2018;7:F1000 Faculty Rev-1350.
8. Lipton JM, Atsidaftos E, Zyskind I, et al. Improving clinical care and elucidating the pathophysiology of Diamond Blackfan anemia: an update from the Diamond Blackfan Anemia Registry. Pediatr Blood Cancer. 2006;46(5):558-564.
9. Li H, Lodish HF, Sieff CA. Critical issues in Diamond-Blackfan anemia and prospects for novel treatment. Hematol Oncol Clin North Am. 2018;32(4):701-712.
10. Ohene-Abuakwa Y, Orfali KA, Marius C, et al. Two-phase culture in Diamond Blackfan anemia: localization of erythroid defect. Blood. 2005;105(2):838-846.
11. Iskander D, Psaila B, Gerrard G, et al. Elucidation of the EP defect in Diamond-Blackfan anemia by characterization and prospective isolation of human EPs. Blood. 2015;125(16):25532557.
12. Ulirsch JC, Verboon JM, Kazerounian S, et al. The genetic landscape of Diamond-Blackfan anemia. Am J Hum Genet. 2018;103(6):930-947.
13. O'Donohue MF, Da Costa L, Lezzerini M, et al. HEATR3 variants impair nuclear import of uL18 (RPL5) and drive DiamondBlackfan anemia. Blood. 2022;139(21):3111-3126.
14. Bhar S, Zhou F, Reineke LC, et al. Expansion of germline RPS20 mutation phenotype to include Diamond-Blackfan anemia. Hum Mutat. 2020;41(11):1918-1930.
15. Ludwig LS, Gazda HT, Eng JC, et al. Altered translation of GATA1 in Diamond-Blackfan anemia. Nat Med. 2014;20(7):748-753.
16. Sankaran VG, Ghazvinian R, Do R, et al. Exome sequencing identifies GATA1 mutations resulting in Diamond-Blackfan anemia. J Clin Invest. 2012;122(7):2439-2443.
17. Gripp KW, Curry C, Olney AH, et al. Diamond-Blackfan anemia with mandibulofacial dystostosis is heterogeneous, including the novel DBA genes TSR2 and RPS28. Am J Med Genet A. 2014;164A(9):2240-2249.
18. Calvino FR, Kharde S, Ori A, et al. Symportin 1 chaperones 5S RNP assembly during ribosome biogenesis by occupying an essential rRNA-binding site. Nat Commun. 2015;6:6510-6517.
19. Ball SE, McGuckin CP, Jenkins G, et al. Diamond-Blackfan anaemia in the U.K.: analysis of 80 cases from a 20-year birth cohort. Br J Haematol. 1996;94(4):645-653.
20. Willig TN, Niemeyer CM, Leblanc T, et al. Identification of new
prognosis factors from the clinical and epidemiologic analysis of a registry of 229 Diamond-Blackfan anemia patients. DBA group of Societe d'Hematologie et d'Immunologie Pediatrique (SHIP), Gesellshaft fur Padiatrische Onkologie und Hamatologie (GPOH), and the European Society for Pediatric Hematology and Immunology (ESPHI). Pediatr Res. 1999;46(5):553-561.
21. Janov AJ, Leong T, Nathan DG, et al. Diamond-Blackfan anemia. Natural history and sequelae of treatment. Medicine (Baltimore). 1996;75(2):77-78.
22. Akram T, Fatima A, Klar J, et al. Aberrant splicing due to a novel RPS7 variant causes Diamond-Blackfan anemia associated with spontaneous remission and meningocele. Int J Hematol. 2020;112(6):894-899.
23. Smetanina NS, Mersiyanova IV, Kurnikova MA, et al. Clinical and genomic heterogeneity of Diamond Blackfan anemia in the Russian Federation. Pediatr Blood Cancer. 2015;62(9):1597-1600.
24. Wlodarski MW, Da Costa L, O'Donohue MF, et al. Recurring mutations in RPL15 are linked to hydrops fetalis and treatment independence in Diamond-Blackfan anemia. Haematologica. 2018;103(6):949-958.
25. Narla A, Vlachos A, Nathan DG. Diamond Blackfan anemia treatment: past, present, and future. Semin Hematol. 2011;48(2):117-123.
26. Kubickova A, Maceckova Z, Vojta P, et al. Missense mutation in RPS7 causes Diamond-Blackfan anemia via alteration of erythrocyte metabolism, protein translation and induction of ribosomal stress. Blood Cells Mol Dis. 2022;97:102690.
27. Dutt S, Narla A, Lin K, et al. Haploinsufficiency for ribosomal protein genes causes selective activation of p53 in human erythroid progenitor cells. Blood. 2011;117(9):2567-2576.
28. Danilova N, Sakamoto KM, Lin S. Ribosomal protein S19 deficiency in zebrafish leads to developmental abnormalities and defective erythropoiesis through activation of p53 protein family. Blood. 2008;112(13):5228-5237.
29. Chakraborty A, Uechi T, Higa S, et al. Loss of ribosomal protein L11 affects zebrafish embryonic development through a p53dependent apoptotic response. PLoS One. 2009;4(1):e4152-4160.
30. Tiu GC, Kerr CH, Forester CM, et al. A p53-dependent translational program directs tissue-selective phenotypes in a model of ribosomopathies. Dev Cell. 2021;56(14):2089-2102.
31. Matsuda T, Kato T, Kiyotani K, et al. p53-independent p21 induction by MELK inhibition. Oncotarget. 2017;8(35):57938-57947.
32. Doty RT, Phelps SR, Shadle C, et al. Coordinate expression of heme and globin is essential for effective erythropoiesis. J Clin Invest. 2015;125(12):4681-4691.
33. Wang B, Wang C, Wan Y, et al. Decoding the pathogenesis of Diamond-Blackfan anemia using single-cell RNA-seq. Cell Discov. 2022;8(1):41-59.
34. Wilkes MC, Siva K, Chen J, et al. Diamond Blackfan anemia is mediated by hyperactive Nemo-like kinase. Nat Commun. 2020;11(1):3344-3360.
35. Wilkes MC, Scanlon V, Shibuya A, et al. Downregulation of SATB1 by miRNAs reduces megakaryocyte/erythroid progenitor expansion in preclinical models of Diamond-Blackfan anemia. Exp Hematol. 2022;111:66-78.
36. McGowan KA, Mason PJ. Animal models of Diamond Blackfan anemia. Semin Hematol. 2011;48(2):106-116.
37. Taylor AM, Zon LI. Modeling Diamond Blackfan anemia in the zebrafish. Semin Hematol. 2011;48(2):81-88.
38. Danilova N, Bibikova E, Covey TM, et al. The role of the DNA
Haematologica | 108 May 2023 1229 REVIEW ARTICLE - Animal models of Diamond-Blackfan anemia Y.L. Liu et al.
damage response in zebrafish and cellular models of Diamond Blackfan anemia. Dis Model Mech. 2014;7(7):895-905.
39. Uechi T, Nakajima Y, Chakraborty A, et al. Deficiency of ribosomal protein S19 during early embryogenesis leads to reduction of erythrocytes in a zebrafish model of DiamondBlackfan anemia. Hum Mol Genet. 2008;17(20):3204-3211.
40. Bibikova E, Youn MY, Danilova N, et al. TNF-mediated inflammation represses GATA1 and activates p38 MAP kinase in RPS19-deficient hematopoietic progenitors. Blood. 2014;124(25):3791-3798.
41. Danilova N, Sakamoto KM, Lin S. Ribosomal protein L11 mutation in zebrafish leads to haematopoietic and metabolic defects. Br J Haematol. 2011;152(2):217-228.
42. Taylor AM, Humphries JM, White RM, et al. Hematopoietic defects in rps29 mutant zebrafish depend upon p53 activation. Exp Hematol. 2012;40(3):228-237.
43. Amsterdam A, Nissen RM, Sun Z, et al. Identification of 315 genes essential for early zebrafish development. Proc Natl Acad Sci U S A. 2004;101(35):12792-12797.
44. Chen C, Lu M, Lin S, et al. The nuclear gene rpl18 regulates erythroid maturation via JAK2-STAT3 signaling in zebrafish model of Diamond-Blackfan anemia. Cell Death Dis. 2020;11(2):135-145.
45. Oyarbide U, Topczewski J, Corey SJ. Peering through zebrafish to understand inherited bone marrow failure syndromes. Haematologica. 2019;104(1):13-24.
46. Hemann MT, Fridman JS, Zilfou JT, et al. An epi-allelic series of p53 hypomorphs created by stable RNAi produces distinct tumor phenotypes in vivo. Nat Genet. 2003;33(3):396-400.
47. Dickins RA, Hemann MT, Zilfou JT, et al. Probing tumor phenotypes using stable and regulated synthetic microRNA precursors. Nat Genet. 2005;37(11):1289-1295.
48. Jaako P, Flygare J, Olsson K, et al. Mice with ribosomal protein S19 deficiency develop bone marrow failure and symptoms like patients with Diamond-Blackfan anemia. Blood. 2011;118(23):6087-6896.
49. Matsson H, Davey EJ, Draptchinskaia N, et al. Targeted disruption of the ribosomal protein S19 gene is lethal prior to implantation. Mol Cell Biol. 2004;24(9):4032-4037.
50. Kubik-Zahorodna A, Schuster B, Kanchev I, et al. Neurological deficits of an Rps19(Arg67del) model of Diamond-Blackfan anaemia. Folia Biol (Praha). 2016;62(4):139-147.
51. Devlin EE, Dacosta L, Mohandas N, et al. A transgenic mouse model demonstrates a dominant negative effect of a point mutation in the RPS19 gene associated with Diamond-Blackfan anemia. Blood. 2010;116(15):2826-3285.
52. Flygare J, Olsson K, Richter J, et al. Gene therapy of Diamond Blackfan anemia CD34(+) cells leads to improved erythroid development and engraftment following transplantation. Exp Hematol. 2008;36(11):1428-1435.
53. Zivny J, Jelinek J, Pospisilova D, et al. Diamond Blackfan anemia stem cells fail to repopulate erythropoiesis in NOD/SCID mice. Blood Cells Mol Dis. 2003;31(1):93-97.
54. Morgado-Palacin L, Varetti G, Llanos S, et al. Partial loss of Rpl11 in adult mice recapitulates Diamond-Blackfan anemia and promotes lymphomagenesis. Cell Rep. 2015;13(4):712-722.
55. Doty RT, Yan X, Meng C, et al. Single-cell analysis of erythropoiesis in Rpl11 haploinsufficient mice reveals insight into the pathogenesis of Diamond-Blackfan anemia. Exp Hematol. 2021;97:66-78.
56. Kazerounian S, Ciarlini PD, Yuan D, et al. Development of soft tissue sarcomas in ribosomal proteins L5 and S24 heterozygous mice. J Cancer. 2016;7(1):32-36.
57. Kazerounian S, Yuan D, Alexander MS, et al. Rpl5-inducible mouse model for studying Diamond-Blackfan anemia. Discoveries (Craiova). 2019;7(3):e96.
58. Yu L, Lemay P, Ludlow A, et al. A new murine Rpl5 (uL18) mutation provides a unique model of variably penetrant Diamond-Blackfan anemia. Blood Adv. 2021;5(20):4167-4178.
59. Watkins-Chow DE, Cooke J, Pidsley R, et al. Mutation of the Diamond-Blackfan anemia gene Rps7 in mouse results in morphological and neuroanatomical phenotypes. PLoS Genet. 2013;9(1):e1003094.
60. Sato Y, Yano S, Ewis AA, et al. SRY interacts with ribosomal proteins S7 and L13a in nuclear speckles. Cell Biol Int. 2011;35(5):449-452.
61. McGowan KA, Li JZ, Park CY, et al. Ribosomal mutations cause p53-mediated dark skin and pleiotropic effects. Nat Genet. 2008;40(8):963-970.
62. Ferreira R, Ohneda K, Yamamoto M, et al. GATA1 function, a paradigm for transcription factors in hematopoiesis. Mol Cell Biol. 2005;25(4):1215-1227.
63. Khajuria RK, Munschauer M, Ulirsch JC, et al. Ribosome levels selectively regulate translation and lineage commitment in human hematopoiesis. Cell. 2018;173(1):90-103.
64. Fujiwara Y, Browne CP, Cunniff K, et al. Arrested development of embryonic red cell precursors in mouse embryos lacking transcription factor GATA-1. Proc Natl Acad Sci U S A. 1996;93(22):12355-12358.
65. Gutierrez L, Tsukamoto S, Suzuki M, et al. Ablation of Gata1 in adult mice results in aplastic crisis, revealing its essential role in steady-state and stress erythropoiesis. Blood. 2008;111(8):4375-4385.
66. Barlow JL, Drynan LF, Hewett DR, et al. A p53-dependent mechanism underlies macrocytic anemia in a mouse model of human 5q- syndrome. Nat Med. 2010;16(1):59-66.
67. Yang Z, Keel SB, Shimamura A, et al. Delayed globin synthesis leads to excess heme and the macrocytic anemia of Diamond Blackfan anemia and del(5q) myelodysplastic syndrome. Sci Transl Med. 2016;8(338):67-75.
68. Quigley JG, Gazda H, Yang Z, et al. Investigation of a putative role for FLVCR, a cytoplasmic heme exporter, in DiamondBlackfan anemia. Blood Cells Mol Dis. 2005;35(2):189-192.
69. Keel SB, Doty RT, Yang Z, et al. A heme export protein is required for red blood cell differentiation and iron homeostasis. Science. 2008;319(5864):825-828.
70. Doty RT, Yan X, Lausted C, et al. Single-cell analyses demonstrate that a heme-GATA1 feedback loop regulates red cell differentiation. Blood. 2019;133(5):457-469.
71. Panic L, Tamarut S, Sticker-Jantscheff M, et al. Ribosomal protein S6 gene haploinsufficiency is associated with activation of a p53-dependent checkpoint during gastrulation. Mol Cell Biol. 2006;26(23):8880-8891.
72. McGowan KA, Pang WW, Bhardwaj R, et al. Reduced ribosomal protein gene dosage and p53 activation in low-risk myelodysplastic syndrome. Blood. 2011;118(13):3622-3633.
73. Keel SB, Phelps S, Sabo KM, et al. Establishing Rps6 hemizygous mice as a model for studying how ribosomal protein haploinsufficiency impairs erythropoiesis. Exp Hematol. 2012;40(4):290-294.
74. Oliver ER, Saunders TL, Tarle SA, et al. Ribosomal protein L24 defect in belly spot and tail (Bst), a mouse Minute. Development. 2004;131(16):3907-3920.
75. Terzian T, Dumble M, Arbab F, et al. Rpl27a mutation in the sooty foot ataxia mouse phenocopies high p53 mouse models. J Pathol. 2011;224(4):540-552.
76. Leger-Silvestre I, Caffrey JM, Dawaliby R, et al. Specific role for
Haematologica | 108 May 2023 1230 REVIEW ARTICLE - Animal models of Diamond-Blackfan anemia Y.L. Liu et al.
yeast homologs of the Diamond Blackfan anemia-associated Rps19 protein in ribosome synthesis. J Biol Chem. 2005;280(46):38177-38185.
77. Mills EW, Green R. Ribosomopathies: there's strength in numbers. Science. 2017;358(6363):eaan2755.
78. Shi Z, Fujii K, Kovary KM, et al. Heterogeneous ribosomes preferentially translate distinct subpools of mRNAs genomewide. Mol Cell. 2017;67(1):71-83.
79. Vara N, Liu Y, Yan Y, et al. Sustained fetal hematopoiesis causes
juvenile death from leukemia: evidence from a dual-agespecific mouse model. Blood Adv. 2020;4(15):3728-3740.
80. Liu YL, Yan Y, Webster C, et al. Timing of the loss of PTEN protein determines disease severity in a mouse model of myeloid malignancy. Blood. 2016;127(15):1912-1922.
81. Strahm B, Loewecke F, Niemeyer CM, et al. Favorable outcomes of hematopoietic stem cell transplantation in children and adolescents with Diamond-Blackfan anemia. Blood Adv. 2020;4(8):1760-1769.
Haematologica | 108 May 2023 1231 REVIEW ARTICLE - Animal models of Diamond-Blackfan anemia Y.L. Liu et al.
Biosimilars in rare diseases : a focus on paroxysmal nocturnal hemoglobinuria
Austin Kulasekararaj,1 Robert Brodsky,2 Alexander Kulagin3 and Jun Ho Jang4
Abstract
Correspondence: A. Kulasekararaj austin.kulasekararaj@nhs.net
Received: August 5, 2022.
Accepted: December 2, 2022.
Early view: December 15, 2022.
https://doi.org/10.3324/haematol.2022.281562
©2023 Ferrata Storti Foundation
Published under a CC BY-NC license
Biologics, a class of medicines grown in and purified from genetically engineered cell cultures, have transformed the management of many cancers and rare diseases, such as paroxysmal nocturnal hemoglobinuria. As prescription drug spending has increased and exclusivity periods have expired, manufacturers have developed biosimilars–biologics that may be more affordable and highly similar to a licensed biological therapeutic, with no clinically meaningful differences in terms of safety or efficacy. With biosimilars gaining regulatory approval around the globe and broadening patient access to biologics, this review aims to help rare disease healthcare providers familiarize themselves with biosimilars, understand their development and regulatory approval process, and address practical considerations that may facilitate their use.
Introduction
Biologics, which include hormones, blood products, cytokines, growth factors, vaccines, and monoclonal antibodies, have emerged as indispensable options in the treatment of cancer and other serious health conditions; however, their use has significantly increased healthcare spending.1 As exclusivity periods for many biologics have expired, manufacturers have developed products called “biosimilars,” which are biological medicines that are highly similar to an approved reference product (RP), with no clinically meaningful differences in terms of safety or efficacy. The European Medicines Agency (EMA) was the first regulatory authority to establish a biosimilar approval framework based on safety, efficacy, and quality.2 Biosimilar recombinant human growth hormone (Omnitrope®, Sandoz GmbH, Kundl, Austria) was the first medicine to be approved through the EMA biosimilar regulatory pathway in 2006.3 Since then, dozens of biosimilar medicines have been approved and used in clinical practice with no evidence to date that they perform any differently from the RP on a population level.4
In the US, the Biologics Price Competition and Innovation Act (BPCIA) of 2009 authorized the US Food and Drug Administration (FDA) to oversee a biosimilar approval pathway.5 Modeled with the same intention of the law that allows the development and the approval of generic alter-
natives to small-molecule drugs, BPCIA was designed to encourage competition and innovation.6 A biosimilar of the granulocyte colony-stimulating factor filgrastim7 (Zarxio®, Sandoz Inc., Princeton, NJ, USA) was the first biosimilar approved in the US, in March 2015.4,7
Despite the endorsement of biosimilars by regulatory authorities around the world, they remain underused.8 This review provides an overview of the expanding knowledge base regarding biosimilars. We seek to help rare disease healthcare providers (HCP) familiarize themselves with biosimilars and understand how they are developed, as well as address practical considerations to facilitate their use.
What are biosimilars?
A biosimilar may be defined, in part, as a biologic agent that is highly similar to a licensed RP (Online Supplementary Table S1), the off-patent product to which they offer an alternative.2,5,9,10 Biosimilars have no clinically meaningful differences from originator biologics in function, purity, potency, pharmacokinetics (PK), pharmacodynamics (PD), clinical efficacy, safety, and immunogenicity.
To better explain what biosimilars are, it helps to understand what they are not. Biosimilars are fundamentally
1Department of Haematological Medicine, King's College London School of Medicine, London, UK; 2Division of Hematology, Johns Hopkins Medicine, Baltimore, MD, USA; 3RM Gorbacheva Research Institute, Pavlov University, St. Petersburg, Russia and 4Division of Hematology-Oncology, Samsung Medical Center, Sungkyunkwan University School of Medicine, Seoul, South Korea
Haematologica | 108 May 2023 1232 REVIEW ARTICLE
different from generic drugs (Figure 1). A generic drug is a small molecule with a well-defined structure that is identical to its RP. In addition, generics are usually produced by chemical synthesis, a wholly reproducible process that is generally faster and lower in cost than the development of biologics. They are also indistinguishable from their reference drugs in potency, dosage, route of administration, safety profile, and indication. In contrast, biologics, including biosimilars, are large proteins with complex physicochemical structures (Figure 1).11 Their manufacture involves a highly intricate process using genetically engineered cell lines and extraction via complex purification techniques.12-14 Biosimilars have the same amino acid sequence and highly similar structural and functional attributes as their corresponding RP, yet there may be small differences in the clinically inactive components.2,9,15 Therefore, a biosimilar is not an identical copy of its RP. In addition, it takes approximately eight years to develop a biosimilar, at a cost of up to $200 million (Figure 2).16
It is also important to distinguish biosimilars from non-
comparable biologics (also known as “non-comparable biotherapeutics”, “biocopies”, “biomimics”, “intended copies”, and “non-regulated biologics”). Although non-comparables may contain the same amino acid sequence as the RP, they have not usually been subjected to the same rigorous evaluations mandated by biosimilar regulatory procedures.17,18 For example, Abcertin® (Imiglucerase, ISU Abxis, South Korea), a non-comparable enzyme replacement therapy for Gaucher disease, has been approved in South Korea despite the lack of a direct comparison to the RP or physicochemical, immunological, or structural data.17 As a result, non-comparable products may have clinically significant differences in terms of quality, efficacy, and safety compared with their RP. Within the last few years, dozens of biosimilars of interest to hematologists have been approved by regulatory authorities and have been launched in the US, EU, and other countries (Table 1). For example, the first biosimilar to eculizumab RP (Soliris®, Alexion), a monoclonal IgG2/4k antibody, was launched in Russia for the treatment of paroxysmal nocturnal hemoglobinuria (PNH), a rare hema-

Haematologica | 108 May 2023 1233 REVIEW ARTICLE - Biosimilars for rare diseases A. Kulasekararaj et al.
Figure 1. Molecular mass comparisons: small-molecule drugs versus larger biologics. Adapted from Thill et al.11 ave: average; Da: Daltons; EPO: erythropoietin; GCSF: granulocyte colony-stimulating factor; HGH: human growth hormone; mAbs: monoclonal antibodies. Not drawn to scale.
tological disease characterized by hemolytic anemia, thrombosis, and peripheral blood cytopenias.19,20 Several other companies are currently developing eculizumab biosimilars (Table 2).21-24
Development of biosimilars
The development of biosimilars differs from originator biologics and generic drugs in many ways (Table 3). Rather than evaluating optimal dosing or patient benefit per se, the biosimilar development process focuses on building a totality of evidence (TOE), which can be defined as the sum of data from comparative analytical, non-clinical, and clinical studies.25 A TOE aims to demonstrate that there are no clinically meaningful differences in safety or efficacy between the biosimilar candidate and its RP.25-27 Biosimilar development uses a stepwise investigational approach which begins with an extensive analytical characterization of the RP to understand structural and functional characteristics such as molecular weight, higher order structure and posttranslational modifications, mechanism of action, and degradation profile denoting stability (Figure 3).25,28,29 These physical and biological critical quality attributes (CQA) are crucial for the function, efficacy, and safety of the RP, and must be clearly described, measured, and monitored.25,30,31 The number of CQA often differs between biologics. For example, based on a scientific understanding of how the attributes of a monoclonal antibody influence safety, efficacy, immunogenicity, and PK/PD, it may have more than 40 CQA (Online Supplementary Figure S1), and these may need to be analyzed using dozens of assays.32

The knowledge gained from these studies is then used to develop a biosimilar product candidate. A series of laboratory-based comparative structural analyses and functional assays are performed, providing an extensive physicochemical and biological profile of the biosimilar candidate. Comparative clinical PK and PD testing is then carried out.26,27 In order to confirm the absence of any clinically meaningful differences between the biosimilar candidate and the RP, regulatory authorities generally recommend at least one comparative clinical study in a representative indication that confirms equivalence with respect to efficacy, safety, and immunogenicity.26,27
Analytical and functional characterization
The structural and functional characterization of a candidate biosimilar is a crucial component of the development process. Although biosimilars have the same amino acid sequence as the RP, different components of the manufacturing process can lead to molecular differences. For example, the structure and stability of a proposed biosimilar can be influenced by the cell line selected, its mutations and culture conditions, as well as the purification method and storage conditions.14 Moreover, post-translational modifications such as glycosylation may yield variants with different function, stability, pharmacologic activity, and immunogenic potential.33-35
Structural and functional characterization entails an analytical evaluation that identifies potential differences between the biosimilar candidate and its RP.6,30 Analytical methods typically include an assessment of CQA such as the amino acid sequence, the primary and higher-order protein structure, disulfide bonds, glycan profile, and po-
Haematologica | 108 May 2023 1234 REVIEW ARTICLE - Biosimilars for rare diseases A. Kulasekararaj et al.
Figure 2. Development and manufacturing of biosimilars is more complex than small molecule generics. mln: million; bln: billion.
tential impurities. Multiple precise, accurate, reproducible, and highly sensitive analytical assays are typically used to evaluate the same quality attribute and maximize the potential for detecting differences.36 For example, the use of complementary analytical techniques in series, such as peptide mapping and capillary electrophoresis combined
with mass spectrometry, can provide a meaningful and sensitive comparison of the primary amino acid structure of a candidate biosimilar and RP. Any residual uncertainty regarding a demonstration of similarity between a biosimilar and its RP is reduced if the assessment establishes that the results lie within prespecified criteria based on the
Reference drug Active substance Biosimilar proprietary name Marketer Regulatory authority Approval date Epogen®/Procrit® Epoetin alfa Abseamed® Medice EMA 2007 Binocrit® Sandoz Epoetin Alfa Hexal® Hexal Retacrit Pfizer FDA 2018 Eprex®/Erypo® Epoetin zeta Retacrit® Hospira EMA 2007 Silapo® Stada Soliris® Eculizumab Elizaria® Generium Russian Ministry of Health 2019 Neupogen® Filgrastim Accofil® Accord EMA 2014 Filgrastim Hexal® Hexal EMA 2009 Grastofil® Apotex EMA 2013 Nivestim® Hospira EMA 2010 Ratiograstim Ratiopharm EMA 2008 Tevagrastim® Teva EMA 2008 Zarxio® Sandoz EMA 2009 FDA 2015 Nivestym® Pfizer FDA 2018 Releuko® Amneal FDA 2022 Neulasta® Pegfilgrastim Fulphila® Mylan EMA 2018 Fulphila® Mylan/Biocon FDA 2018 Pelgraz® Accord EMA 2018 Ziextenzo® Sandoz EMA 2018 Ziextenzo® Sandoz FDA 2019 Pelmeg® Cinfa EMA 2018 Udenyca® Coherus FDA 2018 Cegfila® Mundipharma EMA 2019 Grasustek® Juta EMA 2019 Nyvepria™ Pfizer EMA 2020 FDA Stimufend® Fresenius Kabi FDA 2022 EMA Fylnetra™ Amneal FDA 2022 Clexane® Enoxaparin sodium Inhixa® Techdow Europe AB EMA 2016 Thorinane® Pharmathen S.A. MabThera®/ Rituxan® Rituximab Rixathon®/Riximyo® Sandoz EMA 2017 Truxima®/Blitzima®/ Ritemvia® Celltrion EMA 2017 Ruxience® Pfizer EMA 2020 Truxima® Celltrion/Teva FDA 2018 Ruxience® Pfizer 2019 RIABNI™ Amgen 2020 EMA: European Medicines Agency; FDA: United States Food and Drug Administration.
Haematologica | 108 May 2023 1235 REVIEW ARTICLE - Biosimilars for rare diseases A. Kulasekararaj et al.
Table 1. Biosimilars in hematology: recommended for approval or approved in the European Union and/or United States.
knowledge of the RP, method capability, and regulatory guidance.32,36,37
Assessment of the candidate biosimilar’s biological activity and mechanism of action follows structural characterization. The goal is to assure the developer that the candidate biosimilar has the same functional activity as its RP. Assays used for functional characterization will depend on the type of molecule, and may include cell-based receptor binding or enzyme kinetics assays. For example, functional assessment of a monoclonal antibody biosimilar candidate involves a clear understanding of the biological effects of the antibody's antigen-binding and complement-binding regions (Online Supplementary Figure S1).25,38 Antibody neutralization and immunogenicity are often mediated via the antigen-binding region. The complement-binding region can impact the PK characteristics, as well as antibody-dependent cell-mediated cytotoxicity and antibody-dependent cellular phagocytosis, both of which are typically important for efficacy.25,38
Non-clinical studies
Once structural and functional similarity has been demonstrated, non-clinical animal studies may be required to assess the safety of the candidate biosimilar prior to conducting clinical studies in humans. Animal studies are
typically used to evaluate toxicology and PK to support the safe use of the proposed biosimilar in human subjects; however, studies have generally shown no unexpected findings of safety or toxicity for either the biosimilar candidate or the respective RP when there are minimal structural and functional differences between the molecules.39 Non-clinical animal studies may be skipped if there are minimal analytical variations between the two molecules or if there is no pharmacologically relevant animal species available.27 For example, animal studies were not conducted in preclinical studies of ABP 959, a candidate biosimilar of eculizumab RP, because its target is specific to human complement protein 5.40 Moreover, non-clinical and clinical data from the RP can be used for modeling and simulation to maximize the value of non-clinical studies. Furthermore, modeling and simulation may be used in the design of more efficient comparative clinical studies, which is of particular importance in the development of biosimilars for rare disease indications.41
Clinical studies
The aims of the clinical evaluation are to assess the potential impact of any differences identified during previous steps of the development process and to confirm comparable performance between the candidate biosimilar and
Biosimilar Developer Status Elizaria® Generium Pharmaceuticals Approved in Russia ABP 959 Amgen Inc. Results from a clinical comparative study in PNH patients are available SB12 Samsung Bioepis Results from a clinical comparative study in PNH patients are available BCD-148 Biocad Clinical comparative study in PNH completed Originator biologic Generic Biosimilar Quality Comprehensive product characterization Comprehensive product characterization Comparison with originator drug Comprehensive product characterization Comparison with originator biologic Pre-clinical Full pre-clinical program Not required
program based on complexity and residual uncertainty from quality Clinical Phase I (generally healthy subjects) Bioequivalence only PK similarity PD similarity if suitable marker available Phase II Not required Not required Phase III in all indications Not required Comparative clinical trial in at least 1 representative indication† Post-approval Risk management plan‡ Yes‡ Yes‡ Pharmacovigilance program Yes Yes
Abbreviated
paroxysmal nocturnal hemoglobinuria.
to other indications based on scientific
Table 2. Current status of eculizumab biosimilars.21-24
PNH:
†Extrapolation
justification. ‡European Union only. PD: pharmacodynamics; PK: pharmacokinetics.
Haematologica | 108 May 2023 1236 REVIEW ARTICLE - Biosimilars for rare diseases A. Kulasekararaj et al.
Table 3. Differences in regulatory requirements for originator compounds, generics, and biosimilars.
Figure 3. Comparison of the development pathway for biosimilars versus originator biologics. The development of an originator biologic typically begins with target identification and validation, assay development for screening, and hit generation and prioritization. Optimization, characterization, and candidate drug selection is followed by broad clinical, dose-ranging, pharmacokinetics (PK) / pharmacodynamics (PD), efficacy, safety, and immunogenicity studies. After regulatory approval, the product undergoes post-marketing surveillance, and on occasion, real-world studies. The development of a biosimilar is a stepwise process that begins with the gathering of existing knowledge about the reference product (RP). Following the development of a candidate biosimilar, it and the RP are then comparatively assessed in terms of their structure, mechanism of action, and PK/PD profile. Comparative assessments of efficacy, safety, and immunogenicity are also performed. After regulatory approval, the biosimilar undergoes post-marketing surveillance and is often compared to the RP in real-world studies. *Nonhuman studies including analytical, in vitro, in vivo (animal), ex vivo studies.

the RP. Indeed, the US BPCIA states that an application for a biosimilar must include data from “a clinical study or studies (including an assessment of immunogenicity and pharmacokinetics or pharmacodynamics) that are sufficient to demonstrate safety, purity, and potency in one or more conditions of use for which the reference product is licensed and for which licensure is sought for the biosimilar product”.27
The clinical development process begins with an evaluation of the PK/PD profile of the candidate biosimilar.6,27,42 These assessments are a critical part of the TOE demonstrating biosimilarity and can help streamline the design and execution of additional comparative clinical trials.43 PK studies measure parameters such as the area under the curve (AUC) and the maximum observed serum concentration (Cmax). The study population should be the most informative for detecting PK differences between the candidate biosimilar and the RP. Healthy subjects are typically chosen to allow a pertinent and sensitive comparison because they are less likely to produce PK and/or PD variability compared
to patients with potential confounding factors such as concomitant disease and medications.6,27 The use of specific patient populations may also be appropriate for various reasons, including potential safety concerns (e.g., known immunogenicity or toxicity from the RP) regarding evaluation in healthy volunteers or if PD biomarkers can only be measured in patients with the relevant disease.
Pharmacokinetic similarity is established when the twosided 90% confidence interval (CI) of the geometric mean ratio of PK values between the candidate biosimilar and the RP lies within a prespecified margin of 80-125% for overall exposure.6,42 The prespecified similarity margin does not denote that the C max and AUC, for instance, of the candidate biosimilar may vary from 80% to 125% of the RP. Rather, both sides of the 90% CI must lie within this margin to meet the similarity standard.
Pharmacodynamic assessments examine the biochemical, physiologic, and molecular effects of the proposed biosimilar and RP on the body, such as receptor binding and postreceptor effects. For example, the hemolytic complement
Haematologica | 108 May 2023 1237 REVIEW ARTICLE - Biosimilars for rare diseases A. Kulasekararaj et al.
activity of eculizumab RP and its biosimilars, which is considered critical to their mechanism of action, was tested using a 50% hemolytic complement assay. This assay is sensitive to the reduction, absence, and/or inactivity of any components of the classical and terminal complement pathway.44 Although PD studies can provide useful evidence of biosimilar function, they are only appropriate when a relevant PD marker is available. Once structural, functional, and pharmacologic similarity has been established, developers can proceed to an evaluation of comparative clinical efficacy and safety. The goal is to demonstrate that the biosimilar candidate has no clinically meaningful differences compared with the RP.18,27 The extent of the clinical program is determined by any residual uncertainty and the degree of similarity demonstrated in analytical and non-clinical testing. In light of the fact that no biosimilar candidates have ever been rejected for approval due to efficacy differences from their respective RP,45 it should be noted that regulatory agencies are beginning to question whether comparative efficacy trials are routinely necessary if a biosimilar candidate has been wellcharacterized and has demonstrated a highly similar clinical pharmacology profile.46
Assessment of similarity between a candidate biosimilar and its RP in a comparative clinical trial is based on the null hypothesis. Using a two-sided test that demonstrates that efficacy lies within prespecified equivalence margins, the assessment must be able to detect any clinically meaningful difference in efficacy.27 The results are typically expressed as the risk ratio (RR) or risk difference (RD) in efficacy between the candidate biosimilar and its RP. Clinical equivalence is established based on a predetermined two-sided 90%47 or 95%41 CI of the RR or RD since the studies are designed to determine both non-inferiority and non-superiority of the candidate biosimilar. If the CI of the RR or RD lies within the equivalence margin, then a biosimilar candidate can be considered to be clinically equivalent to its RP.
Subjects for comparative clinical trials should be chosen to increase the chance of detecting any possible clinically meaningful differences and to adequately assess safety.27 The development of biosimilars for rare diseases is associated with an additional set of challenges.48 For example, experts specializing in the treatment of rare diseases who are needed to conduct the trials are generally limited. Further, the availability of only a few dedicated treatment facilities around the globe make study participation difficult for some patients. In addition, patient populations are small, and the understanding of the disease process may be limited, making selection and enrollment for comparative clinical trials of biosimilars challenging. This is particularly true of treatment-naïve patients as most patients are often already receiving treatment with the originator product. For example, patients with PNH may be reluctant
to participate in a comparative clinical trial because they do not wish to interrupt their current treatment, which further reduces the number of available subjects. Consequently, the ongoing comparative clinical trial for the proposed eculizumab biosimilar ABP 959 recruited patients with PNH who had been previously treated with eculizumab RP.49 In contrast, a comparative clinical trial of Elizaria®, a biosimilar to eculizumab RP available in Russia, included both treatment-naïve patients and patients who had already received eculizumab RP.19 In support of its approval, the Phase 1b open-label study showed acceptable safety and an expected PK/PD profile of Elizaria® in treatmentnaïve patients with PNH during the induction period.50 The identification of endpoints for comparing a biosimilar candidate and its RP must consider how to make a precise comparison of the relevant therapeutic effects while eliminating any confounding factors. Endpoints that are sensitive enough to detect potential differences between the candidate biosimilar and the RP are generally more appropriate than the measures used to demonstrate efficacy in pivotal trials for the RP. The endpoint could be that of clinical outcome, or alternatively, an appropriate surrogate endpoint relevant to clinical outcomes. Studies of eculizumab and its biosimilars, for example, utilized hemolysis as measured by lactase dehydrogenase as a surrogate endpoint. The results from a comparative clinical study can be used to reduce any residual uncertainty regarding whether there are actually any clinically meaningful differences. Since patients in the real world may be switched from an RP to a biosimilar, crossover studies allow developers to better understand comparative efficacy and address potential safety concerns. For example, the DAHLIA study is evaluating the efficacy and safety of ABP 959 compared with eculizumab RP in adult participants with PNH with the use of a crossover design.49 Studies like these may be particularly helpful in alleviating concerns about immunogenicity after a switch from the RP to a biosimilar.
Assessment of immunogenicity
The assessment of immunogenicity is an important component of building the TOE to support biosimilarity and obtain regulatory approval. Due to their antigenic properties, biologics can sometimes trigger unfavorable immune reactions.51 The level of immunogenicity varies between biologics and may increase when they are administered frequently over a long period of time.52 Many factors affect the immunogenicity of biologics, including their structure, primary sequence, and post-translational modifications. The dose, route and frequency of administration, and the product formulation, as well as the patient’s age, sex, genetic profile, and immune status may all also impact a biologic’s immunogenicity.
The presence of antidrug antibodies (ADA) after treatment may decrease the efficacy of the biologic by neutralizing it
Haematologica | 108 May 2023 1238 REVIEW ARTICLE - Biosimilars for rare diseases A. Kulasekararaj et al.
or decreasing its half-life.53 Although immunogenicity is not a concern for most biologics, some biologics may trigger ADA which impact efficacy and safety. Therefore, biosimilar developers should include at least one clinical study that measures and compares binding and neutralizing antibodies between the candidate biosimilar and the RP.42 It is not advisable to use non-clinical methods for evaluating immunogenicity. Assays used for measuring ADA have become more sensitive and allow specific ADA to be identified.54 Consequently, these sensitive assays may lead to the detection of higher levels of ADA versus those observed in the original studies of the RP.55 Thus, the sensitivity of ADA assays must be considered when comparing results from different trials.
Extrapolation of indications
Rather than conducting clinical trials for every approved indication of a particular RP, biosimilar developers may gain approval in some or all of the indications for which the RP is approved, even if the particular biosimilar candidate was not tested in all of them.27,42 For instance, infliximab RP has been studied in and received approval to treat rheumatoid arthritis, Crohn’s disease, ankylosing spondylitis, psoriatic arthritis, and plaque psoriasis. The FDA has approved infliximab biosimilars for the same indications as the RP, even though the biosimilars only underwent clinical testing in a few of the conditions listed above. Similarly, Elizaria® was only tested in a comparative clinical study of patients with PNH, yet it also has indications in Russia for atypical hemolytic uremic syndrome, generalized myasthenia gravis, and neuromyelitis optica spectrum disorder.19,56 Due to the rarity of these diseases and the associated challenges with recruiting patients, extrapolation to additional rare disease indications is critical for the regulatory approval of biosimilars.
Although there is increasing recognition of the value of biosimilars, misunderstandings related to the concept of extrapolation persist, and contribute to the skepticism found among many HCP.57 It is important to emphasize here that extrapolation is not based solely on clinical evidence from one study, nor is it from one indication to another. It is rather that regulatory agencies may allow for extrapolation of indications based on adequate scientific justification supported by the TOE, on the previous finding of safety and effectiveness for the RP in the indications sought for approval, and by adequately addressing several key scientific factors, such as the mechanism of action (Figure 4). Differences in the scientific factors across indications do not preclude extrapolation; however, any differences must be adequately addressed as part of the scientific justification. For example, there may be a difference in the target/receptor between indications, but the comparative functional as-
sessment must demonstrate that binding to all relevant targets/receptors is highly similar between the biosimilar candidate and the RP. If all these factors are adequately addressed, and the study population in the comparative clinical study is sufficiently sensitive so as to allow clinically meaningful differences to be detected, then developers, HCP, and patients can be confident that the candidate biosimilar will have no clinically meaningful differences in efficacy and safety compared with the RP in other approved indications which were not directly studied.
Interchangeability
The emergence of biosimilars has caused many clinicians to reconsider their treatment choices. Based on the law and US FDA draft guidance on interchangeability,58,59 a biosimilar designated as interchangeable “may be substituted for the reference product without the intervention of the healthcare provider who prescribed the reference product” as permitted by state law. In the US, there must be an evidence-based expectation that the biosimilar “can be expected to produce the same clinical result as the reference product in any given patient and, if the biological product is administered more than once to an individual, the risk in terms of safety or diminished efficacy of alternating or switching between the use of the biological product and the reference product is no greater than the risk of using the reference product without such alternation or switch”.59 The FDA guidance on interchangeability indicates that the clinical study should include at least three switches between the biosimilar and RP to support interchangeability.59 The EU and most other countries do not provide regulatory guidance on interchangeability, nor do they evaluate whether biosimilars and RP are interchangeable.
Naming and pharmacovigilance
The FDA recommends the creation of distinguishable names by adding a 4-letter suffix to the “core name” (typically similar to the international non-proprietary name) for a biosimilar.60 For example, specific epoetin alfa and rituximab biosimilars have been given the non-proprietary names epoetin alfa-epbx and rituximab-arrx, respectively. A biosimilar product may not be approved for all the indications approved for the RP for several reasons (e.g., residual regulatory exclusivity protections for the RP). Therefore, the use of unique names is critical for assuring that the appropriate medication is dispensed.61 The adoption of distinguishable names is important to patient safety, and also ensures that specific adverse events are correctly attributed to the appropriate product and manufacturer.60,62 Outside the US, there is no consistent regulatory approach
Haematologica | 108 May 2023 1239 REVIEW ARTICLE - Biosimilars for rare diseases A. Kulasekararaj et al.
Figure 4. Extrapolation of indications for a biosimilar: scientific justification. A biosimilar may be approved for an indication without direct studies of the biosimilar in that indication. Regulatory agencies may allow for extrapolation of indications approved for the reference product (RP) based on adequate scientific justification supported by the biosimilar totality of evidence, the previous finding of safety and effectiveness for the RP in the indications sought for approval, and adequately addressing several key scientific factors. PK: pharmacokinetics. *Non-human studies including analytical,
regarding the naming of biosimilars. In the EU, for example, physicians must document the trade name and the batch number for all biologics. However, this is not routinely done in clinical practice, making it challenging for regulators to identify products with safety issues.
Future perspectives
Biologics are a primary treatment option for several cancers and rare diseases; however, their increasing use is one of the main drivers of the growth in healthcare spending. In fact, biologics accounted for 38% of US prescription drug spending in 2015 due to their high cost per dose, and for 70% of drug spending growth between 2010 and 2015.63 Although real-world evaluation of biosimilar-related healthcare cost savings is limited, there is increasing evidence that market entry of biosimilars has a robust impact. For example, a Johns Hopkins study using employer plan data from 13 large companies reported that the prices for infliximab and filgrastim biosimilars were 32% and 26% lower than their RP, respectively.64 Providence St Joseph Health, a US non-profit health system, implemented a biosimilar utilization management program that yielded savings of $26.9 million over 2 years.65 In addition, a recent analysis estimated the cost saving potential of biosimilar use in the US to be $54 billion over 10 years, with a lower- to upperbound range of $25 billion to $150 billion.63 Moreover, a case

study by the Pacific Research Institute suggested that the annual cost reductions for US employer-sponsored health plans could be as high as 8.4% (i.e., between $262 million and $315 million in annual cost savings) if biosimilars reach a 50% share for a popular biologic.66 Savings could rise to $7 billion across US federal and commercial programs if biosimilars reach a 75% market share. In Europe, in 2017, sales for the top 10 biologic products were €16.5 billion.67 Most of these biologics have lost exclusivity in Europe and biosimilars are available for clinical use. In a study aimed to assess the cost savings generated by the introduction of anti-TNF biosimilars in French hospitals 5 years ago, a total of €824 million was saved.68 Similarly, a Spanish budget impact analysis estimated that figures for the period 20092019 show biosimilar competition to have resulted in cost savings of €2.3 billion, about half the savings being due to a reduction in list prices, and the other half originating from hospital tender discounts.69 Although the discount on biosimilars may vary from country to country, by 2020, annual savings could be seen to have increased up to €10 billion if they achieve at least a 50% share.70 Biosimilar versions of biologics approved for rare diseases, such as eculizumab RP, could, therefore, offer an important means of generating cost savings and improving access.
The past decade has seen an increase in the scientific evidence supporting the use of biosimilar products. Many countries now have well-defined regulatory standards to ensure that biosimilars are as safe and efficacious as their
Haematologica | 108 May 2023 1240 REVIEW ARTICLE - Biosimilars for rare diseases A. Kulasekararaj et al.
in vitro, in vivo (animal), ex vivo studies.
RP counterparts. Because some clinical practice guidelines have not recommended biosimilars, there continues to be skepticism among HCP about their role in clinical practice.8 Given this, there is a need to explain how to switch patients from an RP to a biosimilar. Biosimilar adoption may be more widely implemented when the data supporting their approval and real-world evidence is available for scrutiny. HCP seem particularly uncertain about extrapolation to other indications.8,71 Promoting a greater understanding of the fact that extrapolation is based on the TOE rather than on clinical evidence from one study may help more physicians to use them. A TOE demonstrating that the biosimilar is comparable to the RP is the best assurance that the two molecules have similar efficacy, safety, and immunogenicity in all approved indications of the RP.
In conclusion, as healthcare costs continue to rise, the availability of biosimilars presents an opportunity to expand the treatment armamentarium and deliver savings to healthcare systems and consumers, just as generics have done for many years. The TOE includes data from analytical studies, non-clinical comparative PK testing, and, in most cases, at least one clinical trial to confirm the absence of any clinically meaningful differences between the biosimilar candidate and the RP. Increased adoption of biosimilars will require robust educational initiatives to help HCP better understand what biosimilars are, how they are developed and approved, and how they can be used in practice. Continuing to educate the HCP community regarding biosimilars will foster informed deci-
References
1. Crosson FJ. Addressing the cost of biologic and specialty drugs. JAMA Intern Med. 2021;181(1):22-23.
2. European Medicines Agency. Biosimilars in the EU - Information guide for healthcare professionals. Updated 02/10/2019. https://www.ema.europa.eu/en/documents/leaflet/biosimilarseu-information-guide-healthcare-professionals_en.pdf.
Accessed 14 November 2021.
3. European Medicines Agency. Omnitrope. European public assessment report (EPAR) summary for the public. Updated 28/04/2021.
https://www.ema.europa.eu/en/medicines/human/EPAR/omnitro pe. Accessed 14 November 2021.
4. Kang HN, Thorpe R, Knezevic I, Survey participants from 19 countries. The regulatory landscape of biosimilars: WHO efforts and progress made from 2009 to 2019. Biologicals. 2020;65:1-9.
5. US Food and Drug Administration. Biosimilars action plan: balancing innovation and competition. July 2018. https://www.fda.gov/downloads/Drugs/DevelopmentApprovalPro cess/HowDrugsareDevelopedandApproved/ApprovalApplications /TherapeuticBiologicApplications/Biosimilars/UCM613761.pdf.
Accessed 14 November 2021.
6. US Food and Drug Administration. Guidance for industry: clinical pharmacology data to support a demonstration of biosimilarity
sion making and help enable the safe use of these potentially cost-effective treatments.
Disclosures
AuK has served on advisory boards for Alexion, Amgen, Apellis, Bio-cryst, Celgene, Novartis, Ra Pharma, and Regeneron, and has received travel grants from Achillion, Celgene, and Ra Pharma. RB has received honorarium payments from Alexion Pharmaceuticals, UpToDate, Indy Hematology Review, ISTH Congress, and American Society of Hematology. AlK has received consultant fees from Alexion Pharmaceuticals, Generium and Biocad, and speaker’s fees from Generium. JHJ has no conflicts of interest to declare.
Contributions
All named authors meet the International Committee of Medical Journal Editors (ICMJE) criteria regarding authorship of this article, take responsibility for the integrity of the work as a whole, and have given their approval for this version of the manuscript to be published.
Acknowledgments
Editorial and graphics support were provided by Innovation Communications Group, New York, NY, USA, and paid for by Amgen Inc., Thousand Oaks, CA, USA. Medical writing assistance was provided by Alex Romero, PhD (Amgen Inc.), under the direction of Sonya Lehto, PhD (Amgen Inc.).
Funding
Open Access and Article Processing Charges were funded by Amgen Inc., Thousand Oaks, CA, USA.
to a reference product. December 2016.
https://www.fda.gov/media/88622/download. Accessed 14 November 2021.
7. ZARXIO (filgrastim-sndz) injection [summary of product characteristics]. Sandoz Inc., Princeton, NJ, USA. 2015.
https://www.accessdata.fda.gov/drugsatfda_docs/label/2015/125 553lbl.pdf. Accessed 1 December 2022.
8. Kolbe AR, Kearsley A, Merchant L, et al. Physician understanding and willingness to prescribe biosimilars: findings from a US National Survey. BioDrugs. 2021;35(3):363-372.
9. World Health Organization. Guidelines on evaluation of similar biotherapeutic products (SBPs). WHO Technical Report Series No. 977, 2013.
https://www.who.int/biologicals/publications/trs/areas/biologica l_therapeutics/TRS_977_Annex_2.pdf. Accessed 14 November 2021.
10. Arato T. Japanese regulation of biosimilar products: past experience and current challenges. Br J Clin Pharmacol. 2016;82(1):30-40.
11. Thill M, Thatcher N, Hanes V, Lyman GH. Biosimilars: what the oncologist should know. Future Oncol. 2019;15(10):1147-1165.
12. Declerck P, Farouk-Rezk M, Rudd PM. Biosimilarity versus manufacturing change: two distinct concepts. Pharm Res.
Haematologica | 108 May 2023 1241 REVIEW ARTICLE - Biosimilars for rare diseases A. Kulasekararaj et al.
2016;33(2):261-268.
13. Mellstedt H, Niederwieser D, Ludwig H. The challenge of biosimilars. Ann Oncol. 2008;19(3):411-419.
14. Nathan JJ, Ramchandani M, Kaur P. Manufacturing of biologics. In: Biologic and Systemic Agents in Dermatology. Yamauchi P (Ed.). Springer, Cham, Switzerland, 2018.
15. US Food and Drug Administration. Biosimilars: questions and answers regarding implementation of the Biologics Price Competition and Innovation Act of 2009. https://www.fda.gov/media/119258/download. Accessed 14 November 2021.
16. Agbogbo FK, Ecker DM, Farrand A, et al. Current perspectives on biosimilars. J Ind Microbiol Biotechnol. 2019;46(9-10):1297-1311.
17. Drelichman G, Castaneda-Hernandez G, Cem Ar M, et al. The road to biosimilars in rare diseases - ongoing lessons from Gaucher disease. Am J Hematol. 2020;95(3):233-237.
18. Mysler E, Pineda C, Horiuchi T, et al. Clinical and regulatory perspectives on biosimilar therapies and intended copies of biologics in rheumatology. Rheumatol Int. 2016;36(5):613-625.
19. Kulagin AD, Ptushkin VV, Lukina EA, et al. Randomized multicenter noninferiority phase III clinical trial of the first biosimilar of eculizumab. Ann Hematol. 2021;100(11):2689-2698.
20. Brodsky RA. Paroxysmal nocturnal hemoglobinuria. Blood. 2014;124(18):2804-2811.
21. Elizaria® (eculizumab) injection [summary of product characteristics]. Generium Pharmaceuticals, Moscow, Russia. 2021.
https://www.generium.ru/upload/preparation/elizariya/Elizaria.p df. Accessed on 1 December 2022.
22. ClinicalTrials.gov. Bethesda, MD: National Library of Medicine (US). ClinicalTrials.gov Identifier: NCT04060264; Clinical Trial of BCD-148 and Soliris® for the treatment of patients with paroxysmal nocturnal hemoglobinuria. https://clinicaltrials.gov/ct2/show/NCT04060264. Accessed 4 October 2022.
23. Jang JH, Gomez RD, Bumbea H, et al. A phase III randomized clinical trail comparing SB12 (proposed eculizumab biosimilar) with reference eculizumab in patients with paroxysmal nocturnal hemoglobinuria. Presented at European Hematology Association Annual Meeting, June 16-19, 2022, Vienna, Austria. https://library.ehaweb.org/eha/2022/eha2022congress/357691/jun.ho.jang. Accessed 5 October 2022.
24. Kulasekararaj A, Lanza F, Arvanitakis A, et al. Efficacy and safety of biosimilar candidate ABP 959 as compared with eculizumab reference product in paroxysmal nocturnal hemoglobinuria. Blood. 2022;140(Suppl 1):8660-8662.
25. Markus R, Liu J, Ramchandani M, Landa D, Born T, Kaur P. Developing the totality of evidence for biosimilars: regulatory considerations and building confidence for the healthcare community. BioDrugs. 2017;31(3):175-187.
26. European Medicines Agency. Guideline on similar biological medicinal products. 23 October 2014. CHMP/437/04 Rev. 1. http://www.ema.europa.eu/docs/en_GB/document_library/Scient ific_ guideline/2014/10/WC500176768.pdf. Accessed 14 November 2021.
27. US Food and Drug Administration. Guidance for industry: scientific considerations in demonstrating biosimilarity to a reference product. April 2015. https://www.fda.gov/media/82647/download. Accessed 14 November 2021.
28. Abraham I, Sun D, Bagalagel A, et al. Biosimilars in 3D: definition, development and differentiation. Bioengineered. 2013;4(4):203-206.
29. McCamish M, Woollett G. Worldwide experience with biosimilar
development. MAbs. 2011;3(2):209-217.
30. Chow SC, Song F, Bai H. Analytical similarity assessment in biosimilar studies. AAPS J. 2016;18(3):670-677.
31. US Food and Drug Administration. Guidance for industry. Q8(R2) Pharmaceutical development. November 2009. https://www.fda.gov/media/71535/download. Accessed 14 November 2021.
32. Sivendran R, Ramirez J, Ramchandani M, Liu J. Scientific and statistical considerations in evaluating the analytical similarity of ABP 501 to adalimumab. Immunotherapy. 2018;10(11):1011-1021.
33. Barnes HJ, Ragnarrson G, Alvan G. Quality and safety considerations for recombinant biological medicines: a regulatory perspective. Int J Risk Saf Med. 2009;2009(21):13-22.
34. Kuhlmann M, Covic A. The protein science of biosimilars. Nephrol Dial Transplant. 2006;21 (Suppl 5):v4-8.
35. Colbert RA, Cronstein BN. Biosimilars: the debate continues. Arthritis Rheum. 2011;63(10):2848-2850.
36. US Food and Drug Administration. Quality considerations in demonstrating biosimilarity of a therapeutic protein product to a reference product guidance for industry. April 2015. https://www.fda.gov/media/135612/download. Accessed 14 November 2021.
37. Hutterer KM, Ip A, Kuhns S, Cao S, Wikstrom M, Liu J. Analytical similarity assessment of ABP 959 in comparison with eculizumab reference product. BioDrugs. 2021;35(5):563-577.
38. Declerck PJ. Biosimilar monoclonal antibodies: a science-based regulatory challenge. Expert Opin Biol Ther. 2013;13(2):153-156.
39. Mihalcik L, Chow V, Ramchandani M, Hinkle B, McBride HJ, Lebrec H. Use of nonclinical toxicity studies to support biosimilar antibody development. Regul Toxicol Pharmacol. 2021;122:104912.
40. Chow V, Pan J, Chien D, Mytych DT, Hanes V. A randomized, double-blind, single-dose, three-arm, parallel group study to determine pharmacokinetic similarity of ABP 959 and eculizumab (Soliris®) in healthy male subjects. Eur J Haematol. 2020;105(1):66-74.
41. Wang YC, Wang Y, Schrieber SJ, et al. Role of modeling and simulation in the development of novel and biosimilar therapeutic proteins. J Pharm Sci. 2019;108(1):73-77.
42. European Medicines Agency. Guideline on similar biological medicinal products containing biotechnology-derived proteins as active substance: non-clinical and clinical issues. 18 December 2014.
https://www.ema.europa.eu/en/documents/scientificguideline/guideline-similar-biological-medicinal-products-conta ining-biotechnology-derived-proteins-active_en-2.pdf. Accessed 14 November 2021.
43. Li J, Florian J, Campbell E, et al. Advancing biosimilar development using pharmacodynamic biomarkers in clinical pharmacology studies. Clin Pharmacol Ther. 2020;107(1):40-42.
44. Costabile M. Measuring the 50% haemolytic complement (CH50) activity of serum. J Vis Exp. 2010;29(37):1923.
45. Schiestl M, Ranganna G, Watson K, et al. The path towards a tailored clinical biosimilar development. BioDrugs. 2020;34(3):297-306.
46. Niazi S. Scientific rationale for waiving clinical efficacy testing of biosimilars. Drug Des Devel Ther. 2022;16:2803-2815.
47. European Medicines Agency. Biosimilar medicines: overview. 2017. https://www.ema.europa.eu/en/humanregulatory/overview/biosimilar-medicines-overview. Accessed 25 May 2021.
48. Whicher D, Philbin S, Aronson N. An overview of the impact of rare disease characteristics on research methodology. Orphanet J Rare Dis. 2018;13(1):14.
Haematologica | 108 May 2023 1242 REVIEW ARTICLE - Biosimilars for rare diseases A. Kulasekararaj et al.
49. ClinicalTrials.gov. Bethesda, MD: National Library of Medicine (US). ClinicalTrials.gov Identifier: NCT03818607; A study evaluating the efficacy and safety of ABP 959 compared with eculizumab in adult participants with PNH (DAHLIA). https://clinicaltrials.gov/ct2/show/NCT03818607. Accessed 14 November 2021.
50. Ptushkin VV, Kulagin AD, Lukina EA, et al. [Results of phase Ib open multicenter clinical trial of the safety, pharmacokinetics and pharmacodynamics of first biosimilar of eculizumab in untreated patients with paroxysmal nocturnal hemoglobinuria during induction of therapy]. Ter Arkh. 2020;92(7):77-84.
51. Baker MP, Reynolds HM, Lumicisi B, Bryson CJ. Immunogenicity of protein therapeutics: the key causes, consequences and challenges. Self Nonself. 2010;1(4):314-322.
52. Liang BA, Mackey T. Emerging patient safety issues under health care reform: follow-on biologics and immunogenicity. Ther Clin Risk Manag. 2011;7:489-493.
53. Radstake TR, Svenson M, Eijsbouts AM, et al. Formation of antibodies against infliximab and adalimumab strongly correlates with functional drug levels and clinical responses in rheumatoid arthritis. Ann Rheum Dis. 2009;68(11):1739-1745.
54. Moxness M, Tatarewicz S, Weeraratne D, et al. Immunogenicity testing by electrochemiluminescent detection for antibodies directed against therapeutic human monoclonal antibodies. Clin Chem. 2005;51(10):1983-1985.
55. Kaur P, Chow V, Zhang N, Moxness M, Kaliyaperumal A, Markus R. A randomised, single-blind, single-dose, three-arm, parallelgroup study in healthy subjects to demonstrate pharmacokinetic equivalence of ABP 501 and adalimumab. Ann Rheum Dis. 2017;76(3):526-533.
56. Gusarova V, Degterev M, Lyagoskin I, et al. Analytical and functional similarity of biosimilar Elizaria® with eculizumab reference product. J Pharm Biomed Anal. 2022;220:115004.
57. Cohen H, Beydoun D, Chien D, et al. Awareness, knowledge, and perceptions of biosimilars among specialty physicians. Adv Ther. 2017;33(12):2160-2172.
58. Government Publishing Office [US]. Patient Protection and Affordable Care Act. 23 March 2010. www.gpo.gov/fdsys/pkg/PLAW-111publ148/html/PLAW111publ148.htm. Accessed 14 November 2021.
59. US Food and Drug Administration. Guidance for Industry. Considerations in demonstrating interchangeability with a reference product. May 2019.
https://www.fda.gov/media/124907/download. Accessed 14 November 2021.
60. US Food and Drug Administration. Guidance for industry. Nonproprietary naming of biological products. January 2017. https://www.fda.gov/media/93218/download. Accessed 14 November 2021.
61. Tomaszewski D. Biosimilar naming conventions: pharmacist perceptions and impact on confidence in dispensing biologics. J Manag Care Spec Pharm. 2016;22(8):919-926.
62. Felix T, Johansson TT, Colliatie JA, Goldberg MR, Fox AR. Biologic product identification and US pharmacovigilance in the biosimilars era. Nat Biotechnol. 2014;32(2):128-130.
63. Mulcahy AW, Hlavka JP, Case SR. Biosimilar cost savings in the United States: initial experience and future potential. Rand Health Q. 2018;7(4):3.
64. Socal M, Ballreich J, Chyr L, Anderson G. Biosimilar medications savings opportunities for large employers. March 2020. https://www.eric.org/wp-content/uploads/2020/03/JHUSavings-Opportunities-for-Large-Employers.pdf. Accessed 7 September 2022.
65. Humphreys SZ. Real-world evidence of a successful biosimilar adoption program. Future Oncol. 2022;18(16):1997-2006.
66. Winegarden W. Pacific Research Institute. Impediments to a stronger biosimilars market: an infliximab case study. June 2018. https://www.pacificresearch.org/wpcontent/uploads/2018/06/PolicyObstaclesFweb.pdf. Accessed 14 November 2021.
67. IQVIA Report. The impact of biosimilar competition in Europe. Presentation by Per Troein, European Commission. London: IQVIA; 2018.
68. Jarrion Q, Azzouz B, Robinson J, Jolly D, Vallet C, Trenque T. Penetration rate of anti-TNF biosimilars and savings at 5 years after their introduction in French hospitals. Therapie. 2022;77(4):467-475.
69. Garcia-Goni M, Rio-Alvarez I, Carcedo D, Villacampa A. Budget impact analysis of biosimilar products in Spain in the period 2009-2019. Pharmaceuticals (Basel). 2021;14(4):348.
70. Dutta B, Huys I, Vulto AG, Simoens S. Identifying key benefits in European off-patent biologics and biosimilar markets: it is not only about price! BioDrugs. 2020;34(2):159-170.
71. Jacobs I, Singh E, Sewell KL, Al-Sabbagh A, Shane LG. Patient attitudes and understanding about biosimilars: an international cross-sectional survey. Patient Prefer Adherence. 2016;10:937-948.
Haematologica | 108 May 2023 1243 REVIEW ARTICLE - Biosimilars for rare diseases A. Kulasekararaj et al.
B- and T-cell acute lymphoblastic leukemias evade chemotherapy at distinct sites in the bone marrow
Malwine J. Barz,1* Lena Behrmann,1* Danaëlle Capron,1* Gabriele Zuchtriegel,1* Fabio D. Steffen,1 Leo Kunz,2 Yang Zhang,2 Iria Jimenez Vermeerbergen,1 Blerim Marovca,1 Moritz Kirschmann,3 Antonia Zech,1 César Nombela-Arrieta,4 Urs Ziegler,3 Timm Schroeder,2 Beat Bornhauser1 and Jean-Pierre Bourquin1
1University Children’s Hospital Zürich, Pediatric Oncology and Children’s Research Center, Balgrist Campus AG, Zürich; 2ETH Zürich, Department of Biosystems Science and Engineering, Basel; 3University of Zürich, Center for Microscopy and Image Analysis, Zürich and 4University Hospital Zürich, Division of Hematology, Zürich, Switzerland
*MJB, LB, DC and GZ contributed equally and are listed in alphabetical order.
Abstract
Correspondence: J-P. Bourquin
jean-pierre.bourquin@kispi.uzh.ch
Received: December 2, 2021.
Accepted: October 14, 2022.
Early view: November 3, 2022.
https://doi.org/10.3324/haematol.2021.280451
©2023 Ferrata Storti Foundation
Published under a CC BY-NC license
Persistence of residual disease after induction chemotherapy is a strong predictor of relapse in acute lymphoblastic leukemia (ALL). The bone marrow microenvironment may support escape from treatment. Using three-dimensional fluorescence imaging of ten primary ALL xenografts we identified sites of predilection in the bone marrow for resistance to induction with dexamethasone, vincristine and doxorubicin. We detected B-cell precursor ALL cells predominantly in the perisinusoidal space at early engraftment and after chemotherapy. The spatial distribution of T-ALL cells was more widespread with contacts to endosteum, nestin+ pericytes and sinusoids. Dispersion of T-ALL cells in the bone marrow increased under chemotherapeutic pressure. A subset of slowly dividing ALL cells was transiently detected upon shortterm chemotherapy, but not at residual disease after chemotherapy, challenging the notion that ALL cells escape treatment by direct induction of a dormant state in the niche. These lineage-dependent differences point to niche interactions that may be more specifically exploitable to improve treatment.
Introduction
Acute lymphoblastic leukemia (ALL) disseminates from transformed lymphoid progenitors that most likely arise in specific microenvironments, preferentially in the bone marrow, competing with normal hematopoiesis.1,2 Persistence of minimal residual disease (MRD) under chemotherapy is a strong predictor of relapse,3 but the underlying mechanisms that enable cells to escape treatment are still unclear. Nononcogenic mechanisms of adaptation are likely to contribute to this bottleneck, in which interactions with the tumor microenvironment are thought to play important roles.4 Hematopoietic stem cells (HSC) reside in the bone marrow in proximity to endosteal cells,5 perivascular cells6,7 and peripheral nerve fibers.8 Sinusoidal endothelial networks may also contribute to the support of HSC at different locations.9 Recent advances made in three-dimensional (3D) imaging enable comprehensive visualization and quantification of HSC in mouse models. These imaging studies challenge the notion that HSC are enriched in a specific neighborhood, where HSC localization is determined by microanatomical properties of the bone marrow structures, rather than active selection of niches by HSC.10 Alternative
roles were proposed in currently unexplored heterogeneous subsets of sinusoidal, perisinusoidal and stromal cells.10 Bcell precursor (BCP) ALL cells are thought to compete with healthy HSC by hijacking normal homeostatic functions.1,11 In a xenotransplantation model, human NALM-6 BCP-ALL cells interact with HSC at vascular sites expressing E-selectin and SDF-1 (CXCL12) and remodel the mesenchymal stromal compartment.12,13 Ex vivo, co-cultures with mesenchymal stromal cells or endothelial cells maintain ALL cell survival.14 The contribution of endothelial cells to a leukemia niche remains unclear and was challenged recently by experiments with ALL xenografts, which suggested the persistence of socalled dormant ALL cells after treatment with cytarabine. These cells localize to the endosteum and constitute a potentially reversible quiescent MRD state.15 Clinical observations suggest relevant differences between BCP-ALL and T-ALL with respect to sites of predilection to chemotherapy-resistant states in MRD.16 While MRD levels do not correlate well between peripheral blood and bone marrow in BCP-ALL, MRD levels are comparable in the two compartments in patients with T-ALL.16 This may explain discrepant observations reported with mouse models, in addition to species-related differences. Contradicting previous studies
Haematologica | 108 May 2023 1244 ARTICLE - Acute Lymphoblastic Leukemia
using NALM-6 cells, in vivo imaging of a genetically engineered mouse model of NOTCH-mutated T-ALL revealed that T-ALL cells were highly mobile and cycling even after exposure to chemotherapy. No preferential sub-localization within the bone marrow space was observed,17 challenging the notion that T-ALL may escape chemotherapy in a dormant leukemia niche. These observations indicate that patterns of interaction of leukemia cells with their microenvironment may be more heterogeneous than previously thought.
Leukemia patient-derived xenografts (PDX) using NOD.CgPrkdcscid IL2rgtm1Wjl/SzJ (NSG) mice often reliably mirror the clonal composition and phenotype of the corresponding patients’ samples.18,19 Using 3D confocal fluorescence microscopy, we studied the topology of MRD in the bone marrow after induction treatment, in a variety of primary human high risk BCP- and T-ALL subtypes. We found that BCP-ALL cells engraft and persist preferentially in close proximity to extravascular endothelial sinusoids in the bone marrow, while T-ALL cells have a more widespread distribution including contacts with the endosteal lining, underscoring the highly dynamic mobility of T-ALL in comparison to BCP-ALL. We provide a detailed comparison of engraftment and chemotherapy survival behavior of BCP- and T-ALL, revealing important differences between these leukemic entities. This encourages critical investigation of interactions between leukemic blasts and niche cells to identify druggable pathways for clinical treatments.
Methods
Primary samples
Patients’ samples were obtained with the written informed consent of the patients’ parents or legal guardians in accordance with the Declaration of Helsinki and approval was granted by the ethics commission of the Canton of Zürich (approval number 2014-0383). Xenografts were recovered from cryopreserved bone marrow aspirates of patients enrolled in the ALL-BFM 2000 and 2009 and ALLREZ BFM 2002 studies.
Xenotransplantation
NSG and C57BL/6J mice were obtained from The Jackson Laboratory. Xenotransplantation of ALL samples was performed by intravenous injection into unconditioned 6- to 8-week-old mice in accordance with animal care regulations after approval by legal authorities (125/2013, 124/16, 131/19). For in vivo bioluminescence imaging, the mice were anesthetized, given an intravenous injection of Dluciferin and imaged. Cell proliferation of leukemic cells was traced in vivo using 5(6)-carboxyfluorescein diacetate N-succinimidyl ester (CFSE). Details are provided in the Online Supplementary Methods
Lentiviruses
pSLIG (SFFV-Luc2-IRES-eGFP), pMD2.G and psPAX2 plasmids were used to generate luciferase-expressing lentiviruses. PDX cells were transduced with the lentiviruses and expanded in NSG mice for re-transplantation, as described in the Online Supplementary Methods.
Flow cytometry
Human engraftment was determined in bone marrow harvested from tibiae or femora. Human engraftment was monitored as the percentage of human cells over all human (anti-human-CD19 PE [BioLegend]; anti-humanCD7 PE [ebiosciences]; anti-human-CD45 Alexa Fluor 647 [BioLegend]) and murine leukocytes (anti-mouse-CD45 eFluor 450, [ebiosciences]) (Online Supplementary Methods).
Drug response profiling
Leukemia cells from PDX samples were co-cultured with mesenchymal stromal cells for 24 h in 384-well plates, treated with chemotherapeutic drugs for 72 h and imaged using high-throughput fluorescence microscopy. Drug response profiles were determined by fitting a three-parameter, dose-response model (log IC50, Imax and n) to dimethylsulfoxide-normalized cell counts.
Three-dimensional confocal imaging of bones
Bones were fixed, snap-frozen and cut using a Cryostat for thick sections. Sectioned bones were blocked, stained with primary (anti-human-CD45 [MEM-28], anti-mouseendoglin [AF1320], anti-mouse-perilipin [D1D8], antimouse-laminin [L9393], anti-mouse-collagen type I [CL50151AP], anti-mouse-endomucin [V.7C7], anti-mouseosterix [NBP2-38019]) and secondary antibodies and embedded in RapiClear for imaging. Sinusoids were defined as endoglin+ or endoglinhighendomucinlow, transition zones as endoglinlowendomucinhigh, and nestin-associated vessels as nestin-GFP+endomucin–endoglin–. The endosteal space was set as collagen type I-positive structures or delimited using DAPI and osterix co-staining. Leukemic cells were defined as hCD45+ cells with a round morphology. Tiled z-stack images were acquired using a Leica SP8 inverse microscope.
Distance analysis and random dots
The 3D confocal images were analyzed quantitatively by measuring the spatial proximity between leukemic cells and bone marrow sinusoids or bone using Imaris. First, all imaged channels were preprocessed with a Gaussian filter to remove noise and signals were normalized slice-wise by the mean intensity to account for intensity loss along the z-axis. Leukemic cells were segmented using the hCD45 signal, while vascular surfaces were identified with the endoglin, endomucin or nestin signal by thresholding.
Haematologica | 108 May 2023 1245 ARTICLE - Distinct predilection sites of B- and T-ALL M.J. Barz et al.
Bone structures were either segmented from DAPInegative regions delimited with the osterix signal or from the collagen 1a signal. The masks for surfaces and spots were curated to reduce staining noise by removing small, unconnected objects with a size threshold based on voxel number. Volumes of the vessels, bones and the combined tissue map (leukemic cells, vasculature and bone) were filled separately with an image closing operation, i.e. dilation followed by erosion. Subsequently, the Euclidean distance transformation of the binary blood vessel or bone mask was computed using bwdist in Matlab.20 The transformation provides a distance map of each voxel in the tissue to the nearest voxel of the vasculature or bone mask. The smallest distance of all voxels belonging to a leukemic cell was recorded from the distance map and plotted as histograms. Random virtual cells (random dots) with the same dimensions as the segmented leukemia cells were seeded in the tissue outside of the blood vessels and bones using XiT.21 Specifically, a virtual cell was accepted if the coordinates of the centroid, sampled from a uniform distribution, was within the tissue region but outside of the masked blood vessel or bone structures. Otherwise, the virtual cell position was discarded and the random dot generation was iterated until the total number of leukemic cells in the image was reached. Minimum distances to blood vessel and bone surfaces were inferred as for real leukemic cells. The spatial distribution of leukemic cells were then compared to the randomly dispersed virtual cells. Enrichment of leukemic cells near the vasculature and/or bone was quantified as binwise fold-changes of hCD45+ cells over random dots. Bins containing less than ten random dots were omitted from analysis.
Statistics
Differences between distributions were assessed by a two-tailed Kolmogorov-Smirnov test. Medians as well as individual bins were analyzed using a two-tailed MannWhitney U test. P values <0.05 were considered statistically significant. Statistical analyses were performed using GraphPad Prism (version 5.04) and SciPy (version 1.7.1).
Results
A leukemia xenograft model of induction chemotherapy in acute lymphoblastic leukemia to study minimal residual disease
To study the topology of resistant disease we established a model of induction chemotherapy using primary human leukemia cells derived from nine pediatric BCP-ALL and five T-ALL patients in NSG mice (Figure 1A; Online Supplementary Table S1). Luciferase-positive ALL cells were de-
tected as early as 1 day after transplantation in the femora by bioluminescence imaging (Figure 1B). This supports the notion of the bone marrow as a favorable environment for ALL engraftment. We detected preferential colonization in distinct foci of the proximal and distal metaphyses and epiphyses (Figure 1C). By sequential flow cytometry analysis, leukemic cells were first detected in the bone marrow, subsequently in the spleen and later in the peripheral blood (Figure 1D) with similar kinetics of progression (Figure 1E). To study MRD, we established a 28-day three-drug chemotherapy regimen, combining three out of four drugs of the AIEOP-BFM ALL induction regimen, administering dexamethasone, doxorubicin, and vincristine (Figure 1A).12,22 Animals were treated with this combination beginning on day 11 after transplantation, resulting in responses with detectable residual disease 32 days after initiation of therapy (Figure 1F-H). Reduction of the leukemic burden after induction treatment in vivo was detected in different ALL subtypes (Online Supplementary Table S1). Differences in residual extramedullary involvement were found in the model, in which one PDX showed particularly high leukemia burden in the liver compared to the bone marrow (Figure 1I). In all cases we detected residual cells in the spleen and brain after therapy. We observed involvement of the CNS in 24 independent PDX models (Online Supplementary Figure S1; Online Supplementary Table S2) as also reported previously by others,23,24 and consistent with the well-documented clinical need for intrathecal chemotherapy to prevent relapses in ALL. Between 7 to 28 days after the end of induction, chemotherapy-resistant leukemic cells repopulated the bone marrow leading to relapse. We used our PDX model to chart the spatial organization of leukemic cells in the bone marrow and characterize the niches of MRD in vivo
B- and T-cell acute lymphoblastic leukemia cells preferentially localize perisinusoidally at early engraftment
To define the predilection sites of leukemic cells in the bone marrow, we performed 3D confocal imaging of leukemic cells in murine bone marrow. Engraftment of ALL cells was observed in femora, tibiae, tail and sternum (Online Supplementary Figure S2). Femora were used to quantitatively assess the spatial distribution of ALL cells within the bone marrow microenvironment. To this end, we segmented leukemic cells (anti-human CD45), the host vasculature (anti-mouse endoglin) as well as the bone (collagen I or osterix) and computed a distance isomap around the vasculature (Figure 2A). We visualized engraftment of BCP-ALL and T-ALL cells in the bone marrow at day 11 and day 4, respectively (Figure 2B, C). In order to normalize the unique architectural constraints of each individual bone, we computationally seeded random dots throughout the bone marrow volume, excluding bone ma-
Haematologica | 108 May 2023 1246 ARTICLE - Distinct predilection sites of B- and T-ALL M.J. Barz et al.
Figure 1. In vivo xenotransplantation model for engraftment and minimal residual disease in B-cell precursor acute lymphoblastic leukemia reflects the clinical situation of standard and very high-risk patients. (A) Xenotransplantation protocol of human leukemia cells derived from B-cell precursor acute lymphoblastic leukemia (ALL) and T-ALL patients’ material into NSG mice. For three-drug chemotherapy mice were treated for 28 days with vincristine 0.5 mg/kg weekly on day 1, doxorubicin 2 mg/kg on day 4, and dexamethasone 10.5 mg/kg on days 1-5. The response to treatment was assessed on day 32 after initiation of therapy. (B) Disease progression of B-VHR-20 visualized by in vivo bioluminescence imaging of the total body. (C) Low magnification tiles (5x) from 15 mm thin sections of femora of mice at low, medium and high engraftment (DAPI, blue, indicates nuclei; hCD45+, yellow, indicates leukemic cells). (D) Flow cytometry of bone marrow, spleen, and peripheral blood, each symbol representing data from a single mouse transplanted with B-VHR-20. (E) Progression of hCD45+ cells in the peripheral blood visualized by flow cytometry of further B-cell precursor ALL. (F) Monitoring of chemotherapy response of B-VHR-20 via in vivo bioluminescence imaging and (G) flow cytometry analysis of hCD45+ cells in peripheral blood and (H) bone marrow 32 days after initiation of combination chemotherapy. Medians were compared by a two-tailed Mann-Whitney U test. (I) Flow cytometry analysis of hCD45+ engraftment in spleen, liver and brain upon induction treatment; each symbol represents data from one animal (1 mouse per patient’s material, 2-tailed Kruskal-Wallis test). The percentage of human engraftment was calculated in relation to the total leukocyte count (human CD45+ plus murine CD45+) in mice. VCR: vincristine; DOX: doxorubicin; DXM: dexamethasone; MRD: minimal residual disease; BM: bone marrow; SP: spleen; pB: peripheral blood; PBS: phosphate-buffered saline.

Haematologica | 108 May 2023 1247 ARTICLE - Distinct predilection sites of B- and T-ALL M.J. Barz et al. A B D E F G H I C

Haematologica | 108 May 2023 1248 ARTICLE - Distinct predilection sites of B- and T-ALL M.J. Barz et al. Continued on following page. A B D E G F
C
Figure 2. Distribution patterns of B-cell precursor acute lymphoblastic leukemia and T-acute lymphoblastic leukemia cells in the bone marrow microenvironment are similar at early engraftment. (A) Schematic representation of three-dimensional confocal microscopy followed by automated segmentation and quantitative distance analysis of early engrafted acute lymphoblastic leukemia (ALL): day 11 for B-cell precursor (BCP) ALL and day 4 for T-ALL (B, C). Representative maximal projection of a tiled 100-300 mm z-stack confocal image of patient-derived BCP- or T-ALL cells at early engraftment (B: B-R-03; C: T-VHR09). Scale bars: 500 mm on overviews, 50 µm on zoomed images. Human leukemic cells (CD45+, yellow) in spatial relationship with sinusoids (endoglin+, red) or endosteum (collagen 1a+, white). (D) Schematic categorization of individual leukemia cells into four quartiles based on their distance to bone and blood vessels. (E) Distribution of mean distances of BCP-ALL (red, B-R-03, BSR-21 and B-VHR-24) or T-ALL (blue, T-HR-04, T-VHR-01 and T-VHR-04) cells to the bone and the bone marrow sinusoids at early engraftment (n=1,100 BCP-ALL segmented cells and n=678 T-ALL segmented cells). (F) Bar chart showing binwise fold-changes of BCP-ALL and T-ALL cells over random dots for distances to blood vessels (left panel) and bone (right panel). The data represented are pooled from three different bones transplanted with the same patient-derived BCP-ALL or T-ALL cells. (G) Schematic depiction of predilection sites of leukemic cells in the bone marrow. BV: blood vessel (bone marrow sinusoid); Q: quartile; h: human; RD, random dots.
trix and blood vessels. Mapping the distance of each leukemic cell or random dot to blood vessels and bone we assessed any preferential association of ALL cells to either niche. We dissected the resulting two-dimensional distance distribution into four quartiles by setting a threshold of 10 m m (distance quantiles Q1 to Q4), which is comparable to the size of an ALL cell (Figure 2D). Clustering of BCP-ALL and T-ALL cells close to bone marrow sinusoids was observed at early engraftment (<10 m m, Q1 and Q4, BCP-ALL P<0.001, T-ALL P=0.032) (Figure 2E; Online Supplementary Figure S3A-D). To quantify the enrichment of ALL cells we calculated binwise fold-changes of hCD45+ cells over random dots. At early engraftment ALL cells localized strongly to blood vessels (<5 m m) (Figure 2F; Online Supplementary Figure S3E, F). In contrast to BCP-ALL, T-ALL cells were also strongly enriched in close vicinity to the bone (<24 m m) (Figure 2F; Online Supplementary Figure S3G, H), supporting the notion of different homing sites of BCP-ALL and T-ALL cells in the bone marrow (Figure 2G).
Upon chemotherapy T-cell acute lymphoblastic leukemia cells redistribute in the bone marrow
Next, we assessed the spatial reorganization of BCP-ALL and T-ALL cells after 28 days of induction therapy (Figures 1A and 3A, B). Upon drug perturbation, cells from different BCP-ALL patients were still found close to sinusoids (P<0.001, <10 mm, Q1 and Q4) (Figure 3C; Online Supplementary Figure S4A-E), whereas cells of T-ALL patients localized near the bone (P<0.001, <10 mm, Q1 and Q2) but their position did not differ from random dots with respect to blood vessels (P=ns; <10 mm, Q2 to Q4) (Figure 3C; Online Supplementary Figure S4F, G). Overall, BCP-ALL cells surviving chemotherapy resided close to endothelial blood vessels (Figure 3D; Online Supplementary Figure S4H-J). Chemotherapy-resisting T-ALL cells scattered more broadly in the bone marrow and were less enriched at the vasculature compared to early engraftment (Figure 3D; Online Supplementary Figure S4K, L), but maintained a preference for association with the endosteum. We conclude that the 28-day induction regimen induced different spatial localization of BCP-ALL and T-ALL cells, indicating
immunophenotype-specific survival strategies within the microenvironment (Figure 3E).
T-cell acute lymphoblastic leukemia cells are closer to nestin-positive cells than are B-cell acute lymphoblastic leukemia cells
Given the relevance of the perivascular niche for leukemic engraftment and survival during chemotherapy we investigated the bone marrow vasculature in more detail. As shown by Asada et al., 7 the vascular niche of HSC offers different perivascular cells, such as nestin+ cells, which might interact with leukemic cells.25 Using our established deep-tissue imaging, we studied the spatial relation of BCP-ALL and T-ALL cells with respect to nestin+ cells by xenotransplantation of PDX samples in nestin-GFP transgenic mice (Figure 4A, B). At early engraftment, BCP-ALL cells showed a similar distribution as random dots to nestin+ cells (Figure 4C; Online Supplementary Figure S5), whereas T-ALL cells were enriched at nestin+ cells compared to a random distribution (<20 mm) (Figure 4D; Online Supplementary Figure S5). Consistent with NSG mice, BCP-ALL and T-ALL cells were found close to blood vessels, however T-ALL cells were more enriched at nestin+ structures than were BCP-ALL cells (Figure 4D). In summary, T-ALL cells engraft near blood vessels, bone and nestin+ cells, but BCP-ALL cells predominantly interact with the sinusoidal bone marrow niche (Figure 4E).
B-cell acute lymphoblastic leukemia cells do not co-localize with transition zones
Perivascular cues are essential for the maintenance of normal hematopoiesis and the vascular niche of HSC has been extensively described. 26-28 We therefore explored whether hematopoietic stem and progenitor cells (HSPC, CD34+ cord blood) and BCP-ALL cells occupy the same niche. Using 3D quantitative imaging we investigated in detail the interactions between leukemic cells or HSPC and recently described transitional zones, a special subtype of vessels (endoglinlowendomucinhigh) forming the intersection between arterioles and sinusoids (Figure 5A, B). 29 We observed direct interactions of healthy HSPC with sinusoids (Q1 and Q4) and transition zones as well
Haematologica | 108 May 2023 1249
M.J. Barz et al.
ARTICLE - Distinct predilection sites of B- and T-ALL
B-cell precursor acute lymphoblastic leukemia and T-acute lymphoblastic leukemia cells exhibit distinct patterns in the bone marrow microenvironment upon chemotherapy. (A, B) Representative maximal projection of a tiled 100-300 mm z-stack confocal image of patient-derived B-cell precursor (BCP) acute lymphoblastic leukemia (ALL) or T-ALL cells upon chemotherapy (A: B-VHR-20; B: T-VHR-09). Scale bars: 500 mm on overviews, 50 mm on zoomed images. Human leukemic cells (CD45+, yellow) in spatial relationship with sinusoids (endoglin+, red) or endosteum (collagen 1a+, white). (C) Distribution of mean distances of BCP-ALL (red, B-R-03, B-SR-21 and B-VHR-24) or T-ALL (blue, T-HR-04, T-VHR-01 and T-VHR-04) cells to the bone and the bone marrow sinusoids after induction treatment (segmented cells n=293 BCP-ALL and n=1,777 T-ALL). (D) Bar chart showing binwise fold-changes of BCP-ALL and T-ALL cells over random dots for distances to blood vessels (left panel) and bone (right panel). (E) Schematic depiction of predilection sites of BCP-ALL (left panel) or T-ALL (right panel) cells in the bone marrow. Q: quartile; BV: blood vessel (bone marrow sinusoid); h: human; RD: random dots.
as enrichment in close proximity, as compared to the distribution of random dots (<10 m m; Q2) (Figure 5C). In contrast, leukemic cells were rarely in contact with transition zones, indicating that BCP-ALL cells specifically interact with the sinusoidal bone marrow niche (<10 m m, Q1 and Q4) (Figure 5C; Online Supplementary Figure S6). Hence, transition zones were more likely to be populated by HSPC, which clustered significantly closer to endomucin + cells and blood vessels than did random dots (<5 m m) (Figure 5D). Consequently, we propose that not all HSPC and BCP-ALL cells share the same vascular niche (Figure 5E).
Chemotherapy and engraftment of leukemic cells induce remodeling of the bone marrow vasculature

Following the application of chemotherapeutic drugs in our in vivo model we observed remodeling of bone marrow sinusoids (Figure 6A). In brief, treatment with doxorubicin
for 28 days appeared to increase vessel branching, whereas dexamethasone visually dilated vessels. The combination of dexamethasone, doxorubicin and vincristine affected vessel morphology by leading to a denser network of bone marrow sinusoids. Besides chemotherapeutic stress, we observed vessel remodeling under leukemic infiltration. Compared to early engraftment (Figure 6B), during later stages of leukemia infiltration (Figure 6C) there was a more condensed vasculature. This phenotype was reversible within 4 days after chemotherapy exposure (Figure 6D), suggesting a response that is directly related to leukemic engraftment and chemotherapeutic stress. Overall, re-modeling of the vasculature was stronger in BALL than in T-ALL models (Online Supplementary Figure S7). These observations underline the stable presence of the perivascular niche and possible supportive interactions of niche cells with leukemic blasts even during chemotherapy.
Haematologica | 108 May 2023 1250 ARTICLE - Distinct predilection sites of B- and T-ALL M.J. Barz et al. A C D E B
Figure 3.
Figure 4. T-cell acute lymphoblastic leukemia cells engraft preferentially in close proximity to nestin-positive cells. (A, B) Representative maximum projection of a tiled 100-300 mm z-stack of the bone marrow of nestin-GFP (green) mice transplanted with cells from B-VHR-24 (hCD45+, yellow) 11 days after transplantation (A) or with cells from T-VHR-09 (hCD45+, yellow) 4 days after transplantation (B). Sinusoids are defined as endoglin+ (scale bars: 150 mm). (C) Distribution of B-cell precursor (BCP) acute lymphoblastic leukemia (ALL) (red, left panel) or T-ALL (blue, right panel) cells depending on their distance from sinusoids and nestin-GFP cells. The graph represents pooled data from two BCP-ALL patients (B-VHR-24 and B-SR-22, segmented cells, n=535) or two T-ALL patients (T-HR-04 and T-VHR-09, segmented cells, n=502). (D) Bar chart representing binwise fold-changes of BCP-ALL and T-ALL cells over random dots for distances from blood vessels (left panel) and nestin+ cells (right panel). (E)
Schematic depiction of predilection sites of BCP-ALL (left panel) or T-ALL cells (right panel) in the bone marrow with respect to endoglin+ and nestin+ structures. GFP: green fluorescent protein; Q: quartile; BV: blood vessel (bone marrow sinusoid); h: human; RD: random dots.

Haematologica | 108 May 2023 1251 ARTICLE - Distinct predilection sites of B- and T-ALL M.J. Barz et al. A C D E B
Residual resistant acute lymphoblastic leukemia cells maintain their leukemia repopulating capacity and chemotherapy-sensitivity profiles
To explore the transient nature of the resistant phenotype in our MRD model, we verified the ALL cells’ function by serial transplantation (Figure 7A) and tested their sensitivity to chemotherapeutic agents ex vivo. Residual leukemia cells from very high-risk BCP-ALL and T-ALL were harvested after induction chemotherapy for secondary transplants in NSG mice. These MRD-like (pre-treated) cells recapitulated the leukemia phenotype in secondary transplants with similar

kinetics (Figure 7B) compared to the first transplant of untreated cells (Figure 1E), with leukemia cells detectable in the peripheral blood within 20 to 75 days after transplantation. Accordingly, the degree of bone marrow involvement was comparable both at early time-points (1% engraftment in peripheral blood) (Figure 7C) and at later time-points (50% engraftment in peripheral blood) (Figure 7D). Moreover, these MRD-like ALL cells did not show either increased resistance to ALL chemotherapeutic agents in ex vivo drug sensitivity testing or a delay in response to treatment in vivo (Figure 7E, F; Online Supplementary Figure S8). These ob-
Figure 5. Acute lymphoblastic leukemia (ALL) cells and hematopoietic stem and progenitor cells co-localize with bone marrow sinusoids but ALL cells not with transition zones. (A, B) Representative maximum projection of a tiled 100-300 mm z-stack confocal image of the interactions of hematopoietic stem and progenitor cells (HSPC) (A; hCD45+, yellow/white, CD34+ cord blood cells) or B-cell progenitor (BCP) acute lymphoblastic leukemia (ALL) cells (B; hCD45+, white, B-VHR-20) with sinusoids (endomucinlow, green, endoglin+, yellow) and/or the transition zone (endomucinhigh, green, endoglinlow, yellow). (C) Quantitative analysis of distance of HSPC (n=5,015) or BCP-ALL cells (n=3,350) and corresponding random dots from bone marrow sinusoids. (D) Binwise fold-changes of BCP-ALL cells and HSPC over seeded random dots for distance to blood vessels (left panel) or endomucin (right panel). (E) Schematic presentation of predilection sites of HSPC (left panel) or BCP-ALL cells (right panel) in the bone marrow with respect to endoglin+ and endomucin+ structures. BV: blood vessel (bone marrow sinusoid); h: human; RD: random dots; Q: quartile.
Haematologica | 108 May 2023 1252 ARTICLE - Distinct predilection sites of B- and T-ALL M.J. Barz et al. A C D E B
servations indicate that the phenotype associated with resistance to chemotherapy is transient, suggesting a role for interactions between the cells and their microenvironment.
Induction chemotherapy does not select quiescent populations
Induction of a persistent quiescent state has been inferred as the central mechanism for drug resistance in leukemia. To follow subpopulations that would become more quiescent under chemotherapy, we used CFSE to track cells for up to eight cell divisions.30 PDX ALL cells were stained with CFSE ex vivo, transplanted and induction treatment was initiated after a window for stable engraftment. Bone mar-
row was harvested after either a short period of treatment (3 days) or a long period of treatment (28 days) (Figure 8A). The proportion of CFSE-positive leukemic cells after shortterm treatment was slightly higher than that in untreated controls, indicating that chemotherapy transiently selects a subpopulation of cells with decreased proliferative activity (Figure 8B; Online Supplementary Figure S9). After induction chemotherapy no CFSE-marked populations could be detected (Figure 8C; Online Supplementary Figure S9), and we could not identify the existence of a quiescent subset under these experimental conditions, suggesting that our induction chemotherapy affected proliferative and non-proliferative populations similarly. It has also been proposed that
Figure 6. Vascular changes in bone marrow sinusoids upon chemotherapy or engraftment of acute lymphoblastic leukemia cells. (A) Representative maximal projection of tiled 100-300 mm z-stack confocal images of bone marrow sinusoids (endoglin+, red) upon application of phosphate-buffered saline, dexamethasone, vincristine, doxorubicin, or a combination of the three-drug induction therapeutics. (B-D) Effects of early engraftment (B), vascular remodeling at late engraftment (C) and recovery after induction treatment (D) of B-cell precursor acute lymphoblastic leukemia cells (hCD45+, yellow) on the structure of bone marrow sinusoids (endoglin+, red) represented by maximal projection of tiled 100-300 mm z-stack confocal images. PBS: phosphate-buffered saline; h: human; VCR: vincristine; DOX: doxorubicin; DXM: dexamethasone.

Haematologica | 108 May 2023 1253 ARTICLE - Distinct predilection sites of B- and T-ALL M.J. Barz et al. A B C D
quiescent cells reside in vicinity of the endosteum. However, the distribution of CFSE-positive cells after short-term treatment was similar for both BCP-ALL and T-ALL cells, as observed for the total population of hCD45+ cells (Figure 8DG). After 28 days of chemotherapy, no CFSE-positive cells were observed in the bone marrow in either BCP-ALL or TALL cases (Figure 8E, G). Thus our data challenge the notion that the endosteum constitutes the supportive niche for dormant leukemia cells.31
Discussion
Here we show that the localization of human BCP-ALL is not random with respect to other bone marrow structures

and is distinct from the localization of T-ALL, indicating important functional differences between the two ALL lineage subtypes. BCP-ALL cells survive a typical induction chemotherapy regimen in a sinusoidal context, which is reminiscent of the reported co-localization of pro-B cells and early hematopoietic progenitors in this perisinusoidal space.32 We confirmed that these sites were distinct from the transition zones and nestin+ arteriole-associated pericytes that have been implicated in the control of HSC quiescence.6 Recent studies of the murine bone marrow microenvironment identified that niche-associated factors in sinusoidal endothelial cells and perivascular stromal cells modulate HSPC. Loss of the endothelial-specific Notch ligand DLL4 skewed HSPC to a more myeloid gene expression profile with loss of IL-7R-positive common
Figure 7. Engraftment properties and response of chemotherapy-resistant acute lymphoblastic leukemia cells to chemotherapeutic drugs. (A) Schematic representation of the transplantation model of minimal residual disease. (B) Flow cytometry analysis of engraftment kinetics in peripheral blood of re-transplanted acute lymphoblastic leukemia (ALL) cells harvested from the bone marrow of mice treated with combination chemotherapy from patients B-VHR-12, B-VHR-10, B-VHR-21, B-SR-22, B-HR-31 and T-MR-09. (C, D) Levels of human cell engraftment in mouse bone marrow at 1% engraftment in peripheral blood (early time-point, C) or 50% engraftment in peripheral blood (late time-point, D) upon transplantation of untreated ALL cells versus pre-treated ALL cells resistant to in vivo induction treatment and measured by flow cytometry analysis for patients B-VHR-12, B-VHR-10, B-VHR-21, B-SR-22 and B-HR-31. Medians were compared using an unpaired two-tailed Mann-Whitney U test. (E) Drug response profiles of untreated ALL cells versus pre-treated ALL cells to ex vivo exposure to dexamethasone, vincristine or doxorubicin (9 technical replicates with mean ± standard deviation of B-VHR-20). (F) Flow cytometry analysis of engraftment kinetics in peripheral blood of secondary transplants of ALL cells harvested from the bone marrow of mice treated with combination chemotherapy for 4 weeks from patient T-MR-09 that were treated again with the same combination chemotherapy (therapy start indicated by the black arrow). PBS: phosphate-buffered saline; MRD: minimal residual disease; TP: time-point; pB: peripheral blood; BM: bone marrow.
Haematologica | 108 May 2023 1254 ARTICLE - Distinct predilection sites of B- and T-ALL M.J. Barz et al. A B D E F C

Haematologica | 108 May 2023 1255 ARTICLE - Distinct predilection sites of B- and T-ALL M.J. Barz et al. Continued on following page. A B D E G F C
Figure 8. Induction chemotherapy increases a transient, slowly proliferating subpopulation of leukemic cells, but does not induce quiescence. (A) Schematic representation of NSG mice transplanted with patient-derived xenograft samples, labeled with 5(6)carboxyfluorescein diacetate N-succinimidyl ester (CSFE), which were treated with either induction chemotherapy or a 3-day schedule of vincristine and doxorubicin on day 1 and dexamethasone on days 1-3. (B) Gating strategy of leukemia cells in the mouse bone marrow for flow cytometry analysis of CFSE+ or CFSE– cells after short- or long-term treatment. (C) Quantification of total leukemic burden in femoral bone marrow of patient-derived xenografts of B-cell precursor (BCP) acute lymphoblastic leukemia (ALL) and T-ALL and analysis of proportions of CFSE+ and CFSE– cells in the hCD45+ cell population in the bone marrow after 3 days of chemotherapy or day 32 after chemotherapy. The data represented are from three animals transplanted with the patient-derived xenograft. (D-G) Representative maximum projection of tiled 100-300 mm z-stack confocal images of CFSE+ BCP-ALL (B-R-03) or T-ALL (T-VHR-04) cells (double positive for CFSE in yellow and hCD45 in red, arrowheads) in the bone marrow of the femur after 3 days of chemotherapy (D and F) or day 32 after chemotherapy (E and G). Sinusoids are defined as endoglin+ (blue), endosteum as collagen 1a+ (white). PBS: phosphate-buffered saline; h: human; MRD: minimal residual disease.
lymphoid progenitors cells.33 Mesenchymal stem cell lineage trajectories were identified in the perivascular space, which expresses different hematopoietic cytokines including CXCL12, SCF and IL-7,33,34 with further evidence for modulation of B-cell progenitors.32 These niche-associated factors may contribute to leukemia initiation and progression. Further perturbations of the bone marrow immune microenvironment by B-ALL were detected in human samples, revealing the expansion of non-classical Ly6C–, CSFR1, CD16+ monocytes that depend on vascular-endothelial signaling and upregulate genes involved with vasculo-endothelial interactions. Interference with the CSFR1 receptor synergized with nilotinib in a mouse model of BCR-ABL-positive ALL, supporting a role for abnormal interactions in the perisinusoidal niche in ALL.35
Reproducible detection of BCP-ALL MRD in the perisinusoidal niche also contradicts a broadly discussed report by Ebinger et al., 15 who proposed a model of resistance based on the persistence of a non-dividing endosteal BCP-ALL population after selection by chemotherapy. We have not been able to detect this endosteal MRD population. However, our data indicate that the MRD cells likely persist in a reversible and transient drug-tolerant state. Moreover, it was observed that leukemic cells are imprinted by specific cell types of the bone marrow microenvironment leading to transitory states of chemoresistance.36,37 The diverging observations may arise from the selection of different chemotherapeutic agents in the experiments or resolution of the imaging techniques. Indeed, ALL cells compete with HSC in the vicinity of sinusoidal endothelial cells,12 where the majority of HSC, dormant or cycling, were localized.10,38 We found that ALL cells overlap only with the non-arteriolar HSC niche. Isolation of niche components for single-cell analysis remains challenging, as flow cytometry-based assays massively underestimate the dense mesh of sinusoidal and CXCL12-expressing mesenchymal cells in the bone marrow when compared to quantitative 3D imaging-based studies.39,40 Furthermore, we show that this sinusoidal space is maintained even after massive leukemia progression. We confirm transient alternations in cellular endothelial morphology suggestive of stress response and transient expansion of an adipocytic cluster, as detected by others.13 Dynamic changes of the bone marrow microenvironment
may have functional implications for the leukemic cells. TALL cells derived from distal adipocytic-rich bone marrow in mouse models demonstrated a higher intrinsic resistance.38 Adipocytic enrichment in the bone marrow may restrict the proliferative capacity and induce transcriptomic changes of ALL cells leading to chemoresistance.39,40 Our results also reconcile important observations made with models of T-ALL.17 In vivo imaging of NOTCH-induced murine T-ALL and T-ALL PDX revealed that T-ALL cells survive combination chemotherapy with increased motility and without any evidence of a quiescent MRD subpopulation and with a predilection for endosteal regions, resulting in rapid loss of osteoblasts, challenging the notion of a restricted niche for T-ALL.17 Thus niche heterogeneity may reflect differences in functional dependencies in ALL. Given the impact of CXCL12 disruption in endothelial cells for T-ALL in mouse models, interactions in the perisinusoidal space remain relevant.42,43 This complexity extends to extramedullary sites and can evolve. For example, transgenic expression of the IL-7 receptor in mice leads first to thymic deregulation with malignant evolution in a phenotype that eventually involves the bone marrow.44 Our results point to heterogeneity in extramedullary MRD, also involving secondary lymphoid organs, which is consistent with the heterogeneity of extramedullary involvement in ALL in the clinic.45 Additional heterogeneity of structural and metabolic differences occurs at different sites in the body including alterations with aging.46,47 Integrating imaging approaches and genetic and transcriptomic sequencing analyses48 at single-cell resolution with molecular interactome maps in normal HSC have revealed dynamic relationships.33,34,49,50
In conclusion, specific differences in the localization of leukemic cells upon engraftment and chemotherapy exist between BCP-ALL and T-ALL, suggesting the existence of sites of predilection in the bone marrow microenvironment. More studies are needed to elucidate the functional consequences of niche heterogeneity on leukemia biology and their therapeutic implications. Our observations warrant further dissection of the peri-sinusoidal niche.
Disclosures
No conflicts of interest to disclose.
Haematologica | 108 May 2023 1256 ARTICLE - Distinct predilection sites of B- and T-ALL M.J. Barz et al.
Contributions
MJB, LB, DC, GZ and IJV designed and carried out experiments. MJB, LB, DC, GZ and FDS analyzed data. MJB, LB, DC, GZ, IJV and BM performed and supported the xenograft experiments. DC and GZ performed most of the xenograft experiments and collected the imaging data. LB established the 3D imaging protocols AZ, CN-A and UZ provided technical support and data interpretation for the 3D microscopy. MK wrote the Matlab scripts. MK, LK, YZ and TS contributed to image processing and analysis. BB and J-PB supervised the study; MJB, LB, DC, GZ, FDS, BB and J-PB wrote the manuscript. All authors approved the final version of the manuscript.
Acknowledgments
The authors would like to thank Jasper de Boer for providing the pSLIG plasmid, Sander Botter for his support during the establishment of the bioluminescence imaging protocol and Samanta Kisele for support with the mouse studies.
References
1. Colmone A, Amorim M, Pontier AL, Wang S, Jablonski E, Sipkins DA. Leukemic cells create bone marrow niches that disrupt the behavior of normal hematopoietic progenitor cells. Science. 2008;322(5909):1861-1865.
2. De Bie J, Demeyer S, Alberti-Servera L, et al. Single-cell sequencing reveals the origin and the order of mutation acquisition in T-cell acute lymphoblastic leukemia. Leukemia. 2018;32(6):1358-1369.
3. Schumich A, Maurer‐Granofszky M, Attarbaschi A, et al. Flow‐cytometric minimal residual disease monitoring in blood predicts relapse risk in pediatric B‐cell precursor acute lymphoblastic leukemia in trial AIEOP‐BFM‐ALL 2000. Pediatr Blood Cancer. 2019;66(5):e27590.
4. Hanahan D, Coussens LM. Accessories to the crime: functions of cells recruited to the tumor microenvironment. Cancer Cell. 2012;21(3):309-322.
5. Taichman R, Reilly M, Emerson S. Human osteoblasts support human hematopoietic progenitor cells in vitro bone marrow cultures. Blood. 1996;87(2):518-524.
6. Kunisaki Y, Bruns I, Scheiermann C, et al. Arteriolar niches maintain haematopoietic stem cell quiescence. Nature. 2013;502(7473):637-643.
7. Asada N, Kunisaki Y, Pierce H, et al. Differential cytokine contributions of perivascular haematopoietic stem cell niches. Nat Cell Biol. 2017;19(3):214-223.
8. Yamazaki S, Ema H, Karlsson G, et al. Nonmyelinating Schwann cells maintain hematopoietic stem cell hibernation in the bone marrow niche. Cell. 2011;147(5):1146-1158.
9. Nguyen TS, Lapidot T, Ruf W. Extravascular coagulation in hematopoietic stem and progenitor cell regulation. Blood. 2018;132(2):123-131.
10. Kokkaliaris KD, Kunz L, Cabezas-Wallscheid N, et al. Adult blood stem cell localization reflects the abundance of reported bone marrow niche cell types and their combinations. Blood. 2020;136(20):2296-2307.
11. Itkin T, Gur-Cohen S, Spencer JA, et al. Distinct bone marrow blood vessels differentially regulate haematopoiesis. Nature.
We are grateful to Dominique Bonnet and Diana Passaro, who kindly provided nestin-GFP NSG mice. We thank Zsofia Kovacs, Elisabeth Rushing and Anna Rinaldi for support with magnetic resonance imaging and histopathology analyses of the mouse brain. We also acknowledge the assistance of the Center for Microscopy and Image Analysis of the University of Zürich during image acquisition.
Funding
This study was supported by the Swiss National Science Foundation (310030-182269 and 310030-156407), an SNF Sinergia grant (186271), the EU horizon 2020 ITCC-P4 project, the Novartis Foundation for Biomedical Research, the Stiftung Kinderkrebsforschung Schweiz and the Swiss Pediatric Hematology and Oncology SPHO Biobank Network.
Data-sharing statement
The data supporting the findings of this study are available upon request to the author for correspondence.
2016;532(7599):323-328.
12. Sipkins DA, Wei X, Wu JW, et al. In vivo imaging of specialized bone marrow endothelial microdomains for tumour engraftment. Nature. 2005;435(7044):969-973.
13. Duan C-W, Shi J, Chen J, et al. Leukemia propagating cells rebuild an evolving niche in response to therapy. Cancer Cell. 2014;25(6):778-793.
14. Veiga JP, Costa LF, Sallan SE, Nadler LM, Cardoso AA. Leukemiastimulated bone marrow endothelium promotes leukemia cell survival. Exp Hematol. 2006;34(5):610-621.
15. Ebinger S, Özdemir EZ, Ziegenhain C, et al. Characterization of rare, dormant, and therapy-resistant cells in acute lymphoblastic leukemia. Cancer Cell. 2016;30(6):849-862.
16. van der Velden V, Jacobs D, Wijkhuijs A, et al. Minimal residual disease levels in bone marrow and peripheral blood are comparable in children with T cell acute lymphoblastic leukemia (ALL), but not in precursor-B-ALL. Leukemia. 2002;16(8):1432-1436.
17. Hawkins ED, Duarte D, Akinduro O, et al. T-cell acute leukaemia exhibits dynamic interactions with bone marrow microenvironments. Nature. 2016;538(7626):518-522.
18. Fischer U, Forster M, Rinaldi A, et al. Genomics and drug profiling of fatal TCF3-HLF positive acute lymphoblastic leukemia identifies recurrent mutation patterns and therapeutic options. Nat Genet. 2015;47(9):1020-1029.
19. Richter‐Pechańska P, Kunz JB, Bornhauser B, et al. PDX models recapitulate the genetic and epigenetic landscape of pediatric T‐cell leukemia. EMBO Mol Med. 2018;10(12):e9443.
20. Mishchenko Y. A fast algorithm for computation of discrete Euclidean distance transform in three or more dimensions on vector processing architectures. Signal Image Video P. 2015;9(1):19-27.
21. Coutu DL, Kokkaliaris KD, Kunz L, Schroeder T. Multicolor quantitative confocal imaging cytometry. Nat Methods. 2018;15(1):39-46.
22. Zinngrebe J, Debatin K-M, Fischer-Posovszky P. Adipocytes in hematopoiesis and acute leukemia: friends, enemies, or
Haematologica | 108 May 2023 1257 ARTICLE - Distinct predilection sites of B- and T-ALL M.J. Barz et al.
innocent bystanders? Leukemia. 2020;34(9):2305-2316.
23. Williams MTS, Yousafzai YM, Elder A, et al. The ability to cross the blood–cerebrospinal fluid barrier is a generic property of acute lymphoblastic leukemia blasts. Blood. 2016;127(16):1998-2006.
24. Bartram J, Goulden N, Wright G, et al. High throughput sequencing in acute lymphoblastic leukemia reveals clonal architecture of central nervous system and bone marrow compartments. Haematologica. 2018;103(3):e110-e114.
25. Coutu DL, Kokkaliaris KD, Kunz L, Schroeder T. Threedimensional map of nonhematopoietic bone and bone-marrow cells and molecules. Nat Biotechnol. 2017;35(35):1202-1210.
26. Kopp H-G, Hooper AT, Avecilla ST, Rafii S. Functional heterogeneity of the bone marrow vascular niche. Ann N Y Acad Sci. 2009;1176(1):47-54.
27. Morrison SJ, Scadden DT. The bone marrow niche for haematopoietic stem cells. Nature. 2014;505(7483):327-334.
28. Calvi LM, Link DC. The hematopoietic stem cell niche in homeostasis and disease. Blood. 2015;126(22):2443-2451.
29. Kusumbe AP, Ramasamy SK, Itkin T, et al. Age-dependent modulation of vascular niches for haematopoietic stem cells. Nature. 2016;532(7599):380.
30. Marturano-Kruik A, Nava MM, Yeager K, et al. Human bone perivascular niche-on-a-chip for studying metastatic colonization. Proc Natl Acad Sci U S A. 2018;115(6):1256-1261.
31. Ebinger S, Özdemir EZ, Ziegenhain C, et al. Characterization of rare, dormant, and therapy-resistant cells in acute lymphoblastic leukemia. Cancer Cell. 2016;30(6):849-862.
32. Balzano M, De Grandis M, Vu Manh T-P, et al. Nidogen-1 contributes to the interaction network involved in pro-B cell retention in the peri-sinusoidal hematopoietic stem cell niche. Cell Rep. 2019;26(12):3257-3271.
33. Tikhonova AN, Dolgalev I, Hu H, et al. The bone marrow microenvironment at single-cell resolution. Nature. 2019;569(7755):222-228.
34. Baryawno N, Przybylski D, Kowalczyk MS, et al. A cellular taxonomy of the bone marrow stroma in homeostasis and leukemia. Cell. 2019;177(7):1915-1932.
35. Witkowski MT, Dolgalev I, Evensen NA, et al. Extensive remodeling of the immune microenvironment in B cell acute lymphoblastic leukemia. Cancer Cell. 2020;37(6):867-882.
36. Cahu X, Calvo J, Poglio S, et al. Bone marrow sites differently imprint dormancy and chemoresistance to T-cell acute lymphoblastic leukemia. Blood Adv. 2017;1(20):1760-1772.
37. Heydt Q, Xintaropoulou C, Clear A, et al. Adipocytes disrupt the translational programme of acute lymphoblastic leukaemia to
favour tumour survival and persistence. Nat Commun. 2021;12(1):5507.
38. Acar M, Kocherlakota KS, Murphy MM, et al. Deep imaging of bone marrow shows non-dividing stem cells are mainly perisinusoidal. Nature. 2015;526(7571):126-130.
39. Gomariz A, Helbling PM, Isringhausen S, et al. Quantitative spatial analysis of haematopoiesis-regulating stromal cells in the bone marrow microenvironment by 3D microscopy. Nat Commun. 2018;9(1):2532.
40. Kunz L, Schroeder T. A 3D tissue-wide digital imaging pipeline for quantitation of secreted molecules shows absence of CXCL12 gradients in bone marrow. Cell Stem Cell. 2019;25(6):846-854.
41. Hawkins ED, Duarte D, Akinduro O, et al. T-cell acute leukaemia exhibits dynamic interactions with bone marrow microenvironments. Nature. 2016;538(7626):518.
42. Pitt LA, Tikhonova AN, Hu H, et al. CXCL12-producing vascular endothelial niches control acute T cell leukemia maintenance. Cancer Cell. 2015;27(6):755-768.
43. Passaro D, Di Tullio A, Abarrategi A, et al. Increased vascular permeability in the bone marrow microenvironment contributes to disease progression and drug response in acute myeloid leukemia. Cancer Cell. 2017;32(3):324-341.
44. Silva AP, Almeida ARM, Cachucho A, et al. Overexpression of wild type IL-7Rα promotes T-cell acute lymphoblastic leukemia/lymphoma. Blood. 2021;138(12):1040-1052.
45. Bhojwani D, Pui C-H. Relapsed childhood acute lymphoblastic leukaemia. Lancet Oncol. 2013;14(6):e205-e217.
46. Calvo J, Fahy L, Uzan B, Pflumio F. Desperately seeking a home marrow niche for T-cell acute lymphoblastic leukaemia. Adv Biol Regul. 2019;74:100640.
47. Lassailly F, Foster K, Lopez-Onieva L, Currie E, Bonnet D. Multimodal imaging reveals structural and functional heterogeneity in different bone marrow compartments: functional implications on hematopoietic stem cells. Blood. 2013;122(10):1730-1740.
48. Behrmann L, Wellbrock J, Fiedler W. The bone marrow stromal niche: a therapeutic target of hematological myeloid malignancies. Expert Opin Ther Targets. 2020;24(5):451-462.
49. Baccin C, Al-Sabah J, Velten L, et al. Combined single-cell and spatial transcriptomics reveal the molecular, cellular and spatial bone marrow niche organization. Nat Cell Biol. 2020;22(1):38-48.
50. Mende N, Jolly A, Percin GI, et al. Prospective isolation of nonhematopoietic cells of the niche and their differential molecular interactions with HSCs. Blood. 2019;134(15):1214-1226.
Haematologica | 108 May 2023 1258 ARTICLE - Distinct predilection sites of B- and T-ALL M.J. Barz et al.
TAL1 activation in T-cell acute lymphoblastic leukemia: a novel oncogenic 3’ neo-enhancer
Charlotte Smith,1* Ashish Goyal,2* Dieter Weichenhan,2 Eric Allemand,3 Anand Mayakonda,2 Umut Toprak,4,5 Anna Riedel,2 Estelle Balducci,1 Manisha Manojkumar,2 Anastasija Pejkovska,2 Oliver Mücke,2 Etienne Sollier,2 Ali Bakr,2 Kersten Breuer,2 Pavlo Lutsik,2 Olivier Hermine,3,6 Salvatore Spicuglia,7 Vahid Asnafi, 1 Christoph Plass2,8 and Aurore Touzart1,2
1Université de Paris Cité, Institut Necker Enfants-Malades (INEM), Institut National de la Santé et de la Recherche Médicale (Inserm) U1151, and Laboratory of Onco-Hematology, Assistance Publique-Hôpitaux de Paris, Hôpital Necker Enfants-Malades, Paris, France; 2Division of Cancer Epigenomics, German Cancer Research Center (DKFZ), Heidelberg, Germany; 3Université de Paris Cité, Institut Imagine, Inserm U1163, Paris, France; 4Hopp Children’s Cancer Center Heidelberg (KiTZ), Heidelberg, Germany; 5Division of Neuroblastoma Genomics, German Cancer Research Center (DKFZ), Heidelberg, Germany;
6Department of Hematology, Hôpital Necker Enfants Malades, AP-HP, Faculté de Médecine Paris Descartes, Paris, France; 7Aix-Marseille University, Inserm, Theories and Approaches of Genomic Complexity (TAGC), Equipe Labellisée Ligue, UMR1090, Marseille, France and 8German Cancer Research Consortium (DKTK), Heidelberg, Germany
*CS and AG contributed equally as first authors.
Abstract
Correspondence: A. Touzart aurore.touzart@aphp.fr
C. Plass c.plass@dkfz.de
Received: June 16, 2022.
Accepted: December 28, 2022.
Early view: January 12, 2023.
https://doi.org/10.3324/haematol.2022.281583
©2023 Ferrata Storti Foundation
Published under a CC BY-NC license
T-cell acute lymphocytic leukemia protein 1 (TAL1) is one of the most frequently deregulated oncogenes in T-cell acute lymphoblastic leukemia (T-ALL). Its deregulation can occur through diverse cis-alterations, including SIL-TAL1 microdeletions, translocations with T-cell Receptor loci, and more recently described upstream intergenic non-coding mutations. These mutations consist of recurrent focal microinsertions that create an oncogenic neo-enhancer accompanied by activating epigenetic marks. This observation laid the groundwork for an innovative paradigm concerning the activation of proto-oncogenes via genomic alterations of non-coding intergenic regions. However, for the majority of T-ALL expressing TAL1 (TAL1+), the deregulation mechanism remains 'unresolved'. We took advantage of H3K27ac and H3K4me3 chromatin immunoprecipitation sequencing data of eight cases of T-ALL, including five TAL1+ cases. We identified a putative novel oncogenic neo-enhancer downstream of TAL1 in an unresolved monoallelic TAL1+ case. A rare but recurrent somatic heterozygous microinsertion within this region creates a de novo binding site for MYB transcription factor. Here we demonstrate that this mutation leads to increased enhancer activity, gain of active epigenetic marks, and TAL1 activation via recruitment of MYB. These results highlight the diversity of non-coding mutations that can drive oncogene activation.
Introduction
T-cell acute lymphoblastic leukemia (T-ALL) is a rare, aggressive hematologic malignancy that accounts for 15% of pediatric and 25% of adult ALL.1,2 The use of intensified chemotherapy regimes has led to recent advances in overall survival.3 However, 30-35% of patients still relapse and face a dismal prognosis with an overall survival of less than 20% at 5 years.4,5 T-ALL is caused by the clonal expansion of immature T-cell precursors that are blocked in their thymic differentiation. Several genetic alterations engendering the ectopic expression of key oncogenic transcription factors have been reported, including the HOX gene family members (HOXA,6,7 TLX1,8 TLX3,9,10 NKX1-1 and NXK1-
2,11 basic helix-loop-helix family members (TAL1/2,12-16 LYL1,17 BHLHB1,18 the LMO family members (LMO1, LMO219,20), and MYB.21 Of these transcription factors, the TAL1 oncogene is one of the most frequently deregulated in T-ALL. Indeed, increased TAL1 transcripts are found in up to 60% of patients.1 Under physiological conditions, TAL1 is an essential transcription factor (TF) for the development of the vascular system and for primary and definitive hematopoiesis. During definitive hematopoiesis, TAL1 is required for erythroid differentiation, yet it is epigenetically repressed during human thymopoiesis.14,22,23 Oncogenic events leading to the ectopic expression of TAL1 in the Tcell lineage are considered strong drivers of T-cell leukemogenesis. Such deregulation mechanisms occur in cis
Haematologica | 108 May 2023 1259 ARTICLE
- Acute Lymphoblastic Leukemia
and involve the ‘hijacking’ of enhancer elements leading to oncogene activation. The SIL-TAL1 microdeletion is the predominant deregulation mechanism found in 25% of TALL. The interstitial deletion places the TAL1 gene under the regulatory control of the adjacent STIL gene promoter.13,24 In a minority of cases (<5%), the TAL1 gene is translocated into either the T-cell receptor b (TRB) locus or, more often, the T-cell receptor δ (TRD) locus and under the control of strong T-cell receptor (TCR) cis-regulatory elements.24-26
We and others have identified a third deregulation mechanism consisting of microinsertions 7kb upstream of the TAL1 gene in a non-coding region. These microinsertions create a super-enhancer identifiable by its enrichment in transcriptionally activating epigenetic marks 14,15 and de novo MYB TF binding sites.15 The recruitment of MYB to the mutated sequence and subsequent super-enhancer formation leads to ectopic TAL1 expression. Lastly, a rare, recurrent intronic point mutation responsible for monoallelic TAL1 expression was recently discovered in pediatric T-ALL. The mutation creates a de novo YY1 TF binding site, is associated with active epigenetic marks, and demonstrates enhancer activity.27 Nonetheless, these diverse deregulation mechanisms do not account for all TAL1 positive (TAL1+) patients, suggesting 'unresolved' TAL1 deregulation mechanisms. 28-30 We, therefore, hypothesized that the identi fication of aberrantly formed intergenic histone marks in the vicinity of the TAL1 locus could uncover new TAL1 abnormalities in T-ALL. We discovered a novel recurrent microinsertion downstream of the TAL1 gene leading to the formation of an MYB-dependent neo-enhancer responsible for TAL1 activation.
Methods
Antibody-guided chromatin tagmentation
Genome-wide targeting of histone modifications and MYB were performed by antibody-guided chromatin tagmentation (ACT-seq), according to Carter et al. 31 pA-Tn5ase protein was isolated from E. coli (C3013, New England Biolabs; Ipswich, MA, USA) and transformed with plasmid pET15bpATnp (#121137, Addgene; Watertown, MA, USA). The pA-Tn5 transposome (pA-Tn5ome) was generated by mixing pA-Tn5ase (final concentration either 1.9 mM or 3.3 mM, depending on the pA-Tn5ase preparation) and Tn5ME-A+B load adaptor mix (final concentration 3.3 mM) in complex formation buffer (CB31). The pA-Tn5ome-antibody complexes were formed by mixing 1 mL pA-Tn5ome with 0.8 µL CB and 0.8 m L antibody solution. We used antibodies against histone H3K27ac (#4729, Abcam; Berlin, Germany), H3K4me1 (#8895, Abcam; Berlin, Germany), H3K4me3 (#39915 active motif), IgG (#PP64B, Millipore; Burlington,
MA, USA), H2B (#M30930, Hölzel Dianostika; Köln, Germany), and MYB (#45150, Abcam); 100,000 cells were used for the pA-Tn5ome-ab complex binding and tagmentation. Tagmented DNA was purified using MinElute kit (#28004, Qiagen; Venlo, The Netherlands) and eluted with 20 m L elution buffer (EB). Sequencing libraries were generated under real-time conditions with a LightCycler 480 (Roche Professional Diagnostics; Indianapolis, IN, USA) in 50 mL reaction mixes consisting of 20 mL tagmented DNA eluate, 25 mL NEBNext High Fidelity 2X Mix (#M0541, New England Biolabs; Ipswich, MA, USA), 0.5 mL 100x SYBRGreen, 2.5 mL primer Tn5McP1n and 2.5 m L barcode primer. Reaction conditions were 72°C, 5 minutes (min) (gap repair); 98°C, 30 seconds (sec) (initial melting); followed by cycles of: 98°C (10 sec), 63°C (10 sec), 72°C (10 sec). Cycling was stopped when fluorescence units (FU) had increased by 5. Libraries were purified with HighPrep magnetic beads (#220001, Biozym; Hessisch Oldendorf, Germany) with a bead:DNA ratio of 1.4:1 and eluted with 12 mL EB. Quantity and fragment size of the libraries were determined with a Qubit dsDNA HS assay kit (#Q32854, Invitrogen, ThermoFisher; Waltham, MA, USA) and a TapeStation 4150 with D1000 High Sensitivity Assay (#5067- 5585, Agilent; SantaClara, CA, USA), respectively. Six to eight differently barcoded libraries were multiplexed and sequenced on a single lane of a NextSeq™ 550 system (paired-end, 75 bp, Illumina; San Diego, CA, USA) with mid-output at the Genome and Proteome Core Facility of DKFZ. ACT-seq data were analyzed as previously described.32
Alpha-cas phasing methods and sgRNA sequences
To phase the engineered heterozygous 3’ mutation with the SNP (Hg19: chr1: 47 684 223) in J-3’NE#1 cells, gRNA targeting the region downstream of the SNP (TAL1 SNP DS crRNA) and upstream of the mutation (TAL1 3’NE DS crRNA) were designed. Corresponding Cas9 RNP were prepared as described above and electroporated into J3’NE cells. Forty-eight hours (h) post electroporation gDNA was isolated and amplified by polymerase chain reaction (PCR). Similarly, Jurkat 5’super-enhancer was phased using Cas9 RNP corresponding to TAL1 SNP DS crRNA and TAL1 5’SE US crRNA followed by PCR. The LMO1 activating point mutation in Jurkat cells was phased to an SNP in LMO1 exon 1 (Hg19: chr11: 8 285 124) using LMO1 SNP DS crRNA and LMO1 MUT US crRNA followed by PCR. The LMO2 activating microinsertion in MOLT4 cells was phased to an SNP in LMO2 exon 6 (Hg19: chr11: 33 881 016) by electroporating Cas9 RNP corresponding to LMO2 SNP DS crRNA and LMO2 MUT US crRNA (100,000 MOLT4 cells were electroporated using the following settings: 1350V, 10ms, 3 pulses), followed by PCR. In all cases the PCR product was cloned into a pCR4 TOPO TA vector using a TOPO TA Cloning Kit (Cat. # 450030, Thermo Scientific; Waltham, MA, USA) and
Haematologica | 108 May 2023 1260 ARTICLE - Diverse TAL1 deregulation mechanisms in T-ALL C. Smith et al.
transformed into electrocompetent Stbl3 cells. Ampicillin-resistant colonies were further inoculated for plasmid miniprep. Plasmids were Sanger sequenced using the M13 reverse primer.
See Online Supplementary Table S1 for primer sequences and Online Supplementary Table S2 for gRNA sequences. For ACT-seq oligonucleotide sequences see Online Supplementary Table S3
Studies were conducted with informed consent from all patients and in accordance with the principles of the Declaration of Helsinki, and approved by local and multicenter research ethical committees.
Results
Identification of a putative novel oncogenic neoenhancer associated with an intergenic 3’TAL1 microinsertion
To investigate TAL1 deregulation mechanisms, we took advantage of the Blueprint Consortium T-ALL chromatin immunoprecipitation sequencing (ChIP-seq) series. 33,34 We focused on H3K4me3 and H3K27ac enrichment over the TAL1 locus in eight primary T-ALL samples and the normal thymus (Figure 1A). TAL1 expression was analyzed using available RNA-seq data (n=6) and/or real-time quantitative (RQ) PCR (n=8). Five patient samples displayed high TAL1 expression and were considered TAL1 positive (TAL1+) and three were considered TAL1 negative (TAL1-) ( Online Supplementary Figure S1A and B ). Allelic expression analysis by RNA-seq and Sanger sequencing revealed that all five TAL1+ samples had monoallelic TAL1 expression, indicating cis-deregulation mechanisms (Figure 1C-E, Online Supplementary Figure S1C). We screened TAL1+ patients for the known recurrent mechanisms of TAL1 deregulation. Of these five TAL1 + patients, one (UPNT-760) had a SIL-TAL1 microdeletion, one (UPNT885) had the 5’ super-enhancer mutation (5’SE), and one (UPNT-820) had a translocation involving TAL1 and the TRB locus. Two patients (UPNT-753 and UPNT-802) had unidentified TAL1 deregulation mechanisms and were considered unresolved. ChIP-seq data for H3K27ac and H3K4me3 marks showed enrichment over the TAL1 gene body in all five monoallelically expressing TAL1+ patients (Figure 1A). As expected, H3K27ac enrichment encompassing the 5’super-enhancer was observed in the UPNT-885 sample. In addition, we noticed a unique dual monoallelic enrichment over an intergenic region downstream of the TAL1 gene in one unresolved monoallelic TAL1 + patient (UPNT-802) that was absent in all other TAL1+ patients, suggesting the presence of a novel regulatory element (Figure 1B, Online Supplementary Figure S2 ). We performed whole genome sequencing (WGS) on b oth tumoral and non-tumoral DNA (bone marrow re -
mission sample with undetectable minimal residual disease [MRD]) from UPNT-802 and identi fi ed a heterozygous 21bp microinsertion (variant allele frequency [VAF] 36%) about 4 kb downstream of the TAL1 gene (Hg 19 chr1: 47 677 744) within the genomic region enriched in H3K27ac and H3K4me3 marks (Figure 1B). This variant was somatic and absent in the non-tumoral sample (Figure 1F). We also confirmed the presence of the mutation by Sanger sequencing. Notably, this mutation was stable in leukemic cells expanded in a patient-derived xenograft (PDX) (Figure 1G). As a final verification, we designed mutation specific primers to amplify the microinsertion in the diagnostic sample ( Online Supplementary Figure S1D). Collectively, these results suggest the identification of a novel oncogenic neo-enhancer.
The intergenic 3’-TAL1 microinsertion is responsible for TAL1 deregulation in cell-line models
To study the function of the new putative neo-enhancer, we introduced the heterozygous 3´ microinsertion in Jurkat (TAL1 + ) and Peer (TAL1 - ) T-ALL cell lines using CRISPR-Cas9 technology. In the Jurkat cell line, the 3’ microinsertion was introduced and the original 5’superenhancer subsequently deleted (J-3’NE #1 and J-3’NE #2 derivative cell lines). Likewise, we introduced the 3’ mutation into the Peer cell line (P-3’NE #1, P-3’NE #2, P-3’NE #3 derivative cell lines), and also engineered a Jurkat cell line that was deleted for the original 5’ super-enhancer (J-del derivative cell line) (Figure 2A). Genotyping by Sanger sequencing confirmed successful genomic editing in the derivative cell lines with the insertion of the heterozygous microinsertion ( Online Supplementary Figure S3A and B ). As expected, a strong decrease in TAL1 expression was observed in J-del cells, which was rescued upon introduction of the 3’microinsertion in J-3’NE #1 and J-3’NE #2 derivative cell lines (Figure 2B and G). Whereas cell proliferation was affected in J-del cells, J-3’NE #1 cells displayed unaffected proliferation (similar to normal unedited Jurkat) (Figure 2C). The introduction of this mutation also led to a strong TAL1 activation in the Peer derivative cell lines (P-3’NE #1, P-3’NE #2, P-3’NE #3) (Figure 2D and G). Importantly, whereas wild-type (WT) Peer showed low and biallelic TAL1 expression, the three Peer derivative cell lines displayed monoallelic TAL1 expression in line with cis -activation (Figure 2E). The mutated sequence was cloned in a PGL4.23 plasmid (containing the luciferase gene and a minimal promoter) and demonstrated significantly increased enhancer activity ( P =0.004) compared to the WT sequence in the luciferase reporter assay (Figure 2F), confirming the enhancer function of this variant. Taken together, these results suggest that the novel 3´ microinsertion leads to the creation of a new regulatory element able to activate
Haematologica | 108 May 2023 1261 ARTICLE - Diverse TAL1 deregulation mechanisms in T-ALL C. Smith et al.

A B C F G D E Continued on following page. Haematologica | 108 May 2023 1262 ARTICLE - Diverse TAL1 deregulation mechanisms in T-ALL C. Smith et al.
Figure 1.
fication of a novel oncogenic regulatory element. Blueprint Consortium chromatin immunoprecipitation sequencing (ChIP-seq) tracks for H3K4me3 (in blue) and H3K27ac (in purple) over the TAL1 locus in the normal thymus and eight primary Tcell acute lymphoblastic leukemia (T-ALL) samples. H3K4me3 and H3K27ac enrichment corresponded with TAL1 expression. Type of TAL1 deregulation mechanism is shown. Red arrow indicates a unique 3’ H3K4me3 and H3K27ac enrichment in the T-ALL sample UPNT-802 underlined in black; orange arrow indicates the 5’super-enhancer mutation. Tracks were aligned to the Hg19 genome reference, normalized to normal thymic cell populations where TAL1 is epigenetically silenced and to input samples. Blue arrows on the TAL1 gene indicate the direction of transcription. (B) ChIP-seq tracks for H3K4me3 (in blue) and H3K27ac (in purple) over the TAL1 locus in the unresolved monoallelically-expressing TAL1 patient UPNT-802. Tracks show a unique dual enrichment downstream of the TAL1 gene. Red arrow highlights the somatic 21 bp microinsertion found by whole genome sequencing (WGS). (C) RNA-sequencing analysis confirmed high TAL1 expression in UPNT-802 compared to CD34+ thymocytes. (D) RNA sequencing reads centered on the informative SNP (rs 1010812) in the TAL1- 3’ UTR confirmed that UPNT-802 had monoallelic TAL1 expression. (E) Monoallelic expression was further validated by Sanger sequencing of this 3’UTR heterozygous SNP in genomic DNA (left) and cDNA (right). (F) WGS sequencing reads of tumoral and non-tumoral samples from patient UPNT-802. Red arrow highlights the genomic location of the heterozygous 21 bp microinsertion (Hg19: chr1: 47,677,744); the variant allele frequency (VAF) of the microinsertion was 36%. (G) Sanger sequencing chromatograms from tumoral (Diag), non-tumoral (remission sample), and patient-derived xenograft (PDX) DNA samples confirming the somatic micoinsertion.
TAL1 expression and sustain cell proliferation.
Aberrant TAL1 expression from the mutated allele
In order to associate the 3’ microinsertion with the observed aberrant monoallelic TAL1 expression in J-3’NE #1 cells (Figure 3A), and to prove that the expressed allele carried the mutation, we phased the mutation and the heterozygous 3´-UTR SNP used to study the allelic expression in this cell line. Since the mutation and the SNP are approximately 6.5 kb apart, this region was difficult to clone. To circumvent this problem, we used CRISPRCas9 to delete a large DNA fragment between the SNP and the mutation to reduce the distance between the two variants. The region was then PCR ampli fi ed. The small PCR product was either cloned into a plasmid and Sanger sequenced, or barcoded and directly sequenced using Mi-seq (Illumina; San Diego, CA, USA). We called this allele-phasing method “Alpha-Cas” (see Figure 3B). After deletion of the intervening DNA and cloning into the plasmid, 9 clones were sequenced. Sequences of two clones contained the unexpressed SNP G and the WT sequence; conversely, six clones contained the expressed SNP A and the mutated sequence, demonstrating the phasing of the mutation on the expressed allele. In addition, we found one clone with the unexpressed SNP G and the microinsertion, which likely resulted from a low rate of allelic exchange during the CRISPR-Cas9 cutting and recombination process (technical artefact) (Figure 3C). Mi-seq produced 56,054 aligned sequenced reads with 81% of reads having the expected allele phasing (47.9% of reads contained the expressed SNP A and microinsertion, 33.1% of reads had the unexpressed SNP G and WT sequence), and a minority of reads (19%) demonstrating allelic exchange (Figure 3D). We and others have previously described the TAL1 monoallelic expression associated with the 5’ super-enhancer mutation;14,28 however, allele phasing was not performed at the time of its discovery. To validate the Alpha-Cas method, we used it to phase the 5’ mutation and the expressed allele in the Jurkat cell line. We deleted the 20 kb inter-
vening region between the SNP and 5’ mutation before phasing. Alpha-Cas found the expected SNP and mutation phasing by both cloning and Mi-seq methods: 86.8% of sequencing reads had the expected phased alleles (51.4% of reads with the expressed SNP A and the microinsertion, 35.4% of reads with unexpressed SNP G and the WT sequence). Similarly, we observed a low rate of allelic exchange (13.1%) ( Online Supplementary Figure S4A-D). This method was also suitable to phase intergenic mutations associated with other T-ALL oncogenes. The LMO1 gene is also activated and monoallelically expressed by the creation of a neo-enhancer bound by MYB transcription factor in the Jurkat cell line.35 The mutation and the informative SNP are 4.3 kb apart (Online Supplementary Figure S5A and B). We compared the direct cloning of the entire 4.3 kb region (Online Supplementary Figure S5C) to the Alpha-Cas method for allele-phasing (Online Supplementary Figure S5D and E). Direct cloning and Alpha-Cas produced comparable results with the expected phasing observed in 91% of the Mi-seq sequencing reads, thus validating this method. In the Molt-4 cell line, LMO2 is activated via a distal microinsertion, creating once again a de novo MYB binding motif which leads to its ectopic monoallelic expression36,37 (Online Supplementary Figure S6A and B). This mutation is situated at a long distance from the informative SNP (75.7 kb) making direct cloning impossible, and the Alpha-Cas method proved, therefore, very useful. Alpha-Cas revealed the expected phasing in 93.8% of reads (Online Supplementary Figure S6C). Despite a low rate of allelic exchange occurring during Cas9 recombination, Alpha-Cas is a simple, efficient, and reliable method for allele-phasing, especially in the case of very distant variants.
3’ neo-enhancer: epigenetic profiling
Using the recently described ACT-seq method as an alternative to conventional ChIP-sequencing (see Methods), we observed the creation of the active 3’ neo-enhancer by the increased H3K27ac and H3K4me1 enrichment at the microinsertion in J-3’NE #1, J-3’NE #2 and P-3’NE #1 de-
Haematologica | 108 May 2023 1263 ARTICLE - Diverse TAL1 deregulation mechanisms in T-ALL C. Smith et al.
Identi
Figure 2. CrispR-cas9 engineered cell lines mimic the 3´ neo-enhancer and proximal mutation. (A) Graphic representation of the different CrispR-cas9 derivative cell lines engineered. J-del derives from Jurkat. In this clone, the 5´super-enhancer (orange arrow) was deleted. J-3’NE #1 and J-3’NE #2 also derive from Jurkat. In these clones, the 21 bp microinsertion (red arrow) was introduced 3´ to the TAL1 locus and the 5´super-enhancer was deleted. P-3’NE #1, P-3’NE #2 and P-3’NE #3 derive from the TAL1- cell line Peer. In these clones, the 21 bp microinsertion was introduced 3´ to TAL1. Green and blue arrows represent the respective heterozygous SNP in the TAL1 3’ UTR. (B) TAL1 expression determined by real-time quantitative-polymerase chain reaction (RQ-PCR) in Jurkat, J-del, J-3’NE #1 and J-3’NE #2 derivative cell lines. Expression was normalized to the housekeeping gene GAPDH (n= 3, standard deviation [SD] is shown). (C) Cell proliferation analysis of Jurkat, J-3’NE #1 and J-del cell lines. Cell number was determined using the automated cell counter Countess (Invitrogen; ThermoFisher, Waltham, MA, USA). Three independent experiments were performed; mean cell number and SD (error bar) are shown. (D) TAL1 expression normalized to GAPDH in Jurkat, Peer and Peer derivative cell lines P-3’NE #1, P-3’NE #2 and P-3’NE #3 (n= 3, SD is shown). (E) TAL1 allelic expression in Peer derivative cell lines. Sanger sequencing chromatograms of the informative SNP in the 3’ UTR of TAL1 from genomic DNA (gDNA, left) or complementary DNA (cDNA, right) made from DNAse treated RNA in Peer, P-3’NE #1, P-3’NE #2, and P-3’NE #3. Red boxes highlight the SNP. (F) Luciferase reporter assay. A 556 bp fragment around the 3´neo-enhancer containing either the wild-type sequence (WT) or the mutant allele (MUT) was cloned upstream of luciferase and a minimal promoter in PGL4.23 plasmid. Constructs were electroporated into Jurkat cells. Firefly luciferase activity was measured after 24 hours, normalized to renilla luciferase activity to control for cell number and transfection efficiency, and expressed as a ratio relative to the activity of the WT sequence construct. Error bars are ±SD from three independent experiments. **P=0.004. (G) TAL1 Western blot in Jurkat, J-3’NE#1, Peer and P-3’NE#1 cell lines.

B A C F G D E Haematologica | 108 May 2023 1264 ARTICLE - Diverse TAL1 deregulation mechanisms in T-ALL C. Smith et al.
Figure 3. Neo-enhancer allele phasing. (A) TAL1 allelic expression analysis in J-3’NE #1. Sanger sequencing chromatograms of the informative SNP in the 3’ UTR of TAL1 from genomic DNA (gDNA, upper panel) or complementary DNA (cDNA, bottom panel) made from DNase treated RNA. Red box highlights the SNP. Allele A is expressed. (B) Schematic representation of the allele-phasing “AlphaCas” method. (C) After Cas9-mediated deletion, the region containing the 3’ UTR SNP and the microinsertion was amplified by polymerase chain reaction (PCR) and the PCR product was cloned in pBluescript SK+ plasmid. Representative chromatograms of 9 plasmid sequences are shown. Two clones showed SNP G (left) and wild-type (WT) 3’sequence (right), 6 clones showed SNP A and mutated (MUT) sequence and one clone showed SNP G and mutated sequence. (D) The PCR product was also barcoded and sequenced with Mi-seq. The pie chart represents the respective fractions of the different phasings. The majority of reads (81%) show the expected phasing (light blue and blue) with expressed SNP A phased with the microinsertion and the non-expressed SNP G phased with the WT sequence. A minority of reads (19%) show artefactual allele exchange (orange and beige).

A B C D Haematologica | 108 May 2023 1265 ARTICLE - Diverse TAL1 deregulation mechanisms in T-ALL C. Smith et al.
rivative cell lines (Figure 4A and B). The corresponding sequencing reads contained uniquely the mutated sequence confirming the monoallelic epigenetic activation of the mutated allele (Figure 4C). As control, we also observed an enrichment at the native 5’ super-enhancer in the unedited Jurkat cell line, which was lost in the J-3’NE #1, J3’NE #2 cell lines (Figure 4A). Using primers spanning the 3’ microinsertion site, we performed H3K27ac ChIP-qPCR and observed an increased enrichment in J-3’NE #1 cells compared to Jurkat cells (Figure 4D). We also carried out an allele specific H3K27ac ChIP-qPCR in J-3’NE #1 cells and observed an increased enrichment of this histone mark at the mutated allele compared to the WT allele (Figure 4E).
Microinsertions downstream of the TAL1 gene are recurrent in T-cell acute lymphoblastic leukemia and neo-enhancer activity depends on MYB transcription factor binding.
The 3´neo-enhancer is a rare but recurrent oncogenic event, as we identified another patient (UPNT-613) with a 6 bp microinsertion at the same genomic location from an independent series of 189 T-ALL samples screened for this mutation by Sanger sequencing. This mutation was also detected in its corresponding PDX model (Online Supplementary Figure S7A). Moreover, this patient displayed a high unresolved TAL1 expression (Figure 5A) and, like UPNT-802, this high TAL1 expression was stable in the PDX model (Figure 5B). Using Oxford Nanopore sequencing technology (Oxford Nanopore Technologies; Oxford, UK), we performed a targeted analysis of TAL1 expression in the two 3’NE samples (UPNT-802 and UPNT-613 PDX cells) and in two 5’SE samples (Jurkat cells and UPNT-525 PDX cells) (Figure 5C, Online Supplementary Figure S7B-D). Our results revealed differences in the transcription of the 5’region of the TAL1 gene between the 3’NE and 5’SE samples. Long amplicons were detected (S1/R2 primer pair) uniquely in 5’SE samples whereas 3’NE samples initiated transcription downstream of exon 1 without affecting the TAL1 open reading frame (ORF) (S3/R2 primer pair). We also detected transcription activated downstream of the TAL1 gene near the 3’NE. However, transcription initiated here was not specific to the 3’NE regulatory element but specific to TAL1+ samples, as it was detectable in both 3’NE and 5’SE samples and absent in the TAL1- sample (DND-41) (S9b/R5 primer pair). Similarly to the previously described 5’ superenhancer mutation, both the 3´ microinsertions in UPNT802 and UPNT-613 patient samples were predicted (JASPAR) to create a de novo binding site for MYB transcription factor and other known members of the TAL1 complex38 (Figure 5D, Online Supplementary Table S4) suggesting the creation of the 3’ neo-enhancer is dependent on MYB binding. Using primers spanning either the 5’ super-enhancer site in Jurkat cells (5’SE) or the 3’ microinsertion site (3’NE), we performed MYB ChIP qPCR and observed an increased
MYB enrichment at the 3’NE in J-3’NE #1 and P-3’NE #1 cells. As controls, we verified MYB enrichment at the 5’SE in Jurkat WT cells and its absence in Peer cells lacking MYBdriven super-enhancers (Figure 6A). MYB binding at the 3’NE was also detected in UPNT-802 PDX cells (Online Supplementary Figure S8A). Furthermore, to prove that the observed MYB binding was specific to the 3’mutated sequence, we performed an allele specific MYB ChIP-qPCR in J-3’NE #1, P-3’NE #1 cells and UPNT-802 cells and observed an increased MYB enrichment at the mutated allele compared to the WT allele (Figure 6B, Online Supplementary Figure S8B). In order to definitively link the MYB-dependent epigenetic activation of TAL1, we repressed MYB expression in Jurkat cells using an inducible dCas9-KRAB-MECP2 system with two sgRNA targeting the MYB promoter (Online Supplementary Figure S8C) and measured enhancer activity using a luciferase reporter assay. MYB silencing significantly reduced the enhancer activity associated with the mutated sequence (Figure 6C). Using the same inducible MYB repression system in J’3-NE#1 cells (Figure 6D) resulted in significantly reduced transcriptional and protein TAL1 expression (Figure 6E), demonstrating the essential role of MYB TF for TAL1 expression in these cells. LMO1, whose expression is also driven by a MYB-dependent neo-enhancer in Jurkat cells, served as a positive control (Online Supplementary Figure S8D).
Discussion
TAL1 is a major oncogene in both adult and pediatric TALL. Intriguingly, the mechanisms leading to TAL1 overexpression are extremely diverse. Genetic rearrangements of the TAL1 gene such as SIL-TAL1 microdeletions and TAL1 translocations with TCR loci (TRD or TRB) have long been described.12,13,24-26 More recently, we and others14,28 uncovered novel mutations in a non-coding region leading to oncogene activation via the creation of an oncogenic neo-enhancer upstream of TAL1. The discovery of these mutations represented a major conceptual advancement, highlighting the underestimated contribution of intergenic mutations in genomic alterations driving cancers. In this circumstance, somatic heterozygous microinsertions of variable size create de novo binding sites for MYB TF, leading to the recruitment of a multi-protein complex, epigenetic activation and TAL1 overexpression in leukemic cells. Since this discovery, similar 5’ non-coding mutations affecting two other major T-ALL oncogenes, LMO1 and LMO2, that are frequently co-deregulated with TAL1 were found.35,37
Intergenic non-coding mutations leading to oncogene deregulation are not limited to T-ALL. A pivotal example is the frequent TERT promoter mutations found in many aggressive solid cancers such as melanomas, glioblastomas,
Haematologica | 108 May 2023 1266 ARTICLE - Diverse TAL1 deregulation mechanisms in T-ALL C. Smith et al.
Figure 4. Epigenetic profiling in Jurkat and Peer derivative cell lines. (A) ACT-sequencing (seq) tracks for H3K27ac, H3K4me1 and H3K4me3 histone marks in Jurkat, J-3’NE #1, and J-3’NE #2 derivative cell lines centered over the TAL1 locus. Orange arrow highlights the 5’super-enhancer present in wild-type (WT) Jurkat; red arrow highlights the 3’microinsertion present in J-3’NE #1 and J-3’NE #2. (B) ACT-seq tracks for H3K27ac, H3K4me1, and H3K4me3 histone marks over the TAL1 locus in Peer and P-3’NE #1 derivative cell lines. Red arrow highlights the 3’microinsertion present in P-3’NE #1 cell line. (C) H3K27ac and H3K4me1 ACTseq reads in J-3’NE #2 and P-3’NE #1 over the 3’microinsertion site. All reads contain the mutation. (D) Enrichment of H3K27ac at the 3’microinsertion site in Jurkat and J-3’NE #1 cells as assayed by chromatin immunoprecipitation sequencing (ChIP-seq)quantitative polymerase chain reaction (qPCR) using primers spanning the 3’microinsertion. Mean of three independent experiments with the Standard Deviation (SD) error bar is shown. (E) Enrichment of H3K27ac of the WT or mutant (MUT) allele at the 3’microinsertion site in J-3’NE #1 cells as assayed by ChIP-qPCR using WT specific or MUT specific primers. The mean of three independent experiments and the SD error bar are shown.

A B C D E Haematologica | 108 May 2023 1267 ARTICLE - Diverse TAL1 deregulation mechanisms in T-ALL C. Smith et al.
medulloblastomas, and hepatocellular carcinomas.39 These non-coding mutations occur in the promoter region of TERT and create de novo binding sites for ETS TF, increase chromatin accessibility of the mutant alleles, and cause an epigenetic switch. Finally, a rare, recurrent non-coding
mutation in the promoter region of TAL1 was discovered in two pediatric T-ALL samples. The authors showed that this mutation creates a de novo binding site for YY1 TF and leads to TAL1 activation.27

In the present work, by combining histone ChIP-seq and
Figure 5. 3’NE TAL1 transcription analysis. (A) TAL1 expression was measured by real-time-quantitative polymerase chain reaction RQ-PCR in an independent series of 189 T-cell acute lymphoblastic leukemia (T-ALL). TAL1 expression was normalized to ABL and GAPDH expression and presented according to TAL1 deregulation mechanism, when known. 3’microinsertions are annotated 3’NE. (B) TAL1 expression in diagnostic and patient-derived xenograft (PDX) 3’NE samples. Expression was normalized to GAPDH. (C) Schematic representation of the TAL1 locus showing the positions of the several primers used to amplify different TAL1 transcripts by non-quantitative reverse transcriptase-PCR. TAL1 exons are shown in green (top). Agarose gel analysis of TAL1 and FAS amplicons before long read sequencing. Red stars denote PCR primer dimers. FAS was used as a positive PCR control (bottom). (D) 3’mutations are predicted to create MYB binding sites (JASPAR).
A C D B Haematologica | 108 May 2023 1268 ARTICLE - Diverse TAL1 deregulation mechanisms in T-ALL C. Smith et al.
gene expression data analysis we identified a rare but recurrent novel oncogenic neo-enhancer responsible for TAL1 activation in T-ALL with unknown deregulation mechanisms. By a mechanism analogous to TAL1 5’SE mutations, we demonstrated that 3’NE mutations create a de novo binding site for MYB TF, which drives the deposition of the observed epigenetic marks and aberrant expression of TAL1, probably via its recruitment of CBP/p300 and members of
the TAL1 complex (or core regulatory circuit, CRC).38 Interestingly, these novel microinsertions are the first oncogenic neo-enhancers found downstream of the TAL1 gene. This characteristic is in line with the enhancers’ independent position. Enhancers can be located upstream or downstream of a regulated gene and interact with proximal regulatory elements in the vicinity of transcription start sites, sometimes via long-range chromatin loops.40,41 These types
Figure 6. The neo-enhancer activity is MYB dependent. (A) Enrichment of MYB at 5’super-enhancer (5’SE) or 3’microinsertion site (3’NE) in Jurkat, J-3’NE#1, Peer, and P-3’NE#1 cells using primers spanning the 5’SE or 3’NE, respectively. Mean of three independent experiments and the standard deviation (SD error) bar are shown. (B) Enrichment of MYB at wild-type (WT) or mutated (MUT) alleles at the 3’NE in J-3’NE #1 or P-3’NE #1 cells as assayed by chromatin immunoprecipitation (ChIP)-quantitative-polymerase chain reaction (qPCR) using WT-specific or MUT-specific primers. The mean of three independent experiments and the Standard Deviation (SD) error bar are shown. (C) Luciferase reporter assay using either the WT or MUT allele sequence upon MYB knockdown. Firefly luciferase activity was measured after 24 hours, normalized to renilla luciferase activity to control for cell number and transfection efficiency, and expressed as a ratio relative to the activity of the WT sequence construct. Mean and SD error bar from three independent experiments. (D) Using a repressive doxycycline inducible-dCas9-KRABMeCP2 system and two different sgRNA targeting the MYB locus, MYB was knockdown in the J-3’NE #1 cell line resulting in significantly decreased MYB transcriptional expression (n=4, mean and SD shown). (E) MYB inhibition led to significantly decreased transcriptional TAL1 expression assessed by RQ-PCR and normalized to GAPDH compared to sgRNA control (n=4, mean and SD shown) (top) and decreased TAL1 protein expression: Western blot showing dCas9, MYB, TAL1 and GAPDH protein expression corresponding to the upper expression graph (bottom). ns: not significant.

A B C E D Haematologica | 108 May 2023 1269 ARTICLE - Diverse TAL1 deregulation mechanisms in T-ALL C. Smith et al.
of long-range interactions may be a consequence of genetic alterations at more distant loci and could be pertinent deregulation mechanisms underlining outstanding unresolved monoallelic TAL1 expression in T-ALL. A systematic analysis of histone ChIP-seq data in such cases could be an efficient way to discover potential distant oncogenic neo-enhancers and should be investigated in further studies.
In addition to identifying 3’microinsertions, we demonstrated the mutation’s exclusive presence on the aberrantly-expressed allele using allele phasing. This is also true for TAL1 5’SE mutations and LMO1 and LMO2 intergenic neo-enhancer mutations. These results were expected but had not yet been proven. We circumvented the challenges of phasing distant variants in these cases by developing a new technique based on CRISPR-Cas9 genome editing technology, called Alpha-Cas, to bring these variants closer and facilitate allele phasing analysis. This method is easy to implement and could provide a useful tool to phase potentially very distant mutations and oncogenes.
Disclosures
No conflicts of interest to disclose.
Contributions
VA, AT and CP conceived and designed the study. AT, CS, AG, DW, EA, AR, MM, AP and OM performed the experiments. AM, UT, ES and KB analyzed the sequencing data. All authors critically reviewed the manuscript.
References
1. Ferrando AA, Neuberg DS, Staunton J, et al. Gene expression signatures define novel oncogenic pathways in T cell acute lymphoblastic leukemia. Cancer Cell. 2002;1(1):75-87.
2. Marks DI, Paietta EM, Moorman AV, et al. T-cell acute lymphoblastic leukemia in adults: clinical features, immunophenotype, cytogenetics, and outcome from the large randomized prospective trial (UKALL XII/ECOG 2993). Blood. 2009;114(25):5136-5145.
3. Rivera GK, Raimondi SC, Hancock ML, et al. Improved outcome in childhood acute lymphoblastic leukaemia with reinforced early treatment and rotational combination chemotherapy. Lancet. 1991;337(8733):61-66.
4. Huguet F, Chevret S, Leguay T, et al. Intensified therapy of acute lymphoblastic leukemia in adults: report of the randomized GRAALL-2005 clinical trial. J Clin Oncol. 2018;36(24):25142523.
5. Desjonquères A, Chevallier P, Thomas X, et al. Acute lymphoblastic leukemia relapsing after first-line pediatricinspired therapy: a retrospective GRAALL study. Blood Cancer J. 2016;6(12):e504.
6. Bond J, Graux C, Lhermitte L, et al. Early response-based therapy stratification improves survival in adult early thymic precursor acute lymphoblastic leukemia: a Group for Research on Adult Acute Lymphoblastic Leukemia study. J Clin Oncol. 2017;35(23):2683-2691.
7. Dik WA, Brahim W, Braun C, et al. CALM-AF10+ T-ALL expression profiles are characterized by overexpression of HOXA and BMI1 oncogenes. Leukemia. 2005;19(11):1948-1957.
Acknowledgments
The authors would like to thank the Genomics and Proteomics Core facilities at DKFZ and the Transcriptomics and Genomics, Marseille-Luminy platform for sequencing the ChIP-seq samples. We would also like to thank Guillaume Charbonnier for his help processing the NGS data and Frederic Tores from the bioinformatics platform of Imagine Institute for the ONT analysis.
Funding
The study was supported in part by the Helmholtz-Foundation. AT was supported by a DKFZ postdoctoral fellowship. The work in the VA lab was supported by ARC-Labellisation and the associations “Force Hémato” and “Laurette Fug ain.” This study was also supported in the lab by grants from INCA PLBIO18-031, PLBIO 201800252, and ITMO Cancer Epig-2015 (to VA and SS). SS was supported by the Ligue Contre le Cancer (labeling 2018) and the RNA-sequencing was funded by LIGUE. This work was also supported by La Fondation pour la Recherche Médicale with grant FDT202012010638 (to CS). The ONT sequencing was also supported by ANR funding KREM-AIF (ANR-21-CE17-0014-02) (to EA).
Data-sharing agreement
Data generated during this study hav e been submitted to the NCBI Gene Expression Omnibus repository under the accession number GSE200860.
8. Kennedy MA, Gonzalez-Sarmiento R, Kees UR, et al. HOX11, a homeobox-containing T-cell oncogene on human chromosome 10q24. Proc Natl Acad Sci U S A. 1991;88(20):8900-8904.
9. Bernard OA, Busson-LeConiat M, Ballerini P, et al. A new recurrent and specific cryptic translocation, t(5;14)(q35;q32), is associated with expression of the Hox11L2 gene in T acute lymphoblastic leukemia. Leukemia. 2001;15(10):1495-1504.
10. Van Vlierberghe P, Homminga I, Zuurbier L, et al. Cooperative genetic defects in TLX3 rearranged pediatric T-ALL. Leukemia. 2008;22(4):762-770.
11. Homminga I, Pieters R, Langerak AW, et al. Integrated transcript and genome analyses reveal NKX2-1 and MEF2C as potential oncogenes in T cell acute lymphoblastic leukemia. Cancer Cell. 2011;19(4):484-497.
12. Begley CG, Aplan PD, Davey MP, et al. Chromosomal translocation in a human leukemic stem-cell line disrupts the T-cell antigen receptor delta-chain diversity region and results in a previously unreported fusion transcript. Proc Natl Acad Sci U S A. 1989;86(6):2031-2035.
13. Brown L, Cheng J-T, Chen Q, et al. Site-specific recombination of the tal-1 gene is a common occurrence in human T cell leukemia. EMBO J. 1990;9(10):3343-3351.
14. Navarro J-M, Touzart A, Pradel LC, et al. Site- and allelespecific polycomb dysregulation in T-cell leukaemia. Nat Commun. 2015;6:6094.
15. Mansour MR, Abraham BJ, Anders L, et al. An oncogenic superenhancer formed through somatic mutation of a noncoding
Haematologica | 108 May 2023 1270 ARTICLE - Diverse TAL1 deregulation mechanisms in T-ALL C. Smith et al.
intergenic element. Science. 2014;346(6215):1373-1377.
16. Xia Y, Brown L, Yang CY, et al. TAL2, a helix-loop-helix gene activated by the (7;9)(q34;q32) translocation in human T-cell leukemia. Proc Natl Acad Sci U S A. 1991;88(24):11416-11420.
17. Mellentin JD, Smith SD, Cleary ML. lyl-1, a novel gene altered by chromosomal translocation in T cell leukemia, codes for a protein with a helix-loop-helix DNA binding motif. Cell. 1989;58(1):77-83.
18. Wang J, Jani-Sait SN, Escalon EA, et al. The t(14;21)(q11.2;q22) chromosomal translocation associated with T-cell acute lymphoblastic leukemia activates the BHLHB1 gene. Proc Natl Acad Sci U S A. 2000;97(7):3497-3502.
19. Royer-Pokora B, Loos U, Ludwig WD. TTG-2, a new gene encoding a cysteine-rich protein with the LIM motif, is overexpressed in acute T-cell leukaemia with the t(11;14)(p13;q11). Oncogene. 1991;6(10):1887-1893.
20. McGuire EA, Hockett RD, Pollock KM, Bartholdi MF, O’Brien SJ, Korsmeyer SJ. The t(11;14)(p15;q11) in a T-cell acute lymphoblastic leukemia cell line activates multiple transcripts, including Ttg-1, a gene encoding a potential zinc finger protein. Mol Cell Biol. 1989;9(5):2124-2132.
21. Clappier E, Cuccuini W, Kalota A, et al. The C-MYB locus is involved in chromosomal translocation and genomic duplications in human T-cell acute leukemia (T-ALL), the translocation defining a new T-ALL subtype in very young children. Blood. 2007;110(4):1251-1261.
22. Herblot S, Steff A, Hugo P, Aplan PD, Hoang T. SCL and LMO1 alter thymocyte differentiation: inhibition of E2A-HEB function and pre-Tα chain expression. Nat Immunol. 2000;1(2):138-144.
23. Zhang JA, Mortazavi A, Williams BA, Wold BJ, Rothenberg EV. Dynamic transformations of genome-wide epigenetic marking and transcriptional control establish T cell identity. Cell. 2012;149(2):467-482.
24. Bernard O, Guglielmi P, Jonveaux P, et al. Two distinct mechanisms for the SCL gene activation in the t(1;14) translocation of T-cell leukemias. Genes Chromosom Cancer. 1990;1(3):194-208.
25. Cauwelier B, Dastugue N, Cools J, et al. Molecular cytogenetic study of 126 unselected T-ALL cases reveals high incidence of TCRb locus rearrangements and putative new T-cell oncogenes. Leukemia. 2006;20(7):1238-1244.
26. Le Noir S, Ben Abdelali R, Lelorch M, et al. Extensive molecular mapping of TCRalpha/delta- and TCRbeta-involved chromosomal translocations reveals distinct mechanisms of oncogene activation in T-ALL. Blood. 2012;120(16):3298-3309.
27. Liu Y, Li C, Shen S, et al. Discovery of regulatory noncoding variants in individual cancer genomes by using cis-X. Nat Genet. 2020;52(8):811-818.
28. Mansour MR, Abraham BJ, Anders L, et al. Oncogene regulation. An oncogenic super-enhancer formed through somatic mutation of a noncoding intergenic element. Science. 2014;346(6215):1373-1377.
29. Ferrando AA, Herblot S, Palomero T, et al. Biallelic transcriptional activation of oncogenic transcription factors in T-cell acute lymphoblastic leukemia. Blood. 2004;103(5):1909-1911.
30. Tan TK, Zhang C, Sanda T. Oncogenic transcriptional program driven by TAL1 in T-cell acute lymphoblastic leukemia. Int J Hematol. 2019;109(1):5-17.
31. Carter B, Ku WL, Kang JY, et al. Mapping histone modifications in low cell number and single cells using antibody-guided chromatin tagmentation (ACT-seq). Nat Commun. 2019;10(1):3747.
32. Liu C-S, Toth R, Bakr A, et al. Epigenetic modulation of radiation-induced diacylglycerol kinase alpha expression prevents pro-fibrotic fibroblast response. Cancers. 2021;13(10):2455.
33. Cieslak A, Charbonnier G, Tesio M, et al. Blueprint of human thymopoiesis reveals molecular mechanisms of stage-specific TCR enhancer activation. J Exp Med. 2020;217(9):e20192360.
34. Belhocine M, Simonin M, Abad Flores JD, et al. Dynamic of broad H3K4me3 domains uncover an epigenetic switch between cell identity and cancer-related genes. Genome Res. 2022;32(7):13281342.
35. Hu S, Qian M, Zhang H, et al. Whole-genome noncoding sequence analysis in T-cell acute lymphoblastic leukemia identifies oncogene enhancer mutations. Blood. 2017;129(24):3264-3268.
36. Abraham BJ, Hnisz D, Weintraub AS, et al. Small genomic insertions form enhancers that misregulate oncogenes. Nat Commun. 2017;8(1):14385.
37. Rahman S, Magnussen M, León TE, et al. Activation of the LMO2 oncogene through a somatically acquired neomorphic promoter in T-cell acute lymphoblastic leukemia. Blood. 2017;129(24):3221-3226.
38. Sanda T, Lawton LN, Barrasa MI, et al. Core transcriptional regulatory circuit controlled by the TAL1 complex in human T cell acute lymphoblastic leukemia. Cancer Cell. 2012;22(2):209-221.
39. Rachakonda S, Hoheisel JD, Kumar R. Occurrence, functionality and abundance of the TERT promoter mutations. Int J Cancer. 2021;149(11):1852-1862.
40. Kim S, Shendure J. Mechanisms of interplay between transcription factors and the 3D genome. Mol Cell. 2019;76(2):306-319.
41. Bulger M, Groudine M. Functional and mechanistic diversity of distal transcription enhancers. Cell. 2011;144(3):327-339.
Haematologica | 108 May 2023 1271 ARTICLE - Diverse TAL1 deregulation mechanisms in T-ALL C. Smith et al.
Venetoclax and dinaciclib elicit synergistic preclinical efficacy against hypodiploid acute lymphoblastic leukemia
Correspondence: E. Diaz-Flores ernesto.diaz-flores@ucsf.edu ernesto.diaz.flores@gmail.com
Received: May 20, 2022.
Accepted: January 13, 2023.
1Department of Pediatrics, Benioff Children’s Hospital, and the Helen Diller Family Comprehensive Cancer Center, University of California, San Francisco, CA; 2Department of Pediatrics, Banner University Medical Center and the University of Arizona Cancer Center, Tucson, AZ; 3Small Molecule Discovery Center, Department of Pharmaceutical Chemistry, University of California, San Francisco, CA; 4Division of Hematology/Oncology, Department of Medicine, University of California San Francisco, San Francsico, CA; 5Computation Biology and Informatics Core at the Helen Diller Family Comprehensive Cancer Center, University of California, San Francisco, CA; 6Department of Epidemiology and Biostatistics, University of California, San Francisco, CA; 7Ben Towne Center for Childhood Cancer Research, Seattle Children’s Research Institute and 8Department of Pediatrics, Seattle Children’s Hospital, University of Washington, Seattle, WA, USA
Abstract
Early view: January 26, 2023. https://doi.org/10.3324/haematol.2022.281443
©2023 Ferrata Storti Foundation
Published under a CC BY-NC license
Hypodiploid acute lymphoblastic leukemia (ALL) is an aggressive blood cancer with a poor prognosis despite intensive chemotherapy or stem cell transplant. Children and adolescents with positive end-of-induction minimal residual disease have an overall survival lower than 30%. However, data regarding therapeutic alternatives for this disease is nearly nonexistent, emphasizing the critical need for new or adjunctive therapies that can improve outcomes. We previously reported on the therapeutic efficacy of venetoclax (ABT-199) in hypodiploid B-lineage ALL but with limitations as monotherapy. In this study, we set out to identify drugs enhancing the anti-leukemic effect of venetoclax in hypodiploid ALL. Using a highthroughput drug screen, we identified dinaciclib, a cyclin-dependent kinase inhibitor that worked synergistically with venetoclax to induce cell death in hypodiploid cell lines. This combination eradicated leukemic blasts within hypodiploid ALL patient-derived xenografts mice with low off-target toxicity. Our findings suggest that dual inhibition of BCL-2 (venetoclax) and CDK9/MCL-1 (dinaciclib) is a promising therapeutic approach in hypodiploid ALL, warranting further investigation to inform clinical trials in this high-risk patient population.
Introduction
The outcome of therapy for childhood acute lymphoblastic leukemia (ALL) has shown significant improvement over time, with expected cure rates exceeding 85%.1 However, despite intensive risk-adapted chemotherapy regimens, children with certain ALL subtypes continue to have very poor prognosis.2 Hypodiploid ALL with fewer than 44 chromosomes presents a distinct genetic profile3 and high relapse rate, particularly in patients who are slow to respond to induction.2,4,5 Hypodiploid ALL is subclassified based on karyotype into high-hypodiploid (HH; 40-43 chromosomes), low-hypodiploid (LH; 32-39 chromosomes), and near-haploid (NH; 24-31 chromosomes), with an 8-year overall survival (OS) of 50%, 40%, and 34% re-
spectively.6 For patients with minimal residual disease (MRD) >0.01%, the 5-year event-free survival (EFS) is 2729% and has not improved in children undergoing allogeneic hematopoietic cell transplantation (HCT).2,4,5 These poor outcomes emphasize the need to identify curative therapies. Furthermore, the high rate of germline TP53 mutations in LH B-lineage ALL (B-ALL) and its association with the cancer-predisposing Li-Fraumeni syndrome requires careful consideration, as such mutations may blunt the efficacy of therapies exerting p53-mediated mechanisms and increase potential acute and late toxicities of current cytotoxic therapies.3
In our previous study, we identified that the survival protein BCL-2 is significantly upregulated in hypodiploid leukemia.7 Through in vivo studies, we demonstrated the
Holly Pariury,1,2 Joshua Fandel,1 Stefanie Bachl,1 Kenny K. Ang,3 Sarine Markossian,3 Chris G. Wilson,3 Benjamin S. Braun,1 Bogdan Popescu,4 Margo Wohlfeil,1 Kyle Beckman,1 Simayijiang Xirenayi,1 Ritu P. Roy,4 Adam B. Olshen,5,6 Catherine Smith,4 Michelle R. Arkin,3 Mignon L. Loh7,8 and Ernesto Diaz-Flores1
Haematologica | 108 May 2023 1272 ARTICLE
- Acute Lymphoblastic Leukemia
significance of BCL-2 as a viable therapeutic target.7 We demonstrated rapid clearance of leukemic blasts from peripheral blood (PB), few off-target toxicities, and marked improvement in OS of patient-derived xenograft (PDX) mice treated with venetoclax (ABT-199) monotherapy, with survival of 85% versus only 15% in untreated mice. Subsequent clinical trials in adult patients with hematologic malignancies have shown the high therapeutic potential of venetoclax.8-13 Through a multicenter collaboration, our studies contributed to the opening of the first phase I study of venetoclax combined with chemotherapy in pediatric patients with relapsed or refractory acute leukemias and other cancers (clinicaltrials gov. Identifier: NCT03181126).8 However, our studies also demonstrated that venetoclax monotherapy was limited by persistence of leukemic blasts in liver and spleen, as well as positive minimal residual disease (MRD) in the bone marrow (BM) of most mice at endof-therapy.
In order to inform a therapeutic approach that capitalizes on the rapid reduction of leukemic burden by venetoclax while overcoming its limitations as monotherapy, we set out to identify compounds that could synergize with venetoclax (either intrinsically or by having complementary tissue distribution), maximizing its anti-leukemic efficacy while preserving low off-target toxicity, with the ultimate goal to improve outcomes for hypodiploid B-ALL patients.
Methods
Preclinical trial design
Over 40 NSG mice of equal sex were injected with three distinct primary human hypodiploid leukemia samples. In order to enroll mice simultaneously in the trial, we selected those showing ≥1% hCD45 in PB or 5x10⁷ units by bioluminescent imaging 4 weeks after injection, 23 mice total (8 NH 1, 8 NH2 and 7 NH3). Mice were randomized to receive vehicle or drugs, either with dimethyl sulfoxide (DMSO) control, venetoclax monotherapy, dinaciclib monotherapy or combination therapy (venetoclax and dinaciclib). Venetoclax was delivered on a weekly schedule of 5 days on, 2 days off (50 mg/kg via oral gavage with a 3-day dose escalation starting at 12.5 mg/kg dose). Dinaciclib was delivered twice weekly (20 mg/kg intraperitonally) or as a combination of venetoclax and dinaciclib. Venetoclax was formulated as previously reported10 and dinaciclib was reconstituted in 20% hydroxypropyl bcyclodextrin.
High-throughput screening
High-throughput screening (HTS) was performed by the HTS Core Facility (Small Molecule Discovery Center) at the University of California, San Francisco (UCSF). NALM-16 cells were screened against a bioactive pathway inhibitor
library (SelleckChem), including Food and Drug Adminstration (FDA)-approved anti-cancer agents and small molecule inhibitors. Cells were treated with each compound at 2-fold serial dilution doses starting from 20 mM and growth inhibition was measured at 48 and 96 hours (h). Growth inhibition was assessed using viability/apoptosis assays. The average Z’ factor for the assay was 0.83+/0.01. Scatterplot analysis of the average percentage growth inhibition was performed to identify compounds that significantly inhibited growth.
Lentiviral transduction
HEK293T cells were transfected with 2 mg of PMD2.G, 6 mg of psPAX2 and 8 m g of the transfer plasmid of interest using 48 mL TransIT LT1 (Mirus) as per their protocol. The supernatant was collected after 72 h, concentrated with Lenti-X Concentrator (Takara Bio, JP), and resuspended in 600 ml HEK medium (50x concentration).
Generation of stable isogenic cell lines with MCL-1 overexpression or knockout via short hairpin RNA
NALM-16 cells (7x10⁶) were transduced with 250 m L of concentrated virus in the presence of polybrene (6 m g/mL). After 48 h, transduced cells were selected via EGFP fluorescence-activated cell sorting (FACS) sorting or puromycin selection (2 m g/mL). After 72 h, viable cells were isolated using a magnetic LeviCell sorting system (LevitasBio), washed, and resuspended in RPMI1640 plus 10% fetal bovine serum.
Patient-derived xenograft samples
PDX samples were obtained from St Jude Children’s Research Hospital. All samples were de-identified and, thus this study was exempt from the UCSF Institutional Review Board. Tumor cells were previously transduced with lentiviral vCL20SF2-Luc2aYFP vector for stable expression of luciferase for live imaging.7
See the Online Supplementary Appendix for additional materials and methods.
Results
High-throughput drug screening identifies compounds with high in vitro efficacy against hypodiploid acute lymphoblastic
leukemia cell lines
In order to capitalize on the rapid reduction of leukemic burden with venetoclax, we set out to identify drugs with efficacy as single agents against hypodiploid B-ALL that could either synergize with venetoclax mechanistically or demonstrate efficacy both in vitro and through preclinical studies in internal organs where venetoclax showed suboptimal results. For this purpose, we performed an unbiased HTS, which utilized a library of 1,835
Haematologica | 108 May 2023 1273 ARTICLE - BCL-2/CDK9 Inhibition eradicates hypodiploid ALL H. Pariury et al.
small molecules from the SelleckChem Bioactive Compound Library that included traditional chemotherapeutic agents, small molecules, and novel compounds. We first assessed growth inhibition to screen compounds at a fixed concentration (125 nM) against NALM16 cells, a human near haploid pre-B-ALL cell line harboring a TP53 mutation. At this dose, over 30 compounds demonstrated inhibitory efficacy greater >50% at 48 h (Figure 1A; Online Supplementary Table S1). Several drug classes were highly represented by those top 30 compounds including those targeting the proteasome, histone deacetylases (HDAC), cyclin-dependent kinases (CDK), and microtubules. We then assessed the efficacy of the top 30 drugs from this initial screen in all three available molecularly distinct NH pre-B-ALL cell lines (NALM-16, MHH-CALL-2, and BECK-1732) (Figure 1A; Online Supplementary Figure S1A ). For this secondary screen, we ran dose response assays at 48 and 96 h (On-
line Supplementary Figure S1B). The half-maximal effective concentration (EC50) of each compound was determined, as shown in the Online Supplementary Table S2. Twelve compounds representing six different drug classes showed EC 50 values at or below 0.2 nM in all three cell lines.
The top five compounds (bortezomib, dinaciclib, paclitaxel, quisinostat, and panobinostat) representing four drug classes (proteasome, CDK, microtubule, and HDAC inhibitors) were selected based on their observed inhibitory efficacy in all three hypodiploid cell lines, known toxicity profile, and clinical availability to undergo further validation of their efficacy for hypodiploid ALL. Among them, dinaciclib (a CDK inhibitor) and bortezomib (a proteasome inhibitor) had the most profound impact starting at 24 h with EC 50 values <100 nM as single drugs (Figure 1B, C; Online Supplementary Figure S1C).
Figure 1. High-throughput screening identifies compounds with high in vitro efficacy against hypodiploid cell lines. (A) Primary drug screening was performed using NALM-16 cells dispensed in 384 plates and subjected to a library of small molecules/bioactive compounds, tested at 0.125 m M. After culturing, growth inhibition was measured using a luminescent cell viability assay and top hits were selected. Negative controls (green circles) represent untreated cells. Positive controls (red circles) represent wells without cells to approximate total inhibition. Hits (yellow circles) were selected from test compounds (grey circles) that exhibited greater than 50% inhibition. The 30 compounds with greatest proliferation inhibition were selected and used for a secondary screening using a range of concentrations in the three hypodiploid cell lines, NALM-16, BECK-1732 and MHH-CALL. (B) Graphs indicate % of viability in NALM-16, BECK-1732 and MHHCALL-2 cells subjected to increasing concentrations of the top 5 compounds. (C) Half-maximal effective concentration (EC50) values (µM) for the top 5 compounds in NALM-16, BECK-1732 and MHHCALL-2 cells are shown at 24 hours.

A B C Haematologica | 108 May 2023 1274 ARTICLE - BCL-2/CDK9 Inhibition eradicates hypodiploid ALL H. Pariury et al.
Bliss scoring identifies dinaciclib as best combination partner with venetoclax
In order to evaluate whether any of the top five compounds identified in our screen acted synergistically with venetoclax, NALM-16 cells were treated with each compound alone and in combination with venetoclax. Dinaciclib showed the highest synergy with 97% growth inhibition in combination with venetoclax and a Bliss score of 0.32 (values >0 indicate synergy)14 at 24 h (Figure 2A). We then validated the efficacy of venetoclax plus dinaciclib in all three hypodiploid cell lines using a serial 2-fold dilution ranging from 8-500 nM. Viability was measured at 24 and 48 h. Percentage of inhibition and BRAID synergy models 15 are represented with isobolograms in Figure 2B, C and Online Supplementary Figure S2A , with a positive k value indicating synergy and a negative value indicating antagonism. This combination was highly synergistic ( k>1 ) in NALM-16 and MHH-CALL2 cell lines. Added synergy was not seen in BECK-1732, given that venetoclax monotherapy at low concentrations was highly efficacious in this cell line ( Online Supplementary Figure S2B ). Similarly, bortezomib showed great efficacy as a single agent in all three cell lines with marginal to no synergy when combined with venetoclax (Online Supplementary Figure S2C). Taken together, these results identified dinaciclib as the best agent to pair with venetoclax for further study in hypodiploid ALL cell lines and led to the pursuit of the mechanism underlying the synergistic combination of venetoclax with dinaciclib.

Dinaciclib exerts its inhibitory effect through CDK9 inhibition
Dinaciclib is a first-generation pan-CDK inhibitor with re-
ported efficacy against CDK1, 2, 5, and 9.16 While CDK1 regulates the G2/M cell cycle checkpoint, controlling cell division, and CDK2 regulates the RB1 cell cycle checkpoint to enter in S-phase, CDK5 and CDK9 have non-cell cycle functions.17 We previously reported that hypodiploid B-ALL frequently presents with mutations in cell cycle regulators including TP53 (mutated in 91% of LH patients) and RB1 alterations (41% and 9% of LH and NH patients, respectively).3 Furthermore, alterations in CDKN2A , encoding for the tumor suppressor p16, which modulates the G1 checkpoint, were seen in 24% of cases in hypodiploid ALL. In order to discern whether the sensitivity of hypodiploid ALL cells to dinaciclib was cell cycle-dependent, we initially subjected the three hypodiploid BALL cell lines to seven CDK inhibitors with a diverse spectrum of efficacy against CDK 1-9 at 24 and 48 h (Figure 3A). Of the seven compounds tested, only flavopiridol and SNS-032, both sharing the targets CDK2 and CDK9 with dinaciclib, showed high efficacy similar to dinaciclib against hypodiploid cell lines. Importantly, roscovitine, which shares CDK1, 2 and 5 targets with dinaciclib but not CDK9, did not affect cell viability. Moreover, inhibitors targeting CDK4/6 (i.e., abemaciclib, palbociclib and ribociclib), had minimal effect, supporting the lack of efficacy observed with cell cycle inhibitors ( Online Supplementary Figure S2D). These results suggested that dinaciclib exerted its inhibitory effect in hypodiploid cells through inhibition of CDK9. In order to validate this observation, we subjected all three hypodiploid cells to NVP-2, a selective CDK9 inhibitor. NVP-2 showed similar efficacy as dinaciclib, as demonstrated by overlapping dose-dependent effects on proliferation and similar EC50 values (Figure 3B).
Figure 2. Dinaciclib demonstrates high synergy with venetoclax. (A) Summary of growth inhibition of indicated agents with and without venetoclax (nM) and Bliss score of the combinations in NALM-16 cells. (B) Isobologram illustration of synergy scores. (C) Synergy scores determined using an isobologram model, of NALM-16 cells treated for 24 hours with a combination of dinaciclib and venetoclax at 6 2-fold serial dilution doses ranging from 0.008-0.5 mM.
A B C Haematologica | 108 May 2023 1275 ARTICLE - BCL-2/CDK9 Inhibition eradicates hypodiploid ALL H. Pariury et al.
Dinaciclib induces cell death rather than cell arrest in hypodiploid acute lymphoblastic leukemia
We then evaluated whether dinaciclib exerted a cytotoxic effect beyond a decrease in proliferation on hypodiploid ALL cells. Using an apoptosis assay, we observed an increase in the levels of active (cleaved) caspase 3 in NALM16 cells exposed to increasing concentrations of dinaciclib for 24 h (Online Supplementary Figure S3A). Furthermore, we assessed the kinetics of apoptosis following dinaciclib treatment between 6 and 24 h, using induction of cleaved PARP and cleaved caspase 3 as the readout. Our data showed dose-dependent induction of cell death by 6 h, which was enhanced over 24 h (Online Supplementary Figure S3B). These findings further demonstrated the rapid cytotoxic activity of dinaciclib against hypodiploid cells in vitro.
Dinaciclib induces cell death in hypodiploid B-lineage acute lymphoblastic leukemia through inhibition of CDK9
In order to explore the underlying mechanism of the apoptotic effect of dinaciclib in hypodiploid ALL, and to better understand the biochemical basis behind the synergistic effect seen with venetoclax, we investigated the dose-dependent effects of dinaciclib on its reported targets (CDK1, 2 and 9) in NALM-16 cells. Based on our prior studies indicating high levels of the prosurvival proteins BCL-2, and MCL-1, and low levels of BCL-xL across all samples,7 we also analyzed the levels of BCL-2 and MCL1 following dinaciclib treatment (Online Supplementary Figure S3C). Increasing concentrations of dinaciclib re-
Figure 3. Dinaciclib exerts its inhibitory effect through CDK9 inhibition. (A) Summary of half-maximal effective concentration (EC50) values in NALM-16, BECK-1732 and MHHCALL-2 cells treated with inhibitors of CDK 1-9 at 48 hours (h). (B) Growth inhibition measured at 48 h using a luminescent cell viability assay in all 3 hypodiploid cells treated with the indicated agents, including NVP-2, a selective CDK9 inhibitor using 7 10fold serial dilution doses ranging from 0.000001-10 mM.
sulted in a significant reduction in CDK9 levels but not CDK1/2 by 6 h at 10 nM drug. Consistent with the known mechanisms of CDK9 phosphorylation of RNA polymerase II (RNA pol II) at Serine 218 (indicating transcription elongation), a decrease in RNA pol II (Ser2) phosphorylation was observed, with concomitant MCL-1 downregulation, a gene reported to be under transcriptional regulation of CDK9.16,17,19 BCL-2 levels were only reduced at high drug concentrations. Notably, the initial increase in MCL-1 at low nanomolar concentrations of dinaciclib did not correlate with changes in proliferation. The observation that MCL-1 levels are downregulated upon CDK9 inhibition were validated using NVP-2 with concomitant upregulation of the apoptotic marker cleaved PARP (Online Supplementary Figure S4).
We then sought to determine the time of onset and extent of apoptosis induced by dinaciclib and venetoclax alone and in combination (Figure 4). The rapid decrease of MCL1 levels, particularly evident from 2 h, demonstrates dinaciclib as an effective MCL-1 inhibitor. Moreover, these data indicate that reduction in RNA pol II (Ser2) and decrease in MCL-1 precedes induction of apoptosis in the absence of BCL-2 inhibition. Importantly, however, in conditions where BCL-2 has been inhibited by venetoclax, the reduction of MCL-1 levels coincides with the induction of apoptosis and occurs at concentrations 10-fold lower. These data suggest that dinaciclib inhibition primarily works through inhibition of MCL-1, and that in the absence of functional BCL-2 (e.g., in the presence of venetoclax), these cells become highly dependent on MCL-1 for survival. In order to validate such observations, we over-

A B Haematologica | 108 May 2023 1276 ARTICLE - BCL-2/CDK9 Inhibition eradicates hypodiploid ALL H. Pariury et al.
Figure 4. Apoptosis induction by dinaciclib, venetoclax and the combination in isogenic lines. NALM-16 cells were treated with dinaciclib, venetoclax or the combination for 2 hours and 8 hours. Levels of CDK9, RNA polymerase II phosphorylation on Ser 2 or Ser 5, prosurvival proteins MCL-1 and BCL-2, and the apoptosis marker cleaved caspase, are shown via western blotting.
expressed MCL-1, selected viable MCL-1-transduced cells (Online Supplementary Figure S5) and subjected them to dinaciclib, either alone or in combination with venetoclax. As shown in Online Supplementary Figure S6A, MCL-1 overexpression, while still under the control of CDK9, impairs the apoptotic effect of dinaciclib and venetoclax alone and more importantly the synergistic effect exerted by the two. Furthermore, downregulation of MCL-1 via short hairpin RNA recapitulated the dinaciclib enhancement of apoptosis by venetoclax as demonstrated by higher levels of cleaved caspase (and therefore apoptosis) at 10-fold lower concentrations (Online Supplementary Figure S6B).
Dinaciclib reduces viability in primary xenograft samples ex vivo

In order to further investigate the combination of dinaciclib and venetoclax in hypodiploid ALL cells, we queried the cancer dependency map (DepMap, http://depmap.org), an open-source repository of genetic and pharmacologic dependencies of cancer cell lines. At a gene expression level, both hypodiploid lines NALM-16 and MHH-CALL-2 showed higher co-expression of CDK9 and BCL-2 than most of the blood lineage cell lines (Figure 5). From a dependency perspective, we found the hypodiploid ALL cell line NALM-16 (data not available for MHH-CALL-2) to be highly genetically dependent on CDK9 compared to other ALL or AML, CLL and CML cell lines analyzed (Online Supplementary Figure S7A). Along these lines, MHH-CALL-2 cell line (data not available for NALM-16) is also more sensitive to dinaciclib and venetoclax compared to other blood cancer lines (Online Supplementary Figure S7B).
In order to validate the broader relevance of the CDK9 pathway in hypodiploid ALL, we looked at the RNA polymerase II/CDK9/MCL-1 complex in a gene expression database of hypodiploid B-ALL patients previously reported.7 This database compared 89 hypodiploid (LH- and
NH-) B-ALL samples to 24 non-hypodiploid B-ALL samples (Online Supplementary Figure S8A). This analysis demonstrated an overexpression of several genes within the mediator complex, working in coordination with CDK9 to mediate transcription, as well as MCL-1, in hypodiploid B-ALL compared to other diploid B-ALL (Online Supplementary Figure S8A, B). When analyzing transcript levels of MCL-1 across B-ALL of different genotypes we observed significantly elevated mRNA levels of MCL-1 levels in LH, masked LH (mLH with chromosomal reduplication), NH and masked NH (mNH) leukemias (Figure 6A). These levels are as high, or higher than, BCL-2 levels (Figure 6B). Consistent with our previously reported protein levels, mRNA levels of the proapoptotic markers (BIM, BAD and PUMA) counteracting BCL-2 and MCL-1 are also elevated in hypodiploid B-ALL (Online Supplementary Figure S9). In order to further validate dinaciclib as a potential therapeutic candidate, we tested its efficacy in five hypodiploid

Haematologica | 108 May 2023 1277 ARTICLE - BCL-2/CDK9 Inhibition eradicates hypodiploid ALL H. Pariury et al.
Figure 5. CDK9 and BCL-2 mRNA levels in hypodiploid acute lymphoblastic leukemia cell lines. Gene expression levels of CDK9 and BCL-2 in blood lineage cell lines (CCLE Expression 22Q2 Public dataset); values expressed as log2 transcript count per million (TPM); highlighted hypodiploid cell lines NALM-16 and MHH-CALL-2.
ALL xenografted patient samples ex vivo, including three LH (harboring mutations in TP53) and two NH (harboring deletions in the Ras-GAP gene NF1) samples (Online Sup-
plementary Table S3). Dinaciclib markedly reduced cell viability at low nanomolar concentrations within 24 h in the majority of the hypodiploid patient cells, with an observed
Comparison of MCL-1 (A) and BCL-2 (B) gene expression in hypodiploid B-lineage acute lymphoblastic leukemia (B-ALL) subtypes (low-hypodiploid [LH], masked low-hypodiploid (mLH), near-haploid [NH] and masked near-haploid [mNH]) vs. diploid B-ALL of different genotypes obtained from microarray data (GSE23237).
Figure

A B Haematologica | 108 May 2023 1278 ARTICLE - BCL-2/CDK9 Inhibition eradicates hypodiploid ALL H. Pariury et al.
6. MCL-1 and BCL-2 levels in B cell acute lymphoblastic leukemia patients.
increase in potency against NH versus LH cells (Online Supplementary Figure S10).
Preclinical efficacy of dinaciclib/venetoclax in hypodiploid acute lymphoblastic leukemia in patientderived xenograft mice
Given our primary interest in identifying drugs with therapeutic potential against hypodiploid leukemia, we next assessed the overall efficacy of dinaciclib alone or in combination with venetoclax in reducing hypodiploid leukemic burden in vivo. For this purpose, we set up a preclinical trial using NH PDX models from NH samples tagged with a luciferase reporter as previously described. Upon engraftment, mice meeting enrollment criteria were randomly assigned to one of four treatment arms: untreated, venetoclax monotherapy, dinaciclib monotherapy or combination therapy with venetoclax and dinaciclib. Consistent with previous results,7 venetoclax alone showed rapid and persistent near-clearance of circulating blasts from PB in all mice (6/6) as measured by hCD45 surface marker expression via flow cytometry (Figure 7A [average] and Online Supplementary Table S4 [by individual mice]) Such a response was accompanied by a significant reduction in overall leukemic burden throughout the trial as measured via bioluminescence imaging (BLI) (Figure 7B, C). Conversely, dinaciclib monotherapy had partial reduction in blasts from PB (3/6 mice) but showed limited effect on reducing leukemic burden as measured by BLI throughout the trial (Figure 7A-C). Consistent with our in vitro data however, the combination of venetoclax and dinaciclib showed a rapid and drastic overall reduction in both circulating blasts and overall leukemic burden in all mice (6/6) which persisted throughout the trial. Most importantly, end-of-trial analyses confirmed overall efficacy of the combination treatment, with a reduction of >97% of leukemic blasts from the bone marrow and liver of all mice as measured by %hCD45 (Figure 7C-E) as well as CD10, CD19 and CD20 (data not shown). Of note, two mice demonstrated greater than 2% hCD45/CD10/CD19-positive blasts within their spleens despite having 1% or less disease in all other organs. A single sample from each treatment arm was randomly selected for immunohistochemistry analysis at the end of the trial. Pathology analysis on these samples confirmed the complete clearance of leukemic blasts in spleen (data not shown) and liver in the mouse treated with combination therapy (Figure 7E).
Combination therapy with dinaciclib and venetoclax was well tolerated
During the first 7 days of combination therapy, the first two mice enrolled demonstrated fatigue and 5-7% weight loss, which improved with subcutaneous rehydration. For the remainder of the trial, all mice received a prophylactic subcutaneous fluid bolus on days 1 and 4 of the trial in
conjunction with their first two doses of dinaciclib. This intervention significantly reduced these symptoms for all additional mice enrolled on the combination arm. Overall, there was limited hematologic toxicity with the combination of venetoclax and dinaciclib (Online Supplementary Figure S11).
Discussion
Hypodiploid B-ALL is an aggressive leukemia with a dismal prognosis for those with slow induction responses despite risk-stratified chemotherapy regimens or HCT. Given the median age of these patients, those surviving aggressive chemotherapy regimens or HCT face significant life-long morbidities. Additionally, due to the frequency of TP53 mutations in LH ALL and its association Li-Fraumeni syndrome, these patients are at particularly high risk of therapy-related toxicities including treatment-related secondary malignancies.3,20 For these reasons, we sought to identify novel or adjunctive therapies that could improve patient outcomes while limiting adverse events and avoiding agents known to increase the risk of secondary malignancies.
Our high-throughput screen identified several classes of drugs – including proteasome, HDAC, CDK and microtubule assembly inhibitors – with high efficacy against hypodiploid leukemia cell lines. The focus of this work was to further interrogate compounds showing synergistic efficacy with venetoclax to capitalize on the rapid reduction of leukemic burden while providing additional efficacy against hypodiploid ALL. Thus, we focused on the combination of dinaciclib and venetoclax as this combination showed the highest synergy in vitro that translated to the in vivo studies.
Dinaciclib, an inhibitor of CDK1, 2, 5 and 9, has shown efficacy in DLBCL, CLL, T-ALL, and small cell lung cancer.19,21-23 It is well tolerated in phase I/II studies, with primary toxicities being transient laboratory abnormalities, tumor lysis syndrome, and limited marrow suppression.24-26 Due to its efficacy in preclinical models and clinical trials it was granted orphan drug designation for CLL by the FDA, and it remains under active study in clinical trials for various malignancies. However, to our knowledge there are no reports of its potential efficacy in primary B-ALL in vivo. Our work indicates that dinaciclib exerts its antileukemic effect on hypodiploid ALL through inhibition of CDK9 but not CDK1 or 2. CDK9 inhibition leads to inhibition and downregulation of RNA polymerase II with concomitant downregulation of the prosurvival protein MCL-1 as reported elsewhere.19,21,27-29 These data were confirmed with the use of another CDK9-specific inhibitor, NVP-2. We had previously reported that hypodiploid ALL cells display intermediate to high protein levels of MCL-17 and in this re-
Haematologica | 108 May 2023 1279 ARTICLE - BCL-2/CDK9 Inhibition eradicates hypodiploid ALL H. Pariury et al.
Figure 7. Preclinical study outcomes. (A) Average percentage of human CD45 (hCD45) in the peripheral blood of mice in each condition (5 vehicle and 6 in each drug condition) and (B) average of whole-body luciferase reporter expression, measured weekly in all 3 subtypes of hypodiploid acute lymphoblastic leukemia (ALL) patient-derived xenograft (PDX) mice treated on the preclinical trial, which included 4 treatment arms: untreated, venetoclax monotherapy, dinaciclib monotherapy or combination therapy with venetoclax and dinaciclib. Data displayed is an aggregate of all 3 near-haploid (NH) B-lineage All (B-ALL) sets. (C) All 3 hypodiploid leukemia primary samples (NH1, 2 and 3) were tagged with a luciferase reporter, prior to engraftment, and mice were imaged weekly using bioluminescent imaging before and during treatment. Data displays a single representative subject from each treatment arm, however, reflects the overall trend seen across all treatment groups. (D) Percentage of hCD45 in peripheral blood (from cardiac puncture), bone marrow, spleen and liver measured at the end of the trial in all 3 subtypes of hypodiploid ALL PDX mice (NH1 – circle, NH2 – square, NH3 -triangle) and compared across the 4 treatment arms. (E) Representative hCD45 immunohistochemistry stains of the liver tissue samples obtained from each arm of the trial at the end of therapy for NH3 mice.
port we indicate that this increase occurs at the transcriptional level.
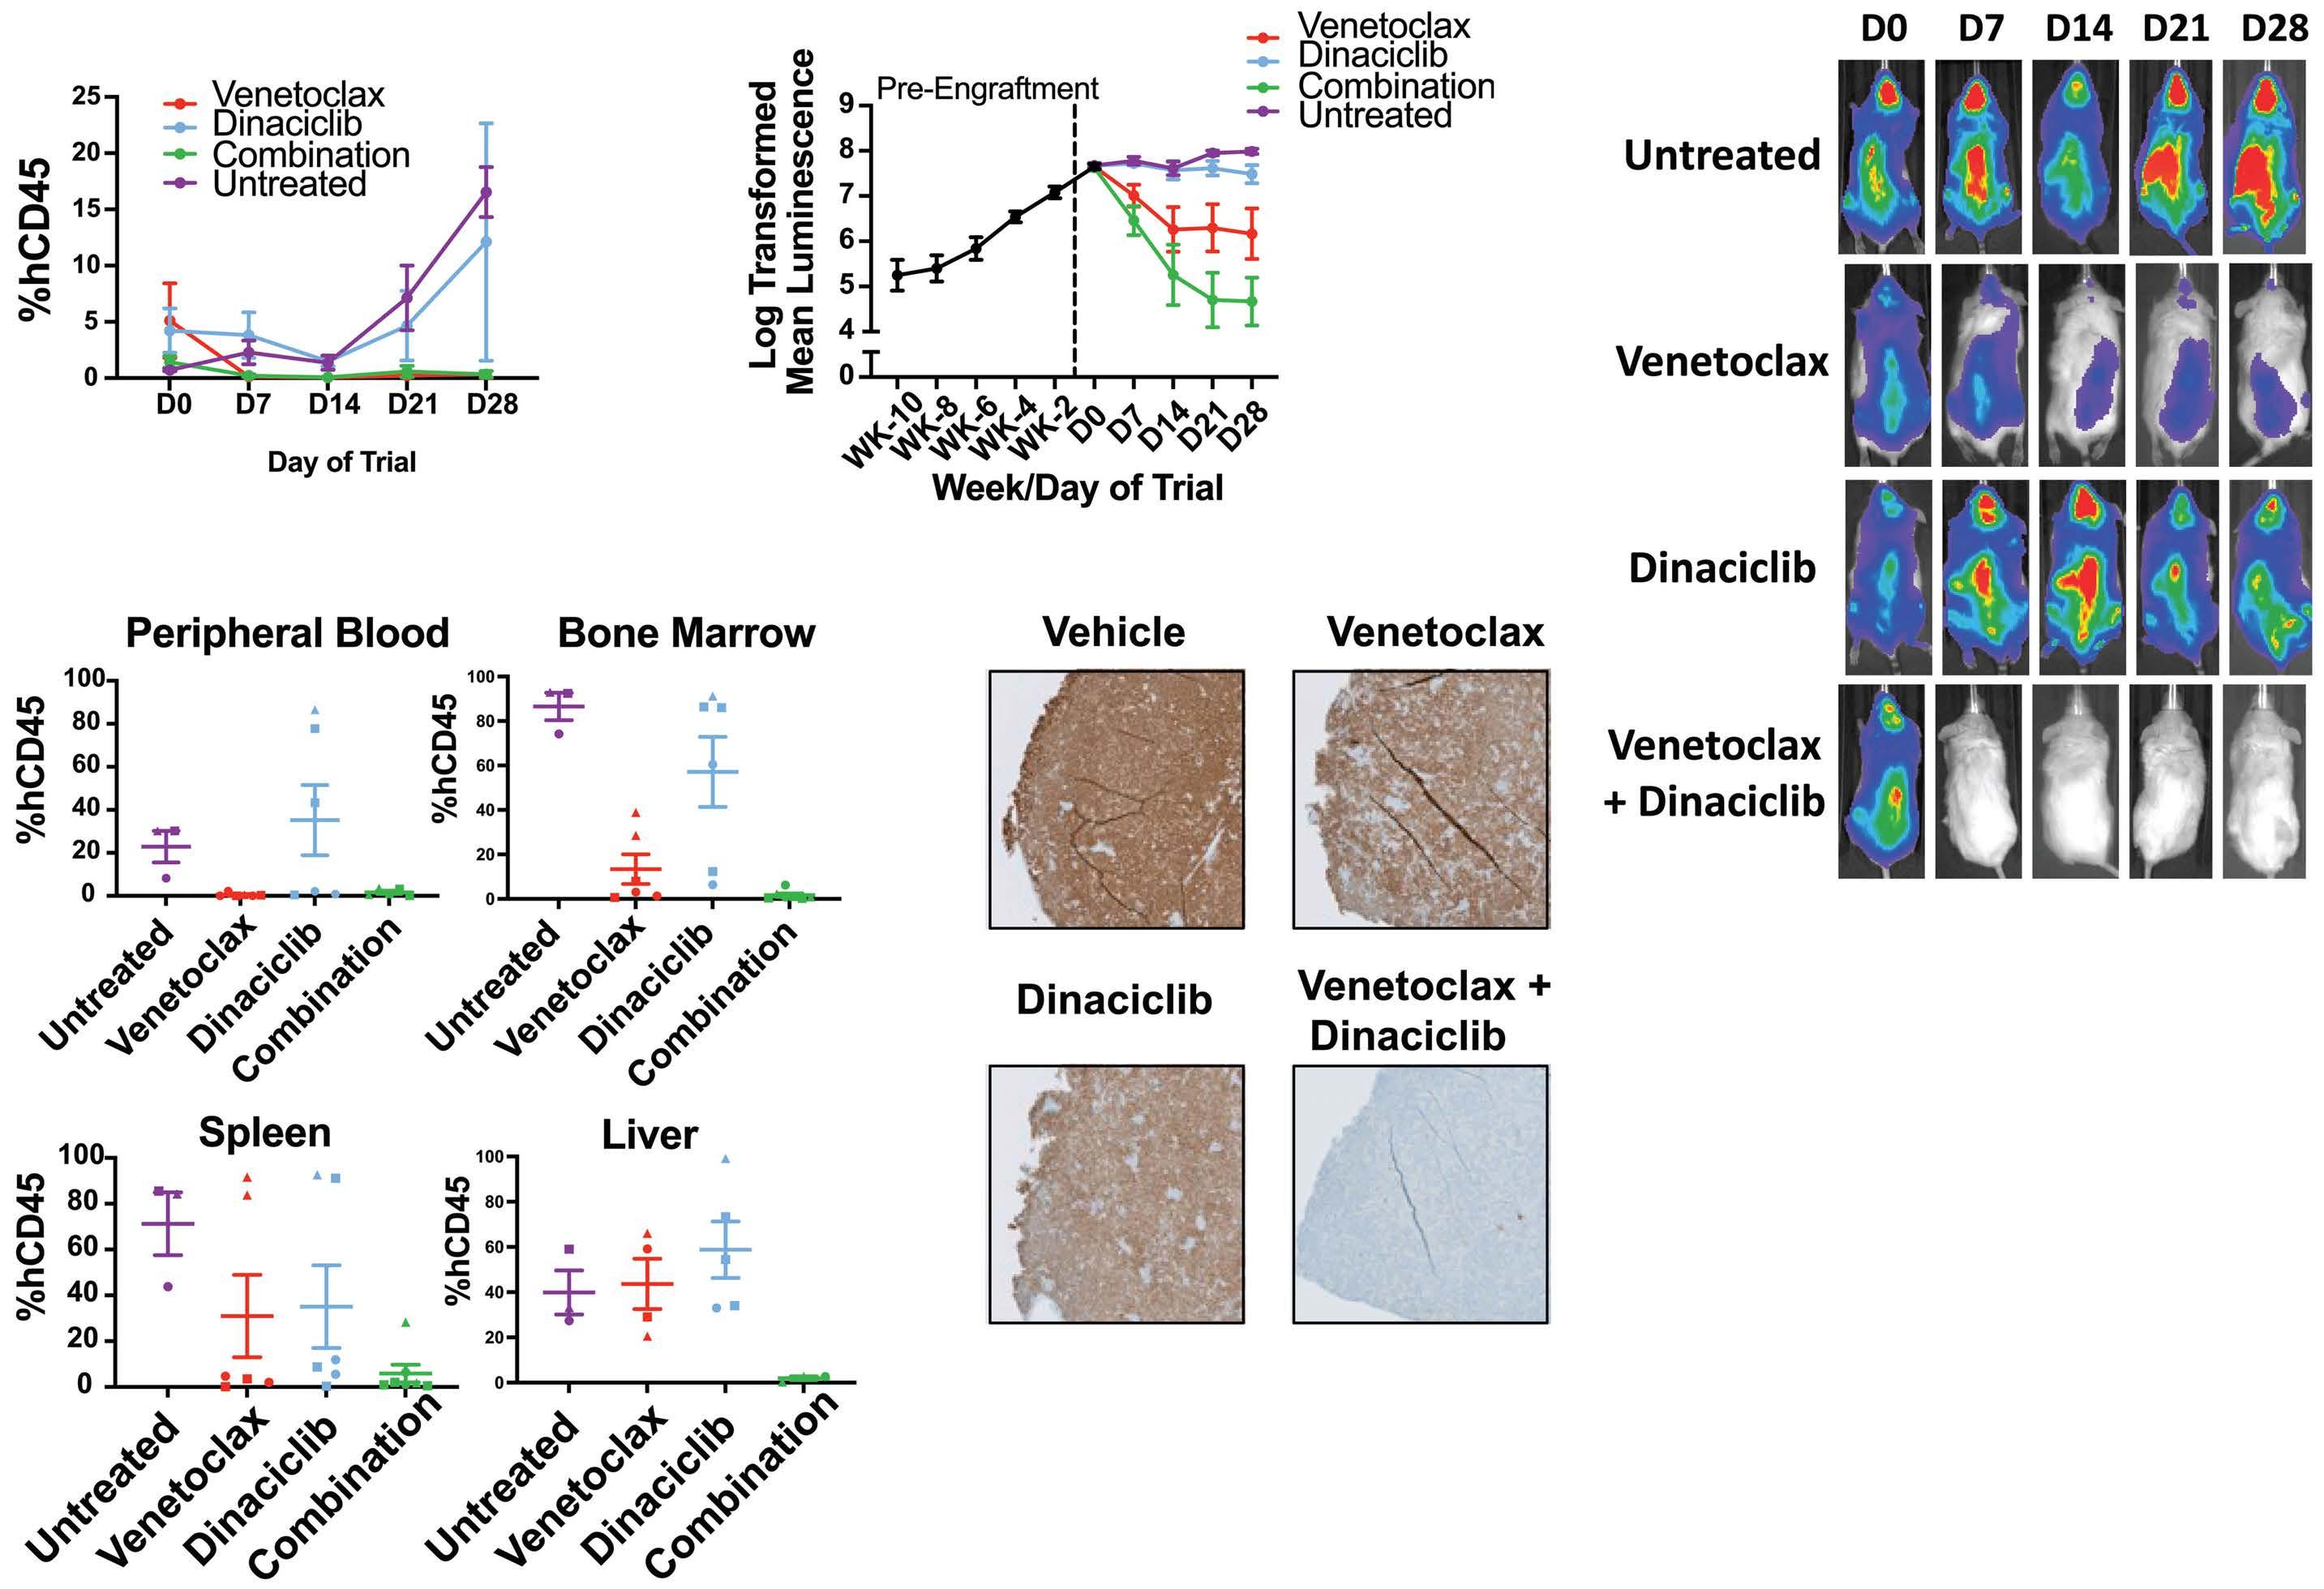
The increased expression of the prosurvival proteins MCL1 and BCL-2 is a well-described feature of many malignancies, allowing for increased survival of cancer cells and resistance to therapy. Hypodiploid cells are characterized by high levels of both BCL-2 and MCL-1 at the protein level7 and, as shown here, also at the transcript level. As we have previously reported, increased levels of BCL-2 with elevated levels of pro-apoptotic markers (BIM, BAD and PUMA) represent a biomarker signature for cellular sensitivity to venetoclax in hypodiploid cells7 and other leukemias. Notably, elevated MCL-1 levels may result in acquired resistance to venetoclax by sequestration of pro-
apoptotic mediators.7,30,31 Importantly, for dinaciclib, while high BCL-2 levels in hypodiploid B-ALL may mediate resistance to dinaciclib as monotherapy, elevated MCL-1 levels may render these cells sensitive to this drug. Thus, this drug combination may sensitize cells with both survival proteins overexpressed and overcome the resistance to both drugs individually. Consistent with our findings, a recent study of venetoclax and S63845 (an alternate MCL1 inhibitor) in diploid leukemias demonstrated synergistic anti-leukemia activity through the impaired binding of BCL-2 and MCL-1 to the apoptosis activator BIM.32 Thus, for hypodiploid B-ALL, which has elevated levels of both BCL-2 and MCL-1, as well as the proapoptotic proteins (BIM, BAD, and/or PUMA) this drug combination may rep-
A B C D E Haematologica | 108 May 2023 1280 ARTICLE - BCL-2/CDK9 Inhibition eradicates hypodiploid ALL H. Pariury et al.
resent a promising targeted therapeutic approach.
Given the cytotoxic rather than cytostatic effect of both venetoclax and dinaciclib, this combination provides a strong rationale for a complementary and effective therapeutic approach. Indeed, our results indicate a potent and synergistic cytotoxic effect when combined and administered to hypodiploid cells. Importantly, this drug combination does not significantly inhibit BCL-xL, an activity linked to severe thrombocytopenia in clinical trials.33 Consistent with this idea, we observed little thrombocytopenia in our preclinical study. Similarly, venetoclax has low off-target toxicity and is well-tolerated in clinical trials; its primary toxicity, tumor lysis syndrome, can be significantly reduced with gradual dose escalation and supportive care measures.
The significance of this work is the identification of a synergistic therapeutic approach against hypodiploid B-ALL in vivo by inhibiting both BCL-2 (venetoclax) and CDK9 (dinaciclib). This combination was remarkably effective in clearing leukemic blast cells from internal organs, overcoming the blast persistence observed when venetoclax was used as monotherapy. We note that the combination of venetoclax and dinaciclib is under study in an active clinical trial for acute myeloid leukemia in adults (clinicaltrials go. Identifier: NCT03484520). When available, information from this trial may allow repurposing this combination for hypodiploid ALL and other B-ALL subtypes that may show sensitivity to this combination in vitro.
While residual leukemic burden observed in solid organs (not in PB or BM) following venetoclax monotherapy may be unique to hypodiploid B-ALL,7 it may represent a largely overlooked mechanism of resistance for some subsets of leukemia in clinical studies using venetoclax. Given the increasing number of clinical trials testing this drug, it would be important to evaluate such a possibility if patients subjected to venetoclax do not achieve complete remission.
Importantly, given that MCL-1 inhibition has been suggested to overcome MCL-1-mediated resistance to venetoclax, and the lack of FDA-approved MCL-1-targeted drugs, dinaciclib may represents an FDA-approved drug with therapeutic potential to overcome MCL-1-mediated resistance. While this study looked at venetoclax in combination with dinaciclib, the combination of venetoclax and anthracyclines warrants further investigation, given the reported inhibitory effect of doxorubicin and daunorubicin on MCL-1.22 A synergistic anti-leukemic effect of venetoclax and daunorubicin would argue in favor of adding venetoclax to the traditional ALL induction backbone while dinaciclib is undergoing further study in the pediatric population.
Moreover, in addition to dinaciclib, this study identified the proteasome and histone deacetylases as potential
targets for hypodiploid leukemia. While both families of proteins regulate a broad range of pathways, which could limit their therapeutic index, work is underway to explore the therapeutic relevance of bortezomib and HDAC inhibitors in treating hypodiploid leukemia.
In summary, our study identified a highly effective and synergistic drug combination, venetoclax and dinaciclib, for the treatment of hypodiploid B-ALL, an aggressive leukemia with few effective current therapies. Thus, while venetoclax monotherapy continues to demonstrate rapid clearance of leukemic blasts from the PB, the addition of dinaciclib led to complete resolution of the leukemic burden within the solid organs of most mice, which was not seen with venetoclax alone. This combination therapy was relatively well tolerated. This study also indicates that intermediate or high levels of BCL-2 and MCL-1 with concomitant levels of pro-apoptotic markers (BIM, BAD and/or PUMA), may represent biomarkers for response to this combination therapy or drugs with similar targets. Finally, the promising results presented in this study may prompt further studies to support the inclusion of hypodiploid and other B-ALL patients to clinical trials combining phase I/II drugs against BCL-2 (mainly venetoclax) and CDK9 (dinaciclib, alvocidib, flavopiridol, SNS-032) or MCL1 (MIK-665). Ongoing research is warranted to confirm the efficacy of combination therapy in LH mouse models harboring TP53 mutations as well as to address questions regarding response duration.
Disclosures
No conflicts of interest to disclose.
Contributions
The concept was developed by ED-F, HP, MRA and MLL. The methodology, validation and formal analysis was performed by HP, JF, SB, KKA, SM, CGW, BSB, BP, MW, KB, SX and ED-F. The investigation was done by HP, KKA, SM, CGW, MRA, MLL and ED-F. MRA and MLL provided resources. RPR, ABO, BP, CS and ED-F analyzed computational data. HP, ED-F, and MLL wrote the original draft. MRA, MLL and EDF wrote, reviewed and edited the manuscript. ED-F visualized the research. ED-F and MLL supervised the research. ED-F and MLL acquired funding.
Acknowledgments
The authors would like to express their gratitude to Su Kim (ABBVIE) for providing us with venetoclax. We also want to thank the Mullighan Laboratory for the hypodiploid xenograft samples as well as the MHH-CALL-2 cells. We express our gratitude to the core facilities at UCSF, in particular the Animal Facilities core (LARC) for mouse housing and handling, the Preclinical Therapeutics core for the assistance in mouse dosing and imaging, the Mouse Pathology Core for the tissue dissection, staining and
Haematologica | 108 May 2023 1281 ARTICLE - BCL-2/CDK9 Inhibition eradicates hypodiploid ALL H. Pariury et al.
analysis and the Computation Biology and Informatics Core for transcriptomics and statistical analyses.
Funding
The research was supported by a C.O.G Foundation grant, Cookies for Kids, Team Connor Foundation, Leukemia Research Foundation and Elsa U. Pardee (to EDF), the Frank A. Campini Foundation (to MLL) and the William and Blanche Hughes Foundation (to MLL and EDF). This study was supported in part by the HDFCCC Laboratory for Cell
References
1. Hunger SP, Lu X, Devidas M, et al. Improved survival for children and adolescents with acute lymphoblastic leukemia between 1990 and 2005: a report from the children's oncology group. J Clin Oncol. 2012;30(14):1663-1669.
2. Pui CH, Rebora P, Schrappe M, et al. Outcome of children with hypodiploid acute lymphoblastic leukemia: a retrospective multinational study. J Clin Oncol. 2019;37(10):770-779.
3. Holmfeldt L, Wei L, Diaz-Flores E, et al. The genomic landscape of hypodiploid acute lymphoblastic leukemia. Nat Genet. 2013;45(3):242-252.
4. Mehta PA, Zhang MJ, Eapen M, et al. Transplantation outcomes for children with hypodiploid acute lymphoblastic leukemia. Biol Blood Marrow Transplant. 2015;21(7):1273-1277.
5. McNeer JL, Devidas M, Dai Y, et al. Hematopoietic stem-cell transplantation does not improve the poor outcome of children with hypodiploid acute lymphoblastic leukemia: a report from Children's Oncology Group. J Clin Oncol. 2019;37(10):780-789.
6. Nachman JB, Heerema NA, Sather H, et al. Outcome of treatment in children with hypodiploid acute lymphoblastic leukemia. Blood. 2007;110(4):1112-1115.
7. Diaz-Flores E, Comeaux EQ, Kim KL, et al. Bcl-2 is a therapeutic target for hypodiploid B-lineage acute lymphoblastic leukemia. Cancer Res. 2019;79(9):2339-2351.
8. Hallek M, Cheson BD, Catovsky D, et al. Guidelines for the diagnosis and treatment of chronic lymphocytic leukemia: a report from the International Workshop on Chronic Lymphocytic Leukemia updating the National Cancer Institute-Working Group 1996 guidelines. Blood. 2008;111(12):5446-5456.
9. Konopleva M, Pollyea DA, Potluri J, et al. Efficacy and biological correlates of response in a phase II study of venetoclax monotherapy in patients with acute myelogenous leukemia. Cancer Discov. 2016;6(10):1106-1117.
10. Pan R, Hogdal LJ, Benito JM, et al. Selective BCL-2 inhibition by ABT-199 causes on-target cell death in acute myeloid leukemia. Cancer Discov. 2014;4(3):362-375.
11. DiNardo CD, Pratz KW, Letai A, et al. Safety and preliminary efficacy of venetoclax with decitabine or azacitidine in elderly patients with previously untreated acute myeloid leukaemia: a non-randomised, open-label, phase 1b study. Lancet Oncol. 2018;19(2):216-228.
12. Davids MS, Roberts AW, Seymour JF, et al. Phase I first-inhuman study of venetoclax in patients with relapsed or refractory non-Hodgkin lymphoma. J Clin Oncol. 2017;35(8):826-833.
13. de Vos S, Swinnen LJ, Wang D, et al. Venetoclax, bendamustine, and rituximab in patients with relapsed or refractory NHL: a phase Ib dose-finding study. Ann Oncol. 2018;29(9):1932-1938.
Analysis Shared Resource Facility through a grant from the NIH (grant number: P30CA082103).
Data-sharing statement
The authors are committed to the dissemination of data that may be requested. All information about patient subjects has been de-identified. Data will be shared via email or secure sharing providers (e.g., Box). Please contact the corresponding author.
14. Liu Q, Yin X, Languino LR, Altieri DC. Evaluation of drug combination effect using a Bliss independence dose-response surface model. Stat Biopharm Res. 2018;10(2):112-122.
15. Twarog NR, Stewart E, Hammill CV, Shelat AA. BRAID: a unifying paradigm for the analysis of combined drug action. Sci Rep. 2016;6:25523.
16. Parry D, Guzi T, Shanahan F, et al. Dinaciclib (SCH 727965), a novel and potent cyclin-dependent kinase inhibitor. Mol Cancer Ther. 2010;9(8):2344-2353.
17. Aleem E, Arceci RJ. Targeting cell cycle regulators in hematologic malignancies. Front Cell Dev Biol. 2015;3:16.
18. Buratowski S. Progression through the RNA polymerase II CTD cycle. Mol Cell. 2009;36(4):541-546.
19. Chen Y, Germano S, Clements C, et al. Pro-survival signal inhibition by CDK inhibitor dinaciclib in chronic lymphocytic Leukaemia. Br J Haematol. 2016;175(4):641-651.
20. Zhou R, Xu A, Gingold J, et al. Li-Fraumeni syndrome disease model: a platform to develop precision cancer therapy targeting oncogenic p53. Trends Pharmacol Sci. 2017;38(10):908-927.
21. Li L, Pongtornpipat P, Tiutan T, et al. Synergistic induction of apoptosis in high-risk DLBCL by BCL2 inhibition with ABT-199 combined with pharmacologic loss of MCL1. Leukemia. 2015;29(8):1702-1712.
22. Inoue-Yamauchi A, Jeng PS, Kim K, et al. Targeting the differential addiction to anti-apoptotic BCL-2 family for cancer therapy. Nat Commun. 2017;8:16078.
23. Frismantas V, Dobay MP, Rinaldi A, et al. Ex vivo drug response profiling detects recurrent sensitivity patterns in drug-resistant acute lymphoblastic leukemia. Blood. 2017;129(11):e26-e37.
24. Kumar SK, LaPlant B, Chng WJ, et al. Dinaciclib, a novel CDK inhibitor, demonstrates encouraging single-agent activity in patients with relapsed multiple myeloma. Blood. 2015;125(3):443-448.
25. Flynn J, Jones J, Johnson AJ, et al. Dinaciclib is a novel cyclindependent kinase inhibitor with significant clinical activity in relapsed and refractory chronic lymphocytic leukemia. Leukemia. 2015;29(7):1524-1529.
26. Ghia P, Scarfo L, Perez S, et al. Efficacy and safety of dinaciclib vs ofatumumab in patients with relapsed/refractory chronic lymphocytic leukemia. Blood. 2017;129(13):1876-1878.
27. Chen Z, Wang Z, Pang JC, et al. Multiple CDK inhibitor dinaciclib suppresses neuroblastoma growth via inhibiting CDK2 and CDK9 activity. Sci Rep. 2016;6:29090.
28. Gregory GP, Hogg SJ, Kats LM, et al. CDK9 inhibition by dinaciclib potently suppresses Mcl-1 to induce durable apoptotic responses in aggressive MYC-driven B-cell lymphoma in vivo. Leukemia. 2015;29(6):1437-1441.
Haematologica | 108 May 2023 1282 ARTICLE - BCL-2/CDK9 Inhibition eradicates hypodiploid ALL P. Pariury et al.
29. Romano G. Deregulations in the cyclin-dependent kinase-9related pathway in cancer: implications for drug discovery and development. ISRN Oncol. 2013;2013:305371.
30. Lin KH, Winter PS, Xie A, et al. Targeting MCL-1/BCL-XL forestalls the acquisition of resistance to ABT-199 in acute myeloid leukemia. Sci Rep. 2016;6:27696.
31. Choudhary GS, Al-Harbi S, Mazumder S, et al. MCL-1 and BCLxL-dependent resistance to the BCL-2 inhibitor ABT-199 can be overcome by preventing PI3K/AKT/mTOR activation in lymphoid
malignancies. Cell Death Dis. 2015;6(1):e1593.
32. Seyfried F, Stirnweiss FU, Niedermayer A, et al. Synergistic activity of combined inhibition of anti-apoptotic molecules in B-cell precursor ALL. Leukemia. 2022;36(4):901-912.
33. Roberts AW, Seymour JF, Brown JR, et al. Substantial susceptibility of chronic lymphocytic leukemia to BCL2 inhibition: results of a phase I study of navitoclax in patients with relapsed or refractory disease. J Clin Oncol. 2012;30(5):488-496.
Haematologica | 108 May 2023 1283 ARTICLE - BCL-2/CDK9 Inhibition eradicates hypodiploid ALL P. Pariury et al.
Signal peptide-CUB-EGF-like repeat-containing protein 1promoted FLT3 signaling is critical for the initiation and maintenance of MLL-rearranged acute leukemia
Binay K. Sahoo,1,2 Yuh-Charn Lin,2,3 Cheng-Fen Tu,2 Chien-Chin Lin,4,5 Wei-Ju Liao,2 Fu-An Li,2 Ling-Hui Li,2 Kurt Yun Mou,2 Steve R. Roffler,2 Shu-Ping Wang,2 Chi-Tai Yeh,6 Chi-Yuan Yao,4,5 Hsin-An Hou,5 Wen-Chien Chou,4,5 Hwei-Fang Tien5 and Ruey-Bing Yang1,2,7,8
1Taiwan International Graduate Program in Molecular Medicine, National Yang Ming Chiao Tung University and Academia Sinica, Taipei; 2Institute of Biomedical Sciences, Academia Sinica, Taipei; 3Department of Physiology, School of Medicine, College of Medicine, Taipei Medical University, Taipei; 4Department of Laboratory Medicine, National Taiwan University Hospital, Taipei; 5Division of Hematology and Department of Internal Medicine; National Taiwan University, Taipei; 6Department of Medical Research and Education, Taipei Medical University, Shuang Ho Hospital, New Taipei City; 7Biomedical Translation Research Center, Academia Sinica, Taipei and 8Ph.D. Program in Drug Discovery and Development Industry, College of Pharmacy, Taipei Medical University, Taipei, Taiwan
Abstract
Correspondence: R-B. Yang
rbyang@ibms.sinica.edu.tw
Received: March 31, 2022.
Accepted: August 11, 2022.
Early view: August 25, 2022.
https://doi.org/10.3324/haematol.2022.281151
©2023 Ferrata Storti Foundation
Published under a CC-BY-NC license
A hallmark of mixed lineage leukemia gene-rearranged (MLL-r) acute myeloid leukemia that offers an opportunity for targeted therapy is addiction to protein tyrosine kinase signaling. One such signal is the receptor tyrosine kinase Fms-like receptor tyrosine kinase 3 (FLT3) upregulated by cooperation of the transcription factors homeobox A9 (HOXA9) and Meis homeobox 1 (MEIS1). Signal peptide-CUB-EGF-like repeat-containing protein (SCUBE) family proteins have previously been shown to act as a co-receptor for augmenting signaling activity of a receptor tyrosine kinase (e.g., vascular endothelial growth factor receptor). However, whether SCUBE1 is involved in the pathological activation of FLT3 during MLL-r leukemogenesis remains unknown. Here we first show that SCUBE1 is a direct target of HOXA9/MEIS1 that is highly expressed on the MLL-r cell surface and predicts poor prognosis in de novo acute myeloid leukemia. We further demonstrate, by using a conditional knockout mouse model, that Scube1 is required for both the initiation and maintenance of MLL-AF9-induced leukemogenesis in vivo. Further proteomic, molecular and biochemical analyses revealed that the membrane-tethered SCUBE1 binds to the FLT3 ligand and the extracellular ligand-binding domains of FLT3, thus facilitating activation of the signal axis FLT3-LYN (a non-receptor tyrosine kinase) to initiate leukemic growth and survival signals. Importantly, targeting surface SCUBE1 by an anti-SCUBE1 monomethyl auristatin E antibody-drug conjugate led to significantly decreased cell viability specifically in MLL-r leukemia. Our study indicates a novel function of SCUBE1 in leukemia and unravels the molecular mechanism of SCUBE1 in MLL-r acute myeloid leukemia. Thus, SCUBE1 is a potential therapeutic target for treating leukemia caused by MLL rearrangements.
Introduction
Signal peptide-Complement protein C1r/C1s, Uegf, and Bmp1 (CUB)-Epidermal growth factor (EGF) domain-containing protein 1 (SCUBE1) is the first member of a small secreted and membrane SCUBE protein family consisting of three members (SCUBE1 to 3).1-3 The SCUBE genes are evolutionarily preserved in vertebrates from zebrafish and mice to humans.1-7 They encode polypeptides of approximately 1,000 residues and are organized in a modular fashion, with five distinctive protein domains including an amino-terminal signal sequence, nine tandem copies of EGF-like repeats, a spacer region, three
cysteine-rich motifs, and one CUB domain at the carboxy terminus.1-7
The function of SCUBE proteins largely depends on their subcellular distribution and cell-type-specific expression. For instance, SCUBE1 is produced and stored in the agranules of resting platelets.5,7 Upon pathological stimulation, it translocates from a -granules to the platelet surface where it is proteolytically released and incorporated into thrombus.5 Our clinical study showed that plasma SCUBE1 released from activated platelets is significantly elevated and is a biomarker of platelet activation in acute coronary syndrome and acute ischemia stroke.8 Apart from secretion, SCUBE proteins are also expressed
Haematologica | 108 May 2023 1284 ARTICLE - Acute Myeloid Leukemia
as peripheral membrane proteins tethered on the cell surface via the spacer and cysteine-rich repeats by two independent mechanisms (i.e., electrostatic and lectin-glycan interactions),9 where they function as co-receptors in promoting the signaling activity of numerous growth factors mediated by receptor tyrosine kinases or receptor serine/threonine kinases including fibroblast growth factor receptor (FGFR),6 vascular endothelial growth factor receptor (VEGFR),10, 11 and bone morphogenetic protein receptor (BMPR).4, 12 Moreover, our previous work showed that SCUBE2, interacting with VEGFR2 on the cell surface, could be internalized by a monoclonal anti-SCUBE2 antibody to inhibit VEGF-stimulated tumor angiogenesis, thus suppressing the pathological growth of solid tumors originating from the lung, pancreas, colon, melanoma, or Leydig cells.11
Rearrangement of the mixed lineage leukemia gene (MLL; also known as lysine methyltransferase 2A, KMT2A) on chromosomal band 11q23 accounts for 10% of all human leukemias and manifests as acute lymphoblastic leukemia or acute myeloid leukemia (AML).13 Although conventional chemotherapy for leukemia has been improved, patients with MLL-rearranged (MLL-r) leukemia generally exhibit relatively poor responses to treatment and have a poor prognosis.14 Expression of the SCUBE1 gene is highly upregulated in MLL-r leukemia.15-17 In addition, zebrafish Scube1 is implicated in primitive hematopoiesis by modulating BMP signal activity during embryogenesis.4 However, whether SCUBE1 is actively involved in the initiation and maintenance of MLL-r leukemogenesis and, if so, whether SCUBE1 represents a potential target to treat MLL-r leukemia remain largely unknown.
In this study, we first show that SCUBE1 is cooperatively upregulated by homeobox A9 (HOXA9) and Meis homeobox 1 (MEIS1) in MLL-r leukemia. Through molecular, genetic, proteomic and biochemical studies we further demonstrated that the membrane-tethered SCUBE1 is essential for the initiation and maintenance of MLL-r leukemia by augmenting the proliferative and survival signaling axis mediated by Fms-like receptor tyrosine kinase 3 (FLT3)-Lck/Yes-related novel protein tyrosine kinase (LYN). In addition, we demonstrated that an anti-SCUBE1 monomethyl auristatin E (an anti-microtubule cytotoxin) antibody-drug conjugate (ADC) shows specific and enhanced anti-leukemic effects in SCUBE1-positive MLL-r AML cells. These results suggest that targeting cell-surface SCUBE1 might be an efficient and promising strategy for treating MLL-r AML.
Methods Patients
The microarray data of patients’ samples were derived from a previous study18 approved by the Research Ethics
Committee of National Taiwan University Hospital, Taiwan.
Mice
All experimental procedures were performed according to a protocol approved by the Institutional Animal Care and Utilization Committee, Academia Sinica, Taiwan (Protocol 20-12-1622).
Chromatin immunoprecipitation
A chromatin immunoprecipitation (ChIP) assay was performed as described previously19 with some modification. The detailed protocol is described in the Online Supplementary Methods.
Methylcellulose colony-formation assay and bonemarrow transplantation
The methylcellulose colony-formation assay was performed as described elsewhere20 with some modification. The detailed protocol is provided in the Online Supplementary Methods.
Proximity ligation assay and cell viability assay with antibody-drug conjugate
The detailed protocols of the proximity ligation assay and cell viability assay are provided in the Online Supplementary Methods.
Results
SCUBE1 is highly expressed in MLL-rearranged acute myeloid leukemia and predicts poor prognosis in de novo acute myeloid leukemia
Previous transcriptomic profiling independently and reproducibly identified SCUBE1 as a highly overexpressed gene in MLL-r AML, including in one of the most common MLL translocations t(9;11) (p22; q23) resulting in MLL fused to AF9 (MLL-AF9).15-17 However, whether SCUBE1 is expressed at the protein level and whether its expression level has any prognostic value in AML remains unclear. We verified that along with mRNA expression, SCUBE1 is highly expressed on the cell surface of two MLL-AF9 AML cell lines (THP-1 and NOMO-1)21 but not in a non-MLL-r AML cell line, KG-1a, which is prone to formation of the t(8:21)(q22;q22)-associated AML1-ETO fusion gene,22 as determined by western blot analysis or flow cytometry analysis with a previously generated anti-SCUBE1 monoclonal antibody23 (Figure 1A-D). Of note, SCUBE1 is also highly expressed in a broader spectrum of hematologic malignancies including MLL-AF4 (MV4-11) leukemic cells as well as Burkitt lymphoma (Daudi) cells (Figure 1A, B). In addition, we did not identify genomic gain or amplification nor activated mutations of the SCUBE1 gene in AML or myelodysplastic syndromes cohorts (Online Supple-
Haematologica | 108 May 2023 1285 ARTICLE - SCUBE1 is a potential therapeutic target for AML B.K. Sahoo et al.
Figure 1. Expression of SCUBE1 in MLL-rearranged acute myeloid leukemia and its association with prognosis of patients with acute myeloid leukemia. (A) Expression of SCUBE1 on the surface of leukemia or lymphoma cell lines determined by flow cytometry with anti-SCUBE1 monoclonal antibody (solid line) compared to corresponding isotype control antibody (dash line). Note that SCUBE1 is highly expressed in MLL-rearranged (MLL-AF9 or MLL-AF4) acute myeloid leukemia (AML) including THP-1, NOMO-1, MOLM-13, and MV4-11 cells as well as Daudi (Burkitt lymphoma) cells. (B) Summary of SCUBE1 expression in acute leukemia or lymphoma cell lines. (C, D) Expression of SCUBE1 in AML cell lines bearing the MLL-AF9 translocation determined at the mRNA level by quantitative polymerase chain reaction (C) and protein level by western blot analysis (D). Anti-SCUBE1 monoclonal antibody (#7), described previously, was used for western blot and flow cytometry analyses. Data are mean ± standard deviation of three independent experiments. **P<0.01. (E) Overall survival and (F) disease-free survival of groups of patients with high SCUBE1 expression (gray line) and low expression (black line). Data were derived from GSE68469 and GSE71014 datasets.

A C B D Haematologica | 108 May 2023 1286 ARTICLE - SCUBE1 is a potential therapeutic target for AML B.K. Sahoo et al. E F
mentary Figure S1). These data suggest that SCUBE1 upregulation might occur in AML cells at the transcriptional rather than genomic level.
We further interrogated a previously published gene expression profiling dataset of bone-marrow mononuclear cells from 227 patients with de novo AML.18 High SCUBE1 expression was associated with a high white blood cell count (P<0.001) and high blast cell count (P<0.001) (Online Supplementary Table S1). Patients with M4 or M5 monoblastic subtypes according to the French-American-British classification frequently have high SCUBE1 expression (P<0.001 and P<0.001, respectively). In line with previous expression profiling studies, high SCUBE1 expression is significantly associated with MLL abnormalities including MLL-r/MLL-partial tandem duplication (MLL-PTD). In addition, overall survival was shorter (median 66.1 months vs. not reached; log-rank P=0.017), as was disease-free survival (median 9.4 vs. 27.0 months; log-rank P=0.011) with high as compared to low SCUBE1 expression after a median follow-up of 57.0 months (Figure 1E, F). On multivariate analysis, besides age or white blood cell count, we also used 2017 European LeukemiaNet risk stratification for analysis, including more comprehensive poor prognostic genetic factors,24 and observed that high SCUBE1 expression remained an independent prognostic factor for overall survival (hazard ratio=1.663, 95% confidence interval: 1.026-2.696) (Online Supplementary Table S2). Our results demonstrate that SCUBE1 is a surface protein predominantly expressed on MLL-r AML cells and high SCUBE1 expression is significantly associated with unfavorable prognosis of AML.
HOXA9 and MEIS1 cooperatively bind on distal regulatory elements and upregulate SCUBE1 expression in MLLrearranged acute myeloid leukemia cells Translocations of MLL produce MLL oncofusion proteins that can activate transcription of downstream target genes,19,25 including the HOXA9 and MEIS1 transcription factors that functionally collaborate to drive leukemogenesis.26 SCUBE1 is highly expressed in MLL-r AML cells but not in normal hematopoietic stem/progenitor cells, peripheral blood cells or in leukemia cells lacking MLL-r (Online Supplementary Figure S2). Hence, SCUBE1 might be directly regulated by MLL fusion genes such as MLL-AF9 or indirectly by its downstream homeodomain-containing transcription factor HOXA9 and its cofactor MEIS1, a member of the three-amino-acid-loop-extension protein family.27
To determine whether the MLL-AF9 fusion protein directly activates the SCUBE1 gene locus, we interrogated a previously published MLL-AF9 ChIP-sequencing dataset derived from THP-1 cells.19 However, virtually no peaks, evidenced by coincident signals in both MLL and MLL-AF9 fusion ChIP-sequencing tracks, localized within the
SCUBE1 promoter region (data not shown). In addition, the gene body showed no significant enrichment of MLL-AF9recruited epigenetic markers of H3K79me2,19 which further supports that SCUBE1 might not undergo transcriptional activation in MLL-r leukemia by directly targeting MLL-AF9. Rather, putative HOXA9/MEIS1 co-bound sites were found located in distal intergenic (20-kb upstream or 82-kb downstream) regulatory regions by an in silico bioinformatic tool PROMO (Online Supplementary Figure S3).28,29 We then performed ChIP with an anti-MEIS1 antibody and confirmed that endogenous MEIS1 protein interacts with two distant regulatory DNA elements that harbor consensus HOXA9/MEIS1 co-bound sites in THP-1 and NOMO-1 cells (Figure 2A, B). In agreement with these findings, HOXA9 and MEIS1 cooperatively transactivated a regulatory DNA fragment containing the HOXA9/MEIS1 cobound sites in a luciferase reporter assay (Figure 2C, D). Consistently, mutation of the HOXA9/MEIS1 binding site abolished HOXA9/MEIS1-mediated co-transactivation of luciferase reporter activity (Online Supplementary Figure S4). Furthermore, double knockdown of HOXA9 and MEIS1 by two independent combinations of lentiviral-mediated delivery of short hairpin RNA (shRNA) (Figure 2E, F) significantly decreased the expression of SCUBE1 at both protein (Figure 2G) and mRNA (Figure 2H) levels in THP-1 or NOMO-1 cells. In agreement with previous genomewide ChIP-sequencing experiments (Online Supplementary Figure S5),30 our results suggest that SCUBE1 is likely a new target transactivated by cooperation between HOXA9 and MEIS1 at co-bound sites located in distal regulatory regions.
SCUBE1 is required for in vitro and in vivo
MLL-rearranged leukemia cell survival
To evaluate the functional role of SCUBE1 in MLL-r leukemia, we transduced THP-1, NOMO-1, and KG-1a leukemic cell lines with inducible lentiviral (shRNA) vectors targeting SCUBE1 (Online Supplementary Figure S6). After SCUBE1 depletion, cell growth was significantly reduced in MLL-r cell lines (THP-1 and NOMO-1), but growth was unaffected in KG-1a cells (a non-MLL-r leukemic cell line) (Online Supplementary Figure S7A-C). Consistently, SCUBE1 knockdown led to disruption of the G1/S and G2/M phases of cell cycle progression (Online Supplementary Figure S8), along with the induction of apoptosis in MLL-r leukemia cells, as revealed by a significant increase in cleaved caspase-3 and marked reduction of survivin (Online Supplementary Figure S7D). Both disruption of cell cycle progression and induction of apoptosis might contribute to the growth inhibitory effects of SCUBE1 knockdown in MLL-r leukemia cells.
We next determined the role of SCUBE1 in leukemia propagation in vivo. THP-1 or NOMO-1 cells transduced with an inducible lentiviral SCUBE1 shRNA#2 vector were
Haematologica | 108 May 2023 1287 ARTICLE - SCUBE1 is a potential therapeutic target for AML B.K. Sahoo et al.

A B G E C D Haematologica | 108 May 2023 1288 ARTICLE - SCUBE1 is a potential therapeutic target for AML B.K. Sahoo et al. Continued on following page. H F
Figure 2. HOXA9 and MEIS1 bind and transactivate the regulatory elements of SCUBE1 in MLL-AF9 cells. (A) Graphical representation of predicted binding sites of HOXA9 and MEIS1 on human SCUBE1 regulatory regions. The binding sites of MEIS1 and HOXA9 on SCUBE1 enhancer or regulator regions were predicted using the PROMO database. The overlapping binding sites of HOXA9 and MEIS1 were found in two regions: region 1 (upstream of the SCUBE1 transcription start site) and region 2 (downstream of the SCUBE1 transcription start site). (B) Chromatin immunoprecipitation assay of KG-1a, THP-1, and NOMO-1 cells with anti-MEIS1 antibody and enriched fragments analyzed by reverse transcriptase polymerase chain reaction. Oligonucleotide F1/R1 or F2/R2 primer pairs were used to amplify ~400 bp of region 1 or 2 of enriched fragments, respectively. (C) Graphical illustration of luciferase-reporter constructs of SCUBE1 regulatory regions. The putative regulatory 440 bp of region 1 or 1,389 bp of region 2 were cloned into the pGL3-basic vector. (D) Luciferase reporter assay with overexpression of HOXA9, MEIS1, or combined HOXA9 and MEIS1 together with the region 1 or 2 reporter constructs in HepG2 cells. Firefly luciferase activity was normalized to Renilla luciferase activity. (E, F) shRNA-mediated knockdown of transcription factors HOXA9 and MEIS1 at protein and mRNA levels in THP-1 and NOMO-1 cells. The quantified band intensities were normalized to loading controls and are mentioned below the corresponding bands. (G, H) mRNA and protein levels of SCUBE1 with HOXA9/MEIS1 knockdown in THP-1 and NOMO-1 cells. The quantified band intensities were normalized to loading controls and are mentioned below the corresponding bands. Data are mean ± standard deviation of three independent experiments. *P<0.05, **P<0.01.
transplanted into NOD-Prkdcscid Il2rgnull (NSG) mice (Figure 3A). After treatment with doxycycline (+Dox) to induce SCUBE1 knockdown, mice transplanted with SCUBE1 shRNA#2 in THP-1 or NOMO-1 cells showed significant downregulation of SCUBE1 expression (Online Supplementary Figure S9), reduced engraftment in bone marrow (Figure 3B) as well as reduced splenomegaly as compared with mice that did not receive doxycycline treatment (Dox) (Figure 3C). Importantly, knockdown of SCUBE1 (+Dox) significantly extended the survival of NSG mice as compared with that of control (-Dox) mice (Figure 3D). These data demonstrate a critical role for SCUBE1 in the growth and survival of MLL-AF9 leukemia cells both in vitro and in vivo.
SCUBE1 is important for MLL-AF9-induced transformation in vitro and MLL-AF9-induced leukemia progression in vivo
To further examine a role for SCUBE1 in leukemogenesis in vivo, we generated a new germline Scube1 knockout (KO) mutant mouse strain, D3 (Online Supplementary Figure S10A-E, Online Supplementary Table S3). We first investigated the role of SCUBE1 in MLL-AF9-mediated transformation of hematopoietic progenitor cells (HPC). cKit+ HPC isolated from bone marrow of wild-type (WT) or KO mice were transduced with lentiviruses expressing SCUBE1 and/or retroviruses expressing MLL-AF9 as indicated (Figure 4A). Of note, similar to human MLL-AF9 AML cells, MLL-AF9-mediated transformation of murine WT HPC also markedly upregulated the cell surface expression of SCUBE1, an effect not seen in KO cells (Online Supplementary Figure S10F). To assess the effect of Scube1 inactivation on MLL-AF9-mediated transformation, infected WT or KO cells were plated in methylcellulose. The number of viable colonies was reduced in the third round of methylcellulose replating in Scube1-KO versus WT HPC (Figure 4B, Online Supplementary Figure S11). SCUBE1 overexpression alone did not drive the oncogenic transformation of the WT HPC, whereas re-expression of SCUBE1 completely rescued the compromised MLL-AF9-mediated transformation by increasing the colony numbers in KO
HPC, like infected WT HPC (Figure 4B and Online Supplementary Figure S11).
To investigate the importance of SCUBE1 in the progression of MLL-AF9-induced leukemia in vivo, donor MLLAF9-transformed WT, KO, or KO HPC with restoration of SCUBE1 expression (KO + SCUBE1) were serially transplanted into recipient C57BL/6J mice (Figure 4A). All mice receiving WT MLL-AF9 transplants died by 120 days after the second bone-marrow transplant, whereas engraftment of KO MLL-AF9 cells (deletion of Scube1) markedly prolonged the survival of mice for more than 200 days (Figure 4E). Consistently, re-expression of SCUBE1 (KO + SCUBE1) conferred a leukemic burden, leading to shorter survival. In agreement with the improved survival, Scube1 inactivation (KO) prevented splenomegaly (Figure 4C) and reduced leukemia infiltration, resulting in normal spleen histology with a clear structure of red and white pulp as well as normal cell density in mice that underwent KO MLL-AF9 transplantation (Figure 4D). By contrast, mice transplanted with WT or KO+SCUBE1 MLL-AF9 cells displayed profound leukemic blast infiltration and spleen hypercellularity (Figure 4D). These results demonstrate a critical function of SCUBE1 in the initiation of MLL-AF9 leukemia in vitro as well as its progression in vivo.
SCUBE1 is critical for maintaining MLL-AF9 transformation
In addition to its function in initiating leukemia, SCUBE1 may also be required to maintain the immortalized state elicited by MLL-AF9. To test this hypothesis, we used a tamoxifen-dependent conditional KO mouse model (Online Supplementary Figure S12A-C). Scube1 conditional KO (Scube1f/f; R26CreERT2) MLL-AF9-transformed HPC failed to form colonies after tamoxifen-induced deletion of Scube1 By contrast, a similar treatment had no effect on control (Scube1f/f) MLL-AF9-immortalized cells, which indicates that treatment with tamoxifen did not cause general cell toxicity (Figure 5A, B).
To further assess the in vivo effect of acute inactivation of Scube1 on leukemia maintenance, primary leukemias generated by transducing c-Kit+ HPC from control or inducible
Haematologica | 108 May 2023 1289 ARTICLE - SCUBE1 is a potential therapeutic target for AML B.K. Sahoo et al.
Figure 3. Inducible knockdown of SCUBE1 in MLL-AF9-translocated acute myeloid leukemia reduced cell growth and increased the survival rate of mice. (A) Schematic representation of in vivo experiments to analyze the effect of SCUBE1 knockdown on the growth of THP-1 and NOMO-1 cells. Sub-lethal irradiation of NSG mice was performed on day 0 followed by intravenous injection of THP-1 or NOMO-1 cells with inducible SCUBE1-shRNA #2 clone. Doxycycline (Dox) was omitted or added in the drinking water of mice on day 1. Spleen and bone-marrow infiltration was measured on day 28, and survival rate was analyzed until all mice showed disease symptoms (hunched back, lack of mobility, paralysis of hind limbs, ruffled coat). Mice were sacrificed on day 28 by cervical dislocation, and spleen and femora were isolated. (B) Bone marrow was isolated from femora and human leukemic cell infiltration was measured by flow cytometry with anti-human CD45 antibody. (C) Spleen enlargement was measured by ratio of spleen weight to body weight. (D) Kaplan-Meier curve showing survival of NSG mice engrafted with THP-1 or NOMO-1 cells bearing doxycycline-inducible SCUBE1-shRNA #2 clone and with (red line) or without (black line) doxycycline treatment. The median survival was 45 days (-Dox) and 65 days (+Dox) or 42 days (-Dox) and 58 days (+Dox) for THP-1 and NOMO-1 cells, respectively. *P<0.05, **P<0.01.

KO mice with MLL-AF9 DsRed were transplanted into secondary recipient mice. When engraftment of leukemia cells reached 10% to 20% DsRed+ in peripheral blood cells, we administered tamoxifen daily for 5 days to the secondary recipient mice (Figure 5C). Effective deletion of Scube1 was verified by genotyping peripheral blood cells at 2 weeks after tamoxifen administration (Online Supplementary Figure S12D). In line with a critical role of SCUBE1 in maintaining the clonogenicity of the leukemic cells, acute tamoxifen-induced Scube1 depletion significantly prolonged survival (Figure 5D) and prevented splenomegaly (Figure 5E) of Scube1f/f; R26CreERT2 mice as compared with
Scube1f/f controls. In addition, we found significantly more apoptotic cells and a markedly reduced number of proliferating MLL-AF9-induced leukemia stem cells in Scube1KO than WT spleens (Online Supplementary Figure S13). Together, these data suggest that MLL-AF9-transformed HPC require SCUBE1 to maintain clonal growth both in vitro and in vivo.
Membrane SCUBE1 binds FLT3 ligand and FLT3 receptor to facilitate activation of the FLT3-LYN signaling axis
To further elucidate the molecular mechanisms underlying the contribution of membrane SCUBE1 to leukemogenesis,
A B C D Haematologica | 108 May 2023 1290 ARTICLE - SCUBE1 is a potential therapeutic target for AML B.K. Sahoo et al.
Figure 4. Scube1 is important for initiation of MLL-AF9-induced leukemia. (A) Schematic representation of experimental procedures to evaluate the role of SCUBE1 in the initiation of leukemia. c-Kit+ hematopoietic cells were isolated from Scube1 knockout (KO) or wild-type (WT) C57BL/6 mouse bone marrow, followed by transduction of MLL-AF9 retrovirus or SCUBE1 lentivirus and methylcellulose colony formation assay. After a third round of colony formation, cells were intravenously injected into sub-lethally irradiated C57BL/6 mice. When the primary transplanted mice showed symptoms of disease, leukemic cells were isolated from bone marrow and secondary transplantation was performed. (B) Methylcellulose colony formation assay after three rounds of replating after MLL-AF9 transduction. (C) Spleen enlargement of secondary transplanted mice. (D) Hematoxylin & eosin-stained spleen histology of secondary transplanted mice. Images were acquired with an Olympus microscope equipped with an Olympus DP70 digital camera; original magnification 10x; scale bar = 200 mm. (E) Kaplan-Meier curve showing survival of secondary transplanted mice. The median survival for WT (black line), KO (red line), and KO+SCUBE1 (blue line) cells was 96.5, 190, and 143 days, respectively. Data are mean ± standard deviation of three independent experiments. *P<0.05, **P<0.01.

A B C D E Haematologica | 108 May 2023 1291 ARTICLE - SCUBE1 is a potential therapeutic target for AML B.K. Sahoo et al.
Figure 5. Scube1 is critical for maintaining MLL-AF9-transformed leukemia stem cells. (A) Schematic representation of experimental procedures to evaluate the role of Scube1 in maintaining leukemia stem cells in vitro. c-Kit+ hematopoietic progenitor cells (HPC) were isolated from Scube1f/f or Scube1f/f; R26CreERT2 C57BL/6 mouse bone marrow, followed by transduction of MLL-AF9 retrovirus and three rounds of methylcellulose colony formation assay. At the fourth round, 4-hydroxy tamoxifen (4OHT) 30 nM was added for the Cre-mediated Scube1 knockout. (B) Methylcellulose colony formation assay at the fourth round after 4-OHT treatment. (C) Schematic representation of experimental procedure to examine the role of Scube1 in the maintenance of leukemia stem cells in vivo. c-Kit+ HPC were isolated from Scube1f/f or Scube1f/f; R26CreERT2 C57BL/6 mouse bone marrow, followed by transduction of MLL-AF9 retrovirus and three rounds of methylcellulose colony formation assay. After a third round of colony formation, the cells were intravenously injected into sub-lethally irradiated C57BL/6 mice. When the primary transplanted mice showed symptoms of disease, leukemic cells were isolated from bone marrow and secondary transplantation was performed. Two weeks after transplantation, established leukemia was confirmed by blast cells in peripheral blood. After disease establishment, five doses of tamoxifen were administered to inactivate Scube1. (D) Kaplan-Meier curve showing survival of secondary transplanted mice. The median survival for Scube1f/f -Tam (dashed blue line), Scube1f/f +Tam (solid blue line), Scube1f/f; R26CreERT2 -Tam (dashed red line), and Scube1f/f; R26CreERT2 +Tam (solid red line) mice was 51.5, 51, 56, and 95 days, respectively. (E) Spleen enlargement of secondary transplanted mice. Data are mean ± standard deviation of three independent experiments. **P<0.01.

A B C D E Haematologica | 108 May 2023 1292 ARTICLE - SCUBE1 is a potential therapeutic target for AML B.K. Sahoo et al.
we used a proteomic proximity labeling assay31 to identify membrane proteins in the immediate vicinity of surface SCUBE1. We conjugated biotin to proteins proximal to SCUBE1 and analyzed the biotin labeled proteins by mass spectrometry. After excluding non-specific proteins, we identified a total of 120 membrane proteins associated with or in close proximity to SCUBE1 commonly shared in both THP-1 and NOMO-1 cells (Figure 6A). Because SCUBE2 and SCUBE3 act as co-receptors to augment the signaling activity of receptor tyrosine kinases such as VEGFR11,32 and FGFR6 and because upregulation of proteintyrosine kinase signaling is a hallmark of AML,33,34 we paid particular attention to receptor tyrosine kinases and their downstream signaling components. Among the 120 identified proteins were four receptor tyrosine kinases - FLT3, ephrin type-B receptor 1 and 3 (EPHB1 and 3), and insulin receptor (INSR) - as well as three non-receptor tyrosine kinases - Lck/Yes-related novel protein tyrosine kinase (LYN), Janus kinase 1 (JAK1) and tyrosine kinase 2 (TYK2) (Figure 6A, Online Supplementary Table S4). FLT3, a class III receptor tyrosine kinase, consists of five extracellular ligand-binding Ig-like motifs, a member-spanning region, a juxtamembrane region followed by a tyrosine kinase domain interrupted by a kinase insert, and the carboxy terminal tail (Figure 6B).33 FLT3 signaling is initiated by the binding of FLT3 ligand (FLT3L) to the extracellular Ig-like domains of FLT3 to induce dimerization, autophosphorylation, proximal recruitment of the Src family of non-receptor tyrosine kinases such as LYN to be activated via tyrosine phosphorylation, and subsequent activation of downstream signaling pathways including phosphatidylinositol 3-kinase/AKT or extracellular signal-regulated kinases (ERK).33
Because the genes encoding FLT333 or its direct signaling component LYN35,36 are often over-expressed or mutated, thus leading to augmented proliferation and survival of human AML,37,38 we further examined whether SCUBE1 biochemically interacts with FLT3L or FLT3 and, if so, whether SCUBE1 can modulate the signaling activity of the FLT3LYN axis. To do this, we transfected HEK-293T cells with a FLAG-tagged SCUBE1 expression plasmid alone or with an expression plasmid encoding Myc-tagged FLT3 or Histagged FLT3L. Immunoprecipitation with anti-FLAG antibody resulted in specific co-immunoprecipitation of FLT3 (Figure 6C) or FLT3L (Online Supplementary Figure S14C). Further deletion mapping revealed that SCUBE1 primarily interacts with the ligand-binding extracellular Ig-like domains of FLT339 (Figure 6C) or FLT3L via its spacer region and the CUB domain (Online Supplementary Figure S14B, C). Furthermore, endogenous SCUBE1 could interact and colocalize with FLT3 on the plasma membranes of THP-1 and NOMO-1 cells (Online Supplementary Figure S15). Together, SCUBE1 might form a complex with FLT3L and FLT3 in MLL-r AML cells.
We further evaluated the effect of SCUBE1 on activating the FLT3-LYN signaling axis by reconstituting FLT3 and LYN expression in the absence or presence of SCUBE1 in HEK293T cells. The tyrosine phosphorylation (pY) status of FLT3 (pFLT3) or LYN (pLYN) was measured by a pan or specific anti-pLYN (pY397) antibody. As shown in Figure 6D, pFLT3 co-expressed with LYN showed a modest increase in expression, probably because of low expression of FLT3L in HEK-293T cells (https://www.proteinatlas.org), whereas ectopic expression of SCUBE1 markedly augmented pFLT3 as well as pLYN levels. Consistently, knockdown of SCUBE1 markedly decreased the intrinsic signaling activity of FLT3-LYN as well as the downstream activation of AKT (but not ERK), as reflected by decreased pY levels of these signaling components in THP-1 and NOMO-1 cells (Figure 6E). Likewise, downregulation of Flt3 phosphorylation was also observed in Scube1-knockout MLL-AF9 murine AML cells (Online Supplementary Figure S16). Furthermore, SCUBE1-mediated specific tyrosine phosphorylation/activation of FLT3 slightly differed from that of FLT3L-induced FLT3 tyrosine phosphorylation (e.g., increased pY768 and pY842 but not pY591 level) (Online Supplementary Figure S17). Nevertheless, additional investigation is needed to fully elucidate the molecular mechanisms underlying the SCUBE1-assisted augmentation of FLT3 activation in AML cells. Together, these data suggest that membrane SCUBE1 might be a co-receptor to facilitate FLT3L binding to FLT3, thus promoting downstream LYN and AKT signaling.
SCUBE1-targeting antibody-drug conjugate effectively inhibits cancer growth
Internalization and trafficking to lysosomes upon antibody binding to a membrane target is a key mechanism for ADC to exert their killing effect following intracellular release of cytotoxic payloads.40 We therefore examined whether a newly generated anti-SCUBE1 monoclonal antibody clone #1 (Online Supplementary Figure S18) could internalize upon binding to SCUBE1 on leukemia cells. We incubated antiSCUBE1 antibody with THP-1 cells and found that the monoclonal antibody rapidly bound (Online Supplementary Figure S19A), efficiently endocytosed to lysosomes and degraded after 24 h (Online Supplementary Figure S19B), which suggests that this monoclonal antibody can be internalized. As a proof of concept for its potential therapeutic use, we generated an ADC combining monoclonal antibody #1 as the SCUBE1-targeting moiety with a proteolytically cleavable valine-citrulline (VC) linker and the anti-microtubule cytotoxic agent monomethyl auristatin E (MMAE) (see Online Supplementary Figure S20) by using the homogeneous trimannosyl glycoengineering platform.41 The average drug-toantibody ratio was 3.89 (Figure 7A, B). Importantly, this ADC (designated as anti-SCUBE1-VC-MMAE) retained similar binding affinity as the parental antibody (Online Supplemen-
Haematologica | 108 May 2023 1293 ARTICLE - SCUBE1 is a potential therapeutic target for AML B.K. Sahoo et al.

A B D E C Haematologica | 108 May 2023 1294 ARTICLE - SCUBE1 is a potential therapeutic target for AML B.K. Sahoo et al. Continued on following page.
Figure 6. SCUBE1 binds FLT3 and promotes FLT3-LYN signaling. (A) Venn diagram showing the number of membrane proteins in the immediate vicinity of surface SCUBE1 identified by proteomic proximity labeling assay in THP-1 and NOMO-1 cells. Of the 113 proteins in common, seven protein tyrosine kinases - four receptor tyrosine kinases (FLT3, EPHB1, EPHB3, and INSR) and three non-receptor tyrosine kinases (LYN, JAK1, and TYK2) - were associated with or in proximity to SCUBE1. The antibody-directed targeting of peroxidase (a combination of a primary mouse monoclonal anti-SCUBE1 antibody and an horse radish peroxidaseconjugated anti-mouse secondary antibody) to SCUBE1, followed by brief labeling with biotin-tyramide enabled proteins in the immediate vicinity of the target to be biotinylated. After cell lysis and capture by immobilized streptavidin, the biotinylated proteins were eluted with reducing agent and analyzed by liquid chromatography-mass spectrometry. The experiment was repeated with only a primary isotype control antibody to identify nonspecific proteins. Mass spectrometry analysis confirmed that SCUBE1 protein was immunoprecipitated by the anti-SCUBE1 antibody under these conditions. (B) Graphic diagrams showing the domain structure of SCUBE1 and deletion constructs of FLT3 used to map the interacting domain. FLAG epitope was added immediately after the signal peptide sequence at the NH2-terminus of the SCUBE1 construct. Likewise, Myc epitope was tagged to the NH2-terminus of FLT3 full-length (FL) and its deletion mutants D1, D2, D3, D4, and D5. SP: signal peptide; CysRich: cysteine-rich; TM: transmembrane domain; JM: juxtamembrane domain. The tyrosine kinase domain (TKD) is separated into two parts by a short region designated the kinase insert (KI). (C) Molecular mapping of the interacting domains between SCUBE1 and FLT3. The expression plasmid encoding FLAG-tagged SCUBE1 was transfected alone or together with a series of Myc-tagged FLT3 constructs in HEK-293T cells for 2 days, then cell lysates underwent immunoprecipitation (IP), followed by western blot (WB) analysis with indicated antibodies to determine the protein-protein interactions. (D) Phosphorylation of LYN analyzed with co-expression of FLT3 and/or SCUBE1 in HEK-293T cells. NH2-terminus HIS-tagged LYN was transfected in HEK293T cells alone or with FLAG-tagged SCUBE1 and/or Myc-tagged FLT3. Two days after transfection, cells were lysed and western blot analysis was performed. The activation of FLT3 was detected with anti-phospho-tyrosine (pY) antibody and total FLT3 activity was detected with anti-Myc antibody. The activation of LYN was detected with a specific anti-pLYN (Y397) antibody and total LYN activity was detected with anti-HIS antibody; SCUBE1 activity was detected with anti-FLAG antibody. Of note, because of its heavy N-linked glycosylation of the extracellular domain, FLT3 displays as two higher molecular masses on western blot analysis: one corresponds to 132 kDa as a not fully processed, partially glycosylated form and the other appears at 160 kDa, representing the mature, fully glycosylated FLT3. The quantified band intensities were normalized to loading controls and are mentioned below the corresponding bands. (E) Effect of SCUBE1 knockdown on phosphorylation/activation of the FLT3-LYN-AKT signal cascade in THP-1 and NOMO-1 cells. To knock down SCUBE1, stable THP-1 and NOMO-1 cell lines carrying inducible SCUBE1-shRNA #1 or #2 were treated without (-) or with (+) doxycycline (Dox) for 5 days. Western blot analysis was used to determine the phosphorylation status of FLT3 (pY), pLYN (Y397), pAKT (S473), or pERK1/2 (T202/Y204) or to quantify the corresponding total protein as controls. SCUBE1 was detected with anti-SCUBE1 #7 monoclonal antibody. The quantified band intensities were normalized to loading controls and are mentioned below the corresponding bands.
tary Figure S21). Five days of treatment with this ADC was effective in reducing cell viability in the SCUBE1-expressing MLL-r leukemia cell lines THP-1 and NOMO-1 (half maximal inhibitory concentration = 0.28±0.08 and 0.46±0.1 nM, respectively), with no effect seen in SCUBE1-negative KG-1a and K562 cells (Figure 7C) or normal murine HPC (Online Supplementary Figure S22). To further evaluate the efficacy of the ADC in vivo, we subcutaneously transplanted THP-1 cells into NSG mice. After treatment with anti-SCUBE1 ADC, THP-1 tumor growth was significantly reduced as compared with the IgG control (Online Supplementary Figure S23A, B). In addition, no antigen-independent toxicity was observed in either treatment group, as evaluated by monitoring body weight loss (Online Supplementary Figure S23C). These results confirm the selectivity of this ADC and suggest that surface SCUBE1 could be exploited as an MLL-r specific biomarker and could potentially be used as a therapeutic target (Figure 8).
Discussion
Our mechanistic study revealed that SCUBE1 is a direct target of the HOXA9/MEIS1 transcriptional regulatory complex. Both HOXA9 and MEIS1 are upregulated by MLL-fusion proteins such as MLL-AF9 in AML and are essential for maintaining leukemic transformation. Our data suggest that
surface SCUBE1 plays a critical pathological role in MLL-r leukemias by acting as a FLT3 co-receptor to facilitate interactions between the FLT3 ligand and FLT3, thus augmenting downstream LYN-AKT signaling to promote leukemia cell proliferation, survival and leukemogenesis. In addition, clinical association studies show that high expression of SCUBE1 is associated with poor overall and disease-free survival in AML patients (Figure 1E, F). Furthermore, multivariate analysis confirmed that high SCUBE1 expression is an independent prognostic factor for overall survival (Online Supplementary Table S2). Using genetic knockdown, we first demonstrated that SCUBE1 is required for cell proliferation and survival of MLL-AF9 THP1 and NOMO-1 leukemia cells both in vitro and in vivo. Furthermore, using global knockout and tamoxifen-inducible Scube1 deletion mouse models, we showed that Scube1 is required for the initiation and maintenance of MLL-AF9transformed HPC. Importantly, SCUBE1 on the plasma membrane of MLL-r leukemia cells is a potential target for immunotherapy as shown by the strong anticancer activity of an anti-SCUBE1 ADC in MLL-AF9 leukemias.
Our studies showed that the SCUBE1-FLT3 interaction is critical for leukemia survival and proliferation mediated through LYN-AKT signaling. Thus, conditional knockout and knockdown of SCUBE1 in MLL-AF9-transduced HPC and leukemia cell lines, respectively, have proven that inhibition of SCUBE1 could have therapeutic benefit for leukemia pa-
Haematologica | 108 May 2023 1295 ARTICLE - SCUBE1 is a potential therapeutic target for AML B.K. Sahoo et al.
Figure 7. Production and in vitro characterization of an anti-SCUBE1 antibody-drug conjugate. (A) Reducing and non-reducing sodium dodecylsulfate polyacrylamide gel electrophoresis (SDS-PAGE) showing Coomassie blue staining of the parental antiSCUBE1 (S1) antibody and an anti-S1 antibody-drug conjugate (ADC) (anti-S1-valine-citrulline [VC]-monomethyl auristatin [MMAE]) antibody on non-reducing and reducing SDS-PAGE. Of note, the non-reduced recombinant anti-S1 antibody was detected with a molecular mass ~180 kDa, whereas individual heavy and light chains are visible at ~55 kDa and ~25 kDa, respectively. (B) Matrix-assisted laser desorption/ionization time-of-flight mass spectrometry showed that the intact antiSCUBE1 ADC was produced with an average drug-to-antibody ratio (DAR) of 3.89. The intact anti-S1-VC-4MMAE with two MMAE on each arm of antibody (see Online Supplementary Figure S13) has a peak at mass 15,6155.60 Da. “A” represents a molecular moiety of dibenzocylcooctyne (DBCO)- polyethylene glycol (PEG) 3-VC-para-aminobenzoate (PAB)-MMAE. “m” indicates uncertain modification of antibody. (C) Anti-SCUBE1 ADC induced cytotoxicity in AML cell lines. Assays were performed in the presence of the unconjugated anti-SCUBE1 antibody or anti-SCUBE1 ADC. MTT was used to measure cell viability after 5 days. The half maximal inhibitory concentration (IC50, nM) of anti-SCUBE1 ADC on killing the SCUBE1 expression in THP-1 and NOMO-1 cells is shown inside the graph. Note that the anti-SCUBE1 ADC did not exhibit antitumor efficacy on SCUBE1-negative KG-1a or K562 cells.

A B C Haematologica | 108 May 2023 1296 ARTICLE - SCUBE1 is a potential therapeutic target for AML B.K. Sahoo et al.
8. Working model illustrating the mechanism of action of surface SCUBE1 in MLL-rearranged leukemias and potential immunotherapy approach. Left. Our study showed that SCUBE1 is a direct downstream target of the transcriptional regulatory complex of HOXA9/MEIS1, which are upregulated by MLL-fusion proteins such as MLL-AF9 and are essential for maintaining leukemic transformation. Surface SCUBE1 plays a critical pathogenic function in MLL-rearranged leukemias by acting as a FLT3 co-receptor via its spacer region and the COOH-terminal CUB domain in facilitating the interaction between FLT3 ligand (FLT3L) and FLT3, augmenting downstream LYN-AKT activation (tyrosine phosphorylation) for leukemic cell proliferation and survival, thus promoting leukemogenesis. Right. Surface expression of SCUBE1 on MLL-rearranged leukemia provides the opportunity for its potential use as a target for immunotherapy because an anti-SCUBE1 monoclonal antibody (mAb) conjugated to an antimitotic agent monomethyl auristatin E (MMAE) leads to significant cell killing specifically of MLL-AF9 leukemias.

tients. Our previous studies demonstrated a signaling regulatory role for SCUBE1 in BMP during mouse brain development7 and zebrafish hematopoiesis.4 In addition, SCUBE1 was recently implicated as a stress-inducible protein after renal ischemia-reperfusion.12 A portion of surface-tethered SCUBE1 appears to be released into the circulation and can serve as a biomarker of platelet activation in acute coronary syndrome and acute ischemic stroke.8 Thus, the circulating and/or surface expression levels of SCUBE1 might have diagnostic and/or prognostic value to select or stratify AML patients who might most benefit from an anti-SCUBE1 ADC regimen and/or possibly be a surrogate marker during antiSCUBE1 therapy. However, further clinical studies are required to validate the biomarker potential of plasma SCUBE1 concentration in AML.
Although small-molecule FLT3 kinase inhibitors are clinically effective, they have drug specificity issues and the acquisition of primary and secondary resistance to treatment.33 It will be of interest to further investigate whether SCUBE1 upregulation could be associated with refractoriness of FLT3 inhibitors and other receptor tyrosine kinase inhibitors in AML. If so, anti-SCUBE1 antibody-based drug delivery might limit the emergence of FLT3 mutants that evade small-molecule inhibitor treatment, thus minimizing the prospect of
recurrent disease. Intriguingly, we also found that surface SCUBE1 is highly expressed in a FLT3-internal tandem duplication (ITD) AML cell line, MV4-11 (Figure 1A, B), and genetic knockdown of SCUBE1 significantly inhibits the growth of MV4-11 cells (Online Supplementary Figure S24). FLT3-ITD is the most common constitutively active mutation in AML patients, conferring poor prognosis, with high rates of relapse even with stem cell transplantation. In addition, because SCUBE1 is a direct target gene of HOXA9 and because HOXA9 is dysregulated in a number of leukemic genetic alterations apart from MLL-translocations such as NUP98fusion,27 surface SCUBE1 might be an ideal therapeutic target for a broader spectrum of hematologic malignancies including FLT3-ITD AML and acute lymphoblastic leukemia. In summary, we discovered that pathological SCUBE1-mediated enhancement of FLT3 signaling is essential for leukemogenesis of MLL-fusion proteins. Using MLL-AF9 as a model, we provide the first in vivo evidence demonstrating a role for SCUBE1 in the initiation and maintenance of MLL-r leukemias. In addition, surface SCUBE1 may represent a novel therapeutic target for delivery of an ADC, which supports the translation of this approach into the clinic in patients with SCUBE1-expressing MLL-r leukemias (Figure 8).
Haematologica | 108 May 2023 1297 ARTICLE - SCUBE1 is a potential therapeutic target for AML B.K. Sahoo et al.
Figure
Disclosures
No conflicts of interest to disclose.
Contributions
BKS and R-BY designed the research and analyzed data; BKS, Y-CL, C-FT, and W-JL performed experiments; C-CL, C-TY, CYY, H-AH, W-CC, and H-FT analyzed AML patients’ data; FAL, KYM, SRR, and S-PW provided critical material; F-AL and L-HL analyzed proteomics results; and all authors approved the final version of the manuscript.
Acknowledgments
The authors thank the Development Center for Biotechnology of Taiwan for producing the anti-SCUBE1 ADC.
References
1. Yang RB, Ng CK, Wasserman SM, et al. Identification of a novel family of cell-surface proteins expressed in human vascular endothelium. J Biol Chem. 2002;277(48):46364-46373.
2. Tsai MT, Cheng CJ, Lin YC, et al. Isolation and characterization of a secreted, cell-surface glycoprotein SCUBE2 from humans. Biochem J. 2009;422(1):119-128.
3. Wu BT, Su YH, Tsai MT, Wasserman SM, Topper JN, Yang RB. A novel secreted, cell-surface glycoprotein containing multiple epidermal growth factor-like repeats and one CUB domain is highly expressed in primary osteoblasts and bones. J Biol Chem. 2004;279(36):37485-37490.
4. Tsao KC, Tu CF, Lee SJ, Yang RB. Zebrafish scube1 (signal peptide-CUB (complement protein C1r/C1s, Uegf, and Bmp1)EGF (epidermal growth factor) domain-containing protein 1) is involved in primitive hematopoiesis. J Biol Chem. 2013;288(7):5017-5026.
5. Tu CF, Su YH, Huang YN, et al. Localization and characterization of a novel protein SCUBE1 in human platelets. Cardiovasc Res. 2006;71(3):486-495.
6. Tu CF, Tsao KC, Lee SJ, Yang RB. SCUBE3 (signal peptide-CUBEGF domain-containing protein 3) modulates fibroblast growth factor signaling during fast muscle development. J Biol Chem. 2014;289(27):18928-18942.
7. Tu CF, Yan YT, Wu SY, et al. Domain and functional analysis of a novel platelet-endothelial cell surface protein, SCUBE1. J Biol Chem. 2008;283(18):12478-12488.
8. Dai DF, Thajeb P, Tu CF, et al. Plasma concentration of SCUBE1, a novel platelet protein, is elevated in patients with acute coronary syndrome and ischemic stroke. J Am Coll Cardiol. 2008;51(22):2173-2180.
9. Liao WJ, Tsao KC, Yang RB. Electrostatics and N-glycanmediated membrane tethering of SCUBE1 is critical for promoting bone morphogenetic protein signalling. Biochem J. 2016;473(5):661-672.
10. Lin YC, Lee YC, Li LH, Cheng CJ, Yang RB. Tumor suppressor SCUBE2 inhibits breast-cancer cell migration and invasion through the reversal of epithelial-mesenchymal transition. J Cell Sci. 2014;127(Pt 1):85-100.
11. Lin YC, Liu CY, Kannagi R, Yang RB. Inhibition of endothelial SCUBE2 (signal peptide-CUB-EGF domain-containing protein 2), a novel VEGFR2 (vascular endothelial growth factor receptor 2) coreceptor, suppresses tumor angiogenesis. Arterioscler Thromb
Funding
This work was supported by grants from Academia Sinica (AS-GC-111-L04 to R-BY), the Biomedical Translation Research Center of Academia Sinica (AS-KPQ-111-KNT to RBY) and the Ministry of Science and Technology of Taiwan (MOST 109-3111-Y-001-001, MOST 109-2320-B-001-012-MY3 and MOST 110-2320-B-001-019-MY3 to R-BY and MOST 1072321-B-001-036-MY3, MOST 110-2326-B-001-004-MY3 to YCL, and MOST 108-2320-B-001-007-MY2 and MOST 110-2628-B-001-017 to S-PW).
Data-sharing statement
Data that support the findings of this study are available from the corresponding author upon reasonable request.
Vasc Biol. 2018;38(5):1202-1215.
12. Liao WJ, Lin H, Cheng CF, Ka SM, Chen A, Yang RB. SCUBE1enhanced bone morphogenetic protein signaling protects against renal ischemia-reperfusion injury. Biochim Biophys Acta Mol Basis Dis. 2019;1865(2):329-338.
13. Meyer C, Burmeister T, Gröger D, et al. The MLL recombinome of acute leukemias in 2017. Leukemia. 2018;32(2):273-284.
14. Hilden JM, Dinndorf PA, Meerbaum SO, et al. Analysis of prognostic factors of acute lymphoblastic leukemia in infants: report on CCG 1953 from the Children's Oncology Group. Blood. 2006;108(2):441-451.
15. Lavallée VP, Baccelli I, Krosl J, et al. The transcriptomic landscape and directed chemical interrogation of MLLrearranged acute myeloid leukemias. Nat Genet. 2015;47(9):1030-1037.
16. Lagacé K, Barabé F, Hébert J, Cellot S, Wilhelm BT. Identification of novel biomarkers for MLL-translocated acute myeloid leukemia. Exp Hematol. 2017;56:58-63.
17. Barabe F, Gil L, Celton M, et al. Modeling human MLL-AF9 translocated acute myeloid leukemia from single donors reveals RET as a potential therapeutic target. Leukemia. 2017;31(5):1166-1176.
18. Lin CC, Hsu YC, Li YH, et al. Higher HOPX expression is associated with distinct clinical and biological features and predicts poor prognosis in de novo acute myeloid leukemia. Haematologica. 2017;102(6):1044-1053.
19. Prange KHM, Mandoli A, Kuznetsova T, et al. MLL-AF9 and MLLAF4 oncofusion proteins bind a distinct enhancer repertoire and target the RUNX1 program in 11q23 acute myeloid leukemia. Oncogene. 2017;36(23):3346-3356.
20. Zeisig BB, So CW. Retroviral/lentiviral transduction and transformation assay. Methods Mol Biol. 2009;538:207-229.
21. Drexler HG, Quentmeier H, MacLeod RA. Malignant hematopoietic cell lines: in vitro models for the study of MLL gene alterations. Leukemia. 2004;18(2):227-232.
22. Mrózek K, Tanner SM, Heinonen K, Bloomfield CD. Molecular cytogenetic characterization of the KG-1 and KG-1a acute myeloid leukemia cell lines by use of spectral karyotyping and fluorescence in situ hybridization. Genes Chromosomes Cancer. 2003;38(3):249-252.
23. Liao WJ, Wu MY, Peng CC, Tung YC, Yang RB. Epidermal growth factor-like repeats of SCUBE1 derived from platelets are critical
Haematologica | 108 May 2023 1298 ARTICLE - SCUBE1 is a potential therapeutic target for AML B.K. Sahoo et al.
for thrombus formation. Cardiovasc Res. 2020;116(1):193-201.
24. Döhner H, Estey E, Grimwade D, et al. Diagnosis and management of AML in adults: 2017 ELN recommendations from an international expert panel. Blood. 2017;129(4):424-447.
25. Lin S, Luo RT, Ptasinska A, et al. Instructive role of MLL-fusion proteins revealed by a model of t(4;11) pro-B acute lymphoblastic leukemia. Cancer Cell. 2016;30(5):737-749.
26. Kroon E, Krosl J, Thorsteinsdottir U, Baban S, Buchberg AM, Sauvageau G. Hoxa9 transforms primary bone marrow cells through specific collaboration with Meis1a but not Pbx1b. EMBO J. 1998;17(13):3714-3725.
27. Collins CT, Hess JL. Role of HOXA9 in leukemia: dysregulation, cofactors and essential targets. Oncogene. 2016;35(9):1090-1098.
28. Messeguer X, Escudero R, Farre D, Nunez O, Martinez J, Alba MM. PROMO: detection of known transcription regulatory elements using species-tailored searches. Bioinformatics. 2002;18(2):333-334.
29. Farre D, Roset R, Huerta M, et al. Identification of patterns in biological sequences at the ALGGEN server: PROMO and MALGEN. Nucleic Acids Res. 2003;31(13):3651-3653.
30. Zhong X, Prinz A, Steger J, et al. HoxA9 transforms murine myeloid cells by a feedback loop driving expression of key oncogenes and cell cycle control genes. Blood Adv. 2018;2(22):3137-3148.
31. Rees JS, Li XW, Perrett S, Lilley KS, Jackson AP. Protein neighbors and proximity proteomics. Mol Cell Proteomics. 2015;14(11):2848-2856.
32. Lin YC, Chao TY, Yeh CT, Roffler SR, Kannagi R, Yang RB. Endothelial SCUBE2 interacts with VEGFR2 and regulates VEGFinduced angiogenesis. Arterioscler Thromb Vasc Biol.
2017;37(1):144-155.
33. Kazi JU, Rönnstrand L. FMS-like tyrosine kinase 3/FLT3: from basic science to clinical implications. Physiol Rev. 2019;99(3):1433-1466.
34. Kazi JU, Rönnstrand L. The role of SRC family kinases in FLT3 signaling. Int J Biochem Cell Biol. 2019;107:32-37.
35. Okamoto M, Hayakawa F, Miyata Y, et al. Lyn is an important component of the signal transduction pathway specific to FLT3/ITD and can be a therapeutic target in the treatment of AML with FLT3/ITD. Leukemia. 2007;21(3):403-410.
36. Dos Santos C, Demur C, Bardet V, Prade-Houdellier N, Payrastre B, Récher C. A critical role for Lyn in acute myeloid leukemia. Blood. 2008;111(4):2269-2279.
37. Stubbs MC, Kim YM, Krivtsov AV, et al. MLL-AF9 and FLT3 cooperation in acute myelogenous leukemia: development of a model for rapid therapeutic assessment. Leukemia. 2008;22(1):66-77.
38. Kamezaki K, Luchsinger LL, Snoeck HW. Differential requirement for wild-type Flt3 in leukemia initiation among mouse models of human leukemia. Exp Hematol. 2014;42(3):192-203.
39. Verstraete K, Vandriessche G, Januar M, et al. Structural insights into the extracellular assembly of the hematopoietic Flt3 signaling complex. Blood. 2011;118(1):60-68.
40. Joubert N, Beck A, Dumontet C, Denevault-Sabourin C. Antibody-drug conjugates: the last decade. Pharmaceuticals (Basel). 2020;13(9):245.
41. Tsai CC, Lee MS, Chen CY, Chuang SH, Chen YJ, Wei WY. Development Center for Biotechnology, Taipei, Taiwan, assignee. Processes for preparing glycoprotein-drug conjugates. US 11,085,062. 2021 Aug. 10.
Haematologica | 108 May 2023 1299 ARTICLE - SCUBE1 is a potential therapeutic target for AML B.K. Sahoo et al.
Effects of nandrolone decanoate on telomere length and clinical outcome in patients with telomeropathies: a prospective trial
Diego V. Clé,1 Luiz Fernando B. Catto,1 Fernanda Gutierrez-Rodrigues,2 Flávia S. Donaires,1 Andre L. Pinto,1 Barbara A. Santana,1 Luiz Guilherme Darrigo Jr.,3 Elvis T. Valera,3 Marcel KoenigkamSantos,1 José Baddini-Martinez,4 Neal S. Young,2 Edson Z. Martinez5 and Rodrigo T. Calado1
1Department of Medical Imaging, Hematology, and Oncology, Ribeirão Preto Medical School, University of São Paulo, São Paulo, Brazil; 2Hematology Branch, National Heart, Lung, and Blood Institute, National Institute of Health, Bethesda, MD, USA; 3Department of Pediatrics, Ribeirão Preto Medical School, University of São Paulo, São Paulo, Brazil; 4Department of Internal Medicine, Ribeirão Preto Medical School, University of São Paulo, São Paulo, Brazil and 5Department of Social Medicine, Ribeirão Preto Medical School, University of São Paulo, São Paulo, Brazil
Abstract
Correspondence: D.V. Clé dvcle@hcrp.usp.br
Received: July 19, 2022.
Accepted: December 14, 2022.
Early view: December 29, 2022.
https://doi.org/10.3324/haematol.2022.281808
©2023 Ferrata Storti Foundation
Published under a CC BY-NC license
Androgens have been reported to elongate telomeres in retrospective and prospective trials with patients with telomeropathies, mainly with bone marrow failure. In our single-arm prospective clinical trial (clinicaltrials gov. Identifier: NCT02055456), 17 patients with short telomeres and/or germline pathogenic variants in telomere biology genes associated with at least one cytopenia and/or radiologic diagnosis of interstitial lung disease were treated with 5 mg/kg of intramuscular nandrolone decanoate every 15 days for 2 years. Ten of 13 evaluable patients (77%) showed telomere elongation at 12 months by flow-fluorescence in situ hybridization (average increase, 0.87 kb; 95% confidence interval: 0.20-1.55 kb; P=0.01). At 24 months, all ten evaluable patients showed telomere elongation (average increase, 0.49 kb; 95% confidence interval: 0.24-1.23 kb; P=0.18). Hematologic response was achieved in eight of 16 patients (50%) with marrow failure at 12 months, and in ten of 16 patients (63%) at 24 months. Seven patients had interstitial lung disease at baseline, and two and three had pulmonary response at 12 and 24 months, respectively. Two patients died due to pulmonary failure during treatment. In the remaining evaluable patients, the pulmonary function remained stable or improved, but showed consistent decline after cessation of treatment. Somatic mutations in myeloid neoplasm-related genes were present in a minority of patients and were mostly stable during drug treatment. The most common adverse events were elevations in liver function test levels in 88%, acne in 59%, and virilization in 59%. No adverse events grade ≥4 was observed. Our findings indicate that nandrolone decanoate elongates telomeres in patients with telomeropathies, which correlated with clinical improvement in some cases and tolerable adverse events.
Introduction
Telomeres are hexameric repetitive DNA sequences and associated proteins that protect the ends of linear chromosomes against DNA damage.1 Chromosome erosion occurs during mitosis, with loss of approximately 50 to 100 base pairs (bp) of telomeric DNA at each cell division.2 When telomeres reach critically short length, cells undergo proliferation arrest or apoptosis,3 and stem cell fate is skewed towards differentiation over self-renewal.4,5 Highly replicative cells express telomerase, an enzyme that actively maintains telomere length (TL) by adding DNA hexanucleotides to the 3’ end of the leading DNA strand, lessening telomere attrition.6 Pathogenic germline variants in the telomerase complex or other telomere bi-
ology genes impair telomere maintenance, causing excessive telomere loss, estimated at approximately 120 bp per year,7 and eventually impacting cell proliferation and tissue regeneration.8 Tissues with high proliferative index or exposed to persistent injury, such as the bone marrow, lung, liver, and skin, appear to be particularly susceptible to a telomere repair defect, and they feature prominently in the clinical spectrum of telomere diseases.9
Telomeropathies are multi-organ diseases with pleiotropic phenotype, including interstitial lung disease,10 bone marrow failure,8 cirrhosis11,12 and mucocutaneous abnormalities, which may be observed either in isolation or in combination and variable severity, even within pedigrees.13 Asymptomatic patients may display subclinical organ dysfunction.14 Curative therapies are few and supportive
Haematologica | 108 May 2023 1300 ARTICLE - Bone Marrow Failure
measures are the usual standard of care. When patients develop severe organ dysfunction, such as aplastic anemia, allogeneic hematopoietic stem cell transplantation (HSCT) may be considered, but pulmonary and hepatic dysfunction associates with treatment-related morbidity and mortality.15,16 Conversely, lung and liver transplantation are frequently contra-indicated due to co-existing cytopenias, and outcomes are poor.17,18
Growth factors and hormones are involved in controlling telomerase function.19 In a mouse model of aplastic anemia with very short telomeres, testosterone upregulated telomerase and attenuated cytopenias.20 In healthy human hematopoietic cells, exposure to androgens increases telomerase activity in vitro; in cells from patients carrying telomerase mutations, androgens ameliorated telomerase function, providing a biological basis for the use of sex hormones to treat telomeropathies.21 In a previous phase I-II prospective trial in telomere diseases, danazol at 800 mg per day for 2 years was associated with telomere elongation in peripheral blood leukocytes.22 Hematological response was observed in 79% of patients, and lung function as well as pulmonary fibrosis were stable during treatment. The most common adverse event (AE) was elevated liver enzyme levels in 41% of patients. We conducted a phase I-II single-center prospective trial in patients with telomere diseases, to assess the safety and the clinical and biological effects of the male hormone nandrolone decanoate, a parenteral synthetic steroidal androgen with lower expected hepatic toxicity than typical for orally administered hormones (clinicaltrials gov. Identifier: NCT02055456).
Methods
Patients and treatment
Male patients >2 years and female patients >16 years were eligible for enrollment at the Ribeirao Preto Medical School University Hospital (Ribeirao Preto, SP, Brazil). Entry criteria were age-adjusted mean TL <1st percentile and/or identified germline pathogenic variants in telomere biology genes associated with at least one cytopenia and/or radiologic diagnosis of interstitial lung disease (ILD) (see details in the Online Supplementary Appendix).22,23 The local Research Ethics Committee approved the protocol and all patients provided written informed consent (CAAE, 19116913.4.0000.5440). Patients were treated with 5 mg/kg of intramuscular nandrolone decanoate every 15 days for 2 years. Patient monitoring is detailed in the Online Supplementary Appendix.
Pulmonary evaluation
Pulmonary involvement was assessed by high-resolution computed tomography (HRCT) of the chest and pulmon-
ary function testing for diffusing capacity for carbon monoxide (DLCO) at baseline and at 24 months. Patients with lung disease had an additional pulmonary evaluation at 12 months. Predicted forced vital capacity (FVC) and predicted DLCO values, corrected for anemia,25 were used to evaluate lung disease progression.
Telomere length measurement and massively parallel targeting sequencing panel
Peripheral blood leukocyte TL was measured by flow-fluorescence in situ hybiridization flow-FISH26 at landmark time points: enrollment, 12 and 24 months of nandrolone treatment.
Patients were screened for somatic mutations in peripheral blood at landmark time points by an error-correcting DNA sequencing panel covering 60 genes associated with myeloid malignancies and clonal hematopoiesis (ArcherDX customized panel; Online Supplementary Appendix; Online Supplementary Table S2)
End points
Primary objectives of the study were safety and nandrolone decanoate activity in slowing telomere attrition in patients. The primary biologic end point was a reduction of ≥20% in the annual rate of telomere attrition in patients with telomere disease (to ≤96 bp/year)7,27 during nandrolone administration. The primary safety end point was the occurrence of AE throughout the treatment period. Secondary end points were hematologic and pulmonary responses (Online Supplementary Appendix). Other secondary end points were the incidence of clonal hematopoiesis and hematologic relapse. Changes in chest HRCT scan quantitative measures were exploratory end points.
Statistics
Summary statistics were used to describe the primary biologic and secondary end points. Linear regression models with mixed effects were used to obtain pairwise comparisons of the means of the variables of interest between different periods. These models include a random effect that accounts for dependence between values from the same individual (paired data). Assumption of normality of residuals was visually checked for the models using normal probability plots. The presence of outliers and influential observations were verified by graphs of the studentized residuals and by the Cook's D statistics. The SAS version 9 (proc mixed) was used , considering a level of significance of 0.05.28
Results
Patients
From May 2014 to October 2017, 20 consecutive patients
Haematologica | 108 May 2023 1301 ARTICLE - Nandrolone decanoate to treat telomere diseases D.V. Clé et al.
were screened for participation and 17 were enrolled. Seven patients withdrew from the study before the end of 2 years (Figure 1). Median age was 36 years (range, 4–59 years), and five patients (29%) were female. All patients were diagnosed with bone marrow failure, seven patients were additionally diagnosed with ILD, and four patients also had liver involvement: radiologic findings of cirrhosis in all four and gastroesophageal varices in three. Five patients displayed cutaneous features of dyskeratosis congenita. At the time of enrollment, one patient had already been submitted to hematopoietic stem cell transplantation due to aplastic anemia in another center (severity not classified) and was eligible for the study due to lung disease. Clinical characteristics are summarized in Table 1. Germline pathogenic variants in telomere biology genes were identified in all but three patients (Table 2). After study completion, patients received treatment according to the physician’s discretion. Some kept supportive care and others received androgens according to local availability (danazol or restarted nandrolone).

Adverse events
The most common AE associated with nandrolone were elevations in liver function test levels in 88%, acne in 59%, and virilization in 59% (Table 3). Severe AE (grade 3) possibly related to drug occurred in seven instances and
injection complications were the most common (cutaneous abscess in UPN #14 and sciatic nerve injury in UPN #15). Additionally, three patients had mild (grade 1) injection site reactions: pain in two (UPN# 6 and UPN#7) and local hematomas in one thrombocytopenic patient (UPN #17). No AE ≥ grade 4 related to nandrolone was observed. Dose reduction to 3.5 mg/kg was necessary in five cases due to severe or moderate AE, as a result of acne (in 2 patients, UPN #1 and UPN #15), depression (1 patient, UPN #8), progressive erythrocytosis (1 patient, UPN #4), or progressive signs of early puberty in a 4-year-old child (UPN #9). An additional reduction to 2.5 mg/kg was necessary in three cases due to symptom persistence (UPN #1, UPN #8 and UPN #9). Seven patients withdrew from the study before the end of 2 years: two patients halted therapy due to grade 3 adverse events (acne and depression - UPN #1 and UPN #8, respectively), one patient sought alternative therapies (UPN #16), and four patients died during the period of nandrolone administration (2 from progressive respiratory failure due to ILD – UPN #3 and UPN #13; and 2 from intracranial hemorrhage – UPN #11 and UPN #14). Additionally, three patients died after treatment completion, of progressive ILD in two (UPN #1 and #2) and complication of cytopenias in one (UPN #9), for a total of seven deaths (41%) by September 2020. No deaths were attributed to nandrolone.
Haematologica | 108 May 2023 1302 ARTICLE - Nandrolone decanoate to treat telomere diseases D.V. Clé et al.
Figure 1. Flowchart of consecutive patients with telomeropathy screened for nandrolone treatment and enrolled in the study. AE: adverse event.
Telomere attrition
Of the 17 patients enrolled, 15 reached 12 months of treatment and 13 were evaluable for primary end point at 12 months. One patient received a HSCT before study inclusion (UPN #10) and, thus TL was not evaluated; for one patient the telomere sample was missing at 12 months. Ten of 13 patients (77%) met the primary efficacy end point at 12 months and showed consistent telomere elongation (Figure 2A). The average increase in TL at 12 months was 0.87 kb (95% confidence interval [CI]: 0.20-1.55; P=0.01). Ten patients reached 24 months of treatment and were evaluable. All of them met the end point criteria and showed telomere elongation at 2 years (Figure 2A). At 24 months the average increase in TL from baseline was 0.49 kb (95% CI: 0.24-1.23; P=0.18).
Hematologic response
In intention-to-treat analysis, eight of 16 patients (50%) with marrow failure (UPN #10, who received HSCT previous to study entry was excluded) reached hematologic response at 12 months, and ten of 16 patients (63%) reached hematologic response at 24 months (Figure 2C). Mean hemoglobin increase was 1.65 g/dL (95% CI: 0.65-2.63; P<0.01) and 2.09 g/dL (95% CI: 0.99-3.18; P<0.01) from baseline to 12 and 24 months, respectively. Absolute reticulocyte count remained stable at 12 months but increased by a mean of 34,487/ m L at 24 months (95% CI: 6,051-62,922; P=0.02) ( Online Supplementary Figure S1).
Five of eight transfusion-dependent patients became transfusion-independent, and one patient showed a reduction in transfusion requirements >50%. Two patients relapsed during the study period: UPN #9 relapsed 3 months after first dose reduction and eventually died of cytopenia complications 1 year after completing the study; and UPN #11 died due to intracranial hemorrhage 4 months after relapse. Platelet and neutrophil counts did not significantly change during nandrolone treatment (Online Supplementary Figure S1). Four patients did not show hematologic response at any time during nandrolone treatment.
Lung disease and pulmonary response
Pulmonary disease (ILD) was identified at baseline in seven patients on HRCT scan, with variable radiologic features. Usual interstitial pneumonia (UIP) pattern was observed in one patients (UPN #3), indeterminate for UIP in three (UPN #2, UPN #4 and UPN #13); non-specific interstitial pneumonia (NSIP) in one (UPN #1); pleuroparenchymatous fibroelastosis (PPFE) in one (UPN #10); and interstitial lung abnormalities without fibrosis in one (UPN # 17). Radiologic patterns did not correlate with any specific genetic lesion (data not shown).
In this ILD subgroup, two patients died during nadrolone use due to respiratory failure at two and 16 months, without pulmonary function re-assessment (considered as non-responders in intention-to-treat analysis). In the
ve
fi
Characteristic All patients (N=17) Patients with identified genetic telomere-biology variants No variant identified (N=3) TERT (N=7) RTEL1 (N=4) TERT&TERC (N=1) TERC (N=1) TINF2 (N=1) Age in years, median (range) 36 (4-59) 40 (21-59) 34 (10-54) 12 30 4 40 (18-40) Female sex, N (%) 5 (29) 3 2 0 0 0 0 Bone marrow failure, N (%) Moderate AA 14 (82) 7 4 0 1 1 2 Severe AA 1 (6) 0 0 1 0 0 0 Myelodysplastic Syndrome 1 (6) 0 0 0 0 0 1 Transfusion dependency, N (%) Red cells 1 (6) 1 0 0 0 0 0 Platelets 3 (18) 1 0 0 0 1 1 Red cells and platelets 4 (24) 0 1 1 1 0 1 Pulmonary fibrosis, N (%) Present 7 (41) 3 3 0 1 0 0 Absent 10 (59) 4 1 1 0 1 3 Hepatic involvement, N (%) Present 4 (24) 2 2 0 0 0 0 Absent 13 (76) 5 2 1 1 1 3 Mucocutaneous features, N (%) 5 (29) 1 2 0 1 1 0
AA: aplastic anemia. Haematologica | 108 May 2023 1303 ARTICLE - Nandrolone decanoate to treat telomere diseases D.V. Clé et al.
Table
1. Baseline characteristics of enrolled patients.
Germline variants in telomere biology genes Somatic gene variants Patient N Phenotype Gene Transcript (RefSeq) DNA change Protein change Zygosity ACMG classi fi ca tion At enrollment At end of treatment Gene/ location VAF% Gene/ location VAF% 1 AA/ILD TERT NM_198253 c.193C>A p.Pro65Thr homo P None None 2 AA/ILD/ LD RTEL1 NM_001283010 c.3054C>T p.Arg743X het P None None 3 AA/ILD RTEL1 NM_001283010 c.3054C>T p.Arg743X het P None Not sequenced 4 AA/ILD/ LD TERT NM_198253 c.2594G>A p.Arg865His het P POT1 c.56G>A:p.Gly19Asp 4.0 POT1 c.56G>A:p.Gly19Asp 6.3 PPM1D c.1281G>A:p.Trp427Ter 0.54 PPM1D c.1281G>A:p.Trp427Ter 0.9CBL c.1348G>A:p.Ala450Thr 0.54TERTp c.-57A>C 0.2 ‡ 5 AA TERT NM_198253 c.2594G>A p.Arg865His het P None None 6 AA TERT NM_198253 c.3234C>G p.Pro1078Leu het LP TERTp c.-146A>C 0.6 TERTp c.-146A>C 1.5 PPM1D c.1654C>T:p.Arg552Ter 0.86 PPM1D c.1654C>T:p.Arg552Ter 0.5 PPM1D c.1262C>G:p.Ser421Ter 1.0 PPM1D c.1262C>G:p.Ser421Ter 2.0 POT1 c.1505+3A>G 0.57 AA TERT NM_198253 c.2594G>A p.Arg865His het P None None 8 AA None*--EZH1 c.2098+2T>G 4.3 9 AA/SK TINF2 NM_001099274 c.844C>T p.Arg282Cys het P None None §§§ 10 AA/ILD/ LD/SK RTEL1 NM_001283009 c.3257A>G p.Tyr1086Cys het LP None None RTEL1 NM_001283009 c.3775_3776del p.Ala1259fsX2 het P
Haematologica | 108 May 2023 1304 ARTICLE - Nandrolone decanoate to treat telomere diseases D.V. Clé et al. Continued on following page.
Table 2. Germline and somatic genetic variants in enrolled patients.
AA: aplastic anemia; ILD: interstitial lung disease; LD: liver disease; MDS: myelodysplastic syndrome; na: not applicable; SK: skin abnormalities; homo: homozygous; het: heterozygous;
§§§ Sequencing performed 18 months after enrollment.
§§ sequencing performed 12 months after enrollment;
§ Sequencing performed 6 months after enrollment;
VAF: variant allele frequency; ACMG classi fi ca tion, Joint Consensus Recommendation of the American College of Medical Genetics and Genomics and the Association for Molecul ar Pathology for the interpretation of sequence variants (Richards et al. Genet Med, 2015); P: pathogenic; LP: likely pathogenic; VUS: variant of uncertain signi fi cance. *N o telomere biology variant was identi fi ed, but the patient was later found to be heterozygous for the SAMD9 gene variant c.740T>C:p.Ile247Thr (NM_001193307), classi fi ed as a VUS according to the ACMG guidelines. ‡ Detected 2 years after end of treatment at VAF of 0.55%. Retrospectively identi fi ed in the sample from the end of treatment at VAF below the assays’ limit of detection (VAF of 0.2%).
11 AA None--ASXL1 c.2858_2859insTGAC: p.Leu953fs 30.0 ASXL1 c.2858_2859insTGAC: p.Leu953fs §§ 6.7 RUNX1 c.965C>G:p.Ser322X 33.0 RUNX1 c.965C>G:p.Ser322X §§ 7.5 12 AA/SK RTEL1 NM_001283009 c.3257A>G p.Tyr1086Cys het LP None None RTEL1 NM_001283009 c.3775_3776del p.Ala1259fsX2 het P 13 AA/ILD/ LD/SK TERT NM_198253 c.2146G>A p. Ala716Thr het P TERTp c.-124A>C 0.85 TERTp c.-124A>C §§ 1 14 MDS None--U2AF1 c.101C>T:p.Ser34Phe 26.0 U2AF1 c.101C>T:p.Ser34Phe § 28.0 15 AA TERC NR_001566.1 r.94C>T na het P None None TERT NM_198253 c.2329G>A p.Val777Met het P 16 AA TERT NM_198253 c.2154C>A p.Asp718Glu het P PIGA c.486delC:p.Val162fs 2.9 PIGA c.486delC:p.Val162fs §§ 12.6 17 AA/ILD/ SK TERC NR_001566.1 r.110_113delGACT na het P None None §§ Germline
in telomere biology genes Somatic gene variants Patient N Phenotype Gene Transcript (RefSeq) DNA change Protein change Zygosity ACMG classi fi ca tion At enrollment At end of treatment Gene/ location VAF% Gene/ location VAF%
variants
Haematologica | 108 May 2023 1305 ARTICLE - Nandrolone decanoate to treat telomere diseases D.V. Clé et al.
remaining evaluable patients, the pulmonary function improved in three or remained stable in two patients during nandrolone therapy (Figure 2B): mean percentage of forced vital capicity (FVC%) was 68.0% (95% CI: 46.8-89.2) at baseline and 69.6 (95% CI: 47.5-91.7) at 2 years (P=not significant); and mean percentage of diffusing capacity of carbon monoxide (DLCO%) was 43.7 (95% CI: 27.4-59.8) at baseline and 49.8 (95% CI: 32.8-66.6) at 24 months (P=not significant) (Table 4). In aggregate, pulmonary response was observed in two patients (29%) at 12 months and in three patients (43%) at 24 months of treatment (Figure 2C). However, after treatment completion, DLCO was consistently reduced in all five cases with available PFT at 612 months post-treatment (Figure 2B) and two more patients died due to respiratory failure 1 and 3 years after stopping nandrolone (Figure 2C).
In three patients with ILD, HRCT visual fibrosis scores remained stable during nandrolone, but quantitative measures obtained at the end of the 2-year treatment showed disease progression in two cases. In the first patient (UPN #4), PV was reduced (5,401 mL at baseline to 5,146 mL at 24 months), and lung density increased (MPD, -733 HU to -726 HU; and P90, -259 HU to -236 HU at baseline and 24 months, respectively), in agreement with a reduction in FVC, as a percentage of predicted values (FVC%) (102% at baseline to 86% at 24 months) observed in PFT. His DLCO, as a percentage of predicted values (DLCO%), remained stable (71% at baseline and 72% at 24 months). The second patient (UPN #10) also showed mild increase in lung density (MPD, -678 HU to -667 HU; and P90, -275 HU to -272 HU, at baseline and 24 months, respectively) but improvement in PV (2,798 mL at baseline
Adverse events All grades Grade 1 Grade 2 Grade 3 N (%) N (%) N (%) N (%) Abnormal elevated serum levels Transaminases 14 (82) 12 (70) 1 (6) 1 (6) Canalicular enzymes 10 (59) 7 (41) 3 (18) 0 Bilirubin 3 (18) 3 (18) 0 0 Cholesterol 1 (6) 1 (6) 0 0 Triglycerides 1 (6) 0 1 (6) 0 Prostate-specific antigen 1 (6) 1 (6) 0 0 Creatinine 4 (24) 4 (24) 0 0 Acne 10 (59) 7 (41) 2 (12) 1 (6) Virilization Voice deepening 5 (29) 5 (29) 0 0 Hirsutism 5 (29) 5 (29) 0 0 Erythrocytosis 6 (35) 3 (18) 3 (18) 0 Injection site reactions Pain 2 (12) 2 (12) 0 0 Hematoma 1 (6) 1 (6) 0 0 Local infection 1 (6) 0 0 1 (6) Sciatic nerve injury 1 (6) 0 0 1 (6) Irritability 5 (29) 5 (29) 0 0 Muco-cutaneous bleeding 4 (24) 4 (24) 0 0 Alopecia 4 (24) 4 (24) 0 0 Hypertrichosis 3 (18) 3 (18) 0 0 Hypertension 2 (12) 0 1 (6) 1 (6) Depression 2 (12) 1 (6) 0 1 (6) Systemic allergic reactions 2 (12) 1 (6) 0 1 (6) Insomnia 2 (12) 2 (12) 0 0 Abdominal pain 2 (12) 2 (12) 0 0 Cramps 2 (12) 2 (12) 0 0 Precocious puberty 1 (6) 0 1 (6) 0 Vulvar synechia 1 (6) 1 (6) 0 0 Clitoromegaly 1 (6) 1 (6) 0 0 Headache 1 (6) 1 (6) 0 0 Prostatism 1 (6) 1 (6) 0 0 Edema 1 (6) 1 (6) 0 0
No adverse event ≥ grade 4 was observed. Haematologica | 108 May 2023 1306 ARTICLE - Nandrolone decanoate to treat telomere diseases D.V. Clé et al.
Table 3. Adverse events during nandrolone treatment.
to 3,086 mL at 24 months) and in all functional parameters in PFT (FVC%: 51% to 57% and DLCO%: 28% to 46%, at baseline and 24 months, respectively). This patient ultimately became oxygen-independent during nandrolone use. The third patient (UPN #17) showed improvement in both quantitative HRCT scores (PV, 2,398 mL to 4,246 mL; MPD, -609 HU to -717 HU; and P90, -243 HU to -288 HU,
at baseline and 24 months, respectively), with sustained FVC% (83% at baseline and 91% at 24 months), and DLCO% (40.4% at baseline and 40.5% at 24 months).
Three patients (UPN #1, UPN #2 and UPN #13) with ILD showed worsening of both visual scores and quantitative measures during treatment (mean PV, 3,581.7 mL to 2,924.3 mL; mean MPD, -706.3 HU to -624 HU, and mean
Figure 2. Biologic and clinical response to nandrolone treatment. (A) Telomere length measured by flow-fluorescense in situ hybridization at baseline and during 12 and 24 months of treatment. (B) Spider graph with the changes in hemoglobin corrected diffusing capacity of the lungs for carbon monoxide for patients with interstitial lung disease treated with nandrolone. (C) Hematologic and pulmonary response in patients treated with nandrolone decanoate. HSCT: hematopoietic stem cell transplantation.

A B C
Haematologica | 108 May 2023 1307 ARTICLE - Nandrolone decanoate to treat telomere diseases D.V. Clé et al.
Table 4. Lung involvement evaluated by pulmonary function testing and quantitative measures in high-resolution computed tomography of the chest in seven patients with interstitial lung disease at baseline and at end-of-treatment.
FVC%: percentage of predicted forced vital capacity; DLCO%: percentage of predicted diffusing capacity for carbon monoxide; PV: pulmonary volume; MPD: mean pulmonary density; P90: 90th percentile of lung density; HU: Hounsfield unit; ns: not significant.
P90, -280.6 HU to -204.3 HU, at baseline and 24 months, respectively), and in spite of some improvement in PFT in two of them (UPN #1, FVC%, 77% to 79%, DLCO%, 38.9% to 46.4%; and UPN #2, FVC%, 53% to 58%, DLCO%, 56% to 58%), all three required supplementary oxygen and died due to progressive pulmonary disease 1 and 3 years after nandrolone discontinuation and at 16 months of treatment, respectively.
An additional patient with pulmonary disease (UPN #3), who was oxygen-dependent at baseline died in the second month of the study due to acute ILD exacerbation, and PFT and HCRT at follow-up were not performed.
Somatic mutations
Genetic somatic mutations were identified in peripheral blood leukocytes in six patients at baseline (Table 2; Figure 3). Clones bearing mutations in genes associated with myeloid neoplasms remained stable (PPM1D mutations in UPN #4 and UPN #6; and U2AF1 mutation in UPN #14) or decreased (ASXL1 and RUNX1 mutations in UPN #11) during nandrolone use. Of note, germline mutations in telomerebiology genes were not identified in two instances (UPN #11 and UPN #14), and despite the transient hematologic response, both prematurely died due to complications of thrombocytopenia.
In patient UPN #4, a POT1 mutation present at baseline increased in clone size and new low-frequency myeloid mutations (PPM1D and CBL) emerged in the course of treatment. The patient showed late hematologic response at 24 months.
TERT promoter (TERTp) mutations also were observed at baseline (UPN #6 and UPN #13), or emerged during the study (UPN #4). In all of them, the variant allele frequency (VAF) remained stable during nandrolone.
The only somatic clone that significantly increased during study treatment was a PIGA mutation in UPN #16. He did not show improvement in blood counts and was sent for
alternative donor HSCT.
The patient UPN #8 carried a SAMD9L germline mutation. At the end of treatment, an EZH1 somatic mutation (VAF, 4.3%) was identified; he showed hematologic improvement and remained stable after drug discontinuation (due to depression).
Discussion
In this single-arm prospective clinical trial, treatment with intramuscular nandrolone decanoate for 2 years led to telomere elongation in peripheral blood leukocytes of patients with telomere diseases. Telomere elongation was associated to a certain degree of hematologic response that, in some cases, was delayed and transient and to a tendency to a stable lung function in patients with previous lung involvement. Somatic mutations associated with myeloid malignancies were present in a minority of patients and did not appear to be influenced by the pharmacologic intervention.
Many androgen formulations have been used to treat acquired and inherited bone marrow failure for decades, with variable outcomes and adverse events.29 In a multisystem, rare, and severe disease lacking effective and definitive therapies, androgen and their derivatives have shown to be safe and to mitigate marrow failure in retrospective30 and prospective22 trials. Since the first observation by Sanchez-Medal31 on the use of anabolic androgens to treat patients with aplastic anemia, the improvement in neutrophils and platelets was less marked and slower. Androgens also are known to stimulate the expansion of the red blood mass via erythropoietin.32,33 These findings may explain the more robust response in the red cell lineage in the current trial. Our present study expands the knowledge of androgen use for telomere diseases in at least four aspects. First, androgen toxicities
Baseline Mean (95% CI) 24 months Mean (95% CI) P value Pulmonary function test (N=7) FVC% 68.0 (46.8-89.2) 69.6 (47.5-91.7) ns DLCO% 43.7 (27.4-59.8) 49.8 (32.8-66.6) ns High resolution computed tomography (N=7) PV (mL) 3,453.7 (2,403.4-4,504.0) 3,483.8 (2,375.2-4,592.3) ns MPD (HU) -678 (-727 to -628.9) -663.7 (-716.6 to -610.7) ns P90 (HU) -262.6 (-303.2 to -221.8) -234.1 (-278.0 to -190.1) ns
Haematologica | 108 May 2023 1308 ARTICLE - Nandrolone decanoate to treat telomere diseases D.V. Clé et al.
are frequent irrespective of specific formulation, especially in liver function tests and clinical virilization. In our study, nandrolone decanoate led to an elevation in liver enzyme levels (88%) more frequently than reported for danazol (41%)22 but adverse events were mild in most cases. That nandrolone decanoate is given intramuscularly, bypassing the hepatic first passage of oral formulations, would suggest less propensity for hepatotoxicity, but our prospective trial does not support this prediction.
However, neither severe liver AE was observed nor was drug administration interrupted due to liver toxicity; in the four patients with liver disease at enrollment, it was stable during the pharmacologic intervention. The AE profile appears to be similar to that reported for patients with Fanconi anemia or dyskeratosis congenita treated with androgens.29 The occurrence of two intracranial hemorrhages is of potential concern, since it is not a commonly reported in telomeropathies. In both cases, trauma, hyper-

A B C D
Haematologica | 108 May 2023 1309 ARTICLE - Nandrolone decanoate to treat telomere diseases D.V. Clé et al. E F
Figure 3. Somatic mutations’ dynamics during nandrolone use. (A) patient UPN #4; (B) patient UPN #6; (C) patient UPN #13; (D) patient UPN #11; (E) patient UPN #14 and (F) patient UPN #16. VAF: variant allele frequency.
tension, or increased hematocrit were not observed. The intracranial bleeding events were correlated with the very low platelet counts (<10,000/mL). However, we cannot exclude an unlikely association with the study drug. Second, all evaluable patients met endpoint criteria at 24 months and showed a reduction in telomere erosion. Indeed, most patients exhibited telomere elongation during the pharmacologic intervention, more significant at 12 months (Figure 2), confirming previous observations in the trial using danazol.22 One major strength of our study is that TL was determined using the flow-FISH technique, which is more accurate and reproducible than quatitative polymerase chain reaction.26,34 Although flow-FISH also has some variability, samples from the same patients at different time points were run together at the end of the study to avoid inter-experiment variability, and the elongation pattern was consistent. Flow-FISH has a limitation to detect small differences in TL between paired samples and differences in the annual rate attrition may be difficult to detect for a given individual. However, as most patients showed the same telomere elongation pattern, flow-FISH was able to detect elongation. Our study, using a different male hormone and a different TL measurement technique, confirms that androgens elongate telomeres of peripheral blood leukocytes of patients with telomeropathies. Additional noncontrolled studies also have suggested that androgens elongate telomeres.30 In aggregate, there is retrospective and prospective evidence that androgens elongate telomeres of telomere disease patients in vivo.
How androgens elongate telomeres is not entirely clear. Androgen exposure increases telomerase expression and activity in vitro in hematopoietic cells.21 Murine models of telomerase deficiency also have shown telomere elongation under androgen treatment that is telomerase-dependent.20 Additionally, our results suggest that androgen therapy influences stem cell mobilization, based on the clonal hematopoiesis findings (Table 2; Figure 3). There is evidence that danazol treatment may modulate TERTp clones, which operate using promoter regions different from sex hormones.21,35,36 Recent findings indicate that short telomeres imbalance stem cell fate towards differentiation at the self-renewal expense.4,5 It is possible that androgens engage quiescent hematopoietic stem cells with longer telomeres and restore hematopoietic stem cell expansion and differentiation.
Third, to the best of our knowledge, this is the first comprehensive analysis of an androgen effects on clonal hematopoiesis. Clones containing mutations associated with myeloid neoplasms remained stable or decreased in size during nandrolone intervention, whereas somatic mutations in telomere biology genes, which may function as somatic genetic rescue,37 appeared in small-size clones (<5%) and remained stable, except for one patient in which a POT1-mutant clone doubled in size during nan-
drolone and contracted after the intervention period (Table 2; Figure 3). Clonal hematopoiesis was present in a minority of patients and did not appear to be significantly influenced by nandrolone. Of note, we identified one particular patient with a germline pathogenic variant in TERT (Asp718Glu) in whom a somatic mutation in the PIGA gene was found (Val162fs). The presence of a glycosylphosphatidylinositol (GPI)-negative clone was confirmed in two cell types by flow cytometry at different time points.38 In our cohort of 87 cases with a GPI-negative clone, this is the only patient with a telomerase mutation in whom a PNH clone was detected by flow cytometry and sequencing, although others have demonstrated frequent minor PNH clones (<0,1%) in inherited marrow failure syndromes.39 On the other hand, the patient had a germline TERT variant predicted to be deleterious in silico and located at the same codon as a previously reported variant predicted to be pathogenic and to reduce telomerase activity to 44%.40 The patient also had a family history of idiopathy pulmonary fibrosis. PNH clones are usually reported in immune aplastic anemia and are thought to be selected by immune escape.41 Although an immune-mediated mechanism cannot be excluded in this case, it is possible that the GPI-negative clone may be the result of genetic drift and not immune selection.41
Forth, the present study extends the observations of the androgen effects on pulmonary function. Seven patients in our study were diagnosed with ILD at baseline; four eventually died from respiratory failure, two of them during nandrolone treatment, emphasizing the severity of the disease when lungs are affected.9,24 There was significant discordance among HRCT scan visual scores and quantitative measurements, PFT parameters, and clinical outcomes during nandrolone intervention, indicating the difficulty in identifying reliable markers for disease progression. Among patients who completed the 2-year intervention, DLCO remained stable or increased in evaluable patients and consistently decreased when they were off study (Figure 4). Although the number of patients with ILD in the present study is small, the PFT results are comparable to those of the danazol study,22 suggesting that androgens may decrease lung disease progression. In aggregate, these findings support prospective studies using androgens specifically in patients with ILD associated with telomeropathies.
This study has limitations. The number of patients is relatively small, but compatible with a very rare disorder in a single-center study. Recruitment of patients from other centers and states was disfavored by patient commute, especially in a large country such as Brazil. Additionally, there is no consensus parameter for lung function in patients with pulmonary fibrosis and telomere disease for appropriate follow-up, especially in smaller trials. In conclusion, nandrolone decanoate elongates telomeres
Haematologica | 108 May 2023 1310 ARTICLE - Nandrolone decanoate to treat telomere diseases D.V. Clé et al.
in patients with telomeropathies, and elongation associates with clinical improvement. These results expand the knowledge on the effects of androgens on telomere maintenance, showing in the clinic that different male hormone formulations are capable of telomere elongation and clinical benefit with tolerable adverse events. As transplant modalities are restricted, nandrolone decanoate may be used to improve hematopoiesis and perhaps stabilize lung function in telomeropathy patients.
Disclosures
No conflicts of interest to disclose.
Contributions
DVC and RTC designed the study. DVC, LFBC, LGDJ, ETV and RTC recruited, treated and followed the patients. FGR, FSD, ALP, BST and BAS performed telomere length measurements and massively parallel targeting sequencing panels. NSY provided and analyzed the massiv ely parallel targeting sequencing data. MKS reviewed high-resolution computed
References
1. Blackburn EH. Telomeres and telomerase: their mechanisms of action and the effects of altering their functions. FEBS Lett. 2005;579(4):859-862.
2. Vaziri H, Dragowska W, Allsopp RC, Thomas TE, Harley CB, Lansdorp PM. Evidence for a mitotic clock in human hematopoietic stem cells: loss of telomeric DNA with age. Proc Natl Acad Sci U S A. 1994;91(21):9857-9860.
3. Calado RT, Young NS. Mechanisms of disease: telomere diseases. N Engl J Med. 2009;361(24):2353-2365.
4. Thongon N, Ma F, Santoni A, Marchesini M, Fiorini E, Rose A, et al. Hematopoiesis under telomere attrition at the single-cell resolution. Nat Commun. 2021;12(1):6850.
5. Donaires FS, Alves-Paiva RM, Gutierrez-Rodrigues F, et al. Telomere dynamics and hematopoietic differentiation of human DKC1-mutant induced pluripotent stem cells. Stem Cell Res. 2019;40:101540.
6. Greider CW, Blackburn EH. Identification of a specific telomere terminal transferase activity in Tetrahymena extracts. Cell. 1985;43(2 Pt 1):405-413.
7. Alter BP, Rosenberg PS, Giri N, Baerlocher GM, Lansdorp PM, Savage SA. Telomere length is associated with disease severity and declines with age in dyskeratosis congenita. Haematologica. 2012;97(3):353-359.
8. Calado RT, Young NS. Telomere maintenance and human bone marrow failure. Blood. 2008;111(9):4446-4455.
9. Calado RT, Young NS. Telomere diseases. In: Jameson JL, editor. Harrison’s principles of internal medicine. 2. New York: McGraw Hill Education. 2018. p. 3466.
10. Tsakiri KD, Cronkhite JT, Kuan PJ, et al. Adult-onset pulmonary fibrosis caused by mutations in telomerase. Proc Natl Acad Sci U S A. 2007;104(18):7552-7557.
11. Calado RT, Regal JA, Kleiner DE, et al. A spectrum of severe familial liver disorders associate with telomerase mutations. Plos One. 2009;4(11): e7926.
12. Patnaik MM, Kamath PS, Simonetto DA. Hepatic manifestations of telomere biology disorders. J Hepatol. 2018;69(3):736-743.
tomography. JBM reviewed pulmonary function testing for diffusing capacity for carbon monoxide. DVC, EZM, NSY and RTC analyzed the data. DVC, NSY and RTC wrote the manuscript; and RTC supervised study conduction. All authors revised the manuscript.
Acknowledgments
The authors would like to thank Ms. Sandra Bresciani for her artwork assistance.
Funding
This investigation was supported by the grant 401446/2013 to RTC from the Brazilian National Council for Scientific and Technological Development (CNPq) and by the grants 13/08135-2 and 16/12799-1 to RTC from the São Paulo Research Foundation (FAPESP).
Data-sharing statement
Original data and protocol are available upon email request to the corresponding author.
13. Savage SA, Bertuch AA. The genetics and clinical manifestations of telomere biology disorders. Genet Med. 2010;12(12):753-764.
14. Armanios M, Blackburn EH. The telomere syndromes. Nat Rev Genet. 2012;13(10):693-704.
15. de la Fuente J, Dokal I. Dyskeratosis congenita: advances in the understanding of the telomerase defect and the role of stem cell transplantation. Pediatr Transplant. 2007;11(6):584-594.
16. Fioredda F, Iacobelli S, Korthof ET, et al. Outcome of haematopoietic stem cell transplantation in dyskeratosis congenita. Br J Haematol. 2018;183(1):110-118.
17. Swaminathan AC, Neely ML, Frankel CW, et al. Lung transplant outcomes in patients with pulmonary fibrosis with telomererelated gene variants. Chest. 2019;156(3):477-485.
18. Kolb JM, Conzen K, Wachs M, et al. Liver transplantation for decompensated cirrhosis secondary to telomerase reverse transcriptase mutation. Hepatology. 2020;72(1):356-358.
19. Bayne S, Liu JP. Hormones and growth factors regulate telomerase activity in ageing and cancer. Mol Cell Endocrinol. 2005;240(1-2):11-22.
20. Bar C, Huber N, Beier F, Blasco MA. Therapeutic effect of androgen therapy in a mouse model of aplastic anemia produced by short telomeres. Haematologica. 2015;100(10):1267-1274.
21. Calado RT, Yewdell WT, Wilkerson KL, et al. Sex hormones, acting on the TERT gene, increase telomerase activity in human primary hematopoietic cells. Blood. 2009;114(11):2236-2243.
22. Townsley DM, Dumitriu B, Liu DL, et al. Danazol treatment for telomere diseases. N Engl J Med. 2016;374(20):1922-1931.
23. Raghu G, Remy-Jardin M, Myers JL, et al. Diagnosis of idiopathic pulmonary fibrosis. An official ATS/ERS/JRS/ALAT clinical practice guideline. Am J Respir Crit Care Med. 2018;198(5):e44-e68.
24. Karczewski KJ, Francioli LC, Tiao G, et al. Variation across 141,456 human exomes and genomes reveals the spectrum of loss-of-function intolerance across human protein-coding genes. bioRxiv. 2019 August 13. https://doi.org/10.1101/531210
Haematologica | 108 May 2023 1311 ARTICLE - Nandrolone decanoate to treat telomere diseases D.V. Clé et al.
[preprint, not peer-reviewed]
25. Macintyre N, Crapo RO, Viegi G, et al. Standardisation of the single-breath determination of carbon monoxide uptake in the lung. Eur Respir J. 2005;26(4):720-735.
26. Gutierrez-Rodrigues F, Santana-Lemos BA, Scheucher PS, AlvesPaiva RM, Calado RT. Direct comparison of flow-FISH and qPCR as diagnostic tests for telomere length measurement in humans. Plos One. 2014;9(11):e113747.
27. Aviv A, Chen W, Gardner JP, et al. Leukocyte telomere dynamics: longitudinal findings among young adults in the Bogalusa Heart Study. Am J Epidemiol. 2009;169(3):323-329.
28. Stroup WW, Milliken GA, Claassen EA, Wolfinger RD. SAS for mixed models: introduction and basic applications. SAS Institute. 2018.
29. Calado RT, Cle DV. Treatment of inherited bone marrow failure syndromes beyond transplantation. Hematology Am Soc Hematol Educ Program. 2017 Dec 8;2017(1):96-101.
30. Kirschner M, Vieri M, Kricheldorf K, et al. Androgen derivatives improve blood counts and elongate telomere length in adult cryptic dyskeratosis congenita. Br J Haematol. 2021;193(3):669-673.
31. Sanchez-Medal L, Gomez-Leal A, Duarte L, Guadalupe Rico M. Anabolic androgenic steroids in the treatment of acquired aplastic anemia. Blood. 1969;34(3):283-300.
32. Shahidi NT. Androgens and erythropoiesis. N Engl J Med. 1973;289(2):72-80.
33. Fried W, Morley C. Effects of androgenic steroids on erythropoiesis. Steroids. 1985;46(4-5):799-826.
34. Baerlocher GM, Mak J, Tien T, Lansdorp PM. Telomere length measurement by fluorescence in situ hybridization and flow cytometry: tips and pitfalls. Cytometry. 2002;47(2):89-99.
35. Gutierrez-Rodrigues F, Sahoo SS, Wlodarski MW, Young NS. Somatic mosaicism in inherited bone marrow failure syndromes. Best Pract Res Clin Haematol. 2021;34(2):101279.
36. Gutierrez-Rodrigues F, Donaires FS, Pinto A, et al. Pathogenic TERT promoter variants in telomere diseases. Genet Med. 2019;21(7):1594-1602.
37. Revy P, Kannengiesser C, Fischer A. Somatic genetic rescue in Mendelian haematopoietic diseases. Nat Rev Genet. 2019;20(10):582-598.
38. Pires da Silva BGP, Fonseca NP, Catto LFB, Pereira GC, Calado RT. The spectrum of paroxysmal nocturnal hemoglobinuria clinical presentation in a Brazilian single referral center. Ann Hematol. 2022;101(5):999-1007.
39. Narita A, Miwata S, Imaya M, et al. Minor PNH clones do not distinguish inherited bone marrow failure syndromes from immune-mediated aplastic anemia. Blood Adv. 2022;6(8):2517-2519.
40. Vulliamy TJ, Kirwan MJ, Beswick R, et al. Differences in disease severity but similar telomere lengths in genetic subgroups of patients with telomerase and shelterin mutations. Plos One. 2011;6(9):e24383.
41. Luzzatto L, Risitano AM. Advances in understanding the pathogenesis of acquired aplastic anaemia. Br J Haematol. 2018;182(6):758-776.
Haematologica | 108 May 2023 1312 ARTICLE - Nandrolone decanoate to treat telomere diseases D.V. Clé et al.
ARTICLE - Chronic Lymphocytic Leukemia
A novel next-generation sequencing capture-based strategy to report somatic hypermutation status using genomic
regions downstream to immunoglobulin rearrangements
1Patrick G Johnston Centre for Cancer Research, Queens University Belfast, Belfast, UK; 2Barts Cancer Institute, Queen Marys University, London, UK; 3Department of Hematology, University Hospital Schleswig-Holstein, Kiel, Germany; 4Belfast City Hospital, Belfast, UK; 5Institute of Applied Biosciences, Centre for Research and Technology Hellas, Thessaloniki, Greece and 6Laboratory of Medical Immunology, Department of Immunology, Erasmus University Medical Center, Rotterdam, The Netherlands
Abstract
Correspondence: D. Gonzalez
D.GonzalezdeCastro@qub.ac.uk
Received: August 15, 2022.
Accepted: December 15, 2022.
Early view: December 29, 2022.
https://doi.org/10.3324/haematol.2022.281928
©2023 Ferrata Storti Foundation
Published under a CC BY-NC license
The somatic hypermutation (SHM) status of the clonotypic, rearranged immunoglobulin heavy variable (IGHV) gene is an established prognostic and predictive marker in chronic lymphocytic leukemia (CLL). Analysis of SHM is generally performed by polymerase chain reaction (PCR)-amplification of clonal IGHV-IGHD-IGHJ gene rearrangements followed by sequencing to identify IGHV gene sequences and germline identity. Targeted-hybridization next-generation sequencing (NGS) can simultaneously assess clonality and other genetic aberrations. However, it has limitations for SHM analysis due to sequence similarity between different IGHV genes and mutations introduced by SHM, which can affect alignment efficiency and accuracy. We developed a novel SHM assessment strategy using a targeted-hybridization NGS approach (EuroClonality-NDC assay) and applied it to 331 samples of lymphoproliferative disorder (LPD). Our strategy focuses on analyzing the sequence downstream to the clonotypic, rearranged IGHJ gene up to the IGHM enhancer (IGHJ-E) which provides more accurate alignment. Overall, 84/95 (88.4%) CLL cases with conventional SHM data showed concordant SHM status, increasing to 91.6% when excluding borderline cases. Additionally, IGHJ-E mutation analysis in a wide range of pre- and post-germinal center LPD showed significant correlation with differentiation and lineage status, suggesting that IGHJ-E analysis is a promising surrogate marker enabling SHM to be reported using NGS-capture strategies and whole genome sequencing.
Introduction
Somatic hypermutation (SHM) is a key part of physiological B-cell development that underlies immunoglobulin (IG) affinity maturation and diversity in rearranged IG genes. Activation-induced cytidine deaminase (AID) enzyme introduces single nucleotide variants (SNV) in transcribed IG gene rearrangements.1,2 AID-mediated SHM is restricted to a narrow window of B-cell development, predominantly in germinal centers (GC), controlling the frequency of genomic mutations.3,4 Lymphoproliferative disorders (LPD) associated with various stages of GC development therefore present variable SHM levels; disorders originating from mature memory B and plasma cells present higher SHM
levels.
Somatic hypermutation status in immunoglobulin heavy chain variable (IGHV) genes is a robust prognostic and predictive marker in chronic lymphocytic leukemia (CLL),5 and can define two groups: mutated-CLL (M-CLL), with a long time to first treatment and overall survival,6,7 and unmutated-CLL (U-CLL), a more aggressive disease, less sensitive to chemoimmunotherapy, and with reduced overall survival.8-10 IGHV SHM status testing is recommended prior to treatment for all patients by the European Research Initiative on CLL (ERIC) and the International Workshop on CLL (iwCLL).11-13
Somatic hypermutation analysis is generally performed by polymerase chain reaction (PCR) amplification of clonal
Neil McCafferty,1,2 James Peter Stewart,1 Nikos Darzentas,3 Jana Gazdova,1 Mark Catherwood,4 Kostas Stamatopoulos,5 Anton W. Langerak6 and David Gonzalez1
Haematologica | 108 May 2023 1313
IGHV-IGHD-IGHJ gene rearrangements followed by Sanger sequencing.14 Rearranged IGH genes and germline identity of the clonal sequence are determined by comparison to IG germline databases, such as ImMunoGeneTics (IMGT).15,16 SHM status in CLL employs a 2% mutational threshold (i.e., 98% identity to the closest germline gene allele) to account for potential polymorphic variation from unknown IGHV alleles, according to the first reports.17-19 Almost two and a half decades later, IMGT have substantially expanded the reference dataset of the polymorphic alleles, challenging the accuracy of this empirical threshold.20 In addition, borderline IGHV identity (97-97.9%, according to ERIC guidelines) presents variable outcomes, warranting caution in clinical decision making.20-22 More recently, a wider borderline group of 97-98.9% IGHV identity was established, as cases with 98-98.9% SHM appear indistinguishable from 97-97.9%,20,21 in contrast to earlier reports.22 In this paper, borderline SHM status refers to the wider 97-98.9% identity.
Polymerase chain reaction amplification of clonal IGHVIGHD-IGHJ gene rearrangements and Sanger sequencing is well-validated, highly standardized, and can be adapted for a small number of cases, but it has limited scalability, provides no insight on subclonal architecture nor assessment of other molecular risk factors.23 Recent next-generation sequencing (NGS) applications for IGHV SHM analysis mainly rely on amplicon-based enrichment and present similar limitations, yet allow analysis of intraclonal variation.24-26 Alternatively, NGS targeted-hybridization/capture applications can simultaneously assess IG/T-cell receptor gene rearrangements alongside other molecular risk factors, enabling a transition from multiple clinical investigations to a single assay.27,28 However, so far, SHM status has not been widely reported using NGS-capture methods.
Current SHM assessment is restricted to the IGHV gene due to technical challenges imposed by the most common PCR methods, but also to the inherent difficulty in accurately distinguishing between SHM and random, non-templated nucleotides inserted at the ends of the recombining V, D and J genes. NGS-capture assessment of clonotypic IGHV genes is challenging due to insufficient and inaccurate read alignment of rearranged genes, particularly in the presence of a high level of SHM. Interestingly, high AID activity continues beyond rearranged IGHV genes (1.5-2kb downstream of IGHM enhancer) and could become a potential surrogate SHM marker (Figure 1A).29,30 Despite multiple studies looking at these regions in mouse models, to the best of our knowledge no studies in CLL or other clinical entities in humans have considered SHM in alternative AID-targeted regions such as IGHJ genes or in the region between the VDJ junction and the IGHM enhancer (IGHJ-E). In this paper, we describe a novel method using targeted NGS-capture data generated with the Eu-
roClonality-NDC assay to report SHM status using IGHJ-E in LPD. This method aims to provide a new alternative for SHM assessment using NGS data without reliance on clonal amplification of VDJ junctions, allowing integrated analysis of SHM alongside clinically relevant genomic alterations in a single assay.
Methods
Patient samples
A total of 331 LPD cases were studied for NGS IGHJ-E SHM status. All samples were collected according to local institutional review board approval and/or policies and in accordance with the Declaration of Helsinki. Patient samples consisted of genomic DNA (gDNA) from three cohorts. Cohort 1 was made up of 73 T-cell LPD (negative controls, presumed to lack IG rearrangements and SHM); cohort 2: 197 B-cell LPD comprising a wide range of clinical entities with different levels of maturation and including 34 CLL cases with SHM data; and cohort 3: whole peripheral blood from 61 CLL samples with available SHM data (Online Supplementary Table S1). Cohorts 1 and 2 are part of the EuroClonality-NDC validation study28 and consisted of 184 high-molecular weight (HMW) and 86 formalin-fixed paraffin-embedded (FFPE) samples. Samples were processed as previously described28 apart from cohort 3 samples, where 500 ng of gDNA were used for PCR-free library preparation.
NGS-capture assessment of clonality and sequence variation
The EuroClonality-NDC ARResT/Interrogate bioinformatics pipeline,31,32 capable of detecting B- and T-cell receptor rearrangements from NGS capture data with >95% sensitivity and specificity, was used for the detection of IGHV-IGHD-IGHJ rearrangements. We used the published threshold of ≥6 unique rearranged clonal fragments to assign IGH clonality.28 Variant calling for somatic sequence variants in IGHJ-E was performed using Pisces (v5.1.3.60) (Illumina, San Diego, CA, USA).33,34 Aligned BAM files were visually assessed using the Integrated Genomic Viewer (IGV v2.5; Broad Institute, Cambridge, MA, USA)35 and ≥6 unique rearranged reads to report IGHV-IGHD-IGHJ rearrangements.
IGHJ-E somatic hypermutation reporting strategy
Next-generation sequencing-capture SHM status was determined using an integrated analytical workflow that combines IGHV-IGHD-IGHJ gene rearrangements and SNV analysis (Figure 1). Rearranged IGHJ genes were identified by ARResT/Interrogate (http://bat.infspire.org/arrest/interrogate/), providing a sample-specific analysis target region covering 1500 bp from the rearranged IGHJ towards the en-
Haematologica | 108 May 2023 1314 ARTICLE - A novel NGS-capture strategy to report SHM status N. McCafferty et al.
hancer region (IGHJ-E). The assessed IGHJ-E region started from the 3’ end of the rearranged IGHJ gene to minimize alignment artefacts associated with reads falling on the VDJ junction. SNV detected in the 1500 bp IGHJ-E target region were assessed for somatic status (Figure 1B and C). Distinction of SHM from non-somatic variants (i.e., polymorphic variants and sequencing/alignment artefacts) was achieved using progressive variant filtering and ROC/AUC analysis using the original clinical IGHV SHM status in CLL cases (see Online Supplementary Methods).
IGHV gene somatic hypermutation analysis by Sanger sequencing
Ninety-five CLL cases from cohorts 2 and 3 were assessed for IGHV gene SHM status using PCR and Sanger sequencing according to ERIC guidelines.12 The IMGT database was used to assign IGH genes and IGHV identity.16
IGHJ-E somatic hypermutation analysis in a wide range of lymphoproliferative disorders
Lymphoproliferative disorder subtypes were categorized into three groups based on the expected SHM frequency. The ‘High’ category included 103 mature LPD where >90% cases are expected to have a significant level of SHM, namely Burkitt’s lymphoma (BL), diffuse large B-cell lymphoma (DLBCL), follicular lymphoma (FL), mucosa-associated lymphoid tissue (MALT) lymphoma, and plasma cell myeloma (PCM). An ‘Intermediate’ category (n=139) was defined for entities in which up to 30-60% of cases contain SHM, i.e., CLL, mantle cell lymphoma (MCL), and marginal zone lymphomas (MZL). The ‘Low’ category (n=89) was reserved for entities with no expected SHM, such as immature B-cell malignancies like B-cell precursor acute lymphoblastic leukemia (BCP-ALL) plus the control T-cell LPD cohort.
Figure 1. Somatic hypermutation frequency over the IGH genes and approaches to report somatic hypermutation status using Sanger sequencing and a novel next-generation sequencing (NGS)-capture approach. (A) Somatic hypermutation (SHM) occurs from the promoter region (P), and the frequency of mutations decreases towards the conserved enhancer region (E). The Sanger sequencing approach targets the clonal immunoglobulin heavy variable (IGHV) gene to compare to a database of known germline sequences and a mutational threshold of 98% is implemented to account for polymorphic variation and distinguish between mutated chronic lymphocytic leukemia (CLL) M-CLL ( ≤ 98%) and unmutated CLL (U-CLL) (>98%). SHM testing by NGS-capture targets the 1500 bp between the 3’ end of the rearranged IGHJ and the IGHM enhancer, referred to as IGHJ-E identity. (B) The clonotypic rearranged IGHJ gene is identified by ARResT/Interrogate and all single nucleotide variants (SNV) detected are reported in the case-specific IGHJ-E. (C) SNV are inspected for non-somatic variants, separating meaningful SHM from any artefacts and polymorphisms. The frequency of true somatic mutations is calculated and IGHJ-E identity is reported as a percentage.

A B C Haematologica | 108 May 2023 1315 ARTICLE - A novel NGS-capture strategy to report SHM status N. McCafferty et al.
Results
Detection of rearranged IGHV genes by next-generation sequencing-capture in chronic lymphocytic leukemia Sanger sequencing showed 27 different rearranged IGHV genes among the cohort of 95 CLL cases, in which IGHV169, IGHV3-21 , and IGHV4-34 were most common: n=13, n=9, and n=9, respectively (Online Supplementary Table S2). IGHV identity results showed 50 M-CLL (IGHV identity <98%) and 45 U-CLL (IGHV identity ≥98%); a total of 12 cases (7 M-CLL and 5 U-CLL) showed borderline IGHV identity (i.e., 97-98.9% identity).
Visual assessment of rearranged IGHV genes was concordant with clonotypic IGHV from the original Sanger sequencing IGHV data in 53/95 (55.8%) cases, all of which were also concordant by ARResT/Interrogate. Of note, M-CLL made up 32/42 (76.2%) discordant cases by visual assessment, and so discordant cases also showed significantly lower IGHV identities compared to concordant cases ( Online Supplementary Figure S1A ; Wilcoxon test, P <0.01). Ten U-CLL cases showed discordant rearranged IGHV genes by visual analysis, including four indetermined IGHV genes and four also undetected by ARResT/Interrogate. Reads in clonally rearranged IGHV genes showed poor alignment of mutated NGS reads, resulting in poor detection of SNV in highly mutated cases ( Online Supplementary Figure S2 ). Taken together, this suggests IGHV analysis by capture-based assays and conventional alignment algorithms is not reliable without significant post-processing manipulation.
Detection of IGHV rearranged genes by ARResT/Interrogate analysis was concordant with clonotypic IGHV in 86/95 (90.5%) cases. Four of the cases with IGHV genes that are not specifically included in the NGS-capture assay were concordant with ARResT/Interrogate, suggesting those IGHV genes were captured due to sequence homology to other IGHV genes included in the assay. No significant difference in percentages of IGHV identity from the original data was shown between ARResT/Interrogate discordant and concordant cases (Wilcoxon test, P=0.9) (Online Supplementary Figure S1B).
mutations ( Online Supplementary Figures S3-S7 ). Receiver operating characteristics analysis of the IGHJ-E region performed against clinical IGHV SHM status in CLL cases showed an area under the curve of 0.94 with an optimal IGHJ-E germline identity threshold of 99.8%, i.e., IGHJ-E identity >99.8% was used to classify samples as U-CLL and ≤99.8% as M-CLL (Online Supplementary Figure S3 ). IGHJ-E analysis showed significant correlation to clinical IGHV identity (Spearman’s test, P<0.01) (Figure 2A). M-CLL cases showed significantly lower IGHJ-E identity compared to U-CLL (Spearman’s test, P <0.01) (Figure 2B). Furthermore, borderline cases showed a distinct IGHJ-E identity that was significantly higher than M-CLL and lower than U-CLL (Wilcoxon test, P <0.01) (Figure 2B).
Employing a 99.8% IGHJ-E and 98% IGHV identity threshold, IGHJ-E SHM status was concordant with IGHV gene SHM status in 84/95 (88.4%) CLL cases (Figure 2C). A positive predictive value (PPV) of 86.5% to report MCLL and a negative predictive value (NPV) of 90.7% to report U-CLL was found in 95 CLL cases. Borderline comprised 12/95 cases and showed the lowest concordance between IGHJ-E and IGHV gene SHM status, with only 8/12 (66.7%), compared to 39/42 (92.9%) M-CLL and 37/41 (90.2%) U-CLL (Figure 2D). Excluding clinically ambiguous borderline cases, overall concordance increased to 91.6% (76/83), with a PPV of 90.7% to report M-CLL and an NPV of 92.5% to report U-CLL.
Assessment of IGHJ-E somatic hypermutation status in lymphoproliferative disorders besides chronic lymphocytic leukemia
Comparison
of NGS-capture IGHJ-E and Sanger sequencing-based IGHV analysis in chronic lymphocytic leukemia
We evaluated the frequency of mutations in the 1500 bp IGH sequence from the 3’ end of the rearranged IGHJ gene to derive the NGS IGHJ-E mutation status. Progressive non-somatic variant filtering was performed using the population GnomAD database (v3, minor allele frequency >0.02%), recurrent polymorphic artefacts from the test samples (TF>10%), and a minimum frequency filter for SNV (variant allele frequency [VAF] >5%) prior to visual IGV assessment of all SNV to confirm somatic
IGHJ-E SHM status was assessed in 331 LPD cases encompassing various lymphoid (B- and T-cell) malignancies categorized by expected SHM frequency into three groups. The High SHM category (103 cases from predominantly [post-]GC malignancies) showed significantly lower IGHJ-E identity than both Intermediate ( P <0.01) and Low ( P <0.01) categories (Figure 3). Intermediate cases (139 cases from malignancies where 3060% carry SHM, such as CLL, MCL and MZL) also showed significantly lower IGHJ-E identity than the Low SHM category (89 cases from immature B-cell malignancies and T-cell LPD) (P<0.01) (Figure 3).
Using the 99.8% threshold, the High SHM category showed 80/103 (77.7%) mutated IGHJ-E sequences, while five showed at least one somatic mutation and 18 reported no mutations. The Intermediate SHM category showed 73/139 (52.5%) mutated IGHJ-E sequences. The Low SHM category showed 88/89 cases (98.9%) mutated IGHJ-E sequences; one angioimmunoblastic T-cell lymphoma (AITL) case was IGHJ-E mutated (mean VAF=0.12) with clonal IGHV-IGHD-IGHJ gene rearrangements (ARResT/Interrogate; http://bat.infspire.org/arrest/inter-
Haematologica | 108 May 2023 1316 ARTICLE - A novel NGS-capture strategy to report SHM status N. McCafferty et al.
Figure 2. Comparison of Sanger sequencing immunoglobulin heavy variable gene to next-generation sequencing IGHJ gene enhancer with regards to identity and somatic hypermutation status in 95 chronic lymphocytic leukemia (CLL) samples from Bcell malignancies. (A) Spearman’s correlation of Sanger sequencing immunoglobulin heavy variable (IGHV) gene compared to next-generation sequencing (NGS) rearranged IGHJ and the IGHM enhancer (IGHJ-E). (B) Comparison of IGHJ-E identity between cases from mutated (<97%), borderline (97-98.9%) and unmutated (>99%) subgroups reported by Sanger sequencing. Wilcoxon signed-rank test, ***P≤0.001, ****P≤0.0001. (C) Pie chart of the NGS IGHJ-E somatic hypermutation (SHM) status concordance to Sanger sequencing. (D) Bar chart of NGS SHM status concordance at mutated (<97%), borderline (97-98.9%) and unmutated (>99%) subgroups reported by Sanger sequencing.
rogate/), consistent with the presence of accompanying clonal B-cell population.
Discussion
This study aimed to develop a novel analytical approach for NGS-capture and whole genome sequencing (WGS) methods as a surrogate for canonical SHM status as -
sessment, complicated by aligning shotgun library preparations to highly mutated rearranged IGHV genes. The NGS-capture IGHJ-E SHM assessment strategy applies four key differences to traditional PCR-based IGHV SHM testing: (i) IGHJ-E as a surrogate SHM marker for IGHV; (ii) a longer assessable IGH sequence (i.e., 1500 bp vs . 300 bp); (iii) exclusion of most polymorphic germline variants; and (iv) a stringent 99.8% mutational threshold. Altogether, 331 LPD cases were assessed for IGHJ-E SHM

A B C D Haematologica | 108 May 2023 1317 ARTICLE - A novel NGS-capture strategy to report SHM status N. McCafferty et al.
Figure 3. Comparison of next-generation sequencing rearranged IGHJ and enhancer gene identity (IGHJ-E) for 331 cases with different expected somatic hypermutation status from B- and T-cell malignancies. Expected somatic hypermutation (SHM) frequency were categorized as High, Intermediate, and Low. High (blue): germinal center (GC) or post-GC B-cell malignancies from Burkitt’s lymphoma (BL), diffuse large B-cell lymphoma. (DLBCL), follicular lymphoma (FL), mucosa-associated lymphoid tissue (MALT) lymphoma, and multiple myeloma (MM). Intermediate (orange): heterogeneous-GC B-cell malignancies from chronic lymphocytic leukemia (CLL), mantle cell lymphoma (MCL), and marginal zone lymphomas (MZL). Low (green): pre-GC B-cell from Bcell acute lymphocytic leukemia (B-ALL) and T-cell malignancies from angioimmunoblastic T-cell lymphoma (AITL), anaplastic large cell lymphoma (ALCL), cutaneous anaplastic large cell lymphoma (C-ALCL), enteropathy-associated T-cell lymphoma (EATL), intestinal T-cell lymphoma (ITCL), mycosis fungoides (MF), peripheral T-cell lymphoma (PTCL), Sézary syndrome (SS), T-cell acute lymphocytic leukemia (T-ALL), and T-cell lymphoblastic lymphoma (T-LBL). Red line: next-generation sequencing (NGS)-capture CLL 99.8% mutational threshold. Wilcoxon signed-rank test, ****P≤0.0001. NGS: next-generation sequencing; PCM: plasma cell myeloma; N: number.
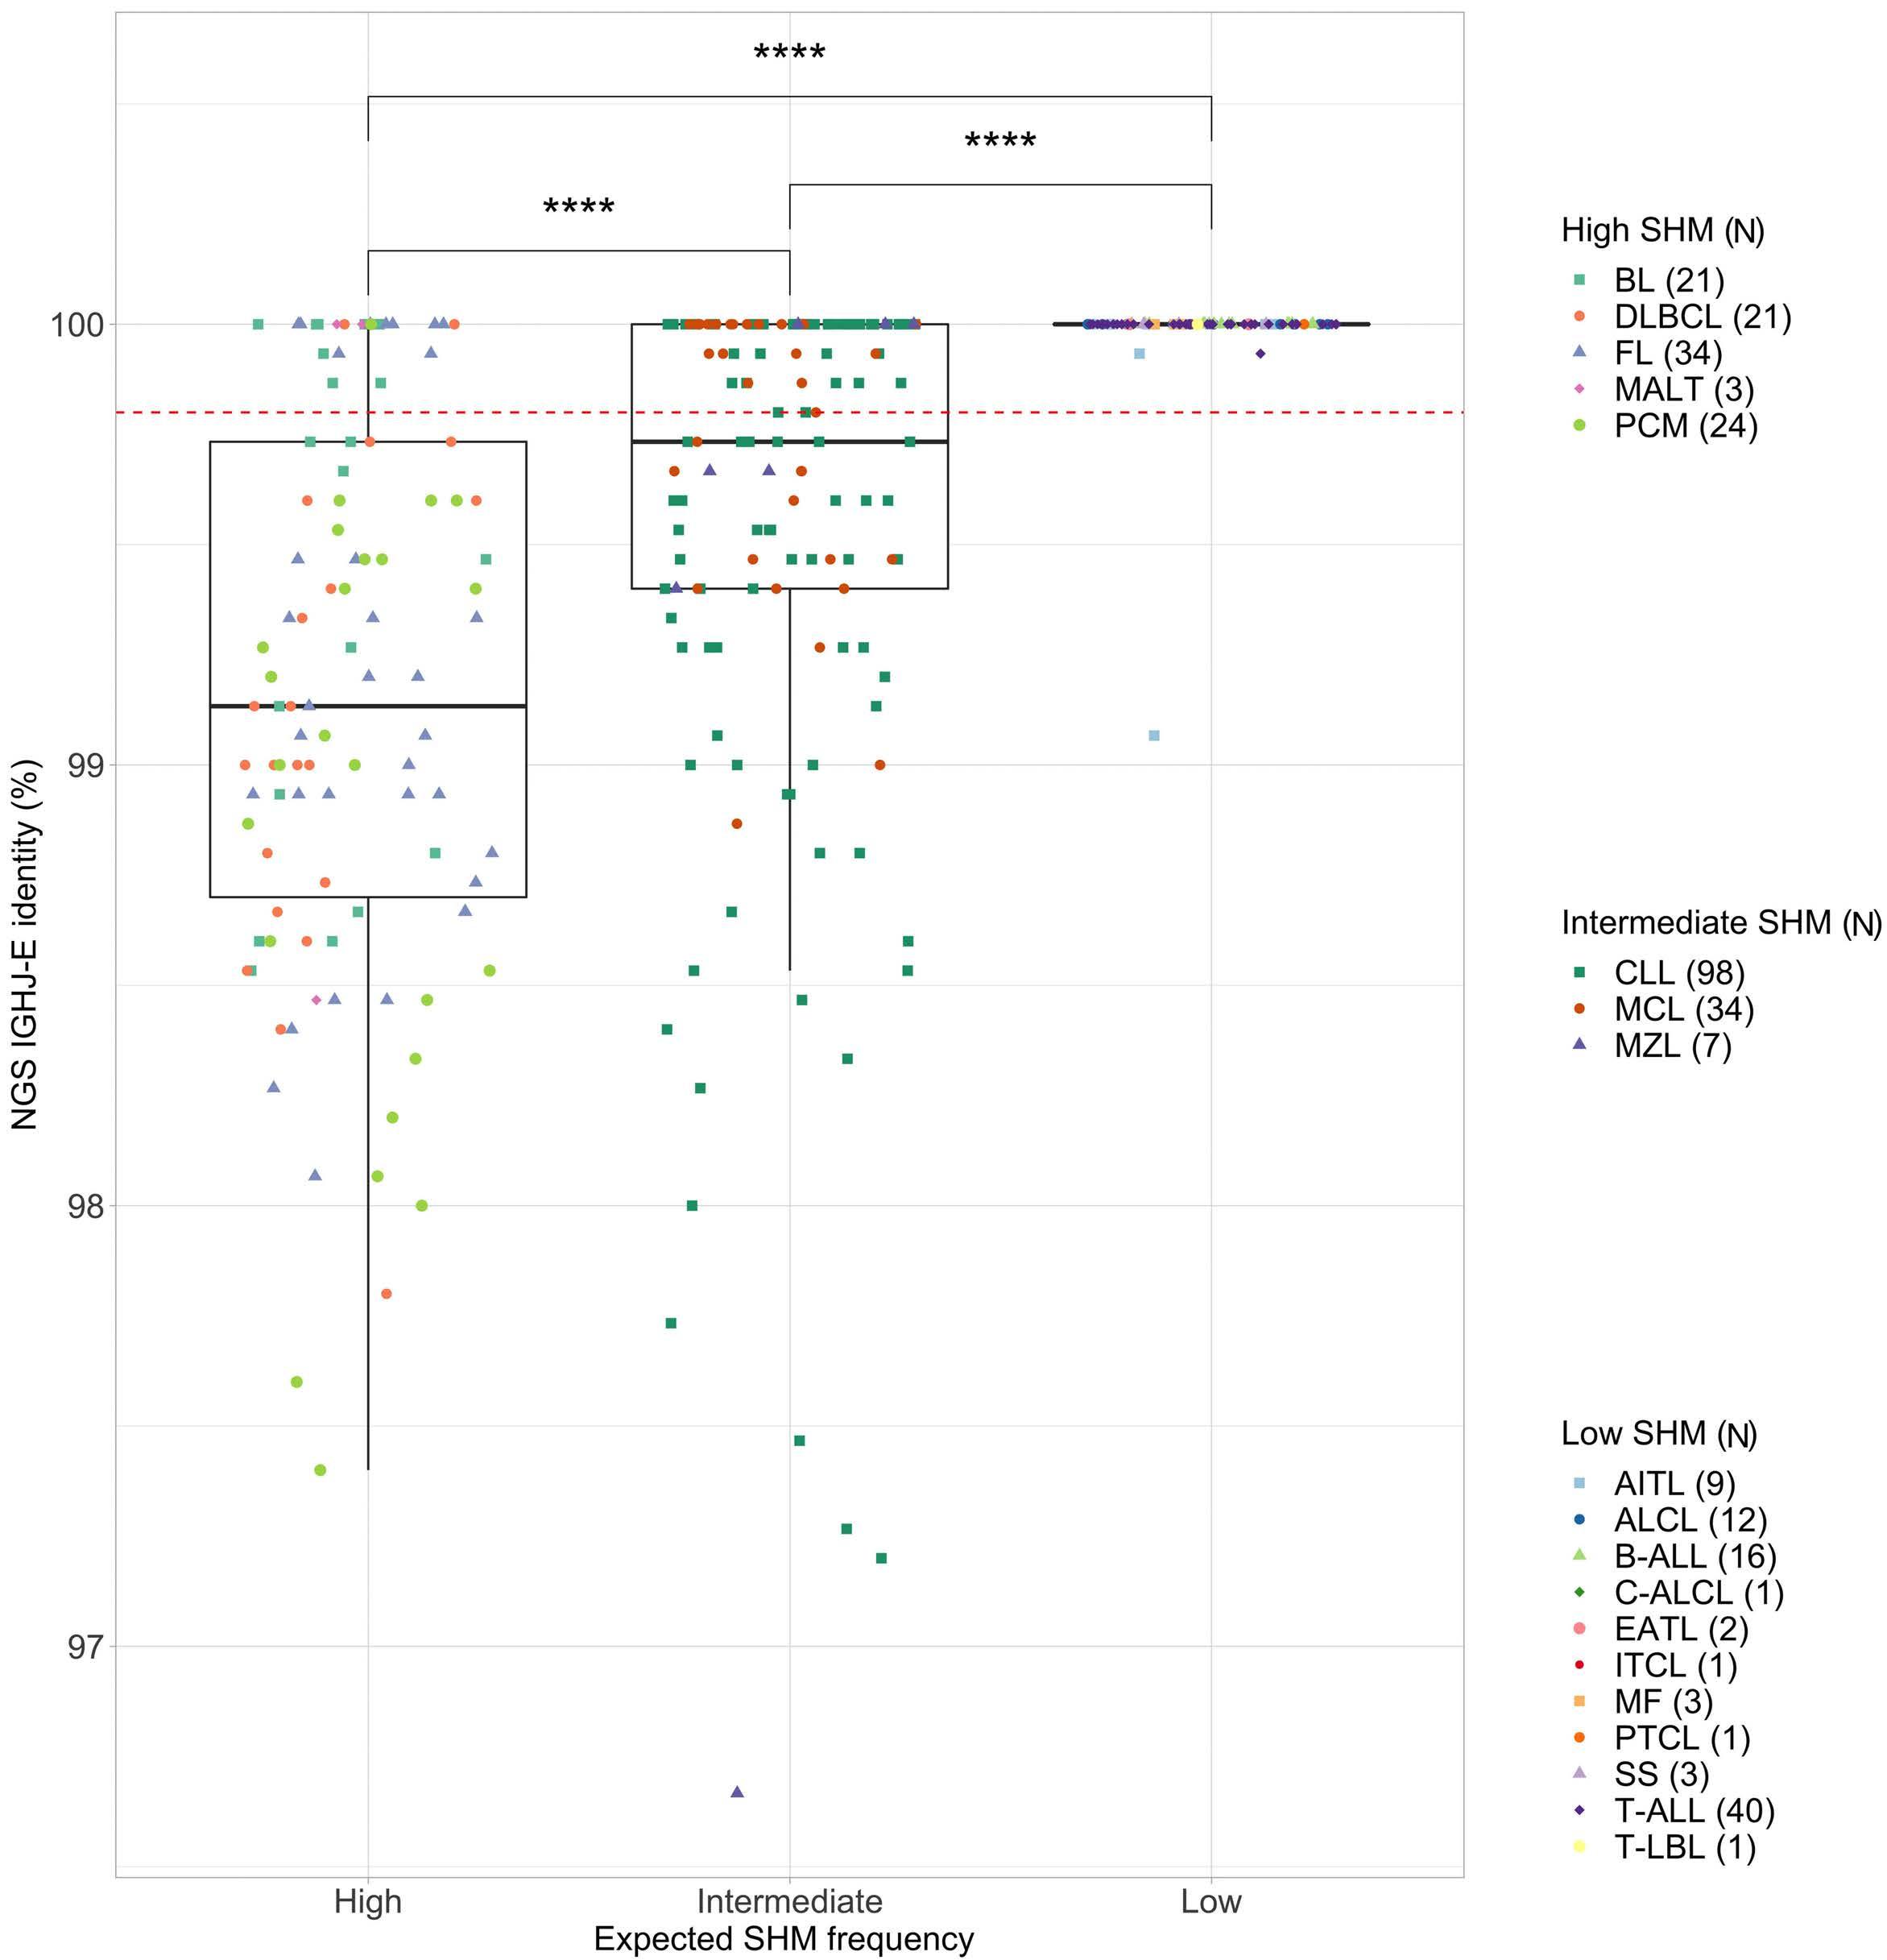
status using this strategy. IGHJ-E NGS showed 88% overall concordance in SHM status to traditional assessment in CLL, which rose to 91.6% when clinically ambiguous borderline cases were disregarded. Next-generation sequencing-capture to report IGHV gene SHM status was initially considered. However, visual assessment of sequencing reads identified clonotypic re-
arranged IGHV genes in only 56% cases, mostly because of SHM inhibiting alignment to the reference genome, as shown by significantly higher IGHV identity in the concordant cases. Consequently, IGHV reads containing potential SHM are unavailable for SHM assessment in the absence of significant post-processing manipulation of unaligned reads. Conversely, ARResT/Interrogate analysis
Haematologica | 108 May 2023 1318 ARTICLE - A novel NGS-capture strategy to report SHM status N. McCafferty et al.
( http://bat.infspire.org/arrest/interrogate/ ), which does not rely on alignment to the reference genome, detected the clonotypic IGHV gene in 89% of cases, suggesting that poor alignment rather than probe hybridization is responsible for the absence of IGHV rearrangements (particularly somatic hypermutated cases) from the aligned files.
Polymerase chain reaction amplification of IGHV-IGHDIGHJ limits assessment to ~300-360 bp of IGHV genes,29,30 while analysis of IGHJ-E provides a larger 1500 bp region with fewer homologous sequences, hence improving read alignment.24,36 One key limitation of IGHJ-E analysis is the assumption that only one allele is contributing to the SHM category, and while this is certainly true in most cases, there is evidence that discordant SHM can be found in 2 alleles in up to 1.5% of CLL.12,13 Chronic lymphocytic leukemia SHM status testing employs a 98% identity threshold for IGHV genes, although functionally, a single SHM could significantly influence B-cell receptor affinity and clonal selection.20 Continuous IGHV-based SHM values have been reported to significantly impact overall survival37 and recent retrospective analysis of historical studies showed that up to 10% of cases can change between M-CLL, U-CLL, and borderline categories using the latest ERIC guidelines and IMGT databases. 21 While the 98% threshold validity can be questioned, it still clearly defines CLL subgroups with independent prognostic and treatment response.20,37-39
The NGS-capture IGHJ-E strategy used a 99.8% mutational threshold to stratify cases with high correlation to conventional IGHV SHM status. We believe that a stringent NGS mutational threshold is required due to reduced AID activity towards the IGH enhancer leading to greater germline homology compared to rearranged IGHV,40 and filtering SNV accounting for most common germline variations. IGHJ-E assessment may provide more clarity for risk-stratification in borderline cases, given the lower concordance with IGHV gene germline identity.
Incidence and burden of SHM differs significantly by LPD subtype, based primarily on the postulated cell of origin and its stage of development in relation to GC.41 B-cell malignancies thought to originate from GC cells display high SHM rates, whereas T-cell and progenitor B-cell malignancies (e.g., B-cell acute lymphocytic leukemia, BALL) are not expected to display SHM. CLL, MCL and MZL constitute an intermediate group where the stage of differentiation is heterogenous, displaying variable SHM status.42 LPD with expected high SHM frequency showed at least one mutation in 81% of cases, with a significantly lower IGHJ-E identity compared to B-ALL and T-cell LPD, providing biological validation of the approach. A single AITL case from the Low SHM category showed mutated
IGHJ-E, and since clonal IG gene rearrangements have been reported in up to one-third of AITL cases,43-45 we hypothesize that the observed SHM in this case is due to infiltrating mature B-cell clones. Cases with an expected Intermediate SHM frequency formed a significantly distinct subgroup between the High and Low SHM categories, as anticipated.
The novel IGHJ-E strategy correlates with CLL SHM status by conventional IGHV sequencing, and detects biologically meaningful SHM in other LPD, offering a strong proof of principle. While conventional IGHV SHM analysis in CLL provides critical prognostic and predictive value, NGS-capture can improve risk stratification by reducing polymorphic interference and evaluating prognostic markers including mutations, translocations and copy number analysis.28
A critical advantage of this new strategy is its potential application in IGKJ and IGLJ genes, providing a more comprehensive view of the SHM status than current methods. This NGS strategy can also be applied to WGS data, something that has not been reported thus far. The main limitation of our study is the small CLL sample size and lack of clinical outcome analysis. Nonetheless, the IGHJ-E method showed a level of discrepancies between SHM categories similar to recent studies using newer versions of IMGT.21 Studies in larger CLL cohorts with long-term follow up are warranted to evaluate the clinical prognostic value, particularly in ambiguous borderline cases. Further investigation into IGHJ-E SHM may confirm its clinical significance and facilitate an integrated next-generation analysis of SHM assessment alongside other genomic risk factors. Additional research may also consider this method in the analysis of WGS data to seamlessly incorporate SHM status in CLL and other LPD.
Disclosures
No conflicts of interest to declare.
Contributions
NMC and JG performed research. NMC, PS and ND performed data analysis. MC, KS and AWL provided clinical samples and data. NMC and DG wrote the manuscript. DG designed and supervised the study. All authors reviewed the manuscript and approved the final version for publication.
Acknowledgments
We would like to acknowledge the EuroClonality-NGS working group for access to cohort data.
Data-sharing statement
The raw data are not available for sharing as no specific consent for this purpose was available.
Haematologica | 108 May 2023 1319 ARTICLE - A novel NGS-capture strategy to report SHM status N. McCafferty et al.
References
1. Goossens T, Klein U, Kuppers R. Frequent occurrence of deletions and duplications during somatic hypermutation: implications for oncogene translocations and heavy chain disease. Proc Natl Acad Sci U S A. 1998;95(5):2463-2468.
2. Liu M, Duke JL, Richter DJ, et al. Two levels of protection for the B cell genome during somatic hypermutation. Nature. 2008;451(7180):841-845.
3. Liu M, Schatz DG. Balancing AID and DNA repair during somatic hypermutation. Trends Immunol. 2009;30(4):173-181.
4. Di Noia JM, Neuberger MS. Molecular mechanisms of antibody somatic hypermutation. Annu Rev Biochem. 2007;76(1):1-22.
5. An international prognostic index for patients with chronic lymphocytic leukaemia (CLL-IPI): a meta-analysis of individual patient data. Lancet Oncol. 2016;17(6):779-790.
6. Fischer K, Hallek M. Optimizing frontline therapy of CLL based on clinical and biological factors. Hematology Am Soc Hematol Educ Program. 2017;2017(1):338-345.
7. Thompson PA, Tam CS, O'Brien SM, et al. Fludarabine, cyclophosphamide, and rituximab treatment achieves longterm disease-free survival in IGHV-mutated chronic lymphocytic leukemia. Blood. 2016;127(3):303-309.
8. Stevenson FK, Krysov S, Davies AJ, Steele AJ, Packham G. Bcell receptor signaling in chronic lymphocytic leukemia. Blood. 2011;118(16):4313-4320.
9. Wiestner A. Emerging role of kinase-targeted strategies in chronic lymphocytic leukemia. Hematology Am Soc Hematol Educ Program. 2012;2012(1):88-96.
10. Hallek M. Chronic lymphocytic leukemia: 2017 update on diagnosis, risk stratification, and treatment. Am J Hematol. 2017;92(9):946-965.
11. Hallek M, Cheson BD, Catovsky D, et al. iwCLL guidelines for diagnosis, indications for treatment, response assessment, and supportive management of CLL. Blood. 2018;131(25):2745-2760.
12. Rosenquist R, Ghia P, Hadzidimitriou A, et al. Immunoglobulin gene sequence analysis in chronic lymphocytic leukemia: updated ERIC recommendations. Leukemia. 2017;31(7):1477-1481.
13. Agathangelidis A, Chatzidimitriou A, Chatzikonstantinou T, et al. Immunoglobulin gene sequence analysis in chronic lymphocytic leukemia: the 2022 update of the recommendations by ERIC, the European Research Initiative on CLL. Leukemia. 2022;36(1):1961-1968.
14. Gupta SK, Viswanatha DS, Patel KP. Evaluation of somatic hypermutation status in chronic lymphocytic leukemia (CLL) in the era of next generation sequencing. Front Cell Dev Biol. 2020;8(1):357.
15. Crombie J, Davids MS. IGHV mutational status testing in chronic lymphocytic leukemia. Am J Hematol. 2017;92(12):1393-1397.
16. Lefranc MP. Immunoglobulins: 25 years of immunoinformatics and IMGT-ONTOLOGY. Biomolecules. 2014;4(4):1102-1139.
17. Oscier DG, Thompsett A, Zhu D, Stevenson FK. Differential rates of somatic hypermutation in VH genes among subsets of chronic lymphocytic leukemia defined by chromosomal abnormalities. Blood. 1997;89(11):4153-4160.
18. Damle RN, Wasil T, Fais F, et al. Ig V gene mutation status and CD38 expression as novel prognostic indicators in chronic lymphocytic leukemia. Blood. 1999;94(6):1840-1847.
19. Hamblin TJ, Davis Z, Gardiner A, Oscier DG, Stevenson FK. Unmutated Ig V(H) genes are associated with a more aggressive form of chronic lymphocytic leukemia. Blood. 1999;94(6):1848-1854.
20. Langerak AW, Davi F, Stamatopoulos K. Immunoglobulin heavy variable somatic hyper mutation status in chronic lymphocytic leukaemia: on the threshold of a new era? Br J Haematol. 2020;189(5):809-810.
21. Raponi S, Ilari C, Della Starza I, et al. Redefining the prognostic likelihood of chronic lymphocytic leukaemia patients with borderline percentage of immunoglobulin variable heavy chain region mutations. Br J Haematol. 2020;189(5):853-859.
22. Davis Z, Forconi F, Parker A, et al. The outcome of chronic lymphocytic leukaemia patients with 97% IGHV gene identity to germline is distinct from cases with <97% identity and similar to those with 98% identity. Br J Haematol. 2016;173(1):127-136.
23. Davi F, Langerak AW, de Septenville AL, et al. Immunoglobulin gene analysis in chronic lymphocytic leukemia in the era of next generation sequencing. Leukemia. 2020;34(10):2545-2551.
24. McClure R, Mai M, McClure S. High-throughput sequencing using the Ion Torrent personal genome machine for clinical evaluation of somatic hypermutation status in chronic lymphocytic leukemia. J Mol Diagn. 2015;17(2):145-154.
25. Stamatopoulos B, Timbs A, Bruce D, et al. Targeted deep sequencing reveals clinically relevant subclonal IgHV rearrangements in chronic lymphocytic leukemia. Leukemia. 2017;31(4):837-845.
26. Rodriguez-Vicente AE, Bikos V, Hernandez-Sanchez M, Malcikova J, Hernandez-Rivas JM, Pospisilova S. Next-generation sequencing in chronic lymphocytic leukemia: recent findings and new horizons. Oncotarget. 2017;8(41):71234-71248.
27. Wren D, Walker BA, Brüggemann M, et al. Comprehensive translocation and clonality detection in lymphoproliferative disorders by next-generation sequencing. Haematologica. 2017;102(2):e57-e60.
28. Stewart JP, Gazdova J, Darzentas N, et al. Validation of the EuroClonality-NGS DNA capture panel as an integrated genomic tool for lymphoproliferative disorders. Blood Adv. 2021;5(16):3188-3198.
29. Chandra V, Bortnick A, Murre C. AID targeting: old mysteries and new challenges. Trends Immunol. 2015;36(9):527-535.
30. Lebecque SG, Gearhart PJ. Boundaries of somatic mutation in rearranged immunoglobulin genes: 5' boundary is near the promoter, and 3' boundary is approximately 1 kb from V(D)J gene. J Exp Med. 1990;172(6):1717-1727.
31. Bystry V, Reigl T, Krejci A, et al. ARResT/Interrogate: an interactive immunoprofiler for IG/TR NGS data. Bioinformatics. 2017;33(3):435-437.
32. Knecht H, Reigl T, Kotrova M, et al. Quality control and quantification in IG/TR next-generation sequencing marker identification: protocols and bioinformatic functionalities by EuroClonality-NGS. Leukemia. 2019;33(9):2254-2265.
33. Dunn T, Berry G, Emig-Agius D, et al. Pisces: an accurate and versatile variant caller for somatic and germline nextgeneration sequencing data. Bioinformatics. 2019;35(9):1579-1581.
34. Chen X, Schulz-Trieglaff O, Shaw R, et al. Manta: rapid detection of structural variants and indels for germline and cancer sequencing applications. Bioinformatics. 2016;32(8):1220-1222.
35. Robinson JT, Thorvaldsdottir H, Winckler W, et al. Integrative genomics viewer. Nat Biotechnol. 2011;29(1):24-26.
36. Lefranc MP, Giudicelli V, Duroux P, et al. IMGT(R), the international ImMunoGeneTics information system(R) 25 years on. Nucleic Acids Res. 2015;43(1):D413-422.
37. Jain P, Nogueras González GM, Kanagal-Shamanna R, et al. The
Haematologica | 108 May 2023 1320 ARTICLE - A novel NGS-capture strategy to report SHM status N. McCafferty et al.
absolute percent deviation of IGHV mutation rather than a 98% cut-off predicts survival of chronic lymphocytic leukaemia patients treated with fludarabine, cyclophosphamide and rituximab. Br J Haematol. 2018;180(1):33-40.
38. Baliakas P, Moysiadis T, Hadzidimitriou A, et al. Tailored approaches grounded on immunogenetic features for refined prognostication in chronic lymphocytic leukemia. Haematologica. 2019;104(2):360-369.
39. Morabito F, Shanafelt TD, Gentile M, et al. Immunoglobulin heavy chain variable region gene and prediction of time to first treatment in patients with chronic lymphocytic leukemia: mutational load or mutational status? Analysis of 1003 cases. Am J Hematol. 2018;93(9):E216-E219.
40. Maul RW, Gearhart PJ. Controlling somatic hypermutation in immunoglobulin variable and switch regions. Immunol Res.
2010;47(1-3):113-122.
41. Seifert M, Scholtysik R, Küppers R. Origin and pathogenesis of B cell lymphomas. Methods Mol Biol. 2013;971(1):1-25.
42. Seifert M, Sellmann L, Bloehdorn J, et al. Cellular origin and pathophysiology of chronic lymphocytic leukemia. J Exp Med. 2012;209(12):2183-2198.
43. Carbone A, Gloghini A, Cabras A, Elia G. The germinal centrederived lymphomas seen through their cellular microenvironment. Br J Haematol. 2009;145(4):468-480.
44. de Leval L. Approach to nodal-based T-cell lymphomas. Pathology. 2020;52(1):78-99.
45. Bruggemann M, White H, Gaulard P, et al. Powerful strategy for polymerase chain reaction-based clonality assessment in T-cell malignancies: report of the BIOMED-2 Concerted Action BHM4 CT98-3936. Leukemia. 2007;21(2):215-221.
Haematologica | 108 May 2023 1321 ARTICLE - A novel NGS-capture strategy to report SHM status N. McCafferty et al.
The IgG-degrading enzyme, Imlifidase, restores the therapeutic activity of FVIII in inhibitor-positive hemophilia
A mice.
1Institut National de la Santé et de la Recherche Médicale, Centre de Recherche des Cordeliers, CNRS, Sorbonne Université, Université Paris Cité, Paris, France; 2Department for Translational Medicine, Skane University Hospital, Lund University, Malmö, Sweden; 3Service de Médecine Interne, Normandie Université, UNIROUEN, Rouen, France and 4Service d'Hématologie Biologique et Unité Fonctionnelle d’Hémostase, Hôpital Cochin, AP-HP Centre, Université Paris Cité, Paris, France
Abstract
Correspondence: S. Lacroix-Desmazes sebastien.lacroix-desmazes@inserm.fr
V. Proulle
Valerie.proulle@aphp.fr
Received: August 5, 2022.
Accepted: January 11, 2023.
Early view: January 19, 2023.
https://doi.org/10.3324/haematol.2022.281895
©2023 Ferrata Storti Foundation
Published under a CC BY-NC license
Neutralizing anti-factor VIII (FVIII) antibodies, known as FVIII inhibitors, represent a major drawback of replacement therapy in persons with congenital hemophilia A (PwHA), rendering further infusions of FVIII ineffective. FVIII inhibitors can also appear in non-hemophilic individuals causing acquired hemophilia A (AHA). The use of non-FVIII bypassing agents in cases of bleeds or surgery in inhibitor-positive patients is complicated by the lack of reliable biological monitoring and increased thrombotic risk. Imlifidase (IdeS) is an endopeptidase that degrades human immunoglobulin G (IgG); it was recently approved for hyperimmune patients undergoing renal transplants. Here we investigated the ability of IdeS to eliminate FVIII inhibitors in vitro and in a model of inhibitor-positive HA mice. IdeS cleaved anti-FVIII plasma IgG from PwHA and AHA patients, and hydrolyzed recombinant human anti-FVIII IgG independently from their subclass or specificity for the A2, A3, C1 or C2 domains of FVIII. In HA mice passively immunized with recombinant human anti-FVIII IgG, IdeS restored the hemostatic efficacy of FVIII, as evidenced by the correction of the bleeding tendency. Our results provide the proof of concept for the transient removal of FVIII inhibitors by IdeS, thereby opening a therapeutic window for efficient FVIII replacement therapy in inhibitor-positive patients.
Introduction
Up to 30% of the persons with hemophilia A (PwHA) may develop neutralizing anti-factor VIII (FVIII) allo-antibodies (FVIII inhibitors) after replacement therapy,1 with approximately 60% exhibiting high inhibitory titers. The onset of FVIII inhibitors is favored by genetic (ethnicity, mutations in the F8 gene) and environmental (exposure) factors.2 Neutralizing auto-antibodies against FVIII can also appear in individuals with no previous history of bleeding, typically in elderly individuals or in the postpartum period,3 causing acquired hemophilia A (AHA).
The management of clinically relevant acute bleeds and/or surgeries in patients with high FVIII inhibitor titers is particularly challenging. Bypassing agents (BPA), such as recombinant activated FVII (rFVIIa) and activated prothrombin complex concentrates (aPCC), or recombinant porcine FVIII, are recommended as first-line treatments.
Apart from their proven efficacy, BPA have major drawbacks, including the need for frequent dosing, the lack of reliable biomarkers for hemostatic efficacy other than clinical improvement, and the increased thrombotic risk.4–7 The development of emicizumab, a humanized bispecific antibody that mimics the co-factor function of FVIII, has revolutionized prophylaxis for PwHA and inhibitors.8,9 Emicizumab dramatically reduces annualized bleeding rates with once-weekly or fewer subcutaneous injections.10 However, emicizumab does not completely restore hemostasis, and standard hemostatic treatments are still required for persons undergoing breakthrough bleeds or surgery.11,12 Further, the concomitant use of emicizumab and BPA, particularly aPCC, carries an increased risk of thrombotic microangiopathies and thromboembolic events.13
Elderly hospitalized patients with acquired HA (PwAHA) with multiple comorbidities are also at increased risks of arterial and venous thrombotic events while receiving high
Melissa Bou-Jaoudeh,1 Sandrine Delignat,1 Victoria Daventure,1 Jan Astermark,2 Hervé Lévesque,3 Jordan D Dimitrov,1 Claire Deligne,1 Valérie Proulle1,4 and Sébastien LacroixDesmazes1
Haematologica | 108 May 2023 1322 ARTICLE - Coagulation & its Disorders
BPA doses.3,7 As a result, on-demand replacement therapy with exogenous FVIII remains the best option for managing acute bleeds or surgery in PwHA and PwAHA. Eliminating neutralizing anti-FVIII antibodies to temporarily restore the hemostatic efficacy of FVIII while avoiding the use of BPA is an appealing new therapeutic option in patients with FVIII inhibitors.
Streptococcus pyogenes, an important human pathogen, produces IdeS (immunoglobulin G [IgG]-degrading enzyme of Streptococcus pyogenes) as a defense mechanism against antibody attack and complement activation.14 IdeS is a cysteine proteinase that can cleave all four human IgG subclasses with a unique degree of specificity below the disulfide bridge in the hinge region.15 However, IdeS only partially hydrolyzes mouse IgG.16 IdeS sequentially cleaves the two heavy chains of IgG with different kinetics, thus releasing the F(ab')2 fragment from the Fc fragment. A recombinant IdeS is commercially available (Imlifidase, Ideferix®) and is the only desensitization treatment European Medicines Agency-approved for kidney transplant patients with donor-specific antibodies.17 IdeS is also being studied for its therapeutic potential in several autoimmune diseases18,19,20 as well as in oncology and gene therapy.21,22 Here, we hypothesized that the cleavage of circulating IgG by IdeS, leading to the fast, though temporary, clearance of IgG, may provide a new therapeutic opportunity for patients with FVIII inhibitors. We demonstrate that IdeS efficiently hydrolyzes polyclonal anti-FVIII IgG in patients’ plasma and monoclonal recombinant human anti-FVIII IgG (anti-FVIII rhIgG) in vitro. We developed a mouse model of inhibitor-positive severe HA by passively immunizing HA mice with anti-FVIII rhIgG. IdeS restored the hemostatic efficacy of FVIII infusions in inhibitor-positive HA mice. Our results provide the proof of concept for temporarily removing FVIII inhibitors by IdeS and opening a therapeutic window for efficient FVIII replacement therapy and better management of patients with FVIII inhibitors.
Methods
Plasma samples from patients with congenital or acquired hemophilia A
Plasma from 102 PwHA was obtained from the MIBS registry (Malmö International Brother Study) that includes siblings with and without a history of inhibitors.23 Plasma from 43 PwAHA was obtained from the SACHA (Surveillance des Auto antiCorps au cours de l’Hémophilie Acquise) French registry at the time of inclusion with titers ≥1 Bethesda units (BU)/mL.7 Procedures were in accordance with the ethical standards of the responsible committees on human experimentation for both cohorts and with the Declaration of Helsinki. MIBS and SACHA are registered (clinicaltrails. gov. Identifier: NCT00231751 and NCT00213473, respect-
ively).7,23
Generation of recombinant human anti-FVIII immunoglobulin G
Four anti-FVIII rhIgGk were produced: BOIIB2 (patent US20070065425A1), KM41,24 LE2E925 and BO2C1126 that are specific for the A2, A3, C1 and C2 domains of FVIII, respectively. The genes encoding the VH regions of IgG and the VL regions of Igk were cloned in eukaryotic expression vectors (kindly provided by Dr. Hugo Mouquet, INSERM, Paris). The corresponding IgG1k and IgG4k were produced in HEK293 cells using the Expi293 protocol (Thermo Scientific) and purified from the culture supernatant by affinity chromatography on protein G-agarose beads (GE Healthcare). Monoclonal IgG were validated by SDS-PAGE, enzymelinked immunosorbant assay (ELISA) and modified Nijmegen-Bethesda assay.
Determination of anti-FVIII antibody inhibitory titers
The inhibitory activity of the anti-FVIII rhIgG was measured using the modified Nijmegen-Bethesda assay (MNBA).27 Monoclonal IgG in phosphate-buffered saline (PBS, pH 7.4, Life Technologies) or in mouse plasma were serially diluted in veronal buffer and incubated vol/vol with a standard pool of human plasma (Siemens Healthcare), used as a source of FVIII, for 2 hours (h) at 37°C. The residual pro-coagulant FVIII activity (FVIII:C) was measured using a chromogenic assay following the manufacturer’s instructions (Siemens Healthcare). In the case of purified IgG, the inhibitory activity of the IgG was expressed in BU/mg IgG, defined as the inverse of the concentration of IgG needed to inhibit 50% of FVIII:C. In the case of IgG in mouse plasma, the inhibitory titers were expressed in BU/mL, defined as the plasma dilution that neutralizes 50% of normal plasma FVIII:C. Titers ≥0.6 BU/mL were considered as positive.
Generation of Imlifidase
The DNA sequence encoding IdeS from S. pyogenes was obtained from Geneart (Thermo Scientific). It was cloned into a pEX-N-His-tagged expression vector for expression in E. coli strain BL21. Protein expression was induced by 0.5 mM IPTG for 4 h at 37°C. Proteins were purified by immobilized metal affinity chromatography (HisTrap FF column, GE Healthcare). Buffer was exchanged with PBS using a PD10 desalting column (GE Healthcare) and endotoxins were removed using the Pierce endotoxin removal kit (Thermo Scientific). Integrity of IdeS was confirmed by SDS-PAGE and concentration was determined using NanoDrop™ with a 50,880 M 1cm 1 extinction coefficient.
Hydrolysis of immunglobulin G by Imlifidase
For IgG in patients’ plasma, 10-fold diluted plasma was incubated in PBS alone or with 0.54 mM IdeS (yielding an approximate 12:1 molar ratio of IgG:IdeS) for 24 h at 37°C. For
Haematologica | 108 May 2023 1323 ARTICLE - Removal of FVIII inhibitors by IdeS in hemophilia A M. Bou-Jaoudeh et al.
anti-FVIII rhIgG1k and rhIgG4k, IgG (1.66 mM) were incubated alone or with IdeS (0.14 mM) at a 12:1 IgG:IdeS molar ratio for 24 h at 37°C.
Mouse model of inhibitor-positive severe hemophilia A
Eight- to 12-week-old male and female exon 16 FVIII-deficient mice28 on a C57BL/6 background (HA mice) were housed and handled in accordance with French regulations and the experimental guidelines of the European Community (Comité d’éthique en expérimentation animale no.005, protocol APAFIS#24748-2020032014465347). Naive HA mice were passively immunized by intravenous injection of the human recombinant BO2C11 IgG1k (600 BU/kg). For determination of IgG half-life, blood was collected at 5 minutes (min), 4 h, 1, 2, 5, and 7 days post-injection. Inhibitory titers were measured in plasma using MNBA.
In vivo efficacy of Imlifidase in inhibitor-positive hemophilia A mice
HA mice were passively immunized by intravenous injection of BO2C11 IgG1k alone at 1,200 BU/kg or 24,000 BU/kg, or of equimolar amounts of BOIIB2, KM41, LE2E9 and BO2C11 in IgG1k format (2,800 BU/kg). Mice were treated 1 day later by intravenous injection of IdeS (0.6 mg/kg or 0.29 mM) or PBS as control. When indicated, mice received a second injection of IdeS 24 h later. Residual levels of intact anti-FVIII rhIgG, partially single-cleaved intermediate IgG, F(ab’)2 fragments, and inhibitory activities were determined by ELISA and MNBA in plasma collected up to 6 days after IdeS or PBS injection.
Evaluation of bleeding tendency and hemostasis
Inhibitor-positive HA mice treated with PBS or IdeS were injected with therapeutic recombinant human FVIII (Helixate®, 200 Ul/kg) via the retro-orbital route 3 days after IdeS or PBS injection. The bleeding tendency and hemostatic parameters were analyzed 2 h later. The bleeding tendency was evaluated using a standardized tail clipping assay in isoflurane-anesthetized mice (2% isoflurane in 30% O2 and 70% N2O; flow: 1 L/min) maintained at 37°C on a heating pad. Three mm of the distal tail was amputated and blood was collected over 10 min. Blood loss in each sample was calculated from a standard curve, as already described.29 The FVIII:C was measured in plasma using a chromogenic test (Siemens Healthcare). Thrombin generation in platelet-poor plasma (PPP) was measured using the Calibrated Automated Thrombrogram and PPP Reagent Low (Stago) as already described,30 except that PPP was diluted 1/6 in HEPES-buffered saline containing 0.5% bovine serum albumin (BSA).
SDS-PAGE and western blot
Purified IgG or IgG in human plasma (5 mg), incubated alone or with IdeS, were separated by SDS-PAGE in NuPAGE 4-
12% gradient Bis-Tris protein gels (Thermo Scientific) under non-reducing conditions, and transferred to nitrocellulose membranes using a semi-dry iBlot system (Invitrogen). Membranes were blocked and incubated with a polyclonal goat anti-human F(ab’)2 fragment-specific antibody (Invitrogen) or a polyclonal rabbit anti-human Fc-specific antibody (Sigma-Aldrich). Bound antibodies were revealed using appropriate secondary antibodies: an horseradish peroxidase (HRP)-coupled rabbit anti-goat IgG (R&D System) or an HRP-coupled goat anti-rabbit IgG (Cell signaling), and the Pierce™ ECL Western Blotting Substrate and iBright™ FL1000 Imaging System (Thermo Scientific).
Human anti-FVIII immunoglobulin G enzyme-linked immunosorbant assay
ELISA plates (Maxisorp, Nunc) were coated with rhFVIII (Advate®, 2.5 mg/mL). Patients’ plasma or purified anti-FVIII rhIgG were added to the wells. Bound anti-FVIII IgG or F(ab’)2 were revealed using an HRP-labeled mouse monoclonal antibody specific for human Fcγ (Southern Biotech) or an HRP-labeled goat anti-human IgG F(ab')2 fragment secondary antibody (Thermo Scientific), respectively, and the o-phenylenediamine dihydrochloride (OPD, Sigma-Aldrich) substrate. Absorbances were read at 492 nm. The titers of anti-FVIII IgG in patients’ plasma were defined as the highest dilution of plasma yielding an optical density (OD) ≥cutoff. The cutoff was computed as the mean OD calculated for the plasma from 22 healthy individuals + 95% percentile*standard deviation.31
Human immunoglobulin G and F(ab’)2 fragments enzymelinked immunosorbant assay
ELISA plates were coated with a goat anti-human Ig k antibody (2.5 mg/mL; Southern Biotech). Purified anti-FVIII rhIgG or mouse plasma containing anti-FVIII rhIgG were added to the wells. Bound IgG were revealed using an HRPlabeled mouse monoclonal antibody specific for human Fcγ (Southern Biotech). Bound F(ab')2 fragments were detected using an HRP-labeled goat anti-human IgG F(ab')2 secondary antibody (Thermo Scientific). Absorbance was read at 492 nm after addition of the OPD substrate. Concentrations were calculated in mg/mL using BO2C11 as a standard.
Results
Imlifidase hydrolyzes anti-FVIII immunglobulin G in plasma from persons with hemophilia A and persons with acquired hemophilia A
We investigated whether IdeS hydrolyzes IgG in the plasma from 43 PwAHA and 102 PwHA. Twenty-two of the 102 PwHA plasma tested positive for FVIII inhibitors (mean ± standard deviation [SD]: 9.8±15.6 BU/mL, ranging from 0.6 to 63 BU/mL; Figure 1). Inhibitor-negative PwHA had titers
Haematologica | 108 May 2023 1324 ARTICLE - Removal of FVIII inhibitors by IdeS in hemophilia A M. Bou-Jaoudeh et al.
below 0.6 BU/mL. Ten-fold diluted plasma was incubated alone or with IdeS (0.54 mM) for 24 h at 37°C. Samples from five randomly selected PwHA were analyzed by western blot to detect F(ab’)2 and Fc fragments before and after IdeS treatment. As expected,32 incubation in the presence of IdeS led to a close to complete degradation of total IgG and the detection of traces of scIgG, together with the accumulation of F(ab’)2 and Fc fragments at 100 and 25 kDa, respectively (Figure 1A).
We confirmed the cleavage of anti-FVIII IgG in plasma from PwHA and PwAHA using an anti-FVIII IgG ELISA. As reported,33 some inhibitor-negative PwHA had detectable levels of FVIII-binding IgG, but at significantly lower levels than inhibitor-positive PwHA (Figure 1B; P<0.0001). Treatment with IdeS resulted in undetectable anti-FVIII IgG titers in the plasma from inhibitor-positive and inhibitornegative PwHA, and PwAHA (P<0.0001 in all cases). This is consistent with the release of the Fc fragments from the F(ab’)2 fragments of the IgG upon IdeS-mediated cleavage and the associated loss of detection of the bound anti-FVIII F(ab’)2 fragments by the anti-human Fc antibody in ELISA.
Imlifidase hydrolyzes anti-FVIII immunoglobulin G irrespective of their subclass and epitope specificity Anti-FVIII IgG in PwHA and PwAHA belong in the large majority to the IgG1 and IgG4 subclasses.33 In order to further
decipher the action of IdeS on anti-FVIII IgG, we generated four monoclonal anti-FVIII rhIgG expressed in both the IgG1k and IgG4k formats, specific for the A2, A3, C1 or C2 domain of human FVIII.

The recombinant IgG1k and IgG4k versions of each monoclonal IgG exhibited identical dose-dependent binding to FVIII in ELISA (Figure 2A) and neutralized FVIII:C within identical orders of magnitude (Table 1). The four IgG were cleaved equally by IdeS, irrespective of their epitope specificity or IgG subclass. Indeed, incubation of each IgG with IdeS at a 12:1 molar excess for 24 h at 37°C resulted in the complete disappearance of the intact IgG and the generation of the F(ab’)2 and Fc fragments (Figure 2B). Time-dependent analyses of IgG cleavage by IdeS, performed using BO2C11, demonstrated that IgG1k and IgG4k are cleaved with similar kinetics. More than 90% of the IgG were hydrolyzed as scIgG within the first 5 min of in vitro incubation and fully hydrolyzed F(ab’)2 fragments were detected from 20 min onwards (Figure 2C). The physical dissociation between F(ab’)2 and Fc fragments upon IdeS cleavage was confirmed by ELISA (Figures 3A; Online Supplementary Figure S1). Under static conditions (i.e., in a test tube), the F(ab’)2 fragments of neutralizing anti-FVIII IgG, generated upon IdeS cleavage, are not eliminated and are presumably still able to neutralize the procoagulant activity of FVIII. Indeed, samples of native or
Figure 1. Hydrolysis of immunglobulin G in the plasma from patients with congenital and acquired hemophilia A. (A) Plasma samples obtained from 5 congenital hemophilia A (HA) patients (P1-P5, MIBS cohort) were pre-incubated for 24 hours (h) at 37°C with Imlifidase (IdeS) (0.54 µM) or phosphate-buffered saline (PBS), and subjected to western blot. Immunoglobulin G (IgG) were recognized with a F(ab’)2-specific antibody (top) or a Fc-specific antibody (bottom). Molecular weight markers are shown at the left of the blot. The predicted molecular weights of intact IgG, scIgG, F(ab’)2 and Fc fragments are shown. (B) Ten-fold diluted plasma from 43 patients with acquired HA (PwAHA) and from 102 patients with mild, moderate or severe HA, with (Inh+ PwHA, n=22) or without (Inh- PwHA, n=80) FVIII inhibitors, were incubated for 24 h at 37°C with IdeS (0.54 µM) or PBS. Inhibitor-positive patients were defined by inhibitory titers ≥ 0.6 Bethesda units (BU)/mL. The graph depicts the titers of FVIII-specific IgG. Plasma samples were diluted at least 1:20. Samples that did not give a positive signal at this minimum dilution were considered as negative (ND: not detectable). Statistical differences were assessed using the two-sided Mann-Whitney test.
A B Haematologica | 108 May 2023 1325 ARTICLE - Removal of FVIII inhibitors by IdeS in hemophilia A M. Bou-Jaoudeh et al.
Figure 2. Cleavage of human monoclonal anti-FVIII immunglobulin G by Imlifidase. (A) Validation of human recombinant monoclonal anti-FVIII immunoglobulin G (IgG). Four human monoclonal neutralizing anti-FVIII IgG were cloned and expressed as IgG1k (left panel) or IgG4k (right panel). Their binding to FVIII was validated in a human anti-FVIII IgG enzyme-linked immunosorbant assay. Results are expressed in arbitrary units (AU, mean ± standard deviation from 3 independent experiments) using the optical densities measured at 492 nm. (B, C) IdeS-mediated hydrolysis of human monoclonal anti-FVIII IgG. The monoclonal anti-FVIII IgG1k (left panel) or IgG4k (right panel) were incubated with Imlifidase (IdeS) at a 12 IgG:1 IdeS molar ratio (1.66 µM IgG vs. 0.14 µM IdeS) for 24 hours (panels B) or for different periods of time (C) at 37°C. Samples were separated by SDSPAGE under non-reducing conditions. Molecular weight markers and the predicted molecular weights of intact IgG, scIgG, F(ab’)2 and Fc fragments are shown on the left and right of each gel, respectively.
The inhibitory activity of the 4 monoclonal IgG1 and IgG4 antibodies was measured in a modified Nijmegen-Bethesda assay. The table depicts, for each immunglobulin G (IgG), the domain specificity, the inhibitory activity in the IgG1 and IgG4 formats and the original reference. mAb: monoclonal antibody. BU: Bethesda units; SD: standard deviation.

A B C
mAb Domain Inhibitory activity (BU/µg, mean±SD) Reference IgG1k IgG4k BOIIB2 A2 6.3±3.0 7.7±0.5 Patent US20070065425 BO2C11 C2 2.6±1.6 1.6±0.8 Jacquemin et al. Blood 199826 KM41 A3 0.023±0.001 0.054±0.011 van den Brink et al. Blood 200124 LE2E9 C1 0.36±0.04 0.77±0.25 Jacquemin et al. Blood 200025
Table 1. Inhibitory activity of monoclonal anti-FVIII IgG1k and IgG4k.
Haematologica | 108 May 2023 1326 ARTICLE - Removal of FVIII inhibitors by IdeS in hemophilia A M. Bou-Jaoudeh et al.
IdeS-cleaved BO2C11 IgG neutralized FVIII:C to a similar extent in vitro in a MNBA, irrespective of the IgG subclass (Figure 3B). Accordingly, plasma from an inhibitor-positive PwHA neutralized FVIII:C to similar extent in vitro following incubation alone or with IdeS (Figure 3C).
Validation of a mouse model of inhibitor-positive hemophilia A

In order to develop a mouse model of inhibitor-positive HA, we first determined the half-life of BO2C11 IgG1k, used
as model IgG, in FVIII-deficient mice. The intravenous injection of 600 BU/kg of BO2C11 IgG1k was followed by a two-phase elimination pattern. Fitting the experimental data to a double exponential decay curve yielded fast and slow elimination half-lives of 0.2 and 9 days, respectively (Figure 4A). Inhibitory titers measured in mice plasma were 12.8±1.2 BU/mL at 5 min and 5.7±1.1 BU/mL at 24 h, representing a 45% reduction. The inhibitory titers remained relatively stable for the next 6 days (i.e., 3.3±1.9 BU/mL at day 7).
Figure 3. Inhibitory activity of F(ab’)2 fragments generated upon Imlifidase cleavage. (A) Binding of BO2C11 immunoglobulin G (IgG) to FVIII following cleavage by Imlifidase (IdeS). BO2C11 IgG1k (left panel) and IgG4k (right panel) at 1.66 µM were incubated alone or with IdeS (0.14 µM) for 24 hours (h) at 37°C (12 IgG:1 IdeS molar ratio). The binding of the intact IgG and/or scIgG to FVIII and that of F(ab’)2 fragments (showed as insets) was validated by enzyme-linked immunosorbant assay. Results are expressed in arbitrary units (AU, representative of 2 experiments) from optical density measured at 492 nm. (B) Inhibitory activity of Id eScleaved BO2C11 IgG. The inhibitory activity of BO2C11 IgG1k and IgG4k incubated in phosphate-buffered saline (PBS) alone (-) or with IdeS (+) was measured in a Bethesda assay. As a control, IdeS was introduced alone in the assay. Values depict the respective % of residual inhibitory activities as compared to the activity measured in the absence of IdeS for IgG1k and for IgG4k (means ± standard deviation of 3 independent experiments). (C) Inhibitory activity of IdeS-cleaved polyclonal anti-FVIII IgG. Plasma (1/10) from an inhibitor-positive patient with hemophilia A (PwHA) was incubated for 24 h at 37°C with IdeS (0.54 µM) or PBS. The binding to FVIII of intact IgG/scIgG and F(ab’)2 fragments was measured by enzyme-linked immunsorbant assay. Results are expressed in AU using the optical densities measured at 492 nm. The inhibitory titer was measured in the plasma treated with PBS or IdeS using a modified Nijmegen-Bethesda assay (n=2, mean ± standard deviation).
A B C Haematologica | 108 May 2023 1327 ARTICLE - Removal of FVIII inhibitors by IdeS in hemophilia A M. Bou-Jaoudeh et al.
In vivo Imlifidase efficacy and pharmacokinetics
In a first series of experiments, HA mice were passively immunized with 1,200 BU/kg of BO2C11 IgG1 k . This amount of IgG1k achieved reproducible inhibitory titers of 9.4±2.3 BU/mL and 5.2±2.7 BU/mL 24 and 96 h later, respectively (Figure 4D), titers for which administration of therapeutic FVIII is inefficient in patients. Inhibitor-positive HA mice were treated with 0.6 mg/kg IdeS 24 h after the injection of BO2C11 IgG1k (Figure 4B). As compared to PBS-treated control mice, IdeS-treated mice experienced a drastic 94% drop in IgG levels (either intact IgG or scIgG that are both detected in the human IgG ELISA) 6 h after IdeS injection (Figure 4C). The rapid loss of detection of IgG in mouse plasma was associated with a slower disappearance of the inhibitory activity towards
FVIII that was still detectable at least 24 h following IdeS injection (Figure 4D). Interestingly, the progressive decrease in inhibitory activity in plasma demonstrated a statistically significant linear correlation with the disappearance of the F(ab’)2 fragments of BO2C11 from the circulation (Figures 4E, F; r 2 =0.93; P <0.0001). The inhibitory activity was below the detection threshold of the assay 2-3 days after IdeS injection. Similar results were obtained when HA mice were passively immunized with a pool of BOIIB2, KM41, LE2E9 and BO2C11 IgG1k (Online Supplementary Figure S2).

Fitting the experimental data of F(ab’)2 catabolism (Figure 4E), from 6 h following IdeS injection onwards, to a onephase decay curve yielded a 11.7 h half-life of human F(ab’)2 fragments in mice (range, 10.1-13.1 h).
Figure 4. Imlifidase-mediated elimination of a FVIII inhibitor in inhibitor-positive hemophilia A mice. (A) Half-life of BO2C11 immunoglobulin G (IgG1k) in hemophilia A (HA) mice. C57BL/6 HA mice (n=5) were passively immunized with BO2C11 IgG1k (600 Bethesda units [BU]/kg). The graph depicts the inhibitory activity towards FVIII measured in plasma over time. (B) HA mice (n=6 per group) were passively immunized with 1,200 BU/kg of BO2C11 IgG1k to reach 10 BU/mL after 24 hours (h), and injected with Imlifidase (IdeS) (0.6 mg/kg, 0.29 µM) or phosphate-buffered saline (PBS) 24 h later. (C-E). The levels of intact IgG and/or scIgG (C, IgG concentration at 24 h: 5.1±0.3 nM), the inhibitory titers (D) and the levels of F(ab’)2 fragments (E) were determined over time by enzyme-linked immunosorbant assay and Bethesda assay (n=4, mean ± standard deviation). The dotted lines represent the respective detection thresholds: 0.03 µg/mL, 0.6 BU/mL and 0.08 µg/mL. (F) The graph shows, for the condition where mice were treated with IdeS, the plasma levels of IgG (C) and F(ab’)2 fragments (E) as a function of the inhibitory activity in plasma (D) at 30, 48, 72 and 96 h following BO2C11 injection. The experimental data were interpolated using a linear curve (R2: goodness of fit). The grey zone in panel (D) depicts inhibitory titers below 5 BU/mL, a titer that is compatible with the hemostatic efficacy of exogenous FVIII.
A B C D E F Haematologica | 108 May 2023 1328 ARTICLE - Removal of FVIII inhibitors by IdeS in hemophilia A M. Bou-Jaoudeh et al.
Imlifidase corrects the bleeding tendency and restores FVIII hemostatic efficacy
In order to provide proof of concept towards the transient removal of FVIII inhibitors by IdeS, thereby opening a therapeutic window for efficient FVIII replacement therapy, inhibitor-positive HA mice were given 200 IU/kg of FVIII 96 h (3 days) after IdeS or PBS treatment (Figure 5A). Two hours later, the bleeding tendency and hemostatic efficacy of therapeutic FVIII were evaluated. The blood loss that followed tail tip amputation of IdeS-treated mice was significantly lower than that measured in PBS-treated mice (Figure 5B; 13±26 mL vs. 74±65 mL; P=0.0047), but was not different from that measured in naive inhibitor-negative HA mice that had received FVIII alone (21±16 mL). The reduction in blood loss was explained by a restoration of the hemostatic efficacy of therapeutic FVIII. FVIII:C recovery in IdeStreated mice was significantly higher than that in PBS-treated mice (Figure 5C; 84.2±29.7% vs. 2.0±1.5%; P=0.0015) and did not differ from that in naive inhibitornegative mice injected with FVIII alone (112.4±58.7%). Accordingly, thrombin generation was significantly increased in IdeS-treated mice as compared to PBS-treated mice (Figures 5D, E; thrombin peak: 52±8 nM vs. 25±19 nM; P=0.0386).
Imlifidase efficacy in the context of very high inhibitory titers
In order to mimic the situation of patients with very high inhibitory titers, we passively immunized HA mice with 24,000 BU/kg of BO2C11 IgG1k to reach inhibitory titers of 171±48 BU/mL and 97±7 BU/mL 24 and 168 h later, respectively. Mice then received either one or two injections of IdeS (0.6 mg/kg) with a 24-h interval. The circulating levels of IgG/scIgG and F(ab’)2 fragments and the inhibitory titers were followed over time. The loss of detection of IgG/scIgG was faster than the decrease in detection of circulating F(ab’)2 fragments and inhibitory activity (Figure 6). As compared to PBS-treated mice, the decrease in inhibitory activity was 27-fold and 68-fold 3 and 6 days after a single IdeS injection, respectively. Redosing of IdeS yielded a further reduction in inhibitory activity below 5 BU/mL (P<0.05 at 96 and 168 h).
Discussion
The promising therapeutic effect of IdeS has already been suggested in several preclinical models of human autoimmune diseases,34–37 and in the context of gene therapy.21 In humans, IdeS potency has been explored in patients with anti-HLA allo-antibodies undergoing kidney transplant38,39 and in patients with Goodpasture syndrome and auto-antibodies directed against the non-collagenous domain of the a3 chain of type IV collagen.19 Our work further
substantiates the efficacy of IdeS treatment in both alloand auto-immune settings. There are alternatives to IdeS for removing pathogenic antibodies, such as plasmapheresis,40 molecules that block the neonatal Fc receptor (FcRn),41,42 immunosuppressive drugs,43,44 or therapeutic antibodies that deplete B cells.45 However, IdeS offers several benefits in terms of specificity and efficacy, fast elimination rate, and long-lasting effects. Importantly, the presence of pre-existing anti-IdeS IgG or the onset of an anti-IdeS immune response, which peaks around 2 weeks after IdeS administration, do not preclude repeated dosing of IdeS for several consecutive days, or at a 6-month distance from the first treatment.46 Furthermore, IdeS can cleave anti-IdeS antibodies with an IgG isotype,21 and neutralization of IdeS by anti-IdeS antibodies has never been proven convincingly.
All pathogenic IgG hydrolyzed by IdeS in the disorders and disease models listed above are specific for antigens exposed at the surface of cells, platelets or viruses. In contrast, FVIII circulates in the blood. The soluble/membrane location of the antigen targeted by the pathogenic IgG determines the functional outcome of IdeS-mediated cleavage. Indeed, IdeS hydrolyzes IgG in two steps, starting with a rapid cleavage of one of the two heavy chains to generate a scIgG, followed by a slow cleavage of the second heavy chain that releases the F(ab’)2 fragment from the Fc fragment.14,15 While scIgG lose their capacity to bind and activate complement, as well as to mediate antibody-dependent cell cytotoxicity (ADCC), they retain their capacity to bind their target antigen and have a normal half-life owing to the preserved binding to the FcRn.14 In contrast, the F(ab’)2 fragments of completely digested IgG lose all Fc fragment-mediated functions but maintain antigen-binding (and possibly neutralizaing capacity during their life span in the circulation. As a result, IdeS-mediated IgG cleavage has an immediate functional repercussion when the pathogenic IgG are directed against membrane antigens and exert their pathogenic effects by complement activation, phagocytosis or ADCC. In contrast, when the pathogenic IgG neutralize soluble antigens, as is the case of inhibitory anti-FVIII IgG, the functional consequence of IdeS-mediated cleavage is delayed until elimination of the F(ab’)2 fragments from the circulation. Hence, in test tubes, the mere in vitro cleavage of monoclonal and polyclonal antiFVIII IgG failed to abrogate the neutralizing activity of the residual F(ab’)2 fragments towards FVIII:C. In vivo, the disappearance of the FVIII inhibitory titers from the plasma of passively immunized inhibitor-positive HA mice required 48 h after dosing with IdeS, which correlated with changes in plasma levels of F(ab’)2 fragments and is consistent with the 12-h half-life of F(ab’)2 fragments that we determined in HA mice.
Different preclinical models of HA have been developed, including dogs, rats and minipigs. FVIII-deficient mice, how-
Haematologica | 108 May 2023 1329 ARTICLE - Removal of FVIII inhibitors by IdeS in hemophilia A M. Bou-Jaoudeh et al.
Figure 5. Efficacy of therapeutic FVIII in inhibitor-positive hemophilia A mice treated with Imlifidase. (A) Hemophilia A (HA) mice were passively immunized with BO2C11 immunoglobulin (Ig) G1k (1,200 Bethesda units [BU]/kg) and treated with Imlifidase (IdeS) (0.6 mg/kg) or phosphate-buffered saline (PBS) 24 hours (h) later. The mice were then administered intravenously with therapeutic FVIII (Helixate®, 200 IU/kg) at day 4. Control mice (wild-type [WT]) were injected with FVIII in the absence of passive immunization with BO2C11 IgG1k and treatment with IdeS. (B-E) Two h after FVIII injection, the mice tails were amputated at the terminal 3 mm and the blood loss was evaluated over 10 minutes (min). (B) In parallel, plasma was collected to determine the restoration of hemostatic efficacy of therapeutic FVIII by measuring the FVIII:C in a chromogenic assay (C), and the levels of thrombin generation (nM) over time (min) and thrombin peak (nM) using a thrombin generation test (D, E). In the graphs, the horizontal bars represent means ± standard deviation (SD) and each symbol depicts an individual animal. Statistical differences were assessed using the non-parametric Kruskal-Wallis test corrected for multiple comparisons using the Dunn’s test (ns: non-significant). In panel (D), the means ± standard error of the means are depicted as plain line and dotted line curves, respectively (n=5-8 mice per group).

A B C D E Haematologica | 108 May 2023 1330 ARTICLE - Removal of FVIII inhibitors by IdeS in hemophilia A M. Bou-Jaoudeh et al.
ever represent the most widely used model owing to the convenience of breeding and availability of tools for studying the immune system and hemostasis. Most importantly, the immune response to human FVIII in mice resembles that seen in allo-immunized PwHA.47 IdeS hydrolyzes IgG from a variety of species, including rabbits, pigs, humans and non-human primates, but not mouse IgG1 and IgG2b.16 As a result, the use of mouse models to study the effect of IdeS on induced endogenous IgG-mediated immune responses is not feasible. In order to tackle this limitation, we validated a model of passive transfer to FVIII-deficient HA mice of a neutralizing anti-FVIII rhIgG. In our study, we validated similar hydrolysis profiles in vitro for four different monoclonal anti-FVIII rhIgG, irrespective of their specificity for different FVIII domains and of their IgG1/4 subclass. The administration of anti-FVIII rhIgG to HA mice has already been performed to confirm their inhibitory activity towards FVIII in vivo, 48 or to study the effect of antibodies on the pharmacokinetics48 or immunogenicity of human therapeutic FVIII.49 Here, we followed the kinetics of one of the anti-FVIII rhIgG (BO2C11 IgG1k) in mice and determined that circulating IgG levels are rather stable 24 h following injection and for up to 5 to 6 days. We also showed that this model allows the precise adjustment and monitoring of the circulating FVIII inhibitory titers. The lack of endogenous production of human IgG is an obvious major limitation of the model, which renders it artificially favorable
to IdeS treatment. However, in humans, IdeS administration results in the rapid elimination of IgG from the circulation within 2 to 6 h and de novo production of endogenous IgG is detected only after 1 to 2 weeks.32,38 Taken together, the data suggest that IdeS is expected to achieve a FVIII inhibitor-free time window in PwHA and PwAHA that is wide enough to ensure hemostatic efficacy of FVIII replacement therapy in cases of breakthrough bleeds or major surgeries. In our experiments, mice with FVIII inhibitory titers of 8.3±2.0 BU/mL were successfully treated with IdeS, and therapeutic FVIII hemostatic efficacy was restored within 72 h. Interestingly, despite the persistence of the neutralizing F(ab’)2 fragments during the first 48 h after IdeS dosing, inhibitory titers were reduced by 37±13% and 84±8%, respectively, 6 and 24 h after IdeS injection. The inhibitory titers measured at the latter time points, i.e., 5.4±1.1 BU/mL and 1.7±0.6 BU/mL, correspond to the situation of patients with low inhibitory titers who may benefit from high-dose FVIII replacement therapy. Similar observations were made when mice with very high inhibitory titers (i.e., 200 BU/mL) were treated with two doses of IdeS, albeit with a further delay to reach an inhibitory titer <5 BU/mL.
The anti-FVIII antibody responses in PwHA and PwAHA are dominated by IgG antibodies.33,50 Indeed, anti-FVIII IgG titers of 1:20 or more were found in all plasma from the MIBS and SACHA cohorts. Although the presence of FVIII-binding IgM, IgA and IgE was not investigated in our study, the latter iso-
Figure 6. Imlifidase-mediated elimination of very high titer inhibitor. Hemophilia A (HA) mice (n=5 per group) were passively immunized with 24,000 Bethesda units (BU)/kg of BO2C11 immunoglobulin (Ig) G1k to reach 200 BU/mL after 24 hours (h). Twentyfour h later, a group of mice was treated with a single dose of Imlifidase (IdeS) (0.6 mg/kg, 0.29 µM, full green circles) or phosphate-buffered saline (PBS), open circles. Another group of mice was treated twice with IdeS (full blue circles) 24 and 48 h after BO2C11 injection. The levels of intact IgG and/or scIgG ((A), IgG concentration at 24 h: 261±8 nM), the levels of F(ab’)2 fragments (B) and the inhibitory titers (C) were determined over time by enzyme-linked immunosorbant assay and Bethesda assay (n=2, mean ± standard deviation). The dotted lines represent the respective detection thresholds: 0.03 µg/mL, 0.08 µg/mL and 0.6 BU/mL. The grey zone depicts inhibitory titers below 5 BU/ml. Statistical differences were assessed between mice treated with one or two injections of IdeS (at the 96- and 168-h time points) using the two-tailed non-parametric Mann-Whitney test (*P<0.05; otherwise non-significant).

A B C Haematologica | 108 May 2023 1331 ARTICLE - Removal of FVIII inhibitors by IdeS in hemophilia A M. Bou-Jaoudeh et al.
types may be found in 3-10% of PwHA and 8-36% of PwAHA.33,50 Although the importance of the latter isotypes in FVIII neutralization in vivo is uncertain, their presence may preclude a substantial percentage of patients from receiving IdeS therapy. These observations argue for prescreening patients to determine their eligibility for IdeS treatment.
The injection of IdeS to PwAHA requiring hemostatic treatment would minimize the need for BPA and the associated thrombotic risk while restoring the efficiency of FVIII treatment and monitoring. Based on our in vivo results, redosing IdeS 24 h after a first dose, as described in other pathologies,51 could be indicated for patients with the highest anti-FVIII levels. The use of IdeS as an immediate first-line therapy may be complementary to the use of immunosuppressive agents (i.e., corticosteroids, cyclophosphamide) to remove the inhibitors for a longer time period. On the other hand, the administration of IdeS to PwHA receiving emicizumab should presumably lead to the simultaneous elimination of both neutralizing anti-FVIII IgG and the drug. This would not only restore the clinical hemostatic efficacy of FVIII replacement but would also eliminate emicizumabrelated biological interference,52 ensuring accurate FVIII:C measurement in plasma. Notably, the majority of IdeS will be cleared from circulation within 24 to 48 h, allowing rapid re-administration of emicizumab for prophylaxis.53 Furthermore, due to limited experience and a lack of guidelines, the management of surgeries in PwHA receiving emicizumab remains an open question. It is further complicated in patients who have inhibitors with variable clinical responses to rFVIIa.54 In these patients, IdeS would provide a brief but beneficial inhibitor-free therapeutic window for high-risk major surgery or breakthrough bleeds. Finally, our in vitro and in vivo findings pave the way for a new therapeutic option to improve the management of FVIII inhibitor patients.
Disclosures
SLD and JDD are inventors on patent EP18305971.6 related to the use of IdeS in the context of AAV-mediated gene therapy. All other authors have no conflicts of interest to dis-
References
1. Lusher JM, Arkin S, Abildgaard CF, Schwartz RS. Recombinant factor VIII for the treatment of previously untreated patients with hemophilia A - safety, efficacy, and development of inhibitors. N Engl J Med. 1993;328(7):453-459.
2. Witmer C, Young G. Factor VIII inhibitors in hemophilia A: rationale and latest evidence. Ther Adv Hematol. 2013;4(1):59-72.
3. Tiede A, Collins P, Knoebl P, et al. International recommendations on the diagnosis and treatment of acquired hemophilia A. Haematologica. 2020;105(7):1791-1801.
close.
Contributions
MBJ, SD, CD, VP, and SLD designed the research. MBJ, VD, SD, and VP performed experiments. JA and HL contributed essential material. MBJ, SD, CD, VP, and SLD analyzed the results and made the figures. MBJ, VP, and SLD wrote the paper.
Acknowledgments
We wish to thank Dr. Carmen Coxon (National Institute for Biological Standards and Control, Hertfordshire, UK) for sharing the cDNA encoding KM41, as well as the staff from “Centre d'Expérimentation Fonctionnelle” at Centre de Recherche des Cordeliers (Paris) for assistance. Helixate® was a kind gift from CSL-Behring.
Funding
This work was supported by the Institut National de la Santé et de la Recherche Médicale (INSERM), Centre National de la Recherche Scientifique (CNRS), Sorbonne Université, Université de Paris, Assistance Publique des Hôpitaux de Paris and by grants from the Bayer Hemophilia Award Program (BHAP 2019 and BHAP 2021), from Agence National de la Recherche (ANR-18-CE17-0010-02-Exfiltrins and ANR-21-CE170043-Persia), from Spark Therapeutics Inc. (Philadelphia, PA), from coordination médicale pour l'étude et le traitement des maladies hémorragiques constitutionnelles (CoMETH) and by the Innovative Medicines Initiative 2 Joint Undertaking ARDAT (Accelerating research & development for advanced therapies) project, under grant agreement No 945473. This joint undertaking received support from the European Union’s Horizon 2020 research and innovation program and EFPIA. MBJ was the recipient of a fellowship from Ministère de l'enseignement supérieur et de la recherche and of the 2022 Martin Villard Haemostasis Award (Grifols Scientific Awards) in basic research.
Data-sharing statements
Original data and protocols are available upon request to the first and corresponding authors.
4. Lloyd Jones M, Wight J, Paisley S, Knight C. Control of bleeding in patients with haemophilia A with inhibitors: a systematic review. Haemophilia. 2003;9(4):464-520.
5. Shapiro AD, Mitchell IS, Nasr S. The future of bypassing agents for hemophilia with inhibitors in the era of novel agents. J Thromb Haemost. 2018;16(12):2362-2374.
6. Baudo F, Collins P, Huth-Kühne A, et al. Management of bleeding in acquired hemophilia A: results from the European Acquired Haemophilia (EACH2) Registry. Blood. 2012;120(1):39-46.
Haematologica | 108 May 2023 1332 ARTICLE - Removal of FVIII inhibitors by IdeS in hemophilia A M. Bou-Jaoudeh et al.
7. Borg JY, Guillet B, Le Cam-Duchez V, et al. Outcome of acquired haemophilia in France: the prospective SACHA (Surveillance des Auto antiCorps au cours de l’Hémophilie Acquise) registry. Haemophilia. 2013;19(4):564-570.
8. Shima M, Hanabusa H, Taki M, et al. Factor VIII–mimetic function of humanized bispecific antibody in hemophilia A. N Engl J Med. 2016;374(21):2044-2053.
9. Lenting PJ, Denis CV, Christophe OD. Emicizumab, a bispecific antibody recognizing coagulation factors IX and X: how does it actually compare to factor VIII? Blood. 2017;130(23):2463-2468.
10. Callaghan MU, Negrier C, Paz-Priel I, et al. Long-term outcomes with emicizumab prophylaxis for hemophilia A with or without FVIII inhibitors from the HAVEN 1-4 studies. Blood. 2021;137(16):2231-2242.
11. Collins PW, Liesner R, Makris M, et al. Treatment of bleeding episodes in haemophilia A complicated by a factor VIII inhibitor in patients receiving Emicizumab. Interim guidance from UKHCDO Inhibitor Working Party and Executive Committee. Haemophilia. 2018;24(3):344-347.
12. Lillicrap D, Fijnvandraat K, Young G, Mancuso ME. Patients with hemophilia A and inhibitors: prevention and evolving treatment paradigms. Expert Rev Hematol. 2020;13(4):313-321.
13. Makris M, Iorio A, Lenting PJ. Emicizumab and thrombosis: The story so far. J Thromb Haemost. 2019;17(8):1269-1272.
14. von Pawel-Rammingen U, Johansson BP, Björck L. IdeS, a novel streptococcal cysteine proteinase with unique specificity for immunoglobulin G. EMBO J. 2002;21(7):1607-1615.
15. Vincents B, von Pawel-Rammingen U, Björck L, Abrahamson M. Enzymatic characterization of the Streptococcal endopeptidase, IdeS, reveals that it is a cysteine protease with strict specificity for IgG cleavage due to exosite binding. Biochemistry. 2004;43(49):15540-15549.
16. Agniswamy J, Lei B, Musser JM, Sun PD. Insight of host immune evasion mediated by two variants of group a Streptococcus Mac protein. J Biol Chem. 2004;279(50):52789-52796.
17. Al-Salama ZT. Imlifidase: first approval. Drugs. 2020;80(17):1859-1864.
18. Wang Y, Shi Q, Lv H, et al. IgG-degrading enzyme of Streptococcus pyogenes (IdeS) prevents disease progression and facilitates improvement in a rabbit model of Guillain-Barré syndrome. Exp Neurol. 2017;291:134-140.
19. Soveri I, Mölne J, Uhlin F, et al. The IgG-degrading enzyme of Streptococcus pyogenes causes rapid clearance of antiglomerular basement membrane antibodies in patients with refractory anti-glomerular basement membrane disease. Kidney Int. 2019;96(5):1234-1238.
20. Montgomery RA, Loupy A, Segev DL. Antibody-mediated rejection: new approaches in prevention and management. Am J Transplant. 2018;18(S3):3-17.
21. Leborgne C, Barbon E, Alexander JM, et al. IgG-cleaving endopeptidase enables in vivo gene therapy in the presence of anti-AAV neutralizing antibodies. Nat Med. 2020;26(7):1096-1101.
22. Järnum S, Runström A, Bockermann R, et al. Enzymatic Inactivation of endogenous IgG by IdeS enhances therapeutic antibody efficacy. Mol Cancer Ther. 2017;16(9):1887-1897.
23. Astermark J, Berntorp E, White GC, Kroner BL. The Malmö International Brother Study (MIBS): further support for genetic predisposition to inhibitor development. Haemophilia. 2001;7(3):267-272.
24. van den Brink EN, Turenhout EAM, Bovenschen N, et al. Multiple VH genes are used to assemble human antibodies directed toward the A3-C1 domains of factor VIII. Blood. 2001;97(4):966-972.
25. Jacquemin M, Benhida A, Peerlinck K, et al. A human antibody
directed to the factor VIII C1 domain inhibits factor VIII cofactor activity and binding to von Willebrand factor. Blood. 2000;95(1):156-163.
26. Jacquemin MG, Desqueper BG, Benhida A, et al. Mechanism and kinetics of factor VIII inactivation: study with an IgG4 monoclonal antibody derived from a hemophilia A patient with inhibitor. Blood. 1998;92(2):496-506.
27. Verbruggen B, Novakova I, Wessels H, et al. The Nijmegen modification of the Bethesda assay for factor VIII:C inhibitors: improved specificity and reliability. Thromb Haemost. 1995;73(02):247-251.
28. Bi L, Lawler AM, Antonarakis SE, et al. Targeted disruption of the mouse factor VIII gene produces a model of haemophilia A. Nat Genet. 1995;10(1):119-121.
29. Russick J, Delignat S, Milanov P, et al. Correction of bleeding in experimental severe hemophilia A by systemic delivery of factor VIII-encoding mRNA. Haematologica. 2020;105(4):1129-1137.
30. Hemker HC, Giesen P, Dieri RA, et al. Calibrated automated thrombin generation measurement in clotting plasma. Pathophysiol Haemost Thromb. 2003;33(1):4-15.
31. Jaki T, Lawo J-P, Wolfsegger MJ, et al. A formal comparison of different methods for establishing cut points to distinguish positive and negative samples in immunoassays. J Pharm Biomed Anal. 2011;55(5):1148-1156.
32. Winstedt L, Järnum S, Nordahl EA, et al. Complete removal of extracellular IgG antibodies in a randomized dose-escalation phase I study with the bacterial enzyme IdeS – a novel therapeutic opportunity. PLoS One. 2015;10(7):e0132011.
33. Whelan SFJ, Hofbauer CJ, Horling FM, et al. Distinct characteristics of antibody responses against factor VIII in healthy individuals and in different cohorts of hemophilia A patients. Blood. 2013;121(6):1039-1048.
34. Nandakumar KS, Johansson BP, Björck L, Holmdahl R. Blocking of experimental arthritis by cleavage of IgG antibodies in vivo. Arthritis Rheum. 2007;56(10):3253-3260.
35. Johansson BP, Shannon O, Björck L. IdeS: a bacterial proteolytic enzyme with therapeutic potential. PLoS One. 2008;3(2):e1692.
36. Yang R, Otten MA, Hellmark T, et al. Successful treatment of experimental glomerulonephritis with IdeS and EndoS, IgGdegrading streptococcal enzymes. Nephrol Dial Transplant. 2010;25(8):2479-2486.
37. Kizlik-Masson C, Deveuve Q, Zhou Y, et al. Cleavage of antiPF4/heparin IgG by a bacterial protease and potential benefit in heparin-induced thrombocytopenia. Blood. 2019;133(22):2427-2435.
38. Jordan SC, Lorant T, Choi J, et al. IgG endopeptidase in highly sensitized patients undergoing transplantation. N Engl J Med. 2017;377(5):442-453.
39. Kjellman C, Maldonado AQ, Sjöholm K, et al. Outcomes at 3 years posttransplant in imlifidase-desensitized kidney transplant patients. Am J Transplant. 2021;21(12):3907-3918.
40. Padmanabhan A, Connelly-Smith L, Aqui N, et al. Guidelines on the use of therapeutic apheresis in clinical practice – evidencebased approach from the writing committee of the American Society for Apheresis: the eighth special issue. J Clin Apher. 2019;34(3):171-354.
41. Wolfe GI, Ward ES, de Haard H, et al. IgG regulation through FcRn blocking: a novel mechanism for the treatment of myasthenia gravis. J Neurol Sci. 2021;430:118074.
42. Blumberg LJ, Humphries JE, Jones SD, et al. Blocking FcRn in humans reduces circulating IgG levels and inhibits IgG immune complex–mediated immune responses. Sci Adv. 2019;5(12):eaax9586.
43. Muntean A, Lucan M. Immunosuppression in kidney
Haematologica | 108 May 2023 1333 ARTICLE - Removal of FVIII inhibitors by IdeS in hemophilia A M. Bou-Jaoudeh et al.
transplantation. Clujul Med. 2013;86(3):177-180.
44. Collins P, Baudo F, Knoebl P, et al. Immunosuppression for acquired hemophilia A: results from the European Acquired Haemophilia Registry (EACH2). Blood. 2012;120(1):47-55.
45. Lee DSW, Rojas OL, Gommerman JL. B cell depletion therapies in autoimmune disease: advances and mechanistic insights. Nat Rev Drug Discov. 2021;20(3):179-199.
46. European Medicines Agency. Idefirix (imlifidase): EU summary of product characteristics. 2020. https://www.ema.europa.eu/en/documents/product information/idefirix epar product information_en.pdf. Accessed 21 Sept 2020.
47. Reipert BM, Ahmad RU, Turecek PL, Schwarz HP. Characterization of antibodies induced by human factor VIII in a murine knockout model of hemophilia A. Thromb Haemost. 2000;84(5):826-832.
48. Batsuli G, Deng W, Healey JF, et al. High-affinity, noninhibitory pathogenic C1 domain antibodies are present in patients with hemophilia A and inhibitors. Blood. 2016;128(16):2055-2067.
49. Gangadharan B, Ing M, Delignat S, et al. The C1 and C2 domains of blood coagulation factor VIII mediate its endocytosis by
dendritic cells. Haematologica. 2017;102(2):271-281.
50. Bonnefoy A, Merlen C, Dubé E, et al. Predictive significance of anti-FVIII immunoglobulin patterns on bleeding phenotype and outcomes in acquired hemophilia A: Results from the Quebec Reference Center for Inhibitors. J Thromb Haemost. 2021;19(12):2947-2956.
51. Jordan SC, Legendre C, Desai NM, et al. Imlifidase desensitization in crossmatch-positive, highly sensitized kidney transplant recipients: results of an international phase 2 trial (Highdes). Transplantation. 2021;105(8):1808-1817.
52. Adamkewicz JI, Chen DC, Paz-Priel I. Effects and interferences of emicizumab, a humanised bispecific antibody mimicking activated factor VIII cofactor function, on coagulation assays. Thromb Haemost. 2019;119(07):1084-1093.
53. Huang E, Maldonado AQ, Kjellman C, Jordan SC. Imlifidase for the treatment of anti-HLA antibody-mediated processes in kidney transplantation. Am J Transplant. 2022;22(3):691-697.
54. Jiménez-Yuste V, Rodríguez-Merchán EC, Matsushita T, Holme PA. Concomitant use of bypassing agents with emicizumab for people with haemophilia A and inhibitors undergoing surgery. Haemophilia. 2021;27(4):519-530.
Haematologica | 108 May 2023 1334 ARTICLE - Removal of FVIII inhibitors by IdeS in hemophilia A M. Bou-Jaoudeh et al.
Duality of Nrf2 in iron-overload cardiomyopathy
Correspondence: L. De Franceschi lucia.defranceschi@univr.it
Received: August 30, 2022.
Accepted: January 17, 2023.
1Department of Medicine, University of Verona and AOUI Verona, Verona, Italy; 2Iron Research Laboratory, Lindsley Kimball Research Institute, New York Blood Center, New York, NY, USA; 3Department of Pathology and Laboratory Medicine, Weill Cornell Medicine, New York, NY; 4Department Molecular Biotechnology and Health Sciences, Molecular Biotechnology Center “Guido Tarrone”, University of Torino, Torino, Italy; 5Department of Molecular Medicine and Medical Biotechnologies, Federico II University of Naples, Naples, Italy; 6CEINGE - Biotecnologie Avanzate, Naples, Italy and 7Department of Medicine and Aging Science, “G. d’Annunzio” University of Chieti, Chieti, Italy
Abstract
Early view: January 26, 2023.
https://doi.org/10.3324/haematol.2022.281995
©2023 Ferrata Storti Foundation
Published under a CC BY-NC license
Cardiomyopathy deeply affects quality of life and mortality of patients with b-thalassemia or with transfusion-dependent myelodysplastic syndromes. Recently, a link between Nrf2 activity and iron metabolism has been reported in liver ironoverload murine models. Here, we studied C57B6 mice as healthy control and nuclear erythroid factor-2 knockout (Nrf2-/-) male mice aged 4 and 12 months. Eleven-month-old wild-type and Nrf2-/- mice were fed with either standard diet or a diet containing 2.5% carbonyl-iron (iron overload [IO]) for 4 weeks. We show that Nrf2-/- mice develop an age-dependent cardiomyopathy, characterized by severe oxidation, degradation of SERCA2A and iron accumulation. This was associated with local hepcidin expression and increased serum non-transferrin-bound iron, which promotes maladaptive cardiac remodeling and interstitial fibrosis related to overactivation of the TGF-b pathway. When mice were exposed to IO diet, the absence of Nrf2 was paradoxically protective against further heart iron accumulation. Indeed, the combination of prolonged oxidation and the burst induced by IO diet resulted in activation of the unfolded protein response (UPR) system, which in turn promotes hepcidin expression independently from heart iron accumulation. In the heart of Hbbth3/+ mice, a model of b-thalassemia intermedia, despite the activation of Nrf2 pathway, we found severe protein oxidation, activation of UPR system and cardiac fibrosis independently from heart iron content. We describe the dual role of Nrf2 when aging is combined with IO and its novel interrelation with UPR system to ensure cell survival. We open a new perspective for early and intense treatment of cardiomyopathy in patients with b-thalassemia before the appearance of heart iron accumulation.
Introduction
Cardiomyopathy deeply affects the quality of life and mortality of patients with b -thalassemia or with transfusion-dependent myelodysplastic syndromes.1-5 Although iron is essential for cardiomyocyte function to sustain aerobic activity, accumulation of iron leads to severe oxidation and cardiomyocyte damage. When iron levels exceed transferrin-binding capacity, the non-transferrin bound iron (NTBI) enters cells and negatively affects the pro-anti-oxidant balance, playing a key role in iron overload (IO) cardiomyopathy. Indeed, studies in patients with b-thalassemia have highlighted the correlation between NTBI and heart disease,6-8 supporting the important role of oxidative stress catalyzed by Fenton and Haber-Weiss reactions in cardiovascular disease. Iron metabolism is thinning regulated by the hepcidin (Hamp)/fer-
roportin (Fpn1) axis in close relationship with erythropoiesis.9 Circulating hepcidin is mainly due to liver production, whereas heart hepcidin expression seems to be more involved in the local effect on heart iron homeostasis. In addition, different factors such as local hypoxia, inflammation, or oxidation may affect heart hepcidin expression independently form iron accumulation.10-12 Nuclear erythroid factor-2 (Nrf2) is a fundamental transcription factor involved in redox response. Indeed, Nrf2 modulates the expression of anti-inflammatory and cytoprotective systems important to ensure cell survival in different tissues such as heart, brain, liver, or erythroblasts against oxidation.13-15 Loss of Nrf2 results in increased susceptibility to cardiovascular diseases induced by angiotensin II or pressure overload or myocardial ischemic reperfusion injury.16-19 In cardiomyocytes, the biologic relevance of Nrf2 is further supported by the cardiac pro-
Enrica Federti,1 Francesca Vinchi,2,3 Iana Iatcenko,1 Alessandra Ghigo,4 Alessandro Matte,1 Serge Cedrick Mbiandjeu Toya,1 Angela Siciliano,1 Deborah Chiabrando,4 Emanuela Tolosano,4 Steven Zebulon Vance,2 Veronica Riccardi,1 Immacolata Andolfo,5,6 Manuela Iezzi,7 Alessia Lamolinara,7 Achille Iolascon5,6 and Lucia De Franceschi1
Haematologica | 108 May 2023 1335 ARTICLE - Iron Metabolism & its Disorders
tective effects of either Nrf2 inducers or Nrf2 overactivation in different models of cardiovascular disease.16-19 Recently, a link between Nrf2 activity and iron metabolism has been reported in liver IO throughout the Bmp6 pathway and in bthalassemic murine erythropoiesis.20,21 Consistent with this observation, severe oxidative stress such as in doxorubicinmediated cardiomyopathy, results in overactivation of Nrf2. This upregulates on one hand heme oxygenase-1 (HO-1) expression that degrades heme and increase the pool of intracellular iron and on the other hand anti-oxidant systems such as Gpx to limit oxidative damage.14,22,23 Despite the growing knowledge on Nrf2 in response to acute oxidative stress in the heart, the role of Nrf2 bridging anti-oxidant systems and iron homeostasis in specialized cells such as cardiomyocytes exposed to prolonged oxidation due to aging or IO is still not understood.
Methods
Animal model and design of the study
C57BL/6J mice as wild-type controls (WT), Nrf2-/- and Hbbth3/+ mice on the same background of WT animals were used. Four- and 12-month-old males were studied. Eleven-month-old WT and Nrf2-/- mice were fed with either standard diet (SD) or a diet containing 2.5% carbonyl-iron for 4 weeks.24 Mice were randomly assigned to the different analysis. Whenever indicated, mice were deeply anesthetized by oxygen and 5% isofl urane and sacrificed by cervical dislocation. Blood and organs were then collected. The Institutional Animal Experimental Committee, University of Verona (CIRSAL) and the Italian Ministry of Health approved the experimental protocol (56DC9.12), following European directive 2010/63/EU and the Federation for Laboratory Animal Science associations guidelines and recommendations.
Echocardiography
Transthoracic echocardiography was performed with a Vevo 2100 echocardiograph (Visual Sonics, Toronto, Canada) equipped with a 22-55 MHz transducer (MicroScan Transducers, MS500D) as previously described.25
Heart molecular analysis
Heart iron concentration
Heart iron concentration (HIC) was evaluated in both mouse strains. Details are reported in the Online Supplementary Appendix.
Perls’ and Masson’ trichrome staining
Heart sections were stained with either Perls’ or Masson’ trichrome stain (N HT15, Sigma-Aldrich) according to the manufacturer’s instructions. Images were digitally acquired with an Echo Revolve RVL-100-G microscope. Col-
lagen deposition was quantified by measuring the intensity of red staining on heart sections via Image J software. The cardiomyocyte area was quantified by averaging the area of at least eight cardiomyocytes in a single heart section via Echo Revolve software.
Immunohistochemistry for ferroportin
Heart sections were rehydrated and treated for 10 minutes with 3% H2O2 (Sigma Aldrich) to block endogenous peroxidases as previously described.26 Details are reported in the Online Supplementary Appendix.
RNA isolation, cDNA synthesis, and quantitative real-time polymerase chain reaction
Total RNA was extracted from mouse tissues using Trizol reagent (Life Technologies). cDNA synthesis from total RNA (1 mg) was performed using SuperScript II First Strand kits (Life Technologies) as previously described.27 Details are reported in the Online Supplementary Appendix
Immunoblot analysis
Frozen heart and aorta from each studied group were homogenized and lysed.28-30 Details are reported in the Online Supplementary Appendix
Heart zymogram for Mmp9 activity and heart caspase 3 activity
Details are reported in the Online Supplementary Appendix. 31
Aorta immuno-microscopic analysis of VCAM-1
Aorta was isolated from WT and Nrf2-/- mice, formalinfixed and frozen in OCT for immunofluorescence analysis of vCAM1, as previously described. Image acquisition was performed using a Zeiss LSM 510 META confocal microscope.28 Details are reported in the Online Supplementary Appendix.
Non-transferrin bound iron measurement
NTBI measurement was conducted using the ultrafiltration method: 90 µl of serum were incubated with 10 l of 800 mM nitrilotriacetic acid (NTA) containing 20 mM Fe (pH 7.0) at 23°C for 30 minutes.26 Details are reported in the Online Supplementary Appendix
Plasma hepcidin measurement
Hepcidin levels were analyzed in mouse plasma using the Hepcidin Murine Compete ELISA kit (Intrinsic Life Sciences, La Jolla, United States), following the manufacturer instructions.32
Statistical analysis
Statistical significance of the differences in gene expression were determined using Student’s t-tests. Stat-
Haematologica | 108 May 2023 1336 ARTICLE - UPR system counteract iron overload cardiomyopathy E. Federti et al.
istical significance of multiple comparisons were calculated using ANOVA, and post hoc correction was performed using Tukey’s multiple comparison tests. A two-sided P<0.05 was considered statistically significant.
Results
Nrf2-/- mice develop an age-dependent cardiomyopathy associated with severe oxidation and degradation of SERCA2a
In order to address the question whether Nrf2 might be important to limit the risk of cardiovascular disease related to aging, we studied Nrf2-/- mice at 4 and 12 months of age. Since Erkens et al. have previously reported a diastolic dysfunction in 5-6-month-old Nrf2-/- mice,33 we carried out echocardiography in 12-month-old Nrf2-/- mice compared to WT animals. As shown in Figure 1A, Nrf2-/mice showed diastolic dysfunction as reversible restrictive filling pattern grade 3, characterized by reduced MV deceleration time, which was associated with increased E/A and left ventricular dysfunction. This is consistent with hypertrophic cardiac ultrasound pattern as also supported by increased in heart-to-body-weight ratio (Online Supplementary Figure S1A) and the upregulation of atrial natriuretic peptide (ANP), a marker of cardiac remodeling and hypertrophy, in the heart of Nrf2-/- mice when compared to WT animals (Figure 1B).34,35 Noteworthy, increased cell volume of cardiomyocytes was found in the heart of 12-months-old Nrf2-/- mice, suggesting an attempt to compensate for loss of cardiomyocyte function/damage in aged Nrf2-/- mice (Online Supplementary Figure S1B). The absence of Nrf2 resulted in increased heart protein oxidations related to downregulation of Nrf2-dependent cytoprotective systems important in cardiomyocyte homeostasis such as catalase, SOD1 or Nqo1 (Figure 1C, D; Online Supplementary Figure S1C, D). In the heart of Nrf2-/mice, we also observed degradation of the sarcoplasmic reticulum calcium ATPase cardiac isoform 2 (SERCA2a), a calcium transport system important for myocardial performance, in agreement with the severe and sustained oxidation observed in mice genetically lacking Nfe2l2 (Figure 1E; SERCA2A proteolytic residues between 60-75 kDa; Online Supplementary Figure S1E).31, 36-39 Consistent with the degradation of SERCA2a protein, we found a compensatory upregulation of sodium calcium exchanger protein 1 (Ncx1) expression as reported in other models of cardiomyopathies (Online Supplementary Figure S1F).40,41 SERCA2A is degraded by metalloproteinase (Mmps) that participates in myocardial remodeling as collagenase.31,37,42,43 Here, we found increased expression and activity of Mmp9 Nrf2-/mice when compared with WT animals (Figure 1F; Online Supplementary Figure S2A). No major change in Mmp2 activity was observed. In addition, we found increased cas-
pase 3 activity, a key molecular marker of apoptosis in the heart of Nrf2-/- mice when compared to WT animals (Figure 1G). This was associated with age-dependent accumulation of K48 polyubiquitin proteins, a key linkage signal for degradation of dysfunctional proteins44-47 (Online Supplementary Figure S2B). Indeed, upregulation of necrostatin-1 mRNA expression observed in the heart form Nrf2-/- mice might be an attempt to control loss of cardiomyocytes induced by chronic oxidation in the absence of Nrf2 (Online Supplementary Figure S2C). Taken together, our data indicate that Nrf2-/- mice develop an age-dependent cardiomyopathy characterized by severe and sustained oxidation, resulting in activation of myocardial remodeling and proapoptotic pathways.
Loss of Nrf2 is associated with chronic cardiac inflammation and vascular dysfunction
The activation of Mmp9 led us to evaluate whether the absence of Nrf2 might favor the activation of NF-kB p65, a redox- and inflammatory-related transcription factor, as a back-up mechanism to limit cardiomyocyte damage. In the heart of Nrf2-/- mice, we found activation of NF-kB p65 when compared to WT animals (Figure 2A; Online Supplementary Figure S2D). This was associated with upregulation of Il-1b expression in both 4- and 12-month-old Nrf2-/mice; whereas Il-6 expression was increased only iin the heart of 4-months-old Nrf2-/- mice when compared to WT animals (Online Supplementary Figure S2SE). In Nrf2-/mice, chronic cardiac inflammation was further supported by upregulation of endothelin-1 (ET-1) expression, a potent pro-inflammatory and vasoactive cytokine as well as of ICAM-1 and VCAM-1, known markers of inflammatory vasculopathy (Figure 2B; Online Supplementary Figure S2F). Similar data were also observed in isolated aorta of Nrf2/- mice, indicating the presence of both local and systemic vascular dysfunction in the absence of Nrf2 (Online Supplementary Figure S3A). Collectively, our data indicate that maladaptive inflammation characterizes the heart of Nrf2/- mice, contributing to reduced cardiomyocyte performance and promoting cardiac remodeling.
Heart iron accumulation characterizes cardiomyopathy of Nrf2-/- mice, leading to cardiac fibrosis
Since previous studies have linked Nrf2 function and iron homeostasis, we asked whether iron accumulated in the heart of Nrf2-/- mice could trigger oxidative stress and inflammatory response. As shown in Figure 2C, we found increased iron deposits in the heart of Nrf2-/- mice when compared to WT animals. This is in agreement with increased NTBI that contributes to formation of ROS (Figure 2D). In Nrf2-/- mice, heart expression of Hamp was significantly lower than in WT animals (Figure 2E). Noteworthy, we observed higher heart expression of Bmp2 mRNA in both young and old Nrf2-/- mice than in WT animals (On-
Haematologica | 108 May 2023 1337 ARTICLE - UPR system counteract
cardiomyopathy E. Federti et al.
iron overload
Figure 1. In the heart, the absence of Nrf2 results in severe protein oxidation with degradation of SERCA2a, promoting age-dependant cardiomyopathy. (A) Left ventricle fractional shortening (FS), internal diameter in systole (LVID) and diastole (LVIDd), mitral valve deceleration time (MVDT) and E/A ratio (MV E/A ratio) of wild-type (WT) (n=5) and Nrf2-/- (n=8) mice. *P<0.05 by non-parametric Mann Whitney test. (B, upper panel) Immunoblot analysis, using specific antibodies against ANP in the heart of 12-month-old WT mice, 4- and 12month-old Nrf2-/- mice. GAPDH serves as protein loading control. One representative gel of 4 with similar results is shown. (B, lower panel) Densitometric analysis of immunoblots (DU: densitometric unit). Data are shown as mean ± standard error of the mean (SEM) (n=4 for each group); *P<0.05 when compared to WT animals. (C) OxyBlot analysis of the soluble fractions of heart from 12month-old WT mice, 4- and 12- month-old Nrf2-/- mice (n=4 for each group). GAPDH serves as protein loading control. Densitometric analysis of immunoblots is shown in the Online Supplementary Figure S1B. (D) Immunoblot analysis, using specific antibodies against catalase, NQO1, SOD1 and Gpx 1 in the heart of 12-month-old WT mice, 4- and 12-month-old Nrf2-/- mice (n=4 for each group). GAPDH serves as protein loading control. One representative gel of 4 with similar results is shown. Densitometric analysis of immunoblots is shown in Online Supplementary Figure S1C. (E) Immunoblot analysis, using specific antibodies against SERCA-2a in the heart of 12-month-old WT mice, 4- and 12month-old Nrf2-/- mice (n=4 for each group). GAPDH serves as protein loading control. One representative gel of 4 with similar results is shown. Densitometric analysis of immunoblots is shown in Online Supplementary Figure S1D. (F) Gelatin zymography stained with Colloidal Coomassie in the heart of 12-month-old WT and Nrf2-/- mice (n=3 for each group). Light bands represent Mmps activity. One representative gel of 4 with similar results is shown. Densitometric analysis of the light bands corresponding to Mmp9 and Mmp2 activities is shown as bar graphs on the left. (G) Caspase 3 activity in the heart of 12-month-old WT (n=4) and Nrf2-/- mice (n=4). Data are shown as mean ± SEM (n=4); *P<0.05 when compared to WT animals.

A C F G D E B
Haematologica | 108 May 2023 1338 ARTICLE - UPR system counteract iron overload cardiomyopathy E. Federti et al.
line Supplementary Figure S3B). This might be part of compensatory mechanisms antagonizing prohypertrophic and pro-apoptotic stimuli such as chronic cardiac oxidation and inflammation.48 Plasma hepcidin was similar in both mouse strains (Online Supplementary Figure S3C).
Reduced heart expression of Hamp and of Hamp/HIC ratio were associated with accumulation of Fpn1 in the heart of Nrf2-/- mice compared to WT animals (Figure 2F; Online Supplementary Figure S3D). This agrees with Fpn1 posttranslational regulation by Hamp as previously observed
Figure 2. In the heart, Nrf2-/- mice display iron accumulation and redox related activation of activation of NF-kB p65, sustaining inflammatory vasculopathy. (A) Immunoblot analysis, using specific antibodies against phosphorylated (p)NF-kB p65, NF-kB p65 in the heart of 12-month-old wild-type (WT) mice, 4- and 12-month-old Nrf2-/- mice (n=4 for each group). GAPDH serves as protein loading control. One representative gel of 4 with similar results is shown. Densitometric analysis of immunoblots is shown in Online Supplementary Figure S2D. (B) Immunoblot analysis, using specific antibodies against ET-1, ICAM1 and VCAM1 in the heart of 12month-old WT mice, 4- and 12-month-old Nrf2-/- mice (n=4 for each group). GAPDH serves as protein loading control. One representative gel of 4 with similar results is shown. Densitometric analysis of immunoblots is shown in Online Supplementary Figure S1F. (C) Perl’s staining in heart tissue sections of Nrf2-/- and WT mice. A representative picture is shown. The quantification of the % of stained tissue is shown on the right. (D) Non-trasferrin-bound iron (NTBI) measurement in the serum of WT and Nrf2-/- mice (n=5 for each group). (E) Quantification of Hamp mRNA levels normalized to Gapdh in the heart of WT and Nrf2-/- mice (n=3 for each group). Data are means ± standard deviation of 3 experiments (**P<0.001, Student’s t-test). (F) Representative images of FPN immunostaining on heart sections of WT and Nrf2-/- mice (scale bars: 370/100 mm) and relative quantification expressed as percentage positive tissue area (n=3 for each group).

A D F E C B
Haematologica | 108 May 2023 1339 ARTICLE - UPR system counteract iron overload cardiomyopathy E. Federti et al.
by Aschemeyer et al 49 Taken together these data support the synergic effect of iron accumulation and defective antioxidant systems in the development of age-dependent cardiomyopathy in Nrf2-/- mice.
Since Nrf2 has been reported to prevent maladaptive cardiac remodeling and interstitial fibrosis,50,51 we evaluated collagen deposition in the heart of Nrf2-/- mice. As shown in Figure 3A, collagen deposition was significantly higher in the heart of Nrf2-/- mice than in WT animals. This was associated with activation of TGF-b1 receptor, which plays a crucial role in profibrotic pathway(s) and in extracellular matrix accumulation (Figure 3B).52,53 In addition, we found increased expression of platelet-derived growth factor-B (PDGF-B) and activation of its receptor (PDGFR-B) as well as of fibroblast growth factor receptor (FGF-R), which are all involved in matrix remodeling and profibrotic events in
collaboration with TGF-b1 system (Figure 3B).54,55
Collectively our data indicate that the absence of Nrf2 leads to age-dependent cardiomyopathy characterized by chronic oxidation amplified by iron accumulation due to abnormal local iron homeostasis. This results in cardiac inflammation and fibrosis in Nrf2-/- mice.
Nrf2-/- mice exposed to iron overload develop compensatory cardiac hypertrophy independently from iron accumulation

Since Lim et al. have previously reported liver iron accumulation in Nrf2-/- mice exposed to iron overload diet due to the perturbation of Hamp-Bmp6 pathway, 11month-old Nrf2-/- mice were fed with either SD or IO diet containing 2.5% carbonyl-iron for 4 weeks. In WT animals, we observed in Nrf2 activation in the heart when compared
Figure 3. Increased collagen deposition and activation of TGf-b dependent pathway characterizes cardiomyopathy of Nrf2-/- mice. (A) Representative images of Picrosirius staining for collagen on heart sections of wild-type (WT) and Nrf2-/- mice (scale bars: 200 mm) and relative quantification expressed as percentage positive tissue area (n=3 for each group). (B, upper panel) Heart immunoprecipitation using specific anti-phosphotyrosine antibodies (IP: pY), revealed with specific anti-TGF receptor (Rec) antibody in 12-month-old WT mice, 4- and 12-month-old Nrf2-/- mice (n=4 for each group). GAPDH in whole-cell lysate (WCL) is used as loading control. One representative gel of 4 others with similar results is presented. Densitometric analysis of immunoblots is shown on the right (DU: densitometric unit). Data are shown as mean ± standard error of the mean (SEM) (n=3); *P<0.05 when compared to WT mice. (B, lower panel) Immunoblot analysis, using specific antibodies against PDGF-B, phosphorylated (p-) PDGFRB, PDGFR-B, p-FGFR1 and FGFR in the heart of 12-month-old WT mice, 4- and 12-month-old Nrf2-/- mice (n=4 for each group). GAPDH serves as protein loading control. One representative gel of 4 with similar results is shown. Densitometric analysis of immunoblots is shown on the right. Data are shown as mean ± SEM (n=4); *P<0.05 when compared to WT mice.
C A B
Haematologica | 108 May 2023 1340 ARTICLE - UPR system counteract iron overload cardiomyopathy E. Federti et al.
to standard diet animals (Online Supplementary Figure S4A). This was in parallel with a better survival rate compared to Nrf2-/- mice (Online Supplementary Figure S4B). Nrf2-/- mice developed cardiac hypertrophy in response to IO compared to WT animals (Figure 4A; Online Supplementary Figure S4C). This was associated with a further increase of cardiomyocyte area, compensatory to myocyte loss in IO Nrf2-/- mice (Figure 4B). In agreement, cardiac troponin T gene expression was increased in IO Nrf2-/mice compared to IO WT animals (Online Supplementary Figure S4D). Perls’ staining revealed heart iron accumulation in WT animals, which was higher than in the heart of Nrf2-/- mice exposed to IO (Online Supplementary Figure S5A). In agreement with previous report by Lim et al., liver iron accumulation was more severe in Nrf2-/- mice than in WT animals and Hamp and Bmp6 expression was downregulated (Online Supplementary Figure S5B, C). NTBI levels were almost unaffected by IO in Nrf2-/- mice, while NTBI significantly increased in IO WT mice compared to standard diet WT animals (Online Supplementary Figure S6A). Heart Hamp mRNA expression was higher in IO Nrf2-/mice than in IO WT animals (Figure 4C). Activation of both NF-kBp65 and STAT3 in response to IO was observed only in the heart of WT animals (Online Supplementary Figure S6B). In agreement, we found upregulation of heart Il-1b and Il-6 mRNA expression only in the heart of WT animals and not in IO Nrf2-/- mice (Online Supplementary Figure S6C). Noteworthy, Bmp2 and Bmp6 mRNA expression was similar in both mouse strains exposed to IO (Online Supplementary Figure S6D). Previous reports have highlighted the link between proteostasis, upregulation of UPR system in response to endoplasmic reticulum (ER)-stress and hepcidin expression.38,56 As shown in Figure 4E and Online Supplementary Figure S6E, IO resulted in accumulation of K48 polyubiquitin proteins in the heart from WT animals compared to SD-treated animals, whereas no change in the degree of K48 polyubiquitin protein accumulation was observed in Nrf2-/- mice under IO diet versus SD. We then sought to investigate the UPR system focusing on the ATF6 branch based on previous reports on diabetic cardiomyopathy.38,57,58 We found increased expression of ATF6, as well as related GADD34 and CHOP in the heart of IO Nrf2-/- mice when compared to either SD treated Nrf2-/- mice or IO WT animals (Figure 4F; Online Supplementary Figure S6F). This was associated with the increase of apoptotic markers beside CHOP such as caspase-3 determined as both pro-caspase 3/caspase 3 ratio and caspase 3 activity in the heart of IO Nrf2-/- mice when compared to IO WT animals (Online Supplementary Figure S7A). Heart expression of necrostatin-1 in the heart was significantly lower in IO Nrf2-/- mice than in IO WT animals, suggesting an exhaustion of cardiomyocyte defense mechanism towards a pro-apoptotic phenotype (Online Supplementary Figure S7B).
In addition, we observed a further increase of PDGF-B expression when compared to standard diet Nrf2-/- animals (Online Supplementary Figure S7C), suggesting a worsening of extracellular matrix remodeling in response to IO. Collagen deposition show a trend of further increase in IO Nrf2-/- mice compared to IO WT animals (Figure 4D; Online Supplementary Figure S7D). This is of interest since ER stress and activation of UPR pathways have been linked to fibrotic organ remodeling.59,60 No major change in heart Fpn1 staining was observed in IO Nrf2-/- mice compared IO WT mice (Online Supplementary Figure S7E).
In order to understand the impact of IO on vascular system in Nrf2-/- mice, we evaluated the effect of IO on isolated aorta of both mouse strains. We found further upregulation of VCAM-1, as marker of inflammatory vasculopathy in IO Nrf2-/- mice when compared to IO WT animals (Figure 4G; Online Supplementary Figure S8). IO induced increased expression of ICAM-1 in isolated aorta of WT mice compared to aorta from standard diet animals (Online Supplementary Figure S8).
Taken together these data indicate that in IO Nrf2-/- mice the upregulation of Hamp is independent from Bmp6 expression, but related to prolonged unmitigated ER stress, highlighting the peculiarity of the heart versus liver setting.20 Thus, the absence of Nrf2 promotes cardiac hypertrophy as an attempt to compensate cardiomyocyte death in the presence of progressive exhaustion of adaptive mechanisms against chronic oxidation.
Chronic cardiac oxidation and inflammation leads to age-dependent hypertrophic cardiomyopathy in murine b-thalassemia
Hypertrophic cardiomyopathy is a severe invalidating complication of patients with b-thalassemia.4,61,62 Recent studies in patients with b-thalassemia have shown that left ventricular diastolic dysfunction might appear early in the absence of magnetic resonance iron heart accumulation, suggesting a biocomplexity of the pathogenesis of cardiomyopathy in b-thalassemia happening behind the heart accumulation of iron.4,61 As shown in Figure 5A, 12month-old b-thalassemic (Hbbth3/+) mice develop a left ventricle hypertrophy, associated with increased cardiomyocyte areas (Figure 5B) and heart expression of atrial natriuretic peptide (ANP) (Online Supplementary Figure S9A). This together with increased caspase 3 activity in the heart support the reduction of cardiomyocyte performance associated with cardiomyocyte death in Hbbth3/+ when compared to WT animals (Online Supplementary Figure S9B). Although heart iron levels by Perls’ staining were similar in Hbbth3/+ and WT animals, NTBI was significantly higher in Hbbth3/+ than in WT mice (Figure 5C; Online Supplementary Figure S9C). Heart Hamp expression was significantly reduced in Hbbth3/+ mice compared to WT animals (Online Supplementary Figure S10A). Noteworthy,
Haematologica | 108 May 2023 1341 ARTICLE - UPR system counteract iron overload cardiomyopathy E. Federti et al.
Figure 4. Nrf2-/- mice exposed to iron overload develop compensatory cardiac hypertrophy associated with activation of unfolded protein response system, resulting in upregulation of hepcidin expression independently from iron heart accumulation. (A) Interventricular septum thickness and left ventricle internal diameter in diastole (IVSTd and LVIDd, respectively) and systole (IVST and LVIDs, respectively) of untreated and iron-overloaded (IO) wild-type (WT) and Nrf2-/- mice. WT: n=4; WT IO: n=6; Nrf2-/-: n=8; Nrf2-/- IO: n= 7. WT vs Nrf2-/-: *P<0.05 and **P<0.01; IO vs. untreated within each group: #P<0.05, ##P<0.01 and ###P<0.001, by one-way ANOVA. (B) Quantification of the average cardiomyocyte area in WT and Nrf2-/mice exposed to standard diet (SD) or IO diet (IO: 2.5% carbonyliron for 4 weeks). (C) Quantification of Hamp mRNA levels normalized to Gapdh in the heart of WT IO and Nrf2-/- IO mice (n=3 for each group). Data are means ± standard deviation of experiments (**P<0.001, Student’s t-test). (D) Representative images of Picrosirius staining for collagen on heart sections of WT and Nrf2-/- mice (scale bars: 370 mm) exposed to IO diet (IO: 2.5% carbonyl-iron for 4 weeks). (E) Western blot (Wb) analysis of ubiquitinated proteins (K48) in the heart of WT and Nrf2-/- mice exposed to SD or IO diet (IO: 2.5% carbonyl-iron for 4 weeks) (n=4 for each group). GAPDH is the protein loading control. Quantification of band area was performed by densitometry and is shown in Online Supplementary Figure S6E. (F) Immunoblot analysis, using specific antibodies against ATF6, GADD34 and CHOP in the heart of WT and Nrf2-/- mice exposed to SD or IO diet (IO: 2.5% carbonyl-iron for 4 weeks) (n=4 for each group). GAPDH serves as protein loading control. One representative gel from 4 with similar results is shown. Densitometric analysis of immunoblots is shown in Online Supplementary Figure S6F. (G) VCAM-1 expression evaluated as fluorescence intensity (green channel) in aortas isolated from WT and Nrf2-/- mice exposed to SD or IO diet (IO: 2.5% carbonyl-iron for 4 weeks) (n=3 for each group). Semiquantitative analysis of the number of pixels in the selected fields is shown in the bar graph as fold-increase compared to SD treated animals (right panel), *P<0.05 compared to WT animals.

A D G E F B C Haematologica | 108 May 2023 1342 ARTICLE - UPR system counteract iron overload cardiomyopathy E. Federti et al.
Figure 5. In murine b-thalassemia, cardiomyopathy is related to severe oxidation, overwhelming cytoprotective mechanisms with degradation of SERCA2A and accumulation of polyubiquinated proteins independently from heart iron accumulation. (A) Left ventricle weight/body weight ratio (LVW/BW) and left ventricle posterior wall thickness in diastole (LVPWTd) and systole (LVPWTs) of 12-monthold wild-type (WT) (n=4) and Hbbth3/+, a model of b-thalassemia (n=6) mice. *P<0.05 and **P<0.01 by non-parametric Mann Whitney test. (B) Quantification of the average cardiomyocyte area in WT and Hbbth3/+ mice (n=3 for each group); representative images of FPN immunostaining on heart sections of WT and Hbbth3/+ mice (scale bars: 370/200 mm). (C) Non-transferrin bound iron (NTBI) measurement in the serum of WT and Hbbth3/+ mice (n=3 for each group). (D, upper panel) Immunoblot analysis, using specific antibodies against phosphorylated p-Nrf2, and Nrf2, in the heart of 12-month-old WT and Hbbth3/+ mice (n=4 for each group). GAPDH serves as protein loading control. One representative gel of 3 with similar results is shown. Densitometric analysis of immunoblots is shown in Online Supplementary Figure S10C. (D, lower panel) Immunoblot analysis, using specific antibodies against HO-1 and SOD 1 in the heart of 12-month-old WT and Hbbth3/+ mice (n=4 for each group). GAPDH serves as protein loading control. One representative gel of 3 with similar results is shown. Densitometric analysis of immunoblots is shown in Online Supplementary Figure S10C. (E) Immunoblot analysis, using specific antibodies against SERCA-2a in the heart of 12-months-old WT and Hbbth3/+ mice (n=4 for each group). GAPDH serves as protein loading control. One representative gel of 3 with similar results is shown. Densitometric analysis of immunoblots is shown in Online Supplementary Figure S10D. (F) Western blot (Wb) analysis of ubiquitinated proteins (K48) in the heart of 12-month-old WT and Hbbth3/+ mice (n=4 for each group). GAPDH is the protein loading control. Quantification of band area was performed by densitometry and is shown in Online Supplementary Figure S10E. (G) Immunoblot analysis, using specific antibodies against ATF6, GADD34 and CHOP in the heart of 12-month-old WT and Hbbth3/+ mice (n=4 for each group). GAPDH serves as protein loading control. One representative gel of 3 with similar results is shown. Densitometric analysis of immunoblots is shown in Online Supplementary Figure S10F.

A B C D E F G Haematologica | 108 May 2023 1343 ARTICLE - UPR system counteract iron overload cardiomyopathy E. Federti et al.
Bmp6 expression was significantly higher in the heart of Hbbth3/+ mice than in WT animals (Online Supplementary Figure S10A). No major change in the heart Bmp2 expression was observed between the two mouse strains (Online Supplementary Figure S10A). This agrees with Bmp6 participating in compensatory mechanisms against severe oxidation and stimulating cardiomyocyte hypertrophy more than in iron homeostasis.63 Indeed, heart protein oxidation was increased in Hbbth3/+ when compared to WT animals (Online Supplementary Figure S10B). This is in agreement with activation of Nrf2- and Nrf2-related cytoprotective systems such as HO-1 and SOD-1 in the heart of Hbbth3/+ mice compared to WT animals (Figure 5D; Online Supplementary Figure S10C). In addition, in the heart of Hbbth3/+ mice, chronic oxidation promoted (i) degradation of SERCA2a (Figure 5E; Online Supplementary Figure S10D); and accumulation of K48 polyubiquitin proteins (Figure 5F; Online Supplementary Figure S11A); and upregulation of ATF6 (Figure 5G; Online Supplementary Figure S11B), resulting in increased expression of proapoptotic protein GADD34 (Figure 5G; Online Supplementary Figure S11G). The synergic effect of chronic cardiac oxidation, activation of the UPR system and inflammation promoted (i) activation of TGF-b receptor (Figure 6A; Online Supplementary Figure S11C); (ii) increase expression of PDGF-B and activation of PDGF-receptor and FGF-receptor (Figure 6B; Online Supplementary Figure S11D), ending in heart collagen deposition in Hbbth3/+ mice (Figure 6C). Collectively, our data indicate that b-thalassemic-related cardiomyopathy is promoted by the combination of different factors having oxidation as an early and central event in diastolic dysfunction and cardiac fibrosis that might be worsened by cardiac iron accumulation as observed in patients with b-thalassemia.
Discussion
Here, we show the dual effect of Nrf2 in cardiomyopathy related to sustained and prolonged oxidation as observed in aging or in iron overload models.
We show that mice genetically lacking Nfe2l2 are highly sensitive to age-induced oxidation, which is associated with heart iron accumulation. In aged Nrf2-/- mice, the downregulation of cardiac hepcidin expression agrees with the lower expression of Bmp6 compared to WT animals. In old Nrf2-/- mice, the detrimental effect of prolonged oxidative stress leads to maladaptive response, resulting in reduced cardiomyocyte performance, degradation of the key cell Ca2+ modulator, SERCA2a, and accumulation of K48 polyubiquitinated proteins.64 The proteotoxic stress promotes cardiac fibrosis throughout the activation of the TGF-b1 pathway. This highlights the key role of Nrf2 function against age-related cardiomyopathy and gives further
importance to the cumulative effects of pro-oxidant factors such as age, diabetes or inflammatory vasculopathy on the pathogenesis of hypertrophic cardiomyopathy.65,66 When IO was used as additional stress to aging, the absence of Nrf2 resulted in cardiac hypertrophy as an attempt to compensate for the loss of cardiomyocytes linked to the detrimental effect of accumulation of K48 polyubiquitinated proteins. This disrupts ER homeostasis, resulting in ER stress and leading to the activation of the UPR system. Whenever the stress is sustained or prolonged, the activation of UPR might not be sufficient to limit/resolve the stress, ending in activation of the proapoptotic pathway.59,67 Among the three branches of the UPR system, the ATF6/CHOP and the CHOP-activating GADD34 pathways have been described to play a crucial role in ischemic/reperfusion myocardial injury or in cardiac hypertrophy or in heart disease related to diabetes.38,59,67 Indeed, we found overactivation of ATF in IO Nrf2-/- mice but not in IO WT animals,57,68 resulting in upregulation of CHOP which in turn induces the expression of DNA damage-inducible proteins such as GADD34. These factors collectively sustain pro-apoptotic pathways such as caspase 3 signaling. As part of the ER stress response, we observed local upregulation of hepcidin, which protects the heart of further iron accumulation. This conclusion is supported by a previous report linking Hamp expression to ER stress and the activation of UPR system.56 Indeed, in Nrf2-/- mice exposed to IO, we found increased Hamp expression independently from Bmp2-6, whose expression is similar to that observed in IO WT animals. Since cardiomyopathy negatively impacts the quality of life of patients with transfusion-dependent and transfusion-independent b-thalassemia, we evaluated cardiomyopathy in aged Hbbth3/+ mice. Although we did not find significant heart iron accumulation, we observed increased NTBI and severe cardiac protein oxidation, which was associated with activation of Nrf2 and upregulation of related antioxidant and cytoprotective systems. In Hbbth3/+ mice, the prolonged cardiac oxidation resulted in increased expression as well as degradation of SERCA2a. This might contribute to impaired myocardial relaxation associated with left ventricular hypertrophy in Hbbth3/+ mice.33 Noteworthy, upregulation of ATF6 in response to ER stress might contribute to upregulation of SERCA2a observed in the heart of Hbbth3/+ mice as an adaptive mechanism against the impairment of cardiomyocyte performance. In Hbbth3/+ mice, the unbalance between prolonged oxidation and cytoprotective systems even in the absence of heart iron accumulation is associated with cardiomyopathy characterized by proteotoxic stress and activation of the UPR system.55 This latter has been described to contribute to the activation of the TGF-b1 pro-fibrotic pathway in lung fibrosis.69,70 Here, we found the activation of the TGF-b1 system associated with collagen
Haematologica | 108 May 2023 1344 ARTICLE - UPR system counteract iron overload cardiomyopathy E. Federti et al.
deposition in the heart of both Nrf2-/- and Hbbth3/+ mice. In the setting of patients with transfusion-dependent or -independent b-thalassemia even in the absence of cardiac iron deposition, early treatment with agents used in the management of heart failure characterized by SERCA2a
dysfunction such as b-blockers, ACE-inhibitors and aldosterone antagonists are beneficial.
In conclusion, our data highlight the dual role of Nrf2 as redox-related transcriptional factor, which is also interrelated with the UPR system to ensure cell survival. The
Figure 6. Activation of the TGF- b pathways and modulation of extracellular matrix remodeling factors characterize cardiomyopathy of b-thalassemic mice. (A) Heart immunoprecipitation using specific anti-phosphotyrosine antibodies (IP: pY), revealed with specific anti-TGF Receptor (Rec) antibody of 12-month-old WT and Hbbth3/+ mice (n=4 for each group). GAPDH in wholecell lysate (WCL) is used as loading control. One representative gel of 3 others with similar results is presented. Densitometric analysis of immunoblots is shown in Online Supplementary Figure S10G. (B) Immunoblot analysis, using specific antibodies against PDGF-B, phosphorylated (p-)PDGFR-B, PDGFR-B, p-FGFR1 and FGFR in the heart of 12-month-old WT and Hbbth3/+ mice (n=4 for each group). GAPDH serves as protein loading control. One representative gel of 3 with similar results is shown. Densitometric analysis of immunoblots is shown in Online Supplementary Figure S10H. (C) Representative images of Picrosirius staining for collagen on heart sections of WT and Hbbth3/+ mice (scale bars: 200 mm) and relative quantification expressed as percentage positive tissue area (n=3 for each group). (D) Schematic diagram of the dual role of Nrf2 in the development of agedependent cardiomyopathy in the presence of iron overload diet. Nrf2 being a redox-related transcriptional factor it protects against age-dependent oxidation. The absence of Nrf2 (Nrf2-/- mice) results in an age-dependent cardiomyopathy, associated with severe oxidation (ROS: reactive oxygen species) and iron accumulation combined with increased non-transferrin bound iron (NTBI). These events favor (i) degradation of the sarcoplasmic reticulum calcium ATPase cardiac isoform 2 (SERCA2a), a calcium transport system important for myocardial performance; (ii) accumulation of polyubiquinated proteins and (iii) activation of transforming growth factor (TGF)-b pathways, promoting collagen deposition and cardiac fibrosis. In mice exposed to iron (Fe) overload diet, the absence of Nrf2 is paradoxically protective. Indeed, the sustained endoplasmic reticulum (ER) stress promotes overactivation of unfolded protein response (UPR) system. This results in upregulation of heart hepcidin, turning iron to accumulate in liver where the abnormality of Bmp2-6 pathway results in local impairment of Hamp synthesis.

A D B C Haematologica | 108 May 2023 1345 ARTICLE - UPR system counteract iron overload cardiomyopathy E. Federti et al.
novel evidence linking overactivation of the UPR system with hypertrophic cardiomyopathy in both IO Nrf2-/- and Hbbth3/+ mice, opens a new perspective on cardiomyopathy in patients with b-thalassemia before the appearance of heart iron accumulation.
Disclosures
FV receives research funding from Silence Therapeutics, Vifor Pharma and PharmaNutra (none of them relevant to the current project). AG is the co-founder and scientific advisor of Kither Biotech, a pharmaceutical product company focused on respiratory medicine that is not in conflict with statements made in this article. All other authors have no conflicts of interest to disclose.
Contributions
EF, AM, FV, ET, AI and LDF designed the experiments, analyzed data and wrote the manuscript. EF, AM, II, SCM, AS
References
1. Wermke M, Eckoldt J, Gotze KS, et al. Enhanced labile plasma iron and outcome in acute myeloid leukaemia and myelodysplastic syndrome after allogeneic haemopoietic cell transplantation (ALLIVE): a prospective, multicentre, observational trial. Lancet Haematol. 2018;5(5):e201-e210.
2. Kumfu S, Fucharoen S, Chattipakorn SC, Chattipakorn N. Cardiac complications in beta-thalassemia: from mice to men. Exp Biol Med (Maywood). 2017;242(11):1126-1135.
3. Temraz S, Santini V, Musallam K, Taher A. Iron overload and chelation therapy in myelodysplastic syndromes. Crit Rev Oncol Hematol. 2014;91(1):64-73.
4. Kremastinos DT, Farmakis D. Iron overload cardiomyopathy in clinical practice. Circulation. 2011;124(20):2253-2263.
5. Dharmarajan K, Rich MW. Epidemiology, pathophysiology, and prognosis of heart failure in older adults. Heart Fail Clin. 2017;13(3):417-426.
6. Hershko C. Pathogenesis and management of iron toxicity in thalassemia. Ann N Y Acad Sci. 2010;1202:1-9.
7. Piga A, Longo F, Duca L, et al. High nontransferrin bound iron levels and heart disease in thalassemia major. Am J Hematol. 2009;84(1):29-33.
8. Ganz T. Systemic iron homeostasis. Physiol Rev. 2013;93(4):1721-1741.
9. Nemeth E, Tuttle MS, Powelson J, et al. Hepcidin regulates cellular iron efflux by binding to ferroportin and inducing its internalization. Science. 2004;306(5704):2090-2093.
10. van Breda GF, Bongartz LG, Zhuang W, et al. Cardiac hepcidin expression associates with injury independent of iron. Am J Nephrol. 2016;44(5):368-378.
11. Merle U, Fein E, Gehrke SG, Stremmel W, Kulaksiz H. The iron regulatory peptide hepcidin is expressed in the heart and regulated by hypoxia and inflammation. Endocrinology. 2007;148(6):2663-2668.
12. Mleczko-Sanecka K, Silvestri L. Cell-type-specific insights into iron regulatory processes. Am J Hematol. 2021;96(1):110-127.
13. Chen QM, Maltagliati AJ. Nrf2 at the heart of oxidative stress and cardiac protection. Physiol Genomics. 2018;50(2):77-97.
14. Liu Z, Han K, Huo X, et al. Nrf2 knockout dysregulates iron
and VR carried out immunoblot and protein analysis. SV carried out ferroportin analysis, NTBI and different heart staining. DB carried out Perls’ staining and analyzed the data. IA carried out molecular analysis and wrote the manuscript. AG performed echocardiography, analyzed data and wrote the manuscript. MI and AL carried out the immune-microscopy on VCAM-1.
Acknowledgements
The authors would like to thank Rachele Perissinotto for preliminary results on MMP9 activity in heart from Nrf2-/- mice.
Funding
This study was founded by UNIVR-FUR to LDF.
Data-sharing statement
Please direct requests for original data to the corresponding author via email.
metabolism and increases the hemolysis through ROS in aging mice. Life Sci. 2020;255:117838.
15. De Franceschi L, Bertoldi M, Matte A, et al. Oxidative stress and beta-thalassemic erythroid cells behind the molecular defect. Oxid Med Cell Longev. 2013;2013:985210.
16. Li J, Zhang C, Xing Y, et al. Up-regulation of p27(kip1) contributes to Nrf2-mediated protection against angiotensin IIinduced cardiac hypertrophy. Cardiovasc Res. 2011;90(2):315-324.
17. Wang H, Lai Y, Mathis BJ, et al. Deubiquitinating enzyme CYLD mediates pressure overload-induced cardiac maladaptive remodeling and dysfunction via downregulating Nrf2. J Mol Cell Cardiol. 2015;84:143-153.
18. Li J, Ichikawa T, Janicki JS, Cui T. Targeting the Nrf2 pathway against cardiovascular disease. Expert Opin Ther Targets. 2009;13(7):785-794.
19. Xing Y, Niu T, Wang W, et al. Triterpenoid dihydro-CDDOtrifluoroethyl amide protects against maladaptive cardiac remodeling and dysfunction in mice: a critical role of Nrf2. PLoS One. 2012;7(9):e44899.
20. Lim PJ, Duarte TL, Arezes J, et al. Nrf2 controls iron homeostasis in haemochromatosis and thalassaemia via Bmp6 and hepcidin. Nat Metab. 2019;1(5):519-531.
21. Matte A, De Falco L, Iolascon A, et al. The interplay between peroxiredoxin-2 and nuclear factor-erythroid 2 is important in limiting oxidative mediated dysfunction in beta-thalassemic erythropoiesis. Antioxid Redox Signal. 2015;23(16):1284-1297.
22. Kerins MJ, Ooi A. The roles of NRF2 in modulating cellular iron homeostasis. Antioxid Redox Signal. 2018;29(17):1756-1773.
23. Fang X, Wang H, Han D, et al. Ferroptosis as a target for protection against cardiomyopathy. Proc Natl Acad Sci U S A. 2019;116(7):2672-2680.
24. Matte A, De Falco L, Federti E, et al. Peroxiredoxin-2: a novel regulator of iron homeostasis in ineffective erythropoiesis. Antioxid Redox Signal. 2018;28(1):1-14.
25. Schnelle M, Catibog N, Zhang M, et al. Echocardiographic evaluation of diastolic function in mouse models of heart disease. J Mol Cell Cardiol. 2018;114:20-28.
Haematologica | 108 May 2023 1346 ARTICLE - UPR system counteract iron overload cardiomyopathy E. Federti et al.
26. Vinchi F, Porto G, Simmelbauer A, et al. Atherosclerosis is aggravated by iron overload and ameliorated by dietary and pharmacological iron restriction. Eur Heart J. 2020;41(28):2681-2695.
27. Andolfo I, Rosato BE, Manna F, et al. Gain-of-function mutations in PIEZO1 directly impair hepatic iron metabolism via the inhibition of the BMP/SMADs pathway. Am J Hematol. 2020;95(2):188-197.
28. Matte A, Recchiuti A, Federti E, et al. Resolution of sickle cell disease-associated inflammation and tissue damage with 17Rresolvin D1. Blood. 2019;133(3):252-265.
29. Federti E, Matte A, Ghigo A, et al. Peroxiredoxin-2 plays a pivotal role as multimodal cytoprotector in the early phase of pulmonary hypertension. Free Radic Biol Med. 2017;112:376-386.
30. Vinchi F, De Franceschi L, Ghigo A, et al. Hemopexin therapy improves cardiovascular function by preventing heme-induced endothelial toxicity in mouse models of hemolytic diseases. Circulation. 2013;127(12):1317-1329.
31. Roczkowsky A, Chan BYH, Lee TYT, et al. Myocardial MMP-2 contributes to SERCA2a proteolysis during cardiac ischaemiareperfusion injury. Cardiovasc Res. 2020;116(5):1021-1031.
32. Schmidt PJ, Racie T, Westerman M, et al. Combination therapy with a Tmprss6 RNAi-therapeutic and the oral iron chelator deferiprone additively diminishes secondary iron overload in a mouse model of beta-thalassemia intermedia. Am J Hematol. 2015;90(4):310-313.
33. Erkens R, Kramer CM, Luckstadt W, et al. Left ventricular diastolic dysfunction in Nrf2 knock out mice is associated with cardiac hypertrophy, decreased expression of SERCA2a, and preserved endothelial function. Free Radic Biol Med. 2015;89:906-917.
34. Zhang C, Wang Y, Ge Z, et al. GDF11 Attenuated ANG II-induced hypertrophic cardiomyopathy and expression of ANP, BNP and beta-MHC through down-regulating CCL11 in mice. Curr Mol Med. 2018;18(10):661-671.
35. Cao X, Mao M, Diao J, et al. Ectopic Overexpression of PPARgamma2 in the heart determines differences in hypertrophic cardiomyopathy after treatment with different thiazolidinediones in a mouse model of diabetes. Front Pharmacol. 2021;12:683156.
36. Temsah RM, Netticadan T, Chapman D, et al. Alterations in sarcoplasmic reticulum function and gene expression in ischemicreperfused rat heart. Am J Physiol. 1999;277(2):H584-594.
37. French JP, Quindry JC, Falk DJ, et al. Ischemia-reperfusioninduced calpain activation and SERCA2a degradation are attenuated by exercise training and calpain inhibition. Am J Physiol Heart Circ Physiol. 2006;290(1):H128-136.
38. Das SK, Wang W, Zhabyeyev P, et al. Iron-overload injury and cardiomyopathy in acquired and genetic models is attenuated by resveratrol therapy. Sci Rep. 2015;5:18132.
39. Silveira C, Campos DHS, Freire PP, et al. Importance of SERCA2a on early isolated diastolic dysfunction induced by supravalvular aortic stenosis in rats. Braz J Med Biol Res. 2017;50(5):e5742.
40. Tsika RW, Ma L, Kehat I, et al. TEAD-1 overexpression in the mouse heart promotes an age-dependent heart dysfunction. J Biol Chem. 2010;285(18):13721-13735.
41. Neef S, Maier LS. Novel aspects of excitation-contraction coupling in heart failure. Basic Res Cardiol. 2013;108(4):360.
42. Prathipati P, Metreveli N, Nandi SS, Tyagi SC, Mishra PK. Ablation of matrix metalloproteinase-9 prevents cardiomyocytes contractile dysfunction in diabetics. Front Physiol. 2016;7:93.
43. Yadav SK, Kambis TN, Kar S, Park SY, Mishra PK. MMP9 mediates acute hyperglycemia-induced human cardiac stem cell death by upregulating apoptosis and pyroptosis in vitro. Cell Death Dis.
2020;11(3):186.
44. Iwabuchi M, Sheng H, Thompson JW, et al. Characterization of the ubiquitin-modified proteome regulated by transient forebrain ischemia. J Cereb Blood Flow Metab. 2014;34(3):425-432.
45. Sato Y, Kobayashi H, Sato S, et al. Systemic accumulation of undigested lysosomal metabolites in an autopsy case of mucolipidosis type II; autophagic dysfunction in cardiomyocyte. Mol Genet Metab. 2014;112(3):224-228.
46. Peikert K, Federti E, Matte A, et al. Therapeutic targeting of Lyn kinase to treat chorea-acanthocytosis. Acta Neuropathol Commun. 2021;9(1):81.
47. Zhai X, Wang W, Sun S, et al. 4-Hydroxy-2-nonenal promotes cardiomyocyte necroptosis via stabilizing receptor-interacting serine/threonine-protein kinase 1. Front Cell Dev Biol. 2021;9:721795.
48. Lu J, Sun B, Huo R, et al. Bone morphogenetic protein-2 antagonizes bone morphogenetic protein-4 induced cardiomyocyte hypertrophy and apoptosis. J Cell Physiol. 2014;229(10):1503-1510.
49. Aschemeyer S, Qiao B, Stefanova D, et al. Structure-function analysis of ferroportin defines the binding site and an alternative mechanism of action of hepcidin. Blood. 2018;131(8):899-910.
50. Li J, Ichikawa T, Villacorta L, et al. Nrf2 protects against maladaptive cardiac responses to hemodynamic stress. Arterioscler Thromb Vasc Biol. 2009;29(11):1843-1850.
51. Nian M, Lee P, Khaper N, Liu P. Inflammatory cytokines and postmyocardial infarction remodeling. Circ Res. 2004;94(12):1543-1553.
52. Ge C, Hu L, Lou D, et al. Nrf2 deficiency aggravates PM2.5induced cardiomyopathy by enhancing oxidative stress, fibrosis and inflammation via RIPK3-regulated mitochondrial disorder. Aging (Albany NY). 2020;12(6):4836-4865.
53. Szostek-Mioduchowska AZ, Lukasik K, Skarzynski DJ, Okuda K. Effect of transforming growth factor -beta1 on alpha-smooth muscle actin and collagen expression in equine endometrial fibroblasts. Theriogenology. 2019;124:9-17.
54. Gallini R, Lindblom P, Bondjers C, Betsholtz C, Andrae J. PDGF-A and PDGF-B induces cardiac fibrosis in transgenic mice. Exp Cell Res. 2016;349(2):282-290.
55. Kalra K, Eberhard J, Farbehi N, Chong JJ, Xaymardan M. Role of PDGF-A/B ligands in cardiac repair after myocardial infarction. Front Cell Dev Biol. 2021;9:669188.
56. Vecchi C, Montosi G, Zhang K, et al. ER stress controls iron metabolism through induction of hepcidin. Science. 2009;325(5942):877-880.
57. Lee JM. Nuclear receptors resolve endoplasmic reticulum stress to improve hepatic insulin resistance. Diabetes Metab J. 2017;41(1):10-19.
58. Minakshi R, Rahman S, Jan AT, Archana A, Kim J. Implications of aging and the endoplasmic reticulum unfolded protein response on the molecular modality of breast cancer. Exp Mol Med. 2017;49(11):e389.
59. Dickhout JG, Carlisle RE, Austin RC. Interrelationship between cardiac hypertrophy, heart failure, and chronic kidney disease: endoplasmic reticulum stress as a mediator of pathogenesis. Circ Res. 2011;108(5):629-642.
60. Tanjore H, Lawson WE, Blackwell TS. Endoplasmic reticulum stress as a pro-fibrotic stimulus. Biochim Biophys Acta. 2013;1832(7):940-947.
61. Chinprateep B, Ratanasit N, Kaolawanich Y, et al. Prevalence of left ventricular diastolic dysfunction by cardiac magnetic resonance imaging in thalassemia major patients with normal left ventricular systolic function. BMC Cardiovasc Disord.
Haematologica | 108 May 2023 1347 ARTICLE - UPR system counteract iron overload cardiomyopathy E. Federti et al.
2019;19(1):245.
62. Spirito P, Lupi G, Melevendi C, Vecchio C. Restrictive diastolic abnormalities identified by Doppler echocardiography in patients with thalassemia major. Circulation. 1990;82(1):88-94.
63. Korf-Klingebiel M, Kempf T, Schluter KD, et al. Conditional transgenic expression of fibroblast growth factor 9 in the adult mouse heart reduces heart failure mortality after myocardial infarction. Circulation. 2011;123(5):504-514.
64. Murphy CJ, Oudit GY. Iron-overload cardiomyopathy: pathophysiology, diagnosis, and treatment. J Card Fail. 2010;16(11):888-900.
65. Gu J, Cheng Y, Wu H, et al. Metallothionein is downstream of Nrf2 and partially mediates sulforaphane prevention of diabetic cardiomyopathy. Diabetes. 2017;66(2):529-542.
66. Tian C, Gao L, Zucker IH. Regulation of Nrf2 signaling pathway in
heart failure: Role of extracellular vesicles and non-coding RNAs. Free Radic Biol Med. 2021;167:218-231.
67. Maejima Y. The critical roles of protein quality control systems in the pathogenesis of heart failure. J Cardiol. 2020;75(3):219-227.
68. Gotoh T, Oyadomari S, Mori K, Mori M. Nitric oxide-induced apoptosis in RAW 264.7 macrophages is mediated by endoplasmic reticulum stress pathway involving ATF6 and CHOP. J Biol Chem. 2002;277(14):12343-12350.
69. Lenna S, Trojanowska M. The role of endoplasmic reticulum stress and the unfolded protein response in fibrosis. Curr Opin Rheumatol. 2012;24(6):663-668.
70. Nakada EM, Sun R, Fujii U, Martin JG. The impact of endoplasmic reticulum-associated protein modifications, folding and degradation on lung structure and function. Front Physiol. 2021;12:665622.
Haematologica | 108 May 2023 1348 ARTICLE - UPR system counteract iron overload cardiomyopathy E. Federti et al.
Pathology review identifies frequent misdiagnoses
in recurrent classic Hodgkin lymphoma in a nationwide cohort: implications for clinical and epidemiological studies
Correspondence: M.V. Boot
max.boot@reinier-mdc.nl
Received: March 4, 2022.
Accepted: July 14, 2022.
1Amsterdam UMC, Department of Pathology, Amsterdam; 2Reinier Haga MDC, Department of Pathology, Delft; 3Department of Epidemiology, Netherlands Cancer Institute, Amsterdam; 4Dutch Pathology Registry (PALGA), Houten; 5Laboratorium Pathologie Oost-Nederland (LABPON), Hengelo; 6Department of Research and Development, Netherlands Comprehensive Cancer Organisation (IKNL), Utrecht; 7Department of Public Health, Erasmus MC, Erasmus University Medical Center, Rotterdam and 8Amsterdam UMC, Department of Hematology, University of Amsterdam, Cancer Center Amsterdam, Amsterdam, the Netherlands
Abstract
Early view: October 20, 2022.
https://doi.org/10.3324/haematol.2022.280840
©2023 Ferrata Storti Foundation
Published under a CC-BY-NC license
Patients treated for classic Hodgkin lymphoma (CHL) have a reported 13-fold increased risk of developing subsequent non-Hodgkin lymphoma (NHL). In light of the growing awareness of CHL mimickers, this study re-assesses this risk based on an in-depth pathology review of a nationwide cohort of patients diagnosed with CHL in the Netherlands (2006-2013) and explores the spectrum of CHL mimickers. Among 2,669 patients with biopsy-proven CHL, 54 were registered with secondary NHL. On review, CHL was confirmed in 25/54 patients. In six of these, the subsequent lymphoma was a primary mediastinal B-cell lymphoma/mediastinal gray zone lymphoma, biologically related to CHL and 19/25 were apparently unrelated B-cell NHL. In 29/54 patients, CHL was reclassified as NHL, including T-cell lymphomas with secondary Hodgkin-like B-blasts (n=15), Epstein Barr virus-positive diffuse large B-cell lymphoma (n=8), CD30+ T-cell lymphoma (n=3) and indolent B-cell proliferations (n=3). Higher age, disseminated disease at presentation, extensive B-cell marker expression and association with Epstein-Barr virus were identified as markers to alert for CHL mimickers. Based on these data, the risk of developing NHL after CHL treatment was re-calculated to 3.6-fold (standardized incidence ratio 3.61; confidence interval: 2.29-5.42). In addition, this study highlights the clinicopathological pitfalls leading to misinterpretation of CHL and consequences for the care of individual patients, interpretation of trials and epidemiological assessments.
Introduction
Successes in the treatment of patients with classic Hodgkin lymphoma (CHL) have resulted in a high long-term survival rate.1 On the downside, these patients also have a high risk of developing treatment-related secondary cancers.2-4 As part of a large epidemiological cohort study, Schaapveld et al. showed that patients treated for CHL who survived for 5 years or longer had a 13-fold increased risk of secondary non-Hodgkin lymphoma (NHL).2 A very recent study based on Surveillance Epidemiology and End Results (SEER) data further showed an increased bidirectional risk of NHL and CHL, especially between CHL and peripheral T-cell lymphoma (PTCL) and between CHL and
diffuse large B-cell lymphoma (DLBCL).5 The increased risk of secondary NHL in CHL patients may be explained by (late) treatment-related toxicity, genetic predisposition, or coincidental (low-grade) NHL diagnosed due to routine long-term follow-up in these patients. More focus has been given to the complex differential diagnosis of CHL in the past few years, and evolving insights may have an impact on epidemiological aspects such as the risk of secondary cancer.
The diagnosis of CHL is defined by a set of typical clinical, morphological, and immunophenotypic criteria.6 In contrast to various other types of malignant lymphoma, the criteria for the diagnosis of CHL have largely remained unchanged since the introduction of this lymphoma entity
Max V. Boot,1,2 Michael Schaapveld,3 Esther C. van den Broek,4 the PALGA Group4, Nathalie J. Hijmering,1 Kimberly van der Oord,5 Flora E. van Leeuwen,3 Avinash G. Dinmohamed,6,7,8 Lianne Koens1 and Daphne de Jong1
Haematologica | 108 May 2023 1349 ARTICLE - Hodgkin Lymphoma
in the revised European-American lymphoma (REAL) classification in 1994 up to the latest World Health Organization (WHO) classification.6,7 Over the past years, the spectrum of gray zones and mimickers surrounding CHL has become better recognized, leading to a refinement of the diagnostic category of true CHL. This has consequences for routine patient management and clinical trials and the interpretation of previously published data on epidemiology, such as risk of secondary NHL. Mediastinal gray zone lymphoma (MGZL) is now recognized as biologically related to both CHL and primary mediastinal B-cell lymphoma (PMBL); it shares morphological and immunophenotypic features with both CHL and PMBL and, together, these entities form a disease spectrum.8-10 Relapse of CHL within this biological spectrum may account for at least a proportion of cases of secondary NHL. Various other NHL are increasingly recognized as CHL mimickers, especially Epstein-Barr virus (EBV)+ proliferations with Hodgkin-like cells that typically have varying expression of B-cell markers. This is most widely described in angioimmunoblastic T-cell lymphoma (AITL) and the related peripheral T-cell lymphomas with follicular T-helper cell phenotype (PTCL-TFH), while immunodeficiency related B-lymphoproliferative disorders across various immunodeficiency settings may likewise deceptively mimic CHL.6,11-17 Increased awareness and recognition of these entities underscore the challenging differential diagnosis of CHL, especially in EBV+ cases.18 As a result, cases diagnosed as CHL in the past may be interpreted differently today.
This study reports the spectrum and incidence of secondary NHL in patients treated for CHL, based on a nationwide, population-based cohort of CHL patients diagnosed in the Netherlands between 2006 and 2013. We re-assessed the risk of secondary NHL after pathology review and suggest clinicopathological clues that may help avoid misdiagnosis in challenging cases.
Methods
Study design and patients
To collect an unbiased, population-based cohort of CHL patients with sufficient follow-up time to have developed subsequent NHL and cover CHL patients with relevant CHL treatment and “modern” diagnostic criteria for CHL, all patients diagnosed with Hodgkin lymphoma between 2006 and 2013 in the Netherlands were identified in the Netherlands Cancer Registry (NCR) and linked to the Dutch network and registry of histo- and cytopathology (PALGA).19 Both the NCR and PALGA have a nationwide coverage of all cancer diagnoses and pathology reports issued in the Netherlands.
Next, all pathology reports on these patients fi led be-
tween 1989 and September 2019 and listing any lymphoma (differential) diagnosis were retrieved and manually curated to select primary diagnoses of CHL between 2006-2013 only. As this study focuses on diagnostic problems and secondary cancer risk in CHL, patients with an initial pathology diagnosis of nodular lymphocyte-predominant Hodgkin lymphoma were excluded. All patients with one or more reported NHL diagnoses after a reported CHL diagnosis were identified and available pathology material of both episodes was requested from the original pathology laboratories for central pathology review. The study protocol was approved by the medical ethical review committee of the VU Medical Center (METc 2018.556) and the PALGA Scientific Committee to comply with the European Union General Data Protection Regulation.
Pathology review
Both CHL and NHL diagnoses were reviewed by three hematopathologists (MB, LK, DdJ) according to a previously reported algorithm (Figure 1).20 When there was a discrepancy between the diagnoses of the reviewers, the case was discussed and a consensus diagnosis was reached. In brief, CHL was considered confirmed in cases with a fully consistent clinical presentation, morphology and immunophenotype.6 In cases of deviation in any primary criterion, additional studies for pertinent differential diagnoses were performed (Online Supplementary Table S1), including immunohistochemistry, T-cell receptor beta and gamma (TCR) and/or immunoglobulin heavy (IGH) and kappa (IGK) light chain rearrangement assays (BIOMED2; InVivoScribe, San Diego, CA, USA).21 Next, in those cases suspected to be AITL or PTCL-TFH without a conclusive clonal TCR rearrangement, targeted panel next-generation sequencing including RHOA , TET2 , DNMT3A , IDH2 and CD28 was performed using IonTorrent (Ion Ampliseq™; Thermo Fisher Scienti fi c, Waltham, MA, USA) as used for routine diagnostic purposes in our laboratory.22 If speci fi c diagnostic criteria for CHL according to the 2016 WHO classification were not met, the original CHL diagnosis was rejected in favor of an alternative diagnosis. Those cases that were highly suspicious for a diagnosis other than CHL, but in which tissue exhaustion or poor DNA quality precluded interpretation of additional studies, were classified as “highly suspicious” for this diagnosis. In the remaining cases, a CHL diagnosis was maintained.
The diagnoses of secondary NHL in all patients were reviewed according to WHO Classification 2016 criteria. In cases in which a relationship between the primary and secondary lymphoma was suspected, additional immunohistochemistry, in situ hybridization or molecular studies were performed to either substantiate or disprove such a relationship.
Haematologica | 108 May 2023 1350 ARTICLE - Misdiagnosis in recurrent classic Hodgkin lymphoma M.V. Boot et al.
Figure 1. Diagnostic algorithm for the central pathology review of reported diagnoses of classic Hodgkin lymphoma with subsequent non-Hodgkin lymphoma. All 54 cases of primary classic Hodgkin lymphoma with a report of subsequent nonHodgkin lymphoma were reviewed according to this algorithm. CHL: classic Hodgkin lymphoma; EBV: Epstein-Barr virus; LD: lymphocyte-depleted; LR: lymphocyte-rich; Ig: immunoglobulin; EBER: Epstein-Barr virus-encoded RNA; H&E: hematoxylin and eosin; IHC: immunohistochemistry; MC: mixed cellularity; NGS: next-generation sequencing; NHL: non-Hodgkin lymphoma; NS: nodular sclerosis; TCR: T-cell receptor; WHO: World Health Organization.

Statistical analysis
For risk calculations, the expected incidence of NHL was calculated based on age-, sex-, and calendar period-specific cancer incidence rates in the Dutch population, multiplied by the corresponding number of person-years at risk during follow-up. Standard methods were used to compute the standardized incidence ratios and corresponding 95% confidence intervals (95% CI) with correction for the duration of follow-up.23 Relations between review diagnosis category, age at diagnosis and disease stage were tested with analysis of variance and Fisher exact tests, respectively, using SPSS (IBM, version 27).
Results
Study population
In the NCR, 2,969 patients were identified with a diagnosis of primary Hodgkin lymphoma between 2006 and 2013. Linkage to the PALGA database was successful in 99.7% of cases (2,959 patients) and a total of 12,923 complete pa-
thology reports were manually curated. Among these, a CHL diagnosis was listed for 2,669/2,959 (90.2%) patients. The remaining 290/2,959 (9.8%) patients were excluded because of the lack of a confirmed CHL diagnosis (Figure 2). In 54/2,669 CHL patients (2.0%), a diagnosis of NHL after CHL was listed, with subsequent NHL recurrence or transformation/progression in 11 of these (Figure 2). The cohort of 2,615 CHL without subsequent NHL served as a control for clinical-pathological and risk assessment evaluations. Both pathology slides and sufficient formalin-fixed paraffin-embedded material were available for 43/54 CHL cases and 46/54 subsequent NHL cases. For 6/54 primary CHL and 5/54 of subsequent NHL, only pathology slides were available. For the remaining 5/54 primary CHL and 3/54 subsequent NHL, no slides or formalin-fixed paraffin embedded tissue was available and the review was based on detailed pathology reports only.
Pathology review
Clinical features and pathology characteristics at review are listed in Table 1 and Online Supplementary Table S1. In
Haematologica | 108 May 2023 1351 ARTICLE - Misdiagnosis in recurrent classic Hodgkin lymphoma M.V. Boot et al.
25/54 cases (46%), the primary CHL diagnosis was confirmed. In 24/54 cases (44%), criteria were met for another diagnosis and a diagnosis of CHL was rejected (Figure 3). Indeed, ten of these were recognized as part of expert consultation at the time of the initial diagnosis, but after start of treatment (n=2) or at retrospective review as part of the diagnostic workup at the time of the subsequent NHL diagnosis (n=8). In 5/54 cases (9%), the primary diagnosis was highly suspicious for NHL; however, no definite immunohistochemical or molecular criteria could be added to refine the diagnosis, mainly due to exhaustion of formalin-fixed paraffin-embedded tissue or poor DNA quality leading to unreliable clonality or next-generation sequencing results. These were classified as highly suspicious for NHL, and in three of these cases, the likelihood that the original diagnosis was NHL was already recognized during follow-up after CHL treatment.

The spectrum of classic Hodgkin lymphoma and primary mediastinal B-cell lymphoma
Six patients covered the spectrum of CHL-MGZL-PMBL with five PMBL and one MGZL “relapse” with an interval of 6 to 70 months after the initial CHL. CHL in this group was marked by varying strong and/or heterogeneous expression of CD20 and/or CD79a in Hodgkin-type cells. A clonal relation could be confirmed in one case using immunoglobulin rearrangement assays (#34). Case #35 showed a first relapse as MGZL (at an interval of 64 months) and a second relapse as CHL (at an interval of 21 months). Reversal of EBV status from EBV+ CHL to EBV– PMBL was observed in case #33 (at an interval of 6 months).
Classic Hodgkin lymphoma with secondary B-cell lymphoma
Eighteen patients with a confirmed diagnosis of CHL developed secondary B-cell lymphomas other than PMCL or MGZL. These included plasmacytoma (n=2), small B-cell lymphoma with plasmacytoid differentiation including nodal marginal zone lymphoma and lymphoplasmacytic lymphoma (n=3), primary cutaneous follicle center cell lymphoma (n=1), follicular lymphoma (n=5), DLBCL, not otherwise specified (EBV–, n=5), high-grade B-cell lymphoma with MYC, BCL2 and BCL6 translocation (n=1), and B-cell acute lymphoblastic leukemia (n=1).
In three of these cases, the indolent B-cell lymphoma could be recognized in retrospect as a composite lymphoma in the primary CHL presentation (#37, #38, #39). Patient #36 exemplifies the complex disease course observed in some of these patients. Twelve years after being diagnosed with EBV+ CHL, this patient presented with EBV+ mononucleosis-like lymphoid hyperplasia, followed 1 year later by EBV+ DLBCL (marked by sheets and individual dispersed strong and uniform CD20+ large cells with varying features of Hodgkin-like cells and proven clonal IGH rearrangement).
T-cell lymphoma with secondary Epstein-Barr viruspositive Hodgkin-like cells
Figure 2.
lymphoma for pathology review. CHL: classical Hodgkin lymphoma; FFPE: formalin-fixed paraffin-embedded tissue material; HL: Hodgkin lymphoma; NCR: Netherlands Cancer Registry; NHL: nonHodgkin lymphoma; NLPHL: nodular lymphocyte-predominant Hodgkin lymphoma; PALGA: Dutch pathology registry.
In 11 patients, the initially diagnosed CHL could in retrospect be unequivocally recognized as T-cell lymphoma with Hodgkin-like cells, mostly EBV+ and were classified as AITL (n=7), PTCL-TFH (n=1) and PTCL-not otherwise specified (n=3). Additionally, in patient #12, a primary diagnosis of CHL could be unequivocally refuted. EBV+ DLBCL was diagnosed with a dense T-cell infiltrate highly suspicious for underlying T-cell lymphoma, which could not be unequivocally substantiated. Review diagnoses were based on standard morphological and immunohistochemical criteria, including aberrant T-cell marker loss (n=3), clonal TCR rearrangement (n=6) or both (n=2). In total, eight of 12 patients relapsed as T-cell lymphoma, four developed subsequent EBV+ DLBCL and one EBV– DLBCL.
Haematologica | 108 May 2023 1352 ARTICLE - Misdiagnosis in recurrent classic Hodgkin lymphoma M.V. Boot et al.
Selection of patients with classic Hodgkin lymphoma with a reported subsequent non-Hodgkin
Table 1. Clinical characteristics of all patients with reported classic Hodgkin lymphoma and immunohistochemical features
all cases with reported subsequent non-Hodgkin lymphoma.
*: no pathology review performed; **: any positive staining, details in Online
DLBCL: diffuse large B-cell lymphoma; EBER: EBV-encoded RNA in-situ hybridization; MGZL: mediastinal gray zone lymphoma; NHL: non-Hodgkin lymphoma;
primary mediastinal large B-cell lymphoma; PTCL, NOS: peripheral T-cell lymphoma not otherwise speci fi ed; PT CL, TFH: peripheral T-cell lymphoma, T-follicular helper cell phenotype.
Diagnostic category Sex Age at primary lymphoma in years Ann Arbor stage Interval CHL-NHL diagnosis in months Immunophenotype of Hodgkin(-like) cells in primary diagnosis showing number and percentage (positive/tested) Male N (%) Female N (%) Median (range) Stage I/II N (%) Stage III/IV N (%) Median (range) CD20 + N (%) CD79a + N (%) PAX-5 + N (%) CD15 + N (%) EBER + N (%) CHL with no reported NHL* N=2,615 1,446 (55) 1,169 (45) 36 (15-75) 1,528 (59) 1,077 (41) No NHL Not reviewed CHL diagnosis not confirmed N=29 18 (62) 11 (38) 46 (23-73) 10 (34) 19 (66) 46 (1-160) 16/29 (55) 14/27 (52) 26/29 (90) 10/27 (37) 20/28 (71) AITL/PTCL- TFH/PTCL-NOS N=15 7 (47) 8 (53) 49 (23-73) 3 (20) 12 (80) 36 (3-160) 7/15 (47) 6/15 (40) 15/15 (100) 7/14 (50) 12/14 (86) DLBCL EBV + N=8 7 (88) 1 (13) 39.5 (24-72) 5 (63) 3 (38) 36 (1-112) 6/8 (75) 5/6 (83) 8/8 (100) 1/7 (14) 8/8 (100) CD30 + T-cell lymphoma N=3 2 (67) 1 (33) 46 (42-73) 2 (67) 1 (33) 86 (83-92) 0/3 (0) 0/3 (0) 0/3 (0) 2/3 (67) 0/3 (0) Other B-cell proliferations N=3 2 (67) 1 (33) 61 (46-66) 0 (0) 3 (100) 65 (13-72) 3/3 (100) 3/3 (100) 3/3 (100) 0/3 (0) 0/3 (0) CHL diagnosis confirmed N=25 15 (60) 10 (40) 39.5 (24-72) 11 (46) 13 (54) 57 (6-149) 3/24 (13) 7/23 (30) 24/24 (100) 19/23 (83) 4/22 (18) Subsequent PMCL/MGZL N=6 4 (67) 2 (33) 53 (40-60) 2 (40) 3 (60) 38 (6-70) 2/6 (33) 2/6 (33) 6/6 (100) 4/6 (67) 1/6 (17) Other subsequent BCL N=19 11 (58) 8 (42) 49 (19-73) 9 (47) 10 (53) 68 (13-149) 1/18 (6) 5/17 (29) 18/18 (100) 15/17 (88) 3/16 (19)
of
S1 ; AITL:
T-cell
Supplementary Table
angio-immunoblastic
lymphoma; CHL: classic Hodgkin lymphoma;
PMBCL:
Haematologica | 108 May 2023 1353 ARTICLE - Misdiagnosis in recurrent classic Hodgkin lymphoma M.V. Boot et al.
Figure 3. Overview of subsequent diagnoses in patients with a confirmed diagnosis of classic Hodgkin lymphoma on review and of alternative diagnoses in patients in whom the diagnosis of classic Hodgkin lymphoma was not confirmed. *: one case was highly likely an alternative diagnosis although lacking unequivocal indicators such as marker loss in the absence of sufficient DNA for molecular testing; †: two cases were highly likely Epstein-Barr virus-positive diffuse large B-cell lymphoma, although no unequivocal indicators could be found in the absence of sufficient material for additional diagnostic testing; AITL: angioimmunoblastic T-cell lymphoma; ALCL: anaplastic large cell lymphoma; B-ALL: B-cell acute lymphoblastic leukemia; CHL: classical Hodgkin lymphoma; CLL: chronic lymphoid leukemia; DLBCL: diffuse large B-cell lymphoma; HGBCL, TH: high-grade large B-cell lymphoma, triple hit; ID-LBCL: immunodeficiency-related large B-cell lymphoma; LPL: lymphoplasmacytic lymphoma; MGZL: mediastinal gray zone lymphoma; Mono-like hyperplasia: mononucleosis-like lymphoid hyperplasia; NHL: non-Hodgkin lymphoma; NMZL: nodal marginal zone lymphoma; PCFLCL: primary cutaneous follicle center cell lymphoma; PMBCL: primary mediastinal large B-cell lymphoma; PTCL, NOS: peripheral T-cell lymphoma not otherwise specified; PTCL, TFH: peripheral T-cell lymphoma, T-follicular helper cell phenotype.
Highly likely review diagnosis of T-cell lymphoma
In three additional patients, the primary CHL diagnosis was highly suspicious for T-cell lymphoma based on clinical, morphological and immunohistochemical criteria. However, poor specimen quality or unavailability of biopsy material precluded further immunohistochemistry or molecular studies for a definite diagnosis and these cases were termed equivocal between CHL and PTCL with a preference for PTCL.
Epstein-Barr virus-positive diffuse large B-cell lymphoma mimicking classic Hodgkin lymphoma
At review, six primary CHL diagnoses were unequivocally recognized as EBV + DLBCL according to the current WHO Classification and further specified according to EAHP-SH 2015 nomenclature.15 The review diagnosis of EBV + DLBCL was based on a polymorphous population of small EBER + lymphoid cells and EBER + Hodgkin-like cells with a complete B-cell immunophenotype and/or light chain expression (n=5), an overt immunodeficiency setting (human immunodeficiency virus [HIV] infection,

methotrexate) as listed in the primary pathology reports (n=1), or both (n=1). There was no clonal TCR rearrangement or T-cell marker loss in any of these. Four patients later developed recurrence, one HIV + patient (#17) developed subsequent EBV– DLBCL, likely also immunodeficiency related 6 and one patient (#19) developed an EBV– indolent B-cell lymphoma (differential diagnosis nodal marginal zone lymphoma/lymphoplasmacytic lymphoma).
Equivocal review diagnosis of Epstein-Barr virus diffuse large B-cell lymphoma
In two cases, the primary CHL diagnosis was highly suspicious for EBV+ DLBCL. Patient #22 presented with isolated cerebral localization with EBER+ Hodgkin-like cells 9 months after the initial disease episode. No tissue was available for additional studies. Patient #23 showed an EBER + Hodgkin-like proliferation with complete B-cell phenotype but there was no information on CD79a, while subsequent diagnosis of EBV+ DLBCL could be made unequivocally.
Haematologica | 108 May 2023 1354 ARTICLE - Misdiagnosis in recurrent classic Hodgkin lymphoma M.V. Boot et al.
CD30+ T-cell lymphoma mimicking classic Hodgkin lymphoma
In three patients, the primary CHL diagnosis was recognized as CD30+ T-cell lymphoma on review, since there was a lack of defining B-cell lineage markers while expression of T-cell markers was confirmed. Two cases were classified as anaplastic large cell lymphoma, ALK–, and one case could be recognized as regional lymph node involvement of mycosis fungoides, histologically confirmed in a skin lesion biopsy 83 months later.
Immunoblasts mistakenly interpreted as Hodgkin cells
In three patients, CD30+ reactive immunoblasts were likely misinterpreted as CHL in cases of B-cell chronic lymphocytic leukemia ( #27) and follicular lymphoma (#28), relapsing as such. Case #29 presented with reactive plasma cell hyperplasia and subsequently as indolent B-cell lymphoma (differential diagnosis nodal marginal zone lymphoma/lymphoplasmacytic lymphoma) 13 months later.
Figure 4. Morphological and immunohistochemical features of classic Hodgkin lymphoma and angioimmunoblastic T-cell lymphoma and Epstein-Barr virus-positive diffuse large B-cell lymphoma mimicking classic Hodgkin lymphoma. (A, B) Case #52. A case of confirmed classical Hodgkin lymphoma from a cervical lymph node with CD20–, EBER+ (not shown) Hodgkin-type cells all of similar size (B, illustrated by PAX-5); (C, D) Case #17 is a case of Epstein-Barr virus-positive diffuse large Bcell lymphoma from an axillary lymph node in a patient positive for human immunodeficiency virus with CD20+/EBER+ Hodgkin-like cells. EBER demonstrates a variation in size and morphology of the tumor cells. (E, F) Case #5. A case of angioimmunoblastic T-cell lymphoma from an axillary lymph node with CD20–/EBER+ Hodgkin-like cells, also showing variable size and morphology of tumor cells. Further details regarding histology are noted in Online Supplementary Table S1. AITL: angio-immunoblastic T-cell lymphoma; CHL: classical Hodgkin lymphoma; DLBCL: diffuse large B-cell lymphoma; EBER: Epstein Barr virusencoded RNA in-situ hybridization. Scale bars: A, C, E: 20 mm; B, D, F: 40 mm.

Immunophenotype of Hodgkin(-like) cells
Compared to Hodgkin-type cells in patients with confirmed CHL diagnoses, in CHL cases that on review were recognized as NHL, Hodgkin-like cells were significantly more frequently positive for CD20 (16/29 vs. 3/24; P=0.001) and EBER (20/28 vs. 4/22; P<0.001) and significantly less often positive for CD15 (10/27 vs. 19/23; P=0.002). Differences in CD79a expression were not statistically significant (14/27 vs. 7/23) and PAX-5 was positive in all cases with varying expression (excluding CD30+ T-cell lymphomas). Details regarding staining intensity are shown in Online Supplementary Table S1
Clinical-pathological correlations
Patients recognized as having AITL/PTCL were significantly older at initial lymphoma presentation with significantly more advanced disease stage compared to those with confirmed CHL and those without secondary NHL (median 49 vs. 36 years, P=0.032; 80% stage III/IV vs. 41.7% stage III/IV; P=0.003). This was not the case in patients recognized as
Haematologica | 108 May 2023 1355 ARTICLE - Misdiagnosis in recurrent classic Hodgkin lymphoma M.V. Boot et al.
having EBV+ DLBCL (median 39.5 years, P=0.473; 38% stage III/IV, P=0.483) (Table 1). Of note, patients without subsequent NHL, but with relapsing CHL (n=289) also presented significantly more often with advanced disease stages (62% [177/289] stage III/IV) compared to patients without relapse (39% [908/2326] stage III/IV; P<0.01).
Interestingly, the initial CHL diagnosis was more often of the mixed cellularity subtype in cases recognized on review as a misdiagnosis (28% [8/29] vs. 10% [256/2640] of confirmed/unreviewed CHL diagnoses). The same held true for the lymphocyte-rich subtype (10% [3/29] vs. 3% [88/2640]). The nodular sclerosis subtype however was more prevalent in the group of confirmed/unreviewed diagnoses with 59% (1531/2640) vs. 28% (8/29) in cases recognized as misdiagnoses. These findings were statistically significant (P<0.01). The remaining cases were either classified as “not otherwise specified” or lacked subclassification with 34% in misdiagnoses (10/29) vs. 28% in unchanged CHL diagnoses (727/2640; not significant).
Cases recognized in retrospect as mimickers were evenly spread throughout the period of the primary CHL diagnosis (2006-2013). No significant differences were noted in the interval between the primary and secondary lymphoma episodes for confirmed CHL and mimickers.
Risk of secondary non-Hodgkin lymphoma after classic Hodgkin lymphoma
Based on the present selection of cases and original pathology diagnoses, risk calculations show a standardized incidence ratio of developing NHL after CHL of 7.79 (95% CI: 5.78-10.3). Based on diagnoses after pathology review, the standardized incidence ratio was significantly lower at 4.39 (95% CI: 2.92-6.35; P=0.015) when still including the equivocal cases (highly likely misdiagnoses) as CHL, and 3.61 (95% CI: 2.29-5.42; P=0.002) when excluding these equivocal cases. In these calculations, the three patients with composite CHL/NHL and recurring NHL were not included as CHL patients with subsequent NHL. It should be noted that the 2,615 CHL patients without a subsequent CHL diagnosis were not subjected to in-depth pathology review. As the a priori rate of misinterpretation is deemed very low, any misdiagnoses in these patients would therefore result in potential minor underestimation of standardized incidence ratios.24
Discussion
The WHO Classification of lymphoma is dynamic and continuously incorporates novel insights into lymphoma biology, which in turn affects classification. As a result, various cases that may have previously fulfilled the diagnostic criteria for CHL may be diagnosed differently today. We initiated this study to evaluate whether the previously
reported 13-fold increased risk of NHL arising as a second malignancy in patients treated for Hodgkin lymphoma, could be substantiated based on the most current WHO Classification.2 The present study found that in patients diagnosed with CHL between 2006-2013 with reported secondary NHL, 44-54% of CHL diagnoses were classified as NHL according to current WHO criteria. Next, these patients actually presented with relapse or transformation of this NHL in the second episode. As a consequence of reclassification in the present study, the previously reported 13-fold risk to develop NHL as a secondary malignancy dropped significantly to a standardized incidence ratio of 3.61-4.39. Although general expert pathology review is reported to show reclassification of 6.7% of cases of CHL by various national and regional pathology review facilities, in specific populations such as relapsed or primary therapy-refractive CHL patients, this problem may be significantly larger at a reported 12%.20,24 In light of the relatively low a priori incidence of NHL, the absolute risk of secondary NHL is therefore very low. This revised view sheds a quite different light on CHL risk assessments and underscores the importance of pathology review in epidemiological studies.2-4
T-cell lymphomas with admixed Hodgkin-like B cells, especially those with follicular T-helper phenotype such as AITL and PTCL-TFH, are increasingly recognized as diagnostic pitfalls. The Hodgkin-like B cells display varying phenotypes with a spectrum ranging from CHL to DLBCL immunophenotype and are most often EBER+ (Figure 4). Thus, subsequent “overgrowth” of this population at relapse, resulting in EBV+ DLBCL, may not be unexpected and was observed in four of 15 AITL/PTCL cases in our series. This aspect also contributes to difficulties in differentiating between these entities.25,26
Likewise, CHL-like B-cell proliferations are part of the spectrum of immunodeficiency-related B-lymphoproliferative disorders. In settings of overt immunodeficiency, such as HIV infection or after solid organ transplantation, this may not pose a major differential diagnostic problem. In elderly patients with presumed immune senescence, this may be more controversial.15
In addition to recalculating the risk of subsequent NHL in CHL patients, this study highlights several clues that help to alert pathologists to avoid pitfalls in CHL diagnosis. Advanced age, generalized lymphadenopathy at presentation (stage III/IV disease) and EBV-association should raise awareness of CHL mimickers. CHL is characterized by a defective B-cell program and loss of mature B-cell markers. While varying and generally weak expression of CD20 and CD79a may be fully acceptable in CHL, strong expression should raise suspicion and justifies in-depth studies to exclude alternative options such as AITL/PTCL or immunodeficiency-related B-lymphoproliferative disorders, as was apparent in our series. In such cases, cor-
Haematologica | 108 May 2023 1356 ARTICLE - Misdiagnosis in recurrent classic Hodgkin lymphoma M.V. Boot et al.
relation with clinical information, including clinical staging, disease distribution (lack of mediastinal involvement, exclusively infradiaphragmatic lymphadenopathy) and potential immunodeficiency states (previous medical history, medication, age) are paramount to establish the most appropriate diagnosis.
In the 25 cases in which CHL was confirmed, various types of secondary NHL were observed that bear different relationships to the initial CHL. Extensive clinical and molecular evidence supports that CHL, PMBL and MGZL belong to a single biological disease spectrum.9,10,27-32 Therefore, PMBL and MGZL after CHL may be considered a form of relapse rather than a second malignancy.18,32 This may be different for other types of subsequent indolent and aggressive B-cell lymphoma classes that in our study included DLBCL (EBV–, n=5), triple-hit high-grade B-cell lymphoma (n=1), B-cell acute lymphoblastic leukemia (n=1) and various types of indolent B-cell lymphoma (n=11). While rare cases are reported in which there is a common clonal origin of synchronous and metachronous CHL and NHL, it is currently unknown whether this is a universal phenomenon or rather the exception.33,34
At the level of individual patients, an adequate diagnosis is obviously required to determine appropriate treatment strategies and guide communication on the expected outcome.35,36 The problem of misdiagnosis also has an impact on the interpretation of clinical trials in CHL patients, especially for those with high stage and relapsed/refractory disease, as was recently shown.20 Both pathologists and treating physicians should be perceptive concerning pitfalls surrounding the diagnosis of CHL. Close interaction between pathologists and hemato-oncologists in multidisciplinary tumor boards is therefore key to optimal patient management in these settings.
This study may have various limitations. Most importantly, the interpretation of diagnostic criteria of CHL and its mimickers are to a certain level subjective and highly complex. We based our review on a combination of morphological, immunohistochemical and molecular findings in all cases. Various cases represent complex differential diagnostic problems in the spectrum of lymphocyte-rich CHL, AITL/PTCL-TFH and EBV+ DLBCL. While we have, to the best of our ability, set objective criteria for each of these options, a certain level of sub-
References
1. Driessen J, Visser O, Zijlstra JM, et al. Primary therapy and relative survival in classical Hodgkin lymphoma: a nationwide population-based study in the Netherlands, 1989-2017. Leukemia. 2021;35(2):494-505.
2. Schaapveld M, Aleman BM, van Eggermond AM, et al. Second cancer risk up to 40 years after treatment for Hodgkin’s lymphoma. N Engl J Med. 2015;373(26):2499-2511.
jective interpretation remains in which other experts might make different choices. We have, therefore, refrained from subjective conclusions in cases in which unequivocal interpretations were not justified.
In conclusion, this study demonstrates that the risk of subsequent NHL in patients treated for CHL is significantly lower than was previously reported and underscores the need for pathology review in epidemiological studies regarding patients with recurring lymphoma. Furthermore, this study shows both underrated and well-known pitfalls in the pathology diagnosis of CHL and their impact on both daily practice and epidemiological descriptions. We emphasize the importance of close interaction between pathologists and hemato-oncologists in establishing a diagnosis of CHL, exploring its differential diagnosis, and parameters that may serve to avoid pitfalls.
Disclosures
No conflicts of interest to disclose.
Contributions
MB, LK, and DdJ: study design, pathology review, and writing the manuscript. MS: study design, statistical analysis, and manuscript review. AD: study design, data collection from the Netherlands Cancer Registry, and manuscript review. NH: immunohistochemical staining and molecular tests, and manuscript review. EvdB: PALGA search, and manuscript review. FvL: study design, and manuscript review. KvdO: manuscript review.
Acknowledgments
We dedicate this study to the me mory of Professor Ton Hagenbeek who passed away in May 2021. Ton’s critical attitude and keen interest in innovations in the field of hematology and hematopathology will remain an inspiration.
Funding
This study was financially supported by the van Vlissingen Lymphoma Foundation.
Data-sharing statement
Anonymized study data are available from the corresponding author.
3. Dores GM, Metayer C, Curtis RE, et al. Second malignant neoplasms among long-term survivors of Hodgkin’s disease: a population-based evaluation over 25 years. J Clin Oncol. 2002;20(16):3484-3494.
4. Swerdlow AJ, Higgins CD, Smith P, et al. Second cancer risk after chemotherapy for Hodgkin’s lymphoma: a collaborative British cohort study. J Clin Oncol. 2011;29(31):4096-4104.
Haematologica | 108 May 2023 1357 ARTICLE - Misdiagnosis in recurrent classic Hodgkin lymphoma M.V. Boot et al.
5. Chihara D, Dores G, Flowers C, Morton LM. The bidirectional increased risk of B-cell lymphoma and T-cell lymphoma. Blood. 2021;138(9):785-789.
6. Bell D, Gaillard F. WHO classification of tumours of haematopoietic and lymphoid tissues. Revised 4th edition. Lyon: International Agency for Research on Cancer IARC; 2010.
7. Harris NL, Jaffe ES, Stein H, et al. A revised European-American classification of lymphoid neoplasms: a proposal from the International Lymphoma Study Group. Blood. 1994;84(5):1361-1392.
8. Kritharis A, Pilichowska M, Evens AM. How I manage patients with grey zone lymphoma. Br J Haematol. 2016;174(3):345-350.
9. Sarkozy C, Chong L, Takata K, et al. Gene expression profiling of gray zone lymphoma. Blood Adv. 2020;4(11):2523-2535.
10. Sarkozy C, Hung SS, Chavez EA, et al. Mutational landscape of gray zone lymphoma. Blood. 2021;137(13):1765-1776.
11. Attygalle AD, Cabecadas J, Gaulard P, et al. Peripheral T-cell and NK-cell lymphomas and their mimics; taking a step forwardreport on the lymphoma workshop of the XVIth meeting of the European Association for Haematopathology and the Society for Hematopathology. Histopathology. 2014;64(2):171-199.
12. Bröckelmann PJ, Goergen H, Fuchs M, et al. Impact of centralized diagnostic review on quality of initial staging in Hodgkin lymphoma: experience of the German Hodgkin Study Group. Br J Haematol. 2015;171(4):547-556.
13. Hartmann S, Goncharova O, Portyanko A, et al. CD30 expression in neoplastic T cells of follicular T cell lymphoma is a helpful diagnostic tool in the differential diagnosis of Hodgkin lymphoma. Mod Pathol. 2019;32(1):37-47.
14. Nicolae A, Pittaluga S, Venkataraman G, et al. Peripheral T-cell lymphomas of follicular T-helper cell derivation with Hodgkin/Reed-Sternberg cells of B-cell lineage: both EBVpositive and EBV-negative variants exist. Am J Surg Pathol. 2013;37(6):816-826.
15. de Jong D, Roemer MG, Chan JK, et al. B-cell and classical Hodgkin lymphomas associated with immunodeficiency: 2015 SH/EAHP Workshop Report-Part 2. Am J Clin Pathol. 2017;147(2):153-170.
16. Natkunam Y, Gratzinger D, Chadburn A, et al. Immunodeficiencyassociated lymphoproliferative disorders: time for reappraisal? Blood. 2018;132(18):1871-1878.
17. Pitman SD, Huang Q, Zuppan CW, et al. Hodgkin lymphoma-like posttransplant lymphoproliferative disorder (HL-like PTLD) simulates monomorphic B-cell PTLD both clinically and pathologically. Am J Surg Pathol. 2006;30(4):470-476.
18. Wang HW, Balakrishna JP, Pittaluga S, Jaffe ES. Diagnosis of Hodgkin lymphoma in the modern era. Br J Haematol. 2019;184(1):45-59.
19. Casparie M, Tiebosch AT, Burger G, et al. Pathology databanking and biobanking in The Netherlands, a central role for PALGA, the nationwide histopathology and cytopathology data network and archive. Cell Oncol. 2007;29(1):19-24.
20. Kersten MJ, Driessen J, Zijlstra JM, et al. Combining brentuximab vedotin with dexamethasone, high-dose cytarabine and cisplatin as salvage treatment in relapsed or refractory Hodgkin lymphoma: the phase II HOVON/LLPC Transplant BRaVE study. Haematologica. 2021;106(4):1129-1137.
21. Langerak AW, Groenen PJ, Bruggemann M, et al. EuroClonality/BIOMED-2 guidelines for interpretation and reporting of Ig/TCR clonality testing in suspected lymphoproliferations. Leukemia. 2012;26(10):2159-2171.
22. Sie D, Snijders PJ, Meijer GA, et al. Performance of ampliconbased next generation DNA sequencing for diagnostic gene mutation profiling in oncopathology. Cell Oncol. 2014;37(5):353-361.
23. Breslow NE, Day NE. Statistical methods in cancer research. Volume II--the design and analysis of cohort studies. IARC Sci Publ. 1987;(82):1-406.
24. Laurent C, Baron M, Amara N, et al. Impact of expert pathologic review of lymphoma diagnosis: study of patients from the French Lymphopath network. J Clin Oncol. 2017;35(18):2008-2017.
25. Gratzinger D, de Jong D, Jaffe ES, et al. T- and NK-cell lymphomas and systemic lymphoproliferative disorders and the immunodeficiency setting: 2015 SH/EAHP Workshop Report-Part 4. Am J Clin Pathol. 2017;147(2):188-203.
26. Xu Y, McKenna RW, Hoang MP, Collins RH, Kroft SH. Composite angioimmunoblastic T-cell lymphoma and diffuse large B-cell lymphoma: a case report and review of the literature. Am J Clin Pathol. 2002;118(6):848-854.
27. Eberle FC, Salaverria I, Steidl C, et al. Gray zone lymphoma: chromosomal aberrations with immunophenotypic and clinical correlations. Mod Pathol. 2011;24(12):1586-1597.
28. Green MR, Monti S, Rodig SJ, et al. Integrative analysis reveals selective 9p24.1 amplification, increased PD-1 ligand expression, and further induction via JAK2 in nodular sclerosing Hodgkin lymphoma and primary mediastinal large B-cell lymphoma. Blood. 2010;116(17):3268-3277.
29. Rosenwald A, Wright G, Leroy K, et al. Molecular diagnosis of primary mediastinal B cell lymphoma identifies a clinically favorable subgroup of diffuse large B cell lymphoma related to Hodgkin lymphoma. J Exp Med. 2003;198(6):851-862.
30. Savage KJ, Monti S, Kutok JL, et al. The molecular signature of mediastinal large B-cell lymphoma differs from that of other diffuse large B-cell lymphomas and shares features with classical Hodgkin lymphoma. Blood. 2003;102(12):3871-3879.
31. Liu PP, Wang KF, Xia Y, et al. Racial patterns of patients with primary mediastinal large B-cell lymphoma. Medicine (Baltimore). 2016;95(27):1-7.
32. Traverse-Glehen A, Pittaluga S, Gaulard P, et al. Mediastinal gray zone lymphoma: the missing link between classic Hodgkin’s lymphoma and mediastinal large B-cell lymphoma. Am J Surg Pathol. 2005;29(11):1411-1421.
33. Küppers R, Dührsen U, Hansmann ML. Pathogenesis, diagnosis, and treatment of composite lymphomas. Lancet Oncol. 2014;15(10):e435-e446.
34. Dobson R, Du PY, Rásó-Barnett L, et al. Early detection of T-cell lymphoma with T follicular helper phenotype by RHOA mutation analysis. Haematologica. 2022;107(2):489-499.
35. Crombie JL, LaCasce AS. Epstein Barr virus associated B-cell lymphomas and iatrogenic lymphoproliferative disorders. Front Oncol. 2019;9:109.
36. Lunning MA, Vose JM. Angioimmunoblastic T-cell lymphoma: the many-faced lymphoma. Blood. 2017;129(9):1095-1102.
Haematologica | 108 May 2023 1358 ARTICLE - Misdiagnosis in recurrent classic Hodgkin lymphoma M.V. Boot et al.
ASXL1 mutations accelerate bone marrow fibrosis via EGR1-TNFA axis-mediated neoplastic fibrocyte generation in myeloproliferative neoplasms
Correspondence:
Z. Xiao zjxiao@ihcams.ac.cn
1State Key Laboratory of Experimental Hematology, National Clinical Research Center for Blood Diseases, Haihe Laboratory of Cell Ecosystem, Institute of Hematology & Blood Diseases Hospital, Chinese Academy of Medical Sciences & Peking Union Medical College, Tianjin, China; 2The Province and Ministry Co-sponsored Collaborative Innovation Center for Medical Epigenetics, Department of Cell Biology, Tianjin Medical University, Tianjin, China and 3Divisions of Pathology and Experimental Hematology and Cancer Biology, Cincinnati Children's Hospital Medical Center, Cincinnati, OH, USA
*ZXS, JQL and YYZ. contributed equally as co-first authors.
#ZJX, XDW, BL and GH contributed equally as co-senior authors.
Abstract
X. Wu wuxudong@tmu.edu.cn
B. Li libing@ihcams.ac.cn
G. Huang gang.huang@cchmc.org
Received: November 7, 2021.
Accepted: June 28, 2022.
Early view: August 25, 2022.
https://doi.org/10.3324/haematol.2021.280320
©2023 Ferrata Storti Foundation
Published under a CC BY-NC license
Apart from the central role of the activated JAK/STAT signaling pathway, ASXL1 mutations are the most recurrent additional mutations in myeloproliferative neoplasms and occur much more commonly in myelofibrosis than in essential thrombocythemia and polycythemia vera. However, the mechanism of the association with ASXL1 mutations and bone marrow fibrosis remains unknown. Here, integrating our own data from patients with myeloproliferative neoplasms and a hematopoietic-specific Asxl1 deletion/Jak2V617F mouse model, we show that ASXL1 mutations are associated with advanced myeloproliferative neoplasm phenotypes and onset of myelofibrosis. ASXL1 mutations induce skewed monocyte/macrophage and neoplastic monocyte-derived fibrocyte differentiation, consequently they enhance inflammation and bone marrow fibrosis. Consistently, the loss of ASXL1 and JAK2V617F mutations in hematopoietic stem and progenitor cells leads to enhanced activation of polycomb group target genes, such as EGR1. The upregulation of EGR1, in turn, accounts for increased hematopoietic stem and progenitor cell commitment to the monocyte/macrophage lineage. Moreover, EGR1 induces the activation of TNFA and thereby further drives the differentiation of monocytes to fibrocytes. Accordingly, combined treatment with a TNFR antagonist and ruxolitinib significantly reduces fibrocyte production in vitro. Altogether, these findings demonstrate that ASXL1 mutations accelerate fibrocyte production and inflammation in myeloproliferative neoplasms via the EGR1-TNFA axis, explaining the cellular and molecular basis for bone marrow fibrosis and the proof-ofconcept for anti-fibrosis treatment.
Introduction
Myeloproliferative neoplasms (MPN) are malignant clonal diseases originating from hematopoietic stem cells, characterized by the proliferation of one or more myeloid lineages and an increasing risk of transformation to acute myeloid leukemia.1 Primary myelofibrosis (PMF) is the subtype with the worst prognosis.2 Moreover, approximately 15% of patients with essential thrombocythemia (ET) or
polycythemia vera (PV) develop post-ET/PV MF over time, which is similar to PMF in treatment and outcome.1 Somatic mutations in Janus kinase 2 (JAK2), calreticulin (CALR), or myeloproliferative leukemia protein (MPL) are regarded as driver mutations that activate the JAK/STAT signaling pathway and are essential for the MPN phenotype.3-5 JAK2V617F is the most common driver mutation and is present in more than 95% of cases of PV and more than 50% of ET and MF (including PMF and post-ET/PV MF) patients.2
Zhongxun Shi,1* Jinqin Liu,1* Yingying Zhao,2* Lin Yang,1 Yanan Cai,1 Peihong Zhang,1 Zefeng Xu,1 Tiejun Qin,1 Shiqiang Qu,1 Lijuan Pan,1 Junying Wu,1 Xin Yan,1 Zexing Li,2 Wenjun Zhang,1 Yiru Yan,1 Huijun Huang,1 Gang Huang,3# Bing Li,1# Xudong Wu1,2# and Zhijian Xiao1#
Haematologica | 108 May 2023 1359 ARTICLE - Myeloproliferative Disorders
Although inappropriate JAK/STAT pathway activation exists in most MF patients, the JAK1/JAK2 inhibitor ruxolitinib has a limited effect on reversing fibrosis grades in MF patients.6 Meanwhile, there are reports of several animal models with Jak2V617F which induce PV or ET-like phenotypes while MF is rare.7-9 Besides driver mutations, additional mutations are common in MF patients,10,11 and the mouse models with concomitant Jak2V617F and Ezh2, Tet2 or Dnmt3a loss showed accelerated MF as well. However, the mechanisms are not fully delineated.12-14
ASXL1 mutations are the most recurrent nondriver mutations in MF and are much more common in PV and ET patients.10,11 As one of the mammalian homologs of the Drosophila Asx, 15 polycomb group (PcG) genes, ASXL1 acts as an essential cofactor for the nuclear deubiquitinase BRCA1-Associated Protein 1 (BAP1)16,17 and as a critical mediator of Polycomb Repressive Complex 2 (PRC2),18 participating in the epigenetic control of gene expression. Frameshift and nonsense mutations are the major types of ASXL1 mutation, resulting in C-terminal truncation and usually loss of ASXL1 expression.18 Wild-type ASXL1 plays an essential role in normal hematopoiesis. Asxl1 knockout mice show impaired hematologic progenitor differentiation and development of myelodysplasia and myelodysplastic syndrome/MPN.19 In Jak2V617F mice, heterozygous knockout of Asxl1 in germline accelerates MF progression,20 while how ASXL1 loss results in transcription deregulation and aberrant lineage differentiation in MPN remains poorly understood.
In this study, we analyzed the clinical characteristics of ASXL1 mutations in MF patients and generated hematopoietic-specific Asxl1 knockout and Jak2V617F knockin mouse models. Our data showed that ASXL1 mutations could promote monocyte/macrophage-mediated inflammation and neoplastic monocyte-derived fibrocyte-induced bone marrow (BM) fibrosis by activating the EGR1-TNFA axis in both ASXL1-mutated MF patients and Asxl1 knockout/Jak2V617F mice, offering novel potential therapeutic strategies for anti-fibrosis treatment.
Methods
Patients and animals
Three hundred and two consecutive MF patients were investigated in this study. Diagnoses were classified according to 2016 World Health Organization (WHO) MPN definitions.21 All patients gave written informed consent compliant with the Declaration of Helsinki. Studies involving medical records and human tissues were approved by the Ethics Committee of the blood disease hospital, Chinese Academy of Medical Sciences & Peking Union Medical College. For mouse model studies, cre-inducible Jak2LSL V617F/+ mice, Asxl1 flox/flox mice and hematopoietic-
specific Vav1-Cre transgenic mice were used. All mice were on a C57BL/6 background. Details are contained in the Online Supplementary Methods. The experimental protocols were approved by the Institutional Animal Care and Use Committee of State Key Laboratory of Experimental Hematology.
In vitro monocyte/macrophage differentiation assay
Murine BM was isolated and enriched for c-kit using CD117 MicroBeads (Miltenyi) and separated using an AutoMACS Pro separator (Miltenyi). BM c-kit+ cells were plated in methylcellulose medium (Methocult M3234, Stem Cell Technologies) supplemented with mouse interleukin (IL)3 (Peprotech, 10 ng/mL) for 1×10⁴ cells per well. After 8 days, colonies were counted, then isolated, pooled, and resuspended in phosphate-buffered saline, and stained with F4/80 antibodies (Biolegend, 123115) for flow cytometric analysis on a FACS Canto II flow cytometer (BD Biosciences). Additionally, Wright-Giemsa-stained cytospin smears were prepared for morphological analysis.
In vitro fibrocyte differentiation assay and quantification
Murine BM nucleated cells or patients’ BM mononuclear cells were resuspended in conditions that promote the differentiation of monocytes to fibrocytes.22,23 Cells were cultured in 24-well tissue culture plates with 5×10⁵ cells/500 mL. After 5 days, immunofluorescence staining was performed to identify fibrocytes. Details of the protocols are provided in the Online Supplementary Methods.
Immunohistochemical and image quantification of patients’ samples
Bone marrow biopsy sections were dewaxed, rehydrated and retrieved. Sections were blocked in 10% donkey/10% goat serum or 10% donkey serum and then incubated with primary antibodies overnight followed by secondary staining. Next, AutoFluo Quencher (Applygen) was applied to quench autofluorescence. Finally, glass coverslips were mounted onto the slides using Mounting Medium with DAPI (Abcam). Images were captured by confocal microscopy (PerkinElmer UltraVIEW VoX system) and quantified using Fiji-ImageJ software. Details of the protocols are contained in the Online Supplementary Methods.
Gene-expression profiling and bioinformatics analysis
Murine BM c-kit+ cells were enriched for bulk RNA sequencing, assay for transposase-accessible chromatin (ATAC) with sequencing and chromatin immunoprecipitation (ChIP) sequencing. Detailed protocols are contained in the Online Supplementary Methods.
A more detailed description of the methods is published in the Online Supplementary Appendix
Haematologica | 108 May 2023 1360 ARTICLE - ASXL1 mutations accelerate BM fibrosis in MPN Z. Shi et al.
Results
ASXL1 mutations are associated with severe disease phenotypes in patients with myelofibrosis
To determine the clinical impact of ASXL1 mutations on MF patients, we analyzed data from 302 MF patients in our single center; 250 (82.8%) patients displayed driver mutations, including 174 (57.6%) JAK2V167F, 63 (20.9%) CALR, and 13 (4.3%) MPL mutations (Online Supplementary Figure S1A). 98 (32.5%) patients harbored ASXL1 mutations. Figure 1A shows the landscape of localizations and types of ASXL1 mutation. Frameshift mutations were the most common mutation type (N=50, 51.0%) followed by nonsense (N=46, 46.9%) and missense mutations (N=2, 2.0%).
Figure 1B-D and Online Supplementary Table S1 summarize the clinical and laboratory characteristics of MF patients according to ASXL1 mutations. In this cohort, ASXL1 mutations were correlated with lower hemoglobin levels, higher monocyte counts, increasing CD34+ cells in peripheral blood (PB), larger spleen sizes, and higher MF grades, consistent with prior studies.10 Similar results were also found in the driver mutation positive (driverMT) cohort (N=250) (Figure 1E-G, Online Supplementary Table S2). We next analyzed the co-mutations in MF patients with or without ASXL1 mutations. Considering the total cohort, compared with ASXL1 wildtype (ASXL1WT) patients, ASXL1-mutated (ASXL1MT) patients more commonly had CALR, KRAS, and ZRSR2 mutations (Online Supplementary Figure S1B), while considering the driverMT cohort, CALR and NRAS mutations were more frequent in the ASXL1MT patients than in the ASXL1WT patients (Online Supplementary Figure S1C). Altogether, these data suggest that ASXL1 mutations are associated with severe disease phenotypes in MF patients.
Asxl1 deletion is associated with enhanced extramedullary hematopoiesis in the spleen and onset of bone marrow fibrosis in Asxl1-/-Jak2V617F/+ mice
To further address the consequences of ASXL1 mutations on MPN in vivo, we utilized Vav1-Cre mice, Asxl1flox/flox and Jak2V617F/+ knockin alleles to achieve hematopoietic cellspecific Jak2V617F/+/Asxl1 flox/flox (Asxl1-/-Jak2VF), Jak2V617F/+ (Jak2VF), and Asxl1flox/flox (Asxl1-/-) mice. In control with wildtype (WT) mice, both Asxl1-/-Jak2VF and Jak2VF mice developed erythrocytosis and died of thrombosis at an early stage of the disease (Figure 2A, Online Supplementary Figure S2A, B). Compared with age-matched Jak2VF mice, Asxl1-/-Jak2VF mice showed lower white blood cell, lymphocyte and platelet counts, and higher monocyte counts in PB (Figure 2A). Furthermore, the percentages of c-kit+ cells in PB were significantly increased in Asxl1-/-Jak2VF mice compared to other genotypes (Figure 2B).
Consistent with PB findings, Asxl1-/-Jak2VF mice showed comparable erythropoiesis in BM and spleens (Online Supplementary Figure S2C), and a decreased proportion of B
lymphocytes (B220+) in BM compared with Jak2VF mice (Online Supplementary Figure S2D). Analysis of the hematopoietic stem and progenitor cell (HSPC) compartment revealed comparable percentages of Lin Scal1+c-kit+ (LSK) cells, granulocyte/macrophage progenitors, and megakaryocyte/erythroid progenitors in the BM of Asxl1-/-Jak2VF and Jak2VF mice (Figure 2C, Online Supplementary Figure S2E), whereas in the comparison with Jak2VF mice, the proportions of granulocyte/macrophage progenitors and megakaryocyte/erythroid progenitors were significantly higher in spleens of Asxl1-/-Jak2VF (Figure 2D, Online Supplementary Figure S2E), in line with the increased spleen weights of Asxl1-/-Jak2VF mice (Figure 2E). We next performed methylcellulose colony-forming assays to verify the effect of Asxl1 deletion on HSPC functions in Asxl1-/-Jak2VF mice. Colonyforming capacities of nucleated cells were enhanced in spleen cells from Asxl1-/-Jak2VF mice compared with those of other genotypes, whereas there was no difference in BM colony-forming capacity between mice of different genotypes (Online Supplementary Figure S3A, B), indicating more activated extramedullary hematopoiesis in the spleens of Asxl1-/-Jak2VF mice.
BM histology analysis revealed typical features of MPN with trilineage hyperplasia, especially increased megakaryocytes and atypia in both Jak2VF and Asxl1-/-Jak2VF mice (Figure 3). Interestingly, reticulin and collagen fiber infiltration was present in Asxl1-/-Jak2VF mice at 16 weeks of age, but not in other genotypes (Figure 3). Additionally, Asxl1-/-Jak2VF and Jak2VF spleen specimens exhibited effacement of normal splenic architecture and extramedullary hematopoiesis was more obvious in Asxl1-/-Jak2VF mice relative to Jak2VF mice (Figure 3, Online Supplementary Figure S3C).
To further confirm that these findings are cell-autonomous, we transplanted BM nucleated cells from Asxl1-/Jak2VF, Jak2VF, Asxl1-/- and WT mice into lethally irradiated recipients ( Online Supplementary Figure S4A ). The survival of recipients of cells from Asxl1 -/-Jak2VF mice was worse than that of mice transplanted with cells of other genotypes ( Online Supplementary Figure S4B ). At 24 weeks after transplantation, Asxl1-/-Jak2VF –cell recipients gradually developed monocytosis and thrombocytopenia compared with Jak2VF–cell recipients (Online Supplementary Figure S4C ). Meanwhile, the proportions of c-kit + cells in PB were significantly higher in Asxl1-/-Jak2VF recipients (Online Supplementary Figure S4D). Additionally, HSPC compartment analysis showed increased myeloid progenitors (Lin-Sca1-c-kit+) in spleens, not in BM of recipients of Asxl1-/-Jak2VF cells in comparison with Jak2VFcell recipients (Online Supplementary Figure S4E), despite comparable spleen weights in these two groups (Online Supplementary Figure S4F). Histological analysis revealed increased reticulin and collagen fibers in BM and enhanced extramedullary hematopoiesis in spleens of recipients of Asxl1-/-Jak2VF cells compared with Jak2VF–cell
Haematologica | 108 May 2023 1361 ARTICLE - ASXL1 mutations accelerate BM fibrosis in MPN Z. Shi et al.
recipients at 38-40 weeks after transplantation ( Online Supplementary Figure S4G).
Taken together, our findings in Asxl1-/-Jak2VF mice are consistent with clinical findings in ASXL1MT MF patients, indicating that ASXL1 mutations are associated with MPN disease progression.

Skewed inflammatory monocyte/macrophage differentiation in ASXL1MT myelofibrosis patients and Asxl1-/-Jak2VF mice
The overproduction of inflammatory cytokines is a hallmark feature in MPN especially in MF. 24 We thus compared the circulating cytokine levels in PV and MF
Figure 1. ASXL1 mutations are associated with severe disease phenotypes in myelofibrosis patients. (A) Landscape of localizations and mutational types of 98 ASXL1 mutations in 302 patients with myelofibrosis (MF). (B-D) Spleen sizes (B) (N=87 for ASXL1MT patients and n=196 for ASXL1WT patients), proportions of CD34+ cells in peripheral blood (PB) (C) (N=38 for ASXL1MT patients and N=79 for ASXL1WT patients), and MF grades (D) (N=98 for ASXL1MT patients and N=204 for ASXL1WTpatients) of MF patients with different ASXL1 mutational status. (E-G) Spleen sizes (E) (N=75 for DriverMTASXL1MT patients and N=157 for DriverMTASXL1WT patients), proportions of CD34+ cells in PB (F) (N=34 for DriverMTASXL1MT patients and N=68 for DriverMTASXL1WT patients) and MF grades (G) (N=85 for DriverMTASXL1MT patients and N=165 for DriverMTASXL1WT patients) of driverMT MF patients with different ASXL1 mutational status. ASXN: additional sex combs N-terminus domain; ASXH: additional sex combs homology domain; PHD: plant homeodomain. LCM: left costal margin. In (B), (C), (E) and (F), the results are presented as the median ± interquartile range. A Mann-Whitney U test was performed between the medians of two groups. In (D) and (G), the results are presented as percentages. A Mann-Whitney U test was performed between ordinal variables. *P<0.05, **P<0.01, ***P<0.001, ****P<0.0001.
D B C E F
Haematologica | 108 May 2023 1362 ARTICLE - ASXL1 mutations accelerate BM fibrosis in MPN Z. Shi et al. A G
patients and observed that MF patients had a more severe inflammatory environment than PV patients ( Online
Supplementary Figure S5A , Online Supplementary Table S3 ). Notably, ASXL1 MT MF patients showed higher levels of tumor necrosis factor (TNF)- a and IL-10 than ASXL1 WT MF patients ( Online Supplementary Figure S5A , Online
Supplementary Table S3 ). Moreover, a set of inflammatory cytokines and chemokines, including TNF- a , CCL2 and CCL5 were elevated in Asxl1 -/- Jak2 VF mice compared
with Jak2VF mice ( Online Supplementary Figure S5B). Several cell populations, such as m onocytes, granulocytes and megakaryocytes, are responsible for overproduction of cytokines in MF.25 Remarkably, we observed that both ASXL1MT MF patients and Asxl1-/-Jak2VF mice had elevated monocyte counts in PB (Figure 2A, Online Supplementary Tables S1 and 2), which are the major cell origin of cytokines in MF.26,27 Subsequent subtype assays of PB monocytes (CD115+CD11b+) in mouse models revealed elev-
Figure 2. Asxl1 deletion is associated with enhanced extramedullary hematopoiesis in Asxl1-/-Jak2VF mice. (A) Hemoglobin, white blood cell, neutrophil, lymphocyte, monocyte, and platelet counts in peripheral blood (PB) were assessed at 12 weeks of age in Asxl1-/-Jak2VF, Jak2VF, Asxl1-/- and WT mice (N=13–15 per group). (B) Representative flow cytometric plots (upper) and the proportions (lower) of c-kit+ cells in PB of Asxl1-/-Jak2VF, Jak2VF, Asxl1-/- and WT mice at 14-16 weeks of age (N=8–9 per group). (C, D) The proportions of LSK cells (Lin Sca-1+c-kit+), granulocyte/macrophage progenitors (Lin Sca-1 c-kit+CD34+FcγRII/IIIhigh), common myeloid progenitors (Lin Sca-1 c-kit+CD34+FcγRII/IIIlow) and megakaryocyte-erythroid progenitors (Lin Sca-1 ckit+CD34 FcγRII/III ) in bone marrow (C) and spleens (D) from Asxl1-/-Jak2VF, Jak2VF, Asxl1-/- and WT mice at 14-16 weeks of age (N=8-9 per group). (E) Representative images (upper) and the weights (lower) of spleens from Asxl1-/-Jak2VF, Jak2VF, Asxl1-/- and WT mice at 14-16 weeks of age (N=11-15 per group). In (A–E), the results are presented as mean ± standard error of the mean. A two-tailed unpaired Student t test was performed between means of two groups. ns, not significant, *P<0.05, **P<0.01, ***P<0.001, ****P<0.0001. Hb: hemoglobin; WBC: white blood cells; NEUT: neutrophils; LYM: lymphocytes; MONO: monocytes; PLT: platelets; GMP: granulocyte/macrophage progenitors; CMP: common myeloid progenitors; MEP: megakyocyte-erythroid progenitors; SSC: side scatter; BM: bone marrow.

A B C E
Haematologica | 108 May 2023 1363 ARTICLE - ASXL1 mutations accelerate BM fibrosis in MPN Z. Shi et al. D
ated Ly6C+ monocytes (inflammatory monocytes),28 but not Ly6C- monocytes in Asxl1-/-Jak2VF mice (Online Supplementary Figure S5C). In addition, monocyte-derived dendritic cells, which accumulate during inflammatory conditions,29 were increased in the PB of Asxl1-/-Jak2VF mice (Figure 4A, Online Supplementary Figure S5D). Consistent with PB findings, Asxl1-/-Jak2VF mice showed higher proportions of monocytes (CD11b+CD115+) in BM and spleens compared with Jak2VF mice (Figure 4B, C, Online Supplementary Figure S6A), while no difference was found in granulocytes (CD11b+CD115-) (Online Supplementary Figure 6B).
Monocyte-derived macrophages are also critical in chronic inflammation. They are highly heterogeneous cells that can rapidly polarize to M1 (pro-inflammatory) or M2 (antiinflammatory) macrophages in response to microenvironmental signals.30 We next analyzed macrophage populations and M1/M2 polarization in mouse models. Gr1 CD115intF4/80+SSClow cells were defined as macrophages in flow cytometry analysis and further classified as M1 (CD80+CD206 ) and M2 (CD80 CD206+) subtypes.31 The
proportions of macrophages, predominantly M1 macrophages, were markedly increased in BM and spleens of Asxl1-/-Jak2VF mice compared with the proportions in Jak2VF mice (Figure 4D, E; Online Supplementary Figure S6C). Similarly, using immunostaining, we observed that ASXL1MT MF patients had higher numbers of CD45+CD68+ cells, which are composed of monocytes and macrophages, in BM specimens than those in ASXL1WT MF patients (Online Supplementary Figure S7, Online Supplementary Table S4).
To confirm the origins of macrophages in mouse models, we performed genotyping identification in sorted Asxl1-/Jak2VF BM macrophages and detected both the Jak2V617F mutation and the Asxl1 deletion (Online Supplementary Figure S6D, E). We next did a noncompetitive bone marrow transplantation assay (Asxl1-/-Jak2VF BM nucleated cells [CD45.2] to lethally irradiated recipients [CD45.1]) and measured the percentages of donor (CD45.2) and recipient (CD45.1) cells in macrophages. Nearly 90% of the total and M1 macrophages were positive for CD45.2 in BM and spleens of Asxl1-/-Jak2VF recipients (Online Supplementary

Haematologica | 108 May 2023 1364 ARTICLE - ASXL1 mutations accelerate BM fibrosis in MPN Z. Shi et al.
Figure 3. Morphology of enhanced extramedullary hematopoiesis and myelofibrosis in Asxl1-/-Jak2VF mice. Representative images of hematoxylin and eosin (H&E), Reticulin and Masson trichrome staining in femur and representative images of H&E staining in spleen biopsy specimens from Asxl1-/-Jak2VF, Jak2VF, Asxl1-/- and WT mice at 16 weeks of age. Asxl1-/-Jak2VF and Jak2VF mice showed increased megakaryocytes and atypia in bone marrow and spleen specimens (arrow). Original magnification 40×, scale bar, 50 mm. BM: bone marrow.
Figure S6F). These data suggest that the increased macrophages are neoplastic macrophages derived from monocytes rather than primary tissue-resident macrophages. On the basis of the above findings, we questioned whether
Asxl1 deletion would lead to the differentiation bias of Asxl1-/-Jak2VF HSPC toward the monocyte/macrophage lineage. To examine this, we isolated Asxl1-/-Jak2VF and Jak2VF BM c-kit+ cells and seeded them in methylcellulose
Figure 4. ASXL1MT myelofibrosis patients and Asxl1-/-Jak2VF mice have increased inflammatory monocytes/macrophages. (A) The proportions of monocyte-derived dendritic cells (CD11cintCD11bhighMHC II+Ly6C+) in peripheral blood of Asxl1-/-Jak2VF, Jak2VF, Asxl1/- and WT mice at 14-16 weeks of age (N=4-6 per group). (B, C) The proportions of monocytes (CD11b+CD115+) in bone marrow (B) and spleens (C) of Asxl1-/-Jak2VF, Jak2VF, Asxl1-/- and WT mice at 14-16 weeks of age (N=6-7 per group). (D) Representative flow cytometric plots (left) and the proportions of total macrophages (Gr-1 CD115intF4/80+SSClow) (middle) and M1(CD80+CD206 )/M2 (CD80-CD206+) subtypes (right) in bone marrow of Asxl1-/-Jak2VF, Jak2VF, Asxl1-/- and WT mice at 14-16 weeks of age (N=7-9 per group). (E) Representative flow cytometric plots (left) and the proportions of total macrophages (Gr-1 CD115intF4/80+SSClow) (middle) and M1(CD80+CD206 )/M2 (CD80-CD206+) subtypes (right) in spleens of Asxl1-/-Jak2VF, Jak2VF, Asxl1-/- and WT mice at 1416 weeks of age (N=7-9 per group). In (A–E), the results are presented as mean ± standard error of mean. A two-tailed unpaired Student t test was performed between means of two groups. ns: not significant, *P<0.05, **P<0.01, ***P<0.001, ****P<0.0001. PB: peripheral blood; moDC: monocyte-derived dendritic cells; BM: bone marrow; SSC: side scatter; FSC: forward scatter.

A D E B C
Haematologica | 108 May 2023 1365 ARTICLE - ASXL1 mutations accelerate BM fibrosis in MPN Z. Shi et al.
supplemented with mouse IL-3 (10 ng/mL) in vitro. On day 8, no difference was found in the numbers of colonies between these two groups (Online Supplementary Figure S8A), while flow cytometric and morphological analysis of cells obtained from colonies showed higher proportions of macrophages (F4/80+) in Asxl1-/-Jak2VF mice than in Jak2VF mice (Online Supplementary Figure S8B, C), indicating a skewed monocyte/macrophage differentiation of Asxl1-/-Jak2VF HSPC.
Altogether, these data indicate that, in the context of a constitutively activated JAK/STAT pathway, ASXL1 mutations induce an inflammatory monocyte/macrophage differentiation bias and enhance inflammation in ASXL1MT MF.
ASXL1 mutations result in increased monocyte-derived fibrocyte differentiation in ASXL1MT myelofibrosis patients and Asxl1-/-Jak2VF mice
Mesenchymal stromal cell (MSC)-derived myofibroblasts were previously considered as the major collagen-producing cells in MPN.32-34 We performed Gli1, Leptin Receptor (LeptinR), and a-SMA immunostaining in MF patients and chose blood vessel as a positive control (Online Supplementary Figure S9A). However, no difference was found in MSC-derived myofibroblasts (Gli1+ and/or LeptinR+ and a-SMA+) as well as Gli1+ cells and LeptinR+ cells between ASXL1WT and ASXL1MT MF patients (Online Supplementary Figures S9B-D and S10, Online Supplementary Table S4). Recently, several studies identified neoplastic monocyte-derived fibrocytes as a separate contributor to BM fibrosis.22,23 Considering the increased monocytes in both ASXL1MT MF patients and Asxl1/-Jak2VF mice, we sought to determine whether monocytederived fibrocytes play a critical role in BM fibrosis formation. Monocyte-derived fibrocytes are positive for both hematopoietic markers and collagen markers.22,23 Accordingly, we performed CD45 and ProCollagenI (ProCol-I) immunostaining of BM specimens from MF patients and observed increased fibrocytes (CD45+ProCol-I+) in ASXL1MT MF patients compared with ASXL1WT MF patients (Figure 5A, B; Online Supplementary Table S4). We next isolated BM nucleated cells from Asxl1-/-Jak2VF, Jak2VF, Asxl1-/- and WT mice and cultured them in conditions that promote the differentiation of monocytes to fibrocytes.22,23 On day 5, the numbers of long spindleshaped CD45+CollagenI (Col-I)+ fibrocytes derived from Asxl1-/-Jak2VF BM nucleated cells were higher than those derived from cells of other genotypes (Figure 5C, D). Genotyping detected the Jak2V617F mutation and Asxl1 deletion in cultured fibrocytes, confirming that the fibrocytes were originated from malignant clones (Online Supplementary Figure S11A–B). We also measured the proportions of fibrocytes (CD45+Col-I+, CD11b+Col-I+ or CD68+Col-I+) using flow cytometry and observed that Asxl1-/-Jak2VF mice exhibited markedly increased fibrocytes in both BM and spleens compared with other genotypes (Figure 5E, F; On-
line Supplementary Figure S11C–D). Overall, these results establish that increased neoplastic monocyte-derived fibrocytes may be associated with acceleration of BM fibrosis in ASXL1MT MF patients and Asxl1/-Jak2VF mice.
Asxl1 deletion results in derepression of polycomb group target genes in Asxl1-/-Jak2VF mice
ASXL1 deletion impairs hematopoiesis and accelerates myeloid malignancies via aberrant histone modifications and dysregulated transcription.35 We thus performed bulk RNA sequencing, ATAC sequencing and ChIP sequencing on Asxl1-/-Jak2VF and Jak2VF BM c-kit+ cells to elucidate the transcriptional and associated epigenetic alterations after Asxl1 deletion. The expression profiles of Asxl1-/-Jak2VF BM c-kit+ cells showed distinct clusters from Jak2VF cells in principal component analysis (Figure 6A). As shown by the heatmap, 2,352 genes were significantly upregulated and 1,504 genes significantly downregulated in Asxl1-/-Jak2VF BM c-kit+ cells compared with Jak2VF cells (fold change >2, P<0.05) (Figure 6B). Interestingly, gene set enrichment analysis showed that the upregulated genes in Asxl1-/Jak2VF were significantly associated with bona fide PcG target genes, as identified by the overlap between H3K27me3 and H2AK119ub1 ChIP-sequencing experiments on Asxl1-/-Jak2VF and Jak2VF BM c-kit+ cells (Figure 6C, D). This is consistent with the genetic categorization of ASXL1 as a PcG gene.36 Integrated analysis of RNA-sequencing and ATAC-sequencing data showed that there was a significant increase of chromatin accessibility associated with upregulated genes (Figure 6E) and these sites with gained accessibility were enriched with increased levels of H3K4me1 and H3K27ac, histone marks of active enhancers in Asxl1-/-Jak2VF BM c-kit+ cells (Figure 6E). Figure 6F shows the changes of representative PcG target genes Jun and Egr1. Taken together, these results demonstrate that Asxl1 deletion results in the derepression of PcG target genes by activating their enhancers in Asxl1-/-Jak2VF BM c-kit+ cells.
Activated EGR1-TNFA axis enhances monocyte/macrophage and fibrocyte differentiation in ASXL1MT myelofibrosis patients and Asxl1-/-Jak2VF mice
To explore the critical driving genes for disease phenotypes, we next performed bulk RNA sequencing on BM ckit+ cells of all genotypes and finally focused on 45 genes that were upregulated in Asxl1-/-Jak2VF BM c-kit+ cells compared with those in the other three genotypes (Figure 7A). Analysis of Kyoto Encyclopedia of Genes and Genomes (KEGG) pathways revealed the enrichment of several inflammation-related pathways including TNF, IL-17 and NFKB pathways (Figure 7B). Notably, in line with the activated TNF pathway, TNF- a levels were elevated in serum of ASXL1MT MF patients and Asxl1-/-Jak2VF mice (Online Sup-
Haematologica | 108 May 2023 1366 ARTICLE - ASXL1 mutations accelerate BM fibrosis in MPN Z. Shi et al.
patients
mice. (A) Representative immunofluorescence imaging of fibrocytes (ProCol-I+CD45+) in bone marrow (BM) specimens from patients with myelofibrosis (MF). Original magnification 60×; scale bar, 10 mm. (B) The number of fibrocytes in BM specimens of ASXL1WT and ASXL1MT MF patients (N=8 for ASXL1WT patients and N=8 for ASXL1MT patients, median= 20.5 cells/10 high power field [HPF] for ASXL1WT patients and 74.0 cells/10 HPF for ASXL1MT patients). (C) Representative immunofluorescence images of fibrocytes (ColI+CD45+) from BM nucleated cells of 14-week-old Asxl1-/-Jak2VF, Jak2VF, Asxl1-/- and WT mice cultured in conditions that promote differentiation to fibrocytes. Left: original magnification 20×; scale bar, 40 mm; right: original magnification 60×; scale bar, 10 mm. (D) The numbers of fibrocytes derived from Asxl1-/-Jak2VF, Jak2VF, Asxl1-/- and WT BM nucleated cells cultured for 5 days (N=3-4 per group). (E, F) The proportions of fibrocytes in BM (E) and spleens (F) of Asxl1-/-Jak2VF, Jak2VF, Asxl1-/- and WT mice at 14-16 weeks of age determined using flow cytometry (N=5-6 per group). In (B), the results are presented as median ± interquartile range. A Mann-Whitney U test was performed between medians of two groups. In (D-F), the results are presented as mean ± standard error of mean. A two-tailed unpaired Student t test was performed between means of two groups. *P<0.05, **P<0.01, ***P<0.001, ****P<0.0001.

A B C D E F
Haematologica | 108 May 2023 1367 ARTICLE - ASXL1 mutations accelerate BM fibrosis in MPN Z. Shi et al.
Figure 5. Increased monocyte-derived fibrocytes in both ASXL1MT myelofibrosis
and Asxl1-/-Jak2VF
Figure 6. Asxl1 deletion results in derepression of polycomb group target genes in Asxl1-/-Jak2VF bone marrow c-kit+ cells. (A) Principal component analysis plot showing the gene-expression profile of bone marrow (BM) c-kit+ cells from Asxl1-/-Jak2VF and Jak2VF mice. Each dot represents an independent biological sample. (B) Heatmap showing significantly upregulated and downregulated genes in Asxl1-/-Jak2VF BM c-kit+ cells compared with Jak2VF BM c-kit+ cells (fold change >2, P<0.05). (C) Gene set enrichment analysis (GSEA) showed that polycomb group (PcG) target genes were significantly depressed in Asxl1-/-Jak2VF BM ckit+ cells when compared to Jak2VF BM c-kit+ cells. PcG target genes were defined by the 4,700 regions co-occupied by H3K27me3 and H2AK119ub1 from ChIP-sequencing data of Asxl1-/-Jak2VF and Jak2VF BM c-kit+ cells. (D) Representative enriched PcG target genes in Asxl1-/-Jak2VF BM c-kit+ cells in GSEA. (E) Metaplots and heatmaps of ATAC sequencing, and H3K4me1 and H3K27ac ChIP sequencing at upregulated genes in Asxl1-/-Jak2VF BM c-kit+ cells and Jak2VF BM c-kit+ cells. (F) Snapshot of the genomic view for H3K4me1 and H3K27ac ChIP sequencing, ATAC sequencing and RNA sequencing at the representative PcG target gene Jun and Egr1 loci. ATAC: assay for transposase-accessible chromatin; Chip: chromatin immunoprecipitation.

A B C D E F
Haematologica | 108 May 2023 1368 ARTICLE - ASXL1 mutations accelerate BM fibrosis in MPN Z. Shi et al.
Figure 7. Activated EGR1 enhances monocyte/macrophage differentiation in Asxl1-/-Jak2VF mice. (A-C) Venn diagram (A), KEGG pathway enrichment analysis (B), and heatmap (C) of upregulated genes in Asxl1-/-Jak2VF compared with Jak2VF, Asxl1-/- and WT BM c-kit+ cells (fold change >2, P<0.05). (D) Relative expressions of Fos, Ccl4, Egr1 and Cxcl2 mRNA were measured in Asxl1-/Jak2VF, Jak2VF, Asxl1-/- and WT bone marrow (BM) c-kit+ cells by real-time quantitative polymerase chain reaction (RT-qPCR) and normalized with one sample of Jak2VF mice (N=3-4 per group). (E) Relative expressions of EGR1 mRNA in BM mononuclear cells from polycythemia vera (PV), ASXL1MT and ASXL1WT myelofibrosis patients measured by RT-qPCR and normalized with one sample of PV patients (N=13 per group). (F) Representative flow cytometric plots (left) and the proportions (middle) of F4/80+ cells and photomicrographs of Wright-Giemsa-stained cytospin smears (right) obtained from colonies generated by Asxl1-/-Jak2VF BM ckit+ cells transduced with either empty vector or Egr1 short hairpin RNA (N=3 independent experiments). In (D-F), the results are presented as mean ± standard error of mean. A two-tailed unpaired Student t test was performed between means of two groups. ns, not significant, *P<0.05, **P<0.01, ***P<0.001, ****P<0.0001. MF: myelofibrosis; SSC: side scatter; EV: empty vector; shRNA: short hairpin RNA.

A B C D E F
Haematologica | 108 May 2023 1369 ARTICLE - ASXL1 mutations accelerate BM fibrosis in MPN Z. Shi et al.
plementary Figure S5A, B). Several inflammation-related genes, such as Egr1, Fos, Cxcl2 and Ccl4, were also upregulated in Asxl1-/-Jak2 BM c-kit+ cells (Figure 7C), which was validated by real-time quantitative polymerase chain reaction analysis (Figure 7D). Among Tnfa- and inflammation-related genes, the PcG target gene Egr1, was of special interest to us and validated by western blot in BM c-kit+ cells (Online Supplementary Figure S12). Upregulated Egr1 can stimulate HSPC along the monocyte/macrophage lineage.37 We further measured its expression in LSK cells, granulocyte/macrophage progenitors and monocytes, and detected comparable upregulation in different cell populations in Asxl1-/-Jak2VF and Jak2VF mice (Online Supplementary Figure S13), which was reminiscent of monocyte/macrophage bias in Asxl1-/-Jak2VF mice and ASXL1MT MF patients. We confirmed the upregulated EGR1 expression in BM mononuclear cells of ASXL1MT MF patients compared with PV and ASXL1WT MF patients (Figure 7E, Online Supplementary Table S5). Increased chromatin accessibility and enhancer activation were consistently observed at the Egr1 locus in Asxl1-/-Jak2VF BM c-kit+ cells (Figure 6F).
We then assessed the causal effect of Egr1 on monocyte/macrophage differentiation. After being transduced with lentivirus-expressing control (empty vector) or specific short hairpin RNA (shRNA) against Egr1, Asxl1-/-Jak2VF BM c-kit+ cells were sorted for expression of green fluorescence protein (GFP) and seeded in methylcellulose supplemented with mouse IL-3 (10 ng/mL) in vitro. On day 8,
we observed that Egr1 knockdown significantly reduced the percentage of macrophages (F4/80+) derived from Asxl1-/-Jak2VF BM c-kit+ cells (Figure 7F).
Apart from participating in hematopoietic differentiation, EGR1 also acts as a master transcription factor to activate TNFA expression. Luciferase activity assay and electrophoretic mobility shift assay have detected the EGR1 binding site on the TNFA promoter in human monocytic cells.38 We next measured the expression of Tnfa mRNA in Asxl1-/Jak2VF BM c-kit+ cells transduced with empty vector or shRNA against Egr1. As shown in Figure 8A, Tnfa expression failed to be upregulated after knockdown of Egr1, and TNF-a production was reduced after knockdown of Egr1 in BM c-kit+ cells as well (Online Supplementary Figure S14). In MPN, TNF- a facilitates the expansion of JAK2V617F-positive clones,39 and its activation was also recently identified as an early event in fibrosis-driving MSC.40
We thus speculated that TNF-a might promote the differentiation of fibrocytes in Asxl1-/-Jak2VF mice. In vitro experiments showed that the numbers of cultured fibrocytes derived from BM nucleated cells treated with murine TNFa (2 ng/mL) were significantly higher than those of cells treated with dimethyl sulfoxide, and the addition of the TNF-a receptor (TNFR) antagonist R-7050 (1 mM) eliminated this effect (Figure 8B). Moreover, R-7050 (1 mM) alone could also decrease the production of fibrocytes (Figure 8B). We also examined the effect of TNF- a on fibrocyte differentiation in the other three genotypes and observed that TNF-a promoted fibrocyte differentiation regardless
TNF- a promotes monocyte-derived fibrocyte differentiation in Asxl1-/-Jak2VF mice. (A) Relative expressions of Egr1 and Tnfa mRNA in Asxl1-/-Jak2VF bone marrow (BM) c-kit+ cells infected with either empty vector or Egr1 shRNA (3 independent experiments). (B) Representative immunofluorescence imaging (left) and numbers (right) of cultured fibrocytes derived from Asxl1-/-Jak2VF BM nucleated cells treated with dimethyl sulfoxide, mouse TNF-a (2 ng/mL), the TNF-a receptor antagonist, R-7050 (1 mM), and mouse TNF-a (2 ng/mL) combined with R-7050 (1 mM) (N=3 per group). Original magnification 20× for images; scale bar, 40 mm. The results are presented as mean ± standard error of mean. A two-tailed unpaired Student t test was performed between means of two groups. *P<0.05, ***P<0.001, ****P<0.0001. EV: empty vector; DMSO: dimethyl sulfoxide; TNF-a: tumor necrosis factor-alpha. shRNA: short hairpin RNA.

A B
Haematologica | 108 May 2023 1370 ARTICLE - ASXL1 mutations accelerate BM fibrosis in MPN Z. Shi et al.
Figure 8.
of Asxl1 and Jak2 mutational status (Online Supplementary Figure S15A-C). To further validate the effect of Egr1 on fibrocyte production in Asxl1-/-Jak2VF mice, we also transfected Asxl1-/-Jak2VF BM nucleated cells with Egr1 shRNA or an empty vector and performed an in vitro fibrocyte differentiation assay. As shown in Online Supplementary Figure S16, the number of fibrocytes significantly reduced after Egr1 knockdown in Asxl1-/-Jak2VF mice, confirming the effect of Egr1 on fibrocyte production. Previous studies found no significant effects of ruxolitinib on fibrocyte differentiation in samples from patients with PMF.23 We thus wondered whether combined inhibition of the JAK/STAT pathway and the TNFR antagonist would suppress fibrocyte differentiation. Excitingly, combining ruxolitinib (100 nM) with R-7050 (1 mM) enhanced the inhibitory effects on fibrocytes compared to the effects of ruxolitinib monotherapy (Online Supplementary Figure S17A), and the efficacy was confirmed in BM mononuclear cells from MF patients (Online Supplementary Figure S17B). Notably, ruxolitinib (100 nM) alone signi ficantly reduced the number of cultured fibrocytes derived from Asxl1-/Jak2VF BM nucleated cells while it did not reduce fibrocyte differentiation of BM mononuclear cells from MF patients (Online Supplementary Figure S17A, B), which was consistent with a previous study of PMF patients’ samples.23
Collectively, our data indicate that an activated EGR1-TNFA axis is involved in monocyte-derived fibrocyte differentiation in ASXL1MT MF and shed light on an attractive combination therapy for anti-fibrosis treatment.
Discussion
Mutated ASXL1 is associated with severe MF-related features in MF patients. Whether ASXL1 mutations are gainof-function or loss-of-function remains a question in myeloid malignancies. Several studies have shown that gain-of-function of truncated ASXL1 mutations contributes to myeloid malignancies,41,42 while neither full-length nor truncated ASXL1 protein was found in ASXL1 -mutated human myeloid leukemia cell lines and clinical samples.18 In this study, we generated a different kind of mouse model for Asxl1 knockout and Jak2V617F MPN, using hematopoietic cell-specific expression as opposed to a prior germline study.20 Our phenotype findings are consistent with previous results in germline Asxl1 +/- and Jak2V617F mouse models, suggesting the crucial role of ASXL1 mutations in MPN progression. Moreover, we further explored the putative mechanism of ASXL1 mutations in MPN progression.
An activated JAK/STAT pathway enhances inflammatory cytokine production and participates in malignant clonal expansion, BM fibrosis and osteosclerosis in MPN.43 Monocytes are the principal source of inflammatory cytokines
in MF patients.27 Both ASXL1MT MF patients and Asxl1-/Jak2VF mice exhibit expansion of monocytes, especially inflammatory-related Ly6C+ monocytes. Ly6C+ monocytes further differentiate into M1 macrophages or monocytederived dendritic cells in response to inflammatory stimuli and these differentiated cells, in turn, secrete cytokines,28 creating a positive feedback loop, which results in a vicious cycle of inflammatory cytokine production. Hence, these data suggest that skewed monocyte and macrophage differentiation results in enhanced inflammation in ASXL1MT MF.
MF was thought to be a reactive phenomenon caused by the interaction between malignant hematopoiesis and the BM microenvironment, mediated by profibrotic cytokines.34,44 Some studies found that Gli1+ and LeptinR+ WT MSC were functionally reprogrammed and differentiated into myofibroblasts and contributed to MF.32,33,40 In our cohort, no difference was found in MSC-derived myofibroblasts between ASXL1MT and ASXL1WT MF patients, suggesting that other fibrosis-driving cells may be the major contributors to the acceleration of fibrosis in ASXL1MT MF. Fibrocytes are derived from monocytes and initially identified in tissue fibrosis diseases such as endstage liver or kidney diseases.45,46 Neoplastic fibrocytes were first found in PMF patients by Verstovsek et al.23 and recently reported to be present in Jak2V617F mouse models as well.22 Deletion or inhibition of neoplastic fibrocytes can ameliorate MPN phenotypes in MPN mouse models, suggesting their crucial role in fibrosis formation.22,23 Using mouse models and patients’ samples, our results suggest that ASXL1 mutations accelerate BM fibrosis by reprograming the fibrosis-driving potential of hematopoietic cells to fibrocytes, and further confirm that neoplastic fibrocytes are the major contributors to BM fibrosis.
The deregulated cells identified upon Asxl1 deletion and the derepression of PcG target genes support the concept that ASXL1 acts as a PcG gene. Mechanistically, we demonstrated that Asxl1 deletion results in increased chromatin accessibility and enhancer activation at derepressed genes. Nevertheless, it still remains elusive why ASXL1 biochemically antagonizes PRC1 catalytic activity while genetically acting as a transcription repressor. Two recent studies in embryonic stem cell models showed that Bap1 loss results in pervasive accumulation of H2AK119ub1 and PRC titration away from its target promoters.47,48 Future studies will be required to test these mechanisms in the Asxl1-/- mouse model.
Notably, Asxl1 deletion activates the enhancer at the PcG target gene Egr1 locus and consequently upregulates Tnfa in Asxl1-/-Jak2VF BM c-kit+ cells. Activated Egr1 increases Asxl1-/-Jak2VF HSPC commitment to monocyte/macrophage lineage and stimulates TNF-a secretion. Interestingly, we detected elevated TNF- a levels uniquely in ASXL1MT MF patients, indicating a relationship between this
Haematologica | 108 May 2023 1371 ARTICLE - ASXL1 mutations accelerate BM fibrosis in MPN Z. Shi et al.
cytokine and disease phenotype caused by ASXL1 mutations. TNF-a is an essential cytokine in MPN and its absence attenuates disease phenotypes in Jak2V617F mice through limiting the expansion of clones.26,39 Our study indicates that TNF-a most likely enhances fibrosis by promoting differentiation of monocytes to fibrocytes, and this effect is not malignant-specific. Thus, an Egr1-mediated monocyte/macrophage differentiation bias and TNF-a secretion synergistically resulted in increased fibrocyte production and accelerated BM fibrosis in ASXL1MT MF. Previous research and our data have confirmed that ruxolitinib has little effect on fibrocyte differentiation in MF patients’ samples in vitro. 23 We therefore combined ruxolitinib with a TNFR antagonist and found remarkably reduced fibrocyte differentiation in vitro. Future in vivo experiments with genetic models and patient-derived xenograft models are necessary to confirm the efficacy and safety of the combination further.
In conclusion, our study illustrates the crucial role of ASXL1 mutation in MPN phenotypes and the onset of BM fibrosis. ASXL1 mutations activate the EGR1-TNFA axis in MPN, leading to monocyte/macrophage-mediated inflammation and neoplastic fibrocyte-induced BM fibrosis. Ruxolitinib together with a TNFR antagonist may mitigate fibrocyte production, providing an attractive theoretical approach to anti-fibrosis treatment.
Disclosures
No conflicts of interest to disclose.
Contributions
ZJX, XDW, BL, GH and ZXS conceived the idea of this study; ZXS, JQL,YYZ, BL, XDW, HG and ZJX designed the research;
ZXS, JQL, YYZ, LY, YNC, PHZ, WJZ, YRY and HJH performed research; JYW, XY, TJQ, ZFX, LJP and SQQ collected clinical
References
1. Nangalia J, Green AR. Myeloproliferative neoplasms: from origins to outcomes. Blood. 2017;130(23):2475-2483.
2. Tefferi A. Primary myelofibrosis: 2021 update on diagnosis, riskstratification and management. Am J Hematol. 2021;96(1):145-162.
3. James C, Ugo V, Le Couédic JP, et al. A unique clonal JAK2 mutation leading to constitutive signalling causes polycythaemia vera. Nature. 2005;434(7037):1144-1148.
4. Pikman Y, Lee BH, Mercher T, et al. MPLW515L is a novel somatic activating mutation in myelofibrosis with myeloid metaplasia. PLoS Med. 2006;3(7):e270.
5. Nangalia J, Massie CE, Baxter EJ, et al. Somatic CALR mutations in myeloproliferative neoplasms with nonmutated JAK2. N Engl J Med. 2013;369(25):2391-2405.
6. Tefferi A. Challenges facing JAK inhibitor therapy for myeloproliferative neoplasms. N Engl J Med. 2012;366(9):844-846.
7. Akada H, Yan D, Zou H, Fiering S, Hutchison RE, Mohi MG.
data; ZXS, JQL, YYZ and YNC analyzed data; ZXS, JQL, YYZ, ZXL and YNC performed statistical and bioinformatic analyses; ZXS, YYZ, BL, XDW, GH and ZJX wrote the manuscript; and all authors reviewed and approved the manuscript. The authorship order among co-first authors was assigned according to working hours and contributions.
Acknowledgments
The authors would like to thank Bin Li (State Key Laboratory of Experimental Hematology) and Ningpu Ban (Pathology Center, Blood Diseases Hospital, CAMS) for assistance in preparation of murine pathology sections. We thank the State Key Laboratory of Experimental Hematology Flow Cytometry Center, Experimental Animal Center and Image Center for assistance with the experiments.
Funding
This study was supported in part by National Natural Science funds (N. 81530008, 81870104 and 82170139 to ZJX, 82070134 and 81600098 to BL, 81770129 to GH, and 81772676 and 31970579 to XDW), the National Key Research and Development Program (N. 2017YFA0504102 to XDW), Tianjin Natural Science funds (N. 18JCZDJC34900 to ZJX, 18JCJQJC48200 to XDW, and 19JCQNJC09400 to BL), the PUMC Youth Fund and Fundamental Research Funds for Central Universities (N. 3332019093 to JQL), CAMS Initiative Fund for Medical Sciences (N. 2016-I2M-1-001 and 2020I2M-C&T-A-020 to ZJX, and 2020-I2M-C&T-B-090 to ZFX), and the Haihe Laboratory of Cell Ecosystem Innovation Fund (N. HH22KYZX0033 to ZJX).
Data-sharing statement
The murine RNA-sequencing, ATAC-sequencing and ChIPsequencing data reported in this paper are available at the NCBI’s Gene Expression Omnibus (GEO) under accession number: GSE181291.
Conditional expression of heterozygous or homozygous Jak2V617F from its endogenous promoter induces a polycythemia vera-like disease. Blood. 2010;115(17):3589-3597.
8. Xing S, Wanting TH, Zhao W, et al. Transgenic expression of JAK2V617F causes myeloproliferative disorders in mice. Blood. 2008;111(10):5109-5117.
9. Mullally A, Lane SW, Ball B, et al. Physiological Jak2V617F expression causes a lethal myeloproliferative neoplasm with differential effects on hematopoietic stem and progenitor cells. Cancer Cell. 2010;17(6):584-596.
10. Vannucchi AM, Lasho TL, Guglielmelli P, et al. Mutations and prognosis in primary myelofibrosis. Leukemia. 2013;27(9):1861-1869.
11. Li B, Gale RP, Xu Z, et al. Non-driver mutations in myeloproliferative neoplasm-associated myelofibrosis. J Hematol Oncol. 2017;10(1):99.
12. Yang Y, Akada H, Nath D, Hutchison RE, Mohi G. Loss of Ezh2 cooperates with Jak2V617F in the development of myelofibrosis
Haematologica | 108 May 2023 1372 ARTICLE - ASXL1 mutations accelerate BM fibrosis in MPN Z. Shi et al.
in a mouse model of myeloproliferative neoplasm. Blood. 2016;127(26):3410-3423.
13. Chen E, Schneider RK, Breyfogle LJ, et al. Distinct effects of concomitant Jak2V617F expression and Tet2 loss in mice promote disease progression in myeloproliferative neoplasms. Blood. 2015;125(2):327-335.
14. Jacquelin S, Straube J, Cooper L, et al. Jak2V617F and Dnmt3a loss cooperate to induce myelofibrosis through activated enhancer-driven inflammation. Blood. 2018;132(26):2707-2721.
15. Simon J, Chiang A, Bender W. Ten different Polycomb group genes are required for spatial control of the abdA and AbdB homeotic products. Development. 1992;114(2):493-505.
16. Dey A, Seshasayee D, Noubade R, et al. Loss of the tumor suppressor BAP1 causes myeloid transformation. Science. 2012;337(6101):1541-1546.
17. Wu X, Bekker-Jensen IH, Christensen J, et al. Tumor suppressor ASXL1 is essential for the activation of INK4B expression in response to oncogene activity and anti-proliferative signals. Cell Res. 2015;25(11):1205-1218.
18. Abdel-Wahab O, Adli M, Lafave LM, et al. ASXL1 mutations promote myeloid transformation through loss of PRC2mediated gene repression. Cancer Cell. 2012;22(2):180-193.
19. Abdel-Wahab O, Gao J, Adli M, et al. Deletion of Asxl1 results in myelodysplasia and severe developmental defects in vivo. J Exp Med. 2013;210(12):2641-2659.
20. Guo Y, Zhou Y, Yamatomo S, et al. ASXL1 alteration cooperates with JAK2V617F to accelerate myelofibrosis. Leukemia. 2019;33(5):1287-1291.
21. Arber DA, Orazi A, Hasserjian R, et al. The 2016 revision to the World Health Organization classification of myeloid neoplasms and acute leukemia. Blood. 2016;127(20):2391-2405.
22. Ozono Y, Shide K, Kameda T, et al. Neoplastic fibrocytes play an essential role in bone marrow fibrosis in Jak2V617F-induced primary myelofibrosis mice. Leukemia. 2021;35(2):454-467.
23. Verstovsek S, Manshouri T, Pilling D, et al. Role of neoplastic monocyte-derived fibrocytes in primary myelofibrosis. J Exp Med. 2016;213(9):1723-1740.
24. Tefferi A, Vaidya R, Caramazza D, Finke C, Lasho T, Pardanani A. Circulating interleukin (IL)-8, IL-2R, IL-12, and IL-15 levels are independently prognostic in primary myelofibrosis: a comprehensive cytokine profiling study. J Clin Oncol. 2011;29(10):1356-1363.
25. Koschmieder S, Chatain N. Role of inflammation in the biology of myeloproliferative neoplasms. Blood Rev. 2020;42:100711.
26. Heaton WL, Senina AV, Pomicter AD, et al. Autocrine Tnf signaling favors malignant cells in myelofibrosis in a Tnfr2dependent fashion. Leukemia. 2018;32(11):2399-2411.
27. Fisher DAC, Miner CA, Engle EK, et al. Cytokine production in myelofibrosis exhibits differential responsiveness to JAK-STAT, MAP kinase, and NFκB signaling. Leukemia. 2019;33(8):1978-1995.
28. Auffray C, Sieweke MH, Geissmann F. Blood monocytes: development, heterogeneity, and relationship with dendritic cells. Annu Rev Immunol. 2009;27:669-692.
29. Domínguez PM, Ardavín C. Differentiation and function of mouse monocyte-derived dendritic cells in steady state and inflammation. Immunol Rev. 2010;234(1):90-104.
30. Locati M, Curtale G, Mantovani A. Diversity, mechanisms, and significance of macrophage plasticity. Annu Rev Pathol. 2020;15:123-147.
31. Chow A, Lucas D, Hidalgo A, et al. Bone marrow CD169+ macrophages promote the retention of hematopoietic stem and
progenitor cells in the mesenchymal stem cell niche. J Exp Med. 2011;208(2):261-271.
32. Schneider RK, Mullally A, Dugourd A, et al. Gli1(+) mesenchymal stromal cells are a key driver of bone marrow fibrosis and an important cellular therapeutic target. Cell Stem Cell. 2017;20(6):785-800.
33. Decker M, Martinez-Morentin L, Wang G, et al. Leptin-receptorexpressing bone marrow stromal cells are myofibroblasts in primary myelofibrosis. Nat Cell Biol. 2017;19(6):677-688.
34. Gleitz HFE, Dugourd AJF, Leimkühler NB, et al. Increased CXCL4 expression in hematopoietic cells links inflammation and progression of bone marrow fibrosis in MPN. Blood. 2020;136(18):2051-2064.
35. Asada S, Fujino T, Goyama S, Kitamura T. The role of ASXL1 in hematopoiesis and myeloid malignancies. Cell Mol Life Sci. 2019;76(13):2511-2523.
36. Scheuermann JC, de Ayala Alonso AG, Oktaba K, et al. Histone H2A deubiquitinase activity of the Polycomb repressive complex PR-DUB. Nature. 2010;465(7295):243-247.
37. Krishnaraju K, Hoffman B, Liebermann DA. Early growth response gene 1 stimulates development of hematopoietic progenitor cells along the macrophage lineage at the expense of the granulocyte and erythroid lineages. Blood. 2001;97(5):1298-1305.
38. Yao J, Mackman N, Edgington TS, Fan ST. Lipopolysaccharide induction of the tumor necrosis factor-alpha promoter in human monocytic cells. Regulation by Egr-1, c-Jun, and NFkappaB transcription factors. J Biol Chem. 1997;272(28):17795-17801.
39. Fleischman AG, Aichberger KJ, Luty SB, et al. TNFa facilitates clonal expansion of JAK2V617F positive cells in myeloproliferative neoplasms. Blood. 2011;118(24):6392-6398.
40. Leimkühler NB, Gleitz HFE, Ronghui L, et al. Heterogeneous bone-marrow stromal progenitors drive myelofibrosis via a druggable alarmin axis. Cell Stem Cell. 2021;28(4):637-652.e638.
41. Yang H, Kurtenbach S, Guo Y, et al. Gain of function of ASXL1 truncating protein in the pathogenesis of myeloid malignancies. Blood. 2018;131(3):328-341.
42. Balasubramani A, Larjo A, Bassein JA, et al. Cancer-associated ASXL1 mutations may act as gain-of-function mutations of the ASXL1-BAP1 complex. Nat Commun. 2015;6:7307.
43. Koschmieder S, Mughal TI, Hasselbalch HC, et al. Myeloproliferative neoplasms and inflammation: whether to target the malignant clone or the inflammatory process or both. Leukemia. 2016;30(5):1018-1024.
44. Zingariello M, Martelli F, Ciaffoni F, et al. Characterization of the TGF-b1 signaling abnormalities in the Gata1low mouse model of myelofibrosis. Blood. 2013;121(17):3345-3363.
45. Kisseleva T, Uchinami H, Feirt N, et al. Bone marrow-derived fibrocytes participate in pathogenesis of liver fibrosis. J Hepatol. 2006;45(3):429-438.
46. Reich B, Schmidbauer K, Rodriguez Gomez M, et al. Fibrocytes develop outside the kidney but contribute to renal fibrosis in a mouse model. Kidney Int. 2013;84(1):78-89.
47. Fursova NA, Turberfield AH, Blackledge NP, et al. BAP1 constrains pervasive H2AK119ub1 to control the transcriptional potential of the genome. Genes Dev. 2021;35(9-10):749-770.
48. Conway E, Rossi F, Fernandez-Perez D, et al. BAP1 enhances Polycomb repression by counteracting widespread H2AK119ub1 deposition and chromatin condensation. Mol Cell. 2021;81(17):3526-3541.
Haematologica | 108 May 2023 1373 ARTICLE - ASXL1 mutations accelerate BM fibrosis in MPN Z. Shi et al.
Heterogeneity in long-term outcomes for patients with Revised International Staging System stage II, newly diagnosed multiple myeloma
Anaïs Schavgoulidze,1 Valérie Lauwers-Cances,2 Aurore Perrot,1 Titouan Cazaubiel,3
Marie-Lorraine Chretien,4 Philippe Moreau,5 Thierry Facon,6 Xavier Leleu,7 Lionel Karlin,8
Anne-Marie Stoppa,9 Olivier Decaux,10 Karim Belhadj,11 Bertrand Arnulf,12 Mohamad Mohty,13 Clara Mariette,14 Cécile Fohrer-Sonntag,15 Pascal Lenain,16 Jean-Pierre Marolleau,17 Mourad Tiab,18 Carla Araujo,19 Frédérique Orsini-Piocelle,20 Arnaud Jaccard,21 Murielle Roussel,1 Lotfi Benboubker,22 Jean-Richard Eveillard,23 Mamoun Dib,24 Marion Divoux,25 Michel Attal,1 Hervé Avet-Loiseau1 and Jill Corre1
1Institut Universitaire du Cancer de Toulouse-Oncopole and Centre de Recherches en Cancérologie de Toulouse Institut National de la Santé et de la Recherche Médicale, Toulouse; 2Centre Hospitalier Universitaire Toulouse, Toulouse; 3Centre Hospitalier Universitaire Bordeaux, Bordeaux; 4Centre Hospitalier Universitaire Dijon, Dijon; 5Centre Hospitalier Universitaire Nantes, Nantes; 6Centre Hospitalier Universitaire Lille, Lille; 7Centre Hospitalier Universitaire Poitiers, Poitiers; 8Centre Hospitalier Universitaire Lyon, Lyon; 9Institut Paoli Calmettes, Marseille; 10Centre Hospitalier Universitaire Rennes, Rennes; 11Centre Hospitalier Universitaire Créteil, Créteil; 12Centre Hospitalier Universitaire, Hopital Saint Louis, Paris; 13Centre Hospitalier Universitaire, Hopital Saint-Antoine, Paris; 14Centre Hospitalier Universitaire Grenoble Alpes, Grenoble; 15Centre Hospitalier Universitaire Hautepierre, Strasbourg; 16Centre de Lutte Contre le Cancer - Centre Henri Becquerel, Rouen; 17Centre Hospitalier Universitaire Amiens, Amiens; 18Centre Hospitalier Départemental Vendée, La Roche-sur-Yon; 19Centre Hospitalier de la Côte Basque, Bayonne; 20Centre Hospitalier Annecy Genevois, Metz-Tessy; 21Centre Hospitalier Universitaire Limoges, Limoges; 22Centre Hospitalier Régional Universitaire Tours, Tours; 23Centre Hospitalier Universitaire de Brest, Brest; 24Centre Hospitalier Universitaire Angers, Angers and 25Centre Hospitalier Régional Universitaire Nancy Vandœuvre les Nancy, Nancy, France
Abstract
Correspondence: Jill CORRE corre.jill@iuct-oncopole.fr
Received: December 22, 2021.
Accepted: May 5, 2022.
Early view: September 29, 2022.
https://doi.org/10.3324/haematol.2021.280566
©2023 Ferrata Storti Foundation
Published under a CC BY-NC license
In the era of personalized treatment in multiple myeloma, high-risk patients must be accurately identified. The International Myeloma Working Group recommends using the Revised International Staging System (R-ISS) to pick out high-risk patients. The main purpose of our work was to explore the heterogeneity of outcome among R-ISS stage II patients assessing the impact of International Staging System (ISS) stage, chromosomal abnormalities and lactate dehydrogenase level in this subgroup. Data were collected from 1,343 patients up to 65 years old with newly diagnosed myeloma, enrolled in three clinical trials implemented by the Intergroupe Francophone du Myélome. All patients were eligible for intensive treatment. Patients in R-ISS stage II but ISS stage I had 1.6 times higher risk of death than patients in R-ISS stage I (adjusted hazard ratio=1.6; 95% confidence interval: 1.1-2.2; P=0.01) and patients in R-ISS stage II but with ISS stage III had a better overall survival than patients in R-ISS stage III (adjusted hazard ratio=0.7; 95% confidence interval: 0.4-0.9, P=0.02). However, among patients classified in R-ISS II, ISS stage and chromosomal abnormalities (del[17p] and t[4;14]) were still relevant prognostic factors for death. Dividing R-ISS stage II into three subgroups: ISS I with standard-risk chromosomal abnormalities, ISS II or III with standard-risk chromosomal abnormalities and patients with high-risk chromosomal abnormalities, median overall survival times were, respectively, not reached, 112 months and 71 months (P<0.001). In conclusion, stratification of patients in the R-ISS stage II group can be improved by taking into account chromosomal abnormalities and ISS. However, this does not improve predictive performance of survival models.
Introduction
Multiple myeloma (MM) is characterized by clonal accumulation of plasma cells in the bone marrow. Despite consider-
able progress in patients’ treatment, there is still wide heterogeneity in outcomes. This can be explained at least partially by the large molecular heterogeneity of MM, with a subgroup of high-risk patients who, although benefiting from
Haematologica | 108 May 2023 1374 ARTICLE - Plasma Cell Disorders
all therapeutic improvements, do not compensate for their poor prognosis at diagnosis. This is the case for patients harboring high-risk chromosomal abnormalities (CA).1–7
Currently, the International Myeloma Working Group (IMWG) recommends using the Revised International Staging System (R-ISS) to identify high-risk patients. This score combines the International Staging System (ISS) evaluation (based on serum b2-microglobulin and albumin levels), abnormal serum lactate dehydrogenase (LDH) level and three high-risk CA: del(17p), t(4;14) and t(14;16).8 Combining predictive factors in a score easy to understand and calculate has the advantage of a fast scoring system and the disadvantages of an oversimplified one. Especially when the parameters constituting the score are independent prognostic factors, their predictive overlap is low, and the risk they confer is additive. Indeed, condensing factors with independent predictive significance into a super-score is rarely successful at improving patients’ classification. Moreover, patients whose tumor harbors a t(4;14) translocation should not be considered as having the same risk as those harboring deletion 17p.1,9,10 Furthermore, the choice of t(14;16) translocation as a CA of interest is still debated as no study has been able to demonstrate its independent impact on the prognosis of patients with MM.11–13 Specifically, for patients to be considered as high-risk using the R-ISS, they must have at least ISS stage III and at least one of the specified CA or a LDH level higher than the upper limit of the normal range (ULN). This means that a patient with deletion 17p can be classified as middle risk (stage II of R-ISS) if he or she does not have ISS stage III at diagnosis and that a patient without any CA could be classified as high risk just because of his or her level of LDH, a biochemical parameter well-known for its lack of specificity.14 These potential misclassifications of patients led us to question the clinical utility of using the R-ISS instead of the ISS, CA and LDH level separately.
In the era of personalized treatment in MM, high-risk patients must, more than ever, be accurately identified, especially for the construction of clinical trials. R-ISS has been assessed by some studies,15–23 but to our knowledge, none of these studies has assessed the performance measures for survival prediction of this combined score compared to the use of the different factors separately. The main purpose of our work was to explore the heterogeneity of outcome among R-ISS stage II patients assessing the impact of ISS, CA and LDH level in this subgroup and to assess the predictive accuracy of the R-ISS and ISS on transplant-eligible patients with newly diagnosed MM (NDMM).
Methods
Patients and methods
Data were collected from NDMM patients up to 65 years old, enrolled in three clinical trials implemented by the
Intergroupe Francophone du Myélome (IFM): (i) IFM 200502 a phase III multicenter randomized, double-blind study comparing maintenance therapy using lenalidomide to placebo after autologous stem cell transplantation (NCT00430365); (ii) IFM/DFCI 2009 a phase III multicenter randomized, open-label study comparing a conventionaldose combination using lenalidomide, bortezomib and dexamethasone to high-dose treatment with autologous stem cell transplantation (NCT01191060); and (iii) IFM 2014-02 a phase III multicenter randomized, open-label study comparing the efficacy of combined high-dose chemotherapy using melphalan and bortezomib versus melphalan alone followed by stem cell transplant in frontline MM patients who were not progressing after induction therapy (NCT02197221). All patients gave written informed consent before entering the source trials. The three studies were approved by the institutional ethics committee of the different coordinating centers (Centre Hospitalier Universitaire Purpan, Toulouse, France for IFM 2005-02 and IFM 2014-02; University Hospital, Nantes, France for IFM/DFCI 2009).
All patients were eligible for high-dose treatment with autologous stem cell transplantation. All data needed for revised staging calculations were included in the data collection plan of these studies. High-risk CA were those defined by the R-ISS: del(17p), t(4;14) and t(14;16). R-ISS stage I includes patients with ISS stage I, no high risk CA and LDH level lower than the ULN. R-ISS stage III includes patients with ISS stage III and either high-risk CA or LDH level higher than the ULN. R-ISS stage II includes all other possible combinations.
Statistical analysis
Categorical data were presented as counts and percentages and compared using the c2 test or Fisher exact test. Continuous variables were described by mean ± standard deviation or median and interquartile range and compared using analysis of variance or the Kruskal-Wallis test. Follow-up duration was estimated using the reverse KaplanMeier method.24 Overall survival (OS) was defined as the time from randomization to death or the last date the patient was known alive. Progression-free survival was defined as the time from randomization to the first documentation of progressive disease, or death due to any cause and patients without progression were censored at the last date of clinical evaluation. All surviving patients were censored after 10 years of follow-up. As it was not possible to adjust correctly for treatment received, because each trial was set up at a different time and had different experimental and control arms, all survival analyses were stratified on treatment arms assuming that the effect of prognostic factors would be similar across strata. This assumption was tested for ISS and RISS by fitting proportional hazards models with inter-
Haematologica | 108 May 2023 1375 ARTICLE - R-ISS stage II heterogeneity in NDMM patients A. Schavgoulidze et al.
actions between the treatment arm and ISS and R-ISS. Hence, overall and progression-free survival curves, estimated using the Kaplan-Meier method, were compared using the stratified log-rank test. The hazard ratio (HR) along with 95% confidence interval (95% CI) for progression and for death were estimated by fitting multivariate stratified Cox proportional hazard models adjusted for age and sex, included as covariates in all models. Time-dependent receiver operating characteristic (ROC) curves were estimated at 10 years to assess predictive power. Discrimination was assessed by the Harrell concordance index (C-index) which estimates the proportion of all pairs of patients in whom prediction and outcome are concordant and takes values from 0.5 (no discrimination) to 1.0 (perfect discrimination).25 R2 was estimated as a measure of the proportion of the survival time explained by the model.26 To compare the different predictive values of RISS or ISS, sequential models were built in the same data set which included all patients in whom ISS, t(4;14), del(17p), t(14;16) and LDH were simultaneously available. Tests were two-sided, and P values <0.05 were considered statistically significant. All analyses were performed using Stata version 14.2 (StataCorp).
Results
The three pooled clinical trials had included 1,614 NDMM patients, 1,343 (83%) of whom were assessable by the RISS at diagnosis and constituted our database (486 patients from the IFM 2005-02 study, 623 patients from the IFM/DFCI 2009 and 234 from the IFM 2014-02 study). The median age of the patients was 58 years and 59% were male. Thirty-six percent of patients had ISS stage I, 47% ISS stage II and 17% ISS stage III; 18% had at least one highrisk CA and 19% had a LDH level higher than the ULN. The median duration of follow-up was 95 months (interquartile range, 81 months - not reached) and the estimated 5-year and 10-year probabilities of overall survival were 73% (95% CI: 70%-75%) and 46% (95% CI: 42%-49%), respectively. Due to high-risk CA or high LDH level, 138 of 487 (28%) ISS stage I patients were classified as R-ISS stage II and, conversely, the absence of high-risk CA and a normal LDH level had classified 116 of 222 (52%) ISS stage III patients as RISS stage II. Overall, 26%, 66% and 8% of patients had RISS stage I, II and III, respectively. The revised staging system results in a substantial increase in stage II category for R-ISS compared to ISS. The patients’ and disease characteristics at diagnosis according to R-ISS disease stages are presented in Table 1. As predictable, increasing R-ISS was associated with a worse Eastern Cooperative Oncology Group performance status, a higher serum creatinine level and a lower hemoglobin level at diagnosis. Survival analyses by R-ISS categories showed that median overall survival
was not reached for the R-ISS stage I patients, and was 108 and 62 months, respectively, for R-ISS stage II and III whereas median progression-free survival times were 41, 35 and 27 months for R-ISS stage I, II and III patients, respectively (Figure 1). In the same cohort of patients, median overall survival was not reached for ISS stage I patients, and was 104 and 82 months for ISS stage II and III. The median progression-free survival times were, 41, 34 and 29 months for ISS stage I, II and III patients, respectively. To assess whether or not improvement in discrimination was obtained between ISS and R-ISS, we compared overall survival and progression-free survival as predicted by the two staging systems between patients in whom the stage was not modified by the revised classification and patients in whom the stage was changed. Patients with R-ISS stage II but ISS stage I had a 1.6 times higher risk of death than patients with R-ISS stage I (adjusted HR=1.6; 95% CI: 1.12.2; P=0.01) whereas no statistically significant improvement was observed for progression-free survival (adjusted HR=1.1; 95% CI: 0.8-1.4; P=0.68). Moreover, patients with RISS stage II but ISS stage III had a better overall survival than patients with R-ISS stage III (adjusted HR=0.6; 95% CI: 0.4-0.9; P=0.01) whereas no statistically significant improvement was observed for progression-free survival (adjusted HR=0.8; 95% CI: 0.6-1.0; P=0.09) (Figure 2).
Focusing on R-ISS stage II, a large and heterogeneous category which encompasses patients from ISS stage I to III, we checked whether ISS stages, CA and high LDH level were still relevant risk factors for death or progression in this subgroup (Table 2). In a multivariate Cox proportional analysis, we observed that LDH level was not an independent risk factor for death, that ISS stage II and ISS stage III patients had similar and higher risk of death than ISS stage I patients and also that patients with high-risk CA had a worse overall survival than standard-risk patients. These results were similar whatever the CA studied: del(17p) vs no del(17p) (adjusted HR=2.7; 95% CI: 1.8-4.2), t(4;14) vs. no t(4;14) (adjusted HR=2.3; 95% CI: 1.6-3.3), and t(14;16) vs no t(14;16) (adjusted HR=2.1; 95% CI: 0.8-5.8) (Figure 3). For progression-free survival analyses, adverse cytogenetics was still a relevant risk factor in this subgroup of patients. In the light of this observation we divided R-ISS stage II into three subgroups (hereafter referred to as “modified R-ISS”): ISS stage I with standard-risk CA, ISS stage II or III with standard-risk CA, and high-risk CA patients. In these subgroups, median overall survival times were not reached, 112 months and 71 months, respectively (P<0.001).
Adjusted for age and sex, the performance of the R-ISS, modified R-ISS and ISS at predicting survival was similar. Time-dependent ROC curves that assess the predictive ability of a marker, C-index, which estimates the proportion of all pairs of patients in whom prediction and outcome are concordant, and R2, the explained variation of survival times by the model, showed no notable improvement in predic-
Haematologica | 108 May 2023 1376 ARTICLE - R-ISS stage II heterogeneity in NDMM patients A. Schavgoulidze et al.
Patient and disease characteristics at diagnosis according to Revised International Staging System disease stages.
R-ISS: Revised International Staging System; IQR: interquartile range; SD: standard deviation; ISS: International Staging System; LDH: lactate dehydrogenase; CA: chromosomal abnormalities; ULN upper limit of normal range.
tion. The same results were observed for progression-free survival (Table 3).
Discussion
Accurate survival prediction is important as prognostic factors may soon influence treatment choice. The indisputable prognostic factors for MM already used to stratify patients in therapeutic trials are ISS disease stage and CA, in particular t(4;14) and del(17p), while the value of t(14;16)
is still being debated. Subsequently, a revised version of the ISS was proposed and validated in further studies.8,15–23 This revised staging system was presented as simple and powerful because it allows three different prognostic groups to be identified based on three known prognostic factors: ISS, high-risk CA and LDH level higher than normal.8 We cannot deny the simplification, since from three factors, only one was constructed, and the results of our study had effectively shown an improved prediction for ISS stages I and III by adding the presence of high-risk CA or high LDH level. This improvement in prediction in the
R-ISS P-value Stage I N 349 (26.0%) Stage II N 888 (66.1%) Stage III N 106 (7.9%) Age, years Median 57.3 58.0 59.1 0.287 IQR 50.2-62.0 52.3-62.0 52.8-62.0 Sex, N (%) Male 205 (58.7) 522 (58.8) 61 (57.5) 0.970 Female 144 (41.3) 366 (41.2) 45 (42.5) Performance status, N (%) 0 177 (55.1) 382 (46.2) 30 (31.6) <0.001 1 126 (39.3) 350 (42.4) 48 (50.5) 2 18 (5.6) 94 (11.4) 17 (17.9) Monoclonal isotype, N (%) IgG 206 (59.0) 547 (61.6) 55 (51.9) 0.186 IgA 73 (20.9) 204 (23.0) 29 (27.4) Light-chain 62 (17.8) 121 (13.6) 18 (17.0) Other 8 (2.3) 16 (1.8) 4 (3.8) Hemoglobin, g/dL Mean (SD) 12.3 (1.7) 10.8 (1.7) 9.4 (1.4) <0.001 Creatinine, mmol/L Median 75.0 80.0 95.0 <0.001 IQR 64.6-86.9 68.0-98.7 76.1-123.9 ISS disease stage, N (%) Stage I 349 (100.0) 138 (15.5) 0 (0.0) <0.001 Stage II 0 (0.0) 634 (71.4) 0 (0.0) Stage III 0 (0.0) 116 (13.1) 106 (100.0) High-risk CA, N (%) Standard risk 349 (100.0) 568 (78.3) 36 (39.1) <.001 High-risk 0 (0.0) 157 (21.7) 56 (60.9) t(4;14), N (%) No 349 (100.0) 636 (87.1) 54 (58.7) <.001 Yes 0 (0.0) 94 (12.9) 38 (41.3) del(17p), N (%) No 349 (100.0) 673 (91.8) 72 (78.3) <0.001 Yes 0 (0.0) 60 (8.2) 20 (21.7) t(14;16), N (%) No 349 (100.0) 752 (98.8) 87 (95.6) 0.002 Yes 0 (0.0) 9 (1.2) 4 (4.4) LDH level, N (%) Higher than ULN 0 (0.0) 179 (22.0) 61 (64.2) <0.001 Lower than ULN 349 (100.0) 634 (78.0) 34 (35.8)
Table 1.
Haematologica | 108 May 2023 1377 ARTICLE - R-ISS stage II heterogeneity in NDMM patients A. Schavgoulidze et al.
low-risk and high-risk classes of the R-ISS was achieved at the expense of the creation of an intermediate-risk class grouping the majority of patients (66% in our study) in which we have shown that the ISS and CA remain independent prognostic factors. We have also shown that the subdivision of the R-ISS stage II group according to ISS and CA allows a better stratification of patients but without improving the performance measurement of the model. The performance of prognostic models is rarely reported in clinical research, although this is strongly recommended in guidelines for transparent reporting.27 Performance measures were not reported for either the ISS or the R-ISS at the time of their first publication and
few studies have tested their performance. Abe et al., Cheng et al. and Zhang et al. reported similar areas under the ROC curves or C-indexes between the ISS and RISS.19,28–30 We have shown that whatever the performance measure, there was no significant improvement in discrimination and classification of patients using the ISS, RISS or its modification by subdivision of the stage II category, suggesting that a better performance measure could only be reached using other biomarkers than those used by the R-ISS. The better stratification of the R-ISS stage II subgroup according to the presence of high-risk CA was also described by the Mayo clinic but an ISS effect was not reported or perhaps was not investigated in this

Haematologica | 108 May 2023 1378 ARTICLE - R-ISS stage II heterogeneity in NDMM patients A. Schavgoulidze et al. A B
Figure 1. Kaplan-Meier survival curves according to Revised International Staging System disease stages. (A) Overall survival. (B) Progression-free survival.
study due to the small sample size of their retrospective cohort.16 In the same vein, Walker et al. have suggested splitting the large R-ISS stage II subgroup according to cytogenetic signature.23 In their cohort of NDMM patients treated with novel therapies, Cho et al. described a similar event rate between ISS stage III patients reclassified as R-ISS stage II and those reclassified as R-ISS stage III, showing that the ISS effect is still of importance, despite the absence of high-risk CA or high LDH level.21 Independent risk factors are cumulative and the more independent risk factors to which a patient is exposed, the higher is his or her likelihood of having a worse outcome.31 Hence,
a simplified prognostic factor with fewer categories than the combined categories of the independent risk factors that make it up is unlikely to offer a better classification. In addition, in the era of personalized medicine, we argue that the paradigm concerning predictive factors is no longer related to the question “how simple should a staging system be?” but rather “what system allows me to classify patients correctly enough to offer them the most appropriate treatment?” This is to be understood, regardless of the number of variables to be included, since health information available today is increasingly numerous and precise, and contributes to more accurate pre-

Haematologica | 108 May 2023 1379 ARTICLE - R-ISS stage II heterogeneity in NDMM patients A. Schavgoulidze et al. A B
Figure 2. Kaplan-Meier survival curves comparing International Staging System disease stages I and III patients after Revised International Staging System reclassification. (A) Overall survival. (B) Progression-free survival. ISS: International Staging System; R_ISS: Revised International Staging System.
Table 2. Multivariate Cox proportional hazards regressions models for overall survival and progression-free survival, stratified by treatment and adjusted for age and sex, of Revised International Staging System stage II patients.
Overall survival Progression-free survival
High-risk chromosomal abnormality is defined by any of del(17p) or t(4;14) or t(14;16). High lactate dehydrogenase level is defined by a measure higher than the upper limit of the normal range. 95% CI: 95% confidence interval; ISS: International Staging System; CA: chromosomal abnormalities; LDH: lactate dehydrogenase.
diction models, as biotechnological and informatics enable us to simplify the most complex information. To exemplify these comments, we have recently shown that a predictive index based on six cytogenetic abnormalities (the linear predictor score) outperformed the predictive ability of the current definition of a high-risk cytogenetic group, the ISS or R-ISS alone and also the separate information based on ISS and the presence of del(17p) or t(4;14).5 For example, the C-index reached a value of 0.70 for the linear predictor score against only 0.55 for the RISS. Unfortunately, in the current study, we could not compare R-ISS to the linear predictor score as the necessary cytogenetic data, such as chromosome 1 abnormalities, were not available. Some other studies suggest improving the R-ISS classification by adding other criteria such as the detection of circulating plasma cells32 or gene-expression data.33 Some teams go further and suggest moving beyond traditional assays (cytogenetics) to favor whole genome sequencing or even whole exome sequencing to capture all the complexity of biological features.34 Obviously, we know that a score cannot be perfect since prognosis is a moving target. It evolves with the development of new therapeutic strategies, and prognostic scores that are efficient today will be rapidly outdated in the future. At the individual level, prognosis also changes according to relapses and the clonal evolution of the disease. Moreover, it has been shown that an undetectable minimal residual disease could overcome the poor prognosis of patients with high-risk myeloma; a single estimate of prognosis at diagnosis is no longer sufficient and the depth of response has to be taken into account.35 Finally, we should consider that both the ISS and R-ISS were developed to better balance adverse biology across study arms in randomized trials and were not designed for the
purpose of making treatment decisions for individual patients. Therefore, these scores probably do not have the precision needed to guide clinical decision-making for individual patients. However, as they are widely used by clinicians it is important to draw attention to the heterogeneity of patients with R-ISS stage II and to try to redefine this category.
The strength of this study lies in the use of more than one performance measure for survival models, time-dependent ROC analysis, the C-index and R2 to quantify the estimated predictive values of the ISS and R-ISS, but also in analyses performed using data from three large clinical trials, which ensured the quality of data with a sufficient follow-up of patients. However, this was also a limitation of the study as the assessment of the predictive ability in patients included in clinical trials limited our results to selected, newly diagnosed patients treated with high-dose chemotherapy. Nevertheless, we do not expect different results for older patients or for those who do not undergo transplantation, since ISS and high-risk CA are also independent prognostic factors in real-life settings.5,36–50 In any case, our results must be confirmed in an older population. Another limitation of our study is the underrepresentation of the cytogenetic aberration t(14;16), which is part of the definition of the R-ISS, although its prognostic significance has not been confirmed by all studies.11,13,36,51 The frequency of t(14;16) was low in our study (1.1%) whereas it can reach 3.5% in the real population. One explanation for this could be that information on this CA was specifically required in the IFM/DFCI 2009 study, whereas it was only recorded as “other CA” in the IFM 2005-02 and the IFM 2014 studies, as the IFM does not consider t(14;16) as an independent risk factor.11 Moreover, LDH level was not reported as a significant prognostic factor in our study, contrary to the main
Adjusted hazard ratio 95% CI P-value Adjusted hazard ratio 95% CI P-value ISS disease stage ISS stage II / stage I 1.70 1.14-2.53 0.009 1.19 0.89-1.60 0.239 ISS stage III / stage I 1.97 1.19-3.27 0.008 1.37 0.94-2.00 0.101 High-risk CA 2.41 1.78-3.26 <0.001 1.56 1.22-1.98 <0.001 High LDH level 1.06 0.75-1.50 0.737 0.91 0.70-1.19 0.497
Haematologica | 108 May 2023 1380 ARTICLE - R-ISS stage II heterogeneity in NDMM patients A. Schavgoulidze et al.
Figure 3. Kaplan-Meier survival curves according to high-risk cytogenetic abnormalities among Revised International Staging System stage II patients. (A) Overall survival according to del(17p) status. (B) Overall survival according to t(4;14) status. (C) Overall survival according to t(14;16) status. (D) Progression-free survival according to del(17p) status. (E) Progression-free survival according to t(4;14) status. (F) Progression-free survival according to t(14;16) status.

B D A C E
Haematologica | 108 May 2023 1381 ARTICLE - R-ISS stage II heterogeneity in NDMM patients A. Schavgoulidze et al. F
Table 3. R² values, C-index and time-dependent receiver operating characteristics, with 95% confidence intervals, for different Cox proportional hazards regression models for overall survival and progression-free survival of patients with multiple myeloma.
Overall survival
Progression free survival
ROC: receiver operating characteristic; ISS: International Staging System; R-ISS: Revised International Staging System.
study that validated the R-ISS,8 but it should be remembered that a high LDH level was not finally retained in the construction of the ISS either.38 This discrepancy may also reflect the fact that increased LDH cannot be related to damage to a specific organ, thus making it an inconstant or non-specific biological risk factor. In our study, in order to ensure that each patient was properly classified according to his or her LDH level, we checked the normal ranges of LDH in 80 laboratories over the study period as normal levels of LDH in the blood can vary depending on the laboratory. Moreover, our population was younger than the population who served to establish the R-ISS and in better health than the whole myeloma population. To be included in our trials, patients had to be under 66 years of age and have normal or subnormal kidney, liver, heart and lung function to be eligible for a transplant. As LDH levels are elevated in the aging population and also in numerous clinical conditions, our selection of patients may have resulted in the creation of a less high-risk group of patients. In conclusion, our data suggest that the R-ISS accurately classifies patients into stages I and III but that within the R-ISS stage II group, ISS and CA are still relevant prognostic factors. As the R-ISS has become the standard for risk stratification in clinical trials, our data suggest that the R-ISS stage II group could be divided according to the presence or not of high-risk CA and ISS to refine stratification. Finally, improving the performance of any model is
References
1. Avet-Loiseau H, Leleu X, Roussel M, et al. Bortezomib plus dexamethasone induction improves outcome of patients with t(4;14) myeloma but not outcome of patients with del(17p). J Clin Oncol. 2010;28(30):4630-4634.
2. Moreau P, Cavo M, Sonneveld P, et al. Combination of International Scoring System 3, high lactate dehydrogenase, and t(4;14) and/or del(17p) identifies patients with multiple myeloma
a challenge and it seems that models have to be made more complex to increase their performance. We believe that this can be achieved by incorporating cytogenetics, genomics and also longitudinally relevant biomarkers such as imaging information and residual disease status.
Disclosures
No conflicts of interest to disclose.
Contributions
JC, VL-C and HA-L designed the research; JC, AS and VL-C analyzed data and wrote the manuscript, which was reviewed and edited by the other co-authors; VL-C performed the statistical analy sis. All other authors provided study samples and clinical data.
Acknowledgments
We thank the Intergroupe Francophone du My élome for providing patients’ samples and clinical data, with special thanks to Sandrine Rollet.
Data-sharing statement
The data that support the findings of this study are available on request from the corresponding author, JC. Of note, patient-level data will be anonymized, and study documents will be redacted in order to protect the privacy of trial participants.
(MM) treated with front-line autologous stem-cell transplantation at high risk of early MM progression-related death. J Clin Oncol. 2014;32(20):2173-2180.
3. Bock F, Lu G, Srour SA, et al. Outcome of patients with multiple myeloma and CKS1B gene amplification after autologous hematopoietic stem cell transplantation. Biol Blood Marrow Transplant. J Am Soc Blood Marrow Transplant.
Models R² C-index Timedependent ROC R² C-index Timedependent ROC ISS disease stage, 95% CI 7.4 0.61 63.2 2.3 0.56 59.7 4.2-11.1 0.59-0.64 58.3-68.1 1.0-4.2 0.54-0.58 53.8-65.6 R-ISS disease stage, 95% CI 9.4 0.62 65.0 2.7 0.56 58.2 5.8-13.6 0.59-0.65 59.4-70.6 1.2-4.7 0.54-0.59 52.3-64.0 Modified R-ISS disease stage by dividing the stage II group, 95% CI 13.9 0.62 65.3 3.8 0.58 58.3 9.4-18.7 0.59-0.64 60.6-70.1 2.0-6.0 0.56-60.4 52.8-63.9
Haematologica | 108 May 2023 1382
A. Schavgoulidze
al.
ARTICLE - R-ISS stage II heterogeneity in NDMM patients
et
2016;22(12):2159-2164.
4. Ziogas DC, Dimopoulos MA, Kastritis E. Prognostic factors for multiple myeloma in the era of novel therapies. Expert Rev Hematol. 2018;11(11):863-879.
5. Perrot A, Lauwers-Cances V, Tournay E, et al. Development and validation of a cytogenetic prognostic index predicting survival in multiple myeloma. J Clin Oncol. 2019;37(19):1657-1665.
6. Walker BA, Mavrommatis K, Wardell CP, et al. A high-risk, double-hit, group of newly diagnosed myeloma identified by genomic analysis. Leukemia. 2019;33(1):159-170.
7. Corre J, Perrot A, Caillot D, et al. Del17p without TP53 mutation confers poor prognosis in intensively treated newly diagnosed multiple myeloma patients. Blood. 2021;137(9):1192-1195.
8. Palumbo A, Avet-Loiseau H, Oliva S, et al. Revised International Staging System for multiple myeloma: a report from International Myeloma Working Group. J Clin Oncol. 2015;33(26):2863-2869.
9. San Miguel JF, Schlag R, Khuageva NK, et al. Bortezomib plus melphalan and prednisone for initial treatment of multiple myeloma. N Engl J Med. 2008;359(9):906-917.
10. Du C, Mao X, Xu Y, et al. 1q21 gain but not t(4;14) indicates inferior outcomes in multiple myeloma treated with bortezomib. Leuk Lymphoma. 2020;61(5):1201-1210.
11. Avet-Loiseau H, Malard F, Campion L, et al. Translocation t(14;16) and multiple myeloma: is it really an independent prognostic factor? Blood. 2011;117(6):2009-2011.
12. Fonseca R, Blood E, Rue M, et al. Clinical and biologic implications of recurrent genomic aberrations in myeloma. Blood. 2003;101(11):4569-4575.
13. Goldman‐Mazur S, Jurczyszyn A, Castillo JJ, et al. A multicenter retrospective study of 223 patients with t(14;16) in multiple myeloma. Am J Hematol. 2020;95(5):503-509.
14. Jacobs EL, Haskell CM. Clinical use of tumor markers in oncology. Curr Probl Cancer. 1991;15(6):299-360.
15. Kastritis E, Terpos E, Roussou M, et al. Evaluation of the Revised International Staging System in an independent cohort of unselected patients with multiple myeloma. Haematologica. 2017;102(3):593-599.
16. González-Calle V, Slack A, Keane N, et al. Evaluation of Revised International Staging System (R-ISS) for transplant-eligible multiple myeloma patients. Ann Hematol. 2018;97(8):1453-1462.
17. Ozaki S, Handa H, Saitoh T, et al. Evaluation of the Revised International Staging System (R-ISS) in Japanese patients with multiple myeloma. Ann Hematol. 2019;98(7):1703-1711.
18. Chen H-M, Wei W, Peng R, et al. [Clinical application of R-ISS staging system in 412 newly diagnosed patients with multiple myeloma]. Zhongguo Shi Yan Xue Ye Xue Za Zhi. 2019;27(1):110-114.
19. Abe Y, Sunami K, Yamashita T, et al. Improved survival outcomes and relative youthfulness of multiple myeloma patients with t(4;14) receiving novel agents are associated with poorer performance of the Revised International Staging System in a real aging society. Oncotarget. 2019;10(5):595-605.
20. Jimenez-Zepeda VH, Duggan P, Neri P, et al. Revised International Staging System applied to real world multiple myeloma patients. Clin Lymphoma Myeloma Leuk. 2016;16(9):511-518.
21. Cho H, Yoon DH, Lee JB, et al. Comprehensive evaluation of the Revised International Staging System in multiple myeloma patients treated with novel agents as a primary therapy. Am J Hematol. 2017;92(12):1280-1286.
22. Tandon N, Rajkumar SV, LaPlant B, et al. Clinical utility of the Revised International Staging System in unselected patients with newly diagnosed and relapsed multiple myeloma. Blood Cancer J. 2017;7(2):e528-e528.
23. Walker I, Coady A, Neat M, et al. Is the Revised International Staging System for myeloma valid in a real world population? Br J Haematol. 2018;180(3):451-454.
24. Schemper M, Smith TL. A note on quantifying follow-up in studies of failure time. Control Clin Trials. 1996;17(4):343-346.
25. Newson RB. Comparing the predictive powers of survival models using Harrell’s C or Somers’ D. Stata J. 2010;10(3):339-358.
26. Royston P. Explained variation for survival models. Stata J. 2006;6(1):83-96.
27. Moons KGM, Altman DG, Reitsma JB, et al. Transparent reporting of a multivariable prediction model for individual prognosis or diagnosis (TRIPOD): explanation and elaboration. Ann Intern Med. 2015;162(1):W1-73.
28. Zhang Y, Chen X-L, Chen W-M, Zhou H-B. Prognostic nomogram for the overall survival of patients with newly diagnosed multiple myeloma. Biomed Res Int. 2019;2019:5652935.
29. Cheng Q, Zhao F, Zhang B, et al. Prognostic nomogram incorporating cytokines for overall survival in patients with newly diagnosed multiple myeloma. Int Immunopharmacol. 2021;99:108016.
30. Cheng Q, Cai L, Zhang Y, et al. Circulating plasma cells as a biomarker to predict newly diagnosed multiple myeloma prognosis: developing nomogram prognostic models. Front Oncol. 2021;11:639528.
31. Weinhold N, Salwender HJ, Cairns DA, et al. Chromosome 1q21 abnormalities refine outcome prediction in patients with multiple myeloma - a meta-analysis of 2,596 trial patients. Haematologica. 2021;106(10):2754-2758.
32. Galieni P, Travaglini F, Vagnoni D, et al. The detection of circulating plasma cells may improve the Revised International Staging System (R-ISS) risk stratification of patients with newly diagnosed multiple myeloma. Br J Haematol. 2021;193(3):542-550.
33. Kuiper R, Zweegman S, van Duin M, et al. Prognostic and predictive performance of R-ISS with SKY92 in older patients with multiple myeloma: the HOVON-87/NMSG-18 trial. Blood Adv. 2020;4(24):6298-6309.
34. Rustad EH, Yellapantula VD, Glodzik D, et al. Revealing the impact of structural variants in multiple myeloma. Blood Cancer Discov. 2020;1(3):258-273.
35. Goicoechea I, Puig N, Cedena M-T, et al. Deep MRD profiling defines outcome and unveils different modes of treatment resistance in standard- and high-risk myeloma. Blood. 2021;137(1):49-60.
36. Fonseca R, Bergsagel PL, Drach J, et al. International Myeloma Working Group molecular classification of multiple myeloma: spotlight review. Leukemia. 2009;23(12):2210-2221.
37. Keats JJ, Reiman T, Maxwell CA, et al. In multiple myeloma, t(4;14)(p16;q32) is an adverse prognostic factor irrespective of FGFR3 expression. Blood. 2003;101(4):1520-1529.
38. Greipp PR, San Miguel J, Durie BGM, et al. International Staging System for multiple myeloma. J Clin Oncol. 2005;23(15):3412-3420.
39. Avet-Loiseau H, Attal M, Moreau P, et al. Genetic abnormalities and survival in multiple myeloma: the experience of the Intergroupe Francophone du Myélome. Blood. 2007;109(8):3489-3495.
40. Chang H, Qi X, Jiang A, et al. 1p21 deletions are strongly associated with 1q21 gains and are an independent adverse prognostic factor for the outcome of high-dose chemotherapy in patients with multiple myeloma. Bone Marrow Transplant. 2010;45(1):117-121.
41. Waheed S, Shaughnessy JD, van Rhee F, et al. International Staging System and metaphase cytogenetic abnormalities in the
Haematologica | 108 May 2023 1383 ARTICLE - R-ISS stage II heterogeneity in NDMM patients A. Schavgoulidze et al.
era of gene expression profiling data in multiple myeloma treated with total therapy 2 and 3 protocols. Cancer. 2011;117(5):1001-1009.
42. Dimopoulos MA, Kastritis E, Michalis E, et al. The International Scoring System (ISS) for multiple myeloma remains a robust prognostic tool independently of patients’ renal function. Ann Oncol. 2012;23(3):722-729.
43. Avet-Loiseau H, Durie BGM, Cavo M, et al. Combining fluorescent in situ hybridization data with ISS staging improves risk assessment in myeloma: an International Myeloma Working Group collaborative project. Leukemia. 2013;27(3):711-717.
44. Hebraud B, Leleu X, Lauwers-Cances V, et al. Deletion of the 1p32 region is a major independent prognostic factor in young patients with myeloma: the IFM experience on 1195 patients. Leukemia. 2014;28(3):675-679.
45. Jian Y, Chen X, Zhou H, et al. Prognostic impact of cytogenetic abnormalities in multiple myeloma: a retrospective analysis of 229 patients. Medicine (Baltimore). 2016;95(19):e3521.
46. Sergentanis TN, Kastritis E, Terpos E, Dimopoulos MA, Psaltopoulou T. Cytogenetics and survival of multiple myeloma: isolated and combined effects. Clin Lymphoma Myeloma Leuk. 2016;16(6):335-340.
47. Pawlyn C, Morgan GJ. Evolutionary biology of high-risk multiple myeloma. Nat Rev Cancer. 2017;17(9):543-556.
48. Pawlyn C, Davies FE. Toward personalized treatment in multiple myeloma based on molecular characteristics. Blood. 2019;133(7):660-675.
49. Thakurta A, Ortiz M, Blecua P, et al. High subclonal fraction of 17p deletion is associated with poor prognosis in multiple myeloma. Blood. 2019;133(11):1217-1221.
50. Sato S, Kamata W, Okada S, Tamai Y. Clinical and prognostic significance of t(4;14) translocation in multiple myeloma in the era of novel agents. Int J Hematol. 2021;113(2):207-213.
51. Mina R, Joseph NS, Gay F, et al. Clinical features and survival of multiple myeloma patients harboring t(14;16) in the era of novel agents. Blood Cancer J. 2020;10(4):40.
Haematologica | 108 May 2023 1384 ARTICLE - R-ISS stage II heterogeneity in NDMM patients A. Schavgoulidze et al.
Defective binding of ETS1 and STAT4 due to a mutation in the promoter region of THPO as a novel mechanism of congenital amegakaryocytic thrombocytopenia
Faleschini,1 Alessandro Pecci4,5 and Anna Savoia1,6
1Institute for Maternal and Child Health, IRCCS “Burlo Garofolo”, Trieste, Italy; 2Department of Pediatric Hematology, Oncology and Bone Marrow Transplant-Sheba Medical Center, Tel Hashomer, Israel; 3The Center for Cancer Research-Sheba Medical Center, Tel Hashomer, Israel; 4Department of Internal Medicine, IRCCS Policlinico San Matteo Foundation, Pavia, Italy; 5University of Pavia, Pavia, Italy and 6Department of Medical Sciences, University of Trieste, Trieste, Italy;
*VC and EA contributed equally as co-first authors.
Abstract
Correspondence: A. Savoia
anna.savoia@burlo.trieste.it
anna.savoia@univr.it
Received: May 23, 2022.
Accepted: August 30, 2022.
Early view: October 13, 2022.
https://doi.org/10.3324/haematol.2022.281392
©2023 Ferrata Storti Foundation
Published under a CC-BY-NC license
Congenital amegakaryocytic thrombocytopenia (CAMT) is a recessive disorder characterized by severe reduction of megakaryocytes and platelets at birth, which evolves toward bone marrow aplasia in childhood. CAMT is mostly caused by mutations in MPL (CAMT-MPL), the gene encoding the receptor of thrombopoietin (THPO), a crucial cytokine regulating hematopoiesis. CAMT can be also due to mutations affecting the THPO coding region (CAMT-THPO). In a child with the clinical picture of CAMT, we identified the homozygous c.-323C>T substitution, affecting a potential regulatory region of THPO. Although mechanisms controlling THPO transcription are not characterized, bioinformatics and in vitro analysis showed that c.-323C>T prevents the binding of transcription factors ETS1 and STAT4 to the putative THPO promoter, impairing THPO expression. Accordingly, in the proband the serum THPO concentration indicates defective THPO production. Based on these findings, the patient was treated with the THPO-mimetic agent eltrombopag, which induced a significant increase in platelet count and stable remission of bleeding symptoms. Herein, we report a novel pathogenic variant responsible for CAMT and provide new insights into the mechanisms regulating transcription of the THPO gene.
Introduction
Congenital amegakaryocytic thrombocytopenia (CAMT) is an autosomal recessive disease characterized by thrombocytopenia with severely reduced or absent megakaryocytes in the bone marrow and progression toward trilineage bone marrow aplasia. Most affected individuals have mutations in MPL, the gene encoding for the receptor of thrombopoietin (THPO),1 and are referred to as having CAMT-MPL. 2 THPO is a crucial regulator of hematopoiesis, being required for both the survival of multipotent hematopoietic progenitors and their differentiation into megakaryocytes, explaining the clinical picture of CAMT.3
Indeed, a few homozygous mutations, (p.Arg38Cys, p.Arg99Trp, p.Arg119Cys, and Arg157*), all affecting the coding region of the THPO gene, have recently been identified in families with severe amegakaryocytic thrombocytopenia (CAMT-THPO2), in some cases associated with
multilineage bone marrow failure.4-6 Moreover, monoallelic mutations (p.Arg31*, p.Arg99Trp, p.Glu204Glyfs*123, and p.Leu269Profs*58) of the same gene cause a dominant form of thrombocytopenia with incomplete penetrance characterized by mild reduction in platelet count and normal platelet size.7,8 Consistent with a haploinsufficiency effect, mild thrombocytopenia is one of the features of the syndromic disorders associated with microdeletions of chromosome 3 containing the THPO gene.4,9,10 Therefore, there is a growing body of evidence regarding the role of THPO alterations as the cause of both autosomal recessive and dominant thrombocytopenia.
Here, we report a patient with severe amegakaryocytic thrombocytopenia caused by a homozygous mutation (c.323C>T) in the promoter region of the THPO gene. Functional studies demonstrated that the mutation affects the binding of two transcription factors, ETS1 and STAT4, to the THPO promoter, significantly reducing the expression of THPO. Consistent with these findings, the affected in-
Valeria Capaci,1* Etai Adam,2* Ifat Bar-Joseph,3 Michela
Haematologica | 108 May 2023 1385 ARTICLE - Platelet Biology & its Disorders
dividual was successfully treated with the THPO receptor agonist eltrombopag.11
Methods
Patient
This study was conducted in accordance with the guidelines of the local Helsinki Committee.
Exome sequencing
Whole exome sequencing was performed using the Twist Human Core Exome Plus Kit (Twist Bioscience, San Francisco, CA, USA) as the gene capture kit, and the enriched libraries were sequenced on a NovaSeq 6000 sequencing machine (Illumina, San Diego, CA, USA). For each sample, paired end reads (2×100 bp) were obtained and processed. The Illumina Dragen Bio-IT Platform version 3.8 was used to align reads to the human reference genome (hg38) based on the Smith-Waterman algorithm,12 as well as to call variants based on the GATK variant caller version 3.7.13 Additional variants were called with Freebayes version 1.2.0.14 Variant annotation was performed using KGG-Seq version 1.2.15 Further annotation and filtration steps were performed by in-house scripts using various additional public and private datasets such as the Human Gene Mutation Database,16 ClinVar,17 gnomAD18 and the Sheba Medical Center's database of all variants from previously sequenced samples. Final variant analysis was only performed on rare mutations with an allele frequency of <0.05 in gnomAD and the in-house database, and that were annotated as protein changing and protein-damaging based on KGG-Seq, in addition to all variants that were previously reported as pathogenic or likely pathogenic in the HGMD or ClinVar datasets.
Plasmids
pGL3-THPO reporter constructs were obtained by cloning each THPO promoter into the pGL3-Basic construct (Promega, Madison, WI, USA) plasmid, upstream to a Firefly luciferase reporter gene, between the KpnII and HindIII restriction sites (New England Biolabs). The Renilla luciferase which is used to normalize luciferase activity is expressed by a pRL-CMV plasmid. The promoter sequences of THPO were obtained from Ensembl (http://www.ensembl.org/index.html) and UCSC (http://genome.ucsc.edu/cgibin/ hgGateway) databases and amplified from control genomic DNA with AccuPrimeTM Taq DNA Polymerase High Fidelity (InvitrogenTM, #12346086), following the manufacturer’s instructions.
In the pGL3-THPO reporter the c.-323C>T was introduced using a Phusion™ Site-Directed Mutagenesis Kit (ThermoScientific, F541), following the manufacturer’s instructions.
Statistical analyses and reproducibility
At least three independent replicates were performed for each of the experiments. All graphs present single data point mean ± standard error of mean. Statistical tests were performed using GraphPad Prism 8. P values were obtained using a two-tailed Student unpaired parametric t test. Reported blots and micrographs are representative of three independent experiments. This study does not include any data deposited in external repositories.
Other standard methods
Methods for standard procedures, including cell culture and transfection, RNA extraction and quantitative realtime polymerase chain reaction, chromatin immunoprecipitation, western blotting and co-immunoprecipitation analysis, dual luciferase assays, and proximity ligation assay are reported in the Online Supplementary Methods
Results
Clinical features of the proband and his family members
The proband (II-3) (Figure 1A) was a 3.5-year-old boy when he presented to our hospital with easy bruising and thrombocytopenia (platelet count: 21x109/L) with a normal mean platelet volume. He had a lifelong history of frequent bruising but no other bleeding symptoms. On a blood count shortly after birth, his platelet count had been 70x109/L but no further workup was done until the age of 2 years, when he was diagnosed with urethral stenosis. At that time, he showed severe thrombocytopenia (platelet count: 20x109/L) and received his only platelet transfusion prior to meatotomy to correct the stenosis. Revision of the blood counts performed prior to our evaluation did not reveal other cytopenias aside from mild occasional neutropenia. Bone marrow examination from two different biopsies showed a normocellular marrow with severe hypoplasia of the megakaryocytes, with a few small immature forms seen, and mild dyserythropoiesis, consistent with amegakaryocytic thrombocytopenia. Chromosomal breakage analysis did not reveal increased breakage in the presence of diepoxybutane, ruling out Fanconi anemia. Moreover, chromosomal analysis on the bone marrow showed a normal 46,XY karyotype and fluorescence in situ hybridization studies did not reveal deletion of chromosomes 5, 7, 5q, 7q, or 20q.
The proband was born to Muslim Palestinian parents who are first cousins to one another. His mother (I-2) has a history of mild thrombocytopenia that worsened during each pregnancy; her platelet counts are now stable around 80x109/L, and her mean platelet volume is normal. She has no history of bleeding symptoms. The proband’s younger sibling (II-4) had a platelet count of 130x109/L around birth but several weeks later a repeat platelet
Haematologica | 108 May 2023 1386 ARTICLE - Loss of THPO expression as a new mechanism of CAMT V. Capaci et al.
Figure 1. Identification of c.-323C>T in the promoter region of the THPO gene in a patient with congenital amegakaryocytic thrombocytopenia. (A) Pedigree of the family. The black symbol indicates the subject carrying the homozygous c.-323C>T (NM_000460.2) mutation with severe thrombocytopenia, and the gray symbols the carriers with mild thrombocytopenia. (B) Electropherograms of the THPO gene showing the c.-323C>T mutation in the proband and in his mother. (C) Genomic structure of the human THPO gene and its transcript variants 5 and 1. The genomic structures of the gene in different species are also reported for evolutionary comparison. The black boxes represent the open reading frame. The red boxes show the regions orthologous to the 119 bp human region surrounding the c.-323C nucleotide aligned in (D). The relative genomic positions of the orthologous regions upstream of the ATG translation start site are also indicated. (D) Multiple alignments of the red squared regions indicated in (C) from different species. The c.-323C nucleotide (bold case), as well as the surrounding positions, are well conserved among species. The asterisks indicate conserved nucleotides. Plt: platelet count x 109/L.

C A
Haematologica | 108 May 2023 1387 ARTICLE - Loss of THPO expression as a new mechanism of CAMT V. Capaci et al. D B
count was 160x109/L. There are no other cytopenias in any family members.
Identification of c.-323C>T in the promoter region of the THPO gene
Whole-exome sequencing allowed us to identify a homozygous nucleotide substitution (chr3:g.184096040G>A from GRCh37) within the THPO gene in the proband (Figure 1B). The human THPO gene is transcribed from two different promoters, generating two major mRNA, one of 2186 bp (transcription variant 5) and the other of 1918 bp (transcription variant 1) originated from different transcription start sites (Figure 1C). Variant 5 (NM_001290003.1) is constituted of seven exons with the first ATG in exon 2 and a putative open reading frame of 493 codons. The chr3:g.184096040G>A substitution would affect nucleotide C at position 98 (c.98C>T; p.Pro33Leu). However, this putative 493 amino acid isoform has never been reported, likely because its translation is inhibited by a series of translational start codons (uAUG) located in the 5′-UTR.19
The transcription variant 1 (NM_000460.4) consists of six exons with the first ATG in exon 2 and an open reading frame of 353 codons (Figure 1C).20,21 Bioinformatics analysis showed that in this transcription variant, the chr3:g.184096040G>A substitution would affect the nucleotide at position 45 upstream of the transcription start site (or nucleotide 323 upstream of the ATG; c.-323C>T).
Considering that the only protein so far detected is the 353 amino acid isoform translated by variant 1, we focused on the c.-323C>T substitution, hypothesizing that it impairs THPO basal promoter activity.
Consistent with consanguinity, segregation analysis revealed that the parents and the younger sibling of the proband (II-4) were heterozygous for c.-323C>T whereas the other two healthy siblings were homozygous for the wildtype allele (Figure 1A). The variant is very rare, reported in the dbSNP (rs1208732776) but not in GnomAD. Moreover, multiple alignment of orthologous regions containing the c.-323C nucleotide from different species shows high sequence homology for a stretch of 25 nucleotides, suggesting an evolutionary conserved function of this region (Figure 1D).
No additional variant was detected in other genes causative of amegakaryocytic thrombocytopenias, such as MPL, MECOM, HOXA11 or RBM8A, nor in those associated with Fanconi anemia or responsible for other inherited bone marrow failure syndromes (Online Supplementary Table S1).
c.-323C>T prevents STAT4 and ETS1 binding and strongly reduces THPO expression
Considering that the mechanisms regulating expression of the THPO gene are still elusive, we inspected the region upstream of the transcription start site, looking for pu-
tative binding sites of transcription factors. Nucleotide c.323C was predicted to be within the consensus sequence for the binding of c-ETS-1 (here after ETS1) and STAT4 (Figure 2A). Of note, these putative binding sites were not recognized when the c.-323C>T substitution was included in a query sequence.
To evaluate its potential pathogenic role, we cloned the wild-type and c.-323C>T region (spanning 450 bp upstream of the transcription start site) of the THPO promoter upstream of the luciferase reporter gene. Transfecting HEK293T cells, which constitutively express THPO,20 we observed that c.-323C>T significantly reduced (by almost 80%) the reporter activity as compared to the wild-type counterpart (Figure 2B).
To determine whether ETS1 and STAT4 regulate THPO transcription, we performed the same assay as above after silencing the two transcription factors, either alone or in combination, and we observed a significant reduction of the luciferase activity when the reporter gene was under the control of the wild-type promoter (Figure 2C). Of note, the luciferase activity was almost absent when the reporter gene was regulated by the mutant promoter, independently of ETS1 and STAT4 downregulation, further supporting the concept that c.-323C>T prevents recruitment of the transcription factors on the THPO regulatory sequences.
Since biological samples from the proband were unavailable, we developed a transient in vitro chromatin immunoprecipitation assay22 to determine whether ETS1 and STAT4 bind the THPO promoter directly. Using the reporter constructs in HEK293T cells, we observed that both ETS1 and STAT4 bound strongly to the synthetic wild-type THPO promoter. Binding of the transcription factors to the mutant promoter was lower, though with different affinity (Figure 2D). Taken together, these data suggest that ETS1 and STAT4 are able to bind the THPO promoter and that this interaction is significantly impaired, at least for STAT4, in the presence of c.-323C>T.
STAT4, ETS1 and STAT3 regulate THPO expression in a liver cell line
Since THPO is mainly produced in the liver,3 we evaluated THPO expression levels by quantitative real-time polymerase chain reaction analysis and western blotting in HepG2 cells. Knocking down ETS1 and STAT4 alone or in combination strongly reduced THPO at both mRNA and protein levels (Figure 3A, B), demonstrating that ETS1 and STAT4 regulate its endogenous expression in a hepatocyte cell model.
To determine whether STAT4 and ETS1 interact with each other, we carried out proximity ligation assays, revealing the presence of complexes between STAT4 and ETS1, whose formation was reduced upon STAT4 knockdown (Figure 3C). The interaction of the two transcription fac-
Haematologica | 108 May 2023 1388 ARTICLE - Loss of THPO expression as a new mechanism of CAMT V. Capaci et al.
Figure 2. Variant c.-323C>T prevents STAT4 and ETS1 binding on the THPO promoter. (A) Schematic representation of the putative binding sites for transcription factors in the regions (wild-type and mutant form of transcript variant 1) upstream of the transcription initiation site (arrow). The c.-323C>T substitution is in bold case. (B) Luciferase assays were performed in HEK293T cells with pGL3-THPO in either the wild type or c.-323C>T forms. Renilla luciferase co-transfected with the reporter was used to normalize for transfection efficiency. (C) Luciferase assays were performed in HEK293T cells upon silencing endogenous STAT4 and ETS1 alone or in combination with specific short interfering RNA for 48 h. (D) Lysates of HEK293T cells transfected with pGL3-THPO either wild-type or c.-323C>T were subjected to chromatin immunoprecipitation analysis with antibodies recognizing STAT4 or ETS1, or with Protein A/G PLUS-Agarose as a negative control. Binding to the THPO promoter region was calculated as the fraction of the input chromatin bound. Binding to non-specific chromatin is shown in the right panel. wt: wildtype; TF: transcription factor; RLU: relative luminescence units; ns: not significant;si: short interfering; ChIP Ab: chromatin immunoprecipitation antibody; CTRL: control.

A B C
Haematologica | 108 May 2023 1389 ARTICLE - Loss of THPO expression as a new mechanism of CAMT V. Capaci et al. D
tors was confirmed by co-immunoprecipitation of the STAT4 and ETS1 proteins from lysates of HepG2 cells (Figure 3D), suggesting that they form a transcriptional complex on THPO regulatory sequences, promoting THPO transcription.

Considering that the expression of THPO in HepG2 cells is induced by JAK2/STAT3 upon uptake of desialylated platelets,23 we further explored the mechanism controlling the transcription of the gene to determine any role of STAT3. PROMO in silico analysis of the THPO promoter did not find any consensus for the binding of STAT3 within the 1,500 bp region upstream of the transcription start site, which includes the c.-323C nucleotide affected by the mutation. Although no binding was expected, we knocked down STAT3 and STAT4 alone or in combination in HepG2 cells. We observed a reduction of THPO expression at both
mRNA and protein levels (Online Supplementary Figure S1A, B), confirming a role of STAT3 in the regulation of the transcription of THPO independently of its binding to the basal promoter.
Serum THPO level was lower than expected in the proband
Since the variant c.-323C>T affects the transcriptional regulation of THPO, we measured the THPO level in the serum of the proband. The THPO concentration was 126 pg/mL (laboratory reference range 15-80 pg/mL for children <15 years old), a value within the normal range when obtained in healthy individuals, and slightly high for children.2,24 Since serum THPO concentration is negatively regulated by the total megakaryocyte and platelet mass,25,26 the THPO level is expected to be very much
Figure 3. STAT4 and ETS1 regulate THPO expression. (A) THPO, STAT4 and ETS1 expression was evaluated by real-time quantitative polymerase chain reaction, normalized to b-actin RNA expression level. (B) Western blot analysis of THPO, STAT4, and ETS1 expression, using HSP90 and GAPDH as a loading control. Right: the graph shows the quantification of western blot bands measured by densitometry, normalized to GAPDH. (C) Proximity ligation assay (PLA) with primary antibodies against STAT4 and ETS1. (D) Lysates of HepG2 cells were subjected to co-immunoprecipitation analysis with antibodies recognizing STAT4 or IgG as a negative control. All the above experiments were performed in HepG2 cells upon silencing of endogenous STAT4 and ETS1, as indicated with specific short interfering (si) RNA for 48 h. Graphs present the mean ± standard error of mean of three independent experiments. Blots are representative of three biological replicates. P values were calculated by a two-tailed unpaired Student t test: *P<0.05, **P<0.01,***P<0.001.
A C D B
Haematologica | 108 May 2023 1390 ARTICLE - Loss of THPO expression as a new mechanism of CAMT V. Capaci et al.
higher than normal in amegakaryocytic thrombocytopenia, as well as in other forms of bone marrow aplasia/hypoplasia.27-29
Effective response to eltrombopag
Based on our overall findings, we considered it reasonable to treat the proband with a THPO-receptor agonist.11 He was therefore started on eltrombopag 1.4 mg/kg/day, leading to an increase in his platelet count and then stabilization around 40x109/L after 1 month. Since this was deemed an inadequate response, the dose was increased to 2.8 mg/kg/day. The patient's platelet count continues to increase gradually after 6 months of treatment at this dose; at the latest analysis, his platelet count was 125x109/L. At present, he is clinically well and no longer has easy bruising.
Discussion
THPO is a critical cytokine that binds to its receptor MPL and stimulates expansion, differentiation, and maturation of megakaryocyte progenitors.30 Additionally, it is essential for the survival of the multipotent hematopoietic stem cell compartment.3 The clinical picture of CAMT reflects these non-redundant roles of the THPO/MPL axis. In fact, patients with CAMT present at birth with amegakaryocytic thrombocytopenia, which progresses to pancytopenia and bone marrow aplasia during childhood. CAMT is caused by biallelic mutations affecting the open reading frame, mainly of MPL but also of the THPO gene, referred to as CAMT-MPL and CAMT-THPO, respectively.1,2,4,31,32
In this paper, we report one patient with a clinical picture of CAMT characterized by severe congenital thrombocytopenia and marked hypoplasia of megakaryocytes but without pancytopenia. Whole exome sequencing analysis revealed a homozygous (c.-323C>T) substitution in a potentially regulatory region of the THPO gene that could explain the disease. Of interest, the proband’s mother (II-2) and one sibling (II-4), heterozygous for c.-323C>T, have asymptomatic mild thrombocytopenia, which is consistent with the slightly reduced platelet count observed in individuals with monoallelic loss-of-function variants of THPO 4-6
Considering that the c.-323C>T substitution was at first regarded as a variant of uncertain significance, we carried out in vitro functional studies to determine its potential effect on THPO expression. We found that the promoter region carrying the variant strongly reduced reporter gene activity, supporting the hypothesis that transcription of the gene and consequent expression of the THPO cytokine are significantly impaired.
Consistent with these findings, the serum THPO concentration in the proband was only slightly above the normal range, despite the severely reduced megakaryocyte and pla-
telet mass. Indeed, serum concentration of THPO is finely regulated by a mechanism of receptor-mediated clearance by megakaryocytes and platelets.25,33 Therefore, the THPO level is always considerably increased in all forms of amegakaryocytic thrombocytopenia or bone marrow aplasia/hypoplasia.2,27-29 For instance, in a recently published series of 56 patients with CAMT due to MPL mutations, the median serum THPO concentration was 1,493 pg/mL.1 The only known exception to this rule is CAMT due to defective THPO production, in which the level of THPO is unexpectedly within the "normal" range, as in our patient but also in those carrying p.Arg38Cys or p.Arg119Cys mutations of THPO, which impair the trafficking of the mutant protein and prevent its secretion.4-6
Hematopoietic stem cell transplantation is the cornerstone of treatment for CAMT-MPL and for other forms of inherited bone marrow failure syndrome. However, transplantation is expected to be ineffective in CAMT-THPO. In fact, hematopoietic stem cell transplantation led to poor and often tragic outcomes in individuals with THPO variants.5 In contrast, these patients showed very good responses to romiplostim, which were characterized not only by increases in platelet count but also improvements of other cytopenias, when present.5,6 Supported by our data, we treated the proband with eltrombopag, another THPO-mimetic drug that was preferred to romiplostim because of its oral daily instead of weekly subcutaneous administration. This is the first report of eltrombopag therapy in a patient with a THPO mutation. The therapy led to a significant and stable improvement of thrombocytopenia and complete remission of bleeding symptoms. We hypothesize that, if untreated, the patient would have progressed to develop multilineage marrow aplasia, as described in the other CAMT patients with homozygous THPO mutations.4,6 Extended follow-up is therefore required to ascertain whether eltrombopag is able to prevent such an evolution in this case.
Overall, these findings underline the fundamental importance of distinguishing patients with CAMT due to THPO mutations from those with mutations in MPL variants or with other inherited bone marrow failure syndromes. Therefore, molecular analysis of the THPO gene, including its regulatory regions, should be routinely included in the diagnostic workup of patients with a clinical suspicion of CAMT. Moreover, in view of the current evidence, we suggest that measurement of serum THPO concentration could be a valuable screening tool to recognize patients with THPO mutations. The finding of a normal serum THPO level in the context of an amegakaryocytic thrombocytopenia should strongly suggest an alteration of THPO.
Little is known about the mechanisms controlling transcription of the THPO gene. In the liver, the main site of production of THPO, the cytokine is expressed constantly, with no transcriptional or post-transcriptional regulation yet identified with the exception of limited evidence suggesting that
Haematologica | 108 May 2023 1391 ARTICLE - Loss of THPO expression as a new mechanism of CAMT V. Capaci et al.
circadian rhythm and inflammation might influence its expression.34,35 Although THPO transcription initiates at two alternative promoters, and multiple alternative splicing events occur at the 5’-UTR, only transcript variant 1 is efficiently translated into THPO.19 The THPO promoter structure and activity have been studied and debated extensively, but no motifs, such as TATA-box, GC- and CAAT-boxes, or transcription factors regulating THPO expression have been characterized upstream of the transcription start site. The only exception is C/EBPdelta binding at approximately 800 bp upstream of the transcription start site, whose role in THPO regulation has yet to be defined.19,36
Our study identified for the first time a regulatory region of THPO transcription, in which ETS1 and STAT4 interact with each other in a complex and bind to consensus sequences regulating the level of expression of the gene. This activity is reduced in the presence of c.-323C>T or by silencing the two transcription factors, either alone or in combination. The effect of ETS1 and STAT4 knockdown on THPO expression was evident in a hepatocyte cell model both at the mRNA and protein levels. Of note, this promoter region is evolutionarily conserved among species, suggesting a conserved mechanism of THPO transcriptional regulation. ETS1 is a transcription factor belonging to the large family of the ETS domain transcription factors, mainly known for its role in immune homeostasis regulation and in cancer development.37,38 However, as supported by our data, it also plays an important role in megakaryopoiesis, as a multilayer regulator.39 STAT4 belongs to the STAT family of transcription factors, whose members are involved in inflammatory responses and in autoimmune/inflammatory diseases.40 Nothing is known about its role in megakaryopoiesis. However, STAT4 is part of a feedback loop circuitry with interleukin-6 (IL6), as IL6 phosphorylates STAT4, which in turn upregulates IL6.41 Of relevance, IL6 enhances THPO mRNA expression, causing inflammatory thrombocytosis,34 supporting a potential role of STAT4 in controlling megakaryopoiesis.
Of note, another member of the STAT family (STAT3) induces THPO transcription upon the binding of desialylated platelets to the Ashwell-Morell receptor23,42 but how STAT3 controls this process is – at least to our knowledge - unknown. Using in silico analysis to explore this mechanism did not reveal any potential direct binding of STAT3 on the THPO promoter. However, we confirmed that it controls the expression level of THPO, which is reduced when STAT3 is silenced. Since STAT3 and STAT4 share upstream activator
References
1. Germeshausen M, Ballmaier M. CAMT-MPL: congenital amegakaryocytic thrombocytopenia caused by MPL mutationsheterogeneity of a monogenic disorder - a comprehensive analysis of 56 patients. Haematologica. 2020;106(9):2439-2448.
2. Germeshausen M, Ballmaier M. Congenital amegakaryocytic
signals and interact in an heterodimeric complex,43 we speculate that the ETS1/STAT4 complex, directly binding the THPO promoter, induces basal expression of the THPO gene; then, upon different stimuli (e.g., a signal from sialylated platelets), the interplay of STAT3 with STAT4 increases THPO expression. However, further studies are needed to verify this intriguing hypothesis and understand the complex mechanisms controlling the level of expression of THPO In conclusion, we identified a family with CAMT caused by the c.-323C>T mutation, which affects the regulatory region of the THPO gene. In patients with a clinical picture of CAMT, the molecular basis of the disease is not always ascertained, although a precise diagnosis is essential for their appropriate management. Measurement of serum THPO concentration could represent a useful screening tool to recognize patients with defective THPO production, who can be treated effectively with THPO-mimetic drugs, avoiding hematopoietic stem cell transplantation.5 Moreover, through the identification of ETS1 and STAT4 as transcription factors recruited on the THPO promoter, we provide novel insights into the mechanisms controlling the expression of the THPO gene.
Disclosures
No conflicts of interest to disclose.
Contributions
VC designed and performed the experiments, analyzed the data, and wrote the manuscript. IBF performed next-generation sequencing analysis. MF interpreted the mutational screening data. EA collected hematologic and clinical data, and wrote the manuscript. AP interpreted genetic and clinical data, and edited the manuscript. AS supervised the project, designed experiments and wrote the paper. All authors critically revised the paper and approved the final version.
Funding
This work was supported by the Italian Ministry of Health, through a contribution given to the Institute for Maternal and Child Health IRCCS ˝Burlo Garofolo˝, Trieste, Italy (grant numbers RC 02/18 and RC 28/22). HepG2 cells were provided by Prof. Claudio Tiribelli, Fondazione Italiana Fegato-ONLUS, Trieste, Italy.
Data-sharing statement
All data relevant to the study are included in the manuscript or are available upon request to the corresponding author.
thrombocytopenia – not a single disease. Best Pract Res Clin Haematol. 2021;34(2):101286.
3. Hitchcock IS, Kaushansky K. Thrombopoietin from beginning to end. Br J Haematol. 2014;165(2):259-268.
4. Dasouki MJ, Rafi SK, Olm-Shipman AJ, et al. Exome sequencing
Haematologica | 108 May 2023 1392 ARTICLE - Loss of THPO expression as a new mechanism of CAMT V. Capaci et al.
reveals a thrombopoietin ligand mutation in a Micronesian family with autosomal recessive aplastic anemia. Blood. 2013;122(20):3440-3449.
5. Seo A, Ben-Harosh M, Sirin M, et al. Bone marrow failure unresponsive to bone marrow transplant is caused by mutations in thrombopoietin. Blood. 2017;130(7):875-880.
6. Pecci A, Ragab I, Bozzi V, et al. Thrombopoietin mutation in congenital amegakaryocytic thrombocytopenia treatable with romiplostim. EMBO Mol Med. 2018;10(1):63-75.
7. Cornish N, Aungraheeta MR, FitzGibbon L, et al. Monoallelic lossof-function THPO variants cause heritable thrombocytopenia. Blood Adv. 2020;4(5):920-924.
8. Noris P, Marconi C, De Rocco D, et al. A new form of inherited thrombocytopenia due to monoallelic loss of function mutation in the thrombopoietin gene. Br J Haematol. 2018;181(5):698-701.
9. Mandrile G, Dubois A, Hoffman JD, et al. 3q26.33-3q27.2 microdeletion: a new microdeletion syndrome? Eur J Med Genet. 2013;56(4):216-221.
10. Õunap K, Pajusalu S, Zilina O, Reimand T, Žordania R. An 8.4‐Mb 3q26.33‐3q28 microdeletion in a patient with blepharophimosis–intellectual disability syndrome and a review of the literature. Clin Case Rep. 2016;4(8):824-830.
11. Ghanima W, Cooper N, Rodeghiero F, Godeau B, Bussel JB. Thrombopoietin receptor agonists: ten years later. Haematologica. 2019;104(6):1112-1123.
12. Smith TF, Waterman MS. Identification of common molecular subsequences. J Mol Biol. 1981;147(1):195-197.
13. Poplin R, Ruano-Rubio V, DePristo MA, et al. Scaling accurate genetic variant discovery to tens of thousands of samples. bioRxiv. 2018; Juy 24. doi: https://doi.org/10.1101/201178 [preprint, not peerreviewed]
14. Garrison E, Marth G. Haplotype-based variant detection from short-read sequencing. arXiv. 2012; July 17. https://doi.org/10.48550/arXiv.1207.3907 [preprint, not peerreviewed]
15. Li M, Li J, Li MJ, et al. Robust and rapid algorithms facilitate largescale whole genome sequencing downstream analysis in an integrative framework. Nucleic Acids Res. 2017;45(9):e75.
16. Stenson PD, Mort M, Ball E V, et al. The Human Gene Mutation Database (HGMD(®)): optimizing its use in a clinical diagnostic or research setting. Hum Genet. 2020;139(10):1197-1207.
17. Landrum MJ, Lee JM, Benson M, et al. ClinVar: improving access to variant interpretations and supporting evidence. Nucleic Acids Res. 2018;46(D1):D1062-D1067.
18. Karczewski KJ, Francioli LC, Tiao G, et al. The mutational constraint spectrum quantified from variation in 141,456 humans. Nature. 2020;581(7809):434-443.
19. Ghilardi N, Wiestner A, Skoda RC. Thrombopoietin production is inhibited by a translational mechanism. Blood. 1998;92(11):4023-4030.
20. Dördelmann C, Telgmann R, Brand E, et al. Functional and structural profiling of the human thrombopoietin gene promoter. J Biol Chem. 2008;283(36):24382-24391.
21. Marcucci R, Romano M. Thrombopoietin and its splicing variants: structure and functions in thrombopoiesis and beyond. Biochim Biophys Acta. 2008;1782(7-8):427-432.
22. Lavrrar JL, Farnham PJ. The use of transient chromatin immunoprecipitation assays to test models for E2F1-specific transcriptional activation. J Biol Chem. 2004;279(44):46343-46349.
23. Grozovsky R, Begonja AJ, Liu K, et al. The Ashwell-Morell receptor regulates hepatic thrombopoietin production via JAK2-STAT3 signaling. Nat Med. 2015;21(1):47-54.
24. Zaninetti C, Gresele P, Bertomoro A, et al. Eltrombopag for the treatment of inherited thrombocytopenias: a phase II clinical trial. Haematologica. 2020;105(3):820-828.
25. Fielder PJ, Hass P, Nagel M, et al. Human platelets as a model for the binding and degradation of thrombopoietin. Blood. 1997;89(8):2782-2788.
26. Ichikawa N, Ishida F, Shimodaira S, Tahara T, Kato T, Kitano K. Regulation of serum thrombopoietin levels by platelets and megakaryocytes in patients with aplastic anaemia and idiopathic thrombocytopenic purpura. Thromb Haemost. 1996;76(2):156-160.
27. Dame C. Thrombopoietin in thrombocytopenias of childhood. Semin Thromb Hemost. 2001;27(3):215-228.
28. Ballmaier M, Schulze H, Strauss G, et al. Thrombopoietin in patients with congenital thrombocytopenia and absent radii: elevated serum levels, normal receptor expression, but defective reactivity to thrombopoietin. Blood. 1997;90(2):612-619.
29. Olnes MJ, Scheinberg P, Calvo KR, et al. Eltrombopag and improved hematopoiesis in refractory aplastic anemia. N Engl J Med. 2012;367(1):11-19.
30. Machlus KR, Italiano JE. Megakaryocyte Development and Platelet Formation. 4th ed. Elsevier Inc. pp 25-46.
31. Ihara K, Ishii E, Eguchi M, et al. Identification of mutations in the cmpl gene in congenital amegakaryocytic thrombocytopenia. Proc Natl Acad Sci U S A. 1999;96(6):3132-3136.
32. Germeshausen M, Ancliff P, Estrada J, et al. MECOM-associated syndrome: a heterogeneous inherited bone marrow failure syndrome with amegakaryocytic thrombocytopenia. Blood Adv. 2018;2(6):586-596.
33. Ichikawa T, Sato F, Terasawa K, et al. Trastuzumab produces therapeutic actions by upregulating miR-26a and miR-30b in breast cancer cells. PLoS One. 2012;7(2):e31422.
34. Kaser A, Brandacher G, Steurer W, et al. Interleukin-6 stimulates thrombopoiesis through thrombopoietin: role in inflammatory thrombocytosis. Blood. 2001;98(9):2720-2725.
35. Tracey CJ, Pan X, Catterson JH, Harmar AJ, Hussain MM, Hartley PS. Diurnal expression of the thrombopoietin gene is regulated by CLOCK. J Thromb Haemost. 2012;10(4):662-669.
36. Ogami K. Gene expression and transcriptional regulation of thrombopoietin. Stem Cells. 1996;14(Suppl 1):148-153.
37. Kim CJ, Lee CG, Jung JY, et al. The transcription factor Ets1 suppresses T follicular helper type 2 cell differentiation to halt the onset of systemic lupus erythematosus. Immunity. 2018;49(6):1034-1048.
38. Dittmer J. The role of the transcription factor Ets1 in carcinoma. Semin Cancer Biol. 2015;35:20-38.
39. Lulli V, Romania P, Morsilli O, et al. Overexpression of Ets-1 in human hematopoietic progenitor cells blocks erythroid and promotes megakaryocytic differentiation. Cell Death Differ. 2006;13(7):1064-1074.
40. Yang C, Mai H, Peng J, Zhou B, Hou J, Jiang D. STAT4: an immunoregulator contributing to diverse human diseases. Int J Biol Sci. 2020;16(9):1575-1585.
41. Nguyen HN, Noss EH, Mizoguchi F, et al. Autocrine loop Involving IL-6 family member LIF, LIF receptor, and STAT4 drives sustained fibroblast production of inflammatory mediators. Immunity. 2017;46(2):220-232.
42. Grozovsky R, Giannini S, Falet H, Hoffmeister KM. Novel mechanisms of platelet clearance and thrombopoietin regulation. Curr Opin Hematol. 2015;22(5):445-451.
43. Lee PW, Racke MK, Lovett-Racke AE, et al. IL-23R-activated STAT3/STAT4 is essential for Th1/Th17-mediated CNS autoimmunity. JCI Insight. 2017;2(17):e91663.
Haematologica | 108 May 2023 1393 ARTICLE - Loss of THPO expression as a new mechanism of CAMT V. Capaci et al.
Targeting a thrombopoietin-independent strategy in the discovery of a novel inducer of megakaryocytopoiesis, DMAG, for the treatment of thrombocytopenia
Long Wang,1* Sha Liu,2* Jiesi Luo,1* Qi Mo,1 Mei Ran,1 Ting Zhang,1 Xiaoxuan Li,1 Wenjun Zou,3 Qibing Mei,1 Jianping Chen,4 Jing Yang,5 Jing Zeng,1 Feihong Huang,1 Anguo Wu,1 Chunxiang Zhang6 and Jianming Wu7,1,6
1Department of Pharmacology, School of Pharmacy, Southwest Medical University, Luzhou, Sichuan; 2Department of Gastroenterology, The Affiliated Hospital of Southwest Medical University, Luzhou, Sichuan; 3School of Pharmacy, Chengdu University of Traditional Chinese Medicine, Chengdu, Sichuan; 4School of Chinese Medicine, The University of Hong Kong, Hong Kong; 5Department of Pharmacy, Chengdu Fifth People’s Hospital, Chengdu University of Traditional Chinese Medicine, Chengdu, Sichuan; 6Education Ministry Key Laboratory of Medical Electrophysiology, Sichuan Key Medical Laboratory of New Drug Discovery and Druggability Evaluation, Luzhou Key Laboratory of Activity Screening and Druggability Evaluation for Chinese Materia Medica, Southwest Medical University, Luzhou, Sichuan and 7School of Basic Medical Sciences, Southwest Medical University, Luzhou, Sichuan, China
*LW, SL and JL contributed equally to this work as co-first authors.
Abstract
Correspondence: W. Jianming jianmingwu@swmu.edu.cn
Z.Chunxiang zhangchx999@163.com
W.Anguo wag1114@foxmail.com
Received: October 1, 2022.
Accepted: December 15, 2022.
Early view: December 22, 2022.
https://doi.org/10.3324/haematol.2022.282209
©2023 Ferrata Storti Foundation
Published under a CC BY-NC license
Thrombocytopenia is a thrombopoietin (TPO)-related disorder with very limited treatment options, and can be lifethreatening. There are major problems with typical thrombopoietic agents targeting TPO signaling, so it is urgent to discover a novel TPO-independent mechanism involving thrombopoiesis and potential druggable targets. We developed a drug screening model by the multi-grained cascade forest (gcForest) algorithm and found that 3,8-di-O-methylellagic acid 2O-glucoside (DMAG) (10, 20 and 40 µM) promoted megakaryocyte differentiation in vitro. Subsequent investigations revealed that DMAG (40 mM) activated ERK1/2, HIF-1b and NF-E2. Inhibition of ERK1/2 blocked megakaryocyte differentiation and attenuated the upregulation of HIF-1b and NF-E2 induced by DMAG. Megakaryocyte differentiation induced by DMAG was inhibited via knockdown of NF-E2. In vivo studies showed that DMAG (5 mg/kg) accelerated platelet recovery and megakaryocyte differentiation in mice with thrombocytopenia. The platelet count of the DMAG-treated group recovered to almost 72% and 96% of the count in the control group at day 10 and 14, respectively. The platelet counts in the DMAG-treated group were almost 1.5- and 1.3-fold higher compared with those of the irradiated group at day 10 and 14, respectively. Moreover, DMAG (10, 25 and 50 mM) stimulated thrombopoiesis in zebrafish. DMAG (5 mg/kg) could also increase platelet levels in c-MPL knockout (c-MPL-/-) mice. In summary, we established a drug screening model through gcForest and demonstrated that DMAG promotes megakaryocyte differentiation via the ERK/HIF1/NF-E2 pathway which, importantly, is independent of the classical TPO/c-MPL pathway. The present study may provide new insights into drug discovery for thrombopoiesis and TPO-independent regulation of thrombopoiesis, as well as a promising avenue for thrombocytopenia treatment.
Introduction
Platelets are crucial for hemostasis, thrombosis, the innate immune response, angiogenesis, inflammation and infection.1,2 Platelets are produced by megakaryocytes, which are derived from hematopoietic stem cells that undergo a continuous process of hematopoietic lineage differentiation. The progress of megakaryocyte differentiation plays
an essential role in the schedule and output of platelet production.3 During differentiation, megakaryocytes undergo endomitosis and cytoplasmic maturation, which results in increased ploidy, cell volume and surface areato-volume ratio and provides an extensive membrane system for further platelet formation.3 The classical TPO/c-MPL signaling pathway is a major driver of megakaryocyte differentiation. TPO (thrombopoietin) binds to its
Haematologica | 108 May 2023 1394 ARTICLE - Platelet Biology & its Disorders
receptor, c-MPL, which induces phosphorylation of JAK2. Subsequently, JAK2 phosphorylates many downstream substrates, leading to the activation of multiple signaling pathways, including STAT3/STAT5, PI3K/AKT and MAPK/ERK. Finally, these activated signaling pathways induce or repress the expression of several transcription factors, such as GATA1, RUNX1, NF-E2, AML1, FLI1 and TAL1, which further promote megakaryocyte differentiation and platelet formation.1,3
Thrombocytopenia, a disorder of low platelet count, is caused by a variety of factors, including radiotherapy and chemotherapy used to treat cancers or tumors. Thrombocytopenia has been a challenge in the clinic for a long time and can lead to abnormal bleeding, infection, poor prognosis and even death.3-5 However, at present, there are still no approved agents for the rapid treatment of radiationor chemotherapy-induced thrombocytopenia.5,6 Generally, platelet transfusion and non-specific drugs, including cytokines, hormones and immunosuppressants, are used to treat thrombocytopenia in the clinic. However, these treatments are usually associated with several harmful side-effects that limit their clinical use.7,8 Therefore, it is urgent to develop non-toxic and non-immunogenic reagents for the treatment of thrombocytopenia. At present, TPO-receptor agonists are the only effective treatment choices for patients with chronic thrombocytopenia who are unresponsive to steroids. However, these drugs may increase the risk of venous and arterial thrombosis, bone marrow (BM) fibrosis, acute myelogenous leukemia and liver toxicity.8 In addition, treatment with a TPO-receptor agonist is not an applicable option for patients who are refractory to these agonists or who have a complete loss of functional c-MPL.9-11 It is, therefore, imperative to develop TPO-alternative therapeutic options to manage thrombocytopenia.
At present, drug discovery still faces numerous challenges and problems, such as high cost, time consumption, offtarget delivery and low efficacy. The identification of suitable, bioactive drug molecules from millions of candidate compounds is extremely difficult and a disheartening part of the drug discovery and development process.12 Fortunately, with rapid advancements in computational power, the blossoming of deep learning technology and the growth of drug-related data, various deep learningbased methodologies have been successfully exploited in all steps of the drug discovery and development process, and can identify potential, active compounds in the vast realm of chemical space quickly and cheaply.13,14 As a primary branch of artificial intelligence, machine learning plays a crucial role in drug discovery and development and includes random forest, support vector machine, k-nearest neighbors, naïve Bayesian, artificial neural networks, principal component analysis, and soon on.12 Deep learning is an important subfield of machine learning.12 Recently, a
new machine learning method, deep forest or multigrained cascade forest (gcForest), has been proposed.15,16
The gcForest algorithm is a combination of traditional machine learning algorithms and deep learning ideas, which shows a greater learning ability and estimation accuracy than any single algorithm. There is no doubt that in the near future, gcForest will provide an alternative avenue and will be in the spotlight for drug discovery.16
To discover more effective agents for use in the treatment of thrombocytopenia, we developed a drug screening model based on the gcForest algorithm to predict active compounds. We then aimed to investigate the effects of 3,8-di-O-methylellagic acid 2-O-glucoside (DMAG), a potential active compound predicted by the drug screening model, on megakaryocyte differentiation and platelet formation, and to elucidate its mechanism of action against thrombocytopenia. Our findings could provide a new therapeutic approach to thrombocytopenia.
Methods
Measurement of megakaryocyte differentiation
Cells incubated with DMAG (10, 20 and 40 mM) for 6 days were harvested and labeled with FITC-CD41 and PE-CD42b antibodies (Biolegend, San Diego, CA, USA) for 30 min on ice in the dark. The percentages of CD41+CD42b+ cells were evaluated by a BD FACSCanto II flow cytometer (BD Biosciences, San Jose, CA, USA).
Animals
Specific pathogen-free Kunming (KM) mice and C57BL/6 mice (8-10 weeks old, weighing 18-22 g) were purchased from Da-suo Biotechnology Limited (Chengdu, China). Tg (cd41:eGFP) transgenic zebrafish were obtained from the Chinese National Zebrafish Resource Center (Wuhan, China). All procedures involving mice and zebrafish were performed in compliance with the laboratory animal ethics committee of Southwest Medical University (License N. 20211123-014).
Construction of a model of carotid artery thrombosis
A ferric chloride (FeCl3)-induced model of carotid arterial thrombus was constructed as described previously.17,18 Briefly, the mice were administered normal saline, TPO (3,000 U/kg), or DMAG (5 mg/kg) daily after irradiation for 10 days and then anesthetized by intraperitoneal injection of sodium pentobarbital (50 mg/kg). The common carotid arteries were exposed, and filter paper (3 × 1.0 mm) saturated with 10% (w/v) FeCl3 was placed on top of the left carotid artery for 3 min to induce thrombosis. After removal of the filter paper, the carotid artery was washed with phosphate-buffered saline. The blood flow was continuously monitored with a vascular flow probe using a
Haematologica | 108 May 2023 1395 ARTICLE - Discovery of a TPO-independent inducer of thrombopoiesis L. Wang et al.
Transonic Model TS420 flowmeter (Transonic Systems, Ithaca, NY, USA) from the onset of the injury until stable occlusion occurred (defined as no flow for 120 min).
Construction of the c-MPL knockout mouse model and treatment of the mice
CRISPR/Cas9-mediated genome engineering19 was used to create a c-MPL knockout (c-MPL-/-) mouse model (C57BL/6 mice). Considering that the c-MPL-201 transcript has 12 exons, we designed two gRNA targeting the 5’ untranslated region and exon 12 to create a thorough knockout model. The gRNA were designed on crispr.mit.edu, and high-score gRNA were used. Cas9 and two gRNA were co-injected into fertilized eggs to produce the knockout mice. The pups were genotyped by polymerase chain reaction (PCR) followed by sequence analysis. The c-MPL-/- mice were randomly divided into two groups (6 males and 6 females in each group): the control group and the DMAG-treated group. The control group and DMAG-treated group were injected intraperitoneally with normal saline or DMAG (5 mg/kg), respectively, for 14 days. Venous plexus blood was collected from the mouse eyes, and routine blood tests were then performed with an automatic blood cell analyzer. The sequences of the gRNA and PCR screening primers are listed in Online Supplementary Table S1
Statistical analysis
All data are expressed as the mean ± standard deviation from at least three independent experiments. Statistical analysis of comparisons among the multiple groups was assessed by one-way analysis of variance (ANOVA) followed by the Tukey post-hoc test. Differences between two groups were analyzed using two-tailed Student t tests. A P value <0.05 was considered statistically significant.
Results
Construction of the drug screening model based on gcForest and prediction of active compounds
Considering that traditional drug discovery in the laboratory is aimless, costly and ineffective, it would be of extreme utility to build a drug screening model for high-throughput virtual screening of potential active compounds before experimental verification. In the present study, we first developed a drug screening model through gcForest (Figure 1A). Of the six datasets, the dataset with an importance ratio of 50% showed the best prediction performance, with an area under the curve (AUC) value of 0.78 (Figure 1C). The validation set containing two active and ten inactive compounds was then used as the input into the model, and the prediction accuracy of the model was 84.6%. Finally, a chemical library was used to predict active compounds through the drug screening model. The
results showed that a natural compound, DMAG, exhibited a very high score of 0.79, indicating that DMAG might have high activity.
DMAG dose-dependently induces megakaryocyte differentiation and maturation
The activities of the potential active compounds predicted by the model were investigated in vitro. Excitingly, we found that DMAG (Online Supplementary Figure S1A), a natural product, had excellent activity in inducing megakaryocyte differentiation of HEL and Meg-01 cells (Figure 2, Online Supplementary Figure S2). After treatment for 6 days, we noted the appearance of numerous large megakaryocyte-like cells in the DMAG (10, 20 and 40 mM)treated HEL group but not in the control HEL group (Figure 2A). Wright-Giemsa staining showed that DMAG significantly increased the cell size and the number of nuclei in HEL cells (Figure 2B). After treatment for 6 days, flow cytometry analysis showed that the expression of the megakaryocytic lineage-specific differentiation marker CD41 and maturation marker CD42b increased in a dose-dependent manner in the DMAG-treated groups (Figure 2C).
A polyploid nucleus is a typical characteristic of mature megakaryocytes. The ploidy was readily validated by DAPI and phalloidin staining in the DMAG-treated group (Figure 2D). Flow cytometry analysis also showed that DMAG markedly increased DNA ploidy in a dose-dependent manner in HEL cells (Figure 2E). A similar result was found in Meg-01 cells (Online Supplementary Figure S2). In addition, a lactate dehydrogenase assay was performed to detect the cytotoxicity of DMAG. The results suggested that all concentrations of DMAG (10, 20 and 40 mM) had no cytotoxicity on HEL cells (Online Supplementary Figure S1B). These results demonstrate that DMAG is a safe inducer of megakaryocyte differentiation and maturation.
Stage- and time-specific activation of ERK1/2 and HIF-1β is involved in DMAG-induced megakaryocyte differentiation
To investigate genomic changes related to the promoting effect of DMAG on megakaryocyte differentiation, we collected cells from the control group and DMAG (40 mM)treated group and performed RNA sequencing. The transcriptome results showed that a total of 4,030 mRNA were differentially expressed (fold-change >2.0 and P<0.05). Kyoto Encyclopedia of Genes and Genomes (KEGG) pathway analysis was applied to identify signaling pathways regulated by DMAG. The results demonstrated that the upregulated mRNA were significantly enriched in MAPK and HIF-1 signaling pathways (Figure 3A), which are closely related to megakaryocyte differentiation.1,20 Conversely, the downregulated mRNA were primarily associated with metabolic, Epstein-Barr virus infection and viral carcinogenesis pathways (Figure 3B). The KEGG pathway
Haematologica | 108 May 2023 1396 ARTICLE - Discovery of a TPO-independent inducer of thrombopoiesis L. Wang et al.
analysis indicated that DMAG might promote megakaryocyte differentiation through the MAPK and HIF-1 signaling pathways. We therefore first determined the expression of MEK and ERK1/2, and HIF-1a and HIF-1b, the key genes involved in the MAPK and HIF-1 signaling pathways, respectively. Our results showed that the phosphorylation of ERK1/2 and the expression of HIF-1b were continuously activated by DMAG from day 1 to day 6 (Figure 3C, Online Supplementary Figure S3). Other known cellular signaling pathways related to megakaryocyte differentiation were also investigated. DMAG treatment had no obvious effects on the activation of the c-MPL, JAK2/STAT and PI3K/AKT signaling pathways (Figure 3C, Online Supplementary Figure S3). These results suggest that DMAG promotes megakaryocyte differentiation by activating ERK1/2 and HIF-1b.
The effect of DMAG on the expression of transcription factors participating in megakaryocyte differentiation
Several transcription factors drive megakaryocyte differentiation and platelet formation.3 We thus examined the temporal expression pattern of NF-E2, GATA1, GATA2, FLI1, TAL1 and RUNX1 during DMAG-induced differentiation of HEL cells by quantitative real-time PCR. The results showed that the transcriptional level of NFE2 in the DMAGtreated group was significantly higher than that in the control group from day 1 to day 6 (Figure 4A). The expression level of GATA1 in the DMAG-treated group was higher than that in the control group from day 2 to day 5 (Figure 4A). In contrast, RUNX1 expression in the DMAG-treated group was lower than that in the control group on days 1, 2, 3 and 5 (Figure 4A). GATA2 expression in the DMAG-treated

A B Haematologica | 108 May 2023 1397 ARTICLE - Discovery of a TPO-independent inducer of thrombopoiesis L. Wang et al.
Figure 1. Construction of the drug screening model. (A) Flowchart for gcForest model construction. (B) Top 20 molecular descriptors. (C) Receiver operator characteristic curves of importance ratios. AUC: area under the curve.

Continued on following page. A B C D E Haematologica | 108 May 2023 1398 ARTICLE - Discovery of a TPO-independent inducer of thrombopoiesis L. Wang et al.
Figure 2. DMAG promotes megakaryocyte differentiation and enhances the DNA ploidy of HEL cells. (A) Representative images of HEL cells treated with different concentrations of DMAG (10, 20 and 40 mM) for 6 days. Bars represent 100 mm. (B) GiemsaWright staining of HEL cells treated with different concentrations of DMAG (10, 20 and 40 mM) for 6 days. Bars represent 25 mm. (C) Flow cytometry analysis of the expression of CD41 and CD42b after cells had been treated with different concentrations of DMAG (10, 20 and 40 mM) for 6 days. The histogram shows the percentage of CD41+CD42b+ cells for each group. (D) Phalloidin staining of HEL cells treated with different concentrations of DMAG (10, 20 and 40 mM) for 6 days. DAPI staining (blue) indicates nuclei, and TRITC phalloidin staining (red) of F-actin indicates the boundary of single cells. Bars represent 25 mm. (E) Flow cytometry analysis of the DNA ploidy of HEL cells treated with different concentrations of DMAG (10, 20 and 40 mM) for 6 days. The histogram shows the percentages of DNA ploidy of the HEL cells treated with the different concentrations of DMAG. In (C) and (E), data are shown as the mean ± standard deviation from three independent experiments. **P<0.01, ***P<0.001, versus the corresponding control. DMAG: 3,8-di-O-methylellagic acid 2-O-glucoside; DAPI: 4',6-diamidino-2-phenylindole.
group was higher than that in the control group at day 3 and decreased at days 4 and 5 (Figure 4A). FLI1 expression in the DMAG-treated group was higher than that in the control group on day 4, becoming lower on day 5 and then higher again on day 6 (Figure 4A). There was no significant difference in TAL1 expression level between the DMAGtreated group and the control group from day 1 to day 5 (Figure 4A). The translational levels of these transcription factors were also determined. Consistent with the transcriptional level, the translational level of NF-E2 in the DMAG-treated group was significantly higher than that in the control group from day 1 to day 6 (Figure 4B, Online Supplementary Figure S4). In contrast, the translational level of RUNX1 in the DMAG-treated group was lower than that in the control group on day 6 (Figure 4B, Online Supplementary Figure S4). However, DMAG had no conspicuous effect on the translational levels of GATA1, TAL1 and FOG1 (Figure 4B, Online Supplementary Figure S4). We further confirmed that DMAG treatment led to a dose-dependent increase in the expression of NF-E2 at the translational level (Figure 4B, Online Supplementary Figure S4). Moreover, the increased expression of NF-E2 induced by DMAG in HEL and Meg-01 cells was confirmed by immunofluorescence analysis (Online Supplementary Figure S5A).
The microtubule cytoskeleton plays a crucial role in the proper maturation of megakaryocytes and proplatelet formation.21 We therefore determined the expression of btubulin, a protein subunit of microtubules, and found that HEL and Meg-01 cells treated with different concentrations of DMAG showed remarkable increases in b-tubulin expression (Online Supplementary Figure S5B). Collectively, these data suggest that DMAG promotes megakaryocyte differentiation through activation of NF-E2 and is probably able to promote proplatelet formation by increasing btubulin expression.
DMAG promotes megakaryocyte differentiation in an ERK1/2-HIF-1β-NF-E2-dependent pathway
Emerging evidence indicates that ERK is required for the transactivation activity of HIF-1 and that HIF-1 promotes the expression of NF-E2, which is closely related to hematopoietic regulation.22-25 To clarify how they mediated
megakaryocyte differentiation induced by DMAG, a stepby-step blocking strategy was performed. First, the ERK1/2-specific inhibitor SCH772984 was used to block the phosphorylation of ERK1/2. When the phosphorylation of ERK1/2 induced by DMAG was blocked, the expression of HIF-1b and NF-E2 was significantly inhibited (Figure 5A, Online Supplementary Figure S6), which indicated that phosphorylation of ERK1/2 induced by DMAG was responsible for the activation of HIF-1b and NF-E2. Wright-Giemsa staining, DAPI and phalloidin staining and flow cytometry analysis further demonstrated that SCH772984 (10 mM) treatment interrupted the acceleration of megakaryocyte differentiation induced by DMAG (Figure 5B-D). We also found that megakaryocyte differentiation induced by DMAG was significantly inhibited when NF-E2 was knocked down by siRNA interference (Online Supplementary Figures S7 and S8). These data demonstrate that DMAG promotes megakaryocyte differentiation in an ERK1/2-HIF-1b-NF-E2dependent pathway.
DMAG enhances platelet recovery in mice with thrombocytopenia and accelerates thrombopoiesis in zebrafish
To investigate the potential therapeutic effect of DMAG in mice with thrombocytopenia induced by 4 Gy X-ray total body irradiation, KM mice were administered DMAG (5 mg/kg) for 17 days after radiation (Figure 6A). As shown, peripheral platelet levels in all irradiated groups dropped to the nadir on day 7 (Figure 6B). However, the numbers of peripheral platelets on day 7 were higher in the groups administered TPO or DMAG than in the irradiated group (Figure 6B). DMAG administration significantly increased the recovery of peripheral platelets in the irradiated mice from day 7 to day 14 (Figure 6B). The platelet counts of the DMAG-treated group recovered to almost 72% and 96% those of the control group at day 10 and day 14, respectively (Figure 6B), while the platelet counts in the irradiated group were only approximately 50% and 75% of those in the control group at day 10 and day 14, respectively (Figure 6B). There was no difference in the mean platelet volume between each group (Online Supplementary Figure S9A), which demonstrated that DMAG had no influence on mean platelet volume. There were no differences in the levels of
Haematologica | 108 May 2023 1399 ARTICLE - Discovery of a TPO-independent inducer of thrombopoiesis L. Wang et al.
DMAG activates the expression of ERK1/2 and HIF-1β. (A, B) Top 20 enriched KEGG pathways targeted by upregulated mRNA (A) and downregulated mRNA (B) induced by DMAG. (C) Western blot analysis of proteins related to megakaryocyte differentiation after the cells were or were not treated with DMAG (40 mM) at the indicated times. All results are shown as the mean ± standard deviation of three independent experiments. *P<0.05, **P<0.01, or indicated as not significant (ns) versus the corresponding control. DMAG: 3,8-di-O-methylellagic acid 2-O-glucoside; KEGG: Kyoto Encyclopedia of Genes and Genomes.

red or white blood cells between the TPO-treated, DMAGtreated and irradiated groups at any of the tested timepoints (Figure 6B), indicating that DMAG had a specific effect on platelet recovery. To verify whether the effect of DMAG on platelet recovery was stable, DMAG administration was ceased on day 18 and the platelet level was monitored sequentially. The platelet count of the DMAG-treated group was maintained at a normal level from day 19 to 25 (Online Supplementary Figure S9B), indicating that the effect of DMAG on platelet recovery was stable and durable. DMAG administration clearly increased the BM nuclear cell count (Online Supplementary Figure S9C), indicating that
DMAG could ameliorate irradiation-induced damage to BM nuclear cells or enhance their proliferation. The visceral indices of the spleen and thymus were examined and it was found that the thymus index was higher in the DMAGtreated group than in the irradiated group (Online Supplementary Figure S10), indicating that DMAG might be able to enhance immune function by alleviating thymus atrophy induced by irradiation.
To investigate whether the increase in peripheral platelets induced by DMAG was due to facilitation of megakaryopoiesis, hematoxylin and eosin (H&E) staining was performed and revealed that the numbers of megakaryocytes
A B C
Haematologica | 108 May 2023 1400 ARTICLE - Discovery of a TPO-independent inducer of thrombopoiesis L. Wang et al.
Figure 3.
in the BM and spleen were clearly increased after administration of DMAG for 10 days (Figure 6C-E). These data suggest that DMAG stimulation is conducive to in vivo platelet recovery after radiation.
To determine whether the platelets stimulated by DMAG
administration were functional, we measured platelet function. A carotid artery thrombosis model was used to assess the effect of DMAG on thrombus formation after vascular injury. The results showed that the time required to form a thrombus that completely occluded the artery
Figure 4. Effects of DMAG on the expression of transcription factors related to megakaryocyte differentiation. (A) Quantitative real-time polymerase chain reaction analysis of the expression of transcription factors involved in megakaryocyte differentiation after cells were or were not treated with DMAG (40 mM) for the indicated times. (B) Western blot detection of transcription factors related to megakaryocyte differentiation after the cells were or were not treated with DMAG (40 mM) for the indicated times or with different concentrations of DMAG (10, 20, 30 and 40 mM) for 3 days. Throughout, data are shown as the means ± standard deviations of three independent experiments. *P<0.05, **P<0.01, ***P<0.001, or indicated as not significant (ns) versus the corresponding control. DMAG: 3,8-di-O-methylellagic acid 2-O-glucoside.

A B Haematologica | 108 May 2023 1401 ARTICLE - Discovery of a TPO-independent inducer of thrombopoiesis L. Wang et al.
Figure 5. The ERK1/2-HIF-1β-NF-E2 signaling pathway is involved in DMAG-induced megakaryocyte differentiation. (A) Western blot analysis of ERK1/2 phosphorylation after HEL cells were pretreated with the ERK1/2 inhibitor SCH772984 (10 mM) followed by DMAG (40 mM) stimulation for 3 days. The histograms show the ratio of p-ERK/ERK, HIF-1b/b-actin and NF-E2/b-actin for each group. (B) Giemsa-Wright staining shows the effects of SCH772984 on DMAG (40 mM)-induced changes in cell morphology. Bars represent 25 mm. (C) Phalloidin staining shows the effects of SCH772984 on DMAG (40 mM)-induced multinuclear formation. Bars represent 25 mm. (D) Detection of the expression of CD41 and CD42b by flow cytometry indicates the effects of SCH772984 on DMAG (40 mM)-induced megakaryocyte differentiation. The histogram shows the percentage of CD41+CD42b+ cells for each group. In (A) and (D), data are shown as the mean ± standard deviation from three independent experiments. * P<0.05, **P<0.01, ***P<0.001, versus the corresponding control. DMAG: 3,8-di-O-methylellagic acid 2-O-glucoside.

A B C D Haematologica | 108 May 2023 1402 ARTICLE - Discovery of a TPO-independent inducer of thrombopoiesis L. Wang et al.
after the initial arterial injury in the DMAG-treated group was significantly shorter than that in the irradiated group (Online Supplementary Figure S11A), suggesting that DMAG promoted thrombus formation in mice with thrombocytopenia. Moreover, collagen-induced platelet aggregation was measured and showed that platelet aggregation was enhanced by DMAG administration (Online Supplementary Figure S11B). These results demonstrate that DMAG can restore platelet function in mice with thrombocytopenia. To further evaluate the potential of DMAG for clinical translation, we investigated the in vivo toxicity of DMAG. Levels of markers of cardiac function markers (creatine kinase, lactate acid dehydrogenase), hepatic function (alanine aminotransferase, aspartate aminotransferase) and renal function (creatinine, blood urea nitrogen) were determined after DMAG administration. There was no difference in creatine kinase content between each group (Online Supplementary Figure S12A), while the lactate dehydrogenase concentration in the DMAG-treated group was lower than that in the irradiated group (Online Supplementary Figure S12A), indicating that DMAG was beneficial to cardiac function. The levels of alanine and aspartate aminotransferases were not remarkable in any group (Online Supplementary Figure S12A), which suggested that DMAG had no effect on hepatic function. The creatinine and blood urea nitrogen levels in the control, TPO-treated and DMAG-treated groups were much lower than those in the irradiated group (Online Supplementary Figure S12A), indicating that DMAG was able to mitigate the renal toxicity induced by irradiation. In addition, H&E staining showed that there were no significant differences in the major organs between the groups (Online Supplementary Figure S12B), suggesting that DMAG did not cause any significant systemic toxicity. The above data suggest that DMAG has no toxicity in vivo; in contrast, DMAG exhibits protective effects on the heart
and kidney in thrombocytopenic mice. Taken together, these results demonstrate that DMAG has excellent therapeutic effects on mice with thrombocytopenia.
The enhanced numbers of megakaryocytes in the DMAGtreated group prompted us to investigate whether DMAG was able to promote the differentiation of hematopoietic progenitors into megakaryocytic progenitors and megakaryocytes in BM. Flow cytometry analysis showed that the proportions of c-Kit+CD41 (hematopoietic progenitors), c-Kit+CD41+ (megakaryocytic progenitors), and c-Kit CD41+ (megakaryocytes) cells were significantly increased in the TPO- and DMAG-treated groups compared with the proportions in the irradiated group (Online Supplementary Figure S13A). The results suggest that DMAG can trigger the production of megakaryocytes at different stages of megakaryopoiesis.

The expression of the megakaryocyte-specific markers CD41 and CD61 was determined by flow cytometry. The results showed that the proportions of CD41+CD61+ cells in the BM and spleen were remarkably higher in the TPO- and DMAG-treated groups than in the irradiated group (Online Supplementary Figure S13B), which indicates that DMAG promoted BM and spleen megakaryocyte differentiation. Flow cytometry was further used to analyze the DNA contents of BM megakaryocytes. As expected, the ploidy of BM megakaryocytes was significantly increased in the TPO- and DMAG-treated groups compared with the irradiated group (Online Supplementary Figure S13C). The expression of the platelet activation marker CD62P (platelet surface P-selectin) was detected by flow cytometry. We found that BM cells of the TPO- and DMAG-treated groups contained significantly higher percentages of platelets (CD41+CD62P+) than those in the irradiated group (Online Supplementary Figure S13D). However, activated platelets (CD41 CD62P+) were almost undetectable in all groups
Continued on following page.
A B Haematologica | 108 May 2023 1403 ARTICLE - Discovery of a TPO-independent inducer of thrombopoiesis L. Wang et al.
Figure 6.
radiation-induced
vivo. (A)
diagram of DMAG administration in KM mice with thrombocytopenia induced by irradiation. (B) Numbers of peripheral platelets, red blood cells and white blood cells in KM mice at the indicated times after injection of normal saline, thrombopoietin (3,000 U/kg), or DMAG (5 mg/kg) daily after irradiation. (C, D) Staining with hematoxylin and eosin shows the megakaryocytes in bone marrow (C) and spleen (D) after mice were treated with normal saline, thrombopoietin (3,000 U/kg) or DMAG (5 mg/kg) for 10 days. Ten microscopy fields per sample were counted. The green circles mark the megakaryocytes. (E) The histogram shows the number of megakaryocytes in the bone marrow and spleen in each group. In (B) and (E), the data are shown as the mean ± standard deviation from three independent experiments. *P<0.05, **P<0.01, ***P<0.001, versus the irradiated group or corresponding control. KM: Kunming; IR: irradiation; DMAG: 3,8-di-O-methylellagic acid 2-O-glucoside; TPO: thrombopoietin; RBC: red blood cell; WBC: white blood cell; BM: bone marrow.
(Online Supplementary Figure S13D). These results indicate that DMAG accelerates thrombopoiesis in BM. Although DMAG did not exert a stimulatory effect on red blood cell recovery in peripheral blood, we still examined the expression of the erythrocyte surface marker Ter119 in
BM cells. Unexpectedly, we found that the percentage of Ter119+ cells was higher in the DMAG-treated group than in the irradiated group (Online Supplementary Figure S14), indicating that DMAG was able to promote erythropoiesis in BM. Furthermore, immunohistochemical staining was

D C E Haematologica | 108 May 2023 1404 ARTICLE - Discovery of a TPO-independent inducer of thrombopoiesis L. Wang et al.
DMAG administration counteracts
thrombocytopenia in
Schematic
carried out to detect the expression of CD41 and NF-E2. The results showed that the numbers of CD41+ megakaryocytes in the TPO- and DMAG-treated groups were higher than the number in the irradiated group (Online Supplementary Figure S15A). Consistent with the findings of the in vitro experiments, NF-E2 expression in BM megakaryocytes in the DMAG-treated groups was significantly higher than that in the irradiated group (Online Supplementary Figure S15A). Serum TPO concentrations were measured and showed that there was no significant difference in TPO levels between the irrdiated group and the DMAG-treated group (Online Supplementary Figure S15B), suggesting that DMAG does not influence TPO production. All these data indicate that DMAG rescues megakaryopoiesis, thereby accelerating the production of platelets in irradiated mice. The effects of DMAG on thrombopoiesis were further verified in zebrafish. Tg (cd41:eGFP) transgenic zebrafish were treated with DMAG (10, 25 and 50 mM) at 3 days post-fertilization (dpf). As expected, the overall numbers of cd41:eGFP thrombocytes at 5 dpf were significantly higher in all the DMAG-treated groups than in the control group (Figure 7A). The dorsal aorta, caudal hematopoietic tissue and tail regions were then carefully observed for cd41:eGFP thrombocytes. It was seen that the numbers of cd41:eGFP cells in all three regions of the DMAG (10, 25 and 50 mM)treated groups were remarkably higher than those of the control group (Figure 7B-D). These results demonstrate that DMAG significantly promotes thrombopoiesis in zebrafish.
The effects of DMAG on megakaryopoiesis and thrombopoiesis are independent of TPO/c-MPL signaling
To gain a deeper understanding of whether DMAG-induced megakaryopoiesis and thrombopoiesis depend on TPO/cMPL signaling in vivo, we used CRISPR/Cas9 technology to construct c-MPL-/- mice. We designed two sgRNA that could generate a 16 kb chromosomal deletion at the c-MPL locus in the mouse genome (Figure 8A, Online Supplementary Figure S16). After obtaining the c-MPL-/- mice, their peripheral platelet levels were measured, and they were found to have severely decreased numbers of platelets (Figure 8B). However, DMAG treatment significantly increased the peripheral platelet level in c-MPL-/- mice on days 7 and 10 (Figure 8B). There were no differences in red or white blood cell counts between the groups (Figure 8B). H&E staining showed that DMAG-treated c-MPL-/- mice had more megakaryocytes in the BM and spleen than control c-MPL-/- mice (Figure 8C, D). Corresponding to the H&E staining results, flow cytometry analysis showed that CD41+ cells (megakaryocytes) were much more abundant in the BM and spleen of DMAG-treated c-MPL-/- mice than in control c-MPL-/- mice (Online Supplementary Figure S17A). Accordingly, the population of megakaryocytic progenitors (c-Kit+CD41+) was significantly increased in DMAG-
treated c-MPL-/- mice compared to that in control c-MPL/- mice (Online Supplementary Figure S17B). Finally, the platelet surface marker CD41+CD62P+ was measured by flow cytometry. The results showed that the number of platelets (CD41+CD62P+) in the BM of c-MPL-/- mice was increased after DMAG administration (Online Supplementary Figure S17C). Collectively, the above results indicate that DMAG is capable of functioning in a TPO-independent manner in promoting megakaryopoiesis and thrombopoiesis in vivo
We also investigated whether DMAG had a stimulatory effect on thrombopoiesis in normal mice. Normal C57BL/6 mice were administered DMAG for 14 consecutive days, and hematologic parameters were measured. Interestingly, we found that DMAG treatment had no effects on peripheral platelet, red blood cell or white blood cell levels (Online Supplementary Figure S18A). Furthermore, H&E staining data demonstrated that the numbers of megakaryocytes in the BM and spleen were not different between the control and DMAG-treated groups (Online Supplementary Figure S18B, C). These data indicate that DMAG has a unique therapeutic effect on mice with thrombocytopenia.
Discussion
Thrombocytopenia is common finding in a multitude of conditions,3,5-7 and can sometimes be life-threatening because of bleeding complications, which in turn profoundly influence subsequent therapies for the diseases.26 However, there are few medical treatments available for thrombocytopenia. The discovery and development of a new drug is an extremely long and costly process, and the success rate is piteously low.13 It is, therefore, critical to develop new approaches that can substantially decrease costs and accelerate the drug discovery process. The adoption of machine learning approaches is ideally suited to do this. The application of machine learning in drug discovery not only decreases the costs, labor and time required to find the ideal compounds from months or years to weeks but also increases the true positive rate to identify structurally novel compounds with the desired bioactivity from thousands of chemical compounds.12 In this study, we developed a drug screening model in hematopoiesis based on a novel gcForest algorithm and virtual screening of potential active compounds from a chemical library. Encouragingly, we found that a natural product, DMAG, not only significantly promoted megakaryocyte differentiation and maturation in vitro but also stimulated platelet recovery in thrombocytopenic mice and the cMPL-/- mouse model, and promoted thrombopoiesis in zebrafish.
In a previous study we demonstrated that DMAG can be
Haematologica | 108 May 2023 1405 ARTICLE - Discovery of a TPO-independent inducer of thrombopoiesis L. Wang et al.
Figure 7. DMAG administration enhances thrombopoiesis in Tg (cd41:eGFP) transgenic zebrafish. (A-C) cd41:eGFP thrombocytes in whole trunk (A), dorsal aorta (B), caudal hematopoietic tissue and tail regions (C) of control and DMAG (10, 25 and 50 m M)-treated zebrafish. (D) Quantification of cd41:eGFP cells in the dorsal aorta, caudal hematopoietic tissue and tail regions in each group. The data are shown as the mean ± standard deviation from three independent experiments. *P<0.05, **P<0.01, ***P<0.001, versus the corresponding control. DMAG: 3,8-di-O-methylellagic acid 2-O-glucoside; DA: dorsal aorta; CHT: caudal hematopoietic tissue.

A B C D Haematologica | 108 May 2023 1406 ARTICLE - Discovery of a TPO-independent inducer of thrombopoiesis L. Wang et al.
separated from a traditional Chinese medicine Sanguisorba officinalis L.27 Sanguisorba officinalis L. is reported to possess hemostatic and anti-leukopenia activities,28 and its active compounds are worthy of future study. Here, we demonstrated that DMAG continuously activated ERK1/2 and HIF-1b expression but did not activate TPO/cMPL signaling or its other downstream signaling pathways. Our results are consistent with previous reports that ERK1/2 is a key regulator of differentiation of megakaryocytes and can act independently of TPO signaling.29-32 HIF1a is a positive regulator of megakaryocyte maturation and platelet formation.21 Previous studies have demonstrated that HIF-1b is crucial for hematopoiesis.33-35 However, its
role in megakaryocyte differentiation and platelet formation is largely unknown. Here, we did not find any change in HIF-1 a expression between the control and DMAGtreated groups, whereas the expression of HIF-1 b was continuously activated by DMAG. We assume that the continuous activation of HIF-1 b is advantageous to the formation of fully active HIF-1, thereby enhancing the expression of genes related to megakaryocyte differentiation.
We determined the expression of transcription factors involved in megakaryocyte differentiation and platelet production and found that NF-E2 was continuously activated by DMAG in a concentration-dependent manner. Studies

A B C D Haematologica | 108 May 2023 1407 ARTICLE - Discovery of a TPO-independent inducer of thrombopoiesis L. Wang et al.
Continued on following page.
Figure 8. DMAG administration promotes megakaryopoiesis and thrombopoiesis in the c-MPL-/- mouse model. (A) Schematic of the construction of the c-MPL-/- mouse model. The blue shears represent sgRNA regions (total size: 14.72 kb). The red line indicates the genomic region of the mouse c-MPL locus. The gray lines represent untranslated regions. The yellow rectangles mark 12 exons of c-MPL. F1, R1 and R2 show the primers used to identify the genotypes of the pups by polymerase chain reaction. (B) Numbers of peripheral platelets, red blood cells and white blood cells in c-MPL-/- mice at the indicated times after administration of normal saline or DMAG (5 mg/kg) daily for 14 consecutive days. (C, D) Hematoxylin and eosin staining shows the distribution of megakaryocytes in the bone marrow (C) and spleen (D) of the control and DMAG-treated groups injected with normal saline or DMAG (5 mg/kg) for 10 consecutive days. Bars represent 100 mm (top) and 50 mm (bottom). Ten microscopy fields per sample were counted. The green circles mark the megakaryocytes. The histogram shows the number of megakaryocytes in the bone marrow (C) and spleen (D) in each group. In (B-D), the data are shown as the mean ± standard deviation from three independent experiments. *P<0.05, **P<0.01, versus the corresponding control. DMAG: 3,8-di-O-methylellagic acid 2-O-glucoside; RBC: red blood cell; WBC: white blood cells; BM: bone marrow.
have shown that NF-E2 is essential for megakaryocyte differentiation and maturation, proplatelet formation and platelet release, independently of the actions of TPO.36-39 We also found that the expression of b-tubulin was significantly enhanced by DMAG in a dose-dependent manner. Tubulin is the major component of microtubules, consisting of a-tubulin and b-tubulin.40 b1-tubulin (TUBB1) is the major b-tubulin isoform that is essential for megakaryocyte maturation and proplatelet formation.41-43 It has been revealed that b1-tubulin is one of the targets of NFE2. The function of b1-tubulin in platelet biogenesis is dependent on NF-E2.44 In our study, the enhanced expression of b-tubulin induced by DMAG may have been mediated by NF-E2, which could be conducive to proplatelet formation. Through treatment with the ERK1/2-specific inhibitor SCH772984, we found that the upregulation of HIF-1b and NF-E2 induced by DMAG was blocked. The results indicated that ERK1/2 is located upstream of HIF1b and NF-E2. These results are consistent with previous reports that ERK is able to regulate HIF-1 transactivation activity and stability and that HIF-1a upregulates the expression of NF-E2 to promote hematopoiesis. In addition, the expression of NF-E2 is upregulated in polycythemic patients with augmented HIF signaling.25 These findings indicate that NF-E2 may be a target of HIF-1. Therefore, an ERK1/2-HIF-1 b -NF-E2-dependent pathway may mediate the effects of DMAG on megakaryocyte differentiation.
The therapeutic action of DMAG on thrombocytopenic mice highlights the importance of a strategy of inducing megakaryocyte differentiation for the treatment of thrombocytopenia, a strategy that could be considered a type of “autotransfusion” of platelets from already existing megakaryocytes in BM. In this study we found that platelet counts in irradiated mice decreased to the lowest level at day 7 after irradiation. The platelet counts in the groups of mice exposed to irradiation, TPO or DMAG were only 34%, 61% and 49%, respectively. of the platelet count of the control group, but the platelet count in the DMAG-treated group was 47% more than that in the irradiated group. The platelet counts recovered gradually from day 7 to day 14. The platelet counts in the DMAGtreated group recovered to almost 72% and 96% of those
in the control group at day 10 and 14, respectively. Nevertheless, the platelet counts in the irradiated group were only 50% and 75% of those in the control group at day 10 and 14, respectively. The platelet counts in the DMAGtreated group were almost 1.5- and 1.3-fold higher than those in the irradiated group at day 10 and 14, respectively. These data demonstrate that DMAG has an excellent ability to stimulate platelet recovery after radiation-induced damage. Moreover, DMAG was able to enhance megakaryopoiesis and thrombopoiesis in c-MPL-/- mice although it did not restore platelet counts to normal levels. The results indicate that DMAG promotes megakaryocyte differentiation and platelet formation in a TPOindependent manner, or at least in part in a TPO-independent manner. Previous studies have demonstrated that although knockout of TPO or c-MPL causes severe thrombocytopenia, the knockout mice are still able to produce a small but sufficient number of platelets to ensure their normal existence and show no symptoms of spontaneous hemorrhage.45 TPO can stimulate megakaryocyte formation but cannot shorten the maturation time of these cells in vivo 46 In addition, humans who have completely lost the function of c-MPL still have a certain number of platelets, indicating that patients without TPO/c-MPL signaling do possess some ability to produce platelets.10 Recent studies have revealed that an inflammatory cytokine, chemokine ligand 5 (CCL5, RANTES), promotes megakaryocyte maturation and proplatelet formation in a CCR5-dependent manner and enhances platelet levels in response to physiological stress.47 Taisuke et al 48 showed that an activated form of tyrosyltRNA synthetase (YRSACT) enhances megakaryopoiesis and platelet production in a TPO-independent manner. Rayko et al. 49 reported that iron de fi ciency increases megakaryocyte differentiation and platelet counts independently of TPO. Wang et al. 30-32,50 demonstrated that several hormones, including human growth hormone, norepinephrine, epinephrine, melatonin, as well as insulin-like growth factor-1, promote megakaryocyte differentiation, proplatelet formation, or platelet production in a TPO-independent manner. These findings and our study suggest that alternative mediators exist and seem able to compensate for the function of TPO when TPO/c-MPL signal-
Haematologica | 108 May 2023 1408 ARTICLE - Discovery of a TPO-independent inducer of thrombopoiesis L. Wang et al.
ing is lost or that they and TPO may act synergistically in regulating megakaryocyte differentiation and platelet formation.
The influence of DMAG in normal mice was investigated. Interestingly, we found that DMAG had no effect on peripheral platelet count or megakaryocyte number in BM in normal mice, indicating that DMAG does not influence thrombopoiesis when the platelet count is normal. We hypothesize that the TPO/c-MPL signaling pathway may have a predominant function in regulating megakaryocyte differentiation and thrombopoiesis under normal conditions. When the TPO/c-MPL signaling pathway is disrupted, the function of the TPO-independent signaling pathway induced by DMAG may stand out. The unique therapeutic action of DMAG in pathological conditions may circumvent a risk of thrombosis.
Because DMAG promotes megakaryocyte differentiation and platelet formation in a TPO-independent manner, it has the potential for use to treat thrombocytopenia in patients who are unresponsive to TPO-receptor agonists or have a complete loss of functional c-MPL. Moreover, because of distinct mechanisms of action, the combined application of DMAG with TPO-receptor agonists may have a better therapeutic effect than a single drug in patients with thrombocytopenia. Collectively, the results of our study demonstrate that DMAG, derived from Sanguisorba officinalis L., stimulates megakaryocyte differentiation and platelet formation through the ERK1/2-HIF-1 b -NF-E2 pathway, which is independent of the TPO signaling pathway (Online Supplementary Figure S19). Our findings provide new insights into alternative treatment options for treating thrombocytopenia.
In summary, our study is the first to establish a drug screening model in hematopoiesis using the gcForest algorithm and demonstrates that DMAG significantly promotes megakaryocyte differentiation and platelet formation. Mechanistically, the action of DMAG involves the TPO-independent ERK/HIF-1/NF-E2 signaling pathway. Our study shows the therapeutic utility of DMAG for thrombocytopenia and provides a new approach for high-throughput drug screening and the treatment of hematologic diseases by targeting TPO-independent signaling.
References
1. Bianchi E, Norfo R, Pennucci V, et al. Genomic landscape of megakaryopoiesis and platelet function defects. Blood. 2016;127(10):1249-1259.
2. Leblanc R, Peyruchaud O. Metastasis: new functional implications of platelets and megakaryocytes. Blood. 2016;128(1):24-31.
3. Eto K, Kunishima S. Linkage between the mechanisms of thrombocytopenia and thrombopoiesis. Blood. 2016;127(10):1234-1241.
Disclosures
No conflicts of interest to disclose.
Contributions
JMW, AGW and CXZ conceived and designed the experiments and supervised all the research. JSL and QM developed the drug screening model. LW, SL, TZ and XXL performed the in vitro experiments . JY and JZ constructed the mouse model. JPC and WJZ analyzed the RNA-sequencing data. LW, SL, MR, FHH and AGW carried out the in vivo experiments. CXZ and WJZ provided the experimental platform. LW, JMW and JSL analyzed the data and wrote the original manuscript. JMW, QBM and CXZ revised the manuscript. All authors approved the final version of the manuscript.
Funding
This work was supported by grants from the Natural Science Foundation of China (82204666, 82074129, 81903829 and 81804221, China), Sichuan Science and Technology Program (2022JDJQ0061, 2019YJ0484, 2019YFSY0014, 2019JDPT0010, and 2019YJ0473, China), the Special Research Project of Sichuan Province Administration of Traditional Chinese Medicine (2018JC013 and 2018JC038, China), the Research Project of Sichuan Provincial Education Department (18TD0051 and 18ZA0525, China), the Luzhou Science and Technology Project (2017S-39(3/5), China), the Joint Project of Luzhou Municipal People’s Government and Southwest Medical University (2018LZXNYD-ZK31, 2018LZXNYD-ZK49, 2019LZXNYD-J11, 2019LZXNYDJ05, 2018LZXNYD-ZK41, 2020LZXNYDZ03, 2020LZXNYDP01 and 2018LZXNYD-YL05, China), the Schoollevel Fund of Southwest Medical University (2021ZKMS044, 2021ZKQN022, 2021ZKMS041, 2018-ZRZD-001, 2019-ZZD006, 2017-ZRZD-017 and 2017-ZRQN-081, China), and the National innovation and entrepreneurship training program for college students, China (201910632002, 201910634003, China).
Data-sharing statement
The authors will make their original data available to future researchers upon request directed to the corresponding author.
4. Li W, Morrone K, Kambhampati S, et al. Thrombocytopenia in MDS: epidemiology, mechanisms, clinical consequences and novel therapeutic strategies. Leukemia. 2016;30(3):536-544.
5. Tamamyan G, Danielyan S, Lambert M. Chemotherapy induced thrombocytopenia in pediatric oncology. Crit Rev Oncol Hematol. 2016;99:299-307.
6. Yamaguchi M, Hirouchi T, Yoshioka H, et al. Diverse functions of the thrombopoietin receptor agonist romiplostim rescue individuals exposed to lethal radiation. Free Radic Biol Med.
Haematologica | 108 May 2023 1409 ARTICLE - Discovery of a TPO-independent inducer of thrombopoiesis L. Wang et al.
2019;136:60-75.
7. Izak M, Bussel JB. Management of thrombocytopenia. F1000Prime Rep. 2014;6:45.
8. Ghanima W, Cooper N, Rodeghiero F, et al. Thrombopoietin receptor agonists: ten years later. Haematologica. 2019;104(6):1112-1123.
9. Poston J, Gernsheimer T. Glucocorticoids promote response to thrombopoietin-receptor agonists in refractory ITP: a case series. Int J Hematol. 2019;110(2):255-259.
10. van den Oudenrijn S, Bruin M, Folman CC, et al. Mutations in the thrombopoietin receptor, Mpl, in children with congenital amegakaryocytic thrombocytopenia. Br J Haematol. 2000;110(2):441-448.
11. Ballmaier M, Germeshausen M. Congenital amegakaryocytic thrombocytopenia: clinical presentation, diagnosis, and treatment. Semin Thromb Hemost. 2011;37(6):673-681.
12. Gupta R, Srivastava D, Sahu M, et al. Artificial intelligence to deep learning: machine intelligence approach for drug discovery. Mol Divers. 2021;25(3):1315-1360.
13. Stokes JM, Yang K, Swanson K, et al. A deep learning approach to antibiotic discovery. Cell. 2020;180(4):688-702.
14. Zhu J, Wang J, Wang X, et al. Prediction of drug efficacy from transcriptional profiles with deep learning. Nat Biotechnol. 2021;39(11):1444-1452.
15. Dong Y, Yang W, Wang J, et al. MLW-gcForest: a multi-weighted gcForest model towards the staging of lung adenocarcinoma based on multi-modal genetic data. BMC Bioinformatics. 2019;20(1):578.
16. Li Y, Zhang Q, Liu Z, et al. Deep forest ensemble learning for classification of alignments of non-coding RNA sequences based on multi-view structure representations. Brief Bioinform. 2021;22(4):bbaa354.
17. Li Y, Li R, Feng Z, et al. Linagliptin regulates the mitochondrial respiratory reserve to alter platelet activation and arterial thrombosis. Front Pharmacol. 2020;11:585612.
18. Wang L, Zhang T, Liu S, et al. Discovery of a novel megakaryopoiesis enhancer, ingenol, promoting thrombopoiesis through PI3K-Akt signaling independent of thrombopoietin. Pharmacol Res. 2022;177:106096.
19. Cong L, Ran FA, Cox D, et al. Multiplex genome engineering using CRISPR/Cas systems. Science. 2013;339(6121):819-823.
20. Qi J, You T, Pan T, et al. Downregulation of hypoxia-inducible factor-1α contributes to impaired megakaryopoiesis in immune thrombocytopenia. Thromb Haemost. 2017;117(10):1875-1886.
21. Poulter N, Thomas S. Cytoskeletal regulation of platelet formation: coordination of F-actin and microtubules. Int J Biochem Cell Biol. 2015;66:69-74.
22. Li Z, Zhou W, Zhang Y, Sun W, et al. ERK regulates HIF1αmediated platinum resistance by directly targeting PHD2 in ovarian cancer. Clin Cancer Res. 2019;25(19):5947-5960.
23. Minet E, Arnould T, Michel G, et al. ERK activation upon hypoxia: involvement in HIF-1 activation. FEBS Lett. 2000;468(1):53-58.
24. Xie Y, Li W, Feng J, et al. MicroRNA-363 and GATA-1 are regulated by HIF-1α in K562 cells under hypoxia. Mol Med Rep. 2016;14(3):2503-2510.
25. Kapralova K, Lanikova L, Lorenzo F, et al. RUNX1 and NF-E2 upregulation is not specific for MPNs, but is seen in polycythemic disorders with augmented HIF signaling. Blood. 2014;123(3):391-394.
26. Roweth H, Parvin S, Machlus K. Megakaryocyte modification of platelets in thrombocytopenia. Curr Opin Hematol. 2018;25(5):410-415.
27. Long W, Liu S, Li XX, et al. Whole transcriptome sequencing and integrated network analysis elucidates the effects of 3,8-di-O-
methylellagic acid 2-O-glucoside derived from Sanguisorba offcinalis L., a novel differentiation inducer on erythroleukemia cells. Pharmacol Res. 2021;166:105491.
28. Wang L, Li H, Shen X, et al. Elucidation of the molecular mechanism of Sanguisorba officinalis L. against leukopenia based on network pharmacology. Biomed Pharmacother. 2020;132:110934.
29. Mazharian A, Watson S, Séverin S. Critical role for ERK1/2 in bone marrow and fetal liver-derived primary megakaryocyte differentiation, motility, and proplatelet formation. Exp Hematol. 2009;37(10):1238-1249.
30. Chen S, Du C, Shen M, et al. Sympathetic stimulation facilitates thrombopoiesis by promoting megakaryocyte adhesion, migration, and proplatelet formation. Blood. 2016;127(8):1024-1035.
31. Xu Y, Wang S, Shen M, et al. hGH promotes megakaryocyte differentiation and exerts a complementary effect with c-Mpl ligands on thrombopoiesis. Blood. 2014;123(14):2250-2260.
32. Chen S, Qi Y, Wang S, et al. Melatonin enhances thrombopoiesis through ERK1/2 and Akt activation orchestrated by dual adaptor for phosphotyrosine and 3-phosphoinositides. J Pineal Res. 2020;68(3):e12637.
33. Adelman D, Maltepe E, Simon M. Multilineage embryonic hematopoiesis requires hypoxic ARNT activity. Genes Dev. 1999;13(19):2478-2483.
34. Ramírez-Bergeron D, Runge A, Adelman D, et al. HIF-dependent hematopoietic factors regulate the development of the embryonic vasculature. Dev Cell. 2006;11(1):81-92.
35. Krock BL, Eisinger-Mathason TS, Giannoukos DN, et al. The aryl hydrocarbon receptor nuclear translocator is an essential regulator of murine hematopoietic stem cell viability. Blood. 2015;125(21):3263-3272.
36. Shivdasani RA, Rosenblatt MF, Zucker-Franklin D, et al. Transcription factor NF-E2 is required for platelet formation independent of the actions of thrombopoietin/MGDF in megakaryocyte development. Cell. 1995;81(5):695-704.
37. Shivdasani RA. The role of transcription factor NF-E2 in megakaryocyte maturation and platelet production. Stem Cells. 1996;14Suppl1:112-115.
38. Fock E, Yan F, Pan S, et al. NF-E2-mediated enhancement of megakaryocytic differentiation and platelet production in vitro and in vivo. Exp Hematol. 2008;36(1):78-92.
39. Fujita R, Takayama-Tsujimoto M, Satoh H, et al. NF-E2 p45 is important for establishing normal function of platelets. Mol Cell Biol. 2013;33(14):2659-2670.
40. McKean P, Vaughan S, Gull K. The extended tubulin superfamily. J Cell Sci. 2001;114(Pt 15):2723-2733.
41. Wang D, Villasante A, Lewis S, et al. The mammalian betatubulin repertoire: hematopoietic expression of a novel, heterologous beta-tubulin isotype. J Cell Biol. 1986;103(5):1903-1910.
42. Schwer H, Lecine P, Tiwari S, et al. A lineage-restricted and divergent beta-tubulin isoform is essential for the biogenesis, structure and function of blood platelets. Curr Biol. 2001;11(8):579-586.
43. Seo H, Chen SJ, Hashimoto K, et al. A β1-tubulin-based megakaryocyte maturation reporter system identifies novel drugs that promote platelet production. Blood Adv. 2018;2(17):2262-2272.
44. Lecine P, Italiano J, Kim S, et al. Hematopoietic-specific beta 1 tubulin participates in a pathway of platelet biogenesis dependent on the transcription factor NF-E2. Blood. 2000;96(4):1366-1373.
45. Kimura S, Roberts AW, Metcalf D, et al. Hematopoietic stem cell
Haematologica | 108 May 2023 1410
- Discovery
TPO-independent inducer of thrombopoiesis L. Wang et al.
ARTICLE
of a
deficiencies in mice lacking c-Mpl, the receptor for thrombopoietin. Proc Natl Acad Sci U S A. 1998;95(3):1195-1200.
46. Zheng C, Yang R, Han Z, et al. TPO-independent megakaryocytopoiesis. Crit Rev Oncol Hematol. 2008;65(3):212-222.
47. Machlus KR, Johnson KE, Kulenthirarajan R, et al. CCL5 derived from platelets increases megakaryocyte proplatelet formation. Blood. 2016;127(7):921-926.
48. Kanaji T, Vo MN, Kanaji S, et al. Tyrosyl-tRNA synthetase stimulates thrombopoietin-independent hematopoiesis accelerating recovery from thrombocytopenia. Proc Natl Acad Sci U S A. 2018;115(35):E8228-E8235.
49. Evstatiev R, Bukaty A, Jimenez K, et al. Iron deficiency alters megakaryopoiesis and platelet phenotype independent of thrombopoietin. Am J Hematol. 2014;89(5):524-529.
50. Chen S, Hu M, Shen M, et al. IGF-1 facilitates thrombopoiesis primarily through Akt activation. Blood. 2018;132(2):210-222.
Haematologica | 108 May 2023 1411 ARTICLE - Discovery of a TPO-independent inducer of thrombopoiesis L. Wang et al.
Pirtobrutinib and venetoclax combination overcomes resistance to targeted and chimeric antigen receptor T-cell therapy in aggressive mantle cell lymphoma
Despite the remarkable success of targeted therapies for mantle cell lymphoma (MCL), including inhibitors of Bruton tyrosine kinase (BTK) and CD19-directed chimeric antigen receptor (CAR) T-cell therapy, resistance and disease relapse persist, so there is an urgent need to develop novel agents and combinatorial strategies against this deadly disease.1,2 BTK is a key component of the B-cell receptor pathway, which regulates B-cell survival and proliferation.
Ibrutinib, the first Food and Drug Administration-approved covalent BTK inhibitor, achieved overall response rates of 70-77% in patients with relapsed/refractory MCL,3 which represented a major milestone in targeted MCL therapies.4 As a key regulator of apoptosis, BCL-2 is aberrantly expressed in MCL, and its inhibition with venetoclax (ABT199) induces massive apoptosis in MCL cells.5 Notably, combinatorial ibrutinib and venetoclax yielded favorable complete response rates in MCL patients in a phase II study (71%)6 and in the phase III SYMPATICO study (62%),3 indicating that novel combinatorial approaches can be useful to overcome therapeutic resistance and increase durability of effective treatments for MCL.
Pirtobrutinib (LOXO-305) is a next-generation, highly selective, non-covalent BTK inhibitor.7 Compared to traditional covalent BTK inhibitors, pirtobrutinib achieves remarkable target coverage regardless of the intrinsically high rate of BTK turnover, and lacks the off-target inhibition of other kinases.8 In the phase I/II BRUIN study pirtobrutinib exhibited promising efficacy in heavily pretreated MCL patients irrespective of prior exposure to covalent BTK inhibitors.9 Given the clinical success of combinatorial ibrutinib and venetoclax in MCL patients, we investigated and here report the antitumor effects of pirtobrutinib in combination with venetoclax in various MCL models in vitro and in vivo to provide proof of concept for further exploration in the clinic. The patients’ apheresis samples used in this study were collected after obtaining informed consent and approval from the Institutional Review Board at The University of Texas MD Anderson Cancer Center and all experimental procedures and protocols were approved by the Institutional Animal Care and Use Committee of The University of Texas MD Anderson Cancer Center.
First, we performed in vitro cell viability assays to test the efficacy of the combination of pirtobrutinib and venetoclax in a panel of MCL cell lines and primary MCL patients’ samples (Figure 1A, B). Compared to the effects of single
agents, the cytotoxicity of the combination was enhanced in all the cells tested irrespective of their response to ibrutinib, venetoclax, and even anti-CD19 CAR T-cell therapy, indicating that this novel combination has promising potential for overcoming multiple types of therapeutic resistance in MCL. A dose-response viability assay for BTK knockdown JeKo-1 cells (JeKo BTK KD_2) (Online Supplementary Figure S1A)10 and ibrutinib-resistant JeKo-1 cells (JeKo-ibrutinib-R)11 showed a clear synergistic effect in reducing cell viability with combination indexes12 <1 (0.54 and 0.47, respectively) (Online Supplementary Figure S1B). As a functional outcome, the annexin V/propidium iodide apoptosis assay revealed enhanced cytotoxicity of the combination compared to single agents in ibrutinib-resistant cell lines (JeKo BTK KD cells and JeKo-ibrutinib-R) and a venetoclax-resistant cell line (Mino-venetoclax-R)13 (Online Supplementary Figure S1C). Consistent with this, reversephase protein array analysis on JeKo-ibrutinib-R cells confirmed enhanced apoptosis for the combination, as demonstrated by increases in the stress response proteins p-NDRG1 and p-JNK, the DNA damage marker γH2AX, and cleaved apoptotic caspases (Online Supplementary Figure S1D). In further accordance with these results, western blotting assay verified that the late-stage cell death markers cleaved caspase 3 and cleaved PARP were markedly increased by the combinatorial treatment (Online Supplementary Figure S1E).
To determine the in vivo anti-MCL efficacy of pirtobrutinib and venetoclax, we tested the combination in an aggressive patient-derived xenograft mouse model generated from a dual ibrutinib- and CD19-targeted CAR T-cell-resistant patient (PT15 in Figure 1B). Compared to a vehicle, each of the single-drug treatments decreased tumor growth in mice, as confirmed by measurement of both tumor volume (Figure 1C) and levels of the tumor marker b2-microglobulin in mouse serum (Online Supplementary Figure S2A). Strikingly, the combination therapy completely suppressed tumor development long after the mice in the other three groups had reached the humane endpoint, and caused no noticeable adverse effects in the mice (e.g., loss of body weight or hair) during the entire treatment (Online Supplementary Figure S2B). The combination treatment was discontinued on day 85 to track the effect on tumor progression. The mice remained tumor-free for more than 2 months. Kaplan-Meier survival analysis demonstrated that the combination therapy dramatically prolonged
Haematologica | 108 May 2023 1412 LETTER TO THE EDITOR
mouse survival with a median survival longer than 150 days, compared to 81 days for the mice treated with pirtobrutinib and 80 days for those given venetoclax, indicating that this novel combination regimen may be a

promising strategy to overcome ibrutinib- and CAR T-cell therapy dual-resistant MCL (Figure 1D).
To validate this in vivo finding, we generated a xenograft model by inoculating Mino-venetoclax-R cells subcu-
Figure 1. The pirtobrutinib-venetoclax combination exhibits enhanced efficacy against mantle cell lymphoma in vitro and in a dual ibrutinib/chimeric antigen receptor T-cell resistant patient-derived xenograft mouse model . (A) The pirtobrutinib and venetoclax combination was tested for effects using a CellTiter-Glo luminescence assay (Promega) after 72 h treatment of a panel of ten mantle cell lymphoma (MCL) cell lines. JeKo-ibrutinib (IBN)-R, Mino-venetoclax-R, Rec-venetoclax-R and Granta-519-venetoclax-R were generated by culturing parental cells with progressively increasing concentrations of ibrutinib or venetoclax. Two BTK knockdown JeKo-1 clones (JeKo BTK KD_1 and JeKo BTK KD_2) were generated using CRISPR/Cas9-mediated editing. Pirtobrutinib 7.5 mM and Venetoclax 25 nM were used for the JeKo-1, Rec-1, SP-49, and Z-138 cell lines; pirtobrutinib 15 mM and venetoclax 50 nM were used for the other cell lines. (B) Apheresis samples from 15 patients (PT1-15) were collected and purified for cell viability assay after 24 h of treatment. The patients’ treatment status is indicated under the x-axis. (C) Isolated MCL cells from an established dual ibrutinib/chimeric antigen receptor T-cell-resistant patient-derived xenograft model were engrafted subcutaneously into 6- to 8-week-old NSG mice. Pirtobrutinib (50 mg/kg, oral gavage, BID) and venetoclax (10 mg/kg, oral gavage, QD) were administered as single agents or in combination when tumors became palpable. Tumor volume was calculated using the formula V = (L x W x W)/2 to assess tumor burden. Tumor volumes of animals in the groups treated with the vehicle, pirtobrutinib, venetoclax and the combination of pirtobrutinib and venetoclax are reported as the mean ± standard error of mean. (D) Kaplan-Meier survival curves of tumor-bearing mice treated with pirtobrutinib and venetoclax were used to estimate the survival rate. The humane endpoint was reached if a tumor diameter exceeded 15 mm. The P value for survival was determined by a logrank (Mantel-Cox) test. *P<0.05, **P<0.01, ***P<0.001, ****P<0.0001. DMSO: dimethylsulfoxide; PBN: pirtobrutinib; VEN: venetoclax; Combo: combination; IBN: ibrutinib; R: resistant; CAR T: chimeric antigen receptor T-cells.
A
C D
B
Haematologica | 108 May 2023 1413 LETTER TO THE EDITOR
taneously into NSG mice. The tumor-bearing mice were administered pirtobrutinib and venetoclax alone or in combination for 25 days and then euthanized. The monotherapy moderately reduced the rate of tumor growth, while the combinatorial treatment almost completely prevented tumor growth, as reflected by tumor volume and mass (Figure 2A, B). These results indicate that the combination holds promise to overcome venetoclax resistance in MCL. To evaluate the transcriptome determinants as-
sociated with this combination, whole-transcriptome RNA sequencing studies were performed on tumor cells harvested from mice treated with vehicle, pirtobrutinib, venetoclax, and the combination of the latter two. A total of 967 genes were differentially expressed in the combined treatment group relative to the group given the vehicle control, of which 478 genes were significantly upregulated while 489 genes were downregulated (absolute [log fold change] >1 and adjusted P value <0.05) (Figure 2C). In

Continued on following page. A B C D E
Haematologica | 108 May 2023 1414 LETTER TO THE EDITOR
Figure 2. The pirtobrutinib and venetoclax combination synergistically prevented tumor growth in the Mino-venetoclax-R xenograft mouse model . (A, B) NSG mice aged 6 to 8 weeks old were subcutaneously engrafted with Mino-venetoclax-R cells, then pirtobrutinib (50 mg/kg, oral, BID) and venetoclax (10 mg/kg, oral, QD) treatment was initiated when tumors became palpable and was continued for 25 days. Tumor volume was monitored and calculated using the formula V = (L x W x W)/2. Tumor weights were recorded at the end of the experiment. Data are represented as mean ± standard error of mean (*P<0.05, **P<0.01, ***P<0.001, ****P<0.0001). (C) Heatmap showing the expression of differentially expressed genes detected by RNA-sequencing of tumors derived from mice treated with vehicle and the pirtobrutinib-venetoclax combination. (D) Venn diagram displaying the number of overlapped and unique differentially expressed genes for the treatment groups versus vehicle. (E) Dot plot showing significantly enriched cancer hallmark pathways (y-axis) in each treatment group compared to control (false discovery rate <0.1). Dots are scaled by enrichment ratio and colored by significance. Shapes represent regulation direction (circle: downregulation, triangle: upregulation). Veh: vehicle; PBN: pirtobrutinib; VEN: venetoclax; Combo: combination; DEG: differentially expressed genes; FDR: false discovery rate.
terms of the genes that were differentially expressed in cells from animals exposed to the combination therapy but not to either monotherapy relative to vehicle, 224 genes (51.9%) were found to be upregulated and 251 genes (60.8%) were downregulated (adjusted P value <0.05) (Figure 2D). Gene set enrichment analysis was performed to determine the associated cancer hallmark gene sets. Compared to single treatments alone and vehicle, combination therapy suppressed mTORC1 signaling, MYC targets, E2F targets, oxidative phosphorylation (OXPHOS), fatty acid metabolism, and adipogenesis pathways (false discovery rate <0.1) (Figure 2E, Online Supplementary Figure S3). It is noteworthy that upregulation of these oncogenic and metabolic pathways has been previously reported to drive ibrutinib resistance in MCL.14,15 Furthermore, not only OXPHOS but also glycolysis, the major energy production pathway, was downregulated in the combination group, indicating that mitochondrial energy production for cancer cells to grow and survive was efficiently blocked by this combination therapy. In summary, our findings demonstrated that the combination of pirtobrutinib and venetoclax had enhanced antitumor efficacy over both monotherapies in preclinical, resistant MCL models and support future investigation of this promising regimen in other B-cell malignancies. Transcriptome profiling revealed a significantly downregulated gene expression signature associated with oncogenic MYC targets, mTORC1 signaling, and metabolic pathways such as glycolysis and OXPHOS. Further mechanistic studies are warranted to elucidate the underpinnings of this combinatorial efficacy. A phase II clinical trial (NCT05529069) based on this study has been activated at MD Anderson Cancer Center.
Authors
Yang Liu,1 Fangfang Yan,2 Vivian Changying Jiang,1 Yijing Li,1 Yuxuan Che,1 Joseph McIntosh,1 Alexa Jordan,1 Ian Hou,1 Lei Nie,1 Jingling Jin,1 Wei Wang,1 Heng-Huan Lee,1 Yixin Yao1 and Michael Wang1,3
1Department of Lymphoma and Myeloma, The University of Texas
MD Anderson Cancer Center; 2Center for Precision Health, School of Biomedical Informatics, The University of Texas Health Science Center at Houston and 3Department of Stem Cell Transplantation and Cellular Therapy, The University of Texas MD Anderson Cancer Center, Houston, TX, USA
Correspondence:
M. WANG - miwang@mdanderson.org
https://doi.org/10.3324/haematol.2022.282031
Received: September 1, 2022.
Accepted: November 28, 2022.
Early view: December 7, 2022.
©2023 Ferrata Storti Foundation
Published under a CC BY-NC license
Disclosures
MW is a consultant to AbbVie, Acerta Pharma, AstraZeneca, BeiGene, BioInvent, Deciphera, InnoCare, Janssen, Kite Pharma, Leukemia & Lymphoma Society, Lilly, Merck, Milken Institute, Oncternal, Parexel, Pepromene Bio, Pharmacyclics, and VelosBio, and he has received research support from Acerta Pharma, AstraZeneca, BeiGene, BioInvent, Celgene, Genmab, Genentech, Innocare, Janssen, Juno Therapeutics, Kite Pharma, Lilly, Loxo Oncology, Molecular Templates, Oncternal, Pharmacyclics, VelosBio and Vincerx. MW has also received speaker’s honoraria from AbbVie, Acerta Pharma, AstraZeneca, BeiGene, BioInvent, Dava Oncology, Eastern Virginia Medical School, IDEOlogy Health, Janssen, Kite Pharma, Leukemia & Lymphoma Society, LLC TS Oncology, Medscape, Meeting Minds Experts, MJH Life Sciences, Merck, Moffit Cancer Center, Oncology Specialty Group, OncLive, Pharmacyclics, Physicians Education Resources (PER), Practice Point Communications (PPC), and Studio ER Congressi. All other authors declare that they have no competing financial interests.
Contributions
MW and YL conceived and designed the study; YL, VCJ, AJ, JM, YL, YC, IH and WW performed the experiments; FY and YL analyzed the data; YL wrote the manuscript; MW, FY, HL, YY, LN and JJ edited the manuscript.
Haematologica | 108 May 2023 1415 LETTER TO THE EDITOR
Acknowledgments
The authors thank the patients and their families for their contribution to this research study. Thanks to Paul C. Dolber and Numsen Hail for offering help in reviewing and revising the manuscript.
Funding
This work was supported by an SRA grant from LOXO Oncology at
References
1. Wang M, Munoz J, Goy A, et al. KTE-X19 CAR T-cell therapy in relapsed or refractory mantle-cell lymphoma. N Engl J Med. 2020;382(14):1331-1342.
2. Jain P, Nastoupil L, Westin J, et al. Outcomes and management of patients with mantle cell lymphoma after progression on brexucabtagene autoleucel therapy. Br J Haematol. 2021;192(2):e38-e42.
3. Wang M, Ramchandren R, Chen R, et al. Concurrent ibrutinib plus venetoclax in relapsed/refractory mantle cell lymphoma: the safety run-in of the phase 3 SYMPATICO study. J Hematol Oncol. 2021;14(1):179.
4. Wen T, Wang J, Shi Y, Qian H, Liu P. Inhibitors targeting Bruton's tyrosine kinase in cancers: drug development advances. Leukemia. 2021;35(2):312-332.
5. Kapoor I, Bodo J, Hill BT, Hsi ED, Almasan A. Targeting BCL-2 in B-cell malignancies and overcoming therapeutic resistance. Cell Death Dis. 2020;11(11):941.
6. Tam CS, Anderson MA, Pott C, et al. Ibrutinib plus venetoclax for the treatment of mantle-cell lymphoma. N Engl J Med. 2018;378(13):1211-1223.
7. Liu Y, Jiang C, Yan F, et al. Pirtobrutinib overcomes ibrutinib and venetoclax resistance in mantle cell lymphoma. Blood. 2021;138(Supplement 1):1182-1182.
Lilly. LOXO Oncology at Lilly provided the pirtobrutinib.
Data-sharing statement
The original data and protocols can be obtained upon reasonable request.
8. Gu D, Tang H, Wu J, Li J, Miao Y. Targeting Bruton tyrosine kinase using non-covalent inhibitors in B cell malignancies. J Hematol Oncol. 2021;14(1):40.
9. Mato AR, Shah NN, Jurczak W, et al. Pirtobrutinib in relapsed or refractory B-cell malignancies (BRUIN): a phase 1/2 study. Lancet. 2021;397(10277):892-901.
10. Li CJ, Jiang C, Liu Y, et al. Pleiotropic action of novel Bruton's tyrosine kinase inhibitor BGB-3111 in mantle cell lymphoma. Mol Cancer Ther. 2019;18(2):267-277.
11. Wang J, Wang J, Lopez E, et al. Repurposing auranofin to treat TP53-mutated or PTEN-deleted refractory B-cell lymphoma. Blood Cancer J. 2019;9(12):95.
12. Chou T-C. The combination index (CI < 1) as the definition of synergism and of synergy claims. Synergy. 2018;7:49-50.
13. Pham LV, Huang S, Zhang H, et al. Strategic therapeutic targeting to overcome venetoclax resistance in aggressive Bcell lymphomas. Clin Cancer Res. 2018;24(16):3967-3980.
14. Zhang L, Yao Y, Zhang S, et al. Metabolic reprogramming toward oxidative phosphorylation identifies a therapeutic target for mantle cell lymphoma. Sci Transl Med. 2019;11(491):eaau1167.
15. Zhao X, Wang MY, Jiang H, et al. Transcriptional programming drives ibrutinib-resistance evolution in mantle cell lymphoma. Cell Rep. 2021;34(11):108870.
Haematologica | 108 May 2023 1416 LETTER TO THE EDITOR
Thrombin formation via the intrinsic coagulation pathway and von Willebrand factor reflect disease severity in COVID-19
Severe coronavirus disease 2019 (COVID-19) has been characterized by hyperinflammation, vascular damage, and thrombosis.1,2 Hyperinflammation causes a vasculopathy, particularly in the lungs. Von Willebrand factor (vWF), a marker of the vasculopathy, indeed, is associated with mortality.3,4 Vascular damage triggers activation of the extrinsic pathway of coagulation via exposure of tissue factor (TF). Moreover, activation of the intrinsic pathway of coagulation on the background of neutrophils and neutrophil extracellular trap (NET) formation appears to be key for COVID-19’s hypercoagulability to occur.1,5,6 Yet, the relative contribution of the extrinsic pathway has not been studied in relation to the intrinsic pathway in COVID-19’s hypercoagulability and thus, firm conclusions cannot be drawn. Here, we assessed markers of the extrinsic and intrinsic pathway in a large and well-defined prospective cohort of patients with COVID-19. The dynamics of coagulation were studied during the first wave of the pandemic using a longitudinal design. Also, associations between activation markers of coagulation, vascular damage, and disease severity (i.e., intensive-care unit [ICU] admission, thrombosis, and mortality) were studied. Consecutive patients with COVID-19 who presented at the Maastricht University Medical Center, Maastricht, the Netherlands, between March 21, 2020, and April 28, 2020, were included. Disease severity was classified as mild (patients not admitted to hospital), moderate (patients admitted to the general ward requiring supplemental oxygen via nasal cannula [≤5 L/min]), and severe (patients requiring supplemental oxygen via a face mask, admitted to the ICU for mechanical ventilation, and/or those who died due to COVID-19). At presentation and at fixed time points during follow-up (i.e., every 5 [±2] days), blood samples were obtained using vacutainer tubes containing 3.2% trisodium citrate and serum tubes; citrated blood was processed immediately and centrifuged at 2,000 g for 10 minutes (min) at room temperature (RT), while serum tubes were allowed to clot for 30 min and centrifuged at 1,885 g for 10 min at RT. Plasma and serum samples were aliquoted and stored at –80°C until testing. Follow-up samples were used when available. Activated coagulation factors in complex with their natural inhibitors (i.e., activated FVII:antithrombin [FVIIa:AT], plasma kallikrein:C1 esterase inhibitor [PKa:C1Inh], FXIa:AT, FXIa:a 1-antitrypsin [a1AT], FIXa:AT, and thrombin:antithrombin [T:AT]), desarginated complement 5a (C5a), and vWF:antigen (vWF:Ag),
were quantified as described.1,7 Free FVIIa (Staclot VIIarTF; Stago, Asniéres-sur-Seine, France) was quantified according to the manufacturer’s instructions. This study was approved by the appropriate ethics committee (20201315), with a waiver of informed consent.
The demographics of the 220 included patients with COVID-19 are depicted in Table 1. Forty-six (21%) patients had mild, 68 (31%) had moderate, and 106 (48%) had severe COVID-19. Thus, 174 patients were admitted, most of whom were treated with antibiotics (n/N=157/174, 90%), chloroquine (n/N=131/174, 75%), and anticoagulation (n/N=154/174, 88%; either prophylactic [n=126] or therapeutic [n=28]) besides oxygen support. At that time, steroids (n/N=6/174, 3%) were not routinely prescribed.
In line with previous studies,8 most patients with severe COVID-19 had elevated levels of D-dimer (n/N=62/64, 97%) and fibrinogen (n/N=55/62, 89%), whereas the activated partial thromboplastin time (n/N=52/71, 73%) and prothrombin time (n/N=56/70, 80%) were often normal (Table 1). Routine coagulation tests were not measured in patients with mild or moderate COVID-19.
We previously demonstrated that T:AT is elevated and linked to disease severity in COVID-19. Neutrophils, NET formation, and activation of the intrinsic pathway drive T:AT levels and COVID-19’s hypercoagulability.1 NET formation, with release of TF, may also activate the extrinsic pathway.9 In order to better understand the interplay and balance between the intrinsic and extrinsic pathways, we assessed markers of the extrinsic pathway. FVIIa:AT, a marker of circulating FVIIa-TF complexes, and free FVIIa did not differ between patients with mild, moderate, or severe COVID-19 and remained stable over time (Table 1; Online Supplementary Table S1). Spearman's ρ indicated a strong positive correlation between T:AT and FXIa:AT (r=0.64; P<0.001) as well as FIXa:AT (r=0.74; P<0.001), but not FVIIa:AT (r=0.14; P=0.097) or free FVIIa (r=0.16; P=0.021; Online Supplementary Figure S1). The role of FVIIa:AT and free FVIIa decreased even more whereas the association of FXI:AT, FIX:AT and T:AT persisted with increasing disease severity, suggesting that FXI activation is mainly caused by FXIIa.10
Activation of the intrinsic pathway may occur on the background of hyperinflammation in COVID-19. FXIa: a 1AT (r=0.38; P<0.001), FIX:AT (r=0.41; P<0.001), T:AT (r=0.35, P<0.001), and vWF:Ag (r=0.39; P<0.001) correlated with CRP (Online Supplementary Table S2). We previously
Haematologica | 108 May 2023 1417 LETTER TO THE EDITOR
Continuous variables were presented as mean (± standard deviation, SD) or median (interquartile range, IQR) as appropriate. Differences between groups were analyzed by unpaired sample t test, Mann Whitney U test, one-way ANOVA, or Kruskal Wallis. Differences in categorical variables were analyzed by chi square test or Fisher’s exact test when appropriate; significant differences between patients groups: severe vs *moderate or †mild disease; moderate vs ‡mild disease. M: male; F: female; NLR: neutrophil-lymphocyte ratio; AST: aspartate transaminase; COPD: chronic obstructive pulmonary disease; CRP: C-reactive protein; CVA: cerebrovascular accident; SBP: systolic blood pressure; DBP: diastolic blood pressure; LDH: lactate dehydrogenase; APTT: activated partial thromboplastin time; PT: prothrombin time; FVIIa: activated FVII; AT: antithrombin; Pka: plasma kallikrein; C1INH: C1 esterase inhibitor; FXIa: activated factor XI; a1AT: a1-antitrypsin; FIXa: activated factor IX; T:AT: thrombin in complex with antithrombin; vWF:Ag: von Willebrand factor antigen.
Normal range Mild (N=46) Moderate (N=68) Severe (N=106) Overall P M/F 26/20 42/26 78/28 0.077 Age in years, median (IQR) 64 (52-74) 73 (60-79)‡ 73 (60-77)† 0.014 Days from illness onset, median (IQR) 7 (5-11) 7 (5-14) 7 (5-14) 0.975 SBP mmHg, mean (SD) 129 (18) 138 (22) 138 (25) 0.063 DBP mmHg, median (IQR) 80 (70-86) 83 (74-87) 80 (70-88) 0.714 Heart rate bpm, median (IQR) 88 (75-100) 90 (80-100) 95 (80-110)*, † 0.013 Body temperature °C, mean (SD) 37.6 (0.9) 38.1 (1.0)‡ 38.1 (1.0)† 0.006 Fever, N (%) >37.9 12 (27) 39 (58)‡ 55 (62)† <0.001 Medical history Hypertension, N (%) Diabetes, N (%) CVA, N (%) Cardiac disease, N (%) COPD/asthma, N (%) None, N (%) 13 (28) 9 (20) 5 (11) 11 (24) 6 (13) 12 (26) 27 (40) 11 (16) 9 (13) 23 (34) 15 (22) 16 (24) 35 (33) 24 (23) 14 (13) 32 (30) 11 (10) 28 (26) 0.452 0.603 0.931 0.560 0.110 0.918 Platelets ×109/L, median (IQR) 130-350 187 (154-292) 214 (147-260) 211 (168-247) 0.985 Leukocytes ×109/L, median (IQR) 3.5-11.0 6.0 (4.8-6.5) 6.6 (4.7-9.0) 7.4 (5.8-10)*, † 0.016 Neutrophils ×109/L, median (IQR) 1.4-7.7 4.8 (3.4-6.5) 5.0 (3.4-7.4) 5.9 (4.7-8.1)† 0.023 Lymphocytes ×109/L, median (IQR) 1.1-4.0 1.1 (0.7-1.5) 0.8 (0.6-1.2) 0.7 (0.5-1.1)† 0.013 NLR, median, (IQR) 4.7 (2.9-6.9) 6.0 (4.1-9.0)‡ 8.6 (5.2-12.5)*, † <0.001 AST U/L, median, (IQR) <35 36 (26-58) 49 (37-64)‡ 55 (40-80)† <0.001 LDH U/L (IQR) <250 253 (202-344) 328 (266-451)‡ 451 (358-595)*, † <0.001 Serum creatinine mmol/L, median (IQR) 60-115 83 (62-113) 88 (71-119) 91 (71-120) 0.369 Albumin g/L, median (IQR) 32.0-47.0 34 (31-38) 33 (30-36) 29 (26-32)*, † <0.001 CRP mg/L, median (IQR) <10 57 (17-95) 69 (39-130)‡ 103 (56-178)*, † <0.001 C5a ng/mL, median (IQR) High C5a, N (%) ≤21.1 15.4 (9.0-25.4) 27 (61) 21.8 (16.8-28.7)‡ 51 (90)‡ 22.1 (11.0-31.5)† 73 (75)* 0.024 0.004 D-dimer mg/L, median (IQR) <500 - - 2,774 (1,167-10,000)Fibrinogen g/L, median (IQR) 1.7-4.0 - - 6.6 (5.3-8.0)aPPT sec, median (IQR) 23-32 - - 29 (27-33)PT sec, median (IQR) 9.9-12.4 - - 11.8 (11.0-12.0)FVIIa mIU/mL, median (IQR) High FVIIa N (%) - 33.1 (21.0-50.8)31.7 (20.0-47.6)39.8 (20.5-55.3)0.360FVIIa:AT pM, median (IQR) High FVIIa:AT, N (%) ≤910 599 (485-719) 3 (7) 556 (476-741) 3 (4) 607 (458-784) 15 (14) 0.790 0.282 PKa:C1Inh nM, median (IQR) High Pka:C1Inh, N (%) ≤0.3 1.6 (0.7-4.1) 40 (89) 2.5 (0.9-4.8) 60 (90) 1.9 (1.0-3.5) 94 (90) 0.957 FXIa:AT pM, median (IQR) High FXIa:AT, N (%) ≤42 23.4 (17.3-35.9) 7 (16) 25.7 (19.8-38.0) 13 (19) 30.0 (22.3-65.2)*, † 40 (39)*, † 0.001 0.003 FXIa:α1AT pM, median (IQR) High FXIa:a1AT (%) ≤248 377 (308-597) 38 (84) 515 (396-751)‡ 64 (96)‡ 545 (402-806)† 103 (99)† 0.003 0.002 FIXa:AT pM, median (IQR) High FIXa:AT N (%) ≤56 53.7 (33.0-71.8) 18 (39) 64.2 (43.4-91.0) 43 (64)‡ 86.8 (62.0-125.6)*, † 84 (81)*, † <0.001 <0.001 T:AT ng/mL, median (IQR) High T:AT N (%) ≤5 4.2 (3.0-5.7) 17 (38) 5.5 (3.7-10.1)‡ 36 (54) 8.7 (4.9-21.2)*, † 78 (75)*, † <0.001 <0.001 vWF:Ag (%) median (IQR) High vWF:Ag, N (%) ≤160 323 (214-422) 40 (89) 361 (263-488) 65 (97) 438 (343-557)*, † 101 (97) <0.001 0.084
Table 1. Baseline characteristics of 220 patients with COVID-19.
Haematologica | 108 May 2023 1418 LETTER TO THE EDITOR
showed the intricate link between the intrinsic pathway, neutrophils, and NET formation.1 NET formation, with the release of RNA and DNA, activates the intrinsic pathway.1113 NET formation, indeed, has been localized to the site of (micro) thrombosis.14 Moreover, NET colocalized with FXII and caused in vitro activation of FXII.5
In order to test the prognostic value of activated coagulation factors in complex with their natural inhibitions and vWF:Ag on ICU admission, thrombosis, and mortality, we performed logistic regression analyses (Table 2). Sixtyfour (29%) of 220 patients with COVID-19 were admitted to the ICU. FXIa:a1AT, T:AT, and vWF:Ag were associated with an increased risk of ICU admission. This observation remained significant for FXIa:a1AT and T:AT in a multivariable model adjusting for age, CRP, and cardiovascular disease. Henderson et al. corroborated our observations and found that FXIa:AT was associated with progression of lung disease on computed tomography; no data on thrombosis were reported.6 We found thrombosis in 29 (13%; 22 pulmonary embolisms, 3 cerebrovascular accidents, 3 peripheral arterial occlusions, and 1 acute coronary syndrome) of 220 patients with COVID-19, with the highest incidence in patients with severe disease (n=23). Logistic regression linked FXIa:AT and T:AT to thrombosis; T:AT remained significant after adjusting for sex. Fiftyeight (33%) of 174 admitted patients with COVID-19 died in the hospital within 28 days; two patients with moderate
disease died because of traumatic brain injury rather than COVID-19 and were excluded from the analysis. Univariable but not multivariable logistic regression linked T:AT and vWF:Ag to in-hospital mortality at 28 days, corroborating previous observations.3,15 Most of these studies, however, were limited because of a cross-sectional design and small sample size. Neither FVIIa:AT nor free FVIIa were associated with clinical outcomes.
Next, we assessed the prognostic value of activated coagulation factors in complex with their natural inhibitors and vWF:Ag over time in admitted patients using linear mixed models (Figure 1). The dynamics of vWF:Ag were associated with clinical outcomes, whereas none of the activated coagulation markers (i.e., FVIIa:AT, free FVIIa, PKa:C1Inh, FXIa:AT, FXIa:a1AT, FIXa:AT and T:AT) was (data not shown); at presentation, however, FXIa:AT (+85.2; 95% confidence interval [CI]: 13.5-156.8; P=0.020) and T:AT (+9.6 (95% CI: 1.4-18; P=0.023) were higher in patients with thrombotic events. vWF:Ag increased over time, particularly in patients admitted to the ICU and in patients who died. The increase in vWF:Ag was steeper in patients who died as compared to those who survived. Of note, elevated levels of PKa:C1Inh, FXIa:a1AT, FIXa:AT and T:AT remained stable during hospital admission (data not shown). Taken together, ongoing vascular damage, as reflected by vWF:Ag, is associated with poor outcomes, whereas activation of the intrinsic pathway relates to COVID-19’s hy-
Figure 1. Predicted estimates of von Willebrand factor antigen stratified by different clinical outcomes at baseline and over time in patients with COVID-19. Linear mixed-effects models were used to illustrate the effects of von Willebrand factor antigen (vWF:Ag) on intensive-care unit (ICU) admission, thrombosis, and 28 day in-hospital mortality. (A) Estimated vWF:Ag was for ICU admitted patients at baseline +9.0 (95% confidence interval [CI]: -55 to 73; P=0.782) higher than non-ICU admitted patients. Over time, vWF:Ag decreased (-3.0; 95% CI: -27 to 22; P=0.826) overall, but increased significantly in ICU admitted patients (+61; 95% CI: 28-94; P<0.001). (B) Baseline vWF:Ag was comparable between patients with (+7.0; 95% CI: -80 to 93; P=0.879) and without thrombosis. Over time, vWF:Ag increased significantly in both groups (+28; 95% CI: 9.0-48; P=0.005) without a statistical significant difference for patients with thrombosis (+34; 95% CI: -7.0 to 74; P=0.103). (C) vWF:Ag tend to be higher in non-survivors (+45; 95% CI: -28 to 117; P=0.225) and increased over time (+28; 95% CI: 8-47; P=0.006) in both groups with a statistically significant sharper increase in non-survivor (+49; 95% CI: 7-90; P=0.023).

A B C
Haematologica | 108 May 2023 1419 LETTER TO THE EDITOR
Table 2. Logistic regression was performed to ascertain the effects of the coagulation factors (per ten units) alone (univariable) and together with other predictors (multivariable) on the likelihood of intensive-care unit admission, thrombosis and 28 day mortality.
*Combined with male sex (OR 2.112; 95% CI: 1.090-4.090; P=0.027), a medical history of hypertension (OR 2.170; 95% CI: 1.121-4.201; P=0.022), cardiac disease (OR 2.139; 95% CI: 1.071-4.273; P=0.031), and C-reactive protein in mg/L (OR 1.008; 95% CI: 1.004-1.0011; P<0.001). †Combined with male sex (OR 3.616; 95% CI: 1.209-10.816; P=0.022). ‡Combined with age in years (OR 1.073; 95% CI: 1.040-1.107; P<0.001), a medical history of diabetes (OR 3.510; 95% CI: 1.729-7.124; P=0.001), and C-reactive protein in mg/L (OR 1.005; 95% CI: 1.001-1.009; P=0.010). OR: odds ratio; CI: confidence interval; AUR: area under the curve; FVIIa: activated FVII; AT: antithrombin: Pka: plasma kallikrein; C1INH: C1 esterase inhibitor; FXIa: activated factor XI; a1AT: a1-antitrypsin; FIXa: activated factor IX; T:AT: thrombin in complex with antithrombin; vWF:Ag: von Willebrand factor antigen; ICU: intensive-care unit.
Univariable OR (95% CI) P AUC (95% CI) ICU admission FVIIa FVIIa Pka:C1Inh FXIa:AT FXIa:a1AT FIXa:AT T:AT vWF:Ag 0.961 (0.858-1.077) 1.005 (0.999-1.010) 1.022 (0.990-1.054) 1.023 (0.999-1.047) 1.001 (1.000-1.001) 1.007 (0.997-1.018) 1.583 (1.253-1.999) 1.026 (1.008-1.045) 0.497 0.097 0.178 0.064 0.028 0.163 <0.001 0.005 0.507 (0.421-0.592) 0.507 (0.404-0.611) 0.515 (0.431-0.599) 0.630 (0.548-0.712) 0.646 (0.570-0.723) 0.682 (0.606-0.759) 0.680 (0.603-0.757) 0.644 (0.566-0.722) Thrombotic events FVIIa FVIIa Pka:C1Inh FXIa:AT FXIa:a1AT FIXa:AT T:AT vWF:Ag 0.929 (0.790-1.093) 1.001 (0.999-1.004) 1.005 (0.975-1.037) 1.024 (1.000-1.048) 1.001 (0.997-1.005) 1.008 (0.997-1.019) 1.402 (1.078-1.824) 1.014 (0.991-1.038) 0.373 0.192 0.741 0.048 0.538 0.141 0.012 0.239 0.521 (0.424-0.618) 0.449 (0.318-0.580) 0.545 (0.435-0.655) 0.632 (0.523-0.741) 0.605 (0.492-0.718) 0.696 (0.591-0.800) 0.685 (0.589-0.780) 0.561 (0.447-0.674) 28 day mortality FVIIa FVIIa Pka:C1Inh FXIa:AT FXIa:a1AT FIXa:AT T:AT vWF:Ag 1.112 (0.995-1.243) 1.001 (0.999-1.003) 0.899 (0.721-1.121) 1.003 (0.978-1.027) 0.998 (0.994-1.003) 1.003 (0.993-1.014) 1.403 (1.116-1.769) 1.034 (1.015-1.054) 0.061 0.305 0.344 0.837 0.503 0.520 0.004 0.001 0.593 (0.497-0.689) 0.474 (0.364-0.584) 0.559 (0.473-0.645) 0.588 (0.501-0.674) 0.512 (0.425-0.598) 0.664 (0.582-0.747) 0.638 (0.553-0.722) 0.660 (0.579-0.740) Multivariable OR (95% CI) P value AUC (95% CI) ICU admission* FVIIa FVIIa Pka:C1Inh FXIa:AT FXIa:a1AT FIXa:AT T:AT vWF:Ag 0.967 (0.849-1.102) 1.007 (1.000-1.015) 1.018 (0.983-1.055) 1.027 (0.996-1.059) 1.005 (1.000-1.010) 1.008 (0,995-1.020) 1.449 (1.092-1.922) 1.020 (0.999-1.043) 0.614 0.059 0.306 0.085 0.047 0.240 0.010 0.068 0.734 (0.659-0.808) 0.773 (0.692-0.854) 0.744 (0.673-0.815) 0.734 (0.660-0.808) 0.747 (0.674-0.820) 0.724 (0.647-0.801) 0.751 (0.677-0.825) 0.738 (0.662-0.814) Thrombotic events† FVIIa FVIIa Pka:C1Inh FXIa:AT FXIa:a1AT FIXa:AT T:AT vWF:Ag 0.969 (0.823-1.140) 1.001 (0.999-1.004) 1.002 (0.971-1.034) 1.019 (0.995-1.044) 1.001 (0.997-1.005) 1.006 (0.995-1.017) 1.336 (1.025-1.740) 1.010 (0.987-1.034) 0.702 0.226 0.913 0.113 0.772 0.257 0.032 0.399 0.594 (0.500-0.687) 0.561 (0.444-0.679) 0.640 (0.542-0.739) 0.699 (0.592-0.806) 0.672 (0.569-0.775) 0.740 (0.639-0.841) 0.725 (0.630-0.821) 0.635 (0.535-0.735) 28 day mortality‡ FVIIa FVIIa Pka:C1Inh FXIa:AT FXIa:a1AT FIXa:AT T:AT vWF:Ag 1.101 (0.966-1.256) 1.000 (0.998-1.002) 0.904 (0.706-1.157) 0.992 (0.959-1.027) 0.997 (0.991-1.004) 0.997 (0.982-1.013) 1.316 (0.990-1.750) 1.007 (0.984-1.031) 0.149 0.910 0.421 0.652 0.379 0.725 0.059 0.555 0.803 (0.733-0.872) 0.817 (0.729-0.905) 0.778 (0.707-0.850) 0.774 (0.702-0.847) 0.777 (0.705-0.849) 0.774 (0.701-0.847) 0.789 (0.718-0.859) 0.773 (0.701-0.845)
Haematologica | 108 May 2023 1420 LETTER TO THE EDITOR
percoagulability and thrombosis. Previous data suggest ongoing activation of the intrinsic pathway, thrombin formation, and vascular damage for up to 3 months after onset of COVID-19.7 Future studies are needed to study the role of coagulation and vascular damage in long COVID-19. Our study has several limitations. First, this cohort was collected at the beginning of the pandemic when thrombotic events were not routinely screened for and thrombosis could have been missed. Second, the limited number of follow-up samples may affect interpretation of data. Our data, however, benefit from the prospective design and inclusion of a large and well-defined cohort of patients with COVID-19. Moreover, our data reflect the natural course of disease because most patients were not treated with glucocorticosteroids and/or immunosuppressive agents.
In conclusion, we showed that thrombin formation, particularly via the intrinsic pathway, is critical for COVID-19’s hypercoagulability to occur. Thrombin formation and vascular damage are important markers of disease severity, thrombosis, and mortality. The intrinsic pathway may therefore be a potential target for the treatment of this devastating disease. Future studies should address whether our findings can be extrapolated to other (viral) respiratory conditions or not.
Authors
Matthias H. Busch,1,2 Sjoerd A. M. E. G. Timmermans,1,2 Sander M. J. van Kuijk,3 Joop P. Aendekerk,2 Renée Ysermans,2 Daan P. C. van Doorn,2 Judith Potjewijd,1,2 Marcel C. G. van de Poll,4 Iwan C. C. van der Horst,4 Jan G. M. C. Damoiseaux,5 Henri M. H. Spronk,2,6 Hugo ten Cate,2,6 Chris P. Reutelingsperger,2 Magdolna Nagy2# and Pieter van Paassen1,2#
1Department of Nephrology and Clinical Immunology, Maastricht University Medical Center; 2Department of Biochemistry, Cardiovascular Research Institute Maastricht; 3Deptartment of Clinical Epidemiology and Medical Technology Assessment;
4Department of Intensive Care Medicine, Maastricht University Medical Center, 5Central Diagnostic Laboratory, Maastricht University Medical Center and 6Thrombosis Expertise Center, Maastricht University Medical Center, Maastricht, the Netherlands
#MN and PvP contributed equally as co-senior authors.
References
1. Busch MH, Timmermans S, Nagy M, et al. Neutrophils and contact activation of coagulation as potential drivers of COVID19. Circulation. 2020;142(18):1787-1790.
2. Klok FA, Kruip M, van der Meer NJM, et al. Incidence of
Correspondence: P. VAN PAASSEN - p.vanpaassen@maastrichtuniversity.nl
https://doi.org/10.3324/haematol.2022.281693
Received: June 30, 2022.
Accepted: December 5, 2022.
Early view: December 15, 2022.
©2023 Ferrata Storti Foundation
Published under a CC BY-NC license
Disclosures
HC and HMHS received funding for research from Bayer and Pfizer; they are stakeholder in Coagulation Profile. HC is a consultant for Alveron and has served at advisory boards for Bayer, Pfizer, Daiichi, Leo and Gilead. CPR is co-inventor of a patent describing use of low anticoagulant heparins in sepsis and owned by Maastricht University. CPR is a scientific consultant for Matisse Pharmaceuticals and Annexin Pharmaceuticals. All other authors have no conflicts of interest to disclose.
Contributions
MHB and SAMEGT collected and managed data and enrolled patients; MHB, SMJK and MN designed and performed statistical analyses, and interpreted data; DPCD performed statistical analyses; MHB wrote the first draft of the manuscript; JP, MP, IH and PP enrolled patients; JPA, RY, and JGMCD collected and stored samples and managed data; MN, HMHS and HC performed experiments and interpreted data; MN, HMHS, HC, CPR and PP supervised experiments, interpreted data, and wrote portions of the manuscript. All authors critically reviewed the manuscript and approved the final version.
Funding
HC and HMHS receive grant support from the Netherlands Heart Foundation (CVON2014-09, Reappraisal of Atrial Fibrillation: Interaction between HyperCoagulability, Electrical Remodeling, and Vascular Destabilization in the Progression of Atrial Fibrillation (RACE V), and from REG-MED XB: Cardiovascular Moonshot. HC was supported by a fellowship of the Gutenberg University Mainz. MV is supported in part by funding from a Health-Holland project/partnership grant (LSHM 9111).
Data-sharing statement
The original data of this study can be obtained upon reasonable request from the corresponding author.
thrombotic complications in critically ill ICU patients with COVID-19. Thromb Res. 2020;191:145-147.
3. Sinkovits G, Reti M, Muller V, et al. Associations between the von Willebrand Factor-ADAMTS13 axis, complement activation,
Haematologica | 108 May 2023 1421 LETTER TO THE EDITOR
and COVID-19 severity and mortality. Thromb Haemost. 2022;122(2):240-256.
4. Vassiliou AG, Keskinidou C, Jahaj E, et al. ICU admission levels of endothelial biomarkers as predictors of mortality in critically Ill COVID-19 patients. Cells. 2021;10(1):186.
5. Englert H, Rangaswamy C, Deppermann C, et al. Defective NET clearance contributes to sustained FXII activation in COVID-19associated pulmonary thrombo-inflammation. EBioMedicine. 2021;67:103382.
6. Henderson MW, Lima F, Moraes CRP, et al. Contact and intrinsic coagulation pathways are activated and associated with adverse clinical outcomes in COVID-19. Blood Adv. 2022;6(11):3367-3377.
7. Willems LH, Nagy M, Ten Cate H, et al. Sustained inflammation, coagulation activation and elevated endothelin-1 levels without macrovascular dysfunction at 3 months after COVID-19. Thromb Res. 2022;209:106-114.
8. Polimeni A, Leo I, Spaccarotella C, et al. Differences in coagulopathy indices in patients with severe versus non-severe COVID-19: a meta-analysis of 35 studies and 6427 patients. Sci Rep. 2021;11(1):10464.
9. Skendros P, Mitsios A, Chrysanthopoulou A, et al. Complement
and tissue factor-enriched neutrophil extracellular traps are key drivers in COVID-19 immunothrombosis. J Clin Invest. 2020;130(11):6151-6157.
10. Naito K, Fujikawa K. Activation of human blood coagulation factor XI independent of factor XII. Factor XI is activated by thrombin and factor XIa in the presence of negatively charged surfaces. J Biol Chem. 1991;266(12):7353-7358.
11. Kannemeier C, Shibamiya A, Nakazawa F, et al. Extracellular RNA constitutes a natural procoagulant cofactor in blood coagulation. Proc Natl Acad Sci U S A. 2007;104(15):6388-6393.
12. Noubouossie DF, Whelihan MF, Yu YB, et al. In vitro activation of coagulation by human neutrophil DNA and histone proteins but not neutrophil extracellular traps. Blood. 2017;129(8):1021-1029.
13. Semeraro F, Ammollo CT, Morrissey JH, et al. Extracellular histones promote thrombin generation through plateletdependent mechanisms: involvement of platelet TLR2 and TLR4. Blood. 2011;118(7):1952-1961.
14. Middleton EA, He XY, Denorme F, et al. Neutrophil extracellular traps contribute to immunothrombosis in COVID-19 acute respiratory distress syndrome. Blood. 2020;136(10):1169-1179.
15. Jin X, Duan Y, Bao T, et al. The values of coagulation function in COVID-19 patients. PLoS One. 2020;15(10):e0241329.
Haematologica | 108 May 2023 1422 LETTER TO THE EDITOR
Predictors of response to venetoclax plus hypomethylating agent therapy and survival in blastphase myeloproliferative neoplasm
Myeloproliferative neoplasms (MPN) with blast-phase (BP) transformation (MPN-BP) are associated with a dismal prognosis with median overall survival of 3.6 months.1 The majority of patients are elderly and unfit for intensive chemotherapy. Venetoclax (Ven) in combination with hypomethylating agent (HMA) is Food and Drug Administration-approved for elderly/unfit acute myeloid leukemia (AML), however MPN-BP patients were excluded from Ven + HMA clinical trials. 2 Nonetheless, therapeutic efficacy of Ven + HMA in MPN-BP has been established through retrospective studies, 3,4 with complete remission with (CR) or without count recovery (CRi) rate of 44% in a multicenter series of 32 treatmentnaïve and relapsed patients with MPN-BP that received Ven plus either azacitidine or decitabine.4 In that particular study, response was superior in the absence of polycythemia vera (PV)/post-PV myelofibrosis phenotype, complex karyotype, and RAS mutations.4 Accordingly, in the current study, our main objective was to examine Ven + HMA treatment outcomes including the impact of karyotype and mutations on response and survival in an expanded cohort of MPN-BP patients treated at the Mayo Clinic outside the clinical trial setting.
The current study comprises of 47 consecutive patients with MPN-BP treated with Ven + HMA at the Mayo Clinic (Rochester MN, Arizona, Florida) between July 2018 and May 2022 and includes 27 patients from a previously published cohort with additional follow-up.4 Study patients were retrospectively recruited after Institutional Review Board approval. Diagnosis of MPN-BP required the presence of ≥ 20% blasts in either the peripheral blood or bone marrow; patients with isolated extramedullary accumulation of blasts (myeloid sarcoma) were excluded.5 Cytogenetic and molecular studies were performed by conventional karyotype, and next-generation sequencing (NGS) of a 42-gene panel, respectively. All patients received at least one cycle of Ven + HMA, with Ven dose adjusted based on drug interactions particularly with azole antifungal prophylaxis. Azacitidine 75 mg/m2 days 1-7 or decitabine 20 mg/m2 days 1-5 was administered as part of the combination therapy. Bone marrow biopsy was obtained after either cycle 1 or 2 in the majority of cases based on treating physician discretion with response assessed according to the 2017 European Leukemia Net (ELN) criteria.6 Determinants of
treatment response were assessed by Chi-square or Fisher’s exact test for nominal data and Wilcoxon ranksum test for continuous variables. Overall survival was evaluated by the Kaplan–Meier method with differences compared by the log-rank test. Analyses were performed using JMP Pro 16 .0.0 software package, SAS Institute, Cary, NC.
A total of 47 patients with intramedullary MPN-BP (median age 71 years, range 46-84; 60% males) received Ven + HMA either upfront or following relapse, of which 32 patients were treatment-naïve and 15 were relapsed/refractory, with eight patients having received prior HMA. Patients with relapsed/refractory disease had received either one (n=15), or two (n=4) prior therapies which included liposomal daunorubicin/cytarabine (n=6), “7cytarabine + 3idarubicin” (n=3), “5cytarabine + 2idarubicin” (n=1), cladribine (n=1), gemtuzumab (n=1), decitabine (n=1), Ven + cytarabine (n=1), azacitidine + ivosidenib (n=1); second line therapies comprised of enasidenib in two patients, and FLAG-IDA, and gemtuzumab, in one patient each. Of note, two patients had relapsed following allogeneic hematopoietic stem cell transplantation (AHSCT). Antecedent MPN included ET/post-ET MF in 18 (38%), PV/post-PV MF in 16 (34%), and PMF in 13 (28%) patients. Driver mutation profile included JAK2 in 76% of the patients and CALR in 18%; other mutations included TP53 in 17 patients (39%), TET2 in ten (23%), ASXL1 in 15 (34%), IDH1/2 in 12 (27%), EZH2 in six (14%), RUNX1 in six (14%), N/KRAS, SRSF2 and U2AF1 in five (11%) each. ELN cytogenetic risk distribution was favorable (2%), intermediate (34%) or adverse (64%); among the latter, 55% were classified as complex. Table 1 lists the characteristics of 47 patients with intramedullary MPN-BP, with treatment details, response rates, and overall outcome.
Thirty-one (66%) patients received decitabine and the remainder azacitidine with a median Ven dose of 200 mg (range, 100-400 mg) administered for a median of three cycles (range, 1-9 cycles). Twenty-one (45%) patients experienced cycle delays/interruptions, with Ven and HMA dose reductions instituted in 27 (57%) and ten (21%) patients, respectively. Pancytopenia related to therapy was noted in 29 (62%) patients and complicated by neutropenic fever in 22 (47%) cases, major hemorrhage in one (2%), tumor lysis syndrome in one (2%), while gastrointestinal toxicity and hepatic dysfunction was docu -
Haematologica | 108 May 2023 1423 LETTER TO THE EDITOR
Table 1. Clinical characteristics at time of leukemic transformation for 47 patients with intramedullary blast phase myeloproliferative neoplasm treated with hypomethylating agent and venetoclax stratified by achievement of complete remission or complete remission with incomplete count recovery.
CR: complete remission; CRi: complete remission with incomplete count recovery; MPN: myeloproliferative neoplasm; NGS: next-generation sequencing; AML: acute myleoid leukemia; ET: essential thrombocythemia; PV: polycythemia vera; PMF: primary myelofibrosis; #Blast percentage was ≥20% either in the peripheral blood or bone marrow.
mented in five (11%) and four (9%) patients, respectively. Treatment was discontinued due to toxicity in six (13%) patients. Eleven (23%) deaths occurred within 90 days, majority (n=8, 73%) were unrelated to therapy. Response was evaluable in all patients with CR and CRi
documented in 20 (43%) patients; 12 (26%) patients with CR and eight (17%) with CRi, partial response in five (11%) patients, resulting in an overall response rate of 53%.
Residual morphological features of MPN were noted in a total of 12 patients which included ten with CR/CRi.
Variables All patients N=47 Patients in CR/CRi N=20 (43%) Patients not in CR/CRi N=27 (57%) P value Age in years, median (range) 71 (46-84) 70 (53-81) 73 (46-84) 0.35 Male, N (%) 28 (60) 12 (60) 16 (60) 1.0 MPN type, N (%) ET/ Post-ET MF PV/ Post-PV MF PMF 18 (38) 16 (34) 13 (28) 10 (50) 3 (15) 7 (35) 8 (30) 13 (48) 6 (22) 0.05 Driver mutation, N (%) JAK2 CALR Triple negative Mutations on NGS, N (%) TP53 TET2 ASXL1 IDH1/2 RUNX1 N/KRAS SRSF2 EZH2 U2AF1 STAG2 46 35 (76) 8 (18) 3 (6) 44 17 (39) 10 (23) 15 (34) 12 (27) 6 (14) 5 (11) 5 (11) 6 (14) 5 (11) 4 (9) 19 13 (68) 4 (21) 2 (11) 19 7 (37) 7 (37) 7 (37) 6 (32) 3 (16) 1 (5) 2 (11) 4 (21) 3 (16) 3 (16) 27 22 (81) 4 (15) 1 (4) 25 10 (40) 3 (12) 8 (32) 6 (24) 3 (12) 4 (16) 3 (11) 2 (8) 2 (8) 1 (4) 0.53 0.83 0.05 0.74 0.58 0.72 0.24 0.88 0.21 0.42 0.17 Splenomegaly, N (%) 16 (34) 6 (30) 10 (37) 0.61 Time to AML in months, median (range) 128 (1-468) 106 (1-468) 133 (4-404) 0.63 Hemoglobin, g/dL, median (range) 8.6 (5.3-14.9) 8.5 (5.3-14.9) 8.7 (5.4-12.3) 0.90 Leukocyte count x109/L, median (range) 6.3 (1-82) 7.4 (1.3-61.4) 6 (1-82) 0.64 Platelet count x109/L, median (range) 111 (8-920) 78 (8-357) 150 (15-920) 0.15 Circulating blasts %#, median (range) 8 (0-90) 4 (0-49) 8 (0-90) 0.78 Bone marrow blasts %#, median (range) 31 (5-90) 42 (9-80) 30 (5-90) 0.21 Karyotype available, N (%) Normal karyotype Complex including monosomal karyotype 44 12 (27) 24 (55) 19 7 (37) 7 (37) 25 5 (20) 17 (68) 0.22 0.04 European LeukemiaNet (ELN) cytogenetic risk stratification, N (%) Favorable Intermediate Adverse 44 1 (2) 15 (34) 28 (64) 19 1 (5) 8 (42) 10 (53) 28 0 (0) 7 (28) 18 (72) 0.28 Extramedullary involvement, N (%) 3 (6) 2 (10) 1 (4) 0.38
Haematologica | 108 May 2023 1424 LETTER TO THE EDITOR
Among complete responders, median time to response was 1.7 months (range, 1-7 months), with median response duration of 5 months (range, 0.4-35 months). Of the ten patients achieving CR/CRi with residual morphological features of MPN, measurable residual disease (MRD) by flow cytometry was present in two of three patients that were assessed. Presence of morphological features of MPN did not significantly impact duration of response (median 6 vs . 2 months in its presence vs. absence; P =0.75). Subsequent relapse was documented in nine (45%) of responding patients. Importantly, seven of 13 (54%) transplant-eligible patients that achieved CR/CRi, were bridged to AHSCT.
CR/CRi rates were similar between patients who received Ven + HMA upfront or in the relapsed setting (47% vs. 33%; P =0.38), with azacitidine or decitabine (50% vs. 39%; P =0.46) or prior HMA exposure (25% vs. 46%; P =0.26). Similarly, presence or absence of JAK2 (37% vs 55%; P =0.31), TP53 (41% vs. 44%; P =0.83), ASXL1 (47% vs. 41%; P =0.74), IDH1/2 (50% vs. 41%; P =0.58), and K/NRAS mutations (20% vs. 46%; P =0.25) did not significantly impact achievement of CR/CRi. On the other hand,
CR/CRi was superior among patients without versus with antecedent PV (55% vs. 19%; P =0.01), with thrombocytopenia ( P =0.10), presence versus absence of TET2 mutation (70% vs. 35%; P=0.05), and absence of complex including monosomal karyotype (60% vs. 29%; P =0.04). Antecedent PV clustered with complex karyotype in 11 of 15 (83%) versus 45% without antecedent PV ( P =0.07). Multivariable analysis confirmed the favorable impact of TET2 mutation ( P =0.02), and absence of antecedent PV ( P =0.009) on CR/CRi (Table 2). Moreover, CR/CRi rates were significantly higher in TET2 mutated versus unmutated patients without antecedent PV (83% vs. 48%) and with antecedent PV (50% vs. 9%) ( P =0.01).
After a median follow up of 6 months (range, 1-37 months) from initiation of Ven + HMA, 31 (66%) patients have died from progressive disease (n=18), infection (n=11), and major hemorrhage (n=2). Overall median survival was 7 months (range, 1-37 months) with 1/2/3-year survival rates of 28%/15%/15% and longer in transplanted patients versus those not transplanted (11 vs. 6 months; P =0.04; 1 /2/3-year survival, 46%/30%/30% vs . 25%/16%/0%) (Figure 1A, B).
Table 2. Predictors of complete response and survival in 47 patients with intramedullary blast phase myeloproliferative neoplasm treated with venetoclax plus hypomethylating agent.
CI: confidence interval; CR/CRi: complete remission/CR with incomplete count recovery; PV: polycythemia vera: ELN- European LeukemiaNet; na: not applicable.
Variables CR/CRi Univariate P value CR/CRi Multivariate P value Odds ratio Overall survival Univariate P value Overall survival Multivariate P value Hazard ratio (95% CI) Age 0.35 0.71 Absence of antecedent PV 0.01 0.009 7.4 0.48 Presence of thrombocytopenia 0.10 0.37 Bone marrow blasts % 0.20 0.95 Absence of complex including monosomal karyotype 0.04 0.11 0.003 0.003 0.3 (0.1-0.7) ELN adverse karyotype 0.19 0.03 Presence of TET2 mutation 0.05 0.02 7.0 0.78 Absence of RAS mutation 0.25 0.02 0.03 0.3 (0.1-0.8) Absence of P53 mutation 0.83 0.08 0.75 ASXL1 mutation 0.74 0.98 Presence of IDH1/2 mutation 0.58 0.07 0.10 Presence of CR/CRi na na 0.02 0.33 Allogeneic transplantation na na 0.08 0.19
Haematologica | 108 May 2023 1425 LETTER TO THE EDITOR
On univariate analysis, overall survival was superior in the absence of complex including monosomal karyotype (10 vs. 5 months; P =0.003), N/KRAS mutations (8 vs. 4 months; P =0.02), and P53 mutations (8 vs. 7 months; P =0.08), in the presence of IDH1/2 mutations (19 vs. 7 months; P =0.07), achievement of CR/CRi (10 vs. 6 months; P =0.02) and AHSCT (11 vs. 6 months; P =0.04). Multivariable analysis confirmed the favorable impact on survival of absence of complex karyotype and N/KRAS mutations ( P =0.003 and P =0.03, respectively) (Table 2).
Figure 1C and D highlight the superior survival observed in patients without complex karyotype, irrespective of AHSCT.
The current series, which is the largest compilation of Ven + HMA treated patients with MPN-BP, serves to expand and refine our prior observations, 3,4 and differs from other reports in terms of exclusion of Ven based regimens with cytarabine or cladribine and patients with MPN in accelerated phase.7,8
The high complete response rate (43%) observed with Ven + HMA was comparable to response following intensive AML induction chemotherapy (CR/CRi 59%).1 In a phase II study of ruxolitinib plus decitabine in patients with either MPN-BP or accelerated phase MPN, overall response rate was 44% (CR/CRi/partial remission [PR] of 0%, 8% and 36%, respectively) per the modified Cheson criteria. 9,10
In our study, CR/CRi rate was higher in relapsed MPN-BP than a prior MD Anderson series in which none of the patients with relapsed disease achieved CR for reasons that are not entirely clear.7 In the particular study, treatment related adverse events (infections in 83% and intracranial hemorrhage in 19%) were also much higher likely because of the utilization of VEN in combination with intensive chemotherapy including cytarabine ≥1 g/m2 or CPX-351 in 19% of patients.7 In another multicentre series of MPN-BP treated with Ven-based regimens, 28% had documented infections and 19% grade 3 hemorrhage.8 The differences
Figure 1. Overall survival of patients with intramedullary blast phase myeloproliferative neoplasms. (A) Overall survival (OS) of 47 patients with intramedullary blast phase myeloproliferative neoplasms (MPN-BP) treated with venetoclax (Ven) + hypomethylating agent (HMA). (B) OS of 47 patients with MPN-BP treated with Ven + HMA stratified by allogeneic transplantation. (C) OS of 44 patients with MPN-BP treated with Ven + HMA stratified by presence or absence of complex including monosomal karyotype. (D) OS of 20 patients with MPN-BP without complex including monosomal karyotype treated with Ven + HMA agent stratified by allogeneic transplantation. CI: confidence interval; yr: years.

A B C D
Haematologica | 108 May 2023 1426 LETTER TO THE EDITOR
in adverse event rates between our study and others are possibly a result of differences in treatment regimens. In the current study, response was superior in TET2-mutated patients without antecedent PV. The sensitivity of TET2 mutations to Ven + HMA is novel in the context of MPNBP, although previously reported in a series of Ven + HMA treated relapsed/refractory AML (n=90), inclusive of a small minority with MPN-BP (n=7).11 Whether the aforementioned finding is a reflection of TET2 mutations and superior response to HMA as in myelodysplastic syndromes (MDS) is unclear,12 since historically response to HMA alone in MPN-BP has been inferior with CR/CRi rate as low as 4%.1 The clustering of antecedent PV with complex karyotype likely accounts for the lower CR/CRi rates observed in patients with antecedent PV. The longer follow-up in our study enabled an accurate estimation of survival which was expectedly longer in patients that underwent AHSCT (median survival 11 months; 3-year survival 30%). In addition, survival was prolonged in patients without complex karyotype and N/KRAS mutations. The current study highlights the divergent effect of tumor genetics on Ven + HMA treatment response in MPN-BP and underscores the significant differences in molecular patterns of response to therapy in comparison with de novo AML in which responses were favorable with NPM1, IDH1/2, and DNMT3A mutations.13 In addition, ASXL1 mutations have been shown to confer sensitivity to Ven + HMA in both AML and MDS with excess blasts, unlike the case in MPN-BP.14,15 The prognostic impact of ASXL1 mutations in blast phase MPN differs from that in MDS and de novo AML as shown in our prior work in which the presence of RUNX1 mutations but not ASXL1 predicted inferior survival in MPN-BP.16 In an analysis of paired chronic and blast phase samples, ASXL1 mutations were detected only during blast phase disease in 33%,16 which might explain the discrepancy in response rates to Ven + HMA. Taken together, our findings which require validation, serve to identify novel subsets of patients with MPN-BP with a higher likelihood of response (TET2 mutated without antecedent PV) and prolonged survival (absence of complex karyotype and N/RAS mutations) following treatment with Ven + HMA.
References
1. Tefferi A, Mudireddy M, Mannelli F, et al. Blast phase myeloproliferative neoplasm: Mayo-AGIMM study of 410 patients from two separate cohorts. Leukemia. 2018;32(5):1200-1210.
2. DiNardo CD, Jonas BA, Pullarkat V, et al. Azacitidine and venetoclax in previously untreated acute myeloid leukemia. N Engl J Med. 2020;383(7):617-629.
3. Gangat N, Morsia E, Foran JM, Palmer JM, Elliott MA, Tefferi A. Venetoclax plus hypomethylating agent in blast-phase myeloproliferative neoplasm: preliminary experience with 12
Authors
Naseema Gangat,1 Rimal Ilyas,1 Kristen McCullough,1 Kebede H. Begna,1 Aref Al-Kali,1 Mrinal M. Patnaik,1 Mark R. Litzow,1 William J. Hogan,1 Abhishek Mangaonkar,1 Hassan Alkhateeb,1 Mithun V. Shah,1 Michelle A. Elliott,1 James M. Foran,2 Talha Badar,2 Jeanne M. Palmer,3 Curtis A. Hanson,4 Animesh Pardanani1 and Ayalew Tefferi1
1Division of Hematology, Mayo Clinic, Rochester, MN; 2Division of Hematology, Mayo Clinic, Jacksonville, FL; 3Division of Hematology, Mayo Clinic, Scottsdale, AZ and 4Division of Hematopathology, Mayo Clinic, Rochester, MN, USA.
Correspondence:
N. GANGAT - gangat.naseema@mayo.edu
A. TEFFERI - tefferi.ayalew@mayo.edu
https://doi.org/10.3324/haematol.2022.282019
Received: August 28, 2022.
Accepted: December 5, 2022.
Early view: December 15, 2022.
©2023 Ferrata Storti Foundation
Published under a CC BY-NC license
Disclosures
No conflicts of interest to disclose.
Contributions
NG and AT designed the study, collected data, performed analyses and wrote the paper; RI collected and analyzed data; CH and CAH reviewed bone marrow morphology; KM, KHB, AA, MMP, MRL, WJH, AM, HA, MVS, MAE, JMF, TB, JMP and AP provided study patients. All authors reviewed the final draft of the paper.
Data-sharing statement
Please email the corresponding author.
patients. Br J Haematol. 2020;191(5):e120-e124.
4. Gangat N, Guglielmelli P, Szuber N, et al. Venetoclax with azacitidine or decitabine in blast-phase myeloproliferative neoplasm: A multicenter series of 32 consecutive cases. Am J Hematol. 2021;96(7):781-789.
5. Arber DA, Orazi A, Hasserjian R, et al. The 2016 revision to the World Health Organization classification of myeloid neoplasms and acute leukemia. Blood. 2016;127(20):2391-2405.
6. Dohner H, Estey E, Grimwade D, et al. Diagnosis and management of AML in adults: 2017 ELN recommendations
Haematologica | 108 May 2023 1427 LETTER TO THE EDITOR
from an international expert panel. Blood. 2017;129(4):424-447.
7. Masarova L, DiNardo CD, Bose P, et al. Single-center experience with venetoclax combinations in patients with newly diagnosed and relapsed AML evolving from MPNs. Blood Adv. 2021;5(8):2156-2164.
8. King AC, Weis TM, Derkach A, et al. Multicenter evaluation of efficacy and toxicity of venetoclax-based combinations in patients with accelerated and blast phase myeloproliferative neoplasms. Am J Hematol. 2022;97(1):E7-E10.
9. Mascarenhas JO, Rampal RK, Kosiorek HE, et al. Phase 2 study of ruxolitinib and decitabine in patients with myeloproliferative neoplasm in accelerated and blast phase. Blood Adv. 2020;4(20):5246-5256.
10. Cheson BD, Bennett JM, Kopecky KJ, et al. Revised recommendations of the International Working Group for Diagnosis, Standardization of Response Criteria, Treatment Outcomes, and Reporting Standards for Therapeutic Trials in Acute Myeloid Leukemia. J Clin Oncol. 2003;21(24):4642-4649.
11. Aldoss I, Yang D, Pillai R, et al. Association of leukemia genetics with response to venetoclax and hypomethylating agents in
relapsed/refractory acute myeloid leukemia. Am J Hematol. 2019;94(10):E253-E255.
12. Bejar R, Lord A, Stevenson K, et al. TET2 mutations predict response to hypomethylating agents in myelodysplastic syndrome patients. Blood. 2014;124(17):2705-2712.
13. DiNardo CD, Tiong IS, Quaglieri A, et al. Molecular patterns of response and treatment failure after frontline venetoclax combinations in older patients with AML. Blood. 2020;135(11):791-803.
14. Gangat N, McCullough K, Johnson I, et al. Real-world experience with venetoclax and hypomethylating agents in myelodysplastic syndromes with excess blasts. Am J Hematol. 2022;97(6):E214-E216.
15. Gangat N, Johnson I, McCullough K, et al. Molecular predictors of response to venetoclax plus hypomethylating agent in treatment-naïve acute myeloid leukemia. Haematologica. 2022;107(10):2501-2505.
16. Lasho TL, Mudireddy M, Finke CM, et al. Targeted nextgeneration sequencing in blast phase myeloproliferative neoplasms. Blood Adv. 2018;2(4):370-380.
Haematologica | 108 May 2023 1428 LETTER TO THE EDITOR
Pirtobrutinib results in reversible platelet dysfunction compared to ibrutinib and acalabrutinib
Covalent, non-reversible Bruton tyrosine kinase inhibitors (BTKi) ibrutinib and acalabrutinib have changed the management landscape of several chronic B-cell malignancies. However, BTKi have demonstrated some challenging off-target toxicities and relatively high rates of discontinuation due to toxicity in non-trial patient populations.1,2 A pooled analysis of the long-term followup of 424 patients receiving ibrutinib enrolled in chronic lymphocytic leukemia (CLL) trials 3 reported any grade bleeding adverse events (AE) in 55% (using multiple AE terms for bleeding) including grade ≥ 3 bleeding events in 5%. A recent pooled analysis of 1,040 patients receiving the more selective, second generation BTKi acalabrutinib reported hemorrhage AE of any grade in 482 patients (46%, grade ≥ 3, 3%).4 The high rates of bleeding AE with covalent BTKi have been attributed to inhibition of platelet tyrosine kinases which results in impaired signaling and function downstream of platelet GPVI, integrin a IIb b 3 and GPIb.5-7 Off-target inhibition of TEC and Src family kinases (SFK) expressed by platelets has been implicated in the mechanism of bleeding as patients with X-linked agammaglobulinemia (XLA), that lack functional BTK, do not suffer from increased bleeding. 8 Pirtobrutinib (formerly Loxo-305) is a non-covalent oral BTKi9 that demonstrates a greater than 300-fold selectivity for BTK versus 363 (98%) of 370 other kinases reducing the potential risk for off-target toxicities and impressive early clinical activity in mantle cell lymphoma (MCL), chronic lymphocytic leukemia (CLL), Waldenstrom’s macroglobulinemia (WM) and Richter transformation (RT) of CLL in patients resistant or intolerant to covalent BTK inhibition in the BRUIN phase Ib/II trial. 9,10 Although follow-up remains relatively short (median, 9 months), grade 1-2 bruising or bleeding was reported in only 22% (20% grade 1, 2% grade 2, 15% treatment-related) with no grade 3-5 bleeding described.11 In order to establish whether the lower rates of bleeding reported in pirtobrutinib trials corresponded with milder platelet dysfunction relative to covalent BTKi ibrutinib and acalabrutinib, we investigated platelet function in patients with non-Hodgkin lymphoma or CLL receiving treatment with covalent and non-covalent BTKi.
We initially characterized the relative effects of BTKi on platelet signaling and function (Figure 1A) following in vitro treatment of blood samples from healthy donors using procedures approved by the University of Reading Research Ethics Committee. Ibrutinib caused complete
inhibition of Src tyrosine autophosphorylation (half maximal inhibitory concentration [IC 50]=1.9 µM) stimulated by the specific GPVI agonist, collagen-related peptide (CRP-XL). Acalabrutinib caused partial inhibition at higher concentrations (>1 µM) while pirtobrutinib did not cause dose-dependent inhibition of SFK activity (Figure 1B). Release of Ca 2+ from intracellular stores downstream of GPVI is dependent on both BTK and TEC5,12 and was inhibited by ibrutinib (IC50 =0.74 µM) and pirtobrutinib (IC50=0.73 µM) with similar potency, but acalabrutinib (IC50=4.2 µM) was less potent (Figure 1C), suggesting that all three inhibitors inhibit both TEC and BTK within the concentration range tested. Future studies could assess the effects of BTKi in the absence of platelet stimulation to elucidate effects on constitutive kinase activity. Ibrutinib and pirtobrutinib inhibited aggregation evoked by CRP-XL with equal potency (IC 50 =3.3 µM) while acalabrutinib (IC 50 =19.1 µM) was again less potent (Figure 1D).
Blood samples were obtained from BRUIN phase Ib/II trial CLL and B-cell non-Hodgkin lymphoma patients (Table 1) receiving pirtobrutinib monotherapy (n=20), and CLL non-clinical trial patients receiving either ibrutinib monotherapy (n=10) or acalabrutinib monotherapy (n=10) under Oxford Radcliffe Biobank research tissue bank ethics, HTA License Number 12217, Oxfordshire C REC:09/H0606/515, project approval code 21/A027 and in accordance with the Declaration of Helsinki. Analysis of platelet function using high throughput plate-based aggregometry (PBA) indicated that aggregation stimulated by CRP-XL was absent in 75% of patients receiving pirtobrutinib, 80% receiving ibrutinib and 40% receiving acalabrutinib (Figure 1E). Responses to 3, 1 and 0.3 µ g/mL CRP-XL were significantly higher in patients receiving acalabrutinib relative to ibrutinib or pirtobrutinib. Responses to collagen were absent in 95% of patients receiving pirtobrutinib, 100% receiving ibrutinib and 70% receiving acalabrutinib (Figure 1F). These data indicate that platelet activation downstream of GPVI is impaired by all three BTKi, but that acalabrutinib caused milder inhibition of GPVI signaling, with ibrutinib and pirtobrutinib causing similar levels of platelet inhibition. Small differences in aggregation responses between BTKi treatments were noted following stimulation with other agonists but differences were not significant compared to healthy controls ( Online Supplementary Figure 1A-D). Future studies could assess functional and signaling responses to GPCR agonists in blood samples treated with
Haematologica | 108 May 2023 1429 LETTER TO THE EDITOR
Figure 1. Pirtobrutinib, ibrutinib and acalabrutinib inhibit platelet signaling and function in vitro and ex vivo. (A) Schematic diagram depicting an abridged platelet GPVI signaling pathway in which stimulation of GPVI results in activation of SFK and BTK/TEC followed by PLCy2 which enables cytosolic Ca2+ release and activation of PKC. Subsequent activation of integrin aIIbb3 enables fibrinogen binding and platelet aggregation. (Bi) Western blot analysis of Src Y418 phosphorylation with GAPDH loading control following stimulation of washed platelets with 3 mg/mL collagen-related peptide (CRP-XL) for 3 minutes in the presence of a range of concentrations of pirtobrutinib, acalabrutinib and ibrutinib (30-0.03 mM) or vehicle and (Bii) graph of mean phosphorylation relative to vehicle treated samples. (Ci) Cytosolic Ca2+ levels after stimulation of fura-2 loaded platelet-rich plasma (PRP) with 3 mg/mL CRP-XL in the presence of Bruton tyrosine kinase inhibitors (BTKi) and (Cii) graphs of mean increase in fura-2 signal relative to vehicle-treated samples and (Ciii) log-half maximal inhibitory concentration (IC50) values for the BTKi. (Di) Graph of % aggregation of PRP measured by PBA after stimulation with 3 mg/mL CRP-XL for 5 minutes in the presence of BTKi and (Dii) mean log-IC50 values. Aggregation of PRP from patients receiving BTKi therapy measured in 96-well plates following stimulation with concentration ranges of (A) CRP-XL, (B) collagen. Plots of (i) concentration-response curves for each agonist in which points represent the mean response to each concentration ± standard error of the mean and (ii) scatter plots of half maximal effective concentration (EC50) values, bars represent the mean ± standard deviation. Failure to induce concentration-dependent aggregation was designated ‘No Response’. The proportion of non-responders is noted at the top of relevant scatter plots. Statistical comparisons were performed by two-way ANOVA with Tukey multiple comparisons test. *P<0.05, **P<0.01.

A Bi Bii
Ci
Cii Ciii
Haematologica | 108 May 2023 1430 LETTER TO THE EDITOR
Di Dii Ei Eii Fi Fii
BTKi in vitro to investigate whether the minor differences observed in the patient groups are linked to their pharmacological properties. Impairment of GPVI-evoked platelet aggregation is thought to be more pronounced when measured by PBA relative to classic Born aggregometry,13 and we found that aggregation responses stimulated by GPVI inhibitors were generally delayed rather than entirely ablated using this method ( Online Supplementary Figure S1 D, F ).
Ibrutinib impairs formation of stable, retracted aggregates under arterial shear conditions and this may underpin higher rates of hemorrhage associated with
ibrutinib therapy. 5,6 We found that the volumes of thrombi formed on collagen following perfusion of whole blood at arterial shear (1,000 s -1 ) for 6 minutes were significantly reduced by all three BTKi relative to healthy controls (Figure 2A). No significant differences were observed between the three BTKi groups. We measured closure time (CT) of the PFA-200 assay using both collagen/ADP and collagen/epinephrine cartridges (Figure 2B). The PFA-200 system uses prolonged (>137 coll/ADP, >199 s coll/EPI) or absent CT to identify impairment of hemostasis at very high shear rates. We found that CT in the collagen/ADP cartridges were pro -
1Common Terminology Criteria for Adverse Events (CTCAE) grading scale. 2International Workshop on Chronic Lymphocytic Leukemia (IWCLL) criteria for chronic lymphocytic leukemia; PET CT criteria for mantle cell lymphoma and lymphoplasmacytoid lymphoma. BTKi: Bruton tyrosine kinase inhibitors; IgM: immunglobulin M; IQR: interquartile range.
Acalabrutinib N=10 Ibrutinib N=10 Pirtobrutinib N=20 Age in years, median (IQR) 77 (67-80) 69 (64-73) 71 (59-79) Sex, N (%) Female Male 5 (50) 5 (50) 6 (60) 4 (40) 9 (45) 11 (55) Diagnosis, N (%) Chronic lymphocytic leukemia (CLL) Richter transformation of CLL Mantle cell lymphoma Lymphoplasmacytoid lymphoma Hairy cell leukaemia variant 10 (100) 0 (0) 0 (0) 0 (0) 0 (0) 10 (100) 0 (0) 0 (0) 0 (0) 0 (0) 11 (55) 2 (10) 4 (20) 2 (10) 1 (5) Prior lines, median (range) 0 (0-1) 1 (0-1) 2 (1-7) Prior cytotoxic chemotherapy, N (%) 1 (10) 6 (60) 17 (85) Prior anti-CD20 monoclonal antibody, N (%) 0 (0) 9 (90) 18 (90) Prior allogenic stem cell transplantation, N (%) 0 (0) 0 (0) 3 (15) Duration of BTK inhibitor in months, median (IQR) 9.5 (2-16) 41 (29-56) 7 (2.5-13.5) Laboratory parameters Hemoglobin (g/L), median (IQR) Platelet count (x109/L), median (IQR) IgM (g/L), median (IQR) 130 (121-144) 161 (151-197) 0.24 (0.12-0.43) 147 (138-151) 172 (169-198) 0.25 (0.17-0.31) 127 (113-134) 207 (110-263) 1.18 (0.27-2.39) Clinical details, N (%) Concurrent antiplatelet drugs Concurrent anticoagulants Inherited bleeding disorders 0 (0) 1 (10) 0 (0) 0 (0) 0 (0) 0 (0) 0 (0) 0 (0) 0 (0) Active bleeding at time of recruitment, N (%) 3 (33) 1 (10) 3 (15) Bleeding on BTKi1, N (%) None Grade 1 Grade 2 Grade 3-5 7 (67) 3 (33) 0 (0) 0 (0) 9 (90) 1 (10) 0 (0) 0 (0) 17 (85) 3 (15) 0 (0) 0 (0) Response to BTKi2, N (%) Complete remission Partial remission Stable or progressive disease Not assessed to date 1 (10) 8 (80) 0 (0) 1 (10%) 6 (60) 4 (40) 0 (0) 0 (0) 5 (25) 9 (45) 2 (10) 4 (20)
Table 1. Patient information.
Haematologica | 108 May 2023 1431 LETTER TO THE EDITOR
longed in 25% of the pirtobrutinib patients (10% failed to close within 300 s) while only 10% of ibrutinib pa-
tients and 0% of acalabrutinib patients had prolonged CT. The CT collagen/epinephrine cartridges was pro -

Continued on following page. A Bi Bii C D E F
Haematologica | 108 May 2023 1432 LETTER TO THE EDITOR
Figure 2. Pirtobrutinib causes similar impairment of platelet function at high shear but the inhibitory effects is rapidly reversed following wash-off. Whole blood from patients receiving Bruton tyrosine kinase inhibitors (BTKi) therapy were perfused through collagen-coated microfluidic chips for 6 minutes at a shear rate of 1,000 s-1 and the volume of resulting thrombi measured by confocal fluorescence microscopy. (A) A scatter plot of thrombus volumes, bars represent the mean ± standard deviation. PFA200 closure times (CT) were also measured in whole blood samples. Scatter plots CT measured in (Bi) collagen/ADP and (Bii) collagen/epinephrine cartridges, including the normal range (green area) and proportion of CT outside of the range (above plot). The P values were calculated using Fisher’s exact test to compare normal and prolonged CT. Flow cytometry was used to assess a-granule secretion by measuring P-selectin exposure in platelet-rich plasma (PRP) from patients receiving BTKi and then again in washed platelets that had been incubated for 1 hour at room temperature after washing. Scatter plots of P-selectin exposure stimulated by (C) 15 mM TRAP-6 or (D) 3 mg/mL CRP-XL after 20 minutes. Lines connect responses in PRP and washed platelets for each patient. The P values were calculated by matched two-way ANOVA with Tukey’s multiple comparison test. (E) Confocal microscopy images of thrombi formed in type I collagen-coated microfluidic chips after perfusing whole blood from healthy donors treated with vehicle, pirtobrutinib (10 µM), ibrutinib (1 µM) or acalabrutinib (1 µM) for 1 hour with or without inhibitor washoff. (F) Bar chart of thrombus volumes normalized to the volume of thrombi formed in vehicle-treated whole blood after washing. Bars represent the mean thrombus volume ± standard error of the mean. P values were calculated using one-way ANOVA with Sidak’s multiple comparisons test.
longed in 45% of pirtobrutinib patients (25% failed to close within 300 s) while 20% of ibrutinib and 10% of acalabrutinib patients had prolonged CT. Differences in CT between the three BTKi were not significant in either the collagen/ADP or collagen/epinephrine tests. In order to control for the effects of different B-cell malignancies present in the pirtobrutinib group on platelet function, we restricted analysis to patients with CLL only and found that this did not alter the results of aggregation, in vitro thrombus formation or PFA-200 assays ( Online Supplementary Figure S2 ).
Rates of hemorrhagic AE for patients with B-cell malignancies receiving BTKi are highest when therapy is first initiated.14 Having established that pirtobrutinib therapy induces similar impairment of hemostasis to acalabrutinib and ibrutinib, we investigated the influence of the duration of BTKi therapy on platelet function parameters. We compared the results of aggregation, thrombus formation and PFA-200 assays of patients within the first 12 months of treatment with a BTKi (n=19) to patients with longer treatment durations (n=21). Duration of therapy had no significant effect on aggregation response to any agonist except U46619, but in vitro thrombus formation was significantly impaired and higher proportion of collagen/epinephrine assays failed to close within 300 s in patients with a treatment duration of <12 months ( Online Supplementary Figure S3 ).
Ibrutinib and acalabrutinib irreversibly inhibit BTK by covalently modifying a cysteine in the ATP binding pocket required for enzymatic activity. Recovery from platelet dysfunction caused by irreversible BTKi is dependent on platelet turnover, which has a half-life of 7 to 10 days. Pirtobrutinib also targets the ATP binding pocket but binds non-covalently and inhibition is reversible. Recovery of normal platelet function is therefore likely to be determined by drug wash-out and not platelet turnover. In order to investigate how wash-off of BTKi influenced platelet function, we measured P-selectin exposure as a marker of α - granule secretion evoked by
CRP-XL or TRAP-6 in PRP or 1 hour after washing the platelets. There was no difference in P-selectin exposure evoked by TRAP-6, except a small but significant decrease after washing in patients receiving acalabrutinib, possibly caused by a small loss in responsiveness during the washing process (Figure 2C). We found that p-selectin exposure evoked by CRP-XL recovered in washed platelets but not in PRP from patients receiving pirtobrutinib. There was no significant difference for patients receiving acalabrutinib or ibrutinib (Figure 2D). We further investigated reversibility by treating whole blood samples from healthy donors with the BTKi and measuring thrombus formation with or without washing off the inhibitors (Figure 2E, F). After pirtobrutinib was washed off, platelet function was not significantly different to vehicle-treated samples, but thrombus formation in ibrutinib- and acalabrutinib-treated samples remained impaired.
Inhibition of SFK is implicated in bleeding risk, and although we found that pirtobrutinib spared SFK activity to a greater extent that the covalent BTKi, this did not result in reduced platelet dysfunction. This study does not rule out that additional effects on coagulation and platelet procoagulant activity may contribute to observed differences, although it should be noted that prior studies attribute increased rates of hemorrhage during BTKi therapy predominantly to inhibition of primary hemostasis. The comprehensive analysis of platelet functional responses presented in this study indicate that low rates of hemorrhage reported in pirtobrutinib trials might not correspond with milder dysfunction compared to ibrutinib and acalabrutinib. Our findings suggest that rapid reversibility in platelet function rather than reduced platelet dysfunction might play a role in the low rates of hemorrhagic adverse events with pirtobrutinib. Further clinical data will be required to identify if the rapid reversal of platelet inhibition observed with pirtobrutinib may simplify elective peri-operative management, emergency surgical management and the management of unrelated major hemorrhage in
Haematologica | 108 May 2023 1433 LETTER TO THE EDITOR
patients on this reversible BTKi compared to irreversible BTKi.
Authors
Alexander P. Bye,1,2 Neline Kriek,2 Tanya Sage,2 Suzannah J. Rawlings,2 Catherine Prodger,3 Murali Kesavan,3 Charlotte Lees,3 Stephen Booth,4 Louise G Cowen,5 Kirsty Shefferd,5 Michael J. Desborough,6 Jonathan M. Gibbins2# and Toby A. Eyre3#
1Molecular and Clinical Sciences Research Institute, St George's University, Cranmer Terrace, London; 2Institute for Cardiovascular and Metabolic Research, School of Biological Sciences, University of Reading, Reading; 3Department of Clinical Hematology, Cancer and Hematology Center, Churchill Hospital, Oxford University Hospitals NHS Foundation Trust, Oxford; 4Department of Clinical Hematology, Royal Berkshire Hospital NHS Foundation Trust, Reading; 5Hematology Late Phase Clinical Trial Unit, Oxford University Hospitals NHS Foundation Trust, Oxford and 6Department of Clinical Hematology, Oxford University Hospitals NHS Foundation Trust, Oxford, UK
#JMG and TAE contributed equally as co-senior authors.
Correspondence:
A.P. BYE - a.bye@sgul.ac.uk
https://doi.org/10.3324/haematol.2022.281402
Received: June 22, 2022.
Accepted: December 5, 2022.

Early view: December 15, 2022.
References
1. Mato AR, Thompson M, Allan JN, et al. Real-world outcomes and management strategies for venetoclax-treated chronic lymphocytic leukemia patients in the United States. Haematologica. 2018;103(9):1511-1517.
2. Forum UC. Ibrutinib for relapsed/refractory chronic lymphocytic leukemia: a UK and Ireland analysis of outcomes in 315 patients. Haematologica. 2016;101(12):1563-1572.
3. Coutre SE, Byrd JC, Hillmen P, et al. Long-term safety of singleagent ibrutinib in patients with chronic lymphocytic leukemia in 3 pivotal studies. Blood Adv. 2019;3(12):1799-1807.
4. Furman RR, Byrd JC, Owen RG, et al. Pooled analysis of safety data from clinical trials evaluating acalabrutinib monotherapy in mature B-cell malignancies. Leukemia. 2021;35(11):3201-3211.
5. Bye AP, Unsworth AJ, Desborough MJ, et al. Severe platelet dysfunction in NHL patients receiving ibrutinib is absent in patients receiving acalabrutinib. Blood Adv. 2017;1(26):2610-2623.
6. Bye AP, Unsworth AJ, Vaiyapuri S, Stainer AR, Fry MJ, Gibbins JM. Ibrutinib inhibits platelet integrin alphaIIbbeta3 outside-in
Published under a CC BY license
Disclosures
APB has received unrelated research funding from Takeda. MJRD has received unrelated funding for teaching or advisory boards from Takeda, Pfizer, Portola, Sanofi, and Amgen. TAE has received unrelated funding for education, advisory boards or research from AstraZenica, Beigene, Janssen, Incyte, Secura Bio, KITE, Roche, Gilead and Abbvie; and funding from and steering committee for Loxo Oncology.
Contributions
APB designed the study, performed research, analysed data, and wrote the manuscript; NK performed research and analysed data; TS and SR performed research; CP collected and collated data; MK, CL, SB, LC and KS collected data; MJD, JMG and TAE designed the study and wrote the manuscript.
Acknowledgments
The authors acknowledge the contribution to this study made by the Oxford Center for Histopathology Research and the Oxford Radcliffe Biobank, which are supported by the National Institutes of Health Research Oxford Biomedical Research Center. The schematic diagram was created with BioRender.com.
Funding
This work was supported by grant RG/20/7/34866 from the British Heart Foundation and a Rosetrees Fellowship StGeorges-21\1 held by APB.
Data-sharing statement
Data is available on request.
signaling and thrombus stability but not adhesion to collagen. Arterioscler Thromb Vasc Biol. 2015;35(11):2326-2335.
7. Levade M, David E, Garcia C, et al. Ibrutinib treatment affects collagen and von Willebrand factor-dependent platelet functions. Blood. 2014;124(26):3991-3995.
8. Futatani T, Watanabe C, Baba Y, Tsukada S, Ochs HD. Bruton's tyrosine kinase is present in normal platelets and its absence identifies patients with X-linked agammaglobulinaemia and carrier females. Br J Haematol. 2001;114(1):141-149.
9. Mato AR, Shah NN, Jurczak W, et al. Pirtobrutinib in relapsed or refractory B-cell malignancies (BRUIN): a phase 1/2 study. Lancet. 2021;397(10277):892-901.
10. Mato AR, Pagel JM, Coombs CC, et al. LOXO-305, a next generation, highly selective, non-covalent BTK inhibitor in previously treated CLL/SLL: results from the phase 1/2 BRUIN study. Blood. 2020;136(Suppl 1):S35-37.
11. Eyre TA, Shah NN, Le Gouill S, et al. BRUIN MCL-321: a phase 3 open-label, randomized study of pirtobrutinib versus investigator choice of BTK inhibitor in patients with previously
Haematologica | 108 May 2023 1434 LETTER TO THE EDITOR
treated, BTK inhibitor naïve mantle cell lymphoma (trial in progress). Blood. 2021;138(Suppl 1):S2422.
12. Atkinson BT, Ellmeier W, Watson SP. Tec regulates platelet activation by GPVI in the absence of Btk. Blood. 2003;102(10):3592-3599.
13. Nicolson PLR, Hughes CE, Watson S, et al. Inhibition of Btk by Btk-specific concentrations of ibrutinib and acalabrutinib
delays but does not block platelet aggregation mediated by glycoprotein VI. Haematologica. 2018;103(12):2097-2108.
14. Byrd JC, Hillmen P, Ghia P, et al. Acalabrutinib versus ibrutinib in previously treated chronic lymphocytic leukemia: results of the first randomized phase III trial. J Clin Oncol. 2021;39(31):3441-3452.
Haematologica | 108 May 2023 1435 LETTER TO THE EDITOR
Sex differences in progression of kidney disease in sickle cell disease
End-organ dysfunction results in substantial morbidity and mortality in sickle cell disease (SCD).1-3 Chronic kidney disease (CKD), defined as kidney damage or decreased kidney function for ≥3 months, is common in SCD.4 While individuals with SCD have shortened life expectancy, female patients appear to live longer than male patients, although some more recent cohort studies show no differences in survival according to sex.1,5,6 This difference in mortality may be driven by less end-organ damage in females. In mouse models of SCD, males present early development of elevated glomerular filtration rate (GFR), with a subsequent progressive decline in renal function over 20 weeks, findings which are not observed in females.7 Estimated GFR (eGFR) decline is also reportedly faster in male than in female SCD patients.8,9 In this study, we evaluated sex differences in kidney complications and the association of CKD with mortality in SCD. We hypothesized that kidney disease is more prevalent in male patients and is associated with a higher risk of mortality. We analyzed a previously described pooled cohort from four centers.10 Adult patients with severe SCD genotypes (HbSS, HbSb0) were evaluated during routine visits to the clinic at 'steady state'. Baseline was defined by first available serum creatinine during the observation period. Only patients with ≥2 creatinine values were evaluated for eGFR decline or CKD progression. Patients with kidney transplant or dialysis requirement were not evaluated for proteinuria or eGFR decline but were included in analyses of baseline CKD and association of CKD with mortality. Each center obtained approval for the study from their Institutional Review Board.
We calculated eGFR using the creatinine-based Chronic Kidney Disease Epidemiology Collaboration (CKD-EPI-2009) equation without adjustment for black race11 and the recent creatinine-based CKD-EPI-2021 equation, which does not include race.12 As CKD-EPI-2021 has not been adequately assessed in SCD, CKD-EPI-2009 was used for primary analyses. We defined CKD as eGFR <90 mL/min/1.73 m2 or proteinuria (≥1+ on urinalysis or urine albumin-creatinine ratio of >300 mg/g) modified from KDIGO (Kidney Disease: Improving Global Outcomes) CKD guidelines.13 Patients with eGFR ≥90 mL/min/1.73 m2 and missing proteinuria data were classified as not having CKD. Hyperfiltration was defined as eGFR >130 mL/min/1.73 m2 for women and >140 mL/min/1.73 m2 for men.14 Progression of CKD was defined as eGFR decline to <90 mL/min/1.73 m2 and ≥25% decline from baseline,15 and rapid kidney function decline was defined as eGFR loss >3.0 mL/min/1.73 m2 annually.16
Continuous variables were summarized by medians and interquartile ranges (IQR), and categorical variables by counts and percentages. A linear mixed effects model with random intercept and random slope for time was used to assess eGFR change over time, adjusted for baseline eGFR, baseline age, main cohort effect, and sex (in the non-stratified analyses). Individual eGFR decline was evaluated from the estimated slope in linear models. Logistic regression modeling, adjusted for baseline eGFR, baseline age and main cohort effect, was used to evaluate the association of sex with rapid eGFR decline. Kaplan-Meier estimates of survival function for age at death were obtained for patients with rapid versus non-rapid eGFR decline and for female versus male patients. Median age at death was obtained from Kaplan-Meier estimates. A Cox regression model evaluated the association of sex, baseline CKD and rapid eGFR decline with age at death. For analyses of age at death, we used age as the time scale and accounted for left truncation using age at baseline (first eGFR measurement) as the left truncation time. In comparisons of sexes, we employed two-sample t test for continuous variables and two-sample proportion test for categorical variables. The interaction between sex and the variable of interest in the mortality analysis was tested to assess if the associations differed according to sex. The interaction of sex and time in the linear mixed effects model was tested to evaluate if eGFR change over time differed according to sex. Analyses were conducted using SAS OnDemand for Academics© 2014 (SAS Institute Inc., Cary, NC, USA). The pooled analysis included 699 individuals (females: 374 [53.5%]) with HbSS and HbS b 0 and at least one eGFR value. Baseline laboratory and clinical data, stratified according to sex, are shown in Table 1. Urine microalbumincreatinine ratios were not available in the majority of patients. Proteinuria was present in 83 of 339 (24.5%) patients with available data (1+ proteinuria in 46 patients; 2+ proteinuria in 19 patients; 3+ proteinuria in 12 patients; 4+ proteinuria in 1 patient; and 5 patients with available albumin-creatinine ratio, and levels >300 mg/g were classified as having proteinuria): 21.7% of female versus 28% of male patients. Using CKD-EPI-2009, baseline hyperfiltration was present in 232 of 699 (33.2%) patients, and 36.4% of female versus 29.5% of male patients. At baseline, 173 of 699 (24.7%) patients had CKD (see Online Supplementary Appendix for KDIGO staging), including 3 on dialysis and 2 with kidney transplants. Ninety-eight of 374 (26.2%) female and 75 of 325 (23.1%) male patients had
Haematologica | 108 May 2023 1436 LETTER TO THE EDITOR
baseline CKD. Twenty-one of 83 patients with proteinuria (25.3%) had baseline eGFR <60 mL/min/1.73 m2, while only 5 of 256 patients without proteinuria (1.95%) had baseline eGFR <60 mL/min/1.73 m2.
Two or more eGFR values were available in 606 patients (excluding kidney transplant or dialysis patients). The median observation period in these patients was 5.20 years (IQR: 1.56, 7.53), with 3128.6 patient-years of observation and a median of 4 (IQR: 2, 10) eGFR values. Progression of CKD occurred in 144 of 606 (23.8%) patients: 83 of 327 (25.4%) female versus 61 of 279 (21.9%) male patients.
Change in eGFR over time for all patients, adjusted for baseline eGFR, baseline age, sex and cohort, was -2.06 mL/min/1.73 m2 per year (95% confidence interval [CI]:2.36, -1.77; P<0.0001), with a decline of -1.86 mL/min/1.73 m2 per year (95% CI: -2.25, -1.48; P<0.0001) in females and -2.33 mL/min/1.73 m2 per year (95% CI: -2.80, -1.87; P<0.0001) in males (Table 2, Figure 1). After adjustment for baseline eGFR, age and cohort, no significant associations were observed between eGFR change over time and use of angiotensin converting enzyme inhibitors/angiotensin receptor blockers (ACE-I/ARB) either in all patients (P=0.15) or
*Proteinuria: at least 1+ by dipstick urinalysis. #Male patients only. P value: comparing differences between male and female patients. eGFR: estimated glomerular filtration rate (using CKD-EPI-2009 without adjustment for black race); N: number; H/O: history of; RAAS blocking agents: renin-angiotensin-aldosterone system blocking agents (angiotensin-converting enzyme inhibitors and angiotensin receptor blockers); IQR: interquartile range; na: not available; RBC: red blood cell.
Variable All patients N Median (IQR)/N (%) Male patients N Median (IQR)/N (%) Female patients N Median (IQR)/N (%) P Age, years 699 26 (19.0-37.3) 325 24 (18-36) 374 27.4 (20-40.0) 0.003 Weight, kg 648 65.5 (57.5-74.8) 299 68.0 (59.6-76.2) 349 63.5 (55.7-73.4) 0.006 Height, cm 313 169.8 (163.7-175.5) 150 175.1 (170.2-180.0) 163 165.1 (160.0-169.2) <0.0001 White blood cell count, x109/L 655 10.5 (7.8-13.0) 308 10.5 (7.5-12.9) 347 10.5 (8.1-13.0) 0.13 Hemoglobin, g/dL 655 8.9 (7.9-10.0) 308 9.3 (8.0-10.5) 347 8.7 (7.9-9.7) <0.0001 Hematocrit, % 653 26.2 (23.0-29.1) 307 26.9 (23.0-30.3) 346 25.6 (22.9-28.1) <0.0001 Reticulocyte count, x109/L 520 255.4 (174.1-355.7) 236 262.7 (174.9-359.0) 284 245.7 (171.7-351.7) 0.45 Platelet count, x109/L 648 409.5 (306.5-521.0) 305 400.3 (298.3-503.0) 343 419 (316.0-535) 0.35 Baseline eGFR, mL/min/1.73m2 699 125.3 (105.0-138.2) 325 128.4 (109.1-144.7) 327 121.8 (101.4-133.5) 0.004 Blood urea nitrogen, mg/dL 371 8.0 (6.0-11.0) 162 9.0 (7.0-11.0) 209 7.0 (5.0-10.0) 0.15 Total bilirubin, mg/dL 616 2.4 (1.5-3.9) 287 2.6 (1.6-4.3) 329 2.3 (1.4-3.8) 0.006 Direct bilirubin, mg/dL 271 0.3 (0.2-0.4) 130 0.3 (0.2-0.4) 141 0.3 (0.2-0.5) 0.20 Indirect bilirubin, mg/dL 271 2.20 (1.50-3.60) 130 2.26 (1.51-3.7) 141 2.1 (1.4-3.5) 0.25 Ferritin, ng/mL 370 494.5 (155.0-1,299.0) 169 367 (129-924) 201 590 (193-1,755) 0.0004 Hemoglobinuria, N (%) 399 78 (19.6) 172 35 (20.4) 227 43 (18.9) 0.73 Proteinuria*, N (%) 339 83 (24.5) 150 42 (28.0) 189 41 (21.7) 0.18 Hemoglobin F, % 419 7.7 (3.5-14.2) 194 7.1 (3.0-12.9) 225 8.4 (4.2-15.8) 0.03 H/O acute chest syndrome, N (%) 657 473 (72.0) 308 222 (72.1) 340 251 (71.9) 0.96 H/O stroke, N (%) 644 115 (17.9) 304 55 (18.1) 340 60 (17.7) 0.88 H/O leg ulcers, N (%) 615 101 (16.4) 292 54 (18.5) 323 47 (14.6) 0.19 H/O priapism#, N (%) 225 93 (41.3) 224 93 (41.5) na naH/O avascular necrosis, N (%) 469 162 (34.5) 212 71 (33.5) 257 91 (35.4) 0.66 Systolic blood pressure, mm Hg 663 118 (109-128) 310 121 (112-131) 353 115 (109-126) 0.0009 Diastolic blood pressure, mm Hg 663 69 (61-75) 310 68 (61-74) 353 69 (63-75) 0.35 H/O diabetes, N (%) 650 12 (1.9) 304 3 (1.0) 346 9 (2.6) 0.13 Chronic RBC transfusion, N (%) 670 66 (9.9) 312 32 (10.3) 358 34 (9.5) 0.74 Hydroxyurea therapy, N (%) 697 371 (53.2) 324 198 (61.1) 373 173 (46.4) 0.0001 RAAS blocking agents, N (%) 385 46 (12.0) 168 25 (14.9) 217 21 (9.7) 0.12
Haematologica | 108 May 2023 1437 LETTER TO THE EDITOR
Table 1. Baseline demographic, laboratory and clinical variables in pooled patient cohorts with sickle cell disease.
in male patients (P=0.29). However, change in eGFR over time was significantly associated with use of ACE-I/ARB in female patients (P=0.006; slopes = -1.49 and -2.70 for the group not using and the group using ACE-I/ARB, respectively), suggesting faster eGFR decline in females on ACEI/ARB than females not taking these agents. No significant associations were observed between change of eGFR over time and hydroxyurea use in all patients (P=0.14), male patients (P=0.16), or female patients (P=0.61). Rapid eGFR de-
cline was observed in 191 of 606 (31.5%) patients, 28.8% female patients and 34.8% male patients. Adjusted for baseline eGFR, baseline age and cohort, there was a trend for association of male sex with rapid eGFR decline (OR: 1.37, 95% CI: 0.96, 1.95; P=0.08). Results obtained using CKD-EPI2021 and alternative definitions are shown in Table 2.
During the observation period, 114 of 698 patients (16.3%), 62 of 373 (16.6%) females and 52 of 325 (16%) males with available data died. The median age at death was 44.8-
*For assessments including eGFR decline, patients were only included if they had ≥ 2 measures of serum creatinine over the observation period (N=606). The model was adjusted for sex, center, baseline WBC count, hemoglobin, eGFR and hydroxyurea therapy in all patients and adjusted for the same variables except sex in male or female patients alone. #Adjusted for age, sex, center and baseline eGFR. °Mortality data were available in 698 patients. Age was used as the time scale and left-truncation was accounted for. The model was adjusted for sex, center, white blood cell count (WBC), hemoglobin, and hydroxyurea therapy in all patients and adjusted for the same variables except sex in male or female patients alone. †Adjusted for sex, center and baseline estimated glomerular filtration rate (eGFR). ACE-I: angiotensin converting enzyme inhibitors; ARB: angiotensin receptor blockers; CKD: chronic kidney disease; HR: Hazard Ratio. CKD Epidemiology Collaboration (CKD-EPI) formulae (CKD-EPI-2009 and CKD-EPI-2021) were used to estimate glomerular filtration rate; race variable excluded from CKD-2009 equation. P value: comparing differences between male and female patients.
Variable All patients (N=699) Males (N=325) Females (N = 374) P CKD-EPI2009 CKD-EPI2021 CKD-EPI2009 CKD-EPI2021 CKD-EPI2009 CKD-EPI2021 CKD-EPI2009 CKD-EPI2021 Prevalence of baseline hyperfiltration (%) 232 (33.2) 227 (32.5) 96 (29.5) 87 (26.8) 136 (36.4) 140 (37.4) 0.056 0.003 Baseline CKD, N (%) 173 (24.8) 162 (23.2) 75 (23.1) 70 (21.5) 98 (26.2) 92 (24.6) 0.34 0.34 Slope of eGFR*# (mL/min/1.73 m2 per year) (95% CI) -2.06 (-2.36 to -1.77) -1.98 (-2.27 to -1.70) -2.33 (-2.80 to -1.87) -2.21 (-2.66 to -1.77) -1.86 (-2.25 to -1.48) -1.82 (-2.20 to -1.43) 0.12 0.18 Progression of CKD* (<90 mL/min/1.73 m2 and ≥25% decline in baseline eGFR), N (%) 144 (23.8) 137 (22.6) 61 (21.9) 57 (20.4) 83 (25.4) 80 (24.5) 0.31 0.24 Progression of CKD* (<90 mL/min/1.73 m2 and ≥50% decline in baseline eGFR), N (%) 55 (9.1) 54 (8.9) 25 (9.0) 25 (9.0) 30 (9.2) 29 (8.9) 0.93 0.97 Prevalence of rapid decline of eGFR* (>3 mL/min/1.73 m2 per year) (%) 191 (31.5) 172 (28.4) 97 (34.8) 88 (31.5) 94 (28.8) 84 (25.7) 0.11 0.11 Prevalence of rapid decline of eGFR* (>5 mL/min/1.73 m2 per year) (%) 125 (20.6) 119 (19.6) 58 (20.8) 55 (19.7) 67 (20.5) 64 (19.6) 0.93 0.97 Association of baseline eGFR (<90 mL/min/1.73 m2) with mortality, HR (95% CI)° 3.12 (2.01-4.84) 3.10 (2.01-4.78) 2.32 (1.19-4.49) 2.88 (1.50-5.52) 4.03 (2.19-7.41) 3.50 (1.91-6.43) 0.52 0.98 Association of baseline CKD with mortality, HR (95% CI)° 2.05 ( 1.33-3.15) 1.98 (1.28-3.04) 2.21 (1.13-4.31) 2.39 (1.23-4.66) 2.12 (1.18-3.82) 1.88 (1.04-3.38) 0.99 0.71 Association of ACE-I/ARB use with mortality, HR (95% CI)† 1.16 (0.57-2.38) 1.15 (0.56-2.37) 1.45 (0.36-5.76) 1.45 (0.36-5.82) 0.47 (0.17-1.32) 0.46 (0.16-1.29) 0.34 0.35 Association of hydroxyurea use with mortality, HR (95% CI)† 0.78 (0.53-1.15) 0.78 (0.53-1.15) 0.76 (0.43-1.37) 0.75 (0.42-1.35) 0.87 (0.51-1.49) 0.87 (0.51-1.49) 0.87 0.84 Association of rapid eGFR decline (>3 mL/min/1.73 m2) with mortality, HR (95% CI)*° 2.64 (1.73-4.03) 2.57 (1.67-3.95) 2.31 (1.17-4.56) 2.31 (1.17-4.58) 3.54 (1.93-6.49) 3.33 (1.80-6.15) 0.17 0.24 Association of rapid eGFR decline (>5 mL/min/1.73 m2) with mortality, HR (95% CI)*° 3.44 (2.17-5.44) 3.43 (2.17-5.43) 4.56 (2.03-10.21) 4.71 (2.08-10.66) 3.78 (2.01-7.11) 3.81 (2.02-7.17) 0.82 0.82
Table 2. Biomarkers of kidney function and association of kidney disease with mortality in male and female patients.
Haematologica | 108 May 2023 1438 LETTER TO THE EDITOR
years overall: 44.8-years for females and 44.5-years for males. Sixty of 173 (34.7%) patients with baseline CKD died versus 54 of 525 (10.3%) patients without CKD. After adjustment for white blood cell (WBC) count, hemoglobin (Hb) and fetal hemoglobin (HbF), CKD was associated with age at death in all patients (hazard ratio [HR]: 2.05, 95% CI: 1.33, 3.15; P=0.0012), and when stratified according to sex, in female patients (HR: 2.12, 95% CI: 1.18, 3.82; P=0.012) and in male patients (HR: 2.21, 95% CI: 1.13, 4.31; P=0.02).
Baseline eGFR <90 mL/min/1.73 m2 was significantly associated with age at death in all patients (HR: 3.12, 95% CI: 2.01, 4.84; P<0.0001), and when stratified according to sex, in female patients (HR: 4.03, 95% CI: 2.19, 7.41; P<0.0001) and in male patients (HR: 2.32, 95% CI: 1.19, 4.49; P=0.013). No significant association was observed between sex and age at death, following adjustment for cohort (HR: 1.22, 95% CI: 0.84, 1.78; P=0.29). Neither baseline CKD nor baseline eGFR <90 mL/min/1.73 m2 showed any interaction with sex in the association with mortality. Adjusted for baseline eGFR, neither hydroxyurea use nor use of ACE-I/ARB were significantly associated with risk of death in all patients, male patients or female patients (Table 2).

Fifty-two of 190 patients (27.4%) with rapid eGFR decline died compared with 46 of 415 patients (11.1%) without rapid eGFR decline. Rapid eGFR decline was associated with age at death in all patients (HR: 2.75, 95% CI: 1.83, 4.14; P<0.0001) following adjustment for sex and cohort, and when stratified according to sex, in female patients (HR: 4.69, 95% CI: 2.63, 8.37; P<0.0001) following adjust-
ment for cohort, but not in male patients (Online Supplementary Figure S1). After adjustment for baseline WBC, Hb, eGFR and use of hydroxyurea, rapid eGFR decline was associated with increased risk of death in all patients (HR: 2.64, 95% CI: 1.73, 4.03; P<0.0001), and when stratified by sex, in female patients (HR: 3.54, 95% CI: 1.93, 6.49; P<0.0001) and male patients (HR: 2.31, 95% CI: 1.17, 4.56; P=0.02). No significant association was observed between sex and risk of death in patients with rapid eGFR decline (HR: 0.77, 95% CI: 0.42, 1.42; P =0.40), but among those with non-rapid eGFR decline, male patients had a significantly higher risk of death than females (HR: 2.20, 95% CI: 1.21, 4.00; P=0.01).
As in our previous report,17 in this pooled analysis hyperfiltration was more prevalent in adult female patients, possibly reflecting earlier declines in eGFR from hyperfiltration to normal range among males. Furthermore, eGFR decline was faster and rapid kidney function decline more common in male patients. However, baseline CKD and progression of CKD were similar in male and female patients, possibly related to the absence of albuminuria assessments in the majority of patients in the pooled analysis, which did not allow a complete assessment of CKD. Although our analyses of interaction of ACE-I/ARB use and time demonstrated eGFR decline was faster in female patients on ACE-I/ARB than in female patients not on such treatment, the number of patients on these agents was only small.
Sex differences in SCD may occur due to lower hemolysis
Figure 1.
filtration rate decline in pooled population with sickle cell disease and stratified according to sex. The change in estimated glomerular filtration rate (eGFR) over time for all patients was -2.06 mL/min/1.73 m2 per year (95% CI: -2.36, -1.77; P<0.0001), for female patients -1.86 mL/min/1.73 m2 per year (95% CI: -2.25, -1.48; P<0.0001), and for male patients -2.33 mL/min/1.73 m2 per year (95% CI: -2.80, -1.87; P<0.0001).
Haematologica | 108 May 2023 1439
Slope of estimated glomerular
LETTER TO THE EDITOR
rates,18 higher HbF levels,19 and greater bioavailability of or responsiveness to nitric oxide in females.20 However, no meaningful differences in baseline Hb, HbF or bilirubin were observed between sexes in this pooled analysis, which may relate to the higher proportion of male patients on hydroxyurea compared to females.
Baseline CKD was associated with age of death in both female and male patients, but no significant association was observed between sex and age at death. Similarly, rapid eGFR decline was significantly associated with increased risk of death in both female and male patients even in adjusted analyses. Although there was no significant association between sex and age at death in patients with rapid eGFR decline, among those with non-rapid eGFR decline, male patients had higher risks of death compared to females. End-organ damage may occur in multiple organ systems simultaneously, with higher mortality seen when multiple organ systems are involved.21 Our study is limited by missing proteinuria data, the lack of albuminuria assessments in the majority of patients, absence of prior longitudinal data from childhood, and exact data on hydroxyurea dosing and adherence. However, it is strengthened by the use of a real-world multicenter cohort with a relatively large sample size given the rarity of the disease under study.
Despite a more rapid eGFR decline and a higher prevalence of rapid kidney function decline in males, mortality associated with kidney disease was not higher in male than female patients with SCD. Further examination of sex-related effects of both kidney disease and multiorgan dysfunction on mortality in SCD is warranted.
Authors
Kenneth I. Ataga,1 Qingning Zhou,2 Santosh L. Saraf,3 Jane S. Hankins,4 Emily J. Ciccone,5 Laura R. Loehr,6 Melanie E. Garrett,7 Allison E. Ashley-Koch,7 Jianwen Cai,8 Marilyn J. Telen9 and Vimal K. Derebail10
1Center for Sickle Cell Disease, University of Tennessee Health Science Center, Memphis, TN; 2Department of Mathematics and Statistics, University of North Carolina at Charlotte, Charlotte, NC; 3Division of Hematology/Oncology, University of Illinois, Chicago, IL;
4Department of Hematology, St. Jude Children’s Research Hospital, Memphis, TN; 5Division of Infectious Diseases, University of North Carolina at Chapel Hill, Chapel Hill, NC; 6Division of General Medicine and Clinical Epidemiology, University of North Carolina at Chapel Hill, Chapel Hill, NC; 7Duke Molecular Physiology Institute, Duke University Medical Center, Durham, NC; 8Department of Biostatistics, University of North Carolina at Chapel Hill, Chapel Hill, NC; 9Division of Hematology, Duke University Medical Center,
Durham, NC; 10UNC Kidney Center, Division of Nephrology and Hypertension, University of North Carolina at Chapel Hill, Chapel Hill, NC, USA
Correspondence:
K.I. ATAGA - kataga@uthsc.edu
https://doi.org/10.3324/haematol.2022.281677
Received: July 1, 2022.
Accepted: December 5, 2022.
Early view: December 22, 2022.
©2023 Ferrata Storti Foundation
Published under a CC BY-NC license
Disclosures
KIA has received research funding from Novartis, Forma Therapeutics and Takeda Pharmaceuticals, served on advisory boards for Novartis, Novo Nordisk, Forma Therapeutics, Agios Pharmaceuticals, and as a consultant for Roche, Pfizer and Biomarin. SLS has received research funding from Novartis, Global Blood Therapeutics and Pfizer, and served as a consultant and on advisory boards for Global Blood Therapeutics, Novartis and Forma Therapeutics. JSH receives research funding from Global Blood Therapeutics, and consultancy fees from Global Blood Therapeutics and MJ Lifesciences. MJT has served on steering committees and advisory committees for Pfizer, GlycoMimetics, Novartis, and Forma Therapeutics. VKD has served on advisory boards for Novartis, Merck, Bayer and Travere, has served as a consultant for Forma Therapeutics, and receives honoraria from UpToDate.
Contributions
KIA designed the study, analyzed the data and wrote the manuscript. QZ and JC analyzed the data, and contributed to study design and manuscript preparation. EJC collected the data and contributed to manuscript preparation. JSH contributed to study design, data collection and manuscript preparation. LRL contributed to manuscript preparation. MEG collected the data and contributed to manuscript preparation. SLS, AEA-K, MJT and VKD contributed to study design and manuscript preparation.
Funding
Funding for this study is provided by FDA grant FD006030 (to KIA, JC and VKD) and NIH grant HL159376 (to KIA, SLS and VKD). MJT and AEA-K received support from grants 2015131 and 2012126 from the Doris Duke Charitable Foundation, NIH grants HL68959 and HL079915, and DK110104 (to AEA-K).
Data-sharing statement
All data generated or analyzed during this study are included in the article and the Online Supplementary Appendix. Further enquiries may be made to the corresponding author.
Haematologica | 108 May 2023 1440 LETTER TO THE EDITOR
References
1. Platt OS, Brambilla DJ, Rosse WF, et al. Mortality in sickle cell disease. Life expectancy and risk factors for early death. N Engl J Med. 1994;330(23):1639-1644.
2. Ataga KI, Moore CG, Jones S, et al. Pulmonary hypertension in patients with sickle cell disease: a longitudinal study. Br J Haematol. 2006;134(1):109-115.
3. Elmariah H, Garrett ME, De Castro LM, et al. Factors associated with survival in a contemporary adult sickle cell disease cohort. Am J Hematol. 2014;89(5):530-535.
4. Group KDIGOKCW. KDIGO 2012 Clinical Practice Guideline for the Evaluation and Management of Chronic Kidney Disease. Kidney Int Suppl. 2013;3(1):1-150.
5. Maitra P, Caughey M, Robinson L, et al. Risk factors for mortality in adult patients with sickle cell disease: a meta-analysis of studies in North America and Europe. Haematologica. 2017;102(4):626-636.
6. Brewin JN, Nardo-Marino A, Stuart-Smith S, et al. The pleiotropic effects of alpha-thalassemia on HbSS and HbSC sickle cell disease: reduced erythrocyte cation co-transport activity, serum erythropoietin, and transfusion burden, do not translate into increased survival. Am J Hematol. 2022;97(10):1275-1285.
7. Kasztan M, Fox BM, Lebensburger JD, et al. Hyperfiltration predicts long-term renal outcomes in humanized sickle cell mice. Blood Adv. 2019;3(9):1460-1475.
8. Asnani M, Serjeant G, Royal-Thomas T, Reid M. Predictors of renal function progression in adults with homozygous sickle cell disease. Br J Haematol. 2016;173(3):461-468.
9. Xu JZ, Garrett ME, Soldano KL, et al. Clinical and metabolomic risk factors associated with rapid renal function decline in sickle cell disease. Am J Hematol. 2018;93(12):1451-1460.
10. Ataga KI, Zhou Q, Derebail VK, et al. Rapid decline in estimated glomerular filtration rate in sickle cell anemia: results of a multicenter pooled analysis. Haematologica. 2021;106(6):1749-1753.
11. Levey AS, Stevens LA, Schmid CH, et al. A new equation to
estimate glomerular filtration rate. Ann Int Med. 2009;150(9):604-612.
12. Inker LA, Eneanya ND, Coresh J, et al. New creatinine- and cystatin C-based equations to estimate GFR without race. N Engl J Med. 2021;385(19):1737-1749.
13. Derebail VK, Ciccone EJ, Zhou Q, Kilgore RR, Cai J, Ataga KI. Progressive decline in estimated GFR in patients with sickle cell disease: an observational cohort study. Am J Kidney Dis. 2019;74(1):47-55.
14. Haymann JP, Stankovic K, Levy P, et al. Glomerular hyperfiltration in adult sickle cell anemia: a frequent hemolysis associated feature. Clin J Am Soc Nephrol. 2010;5(5):756-761.
15. Levin A, Stevens PE. Summary of KDIGO 2012 CKD Guideline: behind the scenes, need for guidance, and a framework for moving forward. Kidney Int. 2014;85(1):49-61.
16. Shlipak MG, Katz R, Kestenbaum B, et al. Rapid decline of kidney function increases cardiovascular risk in the elderly. J Am Soc Nephrol. 2009;20(12):2625-2630.
17. Derebail VK, Zhou Q, Ciccone EJ, Cai J, Ataga KI. Longitudinal study of glomerular hyperfiltration and normalization of estimated glomerular filtration in adults with sickle cell disease. Br J Haematol. 2021;195(1):123-132.
18. Raslan R, Shah BN, Zhang X, et al. Hemolysis and hemolysisrelated complications in females vs. males with sickle cell disease. Am J Hematol. 2018;93(11):E376-E380.
19. Masese RV, Bulgin D, Knisely MR, et al. Sex-based differences in the manifestations and complications of sickle cell disease: report from the Sickle Cell Disease Implementation Consortium. PloS One. 2021;16(10):e0258638.
20. Gladwin MT, Schechter AN, Ognibene FP, et al. Divergent nitric oxide bioavailability in men and women with sickle cell disease. Circulation. 2003;107(2):271-278.
21. Chaturvedi S, Ghafuri DL, Jordan N, Kassim A, Rodeghier M, DeBaun MR. Clustering of end-organ disease and earlier mortality in adults with sickle cell disease: a retrospectiveprospective cohort study. Am J Hematol. 2018;93(9):1153-1160.
Haematologica | 108 May 2023 1441 LETTER TO THE EDITOR
Combination therapy with crizotinib and vinblastine for relapsed or refractory pediatric ALK-positive anaplastic large cell lymphoma
Children with early relapsed or refractory ALK-positive anaplastic large cell lymphoma (ALCL) have a high risk of further disease progression during re-induction with intensive chemotherapy as consolidation before allogeneic stem cell transplantation (SCT).1-3 The intensive re-induction chemotherapy results in considerable treatment-related morbidity and mortality during and after SCT.3 Based on the efficacy of crizotinib4-6 and weekly vinblastine2,7 as monotherapies in relapsed ALK-positive ALCL, a combination of both drugs could offer a potentially less toxic reinduction before SCT, or even allow long-term treatment without SCT. More recently, in vitro ALK-positive ALCL models have shown that combination therapy with crizotinib could have a synergistic effect and overcome resistance.8 We report on 13 patients treated with crizotinib and vinblastine for relapsed ALK-positive ALCL, either enrolled on a clinical trial or treated off-label on an individual basis. Whereas treatment was efficacious with only 2/13 subsequent relapses, severe toxicities occurred in 11/13 patients, including one fatal infection.
We designed a Phase Ib open-label international clinical trial (CRISP, ITCC-053, EudraCT: 2015-005437-53) to assess the recommended Phase II dose (RP2D) for vinblastine in combination with crizotinib. With the trial not yet open in Germany, the combination has been used on an individual basis for patients with a high-risk of relapse in the Non-Hodgkin Lymphoma (NHL)-Berlin-FrankfurtMunster (BFM) study group since 2016. Because the individual treatment and the trial treatment were comparable, we analyzed all data together.
In Stratum I of the CRISP trial, patients with relapsed ALKpositive ALCL received a fixed dose of oral crizotinib 2x150 mg/m2/day (d) per 28-day cycle, based on the responses observed at 2x165 mg/m2/d in pediatric ALCL patients.4 Intravenous vinblastine was escalated with three dose levels from 3-6 mg/m2 per week, using the overdose control method.9 At the time of trial design, unpublished data from the COG-study ANHL12P1 (clinicaltrials.gov NCT01979536) studying the combination of multi-agent chemotherapy with crizotinib, did not show any elevated risk of toxicities. However, based on considerations for pharmacokinetic interactions10 and overlapping toxicities, the vinblastine starting dose was set at 4.5 mg/m2, i.e., 75% of the singleagent dose. Dose-limiting toxicity (DLT) was defined as treatment-related adverse events or abnormal laboratory values during the first cycle, including neutropenia (abso-
lute neutrophil count [ANC] <0.5x10⁹/L), thrombocytopenia (platelets <25x109/L) lasting >7 days, or platelets <50x109/L with significant bleeding). Non-hematologic DLT included any ≥grade 3 treatment-related toxicity despite appropriate management, toxicities of grade ≥2 requiring significant modification, or laboratory abnormalities (grade 4, or grade 3 lasting ≥7 days requiring treatment modification), according to Common Terminology Criteria for Adverse Events v4.03.
We retrospectively identified patients with relapsed or refractory ALK-positive ALCL from the NHL-BFM 2012 registry, treated off-label with the combination therapy. All patients had high-risk relapses and were scheduled to receive consolidation by allogeneic SCT. The recommended dose for oral crizotinib was 2x165 mg/m2/d. Vinblastine was administered at the discretion of the treating physicians. To prevent central nervous system progression,11 dexamethasone (10 mg/m2/d, 5 days every 4 weeks) and intrathecal triple therapy (methotrexate, cytarabine, prednisolone) were also recommended. We collected patients' characteristics and outcomes prospectively; treatment and toxicity data were collected retrospectively. Events were defined as relapse, progressive disease, secondary malignancy, or death from any cause. The prospective trial and the registry were conducted according to the principles of the Declaration of Helsinki and were approved by the institutional ethical committees. All patients or their legal guardians provided written informed consent. Two CRISP trial patients (TP) and 11 NHL-BFM registry patients (RP) received the combination therapy as secondline treatment. Median age was 11.9 years (range, 2.4-17.9) and 8/13 (62%) were male. All patients had received ALCL99 front-line treatment. Four patients had progressed during front-line treatment and 9 relapsed within one year of diagnosis (mean, 7.6 months). Patients' characteristics and treatment are summarized in Table 1, Figure 1, and Online Supplementary Table S1
TP1 was not evaluable for hematologic DLT due to bone marrow involvement. Vinblastine (4.5 mg/m2) was administered despite the fact that protocol criteria had not been fulfilled (grade 4 neutropenia) on day 8. On day 11, this patient developed grade 3 nausea, was unresponsive to antiemetics (DLT) and had grade 3 febrile neutropenia. Because of the DLT, treatment was discontinued. The patient died from refractory shock and liver failure 7 days later. Autopsy revealed a systemic fungal infection (Lich-
Haematologica | 108 May 2023 1442 LETTER TO THE EDITOR
Table 1. Clinical characteristics, treatment, and outcome.
§ Patient received one course of BM ALCL99 chemotherapy (5 days dexamethasone, methotrexate 3 g/m2, cyclophosphamide 5x200 mg/m2, doxorubicin 2x25 mg/m2) after diagnosis of relapse, and brentuximab vedotin after subsequent progression. #Patient received 9 courses of brentuximab vedotin after the 2nd relapse. Adverse events were defined according to Common Terminology Criteria for Adverse Events v4.03. Allo SCT: allogeneic stem cell transplantation; mth: month; d: day; M: male; F: female; N: number; TP: trial patient; RP: registry patient; ITT: intrathecal triple therapy; FOP: freedom of progression; DEX: dexamethasone; HLH: hemophagocytic lymphohistiocytosis; GI: gastrointestinal.
Patient ID Sex Age (years) Type and time of relapse Total daily dose of crizotinib Dose of vinblastine per week (N doses) Concomitant drugs
adverse effects, time to neutropenia, reason for modifications AlloSCT Outcome last follow-up TP1 F 14.3 Relapse (5 mth) 300 mg/m², discontinued 4.5 mg/m², discontinued (N=2) None Grade 3 nausea, grade 4 neutropenia (8 d), grade 4 fungal infection, grade 4 anemia, grade 5 liver failure, suspected HLH No Died of infection (1 mth) TP2 F 2.5 Relapse (6.5 mth) 300 mg/m², discontinued 3 mg/m², discontinued (N=3) None Grade 4 neutropenia (15 d) No FOP (18 mth) RP1 M 17.7 Progression (2.5 mth) 330 mg/m², paused 6 mg/m², paused (N=5) None§ Grade 4 neutropenia (21 d), ascites (possibly due to progression of lymphoma) No Died of lymphoma (2.9 mth) RP2 M 17.3 Progression (1 mth) 260 mg/m², reduced to 100 mg/m² 5.2 mg/m² (N=10) DEX, ITT Grade 4 neutropenia (26 d), grade 4 febrile neutropenia, grade 4 thrombocytopenia with GI hemorrhage, grade 3 hepatotoxicity, grade 3 nausea Yes FOP (67.7 mth) RP3 M 7.7 Relapse (5.5 mth) 420 mg/m² 6 mg/m² (N=9) DEX Grade 4 neutropenia (present at initiation of combination treatment) Yes FOP after relapse# (46.2 mth) RP4 M 14.3 Relapse (7.6 mth) 280 mg/m² (for 13 days) 5.6 mg/m², reduced last dose 3.6 mg/m² (N=14) DEX None reported Yes FOP (44.1 mth) RP5 M 11.4 Progression (5.6 mth) 230 mg/m², paused (4 d) 5 mg/m², discontinued (N=2) ITT Grade 4 neutropenia (7 d), grade 4 polyneuropathy Yes FOP (41.7 mth) RP6 F 1.5 Relapse (11 mth) 340 mg/m², paused 6 mg/m², reduced to 4 mg/m², discontinued (N=7) None Grade 4 neutropenia (16 d) Yes FOP (30.1 mth) RP7 F 10.7 Relapse (5.8 mth) 320 mg/m², discontinued, switch to ceritinib 5 mg/m², reduced 6 mg/m² (N=8) DEX, ITT Grade 4 neutropenia (35 d), febrile neutropenia, colitis, polyneuropathy Yes FOP (38.1 mth) RP8 F 4.0 Relapse (7.1 mth) 560 mg/m², discontinued 6 mg/m², paused and reduced to 5 mg/m² 4 mg/m² (N=11) DEX, ITT Polyneuropathy, gastroparesis Yes FOP (18.8 mth) RP9 M 11.8 Relapse (10.1 mth) 370 mg/m², discontinued 6 mg/m², paused and reduced to 4 mg/m² (N=9) DEX, ITT Grade 4 neutropenia (13 d), febrile neutropenia, paralytic ileus, peritonitis Yes FOP (30.9 mth) RP10 M 6.5 Progression (3.1 mth) 330 mg/m² 3 mg/m² reduced to biweekly, last dose: 1.5 mg/m² (N=8) DEX, ITT Grade 4 neutropenia (20 d), febrile neutropenia Yes FOP (23.1 mth) RP11 M 15.9 Relapse (6.1 mth) 250 mg/m² 3 mg/m² reduced to biweekly (N=7) DEX, ITT Grade 4 neutropenia (12 d) Yes FOP (19.2 mth)
Severe
Haematologica | 108 May 2023 1443 LETTER TO THE EDITOR
theimia species) and suspected secondary hemophagocytic lymphohistiocytosis but no signs of active ALCL. Due to the severe toxicity observed in TP1, TP2 was as-
signed to a vinblastine dose of 3.0 mg/m2 On day 15, vinblastine was administered, despite the fact that the protocol criteria had not been fulfilled (grade 4 neutropenia). The ongoing neutropenia was considered a DLT on day 22, and treatment was discontinued. Neutropenia resolved within 5 days. As per protocol, trial treatment was not resumed. TP2 remained in complete remission (CR) with crizotinib monotherapy (oral 2x100 mg/m2/d) off-study; at the time of writing, this treatment is ongoing after 23 months. Since DLT had occurred in the first 2 TP included in the study, Stratum I was permanently closed in July 2020.
Among the RP, the median initial doses of crizotinib and vinblastine were 330 mg/m2/d (total daily dose, range 250560 mg/m2) and 5.6 mg/m2/week (range, 3-6 mg/m2), respectively. In 9/11 RP, crizotinib and/or vinblastine were reduced, paused, or discontinued due to toxicity. In one patient without dose reductions, crizotinib was only administered for 8 days before conditioning for SCT. Adverse effects included grade 4 neutropenia (reported in 9/11 patients), grade 3-4 febrile neutropenia (4/11), polyneuropathy (3/11), severe gastrointestinal adverse effects including paralytic ileus and hepatotoxicity (4/11). RP9 developed paralytic ileus and bacterial peritonitis after 2 weeks of combination therapy and was managed successfully with treatment discontinuation, antibiotics, and supportive care. Hospitalization was required for adverse effects in 5/11 patients. Because of these unexpected toxicities, the NHL-BFM group discouraged the use of the combination therapy.
For all 13 patients, overall survival (OS) and event-free survival (EFS) at two years were 85% (95%CI: 67-99%) and 77% (95%CI: 5-99%), respectively (Online Supplementary Figures S1 and S2). RP1 received one course of ALCL99 before the combination therapy. This patient had a subsequent relapse three weeks later and died of progressive disease despite treatment with brentuximab vedotin. RP3 had a subsequent relapse after SCT, reached remission with brentuximab vedotin, and has survived event-free with 46 months of follow-up at the time of writing. All other RP received the intended allogeneic SCT at a mean time after relapse of 96 days (range, 60-125) and remained event-free. Median follow-up of the 11 surviving patients was 30.9 months.
RP1 received one course of the BM ALCL99 chemotherapy regimen after diagnosis of relapse: 5-day course with dexamethasone, methotrexate 3 g/m2, cyclophosphamide 5x200 mg/m2, doxorubicin 2x25 mg/m2. d: day; SCT: allogeneic stem cell transplantation; TP:
Shorter time to relapse is the main risk factor for subsequent relapse,1,2 so the observed OS and EFS in our high-risk cohort of 13 pediatric patients with refractory or early relapsed ALCL compared favorably to previous reports.2 Given the favorable safety profile of crizotinib and vinblastine in monotherapies,5,7,12 the severity of toxicity was unexpected, leading to termination of stratum I of the CRISP trial and advice against the combination in the NHLBFM group. In most patients, the doses had to be reduced due to grade 3-4 toxicities, and one patient died of an infection. In addition, the severe gastrointestinal toxicity we

Haematologica | 108 May 2023 1444 LETTER TO THE EDITOR
Figure 1. Treatment overview. Swimmer plot showing individual patient courses with bars representing treatment durations, height of bars reflecting dose. Occurrence of toxicity requiring dose modifications is noted. Patient
trial patient; RP: registry patient; BV: brentuximab vedotin.
observed is unusual during monotherapy with either of the drugs. Similar hematologic toxicity, with ≥ grade 3 neutropenia in 92% of patients, but less severe gastrointestinal toxicity were observed in a recent pediatric Phase Ib trial combining crizotinib with cytotoxic agents.13 With a comparable dose of crizotinib, 4/20 patients in that study experienced dose-limiting toxicities. So far, one case has been reported with the combination of vinblastine and crizotinib in a patient with relapsed ALCL, who also suffered from severe toxicity, including prolonged neutropenia.14
Several reasons for the unexpected toxicities might be considered. These include the short time between frontline and relapse treatment. In addition, crizotinib and vinblastine are substrates of CYP3A,15 and crizotinib has been identified as a moderate CYP3A inhibitor, increasing the exposure to the CYP3A4 model substrate midazolam by 3.7-fold,10 possibly explaining the severe toxicity despite the lower dose of vinblastine administered. Both TP discontinued study treatment before pharmacokinetic sampling had been conducted; this had been scheduled in a predicted steady state for the second cycle. Because of this, no conclusions can be reached about the possible pharmacokinetic interactions. In TP1, neutropenia could have also been influenced by bone marrow involvement and hemophagocytosis.
The main limitation of our study is the implementation of the combination strategy on an individual patient basis in most patients, resulting in treatment heterogeneity. The retrospective collection of toxicity data in those patients does not allow for detailing exact frequencies and grading adverse effects with the combination treatment. With the premature closure of the trial, no safe dose for the combination treatment could be established.
Our real-world observations bring us to the conclusion that the combination of crizotinib and vinblastine appears to be effective for refractory or early relapsed ALKpositive ALCL; however, it is associated with severe toxicities. Further (pre-)clinical pharmacokinetic and pharmacodynamic investigations may help explain the unexpected toxicity. Our observations underline the need to perform clinical trials, even for treatment strategies considered low-risk, such as the combination of wellknown drugs. Clinicians, regulators, and funding bodies should be encouraged to initiate, approve, and support practical clinical trials of combination therapies to improve patient safety even in orphan diseases such as relapsed pediatric ALCL.
Authors
Landman-Parker,5 Heiko-Manuel Teltschik,6 Jan Förster,1 Amambay Riquelme,1 Alwin DR Huitema,3,7,8 Natasha KA van Eijkelenburg,3 Auke Beishuizen,3,4 C Michel Zwaan,3,4 Wilhelm Woessmann1# and Jasper van der Lugt3#
1Pediatric Hematology and Oncology, University Medical Center Hospital Hamburg-Eppendorf, Hamburg, Germany; 2Mildred Scheel Cancer Career Center HaTriCS4, University Medical Center Hamburg-Eppendorf, Hamburg, Germany; 3Princess Máxima Center for Pediatric Oncology, Utrecht, The Netherlands; 4Erasmus Medical Center, Sophia Children’s Hospital, Rotterdam, The Netherlands; 5Pediatric Hematology, Immunology, Oncology, Sorbonne Université, Hôpital Armand Trousseau, APHP, Paris, France; 6Pediatrics 5 –Oncology, Hematology, and Immunology, Olgahospital, Stuttgart, Germany; 7Department of Pharmacy and Pharmacology, Netherlands Cancer Institute, Amsterdam, The Netherlands and 8Department of Clinical Pharmacy, University Medical Center Utrecht, Utrecht University, Utrecht, The Netherlands
*FK and KPJS contributed equally as co-first authors #WW and JvdL contributed equally as senior authors
Correspondence: F. KNÖRR - f.knoerr@uke.de
https://doi.org/10.3324/haematol.2022.281896
Received: August 9, 2022.
Accepted: December 6, 2022.
Early view: December 15, 2022.
©2023 Ferrata Storti Foundation
Published under a CC BY-NC license
Disclosures
KS, RS, AH, NvE, CMZ, AB and JvdL received institutional funding from Pfizer. FK, HT, AR, JF, JLP and WW have no conflicts of interest to declare.
Contributions
FK and KS collected and analyzed the data, and wrote the first draft of the manuscript; HT and JLP provided patient data; AR, JF and NE collected patient data; AB, CMZ, AH, JvdL and WW were involved in the conceptualization and study design of Stratum I of the CRISP trial; JvdL, RS and WW supervised the analyses; all authors reviewed and revised the manuscript, and approved the final version for submission.
Acknowledgments
The authors would like to thank all patients and their families for participating in the registry and clinical trial. We thank our colleagues in the hospitals and reference institutions who contributed to this study for their care of the children and families and data. We thank Pauline Winkler-Seinstra and Judith Hoevenaars for their work as trial managers of the CRISP trial. The authors
Fabian Knörr,1,2* Kim PJ Schellekens,3,4* Reineke A Schoot,3 Judith
Haematologica | 108 May 2023 1445 LETTER TO THE EDITOR
thank the Innovative Therapies for Children with Cancer (ITCC) Consortium for providing the infrastructure and the collaborative environment to run early clinical trials in pediatric oncology.
Funding
Pfizer Inc. provided funding and a clinical research collaboration to implement the CRISP trial. The CRISP trial was sponsored by Erasmus MC Sophia Children’s Hospital, Department of Pediatrics, Rotterdam, The Netherlands, and was funded by the Erasmus MC Vriendenfonds
References
1. Woessmann W, Zimmermann M, Lenhard M, et al. Relapsed or refractory anaplastic large-cell lymphoma in children and adolescents after Berlin-Frankfurt-Muenster (BFM)-type firstline therapy: a BFM-group study. J Clin Oncol. 2011;29(22):3065-3071.
2. Knörr F, Brugières L, Pillon M, et al. Stem cell transplantation and vinblastine monotherapy for relapsed pediatric anaplastic large cell lymphoma: results of the International, Prospective ALCL-Relapse Trial. J Clin Oncol. 2020;38(34):3999-4009.
3. Woessmann W, Peters C, Lenhard M, et al. Allogeneic haematopoietic stem cell transplantation in relapsed or refractory anaplastic large cell lymphoma of children and adolescents--a Berlin-Frankfurt-Munster group report. Br J Haematol. 2006;133(2):176-182.
4. Mosse YP, Voss SD, Lim MS, et al. Targeting ALK with crizotinib in pediatric anaplastic large cell lymphoma and inflammatory myofibroblastic tumor: a Children's Oncology Group Study. J Clin Oncol. 2017;35(28):3215-3221.
5. Mosse YP, Lim MS, Voss SD, et al. Safety and activity of crizotinib for paediatric patients with refractory solid tumours or anaplastic large-cell lymphoma: a Children's Oncology Group phase 1 consortium study. Lancet Oncol. 2013;14(6):472-480.
6. Gambacorti Passerini C, Farina F, Stasia A, et al. Crizotinib in advanced, chemoresistant anaplastic lymphoma kinase-positive lymphoma patients. J Natl Cancer Inst. 2014;106(2):djt378.
7. Brugieres L, Pacquement H, Le Deley MC, et al. Single-drug vinblastine as salvage treatment for refractory or relapsed anaplastic large-cell lymphoma: a report from the French Society of Pediatric Oncology. J Clin Oncol. 2009;27(30):5056-5061.
(now Erasmus MC Foundation), Pfizer and Go4Children to CMZ. The NHL-BFM Registry 2012 was supported by grants from the Deutsche Kinderkrebsstiftung to WW (DKS 2014.11, 2016.24, 2018.21, 2020.15).
Data-sharing statement
Individual patient data that underlie the results reported in this article will be made available in deidentified form to researchers who provide a methodologically sound proposal for data usage. Proposals should be directed to the corresponding author.
8. Arosio G, Sharma GG, Villa M, et al. Synergistic drug combinations prevent resistance in ALK+ anaplastic large cell lymphoma. Cancers. 2021;13(17):4422.
9. Babb J, Rogatko A, Zacks S. Cancer phase I clinical trials: efficient dose escalation with overdose control. Stat Med. 1998;17(10):1103-1120.
10. Mao J, Johnson TR, Shen Z, Yamazaki SJDM. Prediction of crizotinib-midazolam interaction using the Simcyp populationbased simulator: comparison of CYP3A time-dependent inhibition between human liver microsomes versus hepatocytes. Drug Metab Dispos. 2013;41(2):343-352.
11. Ruf S, Hebart H, Hjalgrim LL, et al. CNS progression during vinblastine or targeted therapies for high-risk relapsed ALKpositive anaplastic large cell lymphoma: a case series. Pediatr Blood Cancer. 2018;65(6):e27003.
12. Bouffet E, Jakacki R, Goldman S, et al. Phase II study of weekly vinblastine in recurrent or refractory pediatric low-grade glioma. J Clin Oncol. 2012;30(12):1358-1363.
13. Greengard E, Mosse YP, Liu X, et al. Safety, tolerability and pharmacokinetics of crizotinib in combination with cytotoxic chemotherapy for pediatric patients with refractory solid tumors or anaplastic large cell lymphoma (ALCL): a Children's Oncology Group phase 1 consortium study (ADVL1212). Cancer Chemother Pharmacol. 2020;86(6):829-840.
14. Vanheeswijck L, Verlooy J, Van de Vijver E, et al. The challenges of crizotinib treatment in a child with anaplastic large cell lymphoma. J Pediatr Pharmacol Ther. 2021;26(6):647-654.
15. Zhou-Pan XR, Sérée E, Zhou XJ, et al. Involvement of human liver cytochrome P450 3A in vinblastine metabolism: drug interactions. Cancer Res. 1993;53(21):5121.
Haematologica | 108 May 2023 1446 LETTER TO THE EDITOR
Clonal hematopoiesis by DNMT3A mutations as a common finding in idiopathic splanchnic vein thrombosis
With an incidence of 0.5 cases per 100,000,1 splanchnic vein thrombosis (SVT) belongs to the rare venous thromboses in unusual sites including portal, splenic and mesenteric veins and Budd-Chiari syndrome.2 SVT is generally associated with cirrhosis and thrombophilia, or is a marker of occult cancers, in particular myeloproliferative neoplasms (MPN), liver and pancreatic cancers.3 However, a significant portion of patients (14%) present with idiopathic SVT.2
Clonal hematopoiesis of indeterminate potential is a condition characterized by the presence of a clonal cell population, identified by a recognized hematologic neoplasm driver mutation at a variant allele frequency (VAF) above 2%, in the absence of a World Health Organization (WHO)defined disorder.4,5 Notably, beside the potential evolution into a hematologic cancer, clonal hematopoiesis (CH) is associated with an increased risk of cardiovascular disease.6 While studying patients with SVT, we selected 15 consecutive patients with idiopathic SVT, defined as being negative for cirrhosis, abdominal infections or surgical procedures, and cancers (approved by the institutional ethics committee - code #275/2021). The median age of these 15 patients was 52 years (range, 31-75); eight patients were female. After at least 1 year of follow-up, no significant cytopenias or cellular abnormalities in the peripheral blood were observed. To rule out myeloproliferative disorders, a bone marrow biopsy was performed and no WHO-defined blood disorders were identified. However, it is worth noting that the overall cellularity of these samples was slightly increased in a few patients, with a more prominent expansion of the erythroid compartment. In three patients, a tendency to hyperplasia of megakaryocytes and, in one patient, reduced cellular di-
mension, were observed; these findings were, however, insufficient for a WHO classification as MPN. A next-generation sequencing-based analysis of bone marrow specimens was performed using Myeloid Solution by Sophia Genetics. This analysis covered the coding regions, splicing junctions (± 25 bp) and internal tandem duplications of 30 genes, namely: ABL1 (exons 4-9), ASXL1 (exons 9, 11, 12, 14), BRAF (exon 15), CALR (exon 9), CBL (exons 8, 9), CEBPA (all exons), CSF3R (all exons), DNMT3A (all exons), ETV6 (all exons), EZH2 (all exons), FLT3 (exons 13-15, 20), HRAS (exons 2, 3), IDH1 (exon 4), IDH2 (exon 4), JAK2 (all exons), KIT (exons 2, 8-11, 13, 17, 18), KRAS (exons 2, 3), MPL (exon 10), NPM1 (exons 10, 11), NRAS (exons 2, 3), PTPN11 (exons 3, 7-13), RUNX1 (all exons), SETBP1 (exon 4), SF3B1 (exons 10-16), SRSF2 (exon 1), TET2 (all exons), TP53 (exons 2-11), U2AF1 (exons 2, 6), WT1 (exons 6-10), ZRSR2 (all exons). Thirteen of the 15 patients with idiopathic SVT had mutations in the panel of studied genes (Figure 1A). In 7/15 (46%) patients, the mutational screening was coherent with CH (Table 1, upper part). Three (20%) of the 15 patients had a JAK2 V617F mutation in accordance with the known association of SVT with MPN. In such patients, it could be postulated that SVT precedes the MPN disorder as a premalignant condition or is a phenotypic manifestation of the CH. In this respect, it is worth noting that JAK2, CALR and MPL are frequently mutated in SVT7–9 and that JAK2 V617F mutations are also observed years prior to a diagnosis of MPN, with different expansion kinetics, in relation to the observed VAF.10 Three (20%) of the 15 patients had mutations in DNMT3A (Table 1, upper part). Interestingly, DNMT3A frameshift mutations were observed in two patients while in one patient the frameshift mutation was also associated with a missense mutation.
 Figure 1. Distribution of mutations in patients with splanchnic vein thrombosis.
Haematologica | 108 May 2023 1447 LETTER TO THE EDITOR
The different VAF of these two mutations suggests the presence of compound heterozygosity or two distinct subclones, further highlighting the tendency to select for these aberrations in patients with SVT. While DNMT3A mutations are associated with MPN/myelodysplastic syndromes,11 to our knowledge no data have linked DNMT3A mutations to thrombosis. Lastly, one patient had a mutation in enhancer of zeste homolog 2 (EZH2), which is a histone-lysine N-methyltransferase enzyme. While the JAK2 V617F and DNMT3A mutations clearly have a pathogenic role in MPN, it is worth noting that other genes are consistently mutated in SVT patients, as reported in Table 1 (lower part), but further investigations are essential to assess the relevance of this observation. Even if found to be cancer-associated mutations, most of these additional aberrations have a VAF of 50% or 100%, suggesting a potential germline involvement. Notably, 2/15 (13%) patients had ZRSR2 mutations at the same hot spot (between Ser445 and Ser447), which has never been reported in MPN. ZRSR2 is a minor spliceosome component, which has been associated with the
pathogenesis of both myelodysplastic sdynromes and MPN12,13 and a predisposition to cancer.14 This observation suggests that ZRSR2 mutation at the Ser445/Ser447 site could predispose to the development of SVT. Notably, the two patients were male, coherently with the location of the ZRSR2 gene on the X chromosome. If biologically relevant, it could be speculated that this mutation should be assessed in males with SVT at diagnosis. Overall, our data suggest that idiopathic SVT is associated with CH, and reveal a potentially new subgroup of patients with DNMT3A mutations. Larger cohorts of patients with idiopathic SVT should be assessed to better describe the incidence of CH in this rare condition. The findings should have clinical implications, since the identification of CH in SVT patients should imply closer follow-up over time to check for the potential evolution of the disease into a hematologic cancer, and the need for extended anticoagulation because of the risk of recurrent thrombosis. It would also be informative to model CH in mice to investigate whether CH, including DNMT3A mutations, causes SVT as a phenotypic manifestation of a MPN or simply acts as risk factor for thrombosis. Indeed, the existence of “gray zone disease” could be speculated, with a phenotypic presentation resembling that of MPN but still without a clear morphological classification at histology. In this respect, it is worth noting that a distinct MPN, defi ned as clonal megakaryocyte dysplasia with normal blood values, has been described to be associated with SVT.15 The integration of genetic analyses, in particular DNMT3A mutational status, with clinical and histological assessments could eventually lead to the identi fi cation of a novel entity with therapeutic implications.
Authors
Giovanna Carrà,1 Emilia Giugliano,1 Sofia Camerlo,1 Giorgio Rosati,1 Enrica Branca,1 Beatrice Maffeo,1 Isabella Russo,1 Rocco Piazza,2 Daniela Cilloni1 and Alessandro Morotti1
1Department of Clinical and Biological Sciences, University of Turin, AUO San Luigi, Orbassano and 2Department of Medicine and Surgery, University of Milano-Bicocca and San Gerardo Hospital, Monza, Italy
Correspondence: A. MOROTTI - alessandro.morotti@unito.it
https://doi.org/10.3324/haematol.2022.281705
2022. Accepted: August 31, 2022.
Received: July 8,
Gene Mutation VAF % CH-associated mutations JAK2 V617F 9, 7, 26 DNMT3A Leu805 frameshift 2.8 Tyr660Cys 2.1 Thr691 frameshift 3 Arg882Cys 6 EZH2 Glu404del 2 Additional mutations ZRSR2 Ser445_Arg451dup 100 Ser447_Arg448dup 97 CSF3R Glu405Lys 49 Val674Met 49 Glu808Lys 49 CBL Ile393Thr 50 TET2 Asn488Metfs9 46 Asxl1 Arg302His 48 Leu542Lysfs6 44 RUNX1 Asn248Thr 40 CEBPA His195_Pro196dup 49 VAF: variant allele frequency; CH: clonal hematopoiesis. Haematologica | 108 May 2023 1448 LETTER TO THE EDITOR
Table 1. Mutations and variant allele frequencies in patients with splanchnic vein thrombosis and clonal hematopoiesis.
Early view: October 13, 2022.
©2023 Ferrata Storti Foundation
Published under a CC BY-NC license
Disclosures
No conflicts of interest to disclose.
Contributions
GC, IR, BM and RP analyzed data; EG performed the next-generation
References
1. Schulman S. Splanchnic vein thrombosis: what are the longterm risks? Lancet Haematol. 2018;5(10):e431-e432.
2. Shatzel JJ, O’Donnell M, Olson SR, et al. Venous thrombosis in unusual sites: a practical review for the hematologist. Eur J Haematol. 2019;102(1):53-62.
3. Søgaard KK, Farkas DK, Pedersen L, Sørensen HT. Splanchnic venous thrombosis is a marker of cancer and a prognostic factor for cancer survival. Blood. 2015;126(8):957-963.
4. Steensma DP. Clinical consequences of clonal hematopoiesis of indeterminate potential. Blood Adv. 2018;2(22):3404-3410.
5. Jaiswal S. Clonal hematopoiesis and nonhematologic disorders. Blood. 2020;136(14):1606-1614.
6. Jaiswal S, Natarajan P, Silver AJ, et al. Clonal hematopoiesis and risk of atherosclerotic cardiovascular disease. N Engl J Med. 2017;377(2):111-121.
7. Haslam K, Langabeer SE. Incidence of CALR mutations in patients with splanchnic vein thrombosis. Br J Haematol. 2015;168(3):459-460.
8. Kiladjian J-J, Cervantes F, Leebeek FWG, et al. The impact of JAK2 and MPL mutations on diagnosis and prognosis of splanchnic vein thrombosis: a report on 241 cases. Blood. 2008;111(10):4922-4929.
9. Smalberg JH, Koehler E, Darwish Murad S, et al. The JAK2 46/1
sequencing analyses; SC, GR and EB evaluated patients; DC reviewed the manuscript and data; AM conceived the study and wrote the manuscript.
Funding
This project was funded by the ALT (Associazione per la Lotta alla Trombosi e alle malattie cardiovascolari).
Data-sharing statement
Data are available upon request.
haplotype in Budd-Chiari syndrome and portal vein thrombosis. Blood. 2011;117(15):3968-3973.
10. McKerrell T, Park N, Chi J, et al. JAK2 V617F hematopoietic clones are present several years prior to MPN diagnosis and follow different expansion kinetics. Blood Adv. 2017;1(14):968-971.
11. Kjær L. Clonal hematopoiesis and mutations of myeloproliferative neoplasms. Cancers (Basel). 2020;12(8):E2100.
12. Togami K, Chung SS, Madan V, et al. Sex-biased ZRSR2 mutations in myeloid malignancies impair plasmacytoid dendritic cell activation and apoptosis. Cancer Discov. 2022;12(2):522-541.
13. Madan V, Kanojia D, Li J, et al. Aberrant splicing of U12-type introns is the hallmark of ZRSR2 mutant myelodysplastic syndrome. Nat Commun. 2015;6:6042.
14. Inoue D, Polaski JT, Taylor J, et al. Minor intron retention drives clonal hematopoietic disorders and diverse cancer predisposition. Nat Genet. 2021;53(5):707-718.
15. Barosi G, Rosti V, Massa M, et al. Clonal megakaryocyte dysplasia with normal blood values is a distinct myeloproliferative neoplasm. Acta Haematol. 2022;145(1):30-37.
Haematologica | 108 May 2023 1449 LETTER TO THE EDITOR
Leon's helmet
When we first saw Mr. Leon on the list of patients scheduled during our consultation, we were surprised by his age: 95 years old! The letter sent by his attending physician mentioned massive phlebitis in the left popliteal vein associated with hemoglobin (Hb) at 103 g/L, hyperleukocytosis 14x109/L with neutropenia at 0.42x10⁹/L, and the presence of blast cells. The platelet rate was normal. We immediately thought of a form of myelodysplasia or leukemia.
We called Leon - which was his fictitious first name - and we invited him to come to our office. He was a smiling man, with a sharp look, of medium height, who walked alone with confidence and held a biker’s helmet in his hand. From the outset, he asked us: why should he come urgently while he was in great shape? Worse, he would miss a ping-pong session in his club! Very surprised we asked him if he was accompanied by someone and to whom the helmet belonged. He explained that it belonged to himself and that he had arrived alone driving “his” moped which was parked in front of the building! We were incredulous, wanting to harmonize the reassuring image of the individual we had in front of us with his disturbing blood results we had in our hands. Before continuing, we asked for a new blood test, and then we continued to fill out his file. The man was a retired lathe miller, the father of a 60-year-old son, and a widower. He lived on his own in an apartment and he was perfectly autonomous i.e., he did his own shopping at the market and cooked for himself. Clinical examination was strictly normal except for a few small skin hematomas. Suddenly he started doing push-ups in front of us wanting to prove his athletic form to us, it was too much. A few minutes later, the laboratory communicated the following results: Hb 99 g/L, white blood cells (WBC) 15,01x10⁹/L, absolute neutrophil count (ANC) 1,5x10⁹/L, absolute lymphocyte count (ALC) 2.7x10⁹/L, reticulocytes 62x109/L and a 72% rate of blast cells.; the cytogenetics test for BCR ABL was negative, and multiparametric flow cytometry of blast cells showed that 87% of the cells expressed CD34+/38+ markers. It was acute undifferentiated leukemia. A molecular biology test showed: WT1 expression was positive with 6.96/100 copy; EVI1 expression was negative; absence of FLT3-ITD and NPM1 mutation. Given the context, a myelogram was not performed.
In the meantime, his son had arrived. We announced the "bad news" as well as the possibility, if he wished, to receive simple outpatient treatment. The patient agreed, although he hardly showed an upset look. This is how we started, a first series of azacitidine 75 mg/m²/day, 7 days per month. Chemotherapy resulted in partial remission in-
volving myelodysplasia for 18 months with acceptable toxicity. Two years later, faced with an increase in peripheral blasts cells, we then added all-trans retinoic acid (ATRA) 30 mg/m²/day 10 days per month, for 6 months without noticeable effect, so we stopped it. Three years later, we administered for 6 months, six courses of idarubicin 20 mg/m²/day by mouth (PO), 4 days per month, allowing a reduction in blasts cells at the cost of an increase in transfusion support. Four years later, while the patient showed a correct general condition with an Eastern Cooperative Oncology Group performance status equal to 0, we started treatment with lenalidomide as monotherapy 15 mg PO dispersible tablets (DT)/day for 14 days in a row per month. The answer was correct with Hb 110 g/L, WCB 12x109/L, platelets 154x109/L despite the persistence of an impressive peripheral blast rate of about 50%! On the positive side, the transfusion support had been discontinued. In July 2020: Hb 81 g/L, WCB 36x109/L, platelets 68x109/L and 95% circulating blasts. At first, we increased the dose of lenalidomide to 20 mg DT/day, to which the patient proved to be unresponsive. Moreover, non-COVID pneumonia is complicated. Five years after initial diagnosis, we started venetoclax monotherapy with 80 mg only three times a week (Monday/Wednesday/Friday). A blood test at day +40 show: Hb 95 g/L, WBC 1.06x10⁹/L, platelets 87x109/L, ANC 0.4x10⁹/L, ALC 0.6x10⁹/L and 0% blasts! However, in March 2021, while the patient was on 80 mg DT/day, he was admitted to the emergency room with a neurological syndrome combining dizziness and hallucinations. The blood test showed Hb 118 g/L, WCB 1.87x10⁹/L, ANC 1.38x10⁹/L, ALC 0.42x10⁹/L, platelets 73x109/L and 0% blasts. Tumor lysed syndrome (TLS) was not observed. Venetoclax administration was stopped. The electroencephalogram performed was almost normal. The patient was treated with risperidone, tiapride and rivaroxaban and light monitoring was decided.
Six years later, we commemorated his 100th anniversary in consultation. He was fine, but worried because of an agerelated macular degeneration (ARMD) diagnosis... several months later, the blood count amounted to 5% of circulating blasts once more... and, we resumed venetoclax in small doses. Three months later, everything was fine, but he was hospitalized for COVID-related breathing difficulties even though he was vaccinated. He died on Christmas Eve.
Acute myeloid leukemia (AML) commonly affects the elderly, with a median age of 67 years at diagnosis. Elderly patients (≥ 65 years) with AML often respond poorly to induction chemotherapy and demonstrate increased resistance to treatment. Our patient does not fit into the
Haematologica | 108 May 2023 1450 CASE REPORT
profile of the classic statistics of the different results published with the molecules used.1-7 This explains the choice of dosage used during the 6 years of follow-up. A centenarian patient is therefore unique and must be the subject of special care. No treatment should be imposed. As we can see, even at a very advanced age, while respecting the quality of life, it is possible to treat by changing certain paradigms in the care of patients. The new treatments offer a wide range of care. Currently, we have three molecules: azatidine, lenalidomide and venetoclax1,3,5-7 which are very interesting to use, in the era of molecular-targeted therapies, in particular venetoclax a BCL2 inhibitor5-7 whose effectiveness is remarkable with very acceptable toxicity but which remains to be evaluated. Recently many papers show impressive results in older patients with the azatidine-venetoclax association.7 The issue of treatment costs is an unresolved dilemma to date that may in some countries simply prohibit this type of therapeutic approach.
Authors
Hugo Gonzalez,1 Alice Marceau-Renaut,2 Marc Spentchian,3 Maen Hassoun3 and Geoffroy
Guignedoux4
1Clinical Hematology Department, René DUBOS Hospital, Pontoise; 2CHU Lille, Institut de Recherche contre le Cancer de Lille,
References
1. Thépot S, Itzykson R, Seegers V, et al. Azacitidine in untreated acute myeloid leukemia: a report on 149 patients. Am J Hematol. 2014;89(4):410-416.
2. Johnson DE, Redner RL. An attractive future for differentiation therapy in AML. Blood. 2015;29(4):263-268.
3. Chen Y, Kantarjian H, Estrov Z, et al. A phase II study of Lenalidomide alone in relapsed/refractory acute myeloid leukemia or high-risk myelodysplastic syndromes with abnormalities of chromosome 5. Clin Lymphoma Myeloma Leuk. 2012;12(5):341-344.
4. Bouabdallah R, Lefrère F, Rose C, et al. A phase II trial of induction and consolidation treatment of acute myeloid
UMR9020-UMR-S1277, Canther-Cancer Heterogeneity, Plasticity and Resistance to Therapies, Lille; 3Biological Hematology Department, Le Chesnay-Rocquencourt Hospital, Versailles and 4Biological Hematology Department, René DUBOS Hospital, Pontoise, France
Correspondence:
H. GONZALEZ - hugo.gonzalez@ght-novo.fr
https://doi.org/10.3324/haematol.2022.281125
Received: April 1, 2022.
Accepted: October 5, 2022.
Early view: October 13, 2022.
©2023 Ferrata Storti Foundation
Published under a CC BY-NC license
Disclosures
No conflicts of interest to disclose.
Contributions
All authors wrote and approved the final version of the manuscript. AM-R, MS and MH takes responsibility for the DNA-RNA sequencing date and cytogenetics test. GG takes responsibility for cytology and flow cytometry date.
Acknowledgments
The authors would like to thank the patient and his family.
leukemia with weekly oral Idarubicin alone in low-risk elderly patients. Leukemia. 1999;13(10):1491-1496.
5. Gangat N, Tefferi A. Venetoclax-based chemotherapy in acute and chronic myeloid neoplasms: literature survey and practice points. Blood Cancer J. 2020;10(11):122.
6. Ganzel C, Ram R, Goural A. Venetoclax is safe and effective in relapsed/refractory AML. Leuk Lymphoma. 2020;61(9):2221-2225.
7. DiNardo CD, Jonas BA, Pullarkat V, et al. Azacitidine and venetoclax in previously untreated acute myeloid leukemia. N Engl J Med. 2020;383(7):617-629.
Haematologica | 108 May 2023 1451 CASE REPORT

haematologica
Journal of the Ferrata Storti Foundation

haematologica.org
