haematologica


VOL. 108 MARCH 2023 Journal of the Ferrata Storti Foundation ISSN 0390 - 6078 haematologica.org
J/"#,-#%3,0%&'()*#5*-K%*-%%
4'+5%+*$/1%6,'0-")%
78&"+$%!"+$,0%9:9;<%;;=:>%%% %?*$/@+,0/%9:9;<%;;=A%%%
!"#$%0/B*/C%&0,+/##%
@'(8*##*,-%→%;#$%1/+*#*,-<%;D%1"E#%
!"#$%&'()*+"$*,-%

."&/0#%*##'/1%2'#$%"3$/0%"++/&$"-+/
F,C%&'()*+"$*,-%+,#$%

G5/%&'()*#5/0%*#%"%-,-H&0,3*$% %!,'-1"$*,-%$5"$%I//&#%$5/%% %+,#$%3,0%"'$5,0#%"#%),C%"#%&,##*()/%
6,'0-")%,3%$5/%!/00"$"H%@$,0$*%!,'-1"$*,-%

h aematologica

haematologica
Editor-in-Chief
Jacob M. Rowe (Jerusalem)
Deputy Editors
Carlo Balduini (Pavia), Jerry Radich (Seattle)
Associate Editors
Shai Izraeli (Tel Aviv), Steve Lane (Brisbane), Pier Mannuccio Mannucci (Milan), Pavan Reddy (Ann Arbor), David C. Rees (London), Paul G. Richardson (Boston), Francesco Rodeghiero (Vicenza), Gilles Salles (New York), Kerry Savage (Vancouver), Aaron Schimmer (Toronto), Richard F. Schlenk (Heidelberg), Sonali Smith (Chicago)
Statistical Consultant
Catherine Klersy (Pavia)
Editorial Board
Walter Ageno (Varese), Sarit Assouline (Montreal), Andrea Bacigalupo (Roma), Taman Bakchoul (Tübingen), Pablo Bartolucci (Créteil), Katherine Borden (Montreal), Marco Cattaneo (Milan), Corey Cutler (Boston), Kate Cwynarski (London), Mary Eapen (Milwaukee), Francesca Gay (Torino), Ajay Gopal (Seattle), Alex Herrera (Duarte), Martin Kaiser (London), Marina Konopleva (Houston), Johanna A. Kremer Hovinga (Bern), Nicolaus Kröger (Hamburg), Austin Kulasekararaj (London), Shaji Kumar (Rochester), Ann LaCasce (Boston), Anthony R. Mato (New York), Matthew J. Mauer (Rochester), Neha Mehta-Shah (St. Louis), Moshe Mittelman (Tel Aviv), Alison Moskowitz (New York), Yishai Ofran (Haifa), Farhad Ravandi (Houston), John W. Semple (Lund), Liran Shlush (Toronto), Sara Tasian (Philadelphia), Pieter van Vlieberghe (Ghent), Ofir Wolach (Haifa), Loic Ysebaert (Toulouse)
Managing Director
Antonio Majocchi (Pavia)
Editorial Office
Lorella Ripari (Office & Peer Review Manager), Simona Giri (Production & Marketing Manager), Paola Cariati (Graphic Designer), Giulia Carlini (Graphic Designer), Debora Moscatelli (Graphic Designer), Igor Poletti (Graphic Designer), Marta Fossati (Peer Review), Diana Serena Ravera (Peer Review), Laura Sterza (Account Administrator)
Assistant Editors
Britta Dost (English Editor), Rachel Stenner (English Editor), Anne Freckleton (English Editor), Rosangela Invernizzi (Scientific Consultant), Marianna Rossi (Scientific Consultant), Massimo Senna (Information Technology), Luk Cox (Graphic Artist)
Haematologica | 108 - March 2023
Brief information on Haematologica
Haematologica (print edition, pISSN 0390-6078, eISSN 1592-8721) publishes peer-reviewed papers on all areas of experimental and clinical hematology. The journal is owned by a non-profit organization, the Ferrata Storti Foundation, and serves the scientific community following the recommendations of the World Association of Medical Editors (www.wame.org) and the International Committee of Medical Journal Editors (www.icmje.org).

Haematologica publishes Editorials, Original articles, Review articles, Perspective articles, Editorials, Guideline articles, Letters to the Editor, Case reports & Case series and Comments. Manuscripts should be prepared according to our guidelines (www.haematologica.org/information-for-authors), and the Uniform Requirements for Manuscripts Submitted to Biomedical Journals, prepared by the International Committee of Medical Journal Editors (www.icmje.org).
Manuscripts should be submitted online at http://www.haematologica.org/.
Conflict of interests. According to the International Committee of Medical Journal Editors (http://www.icmje.org/#conflicts), “Public trust in the peer review process and the credibility of published articles depend in part on how well conflict of interest is handled during writing, peer review, and editorial decision making”. The ad hoc journal’s policy is reported in detail at www.haematologica.org/content/policies.
Transfer of Copyright and Permission to Reproduce Parts of Published Papers. Authors will grant copyright of their articles to the Ferrata Storti Foundation. No formal permission will be required to reproduce parts (tables or illustrations) of published papers, provided the source is quoted appropriately and reproduction has no commercial intent. Reproductions with commercial intent will require written permission and payment of royalties.
Subscription. Detailed information about subscriptions is available at www.haematologica.org. Haematologica is an open access journal and access to the online journal is free. For subscriptions to the printed issue of the journal, please contact: Haematologica Office, via Giuseppe Belli 4, 27100 Pavia, Italy (phone +39.0382.27129, fax +39.0382.394705, E-mail: info@haematologica.org).
Rates of the printed edition for the year 2022 are as following:
Institutional: Euro 700
Personal: Euro 170
Advertisements. Contact the Advertising Manager, Haematologica Office, via Giuseppe Belli 4, 27100 Pavia, Italy (phone +39.0382.27129, fax +39.0382.394705, e-mail: marketing@haematologica.org).
Disclaimer. Whilst every effort is made by the publishers and the editorial board to see that no inaccurate or misleading data, opinion or statement appears in this journal, they wish to make it clear that the data and opinions appearing in the articles or advertisements herein are the responsibility of the contributor or advisor concerned. Accordingly, the publisher, the editorial board and their respective employees, officers and agents accept no liability whatsoever for the consequences of any inaccurate or misleading data, opinion or statement. Whilst all due care is taken to ensure that drug doses and other quantities are presented accurately, readers are advised that new methods and techniques involving drug usage, and described within this journal, should only be followed in conjunction with the drug manufacturer’s own published literature.
Direttore responsabile: Prof. Carlo Balduini; Autorizzazione del Tribunale di Pavia n. 63 del 5 marzo 1955. Printing: Press Up, zona Via Cassia Km 36, 300 Zona Ind.le Settevene - 01036 Nepi (VT)
Associated with USPI, Unione Stampa Periodica Italiana. Premiato per l’alto valore culturale dal Ministero dei Beni Culturali ed Ambientali
Haematologica | 108 - March 2023
Table of Contents
Volume 108, Issue 3: March 2023
About the Cover
Image taken from the Editorial by Kathleen Freson in this issue.
Landmark Paper in Hematology
657 The development of graft-versus-host disease prophylaxis
Corey Cutler
https://doi.org/10.3324/haematol.2023.282699
Editorials
659 B-cell precursor leukemias with MYC-rearrangement come into the limelight
Arndt Borkhardt and Günter Henze
https://doi.org/10.3324/haematol.2022.281112
661 Positron emission tomography-computed tomography before autologous stem cell transplant in follicular lymphoma: coming too late?
Clémentine Sarkozy and Gilles Salles
https://doi.org/10.3324/haematol.2022.281255
663 Pain mechanisms in sickle cell disease. Are we closer to a breakthrough?
Nicola Conran
https://doi.org/10.3324/haematol.2022.281200
665 Loss of APOLD1: a new vascular bleeding disorder?
Kathleen Freson
https://doi.org/10.3324/haematol.2022.281354
668 Unbiased decision-making for acute myeloid leukemia still needed
Ann-Kathrin Eisfeld
https://doi.org/10.3324/haematol.2022.281144
670 Surprise, surprise: STAT5 is not enough to stop the steroids
Marta B. Fernandes and João T. Barata
https://doi.org/10.3324/haematol.2022.281369
Review Article
673 Prevention and management of secondary central nervous system lymphoma
Sabela Bobillo et al.
https://doi.org/10.3324/haematol.2022.281457
Articles
690 Acute Myeloid Leukemia
Prediction of complete remission and survival in acute myeloid leukemia using supervised machine learning
Jan-Niklas Eckardt et al.
https://doi.org/10.3324/haematol.2021.280027
Haematologica | 108 - March 2023 I
705 Acute Myeloid Leukemia
A phase Ib trial of mivavotinib (TAK-659), a dual SYK/FLT3 inhibitor, in patients with relapsed/refractory acute myeloid leukemia
Keith W. Pratz et al.
https://doi.org/10.3324/haematol.2022.281216
717 Acute Lymphoblastic Leukemia
Molecular characterization and clinical outcome of B-cell precursor acute lymphoblastic leukemia with IG-MYC rearrangement
Simon Bomken et al.
https://doi.org/10.3324/haematol.2021.280557
732 Acute Lymphoblastic Leukemia
STAT5 does not drive steroid resistance in T-cell acute lymphoblastic leukemia despite the activation of BCL2 and BCLXL following glucocorticoid treatment
Jordy C.G. van der Zwet et al.
https://doi.org/10.3324/haematol.2021.280405
747 Acute Lymphoblastic Leukemia
Three-year results from phase I of ZUMA-4: KTE-X19 in pediatric relapsed/refractory acute lymphoblastic leukemia
Alan S. Wayne et al.
https://doi.org/10.3324/haematol.2022.280678
761 Bone Marrow Transplantation
CD56brightCD16- natural killer cells as an important regulatory mechanism in chronic graft-versus-host disease
Madeline P. Lauener et al.
https://doi.org/10.3324/haematol.2022.280653
772
Coagulation & its Disorders
APOLD1 loss causes endothelial dysfunction involving cell junctions, cytoskeletal architecture, and Weibel-Palade bodies, while disrupting hemostasis
Simon Stritt et al.
https://doi.org/10.3324/haematol.2022.280816
785
Non-Hodgkin Lymphoma
Impact of positron emission tomography - computed tomography status on progression-free survival for relapsed follicular lymphoma patients undergoing autologous stem cell transplantation
Toby A. Eyre et al.
https://doi.org/10.3324/haematol.2021.280287
797 Non-Hodgkin Lymphoma
Inhibition of casein kinase 2 sensitizes mantle cell lymphoma to venetoclax through MCL-1 downregulation
Yvonne J. Thus et al.
https://doi.org/10.3324/haematol.2022.281668
811 Non-Hodgkin Lymphoma
Oral HDAC inhibitor tucidinostat in patients with relapsed or refractory peripheral T-cell lymphoma: phase IIb results
Shinya Rai et al.
https://doi.org/10.3324/haematol.2022.280996
822 Non-Hodgkin Lymphoma
Treatment patterns and outcomes in relapsed/refractory follicular lymphoma: results from the international SCHOLAR-5 study
Paola Ghione et al.
https://doi.org/10.3324/haematol.2022.281421
Haematologica | 108 - March 2023
II
833 Plasma Cell Disorders
Lenalidomide-based triplet regimens in first relapsed multiple myeloma patients: real-world evidence from a propensity score matched analysis
Silvia Mangiacavalli et al.
https://doi.org/10.3324/haematol.2022.281342
843 Platelet Biology & its Disorders
Enhancing regulatory T-cell function via inhibition of high mobility group box 1 protein signaling in immune thrombocytopenia
Haoyi Wang et al.
https://doi.org/10.3324/haematol.2022.281557
859 Red Cell Biology & its Disorders
Inhibition of DAGL β as a therapeutic target for pain in sickle cell disease
Iryna A. Khasabova et al.
https://doi.org/10.3324/haematol.2021.280460
870 Red Cell Biology & its Disorders
Variation and impact of polygenic hematologic traits in monogenic sickle cell disease
Thomas Pincez et al.
https://doi.org/10.3324/haematol.2022.281180
Letters
882 International multicenter retrospective analysis of thiotepa-based autologous stem cell transplantation for secondary central nervous system lymphoma
Jahanzaib Khwaja et al.
https://doi.org/10.3324/haematol.2022.281640
889 Delayed hemolytic transfusion reaction in children with sickle cell disease: first 5-year retrospective study in mainland France
Claire Falguière et al.
https://doi.org/10.3324/haematol.2022.281050
895
Unique pathologic features and gene expression signatures distinguish blastoid high-grade B-cell lymphoma from B-acute lymphoblastic leukemia/lymphoma
Lianqun Qiu et al.
https://doi.org/10.3324/haematol.2022.281646
900 Prognostic impact of pretreatment immunoglobulin clonal composition in pediatric B-lymphoblastic leukemia
Carol Fries et al.
https://doi.org/10.3324/haematol.2022.281146
905 Identification of multiple genetic loci associated with red blood cell alloimmunization in mice
Arijita Jash et al.
https://doi.org/10.3324/haematol.2022.281767
909
Dysfunctional subsets of CD39+ T cells, distinct from PD-1+, driven by leukemic extracellular vesicles in myeloid leukemias
Julian Swatler et al.
https://doi.org/10.3324/haematol.2022.281713
917 Clonal hematopoiesis in diffuse large B-cell lymphoma: clinical impact and genetic relatedness to lymphoma and therapy-related myeloid neoplasm
Ying Liu et al.
https://doi.org/10.3324/haematol.2022.281724
923 COVID-19 pandemic affects the ability of negative D-dimer to identify venous thromboembolism patients at low risk of recurrence: insights from the Apidulcis study
Gualtiero Palareti et al.
https://doi.org/10.3324/haematol.2022.282130
Haematologica | 108 - March 2023 III
Comment
926 Comment on Association of FLT3-internal tandem duplication length with overall survival in acute myeloid leukemia: a systematic review and meta-analysis
Wing H. Tong et al.
https://doi.org/10.3324/haematol.2022.281908
Reply to Comment
928 Reply to the comment on Association of FLT3-internal duplication length with overall survival in acute myeloid leukemia: a systematic review and meta-analysis
Tobias B. Polak et al.
https://doi.org/10.3324/haematol.2022.282138
Haematologica Reviewers in 2022
929 List of the reviewers who in 2022 generously made an essential contribution to the high scientific quality of the journal
Haematologica | 108 - March 2023 IV
The development of graft-versus-host disease prophylaxis
 Corey Cutler
Dana-Farber Cancer Institute, Harvard Medical School, Boston, MA, USA

E-mail: corey_cutler@dfci.harvard.edu
https://doi.org/10.3324/haematol.2023.282699
©2023 Ferrata Storti Foundation
Published under a CC BY-NC license
TITLE
Methotrexate and cyclosporine compared with cyclosporine alone for prophylaxis of acute graft versus host disease after marrow transplantation for leukemia.
AUTHORS Storb R, Deeg HJ, Whitehead J, et al.
JOURNAL The New England Journal of Medicine 1986;314(12):729-735. PMID: 3513012

Allogeneic transplantation is routinely employed as curative therapy for patients with hematologic malignancies and, increasingly, for a variety of non-malignant diseases. Overcoming the barrier of alloimmunity is fundamental to the success of allogeneic transplantation. Thus, the de-
velopment of potent immunosuppressive medications was the key event leading to the routine use of transplantation for the treatment of hematologic malignancies. Methotrexate was the first widely used immunosuppressive agent, and the development of cyclosporine A in the early
Haematologica | 108 March 2023 657 LANDMARK PAPER IN HEMATOLOGY C. Cutler
Figure 1. Mechanisms of action of drugs used in graft-versus-host disease prophylaxis. NF-AT: nuclear factor of activated T cells; IL: interleukin.
1970s represented a major breakthrough in immunosuppression. Methotrexate acts as an antiproliferative agent, preventing cell cycling and division of activated T cells, while cyclosporine A acts by preventing T-cell activation and upregulation in response to inflammatory cytokines and paracrine T-cell signaling. Used individually, each provides some degree of protection against lethal acute graft-versus-host disease (GvHD), although single-agent methotrexate is associated with very modest success. Cyclosporine was noted to be more potent as post-transplant monotherapy when compared with methotrexate, leading ultimately to the clinical trial described below. The landmark randomized trial presented here evaluated the combination of cyclosporine A with methotrexate in comparison to cyclosporine A alone in 93 subjects with acute or chronic myelogenous leukemia transplanted using bone marrow from serologically HLA-matched sibling donors at the Fred Hutchinson Cancer Research Center. This trial,1 along with the later long-term update,2 demonstrated a significant improvement in the rate of both overall and severe acute GvHD when the combination was used, and it was this combination of agents that ushered in the era of modern transplantation.
References
1. Storb R, Deeg HJ, Whitehead J, et al. Methotrexate and cyclosporine compared with cyclosporine alone for prophylaxis of acute graft versus host disease after marrow transplantation for leukemia. N Engl J Med. 1986;314(12):729-735.
The standard-of-care for GvHD prevention for over 25 years has been the combination of a calcineurin inhibitor (either cyclosporine A or, more recently, tacrolimus, which works through a similar mechanism of action) in combination with an antimetabolite (most frequently methotrexate) (Figure 1). Subsequent clinical trials demonstrated some benefit from the addition of a third immunosuppressive agent, but at the cost of excess infectious morbidity, and the substitution of newer immunosuppressive agents was associated with modest benefits at best. As novel immunosuppressive strategies emerge, including the use of additional chemotherapeutic and targeted agents in the peritransplant period, as well as sophisticated methods of graft manipulation, enabling allogeneic stem cell transplantation between mismatched and even haploidentical donor-recipient pairs, it is important to recognize that the simple combination of cyclosporine A and methotrexate was crucial for tens of thousands of patients who underwent successful related and unrelated donor allogeneic stem cell transplantation over the past 25 years.
2. Storb R, Deeg HJ, Pepe M, et al. Methotrexate and cyclosporine versus cyclosporine alone for prophylaxis of graft-versus-host disease in patients given HLA-identical marrow grafts for leukemia: long-term follow-up of a controlled trial. Blood. 1989;73(6):1729-1734.
conflicts of interest to disclose. Haematologica | 108 March 2023 658 LANDMARK PAPER IN HEMATOLOGY C. Cutler
Disclosures No
B-cell precursor leukemias with MYC-rearrangement come into the limelight
Arndt Borkhardt1,2 and Günter Henze3,4
For a young fellow in pediatric hematology one of the mistakes that simply cannot be allowed to happen is the misclassification of Burkitt leukemia with French-American-British (FAB) classification L3 morphology as B-precursor acute lymphoblastic leukemia (BCP-ALL). The intense, basophilic cytoplasm with prominent vacuolization of marrow blasts (but not necessarily in the peripheral blood) is easy to recognize and guides therapy towards short but very intensive pulses of chemotherapy based on cyclophosphamide, high-dose methotrexate, and cytosine arabinoside. This approach was developed in the 1980s of the last century by several study groups in Europe and the USA, including the international Berlin-Frankfurt-Münster study group, and has shown tremendous success.1-3 Previously, the patients, mostly children, succumbed to their leukemia due to very early relapses, usually while still under consolidation therapy. There is an extremely strong correlation between FAB L3 morphology, chromosomal translocations involving the MYC-locus at chromosome 8q24 and the mature B-cell developmental stage with surface immunoglobulin (Ig) expression, so FAB L3 blasts became to be regarded as synonymous with mature B-cell, Burkitt-type leukemia with obligatory MYC activation. But sometimes things are not so simple, and MYC activation, be it by chromosomal translocation t(2;8), t(8;14) or t(8;22), has also been found in leukemias with a more immature, B-cell precursor phenotype (CD10+, CD19+, sIg-).4,5 Although such cases are extremely rare, they are reported recurrently and always raise the extremely difficult clinical question of how to treat those patients: Should they receive ALL-type therapy with induction, consolidation followed by maintenance therapy or with rather short chemo-pulses with drugs that are particularly effective on very rapidly proliferating mature B cells? In this issue of Haematologica, Bomken and colleagues6 address this question and molecularly characterize the largest collection of cases worldwide with unprecedented completeness and accuracy. Encompassing 30 years of registration (1989-2019), their study is remarkable in several ways.
Correspondence: A. Borkhardt
arndt.borkhardt@med.uni-duesseldorf.de
Received: April 7, 2022.
Accepted: April 19, 2022.
Early view: April 28, 2022.
https://doi.org/10.3324/haematol.2022.281112
©2023 Ferrata Storti Foundation
Published under a CC BY-NC license
First, it is impressive simply by its huge number of cases (n=90) and shows the power of large international collaborations across study groups, countries and even continents. This effort allowed them to subgroup BCP-ALL with IG-MYC rearrangement (IG-MYC-r) into three different categories, one in which other, classical BCP-ALL-typical genetic aberrations occurred concurrently with the IG-MYC-r, one with a combination of IG-MYC-r and BCL2/BCL6 rearrangement and one in which IG-MYC-r was the defining and sometimes even sole genetic aberration. In agreement with other studies, the relapse-free survival of children or adults with double- or even triple-hit disease (IG-MYC-r + BCL2 ± BCL6) was below 25% at 2 years, making this group available for other experimental approaches.
Second, Bomken et al. 6 went on to use RNA-sequencing, whole exome and targeted sequencing as well as methylation arrays in a subset of cases and demonstrated the power of these modern molecular tools. Mutational analysis subdivided these IG-MYC-r cases into those with ALLtypical mutations (e.g., affecting the IKZF1 or KRAS gene) and those with “Burkitt-type” mutations (including ID3 and TCF3). Perhaps unsurprisingly, they also identifi ed hidden and previously overlooked aberrations specifically seen in BCP-ALL, e.g. three patients with an IGH-DUX4 rearrangement.7 For those cases, at least, the therapeutic dilemma seems to be solved since they can safely continue to follow BCP-ALL protocols. The mutational part of the article by Bomken et al.6 fits well with another recent study in which Burkitt lymphomas (BL) with immature Bcell immunophenotype were molecularly more similar to BCP-ALL than to classical BL.8
Third, as shown in Figure 5 of their paper, Bomken et al.6 did not find major differences in survival between patients who stayed on therapy for BCP-ALL and those who were taken off protocol. One caveat of the study lies in the unavailability of data regarding treatment for those patients taken off-protocol as well as clinical and laboratory data such as lactate dehydrogenase and uric acid levels, tumor lysis parameters, and blast morphology. It would have
1Department for Pediatric Oncology, Hematology and Clinical Immunology, Medical Faculty, Heinrich-Heine University, Düsseldorf; 2German Cancer Consortium (DKTK), partnering site Essen/Düsseldorf; 3Department of Pediatric Oncology Hematology, CharitéUniversitätsmedizin Berlin, Berlin and 4MVZ University Medical Center Rostock, Rostock, Germany
Haematologica | 108 March 2023 659 EDITORIAL A. Borkhardt and G. Henze
been extremely interesting to know how these were treated and how they looked like clinically. Another publication by Herbrueggen et al.9 is worth noting: the authors reported on 14 patients with pre-B lymphoblastic lymphomas (8 with unquestionable L3 morphology, 3 with mixed L1/L3 morphology and 3 unclassified) and finally recommended therapy according to mature B-cell non-Hodgkin lymphoma protocols with intensive, short treatment courses. However, in four cases of this study, the treating center combined mature B-cell therapy with subsequent maintenance therapy pointing again to the difficulties in determining an overall strategy. At the end of their truly outstanding study of a very rare entity, Bomken et al.6 recommended including IG-MYC-r patients in ALL trials; uniforming registration and treatment would be of major benefit for gaining further insights. Some patients who were taken off protocol were absent from further investigation and likely received unproven, individualized treatment. We agree with the authors’ conclusion, cases with BCP-ALL-specific features and the often subclonal IGMYC-r (often only identified molecularly), should be considered as BCP-ALL. Nevertheless, the results of the study
References
1. Reiter A, Schrappe M, Ludwig WD, et al. Favorable outcome of B-cell acute lymphoblastic leukemia in childhood: a report of three consecutive studies of the BFM group. Blood. 1992;80(10):2471-2478.
2. Patte C, Philip T, Rodary C, et al. Improved survival rate in children with stage III and IV B cell non-Hodgkin's lymphoma and leukemia using multi-agent chemotherapy: results of a study of 114 children from the French Pediatric Oncology Society. J Clin Oncol. 1986;4(8):1219-1226.
3. Murphy SB, Bowman WP, Abromowitch M, et al. Results of treatment of advanced-stage Burkitt's lymphoma and B cell (SIg+) acute lymphoblastic leukemia with high-dose fractionated cyclophosphamide and coordinated high-dose methotrexate and cytarabine. J Clin Oncol. 1986;4(12):1732-1739.
4. Navid F, Mosijczuk AD, Head DR, et al. Acute lymphoblastic leukemia with the (8;14)(q24;q32) translocation and FAB L3 morphology associated with a B-precursor immunophenotype: the Pediatric Oncology Group experience. Leukemia. 1999;13(1):135-141.
5. Sakaguchi K, Imamura T, Ishimaru S, et al. Nationwide study of pediatric B-cell precursor acute lymphoblastic leukemia with
by Herbrüggen et al.9 do raise some doubts as to whether the decision about the appropriate therapy should not also take into account the other clinical parameters mentioned above. This is particularly relevant to those patients who harbor IG-MYC-r as the only and defining aberration. Between 20-30% of patients with available clinical data showed initial central nervous system involvement, a relatively high proportion that exceeds the percentage commonly seen in BCP-ALL, but more commonly seen in Burkitt leukemia.10
In addition, the cascade of disease recurrences is reminiscent of Burkitt leukemia and BL, since almost all recurrences occurred very early on. This underscores another paradigm in pediatric hematology that young fellows learn: if patients survive this disease for 2 years, they can be considered definitively cured.
Disclosures
No conflicts of interest to disclose.
Contributions
Both authors contributed equally.
chromosome 8q24/MYC rearrangement in Japan. Pediatr Blood Cancer. 2020;67(7):e28341.
6. Bomken S, Enshaei A, Schwalbe EC, et al. Molecular characterization and clinical outcome of B-cell precursor acute lymphoblastic leukemia with IG-MYC rearrangement. Haematologica. 2023;108(3):717-731.
7. Lilljebjorn H, Henningsson R, Hyrenius-Wittsten A, et al. Identification of ETV6-RUNX1-like and DUX4-rearranged subtypes in paediatric B-cell precursor acute lymphoblastic leukaemia. Nat Commun. 2016;7:11790.
8. Wagener R, Lopez C, Kleinheinz K, et al. IG-MYC (+) neoplasms with precursor B-cell phenotype are molecularly distinct from Burkitt lymphomas. Blood. 2018;132(21):2280-2285.
9. Herbrueggen H, Mueller S, Rohde J, et al. Treatment and outcome of IG-MYC(+) neoplasms with precursor B-cell phenotype in childhood and adolescence. Leukemia. 2020;34(3):942-946.
10. Salzburg J, Burkhardt B, Zimmermann M, et al. Prevalence, clinical pattern, and outcome of CNS involvement in childhood and adolescent non-Hodgkin's lymphoma differ by nonHodgkin's lymphoma subtype: a Berlin-Frankfurt-Munster Group report. J Clin Oncol. 2007;25(25):3915-3922.
Haematologica | 108 March 2023 660 EDITORIAL A. Borkhardt and G. Henze
Positron emission tomography-computed
tomography before autologous stem cell transplant in follicular lymphoma: coming too late?
Clémentine Sarkozy1 and Gilles Salles2
The report from Eyre et al. in the current issue of Haematologica describes the value of positron emission tomography (PET) and computed tomography (CT) performed before autologous stem cell transplant (ASCT) to predict the outcome of patients with follicular lymphoma receiving this therapy.1 This lymphoma is characterized by an extremely variable clinical course driven by significant biological heterogeneity. The current standard of care for first-line treatment produces a remarkable overall survival rate of 80% at 10 years although relapses continue to occur. Early reports from single centers and one abbreviated randomized study in the late 1990s established that ASCT is a valuable option for patients with relapsed chemosensitive disease. Studies showed that the median progression-free survival and overall survival were around 5 and 8 years, respectively, which compared favorably with survival rates of historical controls.2 Even in the rituximab era and building on the concept of “in vivo purging”, ASCT represented an option for patients at the time of disease recurrence. However, ASCT is not a risk-free procedure, since it is associated with a non-relapse mortality of around 3% at 3 years, and a significantly increased risk of secondary malignancies. Together with the absence of solid randomized data, the lack of a demonstrative plateau in progression-free survival curves indicative of the curative potential of this approach, and new agents progressively available for patients with relapsed or refractory follicular lymphoma, significant disparities regarding the use of ASCT were observed in recent years. For instance, according to data from the Center for International Blood and Marrow Transplant Research (CIBMTR), only 137 patients with follicular lymphoma underwent ASCT in 2020,3 while many active European centers have recently restricted its use (LYSA, unpublished data).
A better characterization of patients with relapsed or refractory follicular lymphoma who might benefit from ASCT has also emerged. One study examined the outcome of patients enrolled in the PRIMA trial (immunochemotherapy followed or not by rituximab maintenance in first line) in whom first-
Correspondence: G. Salles
sallesg@mskcc.org
Received: May 10, 2022.
Accepted: May 10, 2022.
Early view: May 19, 2022.
https://doi.org/10.3324/haematol.2022.281255
©2023 Ferrata Storti Foundation
Published under a CC BY-NC license
line therapy had failed. It was observed that ASCT appeared to improve the overall survival of patients presenting at progression with histological transformation, but not that of patients with documented indolent histology.4 Another retrospective study indicated that an apparent benefit of ASCT was observed primarily in patients having progressive disease within 24 months of therapy initiation (POD24), with a 5-year progression-free survival of 51% versus 19% for ASCT versus standard therapy, respectively, and an overall survival of 77% versus 59%, respectively. Of note, when analyzing these data in all patients intended to receive ASCT, only the difference in progression-free survival, but not overall survival, was found to be statistically significant.5 Comparing two registries, Casulo et al. also reported that ASCT was associated with a favorable outcome among POD24 patients only when a transplant was planned early after relapse, i.e. within the first year.6 Shedding light on these different findings, recent data indicated that a significant proportion of patients with early progression present with histological transformation. Indeed from 19% up to 76% of patients with POD24 were documented to have transformed lymphoma,4,7,8 with this wide range likely reflecting variability in systematic biopsy at the time of progression, expert pathology review of the specimen as well as previous exposure to an anthracycline.
In this issue of Haematologica, Eyre et al. report for the first time the predictive value of PET-CT response (defined as complete metabolic response) in 172 patients with follicular lymphoma undergoing ASCT, assembled across 30 centers. The median time from the diagnosis of follicular lymphoma to ASCT was 4.2 years, the median number of prior lines of treatment was three (range, 1-6) and prior histological transformation was documented in 22 (13%) patients (but patients with transformed disease at the time of relapse preceding ASCT were excluded). POD24 data were available for 73 patients, of whom 45% were considered as POD24 after first line, without significant association with PET status before ASCT. At the time of transplant, 57 patients (33%) did not have a complete metabolic response, whereas 115 (67%) did.
1Département d'Innovation Thérapeutique et Essais Précoces (DITEP) Gustave Roussy, Villejuif, France and 2Memorial Sloan Kettering Cancer Center, New York, NY, USA.
Haematologica | 108 March 2023 661 EDITORIAL C. Sarkozy and G. Salles
Of the patients who did not have a complete metabolic response and had a post-ASCT PET, 64% obtained a complete metabolic response after the transplant. At a post-ASCT median follow-up of 27 months, median post-transplant progression-free survival was 28 months and overall survival was 57 months, with a 1-year non-relapse mortality of 6%. Eyre et al. found that PET status at the time of transplant was highly predictive of outcome: in patients with complete metabolic response, the median progression-free survival was 36 months and the 3-year progression-free survival rate was 50%; the corresponding figures for patients without a complete metabolic response were 22 months and 22% (hazard ratio = 1.8, P=0.01). Patients not achieving a complete metabolic response prior to ASCT also tended to have a nonsignificantly reduced overall survival as well as an increased risk of relapse. In multivariate analysis, age and PET status remained significant for progression-free survival whereas prior lines of therapy, lower performance status, PET-CT status and age were associated with overall survival. Of note, POD24 status was not associated with outcome. Overall, this is the first study reporting the predictive value of PET-CT prior to ASCT in patients with relapsed or refractory follicular lymphoma. These data indicate that ASCT is unlikely to provide a benefit for patients not in complete metabolic response although it is not known whether another strategy would improve their outcome. The main pitfall of the study is the heterogeneity of patients and prior therapies, inherent to its retrospective design. Nevertheless, these results add further to others supporting the use of PET-CT as a valuable predictive tool in patients with follicular lymphoma. However, while this study shows that achieving a complete metabolic response prior to ASCT predicts a prolonged PFS, it does not establish whether ASCT constitutes the optimal therapeutic strategy for patients with chemosensitive relapsed follicular lymphoma, including those with early dis-
References
1. Eyre T, Barrington SF, Okosun J. Impact of positron emission tomography - computed tomography status on progression-free survival for relapsed follicular lymphoma patients undergoing autologous stem cell transplantation. Haematologica. 2023;108(3):785-796.
2. Bachy E, Salles G. Marrow-ablative treatment and autologous stem cell transplantation in follicular NHL. Best Pract Res Clin Haematol. 2011;24(2):257-270.
3. Auletta JJ, Kou J, Chen M, Shaw BE. CIBMTR Summary SlidesCIBMTR Summary Slides - HCT Trends and Survival Data. https://www.cibmtr.org/ReferenceCenter/SlidesReports/SummarySli des/pages/index.aspx (accessed April 25, 2022).
4. Sarkozy C, Trneny M, Xerri L, et al. Risk factors and outcomes for patients with follicular lymphoma who had histologic transformation after response to first-line immunochemotherapy in the PRIMA trial. J Clin Oncol. 2016;34(22):2575-2582.
5. Jurinovic V, Metzner B, Pfreundschuh M, et al. Autologous stem cell transplantation for patients with early progression of follicular lymphoma: a follow-up study of 2 randomized trials from the German Low Grade Lymphoma Study Group. Biol Blood Marrow Transplant. 2018;24(6):1172-1179.
ease progression. Lenalidomide with anti-CD20 antibody combinations are already widely used alternatives to cytotoxic regimens. With respective overall and complete response rates of 96-86% and 77-69% recently reported for axicabtagene ciloleucel9 and tisagenlecleucel,10 chimeric antigen receptor T cells also emerge as very effective tools even for patients with refractory disease. Chimeric antigen receptor T-cell therapies are accompanied with specific and significant toxicities and while the follow-ups of these studies remain short, with 12- to 18-month progression-free survival rates of around 65%, this treatment modality will challenge the remaining indications for ASCT in patients with relapsed or refractory follicular lymphoma. Other forms of efficient immunotherapies, such as bispecific antibodies, will likely be available soon. As always with follicular lymphoma, tradeoff between toxicity and efficacy, as well as costs and patients’ preference, will play a role regarding the optimal sequencing of therapies. Thus, given the uncertainty regarding current and future management, the findings reported by Eyre et al. need to be interpreted cautiously.
Disclosures
In the last 12 months, GS has received financial compensation, for participating in advisory boards or consulting, from Abbvie, Bayer, Beigene, Bristol Myers Squibb/Celgene, Epizyme, Genentech/Roche, Genmab, Incyte, Janssen, Kite/Gilead, Loxo, Milteniy, Molecular Partners, Morphosys, Nordic Nanovector, Novartis, Rapt, Regeneron, and Takeda. CS has received financial compensation for consulting from Incyte Bioscience, Bristol Myers Squibb/Celgene and Gilead; travel support from Astra Zeneca Ab, Takeda, and Incyte Bioscience; and reasearch funds from Bristol Myers Squibb/Celgene.
Contributions
CS and GS co-wrote this editorial.
6. Casulo C, Friedberg JW, Ahn KW, et al. Autologous transplantation in follicular lymphoma with early therapy failure: a national LymphoCare study and Center for International Blood and Marrow Transplant Research analysis. Biol Blood Marrow Transplant. 2018;24(6):1163-1171.
7. Seymour JF, Marcus R, Davies A, et al. Association of early disease progression and very poor survival in the GALLIUM study in follicular lymphoma: benefit of obinutuzumab in reducing the rate of early progression. Haematologica. 2019;104(6):1202-1208.
8. Freeman CL, Kridel R, Moccia AA, et al. Early progression after bendamustine-rituximab is associated with high risk of transformation in advanced stage follicular lymphoma. Blood. 2019;134(9):761-764.
9. Jacobson CA, Chavez JC, Sehgal AR, et al. Axicabtagene ciloleucel in relapsed or refractory indolent non-Hodgkin lymphoma (ZUMA5): a single-arm, multicentre, phase 2 trial. Lancet Oncol. 2022;23(1):91-103.
10. Fowler NH, Dickinson M, Dreyling M, et al. Tisagenlecleucel in adult relapsed or refractory follicular lymphoma: the phase 2 ELARA trial. Nat Med. 2021 282 2021;28(2):325-332.
Haematologica | 108 March 2023 662 EDITORIAL C. Sarkozy and G. Salles
Pain mechanisms in sickle cell disease. Are we closer to a breakthrough?
Nicola Conran
Hematology and Transfusion Center, University of Campinas-UNICAMP, Campinas, São Paulo, Brazil
Correspondence: N. Conran
conran@unicamp.br
Received: April 28, 2022.
Accepted: May 17, 2022.
Early view: May 26, 2022.
https://doi.org/10.3324/haematol.2022.281200
©2023 Ferrata Storti Foundation
Published under a CC BY-NC license
In this issue of Haematologica, Khasabova et al.1 demonstrate a role for accelerated biosynthesis of the endocannabinoid, 2-arachidonoylglycerol (2-AG), and thereby prostaglandin E2-glycerol (PGE2-G) generation, in the hyperalgesia observed in a murine model of sickle cell disease (SCD). Pain is a hallmark of SCD and is a major cause of morbidity in patients, with significant negative effects on quality of life. Acute pain, a characteristic and frequent complication of SCD, is usually generated by vaso-occlusive episodes,2 in which vaso-occlusion and ensuing ischemia-reperfusion processes generate the production of multiple pro-inflammatory molecules and pain mediators, including eicosanoids and bradykinin.3,4 The causes of chronic pain, previously reported to affect approximately 30% of adults with SCD on an almost daily basis,5 are less clear in SCD, but may arise from central sensitization due to nociceptive signaling from the periphery to the central nervous system, leading to pain hypersensitivity, although there is also evidence for a contribution of neuropathic pain.4
Following on from their previous study6 showing that sensitization of nociceptors by PGE2-G in mice with SCD contributes to hyperalgesia (defined as an increased sensitivity to pain), Khasabova et al.1 now go on to show that the majority, but not all, of SCD mice (HbSS Berkeley model) studied exhibit strong mechanical and heat hyperalgesia and that this hyperalgesia is associated with significantly higher plasma levels of 2-AG, as compared to mice without SCD (HbAA) and to SCD mice that are not hyperalgesic. Endocannabinoids, such as 2-AG, are endogenous bioactive lipids that have been proposed as novel therapeutic targets for modulating inflammatory nociceptive pain. 2-AG is often regarded as anti-nociceptive upon its binding to cannabinoid receptors, but becomes pronociceptive when metabolized by cyclooxygenase-2 (COX2) to PGE2-G, and may play a key role in the transformation of acute pain to chronic pain.7
Consistent with a proposed role for increased 2-AG endocannabinoid in the hyperalgesia observed in SCD mice, the administration of exogenous 2-AG to non-hyperalgesic
HbSS mice, but not to HbAA mice, induced rapid mechanical hyperalgesia that persisted for 24 hours. Inhibition of 2-AG hydrolysis, to elevate endogenous 2-AG concentrations, also generated hyperalgesia in non-hyperalgesic hemizygous HbAS mice as well as in HbSS mice. While higher plasma 2-AG levels were limited to the population of HbSS mice that showed hyperalgesia, COX-2 protein (which oxygenates 2-AG to generate PGE2-G) was elevated in the blood cells of all HbSS mice, regardless of their hyperalgesic classification, and higher than in HbAA mice. This may explain why hyperalgesia can be induced by 2AG in non-hyperalgesic HbSS mice, but not in HbAA mice. Addressing the question of whether the elevated 2-AG levels in HbSS mice were due to increased biosynthesis or decreased hydrolysis, the authors found that hyperalgesia in these mice was associated with an increased peripheral blood cell content of diacylglycerol lipase-β (DAGLβ), an enzyme that synthesizes 2-AG from diacylglycerides. Consistent with the hypothesis that elevated DAGLβ expression or activity may accelerate 2-AG biosynthesis and induce the PGE2-G-mediated hyperalgesia observed in SCD mice, administration of a selective inhibitor of DAGLβ temporarily reduced mechanical and heat hyperalgesia in HbSS mice and also decreased circulating concentrations of 2-AG, PGE2 and PGE2-G in mice with SCD.
The management of pain, both acute and chronic, in SCD often requires the use of opioids for analgesia, but challenges can arise from the side-effects associated with such medications, opioid-induced hyperalgesia and, sadly, some provider bias.2 As such, the search continues to identify effective non-opioid-based analgesic therapeutic approaches for pain in SCD. The use of COX-2 inhibitors has previously been suggested for managing chronic pain in SCD,2,8 especially given evidence of elevated COX-2 expression and/or activity in the leukocytes of mice and patients with SCD,1,6,9 with Khasabova et al. previously reporting on the analgesic efficacy of R-flurbiprofen in mice with SCD.6 However, observations in the latest study by Khasabova and colleagues indicate that elevation of 2AG, upstream of COX-2, may be specific to those SCD mice
Haematologica | 108 March 2023 663 EDITORIAL N. Conran
displaying hyperalgesia,1 meaning that approaches that can decrease DAGLβ-mediated biosynthesis of 2-AG could provide targeted relief for hyperalgesia in SCD, with theoretically fewer side effects than those of COX inhibitors.10 Furthermore, combined administration of a selective DAGLβ inhibitor together with opioids could potentially lower the dose of opioid required for analgesia of SCD pain.1,2
One intriguing point of interest that arises from the study by Khasabova et al.1 is that not all the transgenic HbSS mice studied displayed hyperalgesia, and that the hyperalgesia observed arose from a peripheral mechanism of pain. DAGL expression occurs differentially, with DAGLα expression restricted essentially to the central nervous system and DAGLβ activity occurring in immune cells, particularly macrophages. How DAGLβ protein expression is upregulated in the cellular component of the peripheral blood of hyperalgesic HbSS mice, but not in non-hyperalgesic HbSS mice, was not explored, but alterations in the immune cell profile of these mice are possible, and pancellular leukocyte activation is also a characteristic of
References
1. Khasabova IA, Gable J, Johns M, et al. Inhibition of DAGLβ as a therapeutic target for pain in sickle cell disease. Haematologica. 2023;108(3):859-869
2. Sagi V, Mittal A, Tran H, Gupta K. Pain in sickle cell disease: current and potential translational therapies. Transl Res. 2021;234:141-158.
3. Graido-Gonzalez E, Doherty JC, Bergreen EW, Organ G, Telfer M, McMillen MA. Plasma endothelin-1, cytokine, and prostaglandin E2 levels in sickle cell disease and acute vaso-occlusive sickle crisis. Blood. 1998;92(7):2551-2555.
4. Takaoka K, Cyril AC, Jinesh S, Radhakrishnan R. Mechanisms of pain in sickle cell disease. Br J Pain. 2021;15(2):213-220.
5. Smith WR, Penberthy LT, Bovbjerg VE, et al. Daily assessment of pain in adults with sickle cell disease. Ann Intern Med. 2008;148(2):94-101.
SCD. Immunoreactivity for DGLβ has been associated with tumor necrosis factor- a expression in CD68+ monocytes/macrophages in a murine model of inflammatory pain; importantly, selective inhibition of the DAGLβ enzyme, or knockout of its gene, was also shown to prevent pro-inflammatory responses in mouse peritoneal macrophages and allodynic pain responses in the lipopolysaccharide model of inflammatory pain in mice.10 Thus, taken together, a contribution of inflammatory processes to DGLβ upregulation in SCD mice, and hence to the hyperalgesia observed in a subset of these mice, may be suggested. Understanding pain, in the context of the complex pathophysiology of SCD, is a daunting task, but observations such as those reported in this study may throw some light onto the role that peripheral mechanisms of inflammatory pain may play in the progression of acute pain to chronic pain in SCD, and the pain hypersensitivity that can occur in the disease.
Disclosures
No conflicts of interest to disclose.
6. Khasabova IA, Uhelski M, Khasabov SG, Gupta K, Seybold VS, Simone DA. Sensitization of nociceptors by prostaglandin E2glycerol contributes to hyperalgesia in mice with sickle cell disease. Blood. 2019;133(18):1989-1998.
7. Voscopoulos C, Lema M. When does acute pain become chronic? Br J Anaesth. 2010;105(Suppl 1):i69-85.
8. Sadler KE, Stucky CL. Blocking COX-2 for sickle cell pain relief. Blood. 2019;133(18):1924-1925.
9. Aslan M, Canatan D. Modulation of redox pathways in neutrophils from sickle cell disease patients. Exp Hematol. 2008;36(11):1535-1544.
10. Wilkerson JL, Ghosh S, Bagdas D, et al. Diacylglycerol lipase beta inhibition reverses nociceptive behaviour in mouse models of inflammatory and neuropathic pain. Br J Pharmacol. 2016;173(10):1678-1692.
Haematologica | 108 March 2023 664 EDITORIAL N. Conran
Loss of APOLD1: a new vascular bleeding disorder?
Kathleen Freson
Department of Cardiovascular Sciences, Center for Molecular and Vascular Biology, University of Leuven, Leuven, Belgium
Correspondence: K. Freson
Kathleen.freson@kuleuven.be
Received: May 19, 2022.
Accepted: May 27, 2022.
Early view: May 31, 2022.
https://doi.org/10.3324/haematol.2022.281354
©2023 Ferrata Storti Foundation
Published under a CC BY-NC license
The APOLD1 gene encodes apolipoprotein L domain-containing 1 (or vascular early response gene, VERGE; MIM612456), which was identified in 2004 as an endothelial cell early response protein induced after ischemia and expected to regulate endothelial cell signaling and vascular function.1 Remarkably, only 18 PubMed hits are retrieved to date using the search term ‘APOLD1’, illustrating the yet unexplored function of this protein. Apold1 knockout mice displayed reduced edema formation but no changes in infarct size or neurological deficits after experimental stroke.2 This could be explained by the notion that endothelial cells (EC) that stably express VERGE show enhanced permeability while increased VERGE expression has been associated with a breakdown of the blood-brain barrier. Another study with these mice showed that Apold1 deficiency results in a prothrombotic phenotype, accompanied by increased vascular tissue factor activity in the injured carotid arteries and increased platelet aggregation towards collagen.3
A study by Stritt et al., published in this issue of Haematologica, now provides evidence for a role of APOLD1 deficiency in a human vascular bleeding disorder.4 Detailed endothelial morphology and functional studies were performed after siRNA-mediated APOLD1 depletion in human dermal blood EC. The findings are summarized in Figure 1. The observed defects were typically associated in EC structures that highly express APOLD1, i.e., cell-cell junctions and Weibel-Palade bodies (WPB). APOLD1 depletion resulted in alterations of EC morphology with the formation of actin-positive stress fibers and the loss of cell-cell junctions which increased EC permeability (Figure 1). In addition, WPB in EC reformatted to autophagosome-like organelles after APOLD1 depletion, resulting in a spontaneous loss of proteins stored in the WPB, including von Willebrand factor (VWF) and angiopoietin 2 (ANGPT2), which were subsequently enriched in the extracellular space (Figure 1). Increased autophagy flux, earlier described as a regulator of VWF secretion,5 was the proposed mechanism for the spontaneous organelle release. Finally, the data were used to support the discovery of a novel autosomal dominant bleeding disorder found in a
pedigree that presented with a heterozygous APOLD1 R49* nonsense variant detected by whole exome sequencing. The four carriers of this variant presented with an unusual type of spontaneous and trauma-related bleeding defect as they have normal coagulation and platelet function test parameters and do not respond to classical treatment with tranexamic acid or platelet transfusion. Interestingly, the use of vasodilators or aspirin worsened their bleeding tendency, and they developed microcirculatory symptoms, such as livedo reticularis after the administration of desmopressin and Raynaud syndrome. Platelets from these carriers had normal a granule counts but the granules stored less VWF than normal and VWF plasma antigen and activity levels were elevated or in the higher normal range. Platelet a granules express APOLD1. Functional studies using patient-derived EC were not performed to validate the two parts of the study and such investigations will probably be required to better understand the bleeding pathology. It is worth noting that the human phenotype contrasts with that found earlier for Apold1 knockout mice2,3 urging more studies. A vascular bleeding disorder is present in Ehlers-Danlos syndrome (EDS) and is found together with joint hypermobility as a result of abnormalities in the collagen of the vessel subendothelial layer and connective tissues caused by genetic defects in different collagen-coding genes.6 The cause of bleeding in these patients can be due to loss of vessel wall integrity but also defects in the interaction between defective collagen and platelets and VWF, although these latter interactions have not been thoroughly evaluated in EDS patients. If hypermobility is obvious, these patients can be identified by clinicians. Vascular bleeding disorders due to defects in EC integrity are also present in patients with capillary malformation-arteriovenous malformation (CM-AVM) and hereditary hemorrhagic telangiectasia (HHT) due to genetic variants in RASA1 and ENG/ACVRL1/SMAD4/GDF2, respectively.7,8 Patients with these conditions are typically identified by the presence of vascular malformations of the brain causing cerebral hemorrhage. Therefore, EDS, CM-AVM and HHT are typically diagnosed based on the presence of more specific
Haematologica | 108 March 2023 665 EDITORIAL K. Freson
Figure 1. Schematic representation of vascular endothelial cells in a healthy subject and in patient with loss of APOLD1. Healthy blood endothelial cells are closely connected via tight and adherens junctions to prevent blood loss (upper panel). Endothelial cells contain Weibel-Palade bodies that store VWF and ANGPT2, among other proteins. Loss of APOLD1 results in dysmorphic endothelial cells with reduced cell-cell junctions and increased permeability, potentially leading to a bleeding disorder (lower panel). The Weibel-Palade bodies in these cells resemble autophagosomes and spontaneously release their content, resulting in elevated extracellular levels of VWF and ANGPT2. APOLD1: apolipoprotein L domain-containing 1; WT: wild-type; VWF: von Willebrand factor; ANGPT2: angiopoietin 2.

clinical phenotypes than bleeding. No studies have measured VWF levels in EC and plasma of HHT patients and it is not known whether their EC contain normal WPB. Other types of vascular bleeding disorders in humans have not yet been described.
Vascular bleeding disorders are difficult to identify as they are typically missed in the current diagnostic workup due to a lack of efficient laboratory-based screening methods that use patient-derived EC. We know from a next-generation sequencing study that only 3.2% of 619 patients with inherited bleeding of unknown etiology (having normal coagulation and platelet function test parameters) carried genetic variants in known genes for EDS and inherited coagulation and platelet disorders.9 Three of these patients had a genetic variant in a known EDS gene. However, most of these patients with inherited bleeding of unknown etiology remain undiagnosed and the clinical management of their bleeding tendency can be very challenging.
T he vascular bleeding disorder detected in the study by Stritt et al. will be difficult to identify using available laboratory-based assays unless high plasma VWF and ANGPT2 levels are specifically associated with this type of bleeding that occurs in the presence of microcirculatory defects.
Over the last decade, diverse groups have used exome and genome sequencing to detect novel genes for bleeding10 and a look for variants in APOLD1 would be of great importance to validate the findings of this study and enhance our understanding of genotype-phenotype correlations for this gene. This gene can be added as a TIER2 gene to the diagnostic-grade gene list of the International Society of Thrombosis and Haemostasis to enhance knowledge in the scientific community 11 The heterozygous APOLD1 R49* nonsense variant results in a premature stop codon and the generation of a shorter APOLD1 protein that lacks three transmembrane domains and the coiled-coil domain. Platelets from the patients express 50% APOLD1 protein levels and the shorter protein was not detected, pointing to a loss of function. The R49* variant is absent in the population variant database gnomAD (gnomad.broadinstitute.org). Remarkably, this database mentions that the pLI score for APOLD1 is 0, meaning that this gene is not protected against nonsense or frameshift variants. Indeed, gnomAD V2.1.1 (excluding samples in TOPMed, which includes a study of bleeding) contains data on more than 50 subjects who are heterozygous for a nonsense or frameshift APOLD1 variant. This suggests that the R49* variant might cause a yet
Haematologica | 108 March 2023 666 EDITORIAL K. Freson
unexplored disease mechanism, as this frequency seems high for a severe bleeding disorder, or that other patients exist with a very mild (even sub-clinical) phenotype. Additional genetic studies are warranted. In conclusion, the study by Stritt et al. nicely combined basic, clinical, and genetic research to characterize a novel vascular bleeding disorder. Some open questions remain that require additional studies. In particular, further genephenotype investigations will be essential to understand this disorder. The study also nicely illustrates our need for
References
1. Regard JB, Scheek S, Borbiev T, et al. Verge: a novel vascular early response gene. J Neurosci. 2004;24(16):4092-4103.
2. Liu F, Turtzo LC, Li J, et al. Loss of vascular early response gene reduces edema formation after experimental stroke. Exp Transl Stroke Med. 2012;4(1):12.
3. Diaz-Cañestro C, Bonetti NR, Wüst P, et al. Apold1 deficiency associates with increased arterial thrombosis in vivo. Eur J Clin Invest. 2020;50(2):e13191.
4. Stritt S, Nurden P, Nurden AT, et al. APOLD1 loss causes endothelial dysfunction involving cell junctions, cytoskeletal architecture, and Weibel-Palade bodies, while disrupting hemostasis. Haematologica. 2023;108(3):772-784.
5. Torisu T, Torisu K, Lee IH, et al. Autophagy regulates endothelial cell processing, maturation and secretion of von Willebrand factor. Nat Med. 2013;19(10):1281-1287.
6. Jesudas R, Chaudhury A, Laukaitis CM. An update on the new classification of Ehlers-Danlos syndrome and review of the
better laboratory assays to identify bleeding defects caused by defective EC and potentially explain patients with inherited bleeding of unknown etiology.
Disclosures
No conflicts of interest to disclose.
Funding
This work was supported by KULeuven BOF grant C14/19/096 and FWO grant G072921N.
causes of bleeding in this population. Haemophilia. 2019;25(4):558-566.
7. Dejana E, Tournier-Lasserve E, Weinstein BM. The control of vascular integrity by endothelial cell junctions: molecular basis and pathological implications. Dev Cell. 2009;16(2):209-21.
8. Shovlin CL, Simeoni I, Downes K, et al. Mutational and phenotypic characterization of hereditary hemorrhagic telangiectasia. Blood. 2020;136(17):1907-1918.
9. Downes K, Megy K, Duarte D, et al. Diagnostic high-throughput sequencing of 2396 patients with bleeding, thrombotic, and platelet disorders. Blood. 2019;134(23):2082-2091.
10. Ver Donck F, Labarque V, Freson K. Hemostatic phenotypes and genetic disorders. Res Pract Thromb Haemost. 2021;5(8):e12637.
11. Megy K, Downes K, Simeoni I, et al. Curated disease-causing genes for bleeding, thrombotic, and platelet disorders: communication from the SSC of the ISTH. J Thromb Haemost. 2019;17(8):1253-1260.
Haematologica | 108 March 2023 667 EDITORIAL K. Freson
Unbiased decision-making for acute myeloid leukemia still needed
Ann-Kathrin Eisfeld
Division of Hematology, Department of Internal Medicine, The Ohio State University Comprehensive Cancer Center, Columbus, OH and Clara D. Bloomfield Center for Leukemia Outcomes Research, The Ohio State University Comprehensive Cancer Center, Columbus, OH, USA
Correspondence: A-K. Eisfeld
Ann-Kathrin.Eisfeld@osumc.edu
Received: May 18, 2022.
Accepted: June 6, 2022.
Early view: June 16, 2022.
https://doi.org/10.3324/haematol.2022.281144
©2023 Ferrata Storti Foundation
Published under a CC BY-NC license
The outcomes of patients with acute myeloid leukemia (AML) are influenced by patient-associated factors such as age1-2 and racial-ethnic identity,3 and by disease-associated factors such as select molecular aberrations.1,2 The latter factors consist of proliferation markers including blast counts, recurrent cytogenetic features and a growing number of AML-associated gene mutations. All together these molecular features of disease have informed our current routinely used genetic risk classifications, such as the 2017 European LeukemiaNet (ELN) risk stratification by genetics2 which is the basis of providers’ treatment decisions, for example, with respect to the need for an allogeneic transplant in first complete remission. In consideration of our growing knowledge of the molecular landscape and identification of driver lesions, patterns of co-existing gene mutations refined suggestions for a fully genomic risk classification,4,5 and have further enhanced our assessment of AML. As much as the establishment of these risk categories has advanced our understanding of AML and provided benefit to our patients, we are all well aware of their current limitations. The age of patients at diagnosis still carries a heavy weight with regards to survival, and both the molecular landscape and its prognostic associations differ with increasing age. As the majority of the large studies that in-
formed the generation of prognostic stratifications are based on younger patients (<60 or 65 years), this leaves the molecular prognostic associations of older adults underrepresented. Even larger gaps in knowledge, and subsequent representation, exist with respect to patients with different racial-ethnic backgrounds,3 resulting in prognostication efforts being best suited for younger patients of European and/or European-American ancestry. With respect to disease-associated features, the broadening molecular landscape and various (sometimes contradictory) reports of prognostic significance of additional markers further complicate our clinical risk assessment. The logical consequence of this is to have an unbiased approach that considers all currently known features to assess patients’ likelihood of responding to therapy and surviving.
In a study presented in this issue of Haematologica, Eckart et al.6 identified features that were predictive of achieving a complete response (with or without complete hematologic response) and 2-year overall survival using a combination of nine machine-learning algorithms for feature selection on over 200 clinical and molecular parameters available for 1,383 patients treated on different German cooperative study group (AMLCG) protocols with intensive

Haematologica | 108 March 2023 668 EDITORIAL A-K. Eisfeld
Figure 1. Machine learning in clinical prognostication. Eckardt et al. used a machine-learning approach including nine different algorithms for optimal selection of clinical and mutational features that are predictive of achievement of complete remission and/or 2-year overall survival upon intensive induction therapy in patients with acute myeloid leukemia.
frontline chemotherapy.6 They found both known and less well-described predictive features for each outcome endpoint, and validated their approach in a second, large external cohort from the AMLCG. The validation of known features, such as most of our current “favorable risk” markers including inv(16), biallelic CEBPA mutations and NPM1c, and established “adverse risk” markers such as TP53, FLT3-ITD, ASXL1, RUNX1 mutations and age, is reassuring and provides confidence in the identification of less established markers including variants in SF3B1, IKZF1 and/or U2AF1. Importantly, their separate consideration of markers predictive of achievement of complete response or overall survival enables a more refined, and arguably clinically more useful view of predictive markers. While there is considerable overlap between features associated with both complete response and overall survival, those that do not overlap, such as the positive outcome association of t(8;21) only with respect to achievement of complete response but not overall survival, may support the need for additional or different consolidation for those patients in order to translate their chemo-responsive disease also into an equal survival benefit.
The decision of Eckart et al. to restrict the algorithms to clinical parameters, cytogenetics and gene mutations may, at first sight, appear like a limitation to the study approach, as aberrant expression of coding and non-coding RNA, epigenetic changes, as well as more complex expression patterns of genomic response are known prognosticators of survival.7 Similarly, despite the growing evidence of the importance of microenvironmental features and immune response, these are not considered in the algorithms. However, the parameters included are more widely available, making their approach clinically applicable with current routine methods, as validly described by the authors in their discussion.
Hence, the model presented by Eckart et al. provides a very
References
1. Dӧhner H, Weisdorf DJ, Bloomfield CD. Acute myeloid leukemia. N Engl J Med. 2015;373(12):1136-1152.
2. Döhner H, Estey E, Grimwade D, et al. Diagnosis and management of AML in adults: 2017 ELN recommendations from an international expert panel. Blood. 2017;129(4):424-447.
3. Bhatnagar B, Kohlschmidt J, Mrózek K, et al. Poor survival and differential impact of genetic features of black patients with acute myeloid leukemia. Cancer Discov. 2021;11(3):626-637.
4. Papaemmanuil E, Gerstung M, Bullinger L, et al. Genomic cassification and prognosis in acute myeloid leukemia. N Engl J Med. 2016;374(23):2209-2221.
5. Patel JP, Gönen M, Figueroa ME, et al. Prognostic relevance of integrated genetic profiling in acute myeloid leukemia. N Engl J Med. 2012;366(12):1079-1089.
6. Eckardt JN, Rölling C, Metzeler K, et al. Prediction of complete remission and survival in acute myeloid leukemia using supervised machine learning. Haematologica. 2023;108(3)690-704.
7. Ng SW, Mitchell A, Kennedy JA, et al. A 17-gene stemness score
interesting approach to help unbiased feature selection, with important, distinct considerations of different outcome endpoints.
The clinical relevance is currently restricted to patients treated with intensive frontline chemotherapy, which again can be seen as both a strength and a weakness of the study: in the era of choices of frontline treatment for many patients, it is highly relevant to identify those patients with an especially favorable risk who have good chances of responding to standard induction chemotherapy and on whom the authors provide a special focus in their analyses. Furthermore, our vulnerable older and/or unfit patients are now being treated with several newly approved less intensive frontline treatment options such as IDH inhibitors8,9 or BCL2 inhibition/hypomethylating agents.10 However, for future considerations and if there is a wish to perform similar analyses for other treatments, it must be realized that extremely large, relatively uniformly treated patient cohorts are required to firmly establish response predictors to inform our choice of frontline therapy. Assembling a large enough cohort of patients to enable similar machine-learning approaches will be a challenge that is imperative to overcome. Quite likely, it will require collaborative efforts of many treatment centers and associated rigorous data collection and follow-up to provide us with the required information and power for analyses. Furthermore, consideration of other consolidation approaches such as allogeneic transplant, maintenance therapies and measurable residual disease will be important factors - again with the challenge of finding a balance between the necessarily large cohorts, homogeneity of treatment, and comparable genetic and genomic backgrounds.
Disclosures
I do not have any conflicts of interest pertaining to this work. My spouse is employed by Karyopharm Therapeutics and is a stock holder of the company.
for rapid determination of risk in acute leukaemia. Nature. 2016;540(7633):433-437.
8. DiNardo CD, Stein EM, de Botton S, et al. Durable remissions with ivosidenib in IDH1-mutated relapsed or refractory AML. N Engl J Med. 2018;378(25):2386-2398.
9. Stein EM, DiNardo CD, Pollyea DA, et al. Enasidenib in mutant IDH2 relapsed or refractory acute myeloid leukemia. Blood. 2017;130(6):722-731.
10. Roboz GJ, DiNardo CD, Stein EM, et al. Ivosidenib induces deep durable remissions in patients with newly diagnosed IDH1mutant acute myeloid leukemia. Blood. 2020;135(7):463-471.
11. Pollyea DA, Tallman MS, de Botton S, et al. Enasidenib, an inhibitor of mutant IDH2 proteins, induces durable remissions in older patients with newly diagnosed acute myeloid leukemia. Leukemia. 2019;33(11):2575-2584.
12. DiNardo CD, Jonas BA, Pullarkat V, et al. Azacitidine and venetoclax in previously untreated acute myeloid leukemia. N Engl J Med. 2020;383(7):617-629.
Haematologica | 108 March 2023 669 EDITORIAL A-K. Eisfeld
Surprise, surprise: STAT5 is not enough to stop the steroids
Marta B. Fernandes and João T. Barata
In this issue of Haematologica, van der Zwet et al.1 provide evidence that STAT5 is not sufficient to drive resistance to glucocorticoid treatment in T-cell acute lymphoblastic leukemia (T-ALL) cells, although STAT5 promotes significant upregulation of the anti-apoptotic genes BCL2 and BCL2L1 (encoding BCL-XL) specifically when in the presence of glucocorticoids.
To understand why these results are intriguing and relevant from biological and clinical standpoints, we should start by recalling that administration of glucocorticoids (steroid hormones such as prednisolone, used by van der Zwet and colleagues) is a pivotal component of frontline pediatric ALL treatment. Refractory/resistant disease constitutes the main clinical challenge in this aggressive but otherwise curable malignancy. Thus, understanding the mechanisms driving resistance to glucocorticoids is of major biological and clinical relevance. Previous studies identified a number of potential mechanisms, including PI3K-AKT pathway blocking translocation of the glucocorticoid receptor (NR3C1) to the nucleus2 and upregulating BCL-XL and MCL1,3 or different modes of inactivating BIM, a pro-apoptotic gene and major transcriptional target of NR3C1.4 Additionally, interleukin-7 receptor (IL-7R)-mediated signaling, because of IL-7 in the tumor microenvironment or gain-of-function mutations in IL-7R a (encoded by IL7R) or downstream effectors, can drive TALL and promote resistance to steroids.3,5-8
IL-7/IL-7R-mediated signaling involves three main pathways: STAT5, MEK-ERK and PI3K-AKT, all of which rely on upstream activation of JAK1 and JAK3.5 Using patients’ data, van der Zwet et al. showed that activating mutations in IL-7Ra, JAK1, JAK3 or STAT5B associated, as expected, with STAT5 transcriptional activity. However, sensitivity to prednisolone and event-free survival were comparable in patients with high versus low STAT5 transcriptional activity. This constituted a first indication that STAT5 alone cannot be a major reason for steroid resistance in T-ALL patients and that other pathways (for instance PI3K-AKT and/or MEK-ERK) must be taken into account.
Through overexpression of constitutively active forms of IL-7Ra in T-ALL cell lines, combined with pharmacological inhibition of IL-7R-mediated signaling pathways, van der
Correspondence: J.T. Barata
joao_barata@medicina.ulisboa.pt
Received: May 30, 2022.
Accepted: June 13, 2022.
Early view: June 23, 2022.
https://doi.org/10.3324/haematol.2022.281369
©2023 Ferrata Storti Foundation
Published under a CC BY-NC license
Zwet and colleagues then showed that whereas mutant IL7R promoted steroid resistance, this effect did not correlate with upregulation of BCL2 and BCL2L1. As expected, JAK inhibition with ruxolitinib reversed BCL2 and BCL2L1 upregulation and steroid resistance in prednisolonetreated IL7R mutant cells. However, AKT inhibition (alone or in combination with MEK inhibition) also reversed steroid resistance although BCL2 and BCL2L1 transcript levels were not downregulated (if anything they actually increased). Moreover, although a constitutively active form of STAT5B upregulated both anti-apoptotic genes in steroid-treated T-ALL cell lines, this did not result in increased resistance to steroids. These findings are in apparent disagreement with previous studies by Meyer et al., which showed that STAT5 and BCL2 are required for IL-7-mediated resistance to steroids.8 However, STAT5B and BCL2 were silenced in those studies, whereas van der Zwet et al. overexpressed activated STAT5B (with consequent BCL2 upregulation). Thus, the two observations may be reconciled by concluding that STAT5 is necessary but not sufficient for resistance to glucocorticoids. Obviously, a question ensues: why is STAT5 not sufficient? In line with what was suggested by previous work in B- and T-ALL,7,9 the authors propose that this may be because activation of the glucocorticoid receptor (NR3C1) leads to BIM upregulation, which counterbalances the effects of increased BCL2 and BCL-XL by binding directly to them. This is based on co-immunoprecipitation studies, which go beyond previous studies, although unfortunately no functional studies were performed addressing the actual importance of the balance between BIM and BCL2 antiapoptotic family members on sensitivity to glucocorticoids. Nonetheless, the tantalizing corollary, proposed by the authors, is that STAT5 activation only effectively promotes glucocorticoid resistance if cellular defects exist that ultimately disable or decrease steroid-induced pro-apoptotic BIM induction. These defects may be genetic, epigenetic and/or involve the modulation of signaling pathways known to regulate BIM activation, such as MEKERK and PI3K-AKT, which can be regulated cell-autonomously and by microenvironmental factors, including IL-7 (Figure 1A). Obviously, this also implies that heterogeneity
Instituto de Medicina Molecular João Lobo Antunes, Faculdade de Medicina, Universidade de Lisboa, Lisbon, Portugal
Haematologica | 108 March 2023 670 EDITORIAL M.B. Fernandes and J.T. Barata
Figure 1. STAT5 and response to steroids in acute lymphoblastic leukemia. (A) Van der Zwet et al.1 propose that, in the absence of the indicated mechanisms that downregulate NR3C1-mediated BIM activation, NR3C1/STAT5 cooperation in regulating BCL2 and BCLXL expression is insufficient to induce steroid resistance. (B) Upon activation, both NR3C1 and STAT5 translocate to the nucleus. Activation of NR3C1 by steroids promotes the upregulation of BIM and IL7R, whereas STAT5 activation by IL-7R-mediated signaling, enhances the expression of PIM1, CISH and possibly BCL2L1/BCLXL, but not of BCL2. The concomitant activation of glucocorticoidand IL-7R-mediated signaling leads to NR3C1 and STAT5 cooperating in inducing the expression of BCL2 and BCL2L1/BCLXL.

A
Haematologica | 108 March 2023 671 EDITORIAL M.B. Fernandes and J.T. Barata B
should exist in the molecular landscape of T-ALL cell lines and patients’ samples which may justify differences regarding the relevance of STAT5 for resistance to glucocorticoids. Characterizing those differences will likely be essential to identify the best combination therapies required to overcome resistance in particular patients. There are other notable features in the article, namely regarding the role of IL-7R-mediated STAT5 activation in upregulating BCL2 in T-ALL cells. The link between IL-7, STAT5 and BCL2 upregulation in healthy developing T cells has long been established. Because IL-7 activates STAT5 and upregulates BCL2 it has been assumed that BCL2 is upregulated due to STAT5 transcriptional activity also in T-ALL cells. However logical it may seem, this view was proven wrong. Ribeiro et al. showed that STAT5 does not bind to the BCL2 locus and that STAT5 silencing or pharmacological inhibition does not prevent IL-7-mediated BCL2 upregulation in T-ALL cells.10 These observations have now been corroborated by van der Zwet and colleagues, who also showed that a constitutively active mutant form of STAT5B was unable to upregulate BCL2. While this is another nail in the coffin of a longstanding “dogma”, why STAT5 alone does not transcriptionally upregulate BCL2 in T-ALL cells remains a puzzling question. On the other hand, Meyer et al. demonstrated that IL-7-mediated activation of STAT5 could upregulate BCL2 in T-ALL cells, with a major “nuance”: the leukemia cells were treated with glucocorticoids.8 The work from Meijerink’s laboratory is a leap forward in the molecular understanding of how this happens and in integrating the two previous studies (Figure 1B). In the absence of steroids, STAT5 is incompetent to bind the locus or upregulate BCL2, even if
References
1. van der Zwet JCG, Cordo V, Buijs-Gladdines J, et al. STAT5 does not drive steroid resistance in T-cell acute lymphoblastic leukemia despite the activation of BCL2 and BCL-XL following glucocorticoid treatment. Haematologica. 2023;108(3):732-746.
2. Piovan E, Yu J, Tosello V, et al. Direct reversal of glucocorticoid resistance by AKT inhibition in acute lymphoblastic leukemia. Cancer Cell. 2013;24(6):766-776.
3. Li Y, Buijs-Gladdines JG, Cante-Barrett K, et al. IL-7 receptor mutations and steroid resistance in pediatric T cell acute lymphoblastic leukemia: a genome sequencing study. PLoS Med. 2016;13(12):e1002200.
4. De Smedt R, Morscio J, Goossens S, Van Vlierberghe P. Targeting steroid resistance in T-cell acute lymphoblastic leukemia. Blood Rev. 2019;38:100591.
5. Barata JT, Durum SK, Seddon B. Flip the coin: IL-7 and IL-7R in health and disease. Nat Immunol. 2019;20(12):1584-1593.
6. Oliveira ML, Veloso A, Garcia EG, et al. Mutant IL7R
activated mutationally or by IL-7 stimulation. However, in the presence of steroids, STAT5 is required for NR3C1 to bind to the BCL2 locus at two sites, including one with a STAT5 binding motif. Because STAT5 and NR3C1 physically interact, it is possible that, as speculated by the authors, STAT5 is required for heterodimeric or multimeric STAT5NR3C1 complexes to activate BCL2 and other antiapoptotic genes (Figure 1B). Intriguingly, STAT5 and NR3C1 appear to interact in a ‘constitutive’ fashion, independently of STAT5 or NR3C1 activation status, which raises a number of questions. Where in the cell does the interaction occur (cytoplasm, nucleus, both compartments)? Is the interaction required for nuclear translocation and DNA binding? Does it potentially allow for non-phosphorylated, inactive STAT5 to translocate to the nucleus in the presence of steroids? These and other outstanding questions merit investigation, because they may be of great use for the understanding of the crosstalk between glucocorticoid therapeutic signaling and IL-7R-mediated resistance signaling.
Overall, the findings of van der Zwet and colleagues are provocative and may have a considerable impact, not only by augmenting the understanding of the underlying biology of resistance to treatment in T-ALL (extending some of the current views and challenging others) but also, in doing so, by providing hints for devising effective combination strategies to overcome resistance and avoid relapse.
Disclosures
No conflicts of interest to disclose.
Contributions
MF and JTB wrote the manuscript.
collaborates with MYC to induce T-cell acute lymphoblastic leukemia. Leukemia. 2022;36(6):1533-1540.
7. Delgado-Martin C, Meyer LK, Huang BJ, et al. JAK/STAT pathway inhibition overcomes IL7-induced glucocorticoid resistance in a subset of human T-cell acute lymphoblastic leukemias. Leukemia. 2017;31(12):2568-2576.
8. Meyer LK, Huang BJ, Delgado-Martin C, et al. Glucocorticoids paradoxically facilitate steroid resistance in T cell acute lymphoblastic leukemias and thymocytes. J Clin Invest. 2020;130(2):863-876.
9. Jing D, Bhadri VA, Beck D, et al. Opposing regulation of BIM and BCL2 controls glucocorticoid-induced apoptosis of pediatric acute lymphoblastic leukemia cells. Blood. 2015;125(2):273-283.
10. Ribeiro D, Melao A, van Boxtel R, et al. STAT5 is essential for IL7-mediated viability, growth, and proliferation of T-cell acute lymphoblastic leukemia cells. Blood Adv. 2018;2(17):2199-2213.
Haematologica | 108 March 2023 672 EDITORIAL M.B. Fernandes and J.T. Barata
Prevention and management of secondary central nervous system lymphoma
Sabela Bobillo,1 Jahanzaib Khwaja,2 Andrés J.M. Ferreri3 and Kate Cwynarski2
Abstract
Correspondence: K. Cwynarski kate.cwynarski@nhs.net
Received: August 31, 2022.
Accepted: November 9, 2022.

Early view: November 17, 2022.
https://doi.org/10.3324/haematol.2022.281457
©2023 Ferrata Storti Foundation
Published under a CC BY-NC license
Secondary central nervous system (CNS) lymphoma (SCNSL) is defined by the involvement of the CNS, either at the time of initial diagnosis of systemic lymphoma or in the setting of relapse, and can be either isolated or with synchronous systemic disease. The risk of CNS involvement in patients with diffuse large B-cell lymphoma is approximately 5%; however, certain clinical and biological features have been associated with a risk of up to 15%. There has been growing interest in improving the definition of patients at increased risk of CNS relapse, as well as identifying effective prophylactic strategies to prevent it. SCNSL often occurs within months of the initial diagnosis of lymphoma, suggesting the presence of occult disease at diagnosis in many cases. The differing presentations of SCNSL create the therapeutic challenge of controlling both the systemic disease and the CNS disease, which uniquely requires agents that penetrate the blood-brain barrier. Outcomes are generally poor with a median overall survival of approximately 6 months in retrospective series, particularly in those patients presenting with SCNSL after prior therapy. Prospective studies of intensive chemotherapy regimens containing high-dose methotrexate, followed by hematopoietic stem cell transplantation have shown the most favorable outcomes, especially for patients receiving thiotepa-based conditioning regimens. However, a proportion of patients will not respond to induction therapies or will subsequently relapse, indicating the need for more effective treatment strategies. In this review we focus on the identification of high-risk patients, prophylactic strategies and recent treatment approaches for SCNSL. The incorporation of novel agents in immunochemotherapy deserves further study in prospective trials.
Introduction
Secondary central nervous system (CNS) lymphoma (SCNSL) is defined by the involvement of the CNS, either at the time of initial diagnosis of systemic lymphoma or in the setting of relapse, and can be either isolated or with synchronous systemic disease.1 The risk of CNS involvement in patients with diffuse large B-cell lymphoma (DLBCL) is approximately 5%; however, the presence of certain clinical and biological features has been associated with a risk of up to 15%.2 Due to the poor prognosis of SCNSL, there has been growing interest in improving the definition of patients at increased risk of CNS relapse, as well as identifying effective prophylactic strategies to prevent it. In this review we discuss the clinical presentation, the identification of high-risk patients, prophylaxis strategies and recent treatment approaches for SCNSL as well as consider future directions.
MEDLINE, EMBASE and PubMED were systemically searched for publications in English using the following terms: ‘CNS’ and ‘lymphoma’, ‘secondary CNS lymphoma’. References from relevant publications were also searched.
Clinical presentation
DLBCL may involve the brain, meninges, cranial nerves, eyes, and/or spinal cord, which are considered immuneprivileged sites with blood-brain and blood-retinal barriers creating therapeutic challenges. Approximately 40% of patients present with de novo disease and 60% at relapse, either with isolated CNS disease or synchronous systemic involvement.3,4 Patients who relapse after prior treatment typically do so within 6-9 months,5 which may be a consequence of occult CNS malignant cells at diagnosis or a failure of systemic therapy, CNS therapy, or both.
1Department of Hematology, Vall d’Hebron Institute of Oncology (VHIO), Vall d’Hebron University Hospital, Barcelona, Spain; 2Department of Haematology, University College London Hospitals, London, UK and 3Lymphoma Unit, Department of Onco-Hematology, IRCCS San Raffaele Scientific Institute, Milan, Italy
Haematologica | 108 March 2023 673 REVIEW ARTICLE
Although historic reports suggested a high proportion of leptomeningeal involvement,6 more recent data indicate parenchymal involvement in 40%-60% of patients, leptomeningeal involvement in 20%-30%, and both in 10%.3,4,7,8 Direct infiltration of tumor cells from craniofacial or epidural masses into the CNS may also occur. Systemic sites of disease are typically both nodal and extranodal.3 Clinical symptoms are often the first indication of CNS disease and may be diverse, reflecting involvement of the CNS as well as, rarely, the peripheral nervous system. Common symptoms include motor deficits, headaches, cognitive impairment, cranial nerve involvement and neuropsychiatric changes7,9 and, less frequently, blurred vision and floaters in those with ocular involvement. In older patients, CNS relapse may present with more subtle symptoms of asthenia, hearing impairment and urinary incontinence.10
Diagnosis
Biopsy and staging investigations are ideally performed prior to steroid administration, in order to maximize diagnostic yield, since corticosteroids have been shown to prevent or delay diagnosis in 50% of cases.11 Our suggested diagnostic and staging investigations are outlined in Table 1.
Biopsy
The gold standard for SCNSL diagnosis has been the histopathological analysis of a stereotactic biopsy of the brain or cytological examination of cerebrospinal fluid (CSF). Less commonly, the diagnosis can be achieved by cytological examination of vitrectomy samples.12 Histological features of these highly cellular, diffusely growing tumors include atypical medium to large cells with pleomorphic nuclei and distinct nucleoli. Malignant cells express pan B-cell antigens (CD19, CD20, CD22, CD79a) with light chain restriction, negative plasma cell markers and a high Ki67 (MIB1) proliferation index. CSF examination includes biochemical analysis, cell count, morphology, flow cytometry and molecular testing. Increased protein concentration may indicate disruption of the blood-brain barrier, often associated with parenchymal lesions, whereas decreased glucose concentration is usually associated with CSF or meningeal infiltration, especially in cases with high tumor lymphocyte counts. In selected cases, in which findings are inconclusive, analysis of tissue or CSF samples for immunoglobulin gene rearrangements may establish B-cell clonality, supporting the diagnosis.13 Other tests may improve diagnostic rates and are increasingly used in patients with disease that cannot be biopsied. Assessment of the MYD88L265P mutation and interleukin-10 levels in the CSF have shown high diagnostic sensitivity and specificity in patients with primary CNS lymphoma (PCNSL), with high concordance rates in
paired tissue and CSF samples, independently of the site and burden of disease.14 The sensitivity and specificity of these and other promising diagnostic tools should be assessed in patients with SCNSL and prospective studies to validate the efficacy of CSF molecular studies are ongoing (NCT05036564). For intraocular investigation, the diagnostic yield is superior with vitrectomy than with core vitreous sampling.15
Patients with lesions that cannot be biopsied represent a challenge and should, as a standard, be reviewed in a multidisciplinary team setting. Our consensus is that when patients present with concurrent CNS and systemic lymphoma, the diagnosis can be made from a systemic-site biopsy alone if magnetic resonance imaging (MRI) findings are consistent with lymphoma after review by an expert neuroradiologist. Isolated SCNSL may be diagnosed with characteristic brain MRI features alone in the setting of early relapse (i.e., <2 years from initial diagnosis). Biopsy of isolated CNS lesions presenting more than 2 years after the diagnosis of DLBCL is recommended. Decisions should be made in consensus with expert hematologists and neuroradiologists to exclude all other potential differential diagnoses.
Imaging
Imaging should include both the CNS and systemic compartments. Contrast-enhanced MRI of the brain and spinal cord cannot reliably differentiate histological entities, nor exclude CNS involvement, particularly after the use of steroids. MRI scanning according to the International PCNSL Collaborative Group (IPCG)16 is recommended, but experience focused exclusively on SCNSL has not been reported. Ideally MRI should be performed prior to lumbar puncture to exclude focal mass effects and/or obstructive hydrocephalus and avoid non-specific meningeal enhancement that occurs after CSF sampling. Expert neuroradiology review is essential as evolving white matter changes may be due to chemotherapy, radiation or aging.
Whole body positron emission tomography (PET) – computed tomography (CT) is recommended to stage systemic disease. Testicular ultrasound is recommended to exclude testicular involvement and ocular assessment to determine any vitreo-retinal involvement, especially if there are visual symptoms.
Identification of patients with a high risk of central nervous system disease
Our approach to CNS prophylaxis is summarized in Figure 1.
Clinical risk factors
The CNS prognostic model (CNS-IPI), including the five standard International Prognostic Index factors (age >60
Haematologica | 108 March 2023 674 REVIEW ARTICLE - Secondary CNS lymphoma S. Bobillo et al.
years, stage III/IV, ≥2 extranodal sites, elevated lactate dehydrogenase and performance status ≥2) and kidney or adrenal gland involvement, stratifies patients into three categories: low (0-2 risk factors), intermediate (2-3 risk factors) and high risk (4-6 risk factors) with 2-year rates of CNS relapse of 0.6%, 3.4% and 10.2%, respectively.2 This is a robust model, but it underestimates the risk of CNS relapse of specific extranodal lymphomas associated with a high risk of CNS recurrence (i.e. testicular, breast)17,18 that usually present with limited-stage disease, and therefore
fall into the low or intermediate categories. The risk of CNS relapse following disease in other extranodal sites, such as the uterus, bone marrow or epidural space, is controversial19 and craniofacial structures may no longer be high-risk sites since the introduction of rituximab.20 The involvement of ≥3 extranodal sites determined by PET/CT was also shown to confer a high risk of CNS relapse in a retrospective analysis of 1,532 patients, with a 3-year cumulative risk of CNS relapse of 15% compared to 2.6% among patients with ≤2 extranodal sites of disease.21 The
Investigations
Blood tests
Full blood count, renal and liver function, lactate dehydrogenase, virology (human immunodeficiency virus, hepatitis B, hepatitis C)
Imaging
Whole body PET-CT*
MRI brain with gadolinium*
Rationale
As standard prior to treatment. Echocardiogram and formal renal function testing may be required for those with risk factors to assess fitness for treatment
To assess for systemic disease
To assess for CNS disease
MRI whole spine with gadolinium May be required in the presence of clinical symptoms
Fundoscopy and slit lamp examination
Testicular ultrasound
Histology
Stereotactic brain biopsy*
To assess for vitreoretinal involvement
To assess for testicular involvement, as this may not be evaluated by whole body PET-CT
Morphology, immunohistochemistry, cytogenetics
Performance
Recommended
CSF cytology, flow cytometry, biochemistry
CSF molecular studies (MYD88, immunoglobulin/T-cell receptor gene rearrangements)
Lymph node biopsy
Bone marrow examination
Large volume CSF studies may be required if stereotactic biopsy is not possible. Biochemistry may be supportive
Molecular studies may be supportive in complex cases, with unclear histopathological findings
In those in whom stereotactic brain biopsies are not feasible and CSF studies are non-diagnostic, consistent MRI brain imaging alongside a diagnostic lymph node biopsy confirming systemic involvement may be supportive of SCNSL
Not routinely recommended as it will not alter management decisions
Recommended
Recommended
Consider
Recommended in symptomatic patients, consider in asymptomatic
Recommended when PETCT is not available
Recommended in patients with unclear imaging or CNS events occurring after long follow-up
Recommended
Consider
Consider
Not routinely recommended
*Staging investigations should be reviewed in a multidisciplinary setting including lymphoma practitioners, hematopathologists, and neuroradiologists. PET: positron emission tomography; CT: computed tomography; CSF: cerebrospinal fluid; MRI: magnetic resonance imaging; SCNSL: secondary central nervous system lymphoma.
Table 1. Diagnostic and staging investigations.
Haematologica | 108 March 2023 675 REVIEW ARTICLE - Secondary CNS lymphoma S. Bobillo et al.
Figure 1. Algorithm for central nervous system prophylaxis. DLBCL: diffuse large B-cell lymphoma; CNS-IPI: CNS International Prognostic Index; CNS: central nervous system; MRI: magnetic resonance imaging; CSF: cerebrospinal fluid; PET: positron emission tomography; CT: computed tomography; SCNSL: secondary central nervous system lymphoma; CMR: complete molecular response; HD-MTX: high-dose methotrexate; SD: stable disease; PR: partial response; PD: progressive disease; IT: intrathecal. *In testicular DLBCL, consider additional intrathecal therapy.

CNS-IPI model does not include biological risk factors recently associated with higher risk of CNS relapse.
Biological risk factors
Historically, the presence of a MYC translocation along with a BCL2 and/or BCL6 translocation (high-grade B-cell lymphoma with a “double hit” [DHL] or “triple hit” [THL]) has been associated with an increased risk of CNS relapse of up to 50%; however the series yielding these data may have been subject to selection bias since fluorescence in situ hybridization studies were not routinely performed.22 More recent retrospective series showed lower CNS relapse rates of 5-20%.23 A retrospective analysis of 40 patients with early-stage DHL/THL showed a very low rate of CNS events (n=1), suggesting that other clinical features may play a role in CNS relapse.24
An activated B-cell phenotype, as determined by gene expression profiling, constitutes an independent risk factor for CNS relapse according to recent studies, with a CNS relapse risk of 7-9%.23,25 A post-hoc analysis of the GOYA trial showed that an activated B-cell subtype, determined by gene expression profiling, together with high-risk CNSIPI, was associated with a 2-year CNS relapse rate of 15%.25 Two recent studies have utilized multiplatform analyses encompassing point mutations, structural variants and copy-number alterations to define new molecular sub-
groups or clusters of large B-cell lymphomas.26,27 The MCD and C5 clusters include almost exclusively activated Bcell subtypes with a high frequency of MYD88L265P , CD79, PIM1, and ETV6 mutations. Interestingly, the genetic features of these subtypes overlap with those observed in primary extranodal lymphomas of immune-privileged sites such as PCNSL and testicular lymphoma. Moreover, a recent study of 26 patients with DLBCL who experienced either isolated CNS relapse (n=13) or systemic (non-CNS) relapse (n=13), showed a higher prevalence of the MCD subtype in patients with CNS relapse compared to those with systemic (non-CNS) recurrence (38% vs. 8%).28 Although molecular analysis may identify patients with a high risk of CNS relapse more precisely, further studies are required to clarify how this can be incorporated into routine clinical practice.
Baseline screening
Baseline brain imaging and CSF analysis may identify asymptomatic patients with CNS involvement and these patients may benefit from CNS-directed therapies. Cytology is a highly specific test with very limited sensitivity, whereas flow cytometry is a more sensitive tool to detect occult CNS disease.29 In a multicenter study analyzing pretreatment CSF samples from high-risk DLBCL (n=246) and Burkitt lymphoma (n=80), flow cytometry detected CNS
Haematologica | 108 March 2023 676 REVIEW ARTICLE - Secondary CNS lymphoma S. Bobillo et al.
disease in 13% of DLBCL and 11% of Burkitt lymphoma patients whereas cytology was positive in only 4% and 6% of cases, respectively.29
Increased levels of soluble CD19 protein in the CSF were associated with parenchymal CNS lymphoma in a multicenter study including 91 patients with high-risk DLBCL.30 The potential role of CSF circulating tumor DNA to predict CNS relapse in patients with systemic B-cell lymphoma with a high risk of CNS relapse was first explored in a study analyzing tumor mutations in CSF samples from 12 patients with B-cell lymphoma collected at diagnosis and during frontline treatment.31 CSF analysis detected MYD88 and ASXL2 mutations in one of two patients who relapsed in the CNS in a CSF sample collected 3 months prior to the relapse. No mutations were found in the CSF samples from patients without CNS relapse. More recently, a second study identified clonotypic DNA in the CSF from eight of 22 patients with newly diagnosed B-cell lymphoma; two of the eight with positive CSF circulating tumor DNA eventually relapsed in the CNS, resulting in a 12-month cumulative incidence of CNS relapse of 29%.32 Further studies including a larger number of patients are warranted to explore the poten-
tial utility of CSF circulating tumor DNA in identifying patients at higher risk of CNS events.
Strategies for prophylaxis of central nervous system disease
Intrathecal chemotherapy
Prophylaxis with intrathecal (IT) methotrexate (MTX) and/or cytarabine, often combined with steroids, has been used historically in aggressive B-cell lymphomas.33 However, in the rituximab era, the majority of retrospective studies and post-hoc analyses from prospective trials showed lack of efficacy of IT prophylaxis (Table 2).34 Recent retrospective series including older patients and high-risk DLBCL have shown similar results with no apparent benefit of IT prophylaxis.5,34-36
Testicular DLBCL represents a particular scenario in which IT prophylaxis might have a role in the prevention of CNS disease according to data from two prospective single-arm studies conducted by the International Extranodal Lymphoma Study Group (IELSG). The IELSG10 study (n=53)
*Patients receiving rituximab. N: number of patients; IT: intrathecal; MTX: methotrexate; CNS: central nervous system; CHOP: cyclophosphamide, daunorubicin, vincristine; prednisone; R: rituximab; mth: months; NR: not recorded; NCCN: National Comprehensive Cancer Network; NCRI: National Cancer Research Institute; CNS-IPI: CNS-International Prognostic Index; G: obinutuzumab; yr: years.
Study (year) Study design N Patients Treatment IT MTX prophylaxis Time to CNS relapse CNS relapse risk Boehme V et al. (2009)90 Post-hoc analysis RICOVER-60 1,217 61-80 yr “aggressive” CHOP vs R-CHOP 57% 8 mth 6.9% vs. 4.1% (2 yr) No benefit in the rituximab group Tai WM et al. (2011)91 Retrospective 499 ≥18 yr (R)-CHOP 18%* 6%* (2 yr) 6.7 mth No benefit Villa D et al. (2011)92 Retrospective 435 >16 yr, III-IV or testicular (R)-CHOP 4%* 6.7 mth 6.4% (R-CHOP) No benefit Schmitz N et al. (2012)93 Post-hoc analysis MinT trial and others 2,210 18-60 yr CHOP vs. R-CHOP NR 7 mth 2.3% (2 yr) No benefit in the rituximab group Kumar A et al. (2012)94 Prospective NCCN database 989 ≥18 yr R-CHOP 11% (72% IT) 12.8 mth 2% (2.5 yr) 5.4% with prophylaxis vs. 1.4% without prophylaxis No benefit Gleeson M et al. (2017)95 Post-hoc analysis UK NCRI trials 984 ≥18 yr, II-IV or I Bulky R-CHOP 14 vs. R-CHOP 21 18% 8 mth 1.9% (6 yr) No benefit No benefit by CNS-IPI Klanova M et al. (2019)25 Post-hoc analysis GOYA 1,418 ≥18 yr R-CHOP vs. G-CHOP 10% 8.5 mth 2.5% (2 yr) No benefit No benefit by CNS-IPI Eyre T et al. (2019)35 Retrospective 690 >70 yr R-CHOP 14% 9.4 mth 3.1% (3 yr) No benefit
Table 2. Studies with more than 400 patients evaluating the use of intrathecal prophylaxis.
Haematologica | 108 March 2023 677 REVIEW ARTICLE - Secondary CNS lymphoma S. Bobillo et al.
showed a low risk of CNS relapse for patients treated with R-CHOP (rituximab, cyclophosphamide, doxorubicin, vincristine and prednisone) plus contralateral testicular irradiation and four doses of IT MTX (5-year cumulative risk of 6%) compared to patients in previous retrospective series.37 Moreover, after a median follow-up of 5 years, no CNS relapses occurred in the IELSG30 trial analyzing 54 patients treated with R-CHOP, contralateral radiotherapy and intensified CNS prophylaxis with two doses of end-of-treatment high-dose (HD)-MTX (1.5 g/m2) plus four doses of IT liposomal cytarabine.38 These trials have informed clinical practice and as a result many centers have incorporated IT MTX and end-of-treatment HD-MTX as CNS prophylaxis in this particular lymphoma.
High-dose methotrexate
Over recent years, HD-MTX (≥3 g/m2) has been proposed as a potentially better prophylactic strategy in patients with high-risk DLBCL since the majority of relapses in the rituximab era occur in the brain parenchyma. Initial retrospective series suggested a potential benefit of HD-MTX in the prevention of CNS disease; however, in recent years, several large retrospective studies have failed to demonstrate a reduction in CNS relapse (Table 3). A recent multicenter study including 906 patients, of whom 326 were at high risk, showed a CNS relapse risk of 12.2% for patients receiving HD-MTX compared with 11.2% for patients with no prophylaxis.39 Orellana-Noia et al. suggested no benefit of HD-MTX over IT MTX in a series of 1,162 patients from 21 US academic institutions who received CNS prophylaxis (IT MTX n=894, HD-MTX=236), with a CNS relapse rate of 5.4% versus 6.8%, respectively.40 Preliminary results from the largest retrospective series published, including 2,300 high-risk patients, also documented a lack of efficacy of HD-MTX with a 5-year incidence of CNS relapse of 9.1% for patients who received HD-MTX versus 8.4% for those who did not.41 A major limitation of these retrospective reports is that the definition of patients with a high risk of CNS relapse differs greatly between the studies, and the distribution of risk subgroups (i.e., involvement of extranodal sites) varies between the subgroups compared. Patients frequently receive variable numbers of HD-MTX cycles, with or without IT MTX. Finally, there is likely treatment selection bias since younger patients with good performance status are usually more likely to receive CNS prophylaxis than older or unfit patients.
There has been no consensus on the optimal dose or timing of HD-MTX. Wilson et al. conducted a multicenter retrospective study of 1,384 patients treated with R-CHOP-like regimens and HD-MTX prophylaxis, either intercalated or at the end of treatment, and concluded that there was no difference in CNS relapse risk between patients treated with either of the two strategies.5 Furthermore, intercalated HDMTX was associated with increased toxicity resulting in a
delay of subsequent R-CHOP in 19.3% of patients. These results suggest that, when administrated, HD-MTX should be given at the end of R-CHOP treatment.
Incorporation of novel agents for central nervous system prophylaxis
Small molecules such as lenalidomide and ibrutinib have demonstrated activity as single agents in relapsed/refractory PCNSL,42,43 and their good CNS bioavailability suggests that they could play a role in preventing CNS relapse when used in combination with R-CHOP. The addition of lenalidomide to R-CHOP in DLBCL showed a lower than expected rate of CNS relapse in a retrospective analysis of 136 patients from phase II trials, with a 2-year CNS relapse rate of 5% in high-risk patients.44 However, a recent post-hoc analysis of the phase III trial REMARC reported that maintenance with lenalidomide after R-CHOP in older patients (60-80 years) was not associated with lower CNS recurrence rates.45 The two randomized trials evaluating R-CHOP versus lenalidomide plus R-CHOP have not reported CNSspecific outcomes yet.46,47 The PHOENIX phase III trial comparing R-CHOP plus ibrutinib versus R-CHOP in activated B-cell DLBCL showed CNS relapse rates of 2.4% versus 3.8%, respectively.48 The POLARIX phase III study comparing R-CHOP versus R-CHP (rituximab, cyclophosphamide, doxorubicin and polatuzumab, an antibody-drug conjugate targeting CD79b) in intermediate/high-risk DLBCL found similar CNS event rates in both treatment groups (2.7% and 3%, respectively).49 Specific clinical trials focusing on highrisk patients including the new molecular classification are essential to evaluate the potential activity of these and other novel therapies in the prevention of CNS relapses.
Prognosis of secondary central nervous system lymphoma
Analysis of real-world, retrospective data from 173 patients treated with varyingly intensive chemotherapy regimens with curative intent identified patient-related factors of age (>60 years), performance status (>1) at SCNSL diagnosis, as well as disease-related factors of combined parenchymal and leptomeningeal involvement (vs. either alone), and SCNSL development during front-line therapy as adverse prognosticators for overall survival on multivariate analysis.50 Treatment-related factors, including an adequate dose of MTX to penetrate the CNS, are also important. On univariate analysis of 44 patients with treatment-naïve (de novo) SCNSL treated with mainly R-CHOP-like therapy and HD-MTX, MTX dose (3.5 g/m2 vs. lower doses) in induction predicted progression-free and overall survival.51 Response to induction therapy, employing different regimens, is also prognostic according to retrospective studies.51 In the largest prospective trial, the mode of presentation (treat-
Haematologica | 108 March 2023 678 REVIEW ARTICLE - Secondary CNS lymphoma S. Bobillo et al.
ment-naïve vs. relapsed) and complete response to frontline chemotherapy (MATRix: rituximab, methotrexate, cytarabine, thiotepa) were independently significant predictors for progression-free survival.4
Treatment approach for secondary central nervous system lymphoma
There is a lack of randomized trial data to compare regimens, no international consensus guidelines and con-
sequently wide variation in clinical practice. The majority of our suggested treatment recommendations are based on phase II studies, retrospective series and expert consensus. The most important guiding principles are assessment of patients’ fitness and frailty, duration of initial response to prior therapy, the use of a class of agents to which the patient has not previously been exposed and the burden of present disease/mode of presentation. As a standard, enrolment in clinical trials is encouraged at all stages of the treatment pathway in this rare disease. We outline our suggested approach in Figure 2.
K et al. (2022)41
2,267 CNS-IPI ≥4, testicular, breast, double-hit (MYC/BCL2)
R-CHOP 1. None (N=1,875) 2. MTX (N=392)
1. 2% (5 yr) 2. 8.1% (5 yr)
*Frequency of central nervous system relapse. CNS: central nervous system; EN: extranodal; LDH: lactate dehydrogenase; R-CHOP: rituximab plus cyclophosphamide, daunorubicin, vincristine, prednisone; MTX: methotrexate; hyperCVAD: cyclophosphamide, vincristine, doxorubicin, dexamethasone, and methotrexate with cytarabine; CODOX: cyclophosphamide, vincristine, doxorubicin and high-dose methotrexate; CNSIPI: CNS-International Prognostic Index; EOT: end of treatment; IT: intrathecal; HD-MTX: high-dose methotrexate; R-EPOCH: rituximab, etoposide, prednisone, vincristine, cyclophosphamide, and doxorubicin; ECOG PS. Eastern Cooperative Oncology Group performance status; IV: intravenous; ASCT: autologous stem cell transplantation; yr: years.
Study (year) N of patients Risk factors Treatment CNS prophylaxis CNS relapse Comments Abramson JS et al. (2010)96 65 High-risk EN sites >2 EN sites + LDH ↑ Hollander criteria R-CHOP MTX 3-3.5 g/m2 3%* Benefit Cheah C et al. (2014)97 217 High-risk EN sites Multiple EN sites, LDH ↑ B symptoms 1. (R)-CHOP 2. (R)-CHOP 3. Hyper-CVAD CODOX 1. None 2. MTX 1-3 g/m2 3. MTX 1-3 g/m2 + IT 1. 18% (3 yr) 2. 6.9% (3 yr) 3. 2.3% (3 yr) Benefit Ferreri AJM et al. (2015)3 107 High-risk EN sites Stage III-IV + LDH ↑ R-CHOP 1. None or IT 2. MTX 3 g/m2 (N=33) 1. 12%* 2. 0% Benefit Lee K et al. (2019)98 130 High-risk EN sites ≥2 EN sites and LDH ↑ CNS-IPI ≥ 4 R-CHOP 1. None 2. MTX 3.5 g/m2 1. 6.9% (2 yr) 2. 8.1% (2 yr) No benefit Goldschmidt N et al. (2019)99 480 High-risk EN sites Stage IV, LDH ↑, ≥1 EN site CHOP ± R (80%) MTX ≥3 g/m2 (27%) 6.5% No benefit Wilson MR et al. (2020)100 334 High-risk EN sites ≥2 EN sites and LDH ↑ CNS-IPI ≥4 R-CHOP 1. MTX intercalated 2. MTX EOT 1. 6.8% (3 yr) 2. 4.7% (3 yr) No difference between EOT and intercalated Bobillo S et al. (2021)36 585 High-risk EN sites CNS-IPI ≥4 Double-hit (MYC/BCL2) 1. R-CHOP (68%) 2. R-EPOCH (15%) 3. Other (17%) 1. None 2. IT MTX (43%) 3. HD-MTX (7%) 1. 7.5% (5 yr) 2. 5.5% (5 yr) 3. 5% (5 yr) No benefit (IT or HD-MTX) Puckrin R et al. (2021)39 326 CNS-IPI ≥4, testicular, double-hit, LDH ↑ +, ECOG PS >1 + >1 EN 1. R-CHOP 2. Intensive chemotherapy 1. None 2. MTX 3.5 g/m2 (35%) 1. 12.2% 2. 11.2% No benefit ASCT 6% vs non-ASCT Orellana-Noia V et al. (2022)40 1,030 All patients received CNS prophylaxis R-CHOP R-EPOCH 1. MTX (20%) 2. IT (77%) 1. 6.8% 2. 5.4% No benefit MTX IV vs. IT. No benefit in the subgroup analysis Wilson MR et al. (2022)5 1,384 All patients received HD-MTX prophylaxis R-CHOP 1. MTX intercalated 2. MTX
5.7%
5.8%
No
Lewis
EOT 1.
(3 yr) 2.
(3 yr)
difference between EOT and intercalated
No benefit
Table 3. Larger retrospective studies evaluating the use of high-dose methotrexate as central nervous system prophylaxis.
Haematologica | 108 March 2023 679 REVIEW ARTICLE - Secondary CNS lymphoma S. Bobillo et al.
Treatment-naïve secondary central nervous system lymphoma (de novo presentation)
The MARIETTA single-arm phase II trial is the largest prospective study conducted so far in patients with SCNSL (Table 4).4 The study included patients aged 18-70 years with all modes of presentation: de novo (n=32), relapsed concomitant SCNSL (n=28) and relapsed isolated SCNSL (n=15). Patients received three courses of MATRix followed by three courses of RICE (rituximab, ifosfamide, carboplatin and etoposide), with IT therapy and carmustinethiotepa conditioned autologous stem cell transplantation (ASCT) consolidation. One or two courses of R-CHOP were allowed as initial therapy in patients presenting de novo who had extensive or bulky systemic disease during the first weeks after diagnosis. Patients with de novo presentation achieved the best outcomes with an overall response rate after immunochemotherapy of 75% (complete response rate of 55%), and a 2-year progression-free survival of 71%.
The SCNSL1 study evaluated the combination of HD-MTX and cytarabine followed by R-HDS (cyclophosphamide, cytarabine and etoposide) and carmustine-thiotepa con-
ditioned ASCT in 38 patients (18-70 years) of whom 14 (42%) had treatment-naïve DLBCL.3 In the latter subgroup, ten patients (71%) achieved a complete response with 2year event-free and overall survival rates of 48% and 41%, respectively (unpublished data). Two patients died because of toxicity.
Dose-intensive regimens represent an alternative option for young and fit patients. A phase II trial of 111 patients with newly diagnosed high-risk DLBCL, including ten with treatment-naïve SCNSL treated with R-CODOX-M/R-IVAC (rituximab, cyclophosphamide, vincristine, doxorubicin and HD-MTX alternating with ifosfamide, etoposide and HDcytarabine) reported a 2-year progression-free survival of 70% in the SCNSL cohort. Of note, in the whole cohort, patients >50 years and those with poor performance status tolerated treatment poorly and had a 2-year progression-free survival of 43%.52
The combination of R-CHOP plus HD-MTX has also been explored in retrospective series. A collaborative study of the Australasian Lymphoma Alliance analyzed 80 patients with treatment-naïve DLBCL treated with different regimens. Outcomes were similar for patients treated with
Figure 2. Treatment algorithm for patients with secondary central nervous system lymphoma. SCNSL: secondary central nervous system lymphoma; CNS: central nervous system; MATRix: methotrexate, cytarabine, thiotepa, and rituximab; RICE: rituximab, ifosfamide, carboplatin and etoposide; R-CODOX-M: rituximab, cyclophosphamide, vincristine, doxorubicin, methotrexate; R-IVAC: rituximab, ifosfamide, etoposide, and high-dose cytarabine; R-CHOP: rituximab, cyclophosphamide, doxorubicin, vincristine and prednisone; IV: intravenous; IT: intrathecal; MTX: methotrexate; BSC: best supportive care; WBRT: whole brain radiotherapy; R-DHAP: rituximab, cytarabine, cisplatin and dexamethasone: MRI: magnetic resonance imaging; PET: positron emission tomography; CT: computed tomography; PR: partial remission; CR: complete remission; ASCT: autologous stem cell transplantation; BTKi: BTK inhibitors; IMID: immunomodulatory drugs; CAR-T: chimeric antigen receptor T cells. *Patients may have one or two cycles of prior R-CHOP as debulking. ** Including IT chemotherapy. Modifications according to age and performance status. ***Novel therapies (including BTKi, IMID, CAR-T) are best in clinical trials.

Haematologica | 108 March 2023 680 REVIEW ARTICLE - Secondary CNS lymphoma S. Bobillo et al.
MARIETTA
Ferreri et al. (2021)4
Age 18-70 yr
ECOG PS 0-3
Histology: DLBCL
De novo and relapse (43/20/37)
MATRix/RICE
Triple IT or liposomal cytarabine IT Carmustine-thiotepa
ASCT: autologous stem cell transplantation; OS: overall survival; ECOG PS: Eastern Cooperative Oncology Group performance status; DLBCL: diffuse large B-cell lymphoma; MATRix: methotrexate, cytarabine, thiotepa, and rituximab; PFS: progression-free survival; IT: intrathecal; FL: follicular lymphoma; MCL: mantle cell lymphoma; MTX: methotrexate; R-HDS: high-dose sequential chemotherapy with rituximab; PTCL: peripheral T-cell lymphoma; IFO: ifosfamide; AraC: cytarabine; na: not applicable; R-DHAP: rituximab, cytarabine, cisplatin and dexamethasone; yr: year(s).
intensive regimens (HyperCVAD [cyclophosphamide, vincristine, doxorubicin, dexamethasone, and methotrexate with cytarabine] and CODOX-M/IVAC) and R-CHOP plus HD-MTX with 2-year overall survival rates of 55% versus 53%, respectively.53 A small, multicenter study of 41 patients treated mainly with R-CHOP and HD-MTX showed similar outcomes with a 3-year overall survival of 56%.51 Preferred treatment options for patients with a de novo presentation are outlined in Figure 2.
Relapsed isolated secondary central nervous system lymphoma
CNS-directed approaches for SCNSL have been adapted from those used for PCNSL, and although overall outcomes appear to be inferior in patients with SCNSL, the numbers in prospective series are small (see Table 4).
For patients who are fit, intensive therapy should be offered as outcomes in this setting appear to be comparable to those of patients with treatment-naïve SCNSL. The MARIETTA regimen remains a potential treatment regimen with the most robust prospective trial data. However, MATRix induction alone, with consolidation carmustinethiotepa ASCT, may be a reasonable strategy as the disease is only in the CNS compartment and the overall response rate was 67% after two cycles of MATRix in MARIETTA4 and
this strategy has been adopted in retrospective series. Dose modification, especially by reducing doses of cytarabine, is commonly employed if patients have impaired performance status or subsequently develop infectious toxicity, and is recommended to reduce morbidity. For patients not able to tolerate three CNS-directed agents, HD-MTX/cytarabine/rituximab combinations may be an option, particularly for patients >70 years old. The addition of cytarabine to HD-MTX-based regimens improved outcomes in a retrospective review of 80 patients with treatment-naïve SCNSL (2-year overall survival 54% vs. 44%, P=0.037),53 and among 161 patients with isolated SCNSL, there was a trend towards superior outcomes with multi-agent CNS treatment compared with singleagent HD-MTX ( P =0.091). 50 Preferred treatment options for patients presenting with isolated relapse are outlined in Figure 2.
Relapsed concomitant secondary central nervous system lymphoma
These patients have the poorest outcomes in the SCNSL setting.50 MARIETTA documented an overall response rate of 46% and 2-year progression-free survival of 14% for 28 patients with synchronous relapse, which appears lower than that in randomized studies of salvage chemotherapy
Study, author (year) Eligibility Mode of presentation de novo/isolated/ synchronous relapse (%/%/%) Induction and consolidation ASCT, N (%) Outcomes of de novo population OS of all patients OS of ASCT population %
ASCT 37 (49) 2-yr PFS, 71% 2-yr 46% 2-yr 83 SCNLSL1 Ferreri et al. (2015)3 Age 18-70 yr ECOG PS 0-3 Histology: DLBCL, FL, MCL De novo and relapse (42/39/18) MTX/AraC + R-HDS Carmustine-thiotepa ASCT 20 (53) 5-yr OS, 36% 2-yr 41% 5-yr 41% 5-yr 68 NCT01148173 Korfel et al
Age 18-65 yr ECOG PS 0-2 Histology: DLBCL, PTCL Relapse (0/80/20) MTX/IFO + Ara-C/thiotepa + liposomal cytarabine IT Carmustine-thiotepaetoposide ASCT 24 (80) na 2-yr 63% 2-yr 68 HOVON Doorduijn et al.
Age 18-65 yr ECOG PS 0-2 Histology: DLBCL, FL Relapse (0/44/56) R-DHAP
and Busulfan/ cyclophosphamide ASCT 15 (42) na 1-yr 25% 1-yr 32
(2013)7
(2017)101
+ MTX triple IT
Table 4. Prospective trials in secondary central nervous system lymphoma.
Haematologica | 108 March 2023 681 REVIEW ARTICLE - Secondary CNS lymphoma S. Bobillo et al.
Table 5. Retrospective series of patients (N>20) with secondary central nervous system lymphoma treated with autologous stem cell transplantation.
42%
36%, Carmustine-thiotepa 24%, Thiotepa-Etop-AraC-Mel 24%, unknown 17%
BEAM
HD-MTX based Other (including platinum based)
IT therapy with radiation or HD MTX
nr
DLBCL
Band T-cell
24% >64
2 (2-65)
YL et al. (2005) 6
54% 3-yr
nr OS
2-yr
2-yr OS 76% 2-yr PFS 76%
Overall 9%
BuCy +thiotepa or BuMel-thiotepa, rituximab
HD-MTX, vincristine, procarbazine
nr
17% de novo , 83% relapse (65% isolated, 17% synchronous)
nr
Bromberg JE et al . (2013) 8 27
23
Oh DH et al. (2016) 103
ASCT: autologous stem cell transplantation; DLBCL: diffuse large B-cell lymphoma; HD MTX: high-dose methotrexate; OS: overall survival; PFS: progression-free survival; IT: intrathecal;
BEAM: BuMel: busulphan and melphalan; IQR: interquartile range; BuCy: busulfan-cyclophosphamide; nr: not reported; Etop: etopos ide; AraC: cytarabine; Mel: melphalan; CyTBI: cyclophosphamide and total body irradiation; yr: year(s).
Haematologica | 108 March 2023 682 REVIEW ARTICLE - Secondary CNS lymphoma S. Bobillo et al.
Study (year) N of patients Median age in years (range) Histology Mode of presentation ASCT induction regimen ASCT conditioning Non-relapse mortality Survival outcomes Khwaja J et al. (2022) 56 134 61 (21-77) DLBCL De novo 39%, isolated relapse 46%, synchronous relapse 15% HD MTX/AraC- based 92% Thiotepa conditioned (carmustine/thiotepa 84%; busulfan thiotepa 13%) 100-day 3% 3-yr 8% 3-yr OS 72% 3-yr PFS 61% Akin S et al. (2022) 66 102 56 (21-71) Large B-cell lymphoma De novo N=24, relapse N=75, unknown N=3 HD MTX/AraC- based 85%, IT alone 15% BEAM 53%, thiotepabased
gemcitabine- BuMel 18% 1-yr 6% 4-yr PFS 48% 4-yr OS 57% Young PA et al. (2020) 102 21 61 (IQR: 51-65) Band T-cell De novo 38%, relapsed 62% HD-MTX-based 67% Thiotepa + BuCy 100% 100-day 6% 2-yr PFS 76% 2-yr OS 75% Maziarz RT et al. (2013) 65 151 46 (18-72) Band T-cell nr nr BEAM
23%,
10%,
7% 100-day 5% 1-yr 5% 3-yr 7% 3-yr OS 48% 3-yr DFS 36% El
NR
25%, nr 2-yr OS 65%
46%, TBI-based
Carmustine-Cy-Etop 13%, BuMel or BuCy
others
Galaly TC et al. (2018) 49 25
(76% <64
yr, BuCy+Etop, CyTBI Overall 18% 3-yr OS 39%
yr)
Relapse (64% isolated, 36% synchronous)
Kasamon
22
B-cell (low grade and high grade)
MTX/Ara-c combination 79%, MTX + ifosfamide 25%
Carmustine-thiotepa 37%, BEAM/ BEAC 11%, BuCy 11%, TBI 15%, other 30% OS
62 (20-66)
B-cell (high grade)
regimens in DLBCL in which 2-year progression-free survival rates were 24-26%.55 Most patients relapse early and are therefore resistant to primary therapy in both compartments. The minority are chemo-responsive, but those who undergo ASCT have better outcomes (3-year progression-free survival 40%)56 so this should be the treatment goal. Systemic treatment options include RICE and RDHAP (rituximab, cytarabine, cisplatin and dexamethasone) (Figure 2).
Patients who are refractory to primary chemotherapy may be candidates for investigational therapeutic approaches including chimeric antigen receptor T-cell therapy (see below). For less fit patients, if the initial response to primary therapy was complete and prolonged, re-treatment with MTX-based chemotherapy may be appropriate, although evidence is sparse in SCNSL. Preferred treatment options for patients presenting with synchronous relapse are outlined in Figure 2.
Role of autologous stem cell transplantation
In SCNSL there are a few non-comparative prospective and retrospective studies showing that consolidation ASCT in first remission is safe and effective and associated with durable responses (Tables 4 and 5). Compared with whole-brain radiation therapy (WBRT) there is reduced neurotoxicity in the long-term in patients with PCNSL.57 A dynamic review of a patient’s performance status and overall fitness is recommended to assess transplant eligibility accurately as this may improve significantly after treatment initiation. Four phase II prospective trials support this approach in both treatment-naïve SCNSL and relapsed presentations (Table 4). In these trials, 42-80% proceeded to ASCT. The transplantation rate for salvage chemotherapy regimens in randomized studies of systemic DLBCL were 33-55% in the CORAL,58 LY.1259 and ORCHARRD55 studies. MARIETTA included the largest number of patients proceeding to ASCT (n=37) and in this study the 2-year progression-free survival was 83%.4 Survival benefit was demonstrated in a retrospective review of 60 patients with treatment-naïve SCNSL who were or were not give consolidation with intensive chemotherapy and ASCT: the 3-year progression-free survival rates were 75% vs. 26%, respectively (P=0.001) and the 3-year overall survival rates were 75% vs. 29%, respectively (P=0.002).60 ASCT is now increasingly considered a standard of care,61 with the best outcomes reported in those with treatment-naïve SCNSL and isolated relapse presentations. Unlike PCNSL, there are no randomized trials of ASCT consolidation being compared with another strategy in SCNSL.
Older studies with limited numbers of patients proceeding to ASCT53 or including predominantly BEAM (carmustine, etoposide, cytarabine and melphalan) conditioning have questioned the role of ASCT. However, BEAM has largely
been superseded by thiotepa-based conditioning regimens in CNS lymphoma as these latter have superior CNS bioavailability.62 In PCNSL, the outcomes following BEAM conditioning are inferior compared with those after thiotepa-based regimens because of higher risk of relapse.63 In another study, the relapse rate with BEAM was 57% at a median of 2.3 months after ASCT,64 thus this conditioning regimen has fallen out of favor in CNS lymphoma. A matched cohort of 151 patients with SCNSL undergoing ASCT (of whom 46% had BEAM conditioning) were compared with 4,688 patients without CNS lymphoma and no difference in outcomes was found on matched propensity scoring.65
In a retrospective review of 102 patients, multivariate analysis showed that predictors of adverse outcome following ASCT were more than two prior lines of therapy and less than a complete response at ASCT; the 19 patients with both these unfavorable features had a 4-year overall survival of 14%.66 Notably, 53% of the cohort received BEAM conditioning, which has now largely been superseded.
The largest series of 134 SCNSL patients undergoing thiotepa-based ASCT reported 3-year overall and progression-free survival rates of 71.6% (95% CI: 61.9%-not reached) and 61.1% (95% CI: 52.2-68.9%), respectively.56 One-hundred-day non-relapse mortality was 3% and the cumulative incidence at 1 and 3 years was 8.4% (95% CI: 4.7-14.6). The risk factors determining progression after SCNSL were similar to those prior to ASCT. In multivariable analysis, risk factors for progression-free survival were synchronous relapse presentation (compared with isolated relapse or de novo), age and lines of treatment. Importantly those in partial remission according to MRI or PET-CT prior to ASCT had similar outcomes to those in complete remission, which is consistent with findings in PCNSL. Patients who relapsed after ASCT had poor outcomes and time to relapse after ASCT predicted overall survival.56 Allogeneic transplantation is not widely adopted, and there are limited data derived from descriptive series; however, efficacy was described in a case series, albeit with a high 1-year transplant mortality rate of 20%.67 The graft-versus-lymphoma effect is thought to be blunted due to the immune privilege of the CNS.
Less intensive consolidation
In a study of 60 patients with treatment-naïve SCNSL barriers to ASCT that were cited included chemorefractory disease, toxicity from induction therapy, age >65 years and physicians’ decisions.60 Unsuccessful stem cell harvest is also a factor. It is clear that age itself should not be a restrictive factor in a carefully selected population, with patients up to the age of 70 years in prospective trials4 and 77 years in the largest retrospective series receiving thiotepa-based conditioning.56 In patients for whom the
Haematologica | 108 March 2023 683 REVIEW ARTICLE - Secondary CNS lymphoma S. Bobillo et al.
risk of non-relapse mortality would be considered too high, non-ASCT consolidation strategies have been attempted in small retrospective series; however, outcomes remain limited.
Optimal consolidation for older patients who achieve remission has not been established. WBRT can be effective but neurotoxicity remains a concern. Continuous chemotherapy has been investigated as a consolidation strategy but the follow-up is limited and so this strategy is not routinely recommended. HD-MTX, cytarabine, ifosfamide and liposomal doxorubicin were recently employed in a small retrospective series of 19 patients with SCNSL (10 de novo, 9 relapsed) at a single institute.68 At the end of induction, 58% achieved complete remission; the median follow-up was 11 months, progression-free survival was 28 months and overall survival was 34.5 months. Patients in complete remission received consolidation with ifosfamide, etoposide and cytarabine every 3 months, whereas those who did not achieve complete remission were given WBRT. Further data are required to draw conclusions regarding the efficacy of the two strategies.
Role of radiation therapy
WBRT has been found to be effective although responses are usually short-lived, especially when it is used as the sole treatment modality, and relapses outside the radiotherapy field are not uncommon.6
WBRT might have a role as consolidation therapy in patients who do not achieve a complete remission after front-line treatment or in those who cannot proceed to ASCT, especially when residual disease is confined to the CNS.69,70 In the MARIETTA trial, 13 patients received WBRT: seven of the nine patients given WBRT (residual disease, n=5; poor mobilizers, n=2; after ASCT, n=2) after or during immunochemotherapy, to control responsive disease, achieved a complete or partial remission, and only one of them experienced relapse in the CNS; conversely, none of the four patients treated with WBRT for progressive disease responded.4
As salvage therapy in SCNSL, earlier retrospective series showed responses to radiotherapy in 67%-88% of patients, including about 50% who achieved a complete remission with a 2-year overall survival of approximately 30%.71,72 A retrospective study of 44 patients reported that the dominant pattern of relapse after radiotherapy was systemic disease (n=18) and that outcomes were more favorable in patients who received consolidation with ASCT after radiotherapy (n=8).71
Neurotoxicity is the major long-term complication after WBRT in long-lasting survivors particularly in those >60 years with PCNSL. Importantly, the PRECIS study, conducted in patients <60 years with PCNSL, showed significant neurocognitive decline during follow-up in patients randomized to WBRT consolidation with doses of 40 Gy
compared to those randomized to ASCT (64% vs. 13%, P<0.001).57 Significant impairments in some attention, memory and execution functions as well as quality of life have been reported in large prospective trials.70,73 Data from PCNSL have shown that lower doses of radiotherapy, i.e., 23.6 Gy, can be efficacious as a consolidation strategy in patients achieving complete remission after induction, with minimal neurotoxicity, although this approach has been reported predominantly in patients <60 years old.74,75 Although these complications are expected to occur among SCNSL patients as well studies focused on this issue are lacking.
Older/unfit patients
The optimal regimen for treating elderly or frail patients with SCNSL is yet to be defined. Evidence is mainly derived from PCNSL studies. A meta-analysis of 20 PCNSL studies including patients >60 years old found that HDMTX-based therapy was associated with more favorable outcomes than therapies without HD-MTX in elderly patients.76
Trials addressing efficacy and tolerability of MATRix in PCNSL and SCNSL have been restricted to patients ≤70 years with Eastern Cooperative Oncology Group performance status ≤2-3. A recent analysis of tolerability and efficacy of MATRix in 156 patients with PCNSL treated in routine clinical practice showed that older and unfit patients (aged >70 years, n=21; with comorbidities, n=13) had a higher risk of infections and worse outcomes than those who would have meet IELSG32 trial inclusion criteria.77 A small, prospective study of elderly (69-79 years), fit patients with PCNSL treated with rituximab, HD-MTX and cytarabine followed by busulfan-thiotepa conditioned ASCT showed favorable outcomes in this population.78
The addition of rituximab to HD-MTX-based regimens in 38/94 patients with isolated SCNSL was associated with improved overall survival (HR=0.42, 95% CI: 0.25-0.71, P=0.001) with a 44% reduction in risk of death. This was significant even after adjustment for age >60 years, performance status >1, multiagent HD-MTX vs. HD-MTX alone, time to SCNSL and CNS-directed radiotherapy (HR=0.39, 95% CI: 0.22-0.69, P=0.001), and may be considered a less intensive option.50 Other combinations for patients with CNS lymphoma who are not eligible for ASCT include rituximab plus HD-MTX and temozolomide79 or novel agents.
Other less intensive options for patients considered unfit for MTX-based therapy include corticosteroids, oral chemotherapy with or without rituximab and WBRT for patients with parenchymal disease.50 For patients with leptomeningeal involvement, IT chemotherapy alone may be of modest efficacy. Intrathecal MTX, cytarabine, thiotepa and rituximab can be administered into the CSF but need to be given two or three times a week because of rapid
Haematologica | 108 March 2023 684 REVIEW ARTICLE - Secondary CNS lymphoma S. Bobillo et al.
clearance. Clarifying the wishes and priorities of the patient is paramount and palliative approaches or best supportive care may be favored in certain situations.
Progression following a secondary central nervous system lymphoma-directed approach
Patients who progress after MTX-based treatment have a dismal prognosis. In the MARIETTA trial, only seven of the 36 (19%) patients who relapsed received salvage therapy, with no responses and a median overall survival after relapse/progression of 1 month.4
Novel therapies
Novel therapies show promising preliminary results and are currently under investigation. They have been tested either alone or in combination in patients with CNS lymphoma. The Bruton tyrosine kinase (BTK) inhibitor, ibrutinib, showed encouraging activity in patients with PCNSL which are enriched for MYD88 and CD79 mutations. A phase I study including SCNSL and PCNSL demonstrated that ibrutinib reached therapeutic levels in the CNS and reported clinical responses in five of seven patients with SCNSL, including four complete responses, with a median progression-free survival of 7.4 months.80 In a phase II study of 44 patients with relapsed/refractory CNS lymphoma (15 with SCNSL), the overall response rates in patients with SCNSL and PCNSL treated with ibrutinib were 69% and 81%, respectively, with a median progression-free survival of 4 months.81 Ibrutinib has also been combined with MTX and rituximab with promising results.82 An increased risk of aspergillosis has been reported in PCNSL patients treated with combination regimens including ibrutinib and corticosteroids.83 The efficacy of second-generation BTK inhibitors is being investigated in PCNSL patients (NCT04462328). Immunomodulatory drugs, such as lenalidomide and pomalidomide, have also been investigated in relapsed/refractory PCNSL alone or in combination with rituximab with responses, usually of short duration, in approximately 50% of cases.43,84,85 A recent study of lenalidomide and rituximab in 14 patients with relapsed/refractory CNS lymphoma showed responses in three of eight patients with SCNSL.84 The role of lenalidomide as maintenance therapy is being investigated in this setting
CAR T-cell therapy has shown promising results in patients with CNS lymphoma, with a good safety profile. The TRANSCEND study included six patients with SCNSL of whom three achieved a complete remission, with severe neurological toxicity in two cases.86 A small retrospective study also reported complete responses in four of seven patients with SCNSL receiving commercial axicabtagene ciloleucel.87 Similarly, another series of eight patients with refractory SCNSL treated with tisagenlecleucel showed a
complete response rate of 50% with no significant toxicity.88 In a phase I/II trial of 12 patients with refractory PCNSL treated with tisagenlecleucel, the overall response rate was 58% and the complete response rate was 50%.89 The duration of response to CAR T-cell therapy remains to be defined, as the follow-up of published studies is still short. A number of phase I/II studies are currently evaluating the efficacy of CAR T cells in CNS lymphoma (NCT03484702, NCT04608487, NCT04464200).
Summary of our recommended approach to the management of secondary central nervous system lymphoma
Our recommended approach to the management of SCNSL is illustrated in Figure 2 and summarized here. Participation in prospective clinical trials, especially involving novel agents (BTK inhibitors, immunomodulatory drugs, CAR T cells), is recommended.
With regard to de novo presentation, the preferred options for fit patients include the MARIETTA regimen (MATRix/RICE induction and thiotepa-based conditioned ASCT consolidation in those achieving partial or complete remission or with stable disease prior to ASCT) or RCODOX-M/IVAC. Less fit patients may achieve responses with rationalized R-MTX-Ara-C/RICE, R-CHOP and intravenous or intrathecal MTX with consideration of ASCT consolidation with thiotepa-based conditioning.
Among patients presenting with isolated relapse, for fit patients the preferred options are MATRix induction with carmustine/thiotepa-conditioned ASCT consolidation, or the MARIETTA regimen. Less fit patients may achieve responses with R-MTX-Ara-C-based regimens and ASCT consolidation can be considered.
With regard to patients presenting with synchronous relapse, preferred options for fit patients include MATRix/RICE and ASCT consolidation (MARIETTA approach). Less fit patients may achieve responses with salvage chemotherapy (RICE, RDHAP, etc.) or novel approaches based on time to relapse and availability and with the addition of intravenous or intrathecal MTX at induction and then proceeding to ASCT consolidation (in those achieving partial/complete remission before ASCT). This is an area of unmet need and access to novel approaches, including CAR T-cell therapy and other novel agents, is recommended.
Conclusions
Treatment of SCNSL remains a challenge due to the aggressiveness of the disease, heterogeneity of presentation
Haematologica | 108 March 2023 685 REVIEW ARTICLE - Secondary CNS lymphoma S. Bobillo et al.
and the need to address both systemic and brain compartments. The MARIETTA approach has led to long-term responses, especially in patients with treatment-naïve SCNSL; however, outcomes are still dismal in older/unfit patients and in those who relapse after MTX-based treatments. Novel therapies are currently under evaluation, with CAR T-cell treatment showing promising preliminary results in this challenging population. We need to continue to explore more specific methods of identifying patients at highest risk of CNS relapse, and to investigate more effective prophylactic strategies. Integration of molecular biomarkers with classical clinical risk factors might improve the selection of patients for CNS prophylaxis. Moreover, baseline analysis of CSF circulating tumor DNA may have a role in detecting occult CNS involvement in patients with aggressive B-cell lymphomas who could benefit from CNS-directed therapies. The incorporation of novel agents (immunomodulatory agents, BTK inhibitors) into frontline standard immunochemotherapy might reduce the number of CNS events, although this deserves further study in prospective trials.
References
1. Hollender A, Kvaloy S, Lote K, Nome O, Holte H. Prognostic factors in 140 adult patients with non-Hodgkin's lymphoma with systemic central nervous system (CNS) involvement. A single centre analysis. Eur J Cancer. 2000;36(14):1762-1768.
2. Schmitz N, Zeynalova S, Nickelsen M, et al. CNS International Prognostic Index: a risk model for CNS relapse in patients with diffuse large B-cell lymphoma treated with R-CHOP. J Clin Oncol. 2016;34(26):3150-3156.
3. Ferreri AJ, Donadoni G, Cabras MG, et al. High doses of antimetabolites followed by high-dose sequential chemoimmunotherapy and autologous stem-cell transplantation in patients with systemic B-cell lymphoma and secondary CNS involvement: final results of a multicenter phase II trial. J Clin Oncol. 2015;33(33):3903-3010.
4. Ferreri AJM, Doorduijn JK, Re A, et al. MATRix-RICE therapy and autologous haematopoietic stem-cell transplantation in diffuse large B-cell lymphoma with secondary CNS involvement (MARIETTA): an international, single-arm, phase 2 trial. Lancet Haematol. 2021;8(2):e110-e121.
5. Wilson MR, Eyre TA, Kirkwood AA, et al. Timing of high-dose methotrexate CNS prophylaxis in DLBCL: a multicenter international analysis of 1384 patients. Blood. 2022;139(16):2499-2511.
6. Kasamon YL, Jones RJ, Piantadosi SJ, et al. High-dose therapy and blood or marrow transplantation for non-Hodgkin lymphoma with central nervous system involvement. Biol Blood Marrow Transplant. 2005;11(2):93-100.
7. Korfel A, Elter T, Thiel E, et al. Phase II study of central nervous system (CNS)-directed chemotherapy including high-dose chemotherapy with autologous stem cell transplantation for CNS relapse of aggressive lymphomas. Haematologica. 2013;98(3):364-370.
8. Bromberg JE, Doorduijn JK, Illerhaus G, et al. Central nervous system recurrence of systemic lymphoma in the era of stem cell
Disclosures
SB declares speakers’ bureau honoraria from Janssen and Roche and travel support from Gilead. KC declares consulting/advisory fees from Roche, Takeda, Celgene, Atara, Gilead, KITE, Janssen and Incyte; conference/travel support from Roche, Takeda, Kite and Janssen and speakers’ bureau honoraria from Roche, Takeda, Kite and Janssen. AJMF has received speakers’ fees from Gilead and Roche; was a member of advisory boards of Gilead, Juno, Novartis, PletixaPharm, AstraZeneca, BMS, and Roche; currently receives research grants from ADC Therapeutics, Bayer HealthCare Pharmaceuticals, Beigene, Bristol Myers Squibb, Genmab, Gilead, Hutchison Medipharma, Incyte, Janssen Research & Development, MEI Pharma, Novartis, PletixaPharm, Pharmacyclics, Protherics, Roche, and Takeda; and holds patents on NGR-hTNF-a in brain tumors, NGR-hTNF/R-CHOP in relapsed or refractory PCNSL and SNGR-hTNF in brain tumors.
Contributions
All authors contributed equally to writing and editing the paper. All authors reviewed the manuscript and approved its submission.
transplantation--an International Primary Central Nervous System Lymphoma Study Group project. Haematologica. 2013;98(5):808-813.
9. Boehme V, Zeynalova S, Kloess M, et al. Incidence and risk factors of central nervous system recurrence in aggressive lymphoma--a survey of 1693 patients treated in protocols of the German HighGrade Non-Hodgkin's Lymphoma Study Group (DSHNHL). Ann Oncol. 2007;18(1):149-157.
10. Cabannes-Hamy A, Peyrade F, Jardin F , et al. Central nervous system relapse in patients over 80 years with diffuse large B-cell lymphoma: an analysis of two LYSA studies. Cancer Med. 2018;7(3):539-548.
11. Brück W, Brunn A, Klapper W, et al. [Differential diagnosis of lymphoid infiltrates in the central nervous system: experience of the Network Lymphomas and Lymphomatoid Lesions in the Nervous System]. Pathologe. 2013;34(3):186-197.
12. Grommes C, Rubenstein JL, DeAngelis LM, Ferreri AJM, Batchelor TT. Comprehensive approach to diagnosis and treatment of newly diagnosed primary CNS lymphoma. Neuro Oncol. 2019;21(3):296-305.
13. Verploegh IS, Volovici V, Haitsma IK, et al. Contemporary frameless intracranial biopsy techniques: might variation in safety and efficacy be expected? Acta Neurochir (Wien). 2015;157(11):2011-2016.
14. Ferreri AJM, Calimeri T, Lopedote P, et al. MYD88 L265P mutation and interleukin-10 detection in cerebrospinal fluid are highly specific discriminating markers in patients with primary central nervous system lymphoma: results from a prospective study. Br J Haematol. 2021;193(3):497-505.
15. Mudhar HS, Sheard R. Diagnostic cellular yield is superior with full pars plana vitrectomy compared with core vitreous biopsy. Eye (Lond). 2013;27(1):50-55.
16. Barajas RF Jr, Politi LS, Anzalone N, et al. Consensus recommendations for MRI and PET imaging of primary central
Haematologica | 108 March 2023 686 REVIEW ARTICLE - Secondary CNS lymphoma S. Bobillo et al.
nervous system lymphoma: guideline statement from the International Primary CNS Lymphoma Collaborative Group (IPCG). Neuro Oncol. 2021;23(7):1056-1071.
17. Kridel R, Telio D, Villa D, et al. Diffuse large B-cell lymphoma with testicular involvement: outcome and risk of CNS relapse in the rituximab era. Br J Haematol. 2017;176(2):210-221.
18. Hosein PJ, Maragulia JC, Salzberg MP, et al. A multicentre study of primary breast diffuse large B-cell lymphoma in the rituximab era. Br J Haematol. 2014;165(3):358-363.
19. Zhang J, Chen B, Xu X. Impact of rituximab on incidence of and risk factors for central nervous system relapse in patients with diffuse large B-cell lymphoma: a systematic review and metaanalysis. Leuk Lymphoma. 2014;55(3):509-514.
20. Lee GW, Go SI, Kim SH, et al. Clinical outcome and prognosis of patients with primary sinonasal tract diffuse large B-cell lymphoma treated with rituximab-cyclophosphamide, doxorubicin, vincristine and prednisone chemotherapy: a study by the Consortium for Improving Survival of Lymphoma. Leuk Lymphoma. 2015;56(4):1020-1026.
21. El-Galaly TC, Villa D, Michaelsen TY, et al. The number of extranodal sites assessed by PET/CT scan is a powerful predictor of CNS relapse for patients with diffuse large B-cell lymphoma: an international multicenter study of 1532 patients treated with chemoimmunotherapy. Eur J Cancer. 2017;75:195-203.
22. Tomita N, Tokunaka M, Nakamura N, et al. Clinicopathological features of lymphoma/leukemia patients carrying both BCL2 and MYC translocations. Haematologica. 2009;94(7):935-943.
23. Savage KJ, Slack GW, Mottok A, et al. Impact of dual expression of MYC and BCL2 by immunohistochemistry on the risk of CNS relapse in DLBCL. Blood. 2016;127(18):2182-2188.
24. Torka P, Kothari SK, Sundaram S, et al. Outcomes of patients with limited-stage aggressive large B-cell lymphoma with high-risk cytogenetics. Blood Adv. 2020;4(2):253-262.
25. Klanova M, Sehn LH, Bence-Bruckler I, et al. Integration of cell of origin into the clinical CNS International Prognostic Index improves CNS relapse prediction in DLBCL. Blood. 2019;133(9):919-926.
26. Schmitz R, Wright GW, Huang DW, et al. Genetics and pathogenesis of diffuse large B-cell lymphoma. N Engl J Med. 2018;378(15):1396-1407.
27. Chapuy B, Stewart C, Dunford AJ, et al. Molecular subtypes of diffuse large B cell lymphoma are associated with distinct pathogenic mechanisms and outcomes. Nat Med. 2018;24(5):679-690.
28. Ollila TA, Kurt H, Waroich J, et al. Genomic subtypes may predict the risk of central nervous system recurrence in diffuse large Bcell lymphoma. Blood. 2021;137(8):1120-1124.
29. Wilson WH, Bromberg JE, Stetler-Stevenson M, et al. Detection and outcome of occult leptomeningeal disease in diffuse large Bcell lymphoma and Burkitt lymphoma. Haematologica. 2014;99(7):1228-1235.
30. Muñiz C, Martín-Martín L, López A, et al. Contribution of cerebrospinal fluid sCD19 levels to the detection of CNS lymphoma and its impact on disease outcome. Blood. 2014;123(12):1864-1869.
31. Bobillo S, Crespo M, Escudero L, et al. Cell free circulating tumor DNA in cerebrospinal fluid detects and monitors central nervous system involvement of B-cell lymphomas. Haematologica. 2021;106(2):513-521.
32. Olszewski AJ, Chorzalska AD, Petersen M, et al. Detection of clonotypic DNA in the cerebrospinal fluid as a marker of central nervous system invasion in lymphoma. Blood Adv. 2021;5(24):5525-5535.
33. Ribera JM, García O, Grande C, et al. Dose-intensive
chemotherapy including rituximab in Burkitt's leukemia or lymphoma regardless of human immunodeficiency virus infection status: final results of a phase 2 study (Burkimab). Cancer. 2013;119(9):1660-1668.
34. Eyre TA, Djebbari F, Kirkwood AA, Collins GP. A systematic review of the efficacy of CNS prophylaxis with stand-alone intrathecal chemotherapy in diffuse large B-cell lymphoma patients treated with anthracycline-based chemotherapy in the rituximab era. Haematologica. 2020;105(7):1914-1924.
35. Eyre TA, Kirkwood AA, Wolf J, et al. Stand-alone intrathecal central nervous system (CNS) prophylaxis provide unclear benefit in reducing CNS relapse risk in elderly DLBCL patients treated with R-CHOP and is associated increased infection-related toxicity. Br J Haematol. 2019;187(2):185-194.
36. Bobillo S, Joffe E, Sermer D, et al. Prophylaxis with intrathecal or high-dose methotrexate in diffuse large B-cell lymphoma and high risk of CNS relapse. Blood Cancer J. 2021;11(6):113.
37. Vitolo U, Chiappella A, Ferreri AJ, et al. First-line treatment for primary testicular diffuse large B-cell lymphoma with rituximabCHOP, CNS prophylaxis, and contralateral testis irradiation: final results of an international phase II trial. J Clin Oncol. 2011;29(20):2766-2772.
38. Conconi A, Chiappella L, Orsucci L, et al. Intensified (intravenous and intrathecal) CNS prophylaxis in primary testicular diffuse large B cell lymphoma: 5-year results of the IESLG-30 trial. Hematol Oncol. 2021;39(S2):2879.
39. Puckrin R, El Darsa H, Ghosh S, Peters A, Owen C, Stewart D. Ineffectiveness of high-dose methotrexate for prevention of CNS relapse in diffuse large B-cell lymphoma. Am J Hematol. 2021;96(7):764-771.
40. Orellana-Noia VM, Reed DR, McCook AA, et al. Single-route CNS prophylaxis for aggressive non-Hodgkin lymphomas: real-world outcomes from 21 US academic institutions. Blood. 2022;139(3):413-423.
41. Lewis KL. High-dose methotrexate is not associated with reduction in CNS relapse in patients with aggressive B-cell lymphoma. Blood. 2021;138(Suppl 1):181.
42. Soussain C, Choquet S, Blonski M, et al. Ibrutinib monotherapy for relapse or refractory primary CNS lymphoma and primary vitreoretinal lymphoma: final analysis of the phase II 'proof-ofconcept' iLOC study by the Lymphoma Study Association (LYSA) and the French Oculo-cerebral Lymphoma (LOC) network. Eur J Cancer. 2019;117:121-130.
43. Ghesquieres H, Chevrier M, Laadhari M , et al. Lenalidomide in combination with intravenous rituximab (REVRI) in relapsed/refractory primary CNS lymphoma or primary intraocular lymphoma: a multicenter prospective 'proof of concept' phase II study of the French Oculo-cerebral Lymphoma (LOC) network and the Lymphoma Study Association (LYSA). Ann Oncol. 2019;30(4):621-628.
44. Ayed AO, Chiappella A, Pederson L, et al. CNS relapse in patients with DLBCL treated with lenalidomide plus R-CHOP (R2CHOP): analysis from two phase 2 studies. Blood Cancer J. 2018;8(7):63.
45. Bernard S, Ghesquieres H, Casasnovas RO, et al. Incidence of central nervous system relapses in patients with DLBCL treated with lenalidomide as maintenance after R-CHOP. Blood Adv. 2021;5(15):2965-2968.
46. Nowakowski GS, Chiappella A, Gascoyne RD, et al. ROBUST: a phase III study of lenalidomide plus R-CHOP versus placebo plus R-CHOP in previously untreated patients with ABC-type diffuse large B-cell lymphoma. J Clin Oncol. 2021;39(12):1317-1328.
47. Nowakowski GS, Hong F, Scott DW, et al. Addition of lenalidomide to R-CHOP improves outcomes in newly diagnosed diffuse large B-cell lymphoma in a randomized phase II US Intergroup Study
Haematologica | 108 March 2023 687 REVIEW ARTICLE - Secondary CNS lymphoma S. Bobillo et al.
ECOG-ACRIN E1412. J Clin Oncol. 2021;39(12):1329-1338.
48. Younes A, Sehn LH, Johnson P, et al. Randomized phase III trial of ibrutinib and rituximab plus cyclophosphamide, doxorubicin, vincristine, and prednisone in non-germinal center B-cell diffuse large B-cell lymphoma. J Clin Oncol. 2019;37(15):1285-1295.
49. Tilly H, Morschhauser F, Sehn LH, et al. Polatuzumab vedotin in previously untreated diffuse large B-cell lymphoma. N Engl J Med. 2022;386(4):351-363.
50. El-Galaly TC, Cheah CY, Bendtsen MD, et al. Treatment strategies, outcomes and prognostic factors in 291 patients with secondary CNS involvement by diffuse large B-cell lymphoma. Eur J Cancer. 2018;93:57-68.
51. Perry C, Ben Barouch S, Goldschmidt N, et al. Characteristics, management and outcome of DLBCL patients, presenting with simultaneous systemic and CNS disease at diagnosis: a retrospective multicenter study. Am J Hematol. 2019;94(9):9921001.
52. McMillan AK, Phillips EH, Kirkwood AA, et al. Favourable outcomes for high-risk diffuse large B-cell lymphoma (IPI 3-5) treated with front-line R-CODOX-M/R-IVAC chemotherapy: results of a phase 2 UK NCRI trial. Ann Oncol. 2020;31(9):1251-1259.
53. Wight JC, Yue M, Keane C, et al. Outcomes of synchronous systemic and central nervous system (CNS) involvement of diffuse large B-cell lymphoma are dictated by the CNS disease: a collaborative study of the Australasian Lymphoma Alliance. Br J Haematol. 2019;187(2):174-184.
54. Ferreri AJ, Cwynarski K, Pulczynski E, et al. Chemoimmunotherapy with methotrexate, cytarabine, thiotepa, and rituximab (MATRix regimen) in patients with primary CNS lymphoma: results of the first randomisation of the International Extranodal Lymphoma Study Group-32 (IELSG32) phase 2 trial. Lancet Haematol. 2016;3(5):e217-227.
55. van Imhoff GW, McMillan A, Matasar MJ, et al. Ofatumumab versus rituximab salvage chemoimmunotherapy in relapsed or refractory diffuse large B-cell lymphoma: the ORCHARRD study. J Clin Oncol. 2017;35(5):544-551.
56. Khwaja J, Kirkwood AA, Isbell LK, et al. International multicenter retrospective analysis of thiotepa-based autologous stem cell transplantation for secondary central nervous system lymphoma. Haematologica. 2022; Oct 27 doi: 10.3324/haematol.2022.281640. [Epub ahead of print]
57. Houillier C, Dureau S, Taillandier L, et al. Radiotherapy or autologous stem-cell transplantation for primary CNS lymphoma in patients age 60 years and younger: long-term results of the randomized phase II PRECIS study. J Clin Oncol. 2022;40(32):3692-3698.
58. Gisselbrecht C, Glass B, Mounier N, et al. Salvage regimens with autologous transplantation for relapsed large B-cell lymphoma in the rituximab era. J Clin Oncol. 2010;28(27):4184-4190.
59. Crump M, Kuruvilla J, Couban S, et al. Randomized comparison of gemcitabine, dexamethasone, and cisplatin versus dexamethasone, cytarabine, and cisplatin chemotherapy before autologous stem-cell transplantation for relapsed and refractory aggressive lymphomas: NCIC-CTG LY.12. J Clin Oncol. 2014;32(31):3490-3496.
60. Damaj G, Ivanoff S, Coso D, et al. Concomitant systemic and central nervous system non-Hodgkin lymphoma: the role of consolidation in terms of high dose therapy and autologous stem cell transplantation. A 60-case retrospective study from LYSA and the LOC network. Haematologica. 2015;100(9):1199-1206.
61. Snowden JA, Sánchez-Ortega I, Corbacioglu S, et al. Indications for haematopoietic cell transplantation for haematological diseases, solid tumours and immune disorders: current practice in Europe, 2022. Bone Marrow Transplant. 2022;57(8):1217-1239.
62. Wiebe VJ, Smith BR, DeGregorio MW, Rappeport JM. Pharmacology of agents used in bone marrow transplant conditioning regimens. Crit Rev Oncol Hematol. 1992;13(3):241-270.
63. Scordo M, Wang TP, Ahn KW, et al. Outcomes associated with thiotepa-based conditioning in patients with primary central nervous system lymphoma after autologous hematopoietic cell transplant. JAMA Oncol. 2021;7(7):993-1003.
64. Abrey LE, Moskowitz CH, Mason WP, et al. Intensive methotrexate and cytarabine followed by high-dose chemotherapy with autologous stem-cell rescue in patients with newly diagnosed primary CNS lymphoma: an intent-to-treat analysis. J Clin Oncol. 2003;21(22):4151-4156.
65. Maziarz RT, Wang Z, Zhang MJ, et al. Autologous haematopoietic cell transplantation for non-Hodgkin lymphoma with secondary CNS involvement. Br J Haematol. 2013;162(5):648-656.
66. Akin S, Hosing C, Khouri IF, et al. Autologous stem cell transplantation for large B-cell lymphoma with secondary central nervous system involvement. Blood Adv. 2022;6(7):2267-2274.
67. Sterling C, Wagner-Johnston ND, Gladstone DE, et al. Allogenic stem cell transplantation for secondary CNS lymphoma: a retrospective review of 21 patients. Blood. 2019;134(Suppl_1):3342.
68. Wu Y, Sun X, Bai X, et al. Treatment of secondary central nervous system involvement in systemic aggressive B cell lymphoma using R-MIADD chemotherapy: a single-center study. Chin Neurosurg J. 2021;7(1):20.
69. Ferreri AJM, Cwynarski K, Pulczynski E, et al. Whole-brain radiotherapy or autologous stem-cell transplantation as consolidation strategies after high-dose methotrexate-based chemoimmunotherapy in patients with primary CNS lymphoma: results of the second randomisation of the International Extranodal Lymphoma Study Group-32 phase 2 trial. Lancet Haematol. 2017;4(11):e510-e523.
70. Ferreri AJM, Cwynarski K, Pulczynski E, et al. Long-term efficacy, safety and neurotolerability of MATRix regimen followed by autologous transplant in primary CNS lymphoma: 7-year results of the IELSG32 randomized trial. Leukemia. 2022 36(7):1870-1878.
71. Milgrom SA, Pinnix CC, Chi TL, et al. Radiation therapy as an effective salvage strategy for secondary CNS lymphoma. Int J Radiat Oncol Biol Phys. 2018;100(5):1146-1154.
72. Khimani NB, Ng AK, Chen YH, Catalano P, Silver B, Mauch PM. Salvage radiotherapy in patients with recurrent or refractory primary or secondary central nervous system lymphoma after methotrexate-based chemotherapy. Ann Oncol. 2011;22(4):979-984.
73. Houillier C, Taillandier L, Dureau S, et al. Radiotherapy or autologous stem-cell transplantation for primary CNS lymphoma in patients 60 years of age and younger: results of the Intergroup ANOCEF-GOELAMS randomized phase II PRECIS study. J Clin Oncol. 2019;37(10):823-833.
74. Morris PG, Correa DD, Yahalom J, et al. Rituximab, methotrexate, procarbazine, and vincristine followed by consolidation reduceddose whole-brain radiotherapy and cytarabine in newly diagnosed primary CNS lymphoma: final results and long-term outcome. J Clin Oncol. 2013;31(31):3971-3979.
75. Correa DD, Rocco-Donovan M, DeAngelis LM , et al. Prospective cognitive follow-up in primary CNS lymphoma patients treated with chemotherapy and reduced-dose radiotherapy. J Neurooncol. 2009;91(3):315-321.
76. Kasenda B, Ferreri AJ, Marturano E, et al. First-line treatment and outcome of elderly patients with primary central nervous system lymphoma (PCNSL)--a systematic review and individual patient data meta-analysis. Ann Oncol. 2015;26(7):1305-1313.
77. Schorb E, Fox CP, Kasenda B, et al. Induction therapy with the MATRix regimen in patients with newly diagnosed primary diffuse
Haematologica | 108 March 2023 688 REVIEW ARTICLE - Secondary CNS lymphoma S. Bobillo et al.
large B-cell lymphoma of the central nervous system - an international study of feasibility and efficacy in routine clinical practice. Br J Haematol. 2020;189(5):879-887.
78. Schorb E, Kasenda B, Ihorst G, et al. High-dose chemotherapy and autologous stem cell transplant in elderly patients with primary CNS lymphoma: a pilot study. Blood Adv. 2020;4(14):3378-3381.
79. Nagle SJ, Shah NN, Ganetsky A, et al. Long-term outcomes of rituximab, temozolomide and high-dose methotrexate without consolidation therapy for lymphoma involving the CNS. Int J Hematol Oncol. 2017;6(4):113-121.
80. Grommes C, Pastore A, Palaskas N, et al. Ibrutinib unmasks critical role of Bruton tyrosine kinase in primary CNS lymphoma. Cancer Discov. 2017;7(9):1018-1029.
81. Grommes C, Wolfe J, Gavrilovic I, et al. Phase II of single-agent Ibrutinib in recurrent/refractory primary (PCNSL) and secondary CNS lymphoma (SCNSL). Blood. 2018;132(Suppl 1):2965.
82. Grommes C, Tang SS, Wolfe J, et al. Phase 1b trial of an ibrutinibbased combination therapy in recurrent/refractory CNS lymphoma. Blood. 2019;133(5):436-445.
83. Lionakis MS, Dunleavy K, Roschewski M, et al. Inhibition of B cell receptor signaling by ibrutinib in primary CNS lymphoma. Cancer Cell. 2017;31(6):833-843.
84. Rubenstein JL, Geng H, Fraser EJ, et al. Phase 1 investigation of lenalidomide/rituximab plus outcomes of lenalidomide maintenance in relapsed CNS lymphoma. Blood Adv. 2018;2(13):1595-1607.
85. Tun HW, Johnston PB, DeAngelis LM, et al. Phase 1 study of pomalidomide and dexamethasone for relapsed/refractory primary CNS or vitreoretinal lymphoma. Blood. 2018;132(21):2240-2248.
86. Abramson JS, Palomba ML, Gordon LI, et al. Lisocabtagene maraleucel for patients with relapsed or refractory large B-cell lymphomas (TRANSCEND NHL 001): a multicentre seamless design study. Lancet. 2020;396(10254):839-852.
87. Ahmed G, Hamadani M, Shah NN. CAR T-cell therapy for secondary CNS DLBCL. Blood Adv. 2021;5(24):5626-5630.
88. Frigault MJ, Dietrich J, Martinez-Lage M, et al. Tisagenlecleucel CAR T-cell therapy in secondary CNS lymphoma. Blood. 2019;134(11):860-866.
89. Frigault MJ, Dietrich J, Gallagher K, et al. Safety and efficacy of tisagenlecleucel in primary CNS lymphoma: a phase 1/2 clinical trial. Blood. 2022;139(15):2306-2315.
90. Boehme V, Schmitz N, Zeynalova S, Loeffler M, Pfreundschuh M. CNS events in elderly patients with aggressive lymphoma treated with modern chemotherapy (CHOP-14) with or without rituximab: an analysis of patients treated in the RICOVER-60 trial of the German High-Grade Non-Hodgkin Lymphoma Study Group (DSHNHL). Blood. 2009;113(17):3896-3902.
91. Tai WM, Chung J, Tang PL, et al. Central nervous system (CNS) relapse in diffuse large B cell lymphoma (DLBCL): pre- and postrituximab. Ann Hematol. 2011;90(7):809-818.
92. Villa D, Connors JM, Sehn LH, Gascoyne RD, Savage KJ. Diffuse
large B-cell lymphoma with involvement of the kidney: outcome and risk of central nervous system relapse. Haematologica. 2011;96(7):1002-1007.
93. Schmitz N, Zeynalova S, Glass B, et al. CNS disease in younger patients with aggressive B-cell lymphoma: an analysis of patients treated on the Mabthera international trial and trials of the German High-Grade Non-Hodgkin Lymphoma Study Group. Ann Oncol. 2012;23(5):1267-1273.
94. Kumar A, Vanderplas A, LaCasce AS, et al. Lack of benefit of central nervous system prophylaxis for diffuse large B-cell lymphoma in the rituximab era: findings from a large national database. Cancer. 2012;118(11):2944-2951.
95. Gleeson M, Counsell N, Cunningham D, et al. Central nervous system relapse of diffuse large B-cell lymphoma in the rituximab era: results of the UK NCRI R-CHOP-14 versus 21 trial. Ann Oncol. 2017;28(10):2511-2516.
96. Abramson JS, Hellmann M, Barnes JA, et al. Intravenous methotrexate as central nervous system (CNS) prophylaxis is associated with a low risk of CNS recurrence in high-risk patients with diffuse large B-cell lymphoma. Cancer. 2010;116(18):4283-4290.
97. Cheah CY, Herbert KE, O'Rourke K, et al. A multicentre retrospective comparison of central nervous system prophylaxis strategies among patients with high-risk diffuse large B-cell lymphoma. Br J Cancer. 2014;111(6):1072-1079.
98. Lee K, Yoon DH, Hong JY, Kim S, et al. Systemic HD-MTX for CNS prophylaxis in high-risk DLBCL patients: a prospectively collected, single-center cohort analysis. Int J Hematol. 2019;110(1):86-94.
99. Goldschmidt N, Horowitz NA, Heffes V, et al. Addition of highdose methotrexate to standard treatment for patients with high-risk diffuse large B-cell lymphoma contributes to improved freedom from progression and survival but does not prevent central nervous system relapse. Leuk Lymphoma. 2019;60(8):1890-1898.
100. Wilson MR, Eyre TA, Martinez-Calle N, et al. Timing of high-dose methotrexate CNS prophylaxis in DLBCL: an analysis of toxicity and impact on R-CHOP delivery. Blood Adv. 2020;4(15):3586-3593.
101. Doorduijn JK, van Imhoff GW, van der Holt B, et al. Treatment of secondary central nervous system lymphoma with intrathecal rituximab, high-dose methotrexate, and R-DHAP followed by autologous stem cell transplantation: results of the HOVON 80 phase 2 study. Hematol Oncol. 2017;35(4):497-503.
102. Young PA, Gaut D, Kimaiyo DK, et al. Durable survival outcomes in primary and secondary central nervous system lymphoma after high-dose chemotherapy and autologous stem cell transplantation using a thiotepa, busulfan, and cyclophosphamide conditioning regimen. Clin Lymphoma Myeloma Leuk. 2020;20(7):468-479.
103. Oh DH, Chua N, Street L, Stewart DA. Treatment of patients with secondary central nervous system lymphoma with high-dose busulfan/thiotepa-based conditioning and autologous stem cell transplant. Leuk Lymphoma. 2016;57(1):28-33.
Haematologica | 108 March 2023 689 REVIEW ARTICLE - Secondary CNS lymphoma S. Bobillo et al.
Prediction of complete remission and survival in acute myeloid leukemia using supervised machine learning
Jan-Niklas Eckardt,1 Christoph Röllig,1 Klaus Metzeler,2 Michael Kramer,1 Sebastian Stasik,1 Julia-Annabell Georgi,1 Peter Heisig,3 Karsten Spiekermann,4 Utz Krug,5 Jan Braess,6 Dennis Görlich,7 Cristina M. Sauerland,7 Bernhard Woermann,8 Tobias Herold,4 Wolfgang E. Berdel,9 Wolfgang Hiddemann,4 Frank Kroschinsky,1 Johannes Schetelig,1 Uwe Platzbecker,2 Carsten Müller-Tidow,10,11 Tim Sauer,10 Hubert Serve,12 Claudia Baldus,13 Kerstin Schäfer-Eckart,14 Martin Kaufmann,15 Stefan Krause,16 Mathias Hänel,17 Christoph Schliemann,9 Maher Hanoun,18 Christian Thiede,1,11 Martin Bornhäuser,1,11,19 Karsten Wendt2 and Jan Moritz Middeke1
1Department of Internal Medicine I, University Hospital Carl Gustav Carus, Dresden; 2Medical Clinic and Policlinic I Hematology and Cell Therapy. University Hospital, Leipzig; 3Institute of Software and Multimedia Technology, Technical University Dresden, Dresden; 4Laboratory for Leukemia Diagnostics, Department of Medicine III, University Hospital, LMU Munich, Munich; 5Medical Clinic III, Hospital Leverkusen, Leverkusen; 6Hospital Barmherzige Brueder Regensburg, Regensburg; 7Institute for Biometrics and Clinical Research, University Münster, Münster; 8Department of Hematology, Oncology and Tumor Immunology, Charité, Berlin; 9Department of Internal Medicine A, University Hospital Münster, Münster; 10Department of Medicine V, University Hospital Heidelberg, Heidelberg; 11German Consortium for Translational Cancer Research DKFZ, Heidelberg; 12Department of Medicine 2, Hematology and Oncology, Goethe University Frankfurt, Frankfurt; 13Department of Hematology and Oncology, University Hospital Schleswig Holstein, Kiel; 14Department of Internal Medicine 5, Paracelsus Medical Private University Nuremberg, Nuremberg; 15Department of Hematology, Oncology and Palliative Care, Robert-Bosch Hospital, Stuttgart; 16Department of Internal Medicine 5, University Hospital Erlangen, Erlangen; 17Department of Internal Medicine 3, Klinikum Chemnitz GmbH, Chemnitz; 18Department of Hematology and Stem Cell Transplantation, University Hospital Essen, Essen and 19National Center for Tumor Diseases (NCT), Dresden, Germany
Abstract
Correspondence: J-N. Eckardt
jan-niklas.eckardt@uniklinikum-dresden.de
Received: September 15, 2021.
Accepted: March 31, 2022.
Early view: June 16. 2022.
https://doi.org/10.3324/haematol.2021.280027
©2023 Ferrata Storti Foundation
Published under a CC BY-NC license
Achievement of complete remission signifies a crucial milestone in the therapy of acute myeloid leukemia (AML) while refractory disease is associated with dismal outcomes. Hence, accurately identifying patients at risk is essential to tailor treatment concepts individually to disease biology. We used nine machine learning (ML) models to predict complete remission and 2-year overall survival in a large multicenter cohort of 1,383 AML patients who received intensive induction therapy. Clinical, laboratory, cytogenetic and molecular genetic data were incorporated and our results were validated on an external multicenter cohort. Our ML models autonomously selected predictive features including established markers of favorable or adverse risk as well as identifying markers of so-far controversial relevance. De novo AML, extramedullary AML, double-mutated CEBPA, mutations of CEBPA-bZIP, NPM1, FLT3-ITD, ASXL1, RUNX1, SF3B1, IKZF1, TP53, and U2AF1, t(8;21), inv(16)/t(16;16), del(5)/del(5q), del(17)/del(17p), normal or complex karyotypes, age and hemoglobin concentration at initial diagnosis were statistically significant markers predictive of complete remission, while t(8;21), del(5)/del(5q), inv(16)/t(16;16), del(17)/del(17p), double-mutated CEBPA, CEBPA-bZIP, NPM1, FLT3-ITD, DNMT3A, SF3B1, U2AF1, and TP53 mutations, age, white blood cell count, peripheral blast count, serum lactate dehydrogenase level and hemoglobin concentration at initial diagnosis as well as extramedullary manifestations were predictive for 2-year overall survival. For prediction of complete remission and 2-year overall survival areas under the receiver operating characteristic curves ranged between 0.77–0.86 and between 0.63–0.74, respectively in our test set, and between 0.71–0.80 and 0.65–0.75 in the external validation cohort. We demonstrated the feasibility of ML for risk stratification in AML as a model disease for hematologic neoplasms, using a scalable and reusable ML framework. Our study illustrates the clinical applicability of ML as a decision support system in hematology.
Haematologica | 108 March 2023 690 ARTICLE - Acute Myeloid Leukemia
Introduction
Acute myeloid leukemia (AML) is the most common form of acute leukemia in adults and its incidence has been increasing in the past decades. The long-term survival rate of AML patients in the overall patient population is poor.1 Achievement of complete remission (CR) or complete remission with incomplete hematologic recovery (CRi) signifies a crucial milestone in AML therapy as it is associated with significantly improved patient outcome.2 For intermediate- and high-risk patients with good performance status, allogeneic hematopoietic stem cell transplantation in first CR is a curative option.3 However, refractory disease is associated with dismal overall survival (OS) rates, and relapse and death are frequent in patients with primary refractory disease even after allogeneic hematopoietic stem cell transplantation.4 Therefore, efforts have been made to establish predictive markers in order to identify patients at risk of primary treatment failure and predict reduced OS after intensive induction therapy. Potential predictors include patient age,5 high-risk cytogenetics such as complex karyotypes ( ≥ 3 abnormalities),6 and molecular genetics.7 However, most recent studies have been based on hypothesisdriven models that require a priori a hypothesized connection between selected variables to be tested on the given data.8 Machine learning (ML) is a branch of computer science that can process large data sets for a plethora of purposes.9 The underlying mechanism does not necessarily begin with a manually drafted hypothesis model. Rather, ML can detect patterns in pre-processed data and derive abstract information, predictions and similarities.10 Their translation to AML risk assessment has shown the potential for refined prognostic indices and unveiled novel insights into disease biology.11 In this study, we retrospectively analyzed a large cohort of 1,383 newly diagnosed and intensively treated AML patients according to their clinical characteristics and molecular genetics. We evaluated nine different ML models to predict achievement of CR as well as 2-year OS rate, assessed features that were automatically identified by the ML models according to their predictive value and validated our results in an external cohort of 664 AML patients.
Methods
Data set
We retrospectively identified 1,383 patients who had been diagnosed and treated in previously reported multicenter trials (AML96,12 AML2003,13 AML60+,14 and SORAML15) or were enrolled in the multicenter German Study Alliance Leukemia (SAL) AML registry (NCT03188874) en-
compassing 59 centers specialized in the treatment of hematologic malignancies. A short summary of individual trial durations and protocols is provided in the Online Supplementary Material (Online Supplementary Table S1). Eligibility criteria were newly diagnosed AML according to World Health Organization (WHO) criteria,16 age ≥ 18 years, potentially curative treatment with intensive therapy regimens and available diagnostic biomaterial. Patients with acute promyelocytic leukemia were excluded. All mentioned studies were previously approved by the Institutional Review Board of the Technical University Dresden. All participants gave their written informed consent according to the Declaration of Helsinki. AML status was defined as de novo (in patients with no prior hematologic malignancy), secondary (in patients with prior myeloid entities such as myelodysplastic syndromes) and treatment-related (in patients previously exposed to radiotherapy and/or chemotherapy). CR and CRi were defined according to the European LeukemiaNet (ELN) 2017 recommendations.17 Death was defined as death from any cause. Of the 1,383 patients studied, 91 (6.56%) died within 30 days of initial diagnosis. All patients were included in the analysis for both CR and 2year OS. We used 2-year OS because the data set was balanced for this cut-off time with 610/1,383 (44.11%) of patients surviving 2 years or longer, which supports training of a binary classifier. Pre-treatment bone marrow or peripheral blood samples from all patients were screened using next-generation sequencing with the Illumina TruSight Myeloid Sequencing Panel covering 54 genes (Online Supplementary Table S2) that are associated with myeloid neoplasms, as described in detail recently.18 A 5% variant allele frequency mutation calling cut-off was used. An external validation cohort was obtained from the AML Cooperative Group (AMLCG) encompassing 664 newly diagnosed AML patients enrolled in clinical trials (AMLCG-1999 and AMLCG-2008)19 to validate the trained algorithms. For this validation cohort, the same eligibility and exclusion criteria were applied as described above. This study was performed in conformity with Standards for Reporting Diagnostic accuracy studies (STARD) (Online Supplementary Table S3).
Data curation and machine learning pipeline
For the selection of predictive features and subsequent binary decisions for CR and 2-year OS prediction, a multi-stage ML pipeline was developed for this study (Figure 1). Data from the above-mentioned clinical trials and the SAL registry were collected and 212 multimodal variables (clinical data, laboratory parameters as well as molecular and cytogenetic data) became available (see Online Supplementary Table S4 for a full list of variables used in the model). Features were selected according to their support by five-feature selection algorithms: linear
Haematologica | 108 March 2023 691 ARTICLE - Machine learning predicts CR and OS in AML J-N. Eckardt et al.
correlation, chi-square test, recursive feature elimination, lasso regularization and random forest ranking. To be included in a ML model, a variable had to pass a predetermined threshold of overall predictive power determined by summing the normalized scores of these five-feature selection algorithms. Features below the threshold were automatically excluded from the ML models for the respective iteration. In that way, relevant attributes were selected and dimensionality was reduced
Figure 1. Iterative workflow of the machine learning pipeline. For the purpose of this study, 1,383 patients with acute myeloid leukemia from previous multicenter clinical trials and the German Study Alliance Leukemia bioregistry were analyzed. Multimodal clinical, laboratory, cytogenetic and molecular genetic data (1) were available. To remove redundancies and reduce dimensionality, rare features were excluded (2). Data were transformed, scaled and standardized and missing values were imputed (3). Dynamic feature selection was used to identify predictive parameters which were then included for analysis by nine supervised machine learning classifiers (4). Individual model performance and selected features were subsequently put out by the pipeline for interpretation (5). APL: acute promyelocytic leukemia; AML: acute myeloid leukemia.
by excluding sparse features (cut-off 1%). After automated feature selection, binary decision models of the following types were trained: random forest, gradient boosting, adaptive boosting, linear, polynomial and radial basis function kernel (RBF), support vector machines (SVM), k-nearest neighbor, logistic regression, and artificial neural nets using a 9:1 training-to-test split. All test data were strictly withheld from the training stage in order to avoid information leakage and overfitting. The

Haematologica | 108 March 2023 692 ARTICLE - Machine learning predicts CR and OS in AML J-N. Eckardt et al.
best performing models were optimized in a subsequent hyperparameter-optimization step. A more detailed explanation of the ML pipeline is given in the Online Supplementary Material.
Performance evaluation and statistical analysis
To analyze the performance of the ML models we used F1-score, precision and recall as well as precision-recallcurves as standard ML performance metrics, as well as receiver operating characteristics (ROC) with the area under the curve (AUC). Precision (positive predictive value) is the fraction of true positives among all positive predictions while recall (sensitivity) is the fraction of all positive predictions among all true positives and F1score is the harmonized mean of precision and recall. To account for the imbalance of the data set, micro-averaging AUROC was calculated as it computes the total number of cumulative true positives, true negatives, false positives and false negatives globally instead of calculating metrics for each class independently and then averaging them (macro-averaging) which may lead to inaccurate metrics for imbalanced data sets. Additional statistical analysis and visualizations were performed using STATA BE 16.0 and R 3.6.3. Odds ratios and 95% confidence intervals for the binary decision of achieving or failing to achieve CR as well as surviving 2 years or longer were obtained using logistic regression. Statistical significance was determined using a significance level a of 0.05.
Results
We utilized nine ML models to predict CR and 2-year OS in a large data set of 1,383 newly diagnosed and intensively treated AML patients with a median age of 54 years (interquartile range, 43–64). A total of 1,008 patients (72.9%) achieved CR/CRi with induction therapy, while 375 (27.1%) failed to achieve CR/CRi. Of the 1,008 patients who achieved CR/Cri, 755 (74.9 %) did so after two courses of induction therapy, while 253 (25.1 %) received only one course of induction therapy. The median OS was 17.1 months and 44,1% of patients survived 2 years or longer after initial diagnosis. The patients’ baseline characteristics are summarized in Table 1. Detailed information on the characteristics of patients from the different trials of both the internal training and testing cohort as well as the external validation cohort are summarized in Online Supplementary Table S5.
Prediction of complete remission
For CR/CRi, F1-scores ranged between 0.72 and 0.75 while AUROC ranged between 0.77 and 0.86 (Figure 2). Random forest (F1: 0.75; AUROC: 0.86), logistic regression (F1: 0.75;
AUROC: 0.84) and artificial neural nets (F1: 0.73; AUROC: 0.77) were selected for hyperparameter tuning. Random forest and logistic regression converged over 1,000 iterations (Online Supplementary Figure S1). Hyperparameter tuning did not improve the F1 of logistic regression, but random forest achieved an improved final F1 of 0.78. Artificial neural nets did not converge over 1,000 iterations and the F1 of artificial neural nets did not improve, likely due to the requirement of a much larger sample size for deep learning in general. Features for CR/CRi prediction were selected automatically using five-feature selection algorithms that included or rejected features based on an importance score with a predefined threshold. We found the optimum performance was achieved when a summed support threshold of 0.5 was used as a cut-off for inclusion or exclusion of features. Features that were present in less than 1% of patients in the cohort were automatically excluded. Using this method, our algorithms selected 27 features for CR/CRi prediction that were uniformly used in all nine classification models. Patient age at first diagnosis was the most important feature according to our feature selection algorithm. Genetic aberrations included in our model were found in TP53 (n=102, 7.38%), U2AF1 (n=36, 2.60%), NPM1 (n=466, 33.69%), FLT3ITD (n=280, 20.25%), IKZF1 (n=36, 2.6%), CEBPA (doublemutated n=91, 6.58% and bZIP n=30, 2.17%), ASXL1 (n=124, 8.97%), RUNX1 (n=134, 9.69%), IDH1 (n=122, 8.82%), PTPN11 (n=100, 7.23%), SF3B1 (n=41, 2.96%), as well as t(8;21) (n=52, 3.76%), inv(16) or t(16;16) (n=76, 5.50%), del(5) or del(5q) (n=85, 6.15%), del(17) or del(17p) (n=34, 2.50%), complex karyotype (≥3 aberrations, n=152, 10.99%) or normal karyotype (no aberrations, n=707, 51.12%). These genetic features differed substantially between patients achieving CR/CRi (Figure 3A) or failing to achieve CR/CRi (Figure 3B). Clinical and laboratory parameters that were selected by our algorithm were lactate dehydrogenase concentration, white blood cell count, bone marrow blast count, peripheral blood blast count, platelet count and hemoglobin concentration at first diagnosis as well as de novo manifestation of AML and presence or absence of extramedullary disease. Individual feature support calculated by the five-feature selection algorithms is shown in Figure 4A. For these features we subsequently calculated univariate odds ratios to further quantify their predictive capacity for CR. At a significance level of 0.05, we found de novo status of AML, higher hemoglobin concentration at initial diagnosis, normal karyotype, t(8;21), inv(16) or t(16;16), double-mutated CEBPA or mutations in the bZIP domain of CEBPA, and mutations in NPM1 and FLT3-ITD to be associated with significantly higher odds of achieving CR (Figure 4B). Notably, the effect of mutations in FLT3ITD was confined to patients with an FLT3-ITD ratio <0.5 and concurrent NPM1 mutations (odds ratio [OR]=2.01, 95% confidence interval [95% CI]: 1.09-3.71, P=0.024) while
ARTICLE - Machine learning predicts CR and OS in AML Haematologica | 108 March 2023 693 J-N. Eckardt et al.
For a division of the internal cohort by clinical trials, see Online Supplementary Table S5. SAL: German Study Alliance Leukemia registry; AMLCG: AML Cooperative Group; n/N: number; IQR: interquartile range; AML: acute myeloid leukemia; CR: complete remission.
patients who harbored mutated FLT3-ITD with a ratio ≥0.5 and concurrent NPM1 mutations showed less favorable CR rates (OR=0.51, 95% CI: 0.28-0.94; P=0.03). Higher age at initial diagnosis, extramedullary manifestations, complex karyotype, del(5) or del(5q), del(17) or del(17p) as well as mutations in ASXL1 , SF3B1 , RUNX1 , IKZF1 , TP53 and U2AF1 were associated with signi fi cantly lower odds of achieving CR with intensive induction therapy (Figure 4B). IKZF1, SF3B1, and U2AF1 mutations have been reported to be associated with secondary AML.20,21 In a multivariable model adjusted for de novo and secondary AML, we found IKZF1 (OR=0.39, 95% CI: 0.20-0.76; P=0.006), SF3B1 (OR= 0.49, 95% CI: 0.26-0.94; P=0.031) and U2AF1 (OR=0.17, 95% CI: 0.08-0.35; P <0.001) to be independently associated with lower odds of achieving CR. In a multivariable model adjusting for double-mutated CEBPA , mutations of the bZIP domain of CEBPA were still significantly associated with increased odds of achieving CR (OR=5.95, 95% CI:
1.90-18.66; P=0.002). Every 1-year increase in age was associated with a 5.73% decrease in the odds of achieving CR ( Online Supplementary Figure S3A ) and every one mmol/L increase in hemoglobin at initial diagnosis (until normal values were reached) was associated with a 13.15% increase in the odds of achieving CR (Online Supplementary Figure S3B). For molecular genetics associated with CR such as ASXL1, IKZF1, SF3B1, U2AF1 and TP53 (Online Supplementary Figure Table S3C-G), higher variant allele frequency was associated with decreased odds for CR. For biallelic CEBPA mutations and CEBPA-bZIP, variant allele frequency was not available for analysis. For the remaining selected features – peripheral blood blast count, bone marrow blast count, lactate dehydrogenase level, platelet count and white blood cell count at initial diagnosis as well as mutations in PTPN11, and IDH1 – no statistically significant associations with achievement of CR were found (Figure
4B). Variables Training/testing (SAL) External validation (AMLCG) N. of patients 1383 664 Age, median (IQR), in years 54 (43-64) 57 (44-66) Sex, N (%) Female 661 (48) 328 (49) Male 722 (52) 336 (51) AML status, N (%) De novo 1180 (86.4) 570 (85.8) Secondary 146 (10.7) 59 (8.9) Therapy-associated 40 (3.0) 35 (5.3) French-American-British classification, N (%) M0 49 (3.7) 35 (5.4) M1 326 (24.6) 157 (23.6) M2 458 (34.6) 178 (26.8) M3 0 0 M4 248 (18.7) 163 (24.5) M5 191 (14.4) 83 (12.5) M6 46 (3.5) 19 (2.9) M7 6 (0.5) 3 (0.5) European LeukemiaNet 2017 category, N (%) Favorable 518 (37.8) 231 (34.8) Intermediate 510 (37.2) 166 (25.0) Adverse 247 (13.0) 250 (37.7) Complex karyotype (≥3 abnormalities) 154 (11.9) 75 (11.3%) Extramedullary disease, N (%) 201 (14.5) 16 (5.9) White blood cell count, median (IQR), x109/L 20.4 (4.8-56.4) 23.8 (6.4-60.3) Hemoglobin, median (IQR) in mmol/L 5.9 (5.0-7.0) 5.6 (5.0-6.3) Platelet count, median (IQR) x109/L 52 (27-95) 53 (30-102) Lactate dehydrogenase, median (IQR) in U/L 453 (288-821) 466 (291-787) Bone marrow blasts, median (IQR) in % 63 (45-79) 80 (58-90) Peripheral blood blasts, median (IQR) in % 41 (12-74) 23 (4.5-67) Achieved CR after induction therapy, N (%) 1008 (72.9) 445 (67.0) Median OS, in months 17.1 17.3 Overall survival ≥ 2 years, N (%) 610 (44.1) 290 (43.7)
Table 1. Patients’ baseline characteristics.
Haematologica | 108 March 2023 694 ARTICLE - Machine learning predicts CR and OS in AML J-N. Eckardt et al.
Figure 2. Performance of the machine learning algorithms for prediction of complete remission or complete remission with incomplete hematologic recovery. Nine machine learning algorithms were trained and tested on 1,383 patients for whom multimodal clinical, laboratory and cytogenetic as well as molecular genetic data were available (train-test split 9:1, 10-fold cross-validation). Micro-average area under the receiver operating characteristic curve (AUROC) was used to evaluate performance of the imbalanced data set regarding achievement or failure of complete remission after intensive induction therapy. ANN: artificial neural net; CR: complete remission; CRi: complete remission with incomplete hematologic recovery; FPR: false positive rate; KNN: k nearest neighbor; LR: logistic regression; pSVM: polynomial support vector machine; RBF-SVM: radial basis kernel function support vector machine; RF: random forest; SVM: (linear) support vector machine; TPR: true positive rate.
Prediction of 2-year overall survival
Analogous to CR/CRi prediction, the ML pipeline was used to predict 2-year overall survival. For OS, F1-scores ranged between 0.60 and 0.70 (Table 2) while AUROC ranged between 0.63 and 0.74 (Figure 5). Again, random forest (F1: 0.67; AUROC: 0.73), logistic regression (F1: 0.70; AUROC: 0.74) and artificial neural nets (F1: 0.63; AUROC: 0.70) were selected for hyperparameter tuning. Artificial neural nets again did not converge and F1 did not improve over 1,000 iterations. Random forest and logistic regression both converged over 1,000 iterations ( Online Supplementary Figure S2). While F1 did not improve for logistic regression, random forest showed an increased F1 of 0.68 after hyperparameter tuning. The feature selection algorithm chose the 25 most important features based on the same threshold that was previously used for CR prediction (Figure 6A). Again, the most important feature selected by the algorithms was patient age at initial diagnosis. Selected genetic features encompassed
mutations in TP53, NPM1, double-mutated CEBPA, mutations in the bZIP domain of CEBPA, U2AF1, SF3B1, ASXL1, FLT3 -ITD and -TKD (n=62, 4.48%), WT1 (n=102, 7.38%), PTPN11, KRAS (n=79, 5.71%), and DNMT3A (n=396, 28.63%), t(8;21), del(5) or del(5q), inv(16) or t(16;16), del(17) or del(17p), which again differed between patients who survived 2 years or longer (Figure 3C) or died within 2 years after initial diagnosis (Figure 3D). Selected clinical and laboratory features were hemoglobin concentration at initial diagnosis, white blood cell count, peripheral blood blast count, bone marrow blast count, platelet count and lactate dehydrogenase level at initial diagnosis, as well as the presence of extramedullary manifestations. Univariate logistic regression showed significantly increased odds of surviving 2 years or longer for t(8;21), inv(16) or t(16;16), double-mutated CEBPA , mutations in the bZIP domain of CEBPA, FLT3-ITD with low (<0.5) variant allele ratio (irrespective of NPM1 status), mutations of NPM1 as well as higher hemoglobin at initial diagnosis (Figure 6B).

Haematologica | 108 March 2023 695 ARTICLE - Machine learning predicts CR and OS in AML J-N. Eckardt et al.
Figure 3. Mutational spectrum of aberrations selected by machine learning for prediction of complete remission and overall survival. Patients who achieved complete remission (CR)/complete recovery with incomplete hematologic recovery (CRi) after intensive induction therapy (A) showed different molecular patterns regarding molecular features selected by machine learning than patients who failed to achieve CR (B). The mutational spectrum of the cohort of patients who achieved CR largely comprised normal karyotypes (no aberrations) as well as mutations of NPM1 and FLT3-ITD. In the cohort of patients failing to achieve CR the rate of complex karyotypes (≥3 aberrations), del17, del5 or del5p, as well as mutations in TP53, ASXL1, RUNX1, U2AF1, SF3B1 and IKZF1 was higher than that in patients who achieved CR. Patients who survived longer than 24 months (C) were less likely to harbor del17, del5 or del5q, or have mutations in TP53, SF3B1, ASXL1 and U2AF1 than patients who died within 24 months after initial diagnosis (D).
Significantly lower odds were found for higher age at initial diagnosis, higher white blood cell count, lactate dehydrogenase, and peripheral blood blast count, presence of extramedullary manifestations as well as del(17) or del(17p), del(5) or del(5q) and mutations of DNMT3A , FLT3-ITD with high (≥0.5) variant allele ratio (again irrespective of NPM1 status), SF3B1, U2AF1 and TP53 (Figure 6B). In multivariable analysis including AML status ( de novo or secondary AML), mutations in SF3B1 (OR=0.32, 95% CI: 0.14-0.69; P=0.004) and U2AF1 (OR=0.16, 95% CI: 0.06-0.46; P =0.001) were independent markers of decreased odds of surviving 2 years after initial diagnosis.
In a multivariable model adjusting for double-mutated CEBPA, mutations of the bZIP domain of CEBPA were still significantly associated with increased odds of 2-year OS (OR=2.36, 95% CI: 1.01-5.23; P =0.036). For continuous variables, every 1-year increase in age was associated with a 4.27% decrease in the odds of surviving 2 years or longer after initial diagnosis (Online Supplementary Figure S4A ). For hemoglobin, every one mmol/L increase until normal values was associated with a 14.08% increase of the odds (Online Supplementary Figure S4B). Increases in white blood cell count, peripheral blood blast count and lactate dehydrogenase concentration were also associ-

A B
Haematologica | 108 March 2023 696 ARTICLE - Machine learning predicts CR and OS in AML J-N. Eckardt et al. C D
ated with decreases in the odds of survival, however effect sizes were smaller than those for age or hemoglobin (Online Supplementary Figure S4C-E). For molecular genetics associated with 2-year OS, such as ASXL1, DNMT3A, SF3B1 , U2AF1 , and TP53 mutations, higher variant allele frequency was associated with decreased rates of 2-year

OS (Online Supplementary Figure S5). For biallelic CEBPA mutations and CEBPA-bZIP, variant allele frequency was not available for analysis.
External validation
We obtained an external independent cohort of 664 pre-
Figure 4. Feature selection for prediction of complete remission. (A) Five-feature selection metrics (linear correlation, chisquare test, recursive feature elimination, lasso regularization and random forest ranking) were implemented to select patient features for the classification algorithms (Figure 1) in order to predict complete remission (CR) after intensive induction therapy. Based on a continuous feature support metric to aggregate to single metrics mentioned above with a predefined cut-off of 0.5 (determined by optimal classification performance), 27 features were automatically selected to be included for prediction of CR. (B) For each of these features predicted by machine learning, odds ratios and 95% confidence intervals (95% CI) were calculated. BMB: bone marrow blast count; FLT3h/low: FLT3-ITD ratio, h=high>0.5; Hb: hemoglobin; karyotype, c: complex aberrant karyotype (≥3 aberrations); karyotype, n: normal karyotype (no aberrations); LDH: lactate dehydrogenase; PBB: peripheral blood blast count; PLT: platelet count; WBC: white blood cell count.
Haematologica | 108 March 2023 697 ARTICLE - Machine learning predicts CR and OS in AML J-N. Eckardt et al. A B
Table 2. Performance metrics for prediction of complete remission/complete remission with incomplete hematologic recovery and 2-year overall survival by different machine learning models.
Prediction of CR/CRi after intensive induction therapy
Performance of the machine learning models was assessed using the F1-score, precision and recall as well as micro-average area under the receiver operating characteristic curve (see Figures 2 and 5 and Online Supplementary Figures S6 and S7). A comparison between our internal test set (Test) and an external validation cohort (Val.) is shown. Precision (positive predictive value) is the fraction of true positives among all positive predictions. Recall (sensitivity) is the fraction of positive predictions among all true positives. F1-score is the harmonized mean of precision and recall. CR: complete remission; CRi: complete remission with incomplete hematologic recovery; ML: machine learning; AUROC: area under the receiver operating characteristics curve; SVM: support vector machine; RBF: radial basis function kernel. OS: overall survival.
viously untreated AML patients who received intensive induction chemotherapy on two randomized multicenter phase III trials of the German AML Cooperative Group (AMLCG) between 1999 and 201219 to validate our trained models for CR and 2-year OS prediction. Detailed patients’ characteristics and genetic alterations available for the validation cohort are shown in Table 1 and Online Supplementary Tables S4 and S5, respectively. Both previously trained prediction models including the abovementioned prognostic variables for CR and 2-year OS prediction were tested on the validation cohort without re-training. It should be noted that not all prognostic variables included in the final prediction models for training and testing were available in the external validation cohort. Mutation status for FLT3-TKD and IKZF1 was missing. For CR prediction, F1 ranged between 0.72 and
0.76 while AUROC ranged between 0.71 and 0.80 (Online Supplementary Figure S6). For prediction of 2-year OS, F1 ranged between 0.58 and 0.69 while AUROC ranged between 0.65 and 0.75 ( Online Supplementary Figure S7 ). Table 2 provides details of the performance metrics in the internal test set and external validation cohort.
Discussion
Based on genetic and clinical data from a large multicenter cohort of patients we implemented ML models to derive prognostic parameters and subsequently predict CR and 2-year OS in AML patients who received intensive induction therapy. Our ML models were completely agnostic of any pre-existing models or risk scores such as
ML model F1-score Precision Recall AUROC Test Val. Test. Val. Test Val. Test Val. Random forest 0.75 0.76 0.77 0.77 0.78 0.78 0.86 0.78 Linear SVM 0.75 0.76 0.76 0.77 0.77 0.78 0.84 0.78 Logistic regression 0.75 0.76 0.76 0.77 0.77 0.77 0.84 0.78 Adaptive boosting 0.75 0.75 0.75 0.75 0.76 0.77 0.80 0.74 Gradient boosting 0.74 0.74 0.74 0.74 0.75 0.76 0.79 0.76 Polynomial SVM 0.73 0.72 0.76 0.76 0.77 0.77 0.80 0.77 Artificial neural net 0.73 0.73 0.73 0.73 0.74 0.73 0.77 0.71 RBF-SVM 0.72 0.74 0.75 0.76 0.76 0.77 0.83 0.80 k nearest neighbor 0.72 0.72 0.73 0.72 0.75 0.75 0.82 0.77 Prediction of OS ≥2 years Random forest 0.67 0.68 0.67 0.68 0.67 0.68 0.73 0.73 linear SVM 0.70 0.69 0.70 0.69 0.70 0.69 0.74 0.71 Logistic regression 0.70 0.69 0.70 0.69 0.70 0.69 0.74 0.72 Adaptive boosting 0.66 0.66 0.67 0.67 0.66 0.66 0.74 0.65 Gradient boosting 0.65 0.65 0.65 0.65 0.65 0.65 0.72 0.73 RBF-SVM 0.67 0.67 0.67 0.67 0.67 0.67 0.72 0.75 Artificial neural net 0.63 0.63 0.63 0.63 0.63 0.63 0.70 0.68 k nearest neighbor 0.60 0.61 0.60 0.62 0.59 0.61 0.63 0.70 Polynomial SVM 0.60 0.58 0.61 0.60 0.61 0.60 0.70 0.69
Haematologica | 108 March 2023 698 ARTICLE - Machine learning predicts CR and OS in AML J-N. Eckardt et al.
ELN 2017.17 Nevertheless, among the selected features for both CR and OS we found many established markers of good or poor prognosis. Regarding mutational status, established markers for AML risk stratification 17 such as TP53, ASXL1, RUNX1, FLT3-ITD, NPM1, and double-mutated CEBPA were selected. Mutations of TP53 are known to be associated with higher age, complex karyotypes and lower response rates to chemotherapy, yielding poor outcomes.22,23 Accordingly, mutations of RUNX124 and ASXL125 have been reported to be associated with lower CR rates as well as poor survival and AML with mutated RUNX1 is considered a provisional entity in the 2016 WHO classification.26 In contrast, AML with mutations of NPM127–29 or AML with biallelic CEBPA mutations30 were reported to be associated with improved outcomes and distinct comutational phenotypes, and also constitute distinct entities in the 2016 WHO classification. 26 The prognostic role of FLT3-ITD mutations largely depends on the allelic ratio and concurrent mutations of NPM1 31,32 Additionally, in our CR model U2AF1, IKZF1, and SF3B1 mutations were identified as predictive markers for decreased odds of
achieving CR while mutations in U2AF1, SF3B1, as well as DNMT3A were also predictive for decreased 2-year OS. In a multivariable model adjusting for AML status ( de novo/secondary AML) independent prognostic value was confirmed. Mutations of U2AF1 and SF3B1 affect RNA splicing and are frequent in myelodysplastic syndromes33 while in AML they are more commonly found in secondary rather than de novo AML and previous studies reported poor outcomes. 34 IKZF1 is a well-established marker of adverse risk in acute lymphoblastic leukemia,35 however, its role in AML is still controversial. Previous studies have shown frequent co-mutational patterns in AML suggesting antecedent myeloproliferative neoplasms, 21,21 nevertheless their prognostic impact is unclear. In AML with mutated DNMT3A , prognostication is controversial: various studies found inferior survival, but these results have been questioned by other analyses that either found no differences in outcomes or improved survival. 36–38 Additionally, mutations of the bZIP domain of CEBPA were significantly associated with increased odds of achieving CR and 2-year OS irrespective
Figure 5. Performance of machine learning algorithms for prediction of overall survival ≥2 years. As for the prediction of complete remission (Figure 1), machine learning algorithms were also implemented for prediction of overall survival. Microaverage area under the receiver operating characteristic curve (AUROC) was used to evaluate performance. ANN: artificial neural net; CR: complete remission; CRi: complete remission with incomplete hematologic recovery; FPR: false positive rate; KNN: k nearest neighbor; LR: logistic regression; OS: overall survival; pSVM: polynomial support vector machine; RBF-SVM: radial basis kernel function support vector machine; RF: random forest; SVM: (linear) support vector machine; TPR: true positive rate.

Haematologica | 108 March 2023 699 ARTICLE - Machine learning predicts CR and OS in AML J-N. Eckardt et al.
of biallelic status in multivariable models which is in accordance with recent reports.39,40 Regarding cytogenetic features, we initially one-hot encoded every cytogenetic aberration found in the entire cohort; however, to reduce data dimensionality41 those that were present in less than 1% of the cohort were automatically excluded (as was the case for rare molecular genetic features). Cytogenetic

features selected by our algorithm were inv(16)/t(16;16), t(8;21), del(5)/del(5q), and del(17) or del(17p), which are established markers for outcome prediction.17 Strikingly, t(8;21) was associated with the largest increase in odds for both achievement of CR as well as 2-year OS (only 1/52 patients with t(8;21) did not achieve CR) which is in line with previous reports.42,43 With respect to baseline
Figure 6. Feature selection for prediction of overall survival ≥2 years. (A) As for the prediction of complete remission (CR)/complete remission with incomplete hematologic recovery (CRi) (Figure 3), the feature selection algorithms were implemented to determine predictive features for overall survival (OS). Based on a continuous feature support metric with the same predefined cut-off that was used for CR/CRi prediction, 20 features were selected to predict OS ≥2 years. (B) For each of these features, odds ratios and 95% confidence intervals (95% CI) were calculated. BMB: bone marrow blast count; FLT3h/low: FLT3-ITD ratio, h=high>0.5; Hb: hemoglobin; karyotype, c: complex aberrant karyotype (≥3 aberrations); karyotype, n: normal karyotype (no aberrations); LDH: lactate dehydrogenase; PBB: peripheral blood blast count; PLT: platelet count; WBC: white blood cell count.
Haematologica | 108 March 2023 700 ARTICLE - Machine learning predicts CR and OS in AML J-N. Eckardt et al. A B
clinical and laboratory parameters, our analysis showed both CR rates and 2-year OS were significantly associated with age and hemoglobin level at initial diagnosis. Increasing age was associated with progressively lower odds of achieving CR and surviving for 2 years or longer despite the fact that all patients in our cohort received intensive induction therapy. Age is associated with highrisk molecular and cytogenetic features, lower frequencies of favorable markers and poor CR rates and survival. 5,44 Correspondingly, decreasing hemoglobin levels at initial diagnosis were associated with decreased odds of achieving CR and OS. Using these pre-trained ML prediction models, we validated our findings in an external multicenter cohort of 664 AML patients. Model performance remained stable in the external validation despite the fact that two important prognostic variables – FLT3-TKD and IKZF1 - were missing in the external validation cohort, thus demonstrating adequate model transferability both for CR and 2-year OS predictions. Smaller discrepancies in performance between the internal test set and the external validation cohort may stem from missingness of these prognostic variables and/or random fluctuations. Potentially, an inclusion of more external data into the models’ training may further boost performance and even out smaller discrepancies in performance metrics.
The performance of previous efforts at CR prediction in AML using conventional statistical approaches was reportedly moderate. In an analysis of over 4,500 intensively treated adult patients including commonly available clinical characteristics as well as FLT3 and NPM1 mutation status, Walter et al. 7 reported an AUROC between 0.71 and 0.78 while Krug et al. 45 similarly reported an AUROC of 0.72 in a cohort of more than 2,000 patients aged ≥ 60 years with newly diagnosed and intensively treated AML. These moderate accuracies even in large data sets incentivize the implementation of new approaches for data processing in risk evaluation. So far, only a few studies have used ML to predict CR in AML. Gal et al.46 reported a k-nearest neighbor classifier evaluating bone marrow specimens from 473 AML patients between 8 days and 28 years old with an AUROC of 0.81 in their test set. The recent Dialogue for Reverse Engineering Assessment and Methods (DREAM) Acute Myeloid Leukemia Outcome Prediction Challenge was a crowdsourcing effort of 270 registered participants and 79 contributing teams developing over 60 algorithms on proteomic data from a training set of 191 and a test set of 100 AML patients with response to therapy being the primary clinical endpoint in sub-challenge one.47 A final AUROC of 0.796 and a balanced accuracy of 0.779 were reported for the best performing model in the sub-challenge using a random forest model with an evolutionary weighting approach to feature selection.47 Arguably, re-
cent ML efforts in risk stratification, including our study, demonstrate the feasibility of ML technology to identify patients at high risk of treatment failure even considering that most of these recent studies using ML had far smaller data sets than the previously reported models using conventional statistical approaches. In order to implement these models meaningfully into clinical practice, they should not only include genetic alterations, but also acknowledge clinical patients’ characteristics. While genetic alterations are undoubtedly powerful predictors of disease progression, a third of observed variation in survival still stems from demographic and clinical data.48 We believe that the combination of both clinical and genetic data is essential for ML approaches to be beneficial for clinical practice in terms of treatment decision support, possibly in the form of knowledge banks, as recently reported by Gerstung et al.49 They used a data-mining approach comparing different statistical models for outcome prediction with respect to matched genomic and clinical data of 1,540 patients. Gerstung et al. 49 reported that models including a larger variety of relevant data are able to predict patients’ outcome more precisely than done so by restricted models such as the ELN 2017 classification.17 We concur that predictive models incorporating a wide variety of available data from multiple sources for an individual patient may potentially provide a more detailed outlook on the outcome of that particular patient. However, a lack of clinical variables reduces the transferability of ML models based solely on genomic data sets to everyday clinical use as in-depth genetic sequencing is often either not available or not implemented in routine diagnostics. Our approach, however, utilizes both commonly available clinical variables as well as genetic events that can easily be extracted by commercial next-generation sequencing panels encompassing the most commonly mutated genes in AML. Furthermore, our approach was trained and tested on a large multicenter data set and validated on multicenter external data showing high accuracy in identifying patients at risk of primary treatment failure after intensive induction regimens. In such patients, in whom intensive therapy likely does more harm than good, novel regimens with less toxicity can be used, such as the combination of venetoclax and azacitidine for older patients with newly diagnosed AML.50
A limitation of our approach, however, is its retrospective nature. Many recent efforts of ML in hematology, including our study, are based on historic data sets.11 Another limitation of our study is the unavailability of data on measurable residual disease. Assessment of measurable residual disease has become increasingly important in treatment surveillance in AML.51 All of the patients in our study were treated with conventional chemotherapy regimens, except a minority of patients from the SORAML
Haematologica | 108 March 2023 701 ARTICLE - Machine learning predicts CR and OS in AML J-N. Eckardt et al.
study who were additionally treated with sorafenib. However, according to the original report, sorafenib did not affect CR rate or OS.15 Future work will address the ability of ML to predict response to novel treatment regimens, measurable residual disease as well as prospective validation and the implementation of CR prediction for the individual patient at initial diagnosis, ideally including data for a variety of targeted therapies. ML performance is known to scale with sample size and a challenge will be the transfer to smaller data sets as data from trials with targeted therapies emerge. As another limitation of our approach, estimation of OS was confined to a binary classification after dichotomization of the cohort of patients into those who survived longer than 2 years and those who died within 2 years after initial diagnosis. The F1 scores for OS prediction were lower than those for CR prediction. This is arguably a result of the dichotomization of OS and consequent loss of longitudinal information regarding different survival times. Future work will focus on the implementation of longitudinal ML regression models for a more precise estimation of survival times. In order to be implemented into clinical practice, such ML models must be easily accessible by practicing clinicians, build on commonly available data and should be cost-effective while providing accurate and robust prediction results to guide therapeutic strategies. An important goal of our work from a technological perspective was the transferability of our ML pipeline to other cases as most parts of the pipeline are automated and can, potentially, be used for other use cases after adequate data pre-processing, as demonstrated in external validation. Therefore, future work will also focus on transferability of our methodology to other cancer entities which is advantageous over more static conventional statistical approaches that are designed for a specific data set. Incorporating nine ML classifiers instead of one into the pipeline acknowledges that one classifier may be better suited for one use case while another may be superior in a different use case. This is especially evident in the direct comparison of performance between the internal test set and external validation cohort. for example in CR prediction for which the best performing algorithms in internal testing were random forest, logistic regression and linear SVM while in external validation RBF-SVM was superior to random forest, logistic regression and linear SVM, thereby demonstrating the relevance of including more than one ML algorithm in cancer data analysis.
In summary, we evaluated nine ML models on a large multicenter data set of 1,383 intensively treated AML patients and demonstrated high accuracy for CR and OS prediction in both internal testing and external validation. We
provide a method to automatically select predictive features from different data types, cope with gaps and redundancies, apply and optimize different ML models and evaluate optimal configurations in a scalable and reusable ML platform. In a proof-of-concept manner, our algorithms utilize both established markers of favorable or adverse risk and also provide further evidence for the roles of U2AF1, IKZF1, SF3B1, DNMT3A and bZIP mutations of CEBPA in AML risk prediction. Our study serves as a fundament for prospective validation and data-driven ML-guided risk assessment in AML at initial diagnosis for the individual patient.
Disclosures
CT is chief executive officer and co-owner of AgenDix GmbH, a company that performs molecular diagnostics. The other authors declare that they have no competing financial interests.
Contributions
J-NE, KW and JMM designed the study. SS, J-AG, and CT performed molecular analyses. J-NE, CR, KM, MK, KS, UK, JB, DG, CMS, BW, TH, WB, WH, FK, JS, UP, CM-T, TS, HS, CB, KSE, MK, SK, MHänel, CS, MHanoun, CT, MB, and JMM provided patients’ samples. J-NE, PH, and KW developed and implemented the machine learning framework. All authors analyzed and interpreted the data. J-NE wrote the draft. All authors provided important scientific insights, critically revised and edited the manuscript. All authors approved the final version of the manuscript.
Acknowledgments
The authors would like to thank all contributing physicians, laboratories and nurses associated with the German Study Alliance Leukemia and especially participating patients for their valuable contributions. The Else-Kroener-Fresenius Center for Digital Health (EKFZ) is acknowledged for supporting the AI initiative at the Medical Faculty of the Technical University Dresden.
Funding
This work was supported by a MeDDrive grant, number 60499 ‘Machine learning for advanced integrated diagnostics in hematological malignancies’ to JMM from the Technical University Dresden. J-NE is grateful for research support via a scholarship from the Mildred-Scheel-Nachwuchszentrum (German Cancer Aid).
Data-sharing statement
Data are available from the corresponding author upon reasonable request.
Haematologica | 108 March 2023 702 ARTICLE - Machine learning predicts CR and OS in AML J-N. Eckardt et al.
References
1. Shallis RM, Wang R, Davidoff A, Ma X, Zeidan AM. Epidemiology of acute myeloid leukemia: recent progress and enduring challenges. Blood Rev. 2019;36:70-87.
2. Walter RB, Kantarjian HM, Huang X, et al. Effect of complete remission and responses less than complete remission on survival in acute myeloid leukemia: a combined Eastern Cooperative Oncology Group, Southwest Oncology Group, and M. D. Anderson Cancer Center study. J Clin Oncol. 2010;28(10):1766-1771.
3. Koreth J, Schlenk R, Kopecky KJ, et al. Allogeneic stem cell transplantation for acute myeloid leukemia in first complete remission: systematic review and meta-analysis of prospective clinical trials. JAMA. 2009;301(22):2349-2361.
4. Bose P, Vachhani P, Cortes JE. Treatment of relapsed/refractory acute myeloid leukemia. Curr Treat Options Oncol 2017;18(3):17.
5. Appelbaum FR, Gundacker H, Head DR, et al. Age and acute myeloid leukemia. Blood. 2006;107(9):3481-3485.
6. Farag SS, Archer KJ, Mrózek K, et al. Pretreatment cytogenetics add to other prognostic factors predicting complete remission and long-term outcome in patients 60 years of age or older with acute myeloid leukemia: results from Cancer and Leukemia Group B 8461. Blood. 2006;108(1):63-73.
7. Walter RB, Othus M, Burnett AK, et al. Resistance prediction in AML: analysis of 4,601 patients from MRC/NCRI, HOVON/SAKK, SWOG, and MD Anderson Cancer Center. Leukemia. 2015;29(2):312-320.
8. Harrell FE, Lee KL, Mark DB. Multivariable prognostic models: issues in developing models, evaluating assumptions and adequacy, and measuring and reducing errors. Stat Med. 1996;15(4):361-387.
9. Alpaydin E. Introduction to Machine Learning. MIT Press; 2020. 709 p.
10. Bishop C. Pattern Recognition and Machine Learning. New York: Springer-Verlag.
11. Eckardt J-N, Bornhäuser M, Wendt K, Middeke JM. Application of machine learning in the management of acute myeloid leukemia: current practice and future prospects. Blood Adv. 2020;4(23):6077-6085.
12. Röllig C, Thiede C, Gramatzki M, et al. A novel prognostic model in elderly patients with acute myeloid leukemia: results of 909 patients entered into the prospective AML96 trial. Blood. 2010;116(6):971-978.
13. Schaich M, Parmentier S, Kramer M, et al. High-dose cytarabine consolidation with or without additional amsacrine and mitoxantrone in acute myeloid leukemia: results of the prospective randomized AML2003 trial. J Clin Oncol. 2013;31(17):2094-2102.
14. Röllig C, Kramer M, Gabrecht M, et al. Intermediate-dose cytarabine plus mitoxantrone versus standard-dose cytarabine plus daunorubicin for acute myeloid leukemia in elderly patients. Ann Oncol. 2018;29(4):973-978.
15. Röllig C, Serve H, Hüttmann A, et al. Addition of sorafenib versus placebo to standard therapy in patients aged 60 years or younger with newly diagnosed acute myeloid leukaemia (SORAML): a multicentre, phase 2, randomised controlled trial. Lancet Oncol. 2015;16(16):1691-1699.
16. Arber DA, Orazi A, Hasserjian R, et al. The 2016 revision to the World Health Organization classification of myeloid neoplasms and acute leukemia. Blood. 2016;127(20):2391-2405.
17. Döhner H, Estey E, Grimwade D, et al. Diagnosis and management of AML in adults: 2017 ELN recommendations from
an international expert panel. Blood. 2017;129(4):424-447.
18. Stasik S, Schuster C, Ortlepp C, et al. An optimized targeted next-generation sequencing approach for sensitive detection of single nucleotide variants. Biomol Detect Quantif. 2018;15:6-12.
19. Metzeler KH, Herold T, Rothenberg-Thurley M, et al. Spectrum and prognostic relevance of driver gene mutations in acute myeloid leukemia. Blood. 2016;128(5):686-698.
20. Montalban-Bravo G, Kanagal-Shamanna R, Class CA, et al. Outcomes of acute myeloid leukemia with myelodysplasia related changes depend on diagnostic criteria and therapy. Am J Hematol. 2020;95(6):612-622.
21. Zhang X, Zhang X, Li X, et al. The specific distribution pattern of IKZF1 mutation in acute myeloid leukemia. J Hematol Oncol. 2020;13(1):140.
22. Hunter AM, Sallman DA. Current status and new treatment approaches in TP53 mutated AML. Best Pract Res Clin Haematol. 2019;32(2):134-144.
23. Middeke JM, Herold S, Rücker-Braun E, et al. TP53 mutation in patients with high-risk acute myeloid leukaemia treated with allogeneic haematopoietic stem cell transplantation. Br J Haematol. 2016;172(6):914-922.
24. Gaidzik VI, Bullinger L, Schlenk RF, et al. RUNX1 mutations in acute myeloid leukemia: results from a comprehensive genetic and clinical analysis from the AML Study Group. J Clin Oncol. 2011;29(10):1364-1372.
25. Pratcorona M, Abbas S, Sanders MA, et al. Acquired mutations in ASXL1 in acute myeloid leukemia: prevalence and prognostic value. Haematologica. 2012;97(3):388-392.
26. Swerdlow SH, Campo E, Pileri SA, et al. The 2016 revision of the World Health Organization classification of lymphoid neoplasms. Blood. 2016;127(20):2375-2390.
27. Falini B, Brunetti L, Sportoletti P, Martelli MP. NPM1-mutated acute myeloid leukemia: from bench to bedside. Blood. 2020;136(15):1707-1721.
28. Falini B, Martelli MP, Bolli N, et al. Acute myeloid leukemia with mutated nucleophosmin (NPM1): is it a distinct entity? Blood. 2011;117(4):1109-1120.
29. Thiede C, Koch S, Creutzig E, et al. Prevalence and prognostic impact of NPM1 mutations in 1485 adult patients with acute myeloid leukemia (AML). Blood. 2006;107(10):4011-4020.
30. Taskesen E, Bullinger L, Corbacioglu A, et al. Prognostic impact, concurrent genetic mutations, and gene expression features of AML with CEBPA mutations in a cohort of 1182 cytogenetically normal AML patients: further evidence for CEBPA double mutant AML as a distinctive disease entity. Blood. 2011;117(8):2469-2475.
31. Gale RE, Green C, Allen C, et al. The impact of FLT3 internal tandem duplication mutant level, number, size, and interaction with NPM1 mutations in a large cohort of young adult patients with acute myeloid leukemia. Blood. 2008;111(5):2776-2784.
32. Thiede C, Steudel C, Mohr B, et al. Analysis of FLT3-activating mutations in 979 patients with acute myelogenous leukemia: association with FAB subtypes and identification of subgroups with poor prognosis. Blood. 2002;99(12):4326-4335.
33. Cazzola M. Myelodysplastic syndromes. N Engl J Med. 2020;383(14):1358-1374.
34. Papaemmanuil E, Gerstung M, Bullinger L, et al. Genomic classification and prognosis in acute myeloid leukemia. N Engl J Med. 2016;374(23):2209-2221.
35. Vairy S, Tran TH. IKZF1 alterations in acute lymphoblastic leukemia: the good, the bad and the ugly. Blood Rev. 2020;44:100677.
Haematologica | 108 March 2023 703 ARTICLE - Machine learning predicts CR and OS in AML J-N. Eckardt et al.
36. Ley TJ, Ding L, Walter MJ, et al. DNMT3A mutations in acute myeloid leukemia. N Engl J Med. 2010;363(25):2424-2433.
37. Patel JP, Gönen M, Figueroa ME, et al. Prognostic relevance of integrated genetic profiling in acute myeloid leukemia. N Engl J Med. 2012;366(12):1079-1089.
38. Yang L, Rau R, Goodell MA. DNMT3A in haematological malignancies. Nat Rev Cancer. 2015;15(3):152-165.
39. Tarlock K, Lamble A, Wang J, et al. CEBPA bZip mutations are associated with favorable prognosis in de novo AML: a report from the Children’s Oncology Group. Blood. 2021;138(13):1137-1147.
40. Taube F, Georgi JA, Kramer M, et al. CEBPA mutations in 4708 patients with acute myeloid leukemia - differential impact of bZIP and TAD mutations on outcome. Blood. 2022;139(1):87-103.
41. Marimont RB, Shapiro MB. Nearest neighbour searches and the curse of dimensionality. IMA J Appl Math. 1979;24(1):59-70.
42. Schiffer CA, Lee EJ, Tomiyasu T, Wiernik PH, Testa JR. Prognostic impact of cytogenetic abnormalities in patients with de novo acute nonlymphocytic leukemia. Blood. 1989;73(1):263-270.
43. Dastugue N, Payen C, Lafage-Pochitaloff M, et al. Prognostic significance of karyotype in de novo adult acute myeloid leukemia. The BGMT group. Leukemia. 1995;9(9):1491-1498.
44. Kantarjian H, O’Brien S, Cortes J, et al. Results of intensive chemotherapy in 998 patients age 65 years or older with acute
myeloid leukemia or high-risk myelodysplastic syndrome: predictive prognostic models for outcome. Cancer. 2006;106(5):1090-1098.
45. Krug U, Röllig C, Koschmieder A, et al. Complete remission and early death after intensive chemotherapy in patients aged 60 years or older with acute myeloid leukaemia: a web-based application for prediction of outcomes. Lancet. 2010;376(9757):2000-2008.
46. Gal O, Auslander N, Fan Y, Meerzaman D. Predicting complete remission of acute myeloid leukemia: machine learning applied to gene expression. Cancer Inform. 2019;18:1176935119835544.
47. Noren DP, Long BL, Norel R, et al. A crowdsourcing approach to developing and assessing prediction algorithms for AML prognosis. PLOS Comput Biol. 2016;12(6):e1004890.
48. Walter RB, Estey EH. Selection of initial therapy for newlydiagnosed adult acute myeloid leukemia: limitations of predictive models. Blood Rev. 2020;44:100679.
49. Gerstung M, Papaemmanuil E, Martincorena I, et al. Precision oncology for acute myeloid leukemia using a knowledge bank approach. Nat Genet. 2017;49(3):332-340.
50. DiNardo CD, Jonas BA, Pullarkat V, et al. Azacitidine and venetoclax in previously untreated acute myeloid leukemia. N Engl J Med. 2020;383(7):617-629.
51. Voso MT, Ottone T, Lavorgna S, et al. MRD in AML: the role of new techniques. Front Oncol. 2019;9:655.
Haematologica | 108 March 2023 704 ARTICLE - Machine learning predicts CR and OS in AML J-N. Eckardt et al.
A phase Ib trial of mivavotinib (TAK-659), a dual SYK/FLT3 inhibitor, in patients with relapsed/refractory acute myeloid leukemia
Correspondence: M. Levis levisma@jhmi.edu
Received: April 27, 2022.
Accepted: October 5, 2022.

Early view: October 13, 2022.
1Abramson Cancer Center of the University of Pennsylvania, Philadelphia, PA; 2Robert H. Lurie Comprehensive Cancer Center of Northwestern University, Chicago, IL; 3Baylor University Medical Center, Dallas, TX; 4University of Michigan Rogel Cancer Center, Ann Arbor, MI; 5Duke University School of Medicine, Durham, NC; 6University of Cincinnati Cancer Center, Cincinnati, OH; 7Weill Cornell Medical College, New York, NY; 8Winship Cancer Institute of Emory University, Atlanta, GA; 9Sidney Kimmel Comprehensive Cancer Center, Johns Hopkins University, Baltimore, MD and 10Takeda Development Center Americas Inc. (TDCA), Cambridge, MA, USA
Abstract
https://doi.org/10.3324/haematol.2022.281216
©2023 Ferrata Storti Foundation
Published under a CC BY license
Mivavotinib (TAK-659) is an investigational type 1 tyrosine kinase inhibitor with dual activity against spleen tyrosine kinase (SYK) and FMS-like tyrosine kinase 3 (FLT3). We conducted a phase Ib study to investigate the safety, tolerability, and efficacy of mivavotinib in patients with refractory and/or relapsed (R/R) acute myeloid leukemia (AML). Both daily (QD) and twice daily (BID) dosing regimens were evaluated. A total of 43 patients were enrolled, and there were 5 complete responses (4 with incomplete count recovery). In the QD dosing regimen, the maximum tolerated dose (MTD) was not reached up to 160 mg QD per protocol; 140 mg QD was identified as the recommended phase II dose. In the BID dosing regimen, the MTD was 60 mg BID. Thirty patients (70%) experienced a bleeding event on study; the majority were grades 1 or 2, were resolved without mivavotinib modification, and were not considered related to study treatment. Eleven patients (26%) experienced grade ≥3 bleeding events, which were observed most frequently with the 80 mg BID dose. We conducted platelet aggregation studies to investigate the potential role of mivavotinib-mediated SYK inhibition on platelet function. The bleeding events observed may have been the result of several confounding factors, including AML disease status, associated thrombocytopenia, and high doses of mivavotinib. Overall, these findings indicate that the activity of mivavotinib in R/R AML is modest. Furthermore, any future clinical investigation of this agent should be undertaken with caution, particularly in thrombocytopenic patients, due to the potential bleeding risk of SYK inhibition. ClinicalTrials.gov: NCT02323113.
Introduction
Acute myeloid leukemia (AML) is a genetically heterogenous hematologic malignancy that arises from the sequential development of key mutations within hematopoietic stem/progenitor cells.1 Most patients with AML are >60 years of age, and overall prognosis is poor. Although standard-of-care treatment remained almost unchanged for decades, several new agents have recently been approved. Most new therapies are molecularly targeted and are either approved for, or most effective in, genetically-defined AML subtypes.
FMS-like tyrosine kinase 3 (FLT3) is a receptor tyrosine kinase which is important for hematopoiesis; it is expressed
on blasts in most cases of AML.2 Internal tandem duplication (ITD) mutations of FLT3 are among the most common mutations found in AML and are associated with a poor prognosis. Additional activating mutations are found in the tyrosine kinase domain (TKD) and at non-canonical sites.3 Sustained in vivo inhibition of FLT3 is necessary to achieve clinical benefit with this targeted approach.4,5 Two type I tyrosine kinase inhibitors, midostaurin and gilteritinib, have been approved for the treatment of newly diagnosed and relapsed/refractory (R/R) FLT3-mutated AML, respectively.6,7 Gilteritinib has single-agent activity in R/R AML, although most recipients ultimately succumb to the disease.7 Resistance to FLT3 inhibitors occurs through diverse mechanisms, e.g., emergence of FLT3 gatekeeper
Keith W. Pratz,1 Jason Kaplan,2 Moshe Levy,3 Dale Bixby,4 Patrick W. Burke,4 Harry Erba,5 Trisha M. Wise-Draper,6 Gail J. Roboz,7 Nikolaos Papadantonakis,8 Trivikram Rajkhowa,9 Daniela Hernandez,9 Iwona Dobler,10 Richard C. Gregory,10 Cheryl Li,10 Shining Wang,10 Kate Stumpo,10 Karuppiah Kannan,10 Harry Miao10 and Mark Levis9
Haematologica | 108 - March 2023 705 ARTICLE - Acute Myeloid Leukemia
mutations, or RAS-pathway mutations.8
Spleen tyrosine kinase (SYK) is a non-receptor tyrosine kinase crucial to the adaptive immune response.9 Pre-clinical evidence suggests SYK overexpression contributes to FLT3-ITD-mediated transformation and resistance to FLT3 inhibitors,10 suggesting that inhibition of SYK could potentiate (and possibly broaden) the clinical activity of FLT3 inhibition. In addition, data suggest SYK plays a significant role in regulating Hoxa9/Meis1-driven AML,11 encouraging its positioning as another target in the treatment of a biomarker-specific subset of AML patients.
Mivavotinib (TAK-659) is an investigational type 1 tyrosine kinase inhibitor, which binds competitively to the adenosine triphosphate-binding site of an active tyrosine kinase,12 with dual activity against SYK and FLT3.13 In a first-in-human study, mivavotinib induced clinical responses with generally manageable toxicity in patients with R/R B-cell lymphoma.14 We hypothesized that we could identify a mivavotinib dose that would result in sustained in vivo FLT3 inhibition, thereby achieving dual SYK/FLT3 inhibition in AML. This phase Ib study aimed to determine the safety, tolerability, maximum tolerated dose (MTD), and recommended phase II dose (RP2D) of mivavotinib in patients with R/R AML.
Methods
Study design
This was a phase Ib, multicenter, open-label, dose-escalation study of single agent, oral mivavotinib in patients with R/R AML. The primary objective was to determine the MTD/RP2D of mivavotinib. Secondary objectives included characterizing the pharmacokinetic (PK) profile of mivavotinib. An exploratory objective was to determine the optimal FLT3 inhibitory dosing regimen of mivavotinib. The planned phase II expansion of this study was not conducted.
Patients received oral mivavotinib, once (QD) or twice (BID) daily, in 28-day cycles until disease progression or unacceptable toxicity. The starting dose of mivavotinib was 60 mg QD, which had previously been determined to be safe and tolerable.14 QD dose escalation followed 20 mg increments; evaluation of >20 mg increments (not exceeding 100%), alternative dosing regimens, and expansion of existing dose levels for up to 12 evaluable patients, was allowed. Based on ex vivo plasma inhibitory activity (PIA) assay data suggesting non-sustained 90% FLT3 inhibition in vivo with QD dosing, patients were also enrolled to receive mivavotinib BID at a starting dose of 80 mg, followed by a group of patients who received 60 mg BID. Dose escalation was to continue in a 3+3 design until the MTD was reached, or the RP2D if different from the MTD. Patients were followed for 28 days after the last mivavotinib
dose, or until initiation of subsequent anticancer therapy, whichever occurred first.
The MTD was determined based on dose-limiting toxicities (DLT) defined as any of the adverse events (AE) listed in the Online Supplementary Appendix occurring in Cycle 1 and considered by the investigator to be at least possibly related to mivavotinib.
This study was conducted in compliance with the principles of the Declaration of Helsinki, Good Clinical Practice standards, applicable regulatory requirements, and the International Conference on Harmonization guidelines. It was approved by the institutional review boards (IRB) and/or independent ethics committees (IEC). All patients provided informed consent.
Study population
Patients ≥18 years with histologically confirmed primary/secondary AML who were unlikely to benefit from standard therapies or who refused standard treatment were enrolled. Eligibility criteria are detailed in the Online Supplementary Appendix.
Assessments
Response was evaluated using the Revised Recommendations of the International Working Group for AML.15 Modifications to these response criteria are defined in the Online Supplementary Appendix. Bone marrow biopsies and/or aspirates for disease response monitoring were performed at screening, at the end of Cycles 1, 2, and 4, and as clinically indicated beyond Cycle 4. AE were graded according to the National Cancer Institute Common Terminology Criteria for Adverse Events, version 4.03. Pharmacokinetic and pharmacodynamic methods and statistical analyses are described in the Online Supplementary Appendix
Results
Patients' characteristics and treatment
Between April 2015 and March 2018, 43 patients were enrolled and received ≥1 dose of mivavotinib (60 mg QD, n=4; 100 mg QD, n=7; 120 mg QD, n=4; 140 mg QD, n=5; 160 mg QD, n= 9; 80 mg BID, n= 6; 60 mg BID n=8). In general, patients were heavily pre-treated, and 70% had a poor risk status according to the European LeukemiaNet classification (assessed locally) (Table 1).1 During trial design, next-generation sequencing was generally unavailable, and data were not available for most patients. Median age was 65 years; 74% of patients were White, most (84%) had received intensive therapy, and 7 (16%) had received treatment with an FLT3 inhibitor. Fifty-one percent of patients had centrally assessed FLT3 mutation at enrollment (56% as assessed locally); 6 (14%) patients had NPM-1 co-mu-
Haematologica | 108 March 2023 706 ARTICLE - Mivavotinib (TAK-659) in AML K.W. Pratz et al.
tation (Table 1). At data cutoff, all patients had discontinued treatment due to AE or disease progression.
Dose-limiting toxicities and maximum tolerated dose determination
Thirty-four patients were evaluable for MTD determination (completed ≥75% of planned dosing in Cycle 1 and/or experienced a DLT). In the QD cohort, the DLT at 160 mg QD was associated with asymptomatic increase in amylase (grade 3) and lipase (grade 4) in one patient. Among 9 patients receiving 160 mg QD, 4 could not complete the DLT period: one died of infection/progressive disease (PD), 2 died of hemorrhagic events assessed as unrelated to mivavotinib, and another experienced a DLT. Since only one DLT was reported, the MTD was not reached per protocol. However, based on consensus from the study investigators that 160 mg QD was not well tolerated (due to grade 2 AE, such as increased transaminase and amylase/lipase), it was decided that doses above this should not be investigated. The RP2D was, therefore, determined to be 140 mg QD, supported by clinical efficacy (the first QD dose at which an objective response was observed), initial evidence of at least 90% FLT3 inhibition by Cycle 1 day 15, and no DLT or grade 2 AE.
In the 80 mg BID cohort, one of 3 patients experienced gastrointestinal (GI) bleeding (grade 3) as a DLT, and the cohort was expanded to 3 additional patients. Of these, one experienced asymptomatic increase in amylase (grade 3) and lipase (grade 4) as DLT, and another experienced both a GI bleed (grade 3) and a grade 5 intracranial hemorrhage (assessed as unrelated to treatment by the investigator). Therefore, this dose was considered to be above the MTD.
For the final cohort, 8 patients were treated at 60 mg BID. While no DLT were identified in the first 3 patients, the sponsor and investigators agreed to further expand the dose level to gather additional safety and efficacy data. No episodes of DLT were observed, and this dose level was determined to be the BID MTD.
Treatment exposure and safety
All 43 patients were evaluable for safety (having received ≥1 mivavotinib dose). The median number of mivavotinib cycles was 2.0 for both the QD and BID regimens (QD range, 1-11; BID range, 1-6); 23% of patients received ≥4 treatment cycles and the median duration of treatment was 7.9 weeks (range, 1-44) QD versus 4.6 weeks (range, 2-22) BID.
All patients (100%) experienced ≥1 treatment-emergent adverse event (TEAE); 36 patients (84%) experienced ≥1 TEAE that was assessed by the investigator as related to mivavotinib. The most frequently reported TEAE were febrile neutropenia (60%), increased aspartate aminotransferase (AST) (51%), diarrhea (40% [generally grade 1 or 2]),
Table 1. Baseline demographics and disease characteristics.
Patients (N=43)
increased amylase (37%), fatigue (35%), increased alanine aminotransferase (ALT) (33%), and increased lipase (33%) (Table 2). Increased enzyme levels were generally asymptomatic and consistent with previous observations.14 Dose interruptions for these events were infrequent.
The overall frequencies of grade ≥3 TEAE and drug-related grade ≥3 TEAE were 98% and 49%, respectively. The most frequent grade ≥3 AE were febrile neutropenia (56%), anemia (28%), increased amylase (21%), increased lipase (21%), and a drop in platelet count (21%). Overall, 41 paMedian age, years (range) 65 (25-86) Male, N (%) 23 (53) ECOG PS, N (%) 0 7 (16) 1 35 (81) Not done 1 (2) Risk status,* N (%) Favorable 1 (2) Intermediate 7 (16) Poor 30 (70) Unknown 5 (12) Mutation status, N (%) FLT3-WT 13 (30) FLT3-ITD 12 (28) FLT3-TKD 6 (14) FLT3-ITD/TKD 4 (9) Previous therapy, N (%) Intensive† 36 (84) Non-intensive‡ 6 (14) Unknown 1 (2) N lines of previous therapy, median (range) 3 (1-8) Prior allogeneic transplant, N (%) 7 (16) Prior FLT3 inhibitor, N (%) 7 (16)§ Co-mutations, N (%) NPM1 6 (14) IDH1 2 (5) IDH2 2 (5) DNMT3A 2 (5) Other gene 12 (28)
Haematologica | 108 March 2023 707 ARTICLE - Mivavotinib (TAK-659) in AML K.W. Pratz et al.
*Risk status conforms to the European LeukemiaNet classification system but confined to karyotype only because next-generation sequencing results were not available. †Intensive previous therapy defined as any patient who received 7+3, high-dose chemotherapy and/or allogeneic transplant ± azacitidine or dacogen. ‡Nonintensive previous therapy defined as any patient who received azacitadine only, dacogen only, or both. §Seven patients had prior exposure to other FLT3 inhibitors including sorafenib (N=5), midostaurin (N=1), and both sorafenib and midostaurin (N=1). N: number; ECOG PS: Eastern Cooperative Oncology Group performance status; FLT3: FMS-like tyrosine kinase 3; ITD: internal tandem duplication; TKD: tyrosine kinase domain; WT: wild-type.
*A treatment-emergent adverse event (TEAE) was defined as any adverse event occurring on or after day 1 of Cycle 1 of treatment with mivavotinib. N: number; ALT: alanine aminotransferase; AST: aspartate aminotransferase.
tients (95%) experienced a serious AE (SAE); SAE were drug-related in 12 patients (28%). The most frequent drugrelated SAE was gastric hemorrhage, which occurred in 3 patients (7%) who received 80 mg BID. Thirty of 43 patients (70%) experienced a bleeding event while on study (Figure 1; Online Supplementary Table S1); only epistaxis occurred with a frequency to be included within the TEAE threshold of >20% of patients (low-grade events, common in patients with AML) (Table 2). The majority were grades 1 or 2, resolved without mivavotinib dose modification and were not considered at the time as being related to mivavotinib. Eleven patients (26%) experienced grade ≥3 bleeding events that were most frequently observed at 80 mg BID (Table 3), which is consistent with this dose surpassing the MTD. Thirteen patients experienced bleeding involving the GI tract: 7 patients had events that were considered grade ≥3 (100 mg QD, n=1; 120 mg QD, n=1; 140 mg QD, n=1; 160 mg QD, n=1; 80 mg BID, n=3), and some patients experienced recurrent events. Seven patients experienced intracranial bleeding, 4 of which were considered grade ≥3. Median platelet count of patients with any bleeding event on the study day preceding the event was 25x109/L (range, 5-375.3x10⁹/L) compared with a median platelet count 32x109/L (range,
3-375x109/L) of all patients at any given time. The median day of occurrence of all bleeding events was day 22 (range, -1 to 262).
Twenty-nine patients (67%) discontinued mivavotinib due to a TEAE. Hemorrhagic events were the most common, with 9 patients having a GI-related or central nervous system-related bleeding event leading to study discontinuation (60 mg QD, n=1; 140 mg QD, n=2; 160 mg QD, n=2; 80 mg BID, n=4). Of these, 5 were considered related to treatment with mivavotinib: grade 4 GI hemorrhage (140 mg QD, n=1); grade 3 GI hemorrhage (160 mg QD, n=1); grade 3 gastric hemorrhage, grade 3 subdural hematoma, and grade 3 gastric hemorrhage (80 mg BID, n=3).
There were 26 on-study deaths (any death occurring after informed consent and ≤28 days after the last dose of mivavotinib), one of which was considered related to mivavotinib (multi-organ failure). Other causes of death included progression of AML (n=11), cardiac arrest/failure (n=5), infection (n=3), neutropenia (n=1), pulmonary edema (n=1), respiratory failure (n=1), gastric hemorrhage (n=1), intracranial hemorrhage (n=1), and not speci
Pharmacokinetics and pharmacodynamics
Following 60-160 mg QD or 60-80 mg BID, mivavotinib was
fied (n=1).
Preferred term Grade 1 or 2 N (%) Grade ≥3 N (%) Overall total N (%) Patients with any TEAE* 43 (100) Febrile neutropenia 2 (4) 24 (56) 26 (60) Increased AST 14 (32) 8 (19) 22 (51) Diarrhea 17 (40) - 17 (40) Increased amylase 7 (16) 9 (21) 16 (37) Fatigue 11 (26) 4 (9) 15 (35) Increased ALT 11 (26) 3 (7) 14 (33) Increased lipase 5 (12) 9 (21) 14 (33) Headache 13 (30) - 13 (30) Anemia - 12 (28) 12 (28) Petechiae 12 (28) - 12 (28) Nausea 10 (23) 1 (2) 11 (26) Pyrexia 9 (21) 2 (5) 11 (26) Hypophosphatemia 4 (10) 7 (16) 11 (26) Epistaxis 11 (26) - 11 (26) Dizziness 11 (26) - 11 (26) Cough 10 (23) - 10 (23) Stomatitis 6 (14) 3 (7) 9 (21) Chills 9 (21) - 9 (21) Drop in platelet count - 9 (21) 9 (21) Hypocalcemia 7 (16) 2 (5) 9 (21)
Table 2. Treatment-emergent adverse events occurring in >20% of all patients.
Haematologica | 108 March 2023 708 ARTICLE - Mivavotinib (TAK-659) in AML K.W. Pratz et al.
rapidly absorbed with a median tmax of 1-3 hours and a geometric mean Cmax of 74-322 ng/mL. Plasma exposure of mivavotinib was generally dose proportional in the dose ranges studied (Figure 2A, B). Following BID dosing, the pre-dose concentrations of mivavotinib on Cycle 1 day 15 were slightly higher than the pre-dose concentration following QD dosing across the dose groups, suggesting a slightly higher accumulation in Ctrough with BID dosing. Mivavotinib was specifically developed as an inhibitor of SYK, with a half maximal inhibitory concentration (IC50) of 2-3.2 nM (0.7-1.1 ng/mL) in kinase assays.13 The evaluation of additional kinases revealed that mivavotinib had activity against FLT3 isoforms ranging from 4.6-22 nM (1.6-7.6 ng/mL). In the previously published study of mivavotinib in lymphoma patients (where the target was SYK), the dose identified for expansion was 100 mg QD.14 A large body of data on FLT3 inhibition has established that responses in AML patients with FLT3 activating mutations correlate with sustained inhibition of pFLT3 to 15% of
baseline (and preferably even lower).15,16-19 Using Molm14 cells (a human AML cell line which expresses an FLT3-ITD mutation20) incubated in human plasma spiked with increasing concentrations of mivavotinib, we determined the IC50 of mivavotinib in plasma against FLT3-ITD to be approximately 80 nM (27.6 ng/mL) (Figure 2C). From this dose-response curve, we estimated that the target mean trough concentration in patient plasma for optimal efficacy against FLT3-mutant AML with >85% suppression of FLT3-ITD signaling would be approximately 400-500 nM (137.8-172.2 ng/mL). Steady state trough samples taken from trial participants on day 15 of Cycle 1 prior to mivavotinib administration were analyzed for mivavotinib concentrations (Figure 2D). A dose of 80 mg BID came closest to achieving this mean target concentration.
We used a plasma inhibitory activity (PIA) assay for FLT3 to estimate the degree of in vivo FLT3 inhibition in patients dosed with mivavotinib. This is a well-established assay that has been used in the development of other FLT3 in-

Haematologica | 108 March 2023 709 ARTICLE - Mivavotinib (TAK-659) in AML K.W. Pratz et al.
Figure 1. Number of hemorrhagic events on study (grade 1 or 2 and grade ≥3). AE: adverse event.
hibitors.4 Plasma samples are collected at trough time points from patients taking the inhibitor long enough to achieve steady state exposure. An FLT3-ITD-expressing cell line is incubated in the plasma, and the degree of FLT3 inhibition observed relative to control or baseline plasma is quantified.21 For other FLT3 inhibitors, the assay correlates well with the degree of inhibition achieved in leukemic blasts circulating in the patient, and this appears to be the case for mivavotinib. The degree of FLT3 inhibition observed in the PIA assay for trial participants generally matched PK data (Figure 3A).
During the study, it was evident from selected PIA analysis at trough time points that sustained in vivo FLT3 inhibition was achieved after BID dosing when compared to QD dosing with the same amount of total daily dose. The results are consistent with an expected higher steady state trough concentration after BID dosing, while the total daily drug exposure remained unchanged compared with QD dosing (Figure 3B). In accordance with the PK data, 80 mg BID resulted in the most effective FLT3 inhibition.
Efficacy
Thirty-three patients (76.7%) were evaluable for response. Five patients had complete responses (4 with incomplete count recovery, one complete response; overall rate, 15%), 19 had stable disease, 5 had PD, and 4 had clinical benefit despite PD. Response was first observed at the 140 mg QD dose, with 2 subsequent responses at the 160 mg QD dose, and one in each of the 60 mg and 80 mg BID cohorts. One responding patient had prior exposure to an
FLT3 inhibitor (sorafenib/midostaurin). Responses were primarily observed in patients with an FLT3-ITD mutation based on central testing. Results for two responding patients had unquantifiable FLT3-ITD, so the true mutation status of these patients is unknown. (Local results reported the FLT3 status as wild-type [WT] in one patient and unknown in the other). No responding patients had FLT3-WT or FLT3-TKD mutations according to central testing. One responding patient had an NPM1 mutation (NPM1 mutation status was unavailable for most patients, including the remaining 4 responders). Of 19 patients with FLT3 mutations who were treated at 120, 140, or 160 mg QD or BID, 3 had objective responses with incomplete count recovery (CRi) and 13 experienced a reduction in marrow blast percentage (range, 22.5-98.6%).
Additional antileukemic activity was observed in 21 of 33 patients with a ≥50% reduction in peripheral blast count from baseline across all dose levels, including 12 of 21 with QD dosing and 9 of 12 with BID dosing. These peripheral blast reductions included both FLT3-WT and FLT3-mutated patients. These findings are similar to those in midostaurin monotherapy, which has been shown to frequently reduce peripheral blood blast counts in FLT3WT and FLT3-mutated patients, but which has a more limited influence on bone marrow blast reductions and clinical response.22
The duration of therapy, with responses and reasons for discontinuing mivavotinib are shown in Figure 4A. Further details of patients who responded to treatment are provided in the Online Supplementary Appendix.
Hemorrhagic event, N (%) 60 mg QD N=4 100 mg QD N=7 120 mg QD N=4 140 mg QD N=5 160 mg QD N=9 60 mg BID N=8 80 mg BID N=6 Total N=43 Patients with grade ≥3 bleeding 1 (25) 2 (29) 1 (25) 1 (20) 2 (22) 0 4 (67) 11 (26) Gastric hemorrhage - - - - - - 3 (50) 3 (7) Subdural hematoma 1 (25) - - - 1 (11) - 1 (17) 3 (7) Gastrointestinal hemorrhage - - - 1 (20) 1 (11) - - 2 (5) Hematochezia - - 1 (25) - - - - 1 (2) Hemoptysis - - - - - - 1 (17) 1 (2) Rectal hemorrhage - - - - - - 1 (17) 1 (2) Hemorrhagic diarrhea - 1 (14) - - - - - 1 (2) Hemarthrosis - 1 (14) - - - - - 1 (2) Hematemesis - - - - - - 1 (17) 1 (2) Intracranial hemorrhage - - - - - - 1 (17) 1 (2) Lower gastrointestinal hemorrhage - 1 (14) - - - - - 1 (2) Upper gastrointestinal hemorrhage - - - - 1 (11) - - 1 (2)
Haematologica | 108 March 2023 710 ARTICLE - Mivavotinib (TAK-659) in AML K.W. Pratz et al.
Table 3. Grade ≥3 hemorrhagic events on study according to mivavotinib dose.
N: number; BID: twice daily; QD: once daily.
Of the 33 patients evaluable for response, 19 harbored an FLT3 mutation (either ITD, TKD or both), 8 were FLT3WT, and the status of FLT3-ITD was not determined/unknown for the remaining patients. The best change in the marrow blast percentage for these 33 patients is shown in Figure 4B. The results are consistent with what might be expected of an FLT3 inhibitor, but there were also modest reductions in select patients who were FLT3-WT, or whose FLT3-ITD status was not determined/unknown.
Effect of mivavotinib on platelet aggregation
In response to the frequency of bleeding events reported, and emerging data regarding the role of SYK in platelet function, we investigated the effect of mivavotinib on human platelet aggregation. An in vitro assay was used based on the principle that human platelets in samples of platelet rich plasma will aggregate in the presence of adenosine diphosphate (10 m M) or collagen (2 m g/mL). The mean C max of 574 ng/mL mivavotinib, observed in the 140 mg QD cohort and corresponding to 1.07 mM, was used to
Figure 2. Pharmacokinetics of mivavotinib. (A) Plasma concentration-time profiles of mivavotinib in patients with acute myeloid leukemia (AML) following a single dose on Cycle 1 day 1. (B) Plasma concentration-time profiles of mivavotinib in patients with AML following a single dose on Cycle 1 day 15. (C) Dose-response experiment for inhibition of tyrosine kinase 3 (FLT3) phosphorylation by mivavotinib. Mivavotinib was spiked at the indicated concentrations into normal donor plasma. Molm-14 cells were incubated for one hour and analyzed for FLT3 phosphorylation by immunoblotting (inset) as described in the Methods. Densitometric analysis of the immunoblot is plotted on the graph, and regression analysis after linear conversion yielded an estimate of the half maximal inhibitory concentration (IC50) at 80 nM (27.6 ng/mL). The experiment was performed 3 times, and a representative blot is shown. (D) Plasma samples from trial participants were collected prior to study drug administration on day 15 of Cycle 1. Mivavotinib concentration was determined by mass spectrometry (see Online Supplementary Methods) and the concentrations for each patient are plotted according to dose level. The solid black line represents the mean concentration for that group. SD: standard deviation; QD: once daily; BID: twice daily.

Haematologica | 108 March 2023 711 ARTICLE - Mivavotinib (TAK-659) in AML K.W. Pratz et al. A B C D
select the mivavotinib concentration. Concentrations tested were 10-fold higher and lower, resulting in concentrations of 0.107, 1.07, and 10.7 mM mivavotinib. The 1.07 µM mivavotinib plasma concentration prevented aggregation caused by collagen; 10.7 mM mivavotinib prevented aggregation caused by either adenosine diphosphate (Figure 5A) or collagen (Figure 5B). Mivavotinib plasma concentrations of 1.07 mM or above may have the potential to inhibit platelet aggregation, thus making severely thrombocytopenic patients more susceptible to a hemorrhagic event. Though inhibition of platelet aggregation was not observed at the lower concentration (0.107 mM) in the in vitro assay, it does not rule out the possibility of lower doses of mivavotinib having a similar effect in this patient population.

Discussion
The primary objective of this study was to determine the MTD/RP2D of mivavotinib in patients with R/R AML who either were unlikely to achieve a durable remission from standard therapies or who declined to undergo standard treatment. The patients enrolled in the study were mainly elderly, heavily pre-treated, and with a poor risk status. Dosing was switched from QD to BID based on preliminary population PK data that suggested that trough concentration was higher with BID dosing. A higher trough concentration was anticipated to offer more consistent >90% pFLT3 inhibition, thought to be necessary for FLT3-driven efficacy. However, neither selected RP2D, 140 mg QD or 60 mg BID,
achieved a consistent or sustained 90% FLT3 inhibition. We conclude that mivavotinib has clinical activity as a dual SYK/FLT3 inhibitor. When daily doses of mivavotinib were increased to a point of FLT3 inhibition, marrow blast reduction was observed in patients with FLT3-ITD mutations, establishing its efficacy as an FLT3 inhibitor. In addition, signs of antileukemic activity were observed in patients without FLT3 mutations and without sustained 90% FLT3 inhibition, suggesting SYK inhibition. While better initial disease control was achieved in select patients at the higher mivavotinib QD and BID doses, response durations were short, and high-grade AE occurred, resulting in either dose modification or discontinuation of mivavotinib. Overall, patients received mivavotinib for a median of 6.7 weeks, with 67% discontinuing due to an AE or death. Previously developed FLT3 inhibitors have been observed to induce a reduction in marrow blasts, typically within 1-2 months of therapy. R/R AML patients treated with gilteritinib required a median of 48 days to achieve their best response.18 Therefore, mivavotinib may have induced a higher response rate if it were not for the toxicity induced at the highest dose levels, particularly the 80 mg BID regimen, which was considered above the MTD. The overall safety profile observed in AML patients was generally consistent with the known safety profile of mivavotinib; events were typically associated with underlying AML. Major hemorrhagic events occurred at a rate beyond what might be reasonably expected in this population, particularly at the highest doses of mivavotinib. This was evident based on DLT identification and following the find-
Figure 3. Pharmacodynamics of mivavotinib. (A) Plasma inhibitory activity (PIA) results plotted against mivavotinib concentrations. Plasma samples from Cycle 1 day 15 were available from 35 patients. The plasma was used for PIA analysis and pharmacokinetic (PK) analysis. PIA results, expressed as percentage of FLT3 phosphorylation relative to baseline, are plotted for each patient on the y-axis, and the concentration of mivavotinib for that same sample is plotted on the x-axis. The doseresponse curve from Figure 1A is overlaid for reference. (B) Representative immunoblots of phosphorylated FLT3 (pFLT3) from patients receiving once daily (QD) or twice daily (BID) mivavotinib, demonstrating more sustained FLT3 inhibition with twice daily dosing. Plasma samples were collected prior to study drug administration on the indicated day.
Haematologica | 108 March 2023 712 ARTICLE - Mivavotinib (TAK-659) in AML K.W. Pratz et al. A B
Figure 4. Clinical activity of mivavotinib. (A) Swimmer plot for all study participants. The number of days of each patient’s treatment is shown in individual columns. An “X” at the end of a column indicates that the study treatment ended with the death of the patient. ● Reason for discontinuation of treatment: either disease progression; a treatment-emergent adverse event (TEAE; hemorrhagic or other), in some cases followed by the death of the patient if it occurred within 30 days of stopping treatment; or ‘other’ (one patient discontinued treatment because the study drug had been withheld for a prolonged period of time due to serious adverse event [SAE]). (B) Waterfall plot for best change in marrow blast percentage for all response evaluable patients. CR: complete response; Cri: incomplete count recovery; AE: adverse event; QD: once daily; BID: twice daily; SD: stable disease; PD: progressive disease.

Haematologica | 108 March 2023 713 ARTICLE - Mivavotinib (TAK-659) in AML K.W. Pratz et al. A B
ing that the 80 mg BID dose was, in large part, not tolerated due to these events. Eleven patients had grade ≥3 bleeding events, 2 of which were fatal. Given the nature of R/R AML, it is not uncommon to encounter major and/or fatal bleeding events.23 Due to time constraints and the number of study sites, bleeding events were not evident until the data were later reviewed. After bleeding events had been reviewed, in vitro studies were undertaken to mechanistically characterize their potential relationship with mivavotinib.
This study of mivavotinib had been initiated before the effects of SYK and Bruton’s tyrosine kinase (BTK) inhibition on platelet function were known. Activated B-cell receptor signaling is carried forward by associating with transmembrane proteins containing immunoreceptor tyrosine-based activation motifs, which recruit and activate SYK. SYK then activates phospholipase Cγ2.9 This central role in signaling makes SYK an attractive target for B-cell malignancies, an approach that has been validated in clinical studies of SYK inhibitors in lymphoma and chronic lymphocytic leukemia.24-26 However, platelet collagen receptor glycoprotein VI signaling is also carried out via an immunoreceptor tyrosine-based activation motif-containing protein and SYK.27 There is now a substantial body of literature supporting the role of SYK in mediating platelet aggregation and activation, and SYK inhibitors are postulated to have the potential to induce platelet dysfunction (and, therefore, bleeding).28 BTK also regulates phospholipase C γ 2 in both B-cell and platelet signaling, and BTK inhibitors have been associated with increased bleeding risk.29,30 Our data demonstrating the effect of mivavotinib on platelet aggregation may offer an explanation for the hemorrhagic DLT and increase in bleeding events at the 80 mg BID dose level.
Mivavotinib had been previously characterized as having single-agent efficacy with an acceptable toxicity profile in B-cell lymphoma.14 An important difference between lymphoma and AML patients, however, is that AML patients often have thrombocytopenia. Patients who suffered hemorrhagic events in the present study had a median platelet count of 25x109/L, typical for a population of relapsed AML patients. Entospletinib is another SYK inhibitor with activity against FLT3 that is under investigation for AML,31 although, as far as we are aware, there have been no reports of excessive bleeding.32 We hypothesize that increasing the dose of mivavotinib in an attempt to augment FLT3 inhibition might have gone over the threshold of affecting platelet function. While it may be possible that mivavotinib inhibits platelet aggregation at high-dose levels, resulting in hemorrhagic events, several confounding factors remain. First, in addition to being severely myelosuppressed, several patients experiencing both major and non-major GI or central nervous system hemorrhagic events had either a prior history of such events, or predisposing conditions, which supports the fact that several events were not considered to be related to treatment. In addition, concomitant administration of hydroxyurea was allowed through Cycle 1, if needed, to control circulating blasts; hydroxyurea is known to affect the GI mucosa, adding another layer of complexity to the interpretation of GI bleeding events.
In pre-clinical toxicology studies of mivavotinib, healthy animals were administered mivavotinib daily by oral gavage for 14 days to 3 months. One of the consistent toxicities in rats and dogs was GI mucosal hemorrhage, which, while present at doses of ≥30 mg/kg in rats and ≥3 mg/kg in dogs, was dose limiting in dogs only at ≥10 mg/kg (3fold clinical C max exposure associated with bleeding AE). Although the impact of mivavotinib on platelet function in

A
Haematologica | 108 March 2023 714 ARTICLE - Mivavotinib (TAK-659) in AML K.W. Pratz et al. B
Figure 5. The effect of mivavotinib on human platelet aggregation driven by adenosine diphosphate or collagen. The effect of mivavotinib on human platelet aggregation driven by (A) adenosine diphosphate (ADP) (10 mM) or (B) collagen (2 mg/mL). Mivavotinib concentrations tested were 10-fold higher and lower than the Cmax of 574 ng/mL, observed in the 140 mg daily (QD) cohort (corresponding to 1.07 mM), resulting in concentrations of 0.107, 1.07 and 10.7 mM mivavotinib. Error bars are representative of the Standard Error of the Mean.
rats and dogs is not known, the presence of dose-limiting toxicity related to hemorrhage at exposures several fold higher than those at which bleeding AE were noted clinically supports a role for high doses of mivavotinib in hemorrhagic events.
Our central hypothesis for this trial, based on pre-clinical AML studies, was that SYK inhibition would potentiate the responses induced by FLT3 inhibition and possibly decrease the development of resistance. While early signs of clinical activity suggested this was possible, most patients were not on study long enough to confirm this hypothesis. Despite several confounding factors, our findings nonetheless raise important potential concerns about the general feasibility of high-dose SYK inhibition in any patient population with severe thrombocytopenia. This caution may also apply to the use of BTK inhibitors in such patients. For these reasons, any future studies of mivavotinib in AML, if they take place at all, should re-evaluate dose selection and schedule to optimize the benefit versus risk profile.
Disclosures
KWP has received consultancy fees from AbbVie, Astellas, Boston BioMedical, Bristol Myers Squibb, Novartis, Jazz Pharmaceuticals, and Celgene, and institutional research funding from AbbVie, Astellas, Agios, Daiichi Sankyo, and Millennium; JK is now employed by Ayala Pharma; ML has been a speaker/consultant for AbbVie, Amgen, AZ, Beigene, BMS, Dova, Epizyme, Gilead, GSK, Janssen, Jazz, Karyopharm, Sanofi, Seagen, Takeda, and TG Therapeutics; PB has received funding from Millennium-Takeda for a separate clinical trial; HE has received support for the work from Takeda, and support outside this work from AbbVie, Agios, Astellas, Bristol Myers Squibb, Celgene, Daiichi Sankyo, Glycomimetics, Immunogen, Incyte, Jazz, Kura Oncology, Macrogenics, Novartis, Pfizer, Servier, Syros, Takeda, and Trillium; TMW-D has received research funding from Merck & Co, BMS, Tesaro/GSK, Janssen, Isoray, AstraZeneca/MedImmune, and Caris Life Sciences, has held a consultancy role for Caris Life Sciences, Rakuten, Exicure, Shattuck Labs, and Merck & Co, holds stock/ownership for High Enroll, has received honoraria from Physician Education Resource, and travel/accommodation/expenses from Merck & Co, BMS, Bexion, AstraZeneca/MedImmune, Caris Life Sciences, Lilly, and Tesaro; GJR has held a consultancy role or has sat on the advisory board or on the Data and Safety Monitoring Committee for the following companies: Actinium, AbbVie, Agios, Amgen, Astellas, AstraZeneca, Bristol Myers Squibb, Blueprint Medicines, Bluebird Bio, Celgene, Glaxo SmithKline, Janssen, Jasper Therapeutics, Jazz, MEI Pharma (IDMC
Chair), Mesoblast, Novartis, Pfizer, Syndax, and Takeda (IRC Chair), and has received research support from Janssen; NP has sat on the advisory board and received honoraria from CTI BioPharma, and indirect research support from AbbVie, Takeda, Gilead, and Immunogen; ID, RCG, CL, SW, KS, KK, and HM are employees of Takeda; ML has received support outside this work from AbbVie, Amgen, Astellas, BristolMyers-Squibb, Daiichi-Sankyo, FujiFilm, Glaxo-Smith-Kline, and Jazz; DB, TR and DH have no conflicts of interest to disclose.
Contributions
KWP, KS, KK and ML contributed to study conception and design; KWP, JK, ML, DB, HE, GJR, NP, TR, DH, KS and ML contributed to collection and assembly of data; KWP, ML, PB, TMW-D, GJR, ID, RCG, CL, SW, KS, KK, HM and ML contributed to data analysis and interpretation; KWP, DB, PB, NP, TR, ID, SW, KS, HM, ML, GJR and DH contributed to the drafting of the manuscript; KWP, JK, ML, HE, TMW-D, RCG, CL, KK and ML contributed to writing the manuscript. All authors approved the manuscript for submission and agree to be accountable for all aspects of the work, which includes ensuring that questions related to the accuracy or integrity of any part of the work are appropriately investigated and resolved.
Acknowledgments
We thank all patients and their families, and investigators at all clinical sites for their participation in the study. We thank Ravi Peri and Francis Wolenksi for their contribution to the study.
Funding
This study is funded by Takeda Development Center Americas Inc. (TDCA). Medical writing support for the development of this manuscript, under the direction of the authors, was provided by Clair Clowes, MPhil., of Ashfield MedComms, an Ashfield Health company, funded by Takeda Pharmaceuticals U.S.A. Inc.
Data-sharing statement
Requests for de-identified datasets for the results reported in this publication will be made available to qualified researchers following submission of a methodologically sound proposal. Data will be made available for such requests following online publication of this article and for one year thereafter in compliance with applicable privacy laws, data protection, and requirements for consent and anonymization. Calithera does not share identified participant data or a data dictionary.
Haematologica | 108 March 2023 715 ARTICLE - Mivavotinib (TAK-659) in AML K.W. Pratz et al.
References
1. Dohner H, Estey E, Grimwade D, et al. Diagnosis and management of AML in adults: 2017 ELN recommendations from an international expert panel. Blood. 2017;129(4):424-447.
2. Levis M, Small D. FLT3: ITDoes matter in leukemia. Leukemia. 2003;17(9):1738-1752.
3. Ambinder AJ, Levis M. Potential targeting of FLT3 acute myeloid leukemia. Haematologica. 2021;106(3):671-681.
4. Levis M, Brown P, Smith BD, et al. Plasma inhibitory activity (PIA): a pharmacodynamic assay reveals insights into the basis for cytotoxic response to FLT3 inhibitors. Blood. 2006;108(10):3477-3483.
5. Pratz KW, Cortes J, Roboz GJ, et al. A pharmacodynamic study of the FLT3 inhibitor KW-2449 yields insight into the basis for clinical response. Blood. 2009;113(17):3938-3946.
6. Stone RM, Mandrekar SJ, Sanford BL, et al. Midostaurin plus chemotherapy for acute myeloid leukemia with a FLT3 mutation. N Engl J Med. 2017;377(5):454-464.
7. Perl AE, Martinelli G, Cortes JE, et al. Gilteritinib or chemotherapy for relapsed or refractory FLT3-mutated AML. N Engl J Med. 2019;381(18):1728-1740.
8. McMahon CM, Ferng T, Canaani J, et al. Clonal selection with RAS pathway activation mediates secondary clinical resistance to selective FLT3 inhibition in acute myeloid leukemia. Cancer Discov. 2019;9(8):1050-1063.
9. Mocsai A, Ruland J, Tybulewicz VL. The SYK tyrosine kinase: a crucial player in diverse biological functions. Nat Rev Immunol. 2010;10(6):387-402.
10. Puissant A, Fenouille N, Alexe G, et al. SYK is a critical regulator of FLT3 in acute myeloid leukemia. Cancer Cell. 2014;25(2):226-242.
11. Mohr S, Doebele C, Comoglio F, et al. Hoxa9 and Meis1 cooperatively induce addiction to Syk signaling by suppressing miR-146a in acute myeloid leukemia. Cancer Cell. 2017;31(4):549-562.
12. Dar AC, Shokat KM. The evolution of protein kinase inhibitors from antagonists to agonists of cellular signaling. Ann Rev Biochem. 2011;80:769-795.
13. Lam B, Arikawa Y, Cramlett J, et al. Discovery of TAK-659 an orally available investigational inhibitor of spleen tyrosine kinase (SYK). Bioorg Med Chem Lett. 2016;26(24):5947-5950.
14. Gordon LI, Kaplan JB, Popat R, et al. Phase I study of TAK-659, an investigational, dual SYK/FLT3 inhibitor, in patients with Bcell lymphoma. Clin Cancer Res. 2020;26(14):3546-3556.
15. Cheson BD, Bennett JM, Kopecky KJ, et al. Revised recommendations of the International Working Group for Diagnosis, Standardization of Response Criteria, Treatment Outcomes, and Reporting Standards for Therapeutic Trials in Acute Myeloid Leukemia. J Clin Oncol. 2003;21(24):4642-4649.
16. Smith BD, Levis M, Beran M, et al. Single-agent CEP-701, a novel FLT3 inhibitor, shows biologic and clinical activity in patients with relapsed or refractory acute myeloid leukemia. Blood. 2004;103(10):3669-3676.
17. Cortes JE, Kantarjian H, Foran JM, et al. Phase I study of quizartinib administered daily to patients with relapsed or refractory acute myeloid leukemia irrespective of FMS-like
tyrosine kinase 3-internal tandem duplication status. J Clin Oncol. 2013;31(29):3681-3687.
18. Perl AE, Altman JK, Cortes J, et al. Selective inhibition of FLT3 by gilteritinib in relapsed or refractory acute myeloid leukaemia: a multicentre, first-in-human, open-label, phase 1-2 study. Lancet Oncol. 2017;18(8):1061-1075.
19. Smith CC, Levis MJ, Frankfurt O, et al. A phase 1/2 study of the oral FLT3 inhibitor pexidartinib in relapsed/refractory FLT3-ITDmutant acute myeloid leukemia. Blood Adv. 2020;4(8):1711-1721.
20. Kelly LM, Yu JC, Boulton CL, et al. CT53518, a novel selective FLT3 antagonist for the treatment of acute myelogenous leukemia (AML). Cancer Cell. 2002;1(5):421-432.
21. Levis M, Perl AE. Gilteritinib: potent targeting of FLT3 mutations in AML. Blood Adv. 2020;4(6):1178-1191.
22. Fischer T, Stone RM, Deangelo DJ, et al. Phase IIB trial of oral midostaurin (PKC412), the FMS-like tyrosine kinase 3 receptor (FLT3) and multi-targeted kinase inhibitor, in patients with acute myeloid leukemia and high-risk myelodysplastic syndrome with either wild-type or mutated FLT3. J Clin Oncol. 2010;28(28):4339-4345.
23. Ho G, Jonas BA, Li Q, et al. Early mortality and complications in hospitalized adult Californians with acute myeloid leukaemia. Br J Haematol. 2017;177(5):791-799.
24. Friedberg JW, Sharman J, Sweetenham J, et al. Inhibition of Syk with fostamatinib disodium has significant clinical activity in non-Hodgkin lymphoma and chronic lymphocytic leukemia. Blood. 2010;115(13):2578-2585.
25. Sharman J, Hawkins M, Kolibaba K, et al. An open-label phase 2 trial of entospletinib (GS-9973), a selective spleen tyrosine kinase inhibitor, in chronic lymphocytic leukemia. Blood. 2015;125(15):2336-2343.
26. Andorsky DJ, Kolibaba KS, Assouline S, et al. An open-label phase 2 trial of entospletinib in indolent non-Hodgkin lymphoma and mantle cell lymphoma. Br J Haematol. 2019;184(2):215-222.
27. Rayes J, Watson SP, Nieswandt B. Functional significance of the platelet immune receptors GPVI and CLEC-2. J Clin Invest. 2019;129(1):12-23.
28. Series J, Ribes A, Garcia C, et al. Effects of novel Btk and Syk inhibitors on platelet functions alone and in combination in vitro and in vivo. J Thromb Haemost. 2020;18(12):3336-3351.
29. Shatzel JJ, Olson SR, Tao DL, et al. Ibrutinib-associated bleeding: pathogenesis, management and risk reduction strategies. J Thromb Haemost. 2017;15(5):835-847.
30. Caron F, Leong DP, Hillis C, Fraser G, Siegal D. Current understanding of bleeding with ibrutinib use: a systematic review and meta-analysis. Blood Adv. 2017;1(12):772-778.
31. Currie KS, Kropf JE, Lee T, et al. Discovery of GS-9973, a selective and orally efficacious inhibitor of spleen tyrosine kinase. J Med Chem. 2014;57(9):3856-3873.
32. Walker AR, Byrd JC, Blachly JS, et al. Entospletinib in combination with induction chemotherapy in previously untreated acute myeloid leukemia: response and predictive significance of HOXA9 and MEIS1 expression. Clin Cancer Res. 2020;26(22):5852-5859.
Haematologica | 108 March 2023 716 ARTICLE - Mivavotinib (TAK-659) in AML K.W. Pratz et al.
ARTICLE - Acute Lymphoblastic Leukemia
Molecular characterization and clinical outcome of B-cell precursor acute lymphoblastic leukemia with IG-MYC rearrangement
Simon Bomken,1,2* Amir Enshaei,1 Edward C. Schwalbe, 3 Aneta Mikulasova,4 Yunfeng Dai, 5 Masood Zaka,6,7 Kent T.M. Fung,1 Matthew Bashton, 8 Huezin Lim,1 Lisa Jones,1 Nefeli Karataraki,1,4 Emily Winterman,1 Cody Ashby, 9 Andishe Attarbaschi,10 Yves Bertrand,11 Jutta Bradtke,12 Barbara Buldini,13 G.A. Amos Burke,14 Giovanni Cazzaniga,15,16 Gudrun Göhring,17 Hesta A. de Groot-Kruseman,18,19 Claudia Haferlach, 20 Luca Lo Nigro, 21 Mayur Parihar, 22 Adriana Plesa, 23 Emma Seaford, 24 Edwin Sonneveld,19 Sabine Strehl, 25 Vincent H.J. van der Velden, 26 Vikki Rand,6,7 Stephen P. Hunger, 27 Christine J. Harrison,1 Chris M. Bacon,1,2 Frederik W. van Delft,1,2 Mignon L. Loh, 28 John Moppett, 24 Josef Vormoor,1,19° Brian A. Walker, 29 Anthony V. Moorman 1 and Lisa J. Russell 1,4*
1 Wolfson Childhood Cancer Centre, Translational and Clinical Research Institute, Newcastle University, Newcastle upon Tyne, UK; 2 The Great North Children's Hospital, Newcastle upon Tyne Hospitals NHS Foundation Trust, Newcastle upon Tyne, UK;
3 Department of Applied Sciences, Northumbria University, Newcastle upon Tyne, UK;
4 Biosciences Institute, Newcastle University, Newcastle upon Tyne, UK; 5 Department of Biostatistics, Colleges of Medicine, Public Health and Health Professions, University of Florida, Gainesville, FL, USA; 6 School of Health and Life Sciences, Teesside University, Middlesbrough, UK; 7 National Horizons Centre, Teesside University, Darlington, UK; 8 The Hub for Biotechnology in the Built Environment, Faculty of Health and Life Sciences, Northumbria University, Newcastle upon Tyne, UK; 9 Department of Biomedical Informatics / Cancer Institute, University of Arkansas for Medical Sciences, Little Rock, AR, USA; 10 St Anna Children's Hospital, Medical University of Vienna, Vienna, Austria;
11 Department of Institute of Hematology Oncology Pediatric (IHOP), Hospices Civils de Lyon, Lyon, France; 12 Institute of Pathology, Department Cytogenetics, University Hospital Giessen and Marburg, Giessen, Germany; 13 Maternal and Child Health Department, Padua University, Padua Italy; 14 Department of Paediatric Haematology, Oncology, and Palliative Care, Cambridge University Hospitals NHS Foundation Trust, Addenbrooke's Hospital, Cambridge, UK; 15 School of Medicine and Surgery, University of Milano-Bicocca, Monza, Italy; 16 Centro Ricerca Tettamanti, University of Milano-Bicocca, Monza, Italy; 17 Department of Human Genetics, Hannover Medical School, Hannover, Germany; 18 Dutch Childhood Oncology Group (DCOG), Utrecht, the Netherlands;
19 Princess Máxima Center for Pediatric Oncology, Utrecht, the Netherlands; 20 MLL Munich Leukemia Laboratory, Munich, Germany; 21 Cytogenetic-CytofluorimetricMolecular Biology Laboratory, Center of Pediatric Hematology Oncology, Azienda Policlinico "G. Rodolico - San Marco", Catania, Italy; 22 Department of Cytogenetics and Laboratory Haematology, Tata Medical Centre, Kolkata, India; 23 Hematology and Flow cytometry Laboratory, Lyon Sud University Hospital, Hospices Civils de Lyon, Lyon, France; 24 Department of Paediatric Oncology, Bristol Royal Hospital for Children, Bristol, UK; 25 St. Anna Children's Cancer Research Institute (CCRI), Vienna, Austria; 26 Department of Immunology, Erasmus MC, University Medical Center Rotterdam, Rotterdam, the Netherlands; 27 Department of Pediatrics and the Center for Childhood
Cancer Research, Children's Hospital of Philadelphia and the Perelman School of Medicine, University of Pennsylvania, Philadelphia, PA, USA; 28 Department of Pediatrics, Benioff Children's Hospital and the Helen Diller Family Comprehensive Cancer Center, University of California, San Francisco, CA, USA and 29 Melvin and Bren Simon Comprehensive Cancer Center, Division of Hematology Oncology, Indiana University, Indianapolis, IN, USA
*SB and LJR contributed equally to this work.
°current address University Medical Center Utrecht, Utrecht, the Netherlands
Correspondence: L.J. Russell lisa.russell@newcastle.ac.uk
S. Bomken s.n.bomken@newcastle.ac.uk
Received: January 6, 2022.
Accepted: March 31, 2022.
Early view: April 28, 2022.
https://doi.org/10.3324/haematol.2021.280557
©2023 Ferrata Storti Foundation
Published under a CC BY license
Haematologica | 108 March 2023 717
Abstract
Rarely, immunophenotypically immature B-cell precursor acute lymphoblastic leukemia (BCP-ALL) carries an immunoglobulin-MYC rearrangement (IG-MYC-r). This can result in diagnostic confusion with Burkitt lymphoma/leukemia and use of individualized treatment schedules of unproven efficacy. Here we compare the molecular characteristics of these conditions and investigate historic clinical outcome data. We identified 90 cases registered in a national BCP-ALL clinical trial/registry. When present, diagnostic material underwent cytogenetic, exome, methylome and transcriptome analyses. The outcomes analyzed were 3-year event-free survival and overall survival. IG-MYC-r was identified in diverse cytogenetic backgrounds, co-existing with either established BCP-ALL-specific abnormalities (high hyperdiploidy, n=3; KMT2A-rearrangement, n=6; iAMP21, n=1; BCR-ABL1, n=1); BCL2/BCL6-rearrangements (n=15); or, most commonly, as the only defining feature (n=64). Within this final group, precursor-like V(D)J breakpoints predominated (8/9) and KRAS mutations were common (5/11). DNA methylation identified a cluster of V(D)J-rearranged cases, clearly distinct from Burkitt leukemia/lymphoma. Children with IG-MYC-r within that subgroup had a 3-year event-free survival of 47% and overall survival of 60%, representing a high-risk BCP-ALL. To develop effective management strategies this group of patients must be allowed access to contemporary, minimal residual disease-adapted, prospective clinical trial protocols.
Introduction
Immunoglobulin (IG)-driven overexpression of the oncogene MYC is the genetic hallmark of mature, germinal center-derived Burkitt lymphoma (BL). However, IG-MYC translocations are observed in other mature B-cell malignancies including 5-14% of diffuse large B-cell lymphomas, high-grade B-cell lymphomas with BCL2-rearrangement (BCL2-r) and/or BCL6-rearrangement (BCL6-r), and multiple myeloma.1-5 High MYC expression is driven by juxtaposition to powerful IG super-enhancers, most commonly the heavy chain locus resulting from the translocation, t(8;14)(q24;q32), but alternatively kappa or lambda light chain loci in the translocations t(2;8)(p11;q24) and t(8;22)(q24;q11), respectively.
Much less commonly, IG-MYC rearrangements (IG-MYC-r) have been identified in lymphoid malignancies expressing a surface immunoglobulin-negative, immature B-cell precursor (BCP) immunophenotype.6-13 Several recent clinical trials of acute lymphoblastic leukemia (ALL) have excluded these patients to avoid the risk of mistreating mature Bcell non Hodgkin lymphomas (B-NHL). However, a large RNA sequencing study recently identified a distinct group of 18/1,988 (0.9%) BCP-ALL cases characterized by IG translocations with either BCL2, BCL6 and/or MYC, 14 while a Nordic population-based study estimated the frequency of IG-MYC-r in childhood BCP-ALL at 0.6%.15
Despite the rarity of these conditions, knowing whether to diagnose and treat them as an ALL or Burkitt leukemia/lymphoma is important, with the relevant therapies being markedly different. A recent molecular study of 12 patients demonstrated genetic/epigenetic similarities to BCP-ALL.16 In contrast, a retrospective clinical study of 14 cases registered with the German BFM-NHL group encouraged treatment according to a mature B-NHL protocol.17 Clearly there is no current consensus, with many reported
patients receiving hybrid protocols outside the clinical trial setting.17,18
Here, we studied the molecular and clinical characteristics of a cohort of 90 BCP-ALL cases, enrolled in large national clinical trials/registries. Combining cytogenetic characteristics, somatic mutations, DNA methylation and gene expression analysis, we addressed the question of which disease precursor B-cell IG-MYC-r leukemias representBCP-ALL or BL. We further sought to determine the prognostic implications of the presence of an IG-MYC-r. We found that IG-MYC-r was present in diverse cytogenetic backgrounds and defined three subgroups within our cohort: (i) cases with IG-MYC-r and a cytogenetic abnormality recurrently seen in BCP-ALL; (ii) cases with IG-MYC-r and BCL2-r/BCL6-r; and (iii) the majority of cases, with IG-MYCr as the defining cytogenetic abnormality. We demonstrate that IG-MYC-r can be either the candidate driver event or a secondary cytogenetic feature. We provide further evidence that the majority are distinct from BL and instead represent a subtype of BCP-ALL with a high risk of early relapse. To improve the care of these patients, clinical outcomes should now be assessed in the setting of prospective minimal residual disease-adapted clinical trials.
Methods
Sample cohort
Patients were identified by the UK Leukaemia Research Cytogenetics Group (LRCG), US Children’s Oncology Group (COG), Dutch Children’s Oncology Group (DCOG) or International Berlin-Frankfurt-Münster (BFM) study group members. The patients’ full characteristics, immunophenotype and additional methodological details are included in the Online Supplementary Data, Online Supplementary Tables S1 and S2 and Online Supplementary Figure S1. The
Haematologica | 108 March 2023 718 ARTICLE - IG-MYC-r B-cell precursor ALL S. Bomken et al.
primary inclusion criteria were enrollment/registration in a BCP-ALL clinical trial/registry and IG-MYC-r detected by karyotyping or fluorescence in situ hybridization (FISH) as a translocation involving an immunoglobulin locus (IG) and MYC: IGH-MYC-r, t(8;14)(q24;q32); IGK-MYC-r, t(2;8)(p11;q24); IGL-MYC-r, t(8;22)(q24;q11). We also identified two patients with T-cell receptor (TCR) translocations to the MYC locus. Non-trial cases were identified from local/national registries based on a local diagnostic immunophenotype of Bcell precursor malignancy. Children were defined as those patients under the age of 18 years at diagnosis. Informed consent and institutional review board approval were obtained at each collaborating center. This study was performed in accordance with the Declaration of Helsinki.
Conventional cytogenetics and fluorescence in situ hybridization
Fixed cells were available for 65 MYC-rearranged patients (Online Supplementary Table S1). IGH, IGK, IGL, MYC, BCL2 and BCL6 FISH studies were performed in all cases with sufficient available cells, in that order of priority. The labeling, capture and scoring methods are described in the Online Supplementary Methods.
Multiplex ligation-dependent probe amplification
Copy number alterations were determined by multiplex ligation-dependent probe amplification (MLPA) using the SALSA MLPA kit P335 (MRC Holland, Amsterdam, the Netherlands) in 27 patients.19 The kit includes probes to IKZF1, CDKN2A/B, PAX5, EBF1, ETV6, BTG1, RB1 and CSF2RA/IL3RA/CRLF2.
Targeted sequencing
DNA from 17 patients was prepared and sequenced using a targeted next-generation approach to identify translocation breakpoints at IG and MYC loci, as described previously.4 BWA-MEM (v0.7.12) and genome assembly GRCh37 was used for sequence mapping. Chromosomal rearrangements were called using Manta (v.0.29.6)4,20 and manually inspected in Integrative Genomics Viewer (Broad Institute, Cambridge, MA, USA).
Whole exome sequencing
DNA libraries of 15 diagnostic and two relapse samples were generated using the TWIST Human Core Exome kit (Twist Biosciences, San Francisco, CA, USA) and paired end sequencing performed on a NovaSeq (Illumina, San Diego, CA, USA) at the Newcastle University Genomics Core Facility. Data were analyzed using the Genome Analysis Toolkit (GATK) including the variant caller MuTect221-23 (Broad Institute).
Illumina Infinium MethylationEPIC BeadChip array
Methylation data were generated for 18 diagnostic samples
at Eurofins Genomics (Ebersberg, Germany) using HumanMethylation Epic arrays (Illumina) and the manufacturer’s standard protocols. To assess relationships between IGMYC-r leukemia and other disease entities, we selected the 1,404 CpG loci previously reported to be related to Bcell maturation16 and performed t-distributed stochastic neighbor embedding (t-SNE) visualization of the combined sample set (Online Supplementary Table S3), as previously reported.24
RNA-sequencing
RNA-sequencing was performed for six patients’ samples at Eurofins Genomics (Ebersburg, Germany) using a TruSeq Stranded mRNA Library Prep Kit (Illumina). Data were quantified using Kallisto25 and analyzed using DEseq2.26 These data were compared with publicly available data (EGAS00001001795).27 The top 5% of the genes with the highest median absolute deviation were selected. The resulting count matrix was used for t-SNE analysis.28
Outcome analysis
Event-free survival (EFS) was defined as time from diagnosis to relapse, second tumor, or death, censoring at last contact. Overall survival (OS) was defined as time from diagnosis to death, censoring at last contact. For patients without data on relapse or second tumor, death was assumed to be the first event. Survival rates were calculated and compared using Kaplan-Meier methods, log-rank tests, and Cox regression models (univariate and multivariate analyses). Other comparisons were performed using the χ2 or Fisher exact test. All tests were conducted at the 5% significance level. All outcome analyses were performed using Intercooled Stata 15.0.
Results
Demographic and clinical characterization
We collected 90 cases of BCP-ALL diagnosed by local hematologists between August 1989 and July 2019 and subsequently identified as having an IG-MYC-r by karyotype or FISH (Online Supplementary Figure S1, Online Supplementary Table S1). The majority were registered at diagnosis in a BCP-ALL clinical trial/registry via the UKALL group (n=32), COG (n=32) or DCOG (n=5). Eighteen additional cases were identified by international BFM study group centers, and eight of these were enrolled on ALL trials. Three further patients in whom IG-MYC-r was only demonstrated at relapse were not included in the survival analysis. Patients received a wide variety of trial- and clinician-determined treatments.
Among 87 cases identified at presentation, the median age at diagnosis was 10 years (range, 0-81 years) (Table 1). Fiftytwo (60%) patients were male, 35 (40%) female. The
Haematologica | 108 March 2023 719 ARTICLE - IG-MYC-r B-cell precursor ALL S. Bomken et al.
Table 1. Clinical characteristics of patients presenting at diagnosis with B-cell precursor acute lymphoblastic leukemia carrying an IG-MYC-rearrangement.
median presenting white blood cell count was 14x109/L (range, 1.6-1200x109/L, n=77 patients). Diagnostic bone marrow blast percentage was available for 64 patients and ranged from 30%-100% with a median of 86.5%. Central nervous system disease was present in 15/64 (23%) cases. Immunophenotype data were available for 33 diagnostic cases and one relapse case (Online Supplementary Table S2). TdT was positive in 22/29 (76%) cases. Of the TdTnegative cases, all seven (100%) were negative for surface immunoglobulin, confirming a BCP immunophenotype.
Cytogenetic characterization identified both heterogeneity and distinct genomic features
Karyotype was available for 89/90 patients (86/87 at diagnosis) and was abnormal in all cases. Three patients had high hyperdiploidy (51-65 chromosomes), a favorable risk feature and eight had high-risk genetics (KMT2A-r, n=6; iAMP21, n=1; BCR-ABL1, n=1) (Table 1, Online Supplementary Table S1). The remaining 75/86 (87%) cases were classified as intermediate cytogenetic risk at diagnosis. Fourteen patients (5 children, 9 adults) had a co-existing BCL2-r, one of whom also had a co-existing BCL6-r (Online Supplementary Table S1). In addition, one adult patient had only a BCL6-r co-existent with their IGH-MYC-r, identified by FISH. In the remaining 64 patients the IG-MYC-r was the defining cytogenetic feature.
Karyotyping and/or FISH showed that 47/90 patients (52%) had rearrangements of the IGH locus, 39 (43%) the IGL locus and three (3%) the IGK locus (Figure 1A). Two (2%) patients had TCR-MYC-r. One patient had both IGH-MYC and IGL-MYC rearrangements.
We estimated the percentage of cells carrying IG-MYC-r in 53 patients with quantitative FISH data and found that, irrespective of the IG locus involved, IG-MYC-r can be either clonal or subclonal (Figure 1B, Online Supplementary Figure S2). Additional evidence for the subclonal nature of some IG-MYC-r was derived from 3/5 KMT2A-rearranged cases (22901, 30611, 17659) in which karyotype and FISH data demonstrated the presence of KMT2A-rearranged but MYC-germline cells, implying that the KMT2A-rearranged transformation preceded the MYC-r (Figure 1C, Online Supplementary Table S1). Furthermore, it was possible to reconstruct the clonal evolution of KMT2A-rearranged case 17659 from the presentation and relapse metaphase data (Figure 1D, Online Supplementary Table S1), showing that the relapse was derived from a clone carrying the cooperating IGL-MYC-r. Patients with other established ALL-specific cytogenetic abnormalities (high hyperdiploidy, iAMP21) harbored MYC-r within the same clone (Online Supplementary Table S1). Together these data show that, for at least a proportion of cases, IG-MYCr are secondary chromosomal events. Nevertheless, when compared with MYC-germline cases of BCP-ALL, a high level of MYC expression was identified, irrespective of the IG partner or degree of clonality (Figure 1E).
In nineteen patients, IG-MYC-r was the sole abnormality (Online Supplementary Table S1). Among the remaining cases, abnormalities of chromosome 1 were the most frequently observed aneuploidy/structural gain (28/89, 31%) (Figures 1F and 2, Online Supplementary Table S1). In the majority (25/28, 89%), 1q abnormalities were shown to be present within the same clone as the IG-MYC-r. One spe-
All N=87 Children N=66 Adults N=21 Sex, N (%) Female Male 35 (40) 52 (60) 26 (39) 40 (61) 9 (43) 12 (57) Age in years Median Range 10 0-81 6 0-17 52 20-81 White blood cell count N (%) of patients with>50 x 109/L Median Range 13/74 (18) 14 1.6-1200 10/57 (18) 14 1.6-1200 3/17 (18) 19 2-131 Central nervous system status, N (%) Positive Negative Not available 15 (23) 49 (77) 23 12 (22) 42 (78) 12 3 (30) 7 (70) 11 Cytogenetic risk group, N (%) Good risk Intermediate risk High risk Not available 3 (3) 75 (86) 8 (9) 1 1 (1) 57 (86) 7 (11) 1 2 (10) 18 (86) 1 (5) 0 Haematologica | 108 March 2023 720 ARTICLE - IG-MYC-r B-cell precursor ALL S. Bomken et al.
Figure 1. Cytogenetic characterization of IG-MYC-rearranged patients. (A) Karyotype reveals the distribution of immunoglobulin chain involvement in MYC translocations (fluorescence in situ hybridization [FISH] data were used for one patient who presented with a normal karyotype). +BCL2/6-r: concomitant BCL2/BCL6-rearrangement; +ALL-r, concomitant established acute lymphoblastic leukemia rearrangement; IG-MYC: IG-MYC rearrangement as the defining cytogenetic abnormality. (B) Percentage of nuclei carrying IG-MYC-r grouped by immunoglobulin chain involvement. Blue dots, IG-MYC-r alone. Green dots, IG-MYC-r and established ALL rearrangement. Red dots, IG-MYC-r and BCL2/BCL6-r. Dotted and dashed lines, interquartile ranges. (C) Percentage rearrangement of MYC (blue dots) and KMT2A (green dots) using FISH. (D) Evolution of t(4;11) and subsequent gain of t(8;22) in case 17659. Percentages at diagnosis represent the proportion of metaphases seen with each abnormality (left panel). Representative chromosomes taken from diagnostic and relapse metaphases (right panel). Gray arrows mark the portion of chromosome 22 translocated to chromosome 8. (E) RNA sequencing comparing expression of MYC among (labeled) cases from the IG-MYC-r cohort with other in-house B-cell precursor ALL cases. TPM: transcripts per million reads. (F) Chromosomal abnormalities observed for chromosome 1 in the karyotypes of patients with IG-MYC-r. Red line: patients with concomitant BCL2-r.

A B C D E F Haematologica | 108 March 2023 721 ARTICLE - IG-MYC-r B-cell precursor ALL S. Bomken et al.
cific feature we identified, which has not been recurrently described in either BL29-32 or BCP-ALL,33 was isochromosome of the long arm of chromosome 1, i(1)(q10). This was observed in nine patients and was associated with IGHMYC in eight.
We further analyzed copy number alterations in nine of the most commonly deleted genes/regions in ALL (Figure 3) for 27 patients with sufficient DNA. Among the 15 cases with IG-MYC-r as the defining cytogenetic abnormality, 11 (73%) showed no deletion within the genes/regions analyzed. This is a remarkably high percentage and even more so when specifically considering pediatric patients among whom 9/10 (90%) had no deletions at diagnosis. This contrasts with just 26% of childhood ALL classified as Bother, the subgroup to which all ten patients would be assigned,19 implying an important driver role for IG-MYC-r in this subgroup of patients.

Finally, in order to investigate the IG and MYC breakpoints at high resolution, we used a targeted sequencing approach4 and were able to resolve exact breakpoints for 15/17 patients analyzed (Figures 3 and 4, Online Supplementary Table S4). MYC breakpoints differed according to IG partner locus. IGH-MYC breakpoints (n=9) were detected
5’ of MYC, within the 5’ untranslated region or within intron 1. One case had an additional breakpoint within intron 2 (Figure 4A). Each resulted in MYC being juxtaposed to the IGH super-enhancers on chromosome 14. In contrast, all IGL-MYC breakpoints (n=5) resulted in the translocation of the IGL super-enhancer 3’ (telomeric) of MYC (Figure 4A). In patients with IGH-MYC-r, the majority (7/9, 78%) had breakpoints located with the V(D)J gene segments. Notably, just two patients had constant region breakpoints, more commonly associated with germinal center class switch recombination activity (Figure 4B). One of these cases also carried an IGH-BCL2-r (30279). In addition, this analysis identified three patients (26683, 27424 and 29785) who had cryptic IGH-DUX4-r,27,34-36 following which they were considered within the group of cases with an established ALL-speci fi c cytogenetic abnormality ( Online Supplementary Table S1). Together these analyses show significant variability in the cytogenetic characteristics of BCP-ALL with IG-MYC-r. In some cases the IG-MYC recombination is clearly a secondary chromosomal event but is still capable of imparting a potentially important biological effect. In other cases it is accompanied by additional IG translocations,
Haematologica | 108 March 2023 722 ARTICLE - IG-MYC-r B-cell precursor ALL S. Bomken et al.
Figure 2. Ideogram of cytogenetic rearrangements reported in the karyotypes of 70 patients with IG-MYC-rearrangements.
notably to BCL2 and/or BCL6. However, in the majority of this cohort, IG-MYC-r occurred either in isolation or in association with additional cytogenetic features not typical of either BCP-ALL or BL. We therefore sought to investigate the relationship between these disease entities further.
IG-MYC-rearranged B-cell precursor acute lymphoblastic leukemias display diverse genetic, epigenetic and transcriptomic features
In order to better characterize the molecular landscape of IG-MYC-r BCP-ALL we analyzed exome sequencing data from 15 diagnostic and two relapse samples, interrogating a panel of genes recurrently mutated in BCP-ALL or BL (Figure 3).14,37-39 In keeping with a recent analysis of exome data from five similar cases,16 we found non-synonymous
variants in KRAS in 5/15 (33%) patients at diagnosis. Mutations were also recurrently identified in genes mutated in BCP-ALL including, FAT4, ASMTL and IKZF1, observed in 6/15 (40%), 3/15 (20%) and 3/15 (20%) patients, respectively. Additional mutations were observed in ANK3, FAT1, FAT2 (2/15, 13%) and PDGFRA (1/15, 7%). However, the cohort also included two patients (4352 and 30279) who harbored BL hotspot mutations in ID3 (L64F) and TCF3 (N554K) (Online Supplementary Figure S3), respectively, and additional characteristic BL mutations in DDX3X, SMARCA4, and CCND3. Interestingly, case 30279 also had IGH-BCL2 and BCL6 rearrangements as have recently been described in a cohort of high-grade, molecular BL.40 Wagener et al . were also able to analyze the methylome of two cases, neither of which carried an IG-BCL2/BCL6 rearrangement, and found these to be distinct from that

Haematologica | 108 March 2023 723 ARTICLE - IG-MYC-r B-cell precursor ALL S. Bomken et al.
Figure 3. Oncoplot depicting the incidence of selected genomic features of IG-MYC-rearranged patients with material available for genomic studies. D: diagnosis; R: relapse; dark-shaded square: positive result; light-shaded square: negative result; white square: not tested; T: 1q translocation.
of BL, instead clustering with BCP-ALL cases.16 Here, we integrated 18 of our cases with published DNA methylation data of BCP-ALL41-43 and BL16,44 cases and identified four clusters (Figure 5A). The biggest, in which no IGBCL2/BCL6 rearrangement or ALL-specific cytogenetic abnormality was identified (cluster A), contained seven cases (4 with IGH-MYC -r, 2 with IGL-MYC -r and 1 with TRA-MYC -r) and appeared most closely associated to BCP-ALL with the TCF3-PBX1 fusion gene. Distinct from cluster A, three patients clustered with cell lines and primary samples from BL patients (cluster B). These three patients carried either BL-like mutations in
ID3/TCF and IGH constant region breakpoints (30279 and 4352) and/or IG-BCL2 -r (30279 and 25729). Cluster C contained three cases identified by targeted IG -sequencing to have IGH-DUX4 . Patient 30611 had a KMT2Ar in 40% of nuclei and clustered with other KMT2A -rearranged samples.

Furthermore, transcriptome analysis was conducted for six patients (5 with methylation data) for whom RNA was available (Figure 5B, C). Patients with IG-MYC -r and no IG-BCL2/BCL6-r or ALL-specific cytogenetic abnormality again associated, although here they were less close to BCP-ALL samples with TCF3-PBX1 . Two IGH-DUX4 pa-
Figure 4. Targeted IG and MYC sequencing identified heterogeneous breakpoints. (A) Distribution of breakpoints within the MYC locus. (B) Distribution of breakpoints within the IGH locus. Each line shows the breakpoints for patients with translocations involving individual genomic loci. Frequency distribution defines a region of increased frequency of breaks (peach shaded area). Upper panels provide an expanded view of the breakpoint hotspots. Each dot represents an individual breakpoint. Blue dots: IGMYC-rearrangement alone. Green dots, IG-MYC-rearrangement and established acute lymphoblastic leukemia rearrangement. Red dots, IG-MYC-rearrangement and BCL2/BCL6-rearrangement.
A B Haematologica | 108 March 2023 724 ARTICLE - IG-MYC-r B-cell precursor ALL S. Bomken et al.
tients (27424 and 29785) were confirmed to cluster with published IGH-DUX4 samples, despite substantially different MYC -r frequencies of 16% and 90%, respectively. KMT2A -r patient 30611 associated with published KMT2A -r patients.
Overall these analyses show that the four cases with an ALL-specific cytogenetic abnormality clustered with the relevant leukemic subgroup. In our methylome analysis, cases with either an additional BCL2/BCL6-r, IGH constant region break or a mutational profile in keeping with BL, clustered with BL. However, cases without BCL2/BCL6-r
or a BL-like profile formed a distinct cluster, strongly indicating they are a subtype of BCP-ALL.
Outcome of patients with IG-MYC-rearranged B-cell precursor acute lymphoblastic leukemia
Our genomic analysis identified three groups of IG-MYC-r cases, defined by: (i) concomitant BCL2/BCL6-r; (ii) co-occurrence of an established ALL-specific cytogenetic abnormality; and (iii) IG-MYC-r in the absence of another defining cytogenetic abnormality (Figure 6). That analysis demonstrated at least a proportion of IG-MYC/IG-
Figure 5. Methylation and transcriptome data identified five clusters within the cohort of patients with IG-MYC-rearrangements. (A) Consensus clustering of methylation data. Common t-distributed stochastic neighbor embedding (t-SNE) visualization of IGMYC-rearranged patients combined with publicly available data for subtypes of B-acute lymphoblastic leukemia (GSE49031, GSE69229, GSE76585), a patient with Burkitt lymphoma (GSE114210) and cell line samples (GSE92378). Each dot represents an individual patient. (B) Consensus clustering of RNA-sequencing data. Common t-SNE visualization of IG-MYC-rearranged patients combined with publicly available RNA-sequencing data for subtypes of B-acute lymphoblastic leukemia (EGAS00001001795). Each dot represents an individual patient. (C) Patients’ identities assigned to clusters. *Methylation and RNA-sequencing data, **RNA-sequencing only.

A B C Haematologica | 108 March 2023 725 ARTICLE - IG-MYC-r B-cell precursor ALL S. Bomken et al.
BCL2/BCL6-r “double/triple hit” cases to be biologically distinct from BCP-ALL, instead showing overlap with molecular BL as has recently been described.40 In keeping with published case reports,45,46 we identified a markedly inferior EFS (hazard ratio [HR]=3.10, 95% confidence interval [95% CI]: 1.42-6.76, P=0.004) and OS (HR=3.78, 95% CI: 1.63-8.79, P=0.002) in comparison to BCL2 wildtype cases. We therefore excluded these cases from subsequent analyses.
For those cases with an ALL-specific cytogenetic abnormality, the IG-MYC-r was often subclonal and DNA methylation/transcriptomic analysis confirmed that they continued to cluster according to the underlying cytogenetic subgrouping. We believe that these cases present less of a diagnostic challenge and should continue to be eligible for inclusion in ALL clinical trials. We therefore further investigated the clinical course of the diagnostically more challenging patients in whom IG-MYCr represented the only recurrent cytogenetic feature. Among 59 cases enrolled in an ALL clinical trial/registry, follow-up data were available from 55 patients. However, only 20 patients (15 children and 5 adults) received the full

protocol on trial (Online Supplementary Figure S1). The remaining patients received unknown off-trial treatment, which was at the clinical team’s discretion. As a result, these off-trial patients had markedly shorter follow-up available, particularly with regard to relapse events (Figure 7). Within the small subcohort suitable for analysis, we did not identify a survival difference between children treated on an ALL trial versus those taken off an ALL trial with 3year EFS being 47% (21-69) versus 67% (37-85) (P= 0.13) and OS being 60% (32-80) versus 80% (50-93) (P=0.15), respectively. Although there were long-term survivors among trial and non-trial patients, the predominant feature among both children and adults was a high frequency of early relapse, consistent with high-risk disease (Figure 7A, B). Insufficient minimal residual disease data were available to allow analysis.
Twenty-six children demonstrated a molecular feature identified within our study (IG-MYC-r clonality >50%, KRAS mutation, abnormal chromosome 1 or i(1)(q10) (Online Supplementary Figure S4). Univariate analysis did not identify any of these to be associated with EFS or OS (Online Supplementary Table S5).
Figure 6. Molecular characteristics of cases of IG-MYC-rearranged acute lymphoblastic leukemia. Summary of three groups defined within the molecular analysis. Cases with a co-existing acute lymphoblastic leukemia (ALL)-specific cytogenetic abnormality are shown in green in the left panel. Cases with an IG-MYC-rearrangement (IG-MYC-r) as the only recurrent cytogenetic feature are shown in blue in the center panel and cases with a co-existing rearrangement of BCL2 and/or BCL6 are shown in red in the right panel. Each donut plot shows the proportion of cases studied which have a specific molecular feature. The total number of cases in each study is shown within each donut. The upper donut plots show the proportion with variable V(D)J gene segment breakpoints (dark segments) and constant segment breakpoints (light segments). The middle donut plots show the proportion of cases with either Burkitt-like TCF3/ID3 mutations (light segments), KRAS mutations (medium segments) or neither such mutation (dark segments). The lower donut plots show the proportion of cases within each of three DNA methylation clusters, either Burkitt-like cluster B (light segments), the IG-MYC-r cluster A (medium segments) or one of the other ALL specific clusters (dark segments). *The single case in the center panel harboring both a constant region breakpoint and an ID3 mutation (case 4352) clustered with Burkitt lymphoma/leukemia cases in our DNA methylation analysis.
Haematologica | 108 March 2023 726 ARTICLE - IG-MYC-r B-cell precursor ALL S. Bomken et al.
Discussion
Although rare, the identification of an IG-MYC-r in the karyotype of patients diagnosed with BCP-ALL challenges diagnostic and clinical decision-making, with many case reports/series demonstrating the lack of uniform management, often involving hybrid ALL/B-NHL treatment.17,18,46
Furthermore, given the poor outcome of non-lymphoblastic/Burkitt leukemia treated with ALL therapy,47,48 several ALL clinical trials have excluded patients with IG-MYC-r, restricting the development of effective protocols. To address this clinical need we have collected the largest published cohort of IG-MYC-r BCP-ALL cases, from the UK, Europe and the USA, studying their molecular biology and clinical outcome.
The principal molecular distinction required is from Burkitt leukemia/lymphoma, which shares the hallmark cytogenetic feature of an IG-MYC-r. However, the majority (approximately 80%) of BL cases have an IGH-MYC-r, while the remainder have IGL or IGK rearrangements in similar proportions.49 In contrast, we identified a much higher frequency of light chain rearrangements and particularly IGLMYC-r. A substantial proportion of BCP-ALL cases harbored subclonal IGH or IGL rearrangements whereas in BL IG-MYC-r is considered a founder oncogenic event and is therefore clonal. We also identified recurrent i(1)(q10). While gains of 1q are the most common abnormality in BL, i(1)(q10) has not been previously reported in that disease.29-32 Equally, we identified only two non-IG-MYC-r patients with i(1)(q10) within the Leukaemia Research Cytogenetics Group (LRCG) database of >12,000 cases of BCP-ALL and while a recently published cohort of ALL had two cases with i(1)(q10) among 18 identified as harboring a BCL2/BCL6/MYC-r, only two other cases with i(1)(q10) were seen among the remaining 1,970 cases.14 Interestingly, isolated cases of immunophenotypically immature BCP-ALL with IG-MYC-r and i(1)(q10) have been reported previously.11,16 While these data support a specific role for i(1)(q10) in BCP-ALL with IG-MYC-r with or without IGBCL2-r, the biological implications of this specific finding are unknown. Our mutational analysis of cases confirmed recurrent KRAS mutations within this group14,16 and identified additional recurrent mutations in the BCP-ALL-related genes IKZF1 and ASMTL
Targeted sequencing of the IGH locus identified breakpoints predominantly within the V(D)J gene segments. This contrasts with germinal center-derived malignancies, including BL, in which just 9-19% of cases carry a V(D)J gene segment breakpoint with rearrangements instead predominantly affecting the constant/switch regions.49-53 While our DNA methylation/transcriptome analyses were able to cluster cases with their underlying cytogenetic aberration (KMT2A-r or IGH-DUX4) when present, other IGMYC-r cases with V(D)J gene segment breakpoints formed
a separate cluster distinct from BL. In just two cases we identified IGH constant region breakpoints, co-occurring with the only examples in our study of typical BL-related mutations in ID3/TCF3, DDX3X, SMARCA4 and CCND3. 37-39 Furthermore, one of these two cases also had an IGBCL2-r. DNA methylation analysis clustered all three cases displaying either IGH constant region breakpoints and/or IG-BCL2-r with BL cases/cell lines, in keeping with the recently described occurrence of BCL2-r in adult molecular BL.40 However, these findings contrast with a subgroup of BCL2/BCL6/MYC rearranged ALL which were recently described to cluster together by RNA-sequencing analysis.14 Whether this relates to alternative experimental approaches/comparators, immunophenotypic inclusion criteria or in fact further demonstrates heterogeneity within this group of patients remains unclear. However, the recent publication of the clinical outcome of this subgroup further supports the dismal prognosis associated with BCL2/BCL6-r ALL.54 Whether BCL2/BCL6-r identifies a different disease from the majority of cases of IG-MYCr BCP-ALL remains to be determined but neither published data nor the data presented here support the treatment of these patients with standard BCP-ALL therapy (Figure 7C).
Given the inconsistent treatment protocols and poor follow-up associated with patients not enrolled on a clinical trial, we sought to define patients suitable for ALL therapy for whom inclusion in prospective clinical trials would offer standardized risk-stratified, response-adapted therapy with analysis of long-term follow-up data. The inclusion of cases with BCP-ALL and an ALL-specific cytogenetic abnormality is, we believe, uncontentious. Nonetheless, the presence of a MYC-r in these cases is bound to generate questions and therefore clinical trial inclusion/exclusion criteria need to be definitive. More challenging are cases in which IG-MYC-r is the only defining cytogenetic abnormality. Historically, these patients’ outcome has been very poor, but the very few data that exist predominantly predate minimal residual disease analysis and response adaptation. With small numbers of patients in both the group remaining on an ALL trial and those removed from trial to receive therapy for which the details are not available, we did not observe a significant difference in EFS or OS. While there was a non-significant trend towards improved outcome for those removed from trial protocol therapy, the impact of heterogeneous clinician-determined therapies was unclear. These therapies are likely to have included ALL or BL protocols but also hybrid treatments delivering intensified early “BL-type” therapy with subsequent addition of ALL maintenance chemotherapy.17,18 These limited data underscore the need for a prospective analysis of outcome using a standardized protocol.
The rarity of the cases makes it unfeasible to conduct a
Haematologica | 108 March 2023 727 ARTICLE - IG-MYC-r B-cell precursor ALL S. Bomken et al.
dedicated trial solely for these patients. Currently they are being lost to investigation and receive therapy of unproven efficacy resulting in outcomes significantly inferior to those of standard ALL or BL. We believe that the underlying biology of these IG-MYC -r patients indicate that they are part of the ALL spectrum. To improve our understanding of this BCP-ALL subtype and patients’ outcome, we strongly suggest that they be included in clinical trials able to prospectively measure early treatment response, supporting informed decision-making on whether to continue a standard treatment strategy or not. Those with very poor response to initial therapy may be considered for alternative therapies, similar to the approach to acute leukemia of ambiguous lineage being taken by some study groups. 55,56
Within that setting, use of disease-agnostic approaches such as antibody or advanced cellular therapies, may be logical.
In summary, we have demonstrated that surface immunoglobulin-negative BCP-ALL with IG-MYC-r are a highrisk subgroup of BCP-ALL. Optimal treatment can only be determined by removing barriers to treating patients with uniform therapy and collection of detailed longterm clinical follow-up data. We believe that clinical trial protocols should not exclude these patients, who should in fact be given access to contemporary, riskstratified, response-adapted therapy.

Disclosures
No conflicts of interest to disclose.
A B C Haematologica | 108 March 2023 728 ARTICLE - IG-MYC-r B-cell precursor ALL S. Bomken et al.
Figure 7. Swimmer plots displaying event-free survival and overall survival. (A) Children and (B) adults with IG-MYC-rearrangements but no other acute lymphoblastic leukemia-specific cytogenetic abnormality. Suggested approach for the assignment of patients to a treatment strategy (C). + For patients without data on relapse or second tumor, death was assumed to be the first event. ALL: acute lymphoblastic leukemia; BCP: B-cell precursor; CCR: continuous complete remission; sIG: surface immunoglobulin.
Contributions
SB, LJR, FWvD and AVM conceived and designed the study; SB, YD, AA, YB, JB, BB, GAAB, GC, GG, HAdG, CH, LLN, MP, AP, ESe, ESo, SS, VHJvdV, VR, SPH, CJH, FWvD, MLL, JV, AVM and LJR provided clinical data and contributed patient samples; SB, ECS, AM, MZ, KTMF, MB, HL, LJ, NK, EW, CA, CMB, BAW, AVM and LJR performed experiments and analyzed experimental data; AE and YD collected and analyzed outcome data; SB, LJR and AVM wrote the manuscript with additional contributions from MLL, JM and JV; all coauthors contributed to manuscript review and editing and approved the final manuscript for submission.
Acknowledgments
We would like to thank patients and their families for donating their samples for research and each of the institutional/national BioBanks for providing those samples for this study, including the Blood Cancer UK Childhood Leukaemia Cell Bank. We thank Adele Fielding for help in identifying UK patients.
Funding
We would like to thank those who provided financial support. Kay Kendall Leukaemia Fund (KKL515), Wellcome Trust Institutional Strategic Support Fund (204787/Z/16/Z), The Newcastle upon Tyne Hospitals NHS charity and KidsCan
References
1. Klapper W, Stoecklein H, Zeynalova S, et al. Structural aberrations affecting the MYC locus indicate a poor prognosis independent of clinical risk factors in diffuse large B-cell lymphomas treated within randomized trials of the German High-Grade Non-Hodgkin's Lymphoma Study Group (DSHNHL). Leukemia. 2008;22(12):2226-2229.
2. Savage KJ, Johnson NA, Ben-Neriah S, et al. MYC gene rearrangements are associated with a poor prognosis in diffuse large B-cell lymphoma patients treated with R-CHOP chemotherapy. Blood. 2009;114(17):3533-3537.
3. Ott G, Rosenwald A, Campo E. Understanding MYC-driven aggressive B-cell lymphomas: pathogenesis and classification. Blood. 2013;122(24):3884-3891.
4. Mikulasova A, Ashby C, Tytarenko RG, et al. Microhomologymediated end joining drives complex rearrangements and overexpression of MYC and PVT1 in multiple myeloma. Haematologica. 2020;105(4):1055-1066.
5. Swerdlow SH, Campo E, Harris NL, et al. WHO Classification of Tumours of Haematopoietic and Lymphoid Tissues (Revised 4th edition): International Agency for Research on Cancer (IARC). 2017
6. Navid F, Mosijczuk AD, Head DR, et al. Acute lymphoblastic leukemia with the (8;14)(q24;q32) translocation and FAB L3 morphology associated with a B-precursor immunophenotype: the Pediatric Oncology Group experience. Leukemia. 1999;13(1):135-141.
7. Loh ML, Samson Y, Motte E, et al. Translocation (2;8)(p12;q24) associated with a cryptic t(12;21)(p13;q22) TEL/AML1 gene
Children’s Cancer Research and The Little Princess Trust (to LJR). LJR held a Newcastle University Research Fellowship and A.M. a Newcastle University Faculty Fellowship. SB was supported by The Sir Bobby Robson Foundation and an MRC Clinician Scientist Fellowship MR/S021590/1. COG funding was available through U10 CA98413 and U10 CA180899 (COG Statistics and Data Center grants), U24 CA114766 and U24-CA196173 (COG Specimen Banking). AVM and CJH were supported by Blood Cancer UK (15036) and Cancer Research UK (A21019, Moorman and Fielding). LLN was partially supported by MFAG 2009 – AIRC (Italian Association for Cancer Research) (Lo Nigro). VR was supported by a Bloodwise (formerly Leukaemia and Lymphoma Research) Senior Bennett Fellowship (#12005), the JGW Patterson Foundation and the Little Princess Trust. MZ was supported by North East Promenaders. GC was supported by the Italian Association for Cancer Research (Grant n.IG17593) and Comitato Maria Letizia Verga.
Data-sharing statement
All previously publicly available datasets used are referred to in the Methods section and in Online Supplementary Table S3. Methylation data are available from the GEO repository under accession number GSE174248. RNA, whole exome and targeted sequencing data are available from the EGA repository under EGA study ID EGAS00001005111.
rearrangement in a child with acute lymphoblastic leukemia. Cancer Genet Cytogenet. 2000;122(2):79-82.
8. Reid MM, Drewery C, Windebank KP. Surface immunoglobulinnegative acute lymphoblastic leukaemia with predominant L1 morphology, occasional L3 cells and t(8;22). Br J Haematol. 2003;122(5):693.
9. Gupta AA, Grant R, Shago M, Abdelhaleem M. Occurrence of t(8;22)(q24.1;q11.2) involving the MYC locus in a case of pediatric acute lymphoblastic leukemia with a precursor B cell immunophenotype. J Pediatr Hematol Oncol. 2004;26(8):532-534.
10. Meeker ND, Cherry AM, Bangs CD, Kimble Frazer J. A pediatric B lineage leukemia with coincident MYC and MLL translocations. J Pediatr Hematol Oncol. 2011;33(2):158-160.
11. Roug AS, Wendtland P, Bendix K, Kjeldsen E. Supernumerary isochromosome 1, idic(1)(p12), leading to tetrasomy 1q in Burkitt lymphoma. Cytogenet Genome Res. 2014;142(1):7-13.
12. Sato Y, Kurosawa H, Fukushima K, Okuya M, Arisaka O. Burkitttype acute lymphoblastic leukemia with precursor B-cell Immunophenotype and partial tetrasomy of 1q: a case report. Medicine (Baltimore). 2016;95(10):e2904.
13. Meznarich J, Miles R, Paxton CN, Afify Z. Pediatric B-cell lymphoma with lymphoblastic morphology, TdT expression, MYC rearrangement, and features overlapping with Burkitt lymphoma. Pediatr Blood Cancer. 2016;63(5):938-940.
14. Gu Z, Churchman ML, Roberts KG, et al. PAX5-driven subtypes of B-progenitor acute lymphoblastic leukemia. Nat Genet. 2019;51(2):296-307.
Haematologica | 108 March 2023 729 ARTICLE - IG-MYC-r B-cell precursor ALL S. Bomken et al.
15. Forestier E, Johansson B, Borgström G, Kerndrup G, Johansson J, Heim S. Cytogenetic findings in a population-based series of 787 childhood acute lymphoblastic leukemias from the Nordic countries. The NOPHO Leukemia Cytogenetic Study Group. Eur J Haematol. 2000;64(3):194-200.
16. Wagener R, Lopez C, Kleinheinz K, et al. IG-MYC (+) neoplasms with precursor B-cell phenotype are molecularly distinct from Burkitt lymphomas. Blood. 2018;132(21):2280-2285.
17. Herbrueggen H, Mueller S, Rohde J, et al. Treatment and outcome of IG-MYC(+) neoplasms with precursor B-cell phenotype in childhood and adolescence. Leukemia. 2020;34(3):942-946.
18. Zhang C, Amos Burke GAA. Pediatric precursor B-cell acute lymphoblastic leukemia with MYC 8q24 translocation - how to treat? Leuk Lymphoma. 2018;59(8):1807-1813.
19. Schwab CJ, Chilton L, Morrison H, et al. Genes commonly deleted in childhood B-cell precursor acute lymphoblastic leukemia: association with cytogenetics and clinical features. Haematologica. 2013;98(7):1081-1088.
20. Chen X, Schulz-Trieglaff O, Shaw R, et al. Manta: rapid detection of structural variants and indels for germline and cancer sequencing applications. Bioinformatics. 2016;32(8):1220-1222.
21. Li H, Durbin R. Fast and accurate long-read alignment with Burrows-Wheeler transform. Bioinformatics. 2010;26(5):589-595.
22. McKenna A, Hanna M, Banks E, et al. The Genome Analysis Toolkit: a MapReduce framework for analyzing next-generation DNA sequencing data. Genome Res. 2010;20(9):1297-1303.
23. Cibulskis K, Lawrence MS, Carter SL, et al. Sensitive detection of somatic point mutations in impure and heterogeneous cancer samples. Nat Biotechnol. 2013;31(3):213-219.
24. Sharma T, Schwalbe EC, Williamson D, et al. Second-generation molecular subgrouping of medulloblastoma: an international meta-analysis of group 3 and group 4 subtypes. Acta Neuropathol. 2019;138(2):309-326.
25. Bray NL, Pimentel H, Melsted P, Pachter L. Near-optimal probabilistic RNA-seq quantification. Nat Biotechnol. 2016;34(5):525-527.
26. Love MI, Huber W, Anders S. Moderated estimation of fold change and dispersion for RNA-seq data with DESeq2. Genome Biol. 2014;15(12):550.
27. Lilljebjorn H, Henningsson R, Hyrenius-Wittsten A, et al. Identification of ETV6-RUNX1-like and DUX4-rearranged subtypes in paediatric B-cell precursor acute lymphoblastic leukaemia. Nat Commun. 2016;7:11790.
28. van der Maaten L, Hinton G. Visualising data using t-SNE. J Mach Learn Res. 2008;9(86):2579-2605.
29. Newman AM, Zaka M, Zhou P, et al. Genomic abnormalities of TP53 define distinct risk groups of paediatric B-cell nonHodgkin lymphoma. Leukemia. 2022;36(3):781-789.
30. Schiffman JD, Lorimer PD, Rodic V, et al. Genome wide copy number analysis of paediatric Burkitt lymphoma using formalinfixed tissues reveals a subset with gain of chromosome 13q and corresponding miRNA over expression. Br J Haematol. 2011;155(4):477-486.
31. Scholtysik R, Kreuz M, Klapper W, et al. Detection of genomic aberrations in molecularly defined Burkitt's lymphoma by arraybased, high resolution, single nucleotide polymorphism analysis. Haematologica. 2010;95(12):2047-2055.
32. Havelange V, Pepermans X, Ameye G, et al. Genetic differences between paediatric and adult Burkitt lymphomas. Br J Haematol. 2016;173(1):137-144.
33. Moorman AV, Ensor HM, Richards SM, et al. Prognostic effect of chromosomal abnormalities in childhood B-cell precursor acute
lymphoblastic leukaemia: results from the UK Medical Research Council ALL97/99 randomised trial. Lancet Oncol. 2010;11(5):429-438.
34. Yasuda T, Tsuzuki S, Kawazu M, et al. Recurrent DUX4 fusions in B cell acute lymphoblastic leukemia of adolescents and young adults. Nat Genet. 2016;48(5):569-574.
35. Liu YF, Wang BY, Zhang WN, et al. Genomic profiling of adult and pediatric B-cell acute lymphoblastic leukemia. EBioMedicine. 2016;8:173-183.
36. Zhang J, McCastlain K, Yoshihara H, et al. Deregulation of DUX4 and ERG in acute lymphoblastic leukemia. Nat Genet. 2016;48(12):1481-1489.
37. Love C, Sun Z, Jima D, et al. The genetic landscape of mutations in Burkitt lymphoma. Nat Genet. 2012;44(12):1321-1325.
38. Schmitz R, Young RM, Ceribelli M, et al. Burkitt lymphoma pathogenesis and therapeutic targets from structural and functional genomics. Nature. 2012;490(7418):116-120.
39. Richter J, Schlesner M, Hoffmann S, et al. Recurrent mutation of the ID3 gene in Burkitt lymphoma identified by integrated genome, exome and transcriptome sequencing. Nat Genet. 2012;44(12):1316-1320.
40. Bouska A, Bi C, Lone W, et al. Adult high-grade B-cell lymphoma with Burkitt lymphoma signature: genomic features and potential therapeutic targets. Blood. 2017;130(16):1819-1831.
41. Nordlund J, Bäcklin CL, Wahlberg P, et al. Genome-wide signatures of differential DNA methylation in pediatric acute lymphoblastic leukemia. Genome Biol. 2013;14(9):r105.
42. Gabriel AS, Lafta FM, Schwalbe EC, et al. Epigenetic landscape correlates with genetic subtype but does not predict outcome in childhood acute lymphoblastic leukemia. Epigenetics. 2015;10(8):717-726.
43. Bergmann AK, Castellano G, Alten J, et al. DNA methylation profiling of pediatric B-cell lymphoblastic leukemia with KMT2A rearrangement identifies hypomethylation at enhancer sites. Pediatr Blood Cancer. 2017;64(3):e26251.
44. Hernandez-Vargas H, Gruffat H, Cros MP, et al. Viral driven epigenetic events alter the expression of cancer-related genes in Epstein-Barr-virus naturally infected Burkitt lymphoma cell lines. Sci Rep. 2017;7(1):5852.
45. Liu W, Hu S, Konopleva M, et al. De novo MYC and BCL2 doublehit B-cell precursor acute lymphoblastic leukemia (BCP-ALL) in pediatric and young adult patients associated with poor prognosis. Pediatr Hematol Oncol. 2015;32(8):535-547.
46. Sakaguchi K, Imamura T, Ishimaru S, et al. Nationwide study of pediatric B-cell precursor acute lymphoblastic leukemia with chromosome 8q24/MYC rearrangement in Japan. Pediatr Blood Cancer. 2020;67(7):e28341.
47. Anderson JR, Wilson JF, Jenkin DT, et al. Childhood nonHodgkin's lymphoma. The results of a randomized therapeutic trial comparing a 4-drug regimen (COMP) with a 10-drug regimen (LSA2-L2). N Engl J Med. 1983;308(10):559-565.
48. Moorman AV, Harrison CJ, Buck GAN, et al. Karyotype is an independent prognostic factor in adult acute lymphoblastic leukemia (ALL): analysis of cytogenetic data from patients treated on the Medical Research Council (MRC) UKALLXII/Eastern Cooperative Oncology Group (ECOG) 2993 trial. Blood. 2007;109(8):3189-3197.
49. Grande BM, Gerhard DS, Jiang A, et al. Genome-wide discovery of somatic coding and non-coding mutations in pediatric endemic and sporadic Burkitt lymphoma. Blood. 2019;133(12):1313-1324.
50. Gelmann EP, Psallidopoulos MC, Papas TS, Dalla Favera R. Identification of reciprocal translocation sites within the c-myc
Haematologica | 108 March 2023 730 ARTICLE - IG-MYC-r B-cell precursor ALL S. Bomken et al.
oncogene and immunoglobulin mu locus in a Burkitt lymphoma. Nature. 1983;306(5945):799-803.
51. Busch K, Keller T, Fuchs U, et al. Identification of two distinct MYC breakpoint clusters and their association with various IGH breakpoint regions in the t(8;14) translocations in sporadic Burkitt-lymphoma. Leukemia. 2007;21(8):1739-1751.
52. López C, Kleinheinz K, Aukema SM, et al. Genomic and transcriptomic changes complement each other in the pathogenesis of sporadic Burkitt lymphoma. Nat Commun. 2019;10(1):1459.
53. Bendig S, Walter W, Meggendorfer M, et al. Whole genome sequencing demonstrates substantial pathophysiological differences of MYC rearrangements in patients with plasma cell
myeloma and B-cell lymphoma. Leuk Lymphoma. 2021;62(14):3420-3429.
54. Paietta E, Roberts KG, Wang V, et al. Molecular classification improves risk assessment in adult BCR-ABL1-negative B-ALL. Blood. 2021;138(11):948-958.
55. Oberley MJ, Raikar SS, Wertheim GB, et al. Significance of minimal residual disease in pediatric mixed phenotype acute leukemia: a multicenter cohort study. Leukemia. 2020;34(7):1741-1750.
56. Orgel E, Alexander TB, Wood BL, et al. Mixed-phenotype acute leukemia: a cohort and consensus research strategy from the Children's Oncology Group Acute Leukemia of Ambiguous Lineage Task Force. Cancer. 2020;126(3):593-601.
Haematologica | 108 March 2023 731 ARTICLE - IG-MYC-r B-cell precursor ALL S. Bomken et al.
STAT5 does not drive steroid resistance in T-cell acute lymphoblastic leukemia despite the activation of BCL2 and BCLXL following glucocorticoid treatment
Correspondence: J.PP. Meijerink
j.meijerink@prinsesmaximacentrum.nl
Received: November 23, 2021.
Accepted: May 30, 2022.
Early view: June 23, 2022.
https://doi.org/10.3324/haematol.2021.280405
©2023 Ferrata Storti Foundation
Published under a CC BY-NC license
Abstract
Physiological and pathogenic interleukin-7-receptor (IL7R)-induced signaling provokes glucocorticoid resistance in a subset of patients with pediatric T-cell acute lymphoblastic leukemia (T-ALL). Activation of downstream STAT5 has been suggested to cause steroid resistance through upregulation of anti-apoptotic BCL2, one of its downstream target genes. Here we demonstrate that isolated STAT5 signaling in various T-ALL cell models is insufficient to raise cellular steroid resistance despite upregulation of BCL2 and BCL-XL. Upregulation of anti-apoptotic BCL2 and BCLXL in STAT5-activated T-ALL cells requires steroid-induced activation of NR3C1. For the BCLXL locus, this is facilitated by a concerted action of NR3C1 and activated STAT5 molecules at two STAT5 regulatory sites, whereas for the BCL2 locus this is facilitated by binding of NR3C1 at a STAT5 binding motif. In contrast, STAT5 occupancy at glucocorticoid response elements does not affect the expression of NR3C1 target genes. Strong upregulation of BIM, a NR3C1 pro-apoptotic target gene, upon prednisolone treatment can counterbalance NR3C1/STAT5-induced BCL2 and BCL-XL expression downstream of IL7induced or pathogenic IL7R signaling. This explains why isolated STAT5 activation does not directly impair the steroid response. Our study suggests that STAT5 activation only contributes to steroid resistance in combination with cellular defects or alternative signaling routes that disable the pro-apoptotic and steroid-induced BIM response.
Introduction
Synthetic steroids remain a vital cornerstone drug in the treatment of pediatric T-cell acute lymphoblastic leukemia (T-ALL). Upon binding with steroids, the glucocorticoid receptor (NR3C1) dimerizes and migrates to the nucleus where it functions as a transcription factor and regulates the expression of multiple steroid-response genes, including the pro-apoptotic gene BIM. 1-3 Resistance to steroid treatment predicts for inferior outcome and therefore remains a major clinical problem in T-ALL.4,5 An important signaling pathway that interferes with steroid sensitivity is the interleukin-7-receptor (IL7R) pathway. Both physiological IL7 signaling or the presence of activating mutations in various IL7R signaling molecules have been linked to steroid resistance in T-ALL patients.6,7
Recently, the mechanisms underlying IL7R-dependent survival and/or steroid resistance have been studied. IL7R signaling results in downstream activation of the PI3K-AKT and STAT5 pathways, but also activates MAPK-ERK signaling.6,8-12
For these individual downstream signaling pathways, different mechanisms have been identified which may contribute to steroid resistance (Figure 1). Activation of the PI3K-AKT pathway is reported to drive phosphorylation of NR3C1, which blocks its migration to the nucleus.13 Additionally, PI3K-AKT signaling can upregulate various anti-apoptotic proteins including BCLXL and MCL1.6 AKT can also inhibit transcription of the important glucocorticoid receptor target gene BIM via an inhibitory phosphorylation of the FOXO3A transcription factor.14 Epigenetic silencing of the BIM locus, as found in some ALL patient-derived xenograft models, has also been proposed as an important mechanism of resistance to steroids.15,16 IL7R signaling mutations, found in approximately 35% of pediatric T-ALL patients, or physiological IL7 signaling activate downstream MAPK-ERK signaling.6,7,12 Activated ERK phosphorylates BIM-L and BIM-EL proteins, which therefore lose their potential to bind and neutralize anti-apoptotic BCL2 protein family members including BCL2, BCL-XL and MCL1, hence resulting in steroid resistance.12 MEK inhibitors, and to a limited extent the JAK inhibitor ruxolitinib, showed
Jordy C.G. van der Zwet, Valentina Cordo’, Jessica G.C.A.M. Buijs-Gladdines, Rico Hagelaar, Willem K. Smits, Eric Vroegindeweij, Laura T.M. Graus, Vera M. Poort, Marloes Nulle, Rob Pieters and Jules P.P. Meijerink°
Princess Máxima Center for Pediatric Oncology, Utrecht, the Netherlands
°Current affiliation: Acerta Pharma, Oss, the Netherlands.
Haematologica | 108 March 2023 732 ARTICLE - Acute Lymphoblastic Leukemia
synergy with steroid treatment by restoring functional BIM levels, thereby representing promising targeted compounds to overcome steroid resistance in T-ALL.6,12
Activation of the glucocorticoid receptor NR3C1 facilitates transcriptional upregulation of glucocorticoid target genes, including BIM and IL7R. 17 Recently, it was shown that by upregulating IL7Ra, steroid treatment could paradoxically induce steroid resistance,18 since enhanced IL7-induced signaling activates STAT5 and consequentially enhances the expression of the pro-survival gene BCL218 and the PIM1 kinase gene.19 Thus far, upregulation of BCL2 is regarded as the driving mechanism for IL7-induced survival and steroid resistance.7,17,18,20,21
Here we explore the significance of STAT5 signaling downstream of physiological or mutant IL7R signaling in relation to steroid resistance in pediatric T-ALL. We studied whether induced expression of the constitutively active N642H STAT5 mutant can activate BCL2 and drive steroid resistance.
Methods
Cell preparation and cytotoxicity assays
An extended description of the generation of SUPT-1 and P12-ICHIKAWA cell lines can be found in the Online Sup-
plementary Methods. For quantitative real-time reversetranscription polymerase chain reaction (RTQ-PCR), immunoblot analysis and cytotoxicity assays, SUPT-1 and CCRF-CEM cells were plated in RPMI-1640 medium as described in the Online Supplementary Methods. For activation of IL7R signaling, the medium of the CCRF-CEM cells was supplemented with 10 ng/mL IL7 (R&D systems). For RTQ-PCR and immunoblot analysis experiments, cells were plated at a concentration of 1x10⁶ cells/mL overnight. For cytotoxicity assays, cells were plated at a concentration of 0.2x10⁶ cells/mL, and cell viability was determined after 4 days by a methylthiazolyldiphenyl-tetrazolium bromide (MTT, Sigma Aldrich) assay.
Immunoblot analysis and immunoprecipitation
Cell pellets of treated cell suspensions were lysed using kinase lysis buffer, and protein eluates were loaded on BioRad Mini-Protean ® TGX TM any-kd precast gels.12 Proteins were transferred to 0.2 m m nitrocellulose membranes using the Trans-Blot ® TurboTM Transfer System (BioRad). Primary antibodies used for immunoblot analysis are listed in the Online Supplementary Methods . Loading controls were equivalent in experiments in which multiple membranes were used. Immunoprecipitation was performed as previously described,12 and as
Figure 1. Schematic overview of IL7-receptor- and steroid-induced signaling. In the presence of IL-7, IL7Ra (left) and IL7Rγ (right) subunits heterodimerize, allowing transphosphorylation of JAK1 and JAK3 kinases and phosphorylation of IL7Ra as a docking site for STAT5. As a result, downstream PI3K-AKT, MAPK-ERK and STAT5 signaling pathways are activated. Activated STAT5 migrates to the nucleus as a homodimer to regulate the transcription of canonical STAT5 target genes, including anti-apoptotic BCL2 and BCLXL. Activated PI3K-AKT signaling upregulates anti-apoptotic BCLXL and MCL1 and can regulate the nuclear translocation of the activated glucocorticoid receptor (NR3C1). Activated MAPK-ERK signaling phosphorylates and therefore inactivates proapoptotic BIM. Upon exposure to steroids, NR3C1 migrates to the nucleus as a homodimer and induces the expression of NR3C1 target genes (including pro-apoptotic BIM) at glucocorticoid response element sites.

Haematologica | 108 March 2023 733 ARTICLE - STAT5 does not drive steroid resistance in T-ALL J.C.G. van der Zwet et al.
described in more detail in the Online Supplementary Methods .
Quantitative
real-time
reverse-transcription polymerase chain reactions
Isolation of RNA, cDNA synthesis and RTQ-PCR were performed as previously described. 22,23 The expression of NR3C1 or STAT5 target genes was calculated using the delta CT (dCT) method as percentage of GADPH expression. Fold expression change was calculated relative to the non-doxycycline-induced (-dox), non-prednisolone treated (-pred) condition. The primers used are described in the Online Supplementary Methods.
Processing and visualization of chromatin immunoprecipitation sequencing data
An extended description of chromatin immunoprecipitation (ChIP)-sequencing can be found in the Online Supplementary Methods . DNA eluates were sequenced using the Illumina NextSeq500 platform of the Utrecht Sequence facility. Raw reads were aligned to the CRCh38 human genome, using the Burrows-Wheeler Aligner tool 24 with default settings. Narrowpeak calling with default settings from MACS2 25 was used for peak calling. BamCoverage from deeptools 26 was used to normalize input signal for figures, using the reads per genomic content method. Peaks were visualized using Integrative Genomics Viewer. 27 Bedtools 28 was used to select unique and overlapping peaks for STAT5/NR3C1. These are visualized using the plotheatmap function from deeptools. MEME-ChIP was used to detect motifs within regions of 50 bp up or down of the summit of NR3C1 or STAT5 peak summits (101 bp window), using default settings.29
Data availability
Affymetrix U133 Plus2 microarray data for the 117 patients as previously published 30 were normalized using the robust multi-array average, computed by the affy package. 31 Microarray data are available at http://www.ncbi.nlm.nih.gov/geo/ under accession number GSE26713. Data analysis is described in the Online Supplementary Methods. A selection of STAT5 target genes ChIP-sequencing files are available at Gene Expression Omnibus under GEO series accession number: GSE171976, https://www.ncbi.nlm.nih.gov/geo/query/acc.cgi?acc=GSE171 976.
Results
Activation of STAT5 target genes does not predict steroid resistance in T-cell acute lymphoblastic leukemia
To study the significance of STAT5 activation in relation to
steroid resistance in pediatric T-ALL, we investigated the expression of STAT5 target genes (e.g., BCL2, BCL2L1 (BCLXL), PIM1, CISH, OSM1 and SOCS2) in our historic microarray dataset of 117 samples from treatment-naïve pediatric T-ALL patients.30 The leukemia subtype and the IL7R signaling pathway mutational status of these patients, as previously determined,6,30 are displayed in Figure 2A. Cluster analysis based on the expression of STAT5 target genes separated T-ALL patients into two major clusters, with cluster B representing patients with high expression of STAT5 target genes. In relation to leukemic subtype, cluster B was significantly enriched for TLX3-rearranged leukemias (P<0.0001), whereas TLX1-/NKX2.1- rearranged patients or TAL1/2- and LMO1/2-rearranged T-ALL patients were strongly associated with cluster A (P=0.0126 and P<0.0001, respectively) (Figure 2B). Moreover, activating IL7R signaling mutations in IL7R, JAK1, JAK3 and/or STAT5B genes were also strongly associated with STAT5 transcriptional activity (P<0.0001) (Figure 2C), in line with previous observations that these mutations are also associated with TLX3-rearranged patients.6,30,32 Enrichment of TLX3-rearranged leukemia and IL7R signaling mutations in samples that display high expression of these STAT5 target genes was verified by performing similar analysis on RNA-sequencing data available from the St. Jude database (Online Supplementary Figure S1).32 These results highlight the contribution of IL7R, JAK1, JAK3 and/or STAT5B mutations to the activation of STAT5 in T-ALL. In relation to ex-vivo prednisolone cytotoxic response levels, as determined for 84 out of these 117 T-ALL patients’ samples, we observed that the prednisolone concentrations lethal to 50% of the T-ALL cells (LC50) were comparable for patients with high or low STAT5 transcriptional activity (Figure 2D). Moreover, no difference in event-free survival was observed between the two groups (log-rank test P=0.24) (Figure 2E). This suggests that the predicted STAT5 activity does not alone predict for sensitivity to steroid treatment at diagnosis, either by not having an immediate impact on steroid sensitivity or due to the presence of alternative resistance mechanisms.
STAT5 activation does not drive steroid resistance in IL7R-mutant cell lines
To further explore the relation between the STAT5-regulated transcriptional program and steroid resistance, we generated SUPT-1 or P12-Ichikawa derivative lines that can be induced to express wild-type IL7R a (IL7RWT) or cysteine-mutant IL7R a molecules (IL7RPILT240-244RFCPH or IL7RPIL240-242QSPSC) following exposure to doxycycline. We previously demonstrated that induced expression of cysteine-mutant IL7Ra molecules, in contrast to wild-type IL7Ra, provoked steroid resistance in otherwise steroidsensitive T-ALL SUPT-1 cells.12 Overexpression of mutant IL7Ra resulted in STAT5 phosphorylation and thus STAT5
Haematologica | 108 March 2023 734 ARTICLE - STAT5 does not drive steroid resistance in T-ALL J.C.G. van der Zwet et al.
Figure 2. STAT5 transcriptional activity in pediatric patients with T-cell acute lymphoblastic leukemia does not predict steroid resistance. (A) Unsupervised clustering of STAT5 target gene expression of 117 treatment-naïve pediatric patients with T-cell acute lymphoblastic leukemia (T-ALL) using Affymetrix U133 Plus2 microarrays. Genes used for clustering were already described STAT5 target genes BCL2, BCL2L1 (BCLXL), PIM1, CISH, OSM1 and SOCS2. For most of these genes, multiple probes were used. Euclidean distances were used to determine clusters. The leukemic subtype and IL7R-pathway mutational status for these patients had been previously determined. Cluster B represents patients with the highest STAT5 transcriptional activity. The four major T-ALL subtypes (characterized by specific oncogenic rearrangements, clustered as described by Homminga et al.30 are represented in green, yellow, pink and blue. Patients who harbor a mutation in the IL7R, JAK1, JAK3 or STAT5 gene are indicated in red (versus no mutations in these genes in black). (B) Representation of the four major leukemic T-ALL subtypes in both STAT5 transcriptional clusters. Statistical differences were calculated by the χ2 test; *P<0.05, ** P<0.01, *** P<0.001, **** P<0.0001. (C) IL7R/JAK1/JAK3/STAT5B mutation status of primary patients’ blasts related to STAT5 transcriptional clusters. Statistical differences were calculated by the χ2 test; *P<0.05, **P<0.01, ***P<0.001, ****P<0.0001. (D) Statistical analysis of in vitro prednisolone sensitivity of patients in low versus high STAT5 transcriptional clusters (Mann-Whitney-test). (E) Kaplan-Meier analysis of event-free survival between patients in low versus high STAT5 transcriptional clusters (long-rank test). LC50: concentrations lethal to 50% of cells.

C D
Haematologica | 108 March 2023 735 ARTICLE - STAT5 does not drive steroid resistance in T-ALL J.C.G. van der Zwet et al. A B E
activation, while no effect was seen upon wild-type IL7Ra overexpression (Figure 3A). Examining the activation of STAT5 target genes, both mutant IL7Ra molecules strongly induced BCL2 and BCL-XL protein expression, but only in the presence of prednisolone. To further validate this concept, we studied the expression of BCL2 and BCLXL and various other STAT5 target genes such as PIM1 and CISH in SUPT-1 cells expressing IL7RWT or a cysteine-mutant IL7R variant. Expression of these STAT5 target genes was also studied in the presence of prednisolone with or without targeted inhibitors of JAK1/2 (ruxolitinib), MEK (selumetinib) and/or AKT (MK2206) (Figure 3B).6,7,12 Again, steroid treatment of IL7R-mutant overexpressing cells led to a nearly two-fold increase in BCL2 and BCLXL expression (Figure 3C). As expected, the JAK inhibitor ruxolitinib effectively blocked downstream STAT5B, MAPK-ERK and AKT pathways (Online Supplementary Figure S2), and also blocked steroid-dependent upregulation of BCL2, BCLXL, CISH and PIM1 (Figure 3C). Treatment with the MEK inhibitor selumetinib, the AKT inhibitor MK2206, or their combination could not block transcriptional upregulation of these genes. Similar results were obtained in the context of IL7-induced signaling in the T-ALL cell line CCRFCEM, indicating that this reflects a general mechanism in T-ALL cells (Online Supplementary Figure S3A, B). Unexpectedly, whereas expression of both mutant IL7R isoforms strongly raised steroid resistance, this effect seemed independent of upregulation of pro-survival proteins BCL2 and BCL-XL via STAT5; while the JAK inhibitor ruxolitinib inhibits upregulation of BCL2 and BCL-XL and reverts steroid resistance in this model, both AKT-inhibitor treatment and combined MEK- and AKT- inhibitor treatment also sensitized SUP-T1 cells to prednisolone treatment (Figure 3D) regardless of the STAT5-driven and steroid-induced BCL2 and BCL-XL induction (Figure 3C). Similar findings were observed for T-ALL CCRF-CEM cells, in which these inhibitors reverted IL7-induced steroid resistance independently of the expression levels of BCL2 and BCL-XL via STAT5 (Online Supplementary Figure S3B,C). Therefore, we conclude that STAT5 activation and consequent upregulation of BCL2 and BCL-XL do not have a direct negative impact on steroid sensitivity as studied in SUPT-1 cell line models (Figure 2D).
STAT5N642H-induced SUPT1 cells remain steroid sensitive despite enhanced BCL2 and BCLXL levels
To further exclude a direct role of active STAT5 signaling in relation to steroid resistance, we generated doxycycline-inducible SUPT-1 and P12-Ichikawa derivative lines that express wild-type STAT5B (STAT5WT) or the constitutively active mutant isoform STAT5N642H (Figure 4A). This activating and transforming STAT5B mutation, found in 4/117 patients of our patient cohort (i.e., 3.4%), solely activates the STAT5-signaling pathway and therefore serves as a
STAT5-focused model.6,33-37 Expression of STAT5BN642H, but not STAT5WT, led to activated STAT5B signaling without affecting the MAPK-ERK or PI3K-AKT signaling pathways (Figure 4A, Online Supplementary Figure S4A).6,33-37 In line with these results, expression of STAT5BWT was ineffective at activating the expression of downstream target genes, while STAT5BN642H induced the expression of canonical STAT5 target genes (Figure 4B, Online Supplementary Figure S4B). Moreover, the expression of STAT5 target genes was further boosted in STAT5N642H cells upon steroid treatment (Figure 4B). In addition to enhanced expression of BCLXL and other classical STAT5 target genes such as PIM1, CISH and OSM1, BCL2 expression was greatly dependent on the steroid treatment. Despite upregulation of BCL2 and BCL-XL anti-apoptotic molecules in the presence of active STAT5 signaling (STAT5N642H) and steroid treatment, the cytotoxic steroid response did not change for SUPT-1 or P12-Ichikawa cells (Figure 4C, D). This again demonstrates that STAT5 signaling alone does not provoke steroid resistance despite the upregulation of anti-apoptotic BCL2 and BCL-XL.
NR3C1-STAT5B co-binding enhances the expression of canonical STAT5 target genes
The enhanced STAT5 transcriptional activity during steroid treatment has previously been attributed to steroid-induced transcriptional upregulation of IL7RA by NR3C1, which can further enhance STAT5 activation and subsequently the upregulation of BCL2 in the presence of IL7.18 As the induction of BCL2 and IL7RA also occurs in parallel in IL7-exposed and inhibitor-treated CCRF-CEM cells (Figure 3B, Online Supplementary Figure S5A), an alternative hypothesis could be that NR3C1 and STAT5B act in a single transcriptional complex and co-regulate an identical set of target genes. To explore this possibility, we performed NR3C1 co-immunoprecipitation experiments using SUPT-1 STAT5BWT and STAT5BN642H cells and identified that NR3C1 and STAT5B could indeed physically interact (Figure 5A). This interaction seemed to be independent of the phosphorylation status of STAT5B, as both (unphosphorylated) wild-type STAT5 and (phosphorylated) mutant STAT5B bound NR3C1 to equal extents following exposure to steroids. Moreover, NR3C1 also bound to STAT5 in the nonprednisolone treated condition (Online Supplementary Figure S5B). To explore whether (mutant) STAT5 and NR3C1 could bind to the same transcriptional regulatory regions, we performed ChIP-sequencing for NR3C1 and STAT5. While wild-type STAT5 was expressed in a non-phosphorylated, transcriptionally inactive form, we observed that it could still bind to many regulatory sites that were also bound by the phosphorylated and constitutively active STAT5BN642H isoform (Figure 5B). While binding of STAT5BWT or STAT5BN642H to regulatory sites was independent of steroid exposure, NR3C1 only bound to DNA upon
Haematologica | 108 March 2023 736 ARTICLE - STAT5 does not drive steroid resistance in T-ALL J.C.G. van der Zwet et al.
Figure 3. Steroid treatment and inhibition of MAPK-ERK and PI3K-AKT signaling enhance the expression of STAT5 target genes in mutant IL7R cell lines. (A) Ligand-independent STAT5B pathway activation in wild-type and cysteine-mutant IL7R overexpressing SUPT-1 cell lines. Protein band intensity for BCL2 and BCL-XL are represented relative to the condition without doxycycline induction and without prednisolone treatment (-dox-pred). Loading controls were equivalent between different membranes used. (B) Graphic representation of Online Supplementary Figure S1: selective inhibition of IL7RMUT activated pathways by ruxolitinib (1 mM, JAK1/2 inhibitor), selumetinib (1 mM, MEK inhibitor) and MK2206 (0.5 mM, AKT inhibitor). (C) Expression of STAT5B target genes in wild-type and mutant IL7R overexpressing SUPT-1 cells. Cells were treated with targeted inhibitors for 30 min before doxycycline induction. Steroid-exposed cells were treated with prednisolone (250 mg/mL) for 16 h. Representative data from two independent experiments with identical conditions. (D) Steroid sensitivity of wild-type and mutant IL7R overexpressing SUPT-1 cells in the absence or presence of targeted inhibitors. Steroid sensitivity was determined by a 4day MTT read-out. Representative data from a biological duplicate.

B C
Haematologica | 108 March 2023 737 ARTICLE - STAT5 does not drive steroid resistance in T-ALL J.C.G. van der Zwet et al. D A
prednisolone treatment, which was expected based on its nuclear translocation upon interaction with steroids.1 We identified genomic regions that were predominantly bound by either STAT5B or NR3C1, denoted as STAT5 or NR3C1 unique binding sites. Interestingly, many genomic regions were bound by both STAT5B and NR3C1 upon steroid exposure, suggesting that STAT5B and NR3C1 can co-regu-
late a common set of target genes. Motif analysis for NR3C1 and NR3C1/STAT5 binding sites revealed significant enrichment of classical glucocorticoid response element motifs38 and STAT5 motifs, but not at binding sites that were uniquely bound by STAT5 (Figure 5C, Online Supplementary Table S1).
We then specifically studied co-occupancy of STAT5 and
Figure 4. Overexpression of STAT5BN642H does not provoke steroid resistance despite enhanced expression of anti-apoptotic molecules upon steroid treatment. (A) Activation of STAT5B signaling and expression of anti-apoptotic Bcl2 family proteins in STAT5B wild-type and mutant overexpressing SUPT-1 cells. Protein band intensity for BCL2 and BCL-XL represented relative to the condition without doxycycline induction and without prednisolone treatment (-dox-pred). Loading controls were equivalent between different membranes used. (B) Expression of STAT5 target genes in STAT5BWT and STAT5BN642H overexpressing SUPT-1 cells in the absence and presence of prednisolone treatment (16 h, 250 mg/mL). Data from biological triplicates with standard deviation indicated. (C) Steroid sensitivity of wild-type and mutant STAT5B overexpressing SUPT-1 and P12 ICHIKAWA cell lines. Steroid sensitivity was determined by a 4-day MTT read-out. Data from biological triplicates with standard deviation indicated.

B C
Haematologica | 108 March 2023 738 ARTICLE - STAT5
J.C.G. van der Zwet et al. D A
does not drive steroid resistance in T-ALL

B Continued on following page. A C Haematologica | 108 March 2023 739 ARTICLE - STAT5 does not drive steroid resistance in T-ALL J.C.G. van der Zwet et al. D
Figure 5. NR3C1 co-regulates the expression of transcriptional STAT5 target genes by co-binding at STAT5-regulated genes. (A) Immunoblot analysis of NR3C1-immunoprecipitation in STAT5BWT and STAT5BN642H SUPT-1 cells. Steroid-exposed cells were treated with prednisolone (250 mg/mL) for 16 h. Loading controls were equivalent between different membranes used. (B) Reads per genomic content-normalized centered heatmap of unique and overlapping NR3C1 and STAT5 chromatin-immunoprecipitation (ChIP) sequencing binding peaks of doxycycline-induced STAT5BWT and STAT5BN642H SUPT-1 cells with (+dox+pred) or without (+doxpred) prednisolone treatment (16 h, 250 mg/mL). Blue represents more reads, indicating confirmed binding of protein at the genome. (C) MEME-ChIP motif analysis of NR3C1 and STAT5 motifs significantly enriched in NR3C1/STAT5 unique or overlapping peak sets. (D) ChIP sequencing identified binding of NR3C1 and STAT5 transcription factors at the STAT5 target genes BCL2, BCLXL and PIM1.
NR3C1 at the regulatory sites of selected STAT5 target genes (Figure 5D, Online Supplementary Figure S5C). For BCLXL and PIM1, we identified STAT5 regulatory sites that were bound by STAT5BN642H but not by wild-type STAT5B, indicating that binding of STAT5 at these regulatory sites is dependent on STAT5 phosphorylation. Interestingly, we found that NR3C1 could also bind to these sites upon steroid exposure in mutant STAT5 cells. For the BCL2 locus, two NR3C1 peaks were identified and bound by NR3C1 only in STAT5N642H cells, with one site harboring a STAT5 binding motif. Interestingly, no clear STAT5 binding was observed at the BCL2 locus, suggesting that STAT5 might be unable to independently regulate BCL2 expression in the absence of steroid treatment or nuclear NR3C1. This is also reflected by the lack of BCL2 expression in STAT5N642H-overexpressing cells in the absence of steroid treatment (Figure 4B, Online Supplementary Figure S3B). We did not identify glucocorticoid response elements at any of the NR3C1-bound sites in BCLXL, PIM or BCL2, suggesting that NR3C1 may be recruited to these binding sites by binding to STAT5B rather than physical binding to DNA. Combined, these data revealed that NR3C1 can interact with STAT5B and bind in or near STAT5-bound genomic sites, even in the absence of a conserved glucocorticoid response element binding motif. Binding of STAT5 to various ‘canonical STAT5 target genes’ seems dependent on its active (phosphorylated) form, which enables recruitment of NR3C1 to these sites following steroid exposure to further boost the expression of these target genes.
In a reciprocal manner, ChIP-sequencing analysis identified STAT5 binding near NR3C1-binding sites that lack conserved STAT5 binding motifs. Examination of various NR3C1 target genes including BIM, KLF13, FKBP5 and GILZ and the newly proposed NR3C1 target genes BMF and MCL1 revealed various NR3C1 binding sites that harbor conserved glucocorticoid response element sequences in BIM, KLF13 and FKBP5 (Figure 6A, B, Online Supplementary Figure S6A, B). Remarkably, binding of STAT5WT and STAT5N624H was observed at glucocorticoid response element sites of KLF13 and FKBP5 that were not flanked by conserved STAT5 binding sequences. This suggests that STAT5 molecules can be recruited to these sites by (direct) interaction with NR3C1, independently of their activation (phosphorylation) state. The significance of STAT5 binding at these sites remains unknown, as the expression of
NR3C1 target genes, including BIM, following steroid exposure remained unaffected upon co-incubation with inhibitors of JAK1/2, MEK, or AKT or of both MEK and AKT (Figure 6C).
NR3C1-induced BIM binds to enhanced BCL2 and BCL-XL protein in STAT5BN642H cells
We then explored whether the pro-apoptotic steroid response (upregulation of pro-apoptotic BIM via NR3C1) could effectively counter-balance the strong upregulation of anti-apoptotic BCL2 and BCL-XL molecules downstream of activated STAT5 during steroid treatment. To do this, we performed BIM-immunoprecipitation experiments in non-induced or doxycycline-induced STAT5BN642H SUPT1 cells that were exposed to prednisolone treatment. As shown in Figure 7, steroid treatment led to increased expression of BIM in its active and unphosphorylated form (total lysate, lanes 2 and 4). In line with previous results,12 active BIM strongly bound to BCL2, BCL-XL and MCL1 (immunoprecipitation, lane 2). Steroid treatment again enhanced the expression of BCL2 and BCL-XL in doxycycline-induced STAT5BN642H cells (total lysate, lane 4). However, immunoprecipitated BIM could effectively bind the upregulated BCL2 and BCL-XL, despite their increased expression (immunoprecipitation, lane 4). Since STAT5N642H overexpression in SUPT-1 cells does not confer steroid resistance (Figure 4C, D), BIM seems to counter the enhanced STAT5/NR3C1 driven anti-apoptotic induction of BCL2 and BCL-XL and therefore preserves a sensitive steroid response. Thus, our study highlights that steroid sensitivity is not solely defined by the upregulation of anti-apoptotic proteins, but is regulated by a tight balance between anti- and pro-apoptotic molecules.
Discussion
Resistance to synthetic steroids remains a problem in the treatment of pediatric ALL. Aberrant activation of the IL7R signaling cascade is frequently observed in T-ALL and is due either to production of IL7 by stromal cells in the leukemia microenvironment7 or to activating mutations in the IL7R signaling pathway.6,12 Activation of the IL7R pathway has been strongly related to steroid resistance via various pro-survival mechanisms downstream of the PI3K-
Haematologica | 108 March 2023 740 ARTICLE - STAT5 does not drive steroid resistance in T-ALL J.C.G. van der Zwet et al.

Continued on following page. B A C Haematologica | 108 March 2023 741 ARTICLE - STAT5 does not drive steroid resistance in T-ALL J.C.G. van der Zwet et al.
Figure 6. Intact NR3C1 transcriptional activity outbalances steroid-dependent enhanced expression of anti-apoptotic molecules. (A) Chromatin immunoprecipitation (ChIP) sequencing identified binding of NR3C1 and STAT5 transcription factors at glucocorticoid response elements of the NR3C1 target genes BIM, FKBP5 and KLF13. (B) Gene expression of NR3C1 target genes (MCL1, KLF13, FKBP5, BIM, BMF and GILZ) in mutant STAT5 overexpressing SUPT-1 cells in the absence or presence of overnight steroid treatment (250 mg/mL). Data from biological triplicate with standard deviations indicated. (C) Gene expression of NR3C1 target genes (BIM and GILZ) in wild-type and mutant IL7R overexpressing SUPT-1 cells in the absence and presence of targeted inhibitors. Cells were treated with targeted inhibitors 30 min before doxycycline-induction. Steroid-exposed cells were treated with prednisolone (250 mg/mL) for 16 h. Representative data from biological duplicates.
AKT, JAK-STAT and MAPK-ERK signaling pathways. Understanding these mechanisms of resistance is of utmost importance, as it may reveal new therapeutic strategies to revert steroid resistance using targeted agents. In the last decade, various steroid resistance mechanisms that are linked to the IL7R pathway have been uncovered. Interestingly, many of these mechanisms involve the inactivation or activation of pro-apoptotic (e.g., BIM, BMF) and anti-apoptotic Bcl-2 family members (e.g., BCL2, BCLXL, MCL1), respectively. In healthy lymphocytes, steroidinduced upregulation of BIM is sufficient to neutralize anti-apoptotic Bcl-2 family members, to antagonize their function and to effectuate cellular apoptosis during early T-cell selection processes.39,40 Overexpression of BCL2 in healthy thymocytes has been demonstrated to outbalance pro-apoptotic BIM, resulting in the abnormal survival and resistance of cells to steroid-induced cell death.41-44 Similarly, upregulation of BCL2 downstream of STAT5 has been proposed to drive IL7-induced steroid resistance in T-ALL patients’ samples.7,18 Here we demonstrate that upregulation of BCL2 and BCLXL by STAT5 is not sufficient to induce steroid resistance in various T-ALL cellular models. Previously, we demonstrated that aberrant activation of the MEK-ERK signaling pathway is one of the major drivers of steroid resistance in IL7R-, JAK1- and RAS-mutant cells, since activated ERK phosphorylates and inactivates proapoptotic BIM.12 MEK inhibitors (and to a lesser extent the JAK inhibitor ruxolitinib) can re-sensitize IL7-induced or IL7R signaling mutant T-ALL patients’ cells to steroid treatment. Other studies also revealed the importance of the pro-apoptotic BIM, since epigenetic silencing of BIM also results in steroid resistance in T-ALL.15,16 Our current study suggests that the anti-apoptotic response of activated STAT5 signaling by itself is insufficient to drive steroid resistance. In fact, combined MEK and AKT inhibition in mutant-IL7R T-ALL cell models resensitized these cells to steroid treatment, despite elevated BCL2 and BCLXL expression levels by activated STAT5 in steroidtreated conditions. The NR3C1-induced expression of BIM seems sufficient to counteract the increased expression of BCL2 and BCL-XL that is caused by steroid/STAT5, through direct binding. Activation of STAT5 may contribute to steroid resistance when the steroid-induced pro-apoptotic BIM response is disabled by (epi-)genetic changes or by MAPK-ERK and PI3K-AKT signaling events.12-16 This is also supported by our observation that active STAT5 sig-
naling, as measured by the expression of various downstream target genes in primary T-ALL patients’ cells, is not associated with steroid resistance in T-ALL patients. Interestingly, we did not observe clear STAT5 binding at the BCL2 locus, despite this harboring a STAT5-binding motif. We demonstrate that this site is bound by NR3C1 upon steroid treatment, only in STAT5-activated cells, resulting in high BCL2 expression. Our results are in line with those of a previous study,20 suggesting that STAT5 itself is unable to regulate the expression of BCL2 despite the presence of a STAT5-binding site. Combined with our observation that BCL2 is induced in steroid-treated STAT5N642H cells, we suggest that nuclear NR3C1 is vital for BCL2 expression in STAT5-activated cells. Our study reveals that expression of BCL2 and the enhanced expression other STAT5-regulated genes following exposure to steroids reflect a common mechanism in different STAT5-activated T-ALL models. Whereas regulatory sites of many genes can be bound by both inactive (non-phosphorylated) STAT5WT and constitutively active (phosphorylated) STAT5N642H, various canonical STAT5 target genes were only bound by active STAT5. Remarkably, NR3C1 is also recruited to these sites upon steroid treatment, which points to important direct co-regulation of NR3C1 in the induction of STAT5 target genes. Although we only analyzed a limited set of genes in more detail, we observed that NR3C1 can be recruited to these sites in the absence of glucocorticoid response element sequences, confirming that NR3C1 can act as a transcriptional co-factor. In combination with our immunoprecipitation results, we suggest that this co-occupancy is caused by direct binding between NR3C1 and STAT5, rather than genomic binding of NR3C1 and STAT5 at overlapping sites. In line with this, we also observed that STAT5 can be recruited to NR3C1-bound target genes irrespective of its activation state. Various of these sites did not contain STAT5-binding motifs, again implying that STAT5 binds directly to NR3C1 rather than binding directly to specific DNA sequences. In contrast to the expression of STAT5 target genes, binding of STAT5 at NR3C1bound target genes did not further enhance the relative expression of NR3C1 downstream target genes, and the expression of these genes also remained unaffected by ruxolitinib treatment. Matched transcriptome studies are required to determine whether the interaction between NR3C1 and STAT5 can regulate the expression of specific genes, or whether it causes more general aberrant transcriptional activity. Additional research is also required to
Haematologica | 108 March 2023 742 ARTICLE - STAT5 does not drive steroid resistance in T-ALL J.C.G. van der Zwet et al.
Figure 7. Steroid-induced BIM in STAT5-activated cells binds the enhanced expression of BCL2 and BCL-XL. Immunoblot analysis of BIM-immunoprecipitation in STAT5BN642H SUPT-1 cells (left: total lysate, right: BIM-immunoprecipitation). Steroidexposed cells were treated with prednisolone (250 mg/mL) for 16 h. The protein abundancy of BCL2, BCL-XL and BIM was quantified, and the expression in cells without doxycycline induction that were treated with prednisolone was taken as the reference. Loading controls were equivalent between different membranes used.

study the exact mechanism by which NR3C1 and STAT5 interact at these genomic regions, and in what ways this physical interaction depends on Tyr694 phosphorylation or a non-dimer form of STAT5.
Co-binding of STAT5 with NR3C1 has previously been reported to occur during glucocorticoid-induced signaling in T cells, mammary and hepatocyte epithelial cells.45-48 Apart from acting as a transcription factor, STAT5 is known to regulate chromatin accessibility of the TCRγ-locus or immunoglobulin heavy-chain,49,50 and induces epigenetic changes at EZH2- and SUZ12-binding sites in STAT5BN642H mutated cells.37 Therefore, STAT5-dependent chromatin remodeling might render (certain) gene sites accessible for NR3C1. This would give an alternative explanation why certain STAT5-target gene sites are only bound by NR3C1 in SUPT-1 cells that overexpress the constitutively active mutant STAT5 molecule.
Our results warrant more detailed research into the mechanisms of STAT5 and NR3C1 cooperation in STAT5induced and NR3C1/steroid-induced signaling. The complexity of STAT5-regulated transcription is exemplified by the interaction of STAT5 with the transcription factor TLX1 in T-ALL cases that harbor a NUP214-ABL1 fusion. Co-binding of these transcription factors drives the expression of BCL2 and MYC in these leukemias. 51 STAT5 therefore seems to act as a versatile transcription factor that can interact with various other transcription factors to promote the transcription of STAT5-regulated genes. In fact, TLX1 and STAT5 are predominantly found at the same enhancer sites in NUP214-ABL1 -positive leukemias, and BET protein inhibitors diminish the expression of BCL2 and MYC. Moreover, deacetylase inhibitors can also inhibit STAT5-mediated transcription by relocating BET proteins.
the
52 These findings and our data highlight
Haematologica | 108 March 2023 743 ARTICLE - STAT5 does not drive steroid resistance in T-ALL J.C.G. van der Zwet et al.
Figure 8. Model of STAT5/NR3C1-regulated transcription and steroid responsiveness. (A) Sole STAT5 activation leads to the transcription of STAT5-target genes (such as BCLXL, but also PIM1, OSM1 and CISH). (B) In the presence of steroid treatment, NR3C1 functions as a transcriptional factor to induce the expression of NR3C1-target genes (such as BIM) at glucocorticoid response elements. In the presence of active STAT5 signaling, NR3C1 also functions as a co-factor at STAT5 transcriptional binding sites (such as BCLXL). Moreover, NR3C1 facilitates the expression of BCL2 by binding at the BCL2 locus in the presence of active STAT5 signaling. Our work suggests that NR3C1-induced BIM expression is sufficient to neutralize enhanced (STAT5/NR3C1-regulated) BCL-XL and BCL2 expression, therefore securing a steroid-sensitive phenotype. (C) In the presence of BIM-inactivating events by active PI3K-AKT and/or MAPK-ERK signaling (in the context of active IL7R-signaling), BIM abundancy or function is diminished. As a result, BIM is unable to neutralize enhanced BCL-XL and BCL2 expression, thus resulting in steroid resistance.
plasticity of STAT5 as a transcription factor, and its ability to induce local or broad epigenetic changes in leukemia.
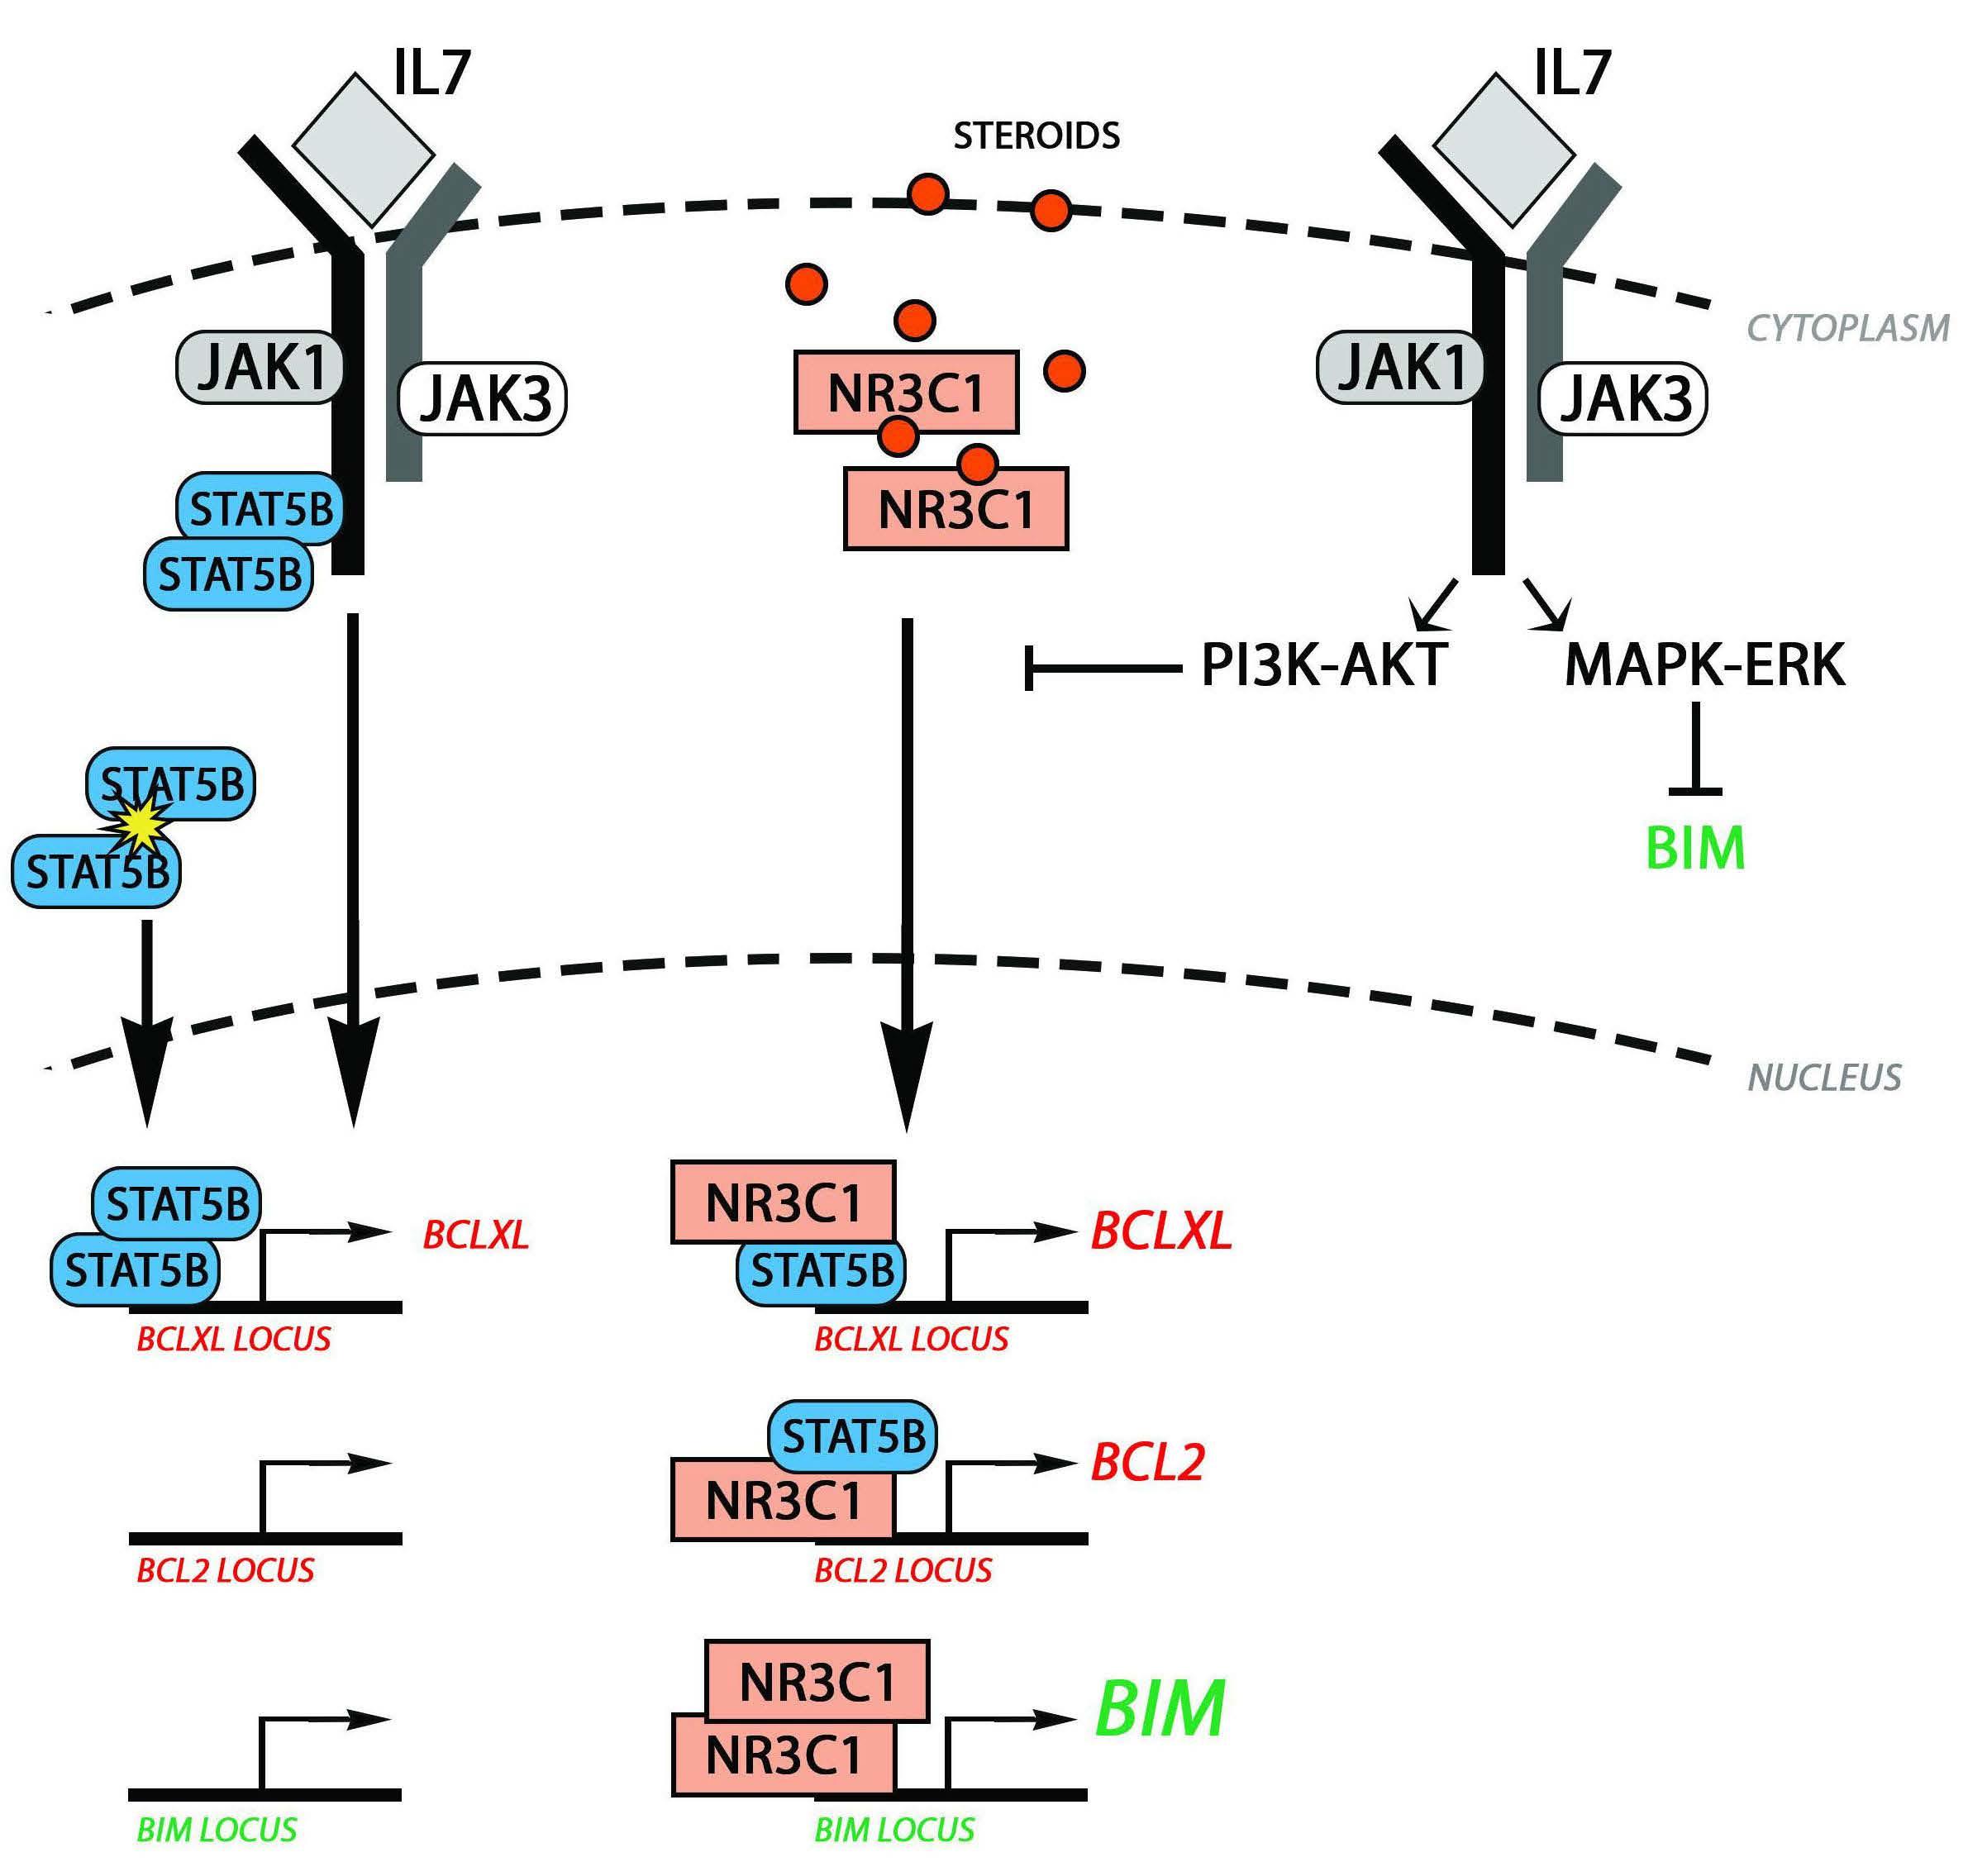
In conclusion, we identified that NR3C1 can directly coregulate the expression of STAT5 target genes including BCL2 and BCLXL, without influencing the steroid response. We demonstrated that NR3C1/STAT5-regulated expression of BCL2 and BCLXL can be counterbalanced by the upregulation of the pro-apoptotic and steroid response gene BIM (Figure 8). Therefore, in the absence of other BIM-inactivating mechanisms by aberrant IL7 signaling, STAT5 activation itself seems insufficient to provoke steroid resistance in TALL. Multi-omic screening of primary patient material, before and after induction therapy, is required to extrapolate our findings to patients.
Disclosures
No conflicts of interest to disclose.
Contributions
JvdZ designed the study, performed research, and wrote the manuscript. JBG, RH, WKS, EV, LG, MN, and VP performed research. RP and VC provided critical input and wrote the manuscript. JM designed and supervised the study and wrote the manuscript.
Acknowledgments
This study was sponsored by grants from the “Kinderen Kankervrij” foundation; KiKa-219 (to JvdZ), KiKa-92 and KiKa-295 (to WKS), KiKa-335 (to VP), KiKa-244 (to EV) and KWF-2016-10335 (to VC).
A B C
Haematologica | 108 March 2023 744 ARTICLE - STAT5 does not drive steroid resistance in T-ALL J.C.G. van der Zwet et al.
Data-sharing statement
The data that support the findings of this study are openly available at http://www.ncbi.nlm.nih.gov/geo/ under accession number GSE26713 (microarray data) and at Gene Expression
References
1. Weikum ER, Knuesel MT, Ortlund EA, Yamamoto KR. Glucocorticoid receptor control of transcription: precision and plasticity via allostery. Nat Rev Mol Cell Biol. 2017;18(3):159-174.
2. Wang Z, Malone MH, He H, McColl KS, Distelhorst CW. Microarray analysis uncovers the induction of the proapoptotic BH3-only protein Bim in multiple models of glucocorticoidinduced apoptosis. J Biol Chem. 2003;278(26):23861-23867.
3. Jing D, Bhadri VA, Beck D, et al. Opposing regulation of BIM and BCL2 controls glucocorticoid-induced apoptosis of pediatric acute lymphoblastic leukemia cells. Blood. 2015;125(2):273-283.
4. Lauten M, Moricke A, Beier R, et al. Prediction of outcome by early bone marrow response in childhood acute lymphoblastic leukemia treated in the ALL-BFM 95 trial: differential effects in precursor B-cell and T-cell leukemia. Haematologica. 2012;97(7):1048-1056.
5. Kaspers GJ, Pieters R, Van Zantwijk CH, Van Wering ER, Van Der Does-Van Den Berg A, Veerman AJ. Prednisolone resistance in childhood acute lymphoblastic leukemia: vitro-vivo correlations and cross-resistance to other drugs. Blood. 1998;92(1):259-266.
6. Li Y, Buijs-Gladdines JG, Cante-Barrett K, et al. IL-7 receptor mutations and steroid resistance in pediatric T cell acute lymphoblastic leukemia: a genome sequencing study. PLoS Med. 2016;13(12):e1002200.
7. Delgado-Martin C, Meyer LK, Huang BJ, et al. JAK/STAT pathway inhibition overcomes IL7-induced glucocorticoid resistance in a subset of human T-cell acute lymphoblastic leukemias. Leukemia. 2017;31(12):2568-2576.
8. Oliveira ML, Akkapeddi P, Ribeiro D, Melao A, Barata JT. IL-7Rmediated signaling in T-cell acute lymphoblastic leukemia: an update. Adv Biol Regul. 2019;71:88-96.
9. Barata JT, Silva A, Brandao JG, Nadler LM, Cardoso AA, Boussiotis VA. Activation of PI3K is indispensable for interleukin 7-mediated viability, proliferation, glucose use, and growth of T cell acute lymphoblastic leukemia cells. J Exp Med. 2004;200(5):659-669.
10. Zenatti PP, Ribeiro D, Li W, et al. Oncogenic IL7R gain-offunction mutations in childhood T-cell acute lymphoblastic leukemia. Nat Genet. 2011;43(10):932-939.
11. Cante-Barrett K, Spijkers-Hagelstein JA, Buijs-Gladdines JG, et al. MEK and PI3K-AKT inhibitors synergistically block activated IL7 receptor signaling in T-cell acute lymphoblastic leukemia. Leukemia. 2016;30(9):1832-1843.
12. van der Zwet JCG, Buijs-Gladdines J, Cordo V, et al. MAPK-ERK is a central pathway in T-cell acute lymphoblastic leukemia that drives steroid resistance. Leukemia. 2021;35(12):3394-3405.
13. Piovan E, Yu J, Tosello V, et al. Direct reversal of glucocorticoid resistance by AKT inhibition in acute lymphoblastic leukemia. Cancer Cell. 2013;24(6):766-776.
14. Xie M, Yang A, Ma J, et al. Akt2 mediates glucocorticoid resistance in lymphoid malignancies through FoxO3a/Bim axis and serves as a direct target for resistance reversal. Cell Death Dis. 2019;9(10):1013.
15. Bachmann PS, Gorman R, Papa RA, et al. Divergent mechanisms of glucocorticoid resistance in experimental models of pediatric
Omnibus under GEO series accession number: GSE171976, https://www.ncbi.nlm.nih.gov/geo/query/acc.cgi?acc=GSE17197 6 (ChIPseq files).
acute lymphoblastic leukemia. Cancer Res. 2007;67(9):4482-4490.
16. Bachmann PS, Piazza RG, Janes ME, et al. Epigenetic silencing of BIM in glucocorticoid poor-responsive pediatric acute lymphoblastic leukemia, and its reversal by histone deacetylase inhibition. Blood. 2010;116(16):3013-3022.
17. Franchimont D, Galon J, Vacchio MS, et al. Positive effects of glucocorticoids on T cell function by up-regulation of IL-7 receptor alpha. J Immunol. 2002;168(5):2212-2218.
18. Meyer LK, Huang BJ, Delgado-Martin C, et al. Glucocorticoids paradoxically facilitate steroid resistance in T cell acute lymphoblastic leukemias and thymocytes. J Clin Invest. 2020;130(2):863-876.
19. De Smedt R, Morscio J, Reunes L, et al. Targeting cytokine- and therapy-induced PIM1 activation in preclinical models of T-cell acute lymphoblastic leukemia and lymphoma. Blood. 2020;135(19):1685-1695.
20. Ribeiro D, Melao A, van Boxtel R, et al. STAT5 is essential for IL7-mediated viability, growth, and proliferation of T-cell acute lymphoblastic leukemia cells. Blood Adv. 2018;2(17):2199-2213.
21. Maude SL, Dolai S, Delgado-Martin C, et al. Efficacy of JAK/STAT pathway inhibition in murine xenograft models of early T-cell precursor (ETP) acute lymphoblastic leukemia. Blood. 2015;125(11):1759-1767.
22. Meijerink J, Mandigers C, van de Locht L, Tonnissen E, Goodsaid F, Raemaekers J. A novel method to compensate for different amplification efficiencies between patient DNA samples in quantitative real-time PCR. J Mol Diagn. 2001;3(2):55-61.
23. Cante-Barrett K, Mendes RD, Smits WK, van Helsdingen-van Wijk YM, Pieters R, Meijerink JP. Lentiviral gene transfer into human and murine hematopoietic stem cells: size matters. BMC Res Notes. 2016;9:312.
24. Li H, Durbin R. Fast and accurate short read alignment with Burrows-Wheeler transform. Bioinformatics. 2009;25(14):1754-1760.
25. Zhang Y, Liu T, Meyer CA, et al. Model-based analysis of ChIPSeq (MACS). Genome Biol. 2008;9(9):R137.
26. Ramirez F, Ryan DP, Gruning B, et al. deepTools2: a next generation web server for deep-sequencing data analysis. Nucleic Acids Res. 2016;44(W1):W160-165.
27. Robinson JT, Thorvaldsdottir H, Winckler W, et al. Integrative genomics viewer. Nat Biotechnol. 2011;29(1):24-26.
28. Quinlan AR, Hall IM. BEDTools: a flexible suite of utilities for comparing genomic features. Bioinformatics. 2010;26(6):841-842.
29. Machanick P, Bailey TL. MEME-ChIP: motif analysis of large DNA datasets. Bioinformatics. 2011;27(12):1696-1697.
30. Homminga I, Pieters R, Langerak AW, et al. Integrated transcript and genome analyses reveal NKX2-1 and MEF2C as potential oncogenes in T cell acute lymphoblastic leukemia. Cancer Cell. 2011;19(4):484-497.
31. Gautier L, Cope L, Bolstad BM, Irizarry RA. affy--analysis of Affymetrix GeneChip data at the probe level. Bioinformatics. 2004;20(3):307-315.
Haematologica | 108 March 2023 745 ARTICLE - STAT5 does not drive steroid resistance in T-ALL J.C.G. van der Zwet et al.
32. Liu Y, Easton J, Shao Y, et al. The genomic landscape of pediatric and young adult T-lineage acute lymphoblastic leukemia. Nat Genet. 2017;49(8):1211-1218.
33. de Araujo ED, Erdogan F, Neubauer HA, et al. Structural and functional consequences of the STAT5B(N642H) driver mutation. Nat Commun. 2019;10(1):2517.
34. Govaerts I, Jacobs K, Vandepoel R, Cools J. JAK/STAT pathway mutations in T-ALL, including the STAT5B N642H mutation, are sensitive to JAK1/JAK3 inhibitors. Hemasphere. 2019;3(6):e313.
35. Kontro M, Kuusanmaki H, Eldfors S, et al. Novel activating STAT5B mutations as putative drivers of T-cell acute lymphoblastic leukemia. Leukemia. 2014;28(8):1738-1742.
36. Bandapalli OR, Schuessele S, Kunz JB, et al. The activating STAT5B N642H mutation is a common abnormality in pediatric T-cell acute lymphoblastic leukemia and confers a higher risk of relapse. Haematologica. 2014;99(10):e188-192.
37. Pham HTT, Maurer B, Prchal-Murphy M, et al. STAT5BN642H is a driver mutation for T cell neoplasia. J Clin Invest. 2018;128(1):387-401.
38. Strahle U, Klock G, Schutz G. A DNA sequence of 15 base pairs is sufficient to mediate both glucocorticoid and progesterone induction of gene expression. Proc Natl Acad Sci U S A. 1987;84(22):7871-7875.
39. Willis SN, Fletcher JI, Kaufmann T, et al. Apoptosis initiated when BH3 ligands engage multiple Bcl-2 homologs, not Bax or Bak. Science. 2007;315(5813):856-859.
40. Strasser A. The role of BH3-only proteins in the immune system. Nat Rev Immunol. 2005;5(3):189-200.
41. Gratiot-Deans J, Merino R, Nunez G, Turka LA. Bcl-2 expression during T-cell development: early loss and late return occur at specific stages of commitment to differentiation and survival. Proc Natl Acad Sci U S A. 1994;91(22):10685-10689.
42. Siegel RM, Katsumata M, Miyashita T, Louie DC, Greene MI, Reed JC. Inhibition of thymocyte apoptosis and negative antigenic selection in bcl-2 transgenic mice. Proc Natl Acad Sci U S A. 1992;89(15):7003-7007.
43. Sentman CL, Shutter JR, Hockenbery D, Kanagawa O, Korsmeyer SJ. bcl-2 inhibits multiple forms of apoptosis but not negative selection in thymocytes. Cell. 1991;67(5):879-888.
44. Wojciechowski S, Tripathi P, Bourdeau T, et al. Bim/Bcl-2 balance is critical for maintaining naive and memory T cell homeostasis. J Exp Med. 2007;204(7):1665-1675.
45. Stocklin E, Wissler M, Gouilleux F, Groner B. Functional interactions between Stat5 and the glucocorticoid receptor. Nature. 1996;383(6602):726-728.
46. Stoecklin E, Wissler M, Moriggl R, Groner B. Specific DNA binding of Stat5, but not of glucocorticoid receptor, is required for their functional cooperation in the regulation of gene transcription. Mol Cell Biol. 1997;17(11):6708-6716.
47. Mueller KM, Themanns M, Friedbichler K, et al. Hepatic growth hormone and glucocorticoid receptor signaling in body growth, steatosis and metabolic liver cancer development. Mol Cell Endocrinol. 2012;361(1-2):1-11.
48. Petta I, Dejager L, Ballegeer M, et al. The interactome of the glucocorticoid receptor and its influence on the actions of glucocorticoids in combatting inflammatory and infectious diseases. Microbiol Mol Biol Rev. 2016;80(2):495-522.
49. Ye SK, Agata Y, Lee HC, et al. The IL-7 receptor controls the accessibility of the TCRgamma locus by Stat5 and histone acetylation. Immunity. 2001;15(5):813-823.
50. Bertolino E, Reddy K, Medina KL, Parganas E, Ihle J, Singh H. Regulation of interleukin 7-dependent immunoglobulin heavychain variable gene rearrangements by transcription factor STAT5. Nat Immunol. 2005;6(8):836-843.
51. Vanden Bempt M, Demeyer S, Broux M, et al. Cooperative enhancer activation by TLX1 and STAT5 drives development of NUP214-ABL1/TLX1-positive T cell acute lymphoblastic leukemia. Cancer Cell. 2018;34(2):271-285.e7.
52. Pinz S, Unser S, Buob D, Fischer P, Jobst B, Rascle A. Deacetylase inhibitors repress STAT5-mediated transcription by interfering with bromodomain and extra-terminal (BET) protein function. Nucleic Acids Res. 2015;43(7):3524-3545.
Haematologica | 108 March 2023 746 ARTICLE - STAT5 does not drive steroid resistance in T-ALL J.C.G. van der Zwet et al.
- Acute Lymphoblastic Leukemia
Three-year results from phase I of ZUMA-4: KTE-X19 in pediatric relapsed/refractory acute lymphoblastic leukemia
Correspondence: A.S. Wayne awayne@chla.usc.edu
Received: March 10, 2022.
Accepted: October 14, 2022.
1Children’s Hospital Los Angeles, USC Norris Comprehensive Cancer Center and Keck School of Medicine, University of Southern California, Los Angeles, CA, USA; 2CHOC Children’s Hospital, Orange, CA, USA; 3Columbia University Irving Medical Center, New York City, NY, USA; 4Texas Children’s Hospital, Houston, TX, USA; 5Johns Hopkins Kimmel Cancer Center, Baltimore, MD, USA; 6The Hospital for Sick Children, University of Toronto, Ontario, Canada; 7Vanderbilt University Medical Center, Nashville, TN, USA; 8University of Miami Miller School of Medicine, Miami, FL, USA; 9University of California San Francisco Benioff Children’s Hospital, San Francisco, CA, USA; 10Children’s Minnesota, Minneapolis, MN, USA; 11Hôpital Universitaire Robert Debré (APHP) and Université de Paris, Paris, France; 12Kite, a Gilead Company, Santa Monica, CA, USA and 13University of Virginia Children's Hospital, UVA Cancer Center, UVA School of Medicine, Charlottesville, VA, USA
Abstract
Early view: October 20, 2022.
https://doi.org/10.3324/haematol.2022.280678
©2023 Ferrata Storti Foundation
Published under a CC BY-NC license
Here we present the 3-year results of ZUMA-4, a phase I/II multicenter study evaluating the safety and efficacy of KTEX19, an autologous anti-CD19 chimeric antigen receptor (CAR) T-cell therapy, in pediatric/adolescent patients with relapsed/refractory B-cell acute lymphoblastic leukemia. Phase I explored two dose levels and formulations. The primary endpoint was the incidence of dose-limiting toxicities. Thirty-one patients were enrolled; KTE-X19 was administered to 24 patients (median age 13.5 years, range 3-20; median follow-up 36.1 months). No dose-limiting toxicities were observed. All treated patients had grade ≥3 adverse events, commonly hypotension (50%) and anemia (42%). Grade 3 cytokine release syndrome rates were 33% in all treated patients, 75% in patients given the dose of 2×10⁶ CAR T cells/kg, 27% in patients given the dose of 1×10⁶ cells/kg in the 68 mL formulation, and 22% in patients given the dose of 1×10⁶ cells/kg in the 40 mL formulation; the percentages of patients experiencing grade ≥3 neurologic events were 21%, 25%, 27%, and 11% respectively. Overall complete remission rates (including complete remission with incomplete hematologic recovery) were 67% in all treated patients, 75% in patients given 2×10⁶ CAR T cells/kg, 64% in patients given 1×10⁶ cells/kg in the 68 mL formulation, and 67% in patients given 1×10⁶ cells/kg in the 40 mL formulation. Overall minimal residual diseasenegativity rates were 100% among responders; 88% of responders underwent subsequent allogeneic stem-cell transplantation. In the 1×10⁶ (40 mL) group (recommended phase II dose), the median duration of remission censored at allogeneic stem-cell transplantation and median overall survival were not reached. Pediatric/adolescent patients with relapsed/refractory B-cell acute lymphoblastic leukemia achieved high minimal residual disease-negative remission rates with a manageable safety profile after a single dose of KTE-X19. Phase II of the study is ongoing at the dose of 1×10⁶ CAR T cells/kg in the 40 mL formulation. ClinicalTrials.gov: NCT02625480.
Introduction
Acute lymphoblastic leukemia (ALL) is the most common childhood malignancy, representing approximately 75% of childhood leukemias and 25% of all childhood cancers; 85% of these cases are B-cell precursor ALL (B-ALL).1-3 Although most children with B-ALL achieve durable complete remissions (CR) after initial treatment, approximately 10-20%
develop relapsed/refractory (R/R) B-ALL with reported 2year event-free survival rates of 35-46% after a second salvage attempt.2,3 While allogeneic stem-cell transplant (alloSCT) is a standard treatment option for many patients who relapse after first-line chemotherapy, some do not qualify for or are not indicated for alloSCT because of an inability to achieve CR, lack of a suitable donor, comorbidities, or late bone marrow relapse.4-8 Rates of relapse fol-
Alan S. Wayne,1 Van Huynh,2 Nobuko Hijiya,3 Rayne H. Rouce,4 Patrick A. Brown,5 Joerg Krueger,6 Carrie L. Kitko,7 Edward Dela Ziga,8 Michelle L. Hermiston,9 Michael K. Richards,10 Andre Baruchel,11 Petra C. Schuberth,12 John Rossi,12 Lang Zhou,12 Lovely Goyal,12 Rajul Jain,12 Remus Vezan,12 Behzad Kharabi Masouleh12 and Daniel W. Lee13
Haematologica | 108 March 2023 747 ARTICLE
lowing alloSCT remain high despite treatment advances and survival rates are low2,9-11 especially for those with residual disease,12,13 highlighting the need for more effective therapies in pediatric R/R B-ALL.
The CD19-targeting immunotherapeutic agent blinatumomab, approved for the treatment of R/R B-ALL in adults and children, has shown efficacy in pediatric R/R B-ALL with CR rates of 39-63%, though the median overall survival (OS) was 7.5-14.6 months with more favorable survival in patients who proceeded to alloSCT.14-18 Tisagenlecleucel, an anti-CD19 chimeric antigen receptor (CAR) T-cell therapy approved for the treatment of R/R B-ALL in patients ≤25 years of age,19,20 led to more favorable remission rates in a phase II study than those previously reported with blinatumomab, although patients who had received prior antiCD19 therapies were excluded from that study.21,22
An anti-CD19 CAR T-cell therapy containing a CD3ζ and CD28 co-stimulatory domain, developed at the National Cancer Institute,23,24 resulted in a 70% complete remission rate (CR+CR with incomplete hematologic recovery [CRi]) in children and adults ≤30 years of age with R/R B-ALL.25 KTE-X19, an autologous anti-CD19 CAR T-cell therapy with a CD3ζ and CD28 co-stimulatory domain,26,27 is approved by the Food and Drug Administration for the treatment of adults with R/R B-ALL.26,28 The manufacturing process for KTE-X19 removes leukemic blasts, as the presence of blasts may result in manufacturing failures and exhaustion of anti-CD19 CAR T cells during ex vivo manufacturing.29,30
KTE-X19 is manufactured at a centralized facility with worldwide shipment allowing for a fast turnaround time, which is critical for patients with rapidly proliferating disease and high tumor burden.28,30,31
Here we report the long-term results of phase I of the multicenter, single-arm, open-label, ZUMA-4 study evaluating the safety and efficacy of KTE-X19 in children and adolescents with R/R B-ALL.
Methods
Patients
In phase I of ZUMA-4, eligible patients were ≤21 years of age with a body weight of ≥6 kg and had R/R B-ALL, defined as refractory to first-line therapy, R/R after two or more lines of systemic therapy, or R/R after alloSCT if the patient was ≥100 days from alloSCT at the time of enrollment and off immunosuppressive medications for ≥4 weeks prior to enrollment. Prior treatment with blinatumomab was allowed (see Online Supplementary Methods for detailed eligibility criteria).
Study design and treatment
The phase I portion of ZUMA-4 was conducted at ten sites in the USA and one in Canada (Online Supplementary Table
S1). The Institutional Review Board of each study site approved the study protocol. All patients or legally acceptable representatives (e.g., parent, legal guardian) provided written, informed assent/consent to participation in the study, which was conducted in accordance with the principles of the Declaration of Helsinki. This trial is registered at www.ClinicalTrials.gov (NCT02625480).
The objective of phase I was to evaluate the safety of KTEX19 and determine the recommended phase 2 dose (RP2D) of KTE-X19 based on the incidence of dose-limiting toxicities (DLT; defined in the Online Supplementary Methods and Online Supplementary Table S2) and the overall safety profile. DLT were evaluated in the first three patients treated at the starting dose of 2×10⁶ CAR T cells/kg. One additional patient was enrolled to receive 2×10⁶ CAR T cells/kg. A Safety Review Team analyzed safety data after these patients had been followed for 28 days post-infusion, and subsequent patients received 1×10⁶ CAR T cells/kg to further evaluate the potential to mitigate the risk of cytokine release syndrome (CRS) and neurologic events and thereby improve the risk:benefit ratio. The 1×10⁶ CAR T cells/kg dosing formulation was modified from 68 mL to 40 mL for patients in a second cohort to achieve a higher final product cell density as part of product optimization to increase cell viability during cryopreservation and thawing.
Patients underwent leukapheresis to obtain cells for CAR T-cell manufacturing, followed by subsequent conditioning chemotherapy with fludarabine 25 mg/m2/day on days -4, -3, and -2, and cyclophosphamide 900 mg/m2 on day -2. Fresh leukapheresis material was used for CAR T-cell manufacturing; the manufactured CAR T cells were cryopreserved for shipment to the sites and thawed prior to infusion. Specified bridging chemotherapy was permitted between leukapheresis and conditioning chemotherapy (Online Supplementary Methods; Online Supplementary Table S3). KTE-X19 was administered on day 0 at the target dose of 2×10⁶ or 1×10⁶ CAR T cells/kg (68 mL or 40 mL formulation). Hospitalization was required for a minimum of 7 days after the infusion, followed by response assessments at prespecified time-points (Online Supplementary Methods).
Patients receiving 1×10⁶ CAR T cells/kg (68 mL) were treated under original toxicity management guidelines, which included administration of tocilizumab for neurologic events only in the context of concurrent CRS and initiation of steroids for grade 2 neurologic events; patients receiving 1×10⁶ CAR T cells/kg (40 mL) were treated under revised toxicity management guidelines according to which steroids were initiated for grade 1 neurologic events (Online Supplementary Table S4).
Outcomes and assessments
The primary endpoint of the phase I part of the study was
Haematologica | 108 March 2023 748 ARTICLE - KTE-X19 in pediatric acute lymphoblastic leukemia A.S. Wayne et al.
the incidence of DLT in the set of patients evaluable for DLT, which included the first three patients treated with KTE-X19 at the 2×10⁶ CAR T cells/kg dose. Secondary endpoints included safety, overall CR rate (CR+CRi), duration of remission (DOR), minimal residual disease (MRD)-negativity rate, alloSCT rate, OS, and relapse-free survival (RFS). CRS was graded according to the 2014 modified criteria of Lee et al 32 Bone marrow evaluations and response assessments were conducted at day 28 and months 2 and 3 during the post-treatment period, and months 6, 9, 12, 15, 18, and 24 during the long-term follow-up period. MRD was tested in bone marrow using flow cytometry (Neogenomics, Fort Myers, FL, USA; sensitivity 0.01%). Additional endpoint and disease assessments are detailed in the Online Supplementary Methods
Statistical analysis
The safety and efficacy analyses included all patients who received any dose of KTE-X19. Data are reported as of September 9, 2020. Additional statistical methods are described in the Online Supplementary Methods.
Results
Patients
Between February 17, 2016 and August 1, 2018, 31 patients were enrolled and underwent leukapheresis. The median time from leukapheresis to KTE-X19 product release was 14.0 days (range, 9.0-20.0) for all treated patients, 16.5 days (range, 12.0-23.0) from leukapheresis to delivery to study site, and 27.0 days (range, 18.0-41.0) from leukapheresis to infusion. Of the 31 enrolled patients, 24 (77%) received conditioning chemotherapy and were subsequently given KTEX19. Seven patients were not given KTE-X19 for the following reasons: adverse event (n=1), unsuccessful product manufacture (n=3), ineligible due to adverse event (n=1), unsuccessful product manufacture and ineligible (n=1), and
death (n=1) (Figure 1). Twenty-four patients received conditioning chemotherapy followed by KTE-X19; four patients received the 2×10⁶ CAR T cells/kg dose, 11 received the 1×10⁶ CAR T cells/kg (68 mL) dose formulation, and nine received the 1×10⁶ CAR T cells/kg (40 mL) dose formulation. The median follow-up for all treated patients was 36.1 months (range, 24.0-53.9). The median age of treated patients was 13.5 years. Forty-two percent of patients had received three or more prior lines of therapy, including six patients (25%) who had previously undergone alloSCT, eight (33%) who had previously received blinatumomab, and one (4%) who had been treated with prior inotuzumab ozogamicin (Table 1). One patient (4%) had non-central nervous system extramedullary disease (Online Supplementary Results). Some patients had high-risk cytogenetics, including the Philadelphia chromosome t(9;22) mutation (n=4 [17%]), MLL translocation t(4;11) t(8;14) (n=1 [4%]), complex karyotype (≥5 abnormalities, n=4 [17%]), low hypodiploidy (30-39 chromosomes, n=1 [4%]), and near triploidy (60-78 chromosomes, n=2 [8%]). Of the 31 enrolled patients, 30 (97%) received bridging therapy per protocol with new baseline disease assessments performed just prior to conditioning chemotherapy.

Safety
Among the three DLT-evaluable patients receiving 2×10⁶ CAR T cells/kg, no DLT were observed. All treated patients (n=24) experienced at least one grade ≥3 adverse event, most commonly hypotension (50%) and anemia (42%) (Table 2; Online Supplementary Table S5). Serious adverse events of any grade occurred in 71% of patients (Online Supplementary Table S6). Grade ≥3 infections occurred in 42% of patients (Online Supplementary Table S7).
CRS was reported in 21 of the 24 treated patients (88%), with eight (33%) experiencing grade ≥3 CRS (Table 3) according to modified Lee grading criteria.32 No grade 4 or grade 5 CRS events occurred. The most common grade ≥3 CRS symptoms were hypotension (50%) and pyrexia (25%).
Haematologica | 108 March 2023 749 ARTICLE - KTE-X19 in pediatric acute lymphoblastic leukemia A.S. Wayne et al.
Figure 1. Flow diagram of patients in the ZUMA-4 study. *Central nervous system lesion (lesion right middle cranial fossa). †Ineligible due to an adverse event (pericardial effusion). ‡Death due to transverse myelitis.
*Three patients (13%) received blinatumomab as the last prior therapy. alloSCT: allogeneic stem cell transplant; BM: bone marrow.
Any-grade and grade ≥3 hypoxia was observed in 13% and 8% of patients, respectively. The median time to the onset of CRS and duration after KTE-X19 infusion was 5 days (range, 1-14) and 7 days, respectively, with all events resolved.
Among all treated patients, any-grade neurologic events were reported in 16 patients (67%), and grade ≥3 events occurred in five patients (21%), with encephalopathy (13%) being the most common grade ≥3 event (Table 3). One grade 4, fully reversible neurologic event (brain edema) occurred in a patient who received 1×10⁶ CAR T cells/kg (68 mL); for the management of this event, the patient was treated with dexamethasone, mannitol, sodium chloride, and tocilizumab. There were no grade 5 neurologic events. Overall, the median time to onset of neurologic events was 9.5 days (range, 3-60) after infusion, the median time from resolution of the first CRS to onset of the first neurologic event was 4 days (range, -3 to 52 [the first CRS resolved after the onset of the first neurologic event in 4 patients]), and the median duration of neurologic events was 8 days. Neurologic events resolved in 14 of 16 patients (88%). The neurologic events of the remaining two patients were ongoing at the time of
death, which was due to an adverse event (n=1) or progressive disease (n=1). Ten of 16 patients (63%) who experienced neurologic events had concurrent CRS.
Among all treated patients, 42% received steroids, 63% received tocilizumab, and 46% received vasopressors (Table 3). Improved overall safety was observed in the nine patients treated with the 1×10⁶ CAR T cells/kg (40 mL) dose under revised toxicity management, relative to the four patients treated with 2×10⁶ CAR T cells/kg and the 11 patients treated with 1×10⁶ CAR T cells/kg (68 mL) under the original guidelines. Of the patients receiving 2×10⁶ CAR T cells/kg, 75% experienced grade ≥3 CRS, compared with 27% and 22% of patients receiving 1×10⁶ CAR T cells/kg (68 mL and 40 mL, respectively). Grade ≥3 neurologic events were observed in 25% of patients who received 2×10⁶ CAR T cells/kg and 27% of patients who received 1×10⁶ CAR T cells/kg (68 mL) but were lowest (11%) in patients who received 1×10⁶ CAR T cells/kg (40 mL). In addition, the median time to onset of neurologic events, as well as CRS, appeared to be delayed in the 1×10⁶ CAR T cells/kg dose cohorts compared with the 2×10⁶ CAR T cells/kg dose cohort (Table 3).
Among the eight patients (33%) who died on study, six
Characteristic 2×10⁶ cells/kg (N=4) 1×10⁶ cells/kg, 68 mL (N=11) 1×10⁶ cells/kg, 40 mL (N=9) All patients (N=24) Age in years, median (range) 11.5 (8-18) 12 (4-17) 14 (3-20) 13.5 (3-20) Sex, N (%) Male Female 2 (50) 2 (50) 8 (73) 3 (27) 5 (56) 4 (44) 15 (63) 9 (38) Lansky score, N (%) 80 90 100 0 1 (25) 2 (50) 1 (9) 6 (55) 2 (18) 0 4 (44) 2 (22) 1 (4) 11 (46) 6 (25) Karnofsky score, N (%) 80 90 100 0 0 1 (25) 2 (18) 0 0 1 (11) 2 (22) 0 3 (13) 2 (8) 1 (4) Number of prior lines of therapy, N (%) ≤2 ≥3 2 (50) 2 (50) 5 (45) 6 (55) 7 (78) 2 (22) 14 (58) 10 (42) Prior blinatumomab, N (%) 0 5 (45) 3 (33) 8 (33) Prior inotuzumab ozogamicin, N (%) 0 1 (9) 0 1 (4) Prior stem cell transplant, N (%) 1 (25) 4 (36) 1 (11) 6 (25) Refractory subgroup pre-enrollment, N (%) Relapsed or refractory to ≥2nd-line therapy Relapsed or refractory after alloSCT Primary refractory 2 (50) 1 (25) 1 (25) 3 (27) 4 (36) 4 (36) 6 (67) 1 (11) 2 (22) 11 (46) 6 (25) 7 (29) Percentage BM blasts at screening, median (range) 57 (41-99) 28 (7-98) 58 (6-97) 44 (6-99) Percentage BM blasts before conditioning, median (range) 85 (49-100) 6 (0-89) 44 (1-82) 37 (0-100)
Table 1. Patients’ characteristics.
Haematologica | 108 March 2023 750 ARTICLE - KTE-X19 in pediatric acute lymphoblastic leukemia A.S. Wayne et al.
died from progressive disease (median, 190.5 days after KTE-X19 infusion), and two patients died from adverse events considered unrelated to KTE-X19, including disseminated mucormycosis (n=1, day 15 after KTE-X19 infusion) and Escherichia sepsis (n=1, day 409 after KTE-X19 infusion). Of those who died, three patients had received 2×10⁶ CAR T cells/kg, four had received 1×10⁶ CAR T cells/kg (68 mL), and one had received 1×10⁶ CAR T cells/kg (40
mL). No patient tested positive for replication-competent retrovirus or antibodies to anti-CD19 CAR at any time.
Efficacy
With a median follow-up of 36.1 months (range, 24.0-53.9), all treated patients (n=24) were evaluable for efficacy. The overall remission rate by investigator assessment was 67%, with 29% of patients (n=7) achieving CR and 38%
*Table includes adverse events of any grade occurring in ≥20% of all patients.
Adverse events, N (%)* 2×10⁶ cells/kg (N=4) 1×10⁶ cells/kg, 68 mL (N=11) 1×10⁶ cells/kg, 40 mL (N=9) All patients (N=24) Any grade Grade ≥3 Any grade Grade ≥3 Any grade Grade ≥3 Any grade Grade ≥3 Pyrexia 4 (100) 3 (75) 11 (100) 3 (27) 8 (89) 2 (22) 23 (96) 8 (33) Hypotension 4 (100) 4 (100) 8 (73) 6 (55) 6 (67) 2 (22) 18 (75) 12 (50) Headache 2 (50) 0 8 (73) 2 (18) 7 (78) 0 17 (71) 2 (8) Anemia 1 (25) 1 (25) 3 (27) 3 (27) 7 (78) 6 (67) 11 (46) 10 (42) Nausea 2 (50) 2 (50) 5 (45) 1 (9) 4 (44) 0 11 (46) 3 (13) Hypokalemia 3 (75) 2 (50) 3 (27) 1 (9) 4 (44) 3 (33) 10 (42) 6 (25) Vomiting 0 0 4 (36) 0 6 (67) 0 10 (42) 0 Neutrophil count decreased 0 0 3 (27) 3 (27) 6 (67) 6 (67) 9 (38) 9 (38) Tachycardia 0 0 4 (36) 1 (9) 5 (56) 0 9 (38) 1 (4) Hypertension 3 (75) 2 (50) 4 (36) 0 1 (11) 0 8 (33) 2 (8) Febrile neutropenia 1 (25) 1 (25) 3 (27) 3 (27) 3 (33) 3 (33) 7 (29) 7 (29) Abdominal pain 1 (25) 0 3 (27) 0 2 (22) 0 6 (25) 0 Confusional state 0 0 4 (36) 0 2 (22) 0 6 (25) 0 Constipation 0 0 4 (36) 0 2 (22) 0 6 (25) 0 Decreased appetite 1 (25) 1 (25) 2 (18) 0 3 (33) 2 (22) 6 (25) 3 (13) Fatigue 0 0 3 (27) 0 3 (33) 0 6 (25) 0 Hypogammaglobulinemia 0 0 2 (18) 0 4 (44) 0 6 (25) 0 Hypomagnesemia 2 (50) 0 1 (9) 0 3 (33) 0 6 (25) 0 Platelet count decreased 2 (50) 2 (50) 2 (18) 2 (18) 2 (22) 2 (22) 6 (25) 6 (25) White blood cell count decreased 1 (25) 1 (25) 2 (18) 2 (18) 3 (33) 2 (22) 6 (25) 5 (21) Cough 0 0 3 (27) 0 2 (22) 0 5 (21) 0 Hypophosphatemia 1 (25) 0 2 (18) 1 (9) 2 (22) 1 (11) 5 (21) 2 (8) Hypoxia 1 (25) 1 (25) 3 (27) 1 (9) 1 (11) 1 (11) 5 (21) 3 (13) Pain 2 (50) 0 1 (9) 0 2 (22) 0 5 (21) 0
Table 2. Adverse events.
Haematologica | 108 March 2023 751 ARTICLE - KTE-X19 in pediatric acute lymphoblastic leukemia A.S. Wayne et al.
achieving CRi (n=9) (Table 4). In the 2×10⁶, 1×10⁶ (68 mL), and 1×10⁶ (40 mL) CAR T cells/kg dose groups, the CR+CRi rate was 75%, 64%, and 67%, respectively. Prespecified subgroup analyses of CR+CRi are reported in Online Supplementary Figure S1. Of eight patients who had received prior blinatumomab therapy, three (38%) achieved CR+CRi (Online Supplementary Figure S1, Online Supplementary Results). The median time from infusion to first CR+CRi across dose levels was 30 days (range, 26-113 days). The overall MRD-negativity rate was 100% among the 16 patients with CR+CRi. Sixteen patients overall (67%) underwent alloSCT as subsequent consolidative therapy, including two, eight and six patients in the 2×10⁶, 1×10⁶ (68 mL), and 1×10⁶ (40 mL) CAR T cells/kg dose groups, respectively. These included 14 of the 16 patients (88%) who achieved CR+CRi, the patient who achieved CR with partial hematologic recovery, and the patient with blastfree hypoplastic/aplastic bone marrow; the latter two
subsequently achieved CR. Of all 16 transplanted patients, the median time to subsequent alloSCT was 2.3 months (range, 1.4-24.9) after KTE-X19; five of the 16 patients had received a prior transplant. Of the two patients who achieved CR+CRi but did not undergo a subsequent alloSCT, one died due to progressive disease, and one was lost to follow-up.
The median DOR for the 16 patients who achieved CR+CRi after KTE-X19 was 7.2 months (95% confidence interval [95% CI]: 4.1 months-not estimable) after censoring for subsequent alloSCT, and was 4.1 months, 10.7 months, and not reached in the 2×10⁶, 1×10⁶ (68 mL), and 1×10⁶ (40 mL) CAR T cells/kg dose groups, respectively (Figure 2A). The median DOR was 14.2 months (95% CI: 3.9 months-not estimable) without censoring for subsequent alloSCT (Online Supplementary Figure S2A). The median DOR among the 14 patients with CR+CRi who underwent a subsequent alloSCT after KTE-X19 was 10.7 months (95% CI: 7.2
*Includes symptoms of cytokine release syndrome and neurologic events occurring in ≥10% of all patients. †Cytokine release syndrome was categorized according to the 2014 modified grading system proposed by Lee et al. 32 ‡Individual symptoms of the cytokine release syndrome and neurologic events were graded according to the National Cancer Institute Common Terminology Criteria for Adverse Events, version 4.03. §One patient treated with 2×10⁶ cells/kg had grade 2 seizure, and one patient treated with 1×10⁶ cells/kg (68 mL) had grade 2 generalized tonic-clonic seizure. ||The neurologic event was ongoing at the time of death. CRS: cytokine release syndrome; NA: not applicable.
Toxicity management, N (%) 2×10⁶ cells/kg (N=4) 1×10⁶ cells/kg, 68 mL (N=11) 1×10⁶ cells/kg, 40 mL (N=9) All patients (N=24) Steroids 1 (25) 4 (36) 5 (56) 10 (42) Tocilizumab 3 (75) 6 (55) 6 (67) 15 (63) Vasopressors for treatment of CRS 3 (75) 4 (36) 2 (22) 9 (38) Adverse events, N (%)* Any grade Grade ≥3 Any grade Grade ≥3 Any grade Grade ≥3 Any grade Grade ≥3 CRS†,‡ Pyrexia Hypotension Headache Tachycardia Chills Febrile neutropenia Hypoxia Sinus tachycardia 4 (100) 3 (75) 4 (100) 1 (25) 0 0 0 1 (25) 0 3 (75) 3 (75) 4 (100) 0 0 0 0 1 (25) 0 9 (82) 9 (82) 8 (73) 3 (27) 2 (18) 0 0 1 (9) 3 (27) 3 (27) 2 (18) 6 (55) 0 1 (9) 0 0 0 0 8 (89) 5 (56) 4 (44) 3 (33) 4 (44) 3 (33) 3 (33) 1 (11) 0 2 (22) 1 (11) 2 (22) 0 0 0 3 (33) 1 (11) 0 21 (88) 17 (71) 16 (67) 7 (29) 6 (25) 3 (13) 3 (13) 3 (13) 3 (13) 8 (33) 6 (25) 12 (50) 0 1 (4) 0 3 (13) 2 (8) 0 Neurologic events‡,§ Confusional state Encephalopathy Aphasia Lethargy Tremor 1 (25) 0 1 (25) 1 (25) 0 0 1 (25) 0 1 (25) 1 (25) 0 0 9 (82) 4 (36) 1 (9) 1 (9) 2 (18) 2 (18) 3 (27) 0 1 (9) 0 1 (9) 0 6 (67) 2 (22) 2 (22) 1 (11) 1 (11) 1 (11) 1 (11) 0 1 (11) 0 0 0 16 (67) 6 (25) 4 (17) 3 (13) 3 (13) 3 (13) 5 (21) 0 3 (13) 1 (4) 1 (4) 0 Onset and duration of toxicity in days, median (range) CRS Time to onset Duration 2 (1-4) 10.5 6 (3-14) 7 7 (1-9) 8 5 (1-14) 7 Neurologic events Time to onset Duration 7 (7-7) NA|| 9 (4-14) 8 10 (3-60) 11 9.5 (3-60) 8
Table 3. Cytokine release syndrome and neurologic events.
Haematologica | 108 March 2023 752 ARTICLE - KTE-X19 in pediatric acute lymphoblastic leukemia A.S. Wayne et al.
months-not estimable). The median RFS for all treated patients (n=24) after censoring for subsequent alloSCT was 5.2 months (95% CI: 0.03 months-not estimable). The median RFS for the group that received 1×10⁶ CAR T cells/kg (40 mL) was not reached and was 5.2 months (95% CI: 0.03 months-not estimable) and 9.1 months (95% CI: 0.03 months-not estimable) in the 2×10⁶ and 1×10⁶ (68 mL) cells/kg cohorts, respectively (Figure 2B). The median RFS was 7.4 months (95% CI: 0.03 months-not estimable) without censoring for subsequent alloSCT (Online Supplementary Figure S2B). For the 16 patients who proceeded to subsequent alloSCT, the median RFS was 9.1 months (95% CI: 9.1 months-not estimable). The median RFS of patients in the intention-to-treat group (i.e., all those enrolled) with and without censoring for subsequent alloSCT (Online Supplementary Figure S3A, B) was 6.1 months (95% CI: 0.03 months-not estimable) and 6.2 months (95% CI: 0.03 months-not estimable), respectively. The median OS was not reached among all treated patients and in both 1×10⁶ CAR T cells/kg dose groups and was 8.0 months for the 2×10⁶ CAR T cells/kg dose group (Figure 2C). The 24month OS rate was 87.5% (95% CI: 38.7-98.1%) for the 1×10⁶ cells/kg (40 mL) dose and 72.7% (95% CI; 37.1-90.3%) for the 1×10⁶ cells/kg (68 mL) dose. In the intention-totreat group, the median OS was not reached (Online Supplementary Figure S3C). Overall, as of the data cutoff, eight of 24 treated patients (33%) had died, one had discontinued the study due to withdrawal of consent, and one was lost to follow-up. The remaining 14 patients (58%) were still alive and in continued follow-up as of the data cutoff; all of these patients underwent subsequent alloSCT after the administration of KTE-X19.
Based on the safety and efficacy data analysis, the RP2D was 1×10⁶ KTE-X19 cells/kg (40 mL formulation) with revised toxicity management.
Translational analysis
CAR T-cell expansion in peripheral blood measured by droplet digital polymerase chain reaction and expressed as the number of CAR gene copies/mg DNA in blood was observed across dose groups with peak CAR T-cell levels reached by day 14 followed by a subsequent CAR T-cell contraction to baseline (Figure 3A; Online Supplementary Table S8). Median CAR T-cell levels were undetectable in blood by droplet digital polymerase chain reaction across all dose groups at 3 months after KTE-X19 infusion (Online Supplementary Table S8). Median peak CAR gene copies/mg DNA in blood were similar between the 1×10⁶ CAR T cells/kg dose cohorts but were higher in the 2×10⁶ CAR T cells/kg cohort (Figure 3B; Online Supplementary Figure S4A). Patients achieving CR+CRi trended toward higher peak blood CAR gene copies/mg DNA in blood than nonresponders, as did patients who were MRD negative compared to those who were MRD positive (Figure 3C, D; Online Supplementary Figure S4B, C). CAR gene copies/µg DNA in blood trended higher in patients who had grade ≥3 neurologic events compared with those who had grade ≤2 neurologic events (Figure 3E; Online Supplementary Figure S4D), while there was no apparent difference in CAR gene copies/mg DNA in blood for the small numbers of patients with either high- or low-grade CRS (Figure 3F; Online Supplementary Figure S4E). The median peak CAR gene copies/mg DNA in blood was 5.16×10⁴ (range, 0-2.40×10⁵) in the 16 patients who had not received prior blinatumomab therapy, and was 6.15×10³ (range, 0-2.49×10⁵) in the eight patients who had received prior blinatumomab.
Peak levels of multiple key serum cytokines, chemokines, and pro-inflammatory biomarkers occurred by day 7. Commensurate with peak CAR expansion, some serum analytes trended higher in patients dosed with 2×10⁶ compared with 1×10⁶ CAR T cells/kg (interleukin [IL]-2, IL-5, IL-
*Of the four patients whose response was unknown or not evaluable, two died and one had refractory disease before the first disease assessment. The remaining patient had refractory disease detected in the day 28 bone marrow assessment. †Minimal residual disease (MRD) negativity was assessed by flow cytometry with a sensitivity of 0.01% at day 28 and months 2 and 3. MRD results after allogeneic stem cell transplant or new anticancer therapies are excluded. MRD: minimal residual disease.
Response category, N (%) 2×10⁶ cells/kg (N=4) 1×10⁶ cells/kg, 68 mL (N=11) 1×10⁶ cells/kg, 40 mL (N=9) All patients (N=24) Overall complete remission rate Complete remission Complete remission with incomplete hematologic recovery 3 (75) 0 3 (75) 7 (64) 3 (27) 4 (36) 6 (67) 4 (44) 2 (22) 16 (67) 7 (29) 9 (38) Complete remission with partial hematologic recovery 0 1 (9) 0 1 (4) Blast-free hypoplastic/aplastic bone marrow 0 0 1 (11) 1 (4) No response 0 1 (9) 1 (11) 2 (8) Unknown or not evaluable* 1 (25) 2 (18) 1 (11) 4 (17) Overall MRD-negativity rate† 3 (75) 8 (73) 7 (78) 18 (75)
Table 4. Remission rates and minimal residual disease status.
Haematologica | 108 March 2023 753 ARTICLE - KTE-X19 in pediatric acute lymphoblastic leukemia A.S. Wayne et al.
Figure 2. Duration of remission, relapse-free survival, and overall survival by dose level. (A) Kaplan-Meier curve of duration of remission. Patients who did not meet the criteria for relapse or who received subsequent anticancer therapy (including allogeneic stem-cell transplantation) and who remained alive were censored at the last evaluable disease assessment. (B) Kaplan-Meier curve of relapse-free survival. Patients who did not meet the criteria for relapse or who received subsequent anticancer therapy (including allogeneic stem-cell transplantation) and who remained alive were censored at the last evaluable assessment. (C) Kaplan-Meier curve of overall survival. Patients who had not died by the analysis data cutoff date were censored at their last contact date. DOR: duration of remission; mo: months; NE: not estimable; NR: not reached; OS: overall survival; RFS: relapsefree survival; 95% CI: 95% confidence interval.

A B C Haematologica | 108 March 2023 754 ARTICLE - KTE-X19 in pediatric acute lymphoblastic leukemia A.S. Wayne et al.
6, IL-8, IL-10, IL-15, IL-16, ferritin, granzyme B, intercellular adhesion molecule 1, interferon-γ, and tumor necrosis factor-a) (Figure 4; Online Supplementary Figure S5; Online Supplementary Table S9).
Peak serum levels of vascular cell adhesion molecule-1
and IL-16 were associated with grade ≥3 CRS. Such associations were not observed in patients with grade ≥3 neurologic events, which may have been due to the small number of patients with such events (Online Supplementary Table S10). Product characteristics were similar
Figure 3. Peak chimeric antigen receptor gene copies/mg DNA and associations with response, minimal residual disease, and toxicity.

(A) Expansion and persistence of chimeric antigen receptor (CAR) gene copies/mg DNA depicted as medians and interquartile ranges.
(B) Peak CAR gene copies/mg DNA by dose level, including the two product formulations for the 1×10⁶ cells/kg dose level. (C-F) Association between peak CAR gene copies/mg DNA and overall remission rate (C), minimal residual disease (D), grade ≥3 neurologic events (E), and grade ≥3 cytokine release syndrome (F). Peak was defined as maximum CAR gene copies/mg of DNA in blood measured after infusion. Patients who were negative for minimal residual disease (MRD) included 16 responders (complete remission [CR] + CR with incomplete hematologic recovery [CRi]) and two non-CR+CRi patients, one with CR with partial hematologic recovery and one with blast-free hypoplastic/aplastic bone marrow. MRD assessment was not available for three patients. BL: baseline; CAR: chimeric antigen receptor; CRS: cytokine release syndrome; D: day; Mo: month; MRD: minimal residual disease; NE: neurologic events; Wk: week.
A B D E F C Haematologica | 108 March 2023 755 ARTICLE - KTE-X19 in pediatric acute lymphoblastic leukemia A.S. Wayne et al.
across dose levels (Online Supplementary Table S11). Proportions of less differentiated CCR7+ T cells in products trended higher in patients with CR+CRi and MRD negativity (Online Supplementary Table S12). This product profile also appeared to trend with higher levels of neurotoxicity but was not associated with CRS. The ratio of CD4 to CD8 T cells was not associated with response or toxicity.

Discussion
In phase I of ZUMA-4, no DLT were observed with KTE-X19
among the DLT-evaluable pediatric patients with R/R BALL. Although no DLT were observed at the initial dose of 2×10⁶ CAR T cells/kg, a lower dose of 1×10⁶ CAR T cells/kg with a 68 mL formulation was explored in a second cohort of patients in an effort to further improve the risk:benefit ratio, and dosing and toxicity management were further optimized in a third cohort at 1×10⁶ CAR T cells/kg with a 40 mL formulation and revised toxicity management. This led to a more optimal risk:benefit ratio for the 1×10⁶ CAR T cells/kg (40 mL) dose level with improvements for CRS and neurologic events. In addition, while MRD-negativity rates were ≥73% for all formulations, rates of MRD nega-
Haematologica | 108 March 2023 756 ARTICLE - KTE-X19 in pediatric acute lymphoblastic leukemia A.S. Wayne et al.
Figure 4. Levels of cytokines and inflammatory markers over time. Levels of key serum biomarkers depicted as medians and interquartile ranges by dose cohort over the first 4 weeks following KTE-X19 infusion. BL: baseline; ICAM: intercellular adhesion molecule 1; IFN-γ: interferon gamma; IL: interleukin; TNF-a: tumor necrosis factor alpha.
tivity and CR alone were highest in patients who received 1×10⁶ CAR T cells/kg (40 mL). Importantly, the medians for DOR, RFS, and OS were not reached among the nine patients in the 1×10⁶ CAR T cells/kg (40 mL) cohort, with most responders (5/6 [83%]) proceeding to subsequent alloSCT. Recognizing the limitations of a small cohort, nevertheless the 24-month OS rate in this group was 87.5%. These results suggest a meaningful durability of response with optimized dosing/formulation of KTE-X19 followed by subsequent alloSCT in pediatric/adolescent patients with R/R B-ALL.
The role of alloSCT following anti-CD19 CAR T-cell therapy in pediatric/adolescent patients with R/R B-ALL is still not well defined; studies in adult populations have provided somewhat conflicting results.33,34 In the present study, the medians for DOR censored at subsequent alloSCT and OS were not reached in patients treated at the RP2D of 1×10⁶ CAR T cells/kg (40 mL). Fourteen of the 16 patients (88%) who achieved CR+CRi, including five treated at the RP2D, underwent alloSCT as subsequent therapy. AlloSCT was not required per protocol but was allowed at the investigators’ discretion. ZUMA-4 was not designed to assess outcomes after subsequent therapies; however, most responding patients proceeded to alloSCT after KTE-X19 as per investigators’ decision.
An evaluation of DOR in ZUMA-4 without censoring for subsequent alloSCT revealed a favorable median of 14.2 months. Additionally, the median RFS with censoring for subsequent alloSCT was 5.2 months, but was 7.4 months without censoring. It has recently been reported that pediatric and young adults with R/R CD19+ ALL who had no history of alloSCT, but who received consolidative alloSCT following anti-CD19 CAR T-cell therapy, trended toward improved leukemia-free survival with ≥ 1 year follow-up.35 In a recently published phase I study of antiCD19 CAR T-cell therapy in children and young adults with R/R B-ALL with 75% of MRD-negative responding patients proceeding to alloSCT, the median OS at 4.8 years followup was 70.2 months following alloSCT, the 5-year eventfree survival following alloSCT was 61.9%, and the cumulative incidence of relapse following alloSCT was only 9.5% at 24 months.36 Interestingly, a retrospective review of pediatric and young adult patients found that CD34-selected T-cell depleted alloSCT following CAR Tcell therapy may result in improved transplant-related mortality and OS versus that with unmodified alloSCT.37
It is difficult to draw conclusions from ZUMA-4 about the association between CAR T-cell persistence and durability of response given the low number of patients and the high rate of subsequent alloSCT. The median CAR T-cell levels in the blood of ZUMA-4 patients were undetectable across all doses at 3 months after the infusion, with the median time to alloSCT being 2.3 months and alloSCT likely eliminating remaining CAR T cells. Similarly, sub-
sequent alloSCT precludes the assessment of B-cell aplasia in ZUMA-4. In studies with tisagenlecleucel, and in contrast to our study, subsequent alloSCT was performed in a minority of responding patients (12% to 16%).38,39 With a short median follow-up of only 13.1 months approximately 40% of patients with a complete response to tisagenlecleucel relapsed, mostly with CD19– leukemia despite persistent CAR T cells.21 After a median 24-month follow-up in that study, the 18-month OS rate was 70%,38 whereas the 24-month OS rate in ZUMA-4 for patients treated at the RP2D was 87.5%. Data presented herein support the promising potential role for KTE-X19 in extending response durability and survival in pediatric/adolescent patients with R/R B-ALL, particularly if followed by alloSCT.
While differences in trial designs and patient populations preclude direct trial-to-trial comparisons, recent studies with blinatumomab, which also targets CD19, indicate a median OS of just 7.5 months in pediatric R/R B-ALL,14 similar to results in adult ALL.40 Also for blinatumomab, consolidation with subsequent alloSCT has shown improved outcomes (87% vs. 29% 1-year OS probability for patients with vs. without subsequent alloSCT, respectively).17 Additionally, remission rates with blinatumomab were higher among pediatric patients with lower baseline tumor burden (<50% blasts; 56% CR) than in those with higher tumor burden (≥50% blasts; 33% CR).14
Data from ZUMA-4 suggest that KTE-X19 has the potential to offer more favorable efficacy in patients with high disease burden compared to results reported with blinatumomab. In ZUMA-4, a clear association between remission rates and bone marrow blasts prior to conditioning chemotherapy was not apparent, as CR rates were 83%, 50%, 80%, 50%, and 60% in patients with ≤5%, >5 to ≤25%, >25 to ≤50%, >50 to ≤75%, and >75 to 100% blasts at baseline, respectively. However, the small number of patients in each quartile, as well as the relatively high median tumor burden at baseline, limits interpretation (Online Supplementary Figure S1). This is in line with the findings of another pediatric and young adult study using CD19-directed CAR T-cell therapy in which no difference was observed in response rates based on disease burden.41 Notably, however, a large retrospective study of pediatric and young adult patients with ALL found that pre-treatment disease burden was independently associated with poorer survival after CD19 CAR Tcell therapy.42
While CR+CRi rates appeared lower in patients who had received prior blinatumomab therapy in ZUMA-4, conclusions are limited due to the small number of patients. There are conflicting reports on the impact of prior antiCD19 therapies, such as blinatumomab, in patients who later receive anti-CD19 CAR T-cell therapy. In a single institution study it was observed that prior blinatumomab
Haematologica | 108 March 2023 757 ARTICLE - KTE-X19 in pediatric acute lymphoblastic leukemia A.S. Wayne et al.
therapy was associated with a significantly higher rate of failure to achieve MRD-negative remission and also subsequent loss of remission with antigen escape after tisagenlecleucel in pediatric and adult R/R ALL.43 In contrast, a large, multicenter retrospective study of CD19 CAR Tcell therapy in pediatric and young adult patients with R/R ALL found no difference in outcomes in regard to prior blinatumomab exposure, with the exception that non-response to blinatumomab was independently associated with lower CR, RFS, and event-free survival rates.42 In ZUMA-4, one of three patients who had had a prior nonresponse to blinatumomab achieved a CR; however, the small numbers limit interpretation of these data. The adverse event profile in ZUMA-4 was consistent with that in prior studies of anti-CD19 CAR T-cell therapies. For the patients who received KTE-X19, the median time from leukapheresis to product delivery to the study site was 16.5 days. In comparison, for the first 37 commercially manufactured tisagenlecleucel products for patients with B-ALL, the reported median throughput time was 23 days from receipt of the leukapheresed product to delivery to the clinical site.44 The rapid turnaround time for treated patients in ZUMA-4 supports the feasibility in the setting of rapidly proliferating ALL. With the RP2D established, ZUMA-4 has transitioned into the phase II portion of the study.
We observed higher proportions of less differentiated CCR7+ T cells in products in patients with CR+CRi and a trend in MRD-negative patients, as well as a trend toward higher peak CAR T-cell expansion in patients achieving CR/CRi and MRD negativity. These findings are consistent with a report that the frequency of CCR7+ T cells in antiCD19 CAR T-cell products correlates with CAR T-cell expansion.45
ZUMA-4 was limited by the small number of patients treated at each dose level; as such, the study was not powered to assess the contribution of various patients’ characteristics to the outcomes observed. The durable outcomes reported herein are encouraging, although it is challenging to assess the long-term efficacy of KTE-X19 alone given that most responding patients proceeded to subsequent alloSCT. Future studies are warranted to determine which patients might benefit the most from KTEX19 followed by alloSCT.
The unmet medical need in R/R pediatric ALL is greatest for patients who relapse early or have primary refractory disease with a 5-year OS rate of 21-28%.2,4,8,46-48 In addition, the risk of treatment-related morbidity and mortality is 3-5 times greater in patients who have MRD-positive disease at the end of initial and later lines of therapy than in patients who have undetectable MRD.3 To address this evolving unmet medical need, ZUMA-4 was further amended to broaden the eligibility criteria to include patients with MRD-positive disease and patients with early
first relapse (≤18 months). Additionally, a second cohort was opened for pediatric patients with R/R non-Hodgkin lymphoma (diffuse large B-cell lymphoma, Burkitt lymphoma, and primary mediastinal B-cell lymphoma).
Disclosures
ASW reports research funding from Kite, a Gilead Company, Servier, and Institut de Recherches Internationales Servier. VH reports research funding from Servier; consultancy or an advisory role for Jazz, Gilead, and Servier; and speakers' bureau participation for Servier. NH reports consultancy or an advisory role for Stemline Therapeutics; honoraria from Incyte and Stemline Therapeutics; and research funding from Pfizer and Novartis. RHR reports honoraria from Novartis; consultancy or an advisory role for Novartis; and research funding from Tessa. PAB reports consultancy or an advisory role for Novartis, Kite, a Gilead Company, Jazz, Servier, and Janssen. JK reports consultancy or an advisory role for Kite, a Gilead Company, and Novartis; and employment with Parexel, ICON, and Syneos. CLK, EDZ, and MKR have no relevant financial relationships to disclose. MLH reports consultancy or an advisory role for Sobi Pharmaceuticals; spouse employment with GLAdiator Biosciences and Coagulant Therapeutics Corporation; spouse with leadership role at KaliVir Immunotherapeutics; spouse with stock or other ownership in GLAdiator Biosciences, Coagulant Therapeutics Corporation, and KaliVir Immunotherapeutics; and spouse with patents, royalties, or other intellectual property from GLAdiator Biosciences and Coagulant Therapeutics Corporation. AB reports honoraria from Novartis, Jazz, Servier, and Janssen; consultancy or an advisory role for AstraZeneca, Novartis, Jazz, Celgene, and Servier; research funding from Servier; and travel support from Novartis, Servier, and Jazz. PCS reports employment with and travel support from Kite, a Gilead Company; and stock or other ownership in Gilead Sciences. JR reports former employment with Kite, a Gilead Company; and stock or other ownership in Gilead Sciences. LZ reports employment with Kite, a Gilead Company, and stock or other ownership in AbbVie within the past 2 years. LG reports former employment with and stock or other ownership in Kite, a Gilead Company. RJ reports employment with Vida Ventures and former employment with Kite, a Gilead company; stock or other ownership in Gilead and Amgen; consultancy or an advisory role for Capstan; and travel support from Vida Ventures. RV reports former employment with Kite, a Gilead Company, and stock options with Gilead Sciences. BKM reports employment with, stock, and travel support from Kite, a Gilead Company; and stock options with Lava. DWL reports consultancy or an advisory role for Amgen, Bristol Myers Squibb, and Harpoon Therapeutics; research funding from Kite, a Gilead Company; a patent related to CAR T cells; and spouse employment with and stock or other ownership in Karyopharm Therapeutics
Haematologica | 108 March 2023 758 ARTICLE - KTE-X19 in pediatric acute lymphoblastic leukemia A.S. Wayne et al.
Contributions
ASW, RV, RJ, and DWL designed the study. ASW, VH, NH, RHR, PAB, JK, MR, CLK, EDZ, MLH, MKR, AB, and DWL enrolled and treated patients and gathered data. PCS, JR, LZ, LG, BKM, RJ, and RV contributed to the verification, analysis, and interpretation of the data. All authors participated in writing the manuscript, had full access to the data, and approved the final submitted version.
Acknowledgments
The authors would like to thank the patients who participated in the study and their families, friends, and caregivers; the study staff and health care providers at all the study sites; Christine Wang, PhD, Martha Sensel, PhD, MBA,
References
1. DasGupta RK, Marini BL, Rudoni J, Perissinotti AJ. A review of CD19-targeted immunotherapies for relapsed or refractory acute lymphoblastic leukemia. J Oncol Pharm Pract. 2018;24(6):453-467.
2. Sun W, Malvar J, Sposto R, et al. Outcome of children with multiply relapsed B-cell acute lymphoblastic leukemia: a Therapeutic Advances in Childhood Leukemia & Lymphoma study. Leukemia. 2018;32(11):2316-2325.
3. Hunger SP, Mullighan CG. Acute lymphoblastic leukemia in children. N Engl J Med. 2015;373(16):1541-1552.
4. Crotta A, Zhang J, Keir C. Survival after stem-cell transplant in pediatric and young-adult patients with relapsed and refractory B-cell acute lymphoblastic leukemia. Curr Med Res Opin. 2018;34(3):435-440.
5. Cooper SL, Brown PA. Treatment of pediatric acute lymphoblastic leukemia. Pediatr Clin North Am. 2015;62(1):61-73.
6. Gaynon PS, Qu RP, Chappell RJ, et al. Survival after relapse in childhood acute lymphoblastic leukemia. Cancer. 1998;82(7):1387-1395.
7. Malempati S, Gaynon PS, Sather H, La MK, Stork LC, Children's Oncology Group. Outcome after relapse among children with standard-risk acute lymphoblastic leukemia: Children's Oncology Group study CCG-1952. J Clin Oncol. 2007;25(36):5800-5807.
8. Nguyen K, Devidas M, Cheng SC, et al. Factors influencing survival after relapse from acute lymphoblastic leukemia: a Children's Oncology Group study. Leukemia. 2008;22(12):2142-2150.
9. Gassas A, Sung L, Saunders EF, Doyle J. Graft-versus-leukemia effect in hematopoietic stem cell transplantation for pediatric acute lymphoblastic leukemia: significantly lower relapse rate in unrelated transplantations. Bone Marrow Transplant. 2007;40(10):951-955.
10. Kato M, Horikoshi Y, Okamoto Y, et al. Second allogeneic hematopoietic SCT for relapsed ALL in children. Bone Marrow Transplant. 2012;47(10):1307-1311.
11. Locatelli F, Zecca M, Messina C, et al. Improvement over time in outcome for children with acute lymphoblastic leukemia in second remission given hematopoietic stem cell transplantation from unrelated donors. Leukemia. 2002;16(11):2228-2237.
12. Bader P, Salzmann-Manrique E, Balduzzi A, et al. More precisely defining risk peri-HCT in pediatric ALL: pre- vs post-MRD measures, serial positivity, and risk modeling. Blood Adv.
Daniela van Eickels MD, MPH, and Daniel C. Lee, MD of Kite, a Gilead Company, for supporting the development of the manuscript.
Funding
This study was supported by Kite, a Gilead Company. Medical writing support was provided by Nexus Global Group Science, funded by Kite, a Gilead Company.
Data-sharing statement
Kite is committed to sharing clinical trial data with external medical experts and scientific researchers in the interest of advancing public health, and access can be requested by contacting medinfo@kitepharma.com.
2019;3(21):3393-3405.
13. Pulsipher MA, Carlson C, Langholz B, et al. IgH-V(D)J NGS-MRD measurement pre- and early post-allotransplant defines very low- and very high-risk ALL patients. Blood. 2015;125(22):3501-3508.
14. von Stackelberg A, Locatelli F, Zugmaier G, et al. Phase I/phase II study of blinatumomab in pediatric patients with relapsed/refractory acute lymphoblastic leukemia. J Clin Oncol. 2016;34(36):4381-4389.
15. BLINCYTO (blinatumomab) [package insert]. Thousand Oaks, CA: Amgen Inc; 2022.
16. BLINCYTO (blinatumomab) [Summary of Product Characteristics]. The Netherlands: Amgen Europe B.V.; 2022.
17. Locatelli F, Zugmaier G, Mergen N, et al. Blinatumomab in pediatric relapsed/refractory B-cell acute lymphoblastic leukemia: RIALTO expanded access study final analysis. Blood Adv. 2022;6(3):1004-1014.
18. Locatelli F, Zugmaier G, Mergen N, et al. Blinatumomab in pediatric patients with relapsed/refractory acute lymphoblastic leukemia: results of the RIALTO trial, an expanded access study. Blood Cancer J. 2020;10(7):77.
19. KYMRIAH (tisagenlecleucel ) [Summary of Product Characteristics]. Dublin, Ireland: Novartis Europharm Limited; 2022.
20. KYMRIAH (tisagenlecleucel) [package insert]. East Hanover, NJ: Novartis Pharmaceuticals Corporation; 2022.
21. Maude SL, Laetsch TW, Buechner J, et al. Tisagenlecleucel in children and young adults with B-cell lymphoblastic leukemia. N Engl J Med. 2018;378(5):439-448.
22. Rives S, Maude SL, Hiramatsu H, et al. Tisagenlecleucel in pediatric and young adult patients (pts) with relapsed/refractory (R/R) B-cell acute lymphoblastic leukemia (B-ALL): final analyses from the ELIANA study. Hemasphere. 2022;6(Suppl 3):27-28.
23. Kochenderfer JN, Feldman SA, Zhao Y, et al. Construction and preclinical evaluation of an anti-CD19 chimeric antigen receptor. J Immunother. 2009;32(7):689-702.
24. Kochenderfer JN, Wilson WH, Janik JE, et al. Eradication of Blineage cells and regression of lymphoma in a patient treated with autologous T cells genetically engineered to recognize CD19. Blood. 2010;116(20):4099-4102.
25. Lee DW, Kochenderfer JN, Stetler-Stevenson M, et al. T cells expressing CD19 chimeric antigen receptors for acute
Haematologica | 108 March 2023 759 ARTICLE - KTE-X19 in pediatric acute lymphoblastic leukemia A.S. Wayne et al.
lymphoblastic leukaemia in children and young adults: a phase 1 dose-escalation trial. Lancet. 2015;385(9967):517-528.
26. TECARTUS® (brexucabtagene autoleucel) [prescribing information]. Santa Monica, CA: Kite Pharma, Inc; 2021.
27. TECARTUS® (autologous anti-CD19-transduced CD3+ cells) [Summary of Product Characteristics]. Hoofddorp, The Netherlands: Kite Pharma EU B.V.; 2021.
28. Shah BD, Ghobadi A, Oluwole OO, et al. KTE-X19 for relapsed or refractory adult B-cell acute lymphoblastic leukaemia: phase 2 results of the single-arm, open-label, multicentre ZUMA-3 study. Lancet. 2021;398(10299):491-502.
29. Sabatino M, Choi K, Chiruvolu V, Better M. Production of antiCD19 CAR T cells for ZUMA-3 and -4: phase 1/2 multicenter studies evaluating KTE-C19 in patients with relapsed/refractory B-precursor acute lymphoblastic leukemia (R/R ALL). Blood. 2016;128(22):1227.
30. Shah BD, Bishop MR, Oluwole OO, et al. KTE-X19 anti-CD19 CAR T-cell therapy in adult relapsed/refractory acute lymphoblastic leukemia: ZUMA-3 phase 1 results. Blood. 2021;138(1):11-22.
31. Wayne AS, Michel G, Lee DW, et al. ZUMA-4: A phase 1/2 multicenter study of KTE-X19 in pediatric and adolescent patients with relapsed/refractory B cell acute lymphoblastic leukemia or non-Hodgkin lymphoma. Blood. 2020;136(Suppl 1):42.
32. Lee DW, Gardner R, Porter DL, et al. Current concepts in the diagnosis and management of cytokine release syndrome. Blood. 2014;124(2):188-195.
33. Park JH, Riviere I, Gonen M, et al. Long-term follow-up of CD19 CAR therapy in acute lymphoblastic leukemia. N Engl J Med. 2018;378(5):449-459.
34. Hay KA, Gauthier J, Hirayama AV, et al. Factors associated with durable EFS in adult B-cell ALL patients achieving MRDnegative CR after CD19 CAR T-cell therapy. Blood. 2019;133(15):1652-1663.
35. Summers C, Wu QV, Annesley C, et al. Hematopoietic cell transplantation after CD19 chimeric antigen receptor T cellinduced acute lymphoblastic lymphoma remission confers a leukemia-free survival advantage. Transplant Cell Ther. 2022;28(1):21-29.
36. Shah NN, Lee DW, Yates B, et al. Long-term follow-up of CD19CAR T-cell therapy in children and young adults with B-ALL. J Clin Oncol. 2021;39(15):1650-1659.
37. Fabrizio VA, Kernan NA, Boulad F, et al. Low toxicity and
favorable overall survival in relapsed/refractory B-ALL following CAR T cells and CD34-selected T-cell depleted allogeneic hematopoietic cell transplant. Bone Marrow Transplant. 2020;55(11):2160-2169.
38. Grupp SA, Maude SL, Rives S, et al. Updated analysis of the efficacy and safety of tisagenlecleucel in pediatric and young adult patients with relapsed/refractory (r/r) acute lymphoblastic leukemia. Blood. 2018;132(Suppl 1):895.
39. Pasquini MC, Hu ZH, Curran K, et al. Real-world evidence of tisagenlecleucel for pediatric acute lymphoblastic leukemia and non-Hodgkin lymphoma. Blood Adv. 2020;4(21):5414-5424.
40. Kantarjian H, Stein A, Gökbuget N, et al. Blinatumomab versus chemotherapy for advanced acute lymphoblastic leukemia. N Engl J Med. 2017;376(9):836-847.
41. Gardner RA, Finney O, Annesley C, et al. Intent-to-treat leukemia remission by CD19 CAR T cells of defined formulation and dose in children and young adults. Blood. 2017;129(25):3322-3331.
42. Myers RM, Taraseviciute A, Steinberg SM, et al. Blinatumomab nonresponse and high-disease burden are associated with inferior outcomes after CD19-CAR for B-ALL. J Clin Oncol. 2022;40(9):932-944.
43. Pillai V, Muralidharan K, Meng W, et al. CAR T-cell therapy is effective for CD19-dim B-lymphoblastic leukemia but is impacted by prior blinatumomab therapy. Blood Adv. 2019;3(22):3539-3549.
44. Tyagarajan S, Spencer T, Smith J. Optimizing CAR-T cell manufacturing processes during pivotal clinical trials. Mol Ther Methods Clin Dev. 2019;16:136-144.
45. Xu Y, Zhang M, Ramos CA, et al. Closely related T-memory stem cells correlate with in vivo expansion of CAR.CD19-T cells and are preserved by IL-7 and IL-15. Blood. 2014;123(24):3750-3759.
46. Rheingold SR, Ji L, Xu X, et al. Prognostic factors for survival after relapsed acute lymphoblastic leukemia (ALL): a Children’s Oncology Group (COG) study. J Clin Oncol. 2019;37(15_suppl):10008.
47. Oskarsson T, Söderhäll S, Arvidson J, et al. Relapsed childhood acute lymphoblastic leukemia in the Nordic countries: prognostic factors, treatment and outcome. Haematologica. 2016;101(1):68-76.
48. Schrappe M, Hunger SP, Pui CH, et al. Outcomes after induction failure in childhood acute lymphoblastic leukemia. N Engl J Med. 2012;366(15):1371-1381.
Haematologica | 108 March 2023 760 ARTICLE - KTE-X19 in pediatric acute lymphoblastic leukemia A.S. Wayne et al.
CD56brightCD16- natural killer cells as an important regulatory mechanism in chronic graft-versus-host disease
Correspondence: K. R. Schultz kschultz@mail.ubc.ca
Received: January 8, 2022.
1Michael Cuccione Childhood Cancer Research Program, British Columbia Children’s Hospital Research Institute, University of British Columbia, Vancouver, British Columbia, Canada; 2Department of Hematology, Faculty of Medical Sciences, Tarbiat Modares University, Tehran, Iran; 3CancerCare Manitoba, University of Manitoba, Winnipeg, Manitoba, Canada; 4British Columbia Children’s Hospital Research Institute, University of British Columbia, Vancouver, British Columbia, Canada; 5School of Biomedical Engineering, University of British Columbia, Vancouver, British Columbia, Canada; 6Department of Surgery, University of British Columbia, Vancouver, British Columbia, Canada and 7Michael Smith Laboratories, University of British Columbia, Vancouver, British Columbia, Canada
Abstract
Accepted: September 26, 2022.
Early view: October 6, 2022.
https://doi.org/10.3324/haematol.2022.280653
©2023 Ferrata Storti Foundation
Published under a CC BY-NC license
Chronic graft-versus-host disease (cGvHD) is a major cause of morbidity after hematopoietic stem cell transplantation (HSCT). In large patient populations, we have shown a CD56bright natural killer (NK) population to strongly associate with a lack of cGvHD and we hypothesize that these cells function to suppress cGvHD. We aimed to isolate and define the characteristics of regulatory NK (NKreg) cells associated with suppression of cGvHD. Immunophenotypic evaluation of a large pediatric population found the CD56bright NK population associated with a lack of cGvHD to be perforin-, Granzyme B-, and CD335+. Transcriptome analysis of a small patient cohort of CD56bright compared to CD56dim NK cells found the NK reg cells to also overexpress Granzyme K, IL-7R, GPR183, RANK, GM-CSFR, TCF7, and IL23A. Further analysis of this CD56bright NK reg population found a subpopulation that overexpressed IRF1, and TNF. We also found that viable NKreg cells may be isolated by sorting on CD56+ and CD16- NK cells, and this population can suppress allogeneic CD4+ T cells, but not Treg cells or CD8+ T cells through a non-cytolytic, cell-cell contact dependent mechanism. Suppression was not reliant upon the NKp44, NKp46, or GPR183 receptors. Additionally, NKreg cells do not kill leukemic cells. Moreover, this is the first paper to clearly establish that a CD56brightCD3-CD16-perforin- NK reg population associates with a lack of cGvHD and has several unique characteristics, including the suppression of helper T-cell function in vitro. With further investigation we may decipher the mechanism of NKreg suppression and operationalize expansion of NKreg cells associated with cGvHD suppression.
Introduction
Hematopoietic stem cell transplantation (HSCT) is an important therapeutic option for patients with non-malignant diseases as well as high-risk and refractory hematopoietic malignancies.1 HSCT may be followed by chronic inflammation due to tissue self-antigen mismatches among the transplant donor and recipient. As a result, HSCT is often attributed to an increased risk of health complications, the most severe being chronic graft-versus-host disease (cGvHD).2 cGvHD is a multisystemic disorder that occurs due to foreign donor immune cells attacking the recipient’s tissues.3 cGvHD has been estimated to develop in 25% of pediatric and 60% of adult HSCT survivors, may cause
chronic and often irreversible organ damage, and has a 1025% mortality rate.4
Various immune-suppressive cell populations appear to associate with suppression of cGvHD, including Treg cells, Breg cells, M2 macrophages, dendritic cells, and CD56bright natural killer (NK) cells.5 In previous correlative studies, we observed an increased number of CD56brightCD335+CXCR3+ NK cells in adult patients who did not develop cGvHD6 and a similar lack of CD56brightCD3- NK cells in a large pediatric cohort before the onset of cGvHD.7 In a separate large adult clinical trial comparing G-CSF-mobilized marrow to G-CSFmobilized peripheral blood, a decreased number of CD56bright NK cells in the donor product correlated with the development of cGvHD, and statistical analysis of the donor
Madeline P. Lauener,1 Shima AzadPour,2 Sayeh Abdossamadi,1 Vaishnavi Parthasarathy,1 Bernard Ng,1 Elena Ostroumov,1 Geoffrey D.E. Cuvelier,3 Megan K. Levings,4,5,6 Katherine N. MacDonald,4,5,7 Amina Kariminia1 and Kirk R. Schultz1
Haematologica | 108 March 2023 761 ARTICLE - Bone Marrow Transplantation
product suggested that the low number of CD56bright NK cells was the mechanism for this increased cGvHD.8
To date, strategies targeted to augment immune suppressive populations in cGvHD have focused on increasing the number and function of T reg cells. Two approaches, low dose IL-2 and extracorporeal electrophoresis (ECP), have attempted to expand Treg cells to inhibit cGvHD.9 While the association of T reg expansion and therapeutic outcome is considered the primary explanation, an alternative mechanism was identified as cGvHD inhibition being mediated by a CD56bright NK cell contact‐dependent cell cycle arrest of effector T cells through the NK receptors NKp44 and NKp46.10 Further, low dose IL-2 as treatment of systemic lupus erythematosus has shown to successfully suppress disease activity through both an increase in Treg cells and NK cells.11 Similarly, recent evidence supports that ECP therapy suppresses cGvHD primarily through increased CD56bright NK cells.12
Based on this data, we hypothesized that there is a subset of CD56bright NK cells which suppress the development of cGvHD and are functionally consistent with described regulatory NK cells (NKreg).13,14 We proposed to better characterize the CD56bright NK-cell subset associated with a lack of cGvHD. In order to meet our objective, we first identified the NK reg subpopulation most significantly associated with immune tolerance in a large HSCT patient cohort. Second, in a smaller HSCT patient cohort, we determined the genes of CD56bright NK cells as compared to CD56dim NK cells which are associated with cGvHD suppression. Third, based on the previous transcriptome results, we determined the optimal cell surface markers to isolate the NK reg cell subpopulation while also defining the phenotype of NK cells. Lastly, we investigated the cytotoxicity and suppressive capacity of NKreg cells.
Methods
Immune cell populations in hematopoietic stem cell transplantation patients associated with chronic graftversus-host disease
Pediatric HSCT patient peripheral blood mononuclear cells (PBMC) (previously described7,15,16) (Online Supplementary Table S1) were utilized for identifying immune cell populations associated with cGvHD. Study groups included evaluable patients at the onset of cGvHD with time control samples with no cGvHD obtained at 3, 6, and 12 months after HSCT. Of the CD56brightCD3- cell population, phenotyping was performed for expression of perforin, Granzyme B, CD335(NKp46) and CD69.
Hematopoietic stem cell transplantation patient transcriptome analysis of NK cells (nanoString)
Select day 100 HSCT patient peripheral blood PBMC from three cohorts (cGvHD [n=6], late aGvHD ≥114 days after
HSCT [n=6], or no late aGvHD or cGvHD [n=6]) were utilized [previously described7,15,16]) (Online Supplementary Table S1). Total RNA was extracted from sorted NK subpopulations using the RNeasy Mini Kit (QIAGEN, Valencia, CA, USA) for nanoString (nanoString, Seattle).
Evaluation of NK reg cell suppression
CD4+ T cells were isolated using the EasySep™ Human CD4+ T Cell Isolation Kit and CD8+ T cells were isolated using the EasySep™ Human CD8+ T Cell Isolation Kit (StemCell Technologies, Vancouver, BC, Canada). The T cells were stained using Cell Proliferation Dye eF450 (eBioscience, Mississauga, ON, Canada), and activated via the ImmunoCult™ Human CD3/CD28 T Cell Activator (StemCell Technologies, Vancouver, BC, Canada). Healthy donor PBMC samples were enriched for total NK cells using the NK Cell Enrichment Kit (StemCell Technologies, Vancouver, BC, Canada). CD56brightCD16- and CD56dimCD16+ NK cells were sorted using sterile Beckman Coulter Astrios FACS sorting, and co-cultured with allogeneic activated CD4+ or CD8+ T cells for 96 hours (h). Treg cells were obtained from our collaborators (MKL) after expansion, as previously described (protocol F).17 In order to determine if the suppressive capacity of NKreg cells on CD4+ T cells is contact dependent the above procedures were followed using a 96-well transwell plate (Corning, Corning, NY, USA). Additionally, supernatant from a 96-h 1:1 NK reg versus CD4+ T-cell suppression assay was cultured with fresh allogeneic activated CD4+ T cells for 72 h and then analyzed.
In order to determine if the suppressive mechanism of NKreg cells is reliant on NKp44, NKp46, or GPR183 receptors the above assay preparation/analysis procedures were followed with addition of the soluble antagonists: 1 ug/mL UltraLEAF™ Purified anti-human NKp4610 (BioLegend, San Diego, CA, USA), 1 ug/mL Ultra-LEAF™ purified anti-human NKp4410 (BioLegend, San Diego, CA, USA), and 25 nM NIBR18918 (Sigma Aldrich, Oakville, CA, USA).
Evaluation of NK reg cell induction of apoptosis and killing
In order to investigate NK-cell induction of CD4+ T-cell apoptosis, the suppression assay co-cultured cells were harvested after 96 h, and the FITC Annexin V apoptosis detection kit (BioLegend, San Diego, CA, USA) was utilized. Further, this kit was utilized to determine the cytolytic effect of NK reg cells towards MOLT-4 (ATCC® CRL1582™), and Jurkat, Clone E61 (ATCC® TIB152™) cell lines.
In order to investigate general NK-cell killing, NKreg cells and CD56dim NK cells were co-cultured with D-luciferin K562 cells (Gold Biotechnology, St Louis, MO, USA) for 24 h.
Statistical analysis
Refer to the Online Supplementary Appendix
The study was approved by the Canadian Ethics Review Board (H18-00022 and H16-00533).
Haematologica | 108 March 2023 762 ARTICLE - Characterization of NK reg cells in cGvHD M. Lauener et al.
Results
Identification of cell populations in hematopoietic stem cell transplantation patients associated with chronic graft-versus-host disease
A previous analysis of a pediatric cohort (n=241) from the PBMTC 1202/ABLE1.0 study found that patients at day 100 after HSCT who later developed cGvHD had decreased CD56brightCD3- NK-cell numbers, similar to our previously
described research in adult cohorts.6,8 Using the identical strict criteria of biological significance limited to significant P value, ROC AUC of ≥0.60, and effect ratio of either ≤0.75 or ≥1.3 after a Bonferroni correction, further immunophenotypic evaluation was performed on the CD56brightCD3- NK populations from the PBMTC/ABLE cohort. Of samples taken before the onset of cGvHD at day 100, we found a lack of cGvHD to be associated with CD56brightCD3- NK cells which were further characterized by being perforin-
Figure 1. Immune cell populations in hematopoietic stem cell transplantation patients associated with chronic graft-versushost disease. CD56bright and CD56dim NK-cell immunophenotypic expression for each group of hematopoietic stem cell transplantation (HSCT) patients (chronic graft-versus-host disease [cGvHD], acute GvHD [aGvHD], and controls) at day 100 before and at the onset of cGvHD and the differential expression between controls and GvHD subjects. (A) Regulatory NK (NKreg) cell subpopulations of HSCT patients at day 100 before the onset of cGvHD compared to HSCT patients without cGvHD. (B) NKreg cell subpopulations of HSCT patients at the onset of cGvHD compared to HSCT patients without cGvHD. (C) Correlation of CD56brightperforin- NK reg cells with other immune cell populations. For the cell subtype contrast, significance identified as P<0.05 and effect ratio >5 or <0.2. For the group contrast, significance identified as P<0.05 and effect ratio >2 or <0.5. In order to test for differential expression between CD56bright and CD56dim NK cells of each gene, a paired t test on samples from each group was performed. In order to test for group differences of each gene, a Student’s t test on samples from each cell subtype was performed. GvHD, n=44; no GvHD, n=190.

A B C
Haematologica | 108 March 2023 763 ARTICLE - Characterization of NK reg cells in cGvHD M. Lauener et al.
(effect ratio [ER]=0.67; P=0.007; AUC=0.63), CD335+ (ER=0.67; P=0.004; AUC=0.64), and close to meeting our criteria for Granzyme B- (ER=0.54; P=0.03; AUC=0.59) (Figure 1A). A second analysis performed at cGvHD onset compared patients with cGvHD to time-matched samples of patients that had no cGvHD (onset of cGvHD<4 months linked to non-cGvHD controls at 3 months, onset >4 months to ≥8 months to 6 month controls, and cGvHD onset >8 months to 12 month non-cGvHD controls). The samples taken at the onset of cGvHD showed that CD56brightCD3- NK cells were perforin- (ER=0.51; P=2.3x10⁻⁷; AUC=0.64), CD335+ (ER=0.61; P=3.7x10⁻⁵; AUC=0.64), or Granzyme B- (ER=0.41; P=2.2x10⁻⁶; AUC=0.69) (Figure 1B). Since the association of a lack of cGvHD was most significant with a subpopulation that was perforin-, a regression analysis evaluated CD56brightCD3-perforin- NK cells against all markers and found a significant correlation with CD56brightCD3-Granzyme B- NK cells (Pearson average correlation [PAC]=0.78; P<1x10-17) and inverse relationship with CD56dimperforin+ and CD56dimGranzyme B+ NK cells (PAC=-0.76; P<1x10-17 and PAC=-0.79; P<1x10-17, respectively) (Figure 1C). Based on these findings, we concluded that perforin negativity is most significantly associated with the NK reg subpopulation important in suppressing cGvHD.
Comparison of transcriptome expression by CD56bright to CD56dim NK cells in hematopoietic stem cell transplantation patients
In order to further evaluate for additional markers associated with a lack of cGvHD and the CD56brightCD3- NK-cell population, we performed transcriptome analysis in a representative cohort of patients from the larger ABLE/PBMTC cohort. This was measured by nanoString on PBMC samples at day 100 after HSCT in immune-tolerant patients (n=6) that had neither late aGvHD nor cGvHD. In this patient set, we compared the expression of CD56bright to CD56dim NK cells (Online Supplementary Table S2, column 1; Figure 2A). We confirmed that the CD56bright NK cells had low expression of perforin and Granzyme B, and increased expression NKp46. Additional significant markers associated with this population were characterized by overexpression of Granzyme K (ER=16.2), IL-7R (ER=27.8), GPR183 (ER=19.1), RANK (ER=12.1), GM-CSFR (ER=7.9), TCF7 (ER=6.8), IL23A (ER=6.8), and others. We also found a significant lack of expression of select genes in CD56bright NK cells compared to CD56dim NK cells (ER≤0.2), including FcRγ (FCGR3A/B; ER=0.04), CCL4 (ER=0.04), LILRB1 (ER=0.06), and others (Online Supplementary Table S2; Figure 2A).
In order to investigate for markers that had expression most closely within induction of immune tolerance we evaluated whether the CD56bright:CD56dim NK-cell expression ratio is altered in patients with GvHD. We focused on the CD56bright population for transcriptome
expressions differing in the late aGvHD (n=6) or cGvHD (n=6) patients. We found that there was a lower ratio for IL7R in the late aGvHD group (ER=25.5), and even lower in the cGvHD group (ER=20.8). Additional markers decreased in either late aGvHD or cGvHD in the CD56bright:CD56dim ratio included GPR183, Granzyme K, RANK, GM-CSFR, TCF7, IL-23A, and others. Ratios that increased in patients with either late aGvHD or cGvHD included FcR γ (FCGR3A/B), CCL4, LILRB1, and others (Online Supplementary Table S2, columns 2 and 3).
Evaluation for transcriptome expression in CD56bright NK cells associated with a lack of late acute and chronic graft-versus-host disease
In order to determine if any of the markers identified in the transcriptome were characteristic of a subpopulation of CD56bright NK cells most closely associated with a lack of cGvHD, we evaluated CD56bright NK cells in HSCT patients with no GvHD compared to patients that developed cGvHD. We found the CD56bright NK cells in the no GvHD group to overexpress interferon regulatory factor 1 (IRF1) (ER=1.4, P=0.03), and tumor necrosis factor (TNF) (ER=2.1, P=0.03) (not shown in the Online Supplementary Table S1, column 4 due to ER being less than 5) and the CD56bright NK cells in the cGvHD group compared to no late aGvHD or cGvHD group to overexpress IL13RA1 (ER=5.4, P=0.05) (Figure 2B).
Confirmation of transcriptome differences by surface and intracellular expression in CD56bright NK cells
Based on the immunophenotypic characterization of the larger populations and the confirmation by nanoString, we hypothesized that a subpopulation of CD56bright NK cells that are perforin- and Granzyme B- (NKreg) may have the greatest ability to act as a cGvHD suppressor. However, isolation of this population based on cytoplasmic perforin and granzyme staining results in non-viable cells. Therefore, we aimed to determine the optimal cell surface-expression approach to isolate the NKreg population based on the candidates identified in the nanoString analysis. Our selected markers were significantly associated with a lack of GvHD development in the CD56bright NK-cell subset and expressed on the cell surface. Using these criteria, we selected the following markers: CD56, IL-7R, GPR183, GM-CSFR, CD62L, and CD16. We also investigated CXCR3 expression based on previous data which showed this marker to be highly expressed by CD56bright NK cells associated with immune tolerance.6
We verified that expression of Granzyme K, GPR183, IL7R, CXCR3, and CD62L was present in the CD56bright NKcell population. Additionally, we confirmed the CD25, NKp44, and NKp46 expression ( Online Supplementary Figure S1), and lack of KIR expression (Online Supplementary Figure S2) among the CD56bright NK cells. In contrast,
Haematologica | 108 March 2023 764 ARTICLE - Characterization of NK reg cells in cGvHD M. Lauener et al.
Figure 2. Differences between CD56bright and CD56dim NK cells that are associated with a lack of graft-versus-host disease (GvHD) and differences in gene expression between CD56bright NK cells in hematopoietic stem cell transplantation (HSCT) patients who developed GvHD versus those who were immune-tolerant (no late acute GvHD or chronic GvHD) measured on samples from day 100 post HSCT. CD56bright and CD56dim NK cell gene expression for HSCT patients (cGvHD, and no late aGvHD or cGvHD) at day 100 post HSCT and before the potential onset of cGvHD. (A) Gene expression of CD56bright NK cells as compared to CD56dim NK cells among HSCT patients that did not develop late aGvHD or cGvHD. (B) Gene expression of CD56bright and CD56dim NK cells among HSCT patients that developed cGvHD as compared to those who did not develop late aGvHD or cGvHD. For the cell subtype contrast and group contrast, significance identified as P<0.05 and effect ratio >5 or <0.2. In order to test for differential expression between CD56bright and CD56dim NK cells of each gene, a paired t test on samples from each group was performed. In order to test for group differences of each gene, a Student’s t test on samples from each cell subtype was performed. Late aGvHD, n=6; cGvHD, n=6; no GvHD, n=6.

the CD56dim NK cells show RNA and protein expression of KIR, Granzyme B, and perforin. However, unlike the transcriptome findings, GM-CSF showed minimal protein expression among the CD56bright NK cells. When investigating the optimal cell-surface marker combination for sorting the NKreg cells we found that the greatest purity (>95%) for perforin- Granzyme B- NK cells (Online Supplementary Figure S3) was in a CD56bright and CD16- NKcell population. In contrast, the CD56brightCD16+ subset is >70% perforin + Granzyme B + . The other investigated markers (IL-7R, GPR183, GM-CSFR, and CD62L) in combination with CD56 did not result in consistent isolation of pure (>95%) perforin-, Granzyme B- NK reg cells. Therefore, we define the NKreg subpopulation as CD56brightCD16NK cells and utilized these isolated cells for all NK reg functional evaluations.
Evaluation of regulatory CD56brightCD16- NK-cell ability to suppress T-cell proliferation
A major characteristic of Treg cells is that they suppress Tcell function,19 which is necessary to suppress the development of GvHD. The evaluation of CD56brightCD16- NK reg cell’s ability to suppress allogeneic CD4+ T cells found the NK reg cells to strongly suppress T-cell proliferation, particularly at the 1:1 (approximately 96% suppression) ratio (Figure 3A). In contrast, the CD56dimCD16+ NK cells have minimal suppressive capacity (Figure 3B). The suppressive capacity of T reg cells was comparable to that of NKreg cells (Figure 3C). Interestingly, the NKreg cells suppress CD4+ T-cell proliferation significantly stronger than CD8+ T-cell proliferation at the 1:1 ratio (7.67% suppression of CD8+ T-cell proliferation, compared to 94% of CD4+ T-cell proliferation) (Figure 4). NKreg cells also did not significantly suppress Treg
A B
Haematologica | 108 March 2023 765 ARTICLE - Characterization of NK reg cells in cGvHD M. Lauener et al.
cell proliferation at the 1:1 ratio compared to the Treg control (126% proliferation, SD=44.6, P=0.42) (Figure not shown).
Evaluation of the cytolytic ability of CD56brightCD16- NK reg cells
NK reg cells were found to not be cytotoxic towards K562 cells, but CD56dimCD16+ NK cells lysed the target (Online Supplementary Figure S4). Additionally, NKreg cells did not induce apoptosis of CD4+ T cells, but CD56dimCD16+ NK cells induced substantial apoptosis of CD4+ T cells (Figure 5). Further, as expected, NKreg cells did not result in significant (P>0.05) killing of leukemic cells at the 10:1 (10.5% apoptosis of Jurkat cells, SD=4.95; 6% apoptosis of MOLT-4 cells, SD=0) or 1:1 (9% apoptosis of Jurkat cells, SD=4.36; 3% apoptosis of MOLT-4 cells, SD=0) ratios (Figure not shown).
Evaluation of cell-cell contact dependence for CD56brightCD16- NK reg cell suppression

In order to evaluate whether NK reg cells suppress through cell-cell contact, NKreg cells were co-cultured with allogeneic CD4+ T cells in a transwell plate to prevent direct contact between the two cell types, but still allow transfer of soluble factors through the permeable membrane. In this environment, there was found to be a significant decrease in the suppressive effect of the NKregs (91% of CD4+ T cells continued to proliferate at the 1:1 ratio) (Figure 6). In confirming that suppression was not through a soluble factor secreted by NKreg cells, we found no suppression of CD4+ T-cell proliferation when co-culturing with the NKreg suppression assay supernatant (Online Supplementary Figure S5).
Figure 3. Evaluation of CD56brightCD16- NK reg cell ability to suppress CD4+ T-cell proliferation. Suppressive effect of (A) CD56brightCD16- regulatory NK (NKreg) cells, (B) CD56dimCD16+ NK cells, and (C) Treg cells towards allogeneic CD4+ T cells. On the histograms, the x-axis displays the cell proliferation dye (CPD) eF450 and the y-axis displays the cell count. (D) Suppressive capacity of CD56brightCD16- NK reg cells, CD56dimCD16+ NK cells, and Treg cells towards allogeneic CD4+ T cells at the 1:1, 1:2, 1:4, and 1:8 ratios as compared to the activated CD4+ T-cell control (mean +/- standard deviation). *P<0.05, ***P<0.0005. Statistical analyses for suppression experiments were performed using Microsoft Excel version 2110 and a two-tailed t test – two-sample assuming unequal variance. The data is from a single experiment representative of 5 experiments for the NK-cell vs. CD4+ T-cell assays, and 2 experiments for the Treg cell vs. CD4+ T-cell assay.
A B C D Haematologica | 108 March 2023 766 ARTICLE - Characterization of NK reg cells in cGvHD M. Lauener et al.
Evaluation of GPR183R, NKp46, and NKp44 dependence for CD56brightCD16- NK reg cell suppression
Based on the transcriptome study results and previous studies,10 we investigated the role of the GPR183, NKp44, and NKp46 receptors in the NKreg suppressive mechanism. We blocked GPR183R using the antagonist NIBR189 and NKp44 and NKp46 using blocking monoclonal antibodies. We found no significant difference in NK reg cell suppressive capacity when GPR183R, NKp44, or NKp46 were blocked in solution (Online Supplementary Figure S6).
Discussion
Previous large patient population correlative studies have found CD56bright NK reg cells to be the consistent cell population associated with lack of cGvHD and development of immune tolerance. In this study, we further characterized the NK reg population through immunophenotypic, transcriptomic, and functional analysis as a NKreg subpopulation, identifying CD56brightperforin- cells to have the most significant association both before and at the onset of cGvHD, with Granzyme B- cells strongly correlating with the perforin- group. Within a smaller cohort of HSCT patient samples, transcriptome analysis identified additional
markers that may be characteristic of this distinct CD56bright NK subpopulation associated with the suppression of GvHD. Based on these findings, we determined that we could sort CD56+ and CD16- NK cells to obtain a high purity of the NK reg subpopulation for manipulation in vitro. The identified NK reg population is similar to Treg cells in its strong cell-cell contact-dependent suppression of CD4+ T cells. However, NKreg cells do not appear to suppress Treg cells or CD8+ T cells, suggesting that NKreg cells selectively regulate T-cell subsets, differentiating their function from Treg cells which strongly suppress both CD4+ and CD8+ T cells.20 This finding may correlate to NK cells contribution to the graftversus-leukemia affect in HSCT patients, which is strongly mediated by CD8+ T cells.21 As expected, the NKreg cells did not result in significant killing of leukemic cells. Further, the NK reg cells exhibited a lack of cytotoxicity towards CD4+ T cells and K562 cells, differentiating their function from CD56dimCD16+ NK cells, which significantly lysed both target cell populations.

Contrary to others, our studies show there to be no significant difference in NK reg cell suppressive capacity when the NKp44 or NKp46 receptors were blocked in solution. However, these studies utilized CD56bright NK cells expanded with low-dose IL-2, which may activate and mature the cells towards the cytolytic CD56bright population.22 Our ana-
Figure 4. Evaluation of CD56brightCD16- NK reg cell ability to suppress CD8+ T-cell proliferation. Suppressive effect of (A) CD56brightCD16- regulatory NK (NKreg) cells towards allogeneic CD8+ T cells compared to the CD8+ T-cell control. On the histograms, the x-axis displays the cell proliferation dye (CPD) eF450 and the y-axis displays the cell count. (B) Proliferation of CD8+ or CD4+ T cells after 96-hour co-culture with allogeneic CD56brightCD16- NK reg cells at the 1:1 ratio as compared to the activated CD8+ or CD4+ T-cell controls (mean +/- standard deviation). *P<0.05, ***P<0.0005. Statistical analyses for suppression experiments were performed using Microsoft Excel version 2110 and a two-tailed t test – two-sample assuming unequal variance. The data is from a single experiment representative of 3 experiments.
A B Haematologica | 108 March 2023 767 ARTICLE - Characterization of NK reg cells in cGvHD M. Lauener et al.
lyses were performed on freshly isolated, unexpanded NKreg cells to be more reflective of their in vivo function. Additionally, we found no significant difference in the NK reg cell suppressive capacity when the candidate receptor GPR183R was blocked in solution. Further, our nanoString study revealed no significant differences in PD-1 and LAG3 expression of NK cells, thus we also ruled out these immune checkpoints as being important in the NKreg suppressive mechanism. Therefore, like Treg cells,23 the contact-dependent mechanism of NKreg suppression is unknown and requires further study. Other studies have proposed soluble mediators of suppression by cytokine induced NK reg cells, though these cells are both phenotypically and functionally different from the freshly isolated NK reg cells we describe.22,24

Currently, the focus on regulatory mechanisms in cGvHD have primarily evaluated the role of Tregs25 and to a lesser extent, Bregs.26 Thus, strategies to induce immune tolerance through augmentation of regulatory mechanisms have also focused on increasing the function of Tregs, either by strategies that do not suppress Tregs, such as ruxolitinib,27 or expansion of Tregs by low dose IL-2 or ECP.9 Our studies suggest that NKreg cells may have an early innate-mediated tolerogenic stimulus on the development of cGvHD with a lack of NK reg cells both before the onset of cGvHD (Figure 1A) and at the onset of cGvHD (Figure 1B). This may be similar to physiological settings, such as in placental tolerance where CD56bright NK cells are present in the first trimester, while only in the second and third trimester are Treg cells present.28 Interestingly, the successful cGvHD therapies of
Figure 5. CD56brightCD16- NK reg cell induction of CD4+ T-cell apoptosis. Apoptotic CD4+ T cells after the 96-hour suppression assay co-culture were identified with use of Annexin V and 7-AAD flow cytometric staining. Conditions tested included (A) activated CD4+ T cells in the absence of suppressor cells (control), (B) CD56brightCD16- regulatory NK (NKreg) cells, and (C) CD56dimCD16+ NK cells co-cultured with allogeneic CD4+ T cells at the 1:1 ratio. With use of FSC-A and SSC-A, lymphocytes were gated and using CD4 and 7-AAD staining live and dead CD4+ T cells were gated (plots not shown). After, Annexin V and 7-AAD were plotted. For the histogram, Annexin Vnegative and 7-AAD-negative (live) CD4+ T cells are shown in blue, and Annexin V-positive, 7AAD-negative (early apoptotic) and annexin V-positive, 7-AADpositive (late apoptotic) CD4+ T cells are shown in purple. (D) The percentage of apoptotic CD4+ T cells in the CD4+ T-cell control as compared to the NK reg and NKdim conditions are shown (mean +/- standard deviation). NS: not significant. Statistical analyses were performed using Microsoft Excel version 2110 and a two-tailed t test – two-sample assuming unequal variance. The data is from a single experiment representative of 3 experiments.
Haematologica | 108 March 2023 768 ARTICLE - Characterization of NK reg cells in cGvHD M. Lauener et al.
Figure 6. Evaluation of cell-cell contact dependence for CD56brightCD16- NK reg cell suppression. Suppressive effect of CD56brightCD16relulatory NK (NKreg) cells towards allogeneic CD4+ T cells when cells are co-cultured for 96 hours at the ratio 1:1 in a standard round-bottom 96-well plate or 96-well transwell plate. (A) Proliferation of CD4+ T cells (control), (B) proliferation of CD4+ T cells co-cultured with NK reg cells in a standard plate, (C) proliferation of CD4+ T cells co-cultured with NK reg cells in a transwell plate. On the histograms, the x-axis displays the cell proliferation dye (CPD) eF450 and the y-axis displays the cell count. (D) Proliferation of CD4+ T-cell control compared to CD4+ T cells co-cultured with NK reg cells in a standard or transwell plate (mean +/- standard deviation). ***P<0.0005, NS: not significant. Statistical analyses were performed using Microsoft Excel version 2110 and a twotailed t test – two-sample assuming unequal variance. The data is from a single experiment representative of 5 experiments.

low dose IL-2 and ECP, utilised to augment Treg cells, also simultaneously augment CD56bright NK cells, and some studies have suggested that the CD56bright NK population most closely correlates with suppression of cGvHD.12 Moreover, NKreg cells have been found to be important in the suppression of other autoimmune diseases, including solid organ transplantation, and rheumatoid arthritis, and are part of the suppressive tumor immune microenvironment.29 Our findings support that in addition to T reg cells and B reg cells, NKreg cells should also be considered important as part of the regulatory mechanisms that suppress cGvHD. As a result of our studies, we have determined an optimized cell sorting approach to isolate NKreg cells, verified their in vitro suppressive function which may correlate with cGvHD suppression, and outlined additional phenotypic and functional characteristics of NK reg cells. With further investigation we may decipher the mechanism of NKreg suppression and move forward in optimizing and operational-
izing the expansion of NKreg cells associated with cGvHD suppression.
Disclosures
No conflicts of interest to disclose.
Contributions
KRS edited the manuscript and oversaw all aspects of the study and the evaluation of the results. AK oversaw aspects of the study and the evaluation of the results. MPL wrote the manuscript, and performed and interpreted all laboratory studies. SAP performed and interpreted laboratory studies, and wrote the manuscript. SA performed laboratory studies, interpreted the laboratory studies and edited the manuscript. VP performed and interpreted laboratory studies. BN performed all statistical analyses. EO managed ethics applications regarding the study. GC reviewed the manuscript and completed the clinical patient data analysis for the na-
A B C D Haematologica | 108 March 2023 769 ARTICLE - Characterization of NK reg cells in cGvHD M. Lauener et al.
noString study. MKL reviewed the manuscript and provided Treg cells. KNM edited the manuscript, and provided expanded, cryopreserved Treg cells.
Acknowledgments
We would also like to acknowledge the Reid lab members from BCCHR, including Mohammad Reza Rahavi and Ali Farokhi for creating Luciferin-transfected K562 cells and imaging the plates. We further acknowledge the Lim lab members from BCCHR, including Pascal Leclair for contributing Jurkat and MOLT-4 leukemic cell lines. Additionally, we acknowledge the Center for Heart Lung Innovation at St. Paul’s Hospital (Vancouver, BC, Canada) for performing the nanoString assays.
References
1. Park B, Yoo KH, Kim C. Hematopoietic stem cell expansion and generation: the ways to make a breakthrough. Blood Res. 2015;50(4):194-203.
2. Ogonek J, Kralj Juric M, Ghimire S, et al. Immune reconstitution after allogeneic hematopoietic stem cell transplantation. Front Immunol. 2016;7:507.
3. Zeiser R, Blazar BR. Pathophysiology of chronic graft-versushost disease and therapeutic targets. N Engl J Med. 2017;377(26):2565-2579.
4. Boyiadzis M, Arora M, Klein JP, et al. Impact of chronic graftversus-host disease on late relapse and survival on 7,489 patients after myeloablative allogeneic hematopoietic cell transplantation for leukemia. Clin Cancer Res. 2015;21(9):2020-2028.
5. Filipovich AH, Weisdorf D, Pavletic S, et al. National Institutes of Health consensus development project on criteria for clinical trials in chronic graft-versus-host disease: I. Diagnosis and staging working group report. Biol Blood Marrow Transplant. 2005;11(12):945-956.
6. Kariminia A, Holtan SG, Ivison S, et al. Heterogeneity of chronic graft-versus-host disease biomarkers: association with CXCL10 and CXCR3+ NK cells. Blood. 2016;127(24):3082-3091.
7. Schultz KR, Kariminia A, Ng B, et al. Immune profile differences between chronic GVHD and late acute GVHD: results of the ABLE/PBMTC 1202 studies. Blood. 2020;135(15):1287-1298.
8. Kariminia A, Ivison S, Ng B, et al. CD56bright natural killer regulatory cells in filgrastim primed donor blood or marrow products regulate chronic graft-versus-host disease: the Canadian Blood and Marrow Transplant Group randomized 0601 study results. Haematologica. 2017;102(11):1936-1946.
9. Koreth J, Kim HT, Belizaire R, et al. Extra-corporeal photopheresis plus low-dose interleukin-2 for steroidrefractory chronic graft-vs.-host disease: efficacy, safety and immune correlates. Blood. 2017;130(Suppl 1):S515.
10. McQuaid SL, Loughran ST, Power PA, Maguire P, Szczygiel A, Johnson PA. Low-dose IL-2 induces CD56bright NK regulation of T cells via NKp44 and NKp46. Clin Exp Immunol. 2020;200(3):228-241.
11. He J, Zhang R, Shao M, et al. Efficacy and safety of low-dose IL2 in the treatment of systemic lupus erythematosus: a randomised, double-blind, placebo-controlled trial. Ann Rheum Dis. 2020;79(1):141-149.
Funding
The authors would like to acknowledge the funding which supported this study, including a CIHR Foundation grant (to KRS), CIHR Team grant (to KRS and GDC), the Bjorknas Foundation (to KRS), Michael Cuccione Fellowship (to MPL), and CIHR CGS-M and Vanier scholarships (to MPL). Additional resources for the project were supported by collaborators at BCCHR (Megan Levings), BCCHR FlowCore, Canadian Blood Services, and healthy blood donor volunteers.
Data-sharing statement
This study does not consent for data sharing.
12. Iniesta P, Revilla N, Chen-Liang TH, et al. An early increase of CD56bright natural killer subset as dominant effect and predictor of response to extracorporeal photopheresis for graftversus-host disease. Transfusion. 2018;58(12):2924-2932.
13. Fu B, Tian Z, Wei H. Subsets of human natural killer cells and their regulatory effects. Immunology. 2014;141(4):483-489.
14. Kucuksezer UC, Aktas Cetin E, Esen F, et al. The role of natural killer cells in autoimmune diseases. Front Immunol. 2021;12:622306.
15. Cuvelier GDE, Kariminia A, Nemecek ER, et al. Naïve helper Tcell and regulatory T- and NK-cell subsets are associated with pediatric chronic graft-versus-host disease: results of the ABLE/PBMTC 1202 study. Blood. 2020;136(Suppl 1):S11-12.
16. Cuvelier GDE, Nemecek ER, Wahlstrom JT, et al. Benefits and challenges with diagnosing chronic and late acute GVHD in children using the NIH consensus criteria. Blood. 2019;134(3):304-316.
17. Dijke E, Ellis T, Larsen I, et al. Human leukocyte antigen (HLA) class II expression on regulatory T cells (Tregs) isolated from discarded human thymus is induced by in vitro expansion conditions. J Heart Lung Transplant. 2020;39:S178-S179.
18. Clottu AS, Mathias A, Sailer AW, et al. EBI2 expression and function: robust in memory lymphocytes and increased by Natalizumab in multiple sclerosis. Cell Rep. 2017;18(1):213-224.
19. Sakaguchi S, Wing K, Onishi Y, Prieto-Martin P, Yamaguchi T. Regulatory T cells: how do they suppress immune responses? Int Immunol. 2009;21(10):1105-1111.
20. McMurchy AN, Levings MK. Suppression assays with human T regulatory cells: a technical guide. Eur J Immunol. 2012;42(1):27-34.
21. Locatelli F, Pende D, Falco M, Della Chiesa M, Moretta A, Moretta L. NK cells mediate a crucial graft-versus-leukemia effect in haploidentical-HSCT to cure high-risk acute leukemia. Trends Immunol. 2018;39(7):577-590.
22. Konjević GM, Vuletić AM, Mirjačić Martinović KM, Larsen AK, Jurišić VB. The role of cytokines in the regulation of NK cells in the tumor environment. Cytokine. 2019;117:30-40.
23. Schmidt A, Oberle N, Krammer PH. Molecular mechanisms of treg-mediated T cell suppression. Front Immunol. 2012;3:51.
24. Laroni A, Gandhi R, Beynon V, Weiner HL. IL-27 imparts immunoregulatory function to human NK cell subsets. PLoS One. 2011;6(10):e26173.
Haematologica | 108 March 2023 770 ARTICLE - Characterization of NK reg cells in cGvHD M. Lauener et al.
25. Whangbo JS, Antin JH, Koreth J. The role of regulatory T cells in graft-versus-host disease management. Expert Rev Hematol. 2020;13(2):141-154.
26. Nakasone H, Sahaf B, Miklos DB. Therapeutic benefits targeting B-cells in chronic graft-versus-host disease. Int J Hematol. 2015;101(5):438-451.
27. Spoerl S, Mathew NR, Bscheider M, et al. Activity of therapeutic
JAK 1/2 blockade in graft-versus-host disease. Blood. 2014;123(24):3832-3842.
28. Vacca P, Vitale C, Munari E, Cassatella MA, Mingari MC, Moretta L. Human innate lymphoid cells: their functional and cellular interactions in Decidua. Front Immunol. 2018;9:1897.
29. Tian Z, Gershwin ME, Zhang C. Regulatory NK cells in autoimmune disease. J Autoimmun. 2012;39(3):206-215.
Haematologica | 108 March 2023 771 ARTICLE - Characterization of NK reg cells in cGvHD M. Lauener et al.
APOLD1 loss causes endothelial dysfunction involving cell junctions, cytoskeletal architecture,
and Weibel-Palade bodies, while disrupting hemostasis
Correspondence:
S. Stritt simon.stritt@igp.uu.se
1Department of Immunology, Genetics and Pathology, Uppsala University, Uppsala, Sweden; 2Institut de Rythmologie et de Modélisation Cardiaque, Hôpital Xavier Arnozan, Pessac, France;
3Department of Biological Hematology, CHU Montpellier, Université de Montpellier, Montpellier, France; 4Hematology, Hospices Civils de Lyon, Bron Biology Center and HemostasisThrombosis, Lyon-1 University, Lyon, France; 5Laboratory of Excellence GENMED (Medical Genomics), Paris, France; 6Aix Marseille University, INSERM, INRAE, C2VN, Marseille, France and 7University of Bordeaux, INSERM, Bordeaux Population Health Research Center, U1219, Bordeaux, France.
Abstract
P. Nurden paquita.nurden@gmail.com.
Received: February 7 2022.
Accepted: May 10, 2022.
Early view: May 31, 2022.
https://doi.org/10.3324/haematol.2022.280816
©2023 Ferrata Storti Foundation
Published under a CC BY-NC license
Vascular homeostasis is impaired in various diseases thereby contributing to the progression of their underlying pathologies. The endothelial immediate early gene Apolipoprotein L domain-containing 1 (APOLD1) helps to regulate endothelial function. However, its precise role in endothelial cell biology remains unclear. We have localized APOLD1 to endothelial cell contacts and to Weibel-Palade bodies (WPB) where it associates with von Willebrand factor (VWF) tubules. Silencing of APOLD1 in primary human endothelial cells disrupted the cell junction-cytoskeletal interface, thereby altering endothelial permeability accompanied by spontaneous release of WPB contents. This resulted in an increased presence of WPB cargoes, notably VWF and angiopoietin-2 in the extracellular medium. Autophagy flux, previously recognized as an essential mechanism for the regulated release of WPB, was impaired in the absence of APOLD1. In addition, we report APOLD1 as a candidate gene for a novel inherited bleeding disorder across three generations of a large family in which an atypical bleeding diathesis was associated with episodic impaired microcirculation. A dominant heterozygous nonsense APOLD1:p.R49* variant segregated to affected family members. Compromised vascular integrity resulting from an excess of plasma angiopoietin-2, and locally impaired availability of VWF may explain the unusual clinical profile of APOLD1:p.R49* patients. In summary, our findings identify APOLD1 as an important regulator of vascular homeostasis and raise the need to consider testing of endothelial cell function in patients with inherited bleeding disorders without apparent platelet or coagulation defects.
Introduction
Regulation of vascular integrity and the prevention of excessive leakage of blood components are central for homeostasis and ensure proper organ function. Endothelial permeability varies between different vascular beds and is adjusted to the respective tissue functions, thereby allowing for gas exchange, regulation of extracellular fluid volume, osmolarity, pH as well as ion concentration. Breakdown of vascular integrity is a key feature of numerous pathologies including not only acute and chronic inflammatory diseases such as infections, asthma and arthritis, but also cancer and ischemic cardiovascular diseases with emphasis on myocardial infarction and stroke.1,2
Vascular barrier function is mainly established by intercellular adherens and tight junctions between adjacent endothelial cells (EC). The abundance and structural organization of junctional proteins such as claudin-5 (CLDN5) or vascular endothelial cadherin (VE-Cad; CDH5) together with their modulation, spatially and temporally, determine vessel permeability. Stimulation of EC with inflammatory mediators such as thrombin3 or angiopoietin-2 (ANGPT2)4 results in EC activation, junction opening and the formation of intercellular gaps. Likewise, vascular injury or ischemia triggers EC activation and the release of bioactive mediators from Weibel-Palade bodies (WPB) such as von Willebrand factor (VWF) and ANGPT2 thereby interfering with coagulation and also vessel permeability.5–7 In addition, endothelial activation is accom-
Simon Stritt,1* Paquita Nurden,2* Alan T. Nurden,2 Jean-François Schved,3 Jean-Claude Bordet,4 Maguelonne Roux,5 Marie-Christine Alessi,6 David-Alexandre Trégouët,5,7 Taija Mäkinen1 and Muriel Giansily-Blaizot3
Haematologica | 108 March 2023 772 ARTICLE - Coagulation & its Disorders
panied by the expression of immediate early genes such as JUN and FOS as well as the more recently identified Apolipoprotein L domain-containing 1 (APOLD1).8,9 Platelet-, ECand neuron-restricted APOLD1 has been implicated in angiogenesis as well as the regulation of endothelial permeability in mice in response to transient brain ischemia.9–12 However, its precise role in EC biology as well as the molecular mechanisms involved remain unclear. Using in vitro knockdown studies in human dermal blood EC (HDBEC), we now define a role of APOLD1 in modulating the endothelial cytoskeleton, cell-cell junctions and WPB biology. Transfection of HDBEC with APOLD1 siRNA resulted in an increased release of WPB through altered autophagy flux in favor of cargo secretion. The findings may also have clinical implications, because an inherited APOLD1R49* stop codon variant segregated to patients with bleeding of primarily vascular origin within a large French family. Affected family members presented with a severe atypical bleeding diathesis despite unaltered platelet function that has remained undiagnosed during more than 20 years of extensive clinical and biological testing in expert centers including evaluations for platelet, coagulation and connective tissue defects. Treatment of bleeding during delivery or some surgical interventions was complicated not only because platelet transfusions failed to stop blood loss but also because the use of desmopressin to increase VWF secretion from EC provoked a transiently impaired microcirculation. Our study highlights a new molecular pathway that may link defects primarily affecting EC to a bleeding syndrome.
Methods
Cell culture, preparation of platelets,13 immunolabeling of platelets and HDBEC,13 immunogold/transmission electron microscopy, immunoblotting, gene silencing, in vitro permeability assay, VWF, ANGPT1 and ANGPT2 enzyme-linked immunosorbent assays, image acquisition and image analysis14,15 were either performed according to the manufacturers’ protocols or as previously described and are detailed in the Online Supplementary Information
Whole exome and Sanger sequencing
Whole exome sequencing (described in detail in the Online Supplementary Information) identified two candidate variants in a large French family. Of these, APOLD1:p.R49* resulting from the combination of a common variant and a rare adjacent nucleotide substitution in cis, was a primary nonsense variant. Segregation analysis of both the common c.146G>A variant and the rare c.145C>T substitution in APOLD1 was performed on DNA from ten family members of three generations by Sanger sequencing. Blood samples were obtained from patients after in-
formed consent in accordance with the Declaration of Helsinki. Ethical approval was obtained in France from INSERM (RBM 04–14) for the national project “Network on the inherited diseases of platelet function and platelet production” and from the Montpellier local ethical committee (N. 202000352) for the project “Identification of new genes involved in platelet abnormal functions”.
Data presentation and statistical analysis
Data visualization and statistical testing were performed using GraphPad Prism 7. A nonparametric Wilcoxon-MannWhitney test was used for comparisons of two means. For multiple comparisons one-way analysis of variance (ANOVA) followed by a Dunnett multiple comparison test or a two-way ANOVA followed by a Sidak or Tukey multiple comparison test was performed. P-values <0.05 were considered as statistically significant: *P< 0.05; **P< 0.01; ***P< 0.001.
Results
APOLD1 localizes to cell-cell junctions and Weibel-Palade bodies
Given the endothelial and megakaryocyte/platelet-restricted expression of APOLD1,9,11 we first assessed its localization in primary HDBEC and human platelets. In agreement with previous reports, we detected APOLD1 at cell-cell junctions, defined by the presence of VE-Cad, of HDBEC in culture and in addition, we found a co-localization with the major WPB constituent VWF (Figure 1A). The WPB-specific localization of APOLD1 was further confirmed by immunogold electron microscopy (Figure 1B). While an occasional gold particle localized to the external membrane, the majority of gold particles were found inside the WPB suggesting an association of APOLD1 with the tubules of VWF (shown at high magnification in Figure 1Biii). Of note, immunofluorescence labeling of platelets from human controls revealed localization of APOLD1 to a-granules and exclusion from d-granules/lysosomes (Online Supplementary Figure S1A, B). Ultrastructurally, APOLD1 was occasionally found associated with the membrane of a-granules (Figure 1Ci-iii). Immunogold labeling also showed an eccentric localization of APOLD1 in the a-granule lumen (Figure 1Civ), a finding previously described by Cramer et al.16 for platelet-stored VWF in a manner resembling WPB.
APOLD1 regulates the junctional and cytoskeletal architecture in endothelial cells
To further study the function of APOLD1, we validated four short interfering RNA (siRNA) for their ability to ablate APOLD1 expression (Online Supplementary Figure S2A). Efficient silencing was confirmed by immunoblotting and immunolabeling (Online Supplementary Figure S2B, C).
Haematologica | 108 March 2023 773 ARTICLE - APOLD1 regulates endothelial homeostasis S. Stritt et al.
APOLD1 silencing in HDBEC resulted in similar cellular changes for all tested siRNA (Online Supplementary Figure S2D). These changes were characterized by an increase in cell size as well as altered shape (Figure 2A-D) and were associated with EC junction dismantling, evidenced by a reduction in the tight junction protein CLDN5, platelet-EC adhesion molecule 1 (PECAM1/CD31) as well as the reorganization of VE-Cad-positive adherens junctions (Figure 2A, B, E). Moreover, we also found a markedly enhanced
fibronectin fibrillogenesis and actin stress fiber formation, reminiscent of EC activation (Figure 2A, B, E). Functionally, the observed alterations in the absence of APOLD1 resulted in increased endothelial permeability to 40 kDa FITC-dextran, assessed by a transwell permeability assay (Figure 2F). Of note, 50% loss of APOLD1 protein recapitulated the cellular defects observed upon efficient silencing (Online Supplementary Figures S2C and S3). These results reveal a critical role of APOLD1 in controlling
Figure 1. APOLD1 localizes to endothelial cell-cell junctions and von Willebrand factor storage organelles. (A) Cultured human dermal blood endothelial cells (HDBEC) were immunolabeled for Apolipoprotein L domain-containing 1 (APOLD1; green [processed by super-resolution radial fluctuations52]), von Willebrand factor (VWF; cyan), vascular endothelial cadherin (VE-Cad; magenta), F-actin (gray), and nuclei were highlighted with DAPI (blue) and subsequently analyzed by confocal microscopy. Scale bar, 10 mm. (B) Immunogold labeling of adherent HDBEC for APOLD1 and subsequent electron microscopic analysis revealed localization to cell-cell contacts (i, arrowheads) and Weibel-Palade bodies (ii-iii, arrows). Scale bars, 100 nm. Images in (A) and (B) are representative of at least three independent experiments. (C) Immunogold labeling of resting human control platelets reveals APOLD1 localized to the membranes of a-granules (ii-iii) and to have an eccentric localization in the granule lumen, suggesting a possible association with VWF (iv). Of note, APOLD1 was not detected on the platelet surface. Scale bars, 200 nm (i) or 50 nm (ii-iv). Images are representative of one experiment.

A B
Haematologica | 108 March 2023 774 ARTICLE - APOLD1
endothelial
S. Stritt et al. C
regulates
homeostasis
silencing in human dermal blood endothelial cells (HDBEC) alters the organization of cell-cell junctions (claudin 5, CLDN5; vascular endothelial cadherin, VE-Cad; platelet-endothelial cell adhesion molecule 1, PECAM1/CD31) as well as cytoskeletal architecture and leads to increased fibronectin (FN) fibrillogenesis. Arrowheads in (A) highlight disrupted/CLDN5negative junctions. Scale bars, 25 mm. Images are representative of three independent experiments. (C, D) Lack of APOLD1 results in increased HDBEC size and altered shape (aspect ratio = major axis:minor axis). Box plots display first and third quartiles, and whiskers mark minimum and maximum values unless exceeding 1.5 times the interquartile range of at least 150 cells per group from three independent experiments; symbols represent outliers, and the horizontal line denotes the median. (E) Image analysis revealed reduced immunolabeling intensities of the junctional proteins CLDN5 and PECAM1/CD31, alterations of VE-Cad distribution as well as enhanced FN fibrillogenesis and actin stress fiber formation, which is reminiscent of endothelial cell activation leading to increased (F) endothelial permeability (40 kDa dextran-FITC). Data in (E) represent the mean ± standard deviation. Each symbol in (E) represents the average of at least 100 cells from an individual experiment. Pooled data from at least four experiments are displayed. Each symbol in (F) represents one replicate from three independent experiments. WilcoxonMann-Whitney test, ***P<0.001. CTCF: corrected total cell fluorescence.

A B E F C D
Haematologica | 108 March 2023 775 ARTICLE - APOLD1 regulates endothelial homeostasis S. Stritt et al.
Figure 2. APOLD1 silencing alters cytoskeletal and junctional organization of human dermal blood endothelial cells. (A, B) APOLD1
EC junctions as well as cytoskeletal architecture and thereby in modulating endothelial permeability. Moreover, they suggest a critical threshold level of APOLD1 to maintain endothelial homeostasis.
APOLD1 interferes with the biology of endothelial cell storage organelles
We next further explored the implication of APOLD1 localization to endothelial WPB. To this end we took a closer look at VWF, a major constituent of WPB in EC and present in platelet a -granules.16–19 Immunofluorescence labeling and immunoblotting revealed that APOLD1-silenced HDBEC in culture were almost devoid of VWF (Figure 3A, B). Changes in WPB content were not restricted to VWF but, significantly, were also associated with a reduction in cellular ANGPT2 (Figure 3A, B), confirming impaired storage.20 In agreement, we found markedly elevated levels of VWF and ANGPT2 in the supernatant of APOLD1 siRNAtreated HDBEC as compared with controls (Figure 3C, D), excluding impaired protein production as the cause. Using transmission electron microscopy, we readily observed WPB with the typical rod-shaped and striated ultrastructure in control cells (Figure 3Ei, Fi-ii). In contrast, we found that structurally abnormal organelles morphologically resembling autophagosomes with the typical isolation membrane predominated in APOLD1 siRNA-treated HDBEC (Figure 3Eii, Fiii). Immunogold labeling of VWF revealed that the remaining VWF in APOLD1-deficient HDBEC was mainly found in large vacuoles (Figure 3Fiii). An occasional WPB still labeling for VWF was seen apparently releasing its cargo into a vacuole (Figure 3Fiv). Notably, control cells were devoid of these vacuoles and labeling for VWF was restricted to WPB (Figure 3Ei-ii).
In summary these results suggest a role of APOLD1 in modulating endothelial WPB biology.
APOLD1 modulates Weibel-Palade body biology via secretory autophagy
Previous studies have identified a critical role of autophagy in WPB biogenesis and release.21 Given the excessive WPB release from HDBEC in the absence of APOLD1 (Figure 3A-D), we speculated that loss of APOLD1 would interfere with autophagy flux and thereby affect the secretory pathway. An increased expression of the autophagy markers SQSTM1 and LC3B in APOLD1 siRNA-treated HDBEC was indeed reminiscent of altered autophagy flux (Figure 4A-D). Furthermore, there was increased co-localization of VWF with LC3B and the late endosomal/autophagosomal marker RAB7, whereas the association with SQSTM1 and the lysosomal marker LAMP1 was decreased (Figure 4A-F, Online Supplementary Figure S4). This was accompanied by a decreased ratio of mature and pro-VWF in APOLD1-deficient HDBEC, revealing abnormal autophagy-dependent proteolytic processing (Figure 5A, B).
Significantly, blocking the fusion of autophagosomes with lysosomes, a final step of autophagy, with chloroquine resulted in an accumulation of lipidated LC3B-II and SQSTM1 in control HDEBC but did not affect the levels in APOLD1silenced HDBEC (Figure 5A, C, D). All of these features have previously been associated with impaired autophagy flux likely in favor of increased priming of WPB for secretory autophagy.21,22 Therefore, we next silenced autophagy related 5 (ATG5) and ATG7 genes which are critical for the initiation of autophagy and are implicated in WPB maturation as well as cargo release.21 Strikingly, simultaneous loss of ATG5 or ATG7 with APOLD1 partially restored the presence of WPB as compared with that in APOLD1-deficient HDBEC (Online Supplementary Figure S5A-C). Moreover, this led to a reduced release of WPB, evidenced by a decreased presence of VWF and ANGPT2 in the cell culture supernatant of APOLD1/ATG5 and APOLD1/ATG7 double-silenced HDBEC (Online Supplementary Figure S5D-F). These findings reveal a role of APOLD1 in regulating WPB release through modulation of autophagy flux and suggest secretory autophagy as the primary route for the excessive WPB cargo release in the absence of APOLD1.
APOLD1R49* associates with bleeding and vascular problems in a family with an inherited disorder
Among the patients studied by the French Reference Center for Hemorrhagic Syndromes there was a large family with an inherited bleeding disorder for which, despite extensive investigations over many years on coagulation factors and platelet biology in several expert centers (Online Supplementary Tables S1-S3), no obvious cause could be identified. Based on these studies a vascular defect was suspected. The family history of the inherited bleeding disorder extends over three generations (Figure 6A). The index patients are two sisters (pedigree member [PM] 4 and PM6) (Figure 6A, Online Supplementary Table S1), now over 70 years old, who had a severe, atypical bleeding syndrome that was also present in their deceased father (PM1). In addition to the index patients, two of their children (PM9 and PM11), now adults, also suffer from excessive bleeding (Figure 6A, Online Supplementary Table S1). Their syndrome is characterized by severe spontaneous bleeding episodes during childhood, with extensive hemorrhage at menarche for the three affected women (PM4, PM6, PM9) which was difficult to control, and required hospitalization for PM9. Tranexamic acid was ineffective; different oral contraceptive therapies were tried for all of them but often not tolerated; PM9 recently received leuprorelin injections.
PM6 and PM9 have also experienced periods of gastrointestinal bleeding. For PM6, this occurred in her sixties and was intermittent but not abundant. For PM9, gastrointestinal bleeding was observed every 2-3 years during childhood but then stopped. Endoscopic investigations were not per-
Haematologica | 108 March 2023 776 ARTICLE - APOLD1 regulates endothelial homeostasis S. Stritt et al.
constituent von
well as
2 (ANGPT2) as revealed by (A) immunolabeling and (B) immunoblotting with subsequent densitometric quantification of VWF and ANGPT2 levels relative to GAPDH in total cell lysates of control and APOLD1 siRNA-treated human dermal blood endothelial cells (HDBEC). Scale bars, 25 mm. Images and immunoblots are representative of at least three independent experiments. Each symbol in (B) represents one experiment and horizontal lines denote the mean ± standard deviation (SD). Wilcoxon-Mann-Whitney test, ***P<0.001. (C, D) VWF and ANGPT2 content in the supernatant of control and APOLD1 siRNA-treated HDBEC determined by enzyme-linked immunosorbent assay. Each symbol represents an individual sample and horizontal lines denote mean ± SD. Pooled data from four independent experiments are displayed. Wilcoxon-Mann-Whitney test, ***P<0.001. (E) Electron microscopic images of WPB in control siRNAtreated HDBEC (i) and autophagosomes (asterisks) with a developing isolation membrane (arrows) in APOLD1-silenced HDBEC (ii). M: mitochondria. Scale bars, 200 nm. Electron microscopic images are representative of three independent experiments. (F) Immunogold (5 or 10 nm gold particles) labeling of VWF highlights WPB with the typical striated rod-shaped structure in control cells (i-ii) while in APOLD1-silenced HDBEC (iii-v) VWF labeling was detected in vacuoles containing amorphous material (iii, arrowheads) and into which WPB release their cargoes (arrows in iv). Scale bars, 50 nm (i-ii, iv) or 100 nm (iii). Images are representative of three independent experiments.

A B E F C D
Haematologica | 108 March 2023 777 ARTICLE - APOLD1 regulates endothelial homeostasis S. Stritt et al.
Figure 3. APOLD1 modulates Weibel-Palade body biology. (A-C) APOLD1 silencing results in a loss of the major Weibel-Palade body (WPB)
Willebrand factor (VWF) as
angiopoietin
Figure 4. Increased release of Weibel-Palade bodies likely occurs via dysfunctional autophagy flux. (A-F) Immunolabeling and subsequent image analysis of control or APOLD1 siRNA-treated human dermal blood endothelial cell (HDBEC) monolayers reveals increased expression of autophagy markers (A, C) SQSTM1 and (B, D) LC3B in the absence of APOLD1. Von Willebrand factor (VWF) co-localized to a lesser extent to (A, E) SQSTM1 but showed an increased localization to (B, F) LC3B-positive vesicles upon APOLD1 silencing. Each symbol in (C-F) represents one analyzed (N≥6) image. Horizontal lines represent the mean ± standard deviation. Wilcoxon-Mann-Whitney test, ***P<0.001. Images are representative of at least three independent experiments. Scale bars, 10 mm.

formed so that the presence of mild angiodysplasia cannot be excluded. Surgery (PM4, PM6, PM9, PM11) and childbirth (PM4, PM9) was on occasion accompanied by dramatic blood loss and platelet transfusions were ineffective. For PM9 bleeding during delivery was severe and persisted despite continuous transfusions of numerous packed red blood cells and platelet concentrates, but then gradually ceased. Tubal ligation was performed immediately after her first delivery and for PM6 when she was 36 years old. Since middle age, no spontaneous bleeding has been observed for the patients. Another characteristic of the three female cases was the presence of microcirculatory problems (Online Supplementary Table S1). It is noteworthy that the use of vasodilators, piribedil (PM4, PM6) and dihydroergocristine (PM9), for the treatment of Raynaud syndrome or retinal ischemia as well as aspirin (PM6, PM11) intake aggravated the bleeding tendency. Conversely, the use of desmopressin to increase VWF secretion from EC in PM9 provoked a transiently impaired microcirculation evidenced by the appearance of livedo reticularis affecting her legs, due to which the treatment was discontinued (Online Supplementary Table S1).
Whole exome sequencing of DNA from PM4, PM6, PM9,
PM12 and PM13 identified a heterozygous nonsense c.145_146delinsTA; p.R49* variant in APOLD1 predicted to generate a premature stop codon at the early position 49 (detailed in Online Supplementary Information). Interestingly, the nonsense stop-gain p.R49* variant results from a combination in cis of the common c.146G>A; p.R49Q (rs4763876; minor allele frequency 0.05292 Trans-Omics for Precision Medicine [TOPMed] and 0.07359 for the genome Aggregation Database [gnomAD]; predicted to be benign by Polyphen and tolerated by SIFT) and the rare missense c.145C>T; p.R49W (rs757476941; minor allele frequency 7.964 x 10⁻⁵ TOPMed and 6.637 X 10⁻⁵ for the gnomAD; predicted by Polyphen to be probably damaging and by SIFT as potentially deleterious) nucleotide substitution in APOLD1 (Figure 6A, Online Supplementary Figure S6). Sanger sequencing of family members confirmed cosegregation of the R49* variant with the bleeding syndrome and additionally showed the presence of the common p.R49Q variant alone in asymptomatic relatives. Of note, PM4 was homozygous for the c.146G>A nucleotide substitution resulting in a compound heterozygous genotype of p.[R49Q];[R49*] (Figure 6A, Online Supplementary Figure S6). Except for the NM_006040:c.G1336T variant,
A B C D E F
Haematologica | 108 March 2023 778 ARTICLE - APOLD1 regulates endothelial homeostasis S. Stritt et al.
Figure 5. Impaired proteolytic processing of von Willebrand factor upon loss of APOLD1. (A) Immunoblotting of lysates from mock and chloroquine-treated (25 mM for 12 h) control or APOLD1 siRNA-treated human dermal blood endothelial cells (HDBEC) with subsequent densitometric quantification of (B) proteolytic VWF processing, (C) SQSTM1 and (D) LC3B I/II expression. Immunoblots are representative of at least three independent experiments. Bar graphs in (B-D) represent the mean ± standard deviation. Two-way analysis of variance followed by the Sidak multiple comparison test, ***P<0.001.
which was not considered relevant on the basis of HS3ST4 gene function, none of the other 17 candidate rare variants was predicted to be disease-causing, and no other candidate mutations were present in any gene known to be associated with an inherited platelet- or vascular-derived bleeding disorder (Online Supplementary Table S4). Of note, the whole exome sequencing covered coding and flanking regions that were scrutinized for the presence of single nucleotide variations and insertions/deletions. More complex structural variations, or variations outside coding or flanking regions are not included in whole exome sequencing analyses.
Immunofluorescence labeling and immunoblot analysis revealed an approximately 50% reduction of APOLD1 in platelets from PM4 and PM6 as compared to levels in healthy controls (Figure 6B, C), which is in agreement with the heterozygous transmission of the APOLD1R49* variant (Figure 6A). Interestingly, despite the decreased labeling of a-granules by anti-APOLD1 antibodies (Figure 6D), granule numbers were normal (Figure 6D, E). Significantly, a decreased agranule VWF content was noted when comparing the number of a-granules positive for VWF and P-selectin (Figure 6D, F, Online Supplementary Figure S7). This observation parallels the above-identified role of APOLD1 in endothelial VWF biology. In addition, we observed plasma VWF values to be either increased or at the high normal range (VWF:Ag: 186% for PM4; 127% for PM6; 157% for PM9; 186% for PM11; normal range <150%). It should be noted that the blood group of all patients is A (Online Supplementary Table S1). In addition, ANGPT2 plasma levels (2231 pg/mL for PM4; 2490 pg/mL for PM6; 1935 pg/mL for PM11; normal range 1189±77 pg/mL) were increased in the patients studied, while the concentrations of endothelium-stabilizing ANGPT1 (1191 pg/mL for PM4; 1463 pg/mL for PM6; 1135 pg/mL for PM11; normal range 2893±457 pg/mL) were decreased (Online Supplementary Table S2).
These results suggest APOLD1 as a candidate gene for a novel EC-driven defect potentially underlying both the bleeding syndrome and microcirculatory problems in patients with an APOLD1R49* variant.
Discussion
Disintegration of the vascular barrier is a key feature of, and contributes to, the progression of various pathologies including cancer, chronic inflammatory conditions and cardiovascular diseases. Consequently, it is of much clinical interest to advance our understanding of the molecular machinery regulating endothelial integrity.1,2,23 Our study identifies the immediate early gene APOLD1 as a modulator of endothelial homeostasis, regulating the junctional-cytoskeletal interface crucial for endothelial permeability and WPB biology through secretory autophagy. In addition, we describe the co-inheritance of a c.145_146delinsTA variant in APOLD1 leading to a premature stop codon at p.R49* that segregates to affected members of a family with an unusual bleeding diathesis. Based on their functions the other gene variants were not considered as candidates (Online Supplementary Table S4). Despite the reported expression of APOLD1 in neurons,12 there is no evidence of neurological abnormalities in affected patients, strongly suggesting a non-syndromic defect.
Our in vitro studies showed that APOLD1 localizes to HDBEC cell junctions and to WPB. Strikingly, loss of APOLD1 disrupted the cytoskeletal and junctional organization of HDBEC with loss of the major junctional components VECad and claudin-5,14 likely accounting for the increased vascular permeability and altered central function of the EC cytoskeleton. However, much remains to be learned of the role of the associated cytoskeleton in maintaining EC morphology, junctional integrity and dynamics, as well as its

A B C D
Haematologica | 108 March 2023 779 ARTICLE - APOLD1 regulates endothelial homeostasis S. Stritt et al.
Figure 6. APOLD1 is a candidate gene for a bleeding diathesis. (A) Pedigree of the family with a variant in APOLD1. The red filled symbols indicate a bleeding diathesis co-segregating with a nonsense c.145_146delinsTA variant in APOLD1, resulting in a premature stop codon at arginine 49 (R49*). Pedigree members (PM) 7 and 13 only carry the more frequent single base pair substitution c.G146A in APOLD1 (R49Q) which was not associated with a bleeding syndrome. The hashtags indicate patients studied by whole exome sequencing. The other family members have been subjected to Sanger sequencing of APOLD1. Green filled symbols indicate occurrence of impaired microcirculation and yellow filled symbols of drug-associated bleeding. (B) Resting poly-L-lysine immobilized platelets from healthy control and PM4 and PM6 were stained for APOLD1 (magenta), CD41 (cyan) and F-actin (gray). Scale bars, 3 mm. (C) APOLD1 protein expression was analyzed by immunoblotting and densitometric quantification relative to GAPDH of platelet lysates from two unrelated healthy controls as well as PM4 and PM6. The antibody was directed against amino acids 139-192 and only detects full-length APOLD1. Immunoblots are representative of three experiments. Data represent the mean ± standard deviation (SD). (D) Resting platelets from controls or PM4 and PM6 were labeled for CD62 (Pselectin, green; a-granule marker), von Willebrand factor (VWF, magenta; a-granule marker), and CD63 (granulophysin, cyan; dgranule/lysosome marker). F-actin is highlighted in gray. Scale bars, 3 mm. (E, F) Quantification of CD62P-, VWF- and CD63positive granules per platelet from healthy controls, PM4 and PM6. Box plots display first and third quartiles, and whiskers mark minimum and maximum values unless exceeding 1.5 times the interquartile range of at least 100 cells per group; symbols represent outliers, and the horizontal line denotes the median. Results were analyzed by one-way analysis of variance followed by the Dunnett multiple comparisons test, ***P<0.001.

A D E F B C
Haematologica | 108 March 2023 780 ARTICLE - APOLD1 regulates endothelial homeostasis S. Stritt et al.
potentially cell type- and vascular bed-specific regulation.24–28 APOLD1 silencing also perturbed WPB biology with an increased release of cargoes including VWF and ANGPT217–20,29 due to impaired autophagy flux.30 In support, biochemical and ultrastructural analyses revealed a reduced content in WPB, an abnormal presence of autophagosomes as well as the detection of VWF inside large vacuoles in APOLD1 siRNA-treated HDBEC. A seminal study by Torisu et al. identified a critical role of autophagy flux and ATG5 as well as ATG7 for basal WPB release.21 In our experiments the additive loss of ATG5 or ATG7 in APOLD1-silenced HDBEC partially restored the presence of WPB, confirming the participation of APOLD1 in the process of autophagic WPB secretion.21,30 Globally, these results suggest the presence of a signaling cascade that regulates secretory autophagosome-trafficking of WPB and our results indicate that APOLD1 plays a central role therein.
Various cellular mechanisms can contribute to endothelial destabilization including kinase-/phosphatase-mediated phosphorylation/dephosphorylation of junctional proteins or Rho GTPase signaling and the associated cytoskeletal alterations.23 Of note, ANGPT2 has previously been shown to cause destabilization of the endothelium, promote inflammation, and to bind directly to integrin a5β1 and activate it, thereby leading to junction dismantling.4,31–34 Consequently, it is tempting to speculate that the excessive WPB release may directly contribute to the junctional and cytoskeletal alterations as well as to the increased endothelial permeability of APOLD1-deficient HDBEC. In support of this, we observed enhanced fibronectin fibrillogenesis of APOLD1 siRNA-treated cells, a process that involves ligand competent integrin a5β1 in fibrillar adhesions.34,35
Interestingly, upregulation of APOLD1 expression has been reported for patients under conditions of increased shear or cellular stress including inflammatory signals, physical exercise, and hypoxia.36,37 Further studies will be required to understand the consequences of such modifications, including the activation of mechanosensory receptors and modifications of the vessel wall or WPB release. In an APOLD1-deficient mouse model, ischemic brain injury was evaluated because APOLD1, initially named vascular early response gene (VERGE), was recognized as an early gene expressed during ischemia.9,11 Loss of Apold1 did not affect the infarct volume of the induced stroke, but resulted in decreased neurogenesis and angiogenesis during the following month.11 More recently, a mild prothrombotic phenotype was reported after laser-induced carotid vessel lesions in a similar model.38 The mice had a somewhat shorter time to occlusion with increased tissue factor activity in the carotid artery and reduced phosphorylation of the signaling protein, AKT in aortae. Enhanced aggregation of washed platelets to collagen was noted in the absence of APOLD1. The platelet aggregation responses in our family using platelet-rich plasma showed no significant changes.
No data from additional models of thrombosis and hemostasis have been reported for Apold1-/- mice. These published examples reflect the limited information available on the role of this gene and the consequences of its defects. Our in vitro studies in HDBEC showed an unexpected complex role of APOLD1 in the regulation of vascular function and integrity through modulation of EC cytoskeleton and junctions as well as WPB biology. These findings expand the current understanding of APOLD1 function in EC. In the reported family with an unexplained complex phenotype combining severe bleeding and microvascular defects, whole exome sequencing, previously used to recognize new genes involved in unexplained inherited hematological disorders,39–41 identified APOLD1 as the first candidate gene for the affected patients. A premature APOLD1R49* stop codon variant arising from co-inheritance of a potentially deleterious missense variant c.145C>T; p.R49W and a single nucleotide polymorphism c.146G>A; p.R49Q co-segregated over three generations with a familial bleeding diathesis. This resulted in a truncated APOLD1 protein lacking the three transmembrane domains and the coiled-coil domain, which likely renders the protein dysfunctional. Importantly, the common c.146G>A; p.R49Q variant alone did not associate with a bleeding syndrome. In agreement with APOLD1R49* heterozygosity, we observed approximately 50% levels of full-length APOLD1 protein in platelets of PM4 and PM6. Furthermore, we found severe and progressive defects upon APOLD1 silencing in primary HDBEC in vitro, suggesting a critical threshold level of APOLD1 to maintain normal EC physiology. A 50% reduction of APOLD1 in HDBEC significantly disrupted the cytoskeletal and junctional organization and affected WPB cargo content in vitro. This finding suggests that monoallelic defects of APOLD1 in vivo are compatible with a vascular defect. Of note, two other premature stop codon variants in APOLD1 are present in the gnomAD database; however, their pathogenicity remains to be determined. It is important to note that disease-causing variants of MYH9-related disease, a well-studied bleeding disorder caused by rare monoallelic genetic variations, are also present in the gnomAD resource.42
The unusual familial vascular syndrome that was not accompanied by prolonged classical bleeding times, with the patients refractory to platelet transfusions argues against a platelet disorder. Moreover, bleeding was observed in response to the use of vasodilators (PM4, PM5, PM9) indicating an unusual vascular fragility. It therefore appears that the APOLD1 defect in our patients affects critical aspects of the endothelium which favor the risk of hemorrhage, a process already described during inflammation,43 and also observed in patients with hereditary hemorrhagic telangiectasia and cavernous malformations of the brain.44,45 The increased plasma levels of VWF and ANGPT2 detected in the tested patients suggests that the excessive release of WPB identified in vitro for APOLD1-silenced HDBEC is also
Haematologica | 108 March 2023 781 ARTICLE - APOLD1 regulates endothelial homeostasis S. Stritt et al.
present in vivo. In addition, the patients had decreased plasma levels of ANGPT1. This causes a change in the balance between ANGPT1 and ANGPT2 a situation known to impair EC integrity and vascular stability through tyrosine kinase Tie2/Tie1 signaling.46 Changes in the ratio of both these ligands are associated with various pathological states including inflammation and sepsis.43 Gastrointestinal bleeding is frequently present in von Willebrand disease as a result of reduced levels of VWF and increased ANGPT2 inducing proangiogenic dysplasia. The appearance of gastrointestinal bleeds in the described family with an APOLD1R49* variant raises questions on the underlying mechanisms and highlight the need for further investigations on the role of ANGPT1/ANGPT2 in the pathogenesis of lesion formation. The predicted abnormalities of WPB in vivo may contribute to the hemorrhagic syndrome during surgery. WPB defects are known to impair the local hemostatic response of the endothelium, even when plasma VWF levels are normal.47,48 The observed irregular bleeding during various surgical interventions could also reflect the tissue-specific expression of APOLD1 in different vascular beds (https://endotheliomics.shinyapps.io/ec_atlas/).49 It is known that the placenta contains high amounts of APOLD1, possibly explaining the important bleeding observed during delivery (v21.proteinatlas.org; www.proteinatlas.org/ENSG00000178878-APOLD1/tissue).50
The transiently perturbed microcirculation in PM9 after administration of desmopressin to increase endothelial VWF secretion for the prevention of her hemorrhagic syndrome further exemplifies the complexity of the phenotype of this family.
Beyond the classic forms of inherited bleeding disorder associated with a platelet abnormality or VWF defects, many patients with a family history of bleeding remain undiagnosed. To date, analyses of EC function are rarely performed, but should be considered in the future. To aid this, panels designed for high-throughput sequencing could integrate genes involved in EC interactions and WPB function.51 We also anticipate that studies using patientderived endothelial colony-forming cells, also referred to as blood outgrowth EC, will be useful to explore functional aspects of endothelial homeostasis and WPB biology for patients with an undiagnosed inherited bleeding disorder. Up to now most of the studies employing endothelial colony-forming cells have focused on patients with von Willebrand disease. Finally, an improved understanding of the critical levels of predominantly EC-derived ANGPT2, tissue plasminogen-activator and vascular endothelial growth factor for the maintenance of vascular homeostasis will help to understand the implications of EC in the pathogenesis of hemorrhagic syndromes.
In conclusion, we provide evidence that loss of APOLD1 results in increased endothelial permeability and modified EC function with an excessive release of WPB through secre-
tory autophagy. Our findings strongly suggest that APOLD1 modulates endothelial homeostasis with implications for vascular integrity and regulated WPB secretion. Given that APOLD1 is an immediate early gene, its function might come into play fully only after traumatic vessel wall injury, or altered shear stress, for example, in the context of ischemia, atherosclerosis and inflammatory settings, which lead to a boost of APOLD1 transcription.9,36,37 Future studies with Apold1-/- or knockin mice as well as patient-derived EC are required to define the role of APOLD1 in hemostasis more precisely and to further advance our understanding of the molecular functions of APOLD1.
Disclosures
No conflicts of interest to disclose.
Contributions
SS, PN and TM designed experiments and analyzed data; SS, JCB and MGB performed experiments; MR, MCA, DAT and MGB performed genetic studies; PN, ATN, JFS, MCA and MGB enrolled the patients and performed clinical and biological follow-up; SS, PN, ATN and TM wrote the manuscript with input from all the other authors.
Acknowledgments
We thank BioVis (Uppsala University) for electron microscopy analysis, the CIQLE imaging center (Lyon-1 University) for immunogold labeling, Stephanie Burger-Stritt for help with experiments, Pauline Sauguet for collecting clinical data, as well as Henrik Ortsäter, Aissatu Mami Camara, Vanessa Ligonnet and Sofie Lunell-Segerqvist for technical assistance. We are grateful to Isabelle Cau and Alexandre Ranc for help with the enzyme-linked immunosorbent assay for tissue plasminogen activator.
Funding
This work was supported by the Knut and Alice Wallenberg Foundation (2018.0218) and the Swedish Research Council (2020-02692) with funds to TM. SS was supported by a research fellowship from the Deutsche Forschungsgemeinschaft (STR 1538/1-1) and a non-stipendiary long-term fellowship from the European Molecular Biology Organization (ALTF 86-2017). MR was supported by the GENMED Laboratory of Excellence on Medical Genomics, Agence Nationale de la Recherche (ANR-10-LABX-0013). The authors are grateful to the Fondation Maladies Rares for supporting the GIS Maladies Rares 2015 project entitled “Identification of new genes involved in platelet dysfunction”. DAT is partially supported by the EPIDEMIOM-VT Senior Chair from the University of Bordeaux initiative of excellence IdEX.
Data-sharing statement
Data are available upon reasonable request.
Haematologica | 108 March 2023 782 ARTICLE - APOLD1 regulates endothelial homeostasis S. Stritt et al.
References
1. Hu X, De Silva TM, Chen J, Faraci FM. Cerebral vascular disease and neurovascular injury in ischemic stroke. Circ Res. 2017;120(3):449-471.
2. Murakami M, Simons M. Regulation of vascular integrity. J Mol Med. 2009;87(6):571-582.
3. Bogatcheva NV, Garcia JGN, Verin AD. Molecular mechanisms of thrombin-induced endothelial cell permeability. Biochemistry (Mosc). 2002;67(1):75-84.
4. Hakanpaa L, Sipila T, Leppanen V-M, et al. Endothelial destabilization by angiopoietin-2 via integrin β1 activation. Nat Commun. 2015;6:5962.
5. Starke RD, Paschalaki KE, Dyer CEF, et al. Cellular and molecular basis of von Willebrand disease: studies on blood outgrowth endothelial cells. Blood. 2013;121(14):2773-2784.
6. de Boer S, Eikenboom J. Von Willebrand disease: from in vivo to in vitro disease models. Hemasphere. 2019;3(5):e297.
7. El-Mansi S, Nightingale TD. Emerging mechanisms to modulate VWF release from endothelial cells. Int J Biochem Cell Biol. 2021;131:105900.
8. Nagel T, Resnick N, Dewey CF, Gimbrone MA. Vascular endothelial cells respond to spatial gradients in fluid shear stress by enhanced activation of transcription factors. Arterioscler Thromb Vasc Biol. 1999;19(8):1825-1834.
9. Regard JB, Scheek S, Borbiev T, et al. Verge: a novel vascular early response gene. J Neurosci. 2004;24(16):4092-4103.
10. Liu F, Turtzo LC, Li J, et al. Loss of vascular early response gene reduces edema formation after experimental stroke. Exp Transl Stroke Med. 2012;4(1):12.
11. Mirza MA, Capozzi LA, Xu Y, McCullough LD, Liu F. Knockout of vascular early response gene worsens chronic stroke outcomes in neonatal mice. Brain Res Bull. 2013;98:111-121.
12. Koshimizu H, Matsuoka H, Nakajima Y, et al. Brain-derived neurotrophic factor predominantly regulates the expression of synapse-related genes in the striatum: insights from in vitro transcriptomics. Neuropsychopharmacol Rep. 2021;41(4):485-495.
13. Stritt S, Nurden P, Favier R, et al. Defects in TRPM7 channel function deregulate thrombopoiesis through altered cellular Mg(2+) homeostasis and cytoskeletal architecture. Nat Commun. 2016;7:11097.
14. Frye M, Dierkes M, Küppers V, et al. Interfering with VE-PTP stabilizes endothelial junctions in vivo via Tie-2 in the absence of VE-cadherin. J Exp Med. 2015;212(13):2267-2287.
15. Frye M, Taddei A, Dierkes C, et al. Matrix stiffness controls lymphatic vessel formation through regulation of a GATA2dependent transcriptional program. Nat Commun. 2018;9(1):1511.
16. Cramer EM, Meyer D, le Menn R, Breton-Gorius J. Eccentric localization of von Willebrand factor in an internal structure of platelet alpha-granule resembling that of Weibel-Palade bodies. Blood. 1985;66(3):710-713.
17. Metcalf DJ, Nightingale TD, Zenner HL, Lui-Roberts WW, Cutler DF. Formation and function of Weibel-Palade bodies. J Cell Sci. 2008;121(Pt 1):19-27.
18. Rauch A, Wohner N, Christophe OD, et al. On the versatility of von Willebrand factor. Mediterr J Hematol Infect Dis. 2013;5(1):e2013046.
19. Randi AM, Smith KE, Castaman G. von Willebrand factor regulation of blood vessel formation. Blood. 2018;132(2):132-140.
20. Fiedler U, Scharpfenecker M, Koidl S, et al. The Tie-2 ligand angiopoietin-2 is stored in and rapidly released upon stimulation from endothelial cell Weibel-Palade bodies. Blood. 2004;103(11):4150-4156.
21. Torisu T, Torisu K, Lee IH, et al. Autophagy regulates endothelial cell processing, maturation and secretion of von Willebrand factor. Nat Med. 2013;19(10):1281-1287.
22. Wu Q, Hu Y, Jiang M, Wang F, Gong G. Effect of autophagy regulated by Sirt1/FoxO1 pathway on the release of factors promoting thrombosis from vascular endothelial cells. Int J Mol Sci. 2019;20(17):4132.
23. Claesson-Welsh L, Dejana E, McDonald DM. Permeability of the endothelial barrier: identifying and reconciling controversies. Trends Mol Med. 2021;27(4):314-331.
24. Cavey M, Lecuit T. Molecular bases of cell-cell junctions stability and dynamics. Cold Spring Harb Perspect Biol. 2009;1(5):a002998.
25. Tzima E, del Pozo MA, Shattil SJ, Chien S, Schwartz MA. Activation of integrins in endothelial cells by fluid shear stress mediates Rho-dependent cytoskeletal alignment. EMBO J. 2001;20(17):4639-4647.
26. García Ponce A, Citalán Madrid AF, Vargas Robles H, et al. Loss of cortactin causes endothelial barrier dysfunction via disturbed adrenomedullin secretion and actomyosin contractility. Sci Rep. 2016;6:29003.
27. Sauteur L, Krudewig A, Herwig L, et al. Cdh5/VE-cadherin promotes endothelial cell interface elongation via cortical actin polymerization during angiogenic sprouting. Cell Rep. 2014;9(2):504-513.
28. Stehbens S, Wittmann T. Targeting and transport: how microtubules control focal adhesion dynamics. J Cell Biol. 2012;198(4):481-489.
29. Spiel AO, Gilbert JC, Jilma B. von Willebrand factor in cardiovascular disease: focus on acute coronary syndromes. Circulation. 2008;117(11):1449-1459.
30. New J, Thomas SM. Autophagy-dependent secretion: mechanism, factors secreted, and disease implications. Autophagy. 2019;15(10):1682-1693.
31. Felcht M, Luck R, Schering A, et al. Angiopoietin-2 differentially regulates angiogenesis through TIE2 and integrin signaling. J Clin Invest. 2012;122(6):1991-2005.
32. Hakanpaa L, Kiss EA, Jacquemet G, et al. Targeting β1-integrin inhibits vascular leakage in endotoxemia. Proc Natl Acad Sci U S A. 2018;115(28):E6467-E6476.
33. Saharinen P, Eklund L, Alitalo K. Therapeutic targeting of the angiopoietin-TIE pathway. Nat Rev Drug Discov. 2017;16(9):635-661.
34. Clark K, Pankov R, Travis MA, et al. A specific alpha5beta1integrin conformation promotes directional integrin translocation and fibronectin matrix formation. J Cell Sci. 2005;118(Pt 2):291-300.
35. Geiger B, Spatz JP, Bershadsky AD. Environmental sensing through focal adhesions. Nat Rev Mol Cell Biol. 2009;10(1):21-33.
36. Zhou L, Wang LM, Song HM, et al. Expression profiling analysis of hypoxic pulmonary disease. Genet Mol Res. 2013;12(4):4162-4170.
37. Simonsen ML, Alessio HM, White P, Newsom DL, Hagerman AE. Acute physical activity effects on cardiac gene expression. Exp Physiol. 2010;95(11):1071-1080.
38. Diaz-Cañestro C, Bonetti NR, Wüst P, et al. Apold1 deficiency associates with increased arterial thrombosis in vivo. Eur J Clin Invest. 2020;50(2):e13191.
39. Nurden AT, Nurden P. High-throughput sequencing for rapid diagnosis of inherited platelet disorders: a case for a European consensus. Haematologica. 2018;103(1):6-8.
Haematologica | 108 March 2023 783 ARTICLE - APOLD1 regulates endothelial homeostasis S. Stritt et al.
40. Bastida JM, Lozano ML, Benito R, et al. Introducing highthroughput sequencing into mainstream genetic diagnosis practice in inherited platelet disorders. Haematologica. 2018;103(1):148-162.
41. Heremans J, Freson K. High-throughput sequencing for diagnosing platelet disorders: lessons learned from exploring the causes of bleeding disorders. Int J Lab Hematol. 2018;40(Suppl 1):89-96.
42. Bury L, Megy K, Stephens JC, et al. Next-generation sequencing for the diagnosis of MYH9-RD: predicting pathogenic variants. Hum Mutat. 2020;41(1):277-290.
43. Goerge T, Ho-Tin-Noe B, Carbo C, et al. Inflammation induces hemorrhage in thrombocytopenia. Blood. 2008;111(10):4958-4964.
44. Mallet C, Lamribet K, Giraud S, et al. Functional analysis of endoglin mutations from hereditary hemorrhagic telangiectasia type 1 patients reveals different mechanisms for endoglin loss of function. Hum Mol Genet. 2015;24(4):1142-1154.
45. Lopez-Ramirez MA, Pham A, Girard R, et al. Cerebral cavernous malformations form an anticoagulant vascular domain in humans and mice. Blood. 2019;133(3):193-204.
46. Bilimoria J, Singh H. The Angiopoietin ligands and Tie receptors: potential diagnostic biomarkers of vascular disease. J Recept Signal Transduct Res. 2019;39(3):187-193.
47. James AH, Eikenboom J, Federici AB. State of the art: von Willebrand disease. Haemophilia. 2016;22(Suppl 5):54-59.
48. Schillemans M, Kat M, Westeneng J, et al. Alternative trafficking of Weibel-Palade body proteins in CRISPR/Cas9-engineered von Willebrand factor-deficient blood outgrowth endothelial cells. Res Pract Thromb Haemost. 2019;3(4):718-732.
49. Kalucka J, de Rooij LPMH, Goveia J, et al. Single-cell transcriptome atlas of murine endothelial cells. Cell. 2020;180(4):764-779.e20.
50. Uhlén M, Fagerberg L, Hallström BM, et al. Proteomics. Tissuebased map of the human proteome. Science. 2015;347(6220):1260419.
51. Kat M, Margadant C, Voorberg J, Bierings R. Dispatch and delivery at the ER-Golgi interface: how endothelial cells tune their hemostatic response. FEBS J. 2022;289(22):6863-6870.
52. Gustafsson N, Culley S, Ashdown G, et al. Fast live-cell conventional fluorophore nanoscopy with ImageJ through super-resolution radial fluctuations. Nat Commun. 2016;7:12471.
Haematologica | 108 March 2023 784 ARTICLE - APOLD1 regulates endothelial homeostasis S. Stritt et al.
Impact of positron emission tomography - computed tomography status on progression-free
survival for relapsed follicular lymphoma patients undergoing autologous stem cell transplantation
Toby A. Eyre,1
1Department of Haematology, Churchill Hospital, Oxford University Hospitals NHS Foundation Trust, Oxford; 2King’s College London and Guy’s and St Thomas’ PET Centre, School of Biomedical Engineering and Imaging Sciences, King’s College London, King’s Health Partners, London; 3Centre for Haemato-Oncology, Barts Cancer Institute, Queen Mary University of London, London; 4BSBMTCT Data Registry, Guy's Hospital, London;
5Department of Haematology, University College London Hospitals, London; 6Department of Haematology and Bone Marrow Transplantation, Addenbrookes Hospital, Cambridge;
7Department of Haematology, The Christie Hospital NHS Trust, Manchester; 8Department of Haematology and Bone Marrow Transplantation, Leeds Teaching Hospitals NHS Trust, Leeds;
9Department of Haematology and Bone Marrow Transplantation, Royal Marsden Hospital, London; 10Department of Haematology, Norfolk and Norwich University Hospitals, Norwich and 11Department of Haematology and Bone Marrow Transplantation, Southampton University Hospitals, Southampton, UK.
Abstract
Correspondence: T.A. Eyre toby.eyre@ouh.nhs.uk
Received: November 2, 2021.
Accepted: April 28, 2022.
Early view: May 19, 2022.
https://doi.org/10.3324/haematol.2021.280287
©2023 Ferrata Storti Foundation
Published under a CC BY-NC license
The optimum management approach for patients with relapsed or refractory follicular lymphoma remains uncertain. Autologous stem cell transplantation (autoSCT) is considered a standard option in suitable, younger patients with relapsed follicular lymphoma. AutoSCT is associated with very durable remissions in a minority of subjects, but also with significant, well-established toxicities. Although positron emission tomography (PET) status prior to autoSCT is an established prognostic factor in diffuse large B-cell lymphoma and Hodgkin lymphoma, no data exist in follicular lymphoma. We describe survival outcomes according to pre-transplant PET status, classified by the Lugano criteria into complete metabolic remission (CMR) versus non-CMR, in 172 patients with relapsed or refractory follicular lymphoma within a national, multicenter, retrospective British Society of Blood and Marrow Transplantation and Cellular Therapy registry study. The median number of lines of therapy prior to SCT was three (range, 1-6). The median follow-up after SCT was 27 months (range, 3–70). The median progression-free survival for all patients after autoSCT was 28 months (interquartile range, 2336). There was no interaction between age at transplantation, sex, number of months since last relapse, Karnofsky performance status or comorbidity index and achieving CMR prior to autoSCT. Superior progression-free survival was observed in 115 (67%) patients obtaining CMR versus 57 (33%) non-CMR patients (3-year progression-free survival 50% vs. 22%, P=0.011) and by pre-SCT Deauville score (continuous variable 1-5, hazard ratio [HR]=1.32, P=0.049). PET status was independently associated with progression-free status (non-CMR HR=2.02, P=0.003), overall survival (non-CMR HR=3.08, P=0.010) and risk of relapse (non-CMR HR=1.64, P=0.046) after autoSCT by multivariable analysis. Our data suggest that preSCT PET status is of clear prognostic value and may help to improve the selection of patients for autoSCT.
Introduction
Follicular lymphoma (FL) is the most common indolent Bcell non-Hodgkin lymphoma with a relapsing and remitting natural history that typically spans many years. High-dose chemotherapy and autologous stem cell transplantation (autoSCT) has been considered a treatment option for
young, fit patients (usually <70 years old) for a number of decades, although uptake of this approach is somewhat variable across the globe,1 and is most often now reserved for those with relapsed or refractory (R/R) FL.2 Recent evidence has helped to further determine the efficacy of this approach, particularly in high-risk patients, defined by the duration of the first remission being <24 months, i.e., pro-
Sally F. Barrington,2 Jessica Okosun,3 Clementina Abamba,4 Rachel M. Pearce,4 Julia Lee,4 Ben Carpenter,5 Charles R. Crawley,6 Adrian J.C. Bloor,7 Maria Gilleece,8 Emma Nicholson,9 Nimish Shah,10 Kim Orchard,11 Ram Malladi6 and William M. Townsend5
Haematologica | 108 March 2023 785 ARTICLE - Non-Hodgkin Lymphoma
gression of disease within 24 months (POD24).3,4 Published series document that a significant minority (30-40%) of patients benefit from very durable remissions after autoSCT, suggesting that some patients may be cured by this approach.5,6 Conversely, approximately one third of patients relapse within 2 years of this intensive, potentially toxic treatment and therefore derive limited benefit. Toxicities include protracted fatigue, risk of infections and potentially secondary malignancies including secondary myelodysplastic syndrome and acute myeloid leukemia.510 In current routine clinical practice, clinicians are unable to accurately predict which patients may benefit most from autoSCT. The results of some historical studies are now challenging to interpret for several reasons. Some studies were performed in the pre-rituximab era,7,8 some included conditioning regimens now considered obsolete in FL (e.g., total body irradiation)8,9 and others included a significant minority of patients receiving high-dose therapy as first-line therapy consolidation.10,11 In general, published series report outcomes outlining standard clinical parameters, and there are few data with biological or functional imaging assessment of disease status prior to autoSCT in these published cohorts.
To date, there are no prospective data to guide therapeutic decision-making for patients with R/R FL in terms of discriminating which patients might benefit most from autoSCT. It is important that the benefits and curative potential of this potentially toxic therapeutic intervention are better understood in this setting.
Pooled analyses demonstrate the prognostic value of both baseline positron emission tomography (PET)-computed tomography (CT) and PET-based response assessment in FL. Total metabolic tumor volume12 prior to front-line treatment was predictive of progression-free survival (PFS) in a large, pooled, prospective cohort of patients from the PRIMA, PET-Folliculaire and FOLL05 trials. Metabolic response after induction immunochemotherapy, graded according to a five-point scale (Deauville criteria),13,14 also correlated strongly with PFS in a sub-analysis of separate large randomized clinical trials including PRIMA,15 GALLIUM16 and pooled data from three separate trials (PRIMA, PET-Folliculaire, and FOLL05).17
Compelling evidence from R/R Hodgkin lymphoma18 and R/R diffuse large B-cell lymphoma19,20 has shown response according to PET or other functional imaging status is a strong prognostic factor prior to autoSCT. For example, patients in the ORCHARRD trial21 were scanned before autoSCT following three cycles of salvage immunochemotherapy: the PET-negative cohort had a superior PFS and overall survival (OS), with a 2-year PFS of 70% and 2-year OS of 78%, compared to the PET-positive cohort with a 2year PFS of 32% and a 2-year OS of 43% (P=0.001 and P=0.0018, respectively).
Given the lack of evidence base for PET-CT-related prog-
nostication in the pre-SCT setting in FL, but the clear prognostic value of PET-CT following front-line FL treatment, and compelling data from other lymphoma histologies, the clinical studies working group for the British Society of Blood and Marrow Transplantation and Cellular Therapy (BSBMTCT) conducted a retrospective registry analysis to study the outcomes of patients with R/R FL treated with autoSCT who had a preceding PET-CT response assessment. To our knowledge, this is the first series of patients with FL for whom outcomes following autoSCT according to PET-CT response pre-autoSCT is described. We therefore aimed to: (i) analyze outcomes of patients receiving an autoSCT for R/R FL in the modern era in the UK; (ii) analyze the outcomes according to the depth of PET-CT response prior to autoSCT; and (iii) analyze the therapeutic effect of autoSCT in deepening PETbased response.
Methods
We conducted a national, multicenter, retrospective BSBMTCT registry study to describe the characteristics and outcomes of patients ≥18 years of age with R/R FL who received an autoSCT at some point (first-line consolidation treatment or later lines) during their treatment pathway between 01/01/2015 and 31/12/2019. The study was reviewed and approved by the central institutional review board of the Clinical Studies Working Party of BSBMTCT prior to commencing (study reference: CTCR1901). Relevant BSBMTCT-registered transplant centers (n=41) which were identified as having treated a FL patient with an autoSCT during the timeframe were contacted to obtain additional information regarding PET-CT responses. AutoSCT was defined according to the published European Blood and Marrow Transplantation Group (EBMT)/BSBMTCT criteria (https://www.ebmt.org/sites/default/ fi l es/2018-03/MED-AB%20Forms%20Manual.pdf ). Status (complete metabolic response [CMR] and partial metabolic response at autoSCT) was defined according to the Lugano classification.13 The occurrence of new sites of disease following a complete response (CR)/CMR lasting for ≥3 months was defined as a relapse, whereas it was considered progressive disease when CR/CMR had not been achieved. Post-transplant monitoring of patients for relapse/progressive disease was conducted according to the protocols of the local centers. OS was calculated by Kaplan-Meier analysis as the time from autoSCT to death from any cause. PFS was calculated by Kaplan-Meier analysis22 as the time from autoSCT until FL relapse/progression or death from any cause. Non-relapse mortality was calculated by competing risks, including all causes of death occurring after autoSCT other than relapse, with relapse as the competing risk. Relapse rate was calculated
Haematologica | 108 March 2023 786 ARTICLE - Predictive value of PET pre-ASCT in FL T.A. Eyre et al.
by competing risks as the time to relapse after autoSCT, with death without relapse as the competing risk. All four outcomes were censored at the date of last follow-up. Univariable and multivariable Cox regression analyses were used to examine the associations between baseline factors, PET status before autoSCT and PFS and OS.23 The proportional hazard assumption was tested by Schoenfeld residuals for all models. Fine-Grey competing risk analysis was used for equivalent associations with relapse risk and non-relapse mortality. Multivariable analyses were performed by backward selection from candidate factors with P<0.2 in univariate analysis and of clinical relevance. The Deauville score was excluded from multivariable analysis because it was structurally correlated with PET status and because data were incomplete. Likewise, status at transplant was structurally correlated with PET status. Logistic regression (for continuous variables), Wilcoxon rank sum (for ordered categorical variables) or Fisher exact (for binary variables) tests were used to compare PET remission status between different baseline groups. Statistical analyses were performed in Stata 17.0 (StataCorp, College Station, TX, USA). P values <0.05 were regarding as statistically significant.
The primary endpoint of the study was PFS and was stratified according to PET-based response prior to autoSCT. Key secondary endpoints included OS, non-relapse mortality, cumulative incidence of relapse, engraftment and change in the depth of PET status after autoSCT. Patients’ characteristics collected included age, gender, comorbidity index, Karnofsky performance status at autoSCT, prior anti-CD20 monoclonal antibody exposure, duration of first remission (including POD24 status), prior lines of therapy, and salvage regimen(s) used before autoSCT. FL characteristics collected included components of the FL International Prognostic Index (FLIPI) at relapse (age, stage, raised serum lactate dehydrogenase, hemoglobin, number of nodal areas involved), and prior high-grade transformation (whether present at initial diagnosis or relapse). PETCT remission or not (mandatory) and ordinal Deauville score (on a scale from 1 to 5) if reported (not mandatory but recommended) were documented before and after (approximately day 100) autoSCT. All scans were acquired after publication of the Lugano classification which recommended the use of the Deauville score to assess CMR (scores 1-3) versus non-CMR (scores 4 and 5) and was widely adopted in the UK. CT-based responses were reported as per the CT-based assessment of the Lugano classification. The timing of scans during re-induction treatment was not standardized and was determined by the local investigators. Scans were not re-reviewed for this analysis. The autoSCT conditioning regimen and source of hematopoietic stem cells were also collected. Follow-up was censored at the most recent hospital visit or death. Patients without an assessment of PET status at
time of transplant and those with biopsy-proven highgrade transformation (include grade 3B FL) at the relapse that immediately preceded the autoSCT were excluded from the analysis. During the dates the study recruited, in the UK there was no commissioning for any routine consolidation therapy in patients undergoing autoSCT for FL and accordingly consolidation therapy was not administered. The database was locked in March 2021 for analysis.
Results
A total of 381 cases of FL treated with autoSCT were identified within the BSBMTCT registry across 41 centers. Thirty centers responded reporting a total of 172 cases with available data for the final analysis. One-hundred and twenty-seven cases were excluded due to lack of PET data or due to transformed disease at the time of the preceding relapse before autoSCT (Consort Online Supplementary Figure S1). Patients excluded due to lack of PET data were similar to those included, but overall were less heavily pre-treated and had lower FLIPI scores (see Online Supplementary Table S1 for further details).
The median age of the total cohort was 51 years (range, 17-69) at FL diagnosis and the median age at the time of autoSCT was 55 years (range, 22-74). The median time from FL diagnosis to autoSCT was 4 years and 2 months (range, 3 months to 26 years). Fifty-six percent (97/172) of patients were male. Most patients underwent conditioning with BEAM (carmustine, etoposide, cytarabine and melphalan) (48%) or LEAM (lomustine, etoposide, cytarabine and melphalan) (34%). The median number of prior lines of treatment for all patients before autoSCT was three (range, 1-6), and only 2% of patients underwent SCT after first-line therapy. Prior histological transformation was documented in 22 (13%) patients. The median Karnofsky performance status at autoSCT was 90 (range, 70-100). Sixty-three percent of patients had a Hematopoietic Cell Transplantation Comorbidity Index (HCT-CI) of 0, the median HCT-CI was 0 (range, 0-6). Patient- and treatment-related details according to PET status at autoSCT are summarized in Table 1.
PET status at the time of transplant was reported as nonCMR in 57 patients (33%) and CMR in 115 (67%). The ordinal Deauville score was reported for 82 patients (47%) and was missing for 90 patients (53%). Among the 82 cases in which the Deauville score was provided, it was 1-3 in 57 patients (69.5%), 4 in 23 patients (28%), and 5 in two patients (2%). Seventy-five patients had a PET status recorded at follow-up. Of 33/75 patients who were classified as non-CMR before autoSCT and had a post-autoSCT status recorded, 21 (64%) obtained a CMR after the autoSCT. Of the 103 patients in CMR for whom the most
Haematologica | 108 March 2023 787 ARTICLE - Predictive value of PET pre-ASCT in FL T.A. Eyre et al.
aWilcoxon rank-sum test. bFisher exact test. cLogistic regression. dConditioning unknown in one patient. eDoes not apply to patients in first complete remission or with refractory disease. CMR: complete metabolic remission; SCT: stem cell transplantation; m: months; y: years; POD24: progression of disease within 24 months; HCT-CI: Hematopoietic Cell Transplantation Comorbidity Index; BEAM: carmustine, etoposide, cytarabine, melphalan; LEAM: lomustine, etoposide, cytarabine, melphalan; HGT: high-grade transformation; LDH: lactate dehydrogenase; ULN: upper limit of normal; na: not available; CR: complete response; PR: partial response; SD: stable disease; PD: progressive disease; FLIPI: Follicular Lymphoma International Prognostic Index.
CMR at SCT N=115 Non-CMR at SCT N=57 All patients N=172 P value Non-CMR vs. CMRa Age at diagnosis, years Median (range) 54 (30-69) 51 (17-69) 53 (17-69) 0.1587a Age at transplant, years Median (range) 60 (35-73) 55 (22-74) 58 (22-74) 0.1224a > 60 years, N (%) 59 (51%) 21 (37%) 80 (47%) 0.077b Time from diagnosis to SCT Median (range) 4y 2m (4m-26y) 3y 9m (4m-21y) 4y 2m (4m-26y) 0.5003a Sex Male, N (%) 62 (54) 35 (61) 97 (56) 0.415b Number of lines of 1, N (%) 2 (2) 1 (2) 3 (2) 0.089c prior treatment 2, N (%) 48 (42) 15 (27) 63 (37) 3, N (%) 40 (35) 17 (30) 57 (33) 4+, N (%) 25 (22) 23 (41) 48 (28) Median (range) 3 (1-6) 3 (1-6) 3 (1-6) Prior rituximab Yes, N (%) 85 (74) 48 (84) 133 (77) 0.175b Prior obinutuzumab Yes, N (%) 13 (11) 7 (12) 20 (12) 1.000b POD24 Yes, N (%) 24 (48) 9 (39) 33 (45) 0.614b Unknown, N 65 34 99 Karnofsky status at SCT 100, N (%) 30 (27) 15 (28) 45 (27) 0.468c 90, N (%) 65 (59) 36 (67) 101 (62) 80, N (%) 15 (14) 2 (4) 17 (10) 70, N (%) 0 (0) 1 (2) 1 (1) Unknown, N 5 3 8 Comorbidities: HCT-CI 0, N (%) 77 (67) 31 (54) 108 (63) 0.072c 1, N (%) 21 (18) 11 (19) 32 (19) 2, N (%) 6 (5) 5 (9) 11 (6) 3+, N (%) 11 (10) 10 (19) 21 (12) Median (range) 0 (0-6) 0 (0-6) 0 (0-6) Conditioningd BEAM, N (%) 52 (46) 30 (53) 82 (48) 0.246b LEAM, N (%) 44 (39) 14 (25) 58 (34) 0.418b Others, N (%) 18 (17) 12 (23) 31 (18) (BEAM vs. others) HGT before SCT 17 (15) 5 (9) 22 (13) 0.337b Histological grading 1, N (%) 24 (28) 11 (24) 35 (27) 0.030b 2, N (%) 30 (35) 26 (58) 56 (43) 0.279c 3, N (%) 31 (36) 8 (18) 39 (30) Unknown, N 30 12 42 Time since last relapse, me Median (range) 8 (1-54) 7 (1-24) 8 (1-54) 0.459a Ann Arbor stage I-II, N (%) 14 (21) 4 (11) 18 (17) 0.604c III-IV, N (%) 54 (79) 34 (89) 88 (83) Unknown, N 47 19 70 Number of nodal sites 0-4, N (%) 43 (74) 23 (68) 66 (72) 0.632b Unknown, N 57 23 80 LDH >ULN, N (%) 12 (27) 7 (26) 19 (26) 1.000b Unknown, N 70 30 100 Hemoglobin, g/L Median (range) 125.5 (80-163) 130 (51-162) 127 (51-163) 0.797a Unknown, N 63 24 Deauville score 1, N (%) 17 (30) 0 17 (21) N/A 2, N (%) 24 (42) 0 24 (29) 3, N (%) 16 (28) 0 16 (20) 4, N (%) 0 23 (92) 23 (28) 5, N (%) 0 2 (8) 2 (2) Unknown 58 32 90 Status at transplant CR, N (%) 99 (86) 6 (11) 105 (62) 0.0005b PR, N (%) 15 (13) 47 (87) 62 (37) SD / relapse / PD, N (%) 1 (1) 1 (2) 2 (1) FLIPI category Low, N (%) 63 (55) 23 (40) 86 (50) 0.085c Low-intermediate, N (%) 28 (24) 19 (33) 47 (27) High intermediate, N (%) 22 (18) 11 (19) 33 (19) High, N (%) 2 (2) 4 (7) 6 (3)
Haematologica | 108 March 2023 788 ARTICLE - Predictive value of PET pre-ASCT in FL T.A. Eyre et al.
Table 1. Patient and disease characteristics according to positron emission tomography status at transplant.
recent prior regimen was known, 92% (n=95) received rituximab, most commonly alongside cyclophosphamide, doxorubicin, vincristine, and prednisone (R-CHOP, n=46) or bendamustine (R-bendamustine, n=20). These were also the most common prior regimens in patients not obtaining CMR before autoSCT (R-CHOP and R-bendamustine, both n=14 in 43 rituximab-exposed patients). Further details are provided in Online Supplementary Table S2
There was no association between age at autoSCT, sex, number of months since last relapse, Karnofsky performance status or HCT-CI, and achieving CMR before autoSCT. There were indications of a tendency for patients who achieved CMR before autoSCT to have had fewer lines of therapy (P=0.089) and have a lower FLIPI score at the time of the relapse before autoSCT (P=0.085) but these factors did not reach statistical significance. Histological grade at relapse (grade 3a vs. 1-2) (P=0.030) was associated with not having a CMR prior to autoSCT.
Of those with available data regarding POD24, 45% (33/73) of patients had experienced POD24 after first-line therapy; POD24 was not associated with pre-autoSCT PET status. The median follow-up following autoSCT was 27 months
(range, 3–70 months). The median PFS for the whole cohort after autoSCT was 28 months (interquartile range [IQR], 23-36), (Online Supplementary Figure S2A), the median time to relapse was 50 months (IQR, 16 months –not reached) and the median OS was 57 months (IQR, 42 months – not reached) (Online Supplementary Figure S2B). Overall, the day-100 and 1-year non-relapse mortality was 5% and 6%, respectively. There were 14 deaths in remission. These included deaths caused by early infection (n=8, all before day 100), late infection (n=2, both after allogeneic SCT), secondary malignancy (n=2, acute myeloid leukemia, and unknown) and unknown causes (n=2) (Online Supplementary Table S3).
Survival analysis, engraftment and secondary malignancies are presented in Table 2. There were five secondary malignancies in four patients (2%) in the FL cohort, all of which were in the CMR group. These were melanoma (n=1), myelodysplastic syndrome (n=1), myelodysplastic syndrome and vulval cancer (n=1) and acute myeloid leukemia (n=1). Engraftment after autoSCT was not associated with PET status before the transplant. PET status at the time of transplant was strongly predictive of PFS; 115 patients
aCox model unless otherwise specified. bFour patients (3 CMR and 1 non-CMR) had non-relapse causes listed for death, although they had relapsed (1 graft-versus-host disease, 1 Gram-negative sepsis, 1 acute respiratory distress syndrome and 1 renal failure). cFisher exact test; CMR: complete metabolic remission; SCT: stem cell transplantation; CR: complete response; PR: partial response; PET: positron emission tomography.
CMR at SCT N=115 Non-CMR at SCT N=57 All patients N=172 P value Non-CMR vs. CMRa Follow-up Median (range) 2y+4m (3m+5y-7m) 2y+3m (8m+5y-10m) 2y+3m (3m+5y-10m) 0.733 Neutrophil recovery Yes, N 109 55 164 Never fell, N 1 0 1 No (all died before recovery), N 3 1 4 Unknown, N 2 1 3 Recovery time, days Median (range) 11 (8-23) 11 (6-28) 11 (6-28) 0.614 Platelet recovery Yes, N 86 47 133 Never below, N 2 0 2 No (all died before recovery), N 6 3 9 Unknown (after discharge), N 21 7 28 Recovery time, days Median (range) 18 (7-198) 19 (8-46) 18 (7-198) 0.833 Status at follow-up Alive, N 95 43 138 See In CR/PR, N 70 24 94 outcomes After relapse/progression, N 25 19 44 in Table 3 Dead, N 20 14 34 After relapseb, N 13 7 20 In remission, N 7 7 14 Secondary malignancies Yes, N 4 0 4 0.303c PET at follow up Negative, N (%) 32 (73) 17 (59) 49 (67) 0.309c (survivors only) Positive, N (%) 12 (27) 12 (41) 24 (33) Unknown, N 51 14 65
Haematologica | 108 March 2023 789 ARTICLE - Predictive value of PET pre-ASCT in FL T.A. Eyre et al.
Table 2. Survival outcomes, engraftment and secondary malignancies.
with a CMR had a median PFS of 36 months (IQR, 15 months –not reached) versus 22 months (IQR, 7 – 31 months) for the 57 with non-CMR prior to transplant, hazard ratio (HR)=1.80 (95% confidence interval [95% CI]: 1.15-2.84), P=0.011). The 2-year PFS was 64% versus 44% and the 3-year PFS was 50% versus 22% for CMR and nonCMR patients, respectively (Figure 1A, Table 2). Non-CMR was associated with a trend to increased relapse rate (HR=1.51, 95% CI: 0.92-2.47; P=0.101) (Figure 2A). Non-CMR was also associated with a trend towards reduced OS, but this did not reach statistical significance (HR=1.74, 95% CI: 0.87-3.49; P=0.116) (Figure 1B). Non-relapse mortality was not associated with PET status before autoSCT (HR=1.79, P=0.211) (Figure 2B).


Factors associated with improved PFS by univariate analy-
sis (Table 3) were age ≤60 years (age >60 years: HR=1.61, 95% CI: 1.03-2.51; P=0.038) and CMR before autoSCT (nonCMR: HR=1.80, 95% CI: 1.15-2.84; P=0.011) and ordinal Deauville score (continuous variable, HR=1.32, 95% CI: 1.00-1.75; P=0.049) (Online Supplementary Figure S3A). Age and PET status (CMR vs. non-CMR) remained strongly statistically significant for PFS by multivariable analysis (nonCMR: HR=2.02, 95% CI: 1.27-3.21; P=0.003; age >60 years: HR=1.81, P=0.011) (Table 4). Risk factors associated with improved OS that were significant by multivariate analysis were fewer prior lines of therapy (HR=0.59, 95% CI: 0.380.90; P=0.015), lower Karnofsky status (continuous variable HR=0.94, 95% CI: 0.89-0.99; P=0.047) and risk factors associated with worse OS were remission status at trans-
plant (non-CMR: HR=3.08, 95% CI: 1.31-7.24; P=0.010)
A B
Figure 1. Survival according to positron emission tomography status before autologous stem cell transplantation. (A) Progression-free survival and (B) overall survival according to positron emission tomography status before autologous stem cell transplantation. CMR: complete metabolic remission.
Haematologica | 108 March 2023 790 ARTICLE - Predictive value of PET pre-ASCT in FL T.A. Eyre et al. A B
Figure 2. Relapse and non-relapse mortality according to positron emission tomography status before autologous stem cell transplantation. (A) Relapse rate and (B) non-relapse mortality according to positron emission tomography status before autologous stem cell transplantation. CMR: complete metabolic remission.
OS PFS RR a NRM b Levels N % at 3 years (95% CI) HR (95% CI) % at 3 years (95% CI) HR (95% CI) % at 3 years (95% CI) HR (95% CI) % at 3 years (95% CI) HR (95% CI) Age, years ≤ 60 92 81 (67-90) 2.26 50 (35-63) 1.61 41 (28-54) 1.53 10 (4-19) 1.69 >60 80 73 (58-83) (1.10-4.65) 31 (18-45) (1.03-2.51) 57 (42-70) (0.94-2.49) 15 (7-27) (0.66-4.41) Continuous 1.65 1.21 1.17 1.22 per 10 years (1.03-2.66) (0.91 –1.60) (0.83-1.64) (0.65-2.28) Sex Male 97 73 (59-83) 0.66 35 (22-48) 0.82 53 (40-65) 0.82 16 (8-27) 0.62 Female 75 83 (68-91) (0.32-1.33) 49 (33-63) (0.52-1.29) 42 (28-56) (0.49-1.35) 9 (3-18) (0.23-1.67) Lines of Continuous 0.78 1.09 1.14 0.83 prior treatment (0.55-1.11) (0.88-1.36) (0.90-1.43 (0.52-1.34) Prior rituximab No 39 66 (43-82) 0.52 42 (23-61) 0.78 45 (27-61) 0.76 23 (8-41) 0.55 Yes 133 80 (69-88) (0.25-1.07) 41 (29-52) (0.46-1.31) 49 (38-60) (0.43-1.34) 10 (5-18) (0.21-1.45) Prior No 152 77 (67-84) 0.83 41 (30-51) 1.13 48 (38-58) 1.14 13 (7-21) 0.64 obinutuzumab Yes 20 79 (32-95) (0.20-3.53) 47 (17-72) (0.52-2.49) 48 (18-73) (0.50-2.58) 5 (1-21) (0.08-4.95) Karnofsky status at SCT Continuous per 10 units 0.65 (0.35-1.20) 0.96 (0.65-1.42) 1.20 (0.75-1.90) 0.58 (0.27-1.24) Comorbidities None 96 77 (64-86) 1.09 47 (34-58) 1.19 46 (33-57) 0.99 12 (6-21) 1.38 Yes 74 77 (60-88) (0.55-2.14) 31 (16-48) (0.76-1.87) 54 (36-68) (0.61-1.63) 14 (5-27) (0.55-3.48) HCT-CI Continuous 0.96 0.99 0.97 1.01 (0.72-1.27) (0.83-1.18) (0.80-1.17) (0.74-1.36) Conditioning BEAM 90 75 (57-86) 1.18 46 (29-61) 1.29 43 (29-56) 1.31 15 (6-29) 1.00 Other 82 78 (66-87) (0.60-2.34) 35 (23-48) (0.83-2.02) 54 (40-67) (0.80-2.13) 11 (5-20) (0.39-2.53) Days since last relapse Continuous 1.00 (0.99-1.01) 1.00 (0.99-1.00) 1.00 (0.99-1.01) 0.99 (0.98-1.01) Nodal sites 0-4 66 82 (66-90) 2.32 43 (28-56) 1.21 51 (36-64) 0.75 7 (2-17) 4.12 >4 26 65 (42-81) (1.00-5.38) 40 (20-59) (0.66-2.23) 39 (19-58) (0.37-1.52) 21 (8-39) (1.25-13.7) Continuous 1.17 1.02 0.94 1.28 (0.96-1.42) (0.89-1.18) (0.81-1.10) (1.02-1.60) Ann Arbor stage 1-2 18 88 (39-98) 2.00 55 (23-79) 1.53 45 (16-70) 1.36 0 1.80 3-4 88 76 (64-85) (0.47-8.54) 38 (26-49) (0.69-3.40) 52 (39-63) (0.59-3.15 12 (6-21) (0.25-13.1) Continuous 1.36 1.22 1.12 1.40 (0.75-2.44) (0.86-1.73) (0.78-1.59) (0.61-3.21) Histological grade 1-2 3 91 39 82 (70-89) 64 (40-81) 1.62 (0.72-3.66) 38 (25-51) 53 (32-70) 0.83 (0.46-1.49) 56 (42-68) 33 (17-51) 0.67 (0.33-1.33) 9 (4-16) 18 (6-36) 1.52 (0.50-4.64) Continuous 1.36 0.94 0.88 1.31 (0.81-2.27) (0.68-1.31) (0.62-1.24) (0.64-2.71) Continued on following page.
Haematologica | 108 March 2023 791 ARTICLE - Predictive value of PET pre-ASCT in FL T.A. Eyre et al.
Table 3. Univariable analyses.
a By competing risks regression, death without relapse/progression being the competing risk. b By competing risks regression, death from relapse being the competing risk. OS: overall survival; PFS: progression-free survival; RR: relapse rate; NRM: non-relapse mortality; 95% CI: 95% con fi dence interv al; HR: hazard ratio; SCT: stem cell transplantation; HCT-CI: Hematopoietic Cell Transplantation Comorbidity Index; BEAM: carmustine, etoposide, cytarabine, melphalan; POD24: progression of disease within 24 months; ULN: upper limit of normal; CT: computed tomography; PR: partial response; SD: stable disease; PD: progressive disease; FLIPI: Follicular Lymphoma Interna tional Prognostic Index; PET: positron emission tomography;
complete metabolic remission.
CMR:
POD24 No 40 74 (53-86) 1.60 49 (29-66) 1.32 36 (19-53) 1.42 18 (6-33) 0.54 Yes 33 71 (46-86) (0.74-3.45) 36 (18-55) (0.77-2.26) 54 (33-71) (0.76-2.67) 10 (3-24) (0.11-2.63) LDH Normal 53 74 (55-86) 0.98 38 (21-54) 1.18 52 (34-68) 1.09 9 (3-21) 1.70 >ULN 19 82 (53-94) (0.33-2.91) 40 (18-61) (0.60-2.32) 49 (25-70) (0.52-2.31) 11 (2-29) (0.40-7.14) Hemoglobin, <120 31 75 (52-88) 0.78 38 (19-57) 0.78 57 (35-74) 1.89 4 (0-19) 4.82 g/L ≥ 120 54 82 (66-91) (0.30-2.03) 46 (30-61) (0.42-1.46) 41 (25-56) (0.97-3.68) 13 (5-25) (0.62-37.5) Continuous 0.90 0.98 0.93 1.02 per 10g/L (0.74-1.10) (0.85-1.12) (0.80-1.07) (0.99-1.04) CT status at SCT CR PR/SD/PD 105 67 85 (73-92) 65 (48-78) 2.35 (1.19-4.65) 50 (37-62) 26 (12-42) 1.77 (1.13-2.77) 47 (34-59) 52 (36-66) 1.16 (0.71-1.89) 6 (2-14) 23 (12-37) 3.41 (1.31-8.89) Deauville score Continuous 1.65 1.32 1.08 1.76 (1.07-2.53) (1.00-1.75) (0.80-1.44) (1.04-2.98) FLIPI Continuous 1.34 1.15 1.04 1.50 (0.96-1.87) (0.94-1.41) (0.85-1.28) (0.87-2.57) FLIPI category Continuous 1.20 1.10 1.05 1.30 low / low int. / (0.92-1.57) (0.94-1.30) (0.88-1.24) (0.84-2.01) high int. / high PET status at SCT CMR Non-CMR 115 57 82 (71-90) 66 (47-80) 1.74 (0.87-3.49) 50 (37-61) 22 (9-40) 1.80 (1.15-2.84) 42 (31-53) 63 (43-78) 1.51 (0.92-2.47) 11 (4-20) 16 (7-28) 1.79 (0.72-4.45) OS PFS RR a NRM b Levels N % at 3 years (95% CI) HR (95% CI) % at 3 years (95% CI) HR (95% CI) % at 3 years (95% CI) HR (95% CI) % at 3 years (95% CI) HR (95% CI) Haematologica | 108 March 2023 792 ARTICLE - Predictive value of PET pre-ASCT in FL T.A. Eyre et al.
(Online Supplementary Figure S3B) and age >60 years (HR=3.76, 95% CI: 1.59-8.90; P=0.003). PET status and age were the only two factors independently associated with increased risk of relapse after autoSCT by multivariable analysis (non-CMR: HR=1.64, 95% CI: 1.01-2.65; P=0.046). POD24 status was not associated with any of these specific survival or relapse outcome measures. PET status was not independently associated with a difference in non-relapse mortality.
Discussion
To the authors’ knowledge, this BSBMTCT series represents the first and largest experience outlining the value of PET-CT prior to autoSCT in patients with R/R FL. Whereas PET status prior to autoSCT has been previously reported to be predictive of PFS in relapsed classical Hodgkin lymphoma and diffuse large B-cell lymphoma, there have been no studies investigating the impact of PET status on outcome for R/R FL patients undergoing autoSCT. The results of this study demonstrate for the first time that patients with FL who achieve a PETnegative remission (CMR vs. non-CMR) prior to consolidation autoSCT have significantly improved PFS compared to those patients who fail to achieve CMR (HR=1.80, 95% CI: 1.15-2.84; P=0.011). There was a non-significant trend in relapse rate for those undergoing autoSCT in CMR and there was a non-significant trend towards improved OS in those who achieved CMR. Factors that were significant for improved PFS in multivariate analysis were age ≤60 years, and CMR at the time of transplantation and risk factors for OS that retained significance in multivariate analysis were age ≤60 years, and CMR at time of transplantation, number of lines of prior treatment, and Karnofsky score. For patients with data available on POD24 status, we observed no association with worse PFS or OS after autoSCT. Although our study lacked data on this variable in a large proportion of cases, this finding corroborates others indicating that autoSCT has a role in the management of patients with POD24 but chemo-sensitive relapse following early failure of front-line treatment.4 We cannot however exclude the possibility of selection and immortality bias, as the analysis included only patients who experienced POD24 and received an autoSCT and further prospective studies are needed to identify optimal approaches for patients with early treatment failure.
Given that autoSCT carries a risk of non-relapse mortality, significant morbidity, prolonged in-patient admission, a not insignificant risk of secondary hematologic malignancy (a recent BSBMT report of all lymphoma types reported a rate of 3% in over 1,000 patients given BEAM/LEAM and autoSCT24) and incurs significant cost, it is important that the ability to predict patients who may be expected to have
Overall survival (N=163 patients, 28 events)
Progression free survival (N=172 patients, 78 events)
Relapse rate (N=172 patients, 64 events)
Non-relapse mortality rate (N=92 patients, 11 events)
Candidate factors excluded for overall survival: time since last relapse (P=0.69), FLIPI (P=0.42), >4 nodal sites (P=0.25), prior rituximab (P=0.14). P for entry=0.05, P for removal=0.10. Candidate factor excluded for progression-free survival: FLIPI (P=0.60), P for entry=0.05, P for removal=0.10. Candidate factor excluded for relapse rate: hemoglobin <120 g/L (P=0.25), P for entry=0.025; P for removal=0.10. Candidate factors excluded for non-relapse mortality: FLIPI (P=0.45), hemoglobin <120 g/L (P=0.13), age over 60 years old (P=0.10), Karnofsky status at transplant (P=0.15). FLIPI: Follicular Lymphoma International Prognostic Index; SCT: stem cell transplantation; PET: positron emission tomography; CMR: complete metabolic remission.
long remissions with this intensive treatment are improved. Similarly, it is also important that we develop tools to predict which patients may be anticipated to have short-lived benefit from this intensive therapy so that alternative treatment modalities can be assessed in this group and avoid exposing patients to this potentially toxic treatment. Here we present a first step in risk-stratifying patients with R/R FL for autoSCT. Patients in CMR prior to transplant had a 50% (95% CI: 37-61%) chance of remaining alive and progression free at 3 years whereas those who failed to obtain a CMR at this time-point had only a 22% (95% CI: 9-40%) chance of being alive and free of progression at 3 years. Previous retrospective series have identified possible plateaus in the survival curves of patients with FL who have undergone autoSCT and long-term follow-up of this study will be performed to establish whether this is observed and whether PET status remains predictive of longer-term remission.
Factor HR 95% CI P value Age over 60 years 3.76 1.59-8.90 0.003 Number of prior lines 0.59 0.38-0.90 0.015 Karnofsky status at SCT 0.94 0.89-0.99 0.047 PET status at SCT: non-CMR 3.08 1.31-7.24 0.010
Factor HR 95% CI P value Age over 60 years 1.81 1.15-2.85 0.011 PET status at SCT: non-CMR 2.02 1.27-3.21 0.003
Factor HR 95% CI P value Age over 60 years 1.64 1.02-2.66 0.043 PET status at SCT: non-CMR 1.64 1.01-2.65 0.046
Factor HR 95% CI P value >4 nodal sites 2.65 0.87-8.13 0.088 PET status at SCT: non-CMR 1.71 0.63-4.67 0.293
Table 4. Multivariable analysis.
Haematologica | 108 March 2023 793 ARTICLE - Predictive value of PET pre-ASCT in FL T.A. Eyre et al.
These data support the ongoing role of autoSCT in consolidating remissions in patients with R/R FL. The median PFS of 28 months and 3-year PFS rate of 40% (95% CI: 3050) observed in this study for the whole cohort compares favorably with those of other series3-5,11 and if this intervention can be further refined so that it is directed towards those most likely to benefit, the outcomes for patients undergoing this procedure may be further improved.
This is an era of unprecedented development of new therapeutic agents and strategies in R/R FL. While direct comparisons between outcomes of autoSCT and some of these novel approaches are challenging in the absence of randomized controlled trials, it is pertinent to consider how the outcomes for patients undergoing autoSCT for R/R FL compare to those undergoing such novel approaches. The use of allogeneic SCT has been reported in relapsed FL and one series reported a 4-year PFS of 76% but with a non-relapse mortality of 15% and thus the outcomes for PET-negative patients in this study with a 4year PFS of 64% (46-78%) may be considered comparable.25 The immunomodulatory drug lenalidomide in combination with rituximab was used in relapsed FL in the AUGMENT trial, giving an impressive median PFS of 39.4 months although it should be noted that the median number of prior lines of therapy in the AUGMENT trial was only one with a substantial number of patients having received no prior chemotherapy, so it is hard to compare with the cohort of patients in this study who had received a median of three lines.26 A number of PI3 kinase inhibitors have been licensed by the Food and Drug Administration in the USA and show modest response rates, low CR rates and relatively short median PFS of 9-11 months in heavily pre-treated FL.27,28 Antibody-drug conjugates such as the CD19 targeting agent loncastuximab tesirine (ADCT-402) are showing promise; ADCT-402 produced a high CR rate in 15 R/R FL patients (CR 53%) but the follow-up to date is short.29 The oral EZH2 inhibitor tazemetostat has yielded high remission rates with a median PFS of 13.8 months in patients with EZH2 mutations.30 There is great interest in the development of CD3-CD20 bispecific antibodies in Bcell non-Hodgkin lymphoma and high remission rates in R/R FL have been reported with mosunetuzumab31 (overall response rate 67%, CR 51%, median duration of response 20.4 months) and glofitamab32 (overall response rate 69%, CR 59%, median PFS 11.8 months) but follow-up is not sufficient to understand how durable remissions with these agents will be in patients with R/R FL. The place of autoSCT in the management of R/R FL also needs to be considered in light of the development of anti-CD19 directed chimeric antigen receptor T-cell therapy. Two prospective phase II trials (ZUMA-5 assessing axicabtagene ciloleucel, n=108, ELARA assessing tisagenlecleucel, n=97) documented high overall response and CR rates (ZUMA-5
overall response rate 92%, CR 80%; ELARA overall response rate 86.2%, CR 66%) in heavily pre-treated R/R FL patients.33,34 Although chimeric antigen receptor T-cell therapy and bispecific antibodies are particularly promising therapies in R/R FL, the reported median follow-up across all these studies (e.g. ELARA, median 10.9 months, ZUMA-5, median 17 months) is relatively short and the curative potential of these approaches remains uncertain. Thus, although there are many new treatment options in development for R/R FL, there are few that have yet been demonstrated to produce remissions as durable as those achieved by autoSCT in the historical literature and in patients in this study who achieved CMR to autoSCT. There are limitations to this retrospective registry study, most notably the PET scans were not centrally reviewed for this study and some data points were not available for all patients, especially the Deauville score, FLIPI score, and POD24 status. Additionally, we cannot exclude a theoretical selection bias in that the study only collected data on patients who underwent autoSCT and therefore data were not captured on patients who may have been intended to undergo autoSCT but did not receive this treatment for example due to inadequate response to re-induction therapy. We also acknowledge that relatively little is known regarding the relative proportion of patients with R/R FL who receive an autoSCT compared to other therapies in 2022, and recognize that this will vary globally1 according to national guidance, clinical trial options and the availability of novel therapeutics including bispecific antibodies and chimeric antigen receptor T-cell therapy. We believe these intriguing data support the rationale for further efforts to define which patients with FL should undergo autoSCT. A prospective evaluation of the impact of PET remission status on transplant outcome would help to define this role. As we continue to gain better understanding of the molecular pathogenesis and evolution of FL, it may also be possible to define biomarkers, in conjunction with PET, which aid in accurately predicting who stands to benefit most from autoSCT and who should be considered for alternative novel treatment strategies. Such research would be timely as we aim to integrate the plethora of new therapeutic strategies into the treatment paradigm for patients with relapsed FL.
Disclosures
No conflicts of interest to disclose.
Contributions
WT and TAE contributed equally to writing the paper, data collection and analysis, as well as the study design and conception; all other authors contributed to the data collection. SB and JO contributed to writing the paper and the analysis. RMP, CA, RM, and JL contributed to the analysis and data collection. BC, CC, AB, MG, EN and KO contributed
Haematologica | 108 March 2023 794 ARTICLE - Predictive value of PET pre-ASCT in FL T.A. Eyre et al.
to the data collection. All authors reviewed the manuscript and approved its submission.
Acknowledgments
We are grateful to the following consultants and data managers from the contributing sites who provided data: Dr Ben Carpenter (University College London Hospitals, London), Dr Charles Crawley and Lanping Guan (Addenbrookes Hospital, Cambridge), Dr Emma Nicholson and Helena Woods (The Royal Marsden, London), Dr Adrian Bloor and Rose Keogh (The Christie, Manchester), Dr Kim Orchard and Linda Jarvis (Southampton General Hospital, Southampton), Dr Eleni Tholouli and Earl Marchan (Manchester Royal Infirmary, Manchester), Dr Manos Nikolousis and Dr Shankara Paneesha (Heartlands, Birmingham), Dr Toby Eyre (Oxford University Hospitals, Oxford), Dr Jenny Byrne (Nottingham University Hospitals, Nottingham), Dr Maria Gilleece and Zoe Kenworthy (St James Hospital, Leeds), Prof Matt Collin and Louise Duncan (Royal Victoria Infirmary, Newcastle), Dr Victoria Potter and Lawrence Vermeir (King’s College Hospital, London), Dr Patrick Medd and Amy King (Derriford Hospital, Plymouth), Prof Eduardo Olavarria and Farah O’Boyle (Hammersmith Hospital, London), Dr Keith Wilson and David Davies (Cardiff Univ ersity Hospitals, Wales & Swansea), Dr Rachel Protheroe and Andrea Blotkamp (Avon Haematology, Bristol), Dr Murray Martin and Rik Lewin (Leicester Royal Infirmary, Leicester), Dr Jack Fergus and Sammie Pope (Poole Hospital, Poole), Dr Matthew Lawes and Dr Nimish Shah (Norfolk & Norwich Hospitals, Norwich), Dr Nick Morley and Laura Scott (Royal Hallamshire, Sheffield), Dr Ram Malladi and Irshad Mehrali (QE Hospital, Birmingham), Dr Savio Fernandes (Dudley
References
1. Link BK, Day B, Zhou X, et al. Second-line and subsequent therapy and outcomes for follicular lymphoma in the United States: data from the observational national LymphoCare study. Br J Haematol. 2019;184(4):660-663.
2. McNamara C, Montoto S, Eyre TA, et al. The investigation and management of follicular lymphoma. Br J Haematol. 2020;191(3):363-381.
3. Casulo C, Friedberg JW, Ahn KW, et al. Autologous transplantation in follicular lymphoma with early therapy failure: a national LymphoCare study and Center for International Blood and Marrow Transplant Research analysis. Biol. Blood Marrow Transplant. 2018;24(6):1163-1171.
4. Smith SM, Godfrey J, Ahn KW, et al. Autologous transplantation versus allogeneic transplantation in patients with follicular lymphoma experiencing early treatment failure. Cancer. 2018;124(12):2541-2551.
5. Robinson SP, Canals C, Luang JJ, et al. The outcome of reduced intensity allogeneic stem cell transplantation and autologous stem cell transplantation when performed as a first transplant strategy in relapsed follicular lymphoma: an analysis from the Lymphoma Working Party of the EBMT. Bone Marrow Transplant.
Hospital, Birmingham), Dr Majid Kazmi and Jo Topping (London Bridge Hospital, London), Dr Norbert Blesing and Steven Winter (Princess Margaret Hospital, Swindon), Dr Francesca Jones (Walsgrave Hospital, Coventry), Dr Srinivas Pillai and Karen Yarwood (North Staffordshire Hospital, Sta ff ord), Dr Sally Chown (Cheltenham and Gloucester Hospital, Cheltenham).
Funding
TAE recognizes the Oxford National Institute for Health Research (NIHR) Biomedical Research Centre. WT acknowledges funding and support from the NIHR University College Hospitals Biomedical Research Centre. SB acknowledges support from the NIHR and Social Care (RP-216-07-001). King’s College London and Univ ersity College
London Comprehensive Cancer Imaging Centre is funded by Cancer Research UK (CRUK) and the Engineering and Physical Sciences Research Council (EPSRC) in association with the Medical Research Council and Department of Health and Social Care (England). This work was also supported by core funding from the Wellcome/EPSRC Centre for Medical Engineering at King’s College London [WT203148/Z/16/Z] and the NIHR Biomedical Research Centre based at Guy’s and St Thomas’ NHS Foundation Trust and King’s College London and/or the NIHR Clinical Research Facility. The views expressed are those of the authors and not necessarily those of the National Health Service or the NIHR or the UK Department of Health. JO is funded by Cancer Research UK (C57432/A22742).
Data-sharing statement
Please email toby.eyre@ouh.nhs.uk for requests.
2013;48(11):1409-1414.
6. Vose JM, Bierman PJ, Loberiza FR, et al. Long-term outcomes of autologous stem cell transplantation for follicular non-Hodgkin lymphoma: effect of histological grade and Follicular International Prognostic Index. Biol Blood Marrow Transplant. 2008;14(1):36-42.
7. Montoto S, Canals C, Rohatiner AZS, et al. Long-term follow-up of high-dose treatment with autologous haematopoietic progenitor cell support in 693 patients with follicular lymphoma: an EBMT registry study. Leukemia. 2007;21(11):2324-2331.
8. Rohatiner AZS, Nadler L, Davies AJ, et al. Myeloablative therapy with autologous bone marrow transplantation for follicular lymphoma at the time of second or subsequent remission: long-term follow-up. J Clin Oncol. 2007;25(18):2554-2559.
9. Evens AM, Vanderplas A, Lacasce AS, et al. Stem cell transplantation for follicular lymphoma relapsed/refractory after prior rituximab: a comprehensive analysis from the NCCN lymphoma outcomes project. Cancer. 2013;119(20):3662-3671.
10. Jiménez-Ubieto A, Grande C, Caballero D, et al. Autologous stem cell transplantation for follicular lymphoma: favorable
Haematologica | 108 March 2023 795 ARTICLE - Predictive value of PET pre-ASCT in FL T.A. Eyre et al.
long-term survival irrespective of pretransplantation rituximab exposure. Biol Blood Marrow Transplant. 2017;23(10):1631-1640.
11. Jurinovic V, Metzner B, Pfreundschuh M, et al. Autologous stem cell transplantation for patients with early progression of follicular lymphoma: a follow-up study of 2 randomized trials from the German Low Grade Lymphoma Study Group. Biol Blood Marrow Transplant. 2018;24(6):1172-1179.
12. Meignan M, Cottereau AS, Versari A, et al. Baseline metabolic tumor volume predicts outcome in high-tumor-burden follicular lymphoma: a pooled analysis of three multicenter studies. J Clin Oncol. 2016;34(30):3618-3626.
13. Cheson BD, Fisher RI, Barrington SF, et al. Recommendations for initial evaluation, staging, and response assessment of Hodgkin and non-Hodgkin lymphoma: the Lugano classification. J Clin Oncol. 2014;32(27):3059-3068.
14. Barrington SF, Mikhaeel NG, Kostakoglu L, et al. Role of imaging in the staging and response assessment of lymphoma: consensus of the International Conference on Malignant Lymphomas Imaging Working Group. J Clin Oncol. 2014;32(27):3048-3058.
15. Trotman J, Fournier M, Lamy T, et al. Positron emission tomography-computed tomography (PET-CT) after induction therapy is highly predictive of patient outcome in follicular lymphoma: analysis of PET-CT in a subset of PRIMA trial participants. J Clin Oncol. 2011;29(23):3194-3200.
16. Trotman J, Barrington SF, Belada D, et al. Prognostic value of end-of-induction PET response after first-line immunochemotherapy for follicular lymphoma (GALLIUM): secondary analysis of a randomised, phase 3 trial. Lancet Oncol. 2018;19(11):1530-1542.
17. Trotman J, Luminari S, Boussetta S, et al. Prognostic value of PET-CT after first-line therapy in patients with follicular lymphoma: a pooled analysis of central scan review in three multicentre studies. Lancet Haematol. 2014;1(1):e17-e27.
18. Moskowitz AJ, Yahalom J, Kewalramani T, et al. Pretransplantation functional imaging predicts outcome following autologous stem cell transplantation for relapsed and refractory Hodgkin lymphoma. Blood. 2010;116(23):4934-4937.
19. Sauter CS, Matasar MJ, Meikle J, et al. Prognostic value of FDGPET prior to autologous stem cell transplantation for relapsed and refractory diffuse large B-cell lymphoma. Blood. 2015;125(16):2579-2581.
20. Svoboda J, Andreadis C, Elstrom R, et al. Prognostic value of FDG-PET scan imaging in lymphoma patients undergoing autologous stem cell transplantation. Bone Marrow Transplant. 2006;38(3):211-216.
21. Van Imhoff GW, McMillan A, Matasar MJ, et al. Ofatumumab versus rituximab salvage chemoimmunotherapy in relapsed or refractory diffuse large B-cell lymphoma: the ORCHARRD study. J Clin Oncol. 2017;35(5):544-551.
22. Kaplan EL, Meier P. Nonparametric estimation from incomplete observations. J Am Stat Assoc. 1958;53(282):457-481.
23. Cox DR. Models and life-tables regression. J R Stat Soc. 1972;34(2):187-202.
24. Kelsey P, Pearce R, Perry J, et al. Substituting carmustine for lomustine is safe and effective in the treatment of relapsed or refractory lymphoma - a retrospective study from the BSBMT (BEAM versus LEAM). Bone Marrow Transplant. 2021;56:730-732.
25. Thomson KJ, Morris EC, Milligan D, et al. T-cell-depleted reduced-intensity transplantation followed by donor leukocyte infusions to promote graft-versus-lymphoma activity results in excellent long-term survival in patients with multiply relapsed follicular lymphoma. J Clin Oncol. 2010;28(23):3695-3700.
26. Leonard JP, Trneny M, Izutsu K, et al. AUGMENT: a phase III study of lenalidomide plus rituximab versus placebo plus rituximab in relapsed or refractory indolent lymphoma. J Clin Oncol. 2019;37(14):1188-1199.
27. Gopal AK, Kahl BS, de Vos S, et al. PI3Kδ inhibition by idelalisib in patients with relapsed indolent lymphoma. N Engl J Med. 2014;370(11):1008-1018.
28. Flinn IW, Miller CB, Ardeshna KM, et al. DYNAMO: a phase II study of duvelisib (IPI-145) in patients with refractory indolent non-Hodgkin lymphoma. J Clin Oncol. 2019;37(11):912-922.
29. Caimi P, Kahl BS, Hamadani M, et al. Safety and efficacy of Adct402 (loncastuximab tesirine), a novel antibody drug conjugate, in relapsed/refractory follicular lymphoma and mantle cell lymphoma: interim results from the phase 1 first-in-human study. Blood. 2018;132(Suppl 1):2874.
30. Morschhauser F, Tilly H, Chaidos A, et al. Tazemetostat for patients with relapsed or refractory follicular lymphoma: an open-label, single-arm, multicentre, phase 2 trial. Lancet Oncol. 2020;21(11):1433-1442.
31. Budde LE, Assouline S, Sehn LH, et al. Single-agent mosunetuzumab shows durable complete responses in patients with relapsed or refractory B-cell lymphomas: phase I doseescalation study. J Clin Oncol. 2022;40(5):481-491.
32. Hutchings M, Morschhauser F, Iacoboni G, et al. Glofitamab, a novel, bivalent CD20-targeting T-cell–engaging bispecific antibody, induces durable complete remissions in relapsed or refractory B-cell lymphoma: a phase I trial. J Clin Oncol. 2021;39(18):1959-1970.
33. Schuster SJ, Dickinson MJ, Dreyling MH, et al. Efficacy and safety of tisagenlecleucel (Tisa-cel) in adult patients (Pts) with relapsed/refractory follicular lymphoma (r/r FL): primary analysis of the phase 2 ELARA trial. J Clin Oncol. 2021;39(15 Suppl):7508.
34. Jacobson CA, Chavez JC, Sehgal AR, et al. Axicabtagene ciloleucel in relapsed or refractory indolent non-Hodgkin lymphoma (ZUMA-5): a single-arm, multicentre, phase 2 trial. Lancet Oncol. 2022;23(1):91-103.
Haematologica | 108 March 2023 796 ARTICLE - Predictive value of PET pre-ASCT in FL T.A. Eyre et al.
Inhibition of casein kinase 2 sensitizes mantle cell lymphoma to venetoclax through MCL-1 downregulation
Correspondence: M. Spaargaren
marcel.spaargaren@amsterdamumc.nl
Received: June 28, 2022.
Accepted: September 27, 2022.
1Department of Pathology, Amsterdam UMC, University of Amsterdam; 2Lymphoma and Myeloma Center Amsterdam (LYMMCARE); 3Cancer Center Amsterdam (CCA), Cancer Biology and Immunology – Target & Therapy Discovery; 4Division of Molecular Carcinogenesis, Oncode Institute, The Netherlands Cancer Institute; 5The NKI Robotics and Screening Center, The Netherlands Cancer Institute; 6Department of Hematology, Amsterdam UMC, University of Amsterdam and 7Department of Experimental Immunology, Amsterdam UMC, University of Amsterdam, Amsterdam, The Netherlands
Abstract
Early view: October 13, 2022.
https://doi.org/10.3324/haematol.2022.281668
©2023 Ferrata Storti Foundation
Published under a CC BY-NC license
BCL-2 family proteins are frequently aberrantly expressed in mantle cell lymphoma (MCL). Recently, the BCL-2-specific inhibitor venetoclax has been approved by the US Food and Drug Administration for chronic lymphocytic leukemia (CLL) and acute myeloid leukemia (AML). In MCL, venetoclax has shown promising efficacy in early clinical trials; however, a significant subset of patients is resistant. By conducting a kinome-centered CRISPR-Cas9 knockout sensitizer screen, we identified casein kinase 2 (CK2) as a major regulator of venetoclax resistance in MCL. Interestingly, CK2 is over-expressed in MCL and high CK2 expression is associated with poor patient survival. Targeting of CK2, either by inducible short hairpin RNA (shRNA)-mediated knockdown of CK2 or by the CK2-inhibitor silmitasertib, did not affect cell viability by itself, but strongly synergized with venetoclax in both MCL cell lines and primary samples, also if combined with ibrutinib. Furthermore, targeting of CK2 reduced MCL-1 levels, which involved impaired MCL-1 translation by inhibition of eIF4F complex assembly, without affecting BCL-2 and BCL-XL expression. Combined, this results in enhanced BCL-2 dependence and, consequently, venetoclax sensitization. In cocultures, targeting of CK2 overcame stroma-mediated venetoclax resistance of MCL cells. Taken together, our findings indicate that targeting of CK2 sensitizes MCL cells to venetoclax through downregulation of MCL-1. These novel insights provide a strong rationale for combining venetoclax with CK2 inhibition as therapeutic strategy for MCL patients.
Introduction
Mantle cell lymphoma (MCL) is an aggressive incurable Bcell non-Hodgkin lymphoma (NHL), representing 6-8% of all NHL. Currently, first-line therapy for MCL consists of cytarabine-based chemo-immunotherapy regimens followed by autologous stem cell transplantation in eligible patients. Elderly and frail patients are usually treated with adriamycin and cyclophosphamide-based regimens.1 However, virtually all patients relapse and these patients receive other/non-cross-resistant chemo-immunotherapy regimens or targeted therapies such as the Bruton’s tyrosine kinase (BTK) inhibitor ibrutinib. In addition, anti-CD19 chimeric antigen receptor (CAR) T-cell therapy is now approved for relapsed and refractory (R/R) disease, showing complete responses in approximately 65% of patients.1 When these therapies fail, treatment options are limited, and therefore there is a high need for novel treatment strategies.
MCL is characterized by the chromosomal translocation
t(11;14), resulting in the overexpression of cyclin D1, which facilitates cellular transformation by deregulating the cell cycle.2 For malignant transformation, additional aberrations are required, including alterations in the mitochondrial apoptotic pathway, such as upregulation of BCL-2, BCL-XL and Bcl-W and deletion of BIM.3 Hence, targeting anti-apoptotic BCL-2 family proteins is an attractive option for the treatment of MCL.
Recently, the BCL-2 inhibitor venetoclax was approved by the US Food and Drug Administration for chronic lymphocytic leukemia (CLL) and acute myeloid leukemia (AML).4 In MCL, venetoclax has also shown promising efficacy in early clinical trials, with complete response (CR) rates of 18-21% and overall response rates (ORR) of 53-75%, depending on the number and the type of prior treatments.5-7 Combining venetoclax with ibrutinib therapy improved efficacy compared with venetoclax monotherapy, with a CR of 6271%.8,9 However, a significant subset of MCL patients is primary refractory or develops resistance during the course of the disease. Therefore, novel combinations need
Yvonne J. Thus,1,2,3 Martin F.M. de Rooij,1,2,3 Nathalie Swier,1,2,3 Roderick L. Beijersbergen,4,5 Jeroen E.J. Guikema,1,2,3 Marie-José Kersten,2,6 Eric Eldering,2,3,7 Steven T. Pals,1,2,3 Arnon P. Kater2,3,6 and Marcel Spaargaren1,2,3
Haematologica | 108 March 2023 797 ARTICLE - Non-Hodgkin Lymphoma
to be identified to enhance the efficacy of venetoclax in MCL.
Here, we conducted a functional genomic CRISPR-Cas9 knockout sensitizer screen, with a lentiviral guide RNA (gRNA) library that represents all human kinases,10 and identified casein kinase 2 (CK2) as a major determinant of venetoclax sensitivity in MCL cells. We showed that reduced CK2 expression/activity by RNA interference or by treatment with the CK2 inhibitor silmitasertib synergistically increased the effectiveness of venetoclax due to the reduction in MCL-1 protein levels. These findings indicate that the combination of silmitasertib and venetoclax could represent a promising treatment strategy for MCL.
Methods
For detailed information please see the Online Supplementary Appendix.
Cell culture and treatment
The human MCL cell lines Granta-519, Jeko-1, Maver-1, Mino, and Z138 were obtained from DSMZ (Braunschweig, Germany) and cultured in Iscove’s modified Dulbecco’s medium (IMDM; Invitrogen Life Technologies, Carlsbad, CA, USA). The stromal cell line HS-27a and the kidney cell line HEK-293T/17 were obtained from ATCC (Manassas, VA, USA), and cultured in Dulbecco’s Modified Eagle’s Medium (DMEM; Invitrogen).
For co-culture assays, bone-marrow stromal cells were seeded in 96-well plates 4 hours (h) prior to the addition of MCL cells, to allow cell attachment. MCL cells were pre-incubated for 2 h with stromal cells, followed by a 3day co-culture in the presence of the indicated drug concentrations. Cell viability and specific cell death were measured by flow cytometry.
The following small-molecule inhibitors were used: venetoclax/ABT-199, Q-VD-OPh, IPTG (MedChemExpress, Princeton, NJ, USA), silmitasertib/CX-4945, S63845, MK2206 (Selleckchem, Houston, TX, USA), cycloheximide, puromycin (Sigma-Aldrich, St. Louis, MO, USA), and blasticidin (Thermo Fisher Scientific, Waltham, MA, USA).
Patient samples
Patient samples and peripheral blood naïve B cells were obtained as reported previously.11 This study was approved by the AMC Medical Committee on Human Experimentation. Informed consent was obtained in accordance with the revised Declaration of Helsinki 2008.
Cloning, transfection, and transduction
shRNA targeting CSNK2A1 (#1: ATTACCTGCAGGTGGAATATT, #2: TGGACAAACTGCTGCGATATG) and a control construct (CCTAAGGTTAAGTCGCCCTCG) were inserted into the
Acc65I(Asp718I)/EcoRI site of the pLKO-mCherry-IPTG3xLacO vector (a gift from Dr. Noam Zelcer and Dr. Jessica Nelson, Department of Medical Biochemistry, Amsterdam UMC, The Netherlands; Sigma #shc334). Lentiviral particles were produced as described previously.12 Three days after transduction, cells were FACS-sorted using a Sony SH800S cell sorter (Sony Biotechnology, San Jose, CA, USA).
Cells transduced with Lenti-Cas9-Blast (Addgene #52962) were selected for 7 days with blasticidin, 24 h after transduction. Cas9 activity was analyzed by flow cytometry of Lenti-Cas9-reporter-transduced cells (Addgene #67980) using the FACSCanto II flow cytometry system (BD Biosciences, San Jose, CA, USA).
Synthetic lethality screen
The screening procedure was performed as outlined in Figure 1C. (See Online Supplementary Methods for full details.)
Real-time-quantitative polymerase chain reaction
Real-time-quantitative polymerase chain reaction (RTqPCR) was essentially performed as described previously.11
Flow cytometry
Cell viability and (specific) apoptosis were analyzed by flow cytometry using 7-aminoactinomycin-D (7-AAD; Invitrogen) staining. Early apoptosis was determined using Annexin V staining and cell cycle distribution was analyzed using bromodeoxyuridine (BrdU) incorporation performed as previously described.11
Immunoblotting
Immunoblotting was essentially performed as described previously.11,12
Gene expression profile analysis and gene set enrichment analysis
The gene expression profiling data of B cells from 165 MCL patients (GSE93291, GSE132929)13,14 and 10 healthy donors (GSE28491, E-MTAB-1771), publicly available and deposited in the NIH Gene Expression Omnibus and the EMBL European Bioinformatics Institute databases, respectively, were analyzed using the R2 Genomics Analysis and Visualization Platform (http://r2.amc.nl). The GSE93291 dataset was analyzed for gene set enrichment using the gene set enrichment analysis (GSEA) application (version 4.0.3).15
Statistical analysis
Statistical analyses were performed using log-rank tests for Kaplan-Meier analysis, 2-tailed Student t tests for comparisons between 2 groups, and two-way analysis of variance (ANOVA) with Tukey, Šidák or Dunnett’s multiple comparison post-hoc tests as indicated in the figure legends for comparisons between more than 2 groups.
Haematologica | 108 March 2023 798 ARTICLE - CK2 inhibition sensitizes MCL to venetoclax Y.J. Thus et al.
Figure 1. A kinome-centered synthetic-lethal-screen with venetoclax identifies casein kinase 2 knockout as potential sensitizer to venetoclax in Z138. (A) Mantle cell lymphoma (MCL) cell lines were treated with increasing concentrations of venetoclax for 3 days. Viability was assessed by flow cytometry. The mean±standard deviation (SD) of triplicate cultures of an experiment, representative for at least three independent experiments, is shown. (B) Immunoblot analysis of BCL-2, MCL-1, and BCL-XL protein expression in MCL cell lines. β-actin was used as a loading control. Representative immunoblots of three independent experiments are shown. Upper numbers depict the BCL-2 expression levels corrected for β-actin; lower numbers the relative expression of BCL2 over MCL-1 and BCL-XL-combined, corrected for β-actin, as quantified by ImageJ. Equal protein was loaded. (C) Schematic outline of the kinome-centered CRISPR-Cas9 synthetic lethal screen performed in Z138 cells stably expressing Cas9. The drop-out of the blue sgRNA in the vehicle (DMSO)-treated cells identifies its target gene as a straight lethal gene, the exclusive drop-out of the green sgRNA in the venetoclax-treated cells identifies its target gene as a synthetic lethal or sensitizer gene for venetoclax. (See main text for further details.) (D) Distribution of individual gRNA from the synthetic lethality screen, with gRNA targeting the casein kinase 2 (CK2) subunits color-coded subunits. (E) Volcano plot showing the genes specifically depleted from the venetoclaxtreated cells in the synthetic lethal screen (drop-outs), with significant genes shown as a triangle.

Haematologica | 108 March 2023 799 ARTICLE - CK2 inhibition sensitizes MCL to venetoclax Y.J. Thus et al. A B C D E
Results
A kinome-centered CRISPR screen identifies CK2 as potential target for venetoclax sensitization of MCL cells
To assess their sensitivity to venetoclax, five MCL cell lines (Online Supplementary Table S1) were treated with increasing concentrations of venetoclax, and their viability was analyzed after 3 days. In line with previous reports,16-18 two cell lines, Jeko-1 and Z138, were relatively resistant to venetoclax, with IC 50 values approximately 100 times higher compared to the IC50 of the other three cell lines, Granta-519, Maver-1 and Mino (Figure 1A). These IC50 largely correspond to the protein expression of BCL2 (Figure 1B): the venetoclax-resistant cell lines Jeko-1 and Z138 express relatively low BCL-2 protein levels. Next, we performed an unbiased functional genomic CRISPR knockout screen with the Brunello kinome-centered library to identify kinases that, given their druggability, may serve as targets to sensitize MCL cells to venetoclax.10 For this CRISPR screen, the Z138 cell line was selected, being a venetoclax-insensitive cell line with high Cas9 activity after transduction with a Cas9 construct (Online Supplementary Figure S1A). The abundance of the different gRNA was assessed before initiating drug treatment (T0) and after passaging the cells for 10 population doublings in the presence of either DMSO (T1 DMSO) or the IC30 of venetoclax (500 nM, T1 Ven). Then, enrichment or depletion was determined using the DESeq2 and MAGeCK pipelines (Figure 1C).12 The performed screen was of high quality, given the strong correlation between the three independent replicates ( Online Supplementary Figure S1B ) and the selective dropout of the gRNA against reference essential genes compared to non-essential genes in the control cells (T 1 DMSO) versus T0 samples ( Online Supplementary Figure S1C).12
Comparison of the two treated experimental arms (T1 Ven vs. T1 DMSO) identified genes that preferentially affected viability and cell growth in venetoclax-treated cells over DMSO-treated cells (Figure 1D, E). The highest ranked gene was CSNK2A1 , with 7 out of 8 guides significantly depleted and with a median fold change of 0.58. In addition, the gRNA targeting CSNK2A2 and CSNK2B were also significantly depleted (Figure 1D, E). These genes encode the catalytic a - and a ’- subunits, and the regulatory βsubunits of CK2, respectively. CK2 is a pleiotropic serine/threonine protein kinase comprising two β -subunits and two of the a -subunits, resulting in either a 2 β 2, aa ’ β 2, or a ’ 2 β 2 configurations.19,20 It is involved in a broad array of cellular processes, including cell cycle progression, survival and differentiation, and is a regulator and/or mediator of several oncogenic pathways, such as Wnt-, PI3K/Akt- and NF- κ B signaling.19,20
CK2 is aberrantly expressed in MCL and high expression of CK2 is associated with inferior prognosis for MCL patients
CK2 overexpression has been reported in several hematologic malignancies, including MCL, CLL, diffuse large Bcell lymphoma (DLBCL), and multiple myeloma (MM).20-23
In line with this, comparison of primary MCL versus naïve B cells, either from publically available microarray datasets or RT-qPCR, revealed a significant upregulation of CSNK2A1 and CSNK2B RNA expression in MCL cells (Figure 2A, B; Online Supplementary Figure S2A). Moreover, CK2 expression measured in excisional lymph node biopsy material (tumor content ≥60%) of 122 MCL patients that were all treated with rituximab plus cyclophosphamide, doxorubicin, vincristine, and prednisone (R-CHOP) (GSE93291) revealed a 5-year survival of 0% versus 72% in the patients with the highest CSNK2B expression and lowest CSNK2B expression, respectively (Figure 2C).13 CSNK2A1 expression in the same cohort showed a similar trend, although this was not significant (Online Supplementary Figure S2B). Taken together, our results indicate that CK2 is aberrantly expressed and associated with an aggressive disease course.
Targeting of CK2 sensitizes MCL cells to venetoclax
To evaluate CSNK2A1 as a hit from the CRISPR screen, the venetoclax-insensitive cell lines Z138 and Jeko-1, which both express high levels of CK2 a (Online Supplementary Figure S3A, B), were transduced with different IPTG-inducible shRNA targeting CSNK2A1 (Figure 3A). These shRNA induced efficient knockdown of CK2 a protein levels in both cell lines, without affecting the highly homologous CK2 a ’ protein encoded by the CSNK2A2 gene. Viability was only modestly affected (Figure 3B), supporting our screening results, in which CSNK2A1 KO did not affect cell growth in the absence of venetoclax (Online Supplementary Figure S2C). However, both Z138 and Jeko-1 cells became significantly sensitized to venetoclax upon CSNK2A1 silencing, most prominently in Jeko-1, resulting in a 60% increased cell death compared to control cells (Figure 3C).
We next investigated the effects of silmitasertib (CX4945), a specific and selective CK2 inhibitor with proven safety and tolerability profiles in several phase I and II clinical trials.24-27 Upon silmitasertib treatment, phosphorylation of Akt S129, which is exclusively phosphorylated by CK2, was effectively reduced in the MCL cell lines (Figure 4A).28,29 However, cell viability was only decreased at concentrations above 3 mM, with IC50 values as high as 8-10 mM (Figure 4B). Silmitasertib also decreased cell viability of primary samples only at concentrations in the micromolar range. The silmitasertib-sensitivity of the primary MCL samples roughly corresponded to CSNK2 RNA expression (Online Supplementary Figure S4A).
Haematologica | 108 March 2023 800 ARTICLE - CK2 inhibition sensitizes MCL to venetoclax Y.J. Thus et al.
Figure 2. Casein kinase 2 is aberrantly expressed and high expression is associated with poor prognosis in mantle cell lymphoma. (A) RNA expression of the casein kinase 2 (CK2) subunits in 165 primary mantle cell lymphoma (MCL) samples from the microarray datasets GSE93291 and GSE132929, compared to naïve B-cell samples from 10 healthy donors from the microarray datasets GSE28491 and E-MTAB-1771 (**P<0.01, ***P<0.001, ****P<0.0001; ANOVA with Tukey multiple comparison test). (B) mRNA expression of the CK2 subunits in primary MCL samples (n=8) and in naïve B cells from healthy donors (n=2) as determined by quantitative polymerase chain reaction (qPCR) (*P<0.05; unpaired Student t test). (C) Kaplan-Meier analysis depicting overall survival of patients with MCL from the GSE93291 micro-array dataset divided into the highest and lowest quartile of CSNK2B expression (P=0.0006; log-rank test).
Figure 3. shRNA-mediated casein kinase 2 knockdown sensitizes mantle cell lymphoma cells to venetoclax. (A) Immunoblot analysis of casein kinase 2 (CK2)a and CK2a’ (CSNK2A2) protein expression in Z138 and Jeko-1 cells transduced with pLKO-3xLacO-mCherry plasmids encoding two independent shRNAs targeting CSNK2A1 or a scrambled non-targeting shRNA (NT). Cells were treated with IPTG for 3 days. ß-tubulin was used as a loading control. Representative immunoblots of three independent experiments are shown (B) Flow cytometry analysis of the effect of IPTG-induced CSNK2A1 knockdown on cell viability at 7 days of culture, normalized to the untreated condition. The mean±standard error of mean (SEM) of at least four independent experiments performed in triplicate is shown (*P<0.05; paired Student t test). (C) Flow cytometry analysis of the effect of venetoclax treatment on cell viability in CSNK2A1 knockdown cells, normalized to the untreated condition. Cells were treated for 4 days with IPTG, followed by 3 days treatment with both IPTG and venetoclax. Percentage viable cells was normalized to the untreated condition. The mean±SD of triplicate cultures of an experiment, representative of at least three independent experiments, is shown.


Haematologica | 108 March 2023 801 ARTICLE - CK2 inhibition sensitizes MCL to venetoclax Y.J. Thus et al. A B C A B C

Continued on following page. Haematologica | 108 March 2023 802 ARTICLE - CK2 inhibition sensitizes MCL to venetoclax Y.J. Thus et al. A C D E B
Figure 4. Casein kinase 2 inhibition by silmitasertib sensitizes mantle cell lymphoma cells to venetoclax. (A) Immunoblot analysis of p-Akt S129 and total Akt protein expression in the mantle cell lymphoma (MCL) cell lines Z138, Jeko-1, Mino and Granta-519 treated with 4 mM silmitasertib for 4 hours. β-actin was used as a loading control. Representative immunoblots of three independent experiments are shown. (B) Flow cytometry analysis of the effect of 3-day treatment with indicated concentrations of silmitasertib on cell viability of MCL cell lines. The mean±SD of triplicate cultures, of an experiment representative of at least two independent experiments, is shown. (C) Flow cytometry analysis of the effect of 3-day treatment with venetoclax, silmitasertib or the combination of both on cell viability of MCL cell lines. It should be noted that the concentration of venetoclax is in the low µM range for the insensitive cell lines Z138 and Jeko-1, and in the low nM range for the sensitive cell lines Mino and Granta-519. The upper panel depicts the percentage viable cells compared to the untreated condition; blue is no effect, red is strong effect. The lower panel depicts the delta-Bliss values, which is the observed additional effect of the combination over the expected (calculated) effect; grey is no additional effect, green is strong synergy. The graphs depict the effect of 3-day venetoclax treatment on cell viability on MCL cell lines treated in combination with different concentrations of silmitasertib, normalized to the condition without venetoclax. The mean±SD of triplicate cultures of an experiment, representative of at least three independent experiments, is shown (**P<0.01, ***P<0.001, ****P<0.0001; ANOVA with Šidák multiple comparison test of the highest concentration silmitasertib compared to venetoclax only). (D) Flow cytometry analysis of the effect of 2-day treatment with venetoclax (1.6-25 nM), silmitasertib (2.5-10 mM) or the combination of both on the apoptosis of 6 primary MCL samples. Black bars depict the apoptosis as observed in the experiment±SD of triplicate cultures, the grey bars the expected apoptosis based upon the effects of single treatment (*P<0.05, **P<0.01, ***P<0.001, ****P<0.0001, ns=not significant; ANOVA with Dunnett’s multiple comparison test). (E) The expected and observed values of (D). **P<0.01, paired Student t test.
To assess potential synergy between venetoclax and silmitasertib in MCL, cells were treated with increasing doses of either venetoclax, silmitasertib, or a combination of both, and cell survival was determined (Figure 4C). Synergy was assessed using the Bliss independence model: silmitasertib and venetoclax were highly synergistic in all MCL cell lines tested, with DBliss scores up to 55 in Jeko1 (Figure 4C), indicating 55% more cell death in the cells treated with the combination of drugs than expected based upon the effects of single treatment of the drug.30 In agreement, treatment of 6 primary MCL samples with the combination of venetoclax and silmitasertib also resulted in more cell death than predicted, with ΔBliss scores ranging from 6 to 18 (Figure 4D, E). As the IC50 of silmitasertib was only reached in the high micromolar range, indicating off-target effects, assessment of synergy using the Chou Talalay method was not considered appropriate.31 The zero interaction potency (ZIP) model32 revealed synergy scores similar to those of the Bliss independence model (Online Supplementary Figure S4B). Since clinical trials frequently evaluate venetoclax in combination with ibrutinib,8,9,33 we also determined whether targeting CK2 can sensitize MCL cells to venetoclax in the presence of ibrutinib (Online Supplementary Figure S4C, D). Indeed, both CK2 knockdown (KD) and inhibition also potentiated the activity of venetoclax combined with ibrutinib. Interestingly, in Jeko-1, this potentiation by silmitasertib was even stronger for the combination compared to venetoclax alone. Please note that ibrutinib treatment neither affected cell viability by itself nor sensitized the cell lines to venetoclax. This is in line with the observation that, also in patients, ibrutinib does not directly target cell viability, but rather mobilizes the malignant cells from the protective lymphoid organs to the peripheral blood.34,35
To assess whether the venetoclax-sensitizing effect of CK2 silencing or inhibition is a cytostatic or cytotoxic effect,
apoptosis and cell cycle were analyzed using Annexin V staining and BrdU labeling, respectively. Treatment with venetoclax significantly increased the percentage of Annexin V-positive cells in both CSNK2A1 KD cells and silmitasertib-treated cells, whereas the cell cycle was only modestly affected (Online Supplementary Figure S5A, B).
CK2 inhibition down-regulates MCL-1 levels
To investigate the mechanism(s) through which loss of CK2 activity sensitizes MCL cells to venetoclax, we evaluated changes in protein levels of BCL-2, MCL-1, and BCL-XL. The ratio of expression of BCL-2 over MCL-1 and BCL-XL combined has been described as an important determinant of venetoclax sensitivity in MCL,3,16,17 and also corresponds with venetoclax sensitivity in the cell lines used in this study (Figure 1B). Both CK2 silencing and inhibition resulted in markedly reduced MCL-1 levels in MCL cells, wheras BCL-2 and BCL-XL protein levels were unaffected (Figure 5A, B; Online Supplementary Figure S6A). Also in primary MCL samples, silmitasertib treatment decreased MCL-1 protein levels without altering BCL-XL levels (Figure 5C).
To assess whether the reduction in MCL-1 levels was sufficient to sensitize MCL cells to venetoclax, we applied a BH3-mimetic specific to MCL-1, S63845, in combination with venetoclax to the MCL cells, and cell survival was assessed. Indeed, upon MCL-1 inhibition, MCL cells became significantly sensitized to venetoclax, as observed by the shift in the response curve (Figure 5D; Online Supplementary Figure S6B). These results confirm that MCL-1 is a major regulator of venetoclax resistance and that CK2mediated MCL-1 regulation affects venetoclax sensitivity.
CK2 regulates MCL-1 translation
Next, we investigated the mechanism of CK2-mediated MCL-1 protein expression. MCL-1 expression is tightly regulated at multiple levels, involving transcriptional, trans-
Haematologica | 108 March 2023 803 ARTICLE - CK2 inhibition sensitizes MCL to venetoclax Y.J. Thus et al.
Figure 5. Casein kinase 2 regulates MCL-1 protein levels. (A) Immunoblot analysis of casein kinase 2 (CK2)a, MCL-1, BCL-XL and BCL2 protein expression after CSNK2A1 knockdown in Z138 and Jeko-1 cells. Cells were treated with IPTG for 3 days. β-actin was used as a loading control. Representative immunoblots of three independent experiments are shown. (B) Immunoblot analysis of MCL-1, BCLXL and BCL-2 protein expression in Z138 and Jeko-1 cells pre-treated with 10 mM Q-VD-OPh for 1 hour (h), followed by 24 h treatment with 4 mM silmitasertib and/or 1 mM venetoclax. β-actin was used as a loading control. Representative immunoblots of three independent experiments are shown. (C) Immunoblot analysis of MCL-1, BCL-XL and BCL-2 protein expression in two primary MCL samples pre-treated with 10 mM Q-VD-OPh for 1 h, followed by 24-h treatment with 4 mM silmitasertib and/or 1 mM venetoclax. β-actin was used as a loading control. (D) Flow cytometry analysis of the effect of 3-day treatment with indicated concentrations of venetoclax, S63845 or the combination of both on the cell viability of MCL cell lines Z138 and Jeko-1. The mean±SD of triplicate cultures of an experiment, representative of at least three independent experiments, is shown.

lational, and post-translational processes.36 First, we monitored MCL1 mRNA levels by RT-qPCR, and in none of the MCL cell lines were alterations in the expression levels of MCL1 observed upon CK2 targeting, arguing against transcriptional regulation (Figure 6A, B). Next, we assessed whether CK2 inhibition decreased protein stability of MCL1, by blocking translation with cycloheximide (CHX) treatment. The MCL-1 protein half-life was unaffected by CK2 inhibition in both Z138 and Jeko-1 (Figure 6C), suggesting that CK2 regulates MCL-1 protein levels by controlling translation. In agreement, GSEA of an MCL patient cohort of 122 patients (GSE93291) revealed that the expression of genes involved in protein translation was strongly enriched in patients with high versus low CSNK2A1 expression (Online Supplementary Figure S7A). Taken together, these data indicate that CK2 is not involved in MCL1 expression or MCL-1 protein stability and proteasomal degradation, but rather affects MCL-1 translation.
The rate of MCL-1 translation is, amongst others, dependent upon the eukaryotic translation initiation factor 4F (eIF4F) complex.37-41 Association of this complex with
mRNA depends on the cap-binding factor eIF4E, which is inhibited by eIF4E-binding protein (4EBP). The mTOR-dependent phosphorylation of 4EBP releases eIF4E to increase translation initiation, and p38- and extracellular signal-regulated kinase (ERK)-dependent phosphorylation of eIF4E further enhances formation of the eIF4F complex.39 Furthermore, the phosphorylation of ribosomal protein S6 has been implicated in translation initiation. In line with this, both CK2 silencing and inhibition clearly reduced activation of the Akt/mTOR-, p38- and/or the ERKpathways and the subsequent phosphorylation/activation of S6 and the eIF4 complex (Figure 6D; Online Supplementary Figure S7B), indicating their possible role in CK2-controlled MCL-1 translation. The importance of the Akt pathway is further supported by the synergy observed between the Akt inhibitor MK2206 and venetoclax in Jeko-1 and Mino (Online Supplementary Figure S7C). However, Akt inhibition did not result in clear synergy with venetoclax in any of the tested cell lines, indicating that, for example, the p38 and ERK pathways are also involved in the synergy observed between CK2 inhibition and venetoclax. In sum-
Haematologica | 108 March 2023 804 ARTICLE - CK2 inhibition sensitizes MCL to venetoclax Y.J. Thus et al. A B C D

Continued on following page. Haematologica | 108 March 2023 805 ARTICLE - CK2 inhibition sensitizes MCL to venetoclax Y.J. Thus et al. A C D E B
Figure 6. Casein kinase 2 (CK2) mediates MCL-1 protein levels via assembly of the translation machinery. (A) MCL1 mRNA expression after CSNK2A1 knockdown as determined by real-time quantitative polymerase chain reaction (RT-qPCR), normalized to the untreated condition. B2M and HPRT were used as input controls. The mean±Standard Error of Mean (SEM) of at least three independent experiments performed in triplicate is shown (*P<0.05; paired Student t test). (B) MCL1 mRNA expression after 24-hour (h) treatment with 4 mM silmitasertib as determined by RT-qPCR, normalized to the untreated condition. B2M and HPRT were used as input controls. The mean±SEM of at least three independent experiments performed in triplicate is shown (*P<0.05; paired Student t test). (C) Immunoblot analysis and its quantification of MCL-1 protein stability in Z138 and Jeko-1 cells after 4 mM silmitasertib treatment, 200 µg/mL cycloheximide (CHX) treatment, or the combination of both for the indicated time points. Cells were pre-treated with 10 mM QVD-OPh for 1 h. β-tubulin (β-tub) was used as a loading control. Representative immunoblots of at least three independent experiments are shown. Bar graphs depict the mean protein levels of at least three independent experiments, as quantified by ImageJ. (D) Immunoblot analysis of protein expression of the indicated proteins in Z138 CSNK2A1 knockdown cells treated with IPTG for 3 days (left panel) or in Z138 and Jeko-1 cells pre-treated for 1 h with 10 mM Q-VD-OPh, followed by 4 h silmitasertib (4 mM) (right panel). β-actin was used as a loading control. Representative immunoblots of three independent experiments are shown. If an antibody combination did not allow re-probing of the same blot, e.g., for loading or non-phospho controls, the same samples were analyzed by immunoblotting of a parallel gel. (E) A schematic representation of the (putative) signaling pathway underlying CK2mediated MCL-1 translation.
mary, these data indicate that CK2 sensitizes MCL cells to venetoclax by downregulation of MCL-1 levels via interference with the assembly of the eIF4F complex and thus the translation of MCL-1 (Figure 6E).
CK2 inhibition overcomes microenvironmental venetoclax resistance
Microenvironment-mediated drug resistance is commonly observed in MCL, also for venetoclax.3,16 Direct contact with other cells in the lymph node and bone marrow (cell adhesion-mediated drug resistance), as well as paracrine soluble factors such as cytokines and chemokines result in reduced drug efficacy. To study microenvironment-mediated venetoclax resistance, we co-cultured MCL cell lines with the bone marrow stromal cell line HS-27a in the presence of venetoclax. Indeed, the stromal cells protected the MCL cells from venetoclax-induced cytotoxicity (Figure 7A). Importantly, when venetoclax was combined with CK2 silencing or inhibition, this protective effect of the stromal cells was largely abolished, without compromising the viability of the stromal cells (Figure 7B, C; Online Supplementary Figure S8). This further enhances the therapeutic potential of this combination.
To investigate the mechanism underlying the stromal cellmediated venetoclax resistance and the ability of CK2 inhibition to overcome this, we determined the BCL-2 family protein levels in MCL cells co-cultured with stromal cells (Figure 7D). Interestingly, co-culture with stromal cells upregulated MCL-1 levels in MCL cells without affecting BCL2 and BCL-XL levels, and this MCL-1 upregulation was counteracted by CK2 inhibition. Taken together, our data indicate that repression of MCL-1 translation by CK2 inhibition prevents stroma-mediated upregulation of MCL1, thereby sensitizing MCL cells to venetoclax.
Discussion
Whereas venetoclax shows promising anti-tumor activity in MCL patients, a substantial proportion of patients re-
sists the treatment. Our kinome-centered CRISPR-Cas9 venetoclax-sensitizer screen identified the genes encoding the subunits of CK2 as prominent determinants of venetoclax sensitivity in MCL. We observed a strong synergistic effect between venetoclax and CK2 knockdown or inhibition in both venetoclax-sensitive and venetoclax-insensitive MCL cell lines, also in the presence of ibrutinib, and this synergistic effect can be attributed to CK2-mediated regulation of MCL-1 translation. Importantly, combining CK2 inhibition with venetoclax could also overcome microenvironmental protection to venetoclax, providing a clear rationale for combining venetoclax with a CK2 inhibitor in MCL patients.
CK2 is a ubiquitously expressed and constitutively active kinase that is involved in a broad array of cellular processes, including cell cycle progression, survival and differentiation.19,20 CK2 is an attractive kinase to target in cancer, as cancer cells have been shown to be more sensitive to CK2 inhibition than their non-malignant counterparts.20 CK2 is an attractive target also in MCL, as we and others have shown that the CK2 subunits are frequently over-expressed in MCL cells compared to naïve B cells from healthy donors (Figure 2A, B; Online Supplementary Figure S2A).21,22 Furthermore, we show that CSNK2B expression is strongly associated with poor patient survival (Figure 2C), suggesting a possible role for CK2 in the aggressive disease course of MCL.
Using CK2 knockdown, and supported by the use of a specific CK2 inhibitor, our study demonstrates that CK2 is an important regulator of BCL-2 family proteins and thereby venetoclax sensitivity in MCL. This finding may have broader implications, for example, for treatment of other B-cell malignancies. In line with this, Lazaro-Navarro et al.42 recently reported synergy between venetoclax and silmitasertib in B-cell precursor acute lymphoblastic leukemia (BCP-ALL) cells. Furthermore, based on the use of rather non-specific CK2 inhibitors such as TBB, apigenin and quercetin, several prior studies have suggested a possible role for CK2 in the expression of BCL-2 family proteins in various other cell types.23,43-48 For example,
Haematologica | 108 March 2023 806 ARTICLE - CK2 inhibition sensitizes MCL to venetoclax Y.J. Thus et al.
Figure 7. Casein kinase 2 inhibition overcomes microenvironmental venetoclax resistance. (A) Flow cytometry analysis of the effect of a 3-day co-culture with the human stromal cell line HS-27a on venetoclax-mediated toxicity of Z138 and Jeko-1. Data are presented as mean±SEM of at least four independent experiments performed in triplicate. (B) Flow cytometry analysis of the effect of CSNK2A1 knockdown on HS-27a-mediated venetoclax resistance in Z138 cells. Cells were treated for 4 days with IPTG, followed by 3-days treatment with IPTG and/or 1 mM venetoclax. Data are presented as mean±Standard Error of Mean (SEM) of at least three independent experiments performed in triplicate. (C) Flow cytometry analysis of the effect of casein kinase 2 (CK2) inhibition on HS-27a-mediated venetoclax resistance in Z138 and Jeko-1 cells. Cells, cultured alone or co-cultured with HS-27a cells, were treated for 3 days with either 1 mM venetoclax, 4 mM silmitasertib or both. Data are presented as mean±SEM of three independent experiments performed in triplicate. (D) Immunoblot analysis of anti-apoptotic BCL-2 family protein expression in MCL cells treated with silmitasertib, cultured alone or co-cultured with HS-27a cells. MCL cells were pre-treated with 10 mM Q-VD-OPh for 1 h, followed by 1-h pre-incubation on HS-27a cells before 4 mM silmitasertib was added for 24 h. β-tubulin was used as a loading control. Representative immunoblots of two independent experiments are shown. MCL-1 protein expression is quantified by ImageJ and corrected for ß-tubulin levels. *P<0.05; **P<0.01; ***P<0.001, ****P<0.0001; two-way ANOVA with Šidák multiple comparison test.

Russo et al.47 have shown that quercetin synergizes with the dual BCL-2 and BCL-XL inhibitor ABT-737 in primary CLL cells, involving quercetin-mediated downregulation of MCL-1. However, quercetin, apart from being an antioxidant, is a broad spectrum kinase inhibitor that targets, amongst others, PI3K, AMPK and several MAPK, besides CK2,48 whereas for silmitasertib several studies have shown that off-target effects are negligible.26,27 The observed synergistic effect between venetoclax and CK2 knockdown or inhibition is best explained by the specific reduction in MCL-1 protein levels after CK2 inhibition or knockdown; the levels of BCL-XL and BCL-2 were not altered (Figure 5A-C, Figure 8). Elevated MCL-1, and BCLXL, levels have frequently been described as a prominent
determinant of primary venetoclax sensitivity in MCL, and, moreover, upregulation of these proteins has been reported as a mechanism of resistance to prolonged venetoclax treatment.3 The up-regulated MCL-1 and BCL-XL proteins serve as a buffer for the released BH3-only proteins upon venetoclax treatment, resulting in reduced BAK/BAX oligomerization and thus reduced apoptosis (Figure 8). Accordingly, venetoclax combined with MCL-1 inhibitors demonstrated strong synergy in several pre-clinical MCL models (Figure 5D; Online Supplementary Figure S6B).3,16,17 However, in vivo toxicities such as cardiotoxicity have thus far hampered the development and clinical approval of MCL-1 therapy.3 Indirect inhibition of MCL-1 by targeting a tumor-specific molecule such as CK2
Haematologica | 108 March 2023 807 ARTICLE - CK2 inhibition sensitizes MCL to venetoclax Y.J. Thus et al. A B C D
Figure 8. Casein kinase 2 inhibition sensitizes cells to venetoclax and overcomes microenvironmental venetoclax resistance. A schematic representation of the mechanism underlying the prevention of microenvironmental venetoclax resistance by casein kinase 2 (CK2) inhibition. (A) Venetoclax binds to the BH3 domain of BCL-2 with subsequent release of pro-apoptotic proteins such as BIM or truncated Bid (tBid). The pro-apoptotic proteins are then sequestered by MCL-1 or free to bind BAX/BAK, which then oligomerize and initiate the apoptosis cascade. (B) CK2 inhibition or knockdown reduces MCL-1 levels, resulting in increased levels of free proapoptotic proteins, and thus increased induction of apoptosis. (C) Microenvironmental stimulation enhances MCL-1 levels, thereby increasing the buffer for the pro-apoptotic proteins and thus inducing resistance to venetoclax-mediated apoptosis. (D) CK2 inhibition or knockdown counteracts the microenvironmental-mediated MCL-1 upregulation, thereby resensitizing the cells for venetoclax.

might prevent these toxicities, especially since silmitasertib showed a safe tolerability profile in clinical trials (NCT03904862, NCT03897036, NCT03571438, NCT04668209, NCT04663737).24,25 In other hematologic malignancies, MCL-1 is also an important determinant in venetoclax resistance and, moreover, CK2 was frequently found to be over-expressed.3,19-21 Combined with the recently reported synergy between silmitasertib and venetoclax in BCP-ALL cells,42 this highlights the possibilities for a combination therapy of CK2 inhibition and venetoclax in other hematologic malignancies as well, and might expand the application of venetoclax to MCL-1-dependent malignancies such as multiple myeloma. Our data indicate that CK2 regulates MCL-1 levels in MCL via its translation machinery in an mTOR-mediated fashion. Targeting CK2 did not result in diminished MCL-1 RNA levels or protein stability (Figure 6B, C), whereas phosphorylation of translation-regulatory proteins, such as S6, eIF4E and 4EBP, was affected (Figure 6D; Online Supplementary Figure S7C). This is considered to specifically affect mRNA translation of, amongst others, MCL-1; elevated eIF4E phosphorylation correlates with high MCL1 protein levels and overexpression of a phosphomimetic S209D eIF4E variant increases translation of only a limited
number of proteins, among which MCL-1.37,38 Furthermore, we have previously shown that macrophages affect MCL1 translation in CLL cells via the eIF4E-axis40 and others have reported that inhibition of eIF4F assembly in DLBCL cells diminishes MCL-1 levels and synergizes with venetoclax.41 In the pre-B ALL cell line NALM6, silmitasertib treatment was reported to enhance proteasomal degradation of MCL-1.42 However, similar to our findings in MCL, in HEK cells Gandin et al.49 also observed that CK2 controls 4EBP phosphorylation and eIF4F complex assembly. In addition, the expression of genes involved in protein translation correlates with CSNK2A1 expression in MCL patients (Online Supplementary Figure S7A). Notably, in several other cell types CK2 has been shown to phosphorylate components of other translation initiation complexes, thereby also affecting global translation.49-53 Taken together, our data indicate that CK2-mediated regulation of MCL-1 protein levels in MCL is due to the altered activity of translation machinery.
In conclusion, we have shown that aberrant expression of some CK2 subunits in MCL correlates with inferior patient prognosis and that CK2 inhibition strongly sensitizes MCL cells to venetoclax, also in a lymphoid organ-mimetic coculture setting (Figure 8). These pre-clinical findings
Haematologica | 108 March 2023 808 ARTICLE - CK2 inhibition sensitizes MCL to venetoclax Y.J. Thus et al. A B C D
strongly support further clinical investigation of combination therapy of silmitasertib and venetoclax in MCL patients. Our data indicate that MCL-1 downregulation is the main mechanism underlying the observed synergy, which is in accordance with previous studies showing that MCL1 downregulation results in sensitization to venetoclax. CK2 inhibition might provide a less toxic therapeutic strategy to sensitize MCL cells to venetoclax as compared to MCL-1 inhibitors, making this a promising combination therapy for patients with MCL, and possibly other hematologic malignancies.
Disclosures
No conflicts of interest to disclose.
Contributions
YJT designed the research, performed experiments, analyzed the data, and wrote the manuscript; MFMdR designed the research and performed bioinformatics; NS performed experiments; RLB and MJK provided materials; JG, EE and STP analyzed the data and revised the manuscript; APK
References
1. Eyre TA, Cheah CY, Wang ML. Therapeutic options for relapsed/refractory mantle cell lymphoma. Blood. 2022;139(5):666-677.
2. Jares P, Colomer D, Campo E. Molecular pathogenesis of mantle cell lymphoma. J Clin Invest. 2012;122(10):3416-3423.
3. Thus YJ, Eldering E, Kater AP, Spaargaren M. Tipping the balance: toward rational combination therapies to overcome venetoclax resistance in mantle cell lymphoma. Leukemia. 2022;36(9):2165-2176.
4. Kater AP, Wu JQ, Kipps T, et al. Venetoclax plus rituximab in relapsed chronic lymphocytic leukemia: 4-year results and evaluation of impact of genomic complexity and gene mutations from the MURANO phase III study. J Clin Oncol. 2020;38(34):4042-4054.
5. Davids MS, Roberts AW, Kenkre VP, et al. Long-term follow-up of patients with relapsed or refractory Non-Hodgkin lymphoma treated with Venetoclax in a phase 1, first-in-human study. Clin Cancer Res. 2021;27(17):4690-4695.
6. Eyre TA, Walter HS, Iyengar S, et al. Efficacy of venetoclax monotherapy in patients with relapsed, refractory mantle cell lymphoma after Bruton tyrosine kinase inhibitor therapy. Haematologica. 2019;104(2):e68-e71.
7. Zhao S, Kanagal-Shamanna R, Navsaria L, et al. Efficacy of venetoclax in high risk relapsed mantle cell lymphoma (MCL)outcomes and mutation profile from venetoclax resistant MCL patients. Am J Hematol. 2020;95(6):623-629.
8. Tam CS, Anderson MA, Pott C, et al. Ibrutinib plus venetoclax for the treatment of mantle cell lymphoma. N Engl J Med. 2018;378(13):1211-1223.
9. Wang M, Ramchandren R, Chen R, et al. Concurrent ibrutinib plus venetoclax in relapsed/refractory mantle cell lymphoma: the safety run-in of the phase 3 SYMPATICO study. J Hematol Oncol. 2021;14(1):179.
10. Doench JG, Fusi N, Sullender M, et al. Optimized sgRNA design
supervised the study, analyzed data and revised the manuscript; MS designed and supervised the study, analyzed data and wrote the manuscript. All authors edited the manuscript.
Funding
This research was supported by grant UVA 2015-7873 from the Dutch Cancer Society (KWF) to MS and APK, and by a grant from Lymph&Co to MS.
Data-sharing statement
The Perl, R, and Python scripts used for analyzing the CRISPR screen are available in the public GitHub repository (https://github.com/MFMdeRooij/CRISPRscreen). Raw data and the list of genes for which their targeting gRNAs were depleted in the venetoclax-treated arm are provided in Online Supplementary Table S3. Expression profile data analyzed in this study were obtained from Gene Expression Omnibus (GEO) at GSE93291, GSE132929, and GSE28491 and from the EMBL European Bioinformatics Institute database at E-MTAB-1771.
to maximize activity and minimize off-target effects of CRISPRCas9. Nat Biotechnol. 2016;34(2):184-191.
11. Lantermans HC, Minderman M, Kuil A, Kersten MJ, Pals ST, Spaargaren M. Identification of the SRC-family tyrosine kinase HCK as a therapeutic target in mantle cell lymphoma. Leukemia. 2021;35(3):881-886.
12. de Rooij MFM, Thus YJ, Swier N, Beijersbergen RL, Pals ST, Spaargaren M. A loss-of-adhesion CRISPR-Cas9 screening platform to identify cell adhesion-regulatory proteins and signaling pathways. Nat Commun. 2022;13(1):2136.
13. Scott DW, Abrisqueta P, Wright GW, et al. New molecular assay for the proliferation signature in mantle cell lymphoma applicable to formalin-fixed paraffin-embedded biopsies. J Clin Oncol. 2017;35(15):1668-1677.
14. Ma MCJ, Tadros S, Bouska A, et al. Subtype-specific and cooccurring genetic alterations in B-cell non-Hodgkin lymphoma. Haematologica. 2022;107(3):690-701.
15. Subramanian A, Tamayo P, Mootha VK, et al. Gene set enrichment analysis: a knowledge-based approach for interpreting genome-wide expression profiles. Proc Natl Acad Sci U S A. 2005;102(43):15545-15550.
16. Chiron D, Dousset C, Brosseau C, et al. Biological rational for sequential targeting of Bruton tyrosine kinase and Bcl-2 to overcome CD40-induced ABT-199 resistance in mantle cell lymphoma. Oncotarget. 2015;6(11):8750-8759.
17. Prukova D, Andera L, Nahacka Z, et al. Cotargeting of BCL2 with venetoclax and MCL1 with S63845 is synthetically lethal in vivo in relapsed mantle cell lymphoma. Clin Cancer Res. 2019;25(14):4455-4465.
18. Jiang H, Lwin T, Zhao X, et al. Venetoclax as a single agent and in combination with PI3K-MTOR1/2 kinase inhibitors against ibrutinib sensitive and resistant mantle cell lymphoma. Br J Haematol. 2019;184(2):298-302.
19. Roffey SE, Litchfield DW. CK2 regulation: perspectives in 2021.
Haematologica | 108 March 2023 809 ARTICLE - CK2 inhibition sensitizes MCL to venetoclax Y.J. Thus et al.
Biomedicines. 2021;9(10):1361.
20. Borgo C, D’Amore C, Sarno S, Salvi M, Ruzzene M. Protein kinase CK2: a potential therapeutic target for diverse human diseases. Signal Transduct Target Ther. 2021;6(1):183.
21. Chua MMJ, Lee M, Dominguez I. Cancer-type dependent expression of CK2 transcripts. PLoS One. 2017;12(12):e0188854.
22. Manni S, Brancalion A, Mandato E, et al. Protein kinase CK2 inhibition down modulates the NF-κB and STAT3 survival pathways, enhances the cellular proteotoxic stress and synergistically boosts the cytotoxic effect of bortezomib on multiple myeloma and mantle cell lymphoma cells. PLoS One. 2013;8(9):e75280.
23. Kim JS, Eom JI, Cheong JW, et al. Protein kinase CK2alpha as an unfavorable prognostic marker and novel therapeutic target in acute myeloid leukemia. Clin Cancer Res. 2007;13(3):1019-1028.
24. Marschke RF, Borad MJ, McFarland RW, et al. Findings from the phase I clinical trials of CX-4945, an orally available inhibitor of CK2. J Clin Oncol. 2011;29(Suppl):3087.
25. Borad MJ, Bai LY, Chen MH, et al. Silmitasertib (CX-4945) in combination with gemcitabine and cisplatin as first-line treatment for patients with locally advanced or metastatic cholangiocarcinoma: a phase Ib/II study. J Clin Oncol. 2021;39:3.
26. Borgo C, Cesaro L, Hirota T, et al. Comparing the efficacy and selectivity of Ck2 inhibitors. A phosphoproteomics approach. Eur J Med Chem. 2021;214:113217.
27. Rosales M, Rodríguez-Ulloa A, Besada V, et al. Phosphoproteomic landscape of AML cells treated with the ATP-competitive CK2 inhibitor CX-4945. Cells. 2021;10(2):338.
28. Di Maira G, Salvi M, Arrigoni G, et al. Protein kinase CK2 phosphorylates and upregulates Akt/PKB. Cell Death Differ. 2005;12(6):668-677.
29. Manning BD, Toker A. AKT/PKB signaling: navigating the network. Cell. 2017;169(3):381-405.
30. Bliss CI. The toxicity of poisons applied jointly. Ann Appl Biol. 1939;26(3):585-615.
31. Chou TC, Talalay P. Quantitative analysis of dose-effect relationships: the combined effects of multiple drugs or enzyme inhibitors. Adv Enzyme Regul. 1984;22:27-55.
32. Yadav B, Wennerberg K, Aittokallio T, Tang J. Searching for drug synergy in complex dose–response landscapes using an interaction potency model. Comput Struct Biotechnol J. 2015;13:504-513.
33. Le Gouill S, Morschhauser F, Chiron D, et al. Ibrutinib, obinutuzumab, and venetoclax in relapsed and untreated patients with mantle cell lymphoma: a phase 1/2 trial. Blood. 2021;137(7):877-887.
34. De Rooij MFM, Kuil A, Geest CR, et al. The clinically active BTK inhibitor PCI-32765 targets B-cell receptor- and chemokinecontrolled adhesion and migration in chronic lymphocytic leukemia. Blood. 2012;119(11):2590-2594.
35. Chang BY, Francesco M, De Rooij MFM, et al. Egress of CD19+CD5+ cells into peripheral blood following treatment with the Bruton tyrosine kinase inhibitor ibrutinib in mantle cell lymphoma patients. Blood. 2013;122(14):2412-2424.
36. Thomas LW, Lam C, Edwards SW. Mcl-1; the molecular regulation of protein function. FEBS Lett. 2010;584(14):2981-2989.
37. Wendel HG, Silva RLA, Malina A, et al. Dissecting eIF4E action in tumorigenesis. Genes Dev. 2007;21(24):3232-3237.
38. Martínez A, Sesé M, Losa JH, et al. Phosphorylation of eIF4E
confers resistance to cellular stress and DNA-damaging agents through an interaction with 4E-T: a rationale for novel therapeutic approaches. PLoS One. 2015;10(4):e0123352.
39. Bhat M, Robichaud N, Hulea L, Sonenberg N, Pelletier J, Topisirovic I. Targeting the translation machinery in cancer. Nat Rev Drug Discov. 2015;14(4):261-278.
40. van Attekum M, Terpstra S, Slinger E, et al. Macrophages confer survival signals via CCR1-dependent translational MCL-1 induction in chronic lymphocytic leukemia. Oncogene. 2017;36(26):3651-3660.
41. Herzog LO, Walters B, Buono R, et al. Targeting eIF4F translation initiation complex with SBI-756 sensitises B lymphoma cells to venetoclax. Br J Cancer. 2021;124(6):1098-1109.
42. Lazaro-Navarro J, Pimentel-Gutiérrez HJ, Gauert A, et al. Inhibiting casein kinase 2 sensitizes acute lymphoblastic leukemia cells to venetoclax via MCL1 degradation. Blood Adv. 2021;5(24):5501-5506.
43. Pagano MA, Bain J, Kazimierczuk Z, et al. The selectivity of inhibitors of protein kinase CK2: an update. Biochem J. 2008;415(3):353-365.
44. Spagnuolo C, Cerella C, Russo M, Chateauvieux S, Diederich M, Russo GL. Quercetin downregulates Mcl-1 by acting on mRNA stability and protein degradation. Br J Cancer. 2011;105(2):221-230.
45. Zhao M, Ma J, Zhu HY, et al. Apigenin inhibits proliferation and induces apoptosis in human multiple myeloma cells through targeting the trinity of CK2, Cdc37 and Hsp90. Mol Cancer. 2011;10:104.
46. Jacquemin G, Granci V, Gallouet AS, et al. Quercetin-mediated Mcl-1 and survivin downregulation restores TRAIL-induced apoptosis in non-Hodgkin’s lymphoma B cells. Haematologica. 2012;97(1):38-46.
47. Russo M, Spagnuolo C, Volpe S, Tedesco I, Bilotto S, Russo GL. ABT-737 resistance in B-cells isolated from chronic lymphocytic leukemia patients and leukemia cell lines is overcome by the pleiotropic kinase inhibitor quercetin through Mcl-1 downregulation. Biochem Pharmacol. 2013;85(7):927-936.
48. Rather RA, Bhagat M. Quercetin as an innovative therapeutic tool for cancer chemoprevention: molecular mechanisms and implications in human health. Cancer Med. 2020;9(24):9181-9192.
49. Gandin V, Masvidal L, Cargnello M, et al. mTORC1 and CK2 coordinate ternary and eIF4F complex assembly. Nat Commun. 2016;7:11127.
50. Wang X, Paulin FEM, Campbell LE, et al. Eukaryotic initiation factor 2B: identification of multiple phosphorylation sites in the ϵ-subunit and their functions in vivo. EMBO J. 2001;20(16):4349-4359.
51. Homma MK, Wada I, Suzuki T, Yamaki J, Krebs EG, Homma Y. CK2 phosphorylation of eukaryotic translation initiation factor 5 potentiates cell cycle progression. Proc Natl Acad Sci U S A. 2005;102(43):15688-15693.
52. Llorens F, Duarri A, Sarró E, Roher N, Plana M, Itarte E. The Nterminal domain of the human eIF2β subunit and the CK2 phosphorylation sites are required for its function. Biochem J. 2006;394(1):227-236.
53. Borgo C, Franchin C, Salizzato V, et al. Protein kinase CK2 potentiates translation efficiency by phosphorylating eIF3j at Ser127. Biochim Biophys Acta - Mol Cell Res. 2015;1853(7):1693-1701.
Haematologica | 108 March 2023 810 ARTICLE - CK2 inhibition sensitizes MCL to venetoclax Y.J. Thus et al.
Oral HDAC inhibitor tucidinostat in patients with relapsed or refractory peripheral T-cell lymphoma: phase IIb
results
Shinya Rai,1 Won Seog Kim,2 Kiyoshi Ando,3 Ilseung Choi,4 Koji Izutsu,5 Norifumi Tsukamoto,6
Masahiro Yokoyama,7 Kunihiro Tsukasaki,8 Junya Kuroda,9 Jun Ando,10 Michihiro Hidaka,11
Youngil Koh,12 Hirohiko Shibayama,13 Toshiki Uchida,14 Deok Hwan Yang,15 Kenji Ishitsuka,16
Kenichi Ishizawa,17 Jin Seok Kim,18 Hong Ghi Lee,19 Hironobu Minami,20 Hyeon Seok Eom,21
Mitsutoshi Kurosawa,22 Jae Hoon Lee,23 Jong Seok Lee,24 Won Sik Lee,25 Hirokazu Nagai,26
Takero Shindo,27 Dok Hyun Yoon,28 Shinichiro Yoshida,29 Mireille Gillings,30 Hiroshi Onogi31 and Kensei Tobinai5
1Kindai University Hospital, Osaka-Sayama, Japan; 2Samsung Medical Center
Sungkyunkwan University School of Medicine, Seoul, Korea; 3Tokai University Hospital, Isehara, Japan; 4National Hospital Organization Kyushu Cancer Center, Fukuoka, Japan; 5National Cancer Center Hospital, Tokyo, Japan; 6Gunma University Hospital, Maebashi, Japan; 7The Cancer Institute Hospital of Japanese Foundation for Cancer Research, Tokyo, Japan; 8International Medical Center, Saitama Medical University, Saitama, Japan; 9Kyoto Prefectural University of Medicine, Kyoto, Japan; 10Juntendo University Hospital, Tokyo, Japan; 11National Hospital Organization Kumamoto Medical Center, Kumamoto, Japan; 12Seoul National University Hospital, Seoul, Korea; 13Osaka University Hospital, Suita, Japan; 14Japanese Red Cross Nagoya Daini Hospital, Nagoya, Japan; 15Chonnam National University Hwasun Hospital, Jeollanam, Korea; 16Kagoshima University Hospital, Kagoshima, Japan; 17Yamagata University Hospital, Yamagata, Japan; 18Yonsei University College of Medicine, Severance Hospital, Seoul, Korea; 19Konkuk University Medical Center, Seoul, Korea; 20Kobe University Graduate School of Medicine and Hospital, Kobe, Japan; 21National Cancer Center, Gyeonggi, Korea; 22National Hospital Organization Hokkaido Cancer Center, Sapporo, Japan; 23Gachon University Gil Medical Center, Incheon, Korea; 24Seoul National University Bundang Hospital, Gyeonggi, Korea; 25Inje University Busan Paik Hospital, Busan, Korea; 26National Hospital Organization Nagoya Medical Center, Nagoya, Japan; 27Kyoto University Hospital, Kyoto, Japan; 28Asan Medical Center, University of Ulsan College of Medicine, Seoul, Korea; 29National Hospital Organization Nagasaki Medical Center, Omura, Japan; 30HUYABIO International, San Diego, CA, USA and 31Huya Japan GK, Tokyo, Japan
Abstract
Correspondence: S. Rai rai@med.kindai.ac.jp
Received: March 25, 2022.
Accepted: September 27, 2022.
Early view: October 6, 2022.
https://doi.org/10.3324/haematol.2022.280996
©2023 Ferrata Storti Foundation
Published under a CC BY-NC license
Tucidinostat (formerly known as chidamide) is an orally available, novel benzamide class of histone deacetylase (HDAC) inhibitor that selectively blocks class I and class IIb HDAC. This multicenter phase IIb study aimed to investigate the efficacy and safety of tucidinostat, 40 mg twice per week (BIW), in patients with relapsed/refractory (R/R) peripheral T-cell lymphoma (PTCL). The primary endpoint was overall response rate (ORR) assessed by an independent overall efficacy review committee. Between March 2017 and March 2019, 55 patients were treated, and 46 and 55 were evaluated for efficacy and safety, respectively. Twenty-one of 46 patients achieved objective responses with an ORR of 46% (95% confidence interval : 30.9-61.0), including five patients with complete response (CR). Responses were observed across various PTCL subtypes. In angioimmunoblastic T-cell lymphoma, there were two CR and five partial responses (PR) among eight patients, achieving an ORR of 88%. The disease control rate (CR + PR + stable disease) was 72% (33/46). The median progression-free survival, duration of response, and overall survival were 5.6 months, 11.5 months, 22.8 months, respectively. The most common adverse events (AE) (all grades) were thrombocytopenia, neutropenia, leukopenia, anemia, and diarrhea. The grade ≥ 3 AE emerging in ≥ 20% of patients included thrombocytopenia (51%), neutropenia (36%), lymphopenia (22%), and leukopenia (20%). Importantly, most of the AE were manageable by supportive care and dose modification. In conclusion, the favorable efficacy and safety profiles indicate that tucidinostat could be a new therapeutic option in patients with R/R PTCL ( clinicaltrials gov. Identifier: NCT02953652 ).
Haematologica | 108 March 2023 811 ARTICLE - Non-Hodgkin
Lymphoma
Introduction
Peripheral T-cell lymphoma (PTCL) is a rare and heterogeneous disease entity that encompasses nearly 30 distinct subtypes, including PTCL, not otherwise specified (PTCL-NOS), angioimmunoblastic T-cell lymphoma (AITL), and anaplastic large-cell lymphoma (ALCL), most of which show aggressive behavior.1 First-line treatment with cyclophosphamide, doxorubicin, vincristine and prednisone (CHOP), or a CHOP-like regimen has been widely utilized.2,3 Recently, brentuximab vedotin (BV), an antibody–drug conjugate targeting CD30, in combination with cyclophosphamide, doxorubicin, and prednisone has been revealed to be superior to CHOP for patients with CD30-positive PTCL.4 However, the treatment responses are rarely durable in most PTCL subtypes excluding anaplastic lymphoma kinase (ALK)-positive ALCL, and patients with relapsed/refractory (R/R) PTCL have a dismal outcome,5 with a median survival after first relapse or progression of less than 6 months.6,7
For R/R PTCL, several novel single agents such as a folic acid activation inhibitor (pralatrexate),8,9 a purine nucleoside phosphorylase inhibitor (forodesine),10 histone deacetylase (HDAC) inhibitors (belinostat11 and romidepsin12,13), a recombinant cytotoxic fusion protein composed of the diphtheria toxin fragments A and B and human interleukin-2 (E7777),14 BV,15 and a humanized antiCCR4 antibody (mogamulizumab),16 have been approved or are being developed in various countries. However, the responses of these agents, except for BV in patients with R/R CD30-positive ALCL, are generally not durable. Because there is still no established standard treatment in patients with R/R PTCL, novel therapeutic agents are needed to improve the dismal prognosis.
Epigenetic modification has a strong influence on cell regulation and function, and the treatment targeting epigenetics is becoming an attractive strategy in the field of cancer therapy. One of the key epigenetic processes is the posttranslational modification of histone residues that regulates the accessibility of chromatin, thereby controlling various gene expressions.17 Essentially, the balance between histone acetyltransferases (HAT) and HDAC is critical to maintain a normal histone acetylation status,17 and aberrant HDAC activities are associated with the development of various types of cancers.18 In PTCL, several studies showed that class I HDAC (including HDAC1 and HDAC2) were overexpressed regardless of the subtypes of PTCL,19-21 and highly expressed HDAC2 exhibited a poorer overall survival rate.21
Tucidinostat (formerly known as chidamide) is an orally available, novel benzamide class of HDAC inhibitor that selectively blocks class I (HDAC1, 2 and 3) and class IIb (HDAC10) HDAC.22 The anti-tumor effects of tucidinostat such as inducing apoptosis and cell cycle arrest have
been determined by using cancer cells in various preclinical studies.23-25 Furthermore, several reports showed that it could also enhance immune cell-mediated tumor cell cytotoxicity in vitro26,27 and in vivo. 22 The activities of tucidinostat have also been evaluated in clinical studies28-30. In a phase II trial in patients with R/R PTCL, tucidinostat showed an overall response rate of 28%, and was approved in China based on the pivotal trial.29 However, it is still not available for R/R PTCL in many other countries. The current phase IIb study was planned to investigate the safety and efficacy of tucidinostat in Japanese and South Korean patients with R/R PTCL (clinicaltrials gov. Identifier: NCT02953652 ). The dose, 40 mg twice per week (BIW), was determined based on the result from the preceding phase I study for Japanese patients with non-Hodgkin lymphoma, 31 which was higher than that approved for patients with PTCL in China (30 mg BIW). The data described herein led to the approval of tucidinostat for R/R PTCL by the Japanese Ministry of Health, Labour and Welfare in 2021.
Methods Study design
This phase IIb, open-label, non-randomized, single-arm study was conducted in Japan and South Korea to evaluate the safety and efficacy of tucidinostat in patients with R/R PTCL in accordance with Good Clinical Practice, International Council for Harmonization guidelines, applicable drug and data protection laws and regulations, and the Declaration of Helsinki. The study was approved by Ethics Committees at each site and an informed consent was obtained from each patient. Protocol Synopsis is available in the Online Supplementary Appendix
Study population
Patients aged ≥ 20 years with at least one measurable lesion (defined as more than 1.5 cm in greatest dimension) were eligible if they had histologically diagnosed PTCL according to the 2008 World Health Organization classification,32 history of at least one prior previous systemic chemotherapy.
Study treatment
Tucidinostat was administered orally, 40 mg BIW, until progressive disease (PD) or unacceptable toxicities. A cycle was defined as 28 consecutive days. Tucidinostat was stopped temporarily for ≤2 weeks for the management of adverse events (AE). After recovery of AE, dose reductions were allowed from 40 mg to 30 mg, or from 30 mg to 20 mg. Data cut-off occurred in March 2019 when the last subject completed the cycle 5 day 1 assessment.
Haematologica | 108 March 2023 812 ARTICLE - Tucidinostat in patients with R/R PTCL S. Rai et al.
Study endpoints and procedures
The primary endpoint was objective response rate (rate of complete response [CR] and partial response [PR]). Secondary endpoints included ORR by disease subtypes, duration of response (DOR), progression-free survival (PFS), overall survival (OS) and safety parameters, AE (using National Cancer Institute Common Toxicity Criteria Version 4.03 and coded with Medical Dictionary for Regulatory Activities version 21.1), laboratory tests and electrocardiograms (ECG). Based on the disease responsiveness to the most recent therapy, patients were grouped into two subsets: relapsed (patients who had previously achieved CR, unconfirmed CR [CRu], or PR) and refractory (patients who previously had stable disease [SD] or PD). Response was assessed every two cycles according to the computed tomography-based response criteria of the Lugano Classification33 and the modified Severity Weighted Assessment Tool (mSWAT)34 for skin lesions if present. The best response by treatment end was selected as an ORR. An Independent Radiology Review (IRR) reviewed all images and an Independent Overall Efficacy Review Committee (IOERC) reviewed all efficacy data including the radiological assessment provided by the IRR, the mSWAT score, and applicable clinical observations. The disease subtype was independently diagnosed by the Central Pathology Review (CPR). The primary analysis was conducted using IOERC assessment results. Safety data were reviewed by a Data Safety Monitoring Board (DSMB).
Analytical plan
The ORR was calculated on the per protocol set (PPS), subjects who met all eligibility criteria and had completed cycle 1 or discontinued tucidinostat during cycle 1 due to clinical PD. Forty patients were required to meet the target ORR of 30% (95% confidence interval [CI]: 15.844.2), with a power of 89% to show ORR>10% at 2-sided α of 5%. The default significance level was to be 5%; CI were to be 95%, and all tests were to be 2-sided, unless otherwise specified in the description of the analyses.
Results Patients
Between March 2017 and November 2018, 74 patients consented to be screened, and 55 of them were treated with 40 mg of tucidinostat twice per week. Of these, six patients were excluded from the full analysis set (FAS) for efficacy analysis. Among them, four patients did not meet the eligibility criteria, and two patients were not diagnosed as PTCL by the CPR (diffuse large B-cell lymphoma [DLBCL] [n=1] and nodular lymphocyte-predominant Hodgkin lymphoma [n=1]). Because a tumor sample from one patient was not submitted, CPR could not be performed for the patient, and
Diagnosis (confirmed by CPR), N (%)
AITL: angioimmunoblastic T-cell lymphoma; ALCL: anaplastic largecell lymphoma; ALK: anaplastic lymphoma kinase; CPR: central pathology review; CR: complete response; CRu: unconfirmed complete response; DLBCL: diffuse large B-cell lymphoma; EATL: enteropathyassociated T-cell lymphoma; ECOG: Eastern Cooperative Oncology Group; NLPHL: nodular lymphocyte-predominant Hodgkin lymphoma; PD: progressive disease; PR: partial response; PTCL-NOS: peripheral T-cell lymphoma not otherwise specified; N: number of subjects.
the eligibility criteria was not met. Additionally, three patients were excluded from the PPS because they did not complete one cycle of treatment due to adverse events or withdrawal of consent (Online Supplementary Figure S1).
Demographics and disease history are shown in Table 1 and previous cancer therapy is shown in Table2.
The most common subtypes were PTCL-NOS (n=37), followed by AITL (n=10). Patients had been treated with a median of two (range, 1-9) prior systemic therapies. The median time from initial PTCL diagnosis was 1.3 years (range, 0.06-12.88). All patients (n=55) had received prior chemotherapy, and 18 patients (33%) had a history of three or more lines of prior systemic therapies. A total of 20 patients (36%) had previously been treated with single agents, including darinaparsin, 35 forodesine, and romidepsin. Six patients (11%) had received radiotherapy.
Characteristics Total N=55 Sex, N (%) Male Female Age (years), median (min, max) 35 (64) 20 (36) 71 (38, 87) Ethnicity, N (%) Japanese South Korean 39 (71) 16 (29) ECOG Performance Status, N (%) 0 1 2 28 (51) 25 (46) 2 (4)
PTCL PTCL-NOS AITL ALCL, ALK-negative EATL Non-PTCL DLBCL NLPHL Unknown 52 (95) 37 (67) 10 (18) 3 (5) 2 (4) 2 (4) 1 (2) 1 (2) 1 (2) Duration since initial diagnosis in years, median, range 1.339 (0.06-12.88) PTCL subset, N (%) Relapsed (CR, CRu, PR) Refractory (SD, PD) 32 (58) 23 (42)
Table 1. Baseline patient demographic and clinical characteristics.
Haematologica | 108 March 2023 813 ARTICLE - Tucidinostat in patients with R/R PTCL S. Rai et al.
Six patients (11%) had undergone prior autologous stem cell transplantation (SCT) (1 patient, who was diagnosed as DLBCL by the CPR, was excluded from the PPS). Twenty-three patients (42%) were refractory to their most recent therapies. The median time from the last treatment to the start of tucidinostat was 97 days.

Efficacy
In the PPS population (n=46), the primary endpoint of ORR as assessed by IOERC was 46% (95% CI: 30.9-61.0), with five patients experiencing CR (11%, 5/46) and 16 patients experiencing PR (35%, 16/46). The disease control rate (DCR=CR+PR+SD) was 72% (95% CI: 56.5-84.0). Responses were observed across the more common PTCL subtypes of PTCL-NOS, AITL, ALK-negative ALCL and enteropathy-associated T-cell lymphoma. Of interest, the ORR was relatively higher in patients with AITL (88%, 7/8), including two patients (25%, 2/8) of patients with CR ( Table 3). There were no significant differences in the ORR based on sex, Eastern Cooperative Oncology Group (ECOG) performance status, or whether the patients were refractory to their last prior therapies (Online Supplementary Figure S2). In the FAS population (n=49), the ORR as assessed by IOERC was 43% (95% CI: 28.8-57.8). This study included a heavily pretreated patient population with about 33% (15/46) of patients in PPS that received three or more lines of prior systemic therapies, and the ORR was 27% (4/15) in these patients. In the PPS population, the objective responses were seen in two of five patients (40%) who received prior autologous SCT and were also seen in two of three (67%), one of three (33%), and two of six (33%) patients who were previously treated with pralatrexate, romidepsin, or forodesine, re-
spectively. A summary of the patients who have a history of prior romidepsin treatment is shown in the Online Supplementary Table S1 . The median time to response (TTR) was 8.1 weeks (95% CI: 8.0-8.4) in the 21 patients
Figure 1. Waterfall plot showing best percentage change from baseline in sum of products of perpendicular diameter of target lesions in 45 patients.
Characteristics Total N=55
of previous cancer therapy, N (%) Chemotherapy
anticancer therapy
vedotin Darinaparsin Denileukin Diftitox Forodesine Mogamulizumab Pralatrexate Rituximab Romidepsin Radiotherapy Autologous stem cell transplantation Other 55 (100) 16 (29) 2 (4) 8 (15) 2 (4) 6 (11) 1 (2) 3 (5) 2 (4) 4 (7) 6 (11) 6 (11) 2 (4) N of prior systemic therapies including targeted therapies, median (min, max) 2 (1, 9) N of regimens received (%) 1 regimen 2 regimens 3 regimens 4 regimens 5 or more regimens 20 (36) 17 (31) 8 (15) 5 (9) 5 (9) N of days from end of last immediate previous therapy, median (min, max) 97 (29, 3,861) N: number. Haematologica | 108 March 2023 814 ARTICLE - Tucidinostat in patients with R/R PTCL S. Rai et al.
Table 2. Previous cancer therapy.
Type
Other
Brentuximab
achieving objective responses. Waterfall plot of change from baseline in sum of products of perpendicular diameter of diameters are shown in Figure 1. One patient was excluded from these plots since the patient had no postbaseline data. Thirty-eight patients (84%, 38/45) exhibited a decrease in tumor volume of their target lesions, and all AITL patients (n=8) showed tumor size reduction (Figure 1). For patients assessed as CR or PR, 11 of 21 (52%) patients had a dose interruption and six of 21 (29%) patients had a dose reduction prior to achieving objective responses. In addition, ten of 14 (71%) patients assessed as SD had a dose interruption and reduction (Figure 2). The median dose for these responding patients (CR, PR, and SD) who continued treatment at 4 months (n=14) was 40 mg (range, 20-40). The median treatment duration was 80 days (range, 10-580) and the median time to first dose interruption or dose reduction was 15 days (range, 4-366) or 33 days (range, 11-127), respectively. At the data cut-off date, with a median follow-up duration of 8.3 month, eight of 55 (15%) patients continued treatment, and 12 patients received tucidinostat more than 6 months (Figure 2). Two of the patients retained the tumor response at 10 months even after discontinuing tucidinostat. The median PFS was 5.6 months (95%
N: number of patients; 95% CI: 95% confidence interval; CR: complete response; PD: progressive disease; PR: partial response; SD: stable disease; AITL: angioimmunoblastic T-cell lymphoma; ALCL: anaplastic large-cell lymphoma; ALK: anaplastic lymphoma kinase; EATL: enteropathy-associated T-cell lymphoma; PTCL NOS: peripheral T-cell lymphoma not otherwise specified.
 Table 3. Objective response rate assessed by an Independent Overall Efficacy Review Committee (per-protocol set).
Total N=46 Response N (%) 95% CI Objective response CR or PR 21 (46) 30.9-61.0 Best response CR 5 (11) PR 16 (35) SD 12 (26) PD 13 (28)
PTCL-NOS 12/34 (35) 19.7-53.5 AITL 7/8 (88) 47.3-99.7 ALCL, ALK-negative 1/3 (33) 0.8-90.6 EATL 1/1 (100) 2.5-100
ORR by PTCL subtype
Haematologica | 108 March 2023 815 ARTICLE - Tucidinostat in patients with R/R PTCL S. Rai et al.
Figure 2. Swimmer plot showing treatment exposure and responses over time by peripheral T-cell lymphoma subtype in 46 pa-
CI: 2.9-13.4) (Figure 3A), and the median DOR was 11.5 months (95% CI: 5.4-not reached [NR]) (Figure 3B). The median OS was 22.8 months (95% CI: 12.6-NR) (Figure 3C).
Safety and tolerability
The safety population included 55 patients. All patients experienced at least one AE, most of which (93%, 51/55) were related to tucidinostat. The most common AE (all grades) were thrombocytopenia, neutropenia, leukopenia, anemia, and diarrhea (Table 4). ECG abnormalities were uncommon, and grade 1 or 2 ECG QTc prolongation was reported in five patients (9%, 5/55). The grade ≥3 AE emerging in ≥20% of
patients included thrombocytopenia (51%, 28/55), neutropenia (36%, 20/55), lymphopenia (22%, 12/55), and leukopenia (20%, 11/55) (Table 4). Most of the hematologic AE were manageable by supportive care and dose modification, with nine patients receiving a platelet transfusion and 19 patients receiving granulocyte colony stimulating factor (G-CSF). Fourteen (26%, 14/55) patients had 17 serious AE, 10 of which were related to tucidinostat (febrile neutropenia [in two patients]; pneumonia, aplastic anemia, pneumonitis, Pneumocystis jirovecii pneumonia, interstitial lung disease, C-reactive protein increased, hyponatremia, and development of de novo PTCL-unspecified [one patient
 Figure 3. Durability of response to tucidinostat. (A) Kaplan-Meier plot of progression-free survival. (B) Kaplan-Meier plot of duration of response. (C) Kaplan-Meier plot of overall survival.
A B C Haematologica | 108 March 2023 816 ARTICLE - Tucidinostat in patients with R/R PTCL S. Rai et al.
each]). Infections were reported in 19 patients (35%, 19/55), and those grade ≥3 included pharyngitis, enterocolitis infectious, Pneumocystis jirovecii pneumonia, pneumonia, and staphylococcal skin infection (1 patient each). One death from pneumonia was reported in this study, however, this fatal outcome was not judged to be related to tucidinostat, but assessed as being associated with progression of disease.
Dose reduction/interruption of therapy as a result of AE were reported in 40 patients (73%, 40/55) (Table 5), with 26 patients (47%, 26/55) having dose reduction. The major AE leading to drug reduction/interruption were thrombocytopenia (38%, 21/55) and neutropenia (35%, 19/55). Consequently, 18 patients (33%, 18/55) discontinued tucidinostat due to AE, including neutropenia (9%, 5/55), thrombocytopenia (7%, 4/55), lymphopenia (4%, 2/55), and leukopenia (2%, 1/55) (Table 5).
Discussion
Patients with R/R PTCL have dismal outcomes, and there is still high unmet medical need for their treatment op-
tions. In this phase IIb study, the treatment with tucidinostat (40 mg BIW) was effective and well tolerated in Japanese and South Korean patients with R/R PTCL with an ORR of 46% (the primary endpoint), including 11% of patients with CR. Furthermore, the efficacy results included a median PFS, DOR, and OS of 5.6 months, 11.5 months, and 22.8 months, respectively.
In the previous Chinese phase II study of 79 patients with R/R PTCL, tucidinostat, 30 mg BIW, showed that the ORR was 28% including 14% with CR/CRu, and the median PFS, DOR, and OS were 2.1 months, 9.9 months, and 21.4 months, respectively.29 A real-world multicenter monitoring study in 256 Chinese patients with R/R PTCL receiving tucidinostat as a monotherapy, reported an ORR of 39%, a median PFS of 129 days, and a median DOR of 148 days.36 These differences regarding the efficacy data between our study and the Chinese studies may be due in part to the different doses of this agent and the different patient characteristics. As a matter of fact, the median number of prior systemic therapies in our cohort (2 [range, 1-9]) was fewer than that of the pivotal Chinese study (3 [range, 19]), suggesting that patients with favorable features were enrolled in our study. In the present study, the dose of 40
N: number of subjects; AE: adverse event; anemia: anemia/hemoglobin decreased; leukopenia: leukopenia/white blood cell count decreased; lymphopenia: lymphocyte count decreased/lymphopenia; neutropenia: neutropenia/neutrophil count decreased/granulocytopenia; thrombocytopenia: thrombocytopenia/platelet count decreased.
Table 4. Adverse events regardless of causal relationship to tucidinostat observed in ≥10% of patients (n=55).
Adverse event Any grade, N (%) Grade ≥3, N (%) Patients with at least one AE 55 (100) 46 (84) Thrombocytopenia 46 (84) 28 (51) Neutropenia 31 (56) 20 (36) Leukopenia 24 (44) 11 (20) Anemia 18 (33) 9 (16) Diarrhea 17 (31) 1 (2) Lymphopenia 16 (29) 12 (22) Decreased appetite 13 (24) 2 (4) Nausea 12 (22) 0 (0) Pyrexia 11 (20) 0 (0) Blood alkaline phosphatase increased 8 (15) 1 (2) Gamma-glutamyltransferase increased 8 (15) 3 (6) Malaise 8 (15) 0 (0) Aspartate aminotransferase increased 7 (13) 0 (0) Cough 6 (11) 0 (0) Fatigue 6 (11) 0 (0) Headache 6 (11) 0 (0) Weight decreased 6 (11) 1 (2) Haematologica | 108 March 2023 817 ARTICLE - Tucidinostat in patients with R/R PTCL S. Rai et al.
mg BIW was determined based on the results from the phase I study of Japanese patients with non-Hodgkin lymphoma, in which 40 mg BIW was tolerable and the ORR for the 40 mg cohort was higher than that for the 30 mg cohort.31
Several results from the pivotal trials of other HDAC inhibitors in patients with R/R PTCL, have been reported showing the ORR as 26% and 25%-43%, and the PFS as 1.6 months and 4.0-5.6 months for belinostat11 and romidepsin,12,13 respectively. It is difficult to make scientific comparisons between our current trial and any individual trials mainly because of the different patient characteristics and limited subject numbers. However, it is likely that the ORR and PFS were similar to those of romidepsin in Japan. Because tucidinostat is orally available, the advantage would be that tucidinostat may be more convenient in the outpatient setting than other intravenous HDAC inhibitors.
In the present study, efficacy was observed regardless of sex, ECOG performance status, or whether the patient was refractory to their last prior therapy. Furthermore, efficacy was seen across all the disease subtypes, and the patients with AITL tended to have a higher ORR of 88% (Online Supplementary Figure S2). Given the small numbers of patients in some subgroups, including AITL, this should be interpreted with caution. In accordance
with our results, however, treatment with HDAC inhibitors appears to achieve relatively higher response rates in patients with AITL compared to those in their overall PTCL patient population.11-13,29 The unique activity of HDAC inhibitors for AITL might be explained by the fact that epigenetic dysregulation plays a critical role in AITL pathogenesis. Meanwhile, recent molecular studies revealed that AITL and nodal PTCL with T-follicular helper cell (TFH) phenotype share some of the recurrent genetic alterations in epigenetic regulatory genes, such as TET237 and DNMT3A. 1,38,39 Thus, therapies targeting epigenetic changes, such as HDAC inhibitors and the hypomethylating 5-azacytidine agent, either as monotherapy or in combination setting, are now being developed in these diseases.40-42
In this study, a higher dose of tucidinostat, 40 mg BIW was given, compared to that used in the previous studies.29,36 The most common AE were hematologic abnormalities (thrombocytopenia, neutropenia, leukopenia, anemia, lymphopenia), and gastrointestinal disturbances, which were consistent with previously reported AE with tucidinostat28,29,36 as well as with other HDAC inhibitors such as belinostat11 and romidepsin.12 In addition, the AE reported in our study were manageable by supportive care and dose modifications. Most infections were grade 1 to 2 in severity (29%), and grade ≥3 infections occurred in 6% of
N: number of subjects; AE: adverse event; leukopenia: leukopenia/white blood cell count decreased; lymphopenia: lymphocyte count decreased/lymphopenia; neutropenia: neutropenia/neutrophil count decreased/granulocytopenia; thrombocytopenia: thrombocytopenia/platelet count decreased. *All AE regardless of AE leading to dose reduction/Interruption and/or AE leading to discontinuation. Other AE leading to dose reduction/interruption (n=1): angina unstable, bronchitis, vertigo, diarrhea, electrocardiogram QT prolonged, electrocardiogram T wave inversion, nasopharyngitis, nausea, oedema peripheral, peripheral arterial occlusive disease, rash, urticaria. Other AE leading to discontinuation (n=1): blood alkaline phosphatase increased, brain natriuretic peptide increased, dyspnea, interstitial lung disease, peripheral T-cell lymphoma unspecified, pneumocystis jirovecii pneumonia, pneumonia.
Table 5. Adverse events leading to dose reduction/interruption and/or discontinuation in ≥2 patients (n=55).
Adverse events AE leading to dose reduction/interruption, N (%) AE leading to discontinuation, N (%) *Any grade, N (%) Patients with at least one AE 40 (73) 18 (33) 55 (100) Thrombocytopenia 21 4 46 Neutropenia 19 5 31 Decreased appetite 3 0 13 Febrile neutropenia 3 0 3 Leukopenia 2 1 24 Pyrexia 2 0 11 C-reactive protein increased 2 0 3 Hyponatremia 2 0 2 Lymphopenia 0 2 16 Gamma-glutamyltransferase increased 0 2 8 Pneumonitis 0 2 4 Haematologica | 108 March 2023 818 ARTICLE - Tucidinostat in patients with R/R PTCL S. Rai et al.
patients, which were controllable with antibiotic, antimycotic or antiviral agents.
In the present study, forty patients (73%) had dose reduction or interruption which were frequently observed during cycle 1; however, most of these AE were reversible and all patients could resume treatment with tucidinostat. The main reasons for dose reduction/interruption were hematological toxicities such as thrombocytopenia and neutropenia, and 26 patients (47%) consequently had dose reduction. Eighteen patients (33%) discontinued treatment due to AE, most of which were also related to the hematological toxicities. The incidence of discontinuation was slightly higher compared with that of the Chinese study,29 possibly because of the higher dose of tucidinostat in this study. However, 29 (53%) patients did not need dose reduction due to AE. In addition, neither unexpected safety signals nor AE leading to death were observed in this study. Therefore, we consider that 40 mg is suitable as the starting dose. However, it is important to note that patients treated with 40 mg of tucidinostat should be carefully monitored, and appropriate dose modification is essential.
There are several limitations in our study, including the small sample size, short follow-up period, and lack of information regarding the efficacy in patients with nodal PTCL with TFH phenotype, as well as biomarkers that could predict the drug response. Therefore, additional research to address these issues is warranted. Moreover, several drug resistance mechanisms to HDAC inhibitors have been reported in hematological malignancies, including drug efflux, chromatin alterations, upregulation of oxidative stress response mechanism, defect, and upregulation in apoptotic pathways.43,44 Thus, future combination of HDAC inhibitors with other anticancer drugs would be a promising strategy to improve the dismal prognosis of R/R PTCL.45 In conclusion, the current study demonstrated the favorable efficacy and safety of tucidinostat in Japanese and South Korean patients with R/R PTCL. Of note, tucidinostat is orally available and thus may be more convenient in the outpatient setting than conventional cytotoxic agents or other novel intravenous agents for R/R PTCL. Together, the favorable efficacy and safety results indicate that tucidinostat is a promising new therapeutic option in patients with R/R PTCL.
Disclosures
SR receives honoraria (Chugai, Ono and Janssen). WSK. receives research funding (Roche, Sanofi, Pfizer, Johnson & Johnson, Celltrion, Kyowa Kirin, Donga ST, Mundipharma). KA receives research funding (Solasia, Novartis, Janssen, Otsuka, IQVIA, Zenyaku, Chugai, Astellas) and honoraria (Kyowa Kirin, Takeda, Chugai, Meiji Seika, Eisai, Mochida). KoI receives research funding (Celgene, Daiichi Sankyo, HUYABIO, Kyowa Kirin) and honoraria (Celgene, Daiichi San-
kyo, Kyowa Kirin). NT receives research funding (Chugai, Kyowa Kirin, Daiichi Sankyo, Teijin). MY is consultant (Chugai) and receives research funding (Kyowa Kirin). KuT is consultant (Daiich Sankyo, Ono, HUYABIO, Yakuruto, Meiji Seika, Solasia) and receives research funding (Daiich Sankyo, BMS, HUYABIO, Chugai, Bayer, Eisai, Kyowa Kirin, Regeneron Pharmaceuticals, Inc .) and honoraria (Celgene, Chugai, Eisai, Kyowa Kirin, Takeda). JK receives research funding (Ono, Celgene, BMS, Sysmex, Janssen, Otsuka, Kyowa Kirin, Chugai, Pfizer, Ono, Daiichi Sankyo, Sanofi, Eisai, Sumitomo Dainippon, Takeda, Nippon Shinyaku) and honoraria (Celgene, Janssen, BMS, Ono, Sanofi, AbbVie, Takeda). YK has ownership interests (Proteina, DeepMetrics, Curocell, Tomocube, GenomeOpinion, DeepMetrics) and receives research funding (SanofiGenzyme). HS is consultant (Chugai, Eisai, Sanofi, Fujimoto) and receives research funding (Janssen, Takeda, Ono, Novartis, AbbVie, HUYABIO, AstraZeneca, Eisai, Chugai, PharmaEssentia, GSK, Celgene) and honoraria (Chugai, Ono, Janssen, AstraZeneca, Sanofi, Takeda, SymBio, Eisai, Fujimoto, Novartis, AbbVie, Meiji Seika, Nippon Shinyaku, Celgene). KjI is consultant (Daiichi Sankyo), and receives honoraria (Chugai, Celgene, BMS, Kyowa Kirin, Takeda, Daiichi Sankyo, Meiji Seika) and research funding (Ono, Kyowa Kirin). KiI receives research funding (Novartis, AbbVie, Bayer, SymBio, Otsuka, Pfizer, Takeda, Kyowa Kirin) and is membership on another entity’s Board of Directors or its advisory committees (Takeda, Celgene, Ono, Novartis, Chugai, Eisai). HM receives research funding (Asahikasei, Astellas, Bayer, Behringer, BMS, Chugai, CSL Behring, Daiich Sankyo, Sumitomo Dainippon, Eisai, Kyowa Kirin, Lilly, Merck Serono, Mitsubishi Tanabe, MSD, Nippon Kayaku, Nippon Shinyaku, Ono, Otsuka, Sanofi, Shionogi, Takeda, Tanabe Mitsubishi, Taiho, Teijin, Tsumura), honoraria (AbbVie, Bayer, BMS, Chugai, Daiich Sankyo, Eisai, Genomic Health, Kyowa Kirin, Lilly, Meiji Seika, Merck Serono, MSD, Nihon Servier, Novartis, Ono, Otsuka, Pfizer, Sanofi, Sumitomo Dainippon, Taiho, Takeda), and others as clinical trial (AstraZeneca, Bayer, BMS, Chugai, Daiich Sankyo, MSD, Ono, Pfizer, Taiho, Amgen, Novartis, Incyte Biosciences Japan). HN receives research funding (AstraZeneca, Celgene, Mundipharma, Zenyaku Kogyo, Takeda, Chugai, Bayer, BMS, Janssen, Kyowa Kirin, SymBio, Ono, MSD, AbbVie, Eisai, Nippon Shinyaku) and honoraria (Eisai, Chugai, Takeda, Celgene, Mundipharma, Kyowa Kinin, Ono, AstraZeneca, Sanofi, BMS , Novartis, Janssen, SymBio, Chordia Therapeutics, Nihon Medi-Physics). DoHY is consultant (GC cell, Abclon, GI-cell), and receives grants or contracts (AbbVie, Celltrion, Samyang, Beigene) and honoraria (Roche, Amgen, Kirin Pharma, Janssen, Celgene, Takeda). SY receives research funding (Bayer, HUYABIO). MG and HO are employees of HUYABIO international. KeT is consultant (Zenyaku, Eisai, Takeda, Mundipharma, HUYABIO, Kyowa Kirin, Celgene, Chugai, Ono, Yakult, Daiichi Sankyo, Solasia).
Haematologica | 108 March 2023 819 ARTICLE - Tucidinostat in patients with R/R PTCL S. Rai et al.
Contributions
SR, WSK, KA, IC, KoI, NT, MY, KuT, JK, JA, MH, YK, HS, TU, DeHY, KjI , KiI, JSK, HGL, HM, HSE, MK, JHL, JSL, WSL, HN, TS, DoHY and SY participated in the study, treated patients, and provided data. SR, MG, HO and KeT were involved in the manuscript development. MG, HO and KeT were involved in the study design, data collection and analysis and data interpretation. All authors were involved in the review of the content and approved the submitted version of the manuscript.
Acknowledgements
The authors would like to thank the patients, their families, other investigators (Oh, Sung Yong, Yoshihiro Kameoka, Shigeru Kusumoto, Yoshinobu Maeda, Koji Kato, Atae Uts-
References
1. Swerdlow SH, Campo E, Pileri SA, et al. The 2016 revision of the World Health Organization classification of lymphoid neoplasms. Blood. 2016;127(20):2375-2390.
2. Horwitz SM, Zelenetz AD, Gordon LI, et al. NCCN guidelines insights: non-Hodgkin's lymphomas, Version 3.2016. J Natl Compr Canc Netw. 2016;14(9):1067-1079.
3. d'Amore F, Gaulard P, Trümper L, et al. Peripheral T-cell lymphomas: ESMO Clinical Practice Guidelines for diagnosis, treatment and follow-up. Ann Oncol. 2015(Suppl 5):v108-115.
4. Horwitz S, O'Connor OA, Pro B, et al. Brentuximab vedotin with chemotherapy for CD30-positive peripheral T-cell lymphoma (ECHELON-2): a global, double-blind, randomised, phase 3 trial. Lancet. 2019;393(10168):229-240.
5. Chihara D, Fanale MA, Miranda RN, et al. The survival outcome of patients with relapsed/refractory peripheral T-cell lymphomanot otherwise specified and angioimmunoblastic T-cell lymphoma. Br J Haematol. 2017;176(5):750-758.
6. Mak V, Hamm J, Chhanabhai M, et al. Survival of patients with peripheral T-cell lymphoma after first relapse or progression: spectrum of disease and rare long-term survivors. J Clin Oncol. 2013;31(16):1970-1976.
7. Bellei M, Foss FM, Shustov AR, et al. The outcome of peripheral T-cell lymphoma patients failing first-line therapy: a report from the prospective, International T-Cell Project. Haematologica. 2018;103(7):1191-1197.
8. O'Connor OA, Pro B, Pinter-Brown L, et al. Pralatrexate in patients with relapsed or refractory peripheral T-cell lymphoma: results from the pivotal PROPEL study. J Clin Oncol. 2011;29(9):1182-1189.
9. Maruyama D, Nagai H, Maeda Y, et al. Phase I/II study of pralatrexate in Japanese patients with relapsed or refractory peripheral T-cell lymphoma. Cancer Sci. 2017;108(10):2061-2068.
10. Maruyama D, Tsukasaki K, Uchida T, et al. Multicenter phase 1/2 study of forodesine in patients with relapsed peripheral T cell lymphoma. Ann Hematol. 2019;98(1):131-142.
11. O'Connor OA, Horwitz S, Masszi T, et al. Belinostat in patients with relapsed or refractory peripheral T-cell lymphoma: results of the pivotal phase II BELIEF (CLN-19) study. J Clin Oncol. 2015;33(23):2492-2499.
12. Coiffier B, Pro B, Prince HM, et al. Results from a pivotal,
unomiya) and all staff in each hospital for their support in performing the present study. We would also like to thank Kazuhito Yamamoto, Yosuke Minami and Noriko Fukuhara: members of the Independent Overall Efficacy Review Committee, and Noriko Usui, Yoshinobu Kanda, Keita Kirito and Yasuo Ohashi: members of the Data Safety Monitoring Board and Yoshihiro Matsuno, Koichi Ohshima and Shigeo Nakamura: members of the Central Pathological Review. Karen Rittweger provided medical writing assistance, funded by HUYABIO International (Huya, San Diego, USA).
Data-sharing statement
Individual participant data will not be shared, because informed consent was not obtained for data sharing, and protocols will also not be shared, due to sponsor policy.
open-label, phase II study of romidepsin in relapsed or refractory peripheral T-cell lymphoma after prior systemic therapy. J Clin Oncol. 2012;30(6):631-636.
13. Maruyama D, Tobinai K, Ogura M, et al. Romidepsin in Japanese patients with relapsed or refractory peripheral T-cell lymphoma: a phase I/II and pharmacokinetics study. Int J Hematol. 2017;106(5):655-665.
14. Kawai H, Ando K, Maruyama D, et al. Phase II study of E7777 in Japanese patients with relapsed/refractory peripheral and cutaneous T-cell lymphoma. Cancer Sci. 2021;112(6):2426-2435.
15. Pro B, Advani R, Brice P, et al. Brentuximab vedotin (SGN-35) in patients with relapsed or refractory systemic anaplastic largecell lymphoma: results of a phase II study. J Clin Oncol. 2012;30(18):2190-2196.
16. Ogura M, Ishida T, Hatake K, et al. Multicenter phase II study of mogamulizumab (KW-0761), a defucosylated anti-cc chemokine receptor 4 antibody, in patients with relapsed peripheral T-cell lymphoma and cutaneous T-cell lymphoma. J Clin Oncol. 2014;32(11):1157-1163.
17. Strahl BD, Allis CD. The language of covalent histone modifications. Nature. 2000;403(6765):41-45.
18. Weichert W. HDAC expression and clinical prognosis in human malignancies. Cancer Lett. 2009;280(2):168-176.
19. Marquard L, Gjerdrum LM, Christensen IJ, Jensen PB, Sehested M, Ralfkiaer E. Prognostic significance of the therapeutic targets histone deacetylase 1, 2, 6 and acetylated histone H4 in cutaneous T-cell lymphoma. Histopathology. 2008;53(3):267-277.
20. Marquard L, Poulsen CB, Gjerdrum LM, et al. Histone deacetylase 1, 2, 6 and acetylated histone H4 in B- and T-cell lymphomas. Histopathology. 2009;54(6):688-698.
21. Zhang H, Lv H, Jia X, et al. Clinical significance of enhancer of zeste homolog 2 and histone deacetylases 1 and 2 expression in peripheral T-cell lymphoma. Oncol Lett. 2019;18(2):1415-1423.
22. Ning ZQ, Li ZB, Newman MJ, et al. Chidamide (CS055/HBI8000): a new histone deacetylase inhibitor of the benzamide class with antitumor activity and the ability to enhance immune cell-mediated tumor cell cytotoxicity. Cancer Chemother Pharmacol. 2012;69(4):901-909.
23. Zhou J, Zhang C, Sui X, et al. Histone deacetylase inhibitor
Haematologica | 108 March 2023 820 ARTICLE - Tucidinostat in patients with R/R PTCL S. Rai et al.
chidamide induces growth inhibition and apoptosis in NK/T lymphoma cells through ATM-Chk2-p53-p21 signalling pathway. Invest New Drugs. 2018;36(4):571-580.
24. Liu Z, Ding K, Li L, et al. A novel histone deacetylase inhibitor Chidamide induces G0/G1 arrest and apoptosis in myelodysplastic syndromes. Biomed Pharmacother. 2016;83:1032-1037.
25. Zhao B, He T. Chidamide, a histone deacetylase inhibitor, functions as a tumor inhibitor by modulating the ratio of Bax/Bcl-2 and P21 in pancreatic cancer. Oncol Rep. 2015;33(1):304-310.
26. Wei C, Hu S, Luo M, et al. A novel mechanism of action of histone deacetylase inhibitor chidamide: enhancing the chemotaxis function of circulating PD-1(+) cells from patients with PTCL. Front Oncol. 2021;11:682436.
27. Yao Y, Zhou J, Wang L, et al. Increased PRAME-specific CTL killing of acute myeloid leukemia cells by either a novel histone deacetylase inhibitor chidamide alone or combined treatment with decitabine. PLoS One. 2013;8(8):e70522.
28. Dong M, Ning ZQ, Xing PY, et al. Phase I study of chidamide (CS055/HBI-8000), a new histone deacetylase inhibitor, in patients with advanced solid tumors and lymphomas. Cancer Chemother Pharmacol. 2012;69(6):1413-1422.
29. Shi Y, Dong M, Hong X, et al. Results from a multicenter, openlabel, pivotal phase II study of chidamide in relapsed or refractory peripheral T-cell lymphoma. Ann Oncol. 2015;26(8):1766-1771.
30. Jiang Z, Li W, Hu X, et al. Tucidinostat plus exemestane for postmenopausal patients with advanced, hormone receptorpositive breast cancer (ACE): a randomised, double-blind, placebo-controlled, phase 3 trial. Lancet Oncol. 2019;20(6):806-815.
31. Yoshimitsu M, Ando K, Ishida T, et al. Oral histone deacetylase inhibitor HBI-8000 (tucidinostat) in Japanese patients with relapsed or refractory non-Hodgkin’s lymphoma: phase I safety and efficacy. Jpn J Clin Oncol. 2022;52(9):1014-1020.
32. Jaffe ES. The 2008 WHO classification of lymphomas: implications for clinical practice and translational research. Hematology Am Soc Hematol Educ Program. 2009:523-531.
33. Cheson BD, Fisher RI, Barrington SF, et al. Recommendations for initial evaluation, staging, and response assessment of Hodgkin and non-Hodgkin lymphoma: the Lugano classification. J Clin Oncol. 2014;32(27):3059-3067.
34. Olsen EA, Whittaker S, Kim YH, et al. Clinical end points and
response criteria in mycosis fungoides and Sézary syndrome: a consensus statement of the International Society for Cutaneous Lymphomas, the United States Cutaneous Lymphoma Consortium, and the Cutaneous Lymphoma Task Force of the European Organisation for Research and Treatment of Cancer. J Clin Oncol. 2011;29(18):2598-2607.
35. Ogura M, Kim WS, Uchida T, et al. Phase I studies of darinaparsin in patients with relapsed or refractory peripheral T-cell lymphoma: a pooled analysis of two phase I studies conducted in Japan and Korea. Jpn J Clin Oncol. 2021;51(2):218-227.
36. Shi Y, Jia B, Xu W, et al. Chidamide in relapsed or refractory peripheral T cell lymphoma: a multicenter real-world study in China. J Hematol Oncol. 2017;10(1):69.
37. Lemonnier F, Couronné L, Parrens M, et al. Recurrent TET2 mutations in peripheral T-cell lymphomas correlate with TFHlike features and adverse clinical parameters. Blood. 2012;120(7):1466-1469.
38. Watatani Y, Sato Y, Miyoshi H, et al. Molecular heterogeneity in peripheral T-cell lymphoma, not otherwise specified revealed by comprehensive genetic profiling. Leukemia. 2019;33(12):2867-2883.
39. Couronné L, Bastard C, Bernard OA. TET2 and DNMT3A mutations in human T-cell lymphoma. N Engl J Med. 2012;366(1):95-96.
40. Lemonnier F, Dupuis J, Sujobert P, et al. Treatment with 5azacytidine induces a sustained response in patients with angioimmunoblastic T-cell lymphoma. Blood. 2018;132(21):2305-2309.
41. Wang L, Qin W, Huo YJ, et al. Advances in targeted therapy for malignant lymphoma. Signal Transduct Target Ther. 2020;5(1):15.
42. Falchi L, Ma H, Klein S, et al. Combined oral 5-azacytidine and romidepsin are highly effective in patients with PTCL: a multicenter phase 2 study. Blood. 2021;137(16):2161-2170.
43. Wang P, Wang Z, Liu J. Correction to: role of HDACs in normal and malignant hematopoiesis. Mol Cancer. 2020;19(1):55.
44. Majchrzak-Celińska A, Warych A, Szoszkiewicz M. Novel approaches to epigenetic therapies: from drug combinations to epigenetic editing. Genes (Basel). 2021;12(2):208.
45. Hontecillas-Prieto L, Flores-Campos R, Silver A, de Álava E, Hajji N, García-Domínguez DJ. Synergistic enhancement of cancer therapy using HDAC inhibitors: opportunity for clinical trials. Front Genet. 2020;11:578011.
Haematologica | 108 March 2023 821 ARTICLE - Tucidinostat in patients with R/R PTCL S. Rai et al.
Treatment patterns and outcomes in relapsed/refractory follicular lymphoma: results from the international SCHOLAR-5 study
Correspondence: M.L. Palomba palombam@mskcc.org
Received: June 1, 2022.
Accepted: October 7, 2022.
Early view: October 20, 2022.
1Roswell Park Comprehensive Cancer Center, Buffalo, NY, USA; 2Memorial Sloan Kettering Cancer Center, New York, NY, USA; 3Centre Hospitalier Lyon Sud, Lyon, France; 4Vall D’Hebron Insitute of Oncology, Barcelona, Spain; 5Kite, A Gilead Company, Santa Monica, CA, USA; 6RainCity Analytics, Vancouver, British Columbia, Canada; 7Delta Hat, Nottingham, UK; 8Wade Outcomes Research and Consulting, Salt Lake City, UT, USA; 9Portuguese Oncology Institute of Porto, Porto, Portugal; 10The Christie NHS Foundation Trust and University of Manchester, Manchester, UK and 11Barts Cancer Institute, Queen Mary University of London, London, UK
*PG and MLP contributed equally as co-first authors
Abstract
https://doi.org/10.3324/haematol.2022.281421
©2023 Ferrata Storti Foundation
Published under a CC BY-NC license
The SCHOLAR-5 study examines treatment patterns and outcomes of real-world follicular lymphoma (FL) patients on 3rd line of treatment (LoT) or higher, for whom existing data are limited. SCHOLAR-5 is a retrospective cohort study using data from adults (≥ 18 years) with grade 1-3a FL, initiating ≥3rd LoT after June 2014 at major lymphoma centers in the US and Europe. Objective response rate (ORR), complete response (CR), progression-free survival (PFS) and overall survival (OS) were analyzed by LoT. Time-to-event outcomes were assessed using Kaplan-Meier methods. Of 128 patients, 87 initiated 3rd LoT, 63 initiated 4th LoT, and 47 initiated 5th LoT. At 1st eligible LoT, 31% progressed within 24-months of 1st LoT anti-CD20 combination therapy, 28% had prior autologous stem cell transplantation, and 31% were refractory to the previous LoT. The most common regimen in each LoT was chemoimmunotherapy; however, experimental drugs were increasingly used at later LoT. In the US, anti-CD20 monotherapy was more common at ≥3rd LoT compared to Europe, where stem cell transplants were more common. ORR at 3rd LoT was 68% (CR 44%), but decreased after each LoT to 37% (CR 22%) in ≥5 LoT. Median OS and PFS at 3rd LoT were 68 and 11 months, respectively, and reduced to 43 and 4 months at ≥5 LoT. Treatments were heterogenous at each LoT in both the US and Europe. Few FL patients achieved CR in later LoT, and duration of response and survival diminished with each subsequent line.
Introduction
Indolent non-Hodgkin lymphoma (iNHL) is a slow growing disease constituting approximately one-third of malignant lymphomas in the US and Europe.1 Follicular lymphoma (FL) is the most common subtype of iNHL.2 Despite high initial response rates to front-line treatment, including chemoimmunotherapies such as R-CHOP (rituximab, cyclophosphamide, doxorubicin hydrochloride, vincristine and prednisone),3 FL is largely considered to be incurable with standard therapies, and a majority of patients experience multiple relapses in their lifetimes.4 Moreover, the durability of remission with available treatments decreases with each subsequent line of therapy (LoT).5-7 The treatment of relapsed/refractory (r/r) FL, as outlined
in National Comprehensive Cancer Network and European Society for Medical Oncology guidelines,8,9 contains a broad range of options. Among these treatments, autologous stem cell transplantation (ASCT) may be associated with improved progression-free survival (PFS) in r/r FL, but the benefit for overall survival (OS) is less welldefined.10 No study has prospectively assessed the utility of ASCT in the rituximab era. Rituximab-based therapies, including R2 (rituximab + lenalidomide)11 and R-BR (rituximab + bendamustine),12 are associated with benefits in PFS. Some newer r/r FL therapies have also shown benefits in PFS, including PI3K (phosphoinositide 3-kinase) inhibitors (e.g., idelalisib)13,14 and EZH2 (enhancer of zeste homolog 2 specific) inhibitors.15 Nonetheless, PFS benefits with these agents tend to not be durable. More recently,
Paola Ghione,1,2* Maria Lia Palomba,2* Hervé Ghesquieres,3 Sabela Bobillo,4 Anik R Patel,5 Myrna Nahas,5 Steve Kanters,6 Kevin Deighton,7 Anthony Hatswell,7 Long Ma,5 Eve H. LimbrickOldfield,6 Julia Thornton Snider,5 Sally W. Wade,8 Maria Teresa Riberio,9 John Radford,10 Sara Beygi5 and John Gribben11
Haematologica | 108 March 2023 822 ARTICLE - Non-Hodgkin Lymphoma
anti-CD19 chimeric antigen receptor (CAR) T-cell therapy has demonstrated promising and durable clinical responses in r/r FL,16 and received regulatory approval by the US Food and Drug Administration for this indication. Due to the variety of treatments available, and the historical lack of a clearly superior treatment for r/r FL, there is substantial variability in the treatment patterns of these patients, especially in later LoT. Retrospective cohort data from the US and a recent systematic review and metaanalysis have shown that a wide range of treatment regimens are used for r/r FL patients at each LoT, and that, despite a plethora of treatment options, survival rates decrease with each subsequent LoT.5,17 The existing literature, however, primarily reports the experience in the US and typically span as far back as the early 2000s, which may not be reflective of care today. The impact, if any, of differences in the routine care and resulting clinical outcomes of r/r FL patients in the US and Europe are not yet fully described.18,19
SCHOLAR-5 is a retrospective cohort study that was conducted at major lymphoma centers in the US and Europe, and as such, provides a broad perspective on available treatment options and associated outcomes in those geographies.20 While SCHOLAR-5 was designed in part to create an external control group against which to compare axicabtagene ciloleucel (axi-cel) results from the pivotal r/r FL ZUMA-5 trial, it also provides unique insights into real-world treatment patterns and outcomes among r/r FL patients in later LoT. The current study, therefore, analyzed SCHOLAR-5 data to describe patient prognostic factors, treatment patterns, and clinical outcomes in the recent, pre-CAR T-cell therapy landscape for r/r FL patients after two or more prior lines of therapy. Additionally, we describe regional differences in patient characteristics, treatments, and outcomes.
Methods
Design and setting
SCHOLAR-5 is an international, multicenter, retrospective cohort study. Data were obtained through chart reviews of patient records from seven institutions in five countries (Barts Cancer Institute and the Christie NHS Foundation Trust, UK; the Centre Hospitalier Lyon-Sud, France; the Vall d’Hebron Institute of Oncology, Spain; the Instituto Portugues de Oncologia do Porto, Portugal; and the Memorial Sloan Kettering Cancer Center and Vanderbilt Medical Center in the US). These sites were selected based on the numbers of eligible patients, data availability across variables of interest, ability to enhance key variables through manual review of clinical notes, and speed of data abstraction. All data were de-identified and data abstraction processes were identical across all sites. Investigators
abided by the general ethical principles outlined in the Declaration of Helsinki and, where necessary, obtained approval from the Independent Review Board(s)/Ethics Committee(s). Additional information on the data sources and data abstraction are provided in the Online Supplementary Appendix S1.1.
Study population and follow-up
In order to meet eligibility for SCHOLAR-5, patients had to be aged ≥18 years with r/r FL grade 1-3a. Each patient was to be initiating 3rd LoT or higher after June 2014. Only patients with biopsy-proven absence of transformation were eligible for inclusion. Patients whose disease transformed during the study period contributed data up until the date of transformation. Patients with prior anti-CD19 or other genetically modified CAR T-cell therapy were excluded, as were patients who met inclusion criteria <12 months before the data collection date (i.e., had <12 months of potential follow-up). See the Online Supplementary Appendix S1.2 and S1.3 for additional details.
Key endpoints
Outcomes of interest were objective response rate (ORR; complete response + partial response), complete response (CR), OS, PFS and time to next treatment (TTNT). Response was determined either by Lugano 2014 criteria or computed tomography (CT) scans using the revised International working group classification.4 POD24, a key baseline characteristic, was defined as patients having progressed within 24 months after initiation of first-line anti-CD20 chemotherapy combination therapy.
Statistical methods
Analyses were carried out by LoT. All eligible LoT from each patient were included in the analysis. The primary analysis considered only systemic therapies as independent LoT. A sensitivity analysis was performed to consider radiotherapy alone as an independent LoT. Data were sufficient to report results separately for 3rd and 4th LoT, but data for 5th LoT and higher were combined for analysis due to small sample size. For response outcomes, 95% confidence intervals were calculated on percentages using the Clopper-Pearson method. For the analysis of ≥5th LoT results, random-effects were used to account for multiple LoT per patient in the calculation of point estimates and confidence intervals. For time-to-event outcomes, the Kaplan-Meier (KM) method was used to construct survival curves, from which median survival, 18-month and 24month proportions were estimated. As with response outcomes, random intercepts were included in the ≥5th LoT analysis for PFS and TTNT to account for multiple LoT and associated outcomes per patient. For OS, only the first eligible ≥5th LoT was included, due to the shared event across lines LoT. For plotting, KM curves were calculated
Haematologica | 108 March 2023 823 ARTICLE - SCHOLAR-5 – unmet needs in r/r FL P. Ghione et al.
separately for 5th and 6th LoT. All analyses were conducted in R version 3.6.3 using the survival package.
Results
Data from 184 patients with r/r non-Hodgkin lymphoma, including 160 r/r FL patients, were included in the SCHOLAR-5 cohort. Figure 1 illustrates the selection process by showing the counts at each step at the Memorial Sloan Kettering Cancer Center site. Of the 1,100 patients in that site’s database, 54 patients met all selection criteria for SCHOLAR-5. The most common reasons for exclusions were patients not having initiated 3rd LoT or higher, followed by patients not having initiated their most recent LoT after 23rd July 2014. The latter was the threshold used to identify the modern treatment era, as defined by the regulatory approval of idelalisib – the first PI3K inhibitor. This flow chart highlights that the relatively modest number of patients obtained from large centers such as MSK was due to the application of our predefined selection criteria rather than to preferential selection, and is representative of the patient selection process at the other contributing centers.
Of the 160 FL patients identifi ed as potentially eligible across all sites, 128 remained after the final data alignment, and these patients contributed a total of 222 eligible lines of systemic therapy. Figure 2 illustrates the effect of each criterion applied in this final data alignment phase. The most common reasons for exclusion were presence of marginal zone lymphoma histology and having fewer than two prior LoT after re-alignment with the study LoT definition. Sixteen patients did not have an eligible ≥ 3rd LoT therapy, with most of them failing to initiate 3rd LoT after the threshold date. Rates of exclusion were similar between the US and Europe.
Baseline characteristics at the first eligible LoT for the included patients are shown in Table 1 for the population overall as well as separated by geography. Thirty-nine percent (39%) of patients were from the US, 20% from France, 17% from the UK, 14% from Spain, and 10% from Portugal. Baseline patient characteristics were comparable between Europe and the US. A higher proportion of patients in Europe had an eligible 3rd LoT, compared to the US and more patients in Europe had received SCT prior to their first eligible LoT. Most patients had grade 1 or 2 FL and stage III-IV disease. Additionally, 30.8% of patients were POD24 (defined by progression of disease within 24 months from initiating first-line anti-CD20 combination therapy). Despite multiple data curation efforts, several variables were not consistently reported in the study database, including the Follicular Lymphoma International Prognostic Index (FLIPI), bone marrow involvement, and the number of nodal sites. Of note, data
curation efforts were successful in improving the reporting of multiple variables, most notably the Eastern Cooperative Oncology Group performance scores (derived from other performance scores) and FLIPI (derived from the reporting of its components). The less consistently reported variables may simply be less often collected in the routine clinical practice setting. See Online Supplementary Table S1 for additional baseline characteristics, and Online Supplementary Table S2 for baseline characteristics separated by LoT. Of note, the proportion of refractory patients increased from 32.6% at 3rd LoT, to 59.7% at 4th and 53.2% at ≥5th LoT, and median time from last therapy reduced from 18.0 months at 3rd LoT, to 9.0 and 7.7 months at 4th and ≥5th LoT.
Treatment patterns
Figure 2 presents the treatment patterns for the overall cohort across all LoT, (panel A), and then separated by geography for 3rd and 4th LoT (panels B and C). The majority
Figure 1. Flowchart of patient selection at Memorial Sloan Kettering Cancer Center. †Eligibility criteria were patients aged ≥18 years; with histologically confirmed diagnosis of indolent nonHodgkin lymphoma (iNHL), with histological subtype limited to follicular lymphoma (FL) grade 1, grade 2, or grade 3a based on criteria established by the World Health Organization 2016 classification; with relapsed/refractory (r/r) disease (i.e., r/r iNHL). Patients with transfomed FL, FL histological grade 3b, prior anti-CD19 CAR T-cell therapy or other genetically modified Tcell therapy were excluded. Patient were only included if eligible within 12 months before the last updated version of the sites database.

Haematologica | 108 March 2023 824 ARTICLE - SCHOLAR-5 – unmet needs in r/r FL P. Ghione et al.
of first-line regimens were chemoimmunotherapy, with anti-CD20 + CHOP-like (e.g., R-CHOP) being the most frequently used regimen. The relative frequency of this regimen declined through subsequent LoT. Nevertheless, chemoimmunotherapy regimens remained common among 2nd LoT patients. There was a large diversity of treatments in 3rd LoT and beyond, suggesting a lack of a standard approach among later line r/r FL patients. This was further emphasized by the larger number of patients using experimental regimens at 3rd LoT and higher, and the later-line use of treatments often reserved for first-line treatment (e.g., anti-CD20 monotherapy and chemoimmunotherapy). Online Supplementary Table S3 provides further details of treatment patterns, and Online Supplementary Figure S2 and Online Supplementary Table S4 present treatment patterns from the sensitivity analysis, where radiotherapy alone was considered an eligible LoT. Figure 3B shows a divergence in treatment patterns between the US and Europe. At 3rd LoT, patients in the US, compared to Europe, were more likely to be prescribed CD20 monotherapy (20% vs. 2%) and R2 and other imidbased treatments (12% vs. 6%). By contrast patients in Europe were more likely to receive SCT (autologous: 18% vs. 0%, allogeneic: 5% vs. 0%). Rates of PI3Ki, experimental, chemotherapy alone, and anti-CD20 combination therapy were similar across geographies. At 4th LoT (Figure 3C), 21% and 18% of regimens were experimental in the US and Europe, respectively, a greater proportion than at 3rd LoT. In Europe, 18% of 4th LoT regimens were chemotherapy alone,
compared to 3% in the US. In the sensitivity analysis in which radiotherapy was an eligible independent LoT (i.e., when not restricting LoT to systemic therapy), the treatment patterns as a whole were generally similar to those seen in the primary analysis (i.e., LoT defined by systemic therapies) and the same conclusions are drawn.

Clinical outcomes by line of treatment
Results of the endpoint analyses are presented in Table 2. ORR was 68.3% at 3rd LoT, decreasing to 62.7% at 4th LoT and 37.2% at 5th LoT. Similarly, CR decreased from 43.9% at 3rd LoT to 21.5% at ≥5th LoT. OS at 24 months was 83.7% at 3rd LoT, decreasing to 72.7% at 4th LoT and 54.3% at ≥5th LoT. By 60 months, OS was 62.6% at 3rd Lot, 52.4% at 4th lot, and 38.0% at ≥5th LoT, although we note that data at this later time point were based on limited number of patients. The decreasing estimated probabilities of OS with each subsequent LoT is highlighted in Figure 4A as the survival lines for later LoT clearly lie below those corresponding to earlier LoT. While the choice to focus on systemic LoT had minimal impact on the treatment patterns, it did have a meaningful impact on endpoint analysis. The sensitivity analysis re-defining LoT to include radiotherapy alone as an independent LoT resulted in estimates of OS increasing (Online Supplementary Table S5) but the patterns remained the same. Note that given the date threshold used for LoT eligibility, a median OS beyond 72 months was not estimable.
Despite the generally long survival times, particularly in
Haematologica | 108 March 2023 825 ARTICLE - SCHOLAR-5 – unmet needs in r/r FL P. Ghione et al.
Figure 2. Flowchart of patient and line-of-therapy exclusion by continent. Sixty patients contributed multiple lines of therapy (LoT) to the analysis set, with these patients contributing a median of 2 LoT (range, 2 – 6). FL: follicular lymphoma. MZL: marginal zone lymphoma.
*Missing percentage based on full sample, while percentage within categories calculated from patients non-missing values (therefore, percentages add up to more than 100%). †Refractory disease was defined as progressing (defined as PD) during or within 6 months after completion of the most recent prior treatment. Relapsed disease was defined as progressing after complete response, partial response or stable disease >6 months after completion of the most recent prior treatment. All characteristics are at or within 6 months of the initiation of 1st eligible line of treatment in analysis, with the exception of disease stage and FLIPI, which are at diagnosis. POD24: having progressed within 24 months of 1st line anti-CD20 monoclonal antibody and chemotherapy combination; FLIPI: Follicular Lymphoma International Prognostic Index.
Europe US Overall Sample size 78 50 128 Age in years, median (range) 65.5 (36-85) 64 (38-86) 65 (36-86) Age ≥ 65 years, N (%) 43 (55.1) 24 (48.0) 67 (52.3) Male, N (%) 41 (52.6) 32 (64.0) 73 (57.0) Follicular lymphoma subtype, N (%) Grade 1 29 (40.8) 30 (65.2) 59 (50.4) Grade 2 32 (45.1) 14 (30.4) 46 (39.3) Grade 3a 10 (14.1) 2 (4.3) 12 (10.3) Missing* 7 4 11 Disease stage at diagnosis, N (%) I 4 (7.4) 2 (4.3) 6 (6.0) II 2 (3.7) 6 (13.0) 8 (8.0) III 10 (18.5) 21 (45.7) 31 (31.0) IV 38 (70.4) 17 (37.0) 55 (55.0) Missing* 24 4 28 FLIPI at diagnosis, N (%) Low 11 (23.9) 9 (21.4) 20 (22.7) Medium 13 (28.3) 21 (50.0) 34 (38.6) High 22 (47.9) 12 (28.6) 34 (38.6) Missing* 32 8 40 Relapsed or refractory to previous LoT†, N (%) Relapsed 53 (68.8) 26 (53.1) 79 (62.7) Refractory 24 (31.2) 23 (46.9) 47 (37.3) Missing* 1 1 2 ECOG 0-1 66 (93.0) 28 (93.3) 94 (93.0) 2-4 5 (7.0) 2 (6.7) 7 (7.0) Missing* 7 20 27 POD24 – yes, N (%) 24 (30.8) 10 (20.0) 34 (26.6) Bone marrow involvement at index date, N (%) 16 (38.1) 3 (18.2) 18 (34.0) Missing* 36 34 70 Prior SCT, N (%) Autologous 22 (28.2) 1 (2.0) 23 (18.0) Allogeneic 1 (1.3) 2 (4.1) 3 (2.3) None 55 (70.5) 47 (93.9) 102 (79.7) Missing* 0 1 1 Prior anti-CD20 + alkylating agent, N(%) Yes 74 (94.9) 40 (80.0) 114 (89.1) No 4 (5.1) 10 (20.0%) 14 (10.9) Best response to last line of therapy, N (%) Complete response 35 (44.8) 18 (36.0) 53 (41.4) Partial response 31 (39.7) 16 (32.0) 47 (36.7) Stable disease 6 (7.7) 10 (20.0) 16 (12.5) Progressive disease 6 (7.7) 6 (12.0) 12 (9.3) Size of largest nodal mass, N (%) ≥ 7cm 13 (30.2) 9 (23.1) 22 (26.8) Missing* 35 11 46
Table 1. Baseline characteristics at first eligible line of therapy.
Haematologica | 108 March 2023 826 ARTICLE - SCHOLAR-5 – unmet needs in r/r FL P. Ghione et al.
Figure 3. Treatment patterns. Experimental category does not include recently accepted treatments (PI3K-d inhibitors, R2, and EZH2i), even if they were not approved at the time of the study. (A) Treatments received by eligible patients, by line of therapy (LoT). The percentage values represent the proportion of patients who contribute to each LoT. (B) Eligible 3rd LoT by continent. (C) Eligible 4th LoT by continent. Note that (A) includes treatments received prior to the approval of idelalisib, whereas (B and C) include only treatments received after 23rd July 2014. Benda: bendamustine; CD20: anti-CD20 monoclonal antibodies; Chemo: chemotherapy; CHOP: cyclophosphamide, doxorubicin, vincristine, and prednisone; CVP: cyclophosphamide, vincristine, prednisolone; EZH2i: enhancer of zeste homolog 2 specific inhibitors, ImiDs: immunomodulatory drugs; R2: rituximab and lenalidomide; SCT: stem cell transplant; PI3Ki: phosphoinositide 3-kinase inhibitor.

Haematologica | 108 March 2023 827 ARTICLE - SCHOLAR-5 – unmet needs in r/r FL P. Ghione et al. A B C
*For ≥5 line of therapy (LoT), 72 eligible lines from 47 patients were included in the analysis, with the exception of overall survival (OS) which included only the 1st eligible line per patient. CI: confidence interval; ORR: overall response rate; CR: complete response; PFS: progressionfree survival; TTNT: time-to-next treatment; --: data not available due to last patient being censored or having an event prior to this time point. ne: not estimable; nr: not reached.
the lower LoT, PFS at 24 months was 16.8% for 3rd LoT, 10.4% for 4th LoT, and 7.9% at ≥5th LoT (Figure 4B). There were no clear trends for PFS and OS when examining the 5th and 6th LoT separately. This is partially a reflection of the much sharper decline in the proportion of progression-free patients relative to the decline in OS. PFS shows only modest durability of response at the 3rd and 4th LoT. These results also highlight the lack of durable response in later LoT. Similarly, TTNT tended to have increasing probabilities of faster events with increasing lines; however, just as the 5th and 6th LoT were less distinguishable for PFS, 3rd and 4th line were close to one another for TTNT.
Discussion
Treatment patterns and clinical outcomes observed in the international SCHOLAR-5 study – a large, contemporary cohort of later line r/r FL patients – demonstrate an important unmet need in real-world treatment of this vulnerable population. Importantly, this study demonstrates that there is no clear consensus for treatment choice in later lines, with a multiplicity of treatments used in each region, and experimental treatments more commonly utilized in later lines in both the US and Europe. Despite ex-
cluding cases of transformation, these findings from the SCHOLAR-5 r/r FL cohort suggest the likelihood, quality, and duration of clinical response decreases with each subsequent LoT, regardless of the type of treatment or geographic region. In other words, available therapies leave an unmet need for some patients with r/r FL who require therapy beyond 2nd line.
SCHOLAR-5 can be contextualized with respect to five recently published r/r FL patient cohorts; however, direct comparisons between patient cohorts can be challenging and should be interpreted with caution. Three cohorts were published prior to SCHOLAR-5, including singlecenter cohorts from the US (Batlevi et al.) and Japan (Fuji et al.) and a large multicenter cohort from the US (Link et al.).5,6,21 Two additional multicenter cohort studies were conducted at approximately the same time as SCHOLAR5, namely the ReCORD-FL and LEO CReWE cohorts.22,23 There were similarities across all of the patient cohorts. The complete response observed in SCHOLAR-5, 43.9% and 27.1% at 3rd and 4th LoT respectively, are comparable to those published for the Japanese cohort (42.1% and 23.8% at 3rd and 4th LoT, respectively),21 for ReCORD-FL (37.4% and 32.0% at 3rd and 4th LoT, respectively), and for LEO CReWE (45% at 3rd LoT). For PFS, medians from the five patient cohorts ranged from 10 to 19 months at 3rd LoT
3rd LoT 4th LoT ≥ 5th LoT Response outcomes (best) ORR N responders 56/82 37/59 24/65 % (95% CI) 68.3 (57.1-78.1) 62.7 (49.1-74.9) 37.2(25.2-51.1) CR N responders 36/82 16/59 14/65 % (95% CI) 43.9 (33.0- 55.3) 27.1 (16.4-40.3) 21.5 (13.2-33.2) Time-to-event outcomes N = 87 N = 63 N = 47* OS Median months (95% CI) 67.6 (60.1-ne) Nr (30.4-ne) 42.8 (15.3-ne) 18 months % (95% CI) 86.5 (79.4-94.3) 83.1 (74.0-93.2) 59.5 (46.6-76.0) 24 months % (95% CI) 83.7 (76.0-92.3) 72.7 (61.7-85.7) 54.3 (41.2-71.5) 36 months % (95% CI) 77.8 (68.9-87.8) 60.7 (48.3-76.3) 51.3 (38.1-69.0) 60 months % (95% CI) 62.6 (50.1-78.2) 52.4 (38.4-71.6) 38.0 (22.6-63.9) PFS Median months (95% CI) 11.0 (9.0-17.9) 9.7 (6.2-16.7) 3.9 (3.0-8.5) 18 months % (95% CI) 33.5 (23.1-48.6) 23.1 (12.7-41.8) 9.9 (4.3-22.8) 24 months % (95% CI) 16.8 (9.1-31.0) 10.4 (3.8-28.6) 7.9 (3.1-20.2) 36 months % (95% CI) 13.4 (6.3-28.5) 6.9 (1.9-25.2) 60 months % (95% CI) TTNT Median months (95% CI) 20.1 (15.7-40.0) 17.9 (14.9-24.2) 7.1 (4.3-17.4) 18 months % (95% CI) 53.3 (43.4-65.5) 48.9 (37.2-64.1) 33.1 (22.7-48.3) 24 months % (95% CI) 41.8 (32.0-54.5) 36.1 (25.1-52.0) 31.5 (21.5-46.0) 36 months % (95% CI) 37.3 (27.8-50.1) 28.3 (17.9-44.8) 25.1 (15.0-41.8) 60 months % (95% CI) 23.2 (13.9-38.9) 19.8 (10.0-39.4)
Table 2. Clinical outcomes by line of therapy.
Haematologica | 108 March 2023 828 ARTICLE - SCHOLAR-5 – unmet needs in r/r FL P. Ghione et al.
and 5 to 12 months at 4th LoT, compared to 11 and 10 months, respectively, in SCHOLAR-5.5,6,21 The comparison for median OS was more challenging given the shorter follow-up in SCHOLAR-5 (up to 7 years, which was shorter than the anticipated median OS for 3rd LoT patients) due to the restricted time period (2014-2020). The similarity in results between the SCHOLAR-5 and patient cohorts going back to the early 2000s suggests that contemporary treatments (those approved in the 2014-2020 study period)
may not offer as significantly improved outcomes over treatments available prior to the introduction of idelalisib. The general alignment of results from SCHOLAR-5, conducted in the US and Europe, to those from the literature (US,5,6 Europe,23 and Japan21), suggest that OS and PFS results in r/r FL patients are similar across these regions. In addition, the inverse relationship between length of overall survival and number of LoT (i.e., shorter survival at higher LoT) in SCHOLAR-5 is consistent with the trends docu-

Haematologica | 108 March 2023 829 ARTICLE - SCHOLAR-5 – unmet needs in r/r FL P. Ghione et al. A B C
Figure 4. Survival curves by line of therapy. (A) Overall survival and (B) progression-free survival by line of therapy (LoT). Blue: 3rd LoT; green: 4th LoT; yellow: 5th LoT; red: 6th LoT. (C) Time to next treatment.
mented in previously reported cohort studies. In contrast to the other cohorts, LEO-CReWE had a much larger proportion of 3rd LoT patients (94% of patients).22 Among those 3rd LoT patients, median survival was 169 months, which is higher than results from all the other cohorts, including SCHOLAR-5. It is unclear why median survival in this cohort was notably higher than in the contemporary cohorts. In this cohort, treatment patterns differed between the US and Europe. Treatment guidelines, product availability (regulatory approvals/reimbursement policies), and physician behavior, can all cause differences in treatment patterns. Timing and availability of novel therapies may differ between the US and Europe, for example access to lenalidomide in r/r FL was highly variable across countries based on regulatory approval and reimbursement, which will have influenced the frequency of this regimen. The treatment landscape for r/r FL continues to evolve, and the need for treatments in this population that will improve survival outcomes, and lead to more durable remission, remains. Based on retrospective studies, ASCT may improve PFS for select patients with r/r FL;10 however, our data show that this treatment is only used in a small subset of 2L+ patients. Outcomes for relapsed/refractory patients remain poor, despite the availability of EZH2 inhibitors, and immunomodulatory agents, and a limited number of Pi3K inhibitors, with only one being marketed in the US. Moreover, none of these options have demonstrated prolonged periods of durable responses in the majority of patients.13,15 Since SCHOLAR-5 was completed, the US Food and Drug Administration granted accelerated approval of axicabtagene ciloleucel, a CAR T-cell therapy, for the treatment of adults with r/r FL after two or more lines of treatment. This approval underscores the critical need for treatments that have the potential to offer durability for patients with r/r FL, a population for whom the prognosis with conventional therapies worsens with each subsequent LoT.
This study adds to a small but growing number of studies that provide insights into the recent treatment landscape and associated outcomes for patients with r/r FL. An important strength of this study was the requirement for biopsy-proven absence of transformation which reduced the potential for misclassification that would have occurred by including patients with transformed FL in the cohort. In addition, as a multi-center and international cohort study, the findings from SCHOLAR-5 can be more generalizable to a wider population as compared to a single-center or single-country study. This study not only describes treatment patterns and outcomes within a substantially sized r/r FL cohort, but also provides insights into treatments and outcomes amongst the US and participating European countries. The insights are based solely on descriptive statistics, similar to the study by Casulo et al., 22 given that the modest sample size and het-
erogeneous choices of therapy in 3rd LoT or higher do not lend themselves to statistical testing.
As SCHOLAR-5 data were collected retrospectively and from clinical practice databases, missing or incomplete data were expected. In order to reduce the impact of this limitation, trained analysts and clinical teams at participating sites curated and enriched the data by reviewing discrepancies, outliers and missing values on key data points, and completing additional data collection, including from review of unstructured data, where possible. As expected in real-world data documenting care provided over several years across many centers, different classification methods were used to assess disease response, and these differences likely introduce more variability into the results as compared to results obtained from the prospective clinical trial setting where procedures, visits, and assessments are outlined per protocol guidance. As can be seen by the flow diagram for patient selection at MSK (Figure 1), strict, clinically-sound criteria were used to identify patients for the SCHOLAR-5 cohort. The benefit of this rigorous selection process is improved likelihood of accurately identifying r/r FL patients who received multiple LoT for SCHOLAR-5, a patient population who would likely have been amongst the eligible population for treatments, such as CAR T-cell therapies, that have been recently approved in the US and Europe. However, the downside of these strict inclusion criteria, including the required recency of the treatments, and the exclusion of cases of transformation, is that the final sample size was lower than was expected at the outset of the study. As such, relatively few patients had 5th line of therapy or higher. Whilst this precluded the breakdown of outcomes by treatment, it also demonstrated that this population represents patients with a rare disease. The MSK flow diagram also provides insights into the modest resulting sample size for SCHOLAR-5, which is consistent with that reported in other related or similar studies. A similarly modest patient population was also observed in the recently published RECORD-FL control cohort,23 where 143 patients initiating 3rd LoT or higher as far back as 2000 were included. In a sub-group analysis that matched the SCHOLAR-5 study period, only 60 initiated 3rd LoT or higher. SCHOLAR-5 patient selection also aligns with the recruitment rate of ZUMA-5.
By restricting our study to a more contemporary setting, we limited the follow-up time for patients within an indolent population. This shorter follow-up time complicates the estimation of median OS, which is expected to be longer than our maximum follow-up time. This in turn impedes naïve comparisons to other patient cohorts. In addition, patients treated with CAR T were excluded from this cohort due to the lack of data during this observation period.
In conclusion, SCHOLAR-5, an international retrospective
Haematologica | 108 March 2023 830 ARTICLE - SCHOLAR-5 – unmet needs in r/r FL P. Ghione et al.
cohort of r/r FL patients from seven major lymphoma centers in the US and Europe, highlights the lack of a definitive standard of care for r/r FL patients. Despite inclusion of new and experimental treatments (excluding CAR T-cell therapies) that were available during the study period, fewer patients had a documented clinical responses in later lines of therapy, and the duration of treatment response diminished with each subsequent line. Newly approved therapies, such as CAR T-cell therapies, have shown efficacy in the trial setting, and future studies will be needed to assess their impact in addressing the need for improved response and survival among r/r FL patients in the routine care setting.
Disclosures
PG is a consultant or advisory board member of AstraZeneca and Daiichi Sankyo. MLP is a consultant of or has advisory role at Novartis, Kite, PCYC and BeiGene; has stock ownership of Seres and Notch; has received research funding from Seres; as well as other remunerations including patents, royalties, other IP from Juno, Seres and Wolters Kluwer. HG is a consultant or advisory role member of Gilead Sciences, Celgene and Roche; has received honoraria from Gilead, Janssen and Celgene; has received travel grants from Roche, Gilead Sciences, Celgene and Takeda. SBo is a consultant or has an advisory role at Jansen, Celgene and Roche. AP is employed by or has a leadership position at Kite, a Gilead company; has stock ownership of Kite, a Gilead company. MN is employed by or has a leadership position at Kite, a Gilead company; has stock ownership of Kite, a Gilead company. SK is employed by or has a leadership position at RainCity Analytics; has received research funding from RainCity Analytics; has received funds from for profit healthcare companies for research. KD and AH are employed by or have a leadership position at Delta Hat. LM is employed by or has a leadership position at Kite, a Gilead company. EHLO is employed by or has a leadership position at RainCity Analytics. JTS is employed by or has a leadership position at Kite, a Gilead company; has stock ownership of Gilead Sciences. SWW is a consultant for or has an advisory role at Kite Pharma, Amgen and Allergan. MTR has no conflicts of interests to be declare. JR is a consultant for or has an advisory role at Takeda, ADCT, BMS, Novartis and KitePharma; has
References
1. Gribben JG. How I treat indolent lymphoma. Blood. 2007;109(11):4617-4626.
2. Al-Hamadani M, Habermann TM, Cerhan JR, Macon WR, Maurer MJ, Go RS. Non-Hodgkin lymphoma subtype distribution, geodemographic patterns, and survival in the US: a longitudinal analysis of the National Cancer Data Base from 1998 to 2011. Am J Hematol. 2015;90(9):790-795.
3. Flinn IW, van der Jagt R, Kahl BS, et al. Randomized trial of
stock ownership of ADCT & AZ (spouse); has received honoraria from Takeda, ADCT, BMS, Novartis and KitePharma; has received other remunerations i.e., speaker's bureau and expert testimony at Takeda and ADCT. SBe is employed by or has a leadership position at Kite, a Gilead company; has stock ownership of Kite, a Gilead company. JG is a consultant or has an advisory role at AZ; has received research funding from Janssen and AZ.
Contributions
The study design and analysis were conducted in a collaboration between Kite, a Gilead Company (study sponsor), and the authors. PG, LP, HG, MTR, SB, SK, AP, JR and JG contributed to data collection and verification. SK, EHLO and KD contributed to data verification and data analysis. All authors contributed to results interpretation, writing of the manuscript and approved the final submitted version. The corresponding author had final responsibility for the decision to submit for publication.
Acknowledgments
We thank patients, family, friends and caregivers as well as the study staff. In addition to the listed authors, support for ethics, data collection and management was provided by Anna Purdum of Kite, a Gilead Company; Victoria Tse, Herve Besson, Nikita Jeswani, and Domitilla Masi, of IQVIA, with funding from Kite, a Gilead Company; Janet Matthews and Sarah Mueller of Cancer Research UK Barts Center; Clare Day and Emma Armstrong of the Christie NHS Foundation; Marion Choquet and Maryam Idlhaj of Centre Hospitalier Lyon Sud; Michelle Okwali of Memorial Sloan Kettering Cancer Center; Yasmina Bernabe of Vall d’Hebron Institute of Oncology; Marina Borges and Maria José Bento of Instituto Português de Oncologia do Porto Francisco Gentil.
Funding
This study was supported by Kite, a Gilead Company.
Data-sharing statement
All data are confidential. They can be made available upon approval of a research proposal and signed data access agreement.
bendamustine-rituximab or R-CHOP/R-CVP in first-line treatment of indolent NHL or MCL: the BRIGHT study. Blood. 2014;123(19):2944-2952.
4. Wang TP, Scott JH, Barta SK. The evolving role of targeted biological agents in the management of indolent B-cell lymphomas. Ther Adv Hematol. 2017;8(12):329-344.
5. Batlevi CL, Sha F, Alperovich A, et al. Follicular lymphoma in the modern era: survival, treatment outcomes, and identification of
Haematologica | 108 March 2023 831 ARTICLE - SCHOLAR-5 – unmet needs in r/r FL P. Ghione et al.
high-risk subgroups. Blood Cancer J. 2020;10(7):74.
6. Link BK, Day BM, Zhou X, et al. Second-line and subsequent therapy and outcomes for follicular lymphoma in the United States: data from the observational National LymphoCare Study. Br J Haematol. 2019;184(4):660-663.
7. National Institute for Health and Care Excellence. Single technology appraisal - Idelalisib for treating follicular lymphoma refractory to 2 treatments [ID1379]. 2018 Available from:
https://www.nice.org.uk/guidance/ta604/evidence/appraisalconsultation-committee-papers-pdf-6906724813.
8. Dreyling M, Ghielmini M, Rule S, et al. Newly diagnosed and relapsed follicular lymphoma: ESMO Clinical Practice Guidelines for diagnosis, treatment and follow-up. Ann Oncol. 2021;32(3):298-308.
9. Zelenetz AD, Gordon LI, Chang JE, et al. NCCN Guidelines® Insights: B-cell lymphomas, Version 5.2021. J Natl Compr Canc Netw. 2021;19(11):1218-1230.
10. Al Khabori M, de Almeida JR, Guyatt GH, Kuruvilla J, Crump M. Autologous stem cell transplantation in follicular lymphoma: a systematic review and meta-analysis. J Natl Cancer Inst. 2012;104(1):18-28.
11. Leonard JP, Jung SH, Johnson J, et al. Randomized trial of lenalidomide alone versus lenalidomide plus rituximab in patients with recurrent follicular lymphoma: CALGB 50401 (Alliance). J Clin Oncol. 2015;33(31):3635-3640.
12. Robinson KS, Williams ME, van der Jagt RH, et al. Phase II multicenter study of bendamustine plus rituximab in patients with relapsed indolent B-cell and mantle cell non-Hodgkin's lymphoma. J Clin Oncol. 2008;26(27):4473-4479.
13. Dreyling M, Santoro A, Mollica L, et al. Phosphatidylinositol 3kinase inhibition by copanlisib in relapsed or refractory indolent lymphoma. J Clin Oncol. 2017;35(35):3898-3905.
14. Gopal AK, Kahl BS, de Vos S, et al. PI3Kδ inhibition by idelalisib in patients with relapsed indolent lymphoma. N Engl J Med. 2014;370(11):1008-1018.
15. Morschhauser F, Tilly H, Chaidos A, et al. Tazemetostat for patients with relapsed or refractory follicular lymphoma: an open-label, single-arm, multicentre, phase 2 trial. Lancet Oncol. 2020;21(11):1433-1442.
16. Jacobson C, Chavez JC, Sehgal AR, et al. Primary analysis of Zuma-5: a phase 2 study of Axicabtagene Ciloleucel (Axi-Cel) in patients with relapsed/refractory (R/R) indolent nonHodgkin lymphoma (iNHL). Blood. 2020;136(Suppl 1):S40-41.
17. Kanters S, Kahl BS, Wiesinger A, et al. Clinical outcomes in patients relapsed/refractory after ≥ 2 prior lines of therapy for follicular lymphoma: a systematic literature review and metaanalysis. J Clin Oncol. 2021;39(15 Suppl):e19548.
18. Fowler NH, Chen G, Lim S, Manson S, Ma Q, Li FY. Treatment patterns and health care costs in commercially insured patients with follicular lymphoma. J Health Econ Outcomes Res. 2020;7(2):148-157.
19. Ta JT, Itani T, Shapouri S, et al. Real-world treatment patterns and outcomes in patients with follicular lymphoma in the United States. J Clin Oncol. 2021;39(15 Suppl):e19534.
20. Ghione P, Ghesquieres H, Bobillo S, et al. Outcomes in laterlines of therapy for relapsed/refractory follicular lymphoma: results from the international SCHOLAR-5 study. Hematol Oncol. 2021;39(S2):851-860.
21. Fuji S, Tada Y, Nozaki K, et al. A multi-center retrospective analysis of patients with relapsed/refractory follicular lymphoma after third-line chemotherapy. Ann Hematol. 2020;99(9):2133-2139.
22. Casulo C, Larson MC, Lunde JJ, et al. Treatment patterns and outcomes of patients with relapsed or refractory follicular lymphoma receiving three or more lines of systemic therapy (LEO CReWE): a multicentre cohort study. Lancet Haematol. 2022;9(4):e289-e300.
23. Salles G, Schuster SJ, Fischer L, et al. A retrospective cohort study of treatment outcomes of adult patients with relapsed or refractory follicular lymphoma (ReCORD-FL). Hemasphere. 2022;6(7):e745.
Haematologica | 108 March 2023 832 ARTICLE - SCHOLAR-5 – unmet needs in r/r FL P. Ghione et al.
Lenalidomide-based triplet regimens in first relapsed multiple myeloma patients: real-world evidence from a propensity score matched analysis
Silvia Mangiacavalli,1* Claudio Salvatore Cartia,1* Monica Galli,2 Sara Pezzatti,3 Angelo Belotti,4 Francesca Fazio,5 Roberto Mina,6 Magda Marcatti,7 Anna Cafro,8 Renato Zambello,9 Laura Paris,2 Gregorio Barilà,10 Cecilia Olivares,11 Alessandra Pompa,12 Rita Mazza,13 Francesca Farina,7 Martina Soldarini,8 Pietro Benvenuti,1 Giuseppina Pagani,14 Michele Palumbo,14 Valeria Masoni,14 Virginia Valeria Ferretti,15 Catherine Klersy,15 Luca Arcaini114# and Maria Teresa Petrucci5#
1Division of Hematology, Fondazione IRCCS Policlinico San Matteo, Pavia; 2Division of Hematology, ASST Papa Giovanni XXIII, Bergamo; 3Division of Hematology, San Gerardo Hospital, Monza; 4Division of Hematology, A.O. Spedali Civili, Brescia; 5Division of Hematology, Department of Translational and Precision Medicine, Azienda Ospedaliera Policlinico Umberto I, Sapienza University of Rome, Rome; 6SSD Clinical Trial in Oncoematologia e Mieloma Multiplo, Division of Hematology, University of Torino, Azienda Ospedaliero-Universitaria Città della Salute e della Scienza di Torino, Torino; 7Division of Hematology and Bone Marrow
Transplant Unit, IRCCS San Raffaele Scientific Institute, Milan; 8Hematology Unit, ASST Grande Ospedale Metropolitano Niguarda, Milan; 9Hematology and Clinical Immunology, Department of Medicine, Azienda Ospedaliera di Padova, Padova; 10University School of Medicine, Department of Medicine, Hematology and Clinical Immunology Branch, Padova; 11Division of Hematology, Ospedale di Circolo & Fondazione Macchi, University of Insubria, Varese; 12Division of Hematology and Stem Cell Transplantation, Fondazione Ca’ Granda IRCCS Ospedale Maggiore Policlinico, Milan; 13Humanitas Clinical and Research Center, IRCCS, Milan; 14Department of Molecular Medicine, University of Pavia, Pavia and 15Clinical Epidemiology and Biostatistics Service, Fondazione IRCCS Policlinico San Matteo, Pavia, Italy
*SM and CSC contributed equally as co-first authors. #LA and MTP contributed equally as co-senior authors.
Abstract
Correspondence: S. Mangiacavalli
s.mangiacavalli@smatteo.pv.it
Received: May 11, 2022.
Accepted: September 23, 2022.
Early view: October 6, 2022.
https://doi.org/10.3324/haematol.2022.281342
©2023 Ferrata Storti Foundation
Published under a CC BY-NC license
Lenalidomide and dexamethasone (Rd)-based triplets, in particular carfilzomib-Rd (KRd) and daratumumab-Rd (DaraRd), represent a standard of care in lenalidomide-sensitive multiple myeloma (MM) patients in first relapse. Meta-analysis of randomized clinical trials (RCT), suggested better outcome with DaraRd. Trying to address this issue in clinical practice, we collected data of 430 consecutive MM patients addressed to Rd-based triplets in first relapse between January 2017 and March 2021. Overall, the most common used regimen was DaraRd, chosen in almost half of the cases (54.4%), followed by KRd (34.6%). Different triplets were used much less commonly. In an attempt to limit the imbalance of a retrospective analysis, we conducted a propensity score matching (PSM) comparison between DaraRd and KRd. After PSM, efficacy of DaraRd versus KRd was similar in terms of overall-response rate (ORR) (OR: 0.9, P=0.685) as well as of very good partial response (VGPR) or better (OR: 0.9, P=0.582). The median progression-free survival (PFS) was significantly longer for DaraRd (29.8 vs. 22.5 months; P=0.028). DaraRd was tolerated better, registering a lower rate of grade 3-4 non-hematological toxicity (OR: 0.4, P<0.001). With the limitations of any retrospective analysis, our real-life PSM comparison between DaraRd and KRd, in first-relapse MM patients, showed better tolerability and prolonged PFS of DaraRd, although with some gaps of performance, in particular of DaraRd, with respect to RCT. Carfilzomib-containing regimens, like KRd, still remain a valid second-line option in the emerging scenario of first-line daratumumab-based therapy.
Introduction
In the therapeutic scenario of multiple myeloma (MM) we have many biological drugs active as a single agent
as well as in different combinations: immunomodulatory drugs (IMIDs) like lenalidomide (R) and pomalidomide (P), anti-CD38 monoclonal antibodies (MoAb) such as daratumumab (Dara) or isatuximab (Isa), anti-SLAM7 MoAb
Haematologica | 108 March 2023 833 ARTICLE - Plasma Cell Disorders
elotuzumab (Elo), new proteasome inhibitors (PI) such as carfilzomib (K) and ixazomib (Ixa). Despite the better outcome observed in the last decade with these new drugs, most patients with MM will relapse after first-line therapy.1-3
Defining the better treatment algorithm at relapse, specifically in first relapse, still remains a therapeutical challenge, influenced by many factors, above all, by specific disease and patients’ characteristics, though drug availability and patients’ preference itself could affect this choice.4,5
Lenalidomide plus dexamethasone (Rd)-based triplet regimens (i.e., KRd, DaraRd, IxaRd, EloRd) have been approved by the Food and Drug Administration (FDA) and European Medicines Agency (EMA) for the treatment of relapse refractory (RR) MM patients who have received at least one prior line of therapy, based on randomized phase III clinical trials (RCT).6-9
Following the principle of switch in drug class at relapse, Rd-based triplets, in particular DaraRd and KRd, have been indicated in recently updated European Society of Medical Oncology (ESMO) and International Myeloma Working Group (IMWG) guidelines as the preferred options in MM patients who have received frontline bortezomibbased therapy without MoAb and who are not refractory to lenalidomide.5,10,11
Phase III RCT represents the optimal approach to assess the advantage of a specific regimen over another. So far there are no RCT that compare these two different regimens head-to-head. Network meta-analyzes of data coming from trials that explored different Rd-based triplets, though with a weaker grade of evidence with respect to RCT, showed better outcome with the combination of DaraRd over other Rd-based combinations, in particular KRd.12-15
Although there are some real-life surveys focusing on the efficacy and tolerability of different Rd-combinations outside RCT, no real-world studies have been specifically focused on the first-relapse scenario.16-19
Therefore, to clarify this issue from real-world data (RWD), we conducted a retrospective analysis on a series of MM patients in first relapse, treated in 12 Italian centers with the aim to describe the pattern of use of different Rd-triplet regimens outside clinical trials and to show whether DaraRd and KRd, indicated as standard of care in recently updated guidelines, represent the most commonly used regimens in clinical practice.10,11
Afterwards, in the attempt to limit the well-known limitations as much as possible and bias of any retrospective observation, we used the propensity score method (PSM), a well-established approach to perform an adjusted comparison between two distinct treatment options, to create two cohorts, balanced for predefined covariates, and assess in a real-world scenario the relative efficacy and tolerability of DaraRd over Krd.20-22
Methods
Study population and study design
After Ethic Committee approval of each participating center and patients’ consent to personal data processing, we reviewed the medical record of 430 MM patients in first relapse consecutively starting Rd-based triplets (DaraRd, KRd, IxaRd, EloRd) according to a market-approved schedule between January 2017 and March 2021.23-26 Patients primary refractory to first-line treatment according to IMWG criteria were excluded from the study.27
Pattern of Rd-based triplet use
Data regarding Rd-based therapy distribution showed that the most commonly used regimen was DaraRd (54.4%, 234 patients), followed by KRd (34.6%, 149 patients). Treatment distribution changed over time, as shown in Figure 1, with a progressive increase in the use of DaraRd. A limited number of patients received EloRd (8.4%, 36 patients) or IxaRd (2.6%, 11 patients), justifying the choice of focusing the comparison only on DaraRd and KRd groups. Among patients treated with DaraRd and KRd, we found 66 patients (15%) addressed to salvage autologous stem cell transplantation (ASCT), 16 patients after DaraRd (24%) and 50 patients after KRd fixed induction (76%) (median progression-free survival [PFS] in transplanted patients 29.7 months).
Since transplant intensification was established to be a priori a significant bias of outcome, these patients in whom a salvage ASCT was originally planned, were excluded from the adjusted comparison.28
Statistical analysis and propensity score method
The outcome of DaraRd and KRd was compared using the propensity score (after a trimming of 5% of observations) to reweight data, according to the Inverse Probability of Treatment method (IPTW analysis).29 According to this method weights are assigned to patients based on the inverse of their probability (estimated by the propensity score) of receiving treatment. Result of this weighting assignment is the creation of a pseudo-population in which patients with a high probability of receiving treatment have a smaller weight and patients with a low probability of receiving treatment have a larger weight. So, in this pseudo-population the distribution of patient characteristics used to calculate the propensity score are independent of treatment assignment.
Data captured for patients treated with DaraRd and KRd and selected as co-variates for the propensity score calculation were the following: age at Rd-triplet start, International Staging System (ISS) stage, presence of high-risk cytogenetic profile according to IMWG consensus, previous exposure to bortezomib, previous ASCT, very good partial response (VGPR) or better, time be-
Haematologica | 108 March 2023 834 ARTICLE - Lenalidomide-based triplets in real life first relapse MM S. Mangiacavalli et al.
tween diagnosis and relapse, myeloma defining events at diagnosis.27,30-32
The planned primary end point of comparison was PFS. Secondary end points were: i) overall response rate (ORR), ii) VGPR or better, iii) overall survival (OS) and iv) safety. ORR accounts for partial response (PR) or better were evaluated according to International Myeloma Working Group (IMWG) criteria.27
PFS was calculated from the time of therapy start until the date of progression, relapse, death, or the date the patient was last known to be in response. OS was calculated from the time of therapy start until the date of death by any cause or the date the patient was last known to be alive.
Grading of adverse events (AE) was evaluated by each clinician through Common Terminology Criteria for Adverse Events (CTCAE) Version 5.0.33
Qualitative variables were described as counts and percentages of each category. Quantitative variables were summarized as median and interquartile range (IQR). Association between two qualitative variables was evaluated via Fisher’s exact test. Quantitative variables were compared between two groups by Mann-Whitney test. Kaplan-Meier product limit method and Cox regression models (reweighted for IPTW) were used to estimate OS and PFS and to compare them between triplets. A landmark analysis was carried out to compare PFS of DaraRd versus KRd according to the 6-month response (≥VGPR vs. PR). Results from Cox models were reported in terms of hazard ratio (HR) (KRd: reference group) for the comparison of DaraRd versus KRd with 95% confidence interval (CI). Best response, administration and safety were compared between triplets by logistic regression model (reweighted for IPTW) and results were reported in terms of odds ratio
(OR) for the comparison of DaraRd versus KRd (reference group) with its 95% CI. Reason for treatment discontinuation was compared between triplets by multinomial logistic regression (reweighted for IPTW), and results were reported as relative risk ratios (RRR) for the comparison of DaraRd versus KRd (reference group) with 95% CI. P values lower than 0.05 were considered signi fi cant. All statistical analyses were performed using Stata 17 (StataCorp. 2021. Stata Statistical Software: Release 17. College Station, TX: StataCorp LLC.)

Results
Comparison between DaraRd and KRd cohorts
The adjusted comparison was performed on 316 patients, 217 receiving DaraRd regimen, compared with 99 treated with KRd.
The unmatched comparison of baseline characteristics in two groups showed that they were well-balanced, except for few differences ( Table 1). In details, patients addressed to DaraRd were slightly older (median age 69 years vs. 64 years in KRD, P<0.001), and they had received a lower rate of prior ASCT (54.4% vs . 71.7% in KRd, P=0.004). Nearly all patients had received prior bortezomib, few patients in both groups were previously exposed to lenalidomide (12 patients, 3.8%), car fi lzomib (8 patients, 2.5%) or daratumumab (1 patient, 0.3%). Most patients in both groups started salvage therapy for symptomatic relapse (93.5% in DaraRd and 99% in KRd). The cytogenetic profile was evaluable in 61% of DaraRd patients and in 72% of KRd patients. The rate of patients carrying one or more high-risk cytogenetic abnormalities, including deletion (17p), translocation (4;14) and transloca-
Haematologica | 108 March 2023 835 ARTICLE - Lenalidomide-based triplets in real life first relapse MM S. Mangiacavalli et al.
Figure 1. Pattern of Rd-based triplet distribution overtime. Rd-based: lenalidomide plus dexamethasone-based.
Krd: carfilzomib-lenalidomide-dexamethasone; DaraRd: daratumumab-lenalidomide-dexamethasone; IPTW: inverse probability of treatment weighted; N: number; ISS: International Staging System; ASCT: autologous stem cell transplantation; PI: proteasome inhibitor; VGPR: very good partial response; SD: standard deviation. a(S) 60% or more clonal plasma cells detected in the bone marrow, (Li) Light chains and (M) MRI . bHigh risk cytogenetic profile was identified by fluorescence in situ hybridation according to IMWG consensus.30
tion (14;16), detected by fluorescence in situ hybridization (FISH) was similar in both groups (26% in DaraRd vs. 30% in KRd, P>0.90).
Comparison between DaraRd and KRd administration
The median follow-up of the entire cohort was 22.8 months (range, 10.8-32.4 months), although this varies by treatment group (median follow-up for DaraRd 19 months vs. 40 months for KRd, P<0.001). There was no difference in terms of median number of administered cycles between the DaraRd and KRd group (13 [range, 621] vs . 10 [range 6-18]) (IPTW analysis: OR: 0.1, 95% CI: 0.0-0.3, P =0.105). The discontinuation rate was significantly lower in DaraRd in comparison to KRd (25.8% [56 patients] vs. 58.6% [58 patients]) (IPTW analysis: OR: 0.2, 95% CI: 0.2-0.3, P<0.001). The most common reason for treatment discontinuation was progressive disease (PD) (31 patients [14.6%] in DaraRd and 34 patients in KRd [34.3%]) followed by adverse events (18 patients [8.5%] in DaraRd and 17 patients [17.1%] in KRd), a limited number of patients in both groups stopped treatment for
other reasons (7 patients [3.3%] in DaraRd and 7 patients [7%] in KRd). Multinomial logistic regression (reweighted for IPTW) showed that patients treated with DaraRd are less likely to discontinue treatment for AE rather than for progressive disease (IPTW analysis: RRR=0.4, 95% CI: 0.2-0.8, P=0.014) than patients treated with Krd.
Efficacy of DaraRd and KRd
The median time to best response was similar between DaraRd and KRd (5.5 months vs . 4.8 months, P =0.670). No significant difference was found between DaraRd and KRd in terms of best response achieved (Table 2), both in the comparison of ORR (IPTW analysis: OR=0.9, P =0.685) and when comparing the rate of CR (IPTW analysis: OR=1.2, P=0.360) and the rate of VGPR or better (IPTW analysis: OR=0.9, P=0.582).
Adjusted median PFS was longer for patients addressed to DaraRd when compared to KRd (29.8 months vs. 22.5 months; IPTW analysis: HR=0.7, 95% CI: 0.6-1.0, P=0.028) (Figure 2).
In a landmark analysis of PFS by 6-month response, in patients reaching VGPR or better, PFS was prolonged
Original cohorts Pseudo-population (IPTW analysis) Type of treatment at relapse KRd (N=99) DaraRd (N=217) P value KRd DaraRd Myeloma-defining events at diagnosis Any CRAB criteria, N (%) HyperCalcemia Renal failure Anemia Bone lesions Only SLiMa CRAB criteria, N (%) 94 (94.9) 22 (22.2) 24 (24.2) 55 (55.6) 81 (81.8) 5 (5.1) 202 (93.1) 34 (15.7) 61 (28.2) 121 (56.0) 158 (73.2) 15 (6.9) 0.598 0.204 0.496 >0.90 0.118 0.45816.2% 27.2% 51.2% 83.0%15.2% 27.7% 52.3% 83.3%ISS, N (%) Stage II and III 59 (63.4) 129 (64.5) 0.896 61.4% 63.8% First-line, N (%) ASCT in first-line PI-based therapy 71 (71.7) 96 (97.0) 118 (54.4) 207 (95.4) 0.004 0.761 67% 97.5% 64% 97.5% Good quality response during first-line, N (%) ≥VGPR 69 (69.7) 146 (68.5) 0.896 69.6% 69.3% Time from diagnosis and relapse in years, mean (SD) 2.9 (2.2) 3.4 (2.7) 0.107 2.8 (2.1) 2.9 (2.1) Median age at second-line start in years, mean (SD) 64 (8) 69 (9) <0.001 66 (8) 66 (10) Cytogenetic proflie at relapse, N (%) Missing Evaluable Standard High riskb 28 (28) 71 (72) 41 (42) 30 (30) 80 (39) 137 (61) 79 (35) 58 (26) >0.90 57.2% 42.8% 60.4% 39.6%
Table 1. Baseline characteristics of KRd- and DaraRd-treated patients in the original cohorts and after inverse probability of treatment method analysis.
Haematologica | 108 March 2023 836 ARTICLE - Lenalidomide-based triplets in real life first relapse MM S. Mangiacavalli et al.
with DaraRd [24-months PFS for DaraRd was 91.8% (95% CI: 86.0-95.2%) vs 69.7% for KRD (95%CI: 59.3%-77.9%) (IPTW analysis: HR: 0.5, 95% CI: 0.3-0.8, P =0.007)]. Patients with PR had similar PFS [24-months PFS for DaraRd was 27.3% (95% CI: 16.4-39.4%) vs 14.0% for KRd (95% CI: 1.8-38.3%) (IPTW analysis: HR: 0.8, 95% CI: 0.41.5, P =0.481)] (Figure 3).

By the cutoff date, 78 patients (24.7%) had died, mainly for disease-related causes (56 patients, 72%). OS did not differ according to Rd-triplet (24-months OS in DaraRd 100% vs . 98.1% in KRd, IPTW analysis: HR=0.9, 95% CI: 0.6-1.2, P=0.377) (Figure 4).

Safety of DaraRd and KRd regimens
The most common reported AE were hematologic toxic-
ity and infections. Overall, three patients died while on treatment: two patients during DaraRd due to pneumonia, one patient during KRd due to sepsis. Hematological toxicity (all grades) was similar between groups (IPTW analysis: OR=0.7, 95% CI: 0.4-1.1, P=0.102). No difference was found also in terms of grade 3 and 4 hematological AE (IPTW analysis: OR=0.7, 95% CI: 0.4-1.1, P=0.102).
Table 3 shows a summary of non-hematological toxicity. When considering non-hematological side effects, DaraRd was better tolerated, with a lower incidence of all grade AE (IPTW analysis: OR=0.4, 95% CI: 0.3-0.6, P<0.001). The lower toxicity rate with DaraRd was confirmed even when considering grade 3 and 4 non- hematological AE (IPTW analysis: OR=0.4, 95% CI: 0.3-0.7, P<0.001). Incidence of grade 3 and 4 infections was 9.7% during DaraRd and 13.1% with
carfilzomib-lenalidomide-dexamethasone.
carfilzomib-lenalidomide-dexamethasone.
DaraRd: daratumumab-lenalidomide-dexamethasone; Krd: carfilzomib-lenalidomide-dexamethasone; IPTW: inverse probability of treatment weighted; N: number; sCR: stringent complete response; CR: complete response; VGPR: very good partial response; PR: partial response; SD: stable disease; PD: progressive disease; ORR: overall response rate; OR: odds ratio; 95% CI: 95% confidence interval. aBest response assessment by physician according to International Myeloma Working Group criteria.27
Original cohorts IPTW analysis Best overall responsea , N (%) DaraRd (N=211) KRd (N=98) OR, (95% CI), P value CR or better sCR CR 47 (22.2) 8 (3.7) 39 (18.5) 26 (26.6) 8 (8.2) 18 (18.4) 1.2, (0.8-1.9), P=0.360 VGPR or better VGPR PR 133 (63) 86 (40.8) 60 (28.4) 64 (64.4) 38 (37.8) 22 (22.5) 0.9, (0.6-1.3), P=0.582 ORRb 193 (91.5) 85 (86.7) 0.9, (0.5-1.6), P=0.685 SD and PD 18 (8.6) 13 (13.2) -
Table 2. Summary of best response achieved in DaraRd and KRd cohorts.
bORR include ≥PR.
Figure 2. Progression-free survival of patients treated with DaraRd versus KRd after cohort matching. DaraRd: daratumumab-lenalidomide-dexamethasone; Krd:
Haematologica | 108 March 2023 837 ARTICLE - Lenalidomide-based triplets in real life first relapse MM S. Mangiacavalli et al.
Figure 3. Six-month landmark analysis of progression-free survival after cohort matching according to therapy received (DaraRd versus KRd) and response achieved. DaraRd: daratumumab-lenalidomide-dexamethasone; Krd:
KRd. Regarding cardiovascular toxicity, in patients receiving KRd cardiac grade 3 and 4 AE were observed in 12.2% of the entire cohort: five patients had grade ≥3 hypertension, seven patients suffered for grade ≥3 cardiac events (i.e., arrhythmia, ischemic heart disease, congestive heart failure).
Discussion
ESMO and IMWG guidelines recommend the use of Rdbased triplets, in particular of DaraRd and KRd, for the treatment of first relapse lenalidomide-sensitive MM patients, based on the results of phase III RCT ASPIRE and POLLUX. These studies showed superior outcome for triplet regimens with respect to doublets.6-11
Although randomized phase III trials remain the optimal approach to inform the superiority of a treatment over another, there are no RCT comparing these regimens head-to-head in homogenous populations.
Some network meta-analyzes of RCT provided indirect comparison, suggesting that anti-CD38 MoAb-based combinations give better outcome.14,15
In addition, given the stringent criteria for patient selection in clinical studies, evidence from real-word experiences are also useful to explore the pattern of use, the efficacy and the safety of Rd-triplets in daily practice.34 Beside some interconnected variables that influence treatment decision at relapse (peculiar clinical aspects, pattern or relapse, previous therapeutic history), there are additional factors that could limit a real-life decisionsmaking process. Among them, timing of market approval and local drug availability are the most relevant.35
In Italy, the first triplet that received market approval was KRd, followed by EloRd, and after a few months, DaraRd
and IxaRd, this latest with a specific restriction for cytogenetically-defined high-risk patients when used in first relapse.23-26
Therefore, we depicted the different use of lenalidomide based-triplets in a large cohort of 430 MM patients treated in 12 Italian centers in a time frame lasting from January 2017 to March 2021.

In our study, DaraRd resulted as the treatment of choice in more than half of the patients (54.4%) with a time-dependent increase in prescription, followed by KRd (34.6%). EloRd and IxaRd were used, as expected, in much smaller groups (Figure 1). This pattern of utilization reflects the progressive change in prescription limitations as well as the acknowledgment for better HR and longer PFS emerging from extended followup of RCT.36,37
Still focusing on treatment distribution, we found that sal-
Adverse event of specific interest, N (%)
DaraRd: daratumumab-lenalidomide-dexamethasone; Krd: carfilzomib-lenalidomide-dexamethasone; N: number. aGastrointestinal include diarrhea, constipation and abdominal discomfort. bHepatic include abnormality in hepatic laboratory tests. cCardiac include arrhythmia, ischemic heart disease, congestive heart failure.
All Grades ≥ Grade 3 DaraRd (N=217) KRd (N=99) DaraRd (N=217) KRd (N=99) Adverse
Infections Gastrointestinala Fatigue Deep vein thrombosis Rash Peripheral neuropathy Hepaticb Acute renal failure 60 (27.7) 41 (18.9) 21 (9.7) 9 (4.2) 9 (4.2) 9 (4.2) 2 (0.9) 2 (0.9) 35 (35.4) 18 (18.2) 12 (12.1) 10 (10.1) 7 (7.1) 3 (3.0) 4 (4.0) 3 (3.0) 21 (9.7) 5 (2.3) 5 (2.3) 4 (1.8) 3 (1.4) 1 (0.5) 0 (0.0) 0 (0.0) 13 (13.1) 5 (5.1) 1 (1.0) 4 (4.0) 1 (1.0) 2 (2.0) 1 (1.0) 2 (2.0)
Table 3. Non-hematological adverse events (all grades and grade ≥3) in DaraRd and KRd cohorts.
events, N (%)
Cardiacc Hypertension 4 (1.8) 5 (2.3) 12 (12.1) 8 (8.1) 1 (0.5) 1 (0.5) 7 (7.1) 5 (5.1)
Haematologica | 108 March 2023 838 ARTICLE - Lenalidomide-based triplets in real life first relapse MM S. Mangiacavalli et al.
Figure 4. Overall survival of patients treated with DaraRd versus KRd after cohort matching. DaraRd: daratumumab-lenalidomidedexamethasone; Krd: carfilzomib-lenalidomide-dexamethasone.
vage ASCT after a fixed number of Rd-based cycles, is still an option for selected patients, as suggested by ESMO and IMWG guidelines.10,28
ASCT was administered in 66 patients (15%), more commonly after KRd triplet re-induction (50 patients, 76%). Since transplant intensification could represent a significant bias for the outcome, we excluded transplanted patients from subsequent DaraRd versus KRd comparison. Nowadays, there are growing experiences confirming the efficacy of KRd salvage regimen when used in daily practice.18,19,38
Collection of data regarding anti-CD38 MoAb daratumumab are more limited, often focusing on its use as a single agent in more advance RRMM patients.39,40
The few RWD on DaraRd found gaps in terms of response rate and PFS with respect to the POLLUX trial, that are largely attributed to a higher rate of baseline adverse prognostic factors like multiple comorbidities, advanced disease phases, lenalidomide refractoriness.16,41
The population of our study had some homogeneous baseline characteristics (all patients were treated in first relapse, they were not primary refractory, and were mostly lenalidomide-naïve), that could represent the clinical setting for better evaluating the real-life performances of DaraRd as well as KRd better, and partly helps in limiting the well-known persistent bias of a retrospective analysis.10 The adoption of the propensity score matched analysis, partly reduces the limits of our non-randomized retrospective comparison by balancing for the several differences in baseline patients’ characteristics.29
Most of the co-variates that we set up for our matching analysis (age at Rd-triplet starting, high-risk cytogenetic profile, ISS stage, previous transplant, good response at first-line therapy, time between diagnosis and relapse) are known confounders that significantly impact on PFS. The availability of these data in a significant part of our population help us to mitigate the loss of patients entering the pseudo-population evaluable for the comparison itself. In terms of efficacy, new triplet regimens have substantially increased the probability of achieving a good quality response, in particular CR, this factor has been associated with better outcome irrespective of the type of therapy and disease phase.42,43
In our matched comparison, most patients achieved at least partial response, without significant difference between DaraRd and KRd (OR=0.9, 95% CI: 0.5-1.6, P=0.685).
In addition a significant proportion of patients reached good quality response, with similar rates of at least VGPR (OR=0.9; 95% CI: range, 0.6-1.3, P=0.582), and CR or better (OR=1.2, 95% CI: 0.8-1.9, P=0.360). On average efficacy was superimposable to that coming from ASPIRE (KRd vs. Rd) and POLLUX (DaraRd vs. Rd) trials.6,7
Regarding the outcome, we found that the median PFS with DaraRd was 29.8 months, better than that reported
by Antonioli and Davies, and longer with respect to PFS observed in our KRd group (median PFS 22.5 months).16,41
In a landmark analysis of PFS by 6-month response, the advantage of DaraRd over KRd was also confirmed in patients reaching VGPR or better, while it was lost in the smaller fraction of patients (cfr Figure 3) with a PR.
In any case, the outcome emerging in both cohorts is worse than that reported in RCT, especially for DaraRd. In fact, in POLLUX subgoup analysis, patients in first relapse had a median PFS of 53.3 months, while in ASPIRE the median PFS in first relapse was 29.6 months.6,36
One of the reasons probably explaining the general loss of performances in our real-world setting is the limited number of cycles received, either with DaraRd (13 cycles) or with KRd (10 cycles). Duration of active treatment in our study was comparable to RWD, but definitely lower than RCT, where the median duration of therapy was 34.3 months in POLLUX and 22 months in ASPIRE, with a progressive gain in response and PFS as long as patients stayed on continuous treatment.6,7,16, 18,19,36,41
In addition, some baseline characteristics may have influenced the general outcome in daily practice, partly explaining the gap between our RWD and RCT. Among relevant prognostic parameters, negative impact of highrisk cytogenetic has been improved, but not completely abrogated even by the most effective regimens employed, including DaraRd and KRd. In detail subgroup analysis of POLLUX and ASPIRE showed that the differences in terms of PFS of these two regimens when used in patients defined as high-risk, is much more limited (26.8 months for DaraRd and 23.1 months for KRD).44,45
One third of our patients in both DaraRd and KRd cohorts were harboring high-risk features while the rate of these patients in POLLUX and ASPIRE were lower (15.4% and 12.1%), maybe contributing to the loss of performance of both regimens in our study; nevertheless the specific impact of high-risk FISH should be addressed only by specific ad hoc studies.41,45
Age, as well as some age-linked comorbidities, most of all cardiovascular disease, maintained its negative impact even in the novel agent era; given the general increase in elderly patients, treatment choice in clinical practice is largely influenced by the tolerability of a specific treatment.46
KRd is effective in elderly patients albeit at the cost of higher toxicity, most of all, in terms of hypertension and cardiac events.47 Even if some loss of DaraRd performance was observed in elderly patients (median PFS in the subgroup of POLLUX with ≥ 75 years, 28.9 months), its safety profile remains acceptable regardless of age.7,48,49
The rapid and remarkable increase over time in the use of DaraRd may be linked to its higher tolerability even when used in a generally older population (Figure 1; Table 1). Details regarding treatment discontinuation and safety
Haematologica | 108 March 2023 839 ARTICLE - Lenalidomide-based triplets in real life first relapse MM S. Mangiacavalli et al.
analysis confirmed that DaraRd is usually well-tolerated also in our real-life scenario. In fact, focusing on treatment received, we observed a lower discontinuation rate with DaraRd (25.8% vs. 58.6%, P<0.001), with a relative risk ratio of discontinuation for progression rather than for toxicity for DaraRd versus KRd (RRR=0.4, P=0.014). Regarding toxicity, rate of grade 3-4 non-hematological AE was significantly lower with DaraRd (Table 3)
Anyway, since in our study patients addressed to KRd are on average younger, grade 3 and 4 toxicity, in particular cardiovascular AE, were superimposable to ASPIRE and to previously RWD.6,18,19
In conclusion, our real-world data depict an evolving pattern in the daily management of lenalidomide-sensitive MM patients in first relapse, with a progressive increase in the last few years in the use of DaraRd. Taking into account the limits of any analysis gathered from retrospective observation, our real-life matching comparison showed higher tolerability of DaraRd over KRd, without new emerging safety concerns for both regimens. In the lack of RCT that directly compare these triplet regimens, our real-life experience suggests a prolonged PFS with DaraRd over KRd, when used in patients who relapsed after primary therapy not including lenalidomide. KRd, thanks to its confirmed efficacy in terms of good response rate, can be a valid alternative option for fit patients in daily practice, taking into account the emerging scenario of Dara-exposed patients.5,48,50
All these findings suggest to tailor the management of our daily practice, balancing best efficacy with higher tolerability.
Disclosures
SM has received honoraria from Bristol-Myers Squibb, Sanofi, AMGEN, GSK Takeda and Janssen; has served on the advisory boards for Sanofi, Takeda, Bristol-Myers Squibb and Janssen. AB has served on the advisory boards of Janssen, Celgene, GSK, Takeda, Sanofi and AMGEN. RM has
References
1. Palumbo A, Anderson K. Multiple myeloma. N Engl J Med. 2011;364(11):1046-1060.
2. Kumar SK, Rajkumar SV, Dispenzieri A, et al. Improved survival in multiple myeloma and the impact of novel therapies. Blood. 2008;111(5):2516-2520.
3. Gulla A, Anderson KC. Multiple myeloma: the (r)evolution of current therapy and a glance into future. Haematologica. 2020;105(10):2358-2367.
4. Harousseau JL, Attal M. How I treat first relapse of myeloma. Blood. 2017;130(8):963-973.
5. Kastritis E, Terpos E, Dimopoulos MA. How I treat relapsed multiple myeloma. Blood. 2022;139(19):2904-2917.
6. Stewart AK, Rajkumar SV, Dimopoulos MA, et al. Carfilzomib, lenalidomide, and dexamethasone for relapsed multiple
received honoraria from Sanofi, Celgene, Takeda, and Janssen; has served on the advisory boards for Sanofi, Takeda, Bristol-Myers Squibb and Janssen; has received consultancy fees from Janssen. MTP has received honoraria from Bristol-Myers Squibb, Sanofi, AMGEN, GSK, Takeda and Janssen; has served on the advisory boards for Celgene-Bristol-Myers Squibb, Sanofi, AMGEN, Sanofi, GSK, Takeda, Roche, Karyopharm and Janssen; received support for attending meetings and/or travel from Janssen, Celgene-Bristol-Myers Squibb, AMGEN, Sanofi and Takeda. FF has received honoraria from Janssen and support for attending meetings and/or travel from Janssen and Sanofi. LA has served on the advisory boards of Roche, JanssenCilag, Verastem, Incyte, EUSA Pharma, Celgene/Bristol Myers Squibb, Kite/Gilead, and ADC Therapeutics; is part of the Speakers’ Bureau for EUSA Pharma, Novartis and received research funding from Gilead Sciences.
Contributions
SM, LA, MG, RM, MTP, SP, AB, FF, MM, AC, RZ and VVF were responsible for the study conception and design. Data preparation and collection was performed by SM, CSC, MG, RM, MTP, SP, AB, FF, MM, AC, RZ, LP, GB, CO, AP, RM and FF. SM, CSC, LA and VVF participated in content planning, interpreted and reviewed the data and wrote the paper. SM, CSC, LA, MG, RM, MTP, SP, AB, FF, MM, AC and RZ reviewed and commented on drafts. All the authors approved the final version of this paper for publication.
Acknowledgements
The authors would like to thank all the patients, families, caregivers, who accepted to participate to this study.
Data-sharing statement
Individual patient data from the trial will not be shared publicly, since a data-sharing plan had not been included when ethical approval was requested. All original data can be obtained from the corresponding authors.
myeloma. N Engl J Med. 2015;372(2):142-152.
7. Dimopoulos MA, Oriol A, Nahi H, et al. Daratumumab, lenalidomide, and dexamethasone for multiple myeloma. N Engl J Med. 2016;375(14):1319-1331.
8. Moreau P, Masszi T, Grzasko N, et al. Oral ixazomib, lenalidomide, and dexamethasone for multiple myeloma. N Engl J Med. 2016;374(17):1621-1634.
9. Lonial S, Dimopoulos M, Palumbo A, et al. Elotuzumab Therapy for Relapsed or Refractory Multiple Myeloma. N Engl J Med. 2015;373(7):621-631.
10. Dimopoulos MA, Moreau P, Terpos E, et al. Multiple myeloma: EHA-ESMO Clinical Practice Guidelines for diagnosis, treatment and follow-up. Ann Oncol. 2021;32(3):309-322.
11. Moreau P, Kumar SK, San Miguel J, et al. Treatment of relapsed
Haematologica | 108 March 2023 840 ARTICLE - Lenalidomide-based triplets in real life first relapse MM S. Mangiacavalli et al.
and refractory multiple myeloma: recommendations from the International Myeloma Working Group. Lancet Oncol. 2021;22(3):e105-e118.
12. Botta C, Ciliberto D, Rossi M, et al. Network meta-analysis of randomized trials in multiple myeloma: efficacy and safety in relapsed/refractory patients. Blood Adv. 2017;1(7):455-466.
13. Chari A, Richardson PG, Romanus D, et al. Real-world outcomes and factors impacting treatment choice in relapsed and/or refractory multiple myeloma (RRMM): a comparison of VRd, KRd, and IRd. Expert Rev Hematol. 2020;13(4):421-433.
14. Dimopoulos MA, Kaufman JL, White D, et al. A Comparison of the efficacy of immunomodulatory-containing regimens in relapsed/refractory multiple myeloma: a network metaanalysis. Clin Lymphoma Myeloma Leuk. 2018;18(3):163-173.
15. Maiese EM, Ainsworth C, Le Moine JG, Ahdesmäki O, Bell J, Hawe E. Comparative efficacy of treatments for previously treated multiple myeloma: a systematic literature review and network meta-analysis. Clin Ther. 2018;40(3):480-494.
16. Antonioli E, Staderini M, Pilerci S, et al. Daratumumab, lenalidomide, and dexamethasone combination in relapsed/refractory myeloma patients: a real-life single-center experience. Leuk Lymphoma. 2020;61(13):3255-3258.
17. Gentile M, Specchia G, Derudas D, et al. Elotuzumab, lenalidomide, and dexamethasone as salvage therapy for patients with multiple myeloma: Italian, multicenter, retrospective clinical experience with 300 cases outside of controlled clinical trials. Haematologica. 2021;106(1):291-294.
18. Conticello C, Romano A, Del Fabro V, et al. Feasibility, tolerability and efficacy of carfilzomib in combination with lenalidomide and dexamethasone in relapsed refractory myeloma patients: a retrospective real-life survey of the Sicilian Myeloma Network. J Clin Med. 2019;8(6):877.
19. Rocchi S, Tacchetti P, Pantani L, et al. A real-world efficacy and safety analysis of combined carfilzomib, lenalidomide, and dexamethasone (KRd) in relapsed/refractory multiple myeloma. Hematol Oncol. 2021;39(1):41-50.
20. Cavo M, Dimopoulos MA, San-Miguel J, et al. Comparative efficacy of bortezomib, melphalan, and prednisone (VMP) with or without daratumumab versus VMP alone in the treatment of newly diagnosed multiple myeloma: propensity score matching of ALCYONE and VISTA phase III studies. Clin Lymphoma Myeloma Leuk. 2020;20(7):480-489.
21. Kumar S, Durie B, Nahi H, et al. Propensity score matching analysis to evaluate the comparative effectiveness of daratumumab versus real-world standard of care therapies for patients with heavily pretreated and refractory multiple myeloma. Leuk Lymphoma. 2019;60(1):163-171.
22. Durie BGM, Kumar SK, Usmani SZ, et al. Daratumumablenalidomide-dexamethasone vs standard-of-care regimens: Efficacy in transplant-ineligible untreated myeloma. Am J Hematol. 2020;95(12):1486-1494.
23. https://www.ema.europa.eu/en/documents/productinformation/darzalex-epar-product-information_en.pdf.
24. https://www.ema.europa.eu/en/documents/productinformation/empliciti-epar-product-information_en.pdf.
25. https://www.ema.europa.eu/en/documents/productinformation/kyprolis-epar-product-information_en.pdf.
26. https://www.ema.europa.eu/en/documents/productinformation/ninlaro-epar-product-information_en.pdf.
27. Kumar S, Paiva B, Anderson KC, et al. International Myeloma Working Group consensus criteria for response and minimal residual disease assessment in multiple myeloma. Lancet Oncol. 2016;17(8):e328-e346.
28. Giralt S, Garderet L, Durie B, et al. American Society of Blood
and Marrow Transplantation, European Society of Blood and Marrow Transplantation, Blood and Marrow Transplant Clinical Trials Network, and International Myeloma Working Group consensus conference on salvage hematopoietic cell transplantation in patients with relapsed multiple myeloma. Biol Blood Marrow Transplant. 2015;21(12):2039-2051.
29. Nichols A. Causal inference with observational data. STATA J. 2007;7(4):507-541.
30. Sonneveld P, Avet-Loiseau H, Lonial S, et al. Treatment of multiple myeloma with high-risk cytogenetics: a consensus of the International Myeloma Working Group. Blood. 2016;127(24):2955-2962.
31. Rajkumar SV, Dimopoulos MA, Palumbo A, et al. International Myeloma Working Group updated criteria for the diagnosis of multiple myeloma. Lancet Oncol. 2014;15(12):e538-548.
32. Greipp PR, San Miguel J, Durie BG, et al. International staging system for multiple myeloma. J Clin Oncol. 2005;23(15):3412-3420.
33. https://ctep.cancer.gov/protocoldevelopment/electronic_ applications/docs/ctcae_v5_quick_reference_5x7.pdf.
34. Mohty M, Terpos E, Mateos MV, et al. Multiple myeloma treatment in real-world clinical practice: results of a prospective, multinational, noninterventional study. Clin Lymphoma Myeloma Leuk. 2018;18(10):e401-e419.
35. Steinmetz HT, Singh M, Milce J, et al. Management of patients with relapsed and/or refractory multiple myeloma treated with novel combination therapies in routine clinical practice in Germany. Adv Ther. 2022;39(3):1247-1266.
36. Bahlis NJ, Dimopoulos MA, White DJ, et al. Daratumumab plus lenalidomide and dexamethasone in relapsed/refractory multiple myeloma: extended follow-up of POLLUX, a randomized, open-label, phase 3 study. Leukemia. 2020;34(7):1875-1884.
37. Mohty M, Knauf W, Romanus D, et al. Real-world treatment patterns and outcomes in non-transplant newly diagnosed multiple Myeloma in France, Germany, Italy, and the United Kingdom. Eur J Haematol. 2020;105(3):308-325.
38. Morabito F, Zamagni E, Conticello C, et al. Adjusted comparison between elotuzumab and carfilzomib in combination with lenalidomide and dexamethasone as salvage therapy for multiple myeloma patients. Eur J Haematol. 2021;108(3):178-189.
39. Markovic U, Romano A, Del Fabro V, et al. Daratumumab as single agent in relapsed/refractory myeloma patients: a retrospective real-life survey. Front Oncol. 2021;11:624405.
40. Jullien M, Trudel S, Tessoulin B, et al. Single-agent daratumumab in very advanced relapsed and refractory multiple myeloma patients: a real-life single-center retrospective study. Ann Hematol. 2019;98(6):1435-1440.
41. Davies F, Rifkin R, Costello C, et al. Real-world comparative effectiveness of triplets containing bortezomib (B), carfilzomib (C), daratumumab (D), or ixazomib (I) in relapsed/refractory multiple myeloma (RRMM) in the US. Ann Hematol. 2021;100(9):2325-2337.
42. Kaddoura M, Binder M, Dingli D, et al. Impact of achieving a complete response to initial therapy of multiple myeloma and predictors of subsequent outcome. Am J Hematol. 2022;97(3):267-273.
43. Landgren O, Iskander K. Modern multiple myeloma therapy: deep, sustained treatment response and good clinical outcomes. J Intern Med. 2017;281(4):365-382.
44. Kaufman JL, Dimopoulos MA, White D, et al. Daratumumab, lenalidomide, and dexamethasone in relapsed/refractory myeloma: a cytogenetic subgroup analysis of POLLUX. Blood Cancer J. 2020;10(11):111.
Haematologica | 108 March 2023 841 ARTICLE - Lenalidomide-based triplets in real life first relapse MM S. Mangiacavalli et al.
45. Avet-Loiseau H, Fonseca R, Siegel D, et al. Carfilzomib significantly improves the progression-free survival of high-risk patients in multiple myeloma. Blood. 2016;128(9):1174-1180.
46. Hari P, Romanus D, Luptakova K, et al. The impact of age and comorbidities on practice patterns and outcomes in patients with relapsed/refractory multiple myeloma in the era of novel therapies. J Geriatr Oncol. 2018;9(2):138-144.
47. Dimopoulos MA, Stewart AK, Masszi T, et al. Carfilzomib, lenalidomide, and dexamethasone in patients with relapsed multiple myeloma categorised by age: secondary analysis from the phase 3 ASPIRE study. Br J Haematol. 2017;177(3):404-413.
48. Facon T, Kumar S, Plesner T, et al. Daratumumab plus
lenalidomide and dexamethasone for untreated myeloma. N Engl J Med. 2019;380(22):2104-2115.
49. Mateos MV, Spencer A, Nooka AK, et al. Daratumumab-based regimens are highly effective and well tolerated in relapsed or refractory multiple myeloma regardless of patient age: subgroup analysis of the phase 3 CASTOR and POLLUX studies. Haematologica. 2020;105(2):468-477.
50. Moreau P, Attal M, Hulin C, et al. Bortezomib, thalidomide, and dexamethasone with or without daratumumab before and after autologous stem-cell transplantation for newly diagnosed multiple myeloma (CASSIOPEIA): a randomised, open-label, phase 3 study. Lancet. 2019;394(10192):29-38.
Haematologica | 108 March 2023 842 ARTICLE - Lenalidomide-based triplets in real life first relapse MM S. Mangiacavalli et al.
Enhancing regulatory T-cell function via inhibition of high mobility group box 1 protein signaling in immune thrombocytopenia
Correspondence: Y. Hou houyu2009@sina.com
1Department of Hematology, Qilu Hospital of Shandong University, Shandong University, Jinan, China; 2Laboratory of Cancer Signaling, Interdisciplinary Cluster for Applied Genoproteomics (GIGA) Stem Cells, University of Liège, CHU, Sart-Tilman, Liège, Belgium and 3Shandong Provincial Key Laboratory of Immunohematology, Qilu Hospital of Shandong University, Shandong University, Jinan, China
Abstract
M. Hou qlhouming@sina.com
Received: June 8, 2022.
Accepted: October 11, 2022.
Early view: October 20, 2022.
https://doi.org/10.3324/haematol.2022.281557
©2023 Ferrata Storti Foundation
Published under a CC BY-NC license
Primary immune thrombocytopenia (ITP) is the most common acquired autoimmune bleeding disorder. Abnormally increased levels of High Mobility Group Box 1 (HMGB1) protein associate with thrombocytopenia and therapeutic outcome in ITP. Previous studies proposed that a natural inhibitor of HMGB1, 18β-glycyrrhetinic acid (18β-GA), could be used for its anti-inflammatory and immune-modulatory effects, although its ability to correct immune balance in ITP is unclear. In this study, we showed that plasma HMGB1 correlated negatively with platelet counts in ITP patients, and confirmed that 18β-GA stimulated the production of regulatory T cells (Treg), restored the balance of CD4+ T-cell subsets and enhanced the suppressive function of Treg through blocking the effect on HMGB1 in patients with ITP. HMGB1 short hairpin RNA interference masked the effect of 18β-GA in Treg of ITP patients. Furthermore, we found that 18β-GA alleviated thrombocytopenia in mice with ITP. Briefly, anti-CD61 immune-sensitized splenocytes were transferred into severe combined immunodeficient mice to induce a murine model of severe ITP. The proportion of circulating Treg increased significantly, while the level of plasma HMGB1 and serum antiplatelet antibodies decreased significantly in ITP mice along 18β-GA treatment. In addition, 18β-GA reduced phagocytic activity of macrophages towards platelets both in ITP patients and ITP mice. These results indicate that 18β-GA has the potential to restore immune balance in ITP via inhibition of HMGB1 signaling. In short, this study reveals the role of HMGB1 in ITP, which may serve as a potential target for thrombocytopenia therapy.
Introduction
Primary immune thrombocytopenia (ITP) is an acquired autoimmune disease characterized by immune-mediated platelet destruction or impaired platelet production or both. Related studies have shown that disturbed helper T-cell subsets are involved in ITP. Platelet autoreactive CD4+ effector T cells are excessively activated, exhibiting decreased apoptosis, whereas CD4+ CD25+ Foxp3+ regulatory T cells (Treg) are numerically and functionally impaired.1 In addition, autoantibody-sensitized platelets are targeted and destroyed by the mononuclear macrophage system in ITP.2 Treg, as immunosuppressive T cells, play a key role in self-
tolerance in many autoimmune diseases. Many studies have shown that Treg are defective in patients with chronic ITP. Both clinical and basic mechanistic studies have shown that a variety of treatments, including glucocorticoids, rituximab, thrombopoietin-receptor agonists, intravenous immunogloblin, and histone deacetylase inhibitors, exert therapeutic effects and modulate the expansion and regulatory functions of Tregs,3-7 among which dexamethasone, thrombopoietin-receptor agonists, intravenous immunoglobulin, and chidamide were also shown to attenuate phagocytosis of the monocyte-macrophage system.2,7-9 High Mobility Group Box 1 (HMGB1) protein, a non-histone nuclear protein, plays a critical role not only inside the cell
Haoyi Wang,1 Tianshu Yu,1 Ning An,2 Yunqi Sun,1 Pengcheng Xu,1 Panpan Han,1 Yajing Zhao,1 Lingjun Wang,1 Xiaofei Ni,1 Yubin Li,1 Guosheng Li,1 Yanfeng Liu,1 Jun Peng,1 Ming Hou1,3 and Yu Hou1,3
Haematologica | 108 March 2023 843 ARTICLE - Platelet Biology & its Disorders
as a DNA chaperone, but also outside of the cell as a damage-associated molecular pattern (DAMP) molecule. Of note, HMGB1 was found to mediate the development and progression of autoimmune diseases, acting on cell surface receptors, and triggering intracellular signaling. The expression of HMGB1 is upregulated in hepatitis B virus infection, accompanied by an increase in the level of pro-inflammatory factors, such as interleukin (IL)-6 and IL17, affecting the balance of Th17/Treg.10 Stimulation of HMGB1 results in markedly reduced expression of Foxp3 and secretion of IL-10 from Treg in mice and humans.11,12 Recently, it has been reported that glycyrrhizin prevents release of HMGB1 induced by severe acute respiratory syndrome coronavirus-2 and inhibits viral replication.13 Studies have also shown higher levels of HMGB1 in the spleen, serum and plasma of patients with ITP, compared with those in healthy controls.14,15 HMGB1 is associated with an imbalance of Treg/Th17 cells and is involved in the pathogenesis of ITP.16
As 18β-glycyrrhetinic acid (18β-GA) is known to bind to HMGB1 directly,17 it has been used as a novel pharmacological inhibitor of HMGB1 cytokine activities in several clinical and experimental studies.18,19 18β-GA, the main active metabolite of glycyrrhiza, can be obtained by glucuronidase hydrolysis of glycyrrhiza after oral administration. There is evidence showing that 18β-GA is associated with regulating the homeostasis of Th1/Th2/Th17/Treg,20 for example, by triggering a curative Th1 response in experimental visceral leishmaniasis, attenuating airway inflammation in allergic asthma by reducing Th2 cytokines through upregulation of Foxp3 and downregulation of STAT6/GATA-3/RORγt expression, suppressing the differentiation of Th17 cells in experimental autoimmune encephalomyelitis, and inhibiting the development of hepatocellular carcinoma by modulating Treg expression.21-24 18β-GA has already been marketed in a variety of dosages for the treatment of liver dysfunction18 and specific cutaneous inflammation.25 Luo et al. reported the effect of licorice, another precursor of 18β-GA, in raising platelet counts, which also proved to be well-tolerated in ITP patients.26 However, to our knowledge, no previous studies have focused on the roles and the mechanism of action of 18β-GA in patients with ITP. Therefore, the current study was performed to evaluate whether the inhibitor of HMGB1 restored immune balance in patients and mice with ITP. Moreover, we investigated the effects of 18β-GA on the modulation of Treg and the monocyte-macrophage system in vivo and in vitro, as well as the underlying molecular mechanisms. Our aim was to provide new insights into the treatment of ITP.
Methods
Patients and controls
A total of 42 patients (25 females and 17 males; 18-66
years old; median age, 47.5 years) with newly diagnosed primary ITP and without prior treatment were enrolled in this study between April 2018 and November 2021 at the Department of Hematology, Qilu Hospital, Shandong University, China. The patients’ platelet counts ranged between 1×10⁹/L and 38×109/L (median count, 13×109/L) and they were diagnosed based on previously recommended criteria.27 Twenty-five age-matched healthy volunteers were included (13 females and 12 males; 18-65 years old; median age, 35 years) with platelet counts ranging between 155×109/L and 311×109/L (median count, 256×109/L). The subjects’ demographics and key clinical information are summarized in Online Supplementary Table S1. All study subjects donated 20 mL of EDTA-anticoagulated venous peripheral blood. The study protocol was approved by the Medical Ethics Committee of Qilu Hospital, Shandong University. All patients provided written informed consent before enrollment into the study, in accordance with the Declaration of Helsinki.
Animal model
A murine model of active ITP was established as previously reported with modifications.28 The strains and backgrounds of the mice are detailed in the Online Supplementary Methods. Briefly, we immunized CD61-knockout mice with CD61+ platelets. Splenocytes from these immunized mice were engrafted into CD61+ severe combined immunodeficient (SCID) mice to construct the active ITP murine model. ITP mice were then randomly separated into groups that received the same volume of either 18 β -GA (30 mg/kg,29 intraperitoneal injection, CAS471-53-4, Sigma-Aldrich, USA), the HMGB1 inhibitor lycopene (5 mg/kg,30 intragastric administration, S3943, Selleck, USA), or 3% dimethylsulfoxide (DMSO, intraperitoneal injection, Sigma-Aldrich, USA) every 2 days from day 1 after radiation and splenocyte infusion. Platelets were counted weekly, and ITP mice were euthanized after 5 weeks. Peripheral blood, spleen, thymus, inguinal lymph nodes, and liver were removed to prepare single-cell suspensions for analyses. All animal experiments were performed with the approval of the Animal Care and Use Committee of Shandong University and undertaken in accordance with the Institutional Guidelines for the Care and Use of Laboratory Animals.
The methods for Treg depletion, the detection of serum anti-platelet CD61-specific antibodies, multiple cytokine analysis, and the analysis of platelet retention using living liver and spleen imaging of ITP mice; cell isolation from ITP patients and healthy controls, immunophenotyping of Treg and monocyte-derived macrophages, suppressive capacity of Treg on the proliferation of CD4+ CD25– effector T cells and CD8+ cytotoxic T lymphocyte-induced platelet apoptosis, lentiviral interference of HMGB1 in Treg and macrophages, determination of acetylation level of
Haematologica | 108 March 2023 844 ARTICLE - Restoring Treg function via HMGB1 in ITP H. Wang et al.
plasma HMGB1 and the redox state test of HMGB1, and western blotting in ITP patients; phagocytic activity of macrophages, quantitative real-time polymerase chain reaction (RT-PCR), enzyme-linked immunosorbent assay (ELISA) in ITP patients and mice; and statistical analysis are explained in the Online Supplementary Data.
Results
18β-GA increased the number of Treg without apparent induction of apoptosis in peripheral blood mononuclear cells from patients with immune thrombocytopenia
We found that 18β-GA only induced apoptosis of peripheral
blood mononuclear cells (PBMC) from patients with ITP at the higher doses of 50 µM and 100 µM (Figure 1A, B). Subsequently, we tested whether 18β-GA affects Treg, using PBMC isolated from ITP patients and healthy controls. We noted that 25 mM and 50 mM 18β-GA increased the number of Treg (Figure 1C-E). Moreover, we detected that Foxp3 mRNA expression in the group treated with 25 mM 18β-GA was higher than that in the DMSO-treated PBMC from ITP patients (Figure 1F). However, the percentages of CD4+ T cells among the PBMC remained unchanged after the respective treatments (Online Supplementary Figure S1). We therefore selected 25 mM 18β-GA as the optimal dose for cell experiments, as it induced an increase in Treg number without apparently causing apoptosis.
Figure 1. 18β-GA increased the number of Treg without apparent induction of apoptosis in peripheral blood mononuclear cells from patients with immune thrombocytopenia. (A) Representative density plots of apoptosis in cultures of peripheral blood mononuclear cells (PBMC) from patients with immune thrombocytopenia (ITP). The percentage of annexin V-positive and propidium iodide (PI)-negative cells among PBMC represents the rate of cell apoptosis. (B) 18β-GA induced apoptosis of PBMC from ITP patients after 3 days at the doses of 50 mM and 100 mM (n=10; Friedman test, ****P<0.0001). Multiple comparisons: **P=0.0069. (C) The gating strategy and representative density plots for identification of CD4+ CD25+ Foxp3+ Treg. (D) In the culture of PBMC from ITP patients, the percentages of Treg were significantly increased 3 days after 18β-GA treatment at the doses of 12.5 mM, 25 µM and 50 mM (n=10; one-way analysis of variance [ANOVA]; *P=0.0167). Multiple comparisons: dimethylsulfoxide (DMSO) vs. 18βGA 12.5 mM, **P=0.0051; DMSO vs. 18β-GA 25 M, **P=0.0031; DMSO vs. 18β-GA 50 mM, **P=0.0076. (E) In the culture of PBMC from healthy controls, the percentages of Treg were significantly increased at 25 mM and 50 mM (n=8, one-way ANOVA, *P=0.0173). Multiple comparisons: DMSO vs. 18β-GA 25 mM, *P=0.0403; DMSO vs. 18β-GA 50 mM, *P=0.0386. (F) Foxp3 mRNA expression of the 18β-GA group was higher than that of controls (n=13, Wilcoxon matched-pairs signed rank test, **P=0.0046). DMSO vs. 18β-GA: 0.0008 (0.0001, 0.0026) vs. 0.0012 (0.0001, 0.0041).

A B D E F C Haematologica | 108 March 2023 845 ARTICLE - Restoring Treg function via HMGB1 in ITP H. Wang et al.
Figure 2. 18β-GA increased the generation and enhanced the suppressive function of Treg from CD4+ T and naïve CD4+ T cells among patients with immune thrombocytopenia. (A) The percentage of Treg in the culture of CD4+ T cells from patients with immune thrombocytopenia (ITP) was increased after 3 days by stimulation with 18β-GA at 25 mM. Paired t test, 4.6200±1.6010 vs. 5.8367±1.9671, n=9; **P=0.0024. (B) 18β-GA increased the generation of Treg from naïve CD4+ T cells from ITP patients after 3 days. Paired t test, 4.0067±2.3976 vs. 5.0967±2.4695, n=9, **P=0.0018. 18β-GA also increased Treg generation from isolated naïve CD4+ T cells from healthy controls. Paired t test, 7.7333±1.9871 vs. 10.0156±2.8094, n=9, **P=0.0012. (C) Representative histogram plots of CFSE of CD4+ CD25–effector T cells. a: DMSO-Teff, b: 18β-GA-Teff, c: Teff+DMSO-Treg, d: Teff+18β-GA-Treg. (D) Division index of effector T-cell proliferation after co-culture with Treg. a: DMSO-Teff, b: 18β-GA-Teff, c: Teff+DMSO-Treg, d: Teff+18β-GA-Treg. Wilcoxon matched-pairs signed rank test, n=8. Treg significantly suppressed proliferation of effector T cells (**Pac=0.0078). Compared with DMSO, 18β-GA significantly enhanced the inhibitory function of Treg (**Pcd=0.0078). (E) The gated dot-plots illustrate the apoptosis of platelets. a: Platelets, b: CD8+ CTL+platelets, c: DMSO-Treg+CD8+ CTL+platelets, d: 18β-GA-Treg+CD8+ CTL+platelets. (F) A significant reduction was observed in CD8+ CTLinduced platelet apoptosis from ITP patients cultured with 18β-GA-Treg in vitro. a: Platelets, b: CD8+ CTL+platelets, c: DMSO-Treg+CD8+ CTL+platelets, d: 18β-GA-Treg+CD8+ CTL+platelets. Paired t test, n=8. Treg markedly decreased the platelet apoptosis mediated by CD8+ CTL (*Pbc=0.0354). After treatment with 18β-GA, Treg significantly reduced CD8+ CTL induced platelet destruction, compared with Treg after treatment with DMSO (*Pcd=0.0497). CFSE: 5(6)-carboxyfluorescein diacetate N-succinimidyl ester (CFSE); Teff: T effector cells; DMSO: dimethylsulfoxide; CTL: cytotoxic T lymphocyte.

A C D E F B Haematologica | 108 March 2023 846 ARTICLE - Restoring Treg function via HMGB1 in ITP H. Wang et al.
18β-GA increased Treg generation from isolated CD4+ T/naïve CD4+ T cells from patients with immune thrombocytopenia and enhanced the suppressive function of the Treg

We noted that the percentage of Treg increased after stimulating CD4+ T cells from patients with ITP with 25 mM 18β-GA (Figure 2A). Furthermore, peripheral Treg induced
from naïve CD4+ T cells in patients with ITP and healthy controls were also significantly expanded after treatment with 18β-GA (Figure 2B).
We then explored whether 18 β -GA enhances the suppressive function of Treg from patients with ITP. After drug elution, we co-cultured 5(6)-carboxyfluorescein diacetate N-succinimidyl ester (CFSE)-labeled CD4+ CD25 effector
Figure 3. 18β-GA inhibited the expression of HMGB1 in CD4+ T cells from patients with immune thrombocytopenia by suppressing NF-κB signaling. (A) The levels of HMGB1 in plasma of patients with immune thrombocytopenia (ITP) were higher than those in healthy controls (unpaired Student t test, *P=0.0335, 69.8793±20.7887 vs. 114.8579±60.2011, healthy controls n=10, ITP patients n=15). Immunoprecipitation of plasma HMGB1 with anti-HMGB1 antibodies in ITP patients. Western blotting with the anti-human HMGB1 antibody and acetylated-lysine antibody. Plasma HMGB1 in ITP patients was obviously acetylated. (B) The percentage of Treg stimulated with different redox states of HMGB1. 18β-GA inhibited the effect of HMGB1 with different redox states on Treg. a: DMSO; b: HC-HMGB1 (HMGB1 from healthy controls); c: ITP-HMGB1 (HMGB1 from ITP patients); d: ITP-frHMGB1 (ITP-fully reduced HMGB1); e: ITP-oxiHMGB1 (ITP-oxidized HMGB1); f: ITP-HMGB1+18β-GA; g: ITP-frHMGB1+18β-GA; h: ITP-oxiHMGB1+18β-GA. n=6. Paired t test, **Pab=0.0013; ***Pac=0.0001; ***Pbc=0.0006; **Pae=0.0023; ****Pcf<0.0001; *Pdg=0.0109; *Peh=0.0303. (C) The level of HMGB1 in plasma correlated negatively with the platelet count in routine blood tests in ITP patients, n=15, Pearson correlation, r=0.5796, R2=0.3359, *P=0.0236. (D) HMGB1 mRNA expression in CD4+ T cells from ITP patients at the time of enrollment were higher than that in healthy controls (unpaired Student t test, **P=0.0014, 0.0314±0.0203 vs. 0.0852±0.0449, healthy controls n=10, ITP patients n=18). (E) Relative integrated density of HMGB1 of isolated CD4+ T cells from ITP patients and healthy controls after 3 days cultured by western blotting (unpaired t test, *P=0.0367, healthy controls n=3, ITP patients n=4). (F) 18β-GA reduced HMGB1 expression (*P=0.0182) and phosphorylated NF-κB expression (*P=0.0476) of CD4+ T cells from ITP patients after 3 days (paired t test, n=3). IP: immunoprecipitation; HC: healthy controls; DMSO: dimethylsulfoxide; ns: not significant.
A B C F D E Haematologica | 108 March 2023 847 ARTICLE - Restoring Treg function via HMGB1 in ITP H. Wang et al.
T cells with Treg. The division index of effector T cells was calculated using Flow Jo software. We confirmed that 18 β -GA enhanced the suppressive function of Treg towards CD4+ CD25 effector T cells (Figure 2C, D). We observed that 18β-GA alone had no apparent effect on the proliferation of effector T cells; however, Treg markedly suppressed the proliferation of effector T cells after treatment with DMSO or 18β-GA. Furthermore, we found that, compared with DMSO, 18β-GA significantly enhanced Treg function in suppression of effector T-cell proliferation. In addition, we noted that Treg from ITP patients treated with either DMSO or 18 β -GA reduced CD8+ cytotoxic T lymphocyte (CTL)-mediated platelet destruction, although the Treg treated with 18β-GA significantly reduced CD8+ CTL-induced platelet apoptosis, compared with that of Treg treated with DMSO (Figure 2E, F). These findings suggest that 18β-GA enhanced the immunosuppressive ability of Treg.
18β-GA inhibited the expression of HMGB1 in CD4+ T cells from patients with immune thrombocytopenia by suppressing NF-κB signaling
Using ELISA, we found that the expression of HMGB1 in the plasma of active ITP patients was higher than that in healthy controls. We also found that the plasma HMGB1 in patients with ITP was acetylated, showing that it was released from the nuclei of cells31 (Figure 3A). Next, we compared the proliferation of HMGB1-treated Treg. HMGB1 was enriched from the plasma of healthy controls and ITP patients (HC-HMGB1 and ITP-HMGB1, respectively). The proportions of Treg were significantly decreased with HCHMGB1 and ITP-HMGB1, and augmented with oxidized HMGB1 (ITP-oxiHMGB1), compared with the DMSO group. Moreover, Treg expansion was stimulated in the ITPHMGB1 and fully reduced HMGB1 (ITP-frHMGB1) groups, while it was suppressed in the ITP-oxiHMGB1 group, after 18β-GA treatment (Figure 3B).
The level of HMGB1 in plasma correlated inversely with platelet counts of patients with ITP (Figure 3C). Moreover, the mRNA expression of HMGB1 in CD4+ T cells from ITP patients was higher than that of healthy controls (Figure 3D). We further investigated whether CD4+ T cells could secrete HMGB1 directly after cell culture. Our western blotting results showed an increase in HMGB1 expression in CD4+ T cells from patients with active ITP, compared with the expression in healthy controls (Figure 3E). The nuclear factor κB (NF-κB) signaling pathway is the major downstream pathway of HMGB1 intracellularly and extracellularly.32 We demonstrated that expression of phosphorylated NF- κ B (P65) and the levels of HMGB1 decreased significantly in CD4+ T cells of patients with ITP after 18β-GA stimulation (Figure 3F). Moreover, the level of phosphorylation of heat shock factor 1 (HSF1) in CD4+ T cells from ITP patients was significantly increased after
18β-GA modulation. The mRNA expression of HMGB1 was significantly increased after addition of HSF1 inhibitor, and this effect could not be reversed by 18β-GA (Online Supplementary Figure S2).
18β-GA inhibited the expression of HMGB1, in turn increasing the number and restoring the immunosuppressive capacity of Treg from patients with immue thrombocytopenia
We used recombinant human HMGB1 protein (rhHMGB1) in cell experiments to simulate the high level of HMGB1 in the plasma of patients with ITP. We demonstrated that, compared with DMSO, 18β-GA increased Treg generation from isolated CD4+ T cells from ITP patients (18β-GA vs. DMSO; P=0.0069) (Figure 4A). However, we noticed that this change was apparently attenuated with additional treatment of rhHMGB1 at 100 ng/mL (18 β -GA vs rhHMGB1+18β-GA; P=0.0725). We also found that HMGB1 itself reduced the number of Treg directly (DMSO vs rhHMGB1; P=0.0007), whereas this phenomenon was reversed when cells were also treated with 18 β -GA (rhHMGB1 vs. rhHMGB1+18β-GA; P=0.0036) for 3 days. Next, to determine whether the mechanism of action of 18β-GA was mediated by HMGB1, we performed a lentiviral interference test (Figure 4B-E). We observed that the transfection with short hairpin (sh)RNA successfully silenced the HMGB1 in Treg with a knockdown efficiency of ≥78.7% as indicated by RT-PCR (Figure 4B). The cells were then divided into six groups (Figure 4C, D). We found that, compared to Treg transfected with the control lentivirus, Treg transfected with HMGB1 shRNA had a stronger immunosuppressive ability on effector T cells, similar to that produced by 18β-GA modulation, Moreover, HMGB1 shRNA interference masked the effect of 18β-GA in Treg of patients with ITP. We did not observe any significant statistical difference in the immunosuppressive ability of Treg transfected with HMGB1 shRNA after treatment with DMSO or 18β-GA.
18β-GA ameliorated thrombocytopenia in an active murine model of immune thrombocytopenia via inhibition of HMGB1 signaling
We constructed a murine model of active ITP.28 We administered 18β-GA (30 mg/kg) or 3% DMSO via intraperitoneal injections every 2 days from day 1 after radiation and splenocyte transfusion (Figure 5A). Following the radiation and transfer of anti-CD61 immune-sensitized splenocytes into SCID mice, platelet counts dropped to a nadir on day 14. On day 21, significantly higher platelet counts were observed in the 18 β -GA-treated group than in the control group (Figure 5B). The level of plasma HMGB1 in ITP mice was significantly higher than that in SCID mice without splenocyte transfusion (Figure 5C). Nevertheless, the mRNA expression of HMGB1 in mice spleen in the 18β-GA
Haematologica | 108 March 2023 848 ARTICLE - Restoring Treg function via HMGB1 in ITP H. Wang et al.
Figure 4. 18β-GA inhibited the expression of HMGB1 by increasing the number and restoring the immunosuppressive capacity of Treg from patients with immune thrombocytopenia. (A) Compared to dimethylsulfoxide (DMSO), 18β-GA increased the generation of Treg in CD4+ T cells from patients with immune thrombocytopenia (ITP), and this change was attenuated in the rhHMGB1 (100 ng/mL) group, n=11, paired t test, ***PDMSO vs. rhHMGB1=0.0007, **PrhHMGB1 vs. rhHMGB1+18β-GA=0.0036, **PDMSO vs. 18β-GA=0.0069. (B) HMGB1 shRNA transfection successfully silenced the HMGB1 gene in Treg of ITP patients after 72 hours; the knockdown efficiency of HMGB1 gene was ≥78.7% as determined by real-time quantitative polymerase chain reaction (paired t test, n=4, *P=0.0191). (C) Representative histogram of proliferation of CD4+ CFSE+ effector T cells. (D) After treatment with DMSO or 18β-GA, HMGB1 or control shRNA-transfected Treg were co-cultured with CD4+ CD25 effector T cells. The graph shows the division index of the proliferation of effector T cells. Effector T cells co-cultured with HMGB1 shRNA-Treg had a lower level of proliferation, compared with those co-cultured with control shRNA-Treg (*Pcd=0.0209, *Pce=0.0146). There was no statistically significant difference in the immunosuppression of Treg transfected with HMGB1 shRNA after treatment with DMSO or 18β-GA (Pef=ns). Paired t test, n=4. (E) Flow chart of the lentiviral interference. Teff: T effector cells; CFSE: 5(6)-carboxyfluorescein diacetate N-succinimidyl ester; MFI: mean fluorescence intensity.

A B C E D Haematologica | 108 March 2023 849 ARTICLE - Restoring Treg function via HMGB1 in ITP H. Wang et al.
group was lower than that in the control group at day 35 (Figure 5D). It was also seen that 18β-GA increased Treg in peripheral blood, spleen, inguinal lymph nodes and thymus 35 days after splenic transfer (Figure 5E, F). We observed that lycopene (5 mg/kg), another inhibitor of HMGB1,33 also alleviated thrombocytopenia in ITP mice, and induced similar effects on the elevation of platelet counts and upregulation of Treg in various organs as those
induced by 18β-GA. Platelet counts dropped to their minimum levels on day 14 in each group, and platelet counts in mice treated with lycopene were significantly higher than those in the control group on day 28 (Figure 6A). The Treg population increased significantly in the spleen, thymus and peripheral blood by day 35 following treatment with lycopene (Figure 6B). We also found that the level of serum antiplatelet CD61-specific antibodies decreased
18β-GA ameliorated thrombocytopenia in a murine model of active immune thrombocytopenia with increased Treg. (A) Immune thrombocytopenia (ITP) was established in radiated severe combined immunodeficient (SCID) mice with infusion of 5×10⁴ splenocytes from CD61-knockout mice immunized against wildtype C57BL/6 mice platelets. Platelet counts were monitored weekly for 5 weeks. We defined the day of splenocyte infusion as day 0. The drug intervention was administered on day 1, and repeated every 2 days thereafter. (B-F) Treatment with 18β-GA (30 mg/kg) or control (3% dimethylsulfoxide [DMSO] in phosphate-buffered saline) was administered on day 1 and repeated every 2 days; n=5 for the control group and n=5 for the 18β-GA group. (B) On day 21, a significantly higher platelet count was observed in the 18β-GA-treated group than in the control group. The lines denote medians of platelet counts in each group as the data were not normally distributed. Significance among groups was determined by two-way analysis of variance, ****PTime<0.0001, ***Pplatelets=0.0002 (multiple comparisons: *P21=0.0158). (C) The level of plasma HMGB1 in mice with ITP was significantly higher than that in SCID mice. Unpaired t test, *P=0.0142. (D) Relative mRNA expression of HMGB1 in the spleen at day 35 was higher after 18β-GA treatment than after DMSO treatment. Unpaired t test, *P=0.0482. Peripheral blood, spleens, thymuses, inguinal lymph nodes and livers were harvested from ITP mice at day 35 after splenocyte transfer. (E) The gating strategy and representative density plots for identification of CD4+ CD25+ Foxp3+ Treg (F) 18 β -GA-treated ITP mice had a higher percentage of Treg in spleen (*P=0.0340), thymus (**P=0.0075), inguinal lymph nodes (**P=0.0017), and peripheral blood (P=0.1796), compared with the control ITP mice. Differences between two groups were determined by an unpaired t test. KO: knockout.
Figure

A B E F C D Haematologica | 108 March 2023 850 ARTICLE - Restoring Treg function via HMGB1 in ITP H. Wang et al.
5.
significantly in the 18β-GA and lycopene groups, compared with that in the control group since day 14 (Figure 6C, D). Plasma HMGB1 expression was downregulated in the lycopene-modulated group, compared with that in the control group on day 35 (Figure 6E).
In addition, we performed a Treg cell-depletion study and found that thrombocytopenia was exacerbated in ITP mice receiving Treg-depleted splenocytes, in which 18 β -GA failed to raise platelet counts (Figure 6F). However, 18βGA was still capable of raising platelet counts in ITP mice after CD19+ B-cell and CD8+ T-cell depletion (Online Supplementary Figure S3).
Moreover, we observed that, on day 35 after treatment with 18β-GA, the levels of proinflammatory cytokines such as interleukin (IL)-6, IL-12, tumor necrosis factor-alpha (TNF- a) and interferon-gamma (IFN- γ) were decreased, whereas the anti-inflammatory cytokine transforming growth factor-beta (TGF-β) increased in the serum of ITP mice (Online Supplementary Table S2).
18β-GA alleviated phagocytosis towards platelets by macrophages from mice and patients with immune thrombocytopenia
We quantified the mean fluorescence intensity of CD80/CD86 on F4/80+ macrophages on day 35 in ITP mice. It was observed that CD80 and CD86 expression on macrophages from spleen and liver decreased after 18 β -GA treatment compared with the control group (Figure 7A, B).
In addition, platelets residing within the spleen and liver of ITP mice on day 35 were assessed by total radiant efficiency in the region of interest with an in vivo live imaging system. The total radiant efficiency of the region of interest in the 18β-GA-treated group was lower than that in the DMSO-treated group, indicating weaker platelet phagocytosis in the spleen and liver after 18β-GA treatment (Figure 7C, D). Interestingly, we observed that lycopene also downregulated the expression of CD80/CD86 on F4/80+ macrophages (Figure 7E), and attenuated the phagocytic indices of macrophages towards platelets sensitized by anti-mouse CD41 antibody and labeled with 5chloromethylfluorescein diacetate in spleen and liver of ITP mice on day 35 (Figure 7F).
Furthermore, 18β-GA significantly reduced the phagocytic index of CD14+ monocyte-derived macrophages towards platelets in patients with ITP, consistent with results in ITP mice (Figure 8A, B). We blocked HMGB1 expression in monocyte-derived macrophages from patients with ITP (Figure 8C), and found that phagocytic indices were decreased (Figure 8D). Moreover, 18β-GA did not have a significant effect on phagocytic indices of macrophages after blockade of HMGB1. Microscopy images showed that the number of platelets phagocytosed by monocyte-derived macrophages from ITP patients in the 18 β -GA-treated group was less than that in the DMSO group (Figure 8E).
In summary, the results of our in vitro and in vivo studies in ITP demonstrated that 18 β -GA augmented the suppressive function of Treg via inhibition of HMGB1 signaling, with the ultimate effect of restoring the immune balance of the cell subset and improving thrombocytopenia. On the other hand, 18β-GA attenuated the phagocytotic activity of macrophages in ITP mice and patients by blocking HMGB1 (Figure 8F).
Discussion
The pathogenesis of ITP is complex and not fully elucidated, but includes antibody-mediated peripheral platelet destruction and CTL cytotoxicity towards platelets. Management of the condition remains a challenge.
18 β -GA can play a protective role in psoriasis in mice through inhibition of inflammatory cytokines, and activation of Treg in both lymph nodes and the spleen.34 Carbenoxolone, as a derivative of GA, significantly reversed the severity and pathology in experimental autoimmune encephalomyelitis.35 IL-17-secreting and IFN-γ-secreting CD4+ T lymphocytes were remarkably lower in the spleen after carbenoxolone treatment in mice with experimental autoimmune encephalomyelitis. These data show that 18 β -GA can regulate the homeostasis of CD4+ T helper cells, which is consistent with our research. Treg are important for maintaining self-tolerance and immune homeostasis in ITP. Insufficient production and impaired immunosuppressive activity of Treg contribute to loss of immune balance in patients with ITP. In our study, it was demonstrated that 18β-GA could upregulate the proportion and enhance the suppressive activity of Treg in cells of ITP patients. In the murine model of active ITP, 18β-GA significantly increased platelet counts, and enhanced the number and function of naturally occurring Treg in various organs in the ITP mice. Interestingly, a study by Aslam et al. showed that mice with active ITP had low numbers of peripheral splenic Treg, and that intravenous immunoglobulin therapy normalized this peripheral deficiency. Additionally, it was indicated that the peripheral Treg deficiency associated with thymic sequestration of functional Treg, and intravenous immunoglobulin therapy reduced the numbers of thymic Treg by allowing the cells’ release into the periphery, although the underlying mechanism of how intravenous immunoglobulin modulated Treg movements is undefined.5 Our in-vivo study, on the other hand, demonstrated that 18 β -GA not only stimulated thymic expansion of Treg but also rescued the peripheral deficiency by increasing splenic, lymph node infiltrating and circulating Treg numbers. Whether this dual effect was a superimposed result of enhanced Treg induction and Treg release needs to be further investigated.
Haematologica | 108 March 2023 851 ARTICLE - Restoring Treg function via HMGB1 in ITP H. Wang et al.
thrombosis, platelets are increasingly considered as dynamic effector cells across immune and inflammatory continuums.36 Guo et al. found that T-cell-mediated thrombocytopenia was alleviated by allogeneic platelet transfusions in ITP.37 Thus, as versatile cells that orchestrate immune host responses, it is likely that a rising plaB
Figure 6. 18β-GA exerted a therapeutic effect by inhibiting HMGB1 in mice with immune thrombocytopenia. (A-E) Treatment with 18β-GA (30 mg/kg), lycopene (5 mg/kg), or control (3% dimethylsulfoxide in phosphate-buffered saline) was administered on day 1, and repeated every 2 days after murine models of active immune thrombocytopenia had been established, n=4 for each group. a: control, b: 18β-GA, c: lycopene, d: 18β-GA+lycopene. (A) On day 21, a significantly higher platelet count was observed in the 18βGA-treated group than in the control group (*Pcontrol vs. 18β-GA=0.0128). On day 28, platelet counts increased significantly with treatment with 18β-GA (*Pcontrol vs. 18β-GA=0.0101) or lycopene (*Pcontrol vs. lycopene=0.0160). The lines denote the mean (± standard deviation [SD]) of platelet counts in each group as the data are normally distributed. Statistical significance among groups was determined by twoway analysis of variance (ANOVA), ****PTime<0.0001, **Pplatelets=0.0010. (B) The percentage of Treg in the spleen, thymus, inguinal lymph nodes, and peripheral blood on day 35. Statistical significance among groups was determined by one-way ANOVA, n=4 for each group. For spleens, **Pab=0.0028, **Pac=0.0098, **Pad=0.0012. For thymuses, *Pab=0.0168, *Pac=0.0243, *Pad=0.0109. For inguinal lymph nodes, *Pab=0.0346, *Pad=0.0144. For peripheral blood, *Pab=0.0155, *Pac=0.0167, **Pad=0.0016. (C) The gating strategy and representative plots for anti-CD61 antibody (%). (D) The level of serum antiplatelet CD61-specific antibodies decreased after day 14. The lines denote the mean (±SD) of % anti-CD61 antibody in each group as the data are normally distributed. Significant differences among groups emerging on day 14. Two-way ANOVA. ***Pab=0.0003, **Pac=0.0037, ***Pad=0.0001 at day 14. At day 35, **Pab=0.0063, *Pac=0.0329, **Pad=0.0038. (E) Plasma HMGB1 levels in ITP mice at day 35. Statistical significance among groups was determined by one-way ANOVA. **Pab=0.0049, **Pac=0.0016, **Pad=0.0012. (F) Thrombocytopenia was exacerbated in ITP mice receiving Treg-depleted splenocytes, where 18β-GA failed to raise platelet counts. The lines denote median (with range) of platelets in each group as the data are not normally distributed, n=4 for each group. Statistical significance among groups was determined by two-way ANOVA, and emerged on day 21: *PControl vs. 18β-GA=0.0367. PTreg-deleted Control vs. Treg-deleted 18β-GA=not significant (ns).
Haematologica | 108 March 2023 852 ARTICLE - Restoring Treg function via HMGB1 in ITP H. Wang et al.

It is worth noting that ITP-specific therapies such as corticosteroids, intravenous immunoglobulin, rituximab, and thrombopoietin-receptor agonists restore Treg balance as an effect accompanying the rise in platelet counts in general, although via different mechanisms of action in ITP. In addition to well-established roles in hemostasis and A C D E F
Figure 7. 18β-GA alleviated the phagocytosis of macrophages in mice with immune thrombocytopenia. (A) Representative histogram plots for mean fluorescence intensity (MFI) of CD80/CD86 on F4/80+ macrophages in spleen and liver of mice with immune thrombocytopenia (ITP). (B) 18β-GA-treated ITP mice had a lower MFI of CD80 and CD86 on F4/80+ macrophages in the spleen and liver, compared with the control ITP mice, n=5 for each group. Differences between two groups were determined by an unpaired t test. (**Pspleen-CD80=0.0095; **Pspleen-CD86=0.0079; *Pliver-CD80=0.0485; *Pliver-CD86=0.0489). (C, D) 18β-GA reduced the platelet retention in spleens and livers in the ITP mice model. Statistical results were calculated as the total radiant efficiency (TRE) in the region of interest (ROI) in the 18β-GA group or the group treated with dimethylsulfoxide (DMSO) divided by the TRE in the ROI in the negative control group. a: DMSO group; b: 18β-GA group; c: negative control group. The TRE of ROI in the 18β-GA group was lower than that in the DMSO group, n=3 for each group. Differences between two groups were determined by an unpaired t test.
(E) Decreased CD80 and CD86 expression on day 35 on F4/80+ macrophages in the spleen and liver of ITP mice treated with 18βGA or lycopene, n=4 for each group. a: control; b: 18β-GA; c: lycopene; d: 18β-GA+lycopene. Statistical significance among groups was determined by one-way analysis of variance (ANOVA). *P<0.05, **P<0.01. (F) 18β-GA and lycopene both attenuated the phagocytic indices on day 35 in spleen and liver of ITP mice, n=4 for each group. a: control; b: 18β-GA; c: lycopene; d: 18β-GA+lycopene. Statistical significance among groups was determined by one-way ANOVA. *P<0.05, **P<0.01.

A C E F B D Haematologica | 108 March 2023 853 ARTICLE - Restoring Treg function via HMGB1 in ITP H. Wang et al.
Figure 8. 18β-GA alleviated the phagocytosis of macrophages in patients with immune thrombocytopenia. (A) Representative plots of intracellular fluorescence of monocyte-derived macrophages in patients with immune thrombocytopenia (ITP) after treatment with DMSO or 18β-GA. Intracellular 5-chloromethylfluorescein diacetate (CMFDA) fluorescence-positive scatters indicate platelets phagocytosed by monocyte-derived macrophages. CD61+ scatters indicate adhered but not-phagocytosed platelets. (B) 18β-GA (25 mM) inhibited phagocytosis of monocyte-derived macrophages from ITP patients towards anti-human CD41 antibody-coated platelets in vitro. Wilcoxon matched-pairs signed rank test, n=8, *P=0.0234. (C) HMGB1 shRNA transfection in monocyte-derived macrophages. HMGB1 shRNA transfection successfully silenced the HMGB1 gene in monocyte-derived macrophages from ITP patients after 72 hours; the knockdown efficiency of the HMGB1 gene was ≥81%, as determined by real-time quantitative polymerase chain reaction (paired t test, n=6, ***P=0.0003). (D) 18β-GA reduced phagocytic indices of monocyte-derived macrophages by blocking HMGB1 in ITP. Statistical significance among groups was determined by one-way analysis of variance, n=6, **P=0.0037. Multiple comparisons: *Pab=0.0457; *Pac=0.0107. (E) Microscopy images comparing phagocytosis towards CMFDA-labeled CD41-opsonized platelets by monocyte-derived macrophages of ITP patients in the presence of DMSO or 18β-GA. Bound but external platelets (CMFDA+APC-CD61: green and red) were distinguished from internalized platelets (CMFDA: green) using APC-anti human-CD61 antibody. Cell nuclei were labeled with DAPI (blue). Ratio of endocytosed platelets to macrophages: the numbers of endocytic platelets and macrophages were calculated by Imagepro Plus 6.0 software, under 200× magnification. Differences between two groups were determined by a paired t test, n=4. (F) Diagram to show the effect of 18β-GA acting on Treg and macrophages via HMGB1 signaling. Mϕ: macrophages; ns: not significant.

E A B C D F Haematologica | 108 March 2023 854 ARTICLE - Restoring Treg function via HMGB1 in ITP H. Wang et al.
telet mass will somehow affect Treg or vice versa. However, 18β-GA increased the number of Treg and enhanced their immunosuppressive function via HMGB1 blockade in the absence of platelets in our in vitro studies, indicating that the immunomodulatory effect of 18β-GA was platelet-independent. Moreover, the results of Treg-depletion in the ITP murine model also showed that the platelet-raising effect of 18β-GA required the involvement of Treg. In addition, 18β-GA reduced the phagocytosis of macrophages towards autologous platelets in ITP. 18β-GA downregulated CD80/CD86 expression and attenuated phagocytosis of macrophages in ITP. Zhao et al. demonstrated that TNF-a blockade corrected the number and function of monocytes and macrophages, leading to remarkable attenuation of antibody-mediated platelet destruction in ITP.38 Our in vivo studies indicated that the level of TNF-a also decreased after 18β-GA treatment. Liu et al showed that a shift in the balance of FcγR toward inhibitory FcγRIIb on monocytes was accompanied by a considerable decrease in monocyte/macrophage phagocytic capacity in ITP.2,8 Zhao et al. found that low-dose chidamide, a type of histone deacetylase inhibitor, restores immune balance in ITP by attenuating macrophage phagocytosis of antibodycoated platelets.7 Miao et al. reported that nuclear HMGB1 promotes the phagocytic ability of macrophages.39,40 Our study also indicated that 18β-GA reduced phagocytosis of macrophages by blocking HMGB1 in ITP.
The active ITP murine model is currently the optimal model for mimicking human, chronic ITP as it encompasses both antibody-mediated and cell-mediated platelet and megakaryocyte destruction.28 We performed cell-depletion studies and found that 18β-GA was still capable of raising platelet counts after CD19+ B-cell and CD8+ T-cell depletion in ITP mice, indicating that 18β-GA has therapeutic potential in patients with either cell-mediated or antibody-mediated thrombocytopenia. However, the use of licorice and its derivatives in ITP might have potential adverse risks, such as headache, and edema.18
The immune modulating potency of 18β-GA in ITP is related to downregulation of HMGB1 expression, as shown by lentivirus interference tests and pharmacological use of rhHMGB1 in vitro, as well as lycopene treatment in ITP mice. GA is directly combined with HMGB1, quenching the physiological activity of HMGB1 for therapeutic purposes.41 HMGB1, a recently discovered cytokine of interest that mediates the response to infection, injury, inflammation and immunoregulation, has become a prospective therapeutic target in several pathological conditions. HMGB1 could exacerbate the imbalance of peripheral immune cell subsets. Li et al. showed that enriched HMGB1 in patients with chronic hepatitis B shifted the Treg/Th17 balance to Th17 dominance via the TLR4-IL-6 pathway.10 Administration of recombinant mouse HMGB1 aggravated airway inflammation and induced Th2, Th17 polarization in
asthmatic mice, and HMGB1 could directly induce differentiation of Th2, Th17 cells in vitro through activating the Toll-like receptor (TLR)2, TLR4, receptor for advanced glycation end products (RAGE)-NF-κB signal pathway in CD4 naïve T cells as Li et al. reported.42 Importantly, HMGB1 stimulation can result in marked downregulated expression of CTLA-4 as well as Foxp3 expression and secretion of IL-10 from splenic Treg in mice.11 It has been suggested that effectively inhibiting HMGB1 expression could be a feasible way to treat liver failure, by enhancing Treg activity in patients with chronic hepatitis B.43 We found that, compared with controls, there was increased expression of HMGB1 in plasma and CD4+ T cells of ITP patients, as well as in plasma of ITP mice. The immune regulatory function of 18β-GA could be apparently attenuated by the addition of rhHMGB1 in vitro. The lentivirus interference test showed that HMGB1 is key to the effect of 18β-GA in Treg of ITP. Inhibition of lycopene in a murine model of active ITP had similar effects as those of 18βGA. A negative correlation between plasma level of HMGB1 and baseline platelet count was documented in ITP patients, and upregulated Treg and downregulated HMGB1 levels were observed together with elevation of platelet count in treated ITP mice. Therefore, HMGB1 has potential values in the diagnosis and management of ITP. Its levels may be indicative of disease severity and prognosis of ITP to a certain extent.
Treg expansion was weakened with ITP-HMGB1 in comparison to HC-HMGB1, suggesting that the redox state of HMGB1 is responsible for immune balance in ITP. Furthermore, wildtype and fully reduced HMGB1 inhibited the proliferation of Treg, whereas both signals were turned off when HMGB1 was oxidized. Extracellular HMGB1 can act both as a chemokine and as a pro-inflammatory mediator, the latter effect depending on the redox state of three cysteines: C23 and C45 must form a disulfide bond within the first HMG-box domain of HMGB1 Box A, whereas the unpaired C106 within Box B must be in the thiol state.44 The cytokine-stimulating and chemotactic activities of HMGB1 are mutually exclusive. In contrast, HMGB1 terminally oxidized to sulfonates potentially induces immune tolerance and upregulates FoxP3 and CD206.45 However, whether ITP-frHMGB1 is partially oxidized and converted into disulfide HMGB1, which plays a pro-inflammatory role, needs further study. It has been reported that glycyrrhizin attenuated disulfide-HMGB1-induced depressive behaviour.46 Consistently, our results showed that the combination of ITP-HMGB1 and 18 β -GA expanded the proportion of Treg, compared with HMGB1 alone. Previous literature described that the binding site of glycyrrhizin to HMGB1 covers specific region on the Cys-23 and Cys-45 side chains, blocking oxidant accessibility to the thiol groups, which protects them from oxidants.47
Haematologica | 108 March 2023 855 ARTICLE - Restoring Treg function via HMGB1 in ITP H. Wang et al.
In addition, as a late inflammatory mediator, HMGB1 responds to the early inflammatory mediator TNF- a , prolonging inflammatory responses during acute liver failure and acute kidney injury; however, glycyrrhizin inhibited pyroptosis in TNF-induced M1 macrophages by inhibition of HMGB1. 48 Glycyrrhizin significantly reduced the degree of ferroptosis during acute liver failure by suppressing oxidative stress via HMGB1 inhibition.49 As 18 β -GA has comprehensive effects involving inflammation, oxidation, etc. in other disease settings, as mentioned above,48,49 it is worth exploring whether these mechanisms are involved in immune modulation targeting the upstream pathogenesis of ITP in future studies. Our results have shown that the phosphorylation of NFκB decreased in CD4+ T cells after 18β-GA treatment. In previous studies, HMGB1 was found to bind to cell surface receptors once released from cells. Classic HMGB1 receptors include the RAGE, TLR2 and TLR4, and NF-κB is a very important downstream factor of these signaling pathways.32,50 Signaling through RAGE leads to activation of NFκB, as well as to signal transduction through ERK and p38, which promotes the production of cytokines (TNF, IL-6 and IFN-γ). HMGB1-dependent activation of TLR2 and TLR4 leads to NF-κB activation through a MyD88-dependent mechanism. Treg selectively expressed several members of the TLR family. TLR ligands can directly modulate the suppressive capacity of Treg.51 Our results provide evidence that 18β-GA inhibits the expression of HMGB1 and phosphorylation of NF-κB, and both restores the immunosuppressive function of Treg and induces their proliferation in ITP. Whether this is related to TLR ligands in ITP remains to be studied further. Treatment of HeLa cells with glycyrrhizin derivatives resulted in enhanced phosphorylation and acquisition of DNA-binding ability of HSF1.52 It has been reported that HSF1 binds directly with the HMGB1 promoter and negatively regulates HMGB1, involving the TLR4/MyD88/NF-κB signal pathway in asthma.53 HSF1 inhibits H2O2-induced cardiomyocyte death through suppression of HMGB1.54 Our study also proved that 18β-GA inhibited the mRNA expression of HMGB1 via phosphorylation of HSF1.
Abnormal cytokine profiles are closely associated with immune imbalance in ITP, and therapeutic options for ITP are associated with correction of cytokine abnormalities. Consistent with the imbalance of Th1/Th2 and Th17/Treg subsets, the levels of IFN- γ and IL-17a were increased, whereas IL-4 and IL-10 levels were decreased in ITP. Other cytokines, including IL-6, TGF- β , and TNF- a , have also been described to be involved in ITP. In our study, TGF-βwas significantly elevated by 18β-GA. However, the levels of TNF- a , IFN- γ , IL-6 and IL-12 reduced after 18 β -
GA administration. These data are consistent with the restoration of immune homeostasis in ITP.
Loss of immune homeostasis is a major characteristic of ITP, and restoring the immune balance is the top priority.
18 β -GA promoted immune balance in ITP by stimulating Treg proliferation and alleviating phagocytosis of monocytes and macrophages. Although the precise mechanism of the interaction between HMGB1 and Treg remains to be elucidated, HMGB1 is emerging as a novel and potential immunoregulatory checkpoint offering new strategies for immune-therapeutics of ITP. This provides a promising therapeutic option in newly diagnosed ITP patients. Large-scale prospective randomized clinical trials, including long-term follow-up and analysis of sustained response, are needed to validate our findings in the future.
Disclosures
No conflicts of interest to disclose.
Contributions
HW, NA, YH, and MH conceived the study and designed the experiments. HW, NA, and YH performed research and analyzed data. TY, YS, PX, PH, YZ, LW, XN, and YL recruited and enrolled the patients and healthy controls for this study. HW, NA, and YH wrote the paper. GL and YL assisted the research. JP edited the paper YH and MH acquired funding for the research. All authors read and approved the final version of the manuscript.
Acknowledgments
We would like to thank Alexandra H. Marshall (Marshall Medical Communications) and Editage (www.editage.com) for English language editing.
Funding
This work was supported by grants from the National Natural Science Foundation of China (n. 81900121, n. 81973994, n. 81900123); Major Research and Development Plan of Shandong Province (2021LCZX05); Young Taishan Scholar Foundation of Shandong Province (n. tsqn201909175); Natural Science Foundation for Distinguished Young Scholars of Shandong Province (ZR2021JQ28); Clinical Research Center of Shandong University (n. 2020SDUCRCC009); and the Graduate Education Reform Project of Shandong University (n. XYJG2020141).
Data-sharing statement
All primary data in this study will be made available upon request to the corresponding authors for individuals with appropriate data-sharing agreements in place.
Haematologica | 108 March 2023 856 ARTICLE - Restoring Treg function via HMGB1 in ITP H. Wang et al.
References
1. McKenzie CG, Guo L, Freedman J, Semple JW. Cellular immune dysfunction in immune thrombocytopenia (ITP). Br J Haematol 2013;163(1):10-23.
2. Liu XG, Ma SH, Sun JZ, et al. High-dose dexamethasone shifts the balance of stimulatory and inhibitory Fcgamma receptors on monocytes in patients with primary immune thrombocytopenia. Blood. 2011;117(6):2061-2069.
3. Stasi R, Cooper N, Del Poeta G, et al. Analysis of regulatory Tcell changes in patients with idiopathic thrombocytopenic purpura receiving B cell-depleting therapy with rituximab. Blood. 2008;112(4):1147-1150.
4. Bao W, Bussel JB, Heck S, et al. Improved regulatory T-cell activity in patients with chronic immune thrombocytopenia treated with thrombopoietic agents. Blood. 2010;116(22):4639-4645.
5. Aslam R, Hu Y, Gebremeskel S, et al. Thymic retention of CD4+CD25+FoxP3+ T regulatory cells is associated with their peripheral deficiency and thrombocytopenia in a murine model of immune thrombocytopenia. Blood. 2012;120(10):2127-2132.
6. Li J, Wang Z, Hu S, Zhao X, Cao L. Correction of abnormal T cell subsets by high-dose dexamethasone in patients with chronic idiopathic thrombocytopenic purpura. Immunol Lett. 2013;154(1-2):42-48.
7. Zhao HY, Ma YH, Li DQ, et al. Low-dose chidamide restores immune tolerance in ITP in mice and humans. Blood. 2019;133(7):730-742.
8. Liu XG, Liu S, Feng Q, et al. Thrombopoietin receptor agonists shift the balance of Fcγ receptors toward inhibitory receptor IIb on monocytes in ITP. Blood. 2016;128(6):852-861.
9. Nagelkerke SQ, Dekkers G, Kustiawan I, et al. Inhibition of FcγRmediated phagocytosis by IVIg is independent of IgG-Fc sialylation and FcγRIIb in human macrophages. Blood. 2014;124(25):3709-3718.
10. Li J, Wang FP, She WM, et al. Enhanced high-mobility group box 1 (HMGB1) modulates regulatory T cells (Treg)/T helper 17 (Th17) balance via toll-like receptor (TLR)-4-interleukin (IL)-6 pathway in patients with chronic hepatitis B. J Viral Hepat. 2014;21(2):129-140.
11. Zhang Y, Yao YM, Huang LF, et al. The potential effect and mechanism of high-mobility group box 1 protein on regulatory T cell-mediated immunosuppression. J Interferon Cytokine Res. 2011;31(2):249-257.
12. Luo C, Liu H, Wang H, Wang J. Toll-like receptor 4 signaling in high mobility group box-1 protein 1 mediated the suppression of regulatory T-cells. Med Sci Monit. 2017;23:300-308.
13. Gowda P, Patrick S, Joshi SD, Kumawat RK, Sen E. Glycyrrhizin prevents SARS-CoV-2 S1 and Orf3a induced high mobility group box 1 (HMGB1) release and inhibits viral replication. Cytokine. 2021;142:155496.
14. Yang PF, Zhang GY, Liu HY, et al. [Expression of HMGB1 in spleen of adult patients with chronic and refractory immune thrombocytopenia and its significance]. Zhongguo Shi Yan Xue Ye Xue Za Zhi. 2018;26(2):516-521.
15. Wang R, Cao Q, Bai ST, Wang L, Sheng GY. Potential role and mechanism for high mobility group box1 in childhood chronic immune thrombocytopenia. Eur Rev Med Pharmacol Sci. 2019;23(24):10931-10941.
16. Zhang G, Yang P, Liu X, et al. HMGB1 is increased in patients with immune thrombocytopenia and negatively associates with Tregs. Thromb Res. 2022;213:128-136.
17. Yamaguchi H, Kidachi Y, Kamiie K, Noshita T, Umetsu H.
Structural insight into the ligand-receptor interaction between glycyrrhetinic acid (GA) and the high-mobility group protein B1 (HMGB1)-DNA complex. Bioinformation. 2012;8(23):1147-1153.
18. Li JY, Cao HY, Liu P, Cheng GH, Sun MY. Glycyrrhizic acid in the treatment of liver diseases: literature review. Biomed Res Int. 2014;2014:872139.
19. Cavone L, Muzzi M, Mencucci R, et al. 18β-glycyrrhetic acid inhibits immune activation triggered by HMGB1, a proinflammatory protein found in the tear fluid during conjunctivitis and blepharitis. Ocul Immunol Inflamm. 2011;19(3):180-185.
20. Wang H, Zhao Y, An N, et al. 18β-glycyrrhetic acid modulates Th1/Th17/Th22/regulatory T cells homeostasis via HMGB1/NF-κB signaling pathway in immune thrombocytopenia. Blood. 2018;132(Suppl 1):1144.
21. Ukil A, Biswas A, Das T, Das PK. 18 Beta-glycyrrhetinic acid triggers curative Th1 response and nitric oxide up-regulation in experimental visceral leishmaniasis associated with the activation of NF-kappa B. J Immunol. 2005;175(2):1161-1169.
22. Kim SH, Hong JH, Lee JE, Lee YC. 18beta-glycyrrhetinic acid, the major bioactive component of Glycyrrhizae radix, attenuates airway inflammation by modulating Th2 cytokines, GATA-3, STAT6, and Foxp3 transcription factors in an asthmatic mouse model. Environ Toxicol Pharmacol. 2017;52:99-113.
23. Endong L, Shijie J, Sonobe Y, et al. The gap-junction inhibitor carbenoxolone suppresses the differentiation of Th17 cells through inhibition of IL-23 expression in antigen presenting cells. J Neuroimmunol. 2011;240-241:58-64.
24. Kuang P, Zhao W, Su W, et al. 18beta-glycyrrhetinic acid inhibits hepatocellular carcinoma development by reversing hepatic stellate cell-mediated immunosuppression in mice. Int J Cancer 2013;132(8):1831-1841.
25. Kowalska A, Kalinowska-Lis U. 18β-glycyrrhetinic acid: its core biological properties and dermatological applications. Int J Cosmet Sci. 2019;41(4):325-331.
26. Luo YG, Liu YQ, Hu J. [Clinical study on effect of recombinant roasted licorice decoction combined with low-dose glucocorticoids in treating idiopathic thrombocytopenic purpura]. Zhongguo Zhong Xi Yi Jie He Za Zhi. 2001;21(7):501-503.
27. Neunert C, Lim W, Crowther M, et al. The American Society of Hematology 2011 evidence-based practice guideline for immune thrombocytopenia. Blood. 2011;117(16):4190-4207.
28. Chow L, Aslam R, Speck ER, et al. A murine model of severe immune thrombocytopenia is induced by antibody- and CD8+ T cell-mediated responses that are differentially sensitive to therapy. Blood. 2010;115(6):1247-1253.
29. Shen S, Zhou M, Huang K, et al. Blocking autophagy enhances the apoptotic effect of 18beta-glycyrrhetinic acid on human sarcoma cells via endoplasmic reticulum stress and JNK activation. Cell Death Dis. 2017;8(9):e3055.
30. Liu CB, Wang R, Yi YF, Gao Z, Chen YZ. Lycopene mitigates βamyloid induced inflammatory response and inhibits NF-κB signaling at the choroid plexus in early stages of Alzheimer's disease rats. J Nutr Biochem. 2018;53:66-71.
31. Evankovich J, Cho SW, Zhang R, et al. High mobility group box 1 release from hepatocytes during ischemia and reperfusion injury is mediated by decreased histone deacetylase activity. J Biol Chem. 2010;285(51):39888-39897.
32. Lotze MT, Tracey KJ. High-mobility group box 1 protein (HMGB1): nuclear weapon in the immune arsenal. Nat Rev Immunol.
Haematologica | 108 March 2023 857 ARTICLE - Restoring Treg function via HMGB1 in ITP H. Wang et al.
2005;5(4):331-342.
33. Musumeci D, Roviello GN, Montesarchio D. An overview on HMGB1 inhibitors as potential therapeutic agents in HMGB1related pathologies. Pharmacol Ther. 2014;141(3):347-357.
34. Chen H, Liu H, Tang B, et al. The protective effects of 18βglycyrrhetinic acid on imiquimod-induced psoriasis in mice via suppression of mTOR/STAT3 signaling. J Immunol Res. 2020;2020:1980456.
35. Chen Y, Hu Z, Li R, et al. The effects of carbenoxolone against experimental autoimmune encephalomyelitis in a mouse model. Neuroimmunomodulation. 2020;27(1):19-27.
36. Guo L, Shen S, Rowley JW, et al. Platelet MHC class I mediates CD8+ T-cell suppression during sepsis. Blood. 2021;138(5):401-416.
37. Guo L, Yang L, Speck ER, et al. Allogeneic platelet transfusions prevent murine T-cell-mediated immune thrombocytopenia. Blood. 2014;123(3):422-427.
38. Zhao Y, Xu P, Guo L, et al. Tumor necrosis factor-a blockade corrects monocyte/macrophage imbalance in primary immune thrombocytopenia. Thromb Haemost. 2021;121(6):767-781.
39. Miao J, Ye S, Lan J, et al. Nuclear HMGB1 promotes the phagocytic ability of macrophages. Exper Cell Res. 2020;393(1):112037.
40. Miao J, Ye P, Lan J, et al. Paeonol promotes the phagocytic ability of macrophages through confining HMGB1 to the nucleus. Int Immunopharmacol. 2020;89(Pt B):107068.
41. Bailly C, Vergoten G. Glycyrrhizin: an alternative drug for the treatment of COVID-19 infection and the associated respiratory syndrome? Pharmacol Ther 2020;214:107618.
42. Li R, Wang J, Zhu F, et al. HMGB1 regulates T helper 2 and T helper17 cell differentiation both directly and indirectly in asthmatic mice. Mol Immunol. 2018;97:45-55.
43. Wang LW, Chen H, Gong ZJ. High mobility group box-1 protein inhibits regulatory T cell immune activity in liver failure in patients with chronic hepatitis B. Hepatobiliary Pancreat Dis Int 2010;9(5):499-507.
44. Yang H, Lundbäck P, Ottosson L, et al. Redox modifications of
cysteine residues regulate the cytokine activity of HMGB1. Mol Med. 2021;27(1):58.
45. Hubert P, Roncarati P, Demoulin S, et al. Extracellular HMGB1 blockade inhibits tumor growth through profoundly remodeling immune microenvironment and enhances checkpoint inhibitorbased immunotherapy. J Immunother Cancer. 2021;9(3):e001966.
46. Lian YJ, Gong H, Wu TY, et al. Ds-HMGB1 and fr-HMGB induce depressive behavior through neuroinflammation in contrast to nonoxid-HMGB1. Brain Behav Immun. 2017;59:322-332.
47. Mollica L, De Marchis F, Spitaleri A, et al. Glycyrrhizin binds to high-mobility group box 1 protein and inhibits its cytokine activities. Chem Biol. 2007;14(4):431-441.
48. Wang Y, Zhang H, Chen Q, et al. TNF-a/HMGB1 inflammation signalling pathway regulates pyroptosis during liver failure and acute kidney injury. Cell Prolif. 2020;53(6):e12829.
49. Wang Y, Chen Q, Shi C, Jiao F, Gong Z. Mechanism of glycyrrhizin on ferroptosis during acute liver failure by inhibiting oxidative stress. Mol Med Rep. 2019;20(5):4081-4090.
50. Yuan S, Liu Z, Xu Z, Liu J, Zhang J. High mobility group box 1 (HMGB1): a pivotal regulator of hematopoietic malignancies. J Hematol Oncol. 2020;13(1):91.
51. Lewkowicz P, Lewkowicz N, Sasiak A, Tchórzewski H. Lipopolysaccharide-activated CD4+CD25+ T regulatory cells inhibit neutrophil function and promote their apoptosis and death. J Immunol. 2006;177(10):7155-7163.
52. Kawashima D, Asai M, Katagiri K, Takeuchi R, Ohtsuka K. Reinvestigation of the effect of carbenoxolone on the induction of heat shock proteins. Cell Stress Chaperones. 2009;14(5):535-543.
53. Shang L, Wang L, Shi X, et al. HMGB1 was negatively regulated by HSF1 and mediated the TLR4/MyD88/NF-κB signal pathway in asthma. Life Sci. 2020;241:117120.
54. Yu Y, Liu M, Zhang L, et al. Heat shock transcription factor 1 inhibits H2O2-induced cardiomyocyte death through suppression of high-mobility group box 1. Mol Cell Biochem. 2012;364(1-2):263-269.
Haematologica | 108 March 2023 858 ARTICLE - Restoring Treg function via HMGB1 in ITP H. Wang et al.
Inhibition of DAGLβ as a therapeutic target for pain in sickle cell disease
Correspondence: D.A. Simone
simon003@umn.edu
Received: December 13, 2021.
Accepted: April 28, 2022.
1Department of Diagnostic & Biological Sciences, School of Dentistry, University of Minnesota, Minneapolis, MN; 2Graduate Program in Neuroscience, University of Minnesota, Minneapolis, MN; 3Department of Anesthesiology, University of Minnesota, Minneapolis, MN
4Department of Neuroscience, University of Minnesota, Minneapolis, MN; 5Department of Biomedical Sciences, University of North Dakota, Grand Forks, ND and 6Hematology/ Oncology, Department of Medicine, University of California Irvine, Irvine, CA, USA
Abstract
Early view: May 26, 2022.
https://doi.org/10.3324/haematol.2021.280460
©2023 Ferrata Storti Foundation
Published under a CC BY-NC license
Sickle cell disease (SCD) is the most common inherited disease. Pain is a key morbidity of SCD and opioids are the main treatment but their side effects emphasize the need for new analgesic approaches. Humanized transgenic mouse models have been instructive in understanding the pathobiology of SCD and mechanisms of pain. Homozygous (HbSS) Berkley mice express >99% human sickle hemoglobin and several features of clinical SCD including hyperalgesia. Previously, we reported that the endocannabinoid 2-arachidonoylglycerol (2-AG) is a precursor of the pro-nociceptive mediator prostaglandin E2-glyceryl ester (PGE2-G) which contributes to hyperalgesia in SCD. We now demonstrate the causal role of 2-AG in hyperalgesia in sickle mice. Hyperalgesia in HbSS mice correlated with elevated levels of 2-AG in plasma, its synthesizing enzyme diacylglycerol lipase β (DAGLβ) in blood cells, and with elevated levels of PGE2 and PGE2-G, pronociceptive derivatives of 2-AG. A single intravenous injection of 2-AG produced hyperalgesia in non-hyperalgesic HbSS mice, but not in control (HbAA) mice expressing normal human HbA. JZL184, an inhibitor of 2-AG hydrolysis, also produced hyperalgesia in non-hyperalgesic HbSS or hemizygous (HbAS) mice, but did not influence hyperalgesia in hyperalgesic HbSS mice. Systemic and intraplantar administration of KT109, an inhibitor of DAGLβ, decreased mechanical and heat hyperalgesia in HbSS mice. The decrease in hyperalgesia was accompanied by reductions in 2-AG, PGE2 and PGE2-G in the blood. These results indicate that maintaining the physiological level of 2-AG in the blood by targeting DAGLβ may be a novel and effective approach to treat pain in SCD.
Introduction
Pain is a characteristic feature of sickle cell disease (SCD).1,2 Patients experience acute and chronic pain which may be associated with hemolysis, vaso-occlusion, vasculopathy, ischemia-reperfusion injury, organ damage, neuropathy and persistent inflammation.3-5 Opioids are typically used to treat pain in SCD6 but are associated with increased symptom burden, depression and utilization of healthcare.7,8 New, effective and safe treatments are needed to manage pain in SCD.
Transgenic Berkley (BERK) and Townes mouse models of SCD expressing >99% human sickle hemoglobin exhibit hyperalgesia and have provided valuable information on mechanisms underlying pain in SCD.9,10 Inflammatory mediators such as prostaglandins, cytokines, interleukins and nerve growth factor are released from immune cells and endothelial cells11-13 and contribute to hyperalgesia by exciting and
sensitizing primary afferent nociceptors.12,14 Importantly, many of these and other inflammatory mediators are increased in the blood of patients with SCD15 and in murine models of SCD.9,16,17 Targeting peripheral mechanisms that underlie nociceptor sensitization in SCD may provide a safe and effective approach for managing pain in these patients without the undesirable side effects of opiates. The endocannabinoid 2-arachidonoylglycerol (2-AG) is an important pain modulator that has both anti- and pro-nociceptive effects.18,19 The reduction in pain has been attributed to suppression of inflammation as well as direct effects on nociceptors and targets within the central nervous system.20 In some pathological conditions, inhibitors of monoacylglyerol lipase, the enzyme that hydrolyzes 2-AG to arachidonic acid and glycerol, increased the level of 2AG and reduced hyperalgesia through mechanisms dependent on the cannaboid CB1 and CB2 receptors.21-25 Although increasing endogenous 2-AG may seem attractive
Iryna A. Khasabova,1 Jacob Gable,2 Malcolm Johns,3 Sergey G. Khasabov,1 Alexander E. Kalyuzhny,4 Mikhail Y. Golovko,5 Svetlana A. Golovko,5 Stacy Kiven,6 Kalpna Gupta,6 Virginia S. Seybold4 and Donald A. Simone1
Haematologica | 108 March 2023 859 ARTICLE - Red Cell Biology & its Disorders
as a strategy for managing pathological pain, 2-AG is also an intermediate in the production of pro-nociceptive lipids. 2-AG is a substrate for cyclooxygenase-2 (COX-2). This enzyme is induced in certain inflammatory conditions,26 including SCD.17 Oxidation of 2-AG produces prostaglandin E2-glycerol (PGE2-G), a highly potent pro-nociceptive lipid.17,27 Hydrolysis of 2-AG by monoacylglyerol lipase also contributes to the metabolic pool of arachidonic acid, a precursor of multiple prostaglandins.
In the present study, we used a humanized transgenic murine model of SCD, the homozygous BERK mouse, to investigate whether hyperalgesia in SCD is associated with increased levels of circulating 2-AG and the enzyme most closely associated with its generation. In the periphery, 2AG is synthesized from diacyglycerides by the β-isoform of diacylglycerol lipase (DAGLβ).28-30 Because DAGLβ is upstream from monoacylglyerol lipase and COX-2 in the production of PGE2 and PGE2-G, we determined whether inhibition of DAGLβ reduces hyperalgesia in HbSS mice and whether the decrease is associated with a reduction of 2AG and its related metabolites, PGE2 and PGE2-G. Our results show that 2-AG is an important intermediate in the synthesis of PGE2 and PGE2-G. The accumulation of 2-AG as a result of increased synthesis leads to an increase in the levels of pro-nociceptive lipids involved in the sensitization of nociceptors and pain in SCD. Targeting 2-AG synthesis may block pain at its source, thus contributing to prevention of hyperalgesia.
Methods
Mice
Male (5-9 months old), homozygous HbSS-BERK, HbAABERK and hemizygous HbAS mice were used (Online Supplement). All protocols were approved by the Institutional Animal Care and Use Committee.
Drugs
2-AG, anandamide (AEA), PGE2-G, PGE2, and their deuterated analogs 2-AG-d5, AEA-d8, PGE2-G-d5, and PGE2-d4 were purchased from Cayman Chemical; stock solutions were prepared in ethanol (10 mg/mL). JZL184, a selective inhibitor of monoacylglyerol lipase, and KT182, an inhibitor of ABHD6,31 were purchased from Cayman Chemical. KT109, an inhibitor of DAGLβ, 29,30 and KT195, an inhibitor of serine hydrolase ABHD6,29,30 were purchased from Sigma-Aldrich. Stock solutions of enzyme inhibitors were prepared in dimethyl sulfoxide (DMSO, 10 mg/mL) and diluted to their final concentration in sterile saline with Tween 80.
Blood collection and analysis
Whole blood (0.5 mL) was collected into MiniCollect® EDTA Tubes (Greiner Bio-One). Blood cells were isolated from
plasma by centrifugation for 10 min at 2,000 x g at 4°C. The pellet containing blood cells was used for western blot; the supernatant (i.e., plasma) was used for measurement of lipids. Samples were frozen in liquid nitrogen and stored at 80°C until processing. The amount of DAGLβ and COX-2 proteins in blood cell lysates was determined by western blot. Levels of 2-AG, AEA, PGE2-G and PGE2 were analyzed by liquid chromatography-nanoelectrospray tandem mass spectrometry. The specificity of the DAGLβ antibody was tested by knocking down DAGLβ in mouse fibrosarcoma cell clone NCTC 247237 with small interfering RNA (siRNA) specific for the DAGLβ gene. The specificity of the COX-2 antibody was tested by pre-incubation of the antibody with nickel resin (GE Healthcare) coated with a 10-fold molar excess of COX-2 His-tag protein purchased from R&D systems (Online Supplement).
Behavioral measures of hyperalgesia
Mechanical hyperalgesia was defined as a decrease in paw withdrawal threshold measured by the up-down method32 or an increase in the frequency of paw withdrawal evoked by ten stimulations with a von Frey monofilament (Stoelting) with a bending force of 3.9 mN applied to each plantar hind paw (Online Supplement).33,34 Heat hyperalgesia was defined as a decrease in the latency of paw withdrawal from radiant heat applied to each plantar hind paw.35 Baseline measurements were taken over 3 days prior to each experiment. The withdrawal threshold, frequency of withdrawal responses and latency were averaged for both paws.
Statistical analyses
Data are presented as the mean ± standard error of the mean and were analyzed by one- and two-way analysis of variance (ANOVA) with repeated measures followed by Bonferroni t tests when normally distributed. Data are presented as the median with 95% confidence interval and compared using a nonparametric test when they did not meet the requirement of normality. The effective dose for 50% of the population (ED50) was determined by non-linear regression analysis in Prism (GraphPad Software). Behavioral dose response data were initially converted to the percent of maximum possible effect (%MPE), which was calculated using the average response in the vehicle (V)treated mice and the post-drug (PD) response in each KT109-treated HbSS mouse according to the equation:
%MPE = (V HbSS – PD HbSS) / (V HbSS – V HbAA) x 100%
Results
Hyperalgesia in HbSS mice was accompanied by an increase in 2-AG in plasma
Consistent with previous reports,9-11,17,20,36-38 the majority of
Haematologica | 108 March 2023 860 ARTICLE - Inhibiting DAGLβ reduces hyperalgesia in SCD mice I.A. Khasabova et al.
-
DAGLβ reduces hyperalgesia in SCD mice
HbSS mice exhibited robust mechanical and heat hyperalgesia, and this was accompanied by an increase of 2-AG in plasma (Figure 1A-C). HbAS or HbSS-BERK sickle mice that exhibited baseline withdrawal frequencies less than 50% and withdrawal latencies to heat less than or equal to the mean minus two standard deviations for the HbAA group, were considered non-hyperalgesic (~15%). The plasma level of 2-AG in non-hyperalgesic HbSS mice was similar to that of HbAA mice.
To determine whether 2-AG contributes directly to hyperalgesia in SCD, 2-AG (18 mg/100 mL) was administered intravenously into the lateral tail vein of non-hyperalgesic HbSS mice in a vehicle of ethanol:saline (20:80, v:v). Mechanical hyperalgesia developed rapidly following a single injection of 2-AG in non-hyperalgesic HbSS mice and persisted for 24 h. No effect was observed in response to the vehicle in non-hyperalgesic HbSS mice, and 2-AG had no effect in HbAA mice (Figure 2A). Importantly, this dose of 2-AG administered by the intraplantar route suppressed mechanical hyperalgesia by ~68% in a mouse model of bone cancer pain and had no effect on naïve mice.24
JZL184, an inhibitor of 2-AG hydrolysis, increased 2-AG and decreased hyperalgesia in models of neuropathic and bone cancer pain.25 Therefore, a single intraperitoneal injection of JZL184 (0.33 mg/kg) or vehicle consisting of DMSO:Tween-80:saline (12:1:87, v:v:v) were used to test the effect of elevating the level of endogenous 2-AG in non-hyperalgesic HbSS mice. A single injection of JZL184 transformed the silent state of non-hyperalgesic hemizygous mice (HbAS), causing mechanical hyperalgesia in these mice and inducing heat hyperalgesia in non-hyperalgesic HbSS mice (Figure 2B, C). Injection of the vehicle in both cases had no effect. Administration of the same dose of
JZL184 to hyperalgesic HbSS mice did not increase the hyperalgesia, which most likely reflects maximum hyperalgesia in these mice. JZL184 had no effect in HbAA mice. Although DAGLβ is upstream of COX-2 in the synthesis of nociceptive derivatives of 2-AG, elevated levels of COX-2 in tissues from SCD contribute to systemic increases in pronociceptive products of 2-AG. COX-2 protein was significantly elevated in blood cells of both hyperalgesic and non-hyperalgesic HbSS mice compared to samples from HbAA mice (Figure 3).
KT109 reduced mechanical and heat hyperalgesia in HbSS mice
The higher level of 2-AG in plasma of hyperalgesic HbSS may reflect an increase in 2-AG synthesis or a decrease in its hydrolysis. Initially we determined whether the increase in 2-AG in plasma was associated with an increase in its biosynthesis. The β-isoform of DAGL contributes to the synthesis of 2-AG in the periphery. Indeed, hyperalgesia in HbSS mice was accompanied by an increase in DAGLβ protein in blood cells (Figure 4). It is noteworthy that the amount of DAGLβ protein in blood cells of non-hyperalgesic HbSS mice did not differ from that of HbAA mice. We next determined if inhibition of DAGLβ would reduce hyperalgesia in HbSS mice. KT109, an inhibitor of DAGLβ with no activity against DAGLa, 29 and KT195, a control for the inhibition of serine hydrolase ABHD6 by KT10929 were used to selectively inhibit DAGLβ Mice were injected intraperitoneally with 50 mL of KT109 or the vehicle for the highest dose of KT109 (100 m g in dimethylsulfoxide [DMSO]:Tween 80:saline in a 30:1:69 v:v:v ratio). Systemic (intraperitoneal) administration of KT109 reduced mechanical hyperalgesia (Figure 5A). A dose of 30 mg eliminated
Figure 1. Increased 2-AG in plasma is associated with hyperalgesia in HbSS-BERK mice. (A) The level of 2-AG was higher in plasma of HbSS mice compared to HbAA mice and non-hyperalgesic (nh) HbSS mice. *Different from HbAA and HbSS (nh) mice at P=0.004, one-way analysis of variance (ANOVA) with Bonferroni t test. Unlike HbAA-BERK and non-hyperalgesic HbSS-BERK mice, hyperalgesic HbSS-BERK mice showed strong mechanical (B) and thermal (C) hyperalgesia. *Different from HbAA and HbSS (nh) mice at P<0.001, one-way ANOVA with Bonferroni t test. Numbers inside bars indicate group size.

C
A B Haematologica | 108 March 2023 861
I.A. Khasabova et al.
ARTICLE
Inhibiting
Figure 2. An increase in systemic 2-AG produced hyperalgesia. (A) 2-AG (18 mg/100 mL) was administered by intravenous injection to HbAA and non-hyperalgesic HbSS mice. Unlike HbAA mice, non-hyperalgesic HbSS mice developed hyperalgesia 60 min after injection; hyperalgesia persisted for 24 hours. The vehicle was ethanol in saline (20:80, v:v). *Different from HbAA mice and #different from vehicle at P<0.001 (F[6,54]=5.52, 2-way repeated measures analysis of variance [ANOVA] with Bonferroni t test, n=5-6 mice/group). (B) Intraperitoneal injection of JZL184 (0.33 mg/kg), an inhibitor of 2-AG hydrolysis, did not reduce hyperalgesia in HbSS mice (2-way ANOVA, P=0.913, n=6 mice/group). When injected into non-hyperalgesic HbAS mice, JZL184 (0.33 mg/kg, intraperitoneal) generated mechanical hyperalgesia in comparison to the vehicle (DMSO:Tween-80:saline, 12:1:87 v:v:v). *Different from baseline and #different from vehicle at P=0.005 (F[5,50]=3.88, 2-way repeated measures ANOVA with Bonferroni t test, n=6-5 mice/group). (C) JZL184 (0.33 mg/kg, i.p.) evoked thermal hyperalgesia in non-hyperalgesic HbSS mice. *Different from baseline and #different from vehicle at P<0.05 (F[3,24]=2.06, 2-way repeated measures ANOVA with Bonferroni t test, n=5 mice/group). BL: baseline; nh: non-hyperalgesic.
mechanical hyperalgesia in HbSS mice by 60 min after injection; the frequency of withdrawal from the mechanical stimulus was not different from that of HbAA mice treated with vehicle at this time point (31.4±4.7% and 27.5±5.2%, respectively). Although the reduction in hyperalgesia in HbSS mice treated with KT109 persisted at 3 h after administration compared to that in HbSS mice treated with vehicle, the effect of the drug was diminished: after 3 h the withdrawal frequency in HbSS mice treated with KT109 was greater than that of HbAA mice treated with vehicle at that time point. The responses of HbAA mice treated with KT109 were not different from baseline or from those given the vehicle through the 3 h testing period (F[1,50]= 0.59, P=0.46 for treatment, n=4-6 mice/group, 2-way repeated measures ANOVA). Because the time course for higher doses was similar, the anti-hyperalgesic effect of doses ranging from 3-300 m g are shown at 90 min after injection (Figure 5B). A dose-response effect was determined on the percent of the maximum possible effect (%MPE). The minimally effective dose was 30 mg and the ED50 was 13.1 mg (95% confidence interval: 0.61-283 mg) (GraphPad Prism).
In order to determine whether the systemic effect of KT109 on mechanical hyperalgesia was due to a peripheral site of action, mice received one intraplantar injection of vehicle (DMSO:Tween 80:saline, 13:05:86.5 v:v:v) or KT109 at doses of 1, 3 and 10 mg into one hind paw (10 mL). Following injec-
tion of vehicle, HbSS mice exhibited mechanical hyperalgesia compared to vehicle-treated HbAA mice throughout the 48 h testing period (Figure 5C). Whereas 3 mg KT109 by intraplantar injection had no effect in HbAA mice, this dose blocked mechanical hyperalgesia in HbSS mice from 30 min through 24 h after injection. Importantly, responses to the mechanical stimulus were also inhibited in the contralateral paw following injection of 3 mg KT109 (Figure 5D). The reduction in mechanical hyperalgesia in the contralateral paw did not occur until 90 min after injection, and mechanical hyperalgesia was blocked on both hind paws through 24 h after injection. Administration of 1, 3 and 10 mg (intraplantar) KT109 confirmed that 3 mg was the minimally effective dose to reduce mechanical hyperalgesia in the paw ipsilateral to the injection in HbSS mice (Figure 5E).
KT109 also inhibits ABHD6,29 but no other serine hydrolases. KT195 is a structural analog of KT109 and a more potent inhibitor of ABHD6 but is inactive against DAGLβ and other serine hydrolases.29 Therefore, we tested the effect of KT195 in HbSS mice (Figure 5F). Consistent with the previous experiment, KT109 (3 mg, intraplantar) reduced mechanical hyperalgesia through the 3 h observation period after treatment. In contrast, intraplantar injection of KT195 did not alter mechanical sensitivity at any time nor did it have an effect in HbAA mice (P=0.34, 1-way repeated measures ANOVA, n=4 mice/group; data not shown). A more potent derivative of KT195, KT182, at the same dose was also with-

A B
Haematologica | 108 March 2023 862 ARTICLE - Inhibiting DAGLβ reduces hyperalgesia in SCD mice I.A. Khasabova et al. C
Figure 3. Levels of COX-2 were higher in blood cells from HbSS mice than in HbAA mice. (A) There was no difference in the level of COX-2 between hyperalgesic and non-hyperalgesic (nh) HbSS mice. In both groups the level of COX-2 was higher than that in HbAA mice. COX-2 was detected with rabbit anti-COX-2 (1:500, ABclonal). The secondary antibody was IRDye 800CW goat antirabbit (1:15,000; LI-COR). Numbers inside bars indicate group size. *Different from HbSS and HbSS (nh) at P=0.008 (one-way analysis of variance with the Student-Newman-Keuls test). (B) Representative images of western blot immunoreactive bands corresponding to COX-2 protein isolated from blood cells (top) and the total protein stain for loading control (bottom). A prominent band corresponding to the ~72 kDa protein was identified as COX-2. (C) The specificity of the COX-2 antibody was tested by pre-incubation of the antibody with nickel resin coated with a 10-fold molar excess of COX-2 His-tag protein (b). The negative control (a) included incubation of COX-2 antibody with nickel resin without protein coating (Online Supplement).

Figure 4. An increase in the amount of DAGLβ in blood cells contributes to the accumulation of 2-AG in plasma. (A) The relative level of DAGLβ protein was defined as the amount of HbSS immunoreactivity in the sample/average amount of HbAA immunoreactivity in the sample/average amount of HbAA immunoreactivity x 100. DAGLβ was detected with rabbit anti-DAGLβ (1:500, Abcam). The secondary antibody was IRDye 800CW goat anti-rabbit (1:15,000; LI-COR). The amount of DAGLβ protein in hyperalgesic HbSS mice was greater than that of non-hyperalgesic (nh) HbSS and HbAA mice. Numbers inside bars indicate group size. *Different from HbSS (nh) and HbAA mice at P=0.002, one-way analysis of variance with Bonferroni t test. (B) Representative images of immunoreactive bands corresponding to DAGLβ isolated from blood cells [top, HbSS mice (a) and HbAA mice (b)] and the total protein stain for loading control (bottom). (C) The specificity of the rabbit anti-DAGLβ antibody was tested by knocking down the DAGLβ gene with siRNA in cultured fibrosarcoma cells. Western blot analysis was performed on 45 mg of protein (top) and verified by Revert™ 700 Total Protein Stain in each well (bottom). The digits represent positive controls (1, 2), negative controls of scrambled siRNA sequence (3) and GAPDH siRNA (4), and DAGLβ siRNA s107015 (5) and s107016 (6). A prominent band corresponding to the ~68 kDa protein was identified as DAGLβ. This band was missing in DAGL-/- cells (Online Supplement).

A B C
A B C
Haematologica | 108 March 2023 863 ARTICLE - Inhibiting DAGLβ reduces hyperalgesia in SCD mice I.A. Khasabova et al.
out effect (P=1.0 for KT182 compared to vehicle, 2-way repeated measures ANOVA with the Bonferroni t test; data not shown). Together these data support the conclusion that the effect of KT109 was specific to the inhibition of DAGLβ.
Intraplantar administration of KT109 (3 mg) also reduced sensitivity to noxious heat (Figure 6A), but the effect had a longer latency and a shorter duration compared to the change in mechanical sensitivity. KT109 did not reduce the level of heat hyperalgesia in HbSS mice until 120 min after

injection and the effect was no longer present at 24 h. Similar to the data for mechanical hyperalgesia, the effect of intraplantar injection of KT109 on the paw contralateral to the injection was consistent with its effect on the paw ipsilateral to the injection (Figure 6B). Neither KT109 nor its vehicle had an effect in HbAA mice. Administration (intraplantar) of 1, 3 and 10 mg KT109 confirmed that 3 mg was the minimally effective dose to reduce thermal hyperalgesia in the paw ipsilateral to the injection in HbSS mice (Figure 6C).
Continued on following page.
A B C D E F
Haematologica | 108 March 2023 864 ARTICLE - Inhibiting DAGLβ reduces hyperalgesia in SCD mice I.A. Khasabova et al.
Figure 5. Systemic and intraplantar administration of KT109 inhibited mechanical hyperalgesia in HbSS mice. (A) HbSS mice exhibited significant mechanical hyperalgesia prior to drug injections (BL, baseline). KT109 (30 mg) was administered by intraperitoneal injection. Vehicle was DMSO:Tween 80:saline (30:1:69 v:v:v). A reduction in hyperalgesia occurred at 60 min and persisted through the 3 h testing period (F[12,90]=3.72, P<0.001 for treatment, n=4-7 mice/group, 2-way repeated measures analysis of variance [ANOVA]). KT109 had no effect in HbAA mice, and the vehicle was without effect in either strain ( P=1.0 in HbAA mice, P=0.57 in HbSS mice, 2-way repeated measures ANOVA). *Different from vehicle in HbAA mice at P<0.001, #Different from vehicle in HbAA mice at P<0.05, †different from vehicle in HbSS mice at P<0.001; +different from vehicle in HbSS at P<0.05 (2-way repeated measures ANOVA with Bonferroni t test). (B) A dose-dependent effect was observed for 3-100 mg KT109 (F[5, 33]=5.341, P<0.001 for treatment, n=4-8 mice/dose, one-way ANOVA). Data for doses were converted to a percent of the maximum possible effect (%MPE). Percent MPE was defined as the average response in the vehicle-treated HbSS mice (V HbSS) minus the post-drug (PD) response in the KT109-treated HbSS mice divided by the average response in the vehicle-treated HbSS mice (V HbSS) minus the average response in vehicle-treated HbAA (V HbAA) mice and multiplied by 100%: %MPE = (V HbSS – PD HbSS)/(V HbSS – V HbAA) x 100%. A dose response analysis confirmed that the dose of 30 mg (intraperitoneal) was the minimally effective dose. The EC50 was 13.1 mg (95% confidence interval: 0.61-283 mg) (GraphPad Prism). Doses were plotted on a log scale. (C) Vehicle was DMSO:Tween 80:saline (13:0.5:86.5 v:v:v). HbSS mice injected with vehicle remained different from HbAA mice injected with vehicle throughout the testing period. KT109 (3 mg, intraplantar) blocked mechanical hyperalgesia ipsilateral to the injection through 24 h (F[3,168]=30.4, P<0.001 for treatment effect, n=5-8 mice/group, 2-way repeated measures ANOVA). *Different from HbSS mice injected with KT109 at P<0.05, **different at P<0.001, †different from HbAA mice at P<0.001 (2-way repeated measures ANOVA with Bonferroni t test). (D) Mechanical hyperalgesia was also blocked in the paw contralateral to the injection (F[1,88]=83.2, P<0.001 for treatment effect, 2-way repeated measures ANOVA), but the effect was not observed until 90 min after intraplantar injection of the drug (#different from vehicle in HbSS mice at P<0.001). Limited data from (A) are included for perspective. (E) Testing doses of 1, 3 and 10 mg (intraplantar) confirmed that 3 mg was the minimum effective dose to reduce mechanical hyperalgesia ipsilateral to the injection in HbSS mice. *Different from vehicle at P<0.001, one-way ANOVA with Bonferroni t test; n=5-8 mice/dose. Doses were plotted on a log scale. (F) The analog KT195 did not reduce mechanical sensitivity ipsilateral to the injection in HbSS mice when administered at the effective dose of KT109 (3 mg, intraplantar). (F[12,100]=4.2, P<0.001 for treatment effect, n=6-8 mice/group, 2-way repeated measures ANOVA). *Different from KT195 and vehicle at P<0.001, two-way ANOVA repeated measures with Bonferroni t test. BL: baseline; i.p.: intraperitoneal; i.pl.: intraplantar.
KT109 reduced the level of 2-AG and its downstream products in HbSS mice
To assess the role of DAGLβ and the effect of KT109 on the production of 2-AG, PGE2 and PGE2-G, these lipids were measured in plasma after intraperitoneal administration of 30 mg of KT109, the smallest dose that reduced mechanical and heat hyperalgesia. Blood was collected at 60 min after injection, a time that coincided with the maximum systemic anti-hyperalgesic effect. PGE2 was measured because of its pro-nociceptive activity and because hydrolysis of 2-AG by monoacylglycerol lipase produces arachidonic acid, a precursor for PGE2 (Table 1). The endocannabinoid AEA was also measured because of its importance in endogenous analgesia. Consistent with their roles in contributing to hyperalgesia, the levels of PGE2 and PGE2-G were elevated in the plasma of HbSS mice compared to the levels in HbAA mice following intraperitoneal administration of vehicle (note the difference in units: pmol for PGE2 and fmol for PGE2-G). The level of AEA was lower in the samples of plasma from HbSS mice. KT109 reduced the level of 2-AG in HbSS mice to a level that was also lower than that in HbAA mice. The levels of PGE2-G and PGE2 in HbSS mice treated with KT109 were reduced to the levels measured in HbAA mice; however, KT109 had no effect on the level of AEA in plasma of HbSS mice. These effects of KT109 are consistent with its role in blocking the production of 2-AG. The recovery of hyperalgesia 24 h after administration of KT109 in HbSS mice was associated with an increase in 2AG in plasma to the level before administration (153.3 ± 19.3 pmol/mL, P=0.57).
Discussion
These data demonstrate for the first time the exceptional contribution of DAGLβ in blood and the associated accumulation of 2-AG, its synthetic product, to hyperalgesia in mice with SCD. A high level of DAGLβ in blood cells distinguished HbSS mice with hyperalgesia from HbAA and non-hyperalgesic HbSS mice. Moreover, the simultaneous increase in both DAGLβ and COX-2 in blood cells ensures the accumulation of 2-AG and the formation of its pro-nociceptive derivatives that are sufficient for hyperalgesia. Two strategies were used to increase 2-AG: injection (intravenous) of exogenous 2-AG and injection of JZL184 to inhibit hydrolysis of endogenous 2-AG. Whereas administration of 2-AG did not promote hyperalgesia in HbAA mice with low levels of DAGLβ and COX-2 in blood cells, the same dose of 2-AG caused hyperalgesia in non-hyperalgesic HbSS mice with a low level of DAGLβ but a high level of COX-2. Although these two enzymes may be regulated independently, functionally they act in concert to achieve maximum hyperalgesia. The hyperalgesic effect of an increase in endogenous 2-AG in response to the administration of JZL184 in non-hyperalgesic HbAS mice, which may represent SCD trait (Online Supplement), emphasizes the importance of the proposed mechanism.
Several factors may contribute to the accumulation of 2AG in HbSS mice. Since SCD in patients and mice is associated with an increase in the number of immune cells,11,39-41 most of which express DAGLβ, 29,42,43 an increase in the level of DAGLβ protein in hyperalgesic HbSS mice may be associ-
Haematologica | 108 March 2023 865 ARTICLE - Inhibiting DAGLβ reduces hyperalgesia in SCD mice I.A. Khasabova et al.
DAGLβ reduces hyperalgesia in SCD mice
Figure 6. Intraplantar administration of KT109 reduced heat hyperalgesia in HbSS mice. (A) HbSS mice had a shorter latency to withdraw from the heat stimulus prior to drug injection. *Different from the same treatment group in HbAA mice at P<0.001 (F[3,60]=20.7, n=4-6 mice/group, 2-way repeated measures analysis of variance [ANOVA] with Bonferroni t test). HbSS mice injected with KT109 maintained this difference from HbAA mice injected with KT109 60 min after drug administration in the paw ipsilateral to the injection, but heat hyperalgesia in HbSS mice was blocked at 2 and 3 h after drug administration (†different from HbSS mice treated with vehicle at P<0.05). (B) Heat hyperalgesia was also blocked in the contralateral hind paw following intraplantar injection of KT109 into the opposite hind paw in a parallel time course (†different from HbSS mice treated with vehicle at P<0.05). Limited data from (A) are included for perspective. (C) Testing doses of 1, 3 and 10 mg (intraplantar) confirmed that 3 mg was the minimum effective dose to reduce thermal hyperalgesia ipsilateral to the injection in HbSS mice. *Different from vehicle at P<0.05, one-way ANOVA with Bonferroni t test; n=6-8 mice/dose. Doses are plotted on a log scale.

ated with an overall increase in immune cells, although an increase in the activity of the enzyme cannot be excluded as well. Post-translational modifications, including phosphorylation44 and cysteine palmitoylation45,46 may contribute to an increase in DAGLβ activity. In addition, increased production of 2-AG may reflect increased availability of substrate. Intracellular mobilization of Ca2+ through Gq/11 protein-dependent activation of phospholipase Cβ promotes the hydrolysis of phosphatidylinositol and the formation of diacylglycerol, the precursor of 2-AG.28,47 Enriched levels of DAGLβ, 2-AG and downstream arachidonic acid and PGE2 in white blood cells are associated with hyperalgesia in mouse models of inflammation.29,30,42,43,48,49
KT109 and its analog KT195 were initially screened for selective binding to serine hydrolases using activity-based protein profiling.29 In this assay KT109 bound to DAGLβ and ABHD6 exhibited partial binding to isoforms of phospholipase-A2 (PLA2), but did not bind to DAGLa or COX-2. KT195 bound to ABHD6 and PLA2 isoforms29,30 but not to DAGLa or DAGLβ. In sickle mice, KT109 (30 mg/mouse = 1.3 mg/kg) produced a dramatic decrease in 2-AG and its downstream metabolite, PGE2-G, with no effect on AEA. The decrease in PGE2 observed in HbSS mice treated with KT109 may be attributed directly to inhibition of PLA2, as suggested in the activity-based protein profiling assay, and indirectly to a decreased contribution of the hydrolysis of 2-AG to the pool of arachidonic acid, its precursor. The present data are consistent with a report on lipopolysaccharide-stimulated mu-
Samples of blood were collected 60 min after injection of KT109 (30 mg, intraperitoneal) or vehicle (DMSO:Tween 80:saline, 28:1:71%). The quantification of lipids was based on the area ratio of analytical internal standard/tested lipid. Lipid values are normalized to volume of plasma (mL). All data are expressed as the mean ± standard error of mean. The sample size is indicated in parentheses. One-way analysis of variance was run across treatment groups within the same lipid. For simplicity, representation of differences between treatment groups is restricted to two levels of significance: HbSS/vehicle different from HbAA/vehicle at aP<0.005; HbSS/vehicle different from HbSS/KT109 at bP<0.005.
rine macrophages in which treatment with KT109 (5 mg/kg), but not KT195, reduced 2-AG.29 Similarly, treatment with KT109 reduced arachidonic acid, PGE2 and PGD2 in macrophages. However, there were no changes in 2-AG or arachidonic acid in brain tissue, in which DAGLa contributes primarily to the generation of 2-AG.
Lipids were measured in plasma 60 min after systemic injection of KT109; the time of maximum anti-hyperalgesia. The effective anti-hyperalgesic doses we determined in HbSS mice following systemic (~1.3 mg/kg, intraperitoneal)
A B C
Lipid HbAA/ vehicle (N=4) HbSS/ vehicle (N=5) HbSS/ KT109 (N=5) 2-AG (pmol) 90±2.9 179±4.0a 73±5.7b AEA (pmol) 0.67±0.08 0.24±0.03a 0.25±0.04b PGE2 (pmol) 0.61±0.12 3.28±0.34a 1.18±0.16b PGE2-G (fmol) 0.17±0.08 6.48±0.74a 2.69±0.75b
Table 1. Effect of KT109 on 2-AG, AEA, PGE2 and PGE2-G in plasma.
Haematologica | 108 March 2023 866
Inhibiting
I.A. Khasabova et al.
ARTICLE -
Figure 7. Biochemical pathways involved in the modulation of pain by KT109 in sickle cell disease. In contrast to HbAA mice, hyperalgesic HbSS mice demonstrated an increase in diacylglycerol lipase β (DAGLβ) in blood cells and 2-arachidonoylglycerol (2-AG) in plasma. High levels of cyclooxygenase-2 (COX-2) oxidize 2-AG to generate the pro-nociceptive lipid mediator prostaglandin E2-glyceryl ester (PGE2-G), which causes pain by sensitizing nociceptors. By inhibiting the enzyme activity of DAGLβ, KT109 reduces the accumulation of 2-AG, a target for COX-2, and thus blocks hyperalgesia in HbSS mice. DAG: diacylglycerol.
administration are consistent with effective doses reported in murine models of acute lipopolysaccharide-induced inflammation, chemotherapy-induced neuropathy and nerve injury.29,48 It is likely that the anti-hyperalgesia observed in vivo was specific to inhibition of DAGLβ and not ABHD6 because the effect was not mimicked by KT195 or KT182 which are each selective for ABHD6.29,31 Moreover, the effect is independent of cannabinoid receptors as the anti-nociceptive effect of KT109 in acute lipopolysaccharide-induced inflammation was maintained in CB1-/- and CB2-/mice.48 Evidence that KT195 bound potently to PLA2 isoforms in an activity-based protein profiling assay30 but had no effect on hyperalgesia in vivo supports the conclusion that the effect of KT109 on hyperalgesia in HbSS mice was specific to inhibition of DAGLβ and downstream production of PGE2-G and less likely due to a decrease in PGE2. Moreover, the decreased production of PGE2-G following administration of KT109 mitigates the seeming paradox of why a decrease in 2-AG is anti-hyperalgesic when an increase in 2-AG, produced by inhibition of 2-AG hydrolysis, is anti-hyperalgesic in multiple models of peripheral inflammation.2123,25
Our behavioral data following intraplantar administration of KT109 are consistent with the contribution of DAGLβ in blood cells to hyperalgesia in SCD. Intraplantar administration of KT109 decreased hyperalgesia in the contralateral paw with a longer latency than in the paw ipsilateral to the injection. The apparent systemic effect of intraplantar KT109 (0.13 mg/kg) exhibited greater potency than intraperitoneal administration of a 10-fold higher dose, suggesting better absorption of the drug in addition to a local action. Although we cannot exclude an effect mediated by the central nervous system, the localization of DAGLβ to immune cells,29 the absence of binding of KT109 to DAGLa within the central nervous system, and the longer latency for the contralateral effect of KT109 suggest that circulating immune cells contribute to hyperalgesia in HbSS mice. Evidence that disruption of DAGLβ in macrophages does
not result in a general accumulation of triacylglycerides, and that DAGLβ is specific for polyunsaturated fatty acids only,30 supports the therapeutic safety of selective DAGLβ inhibitors. Moreover, the increase in COX-2 in blood cells and increase in the pro-nociceptive lipid PGE2-G in plasma in SCD indicates important therapeutic effects of DAGLβ inhibitors for the treatment of pain in SCD. A schematic representation of the biochemical pathway inhibited by KT109 is summarized in Figure 7.

Disclosures
KG has received grants from the UCI Foundation, SCIRE Foundation, Novartis, Grifols, Cyclerion and 1910 Genetics, and honoraria from Novartis, Tautona Group, and CSL Behring; none of these has any conflict with the work presented in this manuscript. None of the other authors have any competing financial interests.
Contributions
IAK designed and performed the biochemical and behavioral experiments, analyzed and interpreted data, and contributed to writing the manuscript. JG performed behavioral experiments and read the manuscript. MJ performed the siRNA knockdown experiments and contributed to the western blot studies. SGK performed behavioral experiments and edited the manuscript. AEK performed the COX-2 immunoprecipitation studies. MYG performed the mass spectrometric assay and associated data analysis. SAG performed the mass spectrometric assay. SK bred and phenotyped sickle and control mice and performed quality control. KG designed the use of sickle mice, produced all mice and edited the manuscript. VSS contributed to the design of experiments, interpretation of data, and writing the manuscript. DAS contributed to the design of experiments, interpretation of data, and writing the manuscript.
Acknowledgments
The authors would like to thank P. Villalta in the Analytical
Haematologica | 108 March 2023 867 ARTICLE - Inhibiting DAGLβ reduces hyperalgesia in SCD mice I.A. Khasabova et al.
Biochemistry Core facility of the University of Minnesota Masonic Cancer Center for direction in the measurement of lipids. Mass spectrometry analysis was performed in the UND MS Core Facility supported by the UND SMHS Dean’s Office.
Funding
This study was supported by National Institutes of Health grants HL135895 to DAS, CA236777 to SGK, HL147562 to KG,
References
1. Ballas SK, Gupta K, Adams-Graves P. Sickle cell pain: a critical reappraisal. Blood. 2012;120(18):3647-3656.
2. Brandow AM, Stucky CL, Hillery CA, Hoffmann RG, Panepinto JA. Patients with sickle cell disease have increased sensitivity to cold and heat. Am J Hematol. 2013;88(1):37-43.
3. Lutz B, Meiler SE, Bekker A, Tao YX. Updated mechanisms of sickle cell disease-associated chronic pain. Transl Perioper Pain Med. 2015;2(2):8-17.
4. Brandow AM, Zappia KJ, Stucky CL. Sickle cell disease: a natural model of acute and chronic pain. Pain. 2017;158(Suppl 1):S79-S84.
5. Gupta K, Jahagirdar O, Gupta K. Targeting pain at its source in sickle cell disease. Am J Physiol Regul Integr Comp Physiol. 2018;315(1):R104-R112.
6. Smith WR. Treating pain in sickle cell disease with opioids: clinical advances, ethical pitfalls. J Law Med Ethics. 2014;42(2):139-146.
7. Carroll CP, Lanzkron S, Haywood C Jr, et al. Chronic opioid therapy and central sensitization in sickle cell disease. Am J Prev Med. 2016;51(1 Suppl 1):S69-S77.
8. Finan PH, Carroll CP, Moscou-Jackson G, et al. Daily opioid use fluctuates as a function of pain, catastrophizing, and affect in patients with sickle cell disease: an electronic daily diary analysis. J Pain. 2018;19(1):46-56.
9. Kohli DR, Li Y, Khasabov SG, Gupta P, et al. Pain-related behaviors and neurochemical alterations in mice expressing sickle hemoglobin: modulation by cannabinoids. Blood. 2010;116(3):456-465.
10. Lei J, Benson B, Tran H, Ofori-Acquah SF, Gupta K. Comparative analysis of pain behaviours in humanized mouse models of sickle cell anemia. PLoS One. 2016;11(8):e0160608.
11. Vincent L, Vang D, Nguyen J, et al. Mast cell activation contributes to sickle cell pathobiology and pain in mice. Blood. 2013;122(11):1853-1862.
12. Pinho-Ribeiro FA, Verri WA Jr, Chiu IM. Nociceptor sensory neuron-immune interactions in pain and inflammation. Trends Immunol. 2017;38(1):5-19.
13. Gupta K, Harvima IT. Mast cell-neural interactions contribute to pain and itch. Immunol Rev. 2018;282(1):168-187.
14. Aich A, Afrin LB, Gupta K. Mast cell-mediated mechanisms of nociception. Int J Mol Sci. 2015;16(12):29069-29092.
15. Keikhaei B, Mohseni AR, Norouzirad R, et al. Altered levels of pro-inflammatory cytokines in sickle cell disease patients during vaso occlusive crises and the steady state condition. Eur Cytokine Netw. 2013;24(1):45-52.
16. Hillery CA, Kerstein PC, Vilceanu D, et al. Transient receptor potential vanilloid 1 mediates pain in mice with severe sickle cell disease. Blood. 2011;118(12):3376-3383.
and a Diversity Supplement 3RO1 HL147562-03S to SGK. The content is solely the responsibility of the authors and does not necessarily represent the official views of the National Institutes of Health.
Data-sharing statement
The published methods and results of this study will be deposited with PubMed Central in accord with the policies of the National Institutes of Health.
17. Khasabova IA, Uhelski M, Khasabov SG, Gupta K, Seybold VS, Simone DA. Sensitization of nociceptors by prostaglandin E(2)glycerol contributes to hyperalgesia in mice with sickle cell disease. Blood. 2019;133(18):1989-1998.
18. Chiurchiù V, Leuti A, Maccarrone M. Cannabinoid signaling and neuroinflammatory diseases: a melting pot for the regulation of brain immune responses. J Neuroimmune Pharmacol. 2015;10(2):268-280.
19. Turcotte C, Blanchet MR, Laviolette M, Flamand N. The CB(2) receptor and its role as a regulator of inflammation. Cell Mol Life Sci. 2016;73(23):4449-4470.
20. Uhelski ML, Simone DA. Sensitization of nociceptors and dorsal horn neurons contributes to pain in sickle cell disease. Neurosci Lett. 2019;705:20-26.
21. Comelli F, Giagnoni G, Bettoni I, Colleoni M, Costa B. The inhibition of monoacylglycerol lipase by URB602 showed an anti-inflammatory and anti-nociceptive effect in a murine model of acute inflammation. Br J Pharmacol. 2007;152(5):787-794.
22. Desroches J, Charron S, Bouchard JF, Beaulieu P. Endocannabinoids decrease neuropathic pain-related behavior in mice through the activation of one or both peripheral CB1 and CB2 receptors. Neuropharmacology. 2014;77:441-452.
23. Kinsey SG, Long JZ, O'Neal ST, et al. Blockade of endocannabinoid-degrading enzymes attenuates neuropathic pain. J Pharmacol Exp Ther. 2009;330(3):902-910.
24. Khasabova IA, Chandiramani A, Harding-Rose C, Simone DA, Seybold VS. Increasing 2-arachidonoyl glycerol signaling in the periphery attenuates mechanical hyperalgesia in a model of bone cancer pain. Pharmacol Res. 2011;64(1):60-67.
25. Khasabova IA, Yao X, Paz J, et al. JZL184 is anti-hyperalgesic in a murine model of cisplatin-induced peripheral neuropathy. Pharmacol Res. 2014;90:67-75.
26. Vardeh D, Wang D, Costigan M, et al. COX2 in CNS neural cells mediates mechanical inflammatory pain hypersensitivity in mice. J Clin Invest. 2009;119(2):287-294.
27. Hu SS, Bradshaw HB, Chen JS, Tan B, Walker JM. Prostaglandin E2 glycerol ester, an endogenous COX-2 metabolite of 2arachidonoylglycerol, induces hyperalgesia and modulates NFkappaB activity. Br J Pharmacol. 2008;153(7):1538-1549.
28. Bisogno T, Howell F, Williams G, et al. Cloning of the first sn1DAG lipases points to the spatial and temporal regulation of endocannabinoid signaling in the brain. J Cell Biol. 2003;163(3):463-468.
29. Hsu KL, Tsuboi K, Adibekian A, Pugh H, Masuda K, Cravatt BF. DAGLβ inhibition perturbs a lipid network involved in macrophage inflammatory responses. Nat Chem Biol. 2012;8(12):999-1007.
Haematologica | 108 March 2023 868 ARTICLE - Inhibiting
I.A. Khasabova et al.
DAGLβ reduces hyperalgesia in SCD mice
30. Shin M, Ware TB, Hsu KL. DAGL-beta functions as a PUFAspecific triacylglycerol lipase in macrophages. Cell Chem Biol. 2020;27(3):314-321.
31. Hsu KL, Tsuboi K, Whitby LR, et al. Development and optimization of piperidyl-1,2,3-triazole ureas as selective chemical probes of endocannabinoid biosynthesis. J Med Chem. 2013;56(21):8257-8269.
32. Chaplan SR, Bach FW, Pogrel JW, Chung JM, Yaksh TL. Quantitative assessment of tactile allodynia in the rat paw. J Neurosci Methods. 1994;53(1):55-63.
33. Khasabova IA, Khasabov S, Paz J, Harding-Rose C, Simone DA, Seybold VS. Cannabinoid type-1 receptor reduces pain and neurotoxicity produced by chemotherapy. J Neurosci. 2012;32(20):7091-7101.
34. Khasabova IA, Khasabov SG, Harding-Rose C, et al. A decrease in anandamide signaling contributes to the maintenance of cutaneous mechanical hyperalgesia in a model of bone cancer pain. J Neurosci. 2008;28(44):11141-11152.
35. Cain DM, Vang D, Simone DA, Hebbel RP, Gupta K. Mouse models for studying pain in sickle disease: effects of strain, age, and acuteness. Br J Haematol. 2012;156(4):535-544.
36. Garrison SR, Kramer AA, Gerges NZ, Hillery CA, Stucky CL. Sickle cell mice exhibit mechanical allodynia and enhanced responsiveness in light touch cutaneous mechanoreceptors. Mol Pain. 2012;8:62.
37. Lei J, Benson B, Tran H, Ofori-Acquah SF, Gupta K. Comparative analysis of pain behaviours in humanized mouse models of sickle cell anemia. PLoS One. 2016;11(8):e0160608.
38. Cataldo G, Rajput S, Gupta K, Simone DA. Sensitization of nociceptive spinal neurons contributes to pain in a transgenic model of sickle cell disease. Pain. 2015;156(4):722-730.
39. Sultana C, Shen Y, Rattan V, Johnson C, Kalra VK. Interaction of sickle erythrocytes with endothelial cells in the presence of endothelial cell conditioned medium induces oxidant stress leading to transendothelial migration of monocytes. Blood. 1998;92(10):3924-3935.
40. Anyaegbu CC, Okpala IE, Akren'Ova YA, Salimonu LS. Peripheral blood neutrophil count and candidacidal activity correlate with the clinical severity of sickle cell anaemia (SCA). Eur J
Haematol. 1998;60(4):267-268.
41. Nickel RS, Osunkwo I, Garrett A, et al. Immune parameter analysis of children with sickle cell disease on hydroxycarbamide or chronic transfusion therapy. Br J Haematol. 2015;169(4):574-583.
42. Shin M, Snyder HW, Donvito G, et al. Liposomal delivery of diacylglycerol lipase-beta inhibitors to macrophages dramatically enhances selectivity and efficacy in vivo. Mol Pharm. 2018;15(3):721-728.
43. Shin M, Buckner A, Prince J, Bullock TNJ, Hsu KL. Diacylglycerol lipase-β is required for TNF-a response but not CD8(+) T cell priming capacity of dendritic cells. Cell Chem Biol. 2019;26(7):1036-1041.
44. Reisenberg M, Singh PK, Williams G, Doherty P. The diacylglycerol lipases: structure, regulation and roles in and beyond endocannabinoid signaling. Philos Trans R Soc Lond B Biol Sci. 2012;367(1607):3264-3275.
45. Martin BR, Cravatt BF. Large-scale profiling of protein palmitoylation 42 in mammalian cells. Nat Methods. 2009;6(2):135-138.
46. Yang W, Di Vizio D, Kirchner M, Steen H, Freeman MR. Proteome scale characterization of human S-acylated proteins in lipid raft-enriched and non-raft membranes. Mol Cell Proteomics. 2010;9(1):54-70.
47. Murataeva N, Straiker A, Mackie K. Parsing the players: 2arachidonoylglycerol synthesis and degradation in the CNS. Br J Pharmacol. 2014;171(6):1379-1391.
48. Wilkerson JL, Ghosh S, Bagdas D, et al. Diacylglycerol lipase β inhibition reverses nociceptive behaviour in mouse models of inflammatory and neuropathic pain. Br J Pharmacol. 2016;173(10):1678-1692.
49. Wilkerson JL, Donvito G, Grim TW, et al. Investigation of diacylglycerol lipase alpha inhibition in the mouse lipopolysaccharide inflammatory pain model. J Pharmacol Exp Ther. 2017;363(3):394-401.
50. Zappia KJ, Guo Y, Retherford D, Wandersee NJ, Stucky CL, Hillery CA. Characterization of a mouse model of sickle cell trait: parallels to human trait and a novel finding of cutaneous sensitization. Br J Haematol. 2017;179(4):657-666.
Haematologica | 108 March 2023 869 ARTICLE - Inhibiting DAGLβ reduces hyperalgesia in SCD mice I.A. Khasabova et al.
Variation and impact of polygenic hematologic traits in monogenic sickle cell disease
Thomas Pincez,1,2 Ken Sin Lo,1 Anne-Laure Pham Hung d’Alexandry d’Orengiani,3 Melanie E. Garrett,4 Carlo Brugnara,5 Allison E. Ashley-Koch,4 Marilyn J. Telen,6 Frédéric Galactéros,3 Philippe Joly,7,8 Pablo Bartolucci3 and Guillaume Lettre1,9
1Montreal Heart Institute, Montréal, Québec, Canada; 2Department of Pediatrics, Division of Pediatric Hematology-Oncology, Charles-Bruneau Cancer Center, CHU Sainte-Justine, Université de Montréal, Montréal, Québec, Canada; 3Red Cell Genetic Disease Unit, Hôpital Henri-Mondor, Assistance Publique-Hôpitaux de Paris (AP-HP), Université Paris Est, IMRBU955 - Équipe n. 2, Créteil, France; 4Duke Molecular Physiology Institute, Duke University Medical Center, Durham, NC, USA; 5Department of Laboratory Medicine, Boston Children's Hospital, Boston, MA, USA; 6Department of Medicine, Division of Hematology, Duke University Medical Center, Durham, NC, USA; 7Unité Fonctionnelle 34445 ‘Biochimie des Pathologies Érythrocytaires’, Laboratoire de Biochimie et Biologie Moléculaire Grand-Est, Groupement Hospitalier Est, Hospices Civils de Lyon, Bron, France; 8Laboratoire InterUniversitaire de Biologie de la Motricité (LIBM) EA7424, Equipe ‘Biologie Vasculaire et du Globule Rouge’, Université Claude Bernard Lyon 1, Comité d’Universités et d’Etablissements (COMUE), Lyon, France and 9Department of Medicine, Faculty of Medicine, Université de Montréal, Montreal, Quebec, Canada
Abstract
Correspondence: G. Lettre guillaume.lettre@umontreal.ca
Received: April 5, 2022.
Accepted: September 28, 2022.
Early view: October 13, 2022.
https://doi.org/10.3324/haematol.2022.281180
©2023 Ferrata Storti Foundation
Published under a CC BY-NC license
Several of the complications observed in sickle cell disease (SCD) are influenced by variation in hematologic traits (HT), such as fetal hemoglobin (HbF) level and neutrophil count. Previous large-scale genome-wide association studies carried out in largely healthy individuals have identified thousands of variants associated with HT, which have then been used to develop multi-ancestry polygenic trait scores (PTS). Here, we tested whether these PTS associate with HT in SCD patients and if they can improve statistical models associated with SCD-related complications. In 2,056 SCD patients, we found that the PTS predicted less HT variance than in non-SCD individuals of African ancestry. This was particularly striking at the Duffy/DARC locus, where we observed an epistatic interaction between the SCD genotype and the Duffy null variant (rs2814778) that led to a two-fold weaker effect on neutrophil count. PTS for these HT which are measured as part of routine practice were not associated with complications in SCD. In contrast, we found that a simple PTS for HbF that includes only six variants explained a large fraction of the phenotypic variation (20.5-27.1%), associated with acute chest syndrome and stroke risk, and improved the statistical modeling of the vaso-occlusive crisis rate. Using Mendelian randomization, we found that increasing HbF by 4.8% reduces stroke risk by 39% (P=0.0006). Taken together, our results highlight the importance of validating PTS in large diseased populations before proposing their implementation in the context of precision medicine initiatives.
Introduction
Sickle cell disease (SCD), the most frequent monogenic disease worldwide, is caused by mutations in the β-globin gene.1 SCD patients present a wide range of complications such as vaso-occlusive crisis (VOC), acute chest syndrome (ACS), stroke, and end-organ dysfunction, and their life expectancy is reduced when compared to the general population.1 Critically, the causes of this clinical heterogeneity are not fully understood.
Hematologic traits (HT) are among the main factors known to be associated with clinical outcomes in SCD. Fetal hemoglobin (HbF) is a major disease modifier, and
is associated with a reduction in the occurrence of several complications such as VOC, ACS, and death.2-4 HbF >30% is associated with an almost complete absence of complications in SCD patients.5 However, most SCD patients have lower HbF levels while not receiving disease-modifying therapy, and for some complications, such as stroke, the risk reduction associated with HbF has not been quantified in large cohorts. Several other HT have been associated with SCD-related complications, notably elevated white blood cell (WBC) count and neutrophil count with survival,2,6,7 low hemoglobin (Hb) levels with composite severe outcomes and death,7,8 and platelet (PLT) count with ACS. 9
Haematologica | 108 March 2023 870 ARTICLE - Red Cell Biology & its Disorders
Polygenic trait scores (PTS) have been developed in an effort to harness the power of large-scale human genetic studies to make useful clinical predictions, and many studies have already recognized their value in the context of precision medicine initiatives.10,11 For each participant, PTS are calculated by adding up the number of phenotype-associated alleles across associated variants, each weighted by the effect of the alleles on the phenotype. One widely discussed limitation of PTS is their poor performance when tested in populations that have different ancestral backgrounds than those in which they were optimized.12 Another equally important aspect that has not been as extensively studied is how well PTS, which are normally calibrated in “healthy” individuals, perform in “diseased” individuals.13 This is important, because PTS could, in theory, be useful to stratify patients into mild or severe categories. For example, if higher WBC count is associated with an increased risk of death in SCD patients, would a PTS developed to capture WBC count variation in healthy individuals be useful to predict death in SCD patients? Here, we explored how SCD impacts the performance of HT PTS, and whether these PTS are clinically useful predictors of SCD-related complications. Our analyses had four aims. First, to study the performance of HT PTS in explaining HT variation in SCD patients. Second, to test if these HT PTS are associated with SCD-related complications. Third, to explore whether specific genetic variants included in the HT PTS have reduced impact (i.e., effect size) on HT variation in the context of SCD. Finally, although not one of the main goals of our study, we also
aimed to carry out genome-wide association studies (GWAS) of HT in up to 1,736 SCD patients to identify strong effect variants that could influence blood-cell phenotypes in this patient population. A summary of the study design is shown in Figure 1.
Methods
Complete details of the methods used are available in the Online Supplementary Appendix.
Study populations
We collected data from three SCD cohorts with SS genotype individuals: the Cooperative Study of Sickle Cell Disease (CSSCD, n=1,278),14 Genetic Modifier (GEN-MOD, n=406),15,16 and Mondor/Lyon (n=372)17 (Online Supplementary Table S1). For replication, we tested associations in the Duke University Outcome Modifying Gene (OMG) SCD cohort (n=333), which has been described elsewhere.18 We collected data according to the principles of the Declaration of Helsinki and the study was approved by the institutional ethics committees. Informed consent was provided by all study participants. For comparison, we also accessed data from non-SCD individuals of African ancestry from the BioMe cohort19 and the UK Biobank (Online Supplementary Table S1).20 To ensure that the differences found were not due to a difference in the sample size between the SCD cohorts and the UK Biobank, we down-sampled the African-ancestry UK Biobank cohort to
Figure 1. Study design and aims. We tested if polygenic trait scores (PTS) developed in non-sickle cell disease (SCD) individuals associate with hematologic traits (HT) (Aim 1) and clinical outcomes (Aim 2) in SCD patients. We also tested if genetic variants associated with HT have different effect sizes when comparing non-SCD and SCD individuals (Aim 3). Finally, we performed genome-wide association studies (GWAS) to identify genetic variants associated with HT in SCD patients (Aim 4). HbF: fetal hemoglobin.

Haematologica | 108 March 2023 871 ARTICLE - Polygenic hematologic traits in SCD T. Pincez et al.
the same number of participants (n=1,278) as in the CSSCD and repeated our analyses.
Polygenic trait scores for hematologic traits
For all HT except HbF, we used the multi-ancestry PTS obtained by the Blood-Cell Consortium to test for association with HT.19 For HbF, we derived a PTS by considering the conditional effect sizes of six variants at three loci (BCL11A, HBS1L-MYB, HBB) associated with HbF levels in SCD patients (Online Supplementary Table S2).21-23 We calculated a bootstrapped, empirical P-value to compare the variance explained by PTS in SCD and non-SCD individuals. We also tested g(HbF), a previously published 4-SNP PTS for HbF,24 in a subset of the CSSCD cohort (n=816). Finally, we analyzed the respective contribution of a-thalassemia and PTS on HT variance explained in the CSSCD cohort.
Association between hematologic traits or polygenic trait scores with SCD-related clinical outcomes
In the CSSCD cohort, we tested the association between PTS and outcomes (VOC rate, ACS rate, stroke), considering only PTS for which the corresponding HT was associated with the outcome (P<0.05). We performed an analysis of deviance to determine if the PTS improves the model beyond the measured HT.
Mendelian randomization
We used a two-sample Mendelian randomization (MR) approach to test if HbF captured by the 6-SNP PTSHbF, causally impact SCD-related complications (VOC rate, ACS rate and stroke). We calculated instrument (i.e., PTS for HbF)-exposure (i.e., HbF) and instrument-outcome (i.e., complications) effects from the GEN-MOD and CSSCD cohorts, respectively. We used the multiplicative random-effect inverse variance-weighted (IVW) approach as the main method for each MR analysis.
Genome-wide association studies of hematologic traits in SCD patients
We performed GWAS for each HT available in the three SCD cohorts separately, then performed a meta-analysis of the results.
Comparing effect sizes of hematologic trait-associated single nucleotide polymorphism in SCD patients and non-SCD individuals
For each single nucleotide polymorphism (SNP)-HT pair considered in the multi-ancestry PTS models, we used the t-statistic to compare the effect in SCD (derived from SCD GWAS meta-analyses) and non-SCD individuals (derived from published multi-ancestry meta-analyses from the Blood-Cell Consortium).19 We computed q-value with a 5% false discovery rate to correct for multiple testing.
Results
Performance of hematologic polygenic trait scores in SCD patients
We investigated the phenotypic variance explained by PTS of HT in SCD patients of African ancestry from three cohorts (CSSCD, GEN-MOD, Mondor/Lyon) and in non-SCD AfricanAmerican individuals from BioMe not included in the discovery effort used to generate the PTS, as well as non-SCD individuals of African ancestry from the UK Biobank (using all African-ancestry participants [n=6,627] or a random subset with a sample size similar to the CSSCD [n=1,278]). In SCD participants, PTS reached significance (P<0.05) in at least one cohort for nine of the 12 HT tested (Table 1); this number remained unchanged after adjustment for multiple testing. PTS for hematocrit (Ht), Hb concentration, and lymphocyte count were not significant. The variance explained by significant PTS was 0.5-4.1% for RBC traits, 0.9-3.8% for WBC traits, and 0.7-4.2% for PLT traits. When we compared the performance of these PTS in SCD participants and nonSCD African-ancestry individuals, we found that all PTS with significant association, except the PTS for eosinophils, explained less phenotypic variance in SCD participants (Table 1, Figure 2A). One of the most striking differences was seen for WBC and neutrophil counts: the mean variance explained was 1.9% and 3.3% in SCD participants and 10.3% and 11.8% in non-SCD individuals, respectively (Figure 2A). HbF levels are an important modifier of severity in SCD. Since it is rarely measured in large non-SCD cohorts, the genetics of this trait have not been extensively studied in very large sample sizes. However, smaller GWAS in SCD patients have identified robust associations between HbF levels and genetic variants at three loci: BCL11A, HBS1L-MYB and the β-globin locus (reviewed by Lettre et al 25). Given this, we derived PTSHbF that includes six conditionally independent variants (Online Supplementary Table S2). PTSHbF was strongly associated with HbF levels in all three SCD cohorts and explained 20.5-27.1% of the variance (Table 1). We compared this PTS with a previously published 4-SNP model for HbF (g(HbF)).24 We used the subset of the CSSCD cohort (n=816) with genotyping or imputation data available for each SNP. Our 6-SNP PTSHbF explained 24.6% of HbF variance (P=5.7x10-51) whereas g(HbF) explained 20.8% of HbF variance (P=1.5x10-42).
Finally, we analyzed the respective contribution of α-thalassemia and PTS on HT variance explained in the CSSCD cohort (Figure 2B). Because HbF is such a strong modifier of SCD phenotype, we also assessed whether PTSHbF could contribute to the phenotypic variation of other HT. a-thalassemia was the main contributor of mean corpuscular hemoglobin (MCH) and mean corpuscular volume (MCV) but was also associated to other RBC, WBC, and PLT traits. PTSHbF explained a large fraction of several RBC traits, but was also associated with several WBC traits; this is consist-
Haematologica | 108 March 2023 872 ARTICLE - Polygenic hematologic traits in SCD T. Pincez et al.
ent with the known beneficial effect of HbF in normalizing HT in SCD patients. PTS for the corresponding HT was the main contributor for several WBC traits and PLT count. Taken together, although most of the PTS for HT derived in non-SCD individuals were associated with HT in SCD individuals, they did not perform as well in this patient population. By contrast, a simple PTS for HbF derived from GWAS performed in SCD patients explained a large proportion of the HbF phenotypic variance.
Associations between hematologic trait polygenic trait scores and SCD-related complications
Variation in HT has been associated with several clinical outcomes observed in SCD patients such as death,2 stroke,26-28 VOC,3 and ACS.4,9 We were able to reproduce most of these results in the genotyped subset of the CSSCD (Online Supplementary Table S3). We asked ourselves whether PTS for HT were also associated with these complications in the largest available SCD cohort (CSSCD). For these analyses, we used significant PTS (Table 1) for which the corresponding
HT was also significantly associated with the complication (Online Supplementary Table S3). In total, we tested seven PTS-complication combinations, and found significant associations for PTSHbF-stroke and PTSHbF-ACS (Table 2). We extended these analyses to determine if the PTS could improve the association of the models beyond the baseline HT measures. We reasoned that, because PTS capture HT heritable variation, they would more faithfully represent “life-long exposure” and add information that is independent of the imprecisions associated with HT measurement in the lab. The statistical models did not improve for stroke and ACS rate, but we found that PTSHbF improved the association with VOC, as described previously (Table 2).29,30 Interestingly, additional analyses revealed that PTSHbF improves the association of the model with VOC in patients with low HbF values (<10%), levels at which HbF is not associated with VOC (Online Supplementary Table S4). For high HbF values (>10%), HbF is strongly associated with VOC, and adding PTSHbF did not improve the statistical model.
Only the phenotypic variance explained for polygenic trait scores (PTS) that were nominally significant were calculated (P<0.05). Empty cells indicate phenotypes that were not available in the corresponding study. All P-values <0.05 remain statistically significant after multiple testing correction except for WBC and WBC (without chr1 - Duffy/DARC) phenotypes in Mondor/Lyon cohort. The aPTS models (except for fetal hemoglobin [HbF]) and the results from the bBioMe African American participants have been reported previously.19 For HbF, we selected six independently associated variants.21-23 SCD: sickle cell disease; CSSCD: Cooperative Study of SCD; GEN-MOD: Genetic Modifier; N: number; MCH: mean corpuscular hemoglobin; MCV: mean corpuscular volume; MPV: mean platelet volume.
Phenotype N of variants in the PTSa SCD cohorts Non-SCD cohorts CSSCD (Nmax= 1,015) GEN-MOD (Nmax = 401) Mondor/Lyon (Nmax = 324) BioMEb (Nmax = 2,651) UK Biobank (Nmax = 6,584) Down-sampled UK Biobank (Nmax = 1,278) Variance (%) P Variance (%) P Variance (%) P Variance (%) P Variance (%) P Variance (%) P Red blood cell (RBC) traits Hematocrit 356 - 0.70 - 0.66 - 0.14 1.4 0.0071 2.1 1.3x10⁻²⁶ 1.5 9.4x10⁻⁵ Hemoglobin 364 - 0.41 - 0.24 - 0.77 1.3 7.4x10⁻⁹ 3.0 1.9x10⁻³⁵ 2.0 2.0x10⁻⁶ MCH 384 0.69 0.014 1.3 0.021 - 0.88 2.2 5.4x10⁻¹⁴ 5.5 2.4x10-42 6.9 4.6x10⁻¹¹ MCV 454 2.3 8.8x10⁻⁷ - 0.078 - 0.55 2.0 9.1x10⁻¹³ 6.6 1.8x10-51 10.4 6.7x10⁻¹⁷ RBC 449 0.47 0.032 4.1 8.1x10⁻⁵ - 0.16 3.8 < 2.2x10⁻¹⁶ 10.6 5.8x10-95 9.3 2.2x10⁻¹⁶ HbF 6 20.5 10.0x10-59 26.5 1.2x10⁻²⁶ 27.1 2.0x10⁻²⁵ White blood cell (WBC) traits WBC 443 1.5 2.5x10⁻⁴ 2.7 0.002 1.6 0.047 12.2 < 2.2x10⁻¹⁶ 8.3 1.5x10-115 7.0 2.3x10⁻²² WBC (without chr1 - Duffy/DARC) 389 0.5 0.023 3.3 3.6x10⁻⁴ 2.3 0.024 1.8 < 2.2x10⁻¹⁶ 1.4 3.9x10⁻²³ 1.4 6.5x10⁻⁶ Eosinophils 346 0.9 0.0038 3.2 4.5x10⁻⁴ 1.1 6.2x10⁻⁶ 3.5 3.3x10-42 3.7 2.8x10⁻¹⁰ Lymphocytes 409 - 0.18 - 0.42 1.4 7.7x10⁻⁹ 3.6 6.9x10-42 2.2 2.1x10⁻⁶ Monocytes 394 0.44 0.00026 - 0.18 3.9 < 2.2x10⁻¹⁶ 5.1 1.9x10-74 6.1 1.4x10⁻¹⁸ Neutrophils (NEU) 352 2.8 1.4x10⁻⁶ 3.8 3.9x10⁻⁴ 12.3 < 2.2x10⁻¹⁶ 11.3 5.4x10-167 10.1 8.9x10-39 NEU (without chr1 - Duffy/DARC) 313 0.8 0.0065 3.9 1.3x10⁻⁴ 0.67 1.1x10⁻⁴ 1.2 3.6x10⁻²² 1.1 3.5x10⁻⁵ Platelet (PLT) traits PLT 553 0.7 0.008 2.0 0.0045 4.2 1.9x10⁻⁴ 3.6 < 2.2x10⁻¹⁶ 6.7 1.9x10-92 7.3 4.0x10⁻²¹ MPV 392 4.1 2.4x10⁻⁴ 8.6 < 2.2x10⁻¹⁶ 12.0 1.7x10-140 12.3 3.4x10⁻³⁰
Table 1. Hematologic trait variance explained by polygenic trait scores in sickle cell disease patients.
Haematologica | 108 March 2023 873 ARTICLE - Polygenic hematologic traits in SCD T. Pincez et al.
Quantifying the causal impact of HbF levels on SCD complications by Mendelian randomization
Using MR, we sought to confirm the causal protective effect of high HbF levels on stroke,27,28 ACS,4 and VOC.3 Although the literature suggests links between high WBC or neutrophil counts and SCD survival,2 we did not test these potential causal relationships by MR because of limited statistical power (see Online Supplementary Appendix). We performed two-sample MR using the pseudo-independent SNP from PTSHbF. We found a causal association between HbF and stroke: a one standard deviation increase in genetically-determined HbF levels (corresponding to 4.8% of HbF) de-

creases the risk of stroke by 39% (odds ratio [95% confidence interval]=0.61 [0.46-0.81]; P=0.0006) (Figure 3). In this analysis, the low-frequency variant rs114398597 located between HBS1L and MYB on chromosome 6 appears as an outlier (Figure 3), but we confirmed that the MR result remained significant after its exclusion (P=3.7x10⁻⁶) (Online Supplementary Table S5). Although the direction of the effect was similar using the sensitivity MR-Egger and weighted median methods, these analyzes were not statistically significant, suggesting insufficient power (Online Supplementary Table S5). We found no heterogeneity in the effect (I2 = 0%) and confirmed the absence of horizontal
Figure 2. Variance explained by polygenic trait scores for hematologic traits. (A) Comparison of variance explained by polygenic trait scores (PTS) for hematologic traits (HT) in African-ancestry non-sickle cell disease (SCD) individuals from BioMe and the UK Biobank, and participants from three SCD cohorts (CSSCD, GEN-MOD, Mondor/Lyon). We only present the variance explained by nominally significant PTS in at least one SCD cohort (Table 1). When the PTS for a given HT was significant in more than one SCD cohort, we calculated the mean and standard deviation (error bars) of the variance explained. We show the empirical P-value for comparison between SCD and non-SCD individuals. (B) Respective contribution of the PTS for corresponding HT, PTSHbF and athalassemia status on the HT variance explained. Analyses performed in the CSSCD cohort. Only the variance explained if the PTS or a-thalassemia was nominally significant is presented (P<0.05). EOS: eosinophils; MCH: mean corpuscular hemoglobin; MCV: mean corpuscular volume; MON: monocytes; MPV: mean platelet volume; NEU: neutrophil count; PLT: platelet count; RBC: red blood cell count; WBC: white blood cell count; Ht: hematocrit; Hb: hemoglobin; HbF: fetal hemoglobin.
A B Haematologica | 108 March 2023 874 ARTICLE - Polygenic hematologic traits in SCD T. Pincez et al.
pleiotropy (Egger intercept, -0.09, standard error = 0.21; P=0.69). We did not find causal association between HbF levels and ACS/VOC rates (Online Supplementary Table S5, Online Supplementary Figure S1); this may have been due to limited statistical power (Online Supplementary Appendix).
SCD partially masks the genetic effect of the Duffy/DARC null variant on white blood cell and neutrophil counts
To understand why the PTS under-performed in SCD patients (excluding PTSHbF), we carried out meta-analyses of
GWAS results for the 11 HT in the three SCD cohorts, and compared effect sizes (βSCD) for the SNP found in the PTS (4,201 SNP-HT pairs) with the effect sizes from multi-ancestry meta-analyses ( β non-SCD).19 Across all SNP and HT, normalized effect sizes were weakly correlated when considering the same effect alleles (Pearson’s r = 0.09; P=2.4x10⁻¹⁰) (Figure 4A). Among the 273 variant-HT pairs that were nominally associated in SCD meta-analyses (P<0.05), 162 (59.3%) had a concordant direction of effect in non-SCD meta-analyses (P=0.002, binomial test).

Figure 3. Mendelian randomization results for fetal hemoglobin levels on stroke. Each dot represents one of the fetal hemoglobin (HbF)-associated SNP, with its corresponding effect on normalized HbF levels (x-axis, standard deviation units) and stroke risk (y-axis, logistic regression beta). The analysis without rs114398597 is significant; see Online Supplementary Table S5 for details. MR: Mendelian randomization.
Table 2. Polygenic trait score for fetal hemoglobin levels is associated with stroke and acute chest syndrome and improves a statistical model of vaso-occlusive crisis rate.
Analyses in 1,278 genotyped CSSCD participants. To contrast models, we performed an analysis of deviance and compared a baseline model (hematologic trait [HT], age, sex, a-thalassemia, and 10 first principal components) with a model that included the same predictors as well as the polygenic trait score (PTS). All P-values <0.05 remain statistically significant after multiple testing correction. *Fine and Gray’s method was used to consider death as a competitive risk of stroke that may have influenced the result. PTSHbF was still associated with stroke in the subdistribution hazard model: hazard ratio (HR) 0.75, 95% confidence interval (CI) (0.61-0.94), P=0.01. ACS: acute chest syndrome; VOC: vasoocclusive crisis; Beta: effect size in standard deviation units; SE: standard error; df: degree-of-freedom; HbF: fetal hemoglobin; WBC: white blood cell count; EOS: eosinophils; NEU: neutrophil count; LYM: lymphocyte count.
Outcome PTS Association of PTS with outcome Comparison of models with and without PTS HR [95%CI] or Beta (SE) P χ2 (1 df) P Stroke (N cases = 104) (N controls = 1,168) HbF* 0.72 [0.59-0.88] 0.002 0.23 0.63 WBC 1.00 [0.82-1.22] 0.99 1.42 0.23 NEU 0.98 [0.81-1.19] 0.82 2.43 0.12 LYM 1.01 [0.83-1.23] 0.90 0.25 0.62 ACS rate (N = 1,271) HbF -0.20 (0.06) 0.0005 0.91 0.34 EOS -0.02 (0.05) 0.75 0.48 0.49 VOC rate (N = 1,271) HbF 0.06 (0.05) 0.21 16.1 6.0x10⁻⁵
Haematologica | 108 March 2023 875 ARTICLE - Polygenic hematologic traits in SCD T. Pincez et al.
After correction for multiple testing (q-value <0.05), we found two variants significantly associated with HT in SCD patients, but with significantly different effect size when comparing βSCD and βnon-SCD : rs8090527 and rs2814778 (Online Supplementary Table S6, Online Supplementary Figures S2, S3). We confirmed that the effect sizes were still different when comparing βSCD to βnon-SCD derived from a downsampled subset of African-ancestry UK Biobank individuals (P<0.05) (Online Supplementary Table S6). We did not explore the association between the intergenic rs8090527
variant and PLT count further as we were unable to replicate it in an independent SCD cohort (Online Supplementary Table S6). The second variant is the previously described Duffy/DARC null variant (rs2814778),31 which had a two-fold weaker effect on neutrophil count in SCD when compared to non-SCD individuals. Based on this observation, we wondered if the apparent poor performance of the WBC and neutrophil count PTS in SCD participants was due to the lower impact of the Duffy/DARC null variant in this patient population. In non-SCD individuals, removing the
Figure 4. Sickle cell disease partially masks the genetic impact of the Duffy/DARC null variant (rs2814778) on neutrophil count. (A) Comparison of effect sizes (Beta) for 3,917 SNP-hematologic trait pairs in sickle cell disease (SCD) patients (x-axis) and nonSCD participants (y-axis). Only variants with a minor allele frequency >1% in the SCD meta-analyses were considered. We highlight two variants with significantly different effect sizes between SCD and non-SCD individuals. (See text for details). The blue line represents the best-fit linear regression line. (B) Variance explained (mean and standard deviation) by polygenic trait scores (PTS) for neutrophil (NEU) and white blood cell (WBC) counts with and without chromosome (chr) 1 variants in SCD (three cohorts) and non-SCD (BioMe and UK Biobank cohorts) individuals. (C) Raw neutrophil count (y-axis) as a function of the multi-ancestry neutrophil PTS (without chr 1 variants, x-axis) in Duffy-positive (Fy+, T/T or C/T genotypes at rs2814778) and Duffy-negative (Fy, C/C genotype) SCD (CSSCD) or non-SCD (UK Biobank) individuals. Regression lines for each of the four subgroups are shown. (D) Comparison of raw neutrophil count between Fy+ individuals with a PTS within the lowest quintile and Fy- individuals with a PTS within the highest quintile, for both SCD (CSSCD) and non-SCD (UK Biobank) individuals. ns: non-significant.

A B C D Haematologica | 108 March 2023 876 ARTICLE - Polygenic hematologic traits in SCD T. Pincez et al.
PTS variants on chromosome 1 (to ensure that the large admixture signal due to the Duffy/DARC locus does not impact the analysis) reduced the mean variance explained for WBC from 10.3% to 1.6%, and for neutrophils from 11.9% to 0.9% (Table 1, Figure 4B). When we repeated this analysis in SCD participants, the PTS for WBC was not affected (from 2.1% to 1.9%), whereas the variance explained by the neutrophil count PTS changed slightly from 3.3% to 2.2% (Figure 4B).
We next specifically focused on the association between Duffy/DARC rs2814778 and WBC or neutrophil counts in SCD and non-SCD individuals. First, consistent with the recessive inheritance of the Duffy-negative blood group, we showed that a recessive genetic model provided a better fit with the data than the standard additive model (Online Supplementary Table S7). Thus, we used a recessive model for all subsequent genetic analyses of this variant. For non-SCD individuals, the single Duffy/DARC variant explained 18.424.2% of the phenotypic variance (Table 3). In contrast, the associations between rs2814778 and WBC or neutrophil counts were either weak or non-significant in SCD participants, with this variant contributing only 0.9-3.3% of the variance in these HT (Table 3). To quantify the magnitude of the difference in effect sizes and provide meaningful clinical estimates, we calculated that the Duffy null genotype (homozygosity for the C-allele at rs2814778) was associated with a mean reduction of 0.76x10⁹ WBC/L (P=0.004) and 0.84x10⁹ neutrophils/L (P=1.6x10⁻⁶) in the CSSCD, and of 1.9x10⁹ WBC/L (P=3.3x10-164) and 1.6x10⁹ neutrophils/L (P=4x10-199) in the UK Biobank. When we considered both SCD status and the Duffy blood group, we found that: 1) SCD has the strongest impact on neutrophil count; 2) Duffy has a weaker effect on neutrophil count in SCD patients;
and 3) the neutrophil PTS (without chromosome 1 variants) remains associated with neutrophil count in all groups (Figure 4C). To further illustrate how SCD modifies the effect of Duffy, we considered the neutrophil PTS (without chromosome 1 variants) quintiles and compared neutrophil count in Duffy-positive individuals with a PTS in the lowest quintile with Duffy-negative individuals with a PTS in the highest quintile (Figure 4D). Whereas in non-SCD UK Biobank participants Duffy outweighs the PTS effect, it is equivalent in SCD patients. We observed a similar effect when analyzing a subset of the non-SCD African-ancestry cohort from the UK Biobank with a sample size similar to the CSSCD, suggesting that the difference in effect size is not due to a difference in sample size (Online Supplementary Table S8, Online Supplementary Figure S3). Finally, we investigated whether sickle cell trait (heterozygosity for the hemoglobin S allele) also modifies the Duffy/DARC effect on neutrophil count. We did not find a significant interaction between these two genotypes in the UK Biobank (P=0.33), indicating that the epistatic effect is specific to SCD.
Taken together, our data suggest that SCD partially masks the strong effect of the Duffy/DARC null variant (rs2814778) on neutrophil count. In non-SCD individuals, the Duffy null variant is the main determinant of neutrophil count, whereas in SCD individuals, its effect is equivalent to the effect of other neutrophil count-associated common variants (as captured by the neutrophil PTS without chromosome 1).
Genome-wide association studies of hematologic traits in SCD patients
To determine if new genetic variation could specifically modulate HT variation in SCD, we carried out GWAS for 11
The direction of the effect is given for the CC genotype (in a recessive genetic model). Neutrophil count is not available in Mondor/Lyon. Effect sizes (Beta) and standard errors (SE) are in standard deviation units. SD: standard deviation; CSSCD: Cooperative Study of Sickle Cell Disease;
Genetic Modifier; WBC: white blood cell count; EAF: effect allele frequency.
| 108 March 2023 877
N Mean (SD) 109/L EAF (C-allele) Beta (SE) P Variance (%) Neutrophils CSSCD 934 5.42 (2.44) 0.842 -0.353 (0.073) 1.6x10⁻⁶ 3.3 GEN-MOD 400 5.84 (2.67) 0.939 -0.019 (0.209) 0.93UK Biobank 6,564 3.10 (1.27) 0.906 -1.166 (0.033) 6.0x10-239 23.1 Down-sampled UK Biobank 1,278 3.04 (1.17) 0.912 -1.228 (0.080) 7.0x10-49 24.2 WBC CSSCD 1,014 12.19 (3.78) 0.845 -0.178 (0.064) 0.005 0.9 GEN-MOD 400 10.60 (3.67) 0.939 -0.092 (0.208) 0.66Mondor/Lyon 322 10.62 (3.01) 0.935 -0.151 (0.214) 0.48UK Biobank 6,584 5.81 (1.66) 0.906 -1.041 (0.036) 5.0x10-171 18.4 Down-sampled UK Biobank 1,278 5.75 (1.56) 0.912 -1.038 (0.083) 4.8x10⁻³⁴ 17.3
Table 3. Genetic association results between the Duffy/DARC null variant (rs2814778) and white blood cell and neutrophil counts.
GEN-MOD:
Haematologica
ARTICLE - Polygenic hematologic traits in SCD T. Pincez et al.
blood-cell traits across all three SCD cohorts available. Given the relatively small sample size of the dataset, we restricted our analyses to variants with a minor allele frequency (MAF) >1%. We found little evidence of association, except for Ht and Hb levels (Online Supplementary Figure S4). We found 24 genome-wide significant (P<5x10⁻⁸) SNPHT associations, including 23 at the known HbF loci and associated with Hb levels, Ht or RBC count (Online Supplementary Table S9). The last variant, rs113819343, was associated with PLT count in the SCD meta-analyses (P=1.4x10⁻⁸). This variant is common in African-ancestry individuals (MAF=5.5%, gnomAD) but rarer in European-ancestry populations (MAF=0.098%). This variant is not associated with PLT count in the multi-ancestry (n=473,895; P=0.72) nor in the African-specific (n=15,171; P=0.27) meta-analyses from the Blood-Cell Consortium.19 Our attempt to replicate this association with PLT count in 333 SCD patients from the OMG cohort was unsuccessful (P=0.69), so it is not possible to conclude if this association is real or a false-positive result.
Discussion
In this study, we explored the utility of PTS for HT in SCD patients. Our analyses highlight several important results, including some with clinical implications. First, we found that PTS for HT derived in non-SCD individuals largely underperformed when tested in SCD patients. This emphasizes the need to derive polygenic predictors directly in SCD patients before trying to implement them into precision medicine initiatives for this patient population. This will require larger SCD cohorts with comprehensive clinical and genetic information. Second, our characterization of the weak association between the Duffy/DARC null rs2814778 variant and neutrophil count in SCD patients suggested that the weaker impact of PTS may partly be due to an epistatic effect of SCD with other HT-associated variants. These results explain the unsuccessful attempts to use the Duffy/DARC null variant as an SCD genetic modifier,32,33 and stress the importance to use all neutrophil-associated variants (ideally identified by GWAS carried out in SCD patients) as potential predictors of SCD complications. Third, a small set of six HbF-associated variants (PTSHbF) were associated with stroke and ACS rate, and improved the statistical modeling of VOC rate. These results support the addition of PTSHbF in clinical efforts to stratify SCD patients based on risk of developing complications. Finally, PTSHbF allowed us to confirm and quantify the causal protective impact of HbF increase on stroke risk reduction, a controversial point in SCD literature (see below). Several non-mutually exclusive factors could explain why PTS for HT were not as strongly associated with HT variation in SCD patients. These patients have different base-
line levels and distribution values for several HT such as Hb and WBC count. This is in part due to the direct hemolytic effect of hemoglobin S, but also to the broad consequences of SCD, such as the induction of a chronic inflammatory state that can lead to cytokine-driven higher WBC count.34,35 Moreover, the frequent intercurrent complications (e.g., VOC) experienced throughout the natural course of SCD could result in greater variability in HT values. Finally, SNP genotyping arrays do not capture all structural variants, which are the main alterations in α-thalassemia, a major determinant MCH and MCV. We showed here that adding α-thalassemia and PTSHbF to PTS for corresponding HT greatly increased the variance explained. Thus, the performance of HT PTS will improve once comprehensive whole-genome sequencing of large SCD cohorts becomes available.
The C-allele of the Duffy/DARC null variant (rs2814778) results in erythroid-specific loss of expression of the Duffy/DARC chemokine reservoir expression gene.36 It has been known for some time that the Duffy/DARC null variant is strongly associated with lower circulating neutrophil and WBC counts in SCD and non-SCD individuals due to extravasation to tissues,31,37,38 and in particular the spleen.39 Although it is unclear why SCD partially masks the effect of this variant on neutrophil count, we may speculate that the precocious and pervasive splenic atrophy observed in SCD patients could lead to a reduced reservoir size. In addition, various Duffy/DARC variants in non-SCD and SCD individuals have been shown to affect the binding of DARC with inflammatory markers such as interleukin 8.40-42 Definitive data are still lacking, but the proinflammatory state of SCD patients may contribute to the observed discrepancy in effect.43
Whether or not the Duffy phenotype is associated with complications in SCD patients remains unclear.32,33,37,44-46 The potential consequences of the Duffy/DARC status in SCD would be linked to circulating proinflammatory cytokines and, in particular, the resulting effect on neutrophil and WBC counts, which has been implicated in several SCD complications.2,6,7 However, our data showed that the Duffy/DARC negative phenotype is not a good proxy for neutrophil count in SCD patients, in contrast to non-SCD individuals in whom it accounts for a large fraction of the phenotypic variance.
Although complex multi-ancestry PTS for general HT that include hundreds of variants performed poorly in SCD patients, we showed that a simple PTS for HbF made of six variants at three loci can capture a large fraction of the phenotypic variance in this important SCD modifier, consistent with previous reports.23,24 One major difference between the general HT and HbF is that we developed PTSHbF using GWAS data from SCD patients. Interestingly, we observed an association between PTSHbF and ACS or stroke in the large CSSCD. We also validated previous observations
Haematologica | 108 March 2023 878 ARTICLE - Polygenic hematologic traits in SCD T. Pincez et al.
that a PTS for HbF can improve a statistical model for VOC rate,29,30 and further discovered that this PTSHbF was useful in the subset of patients with HbF levels <10%. Whether the increase in HbF levels has a beneficial effect on stroke has long been unclear due to data discrepancies. The pre-hydroxyurea (HU) CSSCD (still the largest SCD cohort to date) did not find that high HbF reduces ischemic stroke nor risk of silent infarct (changes in white matter).26,47 Of note, in the CSSCD, results for hemorrhagic stroke and “overall” stroke (considering both ischemic and hemorrhagic stroke) were not reported. A follow-up study of SCD patients identified through screening of newborn did not find a protective effect of HbF.48 In contrast, historical,49 as well as more recent data, found a protective effect of elevated HbF levels on “overall” stroke.28 This protective effect was also reported for incidence of silent infarct.27,50 Furthermore, some studies investigating the association between HbF-associated SNP and stroke reported an association,51,52 while another did not.53 Several factors could have led to such inconsistent results:
1) different studies used different definitions of stroke; 2) only the CSSCD separated ischemic and hemorrhagic stroke based on computed tomography findings (with the limitations associated with this technology to define stroke sub-type);
3) retrospective studies used history of stroke as endpoint;
4) small sample sizes with limited power to detect an effect of HbF on stroke; and
5) differences between SCD studies regarding the age at which HbF levels were measured. (HbF is physiologically higher in younger patients54). Finally, HU has clearly been shown to reduce stroke risk in prospective studies,55 but given the multiple mechanisms by which the drug is beneficial in SCD,56 its protective effect cannot be solely linked to HU-mediated HbF increase.
In this study, we used the large genotyped subset of the CSSCD and combined genetic information in a PTS to show that HbF associates with stroke in SCD patients. Our MR analyses revealed that HbF levels have a causal and protective effect on stroke, although we also acknowledge that the Winner’s curse could have artificially increased our estimate. In effect, while the MR Egger and weighted median MR approaches are sensitive methods to detect horizontal pleiotropy, they are also known to have less statistical power than the multiplicative random-effect IVW method used as the primary discovery method in our analyses.57,58 Thus, the non-significant results for the PTSHbF-stroke using MR-Egger and weighted median approaches should not be interpreted as a lack of validation. What this negative result means is that we cannot exclude the possibility that horizontal pleiotropy could have impacted our HbF-stroke MR result. However, because the MR instruments were selected at clear HbF loci with known regulatory mechanisms (BCL11A, HBS1LMYB, beta-globin), we suggest that the risk of confound-
ing due to horizontal pleiotropy is minimal. Our MR analysis suggests that the impact of HU on stroke is,55 at least in part, mediated by HbF and distinguishes the effect of HU by speci fi cally quantifying how genetically-determined (lifelong) HbF levels modulate stroke risk. Additional large replication cohorts were not available to our group to validate our findings and we acknowledge that this is an important limitation of our study. Specifically, replication of the association and MR results for PTSHbF and stroke would require large SCD cohorts (approx. 2,8005,180 SCD patients; see Online Supplementary Appendix) given the reduction in stroke incidence following the implementation of successful stroke primary prevention programs.48,59 Therefore, we encourage investigators to test our models in their own SCD cohorts, and applaud efforts to create new large collaborative studies of SCD to energize the field of SCD modifier genetics.
Our findings have implications beyond SCD. While PTS have been shown to modulate the penetrance of monogenic mutations in diseases such as coronary artery disease and familial breast and colorectal cancers,60 much less is known about their effect on expressivity (or disease severity).13 This distinction is important because, although they may not cause the disease, several clinical variables and other endophenotypes that are captured by PTS can strongly modify disease severity (e.g., PTS for kidney functions in the context of hypertension, PTS for retinopathy/cataract in diabetic patients). Our analyses indicate that simply translating the genetics of polygenic traits formulated in healthy individuals to diseased populations may not provide the expected gain in risk stratification in the context of precision medicine. Fortunately, large biobanks and other cohorts should soon be able to use powerful GWAS for genetic modifiers in >10,000 patients who all suffer from the same disease.
Disclosures
No conflicts of interest to disclose.
Contributions
TP and GL designed the study. TP, KSL and MEG performed the analyses. TP, ALPHAO, MEG, CB, AEA-K, MJT, FG, PJ, PB and GL collected the clinical and genetic data. TP and GL drafted the paper. GL supervised the study. All authors contributed to data interpretation, revised the manuscript for critical content and approved the final manuscript.
Acknowledgments
We thank all participants for their contribution to this project. We thank Gabrielle Boucher for statistical support. TP is a recipient of a Charles Bruneau Foundation fellowship award and merit scholarship program for foreign students from the Ministry of Education and Higher Education of Quebec.
Haematologica | 108 March 2023 879 ARTICLE - Polygenic hematologic traits in SCD T. Pincez et al.
Funding
This work was funded by the Canadian Institutes of Health Research (PJT #156248), Bioverativ, a Sanofi Company, and the Canada Research Chair Program (to GL). GEN-MOD samples and data collection were supported by NIH grant HL-68922. AA-K, MJT and establishment and analysis of the OMG cohort have been funded by NHLBI (R01HL68959, HL79915, HL70769, HL87681). This research has been conducted using the UK Biobank Resource under Application Number 11707.
References
1. Kato GJ, Piel FB, Reid CD, et al. Sickle cell disease. Nat Rev Dis Primers. 2018;4:18010.
2. Platt OS, Brambilla DJ, Rosse WF, et al. Mortality in sickle cell disease. Life expectancy and risk factors for early death. N Engl J Med. 1994;330(23):1639-1644.
3. Platt OS, Thorington BD, Brambilla DJ, et al. Pain in sickle cell disease. Rates and risk factors. N Engl J Med. 1991;325(1):11-16.
4. Castro O, Brambilla DJ, Thorington B, et al. The acute chest syndrome in sickle cell disease: incidence and risk factors. The Cooperative Study of Sickle Cell Disease. Blood. 1994;84(2):643-649.
5. Steinberg MH, Chui DH, Dover GJ, Sebastiani P, Alsultan A. Fetal hemoglobin in sickle cell anemia: a glass half full? Blood. 2014;123(4):481-485.
6. Sebastiani P, Nolan VG, Baldwin CT, et al. A network model to predict the risk of death in sickle cell disease. Blood. 2007;110(7):2727-2735.
7. Elmariah H, Garrett ME, De Castro LM, et al. Factors associated with survival in a contemporary adult sickle cell disease cohort. Am J Hematol. 2014;89(5):530-535.
8. Miller ST, Sleeper LA, Pegelow CH, et al. Prediction of adverse outcomes in children with sickle cell disease. N Engl J Med. 2000;342(2):83-89.
9. Vichinsky EP, Neumayr LD, Earles AN, et al. Causes and outcomes of the acute chest syndrome in sickle cell disease. National Acute Chest Syndrome Study Group. N Engl J Med. 2000;342(25):1855-1865.
10. Lewis CM, Vassos E. Polygenic risk scores: from research tools to clinical instruments. Genome Med. 2020;12(1):44.
11. Sun J, Wang Y, Folkersen L, et al. Translating polygenic risk scores for clinical use by estimating the confidence bounds of risk prediction. Nat Commun. 2021;12:5276.
12. Martin AR, Kanai M, Kamatani Y, Okada Y, Neale BM, Daly MJ. Clinical use of current polygenic risk scores may exacerbate health disparities. Nat Genet. 2019;51(4):584-591.
13. Oetjens MT, Kelly MA, Sturm AC, Martin CL, Ledbetter DH. Quantifying the polygenic contribution to variable expressivity in eleven rare genetic disorders. Nat Commun. 2019;10:4897.
14. Farber MD, Koshy M, Kinney TR. Cooperative Study of Sickle Cell Disease: demographic and socioeconomic characteristics of patients and families with sickle cell disease. J Chronic Dis. 1985;38(6):495-505.
15. Bartolucci P, Brugnara C, Teixeira-Pinto A, et al. Erythrocyte density in sickle cell syndromes is associated with specific clinical manifestations and hemolysis. Blood. 2012;120(15):3136-3141.
16. Ilboudo Y, Bartolucci P, Rivera A, et al. Genome-wide association study of erythrocyte density in sickle cell disease patients.
Data-sharing statement
The CSSCD genetic dataset is available on the database of Genotypes and Phenotypes (dbGaP: https://www.ncbi.nlm. nih.gov/gap/), accession phs000366.v1.p1. The UK Biobank dataset is publicly available (https://www.ukbiobank.ac.uk/). The GEN-MOD, Mondor/Lyon and BioMe datasets and code supporting the current study have not been deposited in a public repository because data are not public but are available from the corresponding author on request.
Blood Cells Mol Dis. 2017;65:60-65.
17. Pincez T, Lee SSK, Ilboudo Y, et al. Clonal hematopoiesis in sickle cell disease. Blood. 2021;138(21):2148-2152.
18. Xu JZ, Garrett ME, Soldano KL, et al. Clinical and metabolomic risk factors associated with rapid renal function decline in sickle cell disease. Am J Hematol. 2018;93(12):1451-1460.
19. Chen MH, Raffield LM, Mousas A, et al. Trans-ethnic and ancestry-specific blood-cell genetics in 746,667 individuals from 5 global populations. Cell. 2020;182(5):1198-1213.e14.
20. Bycroft C, Freeman C, Petkova D, et al. The UK Biobank resource with deep phenotyping and genomic data. Nature. 2018;562(7726):203-209.
21. Canver MC, Lessard S, Pinello L, et al. Variant-aware saturating mutagenesis using multiple Cas9 nucleases identifies regulatory elements at trait-associated loci. Nat Genet. 2017;49(4):625-634.
22. Bauer DE, Kamran SC, Lessard S, et al. An erythroid enhancer of BCL11A subject to genetic variation determines fetal hemoglobin level. Science. 2013;342(6155):253-257.
23. Galarneau G, Palmer CD, Sankaran VG, Orkin SH, Hirschhorn JN, Lettre G. Fine-mapping at three loci known to affect fetal hemoglobin levels explains additional genetic variation. Nat Genet. 2010;42(12):1049-1051.
24. Gardner K, Fulford T, Silver N, et al. g(HbF): a genetic model of fetal hemoglobin in sickle cell disease. Blood Adv. 2018;2(3):235-239.
25. Lettre G, Bauer DE. Fetal haemoglobin in sickle-cell disease: from genetic epidemiology to new therapeutic strategies. Lancet. 2016;387(10037):2554-2564.
26. Ohene-Frempong K, Weiner SJ, Sleeper LA, et al. Cerebrovascular accidents in sickle cell disease: rates and risk factors. Blood. 1998;91(1):288-294.
27. Calvet D, Tuilier T, Mélé N, et al. Low fetal hemoglobin percentage is associated with silent brain lesions in adults with homozygous sickle cell disease. Blood Adv. 2017;1(26):2503-2509.
28. Sommet J, Alberti C, Couque N, et al. Clinical and haematological risk factors for cerebral macrovasculopathy in a sickle cell disease newborn cohort: a prospective study. Br J Haematol. 2016;172(6):966-977.
29. Rampersaud E, Kang G, Palmer LE, et al. A polygenic score for acute vaso-occlusive pain in pediatric sickle cell disease. Blood Adv. 2021;5(14):2839-2851.
30. Lettre G, Sankaran VG, Bezerra MAC, et al. DNA polymorphisms at the BCL11A, HBS1L-MYB, and β-globin loci associate with fetal hemoglobin levels and pain crises in sickle cell disease. Proc Natl Acad Sci U S A. 2008;105(33):11869-11874.
31. Visscher PM, Reich D, Nalls MA, et al. Reduced neutrophil count
Haematologica | 108 March 2023 880 ARTICLE - Polygenic hematologic traits in SCD T. Pincez et al.
in people of African descent is due to a regulatory variant in the Duffy antigen receptor for chemokines gene. PLoS Genetics. 2009;5(1):e1000360.
32. Farawela HM, El-Ghamrawy M, Farhan MS, Soliman R, Yousry SM, AbdelRahman HA. Association between Duffy antigen receptor expression and disease severity in sickle cell disease patients. Hematology. 2016;21(8):474-479.
33. Schnog JB, Keli SO, Pieters RA, Rojer RA, Duits AJ. Duffy phenotype does not influence the clinical severity of sickle cell disease. Clin Immunol. 2000;96(3):264-268.
34. Hermand P, Azouzi S, Gautier EF, et al. The proteome of neutrophils in sickle cell disease reveals an unexpected activation of interferon alpha signaling pathway. Haematologica. 2020;105(12):2851-2854.
35. Nader E, Romana M, Connes P. The red blood cell-inflammation vicious circle in sickle cell disease. Front Immunol. 2020;11:454.
36. Tournamille C, Colin Y, Cartron JP, Le Van Kim C. Disruption of a GATA motif in the Duffy gene promoter abolishes erythroid gene expression in Duffy-negative individuals. Nat Genet. 1995;10(2):224-228.
37. Afenyi-Annan A, Kail M, Combs MR, Orringer EP, Ashley-Koch A, Telen MJ. Lack of Duffy antigen expression is associated with organ damage in patients with sickle cell disease. Transfusion. 2008;48(5):917-924.
38. Schaefer BA, Flanagan JM, Alvarez OA, et al. Genetic modifiers of white blood cell count, albuminuria and glomerular filtration rate in children with sickle cell anemia. PLoS One. 2016;11(10):e0164364.
39. Duchene J, Novitzky-Basso I, Thiriot A, et al. Atypical chemokine receptor 1 on nucleated erythroid cells regulates hematopoiesis. Nat Immunol. 2017;18(7):753-761.
40. Nebor D, Durpes MC, Mougenel D, et al. Association between Duffy antigen receptor for chemokines expression and levels of inflammation markers in sickle cell anemia patients. Clin Immunol. 2010;136(1):116-122.
41. Moreno Velasquez I, Kumar J, Bjorkbacka H, et al. Duffy antigen receptor genetic variant and the association with Interleukin 8 levels. Cytokine. 2015;72(2):178-184.
42. Schnabel RB, Baumert J, Barbalic M, et al. Duffy antigen receptor for chemokines (Darc) polymorphism regulates circulating concentrations of monocyte chemoattractant protein-1 and other inflammatory mediators. Blood. 2010;115(26):5289-5299.
43. van Beers EJ, Yang Y, Raghavachari N, et al. Iron, inflammation, and early death in adults with sickle cell disease. Circ Res. 2015;116(2):298-306.
44. Elliott L, Ashley-Koch AE, De Castro L, et al. Genetic polymorphisms associated with priapism in sickle cell disease. Br J Haematol. 2007;137(3):262-267.
45. Nolan VG, Adewoye A, Baldwin C, et al. Sickle cell leg ulcers: associations with haemolysis and SNPs in Klotho, TEK and genes of the TGF-beta/BMP pathway. Br J Haematol. 2006;133(5):570-578.
46. Drasar ER, Menzel S, Fulford T, Thein SL. The effect of Duffy
antigen receptor for chemokines on severity in sickle cell disease. Haematologica. 2013;98(8):e87-89.
47. Kinney TR, Sleeper LA, Wang WC, et al. Silent cerebral infarcts in sickle cell anemia: a risk factor analysis. Pediatrics. 1999;103(3):640-645.
48. Bernaudin F, Verlhac S, Arnaud C, et al. Impact of early transcranial Doppler screening and intensive therapy on cerebral vasculopathy outcome in a newborn sickle cell anemia cohort. Blood. 2011;117(4):1130-1140.
49. Powars DR, Schroeder WA, Weiss JN, Chan LS, Azen SP. Lack of influence of fetal hemoglobin levels or erythrocyte indices on the severity of sickle cell anemia. J Clin Invest. 1980;65(3):732-740.
50. van der Land V, Mutsaerts HJMM, Engelen M, et al. Risk factor analysis of cerebral white matter hyperintensities in children with sickle cell disease. Br J Haematol. 2016;172(2):274-284.
51. Leonardo FC, Brugnerotto AF, Domingos IF, et al. Reduced rate of sickle-related complications in Brazilian patients carrying HbF-promoting alleles at the BCL11A and HMIP-2 loci. Br J Haematol. 2016;173(3):456-460.
52. Saraf SL, Akingbola TS, Shah BN, et al. Associations of αthalassemia and BCL11A with stroke in Nigerian, United States, and United Kingdom sickle cell anemia cohorts. Blood Adv. 2017;1(11):693-698.
53. Arez AP, Wonkam A, Ngo Bitoungui VJ, et al. Association of variants at BCL11A and HBS1L-MYB with hemoglobin F and hospitalization rates among sickle cell patients in Cameroon. PLoS One. 2014;9(3):e92506.
54. Maier-Redelsperger M, Noguchi CT, de Montalembert M, et al. Variation in fetal hemoglobin parameters and predicted hemoglobin S polymerization in sickle cell children in the first two years of life: Parisian Prospective Study on Sickle Cell Disease. Blood. 1994;84(9):3182-3188.
55. Ware RE, Davis BR, Schultz WH, et al. Hydroxycarbamide versus chronic transfusion for maintenance of transcranial doppler flow velocities in children with sickle cell anaemia—TCD With Transfusions Changing to Hydroxyurea (TWiTCH): a multicentre, open-label, phase 3, non-inferiority trial. Lancet. 2016;387(10019):661-670.
56. Platt OS. Hydroxyurea for the treatment of sickle cell anemia. N Engl J Med. 2008;358(13):1362-1369.
57. Schmidt AF, Dudbridge F. Mendelian randomization with Egger pleiotropy correction and weakly informative Bayesian priors. Int J Epidemiol. 2018;47(4):1217-1228.
58. Bowden J, Davey Smith G, Haycock PC, Burgess S. Consistent estimation in Mendelian randomization with some invalid instruments using a weighted median estimator. Genet Epidemiol. 2016;40(4):304-314.
59. Fullerton HJ, Adams RJ, Zhao S, Johnston SC. Declining stroke rates in Californian children with sickle cell disease. Blood. 2004;104(2):336-339.
60. Fahed AC, Wang M, Homburger JR, et al. Polygenic background modifies penetrance of monogenic variants for tier 1 genomic conditions. Nat Commun. 2020;11(1):3635.
Haematologica | 108 March 2023 881 ARTICLE - Polygenic hematologic traits in SCD T. Pincez et al.
International multicenter retrospective analysis of thiotepa-based autologous stem cell transplantation for secondary central nervous system lymphoma
Secondary central nervous system lymphoma (SCNSL) is a rare, aggressive disorder with a historically dismal prognosis of <6 months.1 Patients may present de novo with systemic disease or at relapse, either with isolated central nervous system (CNS) disease or synchronous systemic involvement. These differing presentations create the therapeutic challenge of controlling both the systemic and CNS disease. Thiotepa-based autologous stem cell transplant (ASCT) in first remission has been explored in SCNSL as a means of overcoming the poor outlook. Retrospective studies including consolidative ASCT in SCNSL generally include small series of patients with heterogeneous histological subtypes. Transplant-specific outcomes are not well characterized.2-4 Performing large trials is challenging, with the largest prospective series reporting only 37 patients proceeding to ASCT.5 The largest retrospective series (n=151) reported no patients who had received thiotepa-based conditioning, with the majority having undergone BEAM (carmustine, etoposide, cytarabine, melphalan)-conditioned ASCT.6 Thiotepa-based conditioning with carmustine or busulfan has greater CNS bioavailability7 compared with BEAM and produces superior outcomes in primary CNS lymphoma.8 We analyzed the survival outcomes of the largest cohort of patients with SCNSL, focused exclusively on patients with diffuse large B-cell lymphoma (DLBCL) or transformed lymphoma, who were treated with chemoimmunotherapy and consolidated with thiotepa-conditioned ASCT. Consecutive adult patients treated from January 31, 2013 to February 24, 2020 across 17 centers and three countries (UK, Italy and Germany) with thiotepa-based ASCT consolidation were retrospectively reviewed. Patients were followed up to December 1, 2021. CNS involvement was confirmed by brain biopsy and/or cerebrospinal fluid studies and/or neuroimaging. Baseline characteristics, details of therapy and response were collected. The primary endpoints were 3-year progression-free survival (PFS) and overall survival (OS) from time of stem cell infusion; secondary endpoints were the incidences of CNS and systemic relapse and of non-relapse mortality (NRM). OS and PFS estimates were generated using the Kaplan-Meier method and groups were compared using Cox regression and the log-rank test. Backwards selection with P=0.05 for inclusion was used for multivariable analyses. All statistical analyses were conducted using STATA v16.1 software (STATAcorp, College Station, TX, USA).
One hundred thirty-four patients (85 male, 49 female) with SCNSL underwent thiotepa-conditioned ASCT. These patients’ baseline characteristics are outlined in Table 1. Forty-four patients did not have a CNS biopsy and were diagnosed based on a biopsy from a systemic site or neuroimaging alone. At the time of SCNSL diagnosis, 52 (39%) patients had a de novo presentation of SCNSL (synchronous systemic and CNS disease and were treatment-naïve) and 82 (62%) patients had relapsed diffuse large B-cell lymphoma, of whom 62 (46%) had isolated CNS relapse and 20 (15%) had a synchronous relapse presentation (systemic and CNS disease with prior therapy). For those with CNS involvement at relapse, the majority (77/82; 94%) had received prior chemotherapy with R-CHOP (rituximab plus cyclophosphamide, doxorubicin, vincristine and prednisone), including two patients who were given etoposide in addition to R-CHOP. Among all patients, methotrexate-cytarabine-based induction was most frequently used (n=123; 92%). Complete responses or partial responses to induction, as assessed before ASCT by positron emission tomography (PET) with computed tomography (CT) or CT alone, were achieved in 77/94 (82%) and 13/94 (14%) patients, respectively, and by 83/127 (65%) and 37/127 (29%), respectively, according to magnetic resonance imaging (MRI) of the head. The conditioning regimens employed were carmustine-thiotepa (n=112; 84%), busulfan-thiotepa (n=18; 13%), busulfan-lomustinethiotepa (n=2; 1%), thiotepa-etoposide-cytarabine-melphalan (n=1; 1%) and thiotepa alone (n=1; 1%). The median number of CD34+ cells infused was 4.4x10⁶/kg (range, 1.4x10⁶/kg - 37.1x10⁶/kg). The median days to neutrophil and platelet engraftment were 11 (interquartile range, 1012) and 13 (interquartile range, 11-17). Neutrophil and platelet engraftment were defined as the first of 2 consecutive days with an absolute neutrophil count >0.5x10⁹/L and a platelet count >20x109/L, without transfusion support.
At ASCT, the median duration of hospitalization was 22 days (range, 14-298) and the Intensive Care Unit admission rate was 8% (11/130). Grade 3-4 renal impairment was observed in 6% (8/130) and hepatic impairment in 4% (5/130). With a median follow-up of 47 months (interquartile range, 29-60), the 3-year OS and PFS rates were 71.6% (95% confidence interval [95% CI]: 61.9% – not reached) and 61.1% (95% CI: 52.2-68.9%), respectively (Figure 1). Ninety patients with histologically confirmed CNS disease
Haematologica | 108 March 2023 882 LETTER TO THE EDITOR
Presentation All presentations De novo N=52 Relapsed N=82 P valuea De novo N=52 Isolated relapse N=62 Synchronous relapse N=20 P valueb Age at ASCT in years, median (IQR) 53 (46-66) 60.5 (52-66) 0.99 53 (46-66) 61 (51- 68) 59.5 (55.5- 63.5) 0.23 Histology, N (%) DLBCL Transformed indolent lymphoma 48 (92.3) 4 (7.7) 71 (86.6) 11 (13.4) 0.31 48 (92.3) 4 (7.7) 56 (90.3) 6 (9.7) 15 (75.0) 5 (25.0) 0.099 CNS site, N (%) Parenchymal only Leptomeningeal only Parenchymal + leptomeningeal Direct CNS invasion** 29 (55.8) 15 (28.9) 6 (11.5) 2 (3.9) 56 (68.3) 13 (15.9) 8 (9.8) 5 (6.1) 0.28 29 (55.8) 15 (28.9) 6 (11.5) 2 (3.9) 49 (79.0) 7 (11.3) 5 (8.1) 1(1.6) 7 (35.0) 6 (30.0) 3 (15.0) 4 (20.0) 0.002 CNS biopsy, N (%) No Yes 18 (34.6) 34 (65.4) 26 (31.7) 56 (68.3) 0.85 18 (34.6) 34 (65.4) 18 (29.0) 44 (71.0) 8 (40.0) 12 (60.0) 0.60 Prior CNS prophylaxis (relapsed only), N (%) None IT MTX only IV MTX only Both Unknown--49 (61.3) 18 (22.0) 9 (11.3) 4 (5.0) 2 ---36 (59.0) 14 (23.0) 9 (14.8) 2 (3.3) 1 13 (68.4) 4 (21.1) 0 2 (10.5) 1 0.19 Time to SCNSL, N (%) >1 year 3 months – 1 year <3 months On therapy-35 (42.7) 20 (24.4) 16 (19.5) 11 (13.4) --27 (42.6) 14 (22.6) 13 (21.0) 8 (12.0) 8 (40.0) 6 (20.0) 3 (15.0) 3 (15.0) 0.92 Time from SCNSL to ASCT in months, median (IQR) 6.6 (5.0-8.8) 5.2 (3.8-6.8) 0.0004 6.6 (5.0-8.8) 4.8 (3.5-6.5) 6.5 (4.9-8.1) 0.0001 Number of lines of therapy from SCNSL to ASCT, N (%) 1 2 3 48 (92.3) 2 (3.9) 2 (3.9) 73 (89.0) 6 (7.3) 3 (3.7) 0.55c 48 (92.3) 2 (3.9) 2 (3.9) 54 (87.1) 5 (8.1) 3 (4.8) 19 (95.0) 1 (5.0) 0 0.89 ECOG score before ASCT, N (%) 0 1 2 3 Missing 18 (35.3) 26 (51.0) 4 (7.8) 3 (5.9) 1 30 (38.0) 32 (40.5) 11 (13.9) 6 (7.6) 3 0.80c 18 (35.3) 26 (51.0) 4 (7.8) 3 (5.9) 1 22 (38.3) 24 (40.7) 9 (15.3) 4 (6.8) 3 8 (40.0) 8 (40.0) 2 (20.3) 2 (20.0) 0 0.85 Systemic (PET-CT/CT) response before ASCT, N (%) Complete response Partial response Stable disease Progressive disease Unknown/not performed 37 (80.4) 7 (15.2) 1 (2.2) 1 (2.2) 6 40 (83.3) 6 (12.5) 0 2 (4.1) 34 0.74c 37 (80.4) 7 (15.2) 1 (2.2) 1 (2.2) 6 28 (87.5) 3 (9.4) 0 1 (3.1) 30 12 (75.0) 3 (18.8) 0 1 (6.3) 4 0.80 CNS (MRI) response before ASCT, N (%) Complete response Partial response Stable disease Progressive disease Unknown/not performed 28 (56.0) 18 (36.0) 2 (4.0) 2 (4.0) 2 55 (71.4) 19 (24.7) 0 3 (3.9) 5 0.071c 28 (56.0) 18 (36.0) 2 (4.0) 2 (4.0) 2 45 (73.8) 14 (23.0) 0 2 (3.3) 1 10 (62.5) 5 (31.3) 0 1 (6.3) 4 0.33 Induction therapy regimen MATRix alone MATRix + RICE/DeVIC combination MTX+ Ara-c combination RCODOXM/RIVAC Ifosfamide-containing, other* Other 6 (11.5) 22 (42.3) 14 (26.9) 8 (15.4) 2 (3.8) 0 18 (22.0) 16 (19.5) 39 (47.6) 0 6 (7.3) 3 (3.7) <0.001 6 (12.0) 22 (44.0) 14 (28.0) 8 (16.0) 2 0 16 (26.2) 11 (18.0) 31 (50.8) 0 3 1 (1.6) 2 (10.0) 5 (25.0) 8 (40.0) 0 3 (30.0) 2 (10.0) <0.001 Continued on following page.
Haematologica | 108 March 2023 883 LETTER TO THE EDITOR
Table 1. Patients’ baseline characteristics prior to autologous stem cell transplantation.
aP value comparing all relapsed vs. de novo cases. bP value comparing all three groups. P values are for the χ2 or Fisher exact test except for cthe χ2 test for trend. *Ifosfamide-containing regimens included ifosfamide-etoposide-epirubicin, ifosfamide-etoposide ± carboplatin, and ifosfamide-etoposide-cytarabine. **Direct central nervous system invasion refers to infiltration from craniofacial or epidural masses into the central nervous system. ASCT: autologous stem cell transplantation; IQR: interquartile range; DLBCL: diffuse large B-cell lymphoma; CNS: central nervous system; IT: intrathecal; IV: intravenous; MTX: methotrexate; SCNSL: secondary central nervous system lymphoma; ECOG: Eastern Cooperative Oncology Group; PET: positron emission tomography; CT: computed tomography; MRI: magnetic resonance imaging; MATRix: methotrexate, cytarabine, thiotepa, and rituximab; RICE/DeVIC: rituximab, ifosfamide, carboplatin and etoposide/dexamethasone, VP16, ifosfamide, and carboplatin; Ara-C: cytarabine; RCODOXM/RIVAC: rituximab, cyclophosphamide, doxorubicin, vincristine, and methotrexate/rituximab, ifosfamide, etoposide, and high-dose cytarabine.
and 44 patients assessed with neuroimaging alone had similar OS (3-year rates: 70.2% [95% CI: 59.3-78.7] vs 67.2% [95% CI: 50.9-79.1], log rank P=0.92) and PFS (3-year rates: 59.0% [95% CI: 47.9-68.5] vs. 65.5% [95% CI: 49.477.6], P=0.44). During the study period, 48 patients died, 43 relapsed and 14 died without documented relapse. The 100-day NRM was 3% and the cumulative incidence at 1 and 3 years was 8.4% (4.7-14.6). Causes of NRM were infection (6/14), respiratory failure (2/14), secondary acute myeloid leukemia (1/14) and unknown (5/14: all beyond day 100). Most relapses occurred within 2 years of ASCT (34/43; 79%).
The optimal depth of disease response that must be achieved prior to ASCT has previously been uncertain. Our data indicate that patients with a partial response (CNS, systemic or both) prior to ASCT have good outcomes. Those with a partial response after induction chemotherapy in the systemic compartment (by PET-CT/CT) or in the CNS (by MRI) did not differ significantly for PFS, OS or time to relapse when compared with those who had a complete response (Table 2, Online Supplementary Table S1). Combining response data showed a better OS for patients who were in complete remission according to both PET and MRI than for those in partial remission according to either technique (P=0.032, P=0.076, and P=0.055). Two of six patients transplanted with progressive disease responded, and are in complete remission; nevertheless outcomes were worse than those in all other patients, with four of the six progressing.
Adverse predictors of PFS and OS on univariable analysis were older age, Eastern Cooperative Oncology Group score 2-3, number of prior lines of therapy for SCNSL and progressive disease on pre-ASCT MRI. Presentation (relapsed DLBCL with synchronous presentation vs. de novo/isolated relapse) was significantly associated with inferior PFS. The only factors that were associated with poorer PFS in multivariable analysis were synchronous presentation, age and two or more prior lines of therapy. For OS, only age and two or more lines of SCNSL treatment remained significant. This is consistent with data in primary CNS lymphoma and systemic DLBCL.9
Patients presenting with synchronous relapse of SCNSL remain a challenge and have the poorest outcomes. The 3-year PFS in this group was 40.0% (19.3-60.1), compared to 62.7% (47.9-74.4) and 67.7% (53.1-77.1) in the groups with de novo and isolated relapse presentations (Table 2). This
is comparable to the CORAL data of a 3-year PFS of 39% in 68 patients with relapsed/refractory DLBCL undergoing BEAM-conditioned ASCT.10 In our cohort this appears to be driven by a higher rate of systemic relapse after ASCT (55.0% vs. 6.0% de novo vs. 2.1% isolated) and may therefore reflect the difficulty in achieving control of systemic disease at relapse. The risk of systemic failure was greater for those with a synchronous relapse presentation than those with de novo/isolated presentations (hazard ratio synchronous vs. de novo = 14.36 [95% CI: 4.03-51.1%], hazard ratio synchronous vs. isolated = 54.64 [95% CI: 7.1421.8], log rank P<0.0001).
Relapse after ASCT resulted in very poor outcomes. As in the CORAL study, a shorter time to relapse after ASCT was associated with inferior survival.10 In our study, 43 patients relapsed after ASCT (27 CNS only, 13 systemic only, 3 both), at a median of 4.9 months (range, 1-49.3); 34 died with a median survival of 3.7 months (range, 2.1-7.2). Those relapsing <3 months after ASCT had a median survival of 1.5 months (95% CI: 0.72-2.04) compared with 3.7 months (95% CI: 3.01-4.37) for those who relapsed 3-6 months after ASCT and 21.6 months (95% CI: 9.6-not reached) for those who relapsed at ≥6 months (log rank P<0.0001). Of 21 patients receiving salvage chemotherapy, 15 (71%) have died, all due to progressive disease.
Overall, our data support thiotepa-based ASCT as a standard of care of conditioning in SCNSL. Our data suggest that patients with SCNSL undergoing this strategy have superior OS and PFS compared to cohorts receiving BEAM conditioning, although the proportion of SCNSL presentation was not characterized in these studies.4,6 No patients underwent thiotepa-busulfan-cyclophosphamide conditioning which has been used in primary CNS lymphoma with higher rates of NRM and a similar risk of all-cause mortality after 6 months. In our study, the 100-day NRM was 3% and 8.4% at 3 years, with others reporting 100day NRM of approximately 10% in SCNSL.2,3 Hematopoietic recovery times and intensive care admission rates were comparable to those previously published.
Factors significantly associated with inferior PFS and OS in our series included number of prior lines of therapy for SCNSL and older age. Despite this, carefully selected patients >70 years still have good outcomes and should not be excluded. Two prospective trials included patients ≤70 years old, with restrictive criteria for organ function and exclusion of those with human immunodeficiency virus in-
Haematologica | 108 March 2023 884 LETTER TO THE EDITOR
fection or hepatitis.5,11 There are no prospective data for patients >70 years old.12,13 Our unselected retrospective series reflects real-world practice: 30% (38/127) would not have met MARIETTA trial eligibility criteria at SCNSL diagnosis (n=30) or prior to ASCT (n=8) (age up to 77 years [>70 years, n=17; 13%] at SCNSL diagnosis, prior high-dose methotrexate use [n=13; 10%], well-controlled human immunodeficiency virus infection [n=2; 1%], impaired renal function prior to ASCT [glomerular filtration rate <60 mL/min, 6/129; 5%] and left ventricular ejection fraction <50% [3/112; 3%]).
Our data are retrospective and have inherent limitations. We were unable to accurately identify all patients presenting with SCNSL and only included those who proceeded to ASCT. Forty-four percent of those with a relapsed SCNSL presentation presented within a year of a diagnosis of DLBCL, whereas typically 90% of CNS relapses occur during the first year of follow-up,5 demon-
strating a possible selection bias as we postulate a cohort of patients who relapse early may not proceed to ASCT. Data were incomplete or not uniformly performed on baseline risk factors (including cell of origin/gene rearrangements) and therefore analysis of potential confounders may be limited. Despite this being the largest cohort of SCNSL patients treated with thiotepa-conditioned ASCT to date, good outcomes (therefore small numbers of events) limited our ability to run full multivariable models or multivariable analysis by relapse type, and treatment choice bias will limit any comparison of treatment regimens.
In conclusion, thiotepa-conditioned ASCT is an effective consolidation therapy with low NRM and leads to durable responses particularly in those with de novo or isolated relapse presentation. Advanced age (>70 years) does not preclude consideration for this consolidation strategy. Patients presenting with synchronous SCNSL at relapse have

A B C D
Figure 1. Outcomes after autologous stem cell transplantation for secondary central nervous system lymphoma. (A) Progression-free survival. (B) Overall survival. (C) Incidence of systemic relapse after autologous stem cell transplantation (ASCT). (D) Incidence of isolated central nervous system relapse after ASCT.
Haematologica | 108 March 2023 885 LETTER TO THE EDITOR
Risk factor
Risk factor (multivariable analysis)**
§Synchronous relapse versus de novo/isolated presentation hazard ratio for progression-free survival = 2.04 (1.10-3.80) P=0.022; hazard ratio for overall survival = 1.64 (0.83-3.28) P=0.15. *Log-rank test for trend. **All non-conditioning parameters (presentation, age, Eastern Cooperative Oncology Group score, number of prior lines of therapy for secondary central nervous system lymphoma) and backwards selection (P=0.05 for inclusion) were used to select the final model presented above. Including pre-transplant response within the same model reduced the number of complete cases from 130 to 113; for progression-free survival, synchronous disease and ≥2 lines remain significant but age does not. For overall survival, no factors reach statistical significance at P=0.05. As response did not reach significance for either progression-free or overall survival, the model without has been used. ǂSix patients had progressive disease (PD) at transplantation: two with systemic PD, complete remission in central nervous system; one with central nervous system PD (positron emission tomography not performed; isolated presentation); one with systemic PD, partial response in central nervous system; and two with PD in both systemic and central nervous system compartments. HR: hazard ratio; 95% CI: 95% confidence interval; ASCT: autologous stem cell transplantation; ECOG: Eastern Cooperative Oncology Group; SCNSL: secondary central nervous system lymphoma; PET: positron emission tomography; CT: computed tomography; CNS: central nervous system; MRI: magnetic resonance imaging; CR: complete response; PR: partial response; SD: stable disease; PD: progressive disease.
Progression-Free Survival Overall Survival Events/N HR (95% CI) P value Events/N HR (95% CI) P value Presentation§ De novo Isolated relapse Synchronous relapse 20/52 24/62 13/20 1.00 0.91 (0.50-1.65) 1.94 (0.96-3.91) 0.069 18/52 19/62 11/20 1.00 0.80 (0.42-1.63) 1.46 (0.68-3.14) 0.29 Timing of relapse (relapsed only) >1 year 3 months-1 year <3 months On therapy 14/35 8/20 8/16 7/11 1.00 0.90 (0.38-2.16) 1.33 (0.56-3.18) 2.02 (0.81-5.03) 0.20* 9/35 7/20 7/16 7/11 1.00 0.87 (0.36-2.08) 1.48 (0.61-3.58) 2.40 (0.95-6.08) 0.073* Age at ASCT, for an increase of 10 years 57/134 1.39 (1.09-1.75) 0.007 48/134 1.35 (1.04-1.75) 0.022 ECOG score at ASCT 0-1 2-3 43/106 13/24 1.00 1.76 (0.94-3.27) 0.073 34/106 13/24 1.00 2.19 (1.15-4.16) 0.014 Time to ASCT, for an increase of 1 month 57/134 1.01 (0.94-1.08) 0.85 48/134 1.01 (0.94-1.09) 0.77 Number of lines of SCNSL therapy before ASCT 1 2-3 49/121 8/13 1.00 2.36 (1.11-5.02) 0.025 41/121 7/13 1.00 2.48 (1.10-5.60) 0.023 Response before ASCT Systemic (PET-CT/CT) response Complete response Partial response 32/77 7/13 1.00 1.42 (0.63-3.22) 0.40 26/77 7/13 1.00 1.87 (0.81-4.34) 0.13 CNS (MRI) response Complete response Partial response 31/56 13/23 1.00 1.34 (0.75-2.40) 0.31 26/83 16/37 1.00 1.53 (0.82-2.86) 0.18 Combined response Both complete response Either partial response Non-CR (PR/SD/PD by either MRI or PET)ǂ 23/67 21/41 25/50 1.00 1.71 (0.95-3.09) 1.74 (0.98-3.06) 0.076 0.057 18/67 19/41 23/50 1.00 2.03 (1.06-3.90) 2.15 (1.15-4.00) 0.032 0.016
Progression-Free Survival Overall Survival Events/N HR (95% CI) P value Events/N HR (95% CI) P value Presentation De novo or isolated CNS relapse Synchronous relapse 43/110 13/20 1.00 2.18 (1.16-4.12) 0.016--Age at ASCT, for an increase of 10 years 56/130 1.38 (1.07-1.1.76) 0.012 47/130 1.33 (1.02-1.73) 0.033 Number of lines of SCNSL therapy
ASCT 1 ≥2 48/117 8/13 1.00 2.53 (1.18-5.46) 0.018 48/117 8/13 1.00 2.36 (1.04-5.33) 0.039
before
Table 2. Risk factors for progression-free survival and overall survival.
Haematologica | 108 March 2023 886 LETTER TO THE EDITOR
poor outcomes, mainly due to post-ASCT systemic relapse, and may benefit from a different treatment approach. Patients having a partial or complete response after induction therapy can achieve durable remissions with thiotepa-based ASCT. The lack of requirement of a complete response prior to ASCT may help to minimize treatment-related toxicity by shortening courses of induction chemotherapy.
Authors
Jahanzaib Khwaja,1 Amy A. Kirkwood,2 Lisa K. Isbell,3 Sara Steffanoni,4 Harshita Goradia,5 Lisa Pospiech,6 Thomas Fail,7 Emma Nicholson,8 Kate Fletcher,9 Kim M. Linton,10 Katrina E. Parsons,11
Nagah Elmusharaf,12 Lydia Eccersley,13 Toby A. Eyre,14 Sridhar
Chaganti,15 Jeffrey Smith,16 Nisha Thakrar,1 Alexandra Kutilina,3 Teresa Calimeri,4 Nicolas Martinez-Calle,5 Dima El-Sharkawi,8 Wendy Osborne,7 Gerald Illerhaus,6 Christopher P. Fox,5 Andrés J.M. Ferreri,4 Elisabeth Schorb3 and Kate Cwynarski1
1University College London Hospitals, London, UK; 2Cancer Research UK & UCL Cancer Trials Centre, UCL Cancer Institute, University College London, London, UK; 3University Medical Center Freiburg, Freiburg, Germany; 4IRCCS San Raffaele Scientific Institute, Milan, Italy; 5Nottingham University Hospitals NHS Trust, Nottingham, UK; 6Klinikum Stuttgart, Stuttgart, Germany; 7Freeman Hospital, Newcastle, UK; 8Royal Marsden Hospital, London, UK; 9King's College Hospital, London, UK; 10The Christie Hospital, Manchester, UK; 11Beatson West of Scotland Cancer Centre, Glasgow, UK; 12University Hospital of Wales, Cardiff, UK; 13St Bartholomew's Hospital, London, UK; 14Oxford University Hospitals NHS Foundation Trust, Oxford, UK; 15Queen Elizabeth Hospital, Birmingham, UK and 16Aintree University Hospitals NHS Foundation Trust, Liverpool, UK
Correspondence:
K. CWYNARSKI - kate.cwynarski@nhs.net
https://doi.org/10.3324/haematol.2022.281640
Received: June 28, 2022.
Accepted: October 14, 2022.
Early view: October 27, 2022.
©2023 Ferrata Storti Foundation
Published under a CC BY-NC license
Disclosures
JK, AAK, LKI, SS, HG, LP, TF, KF, NE, LE, SC, NT, AK, NMC, and GI have no conflicts of interest to disclose. EN has received grant funding, speaker fees, and travel fees from KITE/Gilead; sat on advisory boards and received conference fees from Novartis: and sat on advisory boards for BMS/Celgene. KML has received
research funding from Blood Cancer UK, Roy Castle Lung Cancer Foundation, Beigene, Genmab, Roche, and Celgene; has provided consultancy services for Genmab and Roche; has received honoraria and speakers bureau fees from Roche, Aptitude Health and Hartley Taylor; has been or is a member of the Board of Directors or advisory committees of Celgene, Kite and Karyopharm; and has received travel support from Celgene and Janssen. KEP has received sponsorship for educational meetings from AbbVie. TAE has received educational and advisory board honoraria, and travel support to attend scientific conferences from Roche; honoraria, research support, and travel support to attend scientific conferences from Gilead; educational and advisory board honoraria from KITE; honoraria from Janssen; honoraria and travel support to attend scientific conferences from AbbVie; honoraria, research funding, and travel support to attend scientific conferences from AstraZeneca; advisory board honoraria, and trial steering committee fees from Loxo Oncology; advisory board honoraria and research funding from Beigene; and advisory board honorarium from Incyte and Secura Bio. JS has received honoraria and sponsorship for meetings from AbbVie, Janssen and AstraZeneca. TC has provided consultancy for Janssen-Cilag; and collaborated with Sandoz, Hema for a future project. DES has received honoraria from Abbvie, AstraZeneca, Janssen, Roche and Takeda; has received conference or travel support from Abbvie and Novartis; and has served on advisory boards for Abbvie, ASTEX, AstraZeneca, Beigene, Janssen, and Kyowa Kiirin. WO has served on advisory boards for Roche, Takeda, Servier, Kite Gilead, MSD, Novartis, Beigene, Autolus, Kyowa Kirin, and Incyte; and has received honoraria from Roche, Takeda, Kite Gilead, Novartis, Kyowa Kirin, Incyte, Astra Zeneca, Pfizer, Syneos, Abbvie, and BMS/Celgene. CPF is an advisory board member for Celgene/BMS, Abbvie , GenMab, Gilead/Kite, Morphosys, Incyte, Janssen, Roche, Takeda, and Atarabio; provides remunerated speaker/educational activities for Gilead/Kite, Janssen, Roche, and Takeda; has received research funding from BeiGene; and has received travel support to attend scientific conferences from Roche. AJMF has received speaker fees from Gilead and Roche; is a member of advisory boards for Gilead, Juno, Novartis, PletixaPharm, and Roche; currently receives research grants from ADC Therapeutics, Bayer HealthCare Pharmaceuticals, Beigene, Bristol Myers Squibb, Genmab, Gilead, Hutchison Medipharma, Incyte, Janssen Research & Development, MEI Pharma, Novartis, PletixaPharm, Pharmacyclics, Protherics, Roche, and Takeda; and holds patents on NGR-hTNF-a in brain tumors and NGR-hTNF/R-CHOP in relapsed or refractory primary CNS lymphoma and SNGR-hTNF in brain tumors. ES has received research funding and speakers’ honoraria from Riemser. KC has played a consulting/advisory role for Roche, Takeda, Celgene, Atara, Gilead, KITE, Janssen, and Incyte; served on speakers bureau for Roche, Takeda, KITE, Gilead, and Incyte, and received conference/travel support from Roche, Takeda, KITE, Janssen, and BMS.
Contributions
JK and KC designed the study, analyzed data and wrote the
Haematologica | 108 March 2023 887 LETTER TO THE EDITOR
manuscript. ES, AJMF, CF, GI, and NMC analyzed data and reviewed the manuscript. AAK performed the statistical analysis and reviewed the manuscript. JK, SS, HG, LP, LKI, TF, EN, KF, KML, KEP, NE, LE, TAE, SC, NT, AK, TC, JS, DES, and WO collected data and reviewed the manuscript.
References
1. Hollender A, Kvaloy S, Lote K, Nome O, Holte H. Prognostic factors in 140 adult patients with non-Hodgkin's lymphoma with systemic central nervous system (CNS) involvement. A single centre analysis. Eur J Cancer. 2000;36(14):1762-1768.
2. Alvarnas JC, Negrin RS, Horning SJ, et al. High-dose therapy with hematopoietic cell transplantation for patients with central nervous system involvement by non-Hodgkin's lymphoma. Biol Blood Marrow Transplant. 2000;6(3a):352-358.
3. Kasamon YL, Jones RJ, Piantadosi S, et al. High-dose therapy and blood or marrow transplantation for non-Hodgkin lymphoma with central nervous system involvement. Biol Blood Marrow Transplant. 2005;11(2):93-100.
4. Akin S, Hosing C, Khouri IF, et al. Autologous stem cell transplantation for large B-cell lymphoma with secondary central nervous system involvement. Blood Adv. 2022;6(7):2267-2274.
5. Ferreri AJM, Doorduijn JK, Re A, et al. MATRix-RICE therapy and autologous haematopoietic stem-cell transplantation in diffuse large B-cell lymphoma with secondary CNS involvement (MARIETTA): an international, single-arm, phase 2 trial. Lancet Haematol. 2021;8(2):e110-e121.
6. Maziarz RT, Wang Z, Zhang MJ, et al. Autologous haematopoietic cell transplantation for non-Hodgkin lymphoma with secondary CNS involvement. Br J Haematol. 2013;162(5):648-656.
7. Wiebe VJ, Smith BR, DeGregorio MW, Rappeport JM. Pharmacology of agents used in bone marrow transplant conditioning regimens. Crit Rev Oncol Hematol. 1992;13(3):241-270.
8. Scordo M, Wang TP, Ahn KW, et al. Outcomes associated with
Data-sharing statement
The data supporting the findings of this study are available within the article and its supplementary materials. Additional data are available on request from the corresponding author.
thiotepa-based conditioning in patients with primary central nervous system lymphoma after autologous hematopoietic cell transplant. JAMA Oncol. 2021;7(7):993-1003.
9. Ferreri AJ, Cwynarski K, Pulczynski E, et al. Chemoimmunotherapy with methotrexate, cytarabine, thiotepa, and rituximab (MATRix regimen) in patients with primary CNS lymphoma: results of the first randomisation of the International Extranodal Lymphoma Study Group-32 (IELSG32) phase 2 trial. Lancet Haematol. 2016;3(5):e217-27.
10. Gisselbrecht C, Glass B, Mounier N, et al. Salvage regimens with autologous transplantation for relapsed large B-cell lymphoma in the rituximab era. J Clin Oncol. 2010;28(27):4184-4190.
11. Ferreri AJ, Donadoni G, Cabras MG, et al. High doses of antimetabolites followed by high-dose sequential chemoimmunotherapy and autologous stem-cell transplantation in patients with systemic B-cell lymphoma and secondary CNS involvement: final results of a multicenter phase II trial. J Clin Oncol. 2015;33(33):3903-3910.
12. Korfel A, Elter T, Thiel E, et al. Phase II study of central nervous system (CNS)-directed chemotherapy including high-dose chemotherapy with autologous stem cell transplantation for CNS relapse of aggressive lymphomas. Haematologica. 2013;98(3):364-370.
13. Doorduijn JK, van Imhoff GW, van der Holt B, et al. Treatment of secondary central nervous system lymphoma with intrathecal rituximab, high-dose methotrexate, and R-DHAP followed by autologous stem cell transplantation: results of the HOVON 80 phase 2 study. Hematol Oncol. 2017;35(4):497-503.
Haematologica | 108 March 2023 888 LETTER TO THE EDITOR
Delayed hemolytic transfusion reaction in children with sickle cell disease: first 5-year retrospective study in mainland France
Delayed hemolytic transfusion reaction (DHTR) is increasingly being reported as a serious complication of red blood cell (RBC) transfusion in patients with sickle cell disease (SCD).1,2 Alloimmunization against RBC antigens has been identified as its leading underlying cause.3,4 DHTR remains a major challenge as it may be under-recognized, leading to patient receiving inappropriate further transfusion that may result in life-threatening exacerbation of hemolysis.1,5 Moreover there is no consensus on its optimal management. Immunoglobulins (IVIG) and erythropoïetin (EPO) are considered beneficial, and eculizumab has recently emerged as a possible alternative treatment. It has been recommended that RBC transfusions be withheld during DHTR as this might aggravate hemolysis, whereas the use of corticosteroids (CS) is still controversial because of its suspected vaso-occlusive triggering effect.6-9 However, in the setting of acute severe DHTR, the potential risks of steroids associated with RBC transfusion must be balanced against their potential lifesaving effects. For patients requiring further transfusion away from the DHTR acute episode, rituximab is recommended to prevent the production of additional alloantibodies.9 However, there is currently a lack of evidence to guide the best management of these “untransfusable” patients.
Our main objective was therefore to update the clinical description of DHTR, immuno-hematology findings, laboratory explorations and immediate management, at nationwide scale for children with SCD, over a 5-year period beginning in 2015, a period of improved awareness of DHTR. The secondary objective was to describe future patient management, when a subsequent RBC transfusion was required, later following the resolution of DHTR. This study was based on a national survey performed through the French national SCD network in which all cases of DHTR in children (age <18 years) diagnosed with SCD, occurring between January 1, 2015 and December 31, 2020 and followed-up in mainland France were collected. Relevant patient data were retrospectively collected from medical files and anonymized. The data collected included clinical and laboratory data at the time of the triggering transfusion (TT) and during the DHTR episode (including evidence of the selective destruction of transfused cells over self-sickle RBC), management and clinical course. Transfusion and antibody history data from the French Blood Agency information system were also ana-
lyzed. Following national recommendations, all French centers deliver cross-matched, leukocyte-reduced, RBC units matched for ABO, RH and K. This study was performed in accordance with the Declaration of Helsinki. DHTR was defined as the occurence at least 3 days after a transfusion, of signs indicating accelerated hemolysis together with a significant decrease in hemoglobin (Hb) (<30%), particularly HbA, indicating preferential hemolysis of the transfused RBC. Whenever possible, the previously published nomogram was applied to confirm the diagnosis.10 Forty-one DHTR were reported by all but one center of the SCD network. Four were excluded due to alternative diagnoses of splenic sequestration in one case, and autoimmune hemolytic anemia in the other three. For these four cases, sequential determinations of hemoglobin A indicated that the increased hemolysis did not selectively target transfused donor RBC. We, thus, considered, 37 DHTR episodes in total, at 18 pediatric centers in mainland France, in 37 children including 35 with HbSS, one with HbSβ° , and one with HbSβ+ diseases. Median age at DHTR diagnosis was 9 years (range, 3-15). Twenty-two patients developed DHTR while on hydroxyurea therapy. For 34 children, the TT was delivered as an occasional transfusion episode, mostly during an inflammatory state (vaso-occlusive crisis [VOC], acute chest syndrom [ACS], infection, pre-operative setting). Three patients were on chronic transfusion programs, initiated 3 to 6 months before the DHTR episode.
Clinical symptoms and biological data collected during DHTR are detailed in Table 1. Pain mimicking VOC was the leading symptom followed by dark urine, indicating of hemoglobinuria. Half the patients developed fever during the DHTR episode. No death or stroke occurred in our series, but we observed posterior reversible leukoencephalopathy syndrome in one child, acute tubular necrosis in another, and ACS in 12 children. All complications occurred before further transfusion.
Post-TT determinations of Hb level and HbA% were monitored in only 20 and nine cases, respectively. During DHTR, Hb electrophoresis was performed for only 16 children, suggesting that the diagnosis of DHTR was initially overlooked for 21 of 37 children. Hb and HbA% were assessed both shortly after the TT and at the time of DHTR symptoms in only nine children. Using nomogram, there was a high risk of ongoing DHTR in these nine episodes.10 For other episodes, signs of accelerated hemolysis, in-
Haematologica | 108 March 2023 889 LETTER TO THE EDITOR
Table 1. Clinical and laboratory data during delayed hemolytic transfusion reaction and by treatment.
DHTR: delayed hemolytic transfusion reaction; TT: triggering transfusion; Hb: hemoglobin; HbA: hemoglobin A; ICU: intensive care unit; SCD sickle cell disease; supportive care: erythropoietin, hydration, oxygenation and analgesic opioids; immunosuppression: immunoglobulins, corticosteroids, rituximab. *Analyses of multiple groups were performed by one-way ANOVA. A probability value P<0.05 was considered statistically significant. **Biological parameters before additional transfusion.
cluding an inappropriate marked drop in HbA levels after the TT were used to diagnose DHTR. Hyperhemolysis (HH) with Hb levels falling below pretransfusion values, occurred in 32 of 37 children. Reticulocyte counts were significantly lower in the subgroup of 17 children receiving an additional transfusion, suggesting that profound erythro-
poiesis impairment might have contributed to the decision to transfuse during DHTR. None of the other clinical or biological parameters differed significantly between the subgroups receiving only supportive care including EPO (n=11), immunosuppression without transfusion (CS, IVIG, and/or rituximab) (n=9) or further transfusion (n=17). In-
Supportive care N=11 Immunosuppression N=9 Additional transfusion N=17 P* Total N=37 Days, median (range) from TT to DHTR diagnosis N=11 10 (5-13) N=9 12 (3-18) N=17 7 (4-38) 0.81 N=37 10 (4-38) Clinical symptoms at admission, N (%) Pain N=11 9 (81) N=9 7 (78) N=17 15 (88) 0.78 N=37 31 (84) Dark urine N=11 6 (55) N=9 5 (56) N=17 9 (53) 0.99 N=37 20 (54) Fever N=11 4 (36) N=9 5 (56) N=17 12 (70) 0.21 N=37 21 (57) Icterus N=11 4 (36) N=9 5 (56) N=17 6 (35) 0.59 N=37 15 (40) SCD complications, N(%) Acute chest syndrome (ACS) N=11 4 (36) N=9 1 (11) N=17 7 (41) 0.29 N=37 12 (32) Kidney failure N=11 0 N=9 0 N=17 1 (6) 0.56 N=37 1 (3) Neurological impairment N=11 0 N=9 0 N=17 1 (6) 0.56 N=37 1 (3) Outcomes, N (%) Clinical and biological improvement N=11 7 (64) N=9 8 (89) N=17 8 (47) 0.11 N=37 23 (62) Long-term consequences/death N=11 0 N=9 0 N=17 0 - N=37 0 Length of hospital stay in days, median (range) N=11 8 (0-21) N=9 9 (4-11) N=17 15 (1-30) 0.02 N=37 9 (0-30) Number of ICU admission N=11 3 (27) N=9 5 (55) N=17 10 (59) 0.19 N=37 18 (49) Biological parameters during TT, median (range) Pre-TT Hb, g/dL N=10 7.4 (5.3-10.3) N=6 6.7 (4.5-8.5) N=16 6.7 (5.0-10.8) 0.19 N=34 6.7 (4.5-10.8) Post-TT Hb, g/dL N=9 9.3 (7.5-12.5) N=5 9.6 (7.6-10.8) N=13 9.5 (7.8-11.4) 0.7 N=20 9.5 (7.5-12.5) Post-TT HbA, % N=5 35 (20-55.4) N=1 35 N=4 24 (21.9-31.8) - N=9 27 (20-55.4) Biological parameters during TT, median (range) Hb nadir, g/dL N=11 5.6 (3.7-7.1) N=9 4.8 (3.1-5.7) N=17 4.9 (2.9-11.1) 0.26 N=37 5.1 (2.9-11.1) HbA nadir, % N=8 11 (0-28) N=3 5 (0-13) N=5 18 (3-28) - N=16 10 (0-28) Highest leukocyte count, x109/L N=8 18.9 (9.8-31.8) N=8 15.6 (12.9-27.1) N=13 21.1 (14.1-36.4) 0.39 N=29 20 (9.8-36.4) Lowest platelet count, x109/L N=6 353 (194-519) N=7 282 (113-395) N=15 247 (126-847) 0.57 N=28 250 (113-847) Lowest reticulocyte count, x109/L N=8 339 (126-547) N=6 223 (79-420) N=14 147 (31-339) 0.006 N=28 220 (31-547) LDH max, IU/L N=9 1,156 (636-4,052) N=7 1,045 (691-6,490) N=12 1,460 (611-9,181) 0.35 N=28 1,224 (611-9,181) CRP max, mg/L N=9 132 (5.4-252) N=7 192 (2.8-264) N=10 149 (7-286) 0.75 N=26 125 (2.8-264) Bilirubin max, mmol/L N=7 86 (34-226) N=8 54 (20-122) N=14 75 (17-117) 0.25 N=28 76 (17-226)
Haematologica | 108 March 2023 890 LETTER TO THE EDITOR
terestingly, HbA levels were unavailable for the eight children who received further transfusions without immunosuppression, suggesting that DHTR was undiagnosed at the time of retransfusion.
Patient management during DHTR is detailed in Table 2. Seventeen patients received an additional transfusion. When no immunosuppressive agent was associated with transfusion, it clearly and consistently worsened hemolysis and resulted in HH episodes. The addition of CS at 1 mg/kg, prescribed for two children was ineffective. When higher CS dose (2 mg/kg) were prescribed for seven children in addition to transfusion, post-transfusion Hb levels were effectively maintained. Interestingly, three of these children had previously experienced a DHTR recurrence when transfusion was attempted with 1 mg/kg of CS for one or without any CS cover for the two others. Eleven patients received IVIG, among which eight did not require further transfusion. For one child, IVIG was the only immunosuppression prescribed, precluding any conclusions on its efficacy to mitigate DHTR. We were able to obtain previous transfusion records and
antibody testing results for all but six children, these remaining children having received transfusion outside France (Table 3). Consistent with adult data showing a history of DHTR and/or alloimmunization to be associated with a higher risk of DHTR, 16 children in our cohort had a history of alloimmunization and/or DHTR.11-13 The number of RBC units transfused before the TT was low (median 4) but seven children developed DHTR after receiving ≥ 12 RBC units. Nine of the 21 patients with no immunization history, therefore receiving RH/K-matched units, developed antibodies. Sixteen patients were already immunized, and were transfused with extended (FY, JK, Ss) matched RBC units. Six of these patients, developed new antibodies, which were anti-M in three cases (M compatibility was not taken into account). For five patients, antibodies were detected only during later tests (3 weeks to 3 months after DHTR).
Eleven children received subsequent transfusions, a median of 3 months (range, 10 days-3 years) after resolution of the DHTR episode (Online Supplementary Figure S1). All three alloimmunized children received rituximab
Supportive care: erythropoietin (EPO), hydration, oxygenation and analgesic opioids; immunosuppression: immunoglobulins, corticosteroids, rituximab, eculizumab; CS: corticosteroids (the dose refers to the total dose prescribed the day transfusion is delivered. The initial dose is usually kept unchanged for 48 hours and then tapered. Overall, mean duration of steroids was 7 days in our study) ; IVIG: intravenous immunoglobulin (total dose); AT1: first additional transfusion; AT2: second additional transfusion; DHTR: delayed hemolytic transfusion reaction; HH: hyperhemolysis; H: hemolysis; CBR: clinical and biological recovery.
Patients EPO IVIG g/kg Rituximab mg/m² Eculizumab CS mg/kg AT1 Initial outcome EPO IVIG g/kg Rituximab mg/m² CS mg/kg AT2 Later outcome Supportive care 3,4,5,7,17,18,27 CBR 12,16,21,22 X CBR Immuno-suppression 10 X 0.8 CBR 13 X 2 CBR 14 X 2 375 CBR 28 X 3 2 CBR 29 1 CBR 30 X 0.8 CBR 32 X 1 CBR 36 1 375 CBR 37 X 1 CBR Additional transfusion 9 0.4 2 X CBR 11,24,34 2 X CBR 31 X 1 375 X X CBR 25 X 375 X X H X CBR 6 1 X H 375 2 X CBR 19 1 X H X 1 CBR 35 X 1 X HH X 1 375 CBR 1 X HH 2 X CBR 8 X HH 1 CBR 2 X HH 375 2 X CBR 15 X HH X 1 375 CBR 20 X HH X CBR 23 X HH CBR 26,33 X HH X HH
Table 2. Delayed hemolytic transfusion reaction management and outcome.
Haematologica | 108 March 2023 891 LETTER TO THE EDITOR
Table 3. Immunohematologic characteristics of the patients.
In bold: new alloantibodies detected after the DHTR episode; DHTR: delayed hemolytic transfusion reaction; TF: transfusion; TT: triggering transfusion; Ab: antibody; RBC: red blood cell; na: not available: number of RBC transfusions unknown due to previous transfusion episodes outside France (mostly in Africa); nd: not done. For patients with antibodies against expressed antigens, molecular analysis was performed to distinguish between allo-and autoantibodies. *Molecular analysis revealed partial D antigen; ⁑these patients were transfused in Africa, where prophylactic antigen matching for Rh antigens is not routinely performed; °median range.
for non-specific prevention, and RBC units compatible in FY, JK and MNS systems, DHTR recurred in one child.
Among the eight children without alloimmunization history, four were managed with rituximab and extensively
Patients Transfusion history DHTR Number of previous TF Previous known Ab Previous DHTR Screening test before TT Screening test during DHTR Post-DHTR screening test (3 weeks3 months) TF episodes RBC units Auto-Ab Allo-Ab Patients without alloimmunization history (N=21) 2 1 1 - -3 na na - -4 6 12 - -5 17 39 - -11 1 1 - - anti-S 13 na na - -14 1 4 - - anti-Mg 17 3 3 - -20 3 4 - -21 1 1 - -22 2 2 - -23 2 2 - anti-Jkb anti-Jkb 25 4 5 - -26 1 1 - anti-M anti-M 27 na na - -29 13 18 - anti-e anti-e 30 27 30 - -32 3 6 - - anti-S 33 2 2 - anti-Jkb anti-Jkb 34 4 4 - anti-Jka anti-Jka 37 2 2anti-s, anti Fya, anti Fy3, anti-c anti-s, anti Fya, anti Fy3, anti-c N=21 2.5 (1-27)° 3.5 (1-39)° 0 New Ab: 6 (29%) New Ab: 9 (43%) Patients with alloimunization or DHTR history (N=16) 1 4 4 - anti-M X - - nd 6 1 1 - anti-Lua - anti-Lua anti-Lua anti-Lua 7 4 9 - anti-Jka - anti-Jka anti-Jka anti-M, anti-Jka 8 14 16 - anti-Jka, anti-S X anti-S anti-S anti-S 9 1 1 - anti-M - - -10 2 2 - anti-M - anti-M anti-M anti-M 12 na na na na X - anti-Jka, anti-M anti-Jka, anti-M 15 4 7 anti-e anti-S - - anti-Jkb anti-Jkb 16 4 4 anti-e anti-M - - - auto 18 8 14 - anti-KEL3 - anti-KEL3 anti-KEL3 nd 19 5 7 - 0 X - -24 11 13 anti-Jka anti-D*, anti Lea - aspecific anti-M anti-M 28 1 1 - anti-M - anti-M anti-M anti-Fya 31 3 4 - anti-KEL3 - - - non-specific Ab 35 na na non-specific Ab anti-C⁑, anti-S na - anti-M, anti-S anti-M, anti-S 36 na na - anti-c⁑, anti-M na anti-c, anti-M anti-c, anti-M nd N=16 4 (1-14)° 5 (1-16)° 4 (25%) 14 (87%) 4 (25%) 8 (50%) New Ab: 4 (25%) New Ab: 6 (38%) All patients (N=37) N=37 3.5 (1-27)° 4 (1-39)° 4 (11%) 14 (38%) 4 (11%) 8 (22%) New Ab: 10 (27%) New Ab: 15 (41%)
Haematologica | 108 March 2023 892 LETTER TO THE EDITOR
matched RBC, with an uneventful course for all children. Without rituximab, three of the other four non-alloimmunized children experienced DHTR recurrence. This analysis of 37 children presenting a DHTR episode during a recent 5-year period in mainland France shows, that DHTR complications are regularly encountered in the pediatric SCD population. Some milder cases almost certainly passed unnoticed, but we can confirm that DHTR morbidity is high in children, as in adults, with SCD-related severe complications occurring in 12 of 37 children.2,11-14 Whenever possible, we used the diagnostic nomogram developed for adults10 to assess the likelihood of DHTR. We recommend the systematic determination of Hb and HbA concentrations within 48 hours of every occasional transfusion, and repeatedly in case of any symptoms occurring in a context of a recent transfusion. Given the non-specific symptoms observed at DHTR presentation, this would facilitate the timely diagnosis of DHTR. Once DHTR has been recognized, the timing of antibody testing is also of key importance: in our study, late screening allowed to capture five among the 15 newly identified alloantibodies, highlighting the need for sequential testing during follow-up. Further transfusion should be avoided during the acute episode, as it can lead to HH, as observed in eight children in our study with apparently overlooked DHTR. However, the SCD-related complications, as well as life-threatening anemia and intravascular hemolysis reactions that can arise during DHTR are not without risks.2,11-14 Timely transfusion, before irreversible multiorgan failure or stroke has occurred, should be considered, to improve oxygen delivery, together with the use of corticosteroids to reduce inflammation.8,9 The efficacy of more recent therapeutic interventions such as eculizumab or tocilizumab needs to be confirmed by additionnal reports.7,15 In the acute DHTR setting, as during future patient management in situations which subsequent RBC transfusion may be required, shared decision-making is crucial. We propose national multidisciplinary meetings, to facilitate close communication between SCD physicians and transfusion medicine specialists for the discussion of preventive strategies.16
Authors
Claire Falguière,1 Slimane Allali,2 Bassem Khazem,1 Annie Kamdem,1 Cécile Arnaud,1 Marie Belloy,3 Corinne Guitton,4 Marie-Hélène Odièvre,5 Sophie Pertuisel,6 Cecile Dumesnil,7 Cécile Guillaumat,8 Nathalie Garrec,9 Alexandra Gauthier,10 Perrine Mahe,11 Valerie Soussan-Banini,12 Laure Le-Carrer,13 Etienne Merlin,14 Audrey David,15 Beatrice Pellegrino,16 Catherine Paillard,17 Jean-Francois Brasme,18 Marie Lagarde,19 France Pirenne20,21 and Corinne Pondarre1,21
1Pediatric Department, Sickle Cell Disease Referral Center, Creteil; 2Pediatric Department, Sickle Cell Disease Referral Center, Necker Hospital, APHP, Paris; 3Pediatric Department, Center for Sickle Cell Disease, Aulnay sous-bois; 4Pediatric Department, Sickle Cell Disease Referral Center, APHP, Kremlin-Bicetre; 5Pediatric Department, Center for Sickle Cell Disease, Trousseau Hospital, APHP, Sorbonne Universite, INSERM UMRS 1134, BIGR, Paris; 6Department of Pediatric Hemato-oncology, University Hospital of Rennes, Rennes; 7Department of Pediatric Hemato-oncology, Hopital Charles Nicolle, Rouen; 8Pediatric Department, Center for Sickle Cell Disease, Corbeil-Essonnes; 9Pediatric Department, Center for Sickle Cell Disease, Jossigny; 10Department of Pediatric Hemato-oncology, Hospices Civils de Lyon, Lyon; 11Pediatric Department, Sickle Cell Disease Referral Center, Montpellier; 12Pediatric Department, Center for Sickle Cell Disease, BoulogneBillancourt; 13Pediatric Department, Center for Sickle Cell Disease, Orsay; 14Pediatric Department, Center for Sickle Cell Disease, Clermont-Ferrand University Hospital, Clermont-Ferrand; 15Department of Pediatric Hemato-oncology, University Hospital of Saint-etienne, Saint-etienne; 16Pediatric Department, Center for Sickle Cell Disease, Poissy; 17Department of Pediatric Hematooncology and Bone Marrow Transplantation Unit, Hopital de Hautepierre, Strasbourg; 18Department of Pediatric Hematooncology, University Hospital of Angers, Angers; 19Pediatric Department, Center for Sickle Cell Disease, Bordeaux; 20Etablissement Francais du Sang, Creteil, and 21Universite Paris Est Creteil INSERM U955, Creteil, France
Correspondence:
C. FALGUIÈRE - claire.falguiere@chicreteil.fr
https://doi.org/10.3324/haematol.2022.281050
Received: July 4, 2022.
Accepted: October 26, 2022. Early view: November 3, 2022.
©2023 Ferrata Storti Foundation
Published under a CC BY-NC license
Disclosures
CoP reports honoraria and expert consultancy for Addmedica and Novartis. All other authors have no conflicts of interest to disclose.
Contributions
CF and CoP cared for some patients, designed and initiated the study, collected and interpreted the data, carried out the statistical analysis, wrote the paper, and had final responsibility for the decision to submit for publication; FP was involved in the collection of transfusion data, interpretation of results, and writing of the manuscript; SA followed up patients, was involved in the interpretation of results, and writing of the manuscript; BK, CA, AK, MB, CoG, MHO, SPCD, CeG, NG, AG, PM, VSB, LL, EM, AD, BP, CaP, JFB and ML cared for the patients and contributed to the writing of
Haematologica | 108 March 2023 893 LETTER TO THE EDITOR
the paper. All authors reviewed the paper and approved the final manuscript.
Data-sharing statement
All data generated or analyzed during this study are included in this
References
1. Thein SL, Pirenne F, Fasano RM, et al. Hemolytic transfusion reactions in sickle cell disease: underappreciated and potentially fatal. Haematologica. 2020;105(3):539-544.
2. Gerritsma J, Bongaerts V, Eckhardt C, et al. Extended phenotyping does not preclude the occurrence of delayed haemolytic transfusion reactions in sickle cell disease. Br J Haematol. 2022;196(3):769-776.
3. Pirenne F. The cause and pathogenesis of hemolytic transfusion reactions in sickle-cell disease. Curr Opin Hematol. 2019;26(6):488-494.
4. Yazdanbakhsh K, Ware RE, Noizat-Pirenne F. Red blood cell alloimmunization in sickle cell disease: pathophysiology, risk factors, and transfusion management. Blood. 2012;120(3):528-537.
5. Win N. Hyperhemolysis syndrome in sickle cell disease. Expert Rev Hematol. 2009;2(2):111-115.
6. Pirenne F, Yazdanbakhsh K. How I safely transfuse patients with sickle-cell disease and manage delayed hemolytic transfusion reactions. Blood. 2018;131(25):2773-2781.
7. Dumas G, Habibi A, Onimus T, et al. Eculizumab salvage therapy for delayed hemolysis transfusion reaction in sickle cell disease patients. Blood. 2016;127(8):1062-1064.
8. Gardner K, Hoppe C, Mijovic A, Thein SL. How we treat delayed haemolytic transfusion reactions in patients with sickle cell disease. Br J Haematol. 2015;170(6):745-756.
9. Chou ST, Alsawas M, Fasano RM, et al. American Society of
published article (and its Online Supplementary Appendix).
Hematology 2020 guidelines for sickle cell disease: transfusion support. Blood Adv. 2020;4(2):327-355.
10. Dessap AM, Pirenne F, Razazi K, et al. A diagnostic nomogram for delayed hemolytic transfusion reaction in sickle cell disease. Am J Hematol. 2016;91(12):1181-1184.
11. Narbey D, Habibi A, Chadebech P, et al. Incidence and predictive score for delayed hemolytic transfusion reaction in adult patients with sickle cell disease. Am J Hematol. 2017;92(12):1340-1348.
12. Habibi A, Mekontso-Dessap A, Guillaud C, et al. Delayed hemolytic transfusion reaction in adult sickle-cell disease: presentations, outcomes, and treatments of 99 referral center episodes. Am J Hematol. 2016;91(10):989-994.
13. Vidler JB, Gardner K, Amenyah K, Mijovic A, Thein SL. Delayed haemolytic transfusion reaction in adults with sickle cell disease: a 5-year experience. Br J Haematol. 2015;169(5):746-753.
14. de Montalembert M, Dumont M-D, Heilbronner C, et al. Delayed hemolytic transfusion reaction in children with sickle cell disease. Haematologica. 2011;96(6):801-807.
15. Chen F, Booth C, Barroso F, et al. Salvage of refractory posttransfusion hyperhaemolysis by targeting hyperinflammation and macrophage activation with tocilizumab. Transfus Med. 2022;32(5):437 440.
16. https://filiere-mcgre.fr/espace-professionnels-de-sante/lesrcp/.
Haematologica | 108 March 2023 894 LETTER TO THE EDITOR
Unique pathologic features and gene expression signatures
distinguish blastoid high-grade B-cell lymphoma from B-acute lymphoblastic leukemia/lymphoma
High-grade B-cell lymphoma (HGBL) encompasses two categories based on genetic features: HGBL with MYC, BCL2, with/without BCL6 rearrangements (HGBL-DH), and HGBL not otherwise specified (HGBL-NOS).1 A small subset of cases of both categories show a blastoid morphology (designated as blastoid HGBL here), which is rare and not well characterized.2 The immature morphology often overlaps with other blastoid B-cell neoplasms, like B-acute lymphoblastic leukemia/lymphoma (B-ALL) or blastoid mantle cell lymphoma. The distinction between blastoid HGBL and CD34 negative B-ALL can be very challenging, especially when blastoid HGBL expresses immature markers such as TdT and/or lacks surface light chains.3-6 On the other hand, B-ALL cases may show unusual fea-
tures such as lack of CD34 and/or TdT, bright CD38 and decreased or absence of CD10.7,8 We previously studied 31 cases of blastoid HGBL initially presented in bone marrow and developed a 6-point scoring system and a diagnostic algorithm to aid in the differential diagnosis of blastoid Bcell neoplasms.4 However, this 6-point scoring system was largely focused on flow cytometric parameters, which may not be available in every practice setting or every case. In addition, the underlying gene expression signature of blastoid HGBL versus B-ALL remains unexplored. Here we collected 64 cases of blastoid HGBL with complete immunohistochemistry (IHC) studies. These cases involved nodal and/or extranodal sites and included 17 cases from a previous study.4 This cohort included 39 men
Figure 1. Comparison of morphologic and immunohistochemical features between blastoid high-grade B-cell lymphoma and Bacute lymphoblastic leukemia/lymphoma. Top row of panels: a representative case of blastoid high-grade B-cell lymphoma (HGBL) with marrow entirely replaced by blastoid lymphoma cells with a starry sky pattern and finely dispersed blastoid chromatin. The lymphoma cells were strongly and diffusely positive for BCL6 and MYC but negative for TdT (upper). Occasional cases may be variably positive for TdT (lower) in a small subset of lymphoma cells. Lower row of panels: in contrast, the lymphoblasts of a representative B-acute lymphoblastic leukemia/lymphoma (B-ALL) case showed similar blastoid morphology but had an opposite immunophenotype: negative for BCL6 and MYC, and positive for TdT. (Magnifications: column 1, Wright Giemsa stains, 100X; column 2, hematoxylin and eosin stains, 50X; the rest: immunohistochemical stains, 50X).

Haematologica | 108 March 2023 895 LETTER TO THE EDITOR
and 25 women with a median age of 60 years (range, 2387 years), with 40% (25/64) being HGBL-NOS and 60% HGBL-DH. Thirty percent of the patients had a history of follicular lymphoma or other type of non-Hodgkin lymphoma. Eighty percent of patients showed extra-nodal site involvement at presentation, with bone marrow involvement in 75% (40/53) biopsied. A B-ALL comparison group (n=37) which were disproportionally enriched with CD34-negative cases (51%) were included to serve the purpose of the study. The B-ALL group included 21 men and 16 women with a younger median age of 44 years (range, 18–83 years). All B-ALL patients presented with bone marrow disease, although extramedullary involvement was seen in 50% of patients. None of the B-ALL patients had a history of B-cell lymphoma. By comparison with B-ALL, blastoid HGBL demonstrated distinctive immunophenotypic and molecular cytogenetic features. By immunohistochemistry, blastoid HGBL showed more frequent MYC and BCL6 expression than BALL cases (86% vs. 27% and 67% vs. 16%, respectively), but less frequent TdT expression defined by ≥5% positivity (12/64, 19% vs. 18/21, 86%), with median of 20% (range, 560%) versus 70% (range, 10-100%) (all P<0.0001). TdT expression was dim partial in blastoid HGBL in contrast to strong diffuse in B-ALL (Figure 1). Fluorescence in situ hybridization (FISH) analysis detected MYC-R in 75% cases of blastoid HGBL while none of the B-ALL cases had MYCR. Blastoid HGBL more frequently had a complex karyotype than B-ALL cases (93% vs. 45%, P=0.0001). However, B-ALL-related translocations were exclusively seen in BALL cases, including BCR::ABL1 in seven CD34-positive B-
ALL cases and MLL-R and translocations involving TCF3 (E2A) (n=10 each) in CD34-negative B-ALL cases. Targeted next-generation sequencing demonstrated TP53 was the most frequently mutated gene in blastoid HGBL, relatively more frequent than in B-ALL (35% vs. 15%, P=0.17). Mutations in NRAS and KRAS were seen exclusively in B-ALL patients (24% and 18%, respectively) (P<0.05).
Detailed flow cytometric study may not be available for every blastoid B-cell neoplasm or in every practice setting. Therefore, we developed a 3-point scoring system using three immunohistochemical markers, MYC, BCL6 and TdT. Expression of MYC, BCL6 and lack of TdT expression were assigned a score of 1 each. In a blastoid B-cell neoplasm, a total score of ≥2 would support a diagnosis of blastoid HGBL and <2 favor a diagnosis of B-ALL (Figure 2). Similar to the previously reported 6-point scoring system, MYC expression serves as a surrogate for MYC-R and presence of either one was sufficient for 1 point. Since the concordance rate of TdT between flow cytometry and IHC was 95% in this cohort, TdT by either method can be used for this scoring system. Of the 64 blastoid HGBL cases, 59 (92%) cases had a score of ≥2 and five (8%) had a score of 1. The performance is similar between those with (44/48, 92%) and without MYC-R (15/16, 94%). In the 37 BALL cases, 34 had a score of <2 while three had a score of 2.
In order to validate the above-mentioned scoring system and also to understand the underlying gene expression signatures associated with blastoid HGBL, RNA-sequencing-based whole transcriptome profiling was performed on archived formalin-fixed paraffin-embedded tissue sec-
Figure 2. Recommended algorithm for the differential diagnosis of blastoid B-cell neoplasms. HGBL: highgrade B-cell lymphoma; BALL: B-acute lymphoblastic leukemia/lymphoma; MCL: mantle cell lymphoma; D/THL: HGBL with MYC, BCL2, and/or BCL6 rearrangements, or double/triple hit lymphoma. FISH: fluorescence in situ hybridization

Haematologica | 108 March 2023 896 LETTER TO THE EDITOR
tions on a subset of cases utilizing extraction-free HTG EdgeSeq technology (HTG Molecular Diagnostics, Inc, Tucson, AZ). Differential expression analysis (DESeq2 package) revealed 4,678 significantly differentially expressed genes between blastoid HGBL (n=52) and B-ALL (n=26) cases, of which, 2,199 (47%) and 2,479 (53%) genes were upregulated and downregulated, respectively (Figure 3A), and clustered in distinct regions by principal component analysis (Figure 3B). In blastoid HGBL, there was enrichment of genes in association with multiple signaling pathways when compared with B-ALL (Figure 3C), supporting distinct gene expression signatures in the two disease entities. These pathways and differentially expressed molecules are mostly responsible for the differential regulation of cell cycle progression in association with cell growth, differentiation, homeostasis and immune response, with predicted activation of the p53 and PI3K/AKT signaling pathways and inhibition of the ERK/MAPK signaling pathway. Blastoid HGBL cases showed upregulation and enrichment in genes relevant for germinal center B-
cell maturation and differentiation, such as MYC (1.85fold), BCL6 (3.32-fold), MS4A1 (CD20) (2.89-fold), PTPRC (CD45) (2.20-fold) (P<0.05 for all, vs. B-ALL), consistent with their relatively increased protein expression levels. In contrast, B-ALL cases maintained high abundance of genes responsible for self-renewal of immature B cells at a precursor level. Six cases with unexpected scores by the 3-point scoring systems had HTG gene expression study performed, and their diagnosis were confirmed by the gene expression signatures for the three blastoid HGBL cases with a score of 1 and three B-ALL cases with a score of 2 (Figure 3D, arrows).
As such, this 3-point IHC-focused scoring system demonstrated a comparable high-performance as the previous 6-point flow-focused scoring system, and showed a sensitivity, specificity, positive and negative predictive values of 92%, 92%, 95% and 87% respectively for establishing a diagnosis of blastoid HGBL versus B-ALL. We therefore propose a diagnostic algorithm for the differential diagnosis of blastoid B-cell neoplasms by incorporating this
Figure 3. Transcriptome profiling in blastoid high-grade B-cell lymphoma in comparison with B-acute lymphoblastic leukemia/lymphoma. (A) Volcano plot of 4,678 significantly differentially expressed (DE) genes with upregulated genes in blue and downregulated genes in red. (B) Principal component analysis revealed distinct clusters formed by differentially expressed genes in blastoid high-grade B-cell lymphoma (HGBL) vs. B-acute lymphoblastic leukemia/lymphoma (B-ALL) cases. (C) Top 30 enriched signaling pathways of DE genes. The bar color corresponds to their respective Z-scores by Ingenuity Pathway Analysis (Invitrogen), with orange colors indicating positive scores for predicted activation, blue colors for negative scores with predicted inhibition, and grey colors for no activity pattern available. NO: nitric oxide; ROS: reactive oxygen species. (D) Heatmap of the top 30 DE genes. Solid arrow - blastoid HGBL cases with 3-point score of 1; open arrow -B-ALL cases with 3-point score of 2.

A B C D
Haematologica | 108 March 2023 897 LETTER TO THE EDITOR
3-point IHC-focused scoring system (Figure 2). For rare extremely challenging cases with equivocal scores, correlation with all available clinicopathologic features is helpful.
This study aimed to improve our understanding of blastoid HGBL with a focus on the differential diagnosis of blastoid HGBL, either HGBL-DH or NOS, versus B-ALL. In general, lymphoma is a nodal-based disease that often occurs in adults, whereas B-ALL is a bone marrow-based disease and frequently affects children. However, blastoid HGBL often presents in or involves bone marrow, whereas up to 25% of B-ALL cases occur in adults, with extramedullary presentations in a subset of cases that often cause diagnostic challenges.9-11 In this study, bone marrow presentation was present in one third of blastoid HGBL cases, mimicking the clinical manifestations of B-ALL patients. Although most B-ALL cases are CD34-positive and easy to recognize, up to a third of B-ALL may lack CD34 expression, making the differential diagnosis with blastoid HGBL difficult.7,8 Distinguishing blastoid HGBL from B-ALL is important, since their treatment and prognosis are substantially different from each other. The diagnostic challenge not only lies in the similar blastoid morphology, but also arises in the overlapping immunophenotypic features between blastoid HGBL and B-ALL. A subset of blastoid HGBL cases may show an immature immunophenotype, such as TdT expression, decreased CD45, and absence of surface light chains, as shown in this study. On the other hand, B-ALL cases may show unusual features such as lack of CD34, CD10, TdT and bright CD38, particularly in BALL patients harboring translocations involving MLL and TCF3. Therefore, no single marker can distinguish blastoid HGBL from B-ALL with the exception of CD34. A scoring system simultaneously evaluating multiple markers is helpful for guiding the work-up and establishing a correct diagnosis. The 3-point scoring system is a simplified scoring system by IHC, which usually can be completed within 1-2 days of the biopsy and is widely available in general practice settings. The IHC-focused 3-point scoring system has an accuracy of 92% and is practically relevant and useful. The score systems were further validated by RNAsequencing-based transcriptome profiling, which revealed more than 4,000 differentially expressed genes underlying the unique molecular signature of blastoid HGBL as compared with B-ALL. The 5th edition of the World Health Organization classification of hematolymphoid neoplasms12 does not recommend to differentiate morphologic subtypes anymore due to the poor interpersonal reproducibility13 while the ICC classification keeps the morphology subtypes.14 So, this score system may also be useful for all HGBL, especially in bone marrow presentation. In addition, a double/triple hit is extremely rare in B-ALL,15 therefore the presence of such would favor a diagnosis of blastoid HGBL.
In summary, blastoid HGBL cases have distinctive immunophenotypic, molecular and cytogenetic characteristics as compared with B-ALL. We proposed an IHC-focused 3point scoring system for the differential diagnosis of blastoid HGBL versus B-ALL, which were further validated by RNA-sequencing-based gene expression profiling. We also reported the transcriptome profiling of blastoid HGBL cases as compared with B-ALL cases, revealing unique molecular signatures underlying the distinct biological processes involved in blastoid HGBL.
Authors
Lianqun Qiu, Jie Xu, Pei Lin, Evan N. Cohen, Guilin Tang, Sa A. Wang, Mahsa Khanlari, Wei Wang, Joseph D. Khoury, Sergej Konoplev, C. Cameron Yin, Jeffrey L. Jorgensen, Francisco Vega, L. Jeffrey Medeiros and Shaoying Li
Department of Hematopathology, The University of Texas MD Anderson Cancer Center, Houston, TX, USA
Correspondence:
S. LI - SLi6@mdanderson.org
https://doi.org/10.3324/haematol.2022.281646
Received: June 24, 2022.
Accepted: October 26, 2022. Early view: November 3, 2022.
©2023 Ferrata Storti Foundation
Published under a CC BY-NC license
Disclosures
No conflicts of interest to disclose.
Contributions
LQ collected data, analyzed the data, and wrote the manuscript. JX, PL, ENC, GT, SAW, MK, WW, JDK, SK, CCY, JLJ and FV contributed data and edited the manuscript. LJM contributed data and wrote the manuscript. SL designed the study, collected and analyzed the data, supervised the study and wrote the manuscript. All authors reviewed and approved the manuscript.
Acknowledgments
The study was partially supported by Faculty Startup Fund (SL) and Research Grant (LQ and SL) from the Division of Pathology and Laboratory Medicine, The University of Texas MD Anderson Cancer Center.
Data-sharing statement
Data are available for sharing upon request to the corresponding author.
Haematologica | 108 March 2023 898 LETTER TO THE EDITOR
1. Kluin PM CE, Harris NL, Jaffe ES, et al. High Grade B-Cell Lymphoma. In: WHO Classification of Tumours of Haematopoietic and Lymphoid Tissues. Edited by Swerdlow EH CE, Harris NL, Jaffe ES, et al., Revised 4th Edition edn. Lyon, France: IARC. 2017.
2. Kanagal-Shamanna R, Medeiros LJ, Lu G, et al. High-grade B cell lymphoma, unclassifiable, with blastoid features: an unusual morphological subgroup associated frequently with BCL2 and/or MYC gene rearrangements and a poor prognosis. Histopathology. 2012;61(5):945-954.
3. Bhavsar S, Liu YC, Gibson SE, Moore EM, Swerdlow SH. Mutational landscape of TdT+ large B-cell lymphomas supports their distinction from B-lymphoblastic neoplasms: a multiparameter study of a rare and aggressive entity. Am J Surg Pathol. 2022;46(1):71-82.
4. Khanlari M, Medeiros LJ, Lin P, et al. Blastoid high-grade B-cell lymphoma initially presenting in bone marrow: a diagnostic challenge. Mod Pathol. 2022;35(3):419-426.
5. Ok CY, Medeiros LJ, Thakral B, et al. High-grade B-cell lymphomas with TdT expression: a diagnostic and classification dilemma. Mod Pathol. 2019;32(1):48-58.
6. Uchida A, Isobe Y, Uemura Y, et al. De novo acute lymphoblastic leukemia-like disease of high grade B-cell lymphoma with MYC and BCL2 and/or BCL6 rearrangements: a case report and literature review. BMC Clin Pathol. 2017;17:21.
7. Ali Shah M, Ahmad U, Tariq Mahmood M, Ahmad AH, Abu Bakar M. Frequency of CD34 and CD10 expression in adolescent and young adult patients having precursor B-cell acute lymphoblastic leukemia and its correlation with clinical outcomes: a single-center study. Cureus. 2022;14(1):e21261.
8. Garg N, Gupta R, Kotru M. CD34 is not expressed by blasts in a third of B-ALL patients and its negativity is associated with aberrant marker expression: a retrospective analysis. Asian Pac J Cancer Prev. 2021;22(3):919-925.
9. Geethakumari PR, Hoffmann MS, Pemmaraju N, et al. Extramedullary B lymphoblastic leukemia/lymphoma (B-ALL/BLBL): a diagnostic challenge. Clin Lymphoma Myeloma Leuk. 2014;14(4):e115-118.
10. Slot LM, Hoogeboom R, Smit LA, et al. B-lymphoblastic lymphomas evolving from follicular lymphomas co-express surrogate light chains and mutated gamma heavy chains. Am J Pathol. 2016;186(12):3273-3284.
11. Fujimoto A, Ikejiri F, Arakawa F, et al. Simultaneous discordant B-lymphoblastic lymphoma and follicular lymphoma. Am J Clin Pathol. 2021;155(2):308-317.
12. Alaggio R, Amador C, Anagnostopoulos I, et al. The 5th edition of the World Health Organization Classification of Haematolymphoid Tumours: lymphoid neoplasms. Leukemia. 2022;36(7):1720-1748.
13. Collinge BJ HL, Wong J, Ben-Neriah S, et al. Characterization of the genetic landscape of high-grade B-cell lymphoma, NOS –An LLMPP Project. Hematol Oncol. 2021;39(S2):157-159.
14. Campo E, Jaffe ES, Cook JR, et al. The International Consensus Classification of Mature Lymphoid Neoplasms: a report from the clinical advisory committee. Blood. 2022;140(11):1229-1253.
15. Liu W, Hu S, Konopleva M, et al. De novo MYC and BCL2 doublehit B-cell precursor acute lymphoblastic leukemia (BCP-ALL) in pediatric and young adult patients associated with poor prognosis. Pediatr Hematol Oncol. 2015;32(8):535-547.
Haematologica | 108 March 2023 899 LETTER TO THE EDITOR
References
Prognostic impact of pretreatment immunoglobulin clonal composition in pediatric B-lymphoblastic leukemia
Refinement of risk-adapted therapy is critical to improving outcomes for childhood B-lymphoblastic leukemia (B-ALL). High-throughput sequencing (HTS) of the immunoglobulin heavy chain (IgH) is a sensitive method for tracking minimal residual disease (MRD).1-4 It may also offer an opportunity to enhance relapse prediction based on the pretreatment diversity of clonal IgH rearrangements. Using pretreatment IgH HTS data (ClonoSEQ, Adaptive Biotechnologies) from 619 pediatric patients uniformly treated on COG Standard Risk (SR) trial AALL0331 and high-risk (HR) trial AALL0232,2 we analyzed survival outcomes for patients with B-ALL by their leukemia-associated IgH clonal composition. We found that the number of dominant IgH sequences detectable at diagnosis impacts prognosis particularly among patients with HR B-ALL who lack favorable cytogenetics, suggesting that pretreatment IgH composition may offer an opportunity to refine risk stratification among select groups.
In B-cell development, IgH variable (V), diverse (D), and joining (J) genes recombine to generate unique V-DJ sequences which, when clonally expanded, produce dominant sequences by which leukemia cells can be tracked. Many patients with B-ALL have one to two dominant IgH sequences, but a subset have none and others have three or more.5 Further, some have numerous subclonal IgH clonotypes as defined by a shared DJ-rearrangement but distinct V genes,5-7 likely reflecting leukemia development from a common precursor recombining the different V genes subsequent to malignant transformation. In 2018, Wood et al. utilized clonal immunoglobulin sequences to report the clinical relevance of end-of-induction (EOI) HTS MRD in pediatric B-ALL.2 Because post-therapy MRD assessment also requires evaluation of a pretreatment specimen to establish the dominant sequence(s) for subsequent evaluation, this analysis incidentally noted that patients without a dominant, pretreatment IgH sequence appeared to have inferior survival.2 Thus, IgH composition may bear prognostic relevance independent of its role in MRD monitoring, but this observation has not been explicitly tested in the clinical trial setting.
Using pretreatment IgH HTS data from 603 patients treated on former COG trials (97% of n=619 fulfilling present HTS quality metrics [n=296 from AALL0331: 5.5% of total 5,377 subjects; n=307 from AALL0232: 9.7% of 3,154 subjects]), we analyzed patient characteristics and survival outcomes by IgH composition (Table 1). We found no significant relationship between IgH composition and risk group, age, sex, or CNS status. However, IgH composition did vary within
cytogenetic groups. The most prevalent cytogenetic lesions overall were the favorable ETV6-RUNX1 fusion (13.1%) and double trisomies (DT) of chromosomes 4 and 10 (16.6%). Patients with DT were overall more likely to demonstrate ≥3 IgH sequences (37%) compared to other cytogenetic groups (ETV6-RUNX1: 17.7%; other/non-favorable cytogenetics: 19.6%) (P<0.01), potentially due to trisomy of the IgH locus on chromosome 14, as most patients with DT have hyperdiploidy. When separated by trial, however, the association between cytogenetics and number of IgH sequences was only significant among patients on AALL0331 (Table 1).
We found that pretreatment IgH composition is prognostic among select risk groups (Figure 1; Table 1). Patients with no dominant IgH sequences had inferior 5-year event-free survival (EFS) compared to patients with 1-2 (hazard ratio =2.44, 95% confidence interval [CI]: 1.29-4.62) and patients with ≥3 (hazard ratio =4.07, 95% CI: 1.71-9.65). Patients with HR B-ALL appeared solely responsible for this difference, as IgH composition was not associated with prognosis among patients on the SR study AALL0331 (Figure 1A). Among patients on the HR study AALL0232, those with no dominant IgH sequences (n=31) had inferior 5-year EFS (73.4%, 95% CI: 59.2-91.1%) compared to patients with 1-2 (n=215) (5-year EFS 87%, 95% CI: 82.3-91.9, P=0.001), while those with ≥3 (n=61) had superior 5-year EFS (94.8%, 95% CI: 89.2-100, P=0.0003) (Figure 1B). We also found that IgH composition is only predictive of outcome in the absence of favorable cytogenetics (Online Supplementary Figure S1). We next discovered that V-DJ subclone evolution is prevalent but not prognostic. Using the dominant IgH sequence as reference, subclones were defined as sequences with D and J genes identical to the dominant sequence, >2 ‘N’ bases at the D-J junction, and a distinct V gene. Of the 430 patients (71.3%) who had at least 1 dominant sequence fulfilling criteria to assess sequence relatedness, 399 (92.8%) had subclones derived from differential V gene recombination into a common DNJ motif. Cytogenetics differed between patients with subclone evolution and those without (Online Supplementary Table S1). Of 31 patients (7.2%) who lacked V-DJ subclone evolution, none had a favorable ETV6-RUNX1 fusion. Likewise, V-DJ subclone diversity was greater among patients with an ETV6-RUNX1 fusion compared to patients with DT or other/non-favorable cytogenetics (P=2.5x10⁻⁵) (Figure 2A). However, the extent of subclone diversity did not impact 5-year EFS (Figure 2B). Our findings reveal that, distinct from the use of HTS MRD for relapse prediction, pretreatment IgH HTS data may pro-
Haematologica | 108 March 2023 900 LETTER TO THE EDITOR
Figure 1. Impact of IgH composition on survival. 5-year event-free survival (EFS) probability is shown according to the number of dominant pretreatment IgH sequences (IgH seq) (0, 1-2, or ≥3) for (A) patients with standard-risk (SR) B-lymphoblastic leukemia (B-ALL) treated on AALL0331 and (B) patients with high-risk (HR) B-ALL treated on AALL0232. IgH composition impacts 5-year EFS in patients with HR B-ALL.
Seq: sequences; WBC: white blood cells; CNS: central nervous system; MRD: minimal residual disease; FC: flow-cytometry; EFS: event-free survival; OS: overall survival; SD: standard deviation; EOI: end of induction; CI: confidence interval. *CNS status definitions: CNS1: absence of blasts in cerebrospinal fluid (CSF); CNS2: <5 WBC/mL CSF and cytospin positive for blasts or >5 WBC/mL but negative by Steinherz/Bleyer algorithm; CNS3: ≥5 WBC/mL CSF and cytospin positive for blasts and/or clinical signs of CNS leukemia. †IgH HTS analysis was limited to patients on AALL0232 with FC MRD <0.10%. ††Patients lacking complete cytogenetic data or with a combination of 2 cytogenetic lesions were excluded. Unfavorable cytogenetics included hypodiploidy, KMT2A rearrangements, and BCR-ABL1 fusions. Note: patient characteristics in this study did not uniformly represent the cytomolecular characteristics of the complete study populations from AALL0331 and AALL0232.

Standard-Risk AALL0331 N=296 High-Risk AALL0232 N=307 0 IgH seq 1-2 IgH seq ≥3 IgH seq Significance (P value) 0 IgH seq 1-2 IgH seq ≥3 IgH seq Significance (P value) N (%) 25 (44.6) 198 (47.9) 73 (54.5) 31 (55.4) 215 (52.1) 61 (45.5) Age in years, mean ± SD 3.6 ± 2.4 3.9 ± 2.3 3.8 ± 2.1 0.60 10.8 ± 5.8 9.6 ± 5.5 8.8 ± 4.9 0.19 WBC x109/L, mean ± SD 8.8 ± 8.0 16.4 ± 12.9 13.7 ± 12.2 0.003 77.2 ± 146.4 69.0 ± 85.0 57.2 ± 74.0 0.52 Sex, N (%) Female Male 16 (64) 9 (36) 85 (42.9) 113 (57.1) 31 (42.5) 42 (57.5) 0.12 13 (41.9) 18 (58.1) 102 (47.4) 113 (52.6) 26 (42.6) 35 (57.4) 0.72 CNS status, N (%)* CNS1 CNS2 CNS3 23 (92) 2 (8) 0 164 (82.8) 33 (16.7) 1 (0.5) 55 (75.34) 16 (21.92) 2 (2.74) 0.19 30 (96.8) 1 (3.2) 0 178 (82.8) 33 (15.3) 4 (1.9) 55 (90.2) 6 (9.8) 0 0.11 EOI MRD (FC), N (%)† <0.01% 0.01-<0.10% 0.10-<1.0% ≥1.0% 16 (64) 6 (24) 1 (4) 2 (8) 158 (79.8) 19 (9.6) 16 (8.1) 5 (2.5) 55 (75.34) 9 (12.33) 9 (12.33) 0 0.14 23 (74.2) 8 (25.8) 0 0 184 (85.6) 31 (14.4) 0 0 56 (91.8) 5 (8.2) 0 0 0.07 Cytogenetic group, N (%)†† ETV6-RUNX1 Double trisomy Unfavorable Neutral Excluded 0 8 (32.0) 0 14 (56.0) 3 (12.0) 14 (7.1) 27 (13.6) 2(1.0) 140 (70.7) 15 (7.6) 4 (5.5) 23 (31.5) 2 (2.7) 41 (56.2) 3 (4.1) 0.02 5 (16.1) 2 (6.5) 2 (6.5) 17 (54.8) 5 (16.1) 46 (21.4) 26 (12.1) 6 (2.8) 121 (56.3) 16 (7.4) 10 (16.4) 14 (33.0) 4 (6.5) 31 (50.8) 2 (3.3) 0.09 5-year EFS, % (95% CI) 92.0 (70.9-98.0) 90.6 (85.3-94.1) 91.5 (81.8-96.2) 0.62 73.4 (51.3-86.7) 87.2 (81.3-91.3) 94.8 (84.2-98.4) 0.0006 5-year OS, % (95% CI) 100 (100-100) 96.8 (92.9-98.6) 97.2 (88.9-99.3) 0.55 90.0 (69.8-96.9) 93.9 (89.2-96.6) 96.7 (86.4-99.2) 0.32
Table 1. Patient characteristics, IgH composition, and survival.
A B Haematologica | 108 March 2023 901 LETTER TO THE EDITOR
vide independent prognostic information. We observed that the number of dominant IgH sequences detectable at diagnosis was associated with outcome in patients with HR leukemia who lacked favorable cytogenetics, with a particularly inferior outcome among patients without a dominant, pretreatment IgH sequence. Absence of a clonal IgH rearrangement at diagnosis may be biologically relevant. For example, the inferior outcomes of certain subgroups which more often lack a clonal IgH, such as KMT2A-rearranged infant leukemia, may relate to leukemic origin from an earlier developmental B-cell stage.8,9 Our observations support this hypothesis, suggesting that cases undergoing leukemic transformation prior to an initial DJ-recombination event may likewise demonstrate less favorable survival. However, the incidence of KMT2A rearrangements in this analysis was too low to test the relationship between this cytogenetic feature and absence of a dominant IgH sequence. Nevertheless, sentinel cytogenetic lesions are prognostic in B-ALL and may correspond to IgH composition. For example, prior reports suggested a lower rate of IgH oligoclonality in patients with an ETV6-RUNX1 fusion compared to those without a characteristic translocation,10 highlighting a potential confounding affiliation between favorable cytogenetics and IgH composition. We also observed that ETV6-RUNX1 leukemias most often show only 1-2 dominant, fully recombined V-DJ
sequences. Furthermore, we unexpectedly observed improved survival among patients with HR B-ALL and ≥3 dominant IgH sequences. A greater proportion of patients with DT (37%) had ≥3 IgH sequences compared to other cytogenetic groups. While this finding might raise concern for a confounding effect of favorable cytogenetics on outcome, it was notably only significant in the AALL0331 cohort for whom no survival difference was observed between IgH groups. We also showed that the impact of IgH composition on prognosis was limited to patients who lacked favorable genetics (Online Supplementary Figure S1), indicating that cytogenetics alone cannot account for the observed survival impact. Instead, other features – such as B-cell stage at the time of leukemic transformation – may underlie the relationship between IgH composition and prognosis.

The significance of subclone evolution in B-ALL remains to be defined. ‘Ordered rearrangement’ of the IgH locus involves an initial D-J joining event with V genes available for ongoing rearrangement,11 resulting in the capacity for subclonal sequences to derive from a common DJ-recombined precursor.12 For example, Bueno et al. did not detect any fully V-DJ-recombined clonal sequence(s) among monozygotic twins with B-ALL.13 However, there was substantial sequence overlap between the twin cases, suggesting that the leukemia cell of origin arose from a shared DJ-recom-
Figure 2. V-DJ subclone diversity. (A) Subclone diversity by cytogenetic group. The total subclone sequence (seq) count (+1; log scale) is shown for 3 cytogenetic cohorts: patients lacking favorable cytogenetics (“Other”), patients with an ETV6-RUNX1 fusion, and patients with double trisomies (DT) of chromosomes 4 and 10. Patients with B-ALL characterized by an ETV6-RUNX1 fusion had an overall greater subclone seq count than those with DT or other/non-favorable cytogenetics. (B) Subclone diversity does not impact survival. 5-year event-free survival (EFS) probability is shown according to each patient’s total subclone seq count. There was no observed impact of subclone seq count on 5-year EFS. V-DJ sequences: IgH variable (V), diverse (D), and joining (J) genes.
A
Haematologica | 108 March 2023 902 LETTER TO THE EDITOR
B
bined progenitor. In 2012, Gawad et al. highlighted the vast extent of subclone diversity which can result from this phenomenon, showing a range of 0-4,021 ‘subclones’ per B-ALL.5 Wu et al. likewise observed a range of 0-4,558 evolved subclones,6 and Bashford-Rogers et al. detected ~32 subclones per dominant clonotype, each with entirely distinct V genes.7 In our analysis, 92.8% of cases (399/430) had subclonal IgH sequences, and 25 (5.8%) had >1,000. Our findings confirm that V-DJ subclone evolution is prevalent in B-ALL and may be greatest in patients with an ETV6-RUNX1 fusion, but the data do not reveal any prognostic impact of this phenomenon. This analysis represents the largest uniformly treated population of pediatric patients with B-ALL to date to undergo pretreatment IgH HTS, offering a unique opportunity to test the prognostic impact of IgH composition. Despite our finding that IgH composition impacts outcome in a specific risk group, this retrospective analysis was limited by sample size and selection. Only 56 patients lacked a dominant IgH sequence, which may not have been adequate to account for the confounding impact of other prognostic features in our multivariate analysis. Furthermore, given the design of the study from which the data were obtained,2 cases were preselected for a HR population with EOI FC MRD ≤0.1%. This enrichment toward a more favorable HR group may have influenced the observed survival impact of IgH composition and precluded our ability to test the relationship to other prognostic features, such as EOI and end-of-consolidation (EOC) MRD. These considerations highlight the importance of future investigations in large, unselected patient cohorts. In conclusion, pretreatment IgH composition may offer an opportunity to refine risk stratification in B-ALL, particularly in select patients with HR disease, by providing information that enhances the ability of current risk stratification to predict which patients are destined for relapse. Identification of more primitive cell populations may likewise beget novel therapeutic options to improve outcomes.
Authors
Carol Fries,1*Lik Wee Lee,2* Meenakshi Devidas,3 Yunfeng Dai,4 Karen R. Rabin,5 Sumit Gupta,6 Mignon L. Loh,7 Ilan R Kirsch,2# Brent Wood8# and Rachel E. Rau5#
1Department of Pediatrics, Hematology/Oncology, University of Rochester, Rochester, NY, USA; 2Adaptive Biotechnologies, Inc., Seattle, WA, USA; 3Department of Global Pediatric Medicine, St Jude Children's Research Hospital, Memphis, TN, USA; 4Department of
Biostatistics, College of Medicine and Public Health and Health Professions, University of Florida, Gainesville, FL, USA; 5Department of Pediatrics, Texas Children’s Cancer Center, Baylor College of Medicine, Houston, TX, USA; 6Division of Hematology/Oncology, Hospital for Sick Children, Faculty of Medicine, University of Toronto, Toronto, Onatario, Canada; 7Department of Pediatrics, Ben Towne Center for Childhood Cancer Research, Seattle Children’s Hospital, Seattle, WA, USA and 8Department of Pathology and Laboratory Medicine, Children's Hospital Los Angeles, University of Southern California, Los Angeles, CA, USA
*CF and LWL contributed equally as co-first authors. #IRK, BW, and RER contributed equally as co-senior authors.
Correspondence:
C. FRIES - carol_fries@urmc.rochester.edu
https://doi.org/10.3324/haematol.2022.281146
Received: April 8, 2022.
Accepted: October 27, 2022.
Early view: November 3, 2022.
©2023 Ferrata Storti Foundation
Published under a CC BY-NC license
Disclosures
LWL has employment and IRK has employment and equity ownership with Adaptive Biotechnologies, Inc.
Contributions
CF, RER and IRK conceived of the project. LWL and IRK executed the primary data analysis. BW provided correlative data. MD and YD provided biostatistical analysis support. CF interpreted data, drafted the initial version of the manuscript, and edited the manuscript. KRR, SG, MLL, IRK, BW, and RER reviewed and revised the manuscript and provided consultation in data interpretation and analysis.
Funding
The presented analysis was supported by the National Cancer Institute/National Institutes of Health funding to Children’s Oncology Group (COG) Hematopoietic Malignancies Integrated Translational Sciences Center (HM-ITSC) Pilot Studies Program Grant UG1CA233249, NCTN Operations Center Grant U10CA180886 and Statistics & Data Center Grant U10CA180899. The content is solely the responsibility of the authors and does not necessarily represent the official views of the National Institutes of Health.
Data-sharing statement
The data presented here are available upon reasonable request to the corresponding author subject to COG data-sharing approval.
Haematologica | 108 March 2023 903 LETTER TO THE EDITOR
References
1. Theunissen PMJ, de Bie M, van Zessen D, de Haas V, Stubbs AP, van der Velden VHJ. Next-generation antigen receptor sequencing of paired diagnosis and relapse samples of B-cell acute lymphoblastic leukemia: clonal evolution and implications for minimal residual disease target selection. Leukemia Res. 2019;76:98-104.
2. Wood B, Wu D, Crossley B, et al. Measurable residual disease detection by high-throughput sequencing improves risk stratification for pediatric B-ALL. Blood. 2018;131(12):1350-1359.
3. Pulsipher MA, Carlson C, Langholz B, et al. IgH-V(D)J NGS-MRD measurement pre- and early post-allotransplant defines very low- and very high-risk ALL patients. Blood. 2015;125(22):3501-3508.
4. Logan AC, Vashi N, Faham M, et al. Immunoglobulin and T cell receptor gene high-throughput sequencing quantifies minimal residual disease in acute lymphoblastic leukemia and predicts post-transplantation relapse and survival. Biol Blood Marrow Transplant. 2014;20(9):1307-1313.
5. Gawad C, Pepin F, Carlton VE, et al. Massive evolution of the immunoglobulin heavy chain locus in children with B precursor acute lymphoblastic leukemia. Blood. 2012;120(22):4407-4417.
6. Wu J, Jia S, Wang C, et al. Minimal residual disease detection and evolved IGH clones analysis in acute B lymphoblastic leukemia using IGH deep sequencing. Front Immunol. 2016;7:403.
7. Bashford-Rogers RJ, Nicolaou KA, Bartram J, et al. Eye on the B-ALL: B-cell receptor repertoires reveal persistence of numerous B-lymphoblastic leukemia subclones from diagnosis to relapse. Leukemia. 2016;30(12):2312-2321.
8. Felix CA, Poplack DG. Characterization of acute lymphoblastic leukemia of childhood by immunoglobulin and T-cell receptor gene patterns. Leukemia. 1991;5(12):1015-1025.
9. Felix CA, Poplack DG, Reaman GH, et al. Characterization of immunoglobulin and T-cell receptor gene patterns in B-cell precursor acute lymphoblastic leukemia of childhood. J Clin Oncol. 1990;8(3):431-442.
10. Hubner S, Cazzaniga G, Flohr T, et al. High incidence and unique features of antigen receptor gene rearrangements in TEL-AML1positive leukemias. Leukemia. 2004;18(1):84-91.
11. Alt FW, Yancopoulos GD, Blackwell TK, et al. Ordered rearrangement of immunoglobulin heavy chain variable region segments. EMBO J. 1984;3(6):1209-1219.
12. Choi Y, Greenberg SJ, Du TL, et al. Clonal evolution in B-lineage acute lymphoblastic leukemia by contemporaneous VH-VH gene replacements and VH-DJH gene rearrangements. Blood. 1996;87(6):2506-2512.
13. Bueno C, Tejedor JR, Bashford-Rogers R, et al. Natural history and cell of origin of TC F3-ZN F384 and PTPN11 mutations in monozygotic twin with concordant BCP-ALL. Blood. 2019;134(11):900-905.
Haematologica | 108 March 2023 904 LETTER TO THE EDITOR
Identification of multiple genetic loci associated with red blood cell alloimmunization in mice
Humoral immunization to red blood cell (RBC) alloantigens can represent a barrier to ongoing transfusion therapy. Humans have a range of tendencies to become alloimmunized. On the extremes, some patients become immunized to multiple alloantigens after a single transfusion whereas others make no detectable alloantibodies after hundreds of transfusions.1 Although an oversimplification of a complex trait, humans have been described as being “responders” versus “non-responders” based upon their tendency to become alloimmunized.1 Alloimmunization against multiple antigens can complicate obtaining sufficient compatible units, leading to insufficient or delayed treatment, and mortality in severe cases. In addition to transfusion, engineered RBC are now being developed to induce immunity (e.g., vaccines2 and tumor immunotherapy3), or to suppress immunity (e.g., treatment of autoimmune disease).4 Thus, understanding factors that regulate immune responses to RBC is important for multiple therapeutic approaches. Numerous murine studies have shown that transfused RBC do not induce a significant alloantibody response unless recipients are first inflamed or transfused RBC are damaged. These findings have translated into humans and constituted considerable progress in understanding environmental factors that regulate responder/non-responder status. However, recipient genetics likely also play a role. Several human loci of interest have been identified,5-7 but achieving sufficient statistical power has been a challenge. Application of murine models to exploration of recipient genetics has not been carried out, since RBC are only weakly immunogenic in the reported mouse models. Importantly, existing murine studies have almost exclusively used mice on a C57BL/6 (B6) background as recipients. We hypothesized that B6 mice represent a model of “non-responders” and that the tendency to become alloimmunized after transfusion would vary across genetically distinct inbred strains. Herein, we demonstrate a continuum of humoral RBC alloimmunization tendency in different inbred strains of mice and identify six genetic loci that are associated with RBC alloimmunization through a genome-wide association study (GWAS).
Thirteen different strains of mice, chosen to represent different phylogenetic arms of inbred mice, were each transfused with RBC expressing either a model alloantigen (HOD)8 or the human K2 alloantigen at low copy number (KEL-K2Lo).9 Blood was collected, transfused, and IgG responses were measured as previously described.9
HOD RBC have repeatedly been shown to induce little to no IgG in otherwise untreated B6 mice (i.e., in the absence of recipient inflammation). KEL-K2Lo RBC have been reported
to not induce IgG in B6 mice even in the presence of inflammation, but rather lead to tolerance.9 Consistent with published findings, neither HOD nor KEL-K2Lo RBC induced considerable IgG in B6 recipients (Figure 1). In contrast, there was wide variability of responsiveness across other strains, with similar (but not identical) patterns between HOD and KEL-K2Lo RBC.
HLA differences in humans can regulate RBC alloimmunization to specific antigens based upon the differential ability of MHCII to present peptides from RBC alloantigens. However, differences in RBC alloimmunization across murine strains were not simply due to variant MHCII, since 129 mice consistently responded more strongly than B6 mice, and both have the same MHC haplotype (H-2b). Also, DBA2 mice have significantly higher average responses than seen in B6 mice that are congenic for the DBA2 H-2d MHC haplotype and are homozygous for H-2d on a B6 background (B6.H2d). Finally, all tested strains have the same amino acid sequence of murine orthologues of lysozyme (contained in HOD) and KEL, ruling out orthology to alloantigen as an independent variable.
Alloantibody responses and high-resolution single nucleotide polymorphisms (SNP) genotyping profiles were generated on 156 F2 mice from a 129S1xB6 F2 cross. F2 mice had a range of responses between the means of parental strains (Figure 2A). Quantitative trait locus (QTL) analysis (reviewed in 10) was performed on the F2 mice using alloantibody levels as a trait. At least six different QTL were identified (false discovery rate [FDR] <0.01), on chromosomes 1, 7, 9, 11, 12, and the X chromosome, respectively (Figure 2B). An additional QTL on chromosome 17 approached the cutoff for significance. The QTL on chromosome 1 appeared to indicate two, and potentially three different loci.
As a control for the QTL process, leukocytes from each mouse were also tested for expression of NK1.1 by flow cytometry. NK1.1 is expressed by B6 but not 129 mice and is encoded by the Klrb1c gene on chromosome 6 at position 129755448-128765604. QTL analysis mapped the NK1.1 gene product to the correct position on chromosome 6 with extreme statistical significance (P< 10–22) (Figure 2C), validating the QTL approach as well as the F2 cohort.
Together, the findings reported herein demonstrate genetic variability across inbred strains of mice regarding the tendency to mount a humoral immune response to a foreign antigen on transfused RBC. This observation demonstrates that the common narrative that RBC are intrinsically nonimmunogenic in mice is an error born from studying only a single inbred recipient strain (i.e., B6). The current data
Haematologica | 108 March 2023 905 LETTER TO THE EDITOR
Figure 1. Genetically distinct mouse strains have different tendencies towards red blood cell alloimmunization. Each of the indicated strains were transfused with HOD (A) or KEL-K2Lo (B) red blood cells (RBC) and IgG responses were tested in serum at 21 days after transfusion. Serum was incubated with alloantigen expressing RBC followed by a fluorescently labeled secondary antibody and median fluorescence intensity (MFI) was determined by flow cytometry. As both alloantigen transgenic mice are on a B6 background, serum was also incubated with B6 RBC and the MFI subtracted from values of alloantigen expressing target cells. Major histocompatibility complex (MHC) haplotypes of the mice used are [A/J (H-2a), AKR/J (H-2k), Balb/cByJ(H-2d), BTBR(H-2b), C57BL6/J(H-2b), C3H/HeJ(H-2k), DBA/2J(H-2d), FVB/NJ(H-2q), KK/HiJ(H-2b), NOD/ShiLtJ(H-2g7), 129S1/SVImJ(H-2b), 129SX1/SvJ(H-2b) ]. No antibodies to background antigens on B6 RBC were detected and the MFI of B6 RBC was subtracted from the MFI of target RBC expressing the indicated alloantigen. Negative values for IgG were determined to be non-biologically relevant and were thus set to a value of zero. The combined results of 3 different experiments are shown, with samples sizes ranging from 13-15 mice. Statistical significance is defined as a Sidak-Bonferroni adjusted P<0.05 in pairwise comparisons estimated from a two-part model (logit & log-linear links) adjusted for experiment – each strain is compared to B6.H2d. Statistical significance is indicated by (*P=<0.05) and (**P<0.001). No experimental results that were obtained with this approach that were excluded from this figure. HOD and KEL-K2Lo mice were bred in the University of Virginia vivarium, all recipient mice were purchased from The Jaxson Laboratory (Bar Harbor, ME) and all procedures were carried out in compliance with approved IACUC protocols.
demonstrate that, similar to humans, recipient genetics affect the tendency to become alloimmunized to RBC transfusion in mice.
Interestingly, one of the few papers that reported transfused RBC as being immunogenic, was an early report by Campbell-Lee et al., which used CBA mice as recipients.11
Although CBA mice are not in the current panel, they are closely related to C3H animals – the significance of these early findings regarding recipient genetics has likely been overlooked. Similarly, papers in RBC engineering that showed strong antibody responses used BALB/c or B6D2F1 mice.2,12,13 Thus, careful attention to recipient strain may help to resolve apparent contradictions in the literature, as well as leading to new understanding of the genetic regulation of RBC alloimmunization. This will be a fundamental consideration in translating RBC-based immunotherapies into humans; murine studies should pay careful attention to the recipient strain being studied and arguably test a range of recipient strains to understand the landscape of potential responses.
Genetic variation in immune responses to various antigens is not itself new. However, it is well understood that genetic determinants of immune response differ with regards to the nature of the antigen.14 Genetic variation of different murine strains in magnitude of antibody responses to sheep red blood cells (SRBC) have previously been reported; however, QTL were not identified.14 More importantly, SRBC are a strong xenoantigen which is fundamentally different than
alloimmunization within the same species. To the best of our knowledge, the current study is the first analysis of immunogenetics of response to RBC alloantigens in mice. Another potentially serious issue raised by the current findings is that the vast majority of knockout mice have been made on a 129 background and then backcrossed to B6. As we (and others) have documented, this approach is susceptible to mistaking the effects of traits inherited from 129 mice for effects of the knocked out gene.15 Even with many generations of backcrossing, genes flanking the knockout gene typically maintain genetics from the donor strain, in this case 129. Because 129 mice tend to respond to RBC antigens, any data from using knockout mice generated with 129 ES cells should consider the proximity of the knocked out gene to the QTL defined herein. Identification of the precise genetic elements that regulate alloimmunization will require additional refinement of the QTL and experimentation through genetic modification. Although highly significant, the QTL generated by this approach are broad (i.e., 880 genes in QTL11). As such, more precise mapping and/or congenesis will be required to identify precise genetic elements. Potential translation into humans will require focused analysis of human genomes associated with alloimmunization; however, it is worth noting that QTL 7 contains ARAP1/STARD10, which was identified as associating with alloimmunization in human patients with sickle cell disease. 5 Variation in human HLA correlates with alloimmunization to some RBC alloantigens

A B Haematologica | 108 March 2023 906 LETTER TO THE EDITOR
and the QTL approaching statistical significance on chromosme 17 may represent variation in mouse MHC. However, as above, the MHC seems neither necessary nor sufficient to regulate RBC alloimmunization as mice with the same H-2 haplotype have significantly different average immune responses to RBC transfusion. Likewise, donor RBC having a different MHC than recipient mice does not seem determinative, as there is a wide range of average responses for A/J, AKR/J, Balb/cByJ, C3H/HeJ, DBA/2J, FVB/NJ, and
NOD/ShiLTJ strains even though each see the H-2b on HOD and KEL-K2Lo RBC as foreign. Importantly, the QTL need not indicate immunoregulatory genes, as they could indicate variant amino acids in RBC proteins that are processed and presented in MHCII between donor and recipient strains. Due to linked recognition, such epitopes could come from proteins other than the transgenic alloantigens being studied.
In addition to generating new genetic regions of interest in
Figure 2. Identification of multiple genetic loci that associate with red blood cell alloimmunization. 156 F2 mice were each transfused with KEL-K2Lo red blood cell (RBC) and alloantibodies were measured at 21 days post transfusion (A). For each animal, expression of NK1.1 was determined on splenocytes by flow cytometry (data not shown). Quantitative trait locus (QTL) analysis was carried out using alloimmunization to RBC (B) or NK1.1 expression (C) as the trait. Starting with a total of 11,125 single nucleotide polymorphisms (SNP), 3,220 differed between the B6 and 129 strains, with 3,118 remaining after filtering for informative markers. Genome-wide association study (GWAS) analysis used a linear model with a transformation y =loge(Pheno1 + 60) applied prior to data analysis and fitted using the lm function in R. From each SNP model fitted, the P value form the F-test was extracted, and adjusted P values (false discovery rate [FDR]) were calculated using the P.adjust function in R. Manhattan plots were constructed with thresholds taken as FDR =0.05 (suggestive) and FDR =0.01 (significant). Back-transformed means for each SNP genotype (AA, AB and BB) along with their standard errors were calculated using the emmeans package in R. For chromosomes where at least one SNP with FDR <0.05 was found, the most significant SNP in the chromosome was identified. In order to assess if any of the other ‘significant SNP’ in the chromosome had any effect in addition to the most significant one, a linear model was fitted with the most significant SNP as well as the SNP to be tested. No formal adjustment for multiple tests was undertaken for this analysis.

C B A Haematologica | 108 March 2023 907 LETTER TO THE EDITOR
alloimmunization (and immunology in general), the data contained herein widen our gaze of the immunogenic properties of RBC, indicating that they are neither intrinsically immunogenic nor non-immunogenic, and their effects are contextual with regards to recipient genetics. Understanding the genetics of RBC alloimmunization, and how it translates into humans, will be essential both to predicting and controlling RBC alloimmunization during transfusion therapy, as well as precision medicine in the use of modified RBC as a cellular therapy with regards to recipient genetics.
Authors
Arijita Jash,1,2 Heather L. Howie,1 Ariel M. Hay,1,2 Chance John Luckey,1 Krystalyn E. Hudson,3 Peter C. Thomson,4 Sarah J. Ratcliffe,5 Mark Smolkin5 and James C. Zimring1,2
1University of Virginia School of Medicine, Charlottesville, VA, USA; 2Carter Immunology Center, University of Virginia, Charlottesville, VA, USA; 3Department of Pathology and Cell Biology, Columbia University Irving Medical Center, New York, NY, USA; 4Sydney School of Veterinary Science, University of Sydney, Sydney, New South Wales, Australia and 5University of Virginia, Public Health Sciences, Division of Biostatistics, Charlottesville, VA, USA
Correspondence:
J.C. ZIMRING - jcz2k@virginia.edu
References
1. Higgins JM, Sloan SR. Stochastic modeling of human RBC alloimmunization: evidence for a distinct population of immunologic responders. Blood. 2008;112(6):2546-2553.
2. Ukidve A, Zhao Z, Fehnel A, et al. Erythrocyte-driven immunization via biomimicry of their natural antigen-presenting function. Proc Natl Acad Sci U S A. 2020;117(30):17727-17736.
3. Zhang X, Luo M, Dastagir SR, et al. Engineered red blood cells as an off-the-shelf allogeneic anti-tumor therapeutic. Nat Commun. 2021;12(1):2637.
4. Pishesha N, Bilate AM, Wibowo MC, et al. Engineered erythrocytes covalently linked to antigenic peptides can protect against autoimmune disease. Proc Natl Acad Sci U S A. 2017;114(12):3157-3162.
5. Hanchard NA, Moulds JM, Belmont JW, Chen A. A genome-wide screen for large-effect alloimmunization susceptibility loci among red blood cell transfusion recipients with sickle cell disease. Transfus Med Hemother. 2014;41(6):453-461.
6. Tatari-Calderone Z, Tamouza R, Le Bouder GP, et al. The association of CD81 polymorphisms with alloimmunization in sickle cell disease. Clin Dev Immunol. 2013;2013:937846.
7. Williams LM, Qi Z, Batai K, et al. A locus on chromosome 5 shows African ancestry-limited association with alloimmunization in sickle cell disease. Blood Adv. 2018;2(24):3637-3647.
8. Desmarets M, Cadwell CM, Peterson KR, Neades R, Zimring JC. Minor histocompatibility antigens on transfused leukoreduced
https://doi.org/10.3324/haematol.2022.281767
Received: July 15, 2022.
Accepted: October 28, 2022.
Early view: November 10, 2022.
©2023 Ferrata Storti Foundation
Published under a CC BY-NC license
Disclosures
JCZ is a co-founder and CSO of Svalinn Therapeutics, neither of which were involved with the current studies. All other authors have no conflicts of interest to disclose.
Contributions
AJ and AMH performed the research. JCZ, CJL, and KEH conceived the work and JCZ supervised the work. HLH processed genomics data. SJR and MS carried out statistical analysis, and PCT performed the QTL analysis. All authors were involved in data interpretation. JCZ wrote the manuscript with editorial input from other authors.
Funding
This work was supported in part by P01 HL132819 from the National Heart Lung and Blood Institute.
Data-sharing statement
Genomics and alloimmunization data available upon request.
units of red blood cells induce bone marrow transplant rejection in a mouse model. Blood. 2009;114(11):2315-2322.
9. Arthur CM, Patel SR, Smith NH, et al. Antigen density dictates immune responsiveness following red blood cell transfusion. J Immunol. 2017;198(7):2671-2680.
10. Abiola O, Angel JM, Avner P, et al. The nature and identification of quantitative trait loci: a community's view. Nat Rev Genet. 2003;4(11):911-916.
11. Campbell-Lee SA, Liu J, Velliquette RW, et al. The production of red blood cell alloantibodies in mice transfused with blood from transgenic Fyb-expressing mice. Transfusion. 2006;46(10):1682-1688.
12. Murray AM, Pearson IF, Fairbanks LD, Chalmers RA, Bain MD, Bax BE. The mouse immune response to carrier erythrocyte entrapped antigens. Vaccine. 2006;24(35-36):6129-6139.
13. Polvani C, Gasparini A, Benatti U, et al. Murine red blood cells as efficient carriers of three bacterial antigens for the production of specific and neutralizing antibodies. Biotechnol Appl Biochem. 1991;14(3):347-356.
14. Ibanez OM, Mouton D, Oliveira SL, et al. Polygenic control of quantitative antibody responsiveness: restrictions of the multispecific effect related to the selection antigen. Immunogenetics. 1988;28(1):6-12.
15. Hay AM, Howie HL, Gorham JD, et al. Mouse background genetics in biomedical research: The devil's in the details. Transfusion. 2021;61(10):3017-3025.
Haematologica | 108 March 2023 908 LETTER TO THE EDITOR
Dysfunctional subsets of CD39+ T cells, distinct from PD-1+, driven by leukemic extracellular vesicles in myeloid leukemias
The immunosuppressive milieu is a hallmark of cancer, including acute and chronic myeloid leukemia (AML/CML). One of the main features of the immune tumor microenvironment is exhaustion/dysfunction of conventional CD4+ and CD8+ T cells, which hampers their effector function and immune killing of cancer cells. Targeting and reinvigoration of such cells by immune checkpoint blockade in solid tumors has revolutionized cancer therapies. However, in myeloid leukemias, immune checkpoint therapies are yet to yield successful results.1,2 Therefore, the identification of novel subsets of exhausted T cells characterized by the expression of targetable markers could facilitate the development of successful therapies. Here, we demonstrate the emergence of extracellular vesicledriven, dysfunctional CD39+ T cells in peripheral blood in myeloid leukemias. The identified CD39+ subsets were distinct from PD-1+ T cells and were therefore unlike CD39+ cells in solid tumors, where exhausted T cells coexpress these markers.3 The identified subsets could be implemented into diagnostic-immune monitoring schemes or could indicate specific immune checkpoint blockade strategies in myeloid leukemias.
AML and CML exhibit similar immunosuppressive landscapes, despite distinct, and heterogenous molecular backgrounds. Striking similarity of immunological parameters in CML and AML across all hematological malignancies has been evidenced in a direct comparative immunogenomic study4 and includes several features of T-cell exhaustion, especially in the bone marrow (BM) of patients at diagnosis. These include increased abundance of PD-1-, TIM-3-, CTLA-4- and TIGIT-expressing CD4+/CD8+ T cells.5–8 The presence of CD8+PD-1+TIGIT+ cells has been associated with a lack of response to induction chemotherapy in AML.9 On the other hand, several studies have found these subsets, especially PD-1-expressing T cells, to be less abundant in the peripheral blood (PB) than in the BM of patients6,10 and to be unchanged or only moderately higher than in healthy controls.8,9,11 Lack of distinct T-cell exhaustion features in PB hinders immune monitoring and the identification of AML/CML patients who could respond to immunotherapies.
Our previous findings have demonstrated that leukemic extracellular vesicles (EV) drive the progression of myeloid leukemias by promoting heterogenous subsets of regulatory T cells.12 Therefore, we hypothesized that leukemic
EV could also promote the emergence of dysfunctional subsets of effector T cells present in the PB of myeloid leukemia patients. We aimed at finding traits relevant to both AML and CML, due to their similar immunological landscape and to potentially implicate new therapeutic targets that could complement the entire spectrum of tyrosine kinase inhibitors and checkpoint inhibitors applicable in myeloid leukemias. First, we performed deep profiling of T-cell maturation and exhaustion in the PB of acute and chronic myeloid leukemia patients at diagnosis (Online Supplementary Table S1) by high resolution, 15-color flow cytometry, followed by unsupervised FlowSOM clustering to assess changes in T-cell subsets in an unbiased manner (Figure 1A, B; Online Supplementary Figure S1Aa-d and Ba-f). Principal component analysis based on the 14 most differential clusters of CD4+ and CD8+ T cells clearly distinguished leukemic patients from healthy controls. Among the subsets contributing to the separation of leukemic samples were T-cell populations expressing CD39, an ectonucleosidase previously identified on dysfunctional T cells in solid tumors, but not leukemias3,13 (Figure 1B). Statistical analysis of FlowSOM clustering revealed that five subsets of CD4+ cells (Online Supplementary Figure S1Aa) and one cluster of CD8+ cells (Online Supplementary Figure S1Ba-c) were significantly upregulated in leukemic patients. The upregulated clusters were predominantly CD39-expressing populations (Figure 1C; Online Supplementary Figure S2Aa to d) The upregulated CD39 expressing subsets included T cells of different maturation/memory statuses: CCR7+CD45RACD28+CD39+PD-1- central memory (CM) CD4+ cells, CCR7-CD45RA-CD28+CD39+PD-1- and CCR7-CD45RACD28+CD39+PD-1+ transitional memory (TM) CD4+ cells and CCR7-CD45RA-CD28+CD39+PD-1- TM CD8+ cells. The two TM subsets of CD4+ cells and one TM subset of CD8+ cells were nearly undetectable in healthy donors, being considered present only in leukemic patients (Figure 1C; Online Supplementary Figure S2Aa-d). Contrary to what is usually observed in solid tumours,3 several CD39-expressing T-cell subsets that were expanded in myeloid leukemias did not express PD-1, a canonical marker of T-cell exhaustion (Figure 1A, C).
Furthermore, the significant expansion of CD39-expressing cells among the total CD4+ and CD8+ T lymphocytes was confirmed by manual analysis of phenotyping data (Figure 1D; Online Supplementary Figure S2Ae, f) Consist-
Haematologica | 108 March 2023 909 LETTER TO THE EDITOR
ent with previous reports6,9,11 we did not observe expansion of T cells expressing other exhaustion markers in PB of patients, such as PD-1, CTLA-4 and TIGIT (Online Supplementary Figure S1Ae), or cytotoxic T lymphocytes expressing proinflammatory mediators IFN- γ and TNF- a , also relevant in immune checkpoint blockade (Online Supplementary Figure S1Af). Moreover, in order to confirm functional effects and activity of CD39 expressed on T cells, we analyzed plasma levels of adenosine – an immunosuppressive metabolite generated from ATP due to activity of CD39/CD73 axis. Plasma of leukemic patients has contained significantly more adenosine (Figure 1E; Online
Supplementary Figure S2Ag), confirming functional relevance of CD39-expressing cells in myeloid leukemias (though adenosine generation does not have to be limited to CD39/CD73-expressing T cells). Crucially, the abundance of total CD4+CD39+ T cells and the three CD39-expressing TM subsets of CD4+ and CD8+ T cells correlated with the amount of leukemic CD34+ cells in AML/CML patients, revealing a link between these subsets and disease burden (Figure 1F).
Previous work suggested that while exhausted T cells may not be highly abundant in the blood of myeloid leukemia patients, they still make up a significant fraction of T cells

Continued on following page. A B C
Haematologica | 108 March 2023 910 LETTER TO THE EDITOR
Figure 1. CD39+ dysfunctional T cells are a hallmark of myeloid leukemias. (A) UMAP (left) and heatmap (middle) representation of the CD4+ T-cell landscape, with different subsets and clusters (unique colors assigned and indicated next to the heatmap), identified by FlowSOM. The percentage and name of each cluster in the analysis are shown next to the heatmap. Heatmap colors represent the median expression of specified markers for each cluster, with blue representing low expression and red representing high expression. UMAP graphs (right) showing the relative expression of CD39 and PD-1 on CD4+ T cells. Differential analysis and distribution of subsets in individual samples of patients are shown in Online Supplementary Figure S1Aa-d. (B) Principal component analysis (PCA) showing different clustering of samples of healthy donors (Healthy) and acute and chronic myeloid leukemia (AML/CML) patients (Leukemia) based on immunological parameters (top 14 contributing populations of CD4+ and CD8+ T cells identified by FlowSOM). The first 2 PC explained a combined 47.1% of the variance, with 28.7% and 18.4% for the first and second PC, respectively. The graph on the right represents the contributions of specified parameters (immune subsets) to the observed differences, the length and direction of the arrows correlating with the movement of samples across the PC1 and PC2 axes. Parameters in one part of the graph negatively correlate with samples in the contrary region of the PCA graph (C) Abundance of specified subsets of CD4+ and CD8+ T cells, as identified by unsupervised analyses, in AML and CML patients and healthy donors. Mean ± standard deviation (SD) is presented (n=8 AML/CML patients [4 AML, 4 CML] and 8 healthy donors). (D) Representative expression of CD39 on CD8+ T cells from healthy donors and AML/CML patients. Expression of CD39 on CD4+ and CD8+ T cells in AML and CML patients and healthy donors. Mean ± SD is presented, unpaired t-test with Welch’s correction (n=8 AML/CML patients [4 AML, 4 CML] and 8 healthy donors). (E) Adenosine level in plasma of AML/CML patients and healthy donors, shown as relative fluorescence units (RFU) in a fluorometric assay, following fluorescence subtraction of endogenous background samples. Data is plotted as violin plots, with median and quartiles marked with dashed lines, unpaired t-test with Welch’s correction (n=19 AML/CML patients [12 AML, 7 CML] and 12 healthy donors). (F) Linear correlation between the percentage (%) of CD34+ leukemic cells and the percentage (%) of total CD4+CD39+ T cells and the percentage (%) of 3 TM CD39 expressing T-cell subsets in AML/CML patients. The Pearson correlation coefficient was used as a measure of linear correlation between parameters. *P<0.05, **P<0.01, ***P<0.001, ****P<0.0001.
in the leukemic BM.1 In order to gain further insight into dysfunctional CD39+ T cells, we analyzed CD39 expression on non-Treg CD4+ and CD8+ T cells in the BM and spleen in a mouse model of CML-like disease. We also included analyses in our previously developed12 model of Rab27a-deficient CML, with attenuated secretion of EV (Figure 2A). While healthy BM and spleen contained almost no CD39+ cells, a significant fraction of CD39+ T cells appeared in mice with CML-like disease (Figure 2B, C), making up approximately 50% of effector T cells in BM (Figure 2C). Consistent with our data from AML/CML patients, these cells predominantly exhibited an antigen-experienced CD44+ memory phenotype (Figure 2D). Strikingly, expansion of CD39+ cells in mice with CML-like
disease was regulated by EV secretion by leukemic cells (in Rab27a knock-out leukemia), pinpointing the involvement of leukemic EV in the development of this dysfunctional subset (Figure 2C), although other factors, including cytokines (IL-6, IL-12, TGF-β), may also potentially contribute to expansion of these cells. This would corroborate our previous data on the proleukemic influence of leukemic EV and the role of Rab27a in disease progression.12
In order to study whether leukemic EV directly drive the expansion of dysfunctional CD39+ T cells, we sorted human non-Treg CD4+ and CD8+ T cells from healthy donors and treated them with EV released by either CMLK562 or AML-MOLM-14 cells. Leukemic EV significantly upregulated the expression of CD39 on both CD4+ and

D E F
Haematologica | 108 March 2023 911 LETTER TO THE EDITOR
Figure 2. CD39+ dysfunctional T cells expand in the bone marrow and spleen of mice with chronic myeloid leukemia-like disease.

(A) Experimental scheme of experiments in an in vivo model of chronic myeloid leukemia-like (CML-like) disease. (B) Unsupervised tSNE clustering of CD3+ Foxp3- effector T cells from the spleens of control mice, healthy mice (CTRL) and animals with leukemia-like disease. The bottom graph shows the localization of CD4+ CD39+ or CD8+ CD39+ cells on the tSNE map. Data from 3 mice (per group) from a single experiment were used as representative groups. In each group, 30,000 viable CD3+ T cells were clustered, 10,000 from each animal (obtained by downsampling in FlowJo). (C) Expression of CD39 on T cells in the bone marrow (BM) and spleen (SPL) of mice bearing leukemia-like disease. In each graph, data are presented as mean ± standard deviation, one-way ANOVA with Tukey’s post-test. N=6-8 animals per group, from 3 different experiments (different litters/groups of animals and leukemic cell injections). (D) Distribution of naïve and memory subsets of T cells among CD39+ T cells in the BM and SPL of mice with CML-like disease (n=6 animals from 3 different experiments). *P<0.05, **P<0.01, ***P<0.001, ****P<0.0001.
CD8+ T cells ex vivo (Figure 3A). Other markers of T-cell exhaustion, such as PD-1, CTLA-4 and LAG-3, were upregulated by leukemic EV (Online Supplementary Figure S2Ba, b), although PD-1 was not exclusively co-expressed with CD39 (Figure 3A), further corroborating the phenotype of T cells in the PB of leukemic patients (Figure 1C). Primary EV isolated from the plasma of AML/CML patients also triggered CD39 expression by T cells (Figure 3A). In order to evaluate whether phenotypic changes and expansion of CD39+ cells induced by leukemic EV are connected to diminished functionality, we analyzed the secretion of proinflammatory cytokines. T-cell production of the effector cytokines IL-6, IFN-γ (by CD4+ T cells) and TNF-a (by CD8+ T cells) and the myeloid chemoattractant chemokine CCL2 was downregulated following treatment with leukemic CML and AML EV (Figure 3B). This demon-
strates that the functionality of effector T cells is hampered by leukemic extracellular vesicles, concurrently with the dysfunctional/exhausted phenotype. Finally, we verified whether leukemic EV also affect the metabolic capacity of T cells. Activated T cells robustly utilize glycolytic metabolism, whereas exhausted T cells exhibit impaired glycolysis and metabolic dysfunction has been recognized as one of hallmarks of T-cell exhaustion.14 First, we measured the glycolytic rate in non-Treg CD4+ and CD8+ T cells using Seahorse technology. Surprisingly, CD8+ T cells treated with leukemic EV exhibited significantly stronger glycolytic flux (Figure 3C). In order to gain deeper insight into the metabolic profile of T cells, we applied the SCENITHTM assay and flow cytometric barcoding to profile several metabolic processes with single-cell resolution15 (Online Supplementary Figure S2Bc). T cells in
A B C D
Haematologica | 108 March 2023 912 LETTER TO THE EDITOR

Continued on following page. A B C D Haematologica | 108 March 2023 913 LETTER TO THE EDITOR
Figure 3. Leukemic extracellular vesicles promote CD39 expression and dysfunction of effector CD4+ (non-Treg) and CD8+ T cells. (A) Representative expression of CD39 following treatment with chronic myeloid leukemia (CML) extracellular vesicles (EV) (for either non-Treg CD4+ or CD8+ T cells, as specified) and expression of CD39 vs. PD-1 following treatment of CD8+ T cells with acute myeloid leukemia (AML) EV (right). Expression of CD39 on CD4+ (non Treg) and CD8+ T cells cultured with leukemic EV: CML-K562 EV, AML-MOLM-14 EV and primary EV from the plasma of leukemia AML/CML patients. For CML-K562 and AML-MOLM14 EV, data are from 4-5 experiments (n=4-5). For plasma EV, n=8 AML/CML patients (3 AML, 5 CML) and 8 healthy donors, the mean ± SD is presented, unpaired t-test with Welch’s correction. (B) Secretion of effector cytokines (pg/mL, calculated per 1x10⁵ cells, final concentration shown on graphs) detected in culture medium of CD4+ (non-Treg) and CD8+ T cells cultured with CMLK562 EV and AML-MOLM-14 EV. Data are from 3-4 experiments (n=3-4, except CCL2 secretion by CD8+ cells treated with AML EV, where n=2). Two-tailed ratio paired t-test. (C) Representative curves of extracellular acidification rate (ECAR) of CD4+ (nonTreg) and CD8+ cells in control conditions and following treatment with CML EV. ECAR was measured under basal conditions and following treatment with rotenone/antimycin (Rot/AA) and 2-deoxyglucose (DG). Basal and compensatory (following Rot/AA) glycolysis/ECAR quantified for CD4+ (non-Treg) and CD8+ cells. (D) Representative histograms for puromycin staining in the SCENITHTM assay in control and CML EV-treated CD8+ T cells under control conditions (CO) and following treatment with DG, oligomycin (O) and deoxyglucose+oligomycin (DGO). Glycolytic capacity calculated for CD4+ (non Treg) and CD8+ T cells in the SCENITHTM assay. For (C, D), the data are from 4 experiments (n=4). For (A-D), samples were paired that were used to treat the same batch of (primary) T cells, two-tailed paired t-test. *P<0.05, **P<0.01, ***P<0.001. For experiments with plasma EV in (A), primary cells from 3 donors were used, so pairing was not performed.
ex vivo cultures exhibited almost complete dependence on glucose as an energy source, but in CD8+ cells, some of the energetic output was also due to mitochondrial respiration (Online Supplementary Figure S2Bd, e). Following treatment with leukemic EV, CD8+ T cells no longer exhibited mitochondrial metabolism and were entirely glycolytic (Figure 3D), consistent with the changes observed in Seahorse experiments (Figure 3C). These results suggest that leukemic EV paradoxically promote a more effector-cell-like, glycolytic metabolism in dysfunctional T cells which might constitute a rescue mechanism to maintain an activated phenotype. On the other hand, increased dependence on glycolysis may render effector CD8+ T cells more susceptible to a glucose-deficient tumor/leukemia microenvironment. The observed increase in glycolytic capacity may also be explained by the fact that leukemic EV shuttle glycolytic enzymes (Online Supplementary Figure S2Bf, g), as observed in mass spectrometry analysis of CML EV proteome, performed initially in our previous study.12
Taken together, our data show that different subsets of CD39+ effector CD4+ and CD8+ T cells constitute hallmarks of acute and chronic myeloid leukemia. The three identified transitional memory subsets were present exclusively in leukemic patients and correlated with leukemic burden. This finding indicates their potential relevance for disease monitoring, especially as exhausted subsets of T cells expressing PD-1 and TIGIT were not observed in the PB of patients, either in this study or in others. 8,9,11 Importantly for immunotherapeutic solutions in AML/CML, three of four CD39-expressing subsets more abundant in myeloid neoplasms did not express PD-1. They could thus constitute a pool of dysfunctional T cells not responding to anti PD-1/PDL1 antibodies that are therefore resistant to therapy. CD39 expression was also observed on AML blasts, which facilitated cytarabine resistance in immunodeficient models.16 CD39 could therefore be a relevant
therapeutic target to mediate both immune and nonimmune eradication of leukemic cells. While our study was limited to a small group of leukemic patients and lacked longitudinal monitoring, we linked the expansion of dysfunctional CD39+ T cells with the burden of CD34+ cells in patients, as well as with Rab27a secretion of EV and disease progression in vivo , which further strengthens our conclusions. We have previously shown that diminished EV secretion (Rab27a deficiency) by leukemic cells attenuated engraftment of leukemic cells in a mouse model of CML-like disease, by promoting effector regulatory T cells, but not suppressive myeloid or B cells.12 CD39-expressing T cells thus constitute another immune cell population that contributes to the observed phenomena. Our findings refer to both AML and CML, and could therefore benefit treatments of both myeloid leukemias, also in combination with tyrosine kinase inhibitors which target specific mutations. Collectively, CD39+ dysfunctional T cells and their specific subsets expand in the PB of patients with myeloid leukemias, due to the influence of leukemic extracellular vesicles. We postulate that the identified subsets of CD39+ T cells can thus both have diagnostic value and be a potential therapeutic target.
Authors
Julian Swatler,1,2 Domenico Lo Tartaro,2 Rebecca Borella,2 Marta Brewinska-Olchowik,1 Annamaria Paolini,2 Anita Neroni,2 Laura TurosKorgul,1 Milena Wiech,1 Ewa Kozlowska,3 Dominik Cysewski,4° Wioleta Grabowska-Pyrzewicz,5 Urszula Wojda,5 Grzegorz Basak,6 Rafael J. Argüello,7 Andrea Cossarizza,2,8 Sara De Biasi2# and Katarzyna Piwocka1#
1Laboratory of Cytometry, Nencki Institute of Experimental Biology, Warsaw, Poland; 2Department of Medical and Surgical Sciences for
Haematologica | 108 March 2023 914 LETTER TO THE EDITOR
Children & Adults, University of Modena and Reggio Emilia, Modena, Italy; 3Department of Immunology, Faculty of Biology, University of Warsaw, Warsaw, Poland; 4Laboratory of Mass Spectrometry, Institute of Biochemistry and Biophysics, Warsaw, Poland; 5Laboratory of Preclinical Testing of Higher Standard, Nencki Institute of Experimental Biology, Warsaw, Poland; 6Department of Hematology, Transplantation and Internal Medicine, Medical University of Warsaw, Warsaw, Poland; 7Aix Marseille University, CNRS, INSERM, CIML, Centre d’Immunologie de Marseille-Luminy, Marseille, France and 8National Institute for Cardiovascular Research, Bologna, Italy
°Current address: Clinical Research Center, Medical University of Bialystok, Bialystok, Poland.
#SDB and KP contributed equally as co-senior authors.
Correspondence:
K. PIWOCKA - k.piwocka@nencki.edu.pl
S. DE BIASI - debiasisara@yahoo.it
https://doi.org/10.3324/haematol.2022.281713
Received: July 5, 2022.
Accepted: November 3, 2022.
Early view: November 17, 2022.
©2023 Ferrata Storti Foundation
Published under a CC BY-NC license
Disclosures
No conflicts of interest to disclose.
Contributions
JS and DLT performed phenotyping of T cells from patients; DLT, JS,
References
1. Goswami M, Gui G, Dillon LW, et al. Pembrolizumab and decitabine for refractory or relapsed acute myeloid leukemia. J Immunother Cancer. 2022;10(1):e003392.
2. Hsieh Y-C, Kirschner K, Copland M. Improving outcomes in chronic myeloid leukemia through harnessing the immunological landscape. Leukemia. 2021;35(5):1229-1242.
3. Bengsch B, Ohtani T, Khan O, et al. Epigenomic-guided mass cytometry profiling reveals disease-specific features of exhausted CD8 T cells. Immunity. 2018;48(5):1029-1045.
4. Dufva O, Pölönen P, Brück O, et al. Immunogenomic landscape of hematological malignancies. Cancer Cell. 2020;38(3):380-399.e13.
5. Li Z, Philip M, Ferrell PB. Alterations of T-cell-mediated immunity in acute myeloid leukemia. Oncogene. 2020;39(18):3611-3619.
6. Brück O, Blom S, Dufva O, et al. Immune cell contexture in the bone marrow tumor microenvironment impacts therapy response in CML. Leukemia. 2018;32(7):1643-1656.
7. Brück O, Dufva O, Hohtari H, et al. Immune profiles in acute
RJA, SDB and AC analyzed and discussed flow cytometry data; JS, RB, MBO, AP, AN, LTK and MW performed ex vivo experiments; JS, LTK and EK performed in vivo experiments; JS, DC performed proteomic analysis; UW, WG-P and GB provided primary material; JS, SDB, AC and KP conceptualized and supervised the project and experiments; JS prepared figures and the manuscript draft; JS, SDB, AC and KP prepared and reviewed the final version of the manuscript. All authors have read and agreed to the published version of the manuscript.
Acknowledgments
The authors would like to thank Ewa Wąsiewicz for collecting clinical samples from leukemic patients and thank all the patients who donated blood for this study. The authors would like to acknowledge Magdalena Lebiedzinska-Arciszewska, PhD (Laboratory of Mitochondrial Biology and Metabolism, Nencki Institute) for help with adenosine measurements.
Funding
This work was supported by EMBO Scientific Exchange Grant (short-term fellowship) STF 8905 (to JS), Polish National Science Center grant 2018/29/N/NZ3/01754 (to JS) and Foundation for Polish Science grant TEAM TECH Core Facility Plus/2017-2/2 (POIR.04.04.00-00-23C2/17-00, co-financed by the European Union under the European Regional Development Fund) (to KP). SDB was the Marylou Ingram Scholar of the International Society for Advancement of Cytometry (ISAC) for the period 2016–2020. RJA is the Marylou Ingram Scholar of the International Society for Advancement of Cytometry (ISAC) for the period 2020–2023.
Data-sharing statement
The experimental methods and protocols are available upon request to the corresponding authors.
myeloid leukemia bone marrow associate with patient age, Tcell receptor clonality, and survival. Blood Adv. 2020;4(2):274-286.
8. Knaus HA, Berglund S, Hackl H, et al. Signatures of CD8+ T cell dysfunction in AML patients and their reversibility with response to chemotherapy. JCI Insight. 2018;3(21):e120974.
9. Wang M, Bu J, Zhou M, et al. CD8 + T cells expressing both PD-1 and TIGIT but not CD226 are dysfunctional in acute myeloid leukemia (AML) patients. Clin Immunol. 2018;190:64-73.
10. Jia B, Wang L, Claxton DF, et al. Bone marrow CD8 T cells express high frequency of PD-1 and exhibit reduced antileukemia response in newly diagnosed AML patients. Blood Cancer J. 2018;8(3):34.
11. Abolhalaj M, Sincic V, Lilljebjörn H, et al. Transcriptional profiling demonstrates altered characteristics of CD8 + cytotoxic T-cells and regulatory T-cells in TP53 -mutated acute myeloid leukemia. Cancer Med. 2022;11(15):3023-3032.
12. Swatler J, Turos-Korgul L, Brewinska-Olchowik M, et al. 4-1BBL–containing leukemic extracellular vesicles promote
Haematologica | 108 March 2023 915 LETTER TO THE EDITOR
immunosuppressive effector regulatory T cells. Blood Adv. 2022;6(6):1879-1894.
13. Li H, van der Leun AM, Yofe I, et al. Dysfunctional CD8 T cells form a proliferative, dynamically regulated compartment within human melanoma. Cell. 2019;176(4):775-789.
14. Franco F, Jaccard A, Romero P, Yu Y-R, Ho P-C. Metabolic and epigenetic regulation of T-cell exhaustion. Nat Metab. 2020;2(10):1001-1012.
15. Argüello RJ, Combes AJ, Char R, et al. SCENITH: a flow cytometry-based method to functionally profile energy metabolism with single-cell resolution. Cell Metab. 2020;32(6):1063-1075.
16. Aroua N, Boet E, Ghisi M, et al. Extracellular ATP and CD39 activate cAMP-mediated mitochondrial stress response to promote cytarabine resistance in acute myeloid leukemia. Cancer Discov. 2020;10(10):1544-1565.
Haematologica | 108 March 2023 916 LETTER TO THE EDITOR
Clonal hematopoiesis in diffuse large B-cell lymphoma: clinical impact and genetic relatedness to lymphoma and therapy-related myeloid neoplasm
Clonal hematopoiesis (CH) is an age-related phenomenon characterized by the overrepresentation of blood cells derived from a single clone, conferring an increased risk of myeloid neoplasms (MN), cardiovascular disease, and death from non-hematological malignancies.1,2 Recent work demonstrated a high prevalence of CH that divergently evolves to lymphoma and MN in patients with angioimmunoblastic T-cell lymphoma (AITL).3 Several studies have shown CH occurs in 10-30% of patients with B-cell lymphoma (BCL).4,5 Whether CH impacts the outcome of BCL remains controversial.4,5 Moreover, whether CH clones divergently evolve to BCL and MN is unclear. Herein, we evaluated a cohort of patients with diffuse large B-cell lymphoma (DLBCL) and high-grade B-cell lymphoma (HGBCL) who were analyzed for mutations using a targeted next-generation sequencing (NGS) panel covering 400 genes (MSK-IMPACT).6 We aimed to investigate: i) the prevalence of CH and its impact on outcome; ii) the risk of t-MN in patients harboring CH mutations; iii) the possibility of divergent clonal evolution from CH to BCL and MN.
NGS data on diagnostic tissue between January 2015 and September 2021 were available for 362 (94%) DLBCL and 23 (6%) HGBCL patients. Among DLBCL, 187 (48.5%) were of germinal center B-cell (GCB) subtype and 173 (45%) of non-GCB subtype and two (0.5%) without an available immunophenotype. Median age was 64 years (range, 19-95) at the time of lymphoma diagnosis and 65 years (range, 2095) at the time of CH detection. Time points for CH detection were variable due to the retrospective nature of the study: 206 and 179 patients were tested after and before chemotherapy, respectively. One hundred and twentyseven patients had paired MSK-IMPACT performed on uninvolved bone marrow (BM) or peripheral blood (PB) (Online Supplementary Figure S1). For cases with paired analysis, a 0.01 variant allele frequency (VAF) cutoff in BM/PB was used for CH calling.5,7,8 In this subgroup, CH was present in 37 of 127 (29%) patients and absent in 90 of 127 (71%) (referred to as CH+ and CH- cohorts, respectively). For the 258 cases without paired analysis, CH calling was performed using NGS data from lymphoma tissue and/or saliva samples based on the following criteria suggesting tissue infiltration by blood: i) variants were reported as common in CH genes in the literature;9 and ii) variants had a VAF <1/10 of the highest VAF of any DLBCL-associated mutation in lymphoma tissue. As a result, 17 (7%) and 241 (93%) patients were classified as CH+ and CH-, respectively. Overall, the CH prevalence was 14% (54/385).
The most common CH mutations were DNMT3A (20/54; 37%), TET2 (13/54; 24%), TP53 (12/54; 22%), PPM1D (7/54; 13%) and ASXL1 (7/54; 13%). The VAF of the CH mutations ranged from 0.01 to 0.28 (Online Supplementary Figure S2). No significant association between the highest VAF and age at CH detection was seen (P=0.9). Twenty-seven patients had VAF ≥0.05 in any CH and 11 had >2 CH. Twentyone patients harbored CH in DNA-repair pathway genes (TP53, PPM1D, CHEK2 and ATM).
CH+ patients were significantly older at the time points of DLBCL diagnosis (median age 70 years vs. 63 years; P<0.01) and CH detection (71 years vs. 64 years; P<0.01) as compared to CH- patients. There were no significant differences in CBC, B symptoms, lactate dehydrogenase (LDH) levels, age-adjusted International Prognostic Index (IPI), disease stage, Ki-67, DLBCL subtype, treatment regimen, tolerance to chemotherapy (absolute neutrophil count [ANC] or BM reserve post chemotherapy) between CH+ and CH- patients (Table1)
Effects of CH on overall survival (OS) were assessed using a multivariable Cox proportional hazard model adjusted for age at diagnosis (modeled with splines with 4 degrees of freedom) and stratified by CH calling method. Significance of associations was evaluated by likelihood ratio test. A P value <0.05 was considered significant. With a median follow-up of 44 months after treatment initiation, the median OS was 69 months (95% confidence interval [CI]: 57-151) for all patients. CH+ patients had inferior survival compared to CH- patients (median OS 46 months, 95% CI: 17not reached [NR] vs. 72 months, 95% CI: 61-NR). Differences in OS were also observed between CH- patients and CH+ patients without mutations in the DNA repair pathway (51 months, 95% CI: 16-NR), and CH+ patients with mutations in the DNA repair pathway (30 months, 95% CI: 14-NR). Patients harboring a CH with a VAF ≥0.05 had inferior survival compared to those whose VAF were all <0.05 (16 months, 95% CI: 10-NR vs. 59 months, 95% CI: 51-NR). Similarly, although cases were limited, >2 CH (24 months, 95% CI: 13-NR vs. 58 months, 95% CI: 17-NR) and TP53 CH (24 months, 95% CI: 11-NR vs. 51 months, 95% CI: 17-NR) were associated with inferior outcomes (Figure 1A-D). However, after age adjustment, the presence of CH, DNA repair pathway CH, and TP53 CH were not significantly associated with OS; although CH with a VAF ≥0.05 and >2 CH showed strong trends towards worse OS (Figure 1E). Analysis on separated paired and unpaired cohorts showed similar impact on survival by CH (data not shown).
Haematologica | 108 March 2023 917 LETTER TO THE EDITOR
N (%)
Patients’ characteristics are summarized by frequency (percentage [%]). Associations between clonal hematopoiesis (CH) status and disease characteristics were tested by Fisher’s exact test. High-grade B-cell lymphoma (HGBCL) refers to diffuse large cell pattern but with MYC, BCL2 and/or BCL6 gene rearrangements. *Severity of neutropenia post first-line diffuse large B-cell lymphoma (DLBCL) chemotherapy when available. Neutropenia: severe (<0.5x10⁹/L); moderate (0.5-<1.0x10⁹/L); mild (1.0-<1.5x10⁹/L); within normal limit (WNL): (≥1.5x10⁹/L). **Bone marrow (BM) cellularity (hypocellular: reduced marrow cellularity after age-adjustment; normocellular or hypercellular: normal or increased marrow cellularity after ageadjustment) at the time point of worst neutropenia (nadir) post DLBCL chemotherapy. M: male; F: female; CBC: complete blood count; LDH: lactate dehydrogenase; na: not available; GCB: germinal-center B cell; WBC: white blood cell; ANC: absolute neutrophil count; PLT: platelet; RCHOP: rituximab plus cyclophosphamide-doxorubicin vincristine prednisone; DA-R-EPOCH: dose-adjusted rituximab etoposide prednisolone vincistrine cyclophosphamide doxorubicin; IPI: International Prognostic Index.
Entire cohort Total N=385 CH+ N=54 CHN=331 P value Age in years at DLBCL diagnosis, N (%) <55 55-70 >70 110 157 118 7 (6) 21 (13) 26 (22) 103 (94) 136 (87) 92 (78) <0.01 Age in years at CH testing, N (%) <55 55-70 >70 100 150 135 5 (5) 20 (13) 29 (21) 95 (95) 130 (87) 106 (79) <0.01 M/F 223/162 33/21 190/141 0.9 CBC at diagnosis, median (range) WBC (x109/L) ANC (x109/L) HGB (g/dL) PLT (x109/L) 7.0 (0.9-39.5) 4.6 (0.1-29.5) 12.6 (6.6-19.0) 236 (23-785) 7.0 (1.0-39.5) 3.8 (0.2-14.7) 12.3 (8.8-16.0) 209 (41-753) 7.0 (0.9-36.8) 4.6 (0.1-29.5) 12.7 (6.6-19.0) 237 (23-785) 0.7 0.1 0.4 0.1 Neutropenia post chemotherapy,* N (%) Severe Moderate Mild WNL 12 12 11 281 1 (8) 2 (17) 3 (27) 43 (15) 11 (92) 10 (83) 8 (73) 238 (85) 0.7 BM cellularity,** N (%) Hypocellular Normocellular or hypercellular na 43 142 200 10 (23) 25 (18) 19 (10) 33 (77) 117 (82) 181 (90) 0.1 B Symptoms, N (%) Yes No na 110 186 89 15 (14) 21 (11) 18 (20) 95 (86) 165 (89) 71 (80) 0.8 High LDH, N (%) Yes No na 163 145 77 24 (15) 21 (14) 9 (12) 139 (85) 124 (86) 68 (88) 0.8 DLBCL subtypes, N (%) GCB Non-GCB HGBCL na 187 173 23 2 22 (12) 26 (15) 6 (26) 0 (0) 165 (88) 147 (85) 17 (74) 2 (100) 0.9 High Ki67 (≥70%), N (%) Yes No na 233 116 36 39 (17) 12 (10) 3 (8) 194 (83) 104 (90) 33 (92) 0.4 Stages at diagnosis, N (%) I/II III/IV na 124 216 45 14 (11) 38 (18) 2 (4) 110 (89) 178 (82) 43 (96) 0.4 ≥2 age-adjusted IPI, N (%) Yes No na 173 92 120 24 (14) 12 (13) 18 (15) 149 (86) 80 (87) 102 (85) 1.0 Initial chemotherapy, N (%) R-CHOP DA-R-EPOCH Clinical trial Others 248 70 28 39 29 (12) 13 (19) 4 (14) 8 (21) 219 (88) 57 (81) 24 (86) 31 (79) 0.2 CH
chemotherapy),
Before After 179 206 12 (7) 42 (20) 167 (93) 164 (80) 0.001 Auto/allo-SCT, N (%) 87 10 (11) 77 (89) 0.7
testing time point (to
Table 1. Histopathological and clinical features of the 385 cases.
Haematologica | 108 March 2023 918 LETTER TO THE EDITOR
Figure 1. Impact of clonal hematopoiesis mutations on patients’ survival. Overall survival (OS) was evaluated by Kaplan-Meier method with left truncation at the time of clonal hematopoiesis (CH) testing to account for CH detection performed after the start of firstline chemotherapy for diffuse large B-cell lymphoma (DLBCL) and high-grade B-cell lymphoma (HGBCL). Although CH with a variant allele frequency (VAF) ≥5% and a higher number of CH mutations (>2) appeared to be associated with inferior OS; based on the calculated P value (≥0.05) after age adjustment, the presence of CH, any CH in DNA repair pathway, and TP53 CH did not show a significant association with OS while CH with a VAF ≥5% and a higher number of CH mutations (>2) showed strong trends towards inferior OS. (A) Impact of all CH mutations on OS (CH+: VAF≥1%; CH-: VAF <1% or absent). (B) Impact of TP53 CH mutations on OS (CH+(Y): CH+ and TP53 CH present; CH+(N): CH+ and TP53 CH absent; CH-: VAF<1% or absent). (C) Impact of VAF of CH mutations on OS [CH+(Y): CH+ with VAF ≥5% in any CH; CH+(N): CH+ with VAF<5% in all CH; CH-: VAF<1% or absent). (D) Impact of number of CH mutations on OS (CH+(Y): CH+ with >2 CH mutations; CH+(N): CH+ with ≤2 CH mutations; CH-: VAF<1% or absent). (E) Multivariable analysis of CH parameters associated with OS in the 385 DLBCL and HGBCL patients. All statistical analyses were performed using R.

A B C E D Haematologica | 108 March 2023 919 LETTER TO THE EDITOR
We observed seven patients with concurrent or subsequent diagnosis of MN (t-MN [n=5], CML [n=1], Phnegative MPN [n=1]). Four of five t-MN cases were CH+ (7% vs. 0.3% in CH- cohort) with time to t-MN development significantly shorter for CH+ patients (P<0.001), suggesting an increased risk of t-MN in CH+ patients. Risk of MN development appeared to be higher in CH+ patients with TP53 CH alone (17% [2/12] vs. 5% [2/42]), although statistical analysis was not performed due to limited t-MN cases. Of note, the CH- patient who developed t-MDS 29 months post CH detection harbored a TP53 mutation (VAF =0.90) in the diagnostic BM. Review of the patient’s prior lymphoma and saliva samples demonstrated the same TP53 with a VAF of 0.002, below the 0.01 cutoff for CH calling (Figure 2).
In order to study the clonal relationship between CH and BCL, corresponding lymphoma tissue were assessed for the CH mutations detected in BM/PB of CH+ patients with paired analysis. Although some CH genes were also mutated in the lymphomas, such as TP53, ASXL1, TET2, SF3B1
and ZRSR2, these mutations were not identical to those detected in BM/PB. All CH mutations present in uninvolved BM/PB were either absent or present at extremely low VAF (<0.005) in lymphoma samples, suggesting blood infiltration of the tissue. In addition, none of the mutations identified in the lymphoma samples were seen in normal BM/PB (Figure 2; Online Supplementary Table S1). We also did not detect shared mutations among t-MN and DLBCL in the same patients. These results indicate clonal unrelatedness between CH/t-MN and DLBCL. NGS studies on all lymphoma tissue (Figure 2A; Online Supplementary Figure 2F) demonstrated a similar mutational profile to those reported in litereature.10
Limited studies are available on the prevalence and clinical significance of CH in DLBCL patients. CH was identified in 12% of HGBCL patients at diagnosis, using a VAF cutoff of 0.05, who demonstrated a trend towards inferior PFS and OS,4 and in 6.5% of DLBCL patients (VAF cutoff 0.1), which was associated with inferior EFS but not OS.11 In our cohort, the high CH prevalence (29%) in patients’
Figure 2. Mutational profiles of lymphoma, clonal hematopoiesis and myeloid neoplasm clones. (A) Mutational profiles of clonal hematopoiesis (CH) and lymphoma clones in 54 CH+ patients. Bone marrow/peripheral blood (BM/PB): cases with paired nextgeneration sequencing (NGS) study on patients’ uninvolved BM or PB samples; unmatched: cases without paired NGS study on patients’ BM or PB samples. (B) Mutational profiles of lymphoma (gray), CH (orange) and myeloid neoplasm (MN) (blue) clones in 7 patients with MN. NS: saliva. Time intervals between CH detection and MN development are shown.

A B
Haematologica | 108 March 2023 920 LETTER TO THE EDITOR
uninvolved BM/PB is related to low VAF cutoff (0.01) and post-treatment testing. The negative impact on outcomes by CH was largely attributed to the older age of CH+ compared to CH- patients as shown in previous studies.4,11 Nevertheless, our data showed evidence suggestive of an association between OS and CH mutations with VAF ≥0.05 and a higher number of CH (>2), which is similar to another study with all types of BCL undergoing autologous stem cell transplant.12 Although CH was not associated with the degree of post-chemotherapy cytopenia in our study, a recent study has shown that CH mutations especially DNMT3A, TET2 and ASXL1 are associated with increased neurotoxicity in BCL patients treated with chimeric antigen receptor (CAR) T-cell therapy.13 Therefore, the impact of CH on treatment related toxicity warrants further study.
Our study showed that CH may increase the risk for t-MN in DLBCL/HGBCL, consistent with the well-recognized elevated risk of hematologic malignancy in CH.1,7 Not surprisingly, all five t-MN in our study evolved from CH clones detected at earlier time points at low levels (VAF 0.0020.02), indicating selective pressure of chemotherapy for expanding pre-existing CH clones, leading to t-MN development. In contrast to the divergent evolution described in AITL,3 we found no evidence of clonal relatedness between CH/MN and BCL. Although a recent study of CH in classic Hodgkin lymphoma showed one case with DNMT3A/TET2 double mutations present both as tissue CH and in EBV+ neoplastic clone, evidence of CH in PB/BM myeloid cells was not demonstrated and it is unclear whether EBV infection played an etiologic role.14 Similarly, although a common stem cell origin of both MDS and plasma cell neoplasm (PCN) has been proposed, a recent study didn’t show evidence of shared mutations between MDS and PCN.15 DNMT3A and TET2 mutations in CH have been differentially detected in normal T cells, but also in myeloid and B-cell lineages at equally high rates.16 Therefore, the lack of evidence for divergent clonal evolution of CH to myeloid and B neoplasms is intriguing and warrants sequencing studies on purified populations. Of note, a recent study showed incompatibility between TET2 deficiency and AID-induced demethylation, which may partially explain the lack of clonal relatedness between CH and lymphoma.17
The uniform diagnoses, NGS analyses and treatment among our patient cohort is a strength of this study. However, due to its retrospective nature, time points of CH testing were variable and not all patients had sequencing data from uninvolved BM/PB, limiting accurate measurement of CH prevalence and the statistical power of outcome analysis. The prevalence of CH based on lymphoma and saliva sequencing data is likely to be underestimated due to low-level or lack of blood infiltration in such samples. Nevertheless, our study has addressed several
questions including: i) the prevalence of CH in DLBCL/HGBCL patients is high; and a higher number of CH mutations (>2) and CH with VAF ≥0.05 show strong trends towards inferior clinical outcome after age adjustment; ii) patients harboring CH mutations have an increased risk of developing t-MN; iii) there is no evidence of clonal relatedness between CH/t-MN and DLBCL. Collectively, our study provides new insights into the impact of CH in DLBCL, risk of t-MN development and the clonal relationships among these entities.
Authors
Ying Liu,1,2 Andriy Derkach,3 Natasha Lewis,1 Menglei Zhu,1,2 Yanming Zhang,4 Maria Arcila,1,2 Gilles Salles,5 Ahmet Dogan1 and Wenbin Xiao1
1Department of Pathology and Laboratory Medicine, Hematopathology Service; 2Department of Pathology and Laboratory Medicine, Molecular Diagnostic Service; 3Department of Epidemiology and Biostatistics; 4Department of Pathology and Laboratory Medicine, Cytogenetics Laboratory and 5Department of Medicine, Lymphoma Service, Memorial Sloan Kettering Cancer Center, New York, NY, USA
Correspondence: Y. LIU - Liuy6@mskcc.org
W. XIAO - Xiaow@mskcc.org
https://doi.org/10.3324/haematol.2022.281724
Received: July 6, 2022.
Accepted: November 10, 2022
Early view: November 17, 2022
©2023 Ferrata Storti Foundation
Published under a CC BY-NC license
Disclosures
WX has received research support from Stemline Therapeutics. AD has received consulting fees from Seattle Genetics, EUSA Pharma, PER, LOXO and research support from Roche and Takeda.
Contributions
YL, ADo and WX conceived the study; YL, ADe and WX analyzed the data and wrote the manuscript; YL, NL, MZ, MA and GS collected and annotated the data; YZ reviewed cytogenetic data. All the authors approved the final version of the manuscript.
Funding
This study was funded by the Center for Hematologic Malignancies at MSKCC and in part through the NIH/NCI Cancer Center Support grant P30 CA008748. WX is supported by a grant from Alex’s
Haematologica | 108 March 2023 921 LETTER TO THE EDITOR
Lemonade Stand Foundation and the Runx1 Research Program, MSK Leukemia SPORE Career Enhancement Program and a National Cancer Institute grant K08CA267058-01.
References
1. Abelson S, Collord G, Ng SWK, et al. Prediction of acute myeloid leukaemia risk in healthy individuals. Nature. 2018;559(7714):400-404.
2. Jaiswal S, Natarajan P, Silver AJ, et al. Clonal hematopoiesis and risk of atherosclerotic cardiovascular disease. N Engl J Med. 2017;377(2):111-121.
3. Lewis NE, Petrova-Drus K, Huet S, et al. Clonal hematopoiesis in angioimmunoblastic T-cell lymphoma with divergent evolution to myeloid neoplasms. Blood Adv. 2020;4(10):22612271.
4. Amini R-M, Ljungström V, Abdulla M, et al. Clonal hematopoiesis in patients with high-grade B-cell lymphoma is associated with inferior outcome. Am J Hematol. 2020 Jul 6. doi: 10.1002/ajh.25927. [Epub ahead of print].
5. Eskelund CW, Husby S, Favero F, et al. Clonal hematopoiesis evolves from pretreatment clones and stabilizes after end of chemotherapy in patients with MCL. Blood. 2020;135(22):20002004.
6. Cheng DT, Mitchell TN, Zehir A, et al. Memorial Sloan Ketteringintegrated mutation profiling of actionable cancer targets (MSK-IMPACT): a hybridization capture-based next-generation sequencing clinical assay for solid tumor molecular oncology. J Mol Diagn. 2015;17(3):251-264.
7. Desai P, Mencia-Trinchant N, Savenkov O, et al. Somatic mutations precede acute myeloid leukemia years before diagnosis. Nat Med. 2018;24(7):1015-1023.
8. Guermouche H, Ravalet N, Gallay N, et al. High prevalence of clonal hematopoiesis in the blood and bone marrow of healthy volunteers. Blood Adv. 2020;4(15):3550-3557.
9. Steensma DP. Clinical consequences of clonal hematopoiesis
Data-sharing statement
We will make our original data and protocols available to other investigators without unreasonable restrictions.
of indeterminate potential. Blood Adv. 2018;2(22):3404-3410.
10. Chapuy B, Stewart C, Dunford AJ, et al. Molecular subtypes of diffuse large B cell lymphoma are associated with distinct pathogenic mechanisms and outcomes. Nat Med. 2018;24(5):679-690.
11. Nicholas J. Boddicker PD, Mithun Vinod Shah, et al. Clonal somatic mutations are a biomarker for inferior prognosis in diffuse large B-cell lymphoma. Blood. 2020;136(Suppl 1):S26-27.
12. Husby S, Favero F, Nielsen C, et al. Clinical impact of clonal hematopoiesis in patients with lymphoma undergoing ASCT: a national population-based cohort study. Leukemia. 2020;34(12):3256-3268.
13. Saini NY, Swoboda DM, Greenbaum U, et al. Clonal hematopoiesis is associated with increased risk of severe neurotoxicity in axicabtagene ciloleucel therapy of large B-cell lymphoma. Blood Cancer Discov. 2022;3(5):385-393.
14. Venanzi A, Marra A, Schiavoni G, et al. Dissecting clonal hematopoiesis in tissues of classical Hodgkin lymphoma patients. Blood Cancer Discov. 2021;2(3):216-225.
15. Klimkowska M, Nannya Y, Gran C, et al. Absence of a common founder mutation in patients with cooccurring myelodysplastic syndrome and plasma cell disorder. Blood. 2021;137(9):1260-1263.
16. Buscarlet M, Provost S, Zada YF, et al. Lineage restriction analyses in CHIP indicate myeloid bias for TET2 and multipotent stem cell origin for DNMT3A. Blood. 2018;132(3):277-280.
17. Rosikiewicz W, Chen X, Dominguez PM, et al. TET2 deficiency reprograms the germinal center B cell epigenome and silences genes linked to lymphomagenesis. Sci Adv. 2020;6(25):eaay5872.
Haematologica | 108 March 2023 922 LETTER TO THE EDITOR
COVID-19 pandemic affects the ability of negative D-dimer to identify venous thromboembolism patients at low risk of recurrence: insights from the Apidulcis study
The results of the Apidulcis study (clinicaltrials gov. Identifier: NCT03678506), recently published in Blood Advances,1 confirmed the high efficacy and safety of extended anticoagulant treatment with a reduced dose of Apixaban (2.5 mg twice a day) in patients (n=446) who had a positive D-dimer test after a single venous thromboembolic (VTE) event during standard anticoagulant therapy or within 2 months after its discontinuation. However, the study also showed that negative D-dimer results failed to identify patients in whom an extended anticoagulation might be safely avoided. Indeed, in patients with negative D-dimer at the time of inclusion in the study (n=286), who remained off anticoagulation, a high incidence of primary outcomes – almost completely represented by recurrent VTE events - was recorded (incidence: 6.2x100 patients/year; 95% confidence interval [CI]: 3.9-9.5). This incidence was not only higher than expected based on observations from previous studies,2,3 but also higher if compared with results obtained in a similarly designed study (3.0x100 patients/year; 95% CI: 2.0-4.4).4 Furthermore, the incidence of VTE events was much higher than that recorded in patients who continued anticoagulation with reduced-dose Apixaban (0.9x100 patients/year; 95% CI: 0.3-2.2). In line with the per protocol stopping rule, the significant difference between the rates of primary outcomes in the two groups led to a premature interruption of the study in December 2021.
We were surprised by the high incidence of recurrent VTE events in patients with persistently negative D-dimer re-
sults and, after the publication of the main report, we explored potential reasons which may have contributed to these findings.
We hypothesized that SARS-CoV-2 infection, which became widespread in Italy while the Apidulcis study was ongoing, might have influenced the above-mentioned results. The recruitment of patients in the study began in August 2018 (see Figure 1); however, much of the study was concomitant to the initial phase (the first affected patient in Italy was diagnosed at the end of February 2020) and the SARS-CoV-2 infection spread during the subsequent months, through all of 2021. As shown in Figure 1, only three thrombotic events (red bars) occurred before the pandemic, while the 16 remaining events occurred during the pandemic. As reported in Table 1, the incidence of recurrences was significantly higher in the last year of the study period, concomitant with the spread of the virus. We also invited all participant investigators to collect information from the patients who had a negative serial D-dimer test at inclusion about possible SARS-CoV-2 infection occurring during the follow-up. Information was gathered from n=258 (90.2%) patients of the 286 with a negative D-dimer test, including all 16 patients who had recurrent events during the pandemic. Three recurrences occurred among the 32 patients who had a positive COVID-19 test during follow-up; while 13 events occurred in the 226 who tested negative. The incidence was 10.3% patients/year; 95% CI: 2.1-30.3 and 6.1% patients/year; 95% CI: 3.2-10.4, respectively.
Figure 1. Recurrent venous thromboembolic events in relation to the number of COVID-19 patients in Italy during the time course of the Apidulcis study. Patient inclusion started in August 2018 and stopped in December 2021. The graph shows recurrent venous thromboembolic events (VTE) (marked as red bars), in relation to the number of COVID-19-positive subjects in Italy (data from Italian “Protezione Civile”; accessed July 31, 2022; https://lab24.ilsole24ore.com/coronavirus/#).

Haematologica | 108 March 2023 923 LETTER TO THE EDITOR
The present data from a post hoc analysis of the Apidulcis study results, lead us to hypothesize that the pandemic has affected the Apidulcis study results, directly or by various mechanisms, contributing to an increased risk of recurrences that could not be predicted by negative Ddimer assay performed at the time of patient enrollment in the study. It is well known that the COVID-19 pandemic is associated with an increased rate of VTE events, which is not limited to patients who are more seriously affected.5,6 Furthermore, an impact of the pandemic on increasing VTE occurrence has been described even in COVID-19-negative populations,7,8 likely due to indirect effects of the pandemic, such as the various restrictions and the lockdown, resulting in a general reduction in physical activity,9 a subsequent trend to obesity, andamong others - an increase in smoking.10
The present data suggest that the pandemic may have influenced the Apidulcis study results. This observation has two important implications.
First and more importantly, it adds further value to the remarkable efficacy and safety of reduced-dose Apixaban, already described in the main report. As the recurrence rate in patients taking reduced-dose Apixaban was comparable to that reported before the COVID-19 pandemic,11 it is tempting to speculate that the reduced-dose Apixaban was consistently effective even in the patients experiencing increased prothrombotic effects associated with the pandemic. Secondly, the results of this post hoc analysis illustrate the pitfalls associated with clinical prediction rules. During the conduct of the Apidulcis study, an unexpected event led to an increase in the baseline recurrence risk, thus substantially changing the targeted study population. We are still convinced that negative Ddimer testing may have a predictive ability for a patient population with a baseline recurrence risk of 3-5% patients/year (i.e., as our study population in the pre-COVID19 era).
Finally, we would like to warn other researchers who plan to investigate the risk of recurrence after VTE, that the COVID19 pandemic likely influences the natural history of VTE.
Authors
Gualtiero Palareti,1 Cristina Legnani,1 Daniela Poli,2 Walter Ageno,3 Vittorio Pengo,4 Sophie Testa,5 Alberto Tosetto,6 Paolo Prandoni1 and the members of Apidulcis study group
1Fondazione Arianna Anticoagulazione, Bologna; 2Malattie Aterotrombotiche, AOU Careggi, Firenze; 3UOC Pronto Soccorso, Medicina d’Urgenza e Centro Trombosi ed Emostasi, ASST dei Sette Laghi, Varese; 4Clinica Cardiologica, Azienda Ospedaliera di Padova, Padova; 5Centro Emostasi e Trombosi, UUOO Laboratorio Analisi chimico-cliniche e microbiologiche, ASST Cremona, Cremona and 6Divisione di Ematologia, Ospedale S. Bortolo AULSS 8 Berica, Vicenza, Italy
Correspondence:
G. PALARETI - gualtiero.palareti@unibo.it
https://doi.org/10.3324/haematol.2022.282130
Received: October 10, 2022.
Accepted: November 16, 2022. Early view: November 24, 2022.
©2023 Ferrata Storti Foundation
Published under a CC BY-NC license
Disclosures
No conflicts of interest to disclose.
Contributions
GP, CL, PP, DP, ST, AT, VP and WA developed the concept and design of the study; GP, CL, PP, DP, ST, AT, VP and WA analyzed and interpreted the data; GP drafted the article; GP, CL, PP, DP, ST, AT, VP and WA critically revised the article for important intellectual content. All authors gave the final approval of the article.
Data-sharing statement
For original data, please contact the corresponding author.
Aug. 2018 - Dec. 2019 Jan. 2020 - Dec. 2020 Jan. 2021 - Dec. 2021 VTE recurrences, N 3 4 12 Follow-up, patient years, N 60 138 137 VTE incidence, % pt/yr (95% CI) 5.0 (1.0-14.6) 2.9 (0.8-7.4) 8.8 (5.4-15.3)
Table 1. Incidence of recurrent venous thromboembolic events in patients during the 3-year running period of the Apidulcis study.
Total number of patients with persistently negative D-dimer recruited in the Apidulcis study: 286. VTE: venous thromboembolic events; pt/yr: patients/year; CI: confidence interval.
Haematologica | 108 March 2023 924 LETTER TO THE EDITOR
Apidulcis study group members: (in order of decreasing cases recruited): Poli Daniela, Lotti Elena, Crudele Felice – Firenze; Ageno Walter, Abenante Alessia, Caiano Lucia, Colombo Giovanna, Guarascio Matteo – Varese; Testa Sophie, Cancellieri Emilia, Morandini Rossella, Paoletti Oriana, Zambelli
Silvia – Cremona; Bucherini Eugenio, Martini Sauro, Vastola Monica – Ravenna; Chistolini Antonio, Serrao Alessandra - Dipartimento di Medicina Traslazionale e di Precisione Sapienza Università di Roma – Roma; Martinelli Ida, Bucciarelli Paolo, Abbattista Maria, Artoni
Andrea, Capecchi Marco, Gianniello Francesca, Scimeca Barbara –Milano; Falanga Anna, Barcella Luca, Gamba Sara, Lerede Teresa, Maggioni Anna, Schieppati Francesca, Russo Laura, Zunino Federica – Bergamo; Tosetto Alberto, Artuso Anna, Bellesso Stefania, Cadau
Jessica, Carli Giuseppe, Nichele Ilaria, Perbellini Omar – Vicenza; Sarti Luca, Caronna Antonella, Gabrielli Filippo, Lami Francesca, Nicolini Alberto, Scaglioni Federica – Modena; Mastroiacovo Daniela, Pinelli Mauro, Desideri Giovambattista - Avezzano (AQ); Cosmi
Benilde, Borgese Laura, Favaretto Elisabetta, Libra Alessia, Migliaccio Ludovica, Sartori Michelangelo – Bologna; Visonà Adriana, Panzavolta Chiara, Scandiuzzi Tatiana, Zalunardo BeniaminoCastelfranco Veneto (TV); Santoro Rita Carlotta, Ierardi Antonella, Leotta Marzia, Strangio Alessandra – Catanzaro; Zanatta Nello, Guzzon Samuele - Conegliano (TV); Grandone Elvira, Colaizzo
Donatella, Favuzzi Giovanni - San Giovanni Rotondo (FG); Lombardi Maria, Rosa, Ferrini Piera Maria, Tassoni Maria Ilaria – Parma; Corradini Sara, Iotti Matteo, Lambertini Isabella, Veropalumbo Maria
Rosaria - Reggio Emilia; Lessiani Gianfranco - Città Sant’Angelo (PE); Parisi Roberto, Bortoluzzi Cristiano, Vo Hong Ngoc – Venezia;
Chiarugi Paolo, Casini Monica – Pisa; Violo Caterina, Nuti Marco –Pisa; Angeloni Lucia - Ospedale "G. Dossetti" - Valsamoggia (BO); Carrozzi Laura, Pancani Roberta, Chimera Davide, Conti Valentina, Meschi Claudia – Pisa; Cattaneo Marco, Podda Gianmarco, Birocchi Simone – Milano; Cuppini Stefano, Marzolo Marco, Milan Marta –Rovigo; Martini Giuliana, Merelli Sara, Pontoglio Sara, Portesi Nicola – Brescia; Villalta Sabina, De Lucchi Lara, Sponghiado Alessandra –Treviso; Becattini Cecilia, Giustozzi Michela, Vinci Alessandra –Perugia; Pignatelli Pasquale, Bucci Tommaso, Menichelli Danilo, Pastori Daniele – Roma; Pomero Fulvio, Casalis Sara, Galli Eleonora - Alba (CN); Ciammaichella Maurizio, Maida Rosa – Roma; De Cristofaro Raimondo, Alberelli Maria Adele, Basso Maria Rosaria, De Candia Erica, Di Gennaro Leonardo – Roma; Mumoli Nicola, Capra Riccardo, Orlando Mariantonia, Porta Cesare, Rotiroti GiuseppeMagenta (MI); Demarco Monica, Petrillo Paola - Castellanza (VA); Rossi Elena, Bartolomei Francesca, Soldati Denise - Roma -Russo Umberto, Burgo Ilaria – Milano; Ziliotti Maurizio, Pataccini Corrado, Terroni Lorenza, Ugolotti Maria Chiara - Fidenza (PR); Di Giorgio Angela – Roma; Cavagna Laura, Mete Francesca / Gino MiriamRivoli (TO); Santoro Angelo, De Carlo Armando – Brindisi; Cappelli Roberto, Bicchi Maurizio, Dyrmo Lediona – Siena; Grifoni Elisa, Masotti Luca - Empoli (FI); Ria Luigi, Spagnolo Marina - Gallipoli (LE); Rupoli Serena, Federici Irene, Morsia Erika, Scortechini Anna Rita, Torre Elena – Ancona; Franchini Massimo, Montorsi Paolo –Mantova; Galgano Giuseppe, De Luca Anna - Acquaviva delle Fonti (BA); Muiesan Maria Lorenza, Paini Anna, Stassaldi Deborah –Brescia and Pengo Vittorio, Denas Gentian, Pesavento Raffaele, Ceccato Davide – Padova, Italy.
1. Palareti G, Poli D, Ageno W, et al. D-dimer and reduced dose apixaban for extended treatment after unprovoked venous thromboembolism: the Apidulcis study. Blood Adv. 2022;6(23):6005-6015.
2. Douketis J, Tosetto A, Marcucci M, et al. Risk of recurrence after venous thromboembolism in men and women: patient level meta-analysis. BMJ. 2011;342:d813.
3. Prandoni P, Vedovetto V, Ciammaichella M, et al. Residual vein thrombosis and serial D-dimer for the long-term management of patients with deep venous thrombosis. Thromb Res. 2017;154:35-41.
4. Palareti G, Cosmi B, Legnani C, et al. D-dimer to guide the duration of anticoagulation in patients with venous thromboembolism: a management study. Blood. 2014;124(2):196-203.
5. Kerbikov O, Orekhov P, Borskaya E, Nosenko N. High incidence of venous thrombosis in patients with moderate-to-severe COVID19. Int J Hematol. 2021;113(3):344-347.
6. Zuin M, Engelen MM, Barco S, et al. Incidence of venous
thromboembolic events in COVID-19 patients after hospital discharge: A systematic review and meta-analysis. Thromb Res. 2022;209:94-98.
7. Qian C, Lyu X, Zhu HD, et al. Venous thromboembolism in nonCOVID-19 population during the pandemic: a nationwide multicenter retrospective survey. J Thromb Thrombolysis. 2021;52(4):1094-1100.
8. Tankere P, Cottenet J, Tubert-Bitter P, et al. Impact of COVID-19 and lockdowns on pulmonary embolism in hospitalized patients in France: a nationwide study. Respir Res. 2021;22(1):298.
9. Curtis RG, Olds T, Ferguson T, et al. Changes in diet, activity, weight, and wellbeing of parents during COVID-19 lockdown. PLoS One. 2021;16(3):e0248008.
10. Alla F, Berlin I, Nguyen-Thanh V, et al. Tobacco and COVID-19: a crisis within a crisis? Can J Public Health. 2020;111(6):995-999.
11. Agnelli G, Buller HR, Cohen A, et al. Apixaban for extended treatment of venous thromboembolism. N Engl J Med. 2013;368(8):699-708.
Haematologica | 108 March 2023 925 LETTER TO THE EDITOR
References
Comment on Association of FLT3-internal duplication
length with overall survival in acute myeloid leukemia: a systematic review and meta-analysis
Acute myeloid leukemia (AML) is the most common type of acute leukemia in adults, accounting for 1.3% of new cancer cases, for example in the United States of America and affecting approximately 0.5% of the whole population at any point during their lives.1 This cancer type is a heterogeneous tumor derived from hematopoietic stem cells with a different profile consisting of cytogenetic, genetic, and epigenetic abnormalities. 2 Genetic analyses, including both karyotyping and screening for recurrent gene fusions and molecular mutations, provide crucial information about its biology. 3 These specific analyses strongly inform prognostic assessment which is used for tailor-made post-remission therapy.1 Of note, since 2017 an enormous growth has been observed in the number of drugs for the treatment of AML, with several new drugs receiving regulatory approval.1
In order to better understand how AML patient survival can be optimized, new risk factors should be included in updated risk assessments tools. This comment focuses on the role of FLT3 -internal tandem duplication ( FLT3 -ITD) mutations which occur in approximately 25% of adults suffering from AML.2 As the prognosis of FLT3ITD AML is related to FLT3 -ITD allelic ratio, length, insertion site, and co-occurring mutations, this genetic aberration was studied by Polak et al. 4 In their recent review in Haematologica , Polak et al. found that there is an association between FLT3-ITD length and overall survival (OS). They studied 2,098 FLT3 -ITD-positive AML patients.4
Although the clinical relevance of Polak’s study is very clear, some methodological issues can be raised concerning the search strategy used, including the possibility to replicate this search.
First, we are interested in the specifics of the search strategy, foremost when using several databases. In our opinion, it is necessary to show all details of the search strategy used for all consulted databases, so this important topic can be replicated or criticised. It is not uncommon to add search details to the Supplementary Appendix, either within the paper or online only.
Second, more specificically, Polak et al. stated that “using all possible spellings of “ FLT3 -ITD” and “Acute Myeloid Leukemia”, however this very brief statement doesn’t clarify which spelling choices were actually used. It would be very helpful if the authors could pro -
vide more details to clarify this part of the text. They might have missed some crucial term variants, or they might have used a term variant with other meanings than the authors would want these terms to have, which might attract non-relevant articles. It would also be very helpful to know which kind of search terms the authors used (controlled vocabulary terms such as MeSH, free text terms, such as words in the abstract or affiliation field).
Third, we have tried to replicate this search with a query of our own making, based on the search the authors described (a combination of three concepts: FLT3-ITD, AML and 1996-2021 (details are provided in the Online Supplementary Appendix ). The results of the replication is as follows: the authors identified 2,010 items in PubMed. With our strategy, we were able to identify 2,348 references in PubMed. This situation is even more telling for Embase and the Cochrane Library. A replication of the search in Embase retrieves 8,689 references (4,051 when excluding meeting abstract references). A more focused search for Embase, which is sometimes applied when the number of results is very high compared to the results in PubMed, retrieves 6,213 references (2,530 when excluding meeting abstracts), approximately 1,000 more than the authors identified. Additionally as we are able to retrieve 306 references from the Cochrane Library (130 when excluding meeting abstract references) it could well be that the authors' strategy for the Cochrane Library was technically imperfect, as they retrieved no references from this source (the Cochrane Library interface at Wiley Online is very sensitive for double spaces or hyphens). Finally, adding other potential relevant sources might increase the number of results even further e.g., searching for this topic in Web of Science retrieves 3,127 references (2,697 when excluding meeting abstract references). We think that Polak et al. might have missed relevant references. It could be that some relevant terms were missed by the authors. We would like to suggest that this should also be clarified by the authors.
To conclude, the authors should be acknowledged for their extensive attempt to study the role FLT3 -ITD length in AML patients in this large meta-analysis. This is a significant clinical genetic aberration which was addressed by Polak et al. However, the literature search methodology is unclear. Adding all search details will aid
Haematologica | 108 March 2023 926 COMMENT
in better understanding of the prognostic value of this aberration and potential new ones to update risk stratification protocols for AML in the upcoming years
Authors
Wing H. Tong1,2 and Jan W. Schoones3
1Department of Public Health and Primary Care (PHEG), Leiden University Medical Center, Leiden; 2Argos Zorggroep “DrieMaasStede”, Center for Specialized Geriatric Care, Schiedam and 3Directorate of Research Policy (formerly: Walaeus Library), Leiden University Medical Center, Leiden, the Netherlands
References
1. Short NJ, Rytting ME, Cortes JE. Acute myeloid leukaemia. Lancet. 2018;392(10147):593-606.
2. Papaemmanuil E, Gerstung M, Bullinger L, et al. Genomic classification and prognosis in acute myeloid leukemia. N Engl J Med. 2016;374(23):2209-2221.
3. Döhner H, Estey E, Grimwade D, et al. Diagnosis and
Correspondence:
W. H. TONG - w.h.tong@lumc.nl
https://doi.org/10.3324/haematol.2022.281908
Received: September 1, 2022.
Accepted: September 9, 2022.
Early view: October 6, 2022.
©2023 Ferrata Storti Foundation
Published under a CC BY-NC license
Disclosures No conflicts of interest to disclose.
management of AML in adults: 2017 ELN recommendations from an international expert panel. Blood. 2017;129(4):424-447.
4. Polak TB, Van Rosmalen J, Dirven S, et al. Association of FLT3ITD length with overall survival in acute myeloid leukemia: a systematic review and meta-analysis. Haematologica. 2022;107(10):2506-2510.
Haematologica | 108 March 2023 927 COMMENT
Replay to the Comment on Association of FLT3-internal tandem duplication length with overall survival in acute myeloid leukemia: a systematic review and meta-analysis
We thank Tong and Schoones for their just and critical appraisal of our manuscript with regards to our search strategy.1 We agree that our search strategy might have benefited from more exhaustive discussion and specification to facilitate reproducible research. Since the more elaborate search strategy proposed by Tong and Schoones identified more references in all databases, we sought to investigate whether we missed any additional relevant references and if these references could possibly affect our results. We detail below that under Tong and Schoones’ search strategy, our results remain unchanged.
We reviewed the additional 338 references from the PubMed search, which yielded no relevant articles. The same applied for the 55 (53 when limited from 1996 to 2021) additional references from the Cochrane Library (reviewing our data, we identified an error in the PRISMA diagram, which stated that 0 references were found in the Cochrane Library. However, our initial strategy identified 252 references from 1996 to 2021, of which no relevant references additional to the PubMed and Embase searches). Unfortunately, applying the proposed Embase and Web of Science searches yielded errors and did not return any results. We were unable to correct there errors. Therefore, we were unable to review additional references from these two databases. We contacted the authors to resolve this issue, and we would be happy to review the additionally found references to assure no relevant articles were missed with our initial search.
In conclusion, Tong and Schoones provide a more detailed, elaborate search strategy, identifying additional articles compared with our initial search. Reviewing these additional references did not yield any additional relevant articles for meta-analysis. Therefore, we conclude that the reported results in our manuscript remain unaffected.
Authors
References
1. Polak TB, Van Rosmalen J, Dirven S, et al. Association of FLT3-ITD length with overall survival in acute myeloid leukemia: a
1Erasmus School of Health Policy & Management, Erasmus University Rotterdam, Rotterdam; 2Department of Biostatistics, Erasmus MC Rotterdam, Rotterdam; 3Department of Epidemiology, Erasmus MC Rotterdam, Rotterdam; 4Real-World Data Department, myTomorrows, Amsterdam; 5Department of Hematology, Cancer Center Amsterdam, Amsterdam University Medical Centers, location VUmc, Amsterdam and 6Department of Hematology, Radboud University Medical Center, Nijmegen, the Netherlands
Correspondence: D.G.J. CUCCHI - d.cucchi@amsterdamumc.nl
https://doi.org/10.3324/haematol.2022.282138
Received: September 20, 2022.
Accepted: September 26, 2022.
Early view: 6 October, 2022.
©2023 Ferrata Storti Foundation
Published under a CC BY-NC license
Disclosures
JJWMJ has received research funding from Novartis and BMS; and adboards from Novartis, Pfizer and Abbvie; is president of Apps for Care and Science Foundation. This foundation has received unrestricted educational grants from Abbvie, Alexion, Beigene, Astellas, EUSApharma, Novartis, Amgen, Sanofi Genzyme, Takeda, Jazz, Pfizer, Roche, Servier, Daiichi-Sankyo, Janssen, Incyte and BMS for development of the HematologyApp. DGJC has received speaker fees from Takeda and conference visit support from Servier. TBP works part-time for expanded access service provider myTomorrows, in which he holds stock and stock options (<0.1%). TBP is contractually free to publish, and the service provider is not involved in any of his past or ongoing research, nor this Letter.
Contributions
DGJC and TBP screened additional references for relevance. DGJC drafted the reply. TBP and JJWMJ revised the reply. All authors approved the final version.
systematic review and meta-analysis. Haematologica. 2022 Oct 6. doi: 10.3324/haematol.2022.281908. [Epub ahead of print]
Tobias B. Polak,1,2,3,4 Jeroen J. W. M. Janssen5,6 and David G. J. Cucchi5
Haematologica | 108 March 2023 928 RESPONSE TO A COMMENT
List of the reviewers who in 2022 generously made an essential contribution to the high scientific quality of Haematologica
Camille N Abboud
Omar Abdel-Wahab
Sheela Abraham
Renata Abrahao
Jeremy S Abramson
Tom Adamkiewicz
Lionel Adès
Ranjana Advani
Pasquale Agosti
Matthew Ahearne
Haifa Kathrin Al-Ali
Domenico Albano
Lorenzo Alberio
Juan Alderuccio
Abdulkareem Almomen
Amin Alousi
Hanny Al-Samkari
Othman Al-Sawaf
Alberto Alvarez-Larrán
Catalina Amador
Richard Ambinder
Jennifer E Amengual
Xiuli An
Gang An
Sarah Anand
Claudio Anasetti
Larry Anderson
Marc PE André
Peter D Aplan
Jane Apperley
Yasuyuki Arai
Robert A Ariëns
Jean-Benoit Arlet
Philippe Armand
Vahid Asnafi
Sarit Assouline
Jon C Aster
Ehab Atallah
Rex KH Au Yeung
Vincent Audard
Holger Werner Auner
Hervé Avet-Loiseau
Irit Avivi
Slim Azouzi
Christian Babbs
Samah Babiker
Veronika Bachanova
Ulrike Bacher
Emmanuel Bachy
Andrea Bacigalupo
Mohsin Badat
Brigitte Bader-Meunier
Davide Bagnara
Nathanael Bailey
Barbara J Bain
Tamam Bakchoul
Nitya Bakshi
Carlo L Balduini
Alessandra Balduini
Adriana Balduzzi
Matthias Ballmaier
Rahul Banerjee
Pankaj Bansal
Joao Barata
Tiziano Barbui
Giovanni Barosi
Paul M Barr
Sharon Barrans
Santiago Barrio
Matthew J Barth
Nancy Bartlett
Lucile Baseggio
Renato Bassan
Francesca Basso-Valentina
Giorgia Battipaglia
Susanne HC Baumeister
Ali Bazarbachi
Fabian Beier
Rafael Bejar
Meral Beksac
Marie C Bene
Zsuzsanna Bereczky
James R Berenson
Sigbjorn Berentsen
Wolfgang Bergmeier
Neil Berinstein
Ellin Berman
Elsa Bernard
Francesco Bernardi
Erik Berntorp
Melissa Berrien-Elliott
Francesco Bertoni
Jan Philipp Bewersdorf
Vijaya R Bhatt
Prakash Bhuyan
Paola Bianchi
Alexander G Bick
Camille Bigenwald
Andrea Biondi
Gail Bishop
Kavita Bisht
Mark J Bishton
Samuel Bitoun
Didier Blaise
Piers Blombery
Alexander Boardman
Sabela Bobillo Varela
Judith M Boer
Leonardo Boiocchi
Nicolas Boissel
Côme Bommier
Dominique Bonnet
Katherine Borden
Arndt Borkhardt
Beat Bornhauser
Guillaume Bossis
Jean P Bourquin
David Boutboul
Luca Braga
Majorie Brand
Susan Branford
Massimo Breccia
Elizabeth A Brem
Edwin Bremer
Emery Bresnick
John Brewin
Sara Bringhen
Annamaria Brioli
Catherine Broome
Valentine Brousse
Pierre Brousset
Patrick Brown
Haematologica | 108 March 2023 929
Jennifer R Brown
Monika Bruggemann
Laurence Brugieres
Julie Bruneau
Benedetto Bruno
Patrick W Burke
John Burthem
Cathy Burton
Loredana Bury
Minji Byun
Megan Bywater
Jo Caers
Sophie Caillat-Zucman
Paolo F Caimi
Mitchell S Cairo
Rodrigo T Calado
Maria Calaminici
Rodney Camire
Stefano Campaner
Robert A Campbell
Elias Campo
Vincent Camus
Jonathan Canaani
Jose A Cancelas
Laura Cannella
Alessio Cantore
Maria D Cappellini
Jean-Claude Carel
Gunnar Cario
Catherine Carmichael
Gonzalo Carreño
Olivier Casasnovas
Giancarlo Castaman
Jorge J Castillo
Paul Castillo Caro
Vagner Castro
Carla Casulo
Marco Cattaneo
Helene Cavé
Michele Cavo
Michele Cea
Grant A Challen
Steven M Chan
Steven Chan
Bjoern Chapuy
Julio Chavez
Chan Yoon Cheah
Deepak Chellapandian
Roy F Chemaly
Sai-Juan Chen
Vivien M Chen
Tsung-Hsien Chen
Danica Chen
Haoyan Chen
Sabina Chiaretti
Nicholas Chiorazzi
David Chiron
Sung Choi
Sylvain Choquet
Douglas B Cines
Emmanuelle Clappier
Marjon H Cnossen
Jonathon B Cohen
Yael C Cohen
Chrystelle Colas
Matthew Collin
James F Collins
Raffaella Colombatti
Nicola Conran
Stefan Constantinescu
Valentino Conter
Jan Cools
Catherine C Coombs
Mhairi Copland
Paul Coppo
Raul Cordoba
Catherine Cordonnier
Seth Corey
Paolo Corradini
Javier Corral
Sergio Cortelazzo
Jorge Cortes
Marta Crespo
Elena Crisa
John D Crispino
Jennifer L Crombie
Nick Cross
Antonio Cuneo
Tom Cupedo
Kate Cwynarski
Florence Cymbalista
Lydie M Da Costa
Mattia D'Agostino
Paola Dal Cin
Frederik Damm
Debbie Daniels
Alexey Danilov
Giovanni D'Arena
Naval Daver
Sanjana Dayal
Stephane De Botton
Raimondo De Cristofaro
Giovanni de Gaetano
Daphne de Jong
Laurence de Leval
Monique de Maat
Adam James de Smith
Valerio De Stefano
Ann Dean
Daniel J DeAngelo
Klaus-Michael Debatin
Joachim Deeg
Sofie Degerman
Michael Deininger
Jan MA Delabie
Michel Delforge
Monique den Boer
Frederik Denorme
Michael JR Desborough
Barbara Deschler
Susan DeWolf
Christian A Di Buduo
Eli L Diamond
Maribel Diaz-Ricart
Daan Dierickx
Jordan D Dimitrov
Meletios A Dimopoulos
Courtney D DiNardo
Angela Dispenzieri
Ahmet Dogan
Inderjeet Dokal
Noriko Doki
Jean Donadieu
Jing-Fei Dong
Adrienne Dorrance
Sinisa Dovat
Peter Dreger
Yigal Dror
Ming Du
Wei Du
Carlo Dufour
Ulrich Dührsen
Nicolas Dulphy
Pierre-Yves Dumas
Charles Dumontet
Jennifer Dunlap
Kieron Dunleavy
Jesus Duque Afonso
Daniel Dürschmied
Cedric Duval
Christopher Dvorak
Mary Eapen
William Eaton
Connie Eaves
Fabio Efficace
Dimitar Efremov
Haematologica | 108 March 2023 930
Dennis A Eichenauer
Sabine Eichinger
HCJ Eikenboom
Ann Kathrin Eisfeld
Sara El Hoss
Siraj El Jamal
Wassim El Nemer
Shannon Elisabeth Elf
Tarec C El-Galaly
Ezzat Elhassadi
Mariana Emerenciano
Jonas Emsley
Monika Engelhardt
Anoop K Enjeti
Zachary Epstein-Peterson
Miriam Erlacher
Jordi Esteve
Aurélie Eude-Caye
Ehud Even-Or
Lorenzo Falchi
Hervé Falet
Brunangelo Falini
Amir T Fathi
Emmanuel Favaloro
Massimo Federico
David J Feith
Hui Feng
Yimei Feng
Hugo F Fernandez
Carlos Fernández de Larrea
Alessandra Ferrajoli
Christopher Ferrand
Felicetto Ferrara
Ivan Ferrer Vicens
Thierry Fest
Jean Feuillard
Michaela Feuring-Buske
Mark A Fiala
Adele K Fielding
Marie-Dominique Filippi
Juergen Finke
Mathieu Fiore
Ute Fischer
Kelsey Fisher-Wellman
Jude Fitzgibbon
Antonia Follenzi
Magali Fontaine
Francesco Forconi
Luc-Matthieu Fornecker
Christopher P Fox
Andrew L Frelinger
Corinne Frere
Kathleen Freson
Camilla Frieri
Benjamin J Frisch
Mattia Frontini
Fabian Frontzek
Steffen Fuchs
Nico Gagelmann
Dave Gailani
Giuseppe Gaipa
PatrickG Gallagher
Andrea Gallamini
Arnold Ganser
Tomas Ganz
Chezi Ganzel
Maciej W Garbowski
David Garcia Azorin
Guillermo Garcia-Manero
Joan C García-Pagán
MosheE Gatt
Norbert Gattermann
Philippe Gaulard
Francesca Gay
Yubin Ge
Guangbo Ge
Roni Gefen
Roland Geisberger
Laurent Genestier
Laura Gengenbach
Alexis Genthon
Marie-Claude Geoffroy
Fabiana Geraci
Alina S Gerrie
Morie Gertz
Mark Blaine Geyer
Waleed Ghanima
Herve Ghesquieres
Paolo Ghia
John S Gibson
Gary E Gilbert
Saar I Gill
Sergio Giralt
Michael Girschikofsky
Gaetano Giuffrida
Mark T Gladwin
Andreas Glenthøj
Ronald S Go
Adam Goldfarb
Hartmut Goldschmidt
Irina Golovleva
Mahasweta Gooptu
Victor R Gordeuk
Leo Gordon
Stephen Gottschalk
Gaurav Goyal
Martin Gramatzki
Steven Grant
Michael R Green
Andreas Greinacher
Jolanta Grembecka
Magnus Grenegard
Paolo Gresele
Michael Grever
William Grey
Steven Grover
Gianni Guidetti
Romain Guieze
François Guilhot
Jay Gunawardana
Kalpna Gupta
Alejandro Gutierrez
Fredrik H Schjesvold
Stefan Habringer
Claudia Haferlach
Torsten Haferlach
Rana Zeeshan Haider
Timon Hansen
Andrew Hantel
Job Harenberg
Julien Haroche
Matthew Harper
Andrew C Harris
Claire Harrison
Paul Harrison
Tanja N Hartmann
Daigo Hashimoto
Henrik Hasle
Hans C Hasselbalch
Robert Hasserjian
Brad Haverkos
Edwin D Hawkins
Tky Hayashi
Johan WM Heemskerk
Ute Hegenbart
Rüdiger Hehlmann
Florian H Heidel
Olaf Heidenreich
Krista M Heinonen
Andrea Henden
Jeanne E Hendrickson
Paul J Hengeveld
Juan-Carlos Hernandez-Boluda
Daniel Herranz
Alex F Herrera
Ingeborg Hers
Haematologica | 108 March 2023 931
Michael Heuser
Elizabeth Hexner
Mats Heymann
Robert C Hider
Douglas R Higgs
Christine Higham
Johann K Hitzler
Theodore Ho
Daniel J Hodson
Dieter Hoelzer
Petter Höglund
Steven Horwitz
Christopher S Hourigan
Chin-Hwa Hu
Tianxiang Hu
Boyu Hu
Gang Huang
Zan Huang
Thomas Hueso
Sarah Huet
Timothy Hughes
Craig Hughes
Philipp von Hundelshausen
Caroline Hutter
Katherine Hyde
Ilaria Iacobucci
Gabriele Ihorst
Andreas Ihrig
Gerald Illerhaus
Takashi Ishida
Alessandro Isidori
Deena Iskander
Prioty Islam
Raphael Itzykson
Stoyan Ivanov
Swaminathan P Iyer
Shai Izraeli
Elias Jabbour
Nicolas Jacquelot
Ulrich Jaeger
Elaine Jaffe
Deepa Jagadeesh
Nitin Jain
Michael Jain
Lasse H Jakobsen
Chloé James
Fabrice Jardin
David Jaye
Tomas Jelinek
Robert R Jenq
Irmela Jeremias
Fengyan Jin
Sonata Jodele
Erel Joffe
Andrew D Johnson
Brian Jonas
Craig T Jordan
Michael J Joyner
Gunnar Juliusson
Walter Kahr
Martin F Kaiser
Theodosia A Kalfa
Michael E Kallen
Manali Kamdar
Guolian Kang
Alesia Kaplan
Rick Kapur
Reuben Kapur
Seth E Karol
Kennosuke Karube
Efstathios Kastritis
Jakob N Kather
Antonis Kattamis
Jun-ichi Kawada
Sabine Kayser
Colm Keane
Beate Kehrel
Ulrich Keller
Michelle Kelliher
Richard Kelly
David Kent
Karen Kesshan
Nige S Key
Irum Khan
Niloufer Khan
Cyrus Khandanpour
Iryna Khasabova
Kiarash Khosrotehrani
Eva Kimby
Kazuo Kinoshita
Fenella Kirkham
Wolfram Klapper
Ulf Klein
Catherine Klersy
Justin Kline
Jan-Henning Klusmann
Tristan E Knight
Stefan Knop
Berengere Koehl
Jiwon Koh
Ulrike Köhl
Donald B Kohn
Mika Kontro
Shahram Kordasti
Felix Korell
John Koreth
Steffen Koschmieder
Thaynew Kowalski
Günter Krause
Stefan Krause
Arne de Kreuk
Robert Kridel
Sigurdur Yngvi Kristinsson
Nicolaus Kroeger
Nicolaus Kröger
Jan Krönke
Michael WM Kühn
Andrea Kuhnl
Roland P Kuiper
Alexander D Kulagin
Austin G Kulasekararaj
Andreas Kulozik
Shaji Kumar
Ajay Kumar
Ralf Küppers
Mineo Kurokawa
Peter Kurre
David M Kurtz
John Kuruvilla
Yok-Lam Kwong
Paul Kyrle
Veerle Labarque
Ann S LaCasce
Joao Lacerda
Elodie Lainey
Laurence Lamant
Bernhard Lammle
Thierry Lamy
Francois Lanza
Riitta Lassila
Sylvain Latour
Caterina Lau
Noa Lavi
Philipp le Coutre
Christelle Le Gall-Ianotto
WilfriedLe Goff
Thierry M Leblanc
Eric Lechman
Carsten W Lederer
Jong Wook Lee
Jeong-Chae Lee
Christine SM Lee
Faezeh Legrand
Zhang Lei
Stig Lenhoff
Peter J Lenting
Haematologica | 108 March 2023 932
Georg Lenz
John Leonard
Lorenzo Leoncini
Guillaume Lettre
Anskar Leung
Ludovic Lhermitte
Shaoguang Li
Zongjin Li
Renhao Li
Jing Li
Ji Li
Jane Liesveld
Stuart E Lind
Tomas L Lindahl
Brian K Link
Goldberg Lior
Jeffrey M Lipton
Jeffrey H Lipton
Hongtao Liu
Zhiqiang Liu
Junling Liu
Han Liu
Yan Liu
Li-gen Liu
Per Ljungman
Franco Locatelli
Sagar Lonial
Philip Low
Maria L Lozano
Rui Lu
Michael Lübbert
Daniel Lucas-Alcaraz
Thomas Luft
Sanne Lugthart
Damien Luque Paz
Marlise R Luskin
Leo Luznik
Andrew Lytle
Xiaochao Ma
Clarisse M Machado
Kellie Machlus
Kylee Maclachlan
John Magenau
Simba Magwenzi
Reiner K Mailer
Ivan Maillard
Alexandros Makis
Hideki Makishima
Michael Makris
Florent Malard
Claudia Maletzki
Vincent Mallet
Maksim Mamonkin
Pier Mannuccio Mannucci
Marc Mansour
Ambroise Marçais
Enrica Marchi
Denese Marks
Oriana Marques
Carsten Marr
Rolf Marschalek
Peter Martin
Paul J Martin
Francisco Martin
Joaquin Martinez-Lopez
Matt Matasar
Maria-Victoria Mateos
Anthony R Mato
Taei Matsui
Masanori Matsumoto
Matthew J Maurer
Michael J Mauro
Richard T Maziarz
Luca Mazzarella
Finnian R Mc Causland
Philip McCarthy
Owen McCarty
Kenneth L McClain
Pamela McKay
Steven McKenzie
Ross McKinnon
Andrew McMillan
Mary Frances McMullin
L. Jeffrey Medeiros
Neha Mehta-Shah
Pablo Menendez
Stephan Menzel
Pietro Merli
Giampaolo Merlini
Reid W Merryman
Marcus Messmer
Sachith Mettananda
Lüder Hinrich Meyer
Everett Meyer
HJ Meyerson
Sylvain Meylan
Yingchang Mi
Hira Mian
Marc Michel
Gerard Michel
Jean B Micol
Marco Mielcarek
Anna Rita Migliaccio
Aleksandar Mijovic
Malgorzata Mikulska
Peter G Miller
Ken Mills
Mark D Minden
Moshe Mittelman
M Mohty
Riccardo Moia
Thierry Molina
Luca Mologni
Joon Ho Moon
Anthony Moorman
Antonio Morales-Hernandez
Ryan Morin
Claudia Morris
Linde M Morsink
Alessandra Mortellaro
Alison Moskowitz
Donia M Moujalled
Guillaume Moulis
Marek Mraz
Christian Muenz
Rene Mulder
Stephen P Mulligan
Charles G Mullighan
Markus Munder
Javier Munoz
Hideki Muramatsu
Khaled M Musallam
Pellegrino Musto
Gary Douglas Myers
Omar Nadeem
Arnon Nagler
Ulhas Naik
Masao Nakagawa
Ryotaro Nakamura
Mariasanta Napolitano
Amina Nardo-Marino
Kikkeri N Naresh
Katherine Nathanson
Yaso Natkunam
Yulia Nefedova
Elizabeta Nemeth
Micha Nethe
Ellis J Neufeld
Cecilia Ng
Timothy C Nichols
Gwen Nichols
Franck Emmanuel Nicolini
Franklin Njoku
Enrico Novelli
Ariela Noy
Ioannis Ntanasis- Stathopoulos
Haematologica | 108 March 2023 933
Erfan Nur
Paquita Nurden
Jamie M O’Sullivan
Jennifer O’Sullivan
Esther A Obeng
Enrique Ocio
Kristen M O'Dwyer
Vivian Oehler
Yishai Ofran
Seishi Ogawa
Hitoshi Okada
Jessica Okosun
Eric Oksenhendler
Timothy S Olson
Adam Olszewski
Choon Kiat Ong
Shin Yeu Ong
Richard J O'Reilly
Rimas J Orentas
Alberto Orfao
German Ott
Oliver G Ottmann
Ingrid Pabinger
Thomas Pabst
Anand Padmanabhan
Eric Padron
Livio Pagano
Jerome Paggetti
Simona Pagliuca
Maria Lia Palomba
Qishen Pang
Gerassimos Pangalis
Milena Pantic
Kostas Pantopoulos
Samir Parekh
Sophie Park
Simrit Parmar
Harsh Parmar
Laura Pasqualucci
Anand A Patel
Mrinal Patnaik
Christopher Jordan Patriquin
Emma de Patter
Steven Pavletic
Charlotte Pawlyn
Martin Bjerregaard Pedersen
Regis Peffault de Latour
Francesco Pegoraro
Naveen Pemmaraju
Vittorio Pengo
Andrea Pepper
Melanie J Percy
Andrew Perkins
Alexander Perl
Carlo Perricone
Salvatore Perrone
Karlheinz Peter
Françoise Pflumio
Helen Philippou
Sjaak Philipsen
Tycel Phillips
Pier-Paolo Piccaluga
Rob Pieters
Martina Pigazzi
Pasquale Pignatelli
Stefano A Pileri
John Pimanda
Mirko Pinotti
Miguel A Piris
Sean Platton
Uwe Platzbecker
Isabelle Plo
Klaus Podar
Daniel A Pollyea
Uday Popat
Rakesh Popat
Zoran Popovic
John B Porter
Leonardo Potenza
Jason Powell
Olga Pozdnyakova
Paolo Prandoni
Kathleen P Pratt
Josef Prchal
Anuja P Premawardena
Claude J Preudhomme
Noemi Puig
Alexandre Puissant
Fabio M Pulcinelli
Vinod Pullarkat
Michael A Pulsipher
Louise E Purton
Zhijian Qian
M Edward Quach
David Qualls
Charles T Quinn
Leticia Quintanilla-Fend
Marc S Raab
Minke AE Rab
Karen R Rabin
Jerald P Radich
Emmanuel Raffoux
Margaret V Ragni
Ron Ram
Alessandro Rambaldi
Raajit Rampal
Vijay Rao
Dinesh Rao
Aaron P Rapoport
Hana Raslova
Lubica Rauova
Farhad Ravandi
Patrick Reagan
Håkon Reikvam
Josep-Maria Ribera
Henry Rice
Paul G Richardson
Anita Rijneveld
Lisa M Rimsza
Tim Ripperger
Antonio Maria Risitano
Susana Rives
David A Rizzieri
Tadeusz Robak
Kathryn G Roberts
Bianca Rocca
Aldo Roccaro
Claire Roddie
Francesco Rodeghiero
Scott Rodig
Luis G Rodríguez-Lobato
Lindsey E Roeker
Mark Roest
Sæmundur Rögnvaldsson
Pierre S Rohrlich
Christoph Röllig
Antonella Ronchi
Anthony Rongvaux
Cliona Rooney
Mark Roschewski
Richard Rosenquist
David Ross
Davide Rossi
Gianantonio Rosti
Lisa Giulino Roth
Camille Roussel
Philippe Rousselot
Paul Rouzaire
Aileen Rowan
Jacob M Rowe
Noemi Roy
Jeffrey Rubnitz
Lixin Rui
Lyndsey Runaas
Vincenzo Russo
David B Sacks
Haematologica | 108 March 2023 934
Michel Sadelain
Hayder Saeed
Giuseppe Saglio
Mamiko Sakata-Yanagimoto
David A Sallman
Vaishali Sanchorawala
Takaomi Sanda
Kristen Sanfilippo
Vijay G Sankaran
Valeria Santini
Sentot Santoso
Miguel A Sanz
Goro Sashida
Yogen Saunthararajah
Kerry Savage
Bipin Savani
Michael R Savona
Caner Saygin
Lauren Schaff
Rüdiger E Scharf
Christof Scheid
Johannes Schetelig
Denis Martin Schewe
Charles A Schiffer
Aaron Schimmer
Carolina Schinke
Richard F Schlenk
Michael Schmitt
Rebekka K Schneider
Heiko Schoder
Michelle Schoettler
Stefan O Schönland
Andre C Schuh
Kirk R Schultz
Martin Schumacher
Jan Jacob Schuringa
Stephen J Schuster
Jurg Schwaller
Adrian Schwarzer
Cristina Scielzo
Michael Scordo
Bart Scott
David W Scott
Hamish Scott
Heidi Segers
Omid Seidizadeh
Martina Seiffert
John Semple
Marcelo M Serra
John Seymour
Gunjan L Shah
NIrav Shah
Haneen Shalabi
Rory Shallis
Panicos Shangaris
Naranie Shanmuganathan
Akshay Sharma
Jeff Sharman
Joseph Shatzel
Bronwen Shaw
Weifeng Shen
Shalini Shenoy
Jumei Shi
Yuankai Shi
Keren Shichrur
Avichai Shimoni
Liran Shlush
Nicholas J Short
Khalid Shoumariyeh
Roni Shouval
David Sibon
Jorge Sierra
Heinz Sill
Richard T Silver
Laura Silvestri
Sharon A Singh
Shireen Sirhan
Tomasz Skorski
Susan L Slager
Robert K Slany
Joseph Slupsky
Gérard Socié
Kah Teong Soh
Eric Solary
Antonio Giovanni Solimando
Pieter Sonneveld
Cynthia So-Osman
Erinn Soucie
Carole Soussain
Paul Spagnuolo
Silvia Spena
Adam Sperling
Vladimir Spiegelman
Henri Spronk
Stephen Spurgeon
Ronald W Stam
Martin Stanulla
Simon J Stanworth
Daniel T Starczynowski
Jan Stary
Christian Steidl
Eytan M Stein
Polina Stepensky
Deborah M Stephens
Elliot Stieglitz
Stephan Stilgenbauer
Wendy Stock
Richard Stone
Jan Storek
Paolo Strati
Jonathan C Strefford
Sabine Strehl
John Strouboulis
Marion Subklewe
Stefan Suciu
Pierre Sujobert
Prithu Sundd
Anna Sureda
Steven Swerdlow
StephenSykes
Tomasz Szczepa
Jeff Szer
Natasha Szuber
Minoru Takata
Hayato Tamai
Jerome Tamburini
Ahmad M Tarawah
Sarah K Tasian
Pierfrancesco Tassone
Courtney J Tate
Isao Tawara
Justin Taylor
David T Teachey
Ayalew Tefferi
Elisa ten Hacken
Evangelos Terpos
Kim Theilgaard-Mønch
Swee Lay Thein
Sebastian Theurich
Felicitas Thol
Andreas Tiede
Anastasia Tikhonova
Hervé Tilly
Ing Soo Tiong
Daisuke Tomizawa
Wei Tong
Wing H Tong
Harrys A Torres
Mauro Torti
Alberto Tosetto
Aurore Touzart
Douglas Tremblay
StevenP Treon
Armando Tripodi
Jan Trka
Judith Trotman
Haematologica | 108 March 2023 935
Xavier Troussard
Sascha A Tuchman
Laxminath Tumburu
Anetta Undas
Pankit Vachhani
Augusto Vaglio
Luca Vago
Maricela Valerio
Koen Van Besien
Arjan A van de Loosdrecht
Dianne E van der Wal
Frank van Leeuwen
Frits van Rhee
Pieter Van Vlierberghe
Marlies Vanden Bempt
Alessandro Maria Vannucchi
Mireya P Velasquez
Adriano Venditti
Girish Venkataraman
Agnès Veyradier
Diego Villa
Francesco Violi
Carlo Visco
Adrián Viteri Noël
Joan-Lluis JL Vives-Corrons
Conrad-Amadeus Voltin
Marie von Lilienfeld-Toal
Ivana von Metzler
Bastian von Tresckow
Jan Voorberg
Josef H Vormoor
Anders Waage
Spencer Waddle
Adam Wahida
Amanda Walne
Liang Wang
Yucai Wang
Wei Wang
Leanne M Ward
Jerry Ware
Ralph Wäsch
Justin M Watts
Ashutosh D Wechalekar
Andrew H Wei
Oliver Weigert
Niels Weinhold
Guenter Weiss
John S Welch
Robert S Welner
Hans-Guido Wendel
Andrew Weng
Connie M Westhoff
Jason R Westin
Adrian Wiestner
Owen Williams
Naomi Winick
Daniel Wiseman
Wilhelm Woessmann
Ofir Wolach
Alisa Wolberg
Daniel Wolff
John C Wood
Bas Wouters
LiJun Xia
Julia Zhe Xu
Motoko Yamaguchi
Jun J Yang
Feng-Chun Yang
Shuang Ye
Moshe Yeshurun
David Yeung
Meira Yisraeli Salman
Satoshi Yoshihara
JA Young
Ryan Young
Loic Ysebaert
Haiqing Yu
Pavel Zak
Carlo Zaninetti
James Zehnder
Joshua F Zeidner
Robert Zeiser
Tony J Zeng
Clive S Zent
Thorsten Zenz
Jiwang Zhang
X Long Zheng
Junke Zheng
Yuping Zhong
Hong-Hu Zhu
Martin Zimmermann
James C Zimring
Emanuele Zucca
Jan Zuna
Jaap Jan Zwaginga
Haematologica | 108 March 2023 936
haematologica
Journal of the Ferrata Storti Foundation
haematologica.org
