
haematologica
Editor-in-Chief
Jacob M. Rowe (Jerusalem)
Deputy Editors
Carlo Balduini (Pavia), Jerry Radich (Seattle)
Associate Editors
Shai Izraeli (Tel Aviv), Steve Lane (Brisbane), Pier Mannuccio Mannucci (Milan), Pavan Reddy (Ann Arbor), David C. Rees (London), Paul G. Richardson (Boston), Francesco Rodeghiero (Vicenza), Gilles Salles (New York), Kerry Savage (Vancouver), Aaron Schimmer (Toronto), Richard F. Schlenk (Heidelberg), Sonali Smith (Chicago)
Statistical Consultant
Catherine Klersy (Pavia)
Editorial Board
Walter Ageno (Varese), Sarit Assouline (Montreal), Andrea Bacigalupo (Roma), Taman Bakchoul (Tübingen), Pablo Bartolucci (Créteil), Katherine Borden (Montreal), Marco Cattaneo (Milan), Corey Cutler (Boston), Kate Cwynarski (London), Mary Eapen (Milwaukee), Francesca Gay (Torino), Ajay Gopal (Seattle), Alex Herrera (Duarte), Shai Izraeli (Ramat Gan), Martin Kaiser (London), Marina Konopleva (Houston), Johanna A. Kremer Hovinga (Bern), Nicolaus Kröger (Hamburg), Austin Kulasekararaj (London), Shaji Kumar (Rochester), Ann LaCasce (Boston), Anthony R. Mato (New York), Matthew J. Maurer (Rochester), Neha Mehta-Shah (St. Louis), Alison Moskowitz (New York), Yishai Ofran (Haifa), Farhad Ravandi (Houston), John W. Semple (Lund), Liran Shlush (Toronto), Sara Tasian (Philadelphia), Pieter van Vlieberghe (Ghent), Ofir Wolach (Haifa), Loic Ysebaert (Toulouse)
Managing Director
Antonio Majocchi (Pavia)
Editorial Office
Lorella Ripari (Office & Peer Review Manager), Simona Giri (Production & Marketing Manager), Paola Cariati (Graphic Designer), Giulia Carlini (Graphic Designer), Debora Moscatelli (Graphic Designer), Igor Poletti (Graphic Designer), Marta Fossati (Peer Review), Diana Serena Ravera (Peer Review), Laura Sterza (Account Administrator)
Assistant Editors
Britta Dost (English Editor), Rachel Stenner (English Editor), Anne Freckleton (English Editor), Rosangela Invernizzi (Scientific Consultant), Marianna Rossi (Scientific Consultant), Massimo Senna (Information Technology), Luk Cox (Graphic Artist)
Haematologica | 108 - February 2023
Brief information on Haematologica
Haematologica (print edition, pISSN 0390-6078, eISSN 1592-8721) publishes peer-reviewed papers on all areas of experimental and clinical hematology. The journal is owned by a non-profit organization, the Ferrata Storti Foundation, and serves the scientific community following the recommendations of the World Association of Medical Editors (www.wame.org) and the International Committee of Medical Journal Editors (www.icmje.org).
Haematologica publishes Editorials, Original articles, Review articles, Perspective articles, Editorials, Guideline articles, Letters to the Editor, Case reports & Case series and Comments. Manuscripts should be prepared according to our guidelines (www.haematologica.org/information-for-authors), and the Uniform Requirements for Manuscripts Submitted to Biomedical Journals, prepared by the International Committee of Medical Journal Editors (www.icmje.org).
Manuscripts should be submitted online at http://www.haematologica.org/.
Conflict of interests. According to the International Committee of Medical Journal Editors (http://www.icmje.org/#conflicts), “Public trust in the peer review process and the credibility of published articles depend in part on how well conflict of interest is handled during writing, peer review, and editorial decision making”. The ad hoc journal’s policy is reported in detail at www.haematologica.org/content/policies.
Transfer of Copyright and Permission to Reproduce Parts of Published Papers. Authors will grant copyright of their articles to the Ferrata Storti Foundation. No formal permission will be required to reproduce parts (tables or illustrations) of published papers, provided the source is quoted appropriately and reproduction has no commercial intent. Reproductions with commercial intent will require written permission and payment of royalties.
Subscription. Detailed information about subscriptions is available at www.haematologica.org. Haematologica is an open access journal and access to the online journal is free. For subscriptions to the printed issue of the journal, please contact: Haematologica Office, via Giuseppe Belli 4, 27100 Pavia, Italy (phone +39.0382.27129, fax +39.0382.394705, E-mail: info@haematologica.org).
Rates of the printed edition for the year 2022 are as following: Institutional: Euro 700 Personal: Euro 170
Advertisements. Contact the Advertising Manager, Haematologica Office, via Giuseppe Belli 4, 27100 Pavia, Italy (phone +39.0382.27129, fax +39.0382.394705, e-mail: marketing@haematologica.org).
Disclaimer. Whilst every effort is made by the publishers and the editorial board to see that no inaccurate or misleading data, opinion or statement appears in this journal, they wish to make it clear that the data and opinions appearing in the articles or advertisements herein are the responsibility of the contributor or advisor concerned. Accordingly, the publisher, the editorial board and their respective employees, officers and agents accept no liability whatsoever for the consequences of any inaccurate or misleading data, opinion or statement. Whilst all due care is taken to ensure that drug doses and other quantities are presented accurately, readers are advised that new methods and techniques involving drug usage, and described within this journal, should only be followed in conjunction with the drug manufacturer’s own published literature.
Direttore responsabile: Prof. Carlo Balduini; Autorizzazione del Tribunale di Pavia n. 63 del 5 marzo 1955. Printing: Press Up, zona Via Cassia Km 36, 300 Zona Ind.le Settevene - 01036 Nepi (VT)
Associated with USPI, Unione Stampa Periodica Italiana. Premiato per l’alto valore culturale dal Ministero dei Beni Culturali ed Ambientali

Haematologica | 108 - February 2023
About the Cover
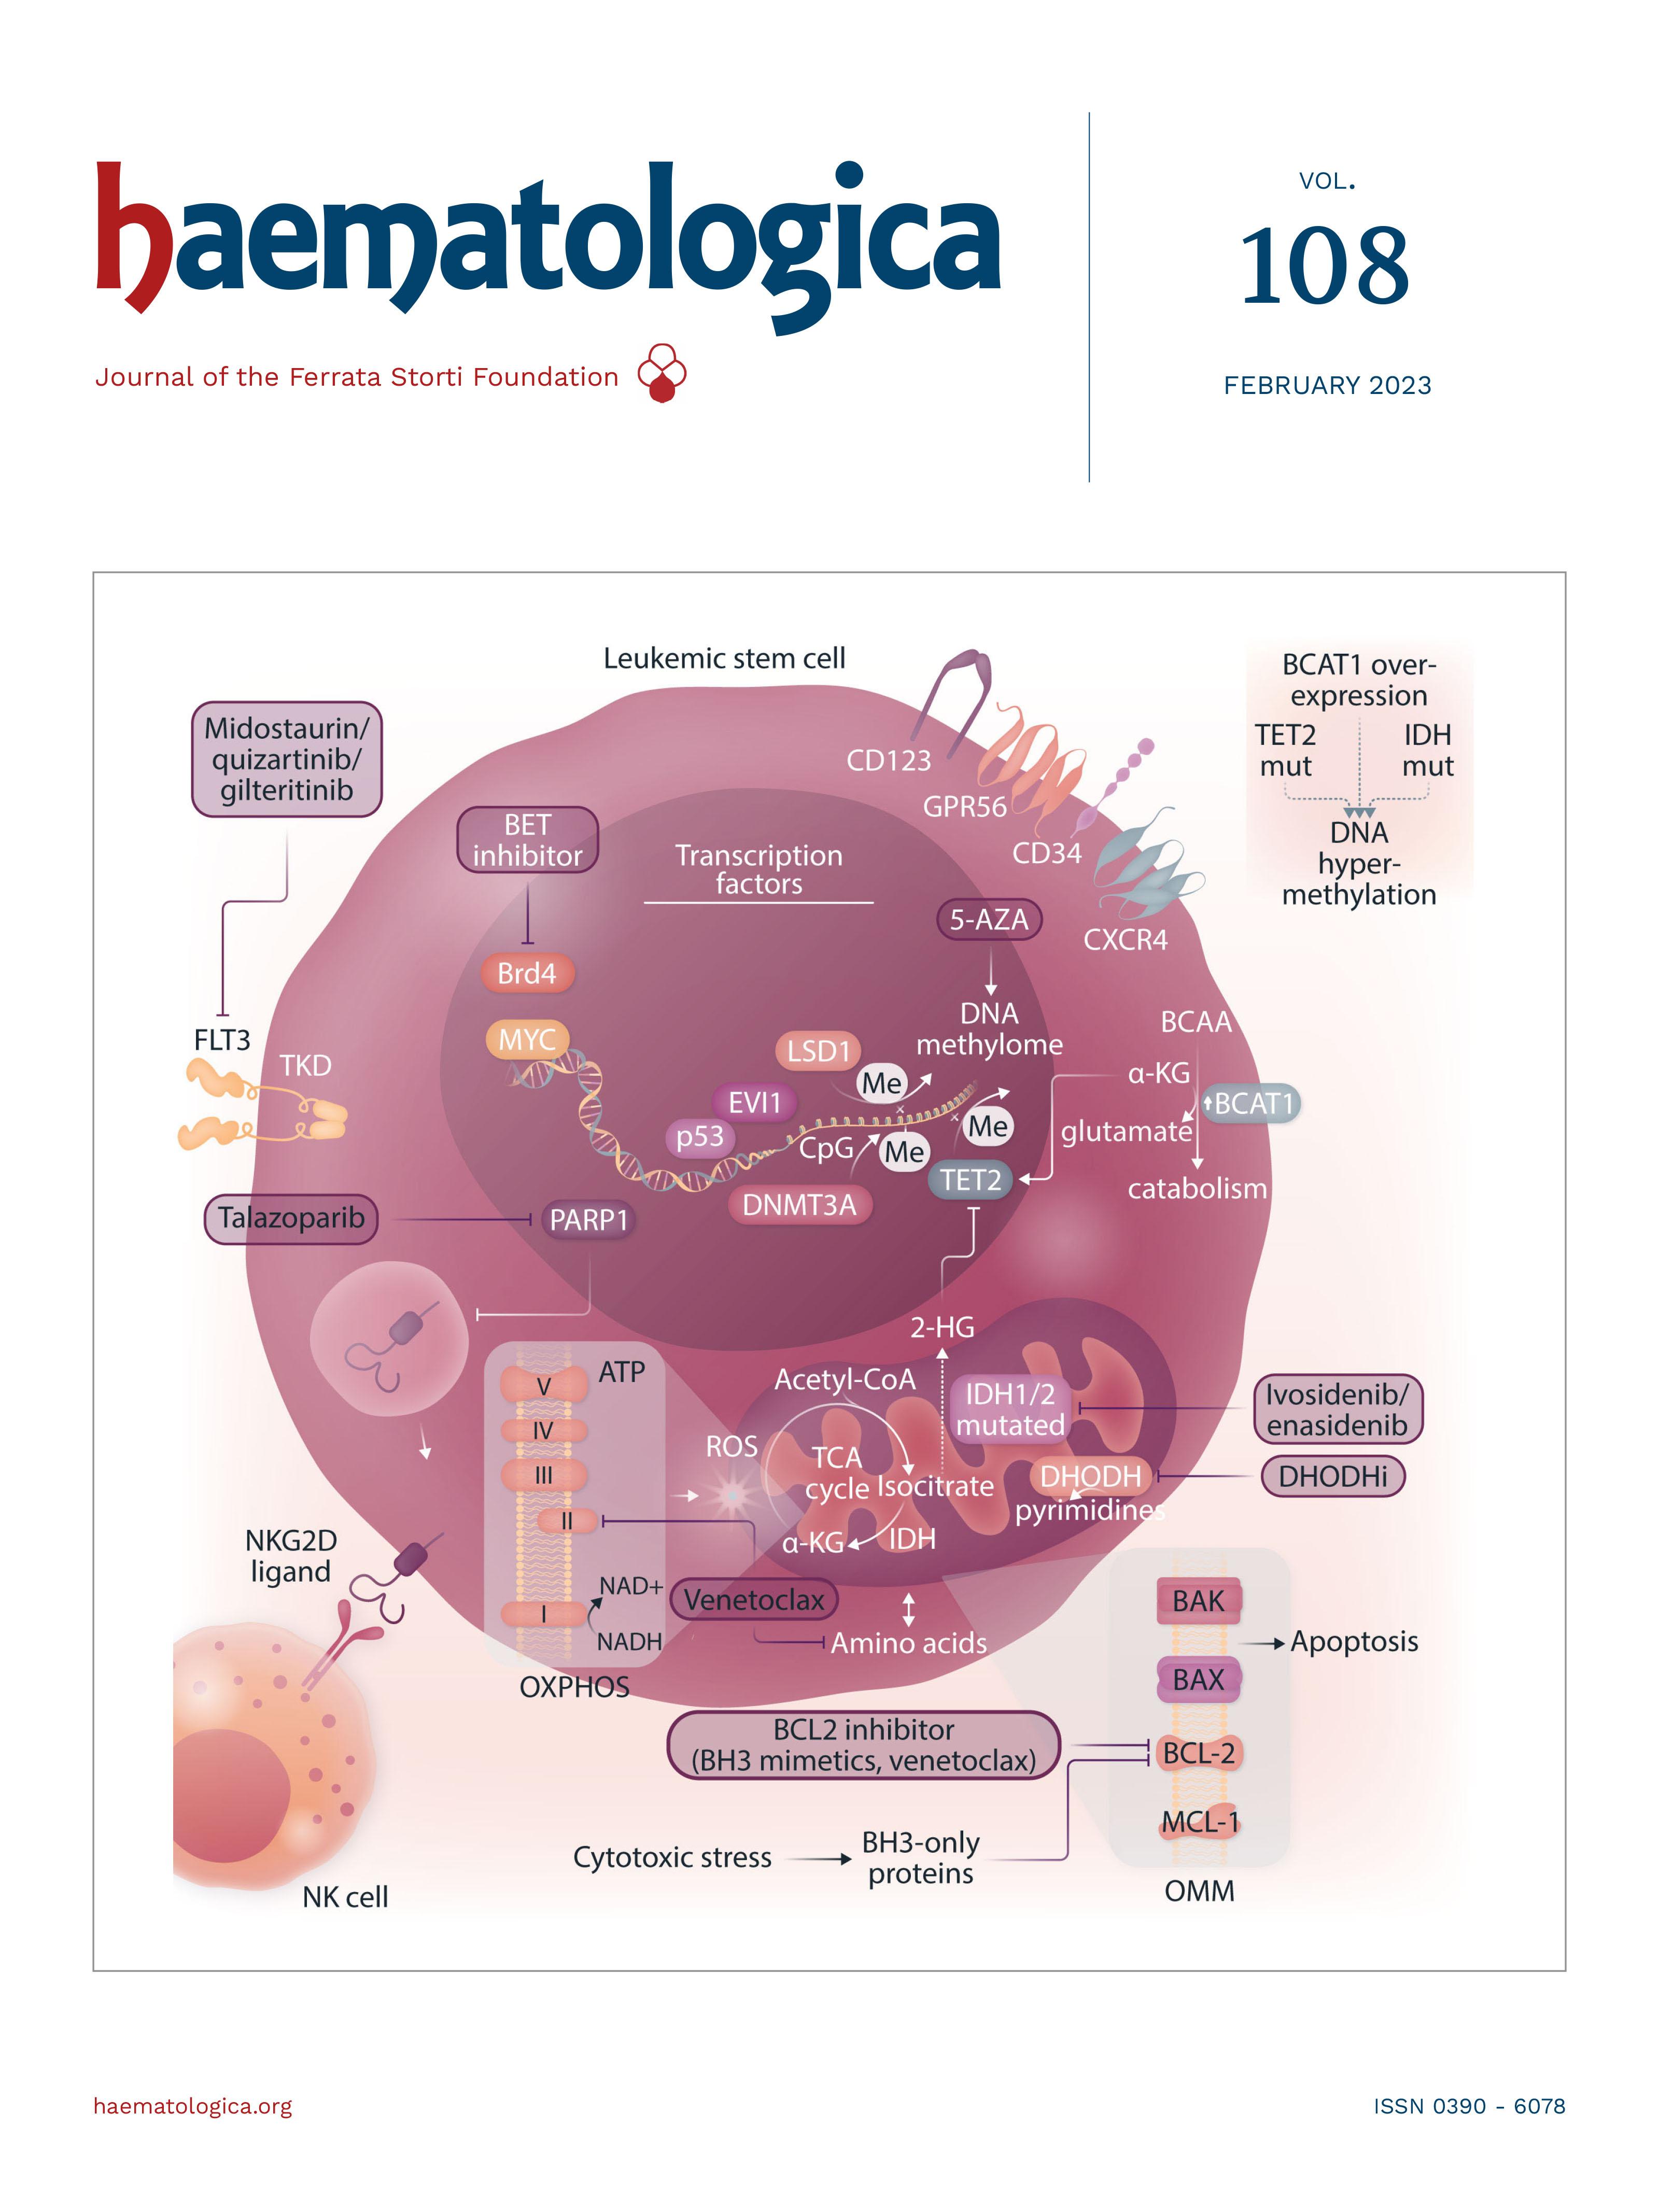
Image taken from the Review Article by Patrick Stelmach and Andreas Trumpp in this issue.
Landmark Paper in Hematology
295 t(15;17) in acute promyelocytic leukemia
Victoria Y. Ling and Steven W. Lane https://doi.org/10.3324/haematol.2022.282577
Editorials
297 KDM4C in germinal center lymphoma: a new piece of the epigenetic puzzle
Karina Close and Jude Fitzgibbon https://doi.org/10.3324/haematol.2022.280898
299 A third form of thrombotic thrombocytopenic purpura? Bernhard Lämmle https://doi.org/10.3324/haematol.2022.281095
301 Fine-tuning alloreactivity against HLA-DP to control leukemia with tolerable graft-versus-host disease Joseph Pidala and Claudio Anasetti https://doi.org/10.3324/haematol.2022.281168
303 Durable discontinuation of systemic therapy for chronic graft-versus-host disease: myth or reality?
Steven Z. Pavletic and Kirk R. Schultz https://doi.org/10.3324/haematol.2022.281114
Review Series
306
Acute myeloid leukemia: introduction to a series highlighting progress and ongoing challenges
Richard F. Schlenk https://doi.org/10.3324/haematol.2022.280803
308
321
The clinical impact of the molecular landscape of acute myeloid leukemia
Sabine Kayser and Mark J. Levis https://doi.org/10.3324/haematol.2022.280801
New drugs before, during, and after hematopoietic stem cell transplantation for patients with acute myeloid leukemia
Razan Mohty et al. https://doi.org/10.3324/haematol.2022.280798
342
353
Update on current treatments for adult acute myeloid leukemia: to treat acute myeloid leukemia intensively or non-intensively? That is the question
Sonia Jaramillo and Richard F. Schlenk https://doi.org/10.3324/haematol.2022.280802
Leukemic stem cells and therapy resistance in acute myeloid leukemia
Patrick Stelmach and Andreas Trumpp https://doi.org/10.3324/haematol.2022.280800
Volume 108, Issue 2:
2023
Table of Contents
February
Haematologica | 108 - February 2023 I
367
Acute Lymphoblastic Leukemia
Targeting dual oncogenic machineries driven by TAL1 and PI3K-AKT pathways in T-cell acute lymphoblastic leukemia
Fang Qi Lim et al.
https://doi.org/10.3324/haematol.2022.280761
382
Acute Lymphoblastic Leukemia
Genome-wide CRISPR screens identify ferroptosis as a novel therapeutic vulnerability in acute lymphoblastic leukemia
Marie-Eve Lalonde et al.
https://doi.org/10.3324/haematol.2022.280786
394
Acute Lymphoblastic Leukemia
BCL6 inhibition ameliorates resistance to ruxolitinib in CRLF2-rearranged acute lymphoblastic leukemia
Shinobu Tsuzuki et al.
https://doi.org/10.3324/haematol.2022.280879
409
Acute Lymphoblastic Leukemia
In vivo stabilization of a less toxic asparaginase variant leads to a durable antitumor response in acute leukemia
Maaike Van Trimpont et al.
https://doi.org/10.3324/haematol.2022.281390
420
Acute Myeloid Leukemia
Relative impact of residual cytogenetic abnormalities and flow cytometric measurable residual disease on outcome after allogeneic hematopoietic cell transplantation in adult acute myeloid leukemia Corentin Orvain et al.
https://doi.org/10.3324/haematol.2022.281585
433
Bone marrow Transplant
Early expression of CD94 and loss of CD96 on CD8+ T cells after allogeneic stem cell tranplantation is predictive of subsequent relapse and survival Kriti Verma et al.
https://doi.org/10.3324/haematol.2021.280497
444
Cell Therapy & Immunotherapy
Molecular monitoring of T-cell kinetics and migration in severe neurotoxicity after real-world CD19-specific chimeric antigen receptor T cell therapy Susanna Carolina Berger, et al. https://doi.org/10.3324/haematol.2022.281110
457
Cell Therapy & Immunotherapy
Potent preclinical activity of FLT3-directed chimeric antigen receptor T-cell immunotherapy against FLT3-mutant acute myeloid leukemia and KMT2A-rearranged acute lymphoblastic leukemia
Lisa M. Niswander et al.
https://doi.org/10.3324/haematol.2022.281456
472
Coagulation & its Disorders
Translational readthrough at F8 nonsense variants in the factor VIII B domain contributes to residual expression and lowers inhibitor association
Maria Francesca Testa et al.
https://doi.org/10.3324/haematol.2022.281279
483
Complications in Hematology
Durable discontinuation of systemic therapy in patients affected by chronic graft-versus-host disease George L. Chen et al.
https://doi.org/10.3324/haematol.2021.279814
Articles
Haematologica | 108 - February 2023 II
490
Hematopoiesis
Osteoprogenitor SFRP1 prevents exhaustion of hematopoietic stem cells via PP2A-PR72/130-mediated regulation of p300
Franziska Hettler et al. https://doi.org/10.3324/haematol.2022.280760
502
Hematopoiesis
ARID5B influences B-cell development and function in mouse Charnise Goodings et al. https://doi.org/10.3324/haematol.2022.281157
513
Inflammatory Myeloid Neoplasm
Serum vascular endothelial growth factor is associated with cardiovascular involvement and response to therapy in Erdheim-Chester disease
Anaïs Roeser et al. https://doi.org/10.3324/haematol.2022.280755
522
Myelodysplastic Syndromes
Selective inhibition of MCL1 overcomes venetoclax resistance in a murine model of myelodysplastic syndromes
Melissa A. Fischer et al. https://doi.org/10.3324/haematol.2022.280631
532
Myelodysplastic Syndromes
High transferrin saturation predicts inferior clinical outcomes in patients with myelodysplastic syndromes
Jennifer Teichman et al. https://doi.org/10.3324/haematol.2022.280723
543
Non-Hodgkin Lymphoma
Focal structural variants revealed by whole genome sequencing disrupt the histone demethylase KDM4C in B-cell lymphomas
Cristina López et al. https://doi.org/10.3324/haematol.2021.280005
555
Non-Hodgkin Lymphoma
Small-molecule SUMO inhibition for biomarker-informed B-cell lymphoma therapy
Uta M. Demel et al. https://doi.org/10.3324/haematol.2022.280995
568 Plasma cell disorders
All-trans retinoic acid works synergistically with the g-secretase inhibitor crenigacestat to augment BCMA on multiple myeloma and the efficacy of BCMA-CAR T cells Estefanía García-Guerrero et al. https://doi.org/10.3324/haematol.2022.281339
Letters
581
Mutations in the RACGAP1 gene cause autosomal recessive congenital dyserythropoietic anemia type III
Gonzalo Hernández et al.
https://doi.org/10.3324/haematol.2022.281277
588
Associations between socioeconomic status and bispecific LV20.19 CAR T-cell therapy outcomes
Jennifer M. Knight et al.
https://doi.org/10.3324/haematol.2022.281957
594
The effects of cardio-selective β blockade on diastolic dysfunction in children with sickle cell disease
Parul Rai et al.
https://doi.org/10.3324/haematol.2022.281428
Haematologica | 108 - February 2023 III
599
IL1RAP is expressed in several subtypes of pediatric acute lymphoblastic leukemia and can be used as a target to eliminate ETV6::RUNX1-positive leukemia cells in preclinical models
Helena Ågerstam et al.
https://doi.org/10.3324/haematol.2022.281059
605
Influence of bisphosphonates or recombinant human parathyroid hormone on in vitro sensitivity of acute lymphoblastic leukemia cells to chemotherapy
Demi T.C. de Winter et al.
https://doi.org/10.3324/haematol.2022.281033
610
615
Impact of daratumumab-based induction on stem cell collection parameters in Swedish myeloma patients
Konstantinos Lemonakis et al. https://doi.org/10.3324/haematol.2022.281610
Cytomegalovirus reactivation after CD19 CAR T-cell therapy is clinically significant
George Chen et al.
https://doi.org/10.3324/haematol.2022.281719
621
Prognostic value of positron emission tomography/computed tomography in transplant-eligible newly diagnosed multiple myeloma patients from CASSIOPEIA: the CASSIOPET study
Françoise Kraeber-Bodéré et al. https://doi.org/10.3324/haematol.2021.280051
627 A novel SART3::RARG fusion gene in acute myeloid leukemia with acute promyelocytic leukemia phenotype and differentiation escape to retinoic acid
Ji Li et al. https://doi.org/10.3324/haematol.2022.281766
633
Therapeutic potential of b-lactam ceftriaxone for chronic pain in sickle cell disease
Ying He et al. https://doi.org/10.3324/haematol.2022.281716
638 ADAMTS13 conformation is closed in non-immune acquired thrombotic thrombocytopenic purpura of unidentified pathophysiology
Bérangère S. Joly et al. https://doi.org/10.3324/haematol.2022.280768
645
Integrating biological HLA-DPB1 mismatch models to predict survival after unrelated hematopoietic cell transplantation
Annalisa Ruggeri et al. https://doi.org/10.3324/haematol.2021.280055
Comment
653
Comment on Antibody response after vaccination against SARS-CoV-2 in adults with hematological malignancies: a systematic review and meta-analysis
Yacong Shao and Yongming Zhou https://doi.org/10.3324/haematol.2022.281902
Response to the comment
655 Reply to the Comment on Antibody response after vaccination against SARS-CoV-2 in adults with hematological malignancies: a systematic review and meta-analysis
Nico Gagelmann and Nicolaus Kröger https://doi.org/10.3324/haematol.2022.282017
Haematologica | 108 - February 2023 IV
t(15;17) in acute promyelocytic leukemia
1QIMR Berghofer Medical Research Institute, 2Faculty of Medicine, University of Queensland, 3Department of Haematology, Princess Alexandra Hospital and 4Department of Haematology and Bone Marrow Transplant, Royal Brisbane and Women’s Hospital, Brisbane, Queensland, Australia
E-mail: steven.lane@qimrberghofer.edu.au https://doi.org/10.3324/haematol.2022.282577

©2023 Ferrata Storti Foundation Haematologica material is published under a CC BY-NC license
TITLE Evidence for a 15;17 translocation in every patient with acute promyelocytic leukemia
AUTHORS Larson RA, Kondo K, Vardiman JW, Butler AE, Golomb HM, Rowley JD.
JOURNAL American Journal of Medicine. 1984;76:827-841. PMID: 6586073.
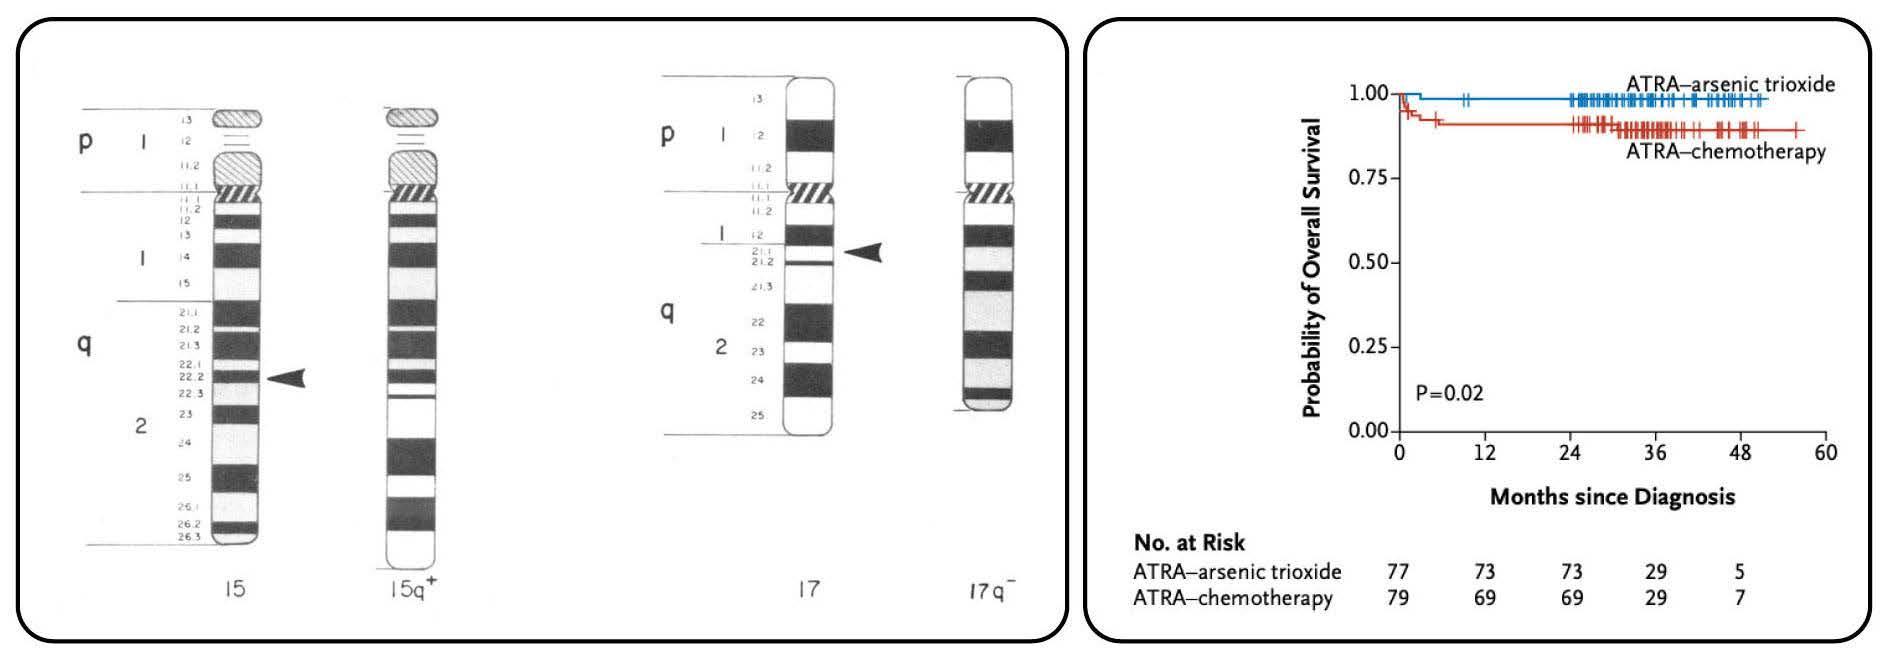
Since its first description by Hillestad in 1957, acute promyelocytic leukemia (APML) has been recognized as a distinct subtype of acute myeloid leukemia (AML) because of its pathognomonic ‘M3’ morphology, fulminant clinical presentation with life-threatening coagulopathy and, more recently, exquisite responsiveness to molecularly targeted differentiation therapy. The diagnostic translocation t(15;17) between chromosomes 15 and 17, which is responsible for the distinctive biology of APML, was definitively established in a seminal publication by Richard Larson, Janet Rowley and colleagues in 1984.1 This manuscript brought together the meticulous characterization of the clinical, microscopic and karyotypic features of a multicenter cohort of 27 patients with APML, in which the t(15;17) was found in all patients.
Following case reports and small case series (including one from Rowley’s group)2 of an abnormal chromosome 17, subsequently noted to reflect a balanced translocation between chromosomes 15 and 17 in APML, Larson et al. examined 27 patients with de novo APML from the University of Chicago, USA and other Chicago centers; at least four of the patients had the atypical ‘microgranular’ variant. Transmission electron microscopy analysis revealed that ‘microgranular’ and granular variant granules are on a continuum of size, thereby leading to the proposal that the names represented an arbitrary division rather than a biologically significant dichotomy. The clinical cohort had a bimodal age distribution skewed towards a younger age (median 26 years). The responses to treatment (mainly cytarabine + anthracycline-based) were a harrowing com-
B
Figure 1. The diagnostic translocation and treatment efficacy in acute promyelocytic leukemia. (A) Schematic of the identical 15;17 translocation identified in every patient of the cohort reported by Larson and colleagues (taken from Larson et al. Am J Med. 1984; with permission).1 (B) Treatment of acute promyelocytic leukemia with all-trans retinoic acid (ATRA) and arsenic trioxide produces almost 100% cure rates (taken from Lo Coco et al. New Engl J Med. 2013; with permission).4
Victoria Y. Ling1-3 and Steven W. Lane1,2,4A
Haematologica | 108 February 2023 295 LANDMARK PAPER IN HEMATOLOGY V.Y. Ling and S.W. Lane
parison to current clinical outcomes, with less than half of patients achieving remission and a median survival of only 8 weeks. The clinical complications of this early cohort reflect the sobering natural history of APML with 40% of patients succumbing to intracranial hemorrhage and reminds us that early effective and protocoled management of coagulopathy in APML are still key for today’s high rates of cure to be realized. The first legacy of this paper was the careful cytogenetic analysis of each patient utilizing specific culture conditions and corroborating banding techniques. Through these karyotypic analyses, the authors identified a t(15;17) with identical breakpoints at 15q22 and 17q21.1 in every patient of their cohort (Figure 1A). They suggested that methodological issues explained the previously reported uneven geographical distribution of t(15;17) in APML. With modern techniques, this has proven to be true with more than 95% of cases of APML containing the described t(15;17). Subsequent to the discovery of t(15;17)(q22;q21.1), a number of groups identified the fusion to be between PML (on
References
1. Larson RA, Kondo K, Vardiman JW, Butler AE, Golomb HM, Rowley JD. Evidence for a 15;17 translocation in every patient with acute promyelocytic leukemia. Am J Med. 1984;76:827-841
2. Rowley J, Golomb H, Dougherty C. 15/17 translocation, a consistent chromosomal change in acute promyelocytic leukaemia. Lancet. 1977;309(8010):549-550.
chromosome 15) and RARA (on chromosome 17), also providing the biological explanation for clinical differentiation responses to all-trans retinoic acid (ATRA) observed in the late 1980s.3 ATRA, now accompanied by arsenic trioxide, forms the backbone of APML therapy4 and has been transformative in converting a highly fulminant, chemotherapyresistant entity into one with a more than 95% cure rate (Figure 1B). These responses are unprecedented in any other subtype of AML or advanced cancer. Exemplified by APML, genetic characterization of AML is now a fundamental requirement, with numerous pathogenic reciprocal translocations and molecular mutations guiding AML classification, prognostication, selection for allogeneic transplantation and rationally designed targeted therapies.
Disclosures
No conflicts of interest to disclose.
Contributions
Both authors contributed equally.
3. Huang M, Ye Y, Chai J, et al. Use of all trans retinoic acid in the treatment of acute promyelocytic leukemia. Blood. 1988;72(2):567-572.
4. Lo-Coco F, Avvisati G, Vignetti M, et al. Retinoic acid and arsenic trioxide for acute promyelocytic leukemia. N Engl J Med. 2013;369(2):111-121.
Haematologica | 108 February 2023 296 LANDMARK PAPER IN HEMATOLOGY V.Y. Ling and S.W. Lane
KDM4C in germinal center lymphoma: a new piece of the epigenetic puzzle
Karina Close and Jude FitzgibbonCentre for Genomics and Computational Biology, Barts Cancer Institute, Queen Mary University of London, London, UK
Correspondence: J. Fitzgibbon j.fitzgibbon@qmul.ac.uk
Received: April 7, 2022.
Accepted: April 19, 2022.
Prepublished: April 28, 2022.
https://doi.org/10.3324/haematol.2022.280898
©2023 Ferrata Storti Foundation
Published under a CC BY-NC license
In this issue of Haematologica, López et al.1 report their findings from mining whole genome sequencing data from tumors of patients (n=183) with germinal center (GC) lymphoma, curated as part of the International Cancer Genome Consortium MMML-Seq (Molecular Mechanisms in Malignant Lymphoma by Sequencing) project, to add histone demethylase KDM4C (4% of cases) to a burgeoning list of epigenetic regulators recurrently altered in these diseases. Both in silico analyses and functional reconstitution studies, in a subset of cell lines, support a tumor suppressive role for KDM4C in contrast to previous reports of its having oncogenic activity,2 underlining the important contribution of cellular and molecular context to the roles of epigenetic regulators.
It is now well established that chromatin deregulation is a hallmark of cancer, seen notably in the B-cell malignancies follicular lymphoma and diffuse large B-cell lymphoma, in which mutations arise early in the evolution of the disease, and typically affect multiple components of the chromatin machinery in the same patient. The introduction of targeted resequencing has highlighted a now familiar gamut of recurring gene mutations in KMT2D, CREBBP, EZH2, ARID1A, EP300 and linker histones3,4 and spurred efforts to understand the nature of cooperation occurring between these regulators, and their functional downstream consequences. The findings here regarding KDM4C (also called JMJD2C), on chromosome 9p24, represent a departure, focusing on copy number variation. The gene encodes a member of the Jumonji family of demethylases, which can remove methyl groups from histone residues H3K9 and H3K36 adding to
the overall complexity of the epigenetic deregulation underlying GC lymphomas (Figure 1) and cautions against a tunnel vision focus on well-characterized marks such as H3K27 and H3K4. Indeed, the study by López et al. on KDM4C creates a heightened awareness of the existence of rare, and for the most part, largely inaccessible structural variants that are difficult to resolve using targeted or whole exome sequencing approaches. Critically, it begs the questions of whether KDM4C or the corresponding chromatin marks H3K9 and H3K36 are deregulated by other recurrent genetic or epigenetic alterations. For instance, an increase in H3K27me3 is induced not only by perturbations of the methyltransferase EZH2 a target of SET domain gain-of-function mutations and amplifications of chromosome 7 in GC lymphomas5,6 but also by loss-of-function mutations and deletions of the corresponding demethylase KDM6A (also known as UTX) in other cancer types including leukemias.7 Indeed, loss of linker histone proteins, frequent in GC lymphomas, has been shown to result in a distinct gain of H3K36 dimethylation.8 It is safe to assume that the application of whole genome sequencing will uncover an increasing number of diverse alterations with converging mechanistic effects to those of already established mutations. The translational application of epigenetic targeting therapies is exemplified by the Food and Drug Administration’s approval of the EZH2 inhibitor tazemetostat for relapsed/refractory follicular lymphoma. The enrichment of EZH2-mutant patients among responders (69% EZH2mut vs. 35% EZH2WT),9 represents the potential of predictive biomarkers, while also highlighting

Haematologica | 108 February 2023 297 EDITORIAL K. Close and J. Fitzgibbon
Figure 1. Epigenetic deregulation in germinal center lymphomas: a growing number of histone proteins and their tail residues are known to be altered in these diseases.
the lack of fidelity of a single genetic predictor of response and resistance to pleiotropically-acting treatments and the need to consider the modulating effects of other factors. The contribution of epigenetic alterations to outcomes in follicular lymphoma is underlined by their inclusion in the clinico-genetic M7-FLIPI score, which has some predictive value for overall survival in patients treated with R-CHOP (rituximab plus cyclophosphamide, doxorubicin, vincristine, prednisone), and with five of the seven constituent genes (EP300, CREBBP, MEF2B, ARID1A, EZH2) representing epigenetic regulators, with either positive or negative predictive value. The holy grail, however, in an evolving treatment landscape, is a predictive model that performs independently of therapy choice, with the M7-FLIPI not being informative in patients treated with rituximab plus bendamustine.10 In this regard, the study by López and colleagues1 makes us cogent that we need to look beyond gene mutations and be as assiduous as possible in documenting the spectrum of lesions that may be contributing to the biology of the cancer. This certainly raises challenges for companion diagnostics, but progress is being made in the ability to assess genomic sequence, translocation, and copy-number data with the aim of classifying patients into higher fidelity subtypes that offer predictive value for treatment.4 This new addition of KDM4C alterations to the growing list of epigenetic deregulation occurring in these diseases suggests that other rarer events have been overlooked and need to be accounted for. Indeed, whether KDM4C plays a key role in the GC reaction and what contribution alterations
References
1. López C, Schleussner N, Bernhart S, et al. Focal structural variants revealed by whole genome sequencing disrupt the histone demethylase KDM4C in B-cell lymphomas. Haematologica. 2023;108(2):543-554.
2. Cloos PAC, Christensen J, Agger K, et al. The putative oncogene GASC1 demethylates tri- and dimethylated lysine 9 on histone H3. Nature. 2006;442(7100):307-311.
3. Okosun J, Bödör C, Wang J, et al. Integrated genomic analysis identifies recurrent mutations and evolution patterns driving the initiation and progression of follicular lymphoma. Nat Genet. 2014;46(2):176-181.
4. Wright GW, Huang DW, Phelan JD, et al. A probabilistic classification tool for genetic subtypes of diffuse large B cell lymphoma with therapeutic implications. Cancer Cell. 2020;37(4):551-568.e14.
5. Morin RD, Johnson NA, Severson TM, et al. Somatic mutations altering EZH2 (Tyr641) in follicular and diffuse large B-cell lymphomas of germinal-center origin. Nat Genet. 2010;42(2):181-185.
have to malignant transformation or disease maintenance remains to be characterized. An attractive feature of leveraging epigenetic mutations for therapeutic intervention in follicular lymphoma is their early and clonally stable occurrence,3 suggesting that this approach could conceivably target the common progenitor cell population that repopulates the tumor at relapse. It would therefore be valuable to establish whether KDM4C alterations occur early in disease evolution.
Despite advances with agnostic treatments such as chimeric antigen receptor T cells and bispecific antibodies, the use of epigenetic-targeting therapies and the profiling of epigenetic landscapes for potential biomarkers remain at the forefront of efforts to achieve precision medicine approaches for GC lymphomas. A key challenge is, therefore, the elucidation of a full picture of the heterogeneous drivers of the epigenetic deregulation frequent in these diseases.
Disclosures
No conflicts of interest to disclose.
Contributions
Both authors contributed equally.
Funding
The group's lymphoma research is funded by Lymph & Co (Amsterdam), Blood Cancer UK (21005) and Cancer Research UK (C355/A26819) under the Accelerator Program.
6. Huet S, Xerri L, Tesson B, et al. EZH2 alterations in follicular lymphoma: biological and clinical correlations. Blood Cancer J. 2017;7(4):e555.
7. Van Haaften G, Dalgliesh GL, Davies H, et al. Somatic mutations of the histone H3K27 demethylase gene UTX in human cancer. Nat Genet. 2009;41(5):521-523.
8. Yusufova N, Kloetgen A, Teater M, et al. Histone H1 loss drives lymphoma by disrupting 3D chromatin architecture. Nature. 2021;589(7841):299-305.
9. Morschhauser F, Tilly H, Chaidos A, et al. Tazemetostat for patients with relapsed or refractory follicular lymphoma: an open-label, single-arm, multicentre, phase 2 trial. Lancet Oncol. 2020;21(11):1433-1442.
10. Pastore A, Jurinovic V, Kridel R, et al. Integration of gene mutations in risk prognostication for patients receiving first-line immunochemotherapy for follicular lymphoma: a retrospective analysis of a prospective clinical trial and validation in a population-based registry. Lancet Oncol. 2015;16(9):1111-1122.
Haematologica | 108 February 2023 298 EDITORIAL K. Close and J. Fitzgibbon
A third form of thrombotic thrombocytopenic purpura?
Bernhard Lämmle1,2,31Department of Hematology and Central Hematology Laboratory, Inselspital, Bern University Hospital, University of Bern, Bern, Switzerland; 2Center for Thrombosis and Hemostasis, University Medical Center Mainz, Mainz, Germany and 3Haemostasis Research Unit, University College London, London, UK
Correspondence: B. Lämmle bernhard.laemmle@uni-mainz.de
Received: April 14, 2022.
Accepted: April 21, 2022.
Prepublished: April 28, 2022.
https://doi.org/10.3324/haematol.2022.281095
©2023 Ferrata Storti Foundation Published under a CC BY-NC license
In this issue of Haematologica a highly provocative letter by B.S. Joly et al., on behalf of the French Reference Center for Thrombotic Microangiopathies (CNR-MAT), reiterates the existence of a so-far largely disregarded - not to say «scotomized» - form of acquired thrombotic thrombocytopenic purpura (TTP).1 In the hundred years since its first description by Moschcowitz in 1924, TTP has attracted the interest of numerous clinicians and researchers; the development of our knowledge on the pathophysiology and more recently new therapeutic advances in this previously mostly fatal disease are a major success story of modern scientific medicine.2 TTP specialists usually distinguish two pathophysiologically distinct forms of TTP: (i) a very rare hereditary or congenital TTP (cTTP) or Upshaw-Schulman syndrome caused by biallelic mutations of the ADAMTS13 gene leading to a severe constitutional deficiency of the von Willebrand factor-cleaving metalloprotease ADAMTS13 and (ii) an acquired, autoimmune TTP (iTTP) associated with autoantibody-mediated severe ADAMTS13 deficiency.3,4 Whereas in plasma from healthy subjects, from patients with hemolytic uremic syndrome or from patients with sepsis, the ADAMTS13 circulates in a closed conformation whereby the two CUB domains interact with the spacer domain, in plasma from patients with acute iTTP, the ADAMTS13 adopts an open conformation allowing cryptic epitopes in the spacer domain to be recognized by specific monoclonal antibodies.5 Thus, an open ADAMTS13 conformation, i.e. a conformation index >0.5, was suggested to be a specific hallmark of acute acquired, autoantibody-mediated TTP.5 A follow-up study initiated by the group of K. Vanhoorelbeke in Kortrijk showed that isolated IgG anti-ADAMTS13 autoantibodies purified from iTTP plasma samples were able to induce an open conformation of ADAMTS13 in normal plasma.6 Furthermore, using a large multicenter cohort of patients with iTTP and plasma samples obtained during acute TTP episodes and during remission, a conformation index >0.5 was not only confirmed to be present in the acute disease phase but also in almost all iTTP samples in remission with an ADAMTS13 activity ≤50% and even in 38% of remission samples with normalized ADAMTS13 activity >50%.6 There-
fore, an open ADAMTS13 conformation was proposed as a specific biomarker for both manifest and subclinical iTTP. In 2016, the French Reference Center for Thrombotic Microangiopathies reported a cross-sectional analysis of all 939 adult patients admitted with a first episode of acute thrombotic microangiopathy with severe ADAMTS13 deficiency between 1999 and 2013.7 Of 772 patients for whom data and blood samples at admission were available, 378 (49%) had idiopathic TTP and 394 (51%) had nonidiopathic TTP, defined as TTP associated with various clinical conditions such as infections, autoimmune diseases, pregnancy, cancer, organ transplantation or drugs. Pathophysiologically, three distinct forms of TTP were delineated: 585 (75%) had iTTP (defined by the presence in plasma of free IgG anti-ADAMTS13 autoantibodies measured by a commercial assay), 21 (3%) had cTTP with biallelic ADAMTS13 mutations, and 166 (22%) had acquired TTP of unknown cause (uTTP), defined by the absence of IgG anti-ADAMTS13 antibodies.7 Of note, 345/378 (91%) of the cases of idiopathic TTP had iTTP whereas only 240/373 (64%) cases of non-idiopathic acquired TTP were classified as iTTP (displaying free anti-ADAMTS13 autoantibodies), and the remaining 133 non-idiopathic cases lacking autoantibodies were denoted as uTTP.
The letter by Joly et al.1 now focuses on the ADAMTS13 conformation in acquired TTP of unknown pathophysiology, tentatively called uTTP. The authors selected a new cohort of 125 adult patients with a first episode of acute non-idiopathic TTP (ADAMTS13 activity <10% of normal) enrolled in the French Thrombotic Microangiopathy Registry between 2012 and 2016. Forty-nine of these 125 patients with non-idiopathic TTP had measurable anti-ADAMTS13 IgG antibodies and were classified as having iTTP whereas 76 did not have free anti-ADAMTS13 IgG and constituted the group of interest, i.e. the uTTP cases. Comparing the uTTP with the iTTP patients, the former were older, had a smaller proportion of females, more often had associated cancers and less often had accompanying autoimmune diseases. The clinical presentation in both groups was similar except for renal abnormalities being more prevalent in uTTP. Laboratory features showed less severe thrombocytopenia, higher creatinine values
Haematologica | 108 February 2023 299 EDITORIAL B. Lämmle
and higher ADAMTS13 antigen levels in uTTP compared to iTTP cases.1 The ADAMTS13 conformation index, measurable in 59/76 uTTP and in 30/49 iTTP patients with ADAMTS13 antigen levels of ≥0.03 µg/mL displayed an open conformation in 23/30 (76%) cases of iTTP but in only 8/59 (13.6%) uTTP patients. The study by Mariotte et al.7 and the letter by Joly et al.1 suggesting the existence of a third pathophysiological form of TTP besides the well-established iTTP and cTTP, raise scientifically and practically important questions. What might the pathophysiology of uTTP be? And what is the most appropriate therapy for this provisional entity? Obviously, uTTP is associated with an acquired severe ADAMTS13 deficiency and several surviving patients may recover normal ADAMTS13 activity. In contrast to most iTTP cases displaying a conformation index >0.5, 51/59 (86.4%) uTTP patients of the present cohort showed a closed ADAMTS13 conformation. Could acquired alterations (deglycosylation, oxidation, proteolysis, high cytokine levels, other factors) during inflammatory reactions severely compromise ADAMTS13 activity? Or are IgM and/or IgA anti-ADAMTS13 autoantibodies,8 not assessed by commercial IgG anti-ADAMTS13 tests, responsible for uTTP? Alternatively, could IgG anti-ADAMTS13 still be cau-
References
1. Joly BS, Roose E, Coppo P, Vanhoorelbeke K, Veyradier A. ADAMTS13 conformation is closed in non-immune acquired thrombotic thrombocytopenic purpura of unidentified pathophysiologyy. Haematologica. 2023;108(2):638-644.
2. Kremer Hovinga JA, Coppo P, Lämmle B, Moake JL, Miyata T, Vanhoorelbeke K. Thrombotic thrombocytopenic purpura. Nat Rev Dis Primers. 2017;3:17020.
3. Scully M, Cataland S, Coppo P, et al. Consensus on the standardization of terminology in thrombotic thrombocytopenic purpura and related thrombotic microangiopathies. J Thromb Haemost. 2017;15(2):312-322.
4. Zheng XL, Vesely SK, Cataland SR, et al. ISTH guidelines for the diagnosis of thrombotic thrombocytopenic purpura. J Thromb Haemost. 2020;18(10):2486-2495.
5. Roose E, Schelpe AS, Joly BS, et al. An open conformation of ADAMTS13 is a hallmark of acute acquired thrombotic thrombocytopenic purpura. J Thromb Haemost. 2018;16(2):378-388.
6. Roose E, Schelpe AS, Tellier E, et al. Open ADAMTS13, induced by antibodies, is a biomarker for subclinical immunemediated thrombotic thrombocytopenic purpura. Blood.
sative, but all bound within circulating IgG-ADAMTS13 complexes9,10 leaving no detectable free antibodies?
It is clear that concerted, multicenter efforts would be ideal to clarify the nature of uTTP. Such exemplary country-wide collaborative cohorts as provided by the French Reference Center for Thrombotic Microangiopathies will be instrumental in unraveling the pathophysiology of uTTP and thereby establishing whether therapeutic plasma exchange with plasma replacement, corticosteroids, other immunosuppressant drugs and caplacizumab2 are the optimal measures also in this form of TTP.
In brief, the research on TTP must go on!
Disclosures
BL is chairman of the data safety monitoring committees for the Baxalta 281102 and the TAK-755-3002 studies (both investigating recombinant ADAMTS13 in hereditary TTP) and for the Takeda SHP655-201 study (recombinant ADAMTS13 in immune-mediated TTP), all three now run by Takeda. He is a member of the advisory board of Ablynx, now part of Sanofi, for the development of caplacizumab; he received congress travel support and/or lecture fees from Baxter, Ablynx, Alexion, Siemens, Bay er, Roche and Sanofi
2020;136(3):353-361.
7. Mariotte E, Azoulay E, Galicier L, et al. Epidemiology and pathophysiology of adulthood-onset thrombotic microangiopathy with severe ADAMTS13 deficiency (thrombotic thrombocytopenic purpura): a cross-sectional analysis of the French national registry for thrombotic microangiopathy. Lancet Haemat. 2016;3(5):e237-245.
8. Ferrari S, Scheiflinger F, Rieger M, et al. Prognostic value of anti-ADAMTS13 antibody features (Ig isotype, titer, and inhibitory effect) in a cohort of 35 adult French patients undergoing a first episode of thrombotic microangiopathy with undetectable ADAMTS13 activity. Blood. 2007;109(7):2815-2822.
9. Ferrari S, Palavra K, Gruber B, et al. Persistence of circulating ADAMTS13-specific immune complexes in patients with acquired thrombotic thrombocytopenic purpura. Haematologica. 2014;99(4):779-787.
10. Froehlich-Zahnd R, George JN, Vesely SK, et al. Evidence for a role of anti-ADAMTS13 autoantibodies despite normal ADAMTS13 activity in recurrent thrombotic thrombocytopenic purpura. Haematologica. 2012;97(2):297-303.
Haematologica | 108 February 2023 300 EDITORIAL B. Lämmle
Fine-tuning alloreactivity against HLA-DP to control leukemia with tolerable graft-versus-host disease
Joseph Pidala and Claudio AnasettiCorrespondence: J. Pidala joseph.pidala@moffitt.org
Received: April 22, 2022.
Accepted: May 4, 2022. Prepublished: May 12, 2022. https://doi.org/10.3324/haematol.2022.281168
©2023 Ferrata Storti Foundation
Published under a CC BY-NC license
In this issue of Haematologica, Ruggeri et al. report that for patients with high expression of HLA-DPB1, hematopoietic stem cell transplantation from unrelated donors who have a mismatch at HLA-DPB1 that is permissive for T-cell epitopes (TCE) improves relapse-free survival over non-TCE-permissive mismatched or even HLA-DPB1 matched donors. Overall survival is also improved for transplants from TCE-permissive donors over those from non-TCE permissive mismatched but not over HLA-DPB1 matched donors.1
The development of large worldwide registries of HLA typed volunteers has allowed transplantation of compatible unrelated donor cells for most patients in need. However, because of the poor linkage disequilibrium between HLA-DP and the rest of the HLA haplotype, most donors have not been selected based on HLA-DPB1, so that about 80% of unrelated transplants have been mismatched at HLA-DPB1. Alloreactivity to isolated HLADPB1 mismatch has been associated with a decreased risk of leukemia relapse but also an increased risk of acute graft- versus-host disease (GvHD) and non-relapse mortality, with no net advantage for disease-free or overall survival.
Distinct HLA-DPB1 disparities are associated with varying degrees of alloreactivity, and multiple models have attempted to identify beneficial disparities associated with improved control of leukemia and less dangerous disparities associated with less serious GvHD. The two models addressed in the study by Ruggeri et al. are the level of HLA-DPB1 expression in the recipient that is directly associated with greater protection from leukemia relapse but also more GvHD, and the selection of TCEpermissive, HLA-DPB1 mismatched donors who are associated with attenuated risks of GvHD and non-relapse mortality.2-5 Their paper reports a significant interaction between high HLA-DPB1 expression in the host and donor HLA-DPB1 TCE-permissiveness in opposing directions, with lower mortality associated with donor TCE-permissiveness in the high-expression recipient group despite increased GvHD and decreased leukemia relapse.1
Mechanistically, there are strong data relating the HLADPB1 regulatory region variant rs9277534 with HLA-DPB1 expression,2 increased GvHD,2-3 and protection from relapse after allogeneic stem cell transplantation.1,2 Furthermore, HLA class II downregulation has been associated with escape from immune control of leukemia after allogeneic stem cell transplantation.6 Additional studies, however, should formally demonstrate that the HLA-DPB1 regulatory region variant rs9277534 is associated with HLA-DPB1 expression in leukemia, and that lower levels of HLA-DPB1 in leukemia increase the risk of relapse after allogeneic stem cell transplantation. Functional studies have clustered HLA-DPB1 mismatched pairs into relatively well defined TCE groups, and clinical association studies have found lower risk of GvHD and mortality within these functionally defined TCE-permissive disparities.4-5 Thus, it is not surprising that TCE-defined permissive HLA-DPB1 disparate donors protect recipients with high HLA-DPB1 expression from excess GvHD and mortality.1 The mechanisms by which TCE-permissive HLA-DPB1 mismatches protect from excess alloreactivity and GvHD-dependent mortality have been related to a narrower functional distance compared to that of the non-permissive disparities, and selection of a narrower immunopeptidome.7-9
A major limitation to the translation of this study’s findings into a decrease in the risk of relapse after transplantation is that only 46% of patients express high levels of HLA-DPB1 based on the polymorphism of the regulatory region variant rs9277534 (see Online Supplementary Figure S1A in the paper by Ruggeri et al.)1 Nevertheless, it is conceivable that, in the future, approaches can be devised to upregulate expression of HLA-DPB1 in leukemia. The baseline DPB1 TCE-permissive match rate among recipients with high expression of HLA-DPB1 was 49% in this study, but it could be improved to 80% by additional donor DPB1 typing.10
While a study of the combined models (HLA-DPB1 expression and TCE-permissiveness) is highly innovative and important, we note that the findings require valida-
Blood and Marrow Transplantation and Cellular Immunotherapy, H. Lee Moffitt Cancer Center and Research Institute, Tampa, FL, USAHaematologica | 108 February 2023 301 EDITORIAL J. Pidala and C. Anasetti
tion in independent study populations, and that analyses will need to account for a potential interaction between HLA-DPB1 expression and TCE-permissiveness for survival and relapse outcomes. Furthermore, application of these findings to unrelated donor search and selection strategies in current practice may be limited. In 65% of the cases studied, classification by the two models was convergent, such that high expression converged with TCE-non-permissive status and low expression converged with TCE-permissive status. We anticipate that under current practice, TCE-permissive donors would be
preferentially selected when available. Possible future application of this combined model approach would require routine assessment of HLA-DPB1 expression, and preferential use of TCE-permissive donors among those with high expression.
Disclosures
No conflicts of interest to disclose.
Contributions
JP and CA both wrote and edited the editorial.
1. Ruggeri A, de Wreede LC, Müller C, et al. Integrating biological HLA-DPB1 mismatch models to predict survival after unrelated hematopoietic cell transplantation. Haematologica. 2023;108(2):645-652.
2. Petersdorf EW, Malkki M, O'HUigin C, et al. High HLA-DP expression and graft-versus-host disease. N Engl J Med. 2015;373(7):599-609.
3. Petersdorf EW, Bengtsson M, De Santis D, et al. Role of HLA-DP expression in graft-versus-host disease after unrelated donor transplantation. J Clin Oncol. 2020;38(24):2712-2718.
4. Fleischhauer K, Shaw BE, Gooley T, et al. Effect of T-cell-epitope matching at HLA-DPB1 in recipients of unrelated-donor haemopoietic-cell transplantation: a retrospective study. Lancet Oncol. 2012;13(4):366-374.
5. Pidala J, Lee SJ, Ahn KW, et al. Nonpermissive HLA-DPB1 mismatch increases mortality after myeloablative unrelated allogeneic hematopoietic cell transplantation. Blood. 2014;124(16):2596-2606.
6. Christopher MJ, Petti AA, Rettig MP, et al. Immune escape of relapsed AML cells after allogeneic transplantation. N Engl J Med. 2018;379(24):2330-2341.
7. Crivello P, Heinold A, Rebmann V, et al. Functional distance between recipient and donor HLA-DPB1 determines nonpermissive mismatches in unrelated HCT. Blood. 2016;128(1):120-129.
8. Meurer T, Crivello P, Metzing M, et al. Permissive HLA- DPB1 mismatches in HCT depend on immunopeptidome divergence and editing by HLA-DM. Blood. 2021;137(7):923-928.
9. Buhler S, Baldomero H, Ferrari-Lacraz S, et al. Analysis of biological models to predict clinical outcomes based on HLADPB1 disparities in unrelated transplantation. Blood Adv. 2021;5(17):3377-3386.
10. Tram K, Stritesky G, Wadsworth K, Ng J, Anasetti C, Dehn J. Identification of DPB1 permissive unrelated donors is highly likely. Biol Blood Marrow Transplant. 2017;23(1):81-86.
Haematologica | 108 February 2023 302 EDITORIAL J. Pidala and C. Anasetti
References
Durable discontinuation of systemic therapy for chronic graft-versus-host disease: myth or reality?
Steven Z. Pavletic1 and Kirk R. Schultz2
1Center for Cancer Research, National Cancer Institute, National Institutes of Health, Bethesda, MD, USA and 2Pediatric Hematology/Oncology/BMT, BC Children's Hospital, Vancouver, British Columbia, Canada
Correspondence: S.Z. Pavletic pavletis@mail.nih.gov
Received: May 2, 2022.
Accepted: May 17, 2022.
Prepublished: May 26, 2022.
https://doi.org/10.3324/haematol.2022.281114
©2023 NIH (National Institutes of Health)
Progress in research into chronic graft-versus-host disease (GvHD) over last two decades has been impressive. Disease manifestations and clinical course are now well characterized, the complex pathophysiology is much better understood, many investigational agents are available for treatment, and a regulatory approval pathway has been established. The goals of the first National Institutes of Health consensus conference, held in 2005, have been achieved and we now have three Food and Drug Administration-approved novel agents for the treatment of chronic GvHD.1 These new drugs hold promise of less toxicity, improved symptom control, and better patient function in steroid-refractory disease. Effective chronic GvHD prevention is now well established and the incidence of chronic GvHD can range as low as 10-12% with novel prophylactic regimens.2,3 However, much work re-
mains to be done. Initial treatment is still prednisone with or without a calcineurin inhibitor, which fails in about 50% of patients. Best choices of subsequent treatments are still being debated and even with novel drugs complete responses in these patients are still in the range of only 10%. Furthermore, highly morbid and disabling forms of chronic GvHD still exist.4 We are still waiting to see published data on improved survival in patients with chronic GvHD and infections remain the leading cause of death in these patients.5 The financial burden of the cost of therapy for chronic GvHD surpasses an average of $300,000/year per patient in the USA.4 Taking all this together, it is no wonder that achieving sustained discontinuation of systemic therapy remains a highly desirable and still elusive goal in chronic GvHD. One of the major barriers is our current inability to reliably choose the tim-
Author, year, reference N Definition off ST % off ST Setting Risk factors for longer time to discontinuation
Chen 20226 684 ≥ 12 months 24% at 5 years
Peripheral blood 32% at 10 years
Multi-center
Stewart 20047 751 Not stated 50% at 7 years Single center
Myeloablative conditioning
Moderate-severe GI cGvHD Lee symptom score
Peripheral blood Female donor to male HLA mismatch
Multiple cGVHD sites Elevated serum bilirubin
Perez 20088 171 Not stated 68% at 5 years Single center Acute GvHD
Curtis 20179 227 ≥ 6 months 27.7% at 5 years Qauternary center
Lee 201810 250 ≥ 9 months 32% at 5 years Single center
Moderate-severe GI cGvHD
Cyclosporine prophylaxis Extensive skin sclerosis
Shorter time from HCT Oral cGvHD Skin cGvHD
ST: systemic therapy; GI: gastrointestinal; cGvHD: chronic graft-versus-host disease; HCT: hematopoietic cell transplantation; GvHD: graftversus-host disease.
Haematologica | 108 February 2023 303 EDITORIAL S.Z. Pavletic and K.R. Schultz
Table 1. Studies evaluating time to permanent discontinuation of systemic therapy.
ing and rate of tapering off systemic therapy, which results in endless cycles of trial-and-error treatments intertwined with disease flares and cumulative drug toxicities. In this issue of Haematologica, Chen et al.6 evaluate the factors associated with durable discontinuation of systemic therapy, defined rigorously as cessation of systemic therapy for at least 12 months, using data from two prospectively followed cohorts from the chronic GvHD consortium. The cumulative incidence estimate of durable discontinuation of systemic therapy was 24% and 32% at 5 and 10 years, respectively, after enrollment. Among patients who discontinued systemic therapy, the median time from chronic GvHD diagnosis to durable discontinuation of systemic therapy was 3.6 years. In multivariate analysis, several factors were identified as being associated with a lower likelihood of discontinuation of systemic therapy (Table 1). The authors also found that many factors known to be associated with the development of chronic GvHD were not associated with the likelihood of discontinuation of systemic therapy, suggesting that the pathophysiological mechanisms of chronic GvHD treatment and control may differ from those driving its initial development. These results suggest that a mandatory 6- to 12-month observation period is required to support the conclusion that systemic therapy has been discontinued permanently. The applicability of the results of this study is limited by the population studied. Patients at low risk of developing chronic GvHD, such as young children or those who received post-transplant cyclophosphamide, antithymocyte globulin, or in vivo/ex vivo T-cell depletion for GvHD prophylaxis were not well represented. Previous studies of the discontinuation of systemic therapy reported rates as low as 27.7% and as high as 68% depending on the population under study and the rigor of the definition (Table 1). With newer GvHD prophylaxis regimens, a lower burden of systemic immunosuppression can be achieved, although the question of overall outcome superiority remains unanswered and drugs to provide a better balance of GvHD and graft-versus-leukemia effects are still needed.2,3
Systemic immunosuppressive therapy used to treat chronic GvHD can impair immunity, adding to the inherent immune dysfunction associated with active chronic GvHD, and therefore increase the risk of opportunistic infections and expose patients to the toxicity associated with the side effects of many medications. These side effects are of particular concern in the context of chronic glucocorticoid use, which has multiple systemic effects some of which can be irreversible, such as osteonecrosis, myopathy, growth failure in children, and osteopenia. There are three immunological scenarios that can unfold after infusion of allogeneic hematopoietic stem cells: (i) normal immunological reconstitution with the achievement of protective immunity and no GvHD – a state of genuine immunological tolerance in which the risk of leukemia relapse is also highest; (ii) so-called functional tolerance in which regulatory mechanisms are in effect resulting in no
clinical GvHD, with good protection against relapse of the malignancy; and (iii) concurrent alloreactive proliferation and immune dysregulation, which are clinically reflected as acute and chronic GvHD and provide protection against malignancy relapse but at the expense of increased mortality, morbidity and long-term disability. This third scenario could be the most desirable one for cure of the malignancy if a way to mitigate GvHD along with eliminating other non-relapse related risks and side effects of therapy could be achieved. The latest 2020 National Institutes of Health chronic GvHD consensus proposed new strategies to achieve that goal.4
The paper by Chen et al.6 challenges the central dogma plaguing the field of chronic GvHD for the last 40 years –the idea that patients need to be tapered off completely from systemic therapy in order to be declared successfully treated. While this seems to be possible in up to one-third of patients after 10 or more years of therapy, there is a large proportion of patients who need indefinite lines of systemic therapy or succumb to non-relapse mortality (most commonly infections). Chronic GvHD is an iatrogenic autoimmune disease but fundamentally not unlike other systemic autoimmune diseases known in medicine, which in their severe forms require lifelong systemic therapy for disease control. Furthermore, some of the drugs we tend to use most for chronic GvHD therapy, such as calcineurin inhibitors, corticosteroids and mycophenolate, are least likely to promote achievement of immunological tolerance and competence needed for normal immune reconstitution. It is said that the worst mistake is one that is being made repeatedly. It is likely that we need to abandon this paradigm that is now more than four decades old and accept that moderate-severe chronic GvHD is indeed “chronic” and to develop personalized and less toxic approaches instead of permanent “trial-and-error” strategies. To get to that point two things are urgently needed: (i) development of qualified biomarker-based immune profiles or algorithms for clinical use that will reliably indicate when chronic GvHD is controlled in an individual patient, so that adequate treatment doses can be given or tapering could be attempted, and (ii) biology-based therapies that allow the most personalized interventions, enabling chronic, successful treatment without detrimental toxicities or excess of malignancy relapses. Viewing chronic GvHD in this way has implications for management approaches and the development of new therapeutic agents. On the road to achieving this imperative goal, the paper by Chen et al. provides a long awaited wake-up call and a critical benchmark for future clinical trials.
Disclosures
No conflicts of interest to disclose.
Contributions
SP and KS co-wrote and edited the manuscript.
Haematologica | 108 February 2023 304 EDITORIAL S.Z. Pavletic and K.R. Schultz
Funding
Support for this research was provided by the Center for Cancer Research, National Cancer Institute, National Insti-
References
1. Zeiser R, Lee SJ. Three US Food and Drug Administrationapproved therapies for chronic GVHD. Blood. 2022;139(11):1642-1645.
2. Kanakry CG, Bolaños-Meade J, Kasamon YL, et al. Low immunosuppressive burden after HLA-matched related or unrelated BMT using posttransplantation cyclophosphamide. Blood. 2017;129(10):1389-1393.
3. Luznik L, Pasquini MC, Logan B, et al. Randomized phase III BMT CTN trial of calcineurin inhibitor-free chronic graft-versus-host disease interventions in myeloablative hematopoietic cell transplantation for hematologic malignancies. J Clin Oncol. 2022;40(4):356-368.
4. Pavletic SZ, Martin PJ, Schultz KR, Lee SJ. The future of chronic graft-versus-host disease: introduction to the 2020 National Institutes of Health consensus development project reports. Transplant Cell Ther. 2021;27(6):448-451.
5. DeFilipp Z, Alousi AM, Pidala JA, et al. Nonrelapse mortality among patients diagnosed with chronic GVHD: an updated analysis from the Chronic GVHD Consortium. Blood Adv. 2021;5(20):4278-4284.
tutes of Health (NIH), Intramural Research Program. The views expressed do not represent the official views of the NIH or the United States Government.
6. Chen GL, Onstad L, Martin PJ, et al. Durable discontinuation of systemic therapy in patients affected by chronic graft-versushost disease. Haematologica. 2023;108(2):483-489.
7. Stewart BL, Storer B, Storek J, et al. Duration of immunosuppressive treatment for chronic graft-versus-host disease. Blood. 2004;104(12):3501-3506.
8. Pérez-Simón JA, Encinas C, Silva F, et al. Prognostic factors of chronic graft-versus-host disease following allogeneic peripheral blood stem cell transplantation: the National Institutes Health scale plus the type of onset can predict survival rates and the duration of immunosuppressive therapy. Biol Blood Marrow Transplant. 2008;14(10):1163-1171.
9. Curtis LM, Pirsl F, Steinberg SM, et al. Predictors for permanent discontinuation of systemic immunosuppression in severely affected chronic graft-versus-host disease patients. Biol Blood Marrow Transplant. 2017;23(11):1980-1988.
10. Lee SJ, Nguyen TD, Onstad L, et al. Success of immunosuppressive treatments in patients with chronic graftversus-host disease. Biol Blood Marrow Transplant. 2018;24(3):555-562.
Haematologica | 108 February 2023 305 EDITORIAL S.Z. Pavletic and K.R. Schultz
Acute myeloid leukemia: introduction to a series highlighting progress and ongoing challenges
Richard F. Schlenk1,21NCT-Trial Center, National Center for Tumor Diseases, German Cancer Research Center and Heidelberg University Hospital, and 2Department of Hematology, Oncology, and Rheumatology at Heidelberg University Hospital, University of Heidelberg, Heidelberg, Germany
Correspondence: R.F. Schlenk richard.schlenk@nct-heidelberg.de
Received: October 24, 2022. Accepted: October 28, 2022. https://doi.org/10.3324/haematol.2022.280803 ©2023 Ferrata Storti Foundation Published under a CC BY-NC license
Introduction
Acute myeloid leukemia (AML) is the most common acute leukemia in adults and its incidence increases with higher age. Currently, the median age at diagnosis in western countries ranges between 65 to 72 years; in consequence half of the patients with newly diagnosed AML are older than this median and are septua-, octo- or nonagenarians. In the era in which cytostatic chemotherapy, autologous as well as allogeneic hematopoietic cell transplantation were the main pillars of curative treatment approaches, significant improvements in outcome were predominantly restricted to “younger” patients, meaning adult patients younger than 60 years.1 With the advent of hypomethylating agents,2,3 a treatment strategy with generally mild side effects and good tolerability became available for older patients, even allowing outpatient administration. Furthermore, hypomethylating agents yielded a small but significant improvement in outcome.2,3 However, the long-term outcome beyond 2 years was still dismal and not improved by these agents.2,3 This situation changed meaningfully in 2020 with the introduction of the BCL-2-inhibitor venetoclax in combination with hypomethylating agents.4 For the first time a substantial proportion of older patients achieved a complete remission either with full or incomplete blood count recovery and, even more importantly, a favorable long-term outcome.4 Since then, successful treatment and long-term remissions are possible even in octa- and nonagenarians.5,6 In my own outpatient clinic, it is amazing to see an increasing proportion of septua- and octogenarians for regular 3-monthly follow-up visits in long-term remission after treatment with azacitidine/venetoclax.
This enormous progress was made possible by substantial advances in sequencing technologies leading to rapid advances in understanding the molecular pathogenesis of AML with translation into precision medicine for those patients. This is exemplified by the introduction of targeted treatment approaches with, for instance, FLT3, IDH1/2 and BCL-2 inhibitors.
Currently, in patients fit for intensive therapy, standard “7+3”-based induction followed by intensive high-dose cytarabine-based consolidation therapy still remains the backbone of the treatment strategy with addition of targeted approaches according to the molecular profile of the disease.7 However, recent results from large randomized studies showed that the beneficial effect of targeted therapy in combination with intensive chemotherapy may be restricted to younger patients (aged ≤60 years) (Erba et al.; unpublished data).8 In both studies, patients older than 60 years suffered from increased toxicity with fatal outcomes when targeted therapy was added to standard intensive induction therapy. This raises a couple of questions. On the one hand, should we redefine the criteria to classify a patient as fit for intensive therapy on the background of these new combination approaches? On the other hand, could non-intensive approaches based on azacitidine/venetoclax be as effective as intensive chemotherapy in younger patients as well? Despite significant advances in biological insights, targeted therapies, and prolonged survival for most AML patients, important questions remain unresolved.
This issue of Haematologica contains a timely series on AML, with four comprehensive papers presented by experts in the field. The authors provide an update on where the field is going in terms of new data and new perspectives, while also outlining remaining challenges. In the first paper9 Sabine Kayser and Mark Levis summarize the current knowledge of the molecular landscape of AML, focusing particularly on the utility of molecular markers in prognostication and treatment decision-making in AML. The second paper10 broadens the view on AML biology with an emphasis on therapy-resistant cells harboring stem cell properties. In this paper Patrick Stelmach and Andreas Trumpp highlight the concept of leukemic stem cells and their important phenotypic and epigenetic plasticity in response to therapy-induced stress, which results in various mechanisms mediating treatment resistance.

Haematologica | 108 February 2023 306 INTRODUCTION TO REVIEW SERIES
The two remaining papers11,12 deal with translation of current knowledge into treatment algorithms. Sonia Jaramillo and I give an overview of the current treatment landscape for adult AML (excluding allogeneic hematopoietic cell transplantation), concentrating on the discourse for whom and when to use intensive or non-intensive approaches.11 Finally, Mohamad Mohty’s group focuses on allogeneic hematopoietic cell transplantation and the role of new drugs before, during and after transplantation.12 In this review it is apparent that the previously largely dichotomized treatment worlds, transplant specialists and leukemia doctors, are moving closer together.12
References
1. Burnett AK, Wetzler M, Löwenberg B. Therapeutic advances in acute myeloid leukemia. J Clin Oncol. 2011;29(5):487-494.
2. Dombret H, Seymour JF, Butrym A, et al. International phase 3 study of azacitidine vs conventional care regimens in older patients with newly diagnosed AML with >30% blasts. Blood. 2015;126(3):291-299.
3. Kantarjian HM, Thomas XG, Dmoszynska A, et al. Multicenter, randomized, open-label, phase III trial of decitabine versus patient choice, with physician advice, of either supportive care or low-dose cytarabine for the treatment of older patients with newly diagnosed acute myeloid leukemia. J Clin Oncol. 2012;30(21):2670-2677.
4. DiNardo CD, Jonas BA, Pullarkat V, et al. Azacitidine and venetoclax in previously untreated acute myeloid leukemia. N Engl J Med. 2020;383(7):617-629.
5. Ramdohr F, Hennings R, Monecke A, Kayser S. Radical surgery and venetoclax+azacitidine in an octogenarian with acute myeloid leukemia. Haematologica. 2022 Dec 22. doi: 10.3324/haematol.2022.282282. [Epub ahead of print].
6. Gonzalez H, Marceau-Renaut A, Spentchian M, Hassoun M, Guignedoux G. Leon's helmet. Haematologica. 2022 Oct 13. doi: 10.3324/haematol.2022.281125. [Epub ahead of print].
When reading these reviews side-by-side, it becomes clear that enormous progress has been achieved in roughly the last decade.1 Furthermore, the ways to move forward in all fields are well illustrated in the papers, allowing the reader to envision what the next review series on AML in Haematologica will look like in a couple of years.
Disclosures
Consulting for or advisory board membership with Daiichi Sankyo, Pfizer, Astellas, and Novartis; research funding from PharmaMar, AstraZeneca, Pfizer, Roche, Boehringer Ingelheim, and Daiichi Sankyo; trav el, accommodation, and expenses covered by Daiichi Sankyo.
7. Döhner H, Wei AH, Appelbaum FR, et al. Diagnosis and management of AML in adults: 2022 recommendations from an international expert panel on behalf of the ELN. Blood. 2022;140(12):1345-1377.
8. Döhner H, Weber D, Krzykalla J, et al. Gemutzumab ozogamicin plus intensive chemotherapy for patients with NPM1-mutated acute myeloid leukemia. 64th ASH Annual Meeting & Exposition New Orleans, Louisiana 2022.
9. Kayser S, Levis MJ. The clinical impact of the molecular landscape of acute myeloid leukemia. Haematologica. 2023;108(2):308-320.
10. Stelmach P, Trumpp A. Leukemic stem cells and therapy resistance in acute myeloid leukemia. Haematologica. 2023;108(2):353-366.
11. Jaramillo S, Schlenk RF. Update on current treatments for adult acute myeloid leukemia: to treat acute myeloid leukemia intensively or non-intensively? That is the question. Haematologica. Haematologica. 2023;108(2):342-352.
12. Mohty R, El Hamed R, Brissot E, Bazarbachi A, Mohty M. New drugs before, during, and after hematopoietic stem cell transplantation for patients with acute myeloid leukemia. Haematologica. 2023;108(2):321-341.
Haematologica | 108 February 2023 307 INTRODUCTION TO REVIEW SERIES R.F. Schlenk
The clinical impact of the molecular landscape of acute myeloid leukemia
Sabine Kayser1 and Mark J. Levis21NCT Trial Center, National Center of Tumor Diseases, German Cancer Research Center (DKFZ), Heidelberg, Germany and 2Sidney Kimmel Comprehensive Cancer Center, Johns Hopkins University Baltimore, MD, USA
Correspondence: S. Kayser s.kayser@dkfz-heidelberg.de
Received: May 28, 2022. Accepted: July 28, 2022. https://doi.org/10.3324/haematol.2022.280801 ©2023 Ferrata Storti Foundation
Published under a CC BY-NC license
Abstract
Research into the underlying pathogenic mechanisms of acute myeloid leukemia (AML) has led to remarkable advances in our understanding of the disease. Mutations now allow us to explore the enormous diversity among cytogenetically defined subsets of AML, particularly the large subset of cytogenetically normal AML. Despite the progress in unraveling the tumor genome, only a small number of recurrent mutations have been incorporated into risk-stratification schemes and have been proven to be clinically relevant, targetable lesions. The current World Health Organization Classification of myeloid neoplasms and leukemia includes eight AML categories defined by recurrent genetic abnormalities as well as three categories defined by gene mutations. We here discuss the utility of molecular markers in AML in prognostication and treatment decision-making. New therapies based on targetable markers include IDH inhibitors (ivosidenib, enasidenib), venetoclax-based therapy, FLT3 inhibitors (midostaurin, gilteritinib, and quizartinib), gemtuzumab ozogamicin, magrolimab and menin inhibitors.
Introduction
Acute myeloid leukemia (AML) is a genetically heterogeneous disease with identifiable somatic mutations in 97.3% of all cases.1 Besides age and comorbidities, the prognosis for patients with AML is largely determined by the biology of the disease.2 Targeted sequencing has identified several mutations that carry prognostic information, including mutations in FLT3, NPM1, KIT, CEBPA and TP53.3 In addition, massively parallel sequencing led to the discovery of recurrent mutations in DNMT3A and IDH. 4,5 Consistently, the recurrent genetic abnormalities defining subtypes of AML are associated with distinctive clinicopathological features, impact prognosis, and are influencing treatment choices. Thus, AML with recurrent genetic abnormalities is included within the current World Health Organization (WHO) classification as a separate entity.6 AML with FLT3 is not included as a separate entity, because it occurs across multiple subtypes. However, the WHO classification acknowledges that FLT3 mutations should be looked for in all AML cases.6
Although new molecular analysis techniques such as ultra-deep sequencing have helped to identify numerous recurrent genetic abnormalities, to date, only a limited
number have been incorporated into risk-stratification schemes such as the National Comprehensive Cancer Network or European LeukemiaNet (ELN) guidelines.7,8 Until recently most patients have been treated with similar chemotherapeutic regimens.9 However, treatment options for AML have expanded as a result of the discovery of genetic abnormalities. Since 2017, eight new targeted drugs have been approved by the Food & Drug Administration (FDA) and six by the European Medicines Agency (EMA).10 These new therapeutics subsume tyrosine kinase inhibitors (TKI), immune checkpoint inhibitors, monoclonal or bispecific T-cell engager antibodies, as well as metabolic and pro-apoptotic agents. Targeting FLT3-kinase signaling is particularly important given that approximately one third of AML patients have a FLT3 mutation.3 In this article, we give an overview of the clinical impact of molecular markers in AML and how they are used as improved strategies for cancer therapy.
Isocitrate dehydrogenase
Isocitrate dehydrogenase (IDH) is an enzyme that catalyzes the oxidative decarboxylation of isocitrate to a-ke-
Haematologica | 108 February 2023 308 REVIEW ARTICLE
toglutarate. Its two isoforms IDH1/IDH2 are recurrently mutated in roughly 20% of de novo AML.3 Mutations in IDH1 occur in about 8% of AML patients and are almost exclusively located at R132.1 IDH2 mutations can be detected in almost 12% and involve substitutions at R140 or R172.11 IDH mutations are frequently associated with intermediate-risk or normal karyotype cytogenetics.12,13 Genetically, IDH mutations are associated with NPM1 mutations,12-15 but less frequently co-occur with TET2 or WT1 mutations, which might be because all three classes of mutations affect DNA methylation.16 Biologically, IDH mutations lead to increased levels of the oncometabolite 2-hydroxyglutarate and consecutively result in arrest of hematopoietic differentiation via inhibition of histone demethylation.17,18
The data regarding outcomes of patients with IDH-mutated AML are conflicting. Three reports from cooperative study groups showed a negative impact of cooperating IDH1/2 mutations on relapse-free survival/relapse risk and overall survival (OS) in AML patients exhibiting the genotype mutated NPM1 with unmutated FLT3-internal tandem duplication (ITD).14,15,19 In a retrospective analysis of 319 patients with newly diagnosed, IDH-mutated AML (127 with IDH1, 135 with IDH2R140, and 57 with IDH2R172 mutations) treated with intensive chemotherapy in three Acute Leukemia French Association (ALFA) prospective trials the presence of NPM1 mutations was the only variable predicting improved OS in multivariate analysis (P<0.0001).20 In contrast, Patel et al. reported a favorable impact of the genotype mutated NPM1 with unmutated FLT3-ITD only if cooperating IDH1/2 mutations were present.21 The prognostic significance of IDH2 mutations in AML also seems to depend on the location of the mutation (IDH1: single nucleotide polymorphism vs. R132;22 IDH2: R140 vs. 172).23 The effects on survival are likely distinct for each of the IDH mutations, with the presence or absence of other mutations also affecting outcomes. Such opposing effects of genotypes on outcome highlight the statistical shortcomings of retrospective molecular studies. Nevertheless, treatment with the IDH inhibitors enasidenib and ivosidenib has added to the armamentarium of targeted therapy. Currently, IDH inhibitors are approved by the FDA as treatment for relapsed/refractory AML with an IDH mutation as well as in newly diagnosed IDH1-mutated AML patients not eligible for intensive chemotherapy. In 2018, the approval of ivosidenib by the FDA was based on an open-label, single-arm phase I trial showing a complete response (CR)/complete response with incomplete count recovery (CRi) rate of 30.4% and a median OS of 8.8 months in patients with relapsed/refractory IDH1-mutated AML.24 In the group of patients with newly diagnosed IDH1mutated AML not eligible for intensive chemotherapy, a CR/CRi rate of 42.4% was achieved with a median OS of 12.6 months. Ivosidenib was subsequently approved by
the FDA for this group of patients in 2019.25
In addition, enasidenib was approved by the FDA in 2017 for the treatment of relapsed/refractory AML with an IDH2 mutation on the basis of a phase I/II trial.26 The overall response rate (ORR) with enasidenib was 40.3% and the median OS was 9.3 months. Enasidenib also showed moderate efficacy in a phase I/II trial of 39 older patients with newly diagnosed AML, resulting in a CR/CRi rate of 21%, an ORR of 30.8%, and a median OS of 11.3 months.27 However, primary and acquired resistance to these drugs are major clinical issues.28 Leukemia stemness seems to be a major driver of primary resistance to IDH inhibitors, whereas the selection of mutations in RUNX1/CEBPA or RAS-RTK pathway genes seems to be the main driver of acquired resistance, along with BCOR, homologous IDH and TET2 mutations, as could be shown by sequencing analysis in serial samples from 60 IDH-mutated AML patients treated with an IDH inhibitor.28
While TET2 is directly affected by the 2-hydroxyglutarate-mediated oncometabolism, it is not yet clear how loss-of-function mutations in BCOR , a transcription corepressor,29 contribute to acquired resistance to IDH inhibition.
In Europe, IDH inhibitors are currently not approved for IDH-mutated AML since the pharmaceutical company could not fully address the major objections raised by the Committee for Medicinal Products for Human Use to support a positive benefit/risk assessment in the proposed indication. Very recently, data from the global, randomized double-blind phase III trial (AGILE) evaluating ivosidenib + azacitidine in patients with newly diagnosed AML with an IDH1 mutation were published.30 Ivosidenib and azacitidine significantly improved the CR rate (47.2% vs. 14.9%; P<0.0001), event-free survival (hazard ratio [HR]=0.33, P=0.002) and OS (24 months vs. 7.9 months, P=0.001) as compared to placebo + azacitidine in patients with newly diagnosed IDH1-mutated AML ineligible for intensive induction chemotherapy. Based on these data, in March 2022 the pharmaceutical company submitted a marketing authorization application to the EMA for ivosidenib in combination with azacitidine as first-line treatment in patients with previously untreated IDH1-mutated AML who are not eligible for intensive chemotherapy. In addition, on May 25, 2022 the FDA approved ivosidenib in combination with azacitidine for newly diagnosed AML with an IDH1 mutation, as detected by an FDA-approved test in adults 75 years or older, or who have comorbidities that preclude the use of intensive induction chemotherapy. Currently, a study of ivosidenib or enasidenib in combination with induction and consolidation chemotherapy, followed by maintenance therapy in patients with newly diagnosed AML or myelodysplastic syndrome (MDS) with excess blasts 2 with an IDH mutation is also recruiting (HOVON150AML; NCT03839771).
Haematologica | 108 February 2023 309 REVIEW ARTICLE - Clinical impact of molecular markers in AML
and M.J. Levis
S. Kayser
A high CR rate was also achieved in the VIALE-A study in AML patients not eligible for intensive chemotherapy after treatment with hypomethylating agents (HMA) and venetoclax,31 particularly in patients with IDH (CR+CRi rate: 75.4% vs. 10.7%; P<0.001) or NPM1 mutations within a normal karyotype (CR+CRi rate: 66.7 vs. 23.5%; P=0.012; VIALE-A).32 Regarding durable remissions with responses lasting for >12 months, NPM1 (9/18; 50%) and IDH2 (7/18; 39%) were among the most frequently mutated genes, with survival ongoing after 21 to 49 months follow-up.32 Regarding IDH1-mutated patients, there was no difference in median OS between IDH1-mutated and wild-type patients (18.3 vs. 12.7 months; P=0.79). Comparable results were achieved with low-dose cytarabine (LDAC) and venetoclax in the VIALE-C study, although the trial failed to meet its primary endpoint of improved OS with the addition of venetoclax to LDAC (7.2 months vs. 4.1 months; HR=0.75; 95% confidence interval [95% CI]: 0.52-1.07; P=0.11).33 However, in an unplanned analysis with an additional 6 months of follow-up a significantly superior median OS of 8.4 months for venetoclax in combination with LDAC (HR=0.70; 95% CI: 0.50-0.98; P=0.04) as compared to 4.1 months after LDAC + placebo as well as overall response (48% vs. 13%; P<0.001) and CR rates (27% vs. 7%; P<0.001) were achieved.33
Based on these results, the FDA and EMA have approved venetoclax for newly diagnosed AML patients ≥75 years old or ineligible for intensive chemotherapy in combination with HMA or LDAC. Currently, these combinations of HMA or LDAC with venetoclax are standard of care in older/unfit patients with AML. There are no clear data to support the superiority of one HMA over another, although there are more data with the azacitidine combinations. Recently, results from a phase Ib trial evaluating venetoclax in combination with standard chemotherapy in 51 elderly AML patients (median age, 72 years; range, 63-80 years) were published.34 During induction, a 7-day prephase/dose ramp-up (days -6 to 0) was followed by an additional 7 days of venetoclax combined with cytarabine 100 mg/m2 intravenously on days 1-5 and idarubicin 12 mg/m2 intravenously on days 2-3 (i.e., “5 + 2”). Consolidation chemotherapy (4 cycles) included 14 days of venetoclax (days -6 to 7) combined with cytarabine (days 1-2) and idarubicin (day 1). Maintenance venetoclax was permitted (7 cycles). The combined chemotherapy with venetoclax was safe and tolerable, leading to an ORR (CR/CRi) of 72% in fit older patients with AML. Patients with de novo AML benefited particularly, with an ORR of 97% as compared to 43% in patients with secondary AML. The median OS for the entire cohort was 11.2 months (95% CI: 7.3-20.1 months). Patients with de novo AML had a longer median OS compared to those with secondary AML (31.3 vs. 6.1 months; P=0.0001).34 Given these promising results, venetoclax in combination with daunorubicin and cytarabine
(e.g. NCT04038437; V-FAST, NCT04075747) or standard intensive chemotherapy (e.g. NCT03709758; NCT04628026) is now being studied as frontline therapy in younger and older patients with AML. Preliminary data suggest a very high ORR of 100% (n=10), with 75% (n=6/8) of the patients achieving measurable residual disease (MRD)-negative remissions assessed using multiparameter flow cytometry. No dose-limiting toxicities were reported in the 200 or 400 mg dosing cohort, whereas one dose-limiting toxicity occurred in the 600 mg dose-escalation cohort (death due to septic shock). Thus, 400 mg (the current FDA/EMA-approved venetoclax dose for AML in combination with HMA) was determined to be the maximal tolerated dose in combination with ‘7 + 3’ induction. The median time to count recovery (defined as an absolute neutrophil count ≥0.5x10⁹/L and a platelet count ≥50x109/L) following ‘7 + 3’ + venetoclax induction was 36 days.35 These results, if confirmed in a larger number of patients, may soon indicate the new standard of care for younger, intensively treatable patients.
Venetoclax in combination with other agents is also being evaluated in relapsed/refractory AML patients (e.g. gemtuzumab ozogamicin [GO] + venetoclax, NCT04070768; gilteritinib + venetoclax, NCT03625505; NCT04330820; oral azacitidine + venetoclax, NCT04887857). Additionally, venetoclax in combination with azacitidine is being evaluated in MRD-positive AML/MDS patients after allogeneic stem cell transplantation (allo-SCT) (NCT04809181) as well as in patients with molecular relapse/progression of NPM1-mutated AML (NCT04867928).
Based on the above data, patients with IDH1 mutations should be treated with ivosidenib (+ azacitidine), whereas for patients with IDH2, venetoclax in combination with azacitidine currently seems the best option, at least in older patients. For younger patients, who are eligible for intensive chemotherapy, treatment with intensive chemotherapy in combination with ivosidenib (IDH1-mutated) or venetoclax (IDH2-mutated) might be an option as soon as more mature data are available.
FLT3 mutations
Approximately one third of AML patients harbor activating FLT3 mutations, which lead to constitutive activation of a receptor tyrosine kinase.3 Given the high incidence of these mutations, they are attractive targets for small-molecule inhibition.36 Currently, only two FLT3 inhibitors are approved by the FDA and EMA, midostaurin and gilteritinib. Midostaurin was the first approved TKI for use in combination with standard intensive chemotherapy for adult patients without age restriction with newly diagnosed FLT3-mutated AML in the USA and Europe.37,38 The approval of midostaurin was based on the positive results of the
Haematologica | 108 February 2023 310
ARTICLE -
REVIEW
Clinical impact of molecular markers in AML S.
Kayser and M.J. Levis
large, international randomized phase III CALGB RATIFY trial.39 The addition of midostaurin to intensive chemotherapy significantly improved OS in younger adults with FLT3-mutated AML with a median OS of 74.7 months for the midostaurin arm (range, 31.5 months - not reached) as compared to 25.6 months for the placebo arm (range, 18.6-42.9 months). Interestingly, this improvement was regardless of the FLT3 mutational status (either ITD or tyrosine kinase domain [TKD]) or the FLT3-ITD allelic ratio. Furthermore, patients undergoing allo-SCT in first CR had a better outcome if they were treated with midostaurin during induction therapy (P=0.08), suggesting that the optimal treatment strategy in FLT3-mutated AML would be to move on to allo-SCT early in first CR.39 Given the remarkable difference in survival after allo-SCT early in first CR in patients treated with midostaurin as compared to those treated with placebo it seems that the combination of midostaurin with intensive chemotherapy results in deeper remissions. The first evidence of this came from a small translational study evaluating the level of MRD in 17 patients treated with cytarabine and anthracycline-based intensive induction chemotherapy.40 A TKI was given to eight (47%) of the 17 patients during induction therapy. In all cases, samples were evaluated at diagnosis and at remission by a highly sensitive combination polymerase chain reaction next-generation sequencing MRD assay for FLT3-ITD. In those patients who were treated with chemotherapy in combination with a TKI during induction, the average level of ITD mutation was significantly lower than that in the nine patients treated with chemotherapy alone (P=0.008).40
Of note, despite inclusion of maintenance therapy on the RATIFY protocol, the FDA did not approve midostaurin as maintenance therapy, whereas the EMA included maintenance in the drug’s product information.41 Lack of re-randomization prior to maintenance was cited by the FDA as a major reason; thus, the contribution of maintenance therapy to the treatment effect could not be determined.42 Results from a post-hoc subset analysis of the RATIFY trial demonstrated no difference in the disease-free survival between the treatment arms during the 12 cycles of maintenance (P=0.49) and no difference in OS from the time of starting maintenance (P=0.35).43 Nevertheless, the data suggest that midostaurin may have delayed, but not prevented relapse in some of these patients, since more relapses were observed after stopping midostaurin (17/69 [25%] vs. 7/51 [14%] on the placebo arm), and more of these relapses occurred within the first 6 months (14 [20%] vs. 2 [4%]).43 Unfortunately, patients were not rerandomized at the start of the maintenance treatment. Moreover, the numbers were too small for any clinically meaningful comparisons. Recently published results of a phase II trial evaluating midostaurin in combination with intensive chemotherapy followed by allo-SCT and single-
agent maintenance therapy for 12 months in adult (median age, 54 years; range, 18-70, 30% older than 60 years) AML patients with FLT3-ITD showed that midostaurin in combination with intensive chemotherapy including allo-SCT can be safely administered, also in older AML patients.44 In contrast to the RATIFY trial, in which midostaurin maintenance therapy was only applied after high-dose cytarabine consolidation, midostaurin maintenance therapy was also administered after allo-SCT. The landmark analysis at day 100 after transplantation favored maintenance therapy after allo-SCT with better event-free survival and OS in patients starting maintenance therapy within 100 days after transplantation.44 Further evidence came from the RADIUS trial, evaluating midostaurin maintenance after allo-SCT.45 Inhibition of FLT3 phosphorylation to <70% of baseline (achieved by 50% of the midostaurin-treated patients) was associated with improved relapse-free survival. Thus, the addition of midostaurin maintenance therapy following allo-SCT may provide clinical benefit in those FLT3-ITD patients with at least 70% inhibition of phosphorylation.45 While this provides evidence that inhibition of FLT3 as post-transplant maintenance therapy is of value, midostaurin does not seem to be the drug of choice, given that there is no way to predict who will achieve adequate in vivo inhibition with this compound. More importantly, these data underline the need for randomized trials to establish the concept of maintenance with targeted agents after consolidation therapy to prevent AML recurrence.
Biologically, maintenance with a TKI to inhibit FLT3 signaling seems to be reasonable, particularly in light of the positive results from the SORMAIN,46 RADIUS45 and ADMIRAL47 trials.
Gilteritinib, a novel, highly selective, potent oral FLT3 inhibitor with activity against ITD and TKD mutations, is the only FDA- and EMA-approved TKI for the treatment of relapsed/refractory FLT3-mutated AML in the USA and Europe.48 The ideal dose of gilteritinib was identified from the multicenter, open-label phase I/II Chrysalis trial evaluating 252 FLT3-mutated patients. Gilteritinib resulted in prolonged responses in patients with heavily pre-treated, relapsed or refractory AML.49 The ORR was 40%, with 8% achieving CR, 4% CRi, 18% CR with incomplete hematologic recovery (CRh), and 10% partial remission. The median OS was 25 weeks (95% CI: 20-30 weeks) and median duration of response 17 weeks (95% CI: 14-29 weeks).49 In addition, gilteritinib was evaluated within a randomized, open-label, multicenter phase III trial (ADMIRAL trial) of relapsed/refractory FLT3-mutated patients, who were randomized 2:1 to receive gilteritinib or salvage chemotherapy.50 Salvage chemotherapy options were LDAC, azacitidine, mitoxantrone/etoposide/cytarabine, or fludarabine/cytarabine/idarubicin and granulocyte colonystimulating factor (FLAG-IDA). Randomization was strat-
Haematologica | 108 February 2023 311 REVIEW ARTICLE - Clinical impact of molecular markers in AML
S. Kayser and M.J. Levis
ified by response to first-line AML therapy and pre-specified chemotherapy (intensive vs. low-intensity). The CR + CRh rate was 21%; the median time to response was 3.6 months (range, 0.9-9.6 months) and the median duration of response was 4.6 months.50 The median OS was significantly longer after gilteritinib than in the salvage chemotherapy arm (9.3 months vs. 5.6 months), and 37.1% compared to 16.7% of the patients were alive at 12 months.50 Furthermore, the OS benefit was observed in patients preselected for both high-intensity (HR=0.66, 95% CI: 0.47-0.93) and low-intensity chemotherapy (HR=0.56, 95% CI: 0.38-0.84).50 Overall, the results support the use of gilteritinib in patients with relapsed/refractory AML. Based on these results, gilteritinib is now approved by the FDA and EMA for the treatment of relapsed/refractory patients with FLT3-mutated AML. Recently, results from the phase III randomized trial comparing gilteritinib in combination with azacitidine versus azacitidine monotherapy for adult patients with newly diagnosed FLT3-mutated AML ineligible for standard chemotherapy were presented (LACEWING trial, NCT02752035).51 While gilteritinib + azacitidine led to significantly higher composite CR rates, the combined therapy failed to improve OS compared to azacitidine alone. Thus, an independent data monitoring committee recommended terminating the study for futility, since concluding results are unlikely to show a statistically significant increase in OS. As a consequence, the pharmaceutical company has stopped enrollment.
In addition, results from a phase I/II study evaluating gilteritinib combined with the “7+3” regimen and consolidation treatment were presented at the annual meeting of the European Hematology Association.52 In this dose-escalation study, 68 FLT3-mutated AML patients received gilteritinib (40, 80, 120, or 200 mg/day) in one of two schedules, in combination with the “7+3” regimen (schedule 1: days 4-17; schedule 2: days 8-21). The maximum tolerated dose of gilteritinib was determined to be 120 mg, which was evaluated in a dose expansion cohort. Remarkably, the composite CR rate of FLT3-mutated patients receiving gilteritinib on schedule 1 (n=22) was 100% and on schedule 2 (n=11) 81.8% with a median disease-free survival of 297 days.52 Very promising results were also achieved in a phase I/II trial in 26 patients with either relapsed/refractory FLT3-mutated AML or high-risk MDS/chronic myelomonocytic leukemia (n=15) or patients with newly diagnosed FLT3-mutated AML (n=11) unsuitable for intensive chemotherapy.53 All patients received azacitidine 75 mg/m2 subcutaneously/intravenously on days 1-7, venetoclax for up to 28 days, and gilteritinib on days 1-28. The gilteritinib dose ranged from 80 mg to 120 mg daily during the phase I dose escalation (3+3 design). However, the triple therapy was so myelosuppressive that a bone marrow evaluation was performed on day 14 and if aplasia
was noted, venetoclax was stopped. Encouraging results were achieved with an ORR (CR+ CRi + morphologic leukemia-free state) of 67% in relapsed/refractory patients and 100% in newly diagnosed patients (CR/CRi, n=9, 82%).53
Currently, several trials of gilteritinib are underway, including a trial of gilteritinib versus placebo as maintenance therapy after consolidation (NCT02927262) or after alloSCT in patients with FLT3-ITD mutations (NCT02997202). There are ongoing trials combining gilteritinib with atezolizumab (NCT03730012) and venetoclax (NCT03625505) in patients with relapsed/refractory AML as well as a randomized phase II trial of gilteritinib versus midostaurin in combination with induction and consolidation chemotherapy (NCT03836209).
High CR rates have also been observed with standard induction therapy with the “7+3” regimen combined with crenolanib (72%)54 and quizartinib (84%),55 surpassing the 59% CR rate observed within the RATIFY trial.39 In addition, quizartinib (40 mg/day on days 8-21) versus placebo in combination with standard induction and post-remission therapy (including allo-SCT) followed by up to 3 years of maintenance therapy with quizartinib (30-60 mg/day) or placebo was evaluated in 539 adult patients with FLT3ITD AML within the global, randomized, double-blind, placebo-controlled phase III QuANTUM-First trial (NCT02668653).56 Therapy with quizartinib resulted in a significantly longer median OS of 31.9 months as compared to 15.1 months with placebo. The safety of quizartinib was shown to be manageable and consistent with the known safety profile. Thus, the pharmaceutical company will share the data with regulatory authorities for possible global approval. Currently, quizartinib is approved in Japan as treatment for adult patients with relapsed/refractory FLT3-ITD mutated AML (approval granted in October 2019). While these results are premature, the high CR rates suggest that the benefit of selective FLT3 inhibitors is not just in depth of response, as with midostaurin, but that more patients may respond overall. Nevertheless, although AML patients may respond to FLT3 inhibitors, the duration of the response is still mostly short due to primary and acquired resistance. The most common mechanism of resistance is due to acquired FLT3-TKD mutations, such as F691L and D835.57 These mutations hinder TKI binding and lead to an active kinase conformation.58,59 This mechanism of resistance was reported for type II inhibitors, including quizartinib. In contrast, gilteritinib and crenolanib showed clinical activity against FLT3-TKD D835 mutations. Nevertheless, the data suggest that this is mainly the case if the FLT3-TKD mutation coexists with FLT3-ITD, but not as much if FLT3-TKD D835 is the only mutation.60 Moreover, they had limited activity against F691L mutations.61 Further mechanisms of resistance are related to the acquisition of multiple RAS/MAPK pathway gene mutations at relapse, frequently in alter-
Haematologica | 108 February 2023 312
ARTICLE - Clinical
of
REVIEW
impact
molecular markers in AML S. Kayser and M.J. Levis
native clones, suggesting a high level of pathway reactivation.62
Recently, the selective and irreversible FLT3 inhibitor, FF10101, was found to have significant activity against FLT3ITD and -TKD mutations, including F691L and D835, both in vitro and in vivo. 63,64 Thus, the inhibitor was evaluated in a phase I dose escalation study in 52 patients with refractory/relapsed AML.65 Continuous treatment with FF-10101 at a dose of 10-225 mg four times a day or 50-100 mg twice daily in pretreated patients (median number of prior therapies, n=3) resulted in a composite CR rate of 13% and a partial response rate of 8%, including those with activating FLT3-TKD mutations resistant to gilteritinib and other FLT3 kinase inhibitors.65 Doses of 50-75 mg twice daily were well tolerated and resulted in sustained FLT3 inhibition. The trial is currently active, but not recruiting patients (NCT03194685). We suggest treatment with gilteritinib for relapsed/refractory FLT3-mutated AML patients, particularly in those patients not eligible for intensive therapy strategies. In younger relapsed/refractory patients, gilteritinib could be used as bridge to transplant. Based on the QuANTUM-First data, quizartinib in combination with standard chemotherapy might soon be available as intensive first-line treatment in younger patients. Whether patients with NPM1-mutated or core binding factor-rearranged (both CD33-positive), newly diagnosed AML and a FLT3 mutation might benefit from combined therapy (midostaurin + GO + standard “7+3” chemotherapy) is currently being evaluated in a phase I/II trial (MOSAIC trial, NCT04385290).
Acute myeloid leukemia with mutated NPM1
NPM1 mutations are one of the most frequent molecular abnormalities in AML, particularly in patients with a normal karyotype.1 NPM1 mutations result in cytoplasmic accumulation of the protein, although it is presently still unclear how they contribute to leukemic transformation.66 The NPM1 mutations subtypes A, B, and D comprise 90% of all variants. These three mutation subtypes have been shown to be reliable markers for MRD detection with high sensitivity.67,68 To date, however, more than 50 different NPM1 mutations have been reported.69 The same assay can be adapted for cases with rare NPM1 mutation variants by replacing mutation-specific primers, but case-specific quantitative, reverse transcriptase polymerase chain reactions (RT-qPCR) need to be carefully established to avoid non-specific background amplification from the wild-type NPM1 allele.70
In NPM1-mutated AML, concurrent mutations typically occur in FLT3, DNMT3A, IDH1/2 or TET2.1 Thus, the prog-
nostic impact of NPM1 mutations should be interpreted in the context of a FLT3-ITD, which occurs in roughly 45% of normal karyotype AML.1,71-74 Particularly in NPM1-mutated patients with a concurrent high FLT3-ITD allelic ratio (≥0.5)8,75-77 the favorable prognostic effect of NPM1 is mitigated or even abolished as compared to that in patients with a low allelic ratio.76,77 In comparison, patients with mutated NPM1 without FLT3-ITD or FLT3-ITD with a low allelic ratio (<0.5) have a somewhat better outcome.8,77 These data have recently been confirmed in a large cohort of intensively treated adult AML patients.78 Moreover, IDH1/2 mutations may also exert a negative prognostic impact on relapse-free survival and OS in patients with mutated NPM1 without FLT3-ITD.14,15 In a retrospective analysis of 319 patients with newly diagnosed AML and an IDH mutation (127 with IDH1, 135 with IDH2R140, and 57 with IDH2R172 mutations) treated with intensive chemotherapy in three Acute Leukemia French Association prospective trials the presence of NPM1 mutations was the only variable predicting improved OS in multivariate analysis (P<0.0001).20 In contrast, Patel et al. reported on a favorable impact of mutated NPM1 without FLT3-ITD only if cooperating IDH1/2 mutations were present.21 Such opposing effects of genotypes on outcome highlight the statistical shortcomings of retrospective molecular studies.
In a study of 245 adult patients with NPM1-mutated AML, relevant MRD checkpoints could be defined.79 Achievement of RT-qPCR negativity after two courses of induction therapy identified patients with a low cumulative incidence of relapse (6.5% after 4 years) as compared to that of RT-qPCR-positive patients (53% after 4 years; P<0.001), translating into significant differences in OS (90% vs. 51%, respectively; P=0.001). After completion of therapy, the cumulative incidence of relapse was 15.7% in MRDnegative patients as compared to 66.5% in MRD-positive patients (P<0.001).79 Another study indicated that a NPM1 mutation cut-off level of 0.01 after induction therapy, as measured by RT-qPCR (with a sensitivity of 10 6), was associated with a cumulative incidence of relapse after 2 years of 77.8% for patients with ratios above the cut-off as compared to 26.4% for those with ratios below the cutoff. In addition, NPM1 MRD positivity by RT-qPCR before allo-SCT is independently associated with a significantly increased risk of relapse and inferior survival.81,82 Assuming that a further reduction of MRD levels optimizes outcome after allo-SCT, this relationship would justify risk-stratified treatment allocation, including the use of additional pretransplant chemotherapy. However, as MRD might simply reflect reduced sensitivity of leukemia cells to chemotherapy, the presence of MRD might only mark those patients who are unlikely to be cured with subsequent similar-type therapies, even if disease levels are brought temporarily below the level of detection. Therefore, a further approach could be pre-emptive immune or antibody therapy
Haematologica | 108 February 2023 313 REVIEW ARTICLE - Clinical impact of molecular markers in AML S. Kayser and M.J. Levis
(NCT02789254) in MRD-positive patients, such as pembrolizumab and azacitidine (PEMAZA trial, NCT03769532) or venetoclax and azacitidine (VIALE-M trial, NCT04102020).
Increasing levels of NPM1 MRD were also predictive of an impending relapse after chemotherapy (MRD increase >1% NPM1mut/ABL1) or allo-SCT (MRD increase >10% NPM1mut/ABL1).83 Importantly, MRD status has been found to be a better predictor of relapse risk than FLT3-ITD in NPM1-mutated AML.84
In the randomized French ALFA-0701 trial showing the superiority of intensive chemotherapy in combination with GO over intensive chemotherapy alone NPM1-MRD was predictive for response to therapy since more MRDnegative results were obtained in patients treated in the GO arm than in those treated in the control arm after induction therapy (39% vs. 7%; P=0.006) as well as at the end of treatment (91% vs. 61%; P=0.028).85 In addition, positive NPM1-MRD (defined as >0.1% in the bone marrow) after induction and at the end of treatment also predicted a higher risk of relapse, but did not influence OS.85
Patients with NPM1 or IDH2 mutations respond very well
to venetoclax + HMA treatment with 2-year OS rates of 71.8% and 79.5%, respectively.32 Similar results were documented within the phase III trial VIALE-A of venetoclax + HMA in newly diagnosed AML.31 Thus, elderly patients with NPM1 mutations or patients not eligible for intensive treatment should be treated with venetoclax in combination with azacitidine. NPM1-mutated AML also appears to be responsive to menin inhibitors (see below).86
CD33-positive acute myeloid leukemia
CD33 is highly expressed on cells of myeloid lineage, thus making it an attractive therapeutic target.87 GO is a humanized anti-CD33 monoclonal antibody linked to the cytotoxic agent calicheamicin.88 GO initially received accelerated approval from the FDA in 2000 for the treatment of patients with CD33-positive AML in first relapse who were ≥60 years and not suitable for intensive chemotherapy.89,90 However, GO was voluntarily withdrawn from the market by the pharmaceutical company in 2010 when a phase III trial comparing standard induction chemotherapy
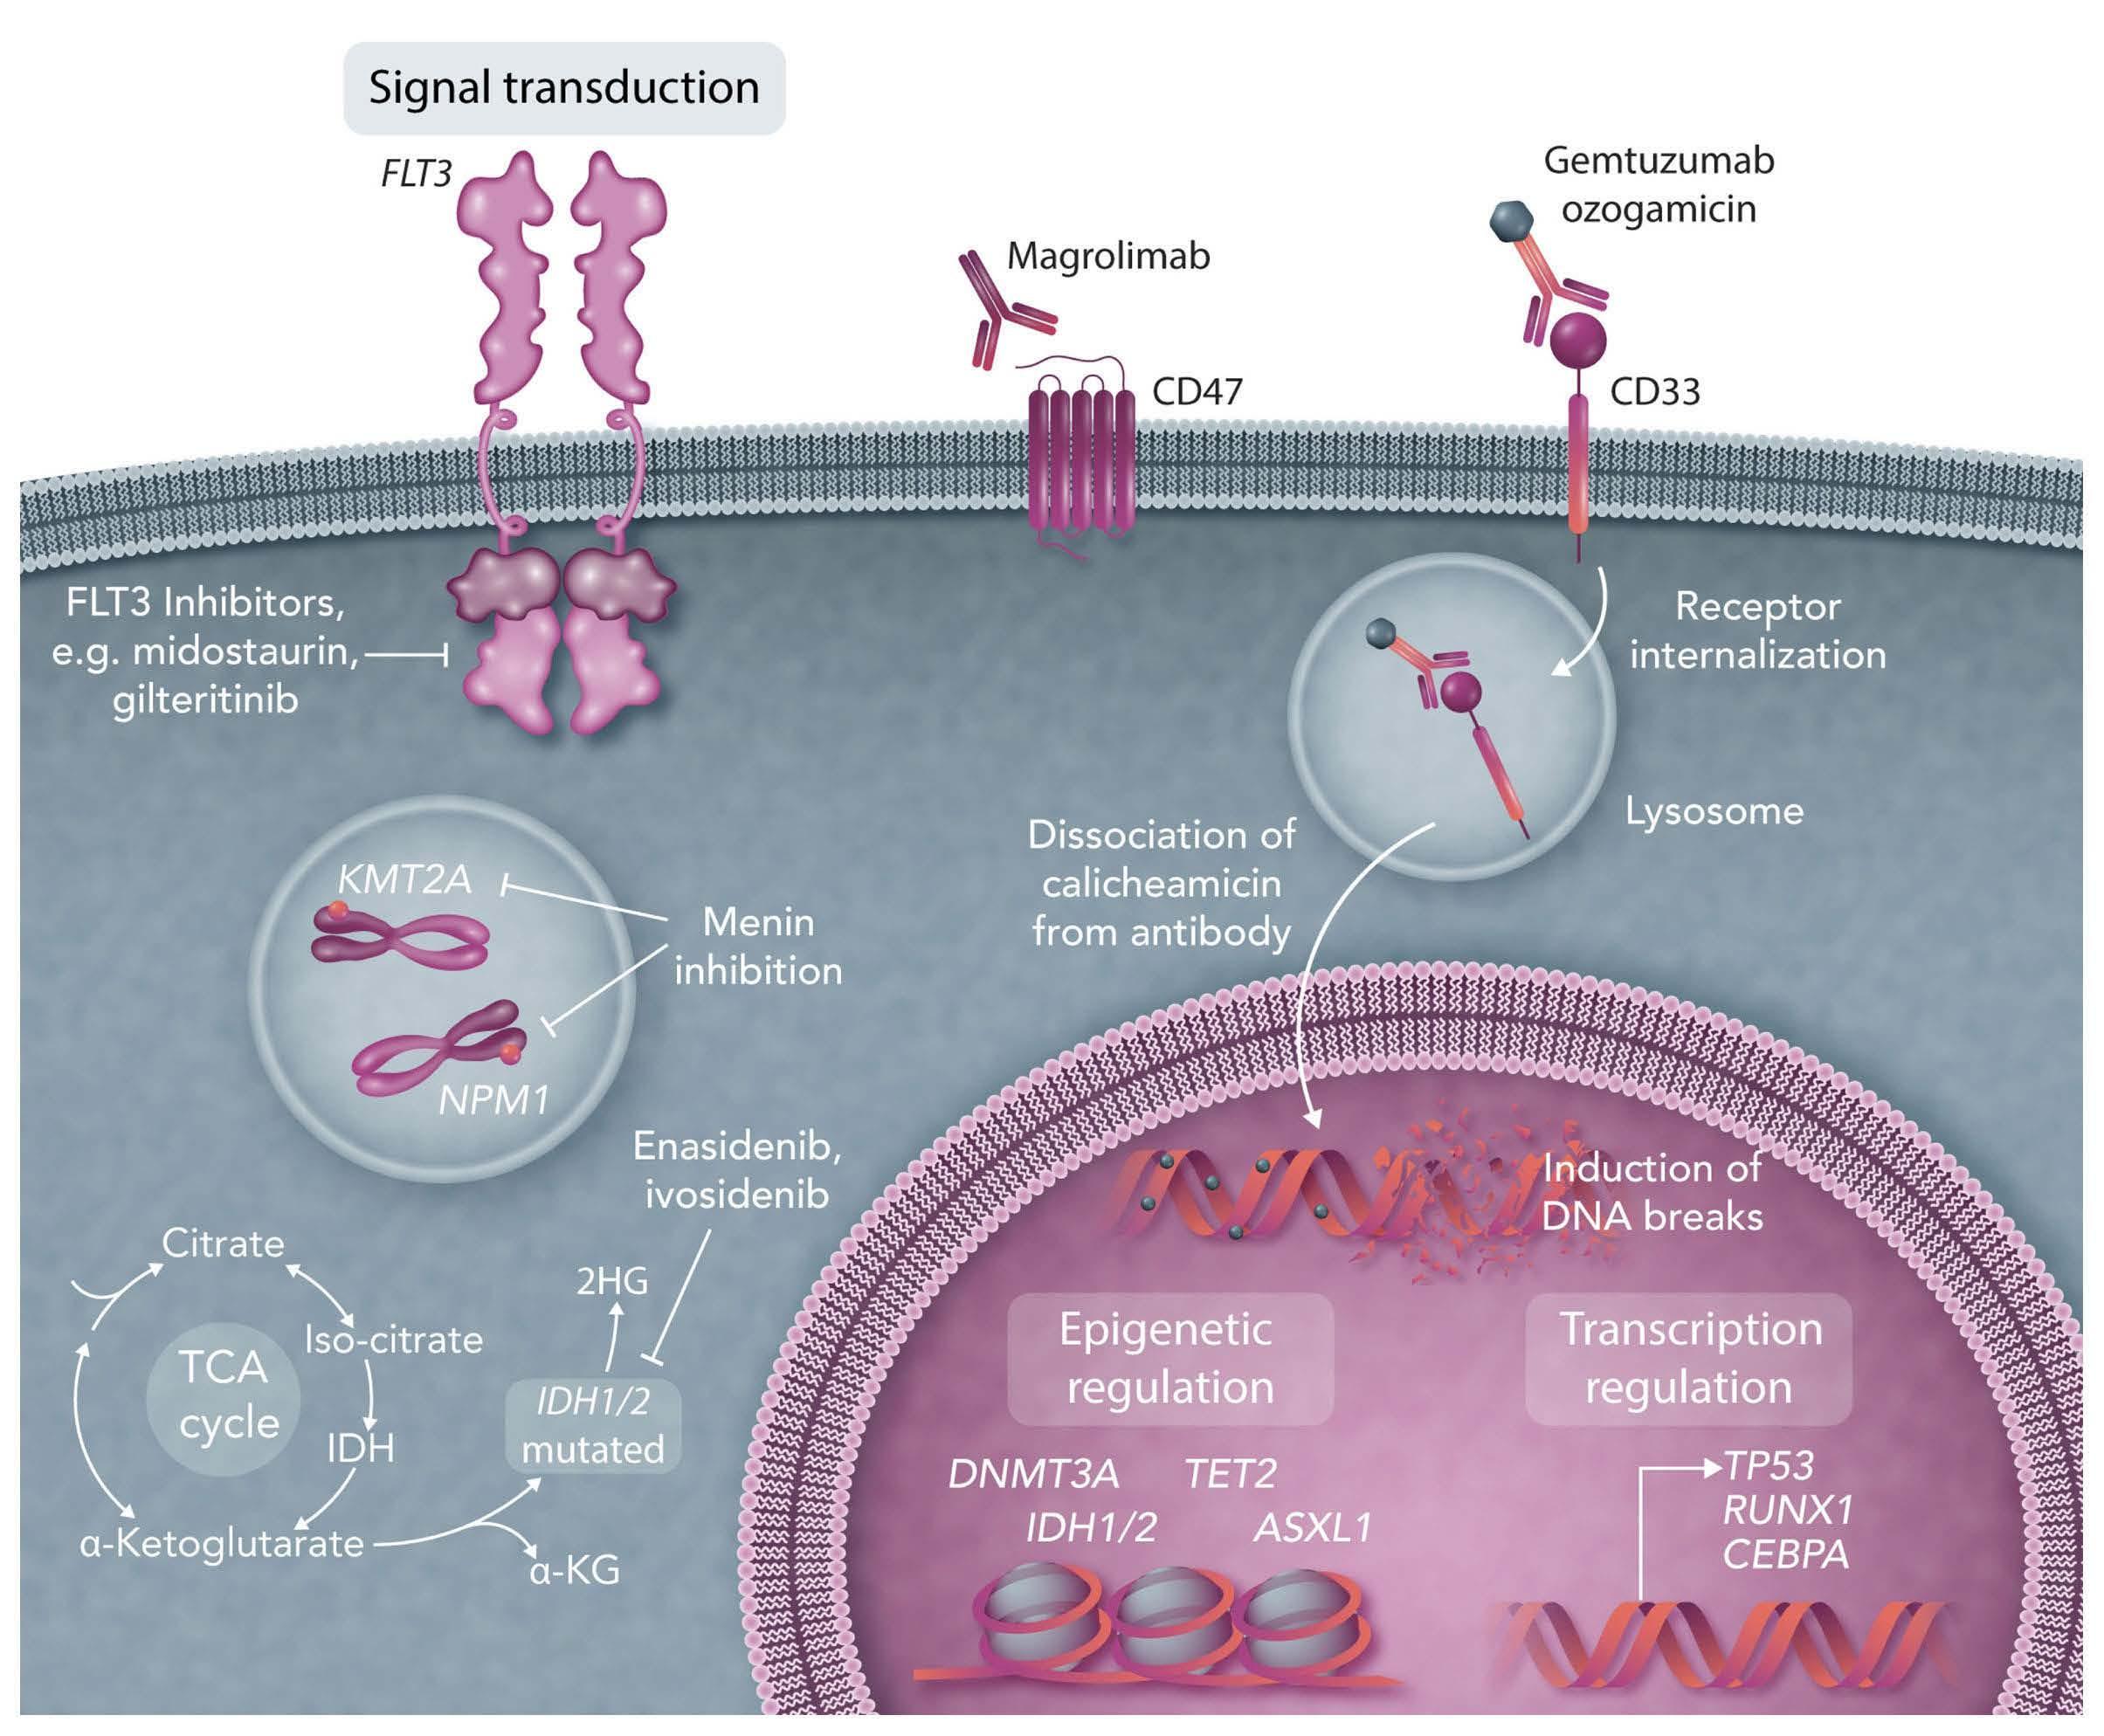
Haematologica | 108 February 2023 314
Figure 1. Genes recurrently mutated in acute myeloid leukemia as well as mechanism of action of targeted therapies. TCA: tricarboxylic acid cycle; IDH: isocitrate dehydrogenase; aKG: alpha-ketoglutarate; 2HG: 2-hydroxyglutarate.
REVIEW
ARTICLE
- Clinical impact of molecular markers in AML S. Kayser and M.J. Levis
(“7+3”) with or without GO in patients younger than 60 years showed an increased early mortality rate (6% vs. 1%).91 Nevertheless, the early mortality rate in the standard arm was unexpectedly low. Consecutively, three other randomized trials showed improved OS rates with the addition of GO in patients with favourable- and intermediate-risk cytogenetics without increased induction mortality.92-94 A reduced risk of relapse (P=0.0001) and improved survival (P=0.01) without increased rates of induction mortality in patients with favorable- and intermediate-risk cytogenetics were reported in a meta-analysis of five trials including 3,325 AML patients randomized to receive GO along with intensive induction chemotherapy.95 Thus, GO was reapproved by the FDA in 2017 and by the EMA in 2018 for the treatment of adult patients (EMA: aged 15 years and older) with newly diagnosed CD33-positive AML. In addition, GO is licenced in the USA as monotherapy for the treatment of patients aged 2 years and older with relapsed or refractory CD33positive AML as well as in patients with newly-diagnosed AML.
Thus, we suggest the use of GO in combination with intensive chemotherapy in patients with CD33-positive, favorable-risk AML (according to risk-stratification schemes such as the National Comprehensive Cancer Network7 or ELN8 guidelines).
Acute myeloid leukemia with TP53 mutations
The tumor protein p53 (TP53) encodes a transcription factor that is involved in cell cycle arrest and apoptosis.96 TP53 mutations occur in roughly 12% of AML patients,97 predominantly in therapy-related or secondary AML as well as in elderly patients.98 Moreover, TP53 alterations are found in roughly 70% of AML patients with a complex karyotype.99 TP53 mutations predict for very low CR rates (less than 30%) and were shown to be an independent poor prognostic factor among the subgroup of AML with complex karyotype.99 Interestingly, TP53 could be identified in hematopoietic stem and progenitor cells in chemotherapy-naïve controls and in therapy-related or secondary AML patients years prior to development of overt disease, suggesting that hematopoietic stem and progenitor cells carrying TP53 may be chemotherapy-resistant and expand after treatment.100 Individuals with clonal hematopoiesis with indeterminate potential have a 13-fold increased risk of developing a hematologic malignancy, and this risk may be increased in the context of cytotoxic therapy, at least if a TP53 mutation is present.100 Recently published data suggest that treatment with decitabine at a dose of 20 mg/m² per day for 10 consecutive days in monthly cycles may improve the dismal outcome
of AML with TP53 alterations.101 Although responses were not durable, they resulted in OS rates that were similar to those of AML patients with an intermediate-risk cytogenetic profile and who also received serial 10-day courses of decitabine.101
Moreover, in 55 patients with TP53-mutated MDS or AML, APR-246 (eprenetapopt), a novel, first-in-class, small molecule, in combination with azacitidine led to an ORR of 73% with a CR rate of 50% in MDS patients (n=20/40) and of 64% and 36% in AML patients (n=4/11). The median survival was 10.8 months with a significant improvement in responding versus non-responding patients by landmark analysis (14.6 vs. 7.5 months; P=0.0005).102 Overall, 35% (n=19/55) of the patients underwent allo-SCT with a median OS of 14.7 months. APR-246 was also evaluated in a phase II trial in 52 TP53-mutated patients (34 with MDS, 18 with AML [including 7 with >30% blast cells]). The ORR among the patients with MDS was 62%, including a CR rate of 47%, with a median response duration of 10.4 months. The ORR among those with AML was 33%, including a CR rate of 17% (27% and 0% CR in the AML patients with less than and more than 30% bone marrow blast cells, respectively). The main treatment-related adverse events were febrile neutropenia (36%) and neurological events (40%), the latter correlating with a lower glomerular filtration rate at treatment onset (P<0.01) and higher age (P=0.05), and resolving with temporary drug interruption without recurrence after adequate APR-246 dose reduction. With a median follow-up of 9.7 months, the median OS was 12.1 months in MDS, and 13.9 and 3.0 months in AML with less than and more than 30% marrow blasts, respectively.103 Recently, a randomized phase III trial of APR246 in combination with azacitidine versus azacitidine alone in TP53-mutated MDS completed accrual (NCT03745716); the final results are pending. Additionally, novel doublet and triplet therapy with venetoclax and azacitidine in combination with APR-246 (NCT04214860, completed, final results are pending) or as post-transplant maintenance are being investigated (NCT03931291, completed, final results are pending).
Recent data from two phase I trials suggest a high response rate after combination therapy with venetoclax and decitabine, azacitidine104 or low-dose cytarabine105 in newly diagnosed elderly (≥60 years) AML patients not eligible for intensive chemotherapy, a group in whom a high incidence of TP53 mutations would be suspected. Responses were also achieved in newly diagnosed patients with TP53 mutations after treatment with venetoclax/azacitidine within the VIALE-A trial, although these were mostly short-lived and not durable.31 Although these data seem to be promising, durable responses are seldom observed. Thus, new treatment approaches are urgently needed for these very high-risk patients.
Haematologica | 108 February 2023 315 REVIEW ARTICLE - Clinical impact of molecular markers in AML S.
M.J. Levis
Kayser and
CD47-positive acute myeloid leukemia
CD47 is a “do not eat me” signal, strongly expressed in solid tumors and myeloid malignancies, which enables cells carrying this protein to evade macrophages.106,107 In preclinical models of AML and MDS, it could be demonstrated that blocking CD47 enhances antitumor response108,109 and that anti-CD47 antibodies stimulate antibody-dependent cellular phagocytosis, promoting priming and memory responses of CD8 T cells.110 Magrolimab targets CD47 on tumor cells, including macrophage phagocytosis.10 Magrolimab is currently being evaluated in several early clinical trials in AML (e.g. NCT04435691). Recently, a phase I trial of magrolimab with azacitidine documented an ORR of 91% in patients with MDS and a CR rate of 42%.111 In addition, high response rates were observed in TP53-mutated MDS patients (NCT03248479). Of note, AML patients with a TP53 mutation (n=12) showed a CR/CRi rate of 75%. With a median followup of 8.8 months, the median duration of response or OS was not met.112 Overall, the therapy was well tolerated, and no treatment-related febrile neutropenia occurred. Common treatment-related adverse events were anemia (44%), fatigue (18%), infusion reactions (18%), neutropenia (8%) and thrombocytopenia (5%). In addition, no patient discontinued treatment due to an adverse event. The mean decline in hemoglobin levels with the first dose of magrolimab + azacitidine was 0.4 g/dL. Fifty-eight percent of the patients no longer required red blood cell transfusions.112 Encouraging results were also reported in a single-arm phase Ib trial of magrolimab + azacitidine at the European Hematology Association meeting 2022 in 72 TP53-mutated AML patients, unsuitable for intensive chemotherapy.113 Magrolimab + azacitidine produced durable responses with an ORR of 48.6% (CR, 33.3%; CRi/CRh, 8.3%; morphological leukemia-free state, 1.4%; partial response, 5.6%) and an encouraging OS of 10.8 months (95% CI: 6.8-12.8 months). The combined therapy had an acceptable safety profile, although there were some safety concerns due to anemia (overall 29.2%; grade 3, 26.4%; grade 4, 2.8%). The most common grade ≥3 adverse events were febrile neutropenia (37.5%), thrombocytopenia (29.2%), pneumonia (26.4%), and neutropenia (20.8%). Grade 3 hemolysis was reported in one patient (1.4%); no grade 4 hemolysis was reported. Adverse events led to discontinuation of magrolimab in 30.6% of the patients and of azacitidine in 29.2% of the patients. Patients who proceeded to allo-SCT had an encouraging 1year OS of 63%.113 These observations are being further evaluated in a randomized, open-label phase III trial for adult AML patients with TP53 mutations (ENHANCE-2, NCT04778397) as well as a randomized phase III study of triple combination therapy with venetoclax/azacitidine + magrolimab versus venetoclax/azacitidine + placebo (NCT05079230).
Lysine-specific
(KMT2A)
methyltransferase 2A
Mutations in the KMT2A gene (formerly known as Mixed Lineage Leukemia, MLL) at 11q23 occur in roughly 10% of acute leukemias.114 KMT2A encodes a histone methyltransferase, which regulates homeobox genes affecting hematopoiesis.115
Menin is essential for the proliferation and survival of KMT2A-rearranged and NPM1-mutated AML.116,117 NPM1 mutations have also been associated with the upregulation of HOXA genes, similar to gene expression patterns observed in patients with KMT2A rearrangements.118,119 These findings have led to the hypothesis that AML patients with NPM1 mutations might also benefit from menin inhibition. Menin inhibitors are a novel class of agents targeting the underlying biology of NPM1- and KMT2A-mutated AML. In preclinical models, small-molecule inhibitors of the menin-KMT2A protein-protein interaction induce differentiation, downregulate critical gene expression programs, and confer a survival advantage in patient-derived xenograft models of NPM1- and KMT2A-mutated AML.120-122 Four different menin-MLL1 inhibitors (SNDX-5613, NCT05326516; JNJ-75276617, NCT04811560; KO-539, NCT04067336; and DSP-5336, NCT04988555) are currently in early-phase clinical trials. Preliminary results in relapsed/refractory AML with NPM1 and KMT2A mutations have shown promising clinical activity.123 In particular, the ORR after singleagent therapy with SNDX-5613 in heavily pretreated patients with relapsed/refractory NPM1- or KMT2A-mutated AML was 55% with a composite CR MRD-negative rate of 31% (n=16/51).86 In addition, responses were durable, lasting more than 6 months in six of the 12 patients who achieved a composite CR.86 Finally, the highly selective, irreversible menin-inhibitor BMF-219 is currently being evaluated in a multicenter phase I trial in relapsed/refractory patients with acute leukemia, diffuse large B-cell lymphoma or multiple myeloma (NCT05153330).
Conclusions
Progress in unraveling the molecular pathogenesis of AML and the identification of the genetic determinants of response to treatment have been impressive and translation of these findings into clinical decision-making has been increasing in recent years. The availability of a molecular profile enables targeted-based treatment (Figure 1). The interplay between various molecular abnormalities suggests that the combined inhibition of several signaling pathways is required to achieve maximum clinical benefit. Thus, evaluation of the genetic profile at diagnosis, but also at relapse is mandatory in all AML patients. Open questions remain about whether patients should be
Haematologica | 108 February 2023 316
ARTICLE
REVIEW
- Clinical impact of molecular markers in AML S.
Kayser and M.J. Levis
treated with intensive or non-intensive approaches and how best to incorporate maintenance therapy, monoclonal antibodies as well as immunotherapy.
Disclosures
SK has served as a consultant for Novartis, Pfizer, Gilead and
References
1. Papaemmanuil E, Gerstung M, Bullinger L, et al. Genomic classification and prognosis in acute myeloid leukemia. N Engl J Med. 2016;374(23):2209-2221.
2. DiNardo CD, Cortes J. Mutations in AML: prognostic and therapeutic implications. Hematol Am Soc Hematol Educ Program. 2016;2016(1):348-355.
3. Cancer Genome Atlas Research Network, Ley TJ, Miller C, Ding L, et al. Genomic and epigenomic landscapes of adult de novo acute myeloid leukemia. N Engl J Med. 2013;368(22):2059-2074.
4. Mardis ER, Ding L, Dooling DJ, et al. Recurring mutations found by sequencing an acute myeloid leukemia genome. N Engl J Med. 2009;361(11):1058-1066.
5. Ley TJ, Ding L, Walter MJ, et al. DNMT3A mutations in acute myeloid leukemia. N Engl J Med. 2010;363(25):2424-2433.
6. Swerdlow SH, Campo E, Harris NL, et al. WHO Classification of Tumours of Haematopoietic and Lymphoid Tissues, Revised 4th Edition. WHO Press. Geneva, Switzerland, 2017.
7. O'Donnell MR, Tallman MS, Abboud CN, et al. Acute myeloid leukemia, version 3.2017, NCCN clinical practice guidelines in oncology. J Natl Compr Canc Netw. 2017;15(7):926-957.
8. Döhner H, Estey E, Grimwade D, et al. Diagnosis and management of AML in adults: 2017 ELN recommendations from an international expert panel. Blood. 2017;129(4):424-447.
9. Roboz GJ. Current treatment of acute myeloid leukemia. Curr Opin Oncol. 2012;24(6):711-719.
10. Kayser S, Levis MJ. Updates on targeted therapies for acute myeloid leukaemia. Br J Haematol. 2022;196(2):316-328.
11. Stein EM. IDH2 inhibition in AML: finally progress? Best Pract Res Clin Haematol. 2015;28(2-3):112-115.
12. Abbas S, Lugthart S, Kavelaars FG, et al. Acquired mutations in the genes encoding IDH1 and IDH2 both are recurrent aberrations in acute myeloid leukemia: prevalence and prognostic value. Blood. 2010;116(12):2122-2126.
13. DiNardo CD, Ravandi F, Agresta S, et al. Characteristics, clinical outcome, and prognostic significance of IDH mutations in AML. Am J Hematol. 2015;90(8):732-736.
14. Paschka P, Schlenk RF, Gaidzik VI, et al. IDH1 and IDH2 mutations are frequent genetic alterations in acute myeloid leukemia and confer adverse prognosis in cytogenetically normal acute myeloid leukemia with NPM1 mutation without FLT3 internal tandem duplication. J Clin Oncol. 2010;28(22):3636-3643.
15. Marcucci G, Maharry K, Wu YZ, et al. IDH1 and IDH2 gene mutations identify novel molecular subsets within de novo cytogenetically normal acute myeloid leukemia: a Cancer and Leukemia Group B study. J Clin Oncol. 2010;28(14):2348-2355.
16. Rampal R, Alkalin A, Madzo J, et al. DNA hydroxymethylation profiling reveals that WT1 mutations result in loss of TET2 function in acute myeloid leukemia. Cell Rep. 2014;9(5):1841-1855.
17. Corces-Zimmerman MR, Majeti R. Pre-leukemic evolution of hematopoietic stem cells: the importance of early mutations in leukemogenesis. Leukemia. 2014;28(12):2276-2282.
Jazz Pharmaceuticals. MJL receives research funding from Novartis and Astellas. MJL serves as a consultant for Novartis, Daiichi-Sankyo, Astellas, and Arog.
Contributions
SK and MJL wrote the manuscript.
18. Reitman ZJ, Yan H. Isocitrate dehydrogenase 1 and 2 mutations in cancer: alterations at a crossroads of cellular metabolism. J Natl Cancer Inst. 2010;102(13):932-941.
19. Boissel N, Nibourel O, Renneville A, et al. Prognostic impact of isocitrate dehydrogenase enzyme isoforms 1 and 2 mutations in acute myeloid leukemia: a study by the Acute Leukemia French Association group. J Clin Oncol. 2010;28(23):3717-3723.
20. Duchmann M, Micol J-B, Duployez N, et al. Prognostic significance of concurrent gene mutations in intensively treated patients with IDH-mutated AML: an ALFA study. Blood. 2021;137(20):2827-2837.
21. Patel JP, Gönen M, Figueroa ME, et al. Prognostic relevance of integrated genetic profiling in acute myeloid leukemia. N Engl J Med. 2012;366(12):1079-1089.
22. Wagner K, Damm F, Göhring G, et al. Impact of IDH1 R132 mutations and an IDH1 single nucleotide polymorphism in cytogenetically normal acute myeloid leukemia: SNP rs11554137 is an adverse prognostic factor. J Clin Oncol. 2010;28(14):2356-2364.
23. Green CL, Evans CM, Zhao L, et al. The prognostic significance of IDH2 mutations in AML depends on the location of the mutation. Blood. 2011;118(2):409-412.
24. Dinardo CD, Stein EM, de Botton S, et al. Durable remissions with ivosidenib in IDH1-mutated relapsed or refractory AML. N Engl J Med. 2018;378(15):2386-2398.
25. Roboz GJ, Dinardo CD, Stein EM, et al. Ivosidenib induces deep durable remissions in patients with newly diagnosed IDH1mutant acute myeloid leukemia. Blood. 2020;135(7):463-471.
26. Stein EM, Dinardo CD, Pollyea DA, et al. Enasidenib in mutant IDH2 relapsed or refractory acute myeloid leukemia. Blood. 2018;130(6):722-731.
27. Pollyea DA, Tallman MS, de Botton S, et al. Enasidenib, an inhibitor of mutant IDH2 proteins, induces durable remissions in older patients with newly diagnosed acute myeloid leukemia. Leukemia. 2019;33(11):2575-2584.
28. Wang F, Morita K, DiNardo CD, et al. Leukemia stemness and co-occurring mutations drive resistance to IDH inhibitors in acute myeloid leukemia. Nat Commun. 2021;12(1):2607.
29. Grossmann V, Tiacci E, Holmes AB, et al. Whole-exome sequencing identifies somatic mutations of BCOR in acute myeloid leukemia with normal karyotype. Blood. 2011;118(23):6153-6163.
30. Montesinos P, Recher C, Vives S, et al. Ivosidenib and azacitidine in IDH1-mutated acute myeloid leukemia. N Engl J Med. 2022;386(16):1519-1531.
31. DiNardo CD, Jonas BA, Pullarkat V, et al. Azacitidine and venetoclax in previously untreated acute myeloid leukemia. N Engl J Med. 2020;383(7):617-629.
32. DiNardo CD, Tiong IS, Quaglieri A, et al. Molecular patterns of response and treatment failure after frontline venetoclax combinations in older patients with AML. Blood. 2020;135(11):791-803.
Haematologica | 108 February 2023 317 REVIEW ARTICLE - Clinical impact of molecular markers in AML S. Kayser and M.J. Levis
33. Wei AH, Montesinos P, Ivanov V, et al. Venetoclax plus LDAC for newly diagnosed AML ineligible for intensive chemotherapy: a phase 3 randomized placebo-controlled trial. Blood. 2020;135(24):2137-2145.
34. Chua CC, Roberts AW, Reynolds J, et al. Chemotherapy and Venetoclax in Elderly Acute Myeloid Leukemia Trial (CAVEAT): a phase Ib dose-escalation study of venetoclax combined with modified intensive chemotherapy. J Clin Oncol. 2020;38(30):3506-3517.
35. Stone RM, DeAngelo DJ, Letai AG, et al. Maximal tolerated dose of the BCL-2 inhibitor venetoclax in combination with daunorubicin/cytarabine induction in previously untreated adults with acute myeloid leukemia (AML). Blood. 2020;136(Suppl 1):1038
36. Ambinder AJ, Levis M. Potential targeting of FLT3 acute myeloid leukemia. Haematologica. 2021;106(3):671-681.
37. Kayser S, Levis MJ, Schlenk RF. Midostaurin treatment in FLT3mutated acute myeloid leukemia and systemic mastocytosis. Expert Rev Clin Pharmacol. 2017;10(11):1177-1189.
38. Keiffer G, Aderhold KL, Palmisiano ND. Upfront treatment of FLT3-mutated AML: a look back at the RATIFY trial and beyond. Front Oncol. 2020;10:562219.
39. Stone RM, Mandrekar SJ, Sanford BL, et al. Midostaurin plus chemotherapy for acute myeloid leukemia with a FLT3 mutation. N Engl J Med. 2017;377(5):454-464.
40. Levis M, Shi W, Chang K, et al. FLT3 inhibitors added to induction therapy induce deeper remissions. Blood. 2020;135(1):75-78.
41. Rydapt. Product Information from 18.09.2017. Accessed 04-102022 Available from: https://www.ema.europa.eu/en/documents/productinformation/rydapt -epar-product-information_en.pdf.
42. Midostaurin Medical Review(s), 2017. https://www.accessdata.fda.gov/drugsatfda_docs/nda/2017/2079 97Orig1 Orig2s000MedR.pdf Accessed 04-10-2022
43. Larson RA, Mandrekar SJ, Huebner LJ, et al. Midostaurin reduces relapse in FLT3-mutant acute myeloid leukemia: the Alliance CALGB 10603/RATIFY trial. Leukemia. 2021;35(9):2539-2551.
44. Schlenk RF, Weber D, Fiedler W, et al. Midostaurin added to chemotherapy and continued single-agent maintenance therapy in acute myeloid leukemia with FLT3-ITD. Blood. 2019;133(8):840-851.
45. Maziarz RT, Levis M, Patnaik MM, et al. Midostaurin after allogeneic stem cell transplant in patients with FLT3-internal tandem duplication-positive acute myeloid leukemia. Bone Marrow Transplant. 2021;56(5):1180-1189.
46. Burchert A, Bug G, Fritz LV, Finke J, et al. Sorafenib maintenance after allogeneic hematopoietic stem cell transplantation for acute myeloid leukemia with FLT3-internal tandem duplication mutation (SORMAIN). J Clin Oncol. 2020;38(26):2993-3002.
47. Perl AE, Larson RA, Podoltsev NA, et al. Follow-up of patients with R/R FLT3-mutation-positive AML treated with gilteritinib in the phase 3 ADMIRAL trial. Blood. 2022;139(23):3366-3375.
48. Xospata Prescribing Information, 2019. https://www.accessdata.fda.gov/drugsatfda_docs/label/2019/211 349s001lbl.pdf
49. Perl AE, Altman JK, Cortes J, et al. Selective inhibition of FLT3 by gilteritinib in relapsed or refractory acute myeloid leukaemia: a multicentre, first-in-human, open-label, phase 1-2 study. Lancet Oncol. 2017;18(8):1061-1075.
50. Perl AE, Martinelli G, Cortes JE, et al. Gilteritinib or chemotherapy for relapsed or refractory FLT3-mutated AML. N
Engl J Med. 2019;381(18):1728-1740.
51. Wang ES, Montesinos P, Minden M, et al. Phase 3, open-label, randomized study of gilteritinib and azacitidine vs azacitidine for newly diagnosed FLT3-mutated acute myeloid leukemia in patients ineligible for intensive induction chemotherapy. Blood, 2021;135(Suppl 1):700.
52. Pratz K, Cherry M, Altman JC, et al. Updated results from a phase 1 study of gilteritinib in combination with induction and consolidation chemotherapy in patients with newly diagnosed AML. HemaSphere. 2019;3(Suppl 1):468.
53. Short NJ, DiNardo CD, Daver N, et al. A triplet combination of azacitidine, venetoclax and gilteritinib for patients with FLT3mutated acute myeloid leukemia: results from a phase I/II study. Blood. 2021;135(Suppl 1):696.
54. Wang ES, Tallman MS, Stone RM, et al. Low relapse rate in younger patients ≤60 years old with newly diagnosed FLT3mutated acute myeloid leukemia (AML) treated with crenolanib and cytarabine/anthracycline chemotherapy. Blood. 2017;130(Suppl 1):566.
55. Altman JK, Foran JM, Pratz KW, Trone D, Cortes JE, Tallman MS. Phase 1 study of quizartinib in combination with induction and consolidation chemotherapy in patients with newly diagnosed acute myeloid leukemia. Am J Hematol. 2018;93(2):213-221.
56. Erba H, Montesinos P, Vrhovac R, et al. Quizartinib prolonged survival vs placebo plus intensive induction and consolidation therapy followed by single-agent continuation in patients aged 18-75 years with newly diagnosed FLT3-ITD+ AML. EHA Library. Erba H. 06/11/22; 356965; S100
57. Smith CC, Paguirigan A, Jeschke GR, et al. Heterogeneous resistance to quizartinib in acute myeloid leukemia revealed by single-cell analysis. Blood. 2017;130(1):48-58.
58. Tarver TC, Hill JE, Rahmat L, et al. Gilteritinib is a clinically active FLT3 inhibitor with broad activity against FLT3 kinase domain mutations. Blood Adv. 2020;4(3):514-524.
59. Kennedy VE, Smith CC. FLT3 mutations in acute myeloid leukemia: key concepts and emerging controversies. Front Oncol. 2020;10:612880.
60. Smith CC, Lin K, Stecula A, Sali A, Shah NP. FLT3 D835 mutations confer differential resistance to type II FLT3 inhibitors. Leukemia. 2015;29(12):2390-2392.
61. Eguchi M, Minami Y, Kuzume A, Chi S. Mechanisms underlying resistance to FLT3 inhibitors in acute myeloid leukemia. Biomedicines. 2020;8(8):245.
62. Smith CC, Levis MJ, Perl AE, Hill JE, Rosales M, Bahceci E. Molecular profile of FLT3-mutated relapsed/refractory patients with AML in the phase 3 ADMIRAL study of gilteritinib. Blood Adv. 2022;6(7):2144-2155.
63. Yamaura T, Nakatani T, Uda K, et al. A novel irreversible FLT3 inhibitor, FF-10101, shows excellent efficacy against AML cells with FLT3 mutations. Blood. 2018;131(4):426-438.
64. Ferng TT, Terada D, Ando M, et al. The irreversible FLT3 inhibitor FF-10101 is active against a diversity of FLT3 inhibitor resistance mechanisms. Mol Cancer Ther. 2022;21(5):844-854
65. Levis MJ, Smith CC, Perl AE, et al. Phase 1 first-in-human study of irreversible FLT3 inhibitor FF-10101-01 in relapsed or refractory acute myeloid leukemia. J Clin Oncol. 2021;39(15):Suppl7008.
66. Falini B, Mecucci C, Tiacci E, et al. Cytoplasmic nucleophosmin in acute myelogenous leukemia with a normal karyotype. N Engl J Med. 2005;352(3):254-266.
67. Grimwade D, Freeman SD. Defining minimal residual disease in acute myeloid leukemia: which platforms are ready for "prime time"? Blood. 2014;124(23):3345-3355.
68. Gorello P, Cazzaniga G, Alberti F, et al. Quantitative assessment
Haematologica | 108 February 2023 318 REVIEW ARTICLE - Clinical impact of molecular markers in AML S. Kayser and M.J. Levis
of minimal residual disease in acute myeloid leukemia carrying nucleophosmin (NPM1) gene mutations. Leukemia. 2006;20(6):1103-1108.
69. Falini B, Sportoletti P, Martelli MP. Acute myeloid leukemia with mutated NPM1: diagnosis, prognosis and therapeutic perspectives. Curr Opin Oncol. 2009;21(6):573-581.
70. Schnittger S, Kern W, Tschulik C, et al. Minimal residual disease levels assessed by NPM1 mutation-specific RQ-PCR provide important prognostic information in AML. Blood. 2009;114(11):2220-2231.
71. Thiede C, Koch S, Creutzig E, et al. Prevalence and prognostic impact of NPM1 mutations in 1485 adult patients with acute myeloid leukemia (AML). Blood. 2006;107(10):4011-4020.
72. Döhner K, Schlenk RF, Habdank M, et al. Mutant nucleophosmin (NPM1) predicts favorable prognosis in younger adults with acute myeloid leukemia and normal cytogenetics: interaction with other gene mutations. Blood. 2005;106(12):3740-3746.
73. Schlenk RF, Döhner K, Krauter J, et al. Mutations and treatment outcome in cytogenetically normal acute myeloid leukemia. N Engl J Med. 2008;358(18):1909-1918.
74. Al Hamed R, Labopin M, Daguindau E, et al. Measurable residual disease, FLT3-ITD mutation, and disease status have independent prognostic influence on outcome of allogeneic stem cell transplantation in NPM1-mutated acute myeloid leukemia. Cancer Med. 2022;11(4):1068-1080.
75. Pratcorona M, Brunet S, Nomdedéu J, et al. Favorable outcome of patients with acute myeloid leukemia harboring a low allelic burden FLT3-ITD mutation and concomitant NPM1 mutation: relevance to post-remission therapy. Blood. 2013;121(14):2734-2738.
76. Gale RE, Green C, Allen C, et al. The impact of FLT3 internal tandem duplication mutant level, number, size, and interaction with NPM1 mutations in a large cohort of young adult patients with acute myeloid leukemia. Blood. 2008;111(5):2776-2784.
77. Schlenk RF, Kayser S, Bullinger L, et al. Differential impact of allelic ratio and insertion site in FLT3-ITD-positive AML with respect to allogeneic transplantation. Blood. 2014;124(23):3441-3449.
78. Schetelig J, Röllig C, Kayser S, et al. Validation of the ELN 2017 classification for AML with intermediate risk cytogenetics with or without NPM1 mutations and high or low ratio FLT3-ITDs. Blood. 2017;130(Suppl 1):2694.
79. Krönke J, Schlenk RF, Jensen KO, et al. Monitoring of minimal residual disease in NPM1-mutated acute myeloid leukemia: a study from the German-Austrian acute myeloid leukemia study group. J Clin Oncol. 2011;29(19):2709-2716.
80. Hubmann M, Köhnke T, Hoster E, et al. Molecular response assessment by quantitative real-time polymerase chain reaction after induction therapy in NPM1-mutated patients identifies those at high risk of relapse. Haematologica. 2014;99(8):1317-1325.
81. Kayser S, Benner A, Thiede C, et al. Pretransplant NPM1 MRD levels predict outcome after allogeneic hematopoietic stem cell transplantation in patients with acute myeloid leukemia. Blood Cancer J. 2016;6(7):e449.
82. Balsat M, Renneville A, Thomas X, et al. Postinduction minimal residual disease predicts outcome and benefit from allogeneic stem cell transplantation in acute myeloid leukemia with NPM1 mutation: a study by the Acute Leukemia French Association Group. J Clin Oncol. 2017;35(2):185-193.
83. Shayegi N, Kramer M, Bornhäuser M, et al. The level of residual disease based on mutant NPM1 is an independent prognostic factor for relapse and survival in AML. Blood. 2013;122(1):83-92.
84. Ivey A, Hills RK, Simpson MA, et al. Assessment of minimal
residual disease in standard-risk AML. N Engl J Med. 2016;374(5):422-433.
85. Lambert J, Lambert J, Nibourel O, et al. MRD assessed by WT1 and NPM1 transcript levels identifies distinct outcomes in AML patients and is influenced by gemtuzumab ozogamicin. Oncotarget. 2014;5(15):6280-6288.
86. Stein EM, Aldoss I, DiPersio JF, et al. Safety and efficacy of menin inhibition in patients (Pts) with MLL-rearranged and NPM1 mutant acute leukemia: a phase (Ph) 1, first-in-human study of SNDX-5613 (AUGMENT 101). Blood. 2021;135(Suppl 1):699.
87. Sievers EL, Larson RA, Stadtmauer EA, et al. Efficacy and safety of gemtuzumab ozogamicin in patients with CD33-positive acute myeloid leukemia in first relapse. J Clin Oncol. 2001;19(13):3244-3254.
88. Godwin CD, Gale RP, Walter RB. Gemtuzumab ozogamicin in acute myeloid leukemia. Leukemia. 2017;(9):1855-1868.
89. Bross PF, Beitz J, Chen G, et al. Approval summary: gemtuzumab ozogamicin in relapsed acute myeloid leukemia. Clin Cancer Res. 2001;7(6):1490-1496.
90. Larson RA, Boogaerts M, Estey E, et al. Antibody-targeted chemotherapy of older patients with acute myeloid leukemia in first relapse using Mylotarg (gemtuzumab ozogamicin). Leukemia. 2002;16(9):1627-1636.
91. Petersdorf SH, Kopecky KJ, Slovak M, et al. A phase 3 study of gemtuzumab ozogamicin during induction and postconsolidation therapy in younger patients with acute myeloid leukemia. Blood. 2013;121(24):4854-4860.
92. Burnett AK, Hills RK, Milligan D, et al. Identification of patients with acute myeloblastic leukemia who benefit from the addition of gemtuzumab ozogamicin: results of the MRC AML15 trial. J Clin Oncol. 2011;29(4):369-377.
93. Burnett AK, Russell NH, Hills RK, et al. Addition of gemtuzumab ozogamicin to induction chemotherapy improves survival in older patients with acute myeloid leukemia. J Clin Oncol. 2012;30(32):3924-3931.
94. Castaigne S, Pautas C, Terré C, et al. Effect of gemtuzumab ozogamicin on survival of adult patients with de-novo acute myeloid leukaemia (ALFA-0701): a randomised, open-label, phase 3 study. Lancet. 2012;379(9825):1508-1516.
95. Hills RK, Castaigne S, Appelbaum FR, et al. Addition of gemtuzumab ozogamicin to induction chemotherapy in adult patients with acute myeloid leukaemia: a meta-analysis of individual patient data from randomised controlled trials. Lancet Oncol. 2014;15(9):986-996.
96. Rotter V, Aloni-Grinstein R, Schwartz D, et al. Does wild-type p53 play a role in normal cell differentiation? Semin Cancer Biol. 1994;5(3):229-236.
97. Grossmann V, Schnittger S, Kohlmann A, et al. A novel hierarchical prognostic model of AML solely based on molecular mutations. Blood. 2012;120(15):2963-2972.
98. Fenaux P, Preudhomme C, Quiquandon I, et al. Mutations of the P53 gene in acute myeloid leukaemia. Br J Haematol. 1992;80(2):178-183.
99. Rücker FG, Schlenk RF, Bullinger L, et al. TP53 alterations in acute myeloid leukemia with complex karyotype correlate with specific copy number alterations, monosomal karyotype, and dismal outcome. Blood. 2012;119(9):2114-2121.
100. Wong TN, Ramsingh G, Young AL, et al. Role of TP53 mutations in the origin and evolution of therapy-related acute myeloid leukaemia. Nature. 2015;518(7540):552-555.
101. Welch JS, Petti AA, Miller CA, et al. TP53 and decitabine in acute myeloid leukemia and myelodysplastic syndromes. N Engl J Med. 2016;375(21):2023-2036.
Haematologica | 108 February 2023 319 REVIEW ARTICLE - Clinical impact of molecular markers in AML S. Kayser and M.J. Levis
102. Sallman DA, DeZern AE, Garcia-Manero G, et al. Eprenetapopt (APR-246) and azacitidine in TP53-mutant myelodysplastic syndromes. J Clin Oncol. 2021;39(14):1584-1594.
103. Cluzeau T, Sebert M, Rahmé R, et al. Eprenetapopt plus azacitidine in TP53-mutated myelodysplastic syndromes and acute myeloid leukemia: a phase II study by the Groupe Francophone des Myélodysplasies (GFM). J Clin Oncol. 2021;39(14):1575-1583.
104. Pollyea DA, Pratz K, Letai A, et al. Venetoclax with azacitidine or decitabine in patients with newly diagnosed acute myeloid leukemia: long term follow-up from a phase 1b study. Am J Hematol. 2021;96(2):208-217.
105. Wei AH, Strickland SA Jr, Hou JZ, et al. Venetoclax combined with low-dose cytarabine for previously untreated patients with acute myeloid leukemia: results from a phase Ib/II study. J Clin Oncol. 2019;37(15):1277-1284.
106. Chao MP, Alizadeh AA, Tang C, et al. Therapeutic antibody targeting of CD47 eliminates human acute lymphoblastic leukemia. Cancer Res. 2010;71(4):1374-1384.
107. Chao MP, Alizadeh AA, Tang C, et al. Anti-CD47 antibody synergizes with rituximab to promote phagocytosis and eradicate non-Hodgkin lymphoma. Cell. 2010;142(5):699-713.
108. Majeti R, Chao MP, Alizadeh AA, et al. CD47 is an adverse prognostic factor and therapeutic antibody target on human acute myeloid leukemia stem cells. Cell. 2009;138(2):286-299.
109. Pang WW, Pluvinage JV, Price EA, et al. Hematopoietic stem cell and progenitor cell mechanisms in myelodysplastic syndromes. Proc Natl Acad Sci U S A. 2013;110(8):3011-3016.
110. Tseng D, Volkmer JP, Willingham SB, et al. Anti-CD47 antibodymediated phagocytosis of cancer by macrophages primes an effective antitumor T-cell response. Proc Natl Acad Sci U S A. 2013;110(27):11103-11108.
111. Sallman DA, Al Malki M, Asch AS, et al. Tolerability and efficacy of the first-in-class anti-CD47 antibody magrolimab combined with azacitidine in MDS and AML patients: phase Ib results. J Clin Oncol. 2020;38(15-Suppl):7507.
112. Sallman DA, Asch AS, Al Malki MM, et al. The first-in-class antiCD47 antibody magrolimab combined with azacitidine is well-tolerated and effective in AML patients: phase 1B results. Blood. 2019;134(Suppl 1):569.
113. Daver NG, Vyas P, Kambhampati S, et al. Tolerability and efficacy of the first-in-class anti-CD47 antibody magrolimab combined with azacitidine in frontline patients with TP53-mutated acute myeloid leukemia: phase 1b results. EHA Library. G Daver N. 06/10/22; 356996; S132.
114. Marschalek R. Systematic classification of mixed-lineage leukemia fusion partners predicts additional cancer pathways. Ann Lab Med. 2016;36(2):85-100.
115. Yu BD, Hess JL, Horning SE, et al. Altered Hox expression and segmental identity in Mll-mutant mice. Nature. 1995;378(6556):505-508.
116. Kühn MW, Song E, Feng Z, et al. Targeting chromatin regulators inhibits leukemogenic gene expression in NPM1 mutant leukemia. Cancer Discov. 2016;6(10):1166-1181.
117. Yokoyama A, Cleary ML. Menin critically links MLL proteins with LEDGF on cancer-associated target genes. Cancer Cell. 2008;14(1):36-46.
118. Mullighan CG, Kennedy A, Zhou X, et al. Pediatric acute myeloid leukemia with NPM1 mutations is characterized by a gene expression profile with dysregulated HOX gene expression distinct from MLL-rearranged leukemias. Leukemia. 2007;21(9):2000-2009.
119. Andreeff M, Ruvolo V, Gadgil S, et al. HOX expression patterns identify a common signature for favorable AML Leukemia. 2008;22(11):2041-2047.
120. Klossowski S, Miao H, Kempinska K, et al. Menin inhibitor MI3454 induces remission in MLL1-rearranged and NPM1-mutated models of leukemia. J Clin Invest. 2020;130(2):981-997.
121. Krivtsov AV, Evans K, Gadrey JY, et al. A menin-MLL inhibitor induces specific chromatin changes and eradicates disease in models of MLL-rearranged leukemia. Cancer Cell. 2019;36(6):660-673.
122. Uckelmann HJ, Kim SM, Wong EM, et al. Therapeutic targeting of preleukemia cells in a mouse model of NPM1 mutant acute myeloid leukemia. Science. 2020;367(6477):586-590.
123. Wang ES, Altman JK, Pettit KM, et al. Preliminary data on a phase 1/2A first in human study of the menin-KMT2A (MLL) inhibitor KO-539 in patients with relapsed or refractory acute myeloid leukemia. Blood. 2020;135(Suppl 1):115.
Haematologica | 108 February 2023 320 REVIEW ARTICLE - Clinical impact of molecular markers in AML S. Kayser and M.J. Levis
New drugs before, during, and after hematopoietic stem cell transplantation for patients with acute myeloid leukemia
Razan Mohty,1 Rama El Hamed,2 Eolia Brissot,3,4 Ali Bazarbachi5 and Mohamad Mohty3,4 1Division of Hematology-Oncology and Blood and Marrow Transplantation Program, Mayo Clinic, Jacksonville, FL, USA; 2Department of Internal Medicine, Jacobi Medical Center/Albert Einstein College of Medicine, Bronx, NY, USA; 3Department of Clinical Hematology and Cellular Therapy, Saint-Antoine Hospital, AP-HP, Sorbonne University, Paris, France; 4INSERM, Saint-Antoine Research Center, Paris, France and 5Bone Marrow Transplantation Program, Department of Internal Medicine, American University of Beirut Medical Center, Beirut, Lebanon
Abstract
Correspondence: M. Mohty mohamad.mohty@inserm.fr
Received: May 28, 2022.
Accepted: September 2, 2022.
https://doi.org/10.3324/haematol.2022.280798
©2023 Ferrata Storti Foundation
Published under a CC BY-NC license
The treatment of acute myeloid leukemia (AML) has evolved over the past few years with the advent of next-generation sequencing. Targeted therapies alone or in combination with low-dose or high-intensity chemotherapy have improved the outcome of patients with AML treated in the frontline and relapsed/refractory settings. Despite these advances, allogeneic stem cell transplantation (allo-HCT) remains essential as consolidation therapy following frontline treatment in intermediateand adverse-risk and relapsed/refractory disease. However, many patients relapse, with limited treatment options, hence the need for post-transplant strategies to mitigate relapse risk. Maintenance therapy following allo-HCT was developed for this specific purpose and can exploit either a direct anti-leukemia effect and/or enhance the bona fide graft-versus-leukemia effect without increasing the risk of graft-versus-host disease. In this paper, we summarize novel therapies for AML before, during, and after allo-HCT and review ongoing studies.
Introduction
The past decade marked a revolution in the treatment of acute myeloid leukemia (AML) with the advent of nextgeneration sequencing, leading to the discovery of new mutations and a better understanding of the biology of AML. Following these innovations, the landscape of AML therapy has evolved rapidly; since 2017, several novel therapies have received regulatory approval, including CPX351,1 midostaurin,2 gilteritinib,3 ivosidenib,4 enasidenib,5 venetoclax,6,7 and glasdegib,8 and gemtuzumab ozogamicin (GO) has re-emerged.9 Following these approvals, numerous doublet and triplet combinations have been tested in which targeted therapy was added to intensive or low-intensity chemotherapy and/or to other targeted agents. In patients lacking targetable mutations, the standard of care remains intensive chemotherapy in fit patients or low-intensity treatment in unfit patients. Several groups of patients, particularly those carrying high-risk mutations, namely TP53 mutations, and complex karyotype, still have a dismal prognosis. Minor changes in the treatment of this category of patients have occurred, with only few drugs being studied for TP53-mutated disease, including APR-246 (eprenetapopt) and anti-CD47 monoclonal antibodies.10,11 Other novel drugs being tested in
MLL-rearranged and NPM1-mutated relapsed AML, are menin inhibitors, which led to an overall response rate of 44% in that population.12 Following induction therapy, consolidation options include chemotherapy in favorable-risk disease or allogeneic hematopoietic cell transplant (alloHCT) in intermediate- and adverse-risk AML. The optimal strategy depends on donor availability, patient- and disease-related characteristics, and the benefits of treatment weighed against treatment-related mortality. In this review, we summarize novel therapeutic approaches for AML before transplant. In addition, we discuss new combinations for conditioning regimens prior to allo-HCT, and we elaborate on post-allo-HCT maintenance strategies to diminish relapse.
Conventional treatment
Since the 1970s, the mainstay of fi rst-line treatment in young, fit patients with AML has been the “7 + 3” regimen, serving as backbone therapy.13
Therapies available for use prior to allogeneic hematopoietic cell transplantation
Haematologica | 108 February 2023 321 REVIEW ARTICLE
This is usually followed by consolidation therapy to achieve lasting remission. This regimen consists of 7 days of continuous, standard-dose cytarabine (100-200 mg/m2 daily), along with anthracycline during the first 3 days and is usually reserved for younger, fit patients. Higher doses of cytarabine have been associated with a small added survival benefit relative to the increased toxicities.14,15 This benefit is more pronounced in young patients <46 years of age, as shown in the EORTC-GIMEMA AML12 trial. In this study, patients aged between 15-60 years were administered standard-dose cytarabine (100 mg/m2 continuous infusion over 10 days) or high-dose cytarabine (3,000 mg/m2 every 12 hours on days 1, 3, 5, and 7). Overall survival (OS) was significantly improved for patients receiving high-dose cytarabine compared to patients receiving standard-dose cytarabine (51.9% vs. 43.3%, respectively; P=0.009).16 On the other hand, 60 or 90 mg/m2 of daunorubicin and 12 mg/m2 of idarubicin have yielded similar survival and complete remission (CR) rates.14,17,18 The combination of fludarabine, cytarabine, granulocyte colonystimulating factor (G-CSF), and idarubicin (FLAG-IDA), previously reserved for relapsed disease, is an alternative induction regimen yielding similar results, especially in favorable-risk disease.19 Moreover, the use of FLAG has been demonstrated to provide superior relapse-free survival, compared to idarubicin and cytarabine (P=0.046), in treating core-binding factor-AML.20 The UK MRC AML 15 trial showed a superior log-reduction reduction in minimal residual disease (MRD) with FLAG-IDA compared to the “7+3” regimen with or without etoposide, but this did not translate into a difference in OS.21 These conventional regimens offer high rates of remission and prolong OS in patients aged <60 years with newly diagnosed AML, but not in older patients, since up to 70% of patients >65 years die within 1 year of diagnosis.22 Newer laboratory techniques, namely next-generation sequencing, identified mutations critical in the pathogenesis of AML leading to the development of targeted therapies. This novel arsenal of targeted drug therapies used as monotherapy or in combination with conventional treatments has revolutionized the treatment landscape of AML. GO is an anti-CD33 monoclonal antibody that was initially approved by the Food and Drug Administration (FDA) for the treatment of CD33-positive AML in first relapse in older patients before being withdrawn because of reports of increased mortality in the SWOG trial in the group treated with “7+3” and GO.23 A meta-analysis of five trials involving more than 3,000 AML patients treated with GO in addition to standard therapy reported a reduction in relapse (P=0.0001) and improved survival (P=0.01) without increasing mortality in patients with favorable- and intermediate-risk cytogenetics.24 Currently, GO is approved by the FDA and European Medicines Agency (EMA) for treating adult patients with newly diagnosed CD33-positive AML
at a dose of 3 mg/m2 on days 1, 4, and 7 with the “7+3” regimen. The addition of GO to the FLAG regimen has also demonstrated superiority over the long-used FLAG-IDA regimen in core-binding factor AML, achieving higher remission rates.25 A head-to-head comparison of “7+3”+GO and FLAG-IDA+GO regimens is needed in patients with core-binding factor AML.
In patients >65 years, treatment choices become more challenging given increased cytogenetic abnormalities and somatic mutations, and thus higher-risk disease, unpredictable response to chemotherapy, and increased chance of treatment-related mortality. Although prognosis is poor in this group compared to that in younger, fitter patients, induction chemotherapy remains standard, whenever possible, offering better outcomes than palliation.26 In this patient population, hypomethylating agents (HMA), alone or in combination, have been shown to play a significant role, such that azacitidine or decitabine alone demonstrated superiority over low-dose cytarabine (LDAC) or supportive care in two cornerstone trials.27,28 Novel therapies in AML prior to allo-HCT are described below. Trials for which results have been published are summarized in Table 1.
Novel therapies
CPX-351
CPX-351 is a novel liposomal carrier containing cytarabine and daunorubicin in a fixed 5:1 molar ratio. It was first studied in a phase I dose-escalation study in 2011, in which the maximum dose tolerated was 100 units/m2, and adverse events were consistent with those of cytarabine and daunorubicin individually.29 A phase II trial randomizing 126 older patients with untreated AML in a 2:1 fashion to receive CPX-351 or the “7+3” regimen documented higher response rates in the CPX-351 arm (66.7% vs. 51.2%; P=0.07).1 A subgroup analysis of cases with secondary AML demonstrated notably improved response rates (57.6% vs. 31.6%, P=0.06), event-free survival (EFS) (hazard ratio [HR]=0.59; P=0.08), and OS (HR=0.46; P=0.01) with CPX351.1 This compound was later approved by the FDA for the treatment of newly-diagnosed, therapy-related AML, and AML with myelodysplastic syndrome (MDS)-related changes based on results of a phase III trial comparing CPX-351 with the “7+3” regimen in which OS was improved with the liposomal formulation (HR=0.69; P=0.005) with an improved CR rate of 38% compared to 26% (P=0.035).30 More patients in the CPX-351 arm (56%) received allo-HCT than in the “7+3” arm (46%).31 At a median follow-up of 60 months, the median OS was not reached in the CPX-351 arm while it was 10.3 months in the “7+3” arm (HR=0.51). This study showed the impact of induction therapy on transplant outcomes, offering older patients with AML high CR rates and prolonged survival after CPX-351 induction therapy followed by allo-HCT. An Italian group re-
Haematologica | 108 February 2023 322 REVIEW ARTICLE R. Mohty et al.
ported similar results with CR rates of 70.4%.32 Patients in this study who had undergone allo-HCT had improved outcomes, thus highlighting the potential impact of CPX351 on post-HCT outcomes.32 Its use was also investigated in the frontline setting to treat AML patients at high risk of mortality from standard induction in a phase II openlabel trial.33 Fifty-six patients were enrolled to receive 50, 75, or 100 units/m2 on days 1, 3, and 5.33 The composite CR was lowest in the 50 units/m2 arm, although the difference was not statistically significant (19% vs. 38% vs 44%; P=0.35).33 The median OS was 4.3 months in the 50 units/m2 arm compared to 8.6 and 6.2 months in the 75 and 100 units/m2 arms, respectively, thus underscoring the efficacy, safety, and tolerability at the substandard dose of 75 units/m2 in some patients at high risk of treatmentrelated mortality.33 Currently, CPX-351 is being investigated in the relapsed/refractory (R/R) setting in combination with FLT3 tyrosine kinase inhibitors (TKI), gilteritinib (NCT05024552) and quizartinib (NCT04128748), and GO, an anti-CD33 antibody drug conjugate (NCT03904251); in the frontline setting combined with fludarabine (NCT04425655), venetoclax (NCT04038437), quizartinib (NCT04128748) and palbociclib (NCT03844997); in therapy-related AML/MDS with glasdegib (NCT04231851); and in older patients with GO (NCT03878927).
BCL-2 inhibitors
B-cell lymphoma 2 (BCL-2) protects cells against apoptosis, and its expression in AML is associated with decreased sensitivity to cytotoxic therapy and, therefore, a higher probability of relapse. Venetoclax is an orally bioavailable inhibitor of BCL-2. Before its introduction for AML, it was FDA-approved for treating 17p-deletion-positive chronic lymphocytic leukemia. Early studies showed only modest efficacy of venetoclax monotherapy in treating R/R AML.34 However, the promising results of two large phase Ib/II trials combining an HMA or LDAC with venetoclax led to the FDA approval of venetoclax combined with azacitidine, decitabine, or LDAC for older (>75 years) patients, unfit for intensive chemotherapy, with the HMA-venetoclax combination being the most commonly used.35,36 The two phase III trials, VIALE-A and VIALE-C, demonstrated a significant survival benefit from combining venetoclax with a HMA.6,7 The VIALE-A trial included patients >75 years, unfit for intensive chemotherapy without prior exposure to HMA.6 Patients were randomized to receive either venetoclax-azacitidine or azacitidine alone: the CR rate was 36.7%, the clinical CR rate was 66.4%, and the median OS was 14.7 months in the group treated with the combination.6 In contrast, 20% of patients in the VIALE-C trial had been previously exposed to HMA treatment. Patients in this trial were randomized to receive either venetoclaxLDAC or LDAC alone: the median OS improved from 4.1 to 7.2 months with the addition of venetoclax, with a 25% re-
duction of the risk of death.7 These two trials established the combination of venetoclax-HMA as a standard of care for AML patients unfit for intensive therapy. It is essential to highlight that CR rates were significantly improved with this combination in all disease subgroups regardless of positive or negative prognostic mutations such as NPM1, IDH-1/2, or FLT3-ITD. This creates room for debate regarding patients with specific targetable mutations who responded to venetoclax-HMA. Do we combine novel drugs targeting mutations with venetoclax, HMA, or all three? The answer will depend on the safety profile of the triple drug combination and large randomized trials should be conducted to compare various doublet combinations to triplet combinations.
A recent prospective trial assessed the use of a venetoclax-azacitidine combination as a bridge to allo-HCT using historical patients who had received intensive chemotherapy prior to allo-HCT as the comparison group.37 Patients who received venetoclax-azacitidine were older and had more secondary AML and adverse cytogenetics. They received mainly reduced intensity conditioning (RIC). The 12month non-relapse mortality, relapse-free survival (RFS), and OS were 19.1%, 58%, and 63% in the venetoclax-azacitidine group compared to 11.8%, 54%, and 70% in the historical intensive chemotherapy group.37 Another retrospective single-center study compared outcomes of patients >60 years of age who received induction venetoclax-azacitidine followed by allo-HCT to the same population of patients eligible for transplant but who chose to defer it.38 The median OS was not reached for patients who underwent allo-HCT compared to 518 days for patients who did not (P=0.01), reinforcing the role of alloHCT even in older patients. Those results are also valid for patients who receive triplet induction. In a phase II trial, FLT3 inhibitors in combination with venetoclax and decitabine (for 10 days) were studied in patients with newly diagnosed and R/R FLT3-mutated AML ≥60 years old.39 Four patients in the newly diagnosed cohort received consolidation with allo-HCT, followed by maintenance in two patients. At 2 years, all four patients were still alive. Hence, the use of triplet induction followed by allo-HCT followed by maintenance could improve long-term survival of newly diagnosed older patients with AML.39 More data are needed to confirm these findings. Venetoclax has since been studied in various combinations including with intensive chemotherapy. The MD Anderson Cancer Center group conducted a phase Ib/II trial of medically fit R/R or newly diagnosed AML patients treated with FLAG-IDA combined with up to 14 days of venetoclax. After an initial high rate of grades 3-4 febrile neutropenia in the first phase of the trial, chemotherapy doses were adjusted and the duration of venetoclax treatment reduced from 21 to 14 days, with a good safety profile. Results demonstrated robust efficacy, with 90% of
Haematologica | 108 February 2023 323 REVIEW ARTICLE R. Mohty et al.
newly diagnosed AML patients achieving CR and 96% achieving MRD negativity.40 The group also investigated the addition of venetoclax to cladribine, idarubicin, and cytarabine (CLIA), which proved safe in newly diagnosed patients without increased mortality and with durable MRD negativity.41 Another venetoclax and intensive chemotherapy combination is the addition of venetoclax to “5+2” induction in older patients, which resulted in high remission rates and had an acceptable safety profile.42 In a propensity-score analysis of trials combining venetoclax with intensive chemotherapy including anthracycline, purine analogues, and cytarabine, the addition of venetoclax led to high rates of MRD negativity compared to chemotherapy alone (86% vs. 61%; P=0.0028). A higher number of patients underwent allo-HCT in first remission in the venetoclax arms. Furthermore, the addition of venetoclax prolonged EFS (HR=0.57; 95% CI: 1.11-2.08; P=0.012).43 The results of this post-hoc analysis are encouraging and should be confirmed by large prospective trials.
It is worth noting that relapse remains common with these regimens secondary to emerging resistance to venetoclax due to overexpression of MCL-1, gain of function of FLT3-ITD, or loss of function of TP53. 44 Combinations of a HMA with an IDH-1/2 inhibitor, which are discussed below, have also been studied to investigate possible synergistic effects of these two types of drugs.
Hedgehog pathway inhibitor: glasdegib
The role of the Hedgehog signaling pathway in hematopoiesis is not clear. The pathway plays an essential role in cellular development and is fundamental in some carcinogenic pathways. Glasdegib is the only Hedgehog pathway inhibitor approved for use in AML, based on the results of the BRIGHT 1003 AML phase II trial evaluating the addition of glasdegib to LDAC in patients with AML/MDS unsuitable for intensive chemotherapy.8 Eightyeight and 44 patients were randomized to glasdegib-LDAC and LDAC, respectively. The median OS was 8.8 months in the combination group compared to 4.9 months in the LDAC group (HR=0.51, 80% CI: 0.39-0.67; P=0.0004). The CR rate was 17% vs. 2.3% (P<0.05) in the glasdegib-LDAC and LDAC arms, respectively. It is worth mentioning that this trial was criticized given that the results in the control arm (LDAC) were lower than those reported in previous studies. Nevertheless, this treatment provides an option for patients who are not eligible for intensive chemotherapy. Investigations of the combination of glasdegib with intensive chemotherapy (NCT03416179) with other novel treatments such as CPX-351 (NCT04231851) are underway.
Targetable mutations
Gene mutations are important in risk-stratification of AML. According to the European LeukemiaNet (ELN) 2017, the presence of a mutated FLT3-ITD or TP53 is associated with
worse outcomes.45,46 On the other hand, mutations in NPM1 without an FLT3-ITD mutation confer a survival advantage.45,47 IDH1/2 mutations were not described in the ELN 2017 risk stratification of AML and their prognostic significance is controversial, largely depending on co-occurring mutations.48 As such, novel treatment has aimed at targeting detectable mutations.
FLT3 inhibitors. The utility of TKI has been established in both solid and hematologic malignancies. Given the negative prognostic influence of FLT3-ITD mutations, the therapeutic potential of TKI has been investigated in this context. Early or first-generation TKI, including midostaurin and sorafenib, are non-specific, targeting an array of TKI other than FLT3-ITD. Next-generation TKI include quizartinib, crenolanib, and gilteritinib, which are more specific and potent. Nevertheless, the relation of specificity to TKI and toxicity profile is not well understood. For example, quizartinib, a fairly specific, second-generation TKI is associated with high rates of toxicity, namely immunosuppression and QTc prolongation.49
Several TKI targeting FLT3 have been evaluated in combination with intensive chemotherapy during induction treatment of AML. Sorafenib has been investigated for more than a decade. Ravandi et al. studied the outcome of patients with previously untreated AML who received a combination of sorafenib, cytarabine, and idarubicin, demonstrating a CR of 95% with an OS of 29 months.50 In contrast, sorafenib combined with the standard “7+3” regimen did not improve OS or EFS in patients >60 years.51 In patients aged <60 years, frontline sorafenib in combination with standard induction significantly prolonged EFS (21 vs. 9 months) and RFS (63 vs. 22 months) when compared to placebo combined with standard induction.52 Recently, a phase II trial documented an improved OS but not EFS with sorafenib combined with intensive frontline chemotherapy, especially in patients with an allelic ratio >0.7.53
The RATIFY trial, central to the FDA approval of midostaurin for treating newly diagnosed FLT3-mutated (FLT3ITD or FLT3-TKD) AML, highlighted improved survival in more than 700 patients aged <60 years, randomized to receive either placebo or midostaurin 50 mg orally twice daily on days 8-21 of each “7+3” cycle and high-dose cytarabine (HiDAC) consolidation.2 Those in remission were also treated with daily midostaurin maintenance therapy for up to 1 year. EFS and 4-year OS were significantly improved in the midostaurin group (8.2 vs. 3 months and 51.4% vs. 44.2%, respectively).2 Importantly, the group that received midostaurin had improved outcomes regardless of the subtype of FLT3 mutation (TKD, ITD low allelic ratio or ITD high allelic ratio).2
The addition of crenolanib to the “7+3” regimen in patients <60 years has demonstrated tolerability and produced
Haematologica | 108 February 2023 324 REVIEW ARTICLE R. Mohty et al.
promising outcomes in a phase II study.54 Importantly, its use in patients with mutations other than FLT3 has demonstrated that the addition of crenolanib can overcome the poor prognosis implied by other concurrent mutations.55 Quizartinib, even as monotherapy, has produced significant remissions in R/R, FLT3-mutated AML.56 A phase III trial, QuANTUM-R, evaluated quizartinib monotherapy versus investigator choice of treatment in R/R FLT3-ITD AML. The OS associated with quizartinib monotherapy was 6.2 months compared to 4.7 months for the other patients (HR=0.76; P=0.02).49 Long-term follow-up of the trial confirmed the results (HR for OS=0.776; P=0.324).57 Although positive, QuANTUM-R results were strongly criticized by the FDA, thus leading to the drug not being approved. This was due to the reported improved OS, which correlated with a median survival extended by only 6 weeks without a significant improvement in EFS. Furthermore, the dropout rate from the chemotherapy arm was much higher (23% vs. 11%) and more patients treated with quizartinib underwent HCT (32% vs. 11%), further confounding the results.58 The phase III trial, ADMIRAL, evaluated monotherapy with gilteritinib versus investigator choice of treatment in the same population: treatment with gilteritinib improved OS from 5.6 to 9.3 months (P<0.001), which led to its approval in the USA and Europe for treatment of this patient population.59
Currently, midostaurin remains the only approved TKI for treating previously untreated FLT3-mutated AML. Midostaurin versus gilteritinib in combination with induction and consolidation in newly diagnosed FLT3-mutated AML is being explored in the HOVON 156 AML trial (NCT04027309). The frontline use of quizartinib in combination with the “7+3” regimen is being investigated in the phase III, double-blind, placebo-controlled QuANTUMFirst trial (NCT02668653). Another phase III study is currently comparing crenolanib versus midostaurin when added to the “7+3” regimen in newly diagnosed FLT3-mutated AML (NCT03258931).60 The results of these two trials could change treatment guidelines for this challenging patient population. Quizartinib is also being evaluated in combination with CPX-351 (NCT04209725) and with CLIA (NCT04047641) in untreated and R/R FLT3-mutated AML. The addition of FLT3-TKI to low-intensity treatment was also studied in patients not eligible for chemotherapy. Sorafenib was added to azacitidine in a phase II trial, showing efficacy in patients with relapsed FLT3-ITD-positive AML.61 Sorafenib was studied in the frontline setting in another phase II trial in combination with azacitidine. Most of the patients were 60 years or older. The combination was both well tolerated and effective.62 Another FLT3 inhibitor, gilteritinib, was added to azacitidine and the combination compared to azacitidine monotherapy (NCT02752035) in the LACEWING phase III trial in the firstline setting.3 Midostaurin was assessed in combination
with azacitidine in newly diagnosed and R/R AML in a phase I/II trial.63 Quizartanib was combined with azacitidine or LDAC in untreated and R/R AML in a phase I/II trial.64 Except for the last trial which showed acceptable CR and OS rates, FLT3-TKI alone or in combination with HMA or LDAC did not markedly change the outcomes of patients with FLT3-mutated AML not eligible for intensive chemotherapy. This could be largely due to an escape mechanism through which leukemic cells develop resistance to treatment. One of the mechanisms of resistance is the upregulation of BCL-2 receptors.65 Based on this finding, several ongoing studies are assessing the use of doublet or triplet combinations of FLT3-TKI and venetoclax. In a phase I/II trial presented at the American Society of Hematology annual meeting in 2021, gilteritinib was combined with venetclax and azacitidine for the treatment of newly diagnosed or R/R FLT3-mutated AML. Two doses were studied and 80 mg was chosen for a phase II trial based on dose-limiting toxicities observed with the 120 mg dose. Even at the 80 mg dose, the triplet combination was associated with marked myelosuppression requiring dose adjustments of azacitidine and venetoclax.66 Nevertheless the efficacy of this triplet combination is promising, with a high CR rate of 100% and 67% in the frontline and R/R AML setting, respectively.
IDH-1/2 inhibitors. IDH-1 and IDH-2 are critical for the oxidative carboxylation of isocitrate. Mutations in these enzymes result in the accumulation of 2-hydroxyglutyrate, causing DNA and histone hypermethylation, cellular differentiation arrest, and tumorigenesis. Such mutations account for 15% of newly diagnosed AML.67 Oral inhibitors of mutant IDH-1 (ivosidenib) and IDH-2 (enasidenib) have been explored in the frontline and R/R settings. In the R/R setting, the FDA approved the two drugs as monotherapy for the corresponding mutation, given promising results of ivosidenib and enasidenib with overall response rates of 41.6% and 40.3%, and median OS of 8.8 and 9.3 months, respectively.4,68 In the frontline setting, both inhibitors were also approved by the FDA for the treatment of older patients ineligible for intensive chemotherapy.69,70 Stein et al. studied the addition of either IDH inhibitor to the “7+3” regimen in patients with de novo IDH-mutated AML. Sixty had mutant IDH-1 and received ivosidenib, among whom the response rate was 93% and 1-year OS 79%. Ninety-one had mutated IDH-2 and received enasidenib, among whom the overall response rate was 73% and OS 75%.71
Combinations of IDH inhibitors with the previously discussed HMA have been explored. Ivosidenib combined with azacitidine was studied as frontline therapy in 23 patients with IDH -mutated AML: the overall response rate was 78% and the CR rate was 70%, with a median time to response of 1.8 months. IDH -mutation clearance was seen in 63% of the patients achieving a CR. Out-
Haematologica | 108 February 2023 327 REVIEW ARTICLE R. Mohty et al.
comes surpassed those expected with azacitidine alone.72,73 The recently published phase III AGILE trial (NCT03173248) compared azacitidine-ivosidenib and azacitidine-placebo in patients with untreated IDH1-mutated AML, ineligible for intensive chemotherapy.74 At a median follow-up of 12.4 months, EFS was significantly better in the combination group (HR=0.33; P =0.002).74
The median OS was 24 months versus 7.9 months in the azacitidine-ivosidenib and azacitidine-placebo groups, respectively (HR=0.44; P =0.001).74 These results led to FDA approval of the azacitidine-ivosidenib combination in patients >75 years or unfit for intensive chemotherapy in May 2022. Similarly, enasidenib combined with azacitidine has been studied in a phase Ib/II study with recently published results. One hundred and one patients (median age of 75 years) were randomized 2:1 to receive azacitidine-enasidenib or azacitidine alone. The overall response rate improved significantly from 36% to 74% in the combination group (OR=4.9; P=0.0003), but the study failed to show any survival difference with the combination. 5 This finding could have been confounded by the subsequent use of salvage enasidenib in the azacitidineonly arm. A large, phase III trial is underway to investigate the impact of adding ivosidenib or enasidenib versus placebo to induction and maintenance therapy in IDH -mutated AML patients eligible for intensive chemotherapy (NCT03839771).
TP53-targeting agents. TP53 mutations occur in up to 20% of patients, are usually associated with complex/monosomal karyotype, and are more common in older patients with therapy-related AML.75 They invariably confer resistance to conventional therapeutic approaches in most patients harboring such mutations.76 Eprenetapopt (APR-246) is a novel agent that could restore activity to mutant p53, thus inducing apoptosis of cancer cells.77 A phase Ib/II study (NCT03072043) investigated the safety and efficacy of adding eprenetapopt to azacitidine in 55 patients with TP53-mutated AML/MDS, in whom the overall response rate and CR in AML patients were 64% and 36%, respectively.10 OS in responding patients improved significantly (14.6 vs. 7.5 months; P=0.0005), and adverse events were those expected with azacitidine or eprenetapopt alone (febrile neutropenia, leukopenia).10 This combination was explored independently by the Groupe Francophone des Myelodysplasies in a phase II study (NCT03588078) of 52 TP53-mutated patients, of whom 18 had AML; the overall response rate and CR rates were 33% and 17%, respectively.78 These two studies highlighted the potential safety and benefit of combining eprenetapopt with azacitidine compared to azacitidine alone. The outcomes of patients with TP53-mutated AML remain poor, and no regimen has improved OS in those patients, including decitabine (10 days)/venetoclax.79
Immunotherapy
Magrolimab (Hu5F9-G4). CD47 has been studied as another potential target for treating AML, specifically in patients who are unfit for high-intensity therapy. The upregulation of CD47 in AML allows tumor cells to evade destruction by macrophages, an effect independently associated with a poor prognosis.80 Hu5F9-G4 (magrolimab) is a monoclonal antibody that binds to CD47, leading to phagocytic elimination of tumor cells. The combination of magrolimab and azacitidine was evaluated in 34 patients with AML or intermediate-high risk MDS, in whom the overall response rate was 65% (CR, 40%).81 Interestingly, among patients with abnormal cytogenetics, 47% achieved a complete cytogenetic response. Among those with concurrently mutated TP53, the overall response rate was 71% (CR, 48%); these patients had a median OS of 12.9 months compared to 18.9 months in patients with TP53 wild-type AML.81 Thus, targeting CD47 without targeting mutated TP53 in this group resulted in favorable outcomes, paving the way for future trials involving the novel monoclonal antibody. There are currently two trials investigating the three-drug combination of magrolimab with venetoclax and azacitidine (NCT05079230 and NCT04435691). In addition, magrolimab-azacitidine is being compared to venetoclax-azacitidine versus intensive chemotherapy alone in previously untreated TP53mutated AML in a phase III trial (NCT04778397).
Impact of minimal residual disease on the outcomes of allogeneic hematopoietic cell transplantation
Evaluation of MRD before and after allo-HCT is of clinical interest with the aim of tailoring patients’ treatment prior to allo-HCT based on their individual risks and identifying and treating patients who are MRD-positive after transplantation before any clinical relapse. Patients who are MRD-positive by multiparametric flow cytometry at the time of allo-HCT were shown to have an increased risk of relapse and decreased leukemia-free survival and OS.82 In an analysis of EBMT registry data, the presence of detectable IDH1-2 mutations prior to transplantation significantly increased the risk of relapse.83 In the HOVON-SAKK-132 phase III trial, patients with AML received consolidation with allo-HCT based on an MRD-adapted approach. Patients received induction chemotherapy with or without lenalidomide.84 After two cycles of induction, patients were randomized, based on baseline risk and MRD status, to a third cycle of induction (favorable-risk cases), autologous stem cell transplantation (intermediate-risk and MRD-negative cases), or allo-HCT (intermediate-risk and MRD-positive or unknown, or high-risk cases). The out-
Haematologica | 108 February 2023 330 REVIEW ARTICLE R. Mohty et al.
come of patients with intermediate-risk disease was similar for patients with MRD-negative or positive disease (4 -year RFS: 50% in MRD-positive cases vs. 52% in MRD-negative cases, HR=1.18, P=059; 4-year OS: 64% in MRD-positive cases vs. 69% in MRD-negative cases, HR=1.31, P=0.46).84 These results indicate that MRD-directed therapy could help to avoid allo-HCT in patients with intermediate-risk AML who are MRD negative prior to transplantation. However, patients stratified into the intermediate-risk group harbor diverse mutations and assessment of the role of MRD on the decision to perform allo-HCT should be studied in those different subgroups. A particular question that should be addressed is the impact of addition of targeted agents to induction treatment and the impact of MRD on the decision to perform allo-HCT, specifically in the era of maintenance therapy. In the post-allo-HCT setting, Shah et al. found that detection of MRD by multiparametric flow cytometry early after allo-HCT predicted relapse (within 2 months) and led to better risk-stratification of patients with AML after transplantation.85 This highlights the need for preventive measures to avoid relapses, discussed later in this review. In summary, MRD-directed therapy could be potentially used for treatment guidance for patients with AML; however, its impact on transplant decisions has not yet been established, especially in patients with intermediate-risk AML who become MRD-negative after transplantation. Similarly, post-allo-HCT MRD should be used to direct maintenance therapy.
Novel approaches in allogeneic hematopoietic cell transplantation for acute myeloid leukemia
While numerous novel therapies are emerging, allo-HCT remains the standard of care for patients with ELN 2017 intermediate- and adverse-risk disease in first CR.46 Based on the results of the BMT CTN 0901 randomized phase III trial, there is clear evidence that myeloablative conditioning (MAC) improves OS in patients with AML or MDS undergoing allo-HCT compared to RIC (HR=1.54; 95% CI: 1.07-2.2; P=0.03).86 Although RIC increases the risk of relapse, it is associated with reduced toxicity, leading to lower treatment-related mortality compared to MAC (9.9% vs. 25.1%; P<0.01), broadening the use of allo-HCT in the older population.86,87 However, the optimal conditioning therapy would be a regimen that carries lower risk of toxicity and treatment-related mortality but retains cytoreductive properties and, ideally, does not affect outcomes, a regimen that was recently described as “reduced toxicity conditioning”.88
Another unmet need is transplantation for refractory leukemia. Sequential approaches are conditioning plat-
forms developed for patients with refractory or active AML. These regimens have two phases of therapy; induction chemotherapy that targets refractory leukemia followed by RIC, relying mainly on the graft-versus-leukemia (GvL) effect. FLAMSA (fludarabine, cytarabine, and amsacrine, followed by 4 Gy of total body irradiation, cyclophosphamide, and an anti-thymocyte globulin) was the first “sequential regimen” developed. More recently FLAMSAlike combinations have emerged.89 Other conditioning regimens recently developed for allo-HCT of active or refractory AML include targeted radiation therapy using antiCD45 monoclonal antibody (Table 2 and Table 3).90 Novel therapies for use in AML during and after allo-HCT are secribed below. Those for which results have been published are summarized in Table 2. Table 3 lists ongoing trials involving novel therapies for AML before, during and after allo-HCT.
Treosulfan-based conditioning regimens
Busulfan is an alkylating agent with an erratic gastrointestinal absorption needing multiple daily oral or targeted intravenous dosing. 91 It is associated with toxicity, mainly veno-occlusive disease and idiopathic pulmonary syndrome. 92 Treosulfan is a bifunctional alkylating prodrug with myeloablative properties and a reduced nonhematologic toxicity profile. It is administered intravenously, but drug levels do not need to be monitored because it does not have dose-limiting organ toxicity. 93 In a dose-finding study, treosulfan was evaluated in combination with fludarabine in patients with hematologic malignancies undergoing allo-HCT. There was no dose-limiting toxicity, and the final dose chosen for further studies was 14 g/m 2 x3. 93 Another phase II open-label, non-randomized trial (AlloTreo) evaluated the safety and efficacy of treosulfan (42 g/m 2) with fludarabine in patients with hematologic malignancies undergoing first allo-HCT. Anti-thymocyte globulin was added to the conditioning regimen in patients undergoing unrelated donor transplants. After 12 years of follow-up, OS and PFS were 41.7% and 31.7%, respectively. The cumulative incidence of relapse was high at 44.5%. This could be explained by the higher disease risk of patients included in the study. 94 To confirm these findings, a phase III, open-label, non-inferiority trial (MCFludT.14/L) was conducted comparing treosulfan/fludarabine (FT10) to RIC fludarabine/busulfan in patients ≥50 years or with comorbidities. Treosulfan was given at a dose of 10 mg/m 2 for 3 days. The study included 476 patients with AML or MDS. The median follow-up was 15.4 and 17.4 months for treosulfan- and busulfan-based conditioning, respectively. The 2-year EFS was higher in the treosulfan arm (64%) than in the busulfan arm (50.4%) ( P <0.0001). Both drugs had similar hematologic toxicity rates (15%); however, treosulfan was associated
Haematologica | 108 February 2023 331 REVIEW ARTICLE R. Mohty et al.
with a lower risk of gastrointestinal toxicity (11% vs. 16%). This trial has shown that treosulfan is non-inferior to busulfan in older patients or those with comorbidities. Based on this study, treosulfan was approved by the EMA at a dose of 30 mg/m2 for malignant diseases.95 A subgroup analysis of patients with AML was presented at the Tandem ASTCT and CIBMTR meetings in 2022: EFS, OS, and graft-versus-host disease (GvHD)-free, relapse/progression-free survival were significantly higher in the treosulfan group (64.7% vs. 53.3%, P=0.01; 72.8% vs. 64.7% P=0.03; and 52.9% vs. 39.6%, P=0.02, respectively).96 These
results support the use of treosulfan rather than busulfan in patients not eligible for standard MAC.
Addition of targeted therapy to standard conditioning regimens
BCL-2 inhibitors
As mentioned earlier, the use of venetoclax has improved the outcomes of patients with AML in the frontline and R/R settings.6 A phase I dose-escalation study assessed the addition of venetoclax to RIC fludarabine/busulfan in adult patients with AML or MDS undergoing allo-HCT.97 Pa-
Table 3. Ongoing trials involving novel therapies in acute myeloid leukemia before, during, and after allogeneic stem cell transplantation.
Study Description Intervention
Population Induction
NCT05024552 Phase I CPX-351 + Gilteritinib
R/R, FLT3-mutated AML
Frontline cohort: >60 years, previously untreated AML/MDS; R/R cohort: >18 years NCT03904251 Phase I CPX-351 + Gemtuzumab Relapsed AML NCT03878927 Phase I CPX-351 + Gemtuzumab >55 years with AML NCT04425655 Phase II CPX-351 + Fludarabine
NCT04128748 Phase Ib/IIa CPX-351 + Quizartinib
Intermediate- or poor-risk AML NCT04038437 Phase I CPX-351 + Venetoclax
Newly diagnosed AML NCT03844997 Phase Ib/IIa CPX-351 + Palbociclib Newly diagnosed AML NCT04231851 Phase II CPX-351 + Glasdegib
Previously untreated therapy-related AML NCT02668653 Phase III "7+3" + Quizartinib vs. "7+3" + Placebo
Newly diagnosed AML NCT03258931 Phase III Crenolanib vs. Midostaurin
Newly diagnosed FLT3-mutated AML NCT03839771 Phase III Ivosidenib/enasidenib vs. Placebo
Newly diagnosed IDH-1/2 mutated AML NCT04435691 Phase Ib/IIa Magrolimab/azacitidine/venetoclax R/R AML, not eligible for salvage chemotherapy or HCT NCT05079230 Phase III Magrolimab/azacitidine/venetoclax vs Placebo/azacitidine/venetoclax
Newly diagnosed AML, ineligible for standard "7+3" NCT04778397 Phase III Magrolimab/azacitidine vs venetoclax/azacitidine
Newly diagnosed, TP53-mutated AML
Conditioning regimen
NCT04195633 Phase II Treosulfan + Fludarabine + TBI
Adult patients with hematologic malignancies NCT03613532 Phase I Venetoclax + Fludarabine + Busulfan Patients with AML/MDS NCT03247088 Phase I/II Sorafenib + Busulfan + Fludarabine R/R AML
NCT02250937 Phase II Venetoclax + Sequential Busulfan + Fludarabine + Cladribine
Patients with AML/MDS
Patients with AML or MDS NCT05139004 Phase I 90Y-DOTA-anti-CD25, basiliximab Patients with high-risk AML/MDS Post-allo-HCT maintenance
NCT04429191 Phase I Anti-CD117, JSP191
NCT03613532 Phase I Venetoclax + Azacitidine Patients with AML/MDS
NCT02997202 BMT-CTN 1506 phase III Gilteritinib vs. Placebo
NCT03564821 Phase I Ivosidenib
NCT03515512 Phase I Enasidenib
NCT03728335 Phase I Enasidenib
NCT04522895 Phase II Enasidenib
NCT04326764 ETAL-4 / HOVON-145 phase III
FLT3-ITD-mutated AML
IDH1-mutant myeloid neoplasms
IDH2-mutant myeloid neoplasms
IDH2-mutant myeloid neoplasms
IDH2-mutated MDS, CMML and AML
Panobinostat vs. SOC High-risk AML or MDS
R/R: relapsed and refractory; AML: acute myelogenous leukemia; MDS: myelodysplastic syndrome; HCT: hematopoietic stem cell transplantation; TBI: total body irradiation; SOC: standard of care; CMML: chronic myelomonocytic leukemia.
Haematologica | 108 February 2023 332 REVIEW ARTICLE R. Mohty et al.
tients received venetoclax at a dose of 200-400 mg starting on day -8 for 6-7 days. A total of 22 patients were included. Acute GvHD was observed in 12/22 patients, with one patient having grade III acute GvHD. The median time to neutrophil engraftment was 15 days, similar to that observed with RIC fludarabine/busulfan. No dose-limiting toxicity was reported; hence, the dose of 400 mg was chosen for the phase II trial.97 A phase II trial assessed the addition of venetoclax to myeloablative fractionated busulfan, fludarabine, and cladribine conditioning in patients with AML or MDS. The authors hypothesized that adding venetoclax might be synergistic with chemotherapy. The study included 33 patients (AML, n=21; MDS, n=10) up to 70 years of age. Venetoclax was administered at a daily dose of 400 mg from day -22 to -3 without azoles. The 1year OS, PFS, relapse, and NRM rates were 84%, 77%, 13%, and 10%, respectively. The median time to neutrophil and platelet engraftment was 15 and 23 days, respectively. The most common grade ≥3 adverse events were febrile neutropenia (58%), mucositis (18%), and pulmonary toxicity (21%). The day 100 grade II-IV acute GvHD rate was low at 3%.98 These results showed that adding venetoclax to the conditioning regimen was safe, did not affect engraftment, and had promising early outcome results.
FLT3-inhibitors
Another targeted agent added to a conditioning regimen was a first-generation FLT3-TKI, investigated in a phase I study presented at the Tandem meetings in 2022, in which sorafenib was added to MAC fractionated busulfan/fludarabine. 99 Twenty-four patients with AML were included. Sorafenib was added from day -24 to -5 at different dose levels (200, 400, 600, and 800 mg). The dose of 800 mg was recommended for the phase II study. The 1-year OS and PFS rates for all patients were 86% and 89%, respectively. The grade II-IV and grade III-IV acute GvHD rates at day 100 were 54% and 5%, respectively. These results show that sorafenib can be safely added to the fractionated busulfan regimen, although longer follow-up and larger studies are needed for a more complete evaluation.
Anti-CD117 monoclonal antibody
An anti-CD117 (c-KIT) monoclonal antibody, JSP191 was added to non-MAC consisting of low-dose total body irradiation and fludarabine. JSP191 depletes both hematopoietic stem cells and leukemic cells and synergizes with total body irradiation and fludarabine facilitating engraftment.100 The phase I study reporting the outcomes of 17 patients was presented at the Tandem meetings in 2022. The combination was safe without any infusion or serious adverse effects observed. Neutrophil engraftment occurred between day 19 and day 26. Only one grade 2-4 side effect was observed. Donor chimerism was evaluated
in 14 patients at day 90; all of them had full myeloid donor chimerism. High rates of MRD clearance were observed in 15/17 subjects who were MRD-positive at the time of transplantation. These results are promising especially with the use of non-myeloablative allo-HCT. The study is ongoing and final results are awaited (NCT04429191).
Sequential approach in relapsed/refractory patients and those transplanted in active disease Given the low response rates and short survival of patients with refractory leukemia, allo-HCT remains the only option of cure. However, MAC is associated with a high treatment-related mortality of around 40% and RIC, although it decreases treatment-related mortality, is insufficient to control refractory leukemia alone through the GvL effect.89,101 A sequential approach was developed through the addition of a short course of intensive chemotherapy prior to RIC with the aim of reducing the disease burden and enhancing the GvL effect. The first sequential regimen developed was the FLAMSA regimen which was associated with high toxicity mainly related to amsacrine and total body irradiation. Another sequential regimen published by Duléry et al. was the TEC-RIC regimen (thiotepa, etoposide, cyclophosphamide followed by RIC of fludarabine, busulfan, and anti-thymocyte globulin). Sixty-one percent of the patients had AML. Results were promising, with 2year OS and EFS rates of 54.7% and 49.3%, 49.2% and 43.8%, 37.9%, and 28%, in haploidentical, related, and unrelated donor transplants, respectively. Mucositis and gut toxicities were the most common toxicities observed.89 These results indicated the safety and efficacy of the TECRIC sequential approach in allo-HCT for active or refractory AML.
Targeted radiation therapy with an anti-CD45 monoclonal antibody (Iomab-B)
Many patients with active R/R AML are not fit for intensive chemotherapy or MAC, making them ineligible for sequential approaches. The SIERRA trial (Study for Iomab-B in Elderly Relapsed or Refractory AML) investigated using Iomab-B, a 131I-labeled anti-CD45 monoclonal antibody, as conditioning prior to allo-HCT.90,102 Patients were randomized to receive Iomab-B followed by fludarabine and lowdose total body irradiation, or conventional care. The median age of the participants was 65 years. The rate of allo-HCT was higher in the Iomab-B arm (90%) than in the conventional care arm (17%). Patients who did not achieve CR in the conventional care arm could cross over to the Iomab-B arm. Median times of neutrophil and platelet engraftment were 14 and 18 days, respectively. Patients enrolled in the Iomab-B arm had a signifi cantly lower incidence of grade ≥3 side effects compared to those in the conventional care arm (5% vs. 30%; P<0.05), with these side effects being mainly sepsis and mucositis. These data
Haematologica | 108 February 2023 333 REVIEW ARTICLE R. Mohty et al.
show that the Iomab-B-based conditioning regimen is safe and associated with acceptable engraftment kinetics.90,102
Novel maintenance approaches to mitigate relapse after allogeneic hematopoietic
cell transplantation
The outcomes of younger patients with R/R AML have improved over the years, likely due to advances in therapeutic regimens. In an EBMT registry analysis, Bazarbachi et al. showed a significant improvement in OS of younger patients with AML relapsing after allo-HCT in more recent years of transplant (2000-2004; HR=0.82; P<0.02 for 20102014 and HR=0.72; P=0.0002 for 2015-2018).103 Despite these advances in the treatment of AML and the potential curative approach with allo-HCT in intermediate- and adverserisk disease, relapse is inevitable in many patients, and they have a dismal prognosis.104 Post-transplant salvage therapy in AML is an area of unmet need. In relapsed patients, treatments are limited and include palliative care, low-dose or high-intensity treatments, donor lymphocyte infusion, and a second allo-HCT in selected cases. Nevertheless, many patients do not tolerate high-dose therapies, hence the need for novel approaches to prevent or treat relapse. Maintenance strategies have been studied recently in many trials aiming to prevent relapse. The main purpose of posttransplant maintenance is not only to induce a direct antileukemic effect through the elimination of any residual leukemia not detected by current laboratory techniques but also to stimulate the GvL effect, ideally without increasing the risk of GvHD.105 Maintenance therapy can also act as a bridge to mount a GvL effect. Several drugs have been assessed in the post-transplant setting, including a HMA alone or in combination with a BCL-2 inhibitor or granulocyte colony-stimulating factor, FLT3 inhibitors, IDH1/2 inhibitors, and there are early data on histone deacetylase (HDAC) inhibitors; many of these have shown efficacy in the frontline or relapsed setting.
Hypomethylating agent therapy alone or in combination
The HMA azacitidine and decitabine are the most studied drugs in the post-transplant maintenance setting, mainly because of their acceptable safety profile. Data from preclinical animal models have shown that azacitidine, in addition to its direct anti-leukemic effect, can upregulate tumor antigens on leukemic cells, activate CD8+ tumorspecific T cells, and induce regulatory T-cell activity. This in turn increases the GvL effect without a concomitant increase in GvHD.106 Following these findings, several trials were conducted to investigate the role of these agents as maintenance therapy after allo-HCT.107 While many studies
support the consideration of a maintenance strategy, some did not demonstrate any benefit.108
In a dose-finding phase I trial, the use of azacitidine monotherapy for maintenance was assessed, starting on day +42 after transplantation. Different dose levels were used. The recommended dose for later studies was 32 mg/m2/day for 5 days in a 30-day cycle. Higher doses were associated with thrombocytopenia. After 12 months of follow-up, the median disease-free survival was 58%, and the 1-year OS was 77%.109 In another phase I/II trial, azacitidine was administered at a dose of 36 mg/m2/day for 5 days in a 28day cycle leading to an increased GvL effect through induction of circulating regulatory T cells without an increase in GvHD.106 In a case series including 18 patients with AML or MDS who were FLT3-negative and in remission following allo-HCT, post-transplant azacitidine maintenance was assessed after starting at a median of 60 days after transplantation. Patients received low-dose azacitidine 32 mg/m2/day for 5 days in a 28-day cycle for up to 5 years.110 A phase III trial comparing azacitidine monotherapy maintenance after allo-HCT at a dose of 32 mg/m2/day for 5 days in a 28-day cycle to no intervention did not show benefit of azacitidine maintenance. Azacitidine was administered for up to 12 cycles (median, 4; range, 1-12). The study included 87 patients with AML, MDS, or chronic myelomonocytic leukemia. After a median follow-up of 4.6 years, azacitidine maintenance did not improve RFS. In a subgroup analysis, patients who received nine or more cycles had an increase in RFS, albeit not statistically significant.111 Despite the negative azacitidine maintenance phase III trial, the use of maintenance therapy should not be abandoned for several reasons. First, the trial involved patients with high-risk disease, including those with FLT3 mutations. Studies have shown that patients with FLT3-mutated AML benefit from the addition of FLT3 inhibitors as maintenance therapy, as discussed later in this review.112 The inclusion of this population could have affected the result of the trial. Second, the study had some selection bias as it excluded patients who received azacitidine for MRD-positive disease. This strategy is denoted as pre-emptive rather than maintenance; those patients might have needed higher doses of azacitidine in addition to other treatment approaches. Oral azacitidine (CC-486) maintenance improved OS and RFS in older patients with AML in remission after induction therapy in the QUAZAR-AML-001 trial.113 Based on these results, CC-486 was studied as maintenance therapy in patients in CR after allo-HCT. In a phase I/II trial, CC-486 was given to seven patients at a dose of 200-300 mg for 7 days and to 23 patients at a dose of 150-200 mg for 14 days in up to 12 cycles of 28 days. The 1-year RFS was 54% and 72%, respectively. CC-486 was tolerated, with gastrointestinal and hematologic toxicities being the most common grade 3-4 adverse events. Only two patients developed chronic GvHD.114 The AMADEUS phase III trial (NCT04173533)
Haematologica | 108 February 2023 334 REVIEW ARTICLE R. Mohty et al.
is ongoing and will address concerns regarding dosing, treatment schedule, and therapy duration using maintenance oral azacitidine (CC-486) compared to placebo for AML and MDS in CR after allo-HCT. Decitabine was also studied for maintenance therapy after allo-HCT. A small dose-finding study assessed the use of low-dose decitabine maintenance therapy after allo-HCT for patients with AML or MDS in CR. Decitabine was given at a dose of 5, 7.5, 10, or 15 mg/m2/day for 5 days in a 6week cycle starting between day +50 and day +100. The maximum tolerated dose was not reached but 10 mg/m2 was chosen because of hematologic toxicities with the 15 mg/m2 dose.115 Results showed a high 2-year OS of 56% and a low cumulative incidence of relapse of 28%. This study indicated that decitabine is safe after allo-HCT and could potentially be used as maintenance therapy. A phase II, open-label, multicenter, randomized controlled trial explored the use of decitabine for maintenance in 204 patients with high-risk AML in CR who were MRD negative after allo-HCT. Patients were randomized, between days 60 and 100 after allo-HCT, to receive recombinant human GCSF in combination for 6 days with low-dose decitabine for 5 days (G-DEC) or no intervention. The cumulative incidence of relapse was lower in the G-DEC group at 15% compared to 38% in the no-intervention group (HR=0.92; 95% CI: 0.18-0.57; P<0.1). There was no statistically significant difference in the incidence of chronic GvHD (G-DEC 23% vs. no-intervention 21.7%; P=0.81).116 Immune cell subtype monitoring revealed a significant increase in CD8+ and regulatory T cells and NK cells by the second or third cycle in the G-DEC group (P<0.5). The latter results are encouraging and demonstrate a potential benefit of maintenance therapy. Nevertheless, more randomized trials are needed to identify the population of patients who would benefit from maintenance therapy, find the best combination, and standardize the dose and schedule of treatment.117
BCL-2 inhibitors
BCL-2 inhibitors, mainly venetoclax, showed promising results in the treatment of AML. Hence, venotoclax was studied in the post-transplant setting. In a cohort study, 23 patients with high-risk AML/MDS in remission after alloHCT received venetoclax (400 mg daily) for 1 year.118 Venetoclax was withheld or its dose was reduced in 11 of the 23 patients. The most common adverse events were cytopenia (7/23) and diarrhea (7/23). Six-month OS and RFS rates were both 87%. This was a small cohort study showing the safety of venetoclax after transplantation. However, doses of venetoclax had to be withheld or reduced in many patients, perhaps because of the continuous daily dosing of the drug rather than administration on fixed days per cycle, allowing cell count recovery. An ongoing phase I trial is currently assessing adding venetoclax to fludarabine/busulfan
conditioning and azacitidine maintenance after allo-HCT in patients with AML/MDS (NCT03613532).
The venetoclax and low-dose decitabine combination was assessed in a prospective study to prevent relapse in highrisk patients with AML or MDS.119 Decitabine was given at a dose of 15 mg/m2 for 3 days and venetoclax at a dose of 200 mg daily for 21 days starting day +100 after transplantation. Twenty patients were included. No grade ≥3 adverse events were observed. The 2-year OS and EFS were 85.2% and 84.7%, respectively. The 100-day acute and chronic GvHD rates were 55% and 20%, respectively. Furthermore, treatment of GvHD did not affect maintenance therapy.119 These studies show that the addition of venetoclax to an HMA to prevent relapse is feasible and safe. Randomized trials should be conducted to confirm these findings, establish the best treatment schedule, and identify patients who would benefit from a combination maintenance approach.
FLT3 inhibitors
FLT3 inhibitors have improved the outcomes of patients with FLT3-mutated AML when added to frontline chemotherapy, as shown in the RATIFY trial, making them a reasonable option to consider for maintenance after allo-HCT.2 In 2015, Antar et al. reported the efficacy and safety of sorafenib maintenance in five patients with FLT3-ITD-mutated AML in remission after allo-HCT.120 These results were reproduced in another multicenter retrospective study showing high 2-year PFS and OS rates (73% and 80%).121,122 In an analysis of the EBMT registry, sorafenib post-transplant maintenance was safe and OS was significantly improved compared to no-sorafenib in 28 patients with FLT3-mutated AML receiving allo-HCT with in vivo T-cell depletion (2-year OS: 82.8% vs. 61.5%; P=0.007).123 Two phase II trials assessed the use of FLT3-inhibitors as maintenance therapy for FLT3-mutated AML after allo-HCT. The SORMAIN phase II trial randomized patients with FLT3-ITD-mutated AML to receive sorafenib for 2 years versus placebo. A total of 84 patients were included.112 The 24-month probability of RFS was significantly higher in patients who received sorafenib (85%) than that in the placebo group (53.3%) with a 74% reduction in relapse or death (HR=0.256, 95% CI: 0.100.65; P=0.002). The estimated 24-month OS was higher in the sorafenib group (90.5%) than in the placebo arm (66.2%) (HR=0.241, 95% CI; 0.08-0.74; log-rank P=0.007). At a median follow-up of 55.1 months, median OS had not been reached in either arm (HR=0.52, 95% CI: 0.24-1.11; P=0.086). Results were seen across patients with or without FLT3-ITD mutations, suggesting an off-target effect of sorafenib in AML. The RADIUS phase II trial assessed the use of midostaurin compared to placebo in 60 patients. The study showed no difference in outcomes, but it was not powered to detect such differences.124 Most patients in both trials did not receive FLT3 inhibitors prior to transplantation.
Haematologica | 108 February 2023 335 REVIEW ARTICLE R. Mohty et al.
In a large, open-label, randomized, phase III trial, 202 patients with FLT3-ITD-mutated AML were randomized to receive sorafenib or placebo as maintenance therapy after allo-HCT.125 The median time to starting sorafenib was 30 days after allo-HCT. At a median follow-up of 22.3 months, the cumulative incidence of relapse was significantly better in the sorafenib arm than in the placebo arm (HR=0.25, 95% CI: 0.11-0.57; P=0.0010). The 2-year leukemia-free survival and OS rates were significantly higher in the sorafenib arm than in the placebo arm: 78.9% versus 56.6% (HR=0.37, 95% CI: 0.22-0.63; P<0.0001) and 82.1% versus 68% (HR=0.48, 95% CI: 0.27-0.86; P=0.012), respectively. These studies establish the utility of sorafenib as maintenance therapy for FLT3-ITD-mutated AML after allo-HCT. These findings led to the publication of a position statement of the EBMT including worldwide experts endorsing the use of sorafenib as post-allo-HCT maintenance.126 Other more selective FLT3 inhibitors are being evaluated in this setting. The BMT-CTN 1506 phase III trial is ongoing and will address the safety and efficacy of gilteritinib compared to placebo for FLT3-ITD-mutated AML as maintenance after allo-HCT (NCT02997202).127
IDH1/2 inhibitors
As mentioned earlier, IDH1/2 inhibitors have proved efficacious as monotherapy or combined with HMA or induction chemotherapy in the frontline and relapsed setting.4,68 Patients with IDH-mutated AML undergoing allo-HCT with MRD-positive disease have a higher risk of relapse.83 Given the favorable safety profile of ivosidenib and enasidenib, these agents would be suitable for post-transplant maintenance. Several studies are currently evaluating the safety and efficacy of IDH1/2 inhibitors for IDH-mutated AML after allo-HCT (NCT03564821, NCT03515512, NCT03728335, NCT04522895).
Eprenetapopt for TP53-mutated acute myeloid leukemia
Allo-HCT is the only curative therapy for patients with TP53-mutated AML. However, despite allo-HCT, their outcomes remain very poor. Eprenetapopt, as described above, is a first-in-class clinical-stage molecule reactivating mutant p53.77
In a phase II, single-arm, open-label trial, presented at the Tandem meetings in 2022, eprenetapopt was given at a dose of 3.7 g/day for 4 days in combination with azacitidine at a dose of 36 mg/m2/day for 5 days.128 Thirty-three adult patients with TP53-mutated AML (n=14) or MDS (n=19) were included. Ten out of 14 patients with AML had detectable TP53 at the time of their transplant. Grade 3-4 adverse events were mainly hematologic. The 1-year RFS was 58%. With a median follow-up of 429 days, the median OS was 586 days, and the 1-year OS was 79%. No apparent treatment-related increase in GvHD was observed. Acute and chronic GvHD were documented in four and ten patients,
respectively. These results show that eprenetapopt maintenance after allo-HCT is safe and certainly promising and its use should be studied further in a large, randomized, phase III trial.
Histone deacetylase inhibitors
HDAC inhibitors are epigenetic modifiers that have direct anti-leukemic and immunomodulatory activity. Additionally, they can modulate regulatory T-cell activity.129 Panobinostat is an oral pan-HDAC inhibitor that has a much higher affinity to class I than to class II HDAC. At a low dose, it saturates class I receptors leading to decreased regulatory T-cell inhibitory function. At higher doses, it saturates class I receptors and attaches to class II receptors which become dominant. This leads to increased regulatory T-cell activity. These properties make it a theoretically suitable drug for post-allo-HCT maintenance.129 The phase I/II PANOBEST trial assessed the feasibility of panobinostat in patients with high-risk AML or MDS in CR after allo-HCT. Patients were treated on a weekly or every other week schedule. Dose-limiting toxicities were reached at 20 mg and 30 mg in the weekly and every other week schedules, respectively. In the phase II part of the trial, patients were randomized to one or other of the schedules using the dose-limiting toxicity identified. The median time of starting panobinostat was 96 days. The main grade 3-4 adverse event was thrombocytopenia (weekly schedule: 28%, every other week: 19%). The cumulative incidence of chronic GvHD at 2 years was 29% and did not differ between the two schedules.130 The 2-year OS and RFS were 81% and 75%, respectively. The findings of this trial are promising, and results are being confirmed in the large phase III ETAL-4/HOVON-145 trial (NCT04326764).
Immunotherapy
Other agents are being investigated with the aim of preventing relapse after allo-HCT. Monalizumab, an IgG4 monoclonal antibody, is an NKG2A checkpoint inhibitor. It improves the NK cell-mediated GvL effect without increasing the risk of GvHD.131 In a phase I dose-finding study presented at the American Society of Hematology meeting in 2021, monalizumab was given at a median time of 83 days after allo-HCT to 15 patients with a hematologic malignancy, including nine with AML and three with MDS. No dose-limiting toxicities were observed, justifying the use of the 1 mg/kg dose. No disease recurrence was observed in patients with AML. Future studies should aim at assessing the efficacy of monalizumab in the clinical setting.132
Conclusions and perspective
Targeted therapy has revolutionized the treatment of AML and improved outcomes. However, in the frontline setting
Haematologica | 108 February 2023 336 REVIEW ARTICLE R. Mohty et al.
standard induction chemotherapy for fit patients and lowintensity treatment (HMA, LDAC) for unfit patients remain the backbone to which targeted therapies are added. Venetoclax is used in the frontline and in the relapsed setting in combination with chemotherapy or HMA owing to its synergistic effect, broadening treatment options, particularly for patients without identified targetable mutations. With the advent of next-generation sequencing, several mutations have been discovered; and future studies should aim at deciphering their role in the pathogenesis of AML. There is also an unmet need to develop novel approaches to target or bypass these mutations. Up to now, allo-HCT has been the mainstay treatment for patients with intermediate- and adverse-risk AML in remission after frontline therapy. We believe that future work should focus on assessing the role of allo-HCT in the era of novel therapies, particularly in the intermediate risk group. With the introduction of next-generation sequencing, the prognostic value of MRD before and after allo-HCT needs to be evaluated. Early studies show worse outcomes after allo-HCT in patients with persistent MRD detectable by next-generation sequencing.83,133 Conditioning regimens have not changed markedly over the last few years despite the emergence of new conventional chemotherapies with anti-leukemia activity. Adding targeted therapies to conventional conditioning regimens (MAC or RIC), is being studied but long-term follow-up is still needed to better
References
1. Lancet JE, Cortes JE, Hogge DE, et al. Phase 2 trial of CPX-351, a fixed 5:1 molar ratio of cytarabine/daunorubicin, vs cytarabine/daunorubicin in older adults with untreated AML. Blood. 2014;123(21):3239-3246.
2. Stone RM, Mandrekar SJ, Sanford BL, et al. Midostaurin plus chemotherapy for acute myeloid leukemia with a FLT3 mutation. N Engl J Med. 2017;377(5):454-464.
3. Wang ES, Montesinos P, Minden MD, et al. Phase 3, open-label, randomized study of gilteritinib and azacitidine vs azacitidine for newly diagnosed FLT3-mutated acute myeloid leukemia in patients ineligible for intensive induction chemotherapy. Blood. 2021;138(Suppl 1):700.
4. DiNardo CD. Ivosidenib in IDH1-mutated acute myeloid leukemia. N Engl J Med. 2018;379(12):1186.
5. DiNardo CD, Schuh AC, Stein EM, et al. Enasidenib plus azacitidine versus azacitidine alone in patients with newly diagnosed, mutant-IDH2 acute myeloid leukaemia (AG221-AML005): a single-arm, phase 1b and randomised, phase 2 trial. Lancet Oncol. 2021;22(11):1597-1608.
6. DiNardo CD, Jonas BA, Pullarkat V, et al. Azacitidine and venetoclax in previously untreated acute myeloid leukemia. N Engl J Med. 2020;383(7):617-629.
7. Wei AH, Montesinos P, Ivanov V, et al. Venetoclax plus LDAC for newly diagnosed AML ineligible for intensive chemotherapy: a phase 3 randomized placebo-controlled trial. Blood. 2020;135(24):2137-2145.
8. Cortes JE, Heidel FH, Hellmann A, et al. Randomized
understand the effect of the combinations on engraftment as well as early and late post-transplant complications and GvHD. Allo-HCT alone has proven to provide long-lasting remissions, although relapses still occur in many patients. Prospective studies should aim to identify patients in need of therapies, whether as maintenance or post-transplant consolidation, to prevent relapse. As with FLT3-mutated AML, in which sorafenib is an established, effective maintenance strategy,126 studies should focus on assessing the role of post-allo-HCT maintenance in other groups of AML. Furthemore, the optimal duration of post-allo-HCT maintenance therapy is not well established, with most studies using an arbitrary duration of 1 to 2 years. However, in the real-life setting, the decision to discontinue maintenance in patients tolerating such therapies is certainly challenging. Accordingly, studies are needed to help to define the optimal maintenance regimen and identify patients who are most likely to benefit.
Disclosures
No conflicts of interest to disclose.
Contributions
RM designed and wrote the manuscript. RAH wrote the manuscript. EB, AB, and MM supervised the work and helped to write the manuscript. All authors reviewed and agreed on the final version of the manuscript.
comparison of low dose cytarabine with or without glasdegib in patients with newly diagnosed acute myeloid leukemia or highrisk myelodysplastic syndrome. Leukemia. 2019;33(2):379-389.
9. Lambert J, Pautas C, Terre C, et al. Gemtuzumab ozogamicin for de novo acute myeloid leukemia: final efficacy and safety updates from the open-label, phase III ALFA-0701 trial. Haematologica. 2019;104(1):113-119.
10. Sallman DA, DeZern AE, Garcia-Manero G, et al. Eprenetapopt (APR-246) and azacitidine in TP53-mutant myelodysplastic syndromes. J Clin Oncol. 2021;39(14):1584-1594.
11. Daver NG, Vyas P, Kambhampati S, et al. Tolerability and efficacy of the first-in-class anti-CD47 antibody magrolimab combined with azacitidine in frontline TP53m AML patients: phase 1b results. J Clin Oncol. 2022;40(16_suppl):7020.
12. Stein EM, Aldoss I, DiPersio JF, et al. Safety and efficacy of menin inhibition in patients (Pts) with MLL-rearranged and NPM1 mutant acute leukemia: a phase (Ph) 1, first-in-human study of SNDX-5613 (AUGMENT 101). Blood. 2021;138(Suppl 1):699.
13. Rai KR, Holland JF, Glidewell OJ, et al. Treatment of acute myelocytic leukemia: a study by Cancer and Leukemia Group B. Blood. 1981;58(6):1203-1212.
14. Estey EH. Acute myeloid leukemia: 2014 update on riskstratification and management. Am J Hematol. 2014;89(11):1063-1081.
15. Lowenberg B. Sense and nonsense of high-dose cytarabine for acute myeloid leukemia. Blood. 2013;121(1):26-28.
Haematologica | 108 February 2023 337 REVIEW ARTICLE R. Mohty et al.
16. Willemze R, Suciu S, Meloni G, et al. High-dose cytarabine in induction treatment improves the outcome of adult patients younger than age 46 years with acute myeloid leukemia: results of the EORTC-GIMEMA AML-12 trial. J Clin Oncol. 2014;32(3):219-228.
17. Gong Q, Zhou L, Xu S, Li X, Zou Y, Chen J. High doses of daunorubicin during induction therapy of newly diagnosed acute myeloid leukemia: a systematic review and meta-analysis of prospective clinical trials. PLoS One. 2015;10(5):e0125612.
18. Li X, Xu S, Tan Y, Chen J. The effects of idarubicin versus other anthracyclines for induction therapy of patients with newly diagnosed leukaemia. Cochrane Database Syst Rev. 2015;(6):CD010432.
19. Burnett AK, Russell NH, Hills RK, et al. Optimization of chemotherapy for younger patients with acute myeloid leukemia: results of the medical research council AML15 trial. J Clin Oncol. 2013;31(27):3360-3368.
20. Borthakur G, Kantarjian H, Wang X, et al. Treatment of corebinding-factor in acute myelogenous leukemia with fludarabine, cytarabine, and granulocyte colony-stimulating factor results in improved event-free survival. Cancer. 2008;113(11):3181-3185.
21. Yin JA, O'Brien MA, Hills RK, Daly SB, Wheatley K, Burnett AK. Minimal residual disease monitoring by quantitative RT-PCR in core binding factor AML allows risk stratification and predicts relapse: results of the United Kingdom MRC AML-15 trial. Blood. 2012;120(14):2826-2835.
22. Meyers J, Yu Y, Kaye JA, Davis KL. Medicare fee-for-service enrollees with primary acute myeloid leukemia: an analysis of treatment patterns, survival, and healthcare resource utilization and costs. Appl Health Econ Health Policy. 2013;11(3):275-286.
23. Petersdorf SH, Kopecky KJ, Slovak M, et al. A phase 3 study of gemtuzumab ozogamicin during induction and postconsolidation therapy in younger patients with acute myeloid leukemia. Blood. 2013;121(24):4854-4860.
24. Hills RK, Castaigne S, Appelbaum FR, et al. Addition of gemtuzumab ozogamicin to induction chemotherapy in adult patients with acute myeloid leukaemia: a meta-analysis of individual patient data from randomised controlled trials. Lancet Oncol. 2014;15(9):986-996.
25. Borthakur GM, Cortes JE, Ravandi F, et al. Fludarabine, cytarabine, G-CSF and gemtuzumab ozogamicin (FLAG-GO) regimen results in better molecular response and relapse-free survival in core binding factor acute myeloid leukemia than FLAG and idarubicin (FLAG-Ida). Blood. 2019;134(Suppl_1):290.
26. Lowenberg B, Zittoun R, Kerkhofs H, et al. On the value of intensive remission-induction chemotherapy in elderly patients of 65+ years with acute myeloid leukemia: a randomized phase III study of the European Organization for Research and Treatment of Cancer Leukemia Group. J Clin Oncol. 1989;7(9):1268-1274.
27. Kantarjian HM, Thomas XG, Dmoszynska A, et al. Multicenter, randomized, open-label, phase III trial of decitabine versus patient choice, with physician advice, of either supportive care or low-dose cytarabine for the treatment of older patients with newly diagnosed acute myeloid leukemia. J Clin Oncol. 2012;30(21):2670-2677.
28. Dombret H, Seymour JF, Butrym A, et al. International phase 3 study of azacitidine vs conventional care regimens in older patients with newly diagnosed AML with >30% blasts. Blood. 2015;126(3):291-299.
29. Feldman EJ, Lancet JE, Kolitz JE, et al. First-in-man study of CPX-351: a liposomal carrier containing cytarabine and daunorubicin in a fixed 5:1 molar ratio for the treatment of relapsed and refractory acute myeloid leukemia. J Clin Oncol.
2011;29(8):979-985.
30. Lancet JE, Uy GL, Cortes JE, et al. CPX-351 (cytarabine and daunorubicin) liposome for injection versus conventional cytarabine plus daunorubicin in older patients with newly diagnosed secondary acute myeloid leukemia. J Clin Oncol. 2018;36(26):2684-2692.
31. Uy GL, Newell LF, Lin TL, et al. Transplant outcomes after CPX351 vs 7+3 in older adults with newly diagnosed high-risk and/or secondary AML. Blood Adv. 2022;6(17):4989-4993.
32. Guolo F, Fianchi L, Minetto P, et al. CPX-351 treatment in secondary acute myeloblastic leukemia is effective and improves the feasibility of allogeneic stem cell transplantation: results of the Italian compassionate use program. Blood Cancer J. 2020;10(10):96.
33. Issa GC, Kantarjian HM, Xiao L, et al. Phase II trial of CPX-351 in patients with acute myeloid leukemia at high risk for induction mortality. Leukemia. 2020;34(11):2914-2924.
34. Konopleva M, Pollyea DA, Potluri J, et al. Efficacy and biological correlates of response in a phase II study of venetoclax monotherapy in patients with acute myelogenous leukemia. Cancer Discov. 2016;6(10):1106-1117.
35. DiNardo CD, Pratz K, Pullarkat V, et al. Venetoclax combined with decitabine or azacitidine in treatment-naive, elderly patients with acute myeloid leukemia. Blood. 2019;133(1):7-17.
36. Wei AH, Strickland SA, Jr., Hou JZ, et al. Venetoclax combined with low-dose cytarabine for previously untreated patients with acute myeloid leukemia: results from a phase Ib/II study. J Clin Oncol. 2019;37(15):1277-1284.
37. Pasvolsky O, Shimony S, Ram R, et al. Allogeneic hematopoietic cell transplantation for acute myeloid leukemia in first complete remission after 5-azacitidine and venetoclax: a multicenter retrospective study. Ann Hematol. 2022;101(2):379-387.
38. Pollyea DA, Winters A, McMahon C, et al. Venetoclax and azacitidine followed by allogeneic transplant results in excellent outcomes and may improve outcomes versus maintenance therapy among newly diagnosed AML patients older than 60. Bone Marrow Transplant. 2022;57(2):160-166.
39. Maiti A, DiNardo CD, Daver NG, et al. Triplet therapy with venetoclax, FLT3 inhibitor and decitabine for FLT3-mutated acute myeloid leukemia. Blood Cancer J. 2021;11(2):25.
40. DiNardo CD, Lachowiez CA, Takahashi K, et al. Venetoclax combined with FLAG-IDA induction and consolidation in newly diagnosed and relapsed or refractory acute myeloid leukemia. J Clin Oncol. 2021;39(25):2768-2778.
41. Reville PK, Kantarjian HM, Borthakur G, et al. Cladribine, idarubicin, cytarabine (ara-C), and venetoclax in treating patients with acute myeloid leukemia and high-risk myelodysplastic syndrome. Blood. 2020;136(Suppl 1):7-9.
42. Chua CC, Roberts AW, Reynolds J, et al. Chemotherapy and Venetoclax in Elderly Acute Myeloid Leukemia Trial (CAVEAT): a phase Ib dose-escalation study of venetoclax combined with modified intensive chemotherapy. J Clin Oncol. 2020;38(30):3506-3517.
43. Lachowiez CA, Reville PK, Kantarjian H, et al. Venetoclax combined with induction chemotherapy in patients with newly diagnosed acute myeloid leukaemia: a post-hoc, propensity score-matched, cohort study. Lancet Haematol. 2022;9(5):e350-e360.
44. DiNardo CD, Tiong IS, Quaglieri A, et al. Molecular patterns of response and treatment failure after frontline venetoclax combinations in older patients with AML. Blood. 2020;135(11):791-803.
45. Al Hamed R, Labopin M, Daguindau E, et al. Measurable residual
Haematologica | 108 February 2023 338 REVIEW ARTICLE R. Mohty et al.
disease, FLT3-ITD mutation, and disease status have independent prognostic influence on outcome of allogeneic stem cell transplantation in NPM1-mutated acute myeloid leukemia. Cancer Med. 2022;11(4):1068-1080.
46. Dohner H, Estey E, Grimwade D, et al. Diagnosis and management of AML in adults: 2017 ELN recommendations from an international expert panel. Blood. 2017;129(4):424-447.
47. Patel JP, Gonen M, Figueroa ME, et al. Prognostic relevance of integrated genetic profiling in acute myeloid leukemia. N Engl J Med. 2012;366(12):1079-1089.
48. Boddu P, Takahashi K, Pemmaraju N, et al. Influence of IDH on FLT3-ITD status in newly diagnosed AML. Leukemia. 2017;31(11):2526-2529.
49. Cortes JE, Khaled S, Martinelli G, et al. Quizartinib versus salvage chemotherapy in relapsed or refractory FLT3-ITD acute myeloid leukaemia (QuANTUM-R): a multicentre, randomised, controlled, open-label, phase 3 trial. Lancet Oncol. 2019;20(7):984-997.
50. Ravandi F, Arana Yi C, Cortes JE, et al. Final report of phase II study of sorafenib, cytarabine and idarubicin for initial therapy in younger patients with acute myeloid leukemia. Leukemia. 2014;28(7):1543-1545.
51. Serve H, Krug U, Wagner R, et al. Sorafenib in combination with intensive chemotherapy in elderly patients with acute myeloid leukemia: results from a randomized, placebo-controlled trial. J Clin Oncol. 2013;31(25):3110-3118.
52. Rollig C, Serve H, Huttmann A, et al. Addition of sorafenib versus placebo to standard therapy in patients aged 60 years or younger with newly diagnosed acute myeloid leukaemia (SORAML): a multicentre, phase 2, randomised controlled trial. Lancet Oncol. 2015;16(16):1691-1699.
53. Wei AH, Kennedy GA, Morris KL, et al. Results of a phase 2, randomized, double-blind study of sorafenib versus placebo in combination with intensive chemotherapy in previously untreated patients with FLT3-ITD acute myeloid leukemia (ALLG AMLM16). Blood. 2020;136(Suppl 1):36-38.
54. Wang ES, Tallman MS, Stone RM, et al. Low relapse rate in younger patients ≤ 60 years old with newly diagnosed FLT3mutated acute myeloid leukemia (AML) treated with crenolanib and cytarabine/anthracycline chemotherapy. Blood. 2017;130(Suppl 1):566.
55. Goldberg AD, Coombs CC, Wang ES, et al. Younger patients with newly diagnosed FLT3-mutant AML treated with crenolanib plus chemotherapy achieve adequate free crenolanib levels and durable remissions. Blood. 2019;134(Suppl_1):1326.
56. Cortes J, Perl AE, Dohner H, et al. Quizartinib, an FLT3 inhibitor, as monotherapy in patients with relapsed or refractory acute myeloid leukaemia: an open-label, multicentre, single-arm, phase 2 trial. Lancet Oncol. 2018;19(7):889-903.
57. Erba H, Montesinos P, Vrhovac R, et al. S100: quizartinib prolonged survival vs placebo plus intensive induction and consolidation therapy followed by single-agent continuation in patients aged 18-75 years with newly diagnosed FLT3-ITD+ AML. HemaSphere. 2022;6 (Suppl 3):1-2.
58. Fletcher L, Joshi SK, Traer E. Profile of quizartinib for the treatment of adult patients with relapsed/refractory FLT3-ITDpositive acute myeloid leukemia: evidence to date. Cancer Manag Res. 2020;12:151-163.
59. Perl AE, Martinelli G, Cortes JE, et al. Gilteritinib or chemotherapy for relapsed or refractory FLT3-mutated AML. N Engl J Med. 2019;381(18):1728-1740.
60. Antar AI, Otrock ZK, Jabbour E, Mohty M, Bazarbachi A. FLT3 inhibitors in acute myeloid leukemia: ten frequently asked questions. Leukemia. 2020;34(3):682-696.
61. Ravandi F, Alattar ML, Grunwald MR, et al. Phase 2 study of azacytidine plus sorafenib in patients with acute myeloid leukemia and FLT-3 internal tandem duplication mutation. Blood. 2013;121(23):4655-4662.
62. Ohanian M, Garcia-Manero G, Levis M, et al. Sorafenib combined with 5-azacytidine in older patients with untreated FLT3-ITD mutated acute myeloid leukemia. Am J Hematol. 2018;93(9):1136-1141.
63. Strati P, Kantarjian H, Ravandi F, et al. Phase I/II trial of the combination of midostaurin (PKC412) and 5-azacytidine for patients with acute myeloid leukemia and myelodysplastic syndrome. Am J Hematol. 2015;90(4):276-281.
64. Swaminathan M, Kantarjian HM, Levis M, et al. A phase I/II study of the combination of quizartinib with azacitidine or low-dose cytarabine for the treatment of patients with acute myeloid leukemia and myelodysplastic syndrome. Haematologica. 2021;106(8):2121-2130.
65. Daver N, Venugopal S, Ravandi F. FLT3 mutated acute myeloid leukemia: 2021 treatment algorithm. Blood Cancer J. 2021;11(5):104.
66. Short NJ, DiNardo CD, Daver N, et al. A triplet combination of azacitidine, venetoclax and gilteritinib for patients with FLT3mutated acute myeloid leukemia: results from a phase I/II study. Blood. 2021;138(Suppl 1):696.
67. Short NJ, Konopleva M, Kadia TM, et al. Advances in the treatment of acute myeloid leukemia: new drugs and new challenges. Cancer Discov. 2020;10(4):506-525.
68. Stein EM, DiNardo CD, Pollyea DA, et al. Enasidenib in mutant IDH2 relapsed or refractory acute myeloid leukemia. Blood. 2017;130(6):722-731.
69. Pollyea DA, Tallman MS, de Botton S, et al. Enasidenib, an inhibitor of mutant IDH2 proteins, induces durable remissions in older patients with newly diagnosed acute myeloid leukemia. Leukemia. 2019;33(11):2575-2584.
70. Roboz GJ, DiNardo CD, Stein EM, et al. Ivosidenib induces deep durable remissions in patients with newly diagnosed IDH1mutant acute myeloid leukemia. Blood. 2020;135(7):463-471.
71. Stein EM, DiNardo CD, Fathi AT, et al. Ivosidenib or enasidenib combined with intensive chemotherapy in patients with newly diagnosed AML: a phase 1 study. Blood. 2021;137(13):1792-1803.
72. DiNardo CD, Stein AS, Stein EM, et al. Mutant isocitrate dehydrogenase 1 inhibitor ivosidenib in combination with azacitidine for newly diagnosed acute myeloid leukemia. J Clin Oncol. 2021;39(1):57-65.
73. Daigle SR, Choe S, Quek L, et al. High rate of IDH1 mutation clearance and measurable residual disease negativity in patients with IDH1-mutant newly diagnosed acute myeloid leukemia treated with ivosidenib (AG-120) and azacitidine. Blood. 2019;134(Suppl 1):2706.
74. Montesinos P, Recher C, Vives S, et al. Ivosidenib and azacitidine in IDH1-mutated acute myeloid leukemia. N Engl J Med. 2022;386(16):1519-1531.
75. Sasaki K, Kanagal-Shamanna R, Montalban-Bravo G, et al. Impact of the variant allele frequency of ASXL1, DNMT3A, JAK2, TET2, TP53, and NPM1 on the outcomes of patients with newly diagnosed acute myeloid leukemia. Cancer. 2020;126(4):765-774.
76. Welch JS, Petti AA, Miller CA, et al. TP53 and decitabine in acute myeloid leukemia and myelodysplastic syndromes. N Engl J Med. 2016;375(21):2023-2036.
77. Lehmann S, Bykov VJ, Ali D, et al. Targeting p53 in vivo: a firstin-human study with p53-targeting compound APR-246 in refractory hematologic malignancies and prostate cancer. J Clin Oncol. 2012;30(29):3633-3639.
78. Cluzeau T, Sebert M, Rahme R, et al. Eprenetapopt plus
Haematologica | 108 February 2023 339 REVIEW ARTICLE R. Mohty et al.
azacitidine in TP53-mutated myelodysplastic syndromes and acute myeloid leukemia: a phase II study by the Groupe Francophone des Myelodysplasies (GFM). J Clin Oncol. 2021;39(14):1575-1583.
79. Maiti A, DiNardo CD, Qiao W, et al. Ten-day decitabine with venetoclax versus intensive chemotherapy in relapsed or refractory acute myeloid leukemia: a propensity score-matched analysis. Cancer. 2021;127(22):4213-4220.
80. Jaiswal S, Jamieson CH, Pang WW, et al. CD47 is upregulated on circulating hematopoietic stem cells and leukemia cells to avoid phagocytosis. Cell. 2009;138(2):271-285.
81. Sallman DA, McLemore AF, Aldrich AL, et al. TP53 mutations in myelodysplastic syndromes and secondary AML confer an immunosuppressive phenotype. Blood. 2020;136(24):2812-2823.
82. Klyuchnikov E, Christopeit M, Badbaran A, et al. Role of pretransplant MRD level detected by flow cytometry in recipients of allogeneic stem cell transplantation with AML. Eur J Haematol. 2021;106(5):606-615.
83. Mohty R, Bazarbachi AH, Labopin M, et al. Isocitrate dehydrogenase (IDH) 1 and 2 mutation is an independent predictor of better outcome in patients with acute myeloid leukemia undergoing allogeneic hematopoietic stem cell transplantation: a study of the ALWP of EBMT. Blood. 2021;138(Suppl 1):2920.
84. Lowenberg B, Pabst T, Maertens J, et al. Addition of lenalidomide to intensive treatment in younger and middleaged adults with newly diagnosed AML: the HOVON-SAKK-132 trial. Blood Adv. 2021;5(4):1110-1121.
85. Shah MV, Jorgensen JL, Saliba RM, et al. Early post-transplant minimal residual disease assessment improves risk stratification in acute myeloid leukemia. Biol Blood Marrow Transplant. 2018;24(7):1514-1520.
86. Scott BL, Pasquini MC, Fei M, et al. Myeloablative versus reduced-intensity conditioning for hematopoietic cell transplantation in acute myelogenous leukemia and myelodysplastic syndromes - long-term follow-up of the BMT CTN 0901 clinical trial. Transplant Cell Ther. 2021;27(6):483.e1-483.e6.
87. Sengsayadeth S, Savani BN, Blaise D, Malard F, Nagler A, Mohty M. Reduced intensity conditioning allogeneic hematopoietic cell transplantation for adult acute myeloid leukemia in complete remission - a review from the Acute Leukemia Working Party of the EBMT. Haematologica. 2015;100(7):859-869.
88. Oudin C, Chevallier P, Furst S, et al. Reduced-toxicity conditioning prior to allogeneic stem cell transplantation improves outcome in patients with myeloid malignancies. Haematologica. 2014;99(11):1762-1768.
89. Dulery R, Menard AL, Chantepie S, et al. Sequential conditioning with thiotepa in T cell- replete hematopoietic stem cell transplantation for the treatment of refractory hematologic malignancies: comparison with matched related, haplomismatched, and unrelated donors. Biol Blood Marrow Transplant. 2018;24(5):1013-1021.
90. Gyurkocza B, Nath R, Seropian SE, et al. High rates of transplantation in the phase III Sierra trial utilizing anti-CD45 (iodine) 131I-apamistamab (Iomab-B) conditioning with successful engraftment and tolerability in relapsed refractory (R/R) acute myeloid leukemia (AML) patients after lack of response to conventional care and targeted therapies. Transplant Cell Ther. 2022;28(3):S35-S36.
91. Palmer J, McCune JS, Perales MA, et al. Personalizing busulfanbased conditioning: considerations from the American Society for Blood and Marrow Transplantation Practice Guidelines Committee. Biol Blood Marrow Transplant. 2016;22(11):1915-1925.
92. Pidala J, Kim J, Anasetti C, et al. Pharmacokinetic targeting of intravenous busulfan reduces conditioning regimen related toxicity following allogeneic hematopoietic cell transplantation for acute myelogenous leukemia. J Hematol Oncol. 2010;3:36.
93. Casper J, Wolff D, Knauf W, et al. Allogeneic hematopoietic stem-cell transplantation in patients with hematologic malignancies after dose-escalated treosulfan/fludarabine conditioning. J Clin Oncol. 2010;28(20):3344-3351.
94. Lazzari L, Ruggeri A, Lupo Stanghellini MT, et al. Treosulfanbased conditioning regimen prior to allogeneic stem cell transplantation: long-term results from a phase 2 clinical trial. Front Oncol. 2021;11:731478.
95. European Medicine Agency. Trecondi. "Available from: https://www.ema.europa.eu/en/medicines/human/EPAR/trecondi" [Accessed April 24, 2022].
96. Stölzel F, Stelljes M, Beelen DW, et al. Favourable outcome after treosulfan based conditioning in patients undergoing an allogeneic hematopoietic cell transplantation (alloHCT) for the treatment of acute myleloid leukaemia (AML): a subgroup analysis of the randomized phase III MC-Fludt.14/L trial. Transplant Cell Ther. 2022;28(3):S81-S82.
97. Garcia JS, Kim HT, Murdock HM, et al. Adding venetoclax to fludarabine/busulfan RIC transplant for high-risk MDS and AML is feasible, safe, and active. Blood Adv. 2021;5(24):5536-5545.
98. Popat UR, Mehta RS, Bassett R, et al. Myeloablative fractionated busulfan conditioning regimen with venetoclax in patients with AML/MDS: prospective phase II clinical trial. Blood. 2021;138(Suppl 1):2879.
99. Popat UR, Mehta RS, Thall P, et al. Myeloablative fractionated busulfan conditioning regimen with sorafenib in patients with AML: results of phase I clinical trial. Transplant Cell Ther. 2022;28(3):S78-S79.
100. Muffly L, Lee CJ, Gandhi A, et al. Preliminary data from a phase 1 study of JSP191, an anti-CD117 monoclonal antibody, in combination with low dose irradiation and fludarabine conditioning is well-tolerated, facilitates chimerism and clearance of minimal residual disease in older adults with MDS/AML undergoing allogeneic HCT. Transplant Cell Ther. 2022;28(3):S476-S478.
101. Blaise D, Vey N, Faucher C, Mohty M. Current status of reducedintensity-conditioning allogeneic stem cell transplantation for acute myeloid leukemia. Haematologica. 2007;92(4):533-541.
102. Gyurkocza B, Nath R, Seropian S, et al. Clinical experience in the randomized phase 3 Sierra trial: anti-CD45 iodine (131I) apamistamab [Iomab-B] conditioning enables hematopoietic cell transplantation with successful engraftment and acceptable safety in patients with active, relapsed/refractory AML not responding to targeted therapies. Blood. 2021;138(Suppl 1):1791.
103. Bazarbachi A, Schmid C, Labopin M, et al. Evaluation of trends and prognosis over time in patients with AML relapsing after allogeneic hematopoietic cell transplant reveals improved survival for young patients in recent years. Clin Cancer Res. 2020;26(24):6475-6482.
104. Bejanyan N, Weisdorf DJ, Logan BR, et al. Survival of patients with acute myeloid leukemia relapsing after allogeneic hematopoietic cell transplantation: a Center for International Blood and Marrow Transplant Research study. Biol Blood Marrow Transplant. 2015;21(3):454-459.
105. Schroeder T, Rautenberg C, Haas R, Germing U, Kobbe G. Hypomethylating agents for treatment and prevention of relapse after allogeneic blood stem cell transplantation. Int J Hematol. 2018;107(2):138-150.
106. Goodyear OC, Dennis M, Jilani NY, et al. Azacitidine augments
Haematologica | 108 February 2023 340 REVIEW ARTICLE R. Mohty et al.
expansion of regulatory T cells after allogeneic stem cell transplantation in patients with acute myeloid leukemia (AML). Blood. 2012;119(14):3361-3369.
107. Assi R, Masri N, Abou Dalle I, El-Cheikh J, Bazarbachi A. Posttransplant maintenance therapy for patients with acute myeloid leukemia: current approaches and the need for more trials. J Blood Med. 2021;12:21-32.
108. Kungwankiattichai S, Ponvilawan B, Roy C, Tunsing P, Kuchenbauer F, Owattanapanich W. Maintenance with hypomethylating agents after allogeneic stem cell transplantation in acute myeloid leukemia and myelodysplastic syndrome: a systematic review and meta-analysis. Front Med (Lausanne). 2022;9:801632.
109. de Lima M, Giralt S, Thall PF, et al. Maintenance therapy with low-dose azacitidine after allogeneic hematopoietic stem cell transplantation for recurrent acute myelogenous leukemia or myelodysplastic syndrome: a dose and schedule finding study Cancer. 2010;116(23):5420-5431.
110. El-Cheikh J, Massoud R, Fares E, et al. Low-dose 5-azacytidine as preventive therapy for relapse of AML and MDS following allogeneic HCT. Bone Marrow Transplant. 2017;52(6):918-921.
111. Oran B, de Lima M, Garcia-Manero G, et al. Maintenance with 5azacytidine for acute myeloid leukemia and myelodysplastic syndrome patients. Blood. 2018;132(Suppl 1):971.
112. Burchert A, Bug G, Fritz LV, et al. Sorafenib maintenance after allogeneic hematopoietic stem cell transplantation for acute myeloid leukemia with FLT3–internal tandem duplication Mutation (SORMAIN). J Clin Oncol. 2020;38(26):2993-3002.
113. Wei AH, Dohner H, Pocock C, et al. Oral azacitidine maintenance therapy for acute myeloid leukemia in first remission. N Engl J Med. 2020;383(26):2526-2537.
114. de Lima M, Oran B, Champlin RE, et al. CC-486 maintenance after stem cell transplantation in patients with acute myeloid leukemia or myelodysplastic syndromes. Biol Blood Marrow Transplant. 2018;24(10):2017-2024.
115. Pusic I, Choi J, Fiala MA, et al. Maintenance therapy with decitabine after allogeneic stem cell transplantation for acute myelogenous leukemia and myelodysplastic syndrome. Biol Blood Marrow Transplant. 2015;21(10):1761-1769.
116. Gao L, Zhang Y, Wang S, et al. Effect of rhG-CSF combined with decitabine prophylaxis on relapse of patients with high-risk MRD-negative AML after HSCT: an open-label, multicenter, randomized controlled trial. J Clin Oncol. 2020;38(36):4249-4259.
117. El Chaer F, Borate U, Dulery R, et al. Azacitidine maintenance after allogeneic hematopoietic cell transplantation for MDS and AML. Blood Adv. 2021;5(6):1757-1759.
118. Kent A, Pollyea DA, Winters A, Jordan CT, Smith C, Gutman JA. Venetoclax is safe and tolerable as post-transplant maintenance therapy for AML patients at high risk for relapse. Blood. 2020;136(Suppl 1):11-12.
119. Wei Y, Xiong X, Li X, et al. Low-dose decitabine plus venetoclax is safe and effective as post-transplant maintenance therapy for high-risk acute myeloid leukemia and myelodysplastic syndrome. Cancer Sci. 2021;112(9):3636-3644.
120. Antar A, Kharfan-Dabaja MA, Mahfouz R, Bazarbachi A. Sorafenib maintenance appears safe and improves clinical outcomes in FLT3-ITD acute myeloid leukemia after allogeneic hematopoietic cell transplantation. Clin Lymphoma Myeloma Leuk.
2015;15(5):298-302.
121. Battipaglia G, Ruggeri A, Massoud R, et al. Efficacy and feasibility of sorafenib as a maintenance agent after allogeneic hematopoietic stem cell transplantation for Fms-like tyrosine kinase 3-mutated acute myeloid leukemia. Cancer. 2017;123(15):2867-2874.
122. Battipaglia G, Massoud R, Ahmed SO, et al. Efficacy and feasibility of sorafenib as a maintenance agent after allogeneic hematopoietic stem cell transplantation for Fms-like tyrosine kinase 3 mutated acute myeloid leukemia: an update. Clin Lymphoma Myeloma Leuk. 2019;19(8):506-508.
123. Bazarbachi A, Labopin M, Battipaglia G, et al. Allogeneic stem cell transplantation for FLT3-mutated acute myeloid leukemia: in vivo T-cell depletion and posttransplant sorafenib maintenance improve survival. A retrospective Acute Leukemia Working Party-European Society for Blood and Marrow Transplant study. Clin Hematol Int. 2019;1(1):58-74.
124. Maziarz RT, Levis M, Patnaik MM, et al. Midostaurin after allogeneic stem cell transplant in patients with FLT3-internal tandem duplication-positive acute myeloid leukemia. Bone Marrow Transplant. 2021;56(5):1180-1189.
125. Xuan L, Wang Y, Huang F, et al. Sorafenib maintenance in patients with FLT3-ITD acute myeloid leukaemia undergoing allogeneic haematopoietic stem-cell transplantation: an openlabel, multicentre, randomised phase 3 trial. Lancet Oncol. 2020;21(9):1201-1212.
126. Bazarbachi A, Bug G, Baron F, et al. Clinical practice recommendation on hematopoietic stem cell transplantation for acute myeloid leukemia patients with FLT3-internal tandem duplication: a position statement from the Acute Leukemia Working Party of the European Society for Blood and Marrow Transplantation. Haematologica. 2020;105(6):1507-1516.
127. Levis MJ, Hamadani M, Logan BR, et al. BMT CTN Protocol 1506: a phase 3 trial of gilteritinib as maintenance therapy after allogeneic hematopoietic stem cell transplantation in patients with FLT3-ITD+ AML. Blood. 2019;134(Suppl_1):4602.
128. Mishra A, Tamari R, DeZern AE, et al. Phase II trial of eprenetapopt (APR-246) in combination with Azacitidine (AZA) as maintenance therapy for TP53 mutated acute myeloid leukemia (AML) or myelodysplastic syndromes (MDS) following allogeneic hematopoietic cell transplantation (HCT). Transplant Cell Ther. 2022;28(3):S34-S35.
129. Shen L, Pili R. Class I histone deacetylase inhibition is a novel mechanism to target regulatory T cells in immunotherapy. Oncoimmunology. 2012;1(6):948-950.
130. Bug G, Burchert A, Wagner EM, et al. Phase I/II study of the deacetylase inhibitor panobinostat after allogeneic stem cell transplantation in patients with high-risk MDS or AML (PANOBEST trial). Leukemia. 2017;31(11):2523-2525.
131. Minetto P, Guolo F, Pesce S, et al. Harnessing NK cells for cancer treatment. Front Immunol. 2019;10:2836.
132. Devillier R, Furst S, boyer Chammard A, et al. Safety of antiNKG2A blocking antibody monalizumab as maintenance therapy after allogeneic hematopoietic stem cell transplantation: a phase I study. Blood. 2021;138(Suppl 1):1817.
133. Kim HJ, Kim Y, Kang D, et al. Prognostic value of measurable residual disease monitoring by next-generation sequencing before and after allogeneic hematopoietic cell transplantation in acute myeloid leukemia. Blood Cancer J. 2021;11(6):109.
Haematologica | 108 February 2023 341 REVIEW ARTICLE R. Mohty et al.
Update on current treatments for adult acute myeloid leukemia: to treat acute myeloid leukemia
intensively or non-intensively? That is the question
Sonia Jaramillo1 and Richard F. Schlenk1,21Department of Internal Medicine V, Heidelberg University Hospital and 2NCT-Trial Center, National Center of Tumor Diseases, Heidelberg University Hospital and German Cancer Research Center, Heidelberg, Germany
Correspondence: F. Schlenk_Richard richard.schlenk@nct-heidelberg.de
Received: June 19, 2022.
Accepted: October 19, 2022.
https://doi.org/10.3324/haematol.2022.280802
©2023 Ferrata Storti Foundation
Published under a CC BY-NC license
Abstract
For several decades, the treatment for acute myeloid leukemia (AML) has been a dichotomous choice between intensive chemotherapy strategies with curative intent and non-intensive options including supportive care. Patients’ age and fitness, as well as comorbidities, primarily influenced this choice. However, the therapeutic armamentarium is evolving, so that there are highly effective and increasingly specific drugs, fitting the mutational profile of a patient’s leukemia. There is now a spectrum of treatment options that are less intense and can be administered in an outpatient setting and to a substantial extent are equally or even more effective than standard intensive therapy. We are, therefore, witnessing a radical change in the treatment landscape of AML. In this review, we examine the current treatment options for patients with AML, considering the molecular spectrum of the disease on the background of patient-related factors.
Introduction
Acute myeloid leukemia (AML) is the most common acute leukemia in adults with an incidence ranging from 2.0 per 100,000 men and women per year in Korea1 to 4.3 per 100,000 people per year in the USA2 with a median age at diagnosis ranging in western countries between 65 and 72 years.3-5 Over the last years the incidence has remained stable in younger patients but has increased significantly in patients aged over 75 years.5-7 This phenomenon has not yet been fully explained, but may be related to various factors, including longer life expectancy, increasing awareness, improving diagnostic sensitivity, better reporting and recording of new cases, and an increase of exposure to risk factors.8 Treatment approaches have been and are influenced by patients’ features such as age, comorbidities, and Eastern Cooperative Oncology Group performance status. However, determining the molecular profile of AML is essential as it has become a major prognostic factor, but even more importantly the pivotal predictive parameter for selecting the most appropriate treatment for an individual case.9-13
Risk stratification guidelines combining information on cytogenetic abnormalities and gene mutations have been
widely used to predict the prognosis of AML patients and to select risk-adapted post-remission therapy, in particular with regards to allogeneic hematopoietic cell transplantation (allo-HCT).14,15 Mutations in genes such as nucleophosmin-1 (NPM1), FMS-related tyrosine kinase 3 (FLT3), and CCAAT/enhancer-binding protein alpha (CEBPA), somatic mutations in isocitrate dehydrogenase 1 and 2 (IDH1/2), RUNX1, TP53 and KMT2A mutations as well as the presence of either t(8;21)(q22;q22)/RUNX1-RUNX1T1 or inv(16) (p13q22)/t(16;16)(p13q22)/CBFB-MYH11 influence the therapeutic approach to patients with newly diagnosed AML9 and documenting their presence has entered clinical routine.15,16 Furthermore, genetic mutations have played and still play an essential role in deciding the type and intensity of induction and post-induction therapy.14,17 However, there are significant barriers to the translation of the molecular characteristics of AML into precise clinical action and ultimately most patients will receive standard-of-care treatments.14 Nevertheless, we currently find ourselves in an era of rapid transition from the use of the standard “7+3” chemotherapy to precise therapeutic strategies based on specific disease characteristics as well as an individual patient’s characteristics. In this review, we examine the current treatment options for pa-
Haematologica | 108 February 2023 342 REVIEW ARTICLE
tients with AML, considering the molecular findings of the disease as well as the age and fitness of the patient.
Intensive versus non-intensive therapy
Non-intensive therapies are being increasingly used in patients above the age of 65 years because of concerns about such patients’ ability to tolerate intensive chemotherapy regimens.18 However, the risk-benefit ratio associated with intensive versus non-intensive therapies in elderly patients in the era of new targeted agents remains unknown as upfront randomized comparisons are lacking. Furthermore, as conventional induction therapies such as the “7+3” regimen have been upgraded with the introduction of new agents, including venetoclax, midostaurin, gilteritinib, quizartinib, gemtuzumab ozogamicin (GO), ivosidenib and enasidenib as well as CPX351, it may be difficult to define the standard in a chemotherapy arm of a future randomized study. Regarding non-intensive therapy, the combination of hypomethylating agents and venetoclax has revolutionized the therapeutic landscape of elderly patients with AML.19 Currently recruiting studies are evaluating the feasibility of non-intensive regimens achieving long-lasting molecular complete remissions (CR) in older as well as younger patients. As an example, VINCENT (EudraCT-No 2021-00324826) is a phase II trial evaluating induction and consolidation therapy with azacitidine and venetoclax (aza-ven) versus standard of care, defined as intensive “7+3” induction therapy with GO in patients fit for intensive induction therapy with NPM1-mutated AML according to Schlenk et al.20 Furthermore, for patients aged between 60 and 75 years in whom allo-HCT is intended, a single-arm, phase II study (NCT04476199) of decitabine plus venetoclax is evaluating this therapy combination as a bridge to allo-HCT. A recent retrospective study aiming to predict the optimal type of conditioning and maintenance therapy to reduce the risk of relapse in older patients undergoing allo-HCT indicated that relapse risk as well as the risk of measurable residual disease (MRD) and treatment-related toxicity can be predicted from baseline genetic characteristics.21
A multicenter, retrospective, cohort study of patients transplanted in first CR after either intensive induction therapy (n=24) or non-intensive therapy with aza-ven (n=24) showed that those treated with intensive induction therapy achieved inferior results compared to those treated nonintensively with regard to both 12-month non-relapse mortality (19.1% vs. 11.8%, respectively) and overall survival (OS) (54% vs. 70%, respectively).22 Further comparative retrospective evaluations in patients with newly diagnosed AML treated with aza-ven (n=143) or intensive chemotherapy (n=149) showed comparable or even superior overall response rates (CR, CR with incomplete recovery of blood counts [CRi], and morphological leukemia-free state) with
aza-ven (76.9%) than with intensive chemotherapy (70.5%) but an inferior median OS (483 days with aza-ven vs. 884 days with intensive chemotherapy; P=0.002).23 Variables that favored response to aza-ven over intensive chemotherapy included older age (odds ratio [OR]=2.79, 95% confidence interval [95% CI]: 1.18-6.59), secondary AML (OR=2.36, 95% CI: 1.0-5-3), and RUNX1 mutation (OR=5.4, 95% CI: 1.1-26.9). Contrary to our expectations, in the azaven subgroup analysis, RUNX1 mutation was not prognostic for either response or OS.23 Based on these findings, RUNX1 might be a useful variable to help guide clinical decisionmaking between aza-ven and intensive chemotherapy. However, the clinical application of conclusions from retrospective analyses are fundamentally limited, so prospective studies are needed to support these observations. In line with these findings, an interim analysis of an ongoing phase II clinical trial (NCT04752527) studying decitabine plus venetoclax for young adults with newly diagnosed adverserisk AML (according to the European LeukemiaNet [ELN] classification) revealed good clinical activity with even better results compared to those of historical controls given intensive chemotherapy (CR with partial hematologic recovery [CRh]: 64.3% vs. 38.3%, respectively).24
ASXL1 has also been described as a potential marker for improved response to venetoclax based on non-intensive therapy in previous studies.25-28 Moreover, in one of these studies, ASXL1 mutation was found to have a favorable impact on the achievement of CR/CRi independently of the presence of a concomitant TP53 mutation.25
On the other hand, the diagnosis of monocytic leukemia was found to favor treatment with intensive chemotherapy compared to aza-ven in the already mentioned retrospective study (CR achievement: OR=0.08, 95% CI: 0.01-0.5).23 In line with this finding, in a cohort study of 100 patients with AML, the presence of a monocytic phenotype was associated with refractoriness to aza-ven (OR=18.285, 95% CI: 4.701-71.129).29 The underlying genetic events that may drive this process are not, as yet, well characterized.
Venetoclax has also been combined with intensive regimens in recent studies. In a prospective cohort study, venetoxclax was added to fludarabine, cytarabine, granulocyte colony-stimulating factor, and idarubicin (FLAG-IDA). Venetoclax and FLAG-IDA were administered to 45 patients with newly diagnosed AML. The authors reported that 89% (n=40/45) of patients attained a composite CR and 93% of these responding patients achieved a deep MRD-negative remission following one cycle of therapy. Even patients with ELN adverse-risk AML without TP53 mutations (n=15) showed favorable survival outcomes. The 12- and estimated 24-month OS rates were 92% and 76%, respectively.30 In the CAVEAT trial, patients with newly diagnosed AML treated with venetoclax combined with cytarabine and idarubicin showed a similar response rate of 97% and a median OS of 31 months.31 Venetoclax was also combined
Haematologica | 108 February 2023 343 REVIEW ARTICLE S. Jaramillo and R.F. Schlenk
with cytarabine and daunorubicin in a recent clinical study. This combination led to similar response rates in patients with de novo AML (n=33) with a composite CR rate of 91% after one cycle of the treatment. Of the 30 patients who reached CR, 29 (97%) did not have detectable MRD after one cycle of therapy.32
There is a tendency to treat older patients with less intensive therapies based on the assumptions that they will neither tolerate nor benefit from intensive therapies.33 Sorror et al. published several tools to support the decision between intensive and non-intensive therapy in a clinical context18,34 and they seem to be as important as other risk factors such as the molecular profile of disease.18 These tools are based on retrospective and prospective data suggesting that elderly patients with AML do not necessarily benefit from less intensive therapies, with regard to survival outcomes or quality of life, regardless of the degree of their medical unfitness as captured by a validated model. Although these tools are being increasingly used in clinical practice, a patient’s fitness still remains a subjective determination for many clinicians. With the approval of newer AML treatment options, including non-intensive therapy with the potential to induce CR, the role of a patient’s fitness in treatment selection has become yet more complex. Clinicians must now determine not only whether a newly diagnosed patient with AML is fit to withstand intensive induction chemotherapy but also whether induction chemotherapy is the optimal choice, given the patient’s disease features and availability of newer, less intensive treatment options. During the COVID-19 pandemic, physicians have been forced to rethink the indications for intensive chemotherapy in young, fit patients. A recent study addressed this issue, looking at responses in patients fit for intensive chemotherapy who were treated with aza-ven or low-dose cytarabine plus venetoclax.35 In 301 patients, with a median age of 72 years (range, 34-90), the composite CR rate was 70% and, with a median follow-up of 8.2 months, the median OS was 12.8 months (95% CI: 10.9 months - not
reached). The mutational landscape of this cohort resembled that expected in the real world and prognostic molecular and clinical factors support findings from previous studies in older patients.19,36,37 These data support the idea of using non-intensive regimens for young and old patients with AML who are actually fit for intensive chemotherapy (Table 1) and, more importantly, they support the adoption of venetoclax regimens to treat patients with AML at a time of critically constrained resources, since such patients spent significantly fewer days in hospital (15 days vs 41 days).38 Similar results were seen in another real-world cohort.39
Recently, decitabine, as monotherapy for 5 to 10 days, was compared to daunorubicin and cytarabine (the “7+3” regimen), followed by one to three additional chemotherapy cycles in patients with newly diagnosed AML above the age of 60 years. The CR/CRi rate was 48% with decitabine and 61% with intensive chemotherapy. As part of the protocol, 122 patients (40%, 30 of them not in CR/CRi) in the decitabine arm, and 118 patients (39%, 11 of them not in CR/CRi) in the intensive chemotherapy arm underwent allo-HCT. The median OS was not significantly different between the groups treated with decitabine or intensive chemotherapy (15 vs. 18 months, respectively; HR=1.04, 95% CI: 0.86-1.26). Interestingly, significantly fewer grade 3-5 adverse events were seen in patients treated with decitabine than in those treated with intensive chemotherapy.40 The potential benefits of intensive versus non-intensive therapy are presented in Table 2.
Targeted therapy in adults fit for intensive chemotherapy FLT3 inhibitors Mutations in FLT3 are among the most frequent genetic aberrations in patients with AML, with the frequency being Marker Favored therapy Evidence source References Age ≥ 65 years Non-intensive Cohort study 19, 23 ELN adverse risk Non-intensive Cohort study 23 Mutated RUNX1 Non-intensive Cohort study 23 Secondary AML Non-intensive Cohort study 23 FAB-M5 morphology Intensive Cohort study 23 ASXL1 Non-intensive Cohort study 25-28 FLT3 Intensive Randomized clinical trial 49-53 Table 1. Potential predictive markers to favor intensive or non-intensive therapy for induction of remission. ELN: European LeukemiaNet; RUNX1: Runt-related transcription factor 1; AML: acute myeloid leukemia; FAB: French American British; ASXL1: Additional sex combs-like 1; FLT3: Fms-related receptor tyrosine kinase 3. Haematologica | 108 February 2023 344 REVIEW ARTICLE S. Jaramillo and R.F. Schlenk
Table 2. Potential benefits of intensive versus non-intensive therapy.
Intensive chemotherapy ± targeted therapies
Combination with venetoclax produced greater molecular remission in fit, de novo AML patients
Non-intensive therapy ± targeted therapies
Evidence source References
Phase I-II clinical trials 30-32
Combination with venetoclax led to improvements in CR in patients with poor-risk cytogenetics
Phase III clinical trials 23, 25-28
Fewer infectious complications Cohort studies 38, 39, 40
Better tolerability for older patients
Phase III clinical trials 36, 37
Fewer days in hospital Cohort studies 38, 39
Combination with FLT3 inhibitors was proven efficacious
Phase II and III clinical trials 49-53
Widely evaluated and broadly accepted Clinical guidelines 16
Addition of GO led to lower relapse rate in younger patients
Combination with IDH inhibitors was proven efficacious
20, 64
Phase I and phase III clinical trials 59-62
CR: complete remission; FLT3: Fms-related receptor tyrosine kinase 3; GO: gemtuzumab ozogamicin; IDH: isocitrate dehydrogenase.
higher in younger patients than in older ones.3 There are two main types of FLT3 mutations: (i) internal tandem duplications (ITD), occurring in 10-25% of patients and resulting in the duplication of nucleotide sequences with differing lengths and insertion sites, are associated with inferior clinical outcomes, in particular in patients with higher allelic ratios41-44 and (ii) single-nucleotide variants in the tyrosine kinase domain (TKD), occurring in 5-10% of patients; these are associated with a more favorable prognosis, in particular when occurring together with NPM1 mutations or core-binding factor AML.43,45 There is a significant unmet medical need to improve the duration of response in patients with newly diagnosed FLT3-ITD-positive AML,46 and so the clinical development of FLT3 inhibitors has been one of the most active fields in precision medicine for AML.47 Type 1 inhibitors, such as midostaurin, gilteritinib and crenolanib are less selective tyrosine kinase inhibitors, whereas the type 2 FLT3 inhibitor quizartinib is highly selective for FLT3 and particularly FLT3ITD.48,49 Midostaurin is currently the only tyrosine kinase inhibitor approved for use in patients with FLT3-mutated newly diagnosed AML that has demonstrated superior results compared to standard intensive therapy for all survival endpoints, including OS.50 In contrast to the Food and Drug Administration (FDA), the European Medicines Agency (EMA)
not only approved midostaurin for the treatment of newly diagnosed AML patients with an activating FLT3 mutation, including FLT3-ITD and FLT3-TKD mutations, in combination with intensive induction and consolidation therapy but also as 1-year maintenance therapy. Supported by a phase II follow-up study of the RATIFY trial, the approval was not agerestricted.51 However, based on published data,50,51 roughly one-quarter of patients treated with midostaurin in combination with intensive induction therapy were refractory and the relapse rate at 2 years exceeded 40% despite consolidation and maintenance therapy with midostaurin. Thus, new treatment options are urgently needed. A recent comparison of patients treated with midostaurin in the single-arm phase-II AMLSG 16-10 trial with a historical cohort of 415 patients treated on five prior AMLSG trials and with patients (18-59 years old) treated on the placebo arm of the RATIFY trial revealed better event-free survival in patients treated within the AMLSG 16-10 trial than in the controls from other AMLSG trials (HR=0.55; P<0.001) as well as the younger patients (<60 years) in the placebo arm of the RATIFY trial (HR=0.71; P=0.005). The treatment effect of midostaurin remained significant in the sensitivity analyses including allo-HCT as a time-dependent covariate as well as a competing event. It should be noted that in the multivariate analysis for event-free survival, allo-HCT in first CR
Haematologica | 108 February 2023 345 REVIEW ARTICLE
Schlenk
S. Jaramillo and R.F.
or CRi as a time-dependent covariate was significantly associated with a better survival (HR=0.49; 95% CI: 0.340.69).52 The same was observed in the RATIFY study and in a recent exploratory analysis of the trial there was particularly good efficacy of induction therapy with midostaurin followed by allo-HCT in first CR in patients with NPM1 wildtype or core-binding factor-negative AML.45,51 In the AMLSG 16-10 trial the median OS was 22.7 months for older patients and 57.3 months for younger patients. In the multivariate analysis, the improvement in OS of elderly patients treated with midostaurin (HR=0.47; P<0.001) was even more pronounced than that in younger patients (HR=0.59; P<0.001). The frequency of serious adverse events was significantly higher in older patients than in younger ones, with the most common ones in older patients being vascular complications (21 vs. 13%, respectively; P=0.04) and metabolism and nutrition disorders (38 vs. 23%, respectively; P=0.003).52
Quizartinib is a type 2 FLT3 inhibitor exhibiting highly potent and selective, but reversible, inhibition of FLT3. It inhibits FLT3 kinase activity by preventing autophosphorylation of the receptor, blocking FLT3-ITD-dependent cell proliferation, and enhancing differentiation of FLT3-ITD-mutated stem cells into mature circulating cells.47 Data from the phase III QuANTUM-First study, a randomized, doubleblinded, placebo-controlled study evaluating quizartinib in combination with induction and consolidation chemotherapy and as 3-year continuation monotherapy in patients (aged 18-75 years) with newly diagnosed FLT3-ITD-positive AML, showed a statistically significant and clinically meaningful improvement in OS when compared with that in patients who received standard treatment and placebo.53 With a median follow-up of 39.2 months, the median OS in the quizartinib arm was significantly longer than that in the placebo arm of the study (31.9 vs. 15.1 months, respectively; HR=0.776, two-sided P=0.0324). The OS rates at 24 months were 54.7% and 44.7% in the quizartinib and placebo arms, respectively. When censoring for allo-HCT, there was still a strong effect in favor of quizartinib (HR=0.752, 95% CI: 0.562-1.008; P=0.055) with a median OS of 20.8 months in the quizartinib arm and 12.9 months in the placebo arm. This suggests that, in contrast to midostaurin, the strong FLT3 inhibitor quizartinib is very efficacious independently of allo-HCT. The efficacy of quizartinib is based on a tendency to a better CR/CRi rate (quizartinib, 71.6%; placebo, 64.9%; P=0.0912) and a significantly better relapse-free survival (HR=0.613, 95% CI: 0.444-0.845) for subjects achieving CR during induction, with a median relapse-free survival of 39.3 months in the quizartinib arm compared to 13.6 months in the placebo arm. Of note, subgroup analyses for OS showed that patients with a higher variant allele frequency (>50%) treated with quizartinib had a significantly greater therapeutic benefit, with a risk reduction of roughly 47% (HR=0.526, 95% CI: 0.29-0.955) com-
pared to patients treated with placebo which again contrasts with the midostaurin data with a risk reduction of only 20% (HR=0.80, 95% CI: 0.6-1.11) in these high-risk patients.50 Furthermore, patients with a high allelic FLT3ITD ratio treated with midostaurin in the AMLSG 16-10 trial did not show a significant improvement in OS compared to patients in the historical cohort treated with chemotherapy alone (HR=1.20, 95% CI: 0.98-1.47; P=0.082).52
Treatment-emergent serious adverse events and adverse events in the QuANTUM-First trial were significantly more frequent in the subgroup of patients older than 65 years, thus, special measures should be taken when treating older patients with quizartinib and intensive chemotherapy regimens.53
Gilteritinib, a type 1, oral FLT3 inhibitor with activity against both FLT3 mutation subtypes (ITD and TKD) and weak activity against c-Kit was evaluated in a phase I study including newly diagnosed patients with FLT3-ITD mutated AML. Patients received induction therapy with gilteritinib plus the “7+3” regimen and high-dose cytarabine consolidation chemotherapy, as well as single-agent maintenance therapy. In an interim analysis of 80 patients with a median age of 59.0 years, the median follow-up for OS was 35.8 months. Serious treatment-related adverse events and adverse events leading to discontinuation of gilteritinib occurred in 12.7%. Among patients within the expansion cohort receiving the final dosage of gilteritinib, the investigator-reported CR/CRi rate was 81.6%. In FLT3-mutated patients who achieved CR or CRi in any dose group, the median duration of the composite CR and disease-free survival were 14.1 and 15.3 months, respectively.54 Based on these results, a study of gilteritinib versus midostaurin in combination with induction and consolidation therapy followed by 1-year maintenance in patients with newly diagnosed AML or myelodysplastic syndromes with excess blasts-2 and with FLT3 mutations eligible for intensive chemotherapy (HOVON 156 AML, NCT04027309) has been initiated. Gilteritinib is also being compared to midostaurin in a randomized, open-label, multicenter phase II study in combination with cytarabine and daunorubicin in newly diagnosed FLT3-mutated AML patients aged 18-65.55 Furthermore, results from two large, randomized studies testing the efficacy of gilteritinib maintenance therapy, one following consolidation therapy (NCT02927262) and the other after allo-HCT (NCT02997202), are currently awaited and should provide more definitive guidance on the use of this tyrosine kinase inhibitor in maintenance therapy.
IDH inhibitors
Isocitrate dehydrogenase 1 (IDH1) and IDH2 are NADP+-dependent enzymes that catalyze the oxidative decarboxylation of isocitrate to a -ketoglutarate and are thus key components of the Krebs cycle.56 Somatic gain-of-func-
Haematologica | 108 February 2023 346 REVIEW ARTICLE S. Jaramillo and R.F. Schlenk
tion mutations in IDH1 or IDH2 are found in approximately 20% of patients with newly diagnosed AML.56-58 Enasidenib is an oral, selective inhibitor of mutated IDH2, approved by the FDA for the treatment of adult patients with relapsed or refractory IDH2-mutated AML. Its approval was based on the results of a phase I/II trial including 176 patients.59 The overall response rate was 40.3% (CR, 27%). Ivosidenib is an oral small molecule inhibitor of mutated IDH1 approved by the FDA for the treatment of adult patients with relapsed or refractory AML with mutated IDH1 The approval was based on results of an open-label, phase I dose-escalation and dose-expansion study involving 258 adult patients with IDH1-mutated AML. The primary efficacy population consisted of 125 patients and the overall response rate ranged from 39.1% (95% CI: 31.946.7%) in relapsed/refractory AML to 55.9% (95% CI: 37.972.8%) in newly diagnosed AML.60
In a recent open-label, multicenter, phase I study (NCT02632708), patients with newly diagnosed mutated IDH1 or IDH2 AML (n=153), were treated with induction therapy (“7+3”) in combination with either ivosidenib (n=60) or enasidenib (n=93). CR/CR with incomplete neutrophil or platelet recovery (CR/CRi/CRp) rates were 72% and 63%, respectively. Among patients with a best overall response of CR/CRi/CRp, of the 41 patients who received ivosidenib, 16 (39%) achieved clearance of the IDH1 mutation, as determined by digital polymerase chain reaction, and 16 of 20 did not have MRD by multiparameter flow cytometry. Likewise, 15/64 (23%) patients receiving enasidenib showed IDH2 mutation clearance and 10/16 (63%) patients became negative for MRD by multiparameter flow cytometry. In the older study population (median age 63 years), the treatment was well tolerated, and the first clinical results were encouraging.61,62 The efficacy of these two compounds is being further evaluated in the ongoing HOVON150 AML randomized phase III trial (NCT03839771). Results of studies of IDH inhibitors with azacitidine were also encouraging, although the composite CR rate (53%) was lower than that seen with intensive therapy.63
Anti-CD33
GO is a humanized immunoglobulin G4 antibody (hP67.6) directed against CD33 and conjugated via a hydrolyzable linker to the DNA toxin calicheamicin. GO/CD33 complexes are internalized into lysosomes, releasing calicheamicin and promoting single- and double-strand DNA breaks and cellular death. Based mainly on the results of the ALFA0701 study in newly diagnosed patients, GO was reapproved for use in AML patients, after it had been withdrawn from the market in June 2010 by Pfizer. In the ALFA 0701 study, patients in the GO arm had significantly improved median event-free (19.6 vs. 11.9 months; P=0.00018) and OS (34 vs. 19.2 months; P=0.046).64 Although the difference in OS was no longer statistically sig-
nificant when updated data were analyzed,65 the trend to a longer OS observed in the GO arm of ALFA-0701 is consistent with the results found in a meta-analysis of individual patients’ data that showed a significant improvement in OS in patients treated with GO.66 In the AMLSG 09-09 study, 588 adult patients with newly diagnosed NPM1-mutated AML were randomly assigned to standard arm (n=296) with induction therapy consisting of idarubicin, cytarabine, etoposide, and all-trans retinoic acid or the GO arm (n=292) with GO as an adjunct to therapy given to the patients in the standard arm.20 The early primary endpoint, event-free survival, was not significantly different between the two arms (HR=0.83, 95% CI: 0.651.04; P=0.10), mainly because of a significantly higher infection-triggered early death rate during induction therapy in the GO arm (10.3% vs. 5.7% in the standard arm; P=0.05). However, the addition of GO resulted in a significant and clinically meaningful reduction in the cumulative incidence of relapse (HR=0.66, 95% CI: 0.49-0.88; P=0.005) leading to a strong recommendation in current guidelines to add GO to standard induction therapy in NPM1-mutated AML.14,67 In a companion study evaluating NPM1 MRD during the trial, overall, the addition of GO significantly reduced MRD levels at all time-points compared to those in the standard arm.68 However, despite achieving NPM1 MRD negativity after consolidation therapy, one-quarter of the patients still relapsed within 4 years.20 This indicates that further efforts need to be invested in refining MRD assessment and determining its relevance, in particular in the evaluation of maintenance therapy. The final results from the AMLSG 0909 study will further clarify the role of GO as an adjunct to intensive induction therapy; however, it is already known that GO in this setting has a broad toxicity spectrum, especially in older patients. Indeed the older population had no benefit from the addition of GO in any of the response or survival endpoints, whereas the rates of CR/CRi, event-free survival and cumulative incidence of relapse were similar between treatment arms. Furthermore, the 30- and 60-day mortality rates were higher in the GO arm.69
NPM1
Nucleophosmin-1 (NPM1) is a nuclear phosphoprotein involved in epigenetic cellular regulation through nuclearcytoplasmic shuttling.70-72 Mutations in NPM1 occur in 30% of patients with AML and are associated with a favorable response to standard intensive chemotherapy, with both high CR rates and good OS.73 As already mentioned, patients harboring mutations in the NPM1 gene respond favorably to intensive induction with the “7+3” regimen plus GO, with CR rates around 85% and 5-year OS around 4050%.20 of note, impressive responses have also been observed when patients are treated with non-intensive therapy (aza-ven). In the VIALE-A phase III study (n=27) the
Haematologica | 108 February 2023 347 REVIEW ARTICLE S. Jaramillo and R.F. Schlenk
overall response rate was 93% and the 2-year OS was 75% for patients harboring a NPM1 mutation.36,37,74 Early mortality (30 days) in this cohort of elderly unfit patients was only 3%.
Furthermore, there are reports about patients not achieving molecular remission after consolidation therapy who had rapid elimination of NPM1 MRD when azacitidine or low-dose cytarabine and venetoclax were administered as bridging therapy to allo-HCT.75 All these data raise the possibility that the non-intensive combination of aza-ven may be equivalent or even superior to intensive chemotherapy in terms of clinical outcome in patients with NPM1-mutated AML which is the basis of the above-mentioned VINCENT trial (EudraCT-No 2021-003248-26).
Secondary acute myeloid leukemia
CPX-351 is a liposomal encapsulation of cytarabine/daunorubicin in a 5:1 molar ratio. Its use was approved based on the results of a randomized study in patients with therapy-associated AML, a history of myelodysplastic syndrome, AML with a history of chronic myelomonocytic leukemia, or de novo AML with myelodysplasia-related cytogenetic changes. CPX-351 was compared to standard induction and consolidation therapy in older patients (6075 years).76 The study showed that patients receiving CPX351 had a higher CR rate (47.7% vs. 33.3%; P=0.016) and better OS (median, 9.56 vs. 5.95 months; P=0.005) compared to those given standard induction and consolidation therapy.76 This study included 63 patients (30 patients in the CPX-351 and 33 in the standard arm) with therapy-related AML. The definition of therapy-related AML was AML in patients who had previously received alkylating agents, ionizing radiation therapy, treatment with topoisomerase II inhibitors, antimetabolites or antitubulin agents. A recent retrospective study compared survival outcomes of patients treated with CPX-351 (n=219) or aza-ven (n=440).38,77 Patients with therapy-related AML (n=17 in each arm) were also included. For all patients, baseline covariates showed that those receiving aza-ven were older (median age, 75 vs. 65 years), mainly had de novo AML (52% vs. 29%) and were treated in the community rather than in academic centers (66% vs. 52%). All other baseline covariates, including cytogenetic risk according to the ELN classification, the presence of prognostic mutations (TP53, ASXL1, RUNX1), or relevant comorbidities were not different between the treatment arms. The median OS was 13 months in patients treated with CPX-351 and 11 months for those given aza-ven (HR=0.87, 95% CI: 0.70-1.07; P=0.184). In the multivariate analysis considering complete cases only (n=133), the type of therapy (CPX-351 vs. aza-ven did not affect OS (P=0.73). In subgroup analysis, none of the AML types (de novo, secondary, or therapy-related AML)
benefited more from one or the other therapy. Regarding safety outcomes, early mortality was similar. However, the rates of documented febrile neutropenia as well as culturepositive infections were significantly higher in patients treated with CPX-351 (90% vs. 53% and 67% vs. 36%, respectively; both P<0.000005). Length of hospital stay, including any admission prior to the next cycle of therapy, was 41 days in patients treated with CPX-351 compared to 15 days in patients treated with aza-ven (P<0.000005). These retrospective data suggest that aza-ven treatment may be equally effective as or at least not inferior to CPX351, and is associated with significantly fewer infectious complications and shorter stays in hospital.
Maintenance therapy
The QUAZAR study, a phase III, randomized, doubleblinded, placebo-controlled trial, evaluated CC-486, an oral, well-tolerated hypomethylating agent, as maintenance therapy in elderly patients above the age of 55 years with intermediate or high-risk AML after achieving first CR or CRi after intensive induction therapy who were ineligible for allo-HCT. The maintenance therapy was intended to be continued until death, relapse, or intolerable toxicity. According to a previous study, at a median follow-up of 41.2 months, CC-486 led to a significant improvement of OS compared to that in the placebo arm (24.7 months vs 14.8 months, respectively; HR=0.69, 95% CI: 0.55-0.86; P=0.0009). The most frequently reported adverse events were grade 1 or 2 nausea, vomiting, and diarrhea; the most common grade 3 or 4 adverse events were neutropenia, anemia, and thrombocytopenia. Based on these results, the FDA and EMA granted approval of CC-486 for patients in CR/CRi unfit for allo-HCT or intensive consolidation therapy after intensive induction therapy.78 In an accompanying study, presented at the 63rd American Society of Hematology annual meeting, in comparison to placebo, CC-486 prolonged OS and relapse-free survival in patients with mutated NPM1, with improvements beyond the prognostic benefit conferred by MRD negativity, suggesting that patients with mutated NPM1 and MRD negativity can attain substantial OS benefit with CC-486 maintenance.79 However, based on the shape of the Kaplan-Meier curves the effect seemed to be limited in time, as relapses appeared to be delayed rather than prevented. A recent retrospective analysis also showed that CC-486 prolonged the survival of patients with AML in remission independently of MRD status.80
Other oral medications are being evaluated as possible maintenance therapies, such as venetoclax in addition to azacitidine,81 quizartinib and gilteritinib in FLT3-mutated AML and ivosidenib as well as enasidenib in IDH1/2-muated AML.
Haematologica | 108 February 2023 348 REVIEW ARTICLE - Missing S. Jaramillo and R.F. Schlenk
Old and frail patients
Older patients are more likely to have comorbidities, impaired performance status, and poorer cytogenetic risk.5 These factors contribute to poorer prognoses and poorer tolerance to intensive therapeutic regimens. Less intensive treatment options such as azacitidine and decitabine have become the backbone for the majority of combination therapy regimens for elderly patients. 36,37,74 Luckily, recent studies have changed the prospective of these patients making the achievement of long-lasting CR possible. The results of the VIALE-A trial revolutionized therapy in elderly patients. In this study 431 elderly unfit patients with AML, ineligible for standard induction therapy, were treated with azacitidine plus either venetoclax (aza-ven) or placebo. The median OS was longer in the aza-ven group than in the placebo group (14.7 vs . 9.6 months, respectively; HR=0.66, 95% CI: 0.52 to 0.85; P<0.001). A composite CR was achieved in 66.4% (95% CI: 60.6-71.9) of the patients in the aza-ven group and 28.3% (95% CI: 21.1-36.3) of the patients in the placebo group ( P <0.001).19 Since then, multiple studies have explored different backbone combination partners for venetoclax in older and younger patients. As a consequence, substances such as glasdegib82 have been eclipsed by venetoclax in combination with hypomethylating agents. Recent studies have shown improvements in remission rates even in patients with TP53 mutations, although this did not translate into longer OS. Further improvements in these difficult-to-treat patients were identified in a phase I/II study evaluating the combination of aza-ven and magrolimab, an anti-CD47 antibody that blocks the “don’t eat me signal” on macrophages. Overall, high CR/CRi rates were reported; in particular in old and frail patients with TP53 -mutated AML the CR/CRi rate was 100% (7/7) and MRD negativity, assessed by multicolor flow cytometry, was achieved by 57% (4/7). 83 Another study presented at the 63rd American Society of Hematology annual meeting was a phase II study evaluating venetoclax added to cladribine and low-dose cytarabine alternating with azacitidine in older and unfit patients with newly diagnosed AML. 84 Again, the CR/CRi rate among 60 evaluable patients was high (93%) and MRDnegativity was achieved by 43 of 51 evaluable patients (84%). Based on these studies, it is safe to say that venetoclax as an adjunct to different backbone therapies provides meaningful improvements in remission rates and, based on partial responses from these last studies, a clinically relevant improvement in OS compared to chemotherapy alone.
There are also preliminary results from studies of the combination of FLT3 or IDH inhibitors with azacitidine in older patients not fit for intensive chemotherapy. A phase II trial evaluated the efficacy of gilteritinib and azacitidine
vs. azacitidine alone in 123 patients with newly diagnosed FLT3-mutated AML randomized 2:1. The composite CR rates were significantly higher for gilteritinib and azacitidine than for azacitidine alone (58.1 vs. 26.5%; P<0.001), however, the median OS was not different, being 9.82 months for the combination and 8.87 months for azacitidine alone (HR=0.916, 95% CI: 0.529-1.585; P=0.753).
IDH inhibitors
The AGILE trial evaluated ivosidenib as an adjunct to azacitidine in elderly patients with IDH1-mutated AML not fit for intensive therapy. One hundred and forty-six patients were randomized: 72 to ivosidenib plus azacitidine (median age, 76 years) and 74 to placebo and azacitidine (median age, 75.5 years). At a median follow-up of 12.4 months, event-free survival, defined as treatment failure, relapse from remission, or death, was significantly longer in the ivosidenib plus azacitidine group than in the placebo + azacitidine group (HR=0.33, 95% CI: 0.16-0.69; P=0.002). The median OS was 24.0 months in the group treated with ivosidenib plus azacitidine and 7.9 months in the group treated with placebo plus azacitidine (HR=0.44; 95% CI: 0.27-0.73; P=0.001). The composite CR rate with ivosidenib plus azacitidine was 53% (95% CI: 41-65) compared to 18% (95% CI: 10-28) with placebo plus azacitidine (P<0.0001). The frequency of all-grade differentiation syndrome, assessed by investigators, was 14.1% with ivosidenib plus azacitidine and 8.2% with placebo plus azacitidine63 (NCT03173248).
Conclusions
Since 1973, induction therapy with cytarabine in combination with an anthracycline has been the standard of care for fit patients with AML.85 In recent years, comprehensive genomic profiling for the most frequent AML mutations has become part of the clinical routine for most patients in economically developed countries. This new knowledge has culminated in the identification of several substances targeting crucial intracellular signaling pathways necessary for the growth of various forms of AML. However, used as single agents, these substances display moderate antileukemic activity. In contrast, when they are administered in combination with hypomethylating drugs or intensive chemotherapy, there is a meaningful improvement in their clinical activity. The approval of the BCL-2-targeted therapy venetoclax has paved the way for exciting future research opportunities for patients deemed unfit to receive intensive chemotherapy, a population with previously very limited therapeutic options. Recently, improvements have been seen even in patients with adverse-risk AML harboring TP53 alterations when treated with antibodies and venetoclax. The un-
Haematologica | 108 February 2023 349 REVIEW ARTICLE S. Jaramillo and R.F. Schlenk
answered question is whether older patients are the only ones who should be treated with non-intensive regimens. Consistent lack of superiority for intensive chemotherapy compared to aza-ven has been seen in several risk groups of elderly and younger patients with AML, mainly in retrospective analyses. This has led to the idea of offering nonintensive therapy regimens to younger patients as well. Indeed, this approach is being tested in different clinical trials. In the era of the COVID-19 pandemic, approaches that facilitate outpatient therapies are all the more preferable. Surrogate endpoints such as MRD may accelerate accurate clinical validation of new therapies. These new and exciting therapies, as well as the fact that we can detect sooner which patients will respond adequately to
References
1. Park E-H, Lee H, Won Y-J, et al. Nationwide statistical analysis of myeloid malignancies in Korea: incidence and survival rate from 1999 to 2012. Blood Res. 2015;50(4):204-217.
2. Siegel RL, Miller KD, Fuchs HE, Jemal A. Cancer statistics, 2022. CA Cancer J Clin. 2022;72(1):7-33.
3. Nagel G, Weber D, Fromm E, et al. Epidemiological, genetic, and clinical characterization by age of newly diagnosed acute myeloid leukemia based on an academic population-based registry study (AMLSG BiO). Ann Hematol. 2017;96(12):1993-2003.
4. https://seer.cancer.gov/statfacts/html/amyl.html. Accessed September 28, 2022.
5. Juliusson G, Antunovic P, Derolf Å, et al. Age and acute myeloid leukemia: real world data on decision to treat and outcomes from the Swedish Acute Leukemia Registry. Blood. 2009;113(18):4179-4187.
6. Ocias LF, Larsen TS, Vestergaard H, Friis LS, Abildgaard N, Frederiksen H. Trends in hematological cancer in the elderly in Denmark, 1980-2012. Acta Oncol. 2016;55(Suppl 1):98-107.
7. Klepin HD, Rao AV, Pardee TS. Acute myeloid leukemia and myelodysplastic syndromes in older adults. J Clin Oncol. 2014;32(24):2541-2552.
8. Bispo JAB, Pinheiro PS, Kobetz EK. Epidemiology and etiology of leukemia and lymphoma. Cold Spring Harb Perspect Med. 2020;10(6):a034819.
9. Papaemmanuil E, Gerstung M, Bullinger L, et al. Genomic classification and prognosis in acute myeloid leukemia. N Engl J Med. 2016;374(23):2209-2221.
10. Schlenk RF, Döhner H. Genomic applications in the clinic: use in treatment paradigm of acute myeloid leukemia. Hematology. 2013;2013(1):324-330.
11. Döhner H, Weisdorf DJ, Bloomfield CD. Acute myeloid leukemia. N Engl J Med. 2015;373(12):1136-1152.
12. Dohner H, Wei AH, Lowenberg B. Towards precision medicine for AML. Nat Rev Clin Oncol. 2021;18(9):577-590.
13. Daver N, Alotaibi AS, Bücklein V, Subklewe M. T-cell-based immunotherapy of acute myeloid leukemia: current concepts and future developments. Leukemia. 2021;35(7):1843-1863.
14. National Comprehensive Cancer Network. Acute myeloid leukemia (version 3.2019) https://www.nccn.org/professionals/physician_gls/pdf/aml.pdf. Accessed December 22, 2020.
15. Dohner H, Wei AH, Appelbaum FR, et al. Diagnosis and
therapy, make the future of AML therapy brighter than ever.
Disclosures
SJS reports no conflicts of interest. RFS reports consulting for or advisory board membership with Daiichi Sankyo, Pfizer, Astellas, and Novartis; research funding from PharmaMar, AstraZeneca, Pfizer, Roche, Boehringer Ingelheim, and Daiichi Sankyo; travel, accommodation, and expenses covered by Daiichi Sankyo.
Contributions
SJ and RFS conceived, designed and wrote this review and gave final approval of the manuscript.
management of AML in adults: 2022 ELN recommendations from an international expert panel. Blood. 2022;140(12):1345-1377.
16. Pollyea DA, Bixby D, Perl A, et al. NCCN guidelines insights: acute myeloid leukemia, version 2.2021. J Natl Compr Canc Netw. 2021;19(1):16-27.
17. Jaramillo S, Schlenk RF. Post-Induction treatment for acute myeloid leukemia: something change? Curr Oncol Rep. 2021;23(9):109.
18. Sorror ML, Storer BE, Fathi AT, et al. Multisite 11-year experience of less-intensive vs intensive therapies in acute myeloid leukemia. Blood. 2021;138(5):387-400.
19. DiNardo CD, Jonas BA, Pullarkat V, et al. Azacitidine and venetoclax in previously untreated acute myeloid leukemia. N Engl J Med. 2020;383(7):617-629.
20. Schlenk RF, Paschka P, Krzykalla J, et al. Gemtuzumab ozogamicin in NPM1-mutated acute myeloid leukemia: early results from the prospective randomized AMLSG 09-09 phase III study. J Clin Oncol. 2020;38(6):623-632.
21. Murdock HM, Kim HT, Denlinger N, et al. Impact of diagnostic genetics on remission MRD and transplantation outcomes in older patients with AML. Blood. 2022;139(24):3546-3557.
22. Pasvolsky O, Shimony S, Ram R, et al. Allogeneic hematopoietic cell transplantation for acute myeloid leukemia in first complete remission after 5-azacitidine and venetoclax: a multicenter retrospective study. Ann Hematol. 2022;101(2):379-387.
23. Cherry EM, Abbott D, Amaya M, et al. Venetoclax and azacitidine compared with induction chemotherapy for newly diagnosed patients with acute myeloid leukemia. Blood Adv. 2021;5(24):5565-5573.
24. Chen S, Xie J, Yang X, Shen H, et al. Venetoclax plus decitabine for young adults with newly diagnosed ELN adverse-risk acute myeloid leukemia: interim analysis of a prospective, multicenter, single-arm, phase 2 trial. Blood. 2021;138(Suppl 1):35.
25. Gangat N, McCullough K, Johnson I, et al. Real-world experience with venetoclax and hypomethylating agents in myelodysplastic syndromes with excess blasts. Am J Hematol. 2022;97(6):E214-E16.
26. Rahmani NE, Ramachandra N, Sahu S, et al. ASXL1 mutations are associated with distinct epigenomic alterations that lead to sensitivity to venetoclax and azacitidine. Blood Cancer J. 2021;11(9):157.
Haematologica | 108 February 2023 350 REVIEW ARTICLE S. Jaramillo and R.F. Schlenk
27. Gangat N, Johnson I, McCullough K, et al. Molecular predictors of response to venetoclax plus hypomethylating agent in treatmentnaive acute myeloid leukemia. Haematologica. 2022;107(10):2501-2505.
28. Aldoss I, Yang D, Pillai R, Sanchez JF, et al. Association of leukemia genetics with response to venetoclax and hypomethylating agents in relapsed/refractory acute myeloid leukemia. Am J Hematol. 2019;94(10):e253-e255.
29. Pei S, Pollyea DA, Gustafson A, et al. Monocytic subclones confer resistance to venetoclax-based therapy in patients with acute myeloid leukemia. Cancer Discov. 2020;10(4):536-551.
30. DiNardo CD, Lachowiez CA, Takahashi K, et al. Venetoclax combined with FLAG-IDA induction and consolidation in newly diagnosed acute myeloid leukemia. Am J Hematol. 2022;97(8):1035-1043.
31. Chua CC, Roberts AW, Reynolds J, et al. Chemotherapy and Venetoclax in Elderly Acute Myeloid Leukemia Trial (CAVEAT): a phase Ib dose-escalation study of venetoclax combined with modified intensive chemotherapy. J Clin Oncol. 2020;38(30):3506-3517.
32. Wang H, Mao L, Yang M, et al. Venetoclax plus 3 + 7 daunorubicin and cytarabine chemotherapy as first-line treatment for adults with acute myeloid leukaemia: a multicentre, single-arm, phase 2 trial. Lancet Haematol. 2022;9(6):e415-e424.
33. Juliusson G, Billstrom R, Gruber A, et al. Attitude towards remission induction for elderly patients with acute myeloid leukemia influences survival. Leukemia. 2006;20(1):42-47.
34. Sorror ML, Storer BE, Fathi AT, et al. Development and validation of a novel acute myeloid leukemia-composite model to estimate risks of mortality. JAMA Oncol. 2017;3(12):1675-1682.
35. Othman J, Amer M, Amofa R, et al. Venetoclax with azacitidine or low dose cytarabine as an alternative to intensive chemotherapy in fit adults during the COVID19 pandemic: real world data from the UK National Health Service. Blood. 2021;138(Suppl 1):2321.
36. DiNardo CD, Pratz KW, Letai A, et al. Safety and preliminary efficacy of venetoclax with decitabine or azacitidine in elderly patients with previously untreated acute myeloid leukaemia: a non-randomised, open-label, phase 1b study. Lancet Oncol. 2018;19(2):216-228.
37. DiNardo CD, Pratz K, Pullarkat V, et al. Venetoclax combined with decitabine or azacitidine in treatment-naive, elderly patients with acute myeloid leukemia. Blood. 2019;133(1):7-17.
38. Matthews A, Perl AE, Luger SM, et al. Real world survival outcomes of CPX-351 versus venetoclax and azacitadine for initial therapy in adult acute myeloid leukemia. Blood. 2021;138(Suppl 1):795.
39. Garcia JS, Wolach O, Vachhani P, et al. Comparative effectiveness of venetoclax combinations vs other therapies among patients with newly diagnosed acute myeloid leukemia: results from the AML Real World Evidence (ARC) initiative. Blood. 2021;138(Suppl 1):2328.
40. Lübbert M, Wijermans P, Kicinski M, et al. 10-Day decitabine vs. conventional chemotherapy ('3+7') followed by allografting (HSCT) in AML patients ≥60 years: a randomized phase III study of the EORTC Leukemia Group, GIMEMA, CELG, and GMDS-SG. EHA Library 2022. (Abstract release date: 05/12/22)
41. Schlenk RF, Kayser S. Midostaurin: a multiple tyrosine kinases inhibitor in acute myeloid leukemia and systemic mastocytosis. Recent Results Cancer Res. 2018;212:199-214.
42. Gale RE, Green C, Allen C, Mead AJ, et al. The impact of FLT3 internal tandem duplication mutant level, number, size, and interaction with NPM1 mutations in a large cohort of young adult patients with acute myeloid leukemia. Blood. 2008;111(5):2776-2784.
43. Boddu P, Kantarjian H, Borthakur G, et al. Co-occurrence of FLT3TKD and NPM1 mutations defines a highly favorable prognostic AML group. Blood Adv. 2017;1(19):1546-1550.
44. Schlenk RF, Kayser S, Bullinger L, et al. Differential impact of allelic ratio and insertion site in FLT3-ITD-positive AML with respect to allogeneic transplantation. Blood. 2014;124(23):3441-3449.
45. Voso MT, Larson RA, Jones D, et al. Midostaurin in patients with acute myeloid leukemia and FLT3-TKD mutations: a subanalysis from the RATIFY trial. Blood Adv. 2020;4(19):4945-4954.
46. Kottaridis PD, Gale RE, Frew ME, et al. The presence of a FLT3 internal tandem duplication in patients with acute myeloid leukemia (AML) adds important prognostic information to cytogenetic risk group and response to the first cycle of chemotherapy: analysis of 854 patients from the United Kingdom Medical Research Council AML 10 and 12 trials. Blood. 2001;98(6):1752-1759.
47. Daver N, Schlenk RF, Russell NH, Levis MJ. Targeting FLT3 mutations in AML: review of current knowledge and evidence. Leukemia. 2019;33(2):299-312.
48. Zarrinkar PP, Gunawardane RN, Cramer MD, et al. AC220 is a uniquely potent and selective inhibitor of FLT3 for the treatment of acute myeloid leukemia (AML). Blood. 2009;114(14):2984-2992.
49. Aikawa T, Togashi N, Iwanaga K, et al. Quizartinib, a selective FLT3 inhibitor, maintains antileukemic activity in preclinical models of RAS-mediated midostaurin-resistant acute myeloid leukemia cells. Oncotarget 2020;11(11);943-955.
50. Stone RM, Mandrekar SJ, Sanford BL, et al. Midostaurin plus chemotherapy for acute myeloid leukemia with a FLT3 mutation. N Engl J Med. 2017;377(5):454-464.
51. Schlenk RF, Weber D, Fiedler W, et al. Midostaurin added to chemotherapy and continued single-agent maintenance therapy in acute myeloid leukemia with FLT3-ITD. Blood. 2019;133(8):840-851.
52. Dohner H, Weber D, Krzykalla J, et al. Midostaurin plus intensive chemotherapy for younger and older patients with AML and FLT3 internal tandem duplications. Blood Adv. 2022;6(18):5345-5355.
53. Erba H, Montesinos P, Vrhovac R, et al. Quizartinib prolonged survival vs placebo plus intensive induction and consolidation therapy followed by sing-agent continuation in patients aged 1875 years with newly diagnosed FLT3-ITD+ AML. EHA Library 2022. (Abstract release date: 05/12/22).
54. Pratz KW, Cherry M, Altman JK, et al. A phase 1 study of gilteritinib in combination with induction and consolidation chemotherapy in patients with newly diagnosed AML: final results. Blood. 2020;136(Suppl 1):16-17.
55. Luger SM, Sun Z, Loghavi S, et al. Phase II randomized trial of gilteritinib vs midostaurin in newly diagnosed FLT3 mutated acute myeloid leukemia (AML). Blood. 2019;134(Suppl_1):1309.
56. Figueroa ME, Abdel-Wahab O, Lu C, et al. Leukemic IDH1 and IDH2 mutations result in a hypermethylation phenotype, disrupt TET2 function, and impair hematopoietic differentiation. Cancer Cell. 2010;18(6):553-567.
57. Ward PS, Patel J, Wise DR, A, et al. The common feature of leukemia-associated IDH1 and IDH2 mutations is a neomorphic enzyme activity converting alpha-ketoglutarate to 2hydroxyglutarate. Cancer Cell. 2010;17(3):225-234.
58. Lu C, Ward PS, Kapoor GS, et al. IDH mutation impairs histone demethylation and results in a block to cell differentiation. Nature. 2012;483(7390):474-478.
59. Stein EM, DiNardo CD, Pollyea DA, et al. Enasidenib in mutant IDH2 relapsed or refractory acute myeloid leukemia. Blood. 2017;130(6):722-731.
60. DiNardo CD, Stein EM, de Botton S, et al. Durable remissions
Haematologica | 108 February 2023 351 REVIEW ARTICLE S. Jaramillo and R.F. Schlenk
with ivosidenib in IDH1-mutated relapsed or refractory AML. N Engl J Med. 2018;378(25):2386-2398.
61. Stein EM, DiNardo CD, Fathi AT, et al. Ivosidenib or enasidenib combined with intensive chemotherapy in patients with newly diagnosed AML: a phase 1 study. Blood. 2021;137(13):1792-1803.
62. Fan B, Chen Y, Yin F, Hua L, et al. Pharmacokinetic/ pharmacodynamic evaluation of ivosidenib or enasidenib combined with intensive induction and consolidation chemotherapy in patients with newly diagnosed IDH1/2-mutant acute myeloid leukemia. Clin Pharmacol Drug Dev. 2022;11(4):429-441.
63. Montesinos P, Recher C, Vives S, et al. Ivosidenib and azacitidine in IDH1-mutated acute myeloid leukemia. N Engl J Med. 2022;386(16):1519-1531.
64. Castaigne S, Pautas C, Terre C, et al. Effect of gemtuzumab ozogamicin on survival of adult patients with de-novo acute myeloid leukaemia (ALFA-0701): a randomised, open-label, phase 3 study. Lancet. 2012;379(9825):1508-1516.
65. Lambert J, Pautas C, Terre C, et al. Gemtuzumab ozogamicin for de novo acute myeloid leukemia: final efficacy and safety updates from the open-label, phase III ALFA-0701 trial. Haematologica. 2019;104(1):113-119.
66. Hills RK, Castaigne S, Appelbaum FR, et al. Addition of gemtuzumab ozogamicin to induction chemotherapy in adult patients with acute myeloid leukaemia: a meta-analysis of individual patient data from randomised controlled trials. Lancet Oncol. 2014;15(9):986-996.
67. Heuser M, Ofran Y, Boissel N, et al. Corrigendum to 'Acute myeloid leukaemia in adult patients: ESMO Clinical Practice Guidelines for diagnosis, treatment and follow-up': [Annals of Oncology Volume 31, Issue 6, June 2020, Pages 697-712]. Ann Oncol. 2021;32(6):821.
68. Kapp-Schwoerer S, Weber D, Corbacioglu A, et al. Impact of gemtuzumab ozogamicin on MRD and relapse risk in patients with NPM1-mutated AML: results from the AMLSG 09-09 trial. Blood. 2020;136(26):3041-3050.
69. Döhner H, Weber D, Krzykalla J, et al. Gemtuzumab ozogamicin plus intensive chemotherapy for patients with NPM1-mutated acute myeloid leukemia. 64th ASH Annual Meeting & Exposition. New Orleans, Louisiana 2022.
70. Colombo E, Marine JC, Danovi D, Falini B, Pelicci PG. Nucleophosmin regulates the stability and transcriptional activity of p53. Nat Cell Biol. 2002;4(7):529-533.
71. Grisendi S, Bernardi R, Rossi M, et al. Role of nucleophosmin in embryonic development and tumorigenesis. Nature. 2005;437(7055):147-153.
72. Falini B, Mecucci C, Tiacci E, et al. Cytoplasmic nucleophosmin in acute myelogenous leukemia with a normal karyotype. N Engl J Med. 2005;352(3):254-266.
73. Thiede C, Koch S, Creutzig E, et al. Prevalence and prognostic impact of NPM1 mutations in 1485 adult patients with acute
myeloid leukemia (AML). Blood. 2006;107(10):4011-4020.
74. DiNardo CD, Tiong IS, Quaglieri A, et al. Molecular patterns of response and treatment failure after frontline venetoclax combinations in older patients with AML. Blood. 2020;135(11):791-803.
75. Tiong IS, Dillon R, Ivey A, et al. Venetoclax induces rapid elimination of NPM1 mutant measurable residual disease in combination with low-intensity chemotherapy in acute myeloid leukaemia. Br J Haematol. 2021;192(6):1026-1030.
76. Lancet JE, Uy GL, Cortes JE, et al. CPX-351 (cytarabine and daunorubicin) liposome for injection versus conventional cytarabine plus daunorubicin in older patients with newly diagnosed secondary acute myeloid leukemia. J Clin Oncol. 2018;36(26):2684-2692.
77. Matthews AH, Perl AE, Luger SM, et al. Real-world effectiveness of CPX-351 vs venetoclax and azacitidine in acute myeloid leukemia. Blood Adv. 2022;6(13):3997-4005.
78. Wei AH, Döhner H, Pocock C, et al. Oral azacitidine maintenance therapy for acute myeloid leukemia in first remission. N Engl J Med. 2020;383(26):2526-2537.
79. Döhner H, Wei AH, Roboz GJ, et al. Prognostic impact of NPM1 and FLT3 mutations at diagnosis and presence of measurable residual disease (MRD) after intensive chemotherapy (IC) for patients with acute myeloid leukemia (AML) in remission: outcomes from the QUAZAR AML-001 trial of oral azacitidine (Oral-AZA) maintenance. Blood. 2021;138(Suppl 1):804.
80. Roboz GJ, Ravandi F, Wei AH, et al. Oral azacitidine prolongs survival of patients with AML in remission independently of measurable residual disease status. Blood. 2022;139(14):2145-2155.
81. Bazinet A, Kantarjian H, Borthakur G, et al. A phase II study of 5azacitidine (AZA) and venetoclax as maintenance therapy in patients with acute myeloid leukemia (AML) in remission. Blood. 2021;138(Suppl 1):2326.
82. Cortes JE, Heidel FH, Hellmann A, et al. Randomized comparison of low dose cytarabine with or without glasdegib in patients with newly diagnosed acute myeloid leukemia or highrisk myelodysplastic syndrome. Leukemia. 2019;33(2):379-389.
83. Daver N, Konopleva M, Maiti A, et al. Phase I/II study of azacitidine (AZA) with venetoclax (VEN) and magrolimab (Magro) in patients (pts) with newly diagnosed older/unfit or high-risk acute myeloid leukemia (AML) and relapsed/refractory (R/R) AML. Blood. 2021;138(Suppl 1):371.
84. Kadia TM, Reville PK, Wang X, et al. Phase II study of venetoclax added to cladribine plus low-dose cytarabine alternating with 5-azacitidine in older patients with newly diagnosed acute myeloid leukemia. J Clin Oncol. 2022;40(33):3848-3857.
85. Yates JW Wallace HJ Jr, Ellison RR, Holland JF. Cytosine arabinoside (NSC-63878) and daunorubicin (NSC-83142) therapy in acute nonlymphocytic leukemia. Cancer Chemother Rep. 1973;57(4):485-488.
Haematologica | 108 February 2023 352 REVIEW ARTICLE S. Jaramillo and R.F. Schlenk
Leukemic stem cells and therapy resistance in acute myeloid leukemia
Patrick Stelmach1,2,3 and Andreas Trumpp1,2,4,5
1Division of Stem Cells and Cancer, German Cancer Research Center (DKFZ) and DKFZZMBH Alliance; 2Heidelberg Institute for Stem Cell Technology and Experimental Medicine (HI-STEM, gGmbH); 3Department of Medicine V, Heidelberg University Hospital; 4Faculty of Biosciences, Heidelberg University and 5German Cancer Consortium (DKTK), Heidelberg, Germany
Correspondence: A. Trumpp a.trumpp@dkfz-heidelberg.de
Received: September 11, 2022.
Accepted: November 9, 2022.
https://doi.org/10.3324/haematol.2022.280800
©2023 Ferrata Storti Foundation
Published under a CC BY-NC license
Abstract
A major obstacle in the treatment of acute myeloid leukemia (AML) is refractory disease or relapse after achieving remission. The latter arises from a few therapy-resistant cells within minimal residual disease (MRD). Resistant cells with long-term self-renewal capacity that drive clonal outgrowth are referred to as leukemic stem cells (LSC). The cancer stem cell concept considers LSC as relapse-initiating cells residing at the top of each genetically defined AML subclone forming epigenetically controlled downstream hierarchies. LSC display significant phenotypic and epigenetic plasticity, particularly in response to therapy stress, which results in various mechanisms mediating treatment resistance. Given the inherent chemotherapy resistance of LSC, targeted strategies must be incorporated into first-line regimens to prevent LSC-mediated AML relapse. The combination of venetoclax and azacitidine is a promising current strategy for the treatment of AML LSC. Nevertheless, the selection of patients who would benefit either from standard chemotherapy or venetoclax + azacitidine treatment in first-line therapy has yet to be established and the mechanisms of resistance still need to be discovered and overcome. Clinical trials are currently underway that investigate LSC susceptibility to first-line therapies. The era of single-cell multi-omics has begun to uncover the complex clonal and cellular architectures and associated biological networks. This should lead to a better understanding of the highly heterogeneous AML at the inter- and intrapatient level and identify resistance mechanisms by longitudinal analysis of patients’ samples. This review discusses LSC biology and associated resistance mechanisms, potential therapeutic LSC vulnerabilities and current clinical trial activities.
Introduction
Acute myeloid leukemia (AML) is a heterogeneous disease with a complex cytogenetic and molecular landscape.1 Following conventional induction chemotherapy, patients are assigned to risk-adapted post-remission consolidative therapies.2 Although the majority of AML patients respond to induction chemotherapy, refractory disease is common and relapse is a major challenge.2 Currently, risk stratification is based on cytogenetic diagnostics for recurrent structural genomic abnormalities and targeted sequencing-based diagnostics for recurrent gene mutations.3 However, the origin of relapse has been traced back to therapy-resistant leukemia cells referred to as minimal residual disease (MRD), containing leukemic stem cells (LSC).4 The cancer stem cell concept attributes the origin of relapse to these therapy-resistant leukemia cells exhibiting specific gene expression signatures related to stemness properties.5 The early detection of these drug-
tolerant persister cells enables allocation of patients to salvage therapies or enrollment in clinical trials prior to overt AML relapse (Figure 1A).
The combination of venetoclax and the hypomethylating agent azacitidine has become the standard of care for patients with newly diagnosed AML ≥75 years of age or those who have comorbidities that preclude the use of standard intensive chemotherapy, as a phase III clinical trial demonstrated durable remissions.6 Furthermore, there is a role for venetoclax + azacitidine in refractory/relapsed AML patients to induce remission prior to allogeneic stem cell transplantation and in newly diagnosed patients in whom intensive chemotherapy is not justifiable (given leukemic organ infiltration or a serious infectious complication in neutropenia).7
Since MRD assessment is routinely performed either by cytogenetics, targeted sequencing detecting specific molecular alterations present at diagnosis, such as NPM1 mutations, or by multiparameter flow cytometry, AML
Haematologica | 108 February 2023 353 REVIEW ARTICLE
evolution trajectories and dynamic properties of therapyresistant AML cells have not so far been captured. The era of single-cell multi-omics provides precious insights into clonal dynamics and enables tracing of distinct subclones and the detection of therapy-resistant leukemia cells during the course of AML therapy. Here, we discuss LSC biology and emphasize resistance mechanisms and therapeutic vulnerabilities thereby highlighting a role for single-cell multi-omics to detect MRD, to uncover clonal dynamics of AML and to identify new therapeutic targets aiming to prevent the re-emergence of AML.
Leukemic stem cells, clonal evolution dynamics and tumor heterogeneity
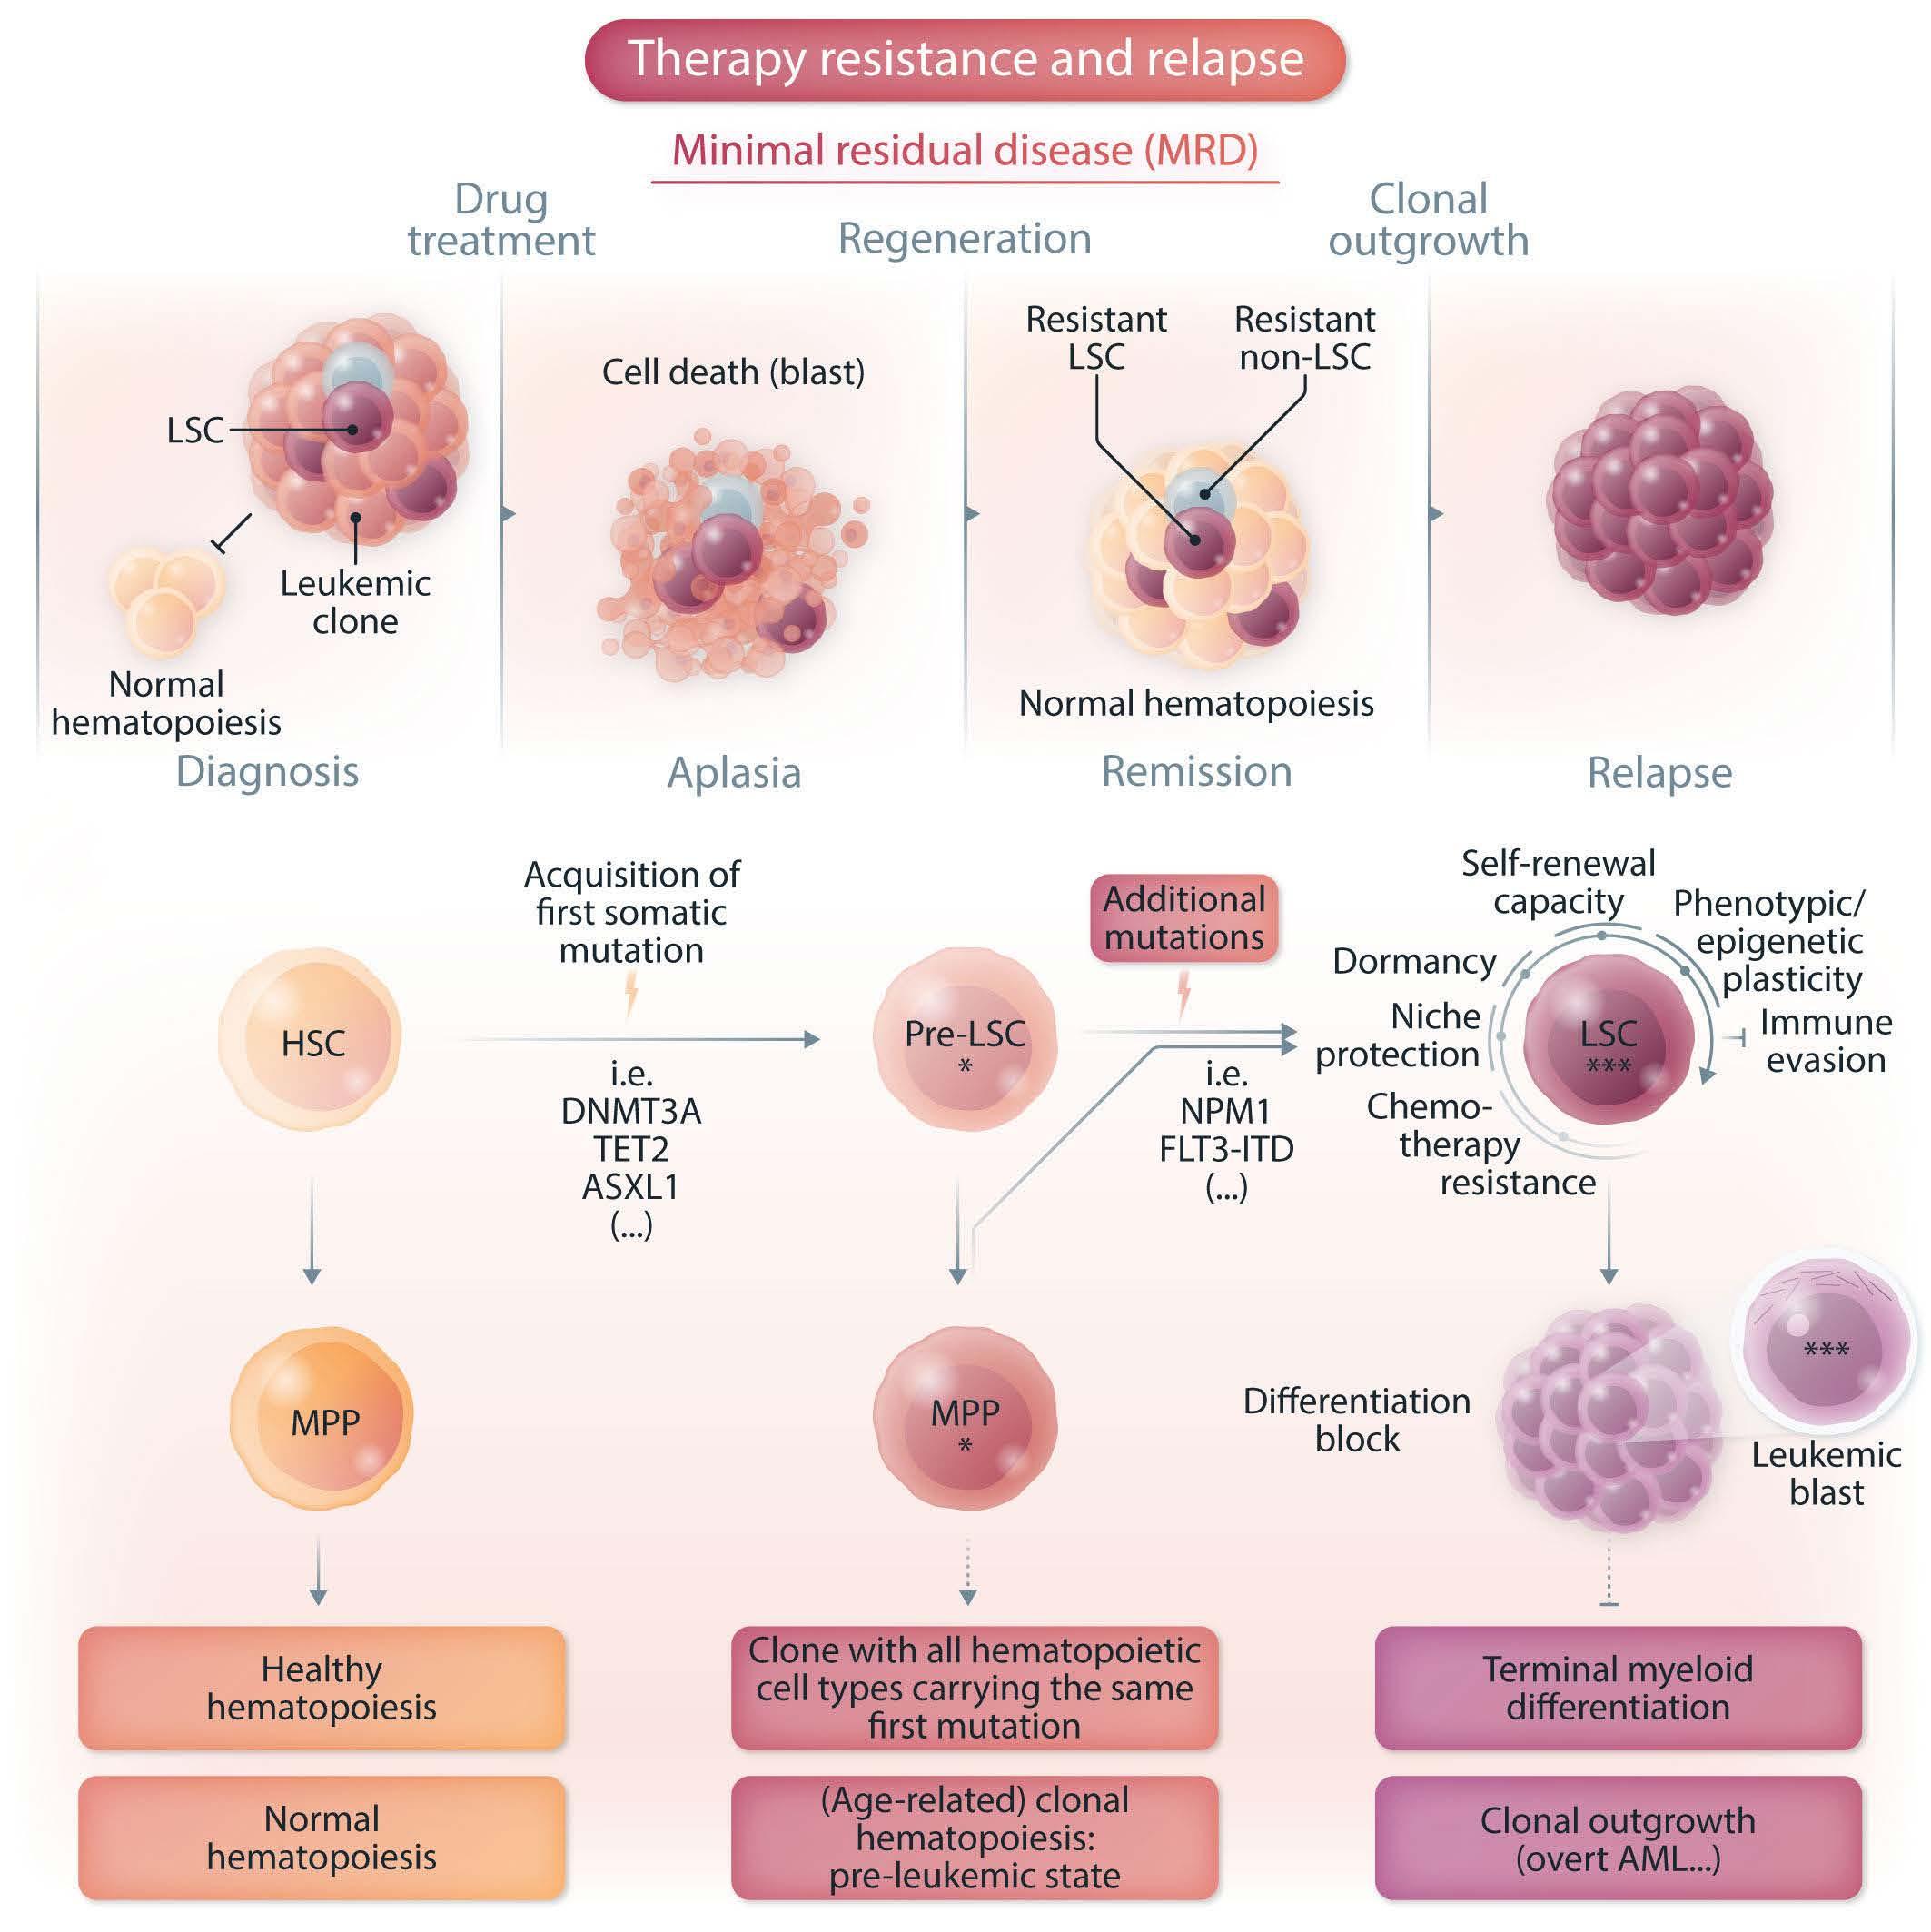
Mature blood and immune cells exhibit tremendous diversity in cell morphology and function. The majority of these cells are derived from multipotent hematopoietic stem cells (HSC), at the top of the hierarchy within the hematopoietic organization. 8 The hallmark of these HSC is their capacity to self-renew maintaining the resident HSC population and generating various progenitors that proliferate and differentiate into mature blood cells and
Figure 1. Evolution and relapse of acute myeloid leukemia. (A) Illustration of minimal residual disease (MRD) and leukemic stem cell (LSC)-mediated therapy resistance in acute myeloid leukemia (AML). Drug-tolerant persister cells, persisting over treatment and fueling relapse, are illustrated (LSC and non-LSC). (B) Scheme of AML evolution illustrating normal hematopoiesis, clonal hematopoiesis (an age-dependent pre-leukemic state) and clonal outgrowth (overt AML). Pre-LSC, in contrast to LSC, maintain their differentiation ability capable of giving rise to mature blood and immune cells. These mutation-bearing progenitors favor an inflammatory environment, thereby contributing to cardiovascular disease and probably also to clonal expansion. Additional mutations in pre-LSC or mutated multipotent progenitor cells then result in LSC fueling clonal outgrowth. HSC: hematopoietic stem cell, MPP: multipotent progenitor cell, pre-LSC: pre-leukemic stem cell.
Haematologica | 108 February 2023 354 REVIEW ARTICLE - LSC-mediated therapy resistance in AML P. Stelmach and A. Trumpp A
B
immune cells. By contrast, committed progenitors have limited and steadily decreasing self-renewal capacity, are exposed to lineage fate and are exhausted within a certain time. 9 At steady state, most HSC are inactive or in a long-term quiescent, but reversible G 0 phase of the cell cycle to maintain their long-term function, a state termed dormancy.10,11 Classically, HSC have been considered as a discrete homogeneous population. However, more recent studies showed significant HSC heterogeneity including early lineage priming and the presence of lineage-biased HSC within the HSC compartment. 8,12,13 HSC reside in a highly specialized, hypoxic bone marrow microenvironment referred to as a niche. The niche concept was proposed in 1978 and is now viewed as a complex network that provides molecular mechanisms and physical interactions that are essential for HSC localization, maintenance and differentiation.14,15
The sequential acquisition of somatic mutations contributing to subsequent clonal evolution constitutes a basic principle in cancer biology.16 This sequence was introduced in studies investigating mutations across different stages of colorectal cancer establishing that genetic alterations cause phenotypic manifestations.17 Since the acquisition of somatic mutations in HSC results in a mutated progeny that is endowed with a Darwinian fitness advantage, these cells are empowered to clonal expansion and will dominate the site in which they originate.16 Additional mutations have the potential to strengthen the growth advantage, resulting in different subclones contributing to independent phylogenetic lineage trees within a tumor reminiscent of a branching evolution.16 Thus, many different subclones are conceivable alongside the dominant clone at diagnosis and these do not contribute significantly to the tumor bulk population. This view shows clearly that tumors are not a collection of homogeneous cells with equal capacity for proliferation but rather a heterogeneous assembly consisting of differently functioning cells working together to maintain tumor growth as a pathophysiological organ.16 The LSC phenotype and its plasticity are shaped by distinct mechanisms including gene mutations, epigenetic modifications that result in specific gene expression programs and the metabolic states that shape a patient’s unique leukemic cell heterogeneity. Complexity is further enhanced through the crosstalk between leukemic cells and non-tumor elements, referred to as the tumor microenvironment.18
Leukemic stem cells re-initiate leukemia
Stem cells can be functionally identified by testing selfrenewal in clonal serial in vivo repopulation assays.16 AML is a prime example in which the capacity to self-renew is
tested in xenotransplantation assays where LSC engraft in immune-deficient recipient mice giving rise to leukemia.19 This was first achieved 30 years ago, when it was possible to engraft normal human hematopoietic cells and leukemic cells in mice.20-22 Engraftment and the potential to initiate leukemia was restricted to the flowsorted CD34+CD38– fraction, establishing that AML is organized as a hierarchy with CD34+CD38– leukemia-initiating cells sitting at its top.21,23 The ability of xenografts to capture even rare relapse-relevant LSC enables comprehensive investigations of therapy resistance and therapeutic approaches. The origin of leukemic cells in relapse samples can be traced back by using specific mutations as lineage tracking marks. Therefore, cells within the diagnostic and relapse samples sharing the same mutational profile will most likely originate from the same founder LSC. Individual variant allele frequencies can then be used to follow the evolution of LSC clones from diagnosis to relapse.24 Leukemic cells capable of engrafting in NSG mice have been demonstrated to be transiently quiescent in the G0 phase of the cell cycle. Following serial transplantation, a rare quiescent long-term leukemia-initiating cell population with extensive self-renewal capacity and an extremely low proliferation rate was identified.25 These data suggest that only LSC subsets drive relapse. Studies with paired diagnostic/relapse samples provide evidence that relapse arises from re-emergence or clonal evolution of a pre-existing and chemotherapy-resistant clone generated before treatment.26-28 Thus, a role for LSC in AML relapse has been demonstrated by combining sequencing of purified AML subpopulations and xenotransplantation assays from paired diagnostic/relapse samples identifying the presence of genetically diverse LSC at diagnosis and two distinct patterns of relapse based on the cell type from which relapse originates.28 In the relapse origin-primitive (ROP) group, a rare population of cells with an HSC-like phenotype already present at diagnosis generates bulk blasts that exhibit extensive myeloid differentiation. By contrast, in the relapse origin-committed group (ROC), relapse originates from cells with an immunophenotype of a more committed progenitor. In both groups of patients relapse is linked to stem cell properties, manifested either as a primitive LSC population giving rise to relapse or as stemness transcriptional programs that are retained in the more differentiated bulk population.28 These findings have considerable implications for cancer biology as well as for how AML should be monitored and treated. The identifi cation of distinct relapse patterns emphasizes that improved methods (including single-cell multi-omics as discussed below) tracking the complex evolutionary history of AML within individual patients are inevitable in the design of further clinical trials as an attempt to overcome LSC-mediated therapy resistance and relapse. Furthermore, the shared functional and
Haematologica | 108 February 2023 355 REVIEW ARTICLE - LSC-mediated therapy resistance in AML P. Stelmach and A. Trumpp
transcriptional stemness properties that underlie both cellular origins of relapse emphasize the importance of integrating new therapeutic approaches targeting stemness properties to prevent AML relapse (Table 1).
Clonal hematopoiesis: an age-related pre-leukemic state
LSC can give rise to leukemic blasts that carry leukemiarelated mutations and are characterized by a differentiation block. By contrast, pre-leukemic stem cells (pre-LSC) harbor recurrent pre-leukemic variants and maintain differentiation and maturation abilities capable of giving rise to mature functional progenitor cells bearing the same variants.29
Clonal hematopoiesis (CH), also called CHIP (clonal hematopoiesis of indeterminate potential), is an age-related condition defined as the presence of myeloid malignancyassociated somatic driver mutations in the peripheral blood without diagnostic criteria for hematologic malignancies.30,31 CH is associated with an increased risk of leukemia and increased mortality largely mediated by cardiovascular disease.32,33 The latter is considered to be caused by a hyperinflammatory phenotype mediated by monocytes and macrophages bearing CH mutations that show increased production of pro-inflammatory cytokines, such as interleukin-1b and interleukin-6, in mice.34,35 DNA methyltransferase 3A (DNMT3A) mutations are the most common driver of this state and most variants exhibit reduced protein stability correlating with strengthened clonal expansion and AML development.36 The tet methylcytosine dioxygenase 2 (TET2) gene has a functionally opposite effect on DNA methylation and is also recurrently mutated in myeloid malignancies and CH.37-39 These CH mutations confer a selection advantage to the mutated cell resulting in clonal expansion.40 Thus, DNMT3A mutation-bearing HSC in AML remission samples, without coincident NPM1 mutations present in AML blasts, have a competitive multilineage repopulation advantage over non-mutated HSC in xenografts, thereby establishing their identity as pre-leukemic HSC.29 These early mutations in pre-LSC precede leukemic transformation and define a pre-leukemic state capable of generating the entire hematopoietic hierarchy (Figure 1B). AML can evolve from such a clonally expanded pre-LSC pool detected in remission samples, indicating that pre-LSC survive chemotherapy and might serve as a reservoir for clonal evolution leading to recurrent disease.29 This was shown by performing deep targeted sequencing of commonly mutated leukemia genes, which revealed that DNMT3A mutations occur in an ancestral cell that gives rise to both T cells and the dominant AML clone present at diagnosis.29 Xenograft repopulation assays then demonstrated that pheno-
typically defined DNMT3A-mutated HSC were functional pre-LSC endowed with a competitive repopulation advantage.29 These data also showed that mutations in healthy HSC or at least multi-potent progenitors can serve as the cell-of-origin for myeloid leukemias in humans. Thus, the accumulation of mutated mature blood cells arising from CH clones/pre-LSC can have an impact on atherosclerosis via monocytes/macrophages but also contribute to clonal expansion and in some rare cases give rise to frank leukemia.37 Within individuals with CH, those with a high risk of developing AML can be identified in predictive models, thereby distinguishing between benign CH and the pre-leukemic state.41
In contrast, other leukemias are considered to be related to specific translocations that can be detected in these cases. AML with chromosomal rearrangements inv(16)(p13q22) or t(16;16)(p13;q22) – collectively referred to as inv(16) – and t(8;21)(q22;q22) are classified as core-binding factor (CBF) leukemias and result in the oncogenic fusion proteins CBFBMYH11 and RUNX1-RUNX1T1 (AML1/ETO), respectively.42 Unique translocations are likely not sufficient to drive leukemogenesis alone and additional mutational events are needed for leukemic evolution and relapse.42-44 However, in those AML cases, pre-LSC/LSC might not evolve from a preexistent CH clone but structural variations may spontaneously occur in stem and progenitor cells or after exposure to genotoxic agents including chemotherapy. The mechanisms of clonal fitness in CH constitute a field of highly competitive research and there is evidence that a pro-inflammatory phenotype contributes to cardiovascular disease. This suggests that clonal expansion is also strengthened through inflammatory pathways; although this needs to be explored further, recent data demonstrate that an enhanced inflammatory response in TET2mutated mice correlates with progression of myeloid neoplasms.45,46
Leukemic stem cell vulnerabilities and mechanisms driving drug-resistance
Chemotherapy resistance
LSC are considered to harbor inherent resistance to antiproliferative therapies. This is linked to their capacity to acquire transient quiescence, dormancy and senescence states and thought to be mediated by several mechanisms including resistance to DNA damage.47-49 Furthermore, it has been suggested that DNMT3A mutations in pre-LSC drive AML chemoresistance.50,51 However, this view was challenged by a recent study demonstrating in a patient-derived xenograft model that resistant AML cells were neither enriched in immature quiescent cells nor in LSC after treat-
Haematologica | 108 February 2023 356 REVIEW ARTICLE - LSC-mediated therapy resistance in AML P. Stelmach and A. Trumpp
REVIEW ARTICLE - LSC-mediated therapy resistance in AML P. Stelmach and A. Trumpp
Table 1. Selection of clinical trials, registered with clinicaltrials.gov, which include strategies targeting leukemic stem cell vulnerabilities in patients with newly diagnosed or relapsed/refractory acute myeloid leukemia.
Condition
target
BET
Drug/intervention
FT-1101/azacitidine
Phase Status (as of October 2022) ClinicalTrials.gov identifier Diagnosis Firstline Relapsed/ refractory
AML/other neoplasms X I Completed NCT02543879 GSK525762 Neoplasms X II Completed NCT01943851 INCB054329 Solid tumors/ X I/II Terminated NCT02431260 hematologic malignancy
ABBV-744 AML X I Terminated NCT03360006
ABBV-075 (mivebresib)/ Neoplasms X I Completed NCT02391480 venetoclax
CPI-0610/ruxolitinib AML/ other neoplasms X I/II Recruiting NCT02158858 MK-8628 (birabresib) AML/DLBCL X I Terminated NCT02698189 RO6870810 AML/MDS X I Completed NCT02308761
FLT3
Quizartinib/CPX-351 AML X II Terminated NCT04209725
Gilteritinib/iadademstat AML X I Not yet recruiting NCT05546580 (LSD1 inhibitor)
Midostaurin/CPX-351/ AML X I/II Recruiting NCT04982354 busulfan/melphalan/ fludarabine/ subsequent allogeneic stem cell transplant
Gilteritinib/CPX-351 AML X I Recruiting NCT05024552 Gilteritinib/midostaurin AML/MDS-EB2 X III Recruiting NCT04027309 Gilteritinib/midostaurin/ AML X II Recruiting NCT03836209 daunorubicin/cytarabine
Quizartinib/chemotherapy/ AML X III Active, not recruiting NCT02668653 placebo
Midostaurin/ AML X I Recruiting NCT03900949 gemtuzumab ozogamicin/ daunorubicin/ cytarabine
Gilteritinib/ AML/MDS X I/II Recruiting NCT05010122 venetoclax/ ASTX727 (decitabine and cedazuridine)
Gilteritinib/ AML/CMML/MDS/MPN X I/II Recruiting NCT04140487 venetoclax/ azacitidine
Gilteritinib/ AML X I/II Not yet recruiting NCT05520567 venetoclax/ azacitidine
PARP1
Veliparib/temozolomide AML/other neoplasms X I Active, not recruiting NCT01139970 Veliparib/carboplatin/ topotecan AML/other neoplasms X X II Active, not recruiting NCT03289910
Talazoparib/ AML X I/II Recruiting NCT04207190 gemtuzumab ozogamicin
BMN 673 AML/other neoplasms X X I Completed NCT01399840
Talazoparib/ AML X I/II Not yet recruiting NCT05319249 allogeneic NK cell transfer
Continued on following page.
LSC
Haematologica | 108 February 2023 357
REVIEW ARTICLE - LSC-mediated therapy resistance in AML P. Stelmach and A. Trumpp
LSC target Drug/intervention Condition Phase Status (as of October 2022) ClinicalTrials.gov identifier Diagnosis Firstline Relapsed/ refractory
BCL-2/ metabolic state
Venetoclax/ AML X I/III Not yet recruiting NCT05356169 intensive chemotherapy
Venetoclax/azacitidine AML X II Recruiting NCT03573024
Venetoclax/gilteritinib AML X I Completed NCT03625505 (FLT3 inhibitor)
Venetoclax/azacitidine/ AML X III Active, not recruiting NCT02993523 placebo
Venetoclax/S64315 AML X I Recruiting NCT03672695 (MCL-1 inhibitor)
Venetoclax/gilteritinib AML X I/II Not yet recruiting NCT05520567 (FLT3 inhibitor)/azacitidine
Venetoclax/ AML X X II Recruiting NCT04746235 ASTX727 (decitabine and cedazuridine)
Venetoclax/azacitidine/ AML X II Recruiting NCT04801797 intensive chemotherapy
Venetoclax/ AML X II Recruiting NCT03455504 intensive chemotherapy
Venetoclax/decitabine/ AML/MDS X X I/II Recruiting NCT03661307 quizartinib (FLT3 inhibitor)
Venetoclax/azacitidine/ AML X II Not yet recruiting NCT05554393 cytarabine/daunorubicin
Venetoclax/ AML/MDS-EB2 X III Recruiting NCT04628026 intensive chemotherapy
Venetoclax/FLAG-Ida AML/MDS X X I/II Recruiting NCT03214562
Venetoclax/azacitidine/ AML X II Not yet recruiting NCT05554406 cytarabine/daunorubicin/ liposome-encapsulated daunorubicin-cytarabine
Venetoclax/decitabine/ AML X III Recruiting NCT05177731 cytarabine/idarubicin
Venetoclax/fludarabine/ AML/MDS/ X I Recruiting NCT03613532 busulfan/azacitidine/ MDS-MPN/ decitabine and cedazuridine/ CMML allogeneic stem cell transplant
Venetoclax/azacitidine AML X II Recruiting NCT04062266
DHODH BAY2402234 Leukemia X I Terminated NCT03404726 JNJ-74856665/ venetoclax/ AML X I Active, not recruiting NCT04609826 azacitidine
PTC299 (emvododstat) AML X I Terminated NCT03761069 IDH1/2 Ivosidenib/enasidenib AML/MDS-EB2 X III Recruiting NCT03839771 Ivosidenib/enasidenib/ AML X II Not yet recruiting NCT05401097 venetoclax/azacitidine
LY3410738 AML/CMML/MDS/MPN X X I Recruiting NCT04603001 (IDH inhibitor)/venetoclax/ azacitidine
Ivosidenib/ AML/MDS/MPN X X II Recruiting NCT04493164 liposome-encapsulated daunorubicin-cytarabine
Ivosidenib/venetoclax AML/other neoplasms X X I/II Recruiting NCT03471260 Ivosidenib/azacitidine AML X III Active, not recruiting NCT03173248
LSC: leukemic stem cell; AML: acute myeloid leukemia; BET: bromodomain and extra-terminal motif; AML: acute myeloid leukemia; DLBCL: diffuse large B-cell lymphoma; MDS: myelodysplastic syndrome; FLT3: FMS-like tyrosine kinase 3; LSD1: lysine-specific histone demethylase; MDS-EB2: myelodysplastic syndrome with excess blasts-2; CMML: chronic myelomonocytic leukemia; MPN: myeloproliferative neoplasm; PARP1: poly-ADP-ribose polymerase 1; NK: natural killer; Bcl-2: B-cell lymphoma 2 protein; FLAG-Ida: fludarabine, cytarabine, granulocyte colony-stimulating factor and idarubicin; DHODH: dihydroorotate dehydrogenase; IDH1/2: isocitrate dehydrogenase 1/2.
Haematologica | 108 February 2023 358
ment with cytarabine, thereby showing that cytarabine similarly depleted quiescent G0 AML cells and proliferating cells (blasts).52 Another study revealed a unique and transient molecular state of leukemia-regenerating cells responsible for re-outgrowth of leukemia distinct from therapy-naïve LSC.53 Furthermore, recent research identified a senescence-like resilience phenotype conferred with superior engraftment potential through which AML cells can survive and repopulate leukemia.49 The authors demonstrated that this transient phenotype of AML cells occurs regardless of their stem cell status and that these cells give rise to relapsed AML with increased stem cell potential.49 Together, these data show that the LSC landscape is shaped by chemotherapy, indicating transient LSC stages with dynamic therapy resistance properties during the course of AML therapy. Hence, targeting distinct LSC states is difficult as they are subject to plasticity, likely patientspecific, and there might be specific situations in which LSC undergo phenotypic plasticity, which may also affect cell surface marker expression. These stages are expected to be dynamic, transient and likely reversible. Thus, targeting LSC by surface markers would still have an impact on eliminating the LSC clone.
MYC is an essential transcription factor regulating metabolic properties including the balance between dormancy and proliferation of stem cells comprising HSC.11,54,55 Recently it has been shown that a distantly located MYC enhancer cluster (BENC) controls these properties and its activity in human LSC is linked to chemosensitivity.56
The chemotherapy-resistant LSC phenotype is shaped by different mechanisms including recurrent genotypes, epigenetic modifications and resulting gene expression programs and also the metabolic state, which are not mutually exclusive. Efforts to identify differentially expressed surface markers distinguishing LSC and HSC in AML patients have spawned specific surface markers enriched in the LSC compartment, including CD34,21 CD123,57 CLEC12A (CLL-1),58 GPR56,59 CD44,60 CD47,61 and CD96.62 HSC reside in a highly specialized bone marrow environment referred to as a niche. In these hypoxic niches HIF1a regulates quiescence by HIF1 a -dependent gene expression including CXCR4, which is also upregulated on the membrane of LSC.63 There is evidence that LSC within their niches may be protected from chemotherapy.48 The area of niche-related potential therapeutic targets and LSC niche-mediated drug resistance mechanisms is not discussed here and is reviewed elsewhere.64
Leukemic stem cell gene signatures and therapeutic targets
Differential gene expression analyses identified altered gene expression programs in LSC that predict clinical parameters including overall survival.65,66 These programs are regulated by the chromatin state (accessibility for tran-
scription factors), epigenetic mechanisms contributing to transcriptional output and LSC plasticity via activation or repression of gene expression.
Gene expression analysis of functionally defined LSC revealed that these cells harbor a transcriptional profile related to HSC and that stemness-related gene expression programs are highly predictive of response to standard AML therapy.65,66 A subset of genes within this transcriptional program of stemness (17-gene signature) yielded a LSC17 score that can serve as a predictor of clinical parameters.66 Another study proposed an RNA-sequencingbased risk stratification model capable of recovering all relevant chromosomal translocations and inversions.67
A recent study investigating HSC-derived AML marked by high expression of the oncogenic transcription factor EVI1 showed that p53 protein expression is influenced in an EVI1-dependent manner.68 The authors demonstrated that the cell-of-origin of leukemia initiation dictates therapeutic sensitivity to inhibitors of LSD1, a histone demethylase implicated in DNA damage responses and in p53 pathways, and that drug resistance could be overcome in HSC-derived leukemias by combining LSD1 inhibition with venetoclax.68
Bromodomain and extra-terminal motif (BET) proteins that modify MYC expression and Brd4, a BET family protein, represent another potential new target for AML therapy. However, BET inhibitor resistance emerges from LSC, is related to transcriptional plasticity and a role for the Wnt pathway has been described.69,70 Interestingly, LSD1 inhibition re-sensitizes AML cells that are resistant to BET inhibition.71
Approaches using preclinical models, including drugs targeting the epigenetic and metabolic state or a specific immunophenotype, exhibit the potential to eradicate relapse-relevant LSC. For example, it was shown that inhibition of miR-126, a microRNA controlling the PI3K-AktmTOR pathway, attenuates LSC activity.72 Furthermore, a recent study developed a combinatorial approach linking the LSC concept to immune evasion.73 AML cells that express natural killer group 2D ligands (NKG2DL) are cleared by natural killer (NK) cells, whereas NKG2DL-negative LSC escape killing by NK cells (Figure 2). Poly-ADP-ribose polymerase 1 (PARP1) is an enzyme involved in several cellular processes, such as DNA repair and gene regulation, which uses NAD+ to transfer ADP-ribose to other proteins. PARP1 represses NKG2DL expression and pharmacological inhibition of PARP1 (by talazoparib) induces NKG2DL reexpression on the LSC surface, rendering these cells amenable to NK cell control in vivo. 73 This concept is being translated into the latest clinical research; upcoming trials will have to prove the clinical efficacy of PARP1 inhibition with subsequent transfer of alloreactive NK cells (clinicaltrials.gov identifier NCT05319249) (Table 1).
Haematologica | 108 February 2023 359 REVIEW ARTICLE - LSC-mediated therapy resistance in AML P. Stelmach and A. Trumpp
Targeting the metabolic state
While HSC adapt their metabolic program depending on their state of activation, LSC are considered to be rather metabolically inflexible, uniquely reliant on mitochondrial oxidative phosphorylation (OXPHOS) for ATP production despite the necessity to retain low levels of reactive
oxygen species.74,75 Due to the decreased glycolytic activity of LSC, one of the three metabolic fuels for the mitochondrial tricarboxylic acid cycle is unavailable and LSC must rely on amino acids and/or fatty acids to fuel OXPHOS.75,76
By contrast, quiescent HSC rely on anaerobic glycolysis metabolizing pyruvate to lactate in their low-oxygen en-
Figure 2. Leukemic stem cell vulnerabilities and targeted therapeutic approaches. The figure illustrates a leukemic stem cell (LSC) and highlights phenotypic characteristics, vulnerabilities and potential therapeutic approaches. LSC are considered metabolically inflexible and uniquely reliant on amino acids and fatty acids to fuel oxidative phosphorylation. BCL-2 and MCL-1 are anti-apoptotic members of the BCL-2 family residing in the outer mitochondrial membrane (OMM). BAX and BAK are pore-forming proteins and the BH3-only proteins are pro-apoptotic. All BCL-2 family proteins interact to maintain the integrity of the OMM. Upon cellular stress, the cell is committed to induce apoptosis via upregulation of the pro-apoptotic BH3-only proteins and downregulation of BCL-2/MCL-1. A shift in the BCL-2 family interactome releases the effector proteins BAX/BAK and promotes homo-oligomerization to form cytotoxic pores in the OMM.80 Hence, BCL-2 inhibitors (called BH3-mimetics) induce apoptosis. Dihydroorotate dehydrogenase localized at the outer layer of the inner mitochondrial membrane is crucial for de novo pyrimidine synthesis thereby providing substrates for nucleic acid synthesis. DNMT3A and TET2 have opposite effects on DNA methylation. DNMT3A catalyzes de novo methylation of cytosine residues (CpG dinucleotide), while TET2 catalyzes the conversion of 5-methylcytosine to 5-hydroxymethylcytosine, the initial step of DNA demethylation. FLT3: FMS-like tyrosine kinase 3; TKD: tyrosine kinase domain; Brd4: member of the BET (bromodomain and extra-terminal motif) family; MYC/p53/EVI1: transcription factors; LSD1: lysine-specific histone demethylase; PARP1: poly-ADP-ribose polymerase 1, me: methylation; DNMT3A: DNA methyltransferase 3A; TET2: tet methylcytosine dioxygenase 2; BCAA: branched-chain amino acids, BCAT1: BCAA transaminase 1; a-KG: alpha-ketoglutarate; 2-HG: 2-hydroxyglutarate; ROS: reactive oxygen species; OXPHOS: oxidative phosphorylation; TCA: tricarboxylic acid cycle; DHODHi: dihydroorotate dehydrogenase inhibitors; 5-AZA: 5-azacitidine; NK cell: natural killer cell; NKG2D ligand: natural killer group 2D ligand; IDH: isocitrate dehydrogenase.
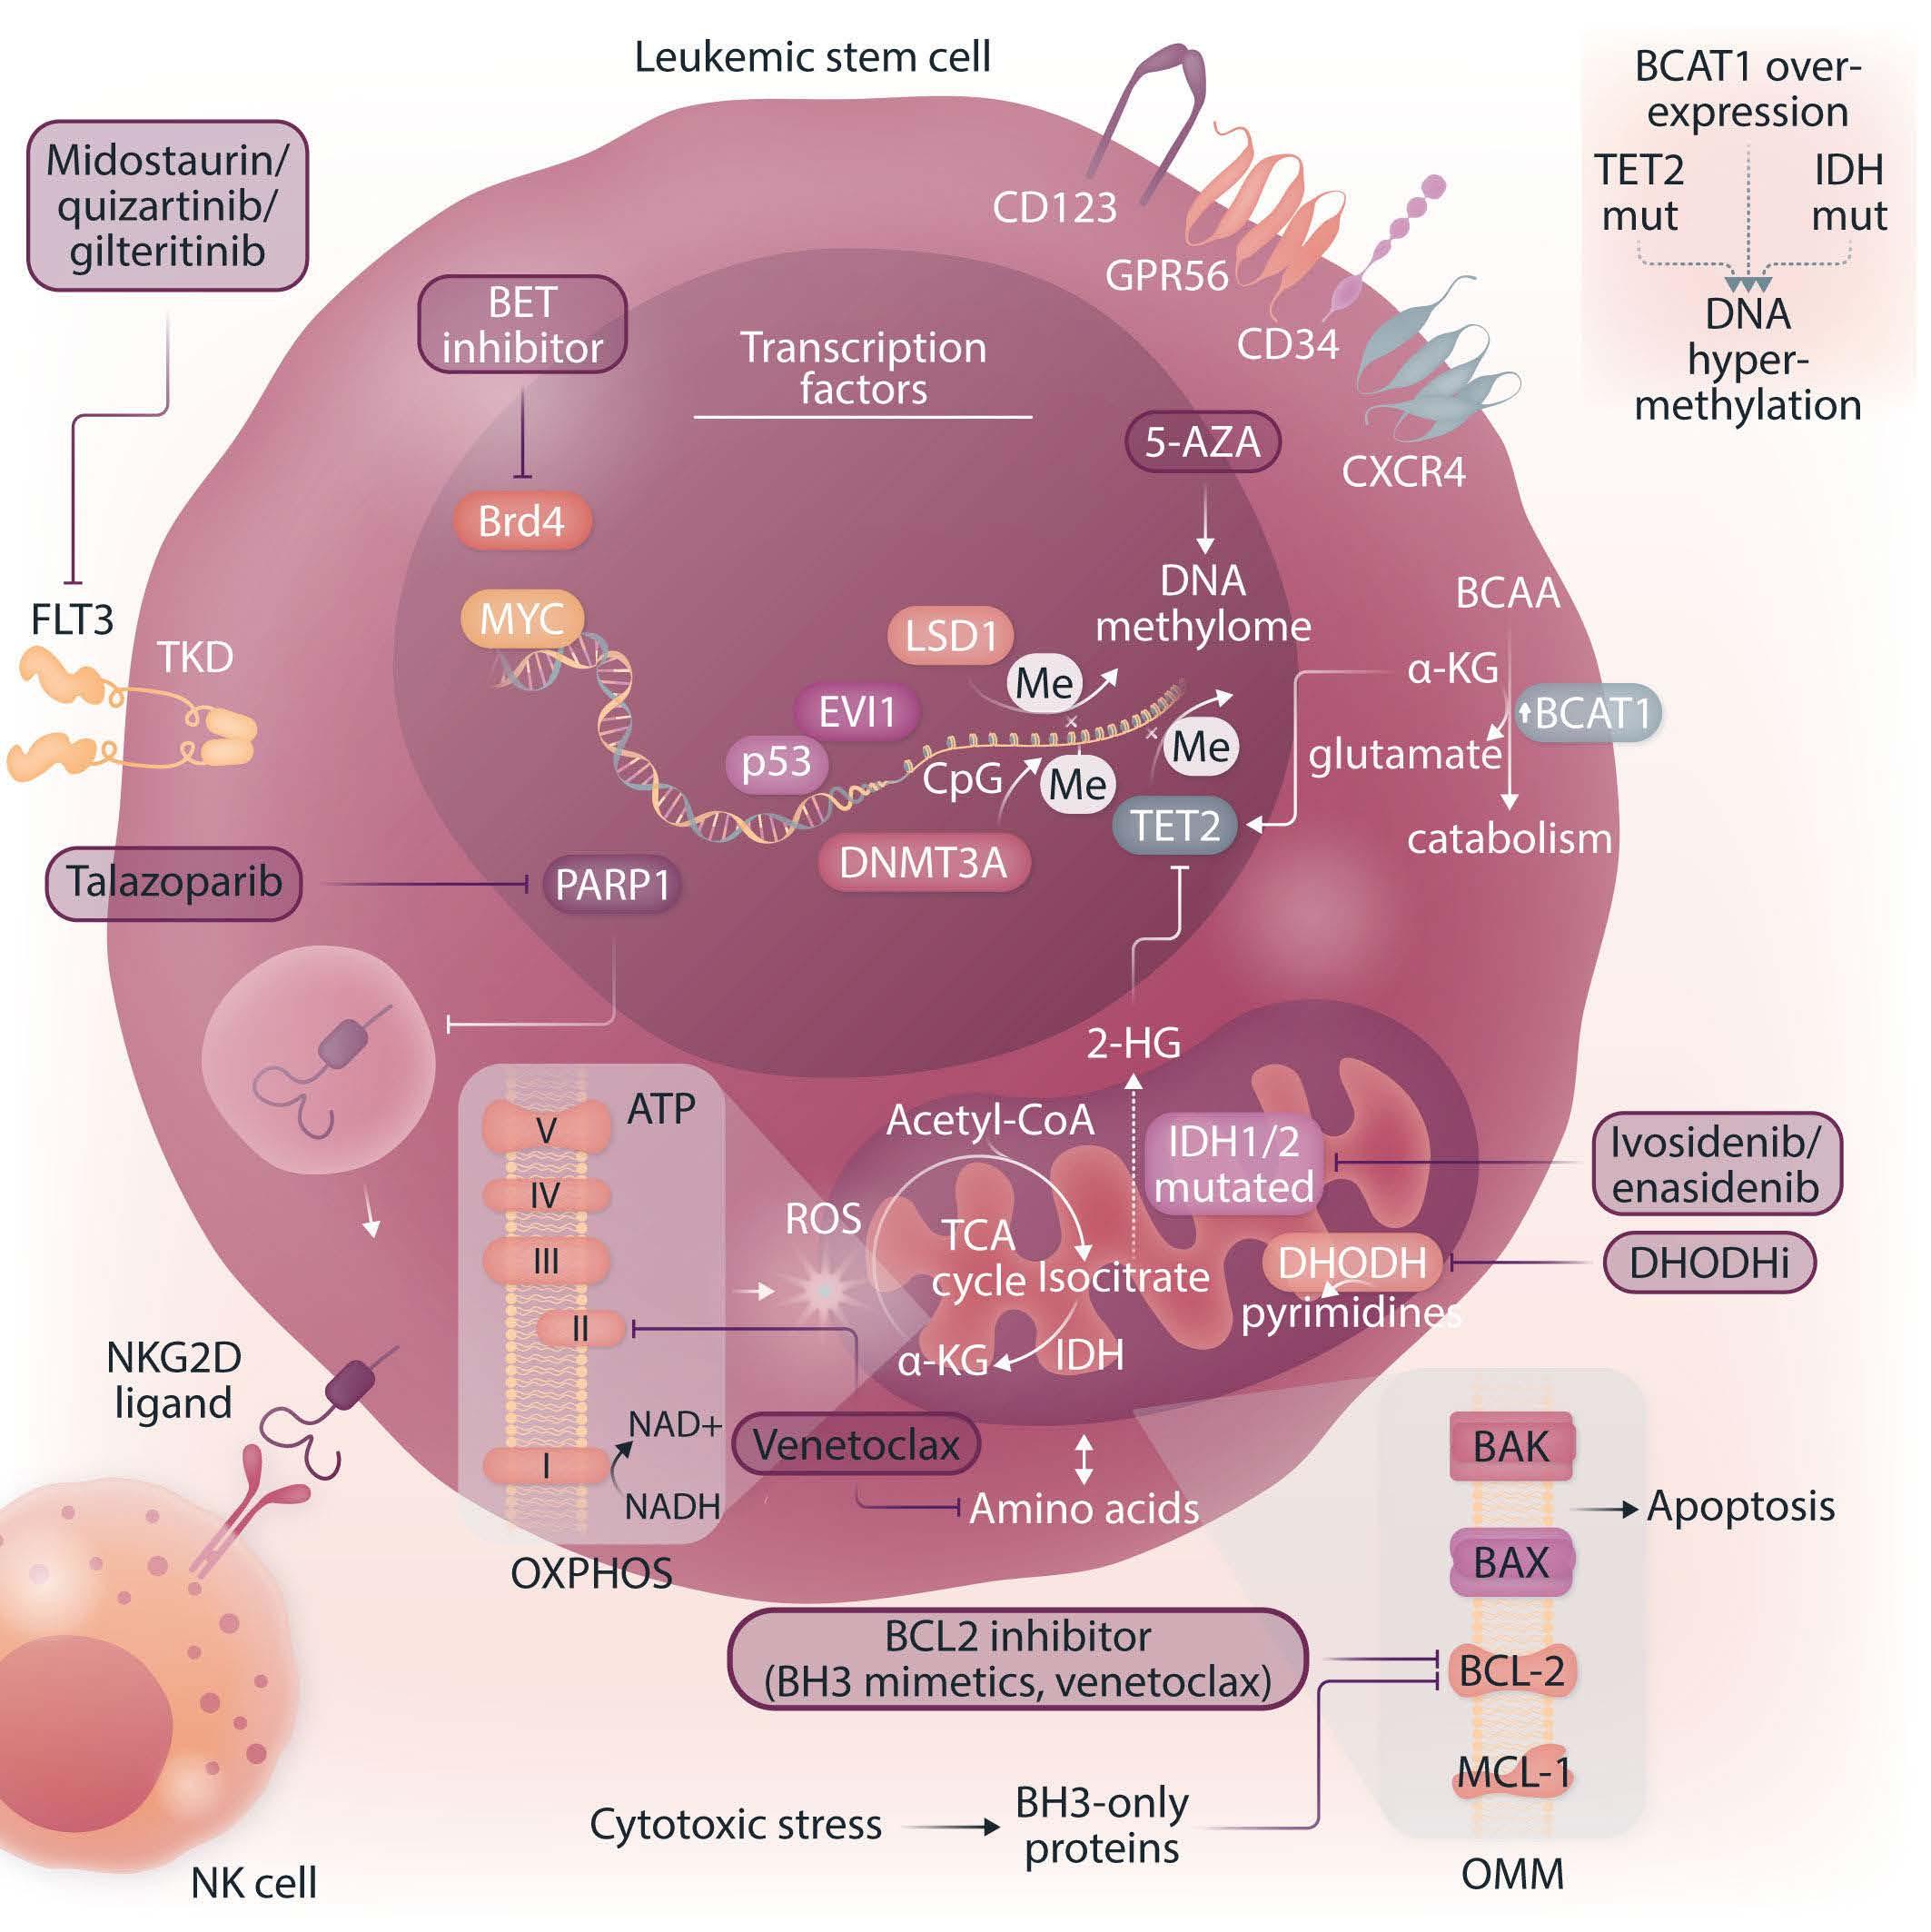
Haematologica | 108 February 2023 360
ARTICLE - LSC-mediated
resistance in
A. Trumpp
REVIEW
therapy
AML P. Stelmach and
vironment (hypoxic niche) reserving OXPHOS to meet increased energy requirements during expansion and differentiation.75,77 This unique reliance has drawn attention to the pharmacological inhibition of OXPHOS in LSC.74,76,78,79 BCL-2 and MCL-1 are anti-apoptotic members of the BCL2 family present in the outer mitochondrial membrane. Upon cellular stress, the cell is commited to induce apoptosis via upregulation of the pro-apoptotic BH3-only proteins and downregulation of BCL-2/MCL-1. This results in a release of the BAX and BAK proteins, forming cytotoxic pores in the outer mitochondrial membrane.80 De novo LSC seem to be dependent on OXPHOS fueled by amino acids and thus rely on amino acid metabolism to provide substrates for the tricarboxylic acid cycle.76 The combination of BCL-2 inhibition (by venetoclax) and the hypomethylating agent azacitidine significantly decreases OXPHOS through amino acid depletion and ETC complex II inhibition thereby selectively targeting LSC.78,80 Interestingly, in relapsed/refractory AML LSC exhibit metabolic plasticity allowing for compensation via upregulation of fatty acid metabolism, becoming resistant to BCL-2 inhibition, and can be re-sensitized to azacitidine/venetoclax by targeting fatty acid transport.76,81 The b-oxidation of fatty acids results in acetyl-CoA producing NADH and FADH2 and fueling OXPHOS to generate ATP. The targeting of fatty acid oxidation and thereby its role in fueling OXPHOS is an exciting new direction in overcoming LSC-mediated therapy resistance in AML.75
In phenotypically monocytic AML, resistance has been mechanistically linked to a distinct transcriptomic profile and a physiological switch from BCL-2 to an MCL-1-mediated pro-survival program. This leads to a loss of BCL-2 expression and dependency and thus mediates insensitivity of such monocytic blasts to venetoclax; it remains unclear whether LSC from these more differentiated AML also behave similarly.82 MCL-1 inhibitors are currently in clinical evaluation and combination therapies could be an efficient approach with side effects that remain manageable.80,82 Finally, recent data indicate that acquired BAX mutations represent another mechanism of adaptive resistance to venetoclax-based AML therapy.83
Maintenance of low levels of reactive oxygen species as well as mitochondrial function are required for LSC stemness.75 LSC use different mechanisms to avoid oxidative stress and maintain low reactive oxygen species levels, including juxtaposition to hypoxic niches,84,85 activation of FOXO transcription factors,86 generation of more glutathione and the removal of damaged mitochondria via mitophagy.87 These highly reactive byproducts of aerobic metabolism contribute to stem cell aging, force cells out of quiescence and compromise their ability to maintain the LSC population.75
Another role in the interplay of LSC metabolic function and therapeutic resistance has emerged for branched-
chain amino acids (BCAA) produced by BCAA transaminase 1 (BCAT1). BCAT1 is overexpressed in a subset of LSC resulting in a survival advantage by depleting a-ketoglutarate, a critical co-factor for TET2, thus mimicking the effects of IDH and TET2 mutations.88 Since amino acid metabolism is crucial for ATP production in LSC, BCAA metabolism constitutes a potential pharmacological target to compromise LSC function selectively (Figure 2).
Dihydroorotate dehydrogenase (DHODH) is an enzyme localized in the inner mitochondrial membrane which catalyzes the fourth step of de novo pyrimidine synthesis. The inhibition of DHODH reduced leukemic burden and decreased levels of leukemia-initiating cells highlighting that pyrimidine synthesis constitutes another metabolic vulnerability.89 Blunting glutamine metabolism and pyrimidine synthesis has been shown to inhibit residual leukemiainitiating cells and such treatment schemes improved survival in leukemia mouse models and patient-derived xenografts.90 Recent data show that the novel DHODH inhibitor AG636 leads to inhibition of the protein translation machinery and confirm that LSC are dependent on de novo pyrimidine synthesis.91 Interestingly, by performing a CRISPR-Cas9 knockout screen using a focused library of epigenetic regulators, CDK5 was identified as a sensitizer to DHODH inhibition, thereby raising the possibility of simultaneously targeting different mitochondrial processes.
Resistance
to targeted therapies for acute myeloid leukemia
While venetoclax targets a distinct metabolic state, other targeted therapeutic approaches inhibit specific oncogenic proteins such as mutant FLT3 or IDH1/2.75 RAS mutations are common mechanisms of resistance to FLT3- and IDHinhibitors and also to BCL-2-inhibitor-based therapies.2
One of the most commonly mutated genes in AML is FLT3, which encodes a receptor tyrosine kinase. The most common type of FLT3 mutation is an internal tandem duplication (FLT3-ITD), consisting of an in-frame amino acid insertion in the juxtamembrane domain of the receptor, which results in constitutive kinase activity.92 While there is also a role for FLT3-tyrosine kinase domain (FLT3-TKD) mutations, in particular, are associated with increased risk of relapse and inferior survival which is influenced by both co-mutations and the ratio of FLT3-ITD to wildtype FLT3 alleles.2,93 Three FLT3 inhibitors (midostaurin, quizartinib and gilteritinib) have been demonstrated to improve overall survival compared with conventional chemotherapy (for gilteritinib, 9.3 months vs. 5.6 months) in randomized phase III trials.94-96 However, secondary mutations of the FLT3 gene frequently lead to therapy resistance.2 Nextgeneration sequencing studies using primary cells from AML patients have established that FLT3-ITD mutations occur relatively late in leukemogenesis.97 In contrast, competitive transplantation experiments in mice indicated
Haematologica | 108 February 2023 361 REVIEW ARTICLE - LSC-mediated therapy resistance in AML P. Stelmach and A. Trumpp
that the mutated FLT3 is expressed on HSC.98 However, another study using single-cell mRNA-sequencing found essentially the opposite.92,99 A recent study shed new light on the subclonal architecture of FLT3-ITD-mutant AML providing evidence that FLT3-ITD mutations may also occur early in leukemic precursor cells and that CD99 may serve as a therapeutic target.100 Furthermore, the combination of single-cell RNA-sequencing and genotyping from bone marrow samples of 16 AML patients demonstrated that FLT3-ITD-mutated cells were enriched in the cell populations with undifferentiated HSC/progenitor-like cell signatures, suggesting that FLT3-ITD confers a strong differentiation block.101 The expression of FLT3-ITD in the MUTZ-3AML cell line and examination of resultant cellular phenotypes by flow cytometry demonstrated that FLT3 expression increased the percent of primitive CD34+ MUTZ-3 cells and that this effect was most pronounced with the FLT3-ITD construct.101 These results help to understand how FLT3-ITD mutations may be associated with HSC and progenitor-like cells. Although the role of FLT3 inhibitors in the clinic is emerging, with demonstration of improved outcomes, their effect on eliminating LSC remains enigmatic.
IDH1 and IDH2 catalyze the oxidative decarboxylation of isocitrate to produce a-ketoglutarate (Figure 2). Mutant IDH1/2 acquire neomorphic catalytic activity and produce 2-hydroxyglutarate,102 which competitively inhibits a-ketoglutarate-dependent enzymes such as TET2.103 TET2 is an epigenetic regulator mediating active DNA demethylation.39 Consequently, IDH1/2 and TET2 mutations result in a state of genomic hypermethylation.104 There is a strong rationale for combining IDH1/2 inhibitors with hypomethylating agents and also for the combination with BCL-2 inhibitors (venetoclax), as the accumulation of 2-hydroxyglutarate caused by IDH1/2 mutations mimics an oxygen-depriving state, thereby decreasing the mitochondrial threshold for induction of apoptosis.105 Oral inhibitors of both mutant IDH1 (ivosidenib) and IDH2 (enasidenib) have shown efficacy in patients with the corresponding mutations.106,107 The combination of ivosidenib + azacitidine has shown superiority compared to azacitidine alone in patients with newly diagnosed IDH1-mutated AML, who were ineligible for intensive induction chemotherapy (clinicaltrials.gov identifier NCT03173248) (Table 1)108 and the combination of ivosidenib + venetoclax in IDH-mutated patients is currently being tested in a clinical trial (clinicaltrials.gov identifier NCT03471260) (Table 1). In a recent study, genomic analyses of longitudinally collected AML samples indicated that stemness is a major driver of primary IDH inhibitor resistance.109 Since IDH inhibitors induce differentiation of leukemic blasts, this seems mechanistically plausible. However, the mechanisms driving stemness in IDH-mutant AML and the role of LSC in this regard remains poorly understood.
Methodological improvements and their significance for translational research in acute myeloid leukemia
Although LSC remain difficult to isolate because of their scarcity, their pronounced similarity to healthy HSC and their phenotypic plasticity, novel technologies now allow the identification of complex heterogeneous cell mixtures at single-cell resolution. Moreover, more sophisticated multi-omics single-cell approaches are now available to capture surface proteins next to the transcriptomes (CITEseq; cellular indexing of transcriptomes and epitopes by sequencing),110,111 chromatin accessibility (ATAC-seq; assay for transposase-accessible chromatin with sequencing) and importantly can also integrate mutational profiling (single nucleotide variations and structural variants)112 and/or tracking of clonal dynamics based on mitochondrial marker mutations (TARGET-seq,113 GoT [genotyping of transcriptomes]114 and MutaSeq115). Although it is becoming increasingly evident that dynamic changes in metabolism play critical roles in LSC function and treatment resistance, approaches based on mass spectrometry of bulk samples and metabolic flux analysis both require large numbers of cells. These are often not available from patients, in particular if smaller subpopulations such as LSC need to be analyzed and thus the development of better, high-resolution, single-cell technologies is much wanted in this area. Further technical advances, each with its inherent merits and limitations, will pave the way towards a more comprehensive understanding of clonal dynamics and the distinct (transient) single-cell states responding to AML therapy driving the continued AML evolution. The integration of single-cell genotyping adds an additional layer of information, thus allowing the capture of even rare clones and the comparison of the networks active in various (pre-)leukemic subclones and wildtype cells within the same patient. This technical progress also offers new opportunities to analyze rare CH clones in the pre-leukemic state and to capture and characterize residual, therapy-resilient relapse-initiating leukemia cells including LSC present in patients’ MRD.
Conclusion
AML is a highly heterogeneous disease characterized by a complex network of genetically distinct subclones arising in a branching evolution alongside the predominant clone. The cells within each genetically identical subclone show their own clone-specific molecular features and develop a specific non-genetically driven hierarchy of cellular differentiation. There is overwhelming evidence that cancer stem cells and stemness properties are clinically relevant,
Haematologica | 108 February 2023 362 REVIEW ARTICLE - LSC-mediated therapy resistance in AML P. Stelmach and A. Trumpp
in particular for AML. In this review we have discussed that overcoming therapy resistance in AML requires not only eradication of bulk tumor cells but also the capture and efficient targeting of therapy-resistant leukemia cells, including LSC. The presence of genetically diverse LSC at diagnosis highlights a major limitation of therapies that target only the specific properties of the dominant clone. The identification of specific patterns of AML relapse demonstrated that these will require different therapies given their distinct stem cell biology.28 Since LSC harbor inherent resistance mechanisms including phenotypic plasticity, dormancy and senescence, conventional chemotherapy is increasingly being added to or replaced by targeted therapeutic strategies to act specifically on LSC properties. Given the chemotherapy resistance of LSC, targeted strategies need to be integrated into first-line regimens to prevent LSC-mediated AML relapse. Venetoclax + azacitidine is a promising approach which is currently reserved for relapsed/refractory patients and newly diagnosed patients of older age or with comorbidities. This combination targets at least some LSC, but the molecular basis of treatment refractoriness and resistance still needs to be better explored and overcome in this setting as well. Nevertheless, BH3 mimetics are among the most promising strategies to treat AML, including LSC. Importantly, with the success of venetoclax + azacitidine and availability of this combination for first-line therapy, the selection of patients who would benefit from either standard chemotherapy or upfront venetoclax + azacitidine treatment is a challenge. Biomarkers need to be developed to stratify patients and clinical trials to monitor LSC-targeting efficacy in AML first-line regimens need to be implemented and used to study, understand and overcome LSC-mediated therapy resistance. Furthermore, new methods of disease monitoring have to be established to track LSC subclones and improve future clinical trials. Despite impressive rates of response to venetoclax + azacitidine, the combination is not curative since LSC exhibit molecular and metabolic plasticity becoming resistant to BCL-2 inhibition (i.e. high expression of MCL-1 or BCL-xL). Importantly, while venetoclax + azacitidine efficiently targets at least some LSC, it may not target all of them in both intra- and inter-patient settings, and the surviving LSC are the drivers of relapse. Thus, many different clinical trials investigating com-
References
1. Papaemmanuil E, Gerstung M, Bullinger L, et al. Genomic classification and prognosis in acute myeloid leukemia. N Engl J Med. 2016;374(23):2209-2221.
2. Short NJ, Konopleva M, Kadia TM, et al. Advances in the treatment of acute myeloid leukemia: new drugs and new challenges. Cancer Discov. 2020;10(4):506-525.
3. Dohner H, Estey E, Grimwade D, et al. Diagnosis and management of AML in adults: 2017 ELN recommendations from an international expert panel. Blood. 2017;129(4):424-447.
binatorial therapeutic approaches to target LSC vulnerabilities and thereby attempt to eradicate relapse-initiating cells through different mechanisms are currently being explored in clinical settings (Table 1).
The era of single-cell multi-omics provides unprecedented opportunities to characterize relapse-initiating cell populations and allows tracking of individual clonal architectures and underlying biological networks. These technical innovations may offer new ways to trace the drivers of relapse, including LSC, within upcoming clinical trials and to identify and target therapy-resistant cells with resilience phenotypes that repopulate leukemia. Many of the cited methods have recently been applied to address basic and translational research questions and offered novel, critical insights into AML biology. However, it seems very difficult that these can be included in clinical routine diagnostics, at least at present, as they are not easily scalable. Nevertheless, these methods will be crucial to characterize the few relapse-initiating cells and to translate the understanding of LSC biology into novel therapeutic strategies for AML therapy. Results obtained from these newer, low-throughput and expensive technologies need to be translated into scalable tools that can, after clinical validation, be implemented in routine clinical practice. Such tools need to fulfill clinical standards regarding specificity, feasibility and cost-efficiency and have to be validated in larger cohorts of patients. Overall, there is increasing evidence for patient-specific approaches that address individual therapeutic vulnerabilities. An inevitable strategy to prevent AML recurrence and improve clinical outcome in the future is the integration of LSC-targeting agents into first-line treatments which may lead to a decrease in relapse frequency and an increase of cure rates of AML patients.
Disclosures
No conflicts of interest to disclose.
Contributions
PS and AT wrote and discussed the manuscript.
Funding
PS is funded by a fellowship of the DKFZ Clinician Scientist Program, supported by the Dieter Morszeck Foundation.
4. Jongen-Lavrencic M, Grob T, Hanekamp D, et al. Molecular minimal residual disease in acute myeloid leukemia. N Engl J Med. 2018;378(13):1189-1199.
5. Trumpp A, Haas S. Cancer stem cells: the adventurous journey from hematopoietic to leukemic stem cells. Cell. 2022;185(8):1266-1270.
6. DiNardo CD, Jonas BA, Pullarkat V, et al. Azacitidine and venetoclax in previously untreated acute myeloid leukemia. N Engl J Med. 2020;383(7):617-629.
Haematologica | 108 February 2023 363 REVIEW ARTICLE - LSC-mediated therapy resistance in AML P. Stelmach and A. Trumpp
7. Stahl M, Menghrajani K, Derkach A, et al. Clinical and molecular predictors of response and survival following venetoclax therapy in relapsed/refractory AML. Blood Adv. 2021;5(5):1552-1564.
8. Haas S, Trumpp A, Milsom MD. Causes and consequences of hematopoietic stem cell heterogeneity. Cell Stem Cell. 2018;22(5):627-638.
9. Laurenti E, Gottgens B. From haematopoietic stem cells to complex differentiation landscapes. Nature. 2018;553(7689):418-426.
10. Wilson A, Laurenti E, Oser G, et al. Hematopoietic stem cells reversibly switch from dormancy to self-renewal during homeostasis and repair. Cell. 2008;135(6):1118-1129.
11. Cabezas-Wallscheid N, Buettner F, Sommerkamp P, et al. Vitamin A-retinoic acid signaling regulates hematopoietic stem cell dormancy. Cell. 2017;169(5):807-823.
12. Yamamoto R, Morita Y, Ooehara J, et al. Clonal analysis unveils self-renewing lineage-restricted progenitors generated directly from hematopoietic stem cells. Cell. 2013;154(5):1112-1126.
13. Notta F, Zandi S, Takayama N, et al. Distinct routes of lineage development reshape the human blood hierarchy across ontogeny. Science. 2016;351(6269):aab2116.
14. Pinho S, Frenette PS. Haematopoietic stem cell activity and interactions with the niche. Nat Rev Mol Cell Biol. 2019;20(5):303-320.
15. Schofield R. The relationship between the spleen colonyforming cell and the haemopoietic stem cell. Blood Cells. 1978;4(1-2):7-25.
16. Kreso A, Dick JE. Evolution of the cancer stem cell model. Cell Stem Cell. 2014;14(3):275-291.
17. Vogelstein B, Fearon ER, Hamilton SR, Feinberg AP. Use of restriction fragment length polymorphisms to determine the clonal origin of human tumors. Science. 1985;227(4687):642-645.
18. Hanahan D, Coussens LM. Accessories to the crime: functions of cells recruited to the tumor microenvironment. Cancer Cell. 2012;21(3):309-322.
19. Doulatov S, Notta F, Laurenti E, Dick JE. Hematopoiesis: a human perspective. Cell Stem Cell. 2012;10(2):120-136.
20. Lapidot T, Pflumio F, Doedens M, Murdoch B, Williams DE, Dick JE. Cytokine stimulation of multilineage hematopoiesis from immature human cells engrafted in SCID mice. Science. 1992;255(5048):1137-1141.
21. Lapidot T, Sirard C, Vormoor J, et al. A cell initiating human acute myeloid leukaemia after transplantation into SCID mice. Nature. 1994;367(6464):645-648.
22. Kamel-Reid S, Dick JE. Engraftment of immune-deficient mice with human hematopoietic stem cells. Science. 1988;242(4886):1706-1709.
23. Bonnet D, Dick JE. Human acute myeloid leukemia is organized as a hierarchy that originates from a primitive hematopoietic cell. Nat Med. 1997;3(7):730-737.
24. Bahr C, Correia NC, Trumpp A. Stem cells make leukemia grow again. EMBO J. 2017;36(18):2667-2669.
25. Hope KJ, Jin L, Dick JE. Acute myeloid leukemia originates from a hierarchy of leukemic stem cell classes that differ in selfrenewal capacity. Nat Immunol. 2004;5(7):738-743.
26. Ding L, Ley TJ, Larson DE, et al. Clonal evolution in relapsed acute myeloid leukaemia revealed by whole-genome sequencing. Nature. 2012;481(7382):506-510.
27. Parkin B, Ouillette P, Li Y, et al. Clonal evolution and devolution after chemotherapy in adult acute myelogenous leukemia. Blood. 2013;121(2):369-377.
28. Shlush LI, Mitchell A, Heisler L, et al. Tracing the origins of relapse in acute myeloid leukaemia to stem cells. Nature.
2017;547(7661):104-108.
29. Shlush LI, Zandi S, Mitchell A, et al. Identification of preleukaemic haematopoietic stem cells in acute leukaemia. Nature. 2014;506(7488):328-333.
30. Steensma DP, Bejar R, Jaiswal S, et al. Clonal hematopoiesis of indeterminate potential and its distinction from myelodysplastic syndromes. Blood. 2015;126(1):9-16.
31. Genovese G, Kahler AK, Handsaker RE, et al. Clonal hematopoiesis and blood-cancer risk inferred from blood DNA sequence. N Engl J Med. 2014;371(26):2477-2487.
32. Jaiswal S, Fontanillas P, Flannick J, et al. Age-related clonal hematopoiesis associated with adverse outcomes. N Engl J Med. 2014;371(26):2488-2498.
33. Jaiswal S, Natarajan P, Silver AJ, et al. Clonal hematopoiesis and risk of atherosclerotic cardiovascular disease. N Engl J Med. 2017;377(2):111-121.
34. Fuster JJ, MacLauchlan S, Zuriaga MA, et al. Clonal hematopoiesis associated with TET2 deficiency accelerates atherosclerosis development in mice. Science. 2017;355(6327):842-847.
35. Cai Z, Kotzin JJ, Ramdas B, et al. Inhibition of inflammatory signaling in Tet2 mutant preleukemic cells mitigates stressinduced abnormalities and clonal hematopoiesis. Cell Stem Cell. 2018;23(6):833-849.
36. Huang YH, Chen CW, Sundaramurthy V, et al. Systematic profiling of DNMT3A variants reveals protein instability mediated by the DCAF8 E3 ubiquitin ligase adaptor. Cancer Discov. 2022;12(1):220-235.
37. Challen GA, Goodell MA. Clonal hematopoiesis: mechanisms driving dominance of stem cell clones. Blood. 2020;136(14):1590-1598.
38. Yang L, Rau R, Goodell MA. DNMT3A in haematological malignancies. Nat Rev Cancer. 2015;15(3):152-165.
39. Rasmussen KD, Helin K. Role of TET enzymes in DNA methylation, development, and cancer. Genes Dev. 2016;30(7):733-750.
40. Bowman RL, Busque L, Levine RL. Clonal hematopoiesis and evolution to hematopoietic malignancies. Cell Stem Cell. 2018;22(2):157-170.
41. Abelson S, Collord G, Ng SWK, et al. Prediction of acute myeloid leukaemia risk in healthy individuals. Nature. 2018;559(7714):400-404.
42. Sood R, Hansen NF, Donovan FX, et al. Somatic mutational landscape of AML with inv(16) or t(8;21) identifies patterns of clonal evolution in relapse leukemia. Leukemia. 2016;30(2):501-504.
43. Borthakur G, Kantarjian H. Core binding factor acute myelogenous leukemia-2021 treatment algorithm. Blood Cancer J. 2021;11(6):114.
44. Faber ZJ, Chen X, Gedman AL, et al. The genomic landscape of core-binding factor acute myeloid leukemias. Nat Genet. 2016;48(12):1551-1556.
45. Jaiswal S, Ebert BL. Clonal hematopoiesis in human aging and disease. Science. 2019;366(6465):eaan4673.
46. Yeaton A, Cayanan G, Loghavi S, et al. The impact of inflammation-induced tumor plasticity during myeloid transformation. Cancer Discov. 2022;12(10):2392-2413.
47. Walter D, Lier A, Geiselhart A, et al. Exit from dormancy provokes DNA-damage-induced attrition in haematopoietic stem cells. Nature. 2015;520(7548):549-552.
48. Ishikawa F, Yoshida S, Saito Y, et al. Chemotherapy-resistant human AML stem cells home to and engraft within the bonemarrow endosteal region. Nat Biotechnol. 2007;25(11):1315-1321.
49. Duy C, Li M, Teater M, et al. Chemotherapy induces senescence-
Haematologica | 108 February 2023 364 REVIEW ARTICLE - LSC-mediated therapy resistance in AML P. Stelmach and A. Trumpp
like resilient cells capable of initiating AML recurrence. Cancer Discov. 2021;11(6):1542-1561.
50. Ho TC, LaMere M, Stevens BM, et al. Evolution of acute myelogenous leukemia stem cell properties after treatment and progression. Blood. 2016;128(13):1671-1678.
51. Guryanova OA, Shank K, Spitzer B, et al. DNMT3A mutations promote anthracycline resistance in acute myeloid leukemia via impaired nucleosome remodeling. Nat Med. 2016;22(12):1488-1495.
52. Farge T, Saland E, de Toni F, et al. Chemotherapy-resistant human acute myeloid leukemia cells are not enriched for leukemic stem cells but require oxidative metabolism. Cancer Discov. 2017;7(7):716-735.
53. Boyd AL, Aslostovar L, Reid J, et al. Identification of chemotherapy-induced leukemic-regenerating cells reveals a transient vulnerability of human AML recurrence. Cancer Cell. 2018;34(3):483-498.
54. Wilson A, Murphy MJ, Oskarsson T, et al. c-Myc controls the balance between hematopoietic stem cell self-renewal and differentiation. Genes Dev. 2004;18(22):2747-2763.
55. Scognamiglio R, Cabezas-Wallscheid N, Thier MC, et al. Myc depletion induces a pluripotent dormant state mimicking diapause. Cell. 2016;164(4):668-680.
56. Bahr C, von Paleske L, Uslu VV, et al. A Myc enhancer cluster regulates normal and leukaemic haematopoietic stem cell hierarchies. Nature. 2018;553(7689):515-520.
57. Jordan CT, Upchurch D, Szilvassy SJ, et al. The interleukin-3 receptor alpha chain is a unique marker for human acute myelogenous leukemia stem cells. Leukemia. 2000;14(10):1777-1784.
58. van Rhenen A, van Dongen GA, Kelder A, et al. The novel AML stem cell associated antigen CLL-1 aids in discrimination between normal and leukemic stem cells. Blood. 2007;110(7):2659-2666.
59. Pabst C, Bergeron A, Lavallee VP, et al. GPR56 identifies primary human acute myeloid leukemia cells with high repopulating potential in vivo. Blood. 2016;127(16):2018-2027.
60. Jin L, Hope KJ, Zhai Q, Smadja-Joffe F, Dick JE. Targeting of CD44 eradicates human acute myeloid leukemic stem cells. Nat Med. 2006;12(10):1167-1174.
61. Majeti R, Chao MP, Alizadeh AA, et al. CD47 is an adverse prognostic factor and therapeutic antibody target on human acute myeloid leukemia stem cells. Cell. 2009;138(2):286-299.
62. Hosen N, Park CY, Tatsumi N, et al. CD96 is a leukemic stem cell-specific marker in human acute myeloid leukemia. Proc Natl Acad Sci U S A. 2007;104(26):11008-11013.
63. Mohle R, Bautz F, Rafii S, Moore MA, Brugger W, Kanz L. The chemokine receptor CXCR-4 is expressed on CD34+ hematopoietic progenitors and leukemic cells and mediates transendothelial migration induced by stromal cell-derived factor-1. Blood. 1998;91(12):4523-4530.
64. Schepers K, Campbell TB, Passegue E. Normal and leukemic stem cell niches: insights and therapeutic opportunities. Cell Stem Cell. 2015;16(3):254-267.
65. Eppert K, Takenaka K, Lechman ER, et al. Stem cell gene expression programs influence clinical outcome in human leukemia. Nat Med. 2011;17(9):1086-1093.
66. Ng SW, Mitchell A, Kennedy JA, et al. A 17-gene stemness score for rapid determination of risk in acute leukaemia. Nature. 2016;540(7633):433-437.
67. Docking TR, Parker JDK, Jadersten M, et al. A clinical transcriptome approach to patient stratification and therapy selection in acute myeloid leukemia. Nat Commun. 2021;12(1):2474.
68. Cai SF, Chu SH, Goldberg AD, et al. Leukemia cell of origin influences apoptotic priming and sensitivity to LSD1 inhibition. Cancer Discov. 2020;10(10):1500-1513.
69. Fong CY, Gilan O, Lam EY, et al. BET inhibitor resistance emerges from leukaemia stem cells. Nature. 2015;525(7570):538-542.
70. Rathert P, Roth M, Neumann T, et al. Transcriptional plasticity promotes primary and acquired resistance to BET inhibition. Nature. 2015;525(7570):543-547.
71. Bell CC, Fennell KA, Chan YC, et al. Targeting enhancer switching overcomes non-genetic drug resistance in acute myeloid leukaemia. Nat Commun. 2019;10(1):2723.
72. Lechman ER, Gentner B, Ng SW, et al. miR-126 regulates distinct self-renewal outcomes in normal and malignant hematopoietic stem cells. Cancer Cell. 2016;29(2):214-228.
73. Paczulla AM, Rothfelder K, Raffel S, et al. Absence of NKG2D ligands defines leukaemia stem cells and mediates their immune evasion. Nature. 2019;572(7768):254-259.
74. Lagadinou ED, Sach A, Callahan K, et al. BCL-2 inhibition targets oxidative phosphorylation and selectively eradicates quiescent human leukemia stem cells. Cell Stem Cell. 2013;12(3):329-341.
75. Culp-Hill R, D'Alessandro A, Pietras EM. Extinguishing the embers: targeting AML metabolism. Trends Mol Med. 2021;27(4):332-344.
76. Jones CL, Stevens BM, D'Alessandro A, et al. Inhibition of amino acid metabolism selectively targets human leukemia stem cells. Cancer Cell. 2018;34(5):724-740.
77. Suda T, Takubo K, Semenza GL. Metabolic regulation of hematopoietic stem cells in the hypoxic niche. Cell Stem Cell. 2011;9(4):298-310.
78. Pollyea DA, Stevens BM, Jones CL, et al. Venetoclax with azacitidine disrupts energy metabolism and targets leukemia stem cells in patients with acute myeloid leukemia. Nat Med. 2018;24(12):1859-1866.
79. Jones CL, Stevens BM, D'Alessandro A, et al. Cysteine depletion targets leukemia stem cells through inhibition of electron transport complex II. Blood. 2019;134(4):389-394.
80. Widden H, Placzek WJ. The multiple mechanisms of MCL1 in the regulation of cell fate. Commun Biol. 2021;4(1):1029.
81. Stevens BM, Jones CL, Pollyea DA, et al. Fatty acid metabolism underlies venetoclax resistance in acute myeloid leukemia stem cells. Nat Cancer. 2020;1(12):1176-1187.
82. Pei S, Pollyea DA, Gustafson A, et al. Monocytic subclones confer resistance to venetoclax-based therapy in patients with acute myeloid leukemia. Cancer Discov. 2020;10(4):536-551.
83. Moujalled DM, Brown FC, Chua CC, et al. Acquired mutations in BAX confer resistance to BH3-mimetic therapy in acute myeloid leukemia. Blood. 2022 Oct 11. [Epub ahead of print]
84. Parmar K, Mauch P, Vergilio JA, Sackstein R, Down JD. Distribution of hematopoietic stem cells in the bone marrow according to regional hypoxia. Proc Natl Acad Sci U S A. 2007;104(13):5431-5436.
85. Mohyeldin A, Garzon-Muvdi T, Quinones-Hinojosa A. Oxygen in stem cell biology: a critical component of the stem cell niche. Cell Stem Cell. 2010;7(2):150-161.
86. Tothova Z, Gilliland DG. FoxO transcription factors and stem cell homeostasis: insights from the hematopoietic system. Cell Stem Cell. 2007;1(2):140-152.
87. Pei S, Minhajuddin M, Adane B, et al. AMPK/FIS1-mediated mitophagy is required for self-renewal of human AML stem cells. Cell Stem Cell. 2018;23(1):86-100.
88. Raffel S, Falcone M, Kneisel N, et al. BCAT1 restricts alphaKG levels in AML stem cells leading to IDHmut-like DNA hypermethylation. Nature. 2017;551(7680):384-388.
89. Sykes DB, Kfoury YS, Mercier FE, et al. Inhibition of
Haematologica | 108 February 2023 365 REVIEW ARTICLE - LSC-mediated therapy resistance in AML P. Stelmach and A. Trumpp
dihydroorotate dehydrogenase overcomes differentiation blockade in acute myeloid leukemia. Cell. 2016;167(1):171-186.
90. van Gastel N, Spinelli JB, Sharda A, et al. Induction of a timed metabolic collapse to overcome cancer chemoresistance. Cell Metab. 2020;32(3):391-403.
91. So J, Lewis AC, Smith LK, et al. Inhibition of pyrimidine biosynthesis targets protein translation in acute myeloid leukemia. EMBO Mol Med. 2022;14(7):e15203.
92. Levis M. FLT3 dancing on the stem cell. J Exp Med. 2017;214(7):1857-1859.
93. Schlenk RF, Kayser S, Bullinger L, et al. Differential impact of allelic ratio and insertion site in FLT3-ITD-positive AML with respect to allogeneic transplantation. Blood. 2014;124(23):3441-3449.
94. Stone RM, Mandrekar SJ, Sanford BL, et al. Midostaurin plus chemotherapy for acute myeloid leukemia with a FLT3 mutation. N Engl J Med. 2017;377(5):454-464.
95. Perl AE, Martinelli G, Cortes JE, et al. Gilteritinib or chemotherapy for relapsed or refractory FLT3-mutated AML. N Engl J Med. 2019;381(18):1728-1740.
96. Cortes JE, Khaled S, Martinelli G, et al. Quizartinib versus salvage chemotherapy in relapsed or refractory FLT3-ITD acute myeloid leukaemia (QuANTUM-R): a multicentre, randomised, controlled, open-label, phase 3 trial. Lancet Oncol. 2019;20(7):984-997.
97. Welch JS, Ley TJ, Link DC, et al. The origin and evolution of mutations in acute myeloid leukemia. Cell. 2012;150(2):264-278.
98. Chu SH, Heiser D, Li L, et al. FLT3-ITD knockin impairs hematopoietic stem cell quiescence/homeostasis, leading to myeloproliferative neoplasm. Cell Stem Cell. 2012;11(3):346-358.
99. Mead AJ, Neo WH, Barkas N, et al. Niche-mediated depletion of the normal hematopoietic stem cell reservoir by Flt3-ITDinduced myeloproliferation. J Exp Med. 2017;214(7):2005-2021.
100. Travaglini S, Angelini DF, Alfonso V, et al. Characterization of FLT3-ITD(mut) acute myeloid leukemia: molecular profiling of leukemic precursor cells. Blood Cancer J. 2020;10(8):85.
101. van Galen P, Hovestadt V, Wadsworth Ii MH, et al. Single-cell RNA-seq reveals AML hierarchies relevant to disease progression and immunity. Cell. 2019;176(6):1265-1281.
102. Ward PS, Patel J, Wise DR, et al. The common feature of leukemia-associated IDH1 and IDH2 mutations is a neomorphic enzyme activity converting alpha-ketoglutarate to 2hydroxyglutarate. Cancer Cell. 2010;17(3):225-234.
103. Xu W, Yang H, Liu Y, et al. Oncometabolite 2-hydroxyglutarate is
a competitive inhibitor of alpha-ketoglutarate-dependent dioxygenases. Cancer Cell. 2011;19(1):17-30.
104. Figueroa ME, Abdel-Wahab O, Lu C, et al. Leukemic IDH1 and IDH2 mutations result in a hypermethylation phenotype, disrupt TET2 function, and impair hematopoietic differentiation. Cancer Cell. 2010;18(6):553-567.
105. Chan SM, Thomas D, Corces-Zimmerman MR, et al. Isocitrate dehydrogenase 1 and 2 mutations induce BCL-2 dependence in acute myeloid leukemia. Nat Med. 2015;21(2):178-184.
106. DiNardo CD, Schuh AC, Stein EM, et al. Enasidenib plus azacitidine versus azacitidine alone in patients with newly diagnosed, mutant-IDH2 acute myeloid leukaemia (AG221-AML005): a single-arm, phase 1b and randomised, phase 2 trial. Lancet Oncol. 2021;22(11):1597-1608.
107. Roboz GJ, DiNardo CD, Stein EM, et al. Ivosidenib induces deep durable remissions in patients with newly diagnosed IDH1mutant acute myeloid leukemia. Blood. 2020;135(7):463-471.
108. Montesinos P, Recher C, Vives S, et al. Ivosidenib and azacitidine in IDH1-mutated acute myeloid leukemia. N Engl J Med. 2022;386(16):1519-1531.
109. Wang F, Morita K, DiNardo CD, et al. Leukemia stemness and co-occurring mutations drive resistance to IDH inhibitors in acute myeloid leukemia. Nat Commun. 2021;12(1):2607.
110. Stoeckius M, Hafemeister C, Stephenson W, et al. Simultaneous epitope and transcriptome measurement in single cells. Nat Methods. 2017;14(9):865-868.
111. Miles LA, Bowman RL, Merlinsky TR, et al. Single-cell mutation analysis of clonal evolution in myeloid malignancies. Nature. 2020;587(7834):477-482.
112. Jeong H, Grimes K, Bruch P-M, et al. Haplotype-aware singlecell multiomics uncovers functional effects of somatic structural variation. bioRxiv. 2021 Nov 13. doi: https://doi.org/10.1101/2021.11.11.468039 [Preprint, not peerreviewed]
113. Rodriguez-Meira A, Buck G, Clark SA, et al. Unravelling intratumoral heterogeneity through high-sensitivity single-cell mutational analysis and parallel RNA sequencing. Mol Cell. 2019;73(6):1292-1305.
114. Nam AS, Kim KT, Chaligne R, et al. Somatic mutations and cell identity linked by genotyping of transcriptomes. Nature. 2019;571(7765):355-360.
115.Velten L, Story BA, Hernandez-Malmierca P, et al. Identification of leukemic and pre-leukemic stem cells by clonal tracking from single-cell transcriptomics. Nat Commun. 2021;12(1):1366.
Haematologica | 108 February 2023 366 REVIEW ARTICLE - LSC-mediated therapy resistance in AML P. Stelmach and A. Trumpp
Targeting dual oncogenic machineries driven by TAL1 and PI3K-AKT pathways in T-cell acute lymphoblastic leukemia
Fang Qi Lim,1 Allison Si-Yu Chan,1 Rui Yokomori,1 Xiao Zi Huang,1 Madelaine Skolastika Theardy,1 Allen Eng Juh Yeoh,1,2 Shi Hao Tan1 and Takaomi Sanda1,3
1Cancer Science Institute of Singapore, National University of Singapore; 2VIVA-NUS CenTRAL, Department of Pediatrics, National University of Singapore and 3Department of Medicine, Yong Loo Lin School of Medicine, National University of Singapore, Singapore
Correspondence: T. Sanda takaomi_sanda@nus.edu.sg
Received: January 27, 2022.
Accepted: August 30, 2022.
Prepublished: September 8, 2022.
https://doi.org/10.3324/haematol.2022.280761
©2023 Ferrata Storti Foundation
Published under a CC-BY-NC license
Abstract
T-cell acute lymphoblastic leukemia (T-ALL) is a malignancy of thymic T-cell precursors. Overexpression of oncogenic transcription factor TAL1 is observed in 40-60% of human T-ALL cases, frequently together with activation of the NOTCH1 and PI3K-AKT pathways. In this study, we performed chemical screening to identify small molecules that can inhibit the enhancer activity driven by TAL1 using the GIMAP enhancer reporter system. Among approximately 3,000 compounds, PIK75, a known inhibitor of PI3K and CDK, was found to strongly inhibit the enhancer activity. Mechanistic analysis demonstrated that PIK-75 blocks transcriptional activity, which primarily affects TAL1 target genes as well as AKT activity. TAL1-positive, AKT-activated T-ALL cells were very sensitive to PIK-75, as evidenced by growth inhibition and apoptosis induction, while T-ALL cells that exhibited activation of the JAK-STAT pathway were insensitive to this drug. Together, our study demonstrates a strategy targeting two types of core machineries mediated by oncogenic transcription factors and signaling pathways in T-ALL.
Introduction
T-cell acute lymphoblastic leukemia (T-ALL) is a malignant disorder resulting from the leukemic transformation of T-cell precursors.1-5 This disease is characterized by aberrant expression of oncogenic transcription factors such as TAL1, TAL2, TLX1, TLX3, LMO1, LMO2, HOXA and NKX2-1, which are exclusively expressed and define distinct molecular subgroups1-5 (called “type A” abnormalities).4 Although recent developments in small-molecule inhibitors have produced remarkable clinical results against certain malignancies, such benefits have not been obtained in T-ALL. Therefore, further advances in prognosis require improved knowledge of T-ALL pathogenesis and the identification of novel therapeutic drugs for this disease.
TAL1 is one of the most prevalent oncogenes in T-ALL and is aberrantly overexpressed in 40-60% of human T-ALL cases.6-8 We previously reported that TAL1 forms an interconnected autoregulatory loop with its regulatory partners (GATA3 and RUNX1) in T-ALL cells,9 which likely
contributes substantially to sustaining the oncogenic transcriptional program. We also identified several critical downstream targets and their enhancers, including the GIMAP and ARID5B genes,10-13 that are directly activated by TAL1 under the control of super-enhancers in T-ALL cells. Interestingly, multiple GIMAP genes, which are located within a gene cluster, are regulated by a single enhancer element in T-ALL cells. TAL1, GATA3, and RUNX1 activate this enhancer, while the tumor suppressor E-proteins (E2A and HEB) inhibit this activity. This element is also directly regulated by NOTCH1,13 another prevalent oncogene in TALL.14 Thus, the activity of the GIMAP enhancer represents the status of oncogenic transcription factors and tumor suppressors in T-ALL cells.
Besides type A abnormalities, many studies have demonstrated that several molecular abnormalities, many of which are pro-proliferative and pro-survival signaling pathways, are shared across different T-ALL subgroups1-5 (called “type B” abnormalities).4 They are often simultaneously present and cooperate with type A abnormalities in T-ALL. These abnormalities include genetic mutations
Haematologica | 108 February 2023 367 ARTICLE - Acute Lymphoblastic Leukemia
in PI3K-AKT-PTEN pathway components, which are more frequently observed in TAL1-positive T-ALL (approximately 50%) than in other subgroups (7-30%), while activation of the JAK-STAT pathway is more frequently observed in TLX1/3-positive T-ALL (43%).15,16 These genetic relationships suggest preferential combination and cooperative effects between specific type A and type B abnormalities. In other words, it is ideal to concurrently block such cooperative mechanisms as a therapeutic strategy. In this study, we began with chemical screening to identify small molecules that can inhibit enhancer activity driven by the TAL1 complex using the GIMAP enhancer reporter system. This pinpointed PIK-75, a known inhibitor of PI3K and cyclin-dependent kinases (CDK), which exerts potent cytotoxicity through inhibition of TAL1 and PI3K-AKT pathways. Our study proposes a strategy targeting dual oncogenic mechanisms driven by type A and B abnormalities in T-ALL cells.
Methods
Cell culture and reagents
All T-ALL cell lines and 293T cells were cultured in RPMI1640 and DMEM medium (BioWest), respectively, supplemented with 10% fetal bovine serum (BioWest) in a CO2 incubator. For interleukin-7 (IL-7) stimulation, HPB-ALL and SUP-T1 cells were cultured with 50 ng/mL recombinant human IL-7 (PeproTech) for 24 hours. Dibenzazepine (DBZ) was purchased from Tocris. THZ1 and (+)-JQ1 were purchased from Selleck Chemicals. WP1130 and PIK75 were purchased from MedChemExpress.
Patient-derived xenograft model
Two human T-ALL patient-derived xenograft (PDX) samples (DFCI-9 and DFCI-15) were kindly provided by Dr Alejandro Gutierrez and were expanded in NOD-SCID- γ mice via tail vein injection. Human leukemic cells were harvested from moribund mice and sorted by fluorescence-activated cell sorting (FACS) using an anti-human CD45-APC antibody (BioLegend) by BD FACS ARIA. The protocol was approved by the Institutional Animal Care and Use Committee of the National University of Singapore.
Chemical screening
Chemical screening was performed at the Center for Highthroughput Phenomics, Genome Institute of Singapore (CHiP-GIS). Briefly, Jurkat cells stably transduced with the eGIMAP-luciferase construct were seeded in 384-well plates at 2,500 cells per well. After 24 hours, compounds from the Epigenetics 151 Library (151 compounds, 2 mM, duplicates), Anticancer Library (414 compounds, 1 mM, triplicates), and Spectrum Collection (2,396 compounds, 1
µM, triplicates), dimethyl sulfoxide (DMSO), and THZ1 (1 µM) were added using a liquid handling workstation. Five hours after incubation, cell viability (fluorescence) and enhancer activity (luminescence) were measured using the ONE-Glo+Tox Luciferase Reporter and Cell Viability Assay (Promega) using a microplate reader (Tecan). The readout was normalized among the replicates.
Knockdown and overexpression experiments
Short hairpin RNA (shRNA) sequences are listed in the Online Supplementary Table S1. Each sequence was cloned into pLKO.1-puro lentiviral vector. 293T cells were transfected with envelope plasmid pMD2.G, packaging plasmids pMDLg/pRRE and pRSV-Rev, and the corresponding shRNA constructs using FuGENE 6 transfection reagent (Promega) and Opti-MEM (Gibco). Jurkat cells were spinoculated with filtered virus-containing medium supplemented with polybrene (Sigma-Aldrich). Puromycin was added 36 hours post infection. For BCL2 overexpression, 293T cells were transfected with pMSCV-GFP-BCL2,11 packaging plasmid gag-pol, and envelope plasmid VSV-G using FuGENE 6 transfection reagent and Opti-MEM. Jurkat cells were spinoculated with filtered virus-containing medium supplemented with polybrene.
RNA extraction and quantitative reverse transcription polymerase chain reaction
Total RNA was extracted using a NucleoSpin RNA kit (Macherey-Nagel). A total of 1,000 ng RNA and 1 m L of ERCC Spike-In (1:100 dilution) (Invitrogen) was reverse-transcribed into cDNA using iScript cDNA Synthesis Kit (BioRad). Quantitative polymerase chain reaction (qPCR) was performed using Power SYBR Green PCR Master Mix (Applied Biosystems) on the Quant Studio 3 System (Thermo Fisher Scientific). mRNA expression levels were evaluated using the ΔΔ Ct method. Primer sequences are listed in the Online Supplementary Table S2.
Protein extraction and western blot analysis
Cells were lysed with Cell Lysis Buffer (Cell Signaling Technology) supplemented with protease inhibitor (Thermo Scientific). Proteins were separated by SDS-PAGE and transferred onto polyvinylidene difluoride membranes (Bio-Rad). The antibodies used are listed in the Online Supplementary Table S3
Cell viability assay
Cell lines were seeded at 5,000 cells per well into 96-well plates. Cell viability was measured after treatment with inhibitors by measuring the luminescence using a CellTiter-Glo assay (Promega). The half maximal inhibitory concentration (IC50) values were determined by the dose response inhibition function using variable slope by GraphPad Prism.
Haematologica | 108 February 2023 368 ARTICLE - Inhibition of CDK and PI3K on T-ALL F.Q. Lim et al.
Flow cytometric analysis
For the apoptosis assay, cells were treated with PIK-75 at the corresponding IC80 values for 4 hours and were stained with AnnexinV-APC (BioLegend) and propidium iodide (Sigma) for 15 minutes. The cells were then analyzed by flow cytometry (BD, LSR II) and FlowJo.
RNA sequencing analysis
Sample preparation
ERCC RNA spike-in controls (1:10) were added at 1 uL per 1 million cells. Total RNA was extracted using QIAzol reagent, miRNeasy Mini Kit, and DNase I (Qiagen). Strandspecific library construction and 100-bp paired-end sequencing with a sequencing depth of 20 M reads on DNBseq were performed at BGI Genomics.
Data processing
RNA sequencing (RNA-seq) reads were mapped to transcript sequences of curated RefSeq and ERCC spike-in controls using salmon (version 1.1.0)17 with the options “-gcBias --seqBias –validateMappings”. The index file for the transcript sequences was created with default settings. Transcript-level read counts were converted to gene-level read counts using tximport (version 1.14.2).18 The genes that did not have more than five read counts in at least two samples were removed. The gene level read counts were normalized using upper quantile normalization, and those of spike-in controls were used to estimate the factor (k=1) of unwanted variation between samples using RUVSeq (version 1.20.0).19 Differentially expressed genes were then estimated using DESeq2 (version 1.26.0).20,21 The estimated unwanted factor was included in the design formula of DESeq2 for spike-in normalization.
Gene set enrichment analysis and gene ontology analysis
Gene set enrichment analysis (GSEA)22 analysis was performed on the normalized RNA-seq data. High-confidence targets of TAL1 were previously defined12 by identifying genes that have enhancer regions bound by TAL1 and are also downregulated by the knockdown. Super-enhancerassociated genes were also previously defined,12 which possess super-enhancers in Jurkat but not in normal thymus, Th1, Th2 or Th17 cells. Gene ontology (GO) analysis was performed using the Enrichr tool.23 The top 10 categories with the lowest adjusted P value were selected.
Statistical analysis
Statistical analysis was performed for the results which were done with biological replicates. Comparisons were performed with Student’s t-tests, and P values denoted as *P<0.05, **P<0.01, or ***P<0.001 were deemed significant (NS, not significant). Standard deviation (SD) was not shown for the results which were done in duplicates.
Dataset availability
RNA-seq data has been deposited in the Gene Expression Omnibus database under accession numbers GSE181435.
Results
Establishment of the GIMAP enhancer reporter system
In our previous study, we identified an enhancer element regulating multiple GIMAP genes within the GIMAP gene cluster13 (also shown in the Online Supplementary Figure S1A). This element was bound by TAL1, its regulatory partners (GATA3 and RUNX1) and coactivators (e.g., CBP) in a T-ALL cell line (Jurkat). The same position was also bound by NOTCH1. Notably, this element was associated with a super-enhancer in multiple T-ALL cell samples, thus showing that it is highly activated in T-ALL cells. We cloned the enhancer sequence into a luciferase reporter construct, which was shown to be activated by TAL1 and its regulatory partners and inhibited by E-proteins in T-ALL cells. In the current study, we utilized this reporter system as a readout to evaluate the overall transcriptional activity. Using this system, we aimed to identify drugs that can globally inhibit transcriptional activity mediated by TAL1 rather than focusing on specific function or expression of GIMAP genes. We established a Jurkat subclone that stably expressed the reporter construct (Figure 1A). Under this condition, luciferase expression can be induced by transcription factors endogenously expressed in Jurkat cells. As a proof of principle, we confirmed that genetic knockdown of TAL1 or its regulatory partners by shRNA significantly inhibited luciferase activity (Figure 1B). Pharmacological inhibition of NOTCH1 activity with DBZ, a γ-secretase inhibitor (GSI), moderately inhibited luciferase activity (Figure 1C) compared to vehicle (DMSO) (Online Supplementary Figure S1B), suggesting that the GIMAP enhancer is not completely dependent on NOTCH1 activity. We also confirmed that a small-molecule inhibitor of CDK7 (THZ1) that inhibits the activation of RNA polymerase II24 strongly downregulated luciferase activity after 5 hours of treatment (Figure 1C). Thus, THZ1 serves as a positive control. Of note, T-ALL cells, including Jurkat cells, are known to be sensitive to transcription inhibition by THZ1 treatment.24 Cell viability was significantly inhibited after 24 hours of treatment (Online Supplementary Figure S1C). Thus, in order to minimize indirect or non-specific effects on transcription due to growth inhibition, we decided to measure luciferase activity only after 5 hours of drug treatment.
Small-molecule screening identified PIK-75, which inhibits GIMAP enhancer activity We then performed a chemical screening using this reporter system to identify small molecules that can block the enhancer activity driven by oncogenic transcription
Haematologica | 108 February 2023 369 ARTICLE - Inhibition of CDK and PI3K on T-ALL F.Q. Lim et al.
factors. We applied three small-molecule libraries (“spectrum collection”, “epigenetic library”, and “anticancer library”), which included a total of approximately 3,000 commercially-available compounds (Figure 2A). We measured both enhancer activity and cell viability in tech-
nical duplicates 5 hours after drug addition. The results were compared to DMSO (negative control) and THZ1 (positive control) (Figure 2B for anticancer library; Online Supplementary Table S4).
As expected, THZ1 strongly inhibited enhancer activity
Figure 1. Establishment of the GIMAP enhancer reporter system. (A) Overview of the strategy used to screen for small-molecule compounds. The GIMAP enhancer luciferase reporter construct (eGIMAP-pGL4.26) was cloned and transfected into Jurkat cells. Stable clones were selected and subjected to drug screening or genetic knockdown. (B) Jurkat cells stably expressing the GIMAP reporter construct were subjected to short hairpin RNA (shRNA) knockdown using lentivirus infection. Cell viability and luciferase activity were measured 3 days post infection. Relative luminescence was determined by normalizing luciferase activity to cell viability and is presented as the fold change compared to the control scrambled RNA (shScrambled RNA). The values are shown as individual dots and the mean ± standard deviation of technical triplicates. (C) Jurkat cells stably expressing the GIMAP reporter construct were treated with DBZ or THZ1. Cell viability and luciferase activity were measured after 5 hours. Relative luminescence was determined by normalizing luciferase activity to cell viability and is presented as the fold change compared to untreated cells (0 nM). The values are shown as individual dots and the mean ± standrard devaition of technical triplicates. Representative results from multiple independent experiments were shown (B and C).
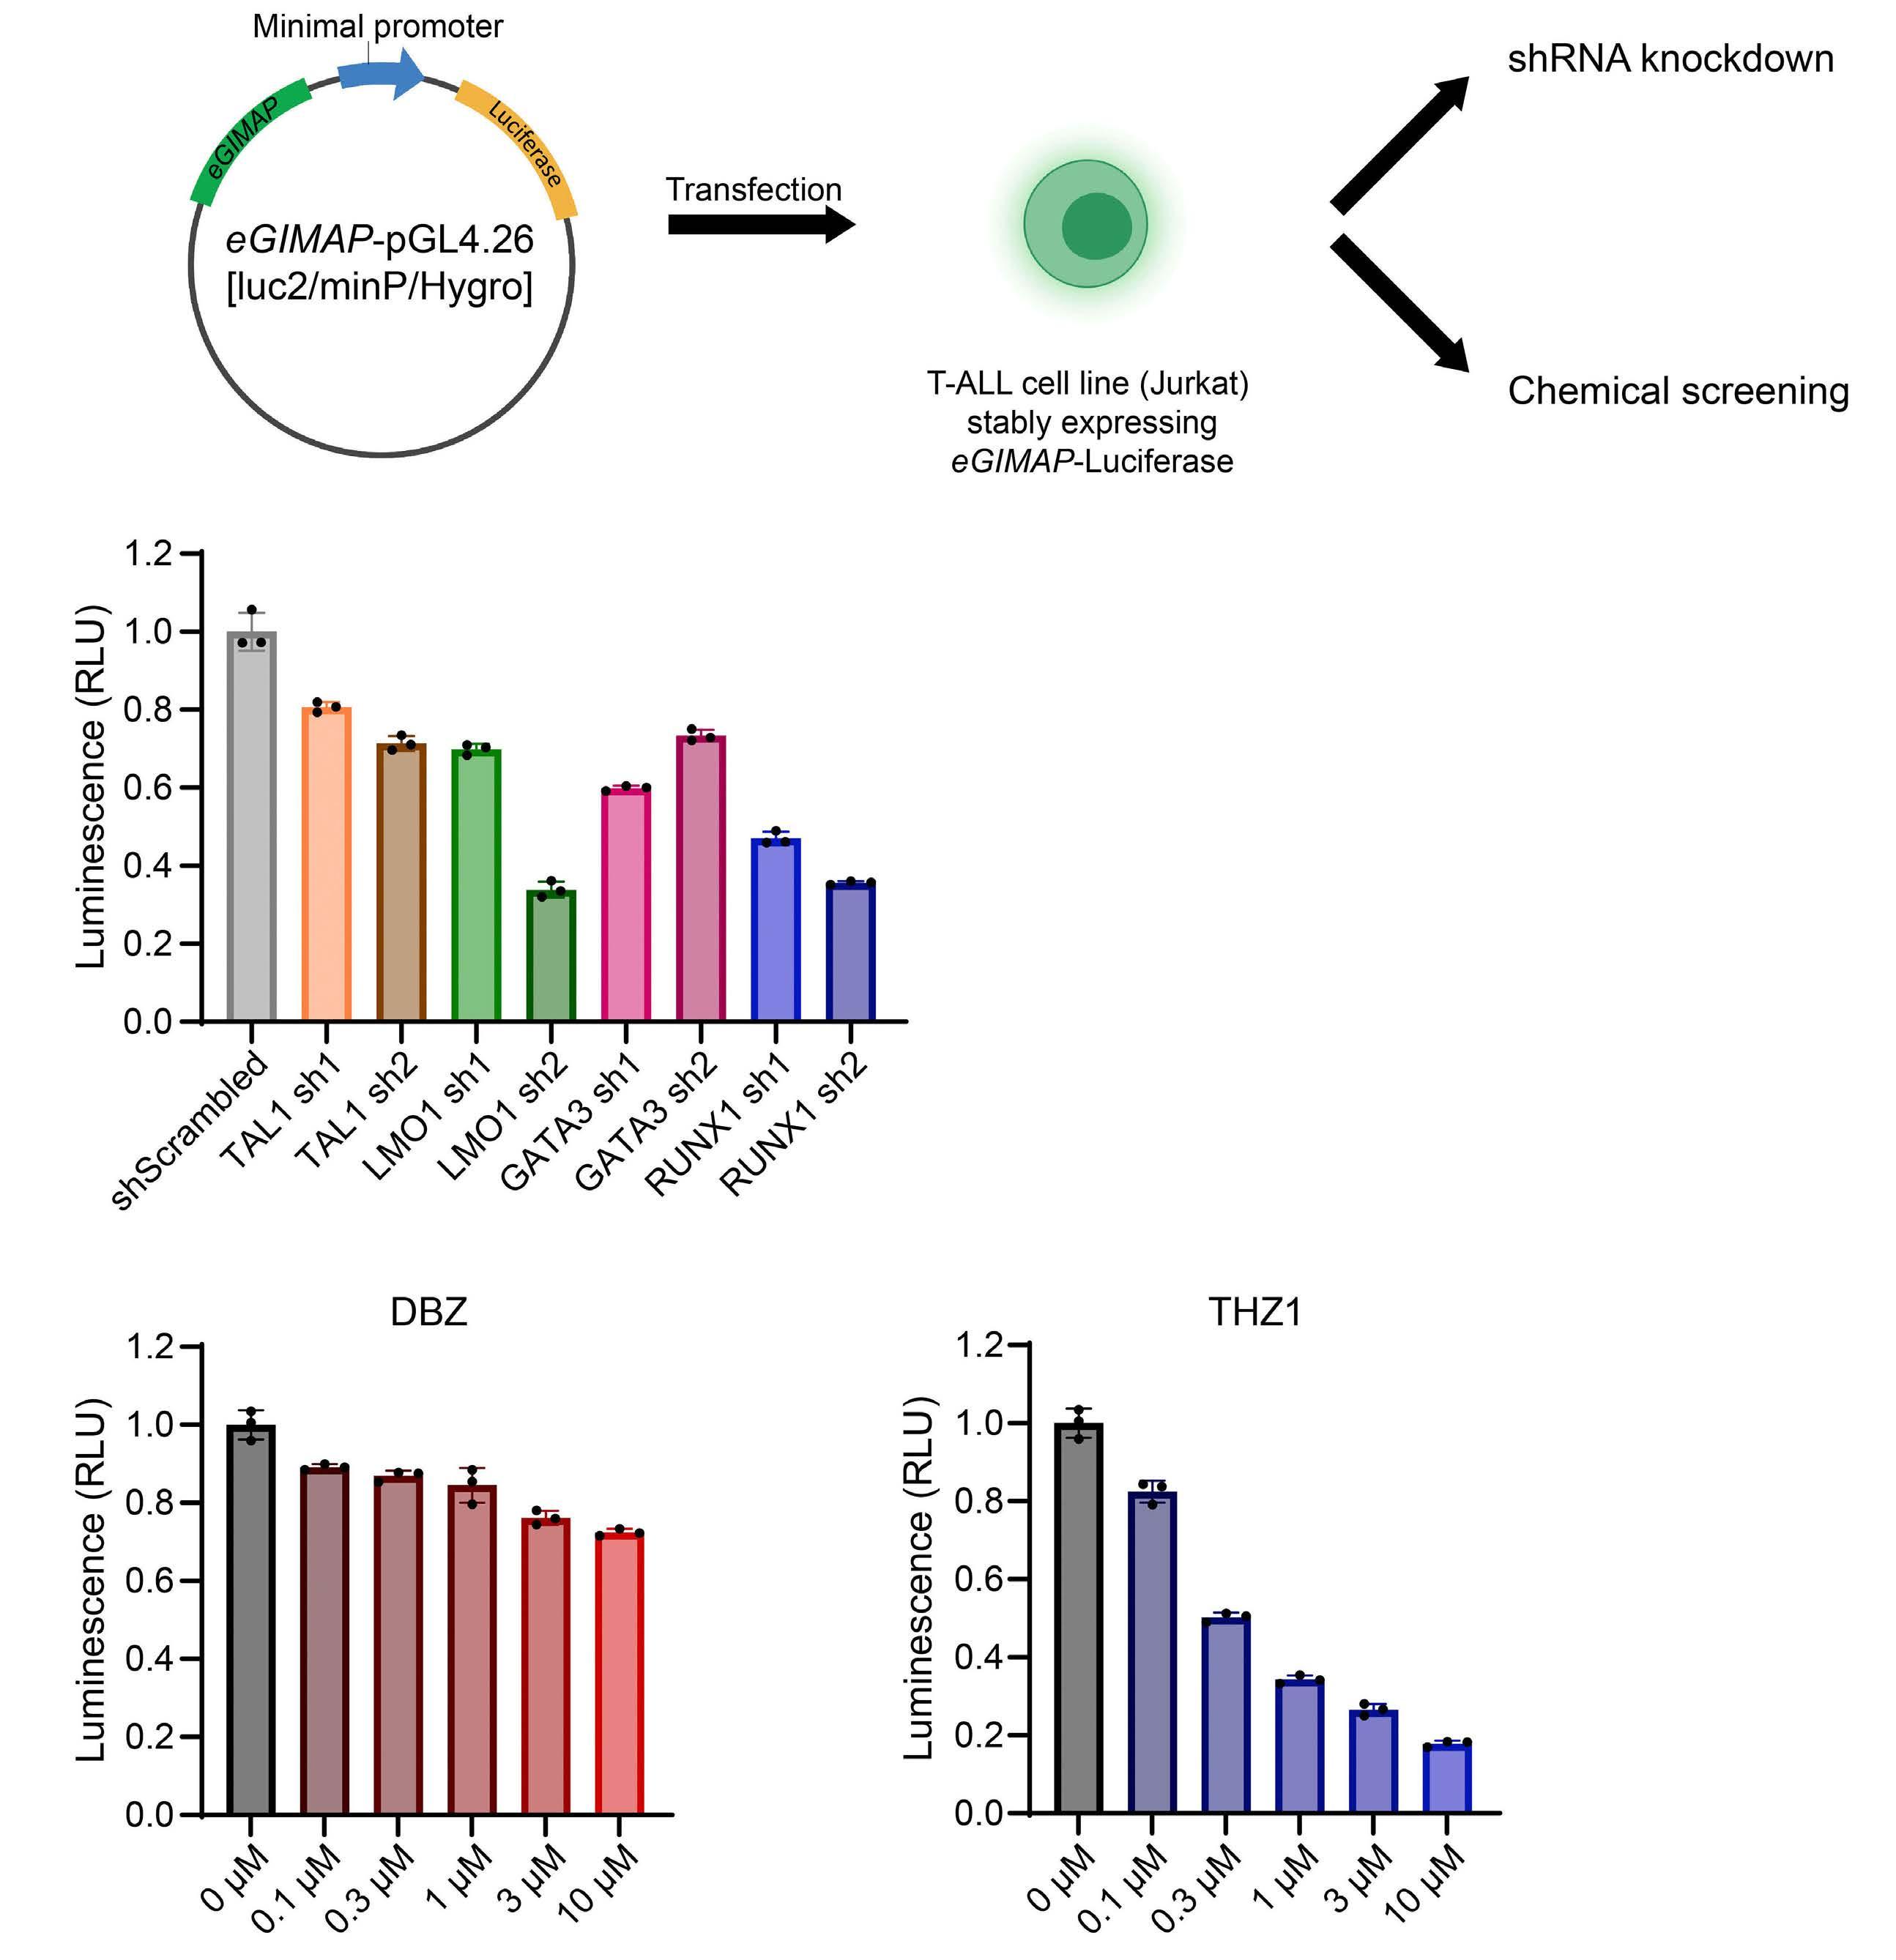
B Haematologica | 108 February 2023 370 ARTICLE - Inhibition of CDK and PI3K on T-ALL F.Q. Lim et al. A C
(shown in red) as compared to DMSO (shown in orange) and the majority of compounds. In contrast, several cytotoxic agents (obatoclax mesylate, PHA-665752, CNX-2006, osimertinib, and AZ5104) dominantly reduced cell viability but not enhancer activity (shown in purple), suggesting that the mechanism of growth inhibition of these compounds is independent of transcription activities. We then shortlisted the compounds that showed stronger reduction in enhancer activity than THZ1 (fold change of luminescence compared to THZ1 <0.5). Notably, two compounds (PIK-75 and WP1130) were statistically significant (P<0.05, shown in green). These drugs also reduced cell viability, demonstrating strong cytotoxicity at even short time points. Independent validation showed that
treatment with PIK-75 significantly inhibited enhancer activity in a dose-dependent manner (Figure 2C), similar to the results of THZ1 treatment. However, WP1130 inhibited the activity only at high concentrations (over 3 mM) and thus was not selected for the downstream analysis. Of note, PIK-75 was originally developed as an inhibitor that blocks PI3K p110a activity.25 Later studies showed that PIK-75 also inhibits other kinases including CDK.25,26 Hence, this drug has multiple targets besides PI3K. In contrast, 34 other small molecules included in our chemical screening (e.g., PI-103), which have been reported to specifically inhibit PI3K or its downstream AKT or mTOR, did not show a stronger inhibitory effect than PIK-75 on luciferase (0.174 for PIK-75, and 0.502-1.188 for 34 drugs) or
Figure 2. Chemical screening using the GIMAP enhancer reporter system. (A) Overview of the chemical screening strategy. Using a liquid handling workstation, 2,961 compounds from 3 chemical libraries, a negative control (dimethyl sulfoxide [DMSO]) and a positive control (THZ1), were added to Jurkat cells that stably expressed the GIMAP enhancer reporter construct. Cell viability and luciferase activity were measured after 5 hours using a microplate reader. Images were created by BioRender. (B) Scatterplot showing luminescence (representing the GIMAP enhancer activity) and fluorescence (representing cell viability) of the cells treated with each of the compounds from the anticancer library. The values shown are the means of technical triplicates, presented as fold change compared to THZ1. (C) Jurkat cells stably expressing the GIMAP enhancer construct were treated with PIK-75 and WP1130 at various concentrations. Cell viability and luciferase activity were measured after 5 hours. Relative luminescence was determined by normalizing luciferase activity to cell viability and is presented as the fold change compared to untreated cells. The values are shown as individual dots and the mean ± standard deviation of technical triplicates. Representative results from multiple independent experiments were shown (C).
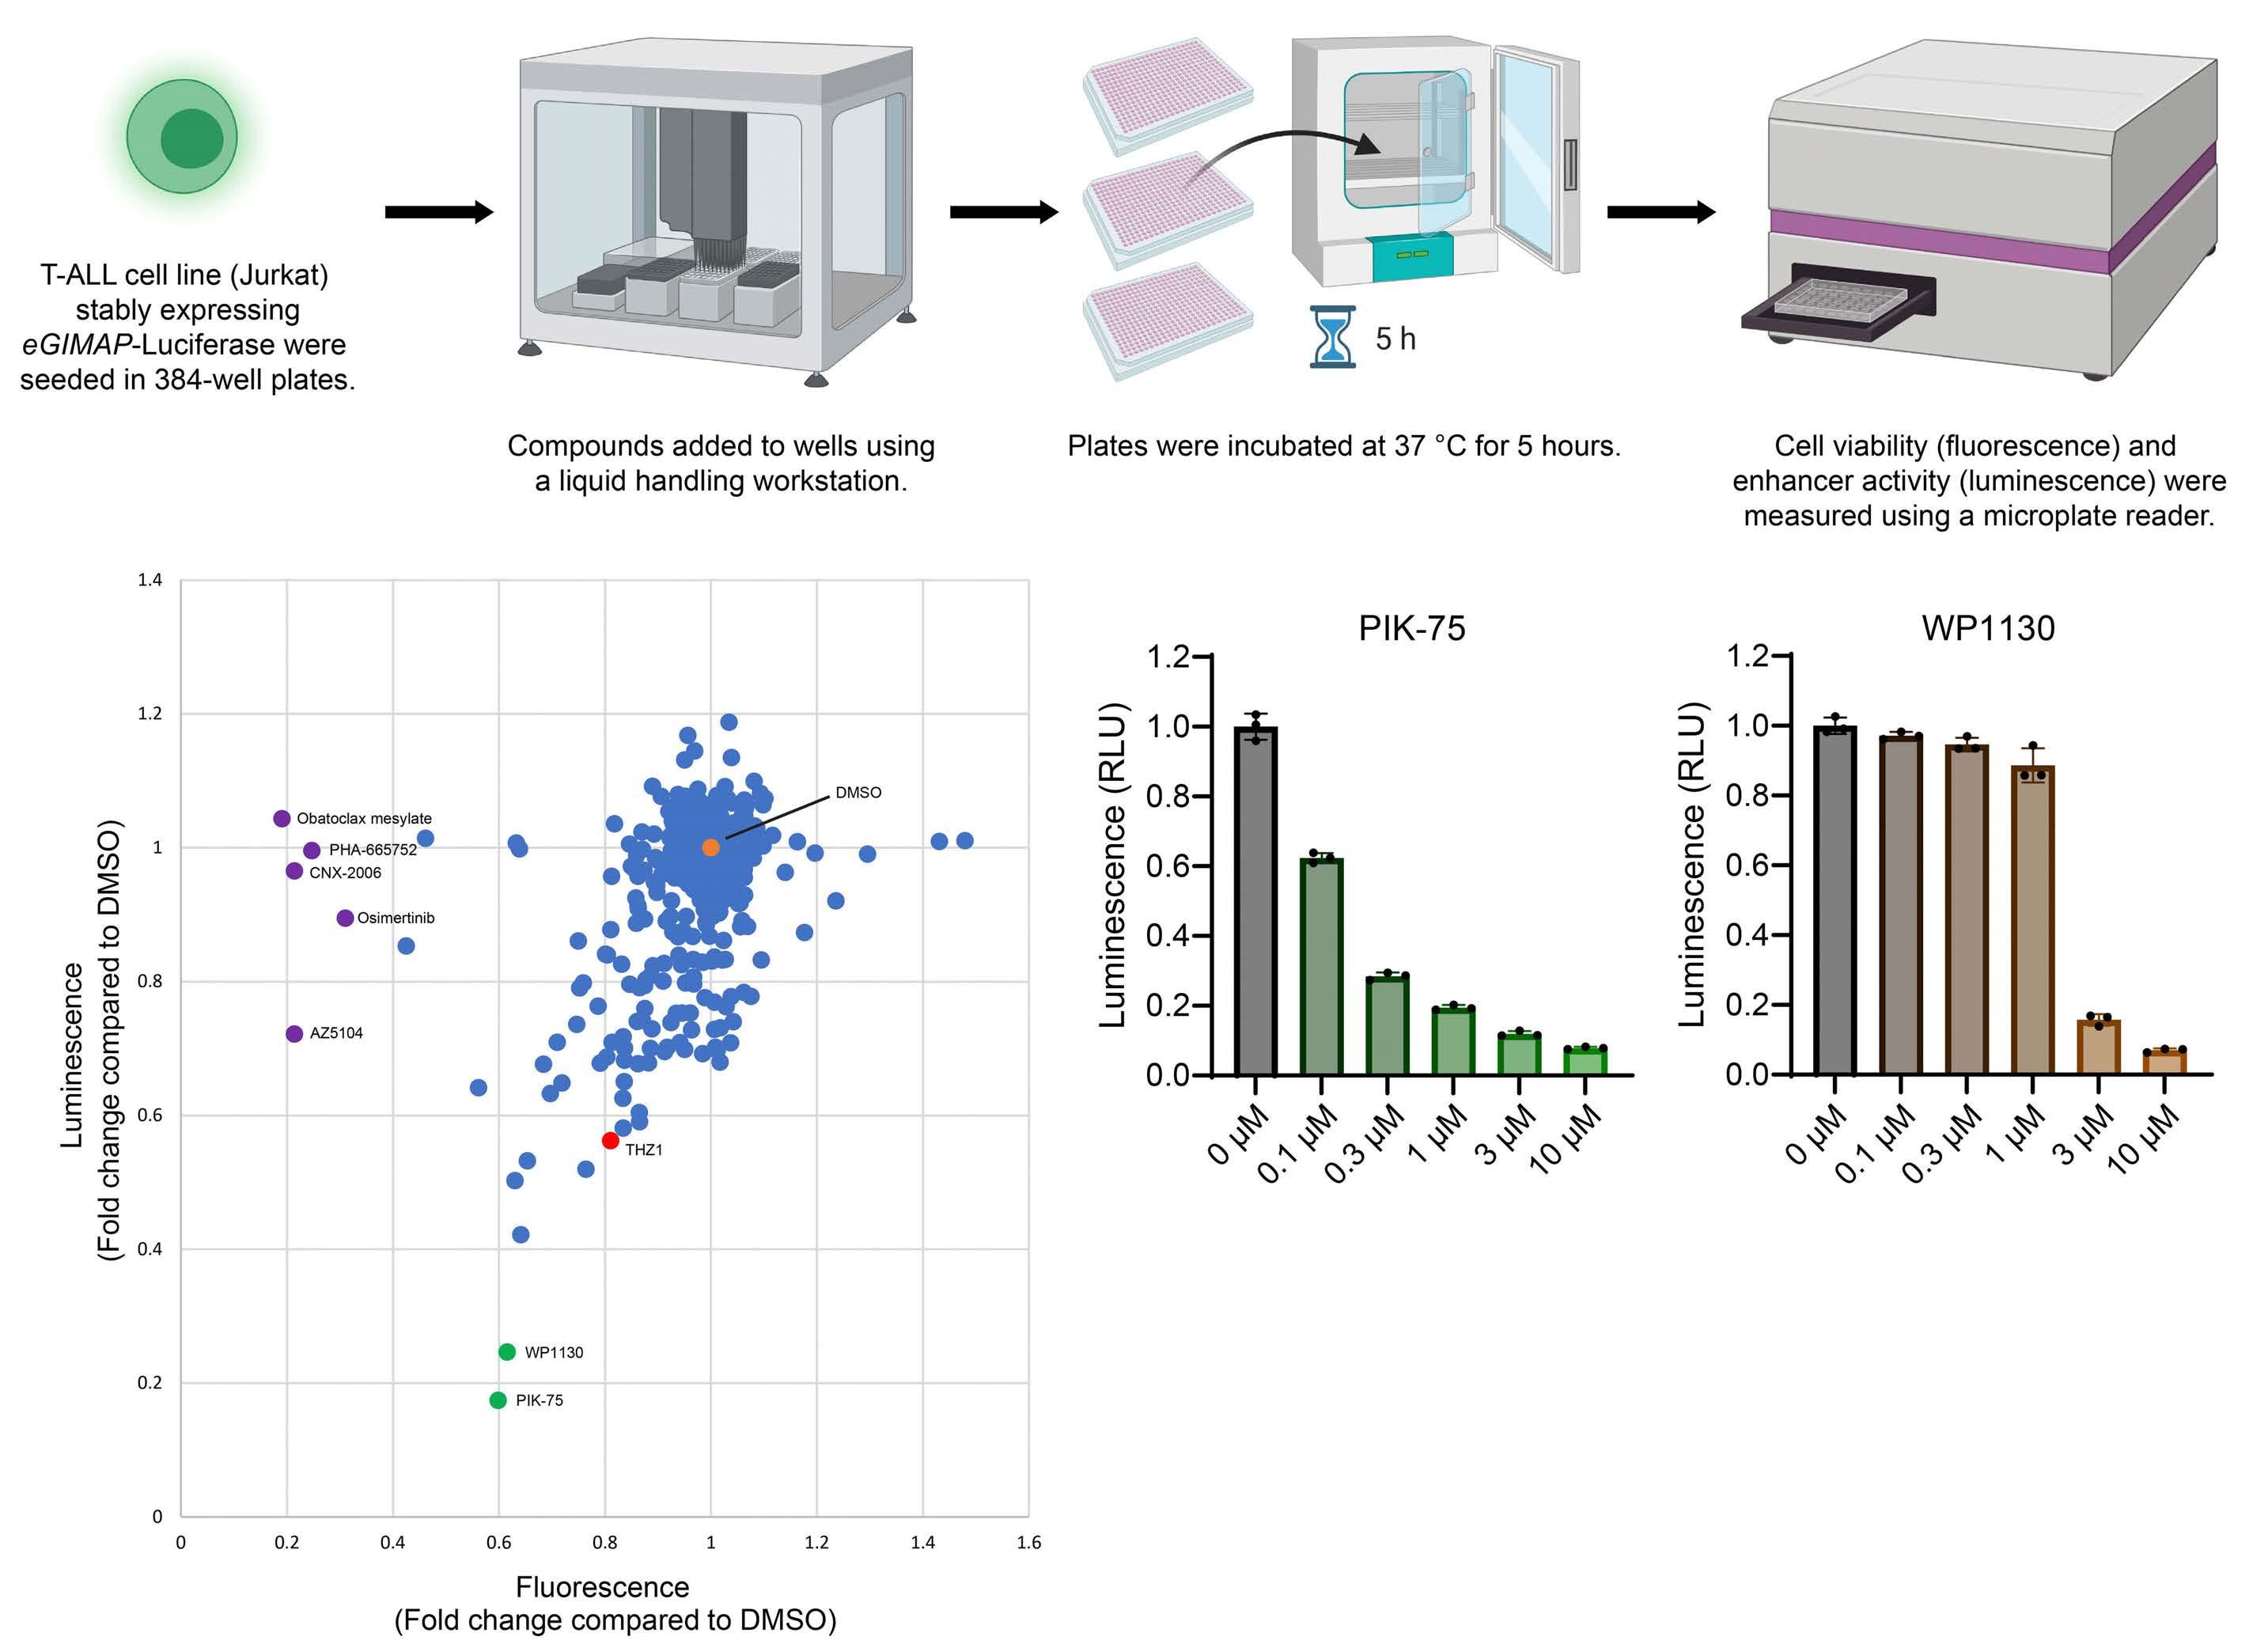
B Haematologica | 108 February 2023 371 ARTICLE - Inhibition of CDK and PI3K on T-ALL F.Q. Lim et al. C A
cell viability (0.599 for PIK-75, and 0.630-1.076 for 34 drugs) (Online Supplementary Table S4). Similarly, A66, which is a more potent inhibitor of p110a subunit of PI3K, did not show a stronger growth inhibitory effect (Online Supplementary Figure S2). This suggested that the effect of PIK-75 is not solely attributed to the inhibition of PI3K, which prompted us to investigate detailed molecular mechanisms.
PIK-75 treatment inhibits cell growth and induces apoptosis in T-cell acute lymphoblastic leukemia cells We first examined the growth inhibitory effect of PIK-75 after 24 hours of treatment across different cell lines, to find if there are any factors associated with the sensitivity. Prior to this, we analyzed the status of AKT, a downstream target of PI3K, which demonstrated that AKT was constitutively phosphorylated on Ser473 in many T-ALL cell lines, most of which were TAL1-positive cell lines (Figure 3A). Of note, we could not find any TAL1-positive cell line without AKT phosphorylation in our stock, suggesting a potential requirement of AKT activity in those T-ALL cases when established in culture. This is similar to the observation in primary human T-ALL cases in which TAL1 overexpression was frequently observed with genetic mutations of the PI3K-AKT pathway.15 Interestingly, we observed a notable difference in drug sensitivity (Figure 3B). Cell lines with viability greater than 20% after treatment with 1 mM PIK-75 at 24 hours, for which IC50 values could not be determined (N.D.), were considered to be insensitive. TAL1-positive T-ALL cell lines were found to be very sensitive to this inhibitor, for which the IC50 values were 59-96 nM (Figure 3C and D). In particular, five TAL1positive cell lines that exhibited constitutive AKT phosphorylation on Ser473 (MOLT-16, MOLT-4, Jurkat, CCRF-CEM, RPMI-8402) were more sensitive than those that exhibited constitutive AKT phosphorylation but did not express TAL1 (SUP-T1, HPB-ALL, LOUCY, P12-ICHIKAWA) (Figure 3C and D). In contrast, four T-ALL cell lines that did not express TAL1 nor exhibit phosphorylated AKT (KOPT-K1, ALL-SIL, DND-41, TALL-1) were the least sensitive (IC50 values N.D.). In particular, DND-41 cells were strongly insensitive to PIK-75 (yellow lines in Figure 3B and C). It is noteworthy that these four lines have been previously reported to be sensitive to GSI.27 Additionally, ALL-SIL cells that do not express TAL1 but harbor the NUP214-ABL1 fusion28 were insensitive to this drug (gray lines in Figure 3B and C). Comparison among three groups of cell lines based on TAL1 and AKT status (“TAL1+pAKT+”, “TAL1-pAKT+”, and “TAL1-pAKT-“) showed that “TAL1+/pAKT+” cell lines (MOLT-16, MOLT-4, Jurkat, CCRF-CEM, RPMI-8402 and PF-382) were most sensitive (IC50 values 59-96 nM) with an exception of PF-382 (N.D.). “TAL1-/pAKT+” cell lines (SUP-T1, HPB-ALL, LOUCY and P12ICHIKAWA) were relatively sensitive (IC50 values 105-172 nM) with the exception of LOUCY and P12-ICHIKAWA (N.D.), while “TAL1-pAKT-” cell lines (KOPT-K1, ALL-SIL, DND-41 and TALL-
1) were least sensitive (N.D.). These results suggested that drug sensitivity is associated with TAL1 and AKT status. We next analyzed cellular phenotypes after PIK-75 treatment. We used 120 nM, which is the IC80 of a sensitive cell line, Jurkat. This analysis showed that apoptosis was induced in Jurkat as early as at 4 hours (Figure 3E; Online Supplementary Figure S3A), which was more evident at higher doses at 24 hours (Online Supplementary Figure S3B). In contrast, there was not much increase in an insensitive cell line (DND-41) (Online Supplementary Figure S3A to C). Together, our results indicated that PIK-75 exerts potent growth inhibitory effects via the induction of apoptosis preferentially in TAL1-positive, AKT-activated T-ALL cells.
Sensitivity to PIK-75 is associated with the dependency on specific PI3K subunits
However, there were some exceptions of cell lines. SUP-T1 was TAL1-negative but sensitive to PIK-75, while PF-382 was TAL1-positive but relatively less sensitive. Thus, we made use of the DepMap database29-32 to further examine the dependency of T-ALL cell lines on the PI3K-AKT pathway based on the CRISPR- or shRNA-mediated genetic inhibition (Online Supplementary Table S5).
This analysis demonstrated that Jurkat (TAL1-positive, PIK75-sensitive cell line) was indeed highly dependent on p110γ/PIK3CG, one of PI3K subunits, as shown by negative score (growth inhibition) after CRISPR-based growth inhibition. In contrast, DND-41 (insensitive line) was not dependent on any of PI3K subunits. Notably, SUP-T1 cells (TAL1-negative, sensitive line) was strongly dependent on p110a/PIK3CA, as supported by both CRISPR and shRNA data. Additionally, we found that PF-382 (TAL1-positive, less sensitive) was dependent on p110d/PIK3CD, while PIK-75 primarily targets p110a/PIK3CA and p110γ/PIK3CG but not p110d/PIK3CD. Thus, PF-382 is less sensitive to PIK-75 likely due to the substate specificity of this drug. Together, these analyses indicated that the dependency on PI3K-AKT pathway is one of main determinants associated with drug sensitivity.
PIK-75 inhibits the phosphorylation of AKT and RNA polymerase II
We next investigated the molecular mechanism of growth inhibition by PIK-75. For this experiment, we used higher concentration (1 mM) to analyze the effect for both sensitive and insensitive lines under the same concentration. Indeed, PIK-75 treatment inhibited the phosphorylation of AKT in both sensitive and insensitive cell line (LOUCY) (Figure 4A). This suggested that insensitive cell lines may have another mechanism that can support their cell survival after PI3K inhibition.
As mentioned above, besides PI3K, PIK-75 has been known to inhibit other kinases including CDK (CDK7 and CDK9) and DNA-PK.25,26 In fact, a decrease in the phosphorylation of
Haematologica | 108 February 2023 372 ARTICLE - Inhibition of CDK and PI3K on T-ALL F.Q. Lim et al.
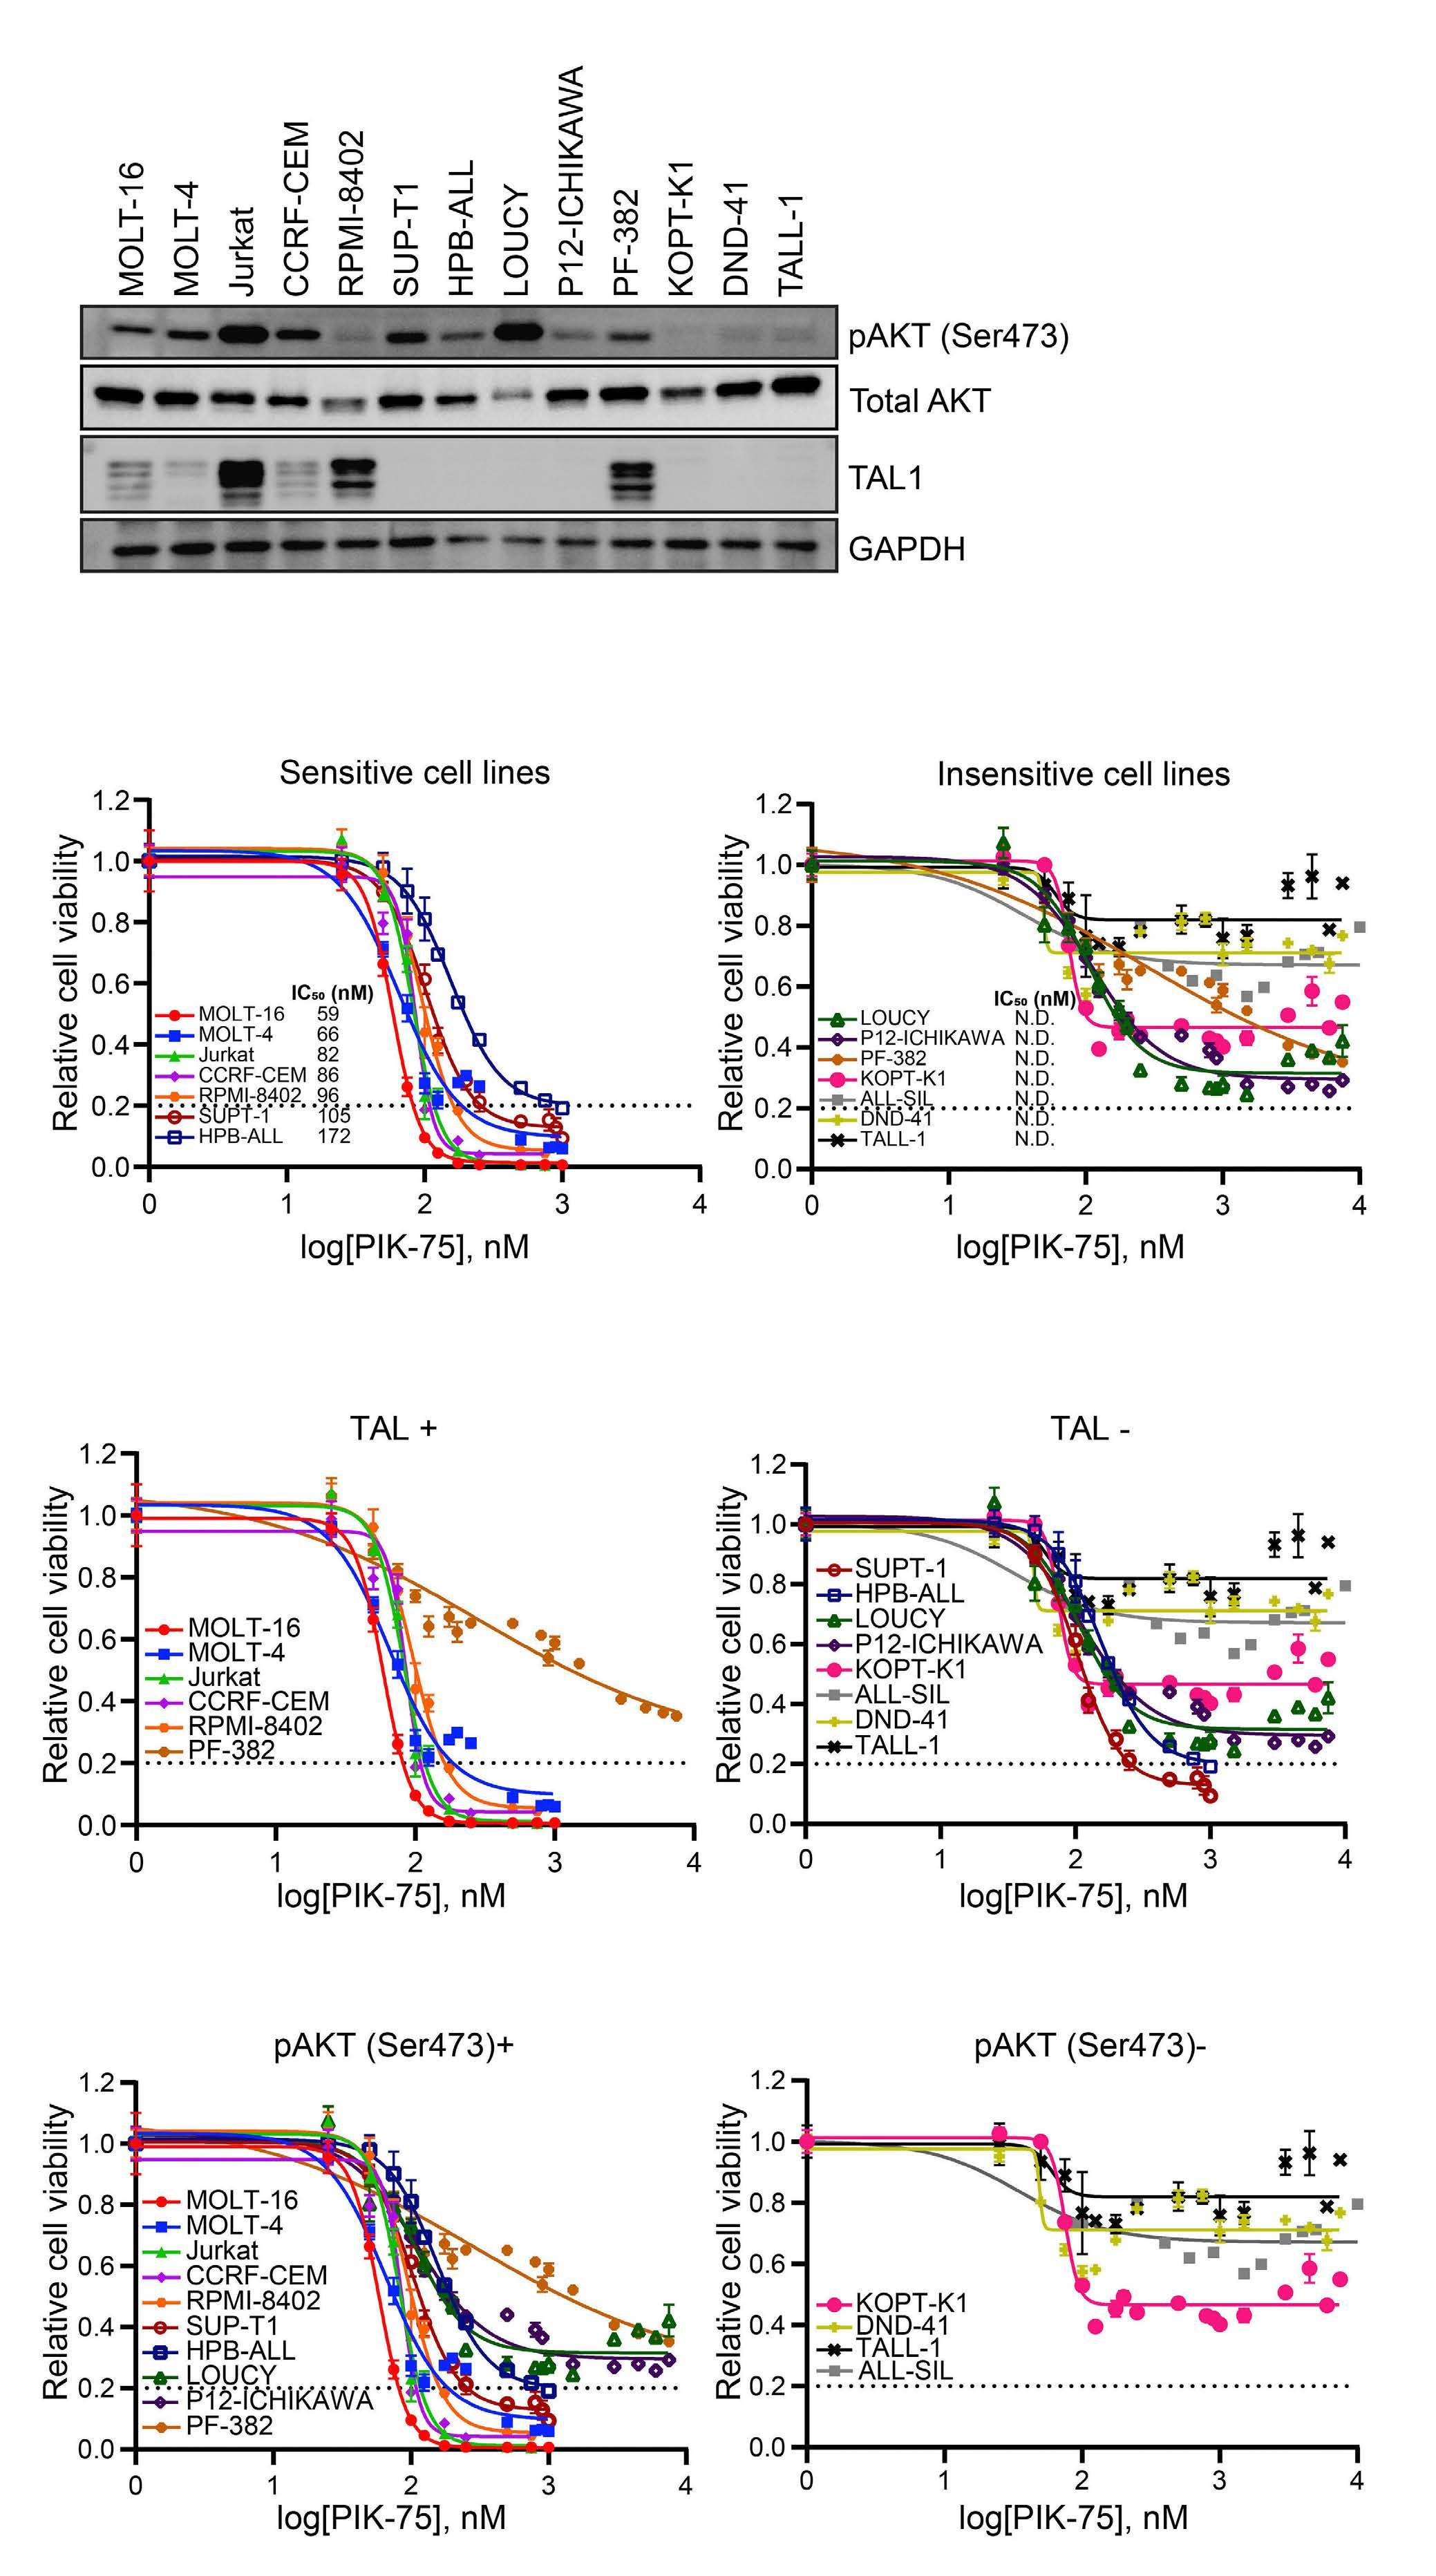
Continued on following page. Haematologica | 108 February 2023 373 ARTICLE
F.Q. Lim et al.
B A C
- Inhibition of CDK and PI3K on T-ALL
Figure 3. Growth inhibitory effect of PIK-75 on T-cell acute lymphoblastic leukemia cell lines. (A) Western blot showing the expression of phosphorylated AKT and TAL1 in T-cell acute lymphoblastic leukemia (T-ALL) cell lines. (B and C) T-ALL cell lines were treated with PIK-75. Cell viability was measured after 24 hours by CellTiter-Glo. The values shown are the mean ± standard deviation of technical triplicates and are normalized to untreated cells. Cell lines with viability greater than 20% after treatment with 1 mM PIK-75 were considered to be insensitive. Not able to be determined (N.D.), half maximal inhibitory concentration (IC50) values could not be determined by the dose response inhibition function using variable slope by GraphPad Prism. Cell lines grouped based on sensitivity to PIK-75 (B) or TAL1 and AKT status (C). (D) Cell lines ranked according to IC50 value. TAL1 and AKT status are annotated by color. (E) Jurkat cells were seeded at 10,000 cells per well, treated with dimethyl sulfoxide (DMSO) or PIK-75 (120 nM) for 4 hours and stained with Annexin V-APC and PI. The values shown are the proportions of the total population ± standard deviation of technical triplicates. Representative results from multiple independent experiments were shown (B to E).
RNA polymerase II at Ser 2 and 5 residues was observed in all treated cell lines, regardless of drug sensitivity (Figure 4A). We observed a significant increase in γH2AX, a surrogate marker of the DNA damage response mediated by DNA-PK,33 in sensitive cell lines. In contrast, in insensitive cell lines, there was little to no increase in γH2AX (Figure 4B). Thus, our results indicated that PIK-75 mainly inhibits the activity of RNA polymerase II and AKT.
PIK-75 affects global transcription in T-cell acute lymphoblastic leukemia cells Because PIK-75 inhibits the activation of RNA polymerase II via the inhibition of CDK, we next examined if it globally inhibits transcription or affects specific genes. We first analyzed the effect of PIK-75 on TAL1 targets at the mRNA level. qRT-PCR analysis demonstrated that the mRNA expression of multiple GIMAP genes was significantly downregulated after 4 hours of treatment in Jurkat (Figure 5A) and other cell lines (Online Supplementary Figure 4A). Similarly, the mRNA expression of other known targets of TAL1,9,12,34 including ARID5B, NKX3-1 and MYB, was also downregulated after treatment (Figure 5B). This trend was found from low doses of PIK-75 in a dose-dependent manner (Online Supplementary Figure S4B).
In order to comprehensively analyze gene expression changes, we performed RNA-seq analysis of one representative sensitive cell line (Jurkat) and one insensitive cell line (DND-41) treated with DMSO (control) or PIK-75 for 4
hours at the IC80 of Jurkat. In order to analyze the global effect on transcription, we added synthesized RNA (ERCC spike-in) to the samples based on the cell number and normalized the expression values with or without the spike-in. Notably, when we analyzed the samples without the spike-in control, a large number of genes were significantly downregulated or upregulated after drug treatment in both cell lines (Figure 5C, top panels). Under this condition, spike-in RNA (shown in orange or purple) were overrepresented in the PIK-75-treated samples in both cell lines compared with the controls, indicating that the expression level of endogenous RNA were inappropriately represented. This suggested that the total pool of endogenous RNA might be reduced by PIK-75 treatment in both cell lines regardless of sensitivity. In fact, when we normalized expression values using spike-in, the number of differentially-expressed genes was largely diminished (Figure 5C, bottom panels). Importantly, there were still many differentially-expressed genes in the sensitive line (Jurkat), while there were very few changes observed in the insensitive line (DND-41) (Figure 5C; Online Supplementary Table S6). This result indicated that PIK-75 can globally affect RNA transcription in both cell lines, while it still affects specific molecular pathways in a sensitive cell line.
PIK-75 inhibits the expression of downstream targets of TAL1 in T-cell acute lymphoblastic leukemia cells We then analyzed molecular pathways that were sensitive
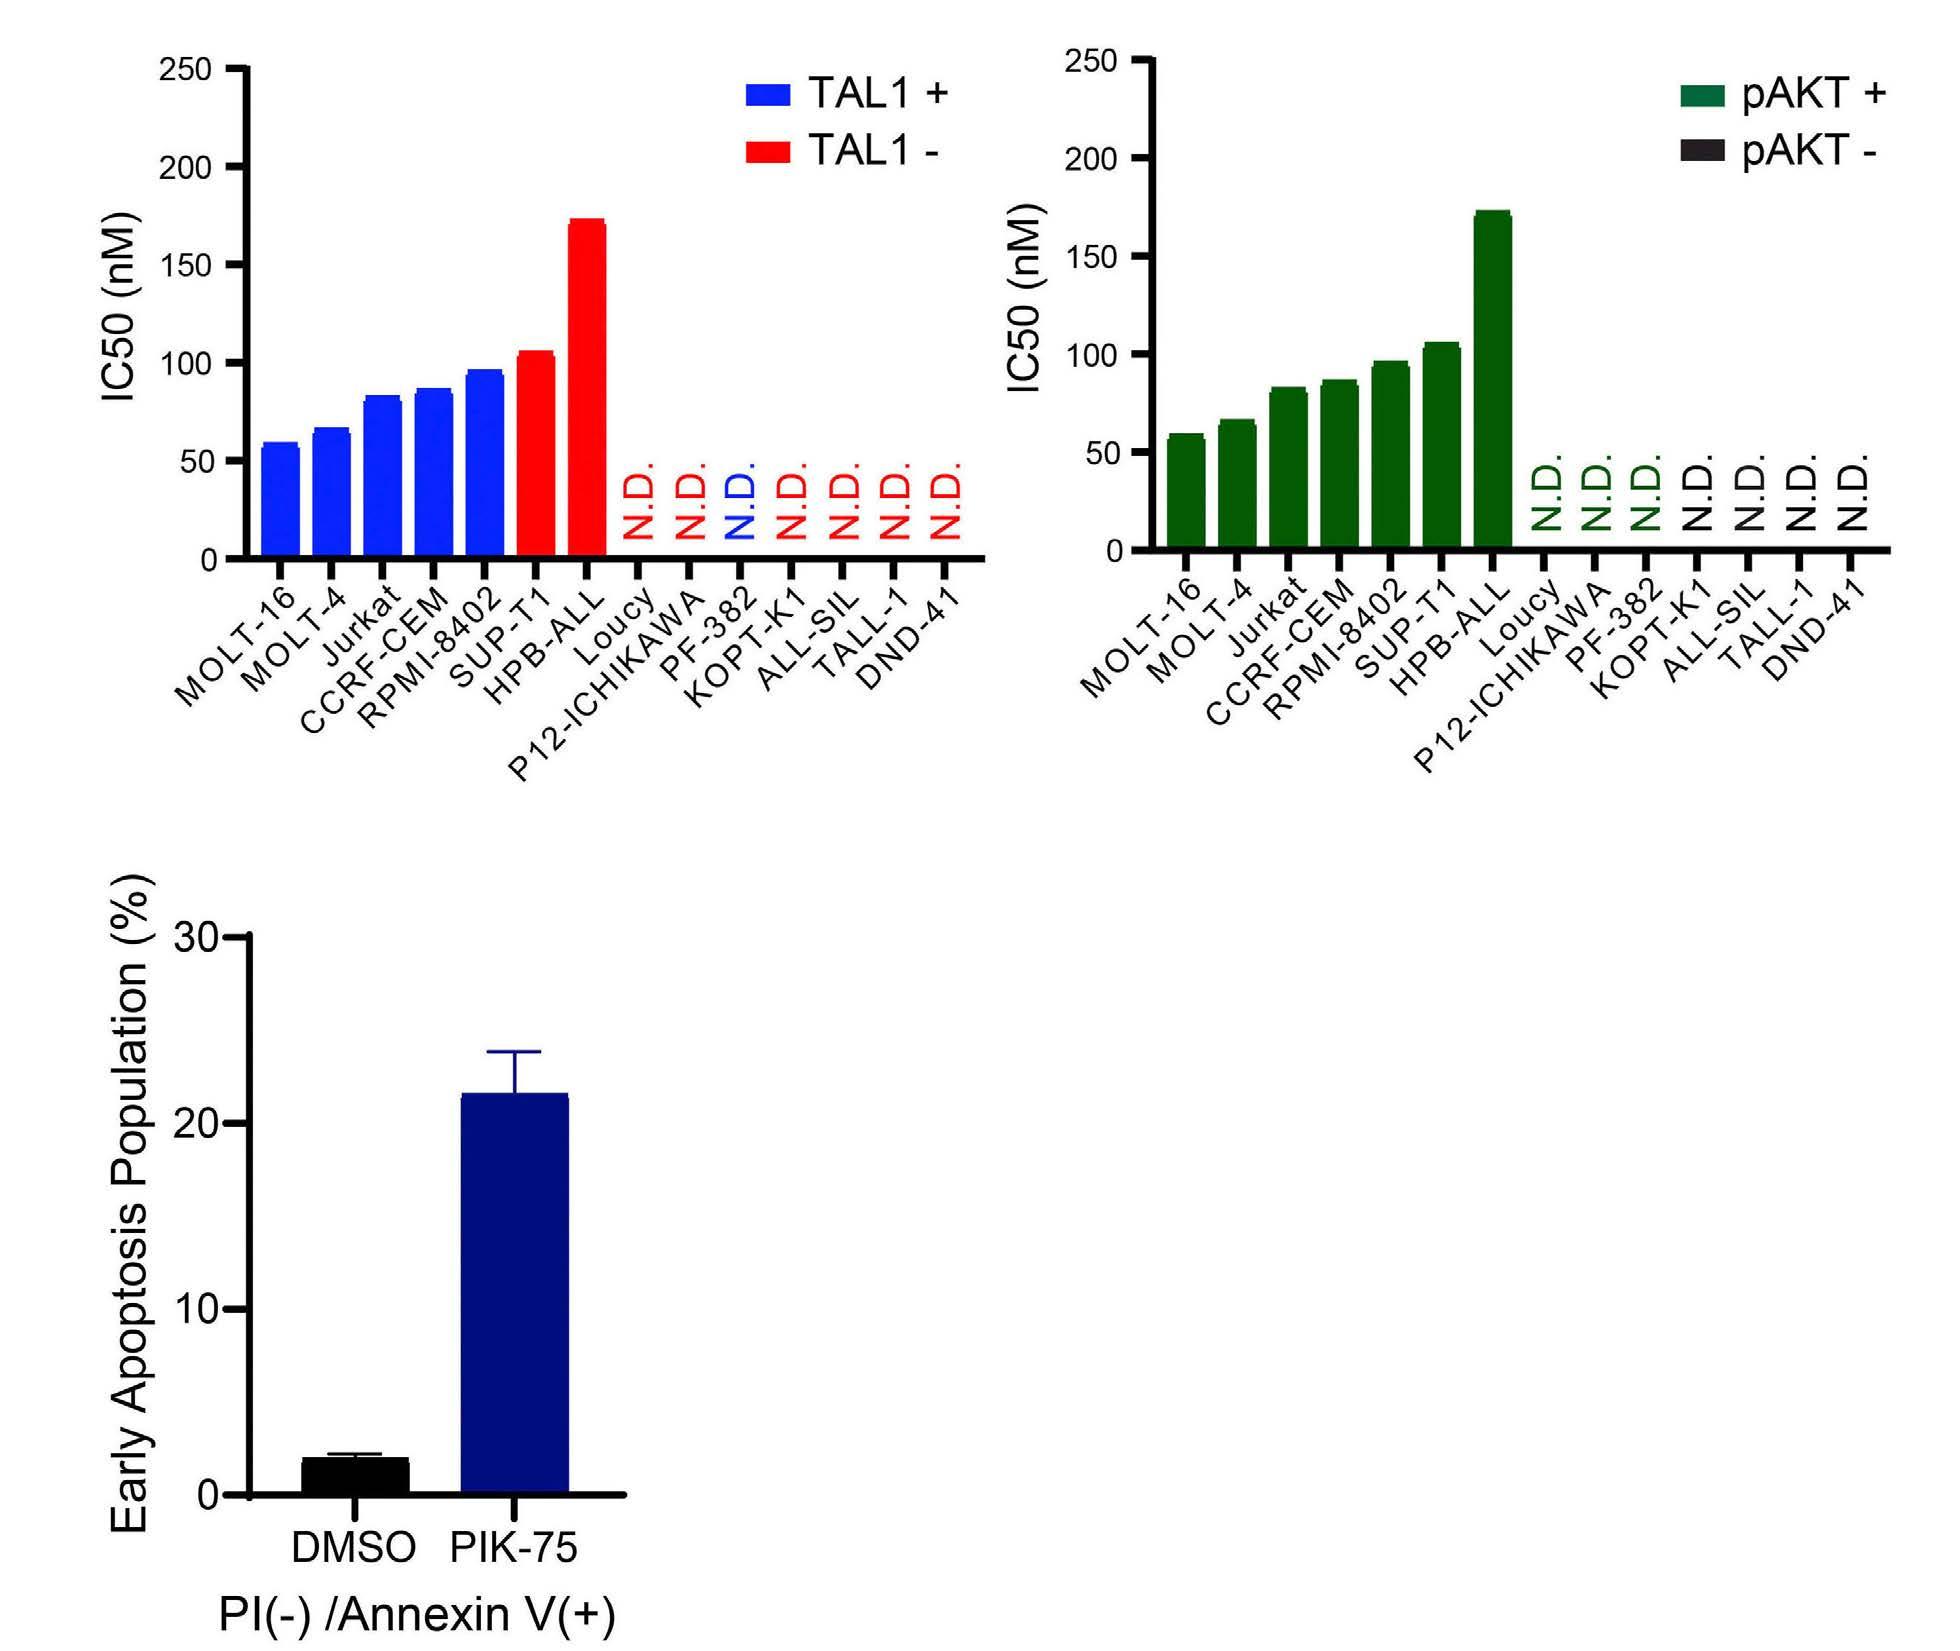
E D
Haematologica | 108 February 2023 374 ARTICLE - Inhibition of CDK and PI3K on T-ALL F.Q. Lim et al.
Figure 4. The effect of PIK-75 on target proteins and pathways. (A) Western blot showing the expression of phosphorylated AKT and RNA polymerase II in 4 T-cell acute lymphoblastic leukemia (T-ALL) cell lines (Jurkat, CCRF-CEM, DND-41, and LOUCY). All cell lines were treated with dimethyl sulfoxide (DMSO) or PIK-75 (1 m M). (B) Western blot analysis showing the expression of γH2AX in Jurkat, CCRF-CEM, DND-41, and LOUCY cells treated with either DMSO or PIK-75 (1 mM).
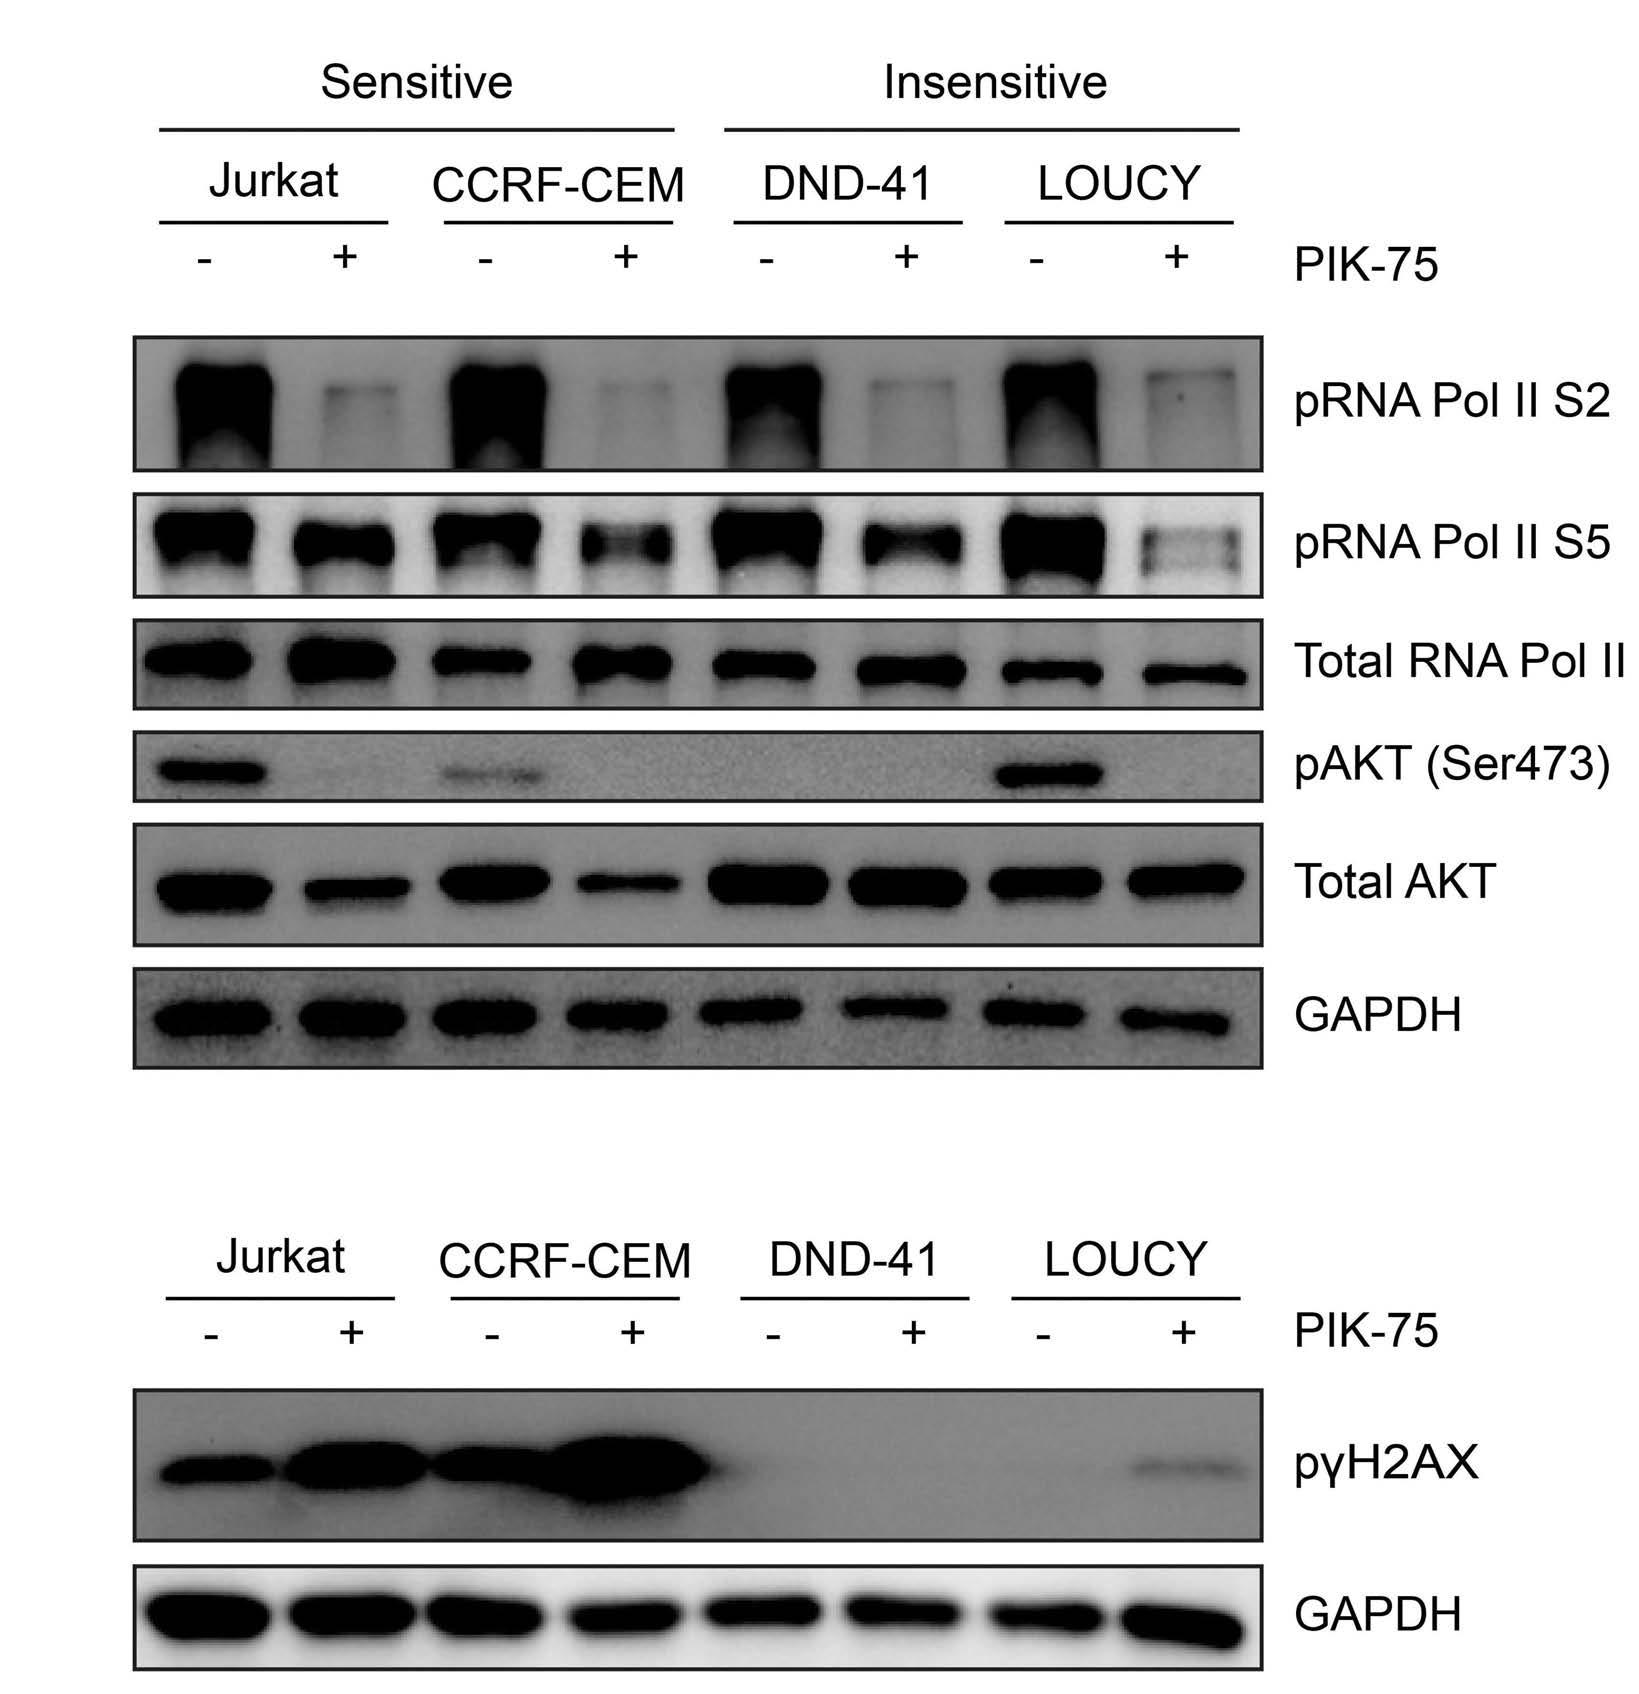
to PIK-75 treatment in a sensitive cell line. Consistent with the qRT-PCR results, GSEA showed that many of high-confidence targets of TAL1 were significantly downregulated by PIK-75 treatment (Figure 6A). In addition, genes that are associated with super-enhancers in Jurkat cells but not in normal thymus were also significantly downregulated. Heatmap analysis also demonstrated the downregulation of TAL1 target genes after PIK-75 treatment in Jurkat cells (Figure 6B). This suggested that although PIK-75 globally affects gene expression, it preferentially inhibits key oncogenic pathways, as previously reported for CDK7 inhibitors (THZ1) or BRD4 inhibitors (JQ1).24,35,36 Similarly, GO analysis with Enrichr indicated that many downregulated genes were involved in transcription pathways (Figure 6C). Related to this point, we also compared the growth inhibitory effect of PIK-75 with THZ1, JQ1 and DBZ (GSI) (Online Supplementary Figure S5A). This result indicated two cell lines (Jurkat and HPB-ALL) which were sensitive to PIK-75 were also sensitive to THZ1, while two cell lines (DND-41 and TALL-1) which were insensitive to PIK-75 were also relatively insensitive to THZ1. In contrast, no strong cytotoxicity or consistent trend were observed for JQ1 in our setting. As expected, both THZ1 and JQ1 inhibited the expression of GIMAPs and ARID5B (Online Supplementary Figure S5B) which are regulated under super-enhancers.12,13 Of note, expression of known downstream targets of NOTCH1, such as HES1 and MYC, were downregulated by DBZ but not by PIK-75 in Jurkat cells (Online Supplemen-
tary Figure S5C). This result suggested that PIK-75’s effect is independent from NOTCH1 activity.
Activation of the JAK-STAT pathway confers drug resistance to PIK-75 treatment Notably, we found that in the insensitive cell line (DND41), the CISH and PIM1 genes were significantly upregulated after treatment (Figure 7A; Online Supplementary Table S6). These genes have been known to serve downstream of the JAK-STAT pathway, which is primarily activated by IL-7 receptor (IL-7R) signaling.37,38 In fact, phosphorylation of STAT5 protein was observed in two insensitive lines (KOPT-K1 and DND-41) at the basal level (Figure 7B). Phosphorylation of multiple JAK and STAT proteins increased after treatment with PIK-75 in DND-41 cells but not in Jurkat cells (Figure 7C). Hence, we postulated that activation of the JAK-STAT pathway may be related to the sensitivity to PIK-75.
In order to further confirm this finding, we tested PIK75 under two other conditions: i) in HPB-ALL cells, which exhibit the constitutive phosphorylation of AKT (Figure 3A) and also express IL-7R that can activate JAK-STAT pathway after IL-7 treatment, and ii) in SUP-T1 cells, which cannot activate this pathway after IL-7 treatment. We first pretreated HPB-ALL cells with IL-7 ligand to induce JAK-STAT activation (Figure 7D) and then treated them with PIK-75. Of note, this cell line is sensitive to PIK-75 in the absence of IL-7 (Figures 3B and 7E), thus
B A Haematologica | 108 February 2023 375 ARTICLE - Inhibition of
T-ALL F.Q. Lim et al.
CDK and PI3K on
suggesting that it is dependent on AKT pathway. Remarkably, IL-7-treated cells were completely insensitive to PIK-75 treatment (Figure 7E), similar to DND-41 cells. The expression of BCL2, an anti-apoptotic protein that has been known as a downstream target of JAK-STAT pathway, was upregulated after IL-7 treatment (Figure 7D and F). This
indicated that the growth inhibitory effect of PIK-75 likely via AKT inhibition can be rescued by the activation of JAKSTAT pathway. In contrast, in SUP-T1 cells, IL-7 treatment did not induce STAT activation or confer resistance to PIK75 (Online Supplementary Figure S6A and B). We also utilized the DepMap dataset, which demonstrated that DND-41 was
C
Figure 5. Gene expression changes after PIK-75 treatment in T-cell acute lymphoblastic leukemia cells. (A and B) mRNA expression levels of GIMAP cluster genes (A) and other TAL1 targets (B) in Jurkat cells 4 hours after PIK-75 treatment (120 nM). Expression values were normalized to spike-in RNA and shown as individual dots and mean ± standard deviation of biological duplicates and technical duplicates. Representative results from multiple independent experiments were shown. (C) MA plot showing the average of normalized counts vs. log2-normalized fold change (FC) between samples treated with dimethyl sulfoxide (DMSO) and PIK-75, estimated using DESeq2 with or without spike-in normalization. Each individual gene and spike-in control are represented by a single dot. RefSeq genes that showed statistically significant differences (adjusted P value <0.01) are colored blue. Similarly, spike-in controls are shown in purple (adjusted P value <0.01) or orange. N.S.: not significant.
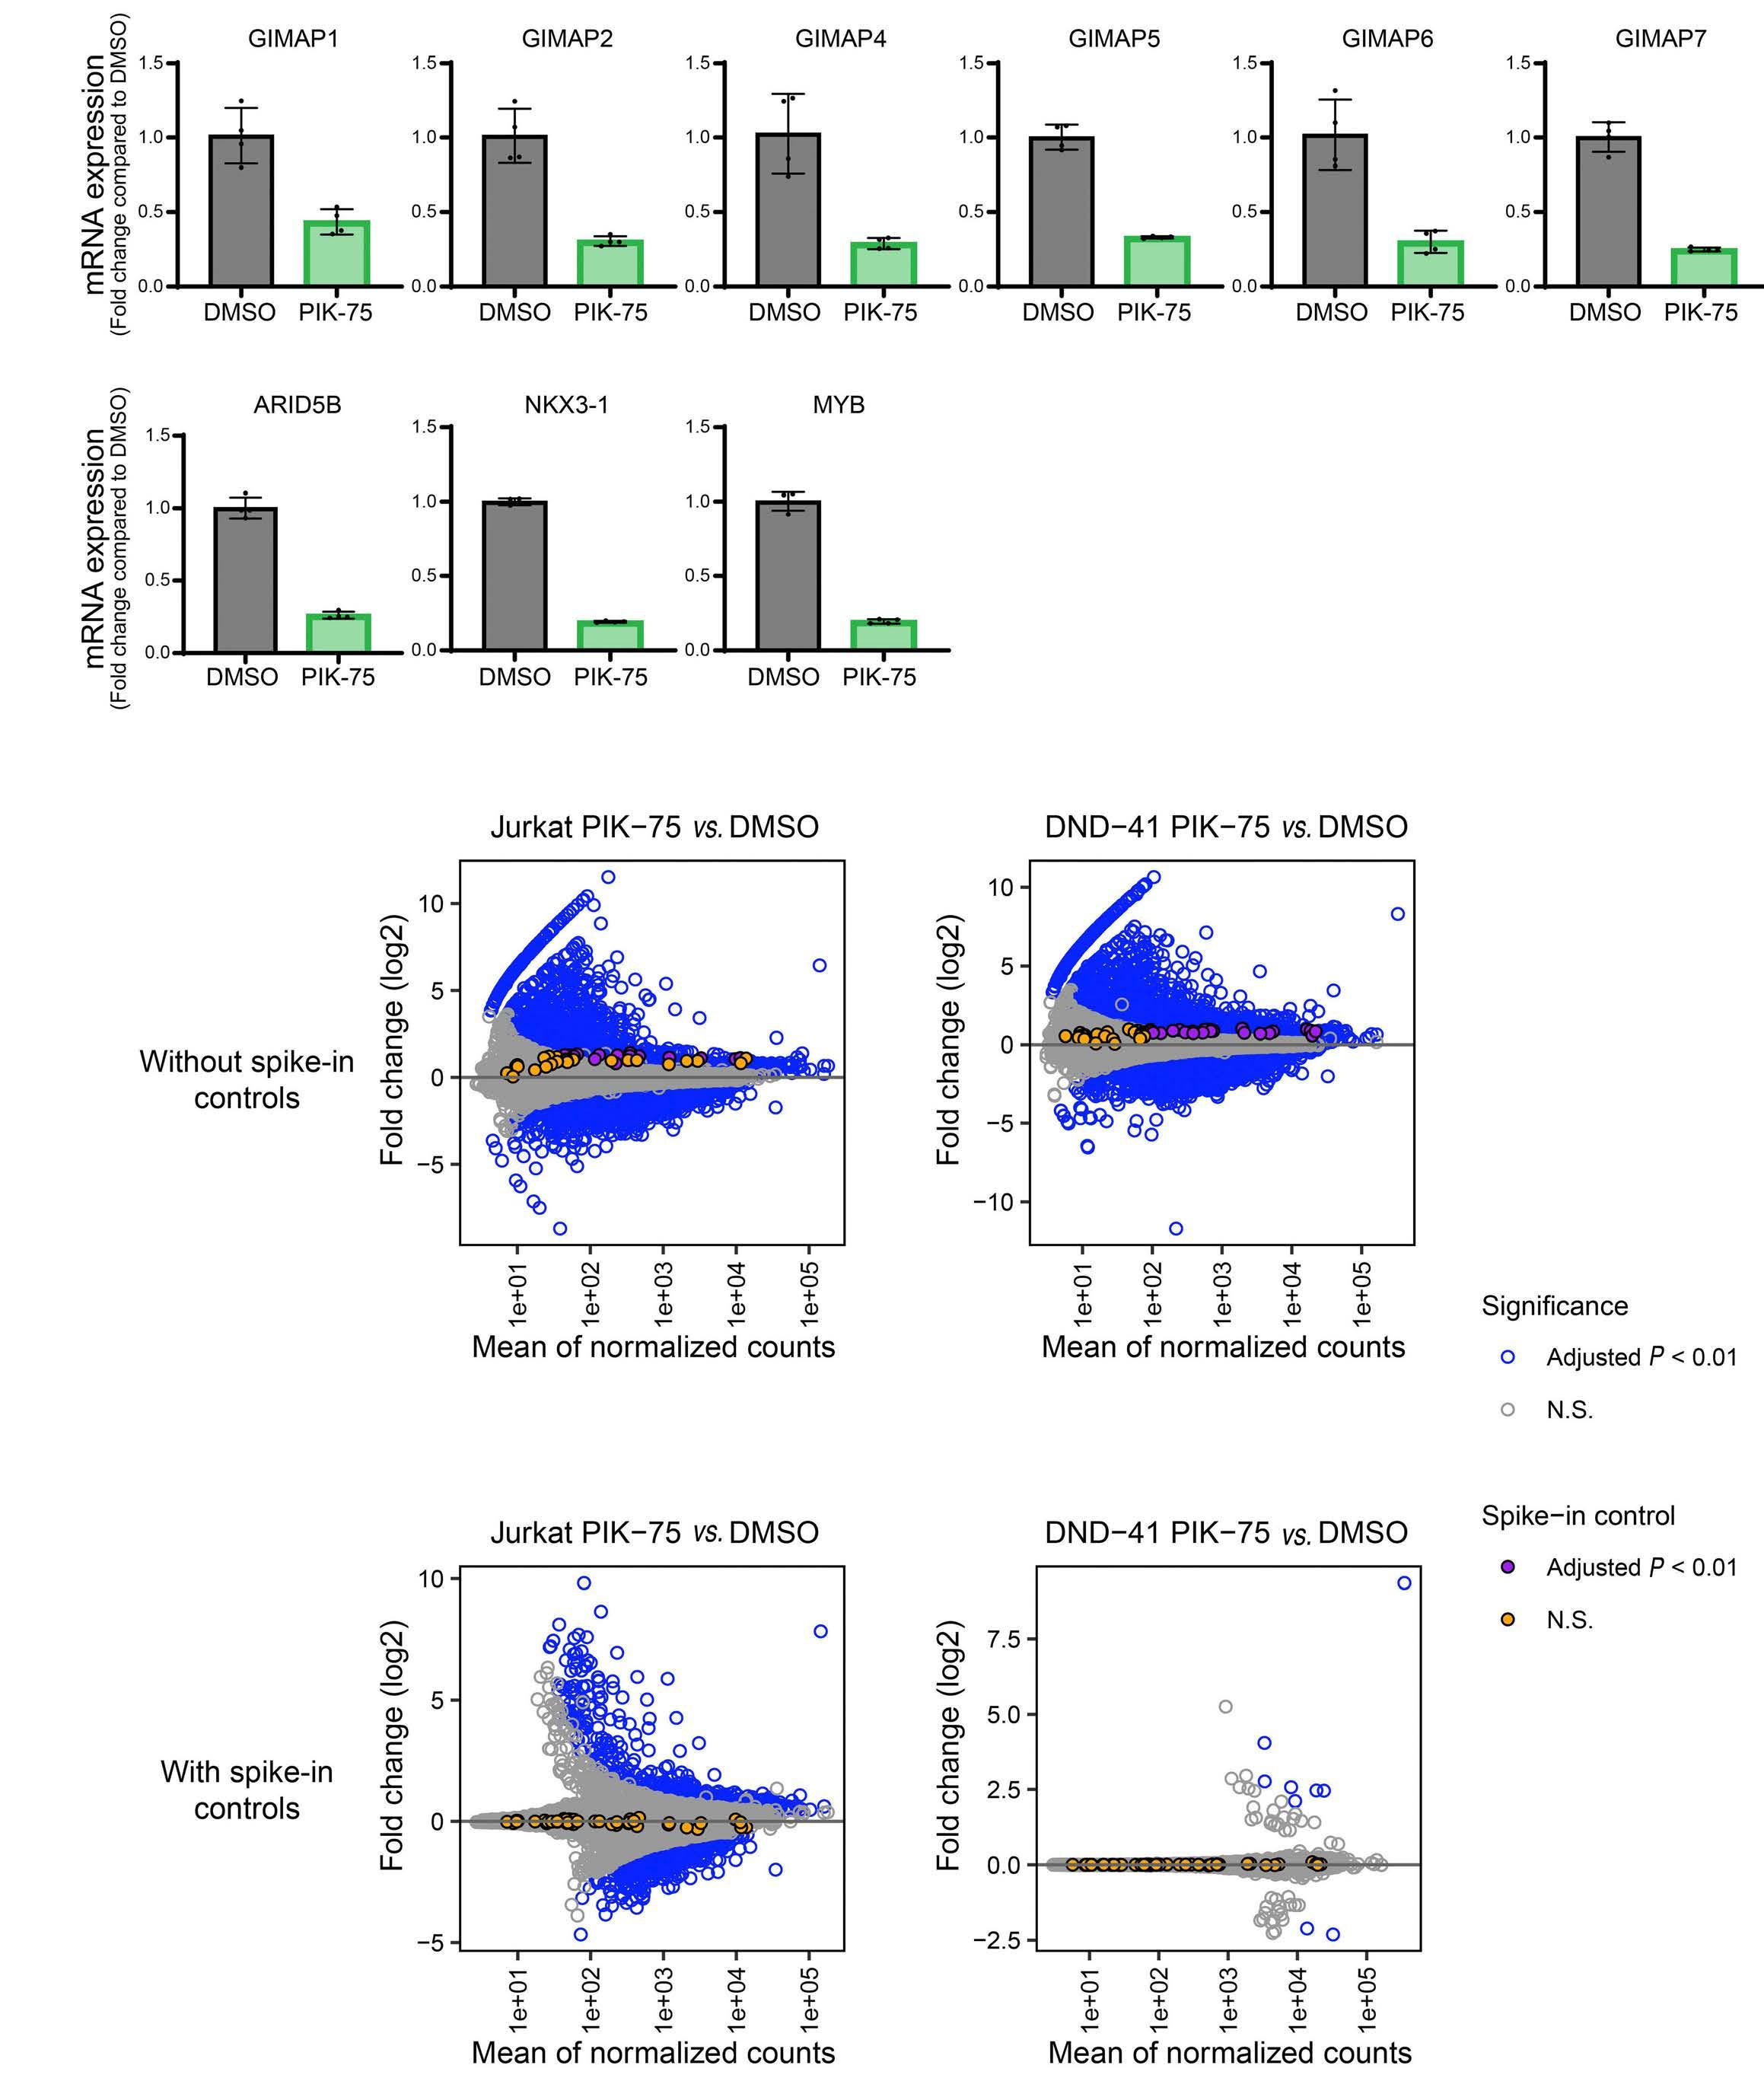
B
A Haematologica | 108 February 2023 376 ARTICLE - Inhibition of CDK and PI3K on T-ALL F.Q. Lim et al.
Figure 6. The effect of PIK-75 on TAL1 targets and super-enhancer-associated genes. (A) Gene set enrichment analysis (GSEA) to determine overall correlation between the change in gene expression after PIK-75 treatment in Jurkat cells and specific set of genes. The list of high-confidence TAL1 target genes (bound by TAL1 and downregulated after TAL1 knockdown in Jurkat cells) and of super-enhancer associated genes were used as gene sets. (B) Heatmap showing the expression of TAL1 targets after PIK-75 treatment. (C) Gene ontology analysis was performed using genes that were significantly downregulated (base mean >10, log2 (fold change) × -log10 (P value) <-1, adjusted P value <0.01) in Jurkat cells 4 hours after PIK-75 treatment. The top 10 terms were selected according to the adjusted P value and are shown according to the combined score. Adjusted P value was calculated using Fisher’s exact test.
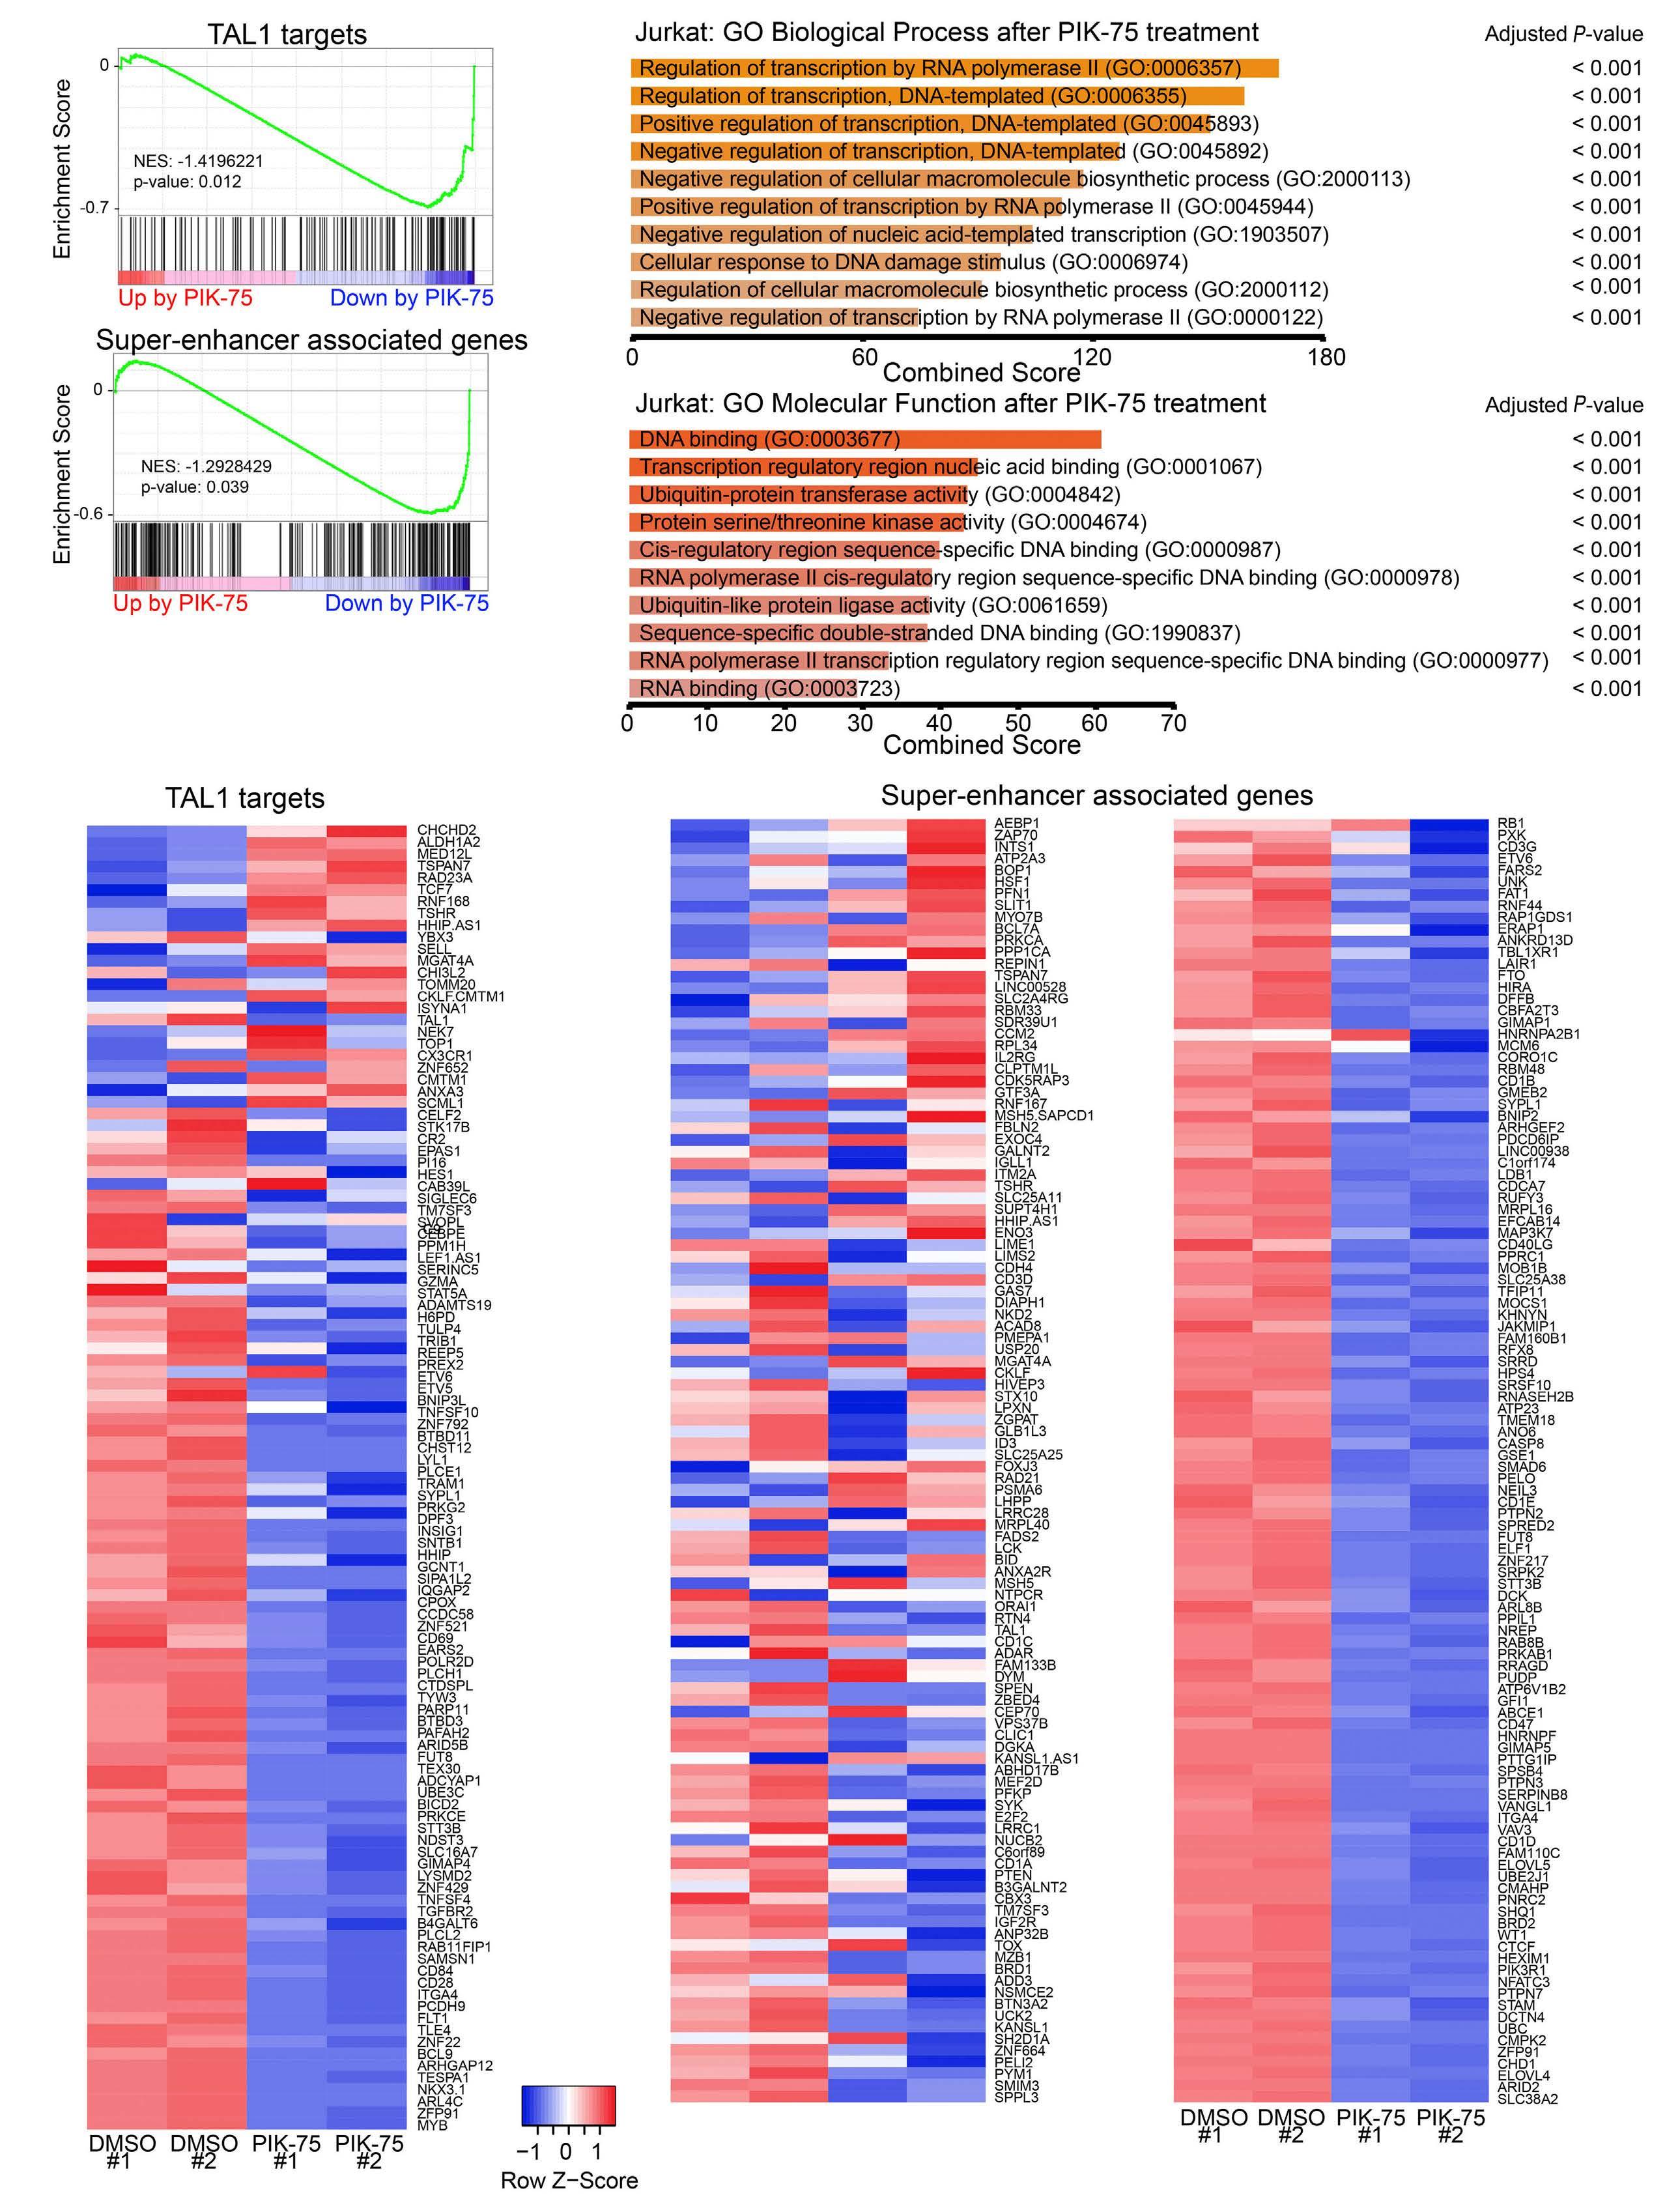
B C A Haematologica | 108 February 2023 377 ARTICLE - Inhibition of
on T-ALL F.Q. Lim et al.
CDK and PI3K
- Inhibition of CDK and PI3K on T-ALL
strongly dependent on IL-7R and JAK1 while SUP-T1 was not affected by IL-7R knockdown. In order to further analyze the effect of JAK-STAT activation, we overexpressed BCL2 in Jurkat cells expressing the GIMAP reporter construct. In this setting, BCL2 expression was able to rescue growth inhibitory effect of PIK-75;
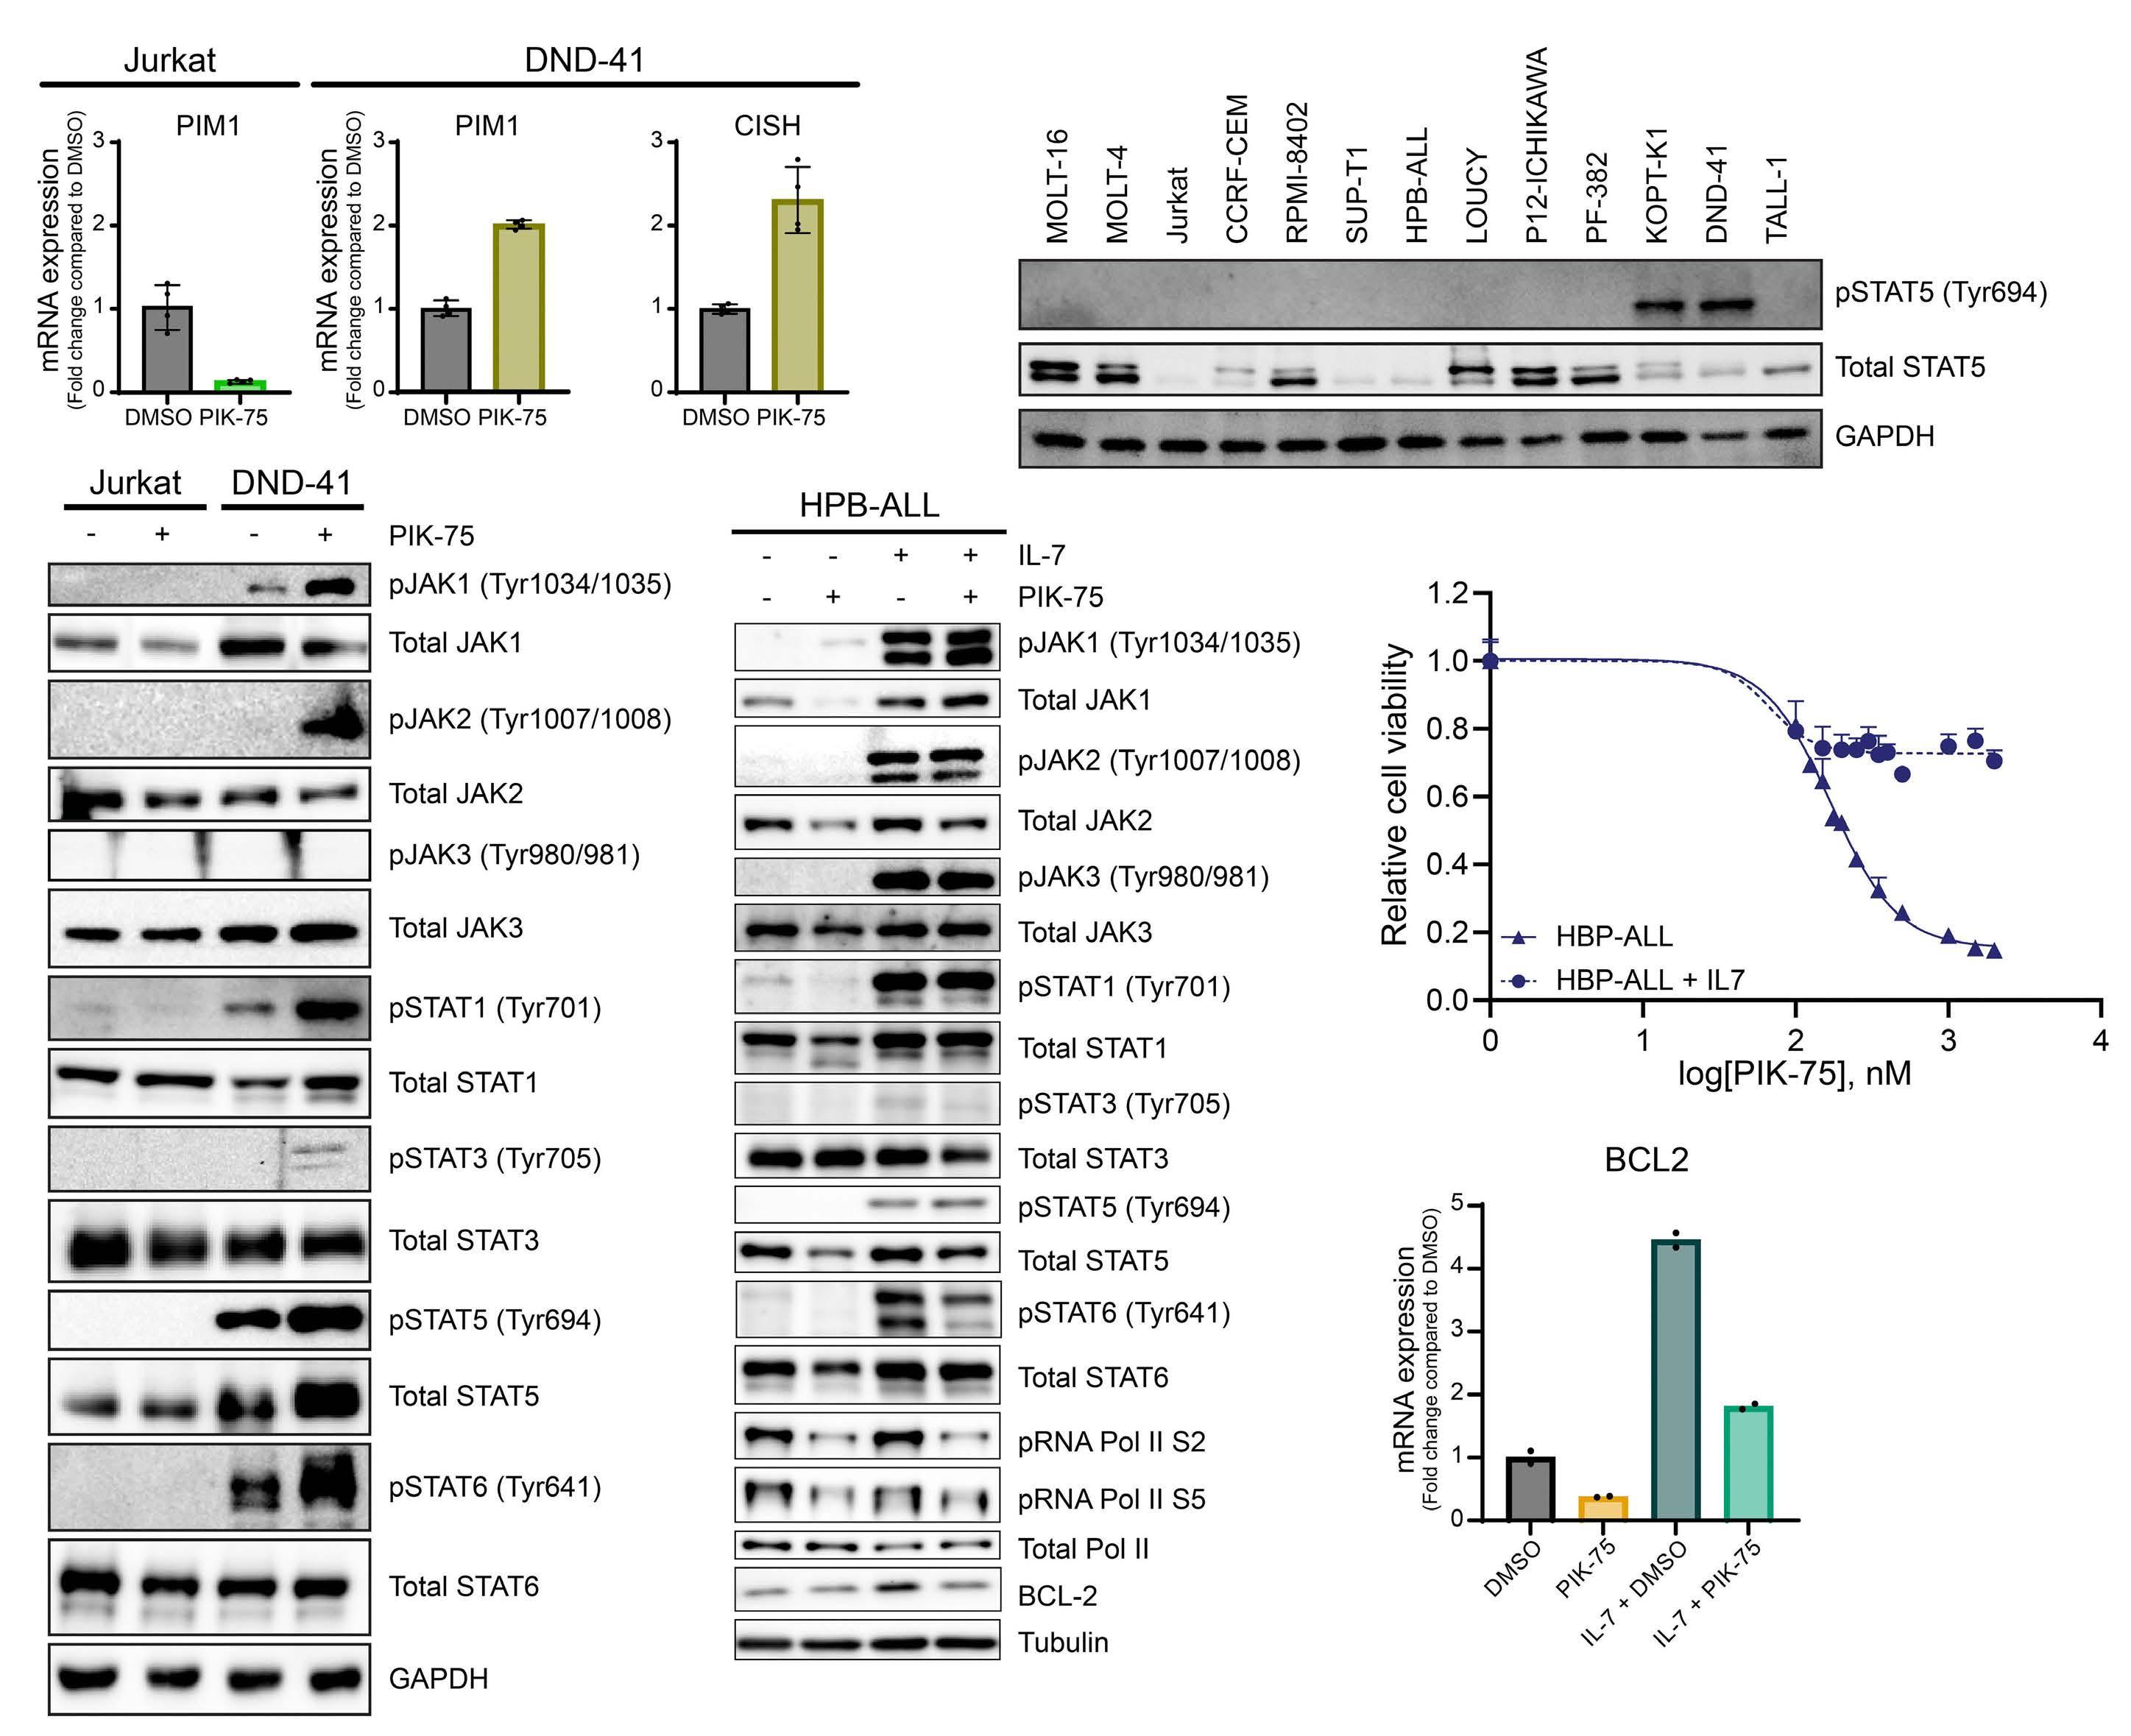
however, luciferase activity was still inhibited (Online Supplementary Figure S6C and D). This result indicated that although BCL2 overexpression can sustain cell viability, it does not affect enhancer activity. Hence, mechanism of drug resistance by JAK-STAT signaling is likely due to the compensation of cell survival pathway but not due to the
Figure 7. Potential involvement of JAK-STAT pathway in drug sensitivity to PIK-75. (A) mRNA expression levels of PIM1 and CISH in Jurkat and DND-41 cells 4 hours after PIK-75 treatment (120 nM). Expression values were normalized to spike-in RNA and shown as individual dots and mean ± standard deviation of biological duplicates and technical duplicates. Representative results from multiple independent experiments were shown. (B) Western blot analysis showing the expression of phosphorylated STAT5 proteins in a panel of T-cell acute lymphoblastic leukemia (T-ALL) cell lines. (C) Western blot analysis showing the expression of multiple JAK and STAT proteins and their phosphorylated forms in Jurkat and DND-41 cell lines after treatment with dimethyl sulfoxide (DMSO) (control) or PIK-75 (120 nM) for 4 hours. (D) Western blot analysis showing the expression of phosphorylated JAK and STAT proteins as well as BCL2 protein with or without IL-7 induction and PIK-75 treatment (HPB-ALL half maximal inhibitory concentration [IC50] =640 nM). (E) HPB-ALL was induced with IL-7 (50 ng/mL) for 24 hours before treatment with PIK-75. Cell viability was measured after 24 hours by CellTiter-Glo. The values shown are the mean ± standard deviation of technical triplicates and are normalized to untreated cells. (F) mRNA expression level of BCL2 in HPB-ALL cells after 24 hours of IL-7 treatment and/or 4 hours of PIK-75 treatment (640 nM) was measured by qunatitative reverse transcription polymerase chain reaction (qRTPCR). Expression values were normalized to spike-in RNA and shown as individual dots and mean of technical duplicates. Representative results from multiple independent experiments were shown.
B A D E F C Haematologica | 108 February 2023 378 ARTICLE
et
F.Q. Lim
al.
interference of enhancer activity. Together, these findings indicated that JAK-STAT-active T-ALL cells are insensitive to PIK-75 treatment.
PIK-75 treatment inhibits the growth of primary T-cell acute lymphoblastic leukemia cells ex vivo Finally, we investigated the potential therapeutic application of PIK-75. We analyzed the effect of PIK-75 on two human primary T-ALL cells (DFCI-9 and DFCI-15) propagated in a PDX model. Indeed, both DFCI-9 and DFCI-15 samples were sensitive to PIK-75, with IC50 values of 118 nM and 112 nM, respectively (Figure 8A). Similarly, we observed a reduction in phosphorylated RNA polymerase II and AKT after PIK-75 treatment in DFCI-15 cells (Figure 8B).
Discussion
In this study, we identified PIK-75 as one of top hit compounds from a chemical screening. This drug exerts potent antitumor effects in vitro via the inhibition of two core oncogenic machineries supporting the proliferation and survival of T-ALL cells: i) a transcriptional program driven by oncogenic transcription factors (type A abnormality) and ii) the PI3K-AKT pathway (type B abnormality). Our results support previous findings on the preferential relationship between type A and B genetic abnormalities and demonstrate the feasibility of a therapeutic strategy concurrently targeting these mechanisms.
In human T-ALL, genetic abnormalities in PI3K-AKT pathway components are more frequently observed in the TAL1-positive T-ALL subgroup.15,39 Under experimental conditions, overexpression of TAL1 together with the activated form of AKT promotes T-ALL cell growth in mouse cells, which demonstrated a cooperative effect between these two abnormalities.40,41 Similar cooperative effects have
been reported for the TLX and JAK-STAT pathways.42,43 These studies suggested an oncogenic collaboration between specific type A and type B abnormalities. In line with this notion, our study demonstrated that TAL1-positive, AKT-activated cell lines are sensitive to PIK-75, while activation of the JAK-STAT pathway confers resistance to this drug. This also suggested that the survival of T-ALL cells is dependent on one specific type B signaling pathway in each subgroup (i.e., PI3K-AKT in TAL1 subgroup, and JAK-STAT in TLX subgroup). However, previous studies showed that small-molecule inhibitors of PI3K or AKT require relatively high concentrations to inhibit cell growth by a single treatment, even though they can inhibit AKT activation.44-46 In this regard, PIK-75 exhibited strong cytotoxicity at low doses. This is likely attributed to concurrent inhibition of RNA polymerase II activity. An early study by Gray and Young’s groups showed that THZ1 can induce a strong growth inhibitory effect by inhibiting the general transcription machinery.24 Similarly, inhibition of BRD4 by JQ1 induces potent cytotoxicity.47,48 Importantly, these studies reported that genes associated with super-enhancers are preferentially downregulated after treatment with these inhibitors. In fact, we observed that many TAL1 targets and super-enhancer-associated genes, including GIMAP and ARID5B, were significantly downregulated. Thus, although this drug affects global transcription and does not directly target TAL1 protein, it predominantly affects the transcriptional program driven by TAL1. Importantly, PIK-75 showed a potent cytotoxicity, demonstrating the advantage of dual inhibition of RNA polymerase II and PI3K-AKT pathway. It is noteworthy that the sensitivity to this drug is not attributed to NOTCH1 status but rather is inversely associated with sensitivity to GSI. Resistance to GSI is a common problem which prevents the application of this type of drug for T-ALL.49 Previously, Look’s group reported that several T-ALL cell lines (DND-41, HPB-ALL, TALL-1 and
Figure 8. Growth inhibitory effect of PIK-75 on primary T-cell acute lymphoblastic leukemia cells. (A) Two patient-derived mouse xenograft samples (DFCI-9 and DFCI-15) were treated with PIK-75. Cell viability was measured after 24 hours by CellTiterGlo. The values shown are the mean ± standard deviation of technical triplicates and are normalized to untreated cells. (B) Western blot analysis showing the expression of RNA polymerase II, AKT, and their phosphorylated forms in DFCI-15 cells after treatment with dimethyl sulfoxide (control) or PIK-75 (DFCI-15 half maximal inhibitory concentration [IC50] =210 nM) for 4 hours.
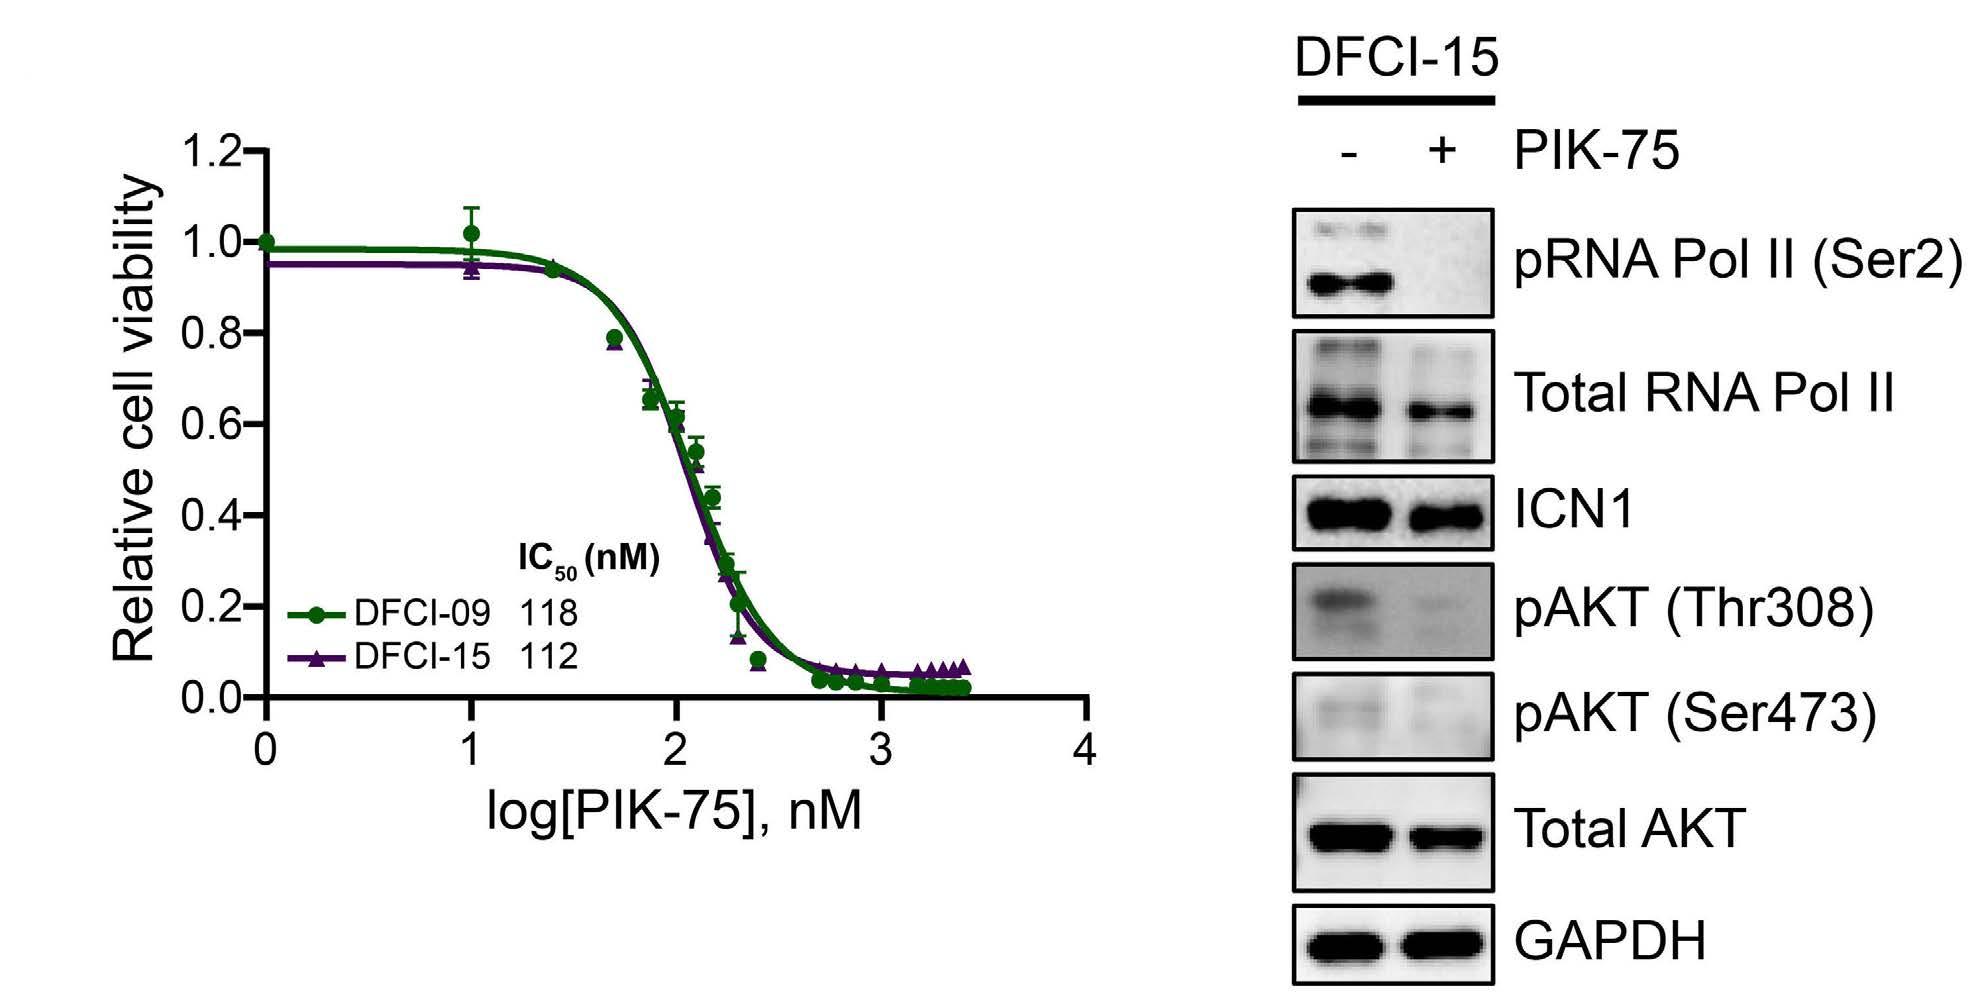
B A Haematologica | 108 February 2023 379 ARTICLE - Inhibition of CDK and PI3K on T-ALL F.Q. Lim et al.
KOPT-K1) are particularly sensitive to GSI, while many other cell lines are resistant.27 Ferrando’s group also reported that many GSI-resistant cell lines exhibit AKT activation, which confers drug resistance after GSI treatment.44 These findings indicated that cell proliferation and survival in the GSI-resistant lines were supported by the PI3K-AKT pathway. In fact, GSI-resistant cell lines are relatively more sensitive than GSI-sensitive cell lines to PI3K/AKT inhibitors.45 In line with this finding, we also demonstrated here that most GSI-resistant lines were sensitive to PIK-75, while four GSI-sensitive cell lines were insensitive. Together, our results highlight the exclusive relationship between oncogenic transcription factors (TAL1 vs. TLX), signaling pathways (PI3K-AKT vs. JAK-STAT) and drug sensitivity (PIK-75-sensitive vs. GSI-sensitive).
Taken together, our study demonstrated that PIK-75 concurrently inhibits two major oncogenic pathways (type A and B abnormalities), which is an ideal strategy to disrupt core machinery supporting the survival of T-ALL cells. Although PIK-75 is an old “forgotten” drug that might have been replaced with more specific PI3K-AKT inhibitors, it is worth revisiting the mechanism of this drug. Because PIK-75 was mainly studied before the concept of enhancer inhibition with CDK7 or BRD inhibitor was established,24,36,37,47,48,50 its activity on CDK might be underestimated. Our study now demonstrates that multi-kinase specificity of PIK-75 rather provides an advantage for the
References
1. Look AT. Oncogenic transcription factors in the human acute leukemias. Science. 1997;278(5340):1059-1064.
2. Armstrong SA, Look AT. Molecular genetics of acute lymphoblastic leukemia. J Clin Oncol. 2005;23(26):6306-6315.
3. Aifantis I, Raetz E, Buonamici S. Molecular pathogenesis of Tcell leukaemia and lymphoma. Nat Rev Immunol. 2008;8(5):380-390.
4. Van Vlierberghe P, Pieters R, Beverloo HB, Meijerink JP. Molecular-genetic insights in paediatric T-cell acute lymphoblastic leukaemia. Br J Haematol. 2008;143(2):153-168.
5. Belver L, Ferrando A. The genetics and mechanisms of T cell acute lymphoblastic leukaemia. Nat Rev Cancer. 2016;16(8):494-507.
6. Brown L, Cheng JT, Chen Q, et al. Site-specific recombination of the tal-1 gene is a common occurrence in human T cell leukemia. EMBO J. 1990;9(10):3343-3351.
7. Ferrando AA, Neuberg DS, Staunton J, et al. Gene expression signatures define novel oncogenic pathways in T cell acute lymphoblastic leukemia. Cancer Cell. 2002;1(1):75-87.
8. Gianni F, Belver L, Ferrando A. The genetics and mechanisms of T-cell acute lymphoblastic leukemia. Cold Spring Harb Perspect Med. 2020;10(3):a035246.
9. Sanda T, Lawton LN, Barrasa MI, et al. Core transcriptional regulatory circuit controlled by the TAL1 complex in human T cell acute lymphoblastic leukemia. Cancer Cell. 2012;22(2):209-221.
10. Tan TK, Zhang C, Sanda T. Oncogenic transcriptional program
treatment of T-ALL. However, we were also aware that one potential problem of this drug is the insolubility,51 which prevents the application of PIK-75 in vivo. Thus, to move this drug forward to the clinical setting, further improvement of the chemical is necessary.
Disclosures
No conflicts of interest to disclose.
Contributions
FQL, ASYC, XZH, and MST performed the experiments; RY conducted the bioinformatic analyses. AEJY, SHT and TS supervised the study. FLQ and TS wrote the manuscript.
Funding
The research is supported by the National Medical Research Council of the Singapore Ministry of Health (NMRC/CIRG/1443/2016 to TS); by the National Research Foundation (NRF) Singapore and the Singapore Ministry of Education (MOE) under its Research Centers of Excellence initiative; and by the National University Cancer Institute Singapore, Yong Siew Yoon Research Grant and NCIS and NUS Cancer Program Seed Funding.
Data-sharing statement
RNA-seq data has been deposited in the Gene Expression Omnibus database under accession numbers GSE181435.
driven by TAL1 in T-cell acute lymphoblastic leukemia. Int J Hematol. 2019;109(1):5-17.
11. Tan SH, Yam AW, Lawton LN, et al. TRIB2 reinforces the oncogenic transcriptional program controlled by the TAL1 complex in T-cell acute lymphoblastic leukemia. Leukemia. 2016;30(4):959-962.
12. Leong WZ, Tan SH, Ngoc PCT, et al. ARID5B as a critical downstream target of the TAL1 complex that activates the oncogenic transcriptional program and promotes T-cell leukemogenesis. Genes Dev. 2017;31(23-24):2343-2360.
13. Liau WS, Tan SH, Ngoc PCT, et al. Aberrant activation of the GIMAP enhancer by oncogenic transcription factors in T-cell acute lymphoblastic leukemia. Leukemia. 2017;31(8):1798-1807.
14. Weng AP, Ferrando AA, Lee W, et al. Activating mutations of NOTCH1 in human T cell acute lymphoblastic leukemia. Science. 2004;306(5694):269-271.
15. Liu Y, Easton J, Shao Y, et al. The genomic landscape of pediatric and young adult T-lineage acute lymphoblastic leukemia. Nat Genet. 2017;49(8):1211-1218.
16. Gutierrez A, Sanda T, Grebliunaite R, et al. High frequency of PTEN, PI3K, and AKT abnormalities in T-cell acute lymphoblastic leukemia. Blood. 2009;114(3):647-650.
17. Patro R, Duggal G, Love MI, Irizarry RA, Kingsford C. Salmon provides fast and bias-aware quantification of transcript expression. Nat Methods. 2017;14(4):417-419.
18. Soneson C, Love MI, Robinson MD. Differential analyses for RNAseq: transcript-level estimates improve gene-level inferences.
Haematologica | 108 February 2023 380 ARTICLE - Inhibition of CDK and PI3K on T-ALL F.Q. Lim et al.
F1000Res. 2015;4:1521.
19. Risso D, Ngai J, Speed TP, Dudoit S. Normalization of RNA-seq data using factor analysis of control genes or samples. Nat Biotechnol. 2014;32(9):896-902.
20. Love MI, Huber W, Anders S. Moderated estimation of fold change and dispersion for RNA-seq data with DESeq2. Genome Biol. 2014;15(12):550.
21. Zhu A, Ibrahim JG, Love MI. Heavy-tailed prior distributions for sequence count data: removing the noise and preserving large differences. Bioinformatics. 2019;35(12):2084-2092.
22. Subramanian A, Tamayo P, Mootha VK, et al. Gene set enrichment analysis: a knowledge-based approach for interpreting genome-wide expression profiles. Proc Natl Acad Sci U S A. 2005;102(43):15545-15550.
23. Chen EY, Tan CM, Kou Y, et al. Enrichr: interactive and collaborative HTML5 gene list enrichment analysis tool. BMC Bioinformatics. 2013;14:128.
24. Kwiatkowski N, Zhang T, Rahl PB, et al. Targeting transcription regulation in cancer with a covalent CDK7 inhibitor. Nature. 2014;511(7511):616-620.
25. Knight ZA, Gonzalez B, Feldman ME, et al. A pharmacological map of the PI3-K family defines a role for p110alpha in insulin signaling. Cell. 2006;125(4):733-747.
26. Thomas D, Powell JA, Vergez F, et al. Targeting acute myeloid leukemia by dual inhibition of PI3K signaling and Cdk9-mediated Mcl-1 transcription. Blood. 2013;122(5):738-748.
27. O'Neil J, Grim J, Strack P, et al. FBW7 mutations in leukemic cells mediate NOTCH pathway activation and resistance to gamma-secretase inhibitors. J Exp Med. 2007;204(8):1813-1824.
28. De Keersmaecker K, Porcu M, Cox L, et al. NUP214-ABL1mediated cell proliferation in T-cell acute lymphoblastic leukemia is dependent on the LCK kinase and various interacting proteins. Haematologica. 2014;99(1):85-93.
29. Dempster JM, Boyle I, Vazquez F, et al. Chronos: a cell population dynamics model of CRISPR experiments that improves inference of gene fitness effects. Genome Biol. 2021;22(1):343.
30. Meyers RM, Bryan JG, McFarland JM, et al. Computational correction of copy number effect improves specificity of CRISPR-Cas9 essentiality screens in cancer cells. Nat Genet. 2017;49(12):1779-1784.
31. Dempster J, Rossen J, Kazachkova M, et al. Extracting biological insights from the Project Achilles Genome-Scale CRISPR screens in cancer cell lines. bioRxiv. 2019. doi: https://doi.org/10.1101/720243 [preprint, not peer-reviewed].
32. Ghandi M, Huang FW, Jane-Valbuena J, et al. Next-generation characterization of the Cancer Cell Line Encyclopedia. Nature. 2019;569(7757):503-508.
33. An J, Huang YC, Xu QZ, et al. DNA-PKcs plays a dominant role in the regulation of H2AX phosphorylation in response to DNA damage and cell cycle progression. BMC Mol Biol. 2010;11:18.
34. Kusy S, Gerby B, Goardon N, et al. NKX3.1 is a direct TAL1 target gene that mediates proliferation of TAL1-expressing human T cell acute lymphoblastic leukemia. J Exp Med. 2010;207(10):2141-2156.
35. Chipumuro E, Marco E, Christensen CL, et al. CDK7 inhibition
suppresses super-enhancer-linked oncogenic transcription in MYCN-driven cancer. Cell. 2014;159(5):1126-1139.
36. Loven J, Hoke HA, Lin CY, et al. Selective inhibition of tumor oncogenes by disruption of super-enhancers. Cell. 2013;153(2):320-334.
37. Ghazawi FM, Faller EM, Parmar P, El-Salfiti A, MacPherson PA. Suppressor of cytokine signaling (SOCS) proteins are induced by IL-7 and target surface CD127 protein for degradation in human CD8 T cells. Cell Immunol. 2016;306-307:41-52.
38. Narlik-Grassow M, Blanco-Aparicio C, Carnero A. The PIM family of serine/threonine kinases in cancer. Med Res Rev. 2014;34(1):136-159.
39. Kimura S, Seki M, Kawai T, et al. DNA methylation-based classification reveals difference between pediatric T-cell acute lymphoblastic leukemia and normal thymocytes. Leukemia. 2020;34(4):1163-1168.
40. Girardi T, Vicente C, Cools J, De Keersmaecker K. The genetics and molecular biology of T-ALL. Blood. 2017;129(9):1113-1123.
41. Bornschein S, Demeyer S, Stirparo R, et al. Defining the molecular basis of oncogenic cooperation between TAL1 expression and Pten deletion in T-ALL using a novel pro-T-cell model system. Leukemia. 2018;32(4):941-951.
42. Vicente C, Schwab C, Broux M, et al. Targeted sequencing identifies associations between IL7R-JAK mutations and epigenetic modulators in T-cell acute lymphoblastic leukemia. Haematologica. 2015;100(10):1301-1310.
43. Vanden Bempt M, Demeyer S, Broux M, et al. Cooperative enhancer activation by TLX1 and STAT5 drives development of NUP214-ABL1/TLX1-positive T cell acute lymphoblastic leukemia. Cancer Cell. 2018;34(2):271-285.e7.
44. Palomero T, Sulis ML, Cortina M, et al. Mutational loss of PTEN induces resistance to NOTCH1 inhibition in T-cell leukemia. Nat Med. 2007;13(10):1203-1210.
45. Sanda T, Li X, Gutierrez A, et al. Interconnecting molecular pathways in the pathogenesis and drug sensitivity of T-cell acute lymphoblastic leukemia. Blood. 2010;115(9):1735-1745.
46. Simioni C, Neri LM, Tabellini G, et al. Cytotoxic activity of the novel Akt inhibitor, MK-2206, in T-cell acute lymphoblastic leukemia. Leukemia. 2012;26(11):2336-2342.
47. King B, Trimarchi T, Reavie L, et al. The ubiquitin ligase FBXW7 modulates leukemia-initiating cell activity by regulating MYC stability. Cell. 2013;153(7):1552-1566.
48. Roderick JE, Tesell J, Shultz LD, et al. c-Myc inhibition prevents leukemia initiation in mice and impairs the growth of relapsed and induction failure pediatric T-ALL cells. Blood. 2014;123(7):1040-1050.
49. Real PJ, Ferrando AA. NOTCH inhibition and glucocorticoid therapy in T-cell acute lymphoblastic leukemia. Leukemia. 2009;23(8):1374-1377.
50. Vervoort SJ, Devlin JR, Kwiatkowski N, Teng M, Gray NS, Johnstone RW. Targeting transcription cycles in cancer. Nat Rev Cancer. 2022;22(1):5-24.
51. Talekar M, Ganta S, Amiji M, et al. Development of PIK-75 nanosuspension formulation with enhanced delivery efficiency and cytotoxicity for targeted anti-cancer therapy. Int J Pharm. 2013;450(1-2):278-289.
Haematologica | 108 February 2023 381 ARTICLE - Inhibition of CDK and PI3K on T-ALL F.Q. Lim et al.
Genome-wide CRISPR screens identify ferroptosis as a novel therapeutic vulnerability in acute lymphoblastic leukemia
Correspondence: R. Marcotte richard.marcotte@nrc-cnrc.gc.ca
Received: February 2, 2022.
1Human Health Therapeutics Research Center, National Research Council Canada and 2Centre Hospitalier Universitaire Sainte-Justine, Université de Montréal, Montréal, Quebec, Canada
Accepted: September 13, 2022. Prepublished: September 22, 2022.
https://doi.org/10.3324/haematol.2022.280786
©2023 Ferrata Storti Foundation
Published under a CC-BY license
Abstract
Acute lymphoblastic leukemia (ALL) is the most frequent cancer diagnosed in children. Despite the great progress achieved over the last 40 years, with cure rates now exceeding 85%, refractory or relapsed ALL still exhibit a dismal prognosis. This poor outcome reflects the lack of treatment options specifically targeting relapsed or refractory ALL. In order to address this gap, we performed whole-genome CRISPR/Cas drop-out screens on a panel of seven B-ALL cell lines. Our results demonstrate that while there was a significant overlap in gene essentiality between ALL cell lines and other cancer types survival of ALL cell lines was dependent on several unique metabolic pathways, including an exquisite sensitivity to GPX4 depletion and ferroptosis induction. Detailed molecular analysis of B-ALL cells suggest that they are primed to undergo ferroptosis as they exhibit high steady-state oxidative stress potential, a low buffering capacity, and a disabled GPX4-independent secondary lipid peroxidation detoxification pathway. Finally, we validated the sensitivity of BALL to ferroptosis induction using patient-derived B-ALL samples.
Introduction
Acute lymphoblastic leukemia (ALL) is the most prevalent cancer during childhood, representing nearly 80% of all cancer in this age group.1 Treatment protocols have greatly improved over the last 30 years, such that the survival rate reaches >85%.2 Despite this therapeutic success, the prognosis for relapsed patients remains dismal with a less than 50% 5-year survival, still making ALL the second highest cause of death by disease amongst children in Canada and in the US. In addition, up to 65-70% of pediatric ALL survivors will suffer from long-term debilitating or even life-threatening treatment related sequelae.3,4 Hence, novel therapeutic avenues that are both more effective at achieving long-term remission while eliciting less acute long-term toxicities than current treatment regimen are required to treat these patients. Recent advances in the use of clustered regularly-interspaced short palindromic repeat (CRISPR)/Cas9 technology has revolutionized functional genomics and the analysis of gene function in mammalian cells with its precision, ease of use, speed, and versatility. Whole-ge-
nome bulk pooled CRISPR screens, using multiple singleguide RNA (sgRNA) targeting each human gene in a single CRISPR library, have allowed the identification of genes implicated in processes underlying phenotypic read-outs such as proliferation and survival in hundreds of tumoral cell lines.5–7 These large datasets revealed panels of core essential and pan-cancer genes and unraveled key players required for cell viability/proliferation in cell lines derived from multiple histotypes. Although ALL is a common form of cancer, very few ALL cell lines have been previously screened by large dropout screen studies.5–7 This is likely explained by the difficulty in infecting pre-B and T lymphocytes with lentiviruses, a technical requirement for performing whole-genome CRISPR screens. In this report, we performed whole-genome dropout CRISPR screens of seven B-ALL cell lines. These screens revealed a surprisingly large subset of essential genes unique to ALL cell survival that were not reported to be core essential genes in previous studies.6–8 These B-ALLenriched genes were implicated in different cellular pathways and functions, many of which were associated directly or indirectly to ferroptosis. In recent years, this
Marie-Eve Lalonde,1 Marc Sasseville,1 Anne-Marie Gélinas,1 Jean-Sébastien Milanese,1 Kathie Béland,2 Simon Drouin,1 Elie Haddad2 and Richard Marcotte1Haematologica | 108 February 2023 382 ARTICLE - Acute Lymphoblastic Leukemia
non-apoptotic pathological cell death has gained increasing attention in cancer research, particularly for its potential tumor suppressor function that could be exploited for neoplastic disease treatment.9–11 By using different cellular and molecular biology approaches, we validate that B-ALL cell lines have an exquisite vulnerability to ferroptosis induction. This sensitivity is illustrated by the extreme responsiveness of cells to glutathione peroxidase 4 (GPX4) inhibition, but also to other pathways that regulate GPX4 activity. We also show that this sensitivity is rescued by exogenous expression of FSP1, a recently characterized ferroptosis inhibitor12,13 that we found to be poorly expressed, not only in B-ALL cells, but in leukemias in general. Finally, we demonstrate that this acute sensitivity to ferroptosis induction is also observed in a panel of B-ALL patient-derived tumor samples.
Methods
B-acute lymphoblastic leukemia cell screens
B-ALL cells were infected with Cas9-2A-blast lentivirus followed by selection with 5-15 mg/mL blasticidin (InvivoGen, CA). Cells were tested for Cas9 activity using the reporter assay described in Tzelepis et al.14 Cas9-expressing B-cell stable pools were transduced at 0.3 multiplicity of infection (M.O.I) with the pLKV2 whole-genome human library (Addgene # 67989), at 300-fold representation in triplicate (~30 million cells per replicate). Twenty-four hours (h) post infection, cells were centrifuged and resuspended in fresh media + 0.5-7.5 mg/mL puromycin (Gibco™). Forty-eight h post puromycin addition, cells were counted with Vi-Cell™ XR (Beckman Coulter, IN) and 30 million cells were pelleted per replicate for T0 time points. M.O.I. evaluation was done using CellTiter-Glo® (Promega, WI) and measured using a Synergy 2 luminometer (BioTek®). Thirty million cells per replicate were plated in culture and left for about 14 doublings with regular passage (2-4 days). After 14 doublings, 30 million cells per replicate were pelleted for the final time points (Tf).
Screen +/- ferrostatin
REH and SEM Cas9 pools were screened as described above, except that each pool was screened +/- 4 mM ferrostatin in parallel. Ferrostatin and puromycin were added 24 h post transfection. Analysis was performed using MAGeCK Maximum Likelihood Estimation (MLE) algorithm with combined data from two cell lines and the MAGeCKFlute R package (version 1.4.3).58
Ethic committee approval
All experiments performed with patient-derived xenografts (PDX) were approved by Ste-Justine Hospital Ethic Committee, under approbation #F9-25754.
Results
Whole-genome CRISPR screens of B-acute lymphoblastic
leukemia cell lines
In order to identify genes that are essential for B-ALL cells, we performed whole-genome pooled dropout CRISPR screens using a two-vector system (Figure 1A).14 First, a stable pool of Cas9-expressing cells was established for each cell line. This preliminary step was limiting for many ALL cell lines, since several pools did not reach the 75% Cas9 activity threshold required for further screening (Online Supplementary Table S2). For some of these cell lines, Cas9 activity decreased rapidly after blasticidin selection, particularly in T-ALL cell lines (data not shown), suggesting that constitutive Cas9 expression might be toxic, similar to what is reported in AML cell lines.14 Of all the pools tested, the seven B-ALL Cas9stable pools attaining >75% Cas9 activity were infected with a whole-genome lentiviral 90K sgRNA library (Online Supplementary Figure S1A and B).14 Screen quality was very high, as shown by the BAGEL essential and non-essential genes8,15 comparison precision/recall curves (Online Supplementary Figure 1C). Furthermore, principal component analysis (PCA) shows that T0 time points from all cell lines are tightly clustered and, despite some variance shown in the Tf between cell lines, cell line replicates were tightly clustered and significantly different from T0, suggesting that significant dropout was achieved in the Tf samples (Online Supplementary Figure S1D).
Whole-genome CRISPR screens identify vulnerabilities specific to B-acute lymphoblastic leukemia
In an attempt to identify essential gene unique to B-ALL, we compared the essential genes identified in the screened B-ALL cell lines with the list of essential genes reported in previous datasets. We noticed a considerable overlap of B-ALL essential genes with Broad and Sanger core essential genes7 (Figure 1B and C; Online Supplementary Tables S3 and S4). One thousand two hundred and four essential genes were identified in at least four of seven B-ALL cell lines (false discovery rate [FDR] <0.05), of which 67% and 63% were also included in the Broad and Sanger gene lists, respectively and, as expected, belong to core biological processes such as the cell cycle, mRNA translation, splicing, and polymerase II transcription pathways that are vital for growth and survival of most cell lines. Strikingly, 72 genes were identified as essential in every B-ALL cell line screened but were not previously identified as essential genes in the Broad and Sanger datasets (Figure 1B, green line). Likewise, 98 genes were previously defined as essential in both the Sanger and Broad dataset but were not essential in any of the ALL cell lines (Figure 1B, red line). We defined as “B-ALLenriched essential genes” all hits that were found in at
Haematologica | 108 February 2023 383 ARTICLE - B-ALL cells are sensitive to ferroptosis induction M-E. Lalonde et al.
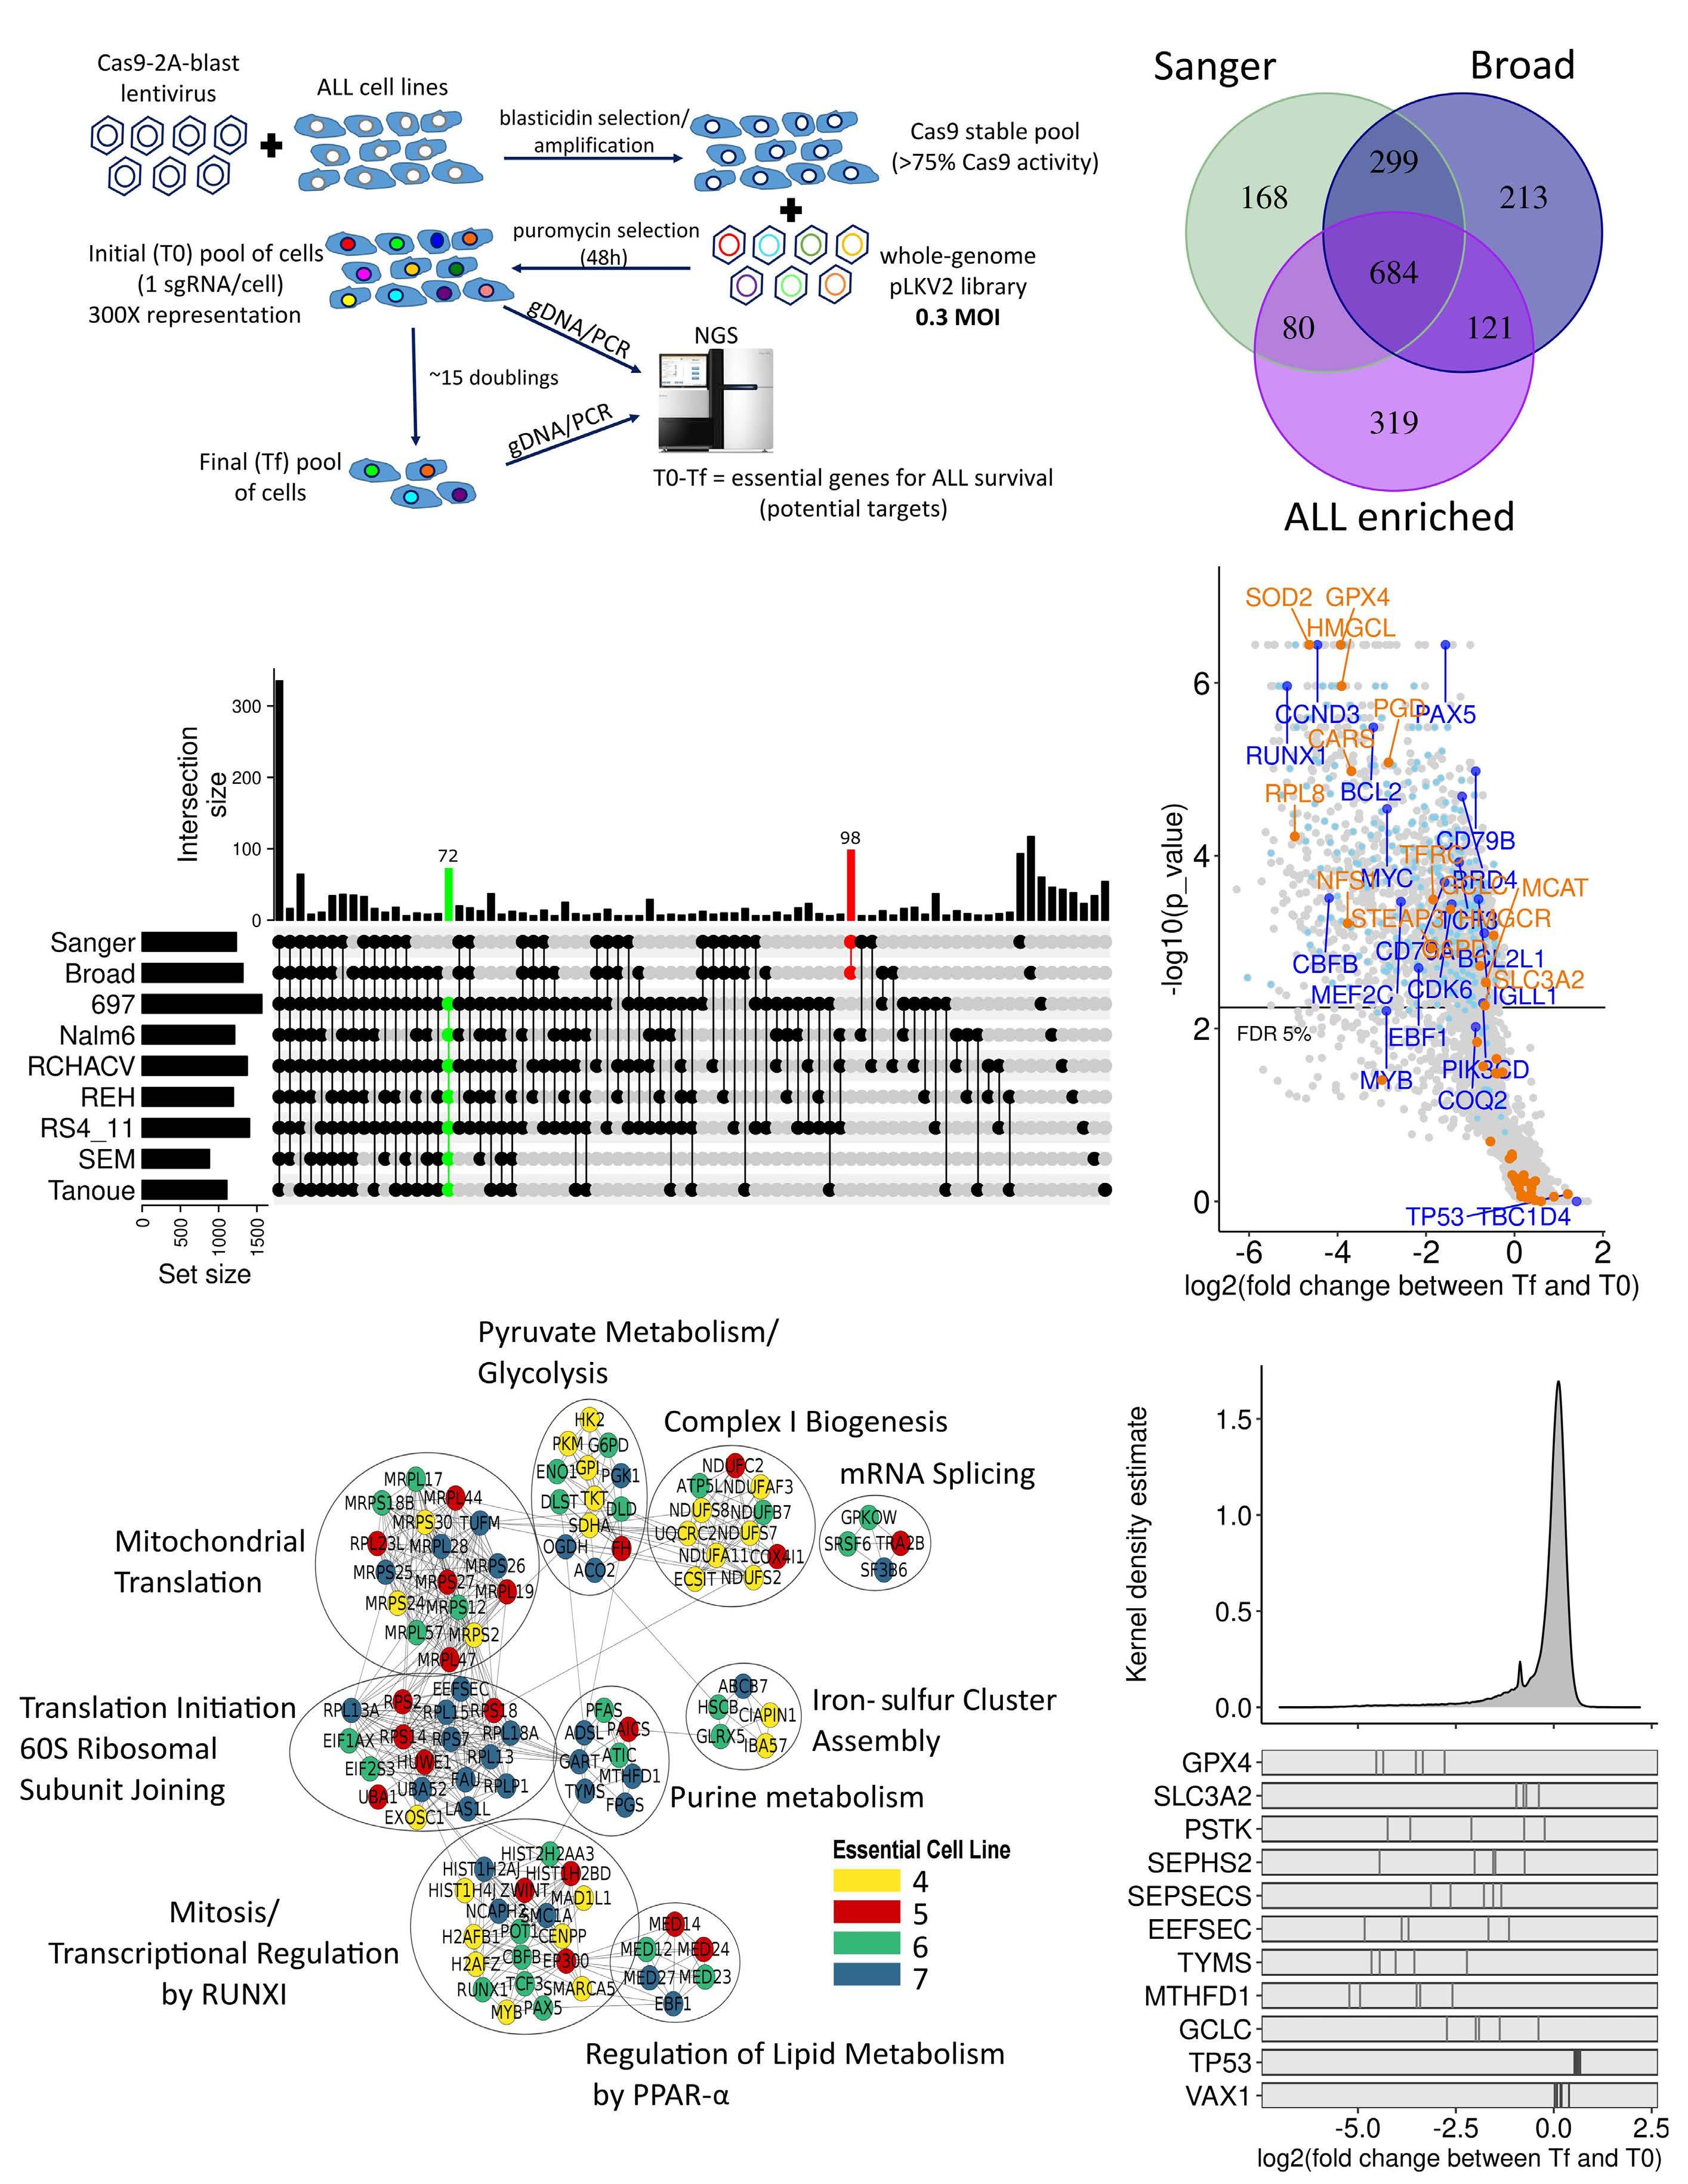
A C B D Haematologica | 108 February 2023 384
M-E.
et al. Continued
following page. E
ARTICLE - B-ALL cells are sensitive to ferroptosis induction
Lalonde
on
F
ARTICLE - B-ALL cells are sensitive to ferroptosis induction
M-E. Lalonde et al.
Figure 1. Whole-genome CRISPR/Cas9 screens of acute lymphoblastic leukemia (ALL) cell lines identify ALL essential genes. (A) Schema of B-ALL screening pipeline. (B) Significant genes set intersection of 7 B-ALL cell line CRISPR screen results with UpSet, “Broad” and “Sanger” essential gene list at false discovery rate (FDR) <0.05. The intersections with more than 5 genes are shown. (C) Overlap between B-ALL essential (>4/7 cell lines, FDR <0.05) genes, “Broad” and “Sanger” core essential genes. (D) Representative Volcano plot of 697 cells CRISPR screen results with FDR <0.05. B-ALL-known dependencies and B-ALL-enriched essential genes are highlighted in dark blue and in light blue, respectively. Genes regulating ferroptosis induction are highlighted in orange) Gene Network Analysis of B-ALL-enriched essential genes where nodes represent genes and edges represent proteinprotein interactions between genes. Node color represents the number of ALL cell lines essential for the given gene. (F) Log2 fold change distribution of single-giude RNA (sgRNA) in the 7 ALL screened cell lines. sgRNA log2 fold change for ferroptosis related genes are illustrated at bottom of the panel. VAX1, negative control. TP53 was enriched in several B-ALL cell lines. Tf: final time points; M.O.I: multiplicity of infection.
least four of seven of B-ALL cell lines, but that were not present in the Broad or Sanger essential gene datasets (a total of 319 genes as shown in Figure 1C). These genes are enriched for ALL-associated transcription factors, such as PAX5, EBF1, CBFB, TCF3, and RUNX1,16–18 B-cell receptor and signaling, such as CD79A, CD79B and PIK3CD, and other known B-cell vulnerabilities, such as CDK6, CCND3, and BCL222–24 (Figure 1D). A few genes were also enriched in screened ALL cell lines, such as TP53 (most B-ALL cell lines have wild-type TP53) and TBC1D4, indicating that knockout (KO) of these genes provided a proliferative advantage (Figure 1D and F; Online Supplementary Table S3). Mapping the “B-ALL-enriched essential genes” onto the STRING database revealed that these genes were members of specific functional subnetworks with multiple protein-protein interactions (Figure 1E), such as RUNX1transcriptional regulation, iron-sulfur cluster assembly, and regulation of lipid metabolism genes. WikiPathway enrichment analysis also identified glutathione metabolism, one carbon metabolism and pentose phosphate pathways, all of which would impact ferroptosis, and ferroptosis regulation itself as specific pathways for B-ALL cell survival (Online Supplementary Table S5). Ferroptosis is an iron-dependent form of necrosis which is triggered via lipid peroxidation of polyunsaturated fatty acid (PUFA) at the cell membrane25 and has garnered significant interest in the past few years as an alternative drug-induced cell death mechanisms to therapy-induced apoptosis-resistant cancers.9 Central to this cell death pathway is GPX4, one of the top-ranked essential gene according to our screen results (Figure 1D and F; Online Supplementary Figure S1E; Online Supplementary Table S3) and is the main inhibitor of ferroptosis induction. Interestingly, multiple genes potentially impacting GPX4 activity were included in “B-ALL-enriched essential genes” list (Figure 1F). Hence, our whole-genome screens of B-ALL cell lines identified several genes unique to this histotype and enriched for specific functional pathways, several of which could directly impact ferroptosis induction.
B-acute lymphoblastic leukemia cells are extremely sensitive to ferroptosis induction GPX4, a selenocysteine-containing glutathione peroxidase, reduces phospholipid hydroperoxides to lipid alcohol with
the help of glutathione (GSH) as an obligate cofactor and acts as the main endogenous inhibitor of ferroptosis induction.26 In order to validate that inhibition of GPX4 induces ferroptosis in ALL cells, we treated cells with RSL3, a direct inhibitor of GPX4.26 Comparison of dose-response curves in B-ALL to non-ALL and GPX4 non-essential cell lines (A549, MCF7, NCIH226) indicates that B-ALL cell lines are particularly sensitive to RSL3 treatment (Figure 2A). This sensitivity was significantly higher compared to the RSL3 sensitivity of many other cell lines reported in previous studies.12,27 In order to confirm that RSL3 treatment induces ferroptosis but not apoptosis, we stained ALL cells with C11 BODIPY™, which stains peroxidated lipids, and Annexin V, respectively (Online Supplementary Figure 2SA). Lipid peroxidation, but not Annexin V staining, was only detected in the RSL3treated cells (Online Supplementary Figure 2A). Notably, higher lipid peroxidation levels were also found in steadystate conditions in B-ALL cells compared to non-ALL cells (Online Supplementary Figure 2SB). In order to confirm the sensitivity of ALL to ferroptosis induction genetically, we generated GPX4 KO clones using CRISPR/Cas9 by constantly growing targeted cells in the presence of ferrostatin-1, a radical trapping agent, which strongly inhibits ferroptosis (Figure 2B and C).25,27 Withdrawal of the drug in GPX4 KO clones led to cell death within 18 h after removal, which confirms the rapid induction of cell death after GPX4 inhibition in B-ALL cells (Figure 2B). RSL3 drug treatment could partially be rescued by the iron chelator deferoxamine (DFO), as well as PD146176, a 15-lipoxygenase inhibitor, and EUK-134, a general antioxidant (Figure 2D), but not with Z-VAD-FMK, a pan-inhibitor of caspases and apoptosis. These results indicate that RSL3 creates a lethal oxidative stress environment that is, to some extent, iron-dependent. Interestingly, only lower DFO concentration that was previously reported could rescue cell viability.25,27,28 This discrepancy can be explained by the fact that B-ALL cells are more sensitive to elevated DFO treatment (Online Supplementary Figure 2C), which could reflect their higher requirement for iron for sustained proliferation compared to other normal cell types and malignancies.29
B-acute lymphoblastic leukemia cells are sensitive to perturbations in pathways regulating GPX4 activity Because of its requirement for specific cellular metabolites,
Haematologica | 108 February 2023 385
Figure 2. B-acute lymphoblastic leukemia are highly sensitive to GPX4 inhibition. (A) Cell viability curves of B-acute lymphoblastic leukemia (B-ALL) (various colors) and other cell lines (gray colors; A549, MCF7, NCI-H226) to the GPX4 inhibitor (RSL3). (B) Growth of REH GFP clones 1 and 2 (negative control) and REH GPX4 knockout (KO) clones 2 and 6 +/- ferrostatin (2 mM) for 18 hours (h). (C) Western blot analysis of GPX4 protein level in GPX4 KO vs. GFP KO clones. (D) RSL3 (1 mM) rescue experiments with the iron chelator deferoxamine (DFO; 10 mM), the pan-caspase apoptotic inhibitor ZVADK (50 mM), the 15lipoxygenase-1 inhibitor PD146176 (0.5 mM), or the superoxide dismutase mimetic EUK-134 (30 mM) in NALM6 and RS4;11 for 24 h. **Unpaired t-test P<0.001 and ***P<0.0001, where P values for RSL3 treated cells were calculated vs. dimethyl sulfoxide (DMSO)-treated cells and where P values for RSL3 + additives were calculated with RSL3-treated cells. Conc: concentration.
GPX4 activity and ferroptosis induction are influenced by many metabolic pathways.9 Several genes regulating these pathways were identified within B-ALL-enriched essential genes (Figures 1F and 6). These include genes implicated in the synthesis of GSH (SLC7A11/SLC3A2/GCLC), mevalonate (HMGCR/MVD/MVK), lipids (ASCL3/4, FASN, MCAT), selenocompounds (SEPSEC, EEFSEC, SEPHS2), and iron metabolism (PCPB2, TFRC, STEAP3).
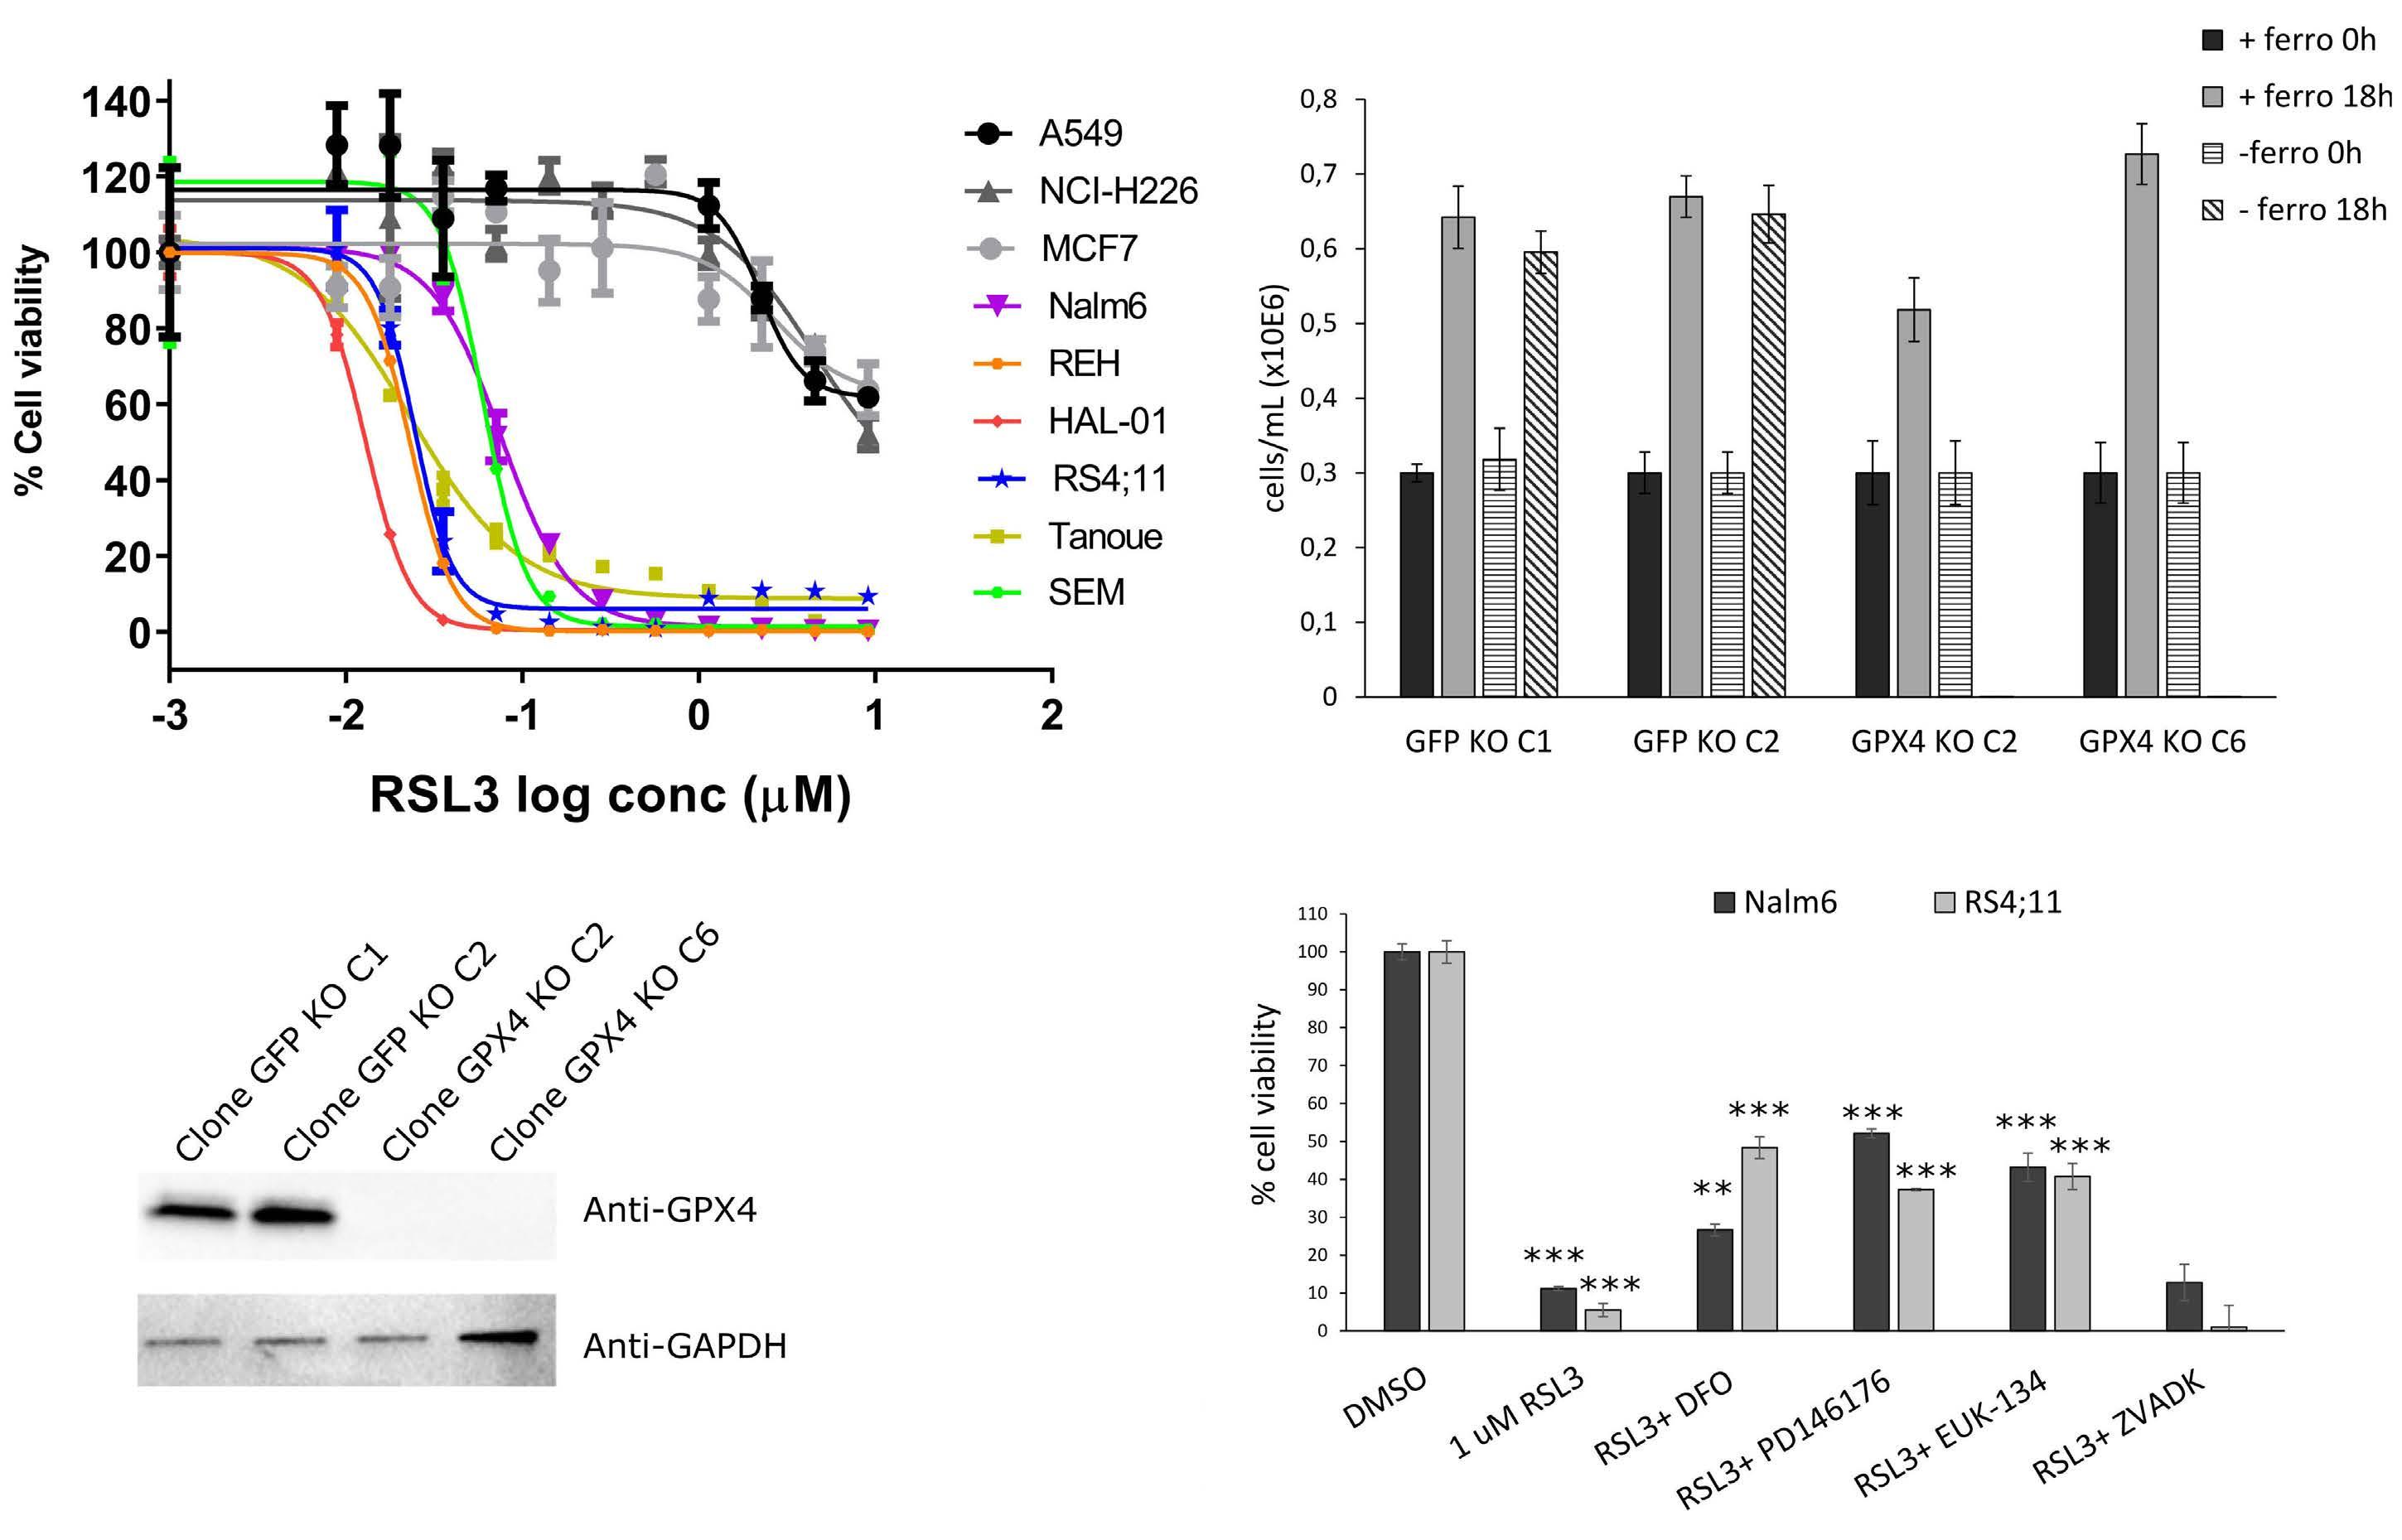
Interestingly, most B-ALL cells showed significantly lower levels of SLC7A11 and GSH compared to non-ALL cells, in steady-state conditions (Figure 3A and B). Because of its essential role for GPX4 activity and in oxidative stress protection, low GSH levels could contribute to the increased sensitivity of B-ALL to ferroptosis induction. Accordingly, BALL cell lines, with the exception of NALM6 whose sensitivity was intermediate, were more sensitive to buthionine sulfoximine (BSO), a glutamate cysteine ligase (GCLC) inhibitor,30 and to erastin (a direct inhibitor of the Xc- transporter responsible for L-cystine import), than non-ALL cell
lines where GPX4 is non-essential (Figure 3C, D and E). Rescue of BSO or treatments in NALM6 and RS4;11 cells by addition of exogenous GSH indicates that GSH synthesis is essential for ferroptosis inhibition in B-ALL lines (Figure 3E). The mevalonate pathway regulates lipid peroxidation by two different mechanisms. First, it produces CoQ10, which contributes to detoxification of lipid reactive oxygen species (ROS).31 Second, it regulates the production of Isopentenyl pyrophosphate (IPP), a metabolite required for Sec-tRNA (a transfer RNA depositing selenocysteine on proteins) synthesis.31 Since GPX4 contains a selenocysteine residue essential for ferroptosis inhibition,32 regulation of selenocysteine incorporation into GPX4 can directly influence its activity. B-ALL cells were more sensitive to inhibition of the mevalonate pathway using FIN56, a dual inhibitor of squalene synthase (an enzyme involved in cholesterol biosynthesis)33 and GPX4 in contrast to non-ALL cells (Figure 3F; Online Supplementary Figure 3A). Consistent with these observations, treatments of B-ALL cells
A B Haematologica | 108 February 2023 386 ARTICLE - B-ALL cells are sensitive to ferroptosis induction M-E. Lalonde et al. C D
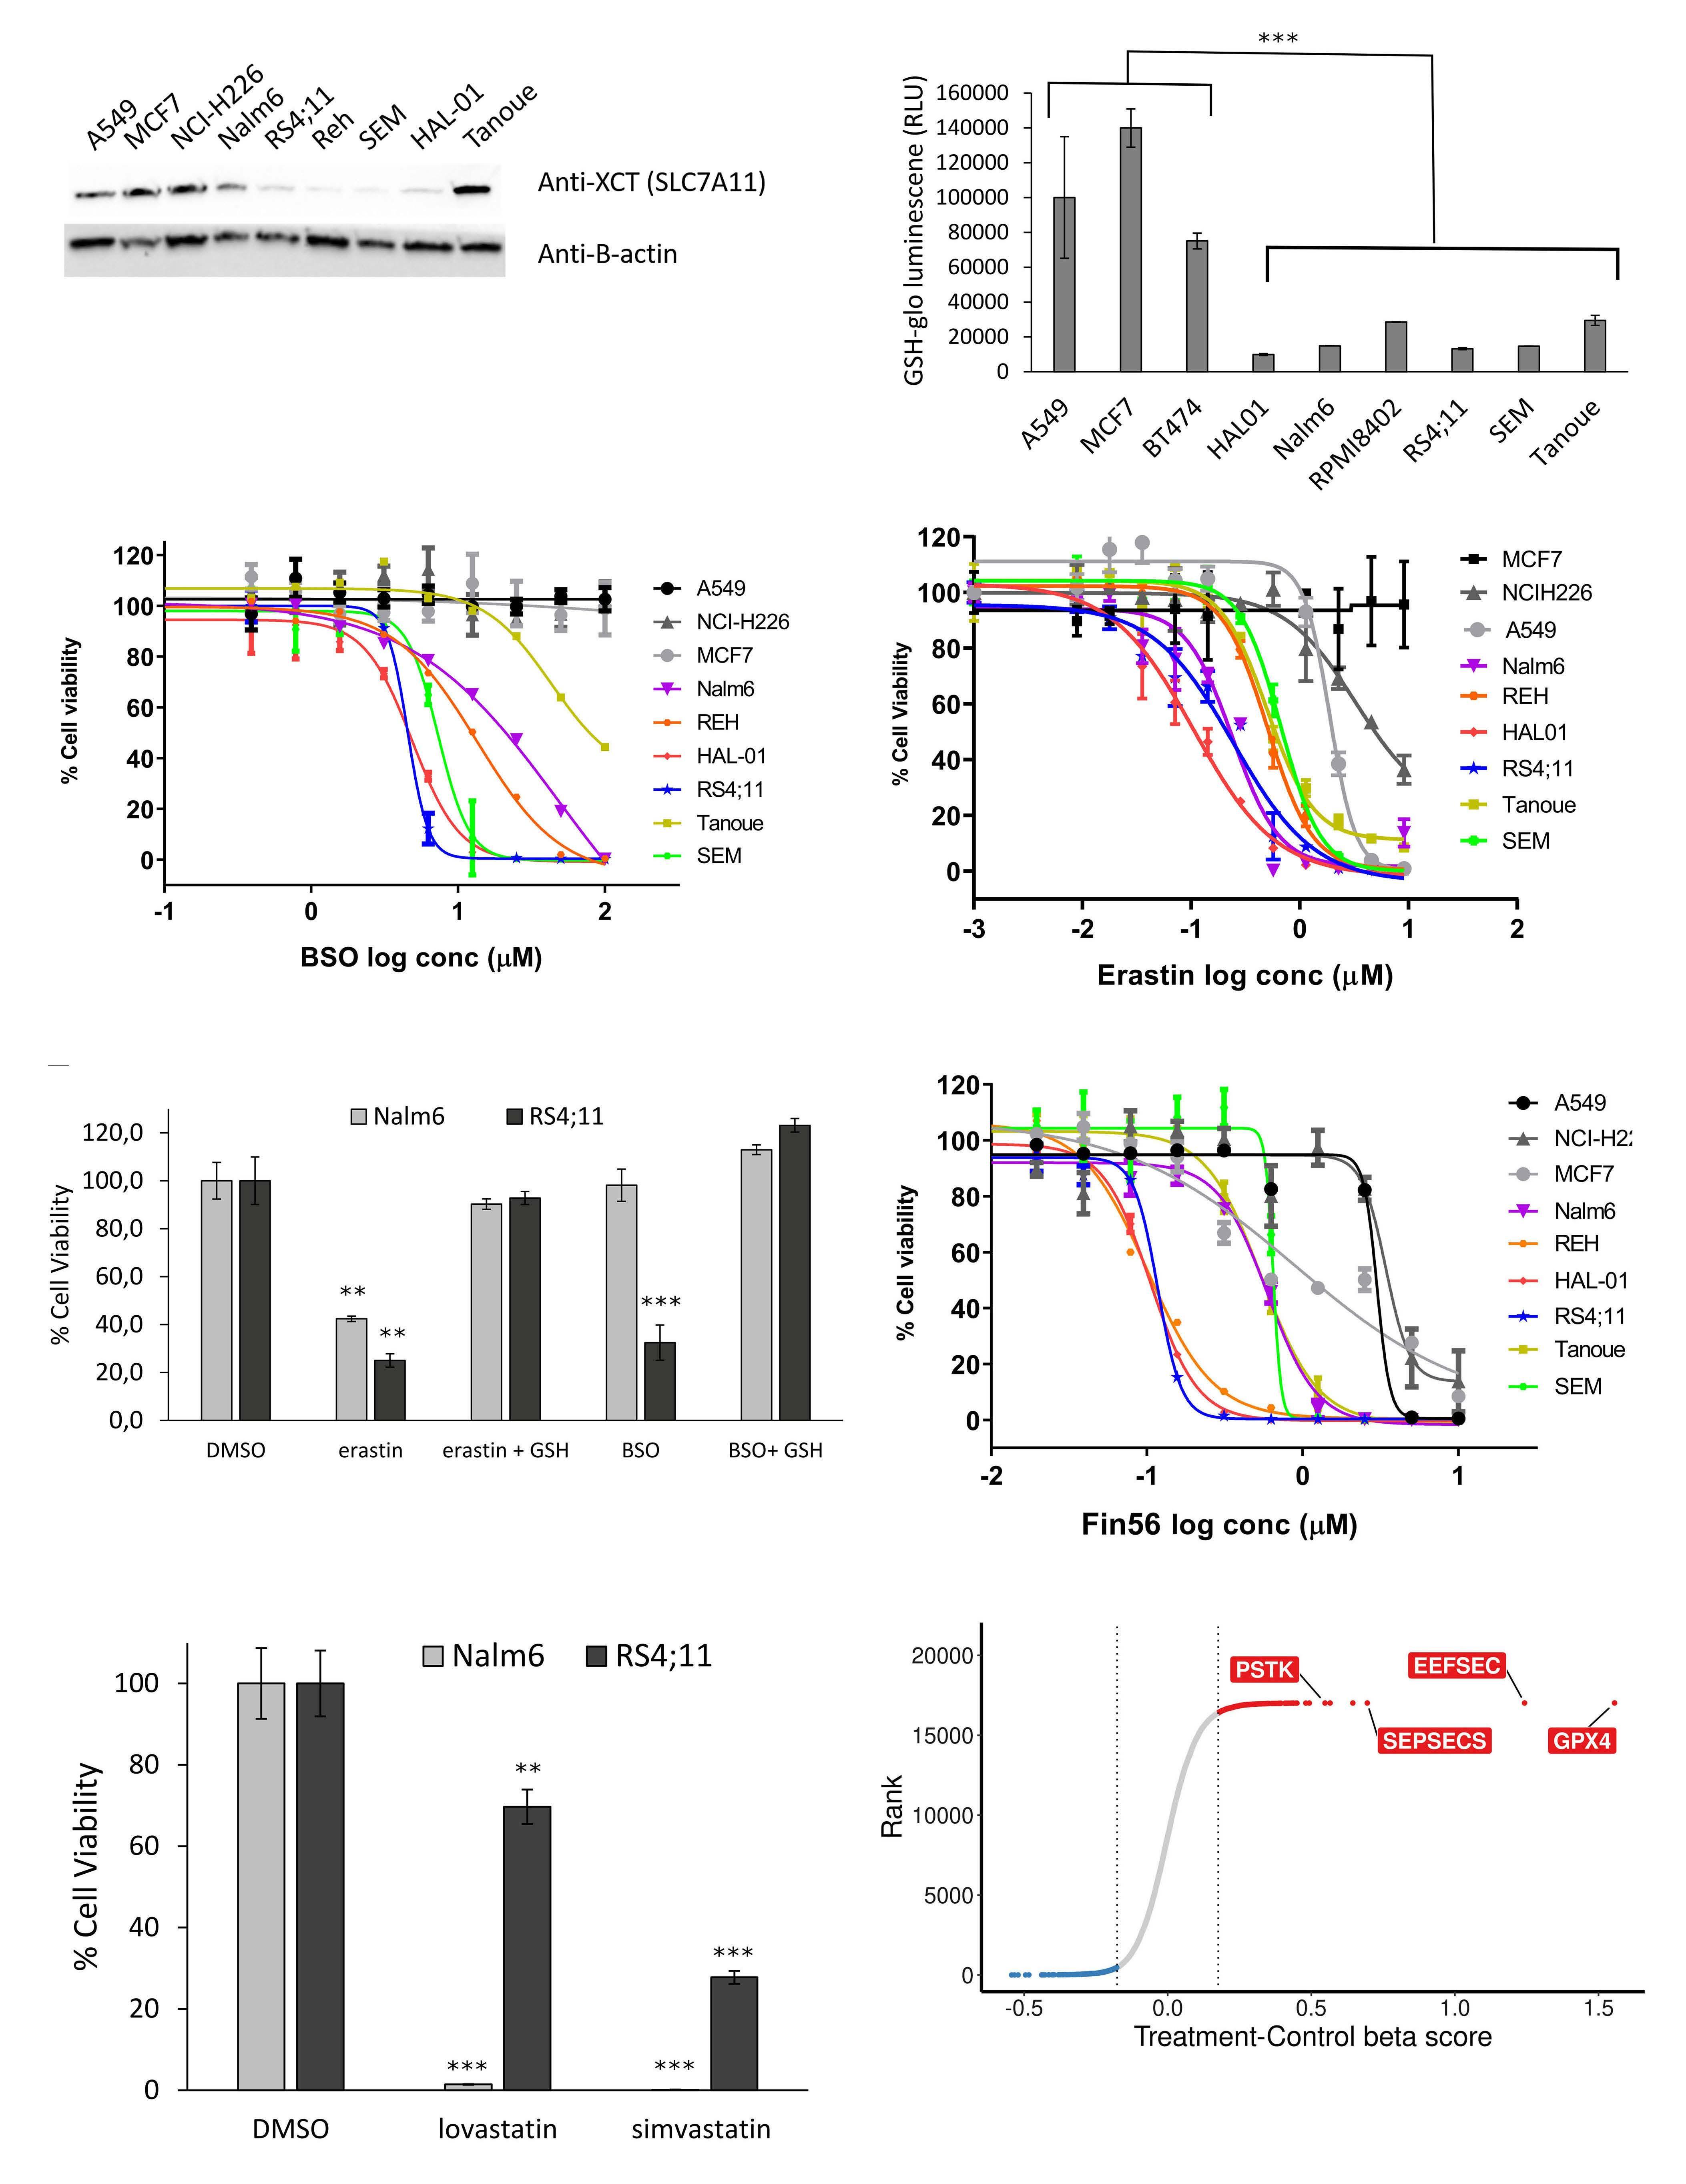
A B C D E F Haematologica | 108 February 2023 387
M-E.
et al. Continued on following page. G
ARTICLE - B-ALL cells are sensitive to ferroptosis induction
Lalonde
H
Figure 3. Pathways controlling GPX4 activity contribute to acute lymphoblastic leukemia sensitivity. (A) Western blot antiSLC7A11 in B-acute lymphoblastic leukemia (B-ALL) cell lines. b-actin is used as loading control. (B) GSH level measurement in steady-state conditions for ALL vs. non-GPX4 sensitive (non-ALL) cells. ***Unpaired t-test P<0.0001. (C) Half maximal inhibitory concentration (IC50) curves of BSO in ALL cell lines vs. non-GPX4 sensitive (non-ALL, gray tone colors) cell lines after 96-hour (h) treatment. Data shown are from one representative experiment. (D) IC50 curves of erastin (system Xc- transporter inhibitor) in ALL vs. non-GPX4 sensitive (non-ALL, gray tone colors) cells. Data shown are from one representative experiment. (E) 10 uM erastin- and 100 uM BSO-treated NALM6 and RS4;11 are rescued by 1 mM GSH (48 h). *** Unpaired t-test P<0.001 and **P<0.01. (F) IC50 curves of Fin56 inhibitor in ALL vs. non-GPX4 sensitive (non-ALL, gray tone colors) cells. Data shown are from 1 representative experiment. (G) Cell viability of NALM6 and RS4;11 following treatment with lovastatin (20 mM) and simvastatin (20 mM) for 72 h. *** Unpaired t-test P<0-002 and **P<0.01. (H) b scores for +/- ferrostatin rescue screens performed in REHcas9 and SEMcas9 pools. Only GPX4 and selenocompound metabolism genes are indicated. Values represent log2 fold change between untreated (control) and treated samples. Conc: concentration.
with other mevalonate pathway inhibitors (lovastatin, simvastatin) also induced cell death (Figure 3G).
In an attempt to determine which genes identified as essential in our primary screens dropped out of the pool specifically because of ferroptosis induction, we performed whole-genome CRISPR screens in two Cas9-expressing BALL cell lines in the presence or absence of ferrostatin-1 (Online Supplementary Figure S3B; Online Supplementary Table S6). In this setting, we would expect genes depleted in the untreated group because of ferroptosis induction to no longer being depleted in the ferrostatin-treated group. As expected, GPX4 sgRNA were no longer depleted in the presence of ferrostatin-1 and showed the highest fold change between untreated and treated samples (Figure 3H). Furthermore, three genes implicated in selenocysteine synthesis (PSTK, EEFESEC and SEPSECS) were also in the top hits further arguing that selenocysteine levels regulate ferroptosis in B-ALL cells (Figure 3G; Online Supplementary Table S6). Cells in which these genes were individually knocked out using CRISPR/Cas9 also showed increased lipid peroxidation (Online Supplementary Figure S3C), strongly supporting ferroptosis induction. These results are consistent with DepMap CRISPR screen data. By segregating cell lines as GPX4 essential or GPX4 non-essential using the CRISPR screens data (Online Supplementary Figure S3D, see materials and methods) and looking for genes that are co-essential with GPX4, we observed co-essentiality of SEPSECS, SEPHS2, EEFSEC, PSTK and SECISBP2 genes (Online Supplementary Figure S3E), which are all selenocompound metabolism genes.
B-acute lymphoblastic leukemia cells express low levels of FSP1, a potent ferroptosis inhibitor
Distribution of GPX4 mRNA expression and protein levels between GPX4-sensitive and non-sensitive cell lines in the DepMap/CCLE indicate that GPX4 expression level does not account for GPX4 essentiality in cells (Online Supplementary Figure S4A, B and C). When looking at differentially expressed genes between these two groups we noticed that FSP1/AIFM2, a recently characterized ferroptosis inhibitor,12,13 was expressed at lower levels in cells that were dependent on GPX4 compared to non-GPX4 essential cells (Online Supplementary Figure S4D). A similar trend was also seen
at the protein level (Figure 4A). Moreover, mRNA and protein levels of FSP1 were particularly low in leukemia cell lines and could not be detected by western blot (Figure 4A and B; Online Supplementary Figure S4D). Thus, this low FSP1 level could potentially contribute to the acute vulnerability of B-ALL cells to ferroptosis induction. In order to test this hypothesis, we generated B-ALL stable pools that overexpressed FSP1 (Figure 4B) and compare their RSL3 doseresponse curve with parental cells (Figure 4C). Both pools (low or high) overexpressing FSP1 rescued sensitivity to RSL3 treatment by approximately ten-fold compared with parental cell lines, suggesting that the low endogenous constitutive levels of FSP1 contribute to the ferroptosis sensitivity in B-ALL. Furthermore, rescue levels being independent of FSP1 overexpression level indicate that weak overexpression is sufficient to inhibit ferroptosis.
Primary B-acute lymphoblastic leukemia patient-derived xenograft samples are also sensitive to ferroptosis induction in vitro
In order to validate that the sensitivity observed in B-ALL cell lines is conserved in PDX samples, we tested different ferroptosis-inducing drugs on nine B-ALL PDX having only gone through a single round of amplification in mice previous to these tests. All PDX samples showed high sensitivity to RSL3 treatment and were even more sensitive than the positive control cell lines, NALM6 (Figure 5A). Furthermore, ferrostatin-1 treatment rescued RSL3 sensitivity in all PDX, indicating that ferroptosis is the major cell death mechanism in these RSL3-treated PDX. B-ALL PDX were also sensitive to three other ferroptosis-inducing drugs - erastin, FIN56 and sulfasalazine - although all PDX were not necessarily sensitive to all drugs (Figure 5B to D). Erastin and sulfasalazine demonstrated a similar sensitivity profile consistent with these two drugs targeting the Xc- transporter. In all, these experiments confirm the extreme sensitivity of B-ALL cell lines and PDX samples to ferroptosis induction.
Discussion
Despite the continuous improvement in treatment outcome and the greater understanding of the molecular pa-
Haematologica | 108 February 2023 388
ARTICLE - B-ALL cells
are
sensitive to ferroptosis induction M-E. Lalonde et al.
thogenesis underlying tumor development, B-ALL still poses unresolved clinical needs, especially to relapsed patient. Developing additional therapeutic avenues by identifying new vulnerabilities is therefore critical to provide new strategies for cancer treatment. In an attempt to fulfill this gap, we performed whole-genome pooled dropout CRISPR screens in B-ALL cell lines. These screens found essential genes that were mostly shared with other cancer histotypes; these genes were enriched in core essential
genes mostly implicated in general processes such as transcription, translation, proteasome, etc. In addition, these screens also identifi ed a panel of more than 300 genes that were essential in most ALL cell line, but not across other tumor histotypes,7 suggesting that these genes represent unique functional vulnerabilities to B-ALL. These were enriched for well-described B-ALL specific transcription factors (PAX5, RUNX1, TCF3, EBF1) and signal transduction pathways (CD79A, CD79B, PIK3CD), but also
Figure 4. Low level of FSP1 in B-acute lymphoblastic leukemia contributes to ferroptosis sensitivity. (A) FSP1 protein level comparison between GPX4-sensitive and non-sensitive CCLE cell lines by cancer type (see material and methods). (B) FSP1 western blot on parental vs. FSP1 overexpressing B-acute lymphoblastic leukemia (B-ALL) cells. b-actin is shown as a loading control. (C) RSL3 dose-response curves in B-ALL pools overexpressing high or low levels of FPS1. Conc: concentration.
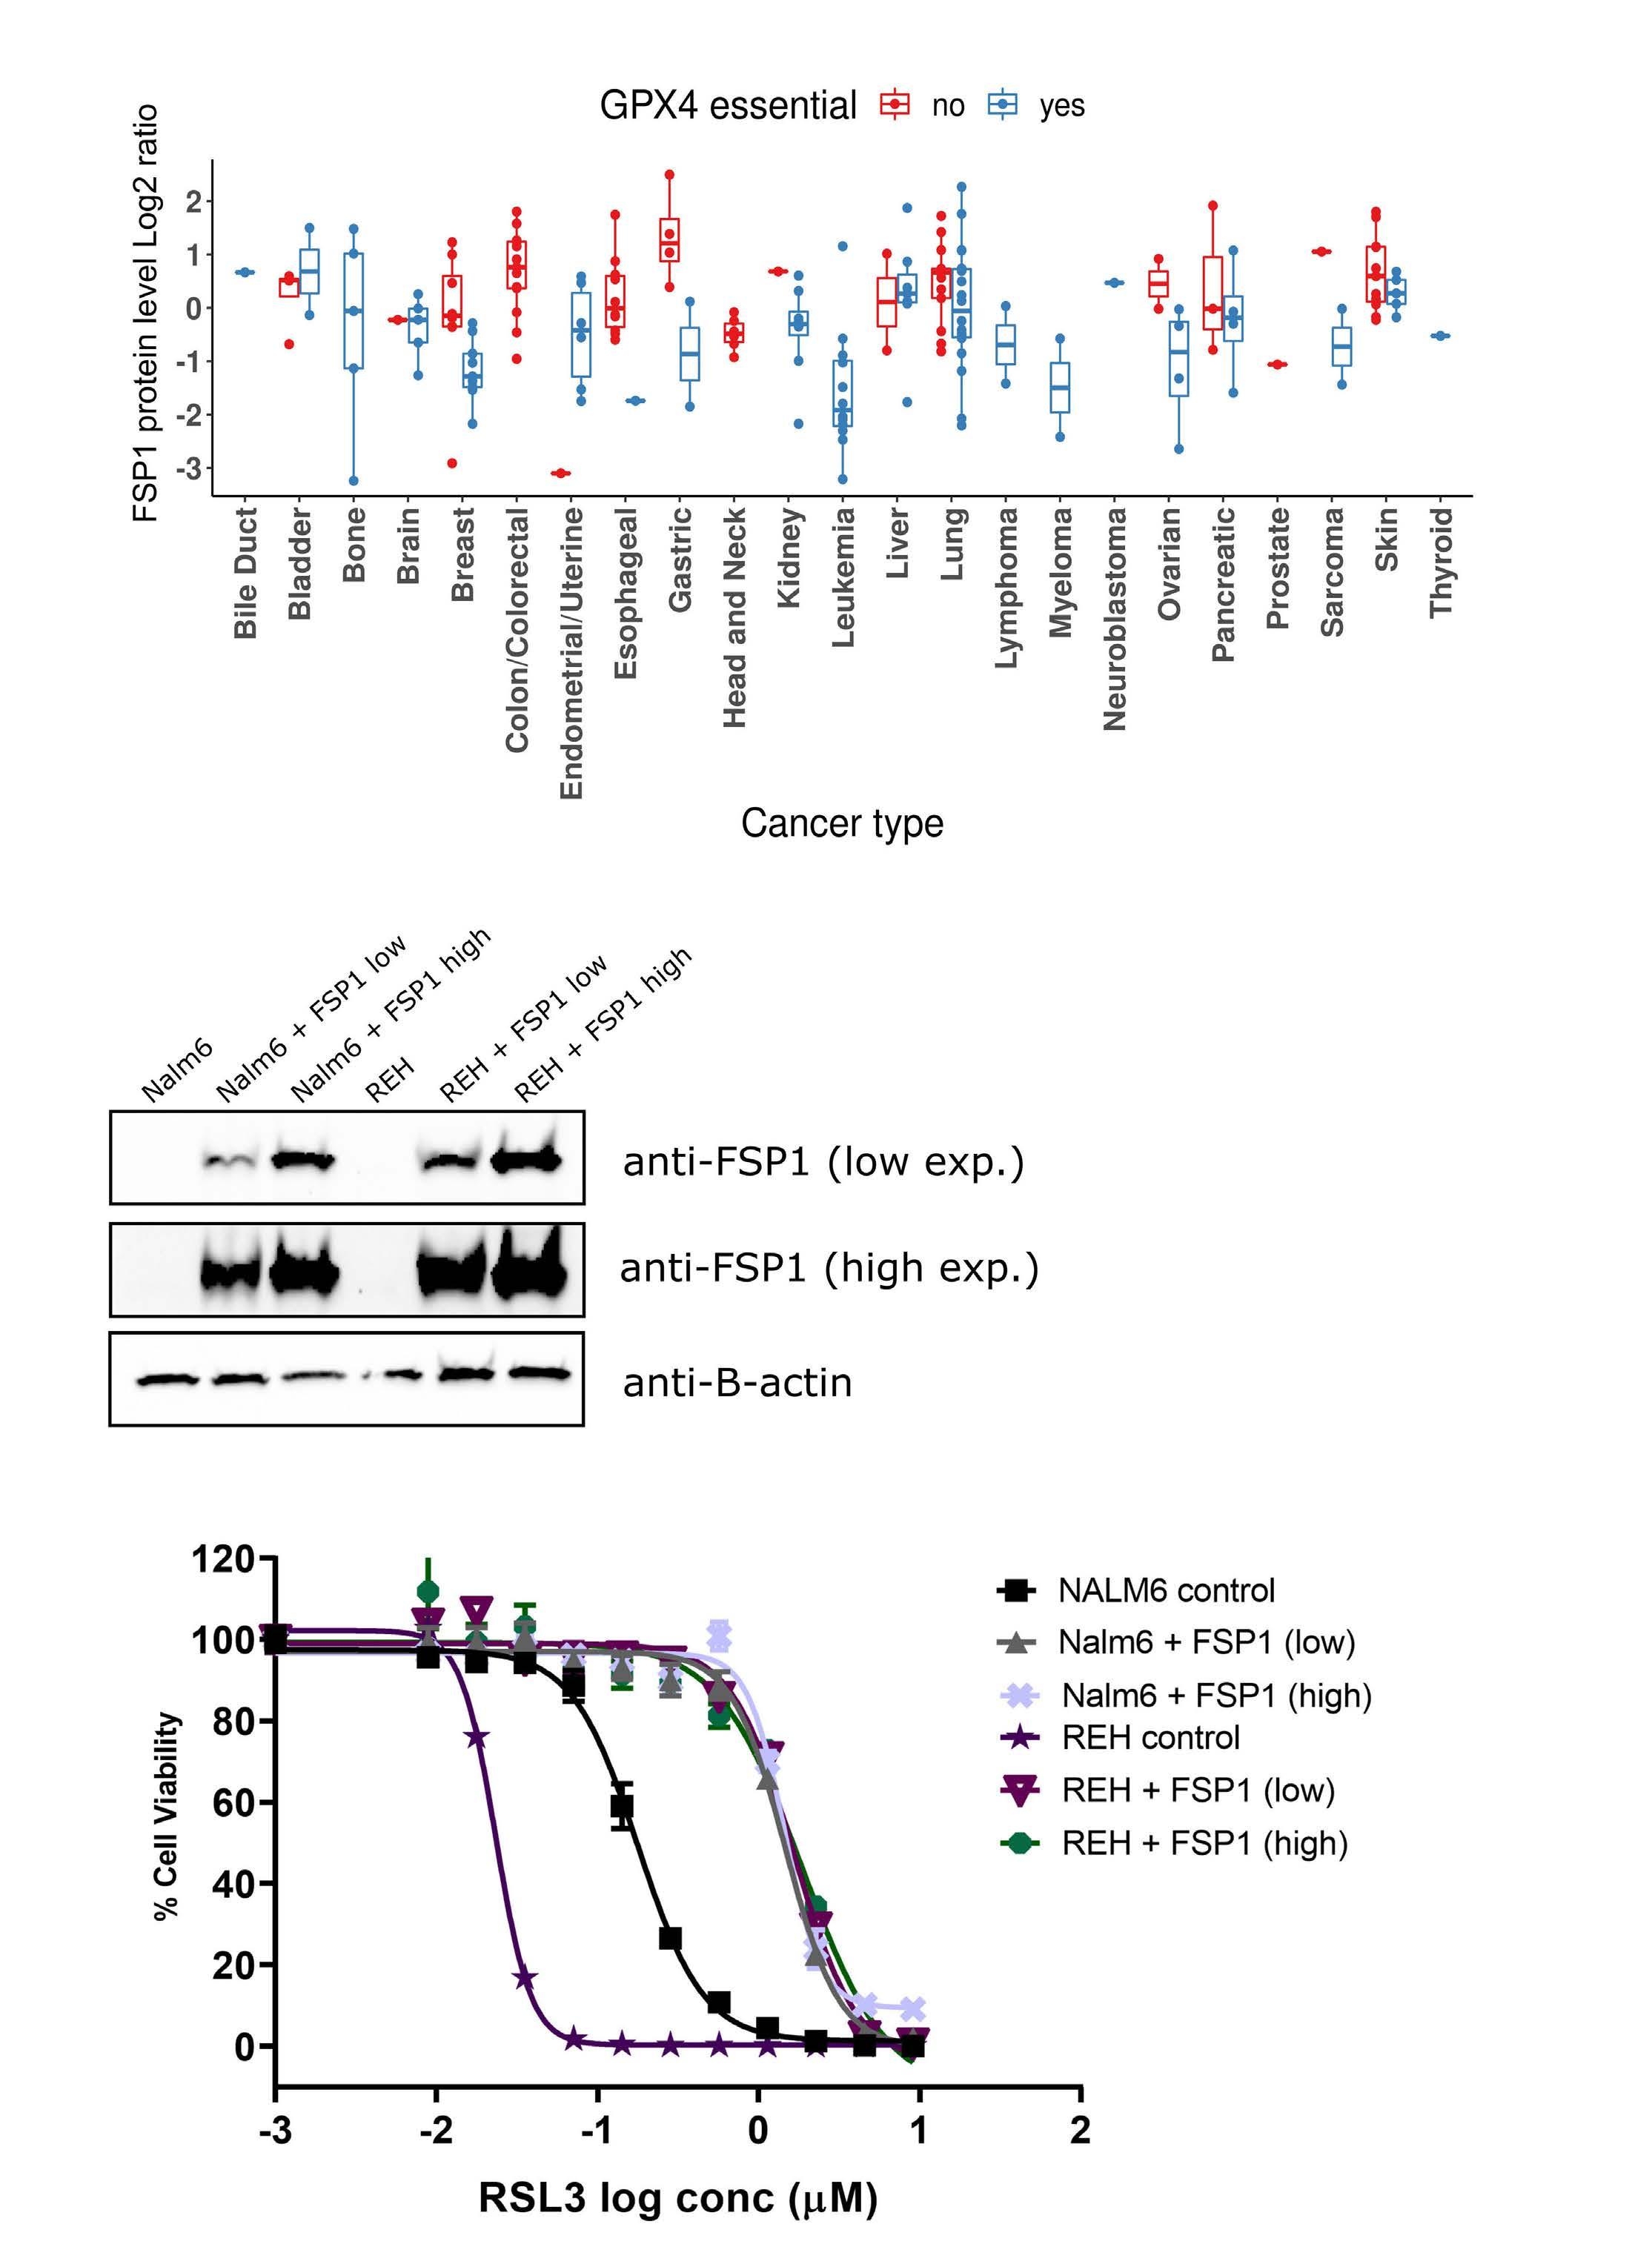
B Haematologica | 108 February 2023 389 ARTICLE -
M-E.
al. A C
B-ALL cells are sensitive to ferroptosis induction
Lalonde et
novel vulnerabilities not previously linked to B-ALL, several of which directly regulate ferroptosis induction. Ferroptosis is a recently described iron-dependent cell death pathway that is characterized by the excessive peroxidation of phospholipid at the cell membranes. This non-apoptotic cell death pathway has garnered increasing interest as a potential novel cancer therapy since “persister” cells rendered drug-tolerant through serial exposure to chemotherapeutic agents and cells that underwent an epithelial-mesenchymal transition, two states associated with resistance to cancer therapy, demonstrate exquisite sensitivity to ferroptosis induction.27,34 The main gatekeeper for ferroptosis induction is GPX4, a glutathione peroxidase, which uses GSH as an obligate cofactor and possess the unique ability to detoxify hydroxyperoxides in complex lipids. Our findings add B-ALL lines to the cell lines or cell state that have been reported to be sensitive to GPX4 inhibition by either ferroptosis inducing drug12,26,27 or direct gene KO.35 To our knowledge, this is the first evidence of such a sensitivity in these cells. Many genes modulating ferroptosis induction are still not labeled as such by KEGG or MSigDB enrichment tools,36–38 especially for genes involved in the multiple metabolic pathways that are indirectly regulating GPX4 activity (Fi-
gure 6). This explains why ferroptosis pathway, even if significantly enriched, was not ranked higher in our Wikipathway analysis (Online Supplementary Table S5) even though many B-ALL essential genes were involved in pathways related to GPX4 activity, such as selenocompound, lipid, mevalonate, GSH and iron metabolism (Figure 6). We validated several of these genetic dependencies using orthogonal assays and demonstrated that inhibition of these pathways induce ferroptosis in B-ALL cells. As seen in the +/- ferrostatin-1 screens, apart from GPX4, B-ALL cells were also particularly sensitive to the depletion of genes implicated in selenocysteine synthesis (Figure 3H). Selenocysteine incorporation into GPX4 is required for its ferroptosis inhibitor activity32 and co-essentiality of selenocysteine synthesis genes with GPX4 was previously demonstrated in glioblastoma cells.39 These results also suggest that the primary role of selenocysteine metabolism in ALL cells is to synthesize GPX4 as none of the 24 other selenocysteine-containing proteins were essential in our screen. This is reminiscent of genetic deletion of selenocysteine-containing proteins in mice where KO of GPX4 is the only one that is embryonic lethal, a phenotype shared with selenocysteine tRNA KO mice.40,41 Several elements seem to synergize to explain the high
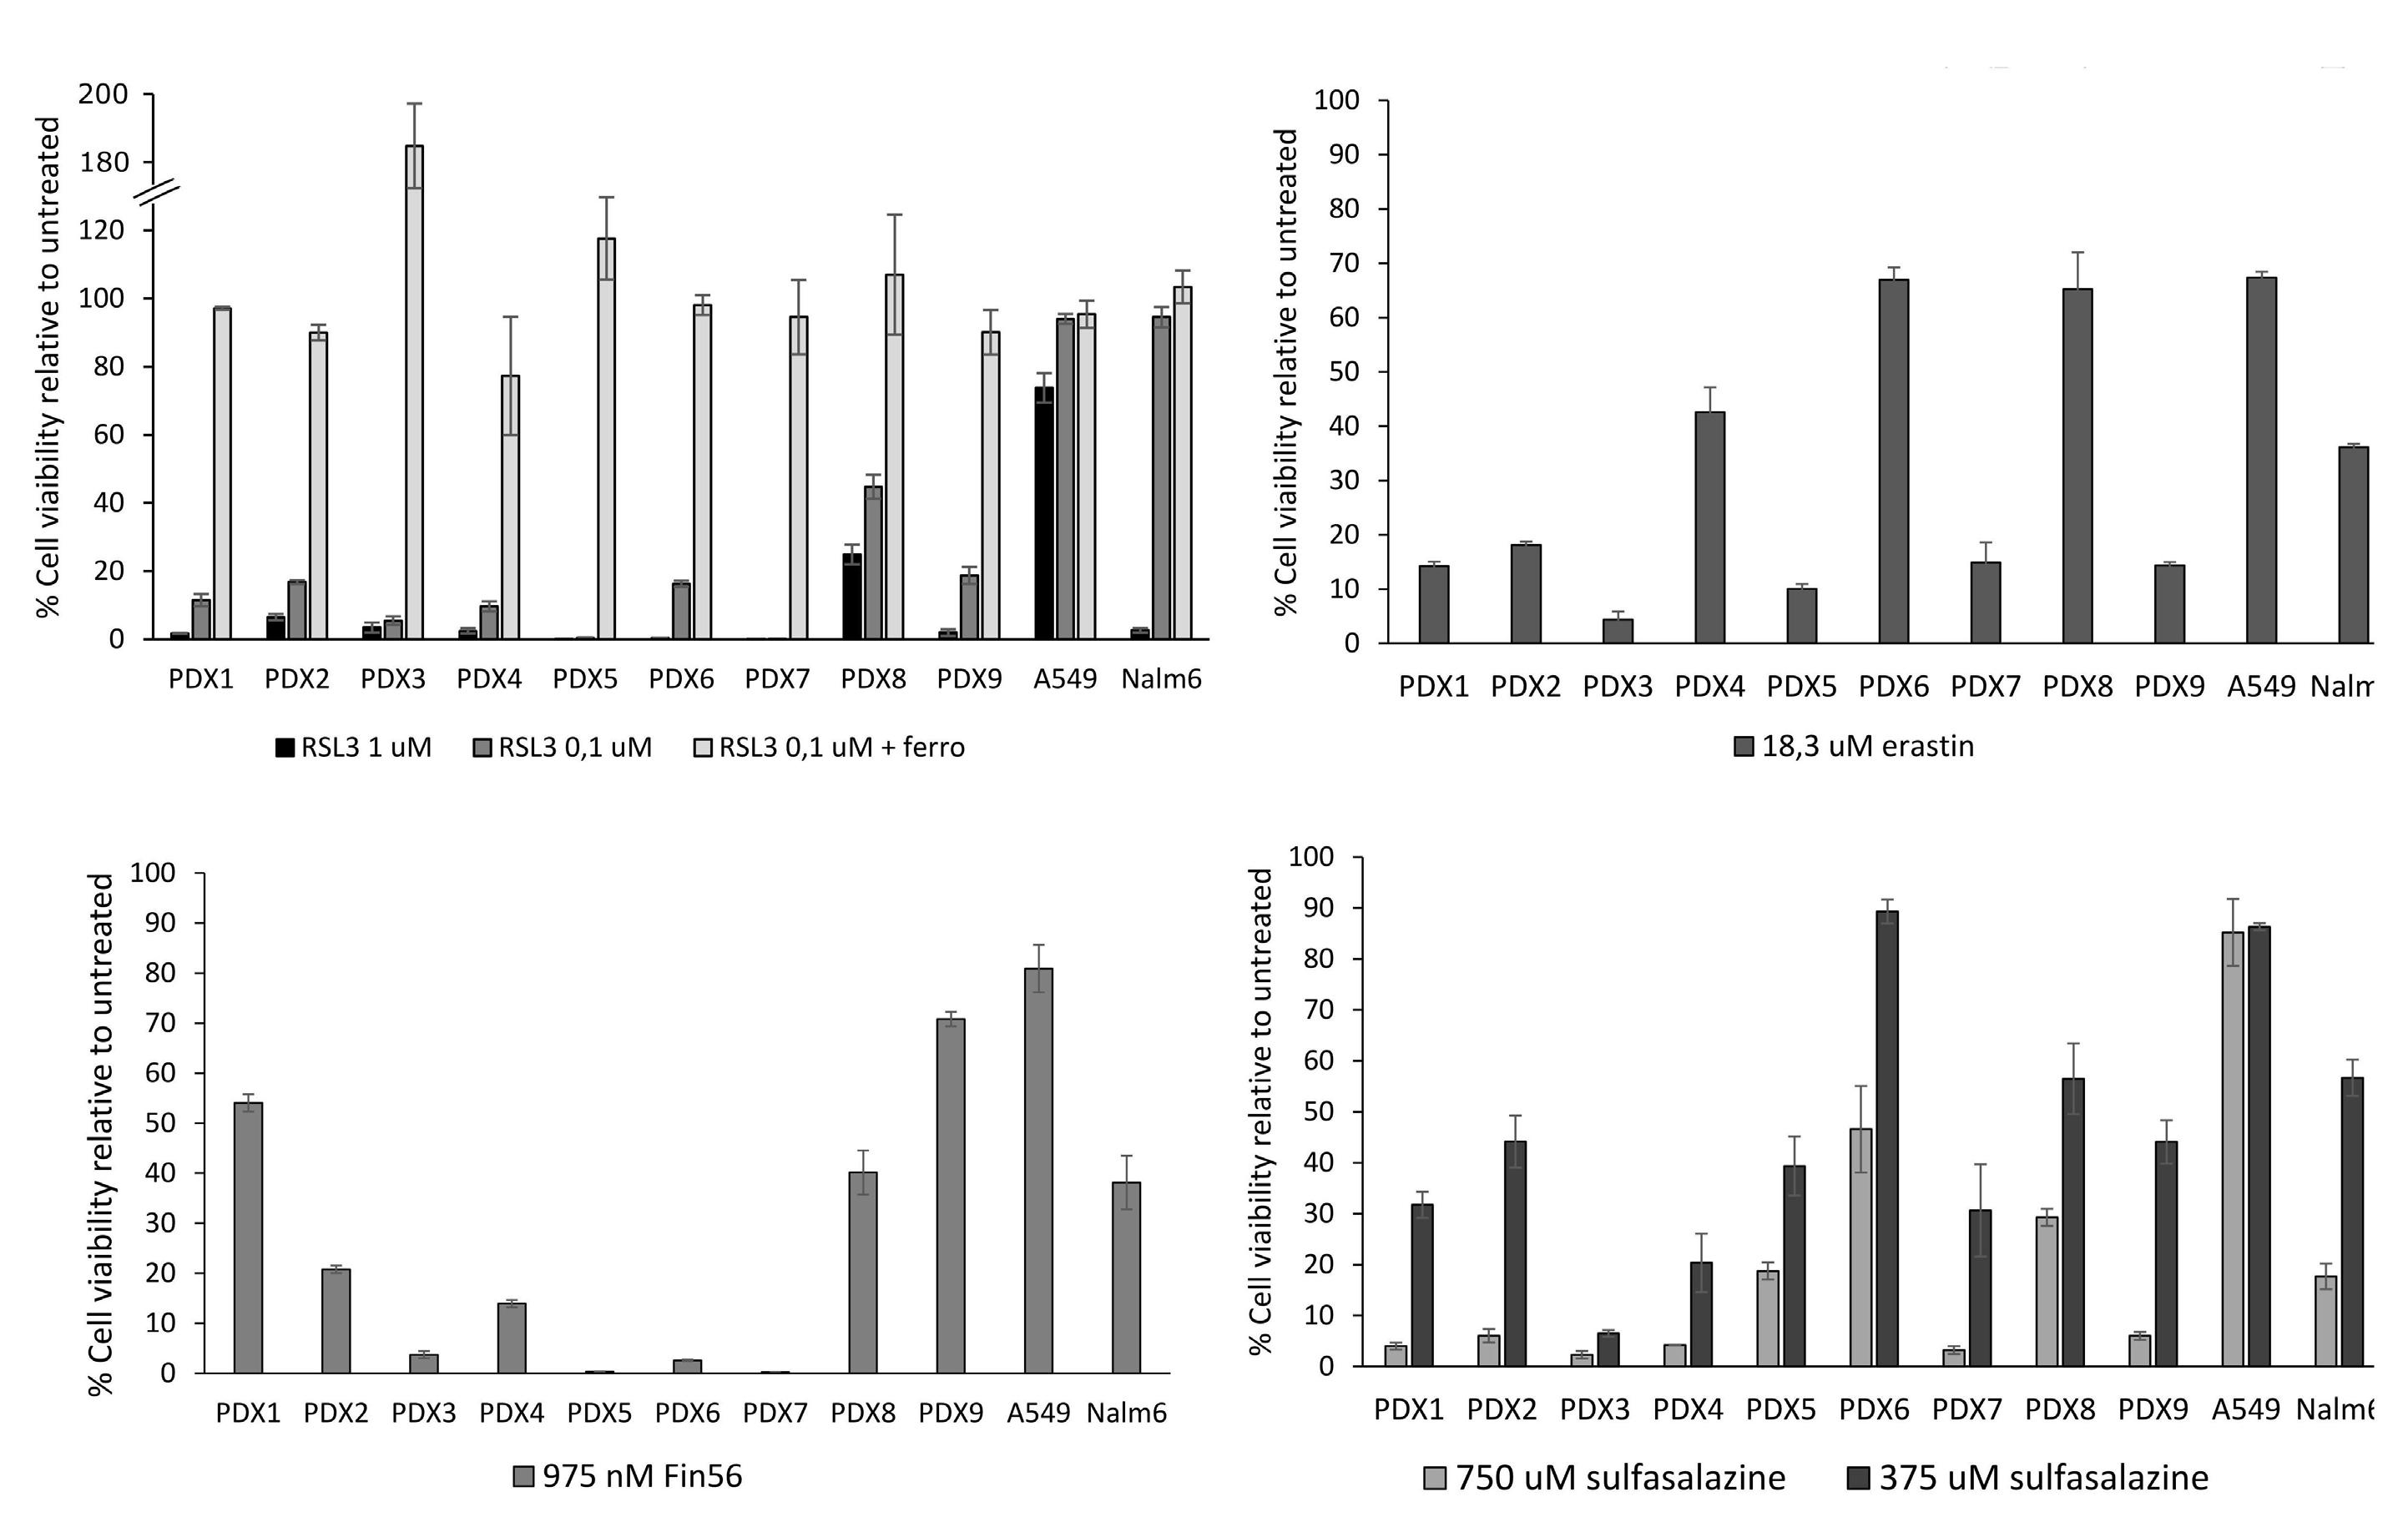
A C Haematologica | 108 February 2023 390 ARTICLE -
M-E. Lalonde et al. D
Figure 5. B-acute lymphoblastic leukemia patient-derived xenografts are sensitive to ferroptosis inducing drugs in vitro. B-acute lymphoblastic leukemia (B-ALL) patient-derived xenografts were treated with (A) RSL3 +/- ferrostatin (ferro), (B) erastin, (C) Fin56, and (D) sulfasalazine. Cell viability was assessed 36 hours post treatment and compared to untreated xenografts.
B
B-ALL cells are sensitive to ferroptosis induction
Figure 6. Integration of GPX4-related pathways. Several genes/pathways found essential in acute lymphoblastic leukemia (ALL) cells potentially regulate GPX4 activity which may explain their acute vulnerability to ferroptosis induction. Genes in bold characters are found within the 319 ALL-enriched essential genes.
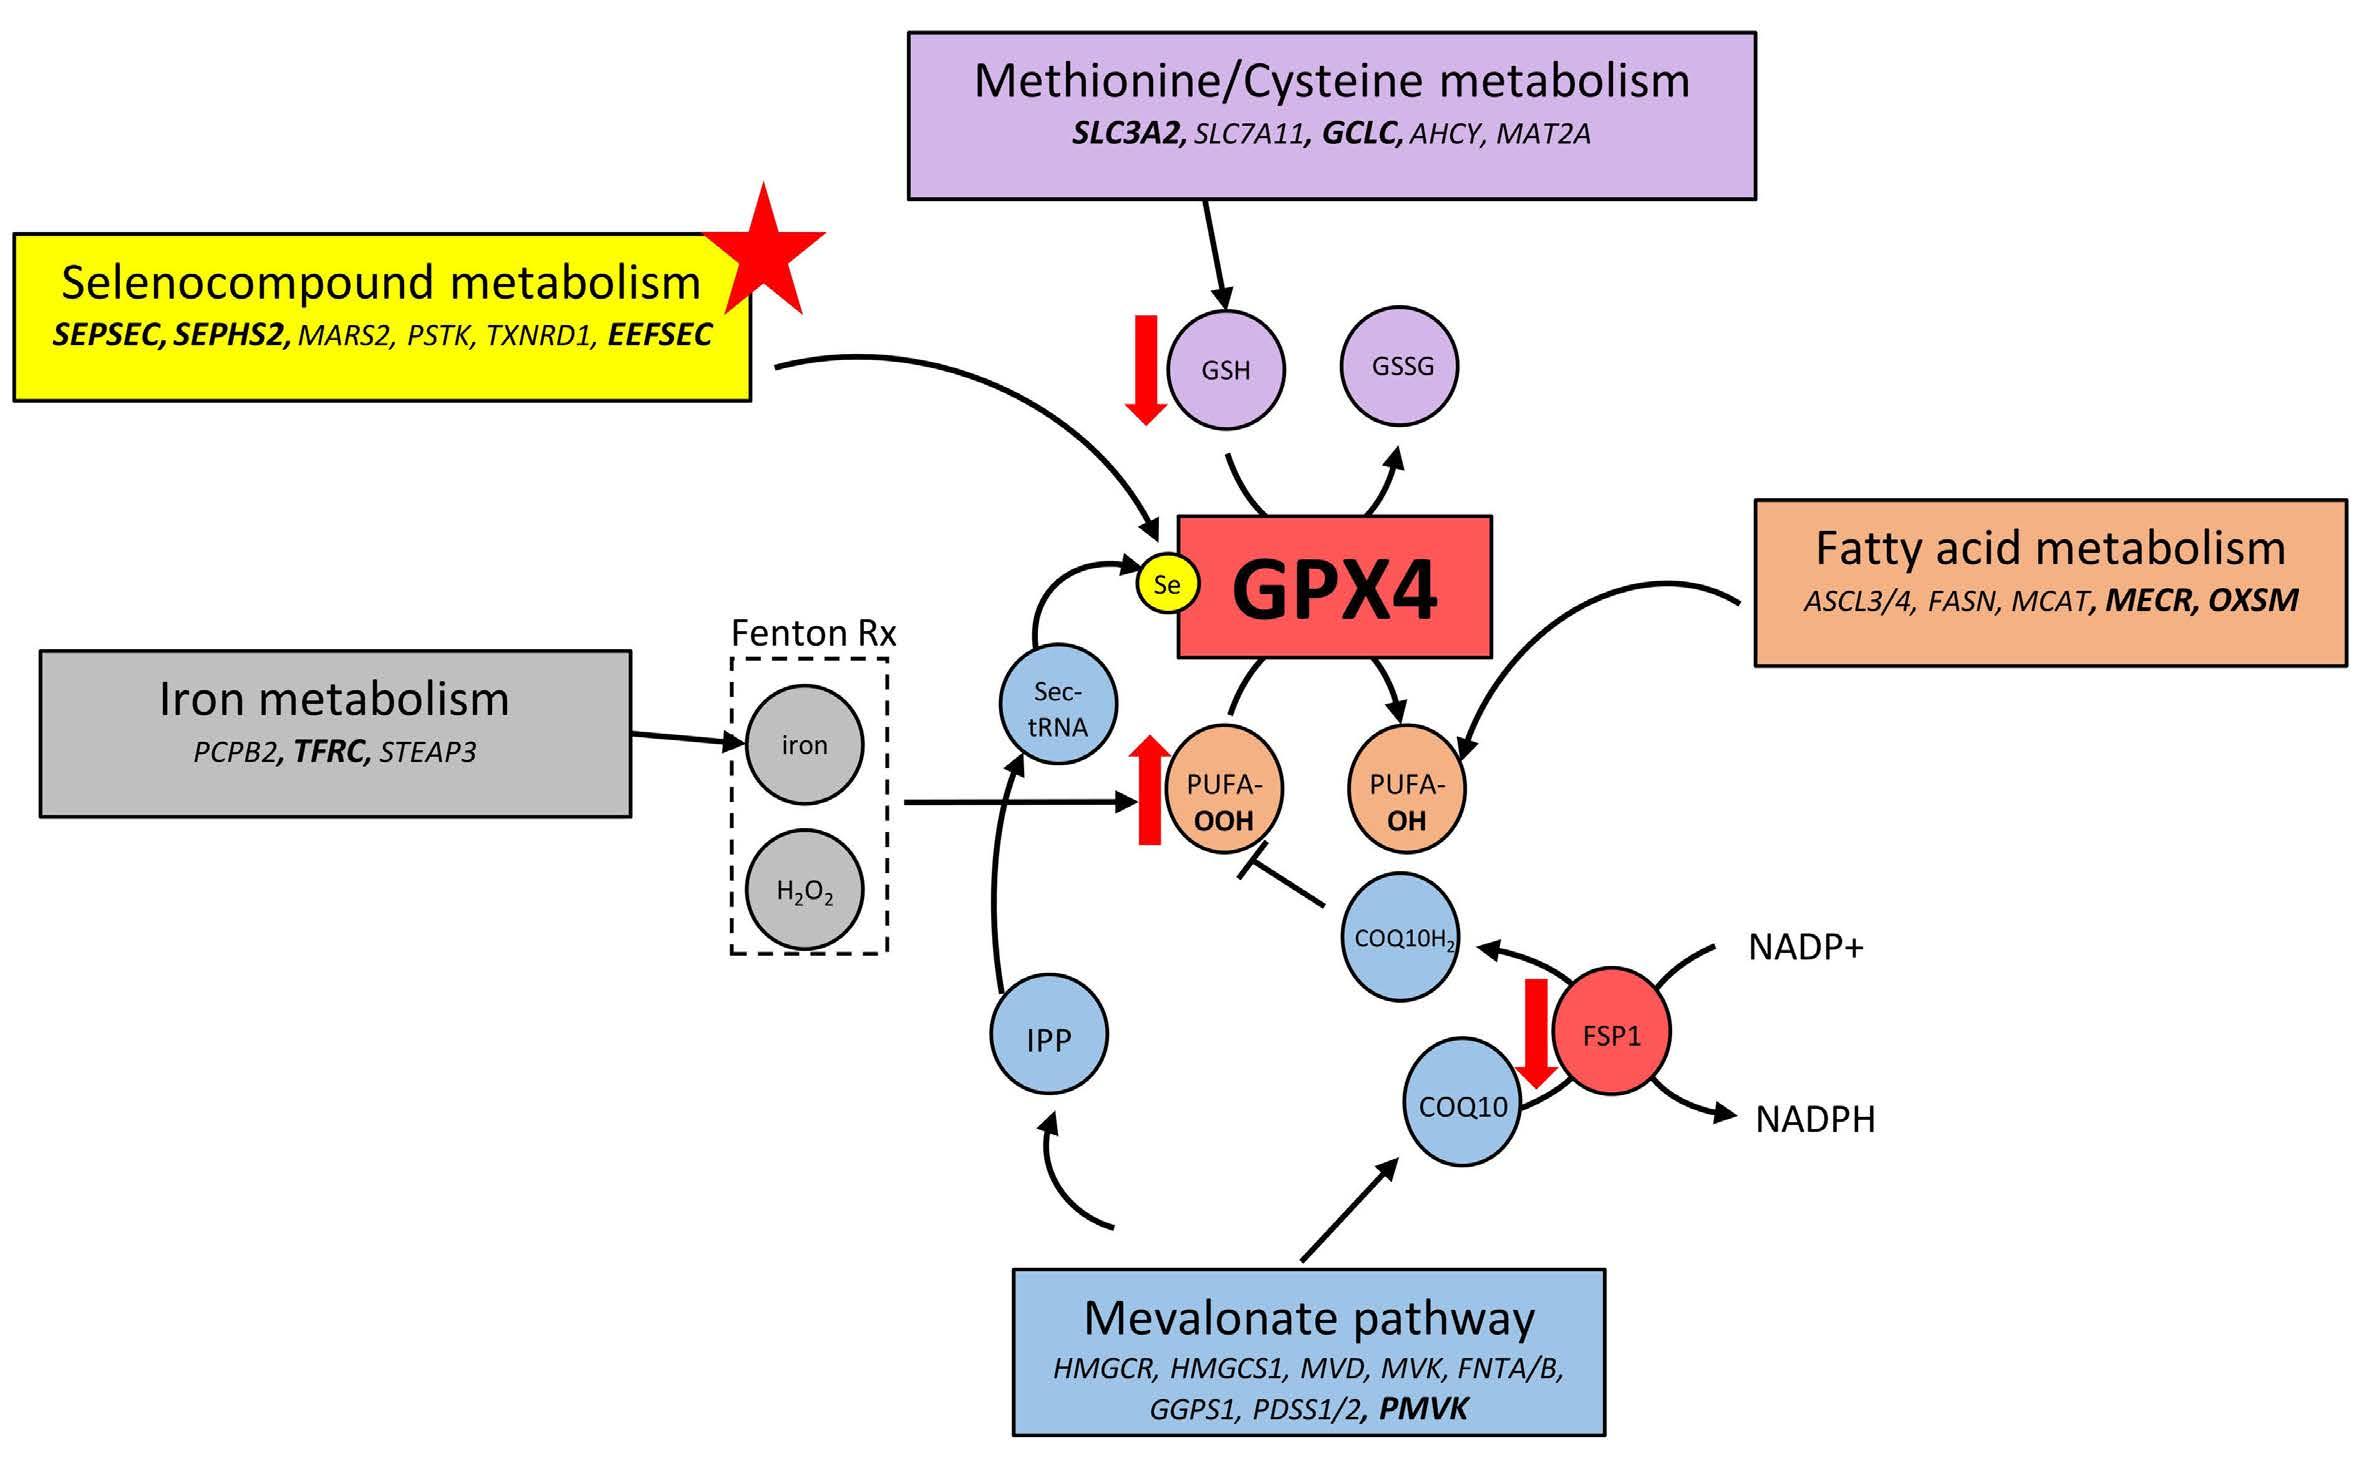
sensitivity of B-ALL cells to ferroptosis induction. High lipid ROS levels in steady-state conditions suggest that B-ALL are under constant oxidative stress. Combined with the low GSH and FSP1 antioxidant levels, it implies that these cells do not possess the buffering capacity that would normally protect them against oxidative stress. And while restoring FSP1 expression levels in B-ALL cell increases resistance to ferroptosis induction (Figure 4C), this only partially rescues sensitivity compared to other resistant cell lines, suggesting that additional elements contribute to the extreme sensitivity of B-ALL cells to ferroptosis induction. One explanation might lie in the high levels of PUFA that were measured in B-ALL42 since a direct correlation between PUFA levels in cell lines and GPX4 KO sensitivity has been established by metabolite dependency association studies.43 In addition, transcriptional repression of the pentose phosphate pathway (PPP) by B-cell-specific transcriptional factor PAX5 and IKZF1 in B-ALL limits its activity and ability to cope with oxidative stress.44 This particular vulnerability results in low levels of NADPH, which prevents GSSG reduction into GSH. The limited PPP activity appears to be controlled both by the serine-threonine protein phosphatase 2A (PP2A) and the Cyclin D3-CDK6 kinase; inhibition of the latter reduces the flow of carbon through the PPP in favor of glycolysis.45 Cyclin D3-CDK6 kinase regulates the switch from glycolysis to the PPP by directly phosphorylating and inhibiting key enzymes, which catalyze key rate-limiting steps in the glycolysis cascade such as 6-phosphofructokinase (PFK1), py-
ruvate kinase M2 (PKM2), but also GPI, PGK1, ENO1, and PKM. Notably, the last four enzymes along with Cyclin D3 (CCND3) and CDK6 are all considered “B-ALL-enriched essential genes” according to our screens. Overall, these results, along with the one presented in this paper, suggest that the low PPP activity found in B-ALL, which leads to low levels of NADPH and GSH, restricts their ability to cope with oxidative stress. This strenuous balance can be easily tipped toward ferroptosis induction when GPX4 is inhibited. Because B-ALL are primed to undergo ferroptosis and multiple metabolic pathways modulate GPX4 activity, several therapeutic opportunities are potentially available to target this vulnerability. As shown by our results and others, ALL cells are also sensitive to drugs such as sulfasalazine (Figure 5D), BSO (Figure 3A), and statins (Figure 3E and 46), which have all been previously used in clinical setting. However, these drugs do not directly target ferroptosis inhibitors such as GPX4 or FSP1, but mainly induce ferroptosis by targeting pathways that incidentally influence sensitivity to ferroptosis induction (lipid metabolism, GSH metabolism, etc). No highly potent bioavailable drug directly targeting ferroptosis inhibitors currently exist, which severely limits the therapeutic validation of this pathway in vivo. IKE, an erastin derivative, has been specifically modified to increase bioavailability in vivo 47 Despite this, pharmacokinetic and biodistribution of the drug showed a very short halflife in vivo (less than 2 hours) and a low achievable concentrations in the blood.47 Moreover, caution should be taken
Haematologica | 108 February 2023 391 ARTICLE - B-ALL cells are sensitive to ferroptosis induction M-E. Lalonde et al.
in developing novel ferroptosis inhibitors for cancer treatment, as ferroptosis has been implicated in neuropathologies development and neurotoxicity,48–51 as well as cardiomyopathies.52 Since many chemotherapies have been shown to induce oxidative stress in cancer cells, combining these treatments with a ferroptosis inducing agent could help prevent the development of treatment-resistant tumor cells. Finally, according to gene/protein expression analyses, other leukemias, such as T-ALL and acute myeloid leukemia (AML), also share a similar expression profile for gene controlling sensitivity to ferroptosis induction and would also likely benefit from therapeutic strategies develop for ALL. In fact, RSL3 sensitivity was previously reported for two T-ALL cell lines,53 and recently, AML cell lines and PDX were shown to be sensitive to ferroptosis induction using APR-246, a p53 activating drug.54 Overall, our work identified a comprehensive set of genetic dependencies and molecular mechanisms sustaining tumorigenesis in B-ALL cell lines, some of which could potentially be further exploited therapeutically.
Disclosures
No conflicts of interest to disclose.
References
1. Sabattini E, Bacci F, Sagramoso C, Pileri SA. WHO classification of tumours of haematopoietic and lymphoid tissues in 2008: an overview. Pathologica. 2010;102(3):83-87.
2. Ellison LF, De P, Mery LS, Grundy PE, for the Canadian Cancer Society’s Steering Committee for Canadian Cancer Statistics. Canadian cancer statistics at a glance: cancer in children. Can Med Assoc J. 2009;180(4):422-424.
3. Vrooman LM, Silverman LB. Treatment of childhood acute lymphoblastic leukemia: prognostic factors and clinical advances. Curr Hematol Malig Rep. 2016;11(5):385-394.
4. Bruzzi P, Bigi E, Predieri B, et al. Long-term effects on growth, development, and metabolism of ALL treatment in childhood. Expert Rev Endocrinol Metab. 2019;14(1):49-61.
5. Meyers RM, Bryan JG, McFarland JM, et al. Computational correction of copy number effect improves specificity of CRISPR–Cas9 essentiality screens in cancer cells. Nat Genet. 2017;49(12):1779-1784.
6. Behan FM, Iorio F, Picco G, et al. Prioritization of cancer therapeutic targets using CRISPR–Cas9 screens. Nature. 2019;568(7753):511-516.
7. Dempster JM, Pacini C, Pantel S, et al. Agreement between two large pan-cancer CRISPR-Cas9 gene dependency data sets. Nat Commun. 2019;10(1):5817.
8. Hart T, Chandrashekhar M, Aregger M, et al. High-resolution CRISPR screens reveal fitness genes and genotype-specific cancer liabilities. Cell. 2015;163(6):1515-1526.
9. Hassannia B, Vandenabeele P, Vanden Berghe T. Targeting ferroptosis to iron out cancer. Cancer Cell. 2019;35(6):830-849.
10. Jiang X, Stockwell BR, Conrad M. Ferroptosis: mechanisms, biology and role in disease. Nat Rev Mol Cell Biol. 2021;22(4):266-282.
11. Wang L, Chen X, Yan C. Ferroptosis: an emerging therapeutic
Contributions
MEL and RM designed the study and prepared the manuscript. MEL and AMG performed the experiments. MEL, MS, AMG, JSM, SD and RM analyzed the data. KB and EH provided patient samples. SD managed resource requirements; and all authors edited and approved the manuscript.
Acknowledgments
We thank Sonia Leclerc for performing next-generation sequencing experiments. We also thank Nadine Fradet, Christine Gadoury and Mylène Gosselin for their contribution to early development of the experimental designs. All authors are members of the NRC-CHUSJ Collaborative Unit for Translational Research (CUTR). This is NRC publication # 53536.
Funding
We would like to acknowledge CUTR for funding part of this work.
Data-sharing statement
Raw screen data are available upon request.
opportunity for cancer. Genes Dis. 2020;9(12):334-346.
12. Doll S, Freitas FP, Shah R, et al. FSP1 is a glutathioneindependent ferroptosis suppressor. Nature. 2019;575(7784):693-698.
13. Bersuker K, Hendricks JM, Li Z, et al. The CoQ oxidoreductase FSP1 acts parallel to GPX4 to inhibit ferroptosis. Nature. 2019;575(7784):688-692.
14. Tzelepis K, Koike-Yusa H, De Braekeleer E, et al. A CRISPR dropout screen identifies genetic vulnerabilities and therapeutic targets in acute myeloid leukemia. Cell Rep. 2016;17(4):1193-1205.
15. Hart T, Moffat J. BAGEL: a computational framework for identifying essential genes from pooled library screens. BMC Bioinformatics 2016;17(1):164.
16. Metzeler KH, Bloomfield CD. Clinical relevance of RUNX1 and CBFB alterations in acute myeloid leukemia and other hematological disorders. Adv Exp Med Biol. 2017;962:175-199.
17. Gu Z, Churchman ML, Roberts KG, et al. PAX5-driven subtypes of B-progenitor acute lymphoblastic leukemia. Nat Genet. 2019;51(2):296-307.
18. Hein D, Borkhardt A, Fischer U. Insights into the prenatal origin of childhood acute lymphoblastic leukemia. Cancer Metastasis Rev. 2020;39(1):161-171.
19. Chu PG, Arber DA. CD79: a review. Appl Immunohistochem Mol Morphol. 2001;9(2):97-106.
20. Kruth KA, Fang M, Shelton DN, et al. Suppression of B-cell development genes is key to glucocorticoid efficacy in treatment of acute lymphoblastic leukemia. Blood. 2017;129(22):3000-3008.
21. Serafin V, Porcù E, Cortese G, et al. SYK Targeting represents a potential therapeutic option for relapsed resistant pediatric ETV6-RUNX1 B-acute lymphoblastic leukemia patients. Int J Mol Sci. 2019;20(24):6175.
Haematologica | 108 February 2023 392 ARTICLE - B-ALL cells are sensitive to ferroptosis induction M-E. Lalonde et al.
22. Bortolozzi R, Mattiuzzo E, Trentin L, Accordi B, Basso G, Viola G. Ribociclib, a Cdk4/Cdk6 kinase inhibitor, enhances glucocorticoid sensitivity in B-acute lymphoblastic leukemia (B-All). Biochem Pharmacol. 2018;153:230-241.
23. Ott CJ, Kopp N, Bird L, et al. BET bromodomain inhibition targets both c-Myc and IL7R in high-risk acute lymphoblastic leukemia. Blood. 2012;120(14):2843-2852.
24. Scheffold A, Jebaraj BMC, Stilgenbauer S. Venetoclax: targeting BCL2 in hematological cancers. Recent Results Cancer Res. 2018;212:215-242.
25. Dixon SJ, Lemberg KM, Lamprecht MR, et al. Ferroptosis: an iron-dependent form of nonapoptotic cell death. Cell. 2012;149(5):1060-1072.
26. Yang WS, SriRamaratnam R, Welsch ME, et al. Regulation of ferroptotic cancer cell death by GPX4. Cell. 2014;156(1-2):317-331.
27. Hangauer MJ, Viswanathan VS, Ryan MJ, et al. Drug-tolerant persister cancer cells are vulnerable to GPX4 inhibition. Nature. 2017;551(7679):247-250.
28. Zhang Y, Swanda RV, Nie L, et al. mTORC1 couples cyst(e)ine availability with GPX4 protein synthesis and ferroptosis regulation. Nat Commun. 2021;12(1):1589.
29. Wang F, Lv H, Zhao B, et al. Iron and leukemia: new insights for future treatments. J Exp Clin Cancer Res. 2019;38(1):406.
30. Griffith OW. Mechanism of action, metabolism, and toxicity of buthionine sulfoximine and its higher homologs, potent inhibitors of glutathione synthesis. J Biol Chem. 1982;257(22):13704-13712.
31. Moosmann B, Behl C. Selenoproteins, cholesterol-lowering drugs, and the consequences revisiting of the mevalonate pathway. Trends Cardiovasc Med. 2004;14(7):273-281.
32. Ingold I, Berndt C, Schmitt S, et al. Selenium utilization by GPX4 is required to prevent hydroperoxide-induced ferroptosis. Cell. 2018;172(3):409-422.
33. Shimada K, Skouta R, Kaplan A, et al. Global survey of cell death mechanisms reveals metabolic regulation of ferroptosis. Nat Chem Biol. 2016;12(7):497-503.
34. Viswanathan VS, Ryan MJ, Dhruv HD, et al. Dependency of a therapy-resistant state of cancer cells on a lipid peroxidase pathway. Nature. 2017;547(7664):453-457.
35. Tsherniak A, Vazquez F, Montgomery PG, et al. Defining a cancer dependency map. Cell. 2017;170(3):564-576.
36. Subramanian A, Tamayo P, Mootha VK, et al. Gene set enrichment analysis: a knowledge-based approach for interpreting genome-wide expression profiles. Proc Natl Acad Sci U S A. 2005;102(43):15545-15550.
37. Liberzon A, Birger C, Thorvaldsdóttir H, Ghandi M, Mesirov JP, Tamayo P. The Molecular Signatures Database (MSigDB) hallmark gene set collection. Cell Syst. 2015;1(6):417-425.
38. Kanehisa M, Goto S. KEGG: kyoto encyclopedia of genes and genomes. Nucleic Acids Res. 2000;28(1):27-30.
39. Kim E, Dede M, Lenoir WF, et al. A network of human functional gene interactions from knockout fitness screens in cancer cells. Life Sci Alliance. 2019;2(2):e201800278.
40. Ufer C, Wang CC. The roles of glutathione peroxidases during embryo development. Front Mol Neurosci. 2011;4:12.
41. Yant LJ, Ran Q, Rao L, et al. The selenoprotein GPX4 is essential
for mouse development and protects from radiation and oxidative damage insults. Free Radic Biol Med. 2003;34(4):496-502.
42. Agatha G, Häfer R, Zintl F. Fatty acid composition of lymphocyte membrane phospholipids in children with acute leukemia. Cancer Lett. 2001;173(2):139-144.
43. Li H, Ning S, Ghandi M, et al. The landscape of cancer cell line metabolism. Nat Med. 2019;25(5):850-860.
44. Xiao G, Chan LN, Klemm L, et al. B-cell-specific diversion of glucose carbon utilization reveals a unique vulnerability in B cell malignancies. Cell. 2018;173(2):470-484.
45. Wang H, Nicolay BN, Chick JM, et al. The metabolic function of cyclin D3-CDK6 kinase in cancer cell survival. Nature. 2017;546(7658):426-430.
46. Sheen C, Vincent T, Barrett D, et al. Statins are active in acute lymphoblastic leukaemia (ALL): a therapy that may treat ALL and prevent avascular necrosis. Br J Haematol. 2011;155(3):403-407.
47. Zhang Y, Tan H, Daniels JD, et al. Imidazole ketone erastin induces ferroptosis and slows tumor growth in a mouse lymphoma model. Cell Chem Biol. 2019;26(5):623-633.
48. Zuo Y, Xie J, Li X, et al. Ferritinophagy-mediated ferroptosis involved in Paraquat-induced neurotoxicity of dopaminergic neurons: implication for neurotoxicity in PD. Oxid Med Cell Longev. 2021;2021:9961628.
49. Do Van B, Gouel F, Jonneaux A, et al. Ferroptosis, a newly characterized form of cell death in Parkinson’s disease that is regulated by PKC. Neurobiol Dis. 2016;94:169-178.
50. Guiney SJ, Adlard PA, Bush AI, Finkelstein DI, Ayton S. Ferroptosis and cell death mechanisms in Parkinson’s disease. Neurochem Int. 2017;104:34-48.
51. Hambright WS, Fonseca RS, Chen L, Na R, Ran Q. Ablation of ferroptosis regulator glutathione peroxidase 4 in forebrain neurons promotes cognitive impairment and neurodegeneration. Redox Biol. 2017;12:8-17.
52. Wu X, Li Y, Zhang S, Zhou X. Ferroptosis as a novel therapeutic target for cardiovascular disease. Theranostics. 2021;11(7):3052-3059.
53. Probst L, Dächert J, Schenk B, Fulda S. Lipoxygenase inhibitors protect acute lymphoblastic leukemia cells from ferroptotic cell death. Biochem Pharmacol. 2017;140:41-52.
54. Birsen R, Larrue C, Decroocq J, et al. APR-246 induces early cell death by ferroptosis in acute myeloid leukemia. Haematologica. 2022;107(2):403-416.
55. Szklarczyk D, Gable AL, Lyon D, et al. STRING v11: protein-protein association networks with increased coverage, supporting functional discovery in genome-wide experimental datasets. Nucleic Acids Res. 2019;47(D1):D607-D613.
56. Shannon P, Markiel A, Ozier O, et al. Cytoscape: a software environment for integrated models of biomolecular interaction networks. Genome Res. 2003;13(11):2498-2504.
57. Chin C-H, Chen S-H, Wu H-H, Ho C-W, Ko M-T, Lin C-Y. cytoHubba: identifying hub objects and sub-networks from complex interactome. BMC Syst Biol. 2014;8 (Suppl 4):S11.
58. Wang B, Wang M, Zhang W, et al. Integrative analysis of pooled CRISPR genetic screens using MAGeCKFlute. Nat Protoc. 2019;14(3):756-780.
Haematologica | 108 February 2023 393 ARTICLE - B-ALL cells are sensitive to ferroptosis induction M-E. Lalonde et al.
BCL6 inhibition ameliorates resistance to ruxolitinib in
CRLF2-rearranged acute lymphoblastic leukemia
Shinobu Tsuzuki,1 Takahiko Yasuda,2 Hiroaki Goto,3 Naoko Maeda,4 Koshi Akahane,5 Takeshi Inukai,5 Hideyuki Yamamoto,6 Sivasundaram Karnan,1 Akinobu Ota,1 Toshinori Hyodo,1 Hiroyuki Konishi,1 Yoshitaka Hosokawa,1 Hitoshi Kiyoi7 and Fumihiko Hayakawa8
1Department of Biochemistry, Aichi Medical University, School of Medicine, Nagakute, Aichi; 2Clinical Research Center, National Hospital Organization Nagoya Medical Center, Nagoya, Aichi; 3Division of Hematology/Oncology, Kanagawa Children’s Medical Center, Yokohama, Kanagawa; 4Department of Pediatrics, National Hospital Organization Nagoya Medical Center, Nagoya, Aichi; 5Department of Pediatrics, Graduate School of Medicine, University of Yamanashi, Chuo, Yamanashi; 6Department of Hematology, Fujita Health University School of Medicine, Toyoake, Aichi; 7Department of Hematology and Oncology, Nagoya University Graduate School of Medicine, Nagoya, Aichi and 8Department of Integrated Health Sciences, Division of Cellular and Genetic Sciences, Nagoya University Graduate School of Medicine, Nagoya, Aichi, Japan
Abstract
Correspondence: S. Tsuzuki tsuzukis@aichi-med-u.ac.jp
Received: February 17, 2022.
Accepted: August 12, 2022. Prepublished: August 25, 2022.
https://doi.org/10.3324/haematol.2022.280879
©2023 Ferrata Storti Foundation
Published under a CC BY-NC license
Philadelphia chromosome-like acute lymphoblastic leukemia (Ph-like ALL) is an intractable disease and most cases harbor genetic alterations that activate JAK or ABL signaling. The commonest subtype of Ph-like ALL exhibits a CRLF2 gene rearrangement that brings about JAK1/2-STAT5 pathway activation. However, JAK1/2 inhibition alone is insufficient as a treatment, so combinatorial therapies targeting multiple signals are needed. To better understand the mechanisms underlying the insufficient efficacy of JAK inhibition, we explored gene expression changes upon treatment with a JAK1/2 inhibitor (ruxolitinib) and found that elevated BCL6 expression was one such mechanism. Upregulated BCL6 suppressed the expression of TP53 along with its downstream cell cycle inhibitor p21 (CDKN2A) and pro-apoptotic molecules, such as FAS, TNFRSF10B, BID, BAX, BAK, PUMA, and NOXA, conferring cells some degree of resistance to therapy. BCL6 inhibition (with FX1) alone was able to upregulate TP53 and restore the TP53 expression that ruxolitinib had diminished. In addition, ruxolitinib and FX1 concertedly downregulated MYC. As a result, FX1 treatment alone had growth-inhibitory and apoptosis-sensitizing effects, but the combination of ruxolitinib and FX1 more potently inhibited leukemia cell growth, enhanced apoptosis sensitivity, and prolonged the survival of xenografted mice. These findings provide one mechanism for the insufficiency of JAK inhibition for the treatment of CRLF2-rearranged ALL and indicate BCL6 inhibition as a potentially helpful adjunctive therapy combined with JAK inhibition.
Introduction
Although recent progress in intensified chemotherapy, coupled with risk stratification, has substantially improved the outcomes of patients with acute lymphoblastic leukemia (ALL), the prognosis of patients with some ALL subsets remains poor.1-4 ALL harbor chromosomal abnormalities and genetic alterations that affect the differentiation and proliferation of lymphoid precursor cells. These abnormalities serve as significant prognostic factors.1-4 Philadelphia chromosome (Ph)-like ALL has a gene expression signature similar to that of Philadelphia chromosome-positive ALL, but does not have the BCR-ABL1 fusion gene.5,6 Ph-like ALL accounts for about 10%-15% of childhood and approximately 20% of adult cases of B-cell pre-
cursor ALL, with a peak of 25%-30% in adolescents and young adults. Ph-like ALL is associated with a poor prognosis1-3,7-11 and affected patients are less likely to achieve minimal residual disease-free remission than those with other types of ALL.10
Genomic alterations in Ph-like ALL affect cytokine receptors, tyrosine kinase signaling, and transcription factors, leading to disease heterogeneity. However, the kinases or pathways affected allow the identification of various Phlike ALL subtypes, including those with CRLF2 rearrangement (IGH-CRLF2 and P2RY8-CRLF2), rearrangement of ABL class tyrosine kinase genes, JAK2 rearrangement, EPOR mutations, and activating mutations of genes involved in JAK/STAT and RAS (NRAS, KRAS, and PTPN11) pathways.1,2,7,9,11 The subtype with CRLF2 gene rearrangement (hereafter
Haematologica | 108 February 2023 394 ARTICLE - Acute
Lymphoblastic Leukemia
CRLF2-ALL) accounts for up to about 60% of cases of Phlike ALL, depending on ethnicity. Rearrangement of the CRLF2 gene located on Xp22.3 and Yp11.3 results in CRLF2 receptor overexpression and is frequently accompanied by JAK mutations.1,2,7,9,12,13 Interestingly, about 50% to 60% of children with Down syndrome-associated ALL have CRLF2 rearrangements (usually P2RY8-CRLF2 fusions) and JAK2R683G mutations.12
Although CRLF2 receptor engagement can activate the JAK-STAT pathway, CRLF2-ALL shows variable responses to type I JAK inhibitors, such as ruxolitinib.4,9,14,15 Adjunctive or alternative treatment approaches are therefore required to improve clinical outcomes. One such approach is the development of a type II JAK2 inhibitor.16 Heat shock protein 90 inhibition could be an alternative to target JAK2 by inducing its degradation.17 Other approaches include combinatorial inhibition targeting JAK2 together with BCL2 and BCL-xL18 or phosphatidylinositol 3kinase/mammalian target of rapamycin.19,20 Recent studies have indicated that GSPT1,21 CRKL, MEK1/2,22 HMGN1,23 and B-cell receptor-like signaling24 are all important targets for better treatment. Additional options include combinations of ruxolitinib with chemotherapeutic drugs.25 These measures have improved CRLF2-ALL treatment in experiments, but their efficacy in patients is unknown as yet.
In this study, an alternative approach was taken to provide an additional adjunctive option under the hypothesis that gene expression changes elicited by JAK inhibitors might mitigate the efficacy of treatment with such inhibitors. This study focused on BCL6 as such a gene.
BCL6 is a DNA-binding protein and predominantly functions as a transcriptional repressor.26 BCL6 plays an essential role in germinal center development. In germinal center B cells, BCL6 represses the transcription of genes involved in DNA damage response elicited by physiological DNA breaks required for immunoglobulin class switch recombination and somatic hypermutation.27,28 The constitutive expression of BCL6 is caused by chromosomal translocations, somatic mutations in DNA sequences involved in silencing BCL6, activating mutations of transcription factors driving BCL6 expression, and deletion/mutation of the gene encoding FBXO11 (a component of a ubiquitin ligase that degrades BCL6 protein) in diffuse large B-cell lymphoma, contributing to development of the lymphoma.28,29 BCL6 is also implicated in oncogenesis and maintenance of other cancers.27
Methods
Reagents
The reagents used in this study are listed in Online Supplementary Table S1
Cell lines
The cell lines used in this study are listed in Online Supplementary Tables S1 and S2. YCUB530 and KOPN4922,31 were provided by Hiroaki Goto (Kanagawa Children’s Medical Center) and Takeshi Inukai (University of Yamanashi), respectively. Cells were authenticated using the GenePrint 10 System (Promega) with Expasy Cellosaurus short tandem repeat references, except for YCUB5 and KOPN49, which lacked such references. Clinical samples of CRLF2-ALL were obtained, with written informed consent to participation in the study, from patients at Nagoya University Hospital (case 1) and National Hospital Organization Nagoya Medical Center (case 2). These patients’ clinical information is described briefly in the Online Supplementary Methods. The study protocol was approved by the ethics committees at Nagoya University, National Hospital Organization Nagoya Medical Center, and Aichi Medical University. Gene mutations in CRLF2-ALL cells used in this study are summarized in Online Supplementary Table S2
Ex vivo drug sensitivity assays
Cells were cultured in triplicate in the presence of the indicated concentrations of drugs or a vehicle. Viable cells were enumerated using a CellDrop BF automated cell counter (DeNovix, Wilmington, DE, USA) or by inspection under a microscope with the trypan blue dye exclusion method. The fraction of surviving cells relative to the control was calculated for each condition. ZIP synergy scores were calculated using the R package synergyfinder (version 2.2.4).
In vivo drug sensitivity assays
Cells (5x10⁶) were transplanted intravenously into NSG mice (obtained from The Jackson Laboratory, Bar Harbor, ME, USA) that had been pre-conditioned using two intraperitoneal injections of busulfan (20 mg/kg) at a 24-hour interval. Mice were given enrofloxacin (170 mg/L) in drinking water ad libitum and randomly assigned to the treatment group with ruxolitinib (100 mg/kg/day) by gastric gavage twice daily or FX132 (30 mg/kg/day) by intraperitoneal injection once daily, or their combination, 5 days on, 2 days off for 4 weeks. Animals administered only vehicle served as controls. A Kaplan-Meier analysis of survival was performed using the R package survival (version 3.2-7), and the survival curve was generated by the R package survminer (version 0.4.8). All animal experiments were performed according to protocols approved by the Institutional Animal Use and Care Committee of Aichi Medical University.
Other methods
Additional methods are described in the Online Supplementary Methods
Haematologica | 108 February 2023 395 ARTICLE - BCL6 inhibition in CRLF2-rearranged leukemia S. Tsuzuki et al.
Data availability
The RNA-sequencing data have been deposited in ArrayExpress under accession number E-MTAB-10755.
Results
BCL6 upregulation after treatment with JAK1/2 inhibitors in CRLF2-ALL We first examined the growth-inhibitory effects of a class I JAK1/2 inhibitor, ruxolitinib. This drug is clinically used to treat JAK-activated myeloproliferative neoplasms and is being tested for its efficacy in CRLF2-ALL in clinical trials.4 The growth of four CRLF2-ALL and five non-CRLF2-ALL cell lines in 5-day ex vivo cultures with graded ruxolitinib concentrations was compared. The growth of two CRLF2-ALL cell lines, MUTZ-5 and YCUB5, was dose-dependently inhibited, but only modestly. The growth inhibition of the other two CRLF2-ALL cell lines, MHH-CALL-4 and NAGL-1, was blunt enough to be indistinguishable from that of the five non-CRLF2-ALL cell lines (Reh, Kasumi-2, Kasumi-7, NALM-1, and NALM-6) (Figure 1A). A similar effect was observed using a class II JAK inhibitor CHZ868 16 ( Online Supplementary Figure S1A ), suggesting that this new type of inhibitor per se does not wholly overcome the resistance of CRLF2-ALL subsets to JAK inhibition.
It was hypothesized that gene expression changes elicited by ruxolitinib might mitigate the treatment efficacy of this inhibitor. Gene expression profiles in MHH-CALL4 and MUTZ-5 cells in the presence or absence of ruxolitinib revealed BCL6 to be one of the genes most remarkably upregulated by ruxolitinib (Figure 1B). BCL6 upregulation was confirmed at the protein level by western blot analysis in four CRLF2-ALL cell lines and samples from two patients with CRLF2-ALL (Figure 1C, Online Supplementary Figure S1B ). Conversely, the five non-CRLF2 ALL cell lines did not show such a response (Figure 1D). CHZ868 treatment likewise upregulated BCL6 expression ( Online Supplementary Figure S1C ). The upregulation of BCL6 transcripts by ruxolitinib or CHZ868 treatment was confirmed by quantitative reverse transcription-polymerase chain reaction (qRT-PCR) ( Online Supplementary Figure S1D ). However, this study did not exclude the possibility that BCL6 protein is additionally upregulated post-translationally. Enforced expression of an active form of STAT5B somewhat reduced BCL6 expression and remarkably blunted ruxolitinib’s effect of upregulating BCL6 (Figure 1E, Online Supplementary Figure S1E ), suggesting a close inverse relationship between STAT5 activity and BCL6 expression. Consistently, STAT5 inhibitors upregulated BCL6 in six CRLF2ALL cells but not in the non-CRLF2-ALL cell line, Reh ( Online Supplementary Figure S1F ). These findings sug -
gest that ruxolitinib upregulates BCL6 through STAT5 inhibition.
Synergy between a JAK inhibitor (ruxolitinib) and BCL6 inhibitors in culture
Given that CRLF2-ALL cells express BCL6 even before ruxolitinib treatment (Figure 1C), we investigated whether BCL6 inhibition affects cell growth in the absence of JAK inhibitors. To this end, three distinct BCL6 inhibitors, BI3802,33 BI3812,33 and FX1,32 were used. BI3802 is a BCL6 degrader, and BI3812 and FX1 interfere with BCL6 interactions with its co-repressors BCOR, NCOR, and SMART. These reagents inhibited the growth of four CRLF2-ALL cell lines and Kasumi-2 and Kasumi-7 but not Reh, NALM1, and NALM-6 cell lines. The growth inhibition of Kasumi2 and Kasumi-7 was consistent with the essential roles of BCL6 in the maintenance of TCF3-PBX134 (Kasumi-2) and MEF2D-rearranged35 (Kasumi-7) ALL (Figure 1F). These findings suggest that BCL6 may, at least in part, play roles in CRLF2-ALL cell growth. The study of primary CRLF2ALL cells (cases 1 and 2 in Figure 1C) was not possible, as these cells could not be maintained in culture long enough to assess drug sensitivity fully. Next, the efficacy of a combination of ruxolitinib and either FX1 or BI3812 for the inhibition of CRLF2-ALL cell growth was investigated. Figure 2 and Online Supplementary Figure S2A show a synergy of the combinations. A similar synergy was observed in modeled CRLF2-ALL in Baf/3 cells (Online Supplementary Figure S2B). Likewise, BCL6 knockdown in the CRLF2-ALL cell lines, MHH-CALL4 and YCUB5, inhibited their growth (Online Supplementary Figure S2C, D), which was further inhibited by ruxolitinib (Online Supplementary Figure S2D), suggesting that the growth inhibitory effects of the BCL6 inhibitors were likely specific. Time-course experiments showed that a combinatorial effect of ruxolitinib and FX1 on cell growth was most pronounced more than 5 days after culture initiation (Online Supplementary Figure S2E). However, there was mostly negligible synergy in five non-CRLF2-ALL cells (Online Supplementary Figure S2F).
Combinatorial effect of ruxolitinib and FX1
in vivo
We next studied the effects of ruxolitinib and FX1 in combination in vivo: FX1 was chosen as the BCL6 inhibitor since BI3802 and BI3812 were not amenable to in vivo treatment.33 Of the four CRLF2-ALL cell lines tested in this study, YCUB5 and MUTZ5 cells had the highest in vivo leukemia-propagating activity (Online Supplementary Figure S3A) and were, therefore, used in these experiments. Compared to vehicle-only treatment, FX1 or ruxolitinib treatment alone prolonged the survival of mice transplanted with CRLF2-ALL cells, but the combination of FX1 and ruxolitinib prolonged survival even further, demonstrating its survival benefit (Figure 3A, B left). Consistently, peripheral
Haematologica | 108 February 2023 396 ARTICLE - BCL6 inhibition in CRLF2-rearranged leukemia S. Tsuzuki et al.
blood collected at the time of treatment completion contained markedly fewer leukemia cells in mice treated with the combination (Figure 3A, B right). A similar observation was made for mice transplanted with leukemia cells from a patient (case 1) (Figure 3C). Addition of FX1 was well tolerated, as suggested by no apparent loss of the treated animals’ bodyweight (Online Supplementary Figure S3B)
Ruxolitinib mitigates TP53-mediated tumor suppression To investigate the molecular mechanisms underlying the synergy between ruxolitinib and FX1, the gene expression of MHH-CALL-4 and MUTZ-5 cells in four treatment conditions were compared: ruxolitinib alone, FX1 alone, their combination, and vehicle-only control. Differentially expressed genes between the conditions were extracted
Figure 1. Upregulation of BCL6 by ruxolitinib and growth inhibition by BCL6 inhibitors. (A) Growth inhibition of CRLF2-ALL cell lines (MHH-CALL-4, MUTZ-5, YCUB5, and NAGL-1) and non-CRLF2-ALL cell lines (Reh, Kasumi-2, Kasumi-7, NALM-1, and NALM6) by the JAK1/2 inhibitor, ruxolitinib. Cells were cultured with the indicated concentrations of ruxolitinib for 5 days, and growth relative to that of vehicle-treated cells is shown as the mean ± standard deviation (SD). (B) Gene expression changes in MHHCALL-4 and MUTZ-5 cells upon treatment with ruxolitinib (1 mM) for 24 h are presented as a volcano plot. BCL6 is represented in red. (C) BCL6 upregulation, at the protein level, with ruxolitinib treatment. The CRLF2-ALL cell lines and clinical samples from two cases were treated with ruxolitinib (1 mM, 24 h), and a western blot analysis was performed for BCL6, phospho-STAT5, and STAT5. GAPDH served as a loading control. (D) Five non-CRLF2-ALL cell lines treated with ruxolitinib were analyzed for BCL6 protein expression. The MHH-CALL4 cell line was included as a positive control. Asterisks indicate nonspecific bands. (E) YCUB5 cells overexpressing an active form of STAT5 or control vector were treated with ruxolitinib and analyzed for BCL6 and TP53 expression. (F) Effects of the BCL6 inhibitors BI3802, BI3012, and FX1 on cell growth. Cells were treated with graded concentrations of BCL6 inhibitors for 5 days, and the cell growth relative to that of vehicle-treated cells is shown as the mean ± SD. Ruxo: ruxolitinib.
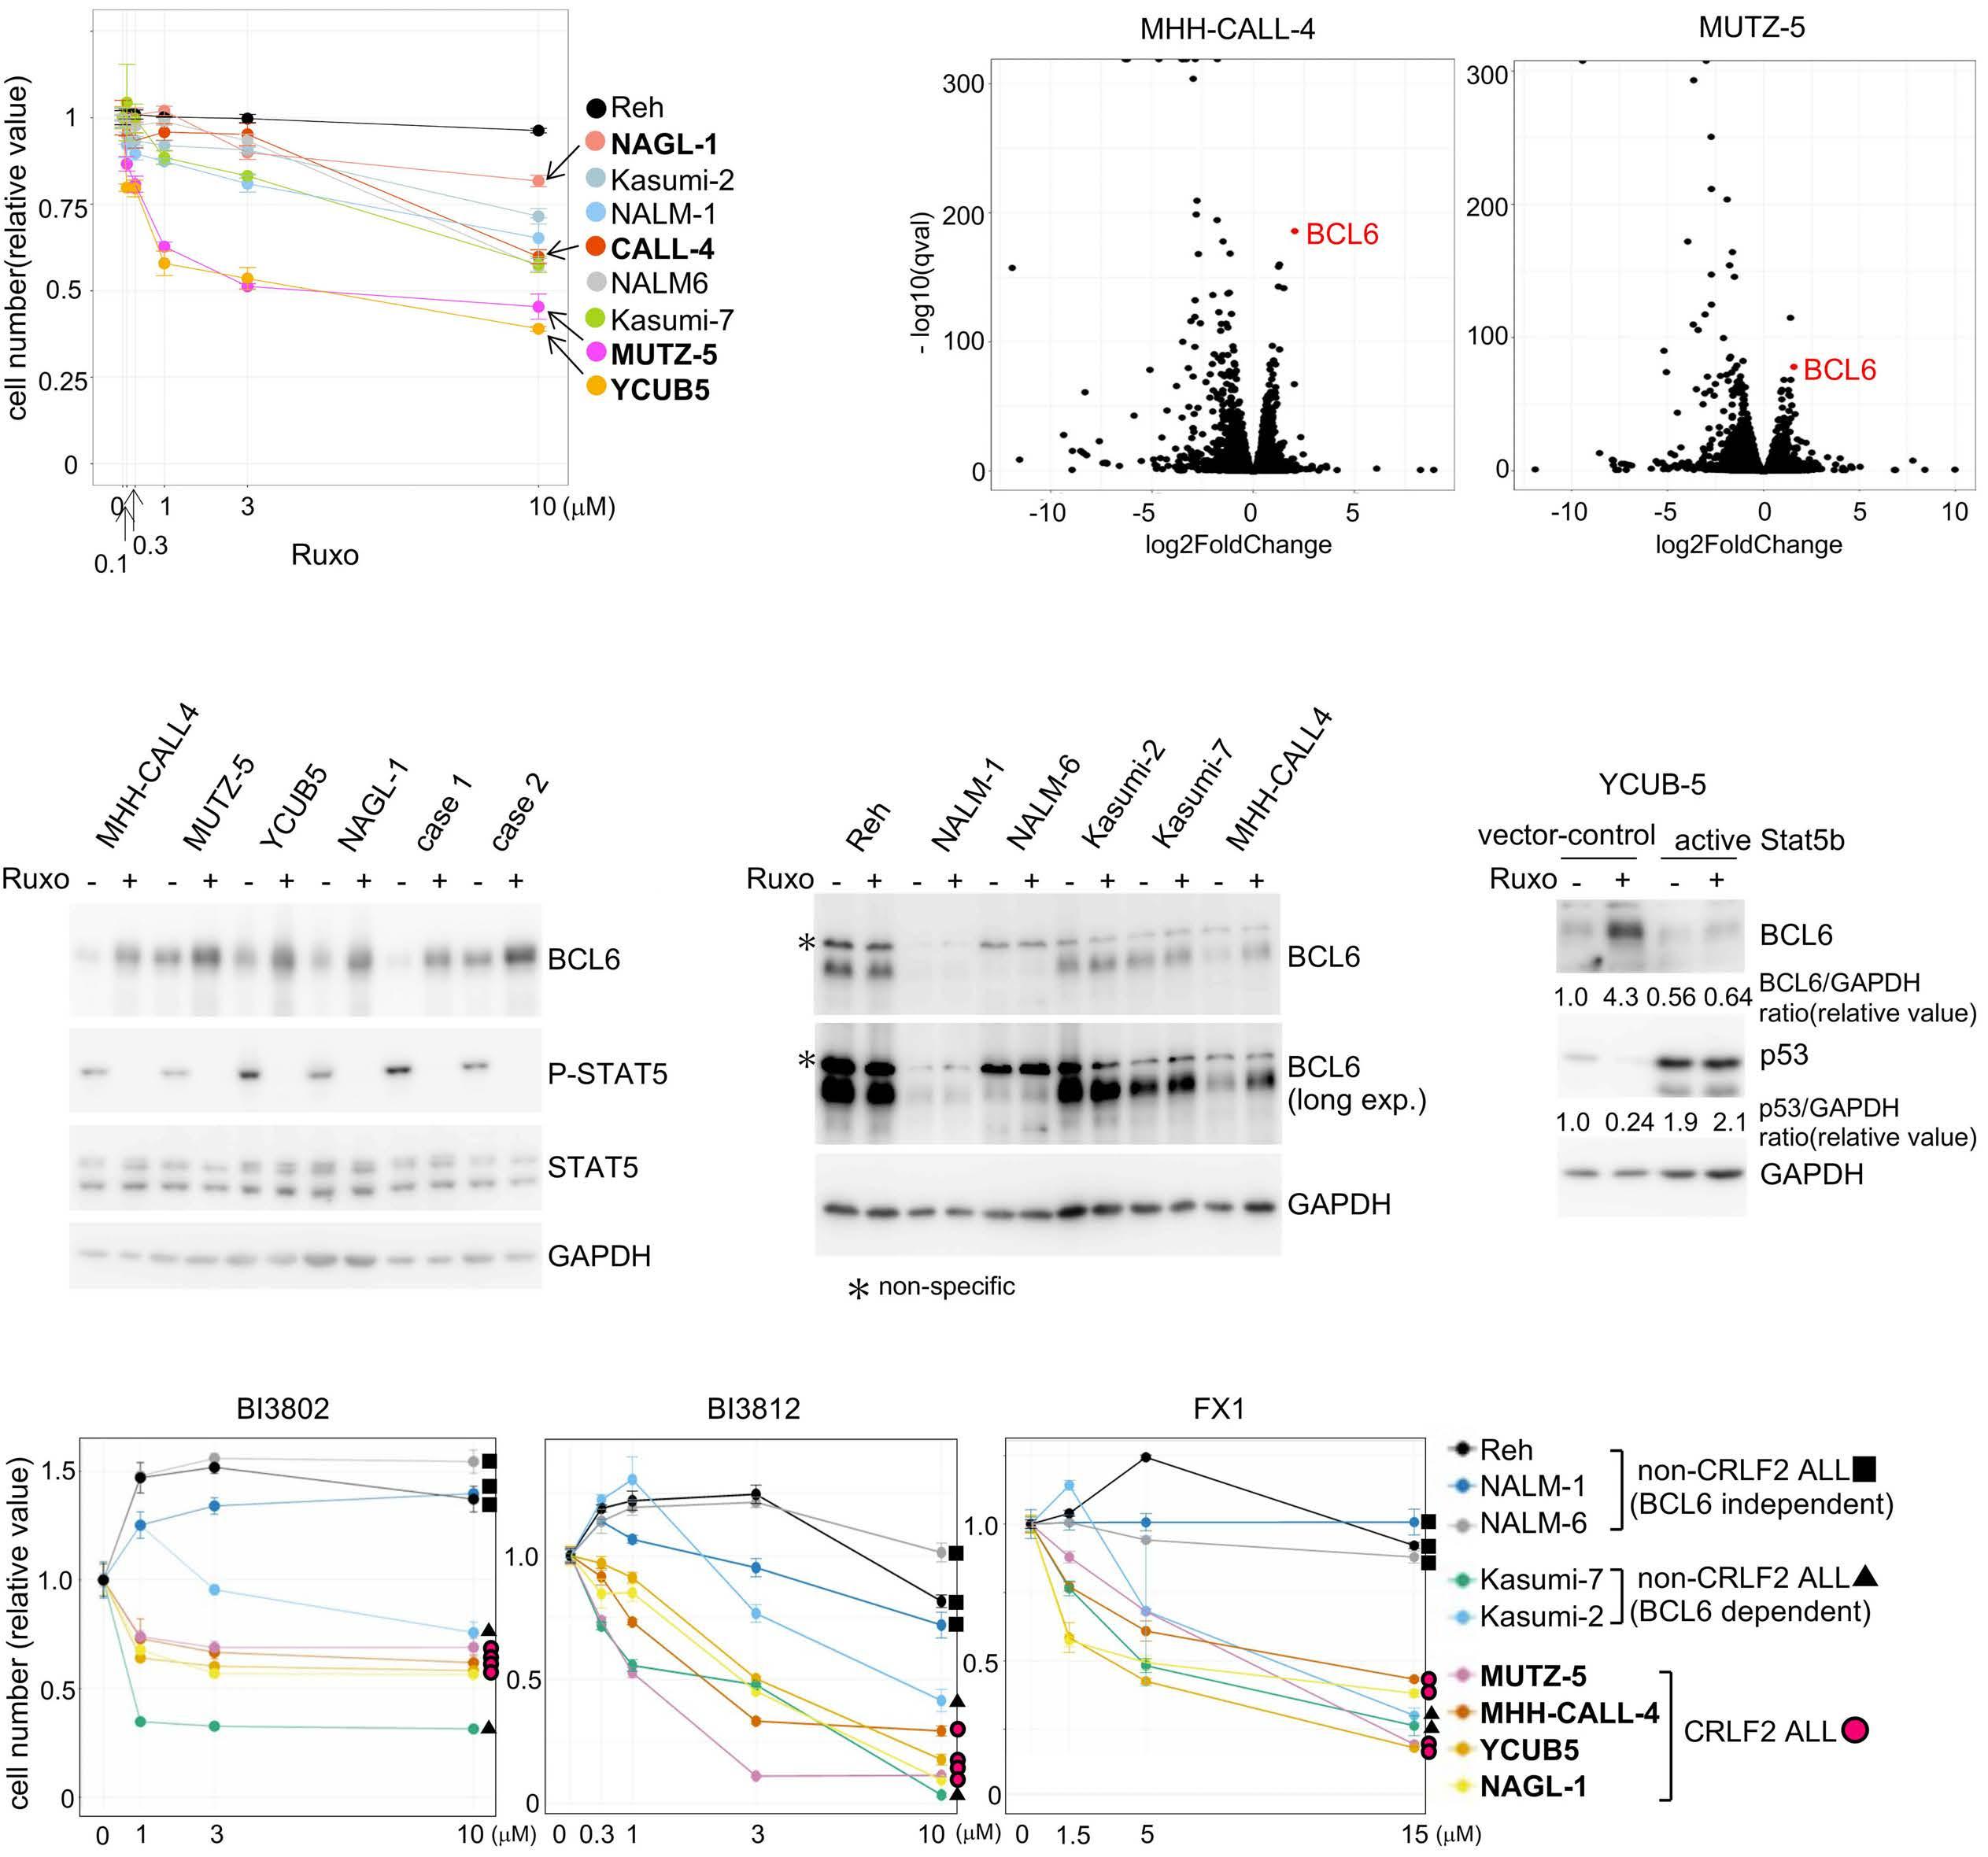
A B C D E F Haematologica | 108 February 2023 397 ARTICLE - BCL6 inhibition in CRLF2-rearranged leukemia S. Tsuzuki et al.
Figure 2. Ruxolitinib and BCL6 inhibitors synergistically suppress growth of CRLF2-ALL cells in culture. Combinatorial effects of ruxolitinib and BCL6 inhibitors on cell growth. CRLF2-ALL cell lines (MHH-CALL-4, MUTZ-5, YCUB5, and NAGL-1) were treated with the indicated concentrations of ruxolitinib, FX1, and BI3812 alone, or a combination of ruxolitinib + FX1 (left) or ruxolitinib + BI3812 (right), for 5 days. The ZIP synergy scores are presented. ZIP synergy scores >10 are regarded as representing “strong synergy.”

Haematologica | 108 February 2023 398 ARTICLE - BCL6 inhibition in CRLF2-rearranged leukemia S. Tsuzuki et al.
and subjected to pathway and gene ontology (GO) term analysis (Figure 4A). First, the focus was on genes that ruxolitinib treatment downregulated compared to vehicle control (Ctr > Ruxo). A pathway involving STAT5 activation was enriched for such genes, consistent with the known activities of JAK1/2 in CRLF2-ALL. Intriguingly, TP53 and apoptotic signaling pathways and positive regulation of cell death and cell cycle arrest GO terms, among others, were likewise enriched. The latter findings suggest that ruxolitinib treatment may mitigate tumor-suppressive activity by downregulating genes involved in the TP53 pathway, cell death, and cell cycle arrest. The focus was then set on genes FX1 upregulated in ruxolitinib-treated cells (Ruxo < Combo). Pathways enriched for such genes again included TP53, apoptotic signaling pathways, and positive regulation of the cell death GO term. These findings suggest that FX1 may counteract, at least in part, ruxolitinib-mediated mitigation of tumorsuppressive activity. This notion was corroborated by gene set variation analysis using MSigDB hallmark gene sets (Figure 4B). Heatmap presentations of such gene expression changes are provided in Online Supplementary
Figure S4A. Indeed, ruxolitinib treatment led to negative enrichment of genes representing TP53 and apoptosis pathways, but the addition of FX1 largely reversed this effect (Figure 4B, Online Supplementary Figure S4A, B). Pathway activity evaluated by PROGENy analysis was consistent with the results (Online Supplementary Figure S4C). In addition, an inhibitor of TP53 transcription activity, pifithrin- a , largely antagonized the growth-suppressive activity of the BCL6 inhibitors FX1 and BI3812 in culture (Online Supplementary Figure S4D), suggesting the involvement of TP53 in BCL6 inhibitor-mediated growth inhibition.
We next investigated whether ruxolitinib, BCL6 inhibitors and their combination affect the levels of TP53 protein (Figure 5). In four CRLF2-ALL cell lines, ruxolitinib treatment diminished TP53 protein and phospho-STAT5 (a substrate of JAK2) levels while upregulating BCL6. This relationship among STAT5 activity, BCL6 expression, and TP53 expression agreed with the observation made in YCUB5 cells forcedly expressing an active STAT5 (Figure 1E). TP53 downregulation coupled with BCL6 upregulation upon STAT5 inhibition was also in accord (Online Supple-
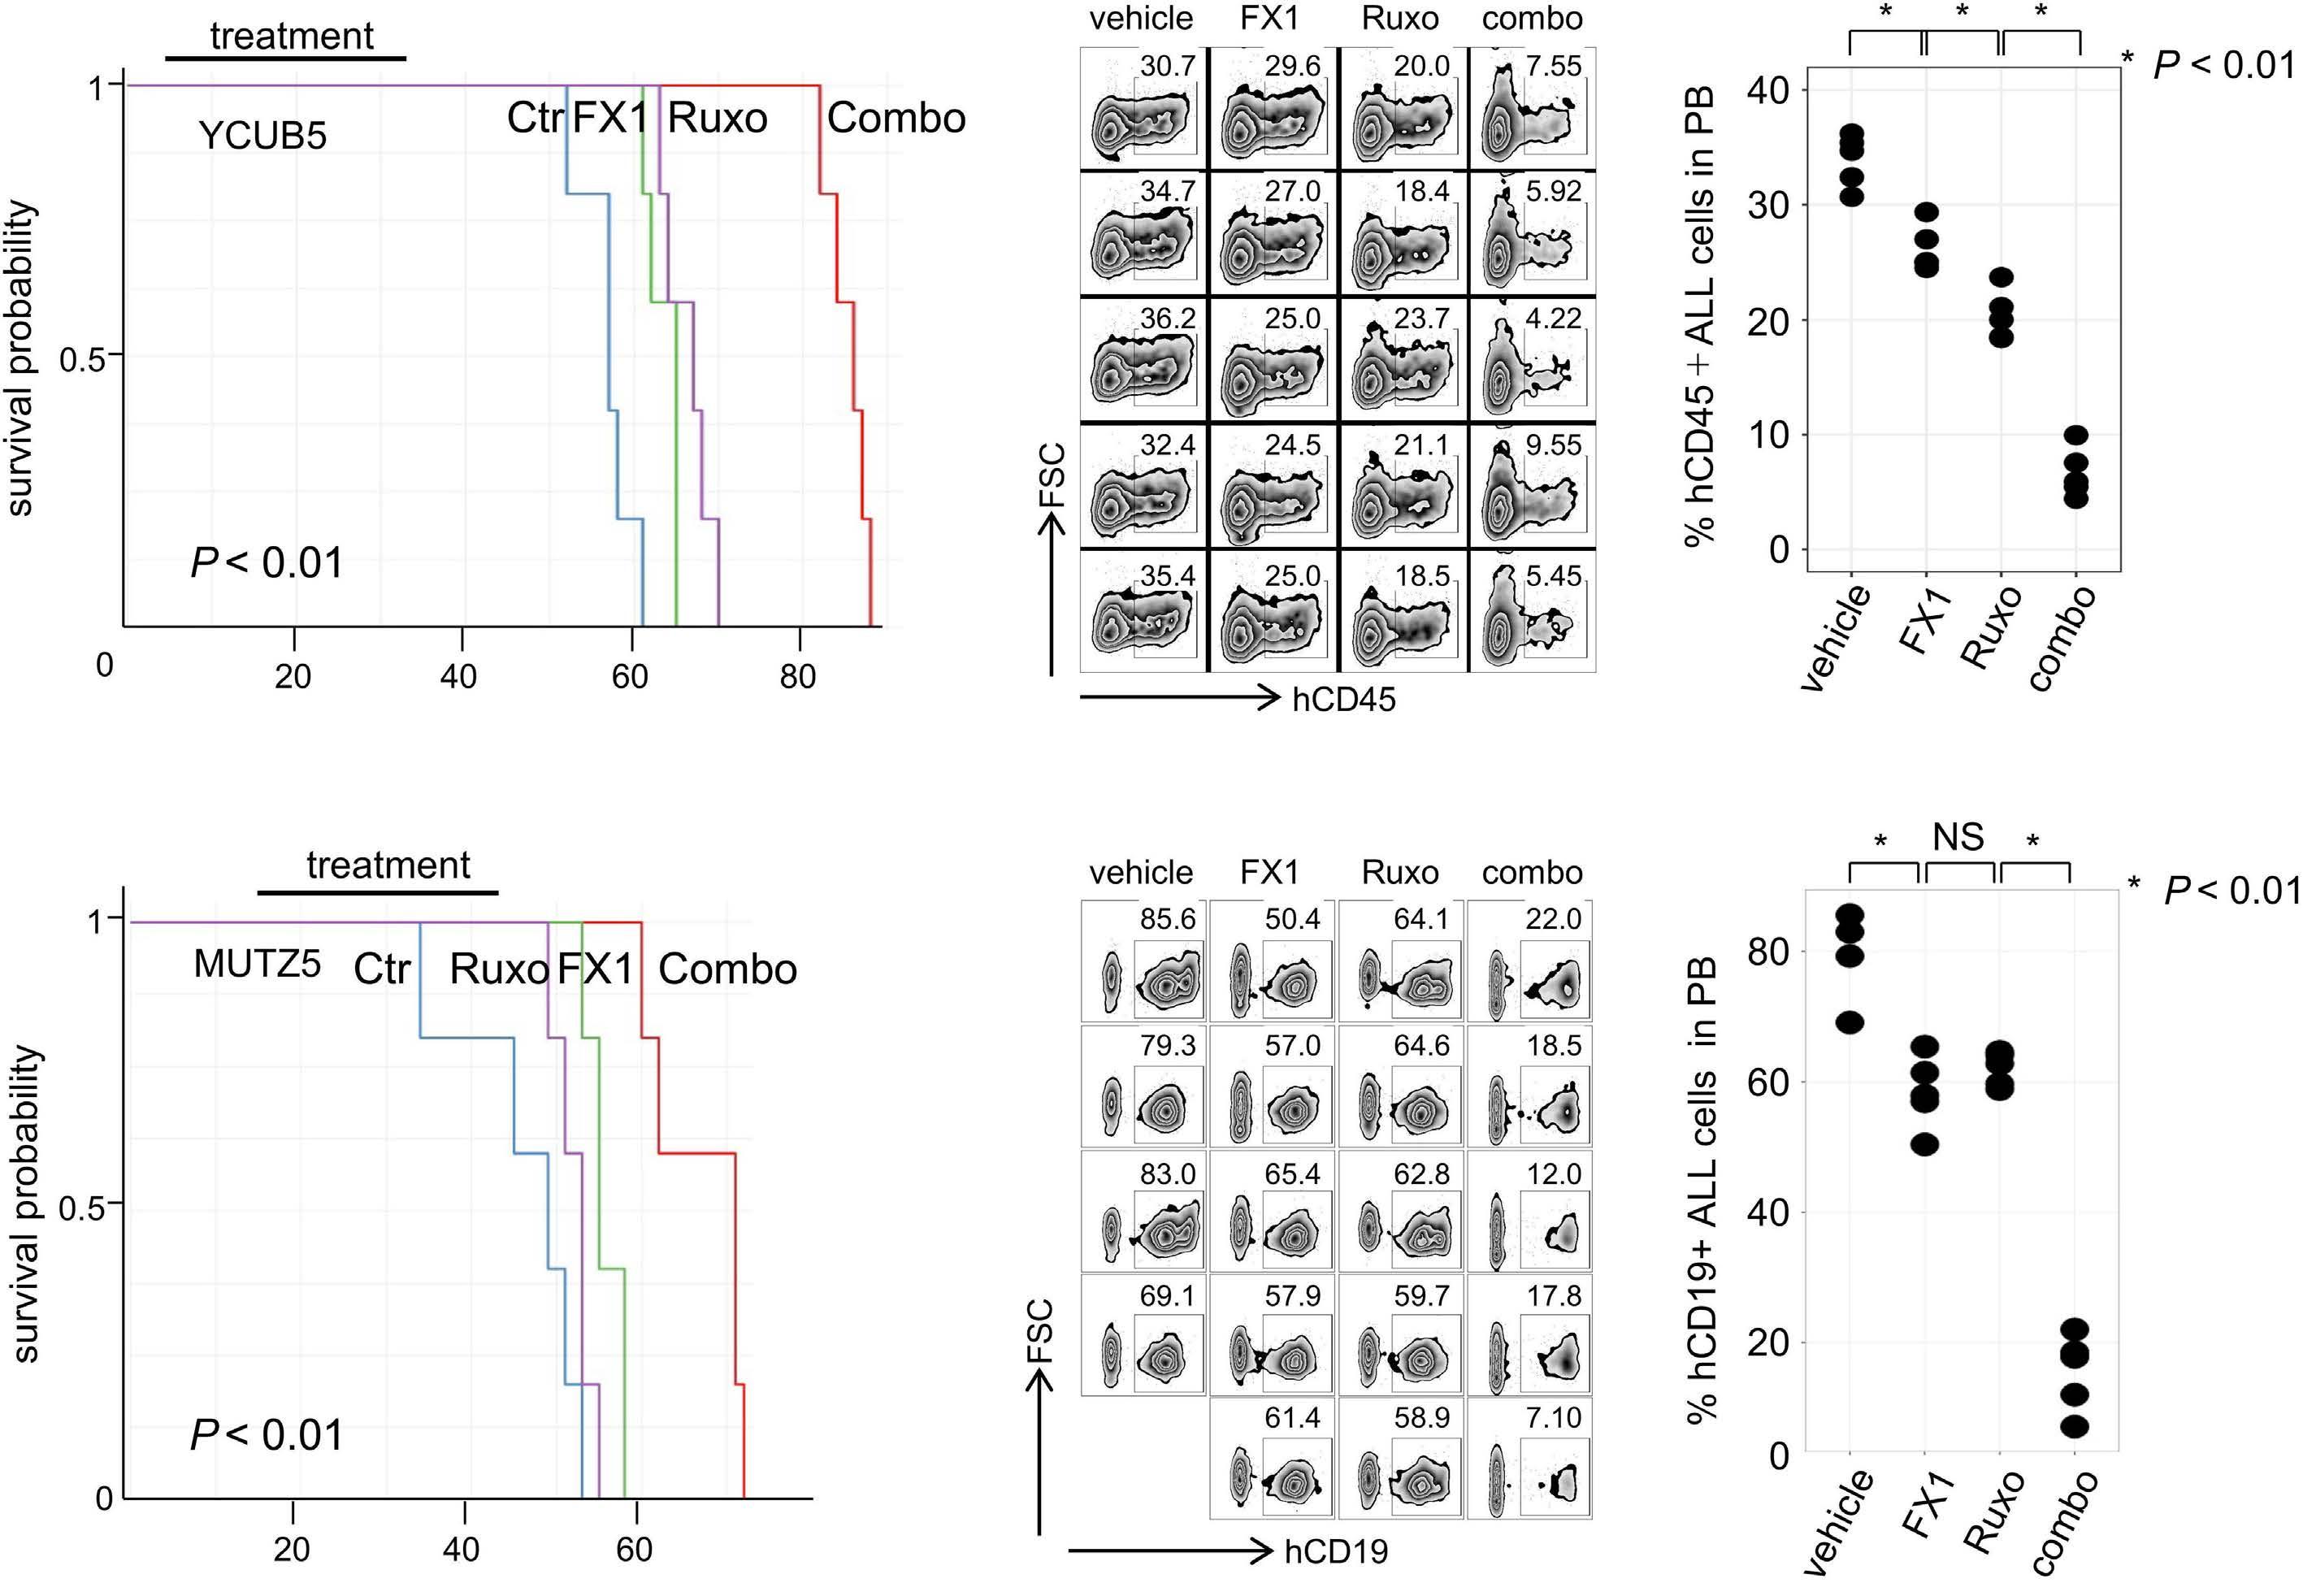
Continued on following page. A B Haematologica | 108 February 2023 399 ARTICLE - BCL6 inhibition in CRLF2-rearranged leukemia S. Tsuzuki et al.
Figure 3. Ruxolitinib and a BCL6 inhibitor (FX1) synergistically suppress CRLF2-ALL growth in vivo. (A-C) Immunodeficient NSG mice were implanted with the indicated cells, (A) YCUB5, (B) MUTZ5, and (C) a CRLF2-ALL patient’s cells, and treated with ruxolitinib or FX1, or their combination. Bars represent treatment periods. Deaths were defined as mice found dead or requiring euthanasia. The Kaplan-Meier survival curves and the differences in survival probability estimated by the log-rank test are presented (left). Peripheral blood drawn at the time of completion of the treatment was evaluated for tumor burden by flow-cytometric analysis after red blood cell lysis, using anti-human CD45 or anti-human CD19 antibodies. Percentages of CD45+ or CD19+ human acute lymphoblastic leukemia cells in peripheral blood are presented (middle), with the graphs (right) showing the statistical difference (pairwise comparisons by a t test) in tumor burden. Ctrl: control; Ruxo: ruxolitinib; combo: FX1 + ruxolitinib; FSC: forward side scatter; ALL: acute lymphoblastic leukemia; PB: peripheral blood; NS: non-significant.
mentary Figure S1F). In contrast, BCL6 inhibitors BI3812 and FX1 alone increased TP53 levels; the increase of BCL6 expression by these inhibitors probably reflected an autoinhibitory effect of BCL6.29 Likewise, a BCL6 degrader, BI3802, increased TP53 protein. In five non-CRLF2 ALL cell lines, there were no appreciable changes in TP53 after treatment with either ruxolitinib or BI3802. However, JAK activity, reflected by phospho-STAT5 level, was lower in the non-CRLF2-ALL cells tested, complicating a direct comparison with CRLF2-ALL cells (Figure 5A).
Of particular note, BCL6 inhibitors restored the TP53 protein levels that ruxolitinib treatment had lowered (Figure 5B). p21CIP1 (CDKN1A) expression, a known transcriptional target of TP53, accompanied the changes in TP53 levels (Figure 5C). A similar result was obtained in two patients’ leukemia cells (Figure 5D). Consistently, BCL6 knockdown upregulated TP53 and blunted ruxolitinib-mediated TP53 downregulation (Online Supplementary Figure S2C).
Given that MDM2 inhibitor-mediated TP53 upregulation (Online Supplementary Figure S5A) inhibited the growth of CRLF2-ALL cells synergistically with ruxolitinib (Online Supplementary Figure S5B), TP53 likely mediates the synergistic activity of FX1 co-treatment with ruxolitinib. Consistently, no synergy was found between ruxolitinib and FX1, BI3812, or an MDM2 inhibitor in a biallelically TP53mutated CRLF2-ALL cell line, KOPN49 (Online Supplementary Figure S5C, D). Notably, however, KOPN49 cells retained the ability to upregulate BCL6 upon ruxolitinib or FX1 treatment like the other four CRLF2-ALL cell lines (Online Supplementary Figure S5E). These findings suggest that BCL6 inhibitors counteract TP53 pathway inhibition
elicited by ruxolitinib. BCL6 functions primarily as a transcriptional repressor, but ruxolitinib treatment did not appreciably downregulate TP53 mRNA levels (Online Supplementary Figure S5F), as confirmed by qRT-PCR (data not shown), which is inconsistent with previous observations made in lymphoma cells.36 Instead, ruxolitinib downregulated, and FX1 addition restored many mRNA encoding molecules that contribute to stabilizing TP5337 (Online Supplementary Figure S5F). Furthermore, chromatin immunoprecipitation sequencing data made available by Cistrome Data Browser (http://cistrome.org.db) showed that BCL6 could bind to genomic regions near the transcription start sites of these genes (Online Supplementary Figure S5G). These observations suggest that BCL6 may account for gene expression changes that concertedly diminish the amount of TP53 protein.
Finally, we focused on the possible involvement of MYC in CRLF2-ALL cell growth. It was seen that ruxolitinib or FX1 alone downregulated MYC target genes and that the combination of ruxolitinib and FX1 did so even further (Figure 4A, B, Online Supplementary Figure S4), thus the effects of ruxolitinib, FX1, and MDM2 inhibitors on MYC expression were investigated. Indeed, MYC was downregulated by ruxolitinib or FX1 alone at the transcript (Figure 6A) and protein (Figure 6B) levels. The downregulation was most prominent with the combination of the two drugs. A similar observation was made using BI3012 in place of FX1 (Online Supplementary Figure S6A). Since TP53 activation with MDM2 inhibitors downregulated MYC expression (Online Supplementary Figure S6B),38,39 the ability of BCL6 in-
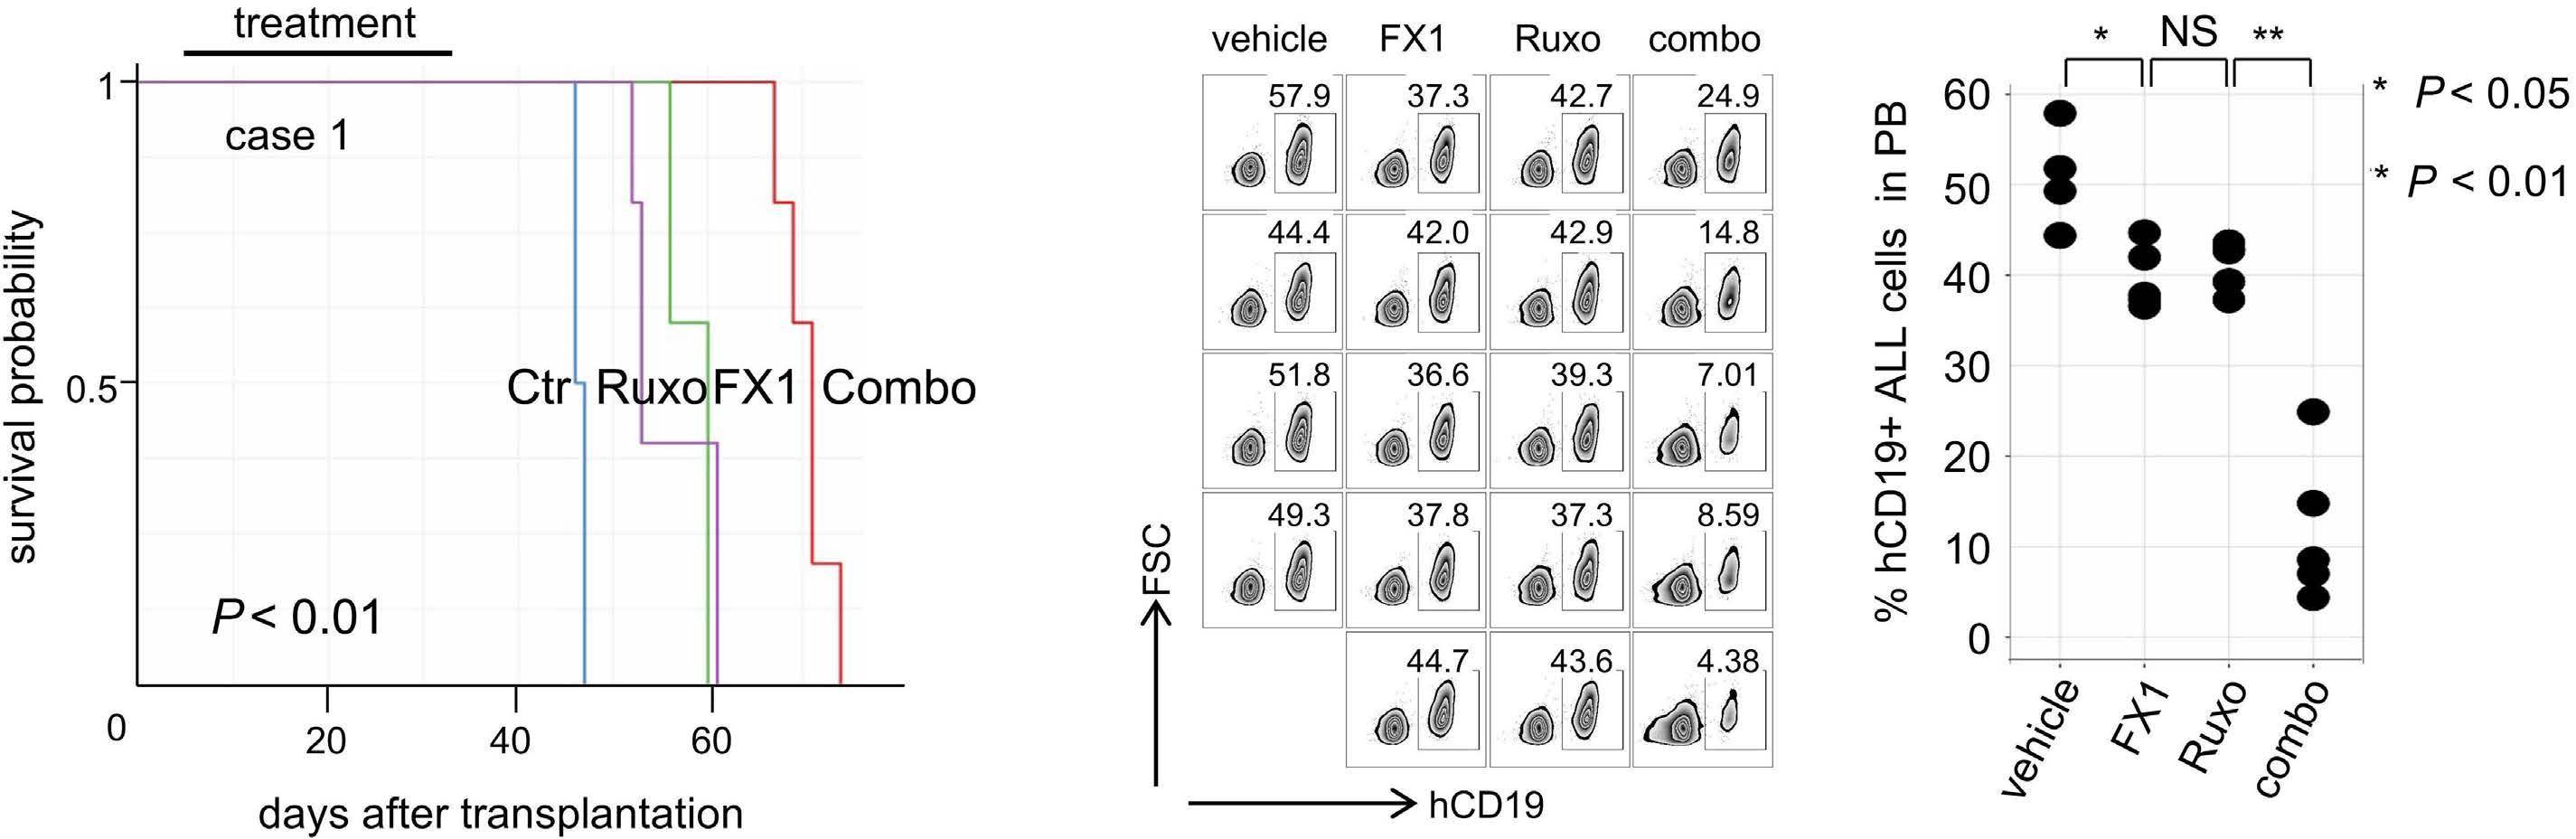
C Haematologica | 108 February 2023 400 ARTICLE - BCL6 inhibition in CRLF2-rearranged leukemia S. Tsuzuki et al.
Figure 4. Critical involvement of the TP53 pathway in the response of CRLF2ALL cells to ruxolitinib and FX1. (A) Two CRLF2-ALL cell lines, MHH-CALL-4 and MUTZ-5, were treated with vehicle, ruxolitinib (1 mM), FX1 (20 mM), or their combination for 24 h. After global analysis of differentially expressed genes between treatment conditions, pairwise comparisons of gene expression between the treatments were made for pathway analysis and represented as a heatmap showing log10(P value). The columns in the heatmap indicate the treatment conditions between which the comparison was made. For example, “Ruxo<Combo” means genes elevated by ruxolitinib+FX1 treatment compared with ruxolitinib treatment alone. (B) Gene set variation analysis of genes with MSigDB hallmark gene sets. Enrichment scores of the indicated gene sets in MHH-CALL-4 (top) and MUTZ-5 (bottom) cells are shown as heatmaps. Ruxo: ruxolitinib; Combo: ruxolitinib+FX1; Ctr: control.
hibitors to downregulate MYC is likely due to TP53 activation. The biallelically TP53-mutated CRLF2-ALL KOPN49 cell line did not show downregulation of MYC in response to FX1, despite retaining the ability to downregulate MYC in response to ruxolitinib (Online Supplementary Figure S6C). Since MYC knockdown inhibited the cell growth of CRLF2-ALL cell lines proportionately to MYC levels (Figure 6C, D), the concerted downregulation of MYC by ruxolitinib and FX1 likely represents one mechanism underlying the synergy in growth inhibition between the two drugs.
Ruxolitinib affects TRAIL- and Fas-mediated tumor suppression
Gene expression analysis revealed the downregulation of apoptosis-associated genes in response to ruxolitinib
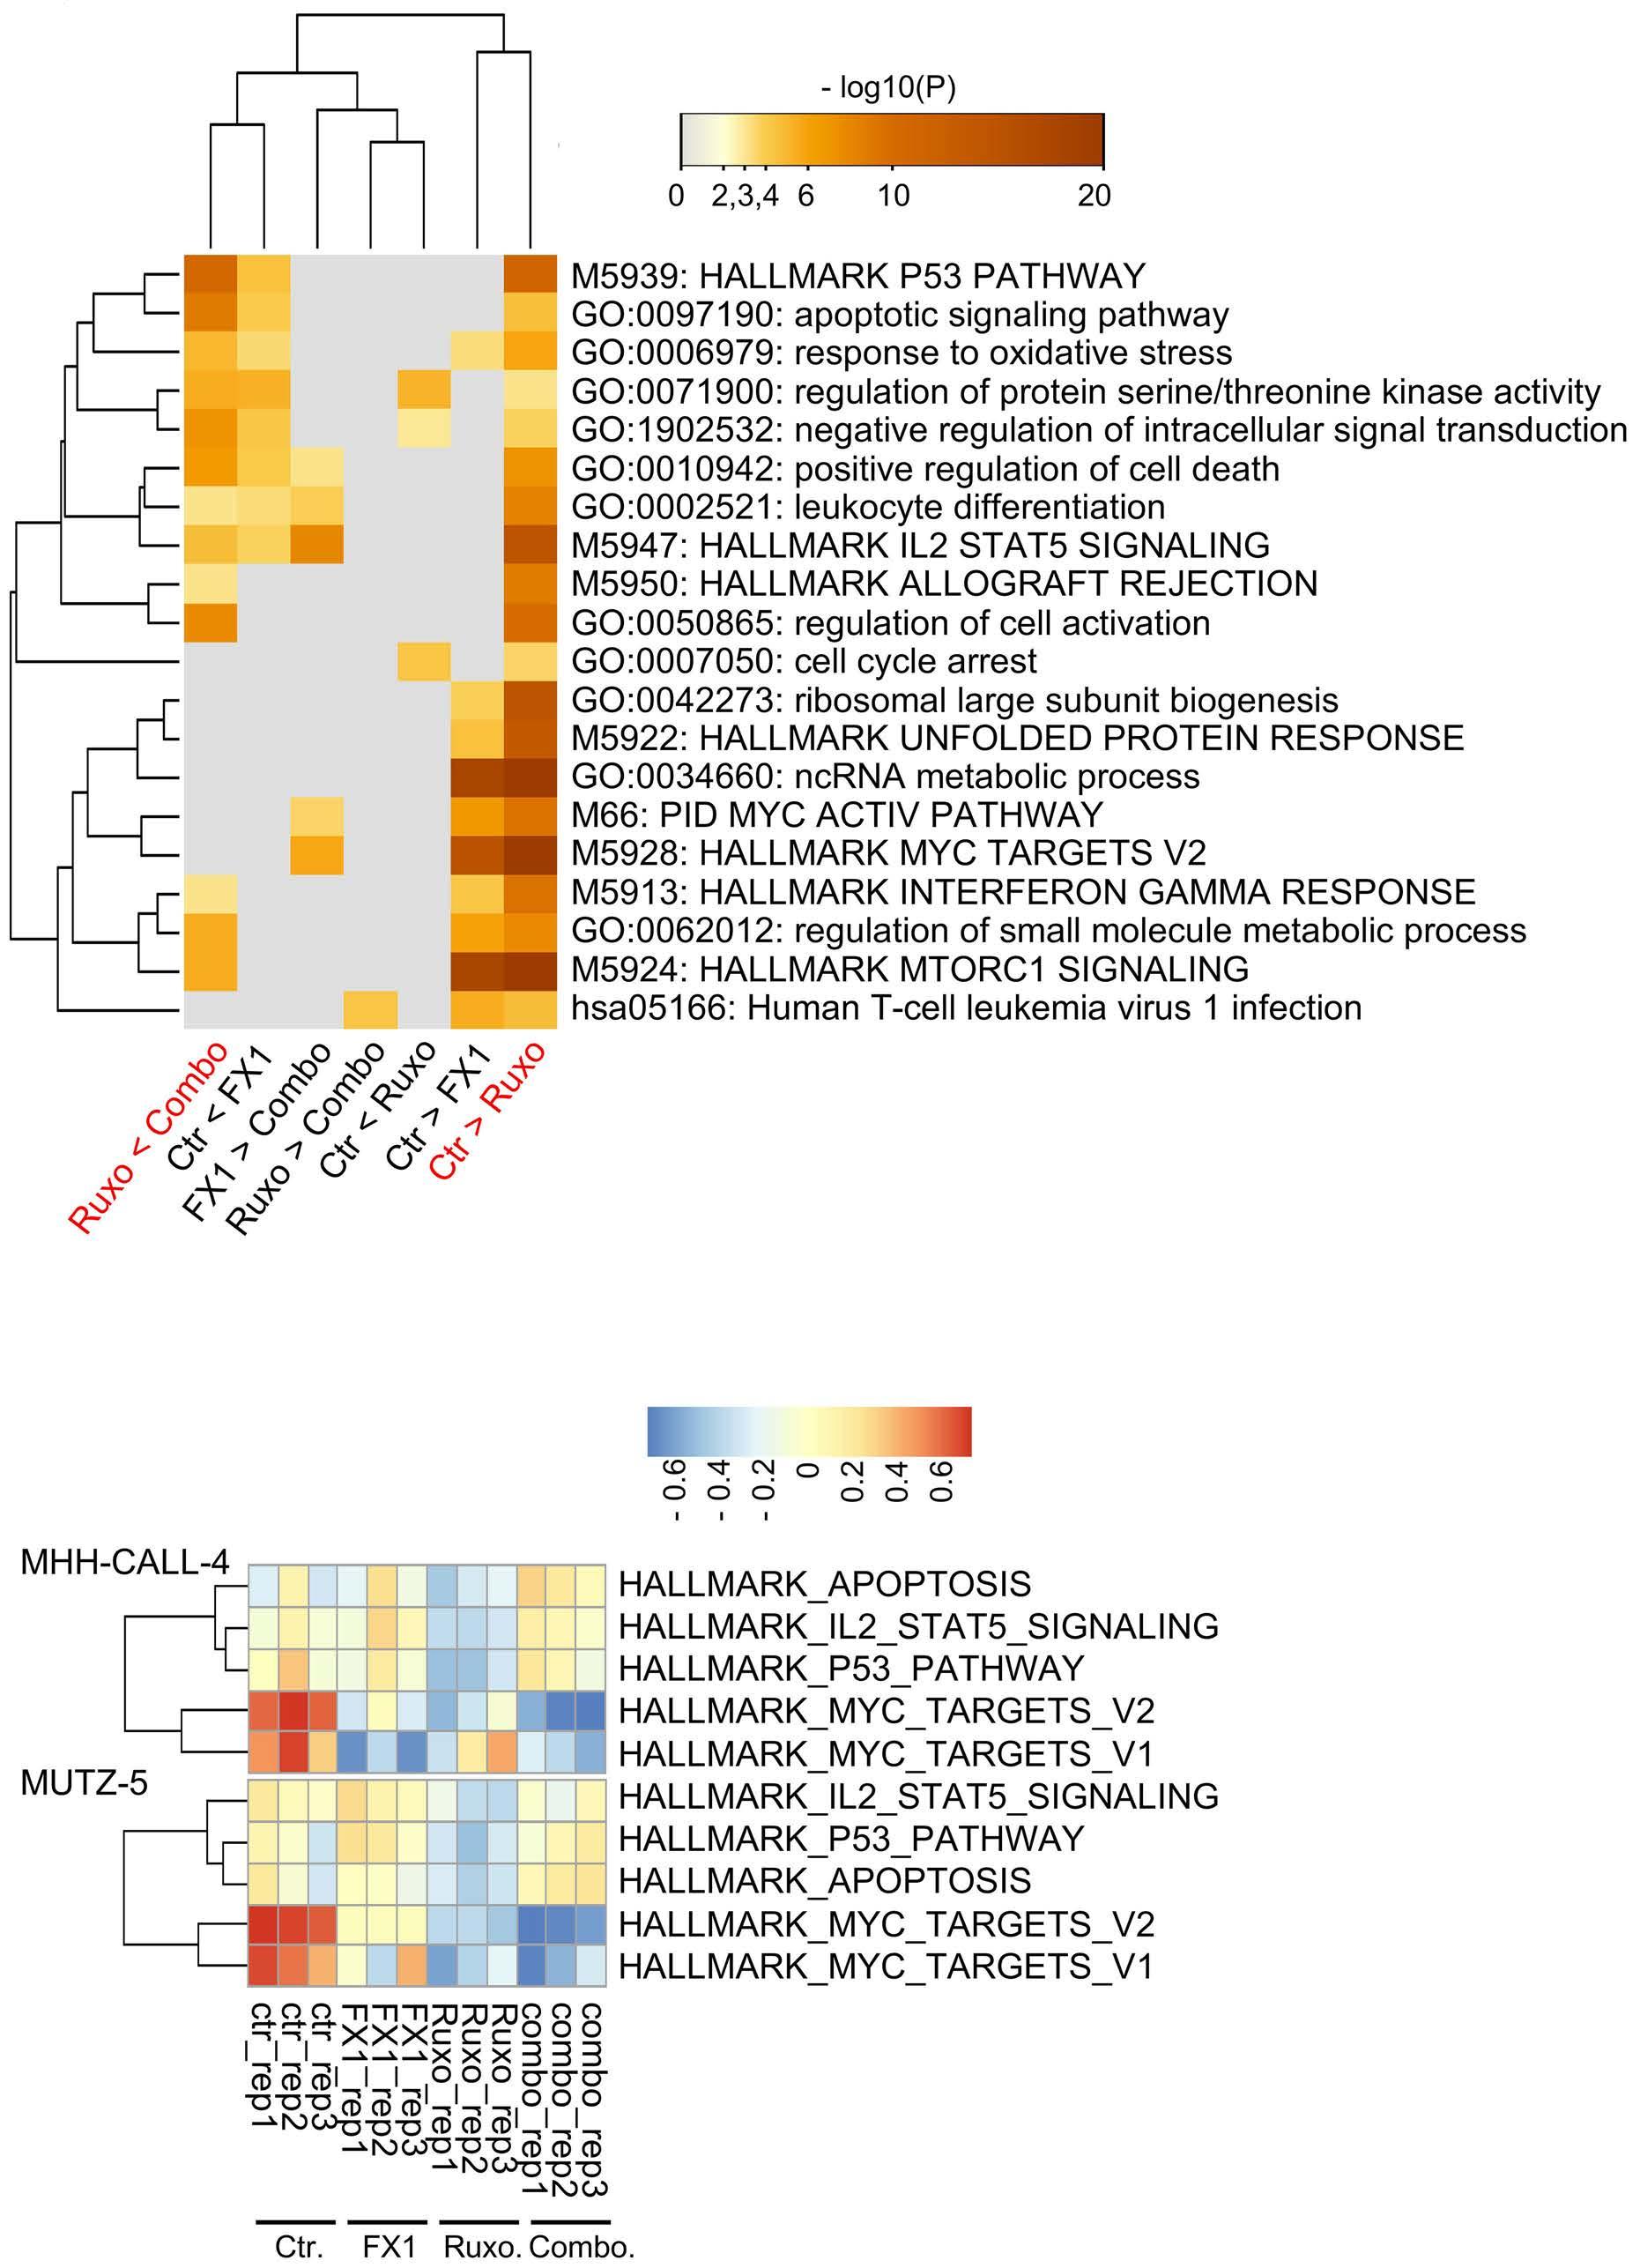
treatment and the reversal of this effect following BCL6 inhibition (Figure 4A, B). As for the “extrinsic” apoptosis pathway-associated genes, TNFRSF10B (TRAIL receptor) and FAS were noticeably downregulated by ruxolitinib treatment and mostly restored by the addition of FX1; both are known transcriptional targets of TP53 40 (Figure 7A).
Indeed, ruxolitinib treatment diminished, but FX1 effectively restored TNFRSF10B and FAS expression in four CRLF2-ALL cell lines and two samples from patients. FX1 alone without ruxolitinib marginally yet reproducibly upregulated the two molecules (Figure 7B). Consistently, TRAIL diminished the number of viable MHH-CALL-4 and MUTZ-5 cells (albeit to a much lesser degree than MHHCALL-4), but ruxolitinib treatment blunted this effect of
A B Haematologica | 108 February 2023 401 ARTICLE - BCL6 inhibition in CRLF2-rearranged leukemia S. Tsuzuki et al.
CRLF2-rearranged
TRAIL. The addition of FX1 largely restored the responsiveness of the cells to TRAIL (Figure 7C). Similarly, ruxolitinib treatment blunted, and FX1 addition
restored sensitivity to FAS-mediated apoptosis in MHHCALL-4 cells. Although MUTZ-5, YCUB5, and NAGL1 cells were minimally sensitive to FAS-mediated apoptosis, FX1
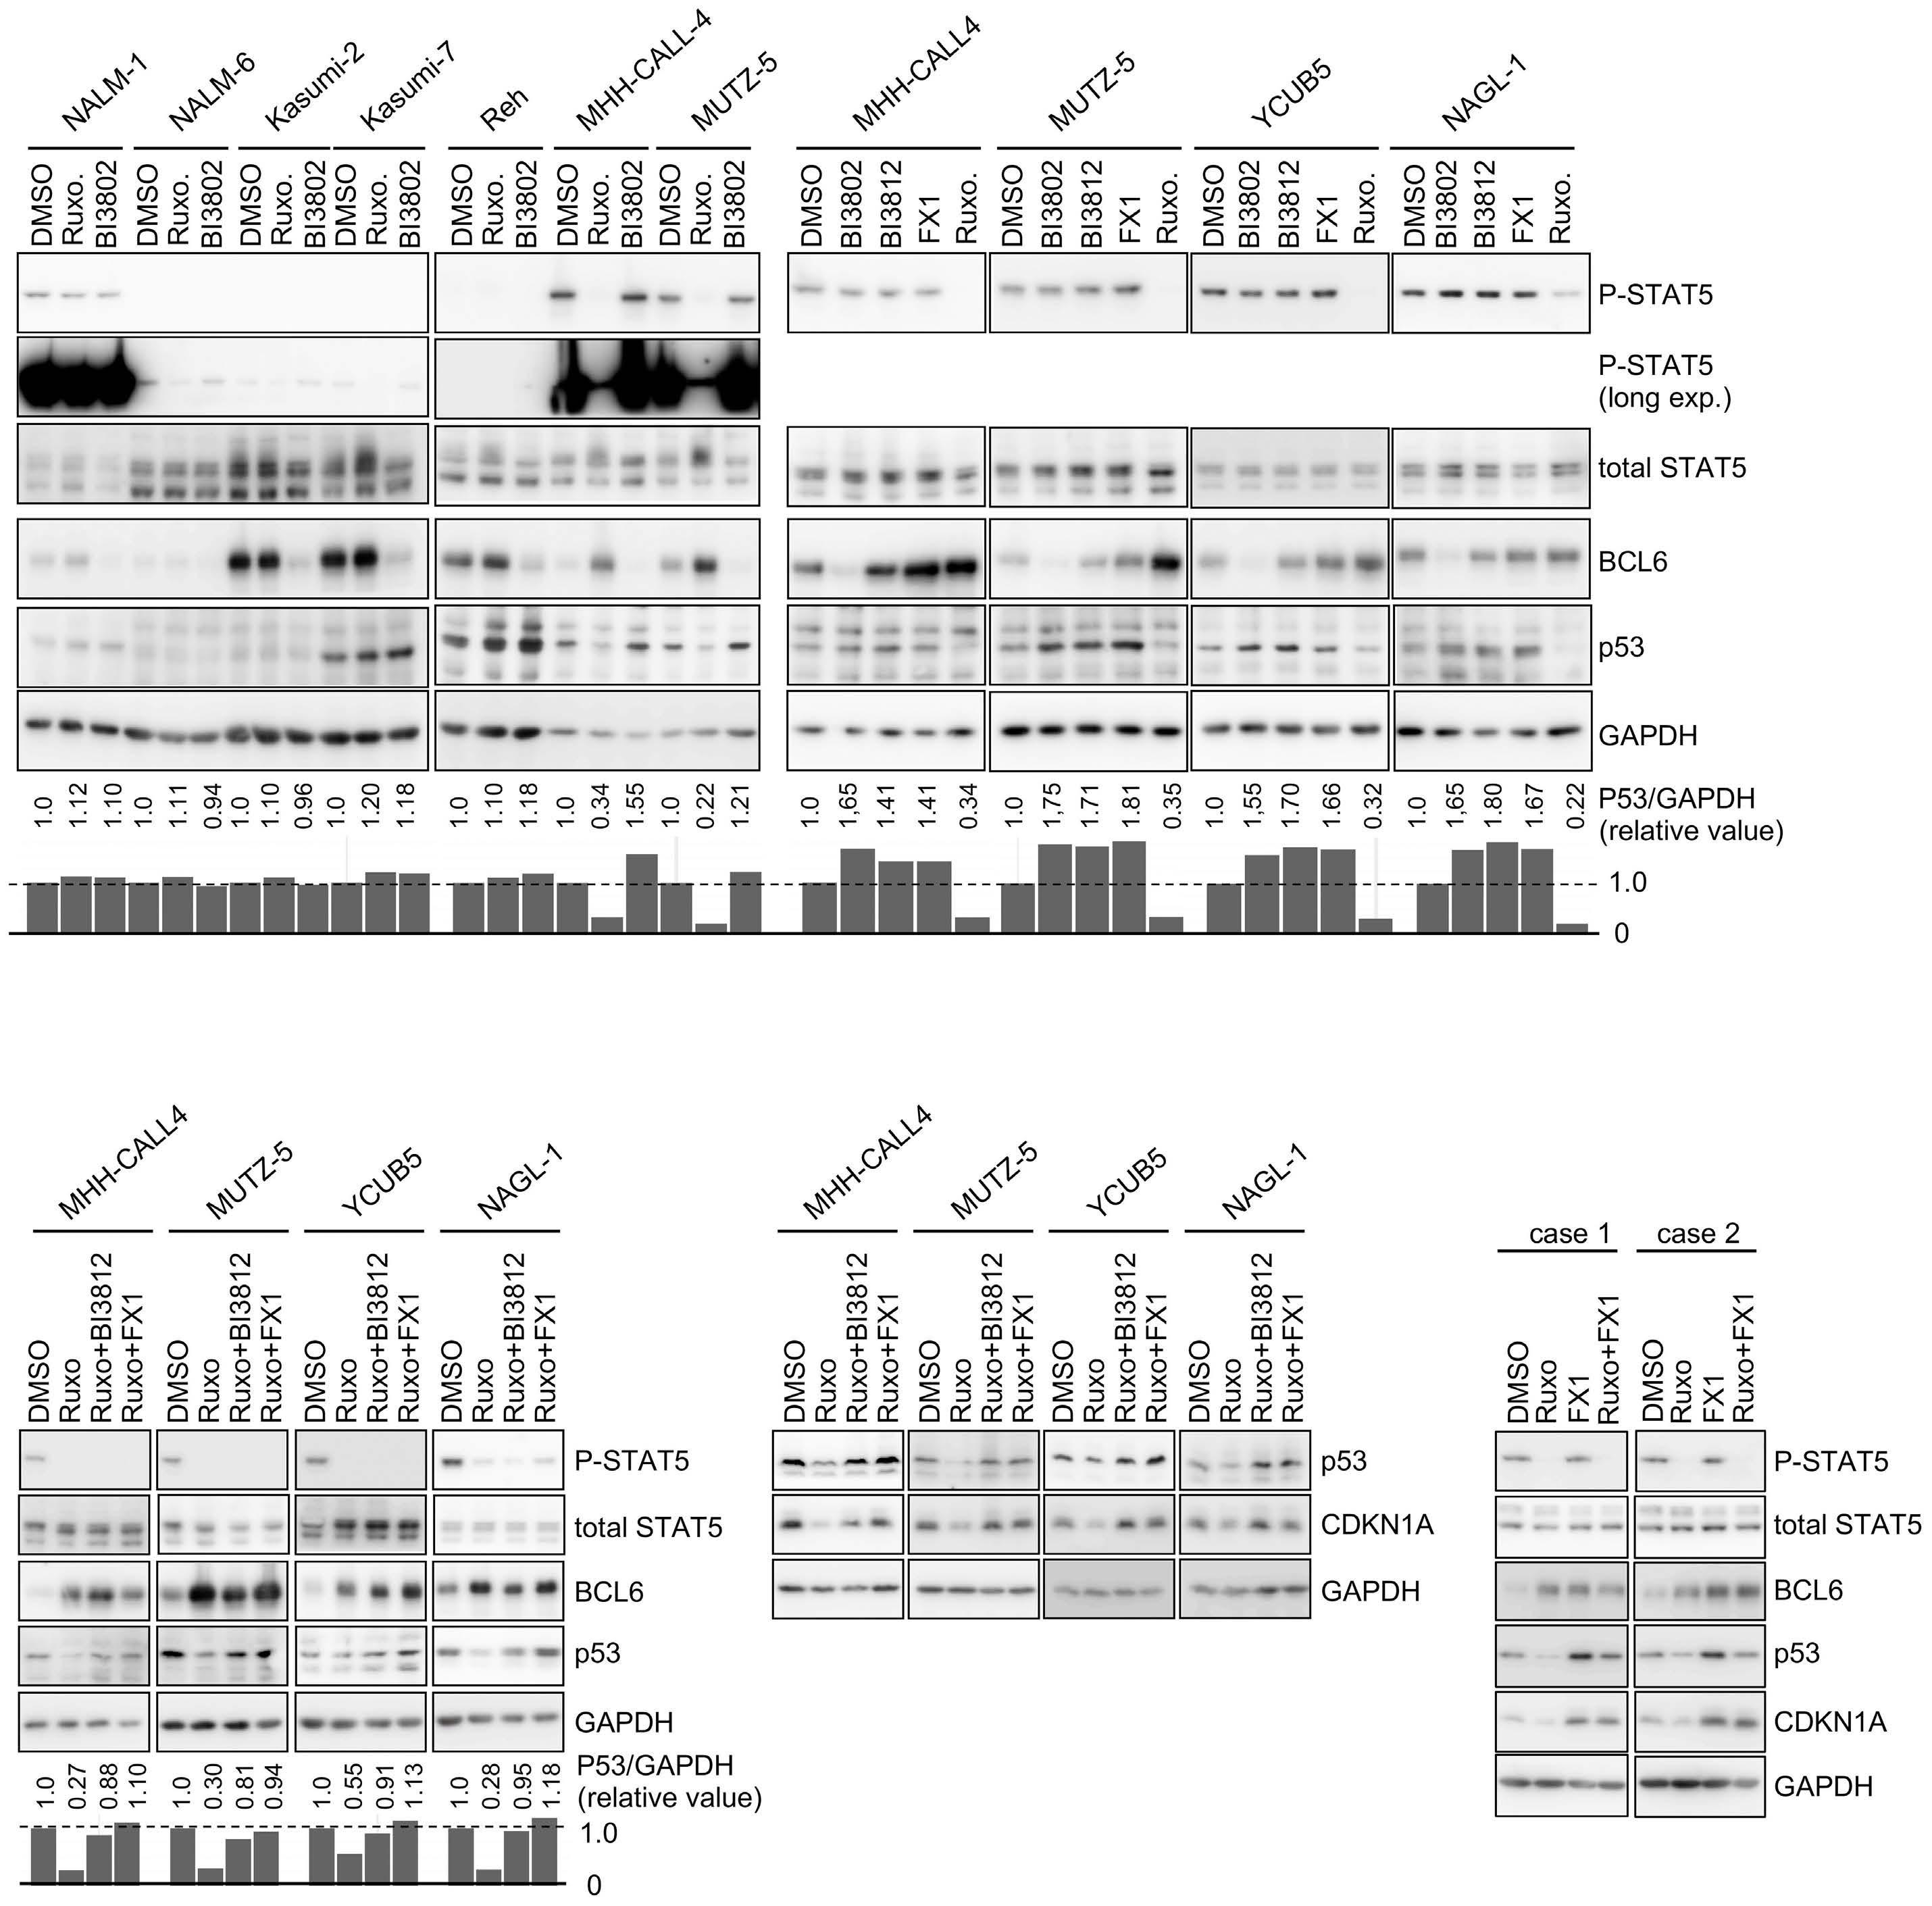
A B C D
Figure 5.
Haematologica | 108 February 2023 402 ARTICLE - BCL6 inhibition in
Alterations of TP53 protein levels in CRLF2-ALL cells in response to treatment with ruxolitinib and BCL6 inhibitors. (A, left) Five non-CRLF2-ALL cell lines and two CRLF2-ALL cell lines (MHH-CALL-4 and MUTZ-5) were treated with vehicle (DMSO), ruxolitinib (1 mM; Ruxo), or BI3802 (3 mM) for 24 h and western blot analysis was performed for the expression levels of phosphoSTAT5, total STAT-5, BCL6, TP53, and GAPDH (a loading control). (A, right) CRLF2-ALL cells were treated with vehicle (DMSO), BI3802 (3 mM), BI3812 (10 mM), FX1 (20 mM), or ruxolitinib (1 mM; Ruxo) for 24 h and subjected to western blot analysis for the indicated proteins. (B) The CRLF2-ALL cells were treated with the indicated drugs for 24 h and subjected to western blot analysis as in (A). In (A) and (B), p53 expression levels were normalized based on GAPDH levels and are presented as bar charts, with controls set to 1.0. (C) The CRLF2-ALL cells were treated with the indicated drugs for 24 h and subjected to western blot analysis, as in (B), for the indicated proteins. (D) Clinical samples from two patients (case 1 and case 2) with CRLF2-ALL were analyzed for the indicated proteins. leukemia S. Tsuzuki et al.
treatment partially sensitized these cells to apoptosis (Figure 7D). Two patients’ cells were sensitive to TRAIL- and FAS-mediated apoptosis, which ruxolitinib blunted but FX1 addition restored (Figure 7E). However, the biallelically TP53-mutated KOPN49 cell line was inert to ruxolitinib or FX1 treatment regarding TNFRSF10B/FAS expression and FAS-mediated apoptosis (Online Supplementary Figure S7A).
MDM2 inhibitors largely recapitulated the observations made using FX1. The MDM2 inhibitors, NVP-CGM097 and MI773, restored TNFRSF10B and FAS expression that ruxolitinib treatment had diminished (Online Supplementary Figure
S7B). The addition of NVP-CGM097 restored the sensitivity of MHH-CALL-4 cells to FAS-mediated apoptosis. The combination of ruxolitinib and MDM2 inhibitor sensitized YCUB5 cells to FAS-mediated cell death (Online Supplementary Figure S7C).
These findings suggest that ruxolitinib allows CRLF2-ALL cells to evade TRAIL- and Fas-mediated immunological elimination. Thus, the use of a BCL6 inhibitor may benefit patients in bolstering such elimination, even while off ruxolitinib treatment. These effects of BCL6 inhibitors likely depend on TP53.
Figure 6. Ruxolitinib and FX1 treatment downregulates MYC. (A) Changes in expression levels of the indicated genes in MHHCALL-4 (upper panel) and MUTZ-5 (lower panel) cells. Cells were treated as in Figure 4A, and gene expression changes are presented as heatmaps. (B) The MYC protein levels in the indicated four CRLF2-ALL cell lines. These MYC levels normalized to GAPDH levels are also depicted. (C, D) The shRNA-mediated knockdown of MYC attenuated the growth of the indicated CRLF2-ALL cells. MYC protein levels (C) and cell growth (D) after the knockdown. Ctr: control; Ruxo: ruxolitinib; Combo: ruxolitinib+FX1.
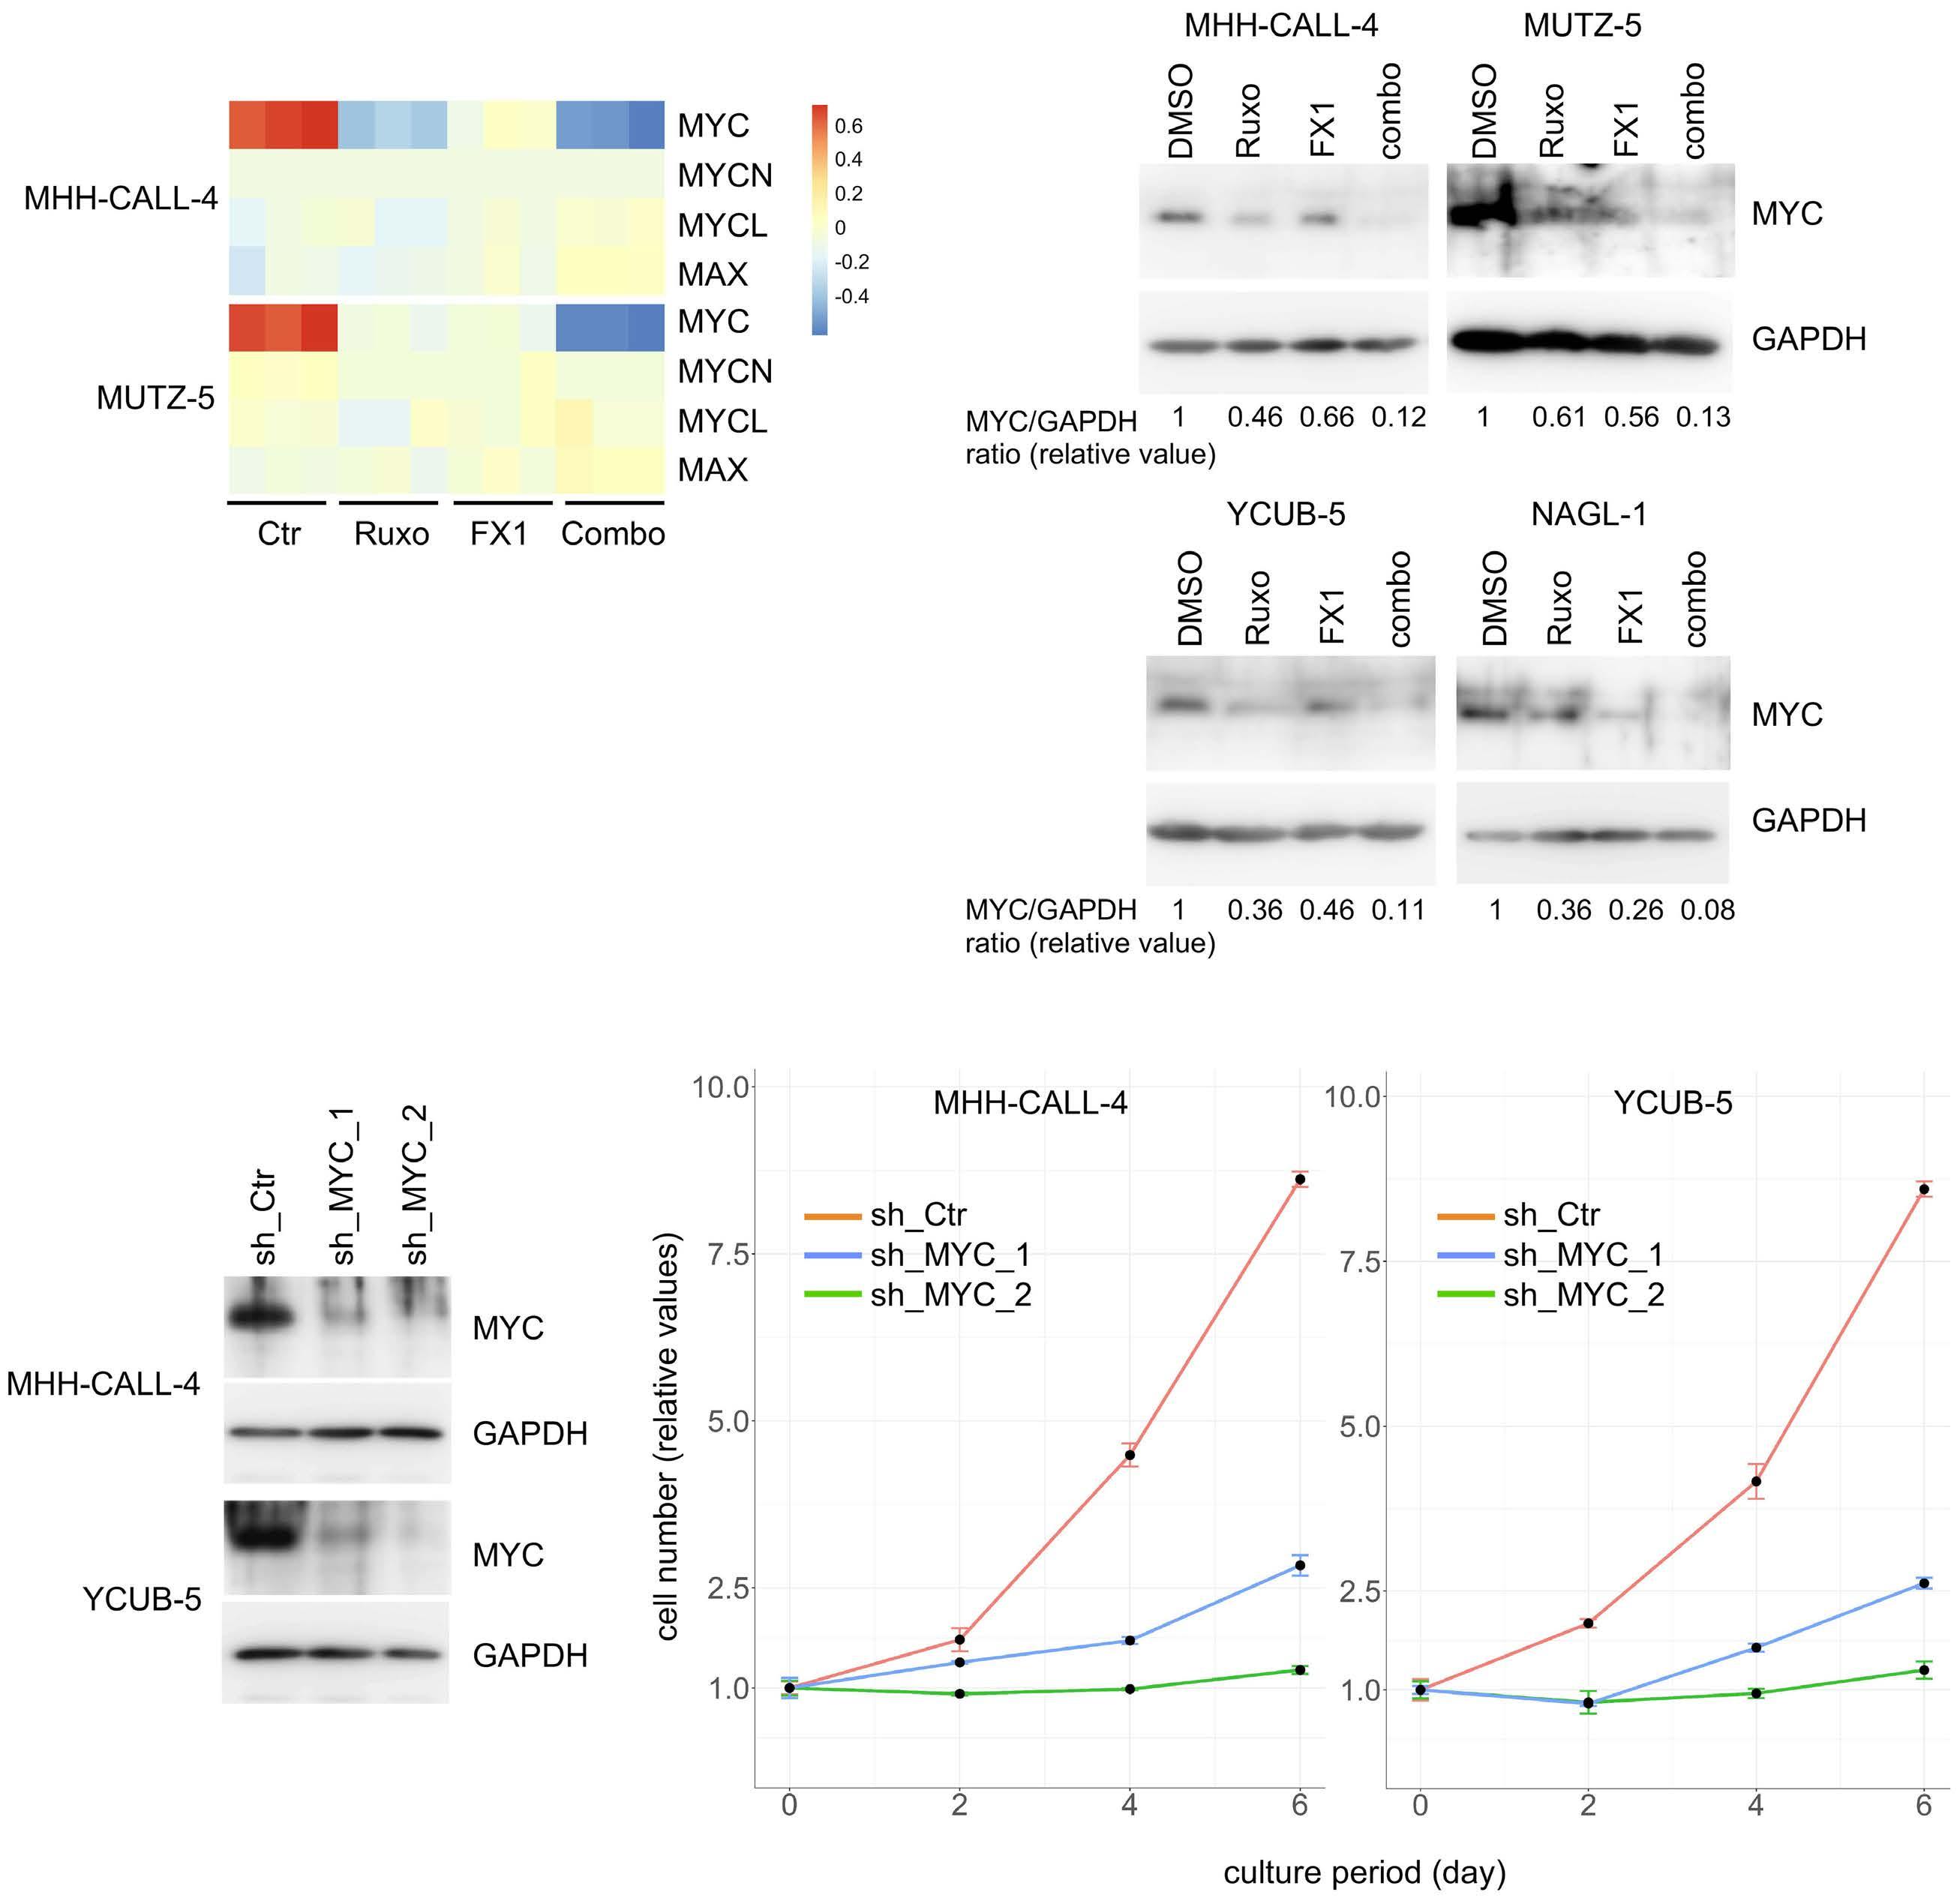
A B C D Haematologica | 108 February 2023 403 ARTICLE - BCL6
S. Tsuzuki et al.
inhibition in CRLF2-rearranged leukemia
Figure 7. Alterations of extrinsic apoptosis pathway gene expression and their relation to sensitivity to TRAIL- and FAS-induced cell death. (A) Heatmap representation of changes in the expression of genes involved in the extrinsic apoptosis pathway. The HMM-CALL4 and MUTZ-5 cells were treated as in Figure 4A. (B) The CRLF2-ALL cells were treated with vehicle (dimethylsulfoxide, DMSO), ruxolitinib (1 mM; Ruxo), FX1 (20 mM), and their combination for 24 h, and the expression of TNFRSF10B (TRAIL receptor) and FAS was analyzed by flow cytometry. Ruxolitinib treatment downregulated the two molecules on the cell surface. FX1 treatment counteracted the downregulation (left panel). FX1 treatment alone upregulated the two molecules’ expression compared with the control treatment (right panel). (C) Cells were treated with the indicated drugs, as in (A), for 24 h and incubated with the indicated concentrations of TRAIL for an additional 12 h. Numbers of viable cells, relative to those not incubated with TRAIL, are shown as the mean ± standard deviation. (D) Cells were treated as in (C) but with the indicated concentrations of anti-FAS antibody instead. Numbers of viable cells, relative to those not incubated with anti-FAS antibodies are presented. (E) Results of clinical sample cells treated as in (C) and (D). Ruxo: ruxolitinib; Ctrl; control; Combo: ruxolitinib + FX1; Ab: antibody.
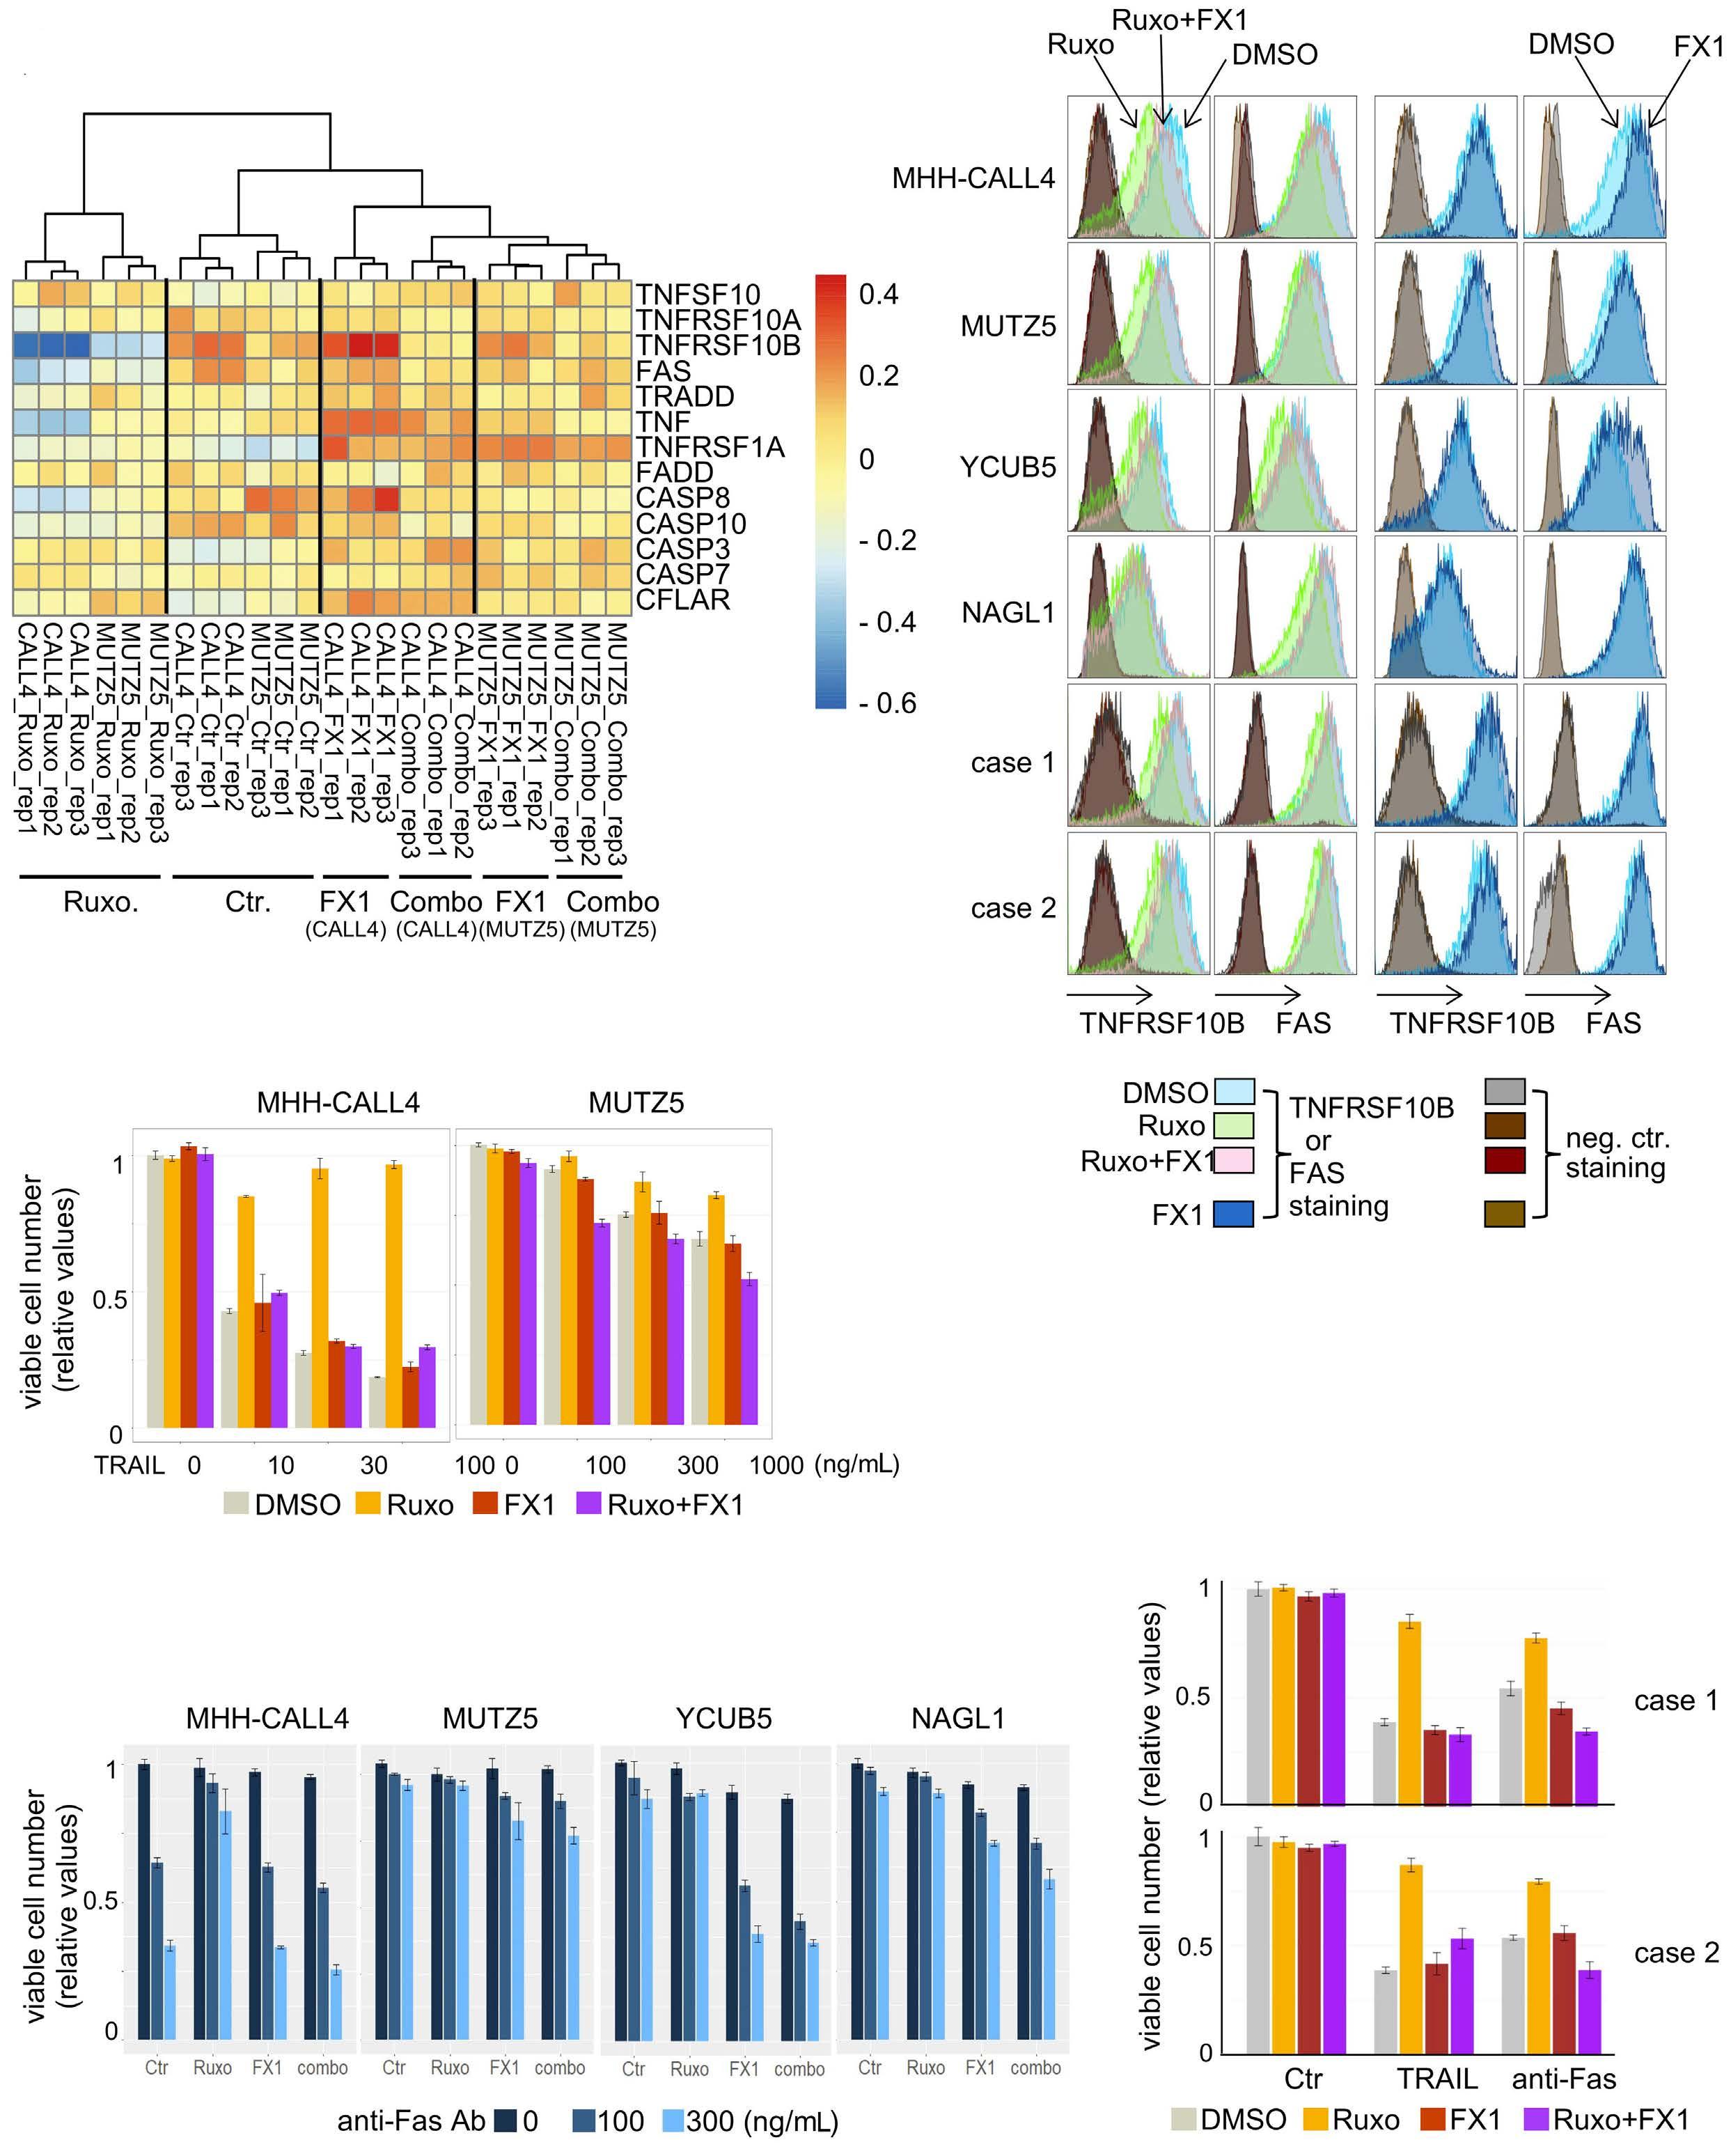
A B C D
Haematologica | 108 February 2023 404 ARTICLE - BCL6 inhibition in CRLF2-rearranged leukemia S. Tsuzuki et al.
E
Ruxolitinib and FX1 co-treatment renders CRLF2-ALL cells hypersensitive to BCL2 inhibition in apoptosis The next focus was on genes affiliated with the “intrinsic” pathway of apoptosis. Gene expression (Figure 8A) and protein expression (Figure 8B; Online Supplementary Figure S8A) analyses suggested that ruxolitinib treatment downregulated, and FX1 addition restored, the expression of the pro-apoptotic molecules PUMA (BBC3), NOXA (PMAIP1), BID, BAX, and BAK. As for anti-apoptotic molecules, ruxolitinib downregulated BCLxL, an effect not modified by the addition of FX1. Ruxolitinib marginally downregulated MCL1 and the addition of FX1 further downregulated this molecule. The ability of FX1 to downregulate MCL1 is likely mediated through the upregulation of TP53, as MDM2 inhibitor-mediated activation of TP53 likewise downregulated MCL1 (Online Supplementary Figure S5A). FX1 and its combination with ruxolitinib did not diminish MCL1 in biallelically mutated TP53 KOPN49 cells (Online Supplementary Figure S8B). These findings suggest that the ruxolitinib and FX1 combination lowers the threshold in executing apoptosis. However, apoptosis was observed only after 6 days in CRLF2-ALL cells and only to a moderate extent (Online Supplementary Figure S8C). BCL2 may be one explanation of the inertness of CRLF2-ALL cells to apoptosis, as the level of this protein did not change appreciably upon treatment with ruxolitinib, FX1, or their combination in the four CRLF2-ALL cell lines tested (Figure 8B; Online Supplementary Figure S8A). Indeed, venetoclax (a BCL2 inhibitor)41 induced striking apoptosis of CRLF2-ALL cells when combined with ruxolitinib and FX1 even at low concentrations (≤30 nM), which itself otherwise had only a minor effect (Figure 8C). Venetoclax remarkably diminished the mitochondrial membrane potential in the presence of both ruxolitinib and FX1, whereas S63845 (a MCL-1 inhibitor) or A-1155463 (a BCLxL inhibitor) did so only modestly (Online Supplementary Figure S8D). These FX1-mediated apoptosis-promoting effects were again, at least partly, mediated through TP53 activation since NVPCGM097 produced an effect similar to that of FX1 (Online Supplementary Figure S8E); the biallelically TP53-mutated CRLF2-ALL KOPN49 cell line was insensitive to NVPCGM097 and FX1 (Online Supplementary Figures S8F, G) regarding venotoclax-induced apoptosis. Overall, these findings suggest that ruxolitinib treatment per se does not favor apoptosis. However, the addition of FX1 tips the balance toward apoptosis, thus rendering CRLF2-ALL cells hypersensitive to venetoclax.
Discussion
CRLF2-ALL responds inadequately to type I JAK1/2 inhibitors, such as ruxolitinib.4,14,15 This study identified upregulated BCL6 as a reason for this. Upregulated BCL6 was
accompanied by a decrease in TP53 protein, with blunted gene expression in the TP53 tumor suppressor pathway. Conversely, BCL6 inhibitors restored TP53 levels and its downstream gene expression. In addition, ruxolitinib and BCL6 inhibitors downregulate MYC in concert. Therefore, these two drugs act synergistically in the treatment of CRLF2-ALL. Although BCL6 upregulation is implicated in imatinib resistance in Ph ALL,42 this study revealed the role of BCL6 in ruxolitinib resistance in CRLF2-ALL. The following findings support the mechanistic link that JAK1/2 inhibition upregulates BCL6, leading to TP53 downregulation: (i) STAT5 activity, estimated by p-STAT5, is inversely correlated to the levels of BCL6 expression (Figure 5A); (ii) manipulation of STAT5 activity suggests that STAT5 harnesses BCL6 expression (Figure 1E; Online Supplementary Figure S1F);24,42,43 (iii) gene expression analysis coupled with publicly available BCL6 chromatin immunoprecipitation sequencing data suggests that BCL6 may downregulate molecules contributing to TP53 protein stabilization (Online Supplementary Figure S5F, G); and (iv) pharmacological degradation, inhibition, and knockdown of BCL6 upregulated TP53 (Figure 5, Online Supplementary Figure S2C). However, the detailed molecular mechanisms underlying these observations await further investigation. Six out of seven CRLF2-ALL cells used in this study had no deletion/mutation of the TP53 gene (Online Supplementary Table S2); this fact, coupled with the reports that TP53 mutation/deletion in clinical CRLF2-ALL cells are rare (<5%),10,44,45 suggests that upregulated TP53 protein in CRLF2-ALL by BCL6 inhibitors is mostly functional. This study suggests that the synergy of BCL6 inhibitors with ruxolitinib largely relies on TP53 activation (Online Supplementary Figures S4D, S5A-D, S6, S7, and S8B, E-G) but does not exclude the possibility of additional mechanisms. Because BCL6 deletion provokes systemic inflammation in mice,46 this study primarily used the small-molecule inhibitors FX1 and BI3812 as probes to infer the effects of BCL6 inhibition; these inhibitors diminish the transcriptional suppressor functions of BCL6 by interfering with the binding of BCL6 to co-repressors. This interference does not provoke inflammation.32 Experiments using these probes suggested that the mere expression of BCL6 does not predict response to BCL6 inhibitors across subtypes of ALL (Figure 1D, F), as in diffuse large B-cell lymphoma.47 This study implied that CRLF2-ALL is BCL6-dependent, particularly when JAK1/2 inhibitors are used, and is therefore amenable to BCL6 inhibition. However, a small fraction of CRLF2-ALL, particularly in children with National Cancer Institute standard-risk disease, does not show the kinase-activated signature (and is thus not considered Phlike ALL),3,7 raising the possibility that this non-Ph-like subset does not show BCL6 dependency. It will, therefore, be important to identify CRLF2-ALL patients who may benefit from the use of BCL6 inhibitors.
Haematologica | 108 February 2023 405 ARTICLE - BCL6 inhibition in CRLF2-rearranged leukemia S. Tsuzuki et al.
Figure 8. Alterations of intrinsic apoptosis pathway gene expression and their relation to the sensitivity to venetoclax-induced cell death. (A) Heatmap representation of changes in the expression of genes involved in the intrinsic apoptosis pathway. Cells were treated as in Figure 4A. (B) Box-plot representations of changes in the expression of selected proteins shown in Online Supplementary Figure S8A. The level of protein in untreated cells is set as 1, and the relative protein expression levels upon treatment with ruxolitinib, FX1, and their combination are presented. GAPDH protein was used as a loading control. (C) Sensitivity of CRLF4-ALL cells to venetoclax-induced cell death in the presence of ruxolitinib, FX1, and their combination. Cells treated with dimethylsulfoxide served as a control. The color-coded legend indicates venetoclax concentrations. Cells were treated with the indicated drugs for 24 h before treatment with graded concentrations of venetoclax for 12 h. The number of live cells following treatment with vehicle alone is set as 1, and the relative values are shown as the mean ± standard deviation. Ruxo: ruxolitinib; Ctrl; control; Combo: ruxolitinib + FX1; PI: propidium iodide.
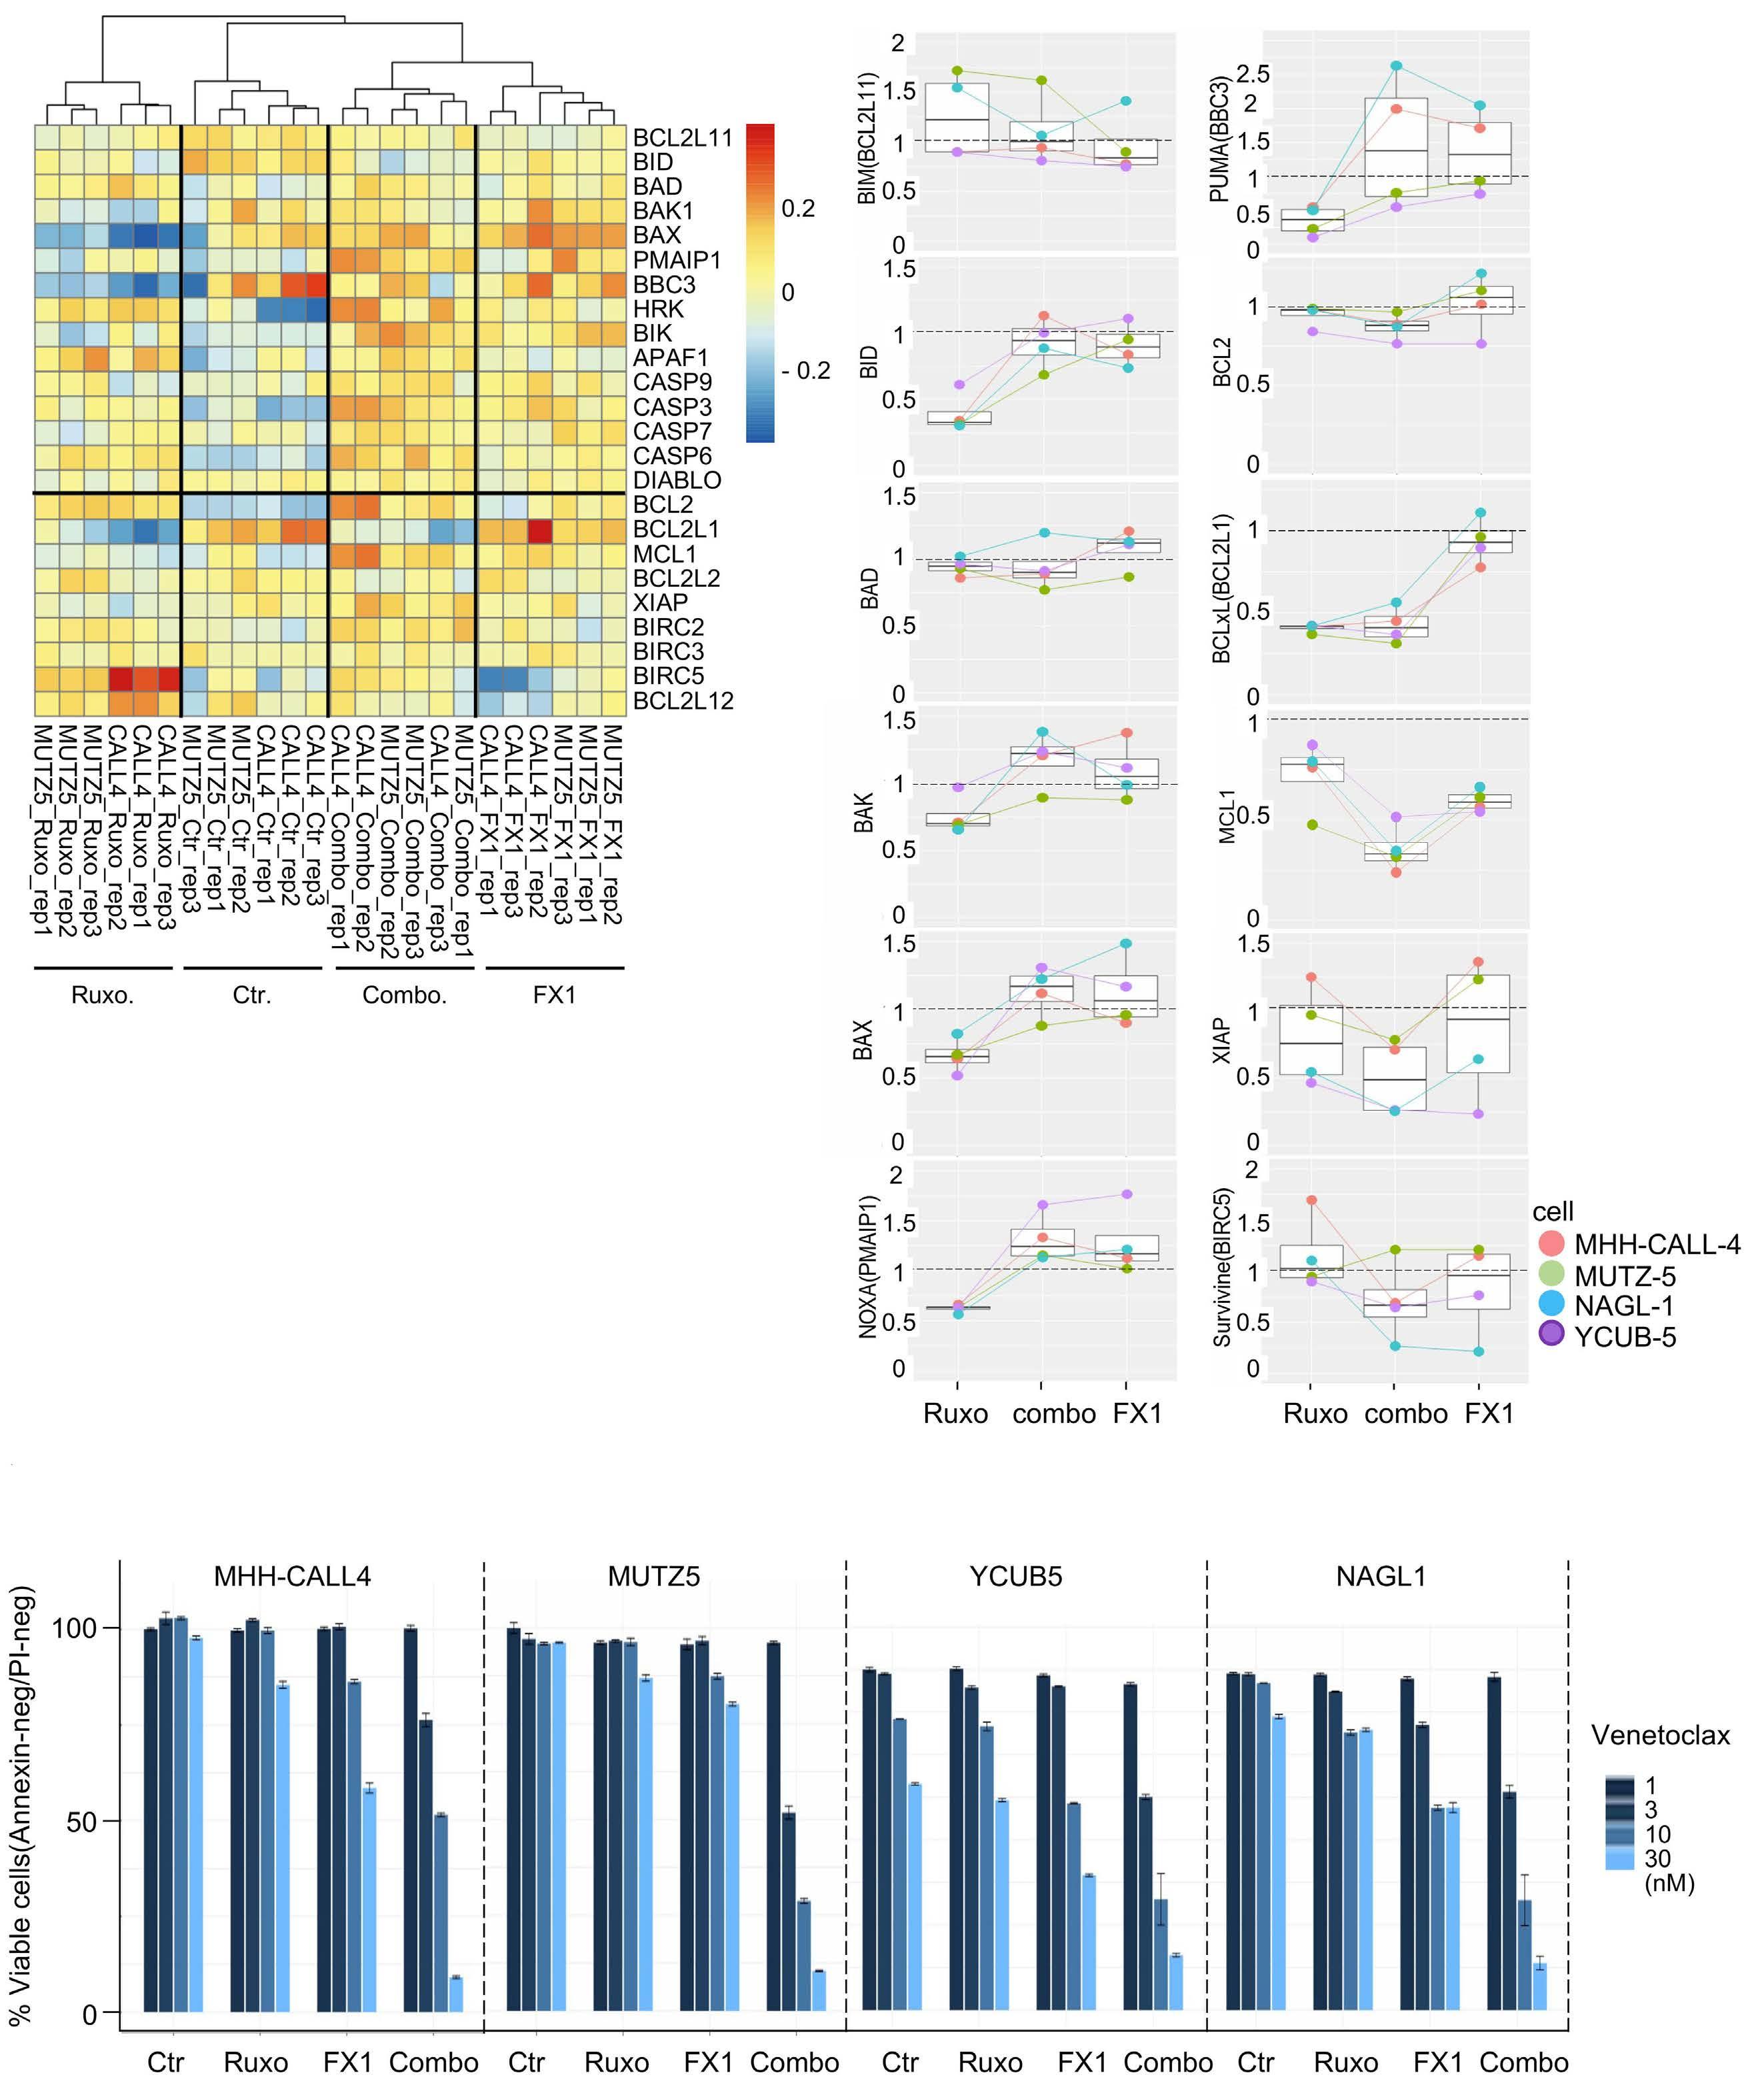
A B C Haematologica | 108 February 2023 406 ARTICLE - BCL6 inhibition in CRLF2-rearranged leukemia S. Tsuzuki et al.
Previous work suggested the use of a combination of a JAK inhibitor and a BCL2/BCLxL dual inhibitor to treat CRLFALL.18 However, BCLxL inhibition could cause life-threatening thrombocytopenia in a clinical setting, whereas a BCL2 inhibitor (venetoclax) does not.41 This study revealed that ruxolitinib downregulated BCLxL, probably due to decreased STAT5 binding to the BCLXL promoter.48 FX1 downregulated MCL1 (Figure 8B), likely through TP53-mediated mechanisms (Online Supplementary Figure S5A).49 In addition, ruxolitinib downregulated, and FX1 restored the expression of the pro-apoptotic proteins PUMA, NOXA, BID, BAX, and BAK (TP53 targets).49,50 However, ruxolitinib and FX1 did not appreciably affect BCL2 expression (Figure 8A, B). Therefore, the ruxolitinib and FX1 combination primes CRLF2-ALL cells to venetoclax hypersensitivity (Figure 8C, Online Supplementary Figure S8D).
Although the number of patients’ samples tested was small and in vivo treatment schedules/dosing have not been optimized, this study illuminates a potential clinical utility of a BCL6 inhibitor in conjunction with JAK inhibition as a strategy to treat CRLF2-ALL.
Disclosures
HK has received research funding from FUJIFILM Corporation, Kyowa Kirin Co., Ltd., Bristol-Myers Squibb, Otsuka Pharmaceutical Co., Ltd., Perseus Proteomics Inc., Daiichi Sankyo Co., Ltd., Abbvie Inc., CURED Inc., Astellas Pharma Inc., Chugai Pharmaceutical Co., Ltd., Zenyaku Kogyo Co., Ltd., Nippon Shinyaku Co., Ltd., Eisai Co., Ltd., Takeda Pharmaceutical Co., Ltd., Sumitomo Dainippon Pharma Co.,
References
1. Malard F, Mohty M. Acute lymphoblastic leukaemia. Lancet. 2020;395(10230):1146-1162.
2. Shiraz P, Payne KJ, Muffly L. The current genomic and molecular landscape of Philadelphia-like acute lymphoblastic leukemia. Int J Mol Sci. 2020;21(6):2193.
3. Gu Z, Churchman ML, Roberts KG, et al. PAX5-driven subtypes of B-progenitor acute lymphoblastic leukemia. Nat Genet. 2019;51(2):296-307.
4. Mullighan CG. How advanced are we in targeting novel subtypes of ALL? Best Pract Res Clin Haematol. 2019;32(4):101095.
5. Den Boer ML, van Slegtenhorst M, De Menezes RX, et al. A subtype of childhood acute lymphoblastic leukaemia with poor treatment outcome: a genome-wide classification study. Lancet Oncol. 2009;10(2):125-134.
6. Mullighan CG, Su X, Zhang J, et al. Deletion of IKZF1 and prognosis in acute lymphoblastic leukemia. N Engl J Med. 2009;360(5):470-480.
7. Harvey RC, Tasian SK. Clinical diagnostics and treatment strategies for Philadelphia chromosome-like acute lymphoblastic leukemia. Blood Adv. 2020;4(1):218-228.
8. Herold T, Schneider S, Metzeler KH, et al. Adults with Philadelphia chromosome-like acute lymphoblastic leukemia frequently have IGH-CRLF2 and JAK2 mutations, persistence of
Ltd., Novartis Pharma K.K., and Sanofi K.K., and honoraria from Astellas Pharma Inc., Abbvie Inc., Chugai Pharmaceutical Co., Ltd., and Novartis Pharma K.K. The other authors have no disclosures to make.
Contributions
ST designed the study, performed experiments, and wrote the manuscript. TY performed experiments and contributed to writing the manuscript. HG, KA, and TI provided cell lines. NM, HY, HK, and FH provided patients’ cells. SK, AO, TH, HK, and YH provided technical help. FH contributed to writing the manuscript.
Acknowledgments
The authors thank the staff of the Division of advanced research promotion in the Institute of comprehensive medical research at Aichi Medical University for support of analyses.
Funding
This work was supported by JSPS KAKENHI grant numbers 18H02645 and 22H02856 (to ST), 18K16103 (to TY), and 18H02835 (to FH); AMED under grant numbers JP17cm0106525 (to TY) and JP20ck0106607 (to FH); a grant from the Princess Takamatsu Cancer Research Fund (11-24307 to ST) and a grant from The Nitto Foundation (to ST).
Data-sharing statement
The RNA-sequencing data have been deposited in ArrayExpress under accession number E-MTAB-10755.
minimal residual disease and poor prognosis. Haematologica. 2017;102(1):130-138.
9. Tasian SK, Loh ML, Hunger SP. Philadelphia chromosome-like acute lymphoblastic leukemia. Blood. 2017;130(19):2064-2072.
10. Jain N, Roberts KG, Jabbour E, et al. Ph-like acute lymphoblastic leukemia: a high-risk subtype in adults. Blood. 2017;129(5):572-581.
11. Roberts KG, Li Y, Payne-Turner D, et al. Targetable kinaseactivating lesions in Ph-like acute lymphoblastic leukemia. N Engl J Med. 2014;371(11):1005-1015.
12. Mullighan CG, Collins-Underwood JR, Phillips LA, et al. Rearrangement of CRLF2 in B-progenitor- and Down syndromeassociated acute lymphoblastic leukemia. Nat Genet. 2009;41(11):1243-1246.
13. Yoda A, Yoda Y, Chiaretti S, et al. Functional screening identifies CRLF2 in precursor B-cell acute lymphoblastic leukemia. Proc Natl Acad Sci U S A. 2010;107(1):252-257.
14. Maude SL, Tasian SK, Vincent T, et al. Targeting JAK1/2 and mTOR in murine xenograft models of Ph-like acute lymphoblastic leukemia. Blood. 2012;120(17):3510-3518.
15. Kim SK, Knight DA, Jones LR, et al. JAK2 is dispensable for maintenance of JAK2 mutant B-cell acute lymphoblastic leukemias. Genes Dev. 2018;32(11-12):849-864.
Haematologica | 108 February 2023 407 ARTICLE - BCL6 inhibition in CRLF2-rearranged leukemia S. Tsuzuki et al.
- BCL6 inhibition in CRLF2-rearranged leukemia
16. Wu SC, Li LS, Kopp N, et al. Activity of the type II JAK2 inhibitor CHZ868 in B cell acute lymphoblastic leukemia. Cancer Cell. 2015;28(1):29-41.
17. Weigert O, Lane AA, Bird L, et al. Genetic resistance to JAK2 enzymatic inhibitors is overcome by HSP90 inhibition. J Exp Med. 2012;209(2):259-273.
18. Waibel M, Solomon VS, Knight DA, et al. Combined targeting of JAK2 and Bcl-2/Bcl-xL to cure mutant JAK2-driven malignancies and overcome acquired resistance to JAK2 inhibitors. Cell Rep. 2013;5(4):1047-1059.
19. Tasian SK, Teachey DT, Li Y, et al. Potent efficacy of combined PI3K/mTOR and JAK or ABL inhibition in murine xenograft models of Ph-like acute lymphoblastic leukemia. Blood. 2017;129(2):177-187.
20. Russell LJ, Capasso M, Vater I, et al. Deregulated expression of cytokine receptor gene, CRLF2, is involved in lymphoid transformation in B-cell precursor acute lymphoblastic leukemia. Blood. 2009;114(13):2688-2698.
21. Chang Y, Min J, Jarusiewicz JA, et al. Degradation of Janus kinases in CRLF2-rearranged acute lymphoblastic leukemia. Blood. 2021;138(23):2313-2326.
22. Sasaki K, Yamauchi T, Semba Y, et al. Genome-wide CRISPRCas9 screen identifies rationally designed combination therapies for CRLF2-rearranged Ph-like ALL. Blood. 2022;139(5):748-760.
23. Page EC, Heatley SL, Eadie LN, et al. HMGN1 plays a significant role in CRLF2 driven Down Syndrome leukemia and provides a potential therapeutic target in this high-risk cohort. Oncogene. 2022;41(6):797-808.
24. Hurtz C, Wertheim GB, Loftus JP, et al. Oncogene-independent BCR-like signaling adaptation confers drug resistance in Ph-like ALL. J Clin Invest. 2020;130(7):3637-3653.
25. Bhm JW, Sia KCS, Jones C, et al. Combination efficacy of ruxolitinib with standard-of-care drugs in CRLF2-rearranged Ph-like acute lymphoblastic leukemia. Leukemia. 2021;35(11):3101-3112.
26. Hatzi K, Jiang Y, Huang C, et al. A hybrid mechanism of action for BCL6 in B cells defined by formation of functionally distinct complexes at enhancers and promoters. Cell Rep. 2013;4(3):578-588.
27. Cardenas MG, Oswald E, Yu W, Xue F, MacKerell AD Jr, Melnick AM. The expanding role of the BCL6 oncoprotein as a cancer therapeutic target. Clin Cancer Res. 2017;23(4):885-893.
28. Saito M, Gao J, Basso K, et al. A signaling pathway mediating downregulation of BCL6 in germinal center B cells is blocked by BCL6 gene alterations in B cell lymphoma. Cancer Cell. 2007;12(3):280-292.
29. Pasqualucci L, Migliazza A, Basso K, Houldsworth J, Chaganti RS, Dalla-Favera R. Mutations of the BCL6 proto-oncogene disrupt its negative autoregulation in diffuse large B-cell lymphoma. Blood. 2003;101(8):2914-2923.
30. Goto H, Naruto T, Tanoshima R, et al. Chemo-sensitivity in a panel of B-cell precursor acute lymphoblastic leukemia cell lines, YCUB series, derived from children. Leuk Res. 2009;33(10):1386-1391.
31. Tamai M, Kasai S, Akahane K, et al. Glucocorticoid receptor gene mutations confer glucocorticoid resistance in B-cell precursor acute lymphoblastic leukemia. J Steroid Biochem Mol Biol. 2022;218:106068.
32. Cardenas MG, Yu W, Beguelin W, et al. Rationally designed BCL6 inhibitors target activated B cell diffuse large B cell lymphoma. J Clin Invest. 2016;126(9):3351-3362.
33. Kerres N, Steurer S, Schlager S, et al. Chemically induced degradation of the oncogenic transcription factor BCL6. Cell Rep. 2017;20(12):2860-2875.
34. Geng H, Hurtz C, Lenz KB, et al. Self-enforcing feedback activation between BCL6 and pre-B cell receptor signaling defines a distinct subtype of acute lymphoblastic leukemia. Cancer Cell. 2015;27(3):409-425.
35. Tsuzuki S, Yasuda T, Kojima S, et al. Targeting MEF2D-fusion oncogenic transcriptional circuitries in B-cell precursor acute lymphoblastic leukemia. Blood Cancer Discovery. 2020;1(1):82-95.
36. Phan RT, Dalla-Favera R. The BCL6 proto-oncogene suppresses p53 expression in germinal-center B cells. Nature. 2004;432(7017):635-639.
37. Lavin MF, Gueven N. The complexity of p53 stabilization and activation. Cell Death Differ. 2006;13(6):941-950.
38. Sachdevaa M, Zhua S, Wua F, et al. p53 represses c-Myc through induction of the tumor suppressor miR-145. Proc Natl Acad Sci U S A. 2009;106(9):3207-3212.
39. Olivero CE, Martinez-Terroba E, Zimmer J, et al. p53 activates the long noncoding RNA Pvt1b to inhibit Myc and suppress tumorigenesis. Mol Cell. 2020;77(4):761-774.
40. Sheikh MS, Fornace AJ Jr. Death and decoy receptors and p53mediated apoptosis. Leukemia. 2000;14(8):1509-1513.
41. Souers AJ, Leverson JD, Boghaert ER, et al. ABT-199, a potent and selective BCL-2 inhibitor, achieves antitumor activity while sparing platelets. Nat Med. 2013;19(2):202-208.
42. Duy C, Hurtz C, Shojaee S, et al. BCL6 enables Ph+ acute lymphoblastic leukaemia cells to survive BCR-ABL1 kinase inhibition. Nature. 2011;473(7347):384-388.
43. Chan LN, Murakami MA, Robinson ME, et al. Signalling input from divergent pathways subverts B cell transformation. Nature. 2020;583(7818):845-851.
44. Roberts KG, Gu Z, Payne-Turner D, et al. High frequency and poor outcome of Philadelphia chromosome-like acute lymphoblastic leukemia in adults. J Clin Oncol. 2017;35(4):394-401.
45. Waanders E, Gu Z, Dobson SM, et al. Mutational landscape and patterns of clonal evolution in relapsed pediatric acute lymphoblastic leukemia. Blood Cancer Discov. 2020;1(1):96-111.
46. Huang C, Hatzi K, Melnick A. Lineage-specific functions of Bcl-6 in immunity and inflammation are mediated by distinct biochemical mechanisms. Nat Immunol. 2013;14(4):380-388.
47. Polo JM, Juszczynski P, Monti S, et al. Transcriptional signature with differential expression of BCL6 target genes accurately identifies BCL6-dependent diffuse large B cell lymphomas. Proc Natl Acad Sci U S A. 2007;104(9):3207-3212.
48. Gesbert F, Griffin JD. Bcr/Abl activates transcription of the Bcl-X gene through STAT5. Blood. 2000;96(6):2269-2276.
49. Pan R, Ruvolo V, Mu H, et al. Synthetic lethality of combined Bcl-2 inhibition and p53 activation in AML: mechanisms and superior antileukemic efficacy. Cancer Cell. 2017;32(6):748-760
50. Maximov GK, Maximov KG. The role of p53 tumor-suppressor protein in apoptosis and cancerogenesis. Biotechnol & Biotechnological Equipment. 2014;22(2):664-668.
Haematologica | 108 February 2023 408
ARTICLE
S. Tsuzuki et al.
In vivo stabilization of a less toxic asparaginase variant leads to a durable antitumor response in acute leukemia
Maaike Van Trimpont,1,2,3 Amanda M. Schalk,4 Yanti De Visser,1,2,5 Hien Anh Nguyen,4 Lindy Reunes,1,2 Katrien Vandemeulebroecke,1,6,7 Evelien Peeters,1,3 Ying Su,4 Hyun Lee,8,9 Philip L. Lorenzi,10 Wai-Kin Chan,10 Veerle Mondelaers,1,6 Barbara De Moerloose,1,6,7 Tim Lammens,1,6,7 Steven Goossens,1,3 Pieter Van Vlierberghe1,2# and Arnon Lavie4,11#
1Cancer Research Institute Ghent (CRIG), Ghent, Belgium; 2Department of Biomolecular Medicine, Ghent University, Ghent, Belgium; 3Department of Diagnostic Sciences, Ghent University, Ghent, Belgium; 4Department of Biochemistry and Molecular Genetics, University of Illinois at Chicago, Chicago, IL, USA; 5Department of Imaging and Pathology, KU Leuven, Leuven, Belgium; 6Department of Pediatric Hemato-Oncology and Stem Cell Transplantation, Ghent University Hospital, Ghent, Belgium; 7Department of Internal Medicine and Pediatrics, Ghent University, Ghent, Belgium; 8Department of Pharmaceutical Sciences, College of Pharmacy, University of Illinois at Chicago (UIC), Chicago, IL, USA; 9Biophysics Core at Research Resources Center, University of Illinois at Chicago (UIC), Chicago, IL, USA; 10Metabolomics Core Facility, Department of Bioinformatics and Computational Biology, The University of Texas MD Anderson Cancer Center, Houston, TX, USA and 11The Jesse Brown VA Medical Center, Chicago, IL, USA.
#PVV and AL contributed equally as co-senior authors
Correspondence: A. Lavie Lavie@uic.edu
Received: May 11, 2022.
Accepted: August 4, 2022.
Prepublished: August 18, 2022.
https://doi.org/10.3324/haematol.2022.281390
©2023 Ferrata Storti Foundation
Published under a CC-BY-NC license
Asparagine is a non-essential amino acid since it can either be taken up via the diet or synthesized by asparagine synthetase. Acute lymphoblastic leukemia (ALL) cells do not express asparagine synthetase or express it only minimally, which makes them completely dependent on extracellular asparagine for their growth and survival. This dependency makes ALL cells vulnerable to treatment with L-asparaginase, an enzyme that hydrolyzes asparagine. To date, all clinically approved L-asparaginases have significant L-glutaminase co-activity, associated with non-immune related toxic side effects observed during therapy. Therefore, reduction of L-glutaminase co-activity with concomitant maintenance of its anticancer L-asparaginase effect may effectively improve the tolerability of this unique drug. Previously, we designed a new alternative variant of Erwinia chrysanthemi (ErA; Erwinaze) with decreased L-glutaminase co-activity, while maintaining its L-asparaginase activity, by the introduction of three key mutations around the active site (ErA-TM). However, Erwinaze and our ErA-TM variant have very short half-lives in vivo. Here, we show that the fusion of ErA-TM with an albumin binding domain (ABD)-tag significantly increases its in vivo persistence. In addition, we evaluated the in vivo therapeutic efficacy of ABD-ErA-TM in a B-ALL xenograft model of SUP-B15. Our results show a comparable long-lasting durable antileukemic effect between the standard-of-care pegylated-asparaginase and ABD-ErA-TM L-asparaginase, but with fewer co-glutaminase-related acute side effects. Since the toxic side effects of current L-asparaginases often result in treatment discontinuation in ALL patients, this novel ErA-TM variant with ultra-low L-glutaminase co-activity and long in vivo persistence may have great clinical potential.
Introduction
L-asparaginases (L-ASNases) are cornerstone drugs in the treatment of acute lymphoblastic leukemia (ALL) and have greatly improved patients’ outcomes over the last 40 years.1,2 Since the introduction of L-ASNases, mortality rates in pediatric ALL patients have drastically decreased, currently reaching overall 5-year survival rates of almost 90%.3 While the depletion of blood asparagine (Asn) represents a critical component of the multiple-drug ALL treatment regimen,3-5 the use of L-ASNase is also associated with a variety of toxic side effects.6-9 A large part of these un-
wanted effects can be attributed to the secondary L-glutaminase co-activity displayed by all clinically approved bacterial L-ASNases.10 These L-ASNases not only convert Asn into L-aspartate (Asp) and ammonia, but also hydrolyse glutamine (Gln) into L-glutamate (Glu) and ammonia.11-13 For all clinically approved L-ASNases, this L-glutaminase coactivity ranges from 2-10% of their primary L-ASNase activity depending on their microbiological origin.10,14,15 Importantly, Gln is much more abundant than Asn in the blood, with levels that range between 500-800 mM compared to ~50 mM for Asn.16,17 Because Gln levels are much higher, extensive amounts of ammonia are produced which
Abstract
Haematologica | 108 February 2023 409 ARTICLE - Acute Lymphoblastic Leukemia
might contribute to L-ASNase-induced neurotoxicity.18-20 The L-glutaminase co-activity also has an impact on protein synthesis in the liver and pancreas resulting in hepatotoxicity, pancreatitis, hyperglycemia, leukopenia and thrombosis.6,14,21
Over the past years, several attempts have been made to develop less toxic, low-glutaminase variants from various biological sources with better enzymatic parameters.10,21,22 Important criteria to keep in mind while designing alternative L-ASNases are efficacy, toxicity, kinetic properties, pharmacokinetics (i.e. in vivo half-life) and immunogenicity.22-24 The active degradation of native L-ASNase enzymes and their short half-life represents one of the biggest problems observed in the L-ASNase research field.25 Currently, the first-line L-ASNase used in the clinic is polyethylene glycol (PEG)-asparaginase, a L-ASNase derived from Escherichia coli (EcA) which is conjugated to a PEG-tag that not only improves the half-life of the enzyme, but also the solubility and masks the bacterial enzyme from the immune system.25-31 However, studies have shown that PEG itself can be immunogenic and that this anti-PEG immune response facilitates clearance in vivo. 10,32,33 Considering the bacterial origin of clinically used L-ASNases, immune responses against the enzyme itself are also commonly observed during therapy, including bronchospasms, anaphylactic shock, and hypersensitivity reactions.21,34,35 Currently, debate is ongoing whether the L-glutaminase coactivity of clinically approved L-ASNases is essential, contributory or fully dispensable for their anticancer effect based on contradictory results.10,36-39 Several studies have shown that the cancer cell killing potential of L-glutaminase co-activity has been linked to asparagine synthetase (ASNS) expression levels.10 Chan et al. found that L-glutaminase co-activity is not required for the cell killing potential of L-ASNase against ASNS-negative ALL cancer cells in vitro using a newly designed L-glutaminase-deficient EcA Q59L mutant (EcAQ59L),40 while other groups reported that Gln depletion contributed to the overall anti-leukemic effect.38,40,41 In addition, Panosyan et al. showed that deamination of Gln may enhance the anti-leukemic effect of L-ASNase.42 Recently, Nguyen et al. engineered a variant of Erwinia chrysanthemi (ErA) with three mutations, ErA-TM, that acquired ultra-low L-glutaminase activity while maintaining its LASNase activity.15 ErA has a very short in vivo half-life, but the authors reported that the addition of a His-SUMO tag N-terminally to ErA-TM enhanced the drug’s in vivo stability.43 Using short-term His-SUMO-ErA-TM treatment, in vivo antileukemic efficacy was successfully demonstrated in a B-ALL xenograft model of SUP-B15 cells and a patient-derived T-ALL xenograft model,43 confirming the previous in vitro results from Chan et al.40 However, it was recently shown that the EcAQ59L of Chan et al. did not induce a durable in vivo anticancer effect against xenografts of the ASNS-negative SUP-B15 leukemia cell line in
NOD/SCID gamma mice (NSG) compared to the L-ASNase wild-type (L-ASNaseWT),44 therefore again contradicting previous reports.40
To clarify whether L-glutaminase co-activity is required for a durable long-term anti-leukemic response, we took advantage of the superior tolerability of our low-glutaminase ErA-TM variant. To further improve the in vivo persistence (even longer than that afforded by the His-SUMO tag43), we introduced an albumin-binding domain (ABD) N-terminal to ErA-TM, which we refer to as ABD-ErA-TM. We show that the introduction of an ABD-tag stabilizes ErA-TM and dramatically enhances its half-life. In addition, we evaluated the in vivo efficacy of this low-glutaminase variant in a SUPB15 ALL xenograft model. Our results show a comparable long-lasting durable antileukemic effect between the mice treated with the standard-of-care PEG-asparaginase and ABD-ErA-TM, but with fewer co-glutaminase related nonimmunological toxicities. In the future, the implementation of this new L-ASNase variant in the clinic could improve ALL patients’ outcomes and quality of life.
Methods
Expression and purification of ABD-ErA-TM and ABD-ErA-WT, crystal structure of ABD-ErA-TM, surface plasmon resonance and isothermal titration calorimetry For detailed methodology, see the Online Supplementary Appendix.
Enzyme activity assay
The catalytic activities of the L-ASNase variants were determined using the aspartic acid b-hydroxamate (AHA) method as previously described.45-47 A detailed protocol can be found in the Online Supplementary Materials and Methods
In vivo
ABD-ErA
-TM and PEG-asparaginase pharmacokinetics and pharmacodynamics study
The pilot pharmacodynamic study was performed at The University of Texas MD Anderson Cancer Center under protocol ACUF #00001658-RN01 following published methods.44,48 For the other pharmacodynamic and pharmacokinetic study, healthy wild-type C57BL/6J were randomly divided into vehicle phosphate-buffered saline (PBS) (n=5), PEG-asparaginase (n=15) and ABD-ErA-TM (n=15) treatment groups. One single administration/dose of 2,500 IU/kg PEG-asparaginase or ABD-ErA-TM was administered via intraperitoneal injection. For the activity determinations, 50 mL of peripheral blood was collected and samples were processed according to the protocol described by Nguyen et al.43 For the amino acid level determinations, 120 mL of peripheral blood was collected and amino acids were measured as previously described.43 For a more detailed
Haematologica | 108 February 2023 410 ARTICLE - Durable antileukemic effect of ABD-tagged ErA-TM M. Van Trimpont et al.
description of the methods used, see the Online Supplementary Appendix.
Single-dose acute toxicity study
Healthy wild-type C57BL/6J (Charles River) mice (9 weeks old; n=18) received one single administration/dose (2,500 IU/kg) of PEG-asparaginase or ABD-ErA-TM via intraperitoneal injection. After 96 hours, blood was collected and hematologic (Vetscan® HM5 Hematology Analyzer; Abaxis) and biochemical analyses (VetScan® VS2 Chemistry Analyzer; Abaxis) were performed. For detailed methodology, see the Online Supplementary Appendix.
In vivo treatment of a SUP-B15 cell line xenograft model with L-ASNases NSG (#005557; The Jackson Laboratory) female mice (n=15) were intravenously injected at 6 weeks of age with 150 mL PBS containing 5 × 10⁶ luciferase-positive SUP-B15 cells. At regular time points, the bioluminescence was measured using the IVIS Lumina II imaging system (PerkinElmer). After evidence of leukemic cell engraftment in the spleen and/or bone marrow, the mice were randomly divided into vehicle PBS (n=5), PEG-asparaginase (n=5) and ABD-ErA-TM (n=5) treatment groups. PEG-asparaginase was administered every 10 days via intraperitoneal injection at a dose of 2,500 IU/kg (total of 5 administration/doses), while ABD-ErA-TM was given at the same dose every 7 days (total of 7 administration/doses). During the experiment, leukemic burden was evaluated via bioluminescent imaging at regular time points.
The ethical committee on animal welfare at Ghent University Hospital approved all the in vivo mice experiments.
Statistical analysis
Statistical power was calculated before every experiment (80% statistical power, a=0.05). The Shapiro-Wilk test was used to check for normality of the data. The amino acid level data were not normally distributed and therefore nonparametric Mann-Whitney U tests were performed. A twosided P value <0.05 was considered statistically significant. For the toxicity data, Mann-Whitney U tests, followed by Bonferroni correction for multiple comparisons, were performed. Results are expressed as mean ± standard deviation where appropriate. GraphPad Prism 9 (GraphPad Software Inc., La Jolly, CA, USA) was used to analyze the data.
Results
Introduction of an ABD-tag extends the in vivo persistence of ErA-TM L-ASNase variants
Dennis et al.49 used phage display to select peptides that bind to serum albumins. The 18-residue peptide SA21 with
the highest binding affinity to the human serum albumin (467 nM) contains two cysteines speculated to form an intramolecular disulfide bond that would stabilize the binding to albumin. We fused this SA21 sequence, from now on referred to as ABD, to our low-glutaminase ErATM variant (Figure 1A). The challenge in the purification was the undesired buildup of inter-ABD disulfide bonds instead of the desired intra-ABD disulfide bonds. The lack of cysteine residues in ErA/ErA-TM suggested that any undesired intermolecular disulfide bridges are between the cysteine of an ABD in a protomer and a cysteine of an ABD in another protomer. In fact, using gel filtration we could see that ~25% of the protein eluted as an octamer instead of the physiological tetramer, presumably due to this incorrect disulfide bond formation between ABD and cysteine residues located in different tetramers (Online Supplementary Figure S1). For the experiments described, only the physiological tetrameric fraction was used. We first verified if the kcat and K m values of ABD-ErA-TM were comparable to the ones from untagged ErA-TM and our previously reported His-SUMO- ErA -TM variant 43 (Table 1). The Km property is key for obtaining complete Asn depletion in vivo. The introduction of the triple mutations to ErA increased the K m from ~50 m M to ~100 m M, and the fusion of ErA-TM to ABD further increased the K m to ~150 m M.
To verify that ABD-ErA-TM can efficiently deplete Asn levels in vivo, we conducted a pilot pharmacodynamic properties study that showed a significant decrease of Asn levels upon ABD-ErA-TM administration (single administration/dose 2,500 IU/kg) (Online Supplementary Figure S2). At the same time, we were encouraged to see a significant increase in half-life compared to that of the HisSUMO-ErA-TM protein43 (38.3 vs. 15.7 hours) (Table 2). Presumably, this increase in half-life is due to the interaction between the ABD moiety and the mouse serum albumin, and that this interaction slows down the degradation of the enzyme. To verify that our molecule binds serum albumins, we used surface plasmon resonance and isothermal titration calorimetry to determine the in vitro interaction with mouse and human serum albumins. Whereas ErA-TM shows no binding of either mouse or human serum albumin, ABD-ErA-TM binds with a low micromolar affinity to both (Table 3; Online Supplementary Figures S3 and S4). To test the prediction that a disulfide bridge between the two ABD cysteines is required for the interaction with albumins, we generated a variant in which these cysteines were mutated to serines (ABD(C→S)-ErATM). As expected, this variant exhibited no affinity to either mouse or human serum albumin. Indeed, the in vivo halflife of the ABD(C→S)-ErA-TM variant was essentially identical to that of ErA-TM (2.5 vs. 2.3 hours) (Table 2). Finally, to obtain a molecular understanding of the ABD, we solved the crystal structure of ABD- ErA-TM at 1.75 Å
Haematologica | 108 February 2023 411 ARTICLE - Durable antileukemic effect of ABD-tagged ErA-TM M. Van Trimpont et al.
Figure 1. Visualization of ABD-ErATM. (A) ABD-ErA-TM is expressed as a His-SUMO fusion protein. Cleavage with SUMO protease releases the molecule used in these studies. Two cysteine residues in the ABD region build the disulfide bond required for albumin binding. (B) The tetrameric ABD-ErA-TM as observed in the crystal structure solved at 1.75 Å resolution. A disulfide bridge is formed between two cysteines of ABD that acts to rigidify the loop structure. Thus, for the first time, we have a view of the ABD-conformation that is required for the interaction with serum albumins.
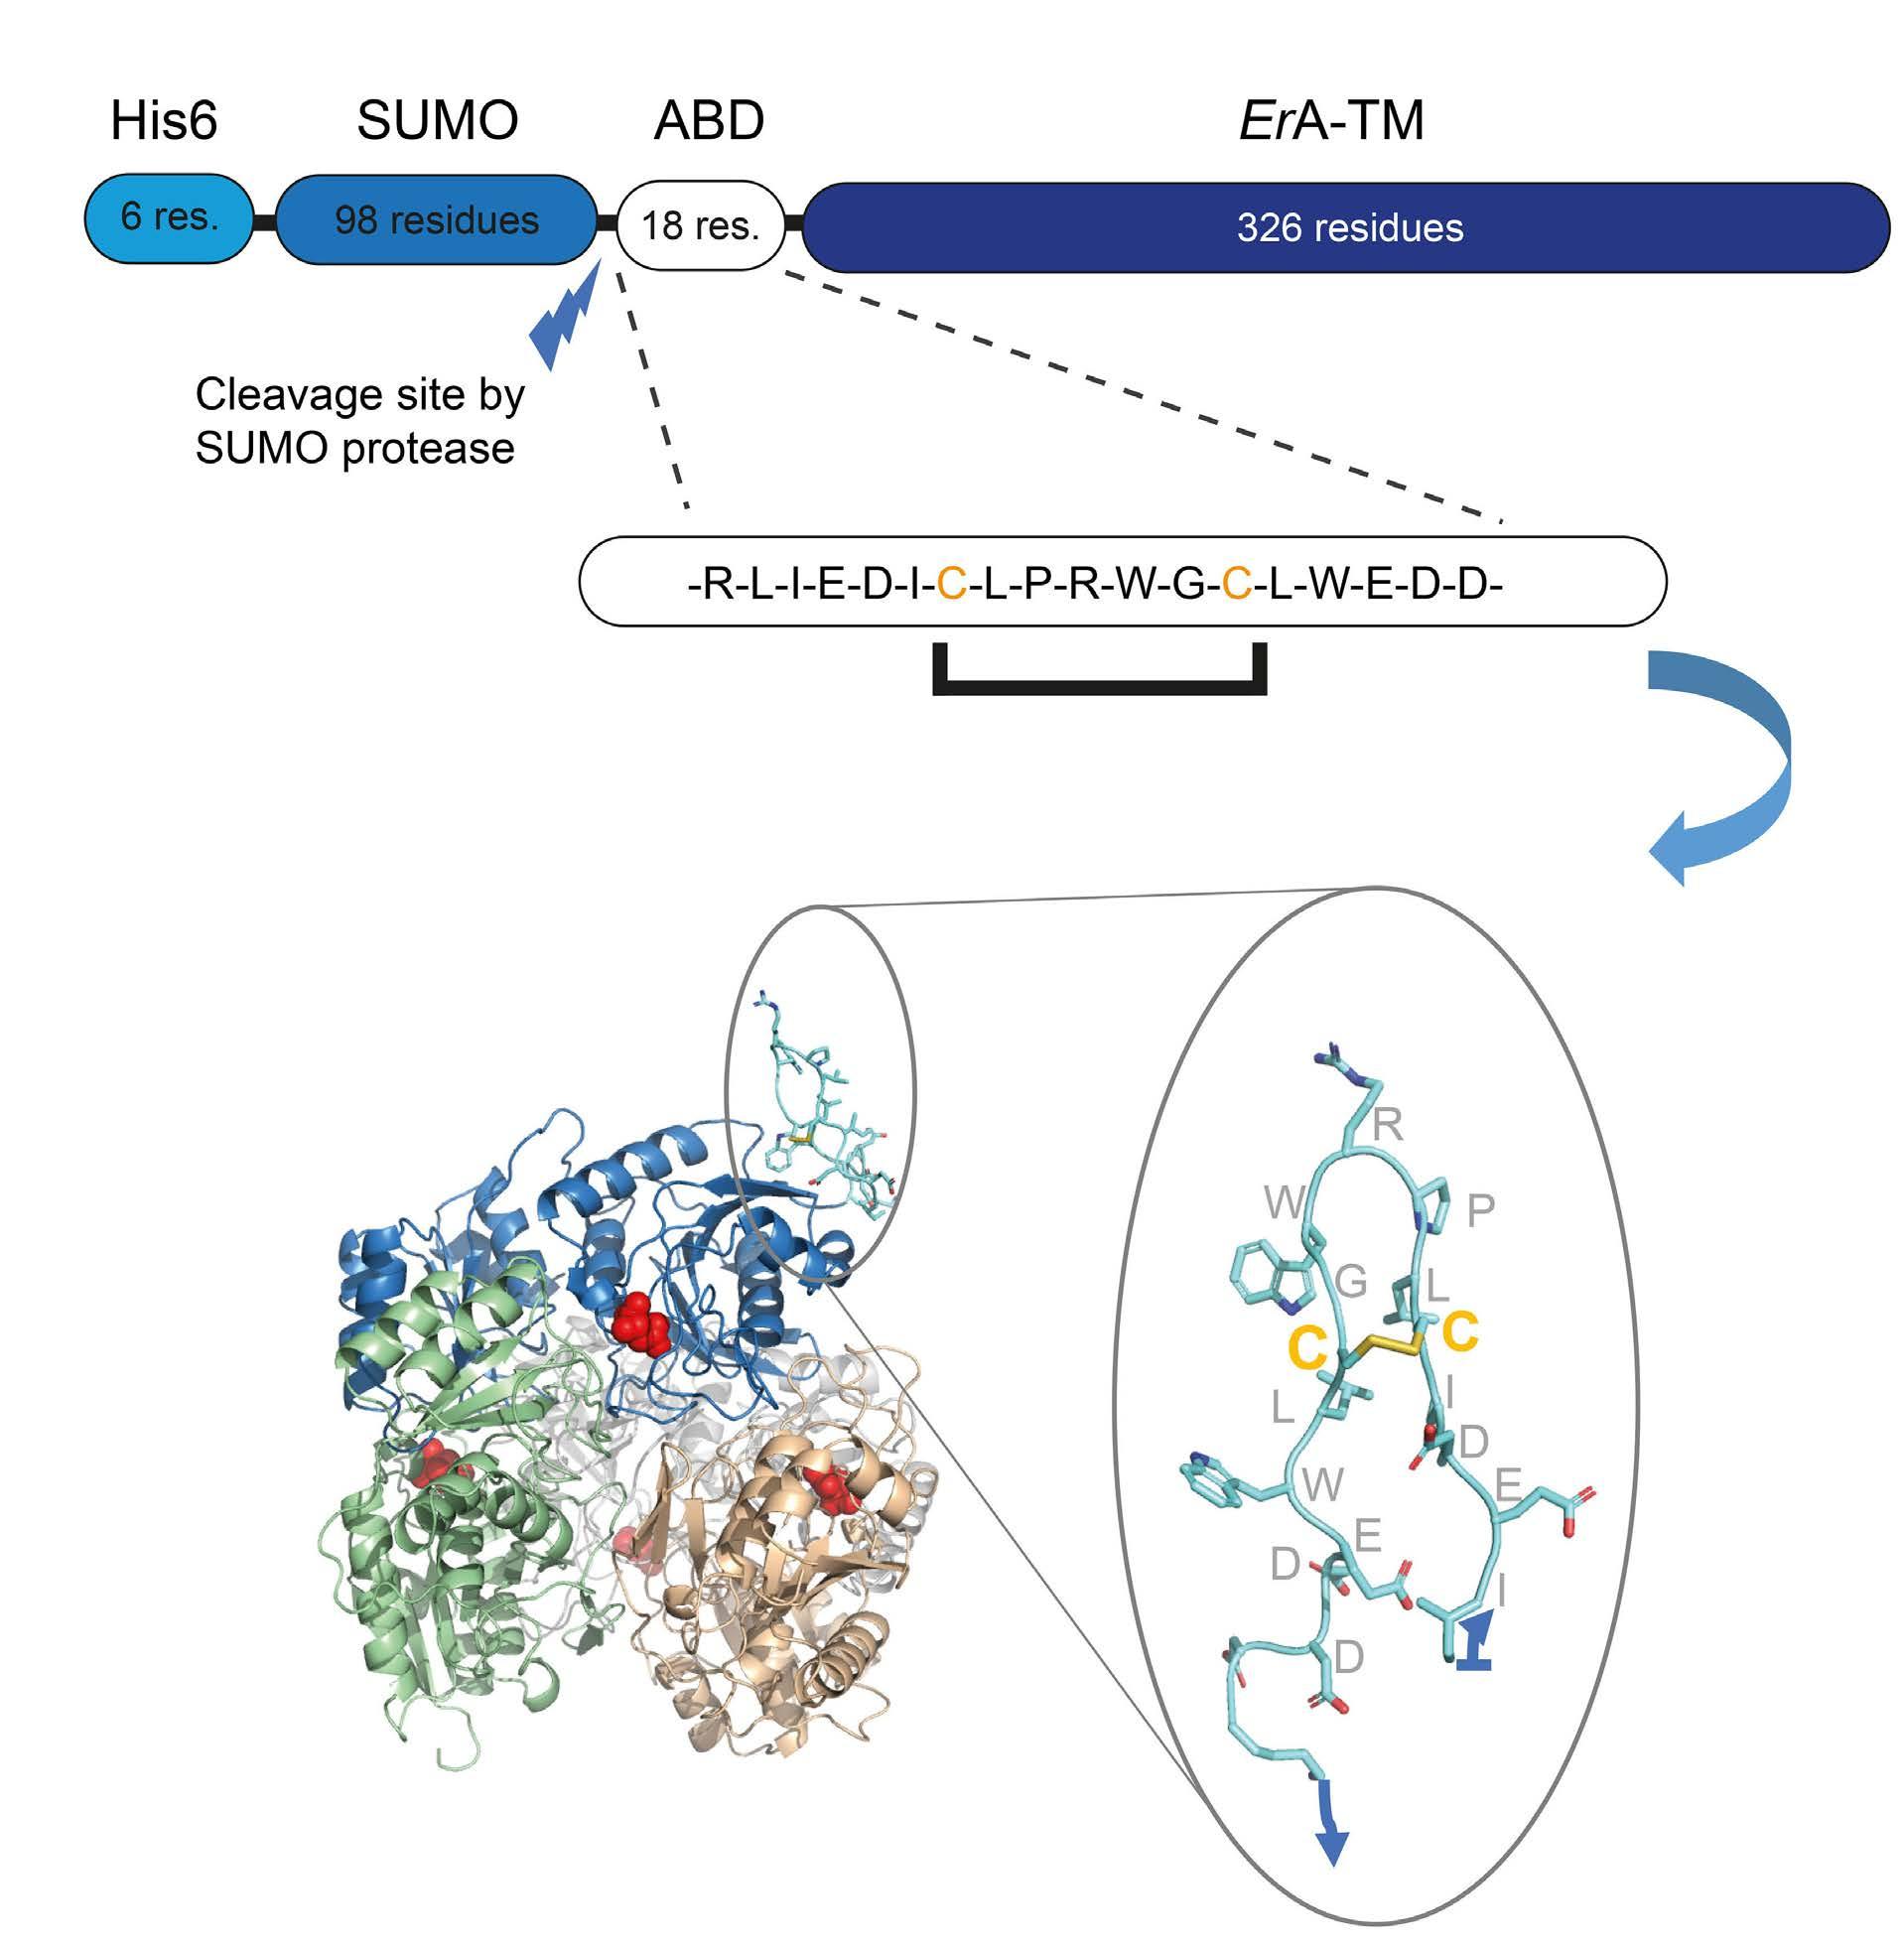
Table 1. L-ASNase kinetic parameters for ABD-ErA wild type and select mutants. This table shows the Km and kcat values of our low-glutaminase alternative ABD-ErA-TM variant compared to the ones from untagged ErA-TM and our previously reported HisSUMO-ErA-TM variant.43
ABD-ErA-WT 311.3±5.5 39.3±3.0 7.92 504.9±30.1 ABD-ErA-TM 289.2±2.6 151.8±4.8 1.91 453.1±6.2 ABD-ErA-TM C7S/C13S 272.8±3.9 138.9±6.2 1.96 417.7±13.6
ErA-WTb 207.5±3.6 47.5±3.5 4.37 353.2±6.1 His-SUMO-ErA-TMb 261.2±2.8 95.0±3.5 2.75 443.5± 4.8
a1 IU of enzyme is defined as the amount of enzyme used to produce 1 mmol of aspartate in 1 minute at 37°C. bKinetic parameters reported by Nguyen et al.15 The introduction of an albumin binding domain (ABD) increases the Km value, a parameter for asparagine specificity, from ~40 mM (ABD-ErA-WT) to ~150 mM. The specific activity (IU/mg of protein) is a commonly used parameter to express specific L-ASNase activity. SD: standard deviation.
resolution. Data collection and refinement statistics are shown in Online Supplementary Table S1 . In the tetrameric molecule, one protomer had clear electron density for the ABD. Presumably, the ABD of the other three protomers were not seen due to being highly flexible. As shown in Figure 1B, the two cysteines of the ABD form a disulfide bridge that acts to rigidify the loop structure. Thus, for the first time, we have a view of the ABD-con-
formation that is required for the interaction with serum albumins.
In vivo pharmacokinetic and pharmacodynamic profiling of ABD-ErA-TM in comparison to PEG-asparaginase To further document the pharmacokinetic profile and pharmacodynamic properties of our ABD-stabilized LASNase variant in comparison to those of the standard-
Enzyme kcat s-1±SD K m mM±SD kcat/ Km s-1 mM-1 Specific activitya IU/mg±SD
Haematologica | 108 February 2023 412 ARTICLE - Durable antileukemic effect of ABD-tagged ErA-TM M. Van Trimpont et al. A B
of-care, healthy C57BL/6J mice were injected intraperitoneally with 2,500 IU/kg of PEG-asparaginase or ABD-ErATM. The L-ASNase activity was measured at days 1, 3, 5, 7, 10 and 14. Although a similar pharmacokinetic profile was seen with the PEG-asparaginase, the activity of ABD-ErATM decreased more rapidly compared to that of the PEGasparaginase (Figure 2A). In addition, we determined the Asn, Asp, Gln, and Glu levels in blood plasma prior to the treatment and at days 1, 3, 5, 7, 10 and 14 after L-ASNase administration. Both enzymes efficiently depleted the blood Asn in a comparable manner (P=0.0079; Mann-Whitney U test), with levels slowly recovering after day 5 for ABD-ErA-TM and after day 7 for PEG-asparaginase (Figure 2B). In line with these results, plasma Asp levels increased significantly at days 1 and 3 (P=0.0079; Mann-Whitney U test) compared to baseline levels and then decreased to the pretreatment level by day 14 for both treatment groups (Online Supplementary Figure S5A). For Gln, only at 24 hours after administration was a minimal but significant reduction in Gln plasma levels seen for PEG-asparaginase, while no decrease of Gln levels was observed in ABD-ErATM mice (Online Supplementary Figure S5B). On the other hand, a consistent differential effect was demonstrated on the plasma Glu levels, with a significant increase in the PEG-asparaginase mice up to day 7 after administration, followed by a decrease towards baseline levels again. These increased Glu levels upon PEG-asparaginase treatment point out that long-term L-glutaminase co-activity is maintained. Notably, a minimal increase was observed in the ABD-ErA-TM group but not to the extent as in the PEG-asparaginase mice, as to be expected from this lowglutaminase variant (Online Supplementary Figure S5C).
Toxicity profiling of ABD-ErA-TM Next, we evaluated the acute toxicity of ABD-ErA-TM versus PEG-asparaginase in healthy wild-type C57BL/6J female mice at a dose of 2,500 IU/kg. We compared the impact of both enzymes on the animals' body weight, one of the main parameters to evaluate L-ASNase toxicity. At
the end of the experiment, PEG-asparaginase mice lost a greater percentage of their starting body weight (P=0.0022; Mann-Whitney U test), while the ABD-ErA-TM mice showed no significant decrease in body weight (Figure 2C). In addition, we also analyzed hematologic parameters, including white blood cell count, red blood cell count and blood platelet levels. While no effect was observed on red blood cell counts, significant differences were seen in white blood cell and blood platelet levels (Online Supplementary Figure S6A-C). As previously mentioned, side effects of L-ASNase treatment, in particular liver and pancreas toxicity, are often observed. Blood chemistry analysis showed a significant decrease in globulin and albumin levels, both markers of hepatic dysfunction, in the PEG-asparaginase group compared to the vehicle group (P=0.0366 and P=0.0084, respectively) (Online Supplementary Figure S6D-E). Other blood parameters, including alanine aminotransferase (Online Supplementary Figure S6F), total bilirubin (Online Supplementary Figure S6G), blood urea nitrogen (Online Supplementary Figure S6H) and amylase (Online Supplementary Figure S6I) did not show any significant changes between groups.
In vivo therapeutic evaluation of ABD-ErA-TM in a B-cell acute lymphoblastic leukemia cell line xenograft model
We evaluated the in vivo efficacy of long-term Asn deprivation using ABD-ErA-TM in a luciferase positive SUP-B15 xenograft mouse model. To examine the need for co-glu-
Table 2. Half-life of ErA variants.
Protein
Half-life, (hours)
ErA-TM 2.3 His-SUMO-ErA-TM 15.7 ABD-ErA-TM 38.3 ABD(C→S)-ErA-TM 2.5
ABD-ErA-TM shows a significant increase in half-life compared to the His-SUMO-ErA-TM protein43 (38.3 vs. 15.7 hours). The in vivo half-life of the ABD(C→S)-ErA-TM variant was essentially identical to that of ErA-TM (2.5 vs. 2.3 hours), demonstrating the need for a disulfide bridge between the two ABD cysteines.
Table 3. Binding affinities determined by surface plasmon resonance and isothermal titration calorimetry.
Surface plasmon resonance (SPR) and isothermal titration calorimetry (ITC) were used to determine the in vitro interaction with mouse serum albumin (MSA) and human serum albumin (HAS). While ErA-TM shows no binding of either MSA or HSA, ABD-ErA-TM binds with a low micromolar affinity to both MSA and HSA. Values are means ± standard deviations from four measurements each for SPR, two measurements for ITC with MSA, and a single measurement for ITC with HSA. NB: no binding; NT: not tested.
Human serum albumin Mouse serum albumin SPR ITC SPR ITC k a kd KD Kd k a kd KD Kd (x
(x
( m
( m
(x
(x
103 M-1s-1)
10-2 s-1)
M)
M)
103 M-1s-1)
10-2 s-1) ( mM) ( mM) ErA-TM NB NB NB NT NB NB NB NT ABD-ErA-TM 1.78±0.55 1.41±0.30 8.11±0.80 4.37 1.71±0.64 0.88±0.30 5.20±0.41 4.95±0.49 ABD(C→S)ErA-TM NB NB NB NT NB NB NB NT
Haematologica | 108 February 2023 413 ARTICLE
Van Trimpont et al.
- Durable antileukemic effect of ABD-tagged ErA-TM M.
Figure 2. ABD-ErA-TM shows reduced toxicity in mice compared to PEG-asparaginase but displays a similar pharmacokinetic profile. (A) L-ASNase activity measurements in blood plasma samples of mice obtained at days 1, 3, 5, 7, 10 and 14 after 2,500 IU/kg of LASNase show a comparable pharmacokinetic profile for both enzymes, although the activity of ABD-ErA-TM decreased more rapidly compared to that of the PEG-asparaginase. (B) Measurement of asparagine levels in blood plasma samples of mice obtained at days 1, 3, 5, 7, 10 and 14 after 2,500 IU/kg of PEG-asparaginase or ABD-ErA-TM. A significant depletion of asparagine is observed for both enzymes (P=0.0079; Mann-Whitney U-test, with levels slowly recovering after day 5 for ABD-ErA-TM and day 7 for PEGasparaginase. (C) After 96 hours, PEG-asparaginase mice lost a greater percentage of their starting body weight (P=0.0022; MannWhitney U test), while the ABD-ErA-TM mice showed no significant decrease in body weight after L-ASNase administration. For each figure, the mean and standard deviation are shown.
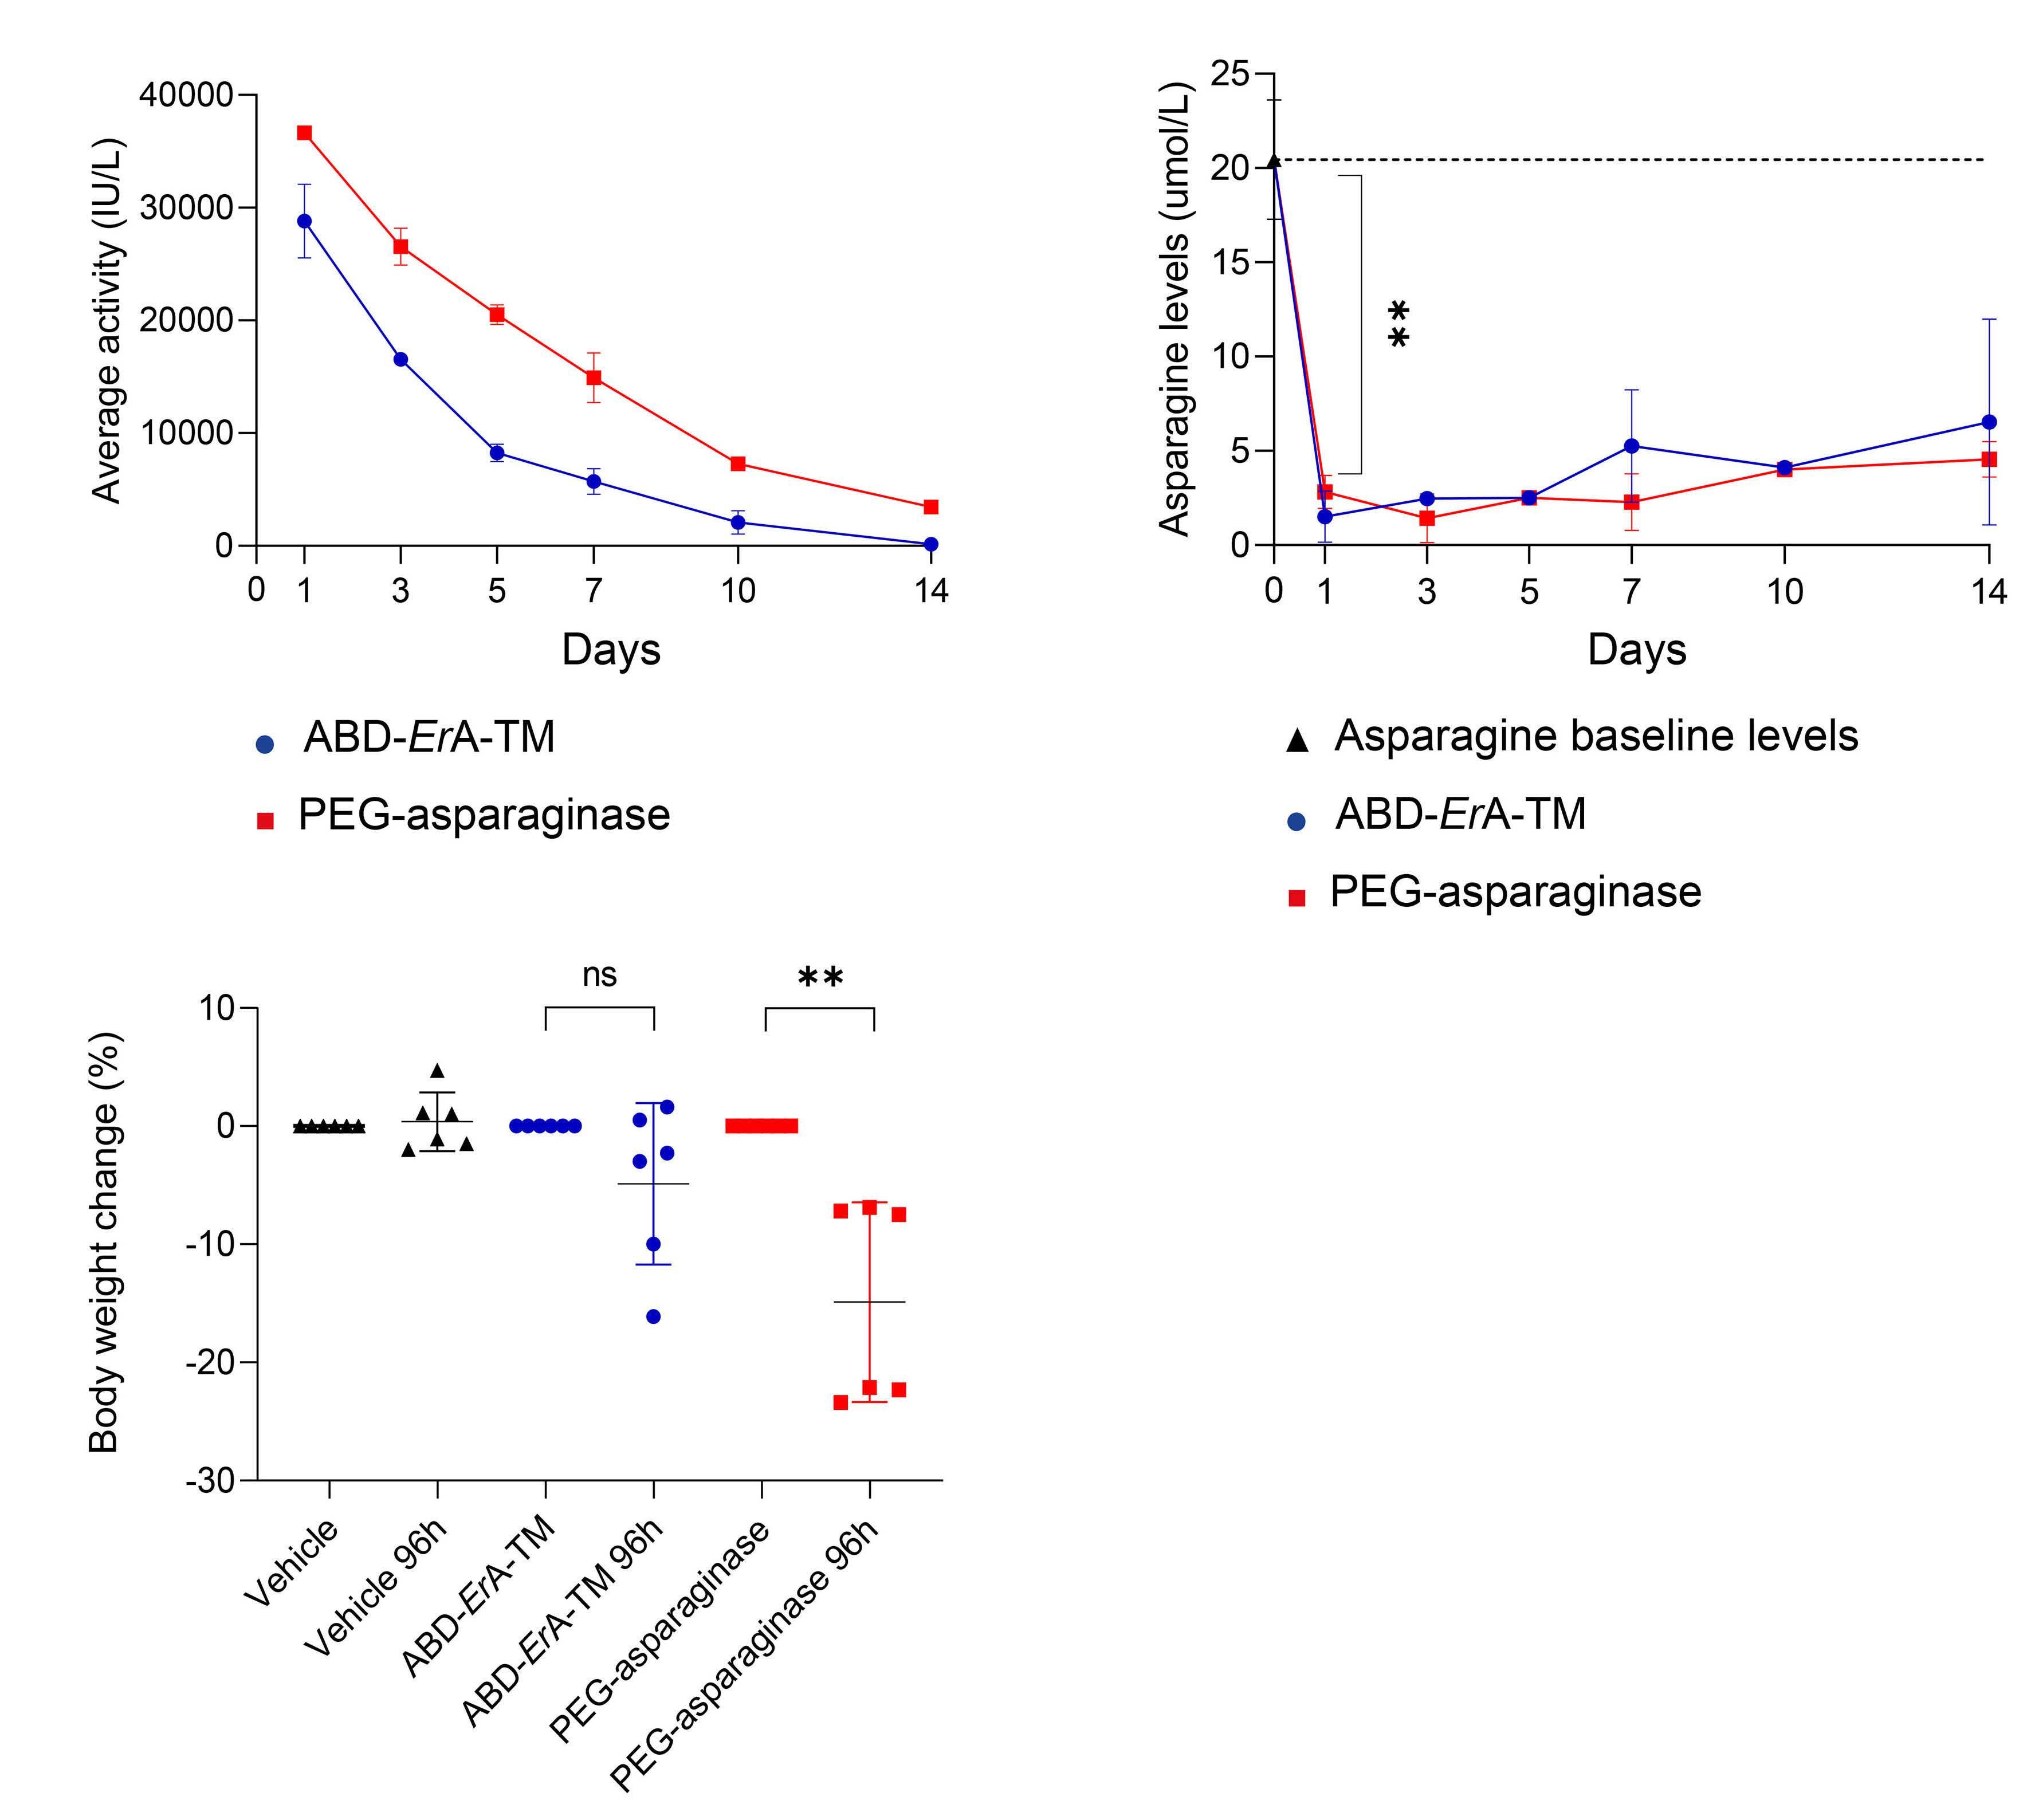
taminase activity to kill ALL cells, we compared our stabilized low-glutaminase variant ABD-ErA-TM with PEG-asparaginase. Based on the results of our pharmacokinetic and pharmacodynamic studies, a dose of ABD-ErA-TM (2,500 IU/kg) was administered every 7 days, while PEGasparaginase (2,500 IU/kg) was given every 10 days guaranteeing continuous Asn deprivation in the blood with minimal residual L-ASNase activity building up before each new dose. In total, mice received either five doses of PEGasparaginase or seven doses of ABD-ErA-TM (Figure 3A). Results not only show that both ABD-ErA-TM and PEG-asparaginase were equally capable of rapidly lowering the leukemic burden, but also that a comparable long-term survival could be accomplished (Figure 3B). During the treatment time course, both PEG-asparaginase and ABDErA-TM treated mice displayed lower bioluminescent signals, below the background detection levels at the end of the treatment, while PBS control mice clearly showed an increase in leukemic burden (Figure 3C). At day 55, control mice had to be euthanized due to ethical humane endpoints, while both PEG-asparaginase and ABD-ErA-TM
mice showed no sign of ALL burden up to day 204, with the exception of one PEG-asparaginase treated mouse that relapsed at day 180 and clearly showed clinical signs of tumor formation.
The L-ASNase activity in blood plasma samples was measured 24 hours after administration of ABD-ErA-TM (at days 1, 8, 15, 22, 36 and 43) and PEG-asparaginase (at days 1, 11, 21 and 41). Results indicate that acceptable stable enzyme activity levels were maintained during the whole experiment (threshold for adequate activity >100 IU/L) without any excessive build-up of L-ASNase activity (Figure 3D). In addition, we also determined the amino acid levels in treated mice to confirm efficacy of Asn depletion during L-ASNase treatment. Both enzymes depleted the blood Asn, which was below detection at every time point (Figure 3E).
Besides the therapeutic effect, the impact and tolerability of both drugs was evaluated on the body weight of the animals. At the end of treatment, we observed a mean weight loss of 8.8% in the ABD-ErA-TM treatment group, while the PEG-asparaginase mice had a mean weight loss
A Haematologica | 108 February 2023 414 ARTICLE - Durable antileukemic effect of ABD-tagged ErA-TM M. Van Trimpont et al. B C
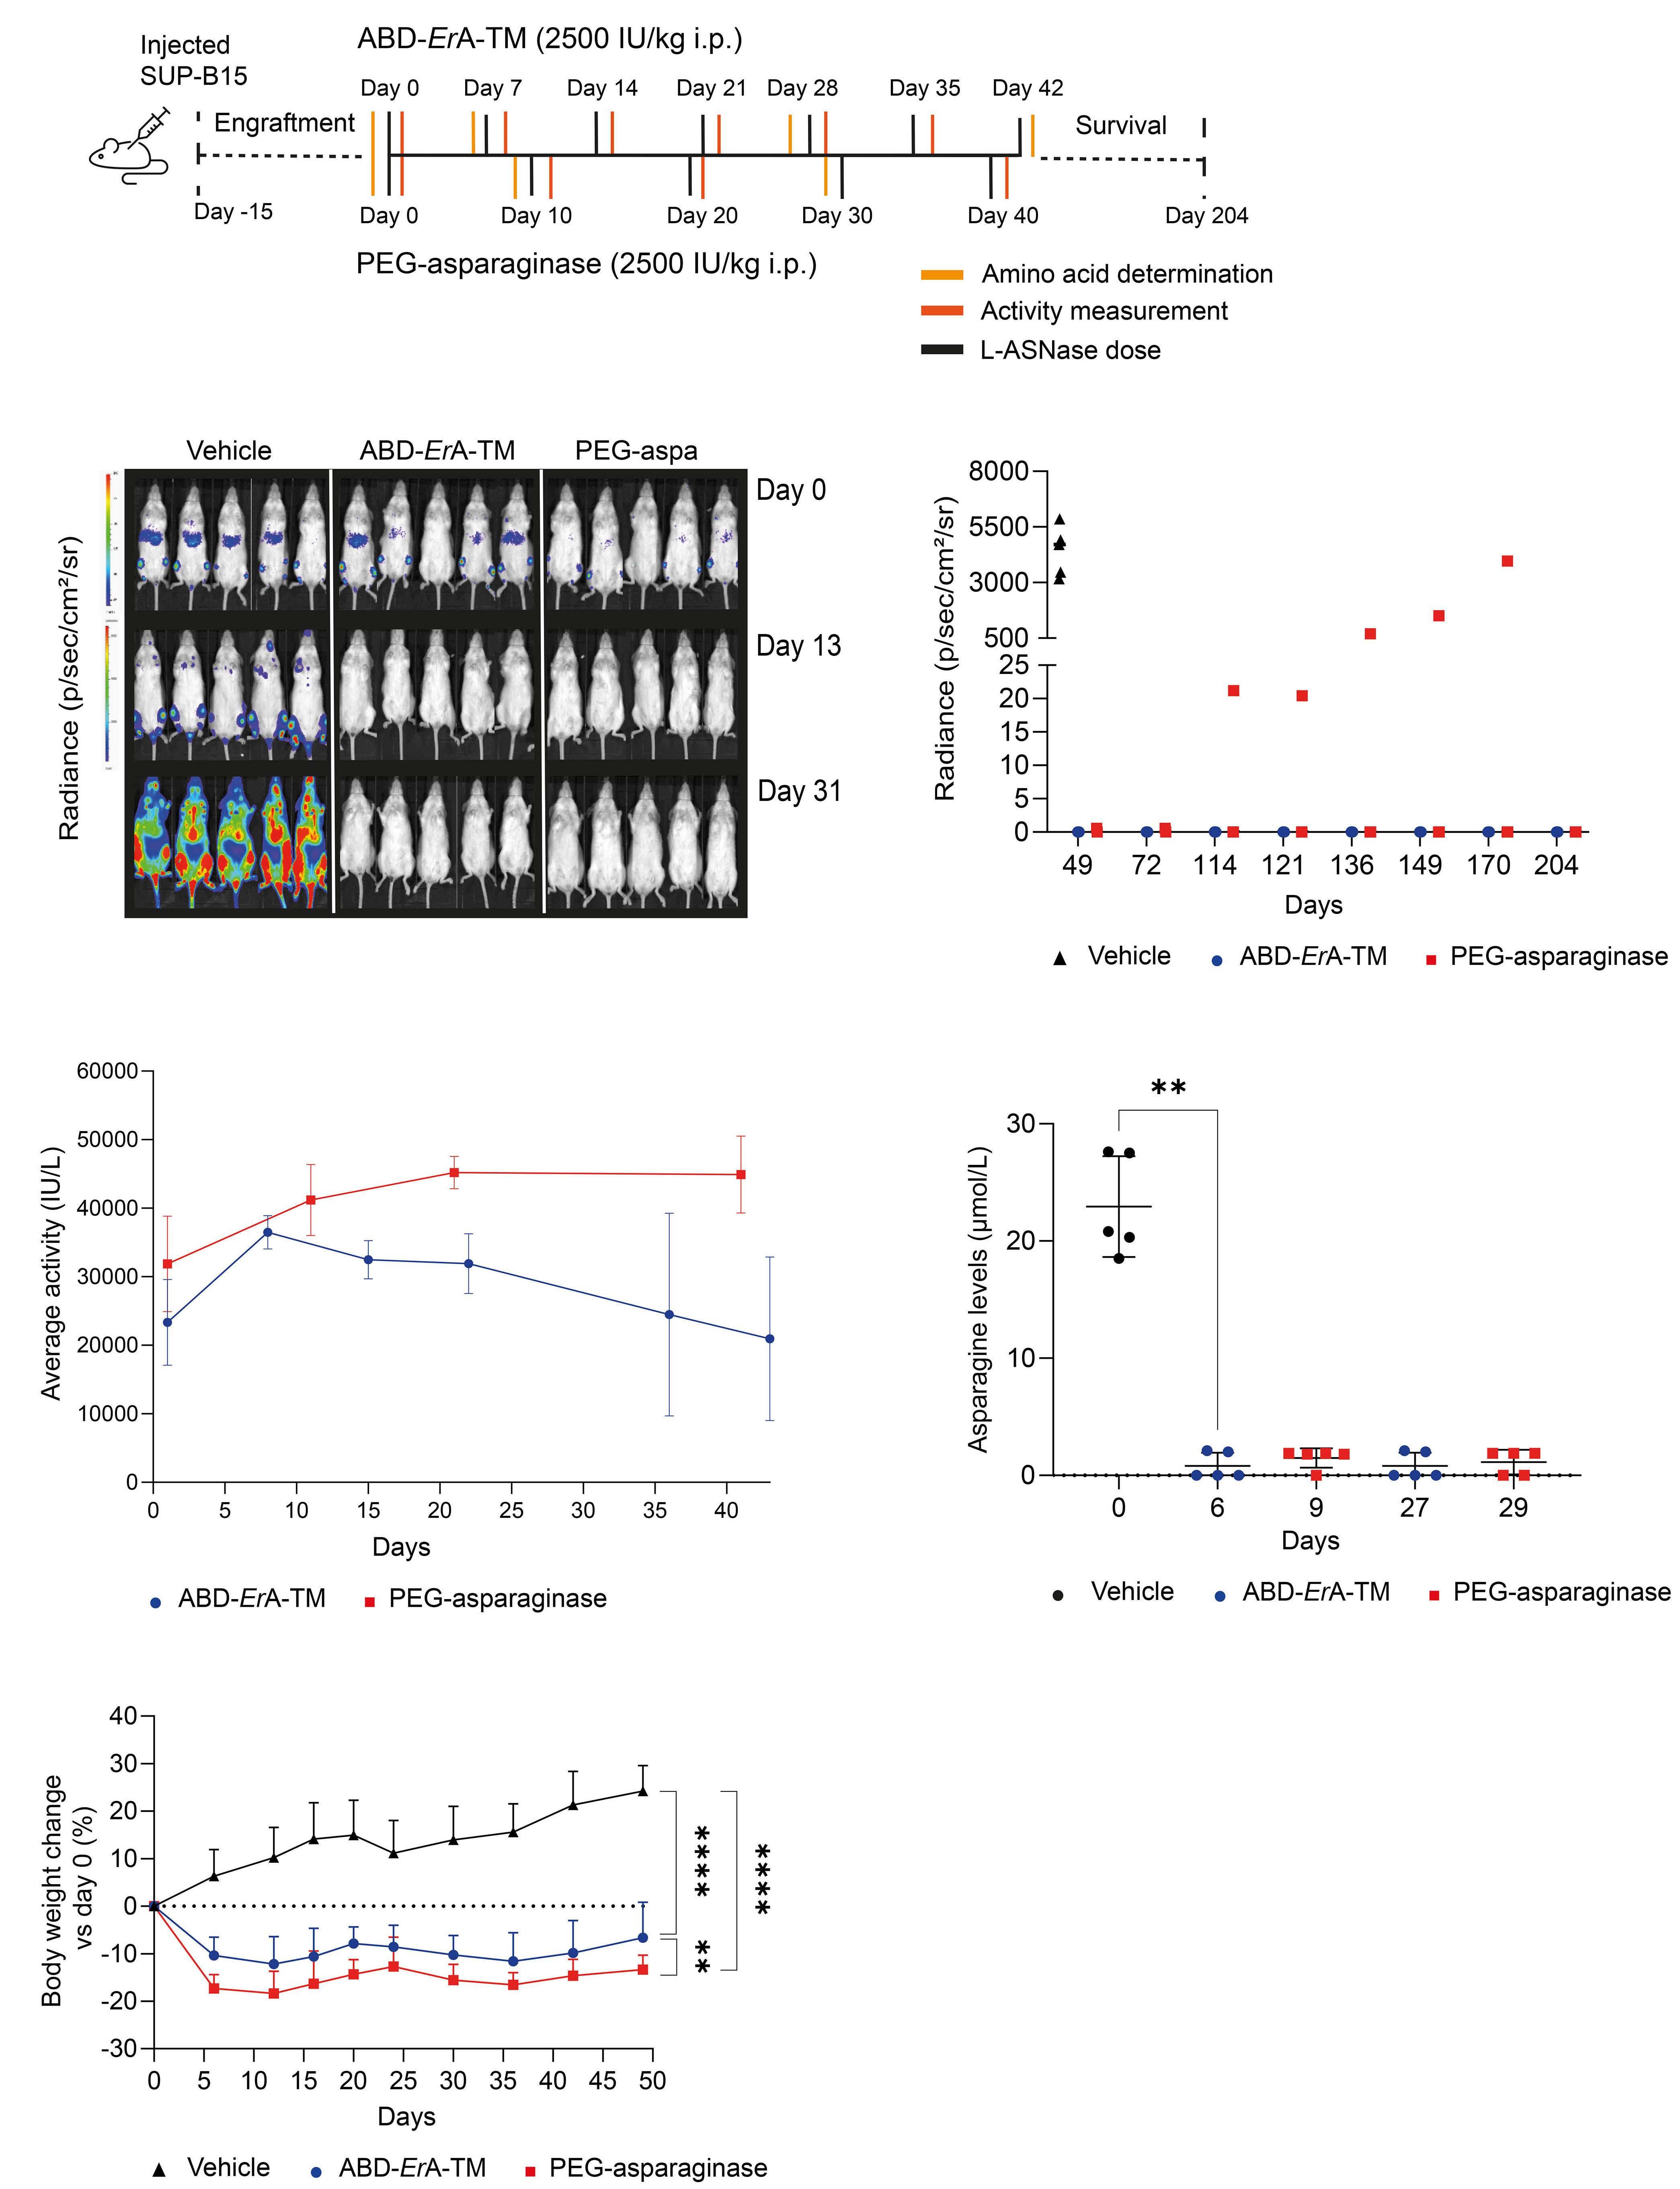
A B C B E D F Continued on following page. Haematologica | 108 February 2023 415 ARTICLE
M. Van Trimpont et al.
- Durable antileukemic effect of ABD-tagged ErA-TM
Figure 3. The low L-glutaminase ABD-ErA-TM eliminates SUP-B15 cells as effectively as the high L-glutaminase PEGasparaginase, but with reduced toxicity. (A) Mice were injected with luciferase-expressing SUP-B15 cells and monitored for engraftment via bioluminescent imaging (BLI). Once engraftment was observed, mice were treated intraperitoneally (i.p.) every 10 days with PEG-asparaginase (n=5), every 7 days with ABD-ErA-TM (n=5) (drug dose for both enzymes 2,500 IU/kg) or vehicle (phosphate-buffered saline, PBS) (n=5). At regular time points during treatment, blood plasma samples were collected for amino acid determinations or activity measurements. (B) For each group, the BLI at regular time points is shown. Before the start of treatment, mice clearly show engraftment of SUP-B15 cells in the bone marrow and spleen area. At days 13 and 31, vehicle PBStreated mice show a very strong BLI signal consistent with a high disease burden, while ABD-ErA-TM and PEG-asparaginase mice show no sign of leukemia. After treatment termination, mice were followed up for survival up to day 204 after initiation of treatment. Only one PEG-asparaginase-treated mouse relapsed and had to be euthanized due to ethical reasons. (C) For both L-ASNase treatment groups, the radiance dramatically decreased returning to background levels by day 31, with the exception of one PEG-asparaginase-treated mouse that relapsed during the survival monitoring. (D) The L-ASNase activity in blood plasma samples was measured 24 hours after each L-ASNase administration. Results clearly show that L-ASNase activity was maintained during the treatment time course. For each time point, the mean and SD are shown. (E) Asparagine levels were measured prior to L-ASNase administration at days 6 and 27 for ABD-ErA-TM and at days 9 and 29 for PEG-asparaginase. Our data show that asparagine levels significantly decreased during L-ASNase therapy in the same manner for both treatment groups compared to day 0 (P=0.0079; Mann-Whitney U test). For each time point, the mean and SD are shown. (F) At the end of treatment, a mean weight loss of 8.8% in ABD-ErA-TM-treated mice was observed, while the PEG-asparaginase-treated mice had a mean weight loss of 13.9% (ABD-ErA-TM vs. PEG-asparaginase P=0.0011; Mann-Whitney U test), demonstrating a better tolerability of ABD-ErA-TM in these mice. For each time point, the mean and SD are shown.
of 13.9% (Figure 3F). At the end of this survival experiment (day 204), mice were sacrificed and analyzed for signs of leukemia development. No significant difference between spleen/body weight in both treated groups was observed (Online Supplementary Figure S7A). In addition, analysis of human CD45+ cells in peripheral blood, spleen and bone marrow showed undetectable levels of leukemic cells in both PEG-asparaginase- and ABD-ErA-TM-treated mice, with exception of the PEG-asparaginase mouse that relapsed during survival monitoring (Online Supplementary Figure S7B).
Together, these results convincingly show that the ABDtag stabilizes this ErA-TM variant in vivo and ABD-ErA-TM can lower ALL leukemic disease burden in a manner comparable to that of the high-glutaminase standard-of-care PEG-asparaginase, but with a better tolerability.
Discussion
Although L-ASNase is a key chemotherapeutic agent in childhood ALL, particularly during the induction phase, its administration is associated with multiple and severe toxicities. Unfortunately, these side effects prevent many patients from receiving their prescribed course of treatment, resulting in a detrimental impact on their outcome.50,51 Several studies showed that the L-glutaminase co-activity of clinically used L-ASNases contributes partially to these unwanted side effects.21 Therefore, lowering L-glutaminase co-activity while maintaining its anticancer effect might provide the required safety profile that reduces treatment interruptions.
Immune reactions during L-ASNase therapy occur frequently together with the development of anti-L-ASNase antibodies.52 Patients suffering from hypersensitivity reactions or silent inactivation to EcA are switched to native
ErA.50,52-54 Although the latter is a useful second-line therapy in ALL, some disadvantages are associated with this drug, including a much shorter half-life compared to that of PEG-asparaginase.6,55 As patients can also develop antibodies against the PEG-tag itself, thereby limiting tolerance and efficacy,33,56 additional research on more immunotolerant tags such as XTEN57 and PASylation58,59 is currently ongoing. In our previous study,43 we presented an ErA-TM variant with significantly lower L-glutaminase but comparable L-ASNase activity relative to ErA-WT. We also achieved an extended circulation time by the fusion of a SUMO tag to these molecules. With the goal of further increasing blood circulation time, we analyzed several other tags, and discovered that the fusion of an ABD to ErA (WT or TM variant) resulted in respective molecules with much longer in vivo half-lives. In this study, we present ABD-ErA-TM, a novel ErA derived variant that is superior to our previous ones43 by combining both low L-glutaminase co-activity and an exceptionally extended in vivo persistence.
Acute toxicological evaluation of ABD-ErA-TM revealed reduced non-immunological toxicity compared to the current first-in-line EcA. Our toxicity data show a clear correlation between reduced L-glutaminase co-activity and reduced drug toxicity, especially on the average percentage of body weight loss. We note that other biochemical parameters of liver and pancreas toxicity including alanine aminotransferase, total bilirubin, blood urea nitrogen and amylase levels did not show any changes. This may not be surprising since L-ASNase toxicity in patients is often only observed after multiple L-ASNase administration/doses.
The clinical relevance of L-glutaminase co-activity, present in all clinically Food and Drug Administration (FDA)approved bacterial L-ASNases, in the context of ALL remains largely unclear. First, it was shown that this L-
Haematologica | 108 February 2023 416 ARTICLE - Durable antileukemic effect of ABD-tagged ErA-TM M. Van Trimpont et al.
glutaminase co-activity was not required to induce an in vivo L-ASNase effect in the leukemic SUP-B15 cell line.43 However, Chan et al.44 showed that a durable and longlasting antileukemic effect in the same SUP-B15 xenograft could only be obtained using a L-ASNase variant that retained its L-glutaminase co-activity.44 Our results clearly contradict these findings and demonstrate that SUP-B15 leukemic cells can be durably killed with a L-ASNase variant with ultra-low glutaminase co-activity. We speculate that the lack of durable response noted by Chan et al.44 was due to insufficient long-term Asn depletion that resulted from using a non-stabilized L-ASNase variant, which means that it needs to be injected more frequently to observe a therapeutic effect. Our results clearly show a similar long-lasting durable anti-leukemic effect between PEG-asparaginase and ABD-ErA-TM. Industrial production problems recently resulted in a shortage of ErA and reduced treatment options for patients who developed hypersensitivity or silent inactivation against PEG-asparaginase. To overcome these manufacturing issues, a recombinant version of ErA, JZP458, was recently developed. While this JZP-458 has been approved by the FDA as part of a treatment regimen for children and adults with ALL or lymphoblastic lymphoma,60 our ABD-ErA-TM has multiple benefits over the JZP-458 preparation. One is avoiding the toxicities that arise due to the glutaminase co-activity. Secondly, the in vivo persistence of JZP-458 is short whereas the albumin binding, provided by the ABD domain, increases the halflife >10-fold. This will provide a dramatic clinical advantage, allowing patients to be dosed once a week instead of three times a week as currently required for Erwinaze or JZP-458. In addition, our new Erwinia L-ASNase preparation requires no additional post-translational modifications resulting in high protein yields. As our ABD-ErA-TM would only need to be administered once a week, smaller amounts will be necessary to treat the same number of patients compared to current standard-of-care LASNases.
Until now, all immune-related side-effects were ignored in our experimental setup, as the in vivo efficacy study was done with human ALL cells xenotransplanted in immunodeficient NSG mice. Unfortunately, good preclinical models to evaluate the immunogenicity of L-ASNases are not available and this is one of the biggest challenges for future L-ASNase research.
In conclusion, this study convincingly shows that high Lglutaminase co-activity present in standard-of-care PEGasparaginase is not essential for durable anti-leukemic properties in vivo , therefore contradicting previous reports. Furthermore, our findings also suggest a decline in in vivo toxicity when L-glutaminase co-activity is reduced. In addition, the fusion of an ABD-tag to our alternative ErA -TM variant increases its half-life and in vivo
stability. Identifying a L-ASNase variant with fewer side effects will not only improve the quality of life of ALL patients directly, but will also allow treatment protocols to be maintained or prolonged, which will translate into improved outcomes, especially for adult ALL patients. In addition, a few aggressive solid cancer subtypes with poor prognosis and a clinical unmet need have been identified as sensitive to Asn deprivation, including ovarian and metastatic breast cancer. However, because of the adverse side effects in adults, clinical trials have been discontinued so far. By identifying a L-ASNase variant with fewer unwanted toxicities, we hope to revive the clinical trials and provide extra therapeutic opportunities for these patients.
Disclosures
AMS, AL and HAN declare competing financial interests by being founders with equity stake in Enzyme by Design Inc.: a start-up developing new L-asparaginases. AL and HAN are inventors of the Int. Patent. Appl. PCT/US2017/020090 (WO2017151707A1) that describes the ABD-ErA-TM variant. None of the other authors declare any competing financial interests.
Contributions
MVT, AMS, HAN, TL, SG, PVV and AL designed the study; MVT, AMS, HAN, HL and WC performed experiments; LR and KV provided excellent technical assistance; TL, SG, PVV and AL supervised this study; MVT and AL drafted the manuscript; MVT, AL, HUN and YDV edited the figures; MVT, AMS, YDV, HAN, LR, KV, EP, YS, HL, PLL, WC, VM, BDM, TL, SG, PVV and AL proofread the original draft and made valuable adjustments; AMS, PLL, TL, SG, PVV, and AL obtained funding for this study. All authors have read and agreed to the published version of the manuscript.
Acknowledgments
The authors would like to thank Sri Ramya Donepudi for assistance with assessment of pharmacodynamics. We also thank the Biostatistics Unit of the Faculty of Medicine and Health Sciences of Ghent University for assistance with the statistics.
Funding
This work was supported by The Belgian Foundation Against Cancer (project grants to PVV and SG), Belgian Stand Up to Cancer Foundation (project grants to PVV and SG) and vzw Kinderkankerfonds (grant to TL); and in part by the Department of Veterans Affairs, Veterans Health Administration, Office of Research and Development Biomedical Laboratory Research and Development MERIT Award I01BX001919 and Chicago Biomedical Consortium Accelerator Award (AL), and NIH SBIR grant R43-CA232798 (AMS). WKC and PLL are supported in part by NIH grants
Haematologica | 108 February 2023 417 ARTICLE - Durable antileukemic effect of ABD-tagged ErA-TM M. Van Trimpont et al.
S10OD012304-01 and P30CA016672. This research used resources of the Advanced Photon Source, a U.S. Department of Energy (DOE) Office of Science User Facility operated for the DOE Office of Science by Argonne National Laboratory under Contract No. DE-AC02-06CH11357. Use of the LS-CAT Sector 21 was supported by the Michigan Economic Development Corporation and the Michigan Technology Tri-Corridor (Grant 085P1000817). The views expressed in this article are those of the authors and do
References
1. Radadiya A, Zhu W, Coricello A, Alcaro S, Richards NGJ. Improving the treatment of acute lymphoblastic leukemia. Biochemistry. 2020;59(35):3193-3200.
2. Malard F, Mohty M. Acute lymphoblastic leukaemia. Lancet. 2020;395(10230):1146-1162.
3. Kumar K, Kaur J, Walia S, Pathak T, Aggarwal D. L-asparaginase: an effective agent in the treatment of acute lymphoblastic leukemia. Leuk Lymphoma. 2014;55(2):256-262.
4. Micallef B, Nisticò R, Sarac SB, et al. The changing landscape of treatment options in childhood acute lymphoblastic leukaemia. Drug Discov Today. 2022;27(5):1483-1494.
5. Endicott M, Jones M, Hull J. Amino acid metabolism as a therapeutic target in cancer: a review. Amino Acids. 2021;53(8):1169-1179.
6. Cecconello DK, Magalhães MR, Werlang ICR, Lee MLM, Michalowski MB, Daudt LE. Asparaginase: an old drug with new questions. Hematol Transfus Cell Ther. 2020;42(3):275-282.
7. Hijiya N, van der Sluis IM. Asparaginase-associated toxicity in children with acute lymphoblastic leukemia. Leuk Lymphoma. 2016;57(4):748-757.
8. Thu Huynh V, Bergeron S. Asparaginase toxicities: identification and management in patients with acute lymphoblastic leukemia. Clin J Oncol Nurs. 2017;21(5):E248-E259.
9. Schmidt MP, Ivanov AV, Coriu D, Miron IC. L-asparaginase toxicity in the treatment of children and adolescents with acute lymphoblastic leukemia. J Clin Med. 2021;10(19):4419.
10. Fonseca MHG, Fiúza TDS, Morais SB, Souza T, Trevizani R. Circumventing the side effects of L-asparaginase. Biomed Pharmacother. 2021;139:111616.
11. Grigoryan RS, Panosyan EH, Seibel NL, Gaynon PS, Avramis IA, Avramis VI. Changes of amino acid serum levels in pediatric patients with higher-risk acute lymphoblastic leukemia (CCG1961). In Vivo. 2004;18(2):107-112.
12. Ollenschläger G, Roth E, Linkesch W, Jansen S, Simmel A, Mödder B. Asparaginase-induced derangements of glutamine metabolism: the pathogenetic basis for some drug-related sideeffects. Eur J Clin Invest. 1988;18(5):512-516.
13. Emadi A, Law JY, Strovel ET, et al. Asparaginase Erwinia chrysanthemi effectively depletes plasma glutamine in adult patients with relapsed/refractory acute myeloid leukemia. Cancer Chemother Pharmacol. 2018;81(1):217-222.
14. Narta UK, Kanwar SS, Azmi W. Pharmacological and clinical evaluation of L-asparaginase in the treatment of leukemia. Crit Rev Oncol Hematol. 2007;61(3):208-221.
15. Nguyen HA, Su Y, Lavie A. Design and characterization of Erwinia chrysanthemi l-asparaginase variants with diminished lglutaminase activity. J Biol Chem. 2016;291(34):17664-17676.
16. Cruzat V, Macedo Rogero M, Noel Keane K, Curi R, Newsholme P.
not necessarily reflect the position or policy of the Department of Veterans Affairs or the United States government.
Data-sharing statement
The authors confirm that the data supporting the findings of this study are available within the article and its supplementary materials. More detailed data are available from the co-senior authors PVV and AL upon reasonable request.
Glutamine: metabolism and immune function, supplementation and clinical translation. Nutrients. 2018;10(11):1564.
17. Watford M. Glutamine and glutamate: nonessential or essential amino acids? Anim Nutr. 2015;1(3):119-122.
18. Tong WH, Pieters R, de Groot-Kruseman HA, et al. The toxicity of very prolonged courses of PEGasparaginase or Erwinia asparaginase in relation to asparaginase activity, with a special focus on dyslipidemia. Haematologica. 2014;99(11):1716-21.
19. Jaing TH, Lin JL, Lin YP, Yang SH, Lin JJ, Hsia SH. Hyperammonemic encephalopathy after induction chemotherapy for acute lymphoblastic leukemia. J Pediatr Hematol Oncol. 2009;31(12):955-956.
20. Frantzeskaki F, Rizos M, Papathanassiou M, et al. L-asparaginase fatal toxic encephalopathy during consolidation treatment in an adult with acute lymphoblastic leukemia. Am J Case Rep. 2013;14:311-314.
21. Van Trimpont M, Peeters E, De Visser Y, et al. Novel insights on the use of L-asparaginase as an efficient and safe anti-cancer therapy. Cancers (Basel). 2022;14(4):902.
22. Beckett A, Gervais D. What makes a good new therapeutic lasparaginase? World J Microbiol Biotechnol. 2019;35(10):152.
23. Avramis VI, Panosyan EH. Pharmacokinetic/pharmacodynamic relationships of asparaginase formulations: the past, the present and recommendations for the future. Clin Pharmacokinet. 2005;44(4):367-393.
24. Asselin B, Rizzari C. Asparaginase pharmacokinetics and implications of therapeutic drug monitoring. Leuk Lymphoma. 2015;56(8):2273-2280.
25. Brumano LP, da Silva FVS, Costa-Silva TA, et al. Development of L-asparaginase biobetters: current research status and review of the desirable quality profiles. Front Bioeng Biotechnol. 2019;6:212-212.
26. Müller HJ, Boos J. Use of l-asparaginase in childhood ALL. Crit Rev Oncol Hematol. 1998;28(2):97-113.
27. Kawedia JD, Rytting ME. Asparaginase in acute lymphoblastic leukemia. Clin Lymphoma Myeloma Leuk. 2014;14 Suppl:S14-17.
28. Soares AL, Guimarães GM, Polakiewicz B, de Moraes Pitombo RN, Abrahão-Neto J. Effects of polyethylene glycol attachment on physicochemical and biological stability of E. coli Lasparaginase. Int J Pharm. 2002;237(1-2):163-170.
29. Meneguetti GP, Santos J, Obreque KMT, et al. Novel site-specific PEGylated L-asparaginase. PLoS One. 2019;14(2):e0211951.
30. Verhoef JJF, Anchordoquy TJ. Questioning the use of PEGylation for drug delivery. Drug Deliv Transl Res. 2013;3(6):499-503.
31. Heo YA, Syed YY, Keam SJ. Pegaspargase: a review in acute lymphoblastic leukaemia. Drugs. 2019;79(7):767-777.
32. Zhang F, Liu M-R, Wan H-T. Discussion about several potential drawbacks of PEGylated therapeutic proteins. Biol Pharm Bull.
Haematologica | 108 February 2023 418 ARTICLE - Durable antileukemic effect of ABD-tagged ErA-TM M. Van Trimpont et al.
2014;37(3):335-339.
33. Kloos R, van der Sluis IM, Mastrobattista E, Hennink W, Pieters R, Verhoef JJ. Acute lymphoblastic leukaemia patients treated with PEGasparaginase develop antibodies to PEG and the succinate linker. Br J Haematol. 2020;189(3):442-451.
34. Krishna M, Nadler SG. Immunogenicity to biotherapeutics - the role of anti-drug immune complexes. Front Immunol. 2016;7:21.
35. Mondelaers V, Ferster A, Uyttebroeck A, et al. Prospective, realtime monitoring of pegylated Escherichia coli and Erwinia asparaginase therapy in childhood acute lymphoblastic leukaemia and non-Hodgkin lymphoma in Belgium. Br J Haematol. 2020;190(1):105-114.
36. Chiu M, Tardito S, Pillozzi S, et al. Glutamine depletion by crisantaspase hinders the growth of human hepatocellular carcinoma xenografts. Br J Cancer. 2014;111(6):1159-1167.
37. Long S, Zhang X, Rao Z, et al. Amino acid residues adjacent to the catalytic cavity of tetramer l-asparaginase II contribute significantly to its catalytic efficiency and thermostability. Enzyme and Microbial Technology. 2016;82:15-22.
38. Offman MN, Krol M, Patel N, et al. Rational engineering of Lasparaginase reveals importance of dual activity for cancer cell toxicity. Blood. 2011;117(5):1614-1621.
39. Parmentier JH, Maggi M, Tarasco E, Scotti C, Avramis VI, Mittelman SD. Glutaminase activity determines cytotoxicity of L-asparaginases on most leukemia cell lines. Leuk Res. 2015;39(7):757-762.
40. Chan WK, Lorenzi PL, Anishkin A, et al. The glutaminase activity of L-asparaginase is not required for anticancer activity against ASNS-negative cells. Blood. 2014;123(23):3596-3606.
41. Maggi M, Chiarelli LR, Valentini G, Scotti C. Engineering of Helicobacter pylori L-asparaginase: characterization of two functionally distinct groups of mutants. PLoS One. 2015;10(2):e0117025.
42. Panosyan EH, Grigoryan RS, Avramis IA, et al. Deamination of glutamine is a prerequisite for optimal asparagine deamination by asparaginases in vivo (CCG-1961). Anticancer Res. 2004;24(2c):1121-1125.
43. Nguyen HA, Su Y, Zhang JY, et al. A novel l-asparaginase with low l-glutaminase coactivity Is highly efficacious against both Tand B-cell acute lymphoblastic leukemias in vivo. Cancer Res. 2018;78(6):1549-1560.
44. Chan WK, Horvath TD, Tan L, et al. Glutaminase activity of Lasparaginase contributes to durable preclinical activity against acute lymphoblastic leukemia. Mol Cancer Ther. 2019;18(9):1587-1592.
45. Fernandez CA, Cai X, Elozory A, et al. High-throughput asparaginase activity assay in serum of children with leukemia. Int J Clin Exp Med. 2013;6(7):478-487.
46. Hejazi M, Piotukh K, Mattow J, et al. Isoaspartyl dipeptidase activity of plant-type asparaginases. Biochem J. 2002;364(Pt 1):129-136.
47. Lanvers-Kaminsky C, Rüffer A, Würthwein G, et al. Therapeutic drug monitoring of asparaginase activity-method comparison of MAAT and AHA test used in the international AIEOP-BFM ALL 2009 trial. Ther Drug Monit. 2018;40(1):93-102.
48. Horvath TD, Chan WK, Pontikos MA, et al. Assessment of lasparaginase pharmacodynamics in mouse models of cancer. Metabolites. 2019;9(1):10.
49. Dennis MS, Zhang M, Meng YG, et al. Albumin binding as a general strategy for improving the pharmacokinetics of proteins. J Biol Chem. 2002;277(38):35035-35043.
50. Pieters R, Hunger SP, Boos J, et al. L-asparaginase treatment in acute lymphoblastic leukemia: a focus on Erwinia asparaginase. Cancer. 2011;117(2):238-249.
51. Gupta S, Wang C, Raetz EA, et al. Impact of asparaginase discontinuation on outcome in childhood acute lymphoblastic Leukemia: a report From the Children's Oncology Group. J Clin Oncol. 2020;38(17):1897-1905.
52. Burke MJ. How to manage asparaginase hypersensitivity in acute lymphoblastic leukemia. Future Oncol. 2014;10(16):2615-2627.
53. Salzer WL, Asselin BL, Plourde PV, Corn T, Hunger SP. Development of asparaginase Erwinia chrysanthemi for the treatment of acute lymphoblastic leukemia. Ann N Y Acad Sci. 2014;1329:81-92.
54. Tong WH, Pieters R, Kaspers GJ,et al. A prospective study on drug monitoring of PEGasparaginase and Erwinia asparaginase and asparaginase antibodies in pediatric acute lymphoblastic leukemia. Blood. 2014;123(13):2026-2033.
55. Salzer WL, Asselin B, Supko JG, et al. Erwinia asparaginase achieves therapeutic activity after pegaspargase allergy: a report from the Children's Oncology Group. Blood. 2013;122(4):507-514.
56. Armstrong JK, Hempel G, Koling S, Chan LS, Fisher T, Meiselman HJ, Garratty G. Antibody against poly(ethylene glycol) adversely affects PEG-asparaginase therapy in acute lymphoblastic leukemia patients. Cancer. 2007;110(1):103-111.
57. Ding S, Song M, Sim BC, et al. Multivalent antiviral XTEN-peptide conjugates with long in vivo half-life and enhanced solubility. Bioconjug Chem. 2014;25(7):1351-1359.
58. Schlapschy M, Binder U, Börger C, et al. PASylation: a biological alternative to PEGylation for extending the plasma half-life of pharmaceutically active proteins. Protein Eng Des Sel. 2013;26(8):489-501.
59. Gebauer M, Skerra A. Prospects of PASylation® for the design of protein and peptide therapeutics with extended half-life and enhanced action. Bioorg Med Chem. 2018;26(10):2882-2887.
60. Maese L, Rizzari C, Coleman R, Power A, van der Sluis I, Rau RE. Can recombinant technology address asparaginase Erwinia chrysanthemi shortages? Pediatr Blood Cancer. 2021;68(10):e29169.
Haematologica | 108 February 2023 419 ARTICLE - Durable antileukemic effect of ABD-tagged ErA-TM M. Van Trimpont et al.
Relative impact of residual cytogenetic abnormalities and flow cytometric measurable residual disease on outcome after allogeneic hematopoietic cell transplantation in adult acute myeloid leukemia
Corentin Orvain,1,2,3,4,5 Jacob A. Wilson,6 Min Fang,1,7 Brenda M. Sandmaier,1,2 Eduardo Rodríguez-Arbolí,1,8 Brent L. Wood,9 Megan Othus,10 Frederick R. Appelbaum1,2 and Roland B. Walter1,2,7,11
1Clinical Research Division, Fred Hutchinson Cancer Center, Seattle, WA, USA; 2Department of Medicine, Division of Hematology/Oncology, University of Washington, Seattle, WA, USA; 3Maladies du Sang, CHU d’Angers, Angers, France; 4Fédération Hospitalo-Universitaire Grand-Ouest Acute Leukemia, FHU-GOAL, Angers, France; 5Université d'Angers, INSERM UMR 1307, CNRS UMR 6075, Nantes Université, CRCI2NA, Angers; 6Cytogenetics Laboratory, Fred Hutchinson Cancer Center, Seattle, WA, USA; 7Department of Laboratory Medicine and Pathology, University of Washington, Seattle, WA, USA; 8Department of Hematology, Hospital Universitario Virgen del Rocío, Instituto de Biomedicina de Sevilla (IBIS/CSIC/CIBERONC), University of Seville, Seville, Spain; 9Department of Pathology and Laboratory Medicine, Children’s Hospital, Los Angeles, CA, USA; 10Public Health Sciences Division, Fred Hutchinson Cancer Center, Seattle, WA, USA and 11Department of Epidemiology, University of Washington, Seattle, WA, USA.
Abstract
Correspondence: R.B. Walter rwalter@fredhutch.org
Received: June 14, 2022.
Accepted: July 25, 2022.
Prepublished: August 4, 2022.
https://doi.org/10.3324/haematol.2022.281585
©2023 Ferrata Storti Foundation Published under a CC-BY-NC license
Measurable residual disease (MRD) before hematopoietic cell transplantation (HCT) is an independent established prognostic factor in patients with acute myeloid leukemia (AML). Several methods exist to evaluate the presence of residual leukemia cells, but how these are used best in combination is unclear. In order to examine how residual cytogenetic abnormalities and MRD testing by multiparameter flow cytometry (MFC) may refine risk assessment before HCT, we analyzed 506 adults with cytogenetically abnormal AML who underwent both routine karyotyping and MFC MRD testing before receiving a first allograft while in morphologic remission. Testing for residual cytogenetic abnormalities and MFC MRD identified four groups of patients with differential relapse-free survival (RFS) (hazard ratio [HR]=1.63 for Cytoabnormal/MFCnegative [P=0.01, n=63], HR=3.24 for Cytonormal/MFCpositive [P<0.001, n=60], and HR=5.50 for Cytoabnormal/MFCpositive [P<0.001, n=56] with Cytonormal/MFCnegative as reference [n=327]) and overall survival (OS) (HR=1.55 for Cytoabnormal/MFCnegative [P=0.03], HR=2.69 for Cytonormal/MFCpositive [P<0.001], and HR=4.15 for Cytoabnormal/MFCpositive [P<0.001] with Cytonormal/MFCnegative as reference). Results were similar for patients who received myeloablative or non-myeloablative conditioning. C-statistic values were higher, indicating higher accuracy, when using pre-HCT cytogenetic and MFC MRD information together for prediction of relapse, RFS, and OS, rather than using either test result alone. This study indicates that residual cytogenetic abnormalities and MFC MRD testing provide complementary prognostic information for postHCT outcomes in patients with cytogenetically abnormal AML undergoing allogeneic HCT.
Introduction
For many adults with acute myeloid leukemia (AML) who have achieved a morphologic remission, allogeneic hematopoietic cell transplantation (HCT) remains an important part of curative therapy.1,2 However, the likelihood of post-HCT relapse varies considerably across individual patients. Among established prognostic factors, evidence of residual leukemia cells at the time of HCT plays a key role in informing on relapse risk. Currently of greatest in-
terest are assays to quantify measurable residual disease (MRD) via multiparameter flow cytometry (MFC) or assessment of molecular abnormalities.3–14 However, less sensitive methods have been used as well for the detection of submicroscopic amounts of AML cells, including routine cytogenetic analysis via chromosome (G-)banding or fluorescence in situ hybridization (FISH), with some studies indicating prognostic significance in the context of allogeneic HCT.15–20
In a previous analysis that included 286 children and
Haematologica | 108 February 2023 420 ARTICLE - Acute Myeloid Leukemia
adults with AML in either remission or relapse transplanted between 2006 and 2009, our group showed that a significant subset of patients (15%) had discordant results from cytogenetic analysis and MFC-based MRD testing. The presence of residual AML before HCT as assessed by either cytogenetics or MFC was associated with increased relapse risk and inferior survival.20 In this earlier study, there was no difference in survival for those testing positive with only one methodology versus both methodologies, but cohort sizes were small and patient characteristics heterogeneous (children and adults; remission and relapse; cytogenetically normal or abnormal at diagnosis), limiting statistical analyses and interpretation.20
In order to re-evaluate the relationship between pre-HCT residual cytogenetic abnormalities and MFC-based MRD testing and post-HCT outcomes, we examined a large cohort of adults with cytogenetically abnormal AML who underwent allogeneic HCT in first or second remission at our institution between April 2006 and May 2021.
Methods Study cohort
We identified all adults ≥18 years of age with AML (2016 World Health Organization criteria)21 who received a first allograft while in first or second morphologic remission (i.e., <5% blasts in bone marrow) with or without peripheral blood count recovery between 4/2006 and 5/2021. Data from 440 of the 506 patients in the final study cohort have been partially reported.22–32 The HCT-specific comorbidity index (HCT-CI) was calculated as described.33 Related or unrelated donors were selected by high resolution HLA-typing. Post-HCT maintenance therapy was not typically done except in a small subset of patients with FLT3-mutated AML after midostaurin was approved in 2017. Information on post-HCT outcomes was captured via the Long-Term Follow-Up Program through medical records from our outpatient clinic and local clinics that provided primary care for patients in addition to records obtained on patients in research studies. All patients were treated on Institutional Review Board-approved research protocols (all registered with ClinicalTrials.gov) or standard treatment protocols and gave consent in accordance with the Declaration of Helsinki. Follow-up was current as of February 10, 2022.
Classification of disease risk and treatment response
The refined MRC/NCRI and the ELN 2017 criteria were used to assign cytogenetic risk at diagnosis.2,34 Cytogenetically normal AML was considered in patients with a normal karyotype regardless of how many metaphases were available for analysis.30–32,35 Since molecular data at
time of diagnosis were lacking in many patients, only cytogenetic risk could be used to classify patients. Secondary AML was defined as disease following an antecedent hematologic disorder or treatment with systemic chemotherapy and/or radiotherapy for a different disorder.30–32 Treatment responses were categorized as proposed by the European LeukemiaNet 2 except that post-HCT relapse was defined as emergence >5% blasts by morphology or MFC in blood or bone marrow, emergence of cytogenetic abnormalities seen previously, or presence/emergence of any level of disease if leading to a therapeutic intervention.30–32
Cytogenetics studies and multiparameter flow cytometry
At the time of diagnosis and before HCT, samples from bone marrow aspirates were tested for cytogenetic abnormalities using standard culturing and G-banding analysis. The karyotype analysis was based on 20 metaphases for most samples as a routine procedure and FISH studies were performed according to standard procedures at the time of diagnosis and pre-HCT assessment in a subset of patients. The presence of any clonal abnormality by either karyotyping or FISH was considered an abnormal cytogenetic result. Ten-color flow cytometry was performed as a routine clinical test on bone marrow aspirates obtained before starting conditioning therapy. The methodology of the MFC MRD assay has remained essentially unchanged throughout the study period.22–24,26,28,30,36 Any measurable level of MRD was considered positive, consistent with prior analyses.22–32
Statistical analysis
Categorical variables were presented as numbers with proportions and compared using the Chi² test or the Fisher’s exact test, for small samples (expected values <5). Continuous variables were presented as medians with interquartile range (IQR) and compared using the non-parametric Mann and Whitney test. Unadjusted probabilities of relapse-free survival (RFS) (events: relapse and death) and overall survival (OS) (event: death) were estimated using the Kaplan-Meier method and compared with the log-rank test; associations with RFS and OS were assessed using Cox regression. Probabilities of relapse (with non-relapse mortality [NRM] as a competing event) and NRM (death without prior relapse with relapse as a competing risk) were summarized using cumulative incidence estimates; associations with cumulative incidence of relapse and NRM were assessed using causespecific regression models. All tests were two-sided with a significant level P<0.05. Statistical analyses were performed with R (R Foundation for Statistical Computing, Vienna, Austria; http://www.r-project.org).
Haematologica | 108 February 2023 421 ARTICLE - Cytogenetics and flow cytometry before allogeneic HCT for AML C. Orvain et al.
Results
Characteristics of study cohort
Of 1,011 adults with AML allografted between 2006 and 2021, 506 patients with cytogenetically abnormal AML at diagnosis and pre-HCT karyotyping and MFC MRD testing available were included in our analysis. In addition to 422 patients with cytogenetically normal AML, we excluded 21 patients because they did not agree to their data being used for research purposes, 40 because they did not have cytogenetic data available at diagnosis, ten because they did not undergo pre-HCT MRD testing, and 12 because they did not have informative pre-HCT cytogenetic studies (not enough metaphases and no FISH study); see Figure 1. Of the 506 patients, cytogenetics studies were abnormal in 119 patients (24%) at the time of HCT (for details on cytogenetic and FISH analyzes, see the Online Supplementary Table S1). No cytogenetic abnormal result was based on an abnormal FISH study alone. Discordant results between pre-HCT cytogenetics and MFC MRD testing were observed in 123 patients (24%) with 63 (12%) having preHCT cytogenetic abnormalities but negative MRD by MFC
and 60 (12%) having normal pre-HCT cytogenetics but positive MFC MRD. Table 1 shows patient characteristics according to pre-HCT cytogenetics and MFC MRD status. Patients with cytogenetic abnormalities were older irrespective of pre-HCT MFC MRD status (P<0.001). Patients with cytogenetically adverse-risk disease at diagnosis were more likely to have persistent abnormal cytogenetics and/or positive MFC MRD pre-HCT (P<0.001). Those with secondary AML were more likely to be MFC MRD-positive, irrespective of the pre-HCT karyotype (P<0.001). FLT3, NPM1, and CEBPA mutational status was infrequently available for patients but those with FLT3-ITD mutations at diagnosis were more likely to have pre-HCT normal cytogenetics and negative MFC MRD (P=0.002).
Relationship between pre-hematopoietic cell transplantation cytogenetic abnormalities, multiparameter flow cytometry measurable residual disease, and post-hematopoietic cell transplantation outcome
With a median follow-up of 5.38 years after HCT in survivors (IQR, 2.48-9.18), there were 173 relapses, 239 deaths,
Figure 1. Flowchart describing the selection and distribution of analyzed patients. AML: acute myeloid leukemia; HCT: hematopoietic cell transplantation; MFC: multiparameter flow cytometry; MRD: measurable residual disease.
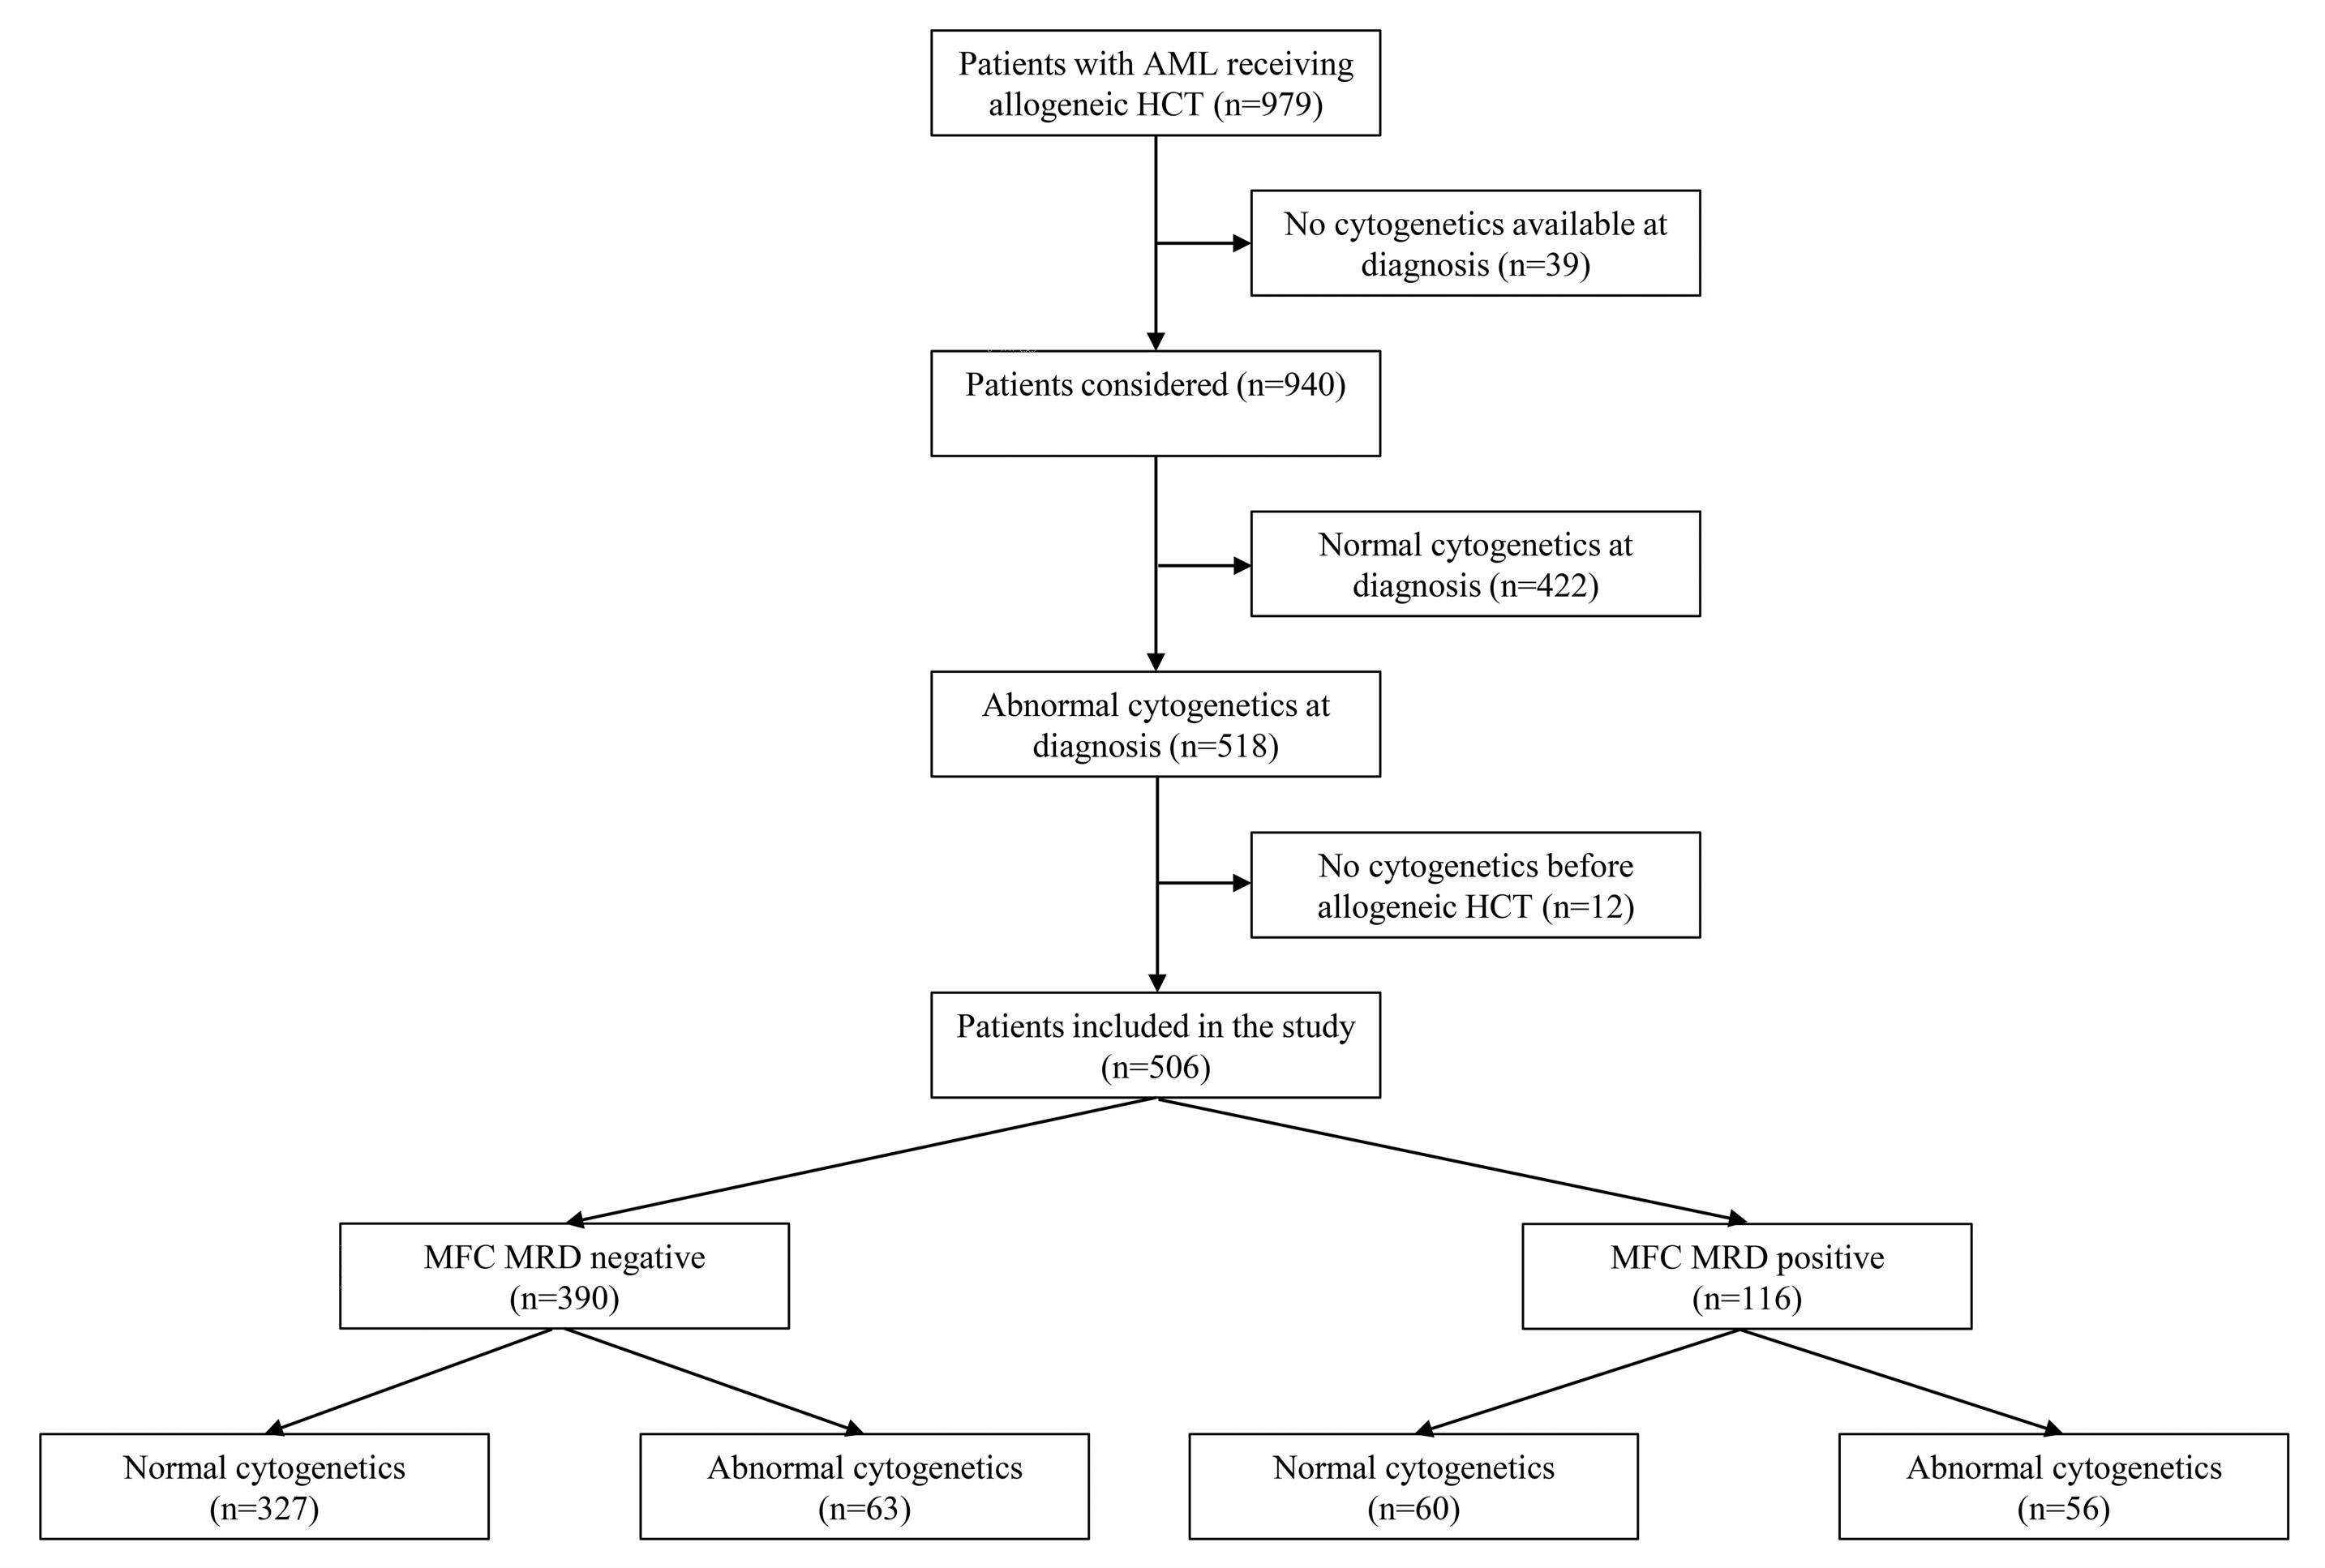
Haematologica | 108 February 2023 422 ARTICLE - Cytogenetics
fl
HCT
C. Orvain et al.
and
ow cytometry before allogeneic
for AML
and 91 NRM events contributing to the probability estimates for relapse, RFS, OS, and NRM. The cumulative incidence of relapse was higher in patients with pre-HCT cytogenetic abnormalities and MFC MRD positivity (3-year cumulative incidence of relapse, 51% vs. 27% for those
without pre-HCT cytogenetic abnormalities and 67% vs 23% for those without pre-HCT MFC MRD positivity, respectively) whereas NRM was similar in all groups (Table 2; Online Supplementary Figure S1; Online Supplementary Figure S2). This translated into lower RFS (median, 0.5 vs.
Table 1. Pre-hematopoietic cell transplantation demographic and clinical characteristics of patients with abnormal cytogenetics at diagnosis, stratified by cytogenetics and multiparameter flow cytometry status before hematopoietic cell transplantation.
Cyto AbN at diagnosis (N=506)
Cyto Normal MFC- (N=327)
Cyto AbN MFC- (N=63)
Cyto Normal MFC+ (N=60)
Cyto AbN MFC+ (N=56)
Median age at HCT in years (IQR) 53 (40-63) 50 (39-60) 63 (55-69) 53 (41-62) 62 (47-67)
Female sex, N (%) 219 (43) 149 (46) 26 (41) 21 (35) 23 (41) HCT-CI, N (%)
0 171 (34) 120 (37) 17 (27) 18 (30) 16 (29) 1-2 175 (35) 105 (32) 24 (38) 28 (47) 18 (32) > 3 160 (32) 102 (31) 22 (35) 14 (23) 22 (39) WBC count at diagnosis x109/L, median (IQR) 6 (2-32) 9 (2-39) 4 (2-24) 3 (1-19) 3 (1-13)
Cytogenetic risk (MRC), N (%)
Favorable 69 (14) 54 (17) 8 (13) 3 (5) 4 (7) Intermediate 229 (45) 163 (50) 26 (41) 23 (38) 17 (30) Adverse 208 (41) 110 (34) 29 (46) 34 (57) 35 (62) Secondary AML 149 (29) 79 (24) 19 (30) 28 (47) 23 (41) Median CR duration before HCT in days (IQR) 98 (70-142) 98 (72-143) 97 (72-131) 116 (68-146) 79 (55-130)
Remission status, N (%)
First remission 421 (83) 274 (84) 51 (81) 50 (83) 46 (82) Second remission 85 (17) 53 (16) 12 (19) 10 (17) 10 (18) Recovered peripheral blood counts before HCT*, N (%) 368 (73) 247 (76) 37 (59) 48 (80) 36 (64)
Unrelated donor, N (%) 366 (72) 238 (73) 41 (65) 49 (82) 38 (68) HLA matching, N (%)
Identical related donor 112 (22) 76 (23) 15 (24) 10 (17) 11 (20) Matched unrelated donor 245 (48) 160 (49) 29 (46) 28 (47) 28 (50) 1-2 allele mismatch 53 (10) 24 (7) 11 (17) 11 (18) 7 (12) Haplo-identical 23 (5) 11 (4) 4 (6) 1 (2% 7 (12) Cord blood 73 (14) 56 (17) 4 (6) 10 (17) 3 (5)
Stem cell source, N (%)
PB 389 (77) 246 (75) 57 (90) 39 (65) 47 (84) BM 44 (9) 25 (8) 2 (3) 11 (18) 6 (11) Cord blood 73 (14) 56 (17) 4 (6) 10 (17) 3 (5)
Conditioning regimen, N (%)
MAC 318 (63) 210 (64) 34 (54) 40 (67) 34 (61) Non-MAC 188 (37) 117 (36) 29 (46) 20 (33) 22 (39)
GvHD prophylaxis, N (%)
CNI+MMF ± sirolimus 229 (45) 152 (46) 24 (38) 28 (47) 25 (45)
CNI+MTX ± other 202 (40) 132 (40) 25 (40) 25 (42) 20 (36)
PTCy 67 (13) 37 (11) 13 (21) 7 (12) 10 (18)
Other 8 (1.6) 6 (12) 1 (2) 0 1 (2)
*Absolute neutrophil count (ANC) ≥1x10⁹/L and platelets ≥100x109/L. AbN: abnormal; IQR: interquartile range; AML: acute myeloid leukemia; BM: bone marrow; CNI: calcineurin inhibitor; GvHD: graft-versus-host disease; HCT: hematopoietic cell transplantation; HLA: human leukocyte antigen; MAC: myeloablative conditioning; MFC: multiparameter flow cytometry; MMF: mycophenolate mofetil; MRD: measurable residual disease; MTX: methotrexate; NMA: non-myeloablative; PB: peripheral blood; PTCy: post-transplantation cyclophosphamide; UCB: umbilical cord blood; WBC: total white blood cell count.
Haematologica | 108 February 2023 423 ARTICLE - Cytogenetics
fl
before allogeneic HCT for AML C. Orvain et al.
and
ow cytometry
Table 2. Outcome probabilities (with 95% con fi dence interval) strati fi ed by pre-hematopoietic cell transplantation measurable residual disease status.
Overall survival (95% CI)
15 (12-18)
10 (8-13)
4 (3-6)
54 (49-58)
59 (55-63)
Relapse-free survival (95% CI)
6.5 (4.7-11.5) 73 (69- 77)
48 (43-53)
53 (48-57)
62 (58-67)
4.2 (2.4-6.8)
CI relapse (95% CI)
CI non-relapse mortality (95 % CI) 1 year 3 years 5 years Median 1 year 3 years 5 years Median 1 year 3 years 5 years 100 days 1 year 3 years
35 (31-40)
33 (29-37)
27 (23-31)
All patients (n=506) N %
10 (7-13)
4 (2-6)
60 (54-65)
65 (61-70)
77 (73-82)
11 (6.8-NR)
54 (49-60)
59 (55-65)
68 (64-73)
8.6 (4.6-NR)
30 (25-34)
27 (23-32)
22 (18-26)
Pre-HCT cytogenetics Normal (n=387) N %
14 (10-17) Abnormal (n=119) N %
19 (11-26)
12 (6-18)
5 (1-9)
34 (26-44)
38 (30-48)
58 (49-67)
1.5 (0.9-2.7)
28 (20-38)
30 (23-40)
43 (35-53)
0.5 (0.4-1.1)
54 (44-63)
51 (42-60)
46 (37-55)
15 (11-18)
10 (7-13)
5 (3-7)
63 (58-69)
68 (63-73)
80 (76-84)
NR (9.1-NR)
58 (53-64)
63 (58-68)
73 (69-78)
11 (6.5-NR)
25 (20-29)
23 (18-27)
17 (13-21)
15 (8-22)
11 (6-17)
3 (0-6)
22 (16-32)
30 (22-40)
49 (40-59)
0.9 (0.8-1.5)
13 (8-22)
18 (12-27)
25 (19-35)
0.4 (0.3-0.5)
71 (62-79)
67 (58-76)
63 (54-72)
13 (10-17)
10 (7-13)
5 (2-7)
65 (60-71)
70 (65-75)
81 (77-86)
NR (11-NR)
60 (55-66)
66 (60-71)
75 (71-80)
NR (8.8-NR)
23 (18-28)
21 (17-26)
15 (11-19)
21 (10-31)
11 (3-19)
6 (0-12)
54 (42-69)
56 (45-71)
73 (63-85)
5.4 (2.0-NR)
46 (35-61)
49 (37-63)
63 (52-76)
2.4 (1.1-NR)
33 (21-45)
31 (19-42)
26 (15-37)
14 (5-23)
10 (2-18)
2 (0-5)
31 (21-46)
41 (30-55)
56 (45-70)
1.2 (0.9-4.0)
19 (11-33)
26 (17-40)
31 (21-46)
0.6 (0.5-0.9)
65 (52-78)
60 (48-73)
59 (46-71)
Pre-HCT MFC Negative (n=390) N %
Positive (n=116) N %
Pre-HCT cytogenetics/MFC
Normal/MFC(n=327) N %
Abnormal/MFC(n=63) N %
16 (6-27)
13 (4-21)
4 (0-9)
13 (7-27)
18 (10-32)
41 (30-56)
0.9 (0.6-1.5)
7 (3-20)
10 (4-22)
20 (11-33)
0.2 (0.3-0.4)
76 (64-88)
74 (62-86)
68 (56-81)
Normal/MFC+ (n=60) N %
Abnormal/MFC+ (n=56) N %
CI: cumulative incidence; HCT: hematopoietic cell transplantation; MFC: multiparameter fl ow cytometry; MRD: measurable residual disease; NR: not reached.
Haematologica | 108 February 2023 424 ARTICLE - Cytogenetics and flow cytometry before allogeneic HCT for AML C. Orvain et al.
8.6 years in those without pre-HCT cytogenetic abnormalities and 0.4 vs. 11 years in those without pre-HCT MFC MRD positivity, respectively) and OS (median, 1.5 vs. 11 years in those without pre-HCT cytogenetic abnormalities and 0.9 years vs. not reached in those without pre-HCT MFC MRD positivity, respectively). Considering results from pre-HCT karyotyping and MFC MRD testing separately, four groups of patients were identified with differential risk of relapse (3-year cumulative incidence of relapse, 21% for Cytonormal/MFCnegative vs. 31% for Cytoabnormal/MFCnegative vs. 60% for Cytonormal/MFCpositive vs. 74% for Cytoabnormal/MFCpositive) whereas NRM was similar between the four groups (Figure 2; Table 2). Similar results were observed for RFS (median, not reached vs. 2.4 years vs. 0.6 years vs. 0.2 years) and OS (not reached vs. 5.4 years vs. 1.2 years vs. 0.9 years) (Figure 2; Table 2).
When comparing persistent cytogenetic abnormalities ac-
cording to pre-HCT MFC MRD status, patients with negative MFC MRD test were more likely to have abnormalities not qualifying for adverse-risk (49% vs. 31%, P<0.001) whereas patients with positive MFC MRD test were likely to have monosomal karyotypes (6% vs. 30%, P<0.001) with deletions (41% vs. 61%, P=0.043) and additional material (19% vs. 54%, P<0.001) being more frequent (Online Supplementary Table S2). Mutational data was only available in a very small fraction of patients before HCT and only three patients had evidence of persistent mutations in our cohort, one with a FLT3-ITD mutation and both pre-HCT abnormal cytogenetics and positive MFC MRD, and two patients with a NPM1 mutation, one with both pre-HCT normal cytogenetics and negative MFC MRD and one with pre-HCT abnormal cytogenetics but negative MFC MRD.
In univariable analysis, both pre-HCT cytogenetic abnormalities and MRD by MFC were individually associated
B
Figure 2. Post-hematopoietic cell transplantation (HCT) outcomes for 506 adults with acute myeloid leukemia and initial abnormal cytogenetics undergoing allogeneic HCT while in first or second morphologic remission, stratified by both pre-HCT cytogenetics and pre-HCT multiparameter flow cytometry. (A) Cumulative incidence of relapse, (B) relapse-free survival, (C) overall survival, and (D) cumulative incidence of non-relapse mortality. Cyto N: normal cytogenetics; Cyto AbN: abnormal cytogenetics; MFC: multiparameter flow cytometry.
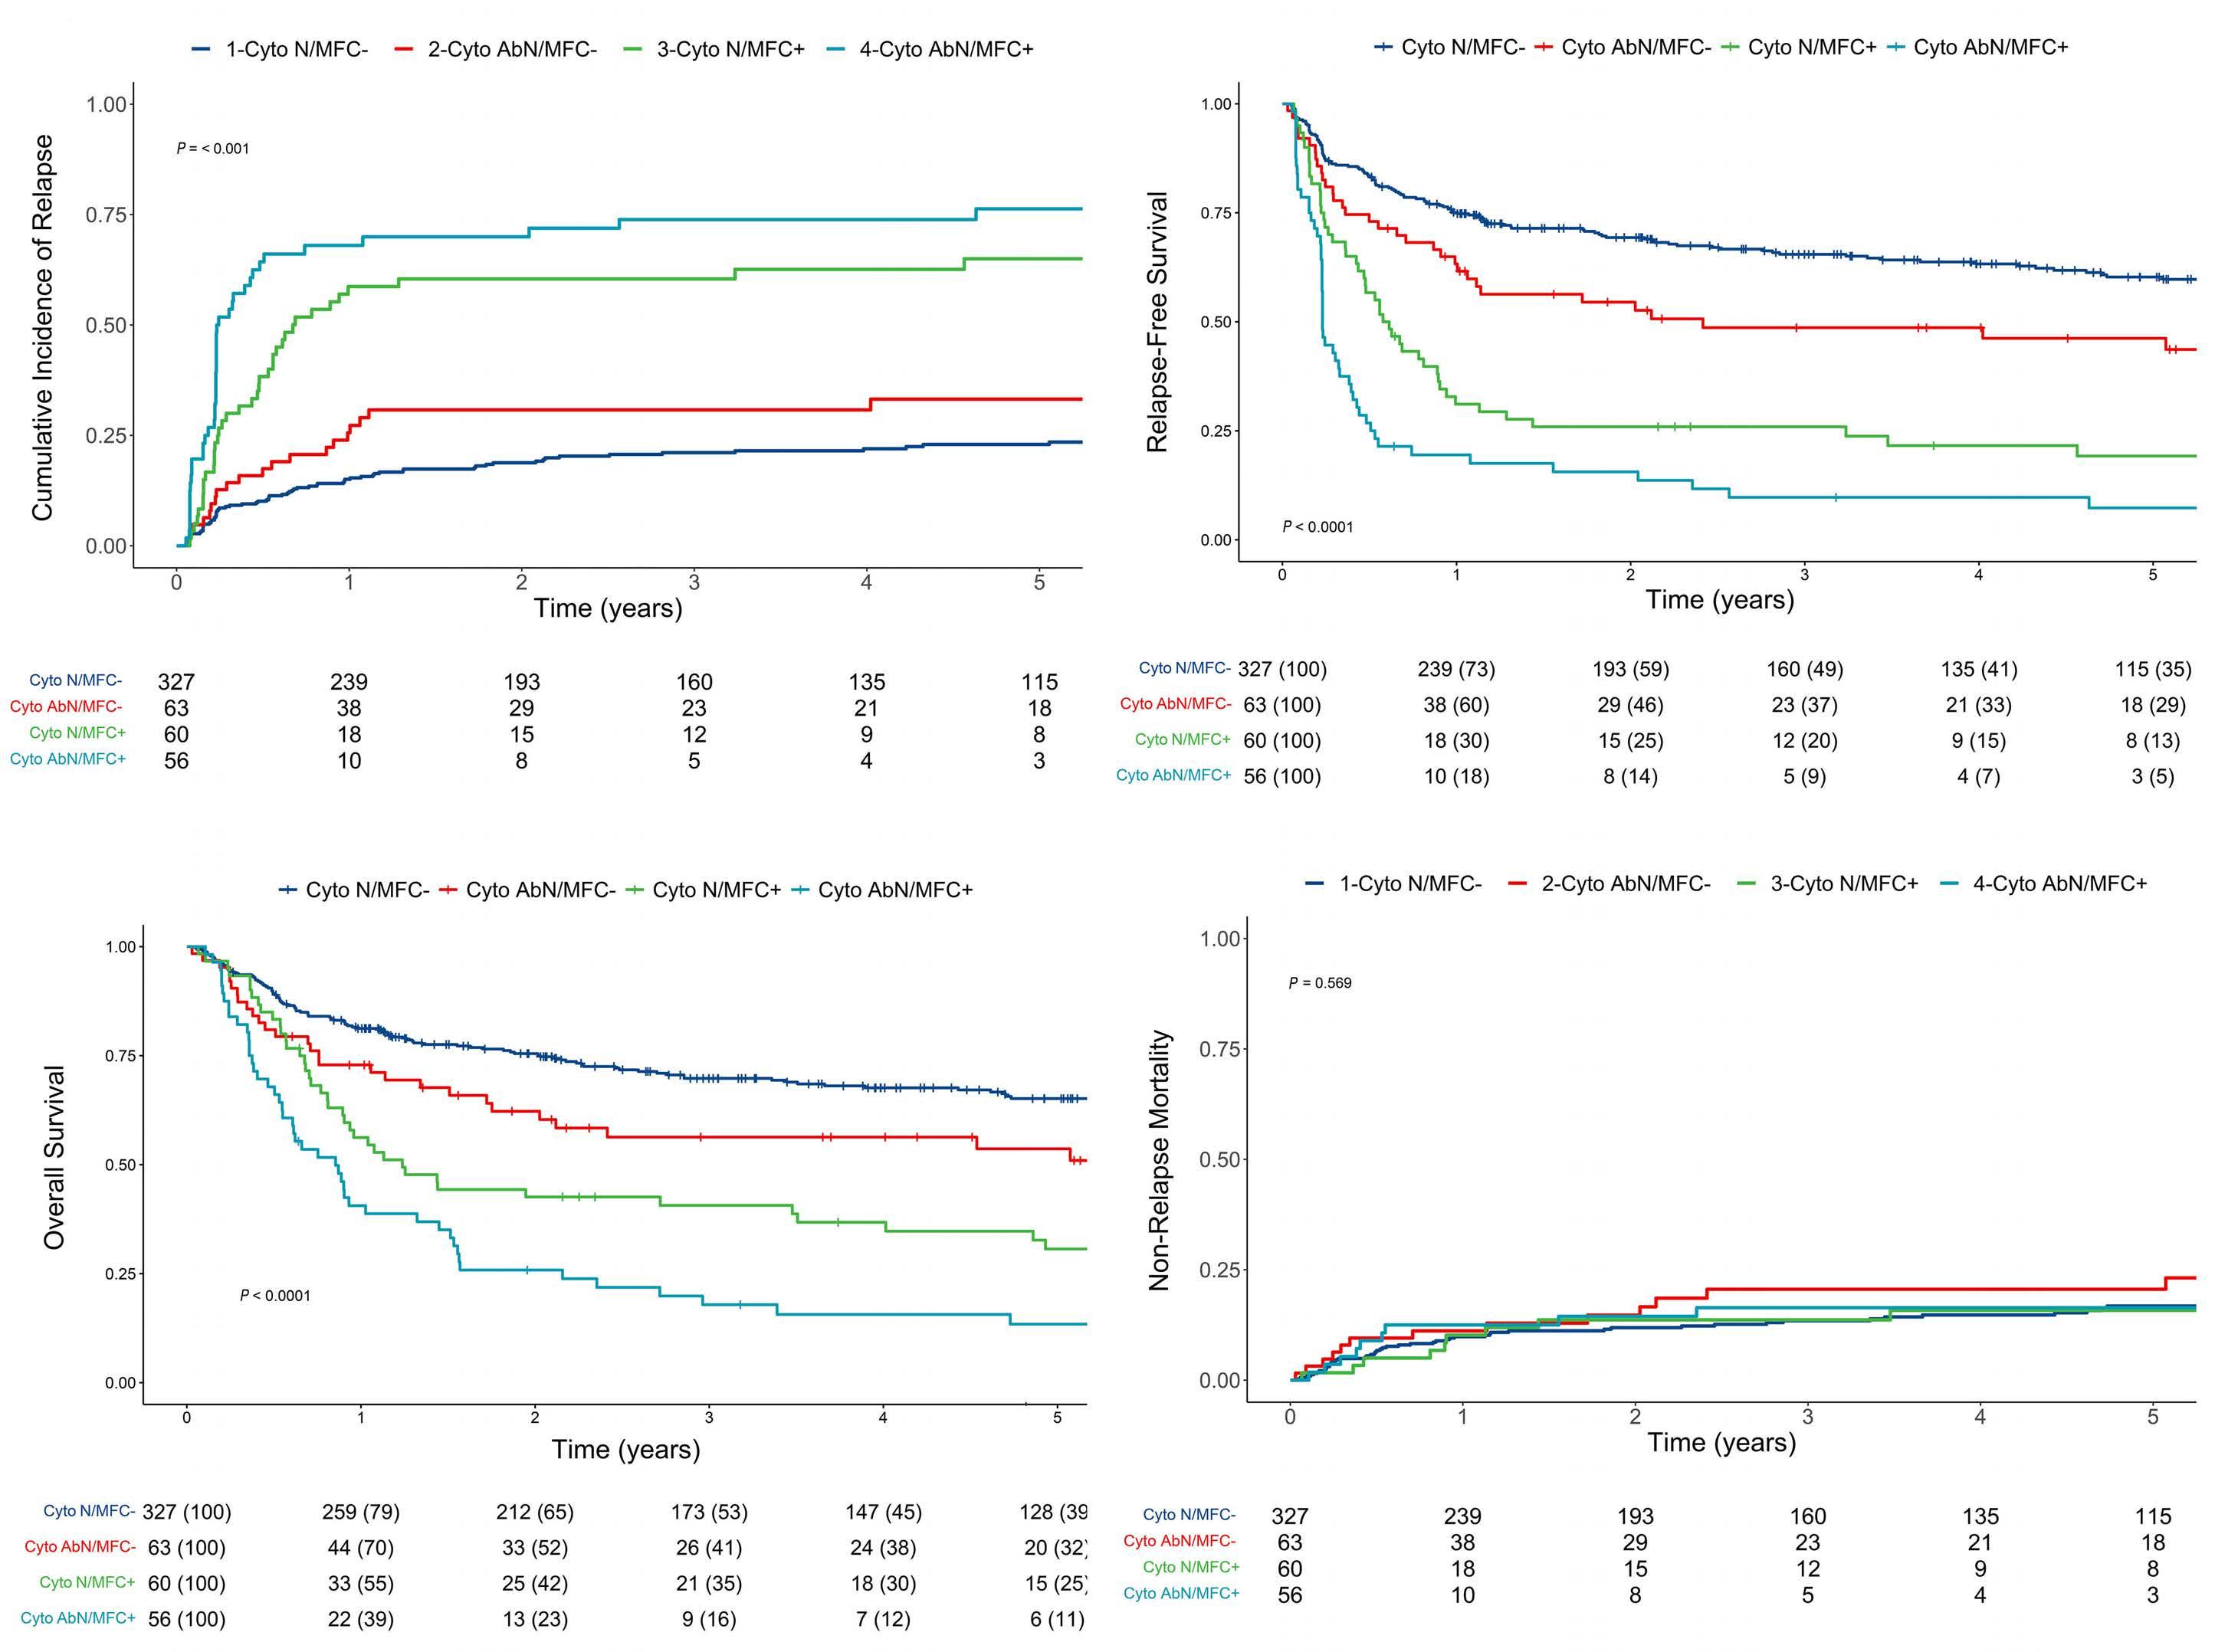
A
Haematologica | 108 February 2023 425 ARTICLE -
C. Orvain et al. C
Cytogenetics and flow cytometry before allogeneic HCT for AML
D
with RFS (HR=2.23, 95% CI: 1.72–2.88, P<0.001, and HR=3.73, 95% CI: 2.90–4.81, P<0.001, respectively) and OS (HR=2.05, 95% CI: 1.56–2.69, P<0.001, and HR=3.03, 95% CI: 2.33–3.93, P<0.001, respectively) (Table 3). Results from pre-HCT cytogenetic and MFC MRD testing identified four groups of patients with differential RFS (HR=1.63, 95% CI: 1.12–2.37, P=0.01, for Cytoabnormal/MFCnegative; HR=3.24, 95% CI: 2.32–4.51, P<0.001, for Cytonormal/MFCpositive; and HR=5.50, 95% CI: 3.94–7.66, P<0.001, for Cytoabnormal/MFCpositive, with Cytonormal/MFCnegative as reference) and OS (HR=1.55, 95% CI: 1.04–2.32, P=0.03, for Cytoabnormal/MFCnegative; HR=2.69, 95% CI: 1.91–3.79, P<0.001, for Cytonormal/MFCpositive; and HR=4.15, 95% CI: 2.94–5.85, P<0.001, for Cytoabnormal/MFCpositive, with Cytonormal/MFCnegative as reference) (Table 3). In a multivariable Cox regression model, both cytogenetic abnormalities and MFC MRD were independently associated with relapse (HR=1.67, 95% CI: 1.16– 2.41, P=0.006 and HR=4.44, 95% CI: 3.11–6.34, P<0.001, respectively), RFS (HR=1.53, 95% CI: 1.13– 2.06, P=0.006 and HR=3.21, 95% CI: 2.39–4.30, P<0.001, respectively), and OS (HR=1.41, 95% CI: 1.03 –1.93, P=0.034 and HR=2.43, 95% CI: 1.81–3.27, P<0.001, respectively) (Table 4). The performance of pre-HCT cytogenetics and MFC MRD test results, separately or together, as predictors for RFS and OS was evaluated by estimating C-statistics in univariable regression models. Higher C-statistic values (indicating higher predictive accuracy) were observed when considering both the results from cytogenetic and MFC MRD testing rather than karyotyping or MFC MRD testing alone. This was true for the prediction of RFS (0.65 vs. 0.58 vs. 0.63) as well as the prediction of OS (0.63 vs. 0.58 vs. 0.61). The C-statistics values were also higher when using the information from both cytogenetic testing and MFC MRD testing separately rather than when assuming residual disease positivity if either or both assays were positive (C-statistic, 0.63 and 0.61 for RFS and OS, respectively).
Relationship between pre-hematopoietic cell transplantation cytogenetics/multiparameter flow cytometry measurable residual disease status, conditioning intensity, and post-hematopoietic cell transplantation outcomes
Overall, similar results were obtained in the subset of patients receiving MAC conditioning compared to the entire study cohort. However, the risk of relapse and OS of patients with or without cytogenetic abnormalities but with negative MFC MRD test were not different (for relapse, HR=1.56, 95% CI: 0.76–3.22, P=0.2, for Cytoabnormal/MFCnegative; HR=5.88, 95% CI: 3.58–9.65, P<0.001, for Cytonormal/MFCpositive; and HR=10.2, 95% CI: 6.13–17.0, P<0.001, for Cytoabnormal/MFCpositive, with Cytonormal/MFCnegative as reference; for OS, HR=1.49, 95% CI: 0.83–2.66, P=0.2, for Cytoabnormal/MFCnegative; HR=3.24 , 95% CI: 2.07–5.07, P<0.001, for Cytonormal/MFCpositive; and HR=4.38, 95% CI: 2.76–6.96, P<0.001, for Cytoabnormal/MFCpositive, with Cytonor-
mal/MFCnegative as reference) (Figure 3A and B). Similar results were observed for patients receiving non-MAC for the outcome of relapse (HR=1.53, 95% CI: 0.77–3.03, P=0.2, for Cytoabnormal/MFCnegative; HR=2.87, 95% CI: 1.48–5.56, P=0.002, for Cytonormal/MFCpositive; and HR=4.83, 95% CI: 2.63–8.86, P<0.001, for Cytoabnormal/MFCpositive, with Cytonormal/MFCnegative as reference) and OS (HR=1.55, 95% CI: 0.88–2.72, P=0.13, for Cytoabnormal/MFCnegative; HR=2.08, 95% CI: 1.22–3.55, P<0.001, for Cytonormal/MFCpositive; and HR=3.93, 95% CI: 2.35–6.57, P<0.001, for Cytoabnormal/MFCpositive, with Cytonormal/MFCnegative as reference) (Figure 3C and D).
Discussion
There is increasing interest in using results from MRD testing in patients with AML to inform on prognosis and, perhaps, to guide therapeutic decision making.37 Our current analyses show that both MFC MRD testing as well as standard cytogenetic analysis, via karyotyping and FISH, provides prognostic information for patients undergoing allografting for AML in morphologic remission. Further, our data indicate that cytogenetic and MFC MRD testing provides complementary rather than identical information. With this, our findings suggest that, for optimal risk assessment and outcome prediction, results from both tests should be considered.
Previous studies that have assessed the prognostic role of abnormal cytogenetics at the time of morphologic response in patients with AML have come to mixed conclusions.15–20,38,39 Although routine cytogenetic testing has a low sensitivity for the detection of residual leukemia considering only 20-30 metaphases are typically analyzed, malignant myeloid cells divide readily in culture, and our results show that pre-HCT cytogenetic studies are useful to evaluate the outcome of adults with AML after HCT. In our cohort, approximately one quarter of patients with cytogenetically abnormal AML at diagnosis were found to have abnormal cytogenetics during the pre-HCT evaluation, and half of these had no disease detectable by flow cytometry. Relative to patients in whom cytogenetic abnormalities could no longer be detected, patients with abnormal cytogenetic findings at the time of HCT had an increased risk of relapse and shorter RFS and OS. Considering that 506 of 940 patients in our cohort had cytogenetically abnormal AML at diagnosis and informative results from pre-HCT karyotyping studies available, one of the limitations of cytogenetic testing as measure for residual AML is that it is applicable to only 54% to 65% of patients.17,38,39
As more MRD assays are becoming available, some patients may be evaluated with more than one assay. A small number of previous studies suggest that the use of more than one of MRD test might improve prognostication.13,40
Haematologica | 108 February 2023 426 ARTICLE - Cytogenetics and flow cytometry before allogeneic HCT for AML C. Orvain et al.
- Cytogenetics and flow cytometry before allogeneic HCT for AML
Table 3. Univariable regression models of study cohort (patients with abnormal cytogenetics at diagnosis).
Relapse Relapse-free survival Overall survival Non-relapse mortality
HR (95% CI) P HR (95% CI) P HR (95% CI) P HR (95% CI) P
Median age at HCT 1.02 (1.00-1.03) 0.004 1.03 (1.02-1.04) <0.001 1.02 (1.02-1.03) <0.001 1.05 (1.03-1.07) <0.001
Female sex 0.96 (0.71-1.30) 0.8 0.84 (0.66-1.08) 0.2 0.77 (0.59-1.00) 0.047 0.66 (0.42-1.01) 0.056
Secondary AML (n=149) 1.32 (0.96-1.81) 0.082 1.43 (1.11-1.84) 0.006 1.38 (1.06-1.80) 0.018 1.65 (1.08-2.52) 0.020
Cytogenetic risk (MRC)
Favorable (n=69) Ref. Ref. Ref. Ref. Intermediate (n=229) 1.95 (1.06-3.61) 0.032 1.65 (1.07-2.54) 0.023 1.75 (1.10-2.80) 0.019 1.37 (0.75-2.53) 0.3 Adverse (n=208) 3.27 (1.79-5.97) <0.001 2.10 (1.36-3.23) <0.001 2.23 (1.40-3.56) <0.001 0.98 (0.51-1.89) >0.9 Remission status at HCT
First remission (n=421) Ref. Ref. Ref. Ref. Second remission (n=85) 1.14 (0.77-1.68) 0.5 1.14 (0.83-1.56) 0.4 1.24 (0.90-1.72) 0.2 1.13 (0.66-1.93) 0.7
Pre-HCT cytogenetics status
Negative (n=387) Ref. Ref. Ref. Ref. Positive (n=119) 2.48 (1.81-3.38) <0.001 2.23 (1.72-2.88) <0.001 2.05 (1.56-2.69) <0.001 1.78 (1.11-2.84) 0.016
Pre-HCT MFC status
Negative (n=390) Ref. Ref. Ref. Ref. Positive (n=116) 5.05 (3.72-6.84) <0.001 3.73 (2.90-4.81) <0.001 3.03 (2.33-3.93) <0.001 1.83 (1.10-3.06) 0.021 Pre-HCT cytogenetics/MFC status
Normal/MRD(n=327) Ref. Ref. Ref. Ref. Abnormal/MRD(n=63) 1.64 (1.00-2.69) 0.051 1.63 (1.12-2.37) 0.011 1.55 (1.04-2.32) 0.032 1.63 (0.93-2.89) 0.091
Normal/MRD+ (n=60) 4.37 (2.95-6.46) <0.001 3.24 (2.32-4.51) <0.001 2.69 (1.91-3.79) <0.001 1.66 (0.84-3.26) 0.14 Abnormal/MRD+ (n=56) 7.43 (5.03-11.0) <0.001 5.50 (3.94-7.66) <0.001 4.15 (2.94-5.85) <0.001 2.60 (1.27-5.32) 0.009
Recovered peripheral blood counts before HCT* (n=368) 1.06 (0.75-1.50) 0.7 0.84 (0.64-1.10) 0.2 0.77 (0.58-1.01) 0.05 0.56 (0.37-0.86) 0.008
Stem cell source
PB (n=389) Ref. Ref. Ref. Ref. BM (n=44) 1.66 (1.06-2.58) 0.026 1.24 (0.83-1.86) 0.3 1.23 (0.81-1.86) 0.3 0.51 (0.19-1.40) 0.2 UCB (n=73) 0.73 (0.45-1.20) 0.2 0.83 (0.57-1.21) 0.3 0.97 (0.66-1.41) 0.9 1.01 (0.57-1.80) >0.9
Conditioning regimen
MAC (n=318) Ref. Ref. Ref. Ref. Non-MAC (n=188) 1.48 (1.09-2.00) 0.012 1.83 (1.43-2.33) <0.001 1.73 (1.34-2.23) <0.001 2.74 (1.81-4.15) <0.001
*Absolute neutrophil count (ANC) ≥1x10⁹/L and platelets ≥100x109/L. AML: acute myeloid leukemia; BM: bone marrow; HCT: hematopoietic cell transplantation; HLA: human leukocyte antigen; MAC: myeloablative conditioning; MFC: multiparameter flow cytometry; MRD: measurable residual disease; PB: peripheral blood; UCB: umbilical cord blood.
Haematologica | 108 February 2023 427 ARTICLE
C. Orvain et al.
ARTICLE - Cytogenetics and flow cytometry before allogeneic HCT for AML
The emerging data for the current and a prior study from our institution indicate that the same principle is true for cytogenetics/MFC MRD testing.20 Almost a quarter of patients (24% in the present series) have discordant results.20 Whereas normal cytogenetics with positive MFC
can be explained by the low sensitivity of cytogenetics, abnormal cytogenetics with negative MFC might be due to some leukemic cells having normal patterns of antigen expression or changing immunophenotypes and/or to the presence of preleukemic cytogenetic abnormalities.17,20 In
Relapse
RFS
OS Non-relapse mortality
HR (95% CI) P HR (95% CI) P HR (95% CI) P HR
(95% CI) P
Median age at HCT 1.00 (0.98-1.01) 0.7 1.01 (1.00-1.02) 0.054 1.01 (1.00-1.02) 0.056 1.04 (1.02-1.07) <0.001
Female sex 1.15 (0.84-1.57) 0.4 1.00 (0.77-1.29) >0.9 0.85 (0.65-1.12) 0.2 0.75 (0.48-1.18) 0.2
Secondary AML (n=149) 0.83 (0.59-1.17) 0.3 0.93 (0.70-1.22) 0.6 1.01 (0.76-1.35) >0.9 1.17 (0.73-1.89) 0.5
Cytogenetic risk (MRC)
Favorable (n=69) Ref. Ref. Ref. Ref. Intermediate (n=229) 2.69 (1.33-5.42) 0.006 1.78 (1.07-2.94) 0.026 1.99 (1.17-3.38) 0.011 1.13 (0.54-2.33) 0.7
Adverse (n=208) 3.44 (1.68-7.05) <0.001 1.79 (1.06-3.01) 0.028 2.02 (1.17-3.47) 0.011 0.69 (0.32-1.49) 0.3 Remission status at HCT
First remission (n=421) Ref. Ref. Ref. Ref. Second remission (n=85) 1.97 (1.24-3.12) 0.004 1.66 (1.13-2.43) 0.010 1.81 (1.24-2.64) 0.002 1.36 (0.69-2.67) 0.4
Pre-HCT cytogenetics status
Negative Ref. Ref. Ref. Ref. Positive 1.72 (1.21-3.12) 0.002 1.56 (1.17-2.08) 0.002 1.49 (1.11-2.02) 0.009 1.27 (0.76-2.11) 0.4 Pre-HCT MFC status
Negative Ref. Ref. Ref. Ref. Positive 4.41 (3.12-6.22) <0.001 3.25 (2.45-4.33) <0.001 2.42 (1.82-3.23) <0.001 1.48 (0.85-2.60) 0.2 Recovered peripheral blood counts before HCT (n=368) 1.39 (0.96-2.01) 0.083 1.15 (0.87-1.54) 0.3 1.00 (0.74-1.35) >0.9 0.81 (0.50-1.30) 0.4
Stem cell source
PB (n=389) Ref. Ref. Ref. Ref. BM (n=44) 1.78 (1.11-2.86) 0.016 1.50 (0.98-2.30) 0.061 1.35 (0.87-2.10) 0.2 0.79 (0.28-2.26) 0.7 Cord blood (n=73) 0.83 (0.49-1.39) 0.5 1.07 (0.72-1.60) 0.7 1.25 (0.84-1.86) 0.3 1.83 (0.97-3.45) 0.063
Conditioning regimen
MAC (n=318) Ref. Ref. Ref. Ref. Non-MAC (n=188) 1.75 (1.20-2.55) 0.003 1.66 (1.22-2.25) 0.001 1.47 (1.07-2.03) 0.019 1.42 (0.83-2.43) 0.2
*Absolute neutrophil count (ANC) ≥1x10⁹ and platelets ≥100x109. AML: acute myeloid leukemia; BM: bone marrow; HCT: hematopoietic cell transplantation; HLA: human leukocyte antigen; MAC: myeloablative conditioning; MFC: multiparameter flow cytometry; MRD: measurable residual disease; MTX: methotrexate; PBSC: peripheral blood; UCB: umbilical cord blood.
Table 4. Multivariable regression models of study cohort (patients with abnormal cytogenetics at diagnosis). Haematologica
| 108 February
428
C. Orvain et al.
2023
Figure 3. Post-hematopoietic cell transplantation (HCT) outcomes for 506 adults with acute myeloid leukemia and initial abnormal cytogenetics undergoing allogeneic HCT while in first or second morphologic remission, stratified by both pre-HCT cytogenetics and multiparameter flow cytometry and conditioning intensity. (A) Cumulative incidence of relapse and (B) overall survival for patients receiving myeloablative conditioning (MAC) and (C) cumulative incidence of relapse and (D) overall survival for patients receiving non-MAC, respectively. Cyto N: normal cytogenetics; Cyto AbN: abnormal cytogenetics; MFC: multiparameter flow cytometry.
contrast to a previous study including some of the patients used in the current analysis, combining pre-HCT cytogenetics and MFC distinguished four groups of patients with different prognosis whereas the first study showed that patients with either or both markers positivity had similar outcomes.20 Whereas we have previously shown that MFC MRD identified two groups of patients with different prognosis,22,26,31,32 we show herein that also considering pre-HCT cytogenetics may further refine the prognostication of patients. This assay could distinguish a group of patients with decreased survival among those with non-measurable residual disease by MFC and a group of patients with very poor outcome among those with MRD by MFC. The predictive value of MFC MRD was also improved when considering pre-HCT cytogenetics with increased C-statistic values
from 0.63 with MFC MRD alone to 0.65 with the combined assays for RFS and from 0.61 to 0.63 for OS. The combination of cytogenetics and MFC has also been shown to be associated with post-HCT outcomes in other studies although because of the relative small sample size, the input of each MRD method on outcome prognostication could not be assessed.41,42 Similar results were observed in other series combining two of the following: MFC, WT1 quantification, NPM1 quantification, or next-generation sequencing (NGS).12,13,40,43–45 How pre-HCT cytogenetics and MFC MRD can be used together with newer methods for MRD detection such as NGS will require further studies. The retrospective nature of our study analyzing patients nonrandomly assigned to different conditioning regimens limits our ability to draw definitive conclusions on the
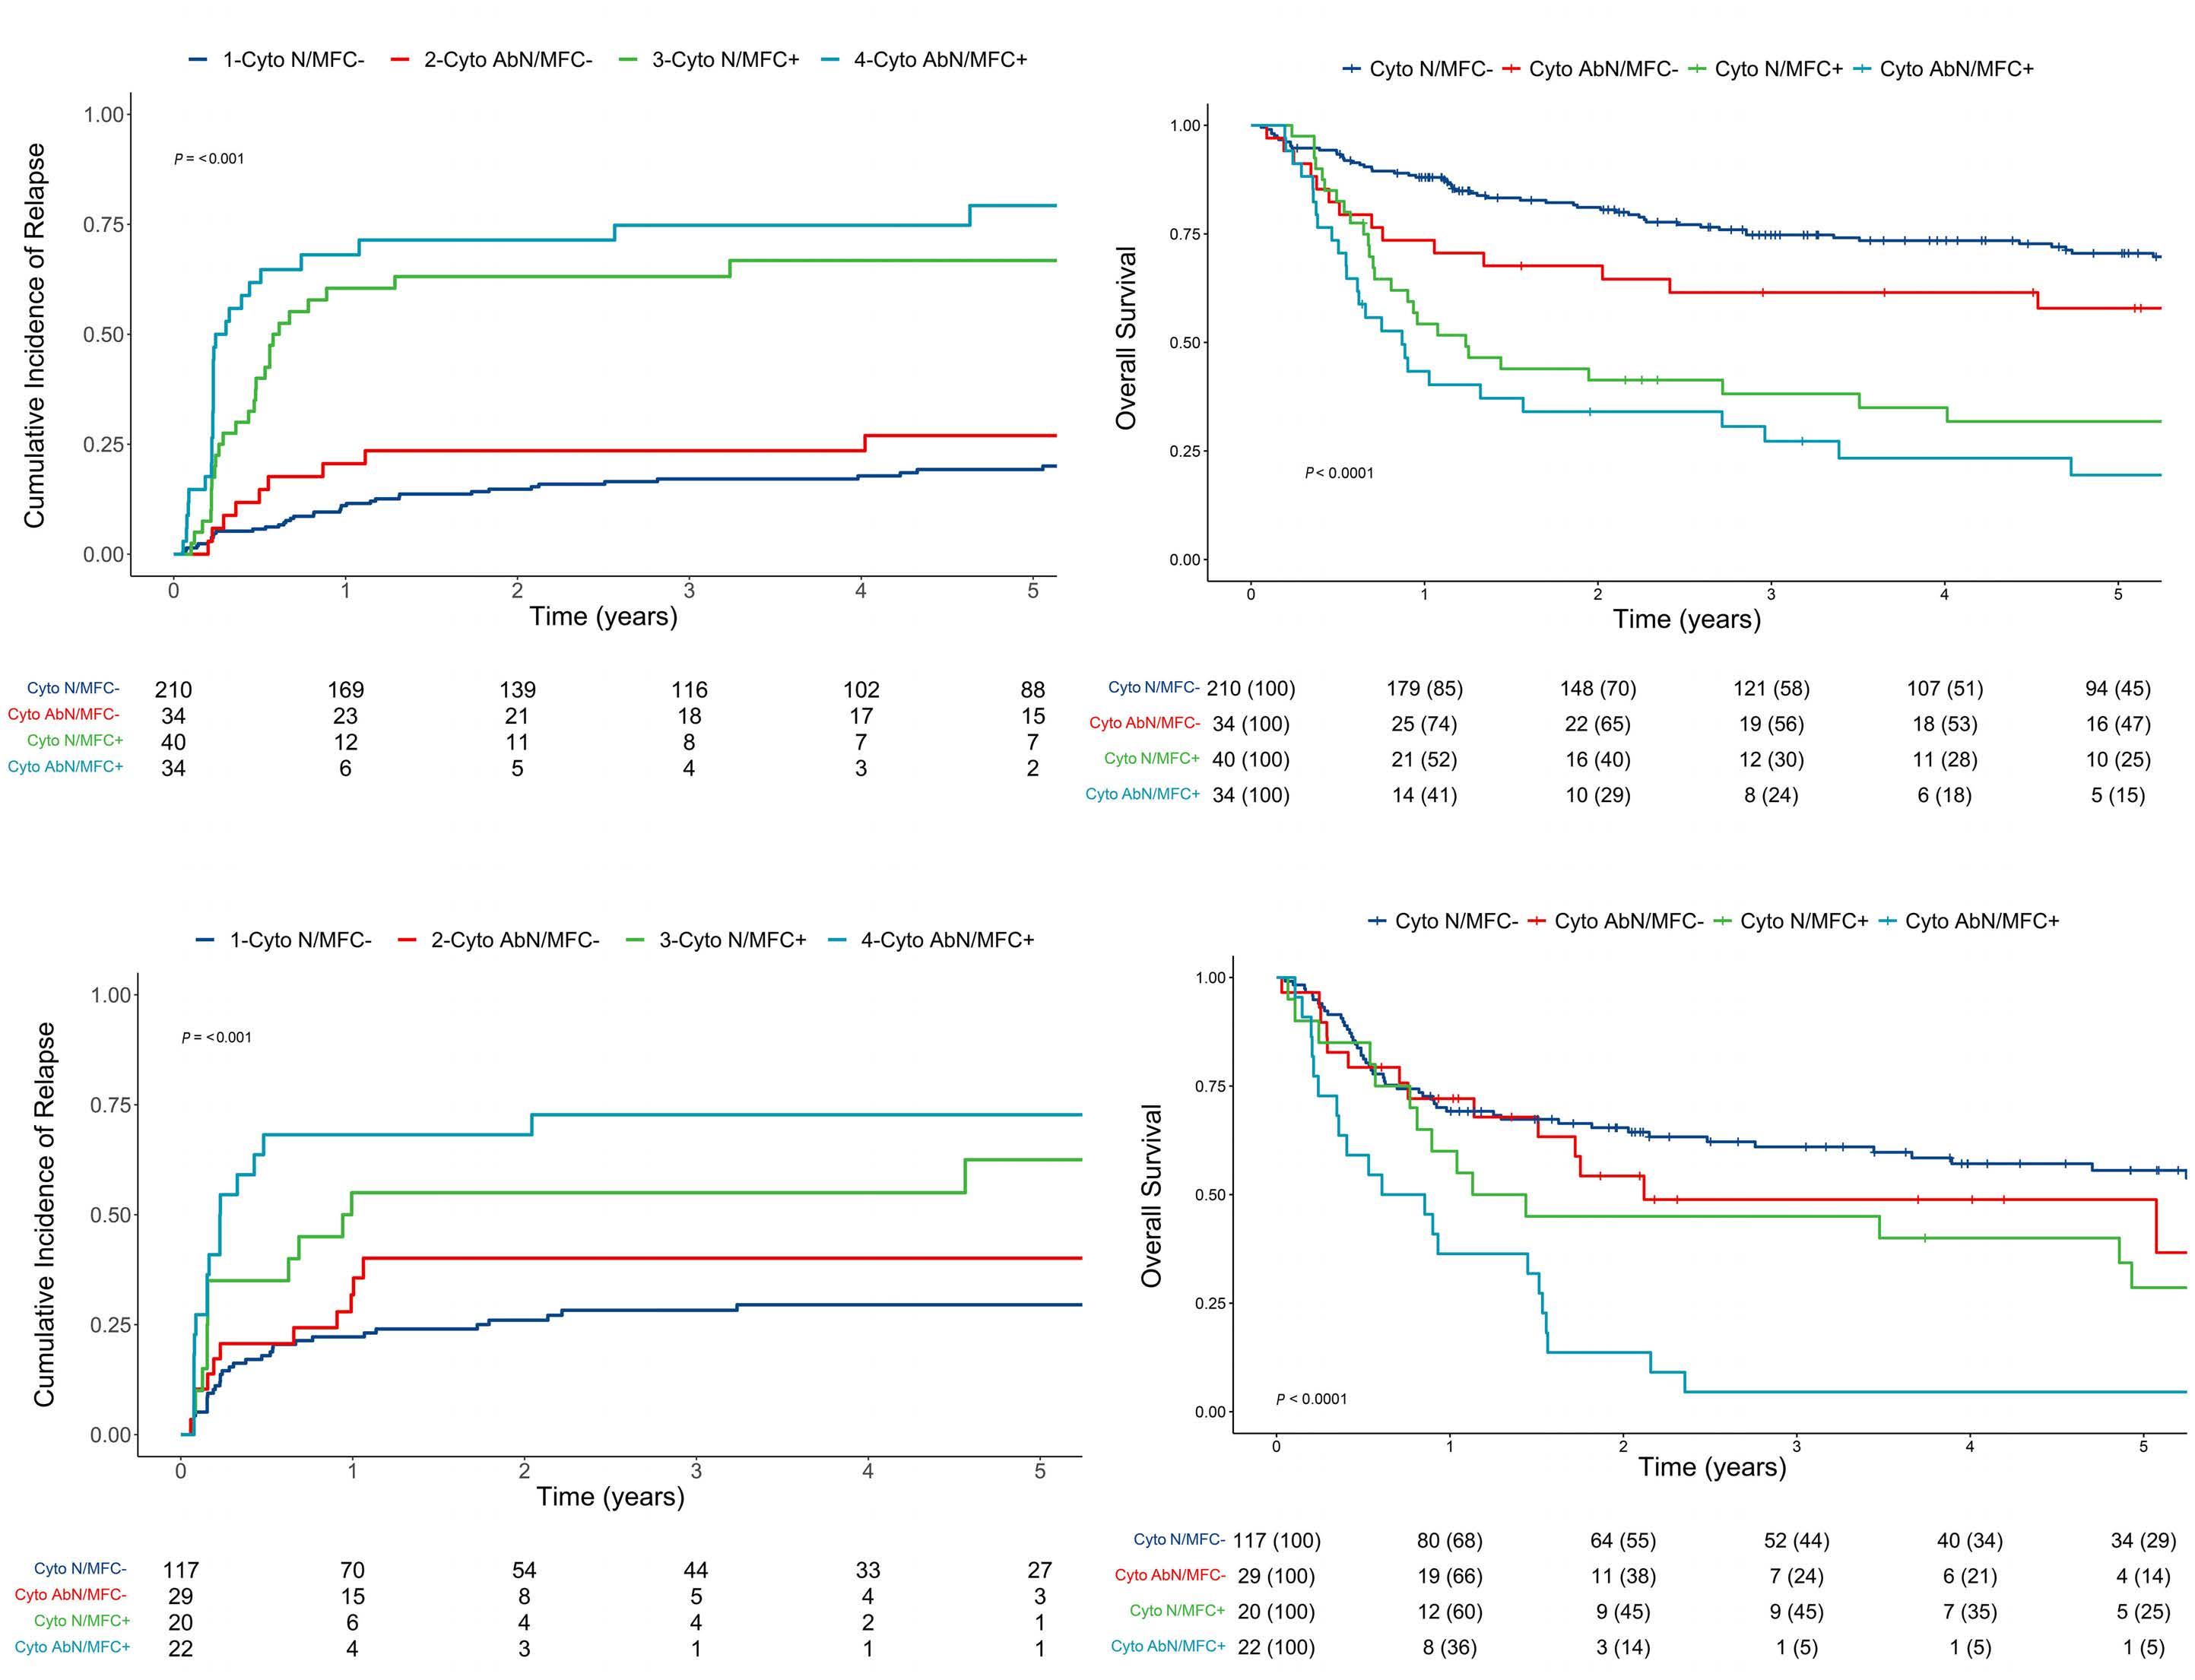
A
Haematologica | 108 February 2023 429 ARTICLE - Cytogenetics and flow cytometry before allogeneic HCT for AML C. Orvain et al.
management of patients with pre-HCT MRD. Our general preference has been for the use of myeloablative conditioning whenever we felt it could be safely administered based on patient age and comorbidities. MFC-based MRD testing has been routinely performed on bone marrow specimens during the pre-HCT work-up in our institution since 2006 and has always been available to transplantation teams. Despite being recognized as a relevant prognostic marker, the pre-HCT MRD status did not play any major role in the selection of the type of preparative regimen. In addition, we did not preemptively apply other strategies to try and prevent relapse (i.e., withdrawal of immunosuppressive agents, donor lymphocyte infusions, or maintenance chemotherapy) based on pre-HCT MRD status. Because mutational profiles were only available for a small subset of patients, our ability to account for disease risk is limited. Pre-HCT molecular data was also infrequently available and potential associations with pre-HCT cytogenetics and MFC MRD could not be extensively explored in this study. This study confirms that data from pre-HCT cytogenetic studies are associated with post-HCT outcomes, as are data from MFC MRD testing. The combined use of pre-HCT cytogenetics and MFC MRD data further refines risk assessment. Our findings indicate that more accurate prognostic information can be gained by distinguishing four groups of patients based on data from cytogenetic and MFC MRD testing. The observation that these four patient subsets have different post-HCT outcome expectations could serve as the basis for the refined evaluation of preHCT or post-HCT preemptive strategies aimed at reducing relapse risks and improving outcomes in adults with AML
References
1. Cornelissen JJ, Blaise D. Hematopoietic stem cell transplantation for patients with AML in first complete remission. Blood. 2016;127(1):62-70.
2. Döhner H, Estey E, Grimwade D, et al. Diagnosis and management of AML in adults: 2017 ELN recommendations from an international expert panel. Blood. 2017;129(4):424-447.
3. Short NJ, Zhou S, Fu C, et al. Association of measurable residual disease with survival outcomes in patients with acute myeloid leukemia: a systematic review and meta-analysis. JAMA Oncol. 2020;6(12):1890.
4. San Miguel JF, Vidriales MB, López-Berges C, et al. Early immunophenotypical evaluation of minimal residual disease in acute myeloid leukemia identifies different patient risk groups and may contribute to postinduction treatment stratification. Blood. 2001;98(6):1746-1751.
5. Terwijn M, van Putten WLJ, Kelder A, et al. High prognostic impact of flow cytometric minimal residual disease detection in acute myeloid leukemia: data from the HOVON/SAKK AML 42A Study. J Clin Oncol. 2013;31(31):3889-3897.
6. Krönke J, Schlenk RF, Jensen K-O, et al. Monitoring of minimal residual disease in NPM1 -mutated acute myeloid leukemia: a
undergoing allografting. How additional information from NGS will further impact risk assessment is unknown.
Disclosures
CO has receieved honoraria from Novartis.
Contributions
RBW conceived and designed the study. CO, JAW, MF, BMS, ERA, BLW, FRA and RBW collected and assembled the data. CO, MO and RBW analyzed and interpreted the data. All authors wrote the manuscript and approved the final version of the manuscript.
Acknowledgments
The authors acknowledge the excellent care provided by the physicians and nurses of the HCT teams, the staff in the Long-Term Follow-up office at the Fred Hutchinson Cancer Center, the Hematopathology Laboratory at the University of Washington, and the patients for participating in our research protocols.
Funding
Research reported in this publication was supported by grants P01-CA078902, P01-CA018029, and P30-CA015704 from the National Cancer Institute/National Institutes of Health (NCI/NIH), Bethesda, MD, USA.
Data-sharing statement
The datasets analyzed during the current study are available from the corresponding author upon reasonable request.
study from the German-Austrian Acute Myeloid Leukemia Study Group. J Clin Oncol. 2011;29(19):2709-2716.
7. Schnittger S, Kern W, Tschulik C, et al. Minimal residual disease levels assessed by NPM1 mutation–specific RQ-PCR provide important prognostic information in AML. Blood. 2009;114(11):2220-2231.
8. Shayegi N, Kramer M, Bornhäuser M, et al. The level of residual disease based on mutant NPM1 is an independent prognostic factor for relapse and survival in AML. Blood. 2013;122(1):83-92.
9. Jourdan E, Boissel N, Chevret S, et al. Prospective evaluation of gene mutations and minimal residual disease in patients with core binding factor acute myeloid leukemia. Blood. 2013;121(12):2213-2223.
10. Yin JAL, O’Brien MA, Hills RK, Daly SB, Wheatley K, Burnett AK. Minimal residual disease monitoring by quantitative RT-PCR in core binding factor AML allows risk stratification and predicts relapse: results of the United Kingdom MRC AML-15 trial. Blood. 2012;120(14):2826-2835.
11. Klco JM, Miller CA, Griffith M, et al. Association between mutation clearance after induction therapy and outcomes in acute myeloid leukemia. JAMA. 2015;314(8):811.
Haematologica | 108 February 2023 430 ARTICLE - Cytogenetics and flow cytometry before allogeneic HCT for AML C. Orvain et al.
12. Rothenberg-Thurley M, Amler S, Goerlich D, et al. Persistence of pre-leukemic clones during first remission and risk of relapse in acute myeloid leukemia. Leukemia. 2018;32(7):1598-1608.
13 Jongen-Lavrencic M, Grob T, Hanekamp D, et al. Molecular minimal residual disease in acute myeloid leukemia. N Engl J Med. 2018;378(13):1189-1199.
14. Morita K, Kantarjian HM, Wang F, et al. Clearance of somatic mutations at remission and the risk of relapse in acute myeloid leukemia. J Clin Oncol. 2018;36(18):1788-1797.
15. Chen Y, Cortes J, Estrov Z, et al. Persistence of cytogenetic abnormalities at complete remission after induction in patients with acute myeloid leukemia: prognostic significance and the potential role of allogeneic stem-cell transplantation. J Clin Oncol. 2011;29(18):2507-2513.
16. Hirsch P, Labopin M, Viguié F, et al. Interest of cytogenetic and FISH evaluation for prognosis evaluation in 198 patients with acute myeloid leukemia in first complete remission in a single institution. Leuk Res. 2014;38(8):907-912.
17. Marcucci G, Mrózek K, Ruppert AS, et al. Abnormal cytogenetics at date of morphologic complete remission predicts short overall and disease-free survival, and higher relapse rate in adult acute myeloid leukemia: results from Cancer and Leukemia Group B Study 8461. J Clin Oncol. 2004;22(12):2410-2418.
18. Balleisen S, Kuendgen A, Hildebrandt B, Haas R, Germing U. Prognostic relevance of achieving cytogenetic remission in patients with acute myelogenous leukemia or high-risk myelodysplastic syndrome following induction chemotherapy. Leuk Res. 2009;33(9):1189-1193.
19. Saini L, Brandwein J, Szkotak A, Ghosh S, Sandhu I. Persistent cytogenetic abnormalities in patients undergoing intensive chemotherapy for acute myeloid leukemia. Leuk Lymphoma. 2018;59(1):121-128.
20. Fang M, Storer B, Wood B, Gyurkocza B, Sandmaier BM, Appelbaum FR. Prognostic impact of discordant results from cytogenetics and flow cytometry in patients with acute myeloid leukemia undergoing hematopoietic cell transplantation: cytogenetics-flow comparison in AML. Cancer. 2012;118(9):24112419.
21. Arber DA, Orazi A, Hasserjian R, et al. The 2016 revision to the World Health Organization classification of myeloid neoplasms and acute leukemia. Blood- 2016;127(20):2391-2405.
22. Walter RB, Gooley TA, Wood BL, et al. Impact of pretransplantation minimal residual disease, as detected by multiparametric flow cytometry, on outcome of myeloablative hematopoietic cell transplantation for acute myeloid leukemia. J Clin Oncol. 2011;29(9):1190.1197.
23. Walter RB, Buckley SA, Pagel JM, et al. Significance of minimal residual disease before myeloablative allogeneic hematopoietic cell transplantation for AML in first and second complete remission. Blood. 2013;122(10):1813-1821.
24. Walter RB, Gyurkocza B, Storer BE, et al. Comparison of minimal residual disease as outcome predictor for AML patients in first complete remission undergoing myeloablative or nonmyeloablative allogeneic hematopoietic cell transplantation. Leukemia. 2015;29(1):137-144.
25. Walter RB, Sandmaier BM, Storer BE, et al. Number of courses of induction therapy independently predicts outcome after allogeneic transplantation for acute myeloid leukemia in first morphological remission. Biol Blood Marrow Transplant. 2015;21(2):373-378.
26. Araki D, Wood BL, Othus M, et al. Allogeneic hematopoietic cell transplantation for acute myeloid leukemia: time to move toward a minimal residual disease–based definition of complete
remission? J Clin Oncol. 2016;34(4):329-336.
27. Hoffmann AP, Besch AL, Othus M, et al. Early achievement of measurable residual disease (MRD)-negative complete remission as predictor of outcome after myeloablative allogeneic hematopoietic cell transplantation in acute myeloid leukemia. Bone Marrow Transplant. 2020;55(3):669-672.
28. Zhou Y, Othus M, Araki D, et al. Pre- and post-transplant quantification of measurable (‘minimal’) residual disease via multiparameter flow cytometry in adult acute myeloid leukemia. Leukemia. 2016;30(7):1456-1464.
29. Morsink LM, Bezerra ED, Othus M, et al. Comparative analysis of total body irradiation (TBI)-based and non-TBI-based myeloablative conditioning for acute myeloid leukemia in remission with or without measurable residual disease. Leukemia. 2020;34(6):1701-1705.
30. Morsink LM, Sandmaier BM, Othus M, et al. Conditioning intensity, pre-transplant flow cytometric measurable residual disease, and outcome in adults with acute myeloid leukemia undergoing allogeneic hematopoietic cell transplantation. Cancers. 2020;12(9):2339.
31. Morsink LM, Othus M, Bezerra ED, et al. Impact of pretransplant measurable residual disease on the outcome of allogeneic hematopoietic cell transplantation in adult monosomal karyotype AML. Leukemia. 2020;34(6):1577-1587.
32. Paras G, Morsink LM, Othus M, et al. Conditioning intensity and peri-transplant flow cytometric MRD dynamics in adult AML. Blood. 2022;139(11):1694-1706.
33. Sorror ML, Maris MB, Storb R, et al. Hematopoietic cell transplantation (HCT)-specific comorbidity index: a new tool for risk assessment before allogeneic HCT. Blood. 2005;106(8):2912-2919.
34. Grimwade D, Hills RK, Moorman AV, et al. Refinement of cytogenetic classification in acute myeloid leukemia: determination of prognostic significance of rare recurring chromosomal abnormalities among 5876 younger adult patients treated in the United Kingdom Medical Research Council trials. Blood. 2010;116(3):354-365.
35. Breems DA, Van Putten WLJ, De Greef GE, et al. Monosomal karyotype in acute myeloid leukemia: a better indicator of poor prognosis than a complex karyotype. J Clin Oncol. 2008;26(29):4791-4797.
36. Wood BL. Acute myeloid leukemia minimal residual disease detection: the difference from normal approach. Curr Protoc Cytom. 2020;93(1):e73.
37. Walter RB, Ofran Y, Wierzbowska A, et al. Measurable residual disease as a biomarker in acute myeloid leukemia: theoretical and practical considerations. Leukemia. 2021;35(6):1529-1538.
38. Oran B, Popat U, Rondon G, et al. Significance of persistent cytogenetic abnormalities on myeloablative allogeneic stem cell transplantation in first complete remission. Biol Blood Marrow Transplant. 2013;19(2):214-220.
39. Niederwieser C, Nicolet D, Carroll AJ, et al. Chromosome abnormalities at onset of complete remission are associated with worse outcome in patients with acute myeloid leukemia and an abnormal karyotype at diagnosis: CALGB 8461 (Alliance). Haematologica. 2016;101(12):1516-1523.
40. Getta BM, Devlin SM, Levine RL, et al. Multicolor flow cytometry and multigene next-generation sequencing are complementary and highly predictive for relapse in acute myeloid leukemia after allogeneic transplantation. Biol Blood Marrow Transplant. 2017;23(7):1064-1071.
41. Norkin M, Katragadda L, Zou F, et al. Minimal residual disease by either flow cytometry or cytogenetics prior to an allogeneic
Haematologica | 108 February 2023 431 ARTICLE - Cytogenetics and flow cytometry before allogeneic HCT for AML C. Orvain et al.
hematopoietic stem cell transplant is associated with poor outcome in acute myeloid leukemia. Blood Cancer J. 2017;7(12):634.
42. Grubovikj RM, Alavi A, Koppel A, Territo M, Schiller GJ. Minimal residual disease as a predictive factor for relapse after allogeneic hematopoietic stem cell transplant in adult patients with acute myeloid leukemia in first and second complete remission. Cancers. 2012;4(2):601-617.
43. Patkar N, Kakirde C, Shaikh AF, et al. Clinical impact of panelbased error-corrected next generation sequencing versus flow
cytometry to detect measurable residual disease (MRD) in acute myeloid leukemia (AML). Leukemia. 2021;35(5):1392-1404.
44. Lambert J, Lambert J, Nibourel O, et al. MRD assessed by WT1 and NPM1 transcript levels identifies distinct outcomes in AML patients and is influenced by gemtuzumab ozogamicin. Oncotarget. 2014;5(15):6280-6288.
45.Tsai C-H, Tang J-L, Tien F-M, et al. Clinical implications of sequential MRD monitoring by NGS at 2 time points after chemotherapy in patients with AML. Blood Adv. 2021;5(10):2456-2466.
Haematologica | 108 February 2023 432 ARTICLE - Cytogenetics and flow cytometry before allogeneic HCT for AML C. Orvain et al.
Early expression of CD94 and loss of CD96 on CD8+ T cells after allogeneic stem cell tranplantation is predictive of subsequent relapse and survival
Correspondence: P. Moss P.Moss@bham.ac.uk
1Institute of Immunology and Immunotherapy, University of Birmingham, Birmingham; 2Center for Computational Biology, University of Birmingham, Birmingham; 3Center for Clinical Hematology, Queen Elizabeth Hospital, Birmingham and 4Addenbrookes Hospital, Cambridge University Hospitals, Cambridge, UK
*KV and WC contributed equally as co-first authors.
Abstract
Received: January 24, 2022.
Accepted: July 25, 2022.
Prepublished: August 4, 2022.
https://doi.org/10.3324/haematol.2021.280497
©2023 Ferrata Storti Foundation
Published under a CC-BY license
Allogeneic stem cell transplantation is used widely in the treatment of hematopoietic malignancy. However, relapse of malignant disease is the primary cause of treatment failure and reflects loss of immunological graft-versus-leukemia effect. We studied the transcriptional and phenotypic profile of CD8+ T cells in the first month following transplantation and related this to risk of subsequent relapse. Single cell transcriptional profiling identified five discrete CD8+ T-cell clusters. High levels of T-cell activation and acquisition of a regulatory transcriptome were apparent in patients who went on to suffer disease relapse. A relapse-associated gene signature of 47 genes was then assessed in a confirmation cohort of 34 patients. High expression of the inhibitory receptor CD94/NKG2A on CD8+ T cells within the first month was associated with 4.8 fold increased risk of relapse and 2.7 fold reduction in survival. Furthermore, reduced expression of the activatory molecule CD96 was associated with 2.2 fold increased risk of relapse and 1.9 fold reduction in survival. This work identifies CD94 and CD96 as potential targets for CD8-directed immunotherapy in the very early phase following allogeneic transplantation with the potential to reduce long term relapse rates and improve patient survival.
Introduction
Allogeneic hematopoietic stem cell transplantation (SCT) is an effective treatment for many patients with hematological malignancy and can provide long term disease control. However, many patients experience disease relapse after transplant and failure to control the primary disease remains a major challenge.1
The immunological graft- versus-leukemia (GvL) effect plays a major role in control of disease relapse and is derived primarily from the capacity of donor-derived immune cells to eliminate residual cancer cells that remain after transplant conditioning.2-5 Alloreactive T-cell responses are believed to be primary mediators of GvL and there is considerable interest in understanding factors that determine the efficacy of the alloreactive immune response post transplant.6,7 A range of studies have identified mechanisms of immune evasion associated with disease relapse including increased expression of in-
hibitory receptors or human leukocyte antigen (HLA) downregulation on tumor cells.8-10
Although most studies of immune reconstitution have been performed at late time points after transplant, often coincident with disease relapse,8 it is likely that immune setpoints established in the very early post-transplant period will ultimately determine clinical outcome.11,12 Indeed, use of cyclophosphamide as early as day 3 post transplant has a profound influence on subsequent development of alloreactive immune responses13 and the degree of iatrogenic immune suppression within the first 2 weeks is correlated with subsequent clinical outcome.14,15 A challenge for undertaking such work has been the intense degree of lymphopenia in the early post-transplant period. Peripheral T-cell reconstitution becomes detectable in most patients by 14 days after transplant16,7 but at the current time no studies have assessed how the T-cell profile at this stage may be correlated with subsequent risk of disease relapse.
Kriti Verma,1* Wayne Croft,1,2* Hayden Pearce,1 Jianmin Zuo,1 Christine Stephens,1 Jane Nunnick,3 Francesca AM Kinsella,1,3 Ram Malladi4 and Paul Moss1,3Haematologica | 108 February 2023 433 ARTICLE - Bone Marrow Transplant
Transcriptional analysis can provide a global assessment of T-cell function and the development of single cell technology allows assessment of lymphoid heterogeneity. Here we use single cell RNA sequencing (scRNA-seq) to define the transcriptional profile of peripheral CD8+ T-cell subsets at 2 weeks after stem cell transplantation and identify five discrete cellular subclusters. Furthermore, using this discovery analysis we identified a potential gene signature associated with disease relapse and applied this to a larger confirmatory patient cohort. This identified that the relative expression of CD94 and CD96 on CD8+ T cells both act as strong determinants of disease relapse. These features provide novel insights into T-cell differentiation in the early post transplant and identify new opportunities for immunotherapy.
Methods
Patient cohort
Patients gave written informed consent using the BOOST ethics approved by the regional ethics committee (05/Q2707/175). scRNA-seq was performed in three patients on peripheral blood T cells taken 2 weeks after transplantation. Patients underwent myeloablative conditioning with fludarabine and busulphan. 5 mg/kg total rabbit ATG was given for T-cell depletion together with ciclosporin and methotrexate as graft-versus-host disease (GvHD) prophylaxis. All patients were in morphological complete remission but had minimal residual disease by genetic analysis. The validation cohort comprised 34 patients with blood collected at 14-28 days post-transplant (Online Supplementary Table S1). No patients had GvHD prior to sampling.
Relapse, survival, grades 2–4 acute GvHD and chronic GvHD were recorded according to consensus conference criteria and NIH criteria respectively.24-25 Relapse and survival data were analyzed by Kaplan-Meier (KM) curve with log-rank test to compare groups and with CoxPH models, using the Survival R package. Multivariate CoxPH models were fitted with clinical covariates chosen a priori. Statistical significance was concluded by a P value <0.05.
Smartseq2 single cell RNA sequencing
Single T cells were sorted using CD3, CD4 and CD8 into a 96-well plate and sequencing was performed by Oxford Genomics Center (Oxford University, UK). T-cell phenotyping on validation cohort utilized antibodies against CD3, CD4, CD8, CD94, CD96, CD53, KLRG1, CD14 and CD19. scRNA-seq data reads were genome-aligned (hg38) using BWA-MEM and feature counts determined using htseqcount from HTSeq17 with parameters: -r pos -m union -s no. Raw feature counts were imported into R version 3.6.1. A single cell experiment object was constructed in R to
store counts and metadata and features with zero count across all cells were removed. Quality control metrics were calculated using scater18 and cells filtered to remove outliers. Cell-specific bias was normalized using the R package scran.19
Marker genes for CD4+ and CD8+ T cells were identified using findMarkers and regarded as differentially expressed after P value adjustment for multiple testing with false discovery rate <0.1. Uniform manifold approximation and projection (UMAP) embeddings were calculated with scater function runUMAP. Marker genes for CD4+ and CD8+ T-cell clusters were identified using findMarkers with the block parameter set to the patient label. Functional enrichments within marker gene sets were identified using the R package gProfiler2 (20). Enrichments of Kyoto Encyclopedia of Genes and Genomes (KEGG) pathway, Biological Process GO term and transcription factor targets were calculated by hypergeometric test.
The activity of gene sets from the Molecular Signatures database was estimated using AUCell (v1.2.4) (21). MSigDb Accessions for Effector and Naïve CD8+ T-cell signatures used: GS9650 GSE23321, KAECH, GOLDRATH and GSE40666. T-regulatory signatures that were compared include GSE25087, GSE7852, GSE22045 and a published signature of regulatory T cells (Tregs).22 Cells are assigned as being active for a given gene set if the area under the curve (AUC) score was above the “Global_k1” threshold in the AUC score distribution. T-cell receptor (TCR) genes were reconstructed using TraCer (version 0.6.0) (42) Assemble and summarize functions for TCR reconstruction and summary of TCR recovery rates.
Results
Single cell RNA sequencing analysis of CD4+ and CD8+ T cells in the very early post-transplant period
Blood samples were taken from three patients at 2 weeks after allogeneic SCT. CD4+ and CD8+ T cells were isolated by fluorescence-activated cell sorting (FACS) and underwent scRNA-seq (Figure 1A). Distributions of read and feature metrics confirmed ~3x10⁶ reads and 1-5k features per cell indicating high quality analysis (Online Supplementary Figure S1).
Two female patients and one male patient were studied whilst all donors were male. Mean expression of genes from the X chromosome was correlated with expression of genes from the Y chromosome in every cell and compared to randomly selected chromosome pairs. Strongly increased expression of Y chromosome-derived genes was observed indicating that sorted cells were predominantly donor-derived (Figure 1B).
UMAP embedding separated the CD4+ and CD8+ T-cell
Haematologica | 108 February 2023 434 ARTICLE - CD94 and CD96 correlate with transplant relapse K. Verma et al.
lineages (Figure 1C) and hierarchical clustering using the top CD4+ and CD8+ marker genes defined distinct transcriptional profiles (Figure 1D). CD4+ T cells were enriched for expression of genes involved in cytokine signaling (IL2RA, ARID5B, LTB, VIM, ITGB1, TIMP1) as well as the TNFRSF18 (GITR) and CTLA4 markers of Treg differentiation (Online Supplementary Figure S2A). In contrast CD8+ T cells showed a cytotoxic genotype with a high expression of granzymes (GZMB, GZMA, GZMK, GZMH), perforin and natural killer cell granule protein 7 (NKG7) (Figure 1D; Online Supplementary Figure S2A). Marker genes confirmed this pattern and pathways previously reported as enriched in GvHD and allograft rejection were also amplified (Online Supplementary Figure S2).
Five CD8+ cell clusters are identifiable at 2 weeks post transplant
Clustering analysis was then applied to the UMAP populations and identified five distinct sub-clusters within the CD8+ population. Gene analysis identified two of these as naïve populations and three as effector subsets (N1, N2; E1, E2, E3). Importantly, these showed similar distribution between the three patients (Figure 2A). Distinct subclusters within CD4+ cells were not clear and further analysis therefore focused on the CD8+ T-cell population. Transcriptional analysis identified that NOTCH2 signaling was enhanced in all effector populations indicating a potential common mechanism for T-cell activation in the early post-transplant period. TCR signaling pathways were also enriched in clusters E1 and E3, indicating likely recent engagement with cognate antigen. Of interest, this was not present in cluster E2 which may have expanded through homeostatic proliferation and was enriched in H3 histone gene expression (Figure 2B and C). The two naïve sub-clusters were distinguishable from each other primarily through increased expression of CNN2, HNRNPM and SLC25A6 in the N2 population (Online Supplementary Figure S2). Naïve cell cluster N1 expressed genes associated with glucose metabolism whilst N2 was active for Hif1a stabilization (Figure 2C). Significant interactions were observed among the effector clusters between checkpoint molecule HLA-E and its ligands CD94, KLRK1 and KLRC4 (Online Supplementary Figure S2F). Transcription factor (TF) target gene enrichment analysis identified selective activity of several TF within the E1 and N1 clusters but only one TF for each of the other three clusters (Figure 2D). In particular, GATA-2 and estrogen receptor a (ERa) target genes were upregulated in clusters E2 and E3 respectively whilst AML2 was the dominant TF in the N2 cluster. A further characteristic feature of cluster E1 was transcriptional regulation from several interferongene regulatory factors (IRF-1, IRF-2, IRF-3) (Figure 2D) whilst heat shock factors (HSF2 and HSF4), which typically regulate genes encoding molecular chaperones and
other stress proteins, were the dominant TF associated with the N1 cluster.
Strong activation of CD8+ T cells early post transplant is associated with subsequent leukemia relapse
We next assessed the transcriptional profile of CD8+ T cells at day 14 in relation to whether or not the patient subsequently stayed in clinical remission or suffered a relapse of the original leukemia. Two patients were seen to relapse at days 29 and 65 respectively whilst the third remained in long term remission.
A ‘relapse gene-signature’ of 47 genes that were either upregulated (n=29) or downregulated (n=18) in CD8+ T cells was defined (Figure 3A). High levels of T-cell activation at day 14 were associated with subsequent risk of disease relapse. In particular, strong upregulation of genes involved in the TCR signaling pathway, such as LCK, STAT1 and STAT4, was present in the patients who relapsed and KEGG pathway analysis showed increased levels of ‘lymphocyte activation’ (Figure 3B). The proportion of effector cells was also increased in this group with a particular increase in clusters E1 and E3 (Figure 3C). Although the proportion of naïve cells was decreased in relapse, the N1 cluster was markedly increased and the major change was a marked reduction in the N2 pool. The amino acid sequence of TCRB CDR3 regions from TCR reconstruction analysis on CD8+ T cells and CD4+ T cells revealed heterogeneity and no evidence of marked clonal expansion was observed at this time point (Figure 3D). Within-cluster comparison of relapse status (Online Supplementary Figure S3) revealed genes differentially expressed in all effector clusters, with E3 showing the most transcriptional divergence (27 differentially expressed genes [DEG]). Whilst Naive cluster N2 had no significant hits, 21 DEG were identified within N1. Of note, the cytotoxicity gene perforin (PFN1) showed reduced expression particularly in E1 cells of relapsed patients, whilst in N1 cells, the immune checkpoint molecule DUSP2 (PAC1) was significantly increased.
Effector CD8+ T cells display a T-regulatory gene signature in patients with subsequent relapse of disease Genes that were overexpressed in effector CD8+ T cells from patients with subsequent relapse were highly enriched for target genes regulated by transcription factors that are key drivers of regulatory T-cell function such as NF-kB subunits Rela/p65, relB, NOTCH2 and IRF1 (Online Supplementary Figure S4). We therefore assessed the relative expression of genes that are associated with CD4+ T-regulatory cell activity within the CD8+ clusters. These were found to be markedly enriched in effector CD8+ cells from patients who went on to relapse (Figure 3A; Online Supplementary Figure S5). Of note, this was most prominent within the E1 and E3 subsets which had
Haematologica | 108 February 2023 435 ARTICLE - CD94 and CD96 correlate with transplant relapse K. Verma et al.
Figure 1. Markers of CD4+ and CD8+ T cells at week 2 post transplant. (A) Sample processing schematic. (B) Y-linked gene expression skew suggesting donor-derived cells. Scatter and Spearman correlation of mean expression of genes expressed on Y chromosome (ChrY) against mean expression of genes on ChrX (left). Right panel show scatter and Spearman correlation of mean gene expression of randomly selected chromosome pairs. (C) Uniform manifold approximation and projection (UMAP) embedding of single cell expression data from CD4+ and CD8+ T cells. (D) Hierarchical clustering of single CD4+ and CD8+ T cells using top marker genes (false discovery rate <0.001; log fold-change >1.5) at day 14. Allo SCT: allogeneic stem cell transplantation.
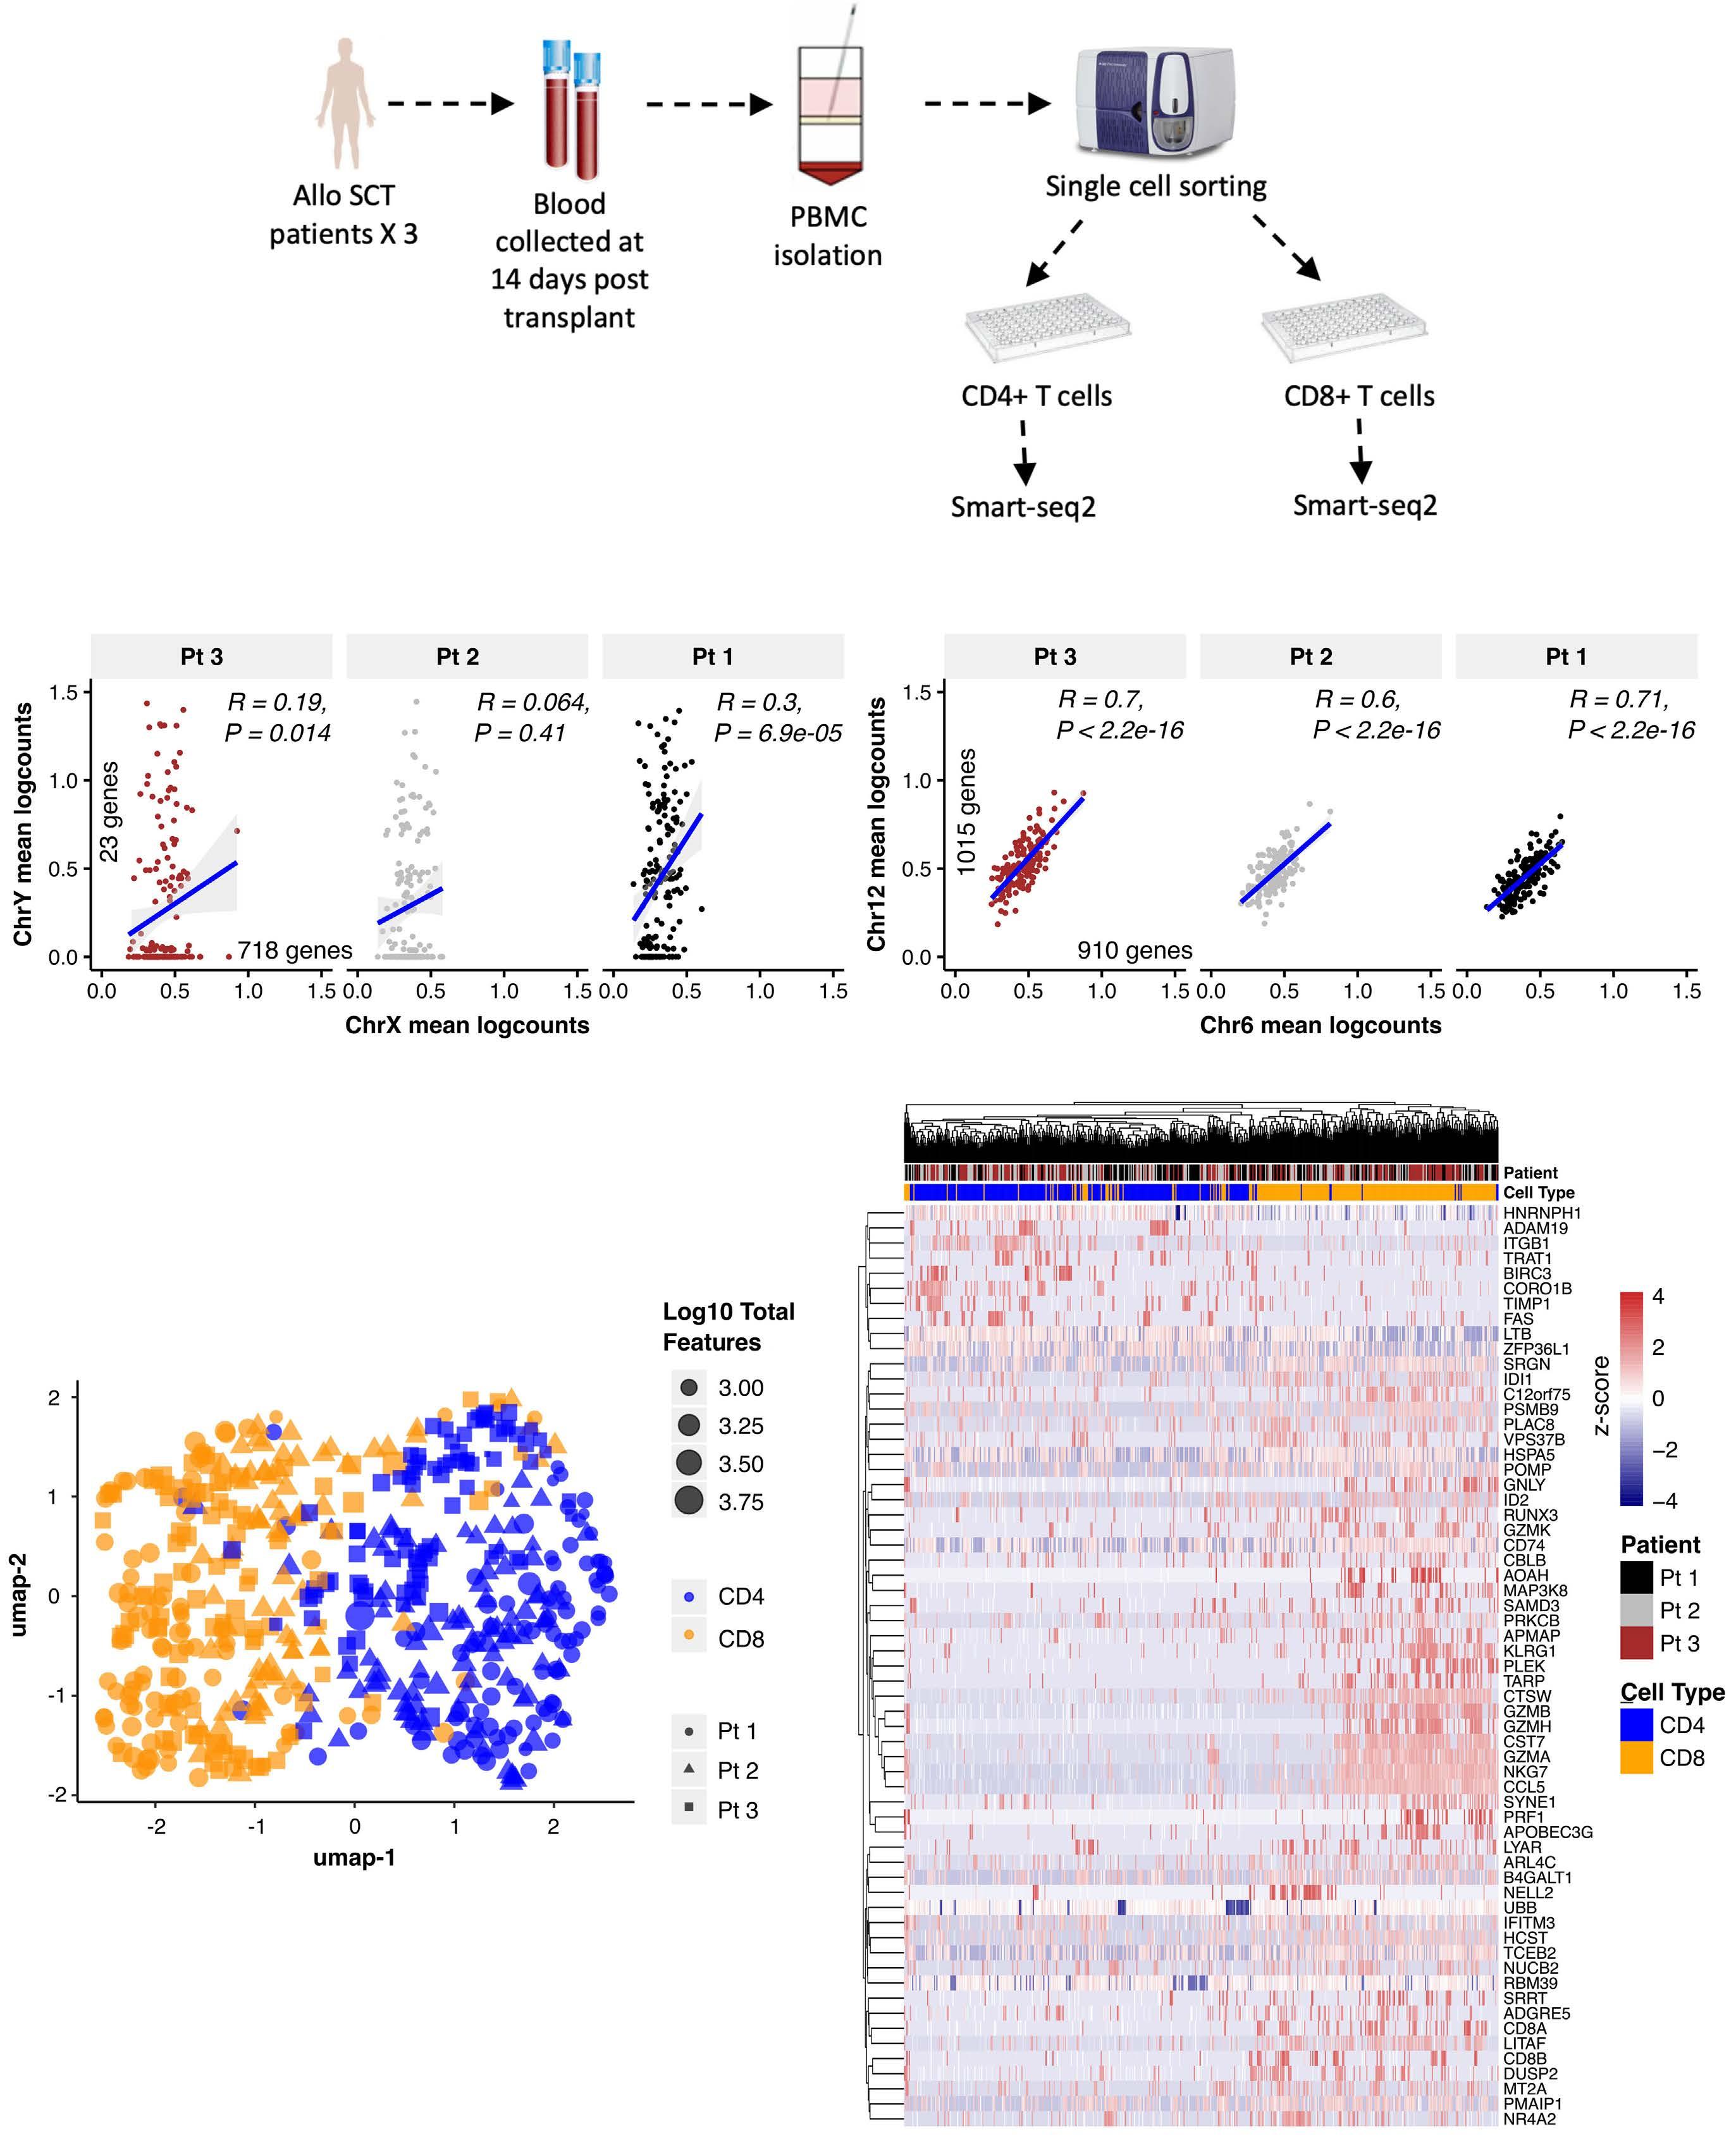
A B C D Haematologica | 108 February 2023 436 ARTICLE - CD94 and CD96 correlate with transplant relapse K. Verma et al.
CD94 and CD96 correlate with transplant relapse
shown high levels of TCR activation (Figure 3E). 52% of effector cells within these subsets expressed a regulatory transcriptional profile in patients that subsequently relapsed compared to only 24% in the patient who remained in remission (Figure 3E). Of note, this regulatory signature was not observed within the CD4+ T-cell population.
Differential expression of CD94 and CD96 on CD8+ T cells within the first month post transplant is highly predictive of subsequent relapse
Using the ‘relapse gene signature’ (Figure 3A) that identified genes within CD8+ cells that were differentially expressed in relation to risk of subsequent relapse, we next went on to assess the expression of these genes or their
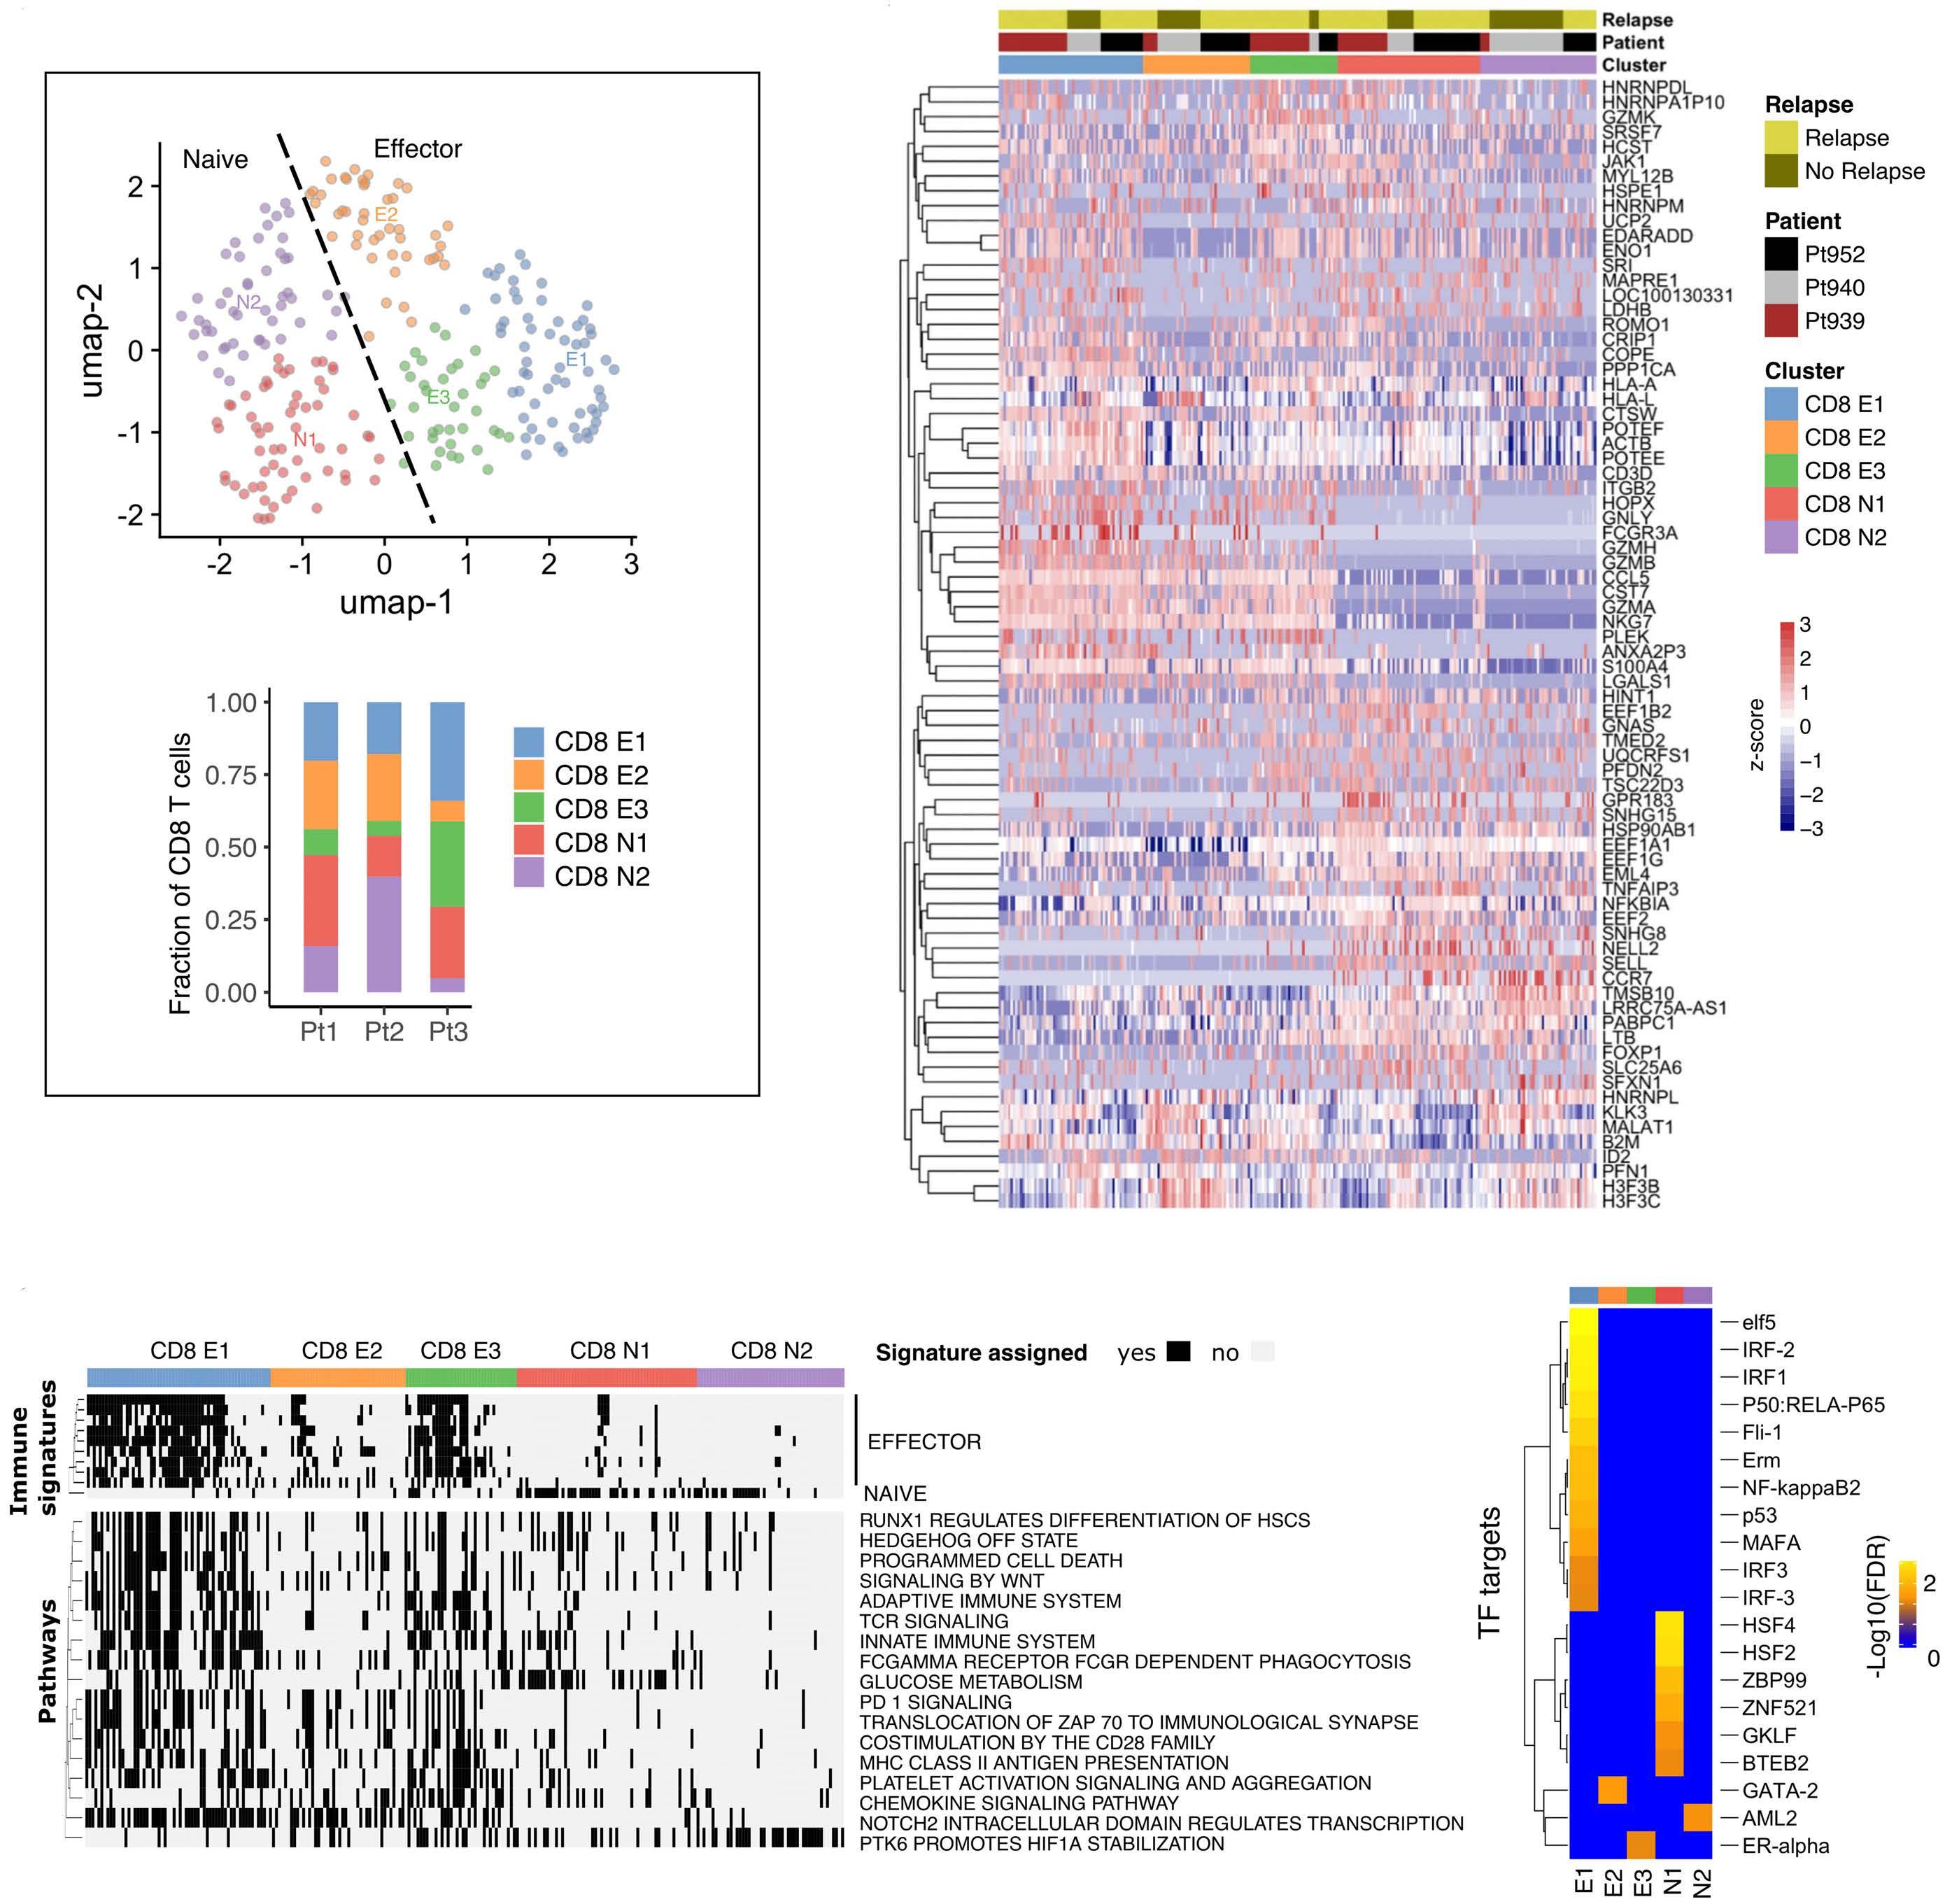
B
D
Figure 2. Characterization of week 2 post transplant CD8+ T-cell subsets. (A) Uniform manifold approximation and projection (UMAP) embedding and graph-based clustering of CD8+ T cells identified effector (E) and naïve (N) cell populations. Inset: proportions of cell populations identified in each patient sample. (B) Expression profile of top marker genes for clusters identified in (A). (C) Profile of selected KEGG and REACTOME gene set signature assignments from AUCell. Cells are assigned as being active for a signature if the area under the curve (AUC) signature score is above a threshold value (global k1 threshold). (D) Transcription factor (TF) targets within marker genes overexpressed in week 2 CD8+ T-cell effector (E) and naïve (N) cell populations.
A
C
Haematologica | 108 February 2023 437 ARTICLE
K. Verma et al.
-
associated proteins in a confirmation cohort of 34 patients (Online Supplementary Table S1). As before, patient blood samples were taken within the first month after transplant and flow cytometry was used to determine expression of proteins on CD8+ T cells. Where antibodies were not available we used quantitative polymerase chain reaction (qPCR) to determine relative mRNA level. Protein expression of selected surface markers associated with T-cell function including CD28, CD53, CD63, CD94, CD95, CD96, CD132, CD164, NKG2D, KLRG1 and CCL5 was assessed using flow cytometry. qPCR was used to determine relative expression of the phosphatase DUSP1 as well as KLRC4 which encodes the intracellular NKG2F (Online Supplementary Figure S6; Figure 4A and D).
The expression of most genes/proteins on CD8+ T cells was not found to be related to subsequent risk of relapse. However, strong and independent correlations
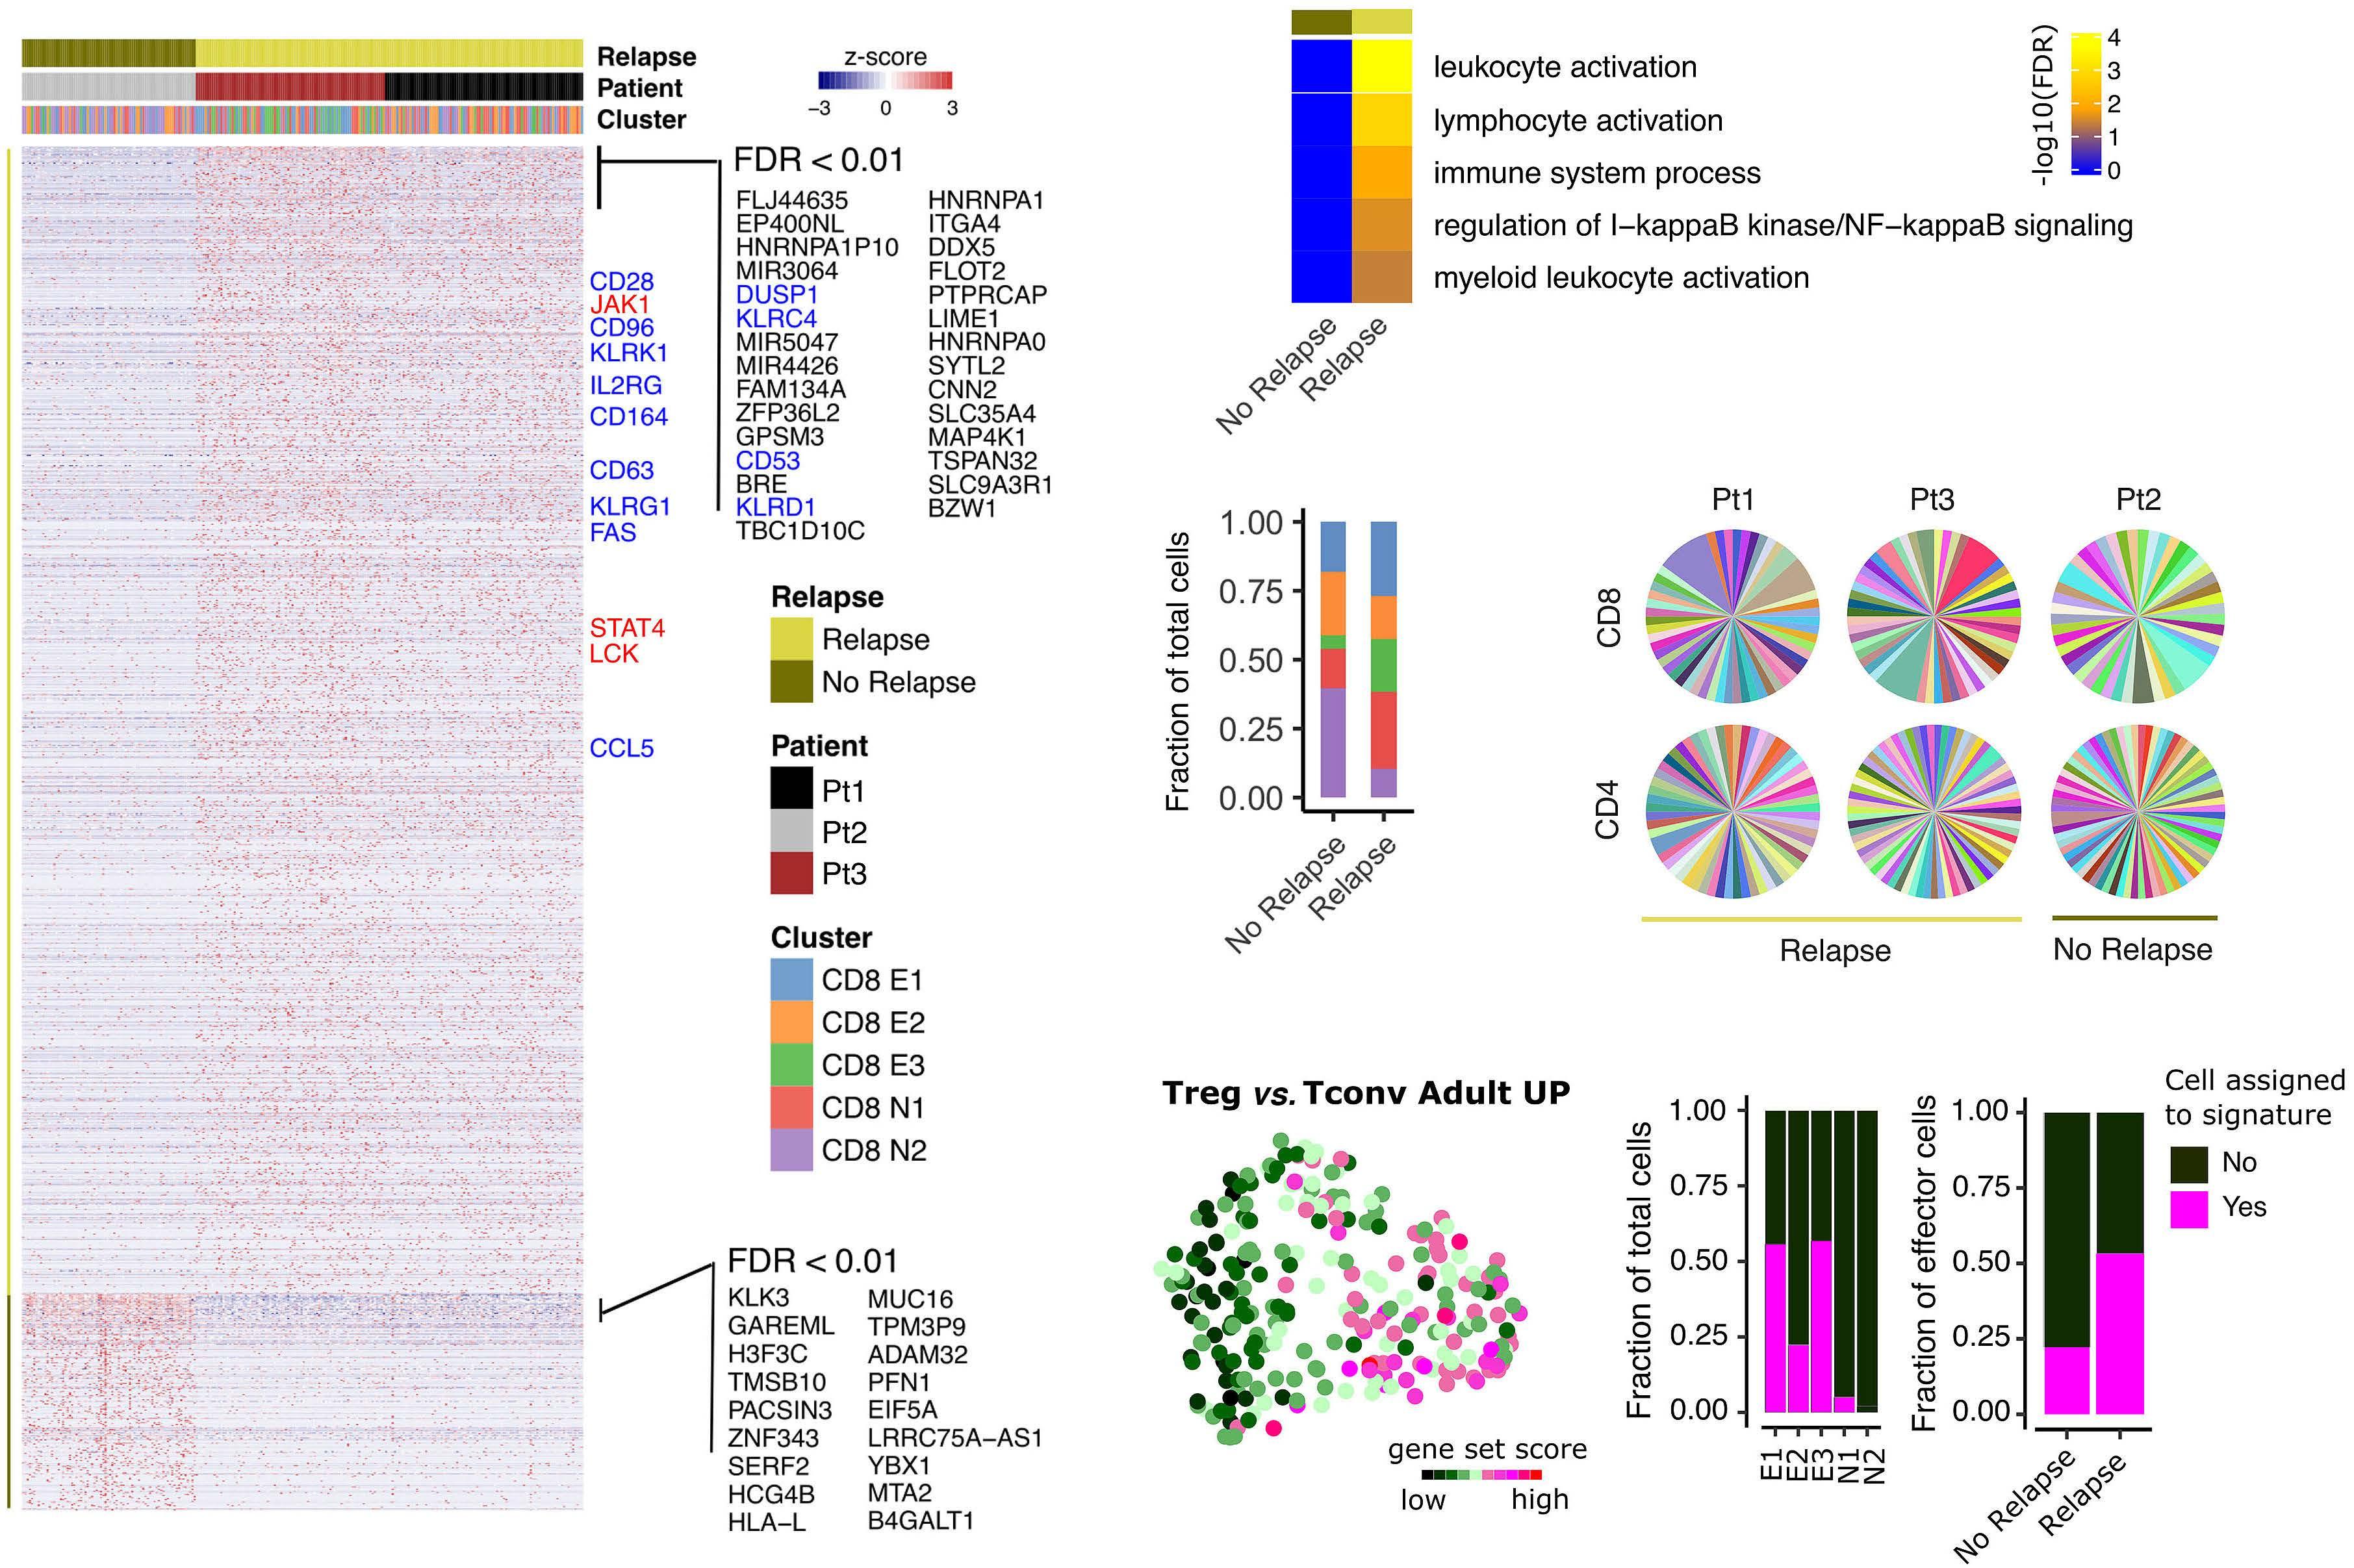
were observed between the relative expression of both CD94/NKG2A and CD96 on CD8+ T cells and the subsequent risk or disease relapse. Cell surface expression of CD94 and CD96 is depicted in a representative FACS plot in Figure 4C. Expression of the inhibitory heterodimer CD94/NKG2A was seen on 37% of CD8+ T cells in patients who relapsed (n=16) compared to only 8% of CD8+ T cells in those that remained in remission (n=18) ( P <0.005; Figure 4A). Overall median percentage of CD94/NKG2A+ cells was 15% within the CD8+ T-cell population and patients with percentage expression above this level had an 81% probability of disease relapse (n=16; P =0.003, Figure 5A) as well as decreased overall survival ( P =0.0047, Figure 5B) ( Online Supplementary Table S1 ). Patients with values below the median displayed a 17% chance of relapse. The mean fluorescence index (MFI) of CD94 was also determined in relation to relapse risk and retained statistical significance (Online
Figure 3. CD8+ T-cell
and T-cell
clonality in
to leukemia relapse at week 2 post transplant. (A) Expression profile of potential relapse marker genes in week 2 (WK2) CD8 T cells (P<0.05). Higher confidence (false discovery rate [FDR] <0.01 and absolute log fold-change >1) markers are labeled. Genes labeled blue were selected for validation by flow cytometry. (B) Proportions of clusters by relapse status. (C) Enrichment of terms, KEGG Pathway analysis of relapse associated genes. (D) T-cell receptor clonality of CD4 and CD8 T cells at WK2 post transplant. Colors represent TRB CD3 amino acid sequences that could be identified from the single cell RNA sequencing data. (E) UMAP embedding overlaid with AUCell signature score for T-regulatory cell (Treg) signature GSE25087 and proportions of cells assigned to this signature stratified by CD8+ T-cell clusters and relapse status.
A
D Haematologica | 108 February 2023 438 ARTICLE - CD94 and CD96 correlate with transplant relapse K. Verma et al.
gene signature
receptor
relation
B C
Supplementary Figure S5 ). Associations of percentage CD94/NKG2A+ cells with outcome remained significant (Relapse Adj. P =0.008 and Survival Adj. P =0.008) after adjusting for covariates in multivariate CoxPH models ( Online Supplementary Figure S7).
Conversely, the expression of CD96 on CD8+ T cells was reduced in patients who suffered disease relapse. In particular, a median of 90% of CD8+ T cells expressed CD96 in this group compared to 97% in those who remained in remission (Figure 4B) and MFI expression was also lower in the relapse cohort ( Online Supplementary Figure S7 ). scRNA-seq data showed that expression of CD96 was most pronounced in CD8+ T cell cluster E3 but cells expressing CD96 were also observed in all other clusters (Figure 4C). Expression of CD94 was most apparent in cells of cluster E1 (Figure 4D). Overall median percentage expression was 95% and relapse was observed in 65% of those with expression below-median compared to 29% of patients with higher levels of CD96 ( P =0.018, Figure 5D). This also translated into lower overall survival for patients in the former group (P=0.016, Figure 5E). Following adjustment for covariates, CD96+ associations retained a similar trend (Relapse Adj. P=0.10 and Survival Adj. P =0.067) ( Online Supplementary Figure S8 ). Relapse and survival associations (univariate CoxPH model) of all covariates are listed in the Online Supplementary Table S2 . There was no significant correlation between GvHD incidence and CD94 or CD96 expression on CD8+ T cells (Figure 5C and F; Online Supplementary Table S1 ).
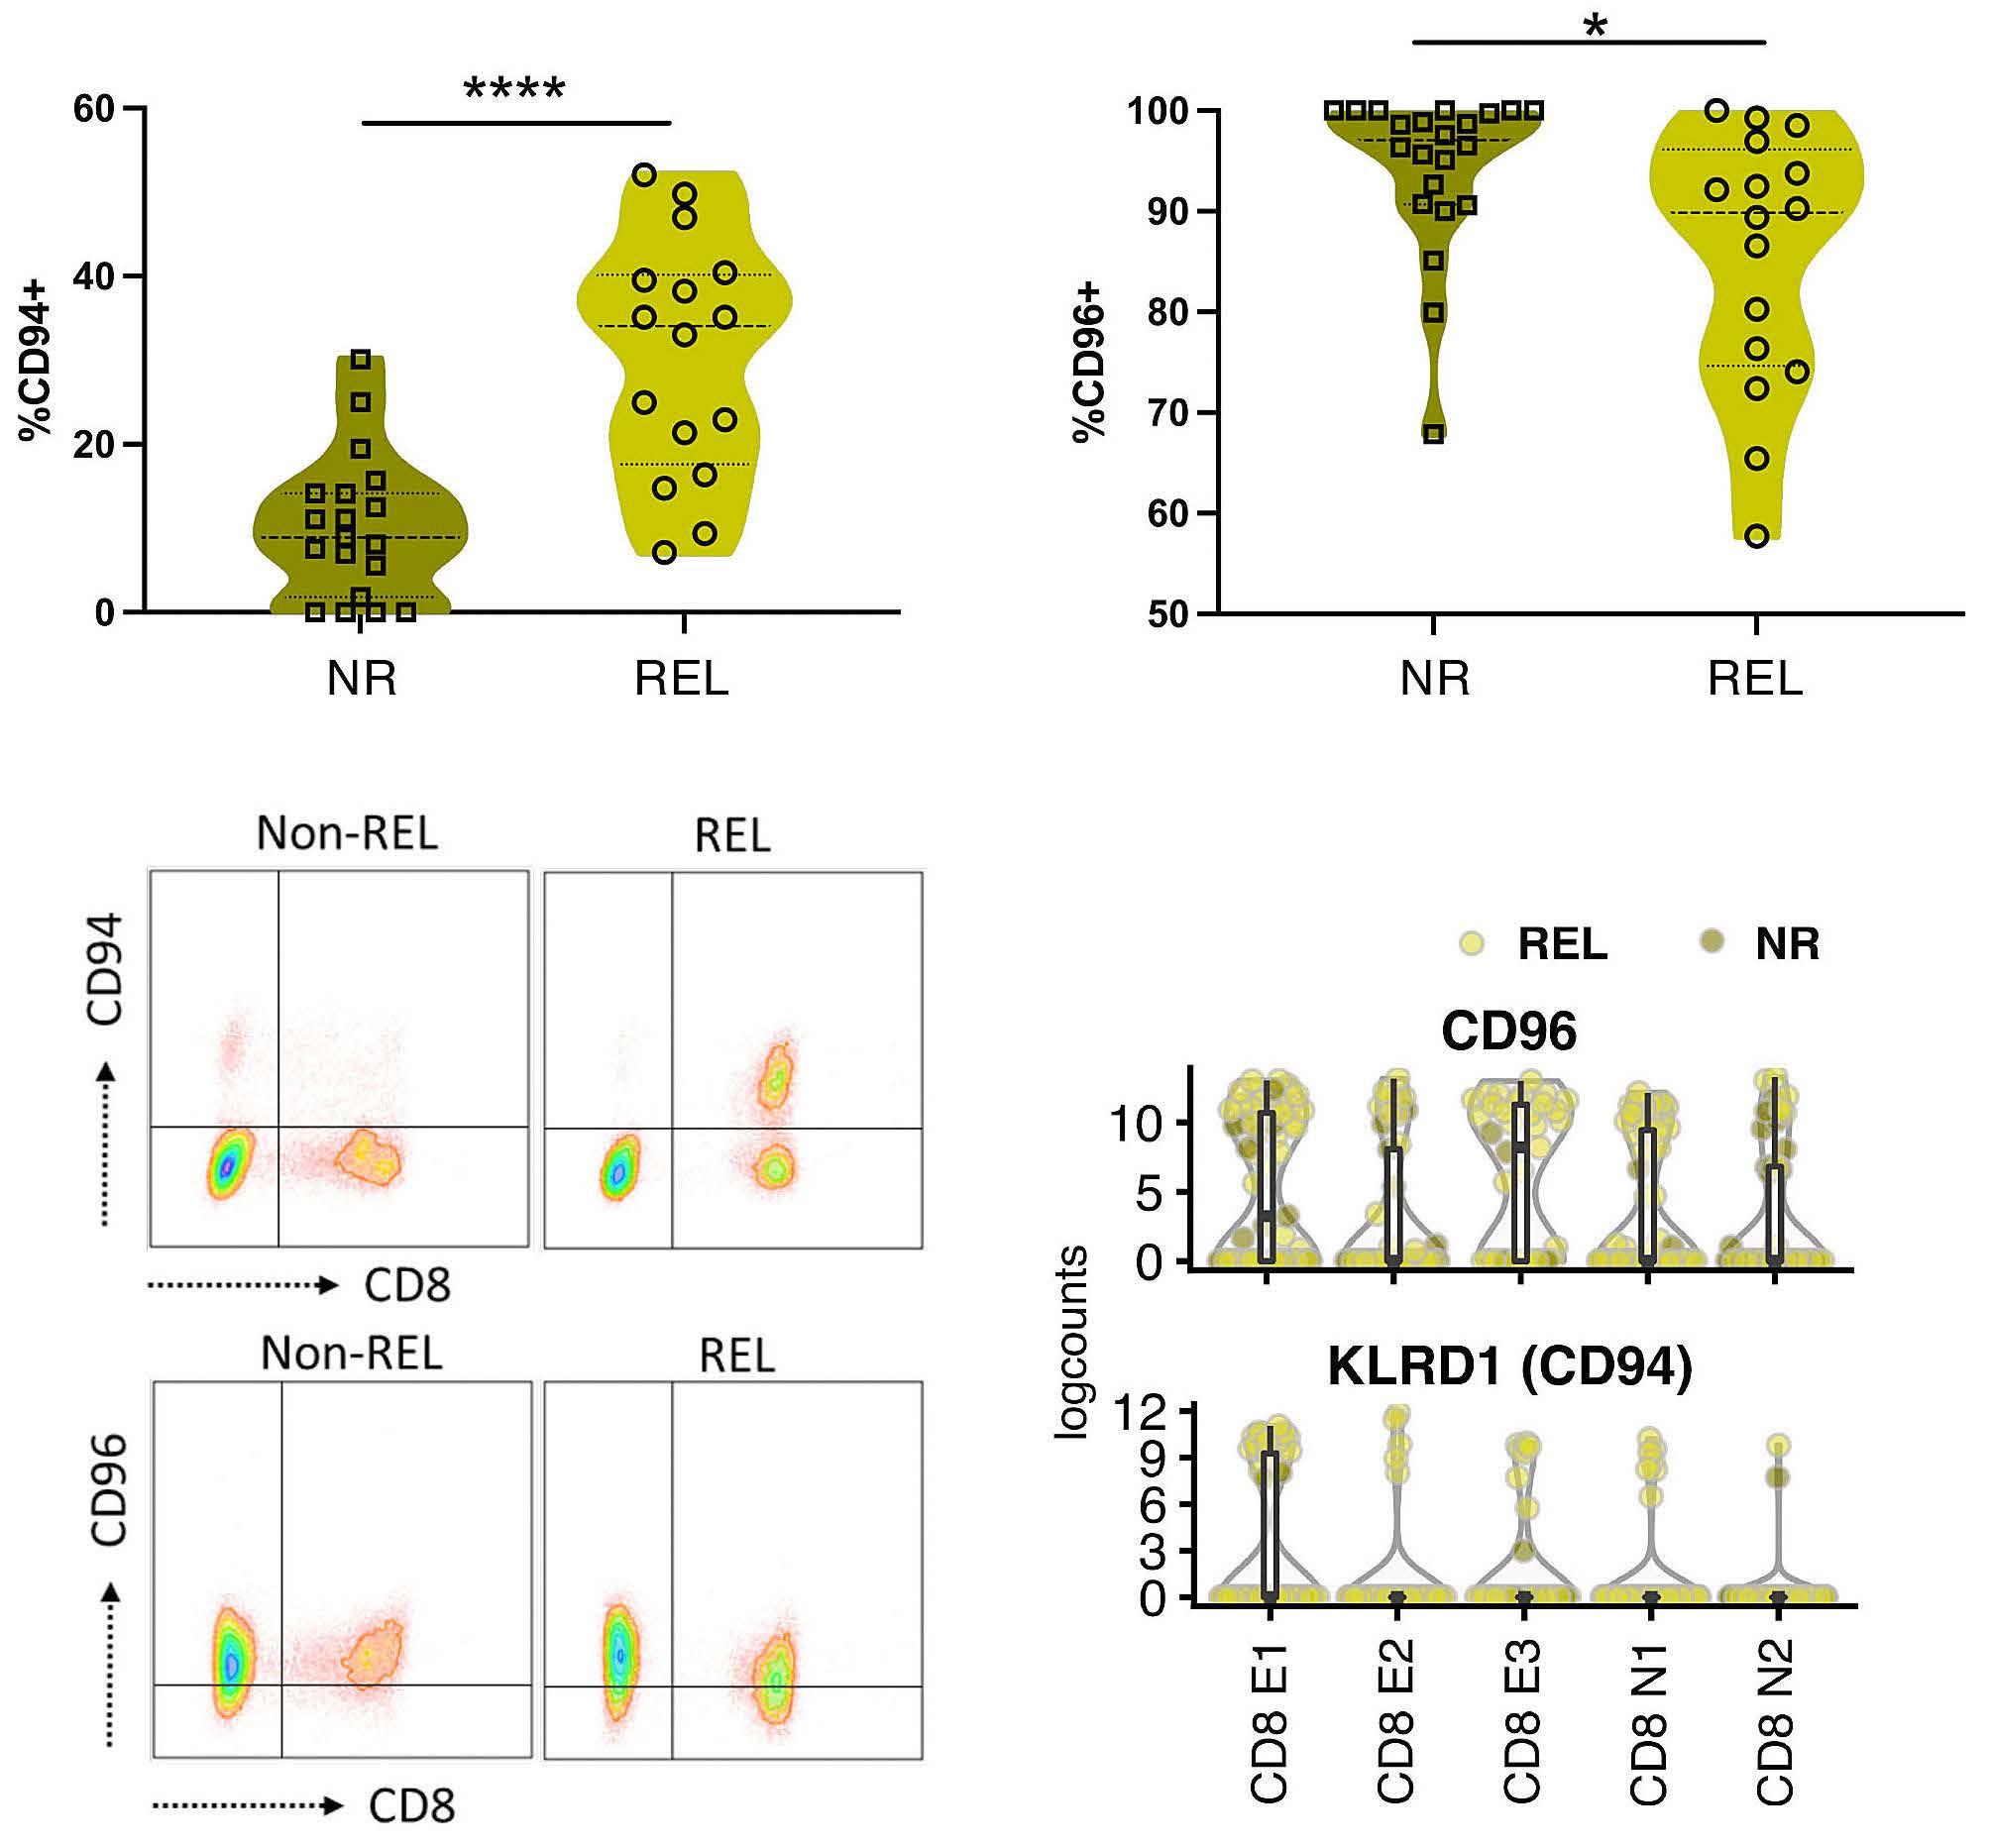
Discussion
Relapse of primary malignant disease is the major clinical challenge in allogeneic SCT at the current time. Here we undertook detailed assessment of the profile of Tcell reconstitution during the very early post-transplant period in order to determine a relapse risk-associated gene signature and identified CD94/NKG2A and CD96 expression on CD8+ T cells as strong determinants of relapse risk. These observations raise a number of questions relating to the differentiation of T cells in the early post-transplant period, the mechanisms of GvL and potential immunotherapeutic opportunities. Five different CD8+ subsets were identified within blood at day 14 after allograft. This is the most detailed characterization of T cells at this very early post-transplant time point and is a unique setting in order to assess Tcell differentiation. T cells are exposed to a range of activation stimuli during this period including TCR-mediated recognition of alloantigen and homeostatic proliferation in response to the intense lymphopenia of the transplant conditioning regimen. TCR signaling was a dominant transcriptional program in two of the effector CD8+ clusters and is likely to reflect recent engagement with alloantigen.26,27 Homeostatic proliferation can also lower the threshold for TCR signaling during this period.28 The Notch2 signaling pathway was strongly upregulated within effector CD8+ cells and reveals a novel role of this pathway in the early post-transplant period. Importantly, Notch2 expression on CD8+ T cells
Figure 4. Validation of selected genes by flow cytometry in patients with disease relapse or no relapse post-allogeneic stem cell transplantation. (A and B) Percentage of CD94+ and CD96+ cells within the CD8+ Tcell subset is depicted in disease relapse (REL) patients (n=16) compared to no relapse (NR) patients (n=18) using flow cytometry. (C) Flow cytometry staining for CD94 and CD96 on CD8+ T cells from REL and NR patient is shown in a representative fluorescenec-activated cell sorting (FACS) plot. (D) Cluster specific gene expression of CD94 and CD96 from single cell RNA sequencing. Mann Whitney-U test was performed for statistical analysis, *P<0.05; ****P<0.001.
A B C D Haematologica | 108 February 2023 439 ARTICLE - CD94 and CD96 correlate with transplant relapse K. Verma et al.
CD94 and CD96 correlate with transplant relapse
Figure 5. Correlation of CD94 and CD96 expression on CD8+ T cells with clinical outcome. Kaplan Meier curves showing (A) time to relapse, (B) survival and (C) acute graft-versus-host disease (aGvHD) incidence post-allogeneic stem cell transplantation in patients with high (>15%) and low (<15%) CD94+ CD8+ T cells. Kaplan Meier curves showing time to (D) relapse, (E) survival and (F) aGvHG disease post-allogeneic stem cell transplantation in patients with high (>95%) and low (<95%) CD96+ CD8+ T cells. Results of log-rank test (p) and Multivariate CoxPH model adjusted P (Adj.P) and hazard ratio (Adj.HR) are indicated.
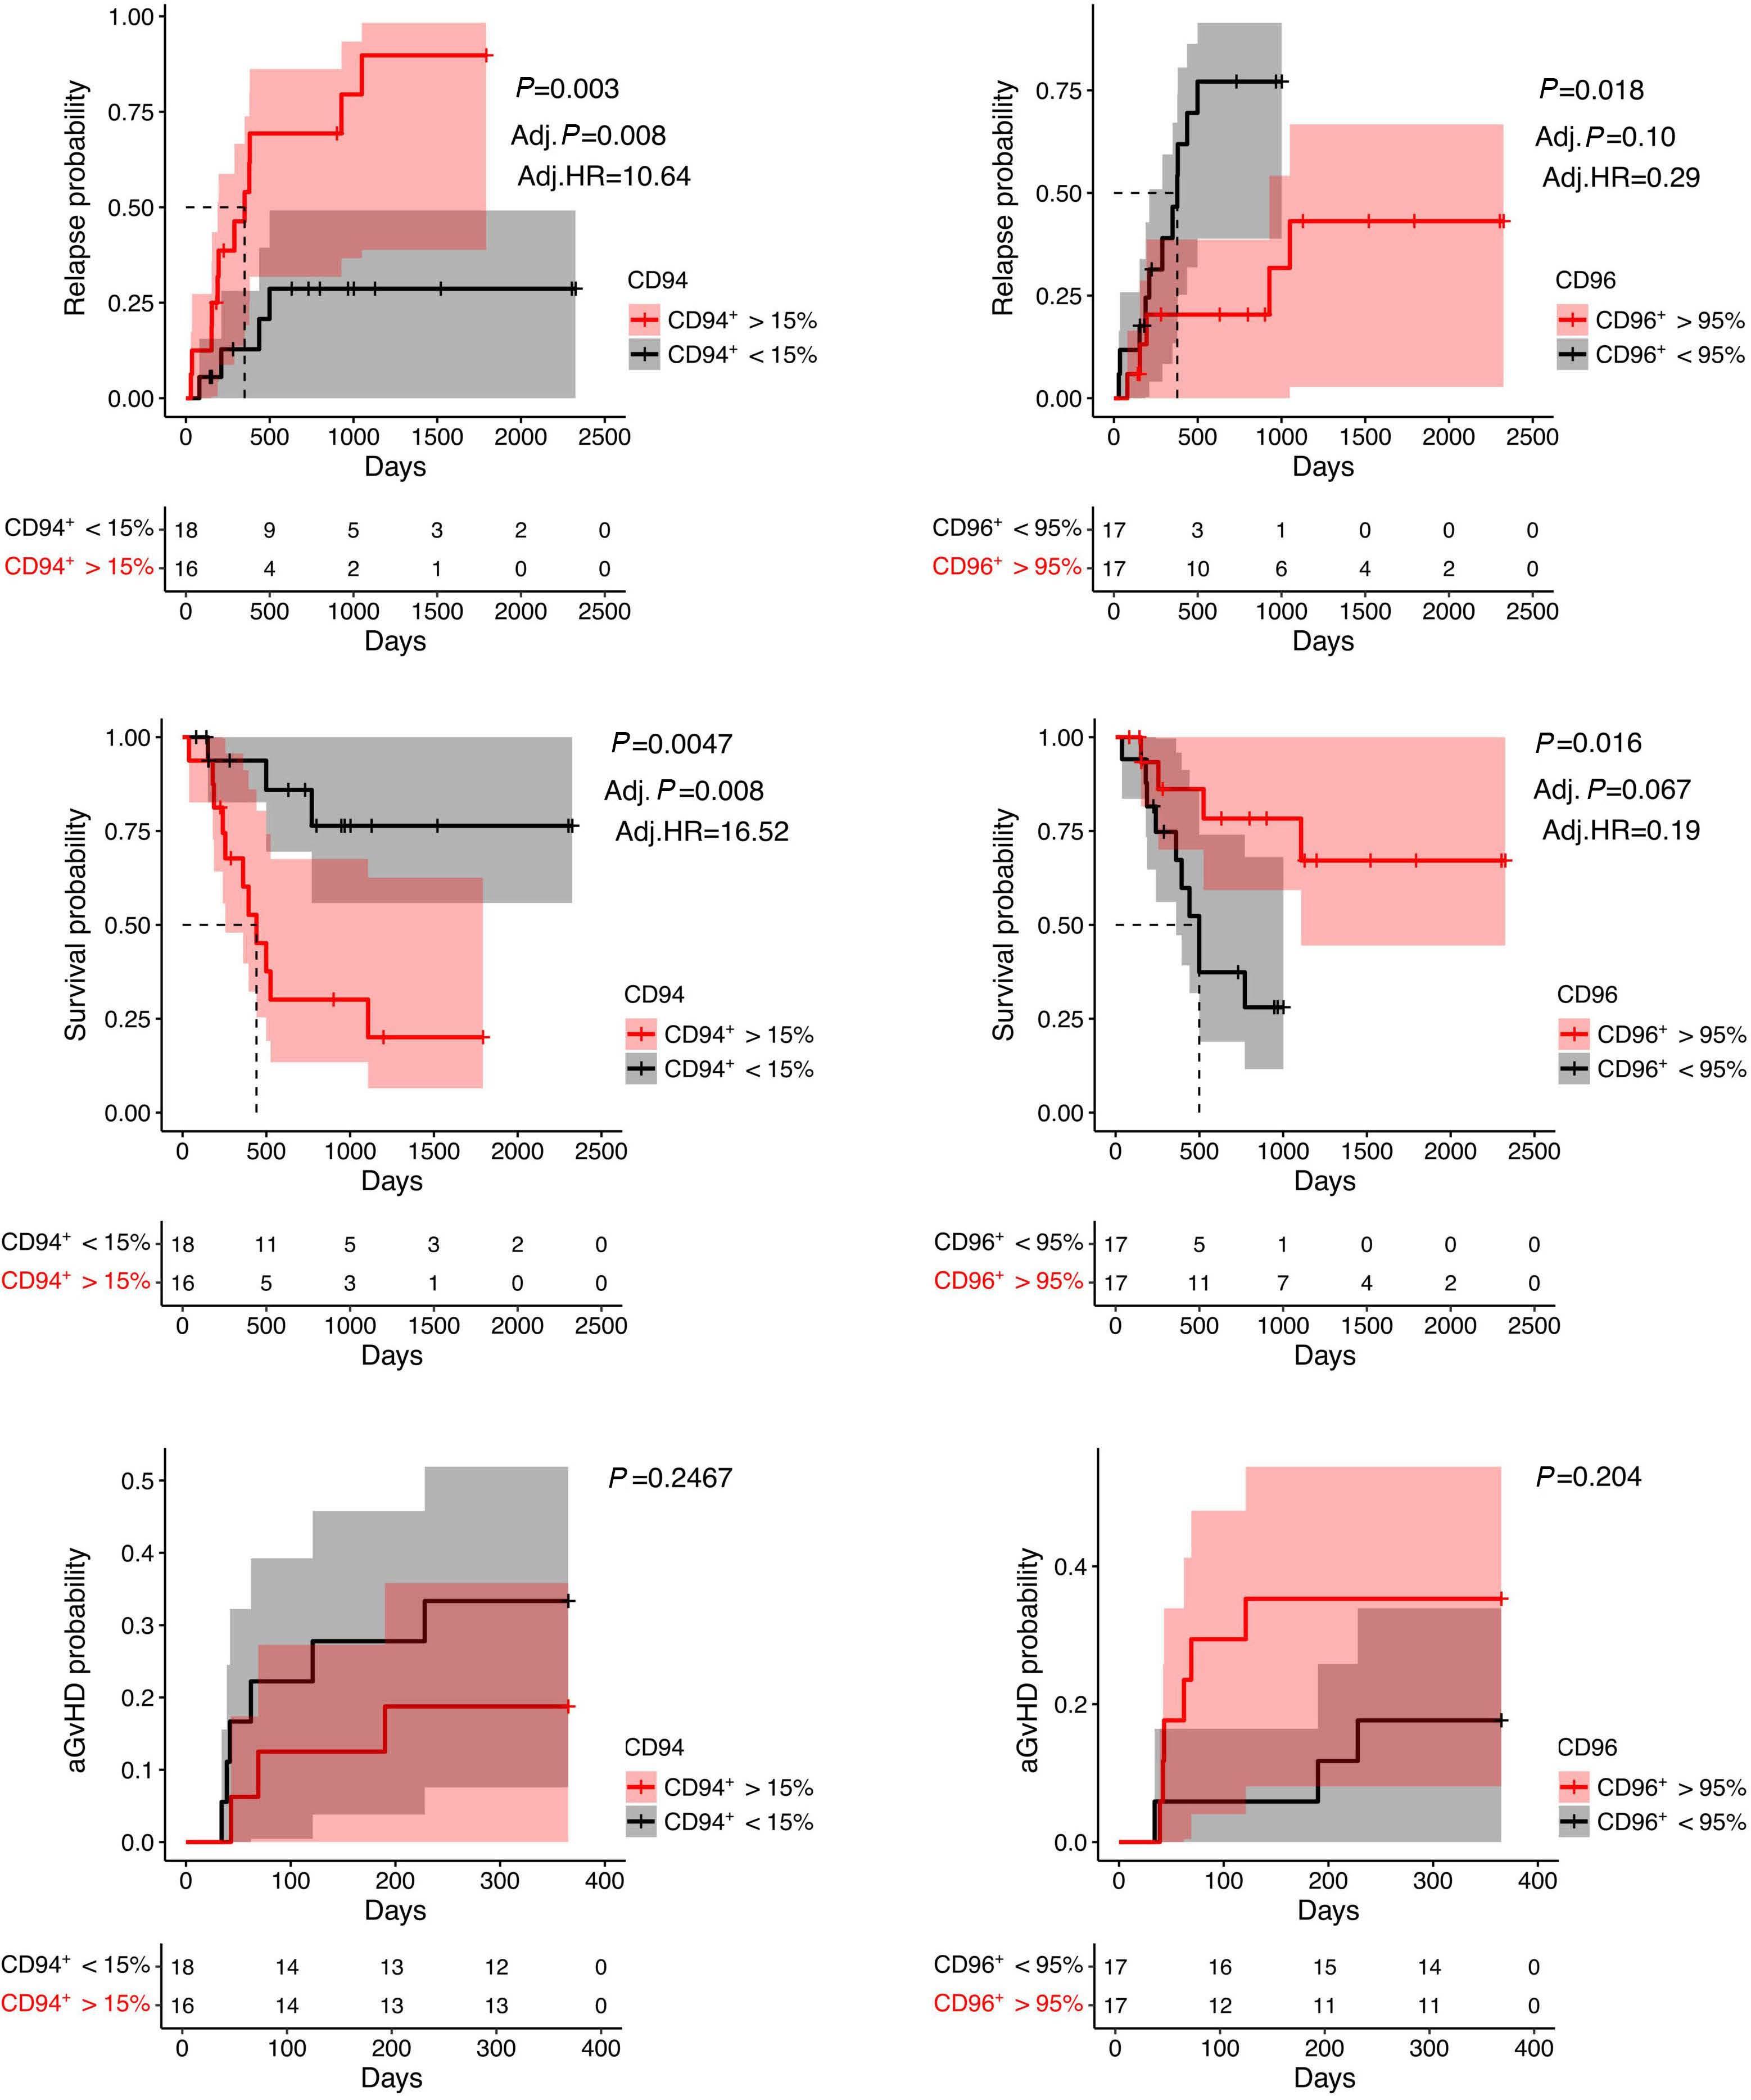
A B C D E F Haematologica | 108 February 2023 440 ARTICLE -
K. Verma et al.
plays an important role in the generation of tumor-specific cytotoxic T cells activity and indicates a potential pathway for intervention to optimize effector T-cell development post transplant. 29 A further feature was that interferon regulatory genes were upregulated in the CD8+ cluster and is noteworthy given the central role for type 1 interferon both in generation of CD8+-mediated GvL responses 30,31 and treatment of disease relapse after transplant. 32 Two discrete naïve pools were also apparent with unique features that included glycolytic metabolism and a IL-17 driven differentiation profile. These pathways deserve further investigation given the suboptimal regeneration of the naïve pool after transplantation.
The major ambition of this work was to identify novel pathways that might represent therapeutic targets to decrease the rate of disease relapse after transplantation. As such we used these transcriptional datasets to define a 39-gene signature within CD8+ T cells that was associated with disease relapse. A striking feature was strong upregulation of genes involved in the TCR signaling pathway, including JAK1 , LCK , STAT1 and STAT4 in patients who went on to suffer disease relapse. This indicates that intense early activation may potentially lead to exhaustion of the GvL immune response and is supported both by increased expression of the exhaustion-associated granzyme K protein and strong PD-1 signaling within effector clusters. 28 These findings may relate to the clinical importance of reducing tumor burden prior to transplantation. Whilst this is generally assumed to reflect a limitation of the GvL response to clear disease it may actually reflect the induction of Tcell anergy or exhaustion in the setting of a low lymphocyte:tumor cell ratio. Indeed, chimeric antigen receptor T-cell therapy has demonstrated the capacity to mediate clearance of substantial tumor load and uncovers the power of cellular immunity to control malignant disease. The importance of T cell exhaustion at the onset of disease relapse has been clearly demonstrated33 and had facilitated the assessment of checkpoint blockade as a means to restore disease control.34-36 Our data suggest that this consequence may already have been determined within the first 2 weeks after transplantation. Why some patients might be particularly prone to intense early T-cell activation is unclear at this time. However, a range of factors could be important such as amount of minimal residual disease, relative expression of alloreactive peptides due to histo-incompatibility, donor T- cell repertoire, early determinants of antigen presentation, and the rate of establishment of donor T-cell chimerism. Another key finding from scRNA-seq was enrichment of gene targets for the transcription factors IRF1 and NFkB subunits Rela/p65, relB which are key drivers of the
regulatory T-cell response. 37-39 A limitation was that we were only able to gain access to transcriptional datasets from CD4+ T regulatory cells and a comparison with well characterized CD8+ regulatory subsets will be an important future ambition. Furthermore, ATG has been shown to promote development of Tregs cells in some in vitro studies. However, 52% of CD8+ T cells acquired a transcriptional profile similar to conventional Tregs in the patients who relapsed and this was particularly evident within the antigen-stimulated effector clusters E1 and E3. We speculate that strong TCR engagement of CD8+ T cells during the unique microenvironmental conditions present during early immune reconstitution, including elevated levels of IL-7 and IL-15, can lead to engagement of a T-regulatory transcriptional program. Considering the active role of Tregs and host antigen-presenting cells (APC) in suppression of alloimmune responses in patients with mixed chimerism following allogeneic HSCT, these findings may potentially contribute to the risk of subsequent disease relapse.40
Expression analysis of relapse-associated genes or associated proteins in the confirmatory cohort of 34 patients revealed that the pattern of CD94 and CD96 expression was strongly associated with risk of relapse. CD94/NKG2A is an NK-associated receptor that is present on a subset of memory CD8 cells and expressed following recent TCR engagement. It binds to HLA-E and acts as an inhibitory regulator to downregulate T-cell activation following antigen recognition (Figure 6). The finding that CD94/NKG2A expression is upregulated early, and is predictive of long term relapse rate, is therefore most likely to reflect a negative feedback response to initial strong engagement with antigen. Indeed, HLA-E expression is upregulated on leukemic blasts as a potential mechanism of evading NK cell-mediated immune surveillance and will act to accentuate this inhibition.41
The other protein whose expression was highly predictive of subsequent relapse was CD96. CD96 is the member of the PVR/nectin family, expressed on all CD8+ T cells, and binds to CD155 on target cells. 31 CD96 competes with the stimulatory CD244 (DNAM-1) and inhibitory TIGIT for engagement and is a potent costimulatory molecule on CD8+ T cells that can be downregulated following recent T-cell activation. As such, the lower levels of CD96 on CD8+ T cells prior to relapse are again likely to reflect a response to recent antigen engagement (Figure 6).
These findings raise the possibility that immunotherapeutic targeting of CD94 and CD96 may help to reduce the rate of disease relapse after SCT. Indeed, antibodies against CD94/NKG2A are now being assessed as ‘checkpoint blockade’ in patients with solid tumors and would be readily transferable to this setting. Our data suggest
Haematologica | 108 February 2023 441 ARTICLE - CD94 and CD96 correlate with transplant relapse K. Verma et al.
that this approach may be valuable when applied very early in the post-transplant setting although must clearly be introduced with caution. In relation to overcoming downregulation of CD96, potential approaches might include blockade of the inhibitory protein TIGIT, with which CD96 competes for binding to CD155, or potentially an agonistic CD96-specific antibody. Again, TIGIT directed checkpoint blockade is currently in trial for patients with malignant disease. Limitations of our study include the fact that patients received T-cell depletion with ATG and as such the findings are not directly transferable to transplant regimens that utilize T-cell replete stem cell grafts. In addition, the sample size of the discovery cohort was small whilst the validation cohort comprised patients with a variety of underlying malignant disorders. Disease relapse is a devastating outcome for patients following SCT and an area where novel immunotherapeutic opportunities are limited. Our findings reveal the importance of studying immune reconstitution in the very early post-transplant period and indicate that CD94/NKG2A and CD96 may represent promising therapeutic pathways to enhance protective GvL responses
References
1. Shouval R, Fein JA, Labopin M, et al. Outcomes of allogeneic haematopoietic stem cell transplantation from HLA-matched and alternative donors: a European Society for Blood and Marrow Transplantation registry retrospective analysis. Lancet Haematol. 2019;6(11):e573-e584.
2. Bleakley M, Riddell SR. Molecules and mechanisms of the graftversus-leukaemia effect. Nat Rev Cancer. 2004;4(5):371-380.
3. Kolb H-J. Graft-versus-leukemia effects of transplantation and donor lymphocytes. Blood. 2008;112(12):4371-4383.
4. Sweeney C, Vyas P. The graft-versus-leukemia effect in AML.
Figure 6. Mechanism of immune escape post-allogeneic stem cell transplantation in patients with acute myeleoid leukemia. Cartoon depicting 3 potential mechanisms by which leukemic cells may escape immune recognition by allogeneic CD8+ T cells within the first few weeks after stem cell transplantation (SCT) leading to disease relapse: (i) CD8 T cells downregulate CD96 on the surface which may result in reduced cytotoxic capacity, (ii) a fraction of CD8 T cells upregulate genes associated with regulatory function which may allow cancer cells to escape, (iii) increased expression of inhibitory receptor complex CD94/NKG2A which interacts with HLA-E expressing leukemic blasts thereby inhibiting a functional T-cell response. TCR: T-cell receptor; Tregs: regulatory T-cells.
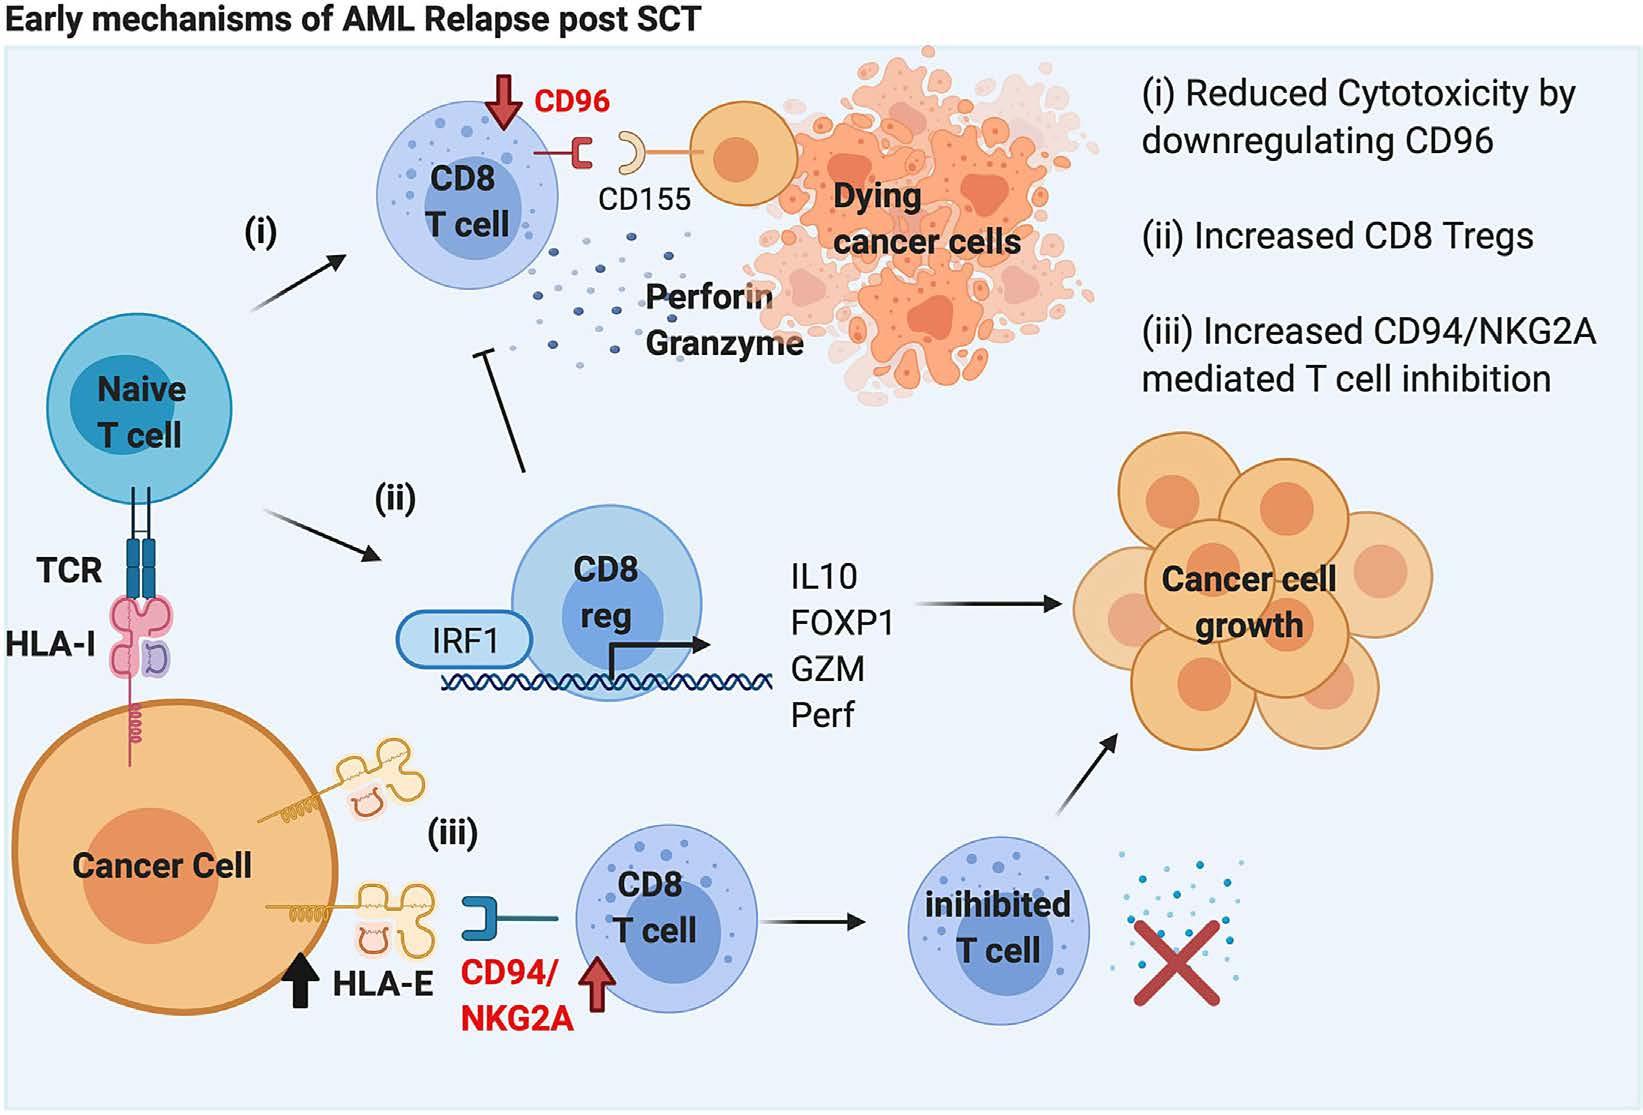
and increase patient survival
Disclosures
No conflicts of interest to disclose.
Contributions
KV, CS and HP performed the experiments. WC and KV analyzed the data. FAM, RM and JN recruited and consented the patients. JN, CS and KV collected and processed the blood samples. KV, WC, FAM, JZ and PM interpreted the data. KV, WC and PM wrote the paper. PM supervised the study.
Funding
This work was supported by financial support from Blood Cancer UK (17009), UK.
Data-sharing statement
Raw sequencing read of the single cell RNA sequencing experiments have been deposited in Gene Expression Omnibus database under the accession number GSE185498.The authors agree to make original data available to other investigators without unreasonable restrictions.
Front Oncol. 2019;9(1217).
5. Horowitz MM, Gale RP, Sondel PM, Goldman JM, Kersey J, Kolb H-J, et al. Graft-versus-leukemia reactions after bone marrow transplantation. Blood. 1990;75(3):555-562.
6. Biernacki MA, Sheth VS, Bleakley M. T cell optimization for graft-versus-leukemia responses. JCI Insight. 2020;5(9):e134939.
7. Rovatti PE, Gambacorta V, Lorentino F, Ciceri F, Vago L. Mechanisms of leukemia immune evasion and their role in relapse after haploidentical hematopoietic cell transplantation. Front Immunol. 2020;11:147.
Haematologica | 108 February 2023 442 ARTICLE - CD94 and CD96 correlate with transplant relapse K. Verma et al.
8. Toffalori C, Zito L, Gambacorta V, et al. Immune signature drives leukemia escape and relapse after hematopoietic cell transplantation. Nat Med. 2019;25(4):603-6611.
9. Jan M, Leventhal MJ, Morgan EA, et al. Recurrent genetic HLA loss in AML relapsed after matched unrelated allogeneic hematopoietic cell transplantation. Blood Adv. 2019;3(14):2199-2204.
10. Vago L, Perna SK, Zanussi M, et al. Loss of mismatched HLA in leukemia after stem-cell transplantation. N Engl J Med. 2009;361(5):478-488.
11. Petersen SL, Madsen HO, Ryder LP, et al. Chimerism studies in HLA-identical nonmyeloablative hematopoietic stem cell transplantation point to the donor CD8(+) T-cell count on day + 14 as a predictor of acute graft-versus-host disease. Biol Blood Morrow Transplant. 2004;10(5):337-346.
12. Fedele R, Martino M, Garreffa C, et al. The impact of early CD4+ lymphocyte recovery on the outcome of patients who undergo allogeneic bone marrow or peripheral blood stem cell transplantation. Blood Transfus. 2012;10(2):174-180.
13. Luznik L, Fuchs EJ. High-dose, post-transplantation cyclophosphamide to promote graft-host tolerance after allogeneic hematopoietic stem cell transplantation. Immunol Res. 2010;47(1-3):65-77.
14. Sharma N, Zhao Q, Ni B, et al. Effect of early posttransplantation tacrolimus concentration on the risk of acute graft-versus-host disease in allogenic stem cell transplantation. Cancers. 2021;13(4):613.
15. Bacigalupo A, Van Lint MT, Occhini D, et al. Increased risk of leukemia relapse with high-dose cyclosporine A after allogeneic marrow transplantation for acute leukemia. Blood. 1991;77(7):1423-1428.
16. Inman CF, Eldershaw SA, Croudace JE, et al. Unique features and clinical importance of acute alloreactive immune responses. JCI Insight. 2018;3(10):e97219.
17. Anders S, Pyl PT, Huber W. HTSeq—a Python framework to work with high-throughput sequencing data. Bioinformatics. 2015;31(2):166-169.
18. McCarthy D, Campbell K, Lun A, Wills Q. Scater: pre-processing, quality control, normalisation and visualisation of single-cell RNA-seq data in R. Bioinformatics. 2017;33(8):1179-1186.
19. Lun AT, McCarthy DJ, Marioni JC. A step-by-step workflow for low-level analysis of single-cell RNA-seq data with Bioconductor. F1000Res. 2016;5:2122.
20. Raudvere U, Kolberg L, Kuzmin I, et al. g:Profiler: a web server for functional enrichment analysis and conversions of gene lists (2019 update). Nucleic Acids Res. 2019;47(W1):W191-W198.
21. Aibar S, González-Blas CB, Moerman T, et al. SCENIC: single-cell regulatory network inference and clustering. Nat Methods. 2017;14(11):1083-1086.
22. Ferraro A, D’Alise AM, Raj T, et al. Interindividual variation in human T regulatory cells. Proc Natl Acad Sci. 2014;111(12):E1111-E120.
23. Efremova M, Vento-Tormo M, Teichmann SA, Vento-Tormo R. CellPhoneDB v2.0: inferring cell-cell communication from combined expression of multi-subunit receptor-ligand complexes. Nat Protoc. 2020;15(4):1484-1506.
24. Przepiorka D, Weisdorf D, Martin P. Consensus conference on acute GVHD grading. Bone Marrow Transplant. 1994;15(6):825-828.
25. Filipovich AH, Weisdorf D, Pavletic S, et al. National Institutes of Health Consensus Development Project on criteria for clinical
trials in chronic graft-versus-host disease: I. diagnosis and staging working group report. Biol Blood Marrow Transplant. 2005;11(12):945-956.
26. Chaudhuri L, Srivastava RK, Kos F, Shrikant PA. Uncoupling protein 2 regulates metabolic reprogramming and fate of antigen-stimulated CD8+ T cells. Cancer Immunol Immunother. 2016;65(7):869-874.
27. Rupprecht A, Bräuer AU, Smorodchenko A, et al. Quantification of uncoupling protein 2 reveals its main expression in immune cells and selective up-regulation during T-cell proliferation. PLoS One. 2012;7(8):e41406.
28. Edershaw S, Verma K, Croft W, et al. Lymphopenia-induced lymphoproliferation drives activation of naive T cells and expansion of regulatory populations. iScience. 2021;24(3):102164.
29. Sugimoto K, Maekawa Y, Kitamura A, et al. Notch2 signaling is required for potent antitumor immunity In Vivo. J Immunol. 2010;184(9):4673.
30. Robb RJ, Kreijveld E, Kuns RD, et al. Type I-IFNs control GVHD and GVL responses after transplantation. Blood. 2011;118(12):3399-3409.
31. Bader CS, Barreras H, Lightbourn CO, al. STING differentially regulates experimental GVHD mediated by CD8 versus CD4 T cell subsets. Science Transl Med. 2020;12(552):eaay5006.
32. Henden AS, Varelias A, Leach J, et al. Pegylated interferon-2a invokes graft-versus-leukemia effects in patients relapsing after allogeneic stem cell transplantation. Blood Adv. 2019;3(20):3013-3019.
33. Norde WJ, Maas F, Hobo W, et al. PD-1/PD-L1 interactions contribute to functional T-cell impairment in patients who relapse with cancer after allogeneic stem cell transplantation. Cancer Res. 2011;71(15):5111-51122.
34. Davids MS, Kim HT, Bachireddy P, et al. Ipilimumab for patients with relapse after allogeneic transplantation. N Engl J Med. 2016;375(2):143-153.
35. Köhler N, Ruess DA, Kesselring R, Zeiser R. The role of immune checkpoint molecules for relapse after allogeneic hematopoietic cell transplantation. Front Immunol. 2021;12:634435.
36. Davids MS, Kim HT, Costello C, et al. A multicenter phase 1 study of nivolumab for relapsed hematologic malignancies after allogeneic transplantation. Blood. 2020;135(24):2182-2191.
37. Karwacz K, Miraldi ER, Pokrovskii M, et al. Critical role of IRF1 and BATF in forming chromatin landscape during type 1 regulatory cell differentiation. Nat Immunol. 2017;18(4):412-421.
38. Ronin E, Lubrano di Ricco M, Vallion R, et al. The NF-κB RelA transcription factor is critical for regulatory T cell activation and stability. Front Immunol. 2019;10:2487.
39. Grinberg-Bleyer Y, Caron R, Seeley JJ, et al. The alternative NFκB pathway in regulatory T cell homeostasis and suppressive function. J Immunol. 2018;200(7):2362-2371.
40. Kinsella FAM, Zuo J, Inman CF, et al. Mixed chimerism established by hematopoietic stem cell transplantation is maintained by host and donor T regulatory cells. Blood Adv. 2019;3(5):734-743.
41. Nguyen S, Beziat V, Dhedin N, et al. HLA-E upregulation on IFNγ-activated AML blasts impairs CD94/NKG2A-dependent NK cytolysis after haplo-mismatched hematopoietic SCT. Bone Marrow Transplant. 2009;43(9):693-699.
42. Stubbington MJT, Lönnberg T, Proserpio V, et al. T cell fate and clonality inference from single-cell transcriptomes. Nat Methods. 2016;13(4):329-332.
Haematologica | 108 February 2023 443 ARTICLE
K. Verma et al.
- CD94 and CD96 correlate with transplant relapse
Molecular monitoring of T-cell kinetics and migration in severe neurotoxicity after real-world CD19-specific chimeric antigen receptor T cell therapy
Susanna Carolina Berger,1,2 Boris Fehse,1,2 Nuray Akyüz,3 Maria Geffken,4 Christine Wolschke,1 Dietlinde Janson,1 Nico Gagelmann,1 Marlene Luther,1 Dominic Wichmann,5 Christian Frenzel,3 Guenther Thayssen,6 Anna Alegiani,6° Anita Badbaran,1 Silke Zeschke,1 Judith Dierlamm,3 Nicolaus Kröger1 and Francis A. Ayuk1
1Department of Stem Cell Transplantation; 2Research Department Cell and Gene Therapy; 3Department of Hematology/Oncology; 4Institute of Transfusion Medicine; 5Department of Intensive Care Medicine and 6Department of Neurology, University Medical Center Hamburg-Eppendorf (UKE), Hamburg, Germany
°Current address: Department of Neurology with Stroke Unit, Asklepios Clinic Altona, Hamburg, Germany.
Abstract
Correspondence: F. A. Ayuk ayuketang@uke.de S. C. Berger su.berger@uke.de
Received: March 28, 2022.
Accepted: August 2, 2022. Prepublished: August 11, 2022.
https://doi.org/10.3324/haematol.2022.281110 ©2023 Ferrata Storti Foundation
Published under a CC BY-NC license
CD19-specific chimeric antigen receptor (CD19-CAR) T-cell therapies mediate durable responses in late-stage B-cell malignancies, but can be complicated by a potentially severe immune effector cell-associated neurotoxicity syndrome (ICANS). Despite broad efforts, the precise mechanisms of ICANS are not entirely known, and resistance to current ICANSdirected therapies (especially corticosteroids) has been observed. Recent data suggest that inflammatory cytokines and/or targeting of cerebral CD19-expressing pericytes can disrupt the blood-brain barrier and facilitate influx of immune cells, including CAR T cells. However, specific tools for CD19-CAR T-cell analysis within often minute samples of cerebrospinal fluid (CSF) are not broadly available. Here, we applied our recently developed digital polymerase chain reaction assays to monitor CD19-CAR T-cell kinetics in CSF and blood in real-world patients with neurotoxicity. Consistently, we observed a CAR T-cell enrichment within CSF in ICANS patients with further progressive accumulation despite intense corticosteroid-containing immuno-chemotherapies in a subset of patients with prolonged and therapy-resistant grade 3-4 neurotoxicity. We used next-generation T-cell receptor-b sequencing to assess the repertoire of treatment-refractory cells. Longitudinal analysis revealed a profound skewing of the T-cell receptor repertoire, which at least partly reflected selective expansion of infused T-cell clones. Interestingly, a major fraction of eventually dominating hyperexpanded T-cell clones were of non-CAR T-cell derivation. These findings hint to a role of therapy-refractory T-cell clones in severe ICANS development and prompt future systematic research to determine if CAR T cells may serve as ‘door openers’ and to further characterize both CAR-positive and non-CAR T cells to interrogate the transcriptional signature of these possibly pathologic T cells.
Introduction
CD19-specific chimeric antigen receptor (CD19-CAR) T-cell therapy mediates durable remission of relapsed and/or refractory (r/r) B-cell malignancies, which prompted approval of several licensed CAR T-cell products, including axicabtagene ciloleucel (axi-cel) and tisagenlecleucel (tisa-cel).1-8 However, this promising treatment modality may be associated with serious toxicities, including a unique immune effector cell-associated neurotoxicity syndrome (ICANS).9-12 The precise mechanisms mediating this potentially lifethreatening condition have not been entirely elucidated, but accumulating evidence suggests that the cytokine re-
lease upon CAR T-cell activation and/or direct targeting of CD19-expressing cerebral pericytes induce vascular injury, which may facilitate migration of immune effectors, including CAR T cells, across the blood-brain-barrier.9,11,13,14 Highdose corticosteroids are the first choice for ICANS-directed therapies, but fail in some patients.10,11 Interleukin (IL)-1 pathway blockade (anakinra) or intrathecally (IT)-administered cytotoxic chemotherapies are used as second-line therapies, but optimal treatment of severe therapy-refractory ICANS has not been established.10,11,15 ICANS monitoring largely relies on assessment of clinical status, imaging, and analysis of serum biomarkers.10,11,16 However, to date systematic data on CAR T-cell kinetics within the cerebrospinal
Haematologica | 108 February 2023 444 ARTICLE - Cell Therapy & Immunotherapy
fl
uid (CSF) are missing, which partly reflects the lack of broadly available diagnostic CAR-specific monitoring tools to easily examine the frequently scanty CSF specimen in the non-trial setting.17,18 In our prior work, we developed and validated digital polymerase chain reaction (dPCR) assays for CD19-CAR T-cell tracking.19-22 Here, we applied these assays to assess the CD19-CAR T-cell kinetics in diagnostic CSF samples and corresponding peripheral blood specimen from patients experiencing severe grade ≥3 neurotoxicity of CD19-CAR T-cell therapy. We found a preferential CAR Tcell enrichment within the CSF with further accumulation under ICANS-directed therapies. We used a previously established T-cell receptor-b (TRB) next-generation sequencing (NGS) assay23 to examine the clonal composition and longitudinal evolution of the refractory cells in patients with prolonged ICANS despite intense steroid-containing immune-chemotherapies.
Methods
Patient
treatment
We examined CAR T-cell kinetics in peripheral blood mononuclear cells (PBMC) and CSF in 48 consecutive patients with r/r B-cell malignancies treated with licensed CAR Tcell products (axi-cel or tisa-cel) after a cyclophosphamide- and fludarabine-based lymphodepleting regimen (described in the Online Supplementary Appendix).8,21 The local ethic committee approved the study (PV7081). Written informed consent for the schedule of sample collection was obtained from all patients. The sample collection schedule is described in detail in the Online Supplementary Appendix. Cytokine release syndrome (CRS) and ICANS were graded according to guidelines of the American Society for Transplantation and Cellular Therapy (ASTCT) and managed as described in the Online Supplementary Appendix.
Digital polymerase chain reaction-based analysis of patient samples
Genomic DNA (gDNA) was isolated from aliquots of patients’ PBMC, CSF, and the infusion product (IP) as described.19,20,22 Briefly, PBMC were isolated from peripheral blood by density-gradient centrifugation using SepMate (Stem Cell Technologies, Cologne, Germany) following the manufacturer’s instructions, washed, and resuspended in phosphate-buffered saline (PBS, Gibco, Thermo Fischer Scientific, Waltham, USA). Samples of CSF or the IP were centrifuged and the mononuclear cells (MNC) resuspended in phospate-buffered saline. Genomic DNA (gDNA) was extracted using QIAamp Blood Mini Kit (Qiagen, Hilden, Germany) following the manufacturer’s protocol. Typically, aliquots of 100–120 ng gDNA, corresponding to 15,000–18,000 diploid genomes (cells), were subjected to the dPCR analy-
sis using the previously described axi-cel-specific19 or “universal” (axi-cel and tisa-cel-specific) dPCR assays.20 All dPCR runs were performed as duplex reactions using the diploid hematopoietic cell kinase gene as reference.19,20 The final concentrations of primers (900 nM) and probes (250 nM) followed Bio-Rad dPCR guidelines. In order to reduce sample viscosity and improve target accessibility, 5 units EcoRI (Thermo Fischer Scientific) were added for 5 minutes at room temperature to the reaction. The dPCR was carried out with the QX100 Droplet Digital PCR System (Bio-Rad Laboratories, Hercules, USA). Droplets were analyzed with the QX100 droplet reader and data processed with QuantaSoft_v1.7 software (Bio-Rad). Data were analyzed and visualized using Graphpad PRISM Software 8.4.3. (GraphPad Software, San Diego, USA). All reported P values are twosided, and values <0.05 were considered statistically significant.
Fluorescent-activated cell sorting
Aliquots of cryopreserved PBMC or the IP were thawed and stained with a CD19-CAR reagent (Miltenyi Biotec, Bergisch Gladbach, Germany) following the manufacturer’s instructions. Briefly, cells were stained for 10 minutes with the CAR reagent, washed twice with fluorescent-activated cell sorting (FACS) buffer (PBS containing 2% fetal bovine serum, Sigma-Aldrich GmbH, Taufkirchen, Germany), and then stained for 15 minutes with a fluorochrome-conjugated anti-CD3 antibody and anti-biotin reagent (Miltenyi Biotec). T cells were sorted on a FACSAria_IIIu (BD Biosciences, San Jose, USA) into CAR-positive and CARnegative subsets, washed with PBS, and used for gDNA isolation.
T-cell receptor-β amplification and Illumina-based nextgeneration sequencing Aliquots of gDNA obtained from samples of PBMC, CSF, or the IP underwent unbiased amplification of the TRB rearrangement using BIOMED2-TRB primer pools as described23 and detailed in the Online Supplementary Appendix. Amplicons were barcoded, sequenced on an Illumina MiSeq sequencer (San Diego, USA) and analyzed using the MiXCR software as described previously,23 and as described in the Online Supplementary Appendix
Results
In our prior work, we treated 21 consecutive r/r B-cell lymphoma patients with axi-cel after a cyclophosphamideand fludarabine-based lymphodepleting therapy in a nontrial setting (March 2019-July 2020).12,21 Since then (until May 2022), additional 27 consecutive patients with advanced Bcell malignancies received axi-cel (n=14) or tisa-cel (n=13). In the entire cohort, the overall incidence of grade ≥1 CRS
Haematologica | 108 February 2023 445 ARTICLE - Molecular CAR T-cell tracking in real-world ICANS S. C. Berger et al.
after axi-cel treatment was 85.7% (grade ≥3 in 14.3%) and 84.6% (grade ≥3 in 15.4%) after tisa-cel. The incidence of ICANS (≥1) was 57.1% (grade ≥3 in 20%) in patients receiving axi-cel, and 38.5% (grade ≥3 in 23.1%) after tisa-cel (Table 1). The median day of ICANS grade 3-4 onset was day 4.5 (range, 0-10), and the median duration was 13.5 days (range, 5-60 days).
Proposed biomarkers associated with high risk of ICANS include measures of tumor burden such as baseline lactate dehydrogenase (LDH), inflammatory markers (IL-6 peak levels), and/or CAR T-cell peak levels.11,24,25 In our small cohort, we found statistically higher pretreatment LDH values (P<0.0001) in patients experiencing grade 4 neurotoxicity compared to those without ICANS (Online Supplementary Figure S1A). Also, peak IL-6 levels tended to be higher in grade ≥3 ICANS patients, although this was not statistically significant (Online Supplementary Figure S1B and C). Similarly, the patients with grade ≥3 ICANS showed a trend towards higher grades of CRS (Online Supplementary Figure S1D). In our prior work in the first 21 axi-cel patients of this cohort, we found that higher CAR T-cell peak values were significantly associated with favorable efficacy with a trend towards increased neurotoxicity.21 In the here updated entire axi-cel cohort (n=35 patients), we found a similar trend with regard to the incidence of neurotoxicity (grade 0 vs. grades 1-4 ICANS), with significantly higher CAR T-cell peak levels in the subgroup of patients with grades 2-4 ICANS compared to grades 01 ICANS (P=0.0142, Figure 1A). In this small cohort of patients, the circulating axi-cel persistence was low in the single-one grade 4 ICANS patient (patient #03, Figure 1B; Online Supplementary Figure S2) and he recovered fully within 24 hours without ICANS-specific treatment, making
alternative neurological pathologies such as a transient ischemic attack very probable. This observation might also reflect the complex and multifactorial nature of the ICANS pathogenesis, in which tumor burden, inflammation, and/or severity of CRS have also been identified as important contributing factors.9-11
Consistent enrichment of CAR T cells within cerebrospinal fluid after real-world CAR therapy
Ten of 48 patients in this cohort experienced grade ≥3 neurotoxicity (Table 1). The patient characteristics and outcomes are described in the Online Supplementary Table S1. We received aliquots of single or serial diagnostic CSF specimen that were obtained for clinical purposes from eight patients (Online Supplementary Appendix), including five of seven axi-cel treated patients and three of three tisa-cel-treated patients (Figure 2A). Using our recently developed and validated dPCR assays,19-22 we first determined whether the persisting CAR T cells proliferated and/or accumulated preferentially in the central nervous system. In all patients, we observed a relative enrichment of CAR-positive T cells on a per million basis within the CSF as compared to the PBMC sample with a median 25.8-fold peak increase (range, 1.5-124.7) in the CSF (Figure 2B). Even though the absolute numbers of leukocytes and CAR T cells were higher in the peripheral blood, we observed a significantly higher (P=0.0073) proportion of CAR T cells among leukocytes within the CSF versus the peripheral blood (Online Supplementary Table S2; Figure 2C). In order to determine whether CAR T cells are detectable within the CSF in the absence of severe ICANS, we also examined the CAR T-cell kinetics in a subset of eight patients with grades 0-2 ICANS undergoing
Figure 1. Chimeric antigen receptor T-cell peak levels in correlation with immune effector cell-associated neurotoxicity syndrome. 35 consecutive relapsed and/or refractory (r/r) B-cell lymphoma patients were treated with axi-cel in the non-trial setting and examined for neurotoxicity. Samples of peripheral blood mononuclear cells (PBMC) were obtained after the chimeric antigen receptor (CAR) T-cell infusion and analyzed by digital polymerase chain reaction for the presence of CAR T cells. (A) Boxplots showing the axi-cel peak levels in correlation with immune effector cell-associated neurotoxicity syndrome (ICANS). Boxplots show median (line), 25th and 75th percentiles (upper and lower box borders), and range (whiskers). (B) Individual axi-cel peak values in correlation with ICANS. The color-coded symbols identify patients with ≥grade 3 ICANS. #: Patient #03 recovered fully within 24 hours without ICANS-specific treatment, making alternative neurological pathologies very probable. Statistical significance: *P≤0.05; **P≤0.01.
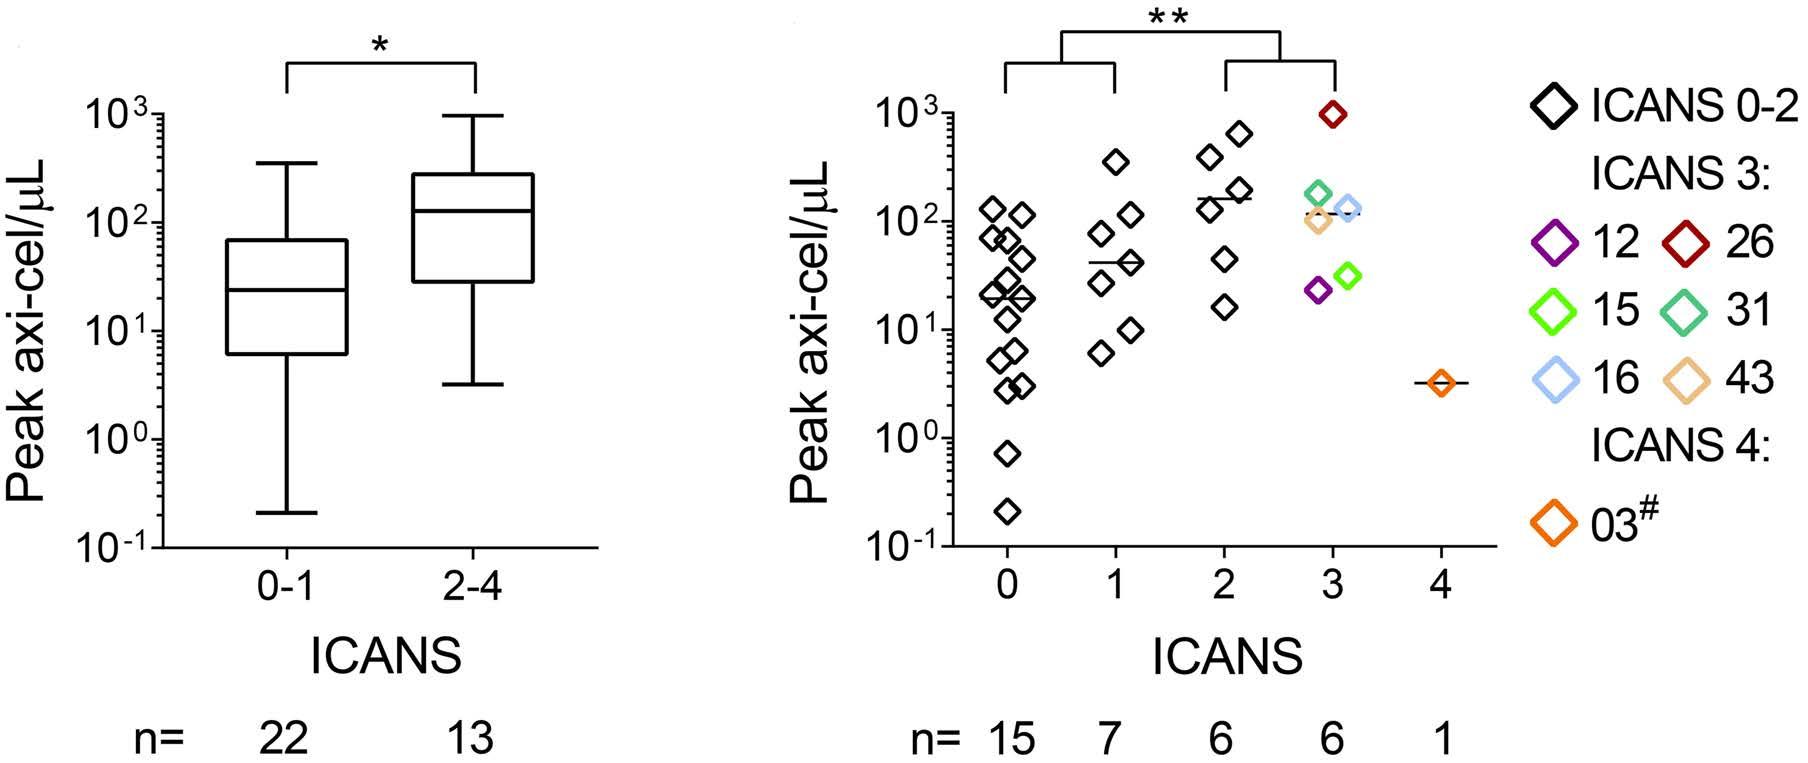
A B Haematologica | 108 February 2023 446 ARTICLE - Molecular CAR T-cell tracking in real-world ICANS S. C. Berger et al.
Table 1. Incidence and treatment of cytokine release syndrome and neurotoxicity after real-world CD19-CAR T-cell therapy.
CD19-CAR total axi-cel tisa-cel N % N % N %
Patients 48 100 35 100 13 100 Indication
DLBCL* 44 91.7 32 91.4 12 92.3 PMBCL 3 6.3 3 8.6 0 0.0 B-ALL 1 2.1 0 0.0 1 7.7
CNS Involvement 5 10.4 4 11.4 1 7.7
CRS
No CRS 7 14.6 5 14.3 2 15.4 CRS 1 11 22.9 7 20.0 4 30.8 CRS 2 23 47.9 18 51.4 5 38.5 CRS 3 6 12.5 5 14.3 1 7.7 CRS 4 1 2.1 0 0.0 1 7.7
CRS, death 1 2.1 0 0.0 1 7.7 ICANS
No ICANS 23 47.9 15 42.9 8 61.5
ICANS 1 9 18.8 7 20.0 2 15.4 ICANS 2 6 12.5 6 17.1 0 0.0 ICANS 3 6 12.5 6 17.1 0 0.0 ICANS 4 4 8.3 1 2.9 3 23.1 ICANS, death 1 2.1 0 0.0 1 7.7 Treatment Dex/Tocilizumab 30 62.5 22 62.9 8 61.5 Anakinra 9 18.8 4 11.4 5 38.5 IT-chemotherapy 4 8.3 3 8.6 1 7.7
Axi-cel: axicabtagene ciloleucel; B-ALL: B-cell acute lymphatic leukemia; CAR T cell: chimeric antigen receptor T cell; CNS: central nervous system; CRS: cytokine release syndrome; Dex: dexamethasone; DLBCL: diffuse large B-cell lymphoma; ICANS: immune effector cell-associated neurotoxicity syndrome; IT-chemotherapy: intrathecal chemotherapy consisting of dexamethasone, cytarabine, and methotrexate; PMBCL: primary mediastinal B-cell lymphoma; tisa-cel: tisagenlecleucel. *One axi-cel treated patient was diagnosed with a progressive follicular lymphoma/DLBCL.
strictly medically indicated lumbar punctures (LP) for neurological symptoms (Online Supplementary Appendix; Online Supplementary Table S3; Online Supplementary Figure S3A). In line with the approval by the local ethic committee, we were able to use aliquots of those CSF samples for the molecular monitoring (Online Supplementary Appendix). An increased frequency of CAR T cells within the CSF compared to the peripheral blood (median, 6.2-fold; range, 0.3-106.8) was also detectable in patients with low grade ICANS and in one patient without ICANS with a diagnostic LP in the context of a grade 2 CRS (On-
line Supplementary Figure S3B; Online Supplementary Table S3). Also, the proportion of CAR-T cells among leukocytes was significantly higher in the CSF compared to the peripheral blood (Online Supplementary Table S2; Online Supplementary Figure 3C; P=0.0016). These results indicate that CAR T cells can be enriched in the CSF regardless of the severity of ICANS. We did not find any significant association of the CAR T-cell enrichment in CSF with the duration or severity of ICANS, responses to ICANS-directed therapies, or active or history of cerebral lymphoma (Online Supplementary Figure S4).
Haematologica | 108 February 2023 447 ARTICLE - Molecular CAR T-cell tracking in real-world ICANS S. C. Berger et al.
Figure 2. Chimeric antigen receptor T-cell enrichment within the cerebrospinal fluid in real-world patients with severe neurotoxicity. (A) Schematic overview of axi-cel or tisa-cel treated patients with grade ≥3 immune effector cell-associated neurotoxicity syndrome (ICANS). Days with ICANS (grades 1-4) are highlighted in black. Ana: anakinra; Dex: dexamethasone; LP: lumbar puncture; m: multiple; N: no; Toci: tocilizumab; ITT: intrathecal therapy consisting of Dex, cytarabine, and methotrexate; Y: yes; : deceased. Updated on May 31st, 2022. (B and C) Detection of chimeric antigen receptor (CAR) T cells in peripheral blood mononuclear cells (PBMC) and diagnostic cerebrospinal fluid (CSF) specimen in patients with grade ≥3 ICANS. Aliquots of diagnostic CSF specimen and PBMC were obtained at indicated days and examined by digital polymerase chain reaction (dPCR) for the presence of CAR T cells. (B) Left panel: frequency of CAR-positive cells per million mononuclear cells (MNC) in corresponding samples of PBMC () and CSF (). Right panel: Fold change (CSF vs. PBMC). Shown are the results on the day (d) of the maximal change if multiple samples were obtained. (C) Proportion of absolute CAR T-cell numbers among leukocytes (leu) within the CSF vs. the peripheral blood (PB). Statistical significance: **P≤0.01.
Sustained CAR T-cell persistence despite glucocorticoid-containing therapies
Recent reports demonstrated rather detrimental effects of intense-steroid treatment with poorer outcome after CAR T-cell therapy as well as the failure to ablate CAR T cells in the peripheral blood in patients with CAR-toxicities. 26-28 However to date, data on CAR T-cell kinetics within CSF, especially in the context of glucocorticoidcontaining therapies, are missing. The majority of the ICANS patients received systemic steroid-containing ICANS-directed treatment and seven of them underwent serial LP (Figure 2A; Online Supplementary Figure S3; Online Supplementary Tables S1 and S3 ) for diagnostic or therapeutic purposes solely based on strong medical indication (Online Supplementary Appendix). Left-over material provided an opportunity to examine CAR T-cell frequencies in serial PBMC samples and diagnostic CSF specimens and to address the impact of glucocorticoidcontaining treatment on the T-cell kinetics. As previously implicated, 26,27 corticosteroids did not prevent the en -
graftment in the peripheral blood or CSF. We observed a median 14.3-fold increase of CAR T-cell numbers per m L despite Dex treatment in serial PBMC specimen (range, 0.9-96,698) as well as in diagnostic CSF samples (median 2.7-fold; range, 0.9-35.8) after transfer. The steroid-treatment did not cause ablation of CAR T cells, but the gene-modified T cells remained detectable at only slightly reduced levels within the peripheral blood (Figure 3A and D). We also found a sustained enrichment of the frequency of CAR T cells within the CSF as compared to the PBMC sample, as indicated by higher frequencies early during steroid-treatment, with further increase to up to 95-fold levels (Figure 3B and E). As before, although the absolute CAR T-cell numbers per m L were generally higher in blood compared to CSF (Figure 3A and D), reflecting overall higher total leukocyte counts, we observed that the proportion of axi-cel or tisa-cel T cells among the leukocytes remained far higher over time within CSF compared to the peripheral blood (Figure 3C and F).
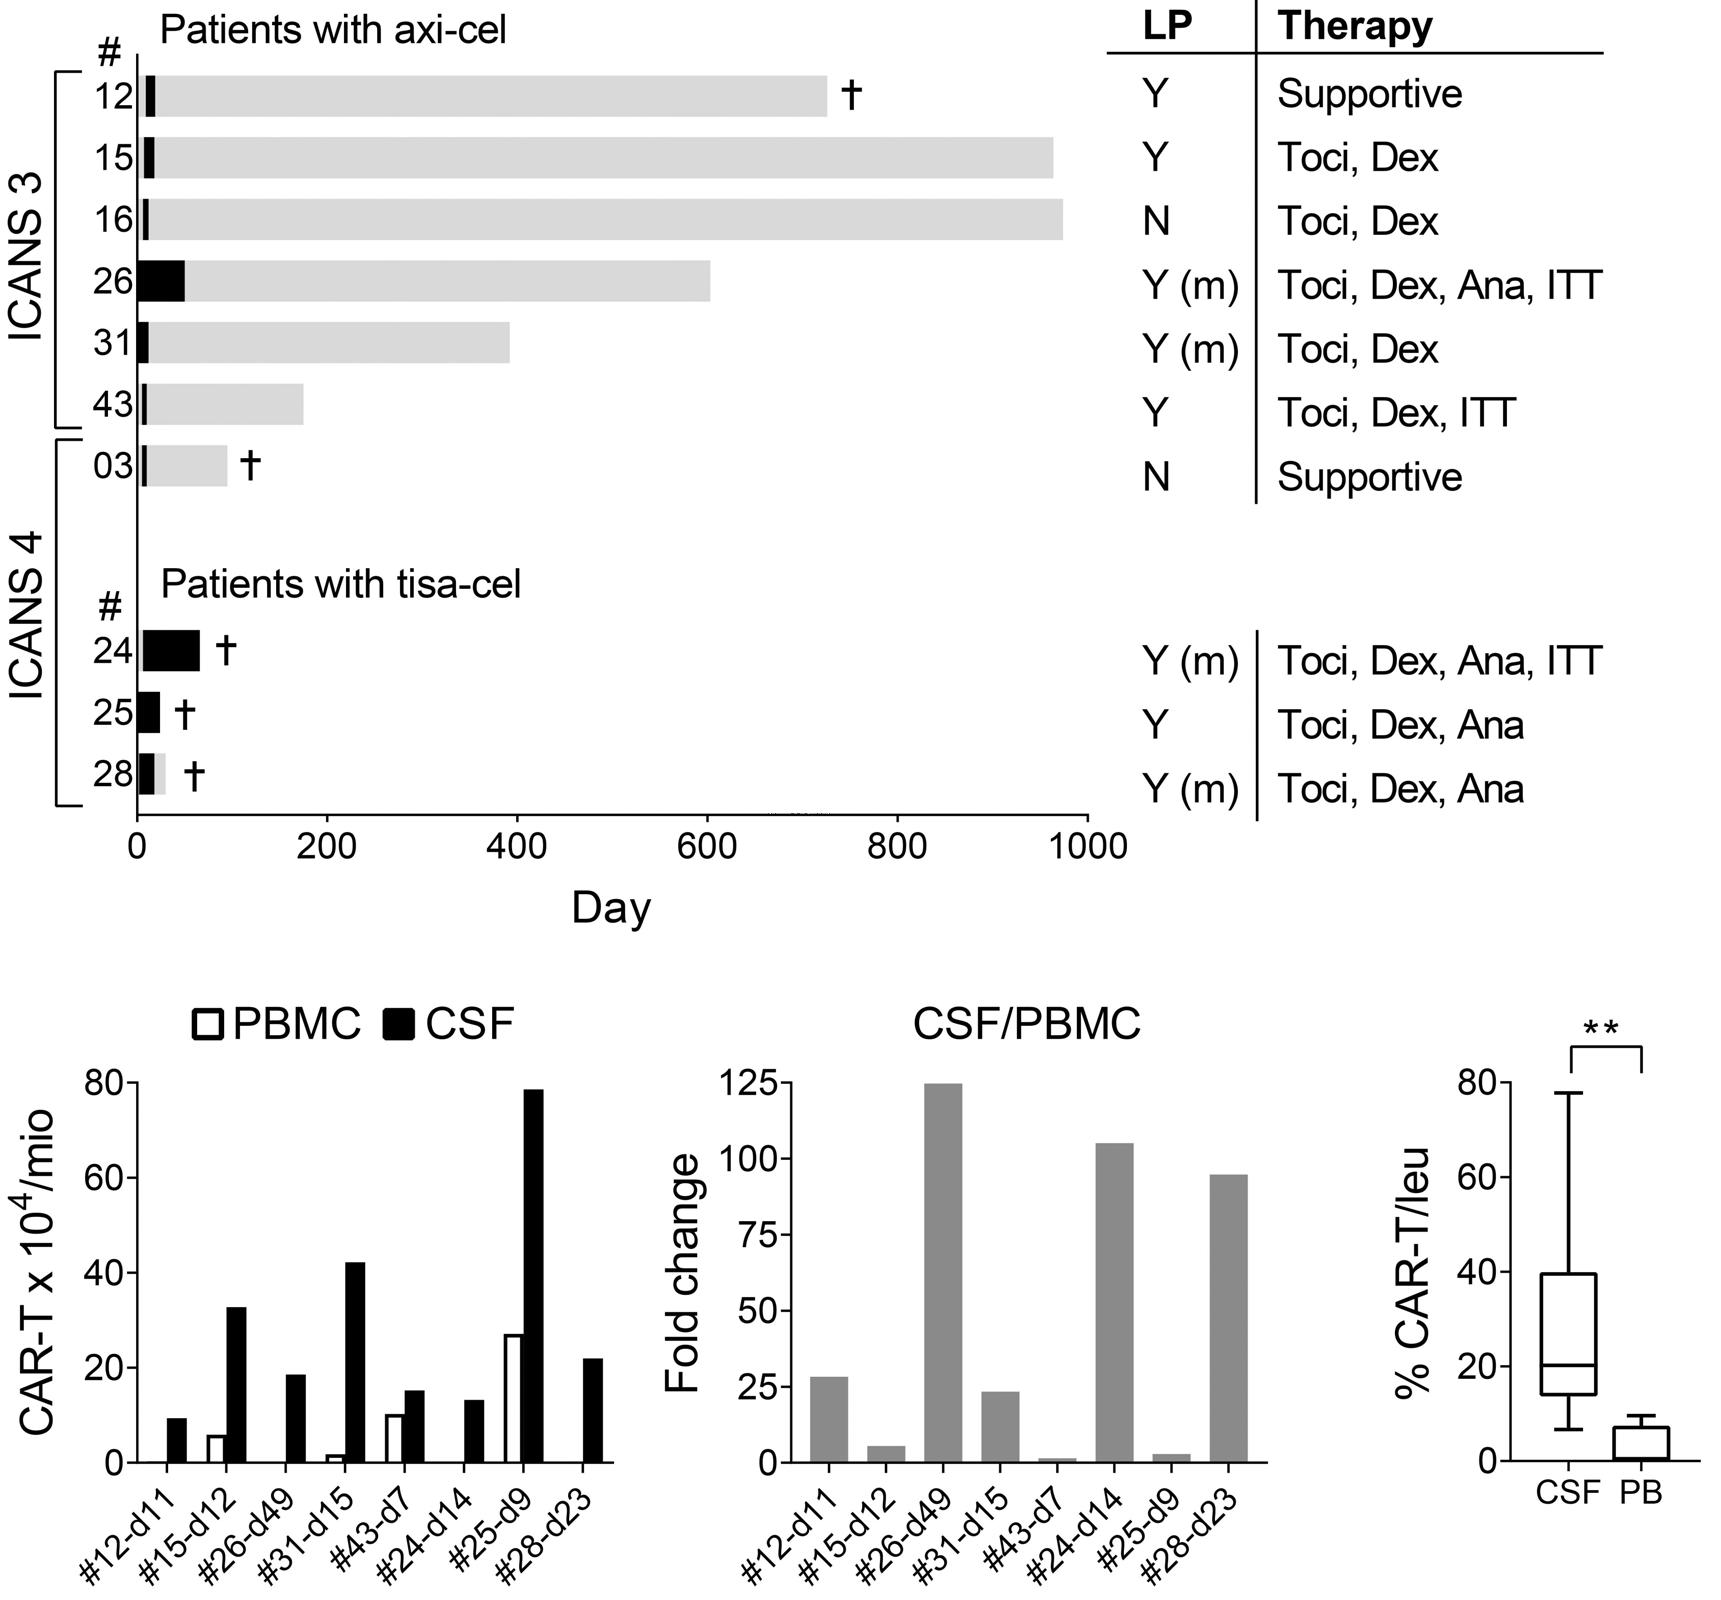
A B
Haematologica | 108 February 2023 448 ARTICLE - Molecular CAR T-cell tracking in real-world ICANS S. C. Berger et al.
C
Development of treatment-refractory neurotoxicity despite intense immune effector cell-associated neurotoxicity syndrome-directed immunochemotherapies in a small subset of patients
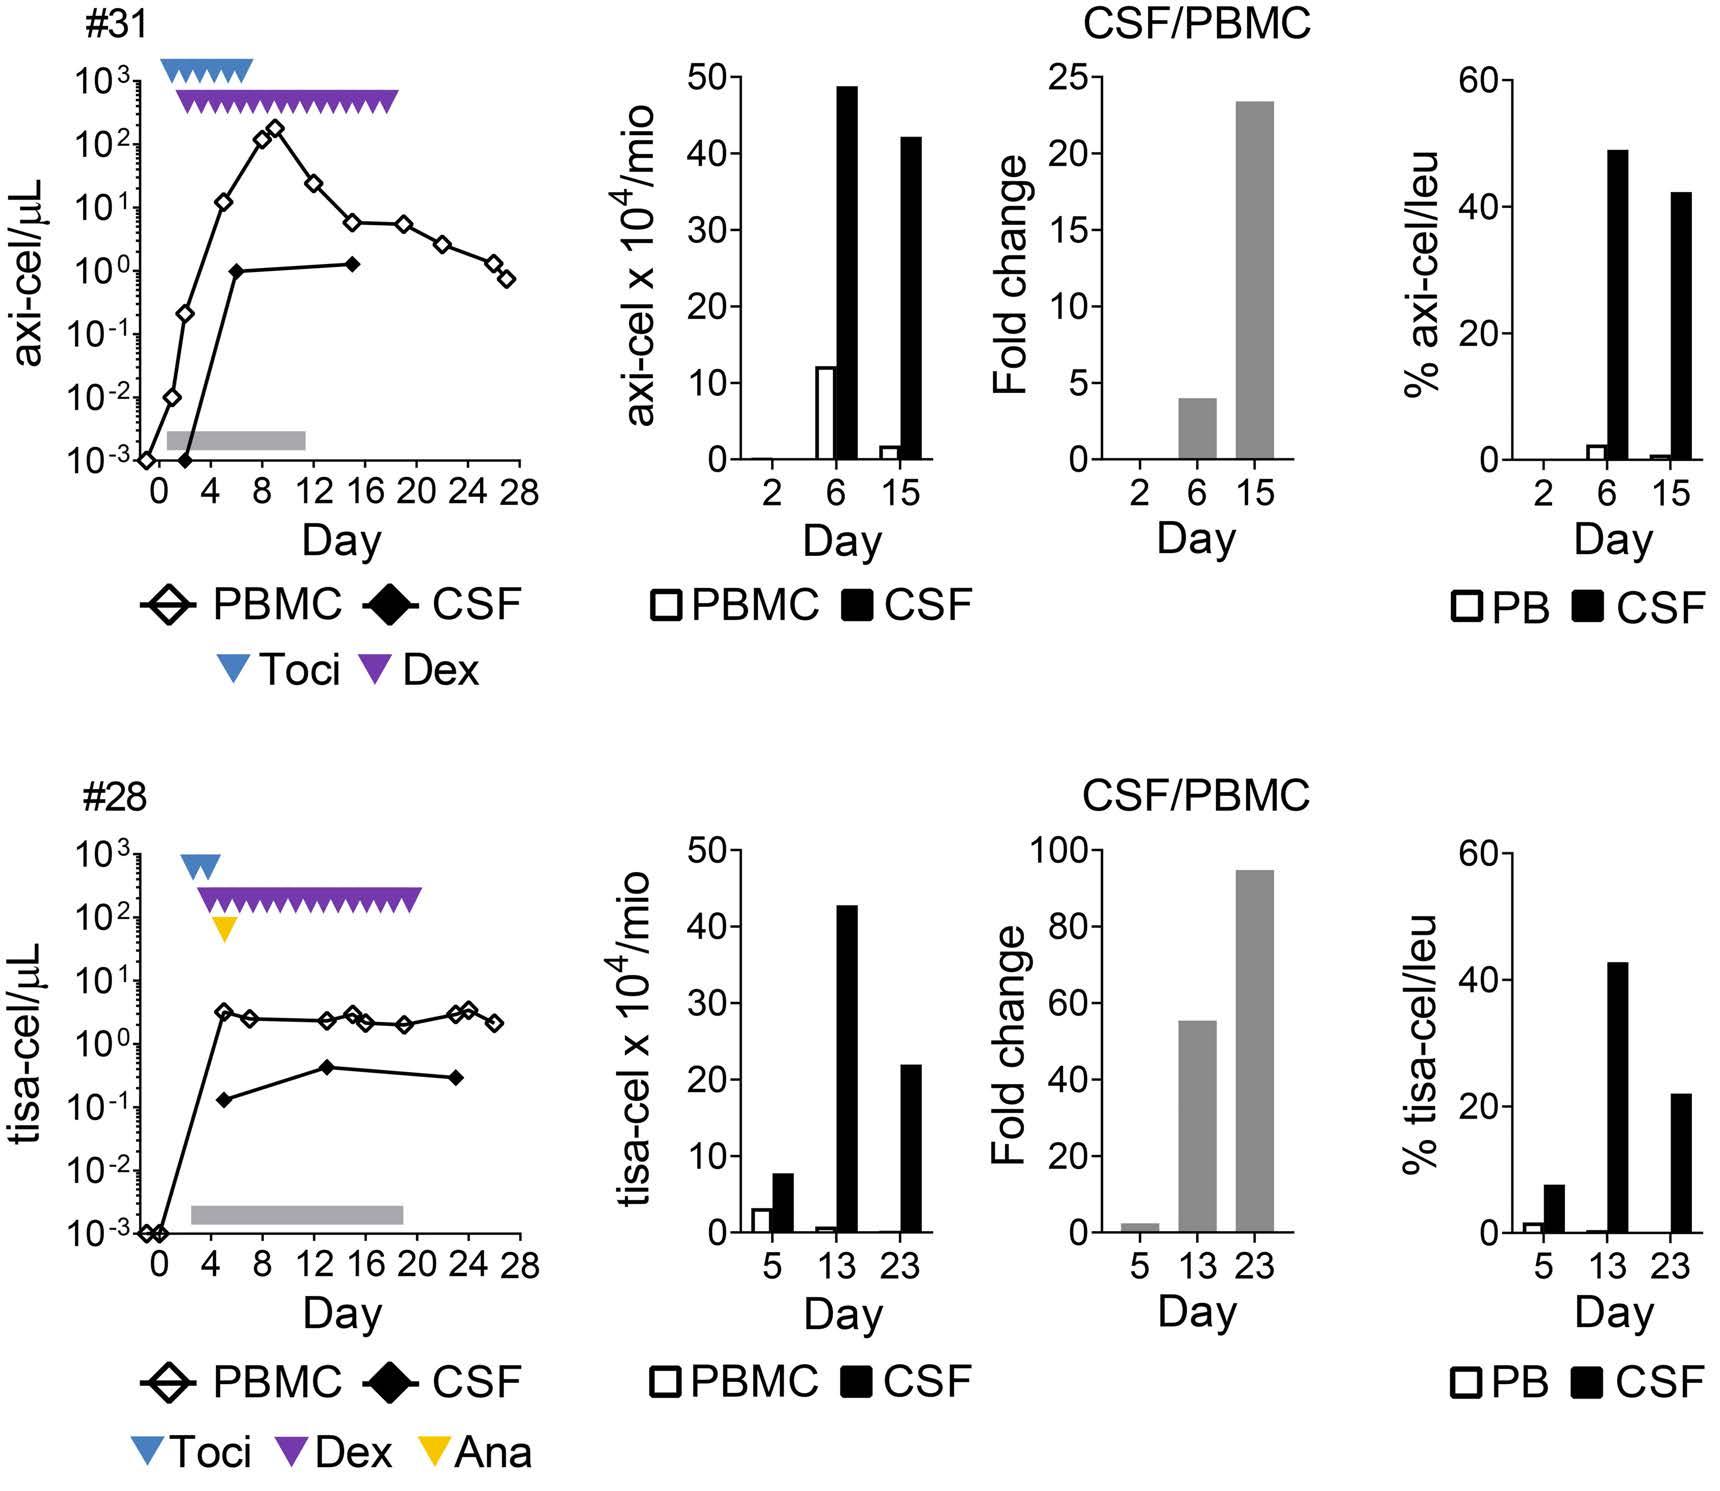
Continued clinical follow-up showed that the ICANS-directed therapies mediated a resolution of the neurotoxicity in the majority of our patients (Figure 2A). However, two patients (#24 and #26) of our cohort experienced prolonged and severe courses of disease despite intense ICANS-directed treatment, including prolonged corticosteroids, anakinra, and repeated IT administration of chemotherapeutic regimen consisting of Dex, cytarabine, and methotrexate (Online Supplementary Table S1).15 Even though all efforts were made to restrict the number of LP, both patients repeatedly underwent this procedure for different medical reasons including diagnostic purposes, drug administration, and/or other therapeutic interventions (for example to release pressure). In order to facilitate the procedures, patient #24 received an implanted Rickham reservoir on day 19 after the CAR T-cell infusion. Analysis of the CAR T- cell kinetics in serial PBMC and CSF
samples in patient #26 showed an initial decline of detectable CAR T cells after the IT chemotherapy (Figure 4A and B), but the CAR T cells continued to persist at up to 125-fold increased frequencies per million cells analyzed in CSF versus PBMC throughout the follow-up (Figure 4B). This also translated in a far higher proportion of CAR T cells among leukocytes in the CSF versus the PB (Figure 4C). Similarly, in patient #24, there was a prolonged CAR T-cell persistence despite the intense treatment (Figure 4E). We observed a 2-fold enrichment of the absolute frequency of CAR-positive cells within CSF at the start of the ICANS-directed treatment, which further increased to up to 105-fold enriched levels in CSF versus PBMC by day 14 (Figure 4F). This was also accompanied by an increased proportion of absolute CAR T cells among leukocytes within CSF versus PB (Figure 4G). Continued ICANS-directed treatment including an IT chemotherapy mediated some decline of the detectable CAR T cells, but they remained present at >20-fold enriched frequencies over time compared to peripheral blood (Figure 4F). In this non-trial setting, we also examined selected inflammatory
A B C D E F ARTICLE - Molecular CAR T-cell tracking in real-world ICANS S. C. Berger et al.
Figure 3. Sustained chimeric antigen receptor T-cell persistence and enrichment despite glucocorticoid containing immune effector cell-associated neurotoxicity syndrome-directed therapy. Chimeric antigen receptor (CAR) T-cell kinetics in serial samples of peripheral blood mononuclear cells (PBMC) and cerebrospinal fluid (CSF) in patients with grade ≥3 neurotoxicity receiving immune effector cell-associated neurotoxicity syndrome (ICANS)-directed therapies. Aliquots of PBMC and CSF were obtained at indicated days and examined by digital polymerase chain reaction (dPCR) for the presence of CAR T cells. (A and D) Shown are absolute numbers of circulating CAR T cells in PBMC () and CSF (). The arrow heads indicate the type and times of the cytokine release syndrome (CRS) or ICANS-directed treatments: blue: tocilizumab (Toci); purple: dexamethasone (Dex); yellow: anakinra (Ana). The grey horizontal bars show the duration of ICANS. (B and E) Left panels: absolute frequencies of CAR-positive cells per million mononuclear cells (MNC) in PBMC () and CSF () on the respective day. Right panels: fold change (CSF vs. PBMC). (C and F) Proportion of absolute CAR T-cell numbers among leukocytes (leu) within the CSF vs. the peripheral blood (PB) on the indicated days after the CAR T-cell infusion. Haematologica | 108 February 2023 449
E F G H
Figure 4. Sustained chimeric antigen receptor T-cell enrichment within the cerebrospinal fluid in 2 patients with prolonged treatment-refractory severe immune effector cell-associated neurotoxicity syndrome. (A and E) Chimeric antigen receptor (CAR) T-cell kinetics. Serial samples of peripheral blood and diagnostic cerebrospinal fluid (CSF) specimen were examined by digital polymerase chain reaction for the presence of CAR T cells. (A) Absolute numbers of circulating CAR T cells in peripheral blood mononuclear cells (PBMC) () and CSF () in (A) patient #26 undergoing axi-cel therapy and (E) patient #24 receiving tisa-cel. The arrow heads indicate type and times of the cytokine release syndrome (CRS)- or immune effector cell-associated neurotoxicity syndrome (ICANS)-directed treatments: blue: tocilizumab (Toci); purple: dexamethasone (Dex); yellow: anakinra (Ana); magenta: methyl-prednisone (MP); brown: IT-Dex; black: intrathecal therapy (ITT) with Dex, cytarabine, and methotrexate. The grey horizontal bars show the duration of ICANS. (B and F) Left panels: Absolute frequency of CAR-positive cells per million mononuclear cells (MNC) in PBMC () and CSF () on indicated days in (B) patient #26 or (F) patient #24. Right panels: fold change (CSF vs. PBMC). (C and G) Proportion of absolute CAR T-cell numbers among leukocytes in CSF vs. PB in (C) patient #26 and (G) patient #24. (D and H) Analysis of inflammatory marker (IL-6, protein) in (D) patient #26 and (H) patient #24.
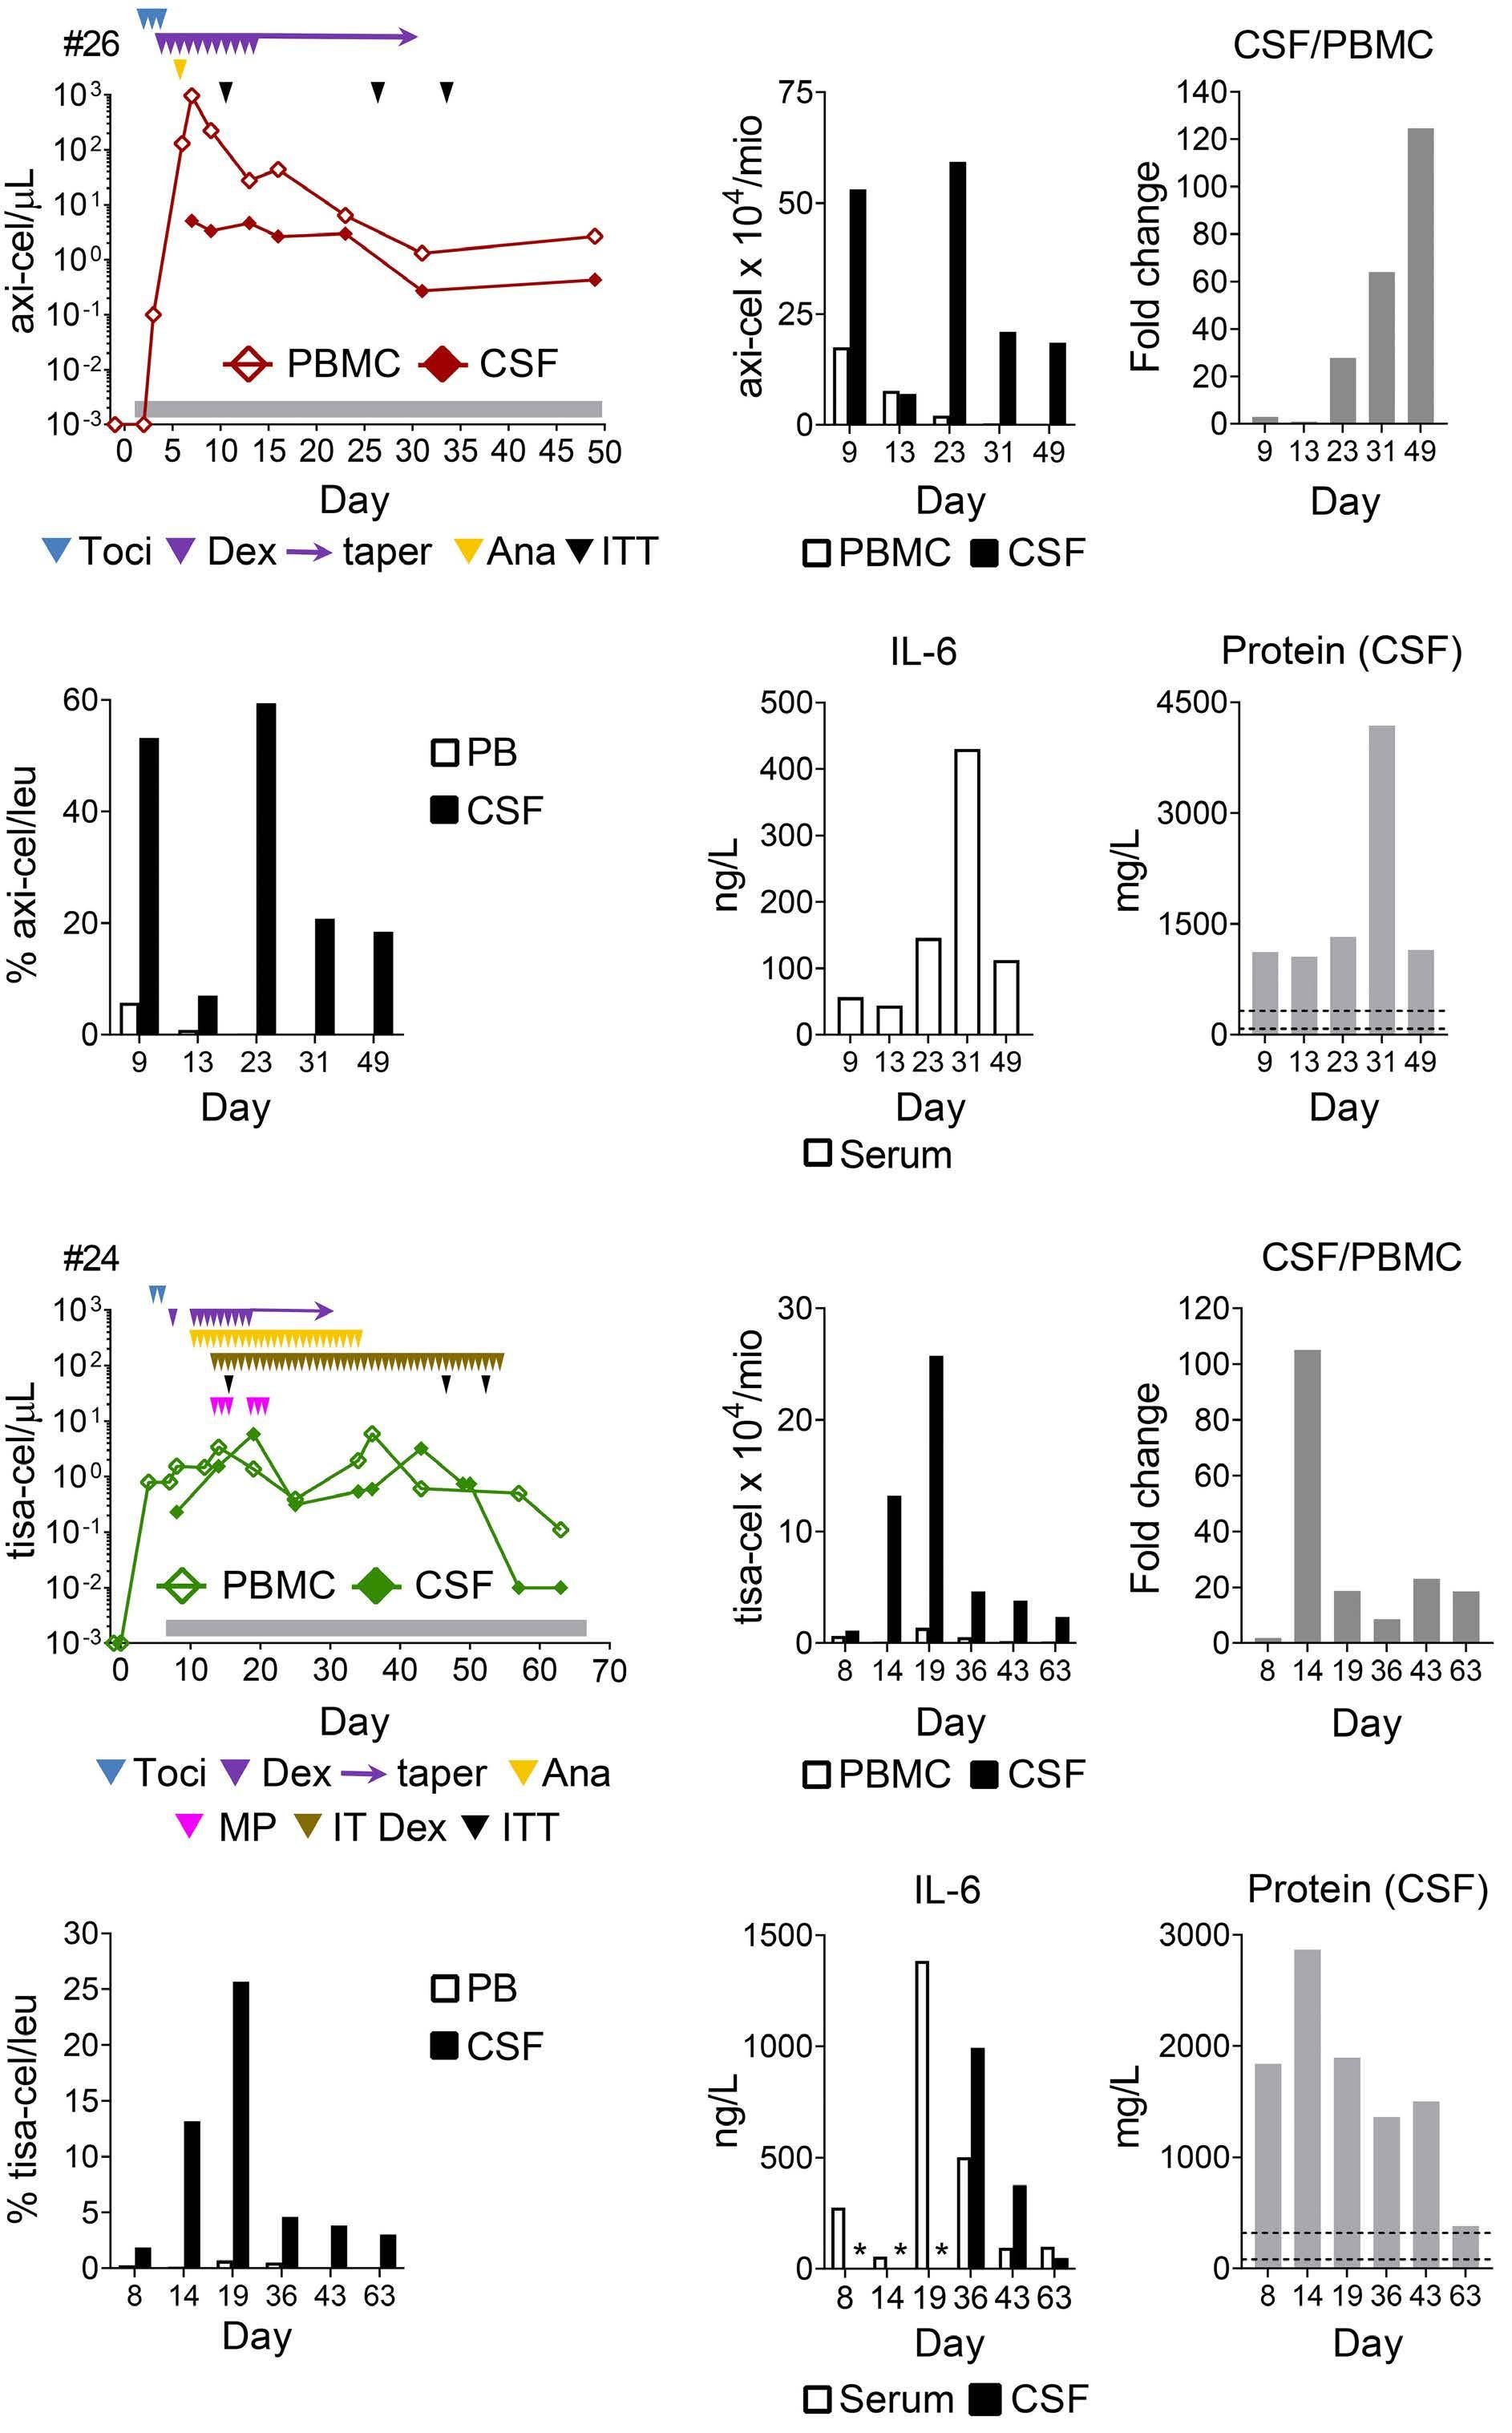
A B
D
Haematologica | 108 February 2023 450 ARTICLE - Molecular CAR T-cell tracking in real-world ICANS S. C. Berger et al.
C
marker such as IL-6 and/or total protein, respectively, and detected in both patients elevated levels in CSF compared to the serum sample (Figure 4D and H). However, high levels of inflammatory marker in CSF were also detected in patients with lower grade ICANS (Online Supplementary Table S5). Whereas the ICANS symptoms gradually resolved over time in patient #26, patient #24 experienced a prolonged treatment-resistant grade 4 ICANS until her death due to progression of lymphoma (Figure 2A, Online Supplementary Table S1). Thus, even very intense systemic and/or local ICANS-directed treatment may fail to mediate timely resolution of neurotoxicity in a subset of patients, which coincides with a continued persistence of possibly pathogenic T cells in the CSF.
Treatment-refractory immune effector cell-associated neurotoxicity syndrome concurs with profound clonal Tcell receptor-β skewing The sustained T-cell persistence in CSF despite prolonged intense therapies in patients #24 and #26 was surprising, but could reflect the selected outgrowth of single treatment-refractory T-cell clones. We used a previously es-
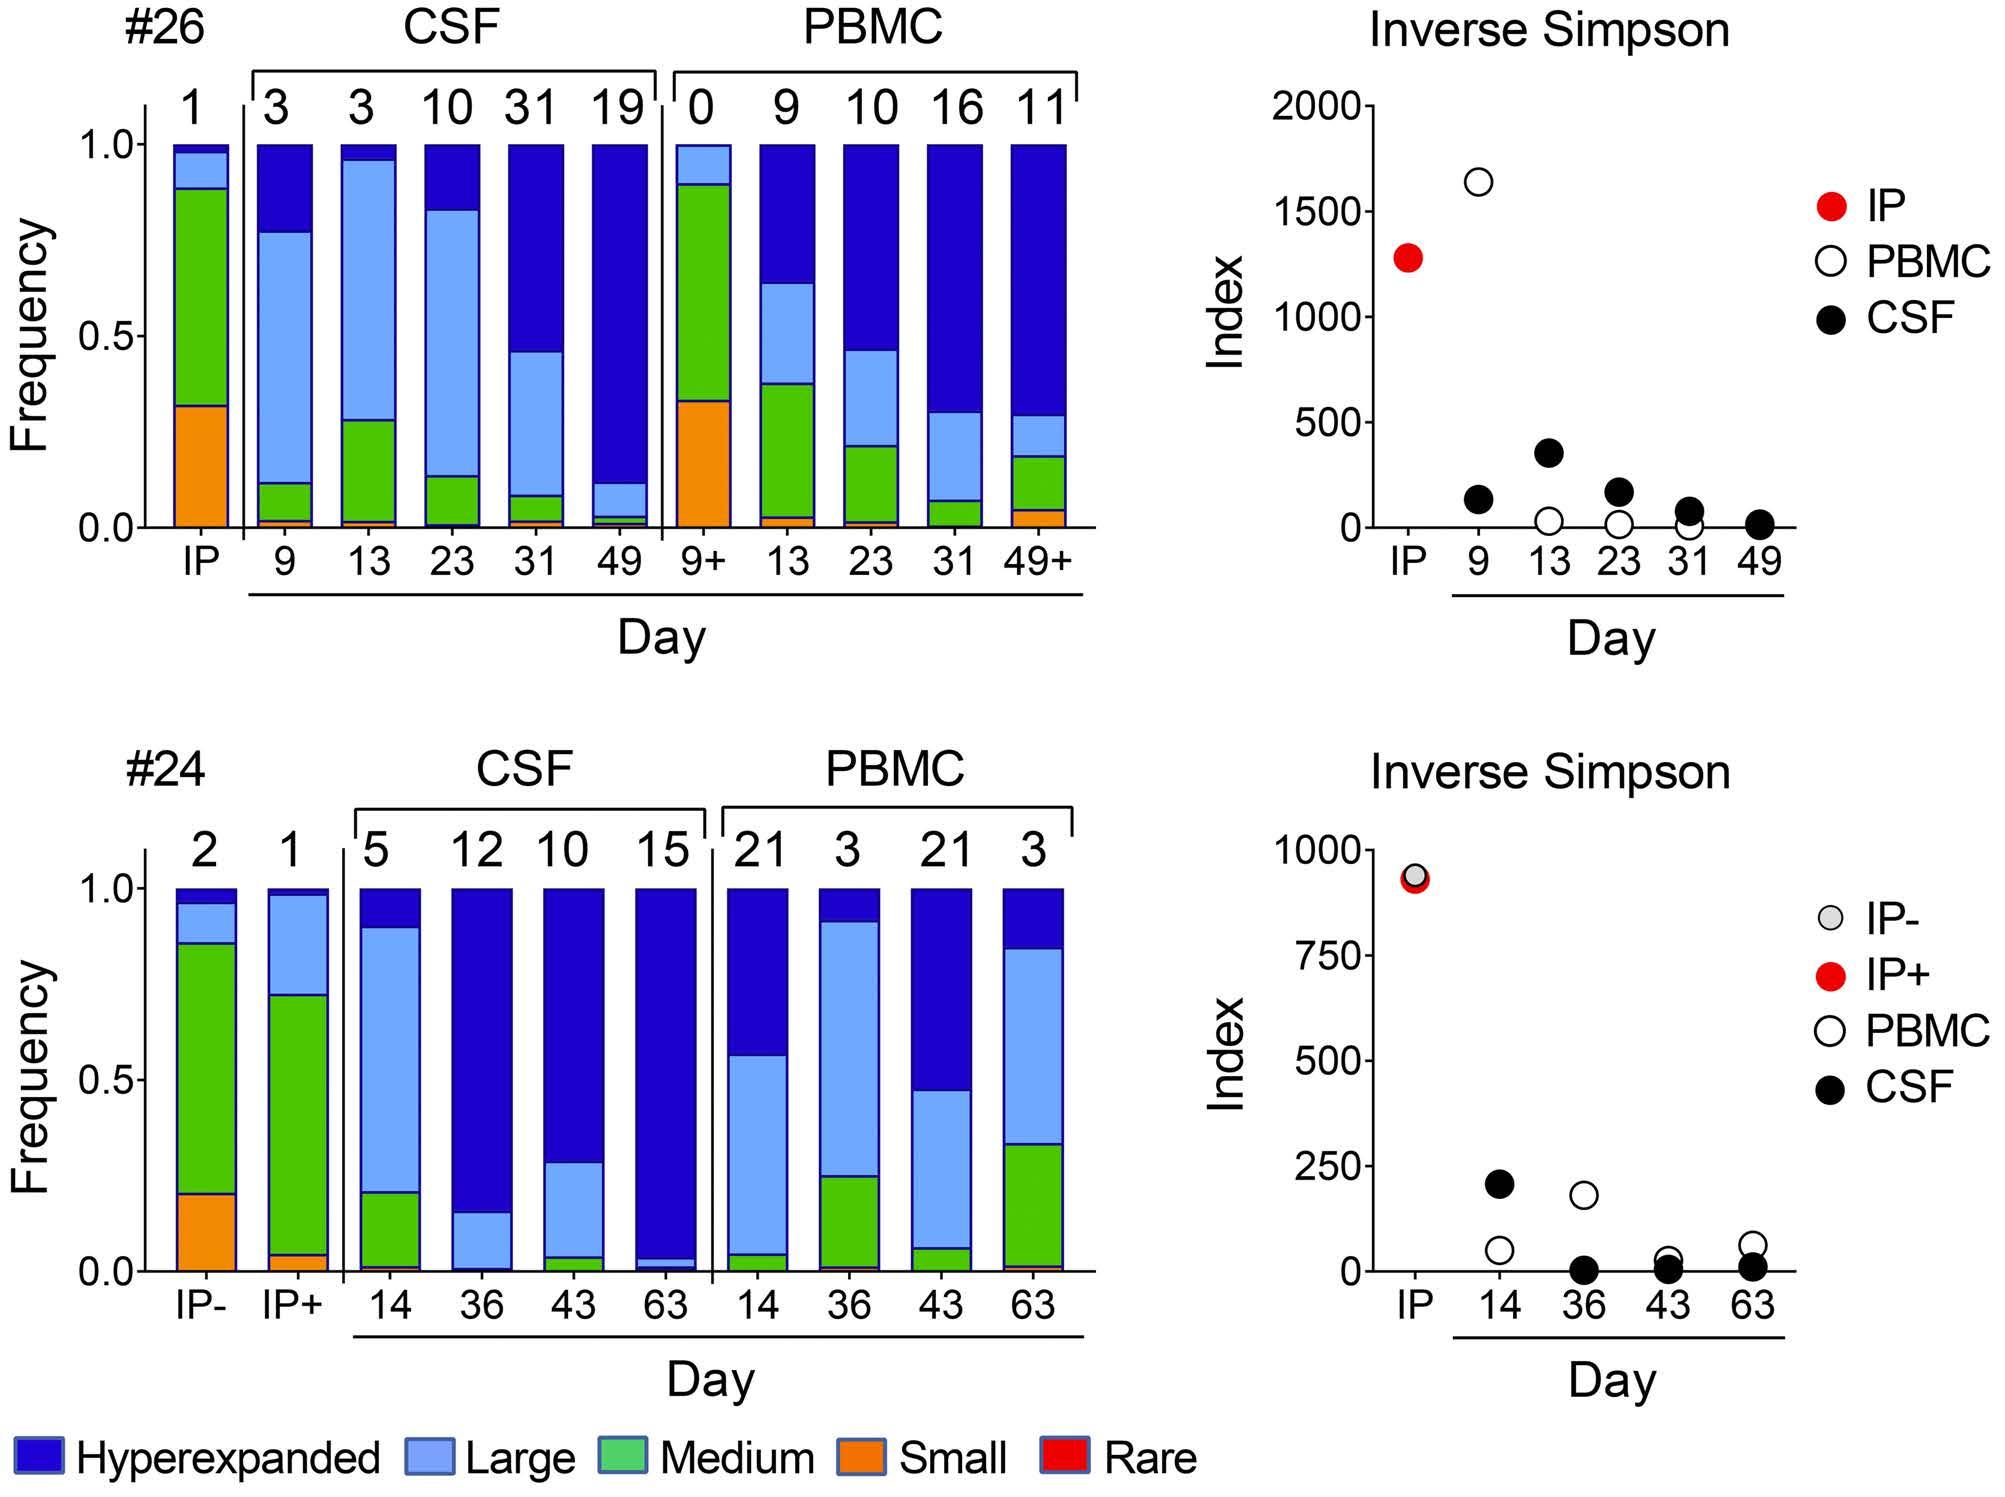
tablished TRB-NGS assay23 to examine the clonal composition of T cells in the CSF of the aforementioned two patients. Our longitudinal analysis of changes in the T-cell receptor (TCR) repertoire revealed a diverse distribution in CSF and blood at the onset of ICANS, with an increasingly skewed repertoire in CSF versus blood during the ICANS-directed treatment. In fact, only 19 hyperexpanded clones accounted for 88% of the TRB repertoire within the CSF sample of patient #26 (Figure 5A), 49 days after the initial diagnosis of ICANS and 48 days after the initiation of intense ICANS-directed treatment (Figure 2A and 4A). Similarly, patient #24 showed a high diversity of the T-cell repertoire within the CSF at the onset of ICANS, but a profound progressive TRB skewing compared to the corresponding samples of PBMC over time, especially at later time points. In this patient, only 15 hyperexpanded clones occupied 94% of the clonal space within the CSF by day 63 (Figure 5C; Online Supplementary Table S6), after 55 days of ICANS-directed treatment (Figure 2A and 4E), whereas the corresponding PBMC sample showed a high level of diversity. This was also reflected by corresponding changes in the inverse Simpson index (Figure 5B and D),
Figure 5. T-cell immune-profiling by T-cell receptor-β next-generation sequencing reveals clonal T-cell repertoire skewing within the cerebrospinal fluid in 2 patients with prolonged neurotoxicity despite intense immune effector cell-associated neurotoxicity syndrome-directed therapies. (A and C) Analysis of the clonal space distribution in (A) patient #26 undergoing axi-cel therapy and (C) patient #24 receiving tisa-cel. Genomic DNA was extracted from aliquots of the infusion product (IP), cerebrospinal fluid (CSF), or peripheral blood mononuclear cells (PBMC), either unsorted or sorted in a chimeric antigen receptor (CAR)-positive (+) or non-CAR (-) subset and examined by T-cell receptor-b next-generation sequencing (TRB-NGS). The panels demonstrate the clonal space distribution on the indicated days. Shown is the frequency of rare (0 ≤ X ≤ 1-05; red bars), small (1-05 ≤ X ≤ 1-04; orange bars), medium (1-04 ≤ X ≤ 1-03; green bars), large (1-03 ≤ X ≤ 0.01; blue bars), and hyperexpanded clones (0.01 ≤ X ≤1; dark blue bars). The inset values above the bars represent the number of hyperexpanded clones. (B and D) Corresponding repertoire metrics of the TRB-NGS analysis shown as inverse Simpson index.
A
C D Haematologica | 108 February 2023 451 ARTICLE - Molecular CAR T-cell tracking in real-world ICANS S. C. Berger et al.
B
which is a measure for diversity. The total number of recovered cells for both patients are shown in Online Supplementary Table S4. Importantly, we did not observe similar changes in the clonal space distribution within CSF or peripheral blood in patients with low grade or no ICANS, respectively (Online Supplementary Figure S5 and S6).
We next examined the fine-specificity of the hyperexpanded clones and their longitudinal evolution over time. In patient #24, we detected a total of 33 unique hyperexpanded clones within the CSF between days 14-63; not all of them persisted throughout all time points, though (Online Supplementary Figure S7). When we analyzed the infused T-cell product, eight of those clones that we detected in the CSF could be directly traced to the CAR-positive subset and 11 to the non-CAR T-cell fraction, with some being present in both subsets (Figure 6A and B). Interestingly, as few as five unique T-cell clones were shared at all time points within the CSF (Figure 7A) and detectable at increasing frequencies in the CSF versus the corresponding peripheral blood sample and/or the IP (Figure 7A) during the intense ICANS-directed treatment. Similarly, only single refractory clones were detectable within the CSF and/or blood in patient #26 (Figure 7B). Collectively, the fine-specific longitudinal analysis of the TCR repertoire within the CSF versus the peripheral blood suggested both, the robust proliferation or accumulation (up to 1,200-fold) of unique T-cell clones within the CSF, as well as the progressive outgrowth of a few treatmentrefractory clones within the CSF over time.
Discussion
Adoptive CAR T-cell therapy targeting CD19 has recently emerged as a novel treatment modality for r/r B-cell tu-
mors and demonstrated an impressive potential to induce durable responses of advanced disease.1-8 However, CAR T-cell therapy can be accompanied by deleterious side effects, including neurological toxicities, which may limit the successful outcome of the approach in a subset of patients.9-11 CAR T cells belong to a unique new entity of ‘living drugs’, which exert unpredictable and patient-specific in vivo kinetics. Efforts have been made to assess the circulating CAR T-cell engraftment in the peripheral blood in the non-trial setting.19-22,29 However, to date still very little is known about the specific CAR T-cell kinetics within the CSF in these patients. Here, we set out to examine the migration and proliferation of CD19-CAR T cells within the CSF of patients experiencing ICANS after real-world axi-cel or tisa-cel therapy. We demonstrated a consistent enrichment of the frequency of CAR-T cells within the CSF in our patients at ICANS onset and further accumulation during ICANS-directed therapies in comparison with peripheral blood. In a small subset of patients with treatment-refractory ICANS, we found a profound progressive skewing of the TCR repertoire with an outgrowth of very few resistant clones. Notably, these clones were derived from the CAR-positive and non-CAR subset of the IP and proliferated and/or accumulated profoundly in vivo
Prior published results of CD19-CAR therapies demonstrated manageable toxicities with a considerable subset of ~40-67% of patients experiencing neurotoxicities.9-11 The observed incidence and outcome of ICANS in our non-trial cohort was in the expected range, and in line with prior research we detected a trend towards higher tumor burden and CAR T peak levels in more severe ICANS patients.11,25 Thus, the identification of prophylactic strategies to prevent the development of ICANS, including thorough clinical and immune monitoring as well as early intervention, continues to have a high priority to further improve patient outcomes.
Figure 6. Hyperexpanded T-cell clones can be traced back to the infused T-cell product and proliferate strongly in vivo. Analysis of the T-cell receptor (TCR) repertoire in patient #24 experiencing a treatment-resistant grade 4 neurotoxicity. Genomic DNA was extracted from (A) the chimeric antigen receptor (CAR)-positive (infusion product positive [IP+]) and non-CAR (IP-) subset of the infused T-cell product and (B) serial diagnostic cerebrospinal fluid (CSF) samples, and then examined by T-cell receptorb next-generation sequencing (TRB-NGS). Shown are the frequencies of 12 hyper-expanded clones that were both detectable in the CSF (B) between days 14-63 and could also be traced back to the CAR-positive (IP+) and/or non-CAR (IP-) subset of the infused T-cell product (A).
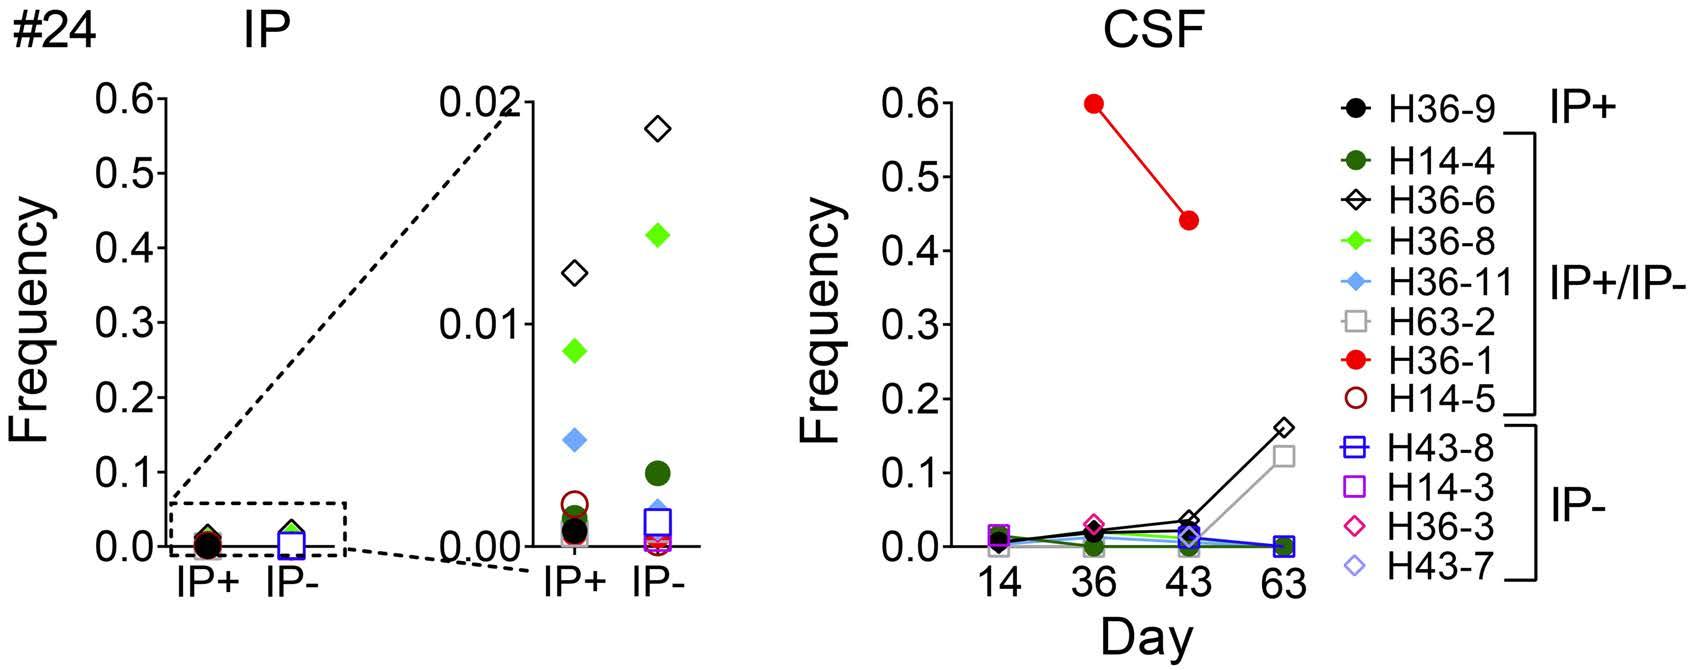
A B Haematologica | 108 February 2023 452 ARTICLE - Molecular CAR T-cell tracking in real-world ICANS S. C. Berger et al.
An important finding of our work is the consistent CAR Tcell increase within the CSF in our ICANS patients with a progressive enrichment despite steroid-containing ICANSdirected therapies. Glucocorticoids have been thought to serve as lymphotoxic drugs, but prior studies indicated that steroids fail to restrict the persistence of transferred T cells, including CAR T-cells, in the peripheral blood.26,27,30 Additionally, recently published work by Strati et al. demonstrated detrimental effects of corticosteroids after CAR T-cell therapy and showed that higher cumulative doses of corticosteroids, as well as a prolonged or early use after CAR T-cell infusion were associated with significantly shorter patient survival and poor outcome.28 In line with these data, we observed in our patients with severe ICANS that corticosteroids may not mediate ablation of CAR T cells and/or resolution of neurotoxicity. Importantly, we extend this work and show for the first time the effects of steroidbased ICANS-directed therapies on the CAR T-cell kinetics within the CSF. However, a limitation of this work in the non-trial setting is, in part due to the inherent ethical concerns, the lack of a cohort of ICANS patients not treated with corticosteroids that could serve as formal control group. Thus, systematic studies in appropriate in vitro or in vivo model systems are urgently needed.31-33 The consist-
ently more profound accumulation of CAR T cells in the CSF versus peripheral blood highlights the importance of the development of effective tools to continue to monitor and control the cell fate after adoptive transfer. Our extensive analysis of the available samples in selected patients showed that the prolonged severe ICANS symptoms coincided with the outgrowth of several treatmentrefractory T-cell clones. To the best of our knowledge, this is the first demonstration of a progressive skewing of the TCR repertoire and longitudinal fine-specific tracking of individual T-cell clones in therapy-resistant severe ICANS. The observation that the clonal diversity within the CSF is more restricted compared to the peripheral blood suggest a role of a CSF-specific environment during severe ICANS, as suggested in prior research.10,11,13,24 A prior study of Shah et al., examined the phenotype of the white blood cells within the CSF in a patient with a steroid-refractory CAR T-cell associated neurotoxicity syndrome.15 The flow cytometric analysis of a single time point (day 13) in that patient revealed, unexpectedly, the predominant presence of a non-CAR CD4+ T-cell population within the CSF. In line with these results, we found that the dominating treatment-refractory clones were at least in part derived from the CAR-negative T-cell fraction. The observation
A ARTICLE - Molecular CAR T-cell tracking in real-world ICANS S. C. Berger et al.
B
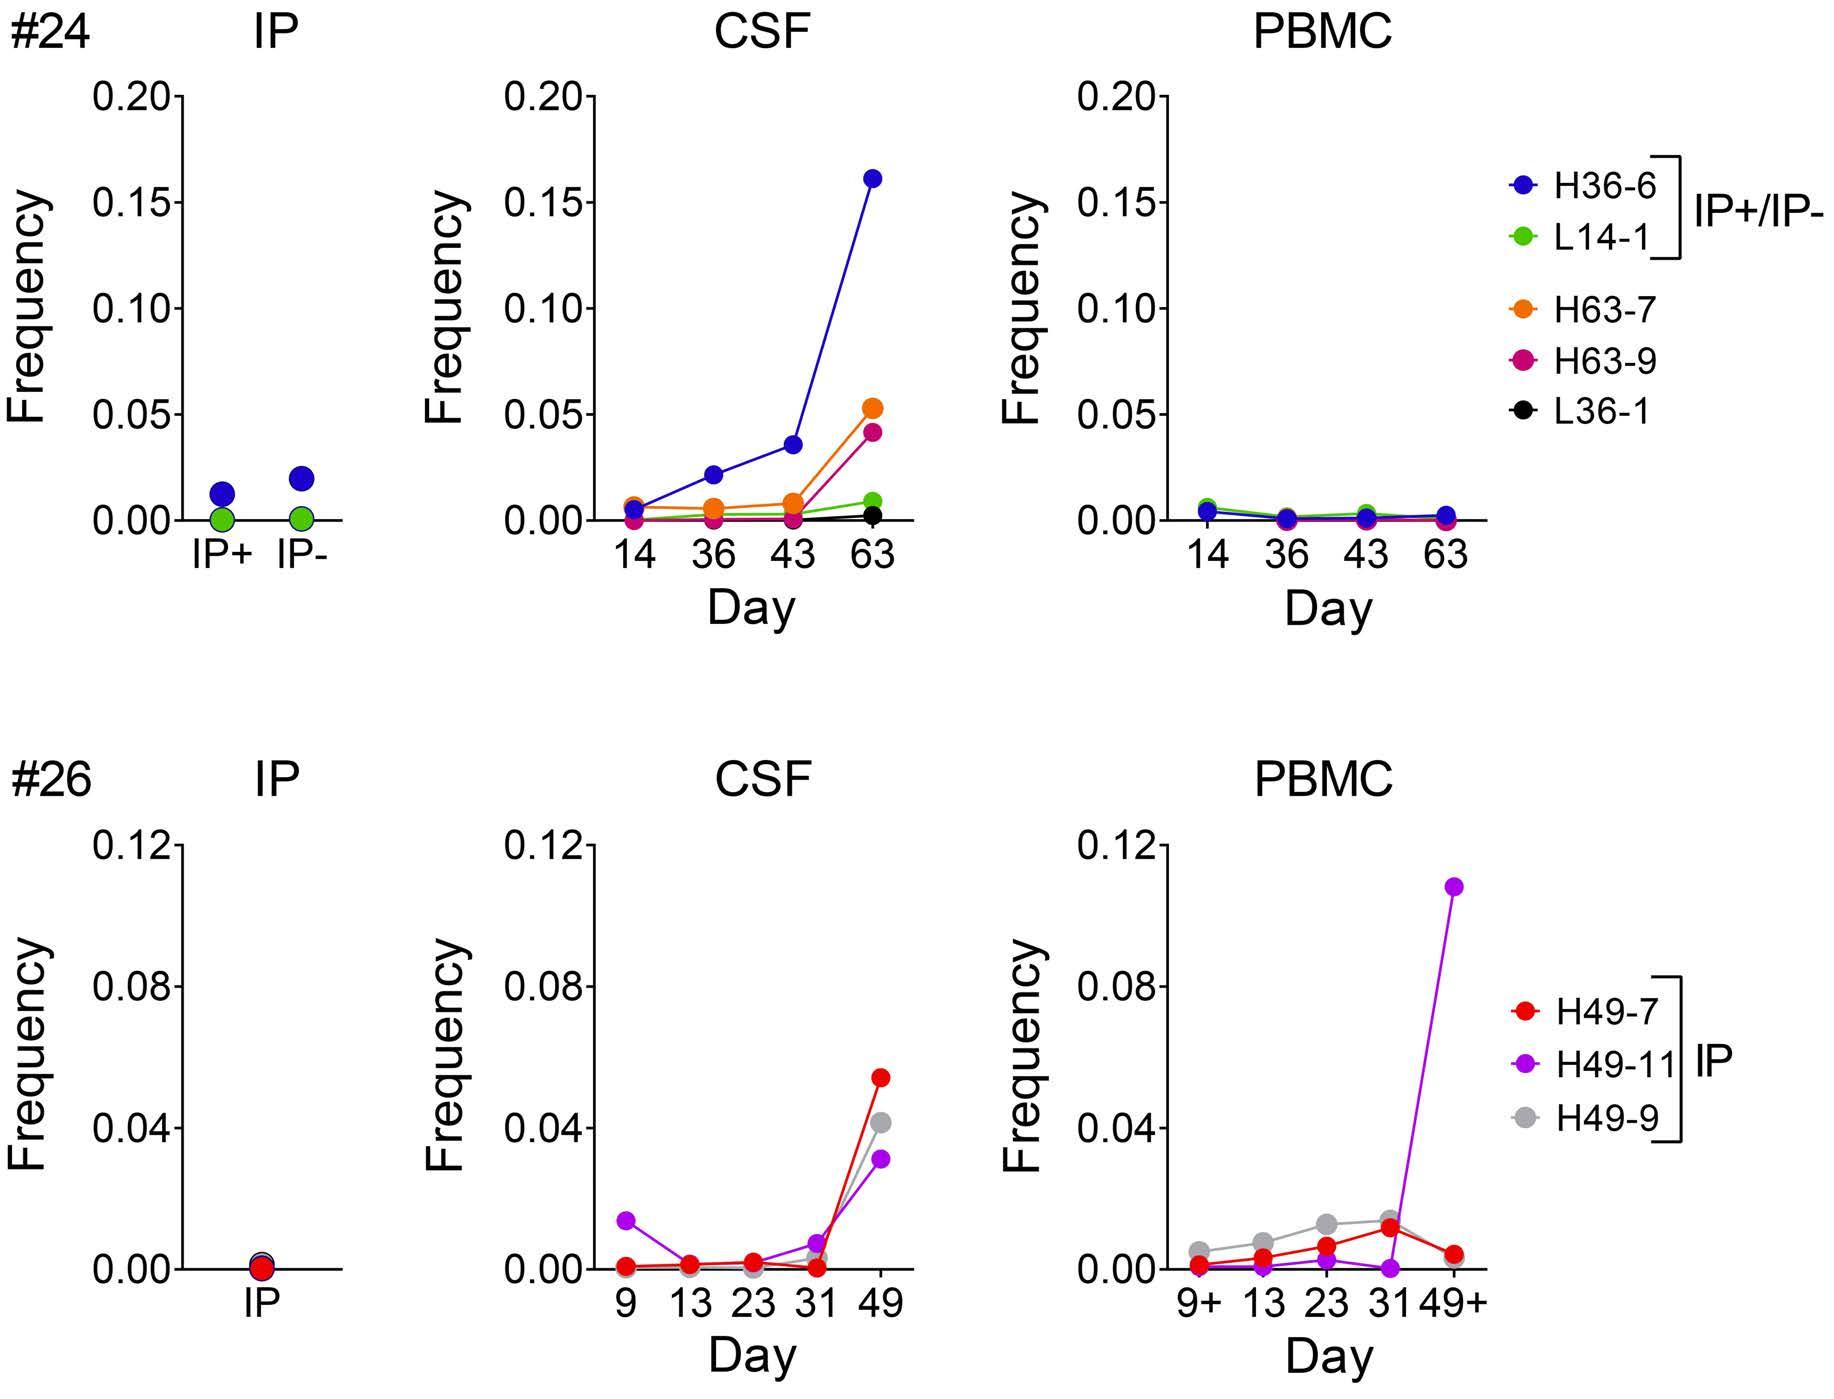
Figure 7. Detection of few persisting T-cell clones despite intense immuno-chemotherapies of severe immune effector cell-associated neurotoxicity syndrome. Longitudinal analysis of the T-cell receptor repertoire in 2 patients with prolonged treatmentresistant neurotoxicity after the CD19-chimeric antigen receptor (CD19-CAR) T-cell infusion. Genomic DNA was extracted from the infused T-cell product (left panels), and samples of cerebrospinal fluid (CSF) (middle panels), or peripheral blood mononuclear cells (PBMC) (right panels) and examined by T-cell receptor-b next-generation sequencing (TRB-NGS). (A) Patient #24: 5 unique T-cell clones were shared at all time points and increased in frequency in CSF, but not PBMC. Two of them were also detectable in the CAR-positive (IP+) and non-CAR (IP-) subset of the infused T-cell product subset. (D) Patient #26: detection of 3 unique T-cell clones throughout all time points with a pattern of increased frequency in CSF. All 3 clones were also detectable in the infusion product (IP). Haematologica | 108 February 2023 453
that both CAR-positive and non-CAR T cells may contribute to the pathology suggests that current ‘built-in’ safety tools and/or suicide-switch strategies, i.e., utilizing the Herpes Simplex Virus type 1 thymidine kinase gene, inducible Caspase-9, or constitutive expression of the truncated epidermal growth factor receptor (EGFR)34-39 may be insufficient in this setting.9-11 Also, it is important to keep in mind that the mere presence of increased Tcell levels in the CSF is formally not sufficient to conclude that these cells themselves are directly mediating neurotoxicity rather than serving as biomarkers of increased expansion. Consequently, we cannot exclude the possibility that primarily inflammatory cytokines rather than T cells mediated the observed severe neurotoxicity. A limitation of our work includes the relatively small number of diagnostic CSF specimens of inherently very small volumes and/or paucity of available cell number as well as the small number of patients. Our findings however emphasize the need for further systematic in-depth studies, using next-generation single cell RNA sequencing, proteomics, and/or epigenetic analysis,40,41 to reveal the precise transcriptional signature underlying the treatment-refractory state of individual T-cell clones. Possible mechanisms may include an acquired steroid-resistance due to altered JAK-STAT-pathway signaling,42,43 upregulation of the glucocorticoid-induced TNF receptor familyrelated protein (GITR) expression,44 and/or a previously observed chemoresistance of certain central memory/memory stem T-cell subsets.45,46 Novel approaches, including small-molecule inhibitors interfering with transcriptional pathways, i.e., Janus kinase- (ruxolitinib) and/or tyrosine kinase (dasatinib) inhibitors, have recently been considered to manage T-cell resistance and/or CAR T-cell mediated toxicities and may provide novel tools to overcome this problem.9,47-50 Collectively, our results show that a subset of infused CAR T cells and non-CAR T cells can resist currently used ICANS-directed regimens and highlight the need to interrogate the biology of treatment-refractory T cells in severe ICANS and the rationale identification of suitable tools to control their survival, all of which will provide insights in and will facilitate the further design of ICANS-directed therapies.
Disclosures
The dPCR assays were made available as Bio-Rad “Expert Design Assays” (axi-cel: dEXD45718942 and tisa-cel/univer-
References
1. Sadelain M, Riviere I, Riddell S. Therapeutic T cell engineering. Nature. 2017;545(7655):423-431.
2. Frigault MJ, Maus MV. State of the art in CAR T cell therapy for CD19+ B cell malignancies. J Clin Invest. 2020;130(4):1586-1594.
3. Neelapu SS, Locke FL, Bartlett NL, et al. Axicabtagene ciloleucel
sal: dEXD88164642) based on an agreement between UMC Hamburg-Eppendorf and Bio-Rad. In accordance with the German law on employee inventions, BF, AB, and SCB received compensation payments. BF has performed consultancy work for Celgene/BMS. FAA has performed consultancy work for Celgene/BMS and is an advisory board member of Kite/Gilead, Celgene/BMS , Novartis and Janssen. NK has received honoraria from Celgene/BMS, Kite/Gilead, Novartis and Janssen. Note that Bio Rad was not involved in the study design, collection, analysis or interpretation of the data, or in the writing of this paper. None of the mentioned sources supported the work described within this manuscript. All other authors have no conflicts of interest to disclose.
Contributions
Patient treatment and oversight undertaken by FAA, NK, CW, DJ, NG, ML, DW, CF, GT, AA and MG. Conceptualization of the study by FAA, BF and SCB. Methodology by SCB, AB, NA, JD and BF. Data collection, analysis, and visualization by SCB, AB, NA, JD, SZ, FAA and BF. Data interpretation by FAA, BF, SCB and NK. Resources and/or research funding acquisition by NK, BF and SCB. The initial version of the manuscript was drafted by SCB, FAA, and BF. All authors read and approved the final version of the manuscrip. Supervision by NK, FAA, BF.
Acknowledgments
The authors would like to thank our team of the Research Department Cell and Gene Therapy and the team of the Cytometry & Cell Sorting Core Unit of the UKE for excellent technical support. We are indebted to our medical teams for outstanding patient care, and particularly our patients for supporting this project.
Funding
This work was partly supported by a grant from the Barbara and Wilfried Mohr-Stiftung (DM1669/100) (to SCB and BF).
Data-sharing statement
The data that support the findings of this study and/or protocols are available from the corresponding authors upon reasonable request. Primers and probes for the digital PCR assays are available as Expert Design assays from Bio-Rad Laboratories (axi-cel: dEXD45718942; “universal”/tisa-cel: dEXD88164642).
CAR T-cell therapy in refractory large B-cell lymphoma. N Engl J Med. 2017;377(26):2531-2544.
4. Schuster SJ, Bishop MR, Tam CS, et al. Tisagenlecleucel in adult relapsed or refractory diffuse large B-cell lymphoma. N Engl J Med. 2019;380(1):45-56.
Haematologica | 108 February 2023 454 ARTICLE - Molecular CAR
tracking in real-world ICANS S. C. Berger et al.
T-cell
5. Turtle CJ, Hanafi L-A, Berger C, et al. Immunotherapy of nonHodgkin's lymphoma with a defined ratio of CD8+ and CD4+ CD19-specific chimeric antigen receptor-modified T cells. Sci Transl Med. 2016;8(355):355ra116.
6. Turtle CJ, Hanafi L-A, Berger C, et al. CD19 CAR-T cells of defined CD4+:CD8+ composition in adult B cell ALL patients. J Clin Invest. 2016;126(6):2123-2138.
7. Abramson JS, Palomba ML, Gordon LI, et al. Lisocabtagene maraleucel for patients with relapsed or refractory large B-cell lymphomas (TRANSCEND NHL 001): a multicentre seamless design study. Lancet. 2020;396(10254):839-852.
8. Jacobson CA, Hunter BD, Redd R, et al. Axicabtagene ciloleucel in the non-trial setting: outcomes and correlates of response, resistance, and toxicity. J Clin Oncol. 2020;38(27):3095-3106.
9. Larson RC, Maus MV. Recent advances and discoveries in the mechanisms and functions of CAR T cells. Nat Rev Cancer. 2021;21(3):145-161.
10. Garcia Borrega J, Heindel K, Göreci Y, et al. Toxicity after chimeric antigen receptor T-cell therapy: overview and management of early and late onset side effects. Internist (Berl). 2021;62(6):611-619.
11. Morris EC, Neelapu SS, Giavridis T, Sadelain M. Cytokine release syndrome and associated neurotoxicity in cancer immunotherapy. Nat Rev Immunol. 2022;22(2):85-96.
12. Rejeski K, Perez A, Sesques P, et al. CAR-HEMATOTOX: a model for CAR T-cell related hematological toxicity in relapsed/refractory large B-cell lymphoma. Blood. 2021;138(24):2499-2513.
13. Gust J, Hay KA, Hanafi LA, et al. Endothelial activation and blood-brain barrier disruption in neurotoxicity after adoptive immunotherapy with CD19 CAR-T cells. Cancer Discov. 2017;7(12):1404-1419.
14. Parker KR, Migliorini D, Perkey E, et al. Single-cell analyses identify brain mural cells expressing CD19 as potential offtumor targets for CAR-T immunotherapies. Cell. 2020;183(1):126-142.
15. Shah NN, Johnson BD, Fenske TS, Raj RV, Hari P. Intrathecal chemotherapy for management of steroid-refractory CAR Tcell-associated neurotoxicity syndrome. Blood Adv. 2020;4(10):2119-2122.
16. Hay KA, Hanafi L-A, Li D, et al. Kinetics and biomarkers of severe cytokine release syndrome after CD19 chimeric antigen receptor-modified T-cell therapy. Blood. 2017;130(21):2295-2306.
17. Jung S, Greiner J, von Harsdorf S, et al. Fatal late onset CAR T cell-mediated encephalitis after axicabtagene ciloleucel in a patient with large B-cell lymphoma. Blood Adv. 2021;12(5):3789-3793.
18. Johansson U, Gallagher K, Burgoyne V, et al. Detection of CART19 cells in peripheral blood and cerebrospinal fluid: an assay applicable to routine diagnostic laboratories. Cytometry B Clin Cytom. 2021;100(6):622-631.
19. Fehse B, Badbaran A, Berger C, et al. Digital PCR assays for precise quantification of CD19-CAR-T cells after treatment with axicabtagene ciloleucel. Mol Ther Methods Clin Dev. 2020;16:172-178.
20. Badbaran A, Berger C, Riecken K, et al. Accurate in-vivo quantification of CD19 CAR-T cells after treatment with axicabtagene ciloleucel (Axi-cel) and tisagenlecleucel (Tisa-cel) using digital PCR. Cancers (Basel). 2020;12(7):1970.
21. Ayuk FA, Berger C, Badbaran A, et al. Axicabtagene ciloleucel in vivo expansion and treatment outcome in aggressive B-cell lymphoma in a real-world setting. Blood Adv. 2021;5(11):2523-2527.
22. Schubert ML, Berger C, Kunz A, et al. Comparison of single copy
gene based duplex quantitative PCR and digital droplet PCR for monitoring of expansion of CD19 directed CAR T cells in treated patients. Int J Oncol. 2022;60(5):48.
23. Simnica D, Akyüz N, Schliffke S, et al. T cell receptor nextgeneration sequencing reveals cancer-associated repertoire metrics and reconstitution after chemotherapy in patients with hematological and solid tumors. Oncoimmunology. 2019;8(11):e1644110.
24. Santomasso BD, Park JH, Salloum D, et al. Clinical and biological correlates of neurotoxicity associated with CAR T-cell therapy in patients with B-cell acute lymphoblastic leukemia. Cancer Discov. 2018;8(8):958-971.
25. Locke FL, Rossi JM, Neelapu SS, et al. Tumor burden, inflammation, and product attributes determine outcomes of axicabtagene ciloleucel in large B-cell lymphoma. Blood Adv. 2020;4(19):4898-4911.
26. Nair R, Drillet G, Lhomme F, et al. Acute leucoencephalomyelopathy and quadriparesis after CAR T-cell therapy. Haematologica. 2021;106(5):1504-1506.
27. Liu S, Deng B, Yin Z, et al. Corticosteroids do not influence the efficacy and kinetics of CAR-T cells for B-cell acute lymphoblastic leukemia. Blood Cancer J. 2020;10(2):15.
28. Strati P, Ahmed S, Furqan F, et al. Prognostic impact of corticosteroids on efficacy of chimeric antigen receptor T-cell therapy in large B-cell lymphoma. Blood. 2021;137(23):3272-3276.
29. Schubert ML, Kunz A, Schmitt A, et al. Assessment of CAR T cell frequencies in axicabtagene ciloleucel and tisagenlecleucel patients using duplex quantitative PCR. Cancers (Basel). 2020;12(10):2820.
30. Hinrichs CS, Palmer DC, Rosenberg SA, Restifo NP. Glucocorticoids do not inhibit antitumor activity of activated CD8+ T cells. J Immunother. 2005;28(6):517-524.
31. Norelli M, Camisa B, Barbiera G, et al. Monocyte-derived IL-1 and IL-6 are differentially required for cytokine-release syndrome and neurotoxicity due to CAR T cells. Nat Med. 2018;24(6):739-748.
32. Taraseviciute A, Tkachev V, Ponce R, et al. Chimeric antigen receptor T cell-mediated neurotoxicity in nonhuman primates. Cancer Discov. 2018;8(6):750-763.
33. Maulana TI, Kromidas E, Wallstabe L, et al. Immunocompetent cancer-on-chip models to assess immuno-oncology therapy. Adv Drug Deliv Rev. 2021;173:281-305.
34. Riddell SR, Elliott M, Lewinsohn DA, et al. T-cell mediated rejection of gene-modified HIV-specific cytotoxic T lymphocytes in HIV-infected patients. Nat Med. 1996;2(2):216-223.
35. Bonini C, Ferrari G, Verzeletti S, et al. HSV-TK gene transfer into donor lymphocytes for control of allogeneic graft-versusleukemia. Science. 1997;276(5319):1719-1724.
36. Fehse B, Kustikova OS, Li Z, et al. A novel 'sort-suicide' fusion gene vector for T cell manipulation. Gene Ther. 2002;9(23):1633-1638.
37. Di Stasi A, Tey S-K, Dotti G, et al. Inducible apoptosis as a safety switch for adoptive cell therapy. N Engl J Med. 2011;365(18):1673-1683.
38. Budde LE, Berger C, Lin Y, et al. Combining a CD20 chimeric antigen receptor and an inducible caspase 9 suicide switch to improve the efficacy and safety of T cell adoptive immunotherapy for lymphoma. PLoS One. 2013;8(12):e82742.
39. Wang X, Chang W-C, Wong CW, et al. A transgene-encoded cell surface polypeptide for selection, in vivo tracking, and ablation of engineered cells. Blood. 2011;118(5):1255-1263.
40. Sheih A, Voillet V, Hanafi L-A, et al. Clonal kinetics and single-cell
Haematologica | 108 February 2023 455 ARTICLE - Molecular
S. C. Berger et al.
CAR T-cell tracking in real-world ICANS
transcriptional profiling of CAR-T cells in patients undergoing CD19 CAR-T immunotherapy. Nat Commun. 2020;11(1):219.
41. Garcia-Prieto CA, Villanueva L, Bueno-Costa A, et al. Epigenetic profiling and response to CD19 chimeric antigen receptor T-cell therapy in B-cell malignancies. J Natl Cancer Inst. 2022;114(3):436-445.
42. Meyer LK, Huang BJ, Delgado-Martin C, et al. Glucocorticoids paradoxically facilitate steroid resistance in T cell acute lymphoblastic leukemias and thymocytes. J Clin Invest. 2020;130(2):863-876.
43. Meyer LK, Verbist KC, Albeituni S, et al. JAK/STAT pathway inhibition sensitizes CD8 T cells to dexamethasone-induced apoptosis in hyperinflammation. Blood. 2020;136(6):657-668.
44. Zhan Y, Funda DP, Every AL, et al. TCR-mediated activation promotes GITR upregulation in T cells and resistance to glucocorticoid-induced death. Int Immunol. 2004;16(9):1315-1321.
45. Zhang Y, Joe G, Hexner E, Zhu J, Emerson SG. Host-reactive
CD8+ memory stem cells in graft-versus-host disease. Nat Med. 2005;11(12):1299-1305.
46. Turtle CJ, Swanson HM, Fujii N, Estey EH, Riddell SR. A distinct subset of self-renewing human memory CD8+ T cells survives cytotoxic chemotherapy. Immunity. 2009;31(5):834-844.
47. Weber EW, Lynn RC, Sotillo E, Lattin J, Xu P, Mackall CL. Pharmacologic control of CAR-T cell function using dasatinib. Blood Adv. 2019;3(5):711-717.
48. Mestermann K, Giavridis T, Weber J, et al. The tyrosine kinase inhibitor dasatinib acts as a pharmacologic on/off switch for CAR T cells. Sci Transl Med. 2019;11(499):eaau5907.
49. Wei S, Gu R, Xu Y, et al. Adjuvant ruxolitinib therapy relieves steroid-refractory cytokine-release syndrome without impairing chimeric antigen receptor-modified T-cell function. Immunotherapy. 2020;12(14):1047-1052.
50. Zeiser R, Polverelli N, Ram R, et al. Ruxolitinib for glucocorticoid-refractory chronic graft-versus-host disease. N Engl J Med. 2021;385(3):228-238.
Haematologica | 108 February 2023 456 ARTICLE - Molecular CAR T-cell tracking in real-world ICANS S. C. Berger et al.
Potent preclinical activity of FLT3-directed chimeric antigen receptor T-cell immunotherapy against FLT3-
mutant acute myeloid leukemia and KMT2A-rearranged acute lymphoblastic leukemia
Lisa M. Niswander,1* Zachary T. Graff,2,3*° Christopher D. Chien,4* John A. Chukinas,1 Christina A. Meadows,3 Lillie C. Leach,3 Joseph P. Loftus,1 M. Eric Kohler,2,3 Sarah K. Tasian,1,5# Terry J. Fry2,3#
1 Children’s Hospital of Philadelphia, Division of Oncology and Center for Childhood Cancer Research, Philadelphia, PA; 2 Center for Cancer and Blood Disorders, Children's Hospital Colorado, Aurora, CO; 3 Department of Pediatrics, University of Colorado Anschutz Medical Campus, Aurora, CO; 4 Pediatric Oncology Branch, Center for Cancer Research, National Cancer Institute, National Institutes of Health, Bethesda, MD and 5 University of Pennsylvania Perelman School of Medicine and Abramson Cancer Center, Philadelphia, PA, USA
°Current affiliation: Medical College of Wisconsin, Department of Pediatrics, Division of Hematology and Oncology, Milwaukee, WI, USA
*LMN, ZTG, and CDC contributed equally as co-first authors. #SKT and TJF contributed equally as co-senior authors.
Abstract
Correspondence: S.K. Tasian tasians@chop.edu T.J. Fry terry.fry@cuanschutz.edu
Received: May 24, 2022.
Accepted: August 3, 2022. Prepublished: August 11, 2022.
https://doi.org/10.3324/haematol.2022.281456
©2023 Ferrata Storti Foundation
Published under a CC BY-NC license
Chimeric antigen receptor (CAR) T-cell immunotherapies targeting CD19 or CD22 induce remissions in the majority of patients with relapsed/refractory B-cell acute lymphoblastic leukemia (ALL), although relapse due to target antigen loss or downregulation has emerged as a major clinical dilemma. Accordingly, great interest exists in developing CAR T cells directed against alternative leukemia cell surface antigens that may help to overcome immunotherapeutic resistance. The fms-like tyrosine kinase 3 receptor (FLT3) is constitutively activated via FLT3 mutation in acute myeloid leukemia (AML) or wild-type FLT3 overexpression in KMT2A (lysine-specific methyltransferase 2A)-rearranged ALL, which are associated with poor clinical outcomes in children and adults. We developed monovalent FLT3-targeted CAR T cells (FLT3CART) and bispecific CD19xFLT3CART and assessed their anti-leukemia activity in preclinical models of FLT3-mutant AML and KMT2A-rearranged infant ALL. We report robust in vitro FLT3CART-induced cytokine production and cytotoxicity against AML and ALL cell lines with minimal cross-reactivity against normal hematopoietic and non-hematopoietic tissues. We also observed potent in vivo inhibition of leukemia proliferation in xenograft models of both FLT3-mutant AML and KMT2A-rearranged ALL, including a post-tisagenlecleucel ALL-to-AML lineage switch patient-derived xenograft model pairing. We further demonstrate significant in vitro and in vivo activity of bispecific CD19xFLT3CART against KMT2Arearranged ALL and posit that this additional approach might also diminish potential antigen escape in these high-risk leukemias. Our preclinical data credential FLT3CART as a highly effective immunotherapeutic strategy for both FLT3mutant AML and KMT2A-rearranged ALL which is poised for further investigation and clinical translation.
Introduction
Fms-like receptor tyrosine kinase 3 (FLT3, also known as CD135) is a cytokine receptor tyrosine kinase expressed on hematopoietic stem and progenitor cells that regulates proliferation and differentiation.1 FLT3 is also expressed
on the majority of acute myeloid leukemia (AML) and many B-acute lymphoblastic leukemia (B-ALL) cells.2 Activating mutations in FLT3 occur in approximately 30% of cases of adult AML and 25-30% of pediatric AML3,4 and result in ligand-independent constitutive activation of downstream signaling pathways and detectable FLT3 re-
Haematologica | 108 February 2023 457 ARTICLE - Cell Therapy & Immunotherapy
ceptor cell surface protein expression. These mutations most frequently include internal tandem duplications (ITD) within the FLT3 juxtamembrane domain and, less commonly, missense point mutations in the activation loop/tyrosine kinase domain.4 FLT3 mutations are associated with poor disease-free and overall survival in adults and children with AML, although consolidation of chemotherapy-induced initial remissions with allogeneic hematopoietic stem cell transplantation and/or addition of targeted FLT3 inhibitors to chemotherapy (including posttransplant maintenance) have recently improved clinical outcomes.5,6
In addition, constitutive wild-type FLT3 overexpression is common in B-ALL harboring rearrangements in lysinespecific methyltransferase 2A (KMT2A, formerly mixed lineage leukemia [MLL]). KMT2A-rearranged (KMT2A-R) cases make up 10% of ALL across the age spectrum, but account for 70-80% of ALL cases in children <12 months of age who have particularly suboptimal clinical outcomes. Recent data from the Interfant-06 (NCT00550992) and AALL0631 (NCT00557193) clinical trials documented 6year and 3-year event-free survival rates of 46% and 36%, respectively, in infants with KMT2A-R ALL.7,8 Worse outcomes, with event-free survival <20%, have been reported for patients aged <90 days at diagnosis, those with a diagnostic white blood cell count >300,000 cells/dL, subjects with poor prednisone prophase responses, and cases with positive measurable residual disease at the end of induction which are largely unsalvageable by chemotherapy intensification or hematopoietic stem cell transplantation.9 Interestingly, highest FLT3 overexpression has been associated with worst outcomes in infants with KMT2A-R ALL,10 highlighting the potential biological importance of successful therapeutic targeting of FLT3.
Chimeric antigen receptor (CAR) T-cell therapy targeting CD19 (CD19CART) or CD22 (CD22CART) has proven highly successful in patients with relapsed/refractory B-ALL,11-14 including infants.15 Despite high rates of initial remission, approximately 50% of patients treated with CD19CART will relapse again within 2 years, often due to target antigen loss and/or lineage switch in KMT2A-R ALL.13,15-17 This phenomenon has led to appreciable interest in alternative strategies that may prevent target antigen escape and increase long-term cure rates, including CAR T cells directed at alternative leukemia cell surface antigens (e.g., TSLPR, BAFFR) and bispecific CAR T cells that recognize and target multiple antigens simultaneously.18 Initial studies of dual-targeting CD19xCD22 CAR T cells demonstrated robust anti-leukemia activity in preclinical B-ALL models,19 and current clinical phase I trials of these bispecific immunotherapies (NCT03241940, NCT03289455, NCT03330691, NCT03448393) have reported exciting early results.20,21 Whether bispecific cellular therapy products
will prevent antigen loss relapse and/or induce greater remission duration does, however, remain unknown. Given the poor clinical outcomes of patients with FLT3mutant AML and KMT2A-R ALL and their shared characteristic of FLT3 overexpression, we hypothesized that immunotherapeutic targeting of the FLT3 cell surface antigen could be highly effective against both high-risk subtypes of leukemia. Herein, we report potent preclinical in vitro and in vivo activity of new FLT3-targeting CAR T cells (FLT3CART) against FLT3-mutant AML and KMT2A-R ALL cell lines and patient-derived xenograft (PDX) models. In these preclinical studies, we demonstrate robust activity of new bicistronic dual FLT3- and CD19-targeting CAR T cells (CD19xFLT3CART) in KMT2A-R ALL cell lines and PDX models which may provide an alternative therapeutic approach for future clinical investigation.
Methods
FLT3 chimeric antigen receptor construct design and Tcell transduction FLT3CART, CD19xFLT3CART, and CD19CART were engineered using previously described methodologies19,22 and as detailed in the Online Supplementary Methods with singlechain fragment variable (scFv) derived from an anti-CD135 NC7 antibody.23 T cells from four healthy donors were utilized for these studies to ensure robustness and reproducibility of results. Transduction efficiency was 52-74% for monovalent FLT3CART and 24-40% for bispecific CD19xFLT3CART across all experimental studies.
Human leukemia cell lines FLT3-mutant (MOLM-14, MV4;11) and wild-type (THP-1) AML cell lines and KMT2A-R (HB11;19, KOPN-8, SEM) and wild-type (NALM-6) ALL cell lines (Figures 1 and 2) were kindly provided by Dr. Martin Carroll at the University of Pennsylvania and Dr. Patrick Brown formerly at Johns Hopkins University or purchased from the DSMZ cell line biorepository (Braunschweig, Germany). Human leukemia cell lines were also lentivirally-transduced with a luciferase/GFP construct and double-sorted for GFP+ cell selection for use in in vivo cell line xenograft model experiments with bioluminescent imaging as described elsewhere.22,24 All cell lines were assessed regularly for Mycoplasma contamination. Cell lines were maintained in vitro for no longer than 2 months in RPMI cell culture medium containing 10% heat-inactivated fetal bovine serum, 2 mM L-glutamine, and 100 U/mL penicillin/streptomycin.
In vitro analyses of FLT3CART and CD19xFLT3CART functionality
Human interleukin-2 (IL-2) and interferon-gamma (IFN-γ)
Haematologica | 108 February 2023 458 ARTICLE - Monovalent and bispecific FLT3CART for AML and ALL L.M. Niswander et al.
cytokine production was evaluated via enzyme-linked immunosorbent assays (ELISA; Biolegend) and leukemia cell viability was assessed via a luciferase assay (Promega), conducted as described previously,22 using luciferase-expressing human ALL or AML cell lines co-incubated in vitro with vehicle, mock-transduced T cells, FLT3CART, CD19CART, or CD19xFLT3CART (Online Supplementary Methods).
Flow cytometry analyses
Flow cytometry data were collected via FACSVerse and LSRFortessa X-20 flow cytometers (BD Biosciences) and analyzed with FlowJo (BD Biosciences) or Cytobank (Beckman-Coulter). FLT3 cell surface molecules/cell were quantified with CD135-phycoerythrin (PE) antibodies (EBioscience) and QuantiBrite-PE beads (Invitrogen). Other antibodies used for flow cytometry studies are listed in the Online Supplementary Methods or below for animal studies.
In vivo analyses of FLT3CART and CD19xFLT3CART functionality
Animal studies were performed at the Children’s Hospital of Philadelphia under a protocol approved by the Institutional Animal Care and Use Committee. The ability of FLT3CART to inhibit AML or ALL proliferation in vivo was assessed in bioluminescent human leukemia cell line xenograft models or primary PDX models using NOD-scid IL2Rγnull (NSG) or NOD-scid IL2Rγnull-3/GM/SF (NSGS) mice as previously described22,24 and as detailed in the Online Supplementary Methods.
Statistical analyses
Statistical analyses and data display were performed using Prism software (GraphPad). Unpaired Student ttests or one-way analysis of variance with Dunnett or Tukey post-tests for multiple comparisons were used to detect differences between or among treatment groups.
Results
Robust in vitro and in vivo activity of FLT3CART against FLT3-ITD acute myeloid leukemia cell lines
In these studies, we first hypothesized that FLT3CART would have potent anti-leukemia effects against FLT3mutant AML. Flow cytometry quantification of surface FLT3 protein expression on human FLT3-ITD (MV4;11, MOLM-14) and FLT3 wild-type (THP-1) AML cell lines demonstrated a range of surface antigen levels (Figure 1A, Online Supplementary Table S1). After T-cell transduction with an optimized second-generation FLT3-targeted CAR construct (Online Supplementary Figure S1A, B), the in vitro activity of FLT3CART against AML cell lines was assessed
via cytokine production and viability assays. We observed that FLT3CART induced greater IL-2 and IFN-γ levels when co-incubated with AML cell lines with higher surface expression of FLT3 (Figure 1B), consistent with previous studies of other antigen-targeting CAR T cells.25,26 FLT3CART also resulted in a significant reduction in the numbers of viable cells of all three AML cell lines tested (Figure 1C).
To evaluate the in vivo activity of FLT3CART, NSG mice were engrafted with luciferase-expressing leukemia cell lines, treated with a single dose of FLT3CART (1x10⁷ total cells, 52-74% transduction efficiency), and followed by bioluminescent imaging to assess effects upon AML proliferation. We observed that FLT3CART potently eradicated leukemia in both MV4;11 and MOLM-14 xenograft models. As with in vitro testing, the observed therapeutic effects were greatest against FLT3-ITD AML cells. Conversely, FLT3CART had minimal in vivo anti-leukemia activity in a FLT3 wild-type THP-1 xenograft model when compared to saline or mock-transduced T-cell negative controls (Figure 1D).
Robust in vitro and in vivo activity of FLT3CART against KMT2A-rearranged acute lymphoblastic leukemia cell lines
As KMT2A-R ALL cells have wild-type FLT3 overexpression with high levels of FLT3 cell surface protein, we next hypothesized that this B-ALL subtype would also be sensitive to FLT3CART. We first confirmed elevated surface expression of FLT3 on the KMT2A-R ALL cell lines HB11;19, KOPN-8, and SEM and low expression on the KMT2A wildtype cell line NALM-6 (Figure 2A, Online Supplementary Table S2). In vitro co-incubation of FLT3CART with KMT2AR, but not control non-KMT2A-R, ALL cell lines induced robust cytokine production and decreased viability (Figure 2B, C). As predicted, FLT3CART treatment of luciferasepositive KMT2A-rearranged ALL cell line xenograft models demonstrated potent in vivo activity with complete leukemia clearance in some models and no anti-leukemia activity detected in the FLT3-low NALM-6 xenograft model (Figure 2D, Online Supplementary Figure S1C). These initial data thus accredit FLT3 as an effective immunotherapeutic target not only for AML, but also for KMT2A-R ALL.
Potent in vivo activity of FLT3CART in patient-derived xenograft models of acute myeloid leukemia and acute lymphoblastic leukemia
Given our goal of potential clinical translation, we further assessed the effects of FLT3CART immunotherapy in vivo in PDX models. A single dose of FLT3CART eradicated leukemia in end-study bone marrow and/or spleens of a FLT3-mutant AML PDX model with CAR T-cell expansion and persistence detected several weeks later (Figure 3A). Interestingly, FLT3CART was also effective against a FLT3
Haematologica | 108 February 2023 459 ARTICLE - Monovalent and bispecific FLT3CART for AML and ALL L.M. Niswander et al.
Figure 1. FLT3CART has potent in vitro and in vivo activity against human FLT3-ITD acute myeloid leukemia cell lines. (A) Flow cytometric quantification of FLT3 surface antigen density on acute myeloid leukemia (AML) cell lines. A split Y-axis is utilized to facilitate comparison with acute lymphoblastic leukemia (ALL) cell lines in Figure 2B. (B) AML cell lines were co-incubated in vitro with FLT3CART or mock-transduced T cells in a 1:1 ratio (30,000 cells) for 48 hours. Production of human interleukin-2 (IL2, left panel) and interferon gamma (IFN-γ, right panel) in culture supernatant was measured by enzyme-linked immunosorbent assay. FLT3CART-induced cytokine production was highest with FLT3-internal tandem duplication (ITD) AML cell lines MOLM-14 and MV4;11. (C) Viability assays of luciferase-transduced AML cell lines co-incubated with FLT3CART at a 1:1 ratio demonstrate significant inhibition of leukemia cell growth in vitro over time with the most complete effects detected against FLT3-ITD AML cell lines. Experiments in (B) and (C) were performed with triplicate technical replicates and results are displayed ± standard error of the mean (SEM). (D) Luciferase-transduced AML cell lines (1x10⁶ cells/mouse) were injected intravenously (IV) into NSG mice. After confirming engraftment via bioluminescent imaging (BLI), cell line xenograft mice were randomized (n=5/group) to receive intravenous saline (yellow), 1x10⁷ mock-transduced T cells (green), or 1x10⁷ FLT3CART (blue) on day 3 or 4 (vertical dashed line). BLI radiance at indicated timepoints is presented graphically ± SEM. FLT3CART displayed in vivo anti-leukemia activity against both tested FLT3-ITD AML cell line models (MOLM-14 and MV4;11), but not against a FLT3 wild-type cell line (THP-1) despite some detection of in vitro activity as above. Data in (B) and (D) were analyzed by one-way analysis of variance (ANOVA) and in (C) by two-way ANOVA with the Dunnett post-test for multiple comparisons using FLT3CART as the comparator. The statistical significance of the effects of FLT3CART compared to those of the mock T-cell group at the last measured time point is displayed. *P<0.05, **P<0.01, ***P<0.001, ****P<0.0001, ns = not significant.
wild-type AML model with somatic monosomy 7 and PTPN11 mutation (Figure 3B), likely due to its similar level of FLT3 cell surface protein expression. We further observed marked leukemia clearance following FLT3CART treatment of FLT3-expressing infant and adult KMT2A-R ALL PDX models with detectable FLT3CART expansion in end-study spleens (Figure 3C, D), but not in a FLT3-low non-KMT2A-R ALL PDX model (Online Supplementary Fig-
ure S2A, B). Of note, FLT3 cell surface antigen expression in most tested KMT2A-R ALL models was observed to be greater than in AML models (Figure 3E, Online Supplementary Figure S2A). Taken together, these findings underscore the potential broad applicability of FLT3CART immunotherapy for AML potentially regardless of FLT3 mutation status and further demonstrate potent antileukemia activity against KMT2A-R ALL.
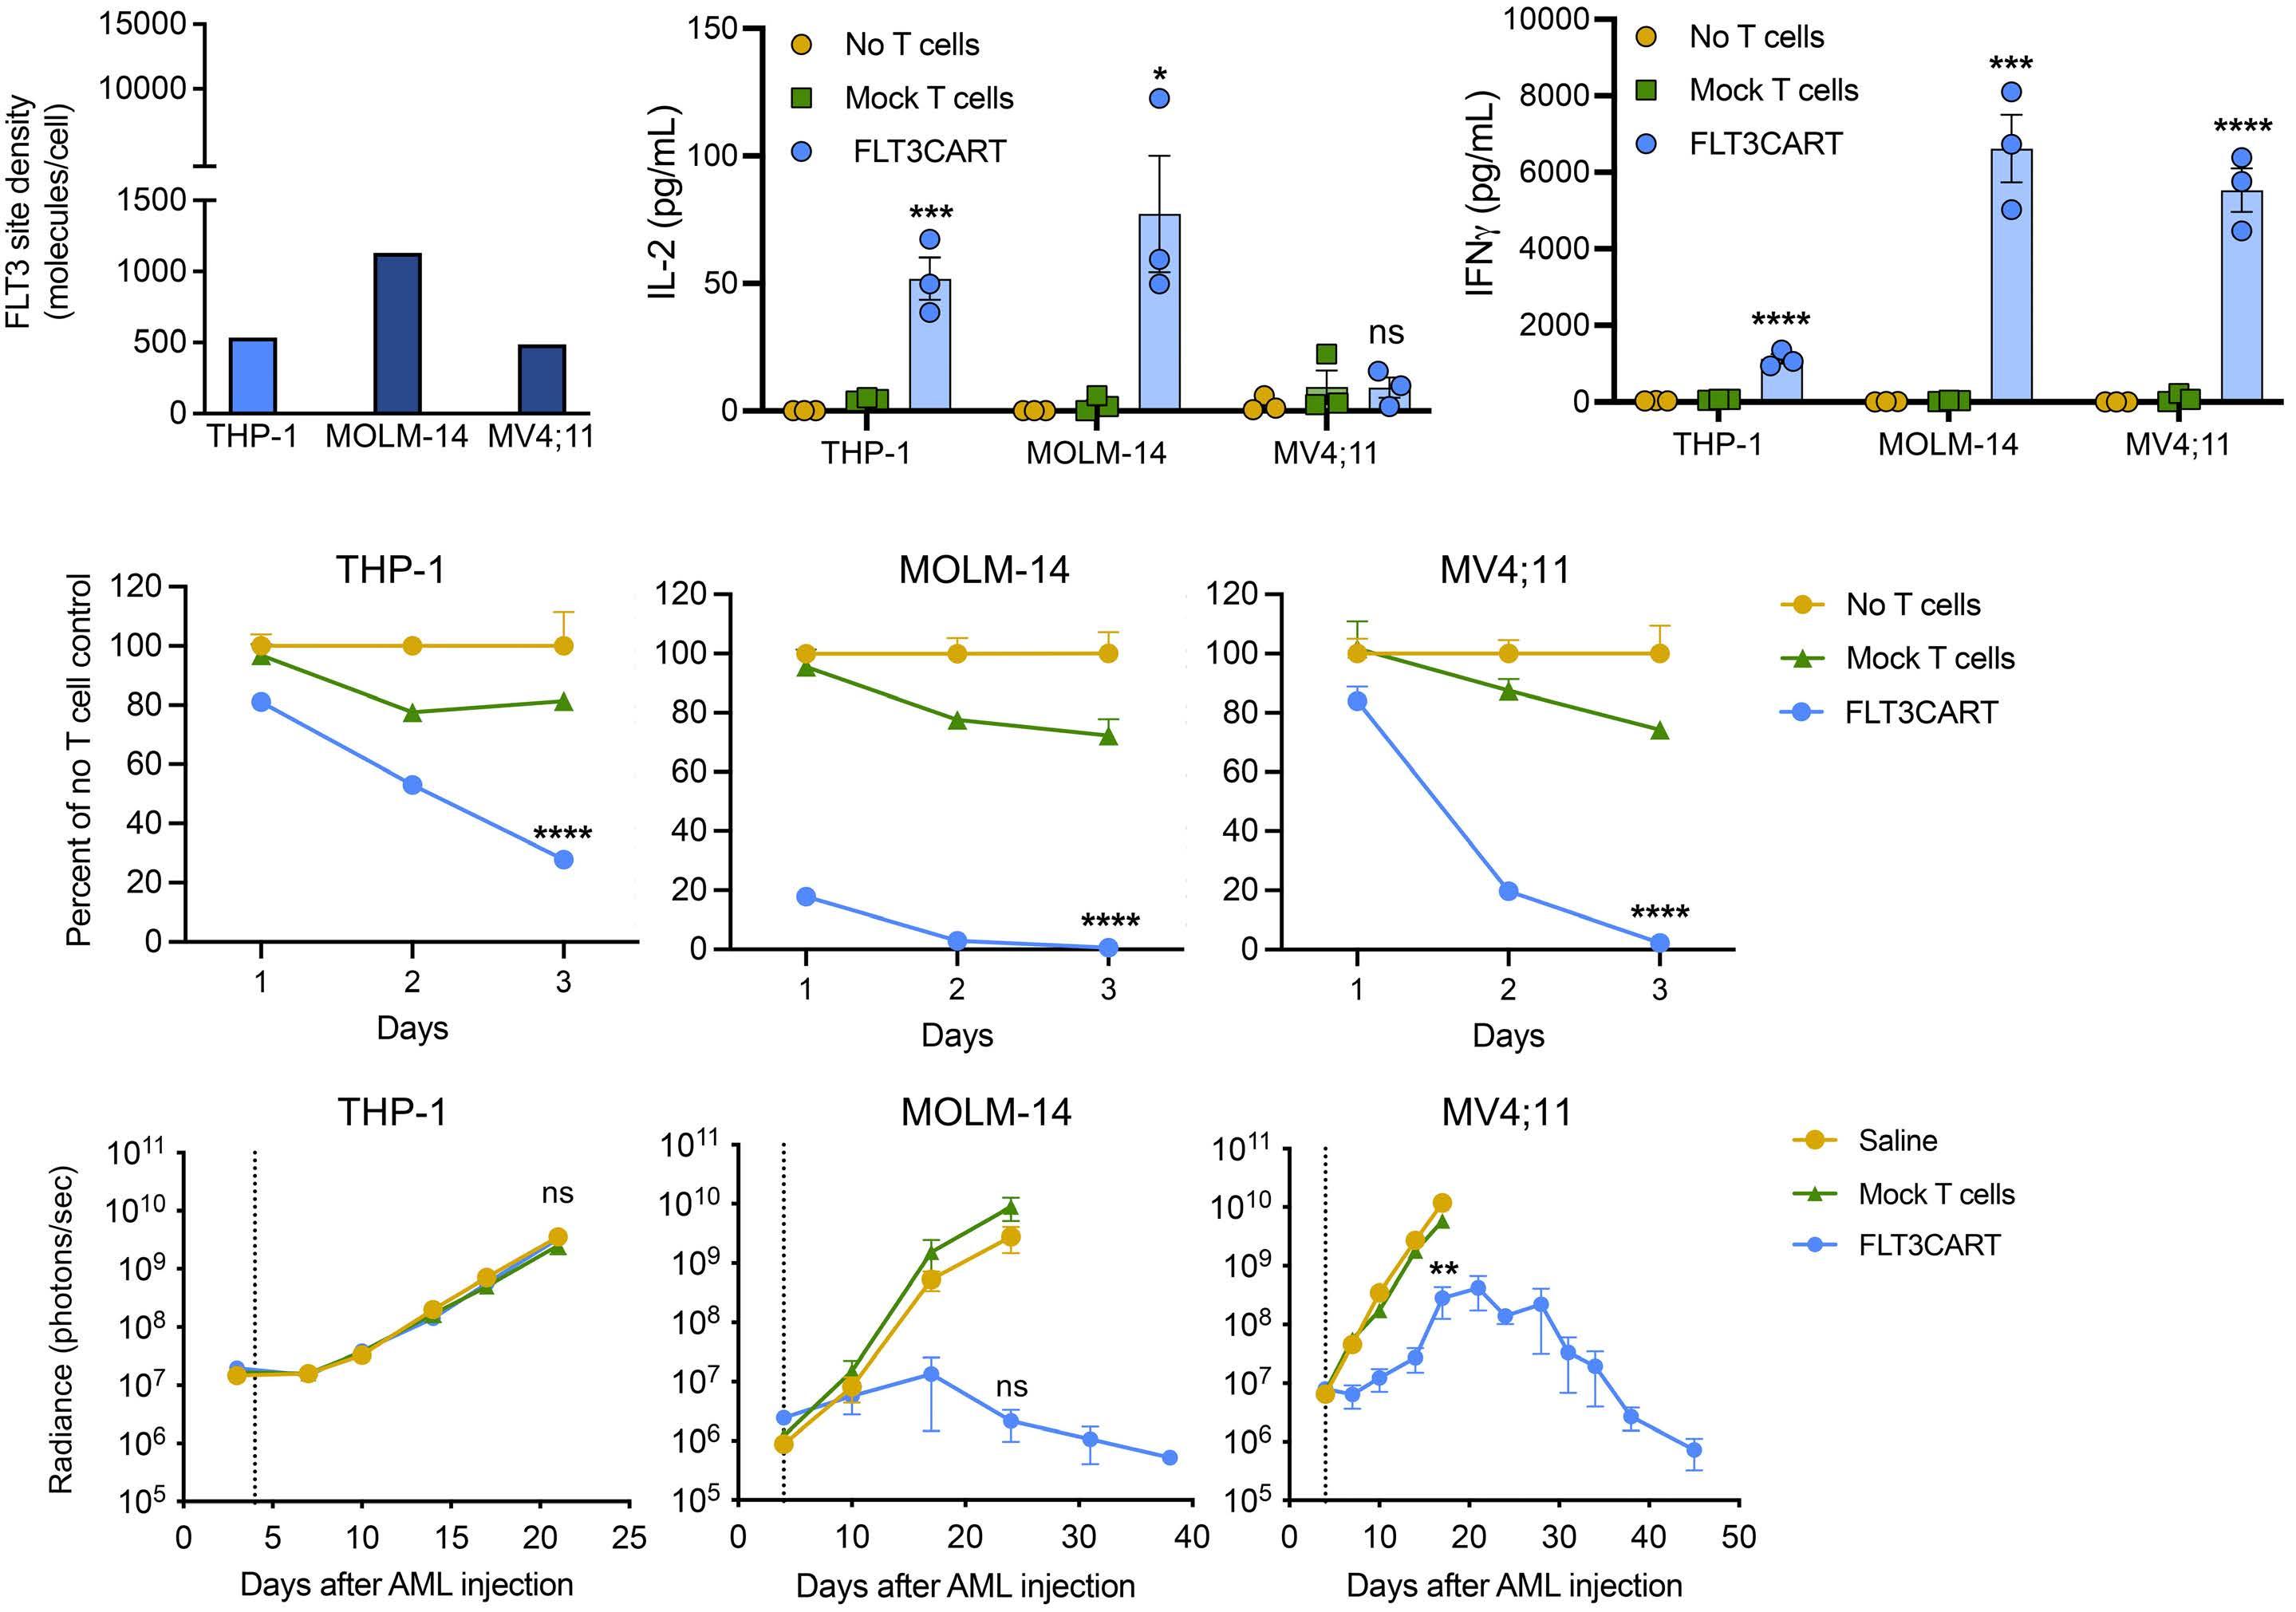
A B C D Haematologica | 108 February 2023 460 ARTICLE - Monovalent and bispecific FLT3CART for AML and ALL L.M. Niswander et al.
Figure 2. FLT3CART has potent in vitro and in vivo activity against human KMT2A-rearranged acute lymphoblastic leukemia cell lines. (A) Flow cytometric quantification of FLT3 surface antigen density on acute lymphoblastic leukemia (ALL) cell lines showed higher expression on KMT2A-rearranged (KMT2A-R) ALL cell lines (HB11;19, KOPN-8, SEM) than on KMT2A wild-type NALM-6 control cells. KMT2A-R ALL cell lines showed equivalent or higher FLT3 surface expression than the FLT3-ITD acute myeloid leukemia cell lines assayed (compare to Figure 2A). SEM uniquely has FLT3 intrachromosomal gene amplification, which explains its almost 10-fold higher number of surface FLT3 molecules.52 (B) ALL cell lines were co-incubated in vitro with FLT3CART or mock-transduced T cells at a 1:1 (30,000 cells) ratio for 48 hours. Production of human interleukin-2 (IL-2, left panel) and interferon gamma (IFN-γ, right panel) in culture supernatant was measured by enzyme-linked immunosorbent assay. FLT3CART-induced cytokine production was highest in co-culture with SEM cells, which had the greatest FLT3 antigen density among ALL cell lines assayed. Minimal IL-2 and IFN-γ production was detected for the negative control NALM-6 cells. (C) In vitro live cell imaging of GFP-transduced ALL cell lines demonstrated significant inhibition of cell growth of KMT2A-R ALL cell lines HB11;19, KOPN-8, and SEM over time when co-incubated with FLT3CART (blue) at a 1:1 ratio. Experiments in (B) and (C) were performed with triplicate technical replicates and results are displayed ± standard error of the mean. (D) Luciferase-transduced ALL cell lines (1x10⁶ cells/mouse) were injected intravenously (IV) into NSG mice. After confirming engraftment via bioluminescent imaging (BLI), cell line xenograft mice were randomized (n=5/group) to receive IV saline (yellow), 1x10⁷ mock-transduced T cells (green), or 1x10⁷ FLT3CART (blue) on day 4 (vertical dashed line). BLI radiance at indicated timepoints is displayed graphically ± standard error of the mean. Rapid and sustained FLT3CART-induced inhibition of leukemia proliferation was observed in HB11;19 and SEM cell line models versus mock T-cell and saline control treatments, while an initially observed anti-leukemia effect in the KOPN-8 cell line model was not sustained. No effects of FLT3CART were detected in the KMT2A wild-type cell line model NALM-6. Data in (B) and (D) were analyzed by one-way analysis of variance (ANOVA) and in (C) by two-way ANOVA with the Dunnett post-test for multiple comparisons using FLT3CART as the comparator. The statistical significance of the effects of FLT3CART compared to those of the mock T-cell group at the last measured time point is displayed. *P<0.05, **P<0.01, ***P<0.001, ****P<0.0001, ns = not significant.
FLT3CART is efficacious in vivo in KMT2A-rearranged acute lymphoblastic leukemia-to-acute myeloid leukemia lineage-switch in patient-derived xenograft models

Patients with KMT2A-R ALL are at increased risk of lineage switch to AML following CD19CART treatment compared to those with non-KMT2A-R ALL.15,17 To assess the activity
of FLT3CART in this setting, we created a pair of ALL and AML PDX models from an adolescent with primary chemotherapy-refractory KMT2A-AFF1 B-ALL who developed lineage-switched CD19-negative KMT2A-AFF1 AML approximately 3 weeks after tisagenlecleucel administration and was resistant to all further chemoimmunotherapy. In these preclinical studies, FLT3CART equipotently
A B C D Haematologica | 108 February 2023 461 ARTICLE - Monovalent and bispecific FLT3CART for AML and ALL L.M. Niswander et al.
inhibited leukemia proliferation in vivo in both KMT2A-R ALL (Figure 4A) and AML (Figure 4B) PDX models, despite a marked reduction in FLT3 surface antigen density after the lineage switch (Figure 4C). These findings suggest that FLT3CART may be a beneficial strategy specifically for patients with KMT2A-R ALL who are prone to lineage-switch relapse.
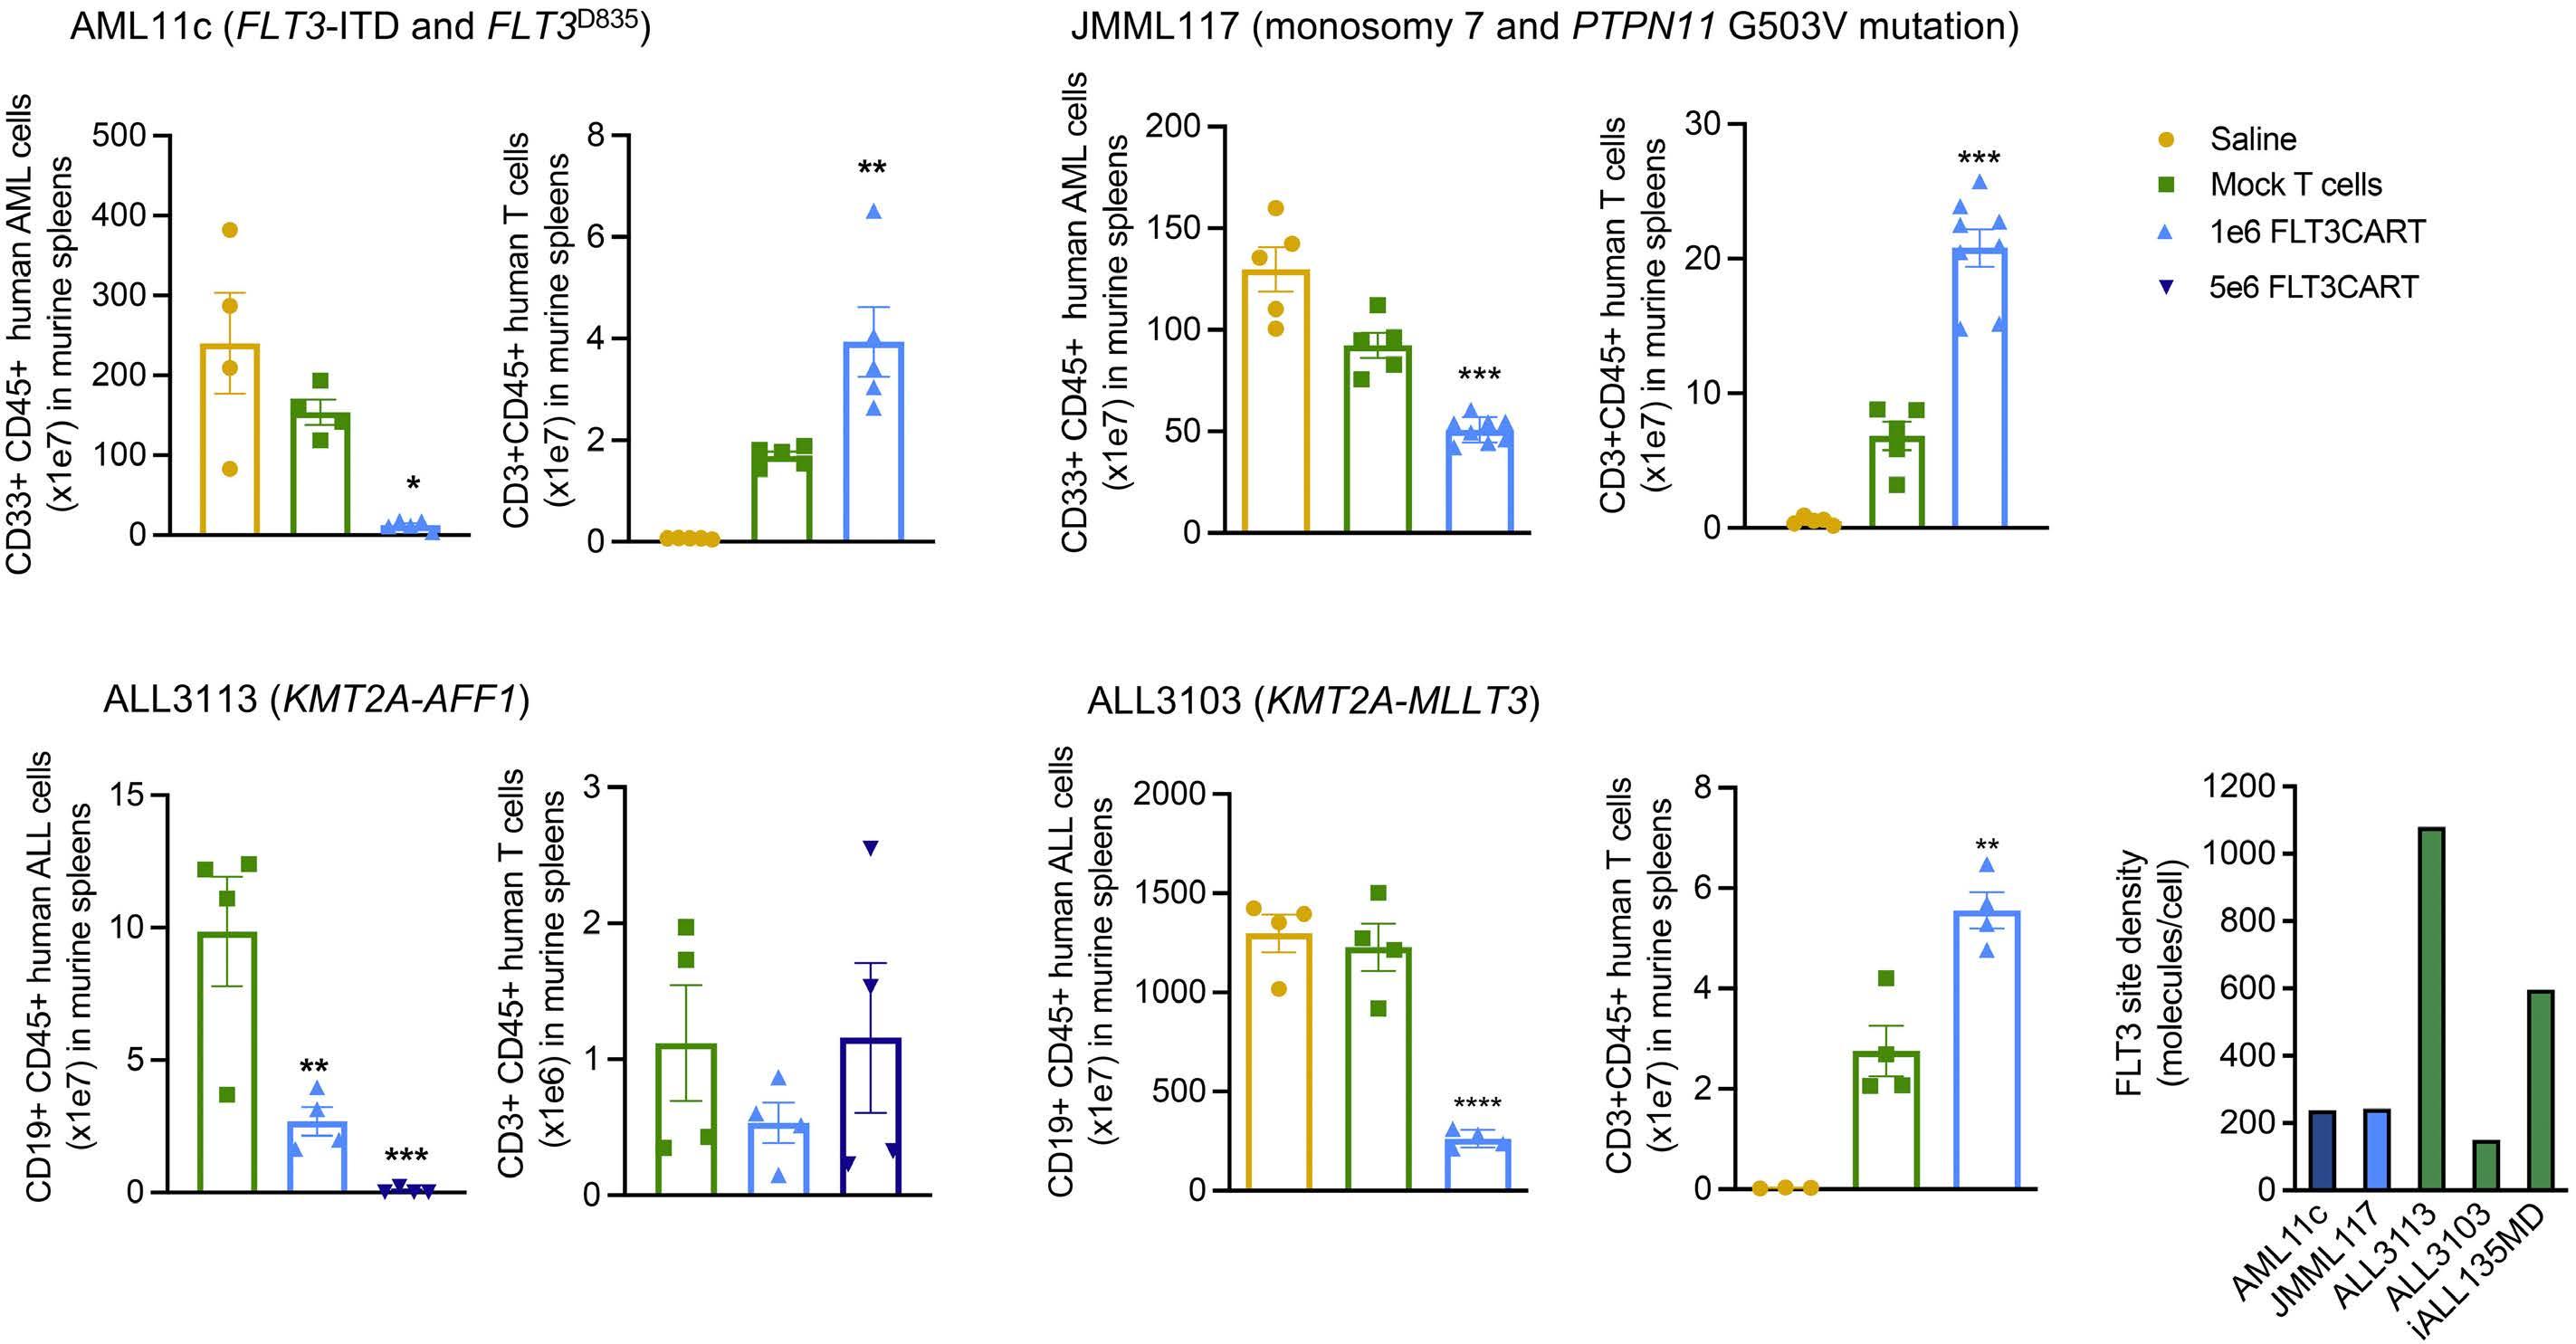
FLT3CART induces minimal detectable on-target/offtumor toxicity
FLT3 RNA and protein expression has been reported in several tissues including early hematopoietic progenitors, cardiomyocytes, and developing neuronal cells (https://www.proteinatlas.org/ENSG00000122025-FLT3/tis-
sue).27-29 To investigate potential non-hematopoietic ontarget/off-tumor toxicities, we first screened for in vitro reactivity of FLT3CART co-incubated with normal human tissue induced pluripotent stem cells (including three neural tissue types) via quantification of IFN-γ cytokine production with MOLM-14 as a FLT3-positive control. We detected a small increase in IFN-γ production following co-culture with cardiomyocytes and no evidence of changes with co-culture of other tissue types assessed (Online Supplementary Figure S3).
To assess for predicted toxicity due to FLT3 expression in the hematopoietic progenitor compartment,27,30 human bone marrow CD34+ cells were untreated or exposed to mock T cells or FLT3CART and assayed for colony forma-
Figure 3. FLT3CART is highly effective against FLT3-mutant acute myeloid leukemia and KMT2A-rearranged acute lymphoblastic leukemia and patient-derived xenografts in vivo. Busulfan-conditioned NSGS mice were engrafted with primary acute myeloid leukemia (AML) cells for the patient-derived xenograft (PDX) models (A) AML11c and (B) JMML117. Once 1-5% CD33+/CD45+ human AML were detectable in peripheral blood, mice were randomized (n=5-8/group) to intravenous (IV) treatment with 1x10⁶ FLT3CART (light blue), mock-transduced T cells (green), or saline (yellow). AML (first panel) and CD3+CD45+ T cells (second panel) were quantified in spleens by flow cytometry at the end of the study, which was determined by the rate of AML progression in control mice (6 weeks of treatment for AML11c, 4 weeks of treatment for JMML117). Unconditioned NSG mice were engrafted with KMT2Arearranged (KMT2A-R) primary acute lymphoblastic leukemia (ALL) cells for the PDX models (C) ALL3113 and (D) ALL3103, and engraftment was monitored by quantitative flow cytometry analysis of sampled peripheral venous blood. Once human leukemia was detected, mice were randomized (n=4/group) to IV treatment with 1x10⁶ (light blue) or 5x10⁶ (dark blue) FLT3CART, mocktransduced T cells (green), or saline (yellow). CD19+CD45+ ALL (first panel) and CD3+CD45+ T cells (second panel) were quantified in spleens by flow cytometry at the end of the study, which was determined by rate of ALL progression in control mice (4 weeks and 2 weeks after treatment for ALL3113 and ALL3103, respectively). Please note that a saline control group was not available for model ALL3113 and that a dose of 5x10⁶ FLT3CART was also included for this study. FLT3CART was effective in clearing KMT2AR ALL and both FLT3-mutant (AML11c) and FLT3 wild-type (JMML117) AML. (E) Flow cytometric quantification of FLT3 surface antigen density on KMT2A-R ALL (green) and FLT3-mutant AML (dark blue) and FLT3 wild-type (light blue) PDX cells. FLT3CART is effective in vivo in PDX models with low FLT3 surface expression. Data are displayed ± standard error of the mean and were analyzed by one-way analysis of variance with the Dunnett post-test for multiple comparisons with significance displayed compared to the mock T-cell control group. Absence of a symbol indicates lack of statistical significance. *P<0.05, **P<0.01, ***P<0.001, ****P<0.0001.
A B C D E Haematologica | 108 February 2023 462 ARTICLE - Monovalent and bispecific FLT3CART for AML and ALL L.M. Niswander et al.
Figure 4. FLT3CART potently inhibits in vivo leukemia proliferation in KMT2A-rearranged acute lymphoblastic leukemia-to-acute myeloid leukemia lineage switch patient-derived xenograft models. (A) NSG mice were injected intravenously (IV) with KMT2Arearranged (KMT2A-R) acute lymphoblastic leukemia (ALL) patient-derived xenograft (PDX) cells and engraftment was monitored by flow cytometry of sampled peripheral blood. Once human leukemia was detected, mice (n=4-5/group) were randomized to IV treatment with 1x10⁶ (light blue) or 5x10⁶ (dark blue) FLT3CART, 1x10⁶ mock-transduced T cells (green), or saline (yellow). CD19+/CD45+ human ALL cells were quantified weekly by flow cytometry of peripheral blood (left panel) and at study endpoint after 4 weeks of treatment in murine spleen (middle panel). Human T cells (CD3+/CD45+) were also enumerated in the spleen (right panel). (B) Busulfan-conditioned NSGS mice were injected with cells from the KMT2A-R acute myeloid leukemia (AML) PDX model established from the same patient in (A) following lineage-switch relapse after having been treated with tisagenlecleucel. Once human AML was detected in peripheral blood by flow cytometry, mice (n=4-5/group) were treated with 1x10⁶ (light blue) or 5x10⁶ (dark blue) FLT3CART, mock-transduced T cells (green), or saline (yellow). Human CD33+/CD45+ AML cells were monitored by flow cytometry in the peripheral blood (left panel) and at study endpoint after 2 weeks of treatment in the spleen (middle-left panel) and bone marrow (middle-right panel). CD3+/CD45+ T cells were also measured in end-study spleens (right panel). FLT3CART cleared leukemia in vivo in both KMT2A-R ALL and lineage-switched KMT2A-R AML relapsed PDX models despite differential FLT3 cell surface expression. (C) Flow cytometric quantification of FLT3 surface antigen density on KMT2A-R ALL (green) and AML (blue) PDX cells demonstrates marked antigen downregulation (arrow) upon lineage-switch relapse. Data in (A) and (B) are displayed ± standard error of the mean and were analyzed by one-way analysis of variance with the Tukey post-test for multiple comparisons with significance displayed compared to the mock T-cell control group. *P<0.05, **P<0.01.
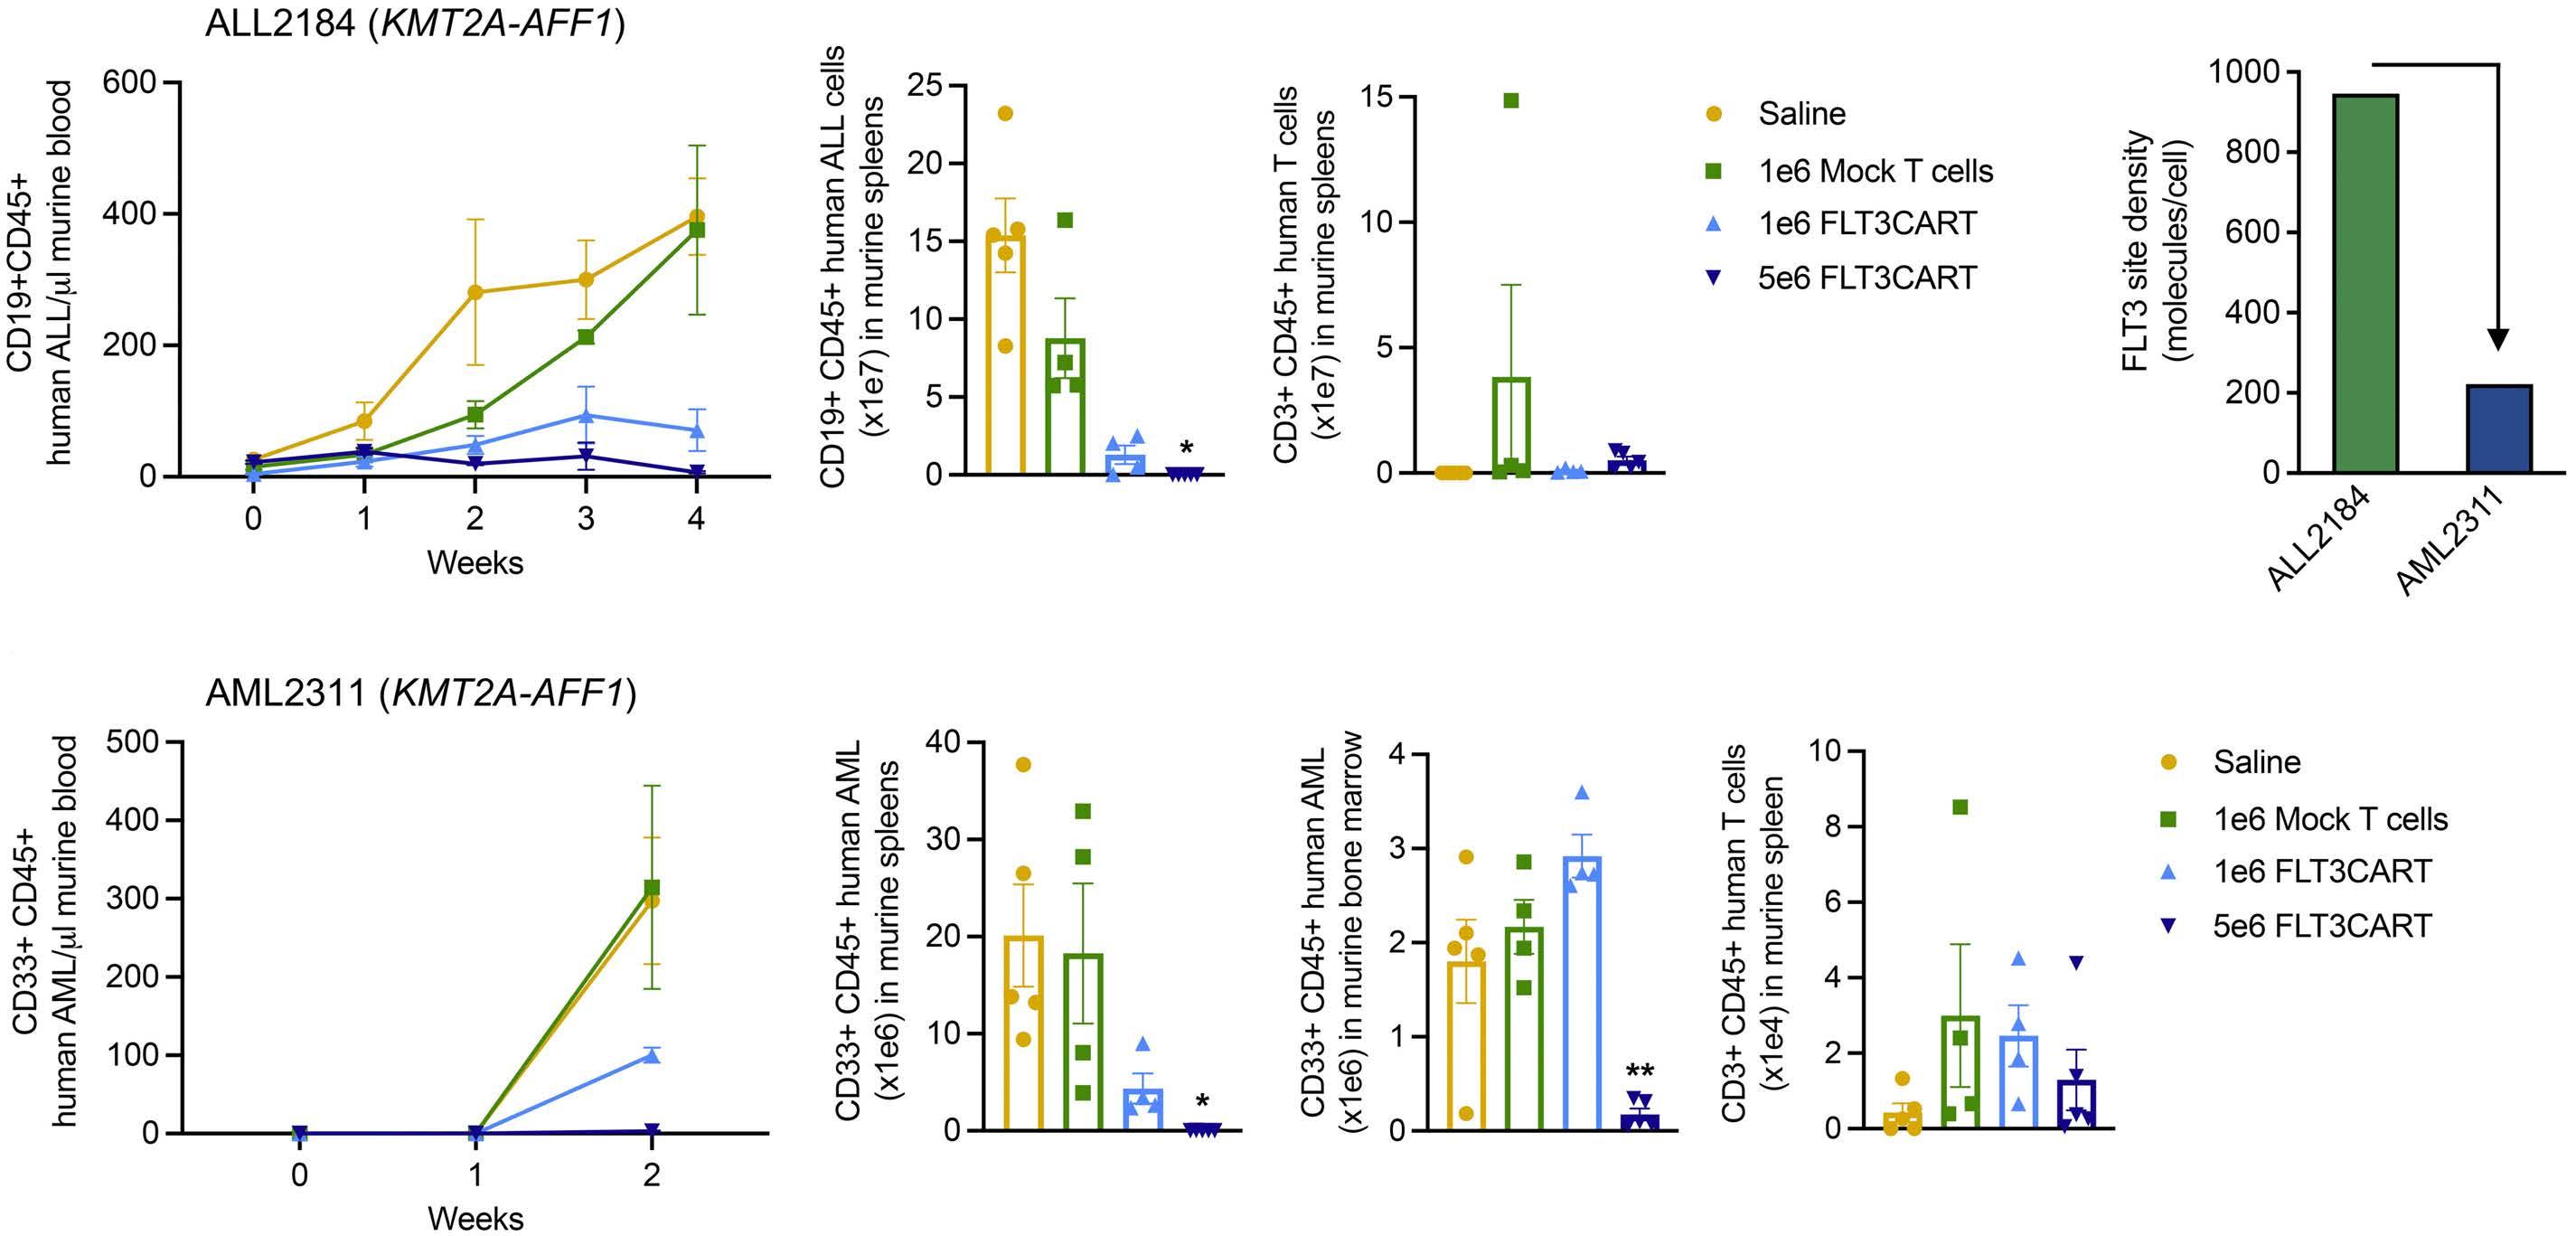
tion. There was no difference in the number of erythroid (CFU-E/BFU-E), myeloid (CFU-GM) or mixed (CFU-GEMM) colonies arising from CD34+ cells exposed to FLT3CART (Online Supplementary Figure S4A). Similarly, we detected no increase in IFN-γ or IL-2 production and no alteration in the viability of CD34+/CD38+ or CD34+/CD38– hematopoietic progenitors with co-culture with FLT3CART (Online Supplementary Figure S4B-D). Taken together, we observed minimal off-tumor effects of FLT3CART against hematopoietic or non-hematopoietic human tissues, although caution remains warranted with regard to potential clinical translation.
Bispecific CD19xFLT3CART also has potent in vitro and in vivo activity against KMT2A-rearranged acute lymphoblastic leukemia
Modulation of target antigen surface expression is another
well-recognized mechanism of leukemia relapse in clinical experience to date with CD19- and CD22-targeting CAR T cells and antibody-based immunotherapies.14,31 As a strategy potentially to augment anti-leukemia activity and perhaps also to diminish risk of antigen escape specifically in KMT2A-R ALL, we generated bicistronic CD19xFLT3-directed CAR constructs using a single vector. Each dual-targeting construct contained the above-described same FLT3 scFv with 4-1BB/CD3�� co-stimulatory domains (Online Supplementary Figure S1A) and an FMC63-derived CD19 scFv with 4-1BB/CD3�� (CD19[BBz]xFLT3CART) or CD28/CD3�� costimulatory domains (CD19[28z]xFLT3CART) (Figure 5A, Online Supplementary Methods). We confirmed bright flow cytometric CD19 cell surface protein expression on all tested B-ALL cell lines with expectedly negligible expression on AML cell lines (Figure 5B). We observed that short-term co-culture of CD19xFLT3CART with SEM cells
A B C Haematologica | 108 February 2023 463 ARTICLE - Monovalent and bispecific FLT3CART for AML and ALL L.M. Niswander et al.
induced similar activation and exhaustion marker expression as was detected with monovalent FLT3CART and CD19CART (Online Supplementary Figures S6 and S7). Coincubation of CD19xFLT3CART (24-40% transduction efficiency) with CD19-negative AML cell lines induced similar levels of IL-2 and IFN-γ production at 48 hours as monovalent FLT3CART and no appreciable cytokine production with CD19CART (Figure 5C, D). Interestingly, bicistronic CD19(28z)xFLT3CART stimulated greatest cytokine production when co-incubated with KMT2A-R ALL cell lines with levels consistently above those in monovalent FLT3CART, CD19CART, or CD19(BBz)xFLT3CART conditions (Figure 5C, D), mimicking the more robust cytokine production that has been observed in preclinical studies of
CD19CART designed with 28z versus BBz co-stimulatory domains.32 Similar effects were observed in NALM-6 cells engineered to overexpress FLT3 without or with CD19 deletion (Online Supplementary Figure S5B). Furthermore, both CD19xFLT3CART inhibited cell viability of the FLT3mutant AML cell lines MOLM-14 and MV4;11 and of all tested ALL cell lines independently of KMT2A mutation status and FLT3 antigen expression (Figure 6). Consistent with cytokine production data, CD19(28z)xFLT3CART also showed faster leukemia cell killing kinetics than those of CD19(BBz)xFLT3CART at early in vitro assessment timepoints.
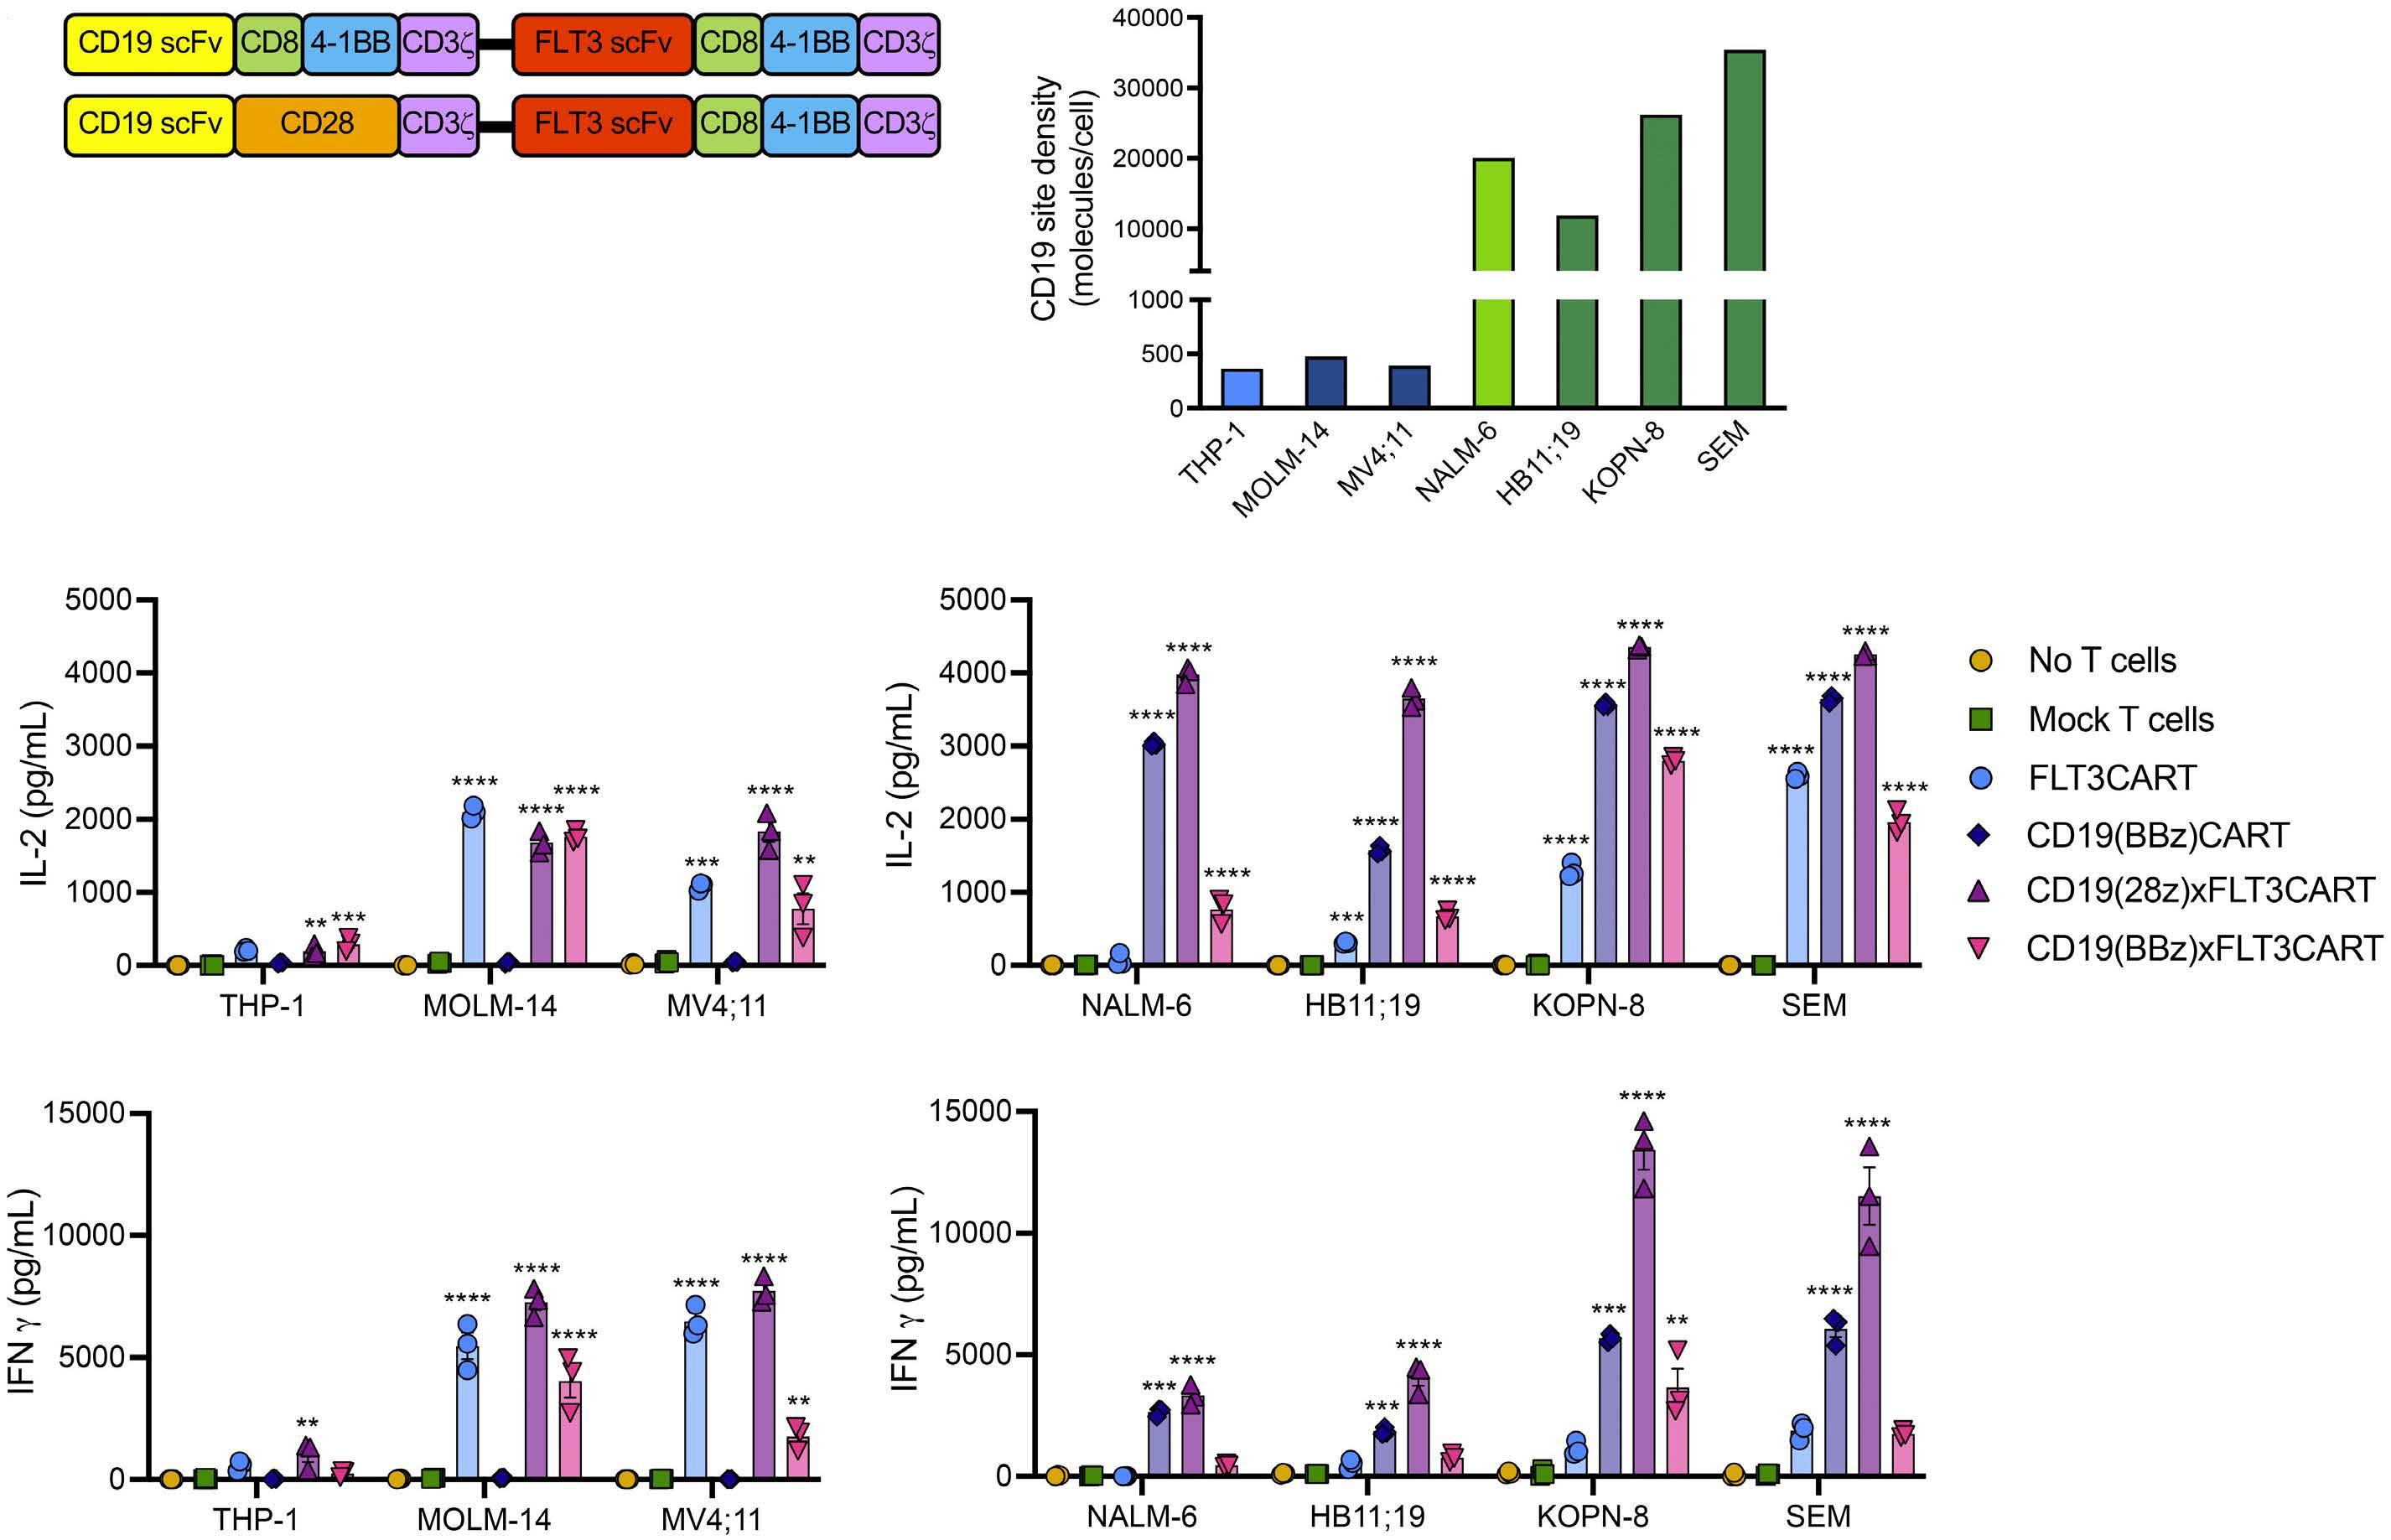
In vivo testing of bispecific CD19xFLT3CART against luciferase-expressing KMT2A-R ALL cell line SEM induced
Figure 5. Robust in vitro cytokine production of bicistronic CD19xFLT3CART against KMT2A-rearranged acute lymphoblastic leukemia. (A) Schematic of bicistronic chimeric antigen receptor constructs containing the same FLT3 scFv (red) with 4-1BB costimulatory domain/CD3�� signaling domain shown in Figure 1A linked with a P2A element (black line) to anti-CD19 scFv FMC63 (yellow) with either 4-1BB/CD3�� (BBz) or CD28/CD3�� (28z) co-stimulatory domains. (B) CD19 antigen expression (molecules/cell) is highly enriched on the cell surface of both KMT2A wild-type (light green) and KMT2A-rearranged (dark green) acute lymphoblastic leukemia (ALL) cell lines, but not expressed on FLT3 wild-type (light blue) or FLT3-mutant (dark blue) acute myeloid leukemia (AML) cell lines, as assessed by quantitative flow cytometry analysis. Luciferase-transduced AML (left panel) and ALL (right panel) cell lines were co-incubated at a 1:1 ratio (30,000 cells) for 48 hours with the indicated CD19CART, FLT3CART, bicistronic CD19xFLT3CART, or mock-transduced T cells. (C) Interleukin-2 (IL-2) and (D) interferon-gamma (IFN-γ) were quantified in culture supernatant by enzyme-linked immunosorbent assay. Cytokine production with dual-targeting CD19xFLT3CART (purple and pink) was either similar or more substantive compared to that with monovalent FLT3CART with the AML and ALL cell lines. Experiments in (C) and (D) were performed in triplicate and results are displayed ± standard error of the mean. Data in (C) and (D) were analyzed by one-way analysis of variance with the Dunnett post-test for multiple comparisons using the mock T-cell group as the comparator. **P<0.01, ***P<0.001, ****P<0.0001.
A B C D Haematologica | 108 February 2023 464 ARTICLE - Monovalent and bispecific FLT3CART for AML and ALL L.M. Niswander et al.
rapid eradication of detectable leukemia, facilitating longterm animal survival (Figure 7A, Online Supplementary Figure S8A). Notably, sustained anti-leukemia responses with CD19(28z)xFLT3CART mirrored those of monovalent FLT3CART and CD19CART in this model. The long-term response to CD19(BBz)xFLT3CART was slightly more variable, although bioluminescence imaging-detectable leukemia remained below initial engraftment levels. Although development of CD19xFLT3CART was intended primarily for testing in our CD19+ ALL models, we also detected robust inhibition of leukemia proliferation in our luciferase+ CD19–MOLM-14 cell line xenograft model treated with the bicistronic CART (Figure 7B, Online Supplementary Figure S8B), suggesting ‘OR’ logic gating of the bispecific constructs with effective anti-AML activity driven by the FLT3-targeting component.
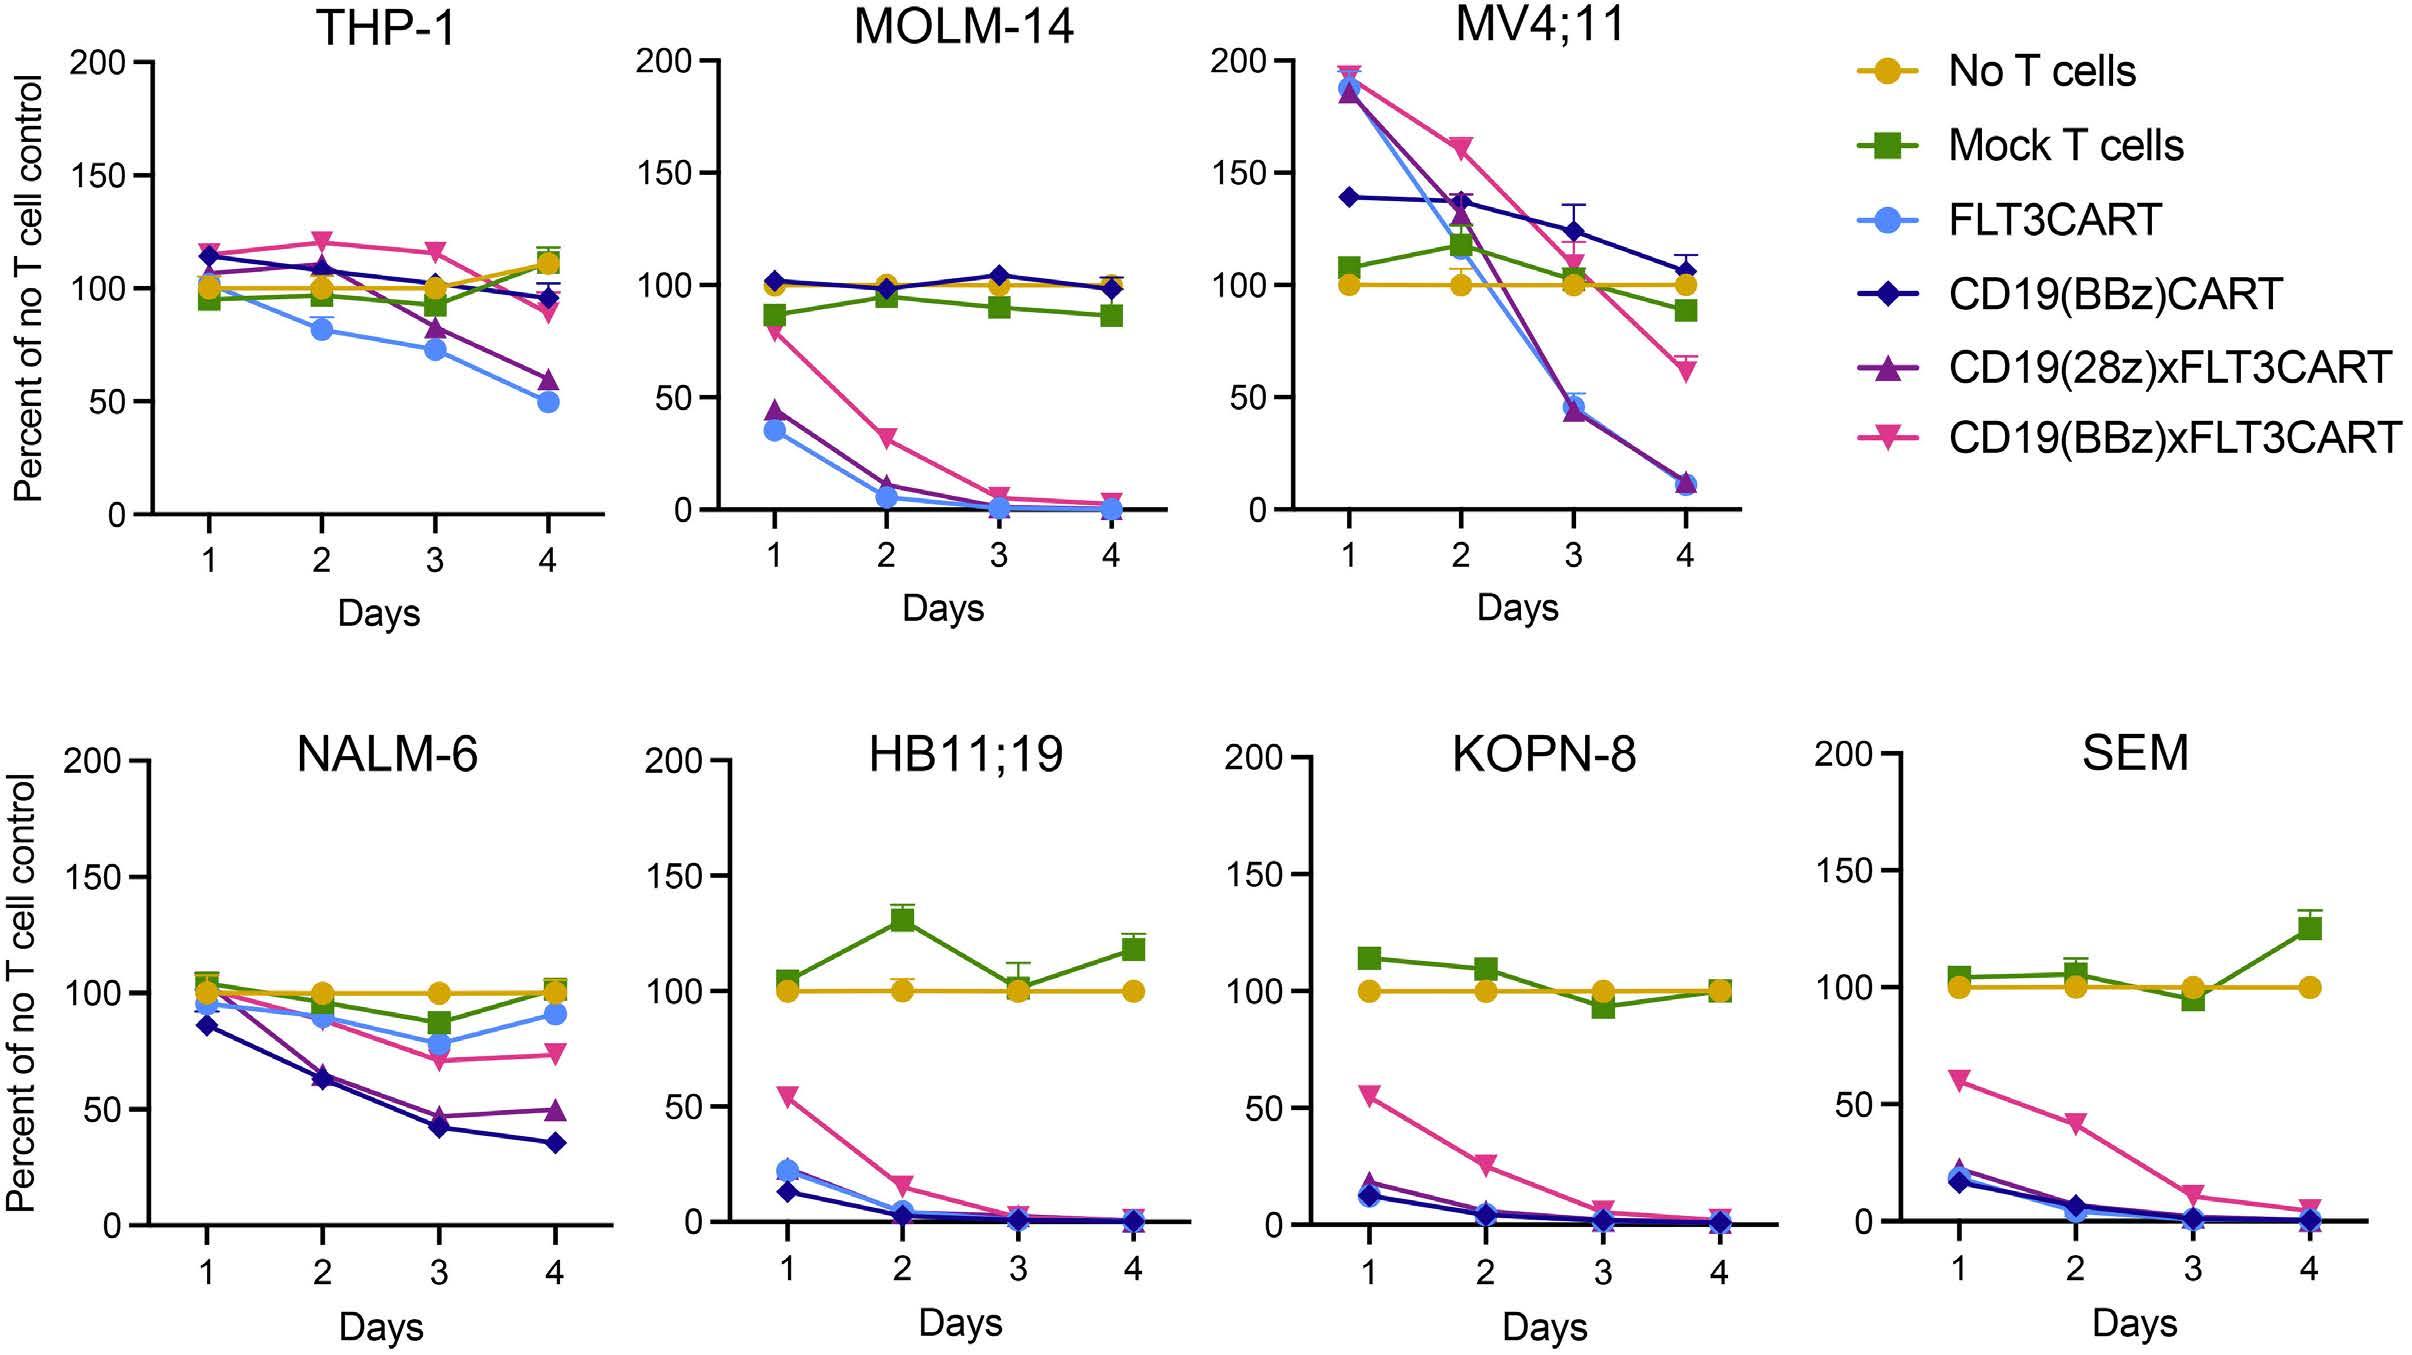
We then assessed and confirmed the in vivo activity of bispecific CD19xFLT3CART in KMT2A-R ALL PDX models established from infant (iALL135MD [PAUYJT33]) (Figure 8A) and young adult patients (ALL3113) (Figure 8B). In both models, bispecific CD19xFLT3CART quickly cleared human ALL proliferation in murine blood with no detectable leukemia remaining in end-study murine spleens, similar to the curative effects seen with monovalent CD19CART or FLT3CART treatment. Consistent with our recent pre-
clinical observations with CD33CART immunotherapy for AML,22 peripheral CAR T-cell expansion and plasma IFN-γ levels at early timepoints were appreciably higher in mice treated with CD19(28z)xFLT3CART compared to 41BB/CD3��-containing monovalent or bicistronic CART. PDX mice treated with CD19(28z)xFLT3CART also showed physical signs of immune activation mimicking cytokine release syndrome with appreciable weight loss compared to that of animals administered negative control or monovalent CART treatment (data not shown), coinciding with the observed robust in vivo T-cell expansion and IFN- γ peak levels. Affected PDX mice subsequently recovered with supportive care and without pharmacological intervention. Taken together, these in vitro and in vivo studies corroborate bicistronic CD19xFLT3CART immunotherapy as an alternative approach for KMT2A-rearranged ALL.
Discussion
Successful development of immunotherapies for children and adults with relapsed/refractory FLT3-mutant AML and KMT2A-R ALL is a high priority given these individuals’ poor clinical outcomes. Cellular immunotherapy has revolutionized treatment for many patients with CD19-ex-
Figure 6. Effective in vitro activity of CD19xFLT3CART against KMT2A-rearranged acute lymphoblastic leukemia. Inhibition of viability of luciferase-transduced human acute myeloid leukemia (AML, top panel) and acute lymphoblastic leukemia (ALL, bottom panel) cell lines co-incubated with CD19CART, FLT3CART, or one of two CD19xFLT3CART in a 1:1 ratio was assessed via luciferase reporter assay at 24, 48, 72, and 96 hours. FLT3CART and both CD19xFLT3CART significantly inhibited the viability of FLT3-ITD AML (CD19-negative) and KMT2A-rearranged ALL (CD19-positive) cell lines, suggesting sufficiency of FLT3 targeting in these ‘OR’gated chimeric antigen receptor constructs. Experiments were performed in triplicate and results are displayed ± standard error of the mean. Data were analyzed by two-way analysis of variance with the Dunnett post-test for multiple comparisons using the mock T-cell group as the comparator. Both CD19xFLT3CART induced statistically significant killing at day 4 versus mock T-cell controls in all cell lines tested (P<0.01).
Haematologica | 108 February 2023 465 ARTICLE - Monovalent and bispecific FLT3CART for AML and ALL L.M. Niswander et al.
Figure 7. Bispecific CD19xFLT3CART inhibits in vivo leukemia proliferation in cell line xenograft models. (A) Luciferase-transduced SEM KMT2A-rearranged acute lymphoblastic leukemia (ALL) cells were injected intravenously into NSG mice on day 0. Once engraftment was detected by bioluminescent imaging (BLI), mice were randomized (n=5/group) to receive intravenous treatment (vertical dashed line) with saline, mock-transduced T cells, monovalent CD19CART, FLT3CART, or bicistronic CD19xFLT3CART (1x10⁷ cell dosing for all groups). Mice were followed by serial BLI twice- or once-weekly with radiance ± standard error of the mean displayed graphically. CD19CART, FLT3CART, and both CD19xFLT3CART resulted in rapid clearance of ALL. (B) In a parallel experiment, luciferase-transduced MOLM-14 FLT3-ITD acute myeloid leukemia (AML) cells were injected into NSG mice on day 0. Once engraftment was detected, mice were randomized (n=5/group) to experimental treatment, followed by BLI as described in (A). Monovalent FLT3CART and bicistronic CD19xFLT3CART potently inhibited in vivo AML proliferation. As expected for CD19negative MOLM-14, monovalent CD19CART had no anti-leukemia activity, confirming ‘OR’ gating logic of the bispecific CD19xFLT3CART seen in Figure 6. Data ± standard error of the mean were analyzed by one-way analysis of variance with significance shown for FLT3CART versus the mock T-cell group. Absence of a symbol indicates lack of statistical significance. ****P<0.0001.
pressing relapsed/refractory B-cell malignancies.11-13 However, subsequent relapse with antigen-downregulated or -loss disease following CD19CART or CD22CART treatment has emerged as a substantive barrier to long-term cure.13,16 It is not yet clear whether new immunotherapies against alternative leukemia target antigens will induce similar mechanisms of resistance. Successful development of CAR T-cell immunotherapies for AML has lagged behind those for B-ALL, in part given concerns about ontarget/off-tumor toxicity due to target antigen expression on normal myeloid cells and/or non-hematopoietic tissues.34
Interestingly, both FLT3-mutant AML and KMT2A-R ALL are driven by hyperactive FLT3 kinase signaling via FLT3 genetic mutation or overexpression and have high cell surface protein expression. Targeting FLT3 activation and downstream signaling with addition of FLT3 inhibitors (e.g., the multi-tyrosine kinase inhibitors, midostaurin and sorafenib, and the more FLT3-selective inhibitors, quizartinib and gilteritinib) to chemotherapy has significantly improved survival in adults and children with FLT3-mutant AML.5,6,35 Conversely, addition of the multi-tyrosine kinase inhibitor lestaurtinib to chemotherapy in the COG AALL0631 phase III trial did not improve outcomes for infants with KMT2A-R ALL versus chemotherapy, although many patients were shown to have had inadequate exposure to the FLT3 inhibitor because of frequent treatment interruptions. Pharmacodynamic analysis of blood specimens from the subset of infants with robust lestaurtinibinduced FLT3 inhibition demonstrated marked
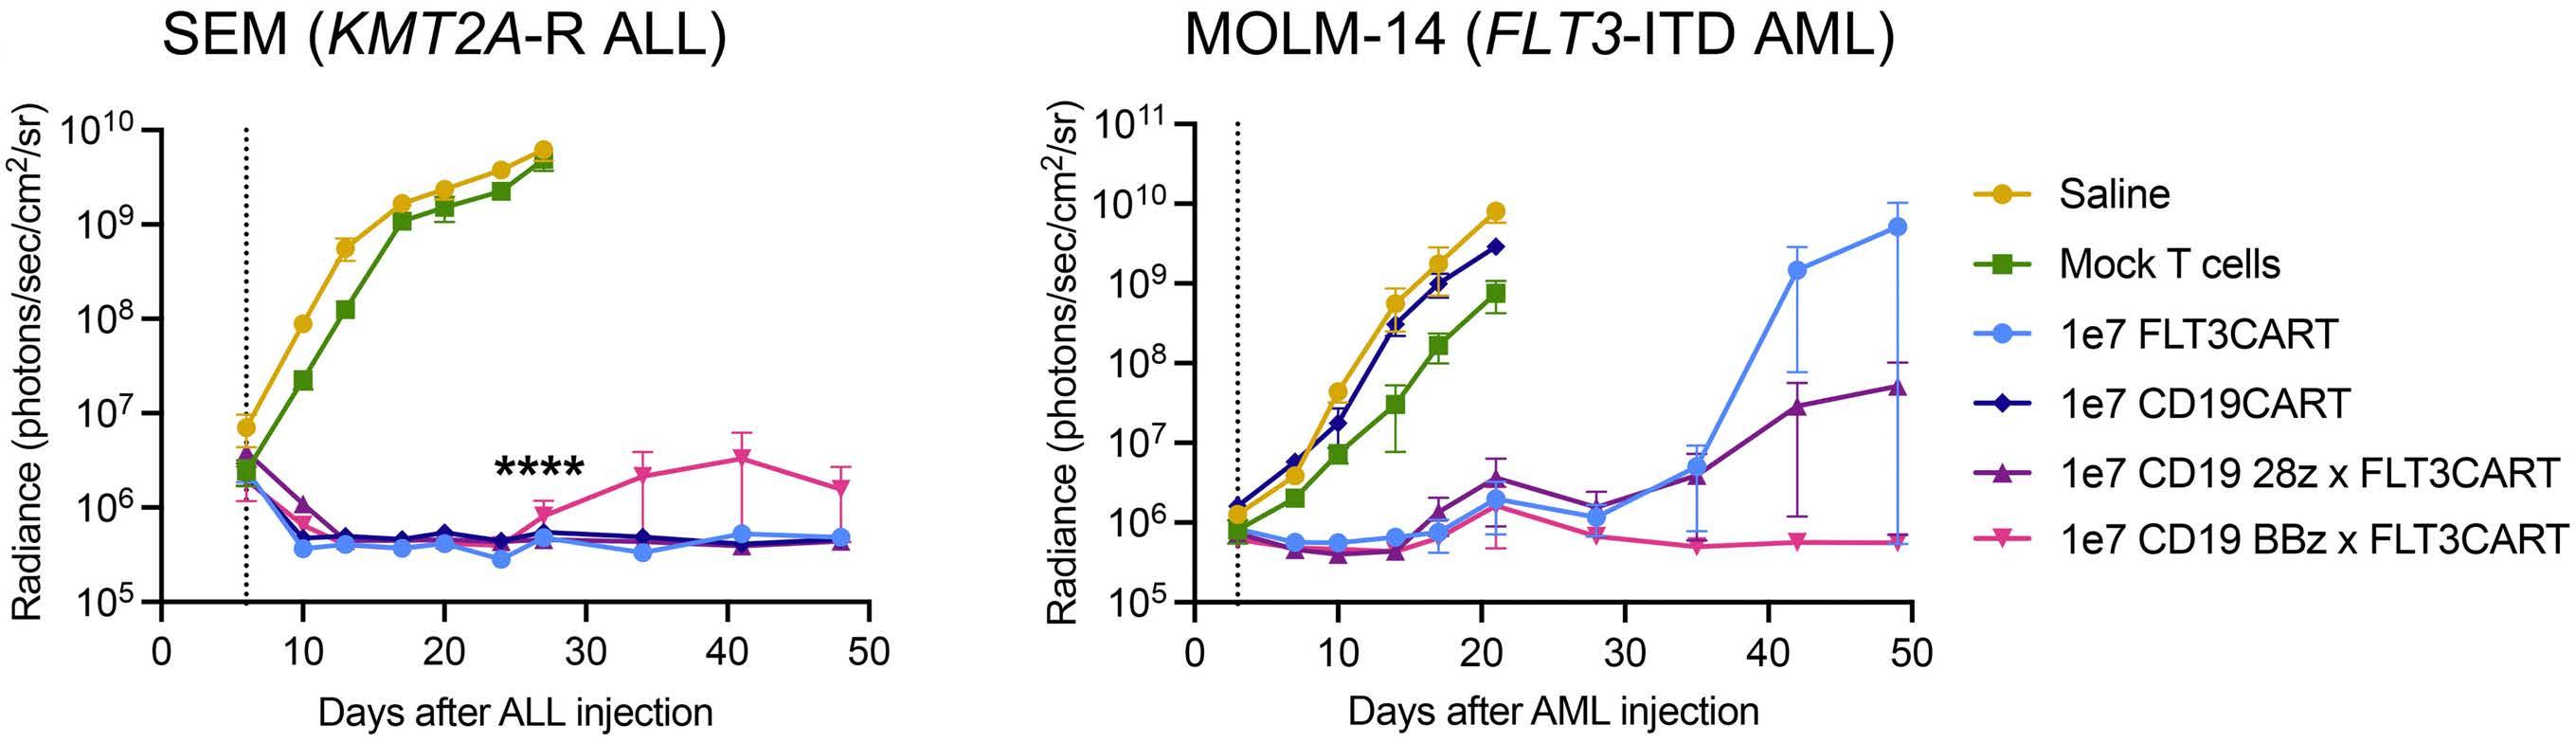
improvement in 3-year event-free survival compared to that of non-inhibited infants,8 highlighting the therapeutic potential of FLT3 inhibition also in patients with KMT2A-R ALL. However, given recent reporting of FLT3-inhibitor resistance mechanisms in patients with FLT3-mutant AML, such tyrosine kinase inhibitor-based therapies may not be curative for all patients.36
Patients with KMT2A-R ALL are also known to be at particularly high risk of lymphoid-to-myeloid lineage switch following CD19CART immunotherapy15,17 when compared to conventional chemotherapy or immunotherapy with the CD19xCD3 bispecific T-cell engager blinatumomab.37 This lineage switch predilection presents a unique barrier to cure of these high-risk patients via CD19CART, as well as an opportunity for alternative therapeutic approaches. Successful development of immunotherapies targeting a surface antigen shared by both lymphoid and myeloid leukemias (such as FLT3) would accordingly not only have broader application for a larger subset of patients, but could theoretically also be beneficial in a lineage switch setting.
Here, we report the preclinical development of new FLT3CART immunotherapy with an eye to clinical translation. In these studies we have demonstrated potent in vitro and in vivo anti-leukemia efficacy against FLT3-mutant AML and KMT2A-R ALL cell lines, as well as robust FLT3CART-mediated eradication of leukemia in vivo in several PDX models of pediatric or young adult FLT3-mutant AML, FLT3 wild-type AML, and KMT2A-R ALL. Consistent with other studies of FLT3-directed CAR T-cell immuno-
A B Haematologica | 108 February 2023 466 ARTICLE - Monovalent and bispecific FLT3CART for AML and ALL L.M. Niswander et al.
therapies,38-42 our FLT3CART showed excellent activity against FLT3-ITD AML, as determined via in vitro cytokine production and viability metrics, as well as in vivo curative effects and long-term survival of treated animals. We were intrigued to discover that flow cytometrically measured FLT3 surface antigen site density was not overtly different in our tested FLT3-mutant versus non-mutant AML cell
lines and PDX models and that FLT3CART also had strong (albeit less complete) activity against FLT3 wild-type AML. These observations are consistent with data from a recent Children’s Oncology Group analysis of primary pediatric AML specimens in which FLT3-ITD cases did not have higher FLT3 cell surface expression than non-ITD cases and FLT3 protein levels did not correlate with differential
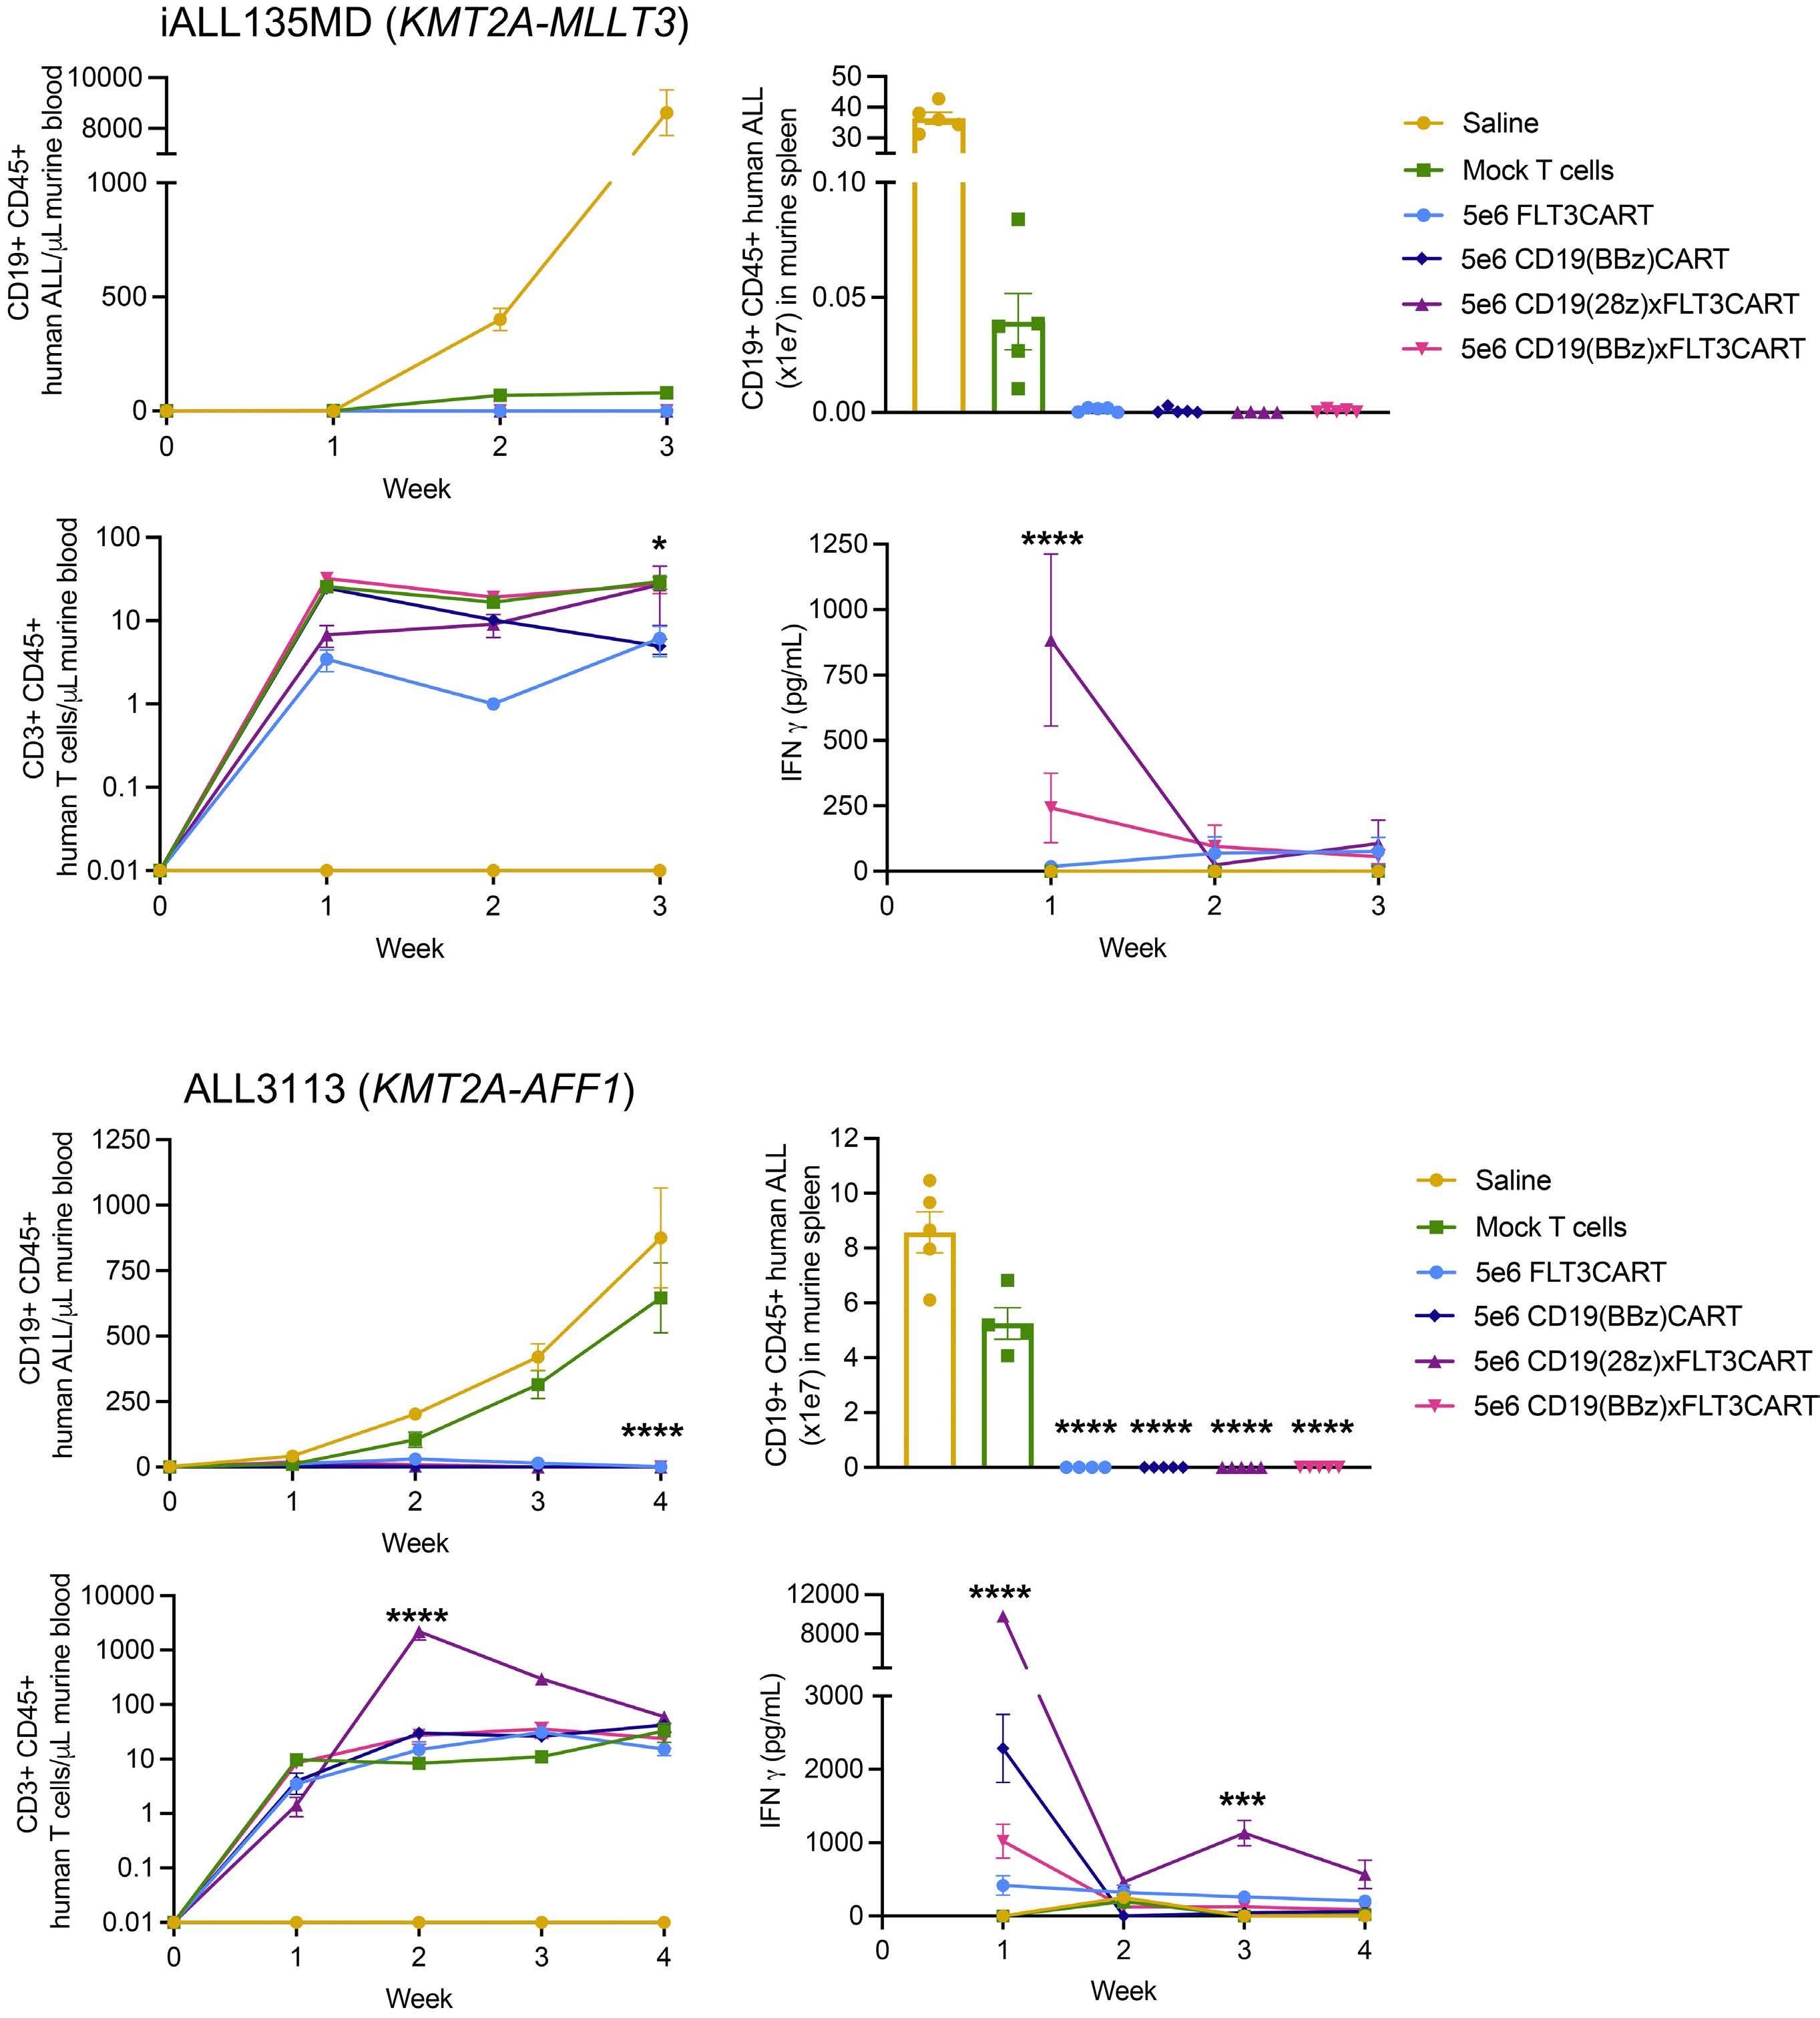
Continued on following page. A B Haematologica | 108 February 2023 467 ARTICLE - Monovalent and bispecific FLT3CART for AML and ALL L.M. Niswander et al.
Figure 8. Bispecific CD19xFLT3CART inhibits in vivo leukemia proliferation in patient-derived xenograft models of KMT2A-rearranged acute lymphoblastic leukemia. Patient-derived xenograft (PDX) models (A) iALL150MD and (B) ALL3113 were randomized (n=5 mice/group) to intravenous (IV) treatment with saline, mock-transduced T cells, CD19CART, FLT3CART, or one of the bicistronic CD19xFLT3CART (5x10⁶ cell dosing for all groups) as designated. Weekly quantitative flow cytometric monitoring of CD19+/CD45+ human acute lymphoblastic leukemia and CD3+ CAR T cells was performed with peripheral venous blood sampling, and interferon gamma (IFN-γ) was measured in prepared plasma by enzyme-linked immunosorbent assay. The study endpoint was determined by the rate of leukemia progression in control mice (3 weeks or 4 weeks of treatment in iALL135MD or ALL3113, respectively). No leukemia was detected in peripheral blood or end-study spleens in either PDX model following treatment with CD19xFLT3CART. An unexpectedly large xenogeneic anti-leukemia effect was observed in the iALL135MD PDX model with mock CAR T-cell versus saline treatment, but was not detected in other PDX models. Peripheral blood T-cell expansion and detectable IFN-γ were equal or greater for the bicistronic CD19xFLT3CART than for the monovalent CD19CART or FLT3CART. Data ± standard error of the mean were analyzed by two-way analysis of variance with the Tukey post-test for multiple comparisons with significance shown for FLT3CART versus CD19(28z)xFLT3CART for the T-cell and IFN-γ panels and versus the mock T-cell group for all other panels. Absence of a symbol indicates lack of statistical significance. *P<0.05, ***P<0.001, ****P<0.0001.
clinical outcomes, as has been reported for CD33 and CD123 antigens.43-45 Our data highlight potentially wider therapeutic applicability of FLT3CART for patients with AML, which merits further exploration.
To our knowledge, our group is the first to demonstrate efficacy of FLT3-targeting CAR T-cell immunotherapy in FLT3-overexpressing KMT2A-R ALL. The importance of target antigen site density for successful treatment of patients with B-ALL with CD19- or CD22-directed immunotherapies is well-established,25,26 but has not yet been elucidated for alternative leukemia antigens. Our present studies show activity of FLT3CART against leukemias with quantitatively lower FLT3 site density than has been reported for CD19 or CD22, but were not designed to identify a site-density threshold for treatment response or failure. Our observations appear consistent with a recent report of FLT3xCD3 bispecific T-cell-engaging antibodies with preclinical activity against leukemia cell lines with a broad range of FLT3 surface protein levels.46 It will be critical to elucidate in future studies the degree to which FLT3 site density influences the therapeutic activity of FLT3CART and whether clinical responses differ between patients with ALL or AML or between patients with FLT3-mutated or FLT3 wild-type AML.
Given the propensity for KMT2A-R ALL-to-AML lineage switch, we importantly report excellent anti-leukemia activity of FLT3CART in a unique pairing of PDX models established from a patient with chemorefractory KMT2A-R ALL who experienced AML lineage switch relapse with retention of the original KMT2A-AFF1 fusion after receiving tisagenlecleucel. These data further underscore FLT3 as a key immunotherapeutic target in KMT2A-R ALL. We hope that ongoing and future studies will shed further light on the potential of FLT3CART to treat or perhaps even prevent these presently universally fatal lineage-switch relapses.15,17 Expanding upon the clinical potential of FLT3CART for patients with relapsed/refractory KMT2A-R ALL, we also report successful development of bispecific CD19xFLT3CART immunotherapy with at least equivalent preclinical activity to that of monovalent CD19CART and FLT3CART. Recent data from clinical phase I studies have
raised exciting promise of bispecific CD19xCD22 and CD19xCD20 CAR T-cell immunotherapies for patients with relapsed/refractory B-ALL or lymphoma.47,48 Further investigation is needed to ascertain whether such approaches have superior long-term clinical efficacy over single antigen-targeting CART and/or prevent antigen escape relapse.
Finally, our preclinical studies suggest a potential therapeutic window for translation of FLT3CART to patients with AML and ALL with largely minimal on-target/offtumor effects detected against normal non-hematopoietic and hematopoietic tissues. Importantly, although FLT3 expression in neural tissues has been reported, we did not observe any reactivity of our FLT3CART against three different induced pluripotent stem cell-derived neuronal cell lines, nor was neurotoxicity seen in vivo in non-human primates by another team studying alternative FLT3 CAR T cells and bispecific antibodies.40,49 Our results are consistent in terms of both anti-leukemia activity and predicted tolerable hematopoietic toxicity with other studies of FLT3-directed monoclonal antibodies,50 bispecific antibodies,46,49,51 and CAR T cells38,40-42 with in vitro and in vivo activity against AML cell lines. Caution must nonetheless still be exercised with translation to clinical investigation. Finally, we uniquely report potent activity of our FLT3CART in multiple clinically-relevant leukemia PDX models, including a previously unknown efficacy of FLT3CART and CD19xFLT3CART immunotherapy specifically against KMT2A-R ALL and in lineage-switch scenarios. Taken together, our results highlight FLT3 as a critical antigen for cellular immunotherapy in two high-risk leukemia subtypes. Clinical investigation of our optimized monovalent FLT3CART immunotherapy will occur soon via a first-inhuman phase I trial.
Disclosures
CDC and TJF have a United States Department of Health and Human Services patent application for FLT3 chimeric antigen receptors (WO2017205747A1). SKT is receiving or has received research funding for unrelated studies from Beam Therapeutics, Gilead Sciences, Incyte Corporation,
Haematologica | 108 February 2023 468 ARTICLE - Monovalent and bispecific FLT3CART for AML and ALL L.M. Niswander et al.
and Kura Oncology, has consulted for bluebird bio, and serves on the scientific advisory boards of Aleta Biotherapeutics, Kura Oncology, and Syndax Pharmaceuticals. TJF is a part-time employee of and owns stock options in Sana Biotechnology. The remaining authors have no conflicts of interest to disclose.
Contributions
LMN performed experiments, analyzed and interpreted data, and wrote the manuscript. ZTG and CDC performed experiments, analyzed and interpreted data, and contributed to writing the manuscript. JAC, CAM, LCL, JPL, and MEK performed experiments and analyzed and interpreted data. SKT and TJF conceived and directed the study, analyzed and interpreted data, and wrote and/or edited the manuscript. All authors approved the final version of the manuscript.
Acknowledgments
We acknowledge Ms Haiying Qin, Dr Christopher Tor Sauter, and Dr Lila Yang at the National Cancer Institute/Pediatric Oncology Branch for experimental assistance and Dr Asen Bagashev at the Children’s Hospital of Philadelphia for helpful scientific discussions.
Funding
We are extremely grateful to the SchylerStrong Foundation for its partnership and generous support of our FLT3CART research, and we dedicate this study to the memory of
References
1. Small D, Levenstein M, Kim E, et al. STK-1, the human homolog of Flk-2/Flt-3, is selectively expressed in CD34+ human bone marrow cells and is involved in the proliferation of early progenitor/stem cells. Proc Natl Acad Sci U S A. 1994;91(2):459-463.
2. Kuchenbauer F, Kern W, Schoch C, et al. Detailed analysis of FLT3 expression levels in acute myeloid leukemia. Haematologica. 2005;90(12):1617-1625.
3. Thiede C, Steudel C, Mohr B, et al. Analysis of FLT3-activating mutations in 979 patients with acute myelogenous leukemia: association with FAB subtypes and identification of subgroups with poor prognosis. Blood. 2002;99(12):4326-4335.
4. Bolouri H, Farrar JE, Triche T, Jr., et al. The molecular landscape of pediatric acute myeloid leukemia reveals recurrent structural alterations and age-specific mutational interactions. Nat Med. 2018;24(1):103-112.
5. Perl AE, Martinelli G, Cortes JE, et al. Gilteritinib or chemotherapy for relapsed or refractory FLT3-mutated AML. N Engl J Med. 2019;381(18):1728-1740.
6. Pollard JA, Alonzo TA, Gerbing R, et al. Sorafenib in combination with standard chemotherapy for children with high allelic ratio FLT3/ITD+ acute myeloid leukemia: a report from the Children's Oncology Group protocol AAML1031. J Clin Oncol. 2022;40(18):2023-2035.
7. Pieters R, De Lorenzo P, Ancliffe P, et al. Outcome of infants
Schyler Anna Herman. These studies were also supported by the National Institutes of Health (NIH)/National Cancer Institute 1U01CA232486 (SKT, TJF) and T32CA009615 (LMN) awards, NIH/National Institute of Child Health and Human Development T32HD043021 award (LMN), Cancer League of Colorado (ZTG), Gabrielle’s Angel Foundation for Cancer Research (SKT), Andrew McDonough B+ Foundation (SKT), Rally Foundation for Childhood Cancer Research (SKT), Gerdin Charitable Foundation (SKT), Lisa Dean Moseley Foundation (LMN, SKT), and St Baldrick’s Foundation/Stand Up to Cancer Pediatric Dream Team (SKT, TJF). Stand Up to Cancer is a program of the Entertainment Industry Foundation administered by the American Association for Cancer Research. LMN is a St. Baldrick’s Foundation Fellow supported by Super Soph’s Pediatric Cancer Research Fund. SKT is a Leukemia and Lymphoma Society Scholar. SKT holds the Joshua Kahan Endowed Chair in Pediatric Leukemia Research at the Children's Hospital of Philadelphia. TJF is the Robert and Kathleen Clark Endowed Chair in Pediatric Cancer Therapeutics at the Children’s Hospital Colorado.
Data-sharing statement
Human leukemia cell lines used in these studies are publicly available through commercial sources and may be made available from the authors upon written request and material transfer agreement approval. The authors are also glad to share guidance regarding protocols and assays used in these studies upon written request.
younger than 1 year with acute lymphoblastic leukemia treated with the Interfant-06 protocol: results from an international phase III randomized study. J Clin Oncol. 2019;37(25):2246-2256.
8. Brown PA, Kairalla JA, Hilden JM, et al. FLT3 inhibitor lestaurtinib plus chemotherapy for newly diagnosed KMT2Arearranged infant acute lymphoblastic leukemia: Children's Oncology Group trial AALL0631. Leukemia. 2021;35(5):1279-1290.
9. Stutterheim J, van der Sluis IM, de Lorenzo P, et al. Clinical implications of minimal residual disease detection in infants with KMT2A-rearranged acute lymphoblastic leukemia treated on the Interfant-06 protocol. J Clin Oncol. 2021;39(6):652-662.
10. Stam RW, Schneider P, de Lorenzo P, Valsecchi MG, den Boer ML, Pieters R. Prognostic significance of high-level FLT3 expression in MLL-rearranged infant acute lymphoblastic leukemia. Blood. 2007;110(7):2774-2775.
11. Gardner RA, Finney O, Annesley C, et al. Intent-to-treat leukemia remission by CD19 CAR T cells of defined formulation and dose in children and young adults. Blood. 2017;129(25):3322-3331.
12. Maude SL, Laetsch TW, Buechner J, et al. Tisagenlecleucel in children and young adults with B-cell lymphoblastic leukemia. N Engl J Med. 2018;378(5):439-448.
13. Fry TJ, Shah NN, Orentas RJ, et al. CD22-targeted CAR T cells induce remission in B-ALL that is naive or resistant to CD19-
Haematologica | 108 February 2023 469 ARTICLE - Monovalent and bispecific FLT3CART for AML and ALL L.M. Niswander et al.
- Monovalent and bispecific FLT3CART for AML and ALL
targeted CAR immunotherapy. Nat Med. 2018;24(1):20-28.
14. Shah NN, Highfill SL, Shalabi H, et al. CD4/CD8 T-cell selection affects chimeric antigen receptor (CAR) T-cell potency and toxicity: updated results from a phase I anti-CD22 CAR T-cell trial. J Clin Oncol. 2020;38(17):1938-1950.
15. Barz Leahy A, Devine KJ, Li Y, et al. Impact of high-risk cytogenetics on outcomes for children and young adults receiving CD19-directed CAR T cell therapy. Blood. 2021;139(14):2173-2185.
16. Orlando EJ, Han X, Tribouley C, et al. Genetic mechanisms of target antigen loss in CAR19 therapy of acute lymphoblastic leukemia. Nat Med. 2018;24(10):1504-1506.
17. Lamble AJ, Myers RM, Taraseviciute A, et al. KMT2A rearrangements are associated with lineage switch following CD19 targeting CAR T-cell therapy. Blood. 2021;138(Suppl 1):256-256.
18. Walsh Z, Ross S, Fry TJ. Multi-specific CAR targeting to prevent antigen escape. Curr Hematol Malig Rep. 2019;14(5):451-459.
19. Qin H, Ramakrishna S, Nguyen S, et al. Preclinical development of bivalent chimeric antigen receptors targeting both CD19 and CD22. Mol Ther Oncolytics. 2018;11:127-137.
20. Cordoba S, Onuoha S, Thomas S, et al. CAR T cells with dual targeting of CD19 and CD22 in pediatric and young adult patients with relapsed or refractory B cell acute lymphoblastic leukemia: a phase 1 trial. Nat Med. 2021;27(10):1797-1805.
21. Spiegel JY, Patel S, Muffly L, et al. CAR T cells with dual targeting of CD19 and CD22 in adult patients with recurrent or refractory B cell malignancies: a phase 1 trial. Nat Med. 2021;27(8):1419-1431.
22. Qin H, Yang L, Chukinas JA, et al. Systematic preclinical evaluation of CD33-directed chimeric antigen receptor T cell immunotherapy for acute myeloid leukemia defines optimized construct design. J Immunother Cancer. 2021;9(9):e003149.
23. Piloto O, Nguyen B, Huso D, et al. IMC-EB10, an anti-FLT3 monoclonal antibody, prolongs survival and reduces nonobese diabetic/severe combined immunodeficient engraftment of some acute lymphoblastic leukemia cell lines and primary leukemic samples. Cancer Res. 2006;66(9):4843-4851.
24. Tasian SK, Kenderian SS, Shen F, et al. Optimized depletion of chimeric antigen receptor T cells in murine xenograft models of human acute myeloid leukemia. Blood. 2017;129(17):2395-2407.
25. Ramakrishna S, Highfill SL, Walsh Z, et al. Modulation of target antigen density improves CAR T-cell functionality and persistence. Clin Cancer Res. 2019;25(17):5329-5341.
26. Majzner RG, Rietberg SP, Sotillo E, et al. Tuning the antigen density requirement for CAR T-cell activity. Cancer Discov. 2020;10(5):702-723.
27. Mackarehtschian K, Hardin JD, Moore KA, Boast S, Goff SP, Lemischka IR. Targeted disruption of the flk2/flt3 gene leads to deficiencies in primitive hematopoietic progenitors. Immunity. 1995;3(1):147-161.
28. Çakmak-Görür N, Radke J, Rhein S, et al. Intracellular expression of FLT3 in Purkinje cells: implications for adoptive Tcell therapies. Leukemia. 2019;33(4):1039-1043.
29. Pfister O, Lorenz V, Oikonomopoulos A, et al. FLT3 activation improves post-myocardial infarction remodeling involving a cytoprotective effect on cardiomyocytes. J Am Coll Cardiol. 2014;63(10):1011-1019.
30. Willier S, Rothämel P, Hastreiter M, et al. CLEC12A and CD33 coexpression as a preferential target for pediatric AML combinatorial immunotherapy. Blood. 2021;137(8):1037-1049.
31. O'Brien MM, Ji L, Shah NN, et al. Phase II trial of inotuzumab ozogamicin in children and adolescents with relapsed or refractory B-cell acute lymphoblastic leukemia: Children's
Oncology Group protocol AALL1621. J Clin Oncol. 2022;40(9):956-967.
32. Cappell KM, Kochenderfer JN. A comparison of chimeric antigen receptors containing CD28 versus 4-1BB costimulatory domains. Nat Rev Clin Oncol. 2021;18(11):715-727.
33. Loftus JP, Yahiaoui A, Brown PA, et al. Combinatorial efficacy of entospletinib and chemotherapy in patient-derived xenograft models of infant acute lymphoblastic leukemia. Haematologica. 2021;106(4):1067-1078.
34. Lamble AJ, Tasian SK. Opportunities for immunotherapy in childhood acute myeloid leukemia. Hematology Am Soc Hematol Educ Program. 2019;2019(1):218-225.
35. Cortes JE, Khaled S, Martinelli G, et al. Quizartinib versus salvage chemotherapy in relapsed or refractory FLT3-ITD acute myeloid leukaemia (QuANTUM-R): a multicentre, randomised, controlled, open-label, phase 3 trial. Lancet Oncol. 2019;20(7):984-997.
36. Alotaibi AS, Yilmaz M, Kanagal-Shamanna R, et al. Patterns of resistance differ in patients with acute myeloid leukemia treated with type I versus type II FLT3 inhibitors. Blood Cancer Discov. 2021;2(2):125-134.
37. Mejstríková E, Hrusak O, Borowitz M, et al. CD19-negative relapse of pediatric B-cell precursor acute lymphoblastic leukemia following blinatumomab treatment. Blood Cancer J. 2017;7(12):659.
38. Chen L, Mao H, Zhang J, et al. Targeting FLT3 by chimeric antigen receptor T cells for the treatment of acute myeloid leukemia. Leukemia. 2017;31(8):1830-1834.
39. Jetani H, Garcia-Cadenas I, Nerreter T, et al. CAR T-cells targeting FLT3 have potent activity against FLT3(-)ITD(+) AML and act synergistically with the FLT3-inhibitor crenolanib. Leukemia. 2018;32(5):1168-1179.
40. Karbowski C, Goldstein R, Frank B, et al. Nonclinical safety assessment of AMG 553, an investigational chimeric antigen receptor T-cell therapy for the treatment of acute myeloid leukemia. Toxicol Sci. 2020;177(1):94-107.
41. Sommer C, Cheng HY, Nguyen D, et al. Allogeneic FLT3 CAR T cells with an off-switch exhibit potent activity against AML and can be depleted to expedite bone marrow recovery. Mol Ther. 2020;28(10):2237-2251.
42. Wang Y, Xu Y, Li S, et al. Targeting FLT3 in acute myeloid leukemia using ligand-based chimeric antigen receptorengineered T cells. J Hematol Oncol. 2018;11(1):60.
43. Tarlock K, Alonzo TA, Loken MR, et al. Disease characteristics and prognostic implications of cell-surface FLT3 receptor (CD135) expression in pediatric acute myeloid leukemia: a report from the Children's Oncology Group. Clin Cancer Res. 2017;23(14):3649-3656.
44. Pollard JA, Loken M, Gerbing RB, et al. CD33 expression and its association with gemtuzumab ozogamicin response: results from the randomized phase III Children's Oncology Group trial AAML0531. J Clin Oncol. 2016;34(7):747-755.
45. Lamble AJ, Eidenschink Brodersen L, Alonzo TA, et al. CD123 expression is associated with high-risk disease characteristics in childhood acute myeloid leukemia: a report from the Children's Oncology Group. J Clin Oncol. 2022;40(3):252-261.
46. Mehta NK, Pfluegler M, Meetze K, et al. A novel IgG-based FLT3xCD3 bispecific antibody for the treatment of AML and B-ALL. J Immunother Cancer. 2022;10(3):e003882.
47. Shah NN, Johnson BD, Schneider D, et al. Bispecific anti-CD20, anti-CD19 CAR T cells for relapsed B cell malignancies: a phase 1 dose escalation and expansion trial. Nat Med. 2020;26(10):1569-1575.
Haematologica | 108 February 2023 470 ARTICLE
al.
L.M. Niswander et
48. Spiegel JY, Patel S, Muffly L, et al. CAR T cells with dual targeting of CD19 and CD22 in adult patients with recurrent or refractory B cell malignancies: a phase 1 trial. Nat Med. 2021;27(8):1419-1431.
49. Brauchle B, Goldstein RL, Karbowski CM, et al. Characterization of a novel FLT3 BiTE molecule for the treatment of acute myeloid leukemia. Mol Cancer Ther. 2020;19(9):1875-1888.
50. Hofmann M, Grosse-Hovest L, Nubling T, et al. Generation, selection and preclinical characterization of an Fc-optimized
FLT3 antibody for the treatment of myeloid leukemia. Leukemia. 2012;26(6):1228-1237.
51. Yeung YA, Krishnamoorthy V, Dettling D, et al. An optimized fulllength FLT3/CD3 bispecific antibody demonstrates potent anti-leukemia activity and reversible hematological toxicity. Mol Ther. 2020;28(3):889-900.
52. Armstrong SA, Golub TR, Korsmeyer SJ. MLL-rearranged leukemias: insights from gene expression profiling. Semin Hematol. 2003;40(4):268-273.
Haematologica | 108 February 2023 471 ARTICLE -
fi
L.M. Niswander et al.
Monovalent and bispeci
c FLT3CART for AML and ALL
Translational readthrough at F8 nonsense variants in the factor VIII B domain contributes to residual expression and lowers inhibitor association
Maria Francesca Testa,1 Silvia Lombardi,1° Francesco Bernardi,1 Mattia Ferrarese,1 Donata Belvini,2 Paolo Radossi,3 Giancarlo Castaman,4 Mirko Pinotti1 and Alessio Branchini1
1Department of Life Sciences and Biotechnology and LTTA Center, University of Ferrara, Ferrara; 2Transfusion Service, Hemophilia Center and Hematology, Castelfranco Veneto Hospital, Castelfranco Veneto; 3Oncohematology-Oncologic Institute of Veneto, Castelfranco Veneto Hospital, Castelfranco Veneto and 4Center for Bleeding Disorders and Coagulation, Careggi University Hospital, Florence, Italy.
°Current address: Department of Biotechnology and Biosciences, University of MilanoBicocca, Milan, Italy.
Abstract
Correspondence: A. Branchini brnlss@unife.it M. Pinotti pnm@unife.it
Received: April 20, 2022.
Accepted: July 29, 2022. Prepublished: August 4, 2022.
https://doi.org/10.3324/haematol.2022.281279 ©2023 Ferrata Storti Foundation Published under a CC BY-NC license
In hemophilia A, F8 nonsense variants, and particularly those affecting the large factor VIII (FVIII) B domain that is dispensable for coagulant activity, display lower association with replacement therapy-related anti-FVIII inhibitory antibodies as retrieved from multiple international databases. Since null genetic conditions favor inhibitor development, we hypothesized that translational readthrough over premature termination codons (PTC) may contribute to immune tolerance by producing full-length proteins through the insertion of amino acid subset(s). To quantitatively evaluate the readthrough output in vitro, we developed a very sensitive luciferase-based system to detect very low full-length FVIII synthesis from a wide panel (n=45; ~60% patients with PTC) of F8 nonsense variants. PTC not associated with inhibitors displayed higher readthrough-driven expression levels than inhibitor-associated PTC, a novel observation. Particularly, higher levels were detected for B-domain variants (n=20) than for variants in other domains (n=25). Studies on plasma from six hemophilia A patients with PTC, integrated by expression of the corresponding nonsense and readthrough-deriving missense variants, consistently revealed higher FVIII levels for B-domain variants. Only one B-domain PTC (Arg814*) was found among the highly represented PTC not sporadically associated with inhibitors, but with the lowest proportion of inhibitor cases (4 out of 57). These original insights into the molecular genetics of hemophilia A, and particularly into genotype-phenotype relationships related with disease treatment, demonstrate that B-domain features favor PTC readthrough output. This provides a potential molecular mechanism contributing to differential PTC-associated inhibitor occurrence, with translational implications for a novel, experimentally based classification of F8 nonsense variants.
Introduction
Hemophilia A (HA [MIM: 306700]), caused by nucleotide variations in the F8 gene (MIM: 300841) that encodes the multi-domain protein coagulation factor VIII (FVIII),1 is one of the most frequent coagulation disorders.2 Standard treatment of severe HA, associated with bleeding in soft tissues, joints, and muscles,3 consists of frequent administrations of exogenous FVIII (replacement therapy),4 whose most frequent drawback is the development of inhibitory (anti-FVIII) antibodies against the infused factor.5,6 Among genetic components playing pathophysiological roles, which include the causative F8 variant and the HLA alleles,7 null genetic conditions such
as F8 large deletions have been found to confer a notable burden of risk. 8 Although it is well recognized that the more disruptive the F8 variant, the more likely the development of inhibitor is, nonsense variants confer a lower risk for inhibitors than envisaged for a potentially null genetic condition. 8-10
Nonsense variants are characterized by the introduction of premature termination codons (PTC) and are responsible for ~11% of human inherited disorders.11,12 Their pathogenic effect is related to the synthesis of truncated molecules with decreased stability and/or loss-of-function, coupled with nonsense-mediated decay of PTCbearing transcripts.13,14 In this view, since residual FVIII levels have been predicted to likely protect against in -
Haematologica | 108 February 2023 472 ARTICLE - Coagulation & its Disorders
hibitor development,15 traces of full-length proteins arising from translational readthrough might confer lower risk for inhibitors after HA treatment. As a matter of fact, translational readthrough, a low-frequency event 16 driven by PTC misrecognition and incorporation of amino acid subsets,17,18 might recode a nonsense to a sense codon producing traces of full-length proteins,19 as demonstrated in a few in vivo studies. 20,21 Translational readthrough is dictated by: (i) the “leakiness” of termination signals and the PTC sequence context, with the downstream nucleotide as a major determinant, 22 and (ii) the type of amino acid incorporated at the PTC position,17,18 which shapes the final protein output in terms of structure/function properties. However, the secreted and functional protein output of readthrough is driven by specific molecular determinants 22–27 even beyond the local nucleotide and protein contexts, as exemplified by the favorable localization of PTC in regions removed from the mature protein (i.e. in pre-peptides).28
Among the several FVIII domains (A1-A2-B-A3-C1-C2), the heavily glycosylated large B domain (908 residues) is removed upon processing/activation and is dispensable for coagulant activity,1,29,30 which has led to therapeutic products with a modified B domain 31 or devoid of this domain. 32,33 The potentially lower impact of B-domain genetic variations on FVIII biosynthesis/trafficking/secretion is reflected by the low number of HA-causing missense variants in this region, 34,35 thus providing a paradigmatic model to test the hypothesis of a favored protein output arising from readthrough. However, despite the hints provided by all these elements, a systematic investigation of F8 PTC, with a particular reference to B-domain PTC, and their association with inhibitor development, has not been performed so far. Here, to interpret the lower inhibitor incidence reported for patients affected by B-domain nonsense variants, we give experimental evidence through an optimized luciferase-based expression system for a higher readthrough output of F8 PTC affecting this domain. This opens the way for a new classification of F8 nonsense variants in relation with inhibitors, thus providing new insights into the molecular genetics of HA, and particularly the genetic components of the main complication of replacement therapy.
Methods
Nomenclature
Nucleotides and residues are numbered in accordance with the Human Genome Variation Society (HGVS) nomenclature, 36 with numbering starting at the A (+1) nucleotide of the AUG (codon 1) translation initiation codon.
Reference F8 sequence, databases and bioinformatic tools
Reference sequences for F8 are NG_011403.2 and NM_000132.4 (GenBank), and NP_000123.1 (GenPept). Genetic and epidemiological information related to the total number of patients with PTC (Ptstot), patients with inhibitor (Pts inh) and inhibitor-associated PTC (PTC inh) were retrieved from EAHAD,37 CHAMP,38 and HMGD.11 Inspection of gnomAD revealed the total number of annotated F8 missense changes, either pathogenic or not (asymptomatic). Full information is reported in the Online Supplementary Methods.
The impact of amino acid substitutions at the PTC positions was predicted by taking advantage of the Protein Variation Effect Analyzer (PROVEAN),39 Sorting Intolerant From Tolerant (SIFT),40 Polymorphism Phenotyping v2 (Polyphen-2),41 and Rare Exome Variant Ensemble Learner (REVEL)42 tools.
Expression studies
The F8 cDNA, cloned in the pCMV6-XL4 expression plasmid with the natural termination codon removed, was joined to the naturally secreted Gaussia luciferase (GL), obtaining the wild-type (WT) FVIII-GL chimera.43,44 The sequences of primers used to generate all variants are listed in Online Supplementary Table S1 . Full details of the cloning strategy are provided in the Online Supplementary Methods and Online Supplementary Figure S1 Site-directed mutagenesis of F8 cDNA to produce FVIII nonsense/missense variants, as well as transient transfection of human embryonic kidney (HEK293) cells, were essentially as described elsewhere. 24,28 Briefly, HEK293 cells, seeded in 48-well culture plates, were transfected with 400 ng of FVIII-GL-encoding plasmids, either WT or bearing nonsense (FVIII PTC)/missense (FVIII missense ) changes, in serum-free medium (Opti-MEM, Gibco, Life Technologies, USA) with Lipofectamine 2000 (Life Technologies) in a 1:1 DNA (µg):lipofectamine (µL) ratio. Transfection efficiency was evaluated by co-transfection with a GFP-coding construct (150 ng). The coefficient of variation for transfection efficiency calculated in our expression system was 12%.
Optimization of the luciferase-based expression system
Luciferase activity was revealed by the Gaussia Luciferase Flash Assay Kit (Thermo Fisher Scientific, USA). Luciferase activity, as relative luminescence units (RLU), was measured on a Glomax 20/20 luminometer (Promega, USA) by mixing 10 µL of medium or cell lysate with 50 µL of coelenterazine diluted in the provided assay buffer, as indicated by manufacturer’s instructions. Media and cell lysates, prepared according to the manufacturer’s instructions with the provided lysis buffer,
Haematologica | 108 February 2023 473 ARTICLE - F8 B-domain PTC readthrough output and inhibitors M. F. Testa et al.
were evaluated after collection at the tested time points (24, 36 and 48 hours) after transfection. Full details on the luciferase-based system as well as its optimization are provided in the Online Supplementary Methods and Online Supplementary Figures S2 and S3.
Patients
Plasma from HA patients was collected at Castelfranco and Careggi Hospital Hemophilia Centers during scheduled routine follow-ups and after a 4-day wash-out. All procedures, approved by the local ethics committees, were in accordance with the Helsinki Declaration, and patients gave written informed consent to participation in the study. FVIII antigen levels in plasma were evaluated by a polyclonal anti-human FVIII enzyme-linked immunosorbent assay (F8C-EIA, Affinity Biologicals).
Statistical analysis
Data were analyzed by correlation analyses and unpaired
t-tests through the GraphPad Prism software (San Diego, USA). The value of P<0.05 was considered as statistically significant.
Results
The combined data obtained from the international EAHAD, CHAMP and HGMD reference databases revealed a similar distribution of HA-associated PTC throughout the FVIII sequence (Figure 1A left panel, blue bars).
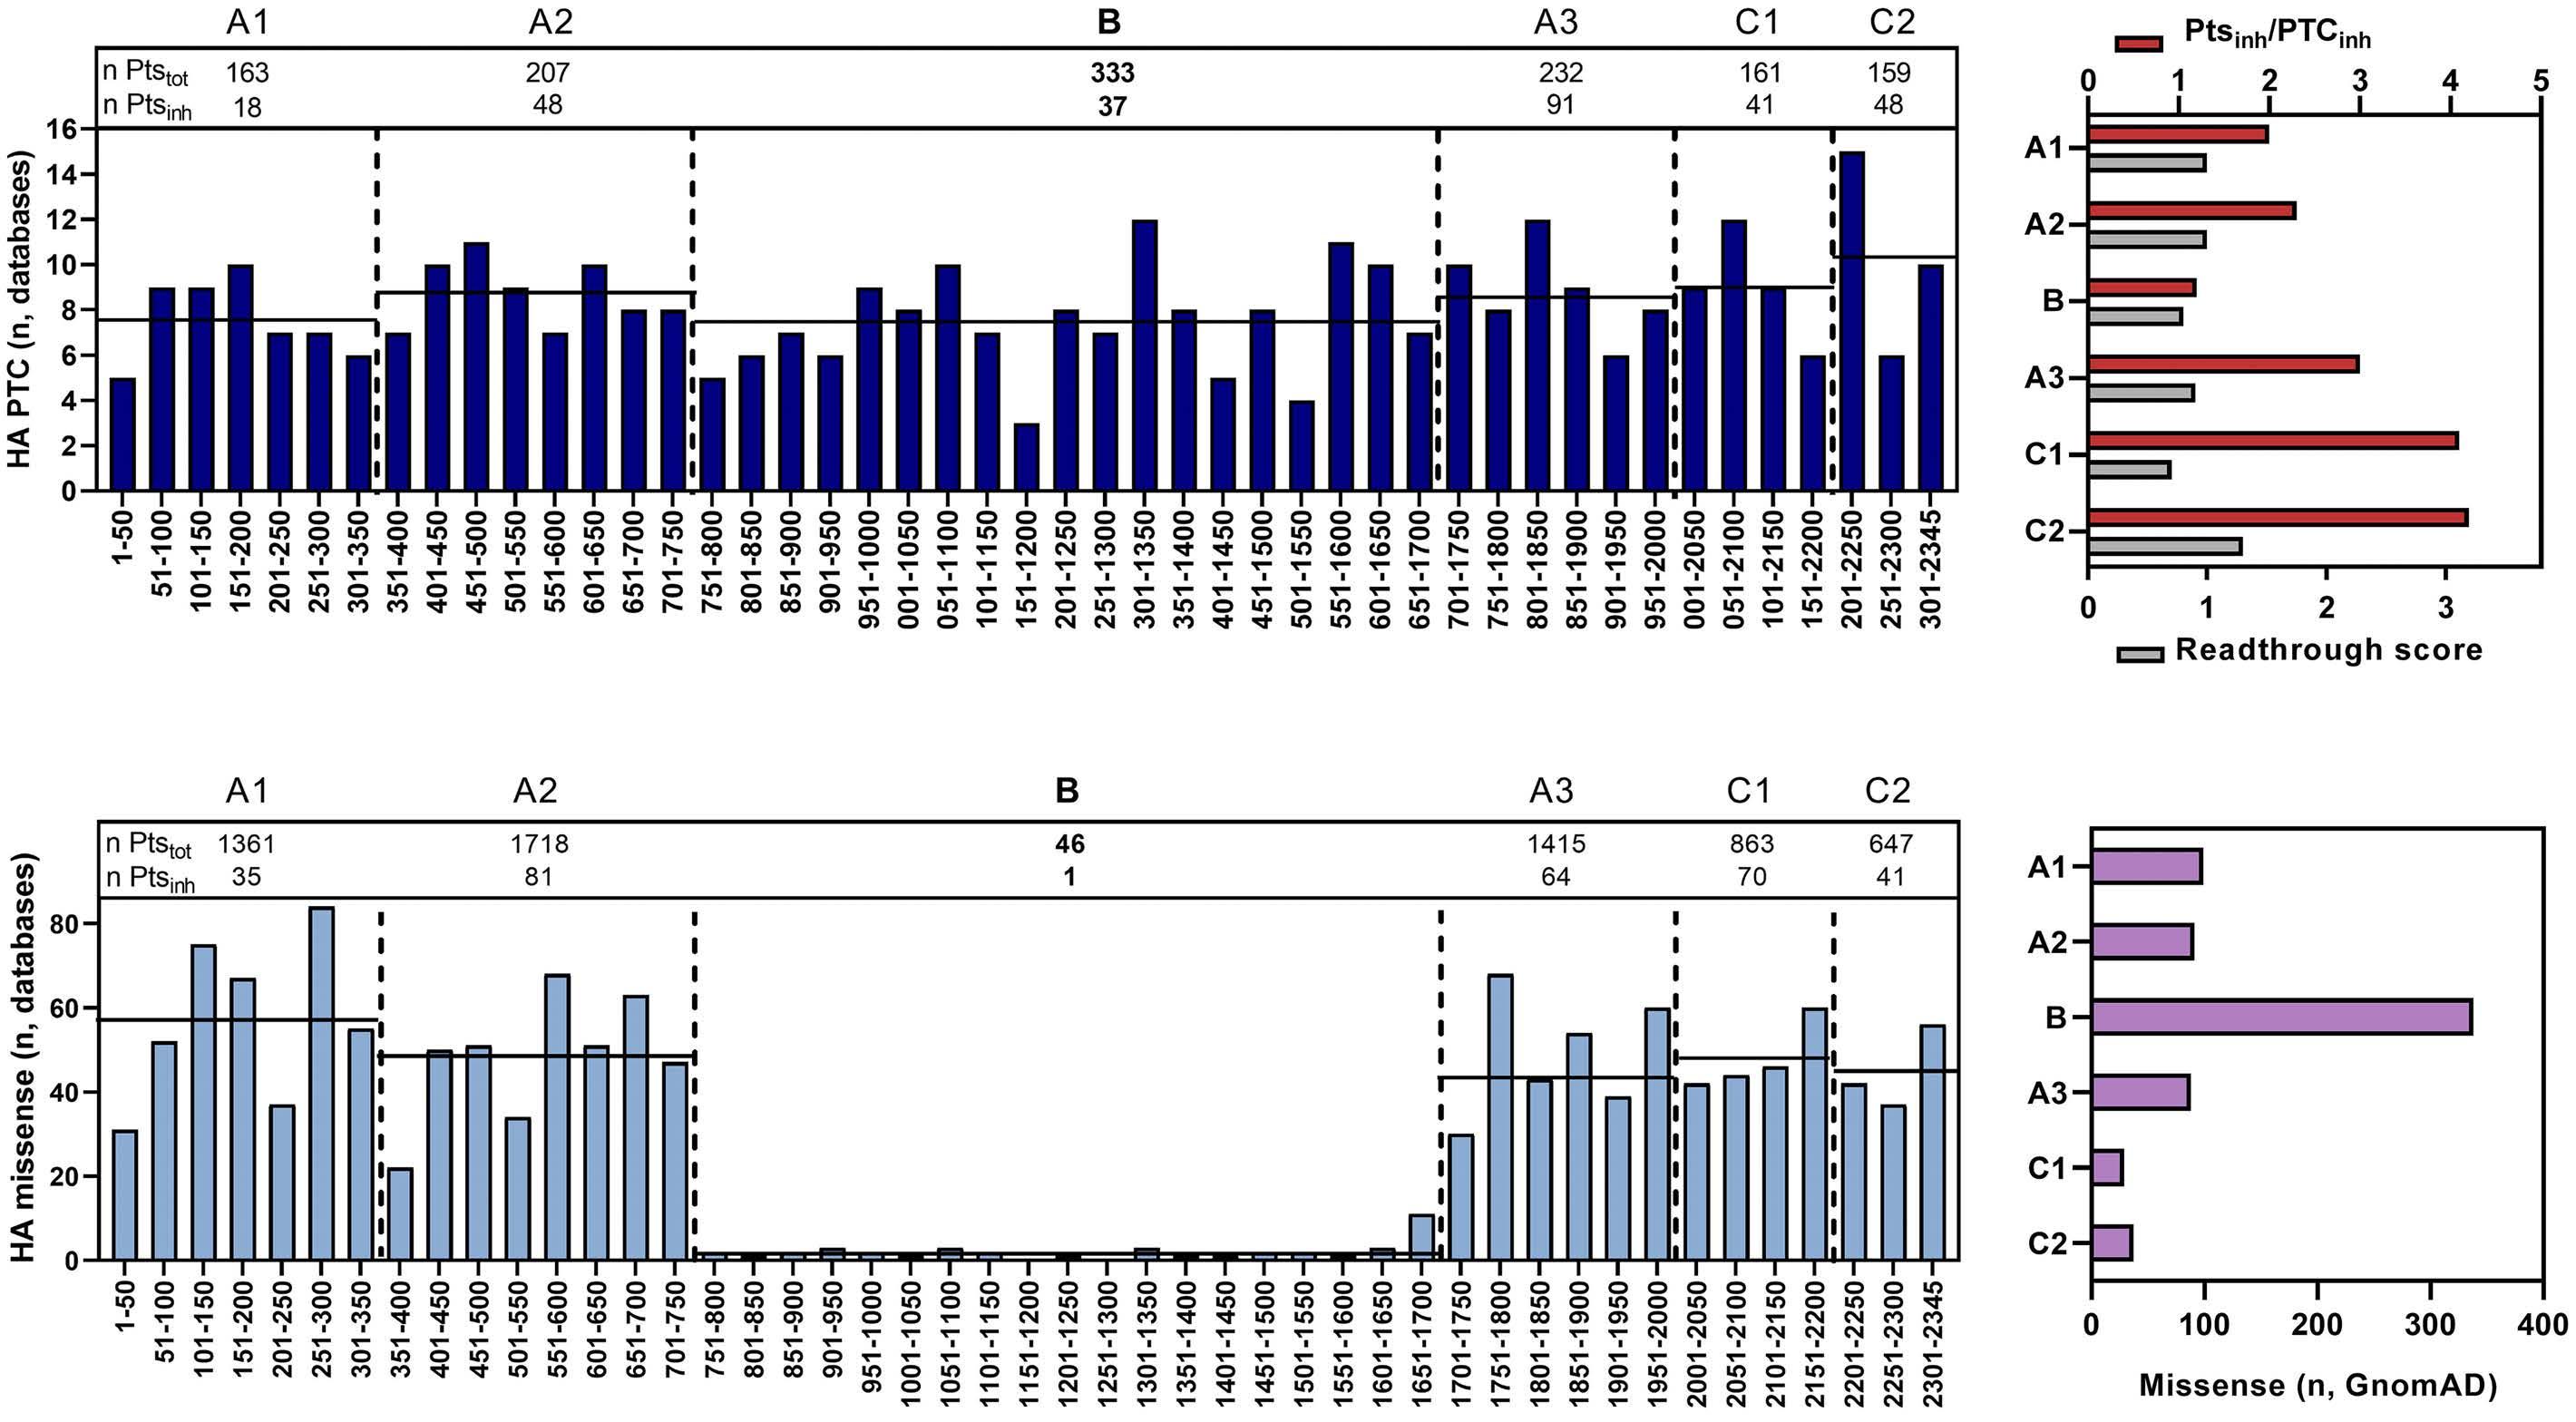
Within the FVIII domains, the mean number of PTC per 50 amino acids (Figure 1A left panel, horizontal black line) ranged from eight (A1 and B domains) to ten (C2 domain). However, the overall number of patients with PTC suffering from inhibitors (Ptsinh) as well as PTC associated with inhibitors (PTC inh) was low for the B domain, particularly considering its large size. The number of PTC found in at least one patient with inhibitor (PTCinh), and
Figure 1. Distribution of F8 nonsense and missense variants in the factor VIII sequence. (A) Left panel. Domains are compared for the total number of patients (n Ptstot) with F8 premature termination codons (PTC). The number of patients with an inhibitor is defined as n Ptsinh. Hemophilia A (HA) PTC (bars) reports the number of PTC depicted per 50 amino acids, namely the sum of each single PTC reported in the variant databases (see text for details) for each factor VIII (FVIII) sequence interval indicated. Black lines: mean number of PTC indicated per 50 amino acids for each domain. Right panel. Ratio (Ptsinh/PTCinh, red bars) between the number of patients with PTC who have developed inhibitors (Ptsinh) and the number of PTC found in at least one patient with inhibitor (PTCinh). Readthrough score (gray bars; according to Manuvakhova et al.22) predicted for all F8 PTC, indicated as the mean score for each FVIII domain. (B) Left panel. Domains are compared for the total number of patients (n Ptstot) with missense variants and the relative number of those with inhibitors (n Ptsinh). Bars represent the number of HA-associated missense variants, grouped as intervals of 50 amino acids in the FVIII sequence, reported in the international databases. Black lines: mean number of missense variants indicated per 50 amino acids for each domain. Right panel. Number of missense nucleotide changes reported in gnomAD.
A B Haematologica | 108 February 2023 474 ARTICLE - F8 B-domain PTC readthrough output and inhibitors M. F. Testa et al.
the number of inhibitor patients for each PTC (Pts inh), were used to calculate the Ptsinh/PTCinh ratio to preliminarily estimate susceptibility to inhibitor development as a function of FVIII domain localization. Interestingly, this ratio was lower for the FVIII B domain (Figure 1A right panel, red bars). Since the PTC nucleotide sequence context is a main determinant of readthrough, for each F8 PTC we further analyzed the predicted scores,22 which estimate the relative susceptibility of PTC to undergo readthrough, and thus potentially predict the level of production of full-length proteins. Readthrough scores were similar in the different domains, thus not supporting a preferential intrinsic susceptibility of B-domain PTC to readthrough (Figure 1A, right panel, gray bars; Online Supplementary Figure S4).
Further inspection of these databases showed a very low number of B-domain missense variants associated with HA (Figure 1B, left panel), whereas numerous missense changes in this region are annotated in gnomAD (Figure
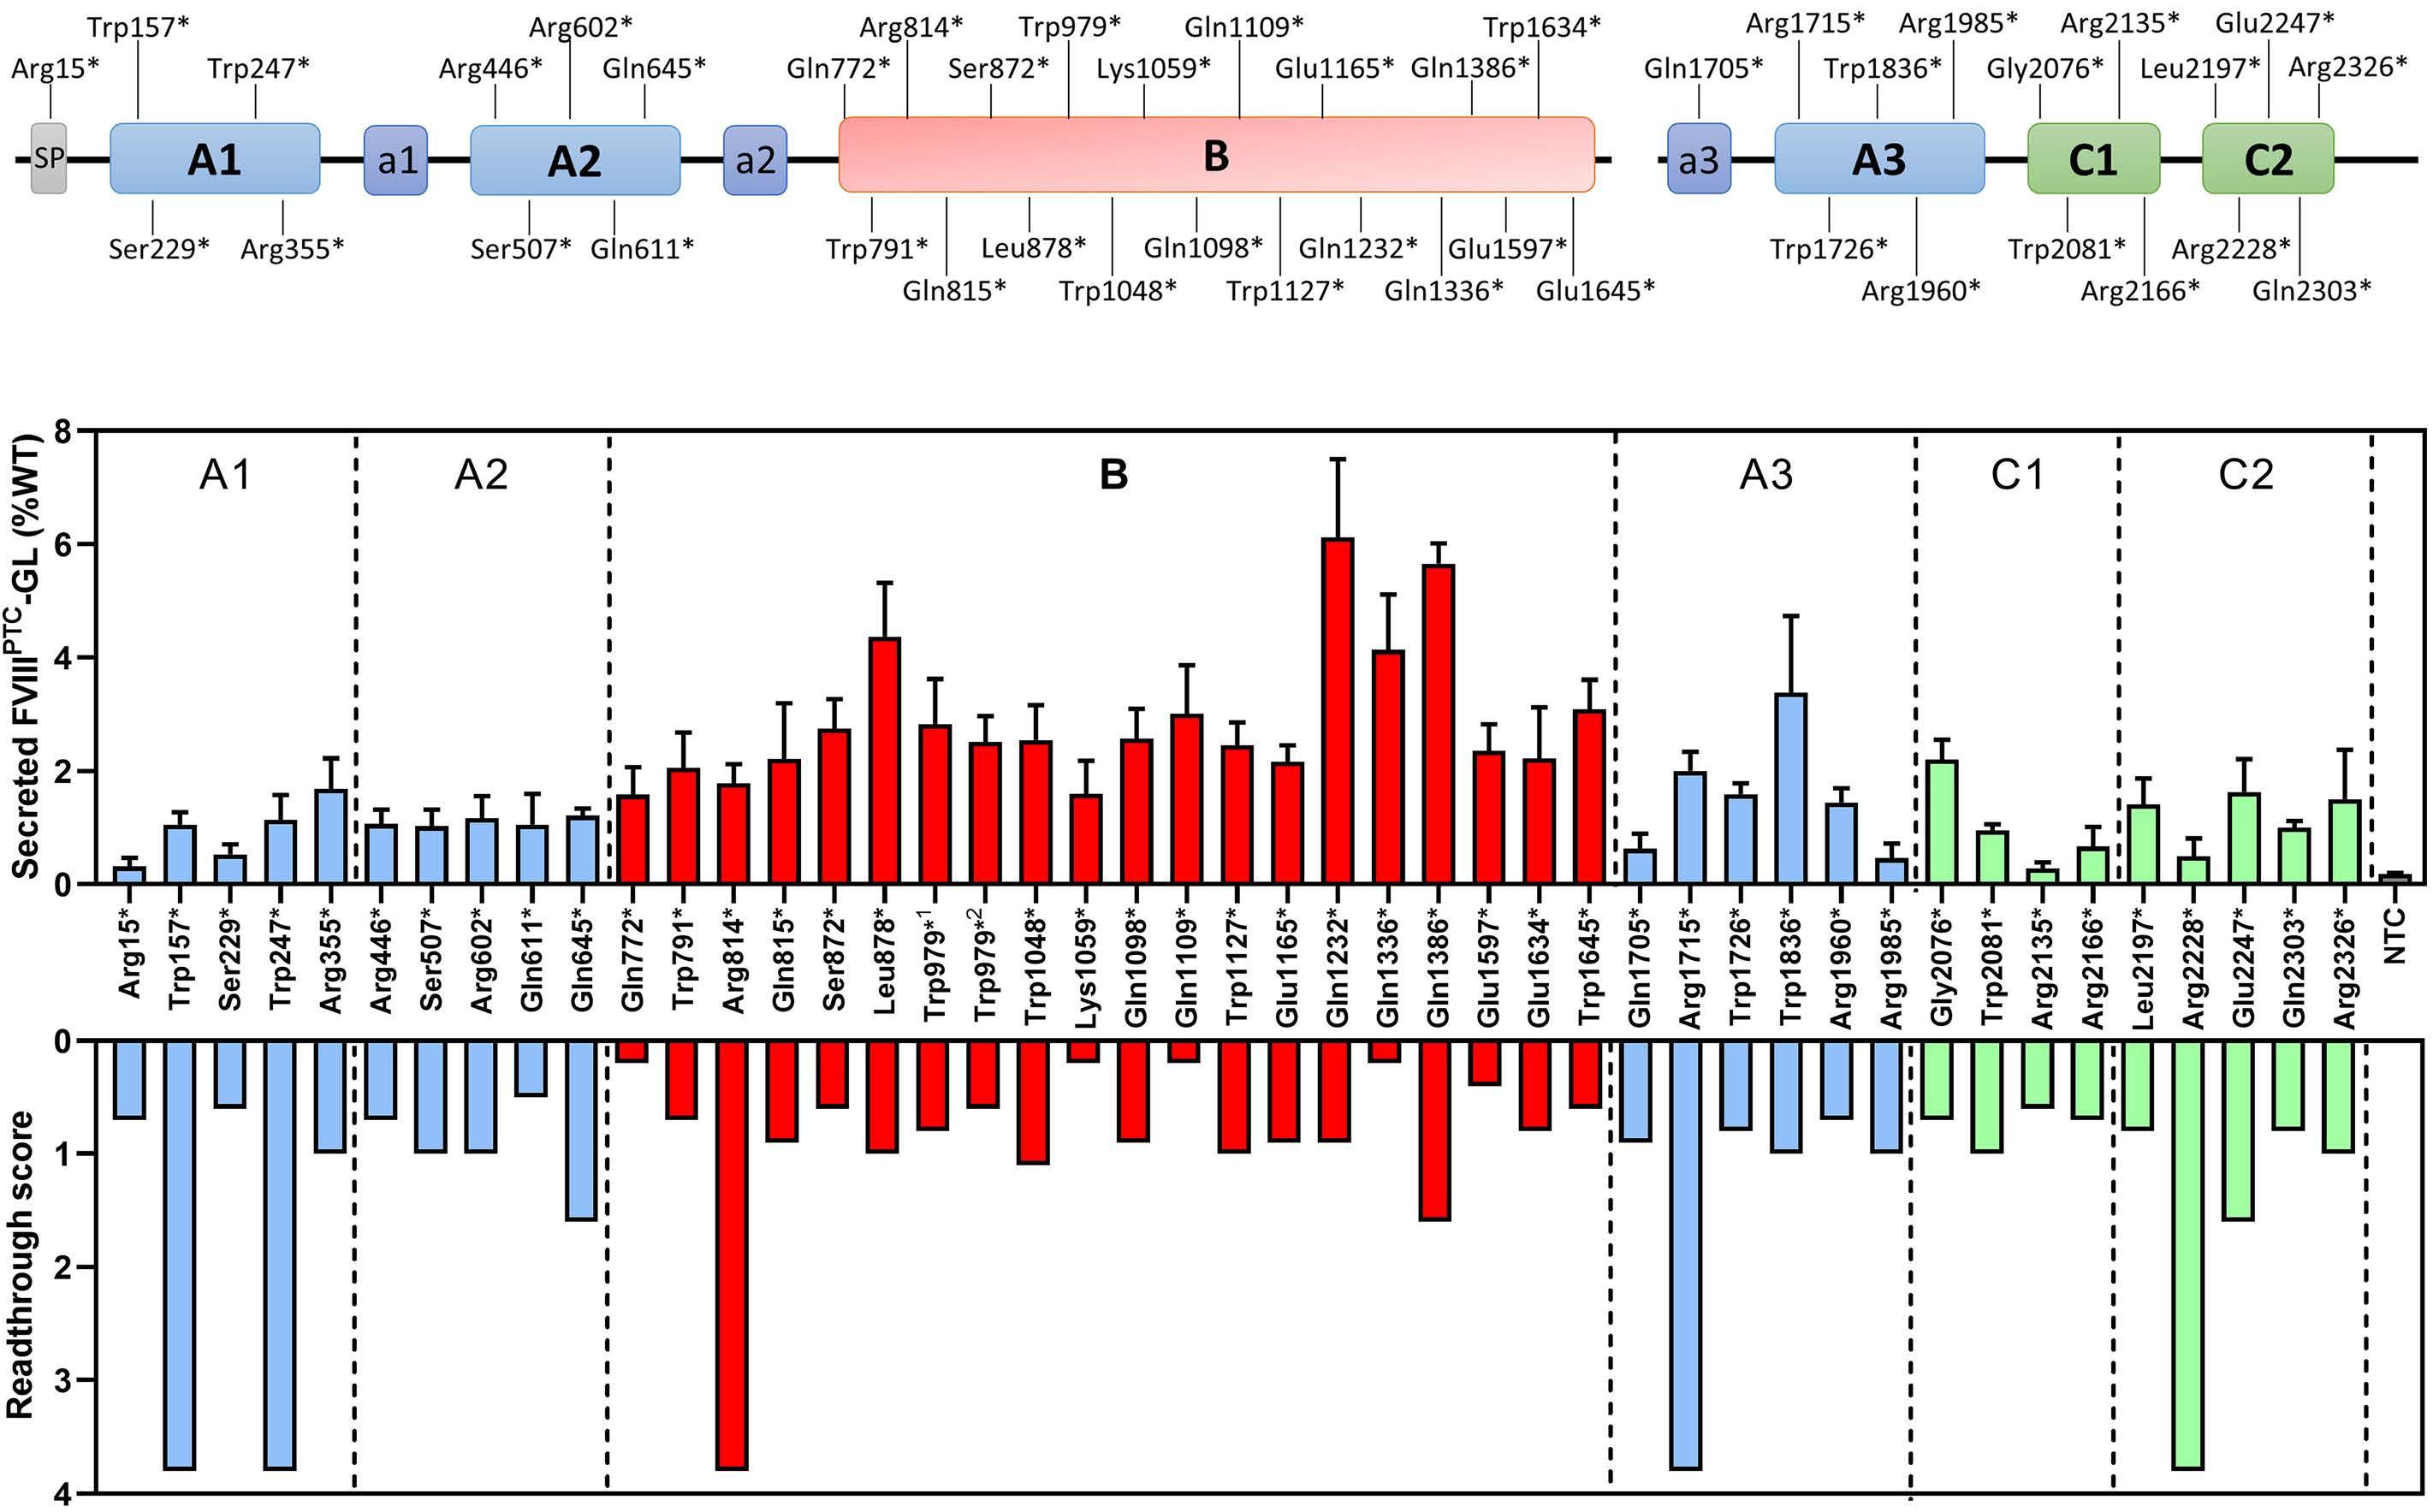
1B, right panel). This observation might be explained by the low degree of causality of most B-domain missense changes, and thus their low association with clinically relevant hemophilia.34,35
Integration of these database-derived data prompted us to hypothesize that the synthesis of full-length FVIII traces by translational readthrough, with potential missense changes introduced having a minor impact, might contribute to the lower association of B-domain nonsense variants with inhibitors.
B-domain premature termination codons display a high readthrough output
Intrigued by these observations, we experimentally investigated readthrough over a wide panel (n=45) of F8 PTC, including the most frequent at CpG sites,45,46 overall representing ~60% of HA patients with PTC (Figure 2A). In particular, we selected PTC as: (i) frequent (n. of patients >5) in the whole F8 sequence (PTC n=20), includ-
Figure 2. Investigation of F8 premature termination codons through expression studies with the FVIII-GL fusion protein. (A) Schematic representation of the factor VIII (FVIII) domain organization and relative position of the F8 premature termination codons introduced in the FVIII-GL fusion protein. The Trp979* variant was analyzed as TGA and TAG PTC, both frequent in the B domain. (B) Upper panel. Luciferase activity levels arising from readthrough of F8 PTC measured in medium from HEK293 cells expressing the PTC-bearing FVIII-GL chimeras. The last column on the right (gray) indicates the luciferase activity measured for the FVIII-GL chimera bearing the natural F8 termination codon (NTC) interposed between FVIII and Gaussia expressed as negative control. 1Trp979* TGA PTC; 2Trp979* TAG PTC. Results (mean ± standard deviation; n=4 replicates) are expressed as percentage of WT FVIII-GL. Lower panel. Readthrough score of investigated F8 PTC (according to Manuvakhova et al 22).
A B Haematologica | 108 February 2023 475 ARTICLE - F8 B-domain PTC readthrough output and inhibitors M. F. Testa et al.
ing those at CpG sites; (ii) frequent (n. of patients ≥3) in the B domain (PTC n=16); and (iii) PTC at which re-insertion of the WT residue is not predicted (PTC n=8), including the Trp979* PTC that was analyzed as frequent TGA and TAG PTC.
To evaluate the occurrence of readthrough in vitro , we optimized several components of a very sensitive luciferase-based system. In particular, we assessed: (i) timedependent expression; (ii) signal detection by including or not the Gaussia signal peptide as well as (iii) by separating fusion partners through a flexible linker; and (iv) background expression by interposing the F8 natural, two or three termination codons between FVIII and Gaussia (Online Supplementary Methods and Supplementary Figure S3). This allowed us to select the FVIII-GL direct fusion, joining FVIII and the mature Gaussia luciferase, and the time point at 48 hours after transfection to discriminate low/very low levels of readthroughderiving full-length FVIII. Facilitated by the high sensitivity of the optimized expression platform, we de-
tected large differences in expression levels among FVIIIPTC-GL variants, ranging from 6.1±1.4% of WT FVIII-GL for the Gln1232* (B domain) to 0.3±0.1% of the Arg2135* (C1) PTC variants (Figure 2B, upper panel). The relationship between secreted levels and readthrough scores for the selected PTC variants (Figure 2B, lower panel) was negligible (r=0.04, P=0.86).
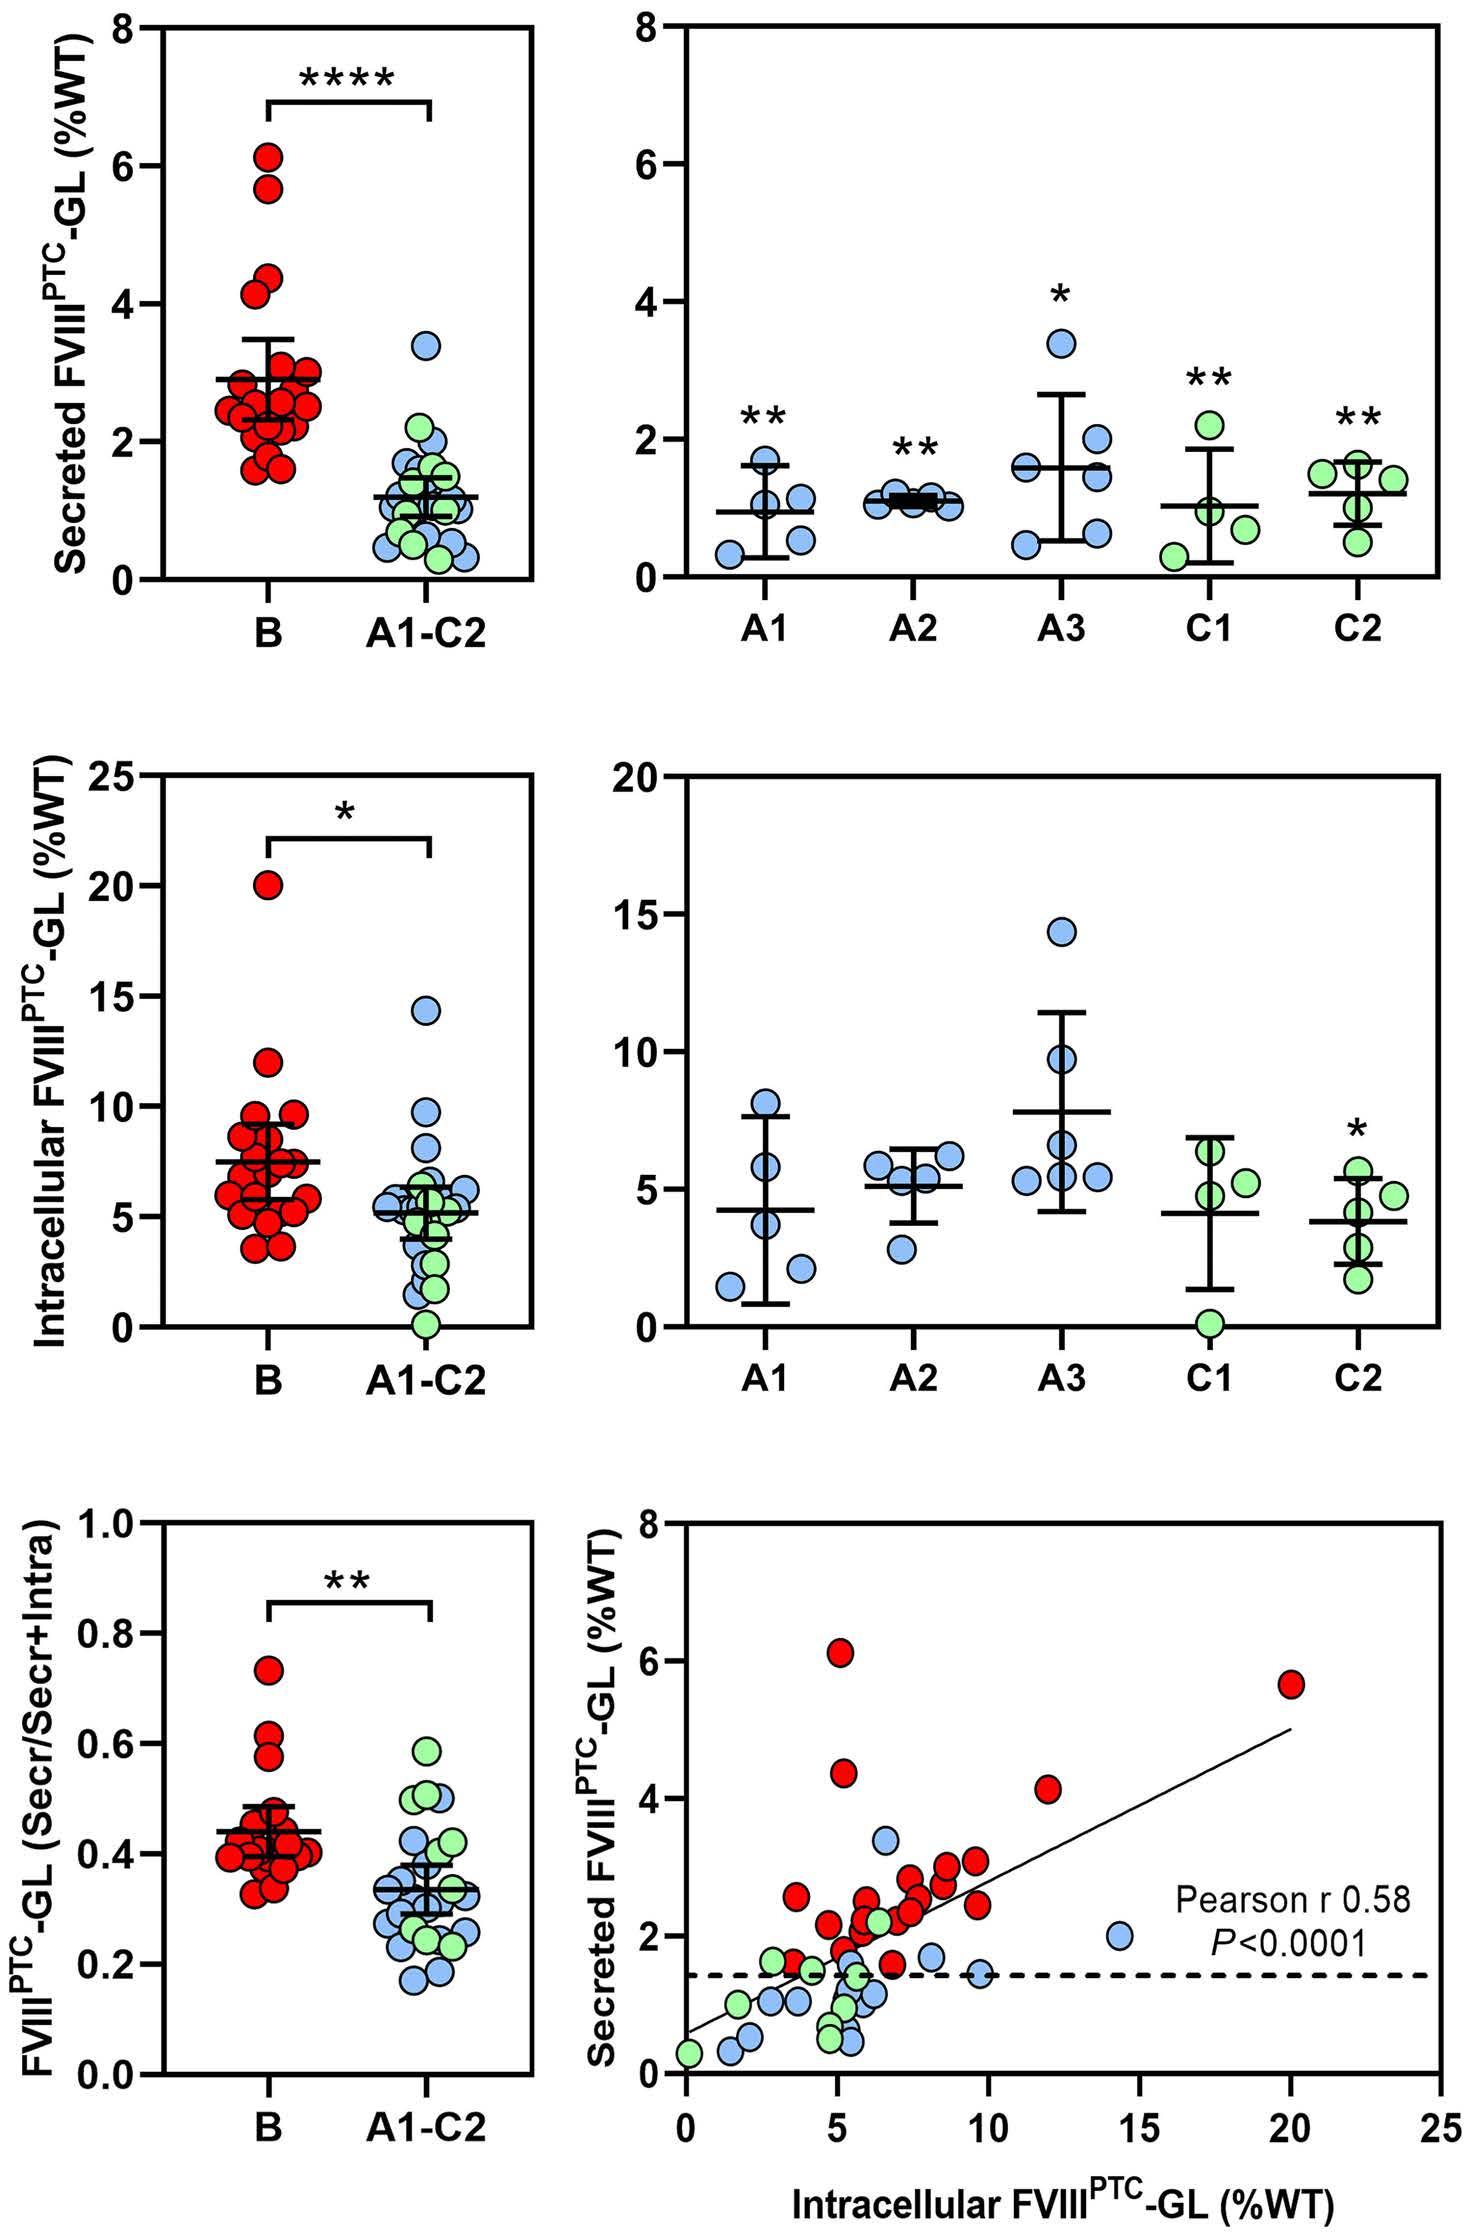
Notably, secreted FVIII PTC-GL levels for B-domain nonsense variants (range, 1.6-6.1%, mean 2.9%, confidence interval (CI): 2.3-3.4% of WT FVIII-GL) were significantly higher (P<0.0001) (Figure 3A, left panel) than those in the other domains (range, 0.3-3.4%, mean 1.2%, CI: 0.9-1.4%), even in domain-domain comparisons (Figure 3A, right panel). Differently, intracellular levels of FVIIIPTC-GL variants, ranging from 0.1% to 20% of WT, were slightly higher for PTC in the B domain (mean 7.4%, CI: 5.8-9.1%) than those in the A1-C2 group (mean 5.2%, CI: 4.1-6.3%) (Figure 3B).
Analysis of secreted levels as a function of the total readthrough products (secreted/secreted+intracellular)
Figure 3. Expression studies and analysis of F8 premature termination codon readthrough. (A) Comparison of luciferase activity levels of secreted full-length FVIII-GL between factor VIII (FVIII) B and A1-C2 domains (left panel) and in domain-domain comparisons (right panel). (B) Comparison of luciferase activity levels of intracellular FVIII-GL, measured in cell lysates, between FVIII B and A1-C2 domains (left panel) and in domain-domain comparisons (right panel). (C) Left panel. Comparison between secreted levels as a function of the total readthrough products (secreted/secreted+intracellular). Right panel. Correlation between luciferase activity levels measured in cell lysates (x axis) and in medium (y axis). Results in (A-C) left panel (mean ± 95% confidence interval) are expressed as percentage of WT FVIII-GL. *P<0.05; **P<0.005; ****P<0.0001.
A B C Haematologica | 108 February 2023 476 ARTICLE - F8 B-domain PTC readthrough output and inhibitors M. F. Testa et al.
(Figure 3C, left panel), and particularly the good correlation between intracellular and secreted FVIII levels (r=0.58, P <0.0001) (Figure 3C, right panel) corroborates the qualitative/quantitative features of readthrough over F8 PTC, and further supports the higher readthrough output for those in the B domain.
Consistent in vivo and in vitro data support higher readthrough protein outputs for B-domain premature termination codons
To corroborate in vitro findings, we evaluated FVIII levels in plasma from six HA patients, four of them bearing highly frequent PTC at CpG sites (Table 1). The B-domain p.Arg814* (1.5±0.2% of reference plasma) and p.Lys1289* (2.1±0.1%) nonsense variants were associated with appreciable antigen levels that were significantly higher (Online Supplementary Table S2, upper part) than those of the p.Arg446* (0.2±0.04%), p.Trp1726* (0.7±0.2%), p.Arg1985* (0.4±0.1%) and p.Arg2135* (0.3±0.1%) variants (Figure 4A, yellow bars; Figure 4B, left panel). In FVIIIPTC-GL expression studies with the six nonsense variants (Table 1), the B-domain Arg814* (1.9±0.3% of WT FVIII-GL) and Lys1289* (2.1±0.2%) showed the highest levels (Figure 4A, light blue bars and Online Supplementary Table S2, middle part; Figure 4B, right panel). To estimate the impact of amino acid substitutions at PTC positions, we took advantage of the PROTEAN, SIFT,
PolyPhen-2 and REVEL bioinformatic tools. This analysis showed variable impacts for amino acid substitutions at Bdomain PTC and consistently detrimental effects for changes at the other PTC positions (Table 1).
To obtain experimental findings, we expressed the most provide readthrough-deriving missense variants (FVIIImissenseGL) (Table 1). We detected intermediate/high (30-100%) secreted levels for the Arg814Trp, Lys1289Tyr/Gln and Arg446Trp, and low (5-15%) levels for the Trp1726Tyr, Arg1985Trp and Arg2135Trp missense variants (Figure 4A, blue bars). B-domain missense variants were those with the highest levels in single (Online Supplementary Table S2, lower part) as well as in group (Figure 4C) comparisons. In addition, even the non-conservative arginine-to-tryptophan substitution, predicted for the frequent TGA PTC at CpG sites, permitted significantly higher secreted levels for the B-domain Arg814Trp substitution as compared with Arg446Trp, Arg1985Trp and Arg2135Trp in the A2-A3-C1 domains (Online Supplementary Figure S5).
To compare the overall profile of plasma and recombinant nonsense/missense variants, we performed correlation analyses. Notably, a good correlation was observed between plasma (yellow) and FVIIIPTC-GL (light blue) levels (r=0.90, P=0.0056) (Figure 4D), as well as between secreted FVIIIPTCGL and secreted FVIIImissense-GL (blue) (r=0.93, P=0.0022) (Figure 4D). These correlations further highlighted the higher
Table 1. Nonsense variants in patients with hemophilia A under study and prediction of amino acid substitutions at premature termination codon positions.
++ 0.960 +++ 0.398 –2 p.Lys1289* B c.3865A>T TAA No No – -1.16 – 0.030 +/++ 0.320 – 0.320 –4 p.Trp1726* A3 c.5177G>A TAG No Yes +++ -11 +++ 0.000 +++ 1.000 +++ 0.852 +++ 49 p.Arg1985* A3 c.5953C>T TGA Yes No +++ -4.98 ++ 0.000 +++ 1.000 +++ 0.700 ++ 52 p.Arg2135* C1 c.6403C>T TGA Yes Yes +++ -5.94 ++ 0.000 +++ 1.000 +++ 0.704 ++
aEAHAD, CHAMP and HGMD databases (see text). bInhibitor status, indicated as frequency (inhibitor patients/total patients), was arbitrarily defined as + (frequency 0.01-0.1), ++ (0.1-0.2) and +++ (>0.2). cFor PROVEAN and SIFT (http://provean.jcvi.org/protein_batch_submit.php?species=human) and Polyphen-2 (http://genetics.bwh.harvard.edu/pph2/) the scores are referred to readthrough-mediated amino acid insertions (TGA, Trp/Cys/Arg; TAG/TAA, Tyr/Gln/Lys), including those derived from non-single nucleotide changes; REVEL (https://sites.google.com/site/revelgenomics/) scores are referred to precomputed amino acid changes resulting from single nucleotide changes, not including readthrough-deriving insertions but indicating the impact of possible natural substitutions at these positions. dCutoff scores were arbitrarily defined as tolerated (–, >-2.5), slightly damaging (+, from -2.5 to -4.5), moderately damaging (++, from -4.5 to -6.5), and severely damaging (+++, <-6.5). eCutoff scores were arbitrarily defined as tolerated (–, >0.05), slightly damaging (+, 0.05-0.03), moderately damaging (++, 0.03-0.01), and severely damaging (+++, <0.01). fCutoff scores were arbitrarily defined as tolerated (–, ≤0.45), slightly damaging (+, 0.45-0.7), moderately damaging (++, 0.7-0.9), and severely damaging (+++, >0.9). gCutoff scores were arbitrarily defined as tolerated (–, ≤0.45), slightly damaging (+, 0.4-0.6), moderately damaging (++, 0.6-0.8), and severely damaging (+++, >0.8). FVIII: factor VIII; PTC: premature termination codon.
Genetic data a Inhibitor statusb Bioinformatic prediction of amino acid substitutionsc Patients 'number Protein variant FVIII domain Nucleotide change PTC CpG site Study patients International databasesa,b PROVEANd Impact SIFTe Impact PolyPhen-2f Impact REVELg Impact 42 p.Arg446* A2 c.1336C>T TGA Yes No +++ -3.14 + 0.030 +/++ 1.000 +++ 0.605 ++ 57 p.Arg814* B c.2440C>T TGA Yes No –/+ -0.46 – 0.020
Haematologica | 108 February 2023 477 ARTICLE - F8 B-domain PTC readthrough output and inhibitors M. F. Testa et al.
Figure 4. Studies in the plasma of patients with hemophilia A and expression studies on corresponding nonsense and missense variants. (A) Comparison among factor VIII (FVIII) residual levels found in the plasma of patients with hemophilia A (HA) (FVIIIPTC Ag, yellow bars), luciferase activity levels of secreted FVIII-GL chimeras bearing patients' premature termination codons (PTC) (FVIIIPTC-GL, light blue bars), and FVIII-GL chimeras bearing the most frequent amino acid(s) inserted by readthrough (FVIIImissense-GL, blue bars) over the six PTC found in patients (for the Lys1289* PTC both the Lys1289Tyr and Lys1289Gln missense variants, predicted to be comparably frequent,17,18 were expressed). (B, C) Comparison of FVIII levels (as reported in A) between FVIII B and A1-C2 domain groups. (D) Correlation analysis of FVIII levels measured in HA plasma (yellow) versus luciferase activity levels of secreted FVIIIPTC-GL variants (light blue), and secreted levels of FVIIIPTC-GL variants versus secreted FVIIImissense-GL variants (blue). The box highlights the B-domain nonsense and missense variants showing the highest levels in all comparisons. Results (mean ± standard deviation; n=4 replicates) are expressed as percentage of reference (pooled normal plasma, PNP, for patients' plasma; WT FVIII-GL for recombinant variants). **P<0.01.
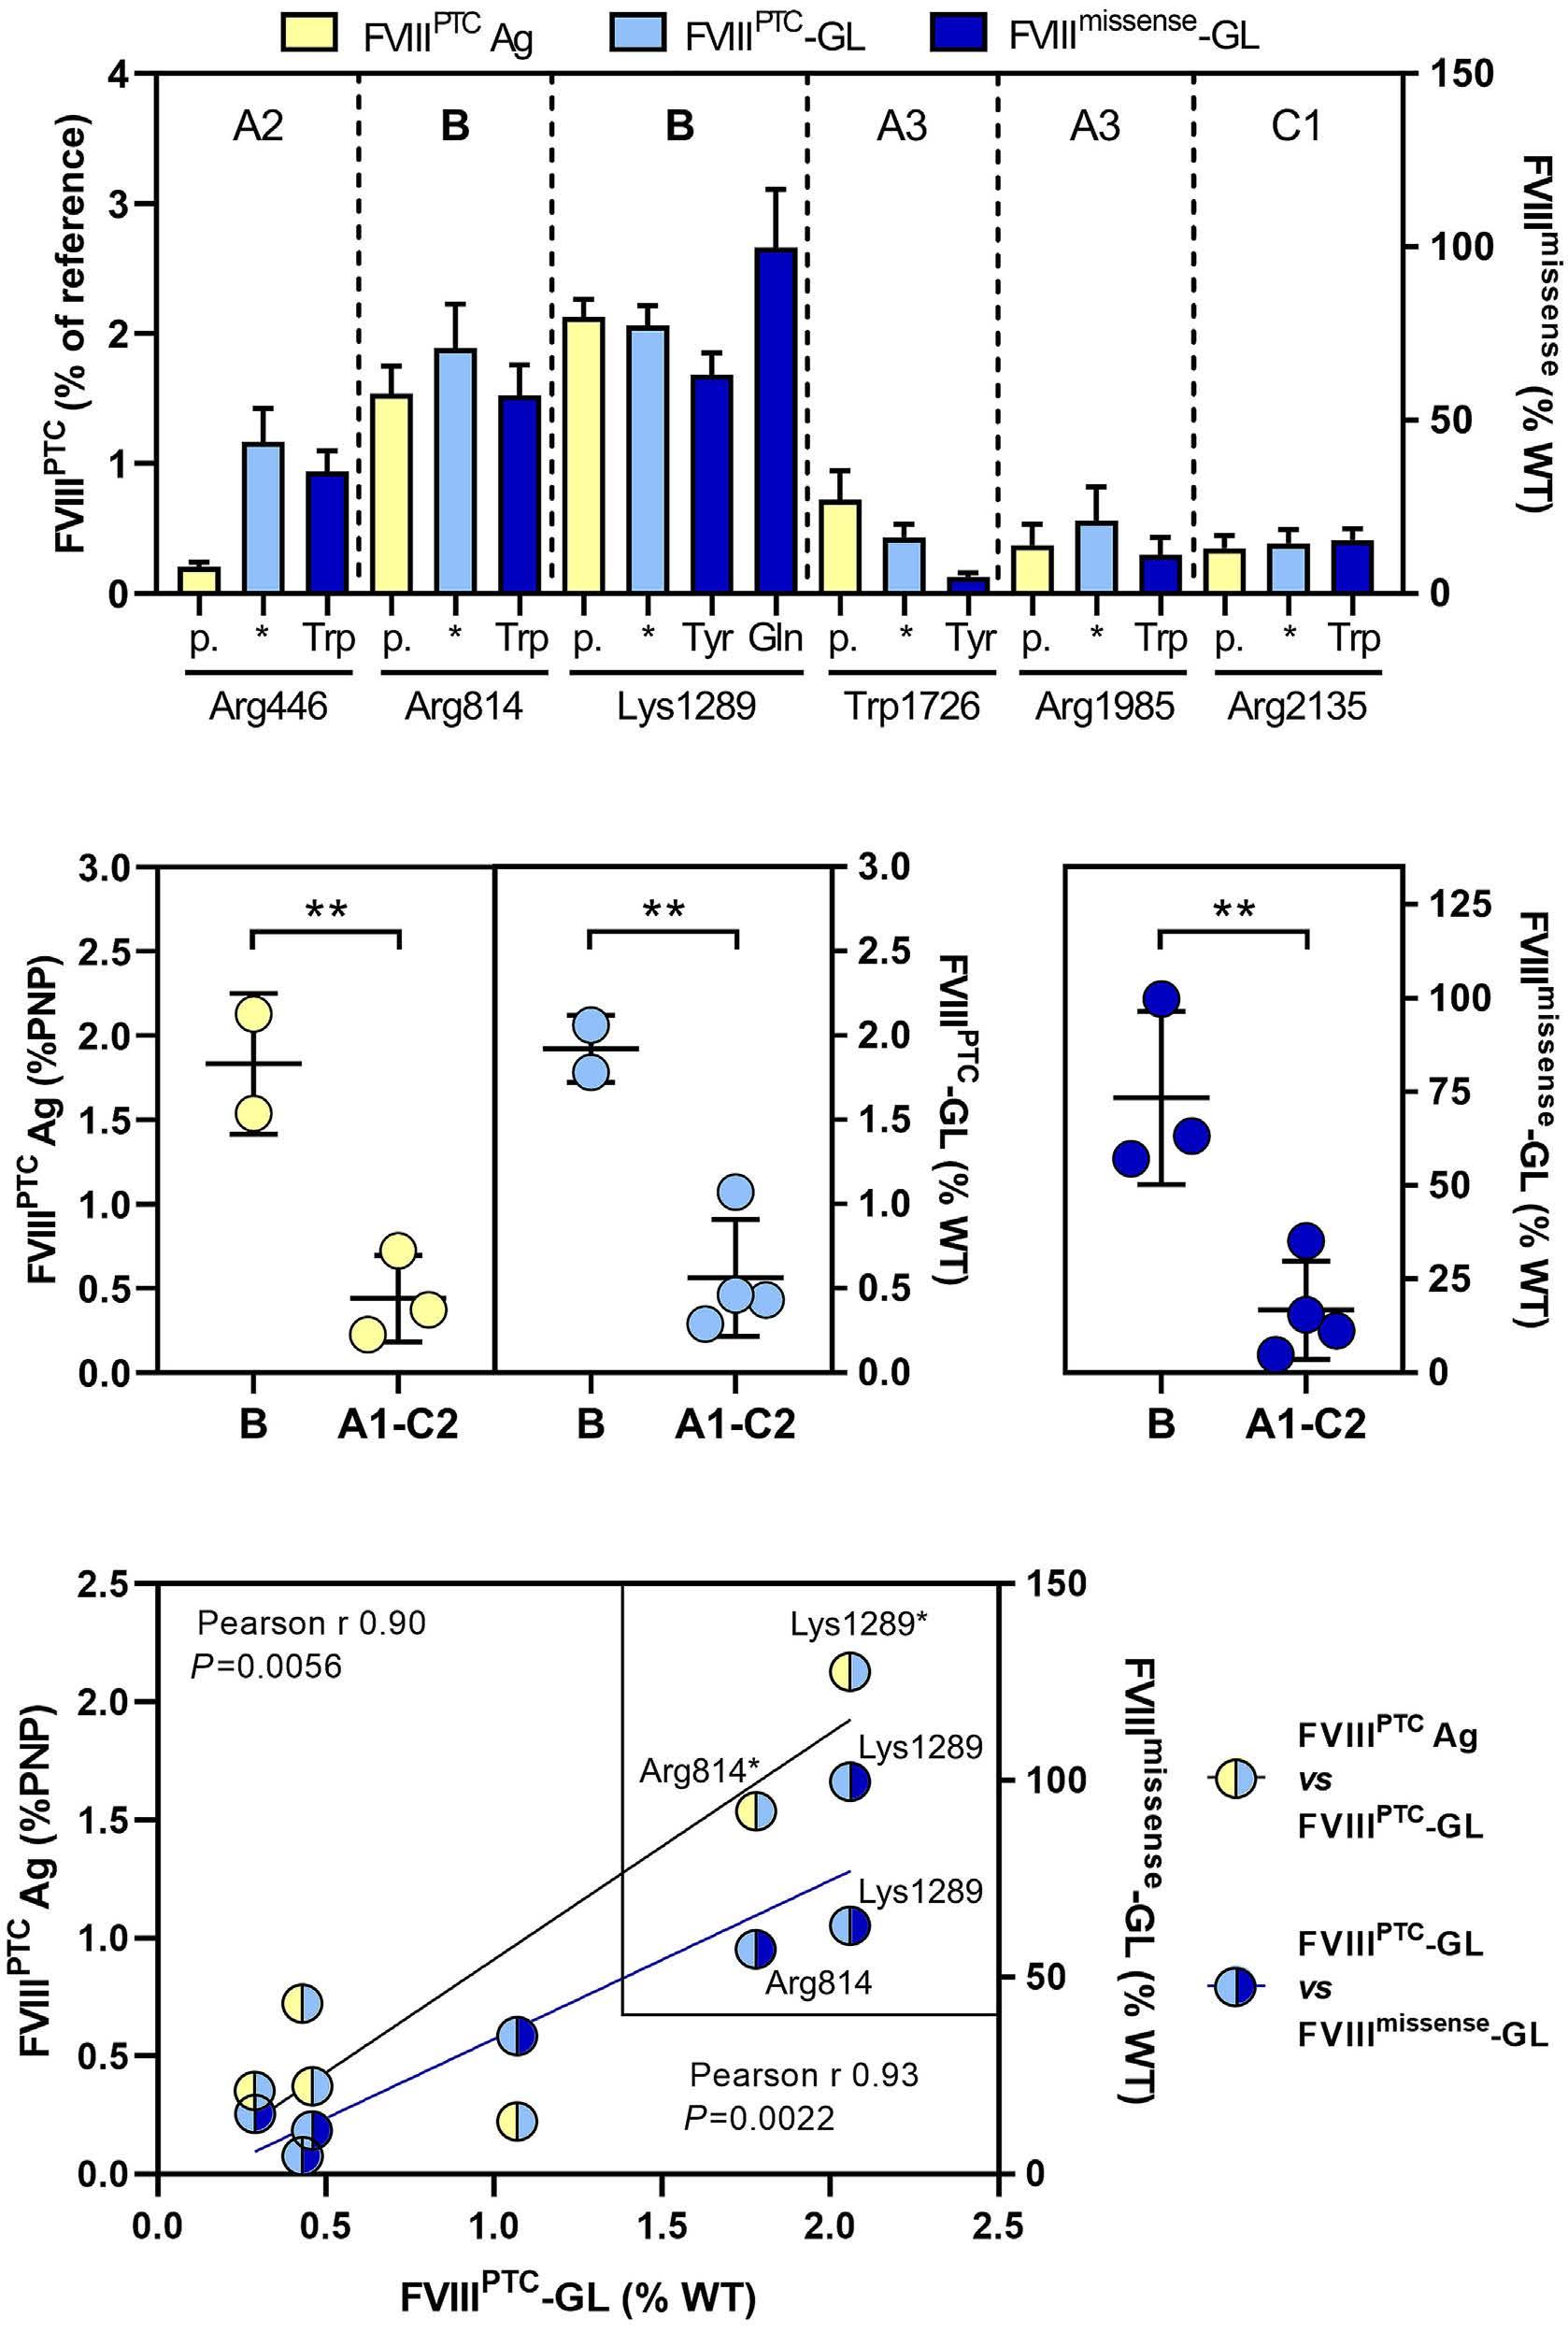
secretion profile of B-domain nonsense and missense variants (Figure 4D, boxed circles).
Secreted FVIII-GL levels are higher for premature termination codons associated with low inhibitor incidence
We compared the secreted levels of all expressed PTC variants in relation to the reported inhibitor status. To this purpose, we categorized F8 PTC as not associated with inhibitors (NO inh) or, to exclude confounding effects of sporadic events, reported to be inhibitor-associated in more than one patient (inh>1). Mean secreted levels of the nonsense variants belonging to the NO inh group were significantly higher than those of the inh>1 group (Figure 5A, left panel). Among the PTC variants in the NO inh
group (total n=21), those in the B domain (n=14) represented the major component. The inhibitor patients’ group included only two B-domain PTC variants (Arg814* and Lys1059*) versus 17 A1-C2 PTC. The highly frequent (n. of Ptstot>10) CpG PTC variants, collectively affecting more than 100 HA patients with inhibitors, were in the lowest tertile of the overall distribution of FVIII-GL levels (Figure 5A, right panel). Interestingly, the B-domain Arg814* is highly frequent (57 patients) (Table 1) and displayed the lowest proportion of patients with inhibitors (4 out of 57). The Arg814* variant produced relatively low expression levels among B-domain PTC, and relatively high levels among inhibitor-associated PTC. We further categorized highly frequent PTC to highlight those most associated with inhibitors (Ptsinh>10). Interestingly, secreted recom-
A B C D Haematologica | 108 February 2023 478 ARTICLE - F8 B-domain PTC readthrough output and inhibitors M. F. Testa et al.
binant FVIII levels were significantly higher in the Ptsinh<10 than in the Ptsinh>10 group (Figure 5B). The analysis of expression levels coherently suggests that a higher readthrough-mediated protein output, resulting in higher residual levels of full-length FVIII, is associated with a lower inhibitor occurrence for B-domain PTC.
Discussion
Nonsense variants alter gene expression and shape patients’ phenotypes through multiple mechanisms, including nonsense-mediated mRNA decay and/or the formation of truncated proteins with reduced or no function.13,14,47 However, PTC suppression mediated by translational readthrough might produce traces of full-length proteins through insertion of amino acid subsets. Albeit occurring with low efficiency,16 this recoding process might have an impact on the outcome of human genetic disorders, and particularly on HA as a two-layer modulator of the resulting disease phenotypes, the bleeding tendency and the immune response to exogenous FVIII infused for therapy. F8 nonsense variants are associated with a lower risk of developing inhibitors than that expected for a potentially null genetic condition.9,10 Since residual FVIII expression is predicted to disfavor inhibitor development,15 readthrough emerges as a plausible candidate to lower the association of nonsense variants with inhibitors. Based on premises such as the: (i) lower occurrence of inhibitors associated with PTC in the B domain as compared with those in the other domains; (ii) very low number of HA-causative B-domain missense variants; and
(iii) high number of annotated but not HA-associated missense nucleotide changes in the B domain, we hypothesized a higher degree of FVIII protein output upon translational readthrough at B-domain PTC. This hypothesis was tested through a sensitive system based on the FVIII-GL chimera, instrumental to discriminate low or very low full-length FVIII levels, hardly feasible through expression of the native FVIII. The optimized luciferasebased expression platform enabled the systematic investigation of a wide panel of F8 PTC representing a large proportion (~60%) of HA patients affected by PTC. The distribution of most B-domain nonsense variants in the higher expression range indicated a higher degree of readthrough for B-domain PTC, resulting from improved biosynthesis and secretion. This finding is modestly explained by the PTC sequence context, a component contributing to PTC readthrough susceptibility, as evaluated through the predicted score22 of each investigated PTC. In vitro data were consistent with residual FVIII levels measured in plasma from the investigated HA patients, with higher FVIII expression levels for B-domain PTC variants. To interpret the readthrough output in terms of amino acid substitutions inserted at the PTC, based on previous experimental evidence on relative frequencies of amino acid insertions,17,18 we expressed the most probable missense variants predicted to arise from readthrough. Biosynthesis/secretion of missense variants, driven by the features of the inserted residue(s) as well as by structural effects on the resulting protein variant, might provide information on the tolerance to amino acid substitutions in each affected domain. The correlation between secreted levels of (plasma/recombinant) nonsense and read-
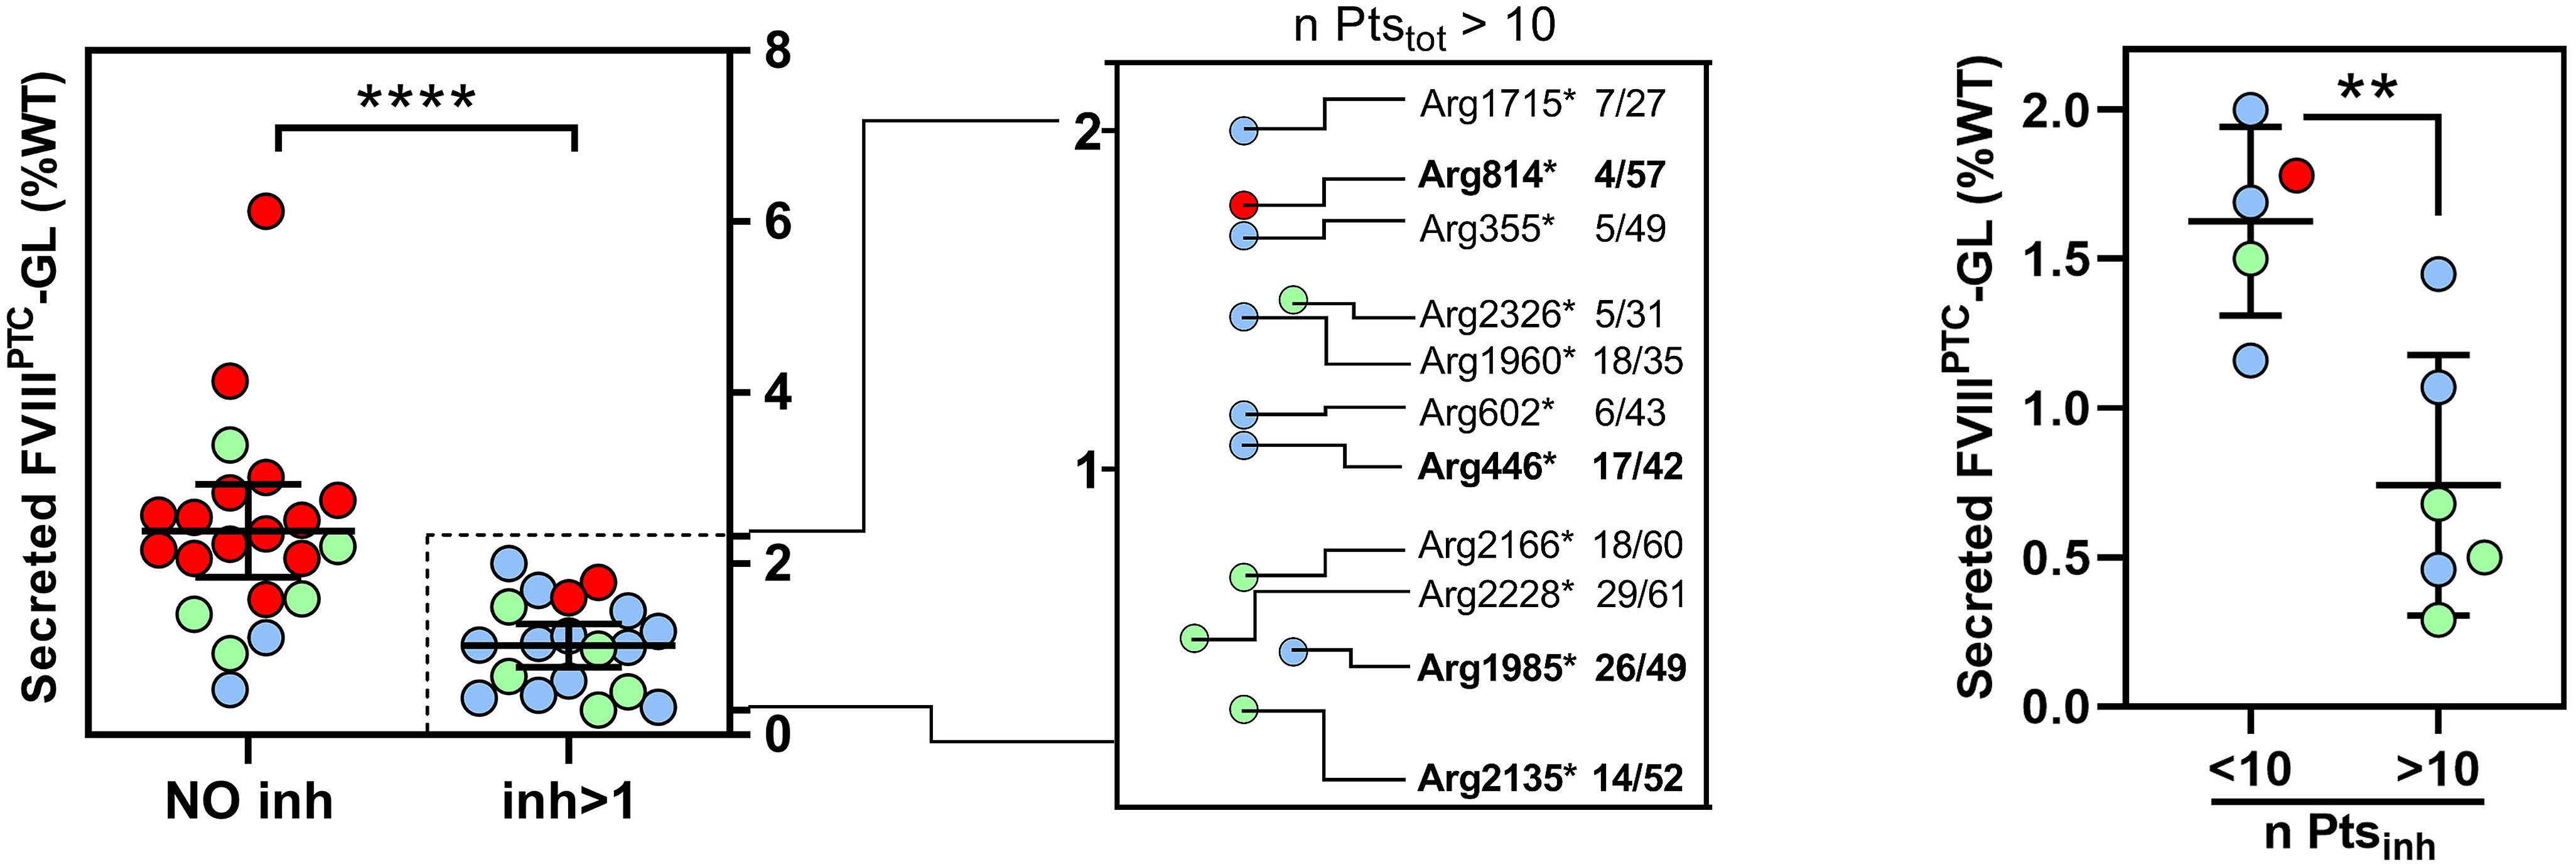
B
Figure 5. Association between residual factor VIII levels and inhibitor occurrence. (A) Left panel. Analysis of secreted levels obtained in expression studies on premature termination codons (PTC) grouped as not associated (NO inh) or associated in at least two patients with inhibitors (inh>1). Right panel. Magnification of the inh>1 group considering frequent PTC (CpG sites) with total patient number (n Ptstot) >10. The relative occurrence of patients with inhibitors on the total number of patients is indicated by the ratio on the right. PTC variants found in the investigated hemophilia A (HA) patients are highlighted in bold. (B) Comparison of secreted levels, obtained in recombinant expression studies, of PTC variants shown in the magnified inh>1 group and further categorized as PTC associated with <10 (inh<10) or >10 (inh>10) of HA patients with inhibitors. Results in (A) (mean ± 95% confidence interval) and (B) (mean ± standard deviation) are expressed as percentage of WT FVIII-GL. **P<0.01; ****P<0.0001.
A
Haematologica | 108 February 2023 479 ARTICLE - F8 B-domain PTC readthrough output and inhibitors M. F. Testa et al.
through-deriving missense variants supported the hypothesis of a favorable protein output for B-domain variants.
Concerning the relationship of our experimental findings with the occurrence of inhibitors, F8 PTC associated with inhibitors (inh>1) displayed lower readthrough-deriving expression levels than those not inhibitor-associated (NO inh), a novel observation in the field. It is worth noting that, in the inh>1 group, only two B-domain PTC are present, both showing the lowest secreted levels among all expressed B-domain PTC. Notably, among the highly represented PTC at CpG sites only one B-domain PTC (Arg814*) was present, albeit with the lowest proportion of cases with inhibitors (4 out of 57) and with relatively high expression levels. Importantly, expression studies suggest that PTC in the A1-C2 domains show lower readthrough levels, as also observed after readthrough induction by drugs,27 and higher association with inhibitors, with particular reference to the frequent CpG PTC reported in hundreds of HA patients.
We are aware of the limits of our study, namely the limited number of HA patients validating the recombinant system to evaluate F8 PTC readthrough, which however was indispensable to assess very low readthrough-related FVIII synthesis, hardly assessable in patients. Vice versa, the highly sensitive expression system might have slightly overestimated residual levels resulting from the most severe variants, particularly those (i.e., Arg1960* and Arg1985*, A3 domain; Arg2228*, C2 domain) strongly associated with inhibitors (~50% of patients).
Notwithstanding, our data provide experimental evidence for FVIII traces arising from readthrough that might have translational implications. It is worth noting that B-domain PTC readthrough, by favoring FVIII biosynthesis/secretion and reverting a null condition, would further reduce the immunogenicity of therapeutic FVIII by ensuring the synthesis of the native A3-C2 FVIII domains. As a matter of fact, genetic defects associated with the lack or alterations of the A3-C2 domains increase the development of inhibitory antibodies targeting these highly immunogenic regions on the infused FVIII.48-50 This further contributes to explain the lower association of B-domain PTC, favoring readthrough,
References
1. Thompson AR. Structure and function of the factor VIII gene and protein. Semin Thromb Hemost. 2003;29(1):11-22.
2. Castaman G, Matino D. Hemophilia A and B: molecular and clinical similarities and differences. Haematologica. 2019;104(9):1702-1709.
3. Peyvandi F, Garagiola I, Young G. The past and future of haemophilia: diagnosis, treatments, and its complications. Lancet. 2016;388(10040):187-197.
4. Mannucci PM. Hemophilia therapy: the future has begun. Haematologica. 2020;105(3):545-553.
with anti-FVIII inhibitory antibodies. In conclusion, through a systematic approach exploring a relevant number of F8 PTC, we provide original: (i) findings on molecular mechanisms potentially contributing to the low inhibitor occurrence in patients with PTC localized in the FVIII B domain; (ii) insights into HA molecular genetics, with a novel classification of F8 nonsense variants, which might assist genetic counseling in HA; and (iii) F8 genotype-phenotype relationships related with individual HA patients’ response to replacement therapy.
Disclosures
No conflicts of interest to disclosure.
Contributions
MFT created constructs and performed preliminary studies to optimize the expression system, performed expression studies with nonsense/missense fusion constructs, analyzed data and compiled figures; SL created plasmids encoding nonsense/missense FVIII-GL fusion proteins; MF performed enzyme-linked immunosorbent assays on patients’ plasma samples; DB, PR and GC enrolled patients, collected and processed blood samples, and collected written consents; AB conceived the study and designed research; and AB, FB and MP analyzed data and wrote the manuscript. All authors revised and approved the final version of the manuscript.
Acknowledgments
The plasmid containing human F8 cDNA (pBS-hF8) was a kind gift from Prof. John McVey (University of Surrey, UK).
Funding
This study was financially supported by the Grifols Martin Villar Haemostasis Award (AB), the Italian Association of Hemophilia Centers (AICE) (AB) and by the University of Ferrara through the “Fondo di Ateneo per la Ricerca (FAR)” (AB, MP, and FB).
Data-sharing statement
For original data, please contact brnlss@unife.it (AB) or pnm@unife.it (MP).
5. Astermark J. Overview of inhibitors. Semin Hematol. 2006;43(2 Suppl 4):S3-7.
6. Franchini M, Mannucci PM. Inhibitors of propagation of coagulation (factors VIII, IX and XI): a review of current therapeutic practice. Br J Clin Pharmacol. 2011;72(4):553-562.
7. Hart DP, Uzun N, Skelton S, et al. Factor VIII cross-matches to the human proteome reduce the predicted inhibitor risk in missense mutation hemophilia A. Haematologica. 2019;104(3):599-608.
8. Gouw SC, van den Berg HM. The multifactorial etiology of
Haematologica | 108 February 2023 480 ARTICLE - F8 B-domain PTC readthrough output and inhibitors M. F. Testa et al.
inhibitor development in hemophilia: genetics and environment. Semin Thromb Hemost. 2009;35(8):723-734.
9. Gouw SC, van den Berg HM, Oldenburg J, et al. F8 gene mutation type and inhibitor development in patients with severe hemophilia A: systematic review and meta-analysis. Blood. 2012;119(12):2922-2934.
10. Shinozawa K, Yada K, Kojima T, et al. Spectrum of F8 genotype and genetic impact on inhibitor development in patients with hemophilia A from multicenter cohort studies (J-HIS) in Japan. Thromb Haemost. 2021;121(5):603-615.
11. Krawczak M, Ball EV, Fenton I, et al. Human gene mutation database-a biomedical information and research resource. Hum Mutat. 2000;15(1):45-51.
12. Mort M, Ivanov D, Cooper DN, Chuzhanova NA. A meta-analysis of nonsense mutations causing human genetic disease. Hum Mutat. 2008;29(8):1037-1047.
13. Mendell JT, Dietz HC. When the message goes awry: diseaseproducing mutations that influence mRNA content and performance. Cell. 2001;107(4):411-414.
14. Khajavi M, Inoue K, Lupski JR. Nonsense-mediated mRNA decay modulates clinical outcome of genetic disease. Eur J Hum Genet. 2006;14(10):1074-1081.
15. Spena S, Garagiola I, Cannavò A, et al. Prediction of factor VIII inhibitor development in the SIPPET cohort by mutational analysis and factor VIII antigen measurement. J Thromb Haemost. 2018;16(4):778-790.
16. Bonetti B, Fu L, Moon J, Bedwell DM. The efficiency of translation termination is determined by a synergistic interplay between upstream and downstream sequences in Saccharomyces cerevisiae. J Mol Biol. 1995;251(3):334-345.
17. Blanchet S, Cornu D, Argentini M, Namy O. New insights into the incorporation of natural suppressor tRNAs at stop codons in Saccharomyces cerevisiae. Nucleic Acids Res. 2014;42(15):10061-10072.
18. Blanchet S, Cornu D, Hatin I, et al. Deciphering the reading of the genetic code by near-cognate tRNA. Proc Natl Acad Sci U S A. 2018;115(12):3018-3023.
19. Rospert S, Rakwalska M, Dubaquié Y. Polypeptide chain termination and stop codon readthrough on eukaryotic ribosomes. Rev Physiol Biochem Pharmacol. 2005;155:1-30.
20. Pacho F, Zambruno G, Calabresi V, Kiritsi D, Schneider H. Efficiency of translation termination in humans is highly dependent upon nucleotides in the neighbourhood of a (premature) termination codon. J Med Genet. 2011;48(9):640-644.
21. Pinotti M, Caruso P, Canella A, et al. Ribosome readthrough accounts for secreted full-length factor IX in hemophilia B patients with nonsense mutations. Hum Mutat. 2012;33(9):1373-1376.
22. Manuvakhova M, Keeling K, Bedwell DM. Aminoglycoside antibiotics mediate context-dependent suppression of termination codons in a mammalian translation system. RNA. 2000;6(7):1044-1055.
23. Branchini A, Ferrarese M, Lombardi S, et al. Differential functional readthrough over homozygous nonsense mutations contributes to the bleeding phenotype in coagulation factor VII deficiency. J Thromb Haemost. 2016;14(10):1994-2000.
24. Branchini A, Ferrarese M, Campioni M, et al. Specific factor IX mRNA and protein features favor drug-induced readthrough over recurrent nonsense mutations. Blood. 2017;129(16):2303-2307.
25. Lombardi S, Ferrarese M, Marchi S, et al. Translational readthrough of GLA nonsense mutations suggests dominantnegative effects exerted by the interaction of wild-type and
missense variants. RNA Biol. 2020;17(2):254-263.
26. Ferrarese M, Baroni M, Della Valle P, et al. Missense changes in the catalytic domain of coagulation factor X account for minimal function preventing a perinatal lethal condition. Haemophilia. 2019;25(4):685-692.
27. Martorell L, Cortina V, Parra R, Barquinero J, Vidal F. Variable readthrough responsiveness of nonsense mutations in hemophilia A. Haematologica. 2020;105(2):508-518.
28. Ferrarese M, Testa MF, Balestra D, et al. Secretion of wild-type factor IX upon readthrough over F9 pre-peptide nonsense mutations causing hemophilia B. Hum Mutat. 2018;39(5):702-708.
29. Shen BW, Spiegel PC, Chang C-H, et al. The tertiary structure and domain organization of coagulation factor VIII. Blood. 2008;111(3):1240-1247.
30. Camire RM, Bos MHA. The molecular basis of factor V and VIII procofactor activation. J Thromb Haemost. 2009;7(12):1951-1961.
31. Stennicke HR, Kjalke M, Karpf DM, et al. A novel B-domain OglycoPEGylated FVIII (N8-GP) demonstrates full efficacy and prolonged effect in hemophilic mice models. Blood. 2013;121(11):2108-2116.
32. Rosen S, Tiefenbacher S, Robinson M, et al. Activity of transgene-produced B-domain-deleted factor VIII in human plasma following AAV5 gene therapy. Blood. 2020;136(22):2524-2534.
33. Seth Chhabra E, Liu T, Kulman J, et al. BIVV001, a new class of factor VIII replacement for hemophilia A that is independent of von Willebrand factor in primates and mice. Blood. 2020;135(17):1484-1496.
34. Ogata K, Selvaraj SR, Miao HZ, Pipe SW. Most factor VIII B domain missense mutations are unlikely to be causative mutations for severe hemophilia A: implications for genotyping. J Thromb Haemost. 2011;9(6):1183-1190.
35. Jourdy Y, Nougier C, Roualdes O, et al. Characterization of five associations of F8 missense mutations containing FVIII B domain mutations. Haemophilia. 2016;22(4):583-589.
36. den Dunnen JT, Dalgleish R, Maglott DR, et al. HGVS recommendations for the description of sequence variants: 2016 update. Hum Mutat. 2016;37(6):564-569.
37. McVey JH, Rallapalli PM, Kemball-Cook G, et al. The European Association for Haemophilia and Allied Disorders (EAHAD) Coagulation Factor Variant Databases: important resources for haemostasis clinicians and researchers. Haemophilia. 2020;26(2):306-313.
38. Payne AB, Miller CH, Kelly FM, Michael Soucie J, Craig Hooper W. The CDC Hemophilia A Mutation Project (CHAMP) mutation list: a new online resource. Hum Mutat. 2013;34(2):E2382-2391.
39. Choi Y, Chan AP. PROVEAN web server: a tool to predict the functional effect of amino acid substitutions and indels. Bioinformatics. 2015;31(16):2745-2747.
40. Sim N-L, Kumar P, Hu J, et al. SIFT web server: predicting effects of amino acid substitutions on proteins. Nucleic Acids Res. 2012;40(Web Server issue):W452-457.
41. Adzhubei I, Jordan DM, Sunyaev SR. Predicting functional effect of human missense mutations using PolyPhen-2. Curr Protoc Hum Genet. 2013;Chapter 7:Unit 7.20.
42. Ioannidis NM, Rothstein JH, Pejaver V, et al. REVEL: an ensemble method for predicting the pathogenicity of rare missense variants. Am J Hum Genet. 2016;99(4):877-885.
43. Bern M, Nilsen J, Ferrarese M, et al. An engineered human albumin enhances half-life and transmucosal delivery when fused to protein-based biologics. Sci Transl Med. 2020;12(565):eabb0580.
44. Lombardi S, Aaen KH, Nilsen J, et al. Fusion of engineered
| 108 February
481 ARTICLE - F8
M. F. Testa et al.
Haematologica
2023
B-domain PTC readthrough output and inhibitors
albumin with factor IX Padua extends half-life and improves coagulant activity. Br J Haematol. 2021;194(2):453-462
45. Pattinson JK, Millar DS, McVey JH, et al. The molecular genetic analysis of hemophilia A: a directed search strategy for the detection of point mutations in the human factor VIII gene. Blood. 1990;76(11):2242-2248.
46. El-Maarri O, Olek A, Balaban B, et al. Methylation levels at selected CpG sites in the factor VIII and FGFR3 genes, in mature female and male germ cells: implications for maledriven evolution. Am J Hum Genet. 1998;63(4):1001-1008.
47. Jopling CL. Stop that nonsense! Elife. 2014;3:e04300.
48. Saenko EL, Ananyeva NM, Kouiavskaia DV, et al. Haemophilia A: effects of inhibitory antibodies on factor VIII functional interactions and approaches to prevent their action. Haemophilia. 2002;8(1):1-11.
49. Walter JD, Werther RA, Brison CM, et al. Structure of the factor VIII C2 domain in a ternary complex with 2 inhibitor antibodies reveals classical and nonclassical epitopes. Blood. 2013;122(26):4270-4278.
50. Gangadharan B, Ing M, Delignat S, et al. The C1 and C2 domains of blood coagulation factor VIII mediate its endocytosis by dendritic cells. Haematologica. 2017;102(2):271-281.
Haematologica | 108 February 2023 482 ARTICLE - F8 B-domain PTC readthrough output and inhibitors M. F. Testa et al.
Durable discontinuation of systemic therapy in patients affected by chronic graft-versus-host disease
George L. Chen,1 Lynn Onstad,2 Paul J. Martin,2 Paul Carpenter,2 Joseph Pidala,3 Sally Arai,4 Corey Cutler,5 Betty K. Hamilton,6 Stephanie J. Lee2 and Mukta Arora7
1Department of Medicine, Roswell Park Comprehensive Cancer Center, Buffalo, NY; 2Clinical Research Division, Fred Hutchinson Cancer Research Center and the Department of Medicine, University of Washington, Seattle, WA; 3Blood and Marrow Transplantation and Cellular Immunotherapy. H. Lee Moffitt Cancer Center and Research Institute. Tampa, FL; 4Department of Medicine, Division of Blood and Marrow Transplantation, Stanford University School of Medicine, Stanford, CA; 5Division of Stem Cell Transplantation and Cellular Therapy, Dana-Farber Cancer Institute, Boston, MA; 6Blood and Marrow Transplantation, Department of Hematology and Medical Oncology, Taussig Cancer Institute, Cleveland Clinic, Cleveland, OH and 7Division of Hematology, Oncology and Transplantation, University of Minnesota Medical Center, Minneapolis, MN, USA
Correspondence: G. Chen george.chen@roswellpark.org
Received: August 12, 2021.
Accepted: March 24, 2022.
Prepublished: May 26, 2022. https://doi.org/10.3324/haematol.2021.279814
©2023 Ferrata Storti Foundation
Published under a CC BY-NC license
Successful treatment of chronic graft-versus-host disease (GvHD) often requires long-term systemic therapy (ST). Durable discontinuation of ST reflects the resolution of active chronic GvHD. We evaluated the factors associated with durable ST discontinuation, defined as cessation of all ST for ≥12 months, using data from two prospectively followed cohorts from the Chronic GvHD Consortium (n=684). Transplant sources were peripheral blood (89%), bone marrow (6.6%), and cord blood (4.4%) from HLA matched related (37.6%), HLA matched unrelated (45%), and other donor types (18%). Half of the patients received non-myeloablative conditioning. The median time from transplantation to chronic GvHD diagnosis was 7.7 months (range, 1.0–141.3) and the median time from chronic GvHD onset to enrollment into the cohorts was 0.9 months (range, 0.0-12.0). The cumulative incidence estimate of durable ST discontinuation was 32% (95% confidence interval: 28%-37%) at 10 years after enrollment into the cohort. Among patients who discontinued ST, the median time from chronic GvHD diagnosis to durable ST discontinuation was 3.6 years (range, 1.2-10.5). In multivariate analysis, patients who received myeloablative conditioning, had chronic GvHD manifested as moderate/severe lower gastrointestinal involvement, and had a higher (worse) Lee symptom overall score were less likely to attain durable ST discontinuation. In contrast, mild lower gastrointestinal involvement and cord blood (vs. peripheral blood) as the graft source were associated with a greater likelihood of ST discontinuation. Although a minority of patients can discontinue ST permanently, most patients require prolonged ST. Viewing chronic GvHD in this way has implications for management approaches.
Abstract Introduction
Chronic graft-versus-host disease (GvHD) is a major complication of allogeneic hematopoietic cell transplantation (HCT).1 It is a leading cause of non-relapse mortality in long-term survivors of allogeneic HCT,2 and is associated with impaired quality of life and lower performance status in patients.3,4
Approximately 30-50% of patients surviving for more than 100 days after allogeneic HCT will develop chronic GvHD and require treatment with systemic immunosuppression.1 Systemic immunosuppression can impair immunological function, increase the risk of opportunistic infections, and expose patients to the risks of medication-specific side effects such as those associated with chronic glucocorticoid therapy.
Successful therapy of chronic GvHD often requires longterm systemic therapy (ST). Previous studies of ST discontinuation reported rates as low as 27.7% and as high as 68%.5-7 The variation in rates of ST discontinuation may have resulted from the populations which were studied. Higher rates of discontinuation were observed in cohorts of patients with less heavily treated chronic GvHD from single institutions while lower rates were observed in cohorts of heavily pretreated patients from a quaternary referral center. Despite this variability, less severe chronic GvHD was associated with an increased likelihood of ST discontinuation across these studies. A significant limitation to the interpretation of these trials is that different definitions of ST discontinuation were used. Two studies defined ST discontinuation without specifying a minimal amount of time that the patient needed to be off ST6,7
Haematologica | 108 February 2023 483 ARTICLE - Complications in Hematology
while other studies defined successful discontinuation as 9 and 6 months off any ST.5,8 Approximately 50% of patients stopping ST for the first time will experience a flare in chronic GvHD symptoms at a median of 3.4 months (interquartile range, 2.3-8.0 months) and may require resumption of ST.8 Discontinuation of ST for a limited time may not represent true resolution of chronic GvHD. Therefore, we evaluated the durable discontinuation of ST, defined as discontinuation of ST for 12 or more months. This definition was proposed to ensure that patients were truly unlikely to flare and need to restart ST.
Methods
Patients
Subjects (n=684) came from two prospectively followed cohorts enrolled onto Chronic GvHD Consortium studies (NCT00637689, NCT01902576).
NCT00637689 “Improving outcomes assessment in chronic GvHD” was a cross-sectional study of chronic GvHD regardless of time since transplantation. The primary objective was testing of National Institutes of Health (NIH) recommended tools to assess chronic GvHD. Eligibility criteria included: (i) a clinical or histological diagnosis of chronic GvHD, and (ii) a need for ST. Severity of chronic GvHD was not an exclusion criterion. Clinical follow-up occurred at 3 months for incident cases, and every 6 months for the duration of the study. Long-term outcomes were determined through review of clinical charts. Six hundred and one subjects were accrued from 2007 to 2012.
NCT01902576 “Chronic GvHD response measures validation” was a prospective cohort study of patients with chronic GcHD starting new ST. The primary objective was testing of the NIH response criteria. Eligibility criteria included: (i) a diagnosis of chronic GvHD according to NIH consensus conference diagnostic and scoring criteria, and (ii) initiation of new ST for chronic GvHD. Severity of chronic GvHD was not an exclusion criterion. The patients had a clinical follow-up at 3, 6, and 18 months and if a new chronic GvHD treatment was started. Long-term outcomes were determined through review of the clinical charts. Three hundred eighty-three subjects were enrolled from 2013 to 2019.
Subjects selected for this analysis had either incident or prevalent chronic GvHD. Patients with prevalent chronic GvHD were limited to those within 12 months from diagnosis to allow evaluation of the defined endpoint of durable discontinuation of ST (off ST for at least 12 months).
The treatments used are listed in Online Supplementary Table S1. Incident cases consisted of those enrolled less than 3 months after diagnosis of chronic GvHD (n=490;
70.6%), and prevalent cases comprised those enrolled 312 months after diagnosis of chronic GvHD (n=194; 28.4%). Subsetting according to incident and prevalent status was not significantly associated with the time to durable discontinuation of ST. Therefore, these two groups were combined for subsequent analyses.
Demographic and transplant characteristics are presented in Table 1 and Online Supplementary Table S2
This study was approved by the Institutional Review Boards of all participating centers, and all participants provided signed informed consent.
Statistical analysis
Descriptive statistics were used to summarize baseline demographic and chronic GvHD characteristics. Chronic GvHD was graded according to NIH severity scales. Baseline grade at enrollment, rather than most severe chronic GvHD status over the observed period, was used. The main endpoint was time to durable ST discontinuation, defined as the cessation of all ST for at least 12 months. Subjects who stopped ST but restarted for any reason within 12 months were considered to have been continuously on ST. These subjects did not meet the endpoint and were censored at last follow-up. The cumulative incidence of durable ST discontinuation was calculated with the competing risks of death and relapse of the disease for which HCT was performed.
Cox proportional hazards models were used to examine associations between durable ST discontinuation and transplant, clinical, and patient-reported variables, first in univariate models (Online Supplementary Table S3), and then in multivariate models. A stepwise procedure was used in the multivariate analysis, with entry into and exit from the model based on a P-value of 0.1, first with the transplant variables, then adding the clinical variables to the transplant model, then adding the patient-reported variables to the model including clinical plus transplant variables. Analyses were performed using SAS/STAT software, version 9.4 (SAS Institute, Inc, Cary, NC, USA).
Results
Chronic graft-versus-host disease clinical and patient-reported outcomes
Chronic GvHD characteristics at enrollment are presented in Tables 2 and 3, and Online Supplementary Table S4. The median time from HCT until the diagnosis of chronic GvHD was 7.7 months (range, 1.0-141.3). The median time from the diagnosis of chronic GvHD to enrollment into the Consortium cohorts was 0.9 months (range, 0.0-12.0). Most patients were affected by moderate (51.2%) or severe (32.2%) chronic GvHD. Grade II-IV acute GvHD preceded the development of chronic GvHD in 51.6% of cases. The
Haematologica | 108 February 2023 484 ARTICLE - Systemic therapy discontinuation for cGvHD G.L. Chen et al.
most common sites of chronic GvHD manifestations were the skin (63.6%), mouth (63.2%), and eyes (51.5%). Most patients had involvement of two or more sites. The
Table 1. Demographic characteristics (684 patients).
Characteristics
N (%) or median (range)
Age at transplant in years), median (range) 51.9 (18.0-78.0)
Age at transplant, N (%)
18-30 74 (10.8%) 31-60 460 (67.3%) >60 150 (21.9%)
Diagnosis, N (%)
Acute leukemia 323 (47.2%) Chronic leukemia 72 (10.5%)
Lymphoma 105 (15.4%) MDS + MPD 120 (17.5%) Other 64 (9.4%)
Donor type, N (%)
HLA-identical sibling 257 (37.6%)
HLA-matched other relative 14 (2.0%)
HLA-mismatched relative 15 (2.2%) HLA-matched unrelated donor 306 (44.7%) Mismatched unrelated donor 92 (13.5%)
Graft source, N (%)
Peripheral blood 609 (89.0%)
Bone marrow 45 (6.6%) Cord blood 30 (4.4%)
Myeloablative, N (%) 341 (50.0%) Missing N=2
GvHD prophylaxis, N (%)
CNI + MTX +/- others 346 (51.0%) CNI + MMF +/- others 271 (40.0%) Other 61 (9.0%) Missing N=6
Female donor, male recipient, N (%) 185 (27.2%) Missing N=3
Donor-recipient CMV match, N (%)
Negative/negative 227 (33.7%)
Positive/negative 78 (11.6%)
Negative/positive 197 (29.3%)
Positive/positive 171 (25.4%) Missing N=11
Months from HCT to chronic GvHD, median (range) 7.7 (1.0-141.3)
Months from chronic GvHD to enrollment, median (range) 0.9 (0-12.0)
Months from HCT to DOLC (survivors), median (range) 95.3 (11.3-181.5)
MDS: myelodysplastic syndrome; MPD: myeloproliferative disorder; HLA: human leukocyte antigen; GvHD: graft-versus-host disease; CNI: calcineurin inhibitor; MTX: methotrexate; MMF: mycophenolate mofetil; CMV: cytomegalovirus; HCT: hematopoietic cell transplantation; DOLC: date of last contact.
median baseline Lee symptom overall summary scale score was 19.8 (range, 0.0-74.4). The median follow-up since transplantation for surviving patients was 95.3 months (range, 11.3-181.5).
Durable discontinuation of systemic therapy
The cumulative incidence of durable ST discontinuation among all patients was 24% (95% confidence interval [95% CI]: 21-28%) at 5 years and 32% (95% CI: 28-37%) at 10 years (Figure 1). Of the 519 subjects who initially stopped ST, 16 (3.1%) did not have sufficient follow-up to document ST discontinuation for ≥12 months. These subjects were considered not to have achieved durable ST discontinuation and follow-up was censored at the last contact. The NIH severity at enrollment among these 16 subjects was mild in 12.5%, moderate in 50% and severe in 37.5%. With regard to clinical outcomes at 5 years, 21% had died without relapse, 17% had relapsed from their underlying disease, 38% were alive but on ST, and 24% were alive and off ST. By 10 years, 27% had died without relapse, 18% had relapsed from their underlying disease, 23% were alive but on ST, and 32% were alive and off ST. The most frequent
Variables
Chronic GvHD NIH global severity
N (%) or median (range)
None 10 (1.5%) Mild 104 (15.2%) Moderate 350 (51.2%) Severe 220 (32.2%)
Prior grade II-IV acute GvHD 350 (51.6%) Missing N=6
Prior grade III-IV acute GvHD 64 (9.4%) Missing N=6
Onset type
De novo 253 (37.0%) Quiescent 273 (39.9%) Progressive 158 (23.1%)
KPS (self-report), median (range) 80.0 (40.0-100.0) Platelet count at chronic GvHD diagnosis
<100x109/L 136 (20.3%)
≥100x109/L 534 (79.7%)
Missing N=14 Bilirubin (mg/dL) at chronic GvHD diagnosis, median (range) 0.5 (0.1-17.9) N. of sites involved
0 10 (1.5%) 1 88 (12.9%) 2 or more 586 (85.7%)
GvHD: graft-versus-host disease; NIH: National Institutes of Health; KPS: Karnofsky performance status scale,
Table 2. Chronic graft-versus-host disease characteristics at enrollment (684 patients).Haematologica | 108 February 2023 485 ARTICLE - Systemic therapy
for cGvHD G.L. Chen et al.
discontinuation
causes of non-relapse death were chronic GvHD, unknown, and infection (Online Supplementary Table S5). The median time from development of chronic GvHD until discontinuation of ST for at least 12 months was 3.6 years
(range, 1.2-10.5). The median time from cohort enrollment until discontinuation of ST for at least 12 months was 3.4 years (range, 0.7-11.9).
Transplant, clinical, and patient-reported variables evalu-
Figure 1. Durable discontinuation of systemic therapy occurred in 32% (95% CI: 28-37%) of patients who developed chronic graft-versus-host disease. Among relapse-free patients surviving at 10 years, 57% (95% CI: 50-63%) had discontinued systemic therapy (ST) for at least 12 months. The curve for ST discontinuation is flat during the first year, reflecting the requirement to demonstrate that the discontinuation of ST was durable for at least 12 months. Durable discontinuation of systemic therapy is shown in blue and measured along the left-sided Y axis, competing risks of relapse and death are shown in red and measured along the right-sided Y axis.
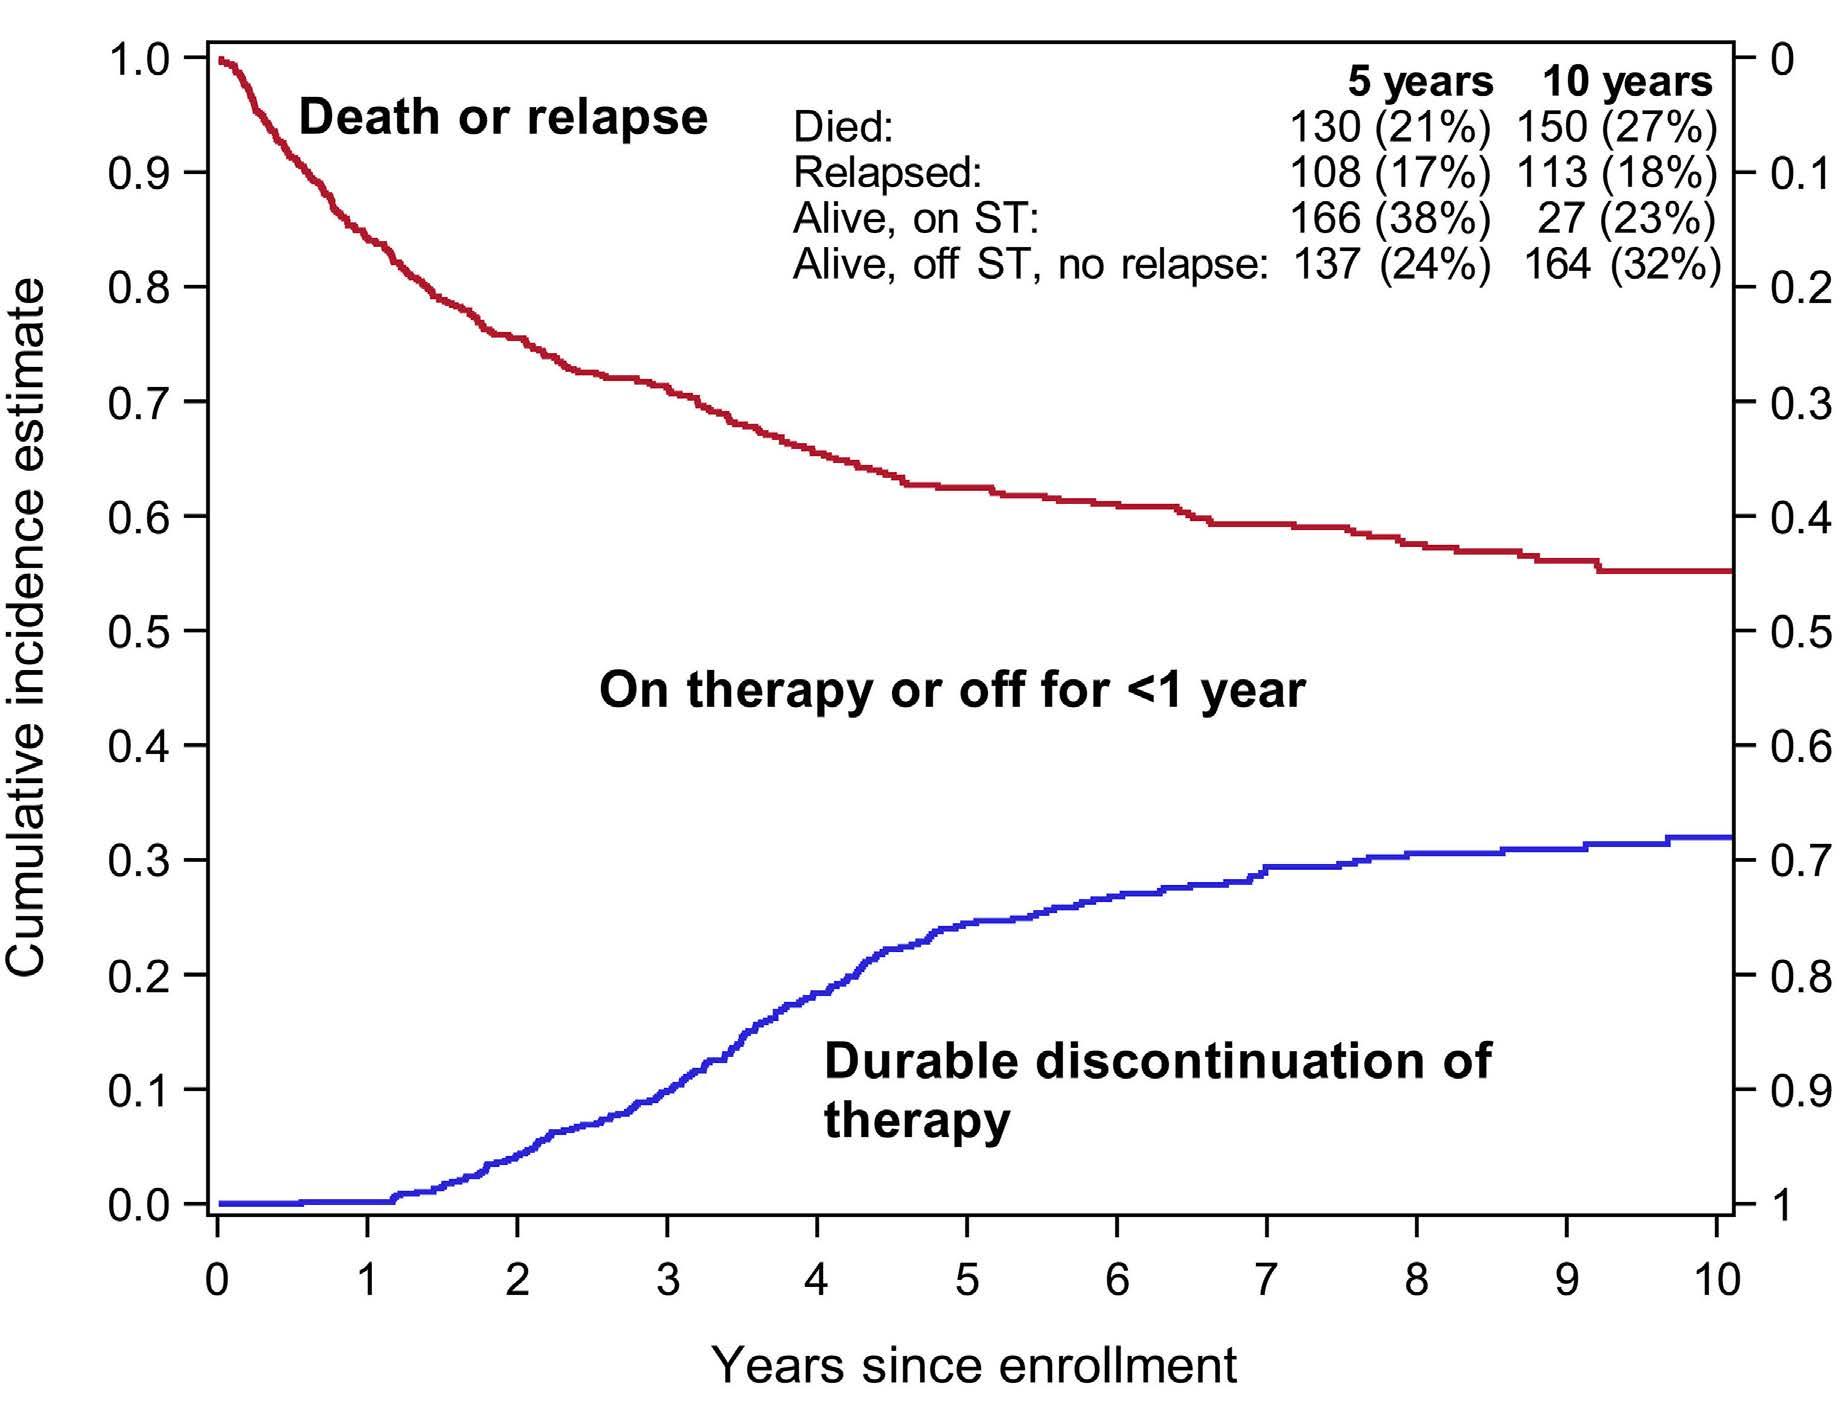
Figure 2. Likelihood of durable discontinuation of systemic therapy. Durable discontinuation was defined as 12 months or more. Patients receiving cord blood grafts or with mild chronic graft-versus-host disease (GvHD) of the lower gastrointestinal tract were more likely to durably discontinue systemic therapy. Myeloablative conditioning and moderate/severe chronic GvHD of the lower gastrointestinal tract were less likely to durably discontinue systemic therapy. The chance of durably discontinuing systemic therapy decreased by 18% for every 10-point worsening (increase) in the Lee symptom scale overall score. Hazard ratios for these factors are illustrated on the right.
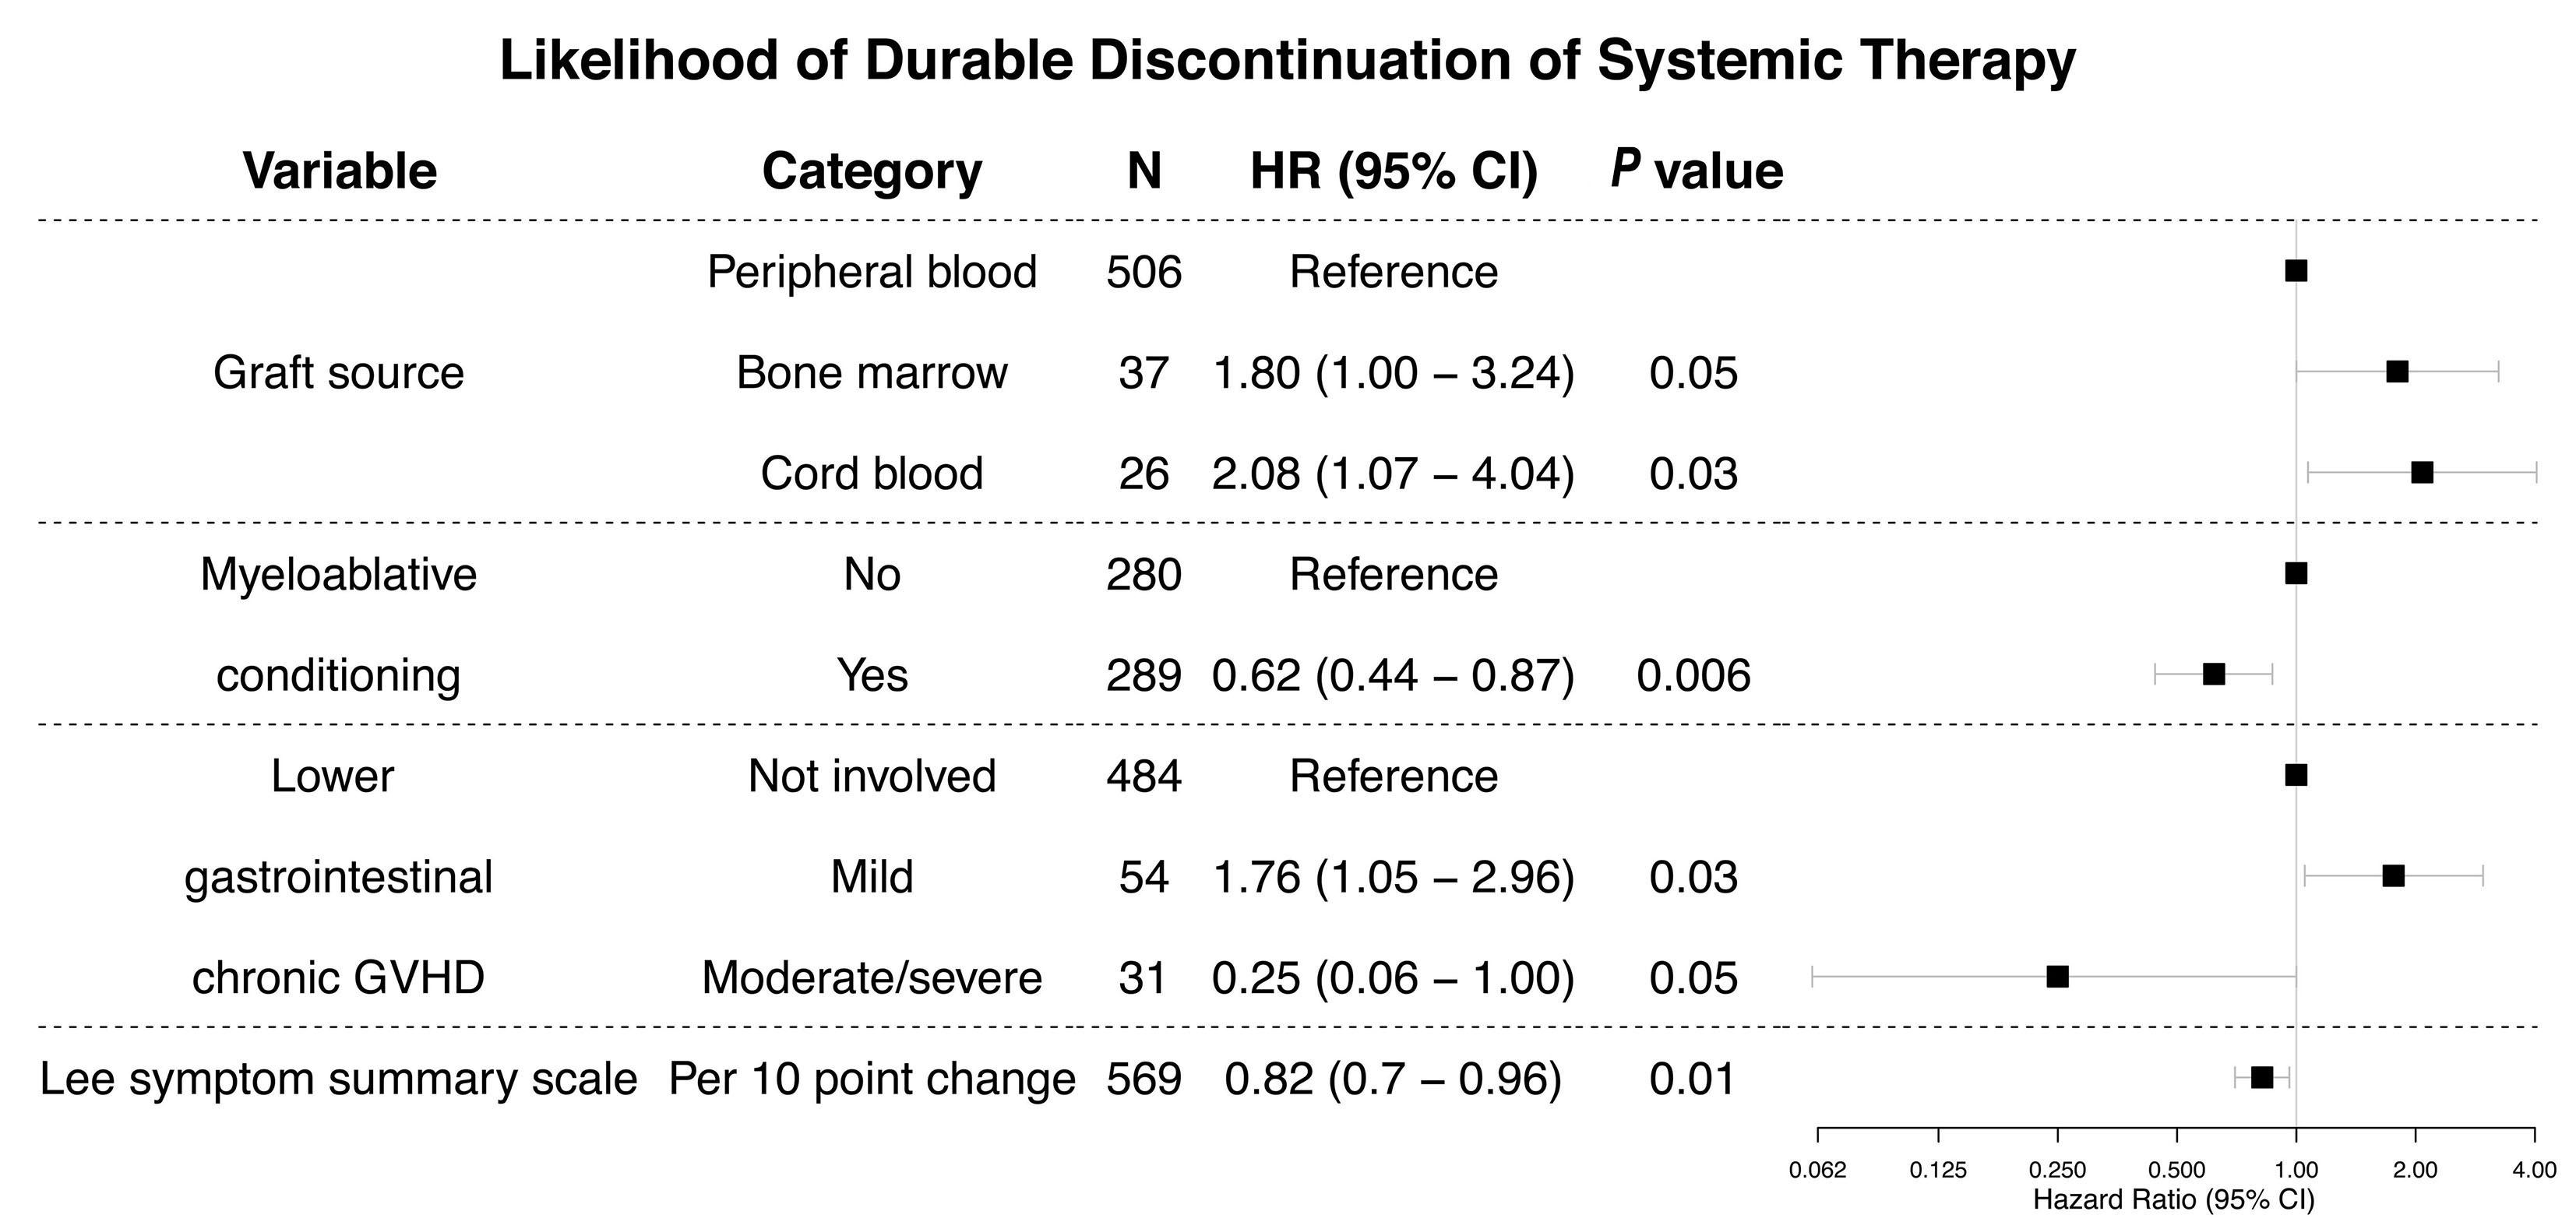
Haematologica | 108 February 2023 486 ARTICLE - Systemic therapy
for cGvHD G.L. Chen et al.
discontinuation
ated for association with durable ST discontinuation are presented in Online Supplementary Table S3. In the multiple regression model (Figure 3), patients who received an umbilical cord blood transplant were 2.08 times (95% CI: 1.07-4.04, P=0.03) and those who received a bone marrow transplant were 1.80 times (95% CI: 1.00-3.24, P=0.05) more likely to discontinue ST compared to patients who received a peripheral blood stem cell transplant. Patients with mild lower gastrointestinal (GI) involvement were 1.76 (95% CI: 1.05-2.96, P=0.03) times more likely to discontinue ST. Patients who underwent myeloablative conditioning (hazard ratio [HR]=0.62, 95% CI: 0.44-0.87, P=0.006), those with moderate to severe lower GI involvement (HR=0.25, 95% CI: 0.06-1.0, P=0.05), and those with a higher Lee symptom summary score at enrollment (HR=0.82 per 10-point increase, 95% CI: 0.700.96, P=0.01) were less likely to discontinue ST. The chance of discontinuing ST decreased by 18% for every 10-point increase in the Lee symptom scale overall score. Results were qualitatively similar when the analysis was limited to incident cases. In an analysis including NIH overall chronic GvHD severity and excluding individual organ involvement because of overlapping content, those with severe chronic GvHD were less likely to durably discontinue ST (HR=0.53, 95%CI: 0.31-0.90, P=0.02) than those with mild or moderate severe GvHD. The presence and severity of individual organs involved by chronic GvHD, including the lungs, was not associated with the probability of ST discontinuation.
Recipient age, recipient and donor HLA mismatching, and transplants with male recipients of grafts from female donors, all factors which have been associated with the development of chronic GvHD, were not associated with the probability of achieving durable ST discontinuation.
Discussion
Upon developing moderate or severe chronic GvHD, patients and their caregivers face a great deal of uncertainty about the duration and success of ST. With a median follow up of almost 8 years, we found that the majority (67%) of patients with chronic GvHD are unable to discontinue ST for more than 12 months. In previous studies, differences in the populations studied and different definitions of what constituted ST discontinuation may have resulted in variability in the discontinuation rates that were reported.5-7 We used a multi-institutional cohort of incident and prevalent cases of chronic GvHD that were within 1 year of diagnosis in order to reduce center bias, and further reduced variability by requiring follow-up for at least 12 months to ascertain that ST discontinuation was durable. This duration was proposed to be long enough to classify patients as having
Table 3. Chronic graft-versus-host disease organ involvement at enrollment (684 patients).
Organ/NIH Grade N (%)
Organ/NIH Grade N (%)
Eye Joint
0 332 (48.5%) 0 478 (69.9%)
1 231 (33.8%) 1 138 (20.2%)
2,3 121 (17.7%) 2,3 68 (9.9%)
Genital Liver
0 488 (87.3%) 0 533 (78.8%)
1 43 (7.7%) 1 48 (7.1%) 2,3 28 (5.0%) 2,3 95 (14.1%) Missing N=125 Missing N=8 GI Lung 0 452 (66.1%) 0 510 (74.6%) 1 168 (24.6%) 1 126 (18.4%) 2,3 64 (9.4%) 2,3 48 (7.0%)
GI - esophagus Mouth 0 582 (85.1%) 0 252 (36.8%) 1 77 (11.3%) 1 327 (47.8%) 2,3 25 (3.7%) 2,3 105 (15.4%)
GI - upper Skin 0 540 (78.9%) 0 249 (36.4%) 1 95 (13.9%) 1 134 (19.6%) 2,3 49 (7.2%) 2,3 301 (44.0%)
GI - lower 0 586 (85.9%) 1 61 (8.9%) 2,3 35 (5.1%) Missing N=2
NIH: National Institutes of Health; GI: gastrointestinal.
discontinued ST without a significant risk that resumption of ST would be necessary. To our knowledge, this is the largest study with the longest follow-up performed to date exploring the issue of ST discontinuation. Similar to prior studies, we found that less severe chronic GvHD and use of umbilical cord blood grafts were associated with a shorter time to ST discontinuation.5-7 Previous studies did not use validated patient-reported instruments to measure the severity of chronic GvHD. We demonstrated that more severe chronic GvHD symptoms, as indicated by higher (worse) Lee symptom scores, were associated with a decreased probability of durable ST discontinuation, consistent with the effect of increased disease burden and emphasizing the importance of measuring patient-reported outcomes. It is intuitive that more symptomatic patients would be less likely to stop ST. Notably, our observed rate of ST discontinuation (24% at 5 years) was closest to that from a quaternary referral center (27.7% at 5 years) with a high number of heavily treated chronic GvHD cases in their clinical population and which similarly defined ST discontinuation as requiring 6 (rather than 12) months without any therapy.5 In contrast, the population we studied was composed of 71.9% incident cases of chronic GvHD, many of whom had not prog-
Haematologica | 108 February 2023 487 ARTICLE - Systemic therapy discontinuation for cGvHD G.L. Chen et al.
ressed to second-line therapy. These results suggest that other than having a biomarker indicative of chronic GvHD, a mandatory 6- to 12-month observation period is needed to support the conclusion that ST has been discontinued permanently.
Most patients are unable to discontinue ST for at least 12 months. Patients who received peripheral blood grafts, received myeloablative conditioning, had a higher (worse) Lee symptom score, and moderate/severe lower GI involvement were less likely to achieve durable ST discontinuation. We observed contradictory effects from lower GI chronic GvHD severity on the likelihood of discontinuing ST: mild lower GI chronic GvHD increased and moderate/severe lower GI chronic GvHD decreased the likelihood compared to no lower GI chronic GvHD. We were unable to separate the effects of moderate versus severe lower GI chronic GvHD because of the small number of cases wth severe lower GI-GvHD, limiting our interpretation of the data. An association between low levels of short chain fatty acids at around day +100 and subsequent development of chronic GvHD was recently reported, implying a role for the microbiome in chronic GvHD.9 Although association is not causation, it is possible that mild lower GI chronic GvHD may reflect an underlying perturbation in the microbiota that is more amenable to intervention by non-chronic GvHD ST such as changes in antibiotics, diet, or hospitalization. Further investigation on this subject will be necessary. We also found that many factors (age, HLA mismatch, recipient/donor sex mismatch) associated with the development of chronic GvHD were not associated with the likelihood of ST discontinuation, suggesting that the pathophysiology of chronic GvHD treatment and control may differ from its development. This study is limited by its reliance on clinical examination/practice to determine chronic GvHD status and on the 12-month waiting period to determine when chronic GvHD had been fully treated and was unlikely to recur. Practitioners may be less likely to discontinue and more likely to restart ST in patients with manifestations of severe chronic GvHD. This was controlled by the long 12month waiting period which allowed an adequate time off therapy to ensure that chronic GvHD flares were unlikely. Indeed, only a small proportion of subjects (3%) restarted systemic therapy within the 12-month period in this study. Of these, the minority had severe chronic GvHD, suggesting that practitioner anxieties about stopping ST in subjects with severe chronic GvHD are less likely to bias the outcomes. Within a single institution and across a multiinstitutional consortium there may be slight variations in chronic GvHD-related definitions. Unfortunately, a clearcut biomarker of chronic GvHD status, which could provide additional precision, is not yet available, despite the application of powerful discovery and analytical techniques. The 12-month waiting period was not based on the
underlying pathophysiology of tolerance induction after allogeneic HCT but rather was a practical cutoff based on the observed time to restart ST. It may still be possible to completely taper ST after many years.
The applicability of this study is limited by the population studied. A diagnosis of chronic GvHD was required for inclusion. Consequently, patients at low risk of developing chronic GvHD, such as young children or those who received post-transplant cyclophosphamide, antithymocyte globulin, or in vivo/ex vivo T-cell depletion as acute GvHD prophylaxis are not well represented. Our findings may not be applicable to these specific populations when they do not develop chronic GvHD. Finally, our findings are based on the clinical course of patients who agreed to participate in observational research. Despite these limitations, we believe our results are still valid and generalizable to patients under treatment with chronic GvHD.
Our findings suggest that for most patients, ST is likely to be a long-term proposition and that there is a much lower probability of being able to discontinue treatment than had been anticipated from earlier studies.6,7 Chronic GvHD may behave more like an ongoing autoimmune disease without resolution than a temporary state in which eventual tolerance is expected. Viewing chronic GvHD in this way has implications for management approaches and the development of therapeutic agents for chronic GvHD. The goal of defining a regimen that minimizes (rather than discontinues) ST or fosters operational immunological tolerance may need to be given higher priority to avoid the see-saw of stopping and restarting ST. Similarly, addressing the factors that contribute to persistent immune deficiency may improve outcomes by decreasing the risk of infections, a major cause of death.
Disclosures
No conflicts of interest to disclose.
Contributions
GLC, LO, SJL, and MA designed the research, analyzed the data, and wrote the manuscript. All authors provided subjects, and read, critiqued, and revised the paper.
Acknowledgments
We thank the patients who participated in the Chronic GVHD Consortium studies and the clinical staff of each member institution.
Funding
This research was supported by grants CA118953 and CA163438 to SJL.
Data-sharing statment
For access to data, please contact Stephanie Lee, sjlee@fredhutch.org
Haematologica | 108 February 2023 488 ARTICLE - Systemic therapy discontinuation for cGvHD G.L. Chen et al.
1. Arora M, Cutler CS, Jagasia MH, et al. Late acute and chronic graft-versus-host disease after allogeneic hematopoietic cell transplantation. Biol Blood Marrow Transplant. 2016;22(3):449-455.
2. Wingard JR, Majhail NS, Brazauskas R, et al. Long-term survival and late deaths after allogeneic hematopoietic cell transplantation. J Clin Oncol. 2011;29(16):2230-2239.
3. Hamilton BK, Storer BE, Wood WA, et al. Disability related to chronic graft-versus-host disease. Biol Blood Marrow Transplant. 2020;26(4):772-777.
4. Pidala J, Kurland B, Chai X, et al. Patient-reported quality of life is associated with severity of chronic graft-versus-host disease as measured by NIH criteria: report on baseline data from the Chronic GVHD Consortium. Blood. 2011;117(17):4651-4657.
5. Curtis LM, Pirsl F, Steinberg SM, et al. Predictors for permanent discontinuation of systemic immunosuppression in severely affected chronic graft-versus-host disease patients. Biol Blood
Marrow Transplant. 2017;23(11):1980-1988.
6. Stewart BL, Storer B, Storek J, et al. Duration of immunosuppressive treatment for chronic graft-versus-host disease. Blood. 2004;104(12):3501-3506.
7. Perez-Simon JA, Encinas C, Silva F, et al. Prognostic factors of chronic graft-versus-host disease following allogeneic peripheral blood stem cell transplantation: the National Institutes Health scale plus the type of onset can predict survival rates and the duration of immunosuppressive therapy. Biol Blood Marrow Transplant. 2008;14(10):1163-1171.
8. Lee SJ, Nguyen TD, Onstad L, et al. Success of immunosuppressive treatments in patients with chronic graftversus-host disease. Biol Blood Marrow Transplant. 2018;24(3):555-562.
9. Markey KA, Schluter J, Gomes ALC, et al. The microbe-derived short-chain fatty acids butyrate and propionate are associated with protection from chronic GVHD. Blood. 2020;136(1):130-136.
References
Haematologica | 108 February 2023 489 ARTICLE - Systemic therapy discontinuation for cGvHD G.L. Chen et al.
Osteoprogenitor SFRP1 prevents exhaustion of hematopoietic stem cells via PP2A-PR72/130-mediated regulation of p300
Franziska Hettler,1* Christina Schreck,1* Sandra Romero Marquez,1 Thomas Engleitner,2,3 Baiba Vilne,4,5 Theresa Landspersky,1 Heike Weidner,6 Renate Hausinger,1 Ritu Mishra,2,7 Rupert Oellinger,2,3 Martina Rauner,6 Ronald Naumann,8 Christian Peschel,1,9 Florian Bassermann,1,9 Roland Rad,2,3,9 Rouzanna Istvanffy1°# and Robert A.J. Oostendorp1#
1Technical University of Munich, School of Medicine, Department of Internal Medicine III Hematology/Oncology, Munich, Germany; 2Technical University of Munich, School of Medicine, Center for Translational Cancer Research (TranslaTUM), Munich, Germany: 3Technical University of Munich, School of Medicine, Institute of Molecular Oncology and Functional Genomics, Munich, Germany; 4Bioinformatics Research Unit, Riga Stradins University Riga, Riga, Latvia; 5netOmics, Riga, Latvia; 6Bone Lab Dresden, Department of Medicine III & Center for Healthy Aging, Technische Universität Dresden, Dresden, Germany; 7School of Medicine, Institute of Clinical Chemistry and Pathobiochemistry, Technical University of Munich, Munich, Germany; 8Max Planck Institute of Molecular Cell Biology and Genetics, Transgenic Core Facility, Dresden, Germany and 9German Cancer Consortium (DKTK), Heidelberg, Germany
°Current affiliation: Technical University of Munich, School of Medicine, Surgery Department, Munich, Germany
*FH and CS contributed equally as co-first authors. #RI and RAJO contributed equally as co-senior authors
Abstract
Correspondence: R.A.J. Oostendorp robert.oostendorp@tum.de
Received: February 2, 2022.
Accepted: August 2, 2022.
Prepublished: August 11, 2022.
https://doi.org/10.3324/haematol.2022.280760 ©2023 Ferrata Storti Foundation
Published under a CC BY-NC license
Remodeling of the bone marrow microenvironment in chronic inflammation and in aging reduces hematopoietic stem cell (HSC) function. To assess the mechanisms of this functional decline of HSC and find strategies to counteract it, we established a model in which the Sfrp1 gene was deleted in Osterix+ osteolineage cells (OS1Δ/Δ mice). HSC from these mice showed severely diminished repopulating activity with associated DNA damage, enriched expression of the reactive oxygen species pathway and reduced single-cell proliferation. Interestingly, not only was the protein level of Catenin beta-1 (bcatenin) elevated, but so was its association with the phosphorylated co-activator p300 in the nucleus. Since these two proteins play a key role in promotion of differentiation and senescence, we inhibited in vivo phosphorylation of p300 through PP2A-PR72/130 by administration of IQ-1 in OS1Δ/Δ mice. This treatment not only reduced the b-catenin/phosphop300 association, but also decreased nuclear p300. More importantly, in vivo IQ-1 treatment fully restored HSC repopulating activity of the OS1Δ/Δ mice. Our findings show that the osteoprogenitor Sfrp1 is essential for maintaining HSC function. Furthermore, pharmacological downregulation of the nuclear b-catenin/phospho-p300 association is a new strategy to restore poor HSC function.
Introduction
All cells of hematopoietic tissues are produced from a limited number of hematopoietic stem cells (HSC), which are localized mostly in the bone marrow (BM). HSC are mainly present as relatively quiescent cells which can be rapidly activated into the cell cycle by infectious and other inflammatory stress events. To prevent premature exhaustion due to replicative stress, the organism ensures
the maintenance of HSC self-renewal under stress conditions through the BM microenvironment, or niche, which limits HSC proliferation and differentiation and promotes self-renewal.1,2 The precise signals and mechanisms through which the niche exerts these HSC regulatory activities have not yet been worked out in detail. Important mediators of HSC regulation by the niche are secreted members of the WNT family. The BM niche secretes both WNT-agonists and WNT-factor-binding antag-
Haematologica | 108 February 2023 490 ARTICLE - Hematopoiesis
onists such as the secreted frizzled-related proteins (SFRP).3 SFRP1 is a secreted glycoprotein member of the SFRP family. In the BM microenvironment, SFRP1 is mainly expressed by mesenchymal stem and progenitor cells (MSPC) and osteoblastic cells.4,5 Recent single-cell expression studies have shown that Sfrp1 expression is mainly restricted to multipotent CXCL12-abundant reticulocytes (CAR cells).6
Secreted SFRP1 modulates the WNT signaling pathway through direct binding to either WNT or FZD receptors,7 or within the cytoplasm, by interacting with Catenin beta-1 (b-catenin).7,8 SFRP1 is mainly known as an inhibitor of canonical WNT signaling, which is characterized by the translocation of b-catenin into the cell nucleus. Here, b-catenin acts as a transcriptional coactivator in different transcription complexes, also called the WNT enhanceosome,9 which governs transcription of WNT target genes.10-13 The b-catenin enhanceosome also contains co-regulator proteins (CREB)-binding protein (CREBBP or CBP) or the closely related binding protein p300 (EP300).14-16 Of these, CBP has been shown to be crucial for HSC self-renewal, while p300 is important for differentiation and senescence in HSC differentiation,17,18 and the loss of p300 promotes the transition from myelodysplastic syndrome into acute myeloid leukemia.19 The b-catenin/p300 interaction is increased by WNT ligands through elevating phosphorylation at Ser89 on p300.20 We have previously shown that deletion of the Sfrp1 gene in mice reduces HSC self-renewal, leading to stem cell exhaustion.21 Furthermore, in many different cancers, SFRP1 is down-regulated due to hypermethylation of the promoter region of the human SFRP1 gene, leading to its decreased activity.22-24 Since Sfrp1 in the BM is mainly expressed by MSPC, we were interested in a more precise assessment of the deleterious effects of deletion of Sfrp1 specifically in osteoprogenitors. Here, we found that Sfrp1 expression in osteogenic niche cells is required for optimal HSC self-renewal and differentiation upon engraftment, by extrinsic modulation of HSC proliferation through pSer89-p300 modulated by PP2A-PR72/130. Importantly, pharmacological treatment completely restored HSC repopulation in serial transplantations.
Methods
Animal studies
Sfrp1fl/fl mice were crossed with Osx-GFP::Cre mice (OsxCre; Jackson Labs, Bar Harbor, ME, USA).25 Litters of OsxCre; Sfrp1fl/+ mice were crossed with Sfrp1fl/fl (S1fl/fl) mice so that litters yielded controls (S1fl/fl, and Osx-Cre [OS1+/+]) as well as Sfrp1-deleted mutants (OS1Δ/Δ). The results from S1fl/fl and OS1+/+ mice were combined as controls (CTRL). Further details are presented in the Online Supplementary
Methods
Competitive repopulation was performed using transplantation of long-term (LT)-HSC into lethally irradiated (8.5 Gy) 129Ly5.1 wild-type (WT) recipient mice, as described previously.26,27 Peripheral engraftment of donor cells was analyzed at regular intervals. Twenty-four weeks after transplantation, recipient mice were sacrificed and the hematopoietic organs were analyzed by flow cytometry. All animal experiments were approved by the Government of Upper Bavaria and performed in accordance with ethical guidelines and approved protocols (Vet_02-14-112, and -17-124). All animals were housed under specifi c pathogen-free conditions, according to the Federation of Laboratory Animal Science Associations and institutional recommendations. Mice used were 8 to 10 weeks old.
Flow cytometry and cell sorting
Hematopoietic Lineage- SCA1+ KIT+ (LSK) cells and their HSC-enriched CD34- CD48- CD150+ subpopulations (LTHSC) were isolated and labeled as reported elsewhere.26,28 All antibodies used in this study are listed in Online Supplementary Table S1. Peripheral blood (PB) was analyzed in an Animal Blood Cell Counter (Scil Vet Abc).
Single-cell cultures
Single LT-HSC were sorted and cultured in conditioned medium and cytokines as described previously,27 before assays. More details can be found in the Online Supplementary Methods.
Hematopoietic colony assay
Cells from the single-cell culture assay or sorted LT-HSC (1x10³) were added to MethoCultTM GF M3434. After 10 to 14 days, colonies formed were counted under a microscope at 100-fold magnification according to standard criteria.
Assessment of DNA damage
Sorted LT-HSC were tested upon nucleic acid damage by single-cell gel electrophoresis (Comet Assay/Cell Biolab). Fluorescence images were taken using a Leica DM RBE microscope with AxioVision software (Carl Zeiss). DNA damage was analyzed by measuring the shift between the comet head (nucleus) and resulting tail (DNA damage).
Immunocytofluorescence staining
Hematopoietic cells were prepared and stained as described elsewhere.26,28 The antibodies used are listed in Online Supplementary Table S1. Pictures were taken using a Leica DM RBE microscope with AxioVision software using standardized exposure settings for all samples. Thirty randomly captured cells per sample were imaged at 100-fold magnification. Confocal fluorescence micro-
Haematologica | 108 February 2023 491 ARTICLE - Osteogenic Sfrp1 limits HSC differentiation F. Hettler et al.
scopy and deconvolution of the fluorescent images were performed on a Leica SP8 confocal microscope. Assessment of different parameters is outlined in the Online Supplementary Methods.
In vivo treatment with IQ-1
In in vivo experiments, the PR72/130-binding inhibitor IQ1 (14 µg/mouse, Selleckchem, S8248) was administered intraperitoneally every 24 h for 5 consecutive days.
RNA sequencing and data analysis
RNA sequencing was performed with 800 to 1,000 sorted LT-HSC. Details are provided in the Online Supplementary Methods. All analyses were performed in python and the R statistical environment (http://www.R-project.org).
Statistical analyses
Statistical tests are indicated in the figure legends. The software used for the computations was GraphPad (La Jolla, CA, USA). P values less than or equal to 0.05 were considered to be statistically significant. Data are presented as the mean ± standard deviation.
Results
Targeted deletion of the Sfrp1 gene in mesenchymal stem and progenitor cells in vivo
The Sfrp1 gene is highly expressed in CD45-Ter119CD31-CD166-SCA-1+ MSPC compared to CD45-Ter119-CD31CD166+SCA-1+ osteoblastic cells (OBC) and CD45-Ter119CD31+SCA-1+ endothelial cells (EC) from WT mice (Online Supplementary Figure S1A-C). For generation of mice with conditional alleles of the Sfrp1 gene, we used the mutant C57Bl/6N-ES cell clone in which exon 2 of the Sfrp1 gene was flanked with loxP sites. The resulting Sfrp1fl/fl mice were crossed with mice expressing CRE eGFP under the continuous control of the promotor for the osteoprogenitor gene Osterix (gene name Sp7) (OS1∆/∆; Online Supplementary Figure S1D, E). We veri fied deletion of Sfrp1 in sorted and cultured MSPC from OS1∆/∆ and control mice via immunostaining and western blot (Online Supplementary Figure S1F-I). Mouse embryonic fibroblasts from Sfrp1 knockout mice and their WT littermates were used for antibody verification (Online Supplementary Figure S1J). OS1Δ/Δ mice are viable and fertile and show unaltered prenatal development (Online Supplementary Figure S2A). However, 8-week-old OS1∆/∆ mice were smaller and weighed less than their Cre- littermates, regardless of sex (Online Supplementary Figure S1A, B). Since a previous study29 had shown that Sfrp1 expression is critical for skeletogenesis in mice, we analyzed bone homeostasis in OS1∆/∆ mice and controls at 8 weeks of age (Online Supplementary Figure S2C-F). We found that 8-week-old
OS1Δ/Δ mice show mild, but significantly reduced femur length, and reduced serum levels of CTX (a bone resorption marker) (Online Supplementary Figure S2C, E). However, trabecular parameters and serum P1NP (a bone formation marker) (Online Supplementary Figure S2D, E) were not affected. Similarly, the numbers of TRAP-positive osteoclasts and osteoblasts on the bone surface were not different between OS1Δ/Δ and control mice (Online Supplementary Figure S2F), indicating that there are no major defects in bone formation in 8-week-old OS1∆/∆ animals. To assess the effect of Sfrp1 deletion on MSPC function, we first scored the frequency of BM colony-forming unit fibroblasts (CFU-F) (Online Supplementary Figure S3A). Interestingly, where the total number of sorted OS1∆/∆ MSPC was decreased in the BM (Online Supplementary Figure S3B), the number of small CFU-F-derived colonies (up to 50 cells) was significantly increased (Online Supplementary Figure S3C). When we stained the colonies after scoring for senescence, we detected an increased number of senescent colonies in OS1∆/∆ mice compared to control mice (Online Supplementary Figure S3D), suggesting that more OS1∆/∆ CFU-F are in a pre-senescent state.
Hematopoiesis in mice with loss of Sfrp1 in bone marrow niche cells
We next investigated how the loss of Sfrp1 in MSPC and osteoprogenitors affects the hematopoietic compartment under steady-state conditions. An initial analysis of the PB and BM of the OS1Δ/Δ mice and control animals showed that the white blood cell counts and total cell numbers of the BM were unchanged (Online Supplementary Figure S4A). In addition, the percentages of B220+ B cells and myeloid cell populations (GR1medCD11b+ monocytes and GR1+CD11b+ granulocytes) of the OS1∆/∆ mice and controls were similar in both PB and BM. Circulating T cells were slightly increased in the PB but not in the BM of OS1∆/∆ mice (Online Supplementary Figure S4B-D).
Furthermore, the numbers of the earliest hematopoietic cells, LSK, CD34-CD48-CD150+ LSK (LT-HSC) and CD34+CD48- LSK (ST-HSC), were unchanged in OS1∆/∆ mice compared to control mice. However, under these steadystate conditions, we observed a significant decrease in the number of SCA1- myeloid progenitor cells (Lin-SCA1KIT+) (Online Supplementary Figure S4E, F) in OS1∆/∆ mice, suggesting reduced transition of stem cells into the myeloid progenitor cell compartment.
Long-term hematopoietic stem cells from OS1∆/∆ mice show strongly reduced repopulation activity
To test whether deletion of Sfrp1 in MSPC and osteoprogenitors indirectly affects stem cell repopulation activity, we transplanted 100 sorted LT-HSC from OS1Δ/Δ or control mice into lethally irradiated WT recipients (Figure 1A). These experiments showed that peripheral engraftment
Haematologica | 108 February 2023 492 ARTICLE - Osteogenic Sfrp1 limits HSC differentiation F. Hettler et al.
from OS1Δ/Δ LT-HSC was severely impaired throughout the 24-week observation period (Figure 1B, C). Furthermore, donor engraftment of OS1 ∆/∆ cells was dramatically reduced in the BM of recipient mice 24 weeks after transplantation, as compared with the engraftment in control mice (Figure 1B, D). The failed repopulation of transplanted OS1∆/∆ LT-HSC was possibly driven by significantly lower regeneration of ST-HSC and LT-HSC compared to that of transplanted control LT-HSC. It is notable that seven out of ten recipient mice transplanted with OS1∆/∆ LT-HSC showed a complete absence of a donor LT-HSC compart-
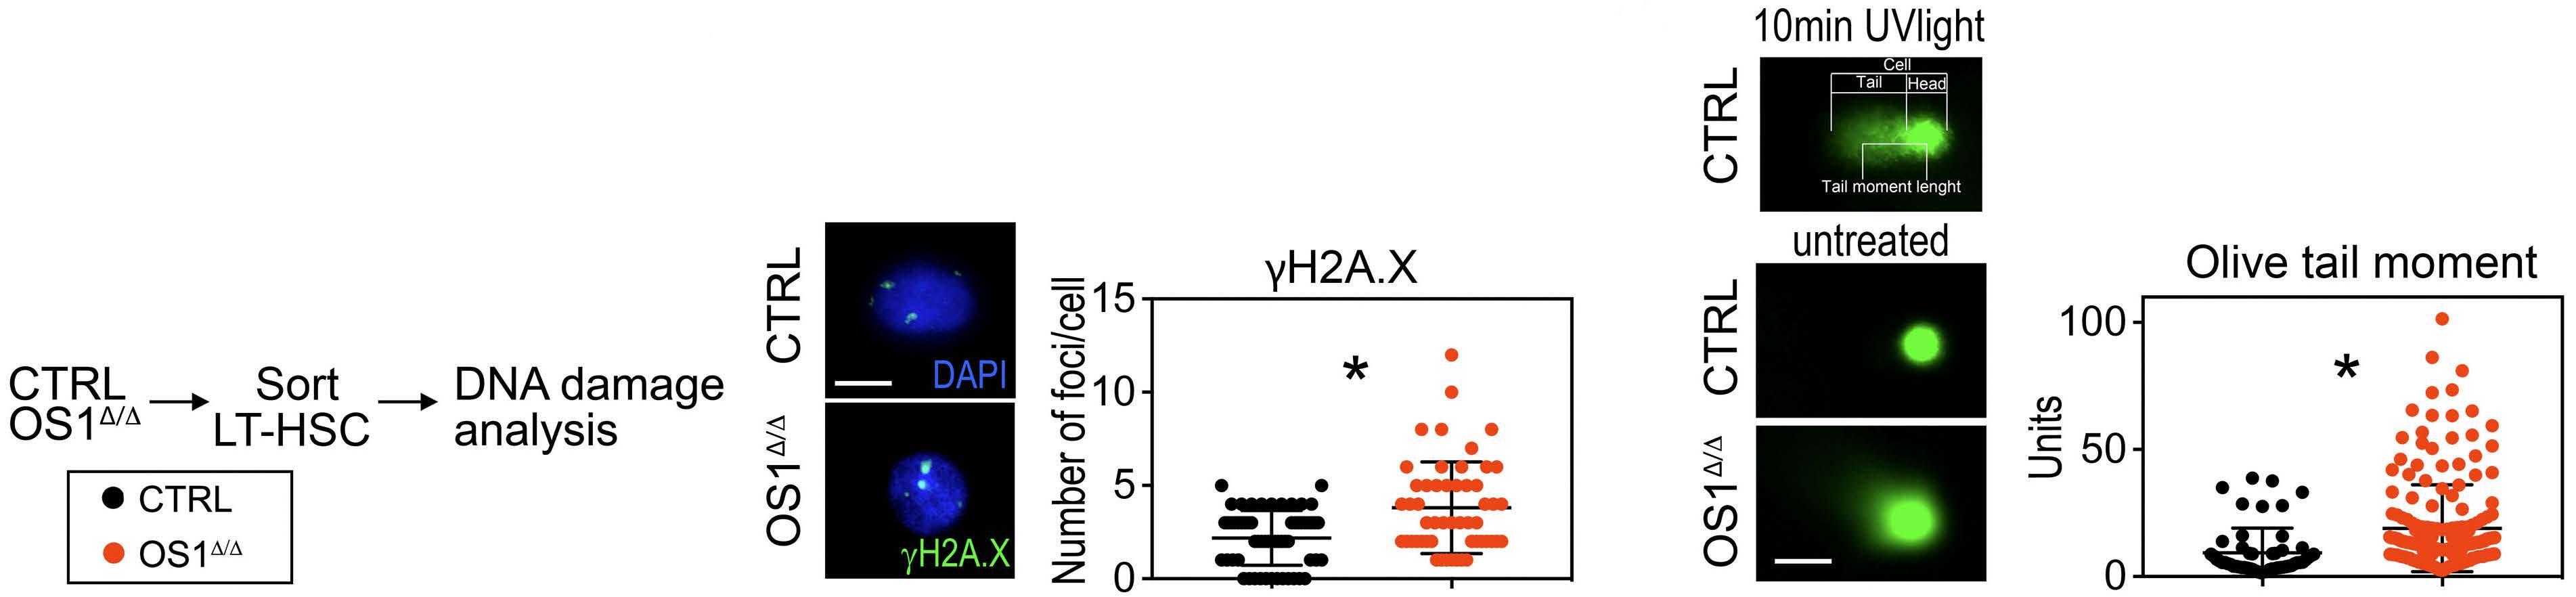
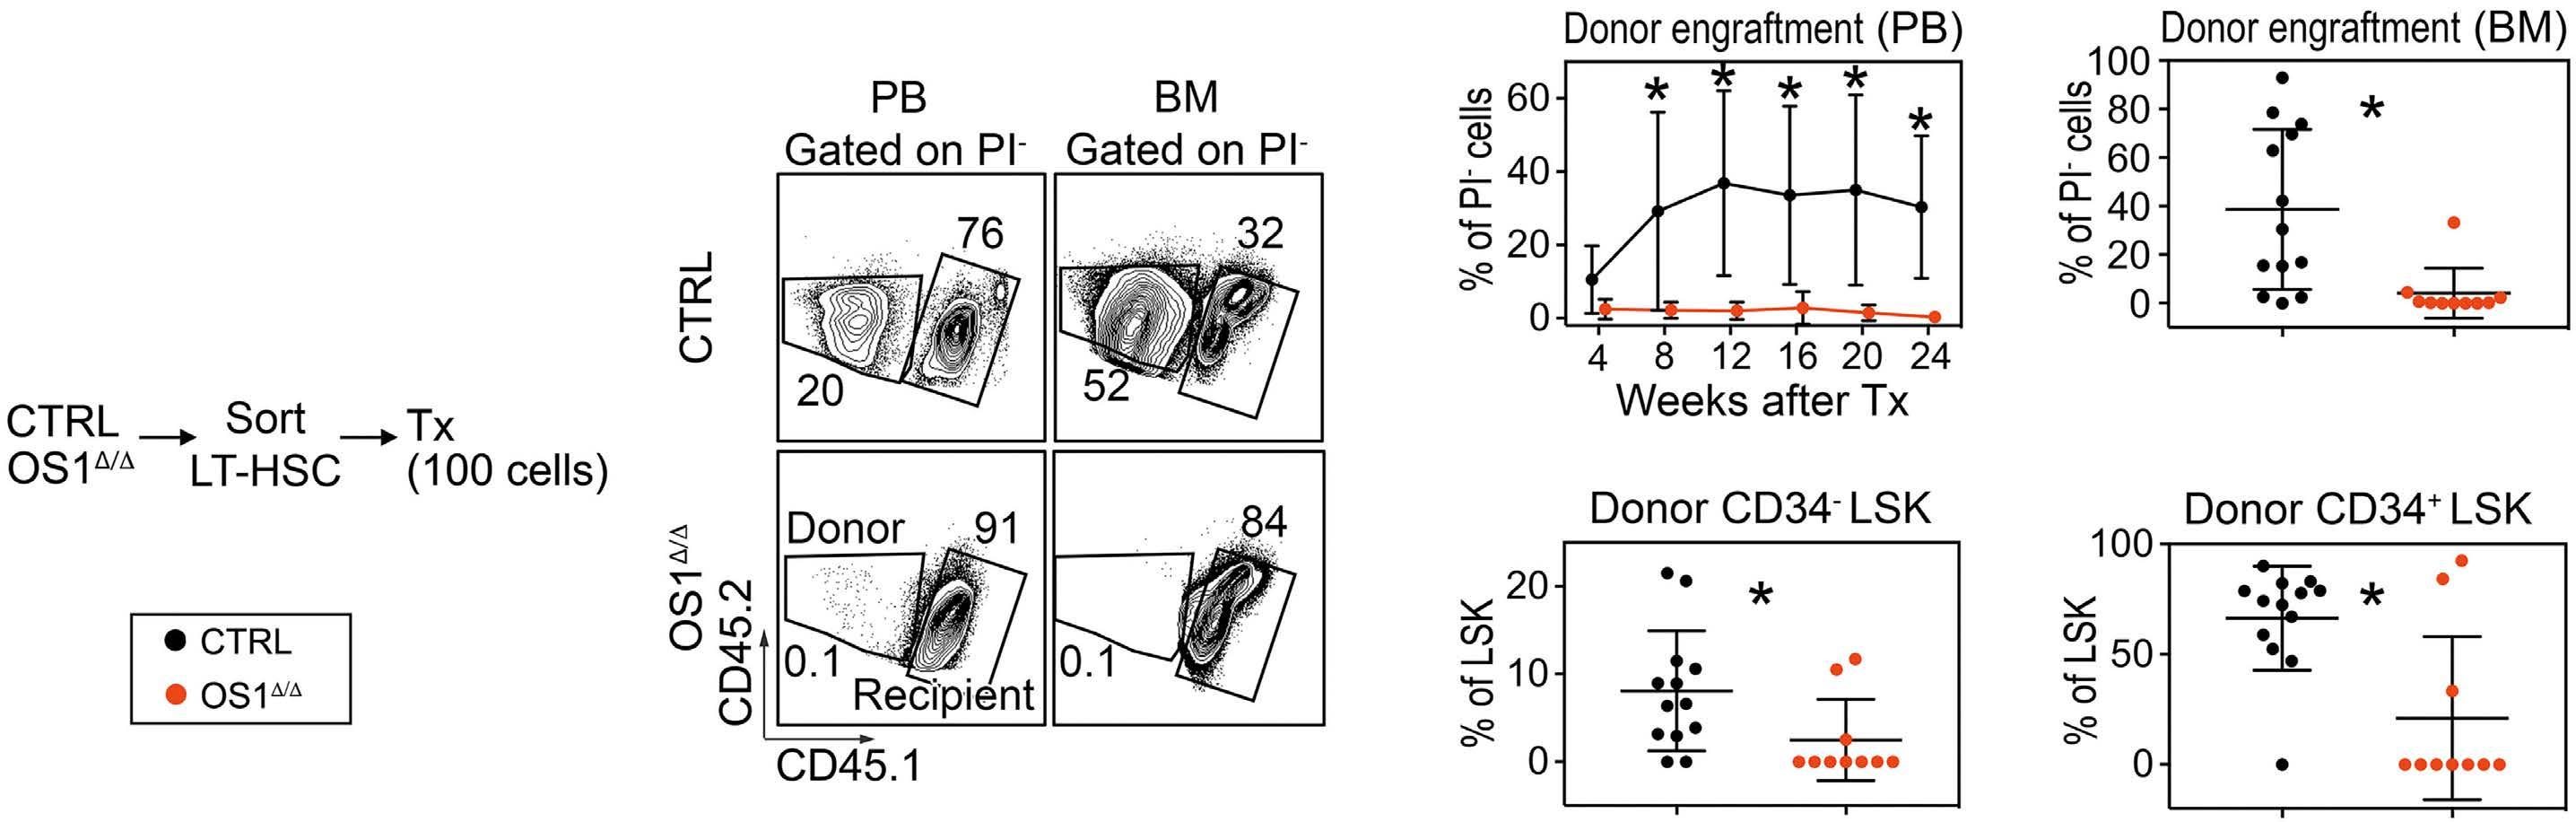
ment (Figure 1E, F). Since LT-HSC with reduced repopulating activity are frequently found to have DNA damage,30,31 we analyzed DNA damage in sorted LT-HSC from OS1∆/∆ and control mice (Figure 2A). Interestingly, LT-HSC from OS1 ∆/∆ mice displayed an increased number of phosphorylated foci on histone H2A.X (γH2A.X) and longer DNA fragment tails in the comet assay, indicating DNA double-strand breaks in LTHSC from OS1Δ/Δ mice (Figure 2B, C). These results suggest that LT-HSC from OS1 Δ / Δ mice may already be dysfunctional prior to transplantation.
Figure 1. Long-term hematopoietic stem cells from OS1∆/∆ mice failed to repopulate in wild-type recipients. (A) Experimental design: long-term hematopoietic stem cells (LT-HSC) from 8- to 10-week-old OS1Δ/Δ mice and control animals (CTRL, Sfrp1fl/fl) were sorted and transplanted into lethally irradiated wild-type recipients. (B) Representative flow cytometry plots of the gating strategy of Ly5.2+ donor cells or Ly5.1+Ly5.2+ recipient cells in peripheral blood (left) and bone marrow (right). (C) Percentage donor cell engraftment in the peripheral blood 4, 8, 12, 16, 20 and 24 weeks after transplantation. (D) Percentage donor engraftment in bone marrow (week 24 after transplantation). (E) Percentage of donor CD34- LSK cells. (F) Percentage of donor CD34+ LSK cells from OS1Δ/Δ mice (n=10) compared to control mice (n=13). Each dot represents one animal (D-F). Values are presented as the mean ± standard deviation. *P≤0.05 indicates a statistically significant difference determined by an unpaired t test. Symbol legends are as shown in (A). CTRL: littermate WT controls; LT-HSC: long-term hematopoietic stem cells; Tx: transplantation; PB: peripheral blood; BM: bone marrow; PI: propidium iodide.
Figure 2. Long-term hematopoietic stem cells from OS1∆/∆ mice showed DNA damage. (A) Experimental design: long-term hematopoietic stem cells (LT-HSC) from 8- to 10-week old OS1Δ/Δ mice and controls (Sfrp1fl/fl) were sorted and analyzed for DNA damage. (B) Left. Representative immunofluorescence staining for nuclei staining with DAPI in blue and histone γH2A.X foci content in green of LT-HSC. Right. Number of histone γH2A.X foci content of LT-HSC of OS1Δ/Δ mice (n=52) compared to controls (n=59). (C) Left. Immunofluorescence staining of a positive control (cells treated with UV light for 10 min), top. Representative immunofluorescence staining of cells from OS1Δ/Δ mice compared to those from control mice; below. Right. Units of olive tail moment (tail DNA/cell DNA * TML) of LT-HSC from OS1Δ/Δ mice (n=200) compared to control mice (n=55) calculated after a comet assay. Each dot represents one cell (B, C). Values are presented as means ± standard deviation. *P≤0.05 indicates a statistically significant difference determined by an unpaired t test. Scale bar: 5 µm. Symbol legends as shown in (A). CTRL: control mice.
A B C
E
A
C Haematologica | 108 February 2023 493 ARTICLE - Osteogenic Sfrp1 limits HSC differentiation F. Hettler et al.
D
F
B
Loss of function of hematopoietic stem cells from OS1∆/∆ mice in vitro
To investigate the survival, proliferation and differentiation of LT-HSC from OS1Δ/Δ mice, we set up single-cell cultures (Figure 3A, D).27,32 In the first experiments, we investigated whether knocking down Sfrp1 in stromal cells alters the potential of conditioned medium to maintain LT-HSC. To do this, we used medium conditioned on the HSC supportive stromal cell line UG26-1B633,34 with knockdownSfrp1 (shSfrp1) or control cells (pLKO.1) (Figure 3A). Interestingly, WT LT-HSC cultured in sh Sfrp1 UG26-1B6 conditioned medium, stem cell factor (KITL), and interleukin-11 showed unchanged survival, but decreased clone size compared to WT LT-HSC cultured in control conditioned medium (Figure 3B, C). Next, we analyzed LT-HSC
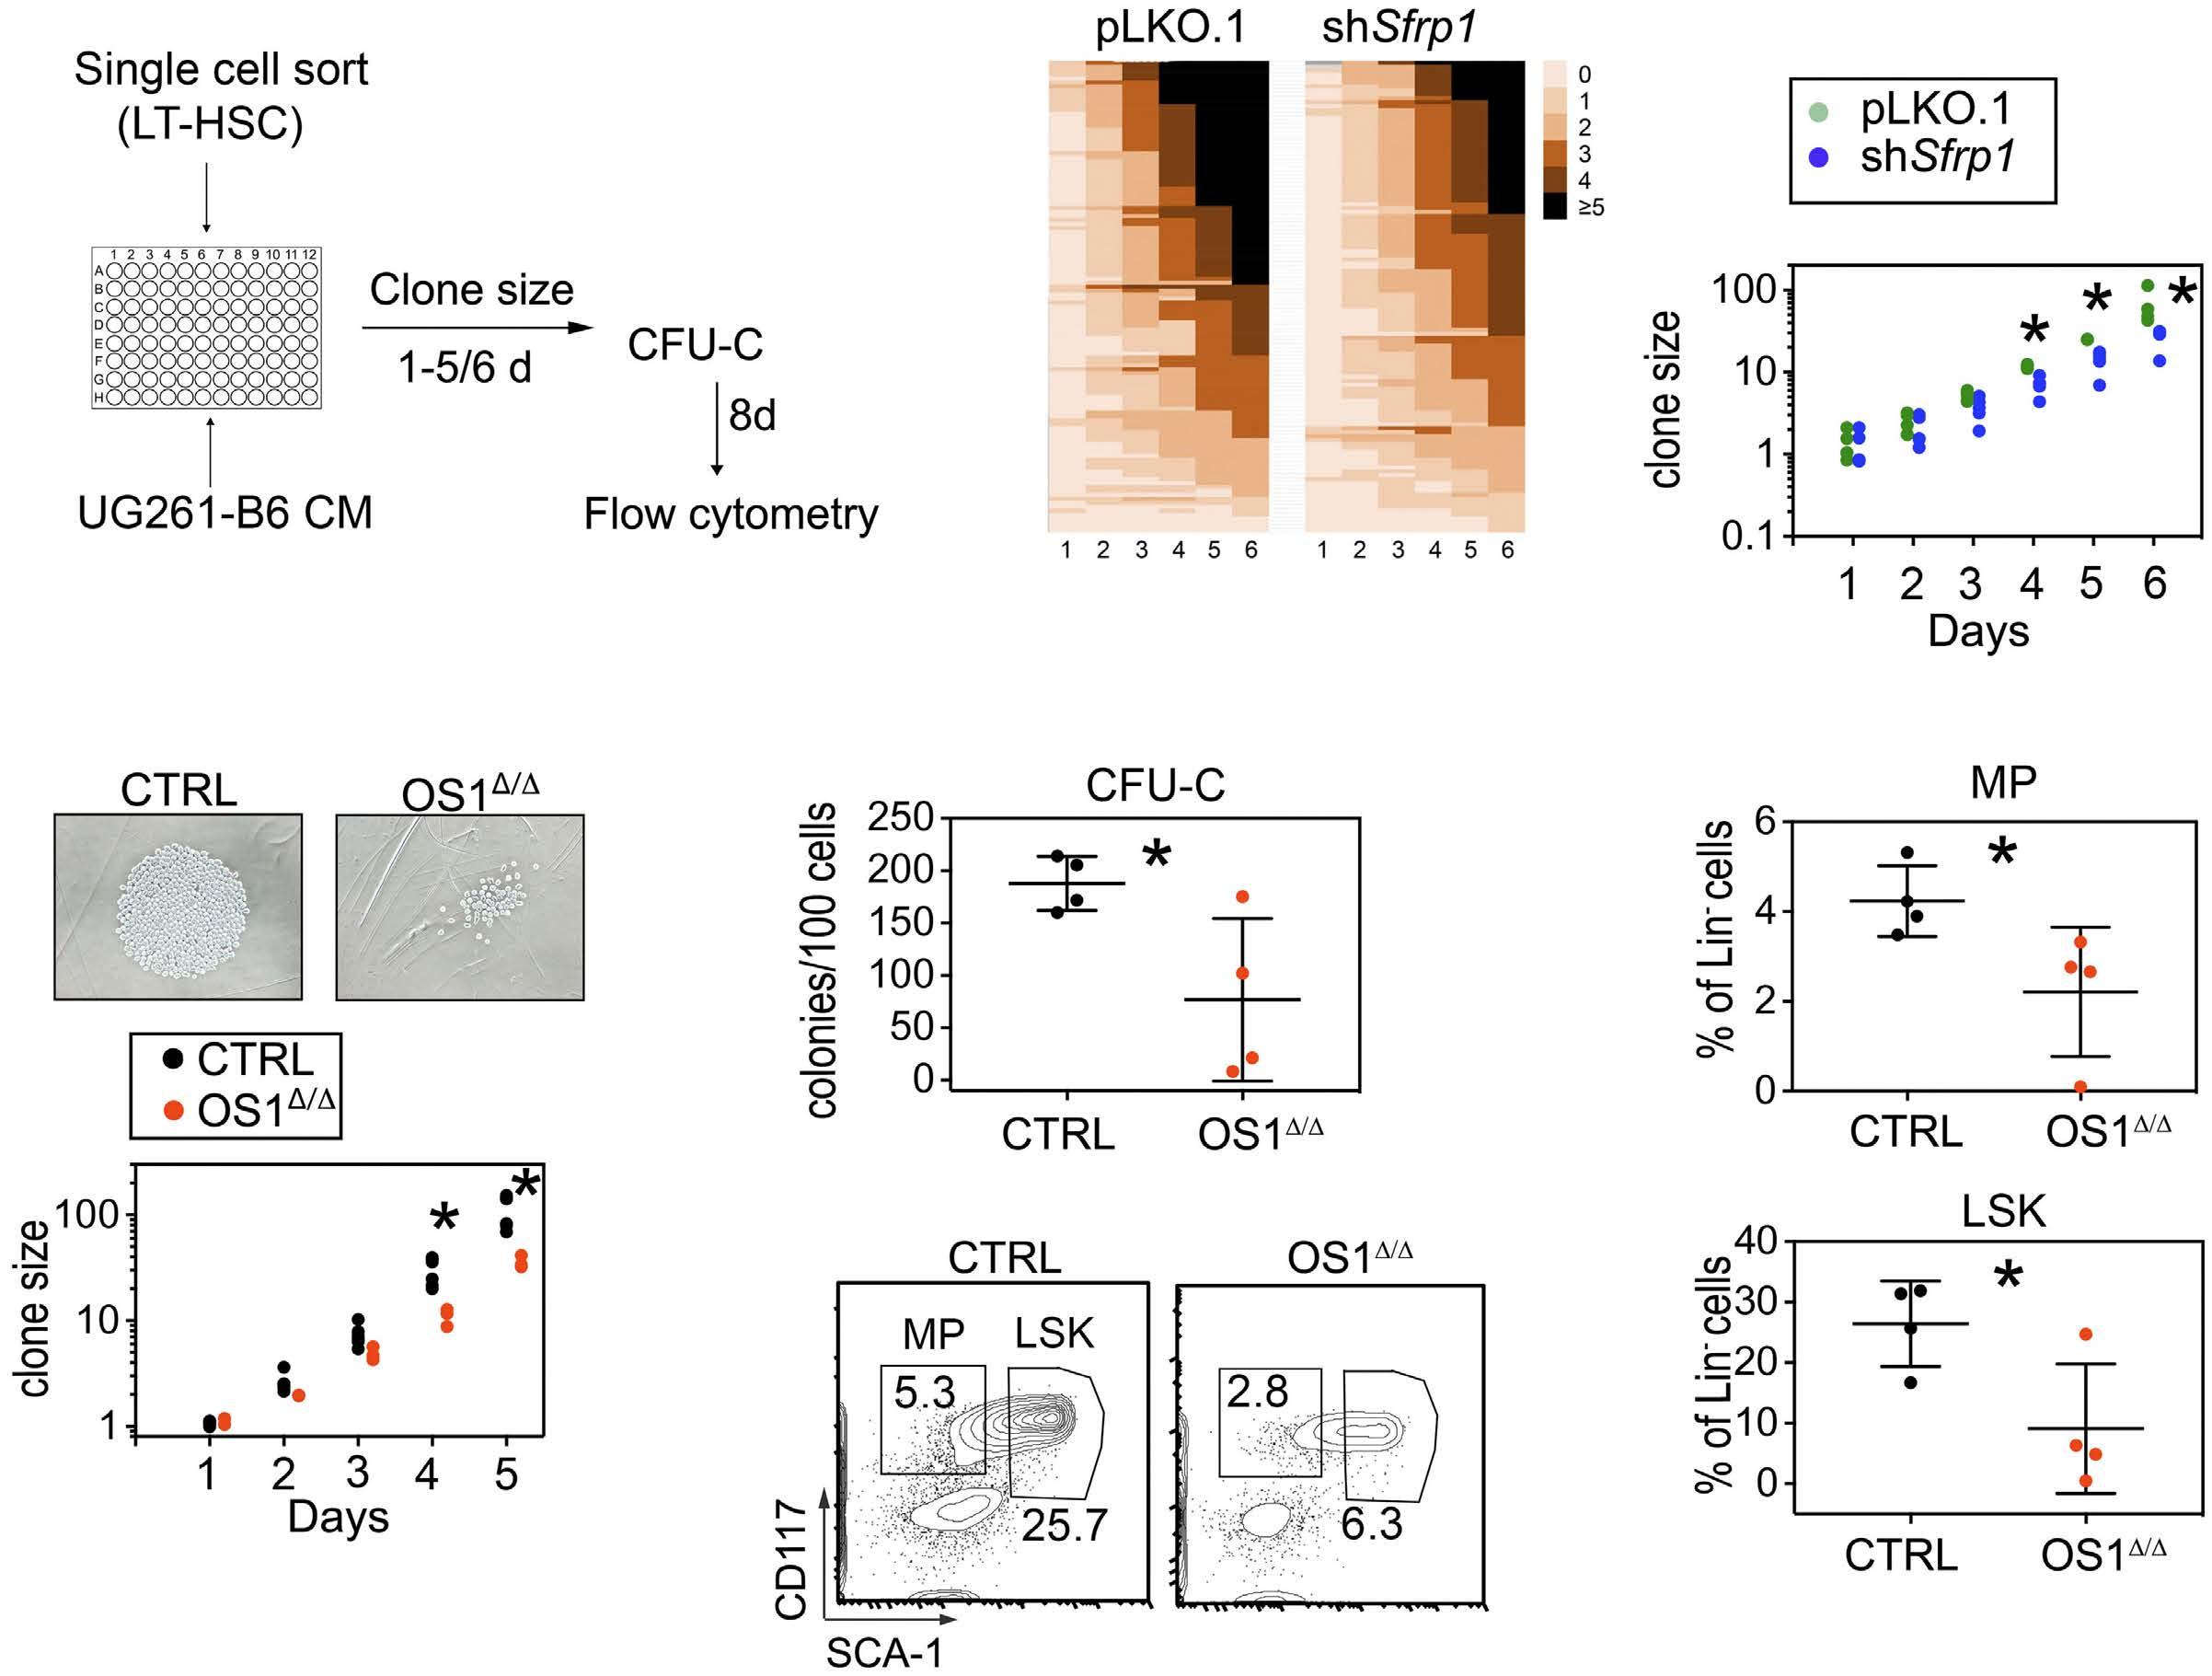
from OS1Δ/Δ mice compared to control LT-HSC in UG26-1B6 conditioned medium (Figure 3A). In this case, we found that LT-HSC from OS1Δ/Δ mice show decreased clone size after 4 and 5 days of culture compared to LT-HSC from control mice (Figure 3D). Importantly, we found a significant decrease in colonies grown from pooled day 6 clones of OS1Δ/Δ LT-HSC (Figure 3E) as well as a significantly decreased proportion of LSK cells and myeloid progenitors in these colonies compared to the control LT-HSC (Figure 3F, G). These results support the view that LT-HSC from OS1Δ/Δ mice have reduced proliferation with decreased colony formation.
To gain insights into the possible molecular mechanisms of reduced proliferation in LT-HSC from OS1Δ/Δ mice, we further investigated the expression of b-catenin co-activating acetylases CREBBP (CBP) and EP300 (p300) in LT-
Figure 3. Long-term hematopoietic stem cells from OS1∆/∆ mice proliferate slowly. (A) Experimental design: details can be found in the Methods. (B) Representative heat maps of the minimal number of cell divisions per clone per well for each long-term hematopoietic stem cell at each day of culture in pLKO.1 (left), or in shSfrp1 UG26-1B6 conditioned medium (right). (C) Counted mean clone size per well over 6 days of wild-type cells in pLKO.1 or in shSfrp1 UG26-1B6 conditioned medium (n=6). (D) Top. Representative picture of cells on day 5 of culture. Bottom: counted mean clone size over 5 days from OS1Δ/Δ mice (n=3) and controls (n=6). (E) Counted total numbers of colonies from OS1∆/∆ mice (n=4) and controls (Sfrp1fl/fl) (n=4) in M3434 after 8 days of culture after 5 days of single-cell culture. (F) Representative flow cytometry plots of harvested cells after 8 days of methylcellulose culture of cells from control mice (left) and OS1∆/∆ mice (right). (G) Percentages of myeloid progenitors (top) and LSK cells (bottom) in harvested cells after 8 days culture in M3434 of cells from OS1∆/∆ mice (n=4) and control mice (n=4). Each dot represents one animal (E, G) or plate (C, D). Values represented in the graphs are means ± standard deviation. *P≤0.05 indicates a statistically significant difference determined by an unpaired t test. Symbol legends as shown in (C). LT-HSC: long-term hematopoietic stem cells; CM: conditioned medium; CFU-C: colony-forming unit-cells; CTRL: control; MP: myeloid progenitors.
A
D E F
Haematologica | 108 February 2023 494 ARTICLE - Osteogenic Sfrp1 limits HSC differentiation F. Hettler et al.
B C
G
HSC (Figure 4A), proteins which are known to regulate proliferation and differentiation in embryonic stem cells,35 self-renewal of HSC,17 and senescence in fibroblasts.18 These experiments showed that in sorted LT-HSC from OS1Δ/Δ mice, the protein levels of both b-catenin and p300 were elevated, while the level of CBP remained unchanged (Figure 4B-D). This suggests that due to the increased expression of p300, CBP-driven self-renewal may be reduced in LT-HSC from OS1 Δ / Δ mice compared to control mice.
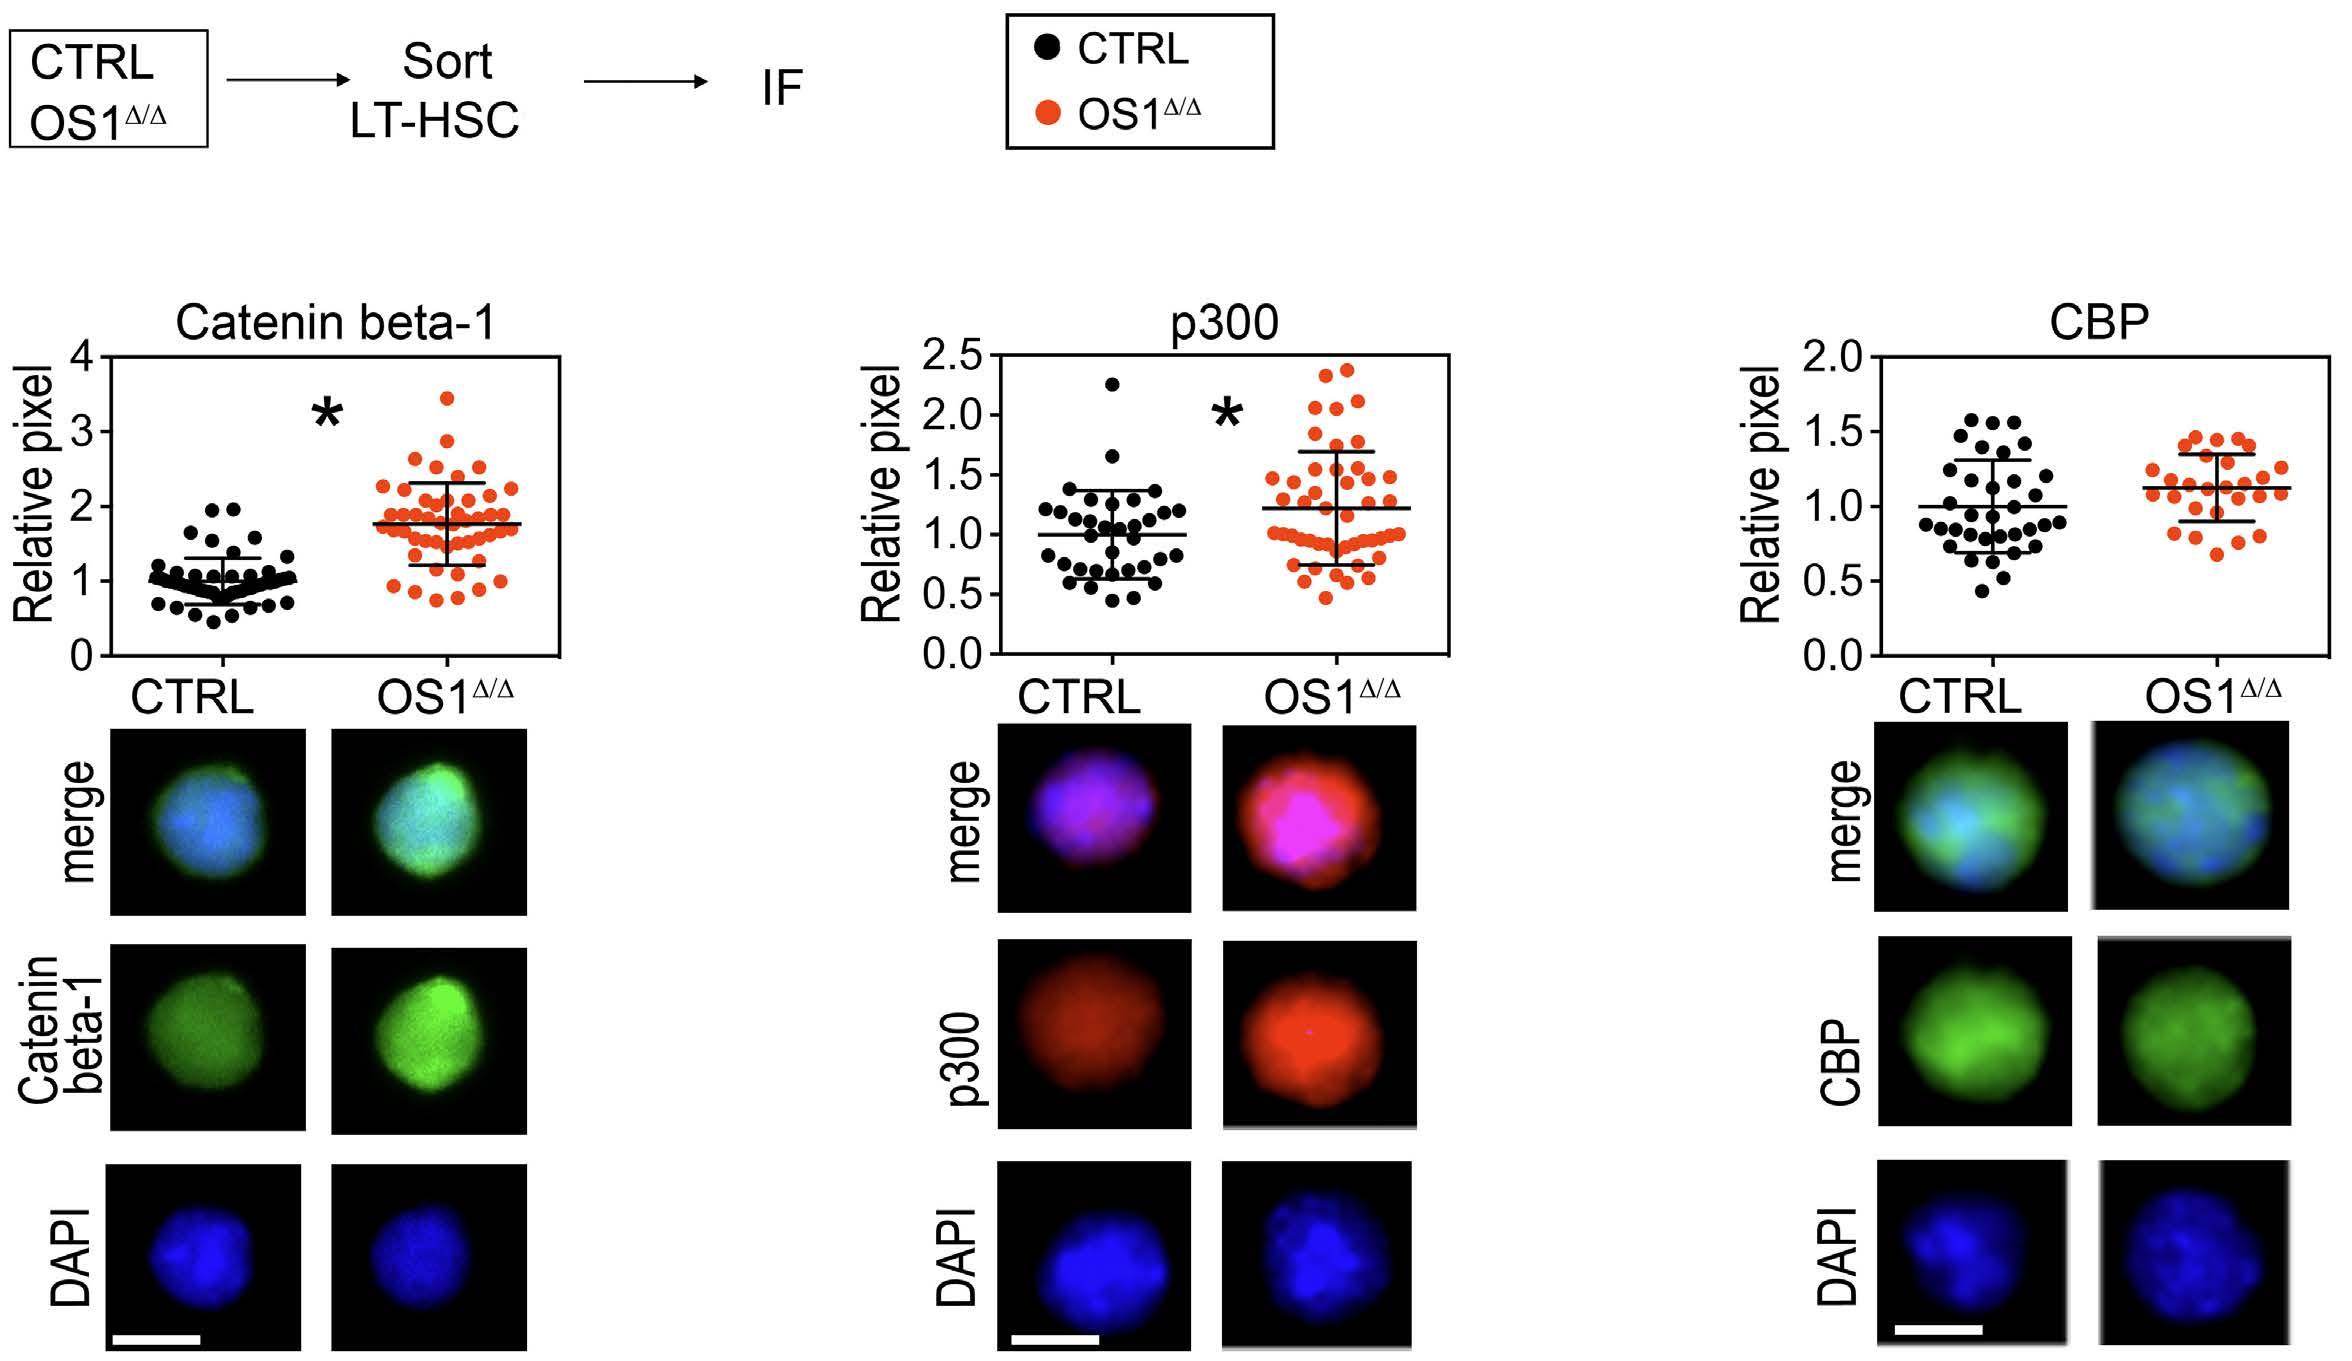
Restoration of hematopoietic stem cell quality with IQ-1 treatment in vivo
Phosphorylation of p300 at position Ser89 is known to stabilize the interaction between b-catenin and p300.20,35 Considering that p300 reduces cell proliferation and promotes differentiation and senescence, IQ-1 has been used to reduce the phosphorylation of Ser89-p300 and, by doing so, indirectly to decrease the activity of the b-catenin/p300 enhanceosome. Interestingly, IQ-1 does not reduce transcriptional activity by binding to p300 directly, but instead it binds to PR72/130 (PPP2R3A), a regulatory subunit of the serine/threonine phosphatase PP2A, which is responsible for reducing pSer-p300.35-38
To reduce the amount of phospho-p300 in vivo, we treated mice for 5 days with IQ-1 via daily intraperitoneal
injection38 and analyzed differentiation and repopulating activity of LT-HSC (Figure 5A, B). We found that IQ-1 treatment did not affect control mice. In OS1Δ/Δ mice, IQ-1 did not affect the absolute numbers of ST-HSC and LT-HSC, while the number of myeloid progenitors was still decreased compared with that in control mice (Figure 5B-E, Online Supplementary Figure S4F). This suggests that IQ1 does not affect steady-state hematopoiesis in either control or OS1Δ/Δ mice.
However, whereas IQ-1 did not affect pSer89-p300 in control LT-HSC, it significantly decreased pSer89-p300 after 5 days of treatment of LT-HSC from OS1Δ/Δ mice (Figure 5F); the protein levels of PPP2R3A and b-catenin were unaltered (Online Supplementary Figure S1G-I). To determine the clonogenic capacity of LT-HSC from untreated and IQ1-treated primary recipient mice, sorted LT-HSC were plated in growth factor-supplemented methylcellulose. Here, we found that IQ-1treatment of donor mice improved colony formation of regenerated LT-HSC, in both control and OS1Δ/Δ mice (Figure 5G), indicating that clonogenic hematopoietic activity in regenerated donor OS1Δ/Δ LT-HSC is restored to control levels by in vivo IQ-1 treatment.
To identify possible underlying molecular changes of the effects of IQ-1 treatment, we analyzed the transcriptome of 500-1000 LT-HSC before and after treatment with IQ-1
A B C D ARTICLE - Osteogenic Sfrp1 limits HSC differentiation F. Hettler et al.
Figure 4. Enhanced β-catenin/p300 signaling in long-term hematopoietic stem cells from OS1∆/∆ mice. (A) Experimental design of immunofluorescence staining of long-term hematopoietic stem cells (LT-HSC) from OS1Δ/Δ and control (Sfrp1fl/fl) mice for (B) catenin beta-1 (b-catenin), (C) p300 and (D) CBP protein content as pixel number of 50-60 LT-HSC sorted from the bone marrow of OS1∆/∆ mice and control mice with representative immunofluorescence nuclei staining with DAPI in blue (bottom), protein of interest in green (middle), and the merged picture (top). Each dot represents one cell (B-D). Values in the graphs are means ± standard deviation. *P≤0.05 indicates a statistically significant difference determined by an unpaired t test. Scale bar: 5 µm. Symbol legends as shown in (A). CTRL: control; IF: immunofluorescence; CBP: CREB-binding protein. Haematologica | 108 February 2023 495
Figure 5. The impact of IQ-1 treatment on the primitive hematopoietic compartment of the bone marrow. (A) Experimental design of the in vivo IQ-1 treatment: 8- to 10-week-old OS1Δ/Δ mice and control mice (Sfrp1fl/fl) were injected intraperitoneally with IQ-1 (14 µg) or vehicle (HF2) for 5 days. The composition of the primitive hematopoietic compartment of the bone marrow was analyzed 24 hours later. (B) Absolute number of long-term hematopoietic stem cells (LT-HSC); (C) absolute number of short-term hematopoietic stem cells; (D) absolute number of LSK cells; and (E) absolute number of myeloid progenitors of OS1∆/∆ mice; (HF2: n=6; IQ-1: n=7) compared to those from controls (HF2: n=7; IQ-1: n=9). (F) Left. Phospho-p300 protein content as relative pixel number of LT-HSC from IQ-1-treated and untreated OS1∆/∆ mice (HF2: n=60; IQ-1: n=60) and control mice (HF2: n=60; IQ1: n=60). Right. Representative immunofluorescence staining for the nuclei staining with DAPI in blue (bottom), phospho-p300 protein in green (middle), and the merged picture (top) of LT-HSC from IQ-1-treated and untreated OS1Δ/Δ mice and controls. (G) Counted total numbers of colony-forming unit-cells from IQ-1-treated and untreated OS1∆/∆ mice (HF2: n=8; IQ-1: n=4) and control animals (HF2: n=8; IQ-1: n=4). Each dot represents one animal (B-E, G) or cell (F). The values shown are means ± standard deviation. *P≤0.05 indicates a statistically significant difference determined by analysis of variance, with a Tukey post-hoc test. Scale bar: 5 µm. Key to symbols as shown in (A). CTRL: control; IF: immunofluorescence; ST-HSC: short-term hematopoietic stem cells; MP: myeloid progenitors; CFU-C: colony-forming unit-cell.
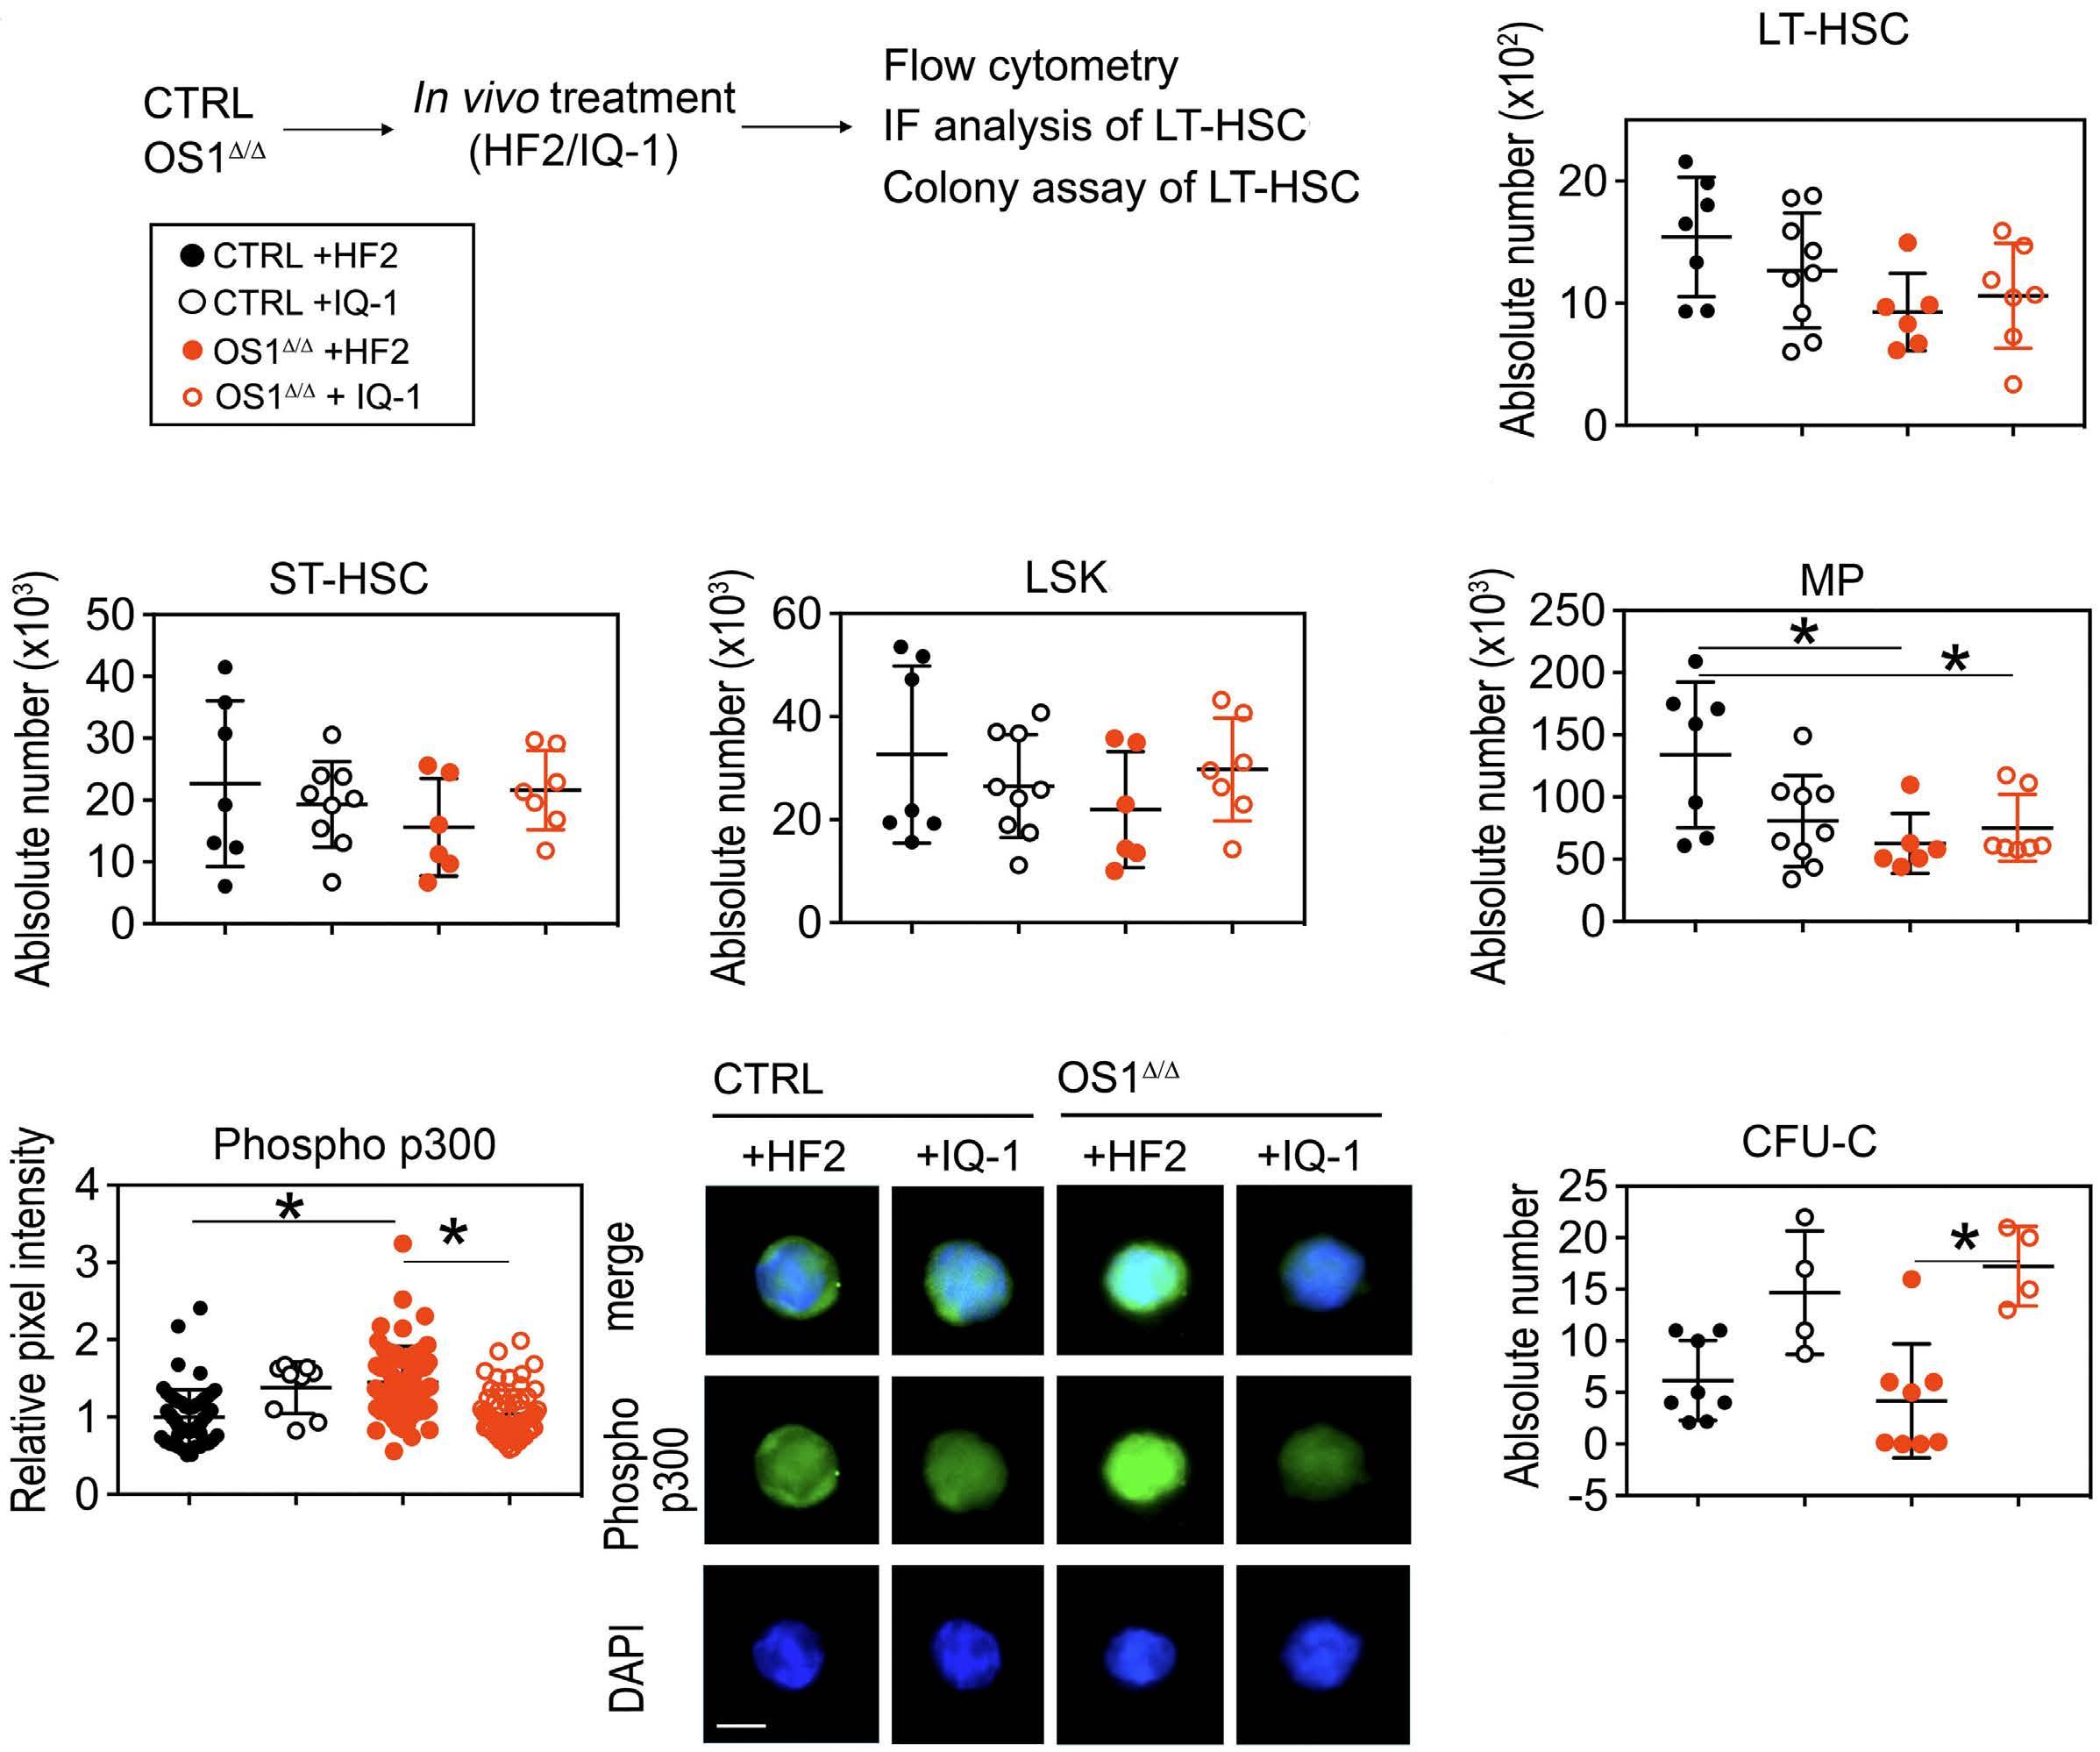
via RNA sequencing (Online Supplementary Figure S5A). Global gene set enrichment analysis showed that the gene sets ‘E2F_target’, and ‘G2M checkpoints’ were significantly enriched in control LT-HSC, whereas ‘Reactive oxygen species pathway’ was enriched in OS1Δ/Δ LT-HSC (Online Supplementary Figure S5B-D). However, the expression of the differentially regulated genes from these gene sets (Online Supplementary Figure S5E-G) was not completely restored in IQ-1-treated animals. Since IQ-1 affects post-translational modi fications through PP2A and such modifications modify protein-pro-
tein interactions, we then looked more closely at subcellular protein levels and localization. For this purpose, LTHSC were sorted from control and OS1 Δ / Δ mice treated with IQ-1 or the vehicle (HF2) (Figure 6A). Confocal analysis of PPP2R3A (PR72/130) and p300 not only showed p300 upregulation in OS1Δ/Δ LT-HSC (see also Figure 4C), but also its co-localization with PR72/130 and a strongly increased nuclear presence of p300 in OS1Δ/Δ LT-HSC (Figure 6B-D and Online Supplementary Videos). In LT-HSC from IQ-1treated control or OS1 Δ / Δ mice, both nuclear p300 and PR72 co-localization with p300 was similar to that of un-
A B C D E F
Haematologica | 108 February 2023 496 ARTICLE - Osteogenic Sfrp1 limits HSC differentiation F. Hettler et al.
G
treated controls, indicating restoration of both nuclear accumulation of p300 and co-localization with PR72/130 by IQ-1 treatment. We then assessed whether pSer89-p300 would also associate more with b-catenin, and found a stronger association in OS1Δ/Δ LT-HSC (Figure 6E, F), indicating increased activity of the b-catenin/p300 complex. In LT-HSC from IQ-1-treated OS1Δ/Δ mice, this association was significantly lower, showing that IQ-1 reduces the interaction of p300 and b-catenin. We then investigated whether the identified changes are sufficient to restore the repopulation activity of LT-HSC from IQ-1-treated OS1Δ/Δ mice (Figure 7A). In line with this hypothesis, we observed that donor LT-HSC from these mice repopulated to a similar extent as LT-HSC from untreated control mice, whereas LT-HSC from untreated OS1Δ/Δ mice did not engraft (Figure 7B, C). Importantly, LTHSC from IQ-1-treated OS1Δ/Δ mice were now able to efficiently regenerate the donor stem and progenitor compartments in recipient BM (Figure 7D). Interestingly, the absolute number of donor-derived CD34- LSK cells and donor-derived myeloid progenitors of transplanted LT-HSC from IQ-1-treated OS1Δ/Δ mice was even higher than that of the donor-derived CD34- LSK cells and myeloid progenitors from transplanted control LT-HSC (Figure 7E-H).
We next investigated the clonogenic ability of the regenerated donor cells (Online Supplementary Figure S6A). In line with the observations described above, regenerated OS1∆/∆ donor LSK cells formed very few colonies, whereas the colony-forming ability of LSK cells from regenerated cells from the IQ-1-treated OS1∆/∆ mice was similar to that of the control donor LSK cells (Online Supplementary Figure S7B). On a molecular level, both phospho-p300 (Ser89) content and the number of γH2A.X foci were similar in regenerated LT-HSC from IQ-1-treated OS1∆/∆ or control donor mice (Online Supplementary Figure S6C, D). To determine whether IQ-1 treatment of dysfunctional HSC in OS1Δ/Δ mice not only restores their engraftment in primary recipients, but also their long-term self-renewal activity, we transplanted donor HSC from primary recipients, and transplanted these into secondary WT recipient mice (Figure 8A, Online Supplementary Figure S7A). For this purpose, 1,000 (Figure 8) or 2,000 (Online Supplementary Figure S7) donor LSK cells were sorted from the BM of recipient mice transplanted with LT-HSC from either IQ-1-treated OS1∆/∆ (n=8) or untreated control mice (n=9). We found that IQ-1 treatment of OS1∆/∆ donors not only restored multilineage engraftment of the primary recipients (Figure 7), but also the long-term repopulating ability
Figure 6. The impact of IQ-1 treatment on the p300 signaling pathway. (A) Experimental design of the in vivo IQ-1 treatment: 8to 10-week-old OS1Δ/Δ mice and control mice (Sfrp1fl/fl) were injected intraperitoneally with IQ-1 (14 µg) or vehicle (HF2) for 5 days. The composition of the primitive hematopoietic compartment of the bone marrow was analyzed 24 hours later. (B) Confocal microscopy pictures of p300 protein (red) and colocalization with PR72 (white) of long-term hematopoietic stem cells (LTHSC) from IQ-1-treated and untreated OS1Δ/Δ mice (HF2: n=30; IQ-1: n=30) and control mice (HF2: n=30; IQ-1: n=30, B-F). (C) Number of voxels of p300 in the nuclear area of LT-HSC from IQ-1-treated and untreated OS1Δ/Δ mice. (D) Number of colocalized voxels of p300 and PR72 in the cytoplasm of LT-HSC from IQ-1-treated and untreated OS1 Δ / Δ mice. (E) Representative pictures of the immunofluorescence staining showing the colocalization of b-catenin and phospho-p300 (white) of LT-HSC from IQ-1-treated and untreated OS1∆/∆ mice and controls. (F) Number of colocalized voxels of phospho-p300 and b-catenin of LT-HSC from IQ-1-treated and untreated control and OS1Δ/Δ mice. Scale bar: 5 µm. Each dot represents one cell. Values are presented as means ± standard deviation. *P≤0.05 indicates a statistically significant difference determined by the Mann-Whitney test. Symbol legends are as shown in (A). CTRL: control; IF: immunofluorescence.
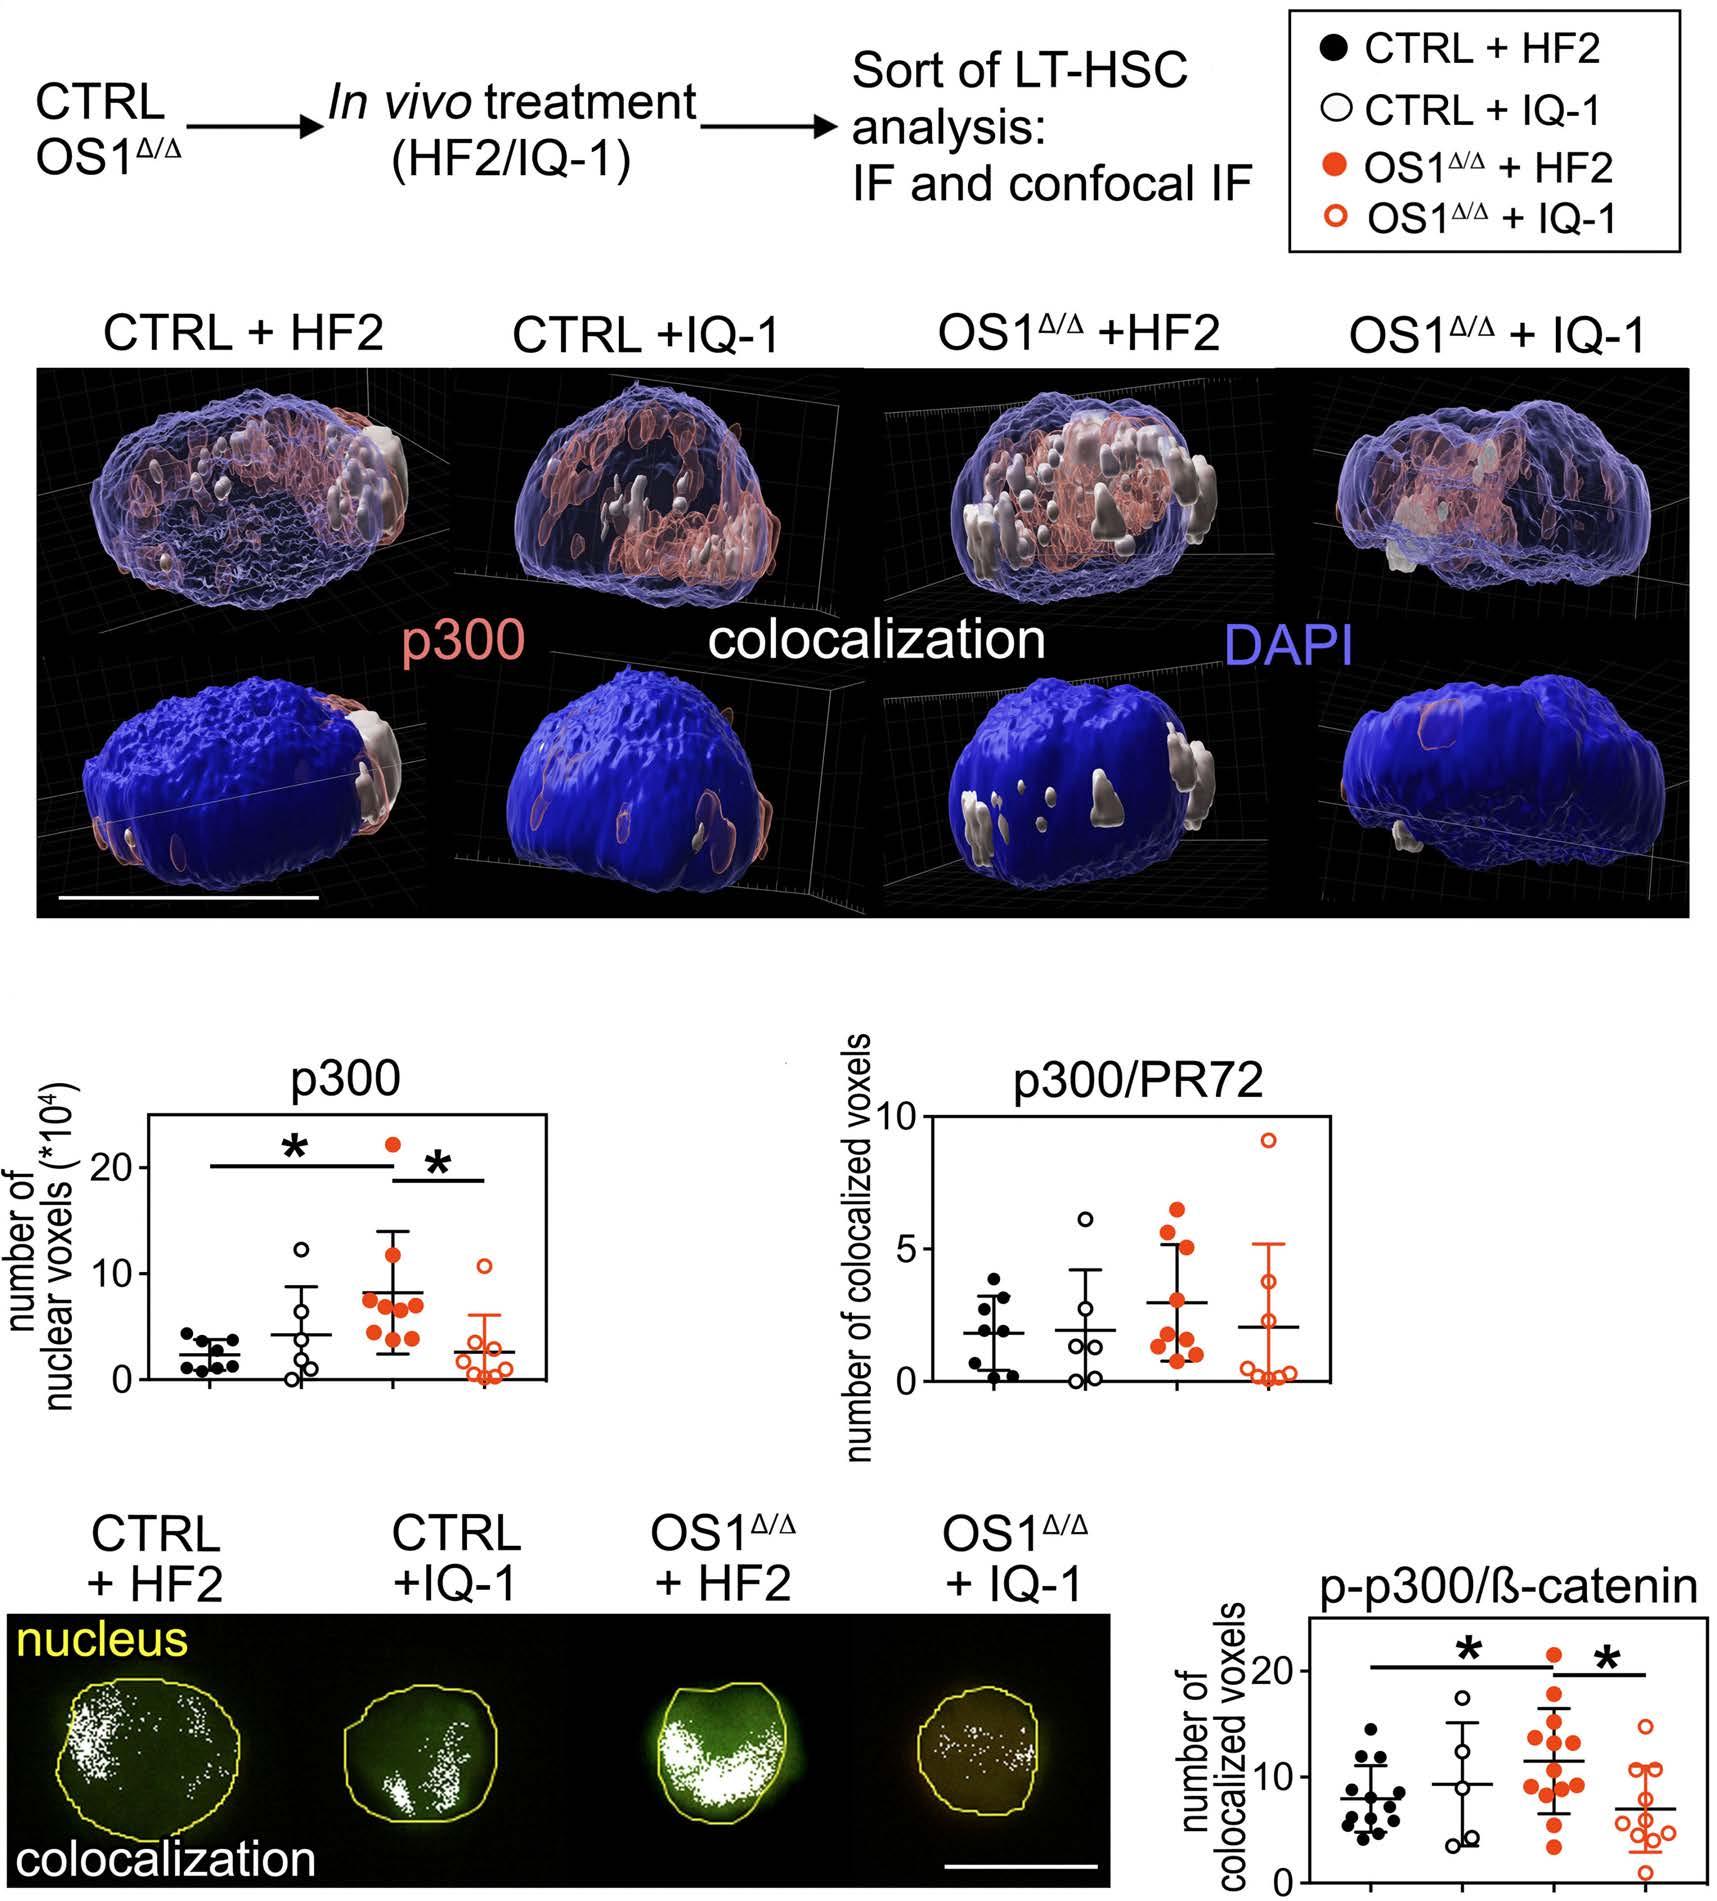
A B C D E F Haematologica | 108 February 2023 497 ARTICLE - Osteogenic Sfrp1 limits HSC differentiation F. Hettler et al.
in secondary recipients to levels comparable to those of the untreated WT controls (Figure 8B-I, Online Supplementary Figure S7B-L). Thus, the long-term repopulating ability of dysfunctional HSC from OS1∆/∆ mice was completely restored by prior in vivo IQ-1 treatment of the OS1Δ/Δ donor mice.
Discussion
Our results show that deletion of Sfrp1 expression in osteoprogenitors strongly reduces the colony-forming and repopulating ability of HSC. Our experiments link these findings to reduced proliferation in single-cell assays, and increased DNA damage. On a molecular level, both b-catenin and p300 levels were elevated, while CBP content was not affected. Mechanistically, we found an increased level of nuclear p300 and an enhanced presence of bcatenin/phospho-p300-containing colocalization, indicating increased p300 transcriptional activity. Furthermore, we provide evidence that interfering with this interaction by decreasing p300 phosphorylation at Serine 89 reverses the dysfunctional hematopoietic phenotype and restores long-term repopulating activity of HSC from OS1Δ/Δ mice. Our study shows that the PR72/130-binding inhibitor IQ-1 reduces nuclear p300 activity of HSC from OS1 Δ / Δ mice. PR72 and PR130 are two proteins derived from the
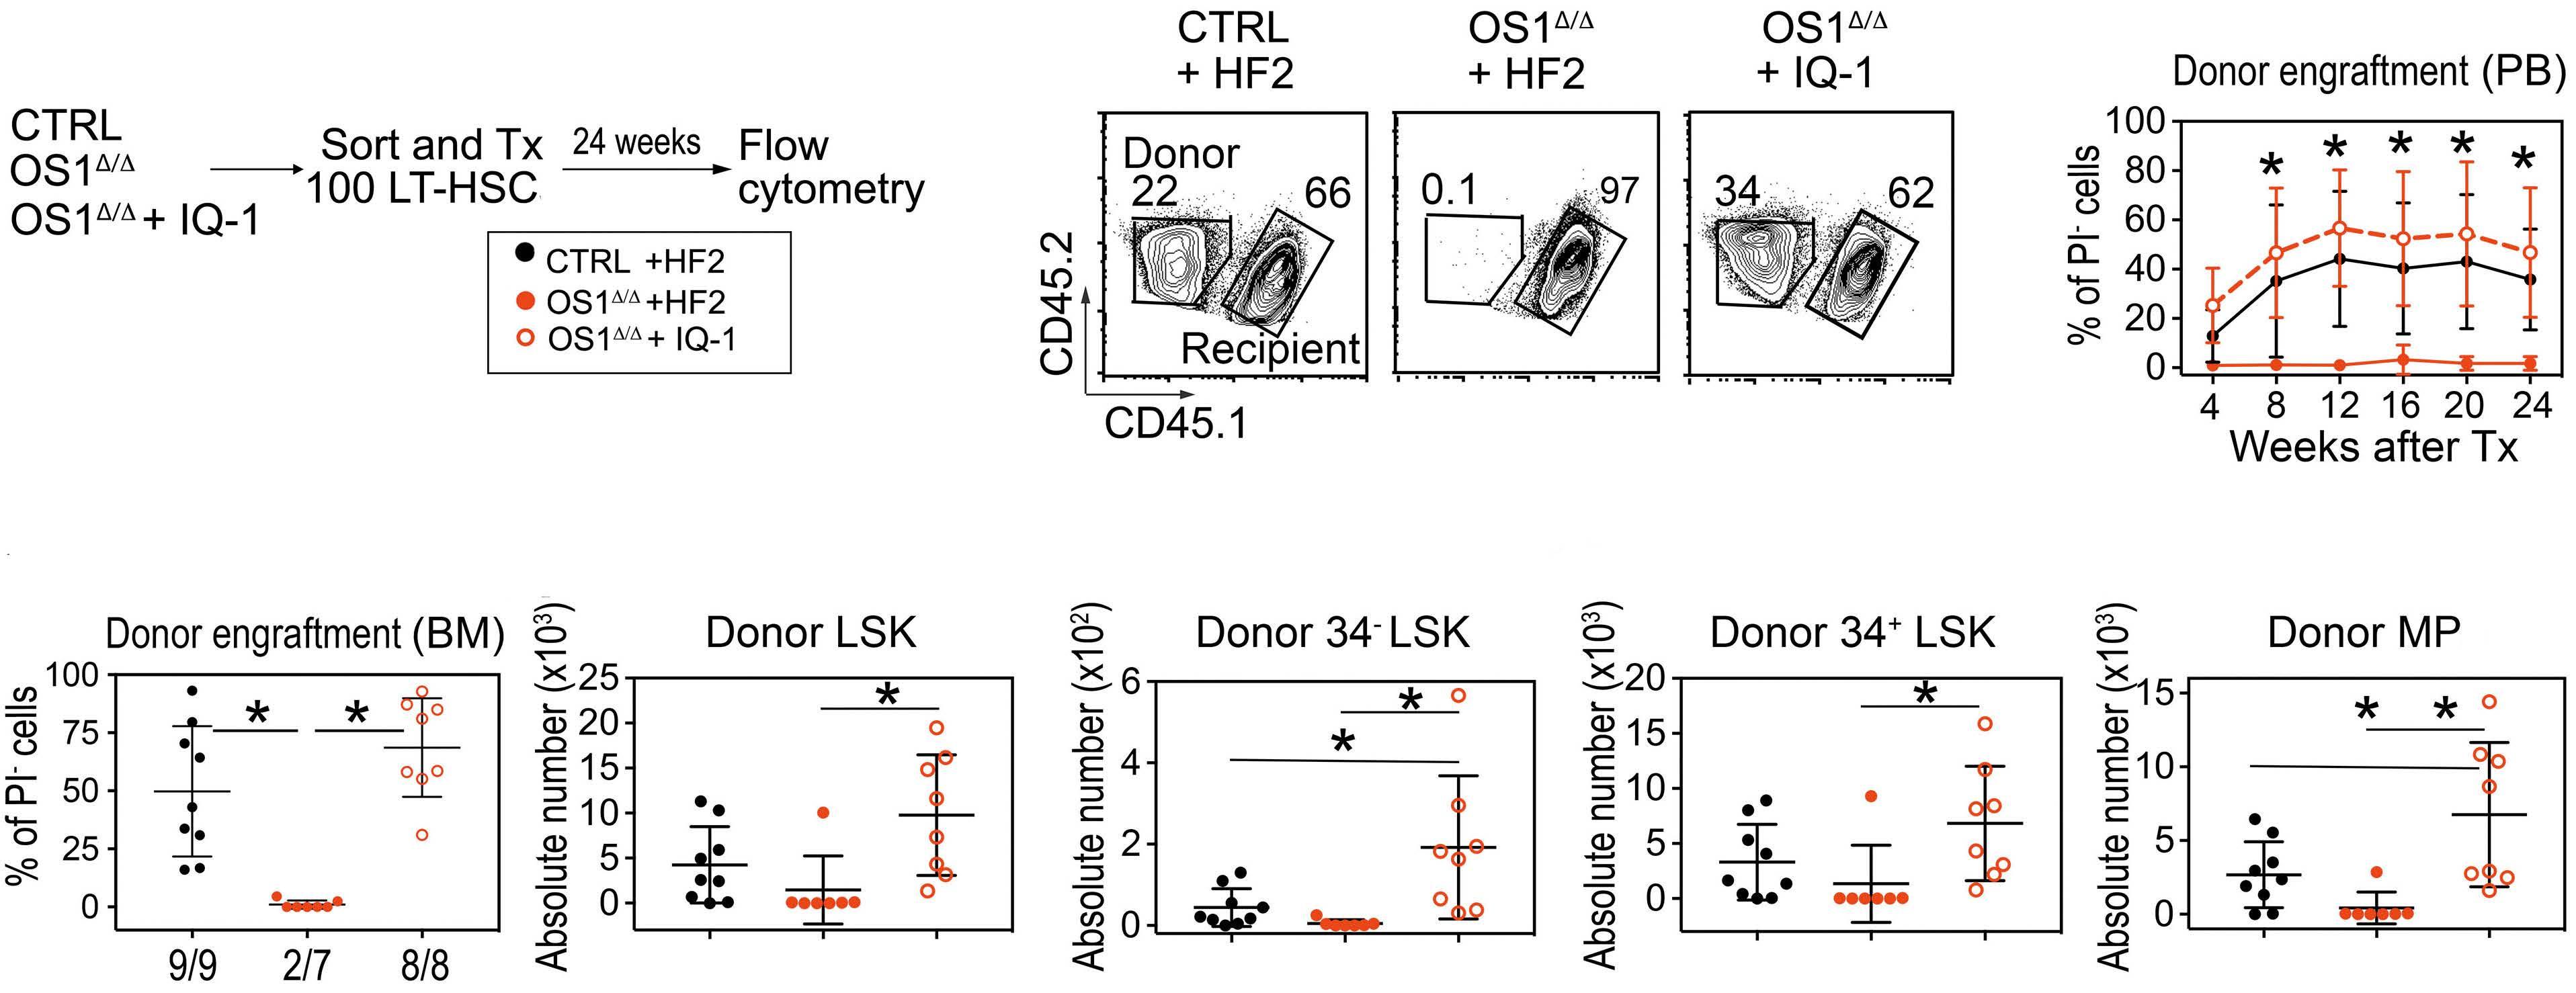
Ppp2r3a gene, and both act as B regulatory subunits of PP2A phosphatase. PR72/130 promotes PP2A phosphatase activity.39 PR72/130 binds to different substrates, including several involved in the DNA damage response and Wnt signaling.39,40 It is of note that in our in vivo study, we found that IQ-1 treatment reduces the level of phospho-p300 in LT-HSC, suggesting that pSer89-p300 is a direct target of the PP2A-PR72/130 phosphatase in OS1Δ/Δ cells. To determine whether p300 activity is the main or even only target of IQ-1 treatment in HSC, more knowledge should be generated in the future about possible targets of this phosphatase in HSC. Nevertheless, our results show that the PP2A-PR72/130 phosphatase regulates the WNT-catenin enhanceosome through p300 phosphorylation in HSC. In other cell systems, increased pSer89-p300 increases differentiation not only in embryonic stem cells,35 but also in teratocarcinoma cells41 and alveolar progenitors.20 Furthermore, p300, but not CBP, has been found to induce a hyperacetylated chromatin state that promotes senescence.18 Consistent with this, we found increased DNA damage, which is often found in senescent LT-HSC.30,31 Self-renewal, on the other hand, requires a full dose of CBP,17 and deletion of CBP results in HSC exhaustion.17,42 In addition, specific inhibition of CBP eliminates cancer stem cells.43 Although the observed effects of IQ-1 in reversing in vivo HSC dysfunction and reduction of nuclear p300 localization as well as pSer89-p300 and its association with
Figure 7. Functionality of long-term hematopoietic stem cells at steady state and after IQ-1 treatment. (A) Experimental design of primary transplantation of IQ-1-treated long-term hematopoietic stem cells (LT-HSC) into lethally irradiated wild-type recipients: 8- to 10-week old OS1Δ/Δ mice were injected intraperitoneally for 5 days with IQ-1 (14 µg) or vehicle (HF2). Twenty-four hours after the last treatment 100 LT-HSC were sorted and transplanted into lethally irradiated recipients. (B) Representative flow cytometry plots of the gating strategy of Ly5.2+ donor cells or Ly5.1+Ly5.2+ recipient cells in peripheral blood. (C) Percentage donor cell engraftment in the peripheral blood 4, 8, 12, 16, 20 and 24 weeks after transplantation. (D) Percentage donor engraftment in bone marrow. Absolute numbers of (E) total donor LSK cells; (F) donor CD34- LSK cells; (G) donor CD34+ LSK cells; and (H) donor myeloid progenitors of OS1Δ/Δ mice (HF2: n=7; IQ-1: n=8) compared to controls (Sfrp1fl/fl, HF2: n=9). Each dot represents one animal (D-H). Values are presented as means ± standard deviation. *P≤0.05 indicates a statistically significant difference determined by analysis of variance, with the Tukey post-hoc test. Symbol legends are as shown in (A). CTRL: control; Tx: transplantation; PI: propidium iodide; PB: peripheral blood; BM: bone marrow; MP: myeloid progenitors.
A
D
Haematologica | 108 February 2023 498 ARTICLE - Osteogenic Sfrp1 limits HSC differentiation F. Hettler et al.
B C
E F G H
b-catenin are clear, the underlying cellular mechanisms still need to be resolved in detail. In our experiments, the total amount of CBP was not altered, but whether IQ-1 increases the accumulation of b-catenin/CBP co localization is as yet unclear. Since depletion of p300 delays the development of senescence in fibroblasts18 and specific inhibition of p300 improves stem cell potency,35,44 reducing nuclear p300 might suffice to improve HSC self-renewal. Our findings that b-catenin is increased in dysfunctional HSC from OS1Δ/Δ mice are in line with the observation that high levels of b -catenin induce a functional decline of HSC45 and increases multilineage differentiation in vitro without affecting survival.46 In addition, considering that SFRP1 is a WNT inhibitor, the association of its deletion and increased canonical WNT signaling would be consistent. To date, the mechanism underlying the association between HSC loss and higher b -catenin levels has not been elucidated. Our findings suggest that increased nuclear localization with a higher probability of b -catenin
binding to p300 may be a possibility. If this is the case, direct or indirect p300 inhibitors such as IQ-1 could promote self-renewal and HSC expansion, similar to embryonic stem cells and induced pluripotent cells.35 In contrast, this line of reasoning suggests that increasing p300 activity in cells with a high b-catenin level, such as in many cancer stem cells, may help to eradicate these diseases.47
Our results indicate that nuclear p300 localization and p300 transcriptional activity in HSC are extrinsically regulated by osteoprogenitors and their progeny in the BM niche. In addition, we provide a rationale and an in vivo strategy to normalize p300 localization and restore longterm repopulating HSC activity. Since we applied the PR72/130 inhibitor IQ-1 in vivo, it is likely that several different SFRP1-responsive cell types, besides the HSC, were affected. Considering that the BM niche can be regarded as an interwoven ecosystem of different cell-types,2 in vivo IQ-1 treatment does not necessarily act indirectly on
B
Figure 8. Engraftment of secondary transplanted IQ-1-treated LSK cells. (A) Experimental design of functionality analysis of IQ1-treated long-term hematopoietic stem cells (LT-HSC) repopulated for 24 weeks in wild-type recipients: 8- to 10-week-old OS1Δ/Δ mice were injected intraperitoneally for 5 days with IQ-1 (14 mg) or the vehicle (HF2). Twenty-four hours after the last treatment the LT-HSC were sorted and transplanted into lethally irradiated recipients. Twenty-four weeks after the transplantation, the donor LSK cells were sorted and transplanted into lethally irradiated wild-type recipients. (B) Representative flow cytometry plots of the gating strategy of Ly5.2+ donor cells or Ly5.1+Ly5.2+ recipient cells. (C) Percentage donor cell engraftment in the peripheral blood (PB) up to 24 weeks after the secondary transplant. (D) Percentage lymphoid cells in the PB up to 24 weeks after the secondary transplant. (E) Percentage myeloid cells in the PB up to 24 weeks after secondary transplant. (F) Percentage donor engraftment in bone marrow. Numbers at the top of the graph represent engrafted mice/total mice. (G) Absolute number of donor CD34- LSK cells; (H) donor CD34+ LSK cells; and (I) donor myeloid progenitors of OS1Δ/Δ mice (IQ-1: n=8) compared to control mice (Sfrp1fl/fl; HF2: n=4). Each dot represents one animal (F-I). Values presented are means ± standard deviation. *P≤0.05 indicates a statistically significant difference determined by an unpaired t test. Symbol legends are as shown in (A). CTRL: control; Tx: transplantation; BM: bone marrow; PI: propidium iodide; MP: myeloid progenitors.
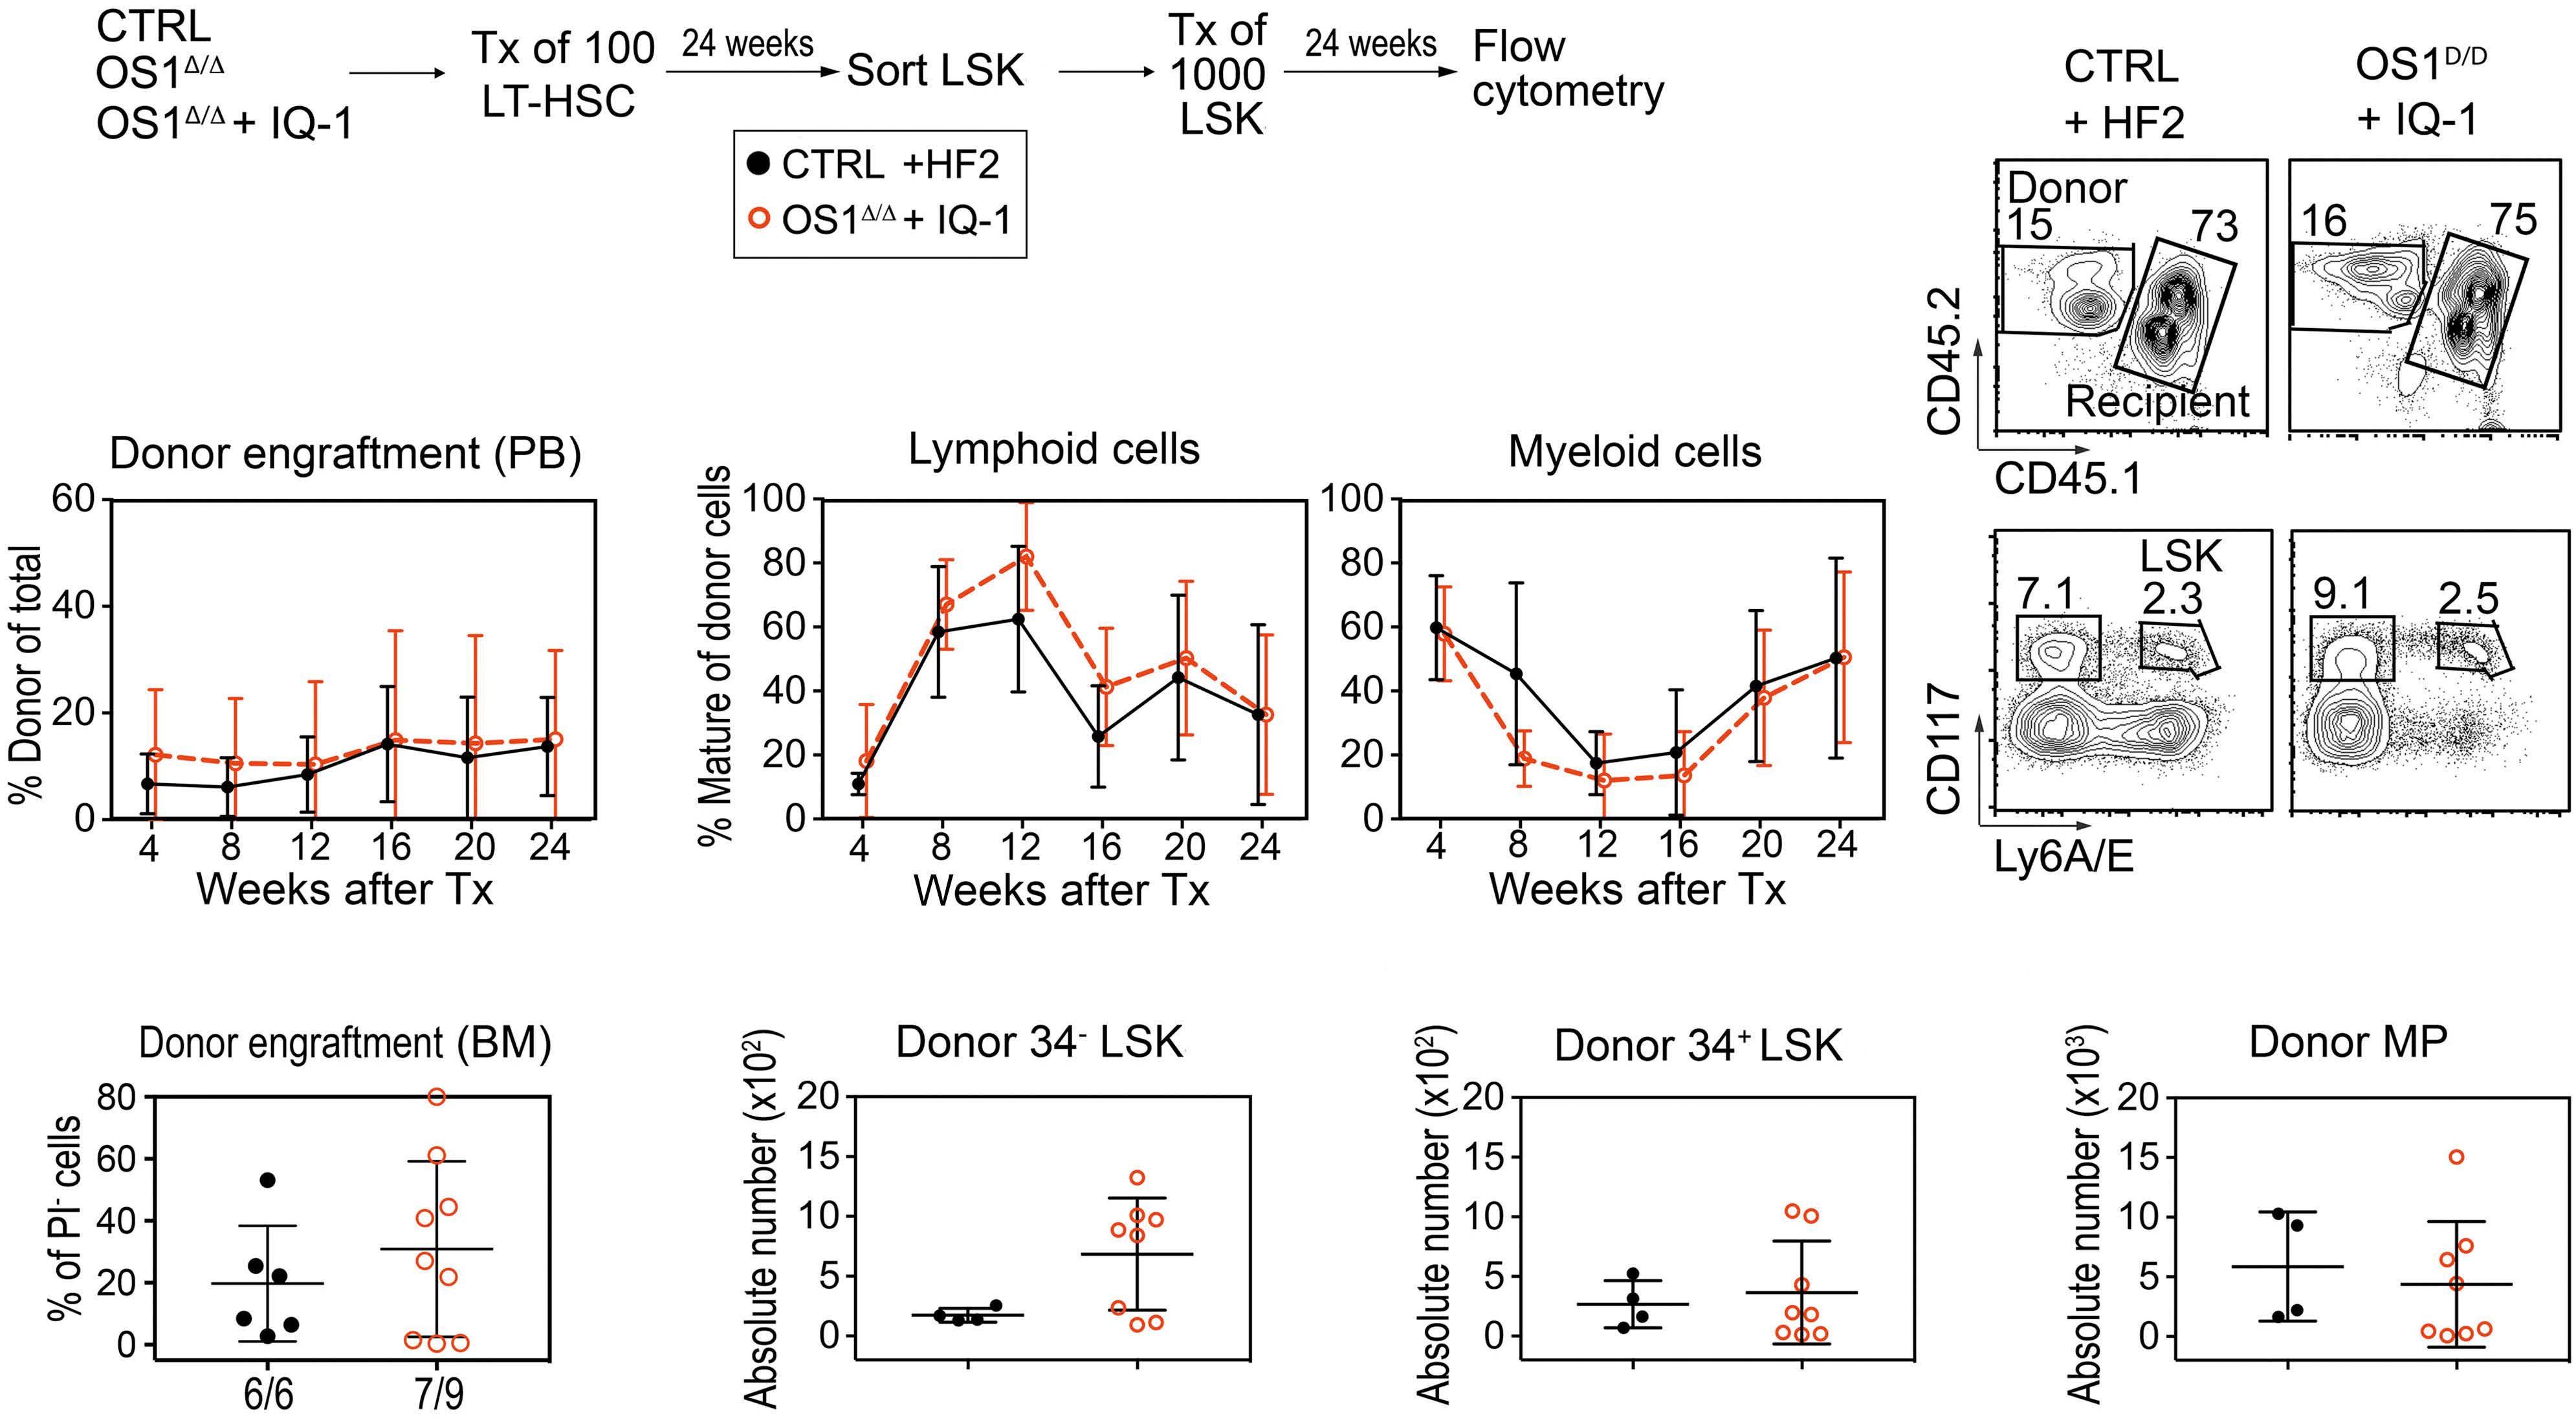
A
C
F
Haematologica | 108 February 2023 499 ARTICLE - Osteogenic Sfrp1 limits HSC differentiation F. Hettler et al.
D E
G H I
HSC through the OS1Δ/Δ osteoprogenitors, but may also restore p300 activity in HSC directly. In addition, since IQ-1 interacts with PR72/130 to modulate PP2A activity towards p300 and both p300 and PR72/130 are ubiquitously expressed in the BM of control animals, we cannot exclude that IQ-1 also affects other PP2A-PR72/130 substrates39,40 or p300 targets which might affect the BM niche or regulate hematopoietic cells in either control or OS1Δ/Δ mice.
Our study may be of interest to clinical scientists, since the promoter region of the SFRP1 gene is hypermethylated in many different cancers and, consequently, SFRP1 expression is reduced.7 Indeed, reduced SFRP1 expression has been proposed to serve as a prognostic marker.48 Our findings that OS1Δ/Δ mice show reduced HSC activity associated with increased nuclear bcatenin/p300 co localization shows that SFRP1 from osteoprogenitors is critical for regulating the activity of these nuclear factors. We therefore propose that the consequences of Sfrp1 deficiency, due either to promoter hypermethylation or to gene deletion, could be addressed with inhibitors such as IQ-1 to restore proliferation of quiescent or senescent cells and control differentiation of malignant stem cells.
Disclosures
No conflicts of interest to disclose.
Contributions
FH, CS, RI, and RAJO conceived the study. FH, CS, SRM, BV, TE, TL, RH, RM, HW, RO, RN, and RI were responsible for the methodology. FH, SRM, CS, TL, RH, RM, BV, RN and RI per-
References
1. Cheng T. Toward 'SMART' stem cells. Gene Ther. 2008;15(2):67-73.
2. Frobel J, Landspersky T, Percin G, et al. The hmatopoietic bone marrow niche ecosystem. Front Cell Dev Biol. 2021;9:705410.
3. Schreck C, Bock F, Grziwok S, Oostendorp RA, Istvanffy R. Regulation of hematopoiesis by activators and inhibitors of Wnt signaling from the niche. Ann N Y Acad Sci. 2014;1310:32-43.
4. Dufourcq P, Descamps B, Tojais NF, et al. Secreted frizzledrelated protein-1 enhances mesenchymal stem cell function in angiogenesis and contributes to neovessel maturation. Stem Cells. 2008;26(11):2991-3001.
5. Nakajima H, Ito M, Morikawa Y, et al. Wnt modulators, SFRP-1, and SFRP-2 are expressed in osteoblasts and differentially regulate hematopoietic stem cells. Biochem Biophys Res Commun. 2009;390(1):65-70.
6. Dolgalev I, Tikhonova AN. Connecting the dots: resolving the bone marrow niche heterogeneity. Front Cell Dev Biol. 2021;9:622519.
7. Baharudin R, Tieng FYF, Lee LH, Ab Mutalib NS. Epigenetics of SFRP1: the dual roles in human cancers. Cancers (Basel). 2020;12(2):445.
formed the investigations. FH, CS , RI and RAJO wrote the paper. RI and RAJO acquired funds. MR, RN, CP, FB, RR, and RAJO were responsible for the resources. FH, SRM, CS, RI, and RAJO provided supervision.
Acknowledgments
We thank Alina Wagner for excellent technical assistance as well as Mauricio Testanera and Theresa Mayo (Technical University of Munich, Gynecology) for critical reading of the manuscript. We also thank Matthias Schiemann, Lynette Henkel, Immanuel Andrä, Corinne Angerpointner, and Susanne Dürr (Flow Cytometry Unit CyTUM, Institut für Mikrobiologie, Immunologie und Hygiene, Technical University of Munich) for cell sorting and help with fluorescent microscopy.
Funding
This work was funded by the Deutsche Forschungsgemeinschaft (DFG, German Research Foundation) grant n. FOR 2033 B3, SFB 1243 A09, OO 8/16 and 8/18 to RO, and BA 2851/6-1 and SFB 1335 Project-ID 360372040 to FB, and the European Research Commission project BCM-UPS, grant #682473 to FB.
Data-sharing statement
Original data are available by contacting Robert A.J. Oostendorp (robert.oostendorp@tum.de) or Rouzanna Istvanffy (rouzanna.istvanffy@tum.de). In addition, all RNA-sequencing datasets from the published article are available for download at the European Nucleotide Archive (https://www.ebi.ac.uk/ena) under accession number PRJEB49216.
8. Liang CJ, Wang ZW, Chang YW, et al. SFRPs are biphasic modulators of Wnt-signaling-elicited cancer stem cell properties beyond extracellular control. Cell Rep. 2019;28(6):1511-1525.
9. Fiedler M, Graeb M, Mieszczanek J, et al. An ancient Pygodependent Wnt enhanceosome integrated by Chip/LDB-SSDP. Elife. 2015;4:09073.
10. Komiya Y, Habas R. Wnt signal transduction pathways. Organogenesis. 2008;4(2):68-75.
11. Nygren MK, Dosen G, Hystad ME, et al. Wnt3A activates canonical Wnt signalling in acute lymphoblastic leukaemia (ALL) cells and inhibits the proliferation of B-ALL cell lines. Br J Haematol. 2007;136(3):400-413.
12. Patel S, Alam A, Pant R, Chattopadhyay S. Wnt signaling and its significance within the tumor microenvironment: novel therapeutic insights. Front Immunol. 2019;10:2872.
13. Reya T, Clevers H. Wnt signalling in stem cells and cancer. Nature. 2005;434(7035):843-850.
14. Anthony CC, Robbins DJ, Ahmed Y, Lee E. Nuclear regulation of Wnt/beta-catenin signaling: it's a complex situation. Genes (Basel). 2020;11(8):886.
Haematologica | 108 February 2023 500 ARTICLE - Osteogenic Sfrp1 limits HSC differentiation F. Hettler et al.
15. Takemaru KI, Moon RT. The transcriptional coactivator CBP interacts with beta-catenin to activate gene expression. J Cell Biol. 2000;149(2):249-254.
16. Teo JL, Ma H, Nguyen C, Lam C, Kahn M. Specific inhibition of CBP/beta-catenin interaction rescues defects in neuronal differentiation caused by a presenilin-1 mutation. Proc Natl Acad Sci U S A. 2005;102(34):12171-12176.
17. Rebel VI, Kung AL, Tanner EA, et al. Distinct roles for CREBbinding protein and p300 in hematopoietic stem cell self-renewal. Proc Natl Acad Sci U S A. 2002;99(23):14789-14794.
18. Sen P, Lan Y, Li CY, et al. Histone acetyltransferase p300 induces de novo super-enhancers to drive cellular senescence. Mol Cell. 2019;73(4):684-698.
19. Man N, Mas G, Karl DL, et al. p300 suppresses the transition of myelodysplastic syndromes to acute myeloid leukemia. JCI Insight. 2021;6(19):138478.
20. Rieger ME, Zhou B, Solomon N, et al. p300/beta-catenin interactions regulate adult progenitor cell differentiation downstream of WNT5a/protein kinase C (PKC). J Biol Chem. 2016;291(12):6569-6582.
21. Renström J, Istvanffy R, Gauthier K, et al. Secreted frizzledrelated protein 1 extrinsically regulates cycling activity and maintenance of hematopoietic stem cells. Cell Stem Cell. 2009;5(2):157-167.
22. Jost E, Schmid J, Wilop S, et al. Epigenetic inactivation of secreted frizzled-related proteins in acute myeloid leukaemia. Br J Haematol. 2008;142(5):745-753.
23. Seeliger B, Wilop S, Osieka R, Galm O, Jost E. CpG island methylation patterns in chronic lymphocytic leukemia. Leuk Lymphoma. 2009;50(3):419-426.
24. Wang Y, Krivtsov AV, Sinha AU, et al. The Wnt/beta-catenin pathway is required for the development of leukemia stem cells in AML. Science. 2010;327(5973):1650-1653.
25. Rodda SJ, McMahon AP. Distinct roles for hedgehog and canonical Wnt signaling in specification, differentiation and maintenance of osteoblast progenitors. Development. 2006;133(16):3231-3244.
26. Schreck C, Istvanffy R, Ziegenhain C, et al. Niche WNT5A regulates the actin cytoskeleton during regeneration of hematopoietic stem cells. J Exp Med. 2017;214(1):165-181.
27. Marquez SR, Hettler F, Hausinger R, et al. Secreted factors from mouse embryonic fibroblasts maintain repopulating function of single cultured hematopoietic stem cells. Haematologica. 2021;106(10):2633-2640.
28. Istvanffy R, Vilne B, Schreck C, et al. Stroma-derived connective tissue growth factor maintains cell cycle progression and repopulation activity of hematopoietic stem cells in vitro. Stem Cell Reports. 2015;5(5):702-715.
29. Bodine PV, Zhao W, Kharode YP, et al. The Wnt antagonist secreted frizzled-related protein-1 is a negative regulator of trabecular bone formation in adult mice. Mol Endocrinol. 2004;18(5):1222-1237.
30. Flach J, Bakker ST, Mohrin M, et al. Replication stress is a potent driver of functional decline in ageing haematopoietic stem cells. Nature. 2014;512(7513):198-202.
31. Walter D, Lier A, Geiselhart A, et al. Exit from dormancy provokes DNA-damage-induced attrition in haematopoietic stem cells. Nature. 2015;520(7548):549-552.
32. Wohrer S, Knapp DJ, Copley MR, et al. Distinct stromal cell factor combinations can separately control hematopoietic stem cell survival, proliferation, and self-renewal. Cell Rep. 2014;7(6):1956-1967.
33. Oostendorp RA, Robin C, Steinhoff C, et al. Long-term maintenance of hematopoietic stem cells does not require contact with embryo-derived stromal cells in cocultures. Stem Cells. 2005;23(6):842-851.
34. Buckley SM, Ulloa-Montoya F, Abts D, et al. Maintenance of HSC by Wnt5a secreting AGM-derived stromal cell line. Exp Hematol. 2011;39(1):114-123. e111-115.
35. Miyabayashi T, Teo JL, Yamamoto M, et al. Wnt/betacatenin/CBP signaling maintains long-term murine embryonic stem cell pluripotency. Proc Natl Acad Sci U S A. 2007;104(13):5668-5673.
36. He K, Xu T, Xu Y, et al. Cancer cells acquire a drug resistant, highly tumorigenic, cancer stem-like phenotype through modulation of the PI3K/Akt/beta-catenin/CBP pathway. Int J Cancer. 2014;134(1):43-54.
37. Schenke-Layland K, Nsair A, Van Handel B, et al. Recapitulation of the embryonic cardiovascular progenitor cell niche. Biomaterials. 2011;32(11):2748-2756.
38. Sasaki T, Kahn M. Inhibition of beta-catenin/p300 interaction proximalizes mouse embryonic lung epithelium. Transl Respir Med. 2014;2:8.
39. Dzulko M, Pons M, Henke A, Schneider G, Kramer OH. The PP2A subunit PR130 is a key regulator of cell development and oncogenic transformation. Biochim Biophys Acta Rev Cancer. 2020;1874(2):188453.
40. Wu CY, Liang Y, Li XF, Song GB. The potential mechanism of PPP2R3A in myocardial cells and its interacting proteins. Eur Rev Med Pharmacol Sci. 2021;25(24):7913-7925.
41. Ugai H, Uchida K, Kawasaki H, Yokoyama KK. The coactivators p300 and CBP have different functions during the differentiation of F9 cells. J Mol Med (Berl). 1999;77(6):481-494.
42. Chan WI, Hannah RL, Dawson MA, et al. The transcriptional coactivator Cbp regulates self-renewal and differentiation in adult hematopoietic stem cells. Mol Cell Biol. 2011;31(24):5046-5060.
43. Zhao Y, Masiello D, McMillian M, et al. CBP/catenin antagonist safely eliminates drug-resistant leukemia-initiating cells. Oncogene. 2016;35(28):3705-3717.
44. Higuchi Y, Nguyen C, Yasuda SY, et al. Specific direct small molecule p300/beta-catenin antagonists maintain stem cell potency. Curr Mol Pharmacol. 2016;9(3):272-279.
45. Luis TC, Naber BA, Roozen PP, et al. Canonical wnt signaling regulates hematopoiesis in a dosage-dependent fashion. Cell Stem Cell. 2011;9(4):345-356.
46. Famili F, Brugman MH, Taskesen E, et al. High levels of canonical Wnt signaling lead to loss of stemness and increased differentiation in hematopoietic stem cells. Stem Cell Reports. 2016;6(5):652-659.
47. Kahn M. Taking the road less traveled - the therapeutic potential of CBP/beta-catenin antagonists. Expert Opin Ther Targets. 2021;25(9):701-719.
48. Rubin JS, Barshishat-Kupper M, Feroze-Merzoug F, Xi ZF. Secreted WNT antagonists as tumor suppressors: pro and con. Front Biosci. 2006;11:2093-2105.
Haematologica | 108 February 2023 501 ARTICLE - Osteogenic
F. Hettler et al.
Sfrp1 limits HSC differentiation
ARID5B influences B-cell development and function in mouse
Charnise Goodings,1* Xujie Zhao,1* Shannon McKinney-Freeman,2 Hui Zhang3 and Jun J. Yang1,41Department of Pharmaceutical Sciences, St. Jude Children's Research Hospital, Memphis, TN, USA; 2Department of Hematology, St. Jude Children's Research Hospital, Memphis, TN, USA; 3Department of Hematology/Oncology, Shanghai Children’s Medical Center, Shanghai, China and 4Department of Oncology, St. Jude Children’s Research Hospital, Memphis, TN, USA.
*CG and XZ contributed equally as co-first authors.
Abstract
Correspondence: J. J. Yang jun.yang@stjude.org
Received: March 29, 2022. Accepted: July 29, 2022. Prepublished: August 4, 2022.
https://doi.org/10.3324/haematol.2022.281157
©2023 Ferrata Storti Foundation
Published under a CC BY-NC license
There is growing evidence for an inherited basis of susceptibility to childhood acute lymphoblastic leukemia. Genomewide association studies by us and others have identified non-coding acute lymphoblastic leukemia risk variants at the ARID5B gene locus, but the molecular mechanisms linking ARID5B to normal and malignant hematopoiesis remain largely unknown. Using a Vav1-driven transgenic mouse model, we characterized the role of Arid5b in hematopoiesis in vivo Arid5b overexpression resulted in a dramatic reduction in the proportion of circulating B cells, immature, and mature Bcell fractions in the peripheral blood and the bone marrow, and also a decrease of follicular B cells in the spleen. There were significant defects in B-cell activation upon Arid5b overexpression in vitro with hyperactivation of B-cell receptor signaling at baseline. In addition, increased mitochondrial oxygen consumption rate of naïve or stimulated B cells of Arid5b-overexpressing mice was observed, compared to the rate of wild-type counterparts. Taken together, our results indicate that ARID5B may play an important role in B-cell development and function.
Introduction
Acute lymphoblastic leukemia (ALL) is the most common cancer in children, with an incidence peaking between 3 and 5 years of age.1,2 Its early onset suggested a possible role of inherited genetic variations in susceptibility to ALL,3 a possibility which is also supported by studies in monozygotic twins with concordant ALL.4-6 Moreover, recent efforts by us and others in genome-wide association studies have provided unequivocal evidence for the genetic basis of ALL susceptibility, with more than 20 risk loci having been identified.7-19 Among them, ARID5B consistently exhibits the strongest association signal across racial and ethnic groups,9,12,16 with the risk variants specifically predisposing children to high-hyperdiploid ALL, in an age-related fashion. There is also emerging evidence that these non-coding variants can directly influence ARID5B transcription in cis. 20 By contrast, there has been a particular paucity of studies investigating the functions of ARID5B in hematopoiesis and how it influences B-cell biology. ARID5B belongs to the AT rich interaction domain (ARID) protein family consisting of 15 members and characterized
by a shared DNA-binding ARID domain.21-24 Shortly after the identification of the ARID5B gene, its in vivo expression was characterized.25 A broad biological function of Arid5b has been indicated by its wide expression in adult organs including lung, small intestine, kidney, muscle, heart, and brain. In the same study, consequences of silencing Arid5b were also investigated. Deficiency of Arid5b led to smaller body size and leanness at birth and reduced growth rate after birth. In the hematopoietic compartment, Arid5b-/mice exhibited a range of transient defects in lymphocyte development, including reduction of cellularity in bone marrow, thymus, and spleen, and significant decreases in early T- and B-cell progenitors in the bone marrow of 3week-old mice, while most of these abnormalities disappeared at 6 weeks old.25 The leanness phenotype of the Arid5b-/- mouse was confirmed in another mouse model presenting with severely less brown adipose at birth, which could not be rescued by high-fat diets directly and is therefore implicated in adipogenesis.26 The nuclear localization and superior binding affinity of ARID5B to the A/T-rich consensus sequence (AATA[C/T])21,27 point to a potential function as a transcription factor. Indeed, by form-
Haematologica | 108 February 2023 502 ARTICLE - Hematopoiesis
ing a complex with PHF2, ARID5B can regulate glucose metabolism by activating the expression of PEPCK and G6PC in hepatocytes.28 In natural killer (NK) cells, downregulation of ARID5B represses UQCRB expression and decreases mitochondrial membrane potential and mitochondrial oxidative metabolism, along with BCL2 downregulation.29 In T-ALL cells, the genome-wide binding profile of ARID5Bbound regions is strongly associated with active histone markers (H3K27ac and H3K4me3), pointing to ARID5B acting as a transcriptional activator.30 In this study, we established mouse models with overexpression and knockout of Arid5b in hematopoietic cells. Using these tools, we comprehensively evaluated the roles of ARID5B in hematopoiesis in vivo, especially B-cell development, providing new insights into its potential contribution to leukemia pathogenesis.
Methods
Arid5b
mouse models
To establish the Arid5b-overexpression mouse model, we first knocked in the tetO cassette at the Arid5b locus. These mice were then crossed with Vav1-tTA animals (Online Supplementary Figure S1A) to induce Arid5b overexpression in hematopoietic cells (Vav1+). Tail biopsies were submitted to Transnetyx (Cordova, TN, USA) for genotyping. Animal experiments were performed according to procedures approved by the St. Jude Children’s Research Hospital Institutional Animal Care and Use Committee. Primers used for genotyping are detailed in Online Supplementary Table S1. Overexpression of Arid5b was confirmed by quantitative reverse transcriptase polymerase chain reaction in different hematopoietic cells. Primers used for the polymerase chain reaction are detailed in Online Supplementary Table S2
Analysis of peripheral blood counts
Peripheral blood was collected from the retro-orbital plexus into capillary tubes and transferred into EDTAcoated tubes to prevent clotting. Blood samples were then submitted to St. Jude Veterinary Pathology Core for automated complete blood counting.
Flow cytometry
Peripheral blood was collected from the retro-orbital plexus of the mice. Bone marrow was isolated from dissected tibiae and femora. Spleens were surgically removed and homogenized into a cell suspension in Iscove modified Dulbecco medium. Cells were stained for surface markers followed by flow cytometry analysis using a BD LSR Fortessa (BD Biosciences, NJ, USA) and data were analyzed using FlowJo software (Tree Star, OR, USA). For cell cycle analysis, cells were fixed with the BD Cytofix/Cytoperm kit
(BD Biosciences #554714) after cell surface staining followed by DAPI staining. Staining of apoptotic cells was done by cell surface staining, followed by labeling with annexin V (BD Biosciences #556420) and DAPI in annexin V staining buffer (BD Biosciences #556454). Representative flow cytometry plots are shown in Online Supplementary Figures S2-S4. Detailed information on the antibodies used is provided in Online Supplementary Table S3
Colony-forming assay
Mouse bone marrow cells were plated in MethoCult M3434 or M3630 medium (StemCell Technologies #03434 and #03630, Vancouver, British Columbia, Canada) to characterize growth and differentiation of myeloid progenitors and pre-B-cell progenitors. Colonies were typed and enumerated by light microscopy after incubation for 7-10 days.
B-cell purification and activation
Splenic cell suspensions were prepared in magnetic-activated cell sorting (MACS) buffer (phosphate-buffered saline/2 mM EDTA/0.5% bovine serum albumin). CD43-negative resting B cells were isolated using the MACS B-cell isolation kit (Miltenyi Biotec, Bergisch Gladbach, Germany). Resting B cells were then activated either by lipopolysaccharide (LPS) from Salmonella enterica serotype typhimurium (Sigma-Aldrich #L6143, MO, USA) at 20 µg/mL or AffiniPure F(ab')₂ Fragment Goat Anti-Mouse IgM, µ Chain Specific (Jackson Immunoresearch Lab, PA, USA) at 10 µg/mL plus murine interleukin (IL)-4 (Peprotech # 214-14, NJ, USA) at 10 ng/mL at 400,000 cells/mL for 24 or 48 hours in RPMI 1640 (ThermoFisher #11875093), 1 × Lglutamine, 10% fetal bovine serum, 1 × essential amino acids, 1 × penicillin/streptomycin, 1 mM sodium pyruvate and 50 mM 2-mercaptoethanol.31
B-cell proliferation assay
For cell proliferation assays, the CellTiter 96 AQueous One Solution Cell Proliferation Assay system (Promega #G3852, WI, USA) was used according to the manufacturer’s instructions. Two hundred thousand cells were placed into each well in a 96-well plate and 10 µL per well of CellTiter 96 AQueous One Solution reagent were added. After incubation for 1 hour in humidified 5% CO2 atmosphere, absorbance at 490 nm was measured.
Results
Arid5b regulates hematopoiesis in mouse
Because ARID5B variants are linked to susceptibility to BALL, we suggest that this gene is involved in normal hematopoiesis, most likely B-lymphocyte development. To test this hypothesis, we generated a hematopoietic-specific Arid5b overexpression (Arid5bOE) mouse model (Online
Haematologica | 108 February 2023 503 ARTICLE - ARID5B influences B-cell development C. Goodings et al.
Figure 1. Effects of Arid5bOE on hematopoietic cells in the peripheral blood. (A) The number of white blood cells in the peripheral blood of Arid5bOE mice (solid bars, n=10) and wild-type litter mates (open bars, n=8). (B) The number of lymphocytes in the peripheral blood of Arid5bOE mice (solid bars, n=10) and wild-type littermates (open bars, n=8). (C) The number of red blood cells in the peripheral blood of Arid5bOE mice (solid bars, n=10) and wild-type littermates (open bars, n=8). (D) The number of B cells (B220+), myeloid cells (Gr1+/Mac1+) and T cells (CD3+) in the peripheral blood of Arid5bOE mice (solid bars, n=9) and wild-type littermates (open bars, n=21). P values were estimated by a two-tail t test. *P<0.05, **P<0.01, ***P<0.001, ****P<0.0001.
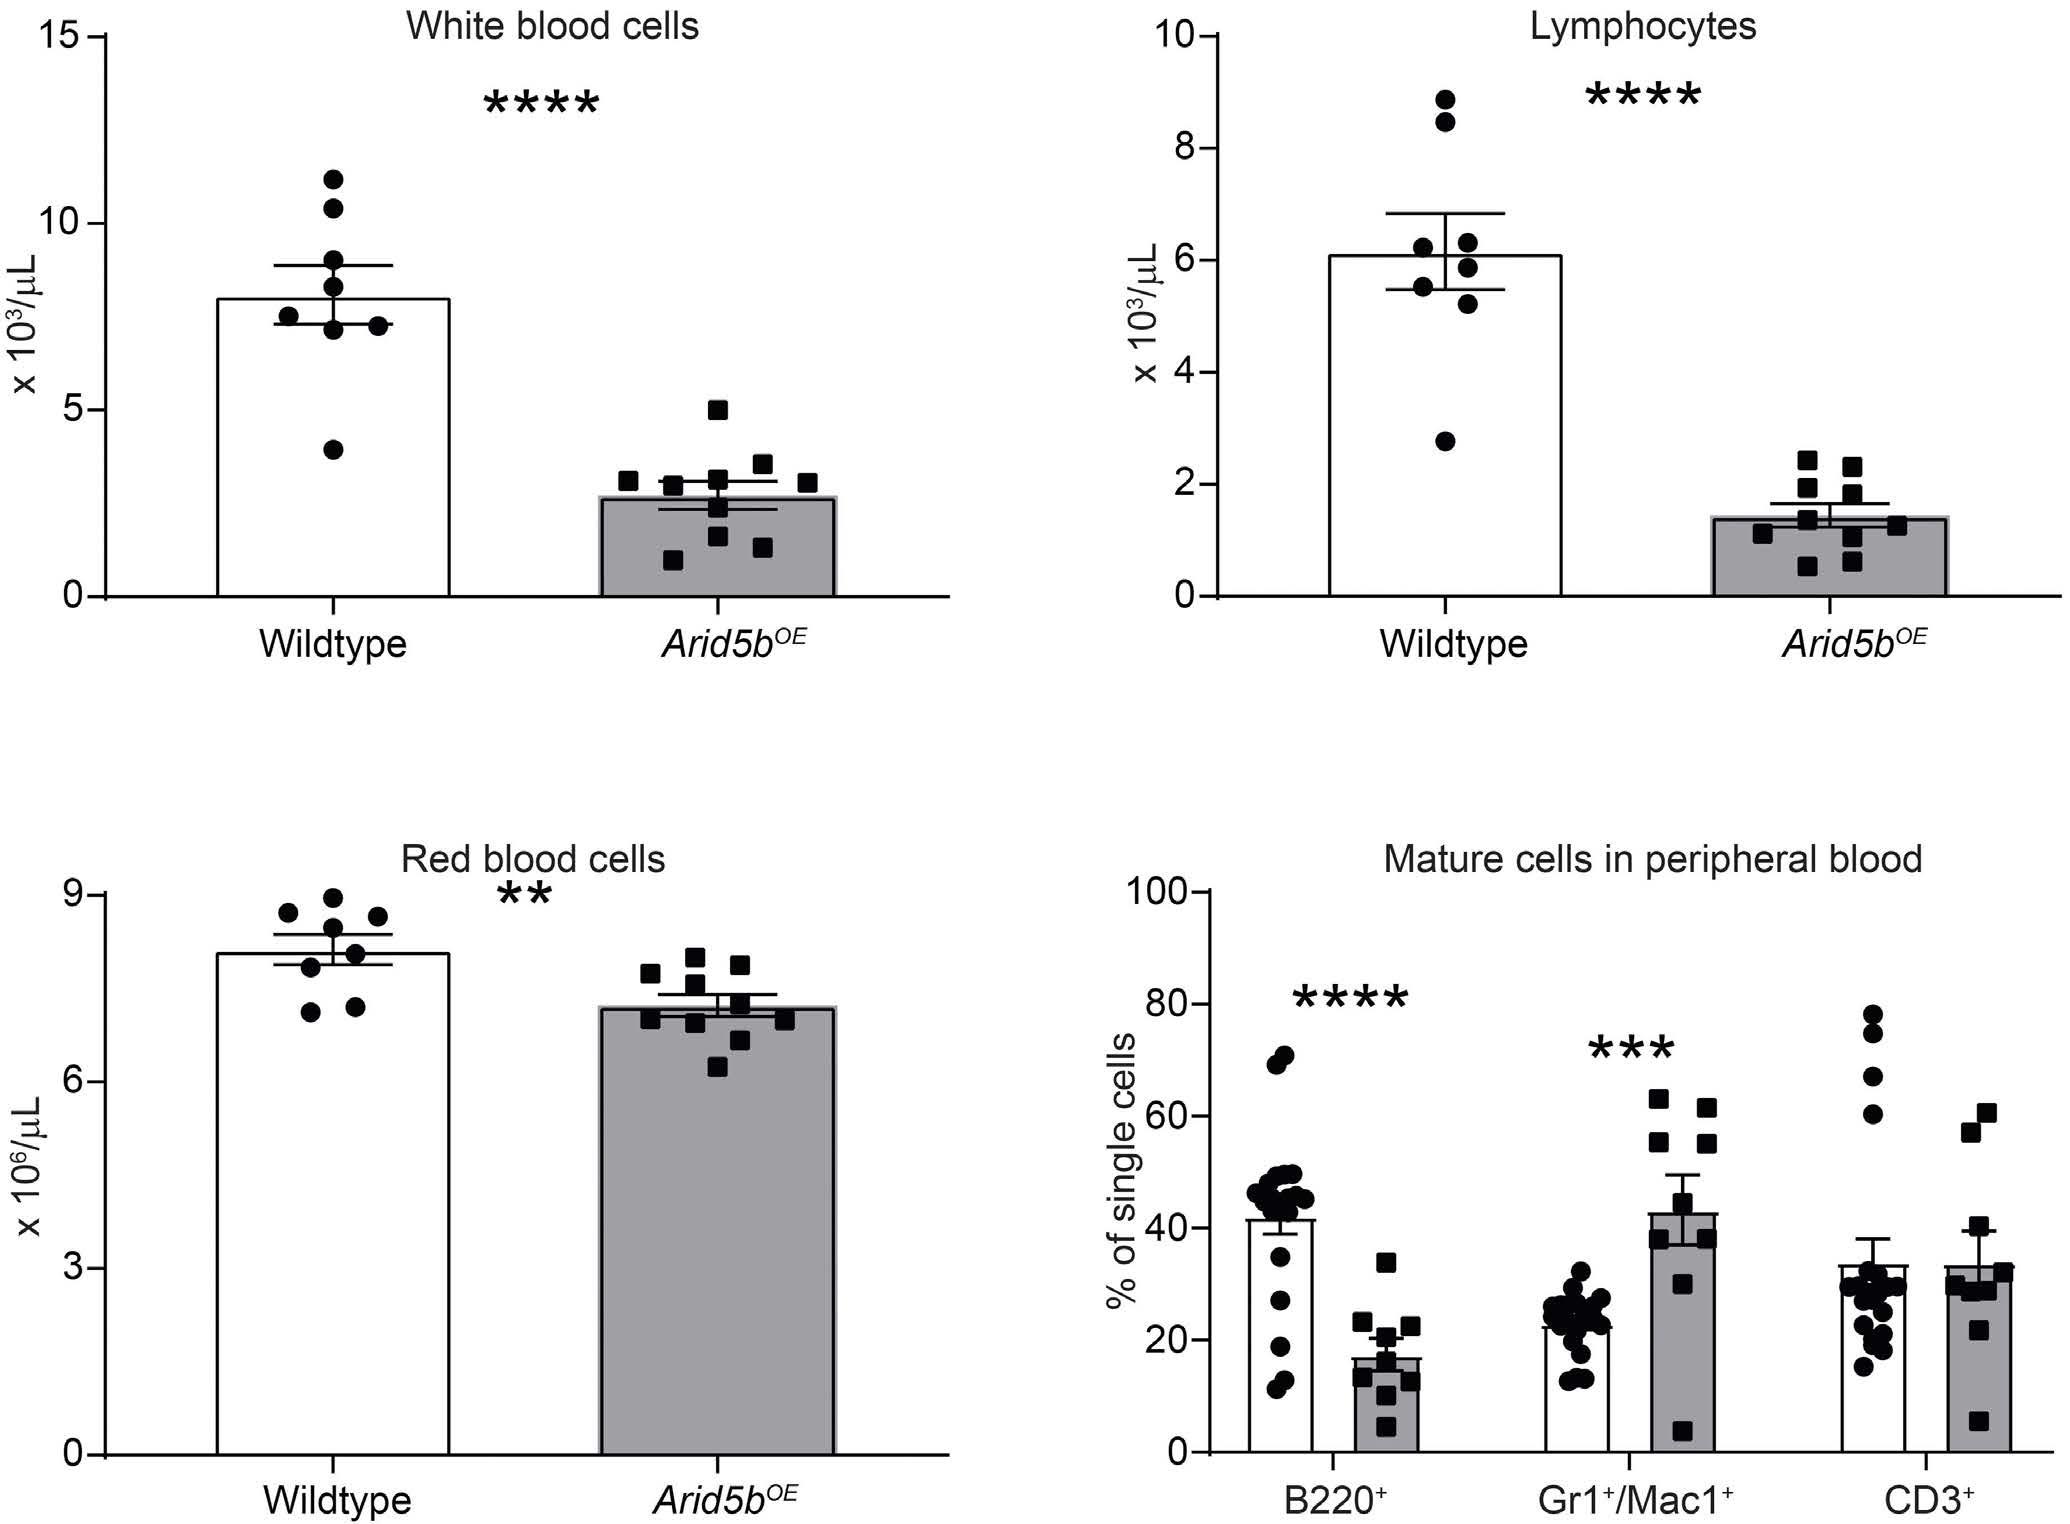
Supplementary Figure S1A), in which Arid5b upregulation can be induced with tetracycline and driven by the Vav1 promoter. Assessed at the transcript level, Arid5b was upregulated 3-fold in bone marrow cells, 2-fold in the spleen, 3-fold in B220+ B cells, 2-fold in Mac1+/Gr1+ myeloid cells, and 4-fold in Ter119+ erythroid cells, when compared to the same populations sorted from wild-type littermates (Online Supplementary Figure S1B). Gross examination of Arid5bOE mice revealed no anatomical abnormalities. At 68 weeks of age, Arid5bOE mice had a decrease in bone marrow cellularity compared to wild-type mice, although this was not observed in the spleen (Online Supplementary Figure S5). Phenotypic characterization of their peripheral blood revealed a significant reduction in the number of circulating white blood cells (Figure 1A), primarily driven by a lower lymphocyte count in Arid5bOE mice (Figure 1B), with a modest reduction in the number of red blood cells (Figure 1C). There was also a significant decrease in the frequency of circulating B220+ cells, an increase in Mac1+ and Gr1+ cells, but no difference in CD3+ T cells in blood (Figure 1D). Both the frequency and the absolute number of B cells (mature and immature) were lower in both bone marrow (Figure 2A, Online Supplementary Figure S6A) and spleen (Figure 2B, Online Supplementary Figure S6E) of Arid5bOE mice when compared to wild-type littermates,
whereas Arid5B overexpression had little effect on CD4+ and CD8+ T-cell homeostasis (Figure 2C, D; Online Supplementary Figure S6B, S6F). In line with this, immunohistochemistry staining demonstrated many fewer B220+ B cells in the bone marrow (Figure 3A) and spleen (Figure 3C) of Arid5bOE mice compared to wild-type littermates, but without obvious difference of CD3+ T cells in either bone marrow (Figure 3B) or spleen (Figure 3D).
By contrast, there was a slight increase in the frequency of myeloid cells in the bone marrow (Figure 4A) and spleen (Figure 4B) of Arid5bOE mice compared to the frequency in their wild-type littermates, although the absolute cell numbers were similar between mice of these two genotypes (Online Supplementary Figure S6C, G). In addition, we observed an increase in erythroblast progenitor frequency and absolute number in the spleens of Arid5bOE mice compared to wild-type littermates (Figure 4D; Online Supplementary Figure S6H), although this was not statistically significant in the bone marrow (Figure 4C; Online Supplementary Figure S6D). Analyzing hematopoietic stem and progenitor populations in the bone marrow, we noted a significant increase in the frequency and quantity of myeloid-biased multipotent progenitor 2 (MPP2) cells (Online Supplementary Figure S7A, B), with no difference observed in hematopoietic stem cells (HSC), MPP3, or MPP4
A B C D Haematologica | 108 February 2023 504 ARTICLE - ARID5B influences B-cell development C. Goodings et al.
Figure 2. Arid5b overexpression results in the reduction of B cells in the bone marrow and spleen. (A, B) Percentage of B220+ and CD19+ B cells in the bone marrow and spleen of Arid5bOE mice (solid bars, n=10) and wild-type littermates (open bars, n=8). (C, D) Percentage of CD4+ and CD8+ T cells in the bone marrow and spleen of Arid5bOE mice (solid bars, n=10) and wild-type littermates (open bars, n=8). P values were estimated by a two-tail t test. *P<0.05, **P<0.01, ***P<0.001.
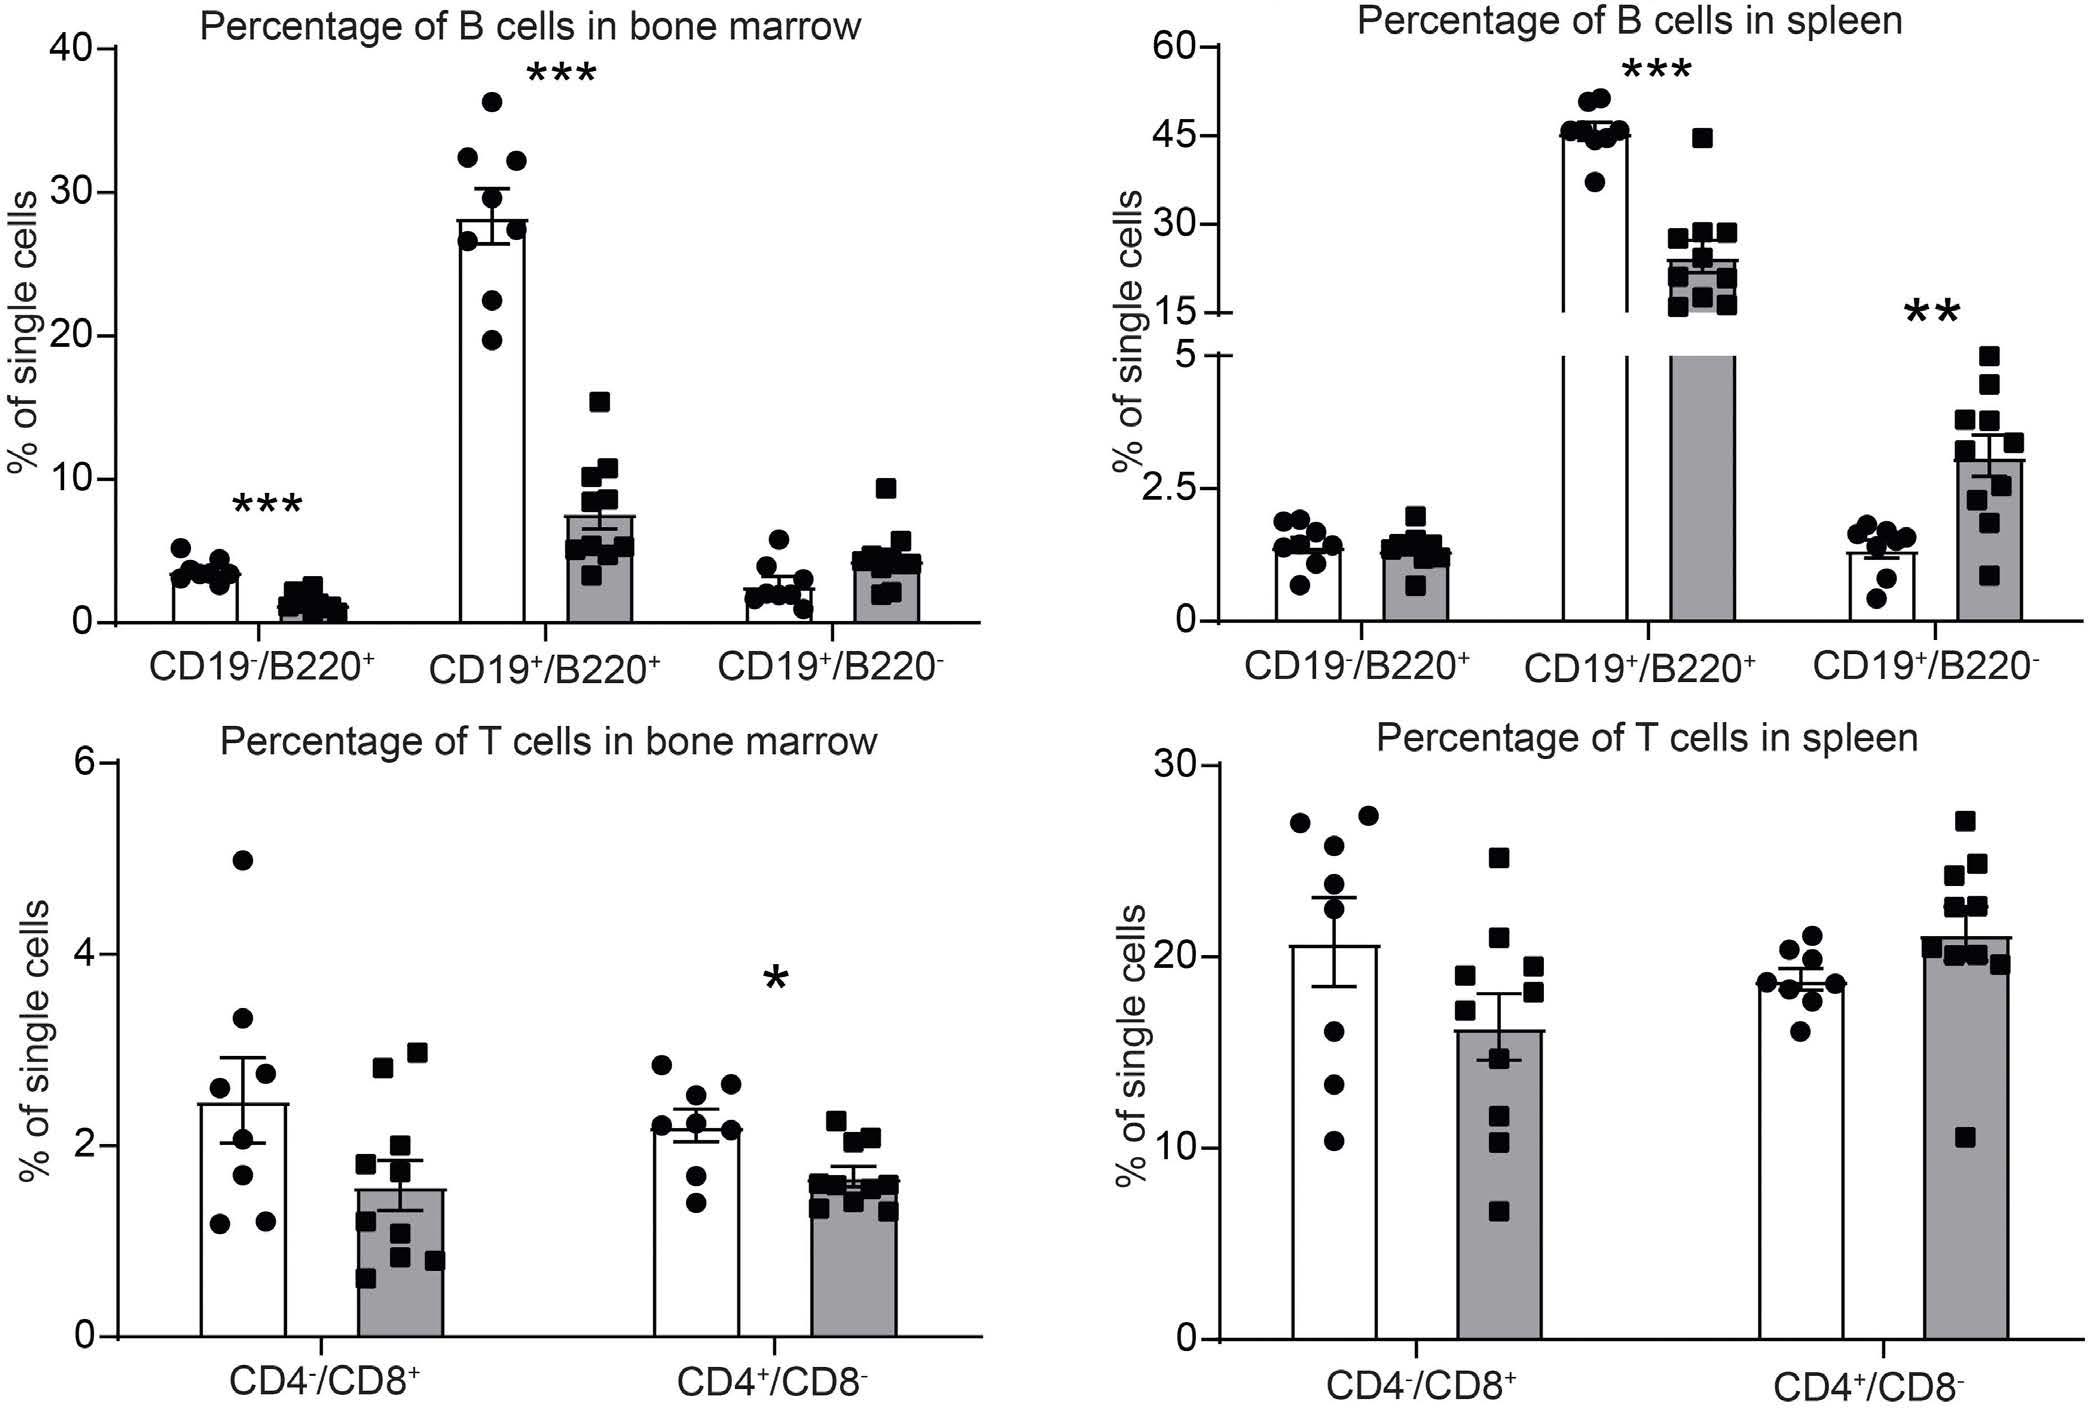
B C D
Figure 3. Representative immunohistochemistry staining of B cells in the bone marrow and spleen of Arid5bOE versus wild-type mice. (A, C) Representative immunohistochemistry staining of B220+ B cells in bone marrow and spleen from an Arid5bOE mouse and wild-type littermate. (B, D) Representative immunohistochemistry staining of CD3+ T cells in bone marrow and spleen from an Arid5bOE mouse and wild-type littermate.
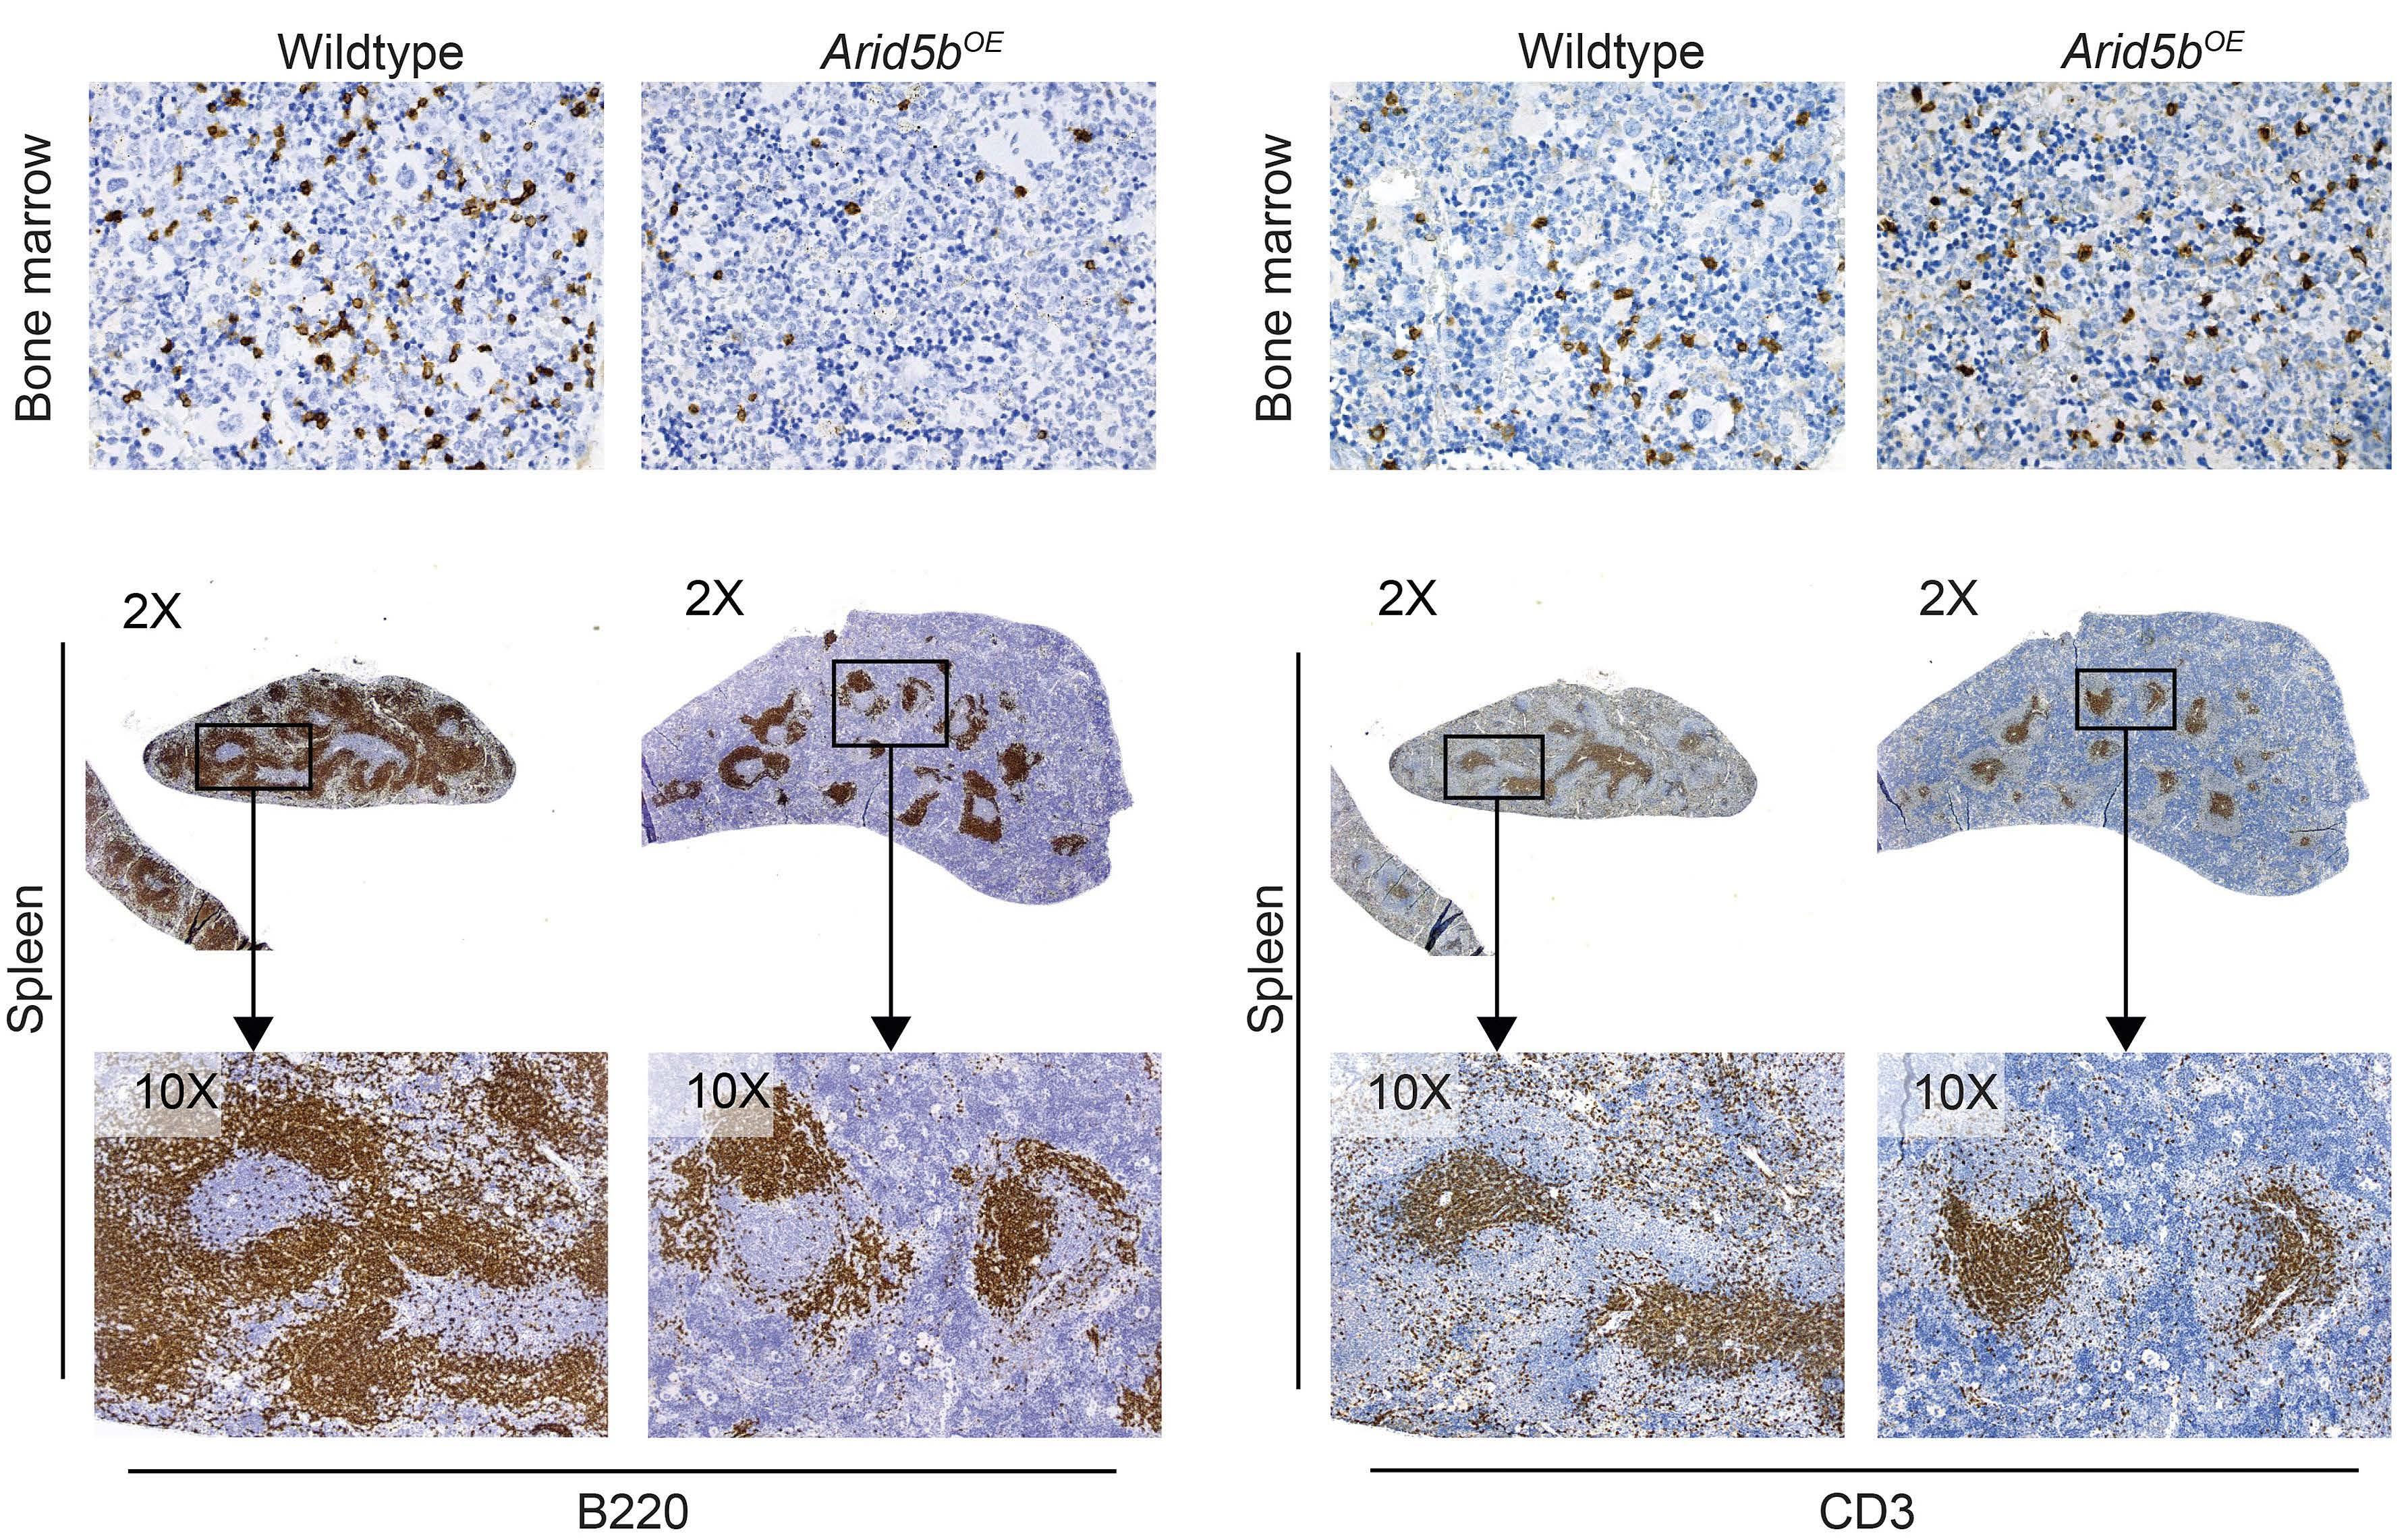
A B C D
Haematologica | 108 February 2023 505 ARTICLE - ARID5B influences B-cell development C. Goodings et al.
A
populations between Arid5b genotypes. An enhanced myeloid colony-forming ability of bone marrow cells from Arid5bOE mice was observed when compared to that of wild-type littermates, mainly driven by increased granulocyte and/or macrophage progenitor cells (granulocytes, macrophages, granulocyte-macrophage) and multi-potential progenitor cells (Online Supplementary Figure S7C).
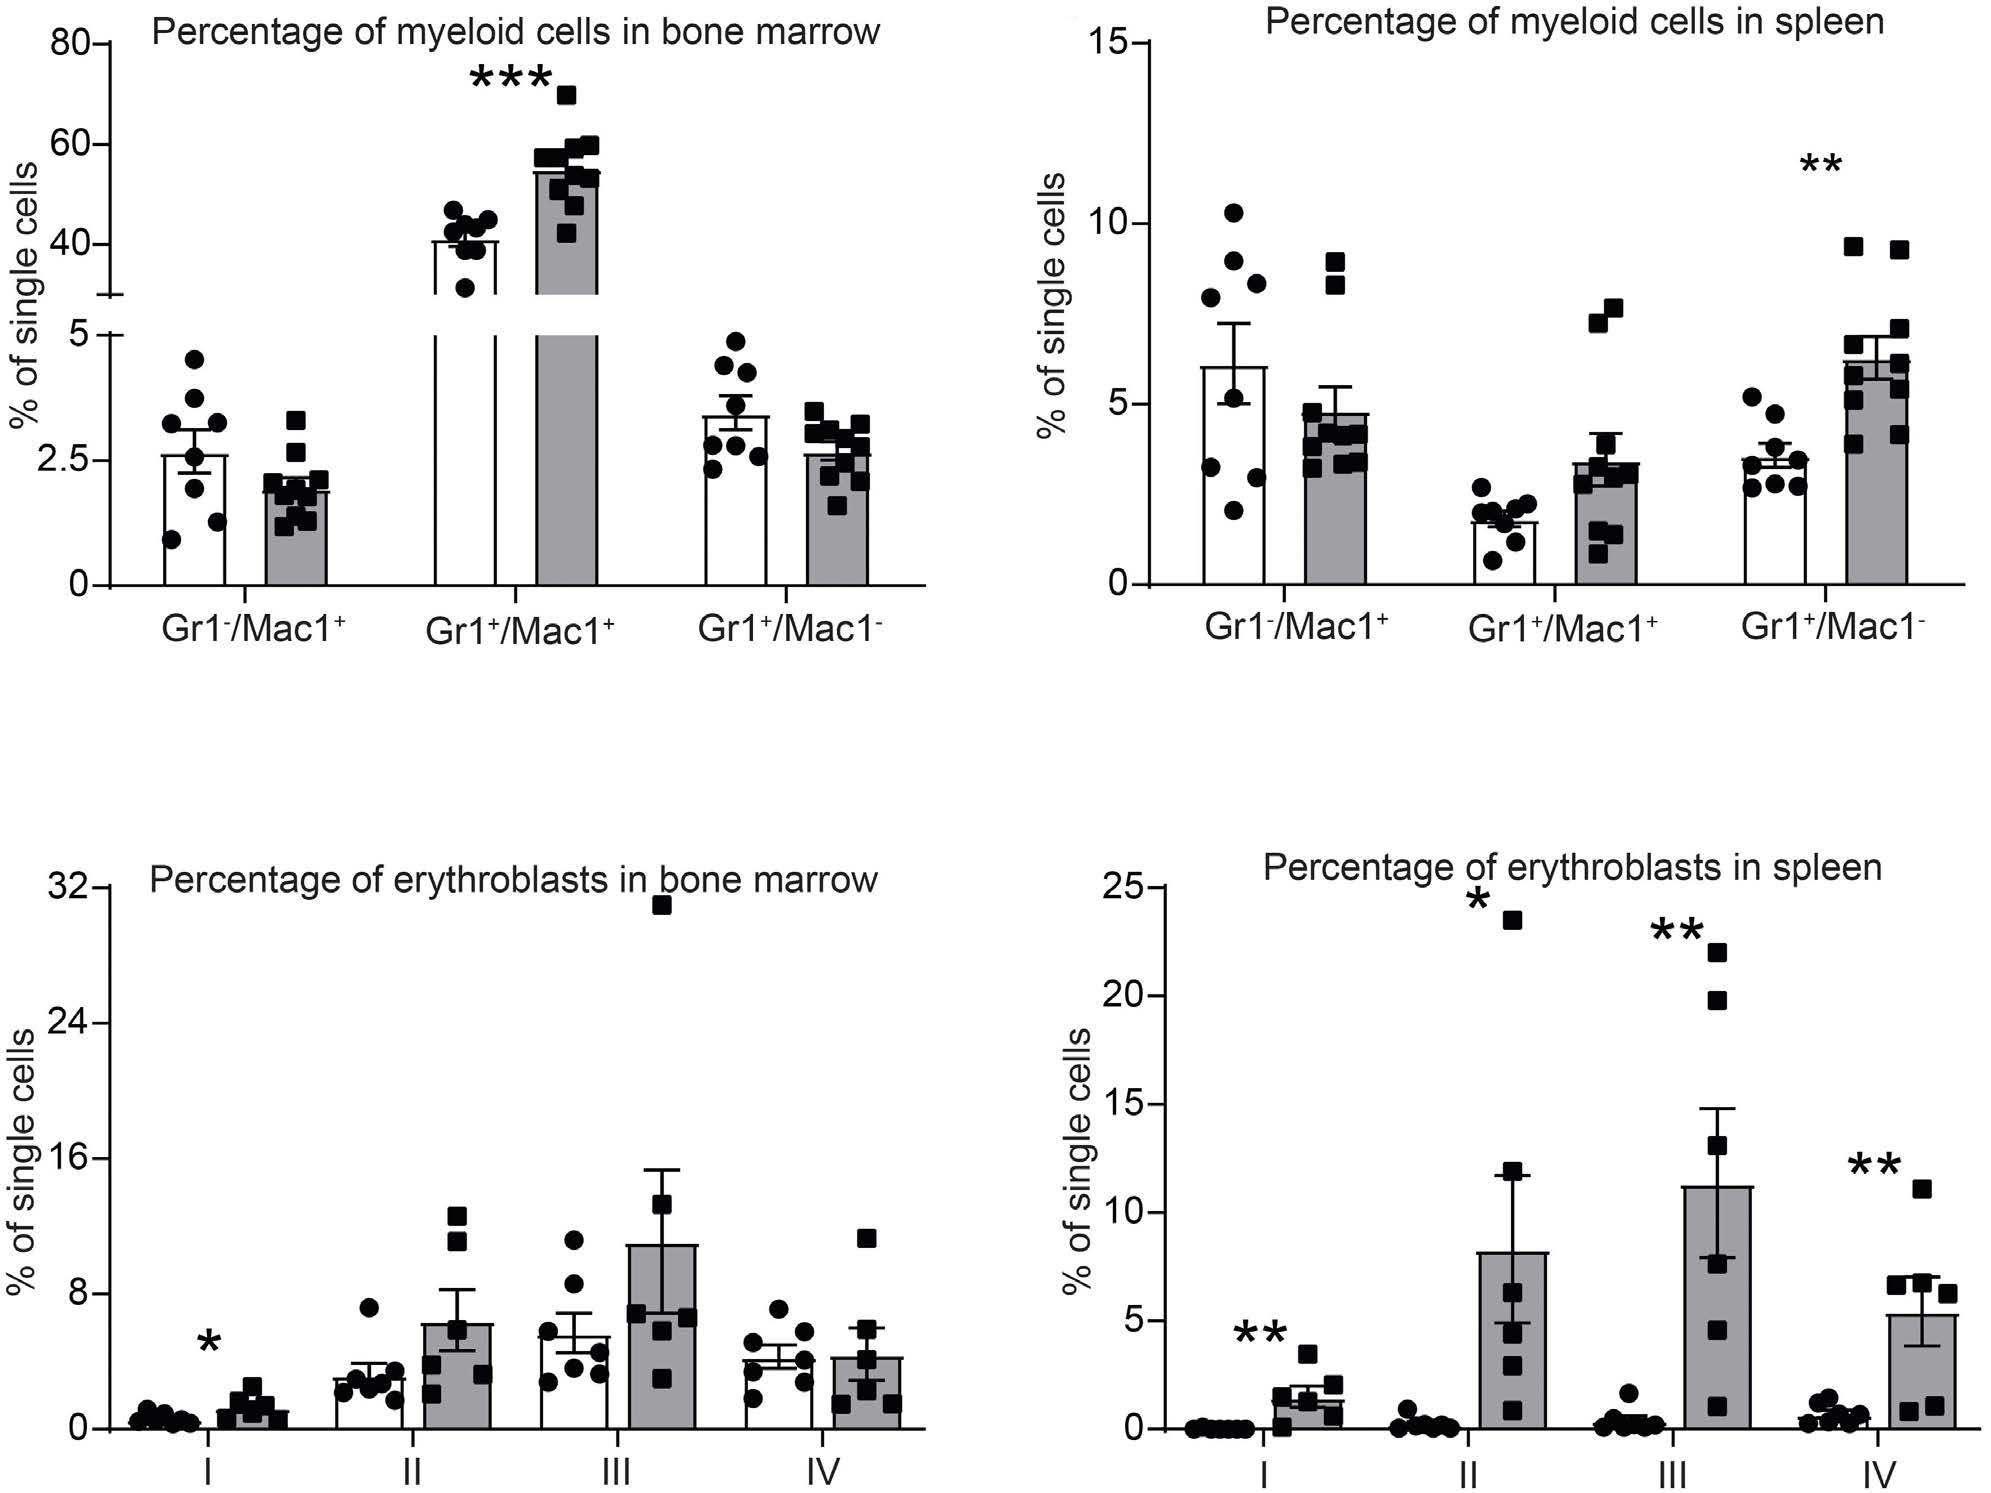
Arid5b regulates B-cell development in bone marrow B-cell lymphopoiesis from hematopoietic progenitors occurs in sequential stages in the bone marrow. To determine which stages were affected in Arid5bOE mice, B cells were analyzed using flow cytometry according to the Hardy fraction scheme.32 Quantification of the proportion and number of pre-pro-B cells (Fraction A), pro-B cells (Fraction B), small pre-B cells (Fraction D), immature B cells (Fraction E) and mature B cells (Fraction F) revealed a significant reduction in the frequency and quantity of these populations in the bone marrow of Arid5bOE mice compared to their wild-type littermates (Figure 5A, B). Interestingly, we found significant increases in apoptosis in both Fractions B and C in Arid5bOE mice (Figure 5C), but no change in the cycling profile of other B cells (Online Supplementary Figure S8). Testing the differentiation capacity of B-cell progenitors in vitro, we found that Arid5bOE bone marrow cells produced significantly fewer pre-B-cell colonies when compared to wild-type littermates in the pres-
ence of IL-7 (Figure 5D).
Effects of Arid5b deficiency on normal hematopoiesis were also analyzed in Mb1- and Vav1-driven Arid5b knockout mouse models (Arid5bKO) (Online Supplementary Figure S9).
In contrast to the overexpression mouse model, the proportion of the pre-B-cell population (Fraction D) was significantly increased in the bone marrow of both Mb1-driven and Vav1-driven Arid5bKO mice compared to their wild-type littermates (Online Supplementary Figure S10A, D). By contrast, no significant changes were noted in hematopoietic stem cells (HSCLT and HSCST), or progenitor cell populations (MPP2, MPP3, and MPP4), and myeloid cells in the bone marrow, spleen, and peripheral blood (Online Supplementary Figures S10B, C, E, F and S11).
Arid5b regulates B-cell development in secondary lymphoid organs
We extended our analysis of B lymphopoiesis to the spleen and peritoneal cavity. B-cell populations in the spleen were divided into four subsets: transitional type 1 B (T1) cells, transitional type 2 B (T2) cells, marginal zone B (MZ) cells, and follicular B (FO) cells. While the transitional and MZ B-cell subsets appeared to be unaffected by the overexpression of Arid5b, we found a significant reduction in the proportion and total number of follicular B cells relative to those in wild-type mice (Figure 6A, B). In the peritoneal cavity B cells, there was also a significant re-
n=8). (C,
A B C D Haematologica | 108 February 2023 506 ARTICLE - ARID5B influences B-cell development C. Goodings et al.
Figure 4. Arid5b overexpression alters the development of myeloid and erythroid cells in the bone marrow and spleen. (A, B) Total Gr1+ and Mac1+ myeloid cells in the bone marrow and spleen of Arid5bOE mice (solid bars, n=10) and wild-type littermates (open bars,
D) Total Ter119+ and CD71+ erythroblasts in the bone marrow and spleen of Arid5bOE mice (solid bars, n=6) and wild-type littermates (open bars, n=7). P values were estimated by a two-tail t test. *P<0.05, **P<0.01, ***P<0.001.
Figure 5. B-cell development in the bone marrow of Arid5bOE versus wild-type mice. (A, B) Frequency and the absolute number of B-cell subsets in the bone marrow of Arid5bOE mice (solid bars, n=7) and wild-type littermates (open bars, n=7). (C) Percentage of annexin V+ cells in various bone marrow B-cell subsets of Arid5bOE mice (solid bars, n=4) and wild-type littermates (open bars, n=5). (D) Pre-B colony-forming units per 200,000 bone marrow cells from Arid5bOE (solid bars, n=19) or wild-type littermates (open bars, n=8): experiment performed in replicate, using MethoCult M3630. P values were estimated by a two-tail t test. *P<0.05, **P<0.01, ***P<0.001, ****P<0.0001.
duction in both B1a and B1b subsets in Arid5bOE mice (Figure 6C, D), but no difference in B2 B cells.
Arid5b influences B-cell activity and metabolism
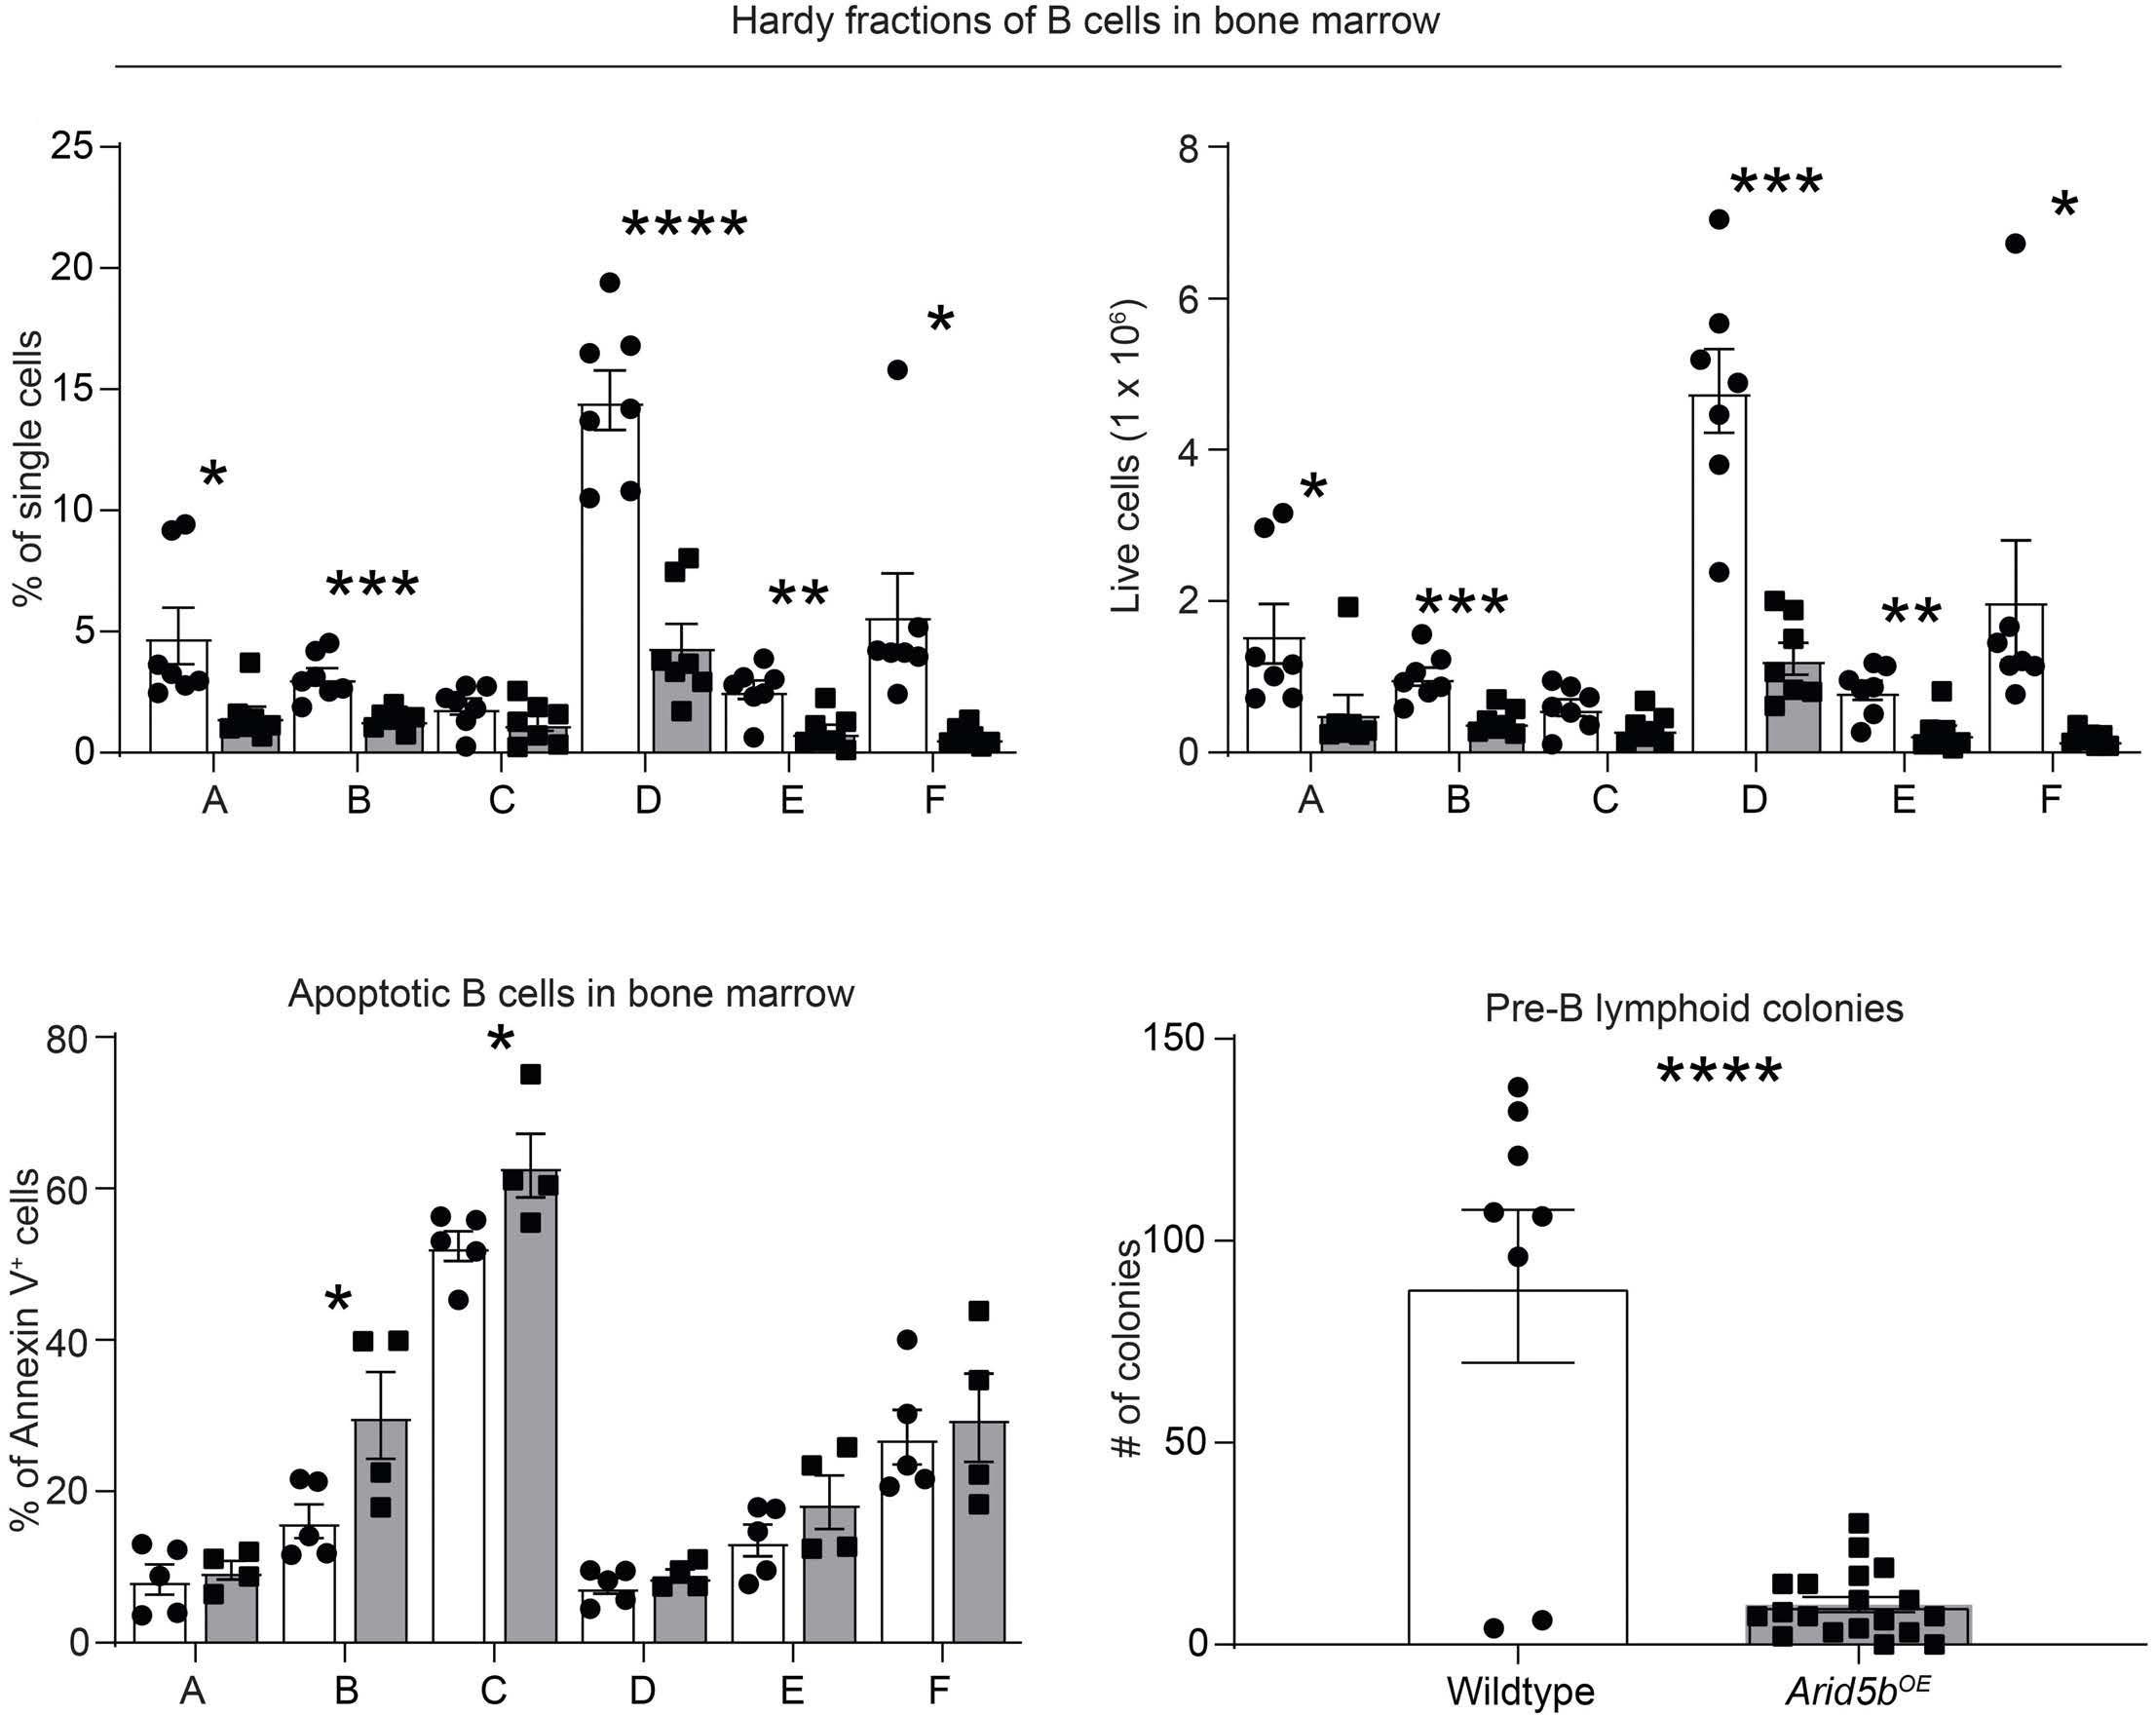
To assess the role of Arid5b in B-cell activation, we purified CD43- resting splenic B cells to be stimulated with anti-IgM and IL-4 or LPS. We found that LPS induced proliferation in both wild-type and Arid5bOE B cells. Surprisingly, anti-IgM- and IL-4-induced proliferation was much less significant in B cells from Arid5bOE mice (Figure 7A), and these cells were also significantly more apoptotic 48 hours after stimulation (Figure 7B). Furthermore, the proliferation defect was consistent across a wide range of anti-IgM antibody concentrations (Figure 7C). Spleen B cells from Arid5bOE mice exhibited a significantly lower level of surface IgD, suggesting a partial maturation blockade at the IgD-negative stage (Figure 7D). In the presence of anti-IgM and IL-4, CD69 and CD86 were both upregulated but to a much lesser degree in Arid5b OE B cells than in B cells from wild-type littermates, 24 hours after stimulation (Figure 7E).
To further explore this, we examined B-cell receptor signaling in B cells with or without Arid5b overexpression using the same activation model mentioned above. Compared to cells from wild-type mice, Arid5bOE cells exhibited higher levels of pBTK and pSYK at baseline and these rose upon anti-IgM and IL-4 stimulation (Figure 8A, B). However, the degree of increase of these two phospho-proteins was significantly smaller with Arid5bOE, suggesting attenuated activation. Similarly, pAKT level was also higher at baseline in Arid5bOE cells with less activation by anti-IgM and IL-4 stimulation compared to that in wild-type cells (Figure 8C). Interestingly, there were also significantly higher levels of surface expression of VpreB and λ5 on CD19+ B cells from Arid5bOE mice than from wild-type mice (Figure 8D). Studies have shown that B cells undergo metabolic changes upon activation.33,34 These changes include increases in oxygen consumption rate (OCR) which is an indicator of oxidative phosphorylation. Our data suggest that at steady-state the B cells from Arid5bOE mice are more active than their wild-type B-cell counterparts. We found that naïve B cells isolated from Arid5bOE mice had in-
A B C D Haematologica | 108 February 2023 507 ARTICLE - ARID5B influences B-cell development C. Goodings et al.
Figure 6. Arid5b overexpression disrupts B-cell development in the spleen and peritoneal cavity. (A, B) Frequency and absolute number of spleen B cells in Arid5bOE mice (solid bars, n=5) and wild-type littermates (open bars, n=6). (C, D) Frequency of B-cell subsets in the peritoneal cavity of Arid5bOE mice (solid bars, n=6) and wild-type littermates (open bars, n=7). P values were estimated by a two-tail t test. *P<0.05, **P<0.01, ***P<0.001, ****P<0.0001.
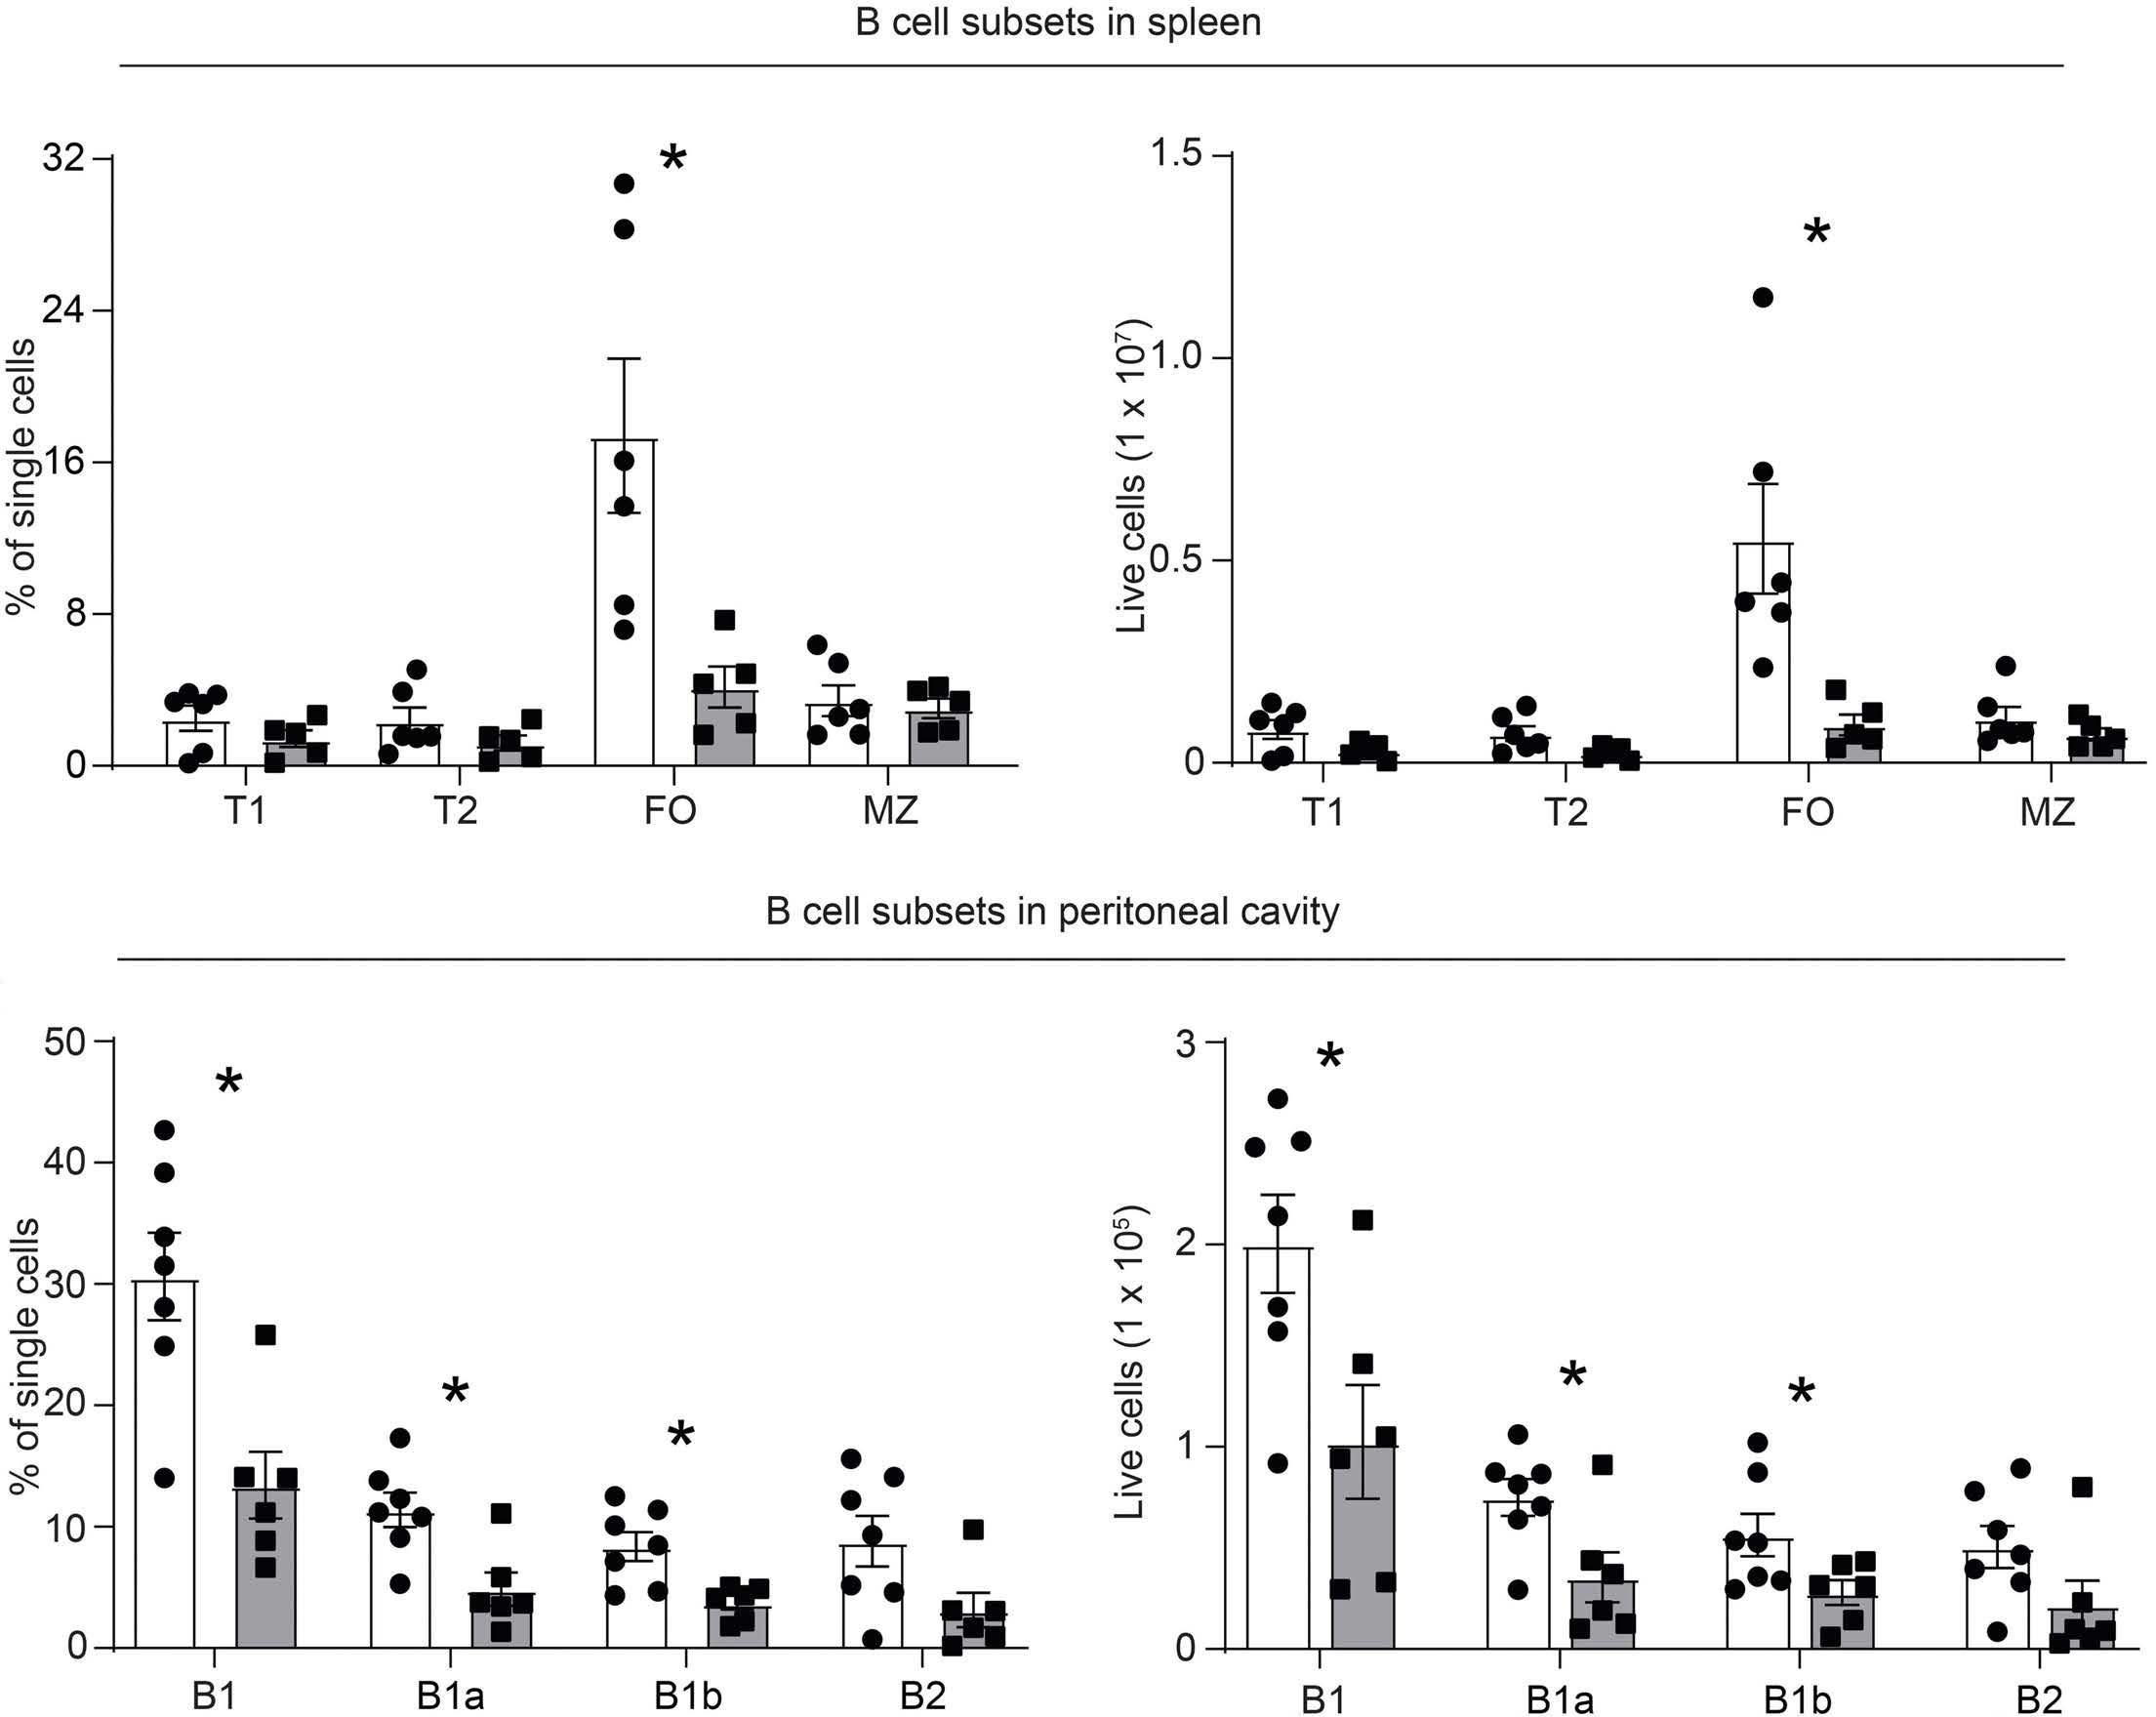
creased OCR when compared to naïve B cells from wildtype littermates ( Online Supplementary Figure S12A). Next, we wanted to gain more insight into the metabolism of B cells from Arid5bOE mice after stimulation with either LPS or anti-IgM and IL-4. We measured the OCR and found that the baseline OCR of Arid5bOE stimulated B cells was higher than that of wild-type mice and showed greater maximum mitochondrial respiration capacity (Online Supplementary Figure S12B). These results together suggested hyperactivation of B cells from Arid5bOE mice compared to their wild-type B-cell counterparts.
Discussion
The genomic region encompassing the ARID5B gene on 10q21.2 is one of the strongest genome-wide association study hits with robust association with ALL risk replicated consistently.9,10,13,35,36 Despite the overwhelming evidence for genetic association with this cancer, the molecular mechanisms by which ARID5B influences normal hematopoiesis have remained poorly understood.
Therefore, our study addressed this knowledge gap by developing mouse models to directly determine hematopoietic consequences of ARID5B deregulation in vivo. Our results showed that overexpression of Arid5b in the mouse hematopoietic system results in marked disruption of B-cell development in vivo; B cells with Arid5B overexpression also exhibited defective activation in vitro in response to stimuli with abnormal mitochondria respiration.
Early studies of Arid5b null mice showed significant alteration in lymphoid development although systematic hematopoietic phenotyping was not performed,25 and these results were confounded by the mixed genetic background of these animals. 26 In our model systems, Arid5b overexpression resulted in remarkable loss of B cells across different developmental stages. Even B cells that reached the terminally differentiated stage failed to be activated by anti-IgM and IL4 stimulation. These cells exhibited a higher propensity for apoptosis and attenuated expression of CD69 and CD86. They were characterized by hyperactive BTK and SYK at baseline compared to B cells from wild-type mice, and were then unresponsive to stimuli in vitro. The effects of ARID5B on B-cell de-
A B C
Haematologica | 108 February 2023 508 ARTICLE - ARID5B influences B-cell development C. Goodings et al.
D
Figure 7. Arid5b overexpression results in defective B-cell activation. (A) Absolute absorbance value from an MTS proliferation assay in three groups of B cells maintained in RPMI 1640 for 48 hours: unstimulated, stimulated with lipopolysaccharide (LPS), and stimulated with IgM F(ab’)₂ fragment and interleukin-4 (IL-4). Wild-type mice are represented by open bars (n=19) and Arid5bOE mice by solid bars (n=13). (B) B-cell apoptosis was evaluated 48 hours after treatment with IgM F(ab’)₂ fragment and IL4 using annexin V and 7-amino actinomycin D in wild-type (open bars, n=19) and Arid5bOE cells (solid bars, n=13). (C) The MTS assay was performed 24 hours after treatment of B cells from wild-type and Arid5bOE mice with varying concentrations of IgM F(ab’)₂ fragment. Absorbance was normalized to that of unstimulated cells. (D) Frequency of IgD-expressing B cells in the spleen of Arid5bOE mice (solid bars, n=6) and wild-type littermates (open bars, n=5). (E) Fold change in cell surface expression of the activation markers CD69 and CD86 on B cells 24 hours after treatment with IgM F(ab’)₂ fragment and IL-4. Expression was normalized to that of unstimulated cells. Wild-type mice are represented by open bars (n=6) and Arid5bOE mice by solid bars (n=6). P values were estimated by a two-tail t test. *P<0.05, **P<0.01, ***P<0.001, ****P<0.0001.
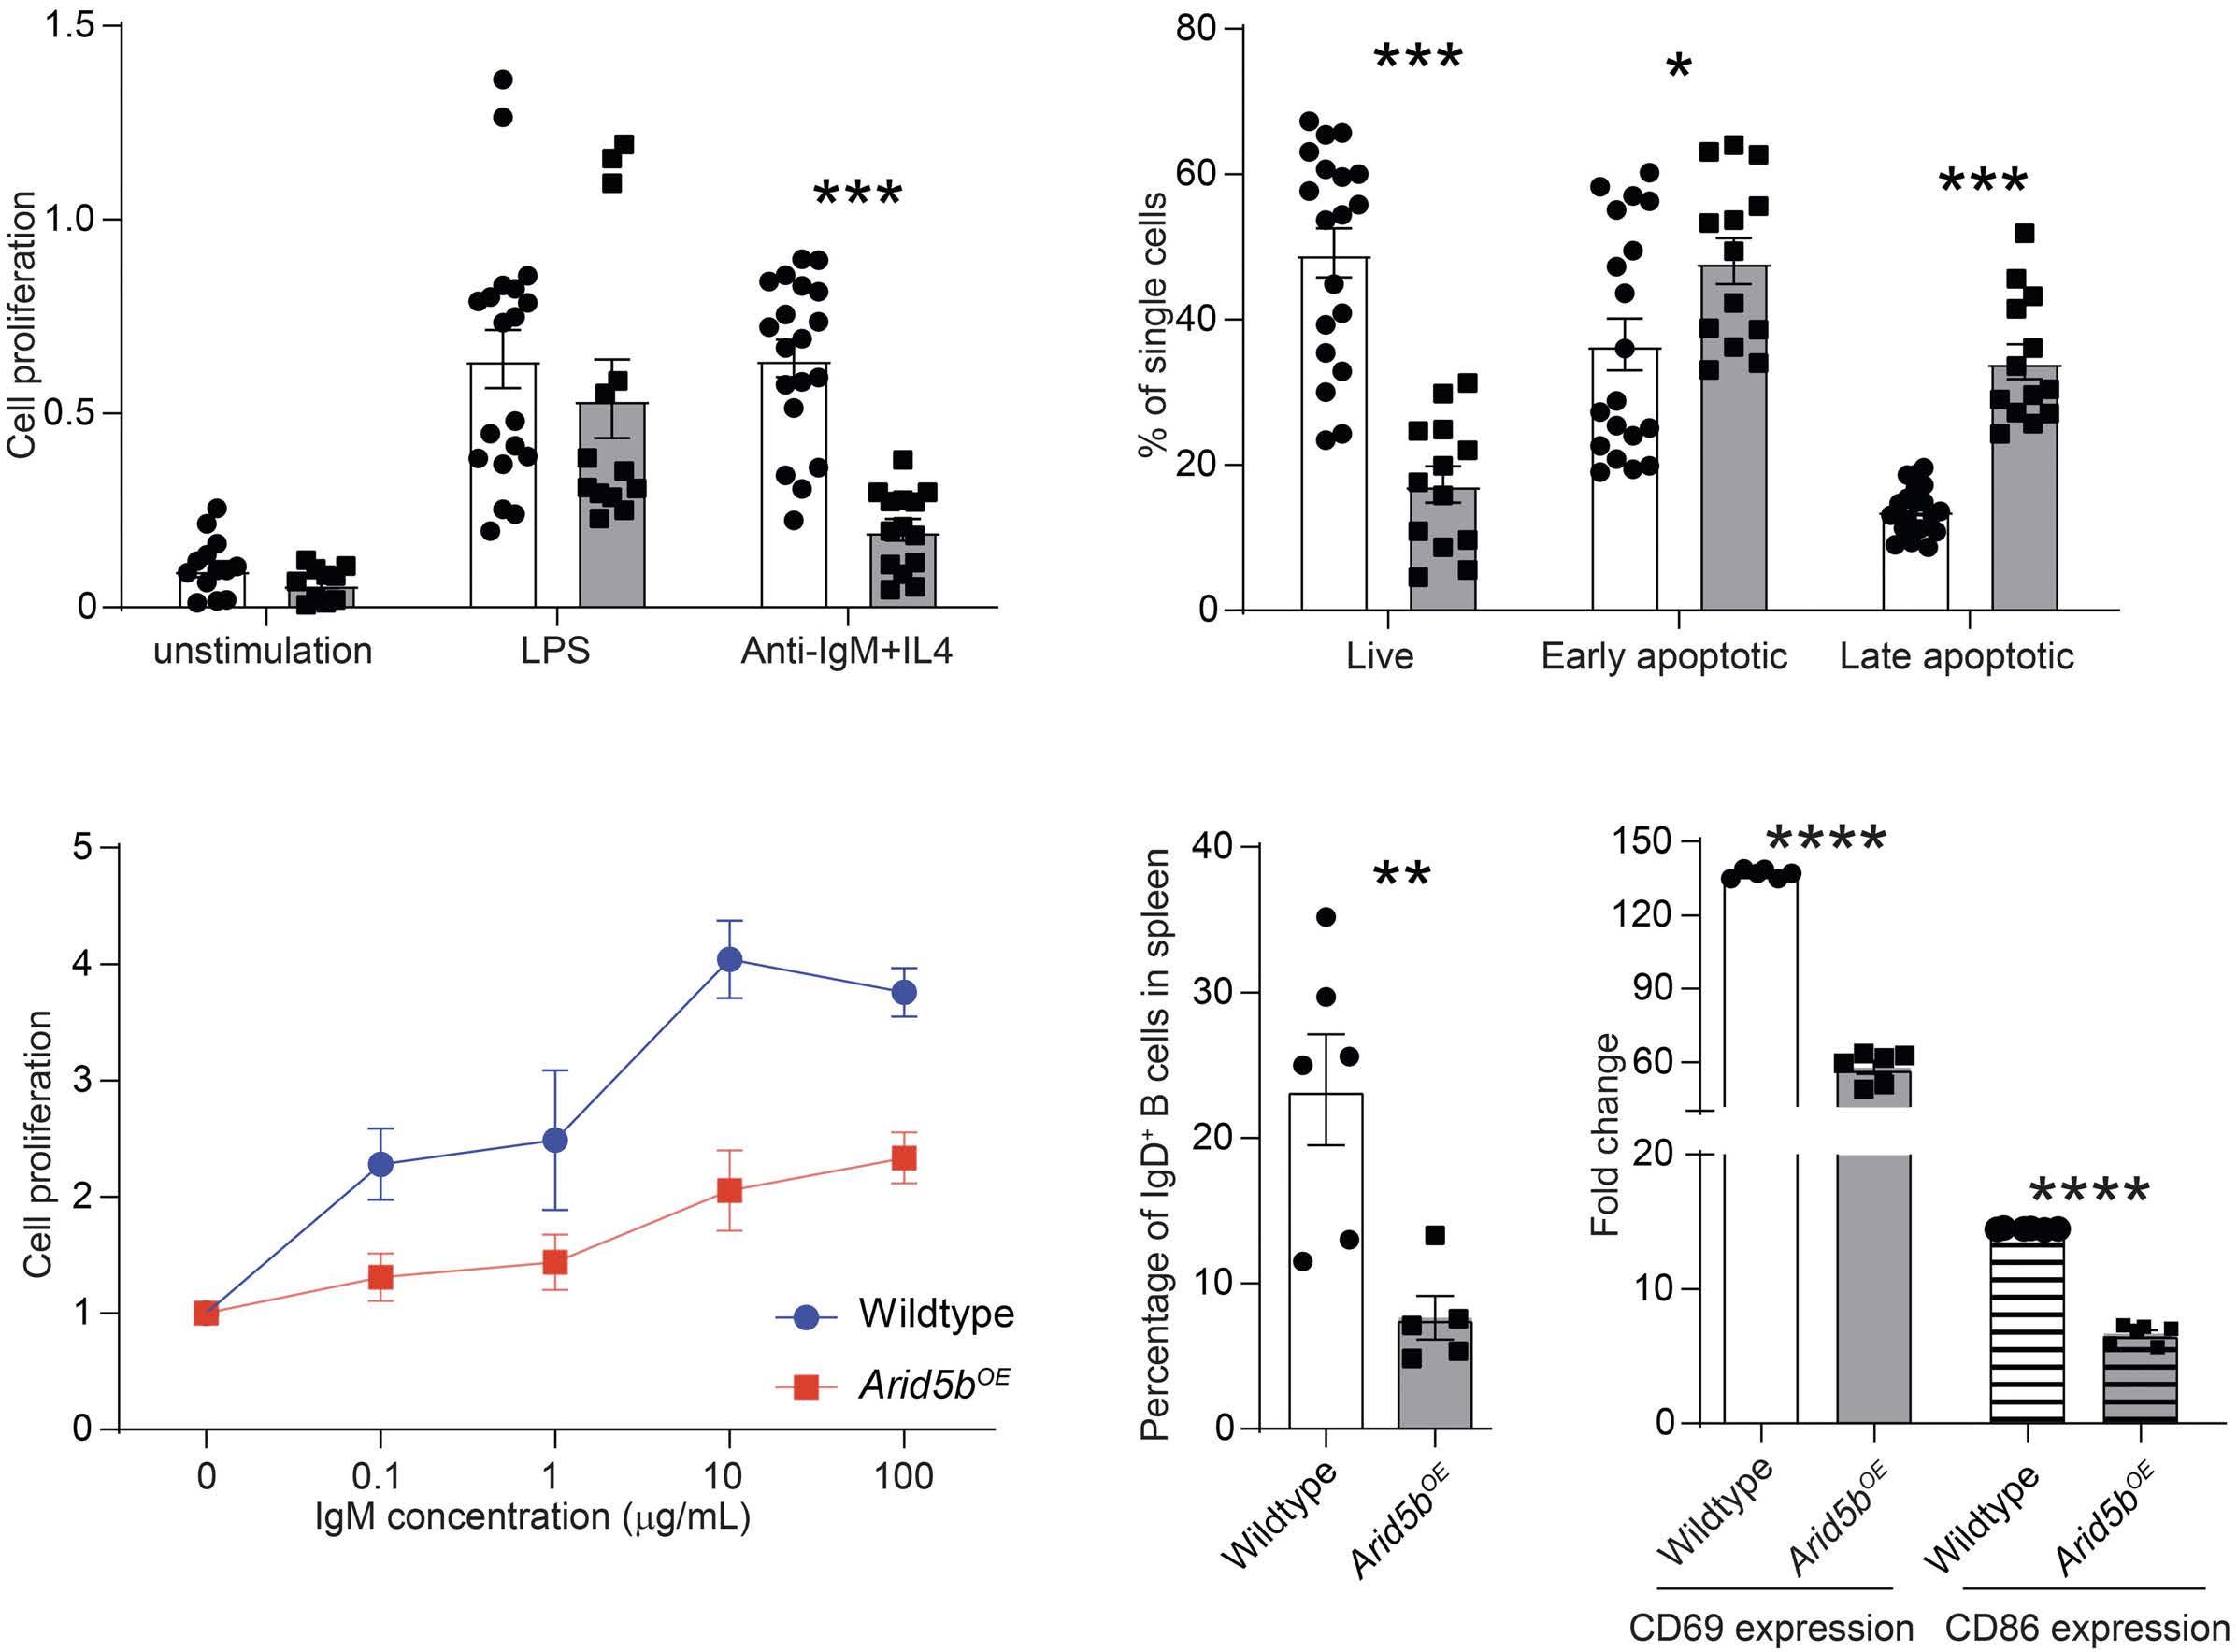
velopment and function are of relevance not only because ALL primarily arises in B progenitor cells, but more importantly ARID5B has also been implicated by genomewide association studies in a range of autoimmune diseases such as rheumatoid arthritis and systemic lupus erythematosus.37,38 Particularly in lupus, aberrant B-cell activation and the production of pathogenic autoantibodies are hallmarks of this disease.39 The ALL risk allele at the ARID5B single nucleotide polymorphism was associated with lower transcription in-cis, 40 linking ARID5B downregulation to leukemogenesis. Taken together, these results point to ARID5B as an important regulator of lymphoid development, especially in the B-cell lineage. In addition, we also explored the effects of Arid5b loss using both Mb1-driven and Vav1-driven knockout mouse models. Compared to wild-type littermates, these mice exhibited modest (but signi fi cant) increases of Hardy
Fractions C and D within the B-cell compartment in the bone marrow of Mb1-driven Arid5bKO mice (Online Supplementary Figure S10A) or Hardy Fractions D and E in Vav1driven Arid5bKO mice (Online Supplementary Figure S10D). However, we cannot defi nitively conclude whether the observed effects of Arid5b overexpression or knockout are completely cell autonomous, especially in the Vav1driven models in which cells of multiple lineages can influence each other. Interestingly, our data suggest that Arid5b overexpression alters glucose metabolism with enhanced oxidative phosphorylation. Thus, one could speculate that the loss of ARID5B would result in decreased oxidative phosphorylation, which has been documented in B-ALL.41
It should be noted that none of our Arid5b mouse models developed overt B-ALL and therefore the direct link of ARID5B with leukemogenesis remains to be established.
A B C D E Haematologica | 108 February 2023 509 ARTICLE - ARID5B influences B-cell development C. Goodings et al.
Figure 8. Arid5b overexpression and defects in B-cell receptor signaling of B cells. (A, B) Mean fluorescence intensity (MFI) for pBTK and pSYK levels in B cells 24 hours after treatment with IgM F(ab')₂ fragment and interleukin-4 (IL-4). Wild-type mice are represented by open bars (n=6) and Arid5bOE mice by solid bars (n=6). (C) MFI for pAKT levels in B cells 24 hours after treatment with IgM F(ab')₂ fragment and IL-4. Wild-type mice are represented by open bars (n=6) and Arid5bOE mice by solid bars (n=6). (D) Surface expression of ��5 and VpreB on CD19+ B cells of Arid5bOE mice (solid bars, n=6) and wild-type littermates (open bars, n=6). P values were estimated by a two-tail t test. *P<0.05, **P<0.01, ***P<0.001, ****P<0.0001.
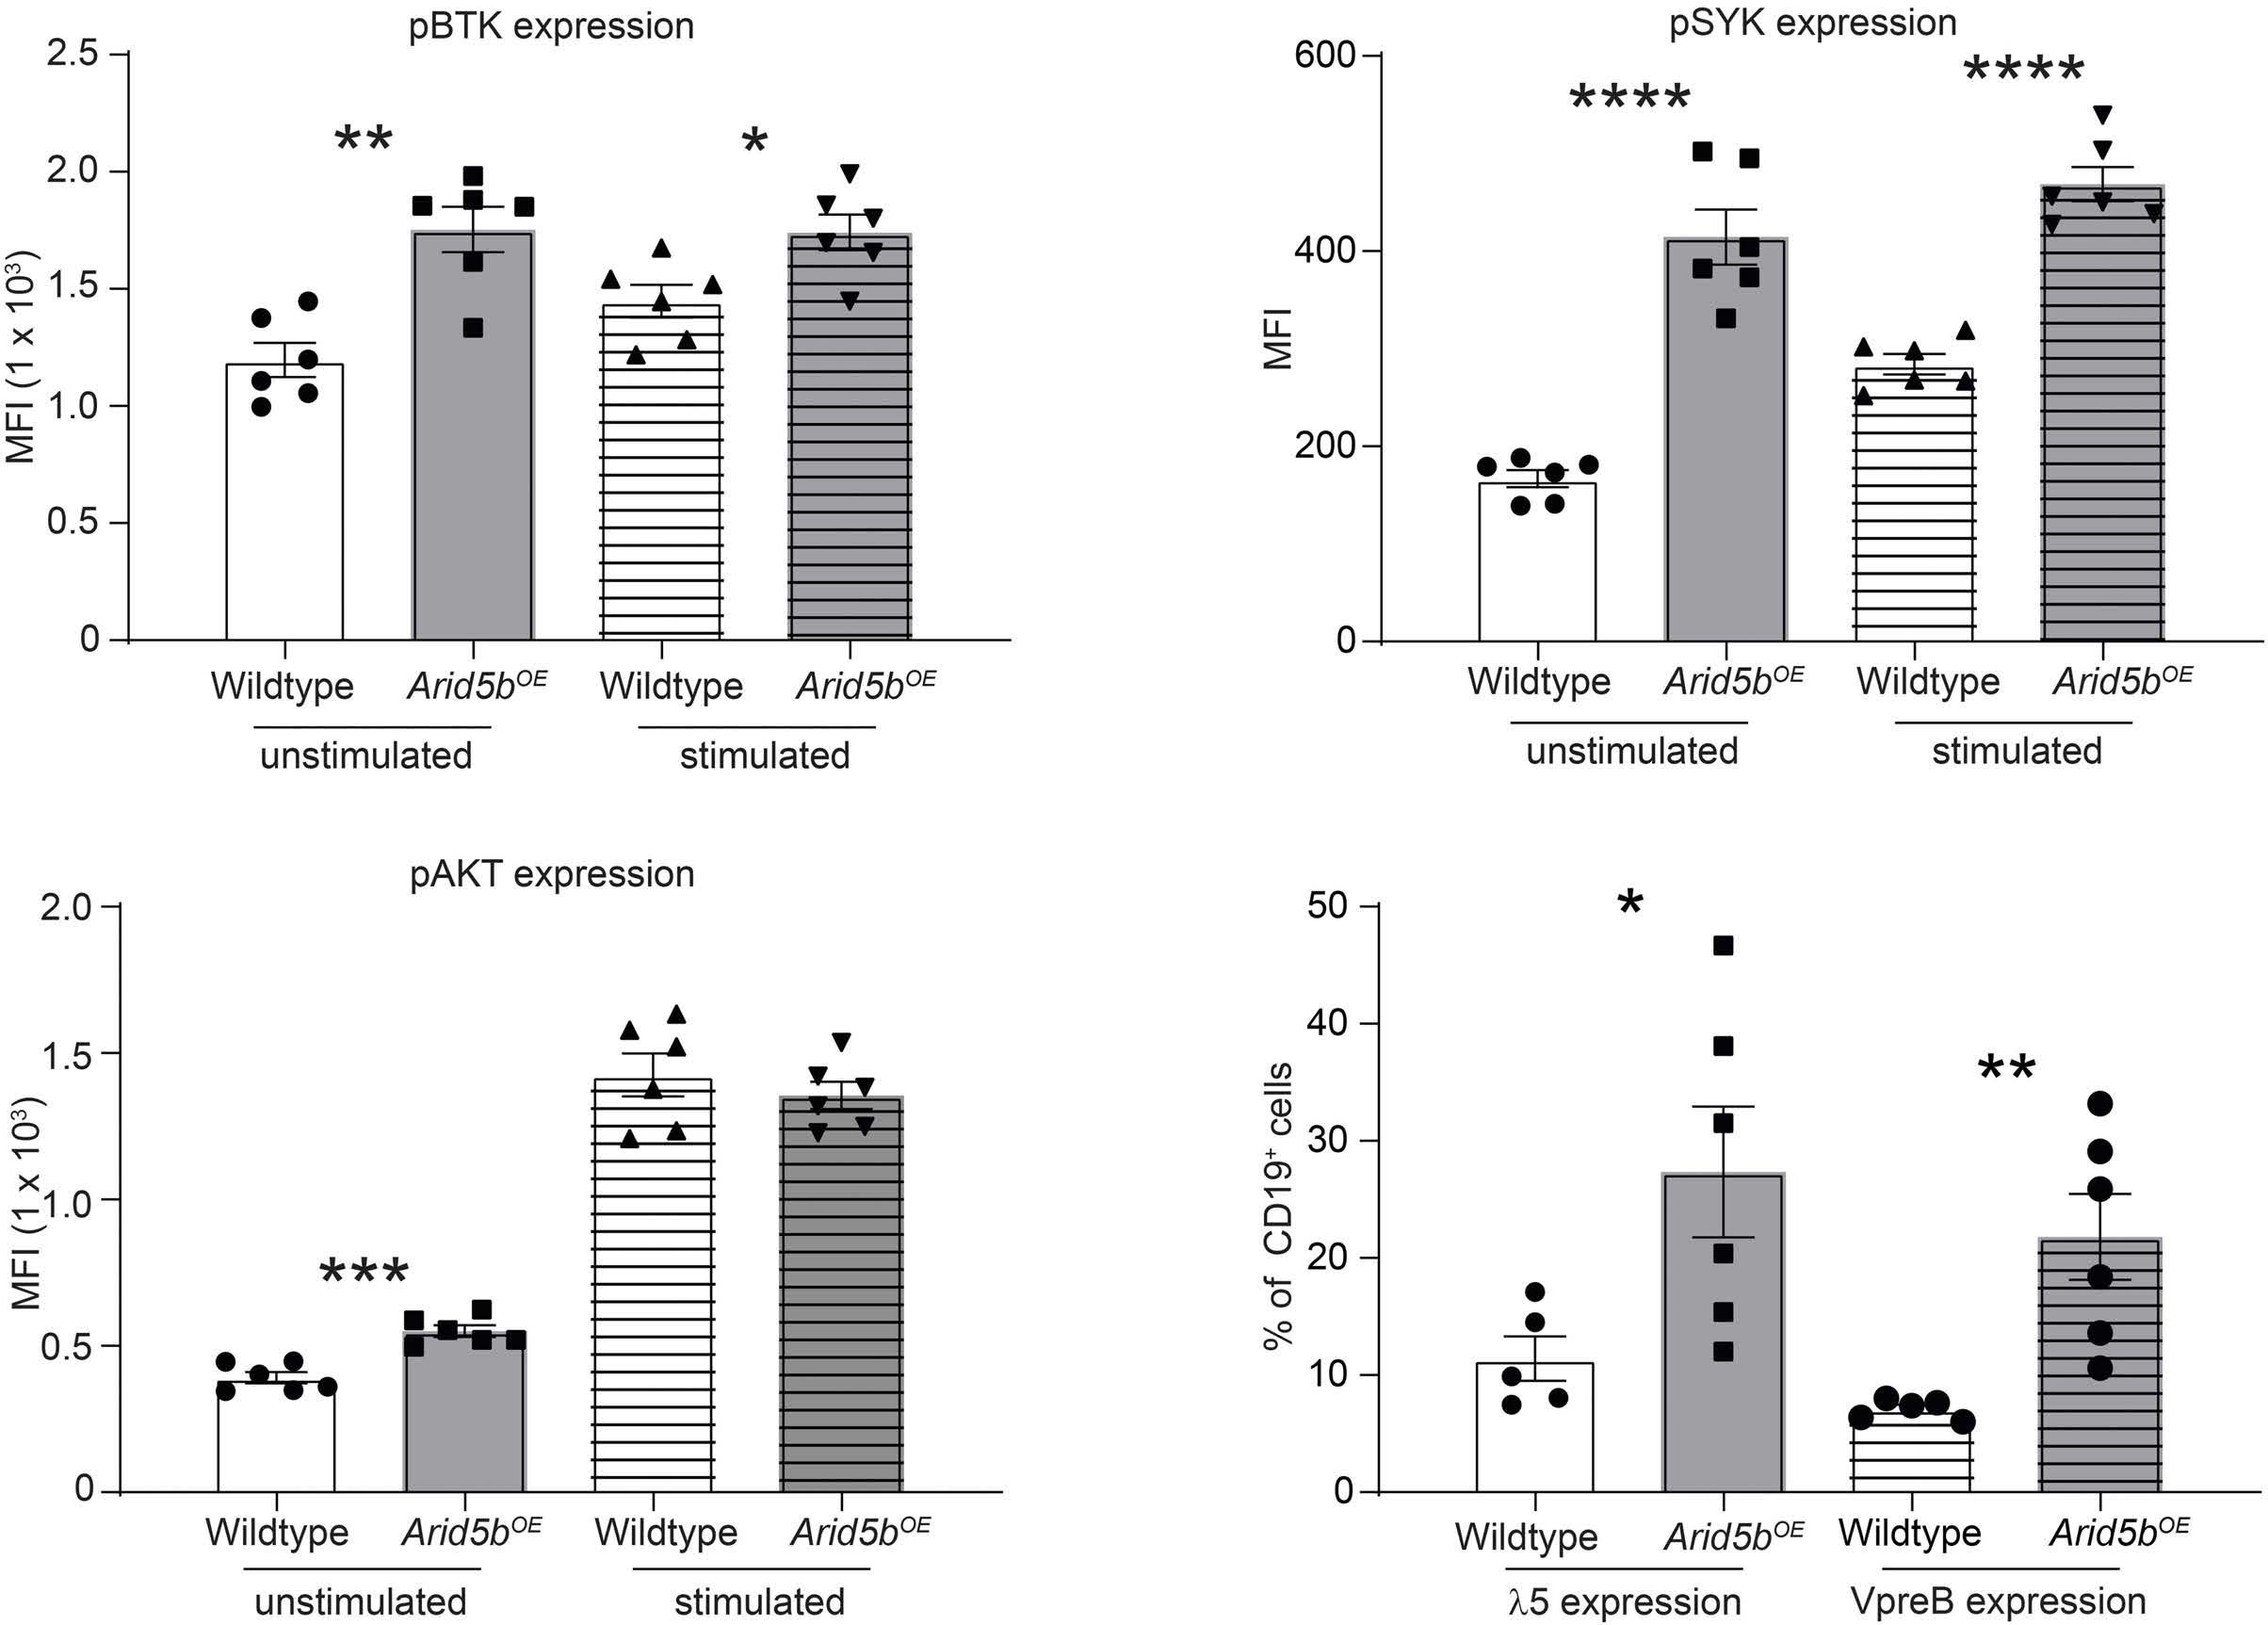
It is plausible that Arid5b deregulation alone is insufficient to induce leukemia without co-operating mutations in other oncogenes or tumor suppressors, with only modest effects on leukemia development in vivo Or ARID5B could only influence leukemogenesis when expressed at a precise level that is probably not recapitulated by ectopic overexpression or knockout in our models. Interestingly, Arid5bOE mice also survived for a shorter time compared to wild-type controls, with signs of hemolytic anemia ( data not shown) , and future studies are warranted to investigate these phenotypes. Nevertheless, alterations in B-cell differentiation and function in Arid5b OE and Arid5b KO mice pointed to the role of this gene in lineage development and relevance to B-ALL. Our comprehensive hematopoietic phenotyping also helped paint a broad picture of ARID5B function, although the detailed molecular mechanisms remain incomplete.
I n conclusion, we mechanistically explored the role of ARID5B in hematopoiesis. Our results provided novel insights into the biological functions of ARID5B in normal
hematopoiesis, especially B-cell lymphopoiesis, further implicating this gene in B-cell-related diseases broadly.
Disclosures
JJY receives research funding from Takeda Pharmaceutical company. The other authors have no potential conflicts of interest to disclose.
Contributions
JJY is the principal investigator of this study, has full access to all the data in the study, and takes responsibility for the integrity of the data and the accuracy of the data analysis. CG and XZ performed the experiments and analyzed the data. JJY, CG, and XZ wrote the manuscript. SMF and HZ contributed reagents, materials and/or data. JJY, XZ, CG, interpreted the data and the research findings. All the coauthors reviewed the manuscript.
Acknowledgments
We thank the patients and parents who participated in the clinical trials included in this study. We thank Dr. Omar I
A B C D Haematologica | 108 February 2023 510 ARTICLE - ARID5B influences B-cell development C. Goodings et al.
Abdel-Wahab for his advice on Arid5b mouse studies. We thank Keith A. Laycock, PhD, ELS, for scientific editing of the article.
Funding
This work was supported by the National Institutes of Health (CA176063), and by the American Lebanese Syrian Associated Charities (ALSAC). The content is solely the
References
1. Pui CH, Robison LL, Look AT. Acute lymphoblastic leukaemia. Lancet. 2008;371(9617):1030-1043.
2. Hunger SP, Mullighan CG. Acute lymphoblastic leukemia in children. N Engl J Med. 2015;373(16):1541-1552.
3. Moriyama T, Relling MV, Yang JJ. Inherited genetic variation in childhood acute lymphoblastic leukemia. Blood. 2015;125(26):3988-3995.
4. Garber JE, Goldstein AM, Kantor AF, Dreyfus MG, Fraumeni JF Jr, Li FP. Follow-up study of twenty-four families with Li-Fraumeni syndrome. Cancer Res. 1991;51(22):6094-6097.
5. Hemminki K, Jiang Y. Risks among siblings and twins for childhood acute lymphoid leukaemia: results from the Swedish Family-Cancer Database. Leukemia. 2002;16(2):297-298.
6. Greaves MF, Maia AT, Wiemels JL, Ford AM. Leukemia in twins: lessons in natural history. Blood. 2003;102(7):2321-2333.
7. Trevino LR, Yang W, French D, et al. Germline genomic variants associated with childhood acute lymphoblastic leukemia. Nat Genet. 2009;41(9):1001-1005.
8. Papaemmanuil E, Hosking FJ, Vijayakrishnan J, et al. Loci on 7p12.2, 10q21.2 and 14q11.2 are associated with risk of childhood acute lymphoblastic leukemia. Nat Genet. 2009;41(9):1006-1010.
9. Yang W, Trevino LR, Yang JJ, et al. ARID5B SNP rs10821936 is associated with risk of childhood acute lymphoblastic leukemia in blacks and contributes to racial differences in leukemia incidence. Leukemia. 2010;24(4):894-896.
10. Yang JJ, Xu H, Yang WJ, et al. Genome-wide association study identifies a novel susceptibility locus at 10p12.31-12.2 for childhood acute lymphoblastic leukemia in ethinically diverse populations. Blood. 2012;120(21):877.
11. Perez-Andreu V, Roberts KG, Harvey RC, et al. Inherited GATA3 variants are associated with Ph-like childhood acute lymphoblastic leukemia and risk of relapse. Nat Genet. 2013;45(12):1494-1498.
12. Xu H, Cheng C, Devidas M, et al. ARID5B genetic polymorphisms contribute to racial disparities in the incidence and treatment outcome of childhood acute lymphoblastic leukemia. J Clin Oncol. 2012;30(7):751-757.
13. Xu H, Yang WJ, Perez-Andreu V, et al. Novel susceptibility variants at 10p12.31-12.2 for childhood acute lymphoblastic leukemia in ethnically diverse populations. J Natl Cancer Inst. 2013;105(10):733-742.
14. Vijayakrishnan J, Kumar R, Henrion MY, et al. A genome-wide association study identifies risk loci for childhood acute lymphoblastic leukemia at 10q26.13 and 12q23.1. Leukemia. 2017;31(3):573-579.
15. Prasad RB, Hosking FJ, Vijayakrishnan J, et al. Verification of the susceptibility loci on 7p12.2, 10q21.2, and 14q11.2 in precursor Bcell acute lymphoblastic leukemia of childhood. Blood. 2010;115(9):1765-1767.
responsibility of the authors and does not necessarily represent the official views of the U.S. National Institutes of Health.
Data-sharing statement
All data needed to evaluate the conclusions in the paper are present in the paper and/or the Online Supplementary Materials.
16. Healy J, Richer C, Bourgey M, Kritikou EA, Sinnett D. Replication analysis confirms the association of ARID5B with childhood Bcell acute lymphoblastic leukemia. Haematologica. 2010;95(9):1608-1611.
17. Evans TJ, Milne E, Anderson D, et al. Confirmation of childhood acute lymphoblastic leukemia variants, ARID5B and IKZF1, and interaction with parental environmental exposures. PloS One. 2014;9(10):e110255.
18. Migliorini G, Fiege B, Hosking FJ, et al. Variation at 10p12.2 and 10p14 influences risk of childhood B-cell acute lymphoblastic leukemia and phenotype. Blood. 2013;122(19):3298-3307.
19. Walsh KM, de Smith AJ, Chokkalingam AP, et al. Novel childhood ALL susceptibility locus BMI1-PIP4K2A is specifically associated with the hyperdiploid subtype. Blood. 2013;121(23):4808-4809.
20. Studd JB, Vijayakrishnan J, Yang M, Migliorini G, Paulsson K, Houlston RS. Genetic and regulatory mechanism of susceptibility to high-hyperdiploid acute lymphoblastic leukaemia at 10p21.2. Nat Commun. 2017;8:14616.
21. Whitson RH, Huang T, Itakura K. The novel Mrf-2 DNA-binding domain recognizes a five-base core sequence through major and minor-groove contacts. Biochem Biophys Res Commun. 1999;258(2):326-331.
22. Yuan YC, Whitson RH, Itakura K, Chen Y. Resonance assignments of the Mrf-2 DNA-binding domain. J Biomol NMR. 1998;11(4):459-460.
23. Yuan YC, Whitson RH, Liu Q, Itakura K, Chen Y. A novel DNAbinding motif shares structural homology to DNA replication and repair nucleases and polymerases. Nat Struct Biol. 1998;5(11):959-964.
24. Zhu L, Hu J, Lin D, Whitson R, Itakura K, Chen Y. Dynamics of the Mrf-2 DNA-binding domain free and in complex with DNA. Biochemistry. 2001;40(31):9142-9150.
25. Lahoud MH, Ristevski S, Venter DJ, et al. Gene targeting of Desrt, a novel ARID class DNA-binding protein, causes growth retardation and abnormal development of reproductive organs. Genome Res. 2001;11(8):1327-1334.
26. Whitson RH, Tsark W, Huang TH, Itakura K. Neonatal mortality and leanness in mice lacking the ARID transcription factor Mrf2. Biochem Biophys Res Commun. 2003;312(4):997-1004.
27. Watanabe M, Layne MD, Hsieh CM, et al. Regulation of smooth muscle cell differentiation by AT-rich interaction domain transcription factors Mrf2alpha and Mrf2beta. Circ Res. 2002;91(5):382-389.
28. Baba A, Ohtake F, Okuno Y, et al. PKA-dependent regulation of the histone lysine demethylase complex PHF2-ARID5B. Nat Cell Biol. 2011;13(6):668-675.
29. Cichocki F, Wu CY, Zhang B, et al. ARID5B regulates metabolic programming in human adaptive NK cells. J Exp Med. 2018;215(9):2379-2395.
Haematologica | 108 February 2023 511 ARTICLE - ARID5B influences B-cell development C. Goodings et al.
30. Leong WZ, Tan SH, Ngoc PCT, et al. ARID5B as a critical downstream target of the TAL1 complex that activates the oncogenic transcriptional program and promotes T-cell leukemogenesis. Genes Dev. 2017;31(23-24):2343-2360.
31. Guo B, Rothstein TL. IL-4 upregulates Igalpha and Igbeta protein, resulting in augmented IgM maturation and B cell receptor-triggered B cell activation. J Immunol. 2013;191(2):670-677.
32. Hardy RR, Carmack CE, Shinton SA, Kemp JD, Hayakawa K. Resolution and characterization of pro-B and pre-pro-B cell stages in normal mouse bone marrow. J Exp Med. 1991;173(5):1213-1225.
33. Akkaya M, Traba J, Roesler AS, et al. Second signals rescue B cells from activation-induced mitochondrial dysfunction and death. Nat Immunol. 2018;19(8):871-884.
34. Waters LR, Ahsan FM, Wolf DM, Shirihai O, Teitell MA. Initial B cell activation induces metabolic reprogramming and mitochondrial remodeling. iScience. 2018;5:99-109.
35. Vijayakrishnan J, Qian M, Studd JB, et al. Identification of four novel associations for B-cell acute lymphoblastic leukaemia
risk. Nat Commun. 2019;10(1):5348.
36. Xu H, Cheng C, Devidas M, et al. ARID5B genetic polymorphisms contribute to racial disparities in the incidence and treatment outcome of childhood acute lymphoblastic leukemia. J Clin Oncol. 2012;30(7):751-757.
37. Okada Y, Terao C, Ikari K, et al. Meta-analysis identifies nine new loci associated with rheumatoid arthritis in the Japanese population. Nat Genet. 2012;44(5):511-516.
38. Tomer Y, Hasham A, Davies TF, et al. Fine mapping of loci linked to autoimmune thyroid disease identifies novel susceptibility genes. J Clin Endocrinol Metab. 2013;98(1):E144-152.
39. Kil LP, Hendriks RW. Aberrant B cell selection and activation in systemic lupus erythematosus. Int Rev Immunol. 2013;32(4):445-470.
40. Zhao X, Qian M, Goodings C, et al. Molecular mechanisms of ARID5B-mediated genetic susceptibility to acute lymphoblastic leukemia. J Natl Cancer Inst. 2022;114(9):1287-1295.
41. Boag JM, Beesley AH, Firth MJ, et al. Altered glucose metabolism in childhood pre-B acute lymphoblastic leukaemia. Leukemia. 2006;20(10):1731-1737.
Haematologica | 108 February 2023 512 ARTICLE - ARID5B
fl
C. Goodings et al.
in
uences B-cell development
Serum vascular endothelial growth factor is associated with cardiovascular involvement and response to therapy in Erdheim-Chester disease
Anaïs Roeser,1 Marine Bravetti,2 Lida Dong,3 Levi-Dan Azoulay,1 Frederic Charlotte,3 Makoto Miyara,4 Pascale Ghillani-Dalbin,4 Jean-François Emile,5 Fadwa El Kouari,6 Hamza Ouni,7 Jean-Marc Lacorte,7 Isabelle Brocheriou,3 Zahir Amoura,1 Fleur Cohen-Aubart1 and Julien Haroche1
1Sorbonne Université, Assistance Publique Hôpitaux de Paris, Hôpital de la Pitié-Salpêtrière, Service de Médecine Interne 2, Centre National de Référence des Histiocytoses, Paris; 2Sorbonne Université, Assistance Publique Hôpitaux de Paris, Hôpital de la Pitié-Salpêtrière, Service de Radiologie Cardiovasculaire et Interventionnelle, Paris; 3Sorbonne Université, Assistance Publique Hôpitaux de Paris, Hôpital de la Pitié-Salpêtrière, Service d’Anatomie et Cytologie Pathologiques, Paris; 4Sorbonne Université, Assistance Publique Hôpitaux de Paris, Hôpital de la Pitié-Salpêtrière, Département d’Immunochimie, Paris; 5EA4340, Université Versailles-Saint Quentin, Assistance Publique Hôpitaux de Paris, Hôpital Ambroise Paré, Département de Pathologie, Boulogne; 6Sorbonne Université, Assistance Publique Hôpitaux de Paris, Unité Fonctionnelle de Production des Médicaments et des Anticancéreux Injectables, Hôpital Pitié-Salpêtrière, Paris and 7Sorbonne Université, Assistance Publique Hôpitaux de Paris, Service de Biochimie Endocrinienne et Oncologique, Hôpital Pitié-Salpêtrière, Paris, France
Abstract
Correspondence: J. Haroche julien.haroche@aphp.fr
Received: January 29, 2022.
Accepted: August 18, 2022. Prepublished: August 25, 2022.
https://doi.org/10.3324/haematol.2022.280755
©2023 Ferrata Storti Foundation
Published under a CC BY-NC license
Erdheim-Chester disease (ECD) is a rare histiocytosis, considered to be an inflammatory myeloid neoplasm. Tropism for specific involvements of the disease remains unexplained. Vascular endothelial growth factor-A (VEGF) is implicated in cancer pathophysiology and mutations of the RAS oncogene have been shown to induce upregulation of VEGF gene expression. We therefore hypothesized that VEGF might play a particular role in ECD pathophysiology. We conducted a retrospective, single-center study to assess serum VEGF (sVEGF) concentrations and determine whether they were associated with the characteristics of ECD patients, and to determine whether VEGF was expressed by histiocytes. We evaluated 247 ECD patients, 53.4% of whom had sVEGF levels above the normal range (>500 pg/mL). Patients with high sVEGF levels more frequently had cardiac and vascular involvement (58.3% vs. 41.4%, P=0.008 and 70.5% vs. 48.3%, P=0.0004, respectively). In treatment-naïve patients (n=135), the association of C-reactive protein >5 mg/L and sVEGF >500 pg/mL was strongly associated with vascular involvement (odds ratio=5.54 [95% confidence interval: 2.39-13.62], P<0.001), and independently associated with cardiac involvement (odds ratio=3.18 [95% confidence interval: 1.34-7.83], P=0.010) after adjustment for the presence of the BRAF V600E mutation. Changes in sVEGF concentration on treatment were associated with a response of cardiac involvement on consecutive cardiac magnetic resonance images. All histological samples analyzed (n=24) displayed histiocytes with intracytoplasmic expression of VEGF, which was moderate to high in more than 90% of cases. Our study suggests a role for VEGF in cardiac and vascular involvement in ECD.
Introduction
Erdheim-Chester disease (ECD) is a rare histiocytosis characterized by tissue infiltration with CD68+ CD1a- histiocytes derived from mononuclear phagocytes harboring recurrent mutations of MAPK-signaling pathway genes.1 Angiogenesis plays an important role in neoplastic and inflammatory processes. Vascular endothelial growth factor-A, commonly referred to simply as VEGF, is the main
pro-angiogenic isoform, and a key regulator of blood vessel growth.2 It is secreted by immune cells, smooth muscle cells, and many tumor cells. VEGF interacts with immune cells in the tumor microenvironment, generating a pro-tumor microenvironment.3
Activation of the RAS oncogene has been shown to induce upregulation of VEGF production.4 VEGF is expressed by histiocytes in 70% of Langerhans cell histiocytosis (LCH) lesions,5 but little is known about the expression of this
Haematologica | 108 February 2023 513 ARTICLE - Inflammatory Myeloid Neoplasm
factor in ECD. Serum VEGF (sVEGF) levels in a series of 24 ECD patients were reported to be higher than those in healthy individuals.6 Polyneuropathy, organomegaly, endocrinopathy, monoclonal gammapathy, and skin changes (POEMS) syndrome is associated with high sVEGF concentrations, which are thought to underlie increased microvascular permeability and other disease manifestations in this syndrome.7
We hypothesized that VEGF plays a role in the pathophysiology of ECD. The aim of this study was to assess sVEGF concentrations in ECD patients, and their association with the characteristics of the patients. The secondary objective was to determine whether VEGF is produced by histiocytes in ECD lesions.
Methods
Patients and methods
We conducted a retrospective study of all patients with ECD seen at the French National Reference Center for Histiocytoses at Pitié-Salpêtrière Hospital. All patients had a clinical and radiological presentation consistent with ECD, and tissue samples were centrally reviewed for pathological confirmation. Patients were included if they had at least one sVEGF determination between January 1, 2009 and December 31, 2019. Previously reported patients were not included in this analysis.6 We searched for the BRAF V600E mutation as previously described.8 sVEGF concentration was assessed by enzyme-linked immunosorbent assay and considered high if it exceeded 500 pg/mL. Interleukin (IL)-6 levels were determined with an immunoenzyme assay (Lumipulse G1200 Fujirebio). Cardiac and vascular involvement (coating of the aorta and/or its branches) was assessed in paraclinical examinations prescribed by the physician. Cardiac magnetic resonance imaging (MRI) scans were reviewed centrally for the purposes of this study by an expert in cardiac imaging. Targeted treatments with BRAF inhibitors (vemurafenib and dabrafenib) and MEK inhibitors (cobimetinib and trametinib) were prescribed at the discretion of the doctors, generally when required due to disease severity. Followup ended in May 2022. Histological samples from patients with extreme (high and low) sVEGF concentrations were reviewed centrally. The immunostaining procedure for VEGF was performed on formalin-fixed, deparaffinized, 3 µm-thick sections with the Ventana Benchmark Ultra platform (Roche Diagnostics, France) and the Optiview visualization system (Roche Diagnostics), according to the manufacturer's instructions. Two different primary antibodies were used: F/PU483-UP (polyclonal, rabbit, Biogenex, USA; dilution 1/20, incubation 32 min at 37°C), and SC-53462 (monoclonal, VG-1, mouse, Santa Cruz, USA; dilution 1/25, incu-
bation 44 min at 37°C). Staining was analyzed by two pathologists. Staining intensity was evaluated with a semi-quantitative score from 0 (no staining) to 3 (intense staining). Endothelial cells were used as an internal positive control. A placental sample was used as an external positive control.
Ethical considerations
This study was performed in accordance with French data protection regulations (CNIL) reference methodology and the Declaration of Helsinki. Demographic, clinical, biological and imaging data were extracted from medical records, together with treatment information. The study was approved by the ethic committee Ile de France III (#2011A00447–34).
Statistics
We used χ² tests, Fisher exact tests, Student t tests, Wilcoxon matched-pairs signed-rank tests and log-rank tests for comparisons, as appropriate. Multiple logistic regression models were built to evaluate the predictive value of biological parameters and their association with disease characteristics. A sensitivity analysis was performed to evaluate the impact of the treatment previously received on these biological parameters. Survival curves were generated by the Kaplan-Meier method, taking into account the time from histological documentation of ECD to death or last follow-up. All the tests performed were two-tailed, with P values <0.05 considered statistically significant. Statistical analyses were performed with R-Studio opensource software version 1.1.456, R open-source software version 3.5.1 (2018-07-02, "Feather Spray") and GraphPad Prism V 8.3 (GraphPad software, La Jolla, CA, USA).
Results
We checked the inclusion criteria for 288 patients. We excluded 30 patients for whom no sVEGF determinations were available, three due to missing data in the medical records and eight for whom the diagnosis was uncertain. sVEGF concentration was high (>500 pg/mL) at the first determination in 132 of the 247 patients (53.4%), and >1,000 pg/mL in 47 (19.0%) (Figure 1). The median sVEGF concentration was 847 pg/mL (interquartile range [IQR]: 627-1,245 pg/mL) in patients with high sVEGF concentrations, and 286 pg/mL (IQR: 194-387 pg/mL) in patients with low sVEGF concentrations. At the time of the first sVEGF determination, 135 of the 245 (55.1%) patients had not yet received any treatment for ECD. Sex, age, BRAF status and prior medication did not differ significantly between patients with and without initially high sVEGF concentrations (Table 1). The proportion of ECD patients with vascular involvement was significantly
Haematologica | 108 February 2023 514 ARTICLE - VEGF as a biomarker in Erdheim-Chester disease A. Roeser et al.
1.
higher in the group of patients with high sVEGF concentrations (70.5% vs. 48.3%, P=0.0004), especially for “coated aorta” (50% vs. 33.6%, P=0.009), and retroperitoneum (70.5% vs. 55.1%, P=0.006). Cardiac involvement was also more frequent in the high sVEGF group (58.3% vs. 41.4%, P=0.008). Coronary arteries, in particular, were affected twice as frequently (27.2% vs. 14.7%, P=0.016). Right atrium pseudotumors were also more frequent in the high sVEGF group (41.7% vs. 29.3%, P=0.043). In 67 patients with cardiac involvement evaluated on centrally reviewed cardiac MRI, late gadolinium enhancement did not differentiate between patients with high and low sVEGF concentrations (31/41 vs. 18/26, P=0.57). Other types of involvement, such as diabetes insipidus, central nervous system involvement, and xanthelasma, were distributed equally between the two groups.
In a logistic regression model, high sVEGF concentration (>500 pg/mL) at the initial measurement (M0) was associated with vascular involvement (odds ratio [OR]=2.56, 95% confidence interval [95% CI]: 1.51-4.38; P=0.001), and, after adjustment for the presence of the BRAF V600E mutation, with cardiac involvement (OR=1.95, 95% CI: 1.09-3.53; P=0.026). The performance of sVEGF concentration for predicting cardiac or vascular involvement, evaluated on a receiver operating characteristic curve (area under the curve: 0.6397), identified a threshold sVEGF concentration at 486.5 pg/mL (sensitivity 61.85%, specificity 64%) for the detection of cardiac or vascular involvement (Online Supplementary Figure S1). A sVEGF concentration threshold of 1,001 pg/mL had a specificity of 89.3% (95% CI: 80.3-94.5)
and a sensitivity of 22.5% (95% CI: 17.0-29.3) for cardiac or vascular involvement, and a specificity of 86.2% (95% CI: 79.0-91.2) and sensitivity of 24% (95% CI: 17.4-32.2) for cardiac involvement alone.
We evaluated the specificity of the correlation observed between sVEGF concentration and cardiovascular involvement by studying other inflammatory biomarkers. C-reactive protein (CRP) concentration at M0, which was available for 167 patients, was high (>5 mg/L) in 116/167 (69.5%) (median CRP: 16.0 mg/L; IQR=3.0-26.06). IL-6 concentration could be determined for 36 patients with high sVEGF concentrations at M0: it was high (>6.5 pg/mL) in 28/36 (77.8%) (median IL-6 level: 14.10 pg/mL; IQR=10.722.0). We observed a significant correlation between sVEGF and CRP concentrations at M0 (Pearson: 0.201, P=0.009), and between sVEGF and IL-6 concentrations (Pearson: 0.381, P=0.002).
Cardiac involvement was more frequent in patients with a high CRP concentration (> 5 mg/L) at M0 (70/116 [60.3%] vs. 16/51 [31.4%], P=0.0006), as was vascular involvement (77/116 [66.4%] vs. 22/51 [43.1%], P=0.0049). The performance of CRP concentration for predicting cardiac or vascular involvement was evaluated on a receiving operating characteristic curve (area under the curve: 0.6561). A threshold CRP concentration of 40.5 mg/L had a specificity of 88.4% (95% CI: 74.9-96.1) and a sensitivity of 28.2% (95% CI: 20.5-37.1).
In a multiple logistic regression model, high CRP (>5 mg/L) and sVEGF (>500 pg/mL) concentrations were independently associated with vascular involvement (OR=2.09
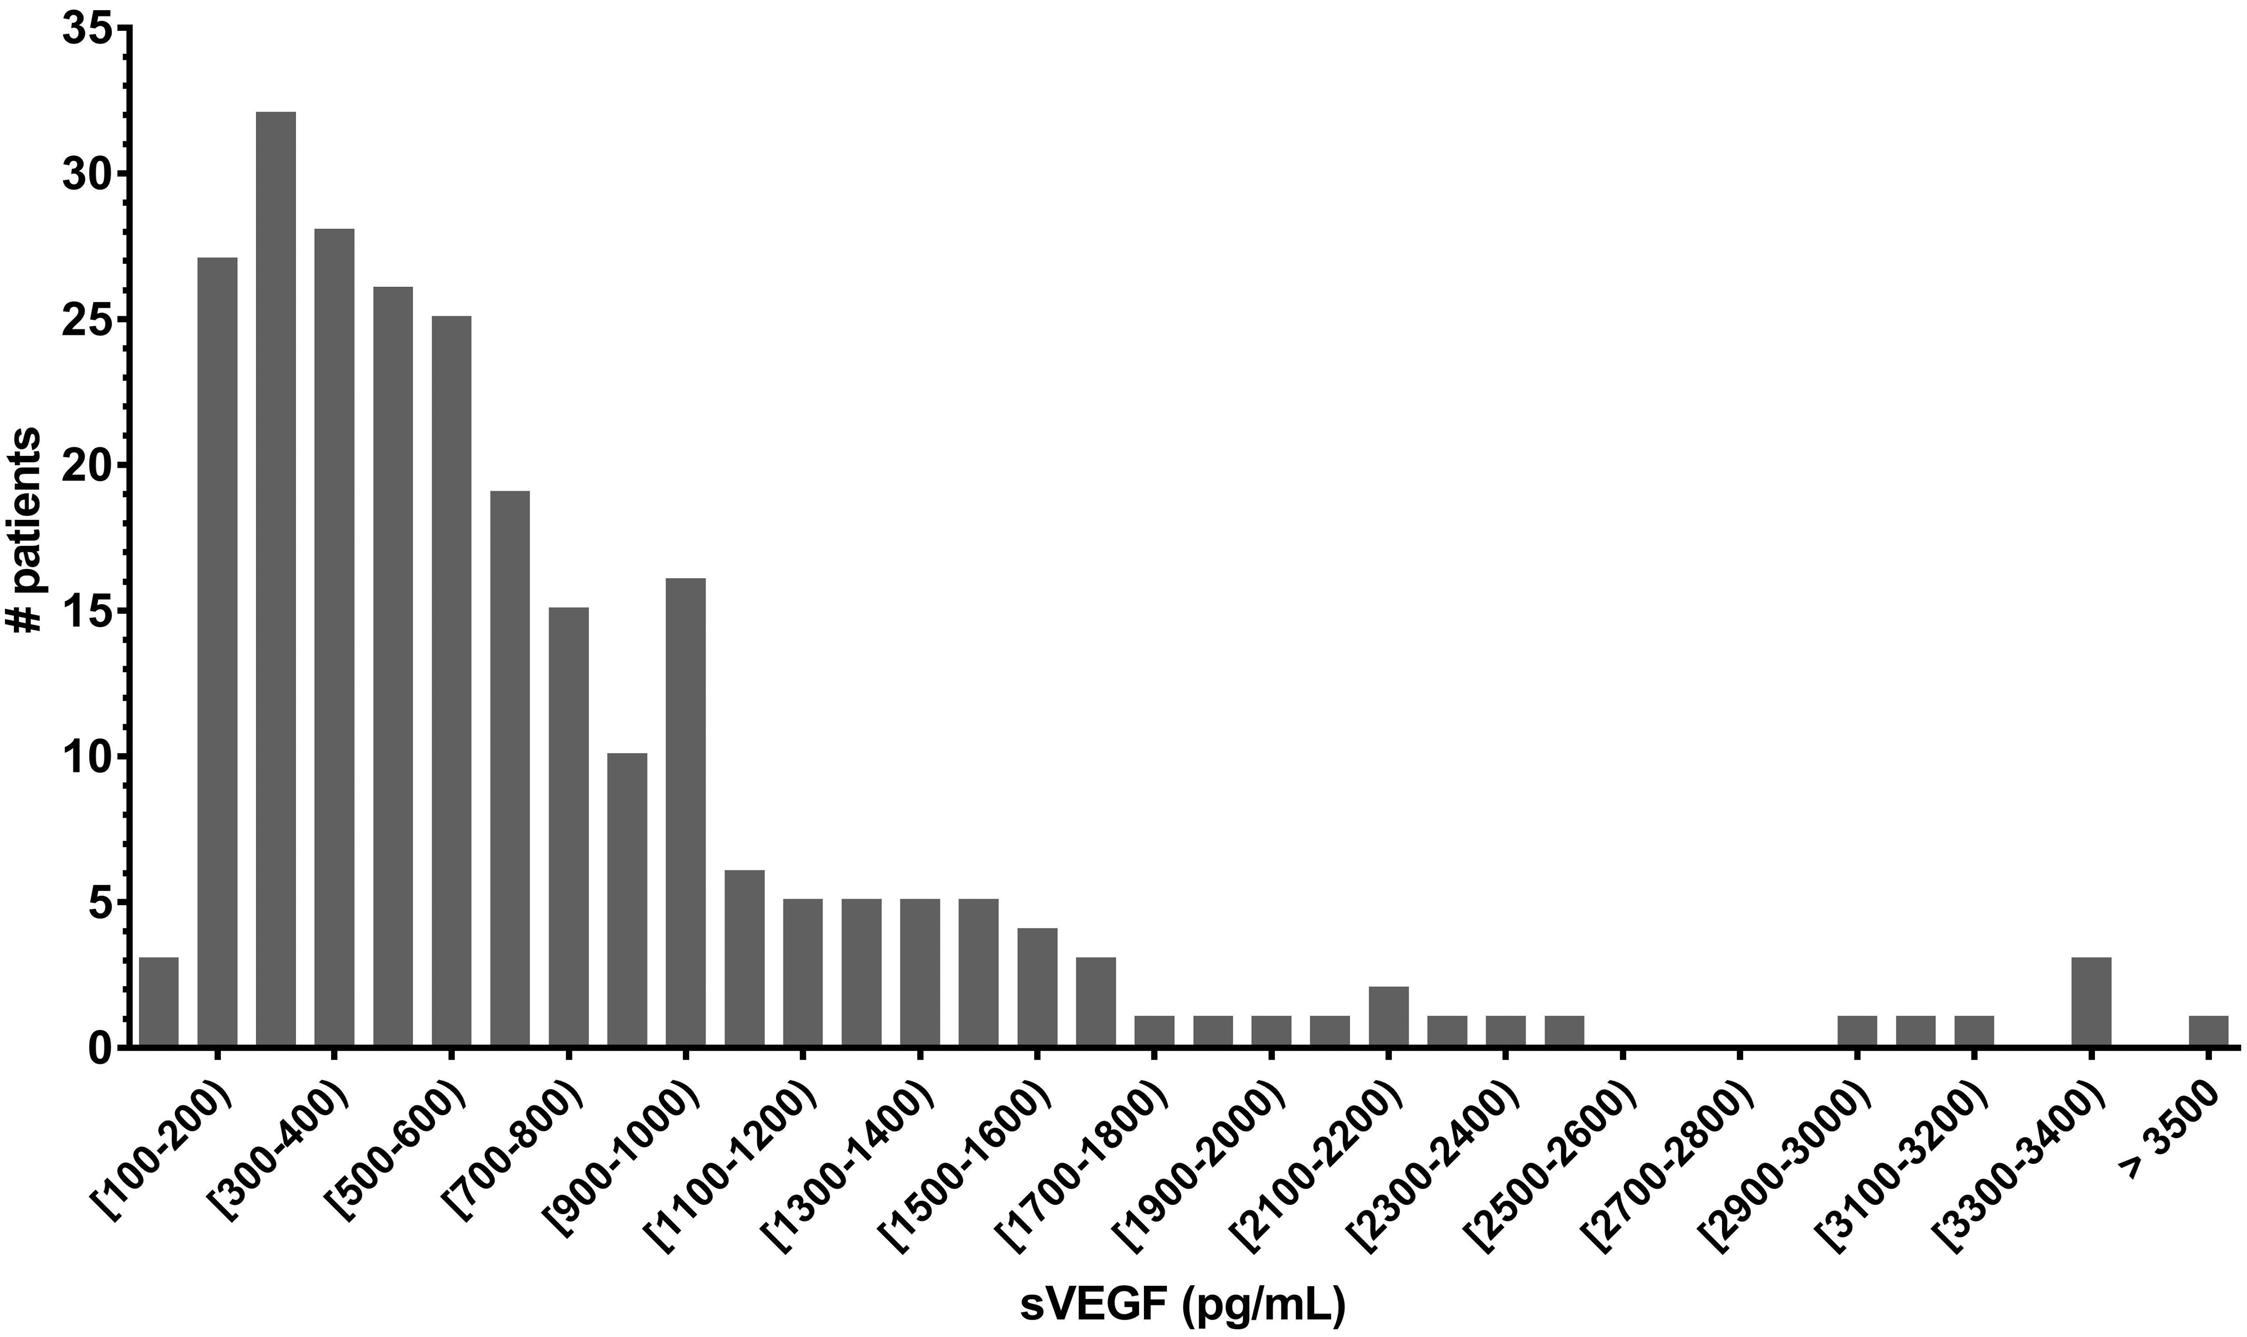
Haematologica | 108 February 2023 515 ARTICLE - VEGF as a biomarker in Erdheim-Chester disease A. Roeser et al.
Figure
Distribution of serum vascular endothelial growth factor levels at initial determination. sVEGF: serum vascular endothelial growth factor.
Table 1. Characteristics of Erdheim-Chester disease patients with and without high serum vascular endothelial growth factor concentrations.
All (N=247)
High serum VEGF concentration (N=132)
Low serum VEGF concentration (N=115) P
Male/female, N/N 167/80 93/39 74/41 0.306
Age at diagnosis in years, mean (SD) 58 (14) 61 (13) 56 (16)
BRAF V600E, n/N (%)
Mixed histiocytosis, N (%)
Langerhans cell histiocytosis Rosaï Dorfman disease
ECD involvements, N (%)
Cardiac involvement
Pericardium
Right atrium pseudotumor
Atria-ventricular septum
Coronary artery
Cardiac dysfunction
Vascular involvement
Coated aorta
Mesenteric artery
Renal artery
Xanthelasma
Diabetes insipidus
CNS involvement
Retro-orbital involvement
Retroperitoneal involvement
142/221 (64.3) 82/122 (67.2) 60/100 (60.0) 0.265
44 (17.8) 37 (14.9) 6 (2.5)
125 (50.6) 71 (28.7) 89 (36.0) 37 (15.0) 53 (21.5) 25 (10.1) 149 (60.3) 105 (42.5) 40 (16.2) 48 (19.4) 53 (21.5) 58 (23.5) 90 (36.4) 45 (18.2) 157 (63.6)
25 (18.9) 21 (15.9) 3 (2.2)
77 (58.3) 41 (31.1) 55 (41.7) 22 (16.7) 36 (27.2) 15 (11.4) 93 (70.5) 66 (50.0) 22 (16.7) 28 (21.2) 30 (22.7) 28 (21.2) 51 (37.9) 28 (21.2) 93 (70.5)
19 (16.4) 16 (13.8) 3 (2.6)
48 (41.4) 30 (25.9) 34 (29.3) 15 (12.9) 17 (14.7) 10 (8.6) 56 (48.3) 39 (33.6) 18 (15.5) 20 (17.2) 23 (20.7) 30 (25.9) 39 (32.8) 17 (14.7) 62 (55.1)
0.598-
0.008 0.366 0.043 0.410 0.016 0.474 0.0004 0.009 0.806 0.429 0.602 0.388 0.442 0.181 0.006
Deaths, N (%) 66 (26.6) 40 (30.3) 26 (22.4) 0.161
Treatment-naïve, n/N (%) 125/216 (57.9) 69/114 (60.5) 56/102 (54.9) 0.403
Treatments previously received, N (%)
Corticosteroids IFN-a or PEG-IFN-a Anakinra Vinblastine Cladribine BRAF inhibitor MEK inhibitor
34 (13.8) 20 (8.1) 6 (2.4) 4 (1.6) 4 (1.6) 8 (3.2) 2 (0.8)
19 (14.4) 9 (3.6) 5 (3.8) 1 (0.8) 1 (0.8) 2 (1.5) 2 (1.5)
15 (13.0) 11 (9.6) 1 (0.9) 3 (2.6) 3 (2.6) 6 (5.2) 0 (0)
0.758 0.430 0.220 0.340 0.340 0.150 0.500
n: number; N: number for whom information available; VEGF: vascular endothelial growth factor; SD: standard deviation; ECD: ErdheimChester disease; CNS: central nervous system; IFN: interferon; PEG-IFN: pegylated interferon. Statistically significant differences are shown in bold.
[95% CI: 1.02-4.29]; P=0.043 and 2.11 [95% CI: 1.08-4.15], P=0.029; respectively). The presence of a BRAF V600E mutation and high CRP concentration (>5 mg/L) were independently associated with cardiac involvement (OR=5.51 [95% CI: 2.55-12.59]; P<0.001 and 2.58 [95% CI: 1.15-5.93]; P=0.023, respectively), whereas high sVEGF concentration (>500 pg/mL) was not (OR=1.84 [95% CI: 0.88-3.90]; P=0.106).
We performed a sensitivity analysis in the subgroup of treatment-naïve patients (n=135). In this subgroup, high CRP (>5 mg/L) and sVEGF (>500 pg/mL) concentrations were independently associated with vascular involvement (OR=2.92 [95% CI: 1.14-7.74]; P=0.027 and 2.99 [95% CI: 1.28-7.13]; P=0.012, respectively). The BRAF V600E muta-
tion, high CRP concentration and high sVEGF concentration were independent predictive factors for cardiac involvement (OR=3.97 [95% CI: 1.48-11.46]; P =0.008, 3.80 [95% CI: 1.26-13.16]; P=0.023 and 2.62 [95% CI: 1.03-6.96]; P=0.047, respectively). The combination of CRP concentration >5 mg/L and sVEGF concentration >500 pg/mL was strongly associated with vascular involvement (OR=5.54 [95% CI: 2.39-13.62]; P<0.001), and independently associated with cardiac involvement (OR=3.18 [95% CI: 1.34-7.83]; P=0.010) after adjustment for the presence of the BRAF V600E mutation.
Consecutive determinations of sVEGF were available for 183 patients with at least two sVEGF determinations. The median time between the first and last determinations
Haematologica | 108 February 2023 516 ARTICLE - VEGF as a biomarker in Erdheim-Chester disease A. Roeser et al.
was 24 months (standard deviation [SD]: 31.86 months). A significant decrease in sVEGF concentration was observed between the first and last visits (P<0.0001), with a median change in sVEGF concentration (ΔsVEGF) of -153 (IQR: -376; -8) (Figure 2A). Early changes in sVEGF concentration were evaluated for 139 patients for whom sVEGF determinations had been obtained 6 months (M6) after the initial determination (M0). We observed a significant decrease in sVEGF concentration at M6 (Wilcoxon matched-pairs signed-rank test, P<0.0001; mean sVEGF concentrations: 700.12 pg/mL at M0 and 527.98 pg/mL at M6) (Figure 2B). At least two cardiac MRI scans had been obtained, separated by an interval of at least 9 months, in 45 patients. The median time between the first and last MRI evaluations was 1,464 days (SD: 1,098.4 days; range: 358-4,506 days). Thoracic aorta coating was observed in 31 patients (68.9 %) and persisted in all cases, whereas some of the cardiac abnormalities observed regressed: a complete response with the disappearance of all abnormalities was noted in six patients, a partial response in 22 patients, stable cardiac lesions in nine patients, and a progression of cardiac involvement was observed in two patients (Table 2). The mean ΔsVEGF was -591.3 pg/mL (SD: 356.4) for patients with a complete response, -163.9 pg/mL (SD: 258.4) for those with a partial response, -239.6 pg/mL (SD: 242.5) for patients with stable disease and +555.5 pg/mL (SD: 219.9) for those displaying disease progression (Figure 3, Table 2). In patients with an initial contrast enhancement on cardiac MRI, ΔsVEGF did not differ significantly between patients with regression or persistence of contrast enhancement (mean difference 67.4 pg/mL,
P=0.64). In univariate analysis, survival differed significantly between patients with a complete response, a partial response, stable disease and progression on cardiac imaging (median survival: undefined for complete responders, 11.5 years for partial responders, 9.2 years for patients with stable disease, and 5.4 years for patients in progression; log-rank test for trend, P=0.0248) (Online Supplementary Figure S2). No significant difference in survival was observed between patients with high and low initial sVEGF concentrations (median survival 10 years vs 16 years, log-rank test, P=0.087) (Online Supplementary Figure S2), or between patients with Δ sVEGF < -500 pg/mL [-500;0), [0; 500) and ≥500 pg/mL (P=0.54). No patients in our cohort received systemic anti-VEGF therapy for ECD or any other indication. We analyzed 26 histological samples from ECD patients with extreme (13 high and 13 low) sVEGF concentrations. Biopsies were performed on perirenal infiltrate in 13 patients (50%), skin in seven (26.9%), bone in three (11.5%) and specimens from other sites in three patients. The median sVEGF levels for the patients for whom biopsy specimens were analyzed was 678.5 pg/mL (IQR: 1812,011). A BRAF V600E mutation was found in 14 cases (58.3%), a MAP2K1 mutation in three, and a NRAS mutation in one. Two samples could not be evaluated, due to a lack of material for one sample and failure of staining of decalcified bone for the other. The Kendall correlation coefficient between the two clones was 0.597. In all 24 samples analyzed, ECD histiocytes displayed intracytoplasmic VEGF staining, classified as low (grade 1) in two cases (8.3 %) and one (4.2%) case, moderate (grade 2) in
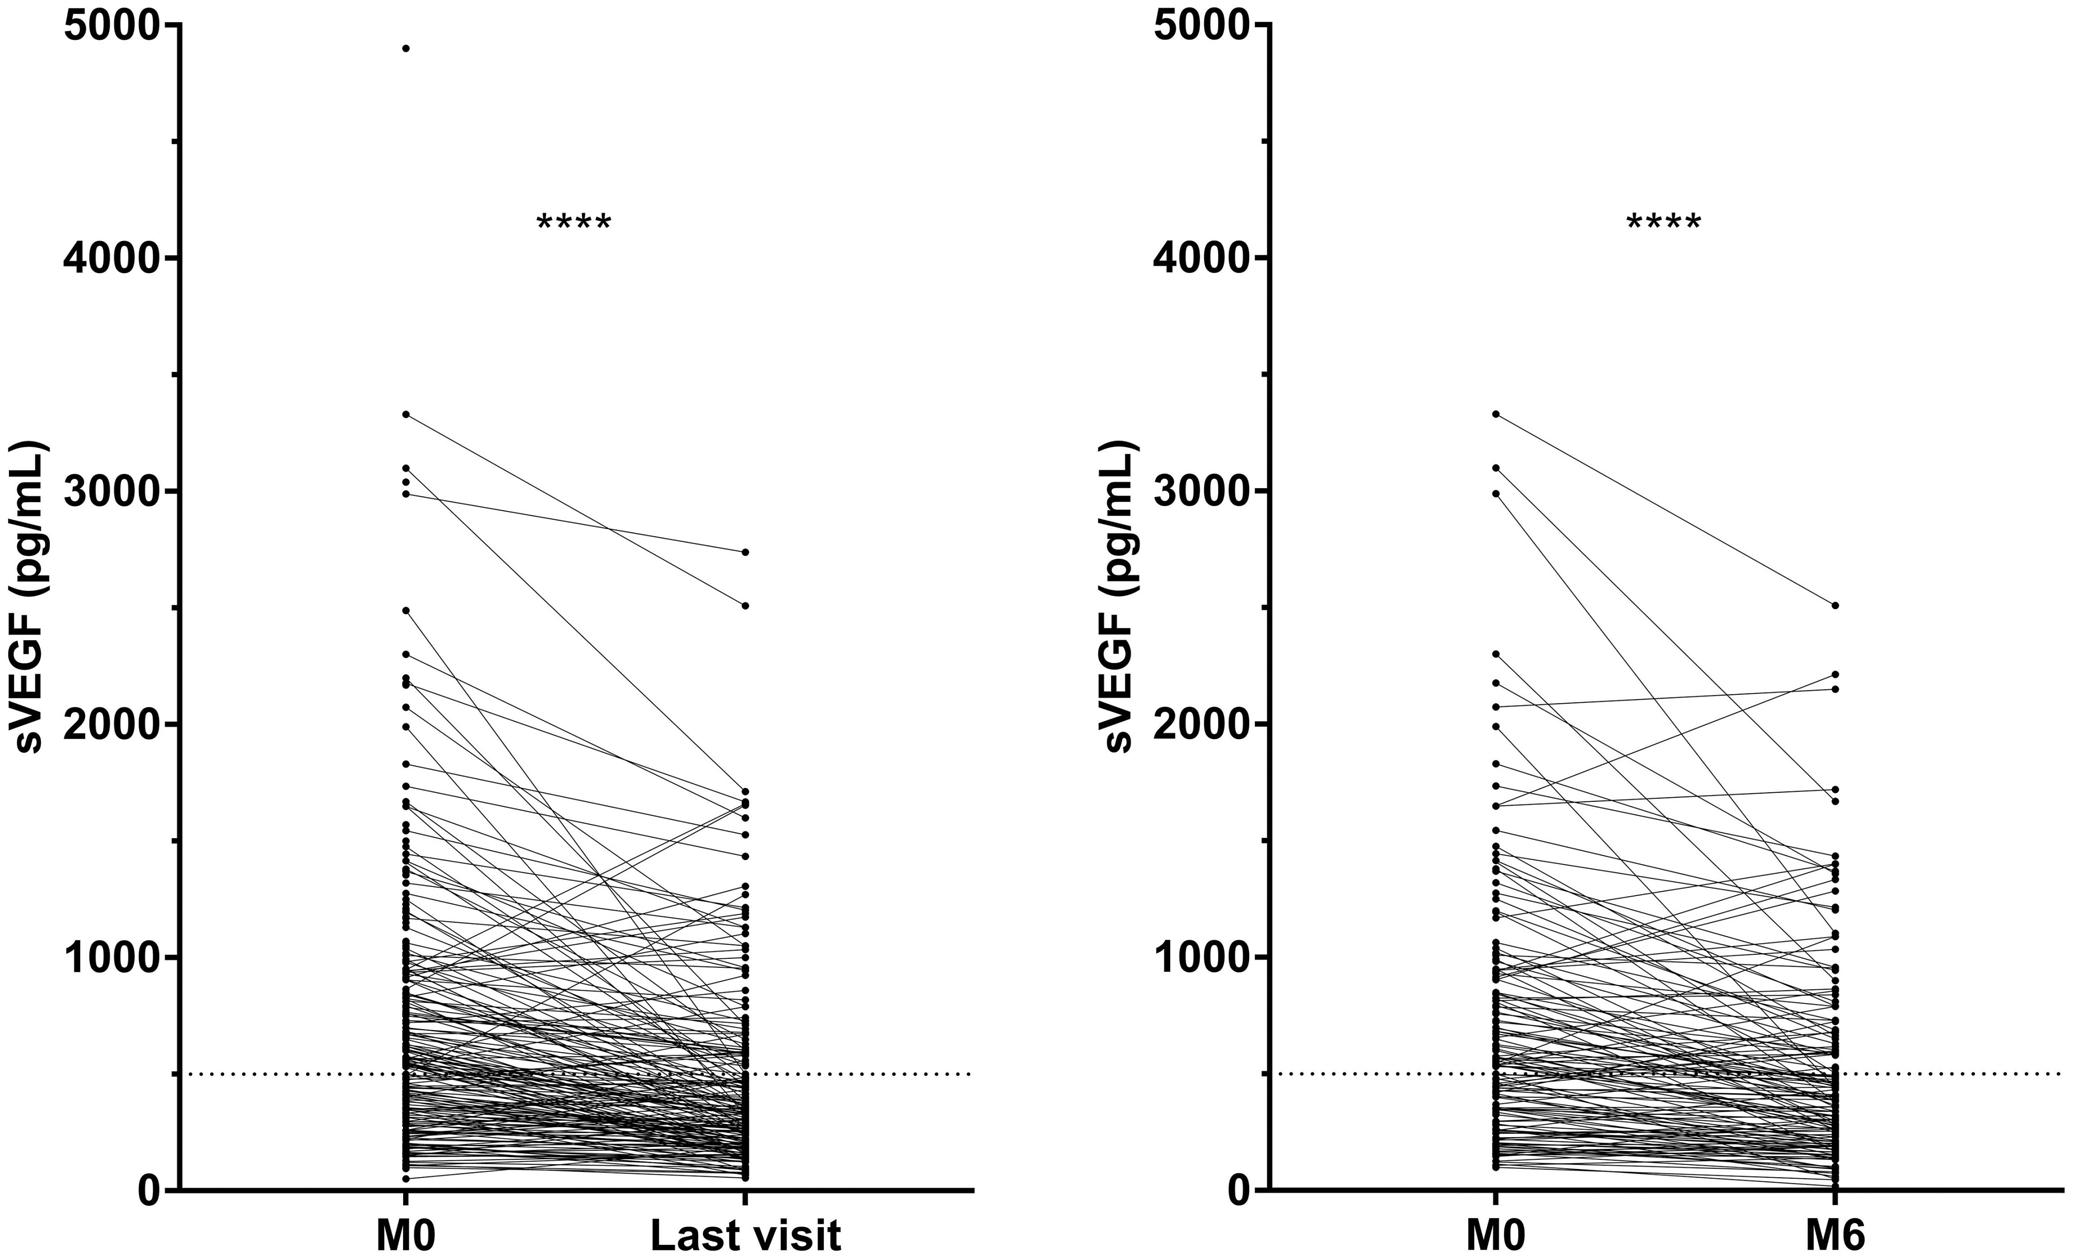
Haematologica | 108 February 2023 517 ARTICLE - VEGF as a biomarker in Erdheim-Chester disease A. Roeser et al.
Figure 2. Change in serum vascular endothelial growth factor concentration in Erdheim-Chester disease patients over time. Change in serum vascular endothelial growth factor (sVEGF) concentration between the initial determination (M0) and determinations at (A) last visit, and (B) first follow-up visit at 6 months (M6).
A B
Table 2. Characteristics of patients with cardiac involvement in Erdheim-Chester disease and different responses to treatment on follow-up cardiac imaging
All (N=45)
Complete response (N=6)
Partial response (N=25) Stability (N=12) Progression (N=2) P
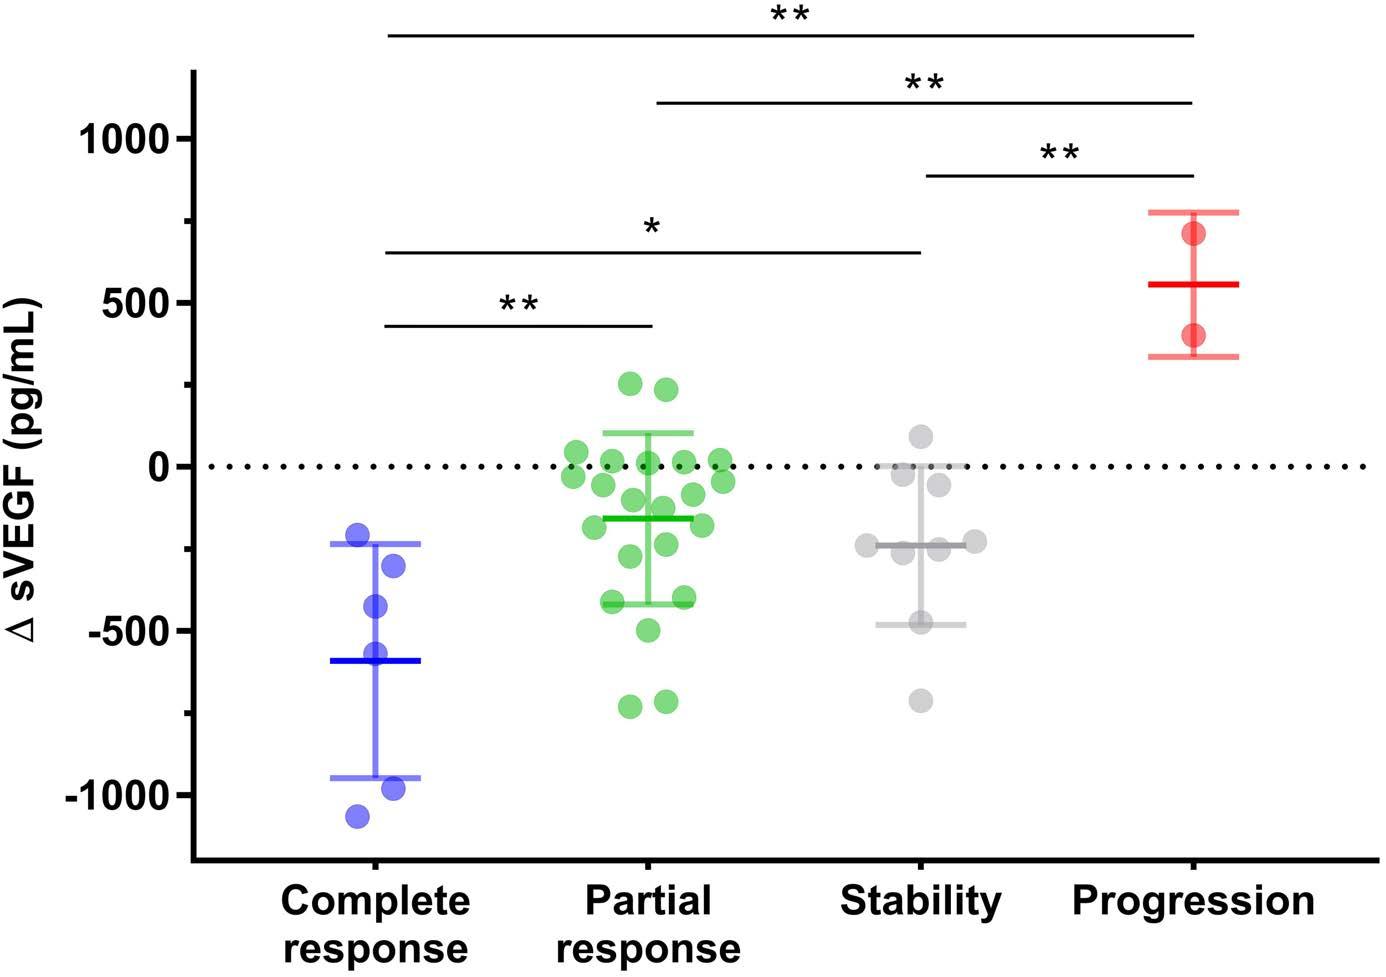
Male/female, N/N 28/17 2/4 16/9 8/4 0/2 0.954
Age at diagnosis in years, mean (SD) 57.9 (13.9) 53 (17.3) 57.3 (13.7) 58.4 (13.1) 68.5 (10.6) 0.440
BRAF V600E, N (%) 41 (91.1) 6 (100) 22 (88) 11 (91.7) 2 (100) 1.00
Mixed histiocytosis, N (%)
Langerhans cell histiocytosis Rosaï Dorfman disease
Deaths, N (%)
9 (20) 9 (20) 0 (0)
1 (16.7) 1 (16.7) 0 (0)
3 (12) 3 (12) 0 (0)
3 (25) 3 (25) 0 (0)
2 (100) 2 (100) 0 (0)
0.111-
Median survival, years 15 (33.3) 10.86 0 (0) Undefined 6 (24) 11.51 8 (66.7) 9.24 1 (50) 5.39 0.025
Treatments, N (%)
Corticosteroids
IFN-a or PEG-IFN-a Anakinra Infliximab Cladribine Imatinib
Targeted therapy
Vemurafenib Dabrafenib Cobimetinib Trametinib
15 (30) 36 (80) 8 (17.8) 2 (4.4) 0 (0) 1 (2.2) 29 (64.4) 28 (62.2) 2 (4.4) 6 (13.3) 1 (2.2)
0 (0) 4 (66.7) 0 (0) 0 (0) 0 (0) 0 (0) 4 (66.7) 4 (66.7) 0 (0) 0 (0) 0 (0)
9 (36) 18 (72) 6 (24) 1 (4) 0 (0) 0 (0) 18 (72) 17 (68) 1 (4) 5 (20) 1 (4)
5 (41.7) 12 (100) 2 (16.7) 1 (8.3) 0 (0) 1 (8.3) 5 (41.7) 5 (41.7) 0 (0) 1 (8.3) 0 (0)
1 (50) 2 (100) 0 (0) 0 (0) 0 (0) 0 (0) 2 (100) 2 (100) 1 (50) 0 (0) 0 (0)
ΔsVEGF in pg/mL, mean (SD) -210.2 (350.0) -591.3 (356.4) -163.9 (258.3) -239.5 (242.5) +555.5 (219.9)
0.497 0.039 1.00 0.5300.197 0.255 0.530 0.648 1.00
VEGF: vascular endothelial growth factor; SD: standard deviation; IFN: interferon; PEG-IFN: pegylated interferon. ΔsVEGF: difference in serum vascular endothelial growth factor concentration. Statistically significant difference shown in bold.
five cases (20.8%) and one (4.2%) case, and intense (grade 3) in 17 (70.8 %) and 22 (91.7 %) cases, based on the F/PU483-UP and VG-1 clones, respectively (Figure 4). None of the biopsies revealed a total absence (grade 0) of histiocytic VEGF staining. Staining of one sample obtained from the decalcified tibia of a patient with a high sVEGF level (1,477 pg/mL) was classi fied as grade 1 with both clones. No association was found between VEGF expression and high or low sVEGF levels (Wilcoxon signed rank, P=0.714), mutational status, or organ involvement. As controls, samples from four cases of reactional sinusal histiocytosis were stained; none of the histiocytes in these cases expressed VEGF. Finally, we investigated whether the observed high levels of sVEGF and histiocytic VEGF expression were ECD-specific or common to other histiocytoses, by analyzing a cohort of patients with Rosai-Dorfman disease (RDD) or LCH. We found that 11 of 31 LCH patients (35.5%) and 12 of 26 of those with RDD (46.1%) had high sVEGF levels (>500 pg/mL). Immunohistochemical analysis of five biopsy specimens from LCH patients revealed grade 3 histiocytic VEGF staining in all five samples after staining with F/PU483-UP and in three of five samples after staining
with SC-53462 antibodies; the other two samples displaying no staining (grade 0) with this second antibody. Two
Figure 3. Change in serum vascular endothelial growth factor concentration in patients with Erdheim-Chester disease and cardiac involvement with a complete response, partial response, stability or progression on follow-up cardiac magnetic resonance imaging. ΔsVEGF: change in serum vascular endothelial growth factor. *P value <0.05; **P value <0.01
Haematologica | 108 February 2023 518 ARTICLE - VEGF as a
in
disease A. Roeser et al.
biomarker
Erdheim-Chester
of the five biopsy specimens from RDD patients presented grade 3 histiocytic VEGF staining with the F/PU483-UP antibody, and three displayed grade 3 histiocytic VEGF staining with the SC-53462 antibody. Three and two samples, respectively, presented grade 2 staining.
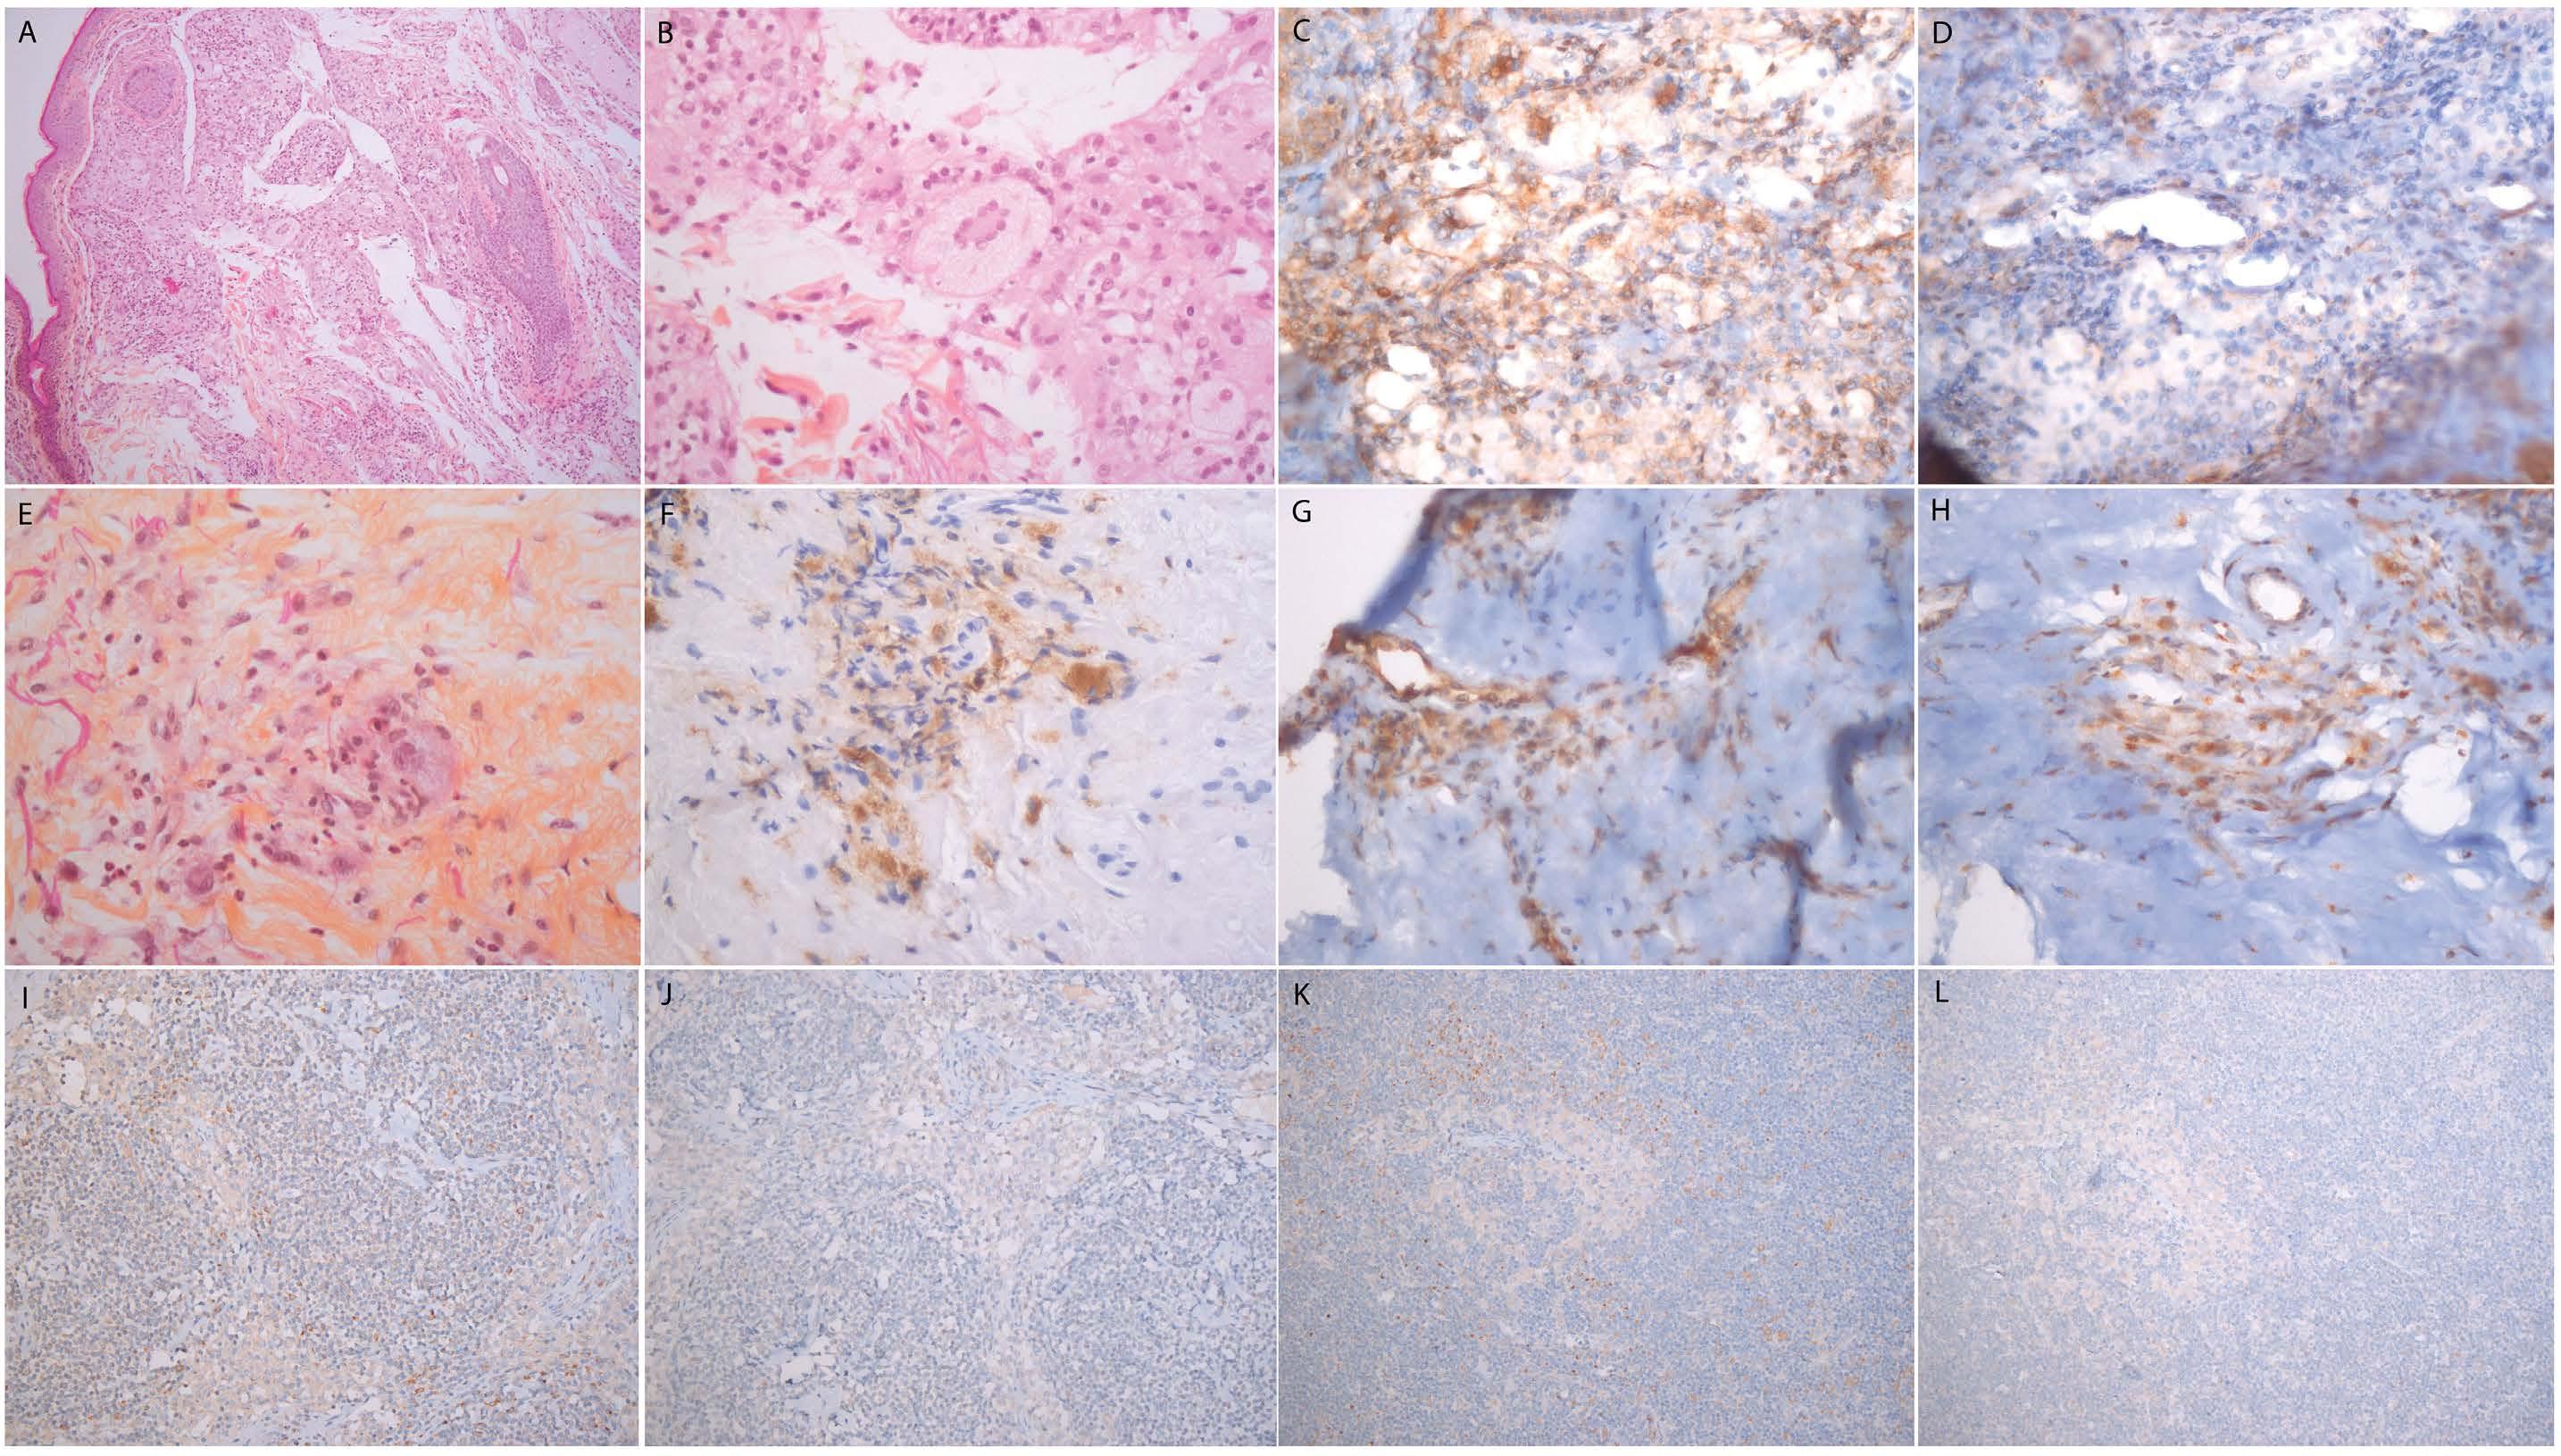
Discussion
In this study we found that sVEGF concentrations were high in 53.4% of ECD patients, and that ECD histiocytes express VEGF. Cardiac and vascular involvements are frequent in ECD, and prognostically relevant.9 However, routine examinations, such as echocardiography or cardiac computed tomography (CT) scans, may underestimate the prevalence of such involvement. We identified an association between high sVEGF and CRP concentrations and cardiac and vascular involvements. This association was confirmed in the subset of treatment-naïve patients, in whom high sVEGF and CRP concentrations were predictive factors independently of each other and of the main factor known to be associated with cardiac involvement, the
BRAF V600E mutation. The change in sVEGF concentration was correlated with the response of cardiac involvement to treatment. sVEGF determinations, combined with determinations of CRP concentration and BRAF status, could help to identify patients likely to benefit from cardiac MRI and vascular imaging, and contribute to monitoring cardiac involvement during treatment. Plasma chromogranin A, which is produced by cardiomyocytes, has been proposed as a biomarker of cardiac involvement in ECD.10 VEGF, at least some of which is produced by histiocytes, may reflect disease activity rather than myocardial injury. Tropism for the heart and blood vessels in ECD has yet to be explained. In mycobacterium-associated granulomas, macrophages produce VEGF, which then triggers monocyte recruitment.11 The VEGF produced by the vascular smooth muscle cells may induce the recruitment of pathological mononuclear cells and inflammatory cells. However, in our study, VEGF expression by histiocytes and increases in sVEGF concentration were not a hallmark of ECD, but a pattern shared with LCH and RDD patients, who have no cardiovascular involvement. Other factors may explain the tissue tropism of ECD. VEGF gene poly-
B C D
Figure 4. Vascular endothelial growth factor staining on Erdheim-Chester
lesions and reactional sinusal histiocytosis. Top. Erdheim-Chester disease (ECD) xanthelasma: (A) infiltration of the dermis with foamy histiocytes (HES x10); (B) Touton giant cell (HEX x40); (C) intense cytoplasmic VEGF staining of histiocytes (VEGF VG1 x40); (D) moderate cytoplasmic VEGF staining of histiocytes (VEGF F/PU483-UP x40). Middle. ECD perirenal infiltrate: (E) histiocyte aggregates embedded in fibrosis (HES x40); (F) cytoplasmic CD68 staining of histiocytes; (G) intense cytoplasmic VEGF staining of histiocytes (VEGF VG1 x40); (H) intense cytoplasmic VEGF staining of histiocytes (VEGF F/PU483-UP x40). Bottom. Reactional sinusal histiocytosis: (I, K) VEGF VG1 x 20; (J, L) VEGF F/PU483 x20.
A
E
I
Haematologica | 108 February 2023 519 ARTICLE - VEGF as a biomarker in Erdheim-Chester disease A. Roeser et al.
disease
F G H
J K L
morphisms have been associated with susceptibility to various types of vasculitis, including giant cell arteritis, Behçet disease, Kawasaki disease12 and chronic peri-aortitis,13 and further studies will be needed to determine their role in ECD. Systemic anti-VEGF therapy has not yet been evaluated in ECD. Three patients with intraocular manifestations of ECD and one case of multisystem LCH with uveal involvement and neovascular glaucoma have been successfully treated with intracameral bevacizumab, in association with systemic treatments, photodynamic therapy, or radiotherapy.14,15 Two cases of juvenile intraocular xanthogranuloma have been treated with intravitreal bevacizumab, leading to a complete or partial regression of lesions.16 Of note, anti-fibrotic tyrosine kinase inhibitors, such as nintedanib, target VEGF receptor, and may be able to decrease the inflammatory and fibrosing effects of VEGF. ERK inhibitors can decrease VEGF gene transcription in vitro 17 Further studies are warranted to assess the potential utility of systemic therapies targeting VEGF in combination with standard therapy or in refractory cases. Our study has several limitations. First, it was a retrospective study, and the evaluation of organ involvement was not standardized. However, CT angiography of the aorta and cardiac MRI or cardiac CT scans were routinely performed at diagnosis at our center, and cardiac MRI scans were reviewed centrally. Immunohistochemical analyses of VEGF expression were performed on a sample of histological specimens from our cohort. There is no consensual VEGF staining protocol. We used a polyclonal rabbit antibody and a monoclonal mouse antibody described in previous immunohistochemical studies.18,19 The correlation between the results obtained with the two antibodies was limited (Kendall coefficient, 0.597). Previous studies have reported poor inter-observer correlation for VEGF staining (k=0.57 in a study on ductal carcinomas of the breast).20 In our study, intensity scores were determined by consensus between two pathologists. sVEGF is a nonspecific
References
1. Haroche J, Charlotte F, Arnaud L, et al. High prevalence of BRAF V600E mutations in Erdheim-Chester disease but not in other non-Langerhans cell histiocytoses. Blood. 2012;120(13):2700-2703
2. Ferrara N, Gerber HP, LeCouter J. The biology of VEGF and its receptors. Nat Med. 2003;9(6):669-676.
3. Fukumura D, Kloepper J, Amoozgar Z, Duda DG, Jain RK. Enhancing cancer immunotherapy using antiangiogenics: opportunities and challenges. Nat Rev Clin Oncol. 2018;15(5):325-340.
4. Rak J, Mitsuhashi Y, Bayko L, et al. Mutant ras oncogenes upregulate VEGF/VPF expression: implications for induction and inhibition of tumor angiogenesis. Cancer Res. 1995;55(20):4575-4580.
marker that may reach high levels in several diseases, including POEMS syndrome, cancer,21-23 anemia with iron deficiency and chronic obstructive pulmonary disease with exacerbations.24 In our study, none of the patients met POEMS criteria, only seven patients had a medical history of prior chronic obstructive pulmonary disease, and eight had a history of solid neoplasm either still active or within the preceding 5 years.
In conclusion, high sVEGF concentrations were frequently observed in ECD patients and were associated with cardiac and vascular involvement. VEGF was at least partly produced by ECD histiocytes. Our results suggest a role for VEGF in the pathogenesis of ECD. sVEGF concentration may reflect cardiovascular involvement, and its determination could potentially help to improve the detection and follow-up of such involvement in patients with ECD. Further studies will be necessary to validate its use as a biomarker.
Disclosures
No conflicts of interest to disclose.
Contributions
AR and JH designed the study; AR, JH, and FCo collected the data; MB centrally reviewed cardiac magnetic resonance imaging; LD and FCh performed the histological analysis; MM and PG-D determined serum VEGF levels; HO and J-ML determined serum IL-6 levels; J-FE analyzed MAPK pathway mutations; AR performed the statistical analysis, interpreted the data and wrote the original draft of the manuscript; and AR, JH, L-DA, J-FE, and FCh reviewed and edited the manuscript. All the authors critically reviewed and approved the final version of the manuscript.
Data-sharing statement
The datasets used and/or analyzed during the current study are available from the corresponding author (JH) on reasonable request.
5. Dina A, Zahava V, Iness M. The role of vascular endothelial growth factor in Langerhans cell histiocytosis. J Pediatr Hematol Oncol. 2005;27(2):62-66.
6. Arnaud L, Haroche J, Ghillani-Dalbin P, Piette JC, Musset L, Amoura Z. Le VEGF est élevé au cours de la maladie d’ErdheimChester: étude monocentrique de 24 patients. Rev Med Int. 2009;30(S2):CO066.
7. Watanabe O, Arimura K, Kitajima I, Osame M, Maruyama I. Greatly raised vascular endothelial growth factor (VEGF) in POEMS syndrome. Lancet. 1996;347(9002):702.
8. Emile JF, Diamond EL, Hélias-Rodzewicz Z, et al. Recurrent RAS and PIK3CA mutations in Erdheim-Chester disease. Blood. 2014;124(19):3016-3019.
9. Haroche J, Cluzel P, Toledano D, et al. Images in cardiovascular
Haematologica | 108 February 2023 520 ARTICLE - VEGF as a biomarker in Erdheim-Chester disease A. Roeser et al.
ARTICLE - VEGF as a biomarker in Erdheim-Chester disease A. Roeser et al.
medicine. Cardiac involvement in Erdheim-Chester disease: magnetic resonance and computed tomographic scan imaging in a monocentric series of 37 patients. Circulation. 2009;119(25):e597-598.
10. Ferrero E, Corti A, Haroche J, et al. Plasma chromogranin A as a marker of cardiovascular involvement in Erdheim-Chester disease. Oncoimmunology. 2016;5(7):e1181244.
11. Harding JS, Herbath M, Chen Y, et al. VEGF-A from granuloma macrophages regulates granulomatous inflammation by a nonangiogenic pathway during mycobacterial infection. Cell Rep. 2019;27(7):2119-2131.
12. Song GG, Kim JH, Lee YH. Vascular endothelial growth factor gene polymorphisms and vasculitis susceptibility: a metaanalysis. Hum Immunol. 2014;75(6):541-548.
13. Atzeni F, Boiardi L, Vaglio A, et al. TLR-4 and VEGF polymorphisms in chronic periaortitis. PLoS One. 2013;8(5):e62330.
14. Tan ACS, Yzer S, Atebara N, et al. Three cases of ErdheimChester disease with intraocular manifestations: imaging and histopathology findings of a rare entity. Am J Ophthalmol. 2017;176:141-147.
15. Shields CL, Hogarty MD, Kligman BE, Christian C, Ehya H, Shields JA. Langerhans cell histiocytosis of the uvea with neovascular glaucoma: diagnosis by fine-needle aspiration biopsy and management with intraocular bevacizumab and brachytherapy. J AAPOS. 2010;14(6):534-537.
16. Ashkenazy N, Henry CR, Abbey AM, McKeown CA, Berrocal AM, Murray TG. Successful treatment of juvenile xanthogranuloma
using bevacizumab. J AAPOS. 2014;18(3):295-297.
17. Textor B, Sator-Schmitt M, Richter KH, Angel P, Schorpp-Kistner M. c-Jun and JunB are essential for hypoglycemia-mediated VEGF induction. Ann N Y Acad Sci. 2006;1091:310-318.
18. Brockington A, Wharton SB, Fernando M, et al. Expression of vascular endothelial growth factor and its receptors in the central nervous system in amyotrophic lateral sclerosis. J Neuropathol Exp Neurol. 2006;65(1):26-36.
19. Berköz M, Özkan-Yılmaz F, Özlüer-Hunt A, et al. Artesunate inhibits melanoma progression in vitro via suppressing STAT3 signaling pathway. Pharmacol Rep. 2021;73(2):650-663.
20. Maae E, Nielsen M, Steffensen KD, Jakobsen EH, Jakobsen A, Sørensen FB. Estimation of immunohistochemical expression of VEGF in ductal carcinomas of the breast. J Histochem Cytochem. 2011;59(8):750-760.
21. Kondo S, Asano M, Matsuo K, Ohmori I, Suzuki H. Vascular endothelial growth factor/vascular permeability factor is detectable in the sera of tumor-bearing mice and cancer patients. Biochim Biophys Acta. 1994;1221(2):211-214.
22. Seyedmirzaei H, Shobeiri P, Turgut M, Hanaei S, Rezaei N. VEGF levels in patients with glioma: a systematic review and metaanalysis. Rev Neurosci. 2021;32(2):191-202.
23. Obermair A, Tempfer C, Hefler L, et al. Concentration of vascular endothelial growth factor (VEGF) in the serum of patients with suspected ovarian cancer. Br J Cancer. 1998;77(11):1870-1874.
24. Pihan M, Keddie S, D’Sa S, et al. Raised VEGF. Neurol Neuroimmunol Neuroinflamm. 2018; 5(5):e486.
Haematologica | 108 February 2023 521
Selective inhibition of MCL1 overcomes venetoclax resistance in a murine model of myelodysplastic syndromes
Melissa A. Fischer,1-2 Yuanbin Song,3,4 Maria P. Arrate,1 Rana Gbyli,4 Matthew T. Villaume,1-2 Brianna N. Smith,1-2,5 Merrida A. Childress,1-2 Thomas P. Stricker,6-7 Stephanie Halene4 and Michael R. Savona1,2,6,8
1Department of Medicine, Vanderbilt University School of Medicine, Nashville, TN, USA; 2Cancer Biology Program, Vanderbilt University School of Medicine, Nashville, TN, USA; 3Department of Hematologic Oncology, Sun Yat-sen University Cancer Center, State Key Laboratory of Oncology in South China, Collaborative Innovation Center for Cancer Medicine, Guangzhou, China; 4Smilow Cancer Center, Yale University School of Medicine, New Haven, CT, USA; 5Department of Pediatrics, Vanderbilt University School of Medicine, Nashville, TN, USA; 6Vanderbilt-Ingram Cancer Center, Vanderbilt University School of Medicine, Nashville, TN, USA; 7Department of Pathology, Microbiology, and Immunology, Vanderbilt University School of Medicine, Nashville, TN, USA and 8Center for Immunobiology, Vanderbilt University School of Medicine, Nashville, TN, USA
Abstract
Correspondence:
M.R. Savona michael.savona@vanderbilt.edu
Received: January 10, 2022.
Accepted: August 11, 2022.
Prepublished: August 18, 2022.
https://doi.org/10.3324/haematol.2022.280631
©2023 Ferrata Storti Foundation
Published under a CC-BY-NC license
Treatment for myelodysplastic syndromes (MDS) remains insufficient due to clonal heterogeneity and lack of effective clinical therapies. Dysregulation of apoptosis is observed across MDS subtypes regardless of mutations and represents an attractive therapeutic opportunity. Venetoclax (VEN), a selective inhibitor of anti-apoptotic protein B-cell lymphoma2 (BCL2), has yielded impressive responses in older patients with acute myeloid leukemia (AML) and high risk MDS. BCL2 family anti-apoptotic proteins BCL-XL and induced myeloid cell leukemia 1 (MCL1) are implicated in leukemia survival, and upregulation of MCL1 is seen in VEN-resistant AML and MDS. We determined in vitro sensitivity of MDS patient samples to selective inhibitors of BCL2, BCL-XL and MCL1. While VEN response positively correlated with MDS with excess blasts, all MDS subtypes responded to MCL1 inhibition. Treatment with combined VEN + MCL1 inhibtion was synergistic in all MDS subtypes without significant injury to normal hematopoiesis and reduced MDS engraftment in MISTRG6 mice, supporting the pursuit of clinical trials with combined BCL2 + MCL1 inhibition in MDS.
Introduction
Myelodysplastic syndromes (MDS) are heterogeneous bone marrow failure neoplasms marked by cytopenias, reduced quality of life and predilection to transform into acute myeloid leukemia (AML). Readily available treatments for MDS are lacking, and adapting newly approved therapies designed for AML to MDS is complicated, largely due to the heterogeneity of MDS. Despite this, and consistent with other myeloid malignancies, clonal hematopoietic stem and progenitor cells (HSPC) in MDS avoid programmed cell death often and share an imbalanced pattern of mitochondrial-controlled BCL2 family proteins.1-4 The BCL2 family includes anti-apoptotic and pro-apoptotic proteins that compete for ligand to block or promote the activation of BAX/BAK oligomerization that is required to induce mitochondrial outer membrane potential and subsequent apoptosis.5,6 As a method to evade apoptosis, cancer cells
often upregulate anti-apoptotic proteins BCL2 and MCL1, leading to a survival advantage in numerous malignancies.5-7 Thus, selective targeting of anti-apoptotic proteins is a viable treatment strategy. Venetoclax (VEN), a Food and Drug Administration-approved therapy that specifically inhibits the anti-apoptotic protein, BCL2, has yielded response rates of up to 50-70% in elderly AML when combined with DNA methyltransferase inhibitors (DNMTi) or low dose cytarabine,8,9 and recently, has shown similar preliminary efficacy in higher risk MDS.10,11 Upregulation of another BCL2 family anti-apoptotic protein, MCL1, is seen in AML and MDS treated with VEN, and is a noted mechanism of VEN resistance.4,12-14 We previously revealed a selective MCL1 inhibitor with activity in AML patient samples dependent on MCL1 protein or resistant to BCL2 inhibition, including AML cells that arose from MDS.13 Taken together, targeting MDS cells via inhibition of BCL2 and/or MCL1 has appeal. We determined the sensitivity of
Haematologica | 108 February 2023 522 ARTICLE - Myelodysplastic Syndromes
MDS cells to inhibition of specific anti-apoptotic proteins, elucidated the characteristic determinants of response, and illustrated synergy with combined BCL2 and MCL1 inhibition both in vitro and in vivo in a murine xenograft model for MDS.
Methods
Patient and control samples
Experiments were conducted on primary MDS patient and normal (age range, 46-56 years [yr]; average, 50 yr) whole bone marrow (WBM) samples accessed from the Vanderbilt-Ingram Cancer Center Hematologic Malignancy Tumor Bank under a tissue collection protocol in accordance with the tenets of the Declaration of Helsinki and approved by the Vanderbilt University Medical Center Institutional Review Board. Normal CD34+ (age range, 26-44 yr; average, 31 yr) BM cells were purchased (Lonza and Hemacare).
Drug combination calculation of synergy
The effects of S63845 + VEN were calculated using the Zero Interaction Potency (ZIP) model, which compares observed and expected combination effects.15-17 The d synergy score predicts the likely interaction between two drugs (<-10: antagonistic; -10 to 10: additive; >10: synergistic).
Colony-forming unit assays
Cells (preparation described below) were plated in MethocultTM H4034 Optimum (STEMCELL Technologies) at a density of 0.05-2x10⁴ cells per mL in the presence of different concentrations of VEN, S63845, or S63845 + VEN compounds. Colonies were counted and identified after 12-14 days by manual observation or by using the STEMvisionTM instrument and software analysis (STEMCELL Technologies). Counts were normalized per 1x10⁴ MDS cells or per 500 normal CD34+ cells for graphical representation.
Cell preparation for colony-forming assays
Cryopreserved MDS whole bone marrow (WBM) or normal WBM and CD34+ cells were thawed and cultured in StemSpanTM (STEMCELL Technologies) + cytokines (10 ng/mL hIL3, 10 ng/mL hSCF, 5 ng/mL hIL6; Peprotech) overnight before plating cells in MethocultTM H4034 Optimum (STEMCELL Technologies). For MDS CD34+ cell plating, CD34+ cells were selected from WBM after thawing using the EasySepTM Human CD34 Positive Selction Kit II (STEMCELL Technologies), and then cultured as described above. Fresh MDS BM cells were treated with 100 nM VEN, 100 nM S63845, or 100 nM of each compound for S63845 + VEN treatments in the same culture conditions as the growth inhibition assays. After 24 hours of treatment, cells were plated in MethocultTM H4034 Optimum at a density of 1-2x10⁴ cells per mL. After colony counts were com-
pleted, the duplicate plates for each treatment group were washed with phosphate-buffered saline + 0.5% bovine serum albumin and pooled to obtain live cell number counts via trypan blue exclusion from the methocult assays on a subset of samples.
Generation of myelodysplastic syndrome patientderived xenotransplants
All animal experiments were approved by the Institutional Animal Care and Use Committee of Yale University. Mouse breeding: MISh/hTRG6 mice with homozygous knockin replacement of the endogenous mouse Csf1, Il3, Csf2, Tpo, Il6 and Sirpa with their human counterparts were bred to MITRG6 mice to generate human cytokine homozygous and hSIRPA heterozygous mice (MISh/mTRG6, labeled MISTRG6 throughout the study). Mice were maintained on continuous treatment with enrofloxacin in the drinking water (0.27 mg/mL, Baytril, Bayer Healthcare). MISTRG/MISTRG6 mice will be available via MTA and requests should be sent to mistrg@yale.edu.
Xenografting: newborn MISTRG6 mice (3 days of age) were X-ray irradiated (X-RAD 320 irradiator) with 2 × 150 cGy 4 hours apart. MDS patient BM CD34-selected cells were incubated with a murine anti-human CD3 antibody (clone Okt3, BioXCell) at 5 mg/100 mL for 10 minutes at room temperature prior to injection. Cells were injected intrahepatically in a volume of 20 m L with a 22-gauge Hamilton needle (Hamilton). Engraftment levels were assessed via BM aspiration at 12/ 16 weeks post-transplantation to assign treatment groups.
Statistical analysis
Data are shown as mean ± standard error of the mean (SEM) and analyzed using Prism 8 (GraphPad Software). Correlation analysis was determined using Spearman nonparametric correlation and statistical analysis was performed using an ANOVA (P<0.0001) followed by the student 2-tailed t-test. P values of <0.05 were considered to be statistically significant (n.s.: not significant, *P<0.05, **P<0.01, ***P<0.001, ****P<0.0001).
Results
Myelodysplastic syndrome subtypes are differentially sensitive to BCL2 inhibition and indiscriminately sensitive to MCL1 inhibition
We successfully cultured 35 MDS patient samples and determined their in vitro sensitivity to BCL2, BCL-XL and MCL1 inhibitors. Using CellTiter-Glo, we generated dose response curves and determined the 50% growth inhibitory concentrations (GI50) for each inhibitor after 48 hours of exposure (Table 1). While few samples were sensitive to BCL-XL inhibition (A-1155463), we observed a range of sen-
Haematologica | 108 February 2023 523 ARTICLE - Synergistic BCL2 and MCL1 inhibition in MDS M.A. Fischer et al.
Table 1. Comprehensive data for 21 untreated, and 14 previously treated myelodysplastic syndromes (MDS) patient samples assessed is represented including growth inhibition at 50% (GI50) for each inhibitor, MDS subtype by 2016 World Health Organization (WHO) classification, sample name/number, mutational status, bone marrow blast percentage, disease origination, treatment for MDS prior to sample acquisition, and karyotype. *Next generation sequencing (NGS) mutation analysis was conducted but no mutation was detected. #Patient MDS029 was considered MDS-EB2 despite only 5% blasts given the presence of Auer rods present in bone marrow aspirate. MDS017 did not have NGS performed. Other genes tested that were not detected in any of the samples include ABL1, BRAF, CALR, CDKN2A, CSF3R, ETV6, FBXW7, GATA2, HRAS, JAK2, KIT, KRAS, MPL, MYD88, NRAS, PHF6, PTEN, ZRSR2
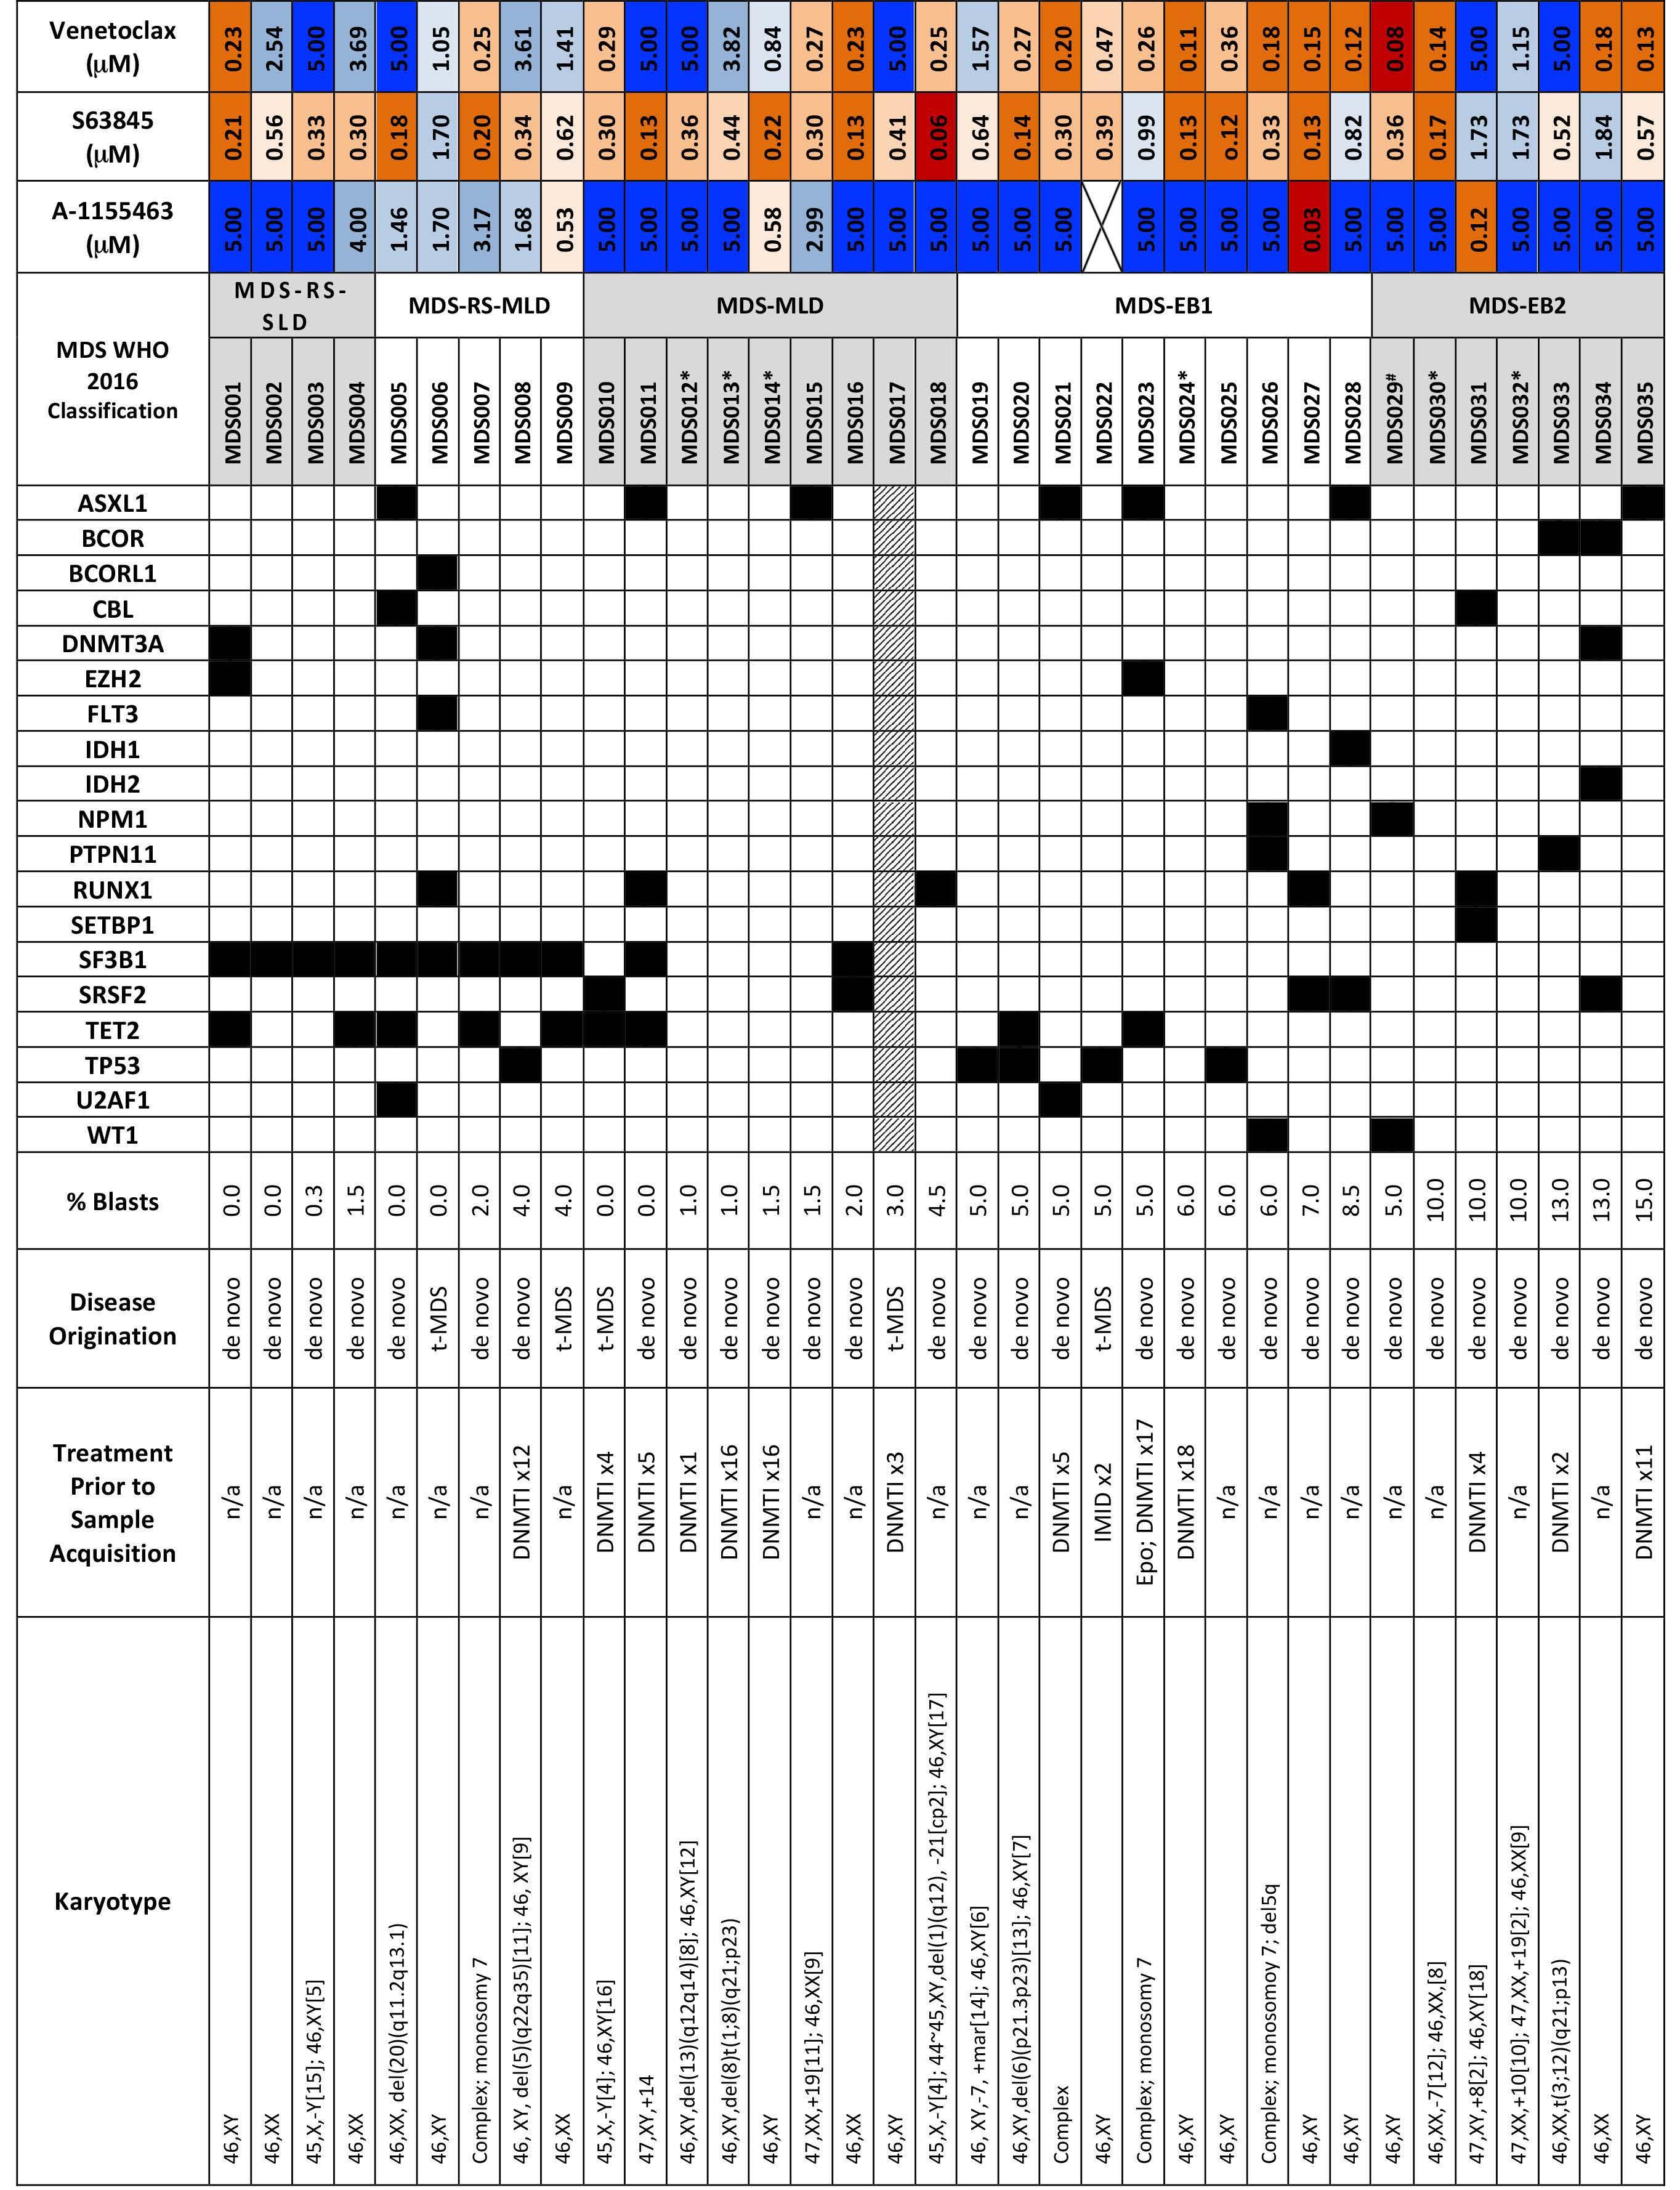
Haematologica | 108 February 2023 524 ARTICLE - Synergistic BCL2 and MCL1 inhibition in MDS M.A. Fischer et al.
sitivities to BCL2 inhibition that positively correlated with blast count. Consistent with previous findings,1,4 lower blast count MDS (RS-SLD/MLD and MLD) exhibited less sensitivity to BCL2 inhibition than higher blast count MDS subtypes (e.g., MDS-EB1; -EB2) (P=0.004) (Online Supplementary Figure S1A). All subtypes were sensitive to the selective MCL1 inhibitor, S63845, with decreased sensitivity in the MDS-EB2 subtype. Samples were assessed using a targeted next generation sequencing (NGS) panel of 37 commonly mutated genes in myeloid diseases. As expected, we observed an increased number of SF3B1 mutations in the lower blast count MDS with ring sideroblasts (MDS-RS) samples.19 RAS-family mutants, particularly PTPN11-mutated AML have previously been shown to connote resistance to VEN.20-24 In this cohort, one of two PTPN11 mutant MDS samples, and two of two CBL mutant samples were completely resistant to BCL2 inhibition (MDS033, MDS005 and MDS031, respectively). Notably, the PTPN11 mutant sample that was not resistant to VEN (MDS026) had a low variant allele frequency (VAF) of 6% for this mutation whereas the other three RAS family mutants that demonstrated VEN-resistance all had VAF above 30%, which likely explains the lack of resistance to VEN in MDS026 (Online Supplementary Table S1). Otherwise, we did not observe any correlation between specific mutations and drug response in this cohort of 35 patient samples.
Dual inhibition of MCL1 and BCL2 is synergistic in all myelodysplastic syndrome samples resulting in increased apoptosis and loss of clonogenicity
In order to determine if co-inhibition of BCL2 and MCL1 is synergistic in MDS, we assessed the efficacy of three-fold dilutions of S63845 + VEN on cell viability and employed the ZIP synergy model to determine the synergistic potential.15 The combined treatment for all samples tested resulted in an average d synergy score >10, suggesting drug synergy (Figure 1A; Online Supplementary Table S2). In order to investigate if the reduced viability seen with dual inhibition of BCL2 and MCL1 led to apoptosis of MDS CD34+ progenitor cells, cells were stained with antihuman CD34, Annexin V, and propidium iodide (PI) 24 hours after treatment with sub-therapeutic doses of each inhibitor (Online Supplementary Figure S1B). Cells treated with S63845 + VEN displayed significant reductions in MDS progenitor cells compared to VEN-treated or S63845-treated cells when all MDS samples were analyzed together (Figure 1B). Similarly, a refined analysis of MDS subtypes revealed that combined treatment significantly reduced MDS progenitors for all subtypes compared to cells treated with S63845 alone. Compared to VEN alone, the dual treatment significantly reduced MDS progenitors in RS-SLD/MLD and MLD and trended toward statistical significance for EB1 and EB2 patient samples
(Figure 1C). In order to determine the long-term effects of reduced viability and increased apoptosis on clonogenicity, colony-forming unit (CFU) assays were performed. In eight tested MDS patient WBM samples, dual treatment of 100 nM S63845 + 100 nM VEN reduced CFU-granulocyte magrophage (CFU-GM) formation by 50-100%, indicating loss of clonogenicity, even in CBL (MDS031) or PTPN11 (MDS033) mutant samples that were resistant to VEN monotherapy (82% and 50% reduction, respectively) (Figure 2A; Online Supplementary Figure 2B). This was further confirmed by trypan blue staining on cells collected from the plates of a subset of samples tested, which showed a reduction of total live cells (Online Supplementary Figure S4). In order to confirm dual inhibition of MCL1 and BCL2 reduced MDS HSPC, we verified this effect in CD34+ cells from four MDS patient samples. Similar to the effects on WBM, dual treatment with 100 nM S63845 + 100 nM VEN reduced CFU-GM formation in MDS HSPC by 42-100%, including a CBL (MDS005) and PTPN11 mutant sample that were resistant to VEN monotherapy (86% and 42%, respectively) (Figure 2A; Online Supplementary Figure S2D). Given the skewing toward CFU-GM colonies from the MDS samples that had been cryopreserved (Online Supplementary Figure S2B and D), we also verified the effects of S63845 + VEN treatment in freshly-obtained MDS patient samples, which corroborated a reduction, specifically, in CFU-GM colonies by 30-93% (Online Supplementary Figure S2E).
While 100 nM S63845 + 100 nM VEN was significantly more effective at reducing MDS WBM and HSPC colony formation, it was also toxic to normal hematopoiesis resulting in a 4-68% reduction in normal WBM CFU-GM colonies (n=8, mean 82% reduction in MDS-WBM-CFU-GM vs. n=4, mean 38% reduction in normal-WBM-CFU-GM, P=0.01) and a 38-69% reduction in normal CD34+ CFU-GM colonies (n=4, mean 80% reduction in MDS-CD34+-CFU-GM vs. n=7, mean 52% reduction in normal-CD34+-CFU-GM, P=0.03) (Figure 2A; Online Supplementary Figure S2A and C). In order to determine a therapeutic window that would not affect normal hematopoiesis, we tested a range of doses of BCL2 + MCL1 inhibition on normal CD34+ cells and found multiple dose combinations that had no significant impact on colony formation (Figure 2B). We reduced the original tested concentration by 50% and assessed dual treatment of 50 nM S63845 + 50 nM VEN, which exemplified the selective targeting of MDS compared to normal WBM cells (n=6, mean 50% reduction in MDS-WBM-CFU-GM vs. n=4, mean 0% reduction in normal-WBM-CFU-GM, P=0.0002) and HSPC (n=4, mean 71% reduction in MDS-CD34+-CFUGM vs. n=2, mean 0% reduction in normal-CD34+-CFU-GM, P=0.02) (Figure 2C; Online Supplementary Figure S3A to D). Markedly, all MDS WBM and CD34+ samples displayed reduced CFU-GM colony formation using either high (100 nM S63835 + 100 nM VEN) or low (50 nM S63845 + 50 nM VEN)
Haematologica | 108 February 2023 525 ARTICLE - Synergistic BCL2 and MCL1 inhibition in MDS M.A. Fischer et al.
Figure 1. Dual inhibition of MCL1 and BCL2 is synergistic in myelodysplastic syndrome cells resulting in increased apoptosis. (A) Cell viability of primary myelodysplastic syndrome (MDS) samples was measured by CellTiter-Glo at 48 hours after treatment with threefold dilutions of S63845, venetoclax (VEN) or a combination of both. Contour plots of synergy scores generated from the cell viability dose matrix of S63845 and VEN using the zero interaction potency (ZIP) model. The synergy scores were represented by pseudocoloring 2-D contour plots over the dose matrix, giving rise to the overall synergy landscape. Red color indicates synergy, while green color indicates antagonism for the various concentrations of the S63845/VEN combination (note different pseudocoloring scale for ZIP synergy scores between the samples). (B and C) Apoptosis in CD34+ cells was measured by annexin V/PI staining using flow cytometry after 24 hours of treatment in all samples combined (B) or broken down into MDS subtypes; MDS-RS-SLD is MDS with ring sideroblast with single lineage dysplasia; MLD is multi-lineage dysplasia; EB1 is excess blasts 5-9%; EB2 is 10-19% blasts (C). The percent of live cells relative to DMSO control were calculated. Statistical comparisons between S63845 or VEN monotherapy and the combination are shown (ANOVA followed by two-tailed t-test; n.s.: not significant, *P<0.05, **P<0.01, ***P<0.001, ****P<0.0001).
combination therapy, even VEN-monotherapy-resistant (GI50 >5 mM) samples (Online Supplementary Table S3).
Combined MCL1 and BCL2 inhibition reduces human myelodysplastic syndrome cell engraftment in MISTRG6 mice
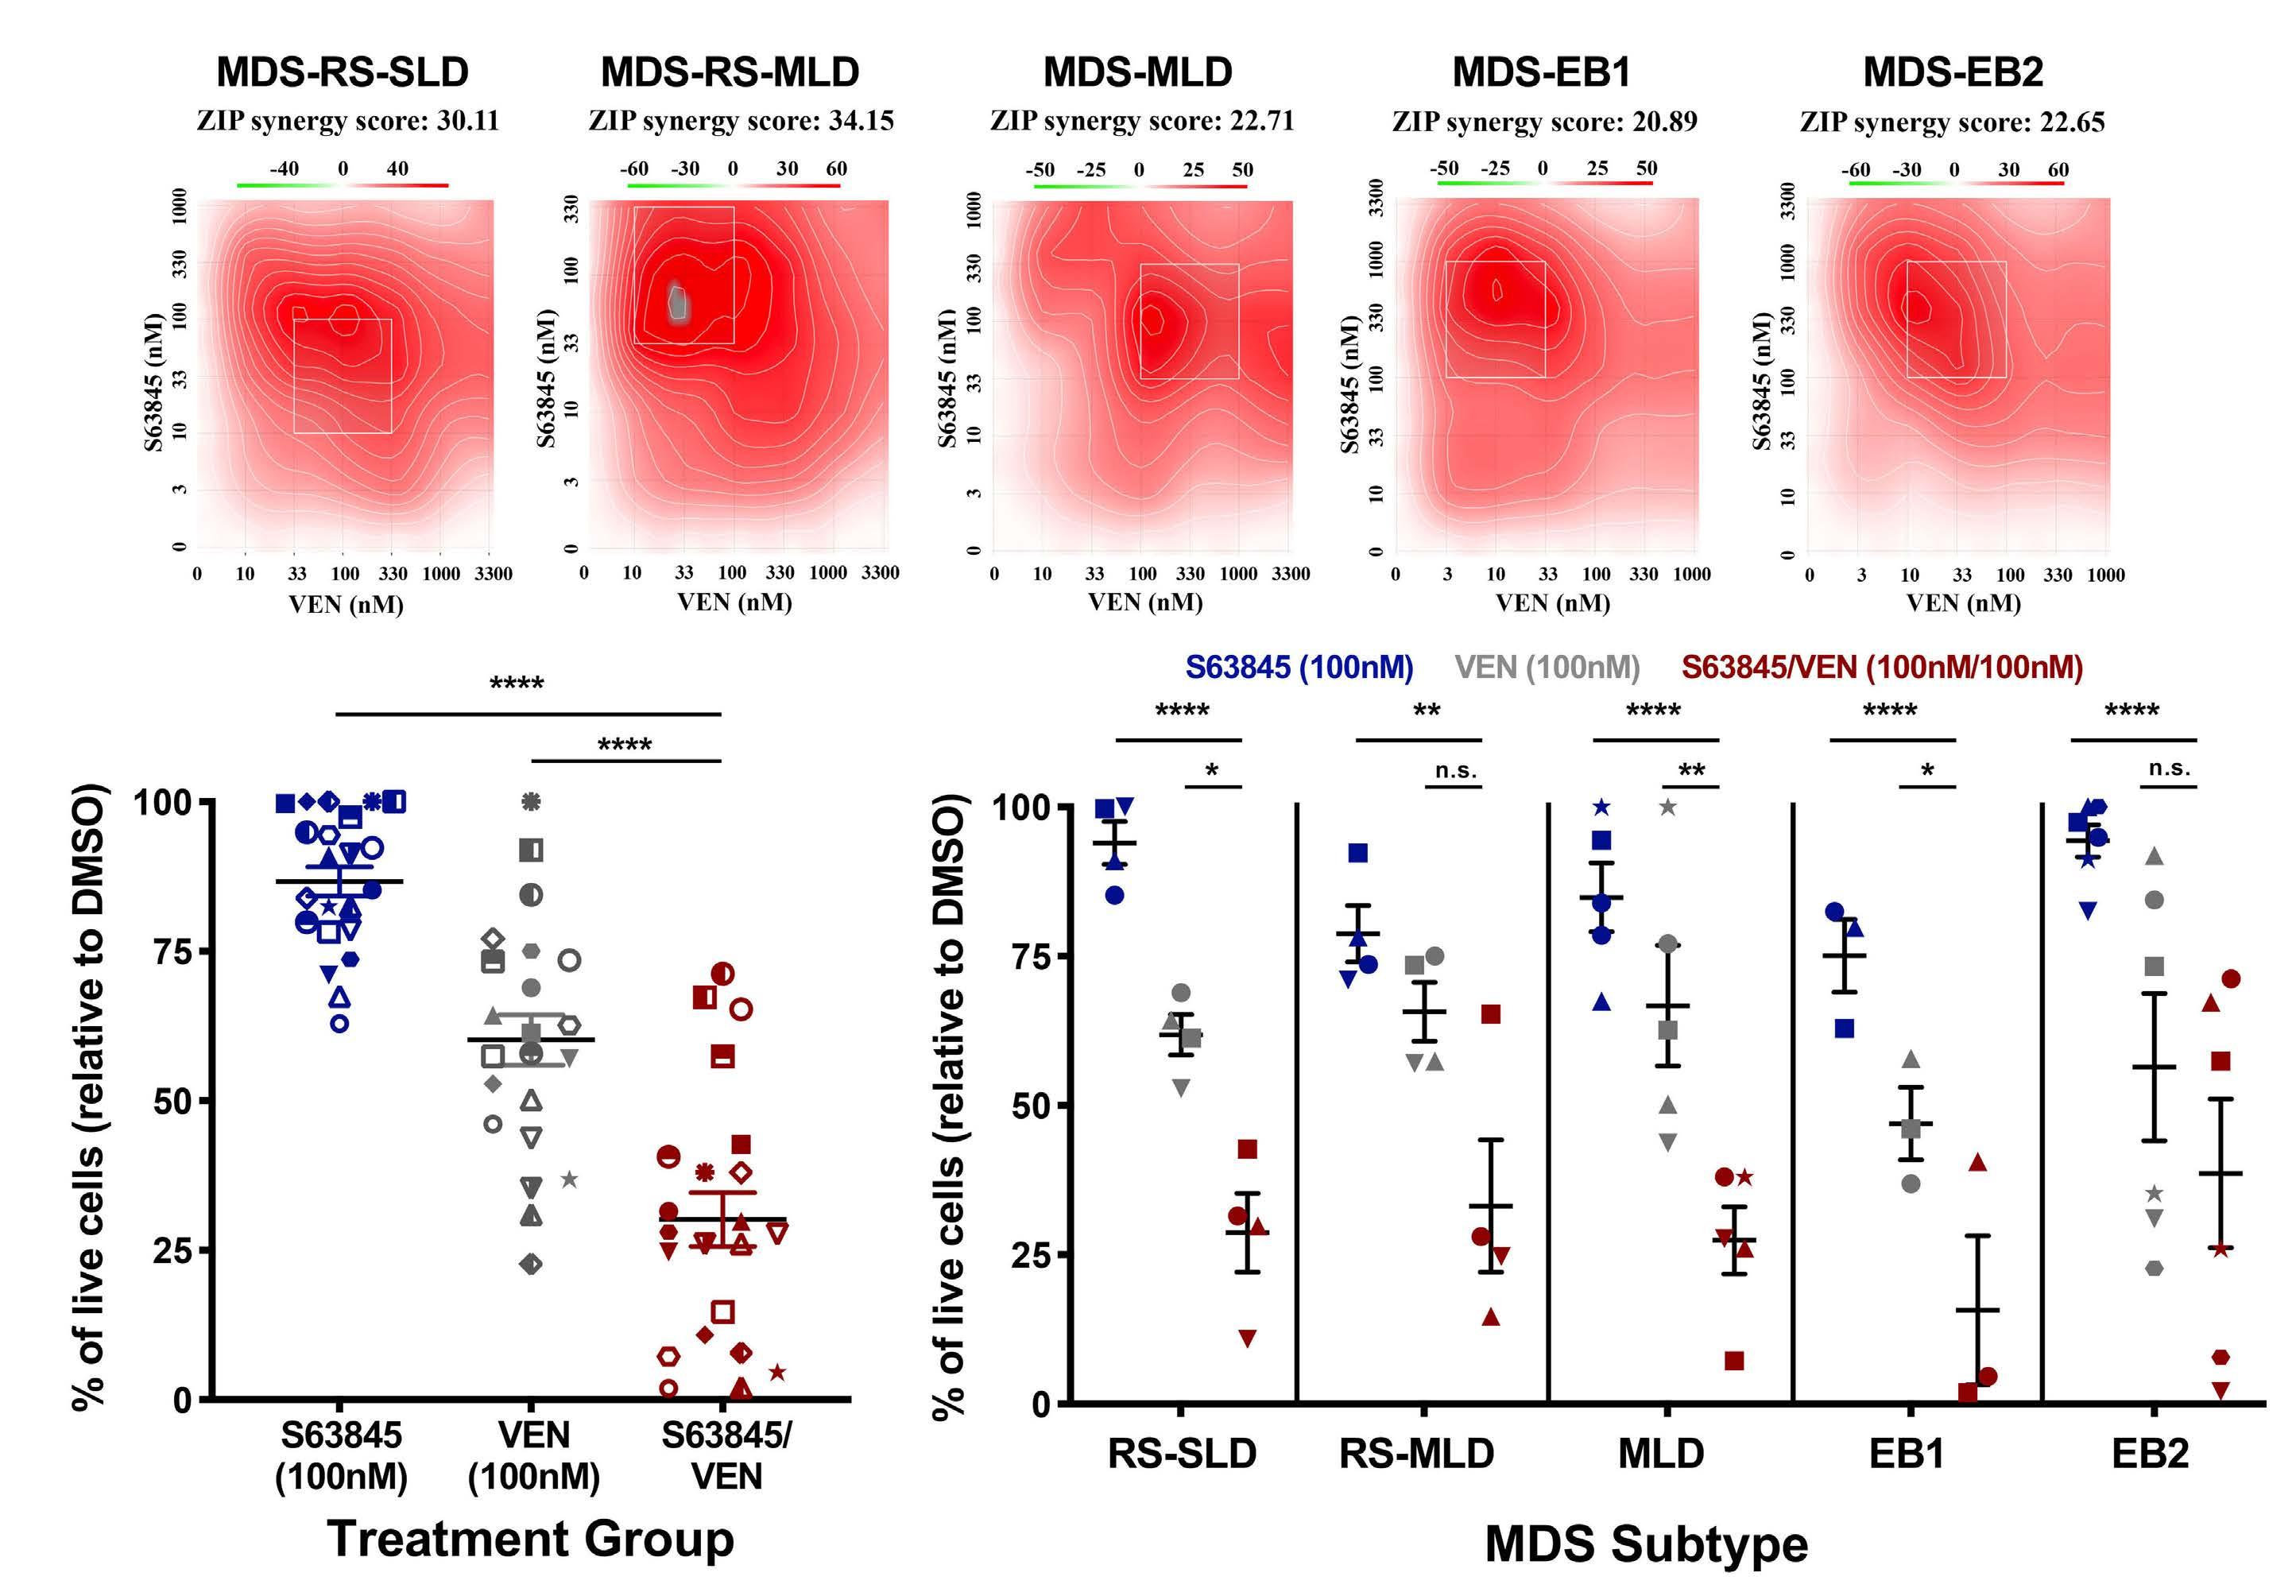
We further validated the efficacy of S63845 + VEN combination treatment using in vivo MDS patient-derived xenotransplants (PDX). We have previously shown successful establishment of MDS PDX with faithful clonal representation in cytokine humanized ‘MISTRG’ mice. MISTRG mice carry humanized alleles for M-CSFh/h, IL-3/GM-CSFh/h, SIRPah/m, and TPOh/h , on the RAG2-/- γc-/- background, and are viable, healthy and fertile. Gene-humanizations via knockin significantly improve the engraftment, differentiation and
maintenance of human cells from MDS and other hematologic malignancies.25-27 As MDS is an inflammatory disorder with elevated IL-6 levels and is highly dependent on its microenvironment,28,29 we made use of a next-generation version of MISTRG with humanization via targeted insertion of human interleukin-6 (IL-6), in short, ‘MISTRG6’. MISTRG6 have been shown recently to efficiently engraft healthy human huCD34+ and myeloma cells.26,30 Before testing the effects of combined BCL2 and MCL1 inhibition experiments in MDS PDX, we performed toxicity evaluations in MISTRG6 mice. Mice were treated with vehicle, VEN (15 mg/kg; 5 days on, 2 days off), or a combination of VEN (15 mg/kg; 5 days on, 2 days off) and S63845 (12.5 mg/kg; 2 days on, 5 days off) for a total of 2 weeks. Measurements were taken prior to starting treatment (Pre), 1 week, and 2 weeks after treat-
B
Haematologica | 108 February 2023 526 ARTICLE - Synergistic BCL2 and MCL1 inhibition in MDS M.A. Fischer et al. A C
ment to determine weight, red blood cell count, hemoglobin, white blood cell count, and platelet count. No detrimental effects were seen on the mouse hematopoietic cells in MISTRG6 mice (Online Supplementary Figure S5). Next, we confirmed engraftment of selected MDS patient samples from Table 1 that had sufficient cells to perform in vivo studies. All three samples engrafted in the MISTRG6 mice, at varying levels in the bone marrow (BM) (Figure 3A and B),
and were largely comprised of the myeloid lineage (Figure 3C). In order to maximize the information we could obtain with this limited resource, we used these test engraftment mice to perform a pilot study comparing vehicle treatment to combined BCL2 + MCL1 inhibition. This preliminary experiment suggested that dual treatment would decrease MDS engraftment in the BM (Online Supplementary Figure S6). B
Figure 2. Combined inhibition of MCL1 and BCL2 reduces clonogenicity at doses that are tolerable to normal hematopoietic stem and progenitor cells. (A) Colony forming assays of normal (NML) whole bone marrow (WBM), MDS WBM, NML CD34+, and MDS CD34+ patient cells. The percent of CFU-GM colonies relative to dimethyl sulfoxide (DMSO) for 100 nM S63845, 100 nM venetoclax (VEN), or S/V (100 nM S63845 + 100 nM VEN) treatment groups were calculated. Statistical comparisons of S/V combination treatment between NML WBM vs. MDS WBM and NML CD34+ vs. MDS CD34+ cells are shown (two-tailed t-test; *P<0.05). (B) Colony-forming assays of NML CD34+ cells treated with a range of combined concentrations of S63845 + VEN (SV). The percent of CFU-GM colonies relative to DMSO were calculated. (C) Colony-forming assays of normal (NML) whole bone marrow (WBM), MDS WBM, NML CD34+, and MDS CD34+ patient cells. The percent of CFU-GM colonies relative to DMSO for 50 nM S63845, 50 nM VEN, or S/V (50 nM S63845 + 50 nM VEN) treatment groups were calculated. Statistical comparisons of S/V combination treatment between NML WBM vs. MDS WBM and NML CD34+ vs. MDS CD34+ cells are shown (two-tailed t-test; *P<0.05; ***P<0.001). CFU-GM is colony-forming unit – granulocyte, macrophage. Data in (A) and (C) is represented as mean ± standard error of the mean, and individual patient samples in (A to C) are represented by unique symbols.
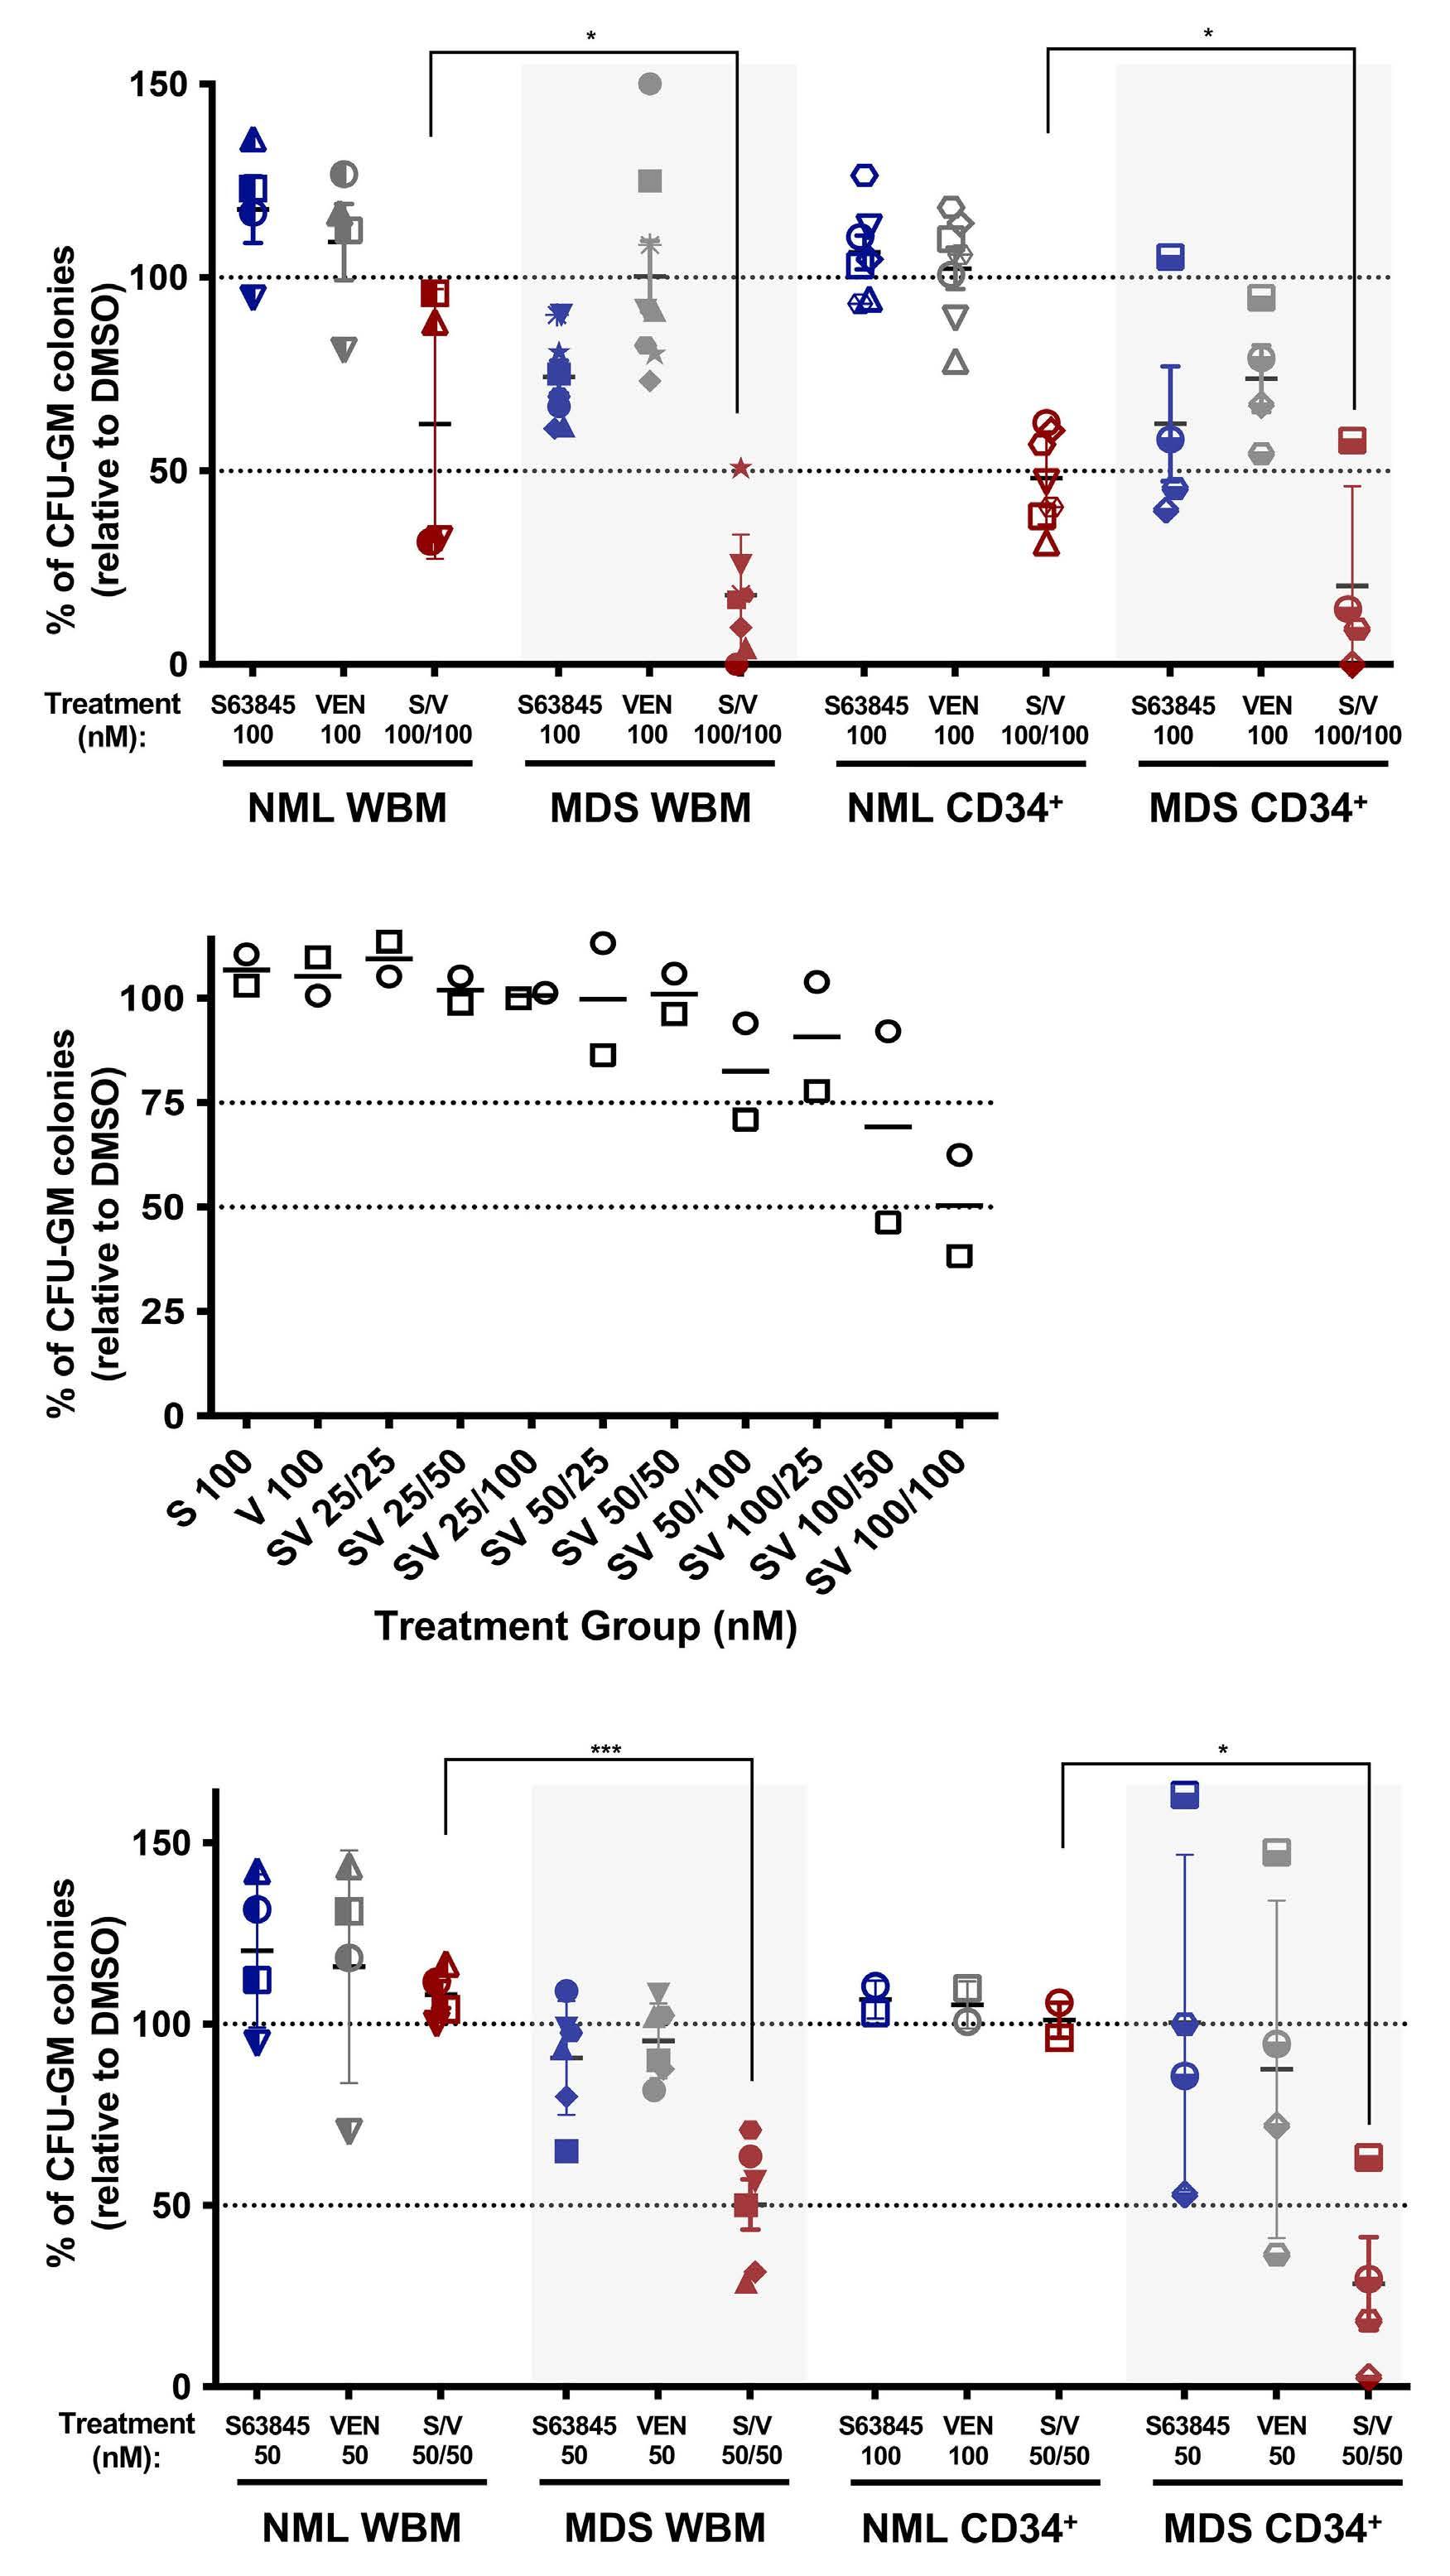
Haematologica | 108 February 2023 527 ARTICLE - Synergistic BCL2 and MCL1 inhibition in MDS M.A. Fischer et al. C A
In vitro assays showed patient sample MDS019 was resistant to VEN treatment alone (Table 1; GI50 =1.6 mM), but responded to dual BCL2+MCL1 inhibition (Online Supplementary Table S2; average ZIP d synergy score =21.6). Since MDS019 also led to the most consistent engraftment (Figure 3A and B), we tested this sample to determine if combined BCL2 + MCL1 inhibition could also overcome VEN resistance in vivo. Remaining cells from MDS019 (MDS-EB1 subtype) were allowed to engraft in MISTRG6 mice for 16 weeks before beginning treatment with vehicle, VEN (15 mg/kg; 5 days on, 2 days off), or a combination of VEN (15 mg/kg; 5 days on, 2 days off) and S63845 (12.5 mg/kg; 2 days on, 5 days off) for a total of 4 weeks (n=4 per treatment group). The percent or total number of human CD45+ (huCD45+) cells in the BM were compared between pre- and post-treatment for each treatment group (Figure 4A and B, respectively).
VEN single treatment reduced the number of huCD45 cells in the BM but displayed a marked increase in the percent of huCD45 cells similar to mice treated with vehicle. Conversely, both of these analyses demonstrated a striking reduction in percent and number of huCD45+ cells in the BM after combined BCL2+MCL1 inhibition, with almost a complete loss of huCD45+ cells. Furthermore, after the completion of the treatment, measurement of the percent of huCD45+/lin-/huCD38-/huCD34+ HSPC in the BM (Figure 4C) indicated this combined treatment, but not VEN treatment
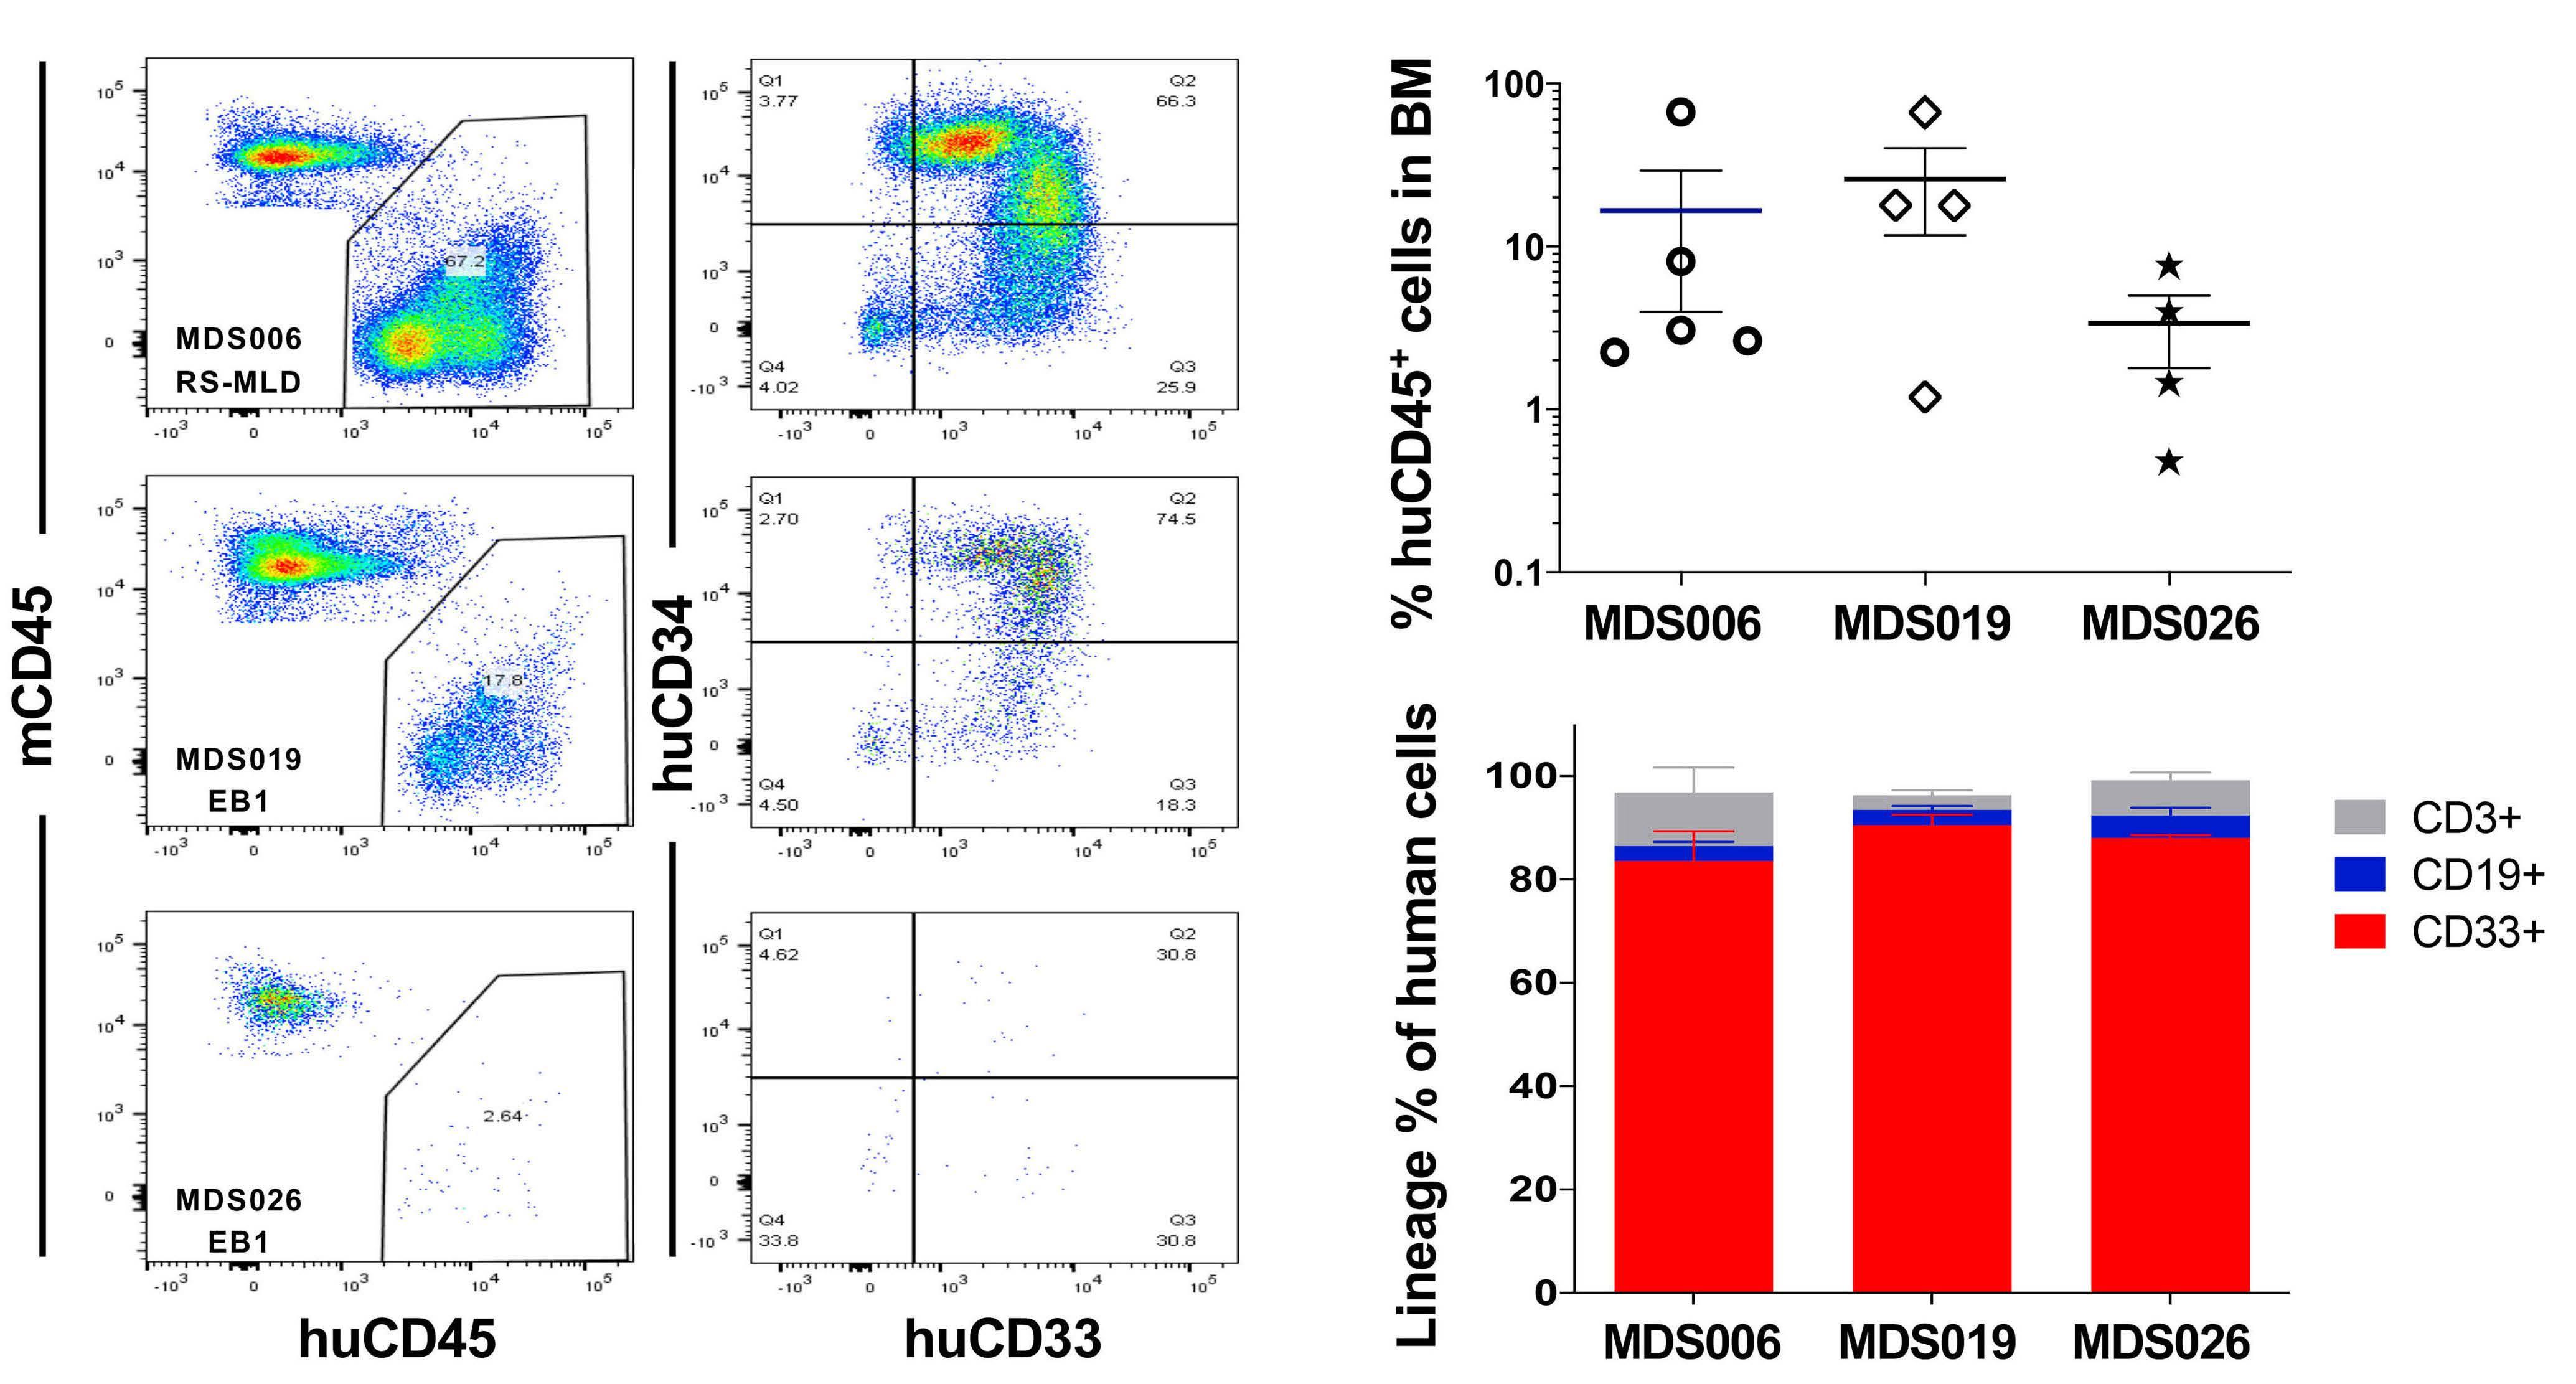
alone, was successful at specifically reducing the MDSHSPC that are known to drive the propagation of MDS. This finding was further exemplified by reduced CD34+ staining by immunohistochemistry in the bone marrow of mice treated with dual BCL2 + MCL1 inhibition (Figure 4D). Notably, these results are consistent with the outcome of the in vitro proliferation assays for MDS019 patient cells.
Discussion
The study of MDS HSPC in vitro is challenging. MDS cell lines are limited, contrived and not representative of MDS, particularly lower risk MDS, so patient samples are required.3133 Ex vivo study of MDS patient samples is also limited by sample heterogeneity, availability, and the practical consideration of how few cells are available in the setting of a disease characterized by marrow failure. Nonetheless, we have performed a comprehensive analysis on a cohort of MDS patient samples to investigate the value of targeting anti-apoptotic proteins for the treatment of MDS. Our data validated previous findings that higher blast count MDS subtypes (EB1 and EB2) are more sensitive to VEN monotherapy than low blast count subtypes.1,4 We illustrated that mutations associated with VEN resistance in AML may be similarly relevant in MDS, and also discovered, importantly, that MCL1 B
Haematologica | 108 February 2023 528 ARTICLE - Synergistic BCL2 and MCL1 inhibition in MDS M.A. Fischer et al. C A
Figure 3. Myeloid engraftment of low and medium-risk myelodysplastic syndromes in MISTRG6 mice. (A to C) Confirmed engraftment of 3 primary myelodysplastic syndrome (MDS) patient cells in MISTRG6 mice. (A) Flow cytometric analysis of mouse vs. human CD45 (mCD45 vs. huCD45; left panels) and huCD34 vs. huCD33 (right panels). (B) Percent of huCD45+ cells in the bone marrow (BM) for each patient sample. (C) Relative distribution of myeloid CD33+ (red), B-lymphoid CD19+ (blue), and T-lymphoid CD3+ (gray) cells as percent of human CD45+ cells for each patient sample.
inhibtion may be effective for all MDS subtypes. Moreover, drug synergy from combining BCL2 and MCL1 inhibitors can be achieved across all subtypes and mutational profiles of MDS in this model, even in the presence of RAS family mutations that are believed to confer resistance to VEN monotherapy (e.g., CBL and PTPN11 in this cohort).20-24 The in vivo reduction of MDS progenitor cells in the BM from MDS PDX is the first successful test of selective anti-apoptotic inhibitors in an in vivo MDS PDX model. Prior patientderived MDS xenograft models have demonstrated inefficient engraftment potential in multiple murine backgrounds and often do not recapitulate the disease characteristics.32,34-42 Other studies have shown mixed results when attempting to improve MDS cell engraftment into mice with co-injection of normal or MDS patient-derived mesen-
chymal stromal cells.40,42 The MISTRG mice overcame the obstacles presented by other models by expressing human cytokines in place of their murine counterparts at the endogenous locus to provide physiological expression of these human cytokines and MISTRG6 mice further provide the otherwise non-crossreactive critical inflammatory cytokine, IL-6, which is over-expressed in mesenchymal stromal cells in MDS and other hematologic malignancies.25 Building on this model allowed us to demonstrate successful engraftment of MDS patient cells in MISTRG6 mice for the first time, and to test the effects of anti-apoptotic inhibitors in vivo. Xenografting of human MDS is improved with the MISTRG6 model, yet a finite number of patient samples with robust cellular engraftment hindered the number of transplants. Nonetheless, these MDS PDX experiments edify findings B A
Figure 4. Evidence of reduced myelodysplastic syndrome engraftment in MISTRG6 mice after co-inhibition of BCL2 and MCL1. (A to D) Patient sample MDS019-EB1 was allowed to engraft in MISTRG6 mice for 16 weeks before beginning treating with vehicle, venetoclax (VEN) (15 mg/kg; 5 days on, 2 days off), or a combination of VEN (15 mg/kg; 5 days on, 2 days off) and S63845 (12.5 mg/kg; 2 days on, 5 days off) for a total of 4 weeks (n=4 per treatment group). The percent (A) or total number (B) of huCD45+ cells in the bone marrow (BM) were compared between pre and post-treatment for each treatment group. (C) After completion of the treatment, the percent of huCD45+/lin-/huCD38-/huCD34+ in the BM was determined. (D) Representative histologic images of BM from mice in (A to C) that were treated with vehicle, VEN, or S63845/VEN and underwent immunohistochemical staining for huCD34 (top panel, original magnification 10x, scale bars: 100 mm; lower panel, original magnification 60x, scale bars:10 µm). The data in (B and C) are represented by mean ± standard error of the mean, and statistical comparisons between vehicle and VEN or combination treatments are shown (two-tailed t-test; n.s.: not significant, *P<0.05, **P<0.01, ***P<0.001).
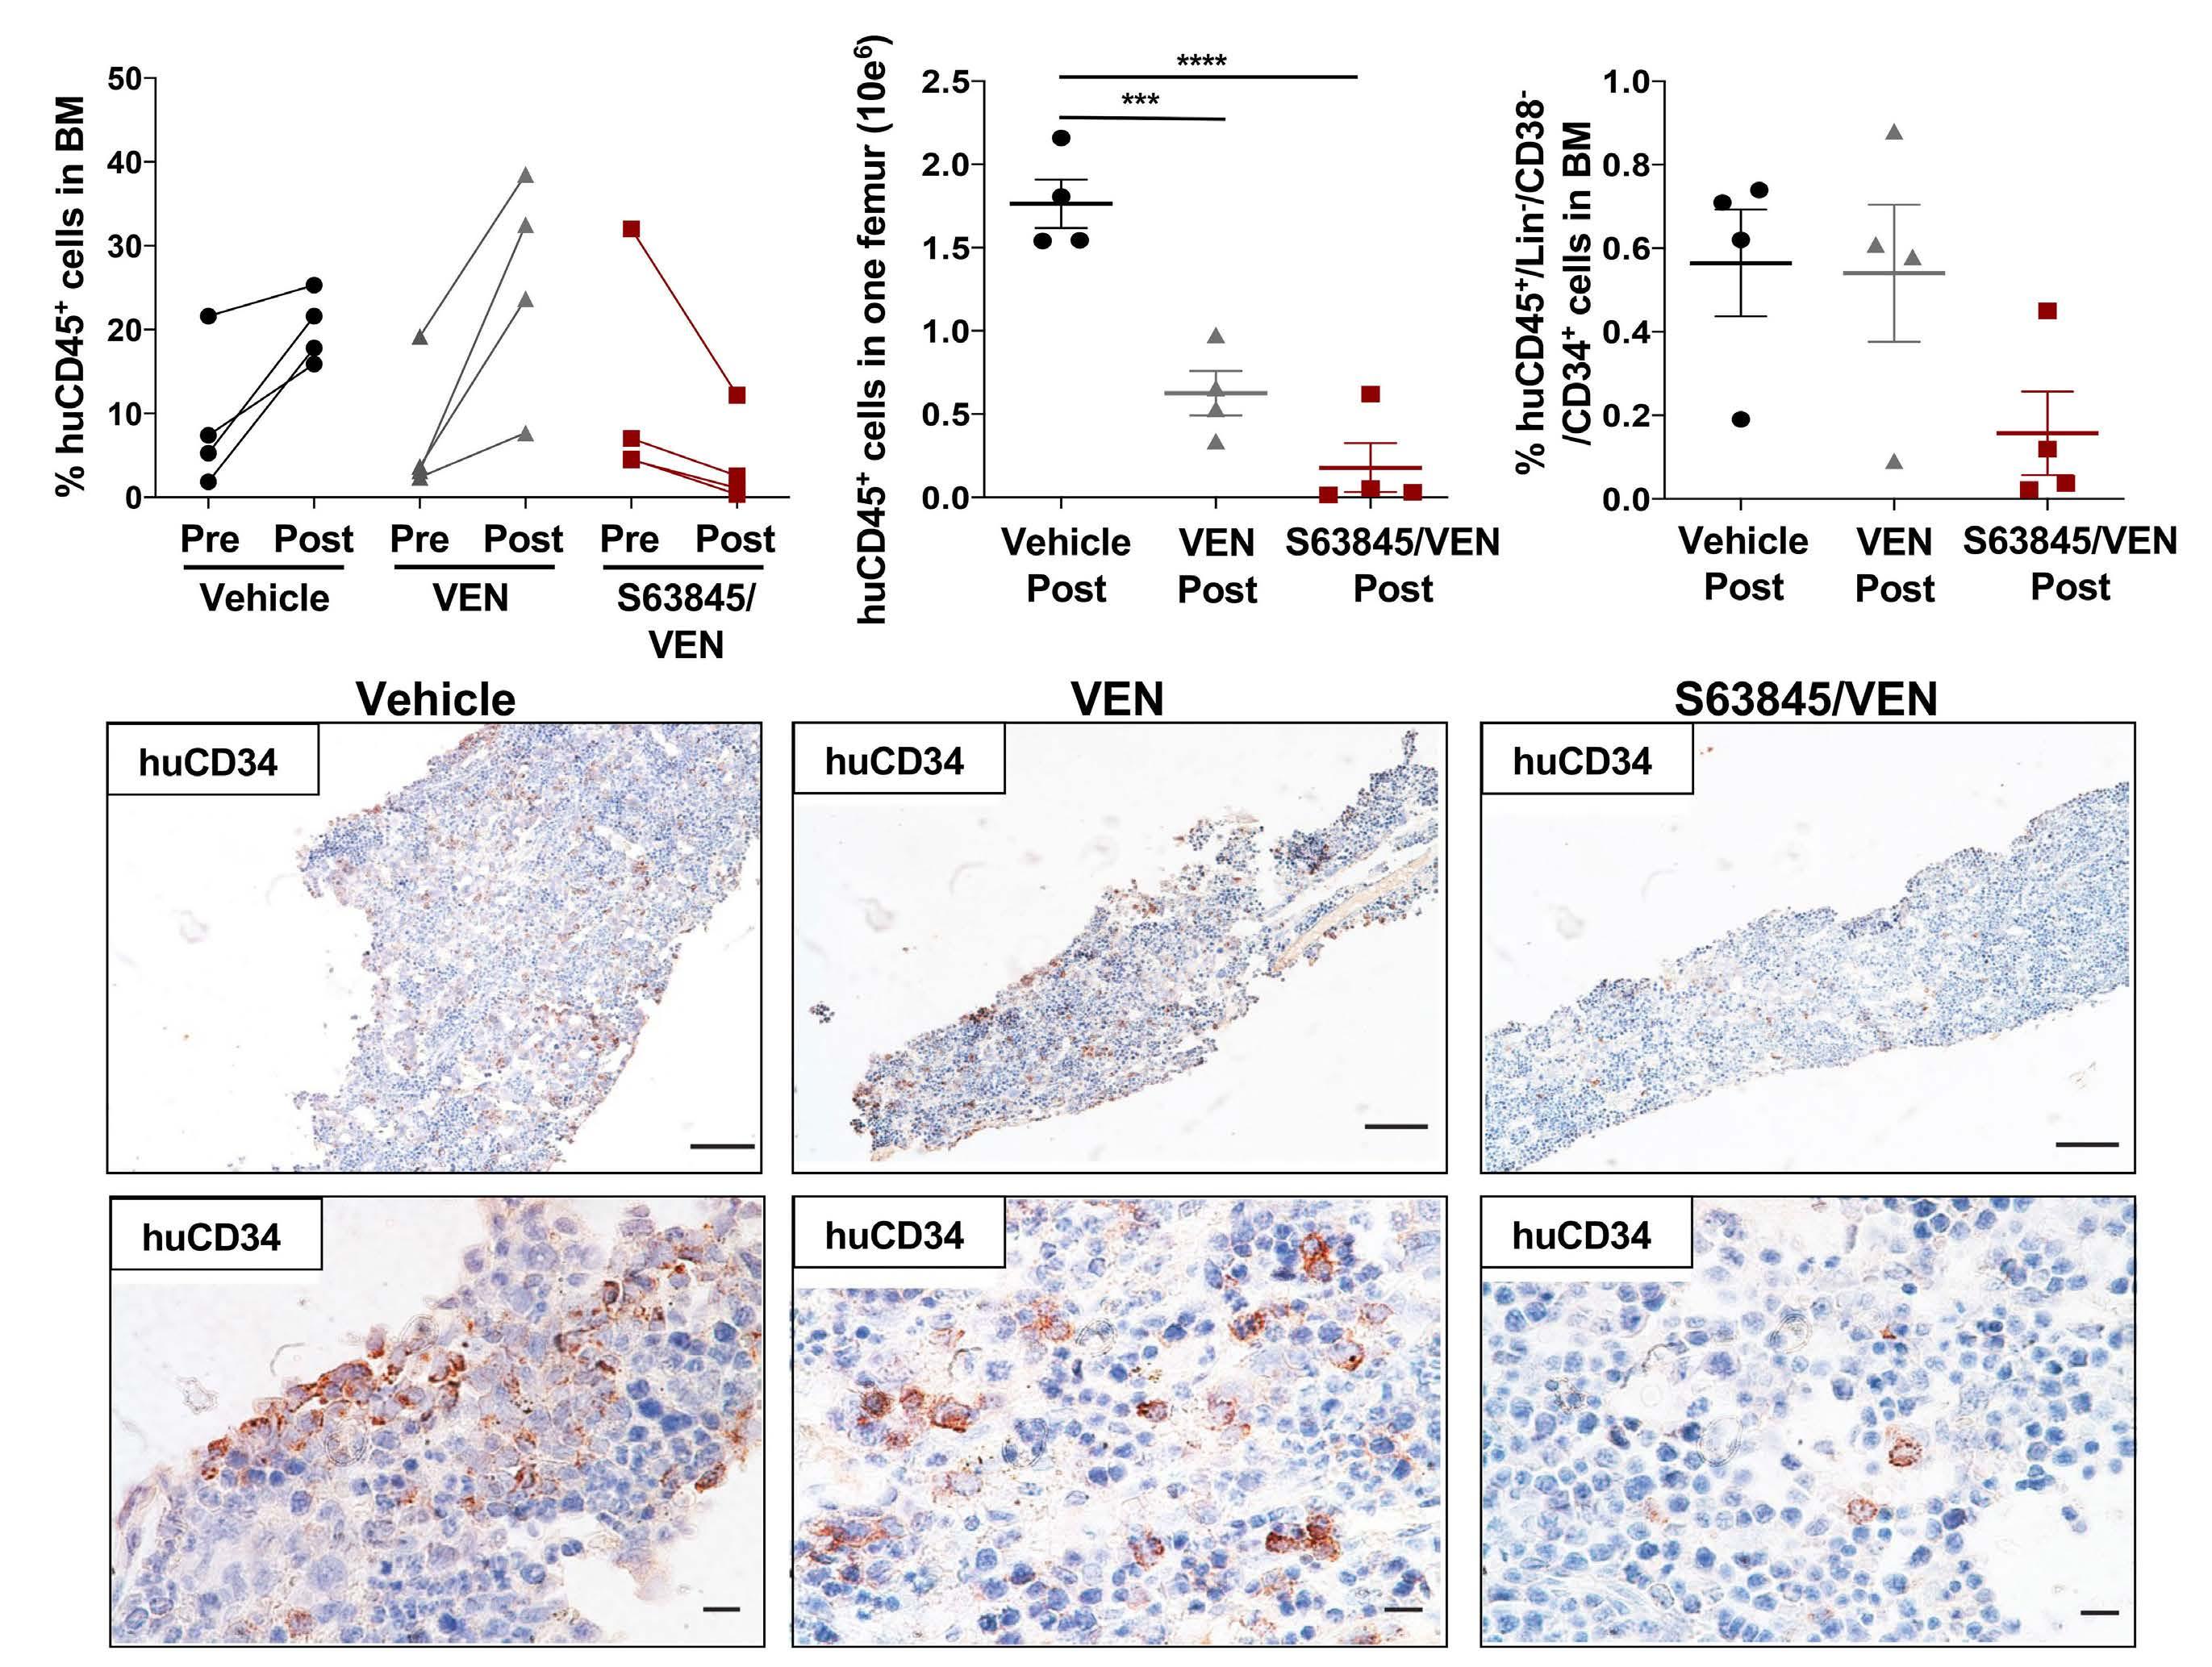
Haematologica | 108 February 2023 529 ARTICLE - Synergistic BCL2 and MCL1 inhibition in MDS M.A. Fischer et al. C D
from our ex vivo studies to illustrate the selective utility of BCL2 inhibitor monotherapy in MDS and provide promise for the use of combined BCL2 + MCL1 inhibition for the treatment of all MDS subtypes, particularly in patients who may be resistant to VEN monotherapy. BCL2 inhibition has changed the standard of care in myeloid malignancies; refining the design of clinical trials testing BCL2 and MCL1 inhibitors in MDS and the precision of patient selection for therapy is a top therapeutic priority. While combination of BCL2 and MCL1 inhibition may have a dose-dependent impact on normal hematopoiesis, experimental evidence seems to indicate that toxicity on normal CD34+ cells is limited at clinically meaningful doses in vivo13 and in vitro, 43 as we have also shown here. The data presented here suggest dual BCL2 + MCL1 inhibition should be considered for the treatment of all MDS subtypes regardless of mutational status, even those with mutations that may be less likely to respond to VEN monotherapy (e.g., TP53 or RAS family mutations),20-24 and carefully designed clinical trials with flexible dosing schedules amenable to MDS are warranted.
Disclosures
MRS has served on consultancy/advisory board/data safety monitoring committees for Abbvie, BMS, CTI, Forma, Geron, Karyopharm, Novartis, Ryvu, Sierra Oncology, Takeda, Taiho TG Therapeutics; has equity in Karyopharm; and his institution has received research funding from ALX Oncology, Incyte, Takeda, and TG Therapeutics. SH serves on the advisory board of FORMA Therapeutics.
Contributions
MAF, YS, and RG designed and performed experiments. MPA, and MTV performed experiments. MAF, YS, RG, MPA, MTV, MAC, BNS, TPS, SH, and MRS analyzed data. MAF and MRS performed statistical analysis and wrote the manuscript. SH and MRS designed and supervised the study. All authors reviewed and edited drafts of the manuscript and approved the final version of the manuscript.
References
1. Reidel V, Kauschinger J, Hauch RT, et al. Selective inhibition of BCL-2 is a promising target in patients with high-risk myelodysplastic syndromes and adverse mutational profile. Oncotarget. 2018;9(25):17270-17281.
2. Parker JE, Mufti GJ, Rasool F, Mijovic A, Devereux S, Pagliuca A. The role of apoptosis, proliferation, and the Bcl-2-related proteins in the myelodysplastic syndromes and acute myeloid leukemia secondary to MDS. Blood. 2000;96(12):3932-3938.
3. Invernizzi R, Pecci A, Bellotti L, Ascari E. Expression of p53, bcl-2 and ras oncoproteins and apoptosis levels in acute leukaemias and myelodysplastic syndromes. Leuk Lymphoma. 2001;42(3):481-489.
4. Jilg S, Reidel V, Muller-Thomas C, et al. Blockade of BCL-2 proteins
Acknowledgments
For the in vivo studies, we thank Yale Pathology Tissue Services, especially A. Brooks for research histology services, Yale Animal Resources Center, especially P. Ranney, J. Fonck for animal care, and Yale Flow Cytometry Core, especially Lesley Divine, Diane Trotta and Chao Wang for flow cytometry analysis.
Funding
This work was generously supported by the Edward P. Evans Foundation (2017-11), Beverly and George Rawlings Directorship, the Biff Ruttenberg Foundation, the Adventure Alle Fund, and the Leukemia and Lymphoma Society (2321-19) for which, MRS is a Clinical Scholar. MRS was supported by the NCI (R01CA262287-01). SH was supported by the NIH/NIDDK (R01DK102792), the Frederick A. Deluca Foundation, the Edward P. Evans Foundation, and the Department of Defense. YS was supported by a pilot grant from the Yale Cooperative Center of Excellence in Hematology (YCCEH) and the National Natural Science Foundation of China (General Program No. 82170137). BNS was supported by the NCI (5K12CA090625). This study was in part supported by the Animal Modeling Core of the Yale Cooperative Center of Excellence in Hematology (NIDDK U54DK106857). Patient samples were garnered from the Vanderbilt-Ingram Cancer Center (VICC) Hematologic Malignancy Tumor Bank. The Vanderbilt-Ingram Cancer Center grant (NCI P30 CA068485-19) supported this work. The REDCap database tool is supported by grant UL1 TR000445 from NCATS/NIH. Flow Cytometry experiments were performed in the VUMC Flow Cytometry Shared Resource. The VUMC Flow Cytometry Shared Resource is supported by the Vanderbilt Ingram Cancer Center (P30 CA68485) and the Vanderbilt Digestiv e Disease Research Center (DK058404).
Data-sharing statement
Not applicable as data generated in this study have been included in the published article.
effi
ciently induces apoptosis in progenitor cells of high-risk myelodysplastic syndromes patients. Leukemia. 2016;30(1):112-123.
5. Bhola PD, Letai A. Mitochondria - judges and executioners of cell death sentences. Mol Cell. 2016;61(5):695-704.
6. Letai A, Bassik MC, Walensky LD, Sorcinelli MD, Weiler S, Korsmeyer SJ. Distinct BH3 domains either sensitize or activate mitochondrial apoptosis, serving as prototype cancer therapeutics. Cancer Cell. 2002;2(3):183-192.
7. Hanahan D, Weinberg RA. Hallmarks of cancer: the next generation. Cell. 2011;144(5):646-674.
8. DiNardo CD, Pratz K, Pullarkat V, et al. Venetoclax combined with decitabine or azacitidine in treatment-naive, elderly patients with acute myeloid leukemia. Blood. 2019;133(1):7-17.
Haematologica | 108 February 2023 530 ARTICLE - Synergistic BCL2 and MCL1 inhibition in MDS M.A. Fischer et al.
9. Wei AH, Strickland SA, Hou J-Z, et al. Venetoclax combined with low-dose venetoclax for previously untreated patients with acute myeloid leukemia: results from a phase Ib/II study. J Clin Oncol. 2019;37(15):1277-1284.
10. Ball BJ, Famulare CA, Stein EM, et al. Venetoclax and hypomethylating agents (HMAs) induce high response rates in MDS, including patients after HMA therapy failure. Blood Adv. 2020;4(13):2866-2870.
11. Zeidan AP, DA, Garcia, JS, et al. A phase 1b study evaluating the safety and efficacy of venetoclax in combination with azacitidine for the treatment of relapsed/refractory myelodysplastic syndrome. Blood. 2020;134(Suppl 1):S565.
12. Pan R, Ruvolo VR, Wei J, et al. Inhibition of Mcl-1 with the pan-Bcl2 family inhibitor (-)BI97D6 overcomes ABT-737 resistance in acute myeloid leukemia. Blood. 2015;126(3):363-372.
13. Ramsey HE, Fischer MA, Lee T, et al. A novel MCL1 inhibitor combined with venetoclax rescues venetoclax-resistant acute myelogenous leukemia. Cancer Discov. 2018;8(12):1566-1581.
14. Konopleva M, Pollyea DA, Potluri J, et al. Efficacy and biological correlates of response in a phase II study of venetoclax monotherapy in patients with acute myelogenous leukemia. Cancer Discov. 2016;6(10):1106-1117.
15. Yadav B, Wennerberg K, Aittokallio T, Tang J. Searching for drug synergy in complex dose-response landscapes using an interaction potency model. Comput Struct Biotechnol J. 2015;13:504-513.
16. Ianevski A, He L, Aittokallio T, Tang J. SynergyFinder: a web application for analyzing drug combination dose-response matrix data. Bioinformatics. 2017;33(15):2413-2415.
17. Ianevski A, Giri AK, Aittokallio T. SynergyFinder 2.0: visual analytics of multi-drug combination synergies. Nucleic Acids Res. 2020;48(W1):W488-W493.
18. Consortium APG. AACR Project GENIE: Powering Precision Medicine through an International Consortium. Cancer Discov. 2017;7(8):818-831.
19. Malcovati L, Papaemmanuil E, Ambaglio I, et al. Driver somatic mutations identify distinct disease entities within myeloid neoplasms with myelodysplasia. Blood. 2014;124(9):1513-1521.
20. Pei S, Pollyea DA, Gustafson A, et al. Monocytic subclones confer resistance to venetoclax-based therapy in patients with acute myeloid leukemia. Cancer Discov. 2020;10(4):536-551.
21. Chyla B, Daver N, Doyle K, et al. Genetic biomarkers of sensitivity and resistance to venetoclax monotherapy in patients with relapsed acute myeloid leukemia. Am J Hematol. 2018;93(8):E202-E205.
22. DiNardo CD, Tiong IS, Quaglieri A, et al. Molecular patterns of response and treatment failure after frontline venetoclax combinations in older patients with AML. Blood. 2020;135(11):791-803.
23. Chen X, Glytsou C, Zhou H, et al. Targeting mitochondrial structure sensitizes acute myeloid leukemia to venetoclax treatment. Cancer Discov. 2019;9(7):890-909.
24. Nechiporuk T, Kurtz SE, Nikolova O, et al. The TP53 apoptotic network is a primary mediator of resistance to BCL2 inhibition in AML Cells. Cancer Discov. 2019;9(7):910-925.
25. Song Y, Rongvaux A, Taylor A, et al. A highly efficient and faithful MDS patient-derived xenotransplantation model for pre-clinical studies. Nat Commun. 2019;10(1):366.
26. Das R, Strowig T, Verma R, et al. Microenvironment-dependent
growth of preneoplastic and malignant plasma cells in humanized mice. Nat Med. 2016;22(11):1351-1357.
27. Saito Y, Ellegast JM, Rafiei A, et al. Peripheral blood CD34(+) cells efficiently engraft human cytokine knock-in mice. Blood. 2016;128(14):1829-1833.
28. Herold M, Schmalzl F, Zwierzina H. Increased serum interleukin 6 levels in patients with myelodysplastic syndromes. Leuk Res. 1992;16(6-7):585-588.
29. Boada M, Echarte L, Guillermo C, Diaz L, Touriño C, Grille S. 5Azacytidine restores interleukin 6-increased production in mesenchymal stromal cells from myelodysplastic patients. Hematol Transfus Cell Ther. 2020;43(1):35-42.
30. Yu H, Borsotti C, Schickel JN, et al. A novel humanized mouse model with significant improvement of class-switched, antigenspecific antibody production. Blood. 2017;129(8):959-969.
31. Drexler HG, Dirks WG, Macleod RA. Many are called MDS cell lines: one is chosen. Leuk Res. 2009;33(8):1011-1016.
32. Rhyasen GW, Wunderlich M, Tohyama K, Garcia-Manero G, Mulloy JC, Starczynowski DT. An MDS xenograft model utilizing a patientderived cell line. Leukemia. 2014;28(5):1142-1145.
33. Tohyama K, Tsutani H, Ueda T, Nakamura T, Yoshida Y. Establishment and characterization of a novel myeloid cell line from the bone marrow of a patient with the myelodysplastic syndrome. Br J Haematol. 1994;87(2):235-242.
34. Muguruma Y, Matsushita H, Yahata T, et al. Establishment of a xenograft model of human myelodysplastic syndromes. Haematologica. 2011;96(4):543-551.
35. Martin MG, Welch JS, Uy GL, et al. Limited engraftment of low-risk myelodysplastic syndrome cells in NOD/SCID gamma-C chain knockout mice. Leukemia. 2010;24(9):1662-1664.
36. Thanopoulou E, Cashman J, Kakagianne T, Eaves A, Zoumbos N, Eaves C. Engraftment of NOD/SCID-beta2 microglobulin null mice with multilineage neoplastic cells from patients with myelodysplastic syndrome. Blood. 2004;103(11):4285-4293.
37. Benito AI, Bryant E, Loken MR, et al. NOD/SCID mice transplanted with marrow from patients with myelodysplastic syndrome (MDS) show long-term propagation of normal but not clonal human precursors. Leuk Res. 2003;27(5):425-436.
38. Wunderlich M, Chou FS, Link KA, et al. AML xenograft efficiency is significantly improved in NOD/SCID-IL2RG mice constitutively expressing human SCF, GM-CSF and IL-3. Leukemia. 2010;24(10):1785-1788.
39. Krevvata M, Shan X, Zhou C, et al. Cytokines increase engraftment of human acute myeloid leukemia cells in immunocompromised mice but not engraftment of human myelodysplastic syndrome cells. Haematologica. 2018;103(6):959-971.
40. Medyouf H, Mossner M, Jann JC, et al. Myelodysplastic cells in patients reprogram mesenchymal stromal cells to establish a transplantable stem cell niche disease unit. Cell Stem Cell. 2014;14(6):824-837.
41. Meunier M, Dussiau C, Mauz N, et al. Molecular dissection of engraftment in a xenograft model of myelodysplastic syndromes. Oncotarget. 2018;9(19):14993-15000.
42. Rouault-Pierre K, Mian SA, Goulard M, et al. Preclinical modeling of myelodysplastic syndromes. Leukemia. 2017;31(12):2702-2708.
43. Moujalled DM, Pomilio G, Ghiurau C, et al. Combining BH3mimetics to target both BCL-2 and MCL1 has potent activity in pre-clinical models of acute myeloid leukemia. Leukemia. 2018;33(4):905-917.
Haematologica | 108 February 2023 531 ARTICLE - Synergistic BCL2 and MCL1 inhibition in MDS M.A. Fischer et al.
High transferrin saturation predicts inferior clinical outcomes in patients with myelodysplastic syndromes
Jennifer Teichman,1 Michelle Geddes,2 Nancy Zhu,3 Mary-Margaret Keating,4 Mitchell Sabloff,5 Grace Christou,5 Brian Leber,6 Dina Khalaf,6 Eve St-Hilaire,7 Nicholas Finn,7 April Shamy,8 Karen W.L. Yee,9 John M. Storring,10 Thomas J. Nevill,11 Robert Delage,12 Mohamed Elemary,13 Versha Banerji,1,4 Brett Houston,14 Lee Mozessohn,1 Lisa Chodirker,1 Liying Zhang,1 Mohammed Siddiqui,1 Anne Parmentier,1 Heather A. Leitch15# and Rena J. Buckstein1#
1Sunnybrook Health Sciences Center, Toronto, Ontario; 2Tom Baker Cancer Center, Calgary, Alberta; 3University of Alberta, Edmonton, Alberta; 4QEII Health Sciences Centre, Halifax, Nova Scotia; 5The Ottawa Hospital, Ottawa, Ontario; 6Juravinski Cancer Center, Hamilton, Ontario; 7Dr. Georges-L-Dumont University Hospital Center, Moncton, New Brunswick; 8Jewish General Hospital, Montreal, Quebec; 9Princess Margaret Cancer Center, Toronto, Ontario; 10McGill University Health Center, Montreal, Quebec; 11Vancouver General Hospital, Vancouver, British Columbia; 12CHU de Québec-Université Laval, Quebec City, Quebec; 13Saskatoon Cancer Agency, Saskatoon, Saskatchewan; 14Cancer Care Manitoba, Winnipeg, Manitoba and 15St. Paul’s Hospital, Vancouver, British Columbia, Canada
#HAL and RJB contributed equally as co-senior authors.
Abstract
Correspondence: J. Teichman jennifer.teichman@mail.utoronto.ca
Received: March 18, 2022.
Accepted: August 5, 2022. Prepublished: August 18, 2022.
https://doi.org/10.3324/haematol.2022.280723
©2023 Ferrata Storti Foundation Published under a CC BY-NC license
Iron overload (IO) reflected by elevated ferritin is associated with increased mortality in myelodysplastic syndromes (MDS), however, ferritin is an imperfect metric. Elevated labile plasma iron correlates with clinical outcomes and transferrin saturation (TSAT) >80%, but is not readily measurable. The trajectory of TSAT, and its association with clinical outcomes remain undefined. Canadian MDS registry patients were evaluated. Mean TSAT, mean ferritin and transfusion dose density (TDD) were determined. Survival was evaluated by TSAT and ferritin (<50%, 50-80%, >80%), (≤500 µg/L, 501-800 µg/L, >800 µg/L). In 718 patients, median age was 74 years; 12%, 31%, 29%, 15% and 13% were IPSS-R very low, low, intermediate, high and very high. TSAT and ferritin were moderately correlated (r=0.63, P<0.0001). TSAT increased over time in transfusion-dependent patients (P=0.006). Higher TSAT and ferritin were associated with inferior 5-year overall (OS), progression-free (PFS), and leukemia-free survival (LFS) (P≤0.008) and higher TDD with inferior 5-year OS. TSAT >80% trended with inferior cardiac death-free survival (P=0.053). In univariate analysis, age, IPSS-R, blast percentage by Eastern Cooperative Oncology Group Performance Status, frailty, Charlson Comorbidity Index, iron chelation (Y/N), TDD, TSAT and ferritin were significantly associated with inferior OS. By multivariable analysis, TSAT >80% (P=0.007) remained significant for OS (R2 30.3%). In MDS, TSAT >80% and ferritin >800 µg/L portended inferior OS, PFS and LFS. TSAT may indicate the presence of oxidative stress, and is readily measurable in a clinical setting. The relationship between TSAT and cardiac death-free survival warrants further study.
Introduction
Myelodysplastic syndromes (MDS) are clonal disorders of ineffective erythropoiesis leading to peripheral blood cytopenias and an increased risk of progression to acute myeloid leukemia (AML). Red blood cell (RBC) transfusion remains a cornerstone of supportive care. RBC transfusion dependence is an independent prognostic factor associated with inferior overall survival (OS) in MDS,1-3 and higher transfusion dose density (TDD) is associated with inferior progression-free survival (PFS).4 However, the relative contributions of underlying disease biology versus trans-
fusion-driven iron toxicity are areas of active investigation. Compared to patients with transfusion-dependent (TD) hemoglobinopathies, MDS patients have shorter life expectancies and thus may be less likely to manifest organ damage from iron overload (IO).5 Rather, it has been hypothesized that IO may lead to oxidative stress6 which further impairs hematopoiesis,7 accelerates mutagenesis and results in progressive marrow failure leading to disease progression and death.4
Serum ferritin level above 1,000 µg/L is associated with increased mortality in MDS.1 However, underlying inflammation confounds interpretation of ferritin, rendering it
Haematologica | 108 February 2023 532 ARTICLE - Myelodysplastic Syndromes
an imperfect metric of true IO. Elevated levels of oxidatively damaging non-transferrin bound iron (NTBI) and labile plasma iron (LPI) correlate with transferrin saturation (TSAT) >70% and >80% respectively,5,8 but NTBI and LPI assays are not readily available and lack international standardization. The trajectory of TSAT in MDS patients, and its association with clinical outcomes has not been defined.
Using the Canadian MDS registry, we aimed to describe trends in TSAT, and to determine if elevated TSAT correlates with ferritin level, and/or predicts for clinical outcomes in MDS.
Methods
Patients
This was a prospective observational study using the Canadian National MDS registry, which captures detailed disease and patient-related characteristics of MDS patients from 15 Canadian centers. Registry details have been described previously.9 Briefly, the registry enrolled patients with MDS, chronic myelomonocytic leukemia (CMML), and low blast count AML with MDS-related changes, within 1 year of diagnosis. Patients were evaluated every 3-6 months until death, loss to follow-up, or withdrawal of consent. We conducted this study with over 11.5 years of prospectively-collected patient data. All patients provided consent to participate, and the registry was approved by the research ethics boards of participating institutions.
Temporal trends in iron parameters
Trends in iron parameters were evaluated among timevarying transfusion dependent (TD) and transfusion-independent (TI) patients, where transfusion-dependence was determined at 6-month intervals. TSAT was calculated as serum iron/total iron binding capacity (TIBC). Mean values of ferritin and TSAT were calculated every 6 months, including values from 3 months prior to and following that visit. If a patient had multiple measurements during each time window, the average was calculated. Natural logarithm transformation was applied for normalizing the distribution of ferritin data by the Shapiro-Wilk normality test. Linear regression was used to evaluate a correlation between ferritin and TSAT. Linear mixed model analysis with repeated measures per subject was used to evaluate changes in ferritin and TSAT over time from enrollment up to 42 months.
Transfusion density
Transfusion dependence was defined as a minimum of one unit per 8 weeks for a duration lasting ≥16 weeks.10 Among TD patients, time-varying TDD was defined as the total number of units transfused per month since the date
of first transfusion. Median TDD for all TD patients was calculated at landmark year 1. Patients who died before 1 year were excluded from this analysis. “Low-TDD” and “High-TDD” were defined as below or above the median. For comparison, a parallel survival analysis was done in which TDD was defined by the revised International Working Group (IWG) criteria of low (≥0.75-<2 units/month) and high (≥2 units/month) transfusion burden.11 Each patient was categorized as TI, low-TDD or high-TDD at sequential 6-month intervals. In order to compare characteristics among the three transfusion groups, a Kruskal-Wallis nonparametric test for continuous variables, and a Fisher exact test or Chi-squared test was applied for categorical variables. A P value of <0.05 was considered statistically significant.
Clinical outcomes
Progression was defined as death or progression to AML. Those with AML at diagnosis by contemporary definitions (20-30% blasts) were excluded from progression-free (PFS) and leukemia-free survival (LFS) analyses. OS, PFS, LFS, cardiac death-free survival (CDFS) and cumulative incidence of death from infection were each evaluated by TDD (TI, low-TDD and high-TDD), TSAT category (<50%, 5080%, >80%), and ferritin category (≤500 µg/L, 501-800 µg/L, >800 µg/L). A patient’s TSAT and ferritin were calculated using the mean of all values from enrolment onwards, provided there had been ≥6 months of follow-up. OS analyses used only those patients surviving ≥1 year, whereas PFS and LFS were calculated in all patients from enrolment. Log-rank tests were used to detect differences in OS, PFS, LFS and CDFS, and Gray’s test was used to detect differences in cumulative incidence of infectious death. All analyses were repeated among lower risk (Revised International Prognostic Scoring System [IPSS-R] very low, low and intermediate) and higher risk (IPSS-R high or very high) patients separately. Univariate and multivariable (MVA) Cox proportional hazards analyses identified variables with a significant impact on OS.
Results
Patient characteristics
Seven hundred and eighteen patients were included. Patient characteristics are listed in Table 1. Median age was 74 years. Collectively, 67% were IPSS-R very low, low or intermediate risk. With a median follow-up of 2.1 years, actuarial OS was 2.7 years (95% confidence interval [CI]: 2.4-3.2). Seventeen percent developed AML and 61% have died. Fifty-six percent had at least one infection, and 7% had a cardiac event leading to hospital admission or death. Among 363 patients for whom cause of death was known, AML, MDS progression, infection, cardiac events,
Haematologica | 108 February 2023 533 ARTICLE - Transferrin saturation predicts survival in MDS J. Teichman et al.
Table 1. Characteristics of 718 myelodysplastic syndrome patients from the Canadian MDS Registry.
Characteristics
TOTAL (N=718)
Median age in years (IQR) 74 (67-80)
Median time from diagnosis to enrolment in months (IQR) 3.7 (1.2-13.9)
Male sex, N (%) 453 (63.3)
ECOG performance status, N (%) 0 1 2 3 4
Diagnosis type, N (%)
299 (42.1) 341 (48.0) 62 (8.7) 8 (1.1) 1 (0.1)
Primary Secondary 651 (91.2) 63 (8.8)
WHO subtype, N (%) MDS-MLD
MDS-MPN, CMML-0, CMML-1 OR CMML2 MDS-EB1 MDS-EB2 MDS-RS-SLD MDS-SLD
Secondary AML, AML (previously RAEBT), T-AML Isolated del5q MDS-RS-MLD MDS-MPN-RS-T MDS-U Unknown
Transfusion, N (%)
203 (28.3) 87 (12.1) 80 (11.1) 81 (11.3) 63 (8.8) 50 (7.0) 35 (4.9) 34 (4.7) 35 (4.9) 9 (1.3) 36 (5.0) 5 (0.7)
TI TD 500 (69.6) 218 (30.4)
IPSS-R categories, N (%) Very low Low Int High Very high Unknown
81 (11.3) 210 (29.2) 192 (26.7) 102 (14.2) 84 (11.7) 49 (6.8)
Median blasts, n=714, % (IQR) 3.0 (1.5-6.0)
Ring sideroblasts ≥15, N (%) 197 (27.4)
Iron chelation treatment (yes) (n=718), N (%)
Among survivors (n=277), N (%) Among non-survivors (n=383), N (%)
95 (13.2) 37 (13.4) 58 (13.2)
Median duration iron chelation in months (IQR) (n=95) 15.4 (3.7-37.3)
Median ferritin at enrolment, mg/L (IQR) (n=718) 443.0 (182.0-1,004.0)
Ferritin categories at enrolment, mg/L (%)
≤500 501-800 >800
Median TSAT at enrolment (n=718), N in % (IQR)
Median TSAT over time in patients ever on ict, N (range)
Median TSAT over time in patients never on ict, N (range)
Comordbidities at enrollent, total n=718, N (%)
Diabetes
Myocardial infarction
Congestive heart failure
Cerebrovasular disease
Valvular heart disease
Dementia
Chronic pulmonary disease
Moderate-severe renal disease
Lymphoma or other solid tumour
Deep vein thrombosis/pulmonary embolism
383 (53.3) 112 (15.6) 223 (31.1)
43 (28-65) 64 (45-91) 41 (27-64)
107 (14.9) 40 (7.0) 22 (3.9) 41 (7.2) 29 (5.1) 11 (1.9) 66 (9.2) 25 (4.4) 94 (13.1) 17 (3.0)
MDS: myelodysplastic syndrome; IQR: interquartile range; ECOG: Eastern Cooperative Oncology Group; WHO: World Health Organization; INT: intermediate; TI: transfusion-independent; TD: transfusion-dependent; IPSS-R: International Prognostic Scoring System- Revised; TSAT: transferrin saturation; ICT: iron chelation therapy.
Haematologica | 108 February 2023 534 ARTICLE - Transferrin saturation predicts survival in MDS J. Teichman et al.
and bleeding accounted for 26%, 20%, 19%, 9.6% and 6.3% of causes, respectively. Among those with infection, pulmonary was the most common source.
Transfusion dose density
Among 500 patients who were TI at baseline, 107 (14.9%) became TD, at a median time to onset of 3.4 months. Among 545 patients who survived ≥1 year, the median TDD at landmark year 1 was 2.74 units/month (interquartile range [IQR], 1.47-4.11). Thus, low-TDD was defined as ≥1 unit/8 weeks but <2.7 units/month, and high-TDD as ≥2.7 units/month. Transfusion density was significantly associated with IPSS-R category (P<0.0001) but not with age, sex, MDS subtype or cytogenetic risk group (Online Supplementary Table S1). The proportion that were TD remained stable over time in all patients (P=0.53) and in the subset with an IPSS-R score of ≤4.5 (P=0.73) but increased from enrollment up to 42 months in those with a IPSS-R score >4.5 (P=0.16) (data not shown).
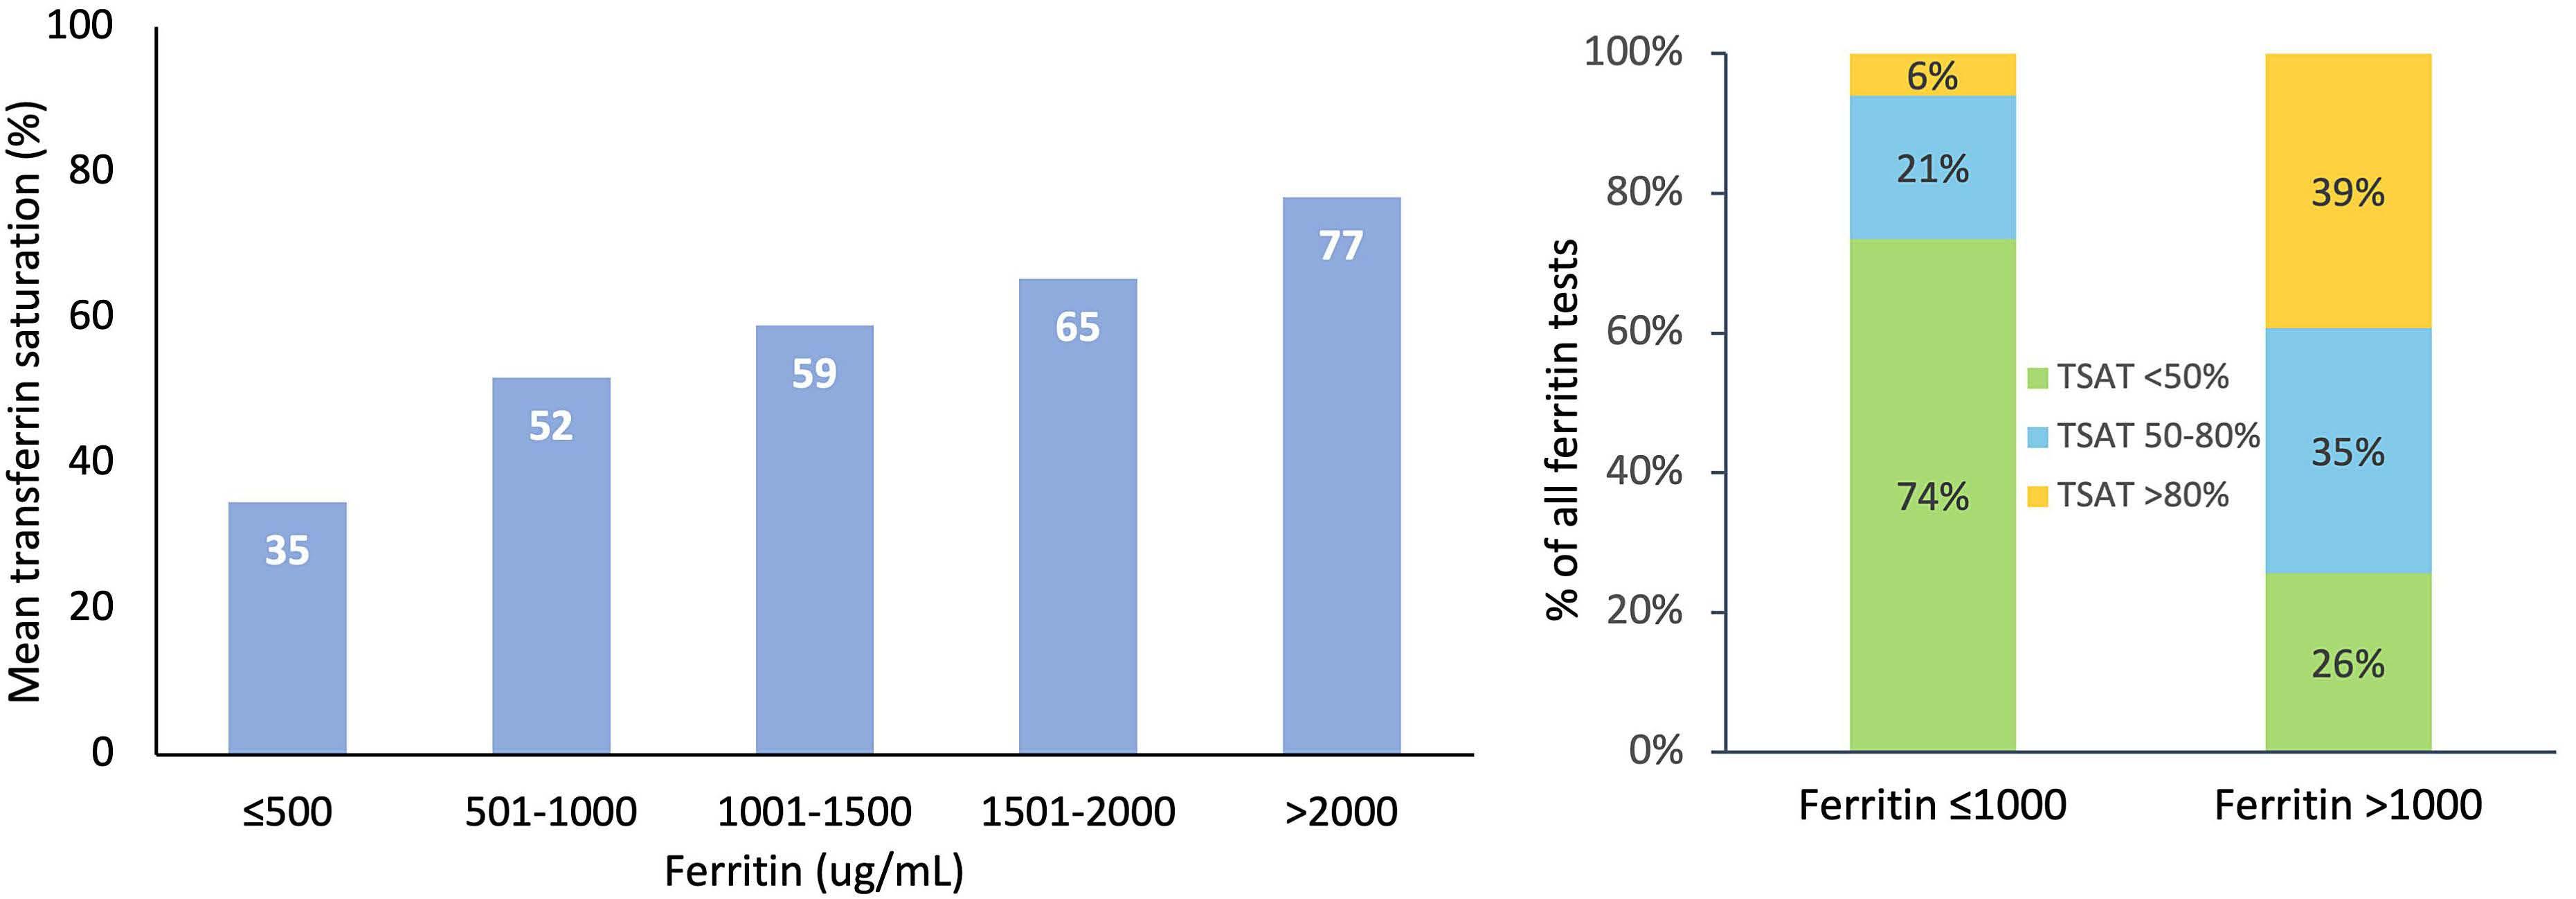
Correlation of transferrin saturation and ferritin
Ferritin and TSAT were only moderately correlated (r=0.63, P<0.0001) across all patients regardless of transfusion dependence. Moderate correlations were also found among time-varying TD (r=0.61) and TI patients (r=0.56). Similarly, mean TSAT increased with incremental ferritin category (Figure 1A). Among 1,657 ferritin levels ≤1,000 µg/L, 6%, 21% and 74% were associated with TSAT >80%, 50-80% and <50%. Conversely, among 680 ferritin levels ≥1,000 µg/L, 39%, 35% and 26% were associated with TSAT >80%, 50-80% and <50% (Figure 1B).
Temporal trends in transferrin saturation and ferritin
Ferritin increased from enrolment to 42 months in all patients (P<0.0001), time-varying TD (P<0.0001) and TI pa-
tients (P<0.0001). Conversely, TSAT remained stable over time in all patients (P=0.094) and time-varying TI patients (P=0.98) but increased in TD patients (P=0.006) (Figure 2).
Survival outcomes among transferrin saturation, ferritin and transfusion density groups
Higher TDD at landmark year 1 was associated with inferior OS (Figure 3), with a 5-year OS of 52%, 44% and 25% among those who were TI, low-TDD and high-TDD, respectively (P<0.0001). OS curves were similar using revised IWG definitions of low and high transfusion burden, with the exception of low-TDD patients where 5-year OS was 33% (95% CI: 22-50) (Online Supplementary Figure S1). When lower and higher risk patients were analyzed separately, higher TDD was associated with inferior OS in lower but not higher risk patients (Online Supplementary Figure S2).
Higher mean TSAT and ferritin were each associated with inferior OS, PFS and LFS (Figure 4). Five-year OS was 46%, 43% and 17% among patients with a mean TSAT <50%, 5080% and >80% respectively (P=0.001), and was 49%, 47% and 32% among patients with ferritin ≤500 µg/L, 501-800 µg/L and >800 µg/L, respectively (P=0.003). Among patients with a mean ferritin >800 µg/L, stratifying by TSAT ≤80% versus >80% further discriminated differences in 5year OS (P=0.014), and this was also seen when lower (P=0.030) and higher risk (P=0.046) patients were analyzed separately. Higher TSAT was associated with inferior OS in lower risk patients (P=0.003), with a trend toward significance in higher risk patients (P=0.16) (Online Supplementary Figure S3). Conversely, an association with inferior PFS and LFS was seen only in higher risk patients (P=0.005 and P=0.031, respectively) (Online Supplementary Figure S4). Ferritin was only associated with inferior OS, PFS and LFS among lower risk patients (P=0.003, P=0.024,
B
Figure 1. Correlations between transferrin saturation and ferritin across all patients regardless of transfusion status, collected from enrolment up to 42 months. (A) Mean transferrin saturation (TSAT) increased with incremental ferritin category (B) TSAT stratified by by ferritin category. Only 39% of all ferritins >1,000 µg/L were associated with a TSAT of >80%.
A
Haematologica | 108 February 2023 535 ARTICLE - Transferrin saturation predicts survival in MDS J. Teichman et al.
Figure 2. Temporal trends in transferrin saturation and ferritin among 718 patients with myelodysplastic syndromes. The stacked bar plots are showing the proportions of patients with ferritin ≤500, 501-800 and >800µg/L, and the proportions of patients with transferrin saturation (TSAT) <50%, 50-80%, and >80% at 6-month intervals from enrolment up to 42 months in all patients, in time-varying transfusion-dependent and in time-varying transfusion-independent patients, where transfusion dependence was determined at sequential 6-month intervals.
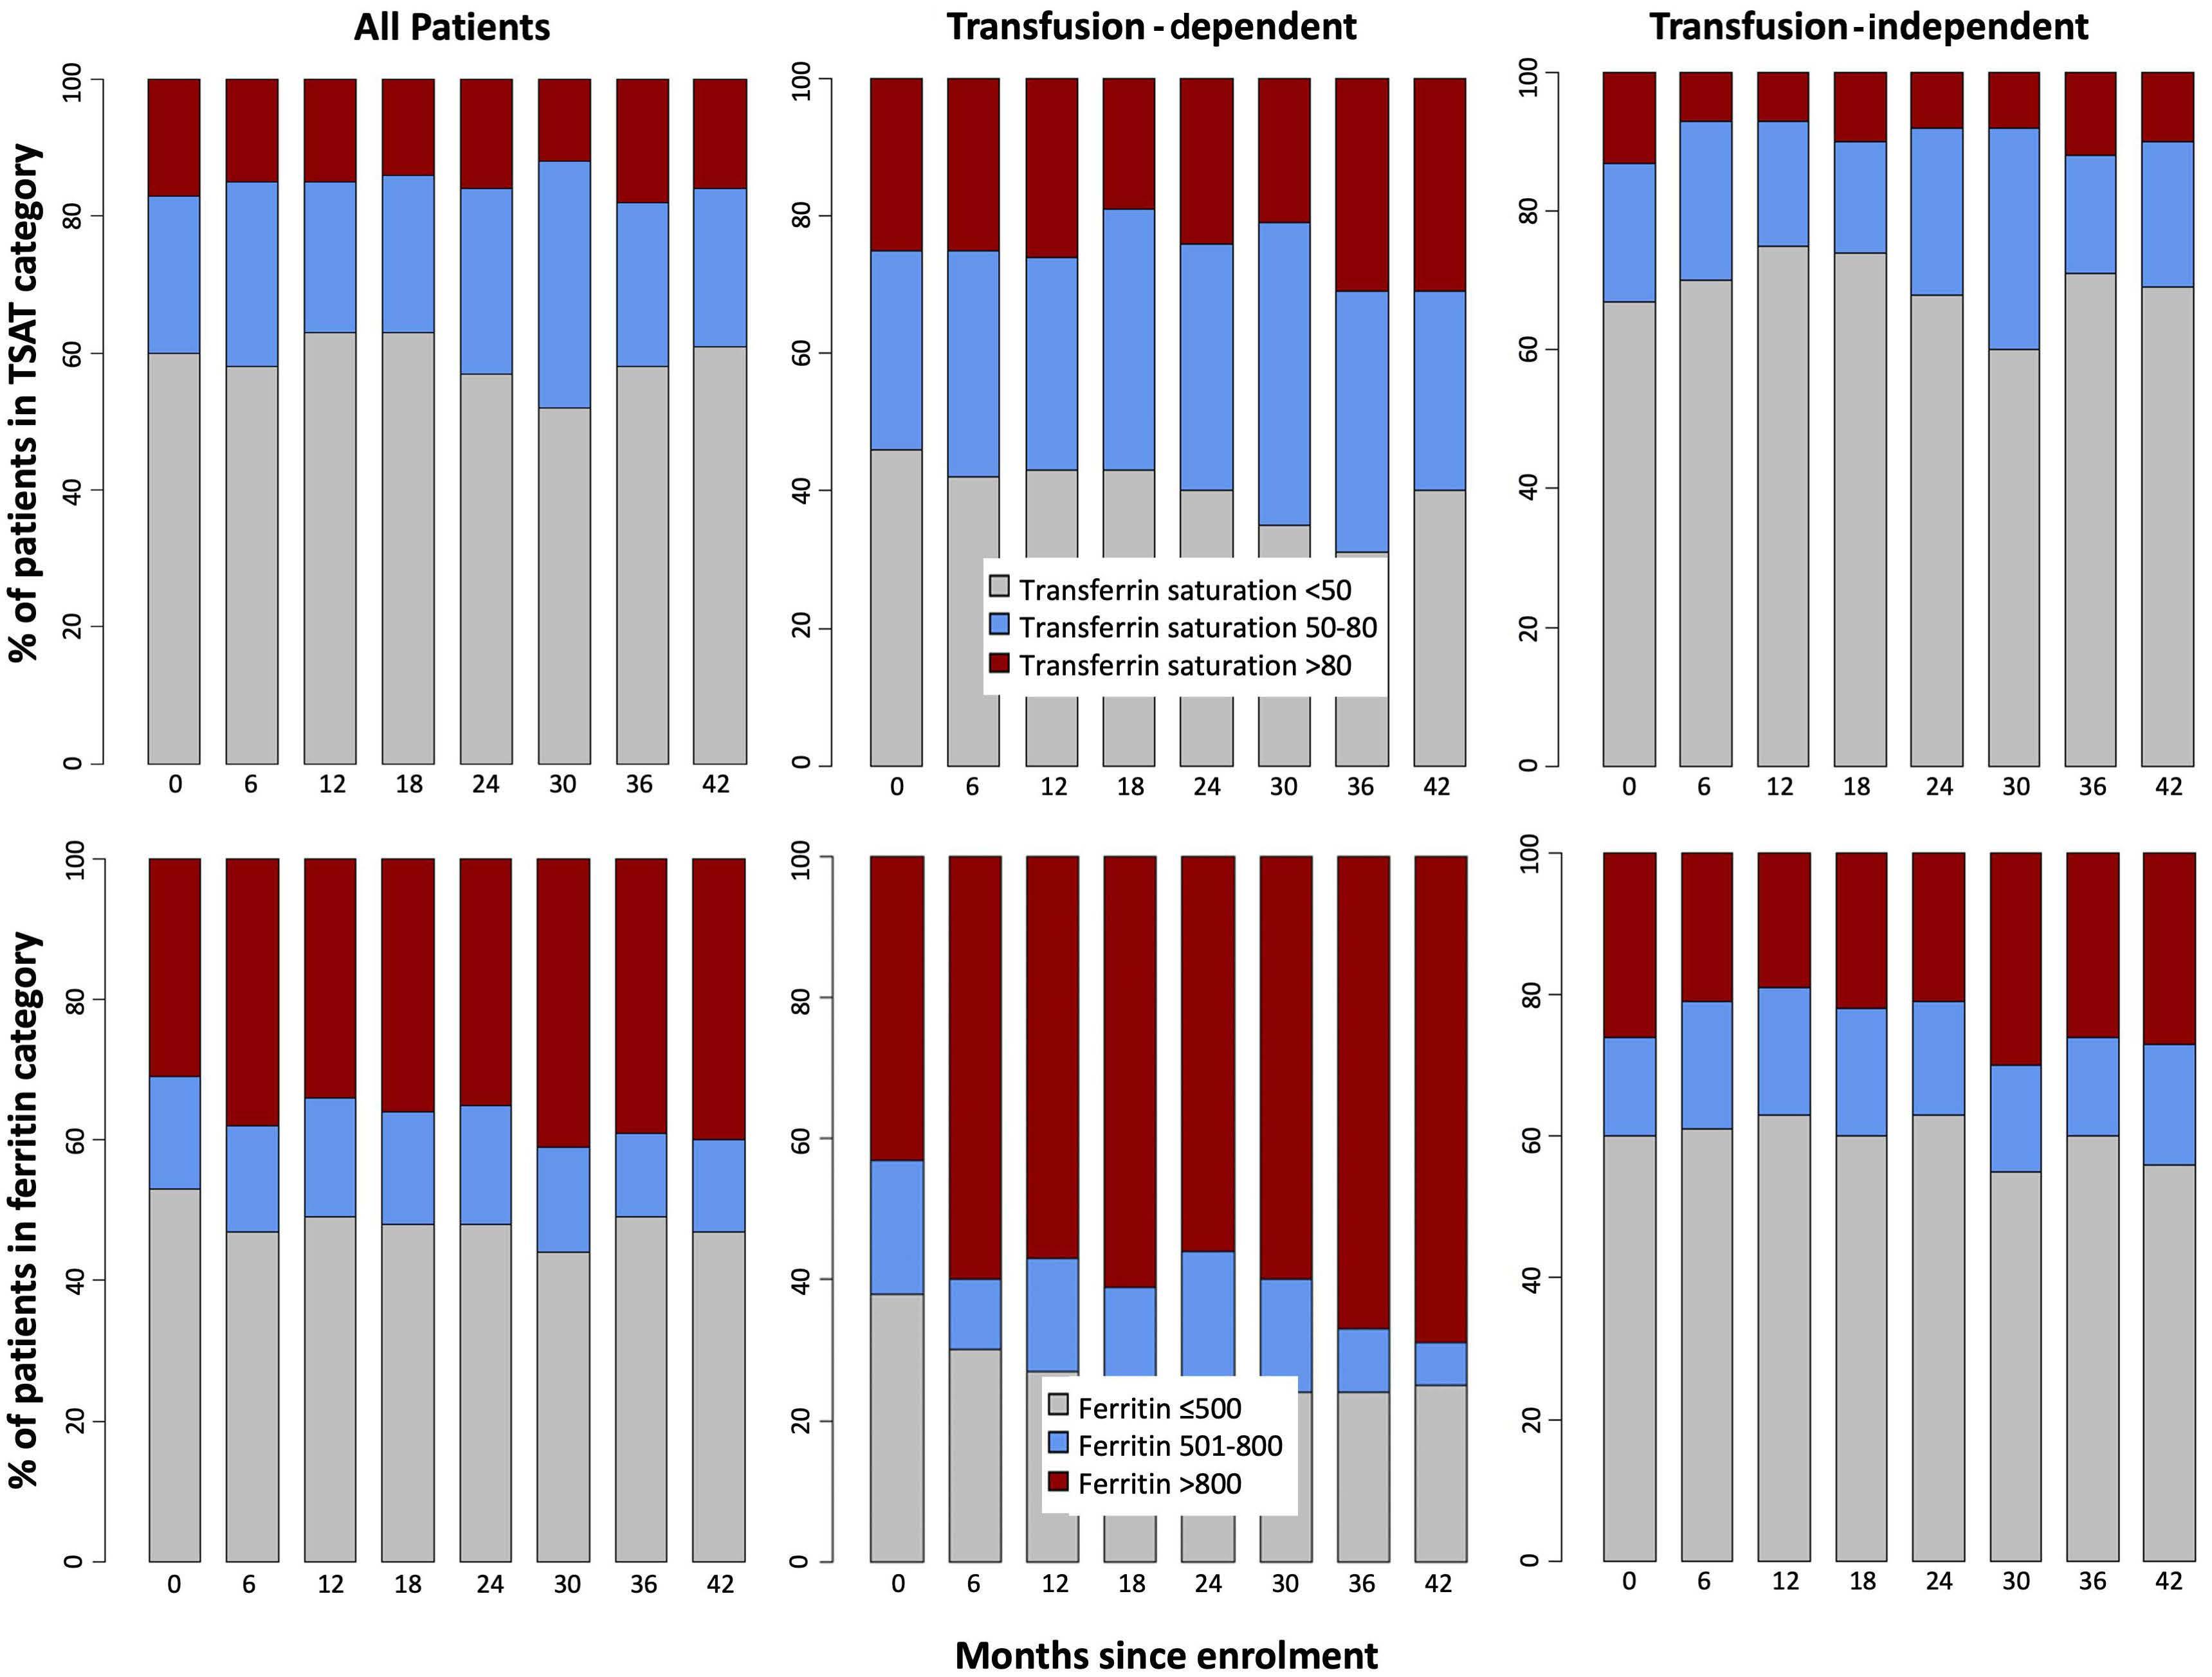
P=0.018 respectively).
Because iron chelation therapy (ICT) can affect measurement of TSAT, we assessed the impact of TSAT on survival according to chelation status (ever vs. never). 13.4% of patients received ICT. The median duration of ICT was 15.4 months (IQR, 3.7-37.3). Higher mean TSAT maintained a statistically significant association with inferior OS (P=0.017), although ICT attenuated this effect both in patients with mean TSAT 50-80% and >80% (Figure 5). A similar attenuating effect of ICT was seen on PFS and LFS (Online Supplementary Figure S5).
Cardiac events resulting in death occurred in 52 patients. Mean TSAT >80% showed a borderline association with inferior CDFS (P=0.053). When looking only at patients who were already TD at enrolment, mean TSAT (P=0.001) but not ferritin (P=0.52) was significantly associated with inferior CDFS (Figure 6A and B).
Seventy patients died from infection at a median of 2 years from enrolment. Ferritin >800 mg/L was associated
with cumulative incidence of infectious death (P=0.021), however TSAT category was not (Online Supplementary Figure S6).
Impact of covariates
By univariate analysis, age, IPSS-R, blast percentage, Eastern Cooperative Oncology Group Performance Status (ECOG), frailty score, Charlson Comorbidity Index, not receiving ICT, TDD, TSAT and ferritin categories were significantly associated with inferior OS (Online Supplementary Table S2). In two MVA models with nearly identical R2 values, TSAT emerged as an independent predictor of OS after adjusting for signi ficant covariates (age, IPSS-R, frailty, Charlson Comorbidity Index and receipt of ICT), however either ferritin or TDD fell out of each model. We then tested the Spearman correlations between each of these three covariates as continuous variables. Ferritin was the most redundant variable, again correlating moderately with TSAT (r=0.64, P<0.0001) and TDD (r=0.46,
Haematologica | 108 February 2023 536 ARTICLE - Transferrin saturation predicts survival in MDS J. Teichman et al.
Figure 3. Overall survival of myelodysplastic syndrome patients. Higher transfusion dose density (TDD) at landmark year 1 is associated with inferior overall survival among all myelodysplastic syndrome patients.
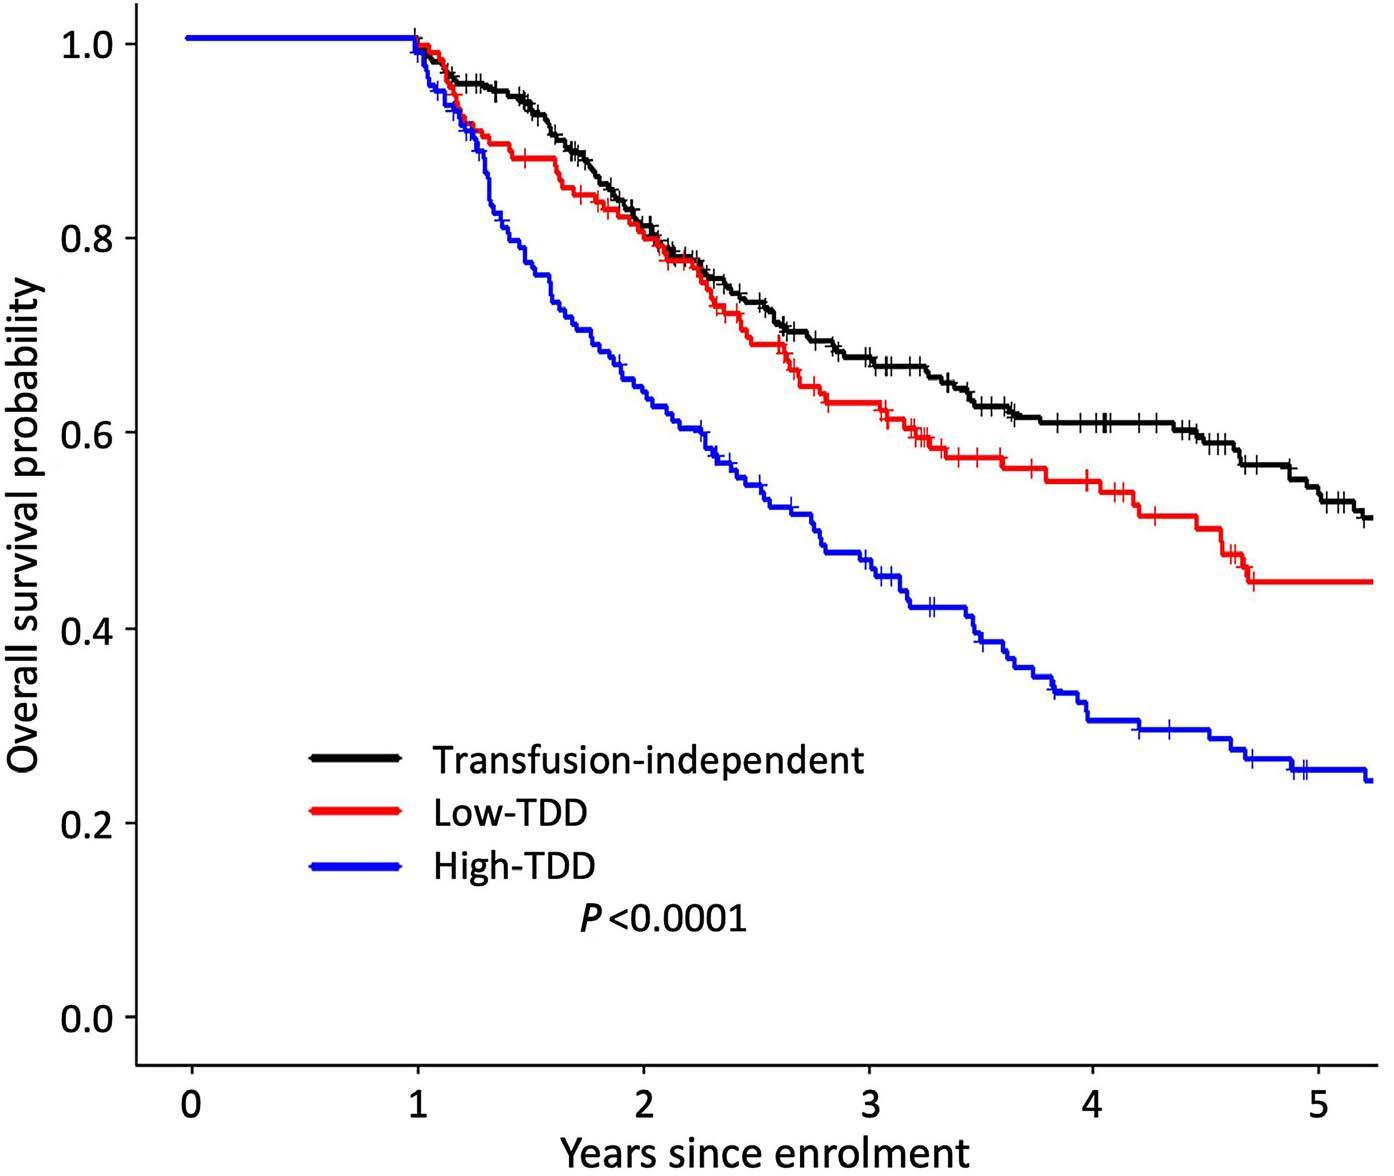
P<0.0001), while TSAT correlated weakly with TDD (r=0.37, P<0.0001).
Discussion
In this retrospective analysis of a large prospectively collected cohort of MDS patients, higher mean TSAT and mean ferritin were each associated with inferior OS, PFS and LFS. The impact of IO on clinical outcomes was not restricted to lower risk patients, as demonstrated by the impact of TSAT on PFS and LFS in higher risk patients. However, TSAT correlated only moderately with ferritin, and unlike ferritin, remained stable over time in TI patients, suggesting that TSAT may be a more appropriate marker of total body iron in MDS patients.
The importance of identifying clinically significant biomarkers of iron toxicity in MDS is well-accepted. Data from the EUMDS registry showed that LPI levels correlate strongly with TSAT, with a threshold effect seen above a TSAT of 80%, and are associated with inferior survival in lower risk MDS.5 A weaker correlation5 or no correlation8 was found between ferritin and LPI. TSAT is a much more readily available, standardized and cost-effective iron parameter in the clinical setting than LPI. In comparing temporal trends of iron parameters, TSAT increased over time only in TD patients. This is consistent with data from the EUMDS registry and suggests that elevated TSAT is specific for transfusional IO.5 Conversely, ferritin increased over time in all subgroups including TI patients, emphasizing its role as a biomarker of inflammatory processes beyond transfusional IO. Ineffective erythropoiesis (IE) may contribute to the elevated ferritin in TI patients, particularly those with ring sideroblasts (MDSRS).5 However, the stability of TSAT among TI patients ar-
gues against IE as the main driver of ferritin (as a surrogate of iron overload) in TI patients.
The development of transfusion dependence in MDS is associated with inferior OS,3 and ICT is associated with improved OS12 after adjusting for IPSS-R, a finding that we recapitulated in our MVA. In fact, the World Health Organization-based prognostic scoring system (WPSS) incorporated transfusion dependence as an independent prognostic factor for OS and LFS.10 Higher TDD is associated with poor OS,1,2 PFS4 and LFS1,13 albeit in heterogeneous MDS populations; the association of TDD with PFS was recently shown among low risk MDS patients.4 We expand this to include an impact on OS in lower risk MDS. We also provide clinically significant TDD thresholds that predict for inferior OS.
The median TDD in this study, 2.7 units/month, was higher than that reported in the European MDS Registry (EUMDS) registry (0.87 units/month)4 likely due to the inclusion of higher risk patients in our cohort, and a TDD definition in the EUMDS registry that divided the number of transfused units over a longer time interval. When we repeated our analysis using the 2018 IWG criteria11 of low (≥0.75-<2 units/month) and high (≥2 units/month) TDD, we found that OS was also inferior in low-TDD patients. While the optimal definition of low-TDD requires further clarification, it is clear that any amount of transfusion dependence associates with inferior outcomes.
We demonstrated that higher TSAT and ferritin are associated with inferior OS, PFS and LFS. Higher TSAT was associated with reduced survival, particularly among lower-risk patients but with a compelling trend toward significance among higher-risk patients. These findings contrast with data from both the EUMDS and Piedmont registries. The Piedmont data used TSAT levels at baseline only.14 The EUMDS authors found no adverse impact of
Haematologica | 108 February 2023 537 ARTICLE - Transferrin saturation predicts survival in MDS J. Teichman et al.
Figure 4. Higher mean transferrin saturation and ferritin are associated with inferior overall survival, progression-free survival and leukemia-free survival. Among those with a mean ferritin >800 µg/L, stratifying by transferrin saturation (TSAT) category further discriminated differences in overall survival (OS) (P=0.014) (dotted inlay). Total numbers of patients at time zero in the black, red and blue groups, respectively, were as follows: 302, 188 and 55 for OS analyses by TSAT category; 248, 100 and 197 for OS by ferritin category; 391, 237 and 90 for progression-free survival and leukemia-free survival by TSAT category; 309, 119, and 290 for progression-free survival and leukemia-free survival by ferritin category.
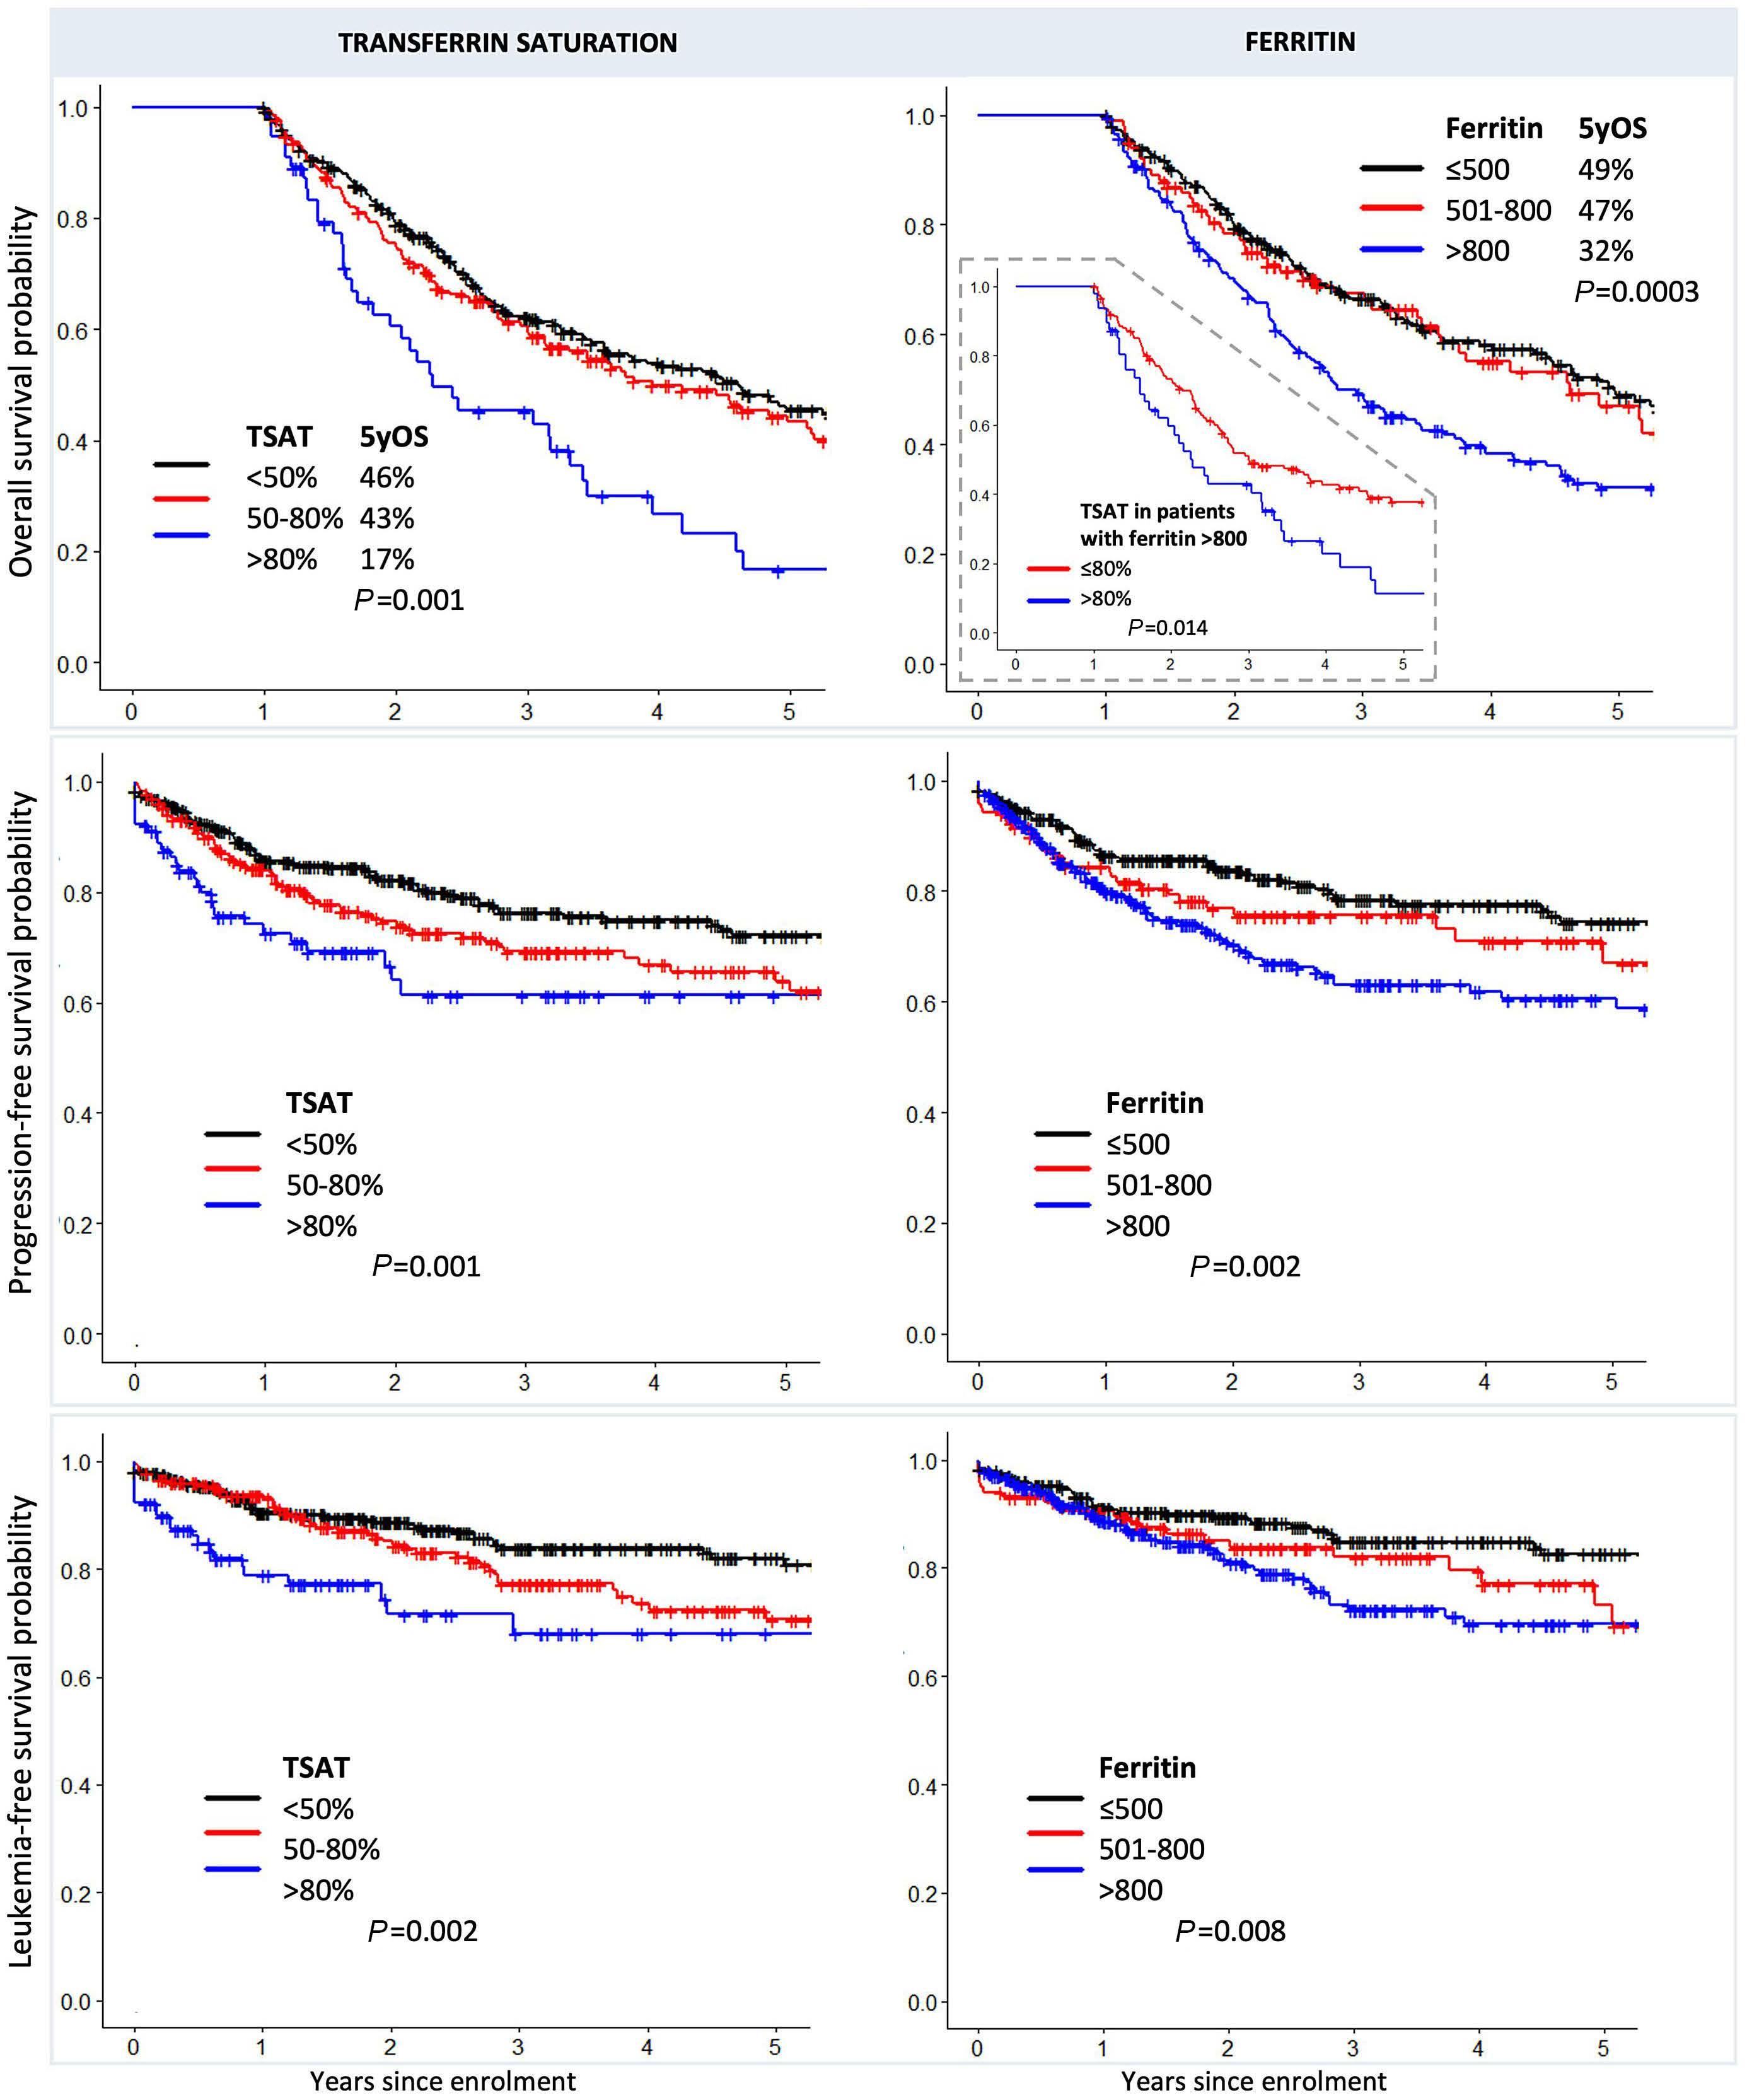
TSAT on PFS after adjusting for age, IPSS-R, receipt of erythropoietin-stimulating agents, and ring sideroblast status. They concluded that TSAT should be used as a screening test to identify patients at risk of elevated LPI.5 The EUMDS cohort was small (n=100), restricted to pa-
tients with lower risk MDS, and defined TSAT as a timevarying covariate (<80% or ≥80%) at each six monthly visit. In our cohort of 718 patients, those with a mean TSAT ≥80% would have had a longer duration of TSAT elevation, and may therefore have been more likely to manifest clini-
Haematologica | 108 February 2023 538 ARTICLE - Transferrin saturation predicts survival in MDS J. Teichman et al.
cal sequelae of IO.
Previous work from Malcovati et al. demonstrated that ferritin ≥1,000 µg/L adversely impacts OS after adjusting for TDD, with a hazard ratio of 1.36 for every 500 µg/L above 1,000 µg/L.1 This effect was not statistically significant among higher risk MDS subtypes. Data from the Piedmont registry similarly showed inferior OS with a baseline ferritin >800 µg/L among lower but not higher risk patients.14 Our ferritin data are in agreement with these. Malcovati et al. posited that only patients with lower risk MDS subtypes survived long enough to manifest the sequelae of tissue IO. The compelling association between TSAT >80% and inferior OS in our higher risk patients argues against this. Furthermore, that ferritin and TDD were interchangeable in our MVA after adjusting for TSAT suggests that both metrics are influenced by the degree of underlying bone marrow failure. Thus, while ferritin appears to be an adequate marker of IO in lower risk disease, it may be confounded by worsening bone marrow failure, infections and inflammation in higher risk patients. That higher TSAT also associates with inferior PFS and LFS, particularly in higher risk patients, supports the hypothesis that LPI may drive mutagenesis, progressive bone marrow failure and progression to leukemia. Preclinical and translational evidence of the impact of IO on DNA mutation rates, error-prone DNA repair, loss of hematopoietic stem cell quiescence and bone marrow failure is extensive, and has been reviewed elsewhere.15 Higher risk patients may be particularly vulnerable,16 possibly due to a higher burden of clonal complexity and/or chromosomal instability compared to lower risk patients. Cardiac disease is a leading cause of death in MDS.17,18 The rate of cardiac death in this study was remarkably similar
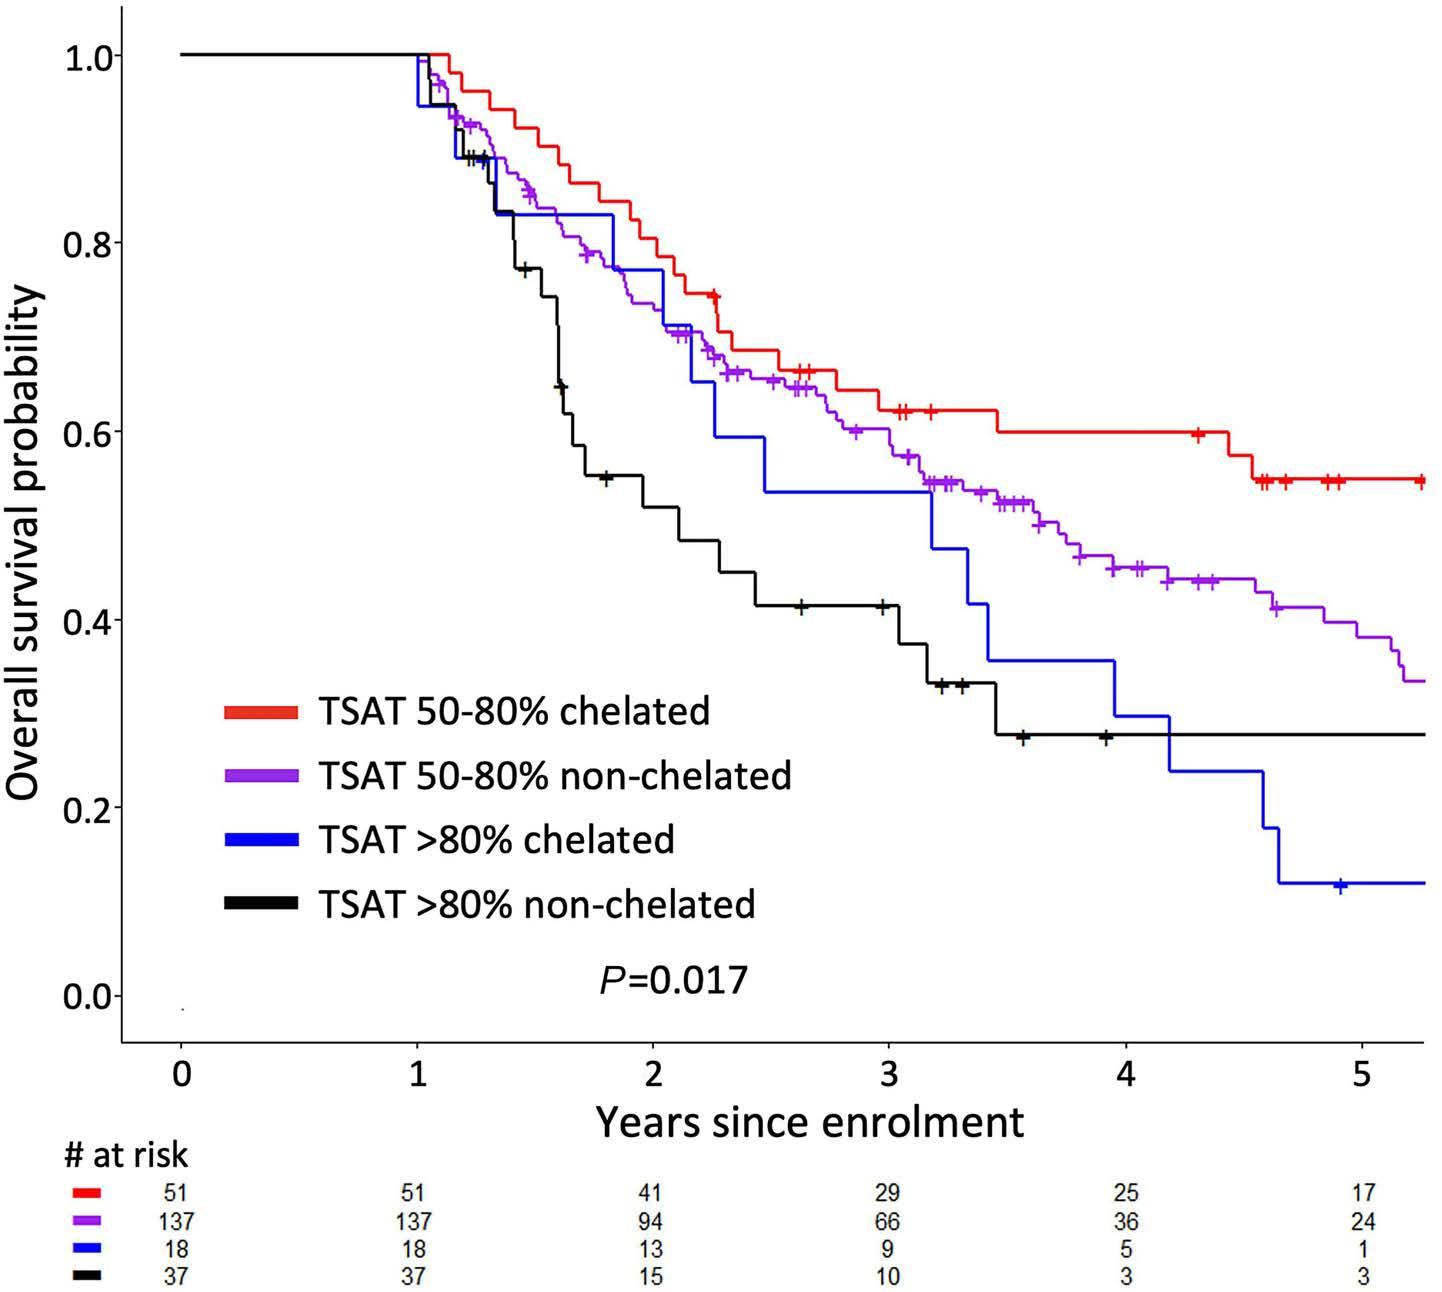
to that reported elsewhere.18 Clonal hematopoiesis may contribute to accelerated cardiovascular disease via increased inflammatory markers.19 IO may also contribute; cardiomyocytes rely heavily on mitochochondrial activity, which is particularly susceptible to iron-driven oxidative damage.15 Transfused chelated MDS patients have a delayed time to cardiac event20 and a trend toward fewer cardiac conditions compared to their non-chelated counterparts.21 In the randomized placebo-controlled TELESTO trial, worsening cardiac function and cardiac death were less common with ICT, albeit with small sample sizes.22 We found that while ferritin >800 µg/L did not predict CDFS (P=0.90), TSAT >80% showed a trend towards significance (P=0.053). Interestingly, TSAT and CDFS were associated in patients who were TD at baseline, suggesting that a prolonged duration of transfusions is required to accumulate clinically meaningful cardiac iron and/or oxidative damage to cardiomyocytes. Alternatively, baseline TD patients may have a higher burden of clonal hematopoiesis contributing to earlier cardiovascular disease. That ferritin was not associated with CDFS may be related to the threshold used, as ferritin >3,000 µg/L is associated with an increased risk of cardiac disease or death in another report of primarily lower risk TD patients.23 Overall, our CDFS findings are hypothesis-generating, and should be interpreted with caution given the limited sample size in this analysis. Preclinical data suggest that IO may increase the risk of infections, possibly through functional impairment of neutrophils, macrophages and natural killer cells.24-27 Clinical studies in MDS support this; higher rates of infection are reported among TD versus TI patients,28 and ICT may prolong the time to first infection among transfused lower
Figure 5. The effect of iron chelation therapy (ever vs. never). Iron chelating therapy has an attenuating effect on the adverse prognostic impact of a higher transferrin saturation (TSAT) in both intermediate (TSAT 50-80%) and high (TSAT >80%) groups, although sample sizes were limited in the tails of the Kaplan Meier survival curves.
Haematologica | 108 February 2023 539 ARTICLE - Transferrin saturation predicts survival in MDS J. Teichman et al.
Figure 6. Cardiac death-free survival. Among patients who were transfusion-dependent at enrollment, higher mean transferrin saturation (TSAT) was associated with inferior cardiac death-free survival (A), but higher mean ferritin was not (B). Total numbers of patients at time zero in the black, red and blue groups were 75, 107 and 36 for the analysis by TSAT, and 48, 31 and 139 for the ferritin analysis, respectively.
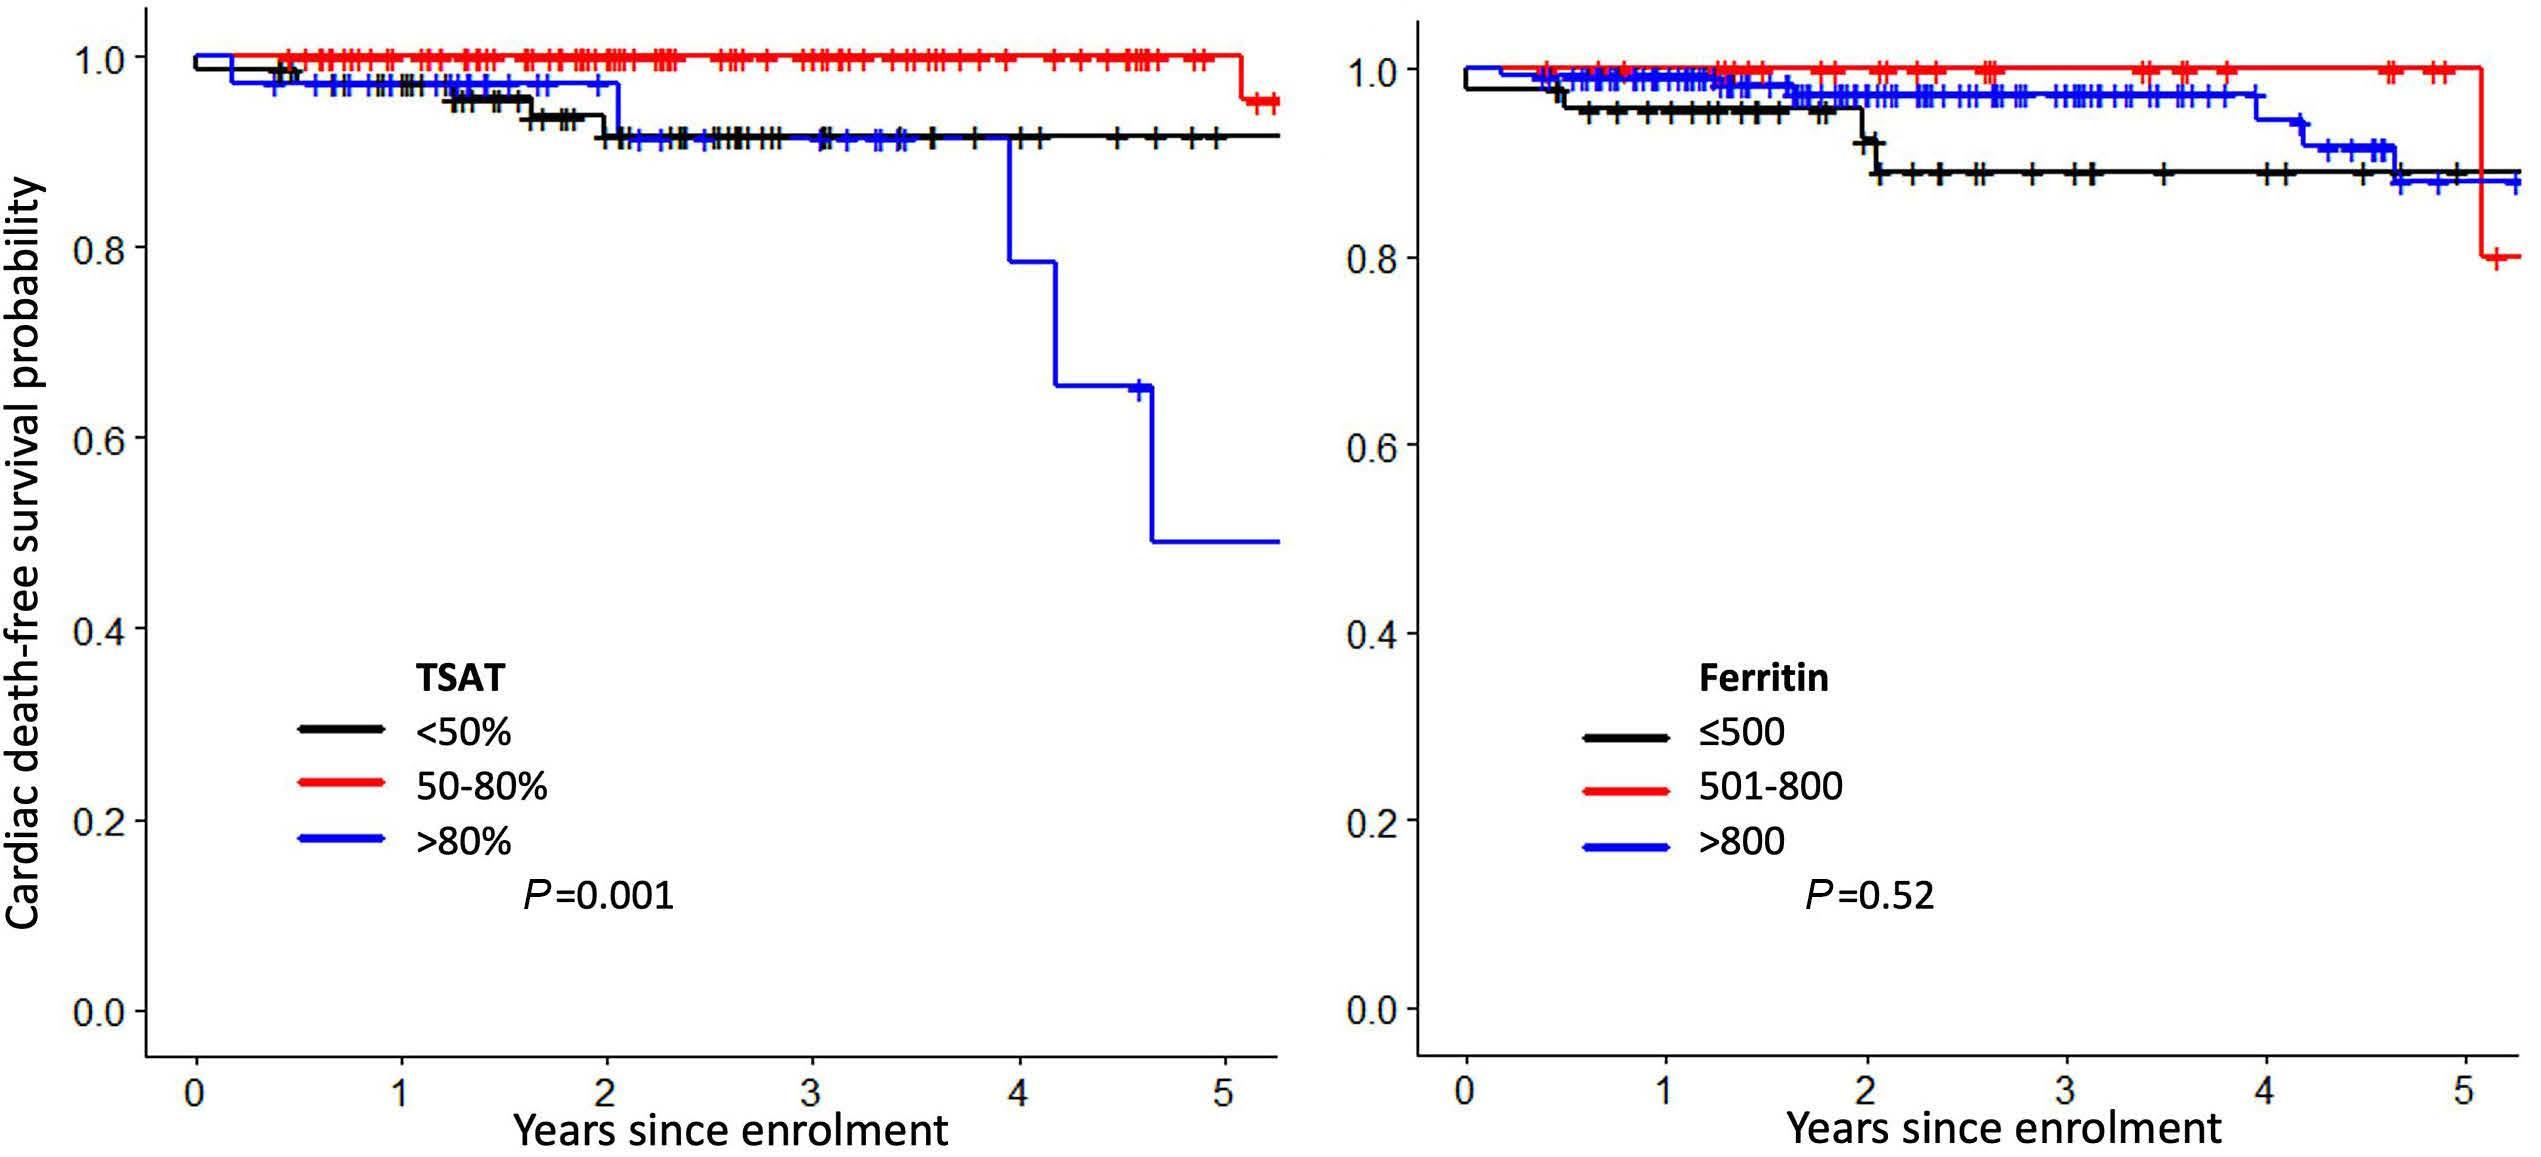
risk patients.29 Elevated ferritin and baseline LPI are risk factors for infection following hematopoietic stem cell transplantation for hematologic disorders.30-35 Furthermore, NTBI and LPI promote bacterial and fungal growth in the sera of such patients.36,37 In the latter study, elevated LPI and fungal growth in vitro were associated with a TSAT >75%.37 We demonstrated an association between elevated ferritin and infectious death in MDS. Higher TSAT, however, did not show an association, suggesting that, at least in the most severe infections leading to death, ferritin may represent an acute phase reactant. Unfortunately, our registry only audits infectious deaths, not total infectious episodes, and thus only captures a small subset of infectious complications. Furthermore, cause of death was missing in 18% of patients. These factors, together with the limited number of patients with TSAT >80% (above which LPI is increased) may partially explain why TSAT did not associate with infectious death. Limitations of this study include the use of mean laboratory values in survival analyses. While a mean value over time is cumbersome to track clinically, we preferred this approach over an arbitrary static measure (i.e., at enrolment or at year 1), and were reassured by the findings that TSAT remained stable over time in TI patients and increased slightly in TD patients. Further limitations include the measurement of cardiac and infectious deaths rather than cardiac and infectious events; the latter were not reliably captured in the registry. Further study of the impact of TSAT and ferritin on cardiac and infectious morbidity is warranted. Similarly, larger studies comparing the clonal evolution and outcomes of patients with TSAT >80% who do and do not receive ICT may clarify the impact of sup-
pressing labile plasma iron. While a minority of patients in our cohort received ICT, TSAT should be interpreted with caution in chelated patients. The presence of free chelate in plasma may artificially increase the measured total iron binding capacity (TIBC) and thus reduce the calculated TSAT. Conversely, chelate-iron complexes may be measured as serum iron, thereby increasing the TSAT.38 True measurement of TSAT during ICT requires alternative laboratory techniques (i.e., urea gel method) or a chelator washout. Furthermore, in a large prospective study of transfusion-dependent anemias, TSAT was not significantly reduced after one year of deferasirox.39 Survival analyses demonstrating an attenuating effect of ICT on the impact of TSAT are limited by sample sizes.
Conclusion
In a large prospective study of MDS patients of all risk categories, TSAT >80% and ferritin >800 µg/L were clinically significant levels associated with inferior OS, PFS and LFS. The effects of transfusional IO were not restricted to lower risk patients, and a higher TSAT appears to be a better biomarker for IO toxicity than ferritin among higher risk patients. Compared to ferritin, TSAT may better reflect of the degree of oxidative stress present. Further study of the relationships between TSAT, reactive oxygen species, PFS, LFS and CDFS in MDS is warranted.
Disclosures
RB has served on BMS/Celgene advisory boards and has received research funding from TaiHo, BMS, Otsuka and Takeda. HL has served on advisory boards and received
A B
Haematologica | 108 February 2023 540 ARTICLE - Transferrin saturation predicts survival in MDS J. Teichman et al.
honoraria from BMS/Celgene, Taiho and Takeda, and has received research funding support from BMS/Celgene. KY has served on advisory committees for BMS/Celgene, Takeda, Astellas, Novartis, and Pfizer, has received research funding support from Astex, Hoffman La Roche, MedImmune, Merck, Millenium and Roche/Genetech, and has received honoraria from Novartis and Pfizer. MG has served on an advisory board and received research funding from BMS/Celgene. NZ has served on advisory boards for TaiHo and BMS/Celgene. AS has served on an advisory board for BMS/Celgene. MS has received research funding support from BMS/Celgene, TaiHo, and Takeda, and has served on a BMS/Celgene advisory board. BL has served on advisory boards and received honoraria from BMS/Celgene, Taiho, Celgene and Otsuka. EH has served on advisory boards and received honoraria from BMS/Celgene. NF has served on advisory boards and received honoraria from BMS/Celgene and has served on an advisory board for Takeda. TN has served on advisory boards and received honoraria from BMS/Celgene, Taiho, and Otsuka. MK has served on a BMS/Celgene advisory board. JS has served on an advisory board and received honoraria from BMS/Celgene. ME has served on the board of directors and advisory committees for BMS/Celgene, and has receiv ed research funding support from BMS. RD has received research funding support
References
1. Malcovati L, Porta MG, Pascutto C, et al. Prognostic factors and life expectancy in myelodysplastic syndromes classified according to WHO criteria: a basis for clinical decision making. J Clin Oncol. 2005;23(30):7594-603.
2. Malcovati L, Porta MGD, Cazzola M. Predicting survival and leukemic evolution in patients with myelodysplastic syndrome. Haematologica. 2006;91(12):1588-1590.
3. Hiwase DK, Singhal D, Strupp C, et al. Dynamic assessment of RBC-transfusion dependency improves the prognostic value of the revised-IPSS in MDS patients. Am J Hematol. 2017;92(6):508-514.
4. de Swart L, Crouch S, Hoeks M, et al. Impact of red blood cell transfusion dose density on progression-free survival in patients with lower-risk myelodysplastic syndromes. Haematologica. 2020;105(3):632-639.
5. de Swart L, Reiniers C, Bagguley T, et al. Labile plasma iron levels predict survival in patients with lower-risk myelodysplastic syndromes. Haematologica. 2018;103(1):69-79.
6. de Souza GF, Barbosa MC, Santos TE, et al. Increased parameters of oxidative stress and its relation to transfusion iron overload in patients with myelodysplastic syndromes. J Clin Pathol. 2013;66(11):996-998.
7. Okabe H, Suzuki T, Uehara E, Ueda M, Nagai T, Ozawa K. The bone marrow hematopoietic microenvironment is impaired in iron-overloaded mice. Eur J Haematol. 2014;93(2):118-128.
8. de Swart L, Hendriks JC, van der Vorm LN, et al. Second international round robin for the quantification of serum nontransferrin-bound iron and labile plasma iron in patients with iron-overload disorders. Haematologica. 2016;101(1):38-45.
from and has served on an advisory board for BMS/Celgene. All remaining authors have no conflicts of interest to disclose.
Contributions
RB overseas the Canadian National MDS registry. MG, NZ, MK, MiS, GC, BL, DK, ES, NF, AS, KY, JS, TN, RD, ME, VB, BH, LM, LC, HL and RB contributed patient data to the registry. MoS and AP provided administrative support for the MDS registry. JT, RB and HL designed the study. LZ performed data analysis. JT wrote the manuscript. RB, HL and LZ edited the manuscript. RB and HL co-supervised the study.
Acknowledgments
The authors would like to thank BMS and Takeda for unrestricted educational grants to support the MDS-CAN registry.
Funding
The Canadian MDS registry is supported by funding from BMS/Celgene and Takeda.
Data-sharing statement
Requests for original data can we sent to the corresponding author
9. Buckstein R, Wells RA, Zhu N, et al. Patient-related factors independently impact overall survival in patients with myelodysplastic syndromes: an MDS-CAN prospective study. Br J Haematol. 2016;174(1):88-101.
10. Malcovati L, Germing U, Kuendgen A, et al. Time-dependent prognostic scoring system for predicting survival and leukemic evolution in myelodysplastic syndromes. J Clin Oncol. 2007;25(23):3503-3510.
11. Platzbecker U, Fenaux P, Adès L, et al. Proposals for revised IWG 2018 hematological response criteria in patients with MDS included in clinical trials. Blood. 2019;133(10):1020-1030.
12. Leitch HA, Parmar A, Wells RA, et al. Overall survival in lower IPSS risk MDS by receipt of iron chelation therapy, adjusting for patient-related factors and measuring from time of first red blood cell transfusion dependence: an MDS-CAN analysis. Br J Haematol. 2017;179(1):83-97.
13. Pereira A, Nomdedeu M, Aguilar JL, et al. Transfusion intensity, not the cumulative red blood cell transfusion burden, determines the prognosis of patients with myelodysplastic syndrome on chronic transfusion support. Am J Hematol. 2011;86(3):245-250.
14. Messa E, Gioia D, Bertassello C, et al. Prognostic value of serum ferritin, transferrin saturation and C- reactive protein at diagnosis in myelodysplastic syndrome patients: analysis of patients from the MDS Piedmont Registry. Blood. 2011;118(21):3807-3807.
15. Kim CH, Leitch HA. Iron overload-induced oxidative stress in myelodysplastic syndromes and its cellular sequelae. Crit Rev Oncol Hematol. 2021;163:103367.
Haematologica | 108 February 2023 541 ARTICLE - Transferrin saturation predicts survival in MDS J. Teichman et al.
16. Kikuchi S, Kobune M, Iyama S, et al. Improvement of ironmediated oxidative DNA damage in patients with transfusion-dependent myelodysplastic syndrome by treatment with deferasirox. Free Radic Biol Med. 2012;53(4):643-648.
17. Adrianzen Herrera D, Pradhan K, Snyder R, et al. Myelodysplastic syndromes and the risk of cardiovascular disease in older adults: a SEER-medicare analysis. Leukemia. 2020;34(6):1689-1693.
18. Brunner AM, Blonquist TM, Hobbs GS, et al. Risk and timing of cardiovascular death among patients with myelodysplastic syndromes. Blood Adv. 2017;1(23):2032-2040.
19. Jaiswal S, Natarajan P, Silver AJ, et al. Clonal hematopoiesis and risk of atherosclerotic cardiovascular disease. N Engl J Med 2017;377(2):111-121.
20. Wong CAC, Leitch HA. Delayed time from RBC transfusion dependence to first cardiac event in lower IPSS risk MDS patients receiving iron chelation therapy. Leuk Res. 2019;83:106170.
21. Lyons RM, Marek BJ, Paley C, et al. Comparison of 24-month outcomes in chelated and non-chelated lower-risk patients with myelodysplastic syndromes in a prospective registry. Leuk Res. 2014;38(2):149-154.
22. Angelucci E, Li J, Greenberg P, et al. Iron chelation in transfusion-dependent patients with low- to intermediate-1risk myelodysplastic syndromes: a randomized trial. Ann Intern Med. 2020;172(8):513-522.
23. Malcovati L, Della Porta MG, Strupp C, et al. Impact of the degree of anemia on the outcome of patients with myelodysplastic syndrome and its integration into the WHO classification-based Prognostic Scoring System (WPSS). Haematologica. 2011;96(10):1433-1440.
24. Nairz M, Haschka D, Demetz E, Weiss G. Iron at the interface of immunity and infection. Front Pharmacol. 2014;5:152.
25. Cantinieaux B, Janssens A, Boelaert JR, et al. Ferritinassociated iron induces neutrophil dysfunction in hemosiderosis. J Lab Clin Med. 1999;133(4):353-361.
26. Barton Pai A, Pai MP, Depczynski J, McQuade CR, Mercier RC. Non-transferrin-bound iron is associated with enhanced staphylococcus aureus growth in hemodialysis patients receiving intravenous iron sucrose. Am J Nephrol. 2006;26(3):304-309.
27. Gomes-Pereira S, Rodrigues PN, Appelberg R, Gomes MS. Increased susceptibility to Mycobacterium avium in hemochromatosis protein HFE-deficient mice. Infect Immun. 2008;76(10):4713-4719.
28. Goldberg SL, Chen E, Corral M, et al. Incidence and clinical complications of myelodysplastic syndromes among United States Medicare beneficiaries. J Clin Oncol.
2010;28(17):2847-2852.
29. Wong CAC, Wong SAY, Leitch HA. Iron overload in lower international prognostic scoring system risk patients with myelodysplastic syndrome receiving red blood cell transfusions: Relation to infections and possible benefit of iron chelation therapy. Leuk Res. 2018;67:75-81.
30. Kataoka K, Nannya Y, Hangaishi A, et al. Influence of pretransplantation serum ferritin on nonrelapse mortality after myeloablative and nonmyeloablative allogeneic hematopoietic stem cell transplantation. Biol Blood Marrow Transplant. 2009;15(2):195-204.
31. Sivgin S, Baldane S, Kaynar L, et al. Pretransplant serum ferritin level may be a predictive marker for outcomes in patients having undergone allogeneic hematopoietic stem cell transplantation. Neoplasma. 2012;59(2):183-190.
32. Tachibana T, Tanaka M, Takasaki H, et al. Pretransplant serum ferritin is associated with bloodstream infections within 100 days of allogeneic stem cell transplantation for myeloid malignancies. Int J Hematol. 2011;93(3):368-374.
33. Ozyilmaz E, Aydogdu M, Sucak G, et al. Risk factors for fungal pulmonary infections in hematopoietic stem cell transplantation recipients: the role of iron overload. Bone Marrow Transplant. 2010;45(10):1528-1533.
34. Pullarkat V, Blanchard S, Tegtmeier B, et al. Iron overload adversely affects outcome of allogeneic hematopoietic cell transplantation. Bone Marrow Transplant. 2008;42(12):799-805.
35. Wermke M, Eckoldt J, Götze KS, et al. Enhanced labile plasma iron and outcome in acute myeloid leukaemia and myelodysplastic syndrome after allogeneic haemopoietic cell transplantation (ALLIVE): a prospective, multicentre, observational trial. Lancet Haematol. 2018;5(5):e201-e210.
36. von Bonsdorff L, Sahlstedt L, Ebeling F, Ruutu T, Parkkinen J. Apotransferrin administration prevents growth of Staphylococcus epidermidis in serum of stem cell transplant patients by binding of free iron. FEMS Immunol Med Microbiol. 2003;37(1):45-51.
37. Petzer V, Wermke M, Tymoszuk P, et al. Enhanced labile plasma iron in hematopoietic stem cell transplanted patients promotes Aspergillus outgrowth. Blood Adv. 2019;3(11):1695-1700.
38. Ikuta K, Ito S, Tanaka H, et al. Interference of deferasirox with assays for serum iron and serum unsaturated iron binding capacity during iron chelating therapy. Clin Chim Acta. 2011;412(23-24):2261-2266.
39. Porter JB, El-Alfy M, Viprakasit V, et al. Utility of labile plasma iron and transferrin saturation in addition to serum ferritin as iron overload markers in different underlying anemias before and after deferasirox treatment. Eur J Haematol. 2016;96(1):19-26.
Haematologica | 108 February 2023 542 ARTICLE - Transferrin
J. Teichman et al.
saturation predicts survival in MDS
Focal structural variants revealed by whole genome sequencing disrupt the histone demethylase KDM4C in B-cell lymphomas
Cristina López,1,2* Nikolai Schleussner,3,4,* Stephan H. Bernhart,5,6,7 Kortine Kleinheinz,8 Stephanie Sungalee,9 Henrike L. Sczakiel,3,4 Helene Kretzmer,5,6,7,10 Umut H. Toprak,11,12,13 Selina Glaser,1 Rabea Wagener,1,2 Ole Ammerpohl,1,2 Susanne Bens,1,2 Maciej Giefing,2,14 Juan C. González Sánchez,15 Gordana Apic,15 Daniel Hübschmann,16,17,18 Martin Janz,3,4 Markus Kreuz,19 Anja Mottok,1 Judith M. Müller,20 Julian Seufert,11 Steve Hoffmann,5,6,7,21 Jan O. Korbel,9 Robert B. Russell,15 Roland Schüle,20,22 Lorenz Trümper,23 Wolfram Klapper,24 Bernhard Radlwimmer,25 Peter Lichter,25 Ralf Küppers,26 Matthias Schlesner,11,27 Stephan Mathas3,4# and Reiner Siebert1,2# and members of the ICGC MMML-Seq Consortium
1Institute of Human Genetics, Ulm University and Ulm University Medical Center, Ulm, Germany; 2Institute of Human Genetics, Christian-Albrechts-University, Kiel, Germany; 3Max-DelbrückCenter for Molecular Medicine in the Helmholtz Association (MDC), Berlin, Germany; 4Hematology, Oncology and Tumor Immunology, Charité - Universitätsmedizin Berlin, Berlin, Germany, and Experimental and Clinical Research Center, a joint cooperation between the MDC and the Charité, Berlin, Germany; 5Interdisciplinary Center for Bioinformatics, University of Leipzig, Leipzig, Germany; 6Bioinformatics Group, Department of Computer, University of Leipzig, Leipzig, Germany; 7Transcriptome Bioinformatics, LIFE Research Center for Civilization Diseases, University of Leipzig, Leipzig, Germany; 8Department for Bioinformatics and Functional Genomics, Institute of Pharmacy and Molecular Biotechnology and Bioquant, University of Heidelberg, Heidelberg, Germany; 9EMBL Heidelberg, Genome Biology Unit, Heidelberg, , Germany; 10Department of Genome Regulation, Max Planck Institute for Molecular Genetics, Berlin, Germany; 11Bioinformatics and Omics Data Analytics (B240), German Cancer Research Center (DKFZ), Heidelberg, Germany; 12Faculty of Biosciences, Heidelberg University, Heidelberg, Germany; 13Hopp-Children’s Cancer Center at the NCT Heidelberg (KiTZ), Division of Neuroblastoma Genomics (B087), German Cancer Research Center (DKFZ), Heidelberg, Germany; 14Institute of Human Genetics, Polish Academy of Sciences, Poznan, Poland; 15BioQuant and Biochemie Zentrum Heidelberg (BZH), Heidelberg University, Heidelberg, Germany; 16German Cancer Consortium (DKTK), Heidelberg, Germany; 17Heidelberg Institute of Stem Cell Technology and Experimental Medicine (HI-STEM), Heidelberg, Germany; 18Computational Oncology, Molecular Precision Oncology Program, National Center for Tumor Diseases (NCT), German Cancer Research Center (DKFZ) and German Cancer Consortium (DKTK), Heidelberg, Germany; 19Institute for Medical Informatics Statistics and Epidemiology, Leipzig, Germany; 20Klinik fur Urologie und Zentrale Klinische Forschung, Klinikum der AlbertLudwigs-Universität Freiburg, Freiburg, Germany; 21Leibniz Institute on Ageing-Fritz Lipmann Institute (FLI), Computational Biology, Jena, Germany; 22BIOSS Centre of Biological Signalling Studies, Albert-Ludwigs-University Freiburg, Freiburg, Germany; 23Department of Hematology and Oncology, Georg-August-University of Göttingen, Göttingen, Germany; 24Hematopathology Section, Christian-Albrechts-University, Kiel, Germany; 25Division of Molecular Genetics, German Cancer Research Center (DKFZ), Heidelberg, Germany; 26Institute of Cell Biology (Cancer Research), University of Duisburg-Essen, Essen, Germany, and German Cancer Consortium (DKTK) and 27Biomedical Informatics, Data Mining and Data Analytics, Augsburg University, Augsburg, Germany
*CL and NS contributed equally as co-first authors. #SM and RS contributed equally as co-senior authors.
Correspondence: R. Siebert reiner.siebert@uni-ulm.de
S. Mathas stephan.mathas@charite.de
Received: September 13, 2021.
Accepted: March 18, 2022. Prepublished: April 28, 2022.
https://doi.org/10.3324/haematol.2021.280005
©2023 Ferrata Storti Foundation
Published under a CC BY-NC license
Histone methylation-modifiers, such as EZH2 and KMT2D, are recurrently altered in B-cell lymphomas. To comprehensively describe the landscape of alterations affecting genes encoding histone methylation-modifiers in lymphomagenesis we investigated whole genome and transcriptome data of 186 mature B-cell lymphomas sequenced in the ICGC MMML-Seq project. Besides confirming common alterations of KMT2D (47% of cases), EZH2 (17%), SETD1B (5%), PRDM9 (4%), KMT2C (4%), and SETD2 (4%), also identified by prior exome or RNA-sequencing studies, we here found
Abstract
Haematologica | 108 February 2023 543 ARTICLE - Non-Hodgkin Lymphoma
ARTICLE - Focal structural variants perturbing KDM4C in B-cell lymphoma
recurrent alterations to KDM4C in chromosome 9p24, encoding a histone demethylase. Focal structural variation was the main mechanism of KDM4C alterations, and was independent from 9p24 amplification. We also identified KDM4C alterations in lymphoma cell lines including a focal homozygous deletion in a classical Hodgkin lymphoma cell line. By integrating RNA-sequencing and genome sequencing data we predict that KDM4C structural variants result in loss-offunction. By functional reconstitution studies in cell lines, we provide evidence that KDM4C can act as a tumor suppressor. Thus, we show that identification of structural variants in whole genome sequencing data adds to the comprehensive description of the mutational landscape of lymphomas and, moreover, establish KDM4C as a putative tumor suppressive gene recurrently altered in subsets of B-cell derived lymphomas.
Introduction
The majority of mature B-cell malignancies originates from the germinal center (GC) B cell or the post-GC stage.1 Historically, Hodgkin lymphoma (HL) and non-Hodgkin lymphomas (NHL) are distinguished. The neoplastic Hodgkin-/Reed-Sternberg cells in classical HL (cHL) are supposed to be derived from pre-apoptotic GC B cell.1 The most prevalent types of GC-derived NHL are diffuse large B-cell lymphoma (DLBCL) and follicular lymphoma (FL).2 DLBCL is an aggressive disease, composed of various subtypes including the gene expression-based GC B-cell like (GCB) and activated B-cell like (ABC) types,2,3 or recently genomically defined groups.4–10 FL is a more indolent disease which occasionally transforms into DLBCL.11
The immanent genomic instability of B cells during the GC reaction, which is required for the formation of antibody diversity, is assumed to be causative for malignant transformation of GC or post-GC B cells.12 The GC reaction requires a tightly controlled balance between proliferation and growth arrest, and between full cellular activation or a rather resting stage. Epigenetic modifiers are key regulators of these “on-off“ stages.12 In line, they are common targets of genomic alterations in GC-derived B-cell lymphomas,11 including the genes encoding the histone methyltransferases KMT2D, KDMT2C and EZH2, the histone acetyltransferases CREBBP and EP300,6,13–15 and the chromatin remodelers including members of the SWI/SNF complex.16 A series of recent studies investigated genomic alteration frequencies in oncogenic drivers including epigenetic modifiers in huge series of patients with DLBCL, but also FL. These studies, investigating in total more than 1,800 DLBCL (Chapuy et al., n=304;5 Schmitz et al., n=574;6 Reddy et al., n= 1,00114), found aberrations in KMT2D (24-31%), CREBBP (11-17%), and EP300 (6-8%).5,6,14 Consequently, alterations in these histone modifiers contribute to the definition of genetic subgroups of DLBCL, such as cluster 3 in Chapuy et al., 5 or the EZB group in Schmitz et al.6 and Wright et al., 4 the BCL2 group in Lacy et al.8 and the EZH2 group in Hübschmann et al.7 Most of these studies characterized the genomic alteration landscape predominantly by exome or otherwise targeted sequencing, in part combined with transcriptome sequencing.10 Methodically, however, although this approach detects single nucleotide variants
(SNV), small insertions and deletions (indels) and gross imbalances, it has an inherent weakness in the detection of some structural variants such as intragenic deletions, chromosomal translocations, and inversions.17
To overcome this shortcoming, we here mined data from whole genome sequencing (WGS) of 186 GC-derived B-cell lymphomas and 183 corresponding germline DNA samples generated by us in the framework of the International Cancer Genome Consortium (ICGC) Molecular Mechanisms in Malignant Lymphoma by Sequencing (MMML-Seq) project (https://dcc.icgc.org).7,18–20 Given the increasing pathogenic, diagnostic and therapeutic importance of altered histone methylation in B-cell lymphomas,11,13,21 we focused here on 79 genes encoding histone methylation modifiers.
Methods
Whole genome and transcriptome sequencing data
We mined WGS data and available RNA-sequencing data of 186 GC-derived B-cell lymphomas from the ICGC MMML-Seq network7 (Online Supplementary Methods). The ICGC MMMLSeq study has been approved by the Institutional Review Board of the Medical Faculties of the University of Kiel (A150/10) and Ulm (349/11), and of the recruiting centers. Methods and procedures used in the ICGC MMML-Seq project have been detailed in various publications7,18,20,22,23 of the network. Sequencing data are available from the European Genome-phenome Archive (EGA) (accession number EGAS00001002199). The genomic status of 79 genes encoding histone methylation modifiers (selected based on http://crdd.osdd.net/raghava/dbem/index.php, accessed 01/03/2018; Online Supplementary Table S1) was investigated.
Cell lines and cell line data
Nineteen B- and T-cell NHL and four cHL-derived cell lines were used in the study (Online Supplementary Table S2). The identity of the cell lines used was confirmed by short tandem repeat analysis using the StemElite ID System (Promega). Copy number data24 and/or exome data25 from previously published studies on the four cHL cell lines herein analyzed and two additional cHL cell lines were included as well as previously reported WGS data from the cHL cell line L1236.26
Haematologica | 108 February 2023 544
C.
al.
López et
Bioinformatics analyses
The computational approaches for the analysis of WGS and transcriptome data were recently described20 (Online Supplementary Materials and Methods). Briefly, WGS data were analyzed using the DKFZ core variant calling workflows of the ICGC Pan-Cancer Analysis of Whole Genomes (PCAWG) project. Allele-specific copy-number alterations were analyzed using ACE-seq and structural variants were called using the SOPHIA algorithm20 and DELLY v0.5.9.27,28 To determine the incidence of structural variants in the PCWAG, filtered structural variant calls were generated by SOPHIA for the PCAWG cohorts processed with the same tools and settings as with the lymphoma cohort used in this study. Transcriptome data were mapped with segemehl 0.2.0.29 Gene expression values were counted by the RNAcounter 1.5.2, using the “--nh” option and counting only exonic reads (-t exon).
Mechismo (http://mechismo.russelllab.org/) was used to predict the potential effect of structural variants and SNV detected by WGS.
Verification of KDM4C alterations by polymerase chain reaction-based Sanger sequencing and fluorescence in situ hybridization
Verification analyses on a DNA level included polymerase chain reaction (PCR) amplification with subsequent Sanger sequencing and fluorescent in situ hybridization (FISH) (Online Supplementary Materials and Methods). Alternative KDM4C fusion transcripts were validated using specific primers to amplify breakpoint fusion sequences from tumor RNA-derived cDNA (Online Supplementary Materials and Methods) and Sanger sequencing. Verifications using FISH were done using two home-made FISH-probes, i.e., using locus-specific and break-apart KDM4C probes (Online Supplementary Material and Methods). Digital image acquisition, processing, and evaluation of FISH assays were performed using ISIS digital image analysis version 5.0 (MetaSystems, Altussheim, Germany). The same FISH approaches were used to evaluate the genomic status of KDM4C in lymphoma cell lines.
Functional analyses
For functional analyses, the respective cells were transfected with doxycycline-inducible KDM4C expression constructs or transduced with KDM4C-encoding lentiviruses (Online Supplementary Materials and Methods). For generation of KDM4C-inducible cells, cells were electroporated in OPTI-MEM I using Gene-Pulser II (Bio-Rad). Twenty-four hours after transfection, hygromycin B (Sigma-Aldrich, Taufkirchen, Germany) was added. After 21–28 days of culture in the presence of hygromycin B, cells were suitable for functional assays. Where indicated, green fluorescent protein-positive (GFP+) cells were enriched 72 h after doxycycline-induction using a FACS Aria. Production of lentivi-
ruses and lentiviral transduction of cells was performed as described previously31 (Online Supplementary Materials and Methods). KDM4C protein expression was assessed by western blot, and immunohistochemistry using a rabbit polyclonal anti-KDM4C antibody raised against amino acids 1007-1056.
Results
Aberrations in genes encoding histone methylation modifiers in the ICGC MMML-Seq cohort determined by whole genome sequencing
We analyzed WGS data of 186 GC-derived B-cell lymphomas7 for somatic aberrations potentially perturbing gene function, including SNV, indels, structural variants and focal copy number aberrations affecting at least two cases in 79 genes encoding histone methylation modifiers. The genes most commonly affected were KMT2D (47% of cases), EZH2 (17%), SETD1B (5%), KDM4C (4%), PRDM9 (4%), KMT2C (4%), and SETD2 (4%) (Figure 1A).
The genes identified and their frequency of alteration in our cohort are grossly in line with previous analyses of DLBCL cohorts.5,6,14 However, alterations of KDM4C have not been emphasized as a recurrent finding in previous whole exome studies of GC B-cell lymphomas. KDM4C (also called JMJD2C) encodes a member of the Jumonji family of demethylases, which activate genes by removing methyl groups from histones H3K9 and H3K36.32,33
Genomic alterations affecting the KDM4C gene locus
We detected aberrations of KDM4C in 7/186 (3.7%) of all cases, and in 4/75 (5.3%) of bona fide DLBCL. In detail, we detected a total of seven focal aberrations in KDM4C, including four heterozygous deletions, one duplication, one translocation and one non-synonymous SNV each, affecting seven patients (Figure 1B; Online Supplementary Table S2). The minimum read number supporting KDM4C alterations was four reads. The cancer cell fraction or the proportion of cancer cells with a KDM4C alteration among all cancer cells suggests that these alterations are clonal in GC B-cell lymphomas (Online Supplementary Table S2). We verified all KDM4C aberrations by FISH using homemade FISH assays and/or PCR and Sanger sequencing (Online Supplementary Table S2).
Pathological and genetic features of the lymphomas with KDM4C gene alterations
The cases displaying KDM4C alterations included four of 75 DLBCL (5.3%), one of 17 FL-DLBCL (5.9%), one of four (25%) large B-cell lymphomas with IRF4-rearrangement, and the one primary mediastinal B-cell lymphoma (Table 1). We explored whether cases with KDM4C aberrations diagnosed as DLBCL (n=4) cluster in a specific genomic subgroup ac-
Haematologica | 108 February 2023 545 ARTICLE - Focal structural variants perturbing KDM4C in B-cell lymphoma C. López et al.
Figure 1. Genomic aberrations of genes encoding histone methylation modi fi ers in germinal center-derived B-cell lymphomas. (A) Genes encoding histone methylation modi fi er s affected by single nucleotide variants, structural variants, focal copy number aberrations, and indels in at least two of t he studied germinal center-derived B-cell lymphomas. The events are shown independently of the transcript isoform affected. Genes encoding histone methyltransferases are named in gr ay, genes encoding demethylases in blue. Categorization according to diagnosis and cell-of-origin classi fi ca tion is shown. The respective type of variant is indicated by color. Only focal aberrations are displayed. (B) UCSC genome browser track (accessed 03.02.2021) displaying the KDM4C genomic aberrations detected in primary lymphomas and lymphoma cell lines. The type of variant is indicated by color and each focal aberration in a separate line. Note, the size of the squares showing the single nucleo tide variants and translocations is not representative of the real size of the genomic aberration to improve the visualization. The heterozygous deletions and the homozygous dele tion are labeled in yellow and red, respectively. Duplication is indicated by a brown color and the translocation in purple. The breakpoints of the genomic aberrations ar e annotated based on hg19 and the KDM4C transcripts displayed as provided by UCSC Genes track. Note, that the L1236 cell line shows homozygously and heterozygously dele ted regions. INV: inversion; TRA: translocation; DEL: deletion; DUP: duplication; ABC: activated B-cell; GCB: germinal center B-cell; n.a.; not available; DLBCL: dif fuse large B-cell lymphoma; FL: follicular lymphoma; LBCL: large B-cell lymphoma; B-NOS: B-cell not otherwise speci fi ed; DH-BL: Double hit -Burkitt lymphoma; PMBL: primary mediastinal B-cell lymphoma; Heter: heterozygous, Homo: homozygous; SNV: single nucleotide variation. Note, the display of KDM4C deletion in My-La is an estimation, an exact breakpoint could not be determined by fl uor escent in situ hybridization.
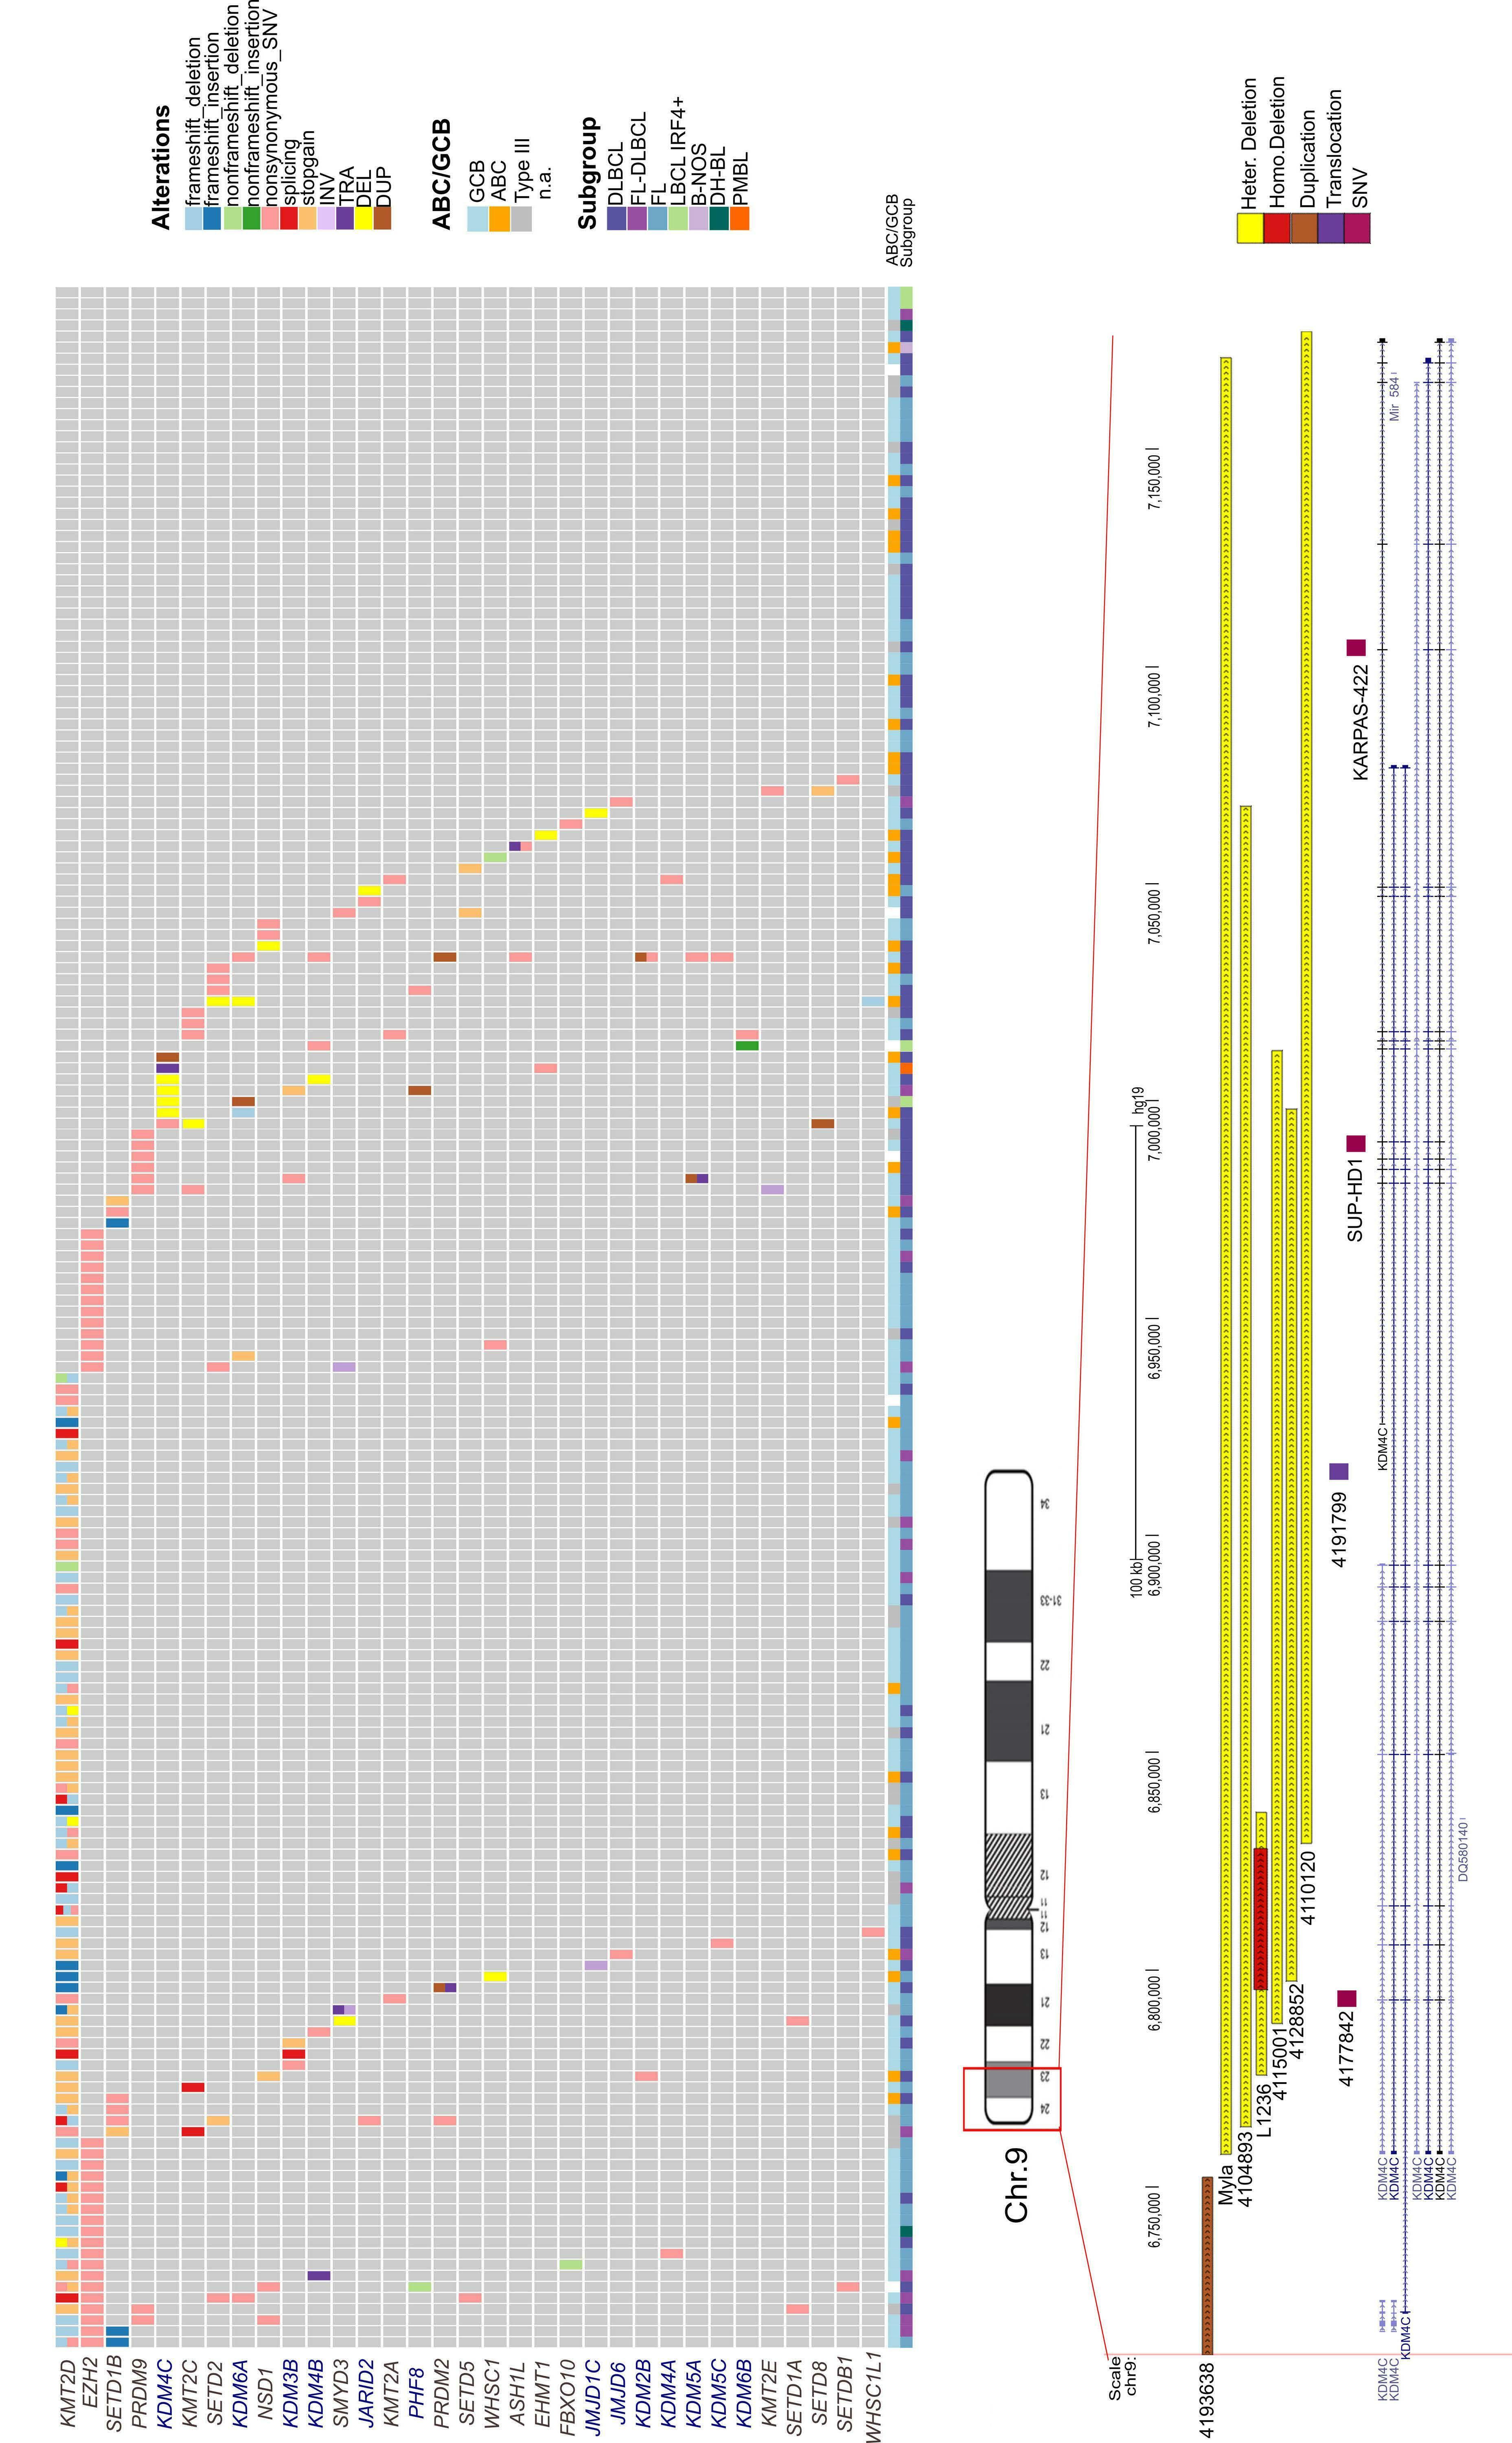
Haematologica | 108 February 2023 546 ARTICLE - Focal structural variants perturbing KDM4C in B-cell lymphoma C. López et al. A B
cording to the non-negative matrix factorization (NMF) clustering described previously by our group,7 which resembles features of genetic DLBCL subgroups previously also described by others4,5 (Table 1). Using the described four-cluster classifier limited to DLBCL cases, we identified two MYD88-like and two TP53-like cases. Using the ninesubcluster classifier established for the whole ICGC MMMLSeq FL and DLBCL cohort, we assigned two cases to the PIM1-like cluster, two cases to the PAX5-like cluster and one case to the MYD88-like cluster (2 cases other than DLBCL or FL not included in the previous NMF analyses, i.e. 1 primary mediastinal B-cell lymphoma and 1 IRF4 rearrangement-positive large B-cell lymphoma). Furthermore, we explored the distribution of KDM4C-altered cases diagnosed as DLBCL (n=4) among transcriptional subgroups based on the cell-of-origin signature. Two cases were classified as GCB-like and two cases as ABC-like lymphomas. Thereafter, we extended the analysis to the whole cohort and we observed that four of seven cases with KDM4C aberrations displayed a GCB signature and two of seven cases an ABC signature (1 case assigned to Type III/unclassified). Overall, KDM4C aberrations were not significantly enriched in any specific genetic or transcriptional subtype of the analyzed lymphomas. In addition, we explored whether KDM4C aberrations were associated with the 9p24.1 amplification, as described previously.34 In five out of seven cases with KDM4C focal aberrations, we did not detect 9p24.1 gain (Online Supplementary Figures S1 and S2). This indicates that the vast majority of focal KDM4C aberrations occurred independently of 9p24 amplifications. We also explored aneuploidy of chromosome 9 and the general genomic ploidy of the KDM4C-altered cases. We did not observe a significant increase of chromosome 9 gains (Online Supplementary Figure S2) or polyploid genome contents (Online Supplementary Figure S3) in cases with KDM4C aberrations as compared to cases without such aberrations. Furthermore, we investigated whether the KDM4C aberrations occurred preferentially in lymphomas with highly rearranged genomes that were predisposed to carry these events by chance. We identified a mean of 73.85 structural variants per case (range, 34-144) in lymphomas with KDM4C aberration compared to a mean of 83.24 structural variants per case (range, 5-1696) in lymphomas lacking KDM4C aberrations. The mean number of structural variants was not significantly different between the two groups of patients (Wilcoxon test, P=0.125) (Online Supplementary Figure S4).
KDM4C
alterations as potential tumor drivers
KDM4C is located in a early replicating genomic region in B cells (at the border of a late replicating region) based on the ENCODE Repli-seq data from different lymphoblastoid cell lines35 (Online Supplementary Figure S5). This fact sug-
gests that mutation of the gene is not a passenger effect caused by late replication. Furthermore, we examined
Table 1. Characteristics and biological features of the cohort. Overview of the age, sex, and lymphoma subtype distribution of the cohort and of KDM4C-affected cases.
Whole cohort (N=186)
KDM4C focal aberrations (N=7)
Median age at diagnosis, years (range) 62.5 (16-89) 57 (16-75)
Male, N (%) 84 (45) 3 (42.9) Diagnostics, N (%)
DLBCL 75 (40.3) 4 (57) FL 86 (46.2) 0 FL-DLBCL 17 (9.1) 1 (14.3)
LBCL-with IRF4 breaks 4 (2.2) 1 (14.3)
B-NOS 1 (0.55) 0 DH-BL 2 (1.1) 0 PMBL 1 (0.55) 1 (14.3)
Cell of origin, N (%)
GCB 124/182 (68.1) 4 (57.1) ABC 29/182 (15.9) 2 (28.6) Type III 29/182 (15.9) 1 (14.3) Hallmark events, N (%)
MYC breaks 18/185 (9.7) 0 BCL2 breaks 106/185 (57.3) 2 (28.6) BCL6 breaks 51 (27.4) 2 (28.6)
NMF subclusters (4 categories, only DLBCL)7, N (%)
BCL2-like 10/72 (13.9) 0/4 (0) BCL6-like 17/72 (23.6) 0/4 (0)
MYD88-like 26/72 (36.1) 2/4 (50)
TP53-like 19/72 (26.4) 2/4 (50) NMF subclusters (9 categories)7, N (%)
B2M like 13/179 (7.3) 0/5 (0)
BCL2-like 35/179 (19.5) 0/5 (0)
BCL6-like 23/179 (12.8) 0/5 (0)
MYD88-like 17/179 (9.5) 1/5 (20)
PAX5-like 19/179 (10.6) 2/5 (40)
PIM1-like 18/179 (10) 2/5 (40)
TP53-like 19/179 (10.6) 0/5 (0)
CSMD1-like 20/179 (11.2) 0/5 (0)
SOCS1-like 15/179 (8.4) 0/5 (0)
Cell of origin based on gene expression classification. N: number; DLBCL: diffuse large B-cell lymphoma; FL: follicular lymphoma; LBCL: large B-cell lymphoma; B-NOS: B-cell lymphoma not otherwise specified; PMBL: primary mediastinal B-cell lymphoma; GCB: germinal center B-cell like; ABC: activated B-cell like; NMF: nonnegative matrix factorization.
Haematologica | 108 February 2023 547 ARTICLE - Focal structural variants perturbing KDM4C in B-cell lymphoma C. López et al.
whether the breakpoints were located in the RGYW/WRCY motif typically associated with the activation-induced cytidine deaminase (AID) enzyme36 that is active in GC B cells. However, none of the breakpoints directly hits these motifs. These facts suggest that mutation of the KDM4C gene in lymphoma is not a bystander effect caused by late replication or aberrant somatic hypermutation. Next we analyzed the incidence of structural variants affecting the KDM4C locus in the 45 tumor datasets with WGS available included in the PCWAG.19 We identified 14 cohorts with an incidence of KDM4C alterations equal to or higher than that reported herein (Online Supplementary Figure S6). Importantly, the cohort with the highest incidence of structural variant breakpoints affecting KDM4C was the DLBCL-US cohort, corroborating our findings and highlighting the relevance of KDM4C alterations in this subgroup of B-cell lymphomas. Other types of cancers harboring structural variants in KDM4C were renal, head and neck, ovarian, hepatocarcinoma, esophageal, bladder, prostate, osteosarcoma, and gastric cancer, suggesting that KDM4C alterations might not be restricted to lymphomas. A role of KDM4C in these tumors has been discussed previously.37–44
Molecular consequence of KDM4C aberrations
The KDM4C protein consists of an N-terminal catalytic domain (JmjN and JmjC) followed by three zinc-fingers (PHD or C2H2) and two C-terminal Tudor domains.45 By
integrating RNA-sequencing and WGS data in the six cases with focal structural variants and available transcriptome data (4 focal heterozygous deletions, 1 translocation, and 1 duplication), we detected alternative KDM4C transcripts in five of them, which were verified by reverse transcriptase PCR and sequencing (Online Supplementary Table S2). In silico analyses using Mechismo (http://mechismo.russelllab.org/) predicted that these alternative transcripts would result in altered proteins lacking the catalytic or recognition (epigenetic readers) domains (Figure 2A). In silico modeling of the non-synonymous somatic SNV (c.G80A, p.R27Q) detected in case 4177842, which lies in the JmJN domain, suggests a possible functional consequence on protein function (Online Supplementary Figure S1).
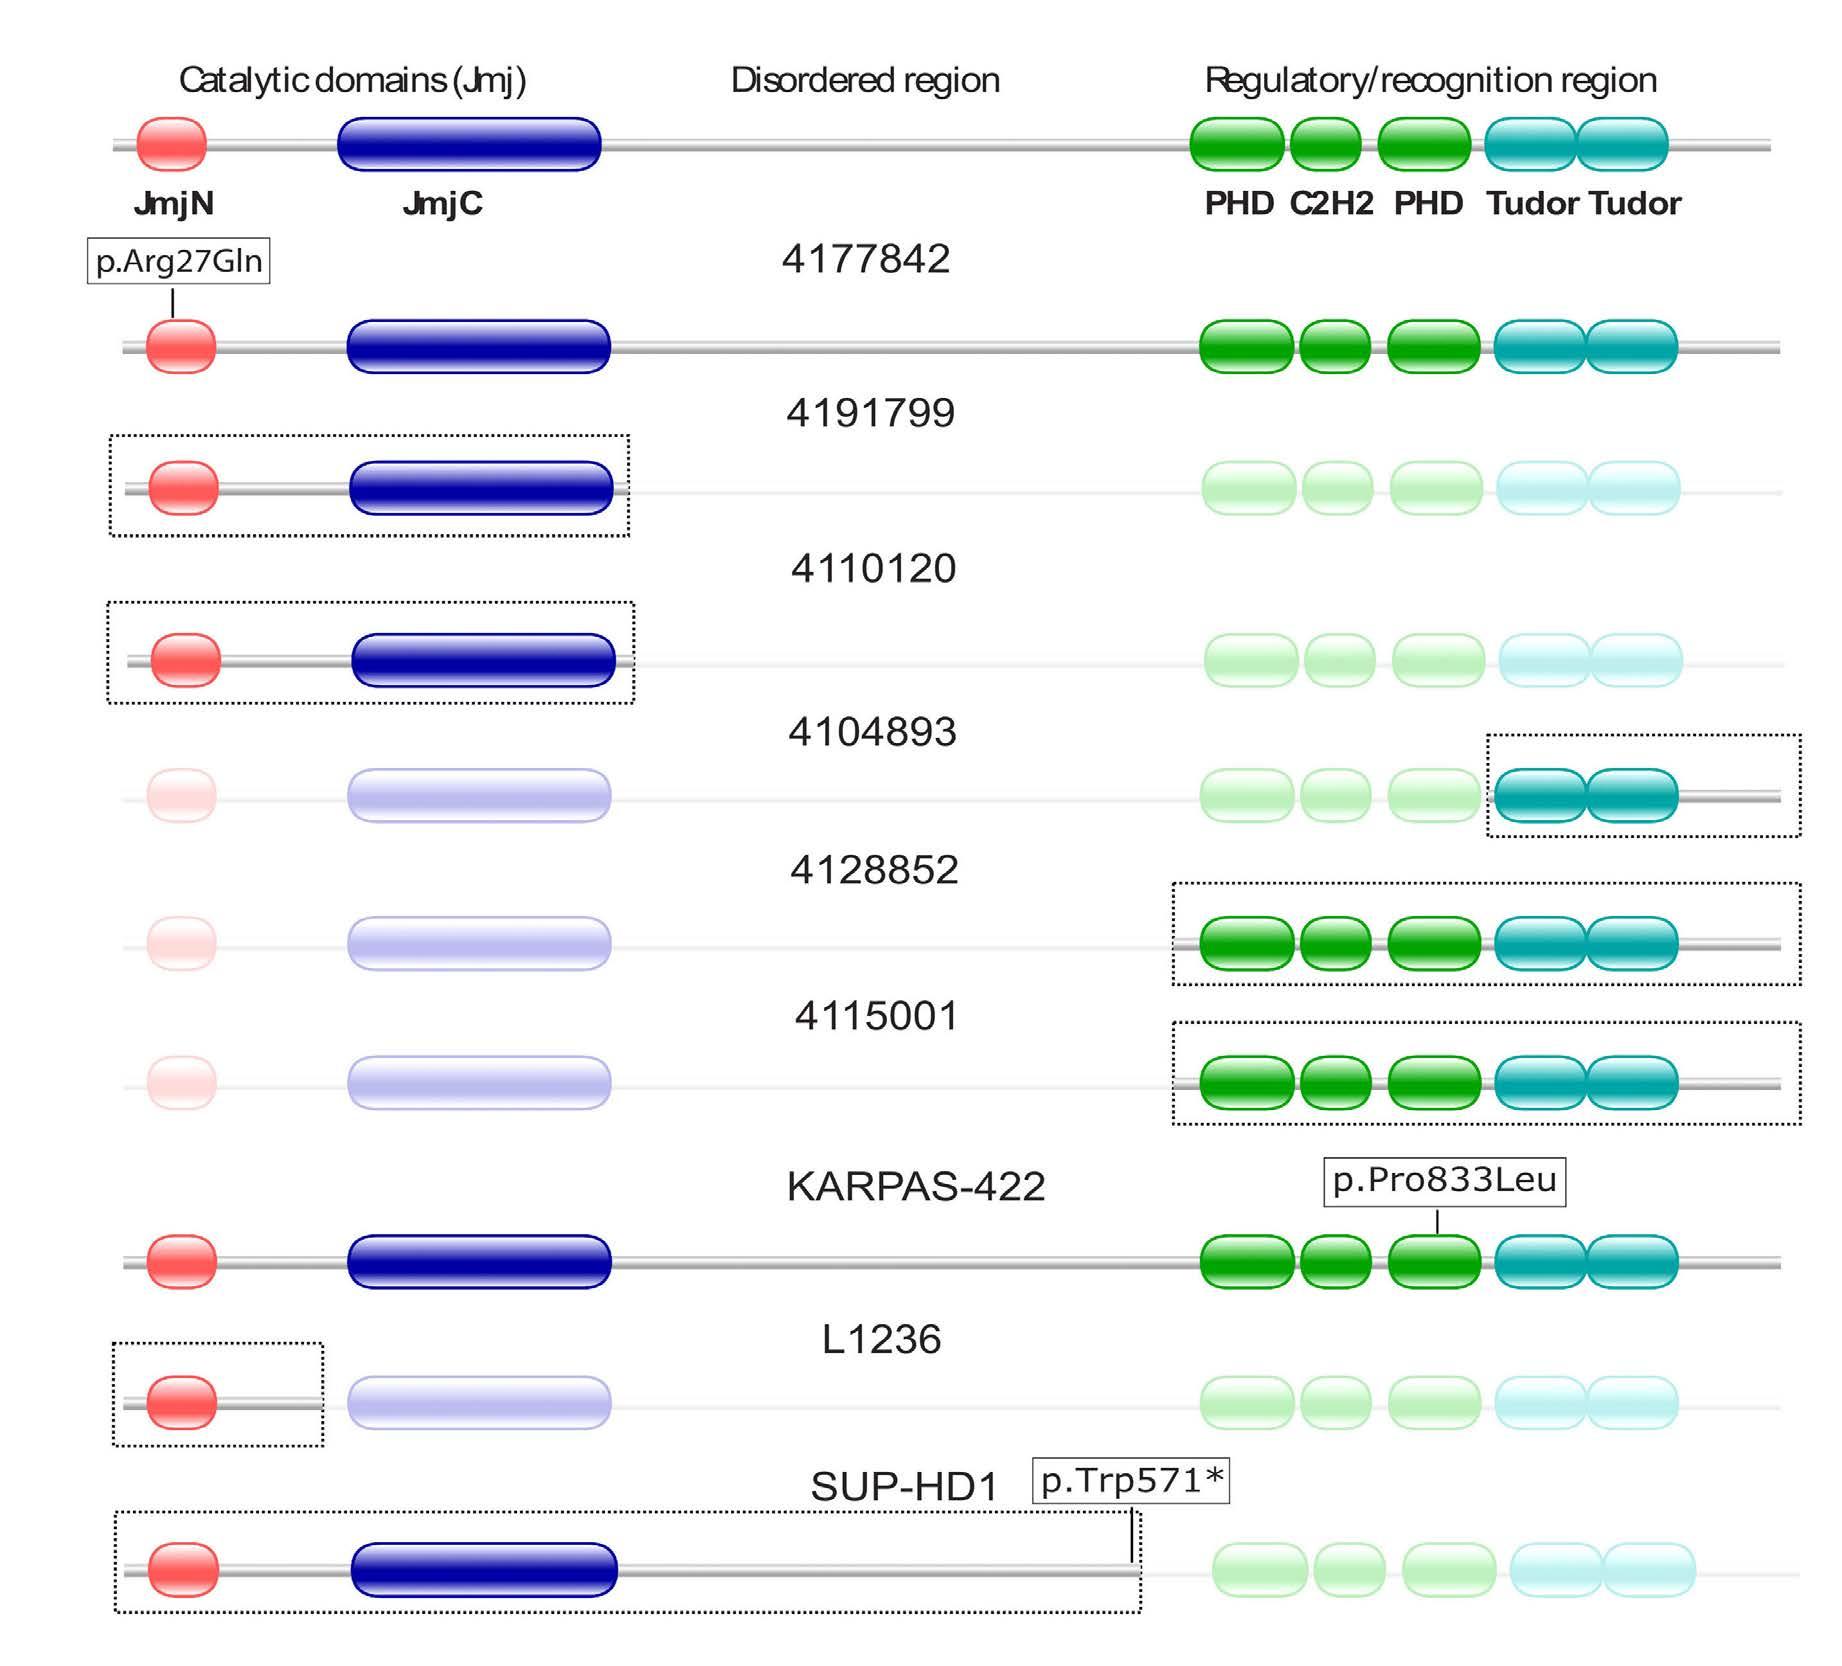
Lack of epigenetic alterations at the KDM4C locus due to KDM4C mutation
As to the recently proposed role of a circular RNA (circRNA) derived from the KDM4C locus (circKDM4C) in repression of proliferation and metastasis in breast cancer,46 we also explored expression of circKDM4C in the RNA-sequencing data of our cohort. We identified circKDM4C expression in three cases (3/180, 1.7%), but none of them showed an alteration of the KDM4C locus (data not shown). In addition, we investigated the epigenetic architecture at the KDM4C locus by mining previously published whole genome bisulfite sequencing and array-
Continued on following page. Haematologica | 108 February 2023 548 ARTICLE - Focal structural variants perturbing KDM4C in B-cell lymphoma C. López et al. A
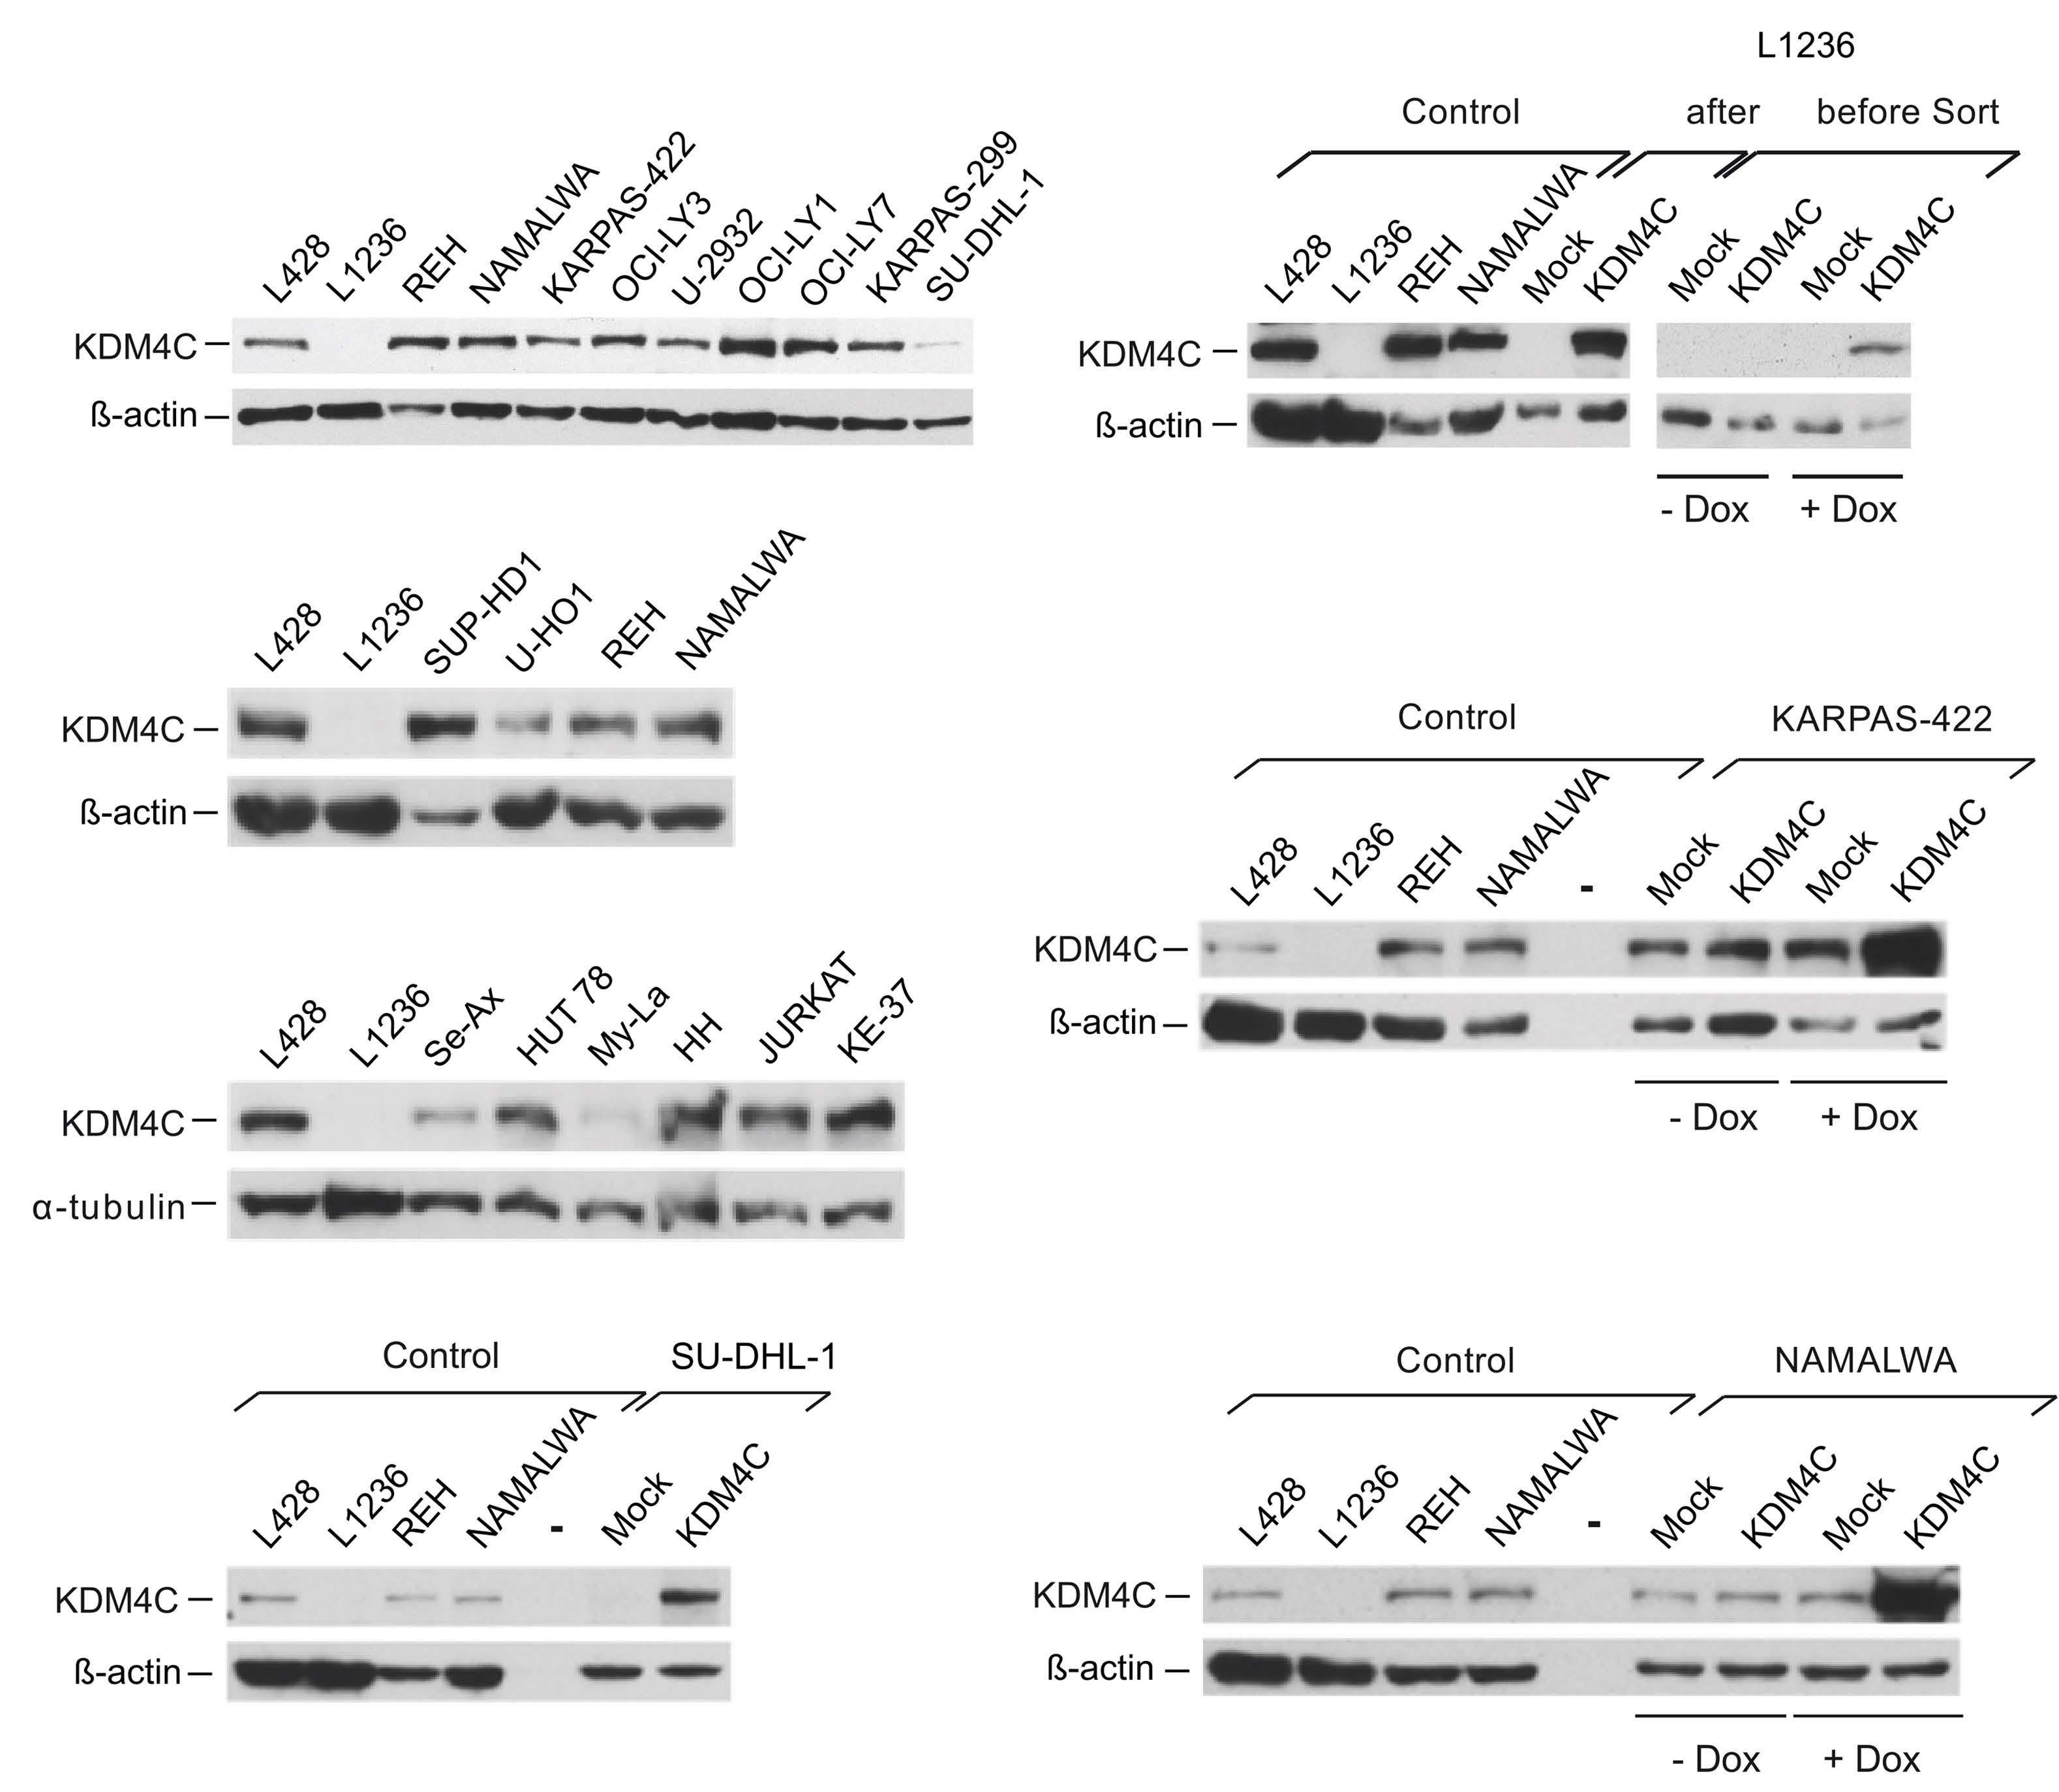
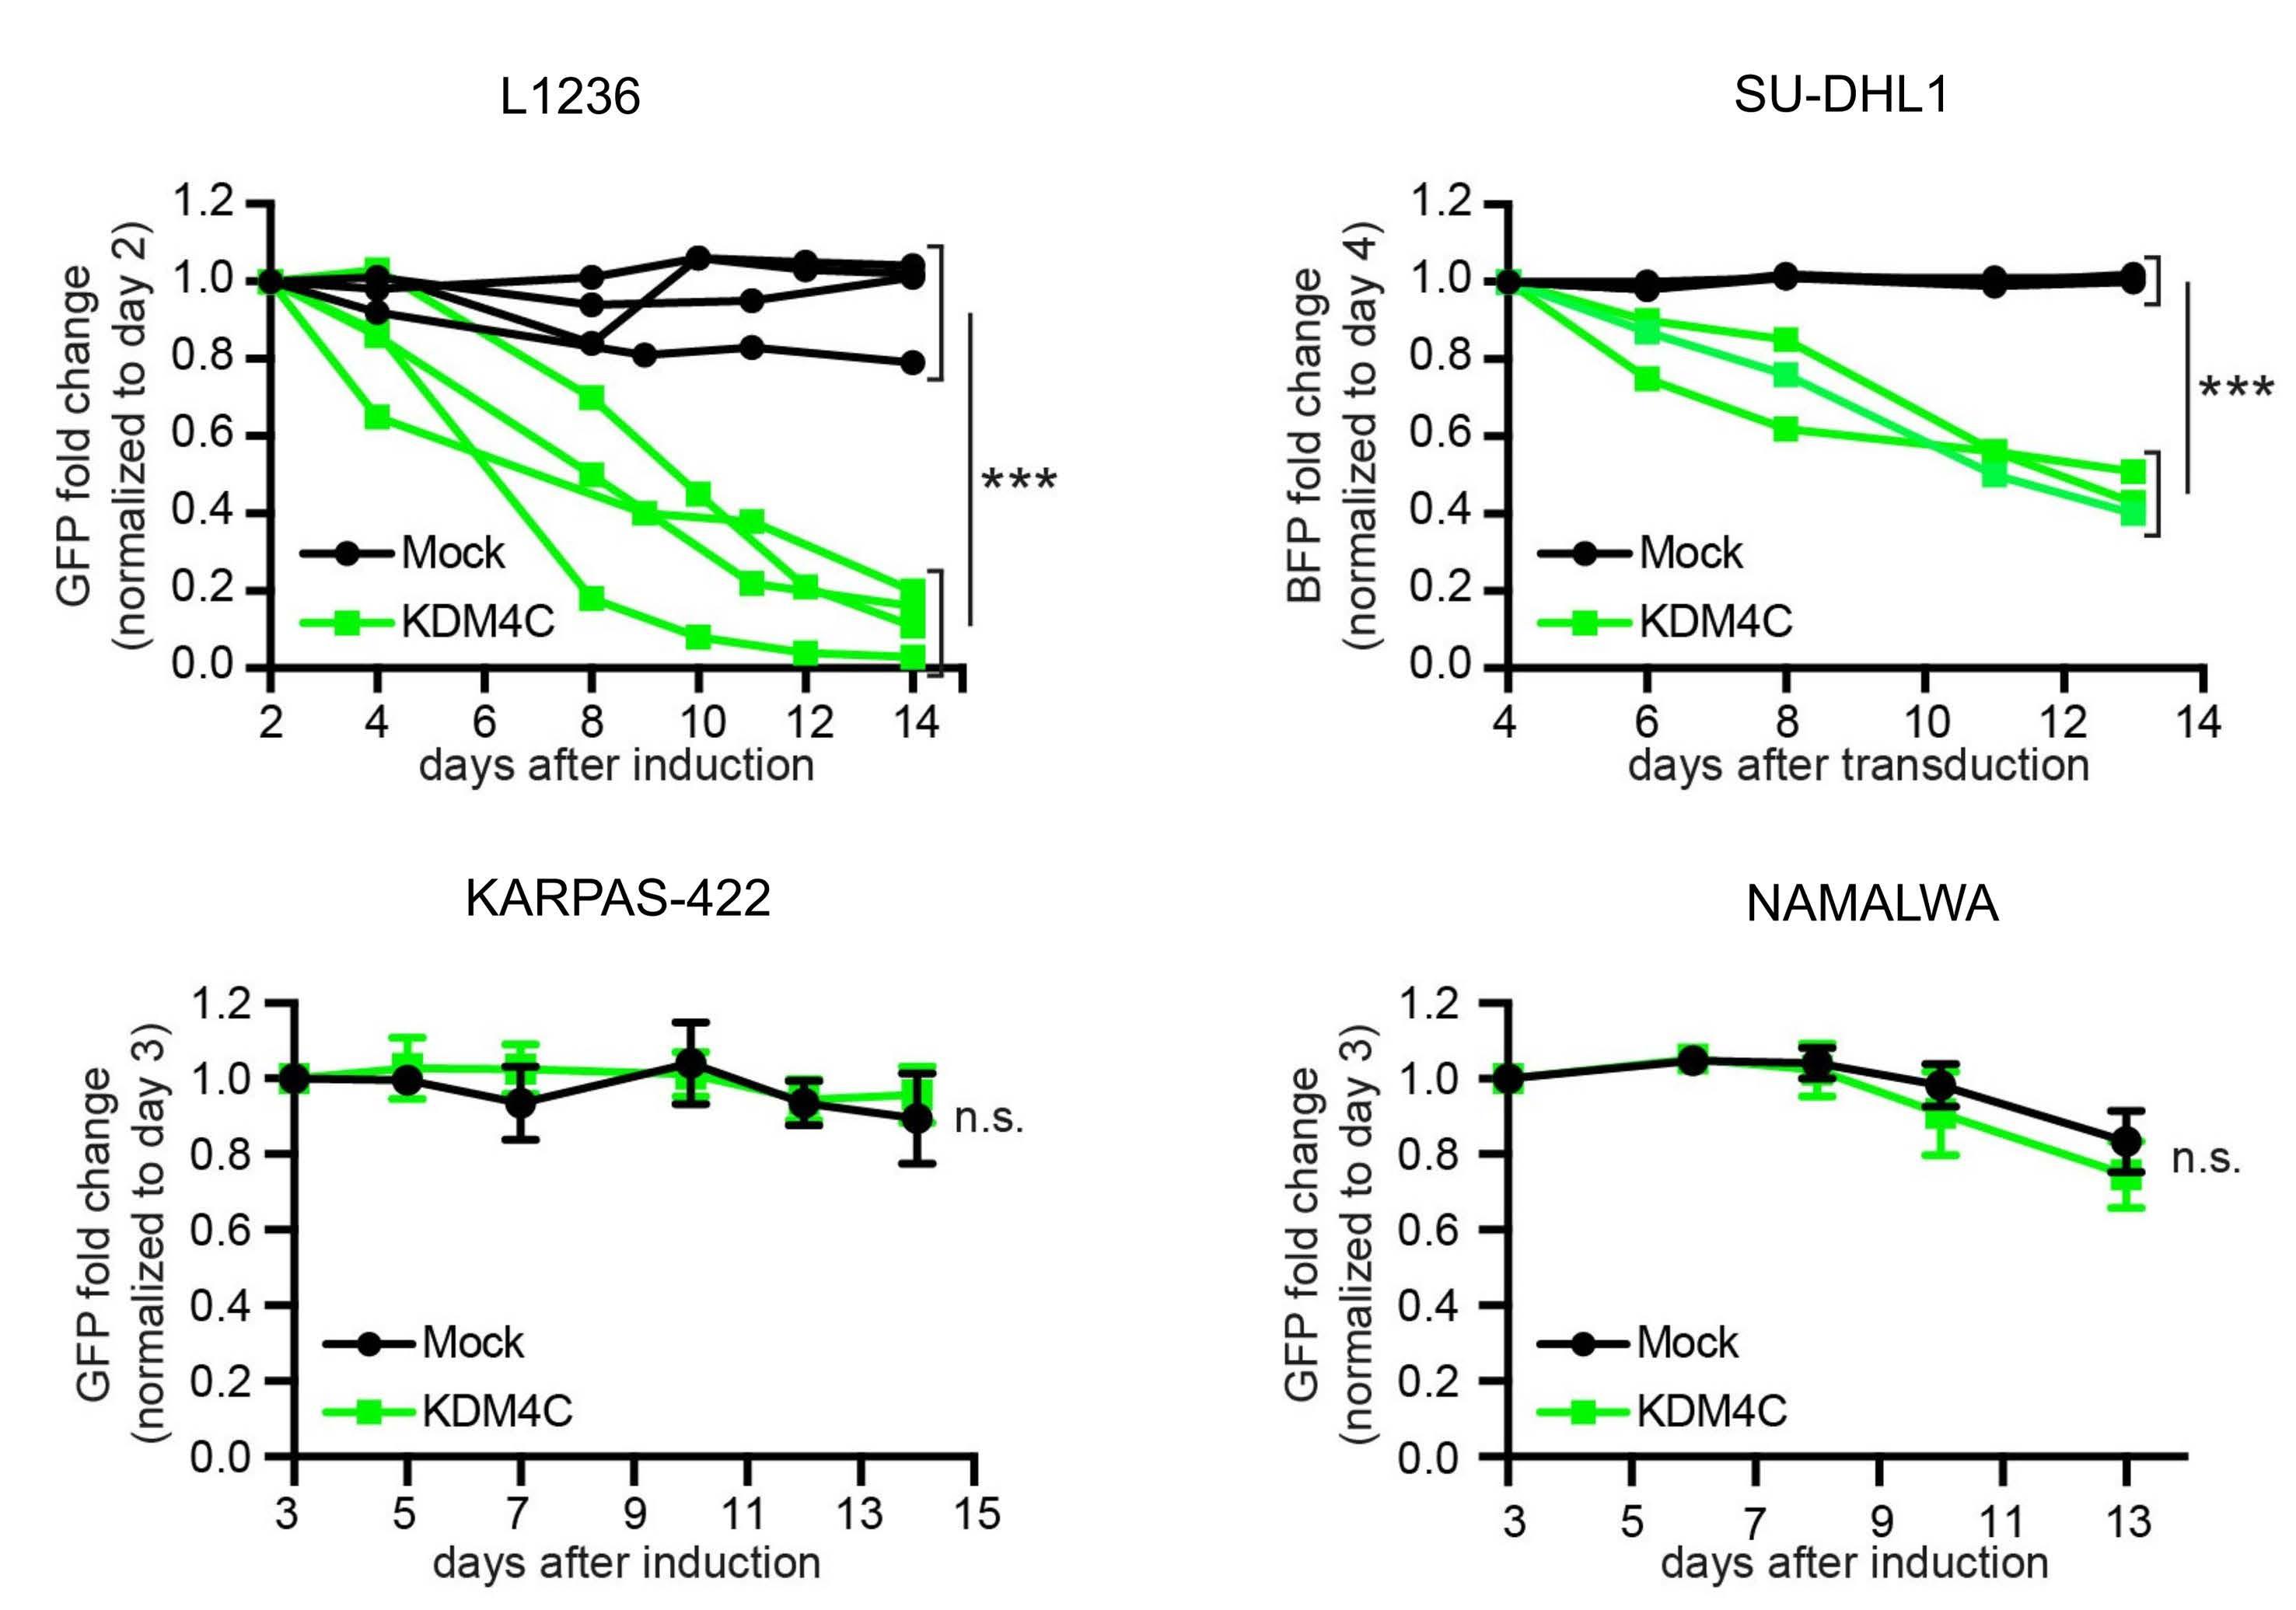
Continued
Haematologica | 108 February 2023 549 ARTICLE -
structural variants
C. López et al. B C D
on following page.
Focal
perturbing KDM4C in B-cell lymphoma
Figure 2. Potential tumor suppressive role of the KDM4C protein. (A) Predicted KDM4C protein alterations associated with genomic and transcriptomic changes. Top panel: structure of the KDM4C protein (Uniprot: Q9H3R0) with highlighted positions of the two N-terminal JmjN and JmjC catalytic domains, the PHD zinc finger domains, and the two C-terminal Tudor recognition domains. Boxes highlight the predicted residual protein structure (if translated) in lymphoma cases and cell lines with somatic KDM4C variants. In case 4177842, the single nucleotide variant (SNV) affects the JmjN domain. In cases 4191799 and 4110120 the regulatory/recognition region is affected, in cases 41074893, 4128852 and 4115001 the catalytic domains are affected. The predicted protein in KARPAS-422 affects the regulatory region; in L1236 the predicted protein abrogates the catalytic domain JmjC, and the regulatory/recognition region, and consequently generates a non-functional protein; in SUP-HD1 the regulatory/recognition domains are predicted to be lost by the truncating SNV. See the extended legend to Figure 2SA in the Online Supplementary Material for more detail. (B) Immunoblotting of KDM4C protein. Left column, upper three panels, KDM4C protein expression in whole cell extracts of various human leukemia/lymphoma-derived cell lines, as indicated. b-actin or atubulin are shown as controls. Note that L1236 cells completely lack KDM4C protein expression, and KDM4C expression in SUDHL-1, My-La and Se-Ax cells is strongly reduced. Upper right panel, KDM4C immunoblotting of L1236 cells before and after transfection with a doxycycline (Dox)-inducible KDM4C-expression vector or respective control (Mock) construct, before (left) and after (right) enrichment of Dox-induced GFP+ cells. b-actin is shown as a control. Right column, center and bottom, immunoblotting of KDM4C of KARPAS-422 and NAMALWA after transfection with Dox-inducible KDM4C or control (Mock) construct, without and after addition of Dox. b-actin is shown as a control. Left column bottom, immunoblotting of KDM4C of SU-DHL-1 cells after lentiviral transduction with KDM4C expression or respective control (Mock) construct. Note, that L428, L1236, REH and NAMALWA extracts were included as positive and negative controls. (C, D) Reconstitution of KDM4C results in loss of cells re-expressing KDM4C in L1236 and SU-DHL-1 in which endogenous expression of the protein is absent and reduced, respectively, but not in those with robust endogenous KDM4C expression (KARPAS-422, NAMALWA). (C) Left, L1236 cells were transfected with Dox-inducible KDM4C-expression or respective control (Mock) construct. GFP expression is driven in parallel to KDM4C by a bidirectional promoter. GFP+ cells were enriched by flow cytometry 48 h after addition of Dox and, thereafter, the percentage of GFP+ cells was monitored over time by flow cytometry. The percentages of KDM4C- or Mock-transfected GFP+ cells normalized to the percentage of GFP+ cells at day 2 after Dox-induction and enrichment of GFP+ cells is shown. Right, SUDHL-1 cells were lentivirally transduced with KDM4C, and the percentage of KDM4C, EBFP+ cells over time was determined as described for L1236 cells. (D) KARPAS-422 (left) and NAMALWA (right) cells were treated and monitored as described in (C) for L1236, with the difference that due to high transfection rates for both cell lines no enrichment of GFP+ cells was required.
based DNA methylation, as well as chromatin state data.22
The promoter and transcription start site region showed strong hypomethylation in all subtypes of lymphomas and B-cell controls (Online Supplementary Figure S7). We did not observe any differential DNA methylation with regard to expression or alteration of the KDM4C locus with the notable exception of CpG cg13880654 associated with an intronic enhancer site which was hypermethylated in the majority of lymphoma cell lines other than Burkitt lymphoma cell lines. Together, the pattern of alterations strongly suggests KDM4C protein loss-of-function as a common effect of the KDM4C gene aberrations (Figure 2A, Online Supplementary Figure S1), indicative of a tumor suppressor function of KDM4C protein.
Transcriptional analyses
Using the RNA-sequencing data, we investigated KDM4C transcript expression in the seven cases with KDM4C alterations compared to 173 GC B-cell lymphomas without KDM4C aberrations. To reduce confounders, we performed these analyses for each lymphoma subtype separately. No statistically significant difference in KDM4C transcript expression was observed between samples with altered as compared to wildtype KDM4C in FL-DLBCL (P=0.4706), in DLBCL (P=0.2095), or in large B-cell lymphomas with IRF4 breaks (P=1), although this analysis was clearly limited by the low number of KDM4C-altered cases per group (Online Supplementary Figure S8).
Next, we performed differential expression analyses of RNA-sequencing data comparing cases with and without
KDM4C alterations. There were only two morphological subgroups for which sufficient numbers of cases with and without KDM4C alterations with RNA-sequencing data were available, namely DLBCL and FL-DLBCL. We performed the differential expression analyses in both of these groups separately. None of the previously described target genes of KDM4C (Online Supplementary Table S3) was among the 107 differentially expressed genes between KDM4C mutated and wildtype cases in the DLBCL group or the 19 differentially expressed genes in the FL-DLBCL group (Online Supplementary Table S4). Notably, there appears to be a small but significant difference in gene expression between the KDM4C-mutated and KDM4C-wildtype cases in the DLBCL group. In contrast, the results in the FL-DLBCL group are in line with common fluctuations that may or may not be due to KDM4C status, as this is only one against all other comparisons, and comparing a random FL-DLBCL case against all others often shows even bigger differences. We analyzed the genes differentially expressed between mutated and unmutated KDM4C in DLBCL using string-db.47 While there are more interactions than randomly expected between the 64 proteins known to string-db (14 vs. 7; P<0001), the only enrichment found was in signal peptide domain from UniProt keywords (25 of 64, false discovery rate=0.0135). Next, we intersected the differentially expressed genes based on KDM4C mutation status in the DLBCL group with genes differentially expressed between subtypes of DLBCL (ABC, GCB and Type III). However, no significant enrichment in the number of overlapping genes was detected.
Haematologica | 108 February 2023 550 ARTICLE - Focal structural variants perturbing KDM4C in B-cell lymphoma C. López et al.
Finally, we examined the expression levels of H3 in the cases harboring KDM4C aberrations as compared to the cases lacking KDM4C alterations, but no significantly differential expression on H3 was detected (P>0.1).
Functional analysis of KDM4C
We explored public data and screened a total of 23 lymphoma cell lines for the presence of inactivating KDM4C alterations using the same approach employed to validate the structural variants described above and combined this with published genomic data from two additional cHL cell lines (Online Supplementary Table S2). We detected KDM4C deletions in the mycosis fungoides-derived cell line MyLa, and the cHL-derived cell line L1236 (Online Supplementary Table S2). More specifically, in WGS data of L123626 we identified a KDM4C deletion of approximately 60 kb (chr9: 6,775,810-6,836,328 bp [hg19], comprising exons 2, 3 and 4) at one allele, with an approximately 32 kb internal deletion of the second allele (chr9: 6,795,791-6,828,233 bp [hg19], affecting exons 3 and 4), resulting in homozygous loss of exons 3 and 4 of KDM4C (Figure 1B). Whereas the larger heterozygous deletion ablates the canonical translation initiation codon, the 32 kb deletion is predicted to encode an (if translated) non-functional protein in L1236 lacking the N-terminus with the catalytic JmjN domain (Figure 2A). The KDM4C heterozygous deletion in My-La cells is in agreement with the conventional cytogenetic analysis describing a del(9)(p21).48 In addition, SUP-HD1 and KARPAS-422 cell lines carry the SNV c.G1713A, p.W571*, and c.C2498T, p.P833L, respectively (Figure 2A, Online Supplementary Table S2) reported in the COSMIC cell lines database (cancer.sanger.ac.uk/cell_lines), which we validated by PCR and Sanger sequencing and which are predicted as pathogenic variants by FATHMM. Evolutionary and protein structure predictions also suggest that p.P833L is a lossof-function variant (Online Supplementary Figure S1). Thus, remarkably, with L1236 and SUP-HD1 two out of six bona fide cHL cell lines show potential inactivating changes in the KDM4C gene suggesting a tumor suppressive role in both GC B-cell lymphomas and cHL.
In agreement with the genomic data, KDM4C immunoblotting of the various cell lines revealed a complete loss of KDM4C protein expression in L1236 cells, and a strong reduction in My-La, but also in the cell lines Se-Ax and SUDHL-1 using a homemade rabbit polyclonal anti-KDM4C antibody (against amino acids 1007-1056) (Figure 2B). To address the functional consequences of KDM4C deletions, we constructed an episomally replicating vector for doxycycline-inducible KDM4C re-expression in L1236 cells as well as KDM4C lentiviruses for re-expression in SU-DHL-1 cells (Figure 2C). In both cell lines, KDM4C re-expression resulted in a loss of KDM4C-expressing cells over time, in agreement with a tumor suppressor function in these cells. Such an effect was not observed in either KARPAS-422 (p.P833L) or
in NAMALWA (no KDM4C aberration) (Figure 2D). In addition, we aimed to investigate the expression of KDM4C by immunohistochemistry in primary tissues as well as cell lines using the anti-KDM4C antibody used for the immunoblotting technique. We were able to prove the lack of expression of KDM4C protein in L1236 and to specifically detect ectopically expressed KDM4C in formalinfixed and paraffin-embedded transfected HEK293 cells (data not shown). However, this as well as several commercially available anti-KDM4C antibodies failed in our hands to reliably quantify KDM4C protein expression in primary tissues (data not shown).
Discussion
Here, we analyzed WGS data of 186 GC B-cell lymphomas to investigate somatic aberrations, including SNV, indels, structural variants, and focal copy number aberrations in 79 genes encoding histone methylation regulators, to identity epigenetic modifiers potentially involved in GC Bcell lymphomagenesis.6,11–16 We identified KDM4C, encoding a histone demethylase, as being recurrently altered in Bcell lymphomas (7/186, 4%).
Integrating RNA-sequencing and WGS data in the six cases with focal structural variants, we detected alternative KDM4C transcripts in five of them. In silico analyses using Mechismo predicted that these alternative transcripts result in altered proteins lacking the catalytic or recognition (epigenetic readers) domains, suggesting a loss of function. In contrast, KDM4C has been previously described as an oncogene in lymphomas, which is activated by large chromosome 9p gains. These gains mostly derive from co-ampli fi cation with JAK2 , CD274 , and PDCD1LG2 , recurrently found in cHL and primary mediastinal B-cell lymphoma.34 Nonetheless, recent studies in these lymphoma subtypes refined the minimally gained region and point to CD274 and PDCD1LG2 as main targets, whereas KDM4C is not consistently gained (Online Supplementary Figure S9). We here detected KDM4C to be altered due to focal structural variants (6/7) rather than gross imbalances. Moreover, we observed that the vast majority of focal KDM4C aberrations occurred independently of 9p24 amplifications. In brief, KDM4C might belong to the increasing list of genes with oncogenic and tumor suppressive function depending on the cellular context and the type of aberration. Examples from hematologic neoplasms include EZH2 and the CEBP gene family.49-51
In addition to genomic mutations, we explored different other layers that could contribute to dysregulated KDM4C in GC B-cell lymphomas. We used previously published data derived from whole genome bisulfite sequencing, array-based DNA methylation, and chromatin state data22
Haematologica | 108 February 2023 551 ARTICLE - Focal structural variants perturbing KDM4C in B-cell lymphoma C. López et al.
to investigate epigenetic alterations at the KDM4C locus. However, we did not find evidence for epigenetic inactivation of the KDM4C locus. Furthermore, we investigated the role of expression of circKDM4C, a circRNA from the KDM4C locus recently described to be of pathogenic relevance in solid tumors.46,52 Although we detected circKDM4C expression in 1.7% of the cases, none of them showed an alteration of the KDM4C locus. Taken together, these results suggest that genomic alterations are the main mechanism involved in KDM4C gene dysregulation in GC B-cell lymphomas. The fact that these genomic alterations are mostly focal structural variants and that SNV of KDM4C (1/7) seem to be rare in GC B-cell lymphomas likely explains why alterations of this gene have been underestimated in previous whole exome analyses.5,6
KDM4C alterations are not exclusive to GC B-cell NHL. Exploring a set of cell lines we observed that L123626 and SUP-HD1, and thus two out of six (33.3%) bona fide cHL cell lines, show potentially inactivating changes in the KDM4C gene, suggesting a tumor suppressive role in both GC B-cell NHL and cHL. We could not detect changes in KDM4C transcript expression between cases with altered and wildtype KDM4C using RNA-sequencing data of the GC B-cell derived lymphomas in the ICGC cohort. In contrast, using KDM4C immunoblotting in the cell lines we observed a complete loss of KDM4C protein expression in L1236 cells, and a strong reduction in My-La, which is in line with the genomic analysis. Subsequent functional analyses using KDM4C re-expression in cell lines with reduced or lack of KDM4C expression support the hypothesis of a tumor suppressor function of KDM4C at least in a subset of lymphomas. In conclusion, our work not only adds KDM4C to the list of histone methylation modifiers recurrently altered in Bcell lymphomas, but it also supports a function of KDM4C as a tumor suppressor at least in a subset of lymphoma types. Moreover, our data demonstrate that focal structural variants contribute to the mutational burden of distinct genes, which might be missed by pure exome and/or RNA-sequencing approaches. This has to be considered if mutational landscapes are defi ned for classi fi cation schemes, such as those proposed for lymphomas.
Disclosures
No conflicts of interest to disclose.
Contributions
CL performed PCR and Sanger sequencing validations. CL, SB and RSi performed FISH validation analyses. NS, MJ and SM realized the functional analyses. SS, UHT, JS, KK, SHB,
DH, MK, and MS performed analysis of next-generation sequencing data. JMM and RSc developed the KDM4C antibody. MG provided the genomic data of cHL cell lines. MS, SH and JOK supervised next-generation sequencing analysis and interpreted data. GA, RBR and JCG generated the protein modeling. AM and WK performed immunohistochemistry analyses. HE, SG, OA, BR and PL analyzed the whole genome bisulfite sequencing and methylation arrays. HLS and MJ provided KDM4C-knockout data of cHL cell lines. NS and HLS cloned KDM4C expression vectors. RK provided normal B-cell samples. CL, RSi and SM interpreted data and wrote the manuscript. RSi and SM designed the study. RW and CL supported coordination of the project. LT performed the clinical coordination of the project. RSi coordinated the ICGC MMML-Seq network. All authors read and approved the final manuscript.
Acknowledgments
We thank the High Throughput Sequencing Unit of the DKFZ Genomics and Proteomics Core Facility for providing whole-genome sequencing services. We thank Prof. Elias Campo and Blanca González-Farré for support with immunohistochemistry experiments, and Prof. Georg Bornkamm for providing pRTS-1. The support of the technical staff of the Institutes of Human Genetics in Kiel and Ulm, as well as the former masters student, Iv an Potreba, are gratefully acknowledged.
Funding
This study was supported by the German Ministry of Science and Education (BMBF) in the framework of the ICGC MMML-Seq (01KU1002A-J) and ICGC DE-Mining (01KU1505G and 01KU1505E) projects. This work was also supported by the BMBF-funded Heidelberg Center for Human Bioinformatics (HD-HuB) within the German Network for Bioinformatics Infrastructure (de.NBI) (#031A537A, #031A537C). Former grant support for MMML by the Deutsche Krebshilfe (2003-2011) is gratefully acknowledged. CL was supported by an Alexander von Humboldt Foundation post-doctoral fellowship. RSi and MG received funding from the European Union's Horizon 2020 research and innovation program under grant agreement n. 952304. Former support to MG in the form of a FEBS long-term fellowship and a “Support for International Mobility of Scientists” fellowship of the Polish Ministry of Science and Higher Education is gratefully acknowledged.
Data-sharing statement
Sequencing data are available from the European Genome-phenome Archiv e (EGA) (accession number EGAS00001002199)
Haematologica | 108 February 2023 552 ARTICLE - Focal structural variants perturbing KDM4C in B-cell lymphoma C. López et al.
1. Swerdlow SH, Campo E, Harris NL, Jaffe ES, Pileri SA, Stein H TJ. WHO Classification of Tumours of Haematopoietic and Lymphoid Tissues. 4th ed.; 2017.
2. Rosenwald A, Wright G, Chan WC, et al. The use of molecular profiling to predict survival after chemotherapy for diffuse large-B-cell lymphoma. N Engl J Med. 2002;346(25):1937-1947.
3. Hummel M, Bentink S, Berger H, et al. A biologic definition of Burkitt’s lymphoma from transcriptional and genomic profiling. N Engl J Med. 2006;354(23):2419-2430.
4. Wright GW, Huang DW, Phelan JD, et al. A probabilistic classification tool for genetic subtypes of diffuse large B cell lymphoma with therapeutic implications. Cancer Cell. 2020;37(4):551-568.e14.
5. Chapuy B, Stewart C, Dunford AJ, et al. Molecular subtypes of diffuse large B cell lymphoma are associated with distinct pathogenic mechanisms and outcomes. Nat Med. 2018;24(5):679-690.
6. Schmitz R, Wright GW, Huang DW, et al. Genetics and pathogenesis of diffuse large B-cell lymphoma. N Engl J Med. 2018;378(15):1396-1407.
7. Hübschmann D, Kleinheinz K, Wagener R, et al. Mutational mechanisms shaping the coding and noncoding genome of germinal center derived B-cell lymphomas. Leukemia. 2021;35(7):2002-2016.
8. Lacy SE, Barrans SL, Beer PA, et al. Targeted sequencing in DLBCL, molecular subtypes, and outcomes: a Haematological Malignancy Research Network report. Blood. 2020;135(20):1759-1771.
9. Runge HFP, Lacy S, Barrans S, et al. Application of the LymphGen classification tool to 928 clinically and geneticallycharacterised cases of diffuse large B cell lymphoma (DLBCL). Br J Haematol. 2021;192(1):216-220.
10. Morin RD, Arthur SE, Hodson DJ. Molecular profiling in diffuse large B-cell lymphoma: why so many types of subtypes? Br J Haematol. 2022;196(4):814-829.
11. Pasqualucci L, Dalla-Favera R. Genetics of diffuse large B-cell lymphoma. Blood. 2018;131(21):2307-2319.
12. De Silva NS, Klein U. Dynamics of B cells in germinal centres. Nat Rev Immunol. 2015;15(3):137-148.
13. Morin RD, Johnson NA, Severson TM, et al. Somatic mutations altering EZH2 (Tyr641) in follicular and diffuse large B-cell lymphomas of germinal-center origin. Nat Genet. 2010;42(2):181-185.
14. Reddy A, Zhang J, Davis NS, et al. Genetic and functional drivers of diffuse large B cell lymphoma. Cell. 2017;171(2):481-494.e15.
15. Hashwah H, Schmid CA, Kasser S, et al. Inactivation of CREBBP expands the germinal center B cell compartment, downregulates MHCII expression and promotes DLBCL growth. Proc Natl Acad Sci U S A. 2017;114(36):9701-9706.
16. Krysiak K, Gomez F, White BS, et al. Recurrent somatic mutations affecting B-cell receptor signaling pathway genes in follicular lymphoma. Blood. 2017;129(4):473-483.
17. Singleton AB. Exome sequencing: a transformative technology. Lancet Neurol. 2011;10(10):942-946.
18. Richter J, Schlesner M, Hoffmann S, et al. Recurrent mutation of the ID3 gene in Burkitt lymphoma identified by integrated genome, exome and transcriptome sequencing. Nat Genet. 2012;44(12):1316-1320.
19. ICGC/TCGA Pan-Cancer Analysis of Whole Genomes Consortium. Pan-cancer analysis of whole genomes. Nature. 2020;578(7793):82-93.
20. López C, Kleinheinz K, Aukema SM, et al. Genomic and transcriptomic changes complement each other in the pathogenesis of sporadic Burkitt lymphoma. Nat Commun. 2019;10(1):1459.
21. Li H, Kaminski MS, Li Y, et al. Mutations in linker histone genes HIST1H1 B, C, D, and E; OCT2 (POU2F2); IRF8; and ARID1A underlying the pathogenesis of follicular lymphoma. Blood. 2014;123(10):1487-1498.
22. Kretzmer H, Bernhart SH, Wang W, et al. DNA methylome analysis in Burkitt and follicular lymphomas identifies differentially methylated regions linked to somatic mutation and transcriptional control. Nat Genet. 2015;47(11):1316-1325.
23. Doose G, Haake A, Bernhart SH, et al. MINCR is a MYC-induced lncRNA able to modulate MYC’s transcriptional network in Burkitt lymphoma cells. Proc Natl Acad Sci U S A. 2015;112(38):E5261-5270.
24. Otto C, Giefing M, Massow A, et al. Genetic lesions of the TRAF3 and MAP3K14 genes in classical Hodgkin lymphoma. Br J Haematol. 2012;157(6):702-708.
25. Liu Y, Abdul Razak FR, Terpstra M, et al. The mutational landscape of Hodgkin lymphoma cell lines determined by whole-exome sequencing. Leukemia. 2014;28(11):2248-2251.
26. Schneider M, Schneider S, Zühlke-Jenisch R, et al. Alterations of the CD58 gene in classical Hodgkin lymphoma. Genes Chromosomes Cancer. 2015;54(10):638-645.
27. Rausch T, Zichner T, Schlattl A, Stütz AM, Benes V, Korbel JO. DELLY: structural variant discovery by integrated paired-end and split-read analysis. Bioinformatics. 2012;28(18):i333-i339.
28. Northcott PA, Buchhalter I, Morrissy AS, et al. The wholegenome landscape of medulloblastoma subtypes. Nature. 2017;547(7663):311-317.
29. Hoffmann S, Otto C, Kurtz S, et al. Fast mapping of short sequences with mismatches, insertions and deletions using index structures. PLoS Comput Biol. 2009;5(9):e1000502.
30. Betts MJ, Lu Q, Jiang Y, et al. Mechismo: predicting the mechanistic impact of mutations and modifications on molecular interactions. Nucleic Acids Res. 2015;43(2):e10.
31. Schleussner N, Merkel O, Costanza M, et al. The AP-1-BATF and -BATF3 module is essential for growth, survival and TH17/ILC3 skewing of anaplastic large cell lymphoma. Leukemia. 2018;32(9):1994-2007.
32. Cloos PAC, Christensen J, Agger K, et al. The putative oncogene GASC1 demethylates tri- and dimethylated lysine 9 on histone H3. Nature. 2006;442(7100):307-311.
33. Loh Y-H, Zhang W, Chen X, George J, Ng H-H. Jmjd1a and Jmjd2c histone H3 Lys 9 demethylases regulate self-renewal in embryonic stem cells. Genes Dev. 2007;21(20):2545-2557.
34. Rui L, Emre NCT, Kruhlak MJ, et al. Cooperative epigenetic modulation by cancer amplicon genes. Cancer Cell. 2010;18(6):590-605.
35. Hansen RS, Thomas S, Sandstrom R, et al. Sequencing newly replicated DNA reveals widespread plasticity in human replication timing. Proc Natl Acad Sci U S A. 2010;107(1):139-144.
36. Yu K, Huang FT, Lieber MR. DNA substrate length and surrounding sequence affect the activation-induced deaminase activity at cytidine. J Biol Chem. 2004;279(8):6496-6500.
37. Krill-Burger JM, Lyons MA, Kelly LA, et al. Renal cell neoplasms contain shared tumor type-specific copy number variations. Am J Pathol. 2012;180(6):2427-2439.
38. Lee DH, Kim GW, Jeon YH, Yoo J, Lee SW, Kwon SH. Advances in histone demethylase KDM4 as cancer therapeutic targets.
References
Haematologica | 108 February 2023 553 ARTICLE - Focal structural variants perturbing KDM4C in B-cell lymphoma C. López et al.
FASEB J. 2020;34(3):3461-3484.
39. Shao N, Cheng J, Huang H, et al. GASC1 promotes hepatocellular carcinoma progression by inhibiting the degradation of ROCK2. Cell Death Dis. 2021;12(3):253.
40. Ma X, Ying Y, Sun J, et al. circKDM4C enhances bladder cancer invasion and metastasis through miR-200bc-3p/ZEB1 axis. Cell Death Discov. 2021;7(1):365.
41. Chen GQ, Ye P, Ling RS, et al. Histone demethylase KDM4C is required for ovarian cancer stem cell maintenance. Stem Cells Int. 2020;2020:8860185.
42. Kleszcz R, Skalski M, Krajka-Kuźniak V, Paluszczak J. The inhibitors of KDM4 and KDM6 histone lysine demethylases enhance the anti-growth effects of erlotinib and HS-173 in head and neck cancer cells. Eur J Pharm Sci. 2021;166:105961.
43. Yang D, Xu T, Fan L, Liu K, Li G. microRNA-216b enhances cisplatin-induced apoptosis in osteosarcoma MG63 and SaOS-2 cells by binding to JMJD2C and regulating the HIF1a/HES1 signaling axis. J Exp Clin Cancer Res. 2020;39(1):201.
44. Lang T, Xu J, Zhou L, et al. Disruption of KDM4C-ALDH1A3 feedforward loop inhibits stemness, tumorigenesis and chemoresistance of gastric cancer stem cells. Signal Transduct Target Ther. 2021;6(1):336.
45. Huang Y, Fang J, Bedford MT, Zhang Y, Xu R-M. Recognition of
histone H3 lysine-4 methylation by the double tudor domain of JMJD2A. Science. 2006;312(5774):748-751.
46. Liang Y, Song X, Li Y, et al. circKDM4C suppresses tumor progression and attenuates doxorubicin resistance by regulating miR-548p/PBLD axis in breast cancer. Oncogene. 2019;38(42):6850-6866.
47. Jensen LJ, Kuhn M, Stark M, et al. STRING 8--a global view on proteins and their functional interactions in 630 organisms. Nucleic Acids Res. 2009;37(Database issue):D412-416.
48. Netchiporouk E, Gantchev J, Tsang M, et al. Analysis of CTCL cell lines reveals important differences between mycosis fungoides/Sézary syndrome vs. HTLV-1(+) leukemic cell lines. Oncotarget. 2017;8(56):95981-95998.
49. Gan L, Yang Y, Li Q, Feng Y, Liu T, Guo W. Epigenetic regulation of cancer progression by EZH2: from biological insights to therapeutic potential. Biomark Res. 2018;6(1):10.
50. Tolomeo M, Grimaudo S. The “Janus” role of C/EBPs family members in cancer progression. Int J Mol Sci. 2020;21(12):1-18.
51. Shaulian E. AP-1 - the Jun proteins: oncogenes or tumor suppressors in disguise? Cell Signal. 2010;22(6):894-899.
52. Ma SD, Xu X, Jones R, et al. PD-1/CTLA-4 blockade inhibits Epstein-Barr virus-induced lymphoma growth in a cord blood humanized-mouse model. PLoS Pathog. 2016;12(5):e1005642.
Haematologica | 108 February 2023 554 ARTICLE - Focal structural variants perturbing KDM4C in B-cell lymphoma C. López et al.
Small-molecule SUMO inhibition for biomarker-informed
B-cell lymphoma therapy
Uta M. Demel,1,2,3 Matthias Wirth,1,2 Schayan Yousefian,1,4,5 Le Zhang,1,2 Konstandina Isaakidis,1,2 Judith Dönig,6 Marlitt Böger,1,2 Nikita Singh,1,2 Hazal Köse,1,2 Simon Haas,1,4,5,7,8,9 Stefan Müller,6 Markus Schick1,2 and Ulrich Keller1,2,7
1Department of Hematology, Oncology and Cancer Immunology, Campus Benjamin Franklin, Charité - Universitätsmedizin Berlin, corporate member of Freie Universität Berlin and Humboldt-Universität zu Berlin, Berlin; 2Max-Delbrück-Center for Molecular Medicine, Berlin; 3Clinician Scientist Program, Berlin Institute of Health (BIH), Berlin; 4Berlin Institute of Health (BIH) at Charité – Universitätsmedizin Berlin, Berlin; 5Berlin Institute for Medical Systems Biology, Max Delbrück Center for Molecular Medicine in the Helmholtz Association, Berlin; 6Institute of Biochemistry II, Goethe University Frankfurt, Medical School, Frankfurt; 7German Cancer Consortium (DKTK), German Cancer Research Center (DKFZ), Heidelberg; 8Heidelberg Institute for Stem Cell Technology and Experimental Medicine (HI-STEM gGmbH), Heidelberg and 9Division of Stem Cells and Cancer, Deutsches Krebsforschungszentrum (DKFZ) and DKFZZMBH Alliance, Heidelberg, Germany
Abstract
Correspondence: Ulrich Keller ulrich.keller@charite.de
Received: March 7, 2022.
Accepted: September 13, 2022. Prepublished: September 22, 2022. https://doi.org/10.3324/haematol.2022.280995
©2023 Ferrata Storti Foundation
Published under a C BY-NC license
Aberrant activity of the SUMOylation pathway has been associated with MYC overexpression and poor prognosis in aggressive B-cell lymphoma (BCL) and other malignancies. Recently developed small-molecule inhibitors of SUMOylation (SUMOi) target the heterodimeric E1 SUMO activation complex (SAE1/UBA2). Here, we report that activated MYC signaling is an actionable molecular vulnerability in vitro and in a preclinical murine in vivo model of MYC-driven BCL. While SUMOi conferred direct effects on MYC-driven lymphoma cells, SUMO inhibition also resulted in substantial remodeling of various subsets of the innate and specific immunity in vivo. Specifically, SUMOi increased the number of memory B cells as well as cytotoxic and memory T cells, subsets that are attributed a key role within a coordinated anti-tumor immune response. In summary, our data constitute pharmacologic SUMOi as a powerful therapy in a subset of BCL causing massive remodeling of the normal B-cell and T-cell compartment.
Introduction
The myelocytomatosis oncogene MYC is deregulated in almost half of all human cancers by chromosomal amplification, translocation or mutations in signaling pathways that regulate MYC expression.1-3 MYC belongs to a family of basic helix-loop-helix leucin zipper DNA binding proteins that function as a transcription factor controlling multiple biological processes including cell proliferation, differentiation, apoptosis and metabolism.1 Control of gene transcription is a well-established function of MYC, while MYC also interferes with translation and protein turnover.4,5 Genetic and epigenetic dysregulation of MYC expression accelerates cell proliferation and drives malignant transformation. So far, there are no effective therapies specifically targeting MYC signaling that have been established for clinical use. Uncontrolled cell growth in response to MYC overexpression creates dependencies on MYC-driven pathways to maintain the tumor phenotype.6 Therefore, the idea of targeting these cellular processes has been developed within the concept of “synthetic lethal interactions”.7,8
SUMOylation is a post-translational protein modification that controls localization, function and half-life of target proteins.9,10 It emerged as a crucial regulatory mechanism for fundamental cellular processes like chromatin organization, transcription and cell proliferation.11 The conjugation of SUMO (SUMO1, SUMO2 or SUMO3) to its substrates is controlled by a multi-step cascade involving the E1 SUMO-activating enzyme SAE1/UBA2, the E2 SUMO-conjugating enzyme UBC9, and various E3 SUMO ligases.12 SUMOylation is a fully reversible protein modification. Deconjugation of SUMO from its substrates is catalyzed by SUMO-specific proteases (or deconjugases) of the SENP (sentrin-specific protease) family.13 Disruption of this well-controlled balance contributes to tumor development and progression.14,15 Of note, dysregulation of oncogenes such as MYC activates SUMOylation and hyperSUMOylation often correlates with poor prognosis in cancer.16,17 However, while activated SUMOylation is a key feature of aggressive cancers, the impact of activated SUMOylation on tumor biology is multifaceted.9,10 Besides its effect on cancer biology itself, SUMOylation restrains anti-tumor immunity by repression of interferon
Haematologica | 108 February 2023 555 ARTICLE - Non-Hodgkin Lymphoma
signaling.18-20 Since SUMOylation is activated in cancer cells with high MYC levels, targeting MYC-induced SUMOylation as a therapeutic vulnerability seems highly attractive.7,21-23 A selective small-molecule inhibitor of SUMOylation that blocks activation of SUMO by the E1 activation enzyme was developed as ML-792 and further refined as ML-093. The clinically applicable form subasumstat (formerly TAK-981)24,25 is currently investigated in clinical trials (clinicaltrials gov. Identifier: NCT03648372, NCT04074330, NCT04381650). Here, we investigated SUMOylation as a MYC-induced molecular vulnerability in aggressive BCL. We uncovered that activated MYC signaling confers susceptibility to pharmacologic SUMO inhibition (SUMOi) in MYC-driven BCL. Next to direct effects on MYC-driven lymphoma, SUMOi challenge resulted in pronounced remodeling of the immune cell landscape.
Methods
Chemicals
SUMOi (ML-093 and Tak-981, as specified in the figure legends) was either purchased from MedChemExpress or provided by Millennium Pharmaceuticals, Inc., a wholly owned subsidiary of Takeda Pharmaceutical Company Limited. SUMOi doses and treatment durations are indicated in the figure legends.
Cell culture
Human diffuse large B-cell lymphoma (DLBCL) cell lines were kept in RPMI-1640 (U-2932, NU-DHL-1, SU-DHL4/5/6/8, DB and Toledo), IMDM (Oci-Ly1) or a-MEM (OciLy19) medium supplemented with 10-20% fetal calf serum (FCS), 1% penicillin streptomycin and 2 mM L-glutamine (Thermo Scientific).
Flow cytometry
Cells were washed in HF2 buffer (ddH2O, 2% FCS, 1% penicillin streptomycin, 1% Hepes, 10% HBSS) and stained on ice for 30 minutes in HF2 (a list of all antibodies is provided in the Online Supplementary Appendix). After washing in HF2 cells were either resuspended in HF2 containing DAPI or propidium iodide (PI) for fluorescence-activated cell sorting (FACS) analysis, stained with the respective antibody combination or fixed with BD Cytofix/Cytoperm for intracellular staining. Data were acquired on Beckman Coulter CytoFLEX S.
Immunoblot analysis
Protein extracts were prepared by solving cell pellets in lysis buffer (150 mM NaCl, 1% NP-40 oder IGEPAL, 0.5% sodium deoxycholate, 0.1% SDS, 50 mM Tris) supplemented with NaF, PMSF and NaVO4 followed by sonification. Protein lysates were fractioned on SDS PAGE gels, transferred to
PVDF Transfer Membran (Thermo Scientific) and incubated with primary antibodies overnight. MYC antibody was obtained by Cell signaling (9402S) and b-tubulin by DSHB (E7). HRP-conjugated secondary antibodies allowed signal detection via enhanced chemiluminescence (ECL) reagents (Millipore).
Cell viability assay
Twenty thousand cells per well were seeded and treatments were administered as indicated. After 24, 48 and 72 hours (h) of incubation, CellTiterGlo (Promega, G7572) was added and luminescence was measured and normalized to dimethyl sulfoxide (DMSO) control.
Mice
Wild-type (wt) mice (CD45.1, C57Bl/6J) were obtained from the Jackson Laboratory. Mice were examined twice a week. All animal experiments were performed in accordance to local authorities (Regierung von Oberbayern, Munich, Germany).
Transplantation and in vivo treatment of mice
1x10 6 Em- myc cells (CD45.2) were transplanted intravenously (i.v.) into C57Bl/6J wt mice. SUMOi or carrier treatment to tumor or wt mice was administered i.v., doses and treatment duration are indicated in the figure legend.
RNA-sequencing and processing of gene expression data
RNA samples were processed and sequenced (paired end, 150 bp/read) by Novogene (Cambridge, UK) on a HiSeq2500 Illumina device with a read depth of >20 M reads. Subsequent quality control, data processing and analysis were performed as previously described.26 RNA-sequencing (RNA-seq) data were uploaded to the European Nucleotide Archive and are available via accession ID: PRJEB53800. Further processing of transcriptomic data including gene set enrichment analysis is described in the Online Supplementary Appendix.
Single-Cell RNA-sequencing analysis
A detailed description of the methods is provided in the Online Supplemental Appendix.
Statistical analysis
Statistical analyses were performed using GraphPad Prism (GraphPad Software). The error bars shown in the figures represent the standard deviation (SD), unless specified otherwise. A P value lower than 0.05 was generally considered significant and all exact P values and tests are indicated in the figures.
Study approval
All animal experiments were performed in accordance
Haematologica | 108 February 2023 556 ARTICLE - SUMO inhibition for MYC-dependent B-cell lymphoma U.M. Demel et al.
with local authorities (Regierung Oberbayern, Munich, Germany and LAGeSo Berlin, Germany).
Results
Activated MYC signaling confers susceptibility to smallmolecule SUMO inhibition in diffuse large B-cell lymphoma cell lines
Activation of the oncoprotein MYC is associated with a hyperSUMOylated phenotype in DLBCL (Figure 1A and B) and both MYC overexpression and enhanced SUMO pathway activity are correlated with adverse clinical outcome (Online Supplementary Figure 1SA to C).
Given the role of MYC in DLBCL, we investigated the sensitivity of DLBCL cell lines to pharmacological SUMO inhibition.24,25 Three of ten cell lines (SU-DHL-8, SU-DHL-5 and Oci-Ly19) were responsive to SUMOi with viabilities below 25% at the highest SUMOi concentration (2,000 nM) (Figure 1C, subasumstat; Online Supplementary Figure S1D, ML-093). Importantly, the broad range of response from exquisite sensitivity (SU-DHL-8, SU-DHL5, Oci-Ly19) to very minor response/non-response in the remainder of DLBCL cell lines revealed that the complex genetic and non-genetic background and dependencies of DLBCL likely define the response to SUMOi.
In order to systematically identify potential biomarkers predictive for SUMOi sensitivity, we ranked the cell lines according to their subasumstat 50% growth inhibitory power (GI50) values and classified the lower third of the panel as SUMOi-responders, and the remaining two thirds constituting the SUMOi low sensitivity/non-responder subset. Gene set enrichment analysis identified the SUMO core pathway to be enhanced as well as various SUMOylation signatures to be enriched in the SUMOi-responsive cell lines (Figure 1D; Online Supplementary Figure S1E), whereas baseline growth characteristics and doubling time were not directly correlated with sensitivity to SUMOi (Online Supplementary Figure S1F and G). Moreover, sensitivity to SUMOi treatment was associated with activated MYC signaling and MYC hallmark gene sets scored among the top enriched gene sets in SUMOi-responsive cell lines (Figure 1D and E; Online Supplementary Figure S1H). Of note, the SU-DHL-8 and Oci-Ly19 cell lines, which had the highest activity of MYC signaling (SU-DHL-8 also harbors an IG::MYC translocation), were among the most sensitive cell lines within the investigated panel (Figure 1C; Online Supplementary Figure S1D and G). We thus concluded that activated MYC signaling is an actionable molecular vulnerability and would predict response to SUMOi. In order to experimentally validate these findings and prove a causal relationship, we ectopically expressed MYC in the human Oci-Ly1 cell line, classified as a non-responder (Figure 1C and F; Online Supplementary Figure S1D). Whereas MYC
overexpression influenced growth kinetics moderately (Online Supplementary Figure S1I) while not affecting basal apoptotic rate or viability (Online Supplementary Figure S1J and K), ectopic MYC expression sensitized Oci-Ly1 to pharmacological SUMO inhibition (Figure 1F; Online Supplementary Figure S1J to L ). Moreover, depletion of SUMO signaling by pharmacological or genetic targeting resulted in impaired MYC pathway activity (Online Supplementary Figure S2; Online Supplementary Table S1).
In summary, we here identify pharmacological SUMO inhibition as a vulnerability and rational treatment strategy for MYC-driven BCL.
SUMO inhibition is an effective therapy for MYC-driven B-cell lymphoma in vivo
Principal-component analysis of mRNA expression of the SUMO core machinery in wt B cells and MYC-driven BCL from Em-myc mice confirmed enhanced SUMO pathway expression in MYC-driven BCL (GSE7897) (Online Supplementary Figure S3A). In order to test whether inhibition of SUMOylation would offer therapeutic efficacy towards MYC-induced BCL, we treated cell lines derived from three independent primary Em-myc lymphomas with SUMOi and detected striking sensitivity to pharmacological inhibition of SUMOylation (Online Supplementary Figure S3B and C ). In order to test therapeutic efficacy in vivo , we transplanted primary Em-myc lymphoma cells into syngeneic wt recipient mice. Seven days after lymphoma cell injection, lymphoma-bearing mice received treatment with SUMOi or carrier solution (Figure 2A). CD45.1 and CD45.2 epitope diversity allowed to discriminate between wt recipient B cells and the syngeneic lymphoma compartment. Strikingly, a single SUMOi therapy resulted in a highly efficient reduction and almost complete eradication of Em-myc -transgenic CD45.2 lymphoma cells in the bone marrow (BM) and spleen (Figure 2B and C; Online Supplementary Figure S4A). Moreover, a single dose of SUMOi treatment significantly reduced spleen weight without causing obvious signs of severe short-term toxicity (Online Supplementary Figure S4B to D). Thus, we here establish activated MYC signaling as an actionable vulnerability and inhibition of SUMOylation as a rational treatment strategy in a preclinical murine model of MYC-driven BCL. Remarkably, SUMOi therapy not only affected the tumor compartment (CD45.2+), but phenotype analysis hinted towards major changes in the composition of the recipient primary and secondary lymphoid organs. Analysis of the CD45.1 wt compartment in lymphoma-grafted mice revealed a significant increase in the abundance of CD3+ T cells in both BM and spleen after SUMOi treatment that was accompanied by a distinct reduction of the recipient B220+ B-cell compartment, particularly in the spleen (Figure 2D; Online Supplementary Figure S4E and F), revealing
Haematologica | 108 February 2023 557 ARTICLE - SUMO inhibition for MYC-dependent B-cell lymphoma U.M. Demel et al.
that B cells were more sensitive to SUMO inhibition than T cells (Online Supplementary Figure S4G). Besides, the effect on B cells was less pronounced in recipient B cells than in MYC-driven lymphoma B cells (Online Supplementary Figure S4H). The abundance of granulocytes and monocytes mostly remained unaffected by SUMOi treatment (Figure 2D; Online Supplementary Figure S4E and F). Thus, SUMO inhibition leads to killing of MYC-driven B-cell lymphoma in vivo. This fast and most likely direct effect was accompanied by alterations of cellular components of the immune system.
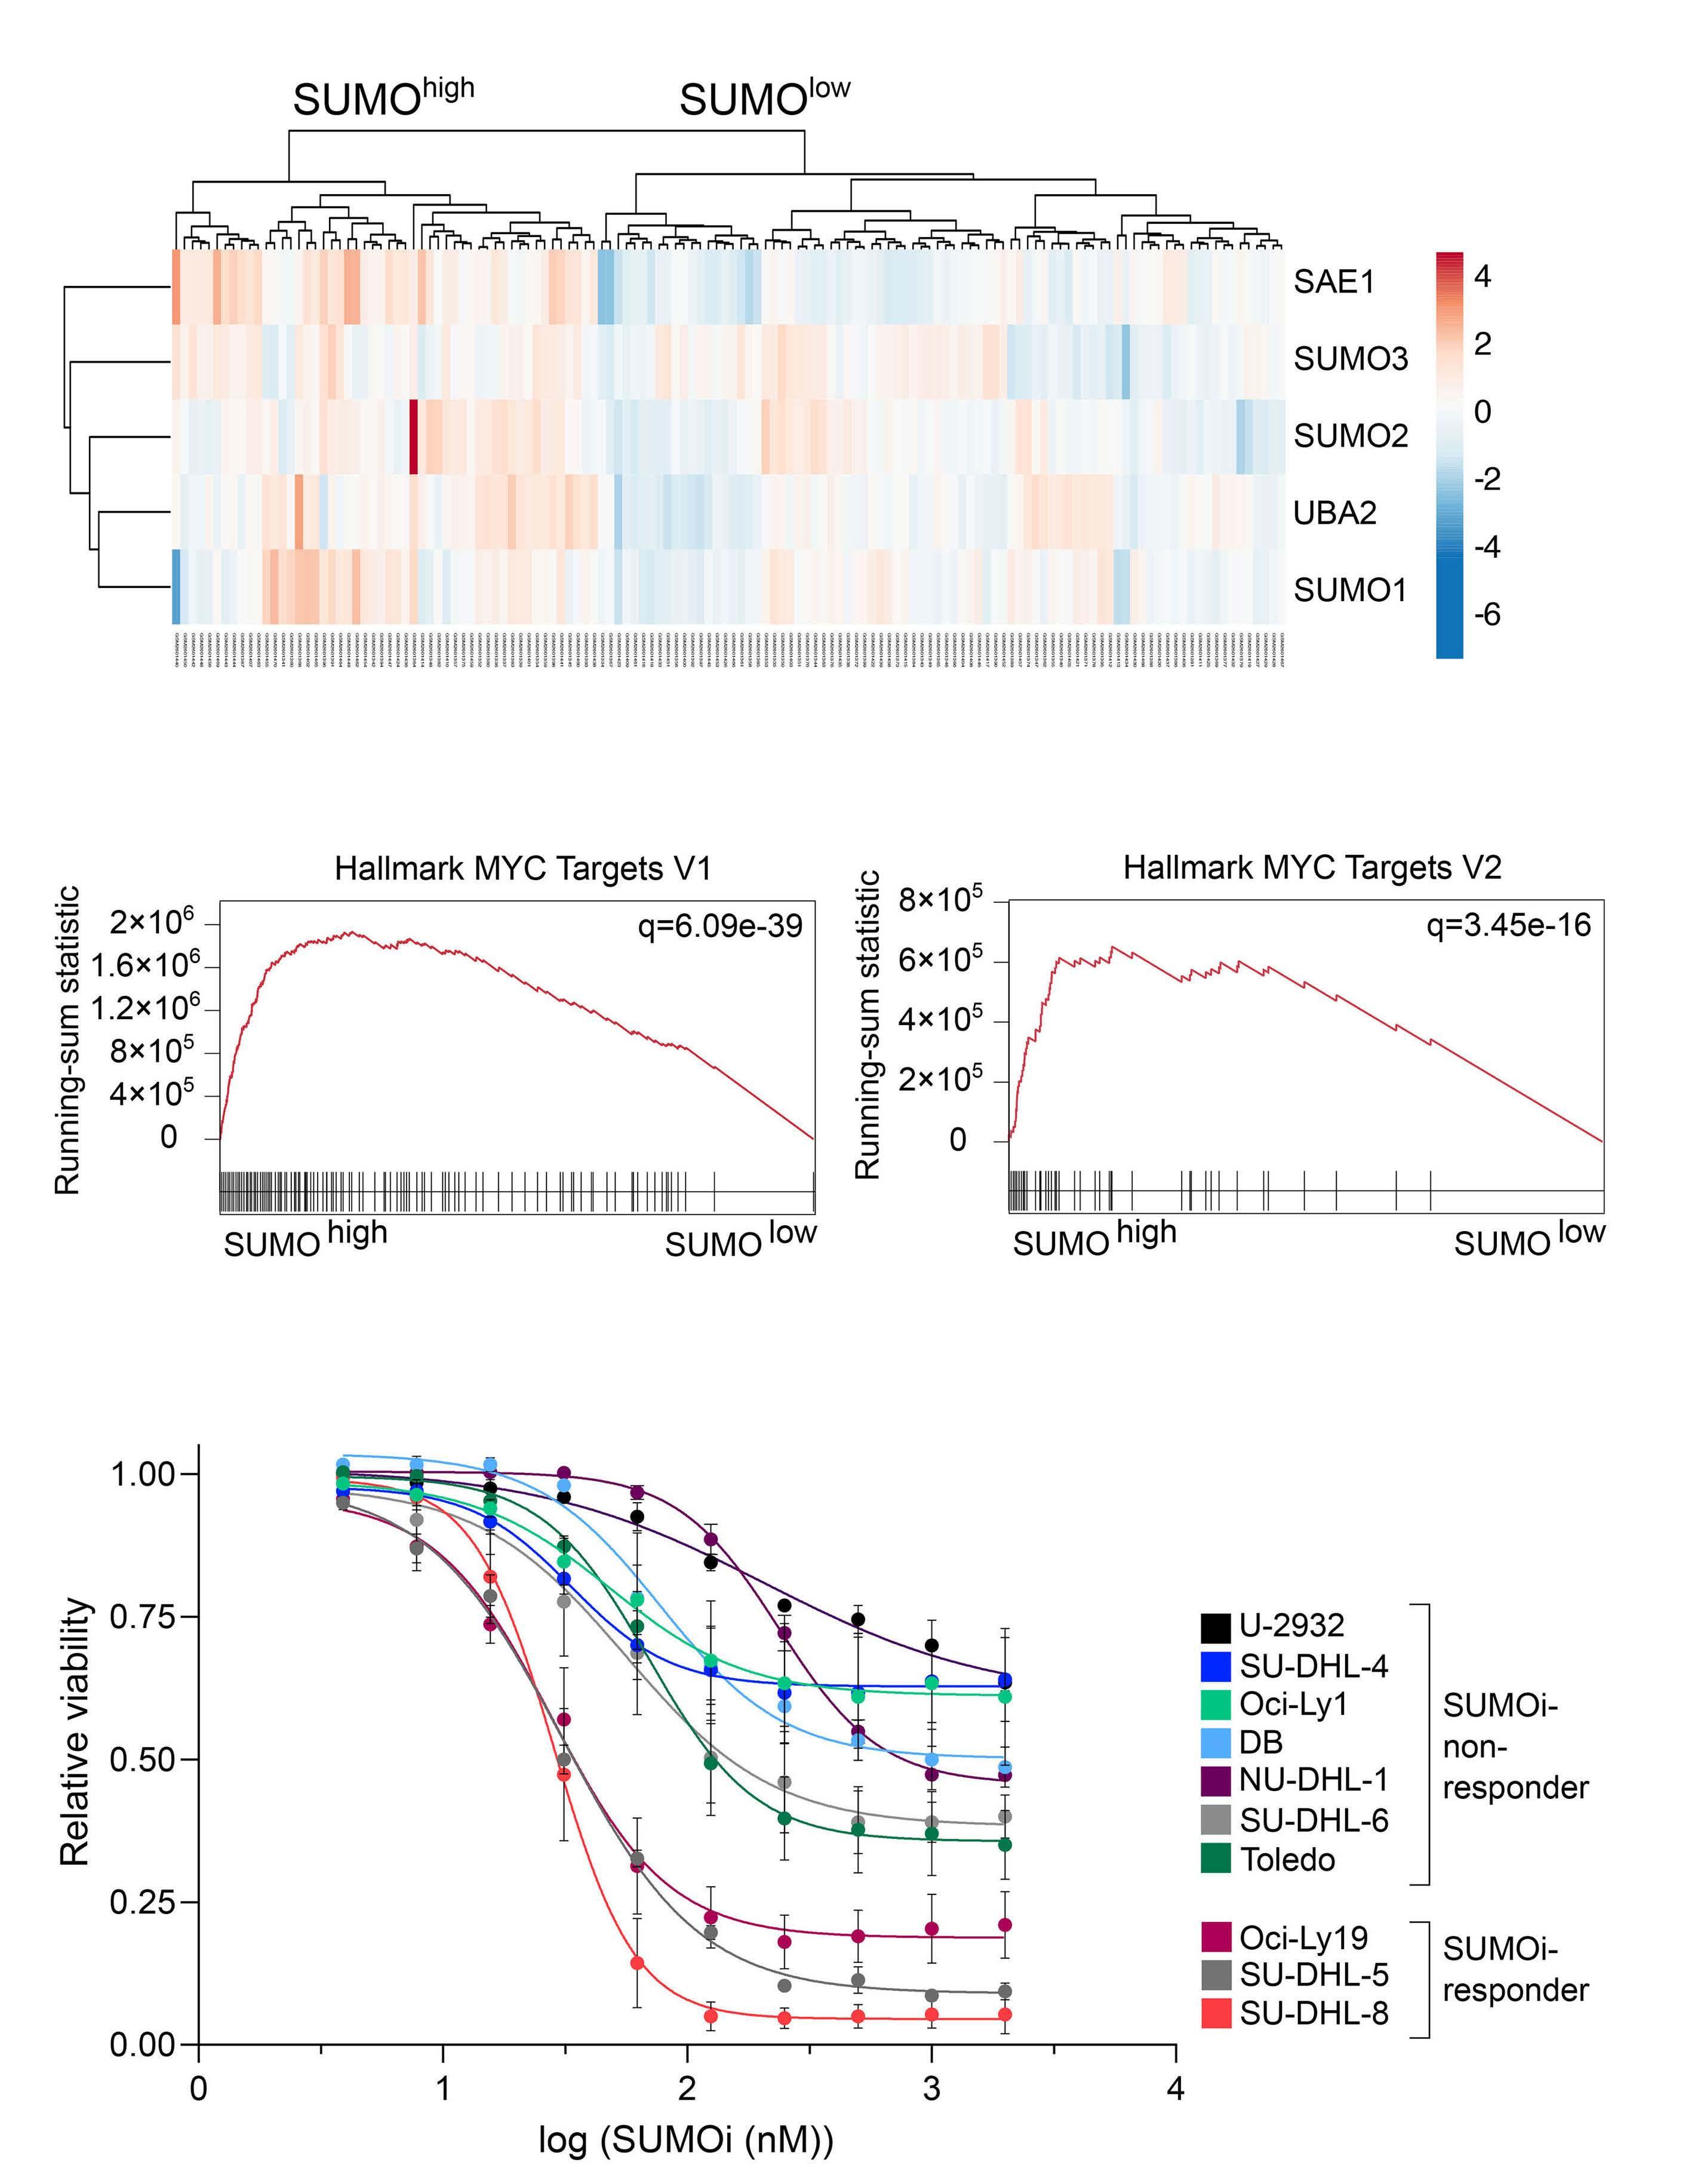
SUMO inhibition remodels immune cell abundance in vivo
Impaired immune surveillance is involved in lymphoma pathogenesis27 and induction of immune activity contributes to cancer control.28,29 In order to test if immune effects by SUMOi treatment are a general feature independent of the presence of lymphoma, we treated C57Bl/6J mice with either SUMOi or carrier control on 2 consecutive days and analyzed splenocytes and BM cells by multicolor flow cytometry (Figure 3A; Online Supplementary Figure S5A and D). In line with our previous findings in lymphoma
Haematologica | 108 February 2023 558 ARTICLE - SUMO
U.M. Demel et al. Continued on following page.
B
inhibition for MYC-dependent B-cell lymphoma
A C
Figure 1. Active MYC signaling confers susceptibility to small-molecule SUMO inhibition in diffuse large B-cell lymphoma cell lines. (A) Hierarchical clustering (Euclidean/Ward) of indicated SUMO core components of normalized human diffuse large B-cell lymphoma (DLBCL) transcriptome profiles (GSE98588) revealed SUMOhigh and SUMOlow subgroups as indicated. (B) Gene set enrichment analysis of SUMOhigh and SUMOlow subgroups using Hallmark gene sets from the molecular-signature database (MSigDb). Indicated MYC target gene signatures have been identified using GeneTrail v3 (Kolgomorov-Smirnov-Test). Adjusted P values (q) are indicated. (C) Flow cytometry analysis of relative viability of indicated DLBCL cell lines treated with increasing SUMO inhibitor (SUMOi) concentrations (Tak-981, 0, 3.9, 7.8, 15.6, 31.2, 62.5, 125, 250, 500, 1,000, 2,000 nM) for 72 hours (h) (n=3). (D) Gene set enrichment analysis of SUMOi-responder (Oci-Ly19, SU-DHL-5, SU-DHL-8) vs. SUMOi-non-responder (U-2932, SUDHL-4, DB, NU-DHL-1) on expression profiles accessed via GSE53798. Enrichment plot on SUMOylation signatures, obtained from the Reactome knowledgebase. Adjusted P values (q) are indicated. Volcano plot displays significant gene signatures of the Hallmark gene set (MSigDb) with both MYC Hallmark signatures (V1, V2) highlighted. (E) Enrichment plot on MYC Hallmark signatures, based on the analysis described in (D). Adjusted P values (q) are indicated. (F) Relative viability of Oci-Ly1 cells transduced with a MYC expression plasmid or a control plasmid, treated with increasing SUMOi concentrations (Tak-981, 0, 3.9, 7.8, 15.6, 31.2, 62.5, 125, 250, 500, 1,000, 2,000 nM) for 72 h (n=3). P values refers to 2,000 nM SUMOi and is determined by unpaired t-test. Immunoblot analysis of Oci-Ly1 control and MYC cell lines.
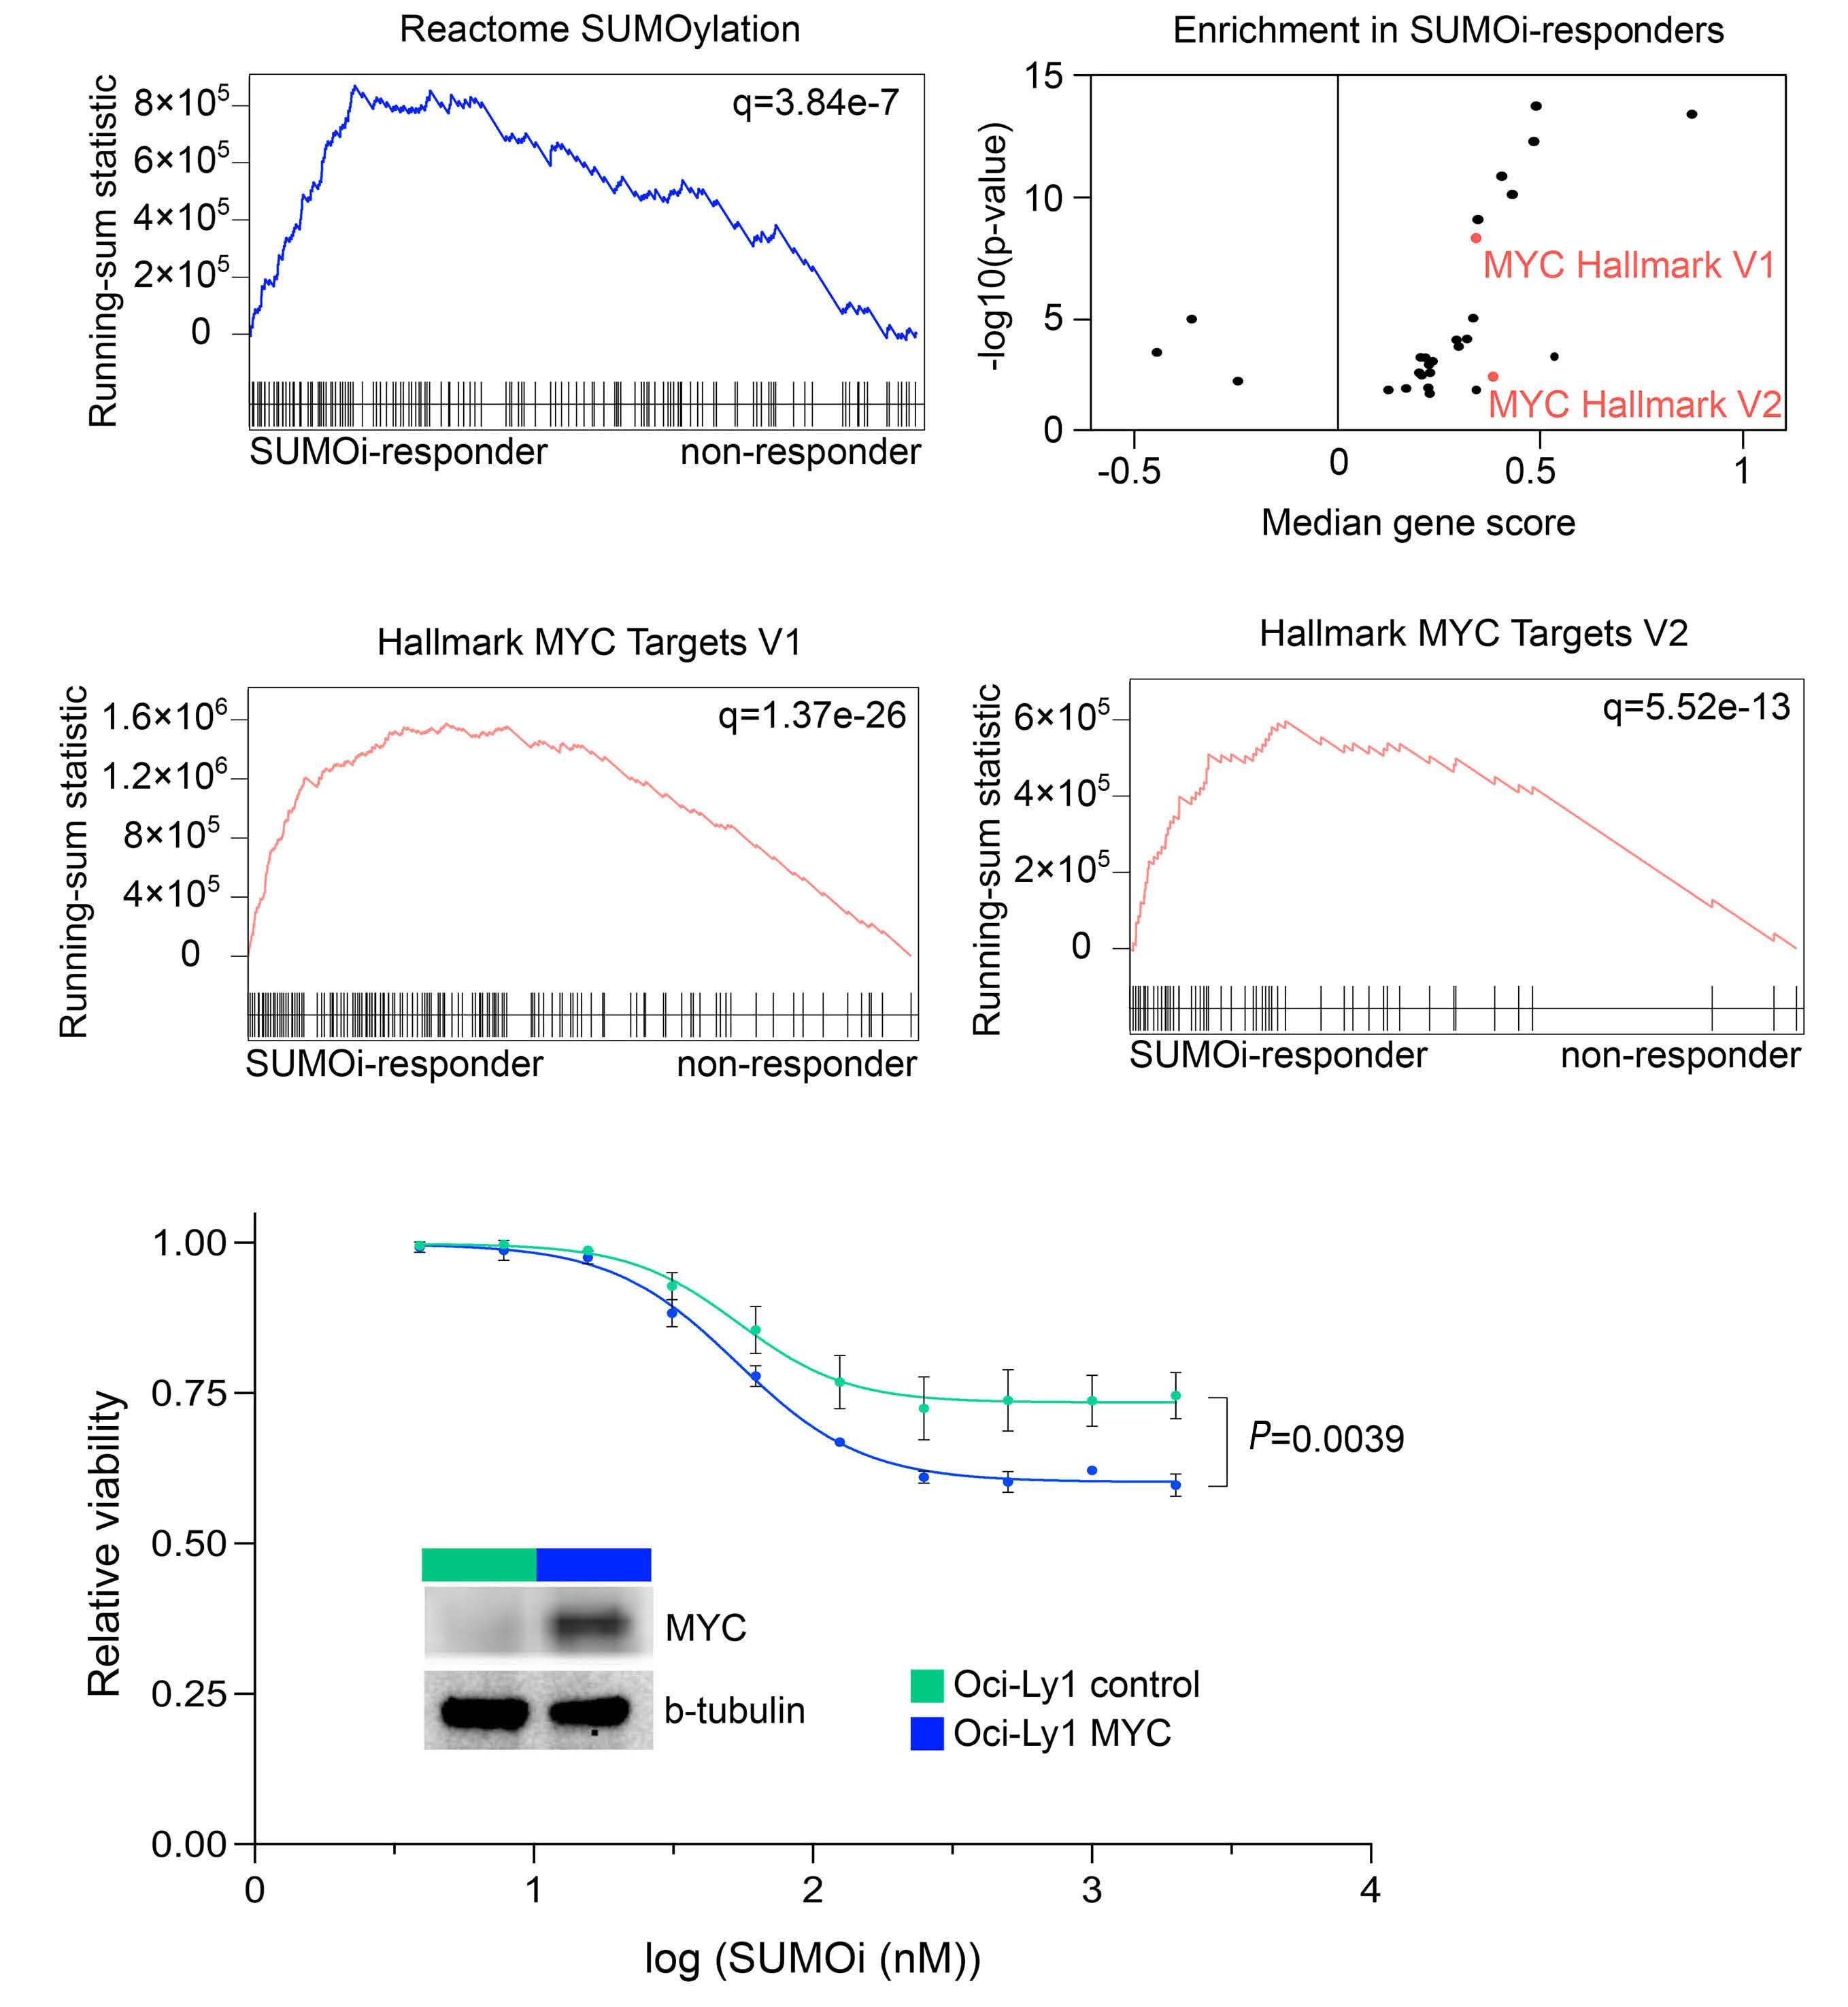
bearing mice, SUMOi treatment led to a relative increase of the CD3+CD4+ T-cell compartment (Figure 3B; Online Supplementary Figure S5B, C, E and F). The increase of CD3+CD4+ T cells, a cellular subset holding an important role in anti-tumor immunity,30,31 was most prominent in the spleen. These effects were accompanied by a reduction of the B220+ B-cell compartment (Figure 3B; Online
Supplementary Figures S5B, C, E and F; and S6A and D). Shifts in immune cell abundance were detected in both BM and spleen, despite of a decline in overall BM and spleen cell numbers upon SUMOi challenge (Online Supplementary Figure S5A and D). We next substantiated the in vivo effects of pharmacological SUMOi on immune cell distribution in more detail.
E Haematologica | 108 February 2023 559 ARTICLE - SUMO inhibition for MYC-dependent B-cell lymphoma U.M. Demel et al. F D
Figure 2. SUMO inhibition is an effective therapy for Myc-driven B-cell lymphoma in vivo. (A) Schematic illustration showing transplantation of Em-myc lymphoma cells (CD45.2) into wild-type (wt) (CD45.1) recipient mice. Mice were treated with carrier or SUMO inhibitor (SUMOi) (ML-093, 50 mg/kg) at day 7 post transplantation. Analysis of bone marrow, spleen and blood was performed at day 9, n=6 per condition. (B) Pie charts representing the frequencies of wt and Em-myc lymphoma cells in the bone marrow (BM) and spleen after carrier vs. SUMOi treatment. (C) Total number of Em-myc lymphoma cells in the BM and spleen following SUMOi treatment compared to carrier. N=6, P values were determined by unpaired t-test. (D) Pie charts representing the frequencies of B cells (B220+), T cells (CD3+), granulocytes (Gr.1+CD11b+) and monocytes (Gr.1- CD11b+) in the BM and spleen after carrier vs. SUMOi treatment. i.v.: intravenously.
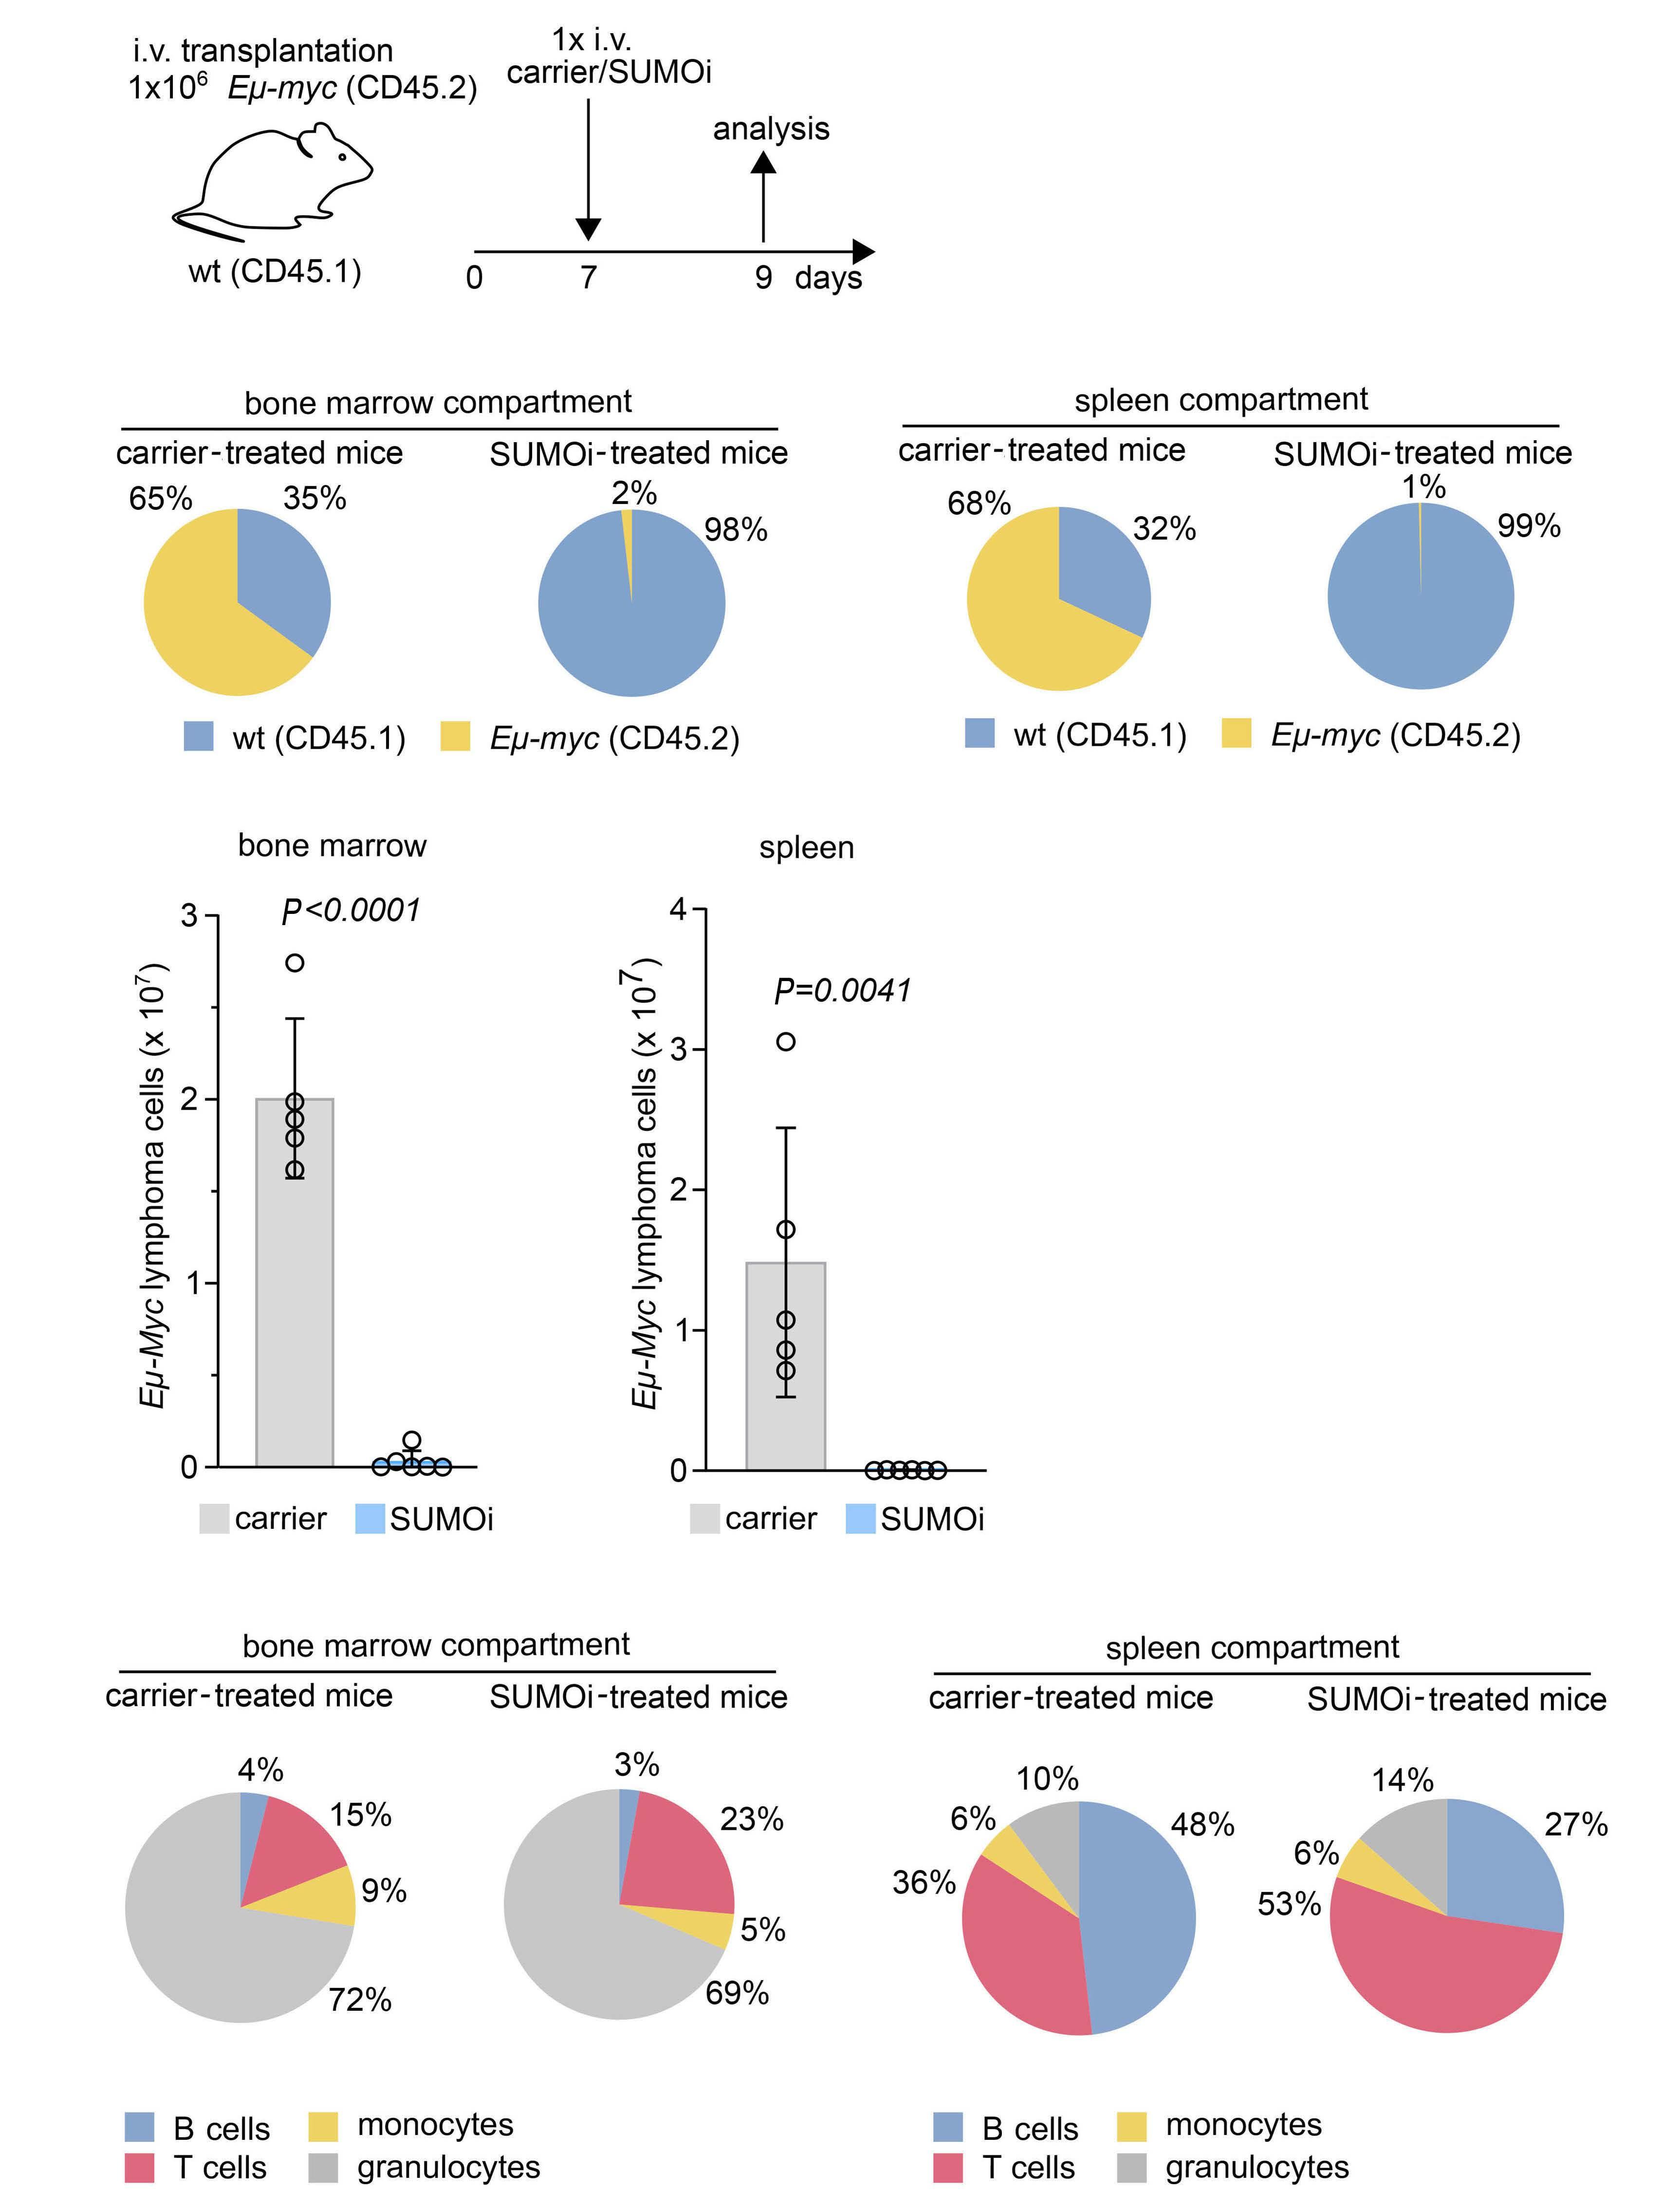
B C Haematologica | 108 February 2023 560 ARTICLE - SUMO inhibition for MYC-dependent B-cell lymphoma U.M. Demel et al. D A
Figure 3. SUMO inhibition induces major changes in the B-cell compartment, favoring a memory B-cell phenotype. (A) Schematic illustration showing treatment of wild-type (wt) mice with carrier or SUMO inhibitor (SUMOi) (ML-093, 50 mg/kg) at day 1 and 2. Analysis of bone marrow (BM) and spleen was performed at day 3, n=6 per condition. (B) Pie charts representing the frequencies of indicated cell populations (B220+ B cells, CD3+CD4+ T cells, CD3+CD8+ T cells) in the BM and spleen after carrier vs. SUMOi treatment. (C) Pie charts representing the frequencies of indicated cell populations in the B220+ BM compartment (B220+IgM- pre-pro B cells, B220+IgM+IgD- immature B cells, B220+CD19+MHC-II+ activated B cells, B220+CD80+CD86+ memory B cells) and B220+ spleen compartment (B220+CD93+ Immature B cells, B220+CD21highCD23low marginal zone B cells, B220+CD21lowCD23high follicular B-cells, B220+CD80+CD86+ memory B cells, B220+CD19+MHC-II+ activated B cells) after carrier vs. SUMOi treatment. (D) Percentage of memory B cells (B220+ CD80+ CD86+) of B220+ BM and spleen cells. N=6, P values were determined by unpaired t-test. i.v.: intravenously.
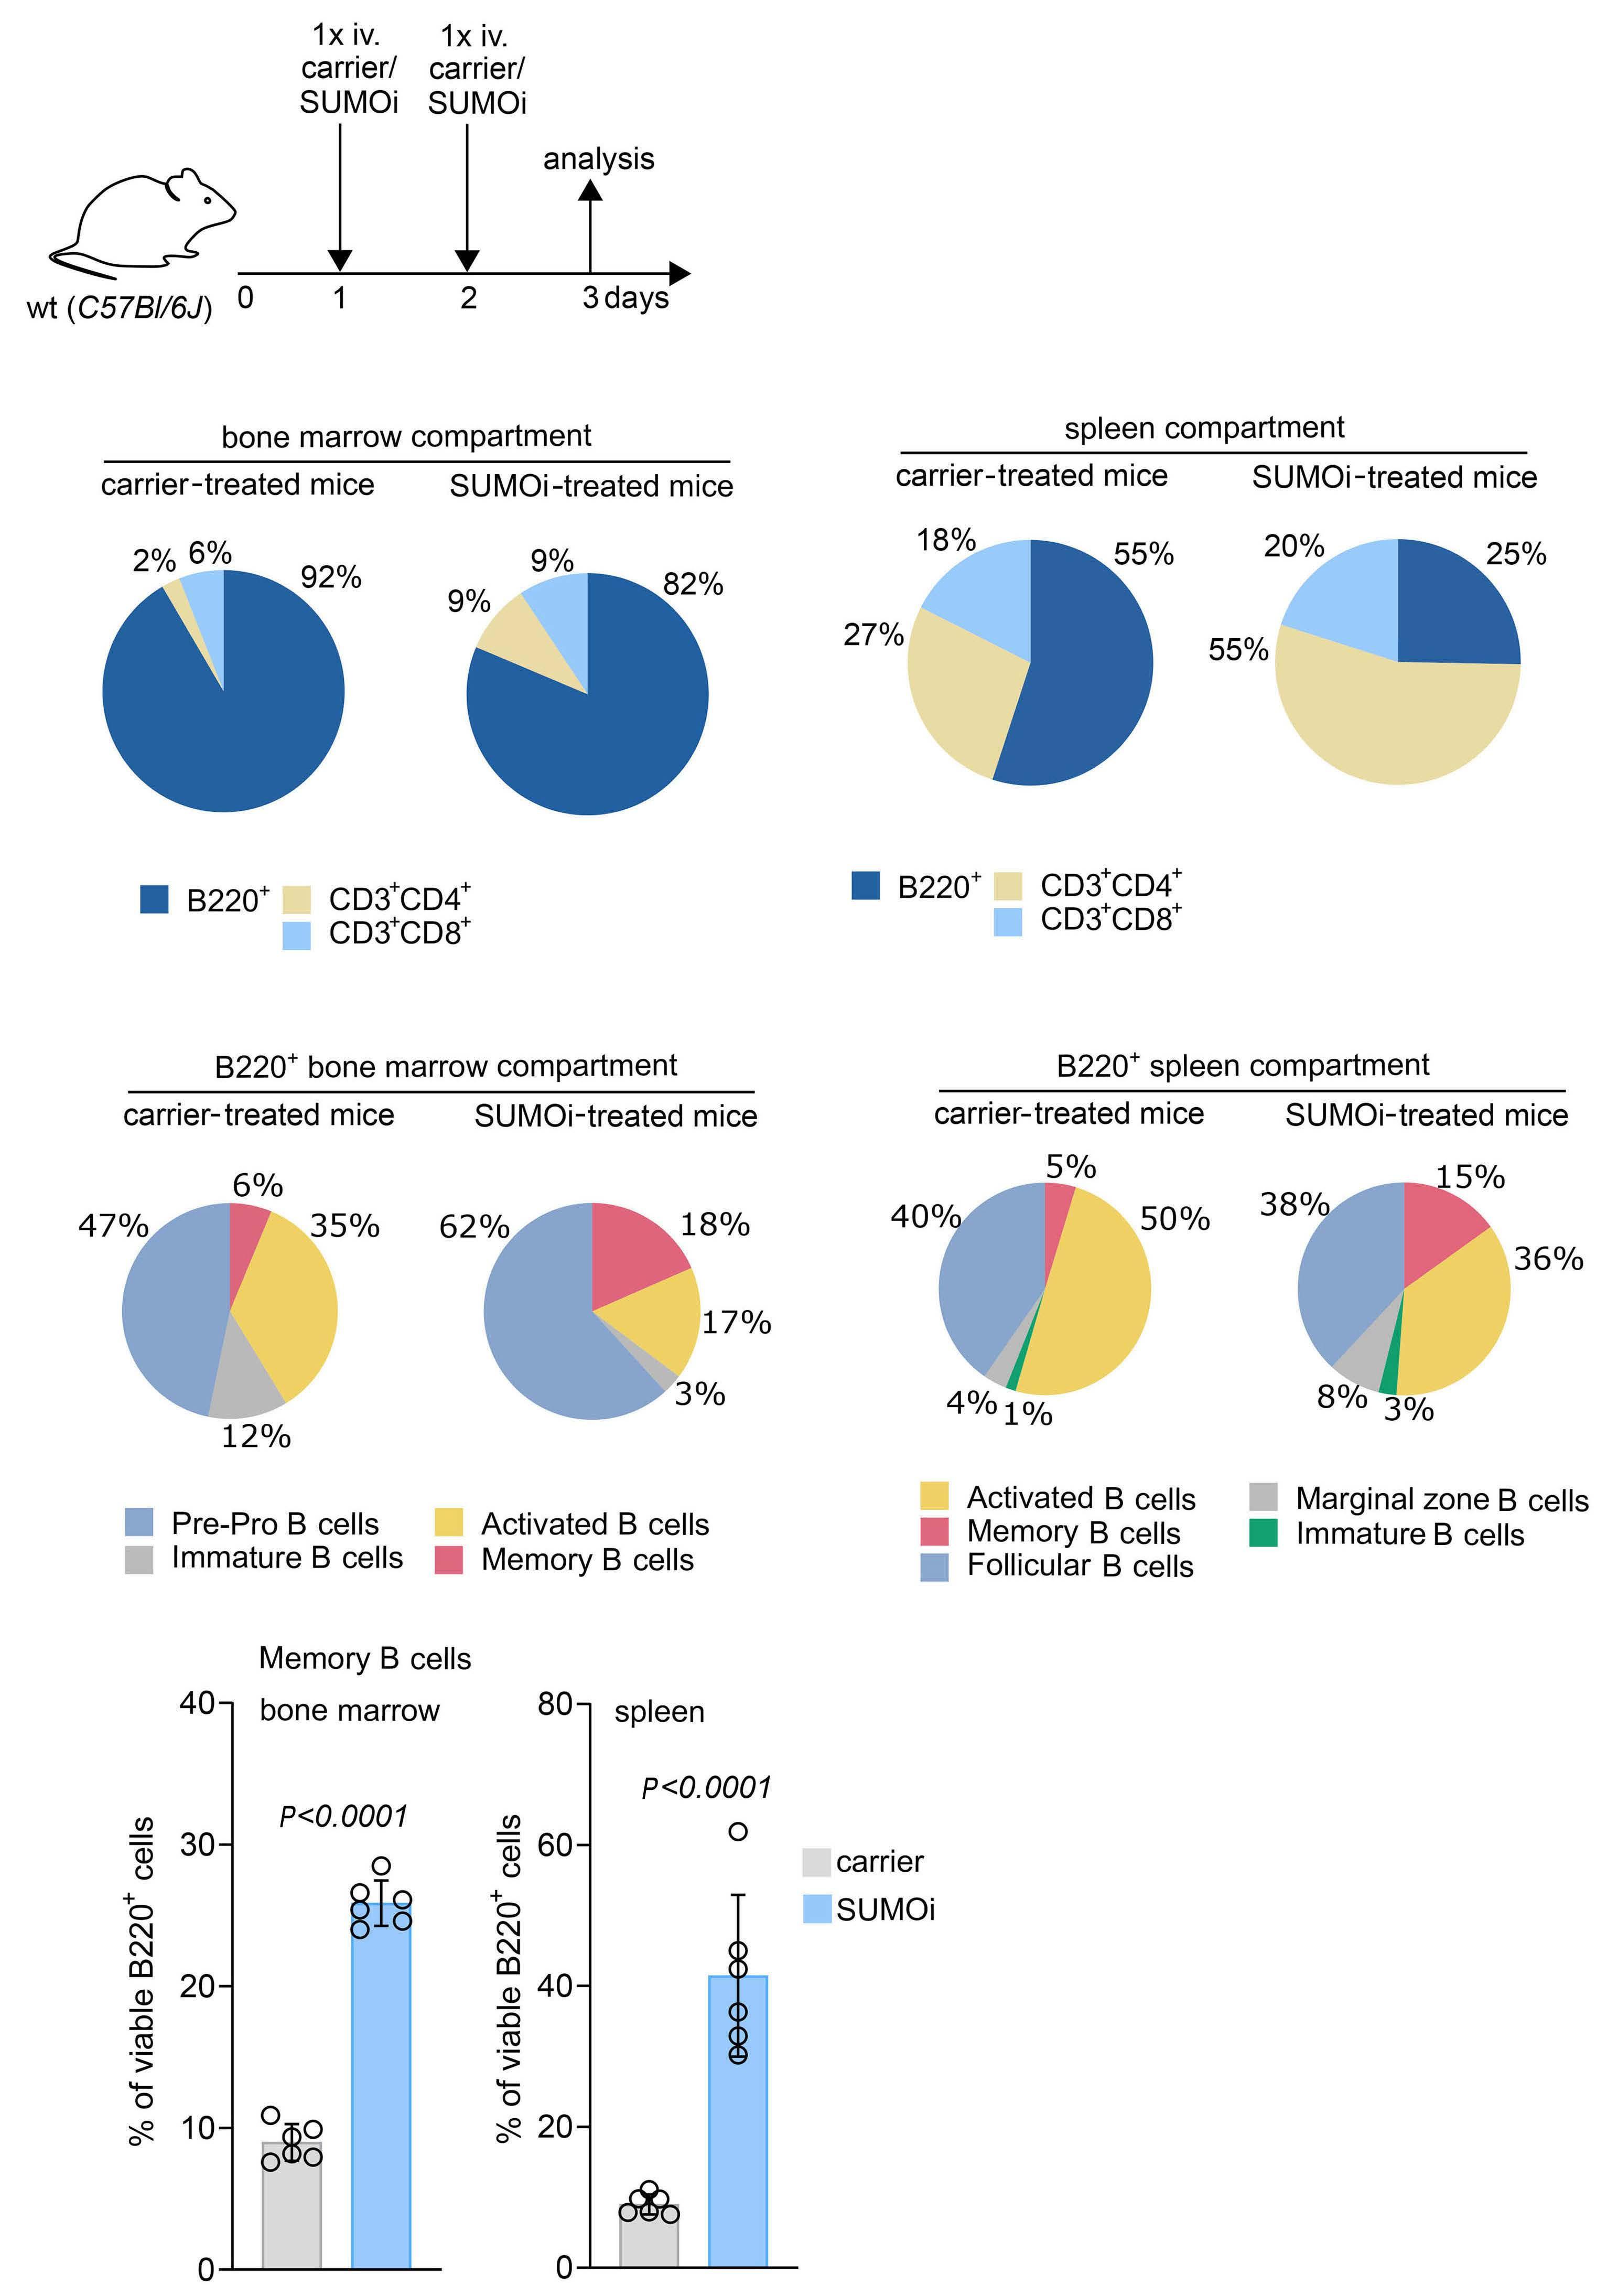
B
Haematologica | 108 February 2023 561 ARTICLE - SUMO inhibition for MYC-dependent B-cell lymphoma U.M. Demel et al. D A
C
SUMO inhibition resulted in a decline of most B-cell subsets within both primary lymphoid BM tissue and the secondary lymphoid organ spleen (Figure 3C), which is in line with recent reports.19 Besides, we detected a significant increase in B220+ B-memory cells after SUMO inhibition in BM and spleen (Figure 3D; Online Supplementary Figures S6D and S7A), indicating effects on a cellular subset important for a coordinated antibody-dependent immune response.32
SUMO-directed intervention not only exerted broad effects on the B-cell subsets, but also on the T-cell compartment, as we observed a significant increase in CD4+ memory and regulatory T cells within BM and spleen upon SUMOi (Figure 4A, B; Online Supplementary Figures S6B and E; and S7B). Beyond, the abundance of BM CD8+ effector memory cells was significantly increased (Figure 4C; Online Supplementary Figures S6C and S7C). Both CD4+ and CD8+ T memory cells are antigen-specific long-term persisting cells that arise from naïve T-cells upon encounter to a cognate antigen and are designated to execute a protective immune response upon antigen reencounter.33,34 Of note, SUMO inhibition was accompanied by a substantially higher abundance of activated CD8+ T cells (Figure 4C and D; Online Supplementary Figures S6C and F; and S7D), a population referred to as cytotoxic T cells with well-described features in host defense and tumor cytolysis.35 This finding is in line with current reports linking SUMO inhibition to enhanced T-cell activation.19,20,36
In summary, our analyses revealed a substantial remodeling of immune cell subsets following SUMO-directed intervention, underscoring the important role of the SUMO pathway in the immune system.
SUMO inhibition substantially alters the normal B-cell landscape
Our preceding analyses revealed pharmacologic inhibition of SUMOylation as a vulnerability in MYC-driven lymphoma that was associated with pronounced changes in the immune cell compartment. In order to decipher the effects of short term highly specific small-molecule SUMOi on Bcell subsets in more detail, we next opted for Cellular Indexing of Transcriptomes and Epitopes by Sequencing (CITE-seq) analysis (dataset GSE193359).20 CITE-seq combines the measurements of surface protein levels and transcriptome analysis to determine cellular states and their alterations at single-cell level.37 In this experiment wt mice were challenged with a lower dose of the SUMO inhibitor subasumstat in line with a recent publication reporting enhanced anti-tumor T-cell capacity upon SUMOi.36 CITE-seq analysis was conducted on spleens from three control and three SUMOi-treated mice. Prior to analysis cells were marked with oligo-conjugated antibodies allowing discrimination between B- and T-cell sub-
sets (Figure 5A). Transcriptomics and surface proteomics were conducted on the 10x Genomics platform. In total 18,361 cells (9,878 cell from control mice and 8,483 from SUMOi-treated mice) were analyzed. Using expression data of B-cell surface markers and B-cell specific marker genes, we annotated 11 different murine B-cell populations (Figure 5B; Online Supplementary Figure S8). SUMOi treatment resulted in decreased abundance of the early and more immature splenic B-cell subset T1 and T3 (Online Supplementary Figure S9A). The abundance of memory and marginal zone B cells was substantially higher in SUMOi-treated mice (Figure 5C and D). Moreover, we detected a striking decline in dark zone and light zone B cells (Figure 5C and D). Of note, MYC expression is induced in light-zone B cells in direct proportion to antigen capture during the dark-zone to light-zone germinal center transition to coordinate residence time in the dark-zone.38 Accordingly, we observed high expression of the MYC core machinery in light-zone B cells that was associated with enhanced expression of the SUMO core machinery (Figure 5E). Remarkably, SUMO inhibition abrogated this effect (Figure 5F; Online Supplementary Figure S9B). Assessing the question of whether cellular proliferation needs to be considered as a confounder effect when evaluating the changes in abundance between treatment conditions, we performed proliferation score analysis on B and T cells within the CITE-seq dataset (Online Supplementary Figure S10A, B and D to F). Differences in proliferation among the different cell populations were overall moderate and not significantly altered after SUMO inhibition among all subsets analyzed (Online Supplementary Figure S10C). In summary, these data revealed the complexity of a SUMO-directed therapeutic intervention on immune cell abundance and specifically on the B-cell landscape. Furthermore, we could link MYC expression to expression of the SUMO core machinery on a single-cell level, highlighting MYC signaling as an actionable vulnerability targeted by SUMO inhibition.
Discussion
Here, we unraveled activation of SUMOylation as a striking vulnerability in MYC-driven BCL. Next to direct effects of specific pharmacological SUMO inhibition on MYC-induced lymphoma, our investigations depicted a substantial remodeling of components of the innate and specific immunity in vivo by SUMOi. Defining strategies to tackle MYC-driven tumors is of huge relevance based on the well-established activation of MYC in the vast majority of cancers, however, direct MYC targeting remains challenging.39 Although MYC targeting via a dominant-negative peptide OMOMYC showed promising preclinical results and is currently tested in a phase I/II
Haematologica | 108 February 2023 562 ARTICLE - SUMO inhibition for MYC-dependent B-cell lymphoma U.M. Demel et al.
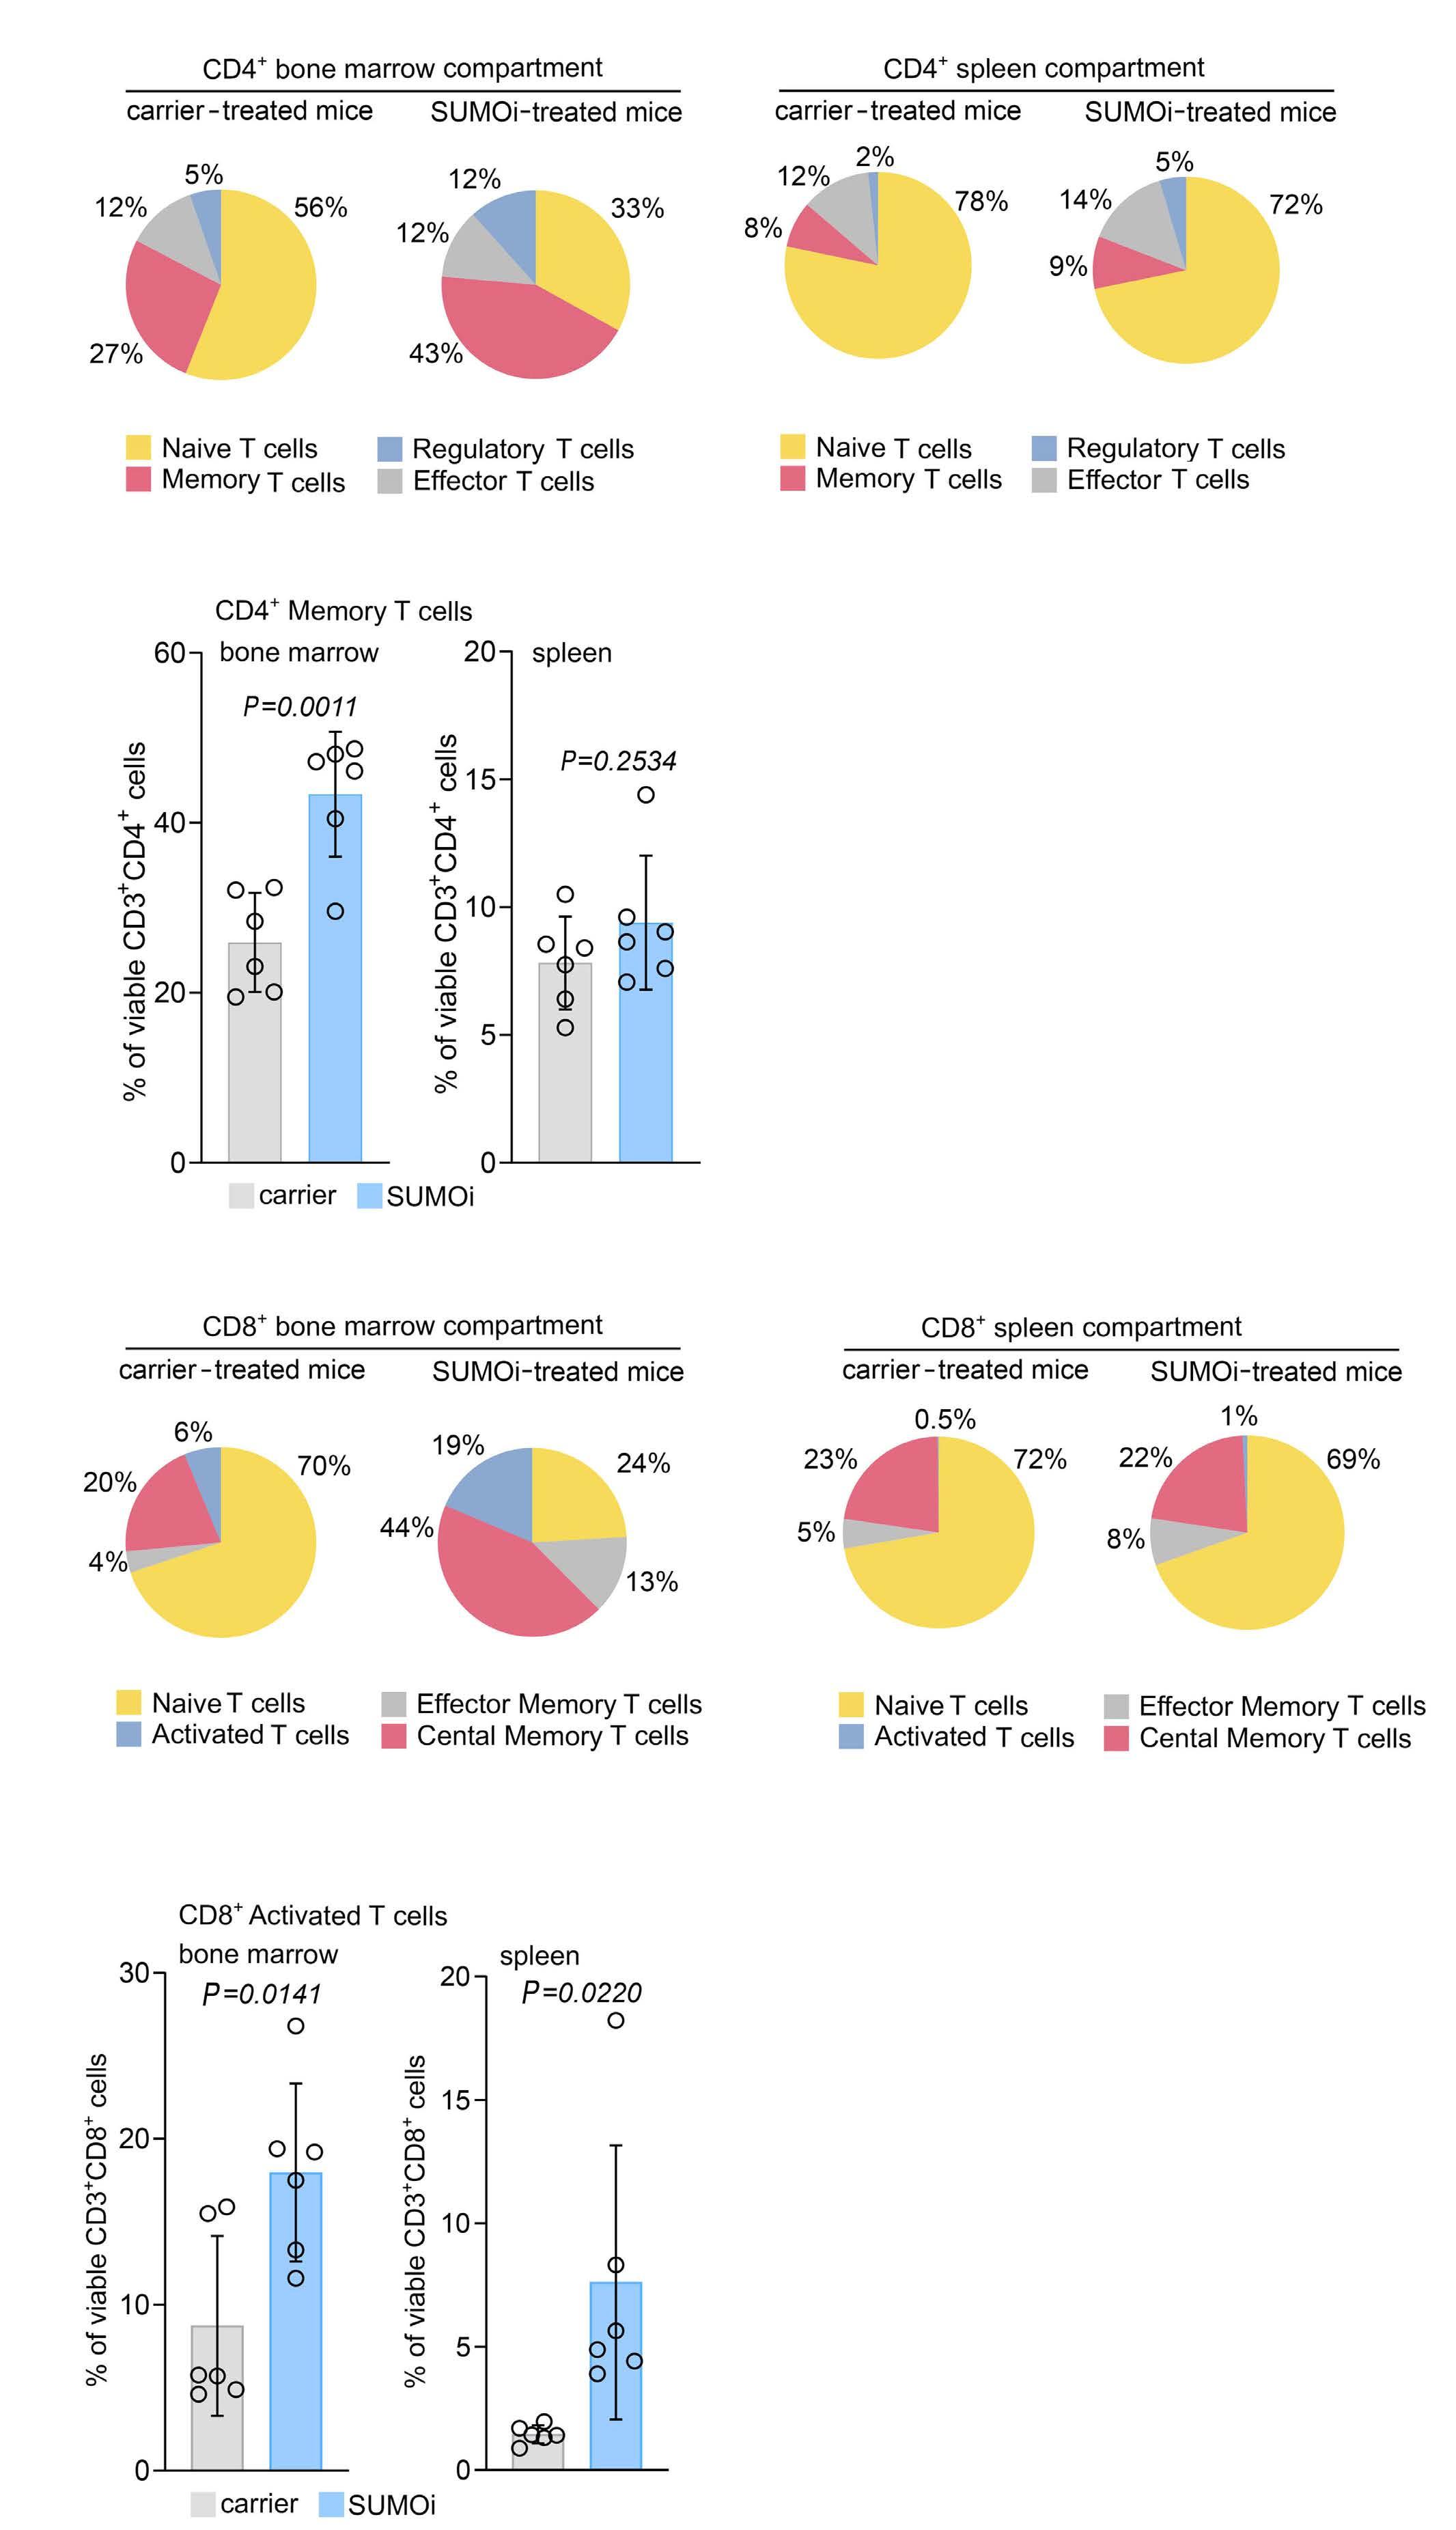
B C Haematologica | 108 February 2023 563 ARTICLE - SUMO
U.M. Demel et al. D A Continued
inhibition for MYC-dependent B-cell lymphoma
on following page.
Figure 4. SUMO inhibition remodels the T-cell compartment towards a memory and activated T-cell phenotype. (A) Experimental setup as outlined in Figure 3A. Pie charts representing the frequencies of the indicated cell populations in the CD3+CD4+ bone marrow (BM) and spleen compartment (CD3+CD4+CD44lowCD62L+ naïve T cells, CD3+CD4+CD44highCD62L- memory T cells, CD3+CD4+CD44lowCD62L- effector T cells, CD3+CD4+CD25+CD69+FoxP3+ regulatory T cells). (B) Percentage of memory T cells (CD3+CD4+CD44highCD62L-) of the CD3+CD4+ BM and spleen cells. N=6, P values were determined by unpaired t-test. (C) Pie charts representing the frequencies of the indicated cell populations in the CD3+CD8+ BM and spleen compartment (CD3+CD8+CD44lowCD62L+ naïve T cells, CD3+CD8+ CD44highCD62L- effector memory T cells, CD3+CD8+CD44highCD62L+ central memory T cells, CD3+CD8+CD25+CD69+ activated T cells) after carrier vs. SUMOi treatment. (D) Percentage of activated T cells (CD3+CD8+CD25+CD69+) of the CD3+CD8+ BM and spleen cells. N=6, P values were determined by unpaired t-test.
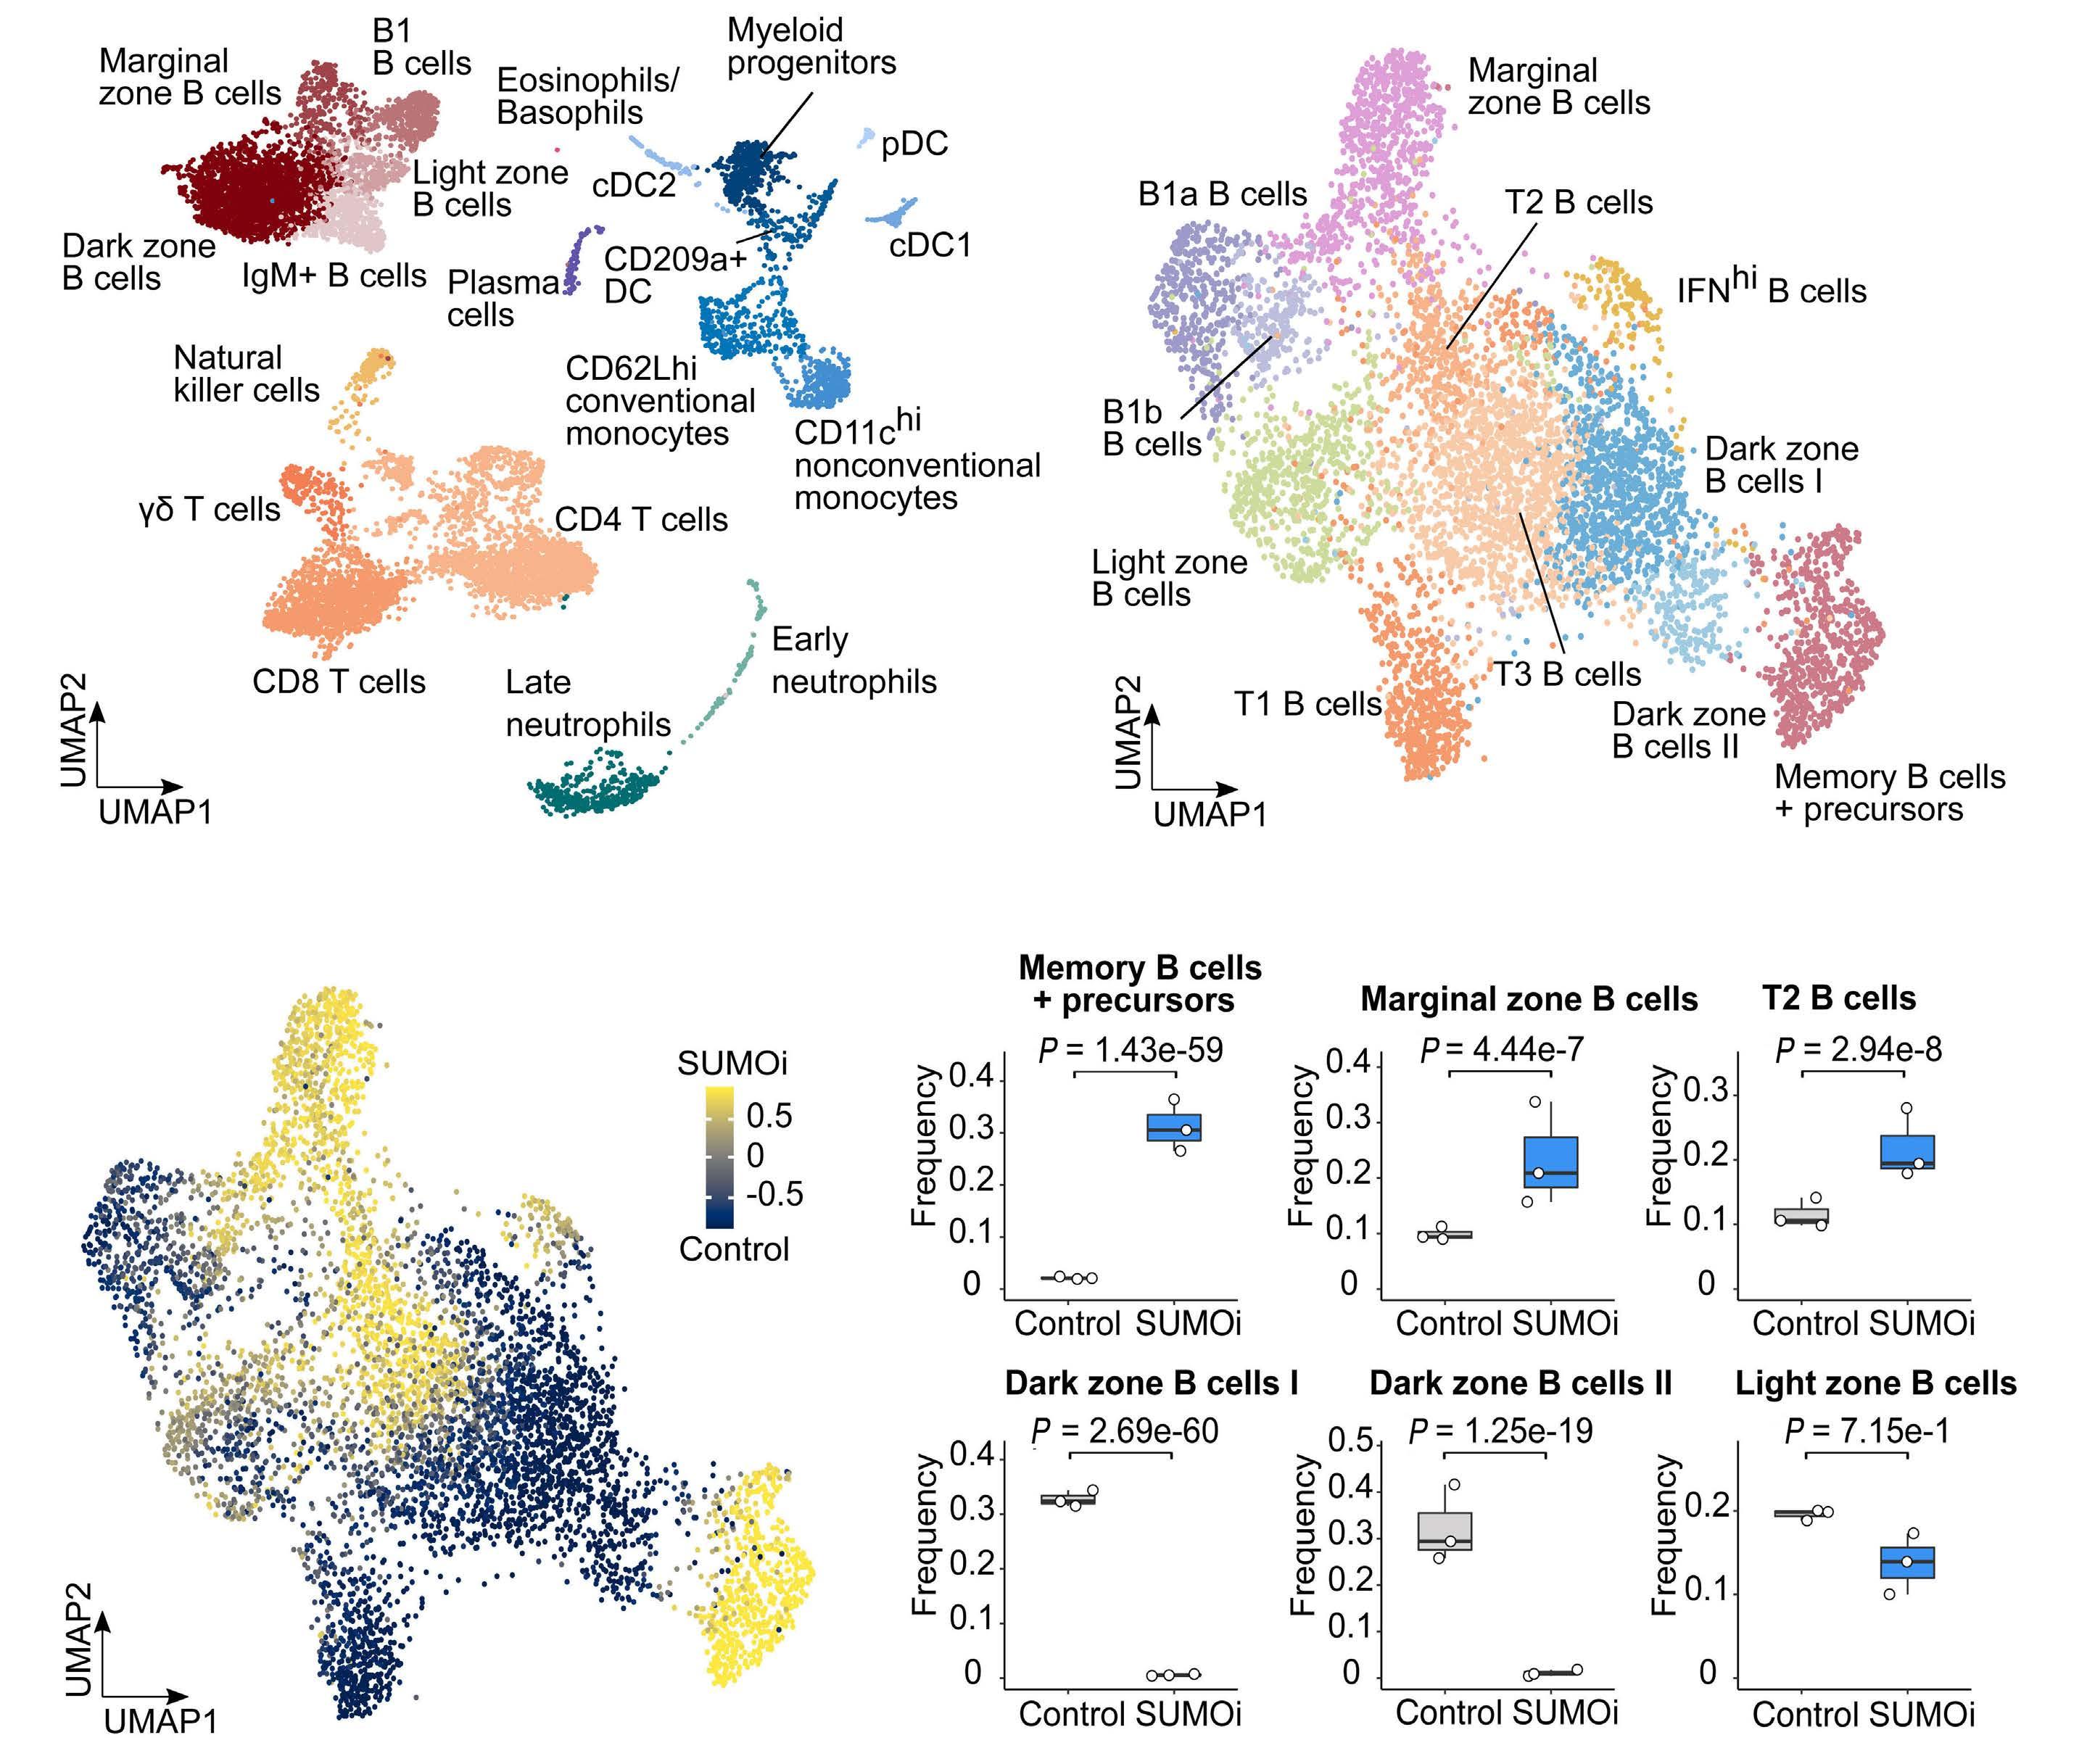
clinical trial (clinicaltrials gov. Identifier: NCT04808362),40 no direct MYC inhibitor has reached clinical practice.8 These unmet challenges favor the idea of targeting deregulated cellular pathways in MYC-overexpressing tumors to translate the concept of “synthetic lethality”7,8 into clinical cancer therapy. We here identified aberrant activity of the SUMO core pathway in aggressive BCL with activated MYC signaling and identified activated MYC signaling
as an actionable molecular vulnerability in vitro and in a preclinical murine model of MYC-driven lymphoma in vivo Notably, SUMO inhibition alone or administered as combination therapy with rituximab, a standard therapy for BCL patients, showed remarkable efficacy in preclinical DLBCL xenograft models.25,41 Besides, SUMO inhibition is currently tested in various clinical trials (clinicaltrials gov. Identifier: NCT03648372, NCT04074330, NCT04381650),
B
C Haematologica | 108 February 2023 564 ARTICLE - SUMO inhibition for MYC-dependent B-cell lymphoma U.M. Demel et al. Continued
D A
on following page.
Figure 5. SUMO inhibition substantially alters the normal B-cell landscape. (A) UMAP visualization of spleen scRNA-sequencing data from control and SUMO inhibitor (SUMOi)-treated mice (subasumstat 7.5 mg/kg on day 1 and 4, spleen cell analysis day 5; dataset GSE193359). (B) B-cell populations identified in (A) were subsetted and reclustered. The UMAP visualization represents B cells from both conditions. (C) Differentially abundant B-cell populations in control and SUMOi-treated mice identified with DA-seq. Cells are colored by DA-seq measure. Yellow = more abundant after SUMOi challenge. Dark blue = more abundant after control treatment. (D) Differential abundance testing on mouse-wise pseudobulks (indicated by white dots, n=3). Bar plots represent the subpopulation frequencies stratified by condition. The median is indicated by the center line of the box plot. The box extends from the 25th to 75th percentiles, whisker length reaches from minimum to maximum. Significance is determined by a Negative Binomial Generalized Linear Model. (E) SUMO and MYC score correlation analysis in control mice. Scaled mean expression values are plotted against each other for each cell population identified in (B). R indicates the Pearson correlation coefficient. The regression line is shown in black. The grey area indicates the 95% confidence interval. (F) SUMO and MYC score correlation analysis in control and SUMOi-treated mice. For each population the Pearson correlation coefficient (R) is plotted. Black bars indicate the range of the 95% confidence interval. The dashed black line at R=0 is a reference line and plotted as a visualization aid.
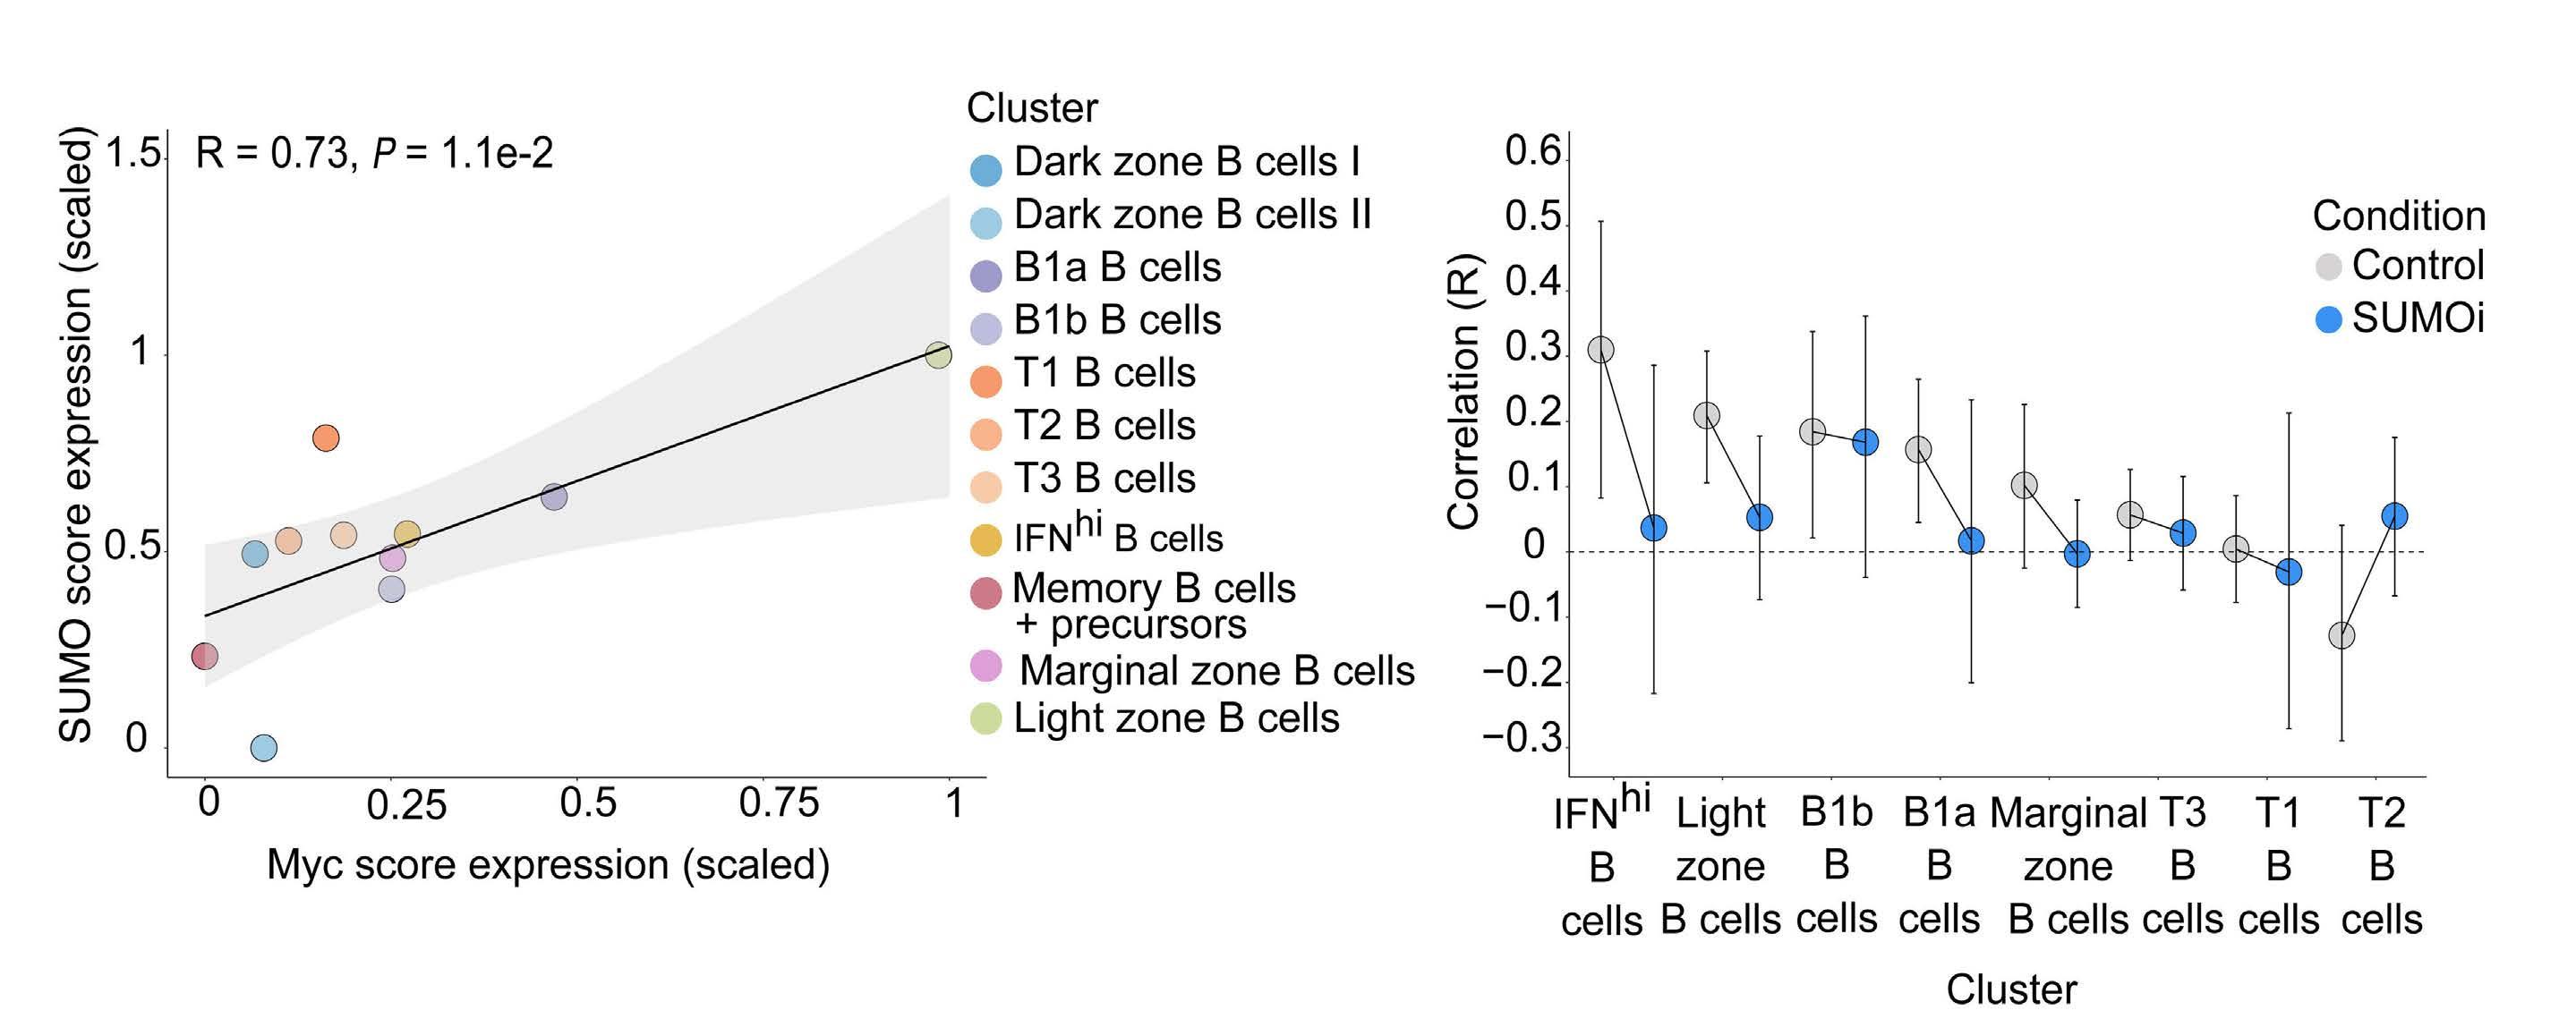
emphasizing the relevance of our findings for biomarkerinformed clinical applications. Our data is in line with an unbiased synthetic lethality screen in MYC-driven breast cancer that uncovered a role for the SUMO activation complex SAE1/2 in MYC-driven tumorigenesis.21 Furthermore, a previous loss-of-function study in BCL-linked silencing of SAE2 to tumor regression in vivo 22 The MYCSUMO connection and MYC-related sensitivity to SUMOi was also identified in aggressive pancreatic cancer.23 We here provide first data indicating that highly specific small-molecule SUMO inhibition is an effective therapy for MYC-driven BCL in vivo and demonstrate a key role for activated MYC signaling in conferring susceptibility to SUMO inhibition in B cells, while non-cancer syngeneic B cells showed remarkably lower killing rates as compared to the MYC-driven lymphoma population. This MYC-dependent effect of SUMO inhibition was confirmed by ectopic expression of MYC in the human DLBCL cells. Moreover, following in vivo low dose SUMOi challenge, CITE-seq analysis showed diminished abundance of wt light-zone B cells that are characterized by high MYC expression and concurrent high expression of the SUMO core machinery. Beyond depicting MYC signaling as a vulnerability, we would like to emphasize that uncovering additional biomarkers predicting SUMOi sensitivity in cancer therapy is
an area worthy of further investigations. Apart from driving cancer progression through tumor cell intrinsic acquisition of cancer hallmarks, MYC restrains the anti-cancer immune response and dysregulates the tumor microenvironment.27,42 We show substantial alteration of the B-cell landscape upon SUMO inhibition in a wt mouse model and report higher abundance of memory B cells after pharmacological SUMO inhibition, accompanied by a decline in immature subsets, which is in line with recent publications.19 B-memory cells are accounted with a key role in sustaining a long-term immune response.32,43 SUMO inhibition not only altered B-cell abundance, but also strikingly increased the abundance of CD8+ cytotoxic T cells as well as CD4+ and CD8+ memory T cells and particularly T-regulatory cells. CD8+ effector T cells exert direct anti-tumor cytotoxicity and CD4+ T cells enhance cytolytic efficacy of CTL by antigen cross-presentation and mediate plasma cell differentiation.30,31,35 T-regulatory cells are accounted with a double-edged role in anti-tumor immunity.44 They suppress anti-cancer immunity, but also drive and control the T-cell immune responses against tumor neoantigens.45 So far, only enhanced CD8+ T-cell activation and augmented anti-tumor sensitivity by SUMOimediated reactivation of type I interferon signaling have been reported before.19,20,36 We here identifi ed a novel
F Haematologica | 108 February 2023 565 ARTICLE - SUMO inhibition for MYC-dependent B-cell lymphoma U.M. Demel et al. E
function of SUMO inhibition in remodeling the immune cell landscape by enhancing abundance of cellular subsets involved in the innate and specific immune response. In summary, we here depict activated MYC signaling as an actionable molecular vulnerability for SUMO inhibition in vitro and in a preclinical murine model of MYC-driven BCL in vivo . Next to direct effects on MYC-driven lymphoma, SUMO inhibition substantially remodels the immune cell landscape in vivo independent of a tumor microenvironment. Our findings thus identify SUMO inhibition as a powerful therapy in a subset of MYC-driven B-cell lymphomas and suggest SUMO-targeted therapies as a potential therapeutic strategy for cancer immunotherapy.
Disclosures
UK received reimbursement for advisory board function, speaker honorary and travel support from Takeda for content unrelated to this manuscript. All other authors report no conflicts of interest.
Contributions
Conception and design of the study by UD, MW, MS and UK. Acquisition of data and/or analysis and interpretation of data by UD, MW, SY, LZ, KI, JD, MB, NS, HK, SH, SM, MS and UK. Drafting of the manuscript by UD, MW, MS and UK. All
References
1. Dang CV. MYC on the path to cancer. Cell. 2012;149(1):22-35.
2. Schick M, Habringer S, Nilsson JA, Keller U. Pathogenesis and therapeutic targeting of aberrant MYC expression in haematological cancers. Br J Haematol. 2017;179(5):724-738.
3. Chen H, Liu H, Qing G. Targeting oncogenic Myc as a strategy for cancer treatment. Signal Transduct Target Ther. 2018;3:5.
4. Singh K, Lin J, Zhong Y, et al. c-MYC regulates mRNA translation efficiency and start-site selection in lymphoma. J Exp Med. 2019;216(7):1509-1524.
5. Ruggero D. The role of Myc-induced protein synthesis in cancer. Cancer Res. 2009;69(23):8839-8843.
6. Stine ZE, Walton ZE, Altman BJ, Hsieh AL, Dang CV. MYC, metabolism, and cancer. Cancer Discov. 2015;5(10):1024-1039.
7. Kaelin WG, Jr. The concept of synthetic lethality in the context of anticancer therapy. Nat Rev Cancer. 2005;5(9):689-698.
8. Dhanasekaran R, Deutzmann A, Mahauad-Fernandez WD, Hansen AS, Gouw AM, Felsher DW. The MYC oncogene - the grand orchestrator of cancer growth and immune evasion. Nat Rev Clin Oncol. 2022;19(1):23-36.
9. Seeler JS, Dejean A. SUMO and the robustness of cancer. Nat Rev Cancer. 2017;17(3):184-197.
10. Hendriks IA, Vertegaal AC. A comprehensive compilation of SUMO proteomics. Nat Rev Mol Cell Biol. 2016;17(9):581-595.
11. Flotho A, Melchior F. Sumoylation: a regulatory protein modification in health and disease. Annu Rev Biochem. 2013;82:357-385.
12. Cappadocia L, Lima CD. Ubiquitin-like protein conjugation: structures, chemistry, and mechanism. Chem Rev.
authors revised the manuscript for important intellectual content and approved the final version submitted for publication.
Acknowledgments
The authors would like to thank Millennium Pharmaceuticals, Inc., a wholly owned subsidiary of Takeda Pharmaceutical Company Limited, for providing ML-093 and subasumstat/Tak-981.
Funding
This work was supported by Deutsche Forschungsgemeinschaft (DFG, SFB824/C3 and SFB1335/P3 to UK; grant KE 222/10-1 to UK and SM, DFG grants MU 1764/7-1 (#494535244) and MU 1764/7-1 to to SM), Deutsche Krebshilfe (grants 70114425 and 70114724 to UK, grant 70114823 to SM), Stiftung Charité (to UK), and Wilhelm-Sander Foundation (2017.048.2 to UK). UD is a participant in the BIHCharité Junior Clinician Scientist program funded by the Charité - Universitätsmedizin Berlin and the Berlin Institute of Health.
Data-sharing statement
Sequencing data were uploaded to the European Nucleotide Archive and are publicly available via accession ID: PRJEB53800.
2018;118(3):889-918.
13. Kunz K, Piller T, Muller S. SUMO-specific proteases and isopeptidases of the SENP family at a glance. J Cell Sci. 2018;131(6);jcs211904.
14. Bawa-Khalfe T, Yeh ET. SUMO losing balance: SUMO proteases disrupt SUMO homeostasis to facilitate cancer development and progression. Genes Cancer. 2010;1(7):748-752.
15. Schick M, Zhang L, Maurer S, et al. Genetic alterations of the SUMO isopeptidase SENP6 drive lymphomagenesis and genetic instability in diffuse large B-cell lymphoma. Nat Commun. 2022;13(1):281.
16. Driscoll JJ, Pelluru D, Lefkimmiatis K, et al. The sumoylation pathway is dysregulated in multiple myeloma and is associated with adverse patient outcome. Blood. 2010;115(14):2827-2834.
17. Sun WC, Hsu PI, Yu HC, et al. The compliance of doctors with viral hepatitis B screening and antiviral prophylaxis in cancer patients receiving cytotoxic chemotherapy using a hospitalbased screening reminder system. PLoS One. 2015;10(2):e0116978.
18. Decque A, Joffre O, Magalhaes JG, et al. Sumoylation coordinates the repression of inflammatory and anti-viral geneexpression programs during innate sensing. Nat Immunol. 2016;17(2):140-149.
19. Kumar S, Schoonderwoerd MJA, Kroonen JS, et al. Targeting pancreatic cancer by TAK-981: a SUMOylation inhibitor that activates the immune system and blocks cancer cell cycle progression in a preclinical model. Gut. 2022;71(11):2266-2283.
Haematologica | 108 February 2023 566 ARTICLE - SUMO inhibition for MYC-dependent B-cell lymphoma U.M. Demel et al.
20. Demel UM, Boger M, Yousefian S, et al. Activated SUMOylation restricts MHC class I antigen presentation to confer immune evasion in cancer. J Clin Invest. 2022;132(9):e152383.
21. Kessler JD, Kahle KT, Sun T, et al. A SUMOylation-dependent transcriptional subprogram is required for Myc-driven tumorigenesis. Science. 2012;335(6066):348-353.
22. Hoellein A, Fallahi M, Schoeffmann S, et al. Myc-induced SUMOylation is a therapeutic vulnerability for B-cell lymphoma. Blood. 2014;124(13):2081-2090.
23. Biederstadt A, Hassan Z, Schneeweis C, et al. SUMO pathway inhibition targets an aggressive pancreatic cancer subtype. Gut. 2020;69(8):1472-1482.
24. He X, Riceberg J, Soucy T, et al. Probing the roles of SUMOylation in cancer cell biology by using a selective SAE inhibitor. Nat Chem Biol. 2017;13(11):1164-1171.
25. Langston SP, Grossman S, England D, et al. Discovery of TAK981, a first-in-class inhibitor of SUMO-activating enzyme for the treatment of cancer. J Med Chem. 2021;64(5):2501-2520.
26. Doffo J, Bamopoulos SA, Kose H, et al. NOXA expression drives synthetic lethality to RUNX1 inhibition in pancreatic cancer. Proc Natl Acad Sci U S A. 2022;119(9):e2105691119.
27. Casey SC, Baylot V, Felsher DW. The MYC oncogene is a global regulator of the immune response. Blood. 2018;131(18):2007-2015.
28. Kubli SP, Berger T, Araujo DV, Siu LL, Mak TW. Beyond immune checkpoint blockade: emerging immunological strategies. Nat Rev Drug Discov. 2021;20(12):899-919.
29. Restifo NP, Dudley ME, Rosenberg SA. Adoptive immunotherapy for cancer: harnessing the T cell response. Nat Rev Immunol. 2012;12(4):269-281.
30. Borst J, Ahrends T, Babala N, Melief CJM, Kastenmuller W. CD4(+) T cell help in cancer immunology and immunotherapy. Nat Rev Immunol. 2018;18(10):635-647.
31. Tay RE, Richardson EK, Toh HC. Revisiting the role of CD4(+) T cells in cancer immunotherapy-new insights into old paradigms. Cancer Gene Ther. 2021;28(1-2):5-17.
32. Sautes-Fridman C, Petitprez F, Calderaro J, Fridman WH. Tertiary lymphoid structures in the era of cancer immunotherapy. Nat Rev Cancer. 2019;19(6):307-325.
33. Martin MD, Badovinac VP. Defining memory CD8 T cell. Front Immunol. 2018;9:2692.
34. Stockinger B, Bourgeois C, Kassiotis G. CD4+ memory T cells: functional differentiation and homeostasis. Immunol Rev. 2006;211:39-48.
35. St Paul M, Ohashi PS. The roles of CD8(+) T cell subsets in antitumor immunity. Trends Cell Biol. 2020;30(9):695-704.
36. Lightcap ES, Yu P, Grossman S, et al. A small-molecule SUMOylation inhibitor activates antitumor immune responses and potentiates immune therapies in preclinical models. Sci Transl Med. 2021;13(611):eaba7791.
37. Stoeckius M, Hafemeister C, Stephenson W, et al. Simultaneous epitope and transcriptome measurement in single cells. Nat Methods. 2017;14(9):865-868.
38. Finkin S, Hartweger H, Oliveira TY, Kara EE, Nussenzweig MC. Protein amounts of the MYC transcription factor determine germinal center B cell division capacity. Immunity. 2019;51(2):324-336.
39. Schneider G, Wirth M, Keller U, Saur D. Rationale for MYC imaging and targeting in pancreatic cancer. EJNMMI Res. 2021;11(1):104.
40. Llombart V, Mansour MR. Therapeutic targeting of "undruggable" MYC. EBioMedicine. 2022;75:103756.
41. Nakamura A, Grossman S, Song K, et al. The SUMOylation inhibitor subasumstat potentiates rituximab activity by IFN1dependent macrophage and NK cell stimulation. Blood. 2022;139(18):2770-2781.
42. Seton-Rogers S. Oncogenes: driving immune evasion. Nat Rev Cancer. 2018;18(2):67.
43. Sharonov GV, Serebrovskaya EO, Yuzhakova DV, Britanova OV, Chudakov DM. B cells, plasma cells and antibody repertoires in the tumour microenvironment. Nat Rev Immunol. 2020;20(5):294-307.
44. Togashi Y, Shitara K, Nishikawa H. Regulatory T cells in cancer immunosuppression - implications for anticancer therapy. Nat Rev Clin Oncol. 2019;16(6):356-371.
45. Pace L, Tempez A, Arnold-Schrauf C, et al. Regulatory T cells increase the avidity of primary CD8+ T cell responses and promote memory. Science. 2012;338(6106):532-536.
Haematologica | 108 February 2023 567 ARTICLE - SUMO inhibition for MYC-dependent B-cell lymphoma U.M. Demel et al.
Estefanía García-Guerrero,1,2 Luis G. Rodríguez-Lobato,1,3 Belén Sierro-Martínez,2 Sophia Danhof,1 Stephan Bates,1 Silke Frenz,1 Larissa Härtle,1 Ralph Götz,4 Markus Sauer,4 Leo Rasche,1 K. Martin Kortüm,1 Jose A. Pérez-Simón,2 Hermann Einsele,1 Michael Hudecek1 and Sabrina R. Prommersberger1
1Lehrstuhl für Zelluläre Immuntherapie, Medizinische Klinik und Poliklinik II and Medizinische Klinik und Poliklinik II, Universitätsklinikum Würzburg, Würzburg, Germany; 2Instituto de Biomedicina de Sevilla (IBIS/CSIC), Department of Hematology, Hospital Universitario Virgen del Rocío, Universidad de Sevilla, Sevilla, Spain; 3Amyloidosis and Multiple Myeloma Unit, Department of Hematology, Hospital Clínic of Barcelona. Institut d’Investigacions Biomèdiques August Pi i Sunyer (IDIBAPS), Barcelona, Spain and 4 Lehrstuhl für Biotechnologie und Biophysik, Julius-Maximilians-Universität Würzburg, Würzburg, Germany
Abstract
Correspondence: S. Prommersberger Prommersbe_S@ukw.de
Received: May 2, 2022.
Accepted: August 23, 2022. Prepublished: September 1, 2022. https://doi.org/10.3324/haematol.2022.281339
©2023 Ferrata Storti Foundation
Published under a CC BY-NC license
B-cell maturation antigen (BCMA) is the lead antigen for chimeric antigen receptor (CAR) T-cell therapy in multiple myeloma (MM). A challenge is inter- and intra-patient heterogeneity in BCMA expression on MM cells and BCMA downmodulation under therapeutic pressure. Accordingly, there is a desire to augment and sustain BCMA expression on MM cells in patients that receive BCMA-CAR T-cell therapy. We used all-trans retinoic acid (ATRA) to augment BCMA expression on MM cells and to increase the efficacy of BCMA-CAR T cells in pre-clinical models. We show that ATRA treatment leads to an increase in BCMA transcripts by quantitative reverse transcription polymerase chain reaction and an increase in BCMA protein expression by flow cytometry in MM cell lines and primary MM cells. Analyses with super-resolution microscopy confirmed increased BCMA protein expression and revealed an even distribution of non-clustered BCMA molecules on the MM cell membrane after ATRA treatment. The enhanced BCMA expression on MM cells after ATRA treatment led to enhanced cytolysis, cytokine secretion and proliferation of BCMA-CAR T cells in vitro, and increased efficacy of BCMA-CAR T-cell therapy in a murine xenograft model of MM in vivo (NSG/MM.1S). Combination treatment of MM cells with ATRA and the γsecretase inhibitor crenigacestat further enhanced BCMA expression and the efficacy of BCMA-CAR T-cell therapy in vitro and in vivo. Taken together, the data show that ATRA treatment leads to enhanced BCMA expression on MM cells and consecutively, enhanced reactivity of BCMA-CAR T cells. The data support the clinical evaluation of ATRA in combination with BCMA-CAR T-cell therapy and potentially, other BCMA-directed immunotherapies.
Introduction
Chimeric antigen receptor (CAR) T-cell therapy directed against B-cell maturation antigen (BCMA) is under clinical investigation for treating multiple myeloma (MM). Several trials have reported efficacy of BCMA-CAR T-cell therapy1–4 and as of June 2022, two BCMA-CAR T-cell products have received clinical approval.5 In the KarMMa study, Idecabtagene vicleucel has achieved an overall response rate (ORR) of 73%, and the mean progression-free survival (PFS) was 8.8 months.6 In the Cartitude-1 study, Ciltacabtagene autoleucel has achieved an ORR of 97%, and the mean PFS had not been reached at 24 months.7 Even though the ORR,
in particular for Ciltacabtagene autoleucel, is very high and the PFS exceeds by far the benchmarks that have been set in heavily pretreated MM patients by other treatment modalities, many patients ultimately relapse. There is an ongoing correlative research effort to delineate the impact of BCMA antigen density and BCMA downmodulation on MM cells, as well as BCMA-CAR T-cell engraftment and persistence on outcome. Based on the available data with CAR T cells from preclinical and clinical development, the prevailing paradigm is that higher antigen density and higher CAR T-cell frequency is expected to correlate with favorable clinical outcome.8–10 BCMA is a tumor necrosis family receptor, that is physio-
All-trans retinoic acid works synergistically with the
γ-
secretase inhibitor crenigacestat to augment BCMA on multiple myeloma and the efficacy of BCMA-CAR T cells
Haematologica | 108 February 2023 568 ARTICLE - Plasma cell disorders
logically expressed on plasma cells, their precursors and polyclonal plasmablasts, and that is absent on hematopoietic stem cells and non-hematopoietic cells and tissues.11,12 BCMA expression has been demonstrated at the gene and protein level on malignant plasma cells from treatment-naïve and previously treated MM patients.11–13 There is considerable inter- and intra-patient variation in BCMA expression, making BCMA hardly detectable by conventional analyses such as flow cytometry and immunohistochemistry in some patients.1,15,16 The range in BCMA antigen density (i.e., molecules per MM cell) that has been reported in several studies has raised concerns that BCMA expression on at least a subset of MM cells may be insufficient for appropriate BCMA-CAR T-cell recognition and stimulation.17 Indeed, antigen density on target cells has been identified as a key parameter that determines CAR T-cell function and therapeutic efficacy.18–20 Staggered thresholds in antigen density are required for inducing cytolytic activity, cytokine secretion and proliferation.21–23 These preclinical assessments are supported by clinical studies showing that low antigen density correlates with inferior clinical outcome after CAR T-cell therapy.8–10 The principle strategies for modulating antigen expression on MM cells are regulation at the gene level and at the protein level. At the protein level, γ-secretase inhibitors (GSI) have been shown to increase the level of BCMA expression on myeloma cell lines and on primary myeloma cells.17 In order to accomplish regulation at the gene level, we focused on all-trans retinoic acid (ATRA). ATRA is approved for the treatment of acute promyelocytic leukemia. Retinoic acids can influence gene expression and protein production in mammalian cells.24 ATRA induces changes in post-translational modifications such as histone acetylation in tumor cells.25–28 These epigenetic changes have been shown to augment CD38 expression on MM cells and subsequently, enhanced efficacy of the CD38-targeting antibody daratumumab.25,29,30 Here, we analyzed the effect of ATRA treatment on BCMA expression on MM cell lines and primary MM cells. We measured BCMA expression on MM cells after ATRA treatment by quantitative reverse transcription polymerase chain reaction (RT-qPCR) and flow cytometry and applied super-resolution microscopy for antigen quantification and distribution analyses on the MM cell surface. We further examined the recognition of MM cells by BCMA-CAR Tcells after ATRA treatment in vitro and in a murine xenograft model of MM in vivo.
Methods
Human subjects
Peripheral blood and bone marrow samples were obtained from healthy donors and patients after written informed
consent to participate in research protocols approved by the Institutional Review Boards of the University of Würzburg.
Cell lines
The OPM-2, NCI-H929 and MM.1S cell lines were obtained from the German Collection of Microorganisms and Cell Cultures (DSMZ, Braunschweig, Germany). The OPM-2 and MM.1S cell lines were modified with firefly-luciferase_GFP by lentiviral transduction.
All-trans
retinoic
acid and crenigacestat treatment
Myeloma cells were cultured in RPMI-1640 (Gibco, Darmstadt, Germany) supplemented with 10% fetal bovine serum at 1x10⁶ cells/mL, 1% glutamin and 1% penicillin and streptomycin (all from Gibco). ATRA (Sigma Aldrich, Darmstadt, Germany) and crenigacestat (LY3039478, MedChemExpress, New Jersey, USA) were reconstituted in dimethyl sulfoxide and added to the medium to a final concentration of 25, 50 or 100 nM (ATRA) and 10 nM (crenigacestat), respectively.
CAR T-cell preparation
A codon-optimized single chain variable fragment (scFv) comprising the variable heavy (VH) and variable light (VL) chain of anti-BCMA mAb BCMA50,31 separated by a (G4S)3 linker, was synthesized (GeneArt, Regensburg, Germany) and fused to a spacer and transmembrane domain, a 41BB_CD3�� signaling module, a T2A element and a truncated epidermal growth factor receptor (EGFRt) in an epHIV7 lentiviral vector backbone.32 Human CD4+ and CD8+ T cells were isolated, activated with CD3/CD28 Dynabeads (Gibco) and transduced. CAR-modified T cells were enriched using the EGFRt marker and expanded with irradiated BCMA+ feeder cells.
Flow cytometry
Bone marrow mononuclear cells were stained with antiCD38-BV421 and anti-CD138-FITC monoclonal antibodies (mAb) (Biolegend, Koblenz, Germany; Clone: HIT2 and DL101, respectively) to identify malignant plasma cells and anti-BCMA-APC mAb (Biolegend; Clone: 19F2) or isotype control (Biolegend; mouse IgG2a,κ) according to the manufacturer’s instructions. Cell viability was assessed by 7AAD staining (BD, Heidelberg, Germany). T cells were stained with anti-EGFR-APC mAb (Biolegend, Clone: AY13) to detect the EGFRt transduction marker expressed in the CAR transgene cassette. Flow cytometry was done on a Canto II (BD) or a MACSquant-10 (Miltenyi Biotec, BergischGladbach, Germany) and data analyzed using FlowJo software (TreeStar, Ashland, OR).
Super-resolution microscopy
Myeloma cells were stained with anti-BCMA-AF647 or -
Haematologica | 108 February 2023 569 ARTICLE - ATRA increases BCMA on multiple myeloma cells E. García-Guerrero et al.
BV421, anti-CD138-FITC antibodies or isotype controls (Biolegend; Clones: 19F2 and MI15). dSTORM (direct stochastic optical reconstruction microscopy) images were acquired on an Olympus IX-71 inverted microscope and reconstructed using the software rapidSTORM3.314. Quantification of BCMA was performed using a custom script written with Mathematica.23,33
In vitro studies with CAR T cells
Cytolytic activity was analyzed in a bioluminescencebased assay using firefly luciferase (ffluc)-transduced target cells and distinct effector to target cell (E:T) ratios. Proliferation of T cells was analyzed by CFSE dye dilution after a 72-hour co-culture with target cells (E:T ratio of 4:1). IFNγ and IL-2 secretion were measured by enzymelinked immunosorbant assay (ELISA) (Biolegend) in supernatants obtained after a 20-hour co-culture of T cells with target cells (E:T ratio of 4:1).
In vivo studies with myeloma cells and CAR T cells
The University of Würzburg Institutional Animal Care and Use Committee approved all mouse experiments. Six- to 8-week old female NSG (NOD-scid IL2rγnull) mice were obtained from Charles River (Sulzfeld, Germany), inoculated by tail vein injection with 2x10⁶ MM.1S/ffluc_GFP and randomly allocated to the treatment groups. ATRA was formulated in PEG300, Tween80 and saline (8:1:9) and administered by intraperitoneal (i.p.) injection (30 mg/kg). Crenigacestat was formulated in PEG300 (Sigma Aldrich), Tween80 (Sigma Aldrich) and saline (8:1:9) and administered by i.p. injection (1 mg/kg). BCMA-CAR-modified and control non-CAR modified T cells were administered i.v. by tail vein injection (1×10⁶ T cells, i.e., 0.5×10⁶ CD4+ and 0.5×10⁶ CD8+). Bioluminescence imaging (BLI) was performed on an IVIS Lumina (Perkin Elmer, Waltham, MA) following i.p injection of D-luciferin (0.3 mg/g body weight) (Biosynth, Staad, Switzerland), and data analyzed using Living Image software (Perkin Elmer).
Statistical analyses
Statistical analyses were performed using Prism software v6.07 (GraphPad, San Diego, California). Unpaired and paired t-tests were used to analyze data from in vitro experiments and from experiments on BCMA expression in vivo P values<0.05 were considered statistically significant. For all other in vivo experiments, statistical analysis was performed with SPSS 28. The measurements per group were described by mean and standard deviation. Normality was checked by qq plots. As the qq plots showed no normal distributed data and due to the small sample size, non-parametric Mann Whitney U tests were used as significance test for comparing the measurements between groups. The CAR T-cell group was compared to CAR T cells + ATRA, and the CAR T cell + GSI group was
compared to CAR T cells + GSI + ATRA. Exact P values were used due to the small sample size. For each time point, each pairwise comparison tested its own null hypothesis so that no adjustment of the a error was needed. P values <0.05 were considered statistically significant.
Results
All-trans retinoic acid treatment augments surface expression of BCMA protein on myeloma cell lines
We determined BCMA baseline expression on three commonly used myeloma cell lines by flow cytometry and found graded BCMA expression with MM.1S being BCMAlow (ΔMFI: 5,349), OPM-2 being BCMAintermediate (ΔMFI: 8,037) and NCI-H929 being BCMAhigh (ΔMFI: 22,014) (Figure 1A). After treating each myeloma cell line with 50 nM ATRA for 72 hours, we found upregulation of BCMA expression on all three myeloma cell lines. However, the hierarchy in BCMA expression had remained unchanged: MM.1S (ΔMFI: 8,837) < OPM-2 (ΔMFI: 13,098) < NCI-H929 (ΔMFI: 32,201) (Figure 1A). We normalized the ΔMFI obtained at baseline to 1 and thus, the relative increase in BCMA expression after ATRA treatment was 1.8-fold in MM.1S, 1.7-fold in OPM 2, and 2.5fold in NCI-H929 myeloma cells (Figure 1A). Upon discontinuation of ATRA treatment, BCMA expression returned to baseline within 72 hours in all three myeloma cell lines, but increased again with the same amplitude when ATRA treatment was reinstalled (Figure 1A). We did not detect an effect of ATRA treatment on the viability of these myeloma cell lines during the assay period (Online Supplementary Figure S1).
In order to derive insights into the density and distribution of BCMA molecules on the surface of myeloma cell lines, we further examined MM.1S cells with and without ATRA treatment by single-molecule sensitive dSTORM superresolution microscopy (Figure 1B and C).33 The data showed variable BCMA expression between MM.1S cells however, there were no BCMAnegative MM.1S cells detectable. Before ATRA treatment, the minimum and maximum density was 1.8 and 11.7 BCMA molecules per µm², respectively, with even BCMA distribution across the cell membrane. After treatment with 100 nM ATRA for 72 hours, there was a minimum of 3.1 BCMA molecules per µm² and a maximum of 13.6 BCMA molecules per µm², and BCMA still occurred as single molecules without cluster formation (Figure 1B).
All-trans retinoic acid and crenigacestat work synergistically in increasing BCMA expression on myeloma cell lines
We were interested in determining the combined effect of ATRA and the GSI crenigacestat, that in previous work has been shown to increase BCMA expression in myeloma cells at the protein level.17 Therefore, we treated MM.1S and
Haematologica | 108 February 2023 570 ARTICLE - ATRA increases BCMA on multiple myeloma cells E. García-Guerrero et al.
OPM-2 myeloma cells with ATRA (100 nM) and with crenigacestat (10 nM) and analyzed BCMA expression by flow cytometry. We found that crenigacestat had a stronger effect on BCMA expression compared to ATRA and that the combined treatment with both compounds had the strongest effect. The relative increase in BCMA protein expression after treatment with crenigacestat alone and in combination with ATRA was 9.6-fold and 18.3-fold on MM.1S cells (Figure 1D) and 5.9-fold and 6.9-fold on OPM2 cells (Online Supplementary Figure S2), respectively. We hypothesized that ATRA induces epigenetic changes in myeloma cells that lead to increased BCMA gene expression and confirmed by RT-qPCR that this was indeed the case. In MM.1S and OPM-2 cells, the relative increase in BCMA transcripts after treatment with ATRA was 1.8-fold (Figure 1E) and 2.1-fold (Online Supplementary Figure S3), respectively.
Taken together, these data show that ATRA treatment leads to increased BCMA gene expression and increased expression of BCMA protein in myeloma cell lines. ATRA works synergistically with the GSI crenigacestat to induce a maximum increase in BCMA protein density on the surface of myeloma cells.
Primary myeloma cells show increased BCMA expression after all-trans retinoic acid treatment, alone and in combination with crenigacestat In order to confirm these findings in primary myeloma cells, we obtained bone marrow from patients with newly
diagnosed (ND, n=7) and relapsed/refractory (R/R, n=11) MM. Patients in the R/R cohort had previously received treatment with immunomodulatory drugs and/or proteasome inhibitors, none of the patients had received antiBCMA therapy. We analyzed purified CD38+CD138+ malignant plasma cells by flow cytometry and found variable BCMA expression between patients as assessed by ΔMFI (range, 94-2,650). There was no significant difference in BCMA expression on myeloma cells from ND and R/R patients (Figure 2A). We submitted primary myeloma cells from n=5 patients (n=3 ND and n=2 R/R) that covered the spectrum of BCMAlow to BCMAhigh expression at baseline to in vitro treatment with ATRA. In each of these patient samples, we detected an increase in BCMA expression by flow cytometry after treatment with ATRA for 72 hours (100 nM P=0.04; 50 nM P=0.01; 25 nM P=0.04) (Figure 2B; Online Supplementary Figure S4). The increase in ΔMFI for BCMA expression on primary myeloma cells after ATRA treatment was on average 1.6-fold (range, 1.2–2.2-fold). After 72 hours of ATRA treatment, there was no impact on the viability of primary myeloma cells (Online Supplementary Figure S5). BCMA expression on primary myeloma cells declined to baseline once exposure to ATRA was discontinued, and increased again upon re-exposure to the drug (Figure 2C). Next, we evaluated the combination treatment of ATRA and GSI on primary myeloma cells from n=3 patients. Consistent with our observation in myeloma cell lines, we observed a stronger increase in BCMA expression with crenigacestat compared to ATRA treatment, and a maxi-
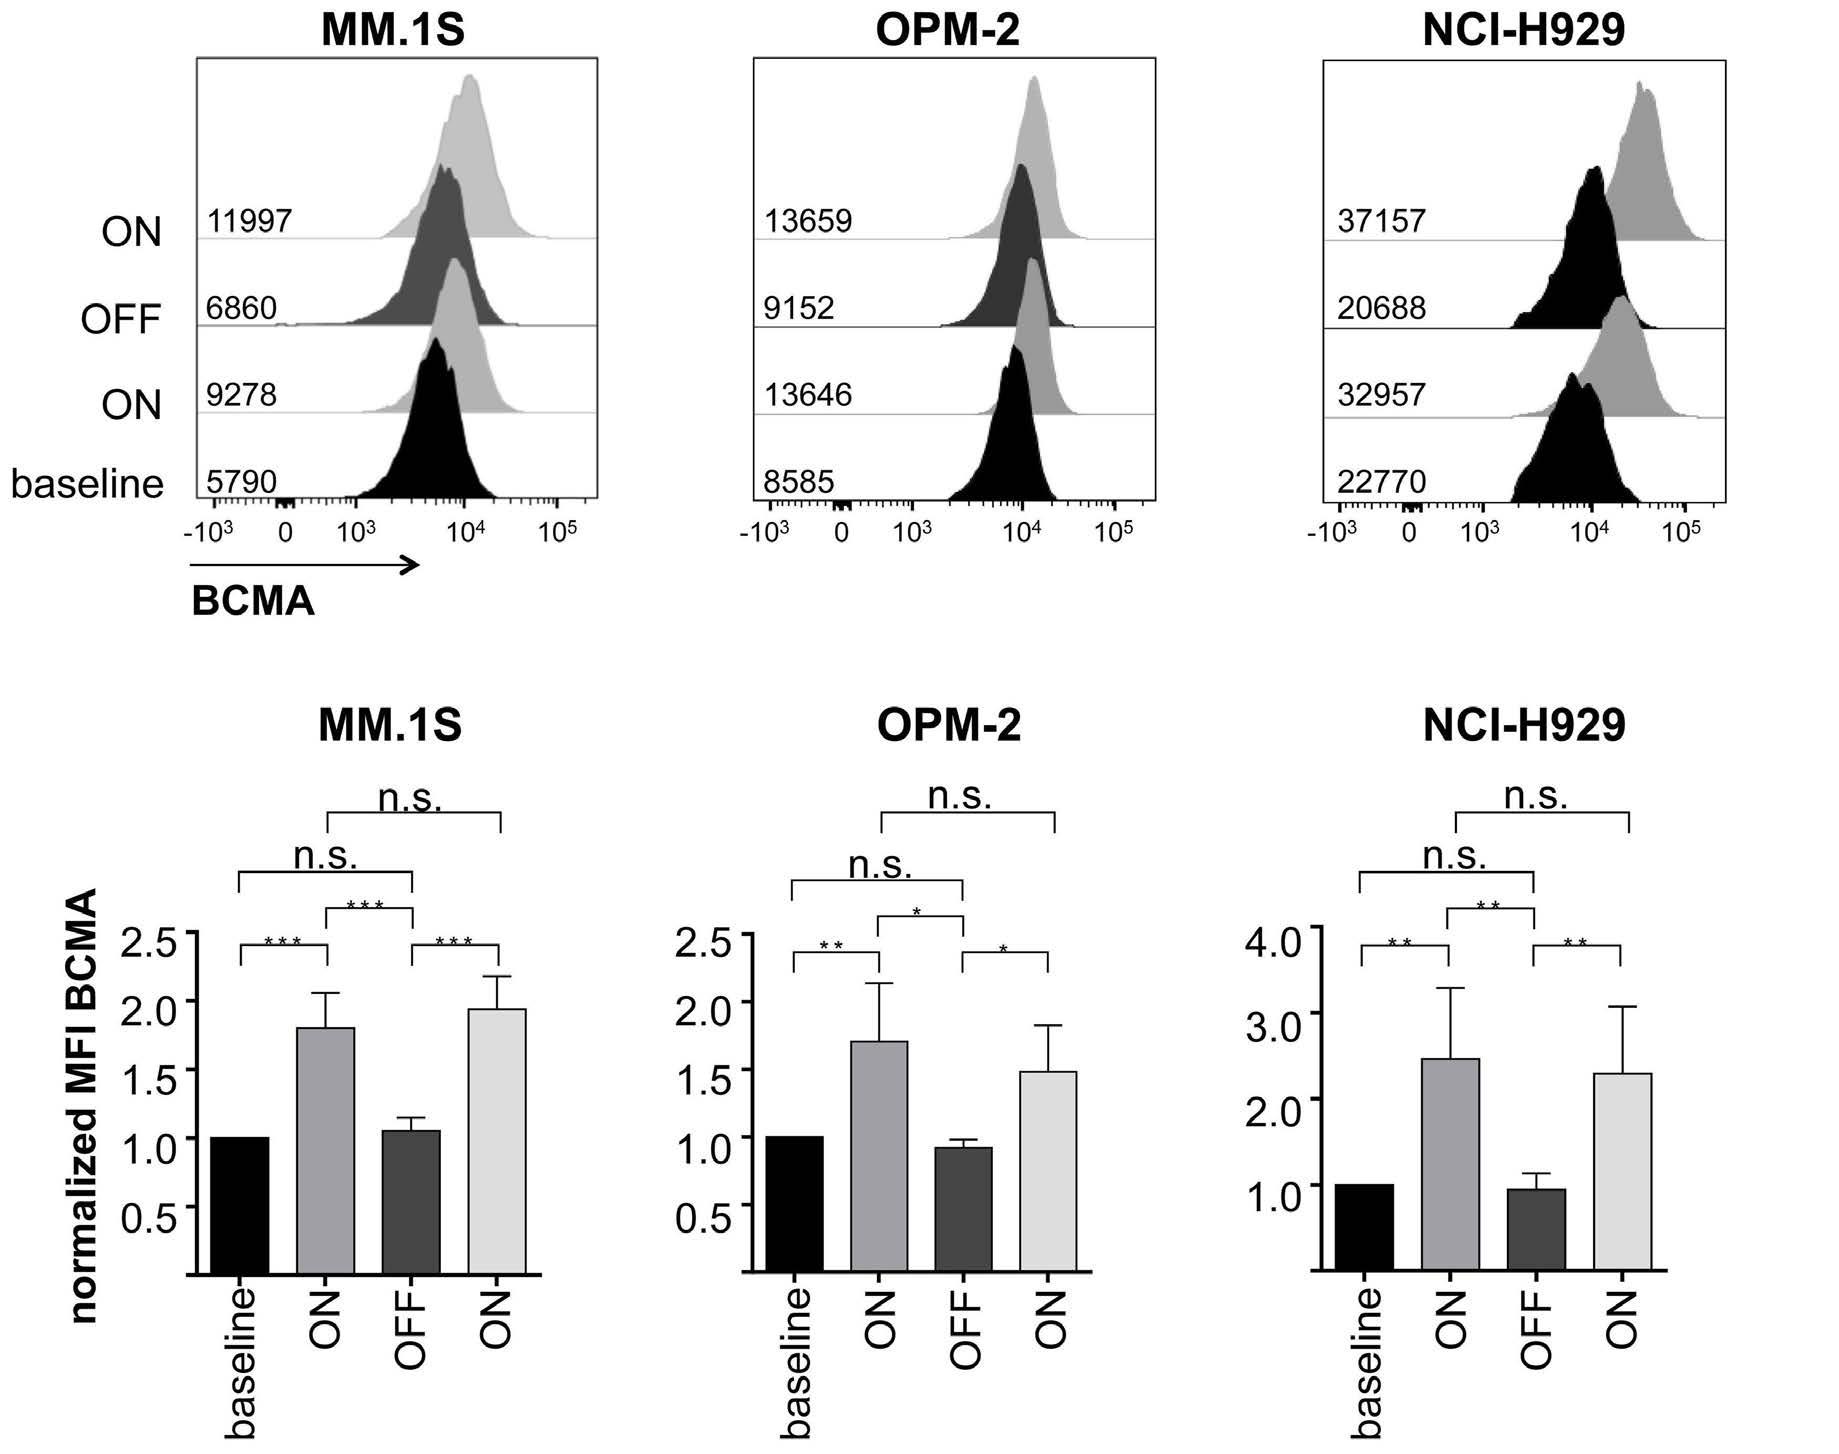
Continued on following page. A Haematologica | 108 February 2023 571 ARTICLE - ATRA increases BCMA on multiple myeloma cells E. García-Guerrero et al.
Figure 1. All-trans retinoic acid treatment enhances B-cell maturation antigen expression on myeloma cell lines. (A) B-cell maturation antigen (BCMA) expression on MM.1S, OPM-2 and NCI-H929 cell lines was analyzed by flow cytometry. Expression was measured on untreated myeloma cell lines, after 72 hours of all-trans retinoic acid (ATRA) treatment (50 nM), 24 hours after subsequent removal of the drug, and 72 hours after ATRA re-exposition. 7-AAD was used to exclude dead cells from analysis. Upper panel: representative overlay histograms. Lower panel: bar diagrams show relative increase normalized to completely untreated cells (n=5). (B) Representative photographs of BCMA molecule distribution on untreated and ATRA-treated MM.1S cells visualized by direct stochastic optical reconstruction microscopy (dSTORM). (C) Number of BCMA molecules on untreated and ATRA-treated MM.1S cells measured by dSTORM. (D) BCMA expression on MM.1S cells that had been treated with 100 nM ATRA and/or 10 nM γ-secretase inhibitors (GSI) crenigacestat for 72 hours was analyzed by flow cytometry (n=5). (E) BCMA RNA levels in MM.1S were analyzed by quantitative reverse transcription PCR (qRT-PCR) assay after incubation with increasing doses of ATRA for 48 hours (n=4). Bar diagrams show mean values + standard deviation. P values between indicated groups were calculated using unpaired t-test. n.s.: not significant. *P<0.05, **P<0.01, ***P<0.001.
mum increase in BCMA expression with the combination treatment. The relative increase in BCMA expression after crenigacestat treatment alone and in combination with ATRA was 6.4-fold and 7.7-fold, respectively (Figure 2D). Taken together, these data show that ATRA alone and in combination with crenigacestat augments BCMA surface expression on primary myeloma cells from patients with ND and R/R disease.
All-trans retinoic acid treatment does not impair BCMACAR T-cell viability and function We sought to determine the effect of ATRA on T cells and confirmed that a 72-hour treatment of CD4+ or CD8+ BCMA-CAR T cells did neither diminish their viability nor expression of the BCMA-CAR as assessed by the percentage of live CARpositive T cells and the mean expression of the CAR_EGFRt transgene by flow cytometry (Figure 3A and B). We also performed functional testing with BCMACAR T cells after 1 week ATRA treatment and found similarly potent and specifi c cytolytic activity against BCMApositive target cells (Figure 3C). The extracellular portion of membrane-bound BCMA can
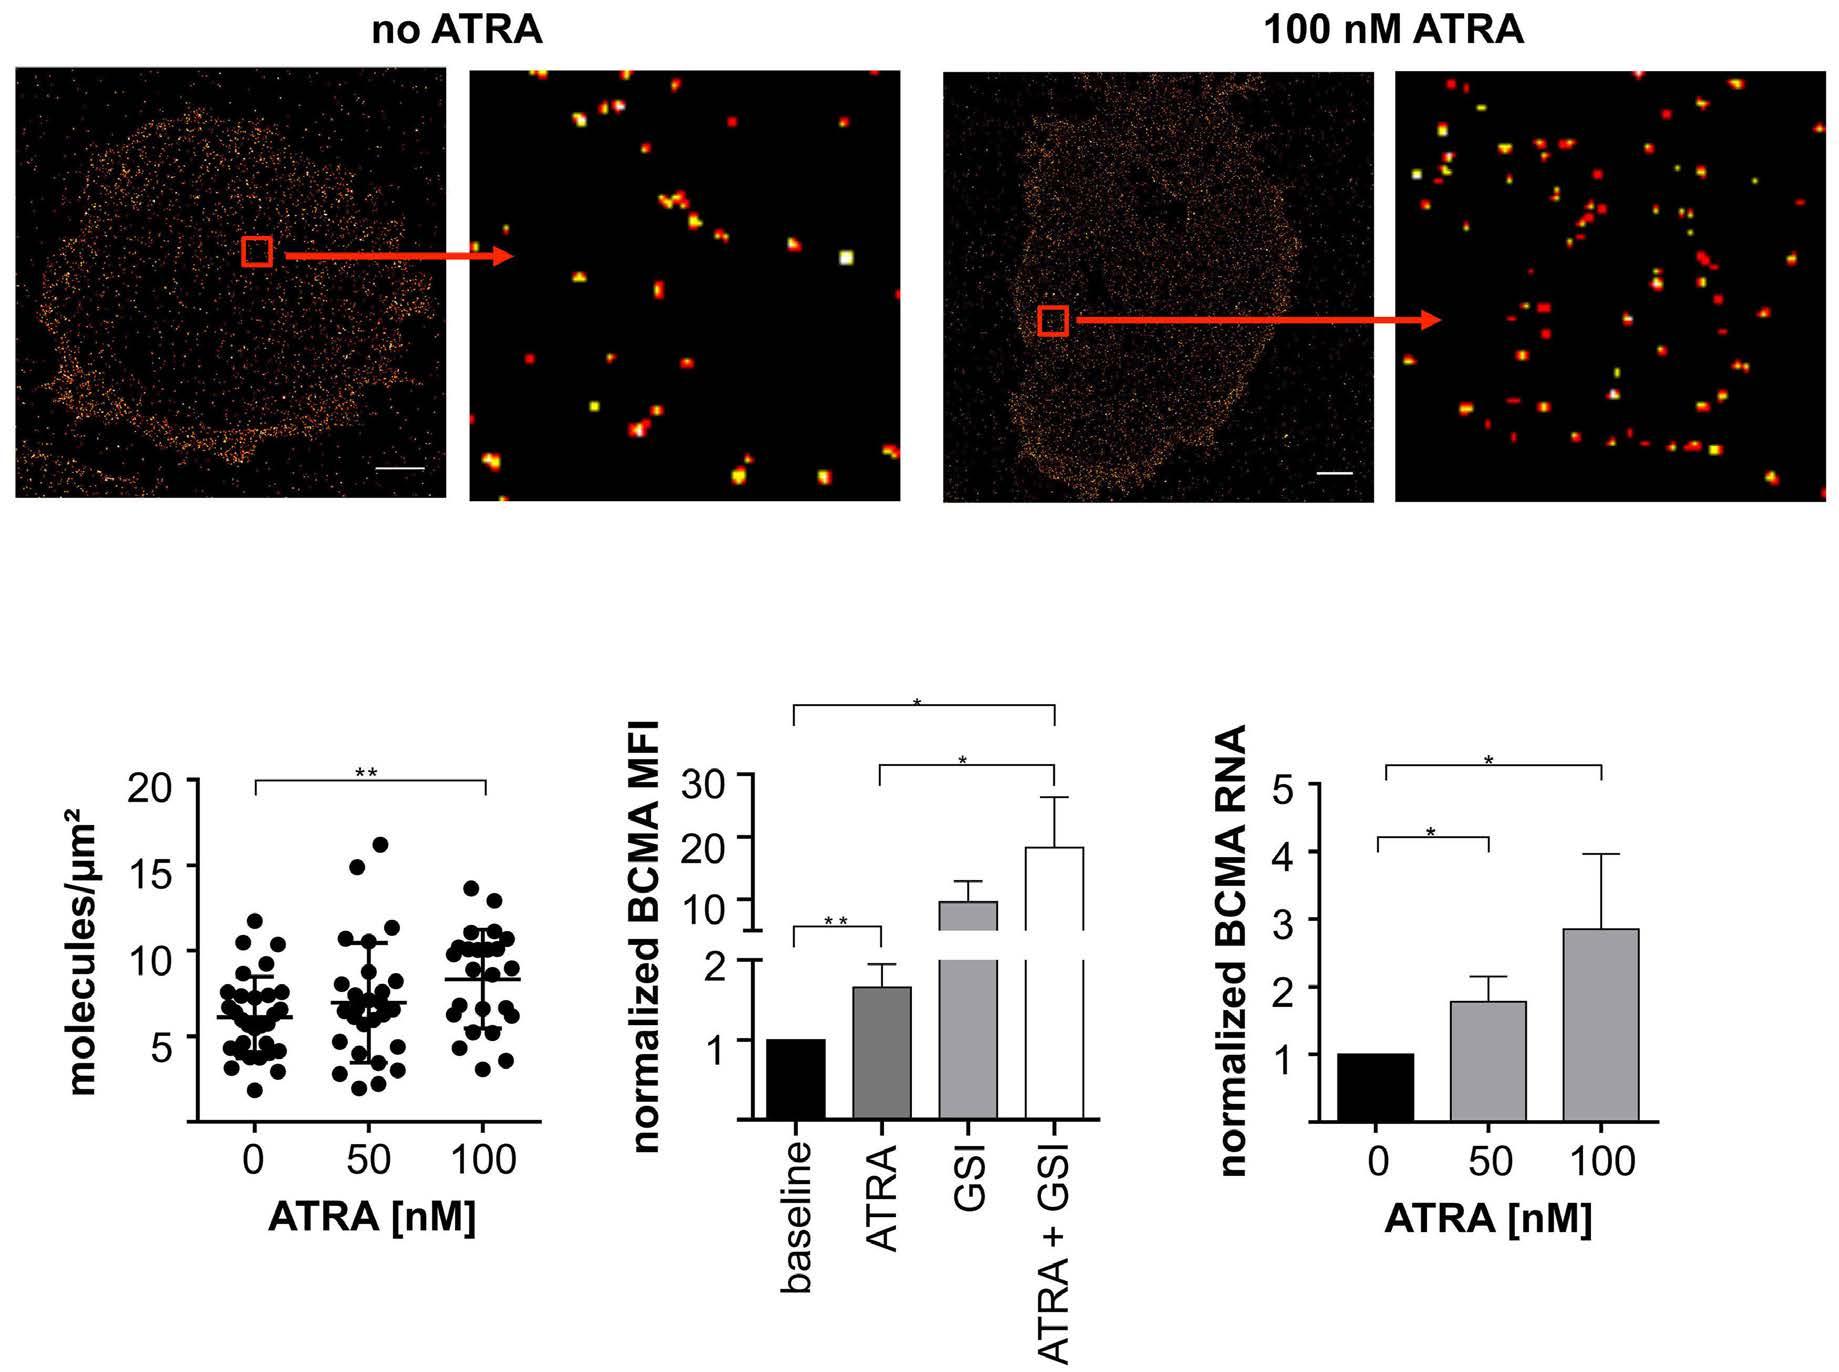
be shed from myeloma cells to release a shorter, soluble BCMA (sBCMA) protein isoform. Depending on the epitope recognized by the BCMA-CAR, sBCMA may interfere with BCMA recognition on myeloma cells. We confirmed that the reactivity of the BCMA-CAR used in this study that contains a scFv derived from the BCMA50 mAb, was not diminished in the presence of sBCMA (Online Supplementary Figure S6). Furthermore, we measured sBCMA in the supernatant of MM.1S, OPM-2 and NCI-H929 cells that had been treated with ATRA for up to 4 days and did not detect a higher concentration of sBCMA compared to nonATRA-treated MM cells (Figure 3D; Online Supplementary Figure S7). Taken together, these data show that ATRA treatment does not affect the viability and function of BCMA-CAR T cells and does not lead to an increased release of sBCMA from MM cells.
Enhanced BCMA expression after all-trans retinoic acid treatment leads to enhanced reactivity of BCMA-CAR T cells against multiple myeloma cell lines in vitro Next, we examined if the increase in BCMA expression after ATRA treatment leads to increased anti-myeloma re-
B C D E Haematologica | 108 February 2023 572 ARTICLE - ATRA increases BCMA on multiple myeloma cells E. García-Guerrero et al.
Figure 2. All-trans retinoic acid treatment leads to enhanced B-cell maturation antigen expression expression on primary myeloma cells. (A) B-cell maturation antigen (BCMA) expression on CD38+ CD138+ myeloma cells from newly diagnosed (ND) and relapse/refractory (R/R) myeloma patients was analyzed by flow cytometry (n=18 biological replicates). Diagram shows differential mean fluorescence intensity (MFI) of BCMA and isotype control staining. (B) BCMA expression on primary myeloma cells before and after alltrans retinoic acid (ATRA) treatment was analyzed by flow cytometry (n=5 biological replicates). Bar diagram shows relative increase of BCMA expression on ATRA-treated multiple myleloma cell lines normalized to untreated cells. (C) Overlay histogram shows BCMA expression on untreated primary myeloma cells 72 hours after ATRA treatment (100 nM), 24 hours after subsequent removal of the drug, and 72 hours after re-exposition. (D) Bar diagram shows BCMA expression on primary myeloma cells after treatment with 100 nM ATRA and/or 10 nM γ-secretase inhibitors crenigacestat for 72 hours (n=3 biological replicates). Bar diagrams show mean values + standard deviation. P values between indicated groups were calculated using unpaired t-test. *P<0.05, **P<0.01, ***P<0.001.
activity of BCMA-CAR T cells. We tested the cytolytic activity of CD8+ BCMA-CAR T cells from healthy donors and MM patients and found superior cytolysis of ATRA-treated compared to non-ATRA-treated myeloma cell lines (Figure 4A; Online Supplementary Figure S8). The increase in cytolysis of myeloma cells was consistent at several E:T ratios and – on example of MM.1S target cells – increased from 42.5% to 55.5% during the 4-hour assay period (E:T =5, P=0.036, Figure 4A). Consistent with our analysis of BCMA expression, we observed the strongest cytolysis when MM1.S cells had been treated with the ATRA plus crenigacestat combination. With ATRA plus crenigacestattreated MM1.S target cells, the specific cytolysis by BCMACAR T cells increased to 74% (P=0,002; Figure 4A). Our analyses also showed increased production of IFNγ and IL-2 from CD8+ and CD4+ BCMA-CAR T cells as assessed by ELISA after a 24-hour co-culture with ATRAtreated versus non-ATRA-treated myeloma target cells. In particular, there was a significant increase in IL-2 production from CD8+ BCMA-CAR T cells after co-culture with MM1.S cells that had been treated with ATRA and the ATRA plus crenigacestat combination (Figure 4B). By CFSE dye dilution, we detected a significant increase in proliferation of CD8+ and CD4+ BCMA-CAR T cells after stimulation with myeloma cells that had undergone treated with ATRA and
the ATRA plus crenigacestat combination (Figure 4C). This proliferation was productive and led to an increase in the percentage of viable BCMA-CAR T cells and the absolute number of BCMA-CAR T cells at the end of the 72-hour assay period. Collectively, these data show that the increased expression of BCMA on myeloma cells after ATRA treatment augments the anti-myeloma response of BCMA-CAR T cells. The increase in anti-myeloma function is strongest, when myeloma cells undergo concurrent treatment with ATRA and crenigacestat.
All-trans retinoic acid treatment enhances the efficacy of BCMA-CAR T-cell therapy in NSG/MM.1S mice
We sought to evaluate the effect of ATRA treatment on the anti-myeloma efficacy of BCMA-CAR T-cell therapy in vivo. In a first experiment, we inoculated NSG mice (n=6) with 2x10⁶ MM.1S cells by tail vein injection to establish systemic MM and then administered a 4-day treatment course with either ATRA (n=3 mice; 30 mg/kg i.p. qd) or solvent control (n=3 mice). After completion of ATRA treatment, we obtained bone marrow and determined BCMA expression on MM.1S cells by flow cytometry. We found significantly higher BCMA expression on MM.1S cells from mice in the ATRA treatment group compared to the con-
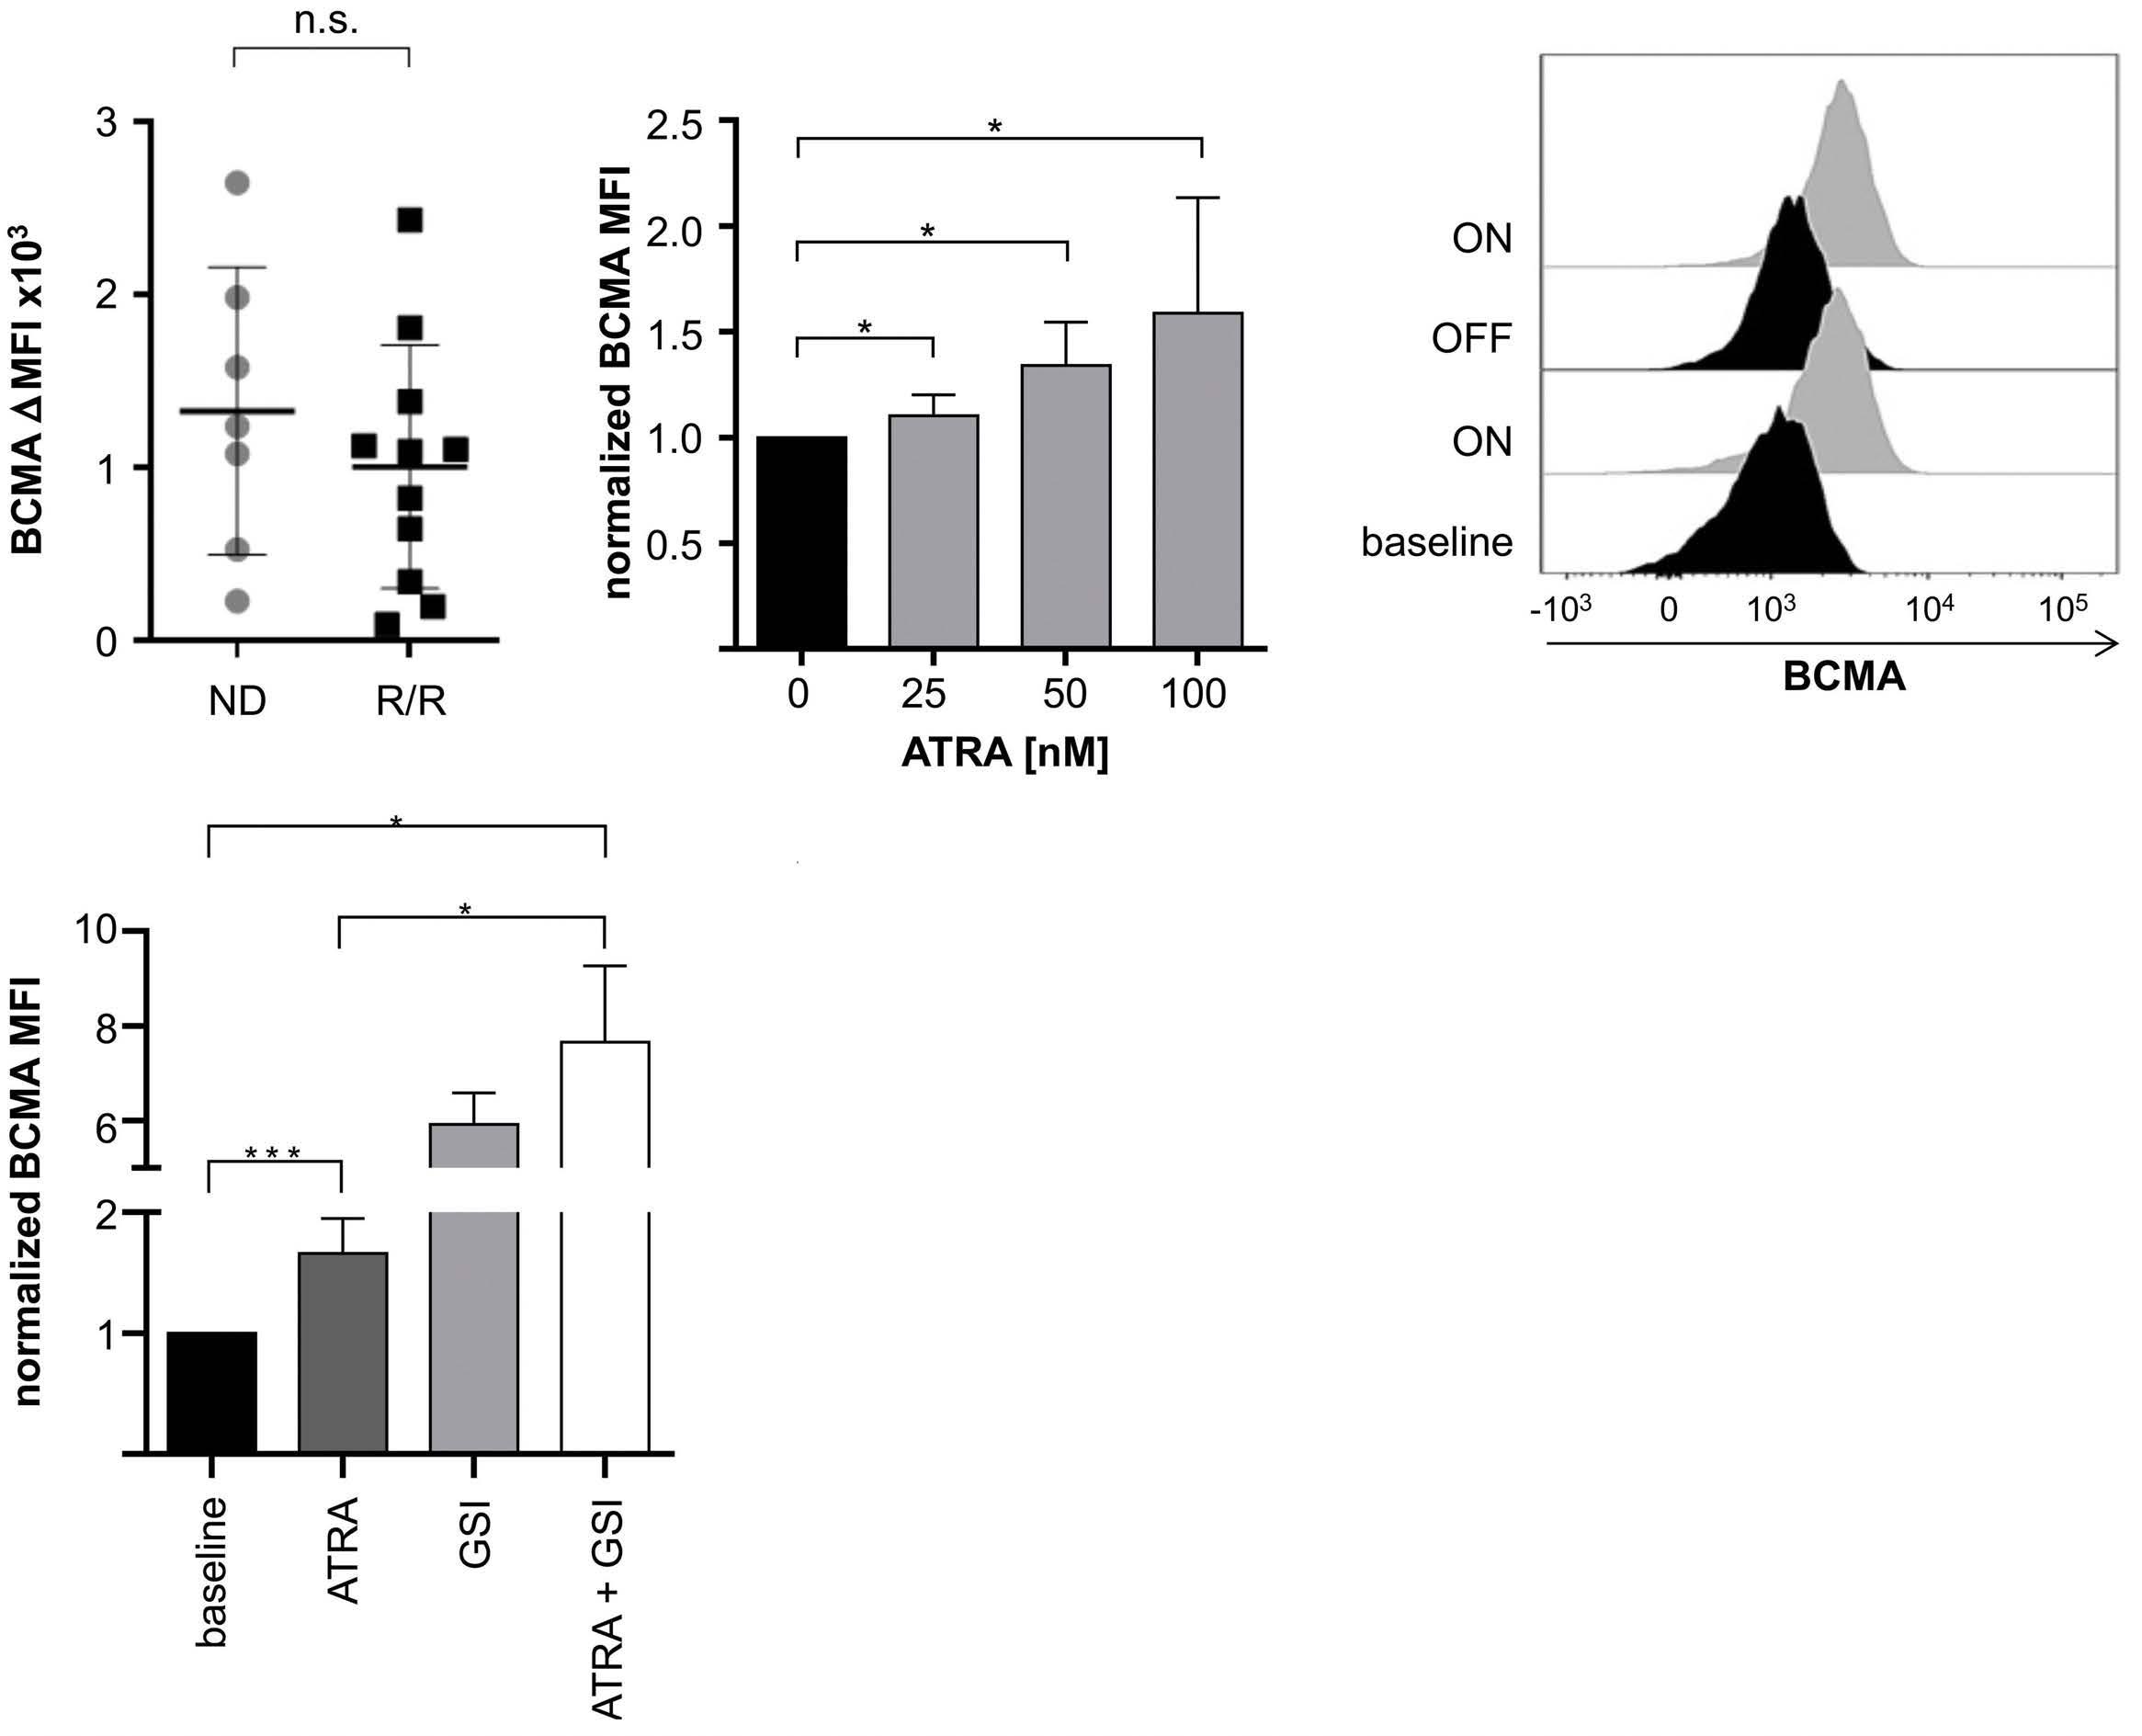
A B C D Haematologica | 108 February 2023 573 ARTICLE - ATRA increases BCMA on multiple myeloma cells E. García-Guerrero et al.
Figure 3. B-cell maturation antigen-CAR T cells are not impaired by all-trans retinoic acid treatment. (A) Cell count and viability of CD4+ and CD8+ B-cell maturation antigen chimeric antigen receptor (BCMA-CAR) T cells after incubation with 100 nM all-trans retinoic acid (ATRA) for 72 hours was analyzed by trypan blue staining (n=3 technical triplicates). Left bar diagram shows the total number of living cells, right bar diagram shows the percentage of viable cells. (B) Expression of the EGFRt-CAR transgene construct after incubation of CD4+ and CD8+ BCMA-CAR T cells with 100 nM ATRA for 72 hours was analyzed by flow cytometry (n=3 technical triplicates). Left bar shows percentage of CAR-positive cells, right bar shows geometric mean of transgene signal (C) Cytolytic activity of CD8+ BCMA-CAR T cells was determined in a bioluminescence-based assay after 4 hours of co-incubation with target cells. T cells had been pretreated with 100 nM ATRA for 1 week. Assay was performed in triplicate wells with 5,000 target cells per well (n=3 biological replicates) (D) Soluble BCMA (sBCMA) concentration in the supernatant of MM.1S after incubation with increasing doses of ATRA was analyzed by enzyme-linked immosorbant assay. Bar diagrams show mean values + standard deviation. P values between indicated groups were calculated using (A to C) unpaired t-test or (D) two-way ANOVA. n.s.: not significant.
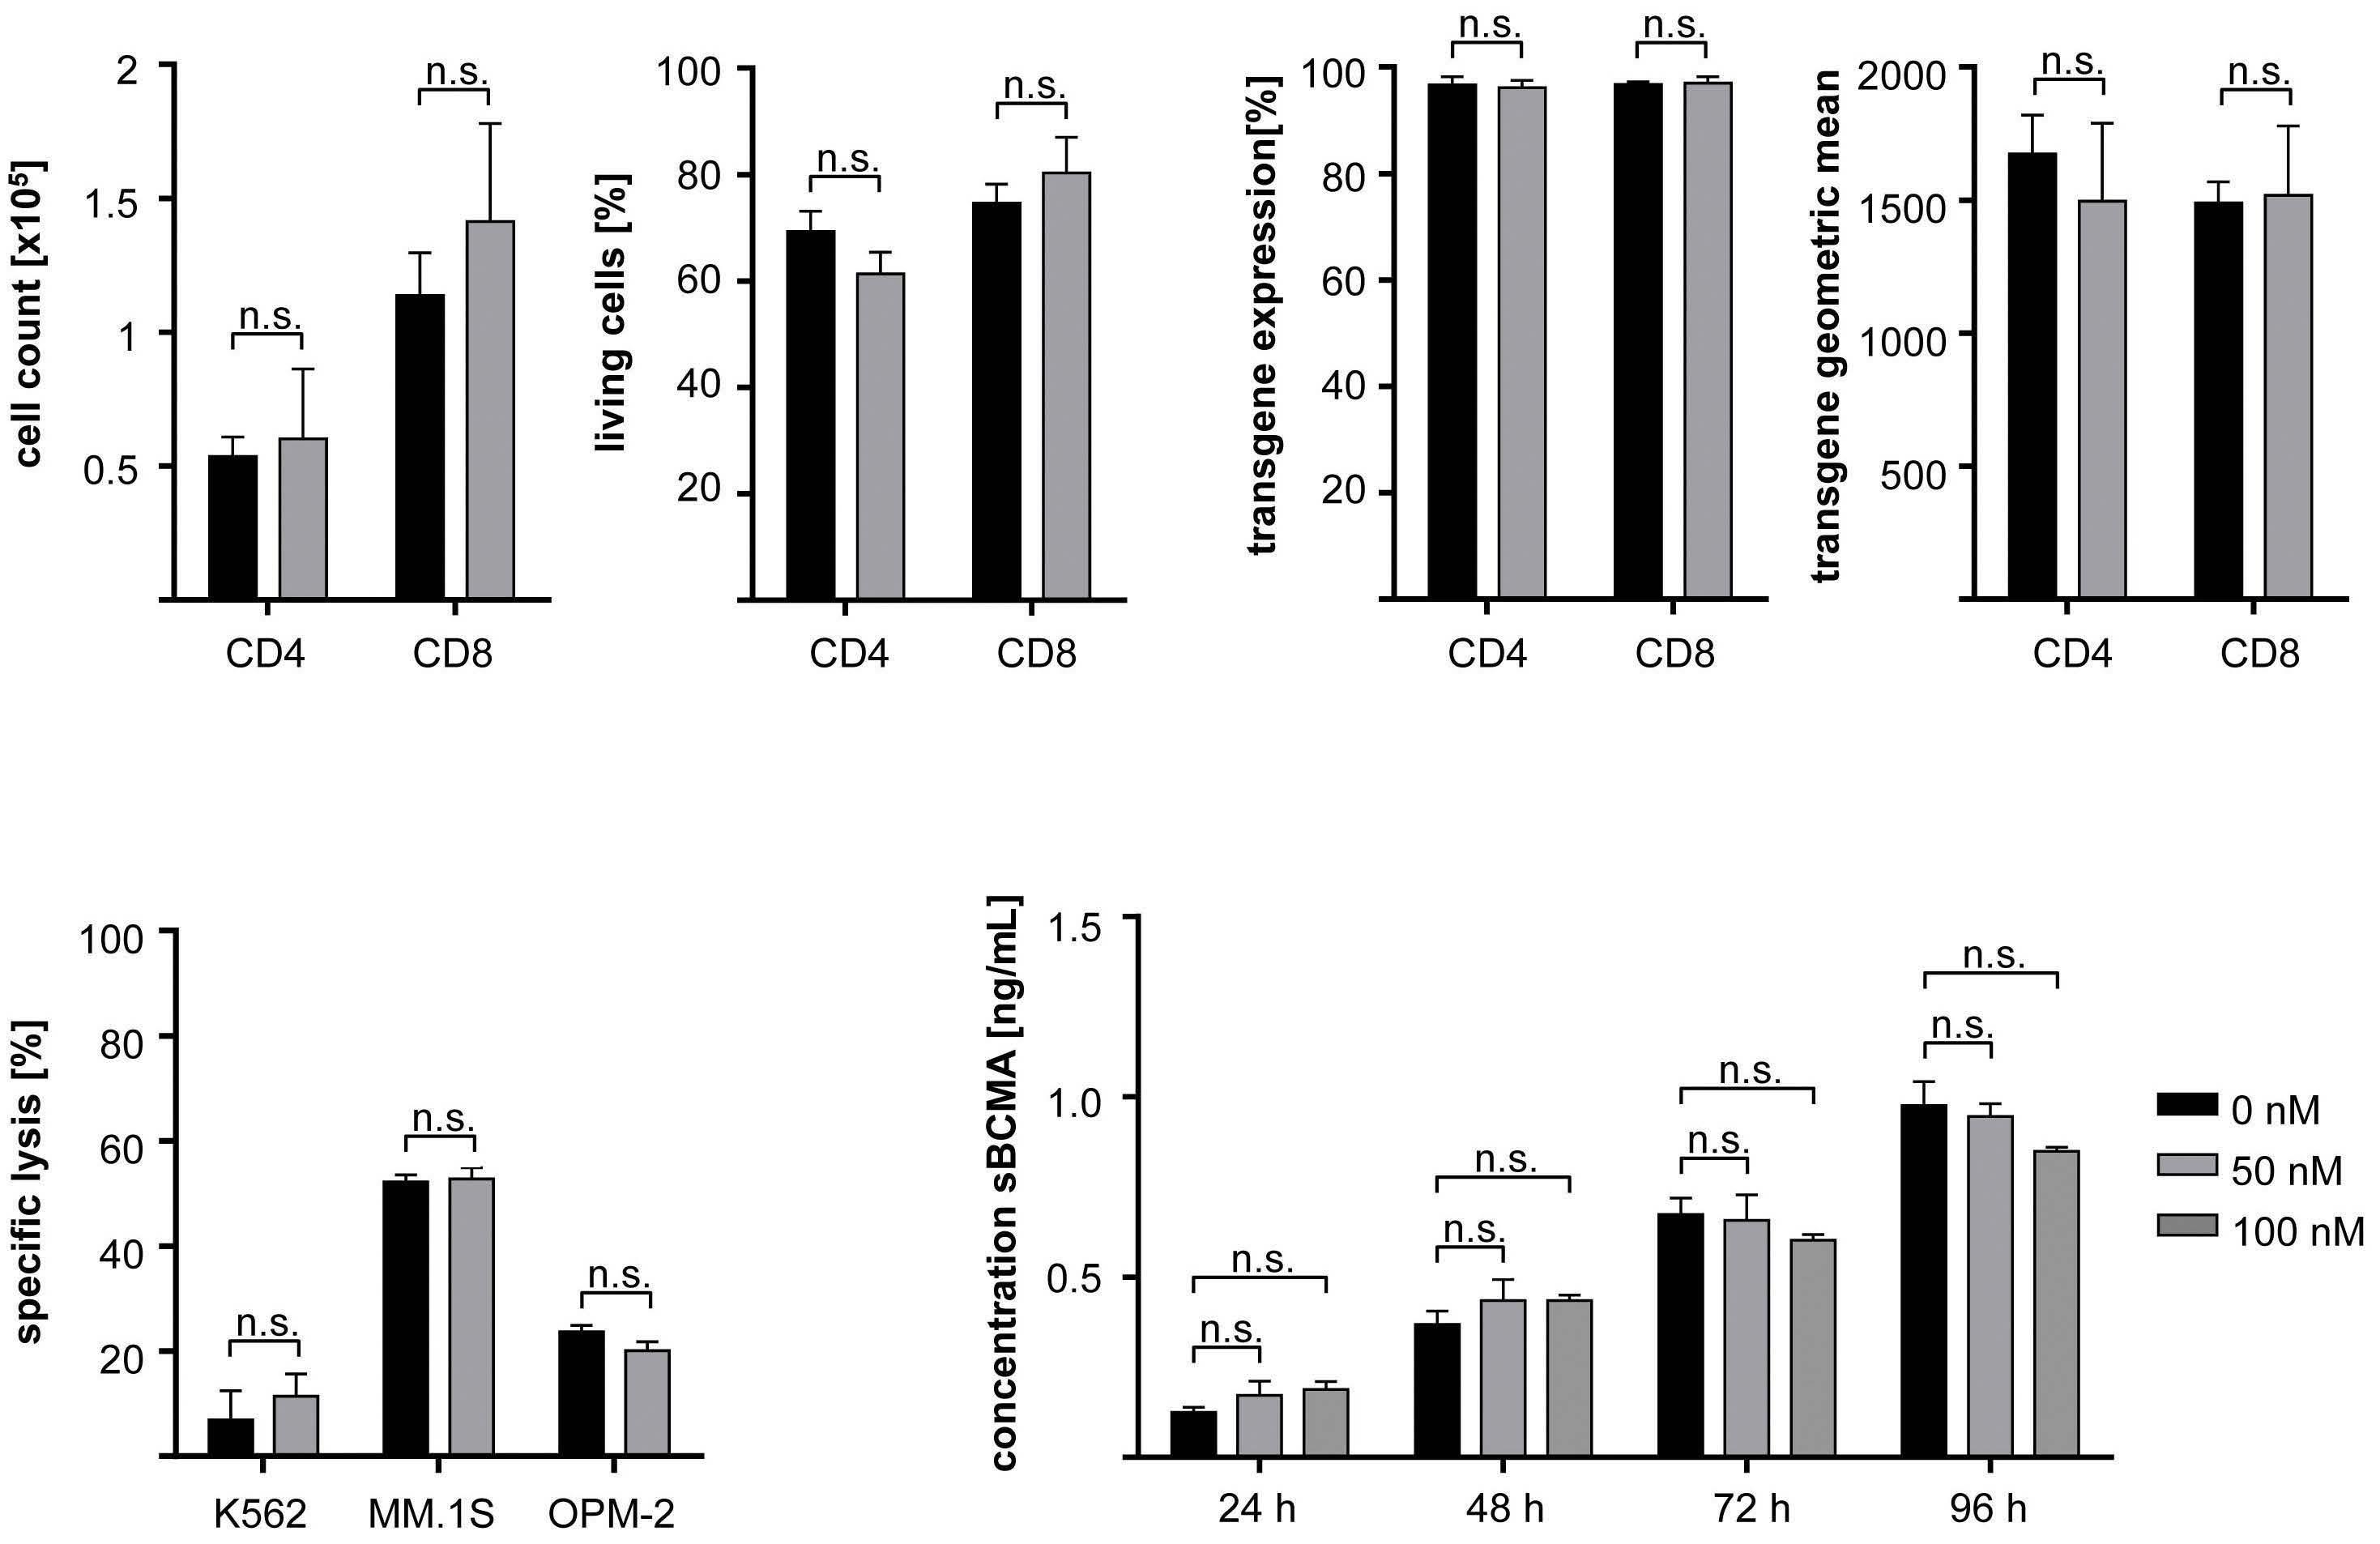
trol group (P=0.002; Figure 5A).
In a second experiment, we performed adoptive transfer of BCMA-CAR T-cells at an effective but non-curative dose (1x10⁶ total CAR-T cells i.v., CD8:CD4 at 1:1 ratio). At this dose, the optimal anti-myeloma response is reached within 1 week after BCMA-CAR T-cell transfer, and MM relapse occurs rapidly within 2 weeks. Concurrent to BCMACAR T-cell therapy, we administered ATRA (30 mg/kg i.p.) and/or crenigacestat (1 mg/kg i.p.), or solvent control as per treatment schedule (Figure 5B). We obtained peripheral blood on day 2 after adoptive transfer and detected a higher percentage of BCMA-CAR T cells in mice that had received a concurrent treatment with either ATRA alone, crenigacestat alone or the ATRA plus crenigacestat combination (Figure 5C), consistent with superior engraftment and induction of in vivo proliferation.
Then, we analyzed myeloma burden and distribution by serial bioluminescence imaging (BLI). At 1 week after BCMA-CAR T-cell transfer, we observed an anti-myeloma effect in each of the treatment groups that had received BCMA-CAR T cells alone or with a concurrent treatment of ATRA, crenigacestat or the ATRA plus crenigacestat combination. We observed the deepest remissions in mice that had received concurrent therapy with the ATRA plus crenigacestat combination, followed by ATRA alone and crenigacestat alone (Figure 5D). Indeed, each of the concurrent treatment regimen that contained ATRA was superior to BCMA-CAR T-cell therapy alone. At 2 weeks after BCMA-CAR T-cell transfer, we observed rapid disease progression in each of the mice that had received BCMA-CAR T-cell therapy alone. We also observed disease progression in all but one of the mice that had received concur-
A B C D Haematologica | 108 February 2023 574 ARTICLE - ATRA increases BCMA on multiple myeloma cells E. García-Guerrero et al.
Figure 4. All-trans retinoic acid treatment enhances the anti-myeloma efficacy of B-cell maturation antigen-CAR T cells in vitro. (A to C) Prior to assay setup, MM.1S cells were incubated with 100 nM all-trans retinoic acid (ATRA) and/or 10 nM γ-secretase inhibitors (GSI) for 72 hours or were left untreated. ATRA was washed out before CAR T cells were added. (A) Cytolytic activity of CD8+ B-cell maturation antigen chimeric antigen receptor (BCMA-CAR) T cells was determined in a bioluminescence-based assay after 4 hours of co-incubation with MM.1S target cells. Assay was performed in triplicate wells with 5,000 target cells per well (n=4 biological replicates). (B) BCMA-CAR T cells were co-incubated with MM.1S cells for 24 hours. Cytokine release of BCMACAR T cells was determined in the supernatant by enzyme-linked immunosorbant assay. Assay was performed in triplicate wells (n=3 biological replicates). (C) CFSE-labeled BCMA-CAR T cells were co-incubated with MM.1S cells. Proliferative capacity of BCMA-CAR T cells was determined after 3 days by measuring the reduction of CFSE-signal (n=3 biological replicates). Bar diagrams show mean values + standard deviation, P values between indicated groups were calculated using unpaired t-test. n.s.: not significant. *P<0.05, **P<0.01.
rent treatment with either ATRA alone or crenigacestat alone. In contrast, there was no disease progression in any of the mice that had received BCMA-CAR T cells and concurrent ATRA plus crenigacestat (Figure 5D). In these mice, the BLI signal remained at baseline (i.e., the level observed before MM.1S inoculation) and analysis of bone marrow confirmed the absence of MM.1S cells (Figure 5E). In particular, treatment with BCMA-CAR T cells and the ATRA plus crenigacestat combination conferred a superior antimyeloma effect compared to the treatment with BCMACAR T cells and crenigacestat alone as assessed by BLI at day 21 and at day 28 (P=0.008 and P=0.036, respectively). In aggregate, these data show that ATRA treatment leads to increased BCMA expression on myeloma cells in vivo and augments the anti-myeloma efficacy of BCMA-CAR T
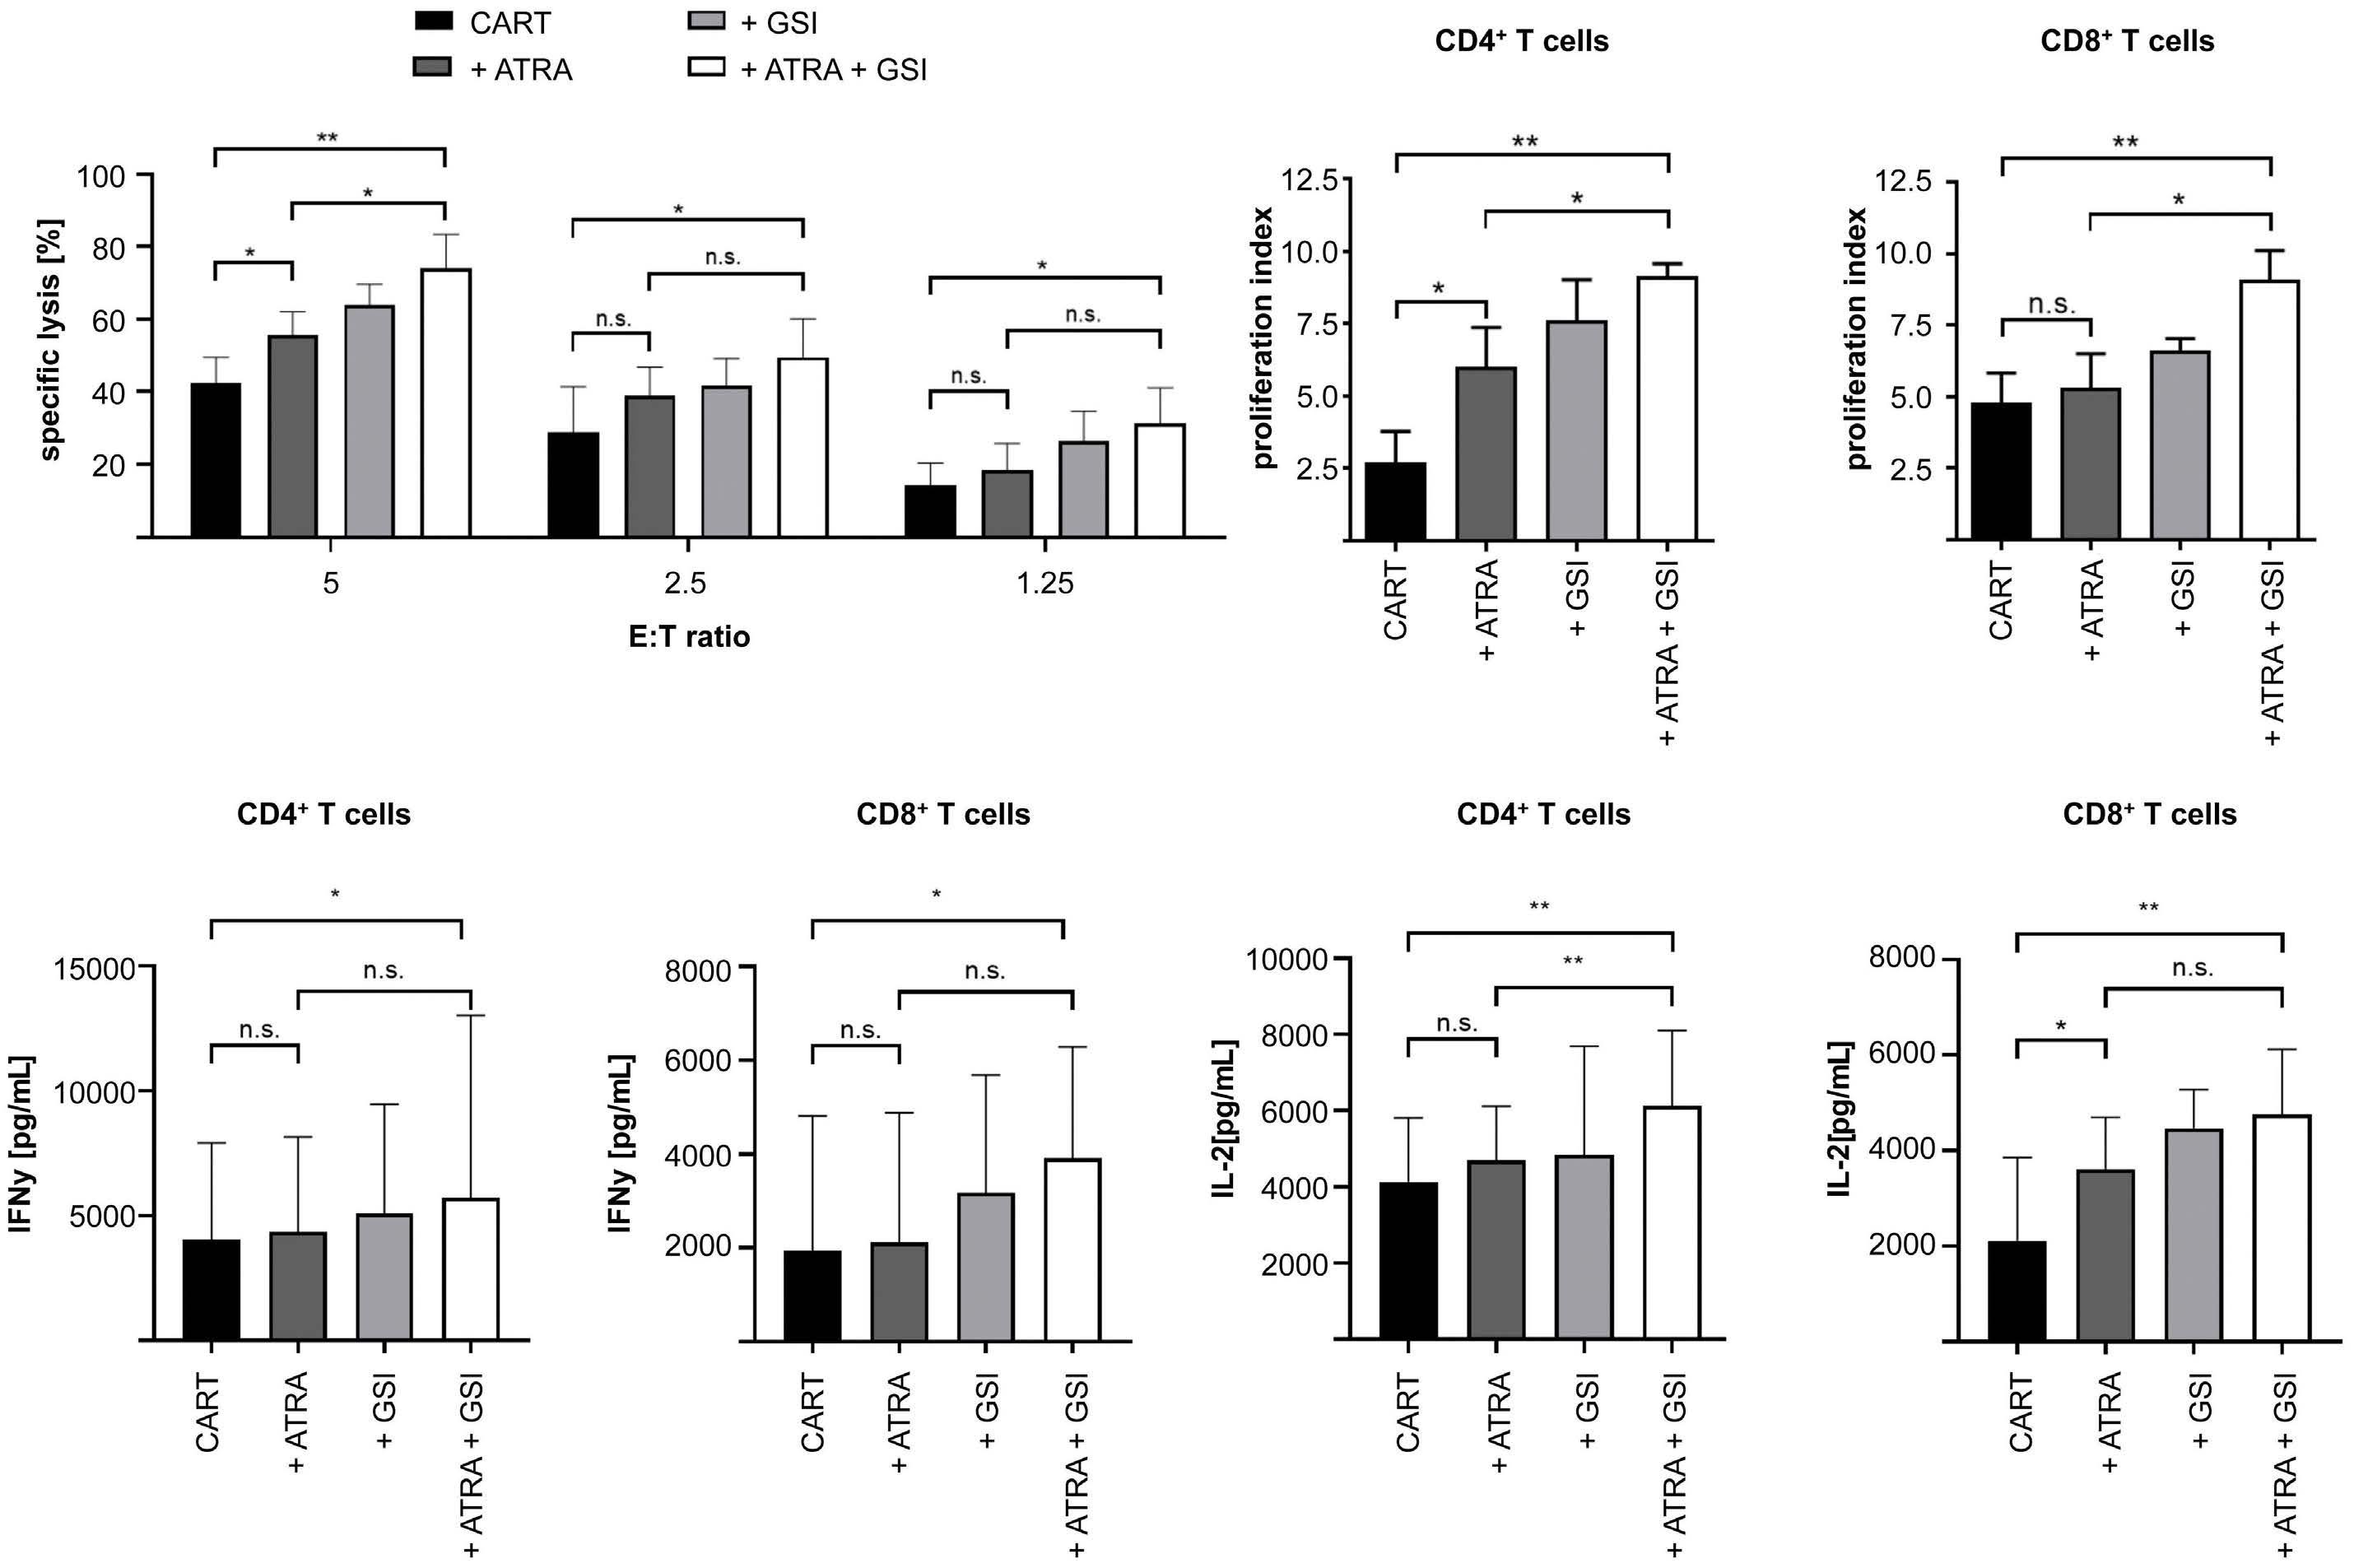
cells. Combination treatment with ATRA and crenigacestat concurrent to BCMA-CAR T-cell therapy confers the strongest improvement of the anti-myeloma response both in terms of depth and duration of myeloma remission.
Discussion
There is a surging clinical and preclinical development of cellular and antibody-based immunotherapies directed against BCMA in MM, including BCMA-specific CAR T cells that have shown their potential to induce very high rates of complete remissions in patients that are resistant to conventional therapies.1–4,34 However, a barrier to consist-
A B C Haematologica | 108 February 2023 575 ARTICLE - ATRA increases BCMA on multiple myeloma cells E. García-Guerrero et al.
Figure 5. All-trans retinoic acid treatment enhances the anti-myeloma efficacy of B-cell maturation antigen-CAR T cells in vivo. (A) NSG mice were inoculated with 2x10⁶ MM.1S cells. After 12 days, mice were intraperitoneally (i.p.) injected with 30 mg/kg alltrans retinoic acid (ATRA) for 4 days. BCMA expression on MM.1S cells obtained from bone marrow of untreated and ATRA-treated mice was analyzed by flow cytometry (n=3). (B) ATRA and crenigacestat treatment scheme for experiments in NSU+00a0\1D) NSG mice were inoculated with 2×10⁶ MM.1S/ffluc_GFP cells. 14 days later, they were treated with 1×10⁶ BCMA-CAR T-cells (CD4+:CD8+ ratio = 1:1). BCMA-CAR T cells were given alone or in combination with ATRA (30 mg/kg body weight as i.p. injection), γ -secretase inhibitors (GSI) crenigacestat (1 mg/kg body weight as i.p. injection) or both drugs (n=5-6 mice per group). 12 doses of ATRA and 7 doses of GSI were injected between day 12 and day 27. BLI was measured on day 14, 21, 26 and 28. (C) Percentage of human T cells (CD3+ CD45+) among living cells (7-AAD-) in peripheral blood was measured two days after CAR T-cell injection (day 16) by flowcytometry. (D) The average radiance of MM.1S signal was analyzed to assess myeloma progression/regression in each treatment group. Bioluminescence (BLI) values were obtained as photon/sec/cm2/sr in regions of interest encompassing the entire body of each mouse. Circles show the bioluminescence signals of single mice, red dots show the mean bioluminescene signals between day 14 (time point of CAR T-cell injection) and day 28 (end of experiment). (E) Percentage of MM.1S cells in bone marrow from mice treated with BCMA-CAR T cells alone or in combination with ATRA and GSI was analyzed by measuring CD138+, ffluc_GFP+, 7-AAD- cells by flow cytometry. (A and C) Bar diagrams show mean values + standard deviation, P values between indicated groups were calculated using unpaired t-test. *P<0.05, **P<0.01. (D) P values between indicated groups were calculated using non-parametric Mann Whitney U tests for comparing CAR T vs. CAR T + ATRA and CAR T + GSI vs. CART + ATRA + GSI. *P<0.05, **P<0.01.
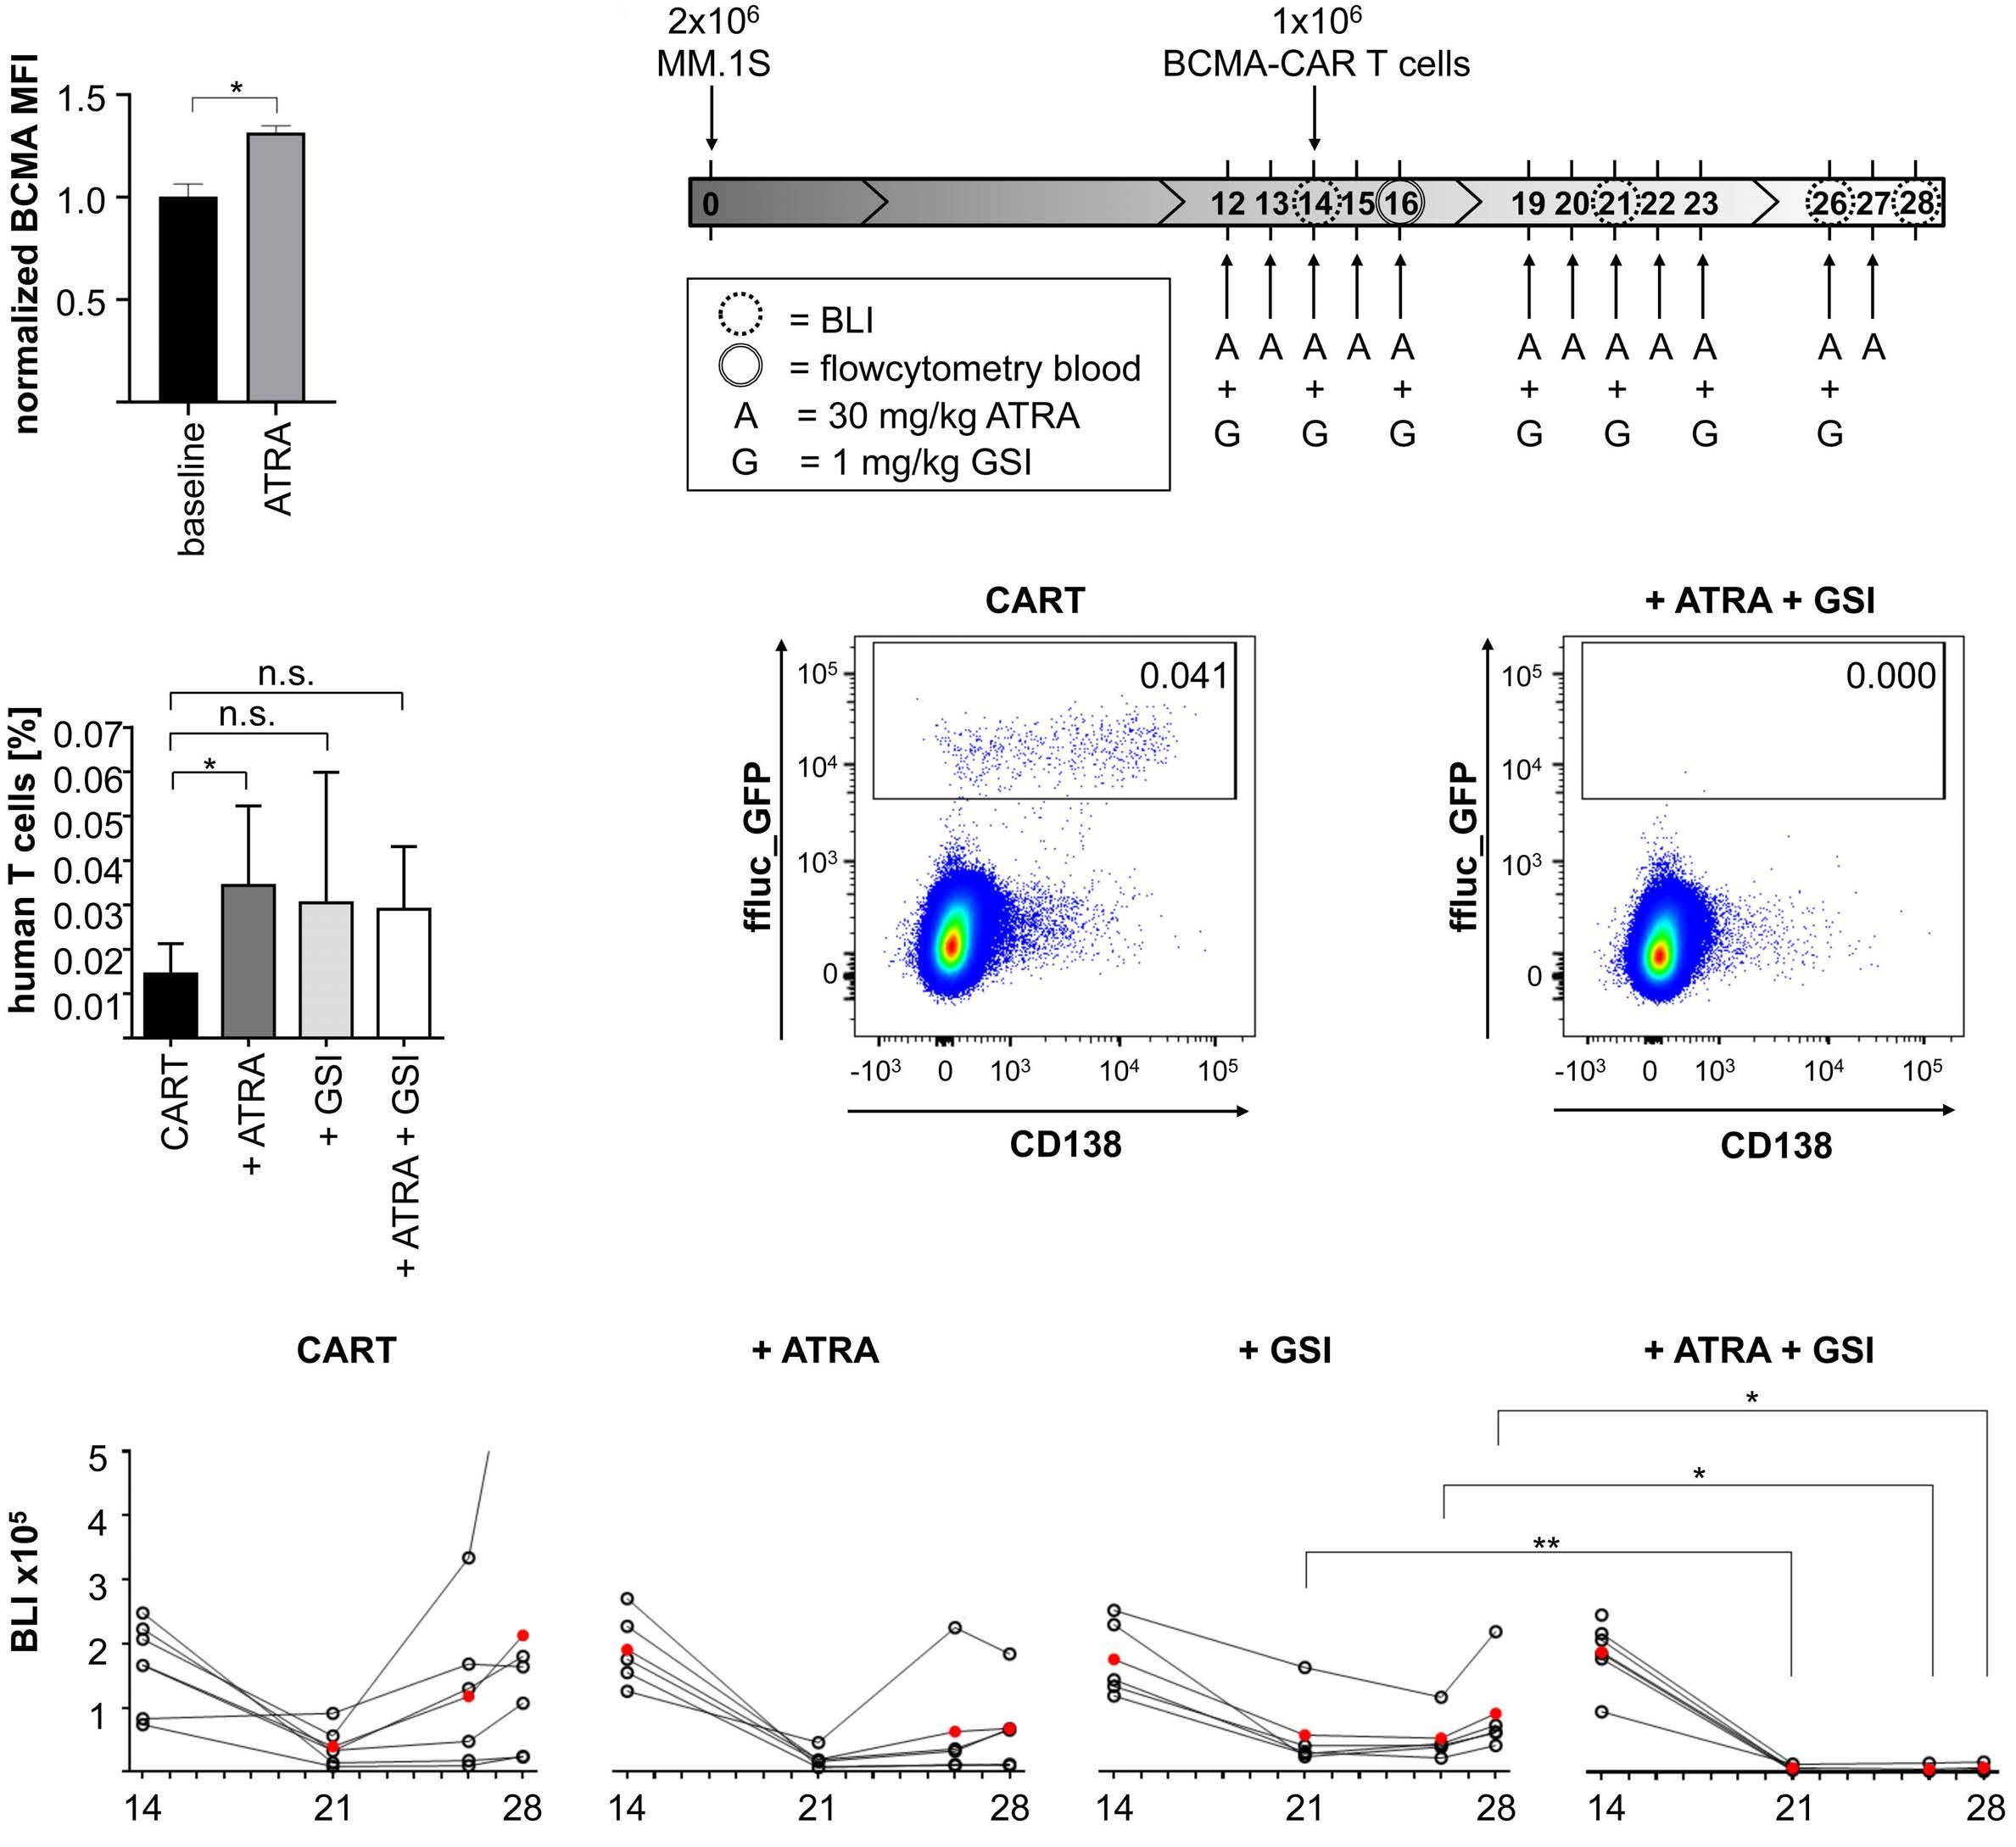
ently inducing durable responses with BCMA-CAR T-cell therapy and eventually cure, is the heterogeneous and sometimes decreasing expression of BCMA on MM cells, which is presumed to be one driver of suboptimal and short-lived response in some MM patients.1,15,16 We performed flow cytometric analysis on primary myeloma
cells and confirmed a highly variable degree of BCMA expression both within the myeloma cell population in a given patient, and between patients. These findings are consistent with prior studies that analyzed BCMA expression on myeloma cells and reported inter- and intrapatient heterogeneity.3,15,17
A B C D
E
Haematologica | 108 February 2023 576 ARTICLE - ATRA increases BCMA on multiple myeloma cells E. García-Guerrero et al.
We reasoned that BCMA gene expression could be increased with an epigenetic modifier such as ATRA and indeed, our data show a signifi cant increase in BCMA transcripts by RT-qPCR and of BCMA protein expression by flow cytometry on several MM cell lines and on primary myeloma cells. We confirmed the presence of BCMA and the increase in BCMA expression after ATRA treatment on BCMAlow myeloma cells by super-resolution dSTORM microscopy. We also showed an increase in BCMA expression after ATRA treatment on myeloma cells in a murine xenograft model in vivo. We confirmed that ATRA does not affect T-cell viability, CAR expression and the effector function of BCMA-CAR T cells. Furthermore, we analyzed whether ATRA treatment leads to increased shedding of sBCMA from myeloma cells. Despite enhanced expression of membrane-bound BCMA on myeloma cells, we did not detect an increase of sBCMA in the supernatant of several myeloma cell lines that we had submitted to ATRA treatment. These data suggest that the catalytic capacity of γsecretase in myeloma cells gets saturated and that therefore, a further increase in BCMA protein expression does not result in increased release of sBCMA. sBCMA may interfere with the recognition of membrane-bound BCMA on myeloma cells and diminish anti-myeloma reactivity.17,35 In our BCMA-CAR, we included a targeting domain that binds to a membrane-proximal BCMA epitope.31 We did not observe reduced anti-myeloma reactivity from T cells expressing this BCMA-CAR in the presence of sBCMA. Several prior studies showed a correlation between BCMA expression on target cells and ensuing anti-myeloma function of BCMA-CAR T cells.17,36 Our data show that the increase in BCMA expression on myeloma cells that is induced by ATRA leads to a substantial increase in specific anti-myeloma reactivity of CD8+ and CD4+ BCMA-CAR T cells. BCMA-CAR T cells showed higher cytolytic activity, cytokine secretion and proliferation after stimulation with ATRA-treated versus non-ATRA-treated myeloma target cells. This effect was accentuated when myeloma cells were treated with ATRA in combination with the GSI crenigacestat. Of particular interest, we observed a strong increase in IL-2 production, in vitro proliferation and viability in CD8+ and CD4+ BCMA-CAR T cells, which are critical attributes to enable engraftment, proliferation and persistence of CAR T cells in a clinical setting in humans.37 These data affirm the prior notion that antigen density on target cells is an important variable that determines the subsequent anti-tumor function of CAR T cells, even though per se a low number of antigen molecules can be sufficient for triggering cytolytic activity.8,20,23 However, several prior studies have shown that diminished antigen expression limits CAR T-cell function in preclinical and clinical studies.10,21
A recent study has reported on the use of crenigacestat to increase BCMA expression on myeloma cells.17 γ-secre-
tase sheds BCMA from the cell surface, leading to the release of sBCMA. Crenigacestat and other GSI inhibit the multisubunit protease γ-secretase, thereby preventing the cleavage of BCMA from the cell surface and leading to increased reactivity of BCMA-CAR T cells.17,38 We reasoned that ATRA as a regulator of BCMA expression at the gene level and crenigacestat as a regulator of BCMA expression at the protein level may have an additive and potentially, synergistic effect. Indeed, our data on BCMA expression and anti-myeloma function of BCMA-CAR T cells show that concurrent ATRA plus crenigacestat treatment confers a maximum effect. In particular, there was a near doubling of cytolytic activity against myeloma cell lines and a near doubling in the number of cell divisions that both CD8+ and CD4+ BCMA-CAR T-cells underwent in vitro, indicating that the combined ATRA plus crenigacestat treatment had brought BCMA expression to a sweet spot where the BCMA-CAR employed in this study conferred optimal stimulation for a productive T-cell response. We acknowledge that for other BCMA-CAR constructs that employ distinct targeting domains may have distinct requirements in antigen density. We also acknowledge that increased cytokine production from BCMA-CAR T cells may be associated with increased toxicity from cytokine release syndrome (CRS) but note that overall, BCMACAR T-cell therapy has been well tolerated.6,7 We assessed the effect of ATRA and crenigacestat treatment on the outcome of BCMA-CAR T-cell therapy in a murine xenograft model – NSG/MM.1S – that we have employed in previous work to determine the anti-myeloma efficacy of BCMA- and SLAMF7-specific CAR T cells. This model is characterized by rapid myeloma progression and – depending on the dose of CAR T cells that is administered – effective but non-curative and curative outcome of CAR T-cell therapy.39 Our data show that anti-myeloma efficacy of BCMA-CAR T cells is increased by concurrent treatment with ATRA, and that a combination of ATRA and crenigacestat leads to significantly improved myeloma regression compared to mice that only received concurrent treatment with crenigacestat. The ability to perform longterm follow-up in this model is limited due to the rigors associated with repeated ATRA and crenigacestat i.p. injections and therefore, we focused our analyses on readouts that can be obtained with a short-term follow-up. The data suggest that the mechanism of action that leads to improved anti-myeloma efficacy is superior engraftment and proliferation of BCMA-CAR T cells in vivo and deeper remission due to superior elimination of myeloma cells.
ATRA is a clinically approved drug with favorable safety profile.40,41 Crenigacestat is in clinical development to treat Alzheimer’s disease and selected cancers and has been reported to possess an acceptable safety profile.42–44 These data suggest that a combination therapy with ATRA
Haematologica | 108 February 2023 577 ARTICLE - ATRA increases BCMA on multiple myeloma cells E. García-Guerrero et al.
and crenigacestat, concurrent to BCMA-CAR T-cell therapy is feasible. Our data show that the effect of ATRA (alone and in combination with crenigacestat) on BCMA expression is rapidly reversible and therefore, ought to be administered concurrent to BCMA-CAR T-cell therapy. Our data suggest that the combination of ATRA with crenigacestat or another GSI will be most effective. In normal hematopoietic cells, the expression of BCMA is restricted to mature B cells and plasma cells. A prior study has shown that ATRA increases BCMA expression in normal B cells however, because the baseline BCMA expression on normal B cells is already sufficient for recognition by BCMA-CAR T cells, we do not anticipate a further increase in toxicity in a clinical setting.45 The concurrent treatment of MM patients with ATRA and crenigacestat is one example of how BCMA expression can be increased and sustained to augment the efficacy of BCMA-CAR T cells. However, this requires that myeloma cells retain at least one allele of BCMA. In the event of a homozygeous BCMA loss, the use of ATRA or crenigacestat will be unable to rescue the efficacy of BCMA-CAR T cells.14 The modulation of BCMA expression at the gene or protein level is also relevant for other modalities of cellular and antibody-based immunotherapy directed against BCMA. The anti-tumor efficacy of T-cell-engaging bispecific antibodies and antibody-drug conjugates is also dependent on antigen density on target cells and in general, a higher antigen density compared to CAR T cells is required to unfold their therapeutic effect.46,47 Recently, several studies have reported on dual- (or even triple-) antigen targeting with CAR T cells against MM, e.g., with BCMA in combination with GPRC5D or SLAMF7.48,49 In preliminary work, we found that the effect of ATRA treatment on the expression of target antigens other than BCMA has to be determined empirically and may, with some antigens, result in diminished expression. In a dual-antigen targeting approach, the effect of ATRA treatment is anticipated to be strongest when expression of both target antigens is increased. However, in the event of antigen loss due to allele deletion or alternative splicing,14,50 the reactivity of CAR T cells against the remaining antigen may be retained and even enhanced through the use of ATRA.
Disclosures
EGG, MH and SRP are co-inventors on a patent application on the use of BCMA-CAR T-cell therapy in combination with ATRA that has been filed by the University of Würzburg, Würzburg, Germany and licensed to T-CURX GmbH, Würzburg, Germany. MH is co-inventor on patent applications and granted patients related to CAR technologies and CAR T-cell therapy that have been filed by the Fred Hutchinson Cancer Research Center, Seattle, WA and the University of Würzburg, Würzburg, Germany that have been, in part, licensed to industry. MH is a co-founder and equity
owner of T-CURX GmbH, Würzburg, Germany. MH further declares speaker honoraria from Novartis, Kite/Gilead, BMS/Celgene and Janssen. JAPS declares speaker or advisory honoraria and/or research funding from Jazz, Pfizer, Takeda, Janssen, BMS/Celgene, Gilead, Novartis. HE declares honoraria from BMS/Celgene, Janssen, Amgen, Takeda, Sanofi and GSK, research funding from BMS/Celgene, Janssen, Amgen, GSK and Sanofi, travel/accomodation expenses from BMS/Celgene, Janssen, Amgen, Takeda, Novartis and advisory/consulting from BMS/Celgene, Janssen, Amgen, Takeda, Sanofi, GSK. LGRL declares speaker honoraria and travel grants from Janssen and Amgen. SD has received speaker honoraria from BMS. The remaining authors declare that they have no conflicts of interest.
Contributions
EGG designed and performed experiments, analyzed data and wrote the manuscript. LGRL and LH designed and performed experiments and analyzed data. BSM, RG, SB, SF and MS performed experiments and analyzed data. SD, KMK and LR provided biologic material and analyzed data. JAPS and HE analyzed data and wrote the manuscript. MH designed experiments, analyzed data, wrote the manuscript and co-supervised the project. SRP designed and performed experiments, analyzed data, wrote the manuscript and supervised the project. All authors approved the final version of the manuscript.
Acknowledgments
The authors thank Daniela Keller (Statistik und Beratung) for assistance with statistical analyses, as well as Felix Maessen and Elke Spirk for technical assistance.
Funding
EGG has been supported by Instituto de Salud Carlos III (PFIS - FI12/00189 and PI20/01792). LGRL has been a BITRECS fellow and has receiv ed funding from the European Union’s Horizon 2020 research and innovation program under the Marie Sklodowska-Curie grant agreement No 754550 and from the “La Caixa” Foundation. SD has been supported by the IZKF Würzburg (Interdisziplinäres Zentrum für Klinische Forschung) and is a fellow of the Clinician Scientist Program of the Else-Kröner Forschungskolleg. The authors have been supported by the patient advocacy group 'Hilfe im Kampf gegen den Krebs e.V.', Würzburg, Germany and 'Forschung hilft' - Stiftung zur Förderung der Krebsforschung an der Universität Würzburg. Further, the authors have been supported by the European Union’s Horizon 2020 research and innovation program under grant agreements No 733297 (EURE-CART to MH, HE and SRP) and No 754658 (CARAMBA to MH, SD, SRP and HE), the German Research Foundation (Deutsche Forschungsgemeinschaft, DFG, project number 324392634, TRR 221, subproject
Haematologica | 108 February 2023 578 ARTICLE - ATRA increases BCMA on multiple myeloma cells E. García-Guerrero et al.
ARTICLE - ATRA increases BCMA on multiple myeloma cells
A03 to MH and HE), the Bavarian Center for Cancer Research (Bayerisches Zentrum für Krebsforschung, BZKF to MH, HE and SRP) and the Stifterverband für die Deutsche Wissenschaft e.V. (to KMK and MH). MS, MH and HE acknowledge funding by the German Ministry for Science and Education (BMBF, Bundesministerium für Bildung und Forschung, grant #13N15986). Further, the authors have been supported by the Innovative Medicines Initiative 2 Joint
References
1. Cohen AD, Garfall AL, Stadtmauer EA, et al. B cell maturation antigen-specific CAR T cells are clinically active in multiple myeloma. J Clin Invest. 2019;129(6):2210-2221.
2. Raje N, Berdeja J, Lin Y, et al. Anti-BCMA CAR T-Cell Therapy bb2121 in relapsed or refractory multiple myeloma. N Engl J Med. 2019;380(18):1726-1737.
3. Ali SA, Shi V, Maric I, et al. T cells expressing an anti-B-cell maturation antigen chimeric antigen receptor cause remissions of multiple myeloma. Blood. 2016;128(13):1688-1700.
4. Zhao W-H, Liu J, Wang B-Y, et al. A phase 1, open-label study of LCAR-B38M, a chimeric antigen receptor T cell therapy directed against B cell maturation antigen, in patients with relapsed or refractory multiple myeloma. J Hematol Oncol. 2018;11(1):141.
5. Mullard A. FDA approves second BCMA-targeted CAR-T cell therapy. Nat Rev Drug Discov. 2022;21(4):249.
6. Munshi NC, Anderson LD, Shah N, et al. Idecabtagene vicleucel in relapsed and refractory multiple myeloma. N Engl J Med. 2021;384(8):705-716.
7. Berdeja JG, Madduri D, Usmani SZ, et al. Ciltacabtagene autoleucel, a B-cell maturation antigen-directed chimeric antigen receptor T-cell therapy in patients with relapsed or refractory multiple myeloma (CARTITUDE-1): a phase 1b/2 openlabel study. Lancet. 2021;398(10297):314-324.
8. Spiegel JY, Patel S, Muffly L, et al. CAR T cells with dual targeting of CD19 and CD22 in adult patients with recurrent or refractory B cell malignancies: a phase 1 trial. Nat Med. 2021;27(8):1419-1431.
9. O'Rourke DM, Nasrallah MP, Desai A, et al. A single dose of peripherally infused EGFRvIII-directed CAR T cells mediates antigen loss and induces adaptive resistance in patients with recurrent glioblastoma. Sci Transl Med. 2017;9(399):eaaa0984.
10. Fry TJ, Shah NN, Orentas RJ, et al. CD22-targeted CAR T cells induce remission in B-ALL that is naive or resistant to CD19targeted CAR immunotherapy. Nat Med. 2018;24(1):20-28.
11. Seckinger A, Delgado JA, Moser S, et al. Target expression, generation, preclinical activity, and pharmacokinetics of the BCMA-T cell bispecific antibody EM801 for multiple myeloma treatment. Cancer Cell. 2017;31(3):396-410.
12. Carpenter RO, Evbuomwan MO, Pittaluga S, et al. B-cell maturation antigen is a promising target for adoptive T-cell therapy of multiple myeloma. Clin Cancer Res. 2013;19(8):2048-2060.
13. Lee L, Bounds D, Paterson J, et al. Evaluation of B cell maturation antigen as a target for antibody drug conjugate mediated cytotoxicity in multiple myeloma. Br J Haematol. 2016;174(6):911-922.
14. Da Vià MC, Dietrich O, Truger M, et al. Homozygous BCMA gene deletion in response to anti-BCMA CAR T cells in a patient with multiple myeloma. Nat Med. 2021;27(4):616-619.
Undertaking under grant agreement No 116026 (T2EVOLVE). This Joint Undertaking receives support from the European Union's Horizon 2020 research and innovation program and EFPIA.
Data-sharing statement Inquiries regarding sharing of de-identified data should be addressed to the corresponding author.
15. Brudno JN, Maric I, Hartman SD, et al. T cells genetically modified to express an anti-B-cell maturation antigen chimeric antigen receptor cause remissions of poor-prognosis relapsed multiple myeloma. J Clin Oncol. 2018;36(22):2267-2280.
16. Frigyesi I, Adolfsson J, Ali M, et al. Robust isolation of malignant plasma cells in multiple myeloma. Blood. 2014;123(9):1336-1340.
17. Pont MJ, Hill T, Cole GO, et al. γ-Secretase inhibition increases efficacy of BCMA-specific chimeric antigen receptor T cells in multiple myeloma. Blood. 2019;134(19):1585-1597.
18. Majzner RG, Mackall CL. Tumor antigen escape from CAR T-cell therapy. Cancer Discov. 2018;8(10):1219-1226.
19. Shah NN, Fry TJ. Mechanisms of resistance to CAR T cell therapy. Nat Rev Clin Oncol. 2019;16(6):372-385.
20. Watanabe K, Terakura S, Martens AC, et al. Target antigen density governs the efficacy of anti-CD20-CD28-CD3 ζ chimeric antigen receptor-modified effector CD8+ T cells. J Immunol. 2015;194(3):911-920.
21. Walker AJ, Majzner RG, Zhang L, et al. Tumor antigen and receptor densities regulate efficacy of a chimeric antigen receptor targeting anaplastic lymphoma kinase. Mol Ther. 2017;25(9):2189-2201.
22. Harris DT, Hager MV, Smith SN, et al. Comparison of T cell activities mediated by human TCRs and CARs that use the same recognition domains. J Immunol. 2018;200(3):1088-1100.
23. Nerreter T, Letschert S, Götz R, et al. Super-resolution microscopy reveals ultra-low CD19 expression on myeloma cells that triggers elimination by CD19 CAR-T. Nat Commun. 2019;10(1):3137.
24. Balmer JE, Blomhoff R. Gene expression regulation by retinoic acid. J Lipid Res. 2002;43(11):1773-1808.
25. Chaudhari N, Talwar P, Lefebvre D'hellencourt C, Ravanan P. CDDO and ATRA instigate differentiation of IMR32 human neuroblastoma cells. Front Mol Neurosci. 2017;10:310.
26. Coltella N, Valsecchi R, Ponente M, Ponzoni M, Bernardi R. Synergistic leukemia eradication by combined treatment with retinoic acid and HIF inhibition by EZN-2208 (PEG-SN38) in preclinical models of PML-RARα and PLZF-RARα-driven leukemia. Clin Cancer Res. 2015;21(16):3685-3694.
27. Martens JHA, Brinkman AB, Simmer F, et al. PML-RARalpha/RXR alters the epigenetic landscape in acute promyelocytic leukemia. Cancer Cell. 2010;17(2):173-185.
28. Mikesch J-H, Gronemeyer H, So CWE. Discovery of novel transcriptional and epigenetic targets in APL by global ChIP analyses: emerging opportunity and challenge. Cancer Cell. 2010;17(2):112-114.
29. Nijhof IS, Groen RWJ, Lokhorst HM, et al. Upregulation of CD38 expression on multiple myeloma cells by all-trans retinoic acid improves the efficacy of daratumumab. Leukemia. 2015;29(10):2039-2049.
Haematologica | 108 February 2023 579
García-Guerrero et al.
E.
30. Uruno A, Noguchi N, Matsuda K, et al. All-trans retinoic acid and a novel synthetic retinoid tamibarotene (Am80) differentially regulate CD38 expression in human leukemia HL-60 cells: possible involvement of protein kinase C-delta. J Leukoc Biol. 2011;90(2):235-247.
31. Hipp S, Tai Y-T, Blanset D, et al. A novel BCMA/CD3 bispecific Tcell engager for the treatment of multiple myeloma induces selective lysis in vitro and in vivo. Leukemia. 2017;31(8):1743-1751.
32. Hudecek M, Sommermeyer D, Kosasih PL, et al. The nonsignaling extracellular spacer domain of chimeric antigen receptors is decisive for in vivo antitumor activity. Cancer Immunol Res. 2015;3(2):125-135.
33. van de Linde S, Löschberger A, Klein T, et al. Direct stochastic optical reconstruction microscopy with standard fluorescent probes. Nat Protoc. 2011;6(7):991-1009.
34. Köhler M, Greil C, Hudecek M, et al. Current developments in immunotherapy in the treatment of multiple myeloma. Cancer. 2018;124(10):2075-2085.
35. Perez-Amill L, Suñe G, Antoñana-Vildosola A, et al. Preclinical development of a humanized chimeric antigen receptor against B cell maturation antigen for multiple myeloma. Haematologica. 2021;106(1):173-184.
36. Ramkumar P, Abarientos AB, Tian R, et al. CRISPR-based screens uncover determinants of immunotherapy response in multiple myeloma. Blood Adv. 2020;4(13):2899-2911.
37. Fraietta JA, Lacey SF, Orlando EJ, et al. Determinants of response and resistance to CD19 chimeric antigen receptor (CAR) T cell therapy of chronic lymphocytic leukemia. Nat Med. 2018;24(5):563-571.
38. Laurent SA, Hoffmann FS, Kuhn P-H, et al. γ-Secretase directly sheds the survival receptor BCMA from plasma cells. Nat Commun. 2015;6:7333.
39. Gogishvili T, Danhof S, Prommersberger S, et al. SLAMF7-CAR T cells eliminate myeloma and confer selective fratricide of SLAMF7+ normal lymphocytes. Blood. 2017;130(26):2838-2847.
40. Frerichs KA, Minnema MC, Levin M-D, et al. Efficacy and safety of aratumumab combined with all-trans tetinoic acid in relapsed/refractory multiple myeloma. Blood Adv. 2021;5(23):5128-5139.
41. Koskela K, Pelliniemi T-T, Pulkki K, Remes K. Treatment of multiple myeloma with all-trans retinoic acid alone and in combination with chemotherapy: a phase I/II trial. Leuk Lymphoma. 2004;45(4):749-754.
42. Massard C, Azaro A, Soria J-C, et al. First-in-human study of LY3039478, an oral Notch signaling inhibitor in advanced or metastatic cancer. Ann Oncol. 2018;29(9):1911-1917.
43. Mir O, Azaro A, Merchan J, et al. Notch pathway inhibition with LY3039478 in soft tissue sarcoma and gastrointestinal stromal tumours. Eur J Cancer. 2018;103:88-97.
44. Even C, Lassen U, Merchan J, et al. Safety and clinical activity of the Notch inhibitor, crenigacestat (LY3039478), in an openlabel phase I trial expansion cohort of advanced or metastatic adenoid cystic carcinoma. Invest New Drugs. 2020;38(2):402-409.
45. Lieberman AA, Ballow M. Effect of retinoic acid on the expression of the receptors that regulate B-cell homeostasis: TACI, BAFF-R, and BCMA. J Allergy Clin Immunol. 2009;123(2):S138-S138.
46. Stone JD, Aggen DH, Schietinger A, Schreiber H, Kranz DM. A sensitivity scale for targeting T cells with chimeric antigen receptors (CARs) and bispecific T-cell engagers (BiTEs). Oncoimmunology. 2012;1(6):863-873.
47. Buongervino S, Lane MV, Garrigan E, Zhelev DV, Dimitrov DS, Bosse KR. Antibody-drug conjugate efficacy in neuroblastoma: role of payload, resistance mechanisms, target density, and antibody internalization. Mol Cancer Ther. 2021;20(11):2228-2239.
48. Zah E, Nam E, Bhuvan V, et al. Systematically optimized BCMA/CS1 bispecific CAR-T cells robustly control heterogeneous multiple myeloma. Nat Commun. 2020;11(1):2283.
49. Fernández de Larrea C, Staehr M, Lopez AV, et al. Defining an optimal dual-targeted CAR T-cell therapy approach simultaneously targeting BCMA and GPRC5D to prevent BCMA escape-driven relapse in multiple myeloma. Blood Cancer Discov. 2020;1(2):146-154.
50. Sotillo E, Barrett DM, Black KL, et al. Convergence of acquired mutations and alternative splicing of CD19 enables resistance to CART-19 immunotherapy. Cancer Discov. 2015;5(12):1282-1295.
Haematologica | 108 February 2023 580 ARTICLE - ATRA increases BCMA on multiple myeloma cells E. García-Guerrero et al.
Mutations in the RACGAP1 gene cause autosomal recessive congenital dyserythropoietic anemia type III
Congenital dyserythropoietic anemia type III (CDA III) is one of the rarest types of CDA. The autosomal dominant form of CDA III, is due to mono-allelic mutations in the KIF23 gene (MIM:105600); two such mutations described so far in a total of three families.1,2 KIF23 encodes mitotic kinesin-like protein (MKLP1), which dimerizes and combines with a homodimer of the RACGAP1 protein (Rac GTPase-activating protein 1), to form the centralspindlin complex regulating Rho GTPase activity and required for cytokinesis.3,4 Sporadic cases with CDA III pathology have been reported, suggesting a different genetic alteration.5 All reported CDA III cases present with a core phenotype consisting of variable degree of macrocytic anemia, signs of intravascular hemolysis, and giant multinucleated erythroblasts in the bone marrow. Additional symptoms such as multiple myeloma, monoclonal gammopathy, angioid streaks, hemosiderinuria, hepatosplenomegaly, iron overload or cirrhosis were described in some CDA III patients.6-9 Using next generation sequencing (NGS) in combination with ex vivo erythroid differentiation we identified two pathogenic missense mutations in the RACGAP1 gene in three unrelated families affected with the recessive form of CDA III.
Written informed consent was obtained for all participants in this study that was conducted in accordance with the Declaration of Helsinki’s ethical principles, and the protocol was approved by the Ethics Committee associated with the UIC on 04/08/2021. The first patient is an 18-year-old male (Family A, II.2, Figure 1A) diagnosed at the age of 4 months suffering from severe macrocytic anemia and hepatosplenomegaly. The parents come from a small village in the South of Spain; with a possible common ancestor 11 generations prior to the proband. Peripheral blood and bone marrow showed multiple erythroid abnormalities, including multinucleated erythroblasts (Online Supplementary Table S1; Figure 1B; Online Supplementary Figure S1A to H). At 18 months of age, radiography of the skull showed a hair-on-end appearance and a computed tomography scan revealed widening of the diploic space (data not shown), both characteristic features of chronic hemolytic disease with ineffective erythropoiesis. Hemolysis was confirmed by increased plasma bilirubin, lactate dehydrogenase (LDH) and undetectable haptoglobin. Serum ferritin levels are normal at 18 years of age and iron overload is not a clinical problem as there is loss of iron via hemosiderinuria (Online Supplementary Figure S1J; Online Supplementary Table S1). Currently, the patient presents with spleno-
megaly, but not obvious ophthalmological problems or biliary lithiasis. Overall, the hematological and cytomorphological studies support the diagnosis of CDA type III. The second patient is a 35-year-old female (Family B, II.1, Figure 1A), with unknown parental consanguinity and a history of antiphospholipid syndrome and papillary thyroid cancer. At birth, she presented with aregenerative macrocytic anemia (Online Supplementary Table S1) and significant hepatosplenomegaly. At the age of 5 months, she was diagnosed with CDA III based on bone marrow morphology (Figure 1B). Splenectomy, done at 9 years of age, reduced her transfusion requirements but moderate macrocytic anemia has persisted (hemoglobin [Hb] 96-101 g/L, mean corpuscular volume [MCV] 123 fL). She has short stature and skull defects secondary to increased extramedullary hematopoiesis. Electron microscopy of bone marrow images show irregular heterochromatin and iron-filled mitochondria.10,11
A 40-year-old male of Sephardic Jewish descent with the diagnosis of CDA III since childhood (Family C, II.3, Figure 1A), based on bone marrow evaluation, was enrolled in the CDA Registry of North America (CDAR).12 Family history was negative for anemia; reportedly his parents were second cousins. He was born at full-term and was diagnosed with significant anemia at 4 months of age, requiring transfusion. He continued to receive three to four transfusions per year for a Hb trough <60 g/L up to 24 years of age (Online Supplementary Table S1). He had hepatosplenomegaly and skull changes due to bone marrow expansion. Despite deferoxamine infusion subcutaneously 5 nights/week at 12-18 years of age, magnetic resonance imaging (MRI) at 24 years of age showed significant iron overload. Therefore, he was started on a chronic transfusion regimen every 2-4 weeks, with the goal to maintain Hb >100 g/L to suppress ineffective erythropoiesis and on deferoxamine continuous intravenous infusion for 9 months, followed by deferasirox up to 34 years of age when he received hematopoietic stem cell transplant.13 The patient reports azoospermia discovered at 24 years of age.
Common clinical hematological features in our three reported patients are: macrocytic anemia, aberrant giant multinucleated erythroblasts in the bone marrow and skull defects secondary to severe anemia with ineffective erythropoiesis. Aside from these core features, a clinical variability exists in both KIF23 and RACGAP1 patients and a deeper phenotypic characterization will require further cases.
Initially, NGS panels failed to detect pathogenic mutations
Haematologica | 108 February 2023 581 LETTER TO THE EDITOR
in known genes associated with congenital anemia (e.g., CDAN1, CDIN1, SEC23B, KIF23, KLF1 and GATA1). In Family A, whole exome sequencing (WES) was performed and predicted pathogenic variants with a minor allele frequency (MAF) <0.03, and proper segregation were selected. RACGAP1 gene was prioritized as a candidate gene due to its role in cytokinesis and its partnering with MKLP1. A very
rare homozygous missense mutation (c.1294C>T;p.Pro432Ser) in RACGAP1 was found in proband A.II.2 (Figure 1A; Online Supplementary Figure S1K). In patient B.II.1, another rare homozygous missense mutation, (c.658A>G;p.Thr220Ala) was found (Figure 1A; Online Supplementary Figure S1K). By means of WES in patient C.II.3, the same homozygous p.Thr220Ala mutation was found
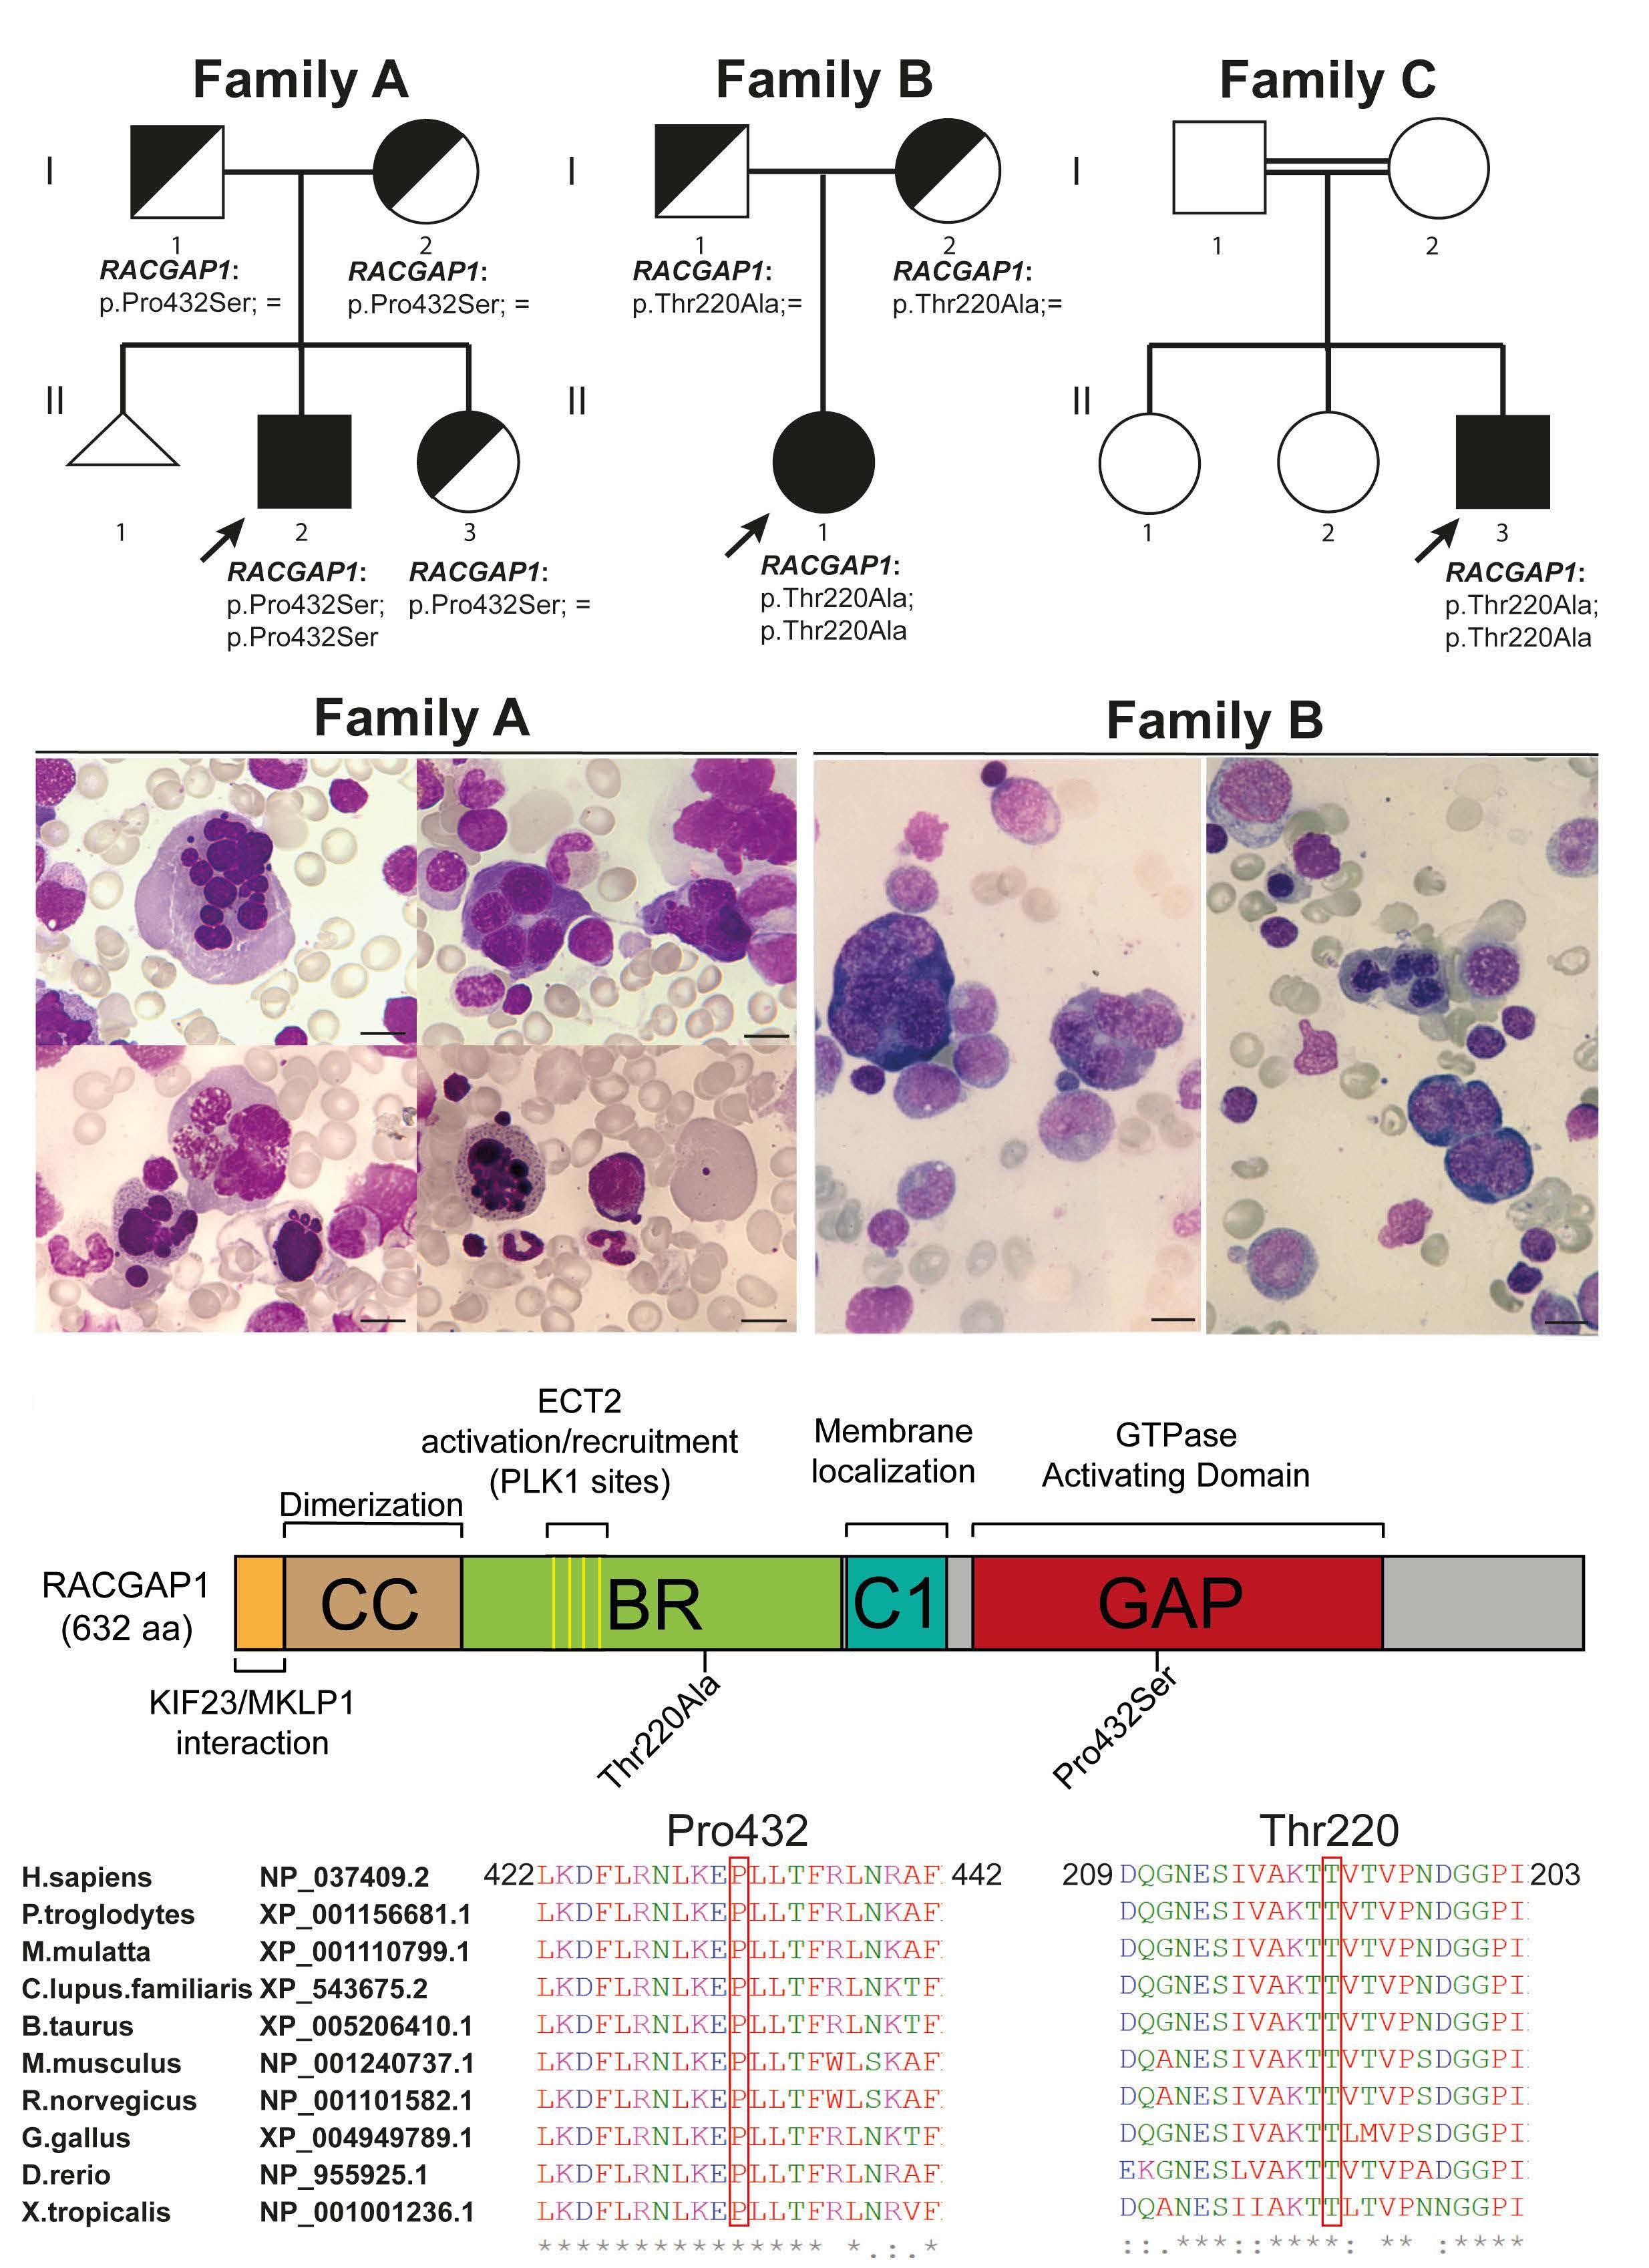
Haematologica | 108 February 2023 582 LETTER TO THE EDITOR Continued
page.
B
on following
A C
Figure 1. RACGAP1 is mutated in autosomal recessive congenital dyserythropoietic anemia III cases. (A) Pedigrees of the 3 families with affected individuals shown in black and healthy carriers shown in half-filled symbols. The family members shown with white symbols were not tested. RACGAP1 genotypes at the protein level are indicated below each individual. Squares denote males, circles denote females, and triangle denotes pregnancy loss. (B) Bone marrow film images showing a multinucleated erythroid cell (top left), an inter-cytoplasmic chromatin bridge between two multinucleated erythroid cells (top right), a multinucleated erythroid form with karyorrhexis (bottom left) and a giant erythrocyte (bottom right) in patient A.II.2 and multinucleated and dysplastic erythroid progenitors in patient B.II.1. Magnification 100x, scale bars represent 5 µm. Additional images are available in the Online Supplementary Figure S1 for patient A.II.2. Bone-marrow images from C.II.3 patient are reported elsewhere.14 (C) Top: schematic representation of RACGAP1 protein domains indicating the localization of the p.Pro432Ser and p.Thr220Ala mutations (CC = coiled-coil, BR = basic region, C1 = cysteine-rich domain, GAP = GTPase-activating domain). Bottom: phylogenetic protein sequence alignment (CLUSTAL omega) of partial RACGAP1 protein sequences showing conservation for Pro432 and Thr220 amino acids. An asterisk (*) denotes fully conserved residue; a colon (:) indicates conservation between amino-acids with strongly similar properties and a period (.) indicates conservation between amino-acids with weakly similar properties.
(Online Supplementary Figure S1K). Carrier status for relatives in Family C could not be evaluated as no DNA was available.
p.Pro432Ser and p.Thr220Ala are rare genetic variants (rs760038605 and rs1264268274) with a very low allele frequency (MAF 0.000008 and 0.000004; GnomAD_exomes). Both classified as pathogenic according to ACMG rules (PM2, PP3 and PS3) with CADD scores of 27.3 and 23.4, respectively. Mutations were submitted to ClinVar database (accession number: SCV002540790 and SCV002540791). Pro432 and Thr220 are 100% conserved among vertebrates and are located in the GTPaseactivating domain and in the basic region of the RACGAP1 protein, respectively (Figure 1C). The RACGAP1 basic region is required for the interaction with the RHOA–GEF ECT2,14 among other proteins. Computational modeling of RACGAP1 in complex with RHOA, CDC42, and RAC1 GTPases suggests that the mutation p.Pro432Ser induces local structural changes affecting two RACGAP1 loops involved in complex formation with each of these GTPases (Online Supplementary Figure S2A). Modeling of the Thr220Ala mutation is not possible as the crystal structure containing this region of RACGAP1 (or homologous protein) is not available.
Given the erythroid-restricted phenotype associated with CDA III, we investigated by ex vivo CD34+ erythroid differentiation whether the identified RACGAP1 mutations cause alterations like those observed in our patients using flow cytometry and cytospin methods (Figure 2). Both mutations impaired cell growth (data not shown), especially the p.Thr220Ala mutation, therefore, only the erythroid differentiation of A.II.2 patient was fully assessed. At terminal differentiation (day 14), A.II.2-derived-erythrocytes (CD71-;CD235a+ cells) were reduced compared with control cells (Figure 2A, lane 13 and 14). Concomitantly, the number of enucleated cells in cytospins was also reduced (Figure 2B). Lentiviral transduction with wild-type (WT) RACGAP1 gene restored the erythrocyte population and reduced multinucleated cells enucleating back to control levels at day 14 (Figure 2A, lanes 14 to 16; Figure 2B). This data is supported by cytospin evaluation showing signifi-
cant multinucleation in ex vivo erythropoiesis, which improved after lentiviral transduction of the WT RACGAP1 gene (Figure 2C to D). Multinucleation defects were also observed in siRNA RACGAP1-silenced HeLa cells. Cytokinesis failure was rescued by WT RACGAP1 construct but not by p.Pro432Ser or p.Thr220Ala mutated RACGAP1 constructs (Online Supplementary Figure S2B to D). Importantly, we observed that ex vivo erythropoiesis from A.II.2 CD34+ cells phenocopied patient macrocytosis. Lentiviral transduction of WT RACGAP1 gene also rescued the macrocytic phenotype (Figure 2E and F). Collectively, this data indicates that RACGAP1 mutations are responsible for the macrocytosis, multinucleation and erythroid defects seen in our patients. RACGAP1 is a known GTPase regulator required for RHOA activation and for RAC1 inactivation to promote cytokinesis. In patient-derived lymphoblastoid cell lines (LCL) we observed decreased levels of active RHOA and CDC42 GTPases, positive regulators of cytokinesis, and increased levels of active RAC1, an inhibitor of cytokinesis (Figure 3A to C). Our data suggests that RACGAP1 mutations results in a GTPase imbalance leading to cytokinesis blockage, which could explain the multinucleation defects observed in patient’s bone marrow erythroblasts in HeLa cells and in the ex vivo CD34+-differentiation. While preparing this submission, it came to our attention a recent report of a single sporadic case of CDA III with p.Leu396Gln and p.Pro432Ser RACGAP1 mutations, published as a letter to the editor in the Blood journal.15 The coincidence of the p.Pro432Ser mutation found in both works (Spanish and South American families) may represent a “hot spot” or a founder mutation in the RACGAP1 gene. The work by Wontakal et al., 15 done independently and in parallel to ours, reinforces our findings and gives some functional data based on HeLa and control erythroid cells. Our work contributes with extensive clinical data in three unrelated patients, detailed characterization of the erythropoiesis defects using patient-derived CD34+ cells, and provides a deeper insight into the molecular mechanisms of these alterations by showing in patient-derived cells a GTPase imbalance that could result in defective cytokinesis.
Haematologica | 108 February 2023 583 LETTER TO THE EDITOR
Figure 2. In vitro erythroid differentiation of patients’ CD34+ cells derived from peripheral blood. (A) Cytometry data of the in vitro erythroid differentiation at different time points showing the proportions of erythroid progenitors, erythroblasts, and erythrocytes in the sample (n=1). Results show 10.3% erythrocytes in controls vs. 4.9% in A.II.2 cells and 1.92% erythroid progenitors in controls vs. 10.3% in A.II.2 cells at day 11 and 41.7% erythrocytes in controls vs. 30.7% in A.II.2 cells and 0.79% erythroid progenitors in controls vs. 10.96% erythroid progenitors in A.II.2 cells at day 14. Chi-square test with 2 degrees of freedom was performed. (B) Quantification of late erythroblast cells at various stages of the enucleation process in cytospins prepared at day 14. Chi-square test with 3 degrees of freedom was performed (n=484-492). (C) Cytospin preparations stained with modified Wright stain from patients A.II.2 and B.II.1 at day 14 showing multinucleation, nuclear deformations, and mitotic alterations. Scale bars represent 5 mm. (D) Quantification of the percentage of multinucleation at day 14 from the cytospins shown in (C). Chi-square test with 2 degrees of freedom was performed. (E) Cytospin preparations at day 14 showing enucleated cells and cells undergoing enucleation. Scale bars represent 5 mm. (F) Quantification of the area of the enucleated cells from panel (E) showing macrocytosis in the cultures from patient A.II.2’s CD34+ cells that is corrected after transduction with the wild-type (WT) RACGAP1 lentiviral construct (n=252-257). Cell area was calculated using Fiji software by selecting cells using a threshold and watershed separation followed by area determination using the Measure particle program. Due to lack of normality of the data (Kolmogorov-Smirnov test), a Krustal-Wallis test with a Dunn’s multiple comparisons test was performed instead of a one-way ANOVA. *P<0.05, **P<0.01, ***P<0.001, ****P<0.0001.
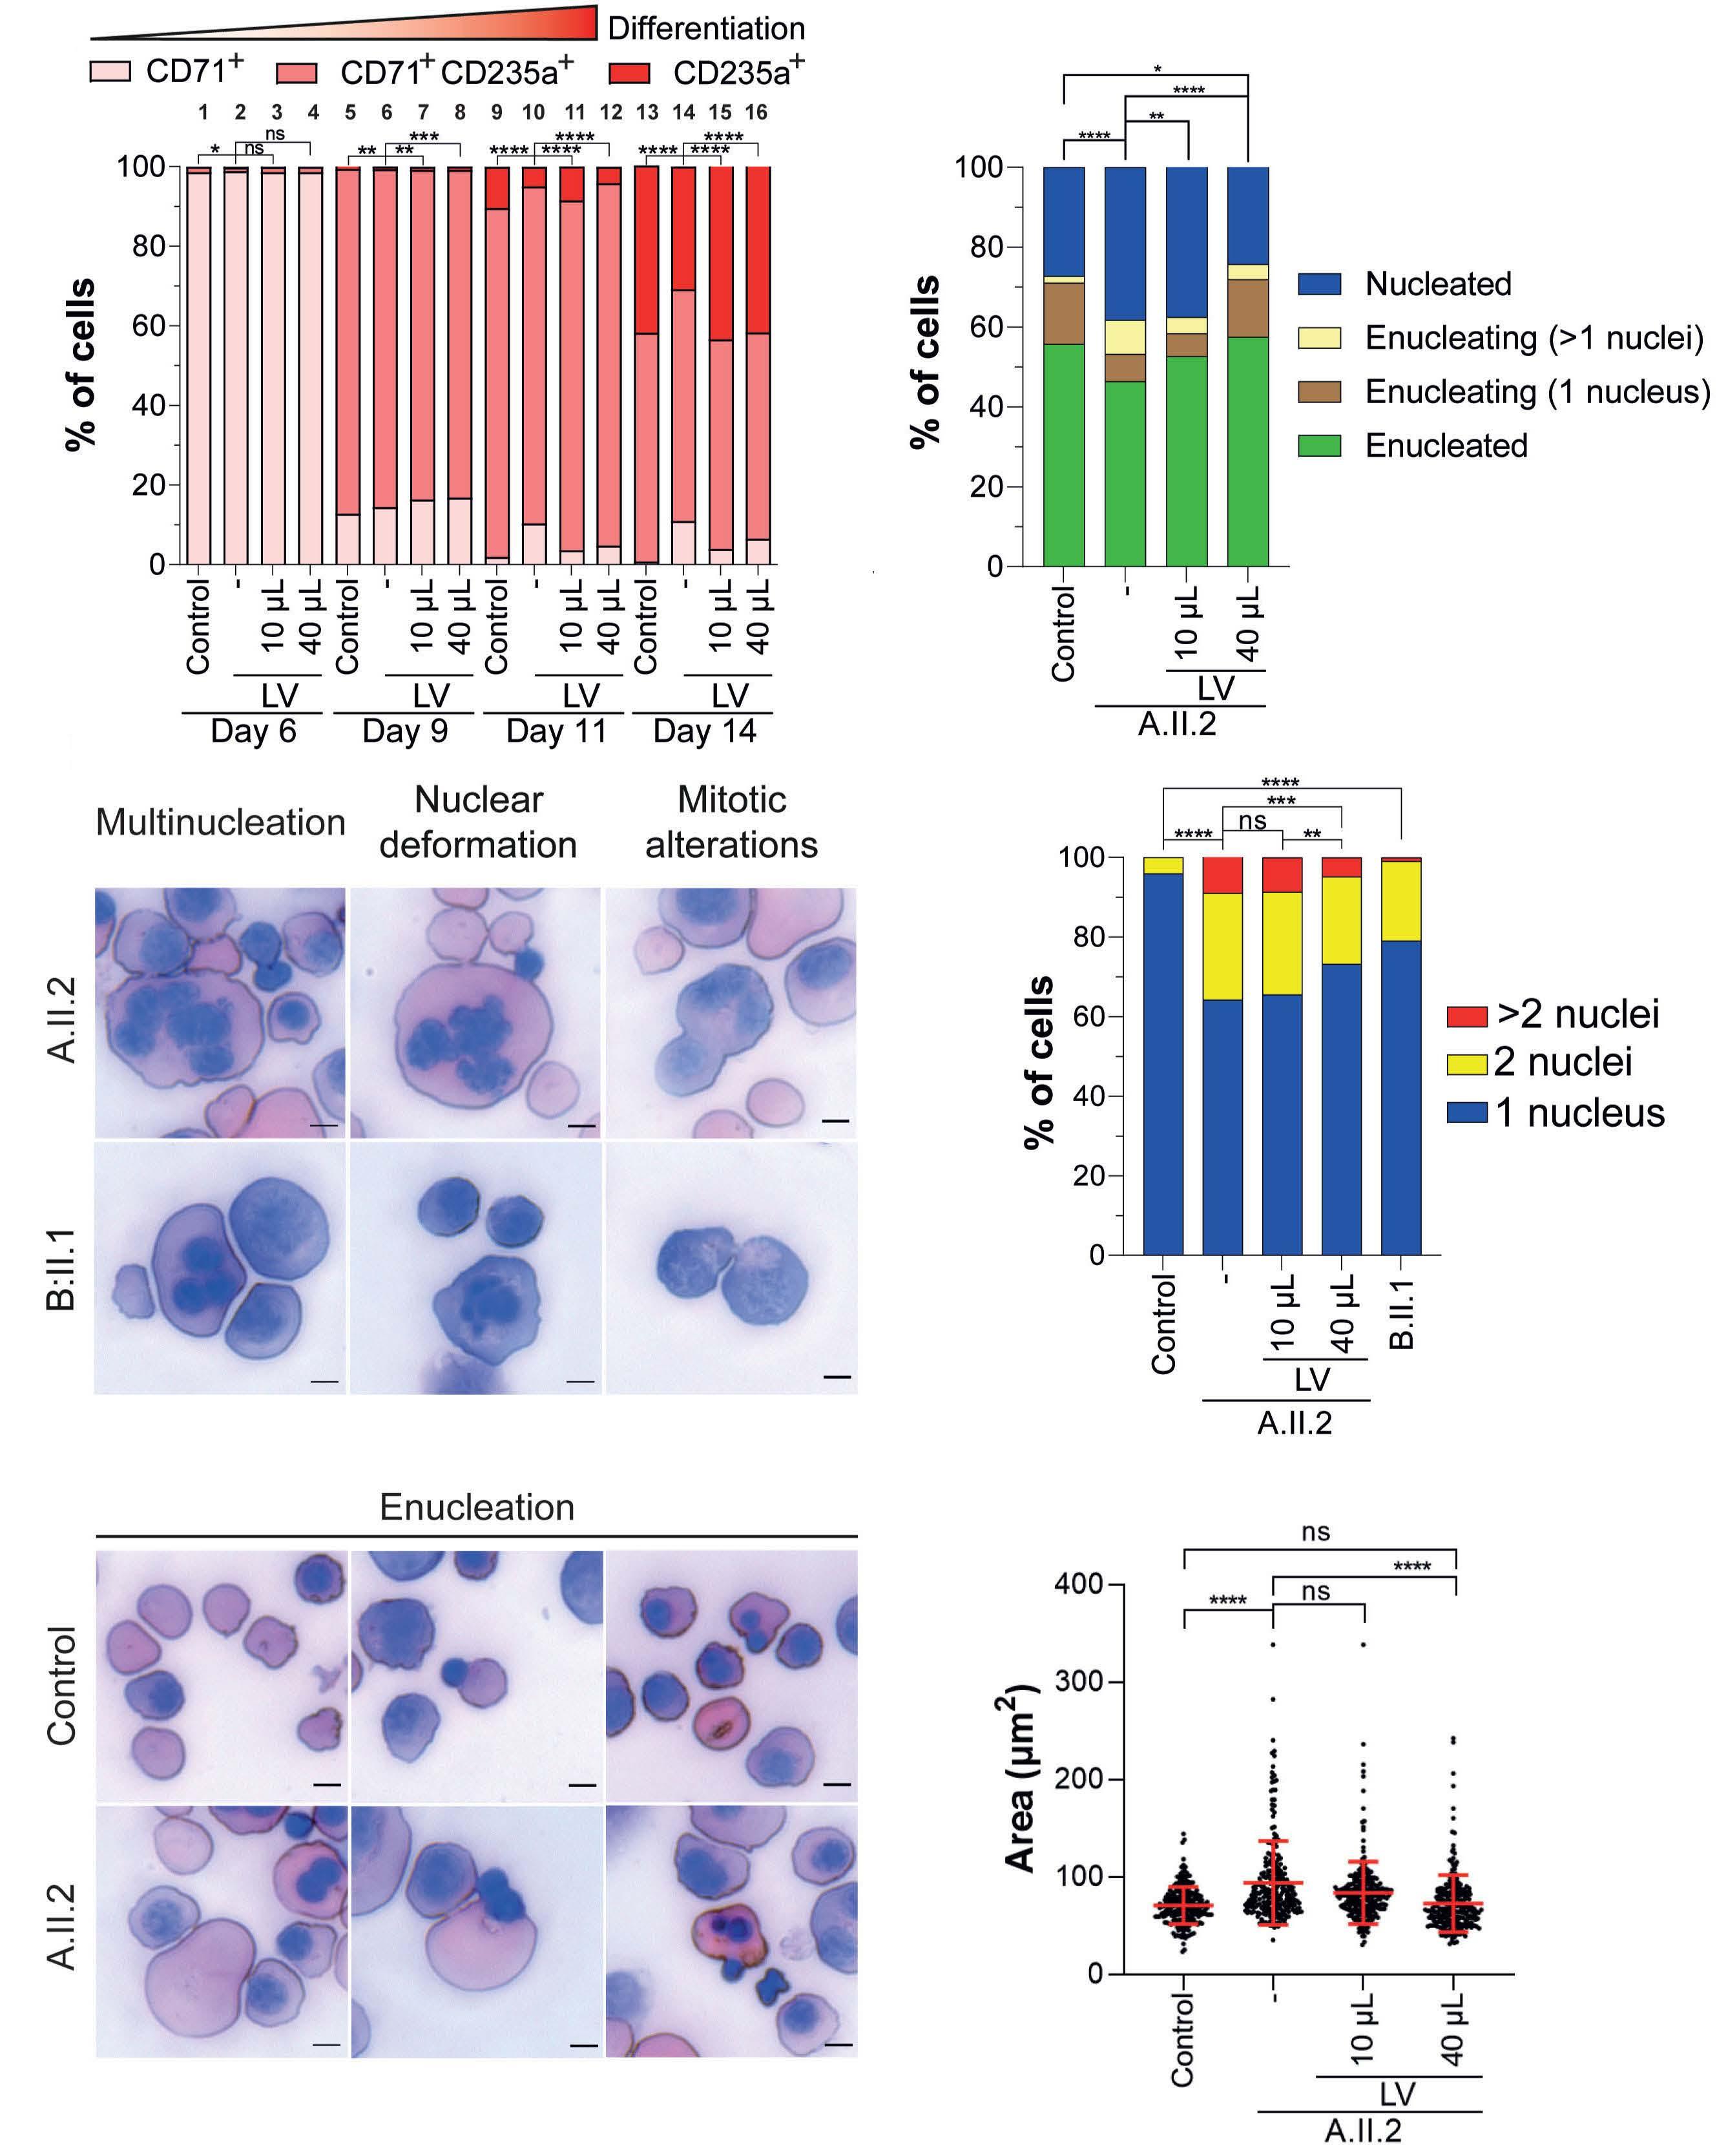
A B D F Haematologica | 108 February 2023 584 LETTER TO THE EDITOR C E
Overall, our work demonstrates that mutations in the RACGAP1 gene cause a recessively inherited form of CDA III, characterized by moderate to severe anemia due to cytokinesis failures producing multinucleated erythroblast and subsequently ineffective erythropoiesis.
Authors
Figure 3. Patients’ RACGAP1 mutations alter normal GTPase balance status and model of GTPase regulation in cytokinesis. (A) Amount of active GTPases (RHOA, RAC1 and CDC42) determined by G-LISA in patient-derived lymphoblastoid cell lines (LCL) from A.II.2 and B.II.1 patients normalized to the mean of 2 different controls. G-LISA experiments were done in quadruplicate (n=4). The Mann-Whitney U test was performed to compare GTPase activation levels in each patient with respect to controls. Dotted lines represent the reference of control levels set to 1.0. Error bars represent the mean +/- standard deviation. *P<0.05, **P<0.01, ***P<0.001. (B) The intermediate step of GTPase activation assessment required for the results shown in (A). Immunoblot of total amounts of RHOA, RAC1 or CDC42 in patients and controls. Three independent protein extracts were generated for each patient/control. The mean amount of each total GTPase was then used to correct the corresponding GTPase activity levels represented in (A). (C) Model for GTPase activation/inactivation in cytokinesis. Correct GTP balance is crucial for cytokinesis. In wild-type (WT) cells (upper panel), RACGAP1 activates RHOA by recruiting the GEF protein ECT2 and directly inactivates RAC1 through its GAP domain, reducing the RAC1-mediated RHOA inhibition. PRC1 inhibits the GAP activity inactivating CDC42. These events generate a strong positive signal to assemble the contractile ring required for cytokinesis. Both mutations (bottom panel) could diminish the RACGAP1-PRC1 interaction, releasing the inhibition to inactivate CDC42. The activation levels of RHOA and CDC42 are diminished while the activation levels of RAC1 are increased, leading to a stronger negative signal towards cytokinesis that leads to a higher degree of multinucleation.
Gonzalo Hernández,1,2* Lídia Romero-Cortadellas,1* Xènia FerrerCortès,1,2 Veronica Venturi,1 Mercedes Dessy-Rodriguez,3,4 Mireia
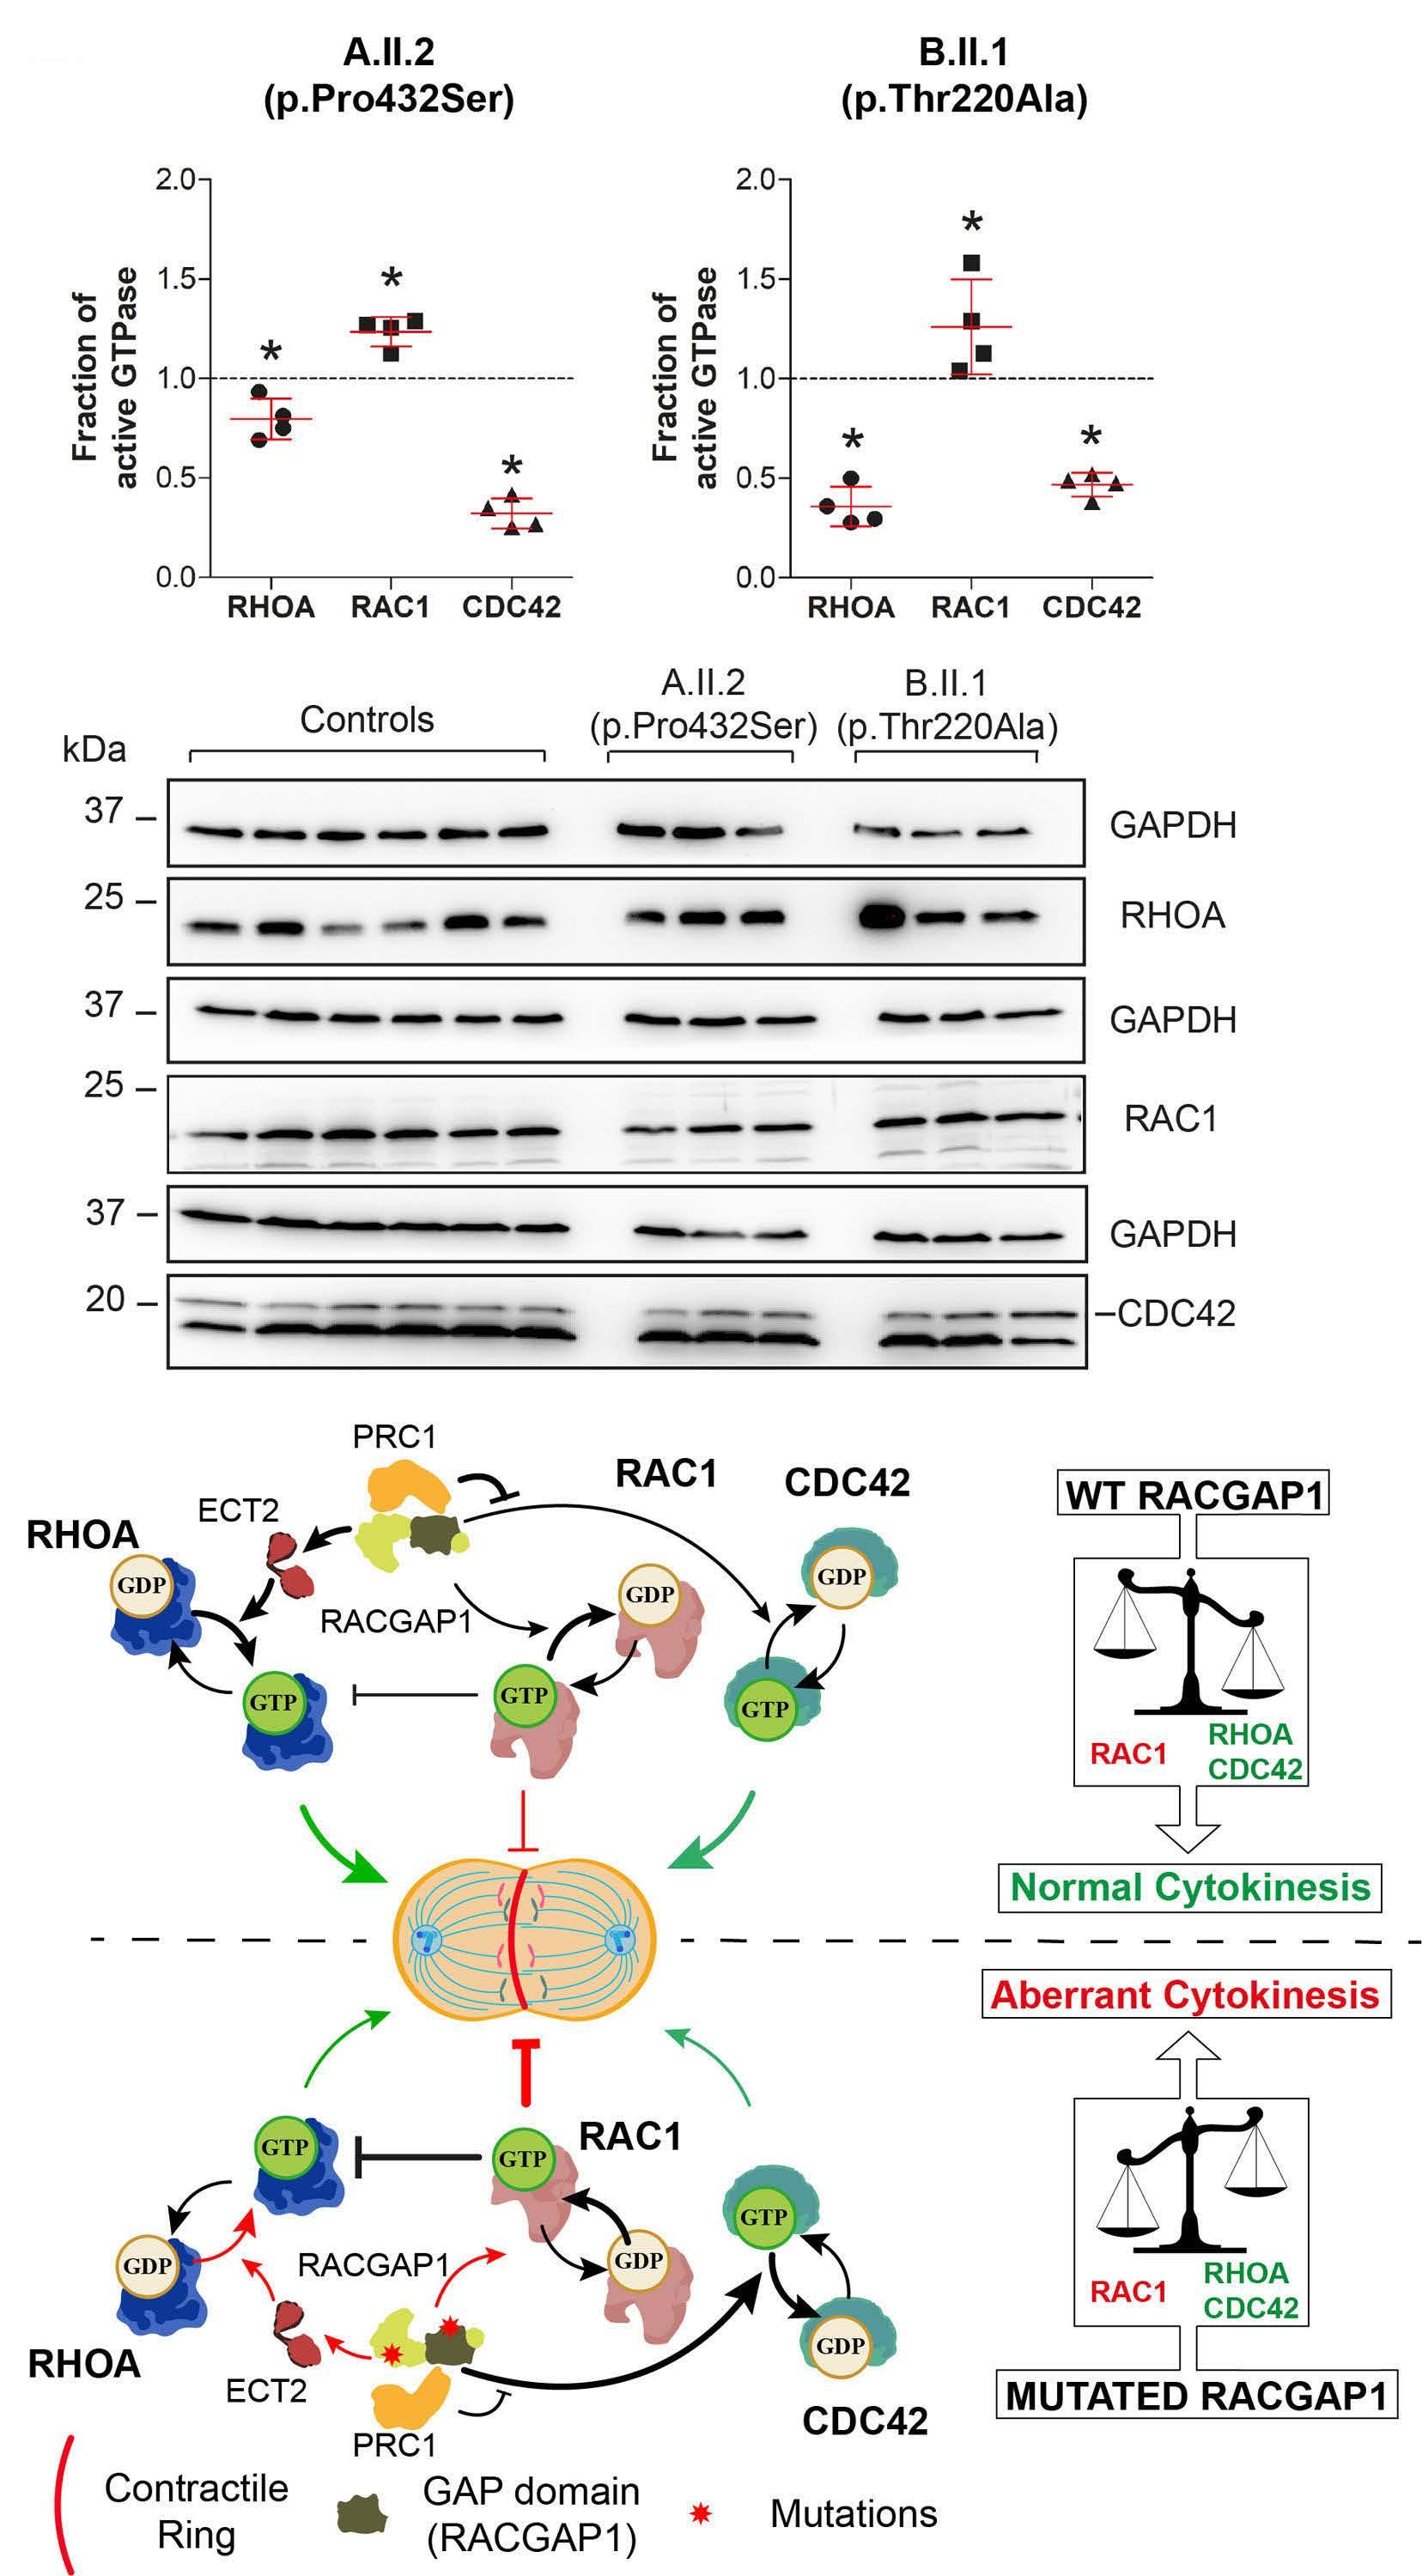
A B Haematologica | 108 February 2023 585 LETTER TO THE EDITOR C
Olivella,5 Ammar Husami,6,7 Concepción Pérez de Soto,8 Rosario M. Morales-Camacho,9 Ana Villegas,10 Fernando-Ataulfo GonzálezFernández,10 Marta Morado,11 Theodosia A. Kalfa,7,12 Oscar QuintanaBustamante,3,4 Santiago Pérez-Montero,2 Cristian Tornador,2 JoseCarlos Segovia3,4 and Mayka Sánchez1,2
1Department of Basic Sciences, Iron metabolism: Regulation and Diseases Group, Universitat Internacional de Catalunya (UIC), Sant Cugat del Vallès, Spain; 2BloodGenetics S.L. Diagnostics in Inherited Blood Diseases, Esplugues de Llobregat, Spain; 3Cell Technology Division, Biomedical Innovative Unit, Centro de Investigaciones Energéticas, Medioambientales y Tecnológicas (CIEMAT) and Centro de Investigación Biomédica en Red de Enfermedades Raras (CIBERER), Madrid, Spain; 4Unidad Mixta de Terapias Avanzadas, Instituto de Investigación Sanitaria Fundación Jiménez, Madrid, Spain; 5Bioscience Department, Faculty of Science and Technology (FCT), Universitat de Vic – Universitat Central de Catalunya (Uvic-UCC), Vic, Spain; 6Division of Human Genetics, Cincinnati Children’s Hospital Medical Center, Cincinnati, OH, USA; 7Department of Pediatrics, University of Cincinnati College of Medicine, Cincinnati, OH USA; 8Service of Pediatric Hematology, Hospital Universitario Virgen del Rocío, UGC HH, HHUUVR, Sevilla, Spain; 9Department of Hematology, Hospital Universitario Virgen del Rocío, Instituto de Biomedicina de Sevilla (IBIS/CISC/CIBERONC), Universidad de Sevilla, Sevilla, Spain; 10Department of Hematology, Hospital Clínico San Carlos. Universidad Complutense, Madrid, Spain; 11Department of Hematology, Hospital La Paz, Madrid, Spain and 12Division of Hematology, Cincinnati Children’s Hospital Medical Center, Cincinnati, OH, USA
*GH and LR-C contributed equally as co-first authors.
Correspondence: M. SÁNCHEZ - msanchezfe@uic.es
https://doi.org/10.3324/haematol.2022.281277
Received: April 29, 2022.
Accepted: September 23, 2022. Prepublished: October 6, 2022.
©2023 Ferrata Storti Foundation
Published under a CC BY-NC license
Disclosures
No conflicts of interest to disclose.
References
1. Liljeholm M, Irvine AF, Vikberg AL, et al. Congenital dyserythropoietic anemia type III (Cda Iii) is caused by a mutation in kinesin family member, KIF23. Blood. 2013;121(23):4791-4799.
2. Méndez M, Moreno-Carralero MI, Peri VL, et al. Congenital dyserythropoietic anemia types Ib, II, and III: novel variants in
Contributions
Study concept and research design by MS. Patients’ clinical data, blood and bone marrow images by IP-S, R-MM-C, MM, F-AG-F, AV and TAK. Sequencing experiments and mutation validation by XF-C, MS, AH, TAK and CT. WES data analysis by GH, CT, AH, and TAK. Molecular experimental work, data plot and statistical analyses by GH, MD, OQ-B and LR-C. Computational modelling GH and MO. Writing of the manuscript by GH, MS, VV, LR-C and TAK. Funding recruitment by MS, SP-M, J-CS, CT and TAK. All authors participated in data discussion, read, and approved the manuscript.
Acknowledgments
We are very grateful to all families and patients who kindly contributed to this study. We thank Dr Vladimir Benes from European Molecular Biology Laboratory (EMBL), Genomics Core Facility, Heidelberg, Germany for his excellent service in whole exome sequencing. We thank Dr Katie G. Seu and Dr Mary Risinger from Cincinnati Children’s Hospital Medical Center for their assistance in proof reading of this manuscript.
Funding
Supported by grant PID2021-122436OB-I00 from MCIN/ AEI /10.13039/501100011033/ ERDF “A way to make Europe” (to MS), PID2020-119637RB-I00 from Ministerio de Ciencia e Innovación y Fondo Europeo de Desarrollo Regional (FEDER)” (to J-CS), AvanCell, B2017/BMD-3692 from Comunidad de Madrid (to J-CS), NEOTEC grant SNEO-20191246 from Spanish CDTI (to CT), grant RTC2019007074-1 from MCIN/AEI /10.13039/501100011033 (to CT, J-CS and MS), and the U.S. National Heart, Lung, and Blood (NHLBI) Institute grant R01 HL152099 (to TAK). GH is supported by funds provided by the APU and ADISCON Patient associations. LR-C holds an FIAGAUR predoctoral fellowship (2020FI-B00038) from Generalitat de Catalunya. XF-C is partially supported by funds provided by the grant RTI-2018-101735-B-I100 (MCI/AEI/FEDER, EU). VV was supported by funds provided by APU and ADISCON patient associations and is currently supported by funds provided by UIC postdoctoral scholarship and by funds provided by RETOS COLABORACION grant RTC2019-007074-1 (MCI/AEI/FEDER, EU) from the Spanish Ministry of Science and Innovation (MICINN). J-CS also received funds from Instituto de Investigación Sanitaria "Fundación Jiménez Díaz" and CIBERER, an initiative of the “Instituto de Salud Carlos III” and “Fondo Europeo de Desarrollo Regional (FEDER)”.
Data-sharing statement Data will be shared upon reasonable request.
the CDIN1 gene and functional study of a novel variant in the KIF23 gene. Ann Hematol. 2021;100(2):353-364.
3. Pavicic-Kaltenbrunner V, Mishima M, Glotzer M. Cooperative assembly of CYK-4/MgcRacGAP and ZEN-4/MKLP1 to form the centralspindlin complex. Mol Biol Cell. 2007;18(12):4992-5003.
4. White EA, Glotzer M. Centralspindlin: at the heart of
Haematologica | 108 February 2023 586 LETTER TO THE EDITOR
cytokinesis. Cytoskeleton. 2012;69(11):882-892.
5. Gambale A, Iolascon A, Andolfo I, Russo R. Diagnosis and management of congenital dyserythropoietic anemias. Expert Rev Hematol. 2016;9(3):283-296.
6. Lind L, Sikstrom C, Sandstrom H, et al. The locus for congenital dyserythropoietic anemia type III (CDA III), associated with monoclonal gammopathy and myeloma, is localized on chromosome 15q21. Am J Hum Genet. 1993;53:A1035.
7. Wickramasinghe SN, Wahlin A, Anstee D, et al. Observations on two members of the Swedish family with congenital dyserythropoietic anaemia, type III. Eur J Haematol. 1993;50(4):213-221.
8. Sandström H, Wahlin A, Eriksson M, Holmgren G, Lind L, Sandgren O. Angioid streaks are part of a familial syndrome of dyserythropoietic anaemia (CDA III). Br J Haematol. 1997;98(4):845-849.
9. Lachowski D, Cortes E, Matellan C, et al. G Protein-coupled estrogen receptor regulates actin cytoskeleton dynamics to impair cell polarization. Front Cell Dev Biol. 2020;8:592628.
10. Villegas A, González L, Furio V, et al. Congenital dyserythropoietic anemia type Iii with unbalanced globin chain synthesis. Eur J Haematol. 1994;52(4):251-253.
11. Pérez-Jacoiste Asín MA, Ruiz Robles G. Skull erythropoiesis in a patient with congenital dyserythropoietic anaemia. Lancet. 2016;387(10020):787.
12. Niss O, Lorsbach RB, Berger M, et al. Congenital dyserythropoietic anemia type I: first report from the Congenital Dyserythropoietic Anemia Registry of North America (CDAR.). Blood Cells Mol Dis. 2021;87:102534.
13. Oh A, Patel PR, Aardsma N, et al. Non-myeloablative allogeneic stem cell transplant with post-transplant cyclophosphamide cures the first adult patient with congenital dyserythropoietic anemia. Bone Marrow Transplant. 2017;52(6):905-906.
14. Petronczki M, Tedeschi A. Cell division: switching on Ect2 in a non-canonical fashion. Curr Biol. 2020;30(16):R947-R949.
15. Wontakal SN, Britto M, Zhang H, et al. RACGAP1 variants in a sporadic case of CDA III implicate the dysfunction of centralspindlin as the basis of the disease. Blood. 2022;139(9):1413-1418.
Haematologica | 108 February 2023 587 LETTER TO THE EDITOR
Associations between socioeconomic status and bispecific
LV20.19 CAR T-cell therapy outcomes
Chimeric antigen receptor (CAR) T-cell therapy utilization has risen sharply in recent years, becoming a standard approach for refractory B-cell malignancies.1 Social disparities contribute independent risk for people with cancer, an effect not fully explained by insurance status or access to care.2 However, this relationship and its biological mechanisms have yet to be examined among CAR T-cell therapy recipients. It is hypothesized that the inflammatory stress response associated with conditions of low socioeconomic status (SES) is a mechanism underlying the impact of social health on medical outcomes.3,4 Importantly, proinflammatory cytokines are associated with the most common CAR T side effects, cytokine release syndrome (CRS) and immune effector cell-associated neurotoxicity syndrome (ICANS). In fact, symptoms from CAR T-cell therapy are associated with neuroinflammatory markers, including cytokines and circulating kynurenine metabolites, that are also associated with worse patient reported outcomes (PRO) and low SES.5-8 Here, we report the association of SES and patient response to novel bispecific anti-CD20 and anti-CD19 (LV20.19) CAR Tcell treatment on a molecular-to-clinical scale by assessing differences in annual income and inflammatory cytokine levels, kynurenine pathway metabolites, PRO, and clinical outcomes.
The current study population (n=15) is derived from the previously reported parent study (n=22) evaluating patients with relapsed, refractory B-cell malignancies treated with LV20.19 CAR T cells on a phase I/Ib clinical trial (clinicaltrials gov. Identifier: NCT03019055).9 All participants provided written informed consent and all procedures were approved in advance by the MCW Institutional Review Board. Patient income was self-reported based on household annual income as either above (high SES) or below (low SES) the 2021 Wisconsin median of $54,660. Further details are described elsewhere.8,9 PRO and blood for kynurenine metabolites and cytokines were collected 15 days prior to CAR T-cell infusion (baseline) and at 14, 28, and 90 days post-infusion (D14, D28, D90). PRO included depression, anxiety, fatigue, sleep, and pain; standard assay methodology was used to assess kynurenine metabolites and cytokines (see Knight et al.8 for details). Tryptophan (TRP) and metabolites — kynurenine, kynurenic acid (KA), 3-hydroxylkynurenine (3-HK), 3-hydroxyanthranilate (3-HAA), and quinolinic acid (QA) — were assessed, as were the following cytokines: interleukin 6 (IL-6), IL-8, granulocyte colony stimulating factor (GCSF), interferon γ (IFNγ), IFNγ-induced protein 10 (IP10),
fractalkine, I-309, tumor necrosis factor a (TNFa), monocyte chemoattractant protein 2 (MCP-2), and B-lymphocyte chemoattractant 1 (BCA-1). CRS grading was performed utilizing Lee 2018 criteria10 and neurotoxicity (NTX) was graded using CTCAE version 5.0.11 Lactate dehydrogenase (LDH) was assessed at baseline as a marker of tumor burden.
Peak cytokine and kynurenine metabolite levels were logtransformed; values below the limit of detection were replaced by half the smallest non-negative value. Mixed effects regression with random subject effect was used to analyze repeated measurements. For adjusted analyses, baseline LDH was included as a covariate in the models. All analyses were performed in R 4.0.3.12 A twosided 5% significance level was used.
Patient demographics, disease characteristics, and select treatment side effects are described in Table 1. Fifty-three percent of study participants reported an annual income below the Wisconsin median in 2021 of $54,660 (low SES). There was no significant difference between SES groups based on age, education level, or clinical response to therapy by D28. Given that baseline LDH was 3.4-fold higher in low versus high SES patients (P=0.04), we also examined SES correlations with each CAR T-cell therapy outcome variable using it as a covariate. Most peak cytokine concentrations were significantly higher in low SES patients (Figure 1A). Low SES patients had a 15.4-fold elevation in IP-10, 7.8-fold elevation of GCSF, 6.8-fold elevation in TNFa, 4.1-fold elevation in IL-8, and 3.4-fold elevation in I-309 and MCP-2 compared to those of high SES (all P<0.05; see the Online Supplementary Table S1).
3-HAA and QA were elevated in low SES patients (Figure 1B), with 3-HAA higher at D28 and QA higher at baseline, D14, and at D28 (all statistically significant; see the Online Supplementary Table S2). TRP, kynurenine, KA, and 3-HK did not differ between SES groups at any time points.
Patients with low SES reported a trend toward higher pain intensity on D28 and had significantly higher pain intensity by D90 (Figure 2) compared to those of high SES. Pain interference trended higher in low SES patients at baseline. Patients of low SES had consistently poor sleep quality (higher than the PSQI threshold of 5 for “poor sleep”13) at baseline, D28, and D90, while patients of high SES did not. Conversely, high SES patients reported significantly more days feeling fatigued on D14. Depression, anxiety, fatigue intensity, and fatigue interference were not different between SES groups (see the Online Supplementary Table S3 for all).
Haematologica | 108 February 2023 588 LETTER TO THE EDITOR
There was a clinically significant difference in the proportion of patients who experienced CRS based on SES (100% of low vs . 57.1% of high SES patients), though this did not reach statistical significance (Table 1). Low SES
Table 1. Baseline patient demographics and clinical findings.
Baseline characteristic Overall (N=15)1
patients experienced significantly higher maximum CRS and at earlier onset times compared to high SES patients. Low SES patients suffered a higher percentage of NTX, higher average NTX grade, and earlier average NTX
Income range $10,001-55,0001 (N=8)1
Income range >$55,0011 (N=7)1 P value2
Age in years (range) 58 (38-72) 66.5 (46-72) 55 (38-69) 0.297 Male sex, N (%) 14 (93) 7 (88) 7 (100)
Level of education, N (%)
HS TS SC CG PGD
Income, N (%)
$10,001- 25,000 $25,001-40,000 $40,001-55,000 $55,001-70,000 $85,001-100,000 >$100,000
Histology, N (%)
CLL DLBCL FL MCL
2 (13) 4 (27) 3 (20) 3 (20) 3 (20)
2 (13) 3 (20) 3 (20) 3 (20) 2 (13) 2 (13)
2 (13) 9 (60) 1(6.7) 3 (20)
2 (25) 2 (25) 2 (25) 1 (12.5) 1 (12.5)
0 (0) 2 (28.5) 1 (14.3) 2 (28.5) 2 (28.5)
2 (25) 3 (37.5) 3 (37.5) 3 (42.9) 2 (28.5) 2 (28.5)
1 (12.5) 5 (62.5) 1 (12.5) 1 (12.5)
1 (14.3) 4 (57.1) 0 (0) 2 (28.5)
0.215
N/A
Baseline LDH (range) 203 (121-2,074) 652 (121-2,074) 190 (147-269) 0.040
Lines of prior therapy (range) 4 (2-11) 5 (2-11) 5 (3-7) 0.678 Prior allogeneic HCT, N (%) 1 (6.7) 1 (12.5) 0 (0) Prior autologous HCT, N (%) 5 (6.7) 1 (12.5) 4 (57.1) 0.12
Clinical response D28, N (%) CR PD PR
12 (80) 1 (6.7) 2 (13)
6 (75) 1 (12.5) 1 (12.5)
6 (85.7) 0 (0) 1 (14.3)
0.740 CRS (Yes), N (%) 12 (80) 8 (100) 4 (57.1) 0.077 Days to CRS (range) 2.5 (0.0-10.0) 2.6 (0-7) 6.8 (1-10) 0.009
Max grade CRS, N (%) 0 1 2 4
3 (20) 7 (47) 4 (27) 1 (6.7)
0 (0) 4 (50) 3 (37.5) 1 (12.5)
3 (42.8) 3 (42.8) 1 (14.3) 0 (0)
0.047
NTX, N (%) 5 (33) 4 (50) 1 (14.3) 0.282 Max NTX grade, N (%) 0 1 3 4
10 (6) 2 (13) 2 (13) 1 (6.7)
4 (50) 1 (12.5) 2 (25) 1 (12.5)
6 (85.7) 1 (14.7) 0 (0) 0 (0)
0.129 Days to NTX (range) 6 (0-9) 4 (0-9) 6
CLL: chronic lymphocytic leukemia; CR: complete response; CRS: cytokine release syndrome; DLBCL: diffuse large B-cell lymphoma; FL: follicular lymphoma; HCT: hematopoietic cell transplantation; LDH: lactate dehydrogenase; MCL: mantle cell lymphoma; NTX: neurotoxicity; PD: progressive disease; PR: partial response; HS: high school; TS: trade school; SC: some college; CG: college graduate; PGD: post graduate degree; CRS: cytokine release syndrome; Max: maximum; NTX: neurotoxicity. Categorical variables were compared between SES groups using Fisher’s exact test, Wilcoxon’s rank sum test was used for ordinal and continuous measures
Haematologica | 108 February 2023 589 LETTER TO THE EDITOR
onset, though these did not reach statistical significance.
The association between low SES and biomarkers became insignificant when LDH was added as a covariate for some, but not all, of the cytokines (BCA-1, G-CSF, I-309, IL-6, IL-8, MCP-2, and TNFa) and one kynurenine metabolite (3-HAA). For the PRO that were worse among individuals of low SES, the associations became more
pronounced/significant for pain and sleep when additionally considering LDH levels. (Online Supplementary Tables S1 to S3). Among the clinical outcomes, only maximum grade of CRS became insignificant when correcting for LDH.
This study provides preliminary evidence that SES is associated with biological and clinical outcomes among patients receiving bispecific LV20.19 CAR T-cell therapy.
B
Figure 1. Peak cytokine levels and kynurenine metabolites compared between socioeconomic status groups. (A) BCA1: B-lymphocyte chemoattractant 1; Frac: fractalkine; GCSF: granulocyte colony stimulating factor (9.3-fold difference); I-309 (2.9-fold); IFNγ: interferon γ; IL6: interleukin 6; IL8: interleukin 8 (3.4-fold); IP-10: interferon γ-induced protein 10 (2.3-fold); MCP-2: monocyte chemoattractant protein 2 (2.0-fold); TNFa: tumor necrosis factor a (4.3-fold). Log transformed peak cytokine levels were compared between socioeconomic status (SES) groups using a student t-test. (B) Kynurenine metabolites were analyzed using linear mixed effects model and estimated marginal means (least-square means) was done to compare kynurenine metabolites between income groups at each time point. +P< 0.1, *P< 0.05, **P< 0.01.
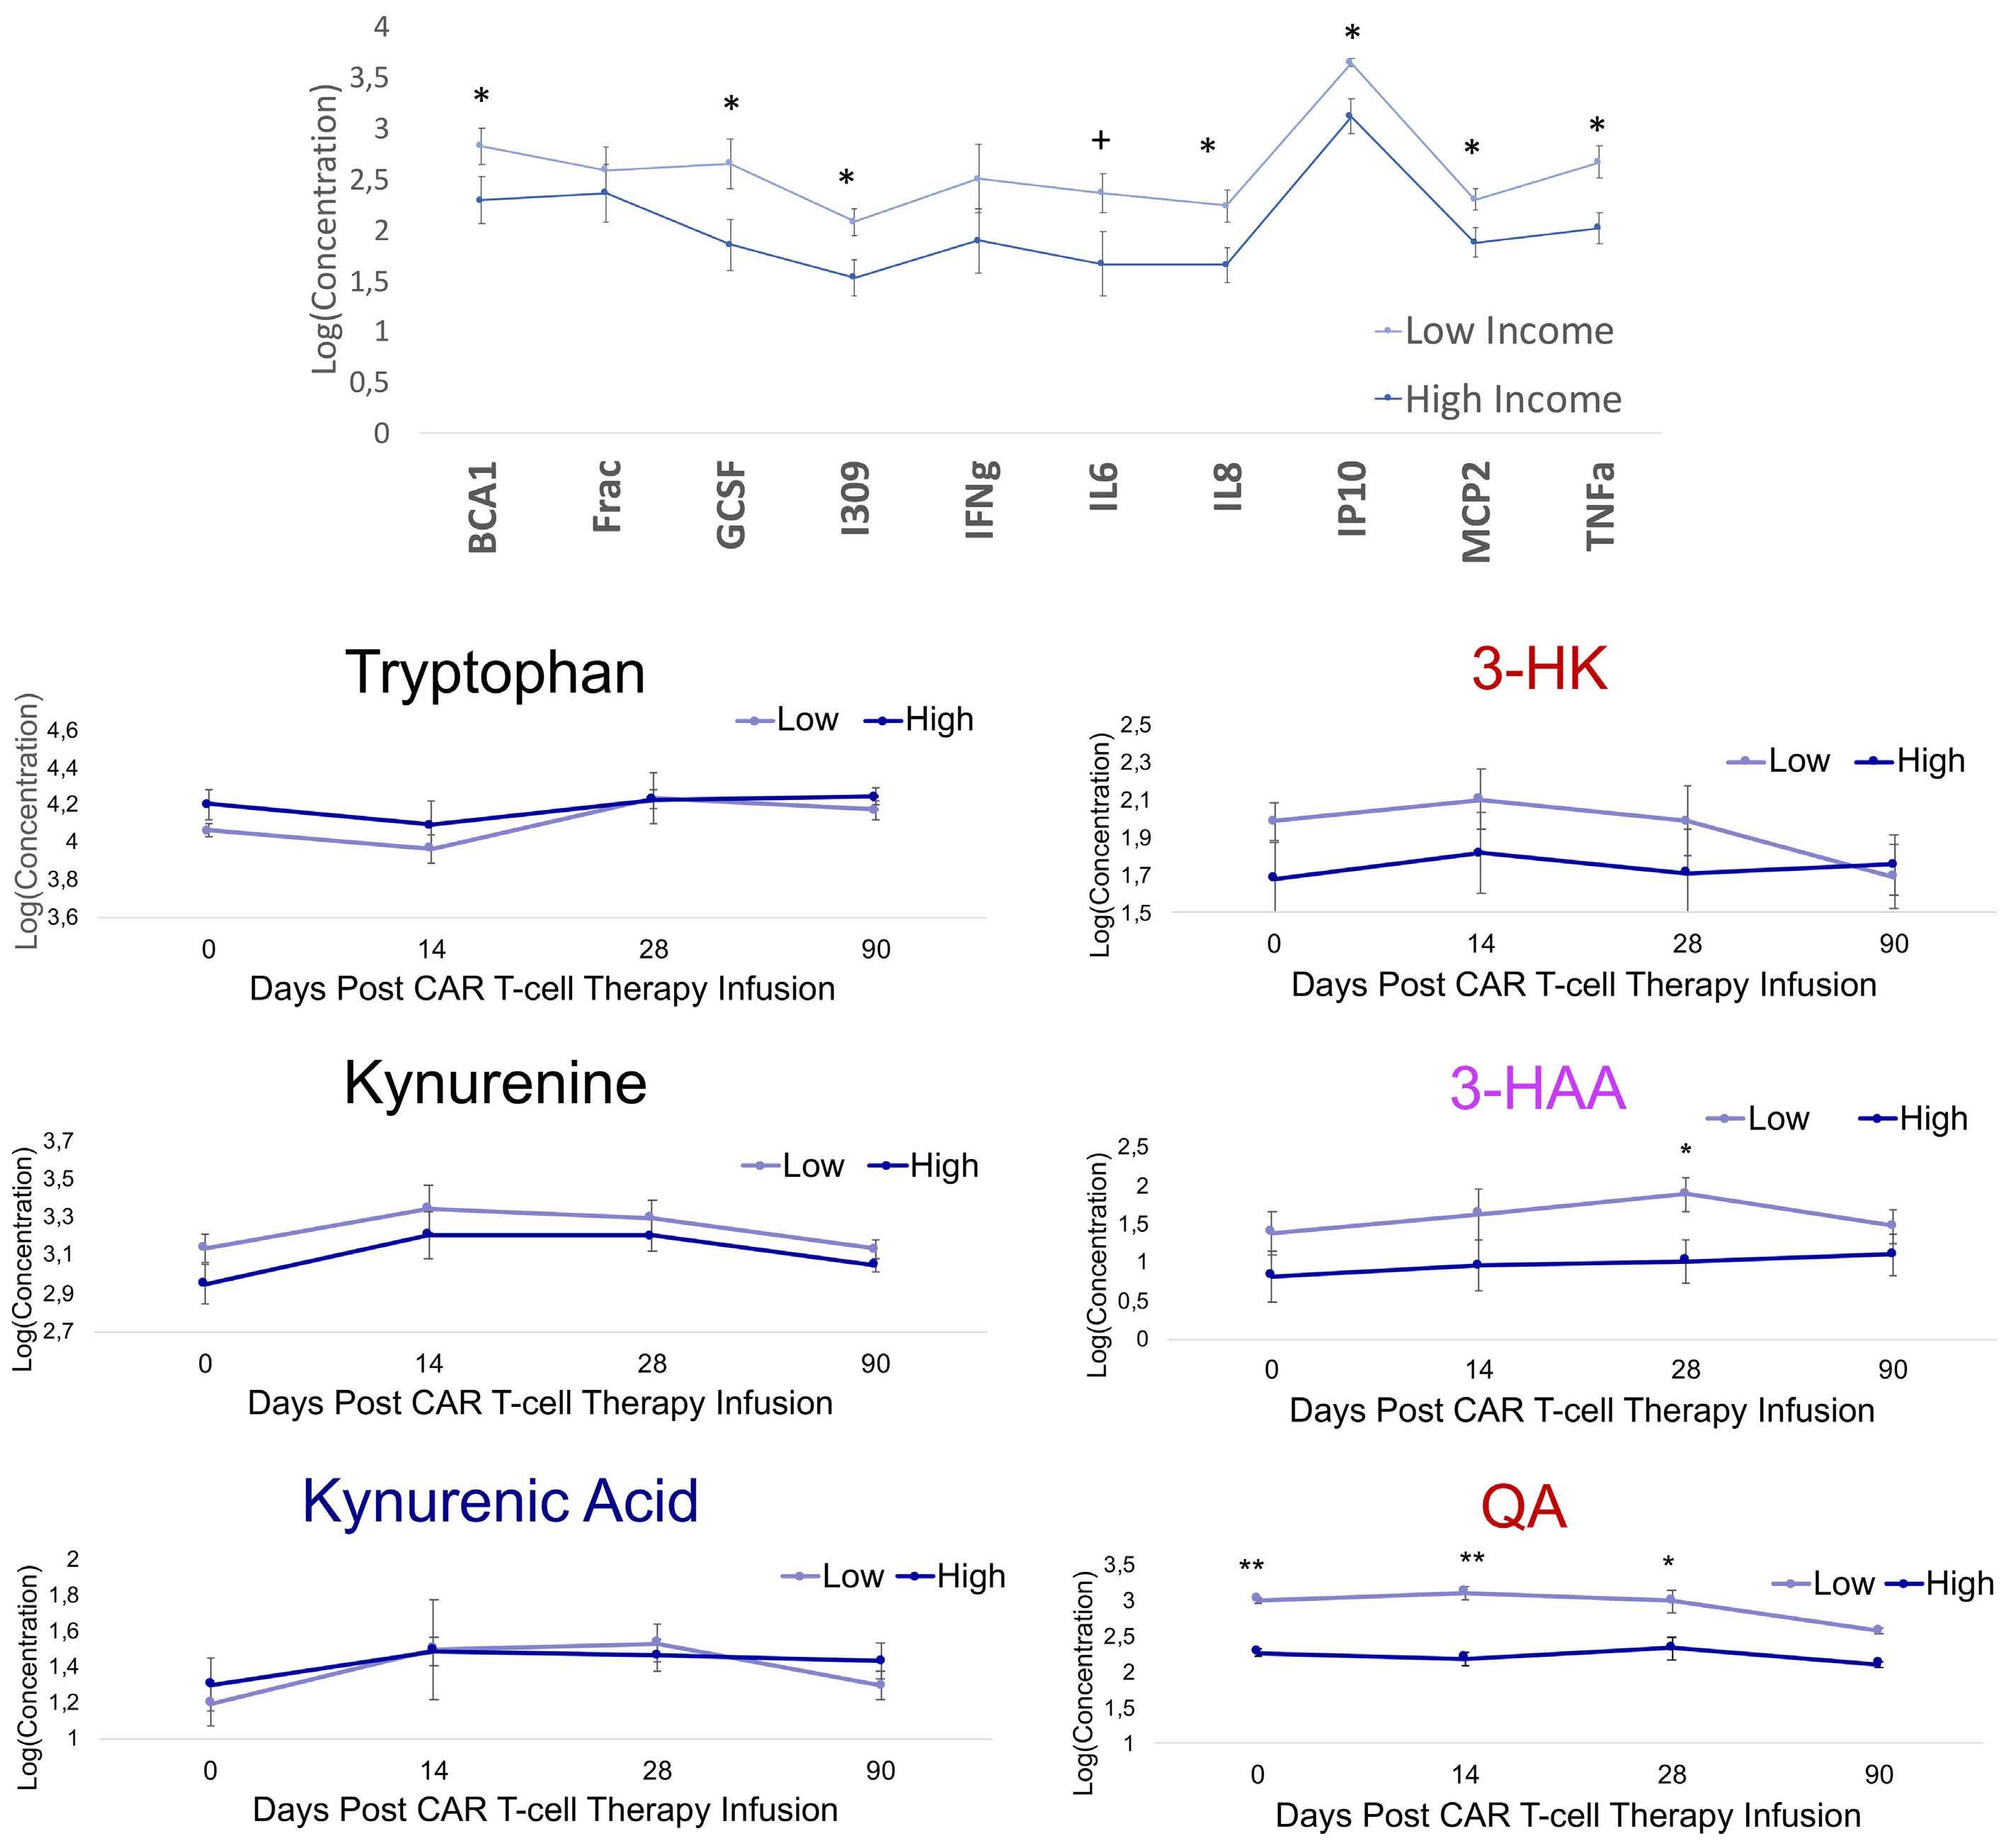
AHaematologica | 108 February 2023 590 LETTER TO THE EDITOR
These pilot data demonstrate that patients of low SES have worse CAR T-cell therapy outcomes, reflected molecularly as higher baseline LDH levels, proinflammatory cytokines, and neurotoxic kynurenine metabolites, and reflected clinically as earlier CRS onset, higher CRS grade severity, and higher reported pain. Low SES patients likely
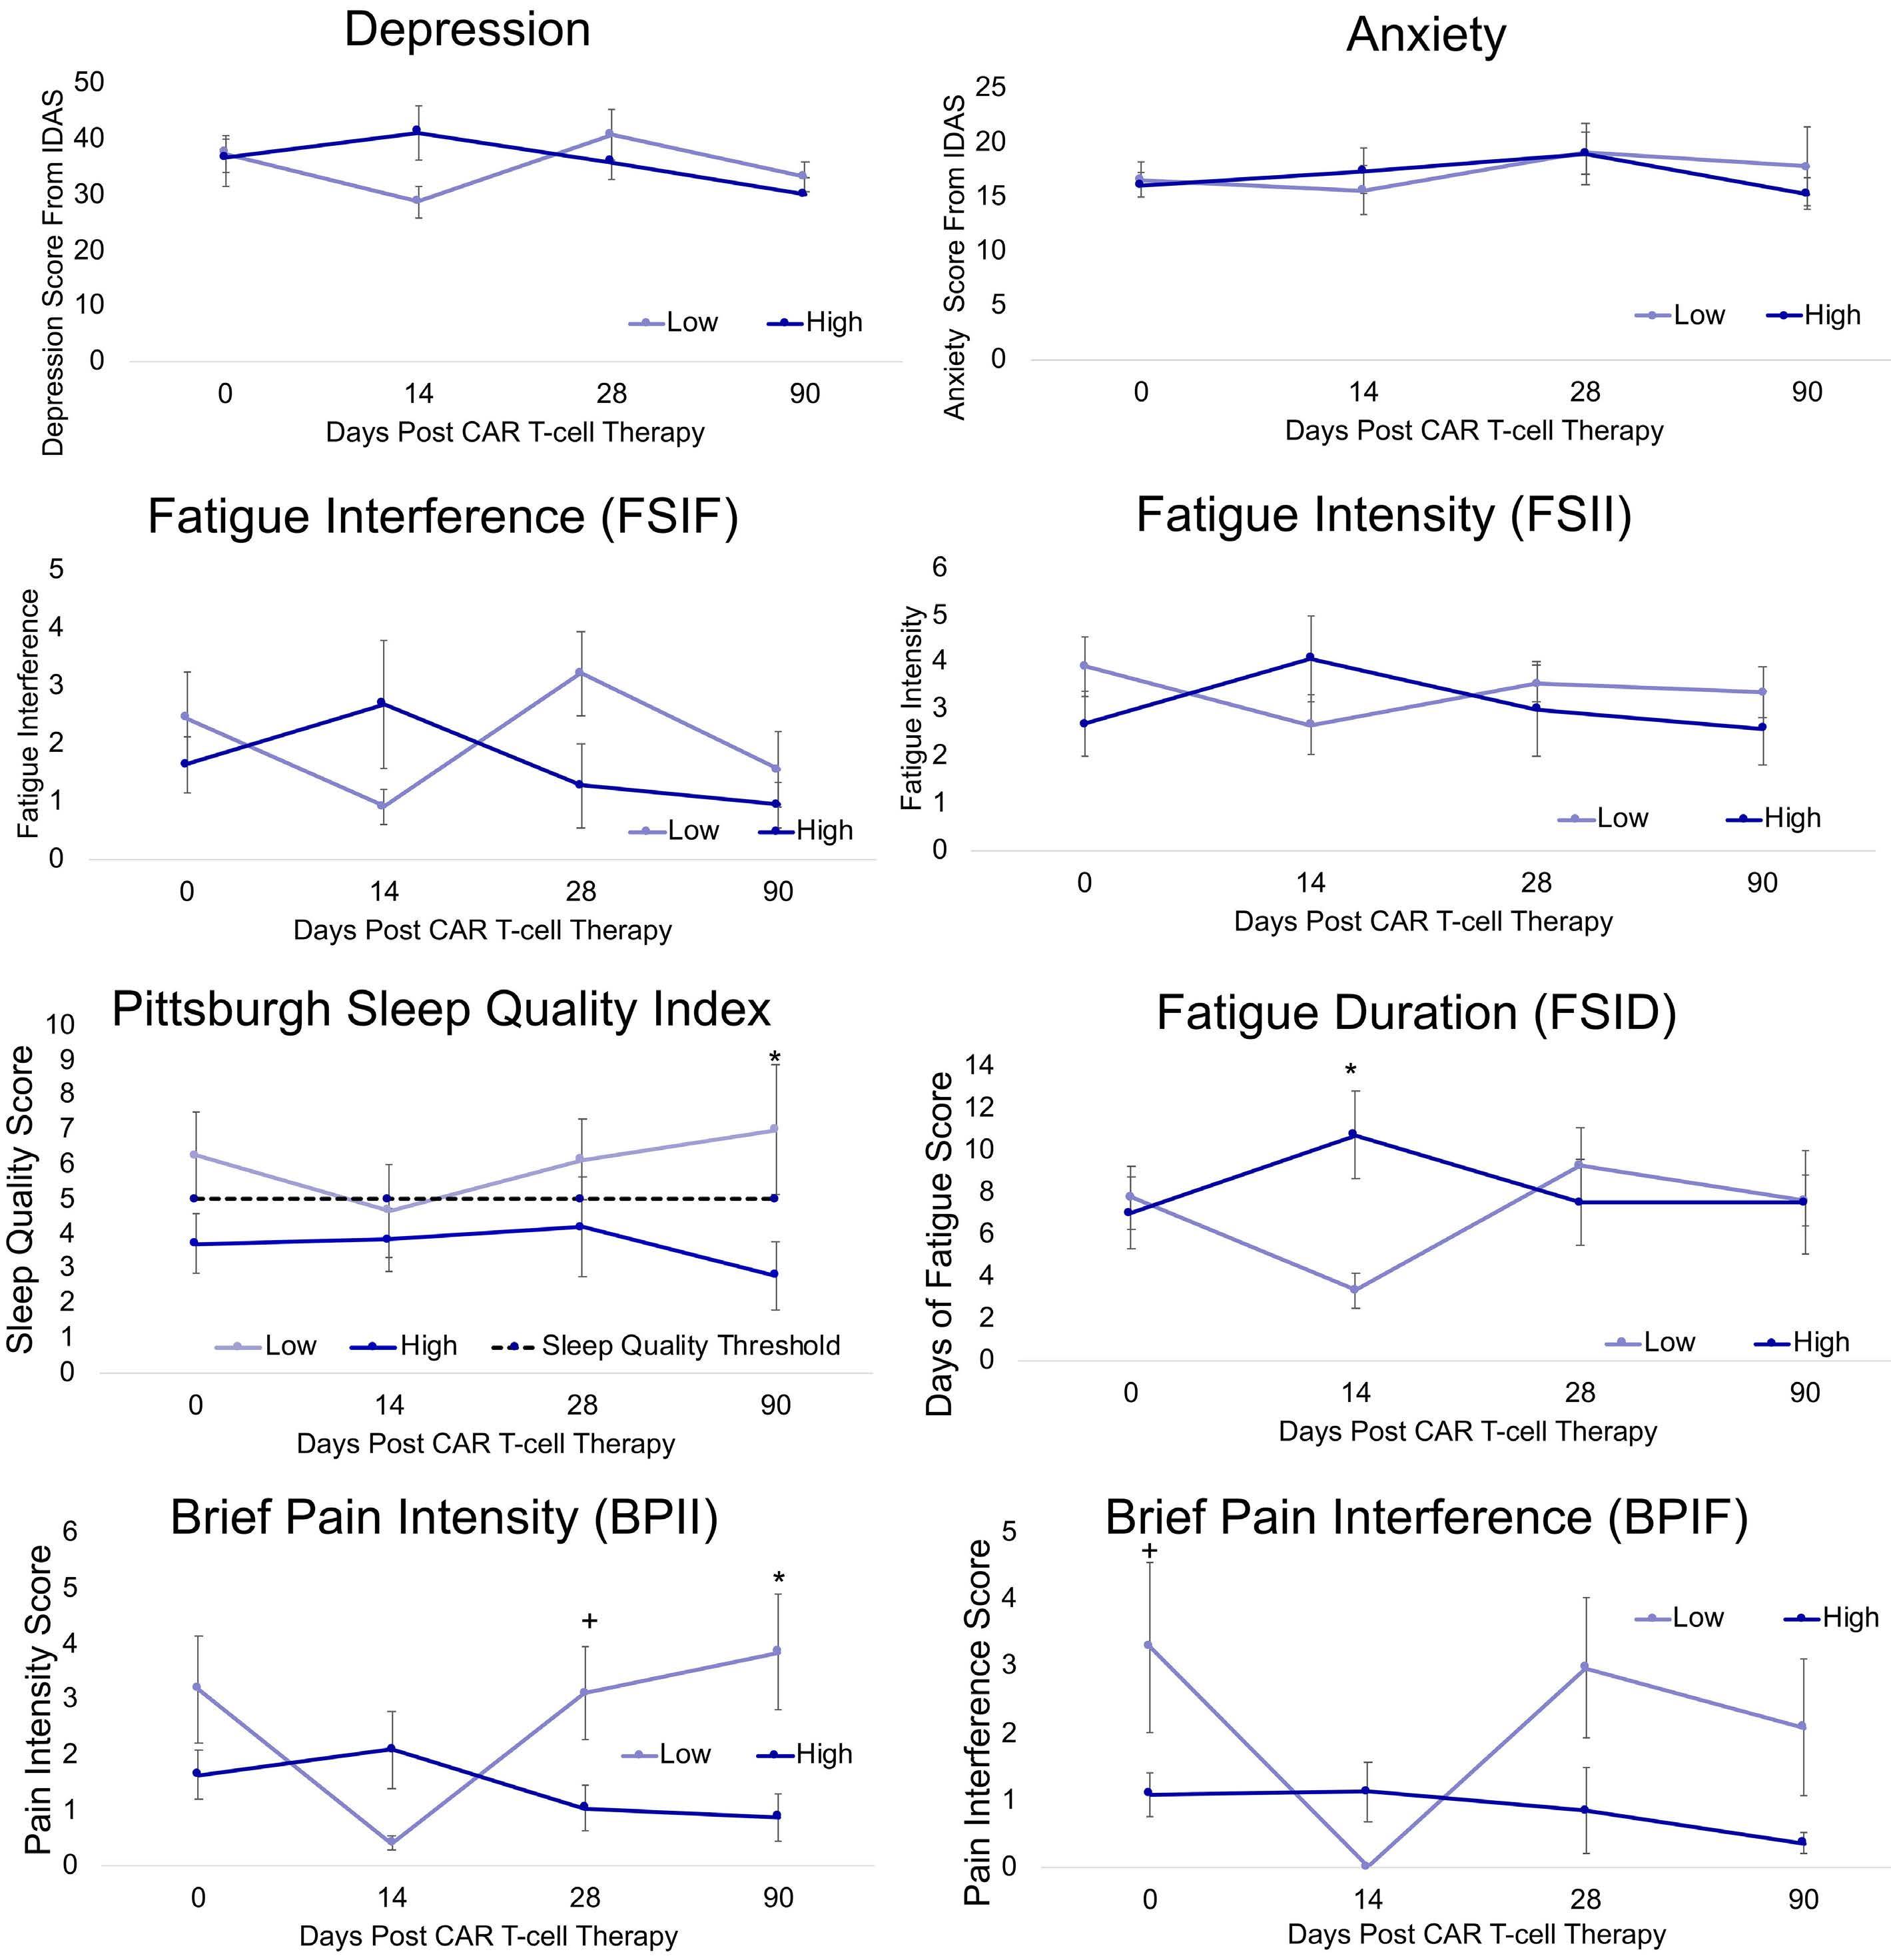
presented with increased tumor burden, as represented by elevated baseline LDH.14 While controlling for LDH tempered some of the associations between biomarkers and SES and outcomes, this was not broadly true, with LDH potentiating the SES relationship with PRO. Together, these findings support the proinflammatory and neuro-
Figure 2. Patient-reported outcomes over time between socioeconomic status groups. Linear Mixed Effects Model and Estimated Marginal Means (least-square means) was done to compare kynurenine metabolites between income groups at each time point. +P< 0.1, *P< 0.05, **P< 0.01. PRO: patient-reported outcomes; SES: socioeconomic status.
Haematologica | 108 February 2023 591 LETTER TO THE EDITOR
toxic metabolite priming of low SES individuals, highlighting candidate biological mechanisms in a novel cancer population that may mediate the relationship between low SES and worse cancer treatment outcomes.
The increase in proinflammatory biomarkers identified among low SES patients may also be associated with worse clinical outcomes. Many of the cytokines were additionally associated with earlier onset and worse severity of CRS. Kynurenine metabolites associated with neurotoxicity in our prior work (3-HAA and QA) were elevated among low SES patients here.8
This study is limited by the small sample size. These provocative findings need to be further evaluated in a larger cohort wherein additional patient-, disease-, and CAR Trelated variables can be appropriately controlled for and mediational analyses conducted.
The current cohort study among individuals receiving bispecific LV20.19 CAR T-cell therapy suggests a biological impact of low SES among CAR T-cell recipients and supports the hypothesis that elevated proinflammatory cytokines and neurotoxic kynurenine metabolites are among the biological mediators of elevated risk. These novel findings identify patients of low SES as a population vulnerable to CAR T-cell therapy side effects, warranting future studies aimed at clarifying the multifactorial social impacts on biological and quality of life outcomes of cancer therapy.
Authors
Jennifer M. Knight,1,2* Edward Hackett,3* Aniko Szabo,4 Ruizhe Wu,4 Garrett Sauber,5 Bryon Johnson,6 Rachel N. Cusatis,7 Elizabeth Aughey,3 Steve W. Cole,8 Cecilia J. Hillard5# and Nirav N. Shah6#
1Department of Psychiatry, Medical College of Wisconsin, Milwaukee, WI; 2Departments of Medicine and Microbiology & Immunology, Medical College of Wisconsin, Milwaukee, WI; 3Medical College of Wisconsin; Milwaukee, WI; 4Division of Biostatistics; Medical College of Wisconsin, Milwaukee, WI; 5Department of Pharmacology and Toxicology and Neuroscience Research Center, Medical College of Wisconsin, Milwaukee, WI; 6BMT and Cellular Therapy Program, Division of Hematology and Oncology, Medical
College of Wisconsin, Milwaukee, WI; 7Department of Medicine, Division of Hematology and Oncology, Medical College of Wisconsin, Milwaukee, WI and 8Departments of Psychiatry and Biobehavioral Sciences and Medicine, Division of Hematology-Oncology, David Geffen School of Medicine at UCLA, Los Angeles, CA, USA
*JMK and EH contributed equally as co-first authors. #CJH abd NNS contributed equally as co-senior authors.
Correspondence: J. M. KNIGHT - jmknight@mcw.edu https://doi.org/10.3324/haematol.2022.281957
Received: August 24, 2022. Accepted: September 23, 2022. Prepublished: October 6, 2022.
©2023 Ferrata Storti Foundation Published under a CC BY-NC license
Disclosures
CJH is a member of the Scientific Advisory Boards of Phytecs, Inc and Formulate Biosciences, and has equity in Formulate Biosciences. BJ reports receiving research support and honoraria and travel support from Miltenyi Biotec. NNS reports participation on advisory boards and/or consultancy for Kite Pharma, BMS, TG therapeutics, Miltenyi Biotec, Lilly, Epizyme, Legend, Incyte, Novartis, and Umoja. He has received research funding and honoraria from Miltenyi Biotec. The remaining authors have no conflicts of interest to disclose.
Contributions
JMK, CJH, NS and AS designed the research. JMK, NS, AS, GS and BJ performed the research. AS contributed vital new reagents or analytical tools. JMK, NS, GS and BJ coellected data. EH, JMK, CJH, AS, RW and GS analyzed and interpreted data. EH, AS, IA and RW performed statistical analysis. JMK, EH, CJH, AS, RW, NS, RNC, SWC and BJ wrote the manuscript.
Data-sharing statement
Data for this study can be attained by contacting the corresponding author.
1. Shah NN, Ahn KW, Litovich CA, et al. Is autologous transplant in relapsed DLBCL patients achieving only a PET+ PR appropriate in the CAR-T cell Era? Blood. 2020;137(20):2854-2855.
2. Chu DI, Moreira DM, Gerber L, et al. Effect of race and socioeconomic status on surgical margins and biochemical outcomes in an equal-access health care setting: results from the Shared Equal Access Regional Cancer Hospital (SEARCH) database. Cancer. 2012;118(20):4999-5007.
3. Shavers VL. Measurement of socioeconomic status in health disparities research. J Natl Med Assoc. 2007;99(9):1013.
4. Knight JM, Rizzo JD, Logan BR, et al. Low socioeconomic status, adverse gene expression profiles, and clinical outcomes in hematopoietic stem cell transplant recipients. Clin Cancer Res. 2016;22(1):69-78.
5. Wang Z, Han W. Biomarkers of cytokine release syndrome and neurotoxicity related to CAR-T cell therapy. Biomarker Res.
References Haematologica | 108 February 2023 592 LETTER TO THE EDITOR
2018;6(1):4.
6. Gust J, Ponce R, Liles WC, Garden GA, Turtle CJ. Cytokines in CAR T cell–associated neurotoxicity. Front Immunol. 2020;11:3271.
7. Powell ND, Sloan EK, Bailey MT, et al. Social stress up-regulates inflammatory gene expression in the leukocyte transcriptome via β-adrenergic induction of myelopoiesis. Proc Natl Acad Sci U S A. 2013;110(41):16574-16579.
8. Knight JM, Szabo A, Arapi I, et al. Patient-reported outcomes and neurotoxicity markers in patients treated with bispecific LV20.19 CAR T cell therapy. Commun Med (Lond). 2022;2:49.
9. Shah NN, Johnson BD, Schneider D, et al. Bispecific anti-CD20, anti-CD19 CAR T cells for relapsed B cell malignancies: a phase 1 dose escalation and expansion trial. Nat Med. 2020;26(10):1569-1575.
10. Lee DW, Santomasso BD, Locke FL, et al. ASBMT consensus
grading for cytokine release syndrome and neurologic toxicity associated with immune effector cells. Biol Blood Marrow Transplant. 2019;25(4):625-638.
11. Common Terminology Criteria for Adverse Events (CTCAE), version 5.0. Washington, DC: US Department of Health and Human Services. 2022 Jan 14.
12. Team RC. R: A language and environment for statistical computing. R Foundation for Statistical Computing, Vienna, Austria. 2015. https://www.gbif.org/tool/81287/r-a-languageand-environment-for-statistical-computing
13. Beck SL, Schwartz AL, Towsley G, Dudley W, Barsevick A. Psychometric evaluation of the Pittsburgh Sleep Quality Index in cancer patients. J Pain Symptom Manag. 2004;27(2):140-148.
14. Jurisic V, Radenkovic S, Konjevic G. The actual role of LDH as tumor marker, biochemical and clinical aspects. Adv Exp Med Biol. 2015:115-124.
Haematologica | 108 February 2023 593 LETTER TO THE EDITOR
The effects of cardio-selective b blockade on diastolic dysfunction in children with sickle cell disease
Among individuals living with sickle cell disease (SCD), diastolic dysfunction (DD) is common (up to 77% of patients) and is associated with exercise intolerance and premature death.1,2 Increase in the left ventricular filing pressure, a marker of DD, leads to left atrial dilation. This maladaptation progresses to pulmonary venous hypertension and the associated increased tricuspid regurgitant jet velocity (TRV), consistent with the phenotype of restrictive cardiomyopathy. Pulmonary hypertension and TRV elevation are predictors of early mortality in adults with SCD.3,4 Several mechanisms have been proposed in the development of DD, including microcirculatory dysfunction, myocardial fibrosis, and siderosis.5,6 There is insufficient evidence to guide the treatment of DD in SCD. b blockers are routinely used in non-SCD patients with heart failure with reduced ejection fraction (HFrEF) and, in some centers, for heart failure with preserved ejection fraction (HFpEF) and DD, a phenotype akin to sickle cardiomyopathy.7 The primary objective of the present study was to test if diastolic parameters improved after initiation of metoprolol, in children with SCD
This is a parallel cohort study, where all subjects were participants of two prospective cohorts: the Sickle Cell Clinical Research and Intervention Program (SCCRIP) (clinicaltrials gov. Identifier: NCT02098863) or the LongTerm Effects of Erythrocyte Lysis (ELYSIS) (clinicaltrials gov. Identifier: NCT00842621).8,9 SCCRIP is a multicenter cohort study, initiated in 2014, that covers ~99% of the actively treated SCD population and evaluates the progression of organ injury over the lifespan of the participating individual.8 ELYSIS was an observational surveillance study of cardiac abnormalities in SCD, conducted from 20092016, which enrolled unbiased patients from the same population as in SCCRIP, excluding those with a history of cardiac surgery, structural heart defects or left ventricular systolic dysfunction.9 For the current analysis, children enrolled in SCCRIP, ages 5-18 years with presence of any finding of DD on clinically indicated echocardiograms (performed at the discretion of the clinician for presence of cardiopulmonary symptoms or hypertension) were started on the cardiac-selective b blocker metoprolol and included in the metoprolol treatment group. Metoprolol was started orally at a dose of 0.1 mg/kg twice daily and titrated up to a maximum of 2 mg/kg/day or 200 mg/day (mean final dose achieved 0.3 mg/kg twice daily) for chronotropic effect. Because ELYSIS occurred prior to the institutional clinical practice of metoprolol treatment, they served as controls from the same institution population.
For this analysis, age-, and sex-matched untreated controls with echocardiographic findings of DD were selected among the ELYSIS participants and frequency-matched at a 1:1 ratio. As there were no a priori sample size calculations based on a specific primary endpoint, these analyses are exploratory. SCCRIP and ELYSIS cohorts are Institutional Review Board-approved, and participants (or their legal guardians) signed informed consent for study participation. This study was in accordance with Declaration of Helsinki.
Complete two-dimensional transthoracic echocardiography was obtained using a Vivid 7 echocardiogram machine with the Echopac picture archive software (GE Medical Systems, Milwaukee, Wisconsin). Measures included early diastolic mitral annulus velocity (e’) and the ratio between early mitral inflow velocity and early diastolic mitral annular velocity (E/e’) obtained at both the septal and lateral annulus. Left atrial end systolic volume index (LAVi) and left ventricular end diastolic volume (LVIDd) were measured. All measurements were performed according to the American Society of Echocardiography guidelines.10 A septal or lateral e’ velocity <2 standard deviations (SD) for that age range, lateral or septal E/e’ >2 SD for that age range, or LAVi of >30 mL/m2 were all considered indicative of DD.11,12 Laboratory measures (hemoglobin, absolute reticulocyte count, lactate dehydrogenase), and spirometry studies were collected. Among treated participants, vaso-occlusive events (VOE) were collected for the 24 months before and after initiation of metoprolol. Among controls, VOE were collected for the 24 months prior to and after the initial echocardiogram. All study evaluations were obtained at steady state (at least 30 days from an acute illness, hospitalization, or emergent blood transfusion). All laboratory tests were obtained within 7 days of echocardiograms. Individuals on monthly transfusions had all the laboratory and echocardiogram evaluations performed on the same day, but prior to the scheduled blood transfusion. Chi-squared or Fisher’s exact tests compared differences in the distribution of genotype, sex, and disease-modifying therapy between metoprolol users and controls. Two-sample t-tests and Wilcoxon rank sum tests compared differences in age, spirometry and VOE. For participants on metoprolol, the baseline values were calculated by averaging all measurements (hematological and echocardiogram) within 6 months prior to starting metoprolol. Duration of metoprolol use for each patient was defined as the period between starting metoprolol and the date
Haematologica | 108 February 2023 594 LETTER TO THE EDITOR
of the last echocardiogram while on metoprolol. Change in all study evaluations from baseline to endpoint were measured using one-sample t-tests (for normally distributed variables) and Wilcoxon signed rank (for non-normally distributed variables). Two-sample t-tests or Wilcoxon rank sum tests were used to compare changes between metoprolol users and the control group. Linear mixed-effect models were used to assess the associations between metoprolol use and diastolic parameters after adjusting for age, sex, hydroxyurea, and transfusions. For all analyses, false discovery rate (FDR) adjusted P values were produced. This analysis included 42 children with SCD; 21 treated with metoprolol for the presence of any abnormal dia-
Table 1. Patient characteristics.
stolic parameter (86% with LAVi >30 mL/m2, 21% with septal E/e’ >2 SD, 15% with septal e’ <2 SD and 5.2% with lateral E/e’ >2 SD) and followed for a mean duration of 14.7±4.8 months. The control group included 21 age- and sex-matched participants, with abnormal diastolic parameters (100% with LAVi >30 mL/m2, 21% with septal E/e’ >2 SD and 5.3% with lateral E/e’ >2 SD), who were followed for 24 months. Most participants were of HbSS genotype and on concomitant disease-modifying therapy (Table 1). Between the two groups, participants in the metoprolol treatment group had a higher number of VOE in the 2 years prior to starting metoprolol compared to controls; however, this was not significant at pFDR 0.35. Furthermore, their
Metoprolol-treatment N=21 Control N=21 pFDR
Baseline age in years (range) 15.33 (6.5-17.83) 14.53 (6.65-17.88) 0.41
Sex, N (%)
Male Female 10 (47.62) 11 (52.38) 10 (47.62) 11 (52.38) >0.99
Genotype, N (%)
Hb SS
Hb Sb0thalassemia
Hb SC Hb Sb+thalassemia
History of disease-modifying therapy, N (%)
Hydroxyurea
Monthly transfusions Both None
Echocardiogram parameters
Lateral e’, m/s Septal e’, m/s Lateral E/e’ Septal E/e’
LVIDd z score
LAVi, mL/m2 TRV, m/s
Hematological parameters
Hemoglobin, g/dL ARC, x103/mm3
LDH, units/L
Spirometry
Baseline FEV1 (% predicted)
Baseline FVC (% predicted)
Baseline FEV1/FVC (% predicted)
18 (85.71) 1 (4.76) 1 (4.76) 1 (4.76)
12 (57.14) 4 (19.05) 3 (14.29) 2 (9.52)
0.19 (0.03) 0.14 (0.03) 6.02 (1.39) 8.37 (1.95) 1.01 (1.58) 39.83 (8.60) 2.30 (0.33)
8.61 (1.03) 279.87 (105.00) 519.29 (144.23)
95.07 (12.21) 98.00 (10.39) 0.97 (0.04)
21 (100) 0 (0) 0 (0) 0 (0)
15 (71.43) 5 (23.81) 0 (0) 1 (4.76)
0.21 (0.02) 0.15 (0.02) 5.88 (1.19) 8.29 (1.67) 1.97 (1.47) 37.75 (6.52) 2.43 (0.23)
8.87 (1.16) 210.13 (111.13) 587.55 (150.30)
73.33 (4.04) 79.00 (10.54) 0.93 (0.07)
0.41
0.53
0.19 0.35 0.91 0.58 0.21 0.48 0.21
0.55 0.19 0.41
0.19 0.19 0.53
Number of VOE (pain crisis + ACS)* 1 (0, 13) 0 (0, 5) 0.35
Note: values presented as mean (standard deviation), median (range), or frequency (%) unless otherwise noted. Tests between-group differences were performed using Chi-square or Fishers Exact test for categorical variables and two-sample t-tests or Wilcoxon rank sum for continuous variables. e’: early annular diastolic velocity; E: early diastolic velocity; LVIDd: left ventricular end-diastolic diameter; LAVi: left atrial volume index; TRV: tricuspid regurgitant velocity; ARC: absolute reticulocyte count; LDH: lactate dehydrogenase; PFT: pulmonary function test; FEV1: forced expiratory volume at 1 second; FVC: forced vital capacity; VOE: vaso-occlusive episodes; ACS: acute chest syndrome; pFDR: false discovery rate (FDR) adjusted P values. *Number of VOE during the 24 months prior to initiation of metoprolol (metoprolol-treatment group) and before baseline echocardiogram (control group). Median and range are reported for the number of VOE.
Haematologica | 108 February 2023 595 LETTER TO THE EDITOR
echocardiographic diastolic parameters, degree of anemia and hemolysis before initiating metoprolol were like the control group (Table 1). We then compared the change in diastolic and hematological parameters over the study period, between the two groups (metoprolol-treatment vs. control) (Table 2). While metoprolol treatment improved LAVi, septal and lateral E/e’, this did not maintain at pFDR <0.05. Next, we evaluated the change in these parameters within each group (Table 2). Metoprolol use resulted in significant decrease in mean LAVi (difference =-4.59±6.86, pFDR =0.04), septal E/e’ (difference =-1.14±1.43, pFDR=0.02), and lateral E/e’ (difference =-0.89±1.22, pFDR =0.04), with no change in hemoglobin or hemolysis markers. However, after adjusting for age, sex, hydroxyurea, and transfusions, the effect of metoprolol on septal E/e’, lateral E/e’ and LVIDd z-score did not maintain at pFDR <0.05 (Online Supplementary Table S1). The decreasing trends in the prevalence of abnormal diastolic parameters with metoprolol treatment are promising but not statistically significant (Online Supplementary Table S2). On the other hand, participants in the control group did not see any change in diastolic
function or hematological parameters over the observation period.
The safety of metoprolol therapy was evaluated by measuring change in forced expiratory volume (FEV1), FEV1/forced vital capacity (FVC) and frequency of VOE (pain crisis or acute chest syndrome) over the observation period. Metoprolol was well tolerated and was not associated with worsening of FEV1 (mean difference =0.64±6.39, pFDR =0.8) and FEV1/FVC (mean difference =-0.02±0.03, pFDR =0.28) or increase in VOE (median difference =0; range, -5 to 2, pFDR 0.77) (Online Supplementary Table S3).
SCD patients have a unique cardiomyopathy that is predominately characterized by DD but with preserved systolic function. Currently, the literature does not support any definitive treatment strategy for DD in patients with SCD. The non-selective b blocker propranolol has been explored as a potential anti-adhesion agent in SCD and found to reduce sickle red cell adhesion when measured in vitro. 13 b blockers are widely used for HFrEF and have been shown to reduce hospitalization and improve survival. Most patients with HFpEF have evidence of DD and
Table 2. Change in diastolic echocardiogram variables and laboratory markers over study period.
Metoprolol-treatment Control
Metoprololtreatment vs. control
Mean change (SD) pFDR Mean change (SD) pFDR pFDR
Hemoglobin, g/dL 0.20 (0.79) 0.40 0.34 (0.77) 0.20 0.86
Hematological parameters
ARC, x103/mm3 -21.75 (113.53) 0.49 -6.61 (65.16) 0.80 0.86
LDH, units/L -34.63 (124.27) 0.20 -46.95 (124.13) 0.24 0.97
Heart Rate, beats/min -6.85 (14.33) 0.16 -7.00 (13.63) 0.20 0.97
TRV, m/s 0.05 (0.26) 0.49 -0.11 (0.25) 0.20 0.17
LVIDd z-score -0.24 (0.88) 0.18 -0.21 (0.74) 0.38 0.86
Septal E/e' -1.14 (1.43) 0.02 -0.01 (1.98) 0.99 0.17
Echocardiographic measurements
Lateral E/e' -0.89 (1.22) 0.03 0.40 (1.57) 0.42 0.08
LAVi, mL/m2 -4.59 (6.86) 0.03 1.68 (11.13) 0.68 0.17
Septal e', m/s 0.00 (0.03) 0.67 -0.16 (2.16) 0.81 0.90
Lateral e', m/s 0.01 (0.03) 0.40 -1.36 (3.17) 0.20 0.17
Note: values presented as mean (standard deviation). Change in values tested using one-sample t-tests or Wilcoxon signed rank tests. ŦTwosample t-tests or Wilcoxon rank sum tests were used to compare changes between metoprolol-treated and control groups. ARC: absolute reticulocyte count; LDH: lactate dehydrogenase; HR: heart rate; TRV: tricuspid regurgitant velocity; LVIDd: left ventricular end-diastolic diameter; e’: early annular diastolic velocity; E: early diastolic velocity; LAVi: left atrial volume index. PFDR: P value adjusted by false discovery rate (FDR).
Haematologica | 108 February 2023 596 LETTER TO THE EDITOR
b blockers have been found to be beneficial in this population.7 One proposed theory is that tachycardia is poorly tolerated in patients with DD as the reduced filling time further increases diastolic filling pressures. b blockers modulate the sympathetic nervous system in the heart by reducing the heart rate and allowing for longer filling times.7 Additionally, the preventive effect of metoprolol on myocardial fibrosis may contribute to halting the progression of DD.14
Our study shows that patients with SCD who were treated with metoprolol, a cardio-selective b blocker, had an improvement in diastolic function with a decrease in LA volume and E/e’ (an echocardiographic surrogate for left ventricle filling pressure). Additionally, the hemoglobin level in those treated with metoprolol did not change, indicating that the improvement in diastolic parameters was likely independent from the degree of anemia. Although underpowered to see a change in heart rate, a reduction was observed, but not significant, pointing to additional mechanisms of DD improvement in addition or independent of heart rate modulation. Airway hyperreactivity is prevalent in patients with SCD irrespective of asthma comorbidity.15 Even though metoprolol is considered cardioselective, as a precaution, none of the patients who were given metoprolol had an asthma diagnosis. Furthermore, treatment with metoprolol did not lead to obstructive respiratory symptoms or increase in VOE. The interpretation of our results is limited by the small sample size, lack of randomization (which did not correct for differences between groups like disease severity and possible mediation of disease-modifying therapies), and a short follow-up period. Our findings are preliminary but indicate potential cardiac benefit of b blocker therapy in SCD to improve DD. Future long-term prospective studies are warranted to confirm our preliminary findings.
Authors
References
1. Sachdev V, Machado RF, Shizukuda Y, et al. Diastolic dysfunction is an independent risk factor for death in patients with sickle cell disease. J Am Coll Cardiol. 2007;49(4):472-479.
2. Sachdev V, Kato GJ, Gibbs JS, et al. Echocardiographic markers of elevated pulmonary pressure and left ventricular diastolic dysfunction are associated with exercise intolerance in adults and adolescents with homozygous sickle cell anemia in the United States and United Kingdom. Circulation. 2011;124(13):1452-1460.
Towbin,4,5 Jane S. Hankins1 and Gary Beasley4,5
1Department of Hematology, St Jude Children’s Research Hospital; 2Department of Biostatistics, St Jude Children’s Research Hospital; 3Division of Pediatric Pulmonology, Le Bonheur Children's Hospital; 4Heart Institute, Division of Pediatric Cardiology, Le Bonheur Children's Hospital and 5Cardio-Oncology/Hematology Services, St Jude Children’s Research Hospital, Memphis, TN, USA
Correspondence: P. RAI - parul.rai@stjude.org
https://doi.org/10.3324/haematol.2022.281428
Received: May 20, 2022. Accepted: September 23, 2022. Prepublished: October 6, 2022.
©2023 Ferrata Storti Foundation Published under a CC BY-NC license
Disclosures
No conflicts of interest to disclose.
Contributions
PR, JSH, GB wrote the manuscript. GK and VO analyzed the data. NK and JAT critically reviewed the data and edited the manuscript.
Acknowledgments
We thank Devi Govindaswamy for performing the screening echocardiograms, and Courtney Davis, Jason Hodges, Pei-Lin, Martha Barton and Jola Dowdy for data collection and regulatory matters. We also thank Russell Ware and Amber Yates for support with assembling the ELYSIS study cohort.
Data-sharing statement
All data generated or analyzed during this study are included in the article and the Online Supplementary Appendix. Further inquiries can be directed to the corresponding author.
3. Mehari A, Gladwin MT, Tian X, Machado RF, Kato GJ. Mortality in adults with sickle cell disease and pulmonary hypertension. JAMA. 2012;307(12):1254-1256.
4. Maitra P, Caughey M, Robinson L, et al. Risk factors for mortality in adult patients with sickle cell disease: a meta-analysis of studies in North America and Europe. Haematologica. 2017;102(4):626-636.
5. Desai AA, Patel AR, Ahmad H, et al. Mechanistic insights and characterization of sickle cell disease-associated cardiomyopathy. Circ Cardiovasc Imaging. 2014;7(3):430-437.
Parul Rai,1 Victoria I. Okhomina,2 Guolian Kang,2 Nour Akil,3 Jeffrey A.Haematologica | 108 February 2023 597 LETTER TO THE EDITOR
6. Niss O, Fleck R, Makue F, et al. Association between diffuse myocardial fibrosis and diastolic dysfunction in sickle cell anemia. Blood. 2017;130(2):205-213.
7. Yamamoto K. beta-Blocker therapy in heart failure with preserved ejection fraction: Importance of dose and duration. J Cardiol. 2015;66(3):189-194.
8. Hankins JS, Estepp JH, Hodges JR, et al. Sickle Cell Clinical Research and Intervention Program (SCCRIP): a lifespan cohort study for sickle cell disease progression from the pediatric stage into adulthood. Pediatr Blood Cancer. 2018;65(9):e27228.
9. Yates AM, Joshi VM, Aygun B, et al. Elevated tricuspid regurgitation velocity in congenital hemolytic anemias: Prevalence and laboratory correlates. Pediatr Blood Cancer. 2019;66(7):e27717.
10. Nagueh SF, Smiseth OA, Appleton CP, et al. Recommendations for the evaluation of left ventricular diastolic function by echocardiography: an update from the American Society of Echocardiography and the European Association of
Cardiovascular Imaging. Eur Heart J Cardiovasc Imaging. 2016;17(12):1321-1360.
11. Eidem BW, McMahon CJ, Cohen RR, et al. Impact of cardiac growth on Doppler tissue imaging velocities: a study in healthy children. J Am Soc Echocardiogr. 2004;17(3):212-221.
12. Diaz A, Zocalo Y, Bia D. Normal percentile curves for left atrial size in healthy children and adolescents. Echocardiography. 2019;36(4):770-782.
13. De Castro LM, Zennadi R, Jonassaint JC, Batchvarova M, Telen MJ. Effect of propranolol as antiadhesive therapy in sickle cell disease. Clin Transl Sci. 2012;5(6):437-444.
14. Kobayashi M, Machida N, Mitsuishi M, Yamane Y. Beta-blocker improves survival, left ventricular function, and myocardial remodeling in hypertensive rats with diastolic heart failure. Am J Hypertens. 2004;17(12 Pt 1):1112-1119.
15. Leong MA, Dampier C, Varlotta L, Allen JL. Airway hyperreactivity in children with sickle cell disease. J Pediatr. 1997;131(2):278-283.
Haematologica | 108 February 2023 598 LETTER TO THE EDITOR
Acute lymphoblastic leukemia (ALL) is the most common type of childhood cancer and in most cases the leukemic cells display a B-cell precursor (BCP) immunophenotype. Although effective, the cytotoxic agents that constitute the backbone of therapy are associated with short- and long-term side effects that negatively influence the health and well-being of the growing child.1-3 Current treatment protocols extend up to 2.5 years, which may lead to problems with adherence to treatment significantly increasing the risk of relapse that, similarly to primary disease in infants and adults, has a less favorable prognosis.4 Newer treatment strategies include the CD22 antibody-drug conjugate inotuzumab ozogamicin, CD19/CD3-bispecific antibodies, and chimeric antigen receptor (CAR) T cells against CD19, which have led to impressive initial response rates in relapsed/refractory BCP-ALL but a lower long-term remission rate partly attributed to loss of surface marker expression on the leukemic cells and insufficient T-cell persistence.5 Hence, new therapeutic options are needed, and preferably ones that specifically target the leukemic cells while sparing healthy bone marrow cells. We have previously shown that interleukin 1 receptor accessory protein (IL1RAP) is upregulated on the surface of chronic myeloid leukemia and acute myeloid leukemia cells and that it can serve as a target for therapeutic antibodies in preclinical models.6-9 Our studies on myeloid malignancies, as well as the initial results from clinical trials of IL1RAP antibodies for the treatment of solid tumors demonstrating that IL1RAP antibodies can be safely administered,10 prompted us to study the potential of IL1RAP as a target for therapy also in BCP-ALL.
To investigate the expression of IL1RAP across different genetic subtypes in BCP-ALL, we used our previously generated RNA-sequencing dataset of 195 pediatric BCP-ALL cases and a set of normal B-cell precursors (Figure 1A).11
In BCP-ALL samples that harbored TCF::PBX1 or DUX4 rearrangements, IL1RAP expression was similar to or lower than that in normal B-cell progenitors. The majority of hyperdiploid cases also showed low IL1RAP expression whereas those with rearrangements of KMT2A displayed higher but variable levels. A significantly higher IL1RAP expression was found in BCR::ABL1-positive cases and Philadelphia chromosome-like BCP-ALL (3.8-fold and 3.1-fold, respectively, compared to normal B-cell progenitors). The
highest expression of IL1RAP was found in ETV6::RUNX1positive BCP-ALL, with the mean level being 4.3 times higher than in normal B-cell progenitors. The mean level was also relatively high (3.6-fold) in the closely related group of ETV6::RUNX1-like BCP-ALL (Figure 1A).
To validate that the gene expression of IL1RAP corresponded to a similar cell surface expression of IL1RAP protein, we performed flow cytometric analysis of 22 primary BCP-ALL bone marrow samples and five normal bone marrow samples. Consistent with the gene expression data, all 13 samples with ETV6::RUNX1 and one of the BCR::ABL1 -positive samples showed high IL1RAP cell surface expression, whereas the expression was low or absent in six out of seven samples with IGH::DUX4 or TCF3::PBX1 (Figure 1B, C; Online Supplementary Figure S1A ). The level of IL1RAP expression was significantly higher in the CD19+ and more immature CD19+CD34+ leukemic cell populations of the ETV6::RUNX1-positive cells than in corresponding normal bone marrow cells (Figure 1C). From a targeting perspective, the higher IL1RAP expression on CD19+CD34+CD38- cells in the ETV6::RUNX1positive cases, compared to corresponding cells harboring IGH::DUX4 or TCF3::PBX1, is interesting to note because this population has been reported to be enriched for leukemia-initiating cells in ETV6::RUNX1-positive BCP-ALL (Figure 1C).12,13 Two ETV6::RUNX1-positive cell lines, REH and AT, and the P190 BCR::ABL1-positive cell line SUP-B15 also showed high cell surface expression of IL1RAP (Figure 1D; Online Supplementary Figure S1B-D). To test the therapeutic potential of IL1RAP as a target on ETV6::RUNX1 -expressing BCP-ALL cells, we first performed antibody-dependent cellular cytotoxicity (ADCC) experiments using IL1RAP antibodies. ADCC is an important mode of action of therapeutic antibodies, in which the antibodies bind specifically to their target on the cell surface and through Fc-mediated binding to immune effector cells direct them to killing of the target-expressing cells.14 Notably, two monoclonal IL1RAP antibodies, mAb81.2 and mAb3F8, efficiently induced ADCC in a dose-dependent manner in three ETV6::RUNX1 -positive primary samples and in REH and AT1 cells, whereas they had only a very weak effect in the ETV6::RUNX1-negative primary sample (Figure 2A, B). As we have previously shown that the response of acute myeloid leukemia and
IL1RAP is expressed in several subtypes of pediatric acute lymphoblastic leukemia and can be used as a target to eliminate ETV6::RUNX1-positive leukemia cells in preclinical models
Haematologica | 108 February 2023 599 LETTER TO THE EDITOR
chronic myeloid leukemia cells to interleukin (IL)-1 stimulation is cellular expansion and increased NFκB activation,6,7 we investigated whether ETV6::RUNX1-positive BCP-ALL cells would react similarly. To do this, we expanded ETV6::RUNX1-positive BCP-ALL samples by serial transplantation in immunodeficient NSG mice. Four out of seven BCP-ALL samples showed engraftment and
subsequent analysis verified the retained IL1RAP surface expression and sensitivity to IL1RAP antibodies in ADCC assays. Furthermore, RNA sequencing confirmed a conserved global gene expression profile, indicating that the patient-derived xenograft (PDX)-samples ALL2x, ALL3x, ALL4x, and ALL7x maintain relevant properties and thus constitute pertinent BCP-ALL models ( Online Supple -
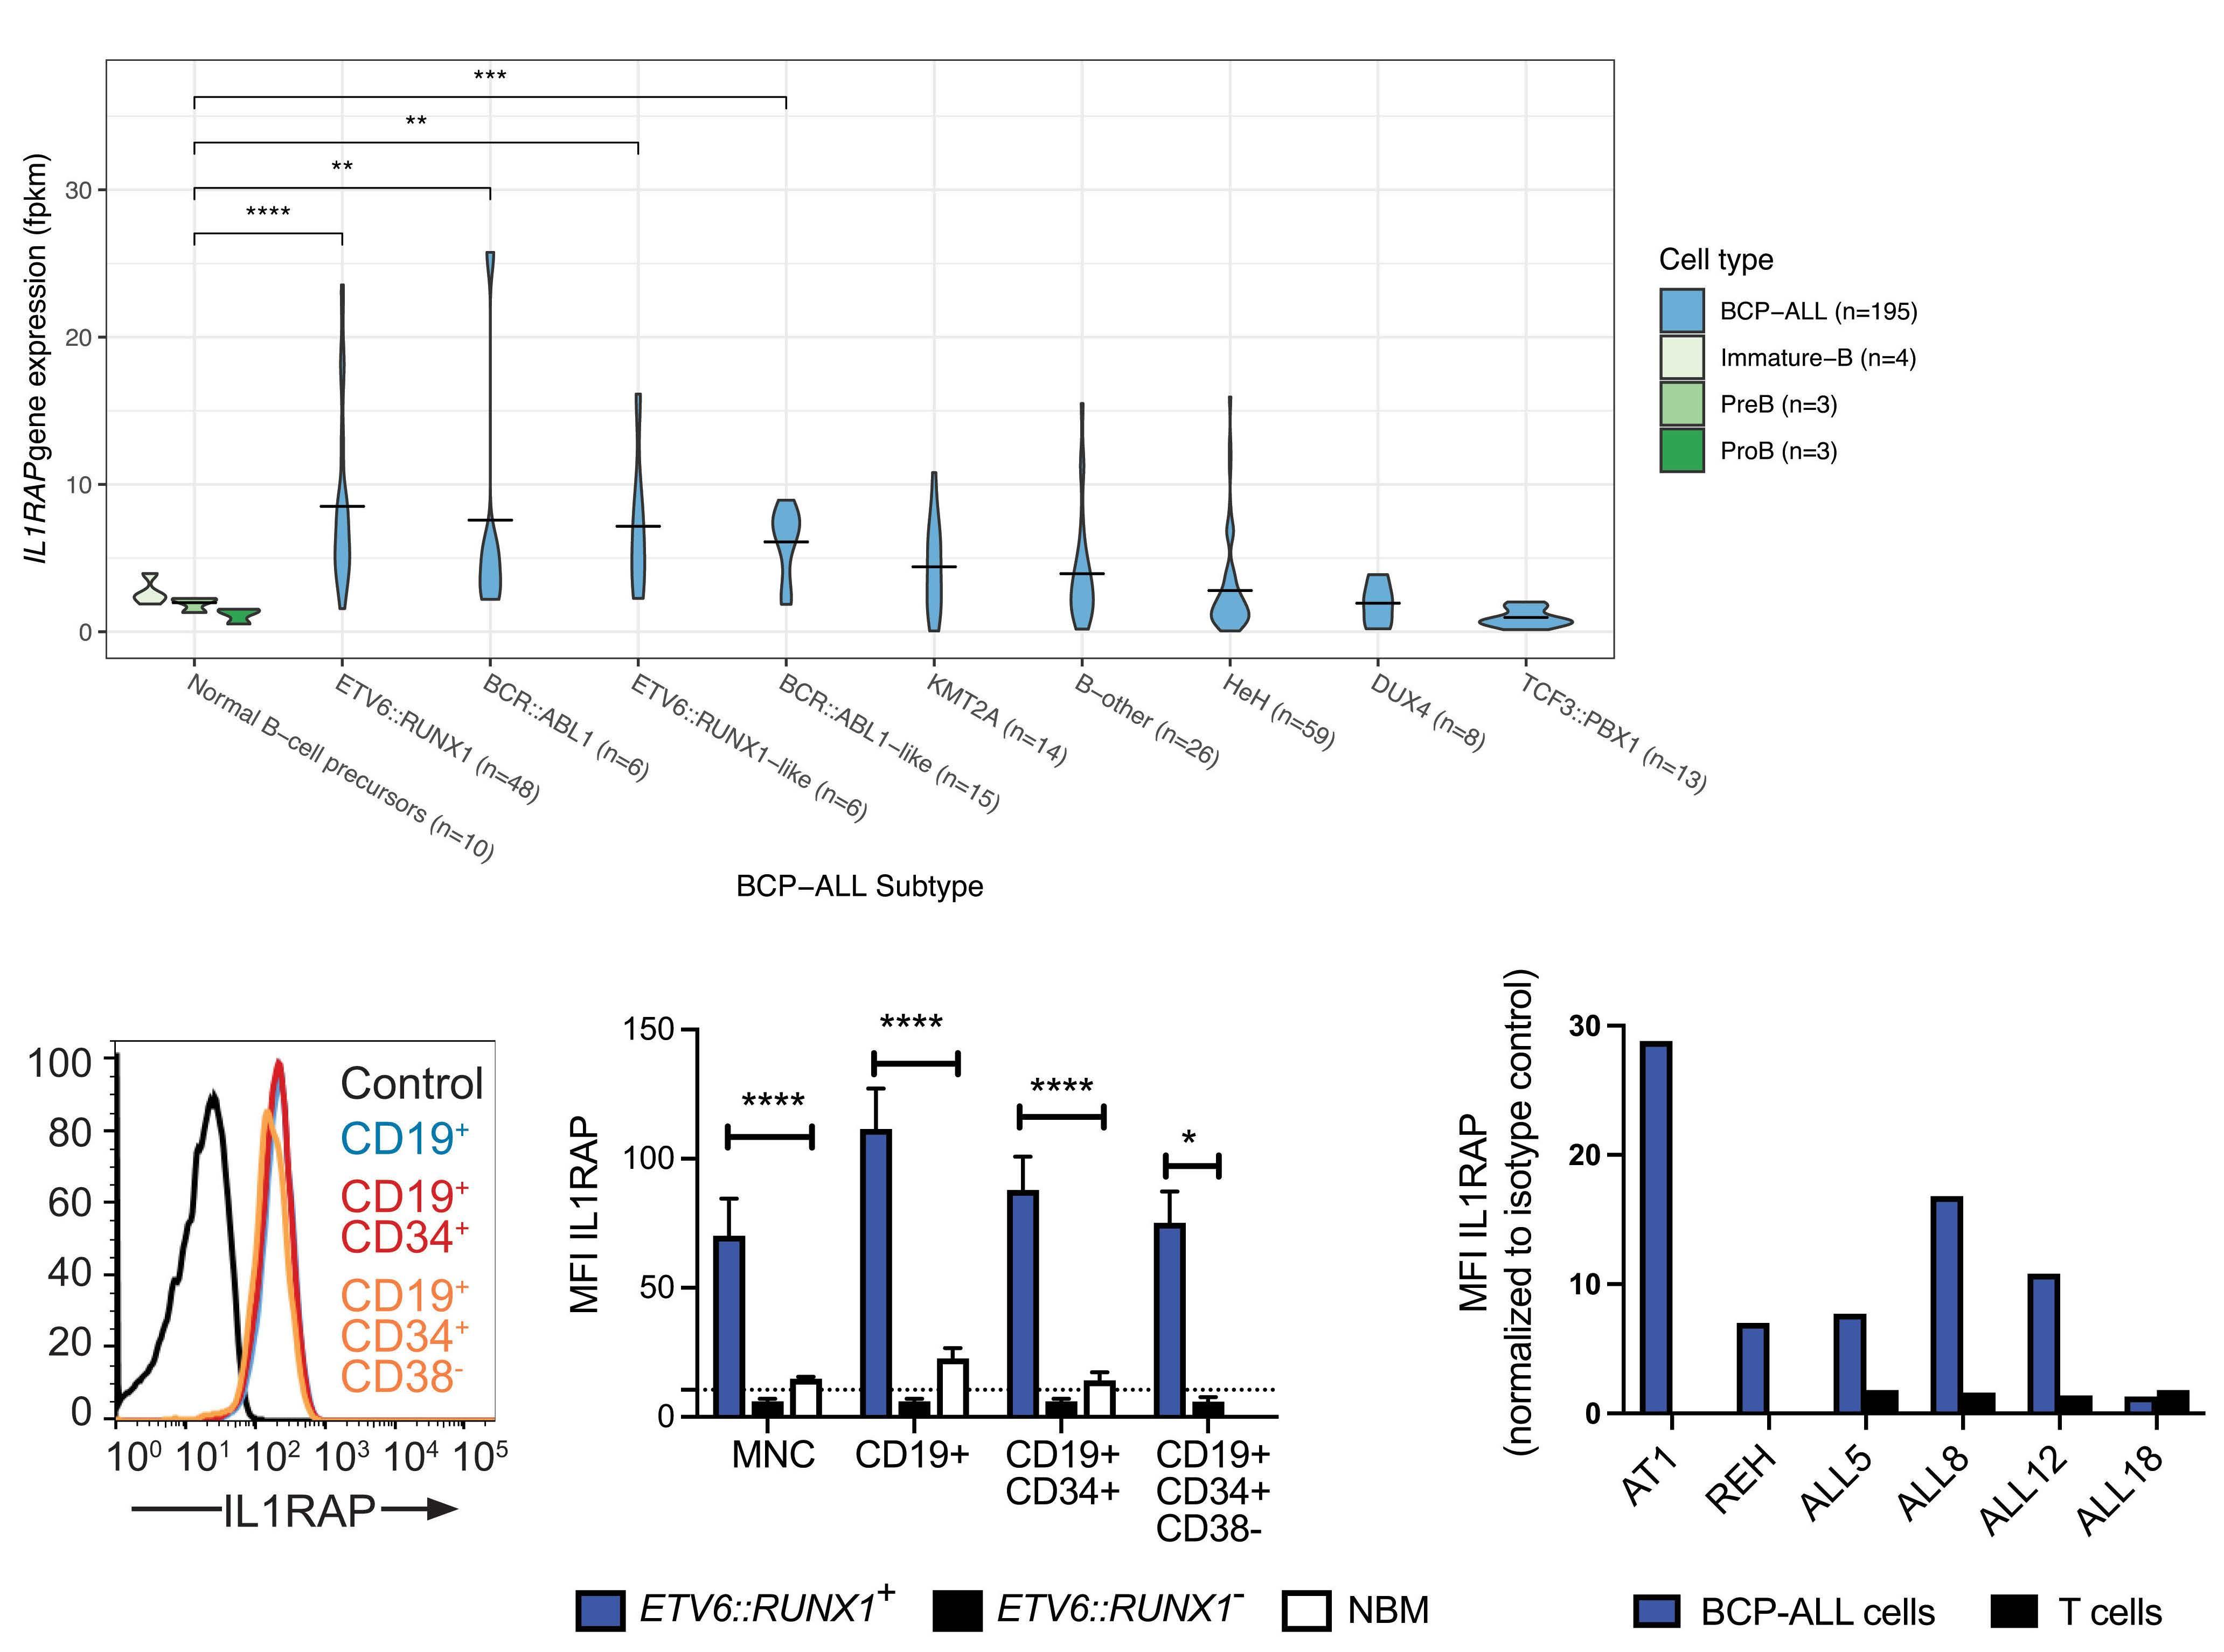
A B C D
Figure 1. ETV6::RUNX1-positive B-cell precursor acute lymphoblastic leukemia cells express IL1RAP. (A) The two genetic subtypes of B-cell precursor acute lymphoblastic leukemia (BCP-ALL) defined by expression of ETV6::RUNX1 or BCR::ABL1 rearrangements, as well as the transcriptionally, closely related ETV6::RUNX1-like and Philadelphia-like (BCR::ABL-like) subtypes, displayed a significantly higher gene expression of IL1RAP compared to normal B-cell precursors in the dataset of 195 cases of pediatric BCPALL. B-other refers to BCP-ALL cases not defined by any of the aforementioned aberrations or hyperdiploidy (HEH), TCF3::PBX1, or rearrangements of KMT2A (MLL) or DUX4. The Wilcoxon signed rank test was used to determine statistically significant differences between groups (**P<0.01; ***P<0.001; ****P<0.0001). (B) Flow cytometric analysis of IL1RAP expression on primary bone marrow cells from a representative patient with ETV6::RUNX1-positive BCP-ALL (ALL4). Isotype antibody-stained cells were used as a control. (C) Flow cytometric analysis of IL1RAP expression on bone marrow cells from 13 patients with ETV6::RUNX1-positive BCP-ALL (ETV6::RUNX1+), seven patients with IGH::DUX4-positive or TCF3::PBX1-positive BCP-ALL (ETV6::RUNX1-), and five healthy donors (NBM). The graph shows the geometric mean fluorescence intensity (MFI) of IL1RAP in each group. The dotted line represents the mean of all isotype control-stained mononuclear cells. The Mann-Whitney test was used to determine statistically significant differences between groups (*P<0.05; ****P<0.0001). (D) Flow cytometric analysis of IL1RAP expression in leukemic cells and T cells from three patients with ETV6::RUNX1-positive BCP-ALL (ALL5, ALL8, and ALL12) and one patient with ETV6::RUNX1negative BCP-ALL (ALL18). As a comparison, the two ETV6::RUNX1-positive cell lines AT1 and REH were included. The data are presented as the geometric MFI for IL1RAP-antibody-stained cells divided by the geometric MFI for cells stained with the isotype control antibody. Fpkm: fragments per kilobase of exon per million mapped reads; MNC: mononuclear cells; NBM: normal bone marrow.
Haematologica | 108 February 2023 600 LETTER TO THE EDITOR
Figure 2. IL1RAP antibodies direct NK cells to killing of ETV6::RUNX1-positive B-cell precursor acute lymphoblastic leukemia cells that lack a general response to IL1 or IL33 stimulation. (A) Primary B-cell precursor acute lymphoblastic leukemia (BCP-ALL) cells were incubated overnight in the presence of increasing concentrations of the IL1RAP antibodies mAb81.2 or mAb3F8 or a corresponding hIgG1 isotype control antibody, and primary human NK cells at a 10:1 effector-to-target cell ratio. The results are presented as the number of viable target cells in wells with antibody divided by the number of viable target cells in wells without antibody. ALL5, ALL8, and ALL12 are positive for ETV6::RUNX1 whereas ALL18 represents a negative sample. The antibody-dependent cellular cytotoxicity (ADCC) assay was performed with NK cells from two different donors, and the data are presented as the mean with error bars representing the range. (B) The ADCC assay was performed as described above, with REH and AT1 as target cells. The samples were set in duplicate and repeated three times with NK cells from three different donors. The data are presented as the mean with error bars representing the standard error of mean (SEM). A Student t test was used to determine statistically significant differences between the effect of each IL1RAP antibody concentration and the corresponding isotype antibody control (*P<0.05; **P<0.01; ***P<0.001; ****P<0.0001). (C) ETV6::RUNX1positive patient-derived xenograft (PDX) BCP-ALL cells (second passage) from four patients were cultured in serum-free media in the presence or absence of IL1 or IL33. The analysis was performed in two biological and two technical replicates. The absolute number of viable cells following 72 hours of culture is presented. The dotted line represents the number of seeded cells. Error bars represent the SEM. (D) NFκB phosphorylation in the same four PDX BCP-ALL samples following stimulation for 15 min with 10 ng/mL IL1 or IL33 was analyzed by phospho-flow. In the histograms, “no ck” refers to samples not stimulated with a cytokine. Isotype antibody-stained cells were used as the control. An acute myeloid leukemia sample (AMLx) was included as a positive control for NFκB phosphorylation in response to IL1 stimulation. (E) Phospho-flow analysis of ALL7x cells that were stimulated with IL1 in the absence or presence of 10 mg/mL of the IL1 signaling blocking antibody mAb3F8. The level of pNFκB from three paired replicates is presented, with the individual replicates marked as blue, red, or yellow. (F) NFκB phosphorylation in primary ALL4 and ALL7 cells following stimulation with IL1 or IL33 analyzed by phospho-flow. “No ck” refers to samples not treated with a cytokine. Isotype antibody-stained cells were used as the control.
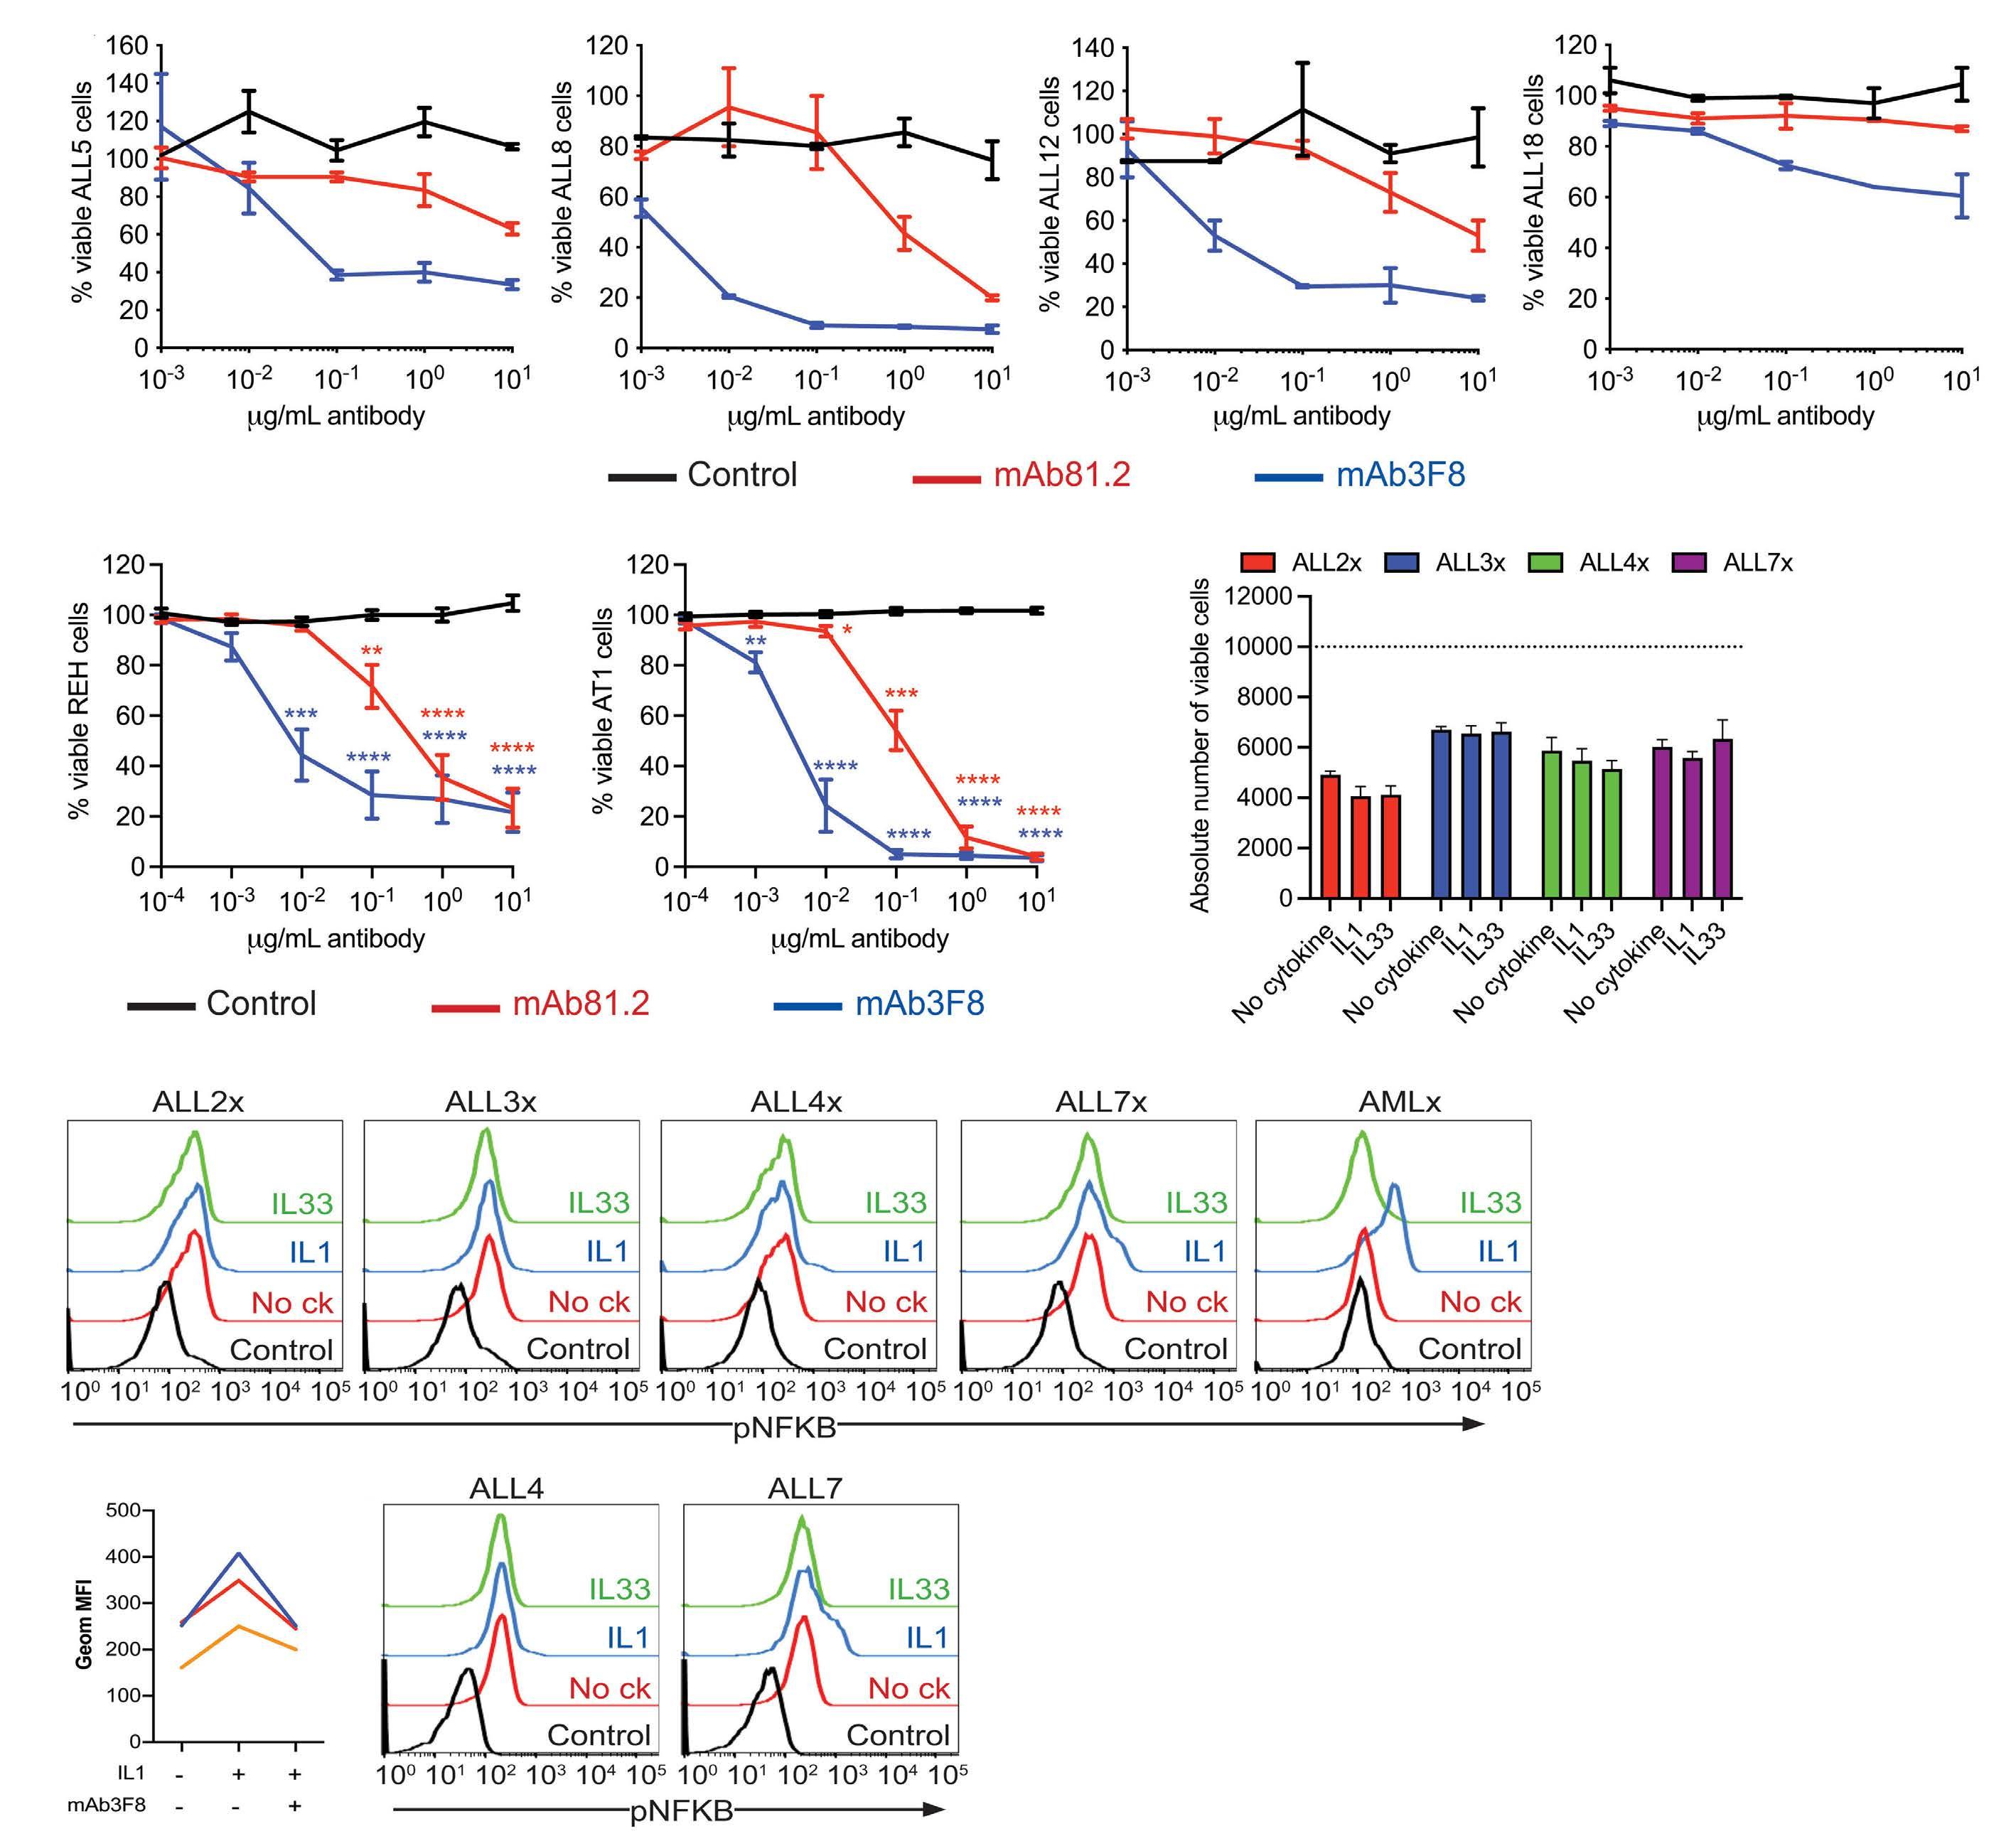
A B C D E F
Haematologica | 108 February 2023 601 LETTER TO THE EDITOR
mentary Figure S2 ). In short-term cultures of the PDX samples, the addition of IL1 or IL33 did not significantly affect the total number of viable cells (Figure 2C). The PDX cells, like the REH and AT1 cells lines, did not show cell surface expression of IL1R1 ( Online Supplementary Figure S3A, B), but as the level of expression of these re-
ceptors may be below the detection limit for flow cytometry, but sufficient to convey signals upon IL1 or IL33 stimulation, we performed phospho-flow cytometric analysis with NF κ B phosphorylation as a marker for IL1RAP-mediated signaling. Upon stimulation with IL1, a partial response was noted only in ALL7x, whereas IL33 did
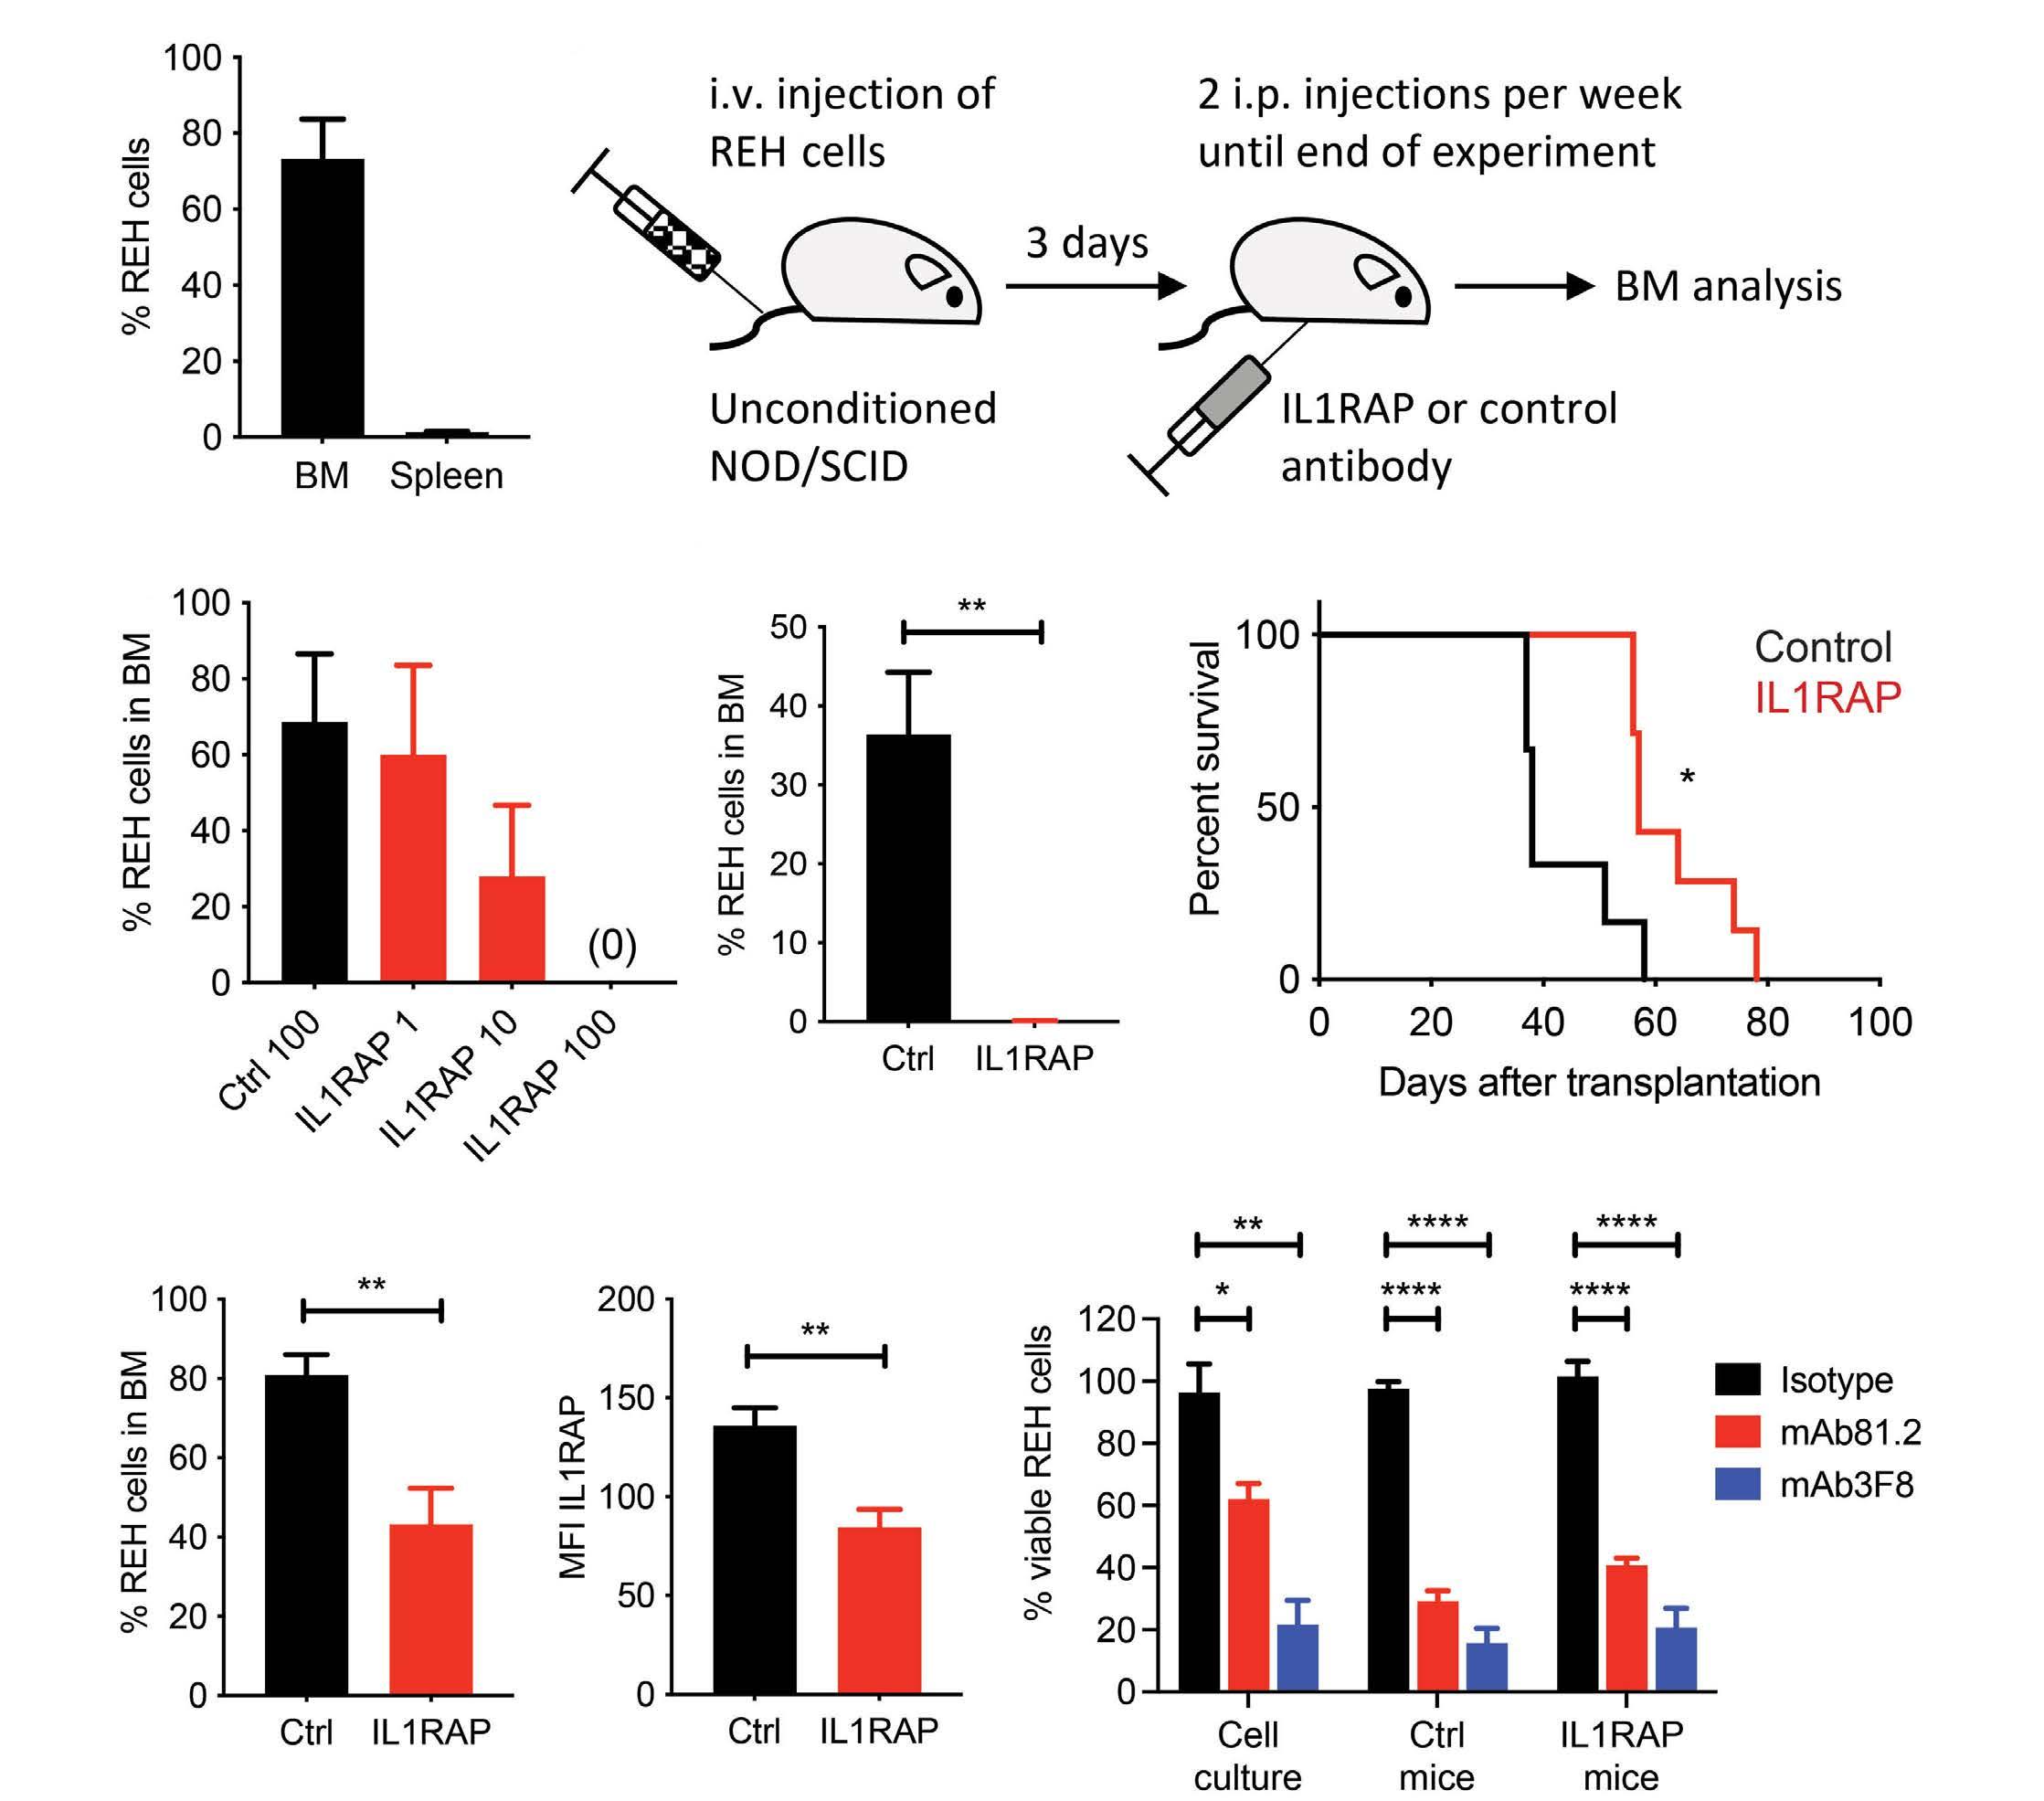
A B D E C G H F
Figure 3. IL1RAP antibodies induce killing of ETV6::RUNX1-expressing B-cell precursor acute lymphoblastic leukemia cells in vivo. (A) Unconditioned NOD/SCID mice were engrafted with REH cells by tail vein injections. At day 42-44 after transplantation the mice (n=5) were euthanized due to disease and displayed a mean of 75% REH cells in bone marrow (BM) as determined by flow cytometry. The spleens contained <1% REH cells. (B) A schematic overview of the antibody treatment model that was used in all in vivo treatment experiments. The antibodies, mAb81.2 or a corresponding mIgG2a isotype control, were distributed biweekly by intraperitoneal injections starting on day 3 after transplantation. The first antibody dose was given as a bolus of a double amount of antibody. (C) REH-engrafted NOD/SCID mice were treated with 1, 10 or 100 mg/dose mAb81.2 or with 100 mg/dose of the isotype control antibody (n=2 per group). The graph shows the mean frequency of REH cells in the BM at the end of the experiment on day 34 after transplantation. Error bars represent the range. (D) REH-engrafted NOD/SCID mice were treated with 50 mg mAb81.2 (n=6) or an isotype control antibody (n=7) per dose, corresponding to approximately 2 mg/kg bodyweight. On day 35 after transplantation the mice were euthanized. The graph shows the frequency of REH cells in the BM. The Mann-Whitney test was used for statistical analysis. (E) For studies of survival, REH-engrafted NOD/SCID mice were treated with 50 mg/dose IL1RAP antibody mAb81.2 (n=7) or isotype control antibody (n=6) and euthanized upon signs of disease. Mice given the control antibody had a median survival of 38 days (range, 37-58 days) and mice treated with mAb81.2 survived a median of 57 days (range, 56-78 days). The log-rank (Mantel-Cox) test was used to determine statistically significant differences between groups. (F) The frequency of REH cells in BM. (G) The expression of IL1RAP on leukemic BM cells. (H) BM cells from two mice treated with IL1RAP antibody and two mice treated with control antibody were incubated overnight in the presence of 10 mg/mL of the IL1RAP antibodies mAb81.2 or mAb3F8 or an isotype control antibody, and primary human NK cells. The results are presented as the number of viable target cells in wells with antibody divided by the number of viable target cells in wells without antibody. An antibody-dependent cellular cytotoxicity assay was performed in duplicate with NK cells from two different donors. REH cells from the cell culture were included for comparison. Unless otherwise stated, the data in Figure 3 are presented as the mean with error bars representing the standard error of mean. A Student t test was used to determine statistical significance following the Shapiro-Wilk test to ascertain Gaussian distribution. *P<0.05; **P<0.01; ***P<0.001; ****P<0.0001. i.v.: intravenous; i.p.: intraperitoneal; Ctrl: control.
Haematologica | 108 February 2023 602 LETTER TO THE EDITOR
not affect the NFκB phosphorylation in any of the samples (Figure 2D). Pre-incubation of ALL7x cells with mAb3F8 or the IL1 receptor antagonist (IL1RA), both known to block IL1 signaling,7 reduced the response to IL1 thereby confirming that NFκB phosphorylation was a specific effect of IL1 stimulation (Figure 2E; Online Supplementary Figure S3C, D). Results from primary ALL4 and ALL7 samples were similar to those of their respective PDX samples (Figure 2F, Online Supplementary Figure S3E). Thus, although IL1RAP-mediated signaling cannot be excluded as biologically important for ETV6::RUNX1-expressing BCP-ALL cells, the potency of a novel IL1RAP-targeting therapy likely primarily relies on the high IL1RAP surface expression demonstrated here to attract agents with cytotoxic potential. To study whether IL1RAP could serve as a therapeutic target on ETV6::RUNX1-expressing cells in vivo, we transplanted PDX cells or REH cells into unconditioned NOD/SCID mice as these, in contrast to the irradiated NSG mice used for the expansion of primary BCP-ALL cells, retain some functional immune cells that can act as effector cells upon treatment with therapeutic antibodies.15 Whereas the PDX samples failed to engraft sufficiently in the unirradiated NOD/SCID strain, transplantation with REH cells led to a reproducible disease with the mice displaying a mean of 75% bone marrow engraftment at day 42-44 after transplantation (Figure 3A). In vivo treatment studies were performed as outlined schematically in Figure 3B. First, a dose titration experiment with three doses of the IL1RAP antibody mAb81.2, ranging from 1 to 100 mg/dose, was performed to determine the dose needed to obtain therapeutic effects. At the end of the experiment on day 34 after transplantation, mice given the isotype control antibody displayed a mean level of 69% leukemic cells in bone marrow (Figure 3C). In contrast, a dose of 10 mg IL1RAP antibody clearly reduced the frequency of leukemic cells (mean 28%) and no leukemic cells could be detected in mice treated with 100 mg IL1RAP antibody (Figure 3C). Based on these results, a dose of 50 mg antibody was selected for the next in vivo experiments in which six mice received IL1RAP antibody and seven the isotype control antibody. When euthanized 35 days after transplantation, mice treated with IL1RAP antibodies had very few leukemic cells in their bone marrow compared to the number in mice given isotype control antibodies (mean: 0.1% vs. 35%) (Figure 3D). To investigate whether targeting BCP-ALL cells with IL1RAP antibodies also translates into increased survival, in the next experiment the mice were euthanized upon the first signs of disease. Notably, mice treated with IL1RAP antibodies had a significantly increased survival compared to control mice (median: 57 vs. 38 days) (Figure 3E). Despite the longer disease latency, the mice treated with IL1RAP antibodies had a lower leukemic cell burden in bone marrow compared to control mice (mean: 43% vs. 81%) (Figure 3F). To determine whether the leukemic cells had lost their
expression of IL1RAP during treatment, a flow cytometric analysis was performed on bone marrow cells. Leukemic cells from mice treated with mAb81.2 retained expression of IL1RAP, albeit at a slightly lower level in control mice, indicating a preferential targeting and killing of IL1RAP highexpressing cells. However, the harvested leukemic bone marrow cells were equally sensitive to ADCC mediated by IL1RAP antibodies (Figure 3G, H; Online Supplementary Figure S3F). We conclude that treatment with IL1RAP antibodies significantly reduces leukemia burden and prolongs survival in mice engrafted with human ETV6::RUNX1-expressing BCP-ALL cells.
In summary, we show here that IL1RAP constitutes a target for antibodies that can induce killing of ETV6::RUNX1-positive BCP-ALL cells by ADCC and that treatment with IL1RAP antibodies in mice engrafted with human ETV6::RUNX1positive BCP-ALL cells reduces leukemia burden. These results suggest that IL1RAP provides a novel therapeutic target in pediatric ETV6::RUNX1-positive BCP-ALL with a possible extension to other genetic subtypes, which together account for about one-third of all BCP-ALL cases.
Authors
Helena Ågerstam,1,2 Henrik Lilljebjörn,1 Marianne Rissler,1 Carl Sandén1 and Thoas Fioretos1,2
1Division of Clinical Genetics, Department of Laboratory Medicine, Lund University, Lund and 2Department of Clinical Genetics and Pathology, Office for Medical Services, Region Skåne, Lund, Sweden
Correspondence:
H. ÅGERSTAM - helena.agerstam@med.lu.se
T. FIORETOS - thoas.fioretos@med.lu.se
https://doi.org/10.3324/haematol.2022.281059
Received: March 16, 2022. Accepted: September 27, 2022. Prepublished: October 13, 2022.
©2023 Ferrata Storti Foundation
Published under a CC BY-NC license
Disclosures
TF is a cofounder and board member of Cantargia AB (Medicon Village, Lund), which develops therapeutic IL1RAP antibodies. Cantargia AB is the owner of the intellectual property rights for agents targeting IL1RAP for use in the treatment and diagnosis of neoplastic hematologic disorders. The other authors do not have any potential conflicts of interest to declare.
Haematologica | 108 February 2023 603 LETTER TO THE EDITOR
Contributions
HÅ and TF designed the study. HÅ, MR, and CS performed the experiments. HÅ, HL, CS, and TF analyzed the data. HÅ wrote the manuscript. HL, MR, CS, and TF critically commented on the manuscript.
Acknowledgments
We thank Cantargia AB for making the IL1RAP antibodies available.
Funding
This work was supported by the Swedish Children’s Cancer Foundation, the Swedish Cancer Society, the Swedish Research Council, the Knut and Alice Wallenberg Foundation, the Magnus Bergvall Foundation, the Royal Physiographic Society, the Medical Faculty of Lund University, and Region Skåne (ALF-medel).
Data-sharing statement
Original data can be made available upon a written request to the corresponding authors.
References
1. Kunstreich M, Kummer S, Laws HJ, Borkhardt A, Kuhlen M. Osteonecrosis in children with acute lymphoblastic leukemia. Haematologica. 2016;101(11):1295-1305.
2. Nielsen SN, Eriksson F, Rosthoej S, et al. Children with low-risk acute lymphoblastic leukemia are at highest risk of second cancers. Pediatr Blood Cancer. 2017;64(10).
3. Tuckuviene R, Ranta S, Albertsen BK, et al. Prospective study of thromboembolism in 1038 children with acute lymphoblastic leukemia: a Nordic Society of Pediatric Hematology and Oncology (NOPHO) study. J Thromb Haemost. 2016;14(3):485-494.
4. Malard F, Mohty M. Acute lymphoblastic leukaemia. Lancet. 2020;395(10230):1146-1162.
5. Si Lim SJ, Grupp SA, DiNofia AM. Tisagenlecleucel for treatment of children and young adults with relapsed/refractory B-cell acute lymphoblastic leukemia. Pediatr Blood Cancer. 2021;68(9):e29123.
6. Ågerstam H, Hansen N, von Palffy S, et al. IL1RAP antibodies block IL-1-induced expansion of candidate CML stem cells and mediate cell killing in xenograft models. Blood. 2016;128(23):2683-2693.
7. Ågerstam H, Karlsson C, Hansen N, et al. Antibodies targeting human IL1RAP (IL1R3) show therapeutic effects in xenograft models of acute myeloid leukemia. Proc Natl Acad Sci U S A. 2015;112(34):10786-10791.
8. Askmyr M, Ågerstam H, Hansen N, et al. Selective killing of
candidate AML stem cells by antibody targeting of IL1RAP. Blood. 2013;121(18):3709-3713.
9. Järås M, Johnels P, Hansen N, et al. Isolation and killing of candidate chronic myeloid leukemia stem cells by antibody targeting of IL-1 receptor accessory protein. Proc Natl Acad Sci U S A. 2010;107(37):16280-16285.
10. Robbrecht D, Jungels C, Sorensen MM, et al. First-in-human phase 1 dose-escalation study of CAN04, a first-in-class interleukin-1 receptor accessory protein (IL1RAP) antibody in patients with solid tumours. Br J Cancer. 2022;126(7):1010-1017.
11. Lilljebjörn H, Henningsson R, Hyrenius-Wittsten A, et al. Identification of ETV6-RUNX1-like and DUX4-rearranged subtypes in paediatric B-cell precursor acute lymphoblastic leukaemia. Nat Commun. 2016;7:11790.
12. Castor A, Nilsson L, Åstrand-Grundström I, et al. Distinct patterns of hematopoietic stem cell involvement in acute lymphoblastic leukemia. Nat Med. 2005;11(6):630-637.
13. Hong D, Gupta R, Ancliff P, et al. Initiating and cancerpropagating cells in TEL-AML1-associated childhood leukemia. Science. 2008;319(5861):336-339.
14. Salles G, Barrett M, Foa R, et al. Rituximab in B-cell hematologic malignancies: a review of 20 years of clinical experience. Adv Ther. 2017;34(10):2232-2273.
15. Shultz LD, Schweitzer PA, Christianson SW, et al. Multiple defects in innate and adaptive immunologic function in NOD/LtSz-scid mice. J Immunol. 1995;154(1):180-191.
Haematologica | 108 February 2023 604 LETTER TO THE EDITOR
Influence of bisphosphonates or recombinant human parathyroid hormone on in vitro sensitivity of acute lymphoblastic leukemia cells to chemotherapy
Osteoporosis and osteonecrosis are serious skeletal side effects during or following treatment of childhood acute lymphoblastic leukemia (ALL).1,2 Osteonecrosis results from impaired blood supply to the bone, which may be caused by intravascular emboli, increased marrow pressure, and/or direct blood vessel injury.2 This condition mainly affects the weight-bearing joints and can result in chronic pain, functional limitations, and articular collapse.3 The exact pathophysiology is not completely understood, but hypercoagulability following exposure to corticosteroids (especially concomitantly with asparaginase) has been shown to be related to the occurrence of osteonecrosis.2 Osteoporosis is induced by the leukemia itself as well as its treatment, and is co-determined by genetic susceptibility.1,4 In addition, it is associated with the occurrence of vertebral and non-vertebral fractures in ALL patients.1
Bisphosphonates, potent antiresorptive agents, are widely used to treat osteoporosis in postmenopausal women and older men, and are increasingly being used used to treat bone fragility due to primary or secondary osteoporosis in children (including those with ALL).5 Although the working mechanism is not completely understood, small (case) studies have reported that bisphosphonates can also ameliorate pain symptoms, enhance musculoskeletal function, and consequently improve mobility in ALL patients with osteonecrosis.6 Furthermore, intermittent administration of recombinant human parathyroid hormone (rhPTH), an anabolic agent, has been shown to increase bone mineral density in postmenopausal women and in children with steroid-treated Duchenne muscular dystrophy.7 Nevertheless, rhPTH has only rarely been used in children and there are currently no studies of rhPTH being used in the pediatric cancer setting due to concerns regarding possible oncogenicity (osteosarcoma) in patients with open epiphyses.7
The influence of bisphosphonates or rhPTH administration on sensitivity to chemotherapy has not been elucidated, since the use of these agents has only been described in small (case) studies, in which no strong evidence for oncological safety has been reported. A recent preclinical study on the effect of zoledronic acid (ZA) on ALL treatment efficacy raises concerns about potential adverse effects of ZA on leukemic drug sensitivity.8 Therefore, we assessed whether in vitro administration of the bonemodifying agents ZA, pamidronic acid (PA), and rhPTH has an impact on the cytotoxic effects of several chemothera-
peutic agents that are commonly used during ALL treatment.
In various T-cell and B-cell leukemia cell lines, methyl-thiazol-tetrazolium (MTT; 3-[4, 5-dimethylthiazoyl-2yl]-2, 5-diphenyltetrazolium bromide; Life Technologies Europe BV, Bleiswijk, the Netherlands) assays were performed to assess leukemia cell viability in vitro. The T-ALL cell lines LOUCY, Jurkat, HBP-ALL, and SupT1 as well as the B-precursor ALL cell lines Reh, RCH-ACV, SUP-B15, RS4;11, and NALM-6 were used (Deutsche Sammlung von Mikroorganismen und Zellkulturen, Braunschweig, Germany). We obtained ZA and PA from Sigma-Aldrich (Schnelldorf, Germany) and Teriparatide (rhPTH [1-34]) from Forsteo®, Eli Lilly Nederland B.V. (Utrecht, the Netherlands). The chemotherapeutic agents vincristine, daunorubicin, dexamethasone, 6-mercaptopurine, pegylated asparaginase, and prednisone were included in the experiments. Experiments were performed to determine potential effects of the single bone-modifying agents on leukemia cell viability. The applied concentration ranges of the bonemodifying agents were based on previous pharmacokinetics studies in adult patients9-11 (as these studies were not available in children), and we used the measured peak plasma concentrations after typically prescribed doses as a reference. Subsequently, to test potential effects of the bone-modifying agents on chemotherapeutic agent-induced cytotoxicity, leukemia cell suspensions with or without a fixed concentration of ZA, PA, or rhPTH were added to 96-well U-bottomed plates with a serial dilution of the chemotherapeutic agents. These fixed concentrations were 1.25 mg/mL (5-fold peak plasma concentration), 10 mg/mL (5-fold), and 0.002 mg/mL (15-fold) for ZA, PA, and rhPTH, respectively. In addition, experiments with 1-, 3-, or 5-fold peak plasma concentrations of ZA or PA were performed for dexamethasone as well as prednisone in a subset of the leukemia cell lines (SupT1, SUP-B15, RS4;11, and NALM-6). The 50th percentile of the maximal inhibitory concentration (IC50) of the chemotherapeutic agents, the bone-modifying agents, and the chemotherapeutic agents in combination with the bone-modifying agents were determined for each leukemia cell line. The combination index method as described by Chou12 was used to quantify the combined effects of the chemotherapeutic agents and bone-modifying agents on the chemotherapeutic agent-induced cytotoxicity. We considered a median combination index of <0.90 as synergism and >1.10 as antagonism. Calculations were
Haematologica | 108 February 2023 605 LETTER TO THE EDITOR
conducted in R (Vienna, Austria). We investigated potential effects of the bone-modifying agents ZA, PA, and rhPTH on leukemia cell viability as well as on cytotoxic responses to the chemotherapeutic agents in vitro. ZA, PA, and rhPTH, as single agents, showed no direct cytotoxic effects on leukemia cell viability in all T-ALL and B-precursor ALL cell lines within ranges of plasma concentrations achieved in patients during clinical application, nor at the intended fixed concentrations (Figure 1). In the dexamethasone-resistant leukemia cell lines (i.e., LOUCY, Jurkat, HPB-ALL, Reh, and RCH-ACV) as well as in the 6-mercaptopurine-resistant leukemia cell line (i.e., Reh) IC50 values were not reached. Therefore, potential synergistic or antagonistic effects of ZA, PA, or rhPTH on the cytotoxic responses to dexamethasone and 6-mercaptopurine could not be determined in these cell lines. Administration of ZA, PA, or rhPTH at the intended fixed concentrations in combination with daunorubicin, 6-mercaptopurine, or pegylated asparaginase showed median combination index values between 0.90-1.10, indicating no synergistic or antagonistic effect. However, dexamethasone in combination with ZA or PA at a 5-fold peak plasma concentration resulted in median combination index
Figure 1. Leukemia cell viability (%) after treatment with bonemodifying agents. (A) Dose-response curves for all T-cell acute lymphoblastic leukemia (ALL) and B-precursor ALL cell lines after 4 days of exposure to 0.050-156.3 mg/mL zoledronic acid. (B) Dose-response curves for all T-ALL or B-precursor ALL cell lines after 4 days of exposure to 0.400-1250 mg/mL pamidronic acid. (C) Dose-response curves for all T-ALL or B-precursor ALL cell lines after 4 days of exposure to 0.0004-1.3 mg/mL recombinant human parathyroid hormone (rhPTH). The experimental conditions in this experiment were performed in duplicate. Data are presented as the mean of these duplicate conditions. The dashed red line represents the IC50 value. The leukemia cell lines included were: LOUCY (T-ALL), Jurkat (T-ALL), HBP-ALL (T-ALL with HOX11L2/TLX3-BCL11B), SupT1 (T-ALL), Reh (ETV6RUNX1, BCP-ALL), RCH-ACV (E2A-PBX), SUP-B15 (BCR-ABL1), RS4;11 (MLL-AF4), and NALM-6 (B-precursor ALL). Cmax: peak plasma concentration (as achieved in patients during clinical application); rhPTH: recombinant human parathyroid hormone.
values of 1.153 and 1.343, which may point towards a slight antagonistic and moderate antagonistic effect, respectively. For rhPTH the effect in combination with dexamethasone was 0.9610 (Figure 2, Online Supplementary Table S1). Despite the fact that these fixed concentrations will not be readily attained in the plasma of patients, we performed additional experiments with 1-, 3-, and 5-fold peak plasma concentrations of ZA or PA in leukemia cells exposed to dexamethasone or prednisone to investigate whether this was a general effect of corticosteroids or a dexamethasone-specific effect. ZA and PA at 1- and 3-fold peak plasma concentrations did not seem to negatively influence either dexamethasone- or prednisone-induced cell death, with median combination index values between 0.90-1.10. However, dexamethasone-exposed leukemia cells in combination with a 5-fold peak plasma concentration of ZA or PA repeatedly showed median combination index values above 1.10 (1.150 and 1.336, respectively) (Figure 3, Online Supplementary Table S2). In addition, our results indicate that ZA, PA, and rhPTH in combination with vincristine treatment act antagonistically rather than synergistically, with median combination index values of 1.192, 1.926, and 2.719, respectively. However, due to pronounced
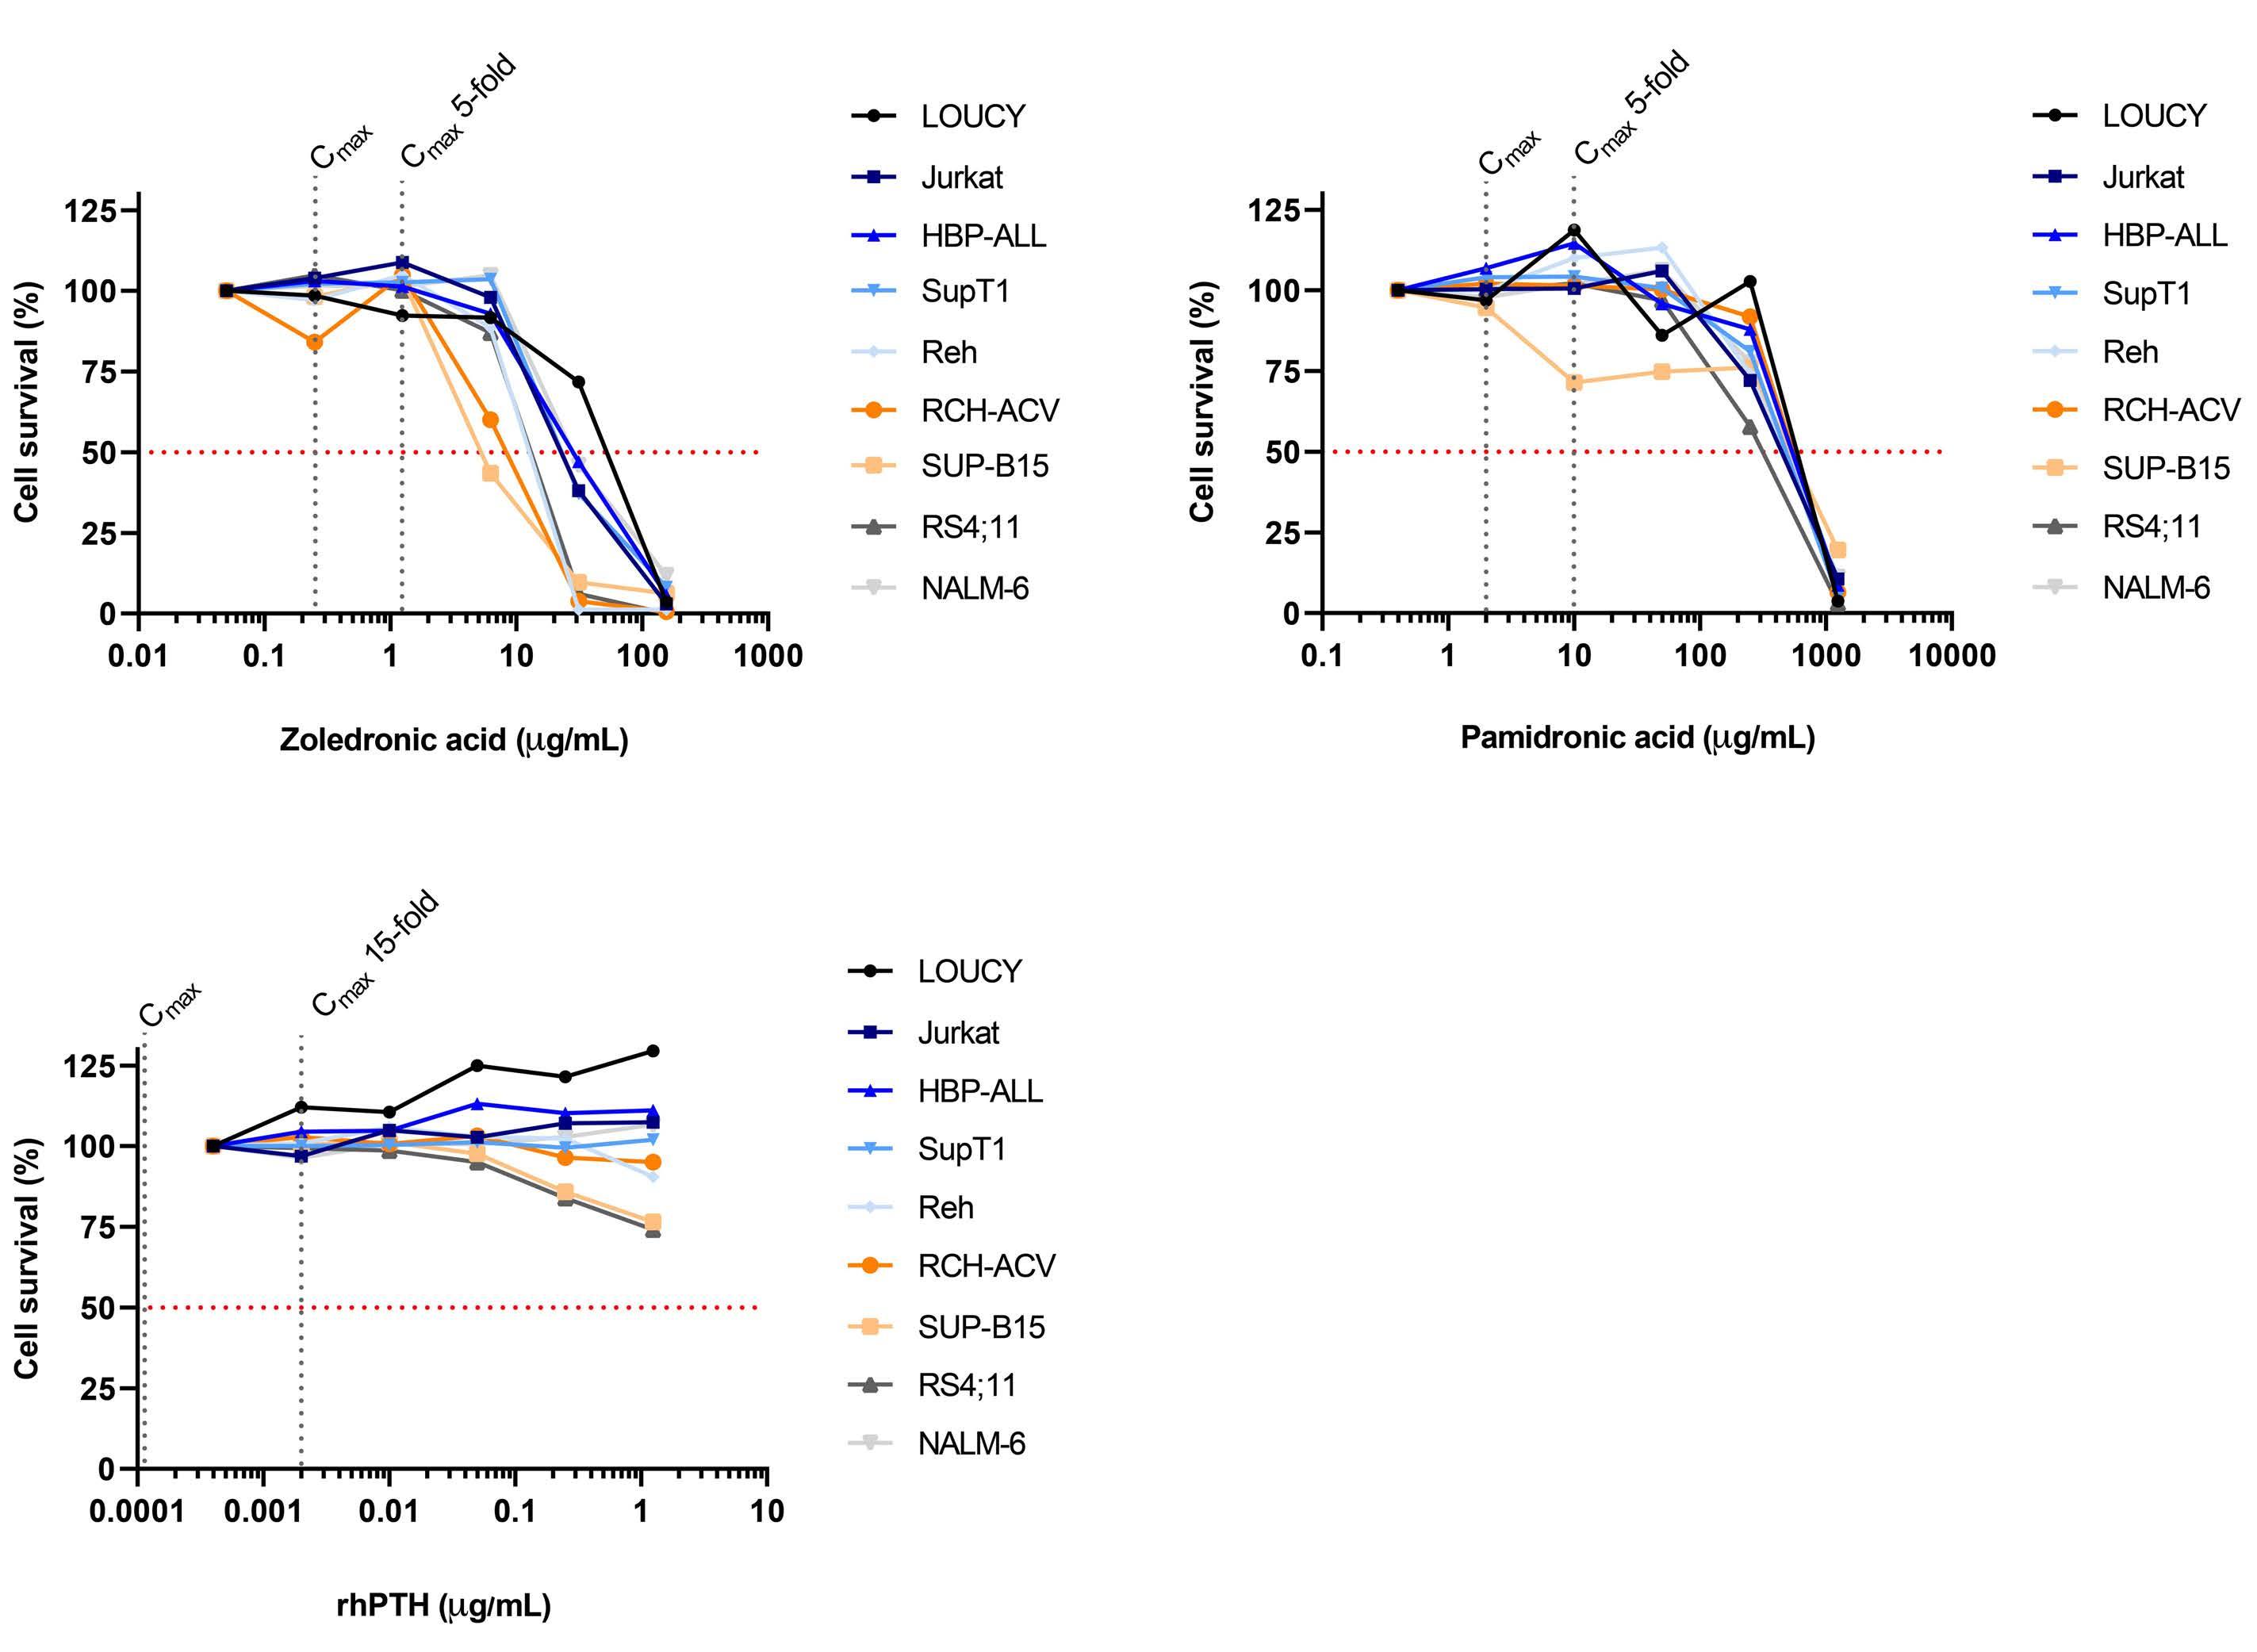
A C B
Haematologica | 108 February 2023 606 LETTER TO THE EDITOR
variability across three independent experiments, it was not possible to obtain reproducible effects of the bonemodifying agents on sensitivity to vincristine (Online Supplementary Table S1, Online Supplementary Figure S1).
Our results support the concerns raised by Janke et al., who observed that ZA may reduce the antileukemic efficacy of dexamethasone and pegylated asparaginase in immunocompetent murine ALL models,8 although they were unable to identify the exact mechanism behind this effect. Bisphosphonates accumulate in bone, due to extensive uptake shortly after intravenous infusion, and once embedded, due to slow release (>120 days).13 We hypothesize that leukemia cells and chemotherapeutic agents may be in close contact with (high concentrations of) bisphosphonates in bone tissue, as the osteoblastic bone marrow niches, which are localized near the inner bone surface,
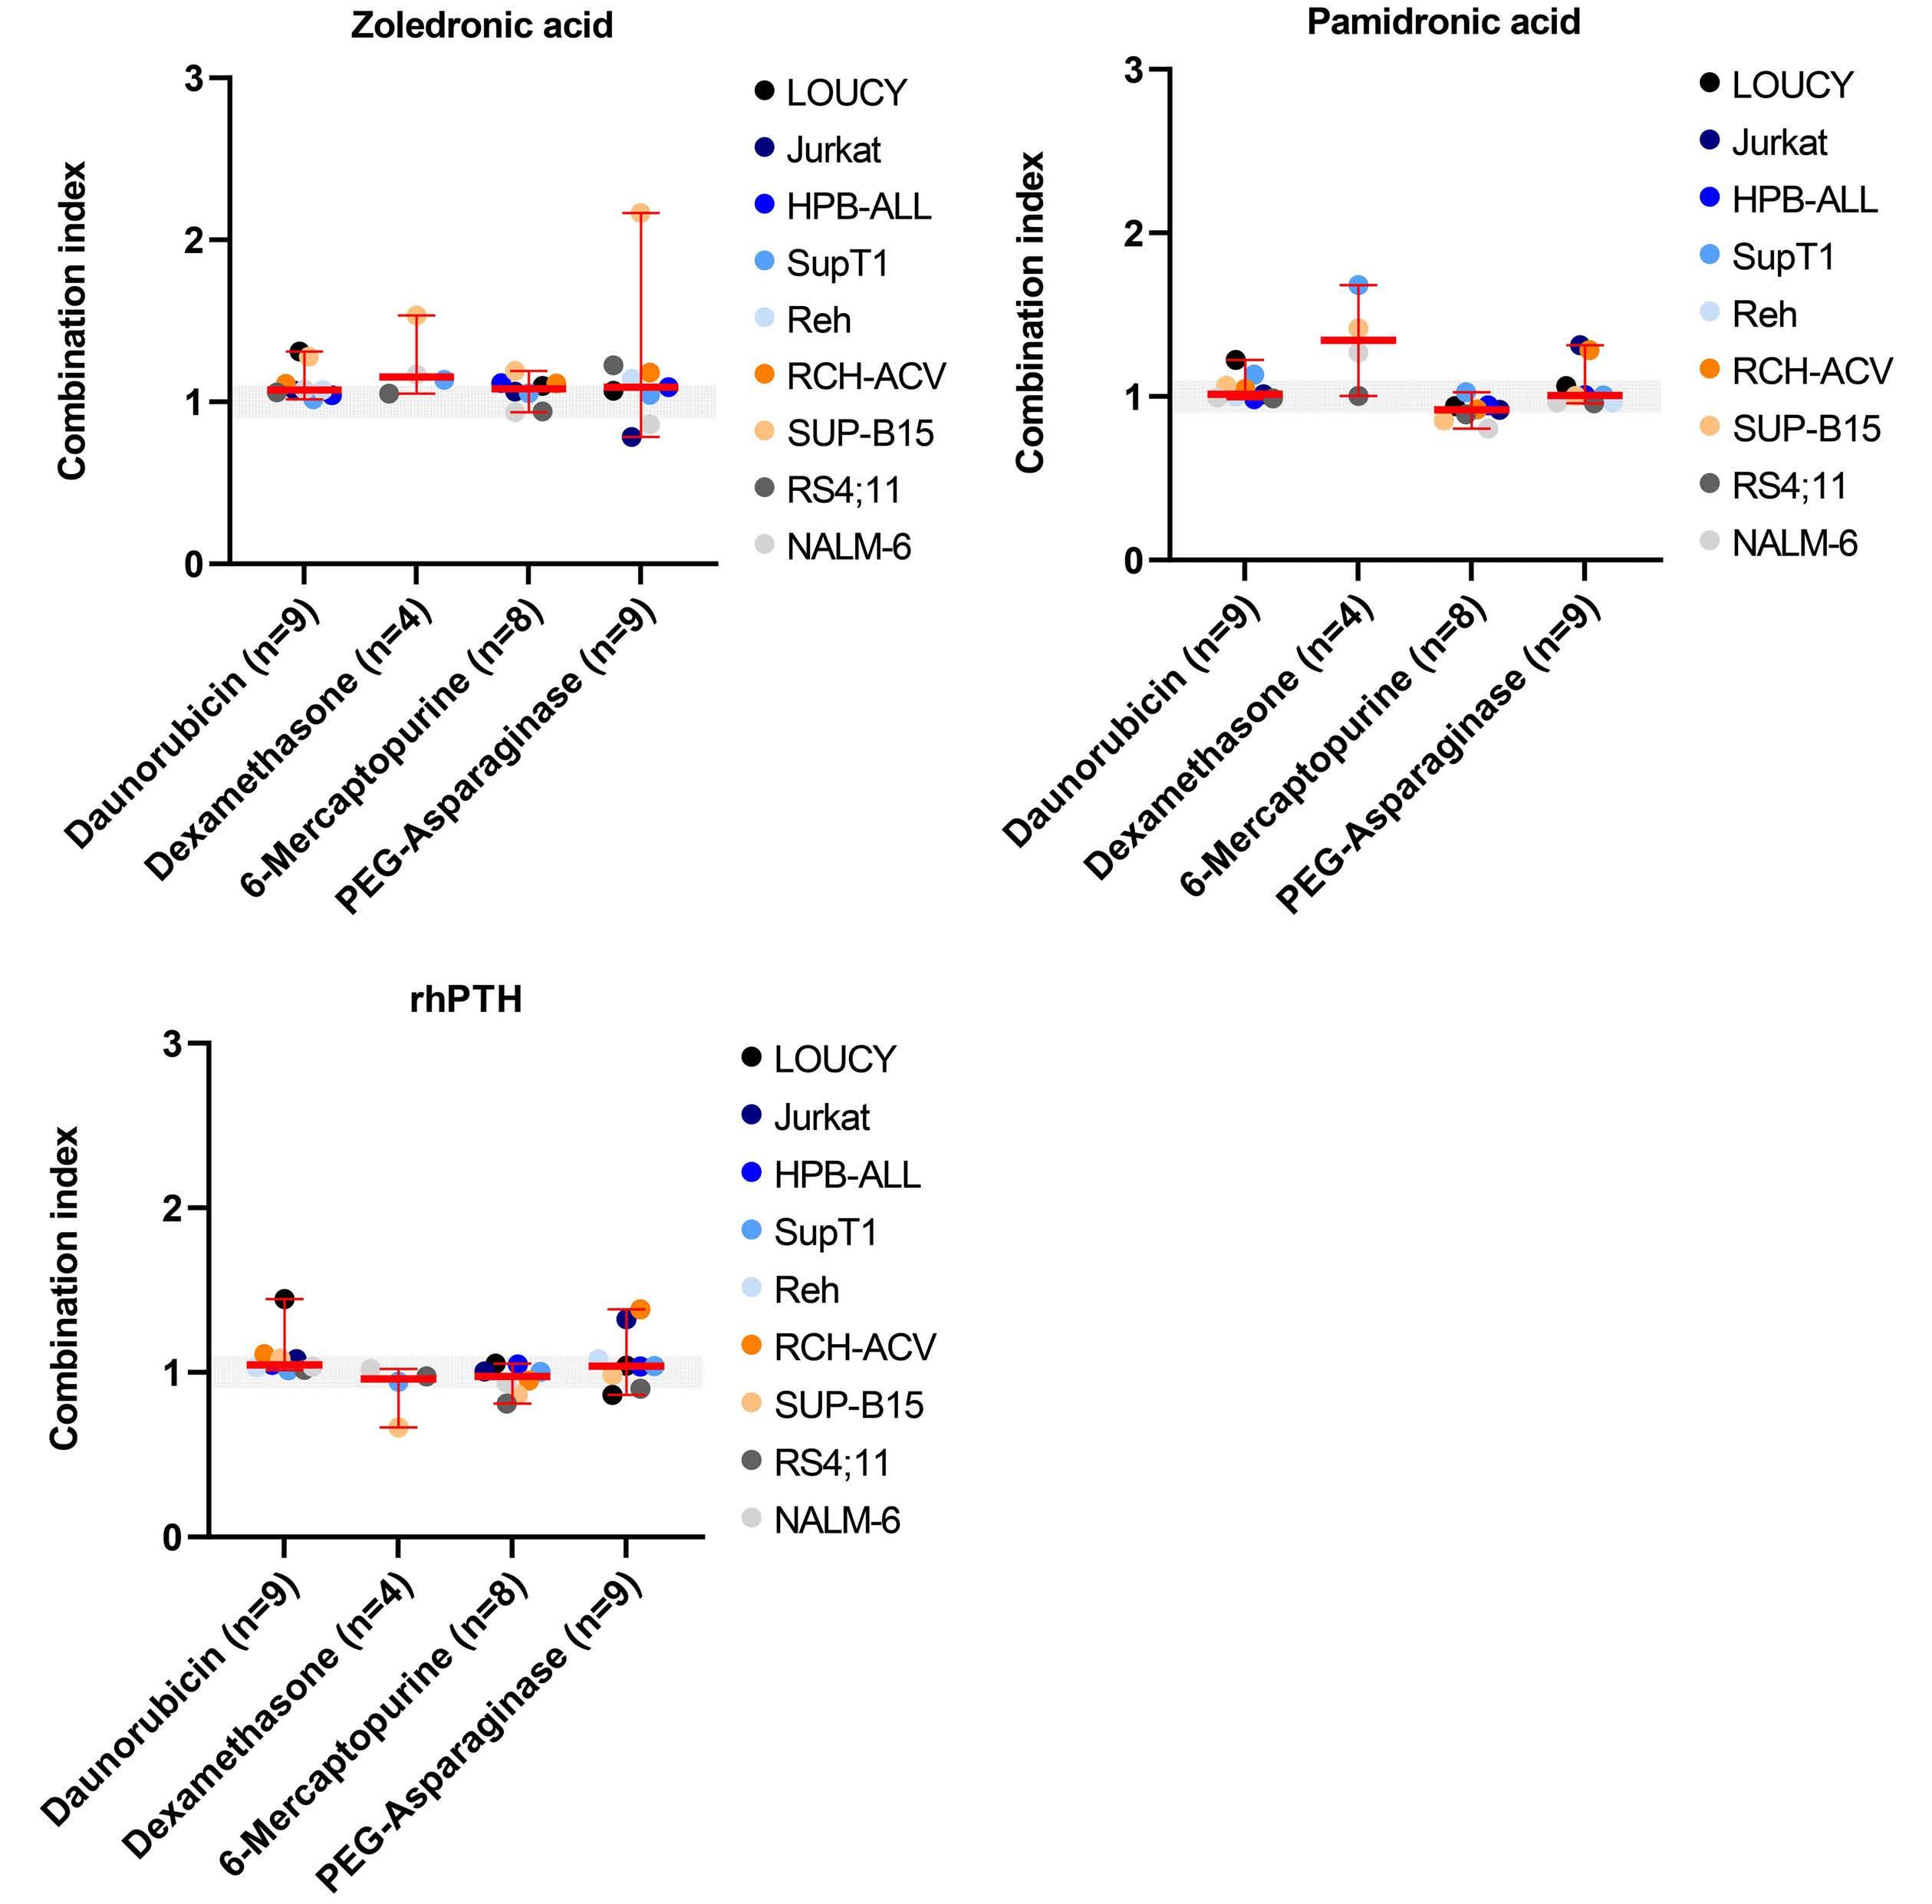
A C
are notorious for harboring leukemia cells as well as chemotherapeutic agents.14 This could potentially be the interphase where leukemia cells are exposed to higher levels of bisphosphonates, thereby influencing the drug sensitivity to a greater extent than measured in our experiments in which 1-, 3-, or 5-fold peak plasma concentrations were used. On the other hand, newly formed bone in the interface between bisphosphonate infusions is bisphosphonate-naïve during growth in the juvenile skeleton,15 because bisphosphonates that are not rapidly taken up by bone will be excreted by the kidneys rapidly after administration.9,10 This suggests that alternate administration of dexamethasone and bisphosphonates (ZA or PA) may be safe and that administration does not have adverse effects on the sensitivity of leukemia cells to chemotherapy. However, there is currently no definitive evidence
B
Figure 2. Scatterplots of the combination index values for individual leukemia cell lines and the median combination index (and range) for all leukemia cell lines combined. (A) Scatterplot for the combined treatment of zoledronic acid and daunorubicin, dexamethasone, 6-mercaptopurine, or peglyated-asparaginase (PEG-asparaginase). (B) Scatterplot for the combined treatment of pamidronic acid and daunorubicin, dexamethasone, 6-mercaptopurine, or PEG-asparaginase. (C) Scatterplot for the combined treatment of recombinant human parathyroid hormone (rhPTH) and daunorubicin, dexamethasone, 6-mercaptopurine, or PEG-asparaginase. Each dot on the scatterplot represents the combination index value for individual T-cell acute lymphoblastic leukemia or B-precursor cell lines. Data are presented as the mean combination index of three independent experiments conducted on different days. The median and range for all leukemia cell lines combined are presented in red. rhPTH: recombinant human parathyroid hormone.
Haematologica | 108 February 2023 607 LETTER TO THE EDITOR
to support the hypothesis that interference of high concentrations of accumulated bisphosphonates in bone tissue with leukemia therapy can be avoided. Hence, preclinical experiments that study the interactions in the bone microenvironment and clinical follow-up studies that assess the frequency of relapse in children with ALL who received bisphosphonates are necessary to provide further
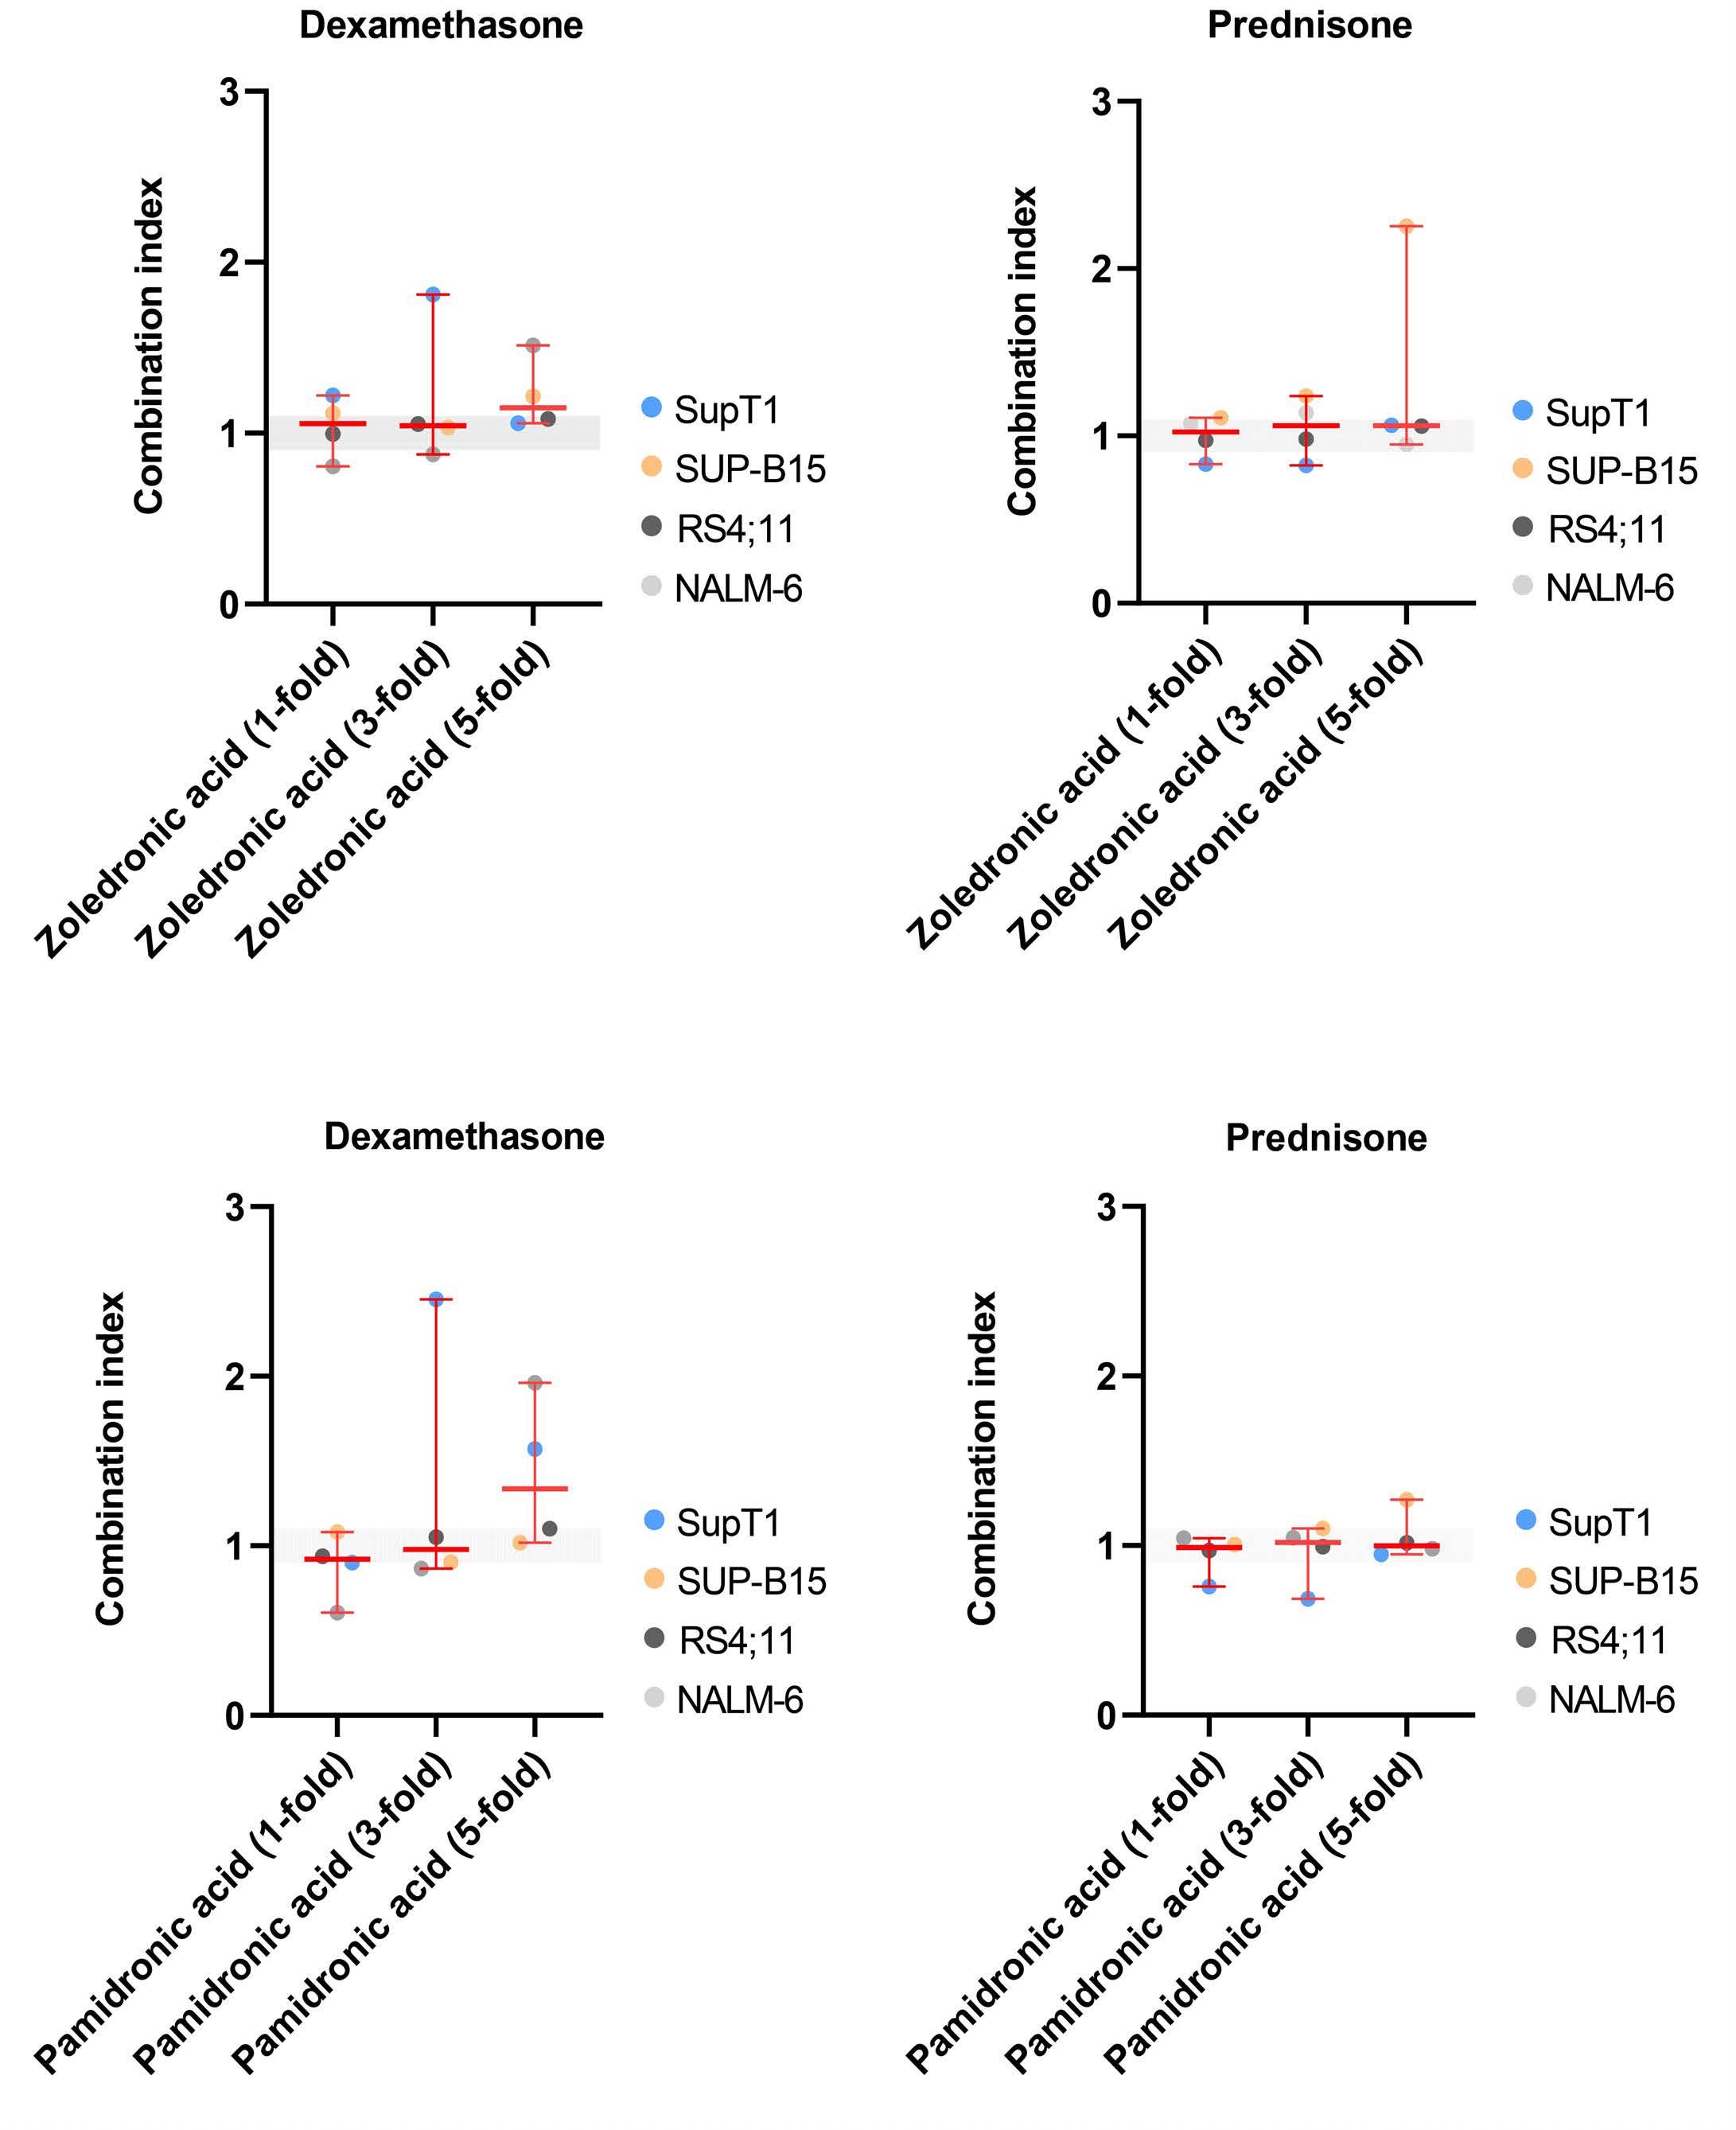
insight.
In conclusion, we showed that ZA, PA, and rhPTH, as single agents, did not have direct cytotoxic effects on leukemia cell viability at any dosage. Furthermore, in vitro administration of ZA, PA, and rhPTH did not seem to affect the leukemic drug sensitivity of daunorubicin, 6-mercaptopurine, and pegylated asparaginase. However, when using 5-
Figure 3. Scatterplots of the combination index values for individual leukemia cell lines and the median combination index (and range) for all leukemia cell lines combined. (A) Scatterplot for the combined treatment of zoledronic acid (at 1-, 3-, or 5-fold peak plasma concentration) and dexamethasone. (B) Scatterplot for the combined treatment of zoledronic acid (at 1-, 3-, or 5-fold peak plasma concentration) and prednisone. (C) Scatterplot for the combined treatment of pamidronic acid (at 1-, 3-, or 5-fold peak plasma concentration) and dexamethasone. (D) Scatterplot for the combined treatment of pamidronic acid (at 1-, 3-, or 5-fold peak plasma concentration) and prednisone. Each dot on the scatterplot represents the combination index value for individual T-cell acute lymphoblastic leukemia or B-precursor cell lines. Data are presented as the mean combination index of three independent experiments conducted on different days. The median and range for all leukemia cell lines combined are presented in red.
A C D B
Haematologica | 108 February 2023 608 LETTER TO THE EDITOR
fold peak plasma concentrations, we observed that ZA and PA had a slight and moderate antagonistic effect, respectively, on dexamethasone-induced cell death. Our results underscore the caution required when using these bonemodifying agents in children with ALL (especially for dexamethasone in combination with ZA or PA), and support the current clinical practice of administering them only in highly selected cases (preferably in clinical trial settings). Moreover, it is still questionable how effective these bone-modifying agents are in ALL patients with (severe) osteonecrosis, as no large studies with high quality evidence are available.
Authors
Demi T.C. de Winter,1 Jenneke E. van Atteveld,1 Jessica G.C.A.M. Buijs-Gladiness,1 Rob Pieters,1 Sebastian J.C.M.M. Neggers,1,2 Jules P.P. Meijerink1,3 and Marry M. van den Heuvel-Eibrink1
1Princess Máxima Center for Pediatric Oncology, Utrecht; 2Department of Endocrinology, Erasmus Medical Center, Rotterdam and 3Acerta-Pharma (belonging to the AstraZeneca Group), Oss, the Netherlands.
Correspondence: D.T.C. DE WINTER - d.t.c.dewinter-2@prinsesmaximacentrum.nl
References
1. van der Sluis IM, van den Heuvel-Eibrink MM, Hählen K, Krenning EP, de Muinck Keizer-Schrama SM. Altered bone mineral density and body composition, and increased fracture risk in childhood acute lymphoblastic leukemia. J Pediatr. 2002;141(2):204-210.
2. Kunstreich M, Kummer S, Laws H-J, Borkhardt A, Kuhlen M. Osteonecrosis in children with acute lymphoblastic leukemia. Haematologica. 2016;101(11):1295.
3. te Winkel ML, Pieters R, Hop WC, et al. Prospective study on incidence, risk factors, and long-term outcome of osteonecrosis in pediatric acute lymphoblastic leukemia. J Clin Oncol. 2011;29(31):4143-4150.
4. te Winkel ML, van Beek RD, de Muinck Keizer-Schrama SM, et al. Pharmacogenetic risk factors for altered bone mineral density and body composition in pediatric acute lymphoblastic leukemia. Haematologica. 2010;95(5):752.
5. Bachrach LK, Ward LM. Clinical review: bisphosphonate use in childhood osteoporosis. J Clin Endocrinol Metab. 2009;94(2):400-409.
6. Daneshdoost SM, El Abiad JM, Ruble KJ, et al. Bisphosphonate therapy for treating osteonecrosis in pediatric leukemia patients: a systematic review. J Pediatr Hematol Oncol. 2021;43(3):e365.
7. Nasomyont N, Keefe C, Tian C, et al. Safety and efficacy of teriparatide treatment for severe osteoporosis in patients with Duchenne muscular dystrophy. Osteoporos Int. 2020;31(12):2449-2459.
https://doi.org/10.3324/haematol.2022.281033
Received: March 10, 2022. Accepted: September 27, 2022. Prepublished: October 13, 2022.
©2023 Ferrata Storti Foundation
Published under a CC BY-NC license
Disclosures
No conflicts of interest to disclose.
Contributions
DTCdW, JEvA, JGCAMB-G, SJCMMN, JPPM, and MMvdH-E contributed to the design of the study. DTCdW and JGCAMB-G contributed to data acquisition. DTCdW, JEvA, JGCAMB-G, SJCMMN, JPPM, and MMvdH-E contributed to data analysis and interpretation. DTCdW, JEvA, JGCAMB-G, SJCMMN, JPPM, and MMvdH-E drafted the manuscript. DTCdW, JEvA, JGCAMB-G, RP, SJCMMN, JPPM, and MMvdH-E reviewed the manuscript and were involved in critical revision of the manuscript for important intellectual content.
Data-sharing statement
Original data are available from the corresponding author on reasonable request.
8. Janke LJ, Kim J, Payton MA, et al. Effects of zoledronic acid on osteonecrosis and acute lymphoblastic leukemia treatment efficacy in preclinical models. Pediatr Blood Cancer. 2021;68(10):e29183.
9. Chen T, Berenson J, Vescio R, et al. Pharmacokinetics and pharmacodynamics of zoledronic acid in cancer patients with bone metastases. J Clin Pharmacol. 2002;42(11):1228-1236.
10. Berenson JR, Rosen L, Vescio R, et al. Pharmacokinetics of pamidronate disodium in patients with cancer with normal or impaired renal function. J Clin Pharmacol. 1997;37(4):285-290.
11. Daddona PE, Matriano JA, Mandema J, Maa Y-F. Parathyroid hormone (1-34)-coated microneedle patch system: clinical pharmacokinetics and pharmacodynamics for treatment of osteoporosis. Pharm Res 2011;28(1):159-165.
12. Chou T-C. Theoretical basis, experimental design, and computerized simulation of synergism and antagonism in drug combination studies. Pharm Rev. 2006;58(3):621-681.
13. Weiss HM, Pfaar U, Schweitzer A, Wiegand H, Skerjanec A, Schran H. Biodistribution and plasma protein binding of zoledronic acid. Drug Metab Dispos. 2008;36(10):2043-2049.
14. Chiarini F, Lonetti A, Evangelisti C, et al. Advances in understanding the acute lymphoblastic leukemia bone marrow microenvironment: from biology to therapeutic targeting. Biochim Biophys Acta. 2016;1863(3):449-463.
15. Land C, Rauch F, Glorieux FH. Cyclical intravenous pamidronate treatment affects metaphyseal modeling in growing patients with osteogenesis imperfecta. J Bone Miner Res. 2006;21(3):374-379.
Haematologica | 108 February 2023 609 LETTER TO THE EDITOR
Impact of daratumumab-based induction on stem cell collection parameters in Swedish myeloma patients
Autologous stem cell transplantation (ASCT) is still considered the golden standard of therapy for younger fit patients with newly diagnosed multiple myeloma (NDMM) even in the era of novel induction regimens as it has led to longer progression-free survival in recent trials.1,2 Recently, two randomized trials evaluated the addition of the anti-CD38 antibody daratumumab to induction and proved that this induces deeper and more durable responses.3,4 In order to perform ASCT, patient’s stem cells need to be collected after a few cycles of induction. Either “steady state” mobilization with cytokines such as filgrastim (G-CSF) or mobilization using chemotherapy such as cyclophosphamide 2-4 g/m2 followed by G-CSF has been used for this purpose.5,6 Plerixafor is used as rescue to patients who mobilize poorly after G-SCF or preemptive when high risk for poor mobilization exists.7,8 A minimum of 2x10⁶ CD34+ cells/kg need to be collected prior to and reinfused after high dose melphalan to ensure adequate bone marrow function after ASCT.5 As a significant portion of myeloma patients can be subjected to tandem ASCT at first line or second ASCT at first relapse the goal often is to collect at least 4x10⁶ CD34+ cells/kg. It has previously been reported9-11 that the addition of daratumumab to induction led to increased use of plerixafor and lower yields of collected CD34+ cells/kg.
In this retrospective study by the Swedish myeloma group, we aimed to report the impact of the addition of daratumumab to induction therapy prior to ASCT on stem cell collection parameters in a real-world population with NDMM.
NDMM patients who proceeded to stem cell mobilization and apheresis at six transplantation centers at different regions in Sweden between February 2020 to November 2021 were included in the study. Upon approval by the Swedish Ethical Committee, local representatives of the Swedish myeloma group retrospectively collected data regarding baseline characteristics, induction regimen, response grade after induction according to the latest IMWG update,12 mobilization regimen and stem cell collection parameters. Patients with missing apheresis data or switching from a non-daratumumab to a daratumumabcontaining induction regimen were excluded. The policy for the use of daratumumab in induction was the same in all the centers as recommended by the Swedish Myeloma Guidelines.
The patients were divided in two groups: daratumumabtreated (patients receiving daratumumab in induction) and non-daratumumab-treated (patients not receiving dara-
tumumab in induction). The primary outcome was mean CD34+ cells/kg collected by apheresis. Secondary outcomes were the proportion of patients being able to collect >4x10⁶ cells/kg, median days of apheresis, the use of plerixafor as rescue to mobilize stem cells and the proportion of patients failing to mobilize stem cells at all. All the centers had a similar policy regarding stem cell collection method and plerixafor use without changes during the study’s observation period. Optia® continuous mononuclear collection (CMNC) system was used for apheresis. A standard washout period of 2 weeks from the end of the last induction cycle to the start of the mobilization regimen was applied. Plerixafor was only used as rescue in case of CD34+ cells/mL < 20,000 in the peripheral blood at the day of planned apheresis. A total of 217 patients were included in the study. Ninetytwo (42%) of the patients received daratumumab-containing induction. Online Supplementary Tables S1 and S2 in the Online Supplementary Appendix summarize baseline characteristics as well as induction and mobilization parameters. There were no significant differences between the two groups regarding median age, presence of anemia, hypercalcemia, bone disease at diagnosis as well as bone marrow plasmocytosis, presence of high risk cytogenetics and ISS stage. Equal number of patients in the two groups received radiation during the induction period. The median age was 61 for daratumumab-treated and 63 for non-daratumumab-treated patients. A slightly higher proportion of daratumumab-treated patients had renal failure at diagnosis (21% vs. 10%, P=0.052). There was a significantly higher percentage of patients treated with lenalidomide in the non-daratumumab group and thalidomide in the daratumumab group as part of induction. The most common used induction regimen in the non-daratumumab group was VRD (bortezomib, lenalidomide, and dexamethasone) (72% of patients). In the daratumumab group, 53 patients (57%) were treated with D-VTd (bortezomib/thalidomide/dexamethasone )and 34 (37%) with D-VRd. Use of alkylators in induction, mainly cyclophosphamide, was slightly higher in non-daratumumab-treated patients but limited to only a few patients in each group. A higher percentage of daratumumab-treated patients achieved ≥ VGPR at the end of induction (86% vs. 66%, P=0.001). Steady-state mobilization was used in 12% of daratumumab treated compared to 3% of non-daratumumab treated patients (P=0.015).
The mean value of CD34+ x106 cells/kg was significantly lower in patients treated with daratumumab as part of in-
Haematologica | 108 February 2023 610 LETTER TO THE EDITOR
duction, 5.14x10⁶ cells/kg compared to 7.22x10⁶ cells/kg in the non-daratumumab-treated population (P<0.001, calculated by independent-samples t-test). Eighty-six percent of non-daratumumab-treated patients were able to collect >4x10⁶ CD34+ cells/kg in comparison to 76% of daratumumab-treated patients (P=0.051) (Figure 1; Table 1). When comparing the impact of different induction regimens in daratumumab-treated patients (D-VRd vs. DVTd) on the mean value of collected stem cells, no significant difference was observed (5.06x10⁶ vs. 5.14x10⁶ CD34+ cells/kg, P=0.894).
Besides the use of daratumumab in induction, other factors with a statistically significant negative impact on the mean values of collected CD34+ cells in univariate analysis were age >60 years and use of thalidomide or radiation in induction while use of lenalidomide in induction led to a higher mean value of collected CD34+ cells. Sex, alkylator use in induction, number of induction cycles, depth of response at the time of apheresis and use of cyclophosphamide in mobilization had no significant effect on
stem cell yield (Table 2).
Factors with statistically significant impact on the primary outcome in univariate analysis were tested in a multivariate analysis using linear regression. Only the use of daratumumab in induction, age >60 years and radiation during induction proved to significantly affect the study’s primary outcome (Table 2).
Five daratumumab-treated patients completely failed to mobilize stem cells compared to just one non-daratumumab-treated patient but this result was not statistically significant (P=0.085). Median days of apheresis were 2 in daratumumab and 1 in non-daratumumab group (P=0.018). There was a significant difference even in mean days of apheresis between the two groups (1.65 days for daratumumab treated vs. 1.42 days for non-daratumumab treated patients, P=0.031). Fourteen daratumumabtreated patients (15%) needed >2 days of apheresis to collect the desired amount of CD34+ cells/kg while only nine (7%) non-daratumumab-treated patients needed >2 days (P=0.074). Plerixafor use as rescue was significantly higher
Figure 1. The impact of daratumumab on mean collected stem cells and rescue use of plerixafor.
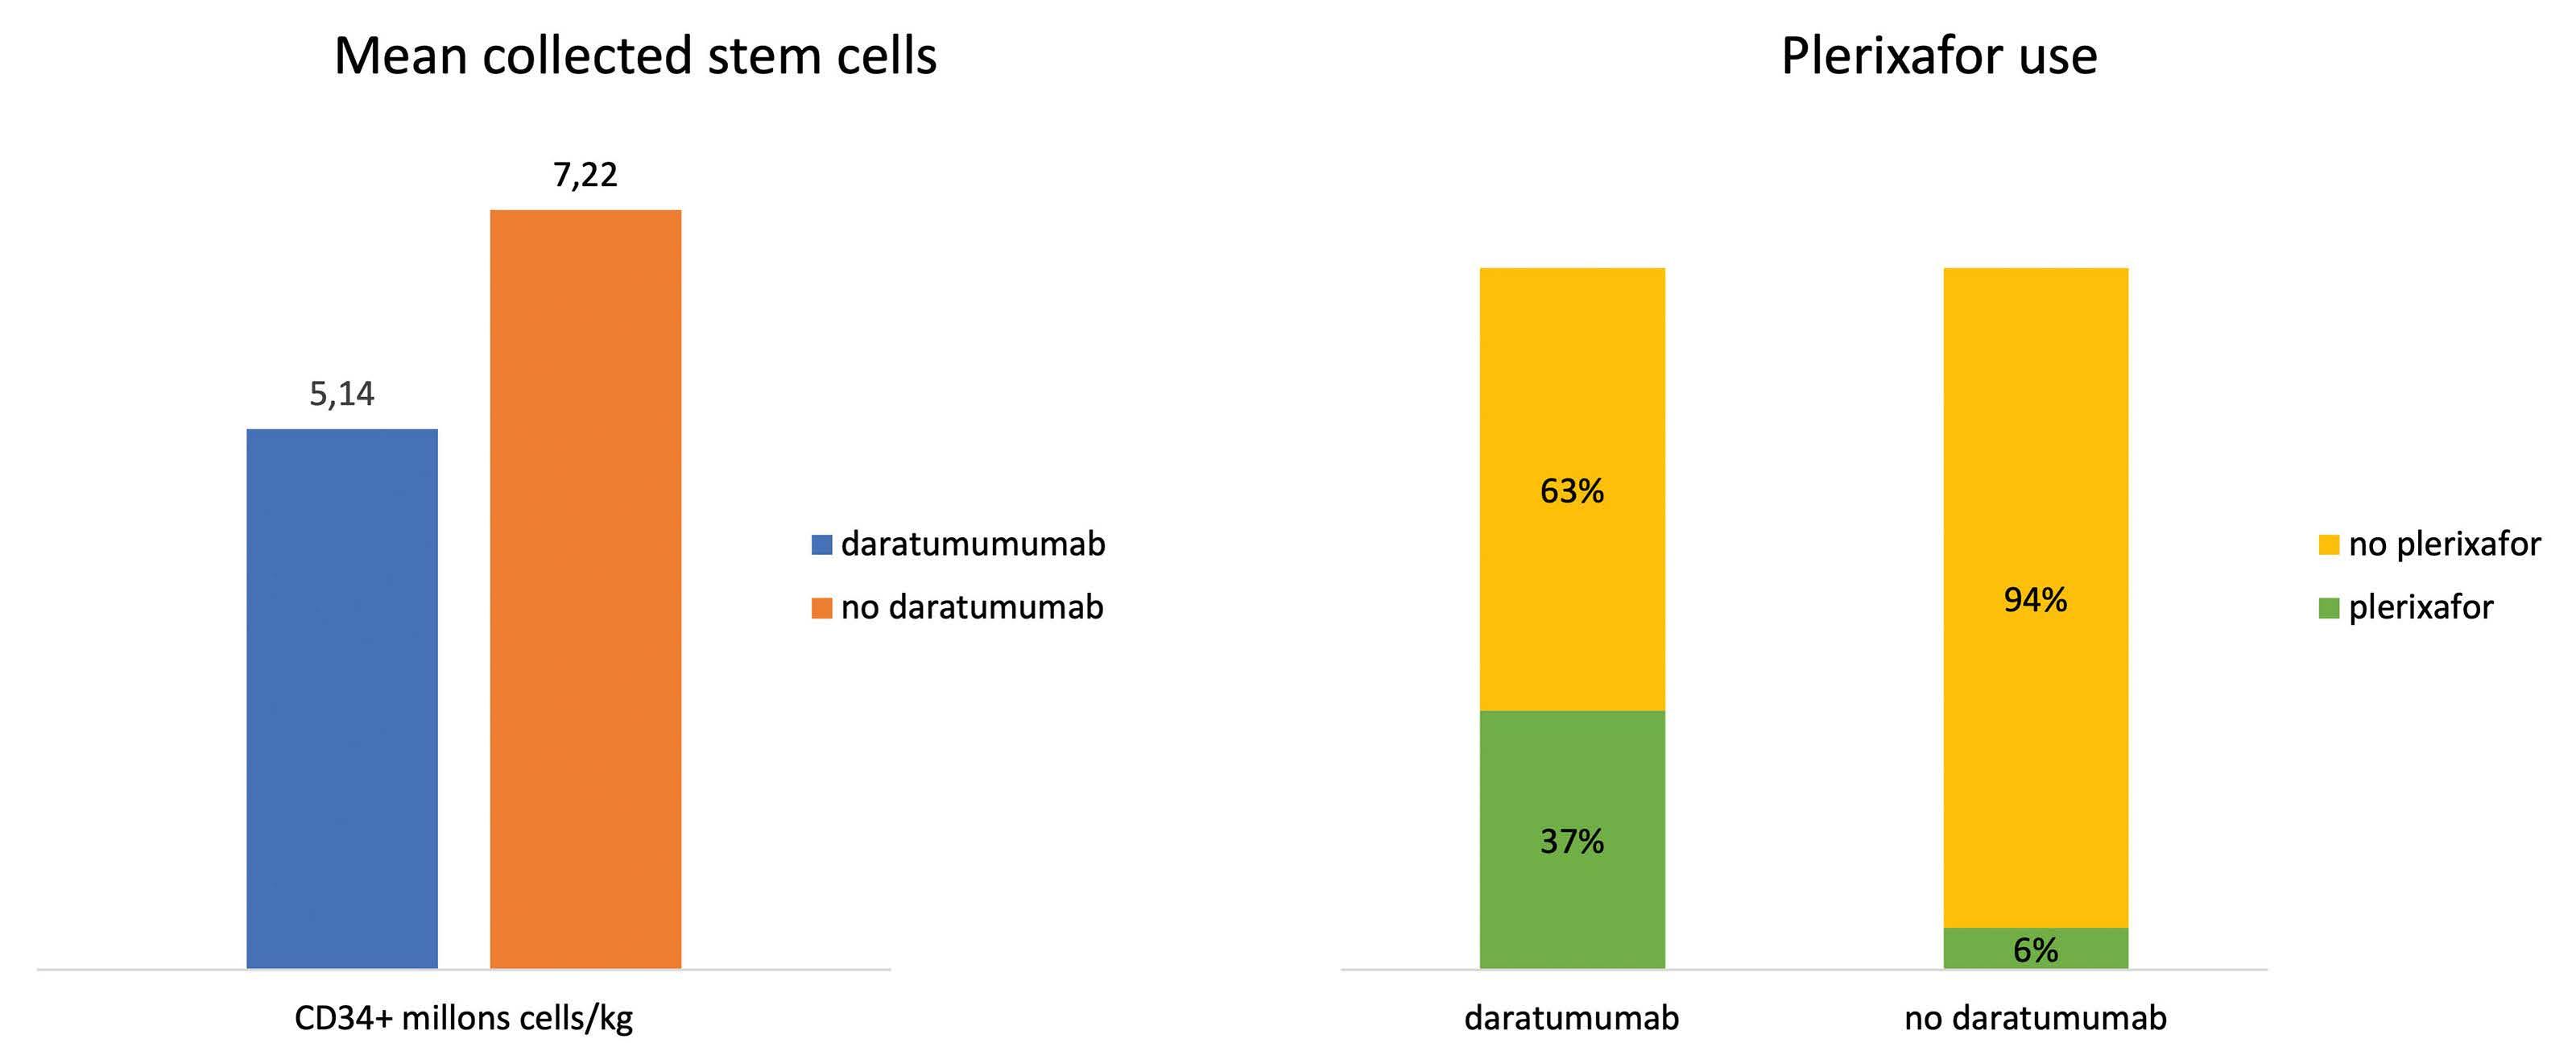
Table 1. Collected CD34+ stem cells, plerixafor use and days of stem cell collection.
Daratumumab-treated, N=92 (%) Non-daratumumab- treated, N=125 (%) P
Collected CD34+ x106 cells/kg
Mean >4x10⁶ failure
Days of stem cells collection
Median Mean >2
5.14 70 (76) 5 (5)
7.22 108 (86) 1 (0.8)
<0.001 0.051 0.085 Plerixafor use 34 (37) 8 (6) <0.001
2 1.65 14 (15)
1 1.42 9 (7)
0.018 0.031 0.074
Haematologica | 108 February 2023 611 LETTER TO THE EDITOR
in the daratumumab-treated patients, 37% versus 6% (P=<0.001, Fisher’s exact test) (Table 1). A comparison of the effect of D-VTd versus VTD on the outcome of stem cell mobilization and collection in the randomized phase III CASSIOPEIA study has recently been published.9 The mean number of collected CD34+ x106 cells/kg was significantly lower (6,7x10⁶ vs. 10x106 cells/kg, P<0.0001) and use of plerixafor higher (22% vs. 8%, P<0.0001) in the D-VTd arm. Similar results have been reported by Chhabra et al 13 for the GRIFFIN (D-VRd vs. VRD in NDMM with intent to transplant) and MASTER (D-KRd in NDMM) trials as well as in small retrospective series by Manjappa et al. 10 and Papaiakovou et al. 11 In the present study we were able to show that the addition of daratumumab to induction leads to statistically significant lower stem cell yield (mean 5.14x10⁶ vs. 7.22x10⁶ cells/kg , P<0.001), higher mean (1.65 days vs. 1.42 days, P=0.031) and median days of apheresis (2 days vs. 1 day,
P=0.018) as well as increased rescue use of plerixafor (37% vs. 6%, P<0.001) in a large, country-wide real-world patient population with NDMM (Figure 1). Daratumumab was the only factor affecting stem cell yield besides age >60 years and radiation during induction in multivariate analysis. Previously identified risk factors for poor stem cell mobilization such as prior therapy with alkylators or lenalidomide were not associated with lower stem cell yield in the present study.14 The reason for the effect of daratumumab on stem cells collection is unknown but a possible explanation could be a daratumumab-induced deficiency of bone marrow stem cells as these also express CD38 to an extent. In conclusion, our study confirms in a large real-world population that the addition of daratumumab in induction for NDMM can induce deeper responses but may have a negative effect on stem cell mobilization and collection, leading to lower stem cell yield. As daratumumab-based
Table 2. Uni- and multivariate analysis of factors affecting stem cell yield.
Mean Univariate analysis Multivariate analysis CD34+ x106 cells/kg P Coefficient B P
Daratumumab induction
Yes No 5.14 7.22 <0.001 -2.099 0 <0.001
Age >60 years Yes No 5.87 7.03 0.007 -1.535 0 <0.001 Sex Female Male 6.77 6.08 0.134
Induction Lenalidomide Yes No Thalidomide Yes No Alkylators Yes No Radiation Yes No
Cyclophosphamide mobilization
6.70 5.66 5.51 6.69 7.51 6.23 4.66 6.64
0.025 0.014 0.070 <0.001
0 -0.576 -0.928 0 -2.207 0
Yes No 6.32 6.57 0.796 ≥VGPR Yes No 6.11 7.09 0.111 >4 induction cycles Yes No 7.31 6.30 0.154
very good partial response.
0.483 0.282 <0.001
Haematologica | 108 February 2023 612 LETTER TO THE EDITOR
VGPR:
quadruplets are rapidly becoming the standard of care in induction, new strategies to facilitate the collection of stem cells should be explored such as omitting cyclophosphamide in mobilization, monitor closely and use early plerixafor in case of low CD34+ cells count in the peripheral blood. This strategy is currently being evaluated in transplantation centers in Sweden.
Authors
Konstantinos Lemonakis,1 Love Tätting,2 Mikael Lisak,3 Kristina Carlson,4 Jacob Crafoord,5 Cecilie H Blimark,3 Antonio I. Santamaria,6 Stina Wichert,1 Stig Lenhoff1 and Markus Hansson3
1Department of Hematology, Skåne University Hospital, Lund; 2Department of Hematology, University Hospital Linköping, Linköping; 3Department of Hematology, Sahlgrenska University Hospital, Gothenburg; 4Department of Hematology, University Hospital Uppsala, Uppsala; 5Department of Hematology, Örebro University Hospital, Örebro and 6Department of Hematology, Norrlands University Hospital, Umeå, Sweden
Correspondence: K. LEMONAKIS - Konstantinos.lemonakis@skane.se
https://doi.org/10.3324/haematol.2022.281610
References
1. Cavo M, Gay F, Beksac M, et al. Autologous haematopoietic stemcell transplantation versus bortezomib-melphalan-prednisone, with or without bortezomib-lenalidomide-dexamethasone consolidation therapy, and lenalidomide maintenance for newly diagnosed multiple myeloma (EMN02/HO95): a multicentre, randomised, open-label, phase 3 study. Lancet Haematol. 2020;7(6):e456-e468.
2. Attal M, Lauwers-Cances V, Hulin C, et al. Lenalidomide, bortezomib, and dexamethasone with transplantation for myeloma. N Engl J Med. 2017;376(14):1311-1320.
3. Moreau P, Attal M, Hulin C, et al. Bortezomib, thalidomide, and dexamethasone with or without daratumumab before and after autologous stem-cell transplantation for newly diagnosed multiple myeloma (CASSIOPEIA): a randomised, open-label, phase 3 study [published correction appears in Lancet. 2019 Jun 14;:]. Lancet. 2019;394(10192):29-38.
4. Voorhees PM, Kaufman JL, Laubach J, et al. Daratumumab, lenalidomide, bortezomib, and dexamethasone for transplanteligible newly diagnosed multiple myeloma: the GRIFFIN trial. Blood. 2020;136(8):936-945.
5. Giralt S, Costa L, Schriber J, et al. Optimizing autologous stem cell mobilization strategies to improve patient outcomes: consensus guidelines and recommendations. Biol Blood Marrow Transplant. 2014;20(3):295-308.
6. Sheppard D, Bredeson C, Allan D, Tay J. Systematic review of randomized controlled trials of hematopoietic stem cell
Received: June 20, 2022. Accepted: September 27, 2022. Prepublished: October 6, 2022.
©2023 Ferrata Storti Foundation Published under a CC BY-NC license
Disclosures
No conflicts of interest to disclose.
Contributions
KL and MH contributed to the design of the study. All authors contributed to data collection. KL carried out the analysis, compiled the data, and drafted the article. LT, ML, KC, JC, CHB, AIS, SW, SL and MH contributed to the writing of the article. All authors approved the final article.
Acknowledgments
We are in debt to Lars Skagerlind and Katarina Olsson Lundberg for data collection.
Funding
This work was supported by grants from ALF and Swedish Cancer foundation.
Data-sharing statement
The source data that support our findings are available upon request to the corresponding author.
mobilization strategies for autologous transplantation for hematologic malignancies. Biol Blood Marrow Transplant. 2012;18(8):1191-1203.
7. Spoerl S, Peter R, Wäscher D, et al. Patients' outcome after rescue plerixafor administration for autologous stem cell mobilization: a single-center retrospective analysis. Transfusion. 2017;57(1):115-121.
8. Andritsos LA, Huang Y, Abraham I, et al. Clinical and cost outcomes of pre-emptive plerixafor administration in patients with multiple myeloma undergoing stem cell mobilization. Leuk Res. 2019;85:106215.
9. Hulin C, Offner F, Moreau P, et al. Stem cell yield and transplantation in transplant-eligible newly diagnosed multiple myeloma patients receiving daratumumab + bortezomib/thalidomide/dexamethasone in the phase 3 CASSIOPEIA study. Haematologica. 2021;106(8):2257-2260.
10. Manjappa S, Fox R, Reese J, et al. Impact of daratumumab on stem cell collection, graft composition and engraftment among multiple myeloma patients undergoing autologous stem cell transplant. Blood. 2020;136(Suppl 1):S35–37.
11. Papaiakovou E, Terpos E, Kanellias N, et al. Impact of daratumumab-containing induction on stem cell mobilization and collection, engraftment and hospitalization parameters among multiple myeloma patients undergoing autologous stem cell transplantation. Blood. 2021;138(Suppl 1):S3886.
12. Kumar S, Paiva B, Anderson KC, et al. International Myeloma
Haematologica | 108 February 2023 613 LETTER TO THE EDITOR
Working Group consensus criteria for response and minimal residual disease assessment in multiple myeloma. Lancet Oncol. 2016;17(8):e328-e346.
13. Chhabra S, Callander N, Costa L, et al. Stem cell collection with daratumumab (DARA)-based regimens in transplant-eligible newly diagnosed multiple myeloma (NDMM) patients (pts) in the
Griffin and Master Studies. Blood. 2021;138(Suppl 1):S2852.
14. Mohty M, Hübel K, Kröger N, et al. Autologous haematopoietic stem cell mobilisation in multiple myeloma and lymphoma patients: a position statement from the European Group for Blood and Marrow Transplantation. Bone Marrow Transplant. 2014;49(7):865-872.
Haematologica | 108 February 2023 614 LETTER TO THE EDITOR
Cytomegalovirus reactivation after CD19 CAR T-cell therapy is clinically significant
Approximately 80% of the world’s population have been infected by cytomegalovirus (CMV) based on seroprevalence data, and immunosuppressed CMV-seropositive patients are at increased risk for CMV reactivation.1 After allogeneic hematopoietic cell transplantation (alloHCT), CMV reactivation occurs in 40-45% of CMV-seropositive recipients and is associated with increased non-relapse mortality.2,3 As in alloHCT, lymphodepleting conditioning is given before CAR T-cell (CAR T) therapy; thus, the incidence of CMV reactivation may also be increased after CAR T therapy.
The incidence and clinical significance of CMV reactivation after CAR T therapy is not well described. CMV viremia (n=14) and end organ disease (pneumonitis [n=2], enteritis [n=1], encephalitis [n=2], and retinitis [n=1)) have been reported after CAR T therapy.4-12 Another study reported that ten of 60 (17%) CMV-seropositive and -seronegative patients receiving CAR T therapy developed CMV reactivation based upon a single test performed from day+14 to +21 after CAR T infusion,13 none of these patients developed CMV organ disease. Interpretation of these studies with regard to CMV reactivation incidence is limited by the unknown or low frequency of testing. Active monitoring with CMV DNA quantitative polymerase chain reaction (qPCR) testing was not described, and CMV reactivation is less likely to be detected if the frequency of testing is low. Therefore, we retrospectively analyzed the clinical outcomes of 65 consecutive patients treated with autologous CD19 targeted CAR T therapy for non-Hodgkin lymphoma from May 2018 to June 2021 who received at least two CMV DNA qPCR tests (Table 1) to determine the incidence of CMV reactivation and its clinical impact. All patients were treated at a single comprehensive cancer center with a dedicated transplant and cellular therapy unit and transfused with leukocyte-reduced blood products that were considered CMV safe. None of the patients received prophylaxis for CMV infection. Patients received prophylaxis against herpes viruses with acyclovir 400 mg by mouth twice a day (renally dosed as needed). CAR T-related clinical data were prospectively gathered as part of the Transplant and Cellular Therapy Program monitoring plan. American Society for Transplant and Cellular Therapy guidelines were used to define and grade cytokine release syndrome (CRS) and immune effector cell-mediated neurotoxicity syndrome (ICANS).14 Reactivation was defined as a CMV DNA qPCR result >400 IU/mL occurring from 4 days before CAR T infusion until the time of death or last follow-up. This CMV DNA qPCR threshold was chosen be-
cause it is the minimum level at which detection of CMV DNA by the qPCR assay is more than 95% reliable (the 95% limit of detection). The 95% limit of quantification of the qPCR assay was 1,000 IU/mL. The test was performed on plasma samples in all patients and at all time points. The CMV qPCR assay was developed and validated in the Roswell Park clinical laboratory and approved for clinical use by the New York State Clinical Laboratory Evaluation Program. CMV DNA qPCR testing was started upon the initial hospitalization for CAR T infusion and as clinically indicated in the outpatient setting. Five hundred and sixty CMV DNA qPCR measurements were included in this analysis (Figure 1A). CMV DNA qPCR testing was performed a median of every 8.4 (min-max 2.8-197.8) days. The median number of CMV DNA qPCR assays per patient was 6 (min-max 2–24).
Estimated with the cumulative incidence function, 44% (95% confidence interval [CI]: 25-62, Figure 1B) of CMV-seropositive patients reactivated CMV by day+100. The cumulative incidence of CMV reactivation for all patients was 22% (95% CI: 13-32) at day+100 after CAR T infusion. Two of 38 (5.2%) CMV-seronegative patients had detectable CMV DNA >400 IU/mL indicative of new infection or reactivation in the setting of falsely negative prior CMV serology. For this analysis, these patients were classified as reactivating CMV. The median CMV DNA qPCR level of the first reactivation episode was 1,384 (min-max 519-12,700) IU/mL. Multivariate Cox proportional hazards modeling of clinical factors univariately associated with CMV reactivation at P<0.1 revealed that age ≥50 years (hazard ratio [HR] 0.2, 95% CI: 0.1–0.4, P<.001) was significantly associated with a decreased risk of reactivation, and positive CMV serostatus (HR 18.5, 95% CI: 4.5–76.6, P<0.001) was significantly associated with an increased risk of reactivation (Online Supplementary Table S1). Age ≥50 years was not significantly associated with non-Hodgkin lymphoma subtype or the number of lines of lymphoma therapy received.
Of the 14 (of a 65 total) patients who reactivated CMV, ten received CMV-specific therapy with foscarnet, ganciclovir, or valganciclovir. This therapy was initiated by the treating physician according to his/her clinical judgement. All ten of these patients had a CMV DNA qPCR >1,000 IU/mL. One patient developed CMV enteritis of the jejunum that was resolved with intravenous foscarnet but complicated by pancreatic necrosis, gastrointestinal perforation and bleeding requiring embolization, and mesenteric ischemia requiring wedge resection and repair. Prior to CAR T therapy the patient presented with a duodenal lesion that was
Haematologica | 108 February 2023 615 LETTER TO THE EDITOR
diffuse large B-cell lymphoma. This patient died from his underlying lymphoma and not from CMV-related causes. Six of 10 (60%) patients receiving CMV therapy responded
Table 1. Demographic characteristics (n=65).
(Figure 1C). Of the four patients with CMV reactivation who did not receive therapy, three of four (75%) had resolution of reactivation without intervention.
All patients N=65
Reactivated CMV N=14 No CMV reactivation N=51
Categorical variables N (%) N (%) N (%)
Male 40 (62) 4 (29) 36 (71)
Age, ≥ 50 years 53 (82) 9 (64) 44 (86) CMV seropositive 27 (42) 12 (86) 15 (29)
Diagnosis – NHL
DLBCL MCL Other*
CD19 CAR T cell
Axicabtagene ciloleucel Tisagenlecleucel Brexucabtagene autoleucel Lisocabtagene maraleucel
KPS
60 70 80
Conditioning regimen
62 (95) 1 (2) 2 (3)
32 (49) 27 (42) 1 (2) 5 (8)
1 (2) 55 (85) 9 (14)
13 (93) 0 1 (7)
9 (64) 5 (36) 0 0
1 (7) 12 (86) 1 (7)
49 (96) 1 (2) 1 (2)
23 (45) 22 (43) 1 (2) 5 (10)
0 43 (84) 8 (16)
Bendamustine Fludarabine/cyclophosphamide 12 (18) 53 (82) 2 (14) 12 (86) 10 (20) 41 (80)
CRS max grade
0 1 2 3
ICANS 0 1 2 3 4 5
Best response
CCR/CR PR NR/SD Progression NE
Numeric variables
23 (35) 18 (28) 18 (28) 6 (9)
37 (57) 11 (17) 4 (6) 9 (14) 2 (3) 2 (3)
21 (32) 12 (18) 3 (5) 20 (31) 8 (12)
4 (29) 6 (43) 4 (29) 0
5 (36) 3 (21) 2 (14) 4 (29) 0 0
3 (21) 2 (14) 1 (7) 5 (36) 3 (21)
Median (min-max)
19 (37) 12 (24) 14 (27) 6 (12)
32 (63) 8 (16) 2 (4) 5 (10) 2 (4) 2 (4)
19 (37) 10 (20) 2 (4) 15 (29) 5 (10)
Age, years 63 (23-81) 61.5 (23-78) 63 (23-81)
CMV DNA qPCR tests per subject 6 (2-24) 12 (2-24) 5 (2-20)
CMV reactivation Time to first CMV reactivation, days Quantity of first CMV reactivation, IU/mL NA NA 21 (-1-73) 1384 (519-12,700) NA NA
Follow-up time, days 468 (151-975) 389** 470 (151-975)
CAR: chimeric antigen receptor; CCR: confirmed complete response; CMV: cytomegalovirus; CR: complete response; CRS: cytokine release syndrome; DLBCL: diffuse large B-cell lymphoma; DNA: deoxyribonucleic acid; KPS: Karnofsky performance status; MCL: mantle cell lymphoma; NA: not applicable; NE: not evaluable due to death before response to therapy could be evaluated; NHL: non-Hodgkin lymphoma; NR: no response; Other: NHL not otherwise specified and T-cell rich B cell; PR: partial response; qPCR: quantitative polymerase chain reaction; SD: stable disease; *NHL not otherwise specified and T-cell rich B-cell NHL; ** only 1 patient still alive for follow-up.
Haematologica | 108 February 2023 616 LETTER TO THE EDITOR
2.3, 95% CI: 1.2–4.5, P=0.02) and treatment with standard of care axicabtagene ciloleucel (HR 2.1, 95% CI: 1.1–3.8, P=0.02) were significantly associated with an increased risk of death, while age ≥50 years (HR 0.5, 95% CI: 0.3-0.9, P=0.02) was significantly associated with a decreased risk LETTER TO THE EDITOR
A B C
Figure 1. Cytomegalovirus reactivation occurs at moderate incidence after CD19 CAR T-cell therapy and can be treated by cytomegalovirus-specific therapies. Cytomegalovirus (CMV) reactivation was defined as >400 IU/mL copies of CMV DNA. (A) Distribution of CMV DNA quantitative polymerase chain reaction (qPCR) testing after CD19 chimeric antigen receptor (CAR) T-cell therapy. CMV DNA qPCR testing occurred primarily during the first 180 days after CD19 CAR T-cell therapy. Testing occurred at the time points indicated by a dot. Red dots indicate CMV reactivation and blue dots indicate no CMV reactivation. (B) Cumulative incidence of CMV reactivation in CMV-seropositive patients. The cumulative incidence was 44% (95% confidence interval [CI]: 25-62) by day+100. (C) Clinical course of patients with CMV reactivation. Fourteen of 65 patients reactivated CMV. Four of these patients were not treated with CMV specific therapy (upper facet). Ten of these patients were treated with CMV-specific therapy (lower facet). Three of 4 patients who were not treated with CMV-specific therapy resolved the infection without intervention as defined by a subsequent CMV DNA qPCR test <400 IU/mL (blue dot, upper facet, below dashed line). The CMV status of the fourth untreated patient was indeterminate due to the lack of follow up CMV DNA qPCR testing. Six of the 10 patients treated with anti-CMV therapy responded to treatment as defined by a subsequent CMV DNA qPCR test ≤400 IU/mL (blue dot) after therapy (lower facet, below dashed line). Level of CMV reactivation is represented by the color of the circle as indicated in the legend with orange indicating CMV DNA qPCR ≥1,001, red indicating CMV DNA qPCR 401-1,000, and blue indicating CMV DNA qPCR ≤400. One patient (G) developed CMV enteritis which was diagnosed with a biopsy of the jejenum (yellow circled X) which demonstrated immunohistochemical staining for CMV in the context of xanthogranulomatous inflammation at day+31 after CAR T infusion. Time and duration of CMV treatment is indicated by the thicker horizontal black bar. Survival time of the patient is indicated by the narrower horizontal gray bar. The events for each patient have been recentered on the day of earliest CMV reactivation. ICANS: immune effector cell associated neurotoxicity syndrome; IU: international units; Rx: treatment; +: censored at last follow-up; x: disease relapse.
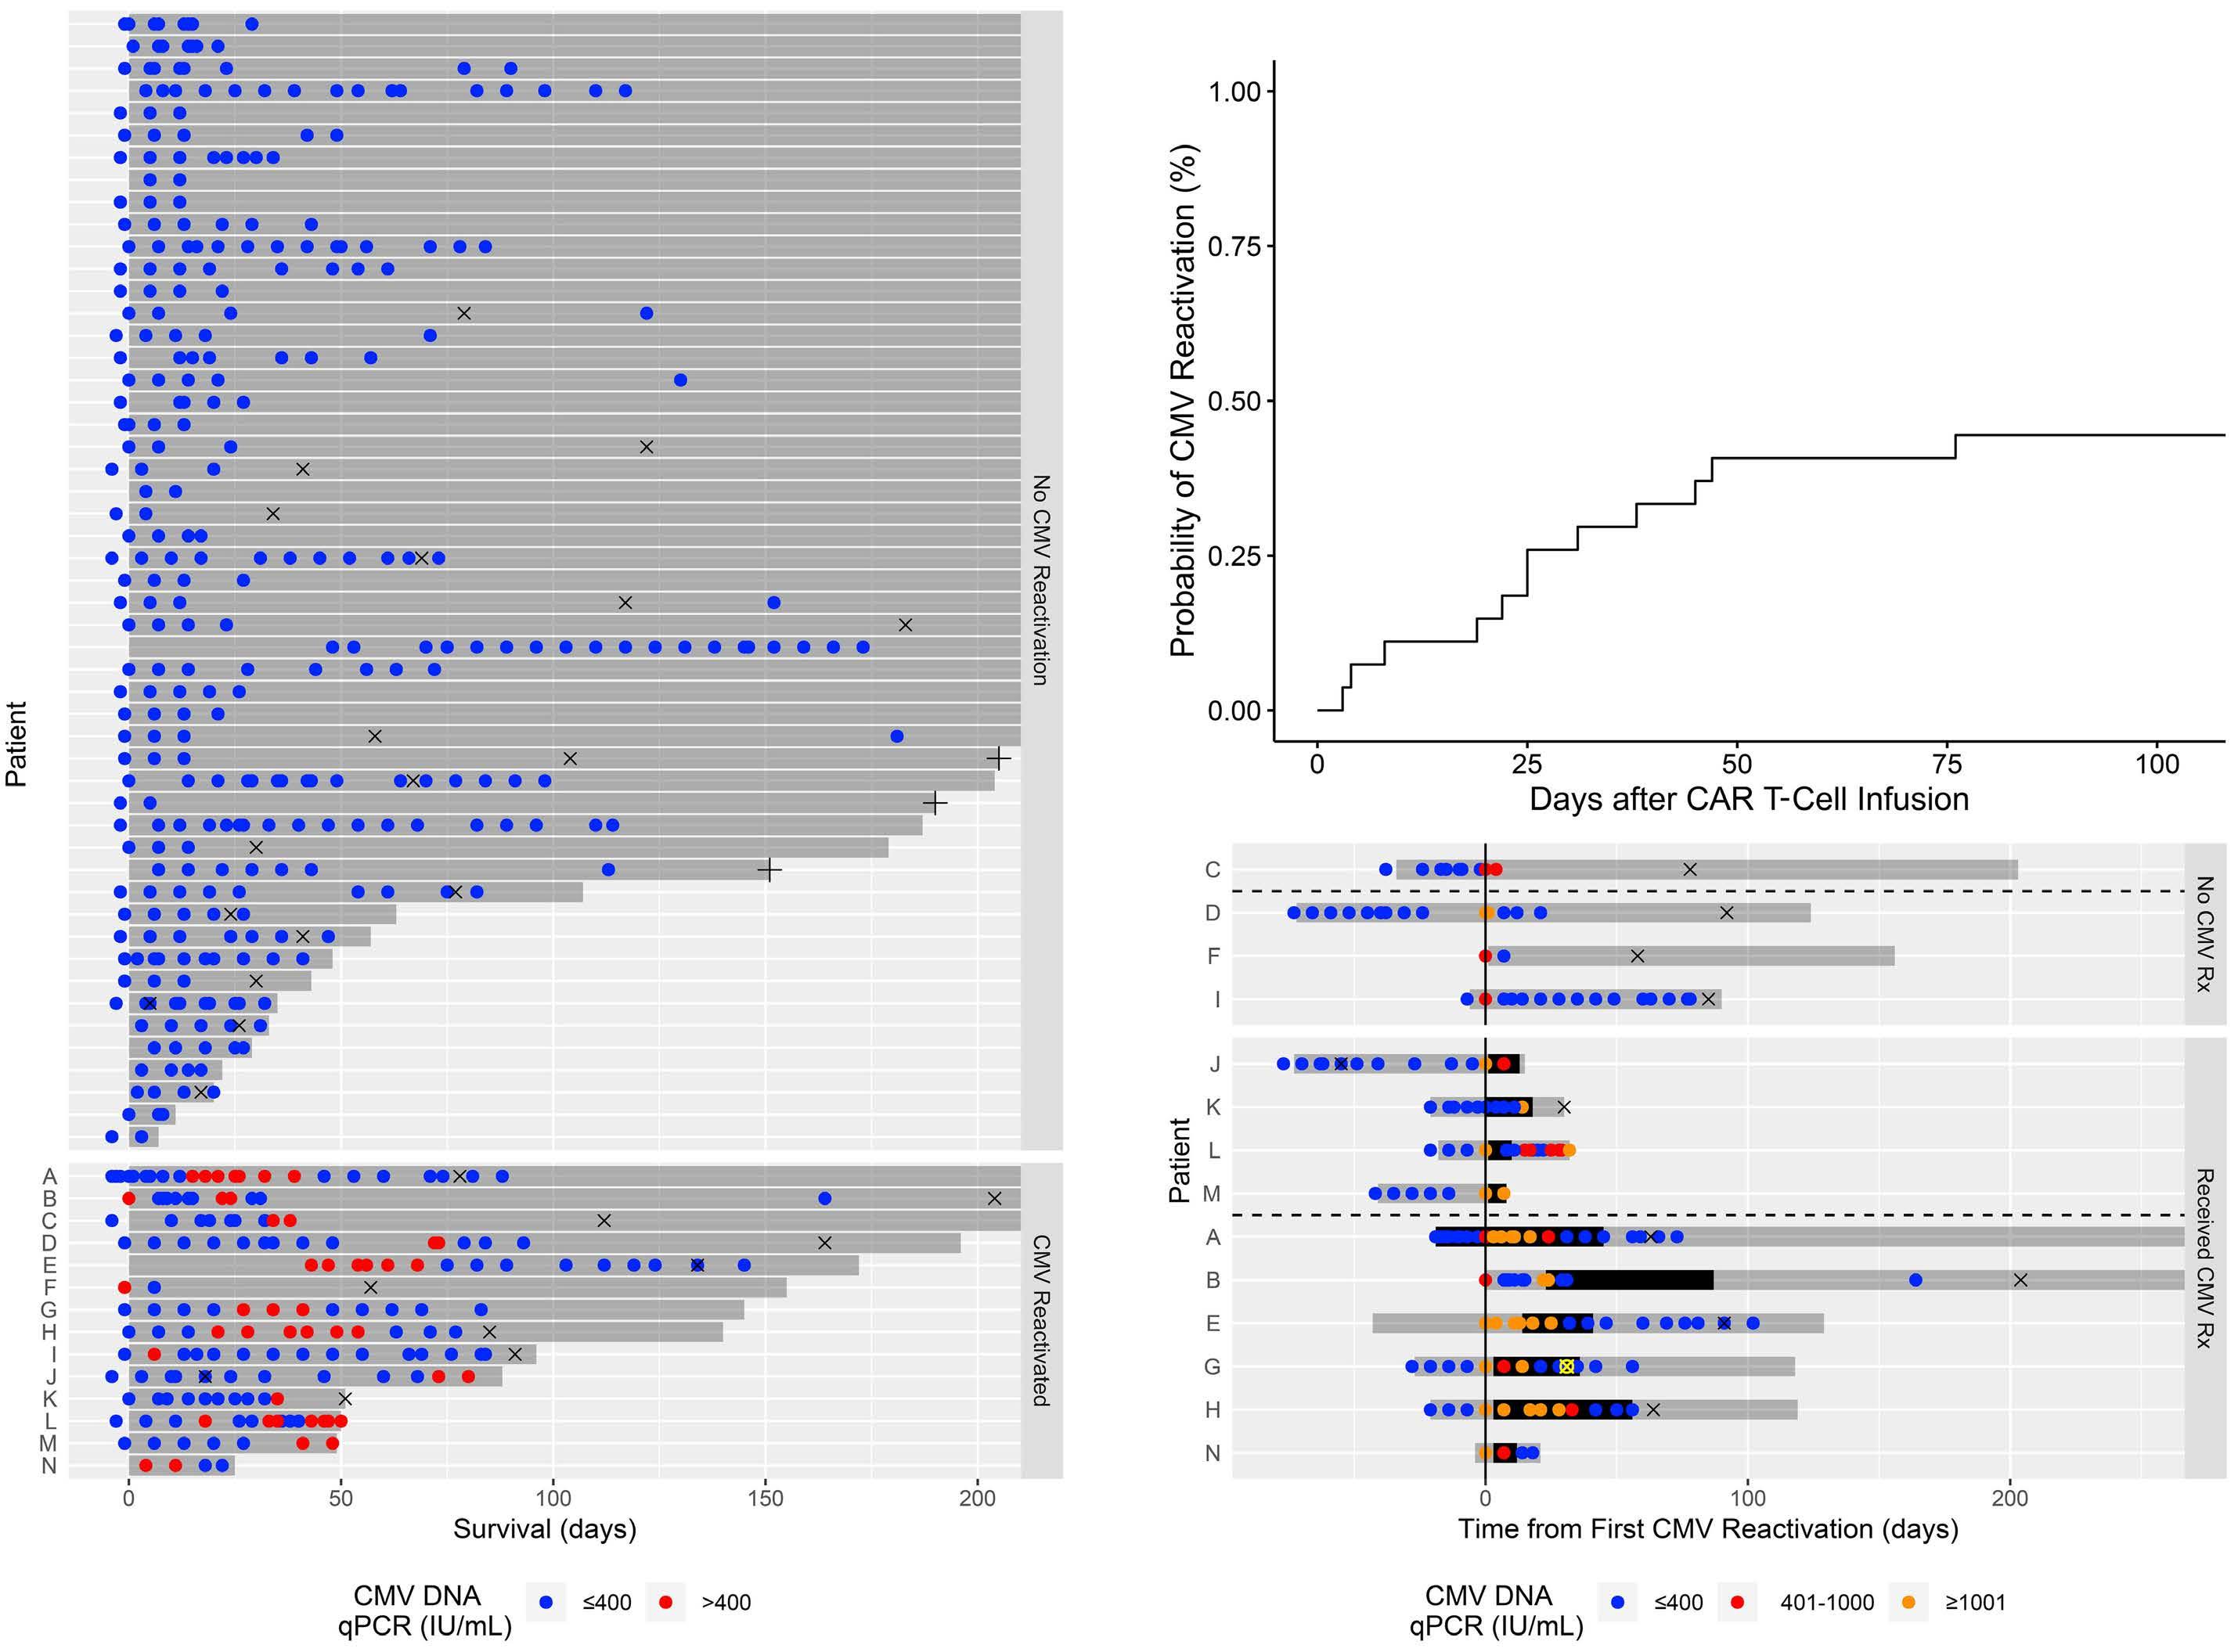
The probability of surviving until day+365 for all patients studied was 54.7% (95% CI: 43.1-68.1). Multivariate Cox proportional hazards modeling of clinical factors univariately associated with survival at P<0.1 revealed that CMV reactivation (defined as CMV DNA qPCR >400 IU/mL, HR Haematologica | 108 February 2023 617
of death (Table 2). Significant associations were observed between treatment with standard of care axicabtagene ciloleucel and the development of ICANS (P=0.005) or CRS (P=0.008), and between CMV serostatus and CMV reactivation (P=0.001). When CMV reactivation was redefined as CMV DNA qPCR >1,000 IU/mL, multivariate analysis resulted in similar conclusions with an increased risk for death associated with CMV reactivation (HR 3.4, 95% CI: 1.8–6.3, P<0.001, Table 2). Recursive partitioning analysis corroborated the significance of CMV reactivation to survival (Online Supplementary Figure S1).
Table 2. Clinical factors affecting overall survival.
Among the 14 patients with CMV reactivation, the most frequent cause of death was lymphoma (n=9, Online Supplementary Table S2). The second most frequent cause of death was infection (n=2). The causes of infection were Candida krusei fungemia and Mucormycosis hepatitis. In the 51 patients without CMV reactivation, the most frequent cause of death was lymphoma (n=11) and the second most frequent cause of death was ICANS (n=3). Infectious causes of death occurred in three patients. The etiology was blood infection (often polymicrobial) by Klebsiella pneumoniae, Enterococcus, Stenotrophomonas mal-
Clinical factor Hazard ratio (95% CI) P value
Univariate analysis
Age
≥50 vs. <50
≥60 vs. <60
≥70 vs. <70
0.5 (0.2-0.9) 0.8 (0.4-1.5) 0.6 (0.3-1.4)
0.02 0.49 0.23
CMV serostatus (positive vs. negative) 1.8 (0.9-3.5) 0.14
Number of prior lines of lymphoma therapy
≥3 vs. <3
≥4 vs. <4
≥5 vs. <5
2.2 (0.7-7.4) 1.5 (0.7-3.0) 1.9 (0.9-3.8)
0.18 0.26 0.09
KPS (<80 vs. 80) 1.8 (0.7-4.9) 0.26 Lymphodepletion regimen (fludarabine/cyclophosphamide vs. bendamustine) 1.3 (0.6-3.0) 0.47
CAR T-cell product (standard of care axicabtagene ciloleucel vs. other) 2.3 (1.2-4.4) 0.02
CMV reactivation (at any time vs. never, defined as CMV DNA qPCR >400 IU/mL) 2.6 (1.4-4.9) 0.003
CMV reactivation (at any time vs. never, defined as CMV DNA qPCR >1,000 IU/mL) 3.7 (2.1-6.7) <0.001
Development of ICANS by grade
≥1 vs. <1 ≥2 vs. <2 ≥3 vs. <3
Development of CRS by grade
≥1 vs. <1
≥2 vs. <2 ≥3 vs. <3
Multivariate analysis (CMV reactivation defined as CMV DNA qPCR >400 IU/mL)
Age (≥50 vs. <50 years)
1.6 (1.0-2.6) 1.5 (0.9-2.7) 1.5 (0.8-2.7)
1.2 (0.8-2.0) 0.8 (0.5-1.4) 0.6 (0.2-1.7)
0.05 0.15 0.18
0.37 0.43 0.36
0.5 (0.3-0.9) 0.02
Number of prior lymphoma therapies (≥5 vs. <5) 2.1 (1.0-4.4) 0.05
CAR T-cell product (standard of care axicabtagene ciloleucel vs. other) 2.1 (1.1-3.8) 0.02
CMV reactivation (at any time vs. never) 2.3 (1.2-4.5) 0.02
Multivariate analysis (CMV reactivation defined as CMV DNA qPCR >1,000 IU/mL)
Age (≥50 vs. <50 years) 0.4 (0.3-0.8) 0.004
Number of prior lymphoma therapies (≥5 vs. <5) 2.2 (1.1-4.4) 0.04
CAR T-cell product (standard of care axicabtagene ciloleucel vs. other) 2.0 (1.1-3.6) 0.02
CMV reactivation (at any time vs. never) 3.4 (1.8-6.3) <0.001
CAR: chimeric antigen receptor; CI: confidence interval; CMV: cytomegalovirus; CRS: cytokine release syndrome; ICANS: immune effector cell-associated neurotoxicity syndrome; KPS: Karnofsky performance status; qPCR: quantitative polymerase chain reaction.
Haematologica | 108 February 2023 618 LETTER TO THE EDITOR
tophillia, Staphylococcus hemolyticus, and Candida glabrata.
Estimated with the cumulative incidence function, disease relapse occurred by day+180 in 42% (95% CI: 29-53). The cumulative incidence of non-relapse mortality was 14% (95% CI: 7-23) by day+180. Ten of the 31 (32%) patients who experienced relapse also reactivated CMV. In nine of these ten patients, CMV reactivation preceded relapse. The median time of CMV reactivation was 21 (min-max -1 to 73) days. The median time of relapse was 88 (min-max 18 to 204) days. Four of the 11 (36%) patients who experienced non-relapse mortality also reactivated CMV at 4, 18, 27, and 41 days.
These data indicate that CMV reactivation occurs at moderate frequency after CAR T therapy and may have clinically signifi cant consequences. We report a higher incidence of CMV reactivation than previously recognized. This was likely due to a more accurate ascertainment of cases by frequent CMV DNA qPCR testing. Although CMV surveillance was not prospectively defined in this study, the frequency of the actual measurements suggests a monitoring level sufficient to reasonably detect CMV reactivation, at least during the first 100 days after CAR T infusion. The cumulative incidence is likely to be an underestimate due to patients who may have had an asymptomatic CMV infection but were not tested.
As with CMV reactivation after alloHCT,2 CMV reactivation after CAR T therapy was associated with increased mortality not due to CMV disease. This was corroborated by the increased risk of death when a higher threshold for CMV reactivation was used (1,000 vs. 400 IU/mL). Paradoxically, age ≥50 was significantly associated with a decreased risk of death. In this patient cohort, younger age may be a surrogate for biologically worse lymphoma. The association between standard of care axicabtagene ciloleucel and increased mortality may have been through ICANS and CRS, both of which were closely associated with axicabtagene ciloleucel use.
The probability that CMV reactivation after CAR T therapy will progress to organ disease is still not known. CMV reactivation resolved without intervention in three cases in our study, suggesting that CMV reactivation may be selflimited in some cases, possibly dependent on the level of CMV reactivation. Future CMV surveillance studies may provide information about the rate of self-resolution of CMV reactivation and the level of CMV reactivation that is associated with adverse clinical outcomes. However, there will be a limitation to the level of CMV reactivation that will be tolerated (and subsequently analyzed) before initiating early therapy given the clinical experience with CMV reactivation in allogeneic HCT. Studies of prophylactic or early therapy may also provide an answer if an appropriate control arm is included.
This study is limited by its retrospective design and the
lower frequency of CMV DNA qPCR testing after day+30 and especially day+100. Patients who received CD19 CAR T therapy but did not have at least two CMV DNA qPCR tests performed (n=5) were excluded from this analysis. In conclusion, CMV reactivation after CAR T therapy is clinically significant. Therefore, prospectively defined surveillance plans to detect reactivation in high risk populations as well as clinical trials to evaluate the risk and benefit of CMV prophylaxis or early treatment after CAR T therapy are necessary.
Authors
George Chen,1 Megan Herr,1 Jan Nowak,2 Christine Ho,1 Nikolaos Almyroudis,3 Kristopher Attwood,4 John Bonnewell,3 Marissa Walsh,3 Brahm Segal,3 Maureen Ross,1 Philip McCarthy1# and Theresa Hahn5#
1Department of Medicine, Transplant and Cellular Therapy Program, Roswell Park Comprehensive Cancer Center; 2Department of Pathology, Roswell Park Comprehensive Cancer Center; 3Department of Internal Medicine, Division of Infectious Diseases, Roswell Park Comprehensive Cancer Center; 4Department of Biostatistics, Roswell Park Comprehensive Cancer Center and 5Department of Cancer Prevention & Control, Roswell Park Comprehensive Cancer Center, Buffalo, NY, USA
#PM and TH contributed equally as co-senior authors. Correspondence: G. CHEN - George.chen@roswellpark.org
https://doi.org/10.3324/haematol.2022.281719
Received: July 22, 2022. Accepted: October 11, 2022. Prepublished: October 20, 2022.
©2023 Ferrata Storti Foundation Published under a CC BY-NC license
Disclosures
BS receives research funding from NextCure and Apellis and is on the advisory board for NextCure. GLC receives clinical research funding from Actinium, AlloVir, and Takeda. PLM receives consultancy fees / honoraria / research funding from Bluebird Bio, BMS/Celgene/Juno, Fate Therapeutics, Hikma, Janssen, Karyopharm, Magenta Therapeutics, Novartis, Oncopeptides, Partner Therapeutics, Sanofi, Starton Therapeutics, and Takeda. The remaining authors have no conflicts of interest to disclose.
Contributions
GLC wrote the manuscript. GLC and MH designed research. GLC,
Haematologica | 108 February 2023 619 LETTER TO THE EDITOR
MH, JN, NA, NW.JB,CH, MR,BS, PLM, and TH provided data. GLC, MH, BS, PLM, and TH analyzed data. All authors read and commented on the manuscript.
Acknowledgements
We gratefully acknowledge the patients described in the study and the clinical team providing care to the patients; without their support, this study could not have been completed.
References
1. Zuhair M, Smit GSA, Wallis G, et al. Estimation of the worldwide seroprevalence of cytomegalovirus: a systematic review and meta-analysis. Rev Med Virol. 2019;29(3):e2034.
2. Green ML, Leisenring W, Xie H, et al. Cytomegalovirus viral load and mortality after haemopoietic stem cell transplantation in the era of pre-emptive therapy: a retrospective cohort study. Lancet Haematol. 2016;3(3):e119-127.
3. Chen GL, Wallace PK, Zhang Y, et al. Low-Level Cytomegalovirus antigenemia promotes protective cytomegalovirus antigen-specific T cells after allogeneic hematopoietic cell transplantation. Biol Blood Marrow Transplant. 2020;26(11):2147-2154.
4. Wittmann Dayagi T, Sherman G, Bielorai B, et al. Characteristics and risk factors of infections following CD28based CD19 CAR-T cells. Leuk Lymphoma. 2021;62(7):1692-1701.
5. Hill JA, Li D, Hay KA, et al. Infectious complications of CD19targeted chimeric antigen receptor-modified T-cell immunotherapy. Blood. 2018;131(1):121-130.
6. Wudhikarn K, Palomba ML, Pennisi M, et al. Infection during the first year in patients treated with CD19 CAR T cells for diffuse large B cell lymphoma. Blood Cancer J. 2020;10(8):79.
7. Baird JH, Epstein DJ, Tamaresis JS, et al. Immune reconstitution and infectious complications following axicabtagene ciloleucel therapy for large B-cell lymphoma. Blood Adv. 2021;5(1):143-155.
8. Abramson JS, Palomba ML, Gordon LI, et al. Lisocabtagene
Funding
This work was supported by Roswell Park Comprehensive Cancer Center and National Cancer Institute (NCI) grant P30CA016056.
Data-sharing statement
Please address requests for data to GC.
maraleucel for patients with relapsed or refractory large B-cell lymphomas (TRANSCEND NHL 001): a multicentre seamless design study. Lancet. 2020;396(10254):839-852.
9. Logue JM, Zucchetti E, Bachmeier CA, et al. Immune reconstitution and associated infections following axicabtagene ciloleucel in relapsed or refractory large B-cell lymphoma. Haematologica. 2021;106(4):978-986.
10. Locke FL, Ghobadi A, Jacobson CA, et al. Long-term safety and activity of axicabtagene ciloleucel in refractory large Bcell lymphoma (ZUMA-1): a single-arm, multicentre, phase 1-2 trial. Lancet Oncol. 2019;20(1):31-42.
11. Zu C, Xu Y, Wang Y, et al. Cytomegalovirus retinitis and retinal detachment following chimeric antigen receptor T cell therapy for relapsed/refractory multiple myeloma. Curr Oncol. 2022;29(2):490-496.
12. Cousin E, Belicard F, Michel L, et al. Severe cytomegalovirus disease with encephalitis after CAR-T cell therapy: a rare but potentially fatal complication. J Med Virol. 2021;93(11):6398-6403.
13. Beyar-Katz O, Kikozashvili N, Bar On Y, et al. Characteristics and recognition of early infections in patients treated with commercial anti-CD19 CAR-T cells. Eur J Haematol. 2022;108(1):52-60.
14. Lee DW, Santomasso BD, Locke FL, et al. ASTCT consensus grading for cytokine release syndrome and neurologic toxicity associated with immune effector cells. Biol Blood Marrow Transplant. 2019;25(4):625-638.
Haematologica | 108 February 2023 620 LETTER TO THE EDITOR
Prognostic value of positron emission
tomography/computed tomography in transplant-eligible newly diagnosed multiple myeloma patients from CASSIOPEIA: the CASSIOPET study
18F-fluorodeoxyglucose (18F-FDG) positron emission tomography (PET)/computed tomography (CT) is a reliable imaging technique for evaluating and monitoring multiple myeloma (MM) patients with a prognostic value for progression-free survival (PFS) and overall survival.1-5 PET/CTpositive features at diagnosis have indeed been found to correlate with poorer outcomes.3,6 Here, we report the first results of CASSIOPET, a companion study of CASSIOPEIA (clinicaltrials gov. Identifier: NCT02541383),7,8 which evaluated the prognostic value of baseline PET/CT on PFS. Study design and eligibility criteria for the CASSIOPEIA trial have been previously published.7 Briefly, transplanteligible patients with newly diagnosed MM (NDMM) were randomized 1:1 to receive four 28-day, pre-autologous stem cell transplant (ASCT) induction cycles and two 28-day post-ASCT consolidation treatment cycles of daratumumab plus bortezomib/thalidomide/dexamethasone (DVTd) or bortezomib/thalidomide/dexamethasone (VTd) in CASSIOPEIA Part 1. The primary endpoint, stringent complete response, was evaluated 100 days after ASCT. In CASSIOPEIA Part 2, patients achieving a partial response (PR) or better 100 days post-ASCT underwent a second 1:1 randomization to observation or maintenance therapy with intravenous daratumumab 16 mg/kg every 8 weeks for up to 2 years.
Among patients randomized in CASSIOPEIA, those eligible for inclusion in CASSIOPET had received a PET/CT scan ≤6 weeks before randomization in CASSIOPEIA. Patients were excluded if they were unable to access or undergo PET/CT investigation, had uncontrolled diabetes, or had received steroids ≤12 hours before the PET/CT scan. All patients provided written informed consent. The primary endpoint of the CASSIOPET study is PFS from the second CASSIOPEIA randomization. This PFS analysis for CASSIOPEIA was recently reported.8 CASSIOPET analyses reported here evaluate the prognostic value of PET/CT at baseline on PFS from the first CASSIOPEIA randomization, PFS differences between baseline PETnegative versus PET-positive patients in each treatment arm, and the effect of daratumumab on PET/CT negativity at post-consolidation.
PET/CT scans were performed at baseline and postconsolidation (day 100 [±7 days] post-ASCT). All patients had fasted for ≥6 hours before the PET/CT scan. No dexa-
methasone was to be administered ≤12 hours before the PET/CT scan. Blood glucose levels were measured before 18F-FDG injection with a preferred glycemia level ≤150 mg/dL. No insulin was administered ≤2 hours before 18FFDG injection, and no oral contrast was given. Whole-body imaging was performed 55 to 75 minutes after the 18F-FDG injection. First scout and low-dose CT data (head to feet) were obtained, followed by PET data acquisition, image reconstruction, and analysis. Acquired imaging data were uploaded to a central electronic repository system (KEOSYS, Saint-Herblain, France) and analyzed using the IMAGYS platform. Five-point Deauville scores (range, 1-5)9 were applied to bone marrow (BM), bone focal lesions (FL), extramedullary disease (EMD), and paramedullary disease (PMD). Localization of the most intense 18F-FDG uptake was identified, and the maximal standardized uptake value (SUVmax) was calculated. Bone SUV max was defined as the hottest value between BM, FL, and PMD. PET images were interpreted (blinded to patient treatment) by an independent team of nuclear-medicine physicians with extensive MM experience. PET/CT scan assessments did not include separate assessments of CT scans; thus, patients may have been PET-negative but could still display lytic lesions in the CT scan.
PET–complete response (PET-CR) was defined as an uptake of less than or equal to the mediastinal blood pool in all localizations. PET–unconfirmed CR (PET-uCR) was defined as an uptake between the mediastinal blood pool and liver. PET-PR was defined as a decrease in the number and/or activity of BM, FL, EMD, or PMD but persistence of lesions with uptake above liver activity or BM uptake above liver activity. Patients with PET–stable disease (PET-SD) had no significant modification of FL, EMD, or PMD compared with baseline. Patients with PET–progressive disease (PETPD) had a new lesion (FL, EMD, or PMD) compared with baseline. PET/CT-positive patients were defined as patients with PET-PR and PET-SD. PET/CT-negative patients were defined as patients with PET-CR and PET-uCR. Clinical response was assessed according to International Myeloma Working Group criteria.10
The prognostic effect of including explanatory PET/CT variables on PFS was assessed using Cox regression models. Seven baseline PET/CT characteristics were
Haematologica | 108 February 2023 621 LETTER TO THE EDITOR
chosen based on expert knowledge: PET positivity, presence of FL, BM infiltration, PMD, EMD, FL SUVmax, and bone SUV max .
The prognostic effect of each of the seven baseline PET characteristics was estimated using a univariable Cox model in addition to the prognostic effect of known prognostic factors: serum lactate dehydrogenase (LDH) levels, serum b2 microglobulin concentration, cytogenetic risk, and International Staging System (ISS) disease staging. The prognostic effect of each of the seven baseline PET characteristics was then estimated adjusting for the treatment group and revised ISS (r-ISS). These covariates were chosen based on expert knowledge without statistical covariate selection procedures due to the relatively small number of PFS events. Adjustment for treatment group accounts for the randomized design of CASSIOPEIA, of which CASSIOPET is an ancillary study. r-ISS is the current stratification score for myeloma patients and combines ISS (which includes serum b 2 microglobulin and serum albumin), cytogenetic risk, and serum LDH level into a single variable.
A final multivariable Cox model was constructed including the seven baseline PET characteristics and adjusting for treatment and r-ISS. At the time of analysis, 20 PFS events were observed in the D-VTd group and 34 in the VTd group. Thus, the third multivariable Cox model results are exploratory and should be interpreted cautiously due to the low ratio of events per variable. Proportional hazards and log-linearity of effects were assessed. No statistically significant violations of the pro-
portional hazard assumption were detected at the customary 5% P value threshold using the Schoenfeld residuals. No violation of the log-linearity assumption was detected using P splines. The presence of multicollinearity was assessed using the variance inflation factor; no value exceeded 2 for all PET/CT characteristics.
The log-rank estimator with Kaplan–Meier representation was used to describe PFS. Baseline and post-consolidation PET/CT negativity rates were compared between treatment groups using the chi-square test, odds ratios, and 2-sided 95% confidence intervals (CI). The role of interactions between baseline PET positivity and treatment in the PFS distribution could not be assessed, as zero PFS events were observed in the D-VTd PET-negative group, leading to a hazard ratio (HR) of 0 with a non-estimable variance using classical statistical tests.
The primary results of CASSIOPEIA Part 1 have been reported (median follow-up, 18.8 months).7 The current analysis of CASSIOPET was performed using patient data with a median follow-up time of 29.2 months. Of 1,085 patients enrolled in CASSIOPEIA, 268 (D-VTd, n=137; VTd, n=131) had assessable baseline PET; 184 (D-VTd, n=101; VTd, n=83) patients were also PET-evaluable post-consolidation (Figure 1). Baseline characteristics of patients with assessable baseline PET were similar to those in the overall CASSIOPEIA trial (Online Supplementary Table S1). At baseline, 54 patients (20%) were PET-negative and 214 (80%) were PET-positive.
PFS was better for baseline PET-negative versus PET-positive patients (hazard ratio [HR]: 0.42, 95% CI: 0.18-0.97,
Figure 1. STROBE flow chart for CASSIOPET. ASCT: autologous stem cell transplant; MRD: minimal residual disease; PET: positron emission tomography; PET/CT: positron emission tomography/computed tomography. aBaseline PET–evaluable patients were defined as patients with assessable baseline PET acquired before the first dosing date. bPost-consolidation PET–evaluable patients included patients with assessable day 100 post-ASCT PET data and positive baseline PET but excluded patients with a date of PET/CT post-consolidation >±90 days from the date of the day 100 MRD assessment. c13 patients had unevaluable baseline PET/CT but evaluable post-consolidation PET/CT and were included in the post-consolidation analysis.
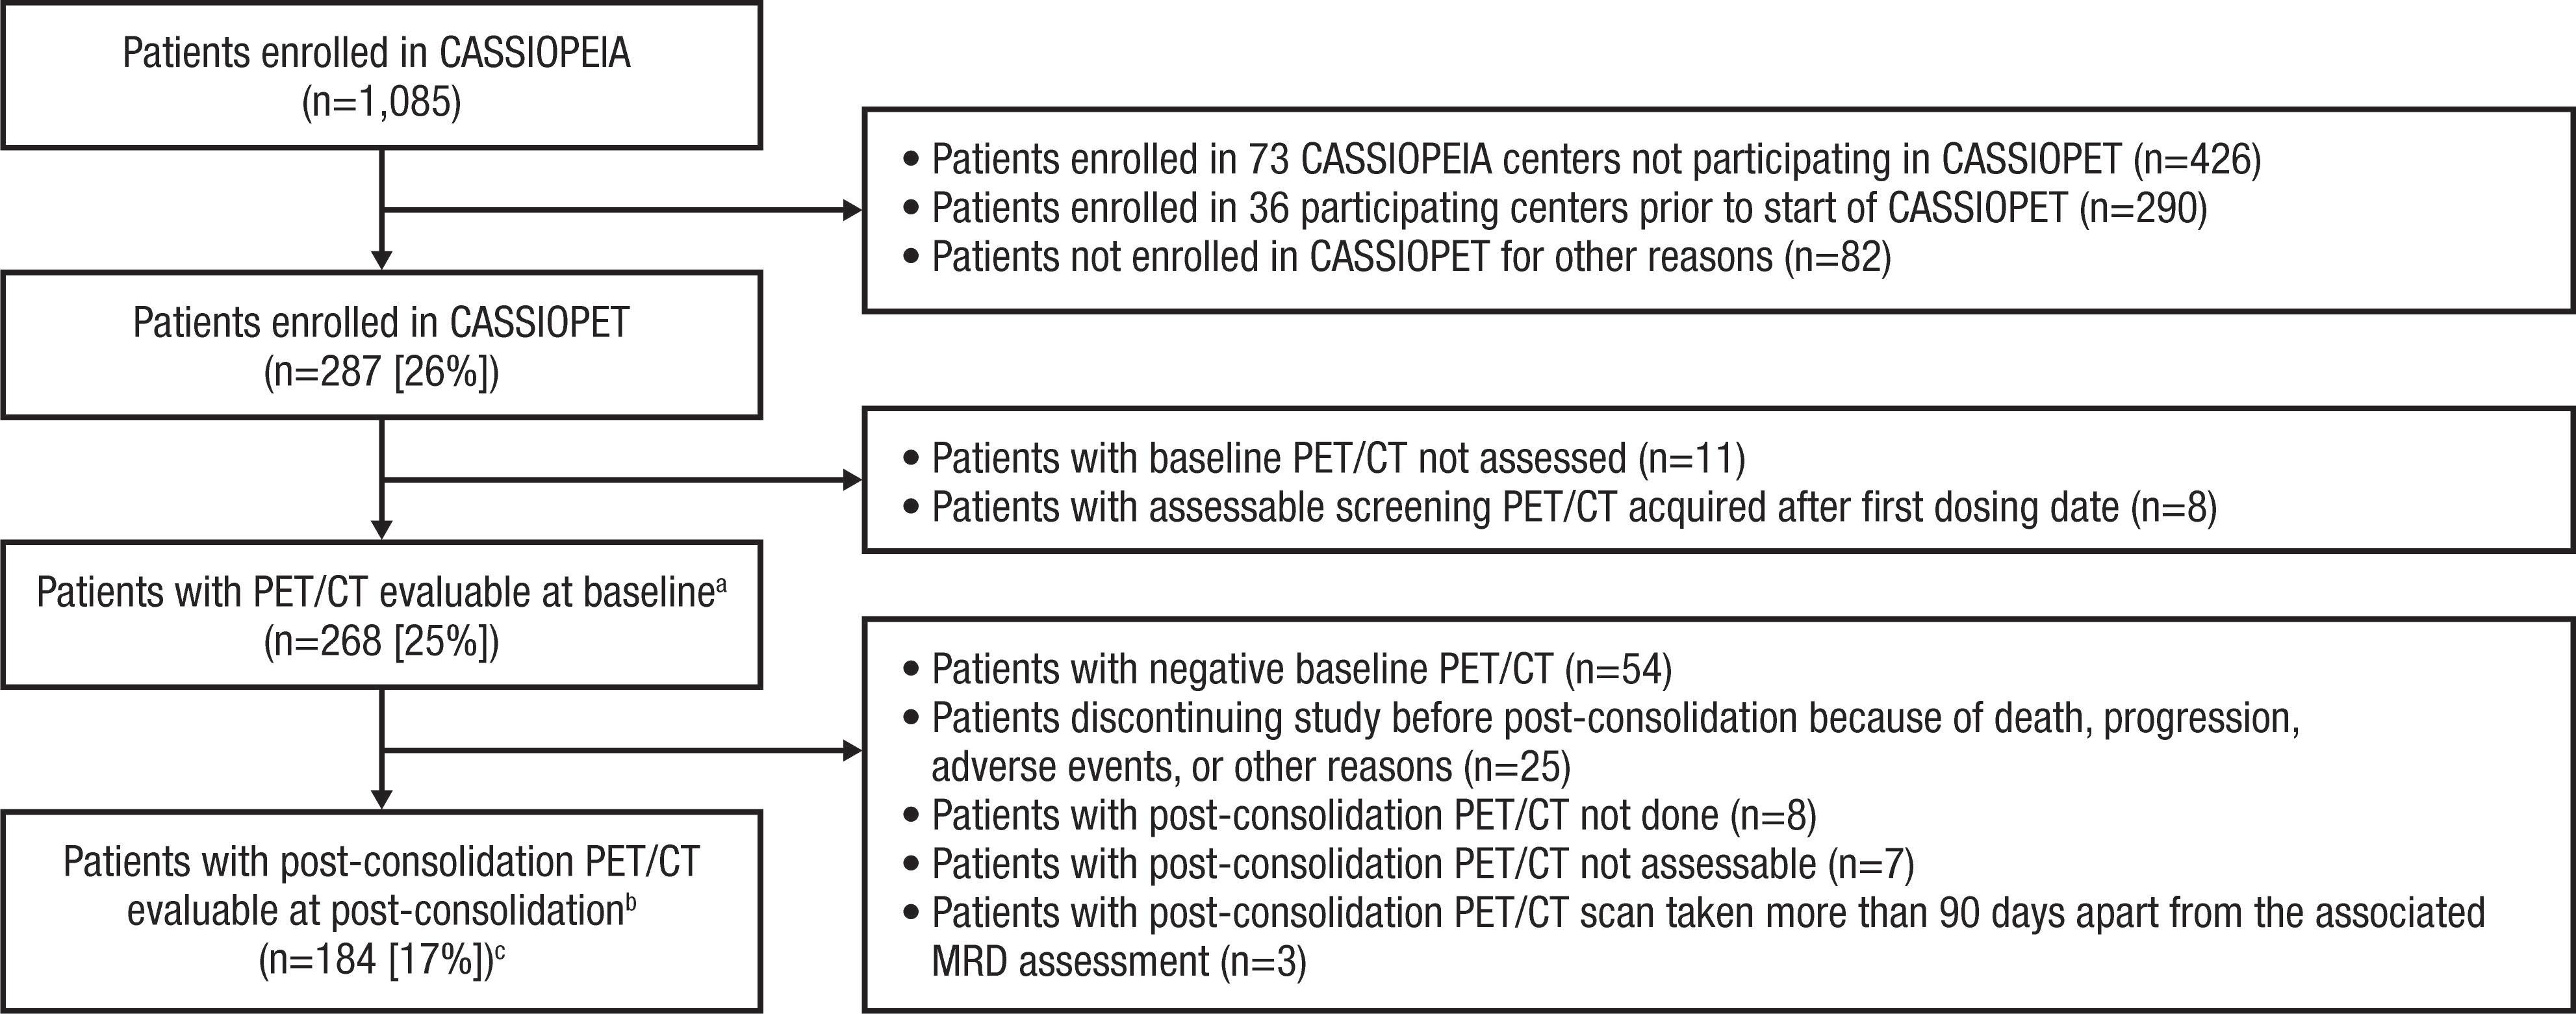
Haematologica | 108 February 2023 622 LETTER TO THE EDITOR
Figure 2. Progression-free survival outcomes by baseline positron emission tomography/computed tomography status in CASSIOPET. (A) Progression-free survival (PFS) for baseline positron emission tomography (PET)-negative patients versus PET-positive patients and (B) PFS for baseline PET-negative patients versus PET-positive patients by treatment group. Baseline PET assessments were performed prior to the first dose of study drug, and PFS was based on time from first randomization. CI: confidence interval; D-VTd: daratumumab plus bortezomib/thalidomide/dexamethasone; HR: hazard ratio; NE: not estimable; VTd: bortezomib/thalidomide/dexamethasone. aBased on a log-rank test.
P=0.0365; Figure 2A). The 12- and 18-month PFS rates were higher in patients who were PET-negative (12- and 18-month rates, 100%) versus PET-positive (12-month rate, 93%; 18-month rate, 87%) at baseline. When stratified by treatment group, PFS was better among patients who were PET-negative versus PET-positive in the D-VTd arm. However, PFS was not significantly different in the VTd arm (Figure 2B). By univariable analysis, baseline PET characteristics associated with PFS were PMD (P<0.001), EMD (P=0.034), FL (P=0.047), FL SUVmax (P=0.043), and bone SUV max (P=0.021). All these characteristics, except for FL, remained prognostic factors when adjusting for treatment arm and r-ISS (Table 1). A multivariable analysis including all PET/CT characteristics and adjusting for treatment arm and r-ISS showed that PMD (HR: 3.16, 95% CI: 1.60-6.28) and EMD (HR: 2.32, 95% CI: 1.04-5.19) remained independently associated with a higher risk of relapse or death (Table 1).
Of the 184 patients with post-consolidation PET measurements, 118 (64%) were assessed as PET-CR and 47 (26%) as PET-uCR (Online Supplementary Table S2). Seventeen (9%) patients were assessed as PET-PR and two (1%) as PET-SD. Overall, 165 (90%) patients were PET-negative and 19 (10%) were PET-positive. The rates of PET negativity were high and similar between the D-VTd (90%) and VTd (89%) groups.
Results of the CASSIOPET study presented here confirm that baseline PET/CT findings have a prognostic value for PFS. PFS was indeed better for baseline PET-negative
versus PET-posi tive NDMM patients, including patients treated with daratumumab. The presence of PMD, EMD, FL, and the FL SUVmax and bone SUV max were associated with shorter PFS. When adjusting for treatment arm and classical NDMM (r-ISS) prognostic score, PMD and EMD had independent prognostic value. PET-CR post-consolidation rates were high and similar in both D-VTd and VTd groups.
PET/CT is negative in approximately 10-20% of symptomatic MM patients. This study shows that PET/CT negativity, even if considered as false-negative for disease detection, could be considered for its prognostic value. Rasche et al. demonstrated that 18F-FDG PET/CT may be considered ineffective for approximately 11% of patients due to low expression of the hexokinase 2 enzyme.11 However, another study of 90 NDMM patients receiving novel agents during induction therapy showed that low hexokinase 2 expression associated with PET/CT negativity correlated with relatively better prognosis versus PET/CT-positive patients.4 Baseline PET/CT-negative patients may thus represent a less aggressive subgroup of MM patients, associated with better outcomes in the setting of quadruplet therapy and ASCT. This prospective study demonstrates PMD as an independent prognostic factor in MM. Previous prospective studies have shown the prognostic value of EMD, SUVmax, and FL number.2,5,6,12,13 However, these studies neither described nor assessed PMD as a potential prognostic biomarker. In the prospective IMAJEM study that
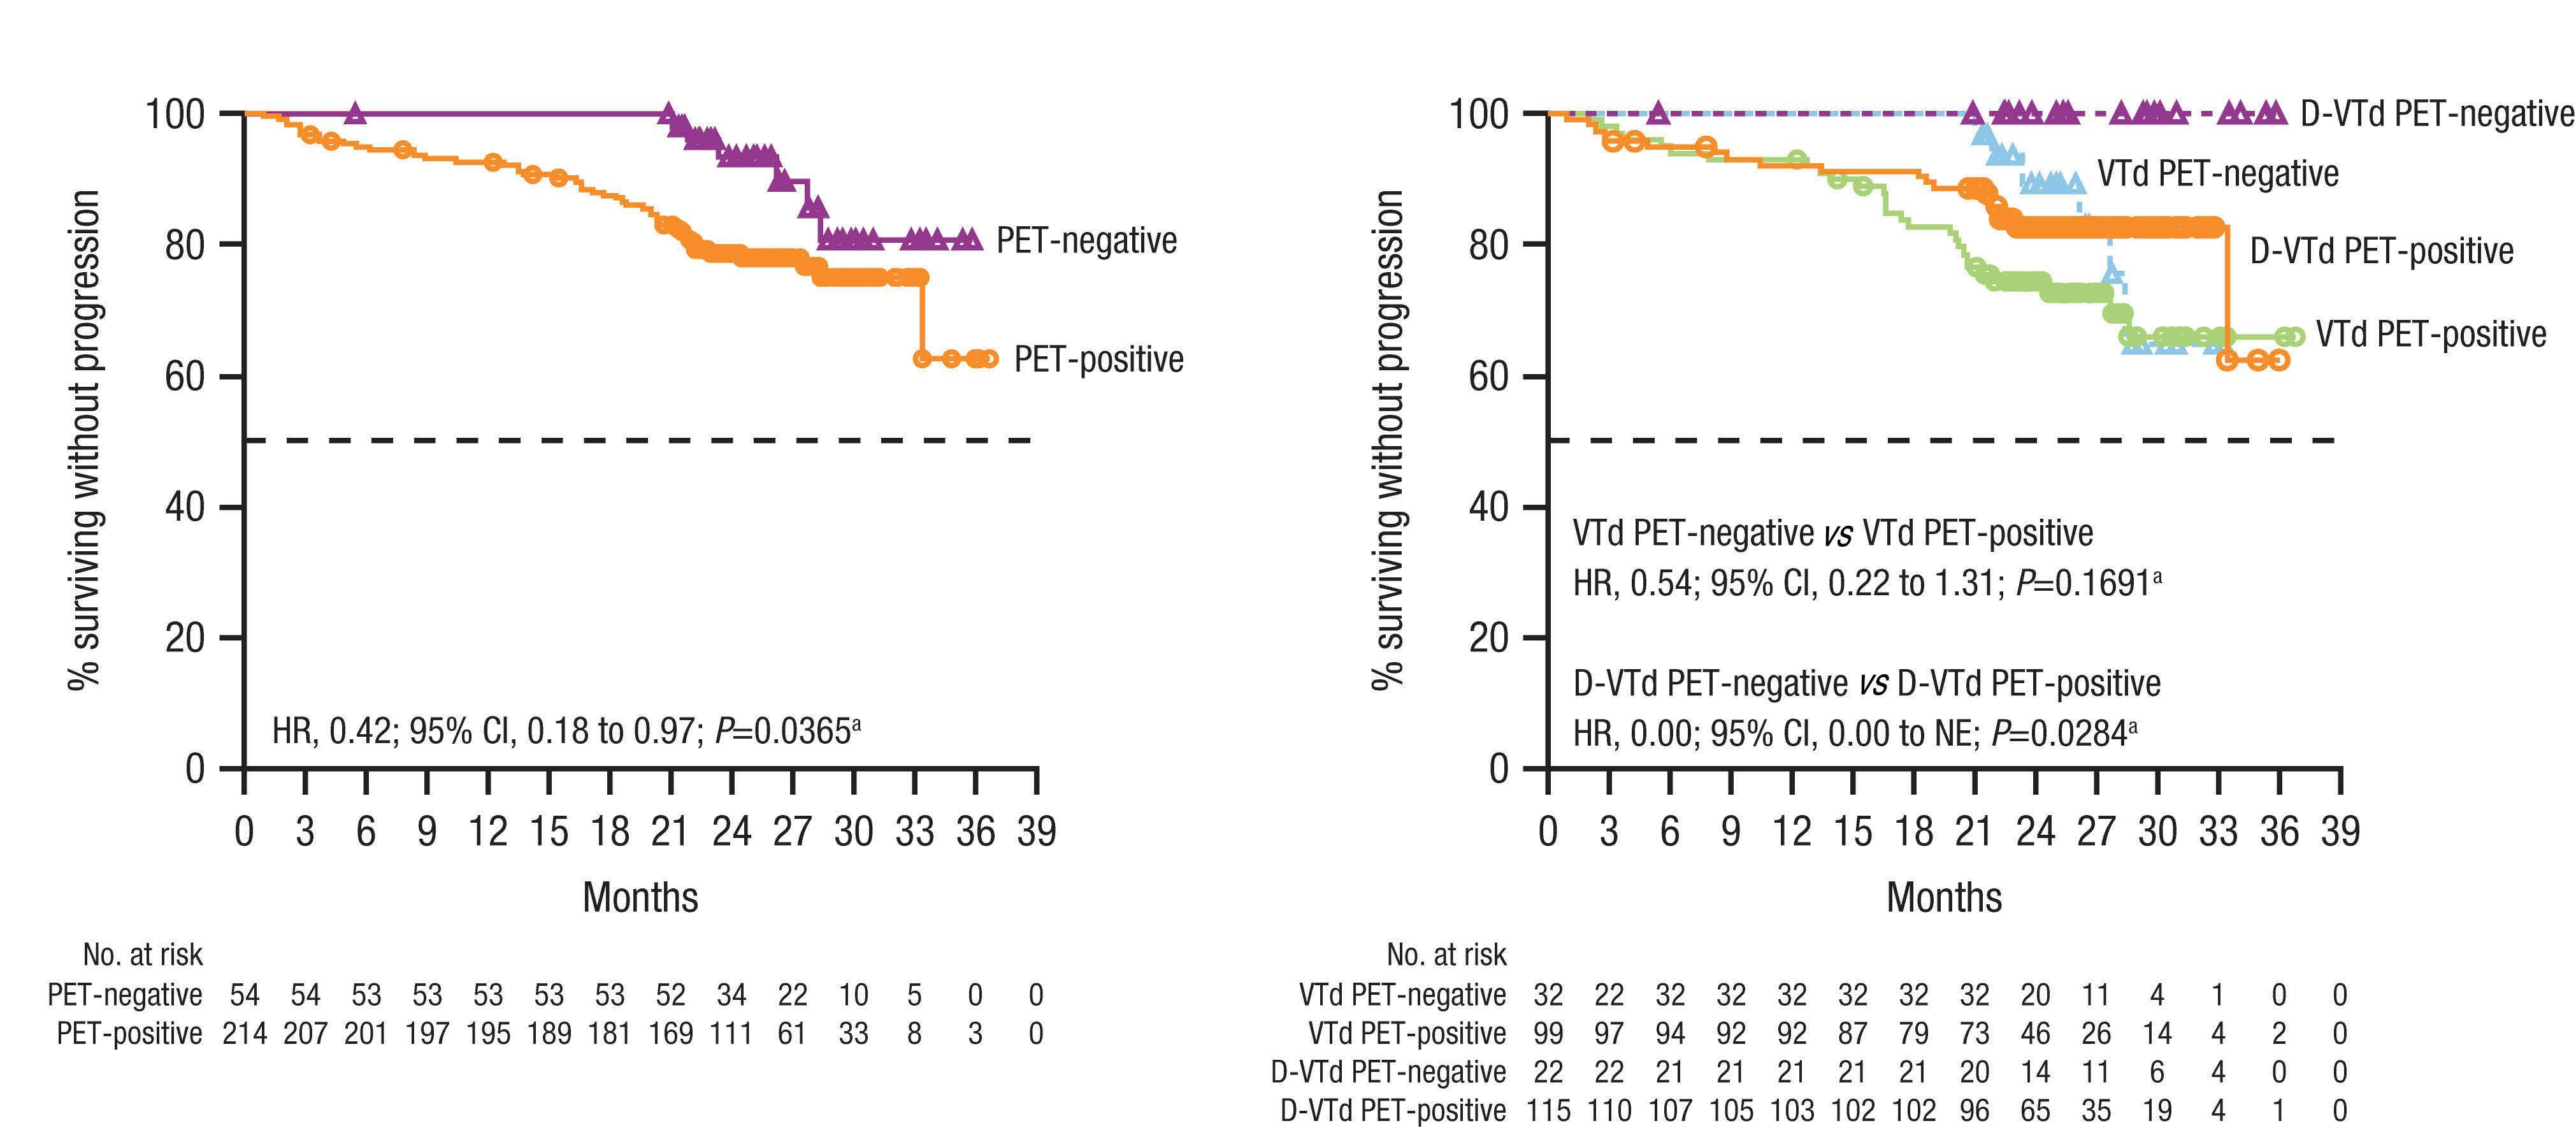
A B Haematologica | 108 February 2023 623 LETTER TO THE EDITOR
demonstrated the prognostic value of EMD, EMD was detected at a similar percentage (7.5%) as in CASSIOPET (511%), but PMD was considered as FL.2 The independent prognostic value of PMD shown here is consistent with data from Rasche et al., indicating the presence of large focal lesions as a strong independent poor prognosis factor in NDMM.14,15
Spatial heterogeneity can limit the sensitivity of risk classification based on cytogenetics and gene expression pro-
filing because these tests are based on cells obtained from a single BM biopsy. Rasche et al. have shown that high-risk genomic alterations can be present in focal lesions, yet absent in other locations.14 Combined with the results of other studies,2,5 several PET/CT characteristics could be defined as possible high-risk biomarkers and used to define high-risk patients at the initial diagnosis of symptomatic MM.
The IMAJEM study2 used background liver uptake to define
Table 1. Univariable and multivariable analyses of the prognostic value of baseline positron emission tomography (PET) characteristics on progression-free survival based on all patients with PET measurements at baseline (54/268 progression-free survival events).
Baseline characteristics PFS events (n/N) Univariable analysis
Analysis adjusted for treatment group and r-ISS
Multivariable analysis adjusted for treatment group, r-ISS, and all baseline PET/CT characteristics HR (95% CI) P value HR (95% CI) P value HR (95% CI) P value PET status
0.037 0.039 0.372 Positive 48/214 1.00 1.00 1.00 Negative 6/54 0.42 (0.18-0.97) 0.41 (0.17-0.95) 0.55 (0.15-2.04)
Presence of FL 0.047 0.051 0.753 No 12/88 1.00 1.00 1.00 Yes 42/180 1.90 (1.00-3.60) 1.90 (1.00-3.62) 0.84 (0.29-2.44) Presence of diffuse BM infiltrationa 0.220 0.234 0.922 No 24/139 1.00 1.00 1.00 Yes 30/129 1.40 (0.82-2.39) 1.39 (0.81-2.39) 1.03 (0.54-1.96) Presence of PMD <0.001 <0.0001 0.001 No 36/221 1.00 1.00 1.00 Yes 18/47 2.81 (1.59-4.98) 3.82 (2.11-6.92) 3.16 (1.60-6.28) Presence of EMD 0.034 0.012 0.041 No 46/247 1.00 1.00 1.00 Yes 8/21 2.21 (1.04-4.69) 2.68 (1.24-5.77) 2.32 (1.04-5.19) FL hottest SUV max b,c 1.03 (1.00-1.06) 0.043 1.06 (1.02-1.10) 0.002 0.96 (0.85-1.08) 0.479
Bone SUV max c 1.04 (1.01-1.07) 0.021 1.06 (1.03-1.10) <0.001 1.07 (0.96-1.19) 0.223 LDH 0.017 <Upper limit 24/155 1.00 d ≥Upper limit 28/103 1.92 (1.11-3.31) d Cytogenetic risk 0.158 Standard 41/219 1.00 d High 13/49 1.56 (0.84-2.92) d Serum b2 microglobulin 13/62 0.009 <3.5 mg/L 1.00 d 3.5-5.4 mg/L 1.43 (0.74-2.78) d >5.4 mg/L 2.68 (1.40-5.12) d ISS stage 0.010 I 18/118 1.00 II 22/111 1.34 (0.72-2.50) d III 14/39 2.80 (1.39-5.65) d
27/167 14/39
BM: bone marrow; CI: confidence interval; EMD: extramedullary disease; FL: focal lesion; HR: hazard ratio; ISS: IMWG International Staging System; IMWG: International Myeloma Working Group; LDH: lactate dehydrogenase; PET: positron emission tomography; PFS: progressionfree survival; PMD: paramedullary disease; r-ISS: IMWG revised International Staging System; SUVmax: maximum standardized uptake value. aDiffuse BM infiltration is considered to be present if visual analysis (Deauville scale) of BM uptake indicates the residual uptake to be > liver activity (4) or >> liver activity (5); otherwise, the diffuse BM infiltration is considered to be absent. bImputed to 1 for patients with no presence of FL. cHighest result among FL hottest SUVmax, BM uptake SUVmax, PMD hottest SUVmax. Imputed FL hottest SUVmax to 1 for patients with no presence of FL. dCovariates not included in the adjusted analysis.
Haematologica | 108 February 2023 624 LETTER TO THE EDITOR
PET/CT negativity, similar to the CASSIOPET study, and was recommended in the recent standardization by Zamagni et al. 5 Regardless of the differing efficacies and regimens, both studies support the prognostic value of PET/CT.
In conclusion, baseline PET/CT findings appear to have a prognostic value for PFS. Longer follow-up in CASSIOPEIA Part 2 will provide additional insight.
Authors
Françoise Kraeber-Bodéré,1,2 Sonja Zweegman,3 Aurore Perrot,4 Cyrille Hulin,5 Denis Caillot,6 Thierry Facon,7 Xavier Leleu,8 Karim Belhadj,9 Emmanuel Itti,10 Lionel Karlin,11 Clément Bailly,1,2 Mark-David Levin,12 Monique C. Minnema,13 Bastien Jamet,1 Caroline Bodet-Milin,1,2 Bart de Keizer,14 Marie C. Béné,2,15 Hervé Avet-Loiseau,16 Pieter Sonneveld,17 Lixia Pei,18 Fabio Rigat,19 Carla de Boer,20 Jessica Vermeulen,20 Tobias Kampfenkel,20 Jérôme Lambert21 and Philippe Moreau2,22
1Service de Médecine Nucléaire, University Hospital Hôtel-Dieu, Nantes, France; 2CRCI2NA, INSERM, CNRS, Université d’Angers, Nantes Université, Nantes, France; 3Amsterdam UMC, Vrije Universiteit Amsterdam, Cancer Center Amsterdam, Department of Hematology, Amsterdam, the Netherlands; 4CHU de Toulouse, IUCT-O, Université de Toulouse, UPS, Service d’Hématologie, Toulouse, France; 5Department of Hematology, Hôpital Haut Lévêque, University Hospital Bordeaux, Pessac, France; 6CHU Dijon, Hôpital du Bocage, Dijon, France; 7University of Lille, CHU Lille, Service des Maladies du Sang, Lille, France; 8CHU Poitiers, Hôpital la Milétrie, Poitiers, France; 9Hôpital Henri Mondor, Lymphoid Malignancies Unit, Créteil, France; 10Department of Nuclear Medicine, Hôpital Henri Mondor, Créteil, France; 11Centre Hospitalier Lyon-Sud Hématologie (HCL), Pierre–Bénite, France; 12Albert Schweitzer Ziekenhuis, Dordrecht, the Netherlands; 13Department of Hematology, University Medical Center Utrecht, Utrecht, the Netherlands; 14Department of Nuclear Medicine and Radiology, University Medical Center Utrecht, Utrecht, The Netherlands; 15Hematology Biology, University Hospital Hôtel Dieu, Nantes, France; 16Unite de Génomique du Myelome, IUC-Oncopole, Toulouse, France; 17Erasmus MC Cancer Institute, Rotterdam, the Netherlands; 18Janssen Research & Development, LLC, Raritan, NJ, USA; 19Janssen Research & Development, LLC, Buckinghamshire, UK; 20Janssen Research & Development, LLC, Leiden, the Netherlands; 21Biostatistical Department, Hôpital Saint Louis, Paris, France and 22Hematology, University Hospital Hôtel-Dieu, Nantes, France
Correspondence:
F. KRAEBER-BODÉRÉ - francoise.bodere@chu-nantes.fr https://doi.org/10.3324/haematol.2021.280051
Received: September 20, 2021. Accepted: October 11, 2022. Prepublished: October 20, 2022.
©2023 Ferrata Storti Foundation
Published under a CC BY-NC license
Disclosures
SZ served in a consulting or advisory role for Celgene, Bristol Myers Squibb, Janssen, Takeda, Oncopeptides, and Sanofi; and received research funding from Takeda and Janssen. AP received honoraria from Amgen, Celgene, Janssen, Sanofi, and Takeda. CH received honoraria from Celgene, Janssen, Amgen, and Takeda; and had travel, accommodations, or other expenses paid or reimbursed by Celgene, Janssen, and Amgen. TF received honoraria from, served in a consulting or advisory role for, and served on a speakers bureau for Janssen. XL received honoraria from and served in a consulting or advisory role for AbbVie, Amgen, Bristol Myers Squibb, Celgene, Gilead, Incyte, Janssen, Karyopharm, Merck, Mundipharma, Novartis, Roche, and Takeda. KB served in a consulting or advisory role for and received honoraria from Amgen, Celgene, Janssen, and Takeda. LK received honoraria from and served in a consulting or advisory role for Amgen, Janssen, Celgene, and Takeda; and had travel, accommodations, or other expenses paid or reimbursed by Amgen and Janssen. M-DL received honoraria from; served in a consulting or advisory role for; and had travel, accommodations, or other expenses paid or reimbursed by Amgen, Janssen, AbbVie, and Celgene. MCM received honoraria from Gilead; served in a consulting or advisory role for Celgene, Amgen, Takeda, JanssenCilag, Servier, and Bristol Myers Squibb; and received research funding from Celgene. PS received honoraria and research funding from Amgen, Celgene, Janssen, Karyopharm, and Takeda; and received researching funding from Skyline. LP and TK are employed by Janssen. FR, CdB, and JV are employed by Janssen and hold stock options from Johnson & Johnson. PM received honoraria from and served in a consulting or advisory role for Celgene, Janssen, Amgen, Sanofi, and AbbVie. All other authors have no conflicts of interest to disclose.
Contributions
All authors contributed to the study design, study execution, data analysis, and manuscript writing. All authors provided a full review of the manuscript and are fully responsible for all content and editorial decisions, were involved in all stages of manuscript development, and have approved the final version.
Funding
This study was funded by the Intergroupe Francophone du Myélome (IFM) and the Dutch-Belgian Cooperative Trial Group for Hematology Oncology (HOVON) and was supported in part by grants from the French National Agency for Research called “Investissements d’Avenir” IRON Labex n◦ ANR-11-LABX-0018-01 and by a grant from INCa-DGOS-Inserm_12558 (SIRIC ILIAD).
Haematologica | 108 February 2023 625 LETTER TO THE EDITOR
Acknowledgments
The authors would like to thank the patients who participated in this study, the investigators who participated in this study, staff members at the study sites, staff members who were involved in data collection and analyses, the data safety monitoring committee, the IFM, HOVON, and the Janssen team. Editorial and medical writing support in the development of an earlier draft of the manuscript were provided by Austin Horton, PhD, of Lumanity Communications Inc., and were funded by Janssen Global Services, LLC.
Data-sharing statement
The data sharing policy of Janssen Pharmaceutical Companies of Johnson & Johnson is available at https://www.janssen.com/clinical-trials/transparency. As noted on this site, requests for access to the study data can be submitted through Yale Open Data Access (YODA) Project site at http://yoda.yale.edu.
1. Jamet B, Bailly C, Carlier T, et al. Interest of Pet imaging in multiple myeloma. Front Med (Lausanne). 2019;6:69.
2. Moreau P, Attal M, Caillot D, et al. Prospective evaluation of magnetic resonance imaging and [18F]fluorodeoxyglucose positron emission tomography-computed tomography at diagnosis and before maintenance therapy in symptomatic patients with multiple myeloma included in the IFM/DFCI 2009 trial: results of the IMAJEM study. J Clin Oncol. 2017;35(25):2911-2918.
3. Cavo M, Terpos E, Nanni C, et al. Role of 18F-FDG PET/CT in the diagnosis and management of multiple myeloma and other plasma cell disorders: a consensus statement by the International Myeloma Working Group. Lancet Oncol. 2017;18(4):e206-e217.
4. Abe Y, Ikeda S, Kitadate A, et al. Low hexokinase-2 expressionassociated false-negative 18F-FDG PET/CT as a potential prognostic predictor in patients with multiple myeloma. Eur J Nucl Med Mol Imaging. 2019;46(6):1345-1350.
5. Zamagni E, Nanni C, Dozza L, et al. Standardization of 18F-FDG–PET/CT according to Deauville criteria for metabolic complete response definition in newly diagnosed multiple myeloma. J Clin Oncol. 2021;39(2):116-125.
6. Zamagni E, Patriarca F, Nanni C, et al. Prognostic relevance of 18-F FDG PET/CT in newly diagnosed multiple myeloma patients treated with up-front autologous transplantation. Blood. 2011;118(23):5989-5995.
7. Moreau P, Attal M, Hulin C, et al. Bortezomib, thalidomide, and dexamethasone with or without daratumumab before and after autologous stem-cell transplantation for newly diagnosed multiple myeloma (CASSIOPEIA): a randomised, open-label, phase 3 study. Lancet. 2019;394(10192):29-38.
8. Moreau P, Hulin C, Perrot A, et al. Maintenance with daratumumab or observation following treatment with bortezomib, thalidomide,
and dexamethasone with or without daratumumab and autologous stem-cell transplant in patients with newly diagnosed multiple myeloma (CASSIOPEIA): an open-label, randomised, phase 3 trial. Lancet Oncol. 2021;22(10):1378-1390.
9. Nanni C, Zamagni E, Versari A, et al. Image interpretation criteria for FDG PET/CT in multiple myeloma: a new proposal from an Italian expert panel. IMPeTUs (Italian Myeloma criteria for PET USe). Eur J Nucl Med Mol Imaging. 2016;43(3):414-421.
10. Kumar S, Paiva B, Anderson KC, et al. International Myeloma Working Group consensus criteria for response and minimal residual disease assessment in multiple myeloma. Lancet Oncol. 2016;17(8):e328-e346.
11. Rasche L, Angtuaco E, McDonald JE, et al. Low expression of hexokinase-2 is associated with false-negative FDG-positron emission tomography in multiple myeloma. Blood. 2017;130(1):30-34.
12. Bartel TB, Haessler J, Brown TLY, et al. F18-fluorodeoxyglucose positron emission tomography in the context of other imaging techniques and prognostic factors in multiple myeloma. Blood. 2009;114(10):2068-2076.
13. Michaud-Robert AV, Zamagni E, Carlier T, et al. Glucose metabolism quantified by SUVmax on baseline FDG-PET/CT predicts survival in newly diagnosed multiple myeloma patients: combined harmonized analysis of two prospective phase III trials. Cancers (Basel). 2020;12(9):2532.
14. Rasche L, Chavan SS, Stephens OW, et al. Spatial genomic heterogeneity in multiple myeloma revealed by multi-region sequencing. Nat Commun. 2017;8(1):268.
15. Rasche L, Angtuaco EJ, Alpe TL, et al. The presence of large focal lesions is a strong independent prognostic factor in multiple myeloma. Blood. 2018;132(1):59-66.
Haematologica | 108 February 2023 626 LETTER TO THE EDITOR
References
A novel SART3::RARG fusion gene in acute myeloid leukemia with acute promyelocytic leukemia phenotype and differentiation escape to retinoic acid
Acute promyelocytic leukemia (APL) is a unique subtype of acute myeloid leukemia (AML) that features promyelocytic leukemia cells, prominent coagulopathy, and the promyelocytic leukemia (PML)::retinoic acid receptor a (RARA) fusion gene derived from translocation t(15;17).1 The introduction of all-trans retinoic acid (ATRA) and later arsenic trioxide (ATO) has revolutionized the treatment of this disease, which is now highly curable.1 In approximately 5% of the cases presenting APL phenotype, PML::RARA was negative. By far, translocations involving RARA and 16 other partner genes have been reported with different sensitivity to ATRA.2 Rearrangement involving the other two members of the retinoic acid receptor family, retinoic acid receptor b (RARB) or retinoic acid receptor γ (RARG), has been reported including TBLR1::RARB, NUP98::RARG, CPSF6::RARG, PML::RARG, NPM1::RARG::NPM1, HNRNPC::RARG and RARG::HNRNPM 2-5 All of these patients demonstrated ATRA resistance. Here, we report a novel SART3::RARG fusion gene in a case of APL-like leukemia (APLL) showing differentiation escape to ATRA. A comprehensive analysis of the patient and preliminary function assays for SART3::RARG were performed. Our work not only enriches our knowledge of APL-like leukemia (APLL), but also lends support to the proposal that RARG rearrangement represent a distinct subtype of AML that needs early recognition and proper management. A 46-year-old previously healthy man was admitted because of gum bleeding and spontaneous ecchymosis. His initial complete blood count showed a white blood cell (WBC) count of 2.0×10⁹/L, hemoglobin level of 99 g/L, and platelet count of 80×109/L. Prominent coagulopathy was noted with prothrombin time of 20.1 seconds (s) (reference 10-14 s), activated partial thromboplastin time of 60.6 s (reference 28-45 s), fibrinogen level of 0.33 g/l (reference 2-4 g/L), fibrinogen/fibrin degradation product levels 27.67 mg/L (reference, 0-5 mg/L), and D-dimer levels 4.37 mg/L (reference, 0-0.5mg/L). Bone marrow (BM) smear showed hypercellularity with 81.7% abnormal promyelocytes (Figure 1A). The blasts featured abundant cytoplasmic coarse granules, lobulated or kidney-shaped nuclear, and occasional nucleoli, reminiscent of APL. Auer rods were absent. Myeloperoxidase (MPO) staining was negative somehow (Figure 1B). These cells were positive for CD13, CD33, and CD117, partially positive for MPO, CD64, and CD15, but negative for CD34, HLA-DR, CD11b, CD14, and other lymphoid-related markers by flow cytometry (Figure 1E). Flu-
orescence in situ hybridization (FISH) using a PML::RARA dual-color dual-fusion probe showed no fusion signals (Figure 1C). Multiplex reverse transcription polymerase chain reaction (RT-PCR) detecting 43 leukemia-related fusion genes including PML::RARA were negative. G-banding karyotype analysis of BM cells revealed a clonal -Y in 16 of 20 metaphase analyzed (Figure 1C). ATRA (20 mg, twice daily) was administered on suspicion of APL for a week without improvement of coagulopathy. He was transferred to our hospital on the 8th day. We continued ATRA treatment and reevaluated his BM morphology and immunophenotype, where there were no signs of differentiation. Meanwhile, his WBC count increased to 6.4×10⁹/L, and he complained of bone pain. Despite strong transfusion supportive care, he died of diffuse alveolar hemorrhage on the 11th day.
Given the absence of PML::RARA, RNA sequencing, singlenucleotide polymorphism (SNP) array, and whole exome sequencing (WES) were performed using the patient’s BM sample to characterize underlying molecular aberrations. The study was approved by the Second Xiangya Hospital Institutional Review Board, Central South University. Informed consent or assent was obtained in accordance with the Declaration of Helsinki. RNA sequencing revealed that SART3 exon 18 was fused to RARG exon 3 (Figures 2A). In order to validate this novel fusion, RT-PCR was performed with the forward primer 5’-TCAAAGTGGCAATCAGCAACC-3’ (at SART3 exon 18), and reverse primer 5’-AGCCTGGGAGGCTCCGTA-3’ (at RARG exon 3). An expected 160 bp band was visualized on agarose gel electrophoresis (Figure 2B) (GenBank accession number ON681589). Using the same primers, a 1,156 bp transcript was amplified from the genomic DNA of BM sample, which localized the genomic breakpoint at SART3 intron 18 (Chr12: 108917694) and RARG intron 2 (Chr12: 53622069) (Figure 2C) (GenBank accession number ON681590). The reciprocal RARG::SART3 fusion was not detected. The fusion was in-frame and encode a 1,406-amino acid chimera (Figure 2E). Immunoblotting of BM mononuclear cell lysate using an anti-RARG antibody (Cell Signaling Technology) confirmed the presence of SART3::RARG as a band (~170 kDa) was visualized in addition to the wild-type RARG band (~55 kDa) (Figure 2D). Furthermore, SNP array revealed a mosaic loss of chromosome Y in accordance with karyotype (Online Supplementary Figure S1A). Besides, a 2.26 Mb microdeletion in
Haematologica | 108 February 2023 627 LETTER TO THE EDITOR
E
Figure 1. Morphologic, immunophenotypic, and cytogenetic features of the SART3::RARG-positive blasts. (A) Wright-Giemsa staining of bone marrow smear showing hypergranular promyelocytes without Auer rods. Original magnification X1,000. (B) Cytochemical evidence for myeloperoxidase negativity of blast cells (as compared with neutrophils; arrows). Original magnification X1,000. (C) Interphase fluorescence in situ hybridization using the PML::RARA dual-color, dual-fusion translocation probe revealed the absence of PML::RARA. (D) Karyotypic analysis of the bone marrow revealed a karyotype of 45,X,-Y[16]/46,XY[4]. (E) Immunophenotype of the patient with SART3::RARG-positive AML. Dot plots of flow cytometry data of bone marrow aspiration sample. Red cluster shows the blast population.
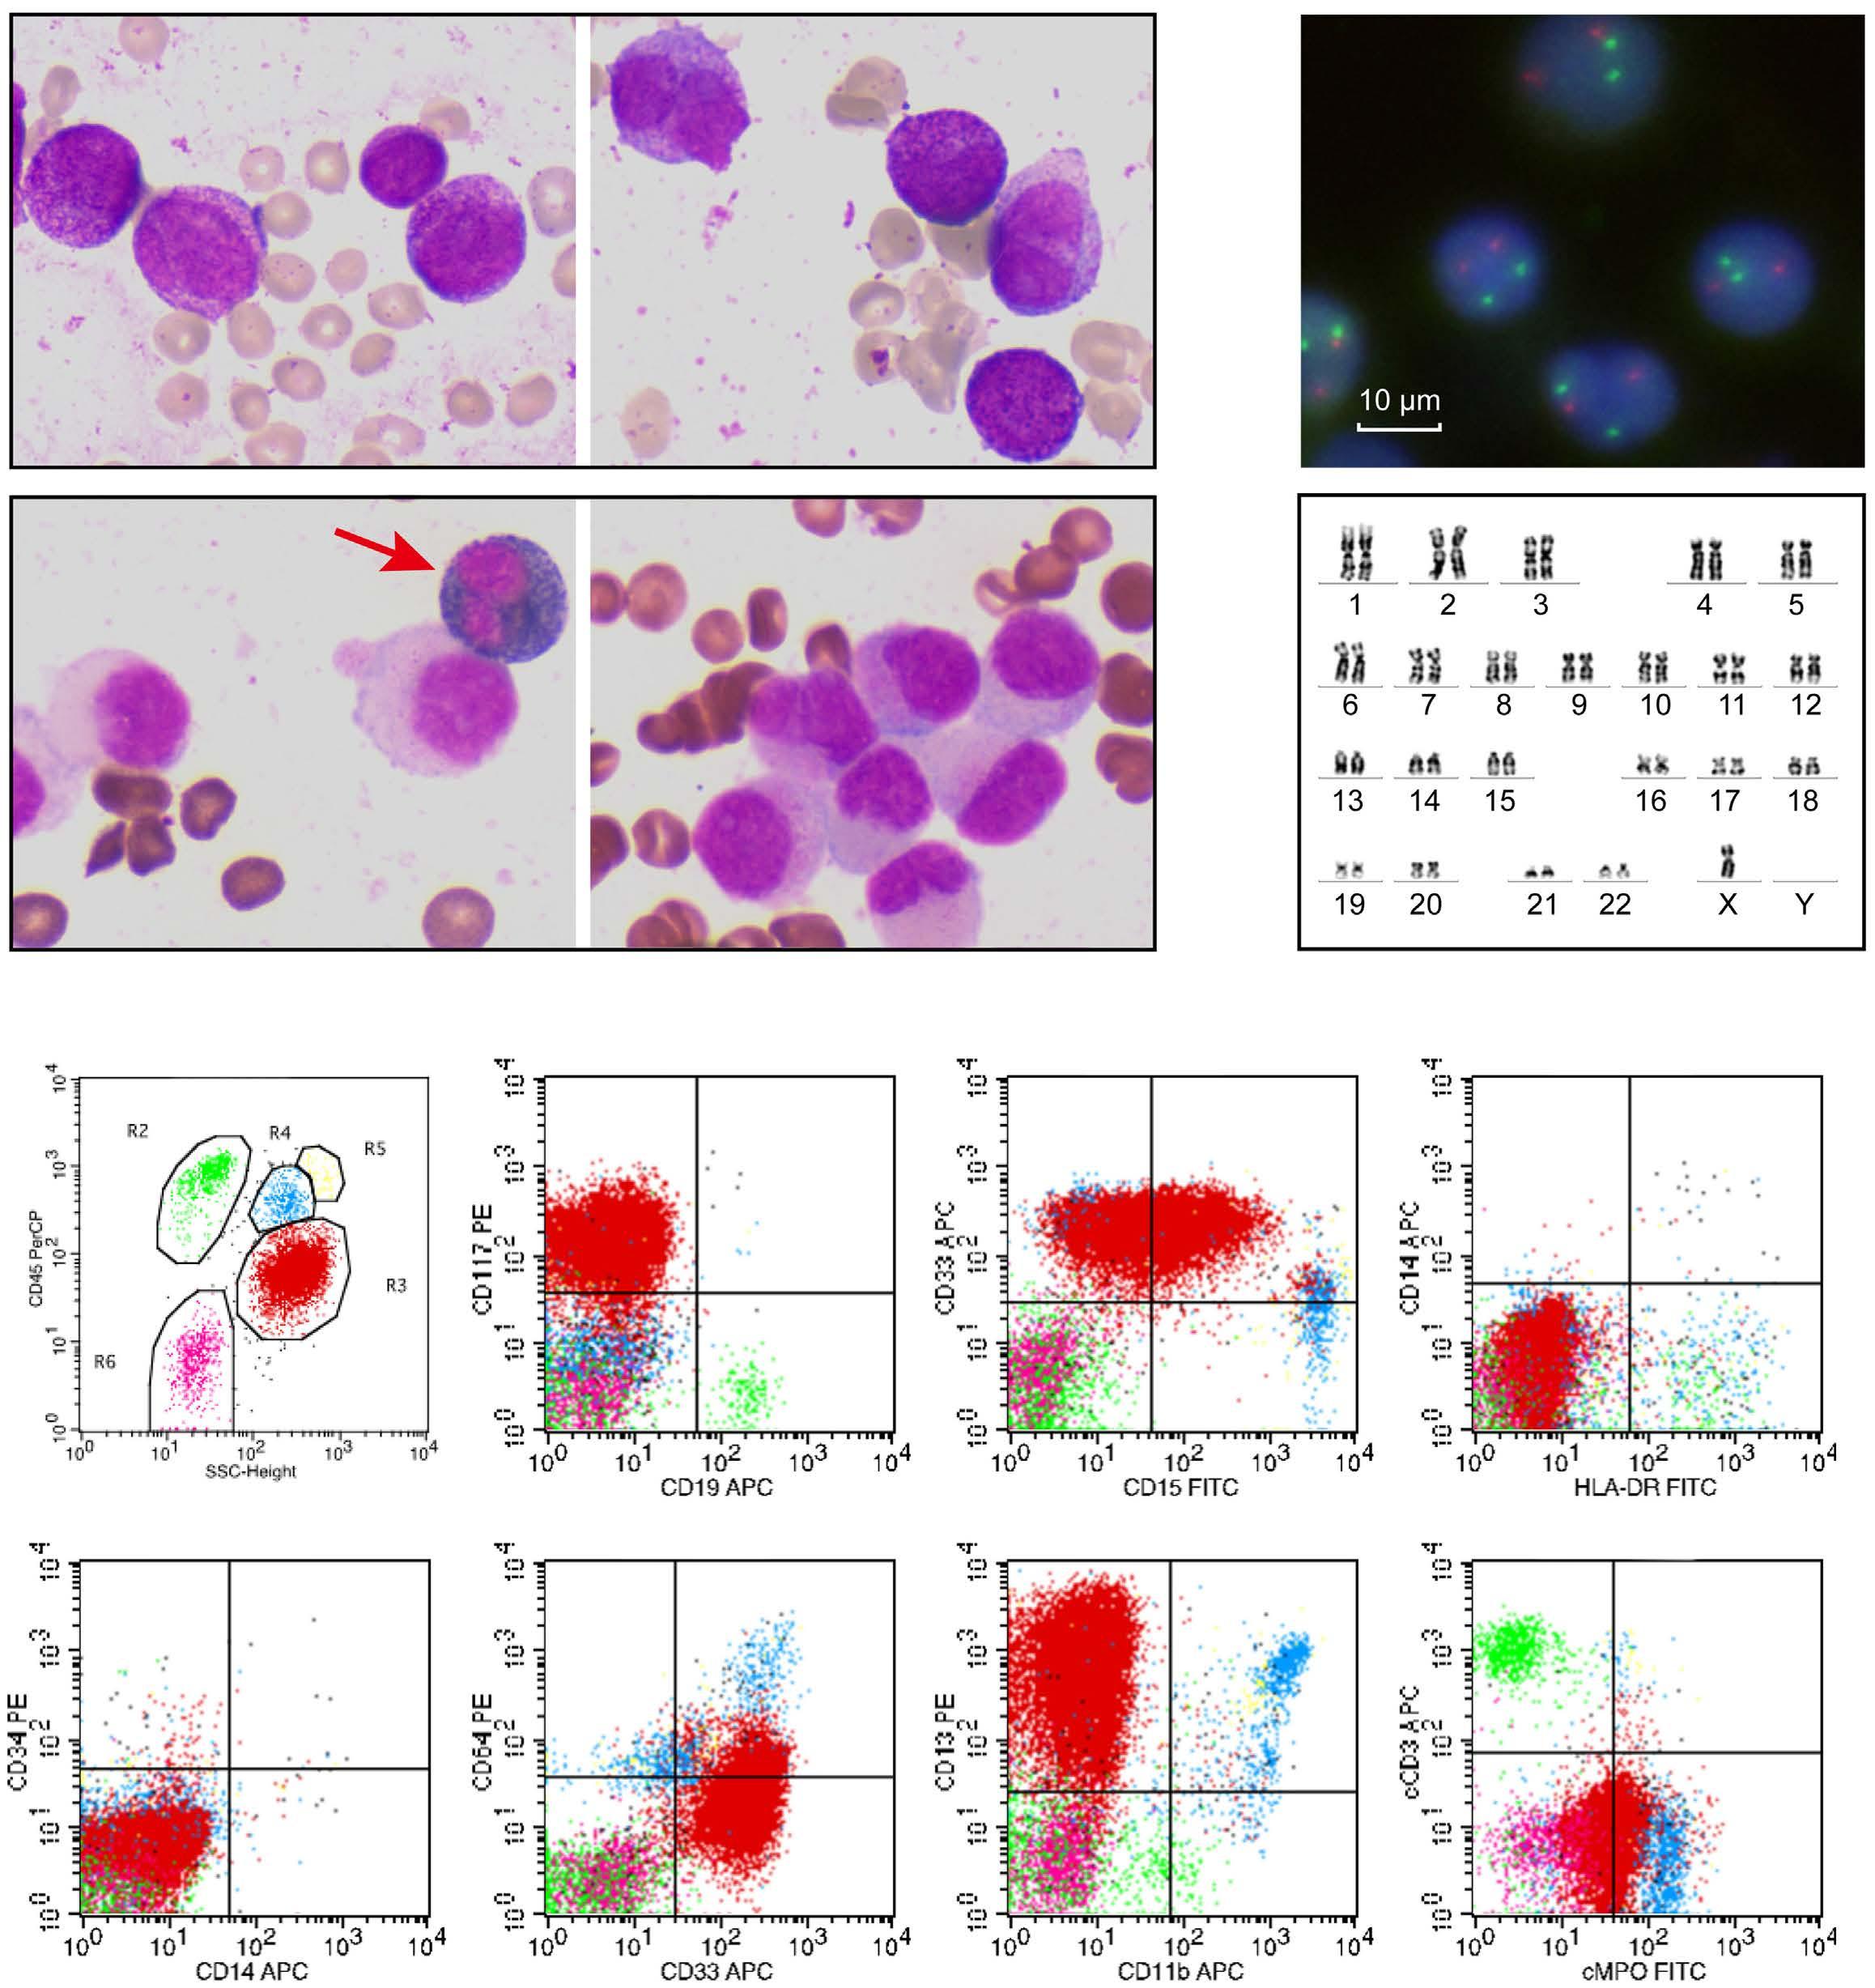
12q21.2, a 1.99 Mb microdeletion in 12q23.3q24.11 encompassing SART3 (Online Supplementary Figure S1B), and a uniparental disomy of a 5.42 Mb segment at 17q21.2q21.32 (Online Supplementary Figure S1C) were detected. Since SART3 and RARG located at 12q23.3 and 12q13.13, respectively, the SART3::RARG fusion gene may result from the microdeletions or cryptic translocations in 12q. In addition, WES identified two somatic mutations, WT1 c.1114-2A>G (variant allele frequency [VAF] 27%) (Online Supplementary Figure S2A) and KDM6A
p.Pro1107AlafsTer46 (VAF 90.5%) (Online Supplementary Figure S2B), which were verified by RT-PCR and Sanger sequencing. Moreover, three MPO mutations (Online Supplementary Table S1) were detected by WES, which might have impaired the enzymatic and immunological activity of MPO in a way of compound heterozygous mutations, leading to negative MPO staining and reduced MPO immunophenotype in this case.6 Retinoic acid receptors (RAR) are members of nuclear hormone receptors, and regulate cell growth, differentiation,
A B C
D
Haematologica | 108 February 2023 628 LETTER TO THE EDITOR
and cell death in response to retinoic acid/ligand binding. Their modular structure features two main functional domains: DNA-binding domain (DBD) and ligand-binding domain (LBD). The three RAR family members, RARA, RARB, and RARG, share high sequence homology but show distinct transcriptional properties.7 During hematopoiesis, RARG is a potent ligand-dependent transactivator that governs hemopoietic stem/progenitor cells self-renewal,
whereas RARA exerts ATRA-reversible basal repressive functions favoring myeloid differentiation.7 SART3 (spliceosome-associated factor 3, U4/U6 recycling protein), is a nuclear RNA-binding protein regulates premRNA splicing, translesion DNA synthesis, and histone chaperoning.8,9 It plays important roles in viral and host gene transcription, embryonic development, and hematopoiesis.8-10 Structurally, SART3 consist of multiple half-a-
Figure 2. Molecular characterization of the SART3::RARG fusion. (A) RNA sequencing analysis revealed the fusion between exon 18 of SART3 and exon 3 of RARG. (B) Reverse transcription polymerase chain reaction (RT-PCR) using bone marrow (BM) cDNA confirmed the SART3::RARG fusion transcript when a 160 bp band was visualized. Partial nucleotide sequences surrounding the junction was shown. (C) RT-PCR for SART3::RARG using BM genomic DNA amplified a band of 1,156 bp. Partial nucleotide sequences surrounding the genomic breakpoint was shown. (D) Western blotting of BM mononuclear cell lysate using anti-RARG antibody showed two bands corresponding to the wild-type RARG (~55 kDa) and the SART3::RARG chimera (~170 kDa) in the patient. 1: the patient with SART3::RARG; 2: a classic APL patient with PML::RARA. (E) Schematic diagram of SART3, RARG, and the SART3::RARG fusion protein. The fusion breakpoint was highlighted with a red arrow. DBD: DNA binding domain; HAT: half-a-tetratricopeptide repeats; LBD: ligand binding domain; LIM: LSm-interacting motif; NLS: nuclear localization sequence; RRM1-2: RNA recognition motifs 1-2; 5’ UTR: 5’ untranslated region.
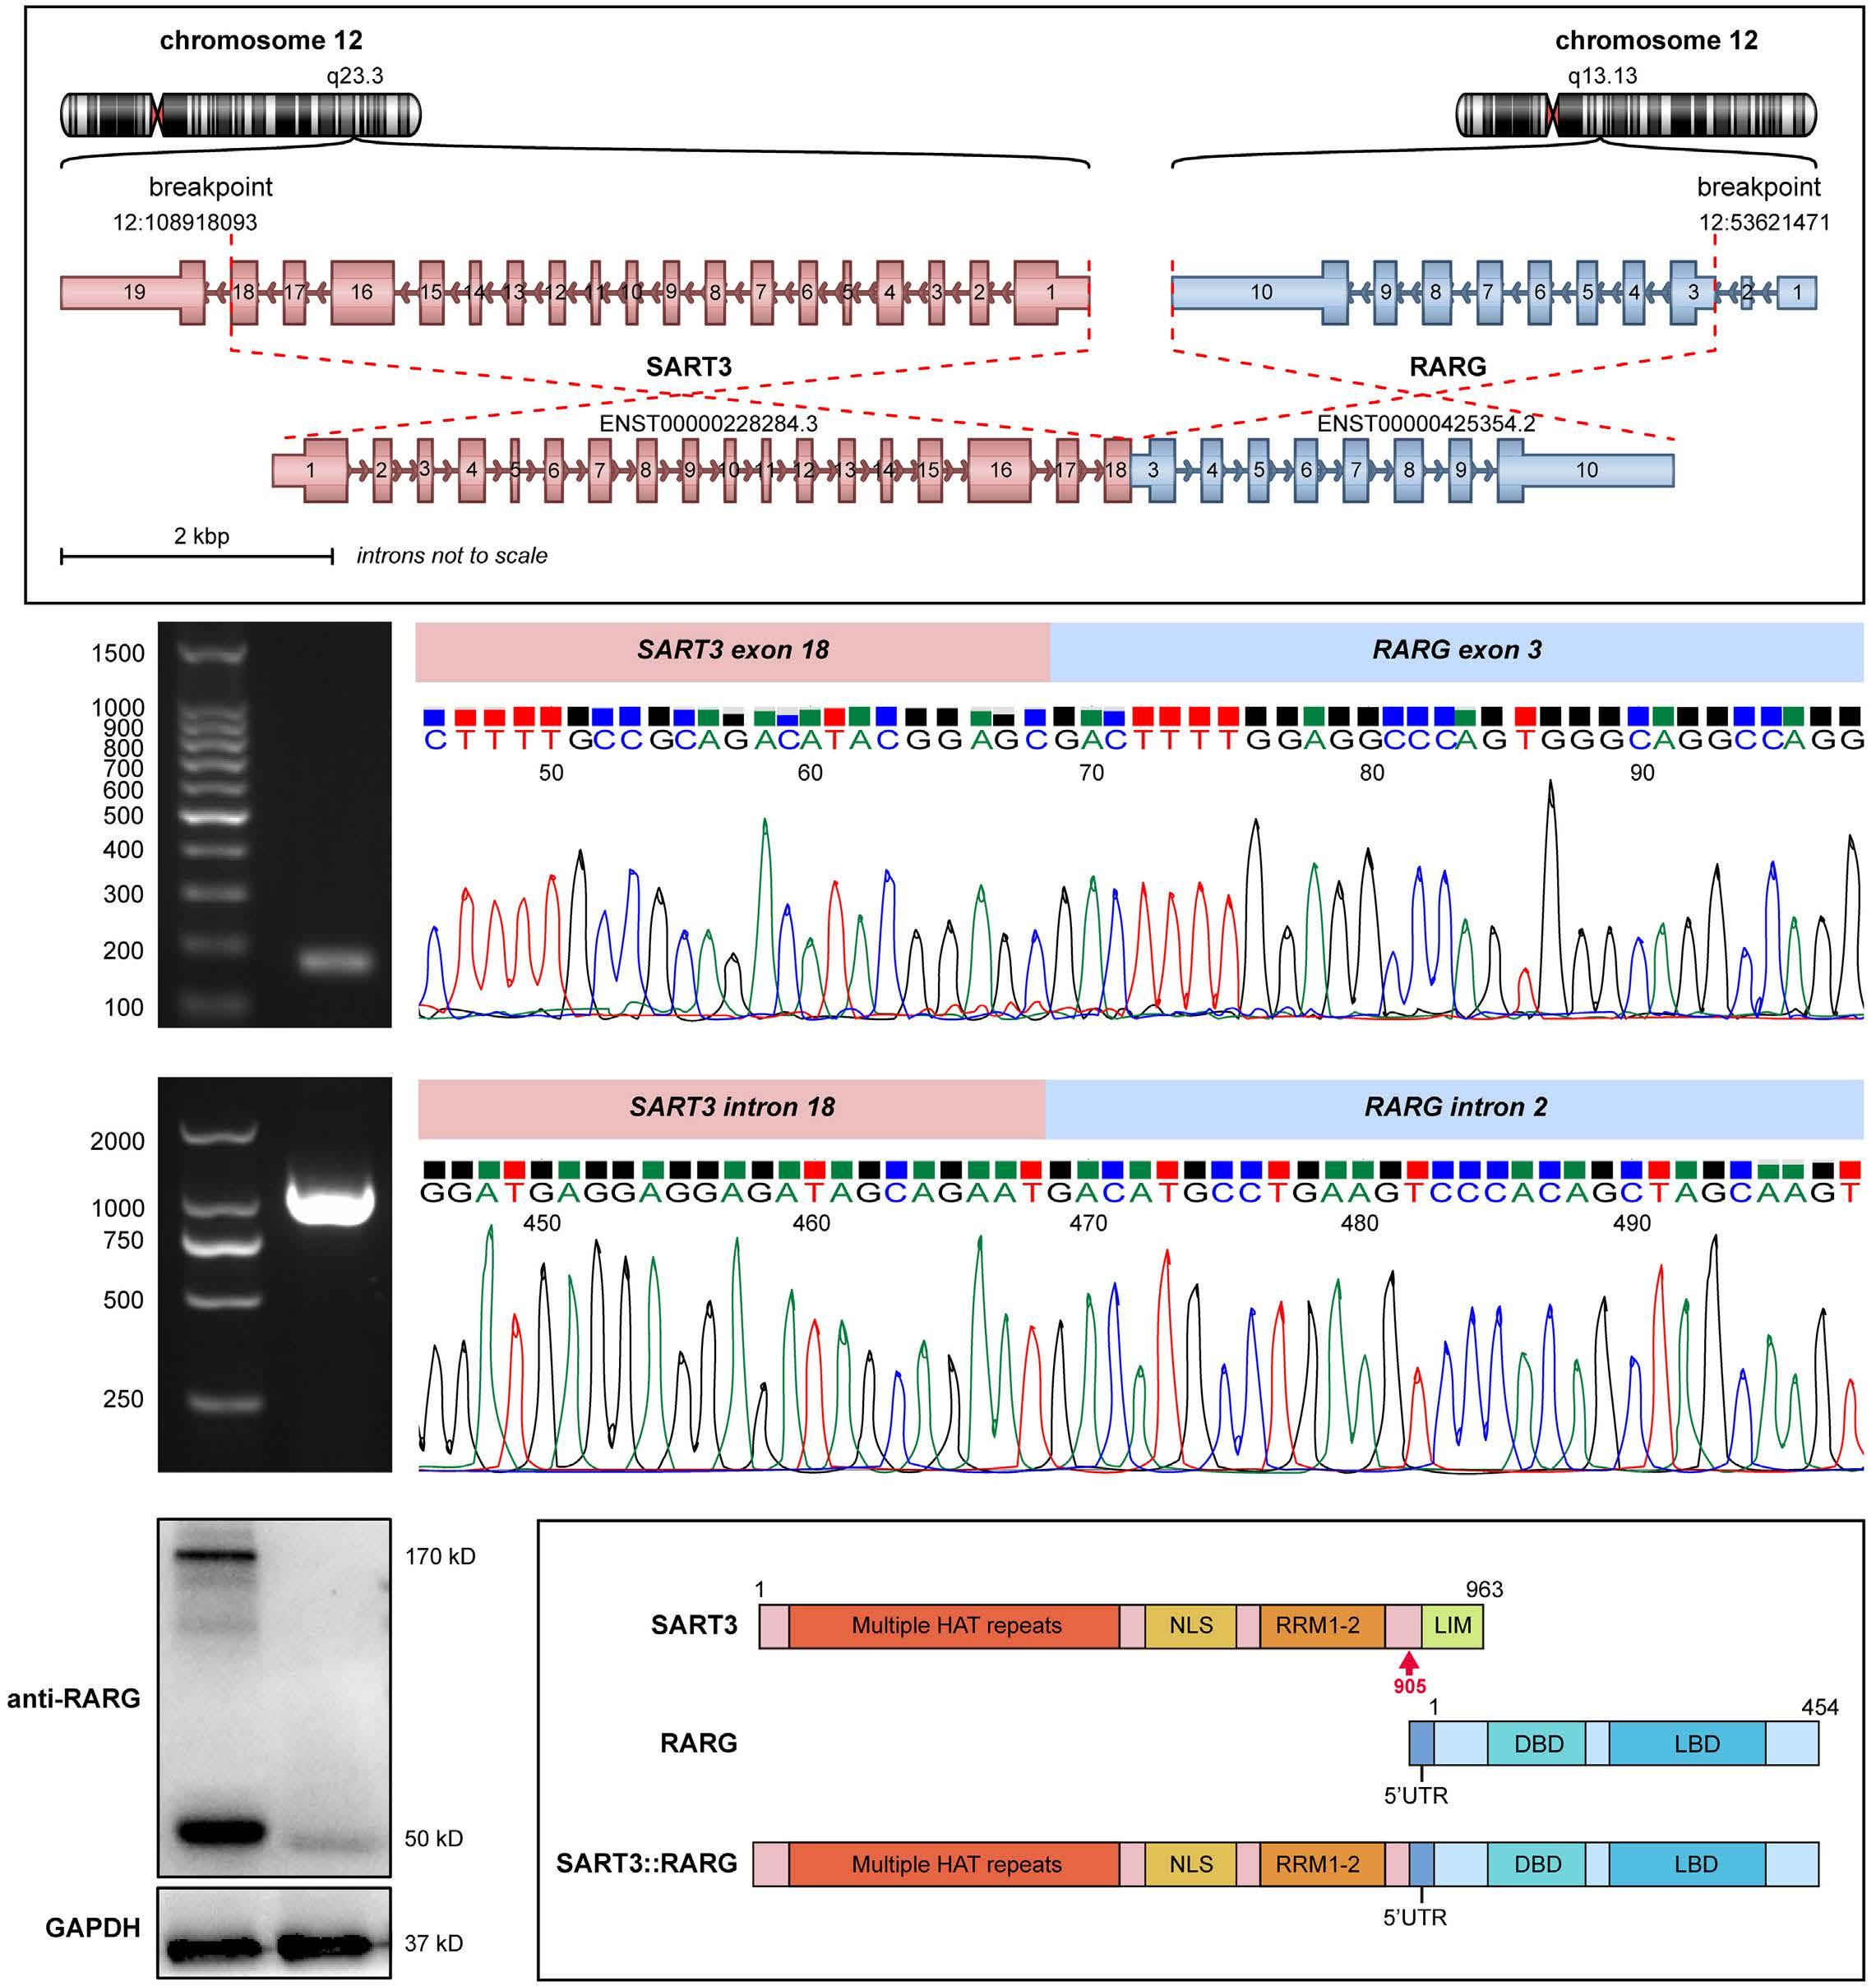
A B C D E
Haematologica | 108 February 2023 629 LETTER TO THE EDITOR
tetratricopeptide (HAT) repeats, a nuclear localization signal (NLS) sequence, two RNA recognition motifs (RRM), and a LSm-interaction motif (LIM) at the C-terminus (Figure 2E). SART3::PDGFRB was reported in a patient with eosinophilia-associated myeloproliferative neoplasm.11 The SART3::RARG chimera retained the HAT repeats, NLS, and RRMs of SART3, an intact RARG, and additional 46 amino acids due to inclusion of partial RARG 5’ untranslated region (UTR) (Figure 2E). The loss of 58 amino acids in the carboxyl terminal of SART3, including the LIM domain, may impair SART3’s function as an mRNA splicing regulator. As shown by immunofluorescence experiments, the subcellular localization of SART3::RARG was primarily intranuclear, diffusely distributed and specifically aggregated in large bright dots (Figure 3A, the second column) similar to that of SART312 but distinct from RARG. Homo-dimerization is a common feature of RARA fusion chimeras as well as NUP98::RARG to gain oncogenic potential.13 As shown in Figure 3A, FLAG-tagged SART3::RARG co-localized with either HA-tagged SART3::RARG or SART3, but not RARG. Co-immunoprecipitation results confirmed the self-association of SART3::RARG and its heterodimerization with SART3, but not with RARG (Figure 3B), suggest that homodimerization of SART3::RARG is mediated by the SART3 portion, likely the HAT repeats.9 Furthermore, dual
luciferase reporter assays revealed that SART3::RARG acts as a dominant-negative RARG mutant (Figure 3C) similar to NUP98::RARG13. In response to ATRA, the transcriptional activity of RARA, PML::RARA, and RARG increased dramatically whereas SART3::RARG showed a blunt ATRA response comparable to ATRA-insensitive ZBTB16::RARA and GTF2I::RARA14 (Figure 3D). Including SART3::RARG, seven different RARG fusion genes have been reported.2-5 Although the breakpoint in RARG varied, occurring at exon 1, 2, 3, or 4 for X::RARG and at intron 9 for RARG::X, all these RARG fusion chimeras retain the DBD and LBD of RARG. From cases reported in the literature, these RARG-rearranged AML were predominantly East Asians, and exhibited APL morphology and immunophenotype, bleeding diathesis, but were insensitive to ATRA. Response to anthracycline plus cytarabine “7+3” induction regimen varied, while incorporating homoharringtonine into reinduction chemotherapy succeed in achieving complete remission. Due to its rarity, the incidence and prognosis of RARG-rearranged AML remain to be determined. The early death of our patient makes it hard to conclude clinical ATRA resistance. However, the lack of an early response suggests ATRA insensitivity. It is reported that CD11b positivity and correction of coagulation disorders are early signs of ATRA's efficacy.1,15 In our
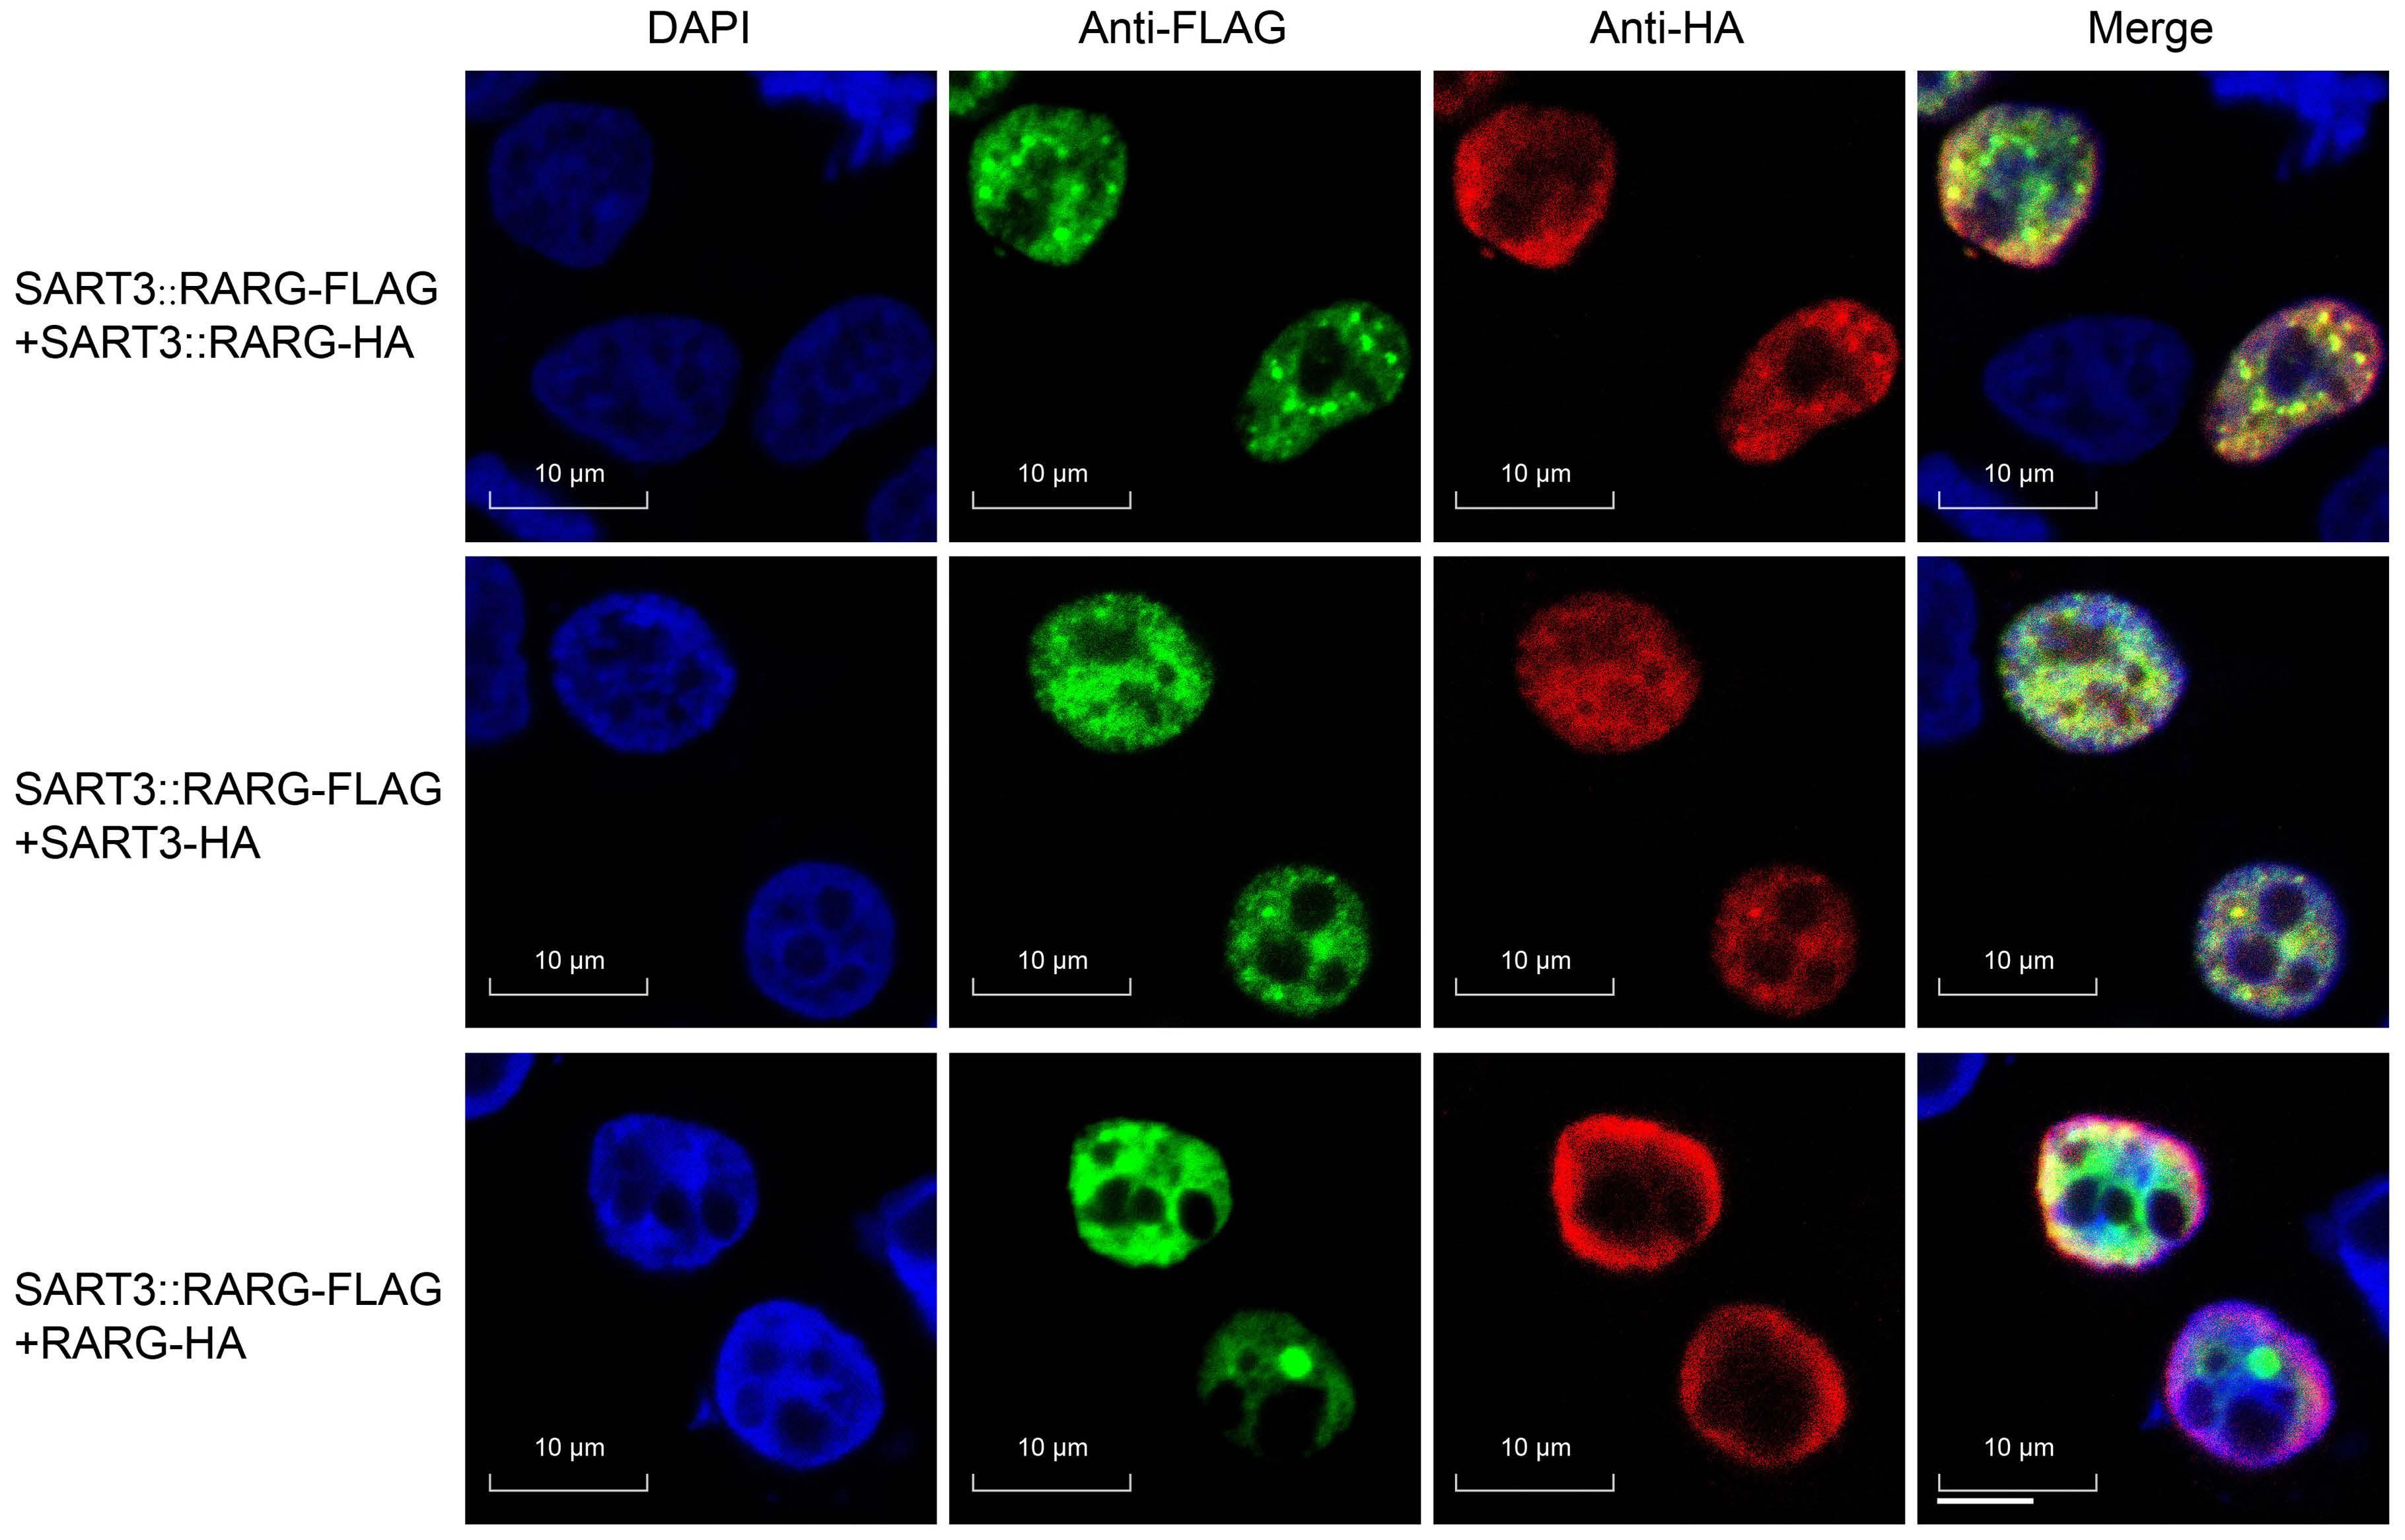
A
Continued on following page.
Haematologica | 108 February 2023 630 LETTER TO THE EDITOR
Figure 3. Functional assays for the SART3::RARG fusion chimera. (A) Subcellular localization/colocalization of SART3::RARG, SART3, and RARG. 293T cells were co-transfected with indicated pcDNA3.1 expression plasmids. Immunofluorescence was performed with anti-FLAG and anti-HA antibodies. The nuclei were visualized with 4’, 6-diamidino-2-phenylindole (DAPI: blue, the first column), FLAG-tagged SART3::RARG was stained with Alexa Fluor 488 (green, the second column), and HA-tagged proteins were stained with Alexa Fluor 594 (red, the third column). The 4th column shows composite images: yellow fluorescence indicates co-localization. Original magnification X630. (B) SART3::RARG interacts with itself or SART3, but not RARG. PcDNA3.1 expression plasmids of SART3::RARG-FLAG was co-transfected into 293T cells with either empty vector or HA-tagged expression vector, as shown in the table. Immunoblotting of whole cell lysate (WCL) confirmed successful transfection and expression (left). Cell lysate were immunoprecipitated (IP) using anti-FLAG antibodies, and analyzed by immunoblotting (right). SART3::RARG-HA and SART3-HA, but not RARG-HA, could be detected after immunoprecipitation with anti-FLAG antibodies. (C) SART3::RARG act as a negative mutant of RARG. 293T cells were transfected with 4×RARE pGL3 reporter vector, pRL-TK, and together with a vector containing one of the following genes: RARA, PML::RARA, GTF2I::RARA, ZBTB16::RARA, RARG, or SART3::RARG. Relative firefly luciferase expression of cell lysate was normalized to Renilla luciferase. The expression of the vector control was set to 1. The error bars represent the mean of an experiment performed in triplicate. (D) SART3::RARG responds poorly to ATRA. 293T cells transfected with the indicated constructs were treated with dimethyl sulfoxide (DMSO), 10 nm ATRA, or 1 mM ATRA for 48 hours. Relative firefly luciferase expression of cell lysate was normalized to Renilla luciferase. N=3 independent experiments. All data are presented as mean ± standard deviation.
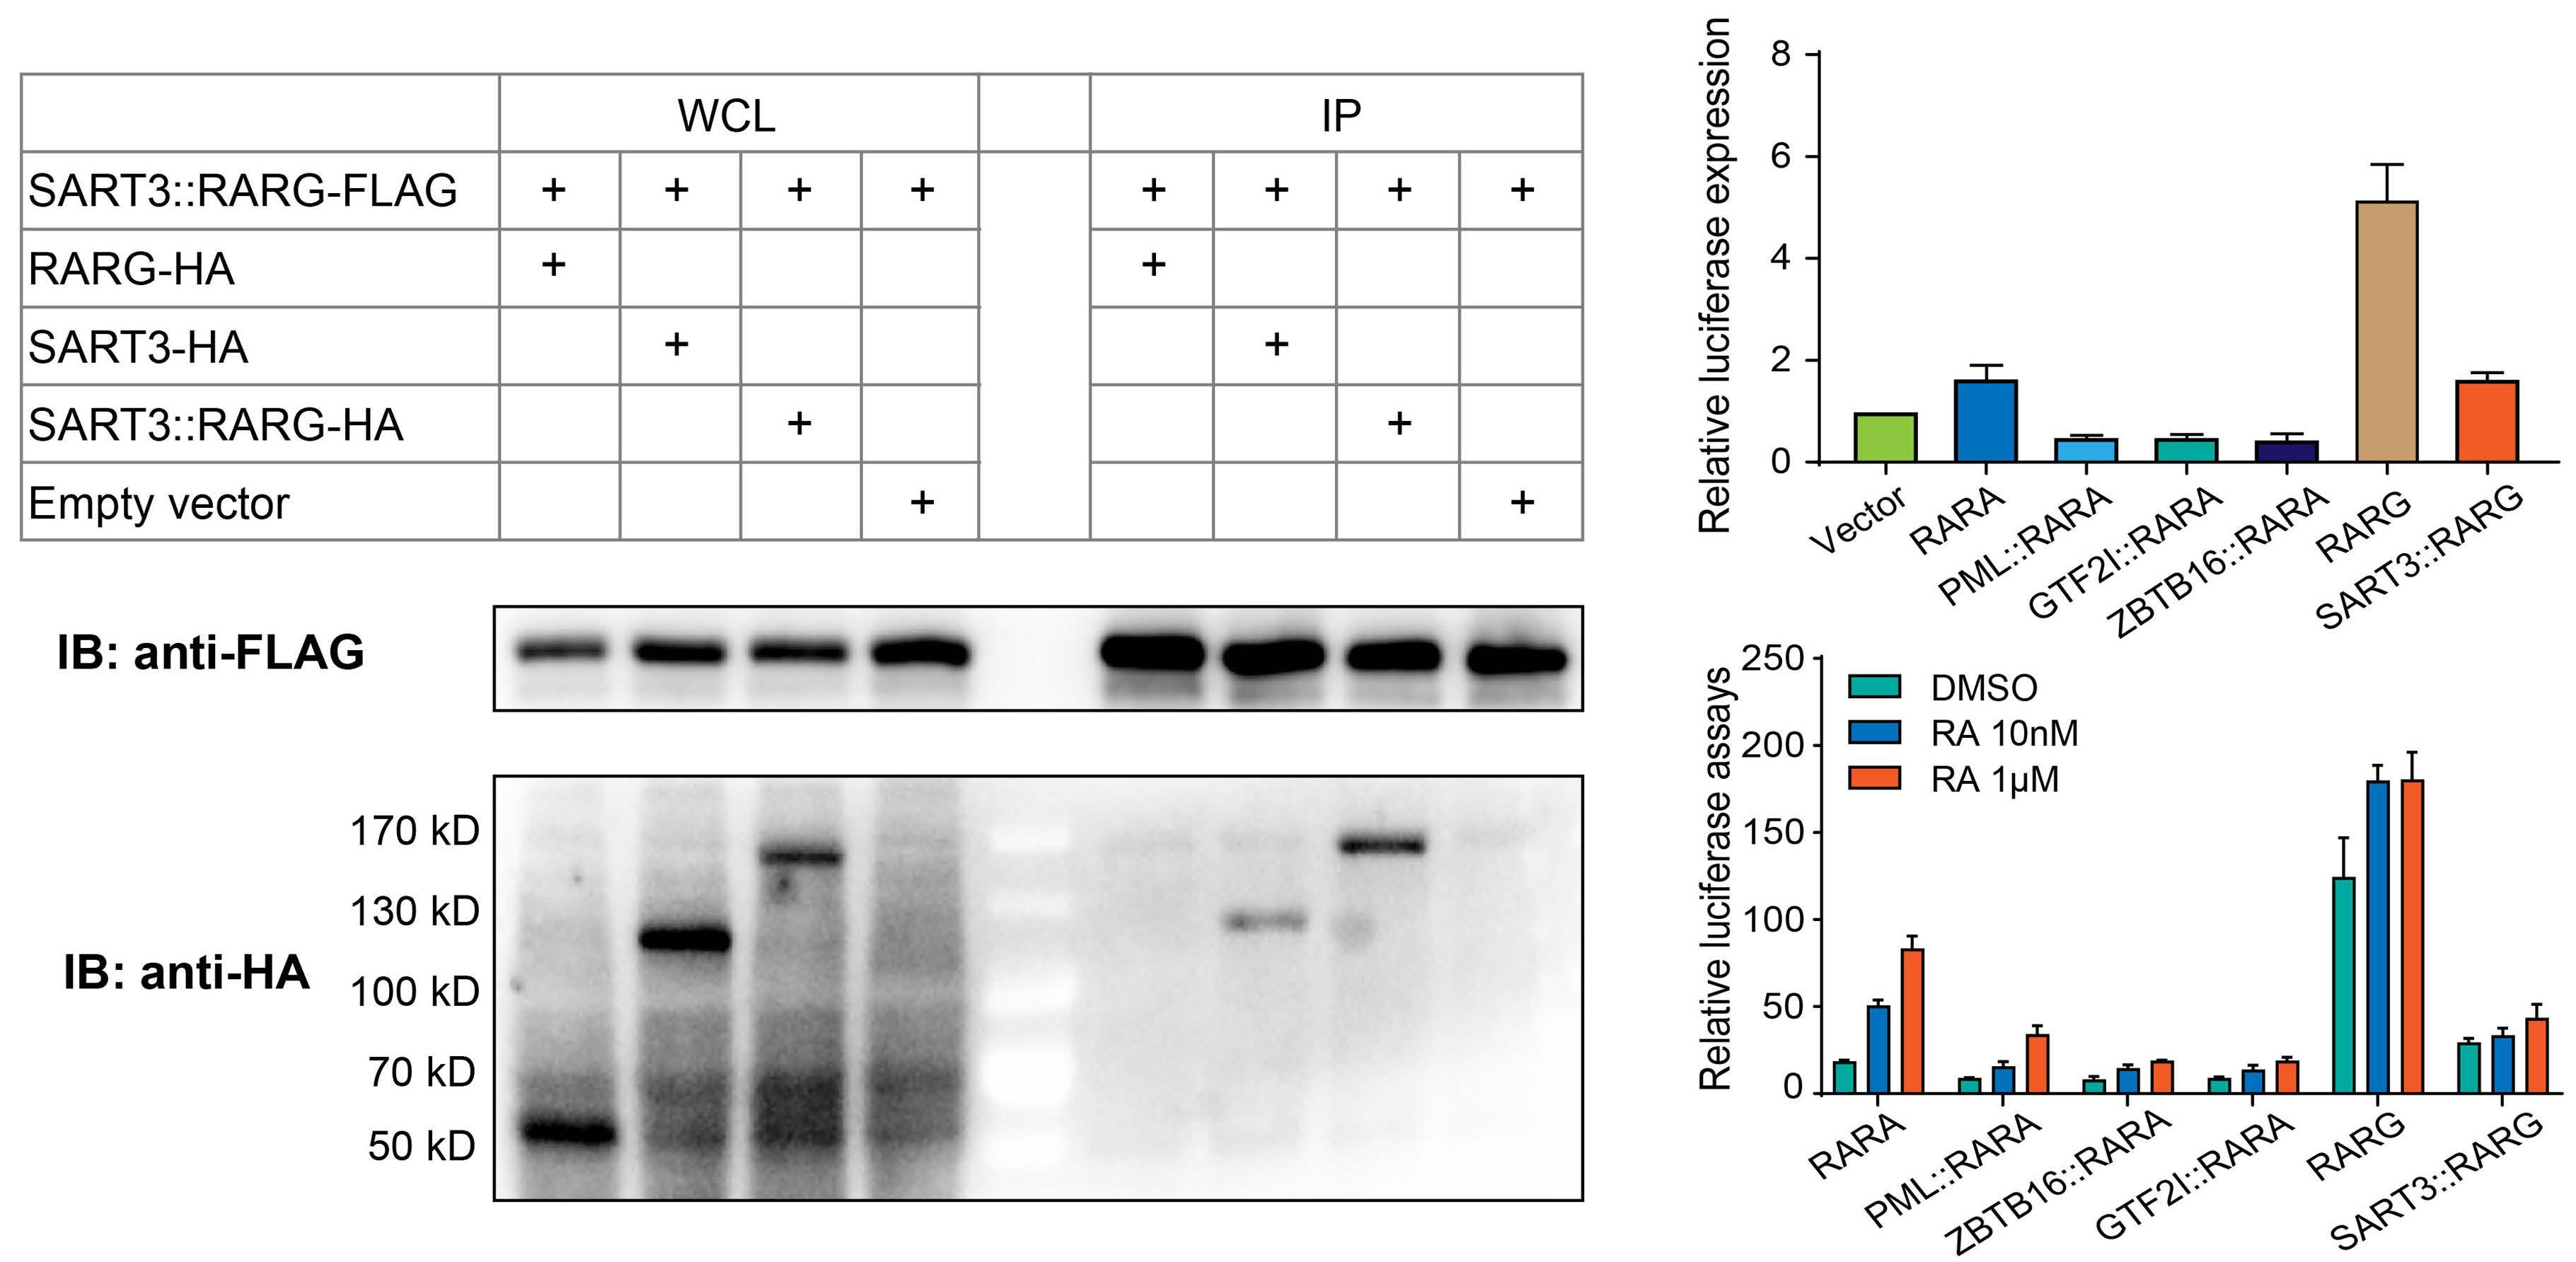
patient, 7 days’ of ATRA therapy failed to upregulate CD11b expression, which were seen as a sign of granulocytic differentiation,15 suggested differentiation escape to ATRA. A total of 10 days’ ATRA treatment together with strong transfusion-supported care, did not bring improvement of coagulopathy, suggested ATRA ineffectiveness. Given the observation that other RARG-rearranged patients were insensitive to ATRA, we propose ATRA withdraw and switching to AML-like approaches in RARG-rearranged APLL. Early identification and strong transfusion supportive care are crucial to avoid early death, whereas optimal treatment requires further investigation. In summary, we have identified a novel SART3::RARG fusion gene in a patient with APL phenotype. Our finding enriched the understanding of APLL. Further studies are needed to elucidate the critical role of SART3::RARG and RARG dysregulation in leukemogenesis and for guiding treatment approaches.
Authors
1Department of Hematology, the Second Xiangya Hospital of Central South University, Changsha; 2Department of Oncology, the Second Xiangya Hospital of Central South University, Changsha and 3Department of Hematology, the First Affiliated Hospital of University of South China, Hengyang, Hunan, China
Correspondence: G. ZHANG - zgsllzy@163.com https://doi.org/10.3324/haematol.2022.281766
Received: July 21, 2022. Accepted: Octber 11, 2022.
B C
D
Ji Li,1 Yang Zhang,2 Junjun Li,3 Yunxiao Xu1 and Guangsen Zhang1
Haematologica | 108 February 2023 631 LETTER TO THE EDITOR
Prepublished: October 27, 2022.
©2023 Ferrata Storti Foundation
Published under a CC BY-NC license
Disclosures
No conflicts of interest to disclose.
Contributions
JL and GZ designed the study, performed the study, and wrote the manuscript. YZ, JL and YX collected data, and interpreted the data.
Acknowledgements
The authors thank the patients and their family for their
contribution to this study. We thank Xiaojiao Sun and Weihong Yang from Kindstar Diagnostics (Wuhan, Hubei, China) for performing next-generation sequencing and assisting with bioinformatics.
Funding
This work was supported by grants from the National Natural Science Foundation of China (grant no. 81700168 to JL) and (grant no. 81500171 to YZ), and Natural Science Foundation of Hunan Province (grant no. 2019JJ40449 to YZ).
Data-sharing statement
Questions regarding data sharing should be addressed to the corresponding author. For original data, please contact zgsllzy@163.com, or lijiji26@163.com.
1. Sanz MA, Fenaux P, Tallman MS, et al. Management of acute promyelocytic leukemia: updated recommendations from an expert panel of the European LeukemiaNet. Blood. 2019;133(15):1630-1643.
2. Geoffroy MC, de The H. Classic and variants APLs, as viewed from a therapy response. Blood. 2019;133(15):1630-1643.
3. Song Y, Hou J, Wan L, et al. A short report of novel RARGHNRNPM fusion gene in resembling acute promyelocytic leukemia. Hematology. 2022;27(1):518-522.
4. Chen X, Wang F, Zhang Y, et al. A novel NPM1-RARG-NPM1 chimeric fusion in acute myeloid leukaemia resembling acute promyelocytic leukaemia but resistant to all-trans retinoic acid and arsenic trioxide. Br J Cancer. 2019;120(11):1023-1025.
5. Su Z, Liu X, Xu Y, et al. Novel reciprocal fusion genes involving HNRNPC and RARG in acute promyelocytic leukemia lacking RARA rearrangement. Haematologica. 2020;105(7):e376-e378.
6. Heiblig M, Paubelle E, Plesa A, et al. Comprehensive analysis of a myeloperoxidase-negative acute promyelocytic leukemia. Blood. 2017;129(1):128-131.
7. Geoffroy MC, Esnault C, de The H. Retinoids in hematology: a timely revival? Blood. 2021;137(18):2429-2437.
8. Huang M, Zhou B, Gong J, et al. RNA-splicing factor SART3 regulates translesion DNA synthesis. Nucleic Acids Res. 2018;46(9):4560-4574.
9. Whitmill A, Timani KA, Liu Y, He JJ. Tip110: physical properties, primary structure, and biological functions. Life Sci. 2016;149:79-95.
10. Liu Y, Timani K, Mantel C, et al. TIP110/p110nrb/SART3/p110 regulation of hematopoiesis through CMYC. Blood. 2011;117(21):5643-5651.
11. Erben P, Gosenca D, Muller MC, et al. Screening for diverse PDGFRA or PDGFRB fusion genes is facilitated by generic quantitative reverse transcriptase polymerase chain reaction analysis. Haematologica. 2010;95(5):738-744.
12. Van Nostrand EL, Freese P, Pratt GA, et al. A large-scale binding and functional map of human RNA-binding proteins. Nature. 2020;583(7818):711-719.
13. Qiu JJ, Zeisig BB, Li S, et al. Critical role of retinoid/rexinoid signaling in mediating transformation and therapeutic response of NUP98-RARG leukemia. Leukemia. 2015;29(5):1153-1162.
14. Li J, Zhong HY, Zhang Y, et al. GTF2I-RARA is a novel fusion transcript in a t(7;17) variant of acute promyelocytic leukaemia with clinical resistance to retinoic acid. Br J Haematol. 2015;168(6):904-908.
15. Horna P, Zhang L, Sotomayor EM, Lancet JE, Moscinski LC. Diagnostic immunophenotype of acute promyelocytic leukemia before and early during therapy with all-trans retinoic acid. Am J Clin Pathol. 2014;142(4):546-552.
Haematologica | 108 February 2023 632 LETTER TO THE EDITOR
References
Therapeutic potential of β-lactam ceftriaxone for chronic pain in sickle cell disease
Sickle cell disease (SCD), one of the most common genetically inherited diseases, is the result of a point mutation in the b -globin gene that promotes hemoglobin polymerization and sickling of red blood cells.1 No longer considered as a simple vasculopathy with anemia and hemolysis, SCD features the presence of complex pathophysiological changes.2 Of the many clinical manifestations of SCD, chronic pain is among the most devastating complications lacking effective treatments.3 In addition to intermittent acute pain crises, patients with SCD suffer from daily pain, which is reported as continuous, constant, and severe4 and can present as spontaneous pain and hypersensitivity to thermal (cold and heat) and mechanical stimuli. We show here that ceftriaxone, a prototype b -lactam antibiotic, effectively alleviates both spontaneous ongoing pain and evoked pain in a humanized mouse model of SCD, through astrocytic inactivation. The pain reversal effect of ceftriaxone identified in this study is independent of the drug’s antibacterial properties. Penicillin prophylaxis has been shown to be effective in preventing life-threatening pneumococcal infections in children with SCD between the ages of 2 months and 5 years,5 highlighting a potential clinical strategy for treating or preventing chronic pain in SCD. Most research on chronic pain in SCD has focused on neuronal mechanisms,6,7 while the participation of glial cells,8 specifically astrocytes, is less understood. Through dual connections to neurons and blood vessels in the central nervous system, astrocytes are positioned to play a vital role in maintaining glutamate homeostasis for neuronal signaling.9 Glutamate transporter 1 (GLT1) is the major astrocytic glutamate transporter responsible for the uptake of over 90% of synaptically released glutamate to prevent excitotoxicity.10 Dysfunction of astrocytic GLT1 has been associated with different neurological disorders including stroke and ischemia.11 This study is the first to investigate the participation of GLT1 in the neuropathology of SCD. Given the emerging evidence suggesting the effectiveness of b -lactam antibiotics at restoring the expression and function of GLT1 in vitro and in vivo, 12 we aimed to examine the therapeutic potential of ceftriaxone for chronic pain in SCD.
We have previously carefully characterized chronic pain behaviors in a targeted knock-in mouse model of SCD (TOW mice) exclusively expressing human alleles encoding normal a - and sickle b -globin.7 We therefore employed humanized TOW mice with SCD (8-10 weeks old) in this study after approval from the University of Illinois institu-
tional animal care and use committee. As compared with age- and sex-matched non-sickle control mice (hbA/hbA), TOW mice (hbS/hbS) exhibited fully developed hypersensitivity to mechanical probing by von Frey filaments (Figure 1A) and to noxious thermal stimuli applied to the left hind paw (Figure 1B). After the baseline sensitivity testing on day 0, mice were treated with intraperitoneal (i.p.) ceftriaxone (200 mg/kg/day) for 7 consecutive days. Nociceptive responses to mechanical and heat stimuli were measured every other day. We found that ceftriaxone gradually reversed the mechanical allodynia and thermal hyperalgesia in TOW mice, without affecting mechanical and thermal sensitivity in control mice (Figure 1A, B). Significant suppression of mechanical and thermal hypersensitivity was observed after four injections of ceftriaxone (0.79±0.15 g in the ceftriaxone group vs. 0.10±0.03 g in the saline group, P<0.001 [Figure 1A]; 7.50 ± 0.44 s in the ceftriaxone group vs. 3.14 ± 0.35 s in the saline group, P< 0.001 [Figure 1B]). By day 6, ceftriaxone had completely restored the mechanical and thermal sensitivity in TOW mice (hbS/hbS) to levels which were indistinguishable from those in the non-sickle control mice (hbA/hbA). The anti-hyperalgesic/allodynic effect lasted for at least 24 days when the experiments stopped on day 28. A shorter period of treatment with ceftriaxone (200 mg/kg/day for 5 days, i.p.) produced a more transient effect that lasted for only 2-3 days (Online Supplementary Figure S1). These results demonstrated a potent and sustained effect of ceftriaxone in relieving evoked pain in mice with SCD.
Persistent ongoing pain, a main complaint of patients with SCD, is rarely studied in preclinical settings. We subjected TOW and control mice to a conditioned place preference (CPP) test to determine non-evoked ongoing pain. We have previously validated this negative reinforcement paradigm to unmask the presence of an aversive state as the result of non-evoked ongoing pain in mice.7,13 After 7 days of treatment with ceftriaxone or saline in TOW mice, a single trial conditioning with saline and clonidine was performed on day 10. During the place preference test 20 h later, saline-pretreated TOW mice (hbS/hbS) spent significantly more time in the chamber that was paired with clonidine (551±58 s) than in the saline-paired chamber (259±43 s, P<0.001), indicative of clonidine-induced CPP (i.e., non-evoked spontaneous pain) in TOW mice with SCD (Figure 1C). In contrast, saline-pretreated non-sickle littermate mice (hbA/hbA) spent equal amounts of time in the saline- or clonidine-paired chambers (364±46 s vs
Haematologica | 108 February 2023 633 LETTER TO THE EDITOR
353 ± 47 s, respectively), suggesting the absence of clonidine-CPP in the non-sickle mice (Figure 1C). Analysis of “difference scores” demonstrated a robust preference for chambers paired with clonidine in sickle mice (hbS/hbS), but not in non-sickle mice (hbA/hbA) (Figure 1D). Consistent with our previous findings in humans4 and mice,6,7 these results confirmed that spontaneous ongoing pain is a major feature in SCD. In TOW mice (h b S/h b S) that received ceftriaxone for 7 days, clonidine failed to generate
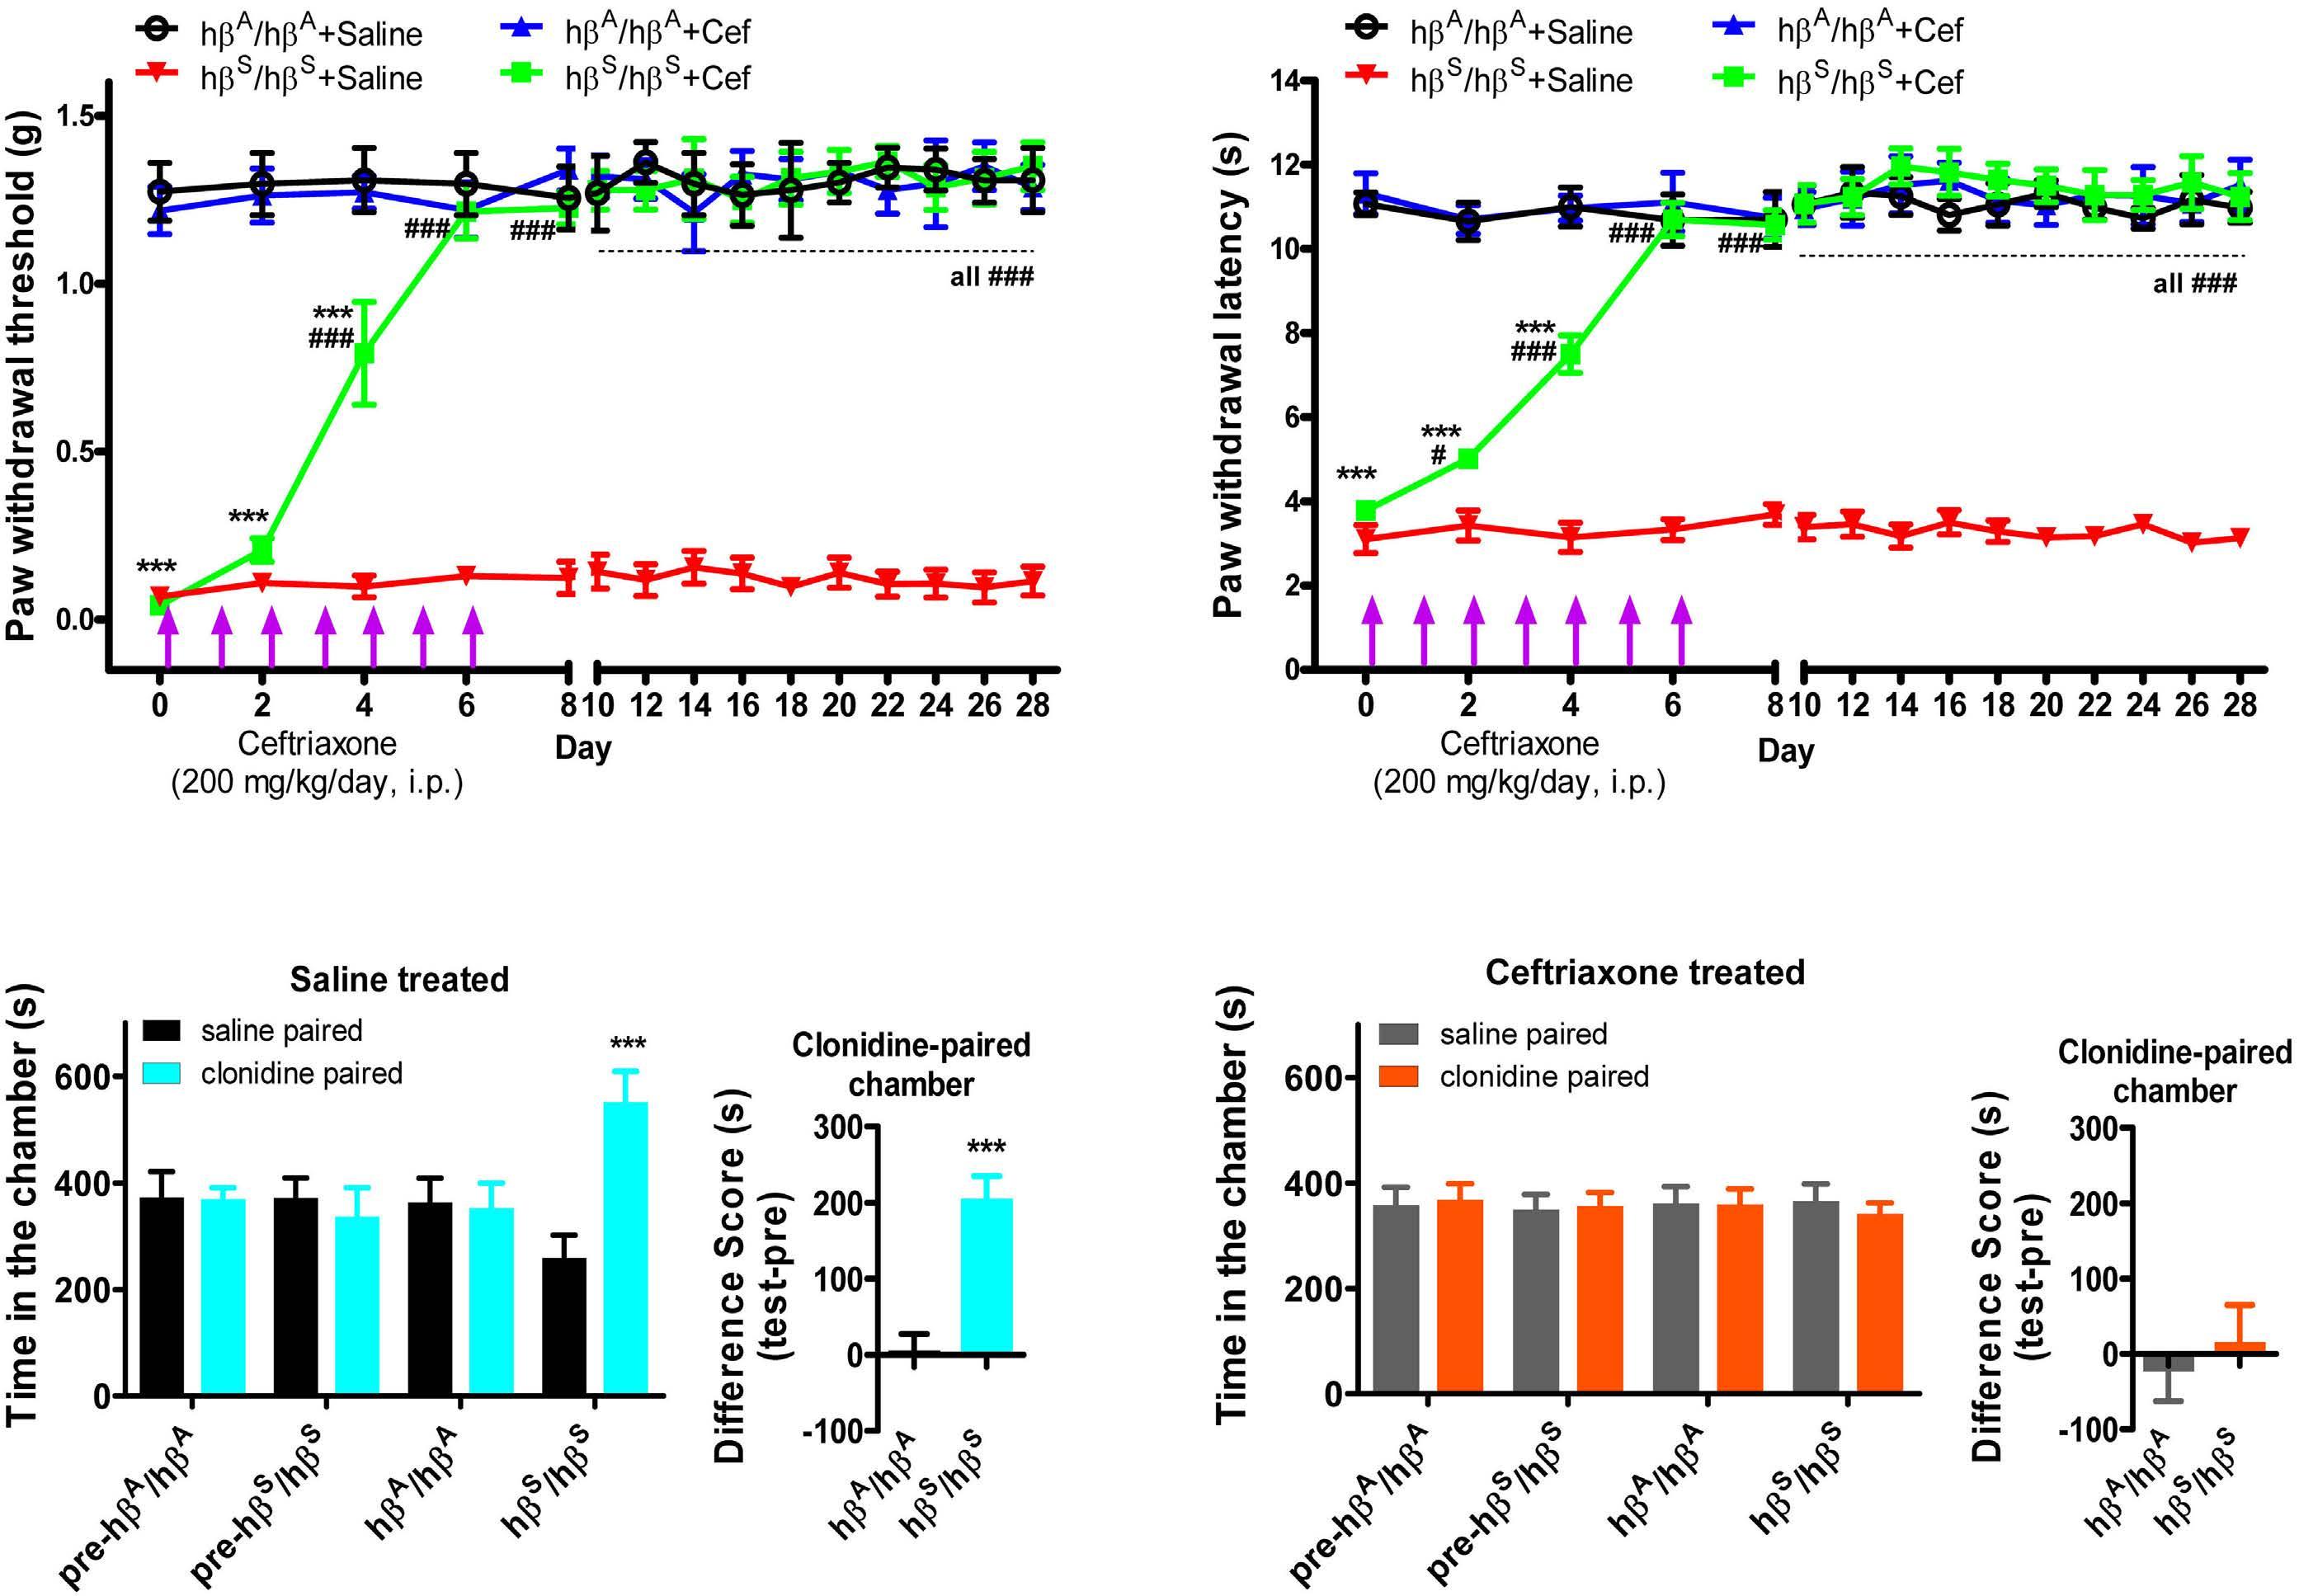
CPP (341±21 s clonidine-paired chamber vs. 366 ± 32 s saline-paired chamber, P>0.05) (Figure 1E), similar to the absence of clonidine-CPP in the non-sickle, control mice (hbA/hbA). No groups of mice exhibited significant difference scores, indicating the absence of ongoing spontaneous pain in SCD mice after ceftriaxone treatment (Figure 1F). Therefore, ceftriaxone effectively blocked ongoing spontaneous pain, disrupting the clonidine-CPP behavior (i.e., ongoing pain) in TOW mice (hbS/hbS). As shown
Figure 1. Ceftriaxone reversed chronic pain in TOW mice, an animal model of sickle cell disease. (A, B) Sensitivity to mechanical (A) and thermal (B) pain stimuli before and after intraperitoneal treatment with ceftriaxone (200 mg/kg/day.) was determined by calibrated von Frey filaments (Stoeling) using the “up-down” algorithm and a plantar tester (UGO Basile) with infrared light/heat stimuli, respectively. ***P<0.001 vs. “hbA/hbA mice + saline” group; #P<0.05, ###P<0.001 vs. “hbS/hbS mice + saline” group; eight mice per group. (C) Intrathecal (i.t.) clonidine (1 µg)-induced conditioned place preference (CPP) in saline-treated TOW sickle cell disease mice. Mice were initially placed in the three-chamber CPP apparatus (San Diego Instruments) to record the “preconditioning” chamber preference. On the day of conditioning, the mice first received saline (5 µL, i.t.) paired with a randomly chosen end chamber and, 4 h later, clonidine (1 µg in 5 µL saline, i.t.) paired with the other end chamber. On the following day, 20 h after the afternoon pairing, mice were placed in the middle chamber of the CPP box with all doors open to enable free access to all chambers. Movement and duration of time each mouse spent in each chamber were recorded for 15 min for offline analysis of chamber preference. hbS/hbS mice spent significantly more time in the clonidine-paired chamber than in the saline-paired chamber, while hbA/hbA mice spent similar amounts of time in either chamber. ***P<0.001, two-way analysis of variance followed by the post hoc Bonferroni test; eight mice per group. (D) Difference scores between test time and preconditioning (pre) time confirmed that hbS/hbS, but not hbA/hbA, mice developed clonidine-induced CPP. ***P<0.001 vs. hbA/hbA mice; eight mice per group. (E) Clonidine (1 µg, i.t.) did not induce CPP in ceftriaxone-treated TOW hbS/hbS mice or hbA/hbA mice. hbS/hbS and hbA/hbA mice spent similar amounts of time in the saline- or clonidine-paired chambers. (F) Difference scores (test time –preconditioning time spent in the clonidine chamber) confirmed the absence of chamber preference. Cef: ceftriaxone; i.p.: intraperitoneal.
A
C
B
D E F
Haematologica | 108 February 2023 634 LETTER TO THE EDITOR
by the CPP test performed on day 30 (Online Supplementary Figure S2), the abolition of ongoing spontaneous pain by ceftriaxone was maintained for at least 3 weeks. The fact that ongoing pain and evoked pain hypersensitivity were no longer detected in TOW mice after 7 days of treatment with ceftriaxone indicates that ceftriaxone suppressed chronic pain in SCD. To correlate pain-related behavioral changes with biochemical adaptations occurring in the central nervous system, the lumbar sections of the spinal cord were harvested for immunohistochemistry and western blotting analyses when the pain reversal effect plateaued on day 10. Compared with non-sickle control mice (hbA/hbA), TOW
mice (h b S/h b S) exhibited substantially increased immunoreactivity of glial fibrillary acidic protein (GFAP),14 demonstrating prominent astrocyte reactivity mainly in the superficial laminae of the dorsal spinal cord in mice with SCD (Figure 2). The enhanced astrocyte reactivity in TOW SCD mice was associated with reduced GLT1 immunofluorescent intensity in the spinal cord dorsal horn. Ceftriaxone significantly attenuated astrocyte reactivity, as demonstrated by a reduced number of GFAP-immunoreactive astrocytes (78 GFAP-immunoreactive cells in 15 regions of interest; 5 slides x 3 mice) in ceftriaxone-pretreated TOW mice (h b S/h b S) compared with that of saline-pretreated TOW mice (h b S/h b S) (175
Figure 2. Immunoreactivity of GFAP and GLT1 in the superficial lamina region of the dorsal spinal cord in TOW mice. GFAP immunoreactivity was elevated, while GLT1 immunoreactivity was diminished in hbS/hbS mice, in comparison with that in the control non-sickle hbA/hbA mice. Ceftriaxone reduced GFAP immunoreactivity and increased GLT1 immunoreactivity in h b S/h b S mice. Green: GFAP (1/500, Sigma-Aldrich); red: GLT1 (1/500, Sigma-Aldrich); blue: DAPI. Scale bar: 20 m m. Quantitation was performed by counting the number of positively stained cells using ImageJ software. Cef: ceftriaxone.
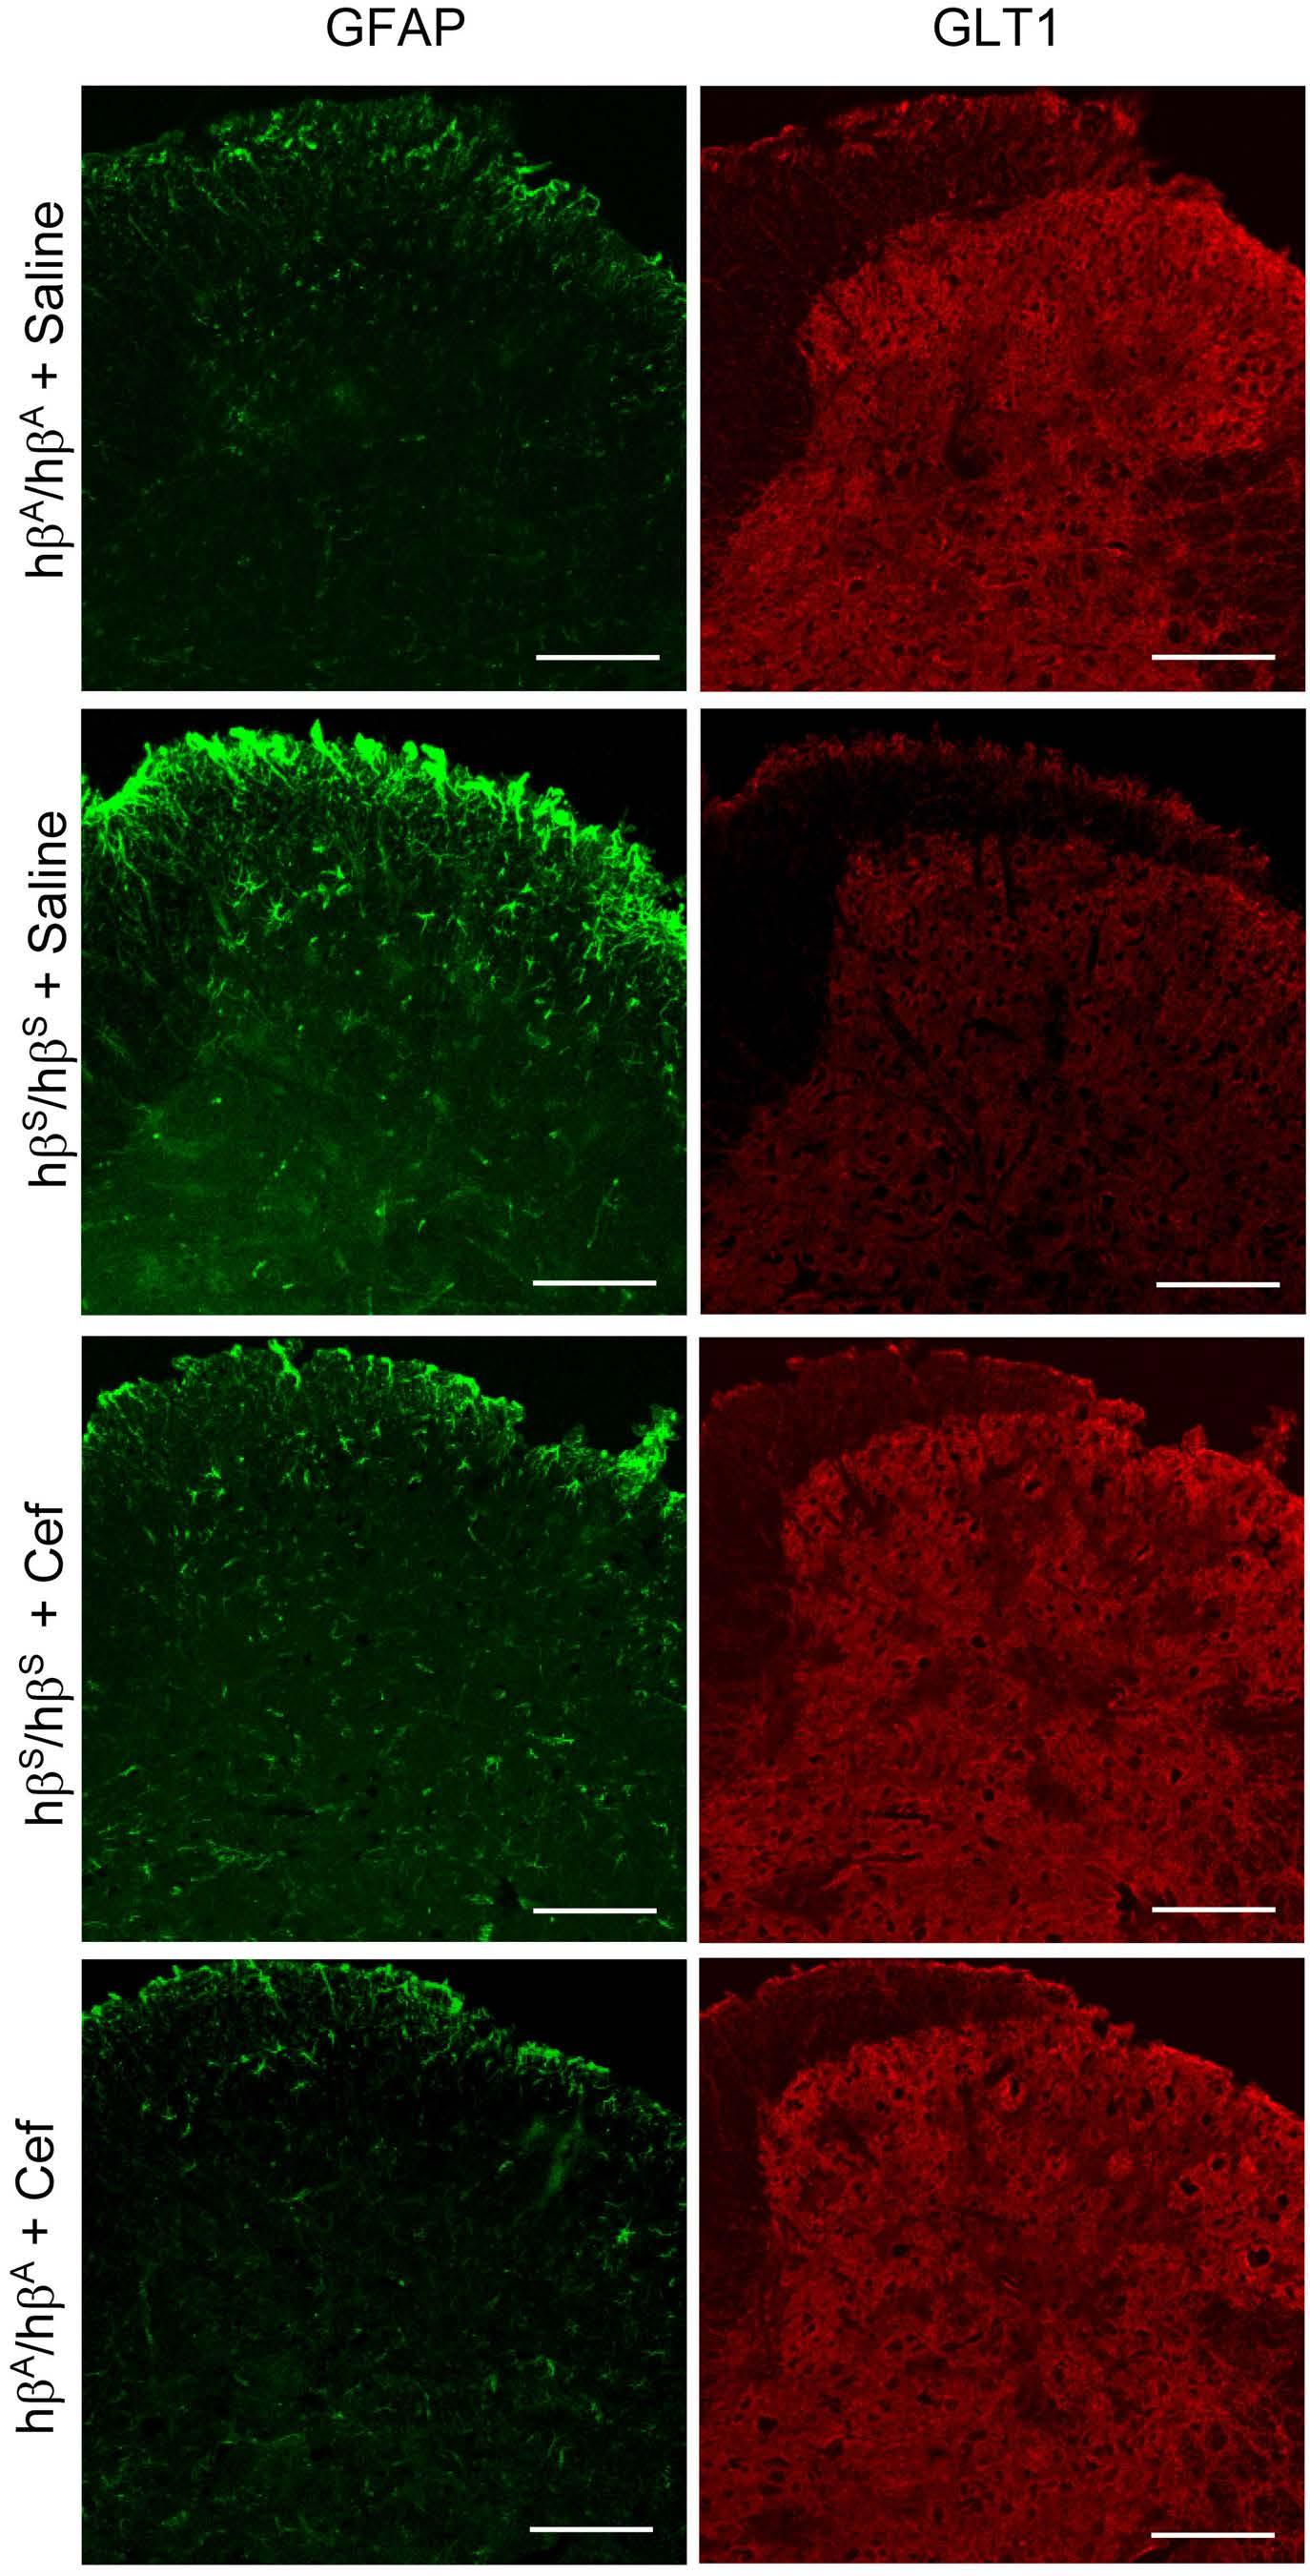
Haematologica | 108 February 2023 635 LETTER TO THE EDITOR
Figure 3. Expression of spinal GFAP and GLT1 in TOW hβS/hβS mice and control hβA/hβA mice, determined by the western blotting. Similarly to immunohistochemical analysis (Figure 2), the western blotting analysis also showed significantly increased expression of GFAP and decreased expression of GLT1 in the spinal cord of hbS/hbS mice. Ceftriaxone suppressed the upregulation of GFAP and promoted the expression of GLT1 in hbS/hbS mice. . *P<0.05, ***P<0001 vs. “hbA/hbA mice + saline” group. ##P<0.01, ###P<0.001 vs. “hbS/hbS mice + saline” group; three mice per group. Cef: ceftriaxone.
GFAP-immunoreactive cells in 15 regions of interest; 5 slides x 3 mice). Meanwhile, reduced spinal GLT1 immunoreactivity in TOW mice (hb S/h bS) was restored by the treatment with ceftriaxone, which inversely correlated with the downregulation of GFAP immunoreactivity induced by ceftriaxone (Figure 2). Western blotting analysis demonstrated that the expression of spinal GFAP increased by 59%, while the expression of spinal GLT1 decreased by 41% in TOW mice (hbS/hbS) (P<0.5 vs. hbA/hbAsaline group) (Figure 3). Ceftriaxone completely blocked GFAP overexpression (P<0.01 vs. hbS/hbS-saline group) and abolished the repressive regulation of GLT1 expression in hbS/hbS mice (P<0.001 vs. hbS/hbS-saline group) (Figure 3). Collectively, these results demonstrated that astrocytes in the spinal dorsal horn became reactive in mice with SCD. Repeated intraperitoneal administration of ceftriaxone reduced astrocyte reactivity by increasing GLT1 expression. In addition to the spinal cord, similar biochemical changes were found, by western blotting analysis, in the dorsal root ganglia where ceftriaxone treatment (200 mg/kg, i.p. for 7 days) reversed GFAP upregulation and GLT1 downregulation in TOW mice (Online Supplementary Figure S3).
This is the first direct evidence that spinal astrocyte reactivity contributes to the development of chronic pain in SCD. Ceftriaxone (200 mg/kg, i.p. for 7 days) effectively blocked mechanical allodynia, heat hyperalgesia, and ongoing spontaneous pain associated with SCD. The effect of ceftriaxone is hypothesized to be mediated through the reversal of GLT1 dysfunction and the suppression of astrocyte reactivity. Ceftriaxone may induce the activation of transcription factor NF-κB, which then binds to and activates the GLT1 promoter.15 The effect of ceftriaxone on chronic pain identified in this study was not related to the drug’s antibacterial properties, because TOW mice did not have active bacterial infections during the experiment.
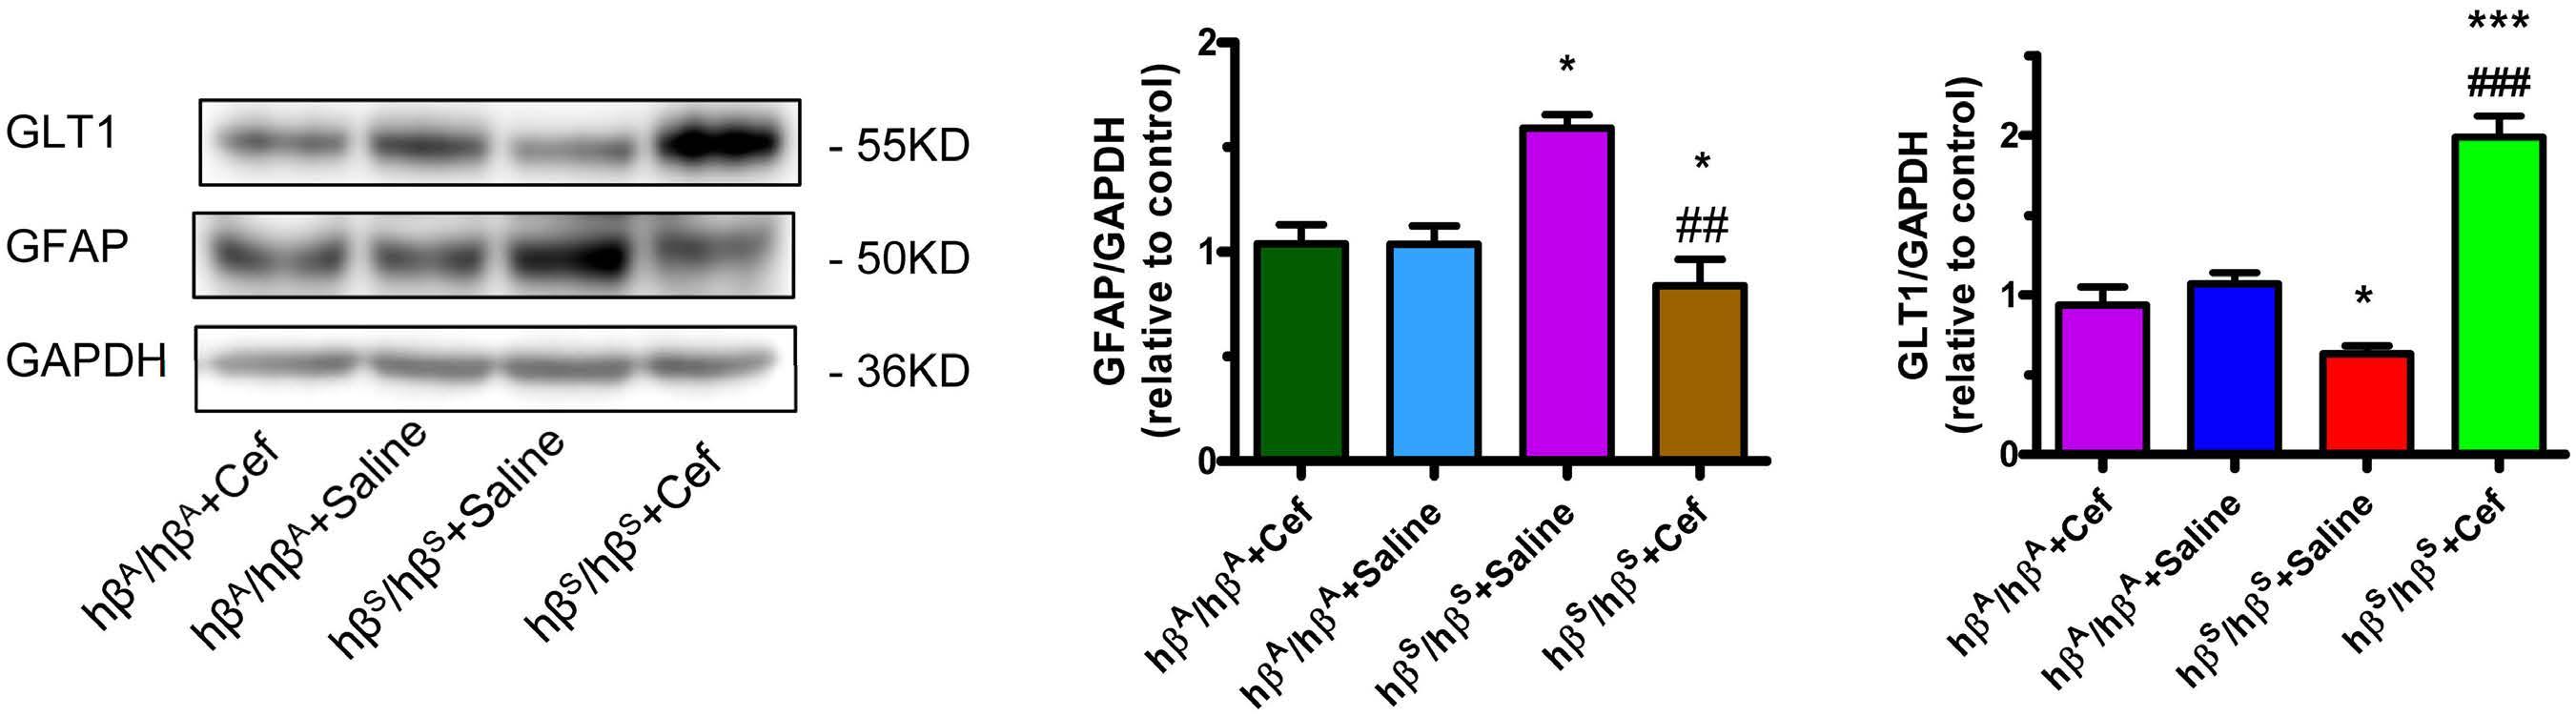
Furthermore, it was shown that non-b-lactam antibiotics, such as doxycycline and kanamycin, had no effect on GLT1 expression and did not exhibit neuroprotective functions.12 While there are concerns about the long-term usage of oral penicillin V in children with SCD, especially on the gut microbiota, our findings warrant further studies on the potential beneficial effect of ceftriaxone for chronic pain in patients with SCD. Moreover, GLT1 may serve as a new target for rational design of selective neuroprotective agents in SCD.
Authors
Ying He1, Xiao Guo1 and Zaijie Jim Wang1
1Departments of Pharmaceutical Sciences, Neurology & Rehabilitation, Bioengineering, Center for Biomolecular Sciences, and Sickle Cell Center, University of Illinois, Chicago, IL, USA
Correspondence: Y. HE - yhe8uic@gmail.com Z. J. WANG - zjwang@uic.edu
https://doi.org/10.3324/haematol.2022.281716
Received: July 6, 2022.
Accepted: October 14, 2022. Prepublished: October 27, 2022.
©2023 Ferrata Storti Foundation Published under a CC BY-NC license
Disclosures
No conflicts of interest to disclose.
Haematologica | 108 February 2023 636 LETTER TO THE EDITOR
Contributions
YH and XG performed the research; YH analyzed the data; and YH and ZJW wrote the manuscript and supervised the study.
Funding
This study was supported in part by grants from the National Heart, Lung, and Blood Institute (NHLBI) R00 HL 133590 (to YH) and R35 HL140021 (to ZJW). Its contents are solely the responsibility of the
References
1. Piel FB, Steinberg MH, Rees DC. Sickle cell disease. N Engl J Med. 2017;376(16):1561-1573.
2. Rees DC, Williams TN, Gladwin MT. Sickle-cell disease. Lancet. 2010;376(9757):2018-2031.
3. Smith WR, Penberthy LT, Bovbjerg VE, et al. Daily assessment of pain in adults with sickle cell disease. Ann Intern Med. 2008;148(2):94-101.
4. Wilkie DJ, Molokie R, Boyd-Seal D, et al. Patient-reported outcomes: descriptors of nociceptive and neuropathic pain and barriers to effective pain management in adult outpatients with sickle cell disease. J Natl Med Assoc. 2010;102(1):18-27.
5. Gaston MH, Verter JI, Woods G, et al. Prophylaxis with oral penicillin in children with sickle cell anemia. A randomized trial. N Engl J Med. 1986;314(25):1593-1599.
6. He Y, Chen Y, Tian X, et al. CaMKIIalpha underlies spontaneous and evoked pain behaviors in Berkeley sickle cell transgenic mice. Pain. 2016;157(12):2798-2806.
7. He Y, Wilkie DJ, Nazari J, et al. PKCdelta-targeted intervention relieves chronic pain in a murine sickle cell disease model. J Clin Invest. 2016;126(8):3053-3057.
8. Valverde Y, Benson B, Gupta M, Gupta K. Spinal glial activation and oxidative stress are alleviated by treatment with curcumin or coenzyme Q in sickle mice. Haematologica.
authors and do not necessarily represent the official views of the NHLBI or the National Institutes of Health. The final peer-reviewed manuscript is subject to the National Institutes of Health public access policy.
Data-sharing statement
The original data and protocols can be made available upon request.
2016;101(2):e44-47.
9. Khakh BS, Sofroniew MV. Diversity of astrocyte functions and phenotypes in neural circuits. Nat Neurosci. 2015;18(7):942-952.
10. Rothstein JD, Dykes-Hoberg M, Pardo CA, et al. Knockout of glutamate transporters reveals a major role for astroglial transport in excitotoxicity and clearance of glutamate. Neuron. 1996;16(3):675-686.
11. Pajarillo E, Rizor A, Lee J, Aschner M, Lee E. The role of astrocytic glutamate transporters GLT-1 and GLAST in neurological disorders: potential targets for neurotherapeutics. Neuropharmacology. 2019;161:107559.
12. Rothstein JD, Patel S, Regan MR, et al. Beta-lactam antibiotics offer neuroprotection by increasing glutamate transporter expression. Nature. 2005;433(7021):73-77.
13. He Y, Tian X, Hu X, Porreca F, Wang ZJ. Negative reinforcement reveals non-evoked ongoing pain in mice with tissue or nerve injury. J Pain. 2012;13(6):598-607.
14. Pekny M, Pekna M. Astrocyte intermediate filaments in CNS pathologies and regeneration. J Pathol. 2004;204(4):428-437.
15. Feng D, Wang W, Dong Y, et al. Ceftriaxone alleviates early brain injury after subarachnoid hemorrhage by increasing excitatory amino acid transporter 2 expression via the PI3K/Akt/NFkappaB signaling pathway. Neuroscience. 2014;268:21-32.
Haematologica | 108 February 2023 637 LETTER TO THE EDITOR
ADAMTS13 conformation is closed in non-immune acquired thrombotic thrombocytopenic purpura of unidentified pathophysiology
Thrombotic thrombocytopenic purpura (TTP) is a rare (prevalence of ~10-20 cases/million worldwide in 2022, incidence of ~1-2 new cases/million/year), relapsing and life-threatening thrombotic microangiopathy due to systemic platelet-rich thrombi of blood microvessels.1,2 The cause of TTP was identified in 1998 as a severe functional deficiency (activity <10 IU/dL) of the enzyme ADAMTS13 (A Disintegrin And Metalloprotease with ThromboSpondin type 1 repeats, member 13).3,4 The structure of ADAMTS13 includes 14 domains: metalloprotease (M), disintegrinlike (D), eight thrombospondin type 1 repeats (T1-T8), cysteine-rich (C), spacer (S) and two CUB (CUB1, CUB2).5 Physiologically, ADAMTS13 prevents the systemic occlusion of the blood microvasculature with platelet-rich thrombi, by specifically cleaving the highly adhesive ultra-large multimers of von Willebrand factor (VWF), a glycoprotein crucial for platelet adhesion and aggregation at sites of vascular injury.1-4
In very rare cases, severe deficiency of ADAMTS13 is due to bi-allelic mutations of the ADAMTS13 gene which cause congenital hereditary TTP.1,2 In contrast, in a very large majority of TTP cases, severe deficiency of ADAMTS13 is an acquired condition, either via specific anti-ADAMTS13 polyclonal autoantibodies (ADAMTS13 antibodies) inducing a catalytic inhibition/accelerated clearance of ADAMTS13 or via other speculative mechanisms (defects of synthesis/secretion, excessive degradation, catalytic inhibition of ADAMTS13).1,2 Thus, the pathophysiology of acquired TTP is either immune-mediated (iTTP, ~75% of cases) or unidentified (uTTP).1,2,6 In terms of clinical presentation of acute events of TTP, about half occur without any other clinical context, defining idiopathic TTP. In contrast, the other half occurs with one or several associated and potentially triggering clinical conditions (mostly infections, autoimmune diseases, cancers, transplantation, drug treatment or pregnancy/post-partum) defining non-idiopathic TTP.1,2,6 When crossing clinical presentation and pathophysiology, we previously showed that ~90% of cases of idiopathic TTP consist of iTTP whereas non-idiopathic TTP includes more balanced proportions of iTTP (~60%) and uTTP (~40%).6 Consequently, uTTP are mostly found among non-idiopathic TTP.
In the 2010s, ADAMTS13 was shown to have a conformational plasticity.7 In healthy individuals, ADAMTS13 circulates in a latent “closed” conformation governed by a local latency due to an interaction between its CUB1-CUB2 domains and its S domain which contains a cryptic highly im-
munodominant epitope8-10 and by a local latency due to the presence of a gatekeeper triad that blocks the active site.10 Upon physiological binding to VWF, ADAMTS13 adopts a short-lived, transient “open” conformation relieving global latency and allowing multiple interactions with VWF (molecular zipper model) and ultimately, its cleaving activity towards VWF (allosteric activation: relieving the gatekeeper triad).8-10 ADAMTS13 conformation was recently investigated in three studies11-13 gathering 102 patients with idiopathic iTTP in the acute phase and during follow-up in clinical remission. In the great majority of these iTTP patients: (i) ADAMTS13 conformation was open in acute phase;11,12 (ii) ADAMTS13 was closed in remission provided that ADAMTS13 activity was normal (>50 IU/dL);11,12 (iii) if open in remission, ADAMTS13 conformation could be returned to closed by preemptive rituximab treatment;13 and (iv) ADAMTS13 antibodies purified from iTTP patients could induce opening of ADAMTS13 in vitro 13 Thus, a sustained open ADAMTS13 conformation appears to be a novel biomarker of acute and subclinical iTTP and appears to be closely linked to the presence of ADAMTS13 antibodies.11-13 The aim of the current study was to investigate whether ADAMTS13 was closed or open in uTTP. Closed ADAMTS13 in uTTP would further validate open ADAMTS13 as a biomarker for iTTP. Open ADAMTS13 in uTTP might imply that pathological triggers (distinct from ADAMTS13 antibodies) commonly found in TTP could induce a switch from the closed to the open conformation of ADAMTS13. To do so, we studied 125 patients with acute non-idiopathic TTP presenting with miscellaneous pathological contexts (autoimmunity, cancer, liver insufficiency, infection, drug treatment) including both cases of uTTP (n=76, group of interest) and iTTP (n=49, control group). The uTTP patients had an older median age, lower female/male ratio, more frequent renal disorders, and higher platelet count, ADAMTS13 antigen level and mortality. Interestingly, ADAMTS13 conformation was closed in 86.4% of uTTP cases but open in 76.7% of iTTP cases.
Adult patients with non-idiopathic TTP from the French Thrombotic Microangiopathy Registry (inclusion period 01.01.2012 – 12.31.2016) were enrolled if they met the following inclusion criteria: age >18 years old, inaugural acute thrombotic microangiopathy event associated with both an ADAMTS13 activity <10 IU/dL and another clinical situation at presentation (excluding pregnancy), available medical data and citrated plasma samples. Cases of hereditary TTP were excluded. Informed consent was obtained from each patient according to the Declaration of Helsinki. The study
Haematologica | 108 February 2023 638 LETTER TO THE EDITOR
Table 1. Demographic, clinical and biological features of 125 patients with non-idiopathic thrombotic thrombocytopenic purpura. Non-idiopathic TTP
Demographic features
uTTP (N=76) iTTP (N=49) P
Age in years (range)§ 61 (49 ; 68) 49 (38 ; 56) 0.0005 Sex ratio* 0.7 F / 1 M 1.6 F / 1 M 0.03
Associated conditions
Autoimmmune diseases 13 (17.1 %) 19 (38.8 %) 0.005
Lupus erythematosus 5 10 Rhumatoid polyarthritis 1 2 Systemic sclerodermia 1 2 Vascularitis 2 1
Antiphospholipid syndrome 1 1 Wegener disease 2 0
Gougerot-Sjögren syndrome 0 1 Hashimoto thyroitidis 0 1
Primary biliary cirrhosis 1 0 Sharp syndrome 0 1
Cancers 24 (31.6 %) 8 (16.3 %) 0.005 Brain 0 1 Lung 2 0 Digestive tract 4 3 Liver, biliary tractus, pancreas 5 0 Kidney 0 1 Uterus 1 1 Prostate 2 1 Hematoproliferative syndromes 10 1 Severe liver insufficiency 5 (6.6 %) 3 (6.1 %) NS Infections 33 (43.4 %) 15 (30.6 %) NS
Bacterial infections
Lung 13 3 Heart (endocarditis) 2 0 Digestive tract 5 4 Urinary tract 6 3 Joints 1 0
Viral infections Hepatitis C virus 1 0 Human immunodeficiency virus 4 4 Parasitic infections Malaria 1 0 Chikungunya 0 1 Drugs 1 (1.3 %) 4 (8.2 %) NS Tacrolimus 1 0 Gemcitabine 0 1 Clopidogrel 0 3
Clinical presentation*
Fever 33 (43.4 %) 16 (32.7 %) NS Neurological features 34 (44.7 %) 24 (49.0 %) NS Abdominal features 20 (26.3 %) 11 (22.4 %) NS Cardiac features 12 (15.8 %) 7 (14.3 %) NS Renal features 59 (77.6 %) 20 (40.8 %) <0.0001
Continued on following page.
Haematologica | 108 February 2023 639 LETTER TO THE EDITOR
Biological data
Hemoglobin, g/dl (range)§ 7.7 (7.0 ; 9.0) 7.7 (6.5 ; 8.7) NS
Platelets x109/L (range)§ 28 (16 ; 60) 15 (9 ; 22) 0.005
Creatinine mmol/L (range)§ 183 (110 ; 406) 107 (68 ; 148) 0.005
ADAMTS13 antigen mg/mL (range)§ 0.20 (0.14 ; 0.27) 0.04 (0.02 ; 0.11) 0.0007 Open ADAMTS13 conformation * 8/59 (13.6 %) 23/30 (76.7 %) <0.0001
Outcome*
Death 6 (7.9 %) 1 (2.0 %) NS
Data are presented as number (percentage) or median [interquartile range]. Comparisons from univariate analysis: §t-test, *χ2 test. P values <0.05 are considered statistically significant. TTP: thrombotic thrombocytopenic purpura; uTTP: acquired non-immune TTP; iTTP: immunemediated TTP; F: female; M: male. NS: not statistically significant.
was approved by the Ethics Committee of Pitié-Salpêtrière and Saint-Antoine Assistance Publique – Hôpitaux de Paris. ADAMTS13 activity was measured using the FRETS-VWF73 method (Peptide Institute Inc, Osaka, Japan) and ADAMTS13 IgG were titrated using the TECHNOZYM® ADAMTS13-INH enzyme-linked immunosorbent assay (ELISA) (Technoclone, Vienna, Austria), as previously described.6 ADAMTS13 antigen levels and ADAMTS13 conformation were determined by our home-made 3H9- and 1C4-ELISA, respectively.11 Quantitative parameters were reported as median (interquartile range) and qualitative parameters as number and percentage. Comparisons between uTTP and iTTP were performed using the Pearson χ2 test and Fisher exact test as appropriate (Stat View version 8.0, Stanford, CA, USA). All tests were two-sided and P values less than 0.05 were considered statistically significant.
Among the 125 patients with non-idiopathic TTP enrolled, ADAMTS13 IgG were negative in 76 patients (uTTP, group of interest) and positive in 49 patients (iTTP, control group). The demographic, clinical and biological features of our TTP patients are presented in Table 1. Patients with uTTP were significantly older (median age, (61 vs. 49 years, respectively, P=0.0005) and had a lower female/male ratio (0.7 vs. 1.6, respectively; P=0.03). Overall, associated clinical contexts consisted in autoimmune diseases (n=32, 25.6%; mostly lupus erythematosus), cancers (n=32, 25.6%), severe liver insufficiency (n=8; 6.4%), infections (n=48, 38.4%) and drugs (n=5, 4.0%). Of note, autoimmune diseases were more frequent in iTTP (P=0.005) while cancers were more frequent in uTTP (P=0.005). The frequency of fever, neurological, digestive or cardiac ischemic symptoms was not significantly different between uTTP and iTTP. In contrast, uTTP patients had a significantly higher frequency of renal disorders (creatinine levels: 183 vs. 107 mmol/L, P=0.005), a significantly higher platelet count (28x109/L vs. 15x109/L; P=0.005) and a non-significantly higher mortality rate (n=6, 7.9% vs. n=1, 2.0%, respectively). ADAMTS13 antigen levels (Table 1, Figure 1A) were higher in uTTP patients (0.20 vs. 0.04 mg/mL, P=0.0007) although there was no influence of the associated clinical conditions (Figure 1B, C). Because a minimal antigen level of 0.03 mg/mL is mandatory to determine ADAMTS13 conformation,11 19 iTTP samples and 17 uTTP
samples had to be excluded from the analysis of ADAMTS13 conformation. ADAMTS13 conformation was open in the majority of iTTP patients (23/30, 76.7%) and closed in the great majority of uTTP patients (51/59, 86.4%) (Table 1, Figure 1D). Additionally, the clinical condition associated with TTP had no influence on ADAMTS13 conformation, either in uTTP or in iTTP (Figure 1E, F).
The first aim of the current study was to investigate whether ADAMTS13 was closed or open in uTTP. Building on previous studies involving 102 patients with idiopathic iTTP found to be associated with an open ADAMTS13 conformation,11-13 we here present original work focusing on 125 cases of non-idiopathic TTP, including both uTTP and iTTP. We confirm that uTTP and iTTP are distinct epidemiological, clinical and biological entities6 and, for the first time, we show that uTTP is mostly associated with a closed ADAMTS13 conformation (Figure 2). In contrast, ADAMTS13 was open in the majority (76.7%) of our 30 patients with non-idiopathic iTTP. However, this 76,7% rate was surprisingly lower than the 92%-100% rate previously reported in 102 patients with idiopathic iTTP.11-13 This difference may be explained by some heterogeneity of ADAMTS13 antibody epitopes as a function of the idiopathic or non-idiopathic presentation of TTP, the antibodies targeting the CS domains being likely the most efficient in maintaining an open ADAMTS13 conformation.7,14,15
With this study, we secondly investigated if pathological contexts commonly associated with non-idiopathic TTP could by themselves (independently of ADAMTS13 antibodies), convert ADAMTS13 from a closed to an open conformation. Our group of interest including 59 uTTP eligible for ADAMTS13 conformation testing exhibited a closed conformation in 86.4% of cases and thus showed that pathological contexts per se are not major triggers of ADAMTS13 opening. However, we surprisingly observed that some rare uTTP patients (8/59, 13.6%) did have an open ADAMTS13; most of them had infections or cancer (Figure 1E). Several mechanisms may be hypothesized to explain these exceptional cases:7 firstly and most likely, ADAMTS13 antibodies (either IgG trapped in ADAMTS13/IgG immune complexes or IgM/IgA class antibodies) may be present in vivo but undetectable in vitro and these cases may correspond to under-
Haematologica | 108 February 2023 640 LETTER TO THE EDITOR
Figure 1. ADAMTS13 antigen levels and conformation in patients with non-idiopathic thrombotic thrombocytopenic purpura. (AC) ADAMTS13 antigen levels in 125 patients with non-idiopathic thrombotic thrombocytopenic purpura (TTP). Each patient is represented by a dot. The continuous lines indicate mean values. The dotted lines represent the minimal ADAMTS13 antigen concentration (0.03 mg/mL) necessary to determine ADAMTS13 conformation. (A) ADAMTS13 antigen levels in cases of TTP of unidentified pathophysiology (uTTP; n=76) and immune-related TTP (iTTP; n=49). P<0.001 by t-test. (B) ADAMTS13 antigen levels in the uTTP samples associated with autoimmunity (n=13), cancer (n=24), liver insufficiency (n=5), infection (n=33) or drug treatment (n=1). (C ) ADAMTS13 antigen levels in the iTTP samples associated with autoimmunity (n=19), cancer (n=8), liver insufficiency (n=3), infection (n=15) or drug treatment (n=4). (D-F) ADAMTS13 conformation in 89 patients with non-idiopathic TTP. A conformation index ≤0.5 corresponds to a closed ADAMTS13 (shown as ● in the figures), while a conformation index >0.5 corresponds to an open ADAMTS13 (shown as ○ in figures). The dotted line (conformation index 0.5) indicates the cut-off value between closed and open ADAMTS13. (D) ADAMTS13 conformation in uTTP (n=59) and iTTP (n=30) patients. P<0.0001 by Fisher test. (E) ADAMTS13 conformation in the uTTP samples associated with autoimmunity (n=7), cancer (n=21), liver insufficiency (n=5), infection (n=25), and drug treatment (n=1). (F) ADAMTS13 conformation in the iTTP samples associated with autoimmunity (n=10), cancer (n=4), liver insufficiency (n=1), infection (n=11) or drug treatment (n=4).
diagnosed iTTP; secondly, and less likely, hyper-elevated VWF levels, commonly observed during infections and cancers, may prolong the physiological opening of ADAMTS13; thirdly, post-translational modifications of ADAMTS13 structure induced by neutrophil-released substances during infections and inflammatory diseases (e.g., deglycosylation or citrullination/oxidation of CUB or M/S domain residues, respectively) may imbalance the stability of intra- and inter-domain interactions normally involved in the maintenance of a closed conformation.7 These last two mechanisms remain very speculative (especially the role of
hyper-elevated VWF levels) because, in the absence of any TTP context, ADAMTS13 conformation was found closed in patients with sepsis11 or COVID-19 infection.16
To conclude, our study shows that TTP-associated triggers other than ADAMTS13 antibodies are poorly involved in the conversion of a closed to an open conformation of ADAMTS13. It also emphasizes the strong link between ADAMTS13 antibodies and an open ADAMTS13 conformation, even if the precise cause/consequence chronological process of this link remains unelucidated. This study also underlines that, besides the well-established congenital
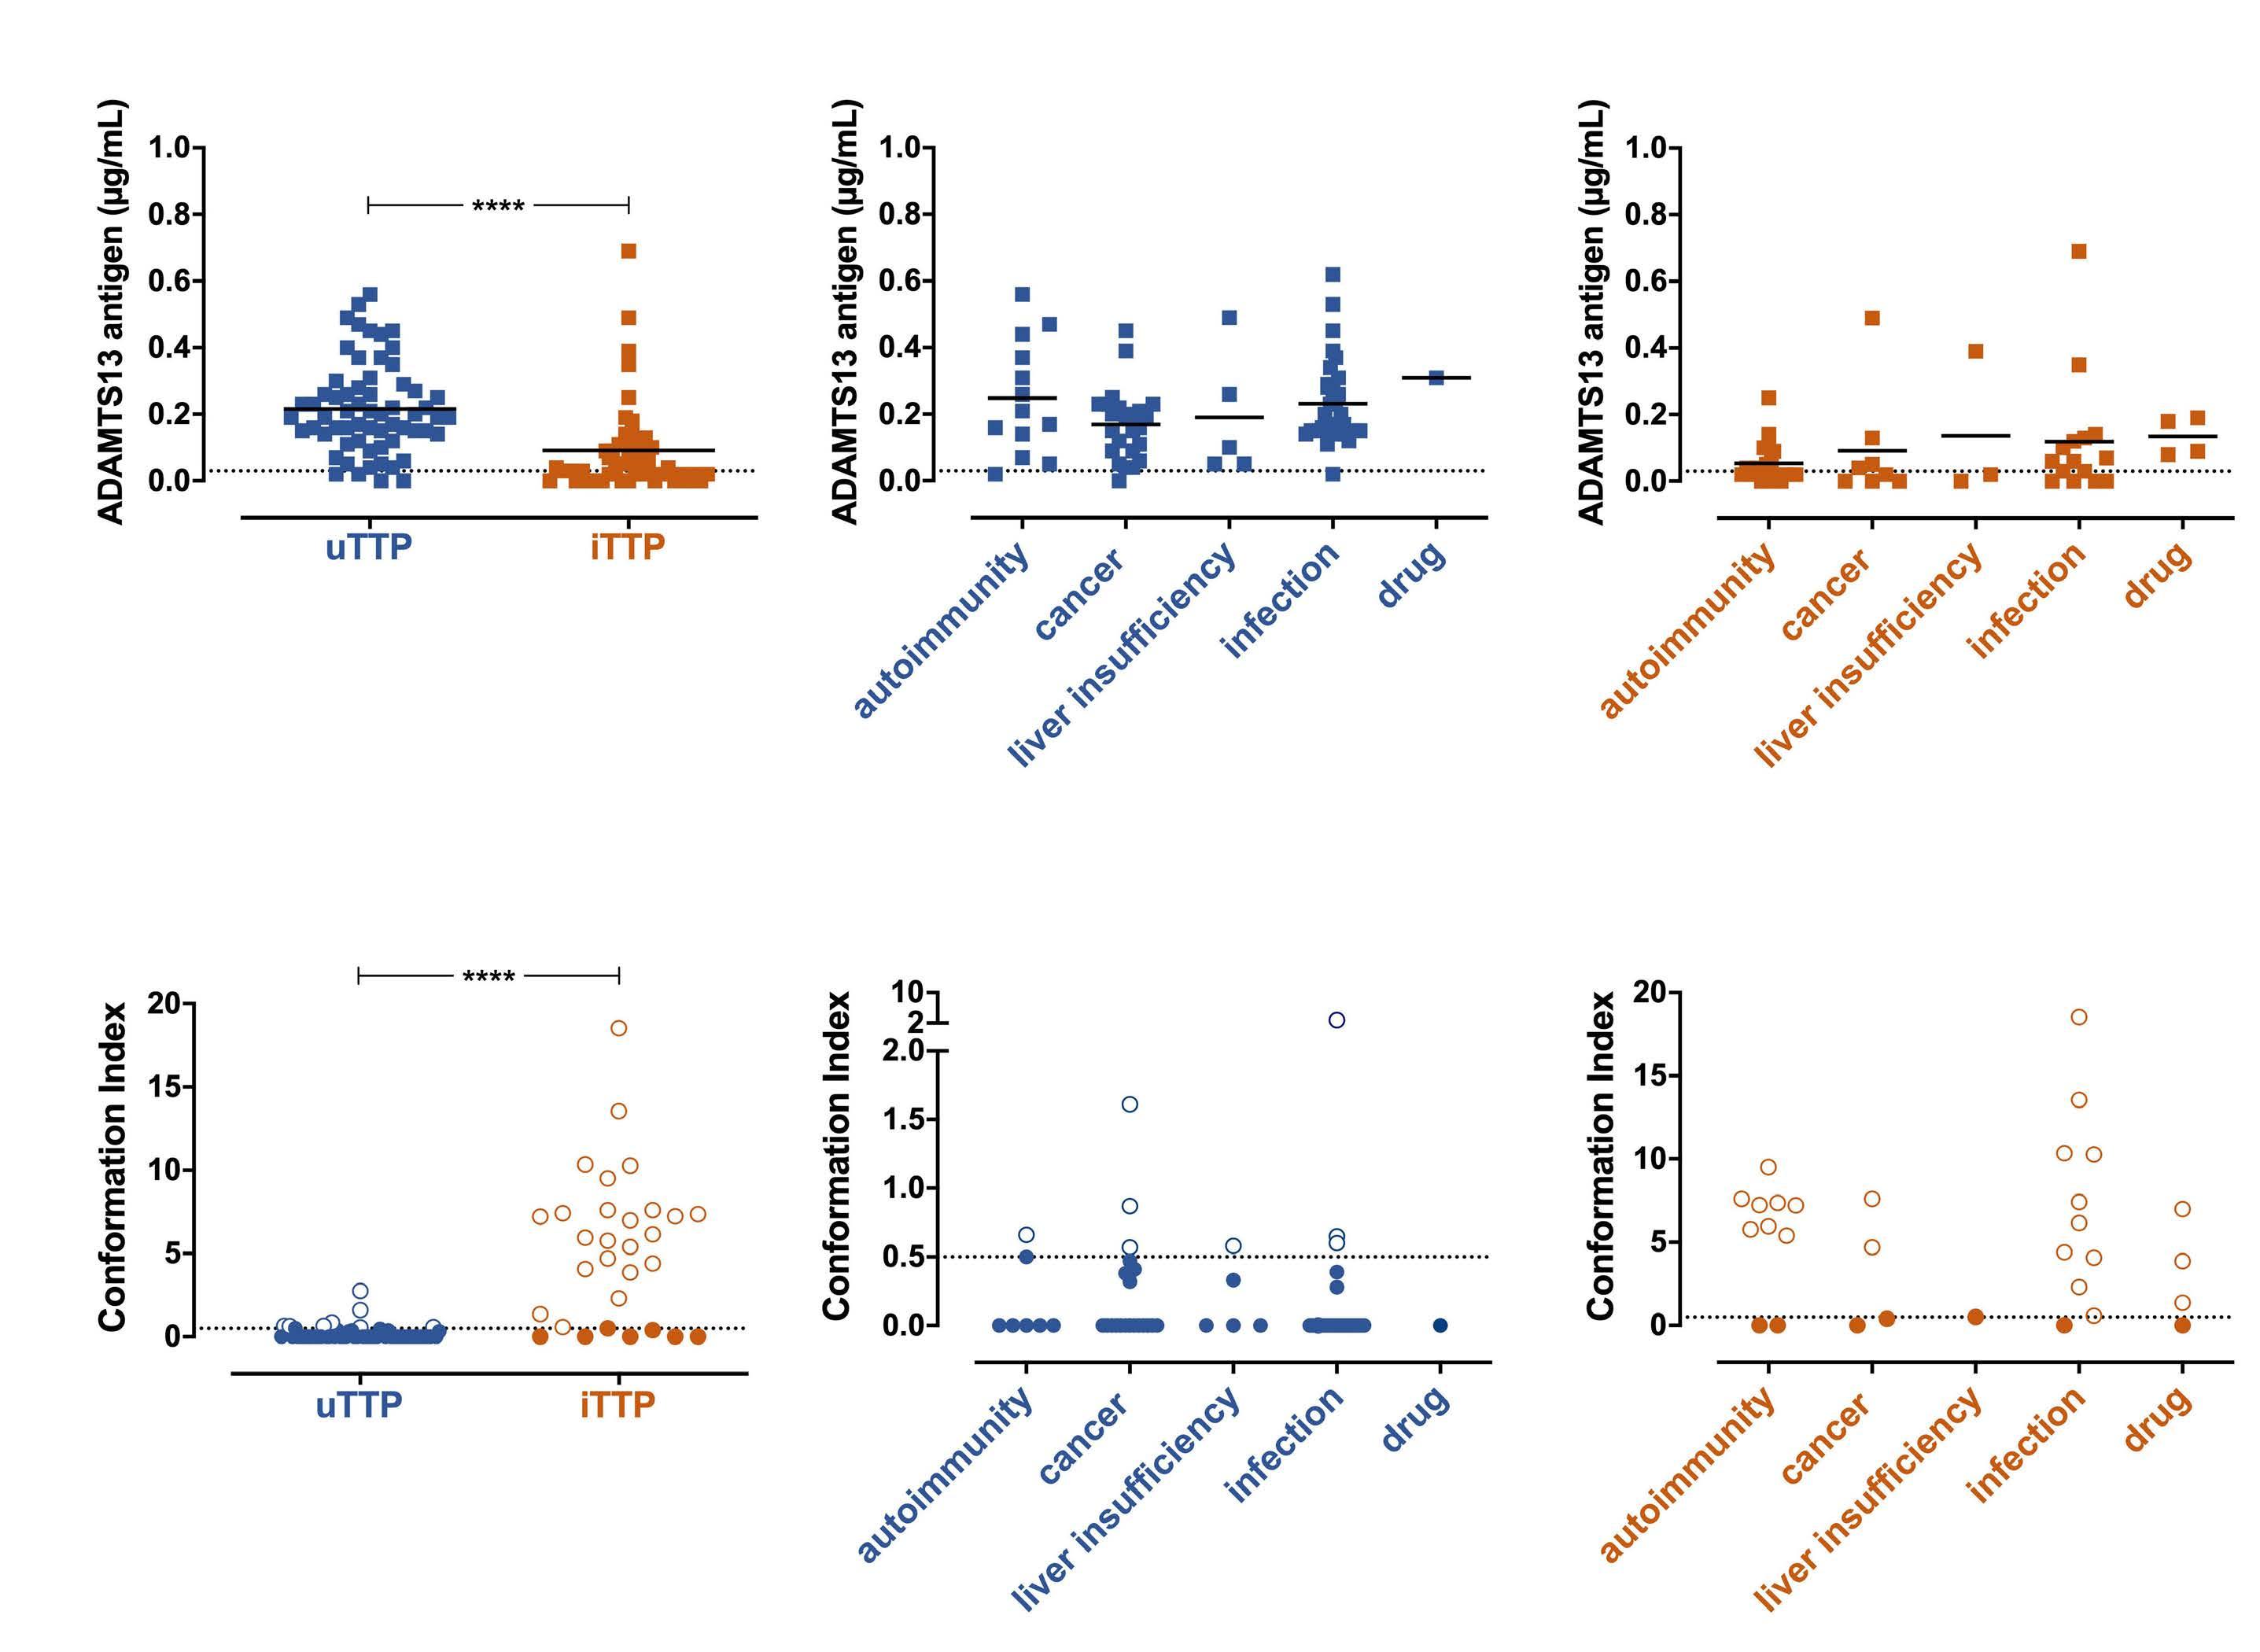
Haematologica | 108 February 2023 641 LETTER TO THE EDITOR A B C D E F
Figure 2. Pathophysiology and clinical presentation of the acquired forms of thrombotic thrombocytopenic purpura. ADAMTS13 is a multidomain protease, whose structure includes a metalloprotease domain (M), a disintegrin-like domain (D), eight thrombospondin type 1 repeats (T1-T8), a cysteine-rich domain (C), a spacer domain (S) and two CUB domains (CUB1, CUB2). Acquired severe deficiency of ADAMTS13 (activity <10 IU/dL) leading to the acquired forms of thrombotic thrombocytopenic purpura (TTP), may be either immune-mediated (iTTP) by anti-ADAMTS13 IgG autoantibodies or of unidentified pathophysiology (uTTP) when no anti-ADAMTS13 IgG autoantibodies can be detected. In most cases, iTTP is characterized by an idiopathic clinical presentation, an open ADAMTS13 conformation and ADAMTS13 IgG autoantibodies. In contrast, uTTP is associated with one or several clinical contexts at presentation, a closed ADAMTS13 conformation and miscellaneous speculated mechanisms for the severe deficiency of the ADAMTS13 (synthesis or secretion defect, proteolytic degradation, catalytic inhibition).
hereditary TTP and iTTP, there is a third form of TTP related to an acquired ADAMTS13 deficiency of unidentified mechanism (uTTP) in which ADAMTS13 IgG are not detectable and the ADAMTS13 conformation is closed. A wide international collaboration is needed to further define this entity as it may have important therapeutic implications.
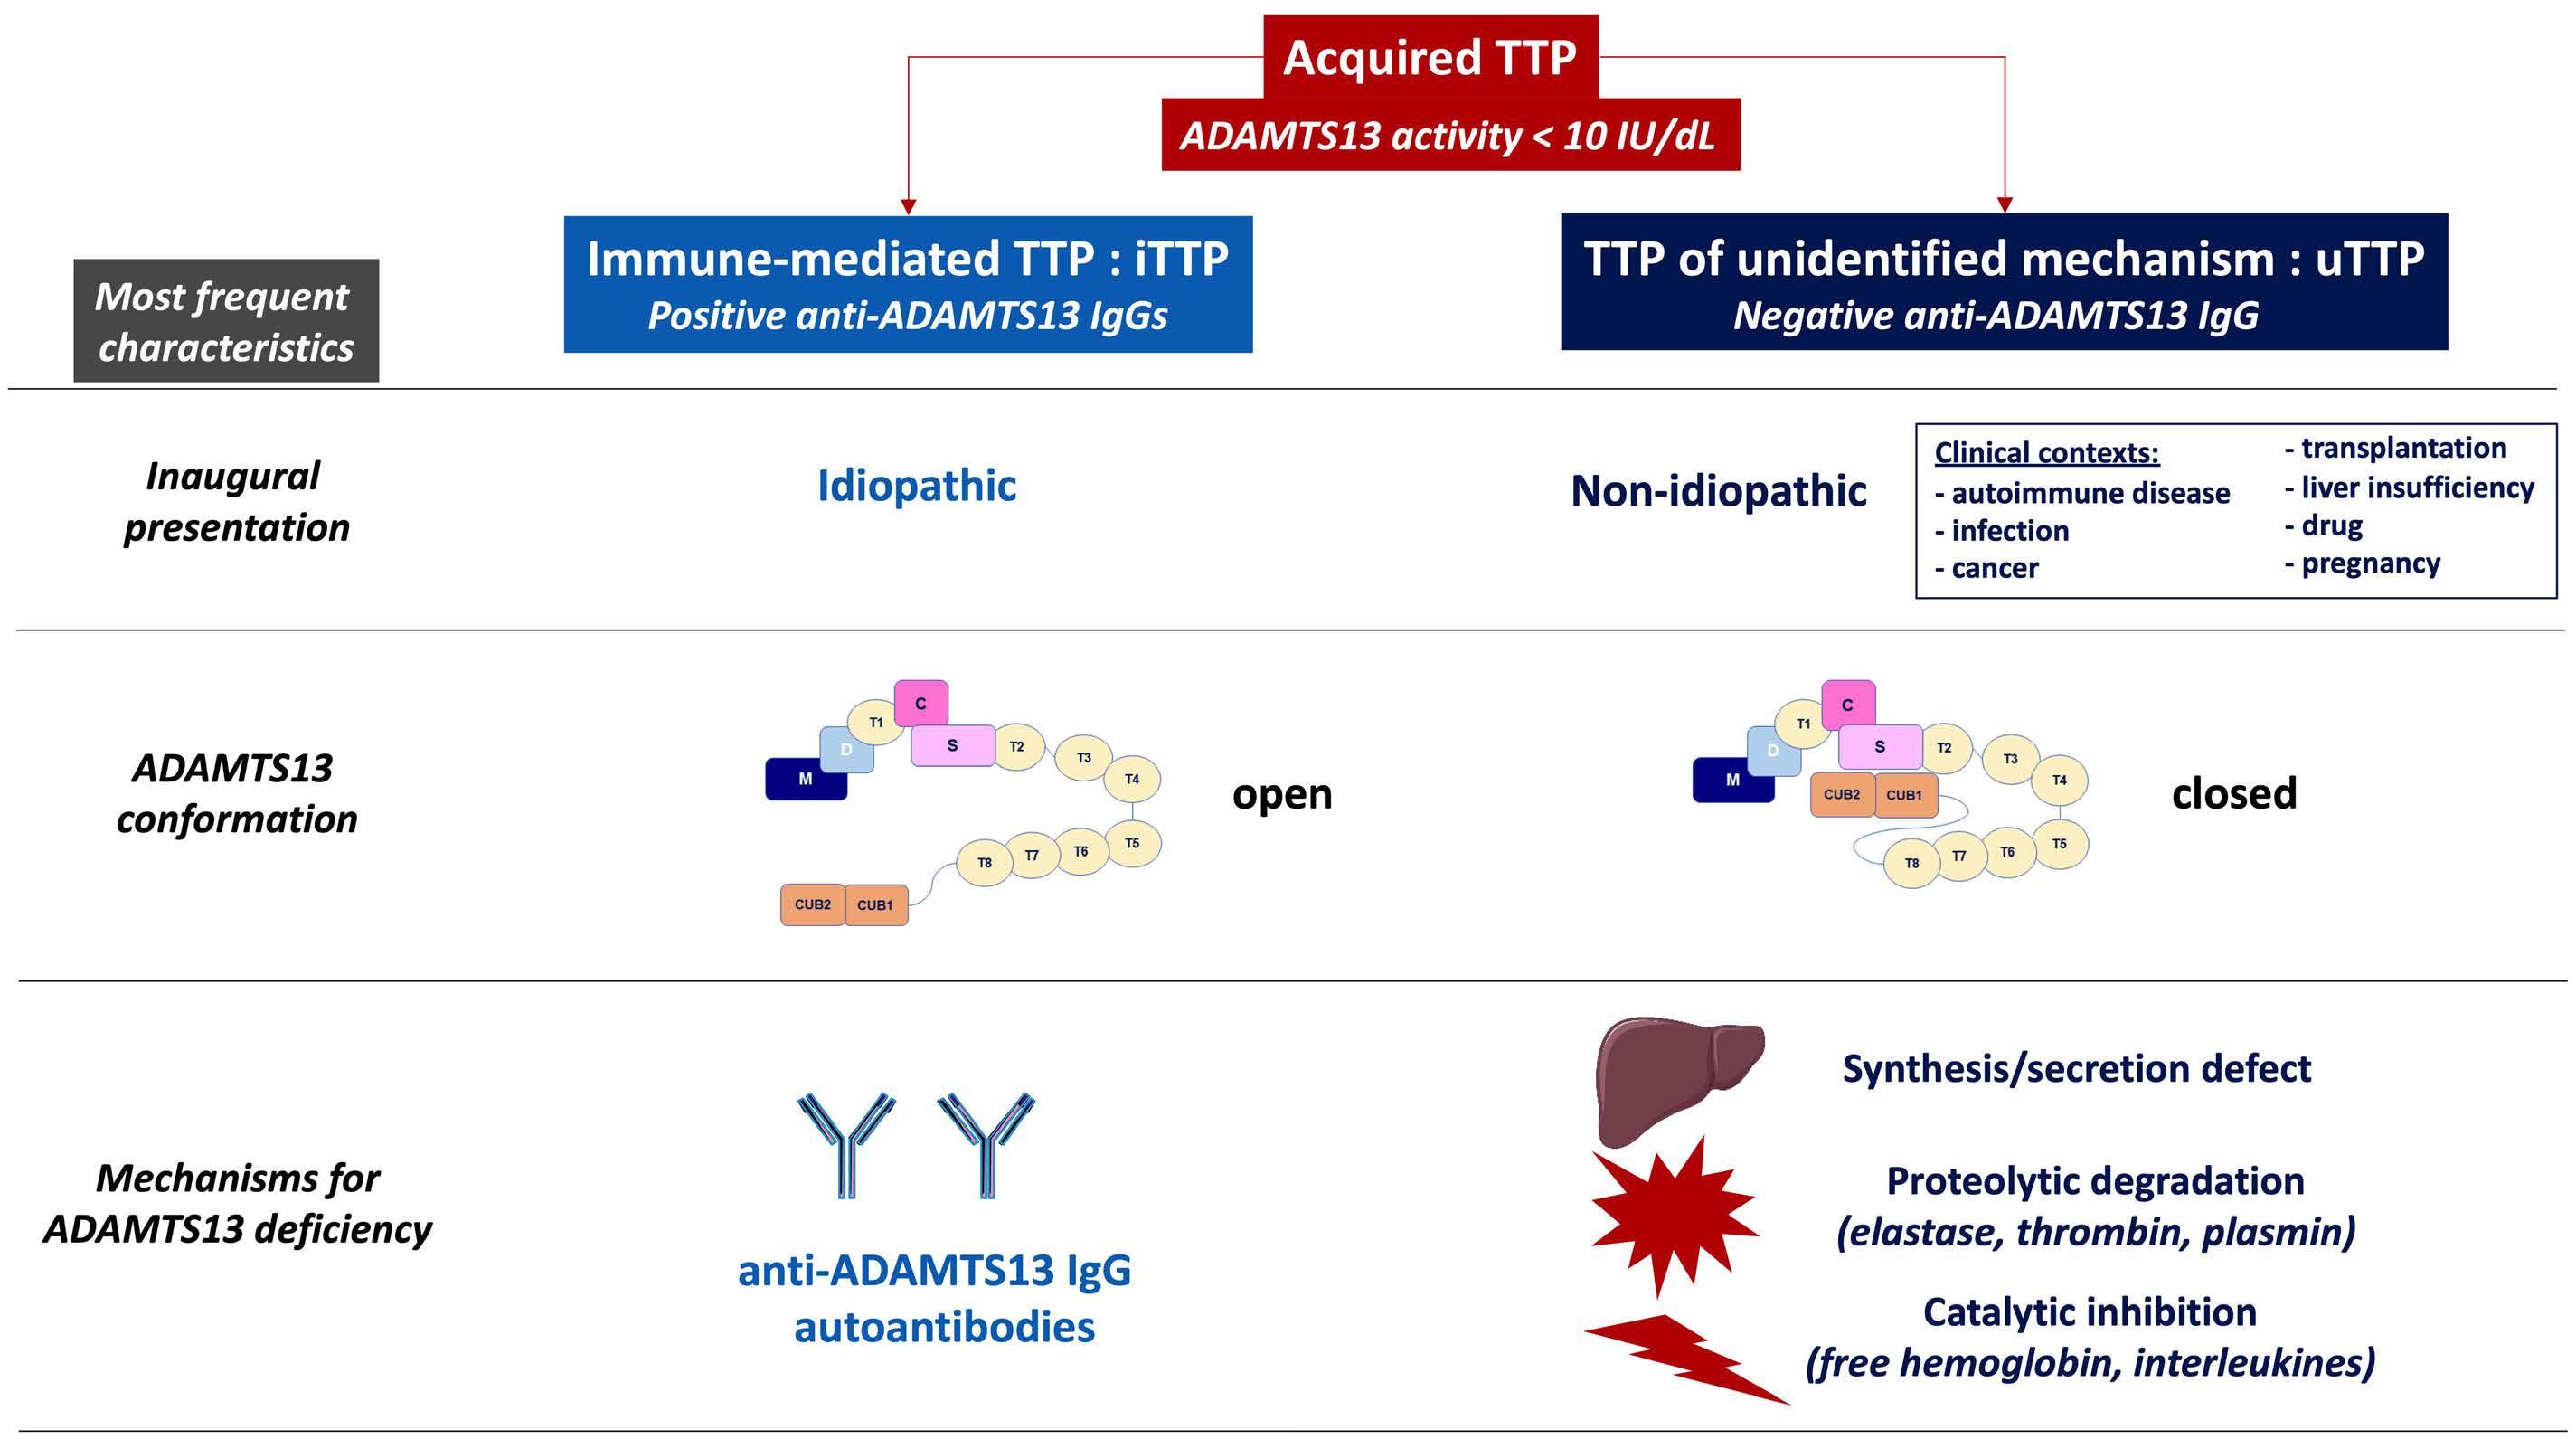
Appendix
The members of the Reference Center for Thrombotic Microangiopathies (CNR-MAT) are: Augusto Jean-François (Service de Néphrologie, Dialyse et Transplantation; CHU Larrey, Angers); Azoulay Elie (Service de Réanimation Médicale, Hôpital Saint-Louis, Paris); Barbay Virginie (Laboratoire d’Hématologie, CHU Charles Nicolle, Rouen); Benhamou Ygal (Service de Médecine Interne, CHU Charles Nicolle, Rouen); Bouzid Raïda (Service d’Hématologie, Hôpital Saint-Antoine, Paris); Charasse Christophe (Service de Néphrologie, Centre Hospitalier de Saint-Brieuc); Charvet-Rumpler Anne (Service d’Hématologie, CHU de Dijon) ; Chauveau Dominique (Service de Néphrologie et Immunologie Clinique, CHU Rangueil, Toulouse); Choukroun Gabriel (Service de Néphrologie, Hôpital Sud, Amiens); Coindre Jean-Philippe (Service de Néphrologie,
CH Le Mans); Coppo Paul (Service d’Hématologie, Hôpital Saint-Antoine, Paris); Corre Elise (Service d’Hématologie, Hôpital Saint-Antoine, Paris); Delmas Yahsou (Service de Néphrologie, CHU de Bordeaux); Jaccard Arnaud (Service d’Hématologie, Hôpital Dupuytren, Limoges); Kwon Theresa (Service de Néphrologie Pédiatrique, Hôpital Robert Debré, Paris); Dossier Antoine (Service de Néphrologie, Hôpital Bichat, Paris); Fain Olivier (Service de Médecine Interne, Hôpital Saint-Antoine, Paris); Frémeaux-Bacchi Véronique (Laboratoire d’Immunologie, Hôpital Européen Georges Pompidou, Paris); Galicier Lionel (Service d’Immunopathologie, Hôpital Saint-Louis, Paris); Grangé Steven (Service de Réanimation Médicale, CHU Charles Nicolle, Rouen); Guidet Bertrand (Service de Réanimation Médicale, Hôpital Saint-Antoine, Paris); Halimi Jean-Michel (Service de Néphrologie Pédiatrique, Hôpital Bretonneau, Tours); Hamidou Mohamed (Service de Médecine Interne, Hôtel-Dieu, Nantes); Herbrecht Raoul (Service d’Oncologie et d’Hématologie, Hôpital de Hautepierre, Strasbourg); Hié Miguel (Service de Médecine Interne, Groupe Hospitalier Pitié-Salpétrière, Paris); Jacobs Frédéric (Service de Réanimation Médicale, Hôpital Antoine Béclère, Clamart); Joly Bérangère (Service d’Hématologie Biologique, Hôpital
Haematologica | 108 February 2023 642 LETTER TO THE EDITOR
Lariboisière, Paris); Kanouni Tarik (Unité d’Hémaphrèse, Service d’Hématologie, CHU de Montpellier); Kaplanski Gilles (Service de Médecine Interne, Hôpital la Conception, Marseille); Lautrette Alexandre (Hôpital Gabriel Montpied, Service de Réanimation Médicale, Clermont-Ferrand); Le Guern Véronique (Unité d’Hémaphérèse, Service de Médecine Interne, Hôpital Cochin, Paris); Martis Nihal (Service de Médecine Interne, CHU de Nice); Moulin Bruno – Krummel Thierry (Service de Néphrologie, Hôpital Civil, Strasbourg); Rebibou Jean-Michel (Service de Néphrologie, CHU de Dijon); Ojeda Uribe Mario (Service d’Hématologie, Hôpital Emile Muller, Mulhouse); Ouchenir Abdelkader (Service de Réanimation, Hôpital Louis Pasteur, Le Coudray); Parquet Nathalie (Unité de Clinique Transfusionnelle, Hôpital Cochin, Paris); Pène Frédéric (Service de Réanimation Médicale, Hôpital Cochin, Paris); Perez Pierre (Service de Réanimation Polyvalente, CHU de Nancy); Philipponnet Carole (Service de Médecine Intensive et Réanimation, CHU de Clermont-Ferrand); Poullin Pascale (Service d’Hémaphérèse, Hôpital la Conception, Marseille); Pouteil-Noble Claire (Service de Néphrologie, CHU Lyon-Sud, Lyon); Presne Claire (Service de Néphrologie, Hôpital Nord, Amiens); Provôt François (Service de Néphrologie, Hôpital Albert Calmette, Lille); Rieu Virginie (Service de Médecine Interne, CHU de Clermont-Ferrand); Rondeau Eric (Urgences Néphrologiques et Transplantation Rénale, Hôpital Tenon, Paris); Saheb Samir (Unité d’Hémaphérèse, Hôpital la Pitié-Salpétrière, Paris); Salanoubat Célia (Service d’Hématologie, Hôpital Sud-Francilien, Corbeil-Essonnes); Seguin Amélie (Service de Réanimation Médicale, Centre Hospitalier de Vendée); Servais Aude (Service de Néphrologie, CHU Necker-Enfants Malades); Stépanian Alain (Laboratoire d’Hématologie, Hôpital Lariboisière, Paris); Ulrich Marc (Service de Néphrologie et de Médecine Interne, Centre Hospitalier de Valenciennes); Veyradier Agnès (Service d’Hématologie Biologique, Hôpital Lariboisière, Paris); Vigneau Cécile (Service de Néphrologie, Hôpital Pontchaillou, Rennes); Ville Simon (Service de Néphrologie, CHU de Nantes); Wynckel Alain (Service de Néphrologie, Hôpital Maison Blanche, Reims); Zunic Patricia (Service d’Hématologie, Groupe Hospitalier Sud-Réunion, la Réunion).
Authors
Bérangère S. Joly,1,* Elien Roose,2,* Paul Coppo,3 Karen Vanhoorelbeke2 and Agnès Veyradier1
References
1. Sukumar S, Lämmle B, Cataland SR. Thrombotic thrombocytopenic purpura: pathophysiology, diagnosis and management. J Clin Med. 2021;10(3):536.
2. Kremer Hovinga JA, Coppo P, Lämmle B, Moake JL, Miyata T,
1Service d’Hématologie Biologique, Hôpital Lariboisière, AP-HP.Nord, Université de Paris and EA3518, Institut Universitaire d’Hématologie, Hôpital Saint Louis, Université de Paris, Paris, France; 2Laboratory for Thrombosis Research, IRF Life Sciences, KU Leuven Campus Kulak Kortrijk, Kortrijk, Belgium and 3Département d’Hématologie Clinique, Hôpital Saint Antoine, Assistance Publique-Hôpitaux de Paris and Université Pierre et Marie Curie, Paris, France
*BSY and ER contributed equally as co-first authors. Correspondence: A. VEYRADIER - agnes.veyradier@aphp.fr
https://doi.org/10.3324/haematol.2022.280768
Received: January 31, 2022. Accepted: March 23, 2022. Prepublished: April 28, 2022.
Disclosures
AV and PC are members of the French advisory boards for caplacizumab (Sanofi) and for recombinant ADAMTS13 (Takeda). KV is a member of the advisory board of Takeda for recombinant ADAMTS13.
Contributions
BJ, ER, PC, KV and AV designed the research. BJ, AV and PC provided samples. ER performed experiments. BJ, ER, AV and KV analyzed data. BJ and ER wrote the manuscript. AV, KV and PC critically reviewed the manuscript. KV provided funding. All authors approved the final manuscript.
Acknowledgments
The authors would like to thank Inge Pareyn, Aline Vandenbulcke, Sandrine Benghezal, Sophie Capdenat, Adeline Delton and Sylvaine Savigny for technical assistance and all the members of the French Reference Center for Thrombotic Microangiopathies listed in the Appendix for including patients.
Funding
This investigation was supported by The European Framework Program for Research and Innovation (Horizon 2020 Marie Sklodowska Curie Innovative training network PROFILE grant 675746), Semmelweis University/KU Leuven (CELSA Research Grant 2018) and the KU Leuven (OT/14/071).
Data-sharing statement: Original data can be made available on reasonable request to the authors.
Vanhoorelbeke K. Thrombotic thrombocytopenic purpura. Nat Rev Dis Primers. 2017;3:17020.
3. Furlan M, Robles R, Galbusera M, et al. von Willebrand factorcleaving protease in thrombotic thrombocytopenic purpura and
Haematologica | 108 February 2023 643 LETTER TO THE EDITOR
the hemolytic-uremic syndrome. N Engl J Med. 1998;339(22):1578-1584.
4. Tsai HM, Lian EC. Antibodies to von Willebrand factor-cleaving protease in acute thrombotic thrombocytopenic purpura. N Engl J Med. 1998;339(22):1585-1594.
5. Zheng X, Chung D, Takayama TK, Majerus EM, Sadler JE, Fujikawa K. Structure of von Willebrand factor-cleaving protease (ADAMTS13), a metalloprotease involved in thrombotic thrombocytopenic purpura. J Biol Chem. 2001;276(44):41059-41063.
6. Mariotte E, Azoulay E, Galicier L, et al. Epidemiology and pathophysiology of adulthood-onset thrombotic microangiopathy with severe ADAMTS13 deficiency (thrombotic thrombocytopenic purpura): a cross-sectional analysis of the French national registry for thrombotic microangiopathy. Lancet Haematol. 2016;3(5):e237-245.
7. Ercig B, Arfman T, Hrdinova J, et al. Conformational plasticity of ADAMTS13 in hemostasis and autoimmunity. J Biol Chem. 2021;297(4):101132.
8. South K, Luken BM, Crawley JTB, et al. Conformational activation of ADAMTS13. Proc Natl Acad Sci U S A. 2014;111(52):18578-18583.
9. Muia J, Zhu J, Gupta G, et al. Allosteric activation of ADAMTS13 by von Willebrand factor. Proc Natl Acad Sci U S A. 2014;111(52):18584-18589.
10. Petri A, Kim H, Xu Y, et al. Crystal structure and substrateinduced activation of ADAMTS13. Nat Commun. 2019;10(1):3781.
11. Roose E, Schelpe AS, Joly BS, et al. An open conformation of ADAMTS13 is a hallmark of acute acquired thrombotic thrombocytopenic purpura. J Thromb Haemost. 2018;16(2):378-388.
12. Jestin M, Benhamou Y, Schelpe AS, et al. Preemptive rituximab prevents long-term relapses in immune-mediated thrombotic thrombocytopenic purpura. Blood. 2018;132(20):2143-2153.
13. Roose E, Schelpe A-S, Tellier E, et al. Open ADAMTS13, induced by antibodies, is a biomarker for subclinical immune-mediated thrombotic thrombocytopenic purpura. Blood. 2020;136(3):353-361.
14. Hrdinová J, D’Angelo S, Graça NAG, et al. Dissecting the pathophysiology of immune thrombotic thrombocytopenic purpura: interplay between genes and environmental triggers. Haematologica. 2018;103(7):1099-1109.
15. Waele LD, Curie A, Kangro K, et al. Anti-cystein/spacer antibodies that open ADAMTS13 are a common feature in iTTP. Blood Adv. 2021;5(21):4480-4484.
16. Joly BS, Darmon M, Dekimpe C, et al. Imbalance of von Willebrand factor and ADAMTS13 axis is rather a biomarker of strong inflammation and endothelial damage than a cause of thrombotic process in critically ill COVID-19 patients. J Thromb Haemost. 2021;19(9):2193-2198.
Haematologica | 108 February 2023 644 LETTER TO THE EDITOR
Integrating biological HLA-DPB1 mismatch models to predict survival after unrelated hematopoietic cell transplantation
Relapse and graft- versus-host disease (GvHD) are the main impediments to the clinical success of allogeneic hematopoietic cell transplantation (HCT) in curing malignant blood disorders. Alloreactive donor T cells are important mediators of both relapse control by graft-versus-leukemia (GvL) effects, and of GvHD.1 In unrelated donor (UD)-HCT, frequent human leukocyte antigen (HLA)-DPB1 disparity is the target of T-cell alloreactivity, contributing to both leukemia control and GvHD.2 We have previously shown that two biological models of HLA-DPB1 mismatching, namely permissiveness according to T-cell epitope (TCE) groups and genetically determined high-expression levels, are individually associated with the risks of non-relapse mortality and GvHD/relapse, respectively.3,4 This led us to hypothesize that combined TCE-permissive and high-expression (TPHE) HLA-DPB1 mismatches might synergize for best outcomes. We tested this novel hypothesis in over 6,000 HCT from 8/8 HLA-matched UD reported to the European Group for Blood and Marrow Transplantation (EBMT), to demonstrate that HLA-DPB1 non-TPHE mismatches were associated with worse relapse-free survival and overall survival than TPHE mismatches, present in 21.7% of single HLADPB1 disparate pairs. Our work provides a synthesis of previous algorithms, mechanistically based on HLA-DPB1 immunopeptidome divergence5 and expression by residual leukemia cells,6,7 respectively, into a new and integrative model for intelligent mismatching in UD-HCT, to improve survival for future patients. Alloreactive donor T cells recognizing patient-specific genetic polymorphisms, including mismatched HLA allotypes, play a major role in both beneficial GvL and severe GvHD after UD-HCT. One of the best examples of these two contrasting aspects of T-cell alloreactivity is donorrecipient HLA-DPB1 disparity, present in over 80% of transplants from UD.3 HLA-DPB1 disparity has been extensively explored for biological models apt to tease out clinically permissive mismatch combinations.2 These include sharing of alloreactive TCE groups between mismatched HLA-DPB1 alleles (TCE-permissiveness), mainly associated with non-relapse mortality,3,8 and high or low expression levels determined by a specific single nucleotide polymorphism in the HLA-DPB1 3’ untranslated region (expression-permissiveness), mainly associated with acute GvHD.4,9 Numerous studies have since investigated the clinical role of these two models in different national
and international cohorts from the USA and Europe, both individually and in direct comparison.10-13 However, it is unclear whether the two models can be integrated, and whether their integration improves prediction of survival. These two questions were addressed in the present study. We investigated a previously unexplored cohort of 6,627 HLA-A, -B, -C, -DRB1-matched (HLA-8/8) first UD-HCT for adult patients with hematologic malignancies, reported by 160 EBMT centers between 2005 and 2017 (Table 1). Reflecting the increasing numbers of available six-loci HLAtyped UD in worldwide registries, and mounting recognition of the relevance of HLA-DPB1 matching for outcome, the percentage of HLA-DPB1 allele-matched pairs was higher in later years compared to earlier years (Table 1). Informed consent was obtained from all patients according to the Declaration of Helsinki, and protocols were approved by the institutional review boards of the participating institutions. Patients had received mainly peripheral blood stem cells under reduced intensity conditioning and cyclosporine-based GvHD prophylaxis with in vivo T-cell depletion by anti-thymocyte globulin; use of post-transplant cyclophosphamide was excluded. The cohort was stratified by HLA-DPB1 allele matches or mismatches, by TCE-permissiveness or TCE-nonpermissiveness according to the threegroup model,3 or in the single HLA-DPB1 graft-versus-host (GvH) mismatched group by high expression or low expression according to the rs9277534 G/A single nucleotide polymorphism4 and/or TCE-permissiveness, for the discrimination between TPHE mismatches and others (Online Supplementary Figure S1A). The primary study endpoint was relapse-free survival; secondary endpoints included nonrelapse mortality, relapse, acute GvHD, chronic GvHD, GvHD-free relapse-free survival (GRFS) and overall survival. Univariable and multivariable analyses by the log-rank test, cumulative-incidence functions and (cause-specific) Coxregression models were adjusted for non-HLA-DPB1 factors (Online Supplementary Table S1). For this hypothesis-testing analysis, P-values <0.05 were considered statistically significant.
HLA-DPB1 allele mismatches were associated with lower risks of relapse, and increased risks of acute GvHD and non-relapse mortality without improved relapse-free survival, compared to matches (Figure 1, Online Supplementary Table S2). When considered individually, TCE-nonpermissive and high-expression HLA-DPB1 single GvH-mismatches were each associated with lower relapse but higher acute
Haematologica | 108 February 2023 645 LETTER TO THE EDITOR
Table 1. Patient, donor and transplant characteristics.
Characteristica
Patients
Age in years, median (range)
Diagnosis
AML/ALL MDS/MPN Other
Disease stage Early Intermediate Advanced
Karnofsky Index ≥90 <90
Total N (%) / Missing N (%)b
Match N (%)c Mismatch N (%)d Pe
6,627 (100) / 0 (0) 1,480 (22.3) 55.1 (18-77) 5,147 (77.7) 54.1 (18-77) 0.06
6,627 (100) / 0 (0) 759 (51.3) 379 (25.6) 342 (23.1)
6,552 (98.9) / 75 (1.1) 664 (45.4) 408 (27.9) 391 (26.7)
2,667 (51.8) 1,236 (24.0) 1,244 (24.2)
2,298 (45.2) 1,493 (29.3) 1,298 (25.5)
0.41
0.47
6,088 (91.9) / 539 (8.1) 1,301 (95.5) 62 (4.5) 4,513 (95.5) 212 (4.5) 0.44
Donor age Median (range) 5,788 (87.3) / 839 (12.7) 1,306 (19.7) 28.6 (18-60) 4,482 (67.6) 30.8 (18-61) <0.001
Donor sex Female Male
Cytomegalovirus match Negative/negative Other
DQB1 Match Mismatch
Year 2005-2011 2012-2017
Stem cell source
Bone marrow Peripheral blood stem cells
Conditioning
Reduced intensity conditioning Myeloablative conditioning
GvHD prophylaxis
CSA-MTX CSA-MMF Tacrolimus-based Other
In vivo T-cell depletion No Yes
HLA-DPB1 T-cell epitople-mismatch Permissive Nonpermissive
Single HLA-DPB1 GvH expression-mismatch Low High
Combined HLA-DPB1 TCE and expression mismatch TPHE Other
6,567 (99.1) / 60 (0.9) 408 (27.9) 1,053 (72.1) 1,421 (27.8) 3,685 (72.2) 0.97
6,555 (98.9) / 72 (1.1) 459 (31.5) 1,000 (68.5) 1,682 (33.0) 3,414 (67.0) 0.28
6,627 (100) / 0 (0) 1,436 (97.0) 44 (3.0) 4,850 (94.2) 297 (5.8) <0.001
6,627 (100) / 0 (0) 276 (18.6) 1,204 (81.4) 1,462 (28.4) 3,685 (71.6) <0.001
6,627 (100) / 0 (0.0) 168 (11.4) 1,312 (88.6) 713 (13.9) 4,434 (86.1) 0.01
6,598 (99.6) / 29 (0.4) 859 (58.6) 607 (41.4) 3,093 (60.3) 2,039 (39.7) 0.261
6,627 (100) / 0 (0) 894 (60.4) 423 (28.6) 131 (8.9) 32 (2.2)
2,922 (56.8) 1,585 (30.8) 503 (9.8) 137 (2.7)
0.08
6,620 (99.9) / 7 (0.1) 385 (26.0) 1,093 (74.0) 1,376 (26.8) 3,766 (73.2) 0.61
5,147 (77.7) / 1,480 (22.3) NA NA 2,875 (55.9) 2,272 (44.1) NA
2,745 (41.4) / 3,882 (58.6) NA NA 1,463 (53.3) 1,282 (46.7) NA
2,745 (41.4) / 3,882 (58.6) NA NA 597 (21.7) 2,184 (78.3) NA
aDiagnosis. AML: acute myeloid leukemia; ALL: acute lymphoblastic leukemia; MDS: myelodysplastic syndrome; MPN: myeloproliferative neoplasm; Other: includes chronic myeloid or lymphatic leukemia, malignant plasma cell disorders and lymphoma. Disease stage. Early: first complete remission, first chronic phase, refractory anemia with or without ring sideroblasts, deletion 5q; Intermediate: second complete remission, chronic phase (not first), refractory anemia with excess blasts-1, refractory anemia with excess blasts-2; Advanced: refractory anemia with excess blasts in transformation, MDS transformed to AML, accelerated phase, blast crisis, partial remission, very good partial remission, refractory, untreated, progression, relapse. GvHD prophylaxis: CSA: cyclosporine A, MTX: methotrexate, MMF: mycophenolate mofetil. In vivo T-cell depletion. Use of anti-thymocyte globulin, anti-T-lymphocyte globulin or Campath. TCE: T-cell epitope, Combined HLA-DPB1 TCE and expression mismatch. TPHE: single graft-versus-host (GvH) mismatches that are both TCE-permissive and high expression; Other: all single GvH mismatches that are not TPHE (for explanations see text). bFor HLA-DPB1 TCE-mismatch, Missing N (%) refer to allele-matched pairs. For Single HLA-DPB1 GvH expression-mismatch and combined HLA-DPB1 TCE and expression mismatch, Missing N (%) refer to the sum of allelematched pairs and pairs that did not have a single DPB1 mismatch in the GvH direction. cNA not applicable. dMismatch refers to allele-level (i.e., 2-digit) mismatch. eP-values were obtained by the χ2 test for categorical variables, and by the Kruskal-Wallis test for continuous variables (i.e. patient and donor age). Statistically significant P-values <0.05 are indicated in bold.
Haematologica | 108 February 2023 646 LETTER TO THE EDITOR
GvHD and non-relapse mortality, compared to allele matches (Online Supplementary Table S2). In contrast, the risk of non-relapse mortality was not higher in TCE-permissive or low-expression HLA-DPB1 single GvH-mismatches compared to allele matches. Importantly, TCE-permissive but not low-expression HLA-DPB1 single GvH-mismatches were associated with lower relapse risks compared to allele matches, albeit with higher GvHD. Neither permissive or nonpermissive TCE-mismatches nor high- or low-expression, were individually associated with
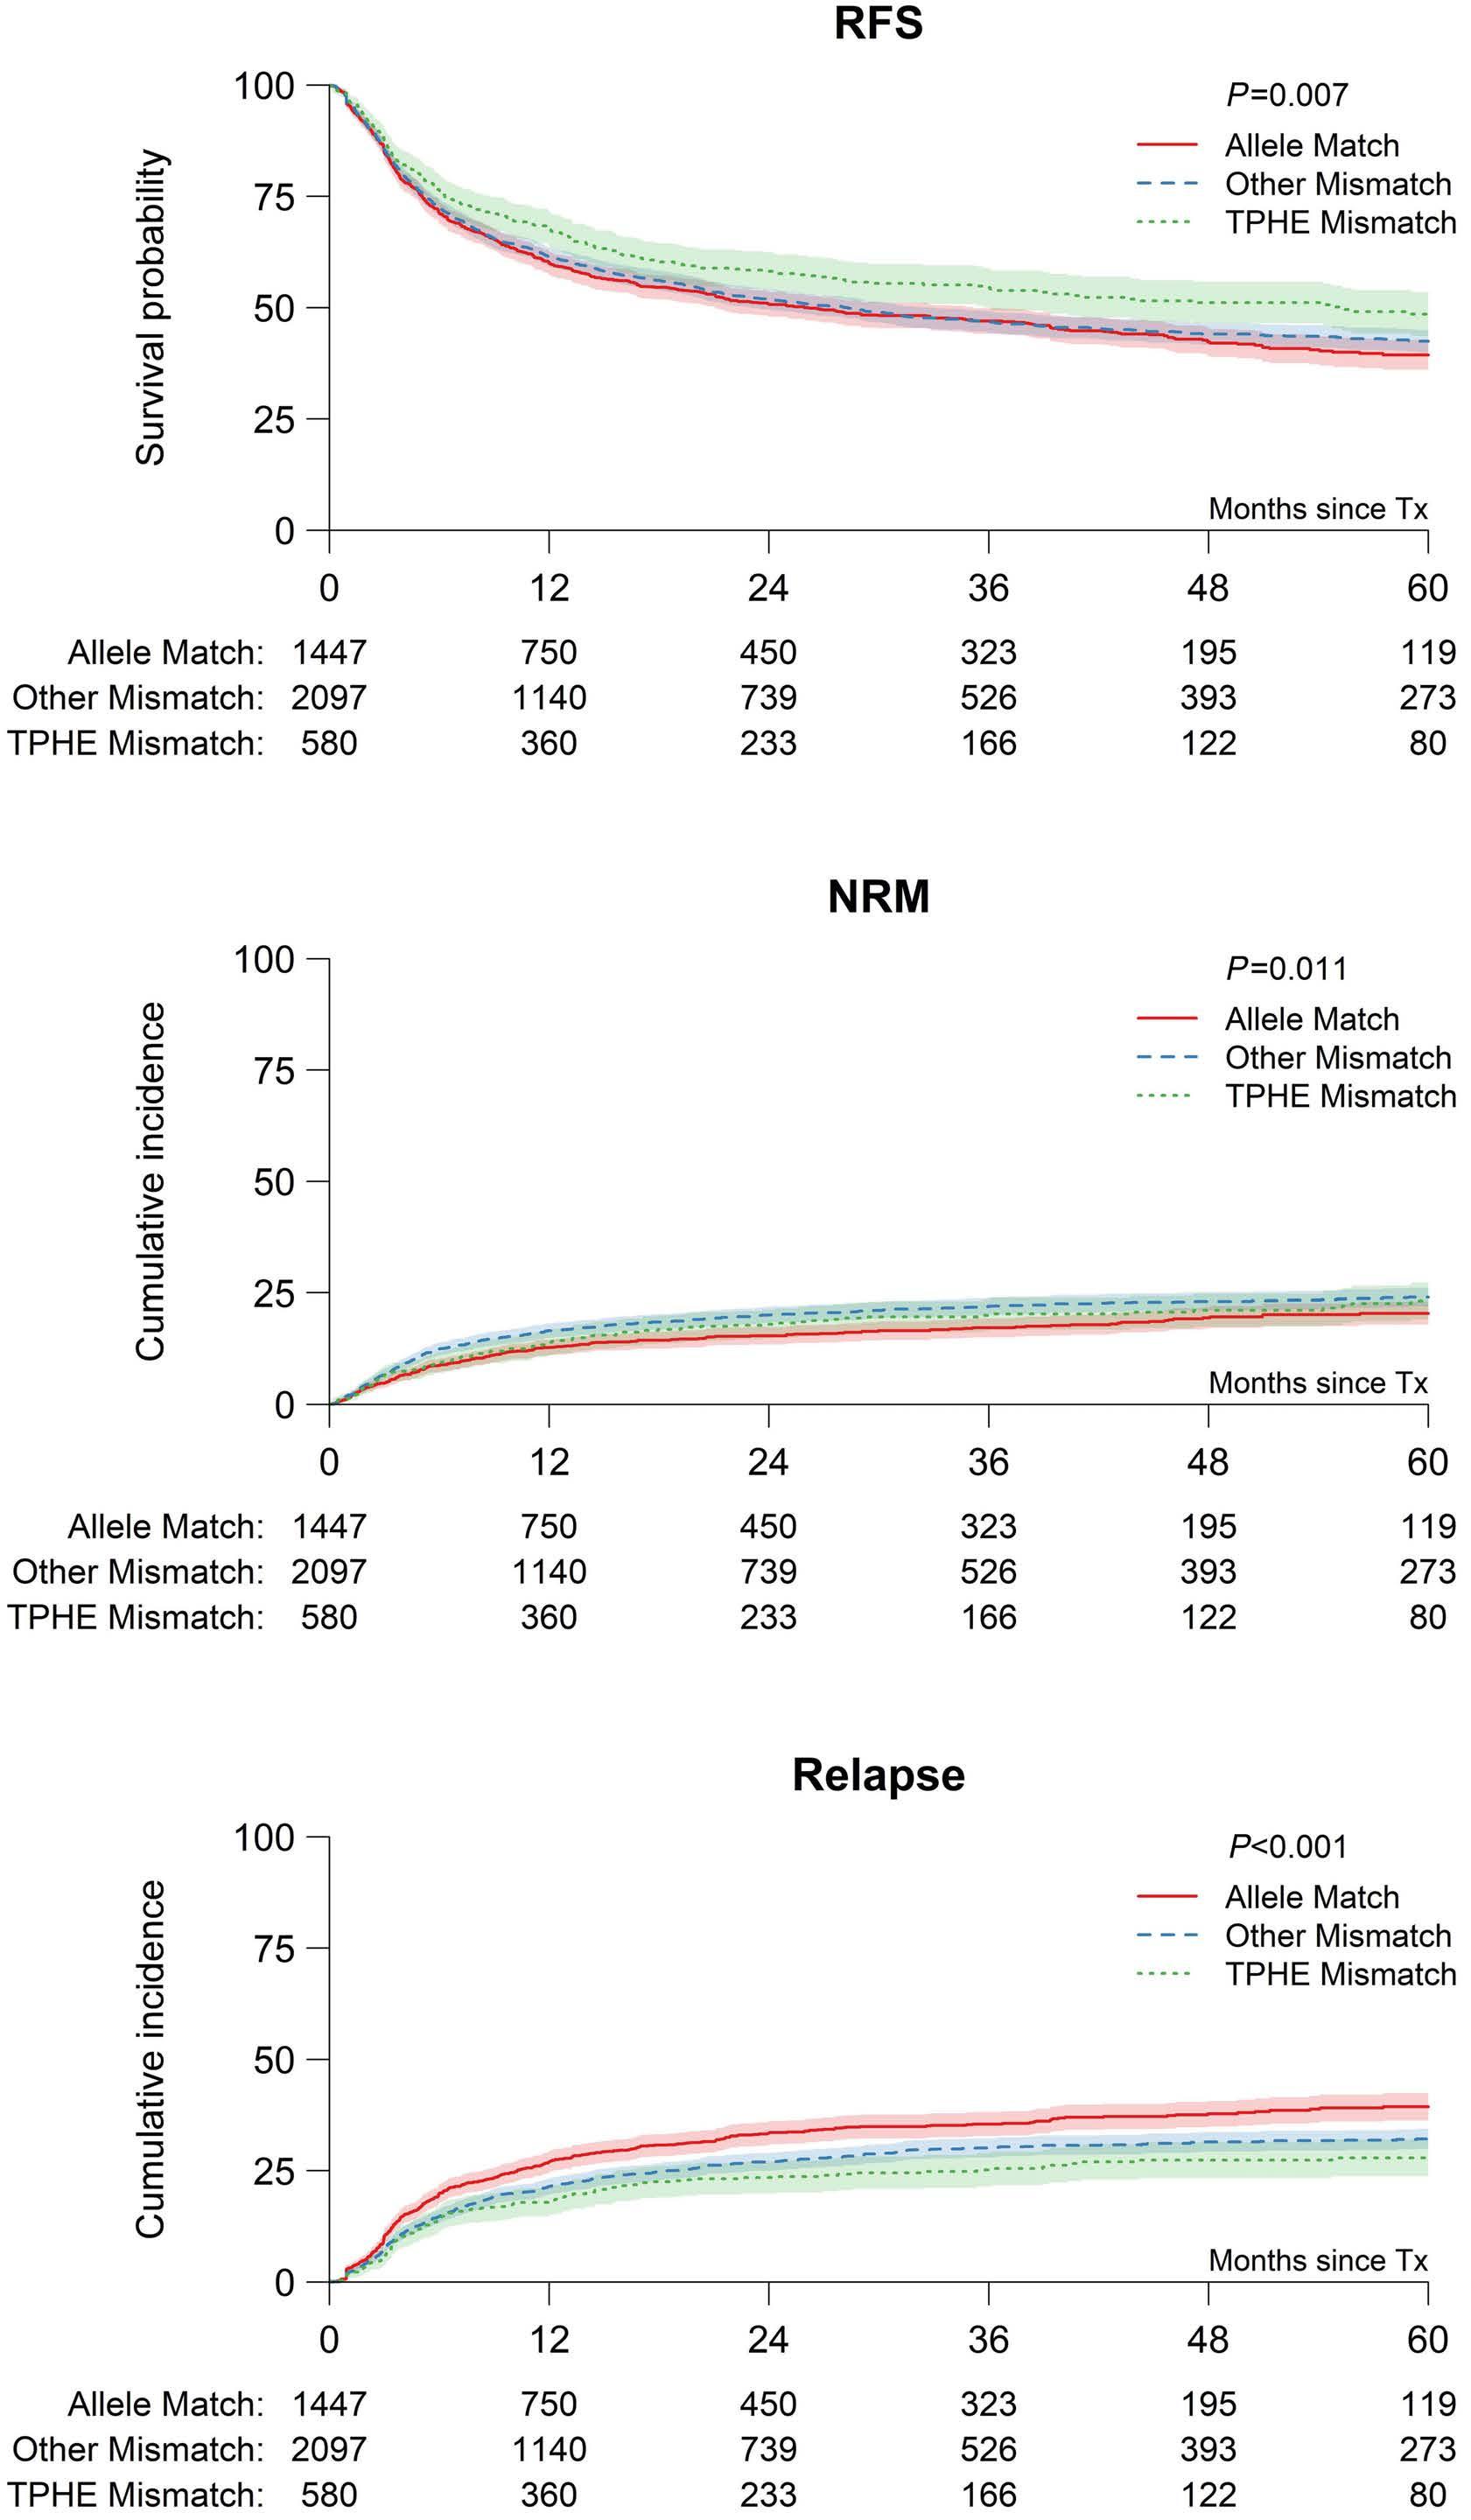
relapse-free survival (Online Supplementary Table S2) or overall survival (data not shown). Reflecting the strong linkage disequilibrium between exon variation of HLA-DPB1 determining TCE groups and the rs9277534 single nucleotide polymorphism determining expression levels,14 there was some overlap between the TCE-model and the expression-model, with 65% of single HLA-DPB1 GvH-mismatches being TCE-nonpermissive and high expression (685/2,745, 25%) or TCE-permissive and low expression (1,100/2,745, 40%) (Online Supplementary
Figure 1. Univariable associations between combined HLA-DPB1 T-cell epitope and expression matching and outcome after 8/8 HLA-matched unrelated donor hematopoietic cell transplantation. Five-year outcome probabilities (A,B) or (C) 5-year cumulative incidence are shown for HLADPB1 T-cell epitope (TCE)-permissive and high expression (TPHE) mismatches, other (i.e. non-TPHE) mismatches or allele matches. (A) Relapse-free survival (RFS) (49% [95% CI: 44-53%], 42% [95% CI: 4045%] or 39% [95% CI: 36-43%], P=0.007), (B) non-relapse mortality (NRM) (23% [95% CI: 19-27%], 24% [95% CI: 22-26%], 20% [95% CI: 18-23%], P=0.01), (C) relapse (28% [95% CI: 24-32%], 32% [95% CI: 30-34%], 39% [95% CI: 36-42%], P<0.001). Overall survival and relapse-free survival were assessed using the Kaplan-Meier (KM) method, with reverse KM for determination of median follow-up. Univariable comparisons were performed using the log-rank test. Outcomes with competing risks were assessed using cumulative incidence curves and univariable comparisons for these outcomes were performed using the Gray test. For each of relapse, acute GvHD, and chronic GvHD, death without the event of interest was a competing event, as was second transplantation.
A B C Haematologica | 108 February 2023 647 LETTER TO THE EDITOR
Figure S1A). In contrast, the remaining 35% of single HLADPB1 GvH-mismatches were TCE-nonpermissive and lowexpression (363/2,745, 13.3%) or TCE-permissive and high expression (TPHE; 597/2,745, 21.7%). We developed and tested the novel hypothesis that the latter group might identify pairs with best outcomes, given that both TCEpermissive and high-expression mismatches were individually associated with reduced relapse risks, but at the same time, TCE-permissive pairs did not have increased risks of non-relapse mortality (Online Supplementary Table S2). Univariable associations with relapse-free survival were better for TPHE-mismatches than for nonTPHE-mismatches or allele-matches, reflecting lower non-relapse mortality and lower relapse (Figure 1, Online Supplementary Figure S1B). Multivariable analysis adjusted for non-HLA-DPB1 factors (Online Supplementary Table S1) confirmed the association between non-TPHE mismatches or allele matches with lower relapse-free survival, compared to TPHE mismatches (hazard ratio [HR]=1.21, 95% confidence interval [95% CI]: 1.04-1.41, P=0.01) (Table 2). With TPHE mismatches as the reference,
overall survival was worse for non-TPHE mismatches but not for allele matches (HR=1.18, 95% CI: 1.01-1.39, P=0.04), while there were no differences in GRFS (Table 2). To confirm the observation that the association of high-expression mismatches with acute GvHD and non-relapse mortality was dependent on the TCE status, we performed interaction analyses. We found a significant interaction between high expression and TCE permissiveness in opposing directions for acute GvHD (interaction HR=0.62; 95% CI: 0.45-0.85, P=0.003) and non-relapse mortality (interaction HR=1.64; 95% CI: 1.09-2.48, P=0.018), with lower mortality associated with TCE permissiveness in the high-expression group despite increased acute GvHD.
Our study is the first to investigate the combined effects of the biological HLA-DPB1 TCE and expression models in HLA-8/8-matched transplantation for association with survival. The results provide a synthesis of both biological algorithms into a new and integrative model for intelligent mismatching in UD-HCT. Mechanistically, HLA-DPB1 TCE permissiveness reflects limited immunopeptidome diver-
Table 2. Multivariable analysis of associations between combined HLA-DPB1 T-cell epitope and expression status and clinical endpoints.
TPHE mismatcha Other mismatcha Allele match
Overall survivalb HR 1.0 1.18 1.08 95% CI 1.01-1.39 0.91-1.28 P 0.04 0.36
Relapse-free survivalb HR 1.0 1.21 1.23 95% CI 1.04-1.41 1.05-1.44 P 0.01 0.01
GvHD-free, relapse free survivalb
HR 1.0 1.05 1.14 95% CI 0.91-1.20 0.99-1.32 P 0.50 0.07
Non-relapse mortalityb HR 1.0 1.17 0.91 95% CI 0.93-1.47 0.71-1.17 P 0.18 0.47
Relapseb HR 1.0 1.21 1.47 95% CI 0.98-1.48 1.20-1.81 P 0.07 <0.001
Acute GvHD 2-4b HR 1.0 0.74 0.66 95% CI 0.62-0.97 0.55-0.80 P <0.001 <0.001
Acute GvHD 3-4b HR 1.0 0.80 0.76 95% CI 0.61-1.07 0.57-1.03 P 0.13 0.08
Chronic GvHDb HR 1.0 0.77 0.89 95% CI 0.66-0.91 0.75-1.05 P 0.002 0.16
aTPHE: combined T-cell epitope (TCE)-permissive and high expression; Other: other single HLA-DPB1 graft-versus-host (GvH)-mismatches, bAdjustment was made for non-HLA-DPB1 variables as in Online Supplementary Table S1. Overall survival: time from transplant to death, Relapse-free survival: time from transplant to first of relapse or progression, second transplant or death; Graft-versus-host disease (GvHD)-free relapse-free survival: time from transplant to first of acute GvHD grades 3-4, extensive chronic GvHD, relapse, second transplant or death; HR: hazard ratio; 95% CI: 95% confidence interval. Patients without the relevant event were censored at last available follow-up. Multivariable analysis was performed using Cox proportional hazards models for overall survival, relapse-free survival, and GvHD relapse-free survival, and cause-specific hazards models for all other outcomes. All analyses were adjusted for the same clinically relevant non-HLA-DPB1 variables of interest (Online Supplementary Table S1). Interactions between HLA-DPB1 allele, TCE or expression matching status and disease stage or Tcell depletion were considered for all endpoints, and found only between T-cell depletion and expression matching for acute GvHD grades 2-4 and between disease stage and expression matching for chronic GvHD. All statistical analysis were performed in R version 3.6.3, using the packages survival (version 3.1-12), cmprsk (version 2.2-9) and prodlim (version 2019.11.13). Statistically significant P-values <0.05 are indicated in bold.
Haematologica | 108 February 2023 648 LETTER TO THE EDITOR
gence between mismatched allotypes, constraining the number and diversity of the alloreactive T-cell receptor repertoire.5 HLA class II expression, on the other hand, is a hallmark of different hematologic malignancies, including acute myeloid leukemia, in which its downregulation is an established mechanism of immune escape after allogeneic HCT.6,7 The favorable associations between HLA-DPB1 TPHE mismatches and survival observed in this study suggest that the GvL effect mediated by limited T-cell alloreactivity in the TCE-permissive setting might be most effective when HLA-DP expression levels on residual malignant cells are high. Concordantly, we found that in the high-expression group, the mean (± standard deviation) immunopeptidome overlap of the informative mismatched HLA-DPB1 alleles was 11% (± 13%) for TCE-permissive pairs, and 1.9% (± 0.8%) for TCE-nonpermissive pairs ( P <0.0001 in the 2-tailed Mann-Whitney test). It should be noted that due to the aforementioned linkage disequilibrium within the HLA-DPB1 locus, TPHE mismatches mostly involve certain HLA-DP allotypes carrying the DEAV motif in the patient but not in the donor, whose immunoepeptidomes have only partly been explored.5,15 Specific immunopeptidome characterization of the relevant TPHE mismatches will help to improve our understanding of the mechanisms underlying alloreactive T-cell-mediated GvL effects.
The present study confirmed previously described associations of HLA-DPB1 allele mismatches with relapse, and of the individual TCE and expression models with non-relapse mortality3,8,12,13 and acute GvHD grade 2-4,4,9,11 but also revealed some differences. Overall survival was not improved for TCE-permissive mismatches, and single HLA-DPB1 high-expression mismatches were not associated with severe acute GvHD grade 3-4 ( data not shown ). Patients in our study received more reduced-intensity/non-ablative conditioning regimens and peripheral blood stem cell products with T-cell depletion, compared to previous cohorts.3,4,11 These transplant characteristics might explain why the GvL advantage for TPHE-mismatches was not negated by GvHD toxicity, resulting in the observed survival benefits in the current study.
Our study has limitations related to its retrospective nature and its current applicability only to patients with single GvH mismatches, resulting in a relatively limited number of patients in the TPHE subset of interest. Further studies are needed to explore the possibility that our observations apply to the entire set of HLADPB1 mismatched patients. Moreover and importantly, confirmation of our findings in additional, independent cohorts is clearly warranted. Nevertheless, our data suggest that the combined consideration of two biological mechanisms of T-cell alloreactivity, TCE and expression,
can teach us new lessons regarding the mechanisms underlying cellular immunotherapy of malignant blood disorders, and help to improve survival after UD-HCT.
Authors
Annalisa Ruggeri,1,2 Liesbeth C. de Wreede,3 Carlheinz R. Müller,4 Pietro Crivello,5 Edouard F. Bonneville,3 Effie W. Petersdorf,6 Gerard Socié,7 Valérie Dubois,8 Riitta Niittyvuopio,9 Juha Peräsaari,10 Ibrahim Yakoub-Agha,11 Jan J. Cornelissen,12 Lotte Wieten,13 Tobias GeddeDahl,14 Edouard Forcade,15 Charles R. Crawley,16 Steven G.E. Marsh,17 Virginie Gandemer,18 Eleni Tholouli,19 Claude-Eric Bulabois,20 Anne Huynh,21 Goda Choi,22 Eric Deconinck,23 Maija Itäla-Remes,24 Stig Lenhoff,25 Mats Bengtsson,26 Jan-Erik Johansson,27 Gwendolyn van Gorkom,28 Jorinde D. Hoogenboom,29 Luca Vago,1,2 Vanderson Rocha,30 Chiara Bonini,1,2 Christian Chabannon2,31 and Katharina Fleischhauer2,5,32
An appendix with all contributing EBMT centers can be found at the end of the manuscript.
1San Raffaele Scientific Institute, Hematology and Bone Marrow Transplantation unit, Milan, Italy; 2Cellular Therapy and Immunobiology Working Party of the EBMT, Leiden, the Netherlands; 3Leiden University Medical Center, Leiden, the Netherlands; 4Zentrales Knochenmarkspender-Register Deutschland, Ulm, Germany; 5Institute for Experimental Cellular Therapy, University Hospital Essen, Essen, Germany; 6Fred Hutchinson Cancer Research Center, Seattle, WA, USA; 7Hôpital St. Louis, Paris, France; 8Histocompatibility Laboratory, EFS Lyon, Lyon, France; 9HUCH Comprehensive Cancer Center, Helsinki, Finland; 10Clinical Laboratory Services, Histocompatibility Testing, Finnish Red Cross Blood Service, Helsinki, Finland; 11CHU de Lille, Lille, France; 12Erasmus MC Cancer Institute, Rotterdam, the Netherlands; 13Transplantation Immunology, Maastricht University Medical Center, Maastricht, the Netherlands; 14Oslo University Hospital, Rikshospitalet, Oslo, Norway; 15CHU Bordeaux, Pessac, France; 16Addenbrookes Hospital, Cambridge, UK; 17Anthony Nolan Research Institute and UCL Cancer Institute, Royal Free Campus, London, UK; 18Centre Hospitalier Universitaire de Rennes, Rennes, France; 19Manchester Royal Infirmary, Manchester, UK; 20CHU Grenoble Alpes - Université Grenoble Alpes, Grenoble, France; 21CHU - Institut Universitaire du Cancer Toulouse, Toulouse, France; 22University Medical Center Groningen (UMCG), Groningen, the Netherlands; 23Hopital Jean Minjoz, Besancon, France; 24Turku University Hospital, Turku, Finland; 25Skanes University Hospital, Lund, Sweden; 26Department of Immunology, Genetics and Pathology, Uppsala University, Uppsala, Sweden; 27Sahlgrenska University Hospital, Goeteborg, Sweden; 28University Hospital Maastricht, Maastricht, the Netherlands; 29EBMT Leiden Study Unit, Leiden, the Netherlands; 30Laboratory of Medical Investigation in Pathogenesis and Targeted Therapy in Onco-Immuno-Hematology (LIM-31) of the
Haematologica | 108 February 2023 649 LETTER TO THE EDITOR
Service of Hematology and Cell Therapy, Hospital das Clínicas da Faculdade de Medicina da USP, São Paulo, SP, Brazil, 31Institut PaoliCalmettes, Centre de Lutte Contre le Cancer, Centre d'Investigations Cliniques en Biothérapie, Université d'Aix-Marseille, Inserm CBT 1409, Marseille, France and 32German Cancer Consortium, partner site Essen/Düsseldorf, Germany
Correspondence: K. FLEISCHHAUER - katharina.fleischhauer@uk-essen.de
https://doi.org/10.3324/haematol.2021.280055
Received: October 12, 2021. Accepted: April 12, 2022. Prepublished: May 12, 2022.
©2023 Ferrata Storti Foundation
Published under a CC BY-NC license
Disclosures
No conflicts of interest to disclose.
Contributions
AR, CC and KF designed the study and wrote the manuscript, LCdW and EFB performed statistical analyses and wrote the manuscript, PC and CRM stratified and validated HLA data, JDH provided data management, VD, JP, LW, SGM, and MB provided HLA types; GS, RN, IYY, JJC, TGD, EF, CRC, VG, ET, CEB, AH, GC, ED, MIR, SL, JEJ, and GvG provided clinical data, EWP, LV, CB and VR provided significant advice throughout the study.
Funding
This work was supported by grants from the Deutsche Forschungsgemeinschaft (DFG FL 843/1-1), the Deutsche José Carreras Leukämie Stiftung (DJCLS R 15-02; DJCLS 20R/2019), and the Joseph-Senker Stiftung to KF, and the DKMS (DKMS-SLS-MHG2018-01) to PC.
Data-sharing statement
The final analysis dataset will be available upon specific request to the chair of the Working Party.
Appendix: EBMT members contributing to this study Austria: Johannes Clausen (Elisabethinen-Hospital, Linz); Wolfgang Holter (St. Anna Kinderspital, Vienna); Peter Kalhs (Medizinische Universität Wien, Vienna). Belgium: Yves Beguin (University of Liege, Liege); Dominique Bron (Institut Jules Bordet, Brussels); Dries Deeren (AZ Delta, Roeselare); Wu Ka Lung (ZNA, Antwerp); Tessa Kerre (Ghent University Hospital, Gent); Xavier Poiré (Cliniques Universitaires St. Luc, Brussels); Dominik Selleslag (A.Z. Sint-Jan, Brugge); Wilfried Schroyens (Antwerp University Hospital (UZA), Antwerp Edegem). Brazil: Vanderson Rocha (Hospital Sirio-Libanes, Sao Paulo). Czech Republic: Pavel Jindra (Charles University Hospital, Pilsen); Jiri Mayer (University Hospital Brno, Brno); Jan
Vydra (Institute of Hematology and Blood Transfusion, Prague); Pavel Zák (Charles University Hospital, Hradec Kralove). Denmark: Bendt Nielsen (University Department of Hematology, Aarhus); Henrik Sengeloev (Bone Marrow Transplant Unit L 4043, Copenhagen). Estonia: Ain Kaare (Tartu University Hospital, Tartu). Finland: Maija Itäla-Remes (Turku University Hospital, Turku); Riitta Niittyvuopio (HUCH Comprehensive Cancer Center, Helsinki); Anu Partanen (Kuopio University Hospital, Kuopio); Juha Peräsaari (Clinical Laboratory Services, Histocompatibility Testing, Finnish Red Cross Blood Service, Helsinki). France: Ibrahim Yakoub-Agha (CHU de Lille, Lille); Jacques-Olivier Bay (CHU Estaing, Clermont Ferrand); Yves Bertrand (Institut d`Hematologie et d`Oncologie Pediatrique, Lyon); Didier Blaise (Programme de Transplantation&Therapie Cellulaire, Marseille); Jean Henri Bourhis (Gustave Roussy Cancer Campus, Villejuif); Claude-Eric Bulabois (CHU Grenoble AlpesUniversité Grenoble Alpes, Grenoble); Christian Chabanon (Institut Paoli-Calmettes, Marseille); Patrice Chevallier (CHU Nantes, Nantes); Thomas Cluzeau (CHU Nice - Hôpital de L`Archet, Nice); Gandhi Damaj (CHU Caen, Caen); Eric Deconinck (Hopital Jean Minjoz, Besancon); Valérie Dubois (Histocompatibility Laboratory, EFS Lyon); Nathalie Fegueux (CHU Lapeyronie, Montpellier); Edouard Forcade (CHU Bordeaux, Pessac); Virginie Gandemer (Centre Hospitalier Universitaire de Rennes, Rennes); Denis Guyotat (Institut de Cancerologie Lucien Neuwirth, Saint Etienne); Mathilde HunaultBerger (CHRU, Angers); Anne Huynh (CHU - Institut Universitaire du Cancer Toulouse, Toulouse); Hélène Labussière-Wallet (Centre Hospitalier Lyon Sud, Lyon); Xavier Leleu (Hopital La Miletrie, Poitiers); Bruno Lioure (Techniciens d`Etude Clinique Suivi de Patients Greffes, Strasbourg); Sebastien Maury (Hôpital Henri Mondor, Creteil); Gérard Michel (Hopital d`Enfants de la Timone, CHU, Marseille); Mohamad Mohty (Hopital Saint Antoine, Paris); Marie Thérèse Rubio (CHRU Brabois, Nancy); Gerard Socié (Hôpital St. Louis, Paris); Herve Tilly (Centre Henri Becquerel, Rouen); Pascal Turlure (CHRU Limoges, Limoges); Germany: Wolfgang Bethge (Universität Tübingen, Tübingen); Jochen Casper (Klinikum Oldenburg, Oldenburg); Pietro Crivello (University Hospital Essen, Essen); Hermann Einsele (Universitätsklinikum Würzburg, Würzburg); Katharina Fleischhauer (University Hospital Essen, Essen); Arnold Ganser (Hannover Medical School, Hannover); Nicolaus Kröger (University Hospital Eppendorf, Hamburg); Sonja Martin (Robert Bosch Krankenhaus, Stuttgart); Carlheinz Müller (German Donor Registry, Ulm); Uwe Platzbecker (Medical Clinic and Policinic 1, Leipzig); Christian Reinhardt (University Hospital Essen, Essen); Kerstin Schäfer-Eckart (Klinikum Nürnberg, Nuünberg); Lorenz Thurner (University of Saarland, Homburg); Thomas Valerius (University Medical Center Schleswig-Holstein, Campus Kiel, Kiel); Gerald. G. Wulf (Universitätsklinikum Göttingen, Göttingen). Greece: Dimitrios Karakasis (Evangelismos Hospital, Athens); Alexandros Spyridonidis (University Hospital of Patras, Patras). Hungary: Peter Hauser (Borsod-Abaúj- Zemplén County Central Hospital, Miskolc); Péter Reményi (Dél-pesti Centrumkórház, Budapest). Iceland: Sigrun Reykdal (Landspitali University Hospital, Reykjavik). Iran: Ashrafsadat Mousavi (Shariati Hospital, Teheran). Italy: Emanuele Angelucci (Ospedale San Martino, Genova); William Arcese (Tor
Haematologica | 108 February 2023 650 LETTER TO THE EDITOR
Vergata¨ University of Rome, Rome); Fabio Benedetti (Policlinico G.B. Rossi, Verona); Paolo Bernasconi (BMT Unit, Pavia); Andrea Biondi (Centro Trapianti di Midollo Osseo, Monza); Francesca Bonifazi (Bologna University, S.Orsola-Malpighi Hospital, Bologna); Chiara Bonini (Ospedale San Raffaele s.r.l., Milano); Angelo Michele Carella (IRCCS, Casa Sollievo della Sofferenza, S. Giovanni Rotondo); Paola Carluccio (U.O. Ematologia con Trapianto, Bari); Marco Casini (Hospital San Maurizio, Bolzano); Luigi Cavanna (Hospital Guglielmo da Saliceto, Piacenza); Fabio Ciceri (Ospedale San Raffaele s.r.l., Milano); Giuseppe Cimino (Ospedale Santa Maria Goretti, Latina); Paolo Corradini (University of Milano, Milano); Renato Fanin (Azienda Ospedaliero Universitaria di Udine, Udine); Piero Galieni (Mazzoni Hospital, Ascoli Piceno); Giovanni Grillo (ASST Grande Ospedale Metropolitano Niguarda, Milano); Anna Paola Iori (University La Sapienza, Rome); Giorgio La Nasa (Centro Trapianti Unico Di CSE Adulti e Pediatrico A. O Brotzu, Cagliari); Franco Locatelli (IRRCS Ospedale Pediatrico Bambino Gesù, Rome); Giuseppe Marotta (U.O.S.A Centro Trapianti e Terapia Cellulare, Siena); Massimo Martino (Grande Ospedale Metropolitano Bianchi Melacrino Morelli - Centro Unico Trapianti A. Neri, Reggio Calabria); Patrizio Mazza (Ospedale Nord, Taranto); Nicola Mordini (Az. Ospedaliera S. Croce e Carle, Cuneo); Maurizio Musso (Ospedale La Maddalena - Dpt. Oncologico, Palermo); Attilio Olivieri (Azienda Ospedali Riuniti di Ancona, Ancona); Vincenzo Pavone (Hospital C. Panico, Tricase Lecce); Fabrizio Pane (University of Napoli, Napoli); Mario Petrini (Azienda Ospedaliero Universitaria Pisana, Pisa); Pietro Pioltelli (Ospedale San Gerardo, Monza); Alessandro Rambaldi (ASST Papa Giovanni XXIII, Bergamo); Annalisa Ruggeri (Ospedale San Raffaele s.r.l., Milano); Marco Ruggeri (S. Bortolo Hospital , Vicenza); Riccardo Saccardi (Azienda Ospedaliera Universitaria Careggi, Firenze); Stella Santarone (Ospedale Civile, Pescara); Rosanna Scimè (U.O.D Trapianti di Midollo Osseo, Palermo); Simona Sica (Universita Cattolica S. Cuore, Rome); Corrado Tarella (European Institute of Oncology, Milano); Luca Vago (Ospedale San Raffaele s.r.l., Milano); Andrea Velardi (Sezione di Ematologia, Perugia); Giuseppe Visani (AORMN Hospital, Pesaro); Marco Zecca (Fondazione IRCCS Policlinico San Matteo, Pavia). Norway: Tobias Gedde-Dahl,Oslo University Hospital, Rikshospitalet, Oslo).
Romania: Alina Tanase (Fundeni Clinical Institute, Bucharest).
Russia: Aleksandr Kulagin (First State Pavlov Medical University of St. Petersburg, St. Petersburg); Valery Savchenko (National Research Center for Hematology, Moscow). Spain: Carmen Albo López (Hospital Álvaro Cunqueiro - Complejo Hospitalario Universitario de Vigo, Vigo); Adrián Alegre Amor (Hospital de la Princesa, Madrid); Jose Luis Bello López (Hospital Clinico Universitario, S. De Compostela); Dolores Caballero (Hospital Clínico, Salamanca); Rafael Duarte (Clinica Puerta de Hierro,
References
1. Copelan EA. Hematopoietic stem-cell transplantation. N Engl J Med. 2006;354(17):1813-1826.
2. Fleischhauer K, Shaw BE. HLA-DP in unrelated hematopoietic
Madrid); Maria Jesús Pascual Cascon (Hospital Regional de Málaga, Malaga); Rocio Parody Porras (ICO – Hospital Duran i Reynals, Barcelona); Jose Antonio Pérez-Simón (Hospital Universitario Virgen del Rocío, Sevilla); Montserrat Rovira (Hospital Clinic, Barcelona); Jaime Sanz (University Hospital La Fe, Valencia); Juan Pio Torres Carrete (Complejo Hospitalario de A Coruña, La Coruna). Sweden: Mats Bengtson (Department of Immunology, Genetics and Pathology, Uppsala University, Uppsala); Jörg Cammenga (University Hospital, Linkoeping); Cecilia Isaksson (Umea University Hospital, Umea); Jan-Erik Johansson (Sahlgrenska University Hospital, Goeteborg); Stig Lenhoff (Skanes University Hospital, Lund); Stephan Mielke (Karolinska University Hospital, Stockholm). Switzerland: Yves Chalandon (Département d`Oncologie, Service d`Hématologie, Geneva); Jakob Passweg (University Hospital, Basel); Urs Schanz (University Hospital, Zürich). The Netherlands: Edouard F. Bonneville (Leiden University Medical Center, Leiden); Goda Choi (University Medical Center Groningen, Groningen); Jan J. Cornelissen (Erasmus MC Cancer Institute, Rotterdam); Liesbeth C. de Wreede (Leiden University Medical Center, Leiden); Jorinde D. Hoogenboom (EBMT Leiden Study Unit, Leiden); Ellen Meijer (VU University Medical Center, Amsterdam); Jürgen Kuball (University Medical Centre, Utrecht); Gwendolyn van Gorkom (University Hospital Maastricht, Maastricht); Joan Hendrik Veelken (Leiden University Hospital, Leiden); Lotte Wieten (University Hospital Maastricht, Maastricht). United Kingdom: Jane Apperley (Imperial College, London); Adrian Bloor (Christie NHS Trust Hospital, Manchester); Jenny Byrne (Nottingham University, Nottingham); Ben Carpenter (University College London Hospital, London); Andrew Clark (Bone Marrow Transplant Unit, Glasgow); Matthew Collin (Adult HSCT Unit, Newcastle upon Tyne); Charles Craddock (University Hospital Birmingham NHS Trust, Birmingham); Charles R. Crawley ( Addenbrookes Hospital, Cambridge); Brenda E. Gibson (Royal Hospital for Children, Glasgow); Anjum Khan (Yorkshire Blood & Marrow Transplant Programme, Leeds); Steven G.E. Marsh (Immunogenetics Research Laboratory, Anthony Nolan Research Institute, Royal Free Hospital, London); Murray Martin (Leicester Royal Infirmary, Leicester); Patrick Medd (University Hospitals Plymouth NHS Trust, Plymouth); Emma Nicholson (Royal Marsden Hospital, London); Kim Orchard (Southampton General Hospital, Southampton); Amit Patel (Clatterbridge Cancer Centre - Liverpool, Royal Liverpool University Hospital, Liverpool); Andy Peniket (Department of Haematology, Oxford); Victoria Potter (Kings College Hospital, London); John Snowden (Sheffield Teaching Hospitals NHS Trust, Sheffield); Eleni Tholouli (Manchester Royal Infirmary, Manchester); Keith M. O. Wilson, (Department of Haematology, Cardiff). USA: Effie W. Petersdorf (Fred Hutchinson Cancer Research Center, Seattle).
cell transplantation revisited: challenges and opportunities. Blood. 2017;130(9):1089-1096.
3. Fleischhauer K, Shaw BE, Gooley T, et al. Effect of T-cell-
Haematologica | 108 February 2023 651 LETTER TO THE EDITOR
epitope matching at HLA-DPB1 in recipients of unrelated-donor haemopoietic-cell transplantation: a retrospective study. Lancet Oncol. 2012;13(4):366-374.
4. Petersdorf EW, Malkki M, O'Huigin C, et al. High HLA-DP expression and graft-versus-host disease. N Engl J Med. 2015;373(7):599-609.
5. Meurer T, Crivello P, Metzing M, et al. Permissive HLA-DPB1 mismatches in HCT depend on immunopeptidome divergence and editing by HLA-DM. Blood. 2021;137(7):923-928.
6. Toffalori C, Zito L, Gambacorta V, et al. Immune signature drives leukemia escape and relapse after hematopoietic cell transplantation. Nat Med. 2019;25(4):603-611.
7. Christopher MJ, Petti AA, Rettig MP, et al. Immune escape of relapsed AML cells after allogeneic transplantation. N Engl J Med. 2018;379(24):2330-2341.
8. Pidala J, Lee SJ, Ahn KW, et al. Nonpermissive HLA-DPB1 mismatch increases mortality after myeloablative unrelated allogeneic hematopoietic cell transplantation. Blood. 2014;124(16):2596-2606.
9. Morishima S, Shiina T, Suzuki S, et al. Evolutionary basis of HLA-DPB1 alleles affects acute GVHD in unrelated donor stem cell transplantation. Blood. 2018;131(7):808-817.
10. Lorentino F, Sacchi N, Oldani E, et al. Comparative evaluation of biological HLA-DPB1 mismatch models for survival and graft versus host disease prediction after unrelated donor hematopoietic cell transplantation. Haematologica. 2020;105(4):e-186-e189
11. Petersdorf EW, Bengtsson M, De Santis D, et al. Role of HLA-DP expression in graft-versus-host disease after unrelated donor transplantation. J Clin Oncol. 2020;38(24):2712-2718.
12. Mytilineos D, Tsamadou C, Neuchel C, et al. The human leukocyte antigen-DPB1 degree of compatibility is determined by its expression level and mismatch permissiveness: a German multicenter analysis. Front Immunol. 2020;11:614976.
13. Buhler S, Baldomero H, Ferrari-Lacraz S, et al. Analysis of biological models to predict clinical outcomes based on HLADPB1 disparities in unrelated transplantation. Blood Adv. 2021;5(17):3377-3386.
14. Fleischhauer K. Immunogenetics of HLA-DP--a new view of permissible mismatches. N Engl J Med. 2015;373(7):669-672.
15. van Balen P, Kester MGD, de Klerk W, et al. Immunopeptidome analysis of HLA-DPB1 allelic variants reveals new functional hierarchies. J Immunol. 2020;204(12):3273-3282.
Haematologica | 108 February 2023 652 LETTER TO THE EDITOR
Comment on Antibody response after vaccination against
SARS-CoV-2 in adults with hematological malignancies: a
systematic review and meta-analysis
With great interest, we read the article entitled “Antibody response after vaccination against SARS-CoV-2 in adults with hematological malignancies: a systematic review and meta-analysis” published in the Haematologica.1 This article aims to evaluate the immune response to SARS-CoV2 vaccine in patients with hematological malignancies. The authors found that seroprotection was significantly lower in patients with hematological malignancies after the first and second doses of the vaccine compared with healthy controls or patients with solid tumors. The pooled results of this study provide very useful information for patient selection decisions. However, we would like to point out some of the shortcomings in the methods and results of this meta-analyis to further refine this important study. The most prominent limitations of this meta-analysis are attributed to inaccurate literature searches and insufficiently refined inclusion and exclusion criteria. The authors emphasized in the text that the time interval of the literature search was between July 1, 2020 and September 16, 2021, and the Cochrane Library, MEDLINE, and LitCovid were used for the search. Nevertheless, we recommend further extensive searches of commonly used databases such as EMBASE, Scopus, Web of Science, and Google Scholar, as it is easy to miss targeted studies by selecting just three databases. After an extended search, we found that five eligible studies were missed by the authors.2-6 Furthermore, the authors should specify i) the type and language limitation of included studies, ii) if there are special requirements for patient characteristics and past history, iii) if there are specific limitations on the completeness of outcome measures and original data. In addition to excluding case reports or series, were other types of studies such as biochemical studies, conference reports, reviews, and comments also excluded? While these methodological details are tedious, they provide a solid premise for further meta-analyses. Another flaw of this meta-analysis is the high heterogeneity in the outcomes. It must be acknowledged that in order to explain the source of heterogeneity in the outcomes, the authors performed extensive sensitivity analyses, subgroup analyses and meta-regression analysis. We would like to provide constructive comments on this massive project to further refine and consolidate the findings of the study. The authors mentioned in reporting antibody responses to the vaccine in the three categories of patients, that there were significant differences in
antibody responses between hematological malignancies, solid cancers, and healthy controls. However, we suggest that the authors should further report on risk ratios for hematological malignancies compared to solid cancers, and risk ratios for hematological malignancies compared to healthy subjects. Second, the authors did not aggregate combined seropositivity rates for lymphocytic and myeloid carcinomas according to the predominant subtype in hematological malignancies. In the meantime, the results can be further refined if the authors report combined response rates for acute leukemia, plasma cell disease, and myelodysplastic neoplasms following vaccination. Third, is it possible to aggregate antibody response rates for immunomodulatory imine drugs and proteasome inhibitors in a subgroup analysis based on the treatments? Finally, the follow-up period in some of the included studies was less than 30 days. Does the shorter follow-up period affect the accuracy of the results? We hope that the authors can respond to the questions and suggestions in order to better refine the conclusions of this study.
Authors
Yacong Shao and Yongming Zhou Department of Hematology, Yueyang Hospital of Integrated Traditional Chinese and Western Medicine, Shanghai University of Traditional Chinese Medicine, Shanghai, China. Correspondence: Yongming Zhou - tigh80ab@126.com https://doi.org/10.3324/haematol.2022.281902
Received: August 4, 2022. Accepted: August 29, 2022. Prepublished: September 29, 2022. ©2023 Ferrata Storti Foundation Published under a CC BY-NC license
Disclosures
No conflicts of interest to disclose.

Haematologica | 108 February 2023 653 COMMENT
Contributions
YZ conceived, designed, and planed the study. YS and YZ supervised and revised the study. Both authors approved the manuscript and agreed to publication.
References
1. Gagelmann N, Passamonti F, Wolschke C, et al. Antibody response after vaccination against SARS-CoV-2 in adults with hematological malignancies: a systematic review and metaanalysis. Haematologica. 2022;107(8):1840-1849.
2. Chevallier P, Coste-Burel M, Le Bourgeois A, et al. Safety and immunogenicity of a first dose of SARS-CoV-2 mRNA vaccine in allogeneic hematopoietic stem-cells recipients. EJHaem. 2021;2(3):520-524.
3. Chiarucci M, Paolasini S, Isidori A, et al. Immunological response against SARS-COV-2 after BNT162b2 vaccine administration is impaired in Aalogeneic but not in autologous stem cell transplant
Data-sharing statement
The datasets used and/or analysed during the current study are available from the corresponding author on reasonable request.
recipients. Front Oncol. 2021;11:737300.
4. Chowdhury O, Bruguier H, Mallett G, et al. Impaired antibody response to COVID-19 vaccination in patients with chronic myeloid neoplasms. Br J Haematol. 2021;194(6):1010-1015.
5. Ramasamy K, Sadler R, Jeans S, et al. COVID symptoms, testing, shielding impact on patient-reported outcomes and early vaccine responses in individuals with multiple myeloma. Br J Haematol. 2022;196(1):95-98.
6. Guglielmelli P, Mazzoni A, Maggi L, et al. Impaired response to first SARS-CoV-2 dose vaccination in myeloproliferative neoplasm patients receiving ruxolitinib. Am J Hematol. 2021;96(11):E408-E410.
Haematologica | 108 February 2023 654 COMMENT
Reply to the Comment on Antibody response after vaccination against SARS-CoV-2 in adults with hematological
malignancies: a systematic review and meta-analysis
We appreciate the comment by Shao and Zhou1 regarding our recent meta-analysis on antibody response after vaccination against SARS-CoV-2 in adults with hematological malignancies.2
We agree with the authors that literature searches for reviews and meta-analysis are essential and using as many databases (commercial and public) as possible ensures accuracy. However, especially this unforeseen and unique evolution of scientific literature production during the COVID-19 pandemic poses extreme challenges for evidence synthesis in general. Therefore, we specifically decided to use publicly available databases for literature storage to enable the replication of findings for all stakeholders and make science more tangible. In that respect, we limited our study inclusion criteria to studies published in English language, original reports (excluding conference abstracts and comments), and reporting outcomes of at least ten patients in the overall reported cohort. Importantly, other co-published meta-analyses included different numbers of studies but showed overlapping findings in overall outcomes with our study.3-5
We also agree that one major limitation in our meta-analysis (and in other existing analysis on COVID-19) is the high heterogeneity of outcomes across studies. Therefore, when interpreting results of the total cohort of hematological malignancies, readers must take into account the relative overrepresentation of some conditions such as chronic lymphocytic leukemia and multiple myeloma, which may have been due to the prevalence as well as the need of rapid recruitment necessary for studies in this evolving pandemic, especially in the early phase. However, in the beginning, the general clinical question was how patients with hematological cancers react to vaccination, which may be particularly important for general patient counseling in the community setting. However, to account for certain confounders as much as possible, we aimed to dissect as many subgroups as possible to show possible differences in outcomes, which is a major limitation in other meta-analyses with fewer studies included. Another reason for heterogeneity may be introduced by the different testing platforms used. For this, we provided transparent information which platforms were used and reported in each study.
For the comparison between hematological and solid cancers, we specifically decided to report them as separate groups to minimize reporting bias when including only studies that used both groups as comparators. When only analyzing hematological and solid cancers / healthy controls in comparative fashion for overall response, the risk ratio
was 0.76 (95% confidence interval [CI]: 0.69-0.84) and 0.70 (95% CI: 0.65-0.75) in favor of solid cancers and healthy controls, respectively. Regarding synthesizing other disease subgroups, we do not believe that this will be of utility for clinicians and community physicians, as such aggregated data also introduce selection bias. Therefore, we included hematological malignancies and then in a next step tried to report as many disease and treatment subgroups as possible. Of note, our analysis was done almost 1 year ago, new meta-analysis may aim to dissect outcomes in a more concise and detailed fashion.
Regarding suggested results for certain treatment platforms, myeloma patients receiving immunomodulatory drugs (IMIDs) showed an overall response of 81% (95% CI: 71-88). However, it should be highlighted that IMID-exposed patients may differ significantly, and reporting may be biased between studies, regarding regimens used that include IMIDs versus monotherapy or conditions in which treatment was applied (newly diagnosed vs. relapses vs. transplant / cellular therapy status). Results for proteasome inhibition could not be extracted reliably and was therefore decided not to be reported. Finally, follow-up period did not affect overall response outcomes.
Authors
Nico Gagelmann and Nicolaus Kröger
Department of Stem Cell Transplantation, University Medical Center Hamburg-Eppendorf, Hamburg, Germany
Correspondence: N. GAGELMANN - n.gagelmann@uke.de
https://doi.org/10.3324/haematol.2022.282017
Received: August 28, 2022.
Accepted: September 22, 2022.
Prepublished: September 29, 2022.
©2023 Ferrata Storti Foundation
Published under a CC BY-NC license
Disclosures
No conflicts of interest to disclose.
Haematologica | 108 February 2023 655 RESPONSE TO A COMMENT
References
1. Shao Y and Zhou Y. Comment on Antibody response after vaccination against SARS-CoV-2 in adults with haematological malignancies: a systematic review and meta-analysis. Haematologica. 2023;108(2):653-654.
2. Gagelmann N, Passamonti F, Wolschke C, et al. Antibody response after vaccination against SARS-CoV-2 in adults with hematological malignancies: a systematic review and metaanalysis. Haematologica. 2022;107(8):1840-1849.
3. Teh JSK, Coussement J, Neoh ZCF, et al. Immunogenicity of COVID-19 vaccines in patients with hematologic malignancies: a
systematic review and meta-analysis. Blood Adv. 2022;6(7):2014-2034.
4. Gong IY, Vijenthira A, Betschel SD, Hicks LK, Cheung MC. COVID19 vaccine response in patients with hematologic malignancy: a systematic review and meta-analysis. Am J Hematol. 2022;97(4):E132-E135.
5. Sakuraba A, Luna A, Micic D. Serologic response following SARS-COV2 vaccination in patients with cancer: a systematic review and meta-analysis. J Hematol Oncol. 2022;15(1):15.
Haematologica | 108 February 2023 656 RESPONSE TO A COMMENT
