Southland Development Authority Market Report & Prospectus
On behalf of Southland Development Authority and the South Suburban Land Bank, I would like to express our deepest gratitude and appreciation for the invaluable contributions made by several esteemed organizations and individuals in the successful development and publication of the Southland Market Report and Prospectus also known as the Investor Lookbook. The unwavering support, guidance, and partnership provided by each of these entities have been instrumental in the realization of this ambitious project.
First and foremost, we extend our heartfelt thanks to the Morse Charitable Trust and Elizabeth Morse Genius Charitable Trust for their generous funding. Their steadfast commitment to supporting initiatives aimed at driving economic growth and development has been pivotal in making this lookbook a reality. We are sincerely grateful for their belief in our vision and their unwavering financial support.
We would also like to extend our sincere appreciation to Cook County President Toni Preckwinkle and the Cook County Bureau of Economic Development for their invaluable assistance throughout the process. Their visionary leadership, strategic insights, and commitment to fostering economic prosperity in the South Suburbs have been instrumental in shaping the direction of this data book. We are deeply grateful for their dedication to the region's development and their collaboration in bringing this project to fruition.
The South Suburban Mayors and Managers Association, the Chicago Metropolitan Agency for Planning, and the many mayors and economic development personnel across the Southland have been indispensable partners in this endeavor. We extend our heartfelt appreciation to each of these entities for their tireless efforts in advancing economic development initiatives and their contributions to this important resource.
Finally, we would like to extend our gratitude to all the individuals and organizations whose contributions, although not mentioned specifically, have been vital to the success of this project. Without their dedication, support, and collaborative spirit, this data book would not have been possible.
Once again, we express our sincerest gratitude to each of these organizations and individuals for their remarkable contributions. Their collective efforts have resulted in a comprehensive and insightful resource that will serve as a catalyst for economic development, strategic planning, and informed decision-making in the South Suburbs.
We look forward to continuing our collaborative efforts in driving economic prosperity and enhancing the quality of life in the South Suburbs.
Sincerely,
Bo Kemp Chief Executive Officer Southland Development Authority
ACKNOWLEDGMENTS
SOUTHLAND DEVELOPMENT AUTHORITY BOARD OF DIRECTORS
David Abshire | Vice President, LB Steel
David Agosto | Senior Vice President, Draper & Kramer
Jeffrey Allen | Director, Commercial Banking at BMO Harris Bank
Vernard Alsberry | President, Village of Hazel Crest
Frank Clark | Former CEO, ComEd
Kristi DeLaurentiis | Executive Director, South Suburban Majors and Managers Association
David Doig | President, Chicago Neighborhood Initiatives
VILLAGE OF ALSIP
John D. Ryan | Mayor
Renee Harding | Clerk
VILLAGE OF BEECHER
Marcy Meyer | President
Charity Mitchell | Administrator
CITY OF BLUE ISLAND
Fred Bilotto | Mayor
Tom Wogan | Administrator
VILLAGE OF BURNHAM
Robert E. Polk | Mayor/President
Lus E. Chavez | Clerk
CITY OF CALUMET
Thaddeus M. Jones | Mayor
Val Williams | Economic Development Consultant
VILLAGE OF CALUMET PARK
Ronald Denson | Mayor
Teri Raney | Administrator
CITY OF CHICAGO HEIGHTS
David A. Gonzalez | Mayor
Matthews Fares | Executive Administrator
CITY OF COUNTRY CLUB HILLS
James W. Ford | Mayor
Carl Estelle | Administrator
VILLAGE OF CRESTWOOD
Ken Klein | Major
Cathy Johnson | Clerk
Dr. Cheryl Green | President,
Governors State University
Felicia Hardy | CEO, Intuition Enterprise, Inc.
Tim Hill | Head of Stakeholder Engagement, OMRON
Craig Howard | Program Director, MacArthur Foundation
Steve Koch | Managing Partner, Bowline Group
Rick Reinbold | President, Village of Richton Park
Lyneir Richardson | CEO, Chicago TREND
VILLAGE OF CRETE
Michael S. Einhorn | Mayor
Michael E. Smith | Administrator
VILLAGE OF DIXMOOR
Fitzgerald Roberts | President
Juanita Darden | Clerk
VILLAGE OF DOLTON
Tiffany A. Henyard| Mayor
Keith Freeman | Administrator
VILLAGE OF EAST HAZEL CREST
Thomas A. Brown| Mayor
Patricia Lazuka | Administrator
VILLAGE OF FORD HEIGHTS
Charles R. Griffin | Mayor
Nyree D. Ford | Clerk
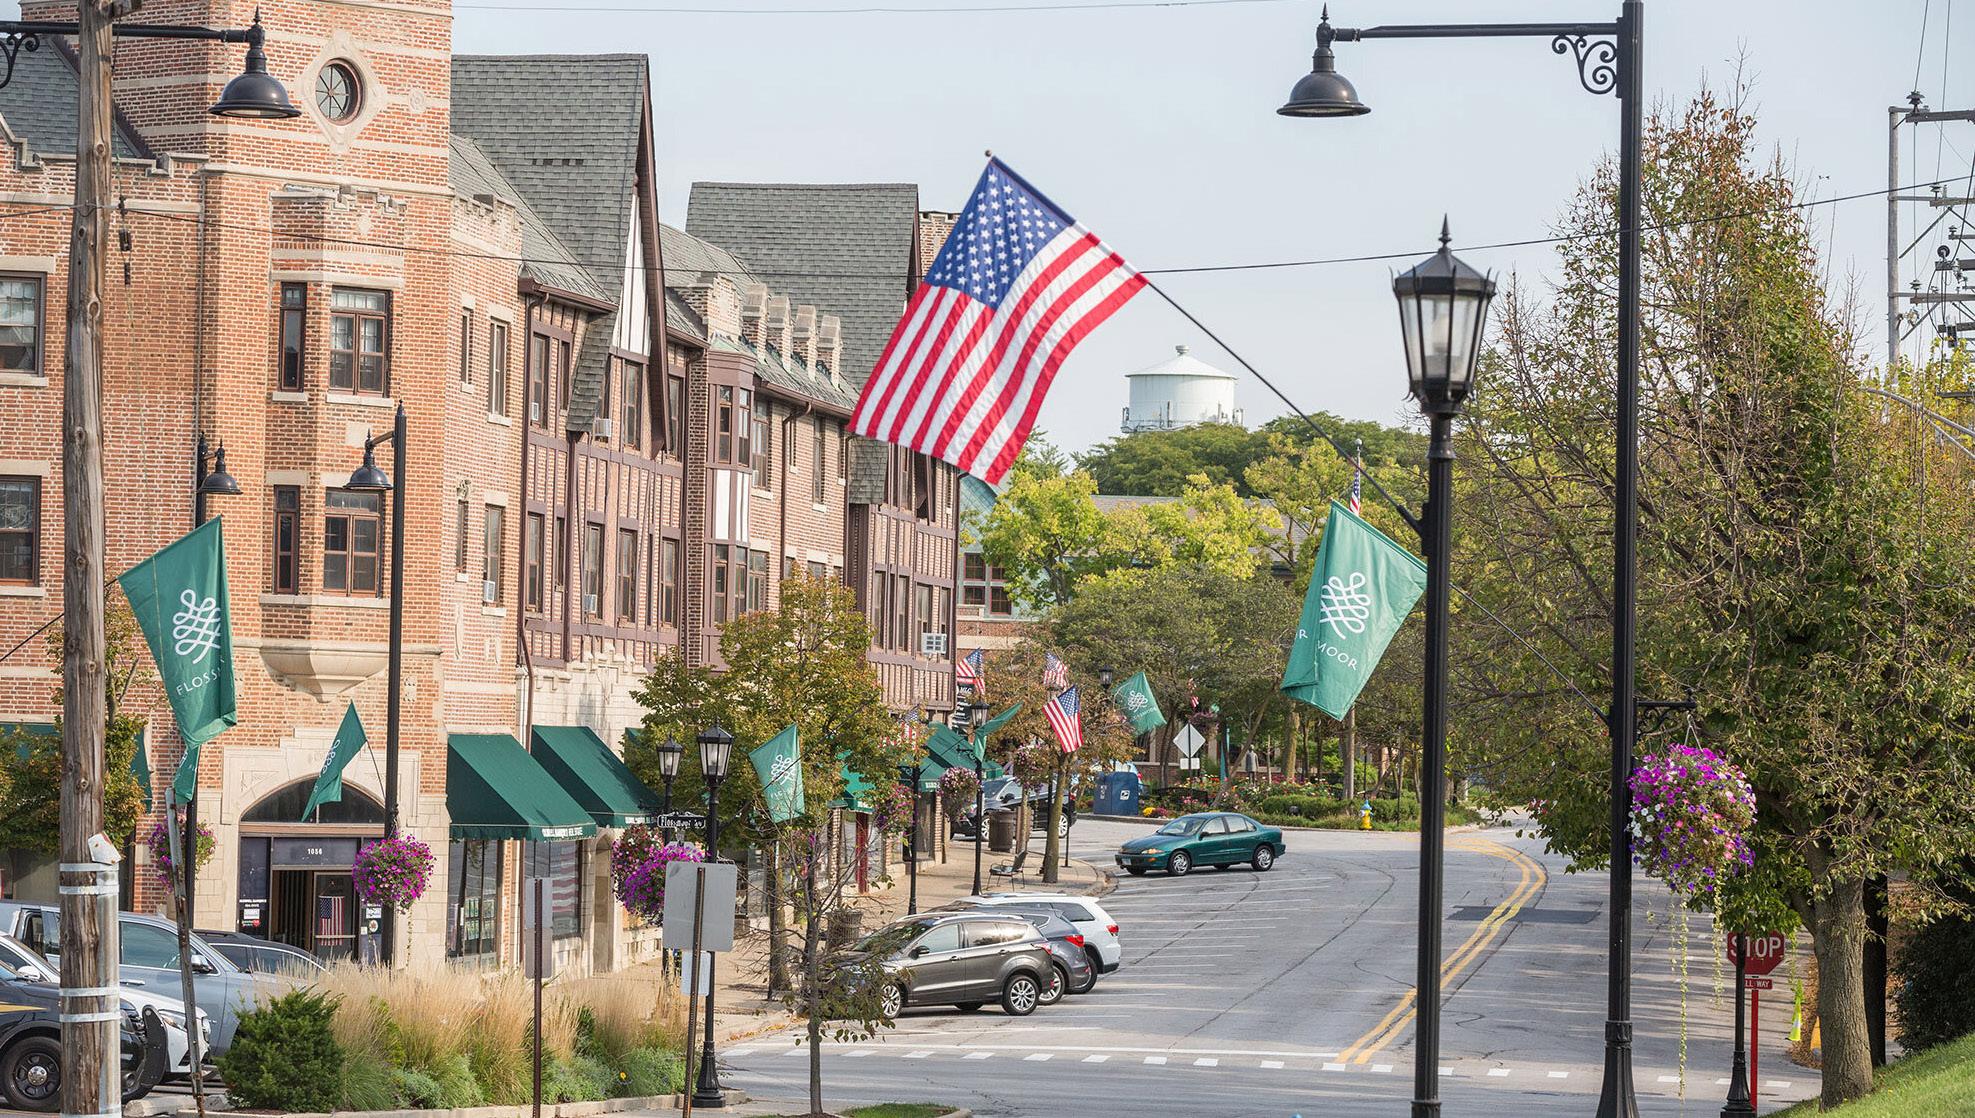
VILLAGE OF FLOSSMOOR
Michelle Nelson | Mayor
Bridget Wachtel | Manager
VILLAGE OF GLENWOOD
Ronald Gardiner | Mayor
Brian Mitchell | Administrator
CITY OF HARVEY
Christopher J. Clark | Mayor
Corean Davis | Administrator
VILLAGE OF HAZEL CREST
Vernard L. Alsberry Jr. | Mayor
Dante Sawyer | Manager
VILLAGE OF HOMEWOOD
Rich Hofeld | President
Irene Sherr | Assitant Deputy Bureau Chief, Cook County Bureau of Economic Development
Nathanial K. Sutton | President,
Sutton Ford Lincoln Mercury
Diana Williams | Chicago
Metropolitan Agency for Planning Board Member and Executive Committee
Nancy Wilson | CEO, Morrison Containter Handling Solutions
Robert Weissbourd | President, RW Ventures, LLC
Angela Mesaros | Economic Development Director
VILLAGE OF LANSING
Patty Eidam | Mayor
Dan Podgorski | Administrator
VILLAGE OF LYNWOOD
Jada Curry | Mayor
Anthony Finch | Administrator
VILLAGE OF MATTESON
Sheila Y. Chalmers-Currin | Mayor
Anthony Burton | Administrator
CITY OF MARKHAM
Roger A. Agpawa | Mayor
Derrick Champion | Economic Development Director
VILLAGE OF MIDLOTHIAN
Gary L'Heureux | Mayor
Kathy Johnson | Administrator
VILLAGE OF MOKENA
Frank A. Fleisher | President/Mayor
John Tomasoski | Administrator
VILLAGE OF MONEE
Therese M. Bogs | Mayor
Ruben Bautista | Administrator
CITY OF OAK FOREST
Henry Kuspa | Mayor
Tim Kristin | Administrator
VILLAGE OF OLYMPIA FIELDS
Sterling M. Burke | Mayor
Drella Savage | Administrator
VILLAGE OF ORLAND HILLS
Kyle R. Hasting | President
Brian O'Neil | Administrator
VILLAGE OF ORLAND PARK
Keith Pekau | President/Mayor
Steve Marciani | Director of Development Services
VILLAGE OF PARK FOREST
Joseph A. Woods | Mayor
Tom Mick | Manager
VILLAGE OF PEOTONE
Peter March | President
Aimee Ingalls | Administrator
VILLAGE OF PHOENIX
Terry R. Wells | Mayor
Patricia Harris | Clerk
VILLAGE OF POSEN
Fred Podbielniak | President
Melanie Myers|Clerk
VILLAGE OF RIVERDALE
Lawrence L. Jackson | Mayor
Nyota T. Figgs | Clerk
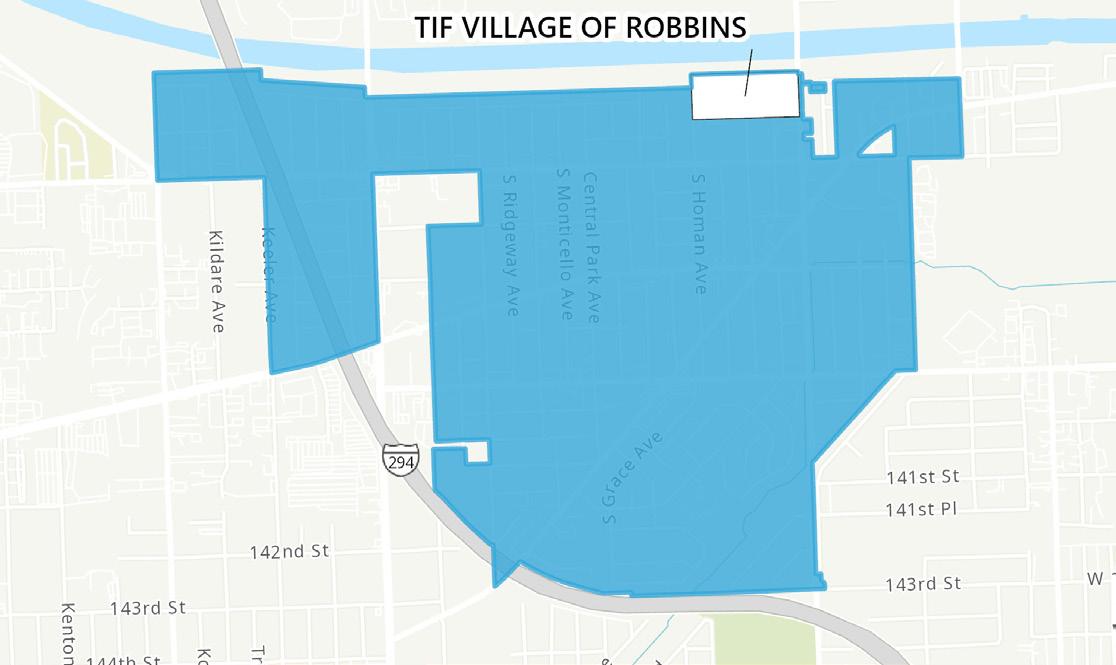
VILLAGE OF ROBBINS
Darren E. Bryan | Mayor
Shuntai Sykes | Administrator
VILLAGE OF RICHTON PARK
Rick Reinbold | Mayor
Pete Saunders | Economic Development Director
VILLAGE OF SAUK
Derrick N. Burgess | Mayor
JW Fairman | Administrator
VILLAGE OF SOUTH CHICAGO HEIGHTS
Terry Matthews | Mayor
Nora Gomez | Administrator
VILLAGE OF SOUTH HOLLAND
Don A. De Graff | Mayor
PROJECT TEAM
SOUTHLAND DEVELOPMENT AUTHORITY
Bo Kemp | CEO, Southland Development Authority
J. Wynsma | Administrator
VILLAGE OF STEGER
Kenneth A. Peterson, Jr. | Mayor
Mary Jo Seehausen | Administrator
VILLAGE OF THORNTON
Joseph Pisarzewski | President
Doug Beckman | Administrator
VILLAGE OF TINLEY PARK
Michael W. Glotz | Mayor
Nancy M. O'Connor | Community Development Director
VILLAGE OF UNIVERSITY
PARK
Joseph E. Roudez III | Mayor
Dorothy R. Jones | Clerk
VILLAGE OF WORTH
Mary Wener | President
Bonnie Price | Clerk
Nicolas Greifer | Director of Economic Development, Southland Development Authority
Mauro Ballesteros Ayala | Data Analytics Manager, Southland Development Authority
Kemdah Stroud | Marketing Manager, Southland Development Authority
Brian Mott | Strategic Director, MetroAlliance
Nigel Griswold | Economist & Policy Strategist, Griswold Consulting Group
GAI CONSULTANTS' COMMUNITY
SOLUTIONS GROUP
Laura Smith, MPA | Urban Analytics Manager
Natalie Frazier, MBA | Assistant Urban Analytics Manager
Hannah Hollinger, LEED-AP | Senior Planner
DOCUMENT SOURCES
Southland Development Authority
CoStar Group
U.S. Census Bureau
American Community Survey
ESRI Business Analyst
Illinois Department of Commerce
Cook County Property Appraiser
Will County Property Appraiser
Chicago Metropolitan Agency for Planning
GAI Consultants' Community Solutions Group
EXECUTIVE SUMMARY
The Southland Development Authority (“SDA”) is a non-profit business organization designed to grow the economy of the South Chicago suburbs, also referred to as Southland. The SDA continually analyzes the assets, markets, and development opportunities of the region; convenes, conceives and executes with partners' large-scale, strategic investments; and provides a nimble, professional, single point of entry for businesses, residents, developers and investors to efficiently and effectively get the resources they need. The SDA has invested in creating this Investor Lookbook, which is comprised of a Market Report (Section 01) and Prospectus (Section 02), to highlight and promote their ongoing efforts to achieve transformative and inclusive economic growth for the region.
INTRODUCTION
Southland consists of 45 cities and villages within the Greater Chicago area, and includes parts of Will County and Cook County, Illinois. Southland has a population of nearly 750,000 people, representing a density of roughly 500 persons per square mile. Southland is an attractive suburban area for all generations— featuring low unemployment rates, prominent business, manufacturing, and logistics corridors, a high diversity index, stable per capita and median household incomes, and located near a major metropolitan area with railway transportation. Southland’s 45 cities and villages are assembled into 7 unique sub-regions to illustrate where many opportunities for dynamic growth and investment intersect. These sub-regions include:
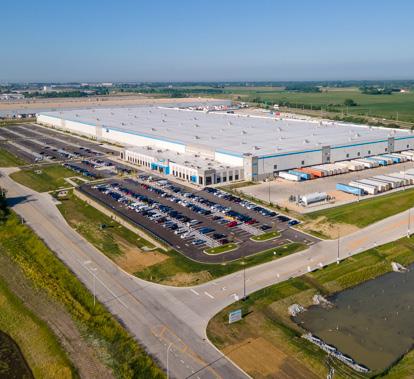
WEST REGION – The West Region is comprised largely of middle- and upper-middle class commuter suburbs with a population of nearly 167,300 persons and 93,000 employees. Due to this commuter lifestyle, the West Region's municipalities are focusing on Transit Oriented Development (TOD), building out new housing, offices, and commercial space all within easy walking distance of their respective train and bus stations. Each municipality within the West Region has begun diversifying economic development to encourage investment into the area.
NORTHWEST REGION – The Northwest Region, like many heavily industrialized areas, is actively diversifying its economy promoting both industrial and logistics development as well as commercial and office space. This region has a population of nearly 88,930 persons and 42,840 employees. As new development is contemplated within the Northwest Region— TOD plans, building new housing, retail, and medical facilities— all within easy walking distance from Metra train stations, this region is establishing itself as a major focus and priority within Southland as a whole.
NORTH CENTRAL REGION – The North Central Region, with a population of roughly 53,500 persons and 20,130 employees, is leveraging its proximity to Chicago, focusing on TOD by developing more housing, retail, and commercial space near the region's transit hubs, as well as expanding and improving existing transit hubs. This North Central Region also has excellent access to freight rail and highways, making the area attractive to industrial and logistics businesses. To support new development, the region has invested millions in water infrastructure within recent years, ensuring the area remains a viable and safe community for both businesses and residents.
NORTHEAST REGION – The Northeast Region, with a population of nearly 112,860 persons and 51,990 employees, has found
great economic success in the transportation and logistics spheres over the last couple of years. As the transportation and logistics sectors have continued to thrive within this region, it has attracted industrial companies back across the state border into Southland at a variety of scales.
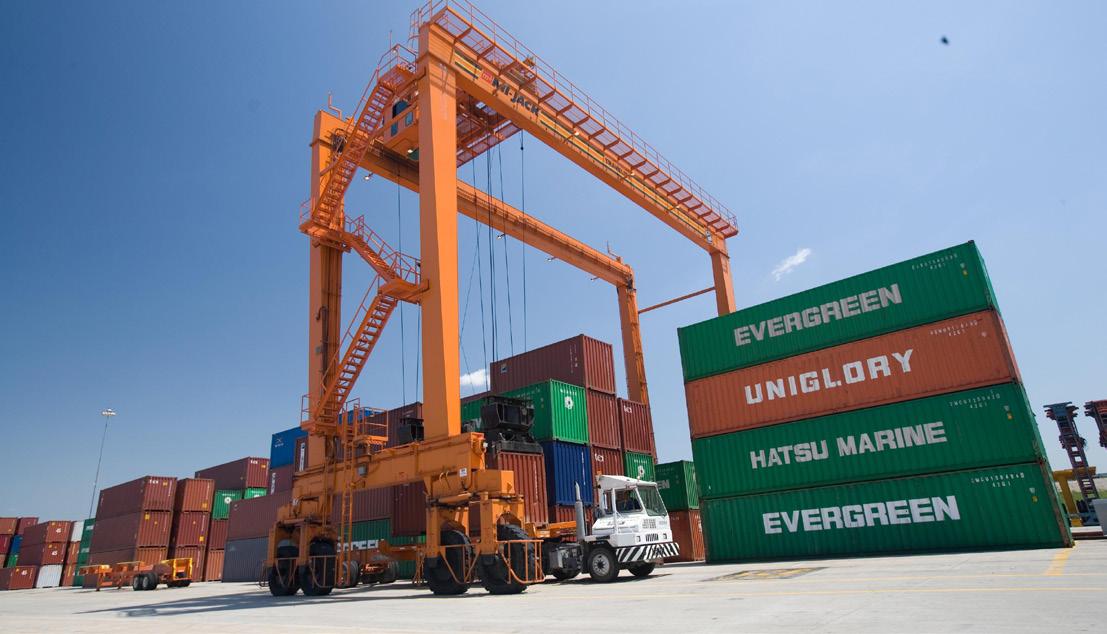
SOUTHEAST REGION – The Southeast Region is by far the most rural part of Southland, with parts of the region located in Will County, businesses face lower potential tax burdens, which has served to attract new and existing businesses to the area. The Southeast Region, with a population of roughly 38,850 persons and 19,510 employees, is currently enjoying a boom in transportation and logistics businesses due to the availability of land, proximity to industrial producers, and accessibility to highways and freight rail.
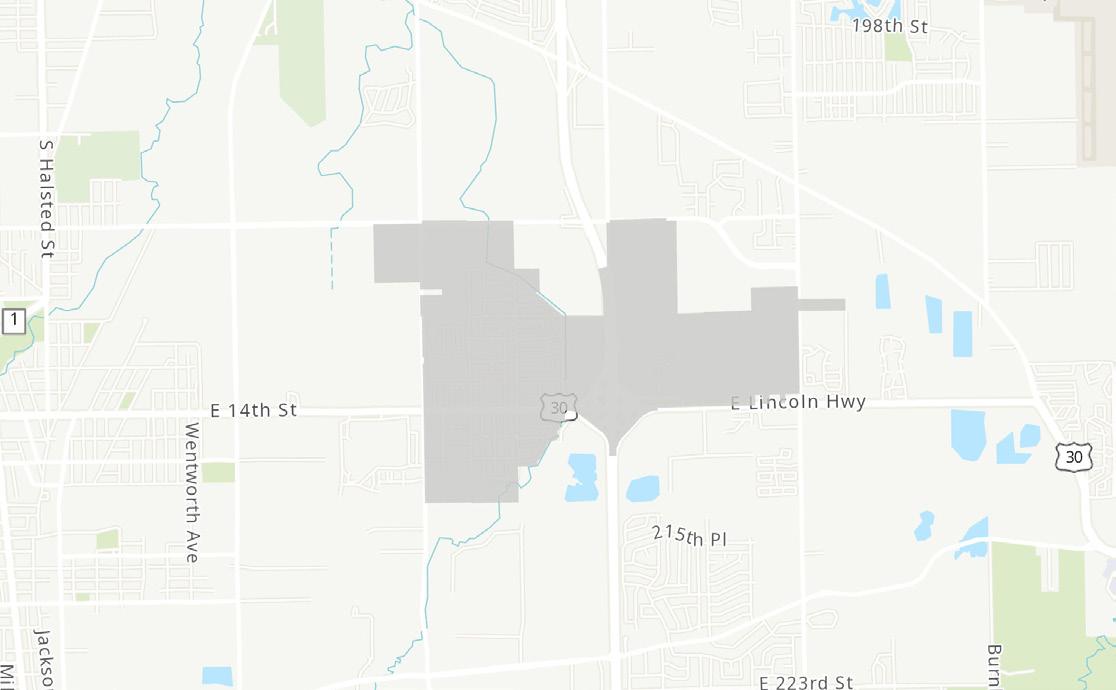
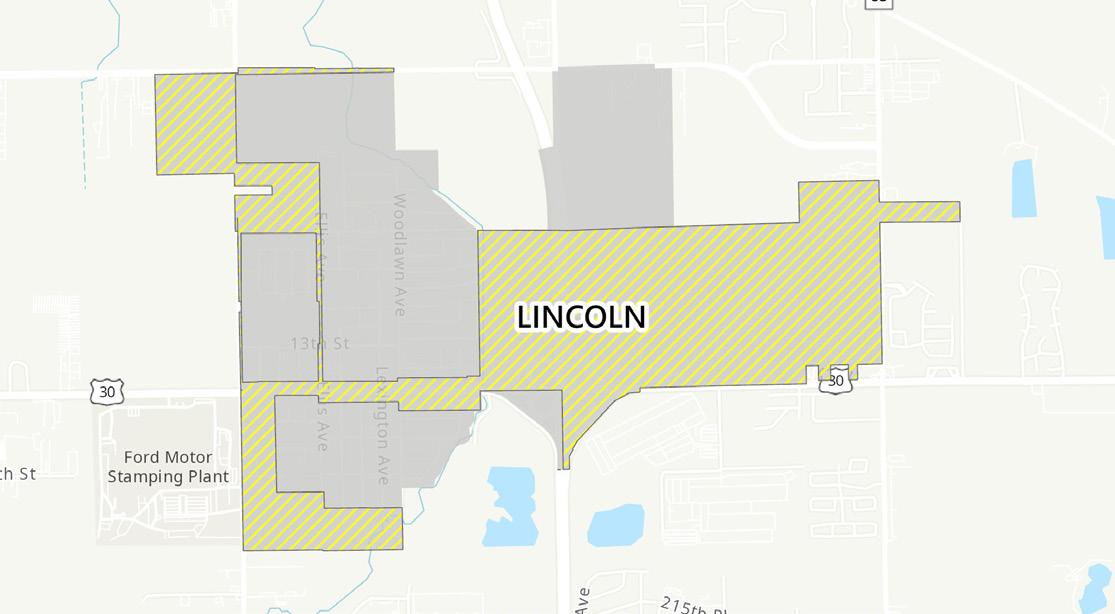
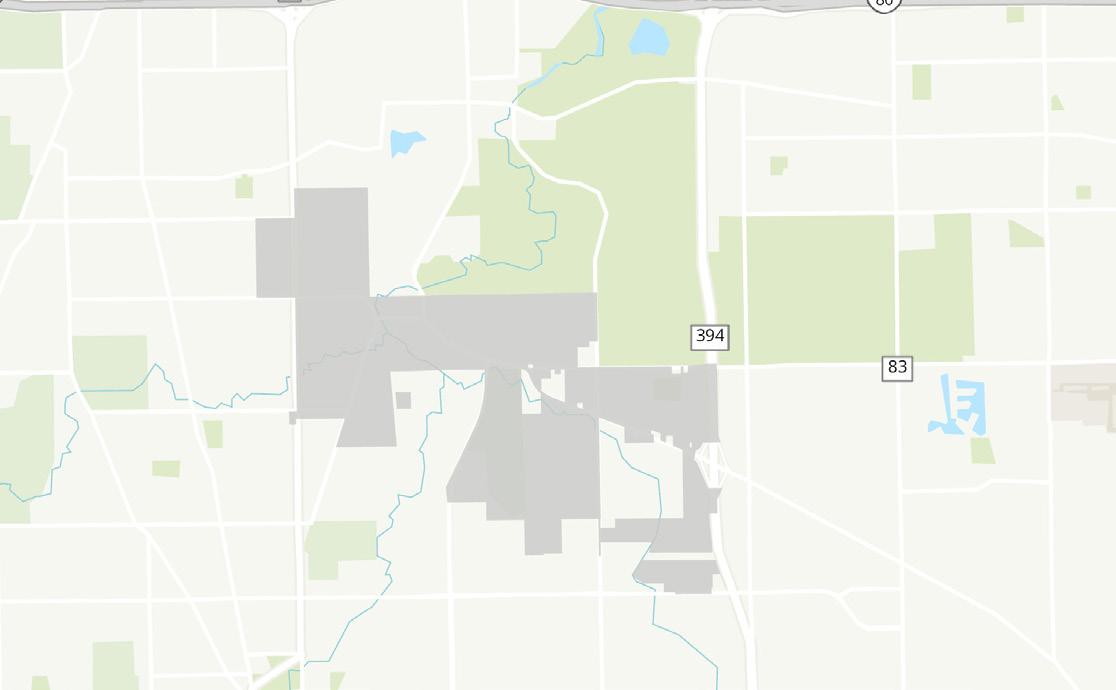
EAST CENTRAL REGION – The East Central Region has perhaps the strongest industrial legacy of anywhere in the overall Southland area. With a population of nearly 60,610 persons and 26,220 employees, the East Central Region has remained a manufacturing hub, including a large Ford Motors plant for which the Village of Ford Heights is named. This region has also started leveraging the finances and resources afforded by their strong manufacturing base to promote a new wave of diverse sustainable development, such as TOD projects as well as Cook County’s first community solar project, the Glenwood site.
CENTRAL REGION – The Central Region is home to a predominantly middle-to-upper-middle class population, with over 117,190 persons and 57,180 employees. While this region is largely a bedroom community to Chicago, its municipalities are working hard to promote diverse development by incentivizing industrial and logistics development, as well as attracting commercial, retail, and offices for the region’s residents to encourage employment within the region. The region is also investing in climate change mitigation and adaptation, ensuring that new development is reasonably protected from floods, droughts, and storms, thus making the region attractive for longterm development.
MARKET REPORT & PROSPECTUS OVERVIEW
THE MARKET REPORT (SECTION 01)
This section provides an overall snapshot of the Southland Development Authority, as well as an introduction to the 7 unique sub-regions comprising the 45 cities and villages within the Greater Chicago area; and an overview of the business and employment trends within Southland's 7 sub-regions. This section also provides data-driven assessment of the historic and current market trends occurring within the overall Southland area and its 7 sub-regions’ office, retail, industrial, and for-rent residential industry sectors, offering insight on the complex market-driven statistics, performance indicators, and historical trends occurring within the Greater Chicago area.
Office Market Trends
Over the last 5 years, total inventory of office space increased in the East Central Region by 37,840 SF, by 42,300 SF in the Northwest Region, and by 12,200 SF in the Central Region. The West Region and North Central Region experienced relatively modest growth, while the inventory within the other Southland sub-regions remained unchanged since 2018. Total inventory of office space
experienced a net increase of 34,251 SF, or 0.3%, within Southland as a whole over the last 5 years. Southland’s office market also experienced a significant increase in average rental rates of 103% over the last 5 years—from $13.60 to $27.54. An increase in Southland's overall office demand may be driving the sub-region's higher average rents.
Retail Market Trends
Over the last 5 years, total inventory of retail space increased within all Southland sub-regions, except for the Northeast Region. The Central Region experienced the greatest increase of total office space by 115,500 SF during this same 5-year period. Total inventory of retail space experienced a net decrease of 21,525 SF, or 0.1%, within Southland as a whole since 2018. Southland’s retail market experienced a significant increase in average rental rates of 9% over the last 5 years, from $14.36 to $15.70. An increase in healthy spending behaviors and overall retail demand within Southland may be driving the higher average rents within the sub-regions.
For-Rent Residential Market Trends
Over the last 5 years, total inventory of for-rent residential units increased significantly in the West Region by 459 units, in the East Central Region by 114 units, and in the Southeast Region by 40 units. All other Southland sub-regions experienced relatively modest growth or remained unchanged since 2018, except for the Northeast Region, which experienced a decrease of 17 units. Southland as a whole also experienced a net increase of 640 units since 2018. Southland’s for-rent residential market also experienced a significant increase in average rental rates per SF of 14% over the last 5 years; from $1.30 to $1.48. An increase in overall rental demand within Southland may be driving the higher average rents within the sub-regions.
Industrial Market Trends
Over the last 5 years, total inventory of industrial/flex space increased significantly in the Central Region by 4.4 million SF; the Southeast Region by 2.2 million SF; and the North Central Region by 755,000 SF. All other Southland sub-regions experienced relatively modest growth or remained unchanged since 2018. Total inventory of industrial/flex space experienced a net increase of over 7.7 million SF, or 9%, within Southland as a whole over the last 5 years. Southland’s industrial/flex market also experienced a significant increase in average rental rates of 35% over the last 5 years, from $5.16 to $6.99. An increase in overall industrial/flex demand within Southland may be driving the higher average rents within the sub-regions.
THE PROSPECTUS (SECTION 02)
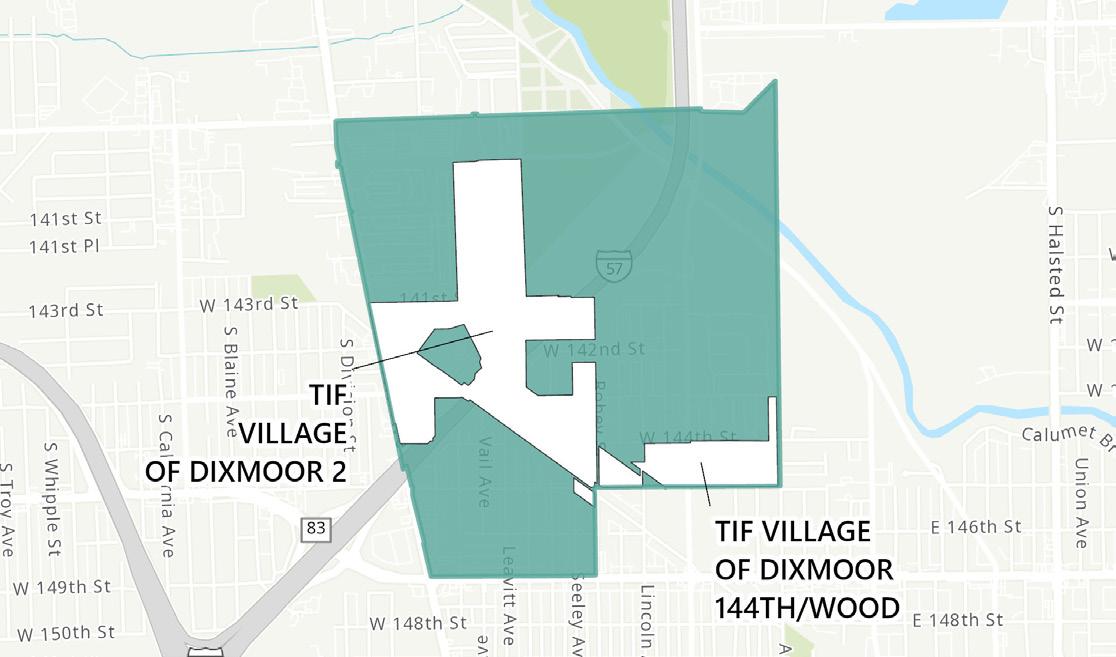
This section provides a comparison of demographic and socioeconomic data, business and employment trends, transportation characteristics, existing inventory, and income-related data for each of Southland’s sub-regions and the individual cities and villages contained within the sub-regions. This section is intended to serve as a tool to providing prospective and future investors and developers insight into the current socio-economic characteristics, existing market conditions, and potential development/redevelopment opportunities within Southland as a whole. Further, the Prospectus provides a detailed overview of available Business Incentive Programs (i.e., Enterprise Zone Program, High Impact Business Program, Tax Increment Financing Districts, Opportunity Zone Program) within Southland overall as well as each of the 45 municipalities therein.
This Market Report and Prospectus document can be read its entirety or by individual section.
SECTION
SECTION ONE MARKET REPORT
The Southland Development Authority has invested in creating this Investor Lookbook to highlight and promote their ongoing efforts to achieve transformative and inclusive economic growth for the region, which consists of 45 cities and villages within the Greater Chicago area.
Included in this Market Report section is an overall snapshot of the Southland Development Authority, as well as an introduction to the 7 unique sub-regions comprising the 45 cities and villages within the Greater Chicago area; and an overview of the business and employment trends within Southland’s 7 sub-regions.
This section also provides a data-driven assessment of the historic and current market trends occurring within the overall Southland area and its 7 subregion’s office, retail, industrial, and for-rent residential industry sectors.
This Market Report section within the overall Investor Lookbook publication helps the Southland Development Authority and interested third parties understand the complex market-driven statistics, performance indicators, and historical trends occurring within the Greater Chicago area.
ABOUT THIS MARKET
SOUTHLAND DEVELOPMENT AUTHORITY
The Southland Development Authority (“SDA”) is a non-profit business organization designed to grow the economy of the South Chicago suburbs, also referred to as Southland. Launched in 2019 by business, civic, and political leaders across Southland, the SDA brings the resources and capacity necessary to achieve transformative and inclusive economic growth for the region by focusing on investment in industry, workforce, housing, and communities.
The SDA continually analyzes the assets, markets, and development opportunities of the region; convenes, conceives and executes with partners' large-scale, strategic investments; and provides a nimble, professional, single point of entry for businesses, residents, developers and investors to efficiently and effectively get the resources they need. By coordinating mutually reinforcing investments in the industries, workforce, real estate, and communities of Southland, the SDA implements transformational economic development—driving business and community growth and prosperity.
Through a single organization—businesses, residents, developers, investors, and others access the resources and networks to support their growth and prosperity. SDA provides expertise and capacity, partnering to develop large scale projects that enable the region to lead in the new economy.
Southland consists of 45 cities and villages within the Greater Chicago area, and includes parts of Will County and Cook County, Illinois. Southland has a population of nearly 750,000 people, representing a density of roughly 500 persons per square mile. Southland is an attractive suburban area for all generations— featuring low unemployment rates; prominent business, manufacturing, and logistics corridors; a high diversity index; stable per capita and median household incomes; and located nearby a major metropolitan area with railway transportation.
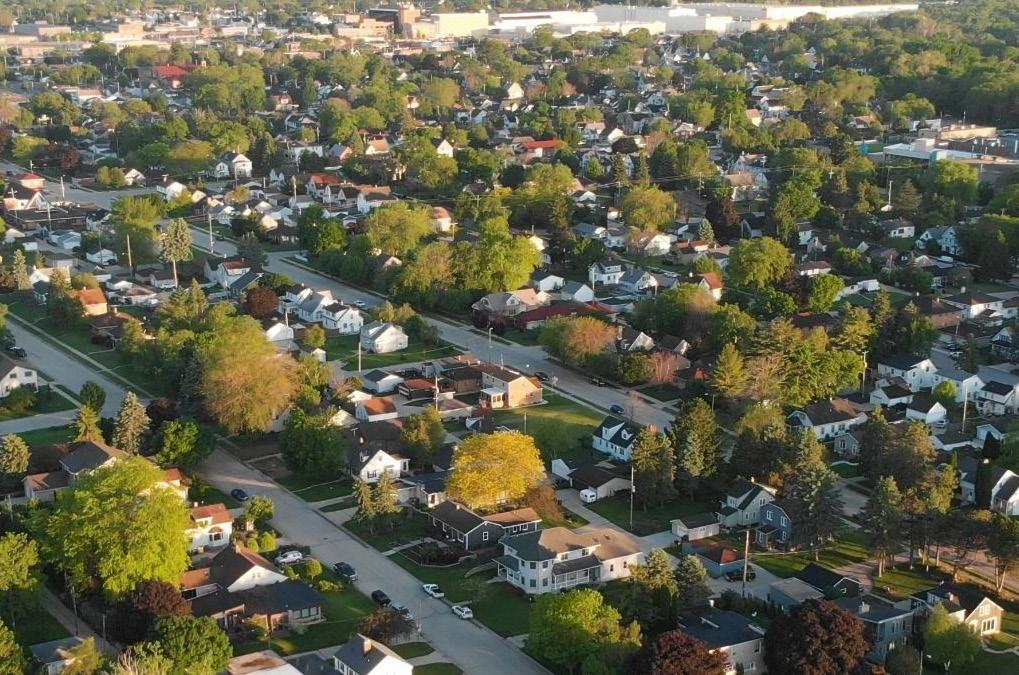
Southland is also home to many great neighborhoods and unique groups, ranging from large, technical-skilled workforce communities to more relaxed single-family detached neighborhoods nestled between vast agriculture farmland. Current strategies of the SDA prioritize Southland’s 45 cities and villages into 7 unique sub-areas to illustrate where many opportunities for dynamic growth and investment intersect. These sub-areas are described in detail in the following pages.
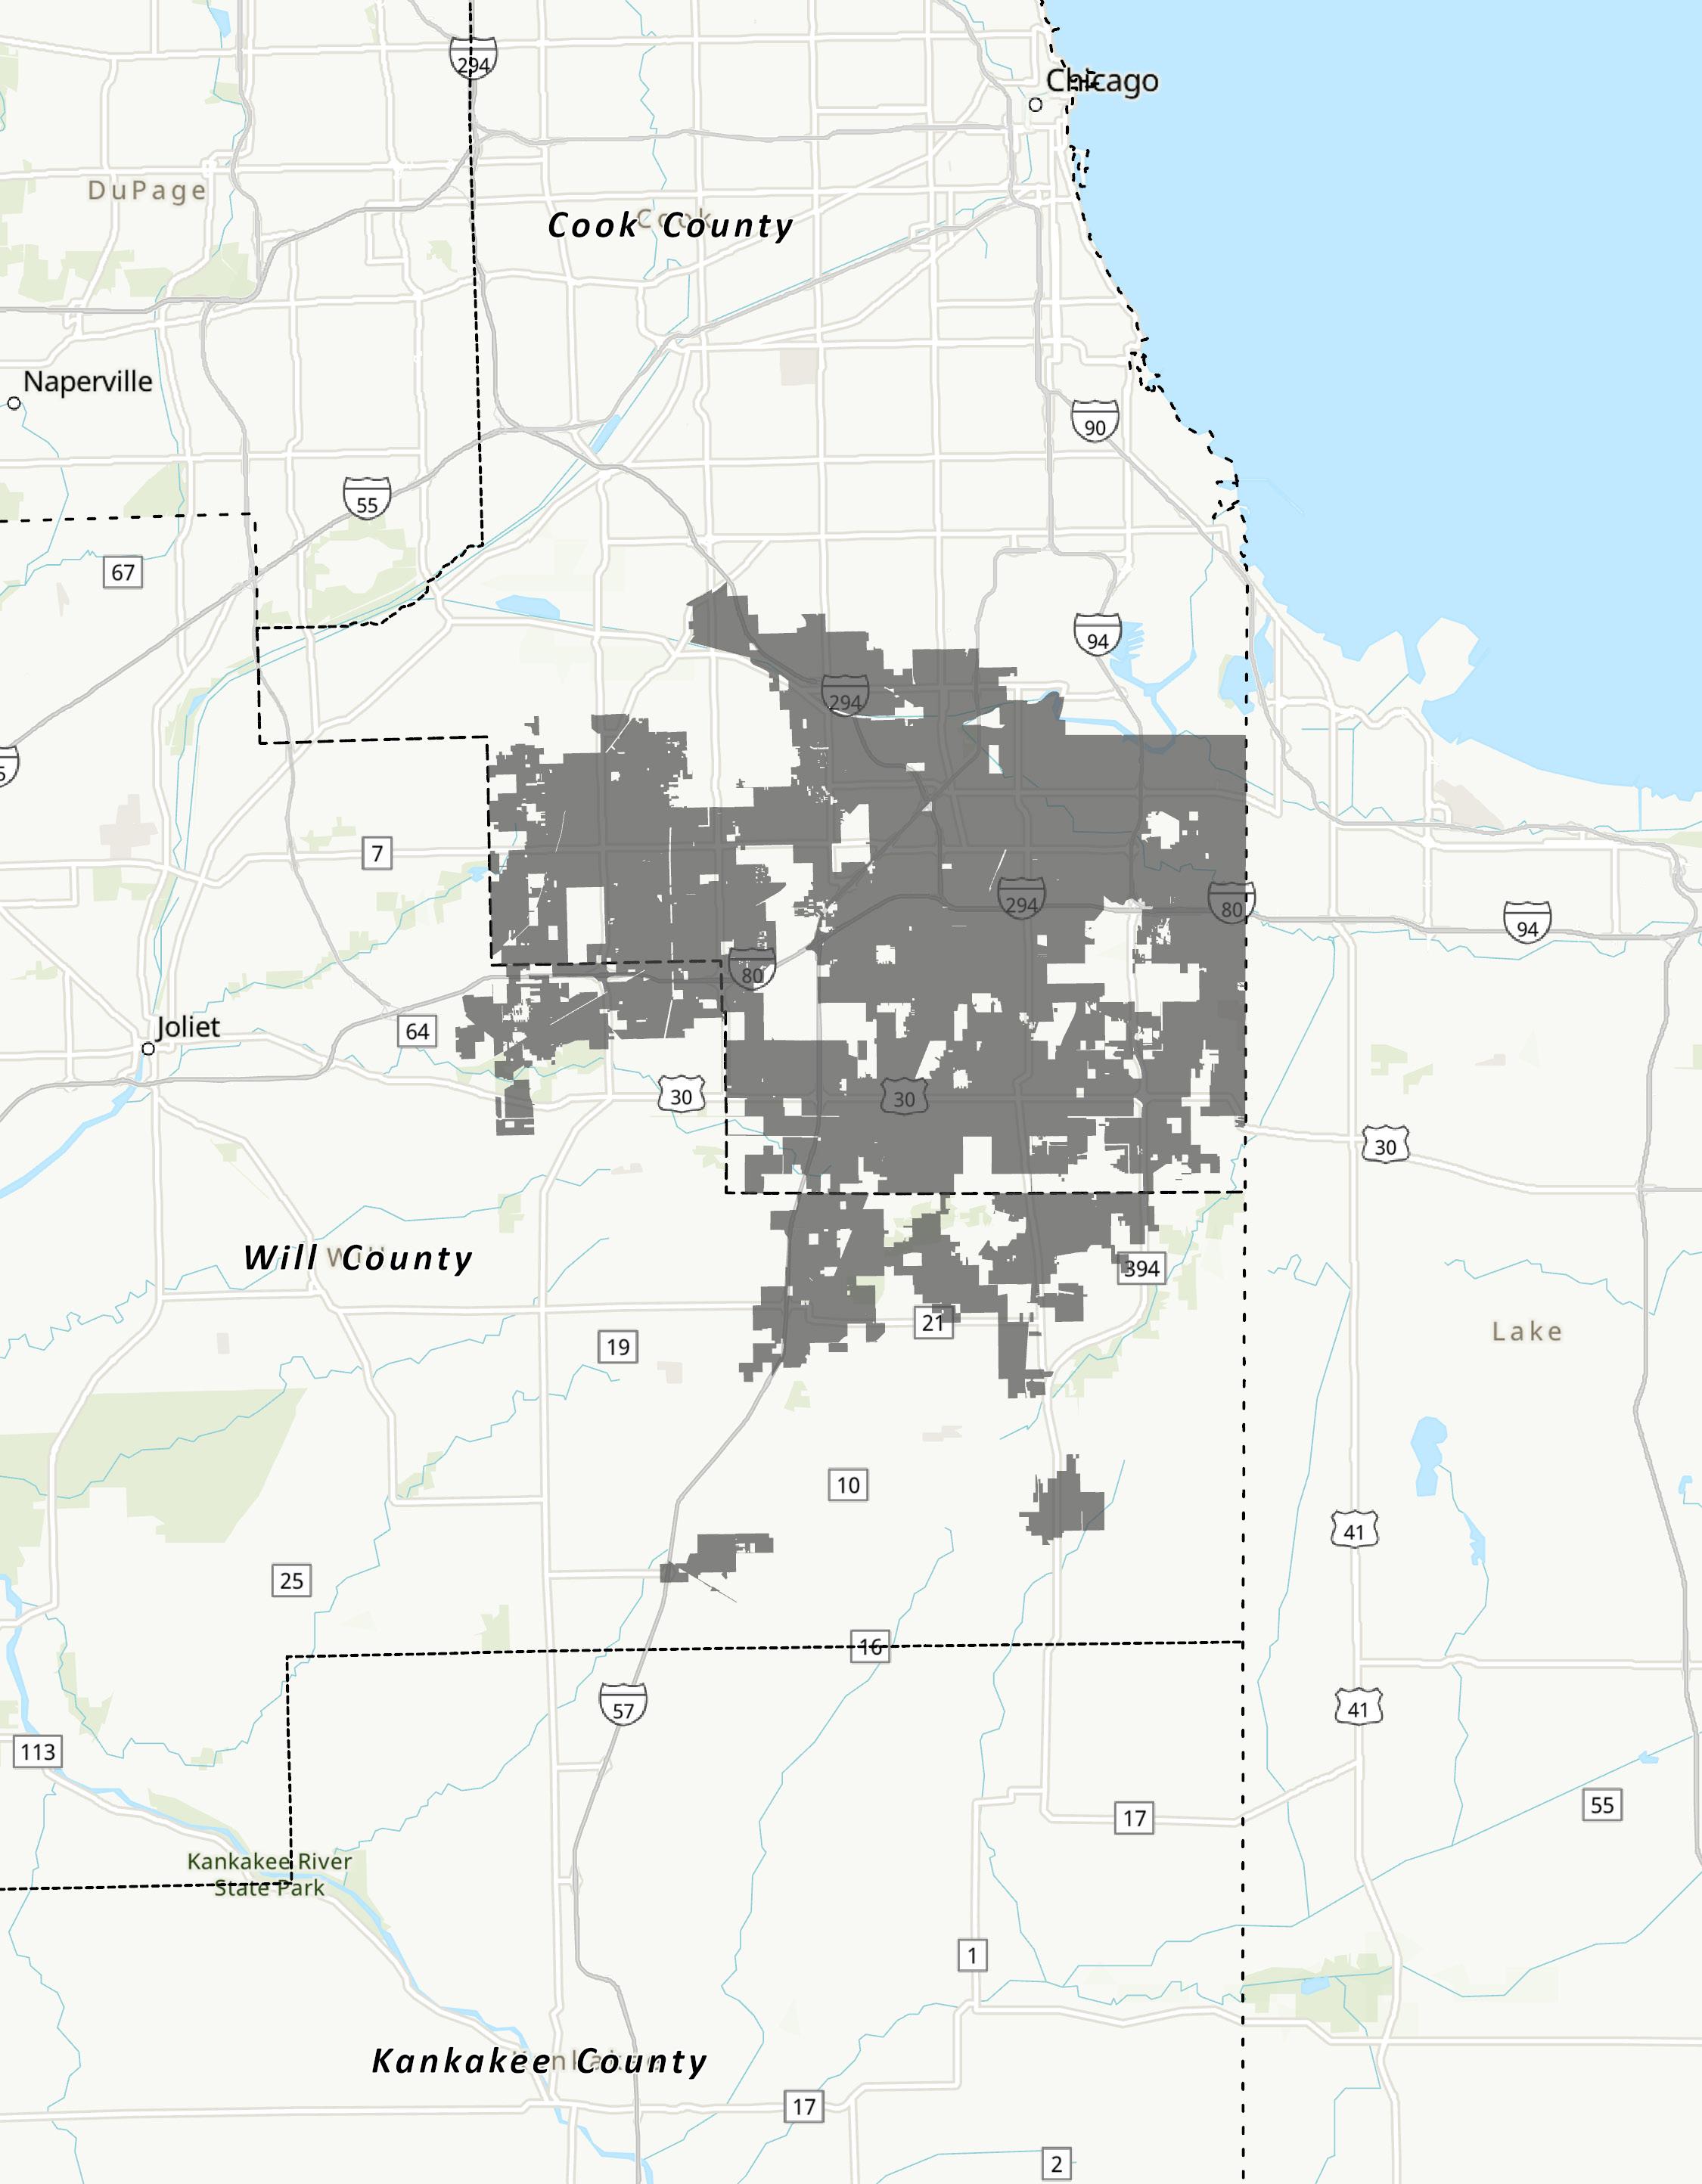
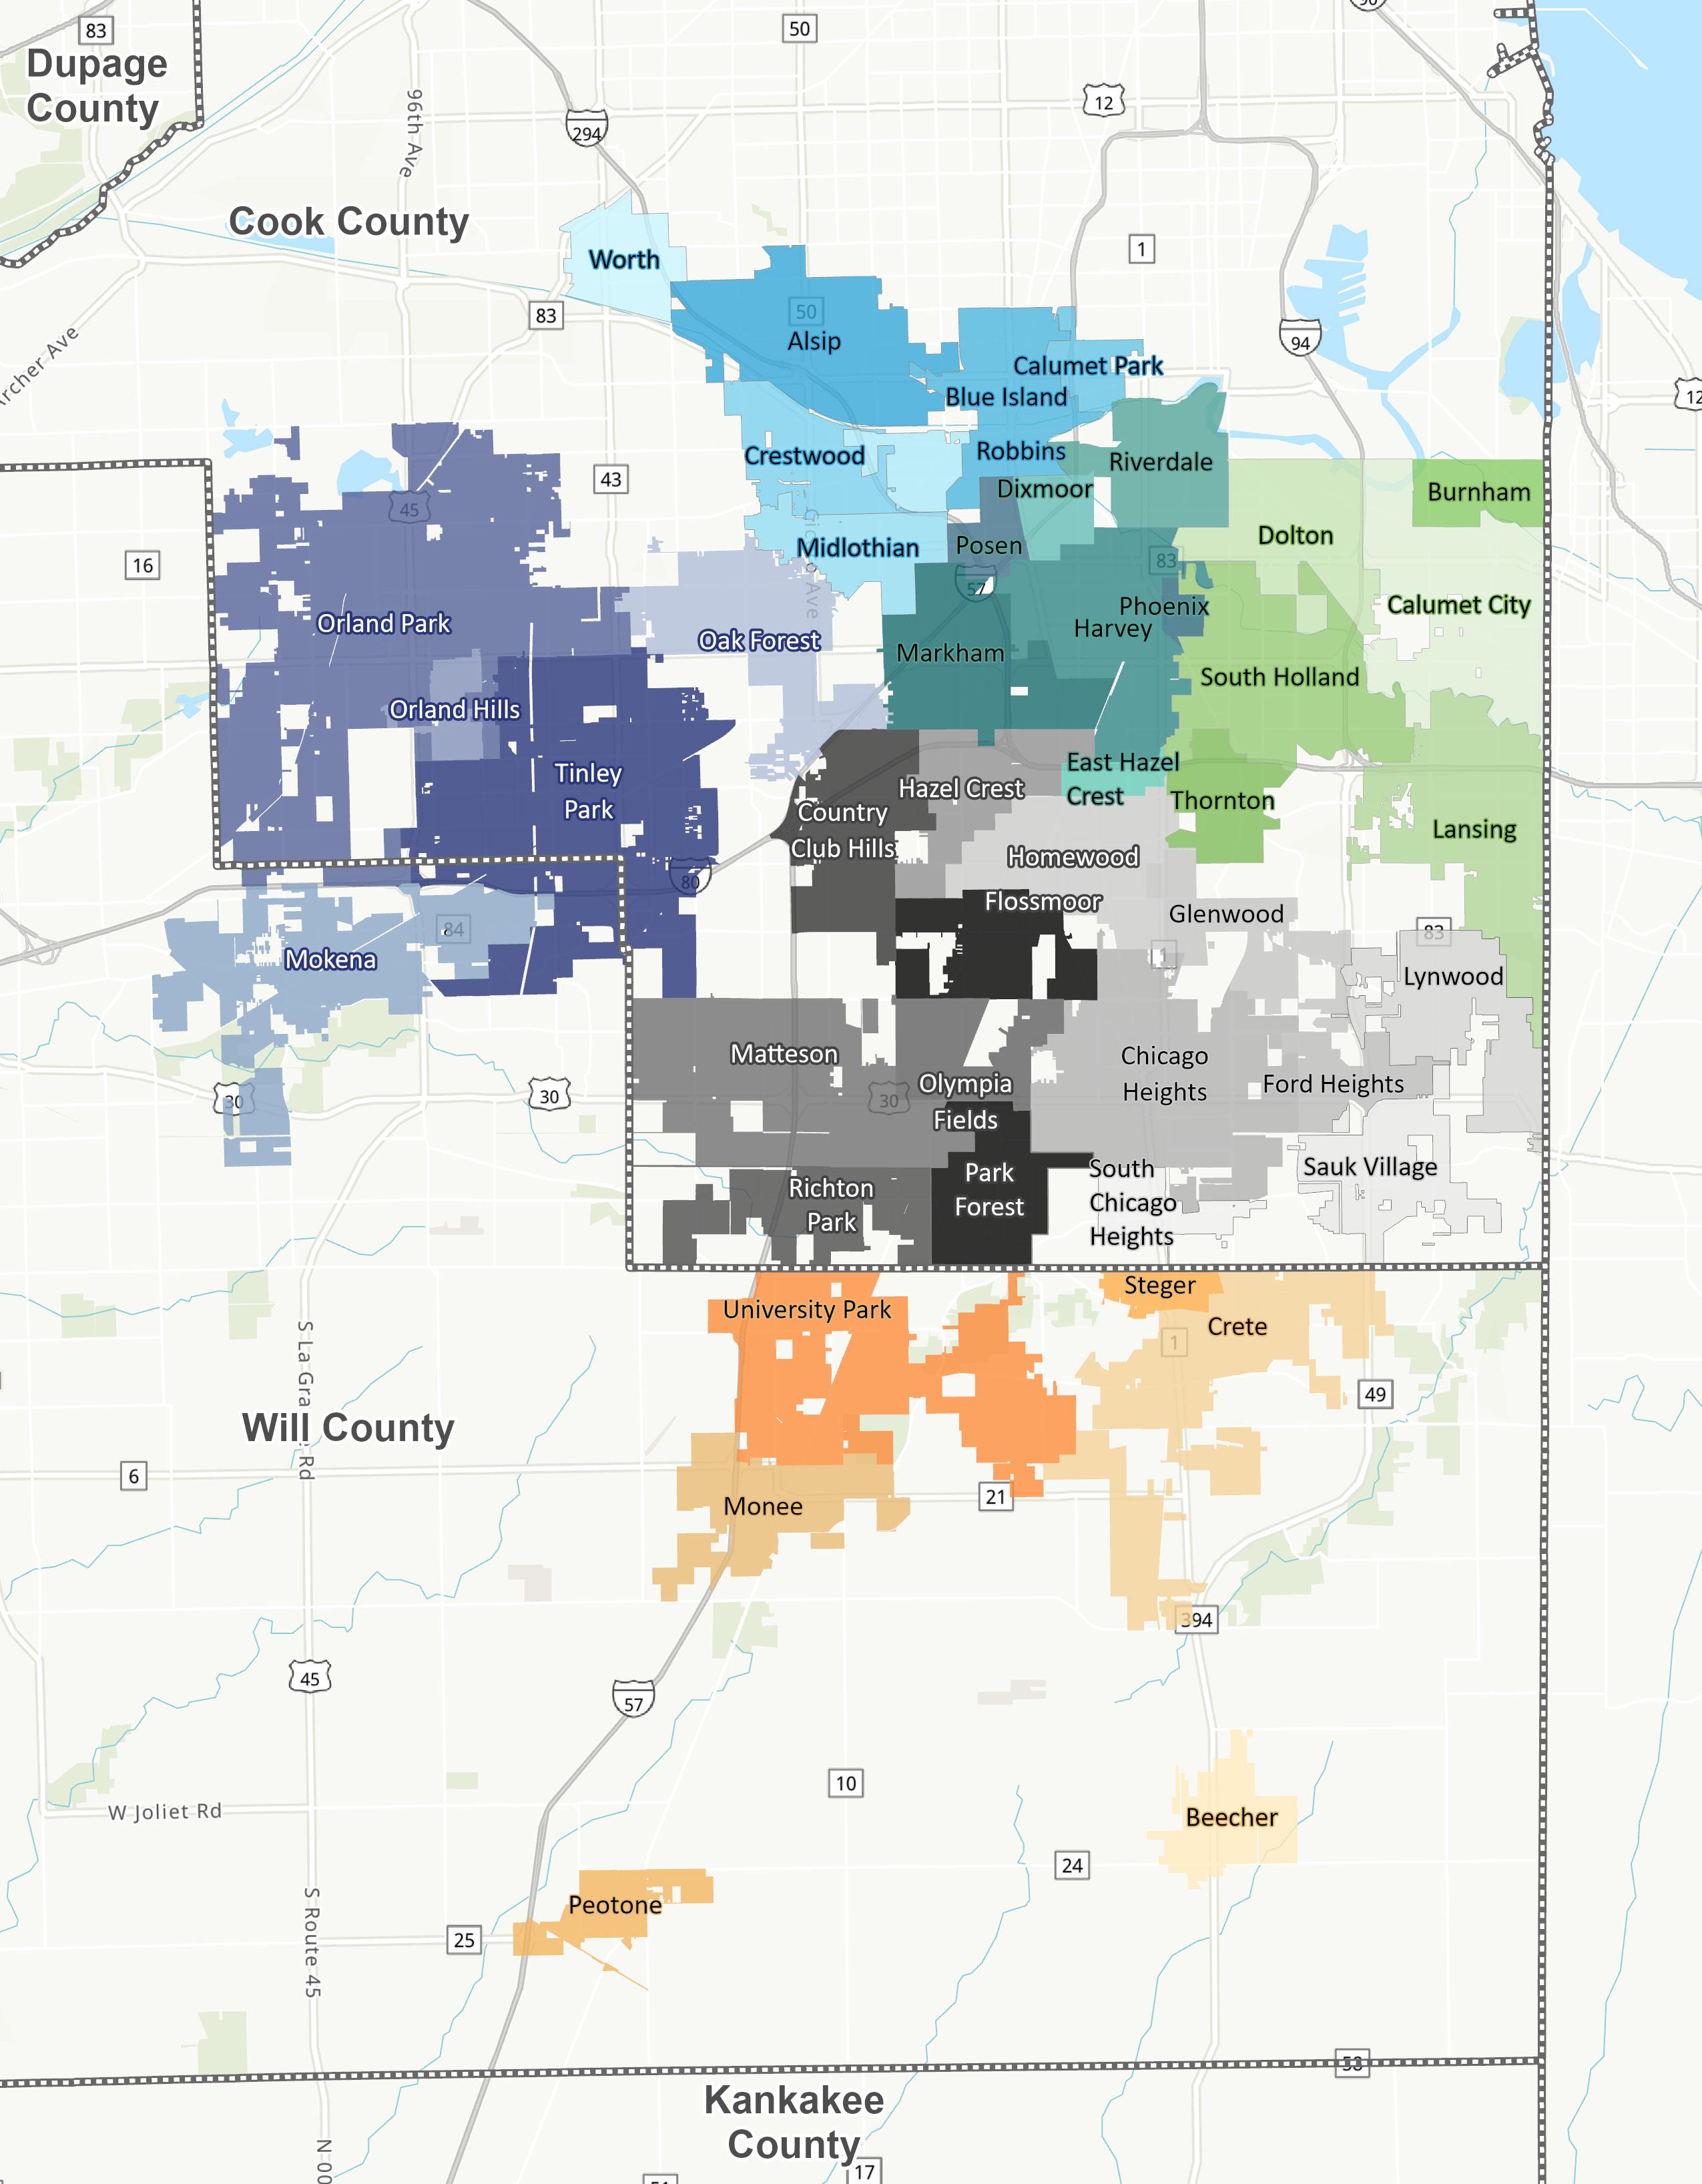
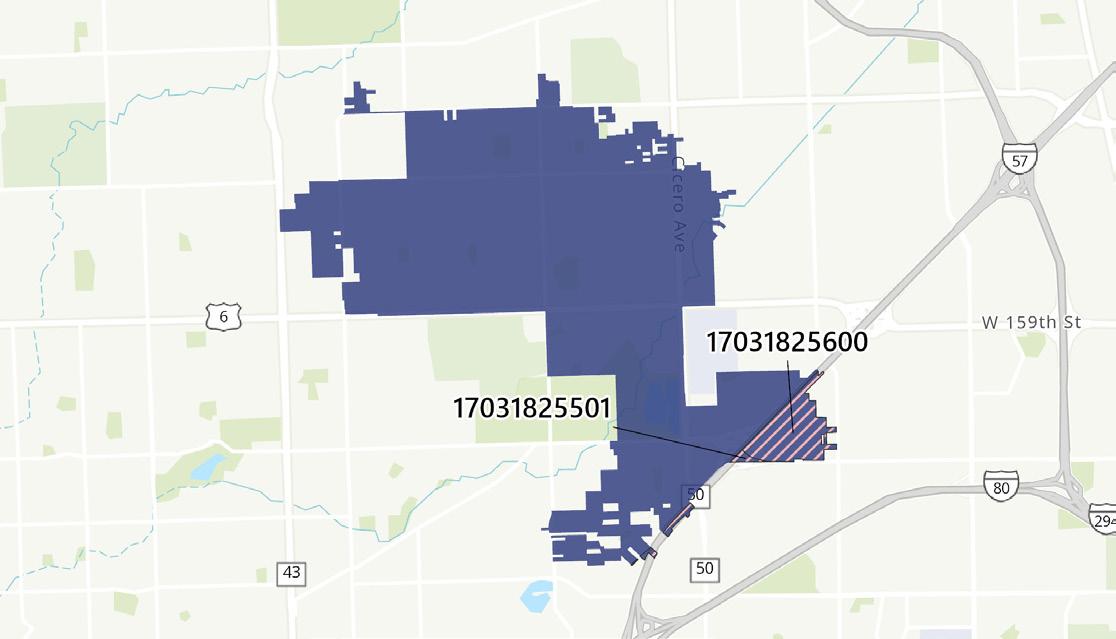
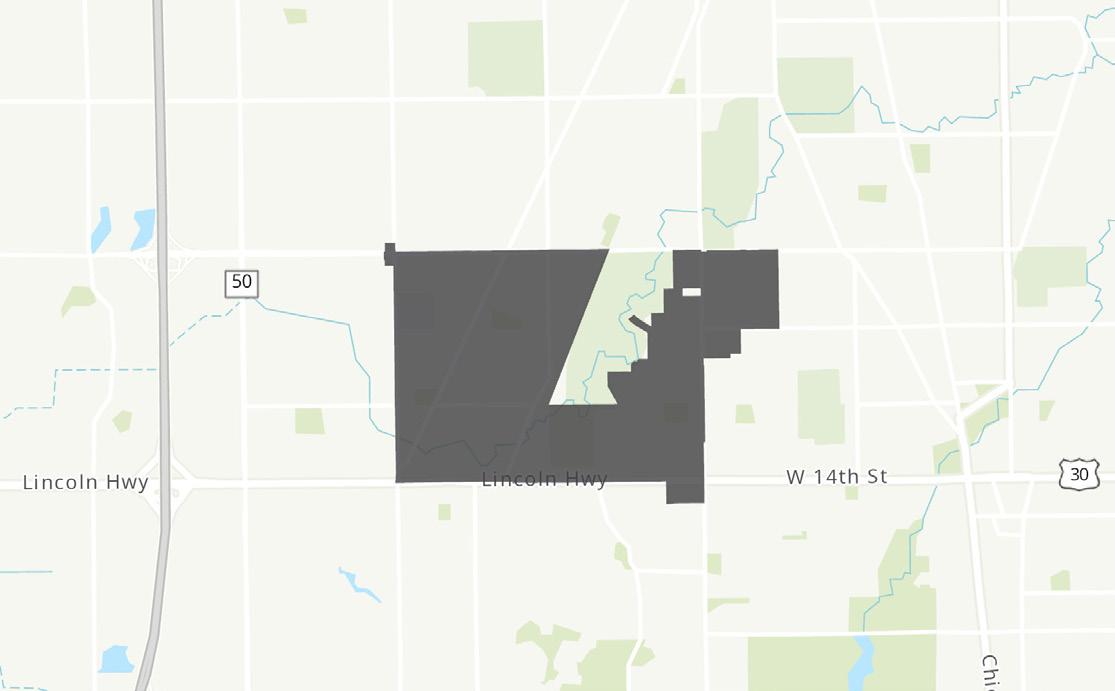
LEGEND
Southland County Boundary State Boundary
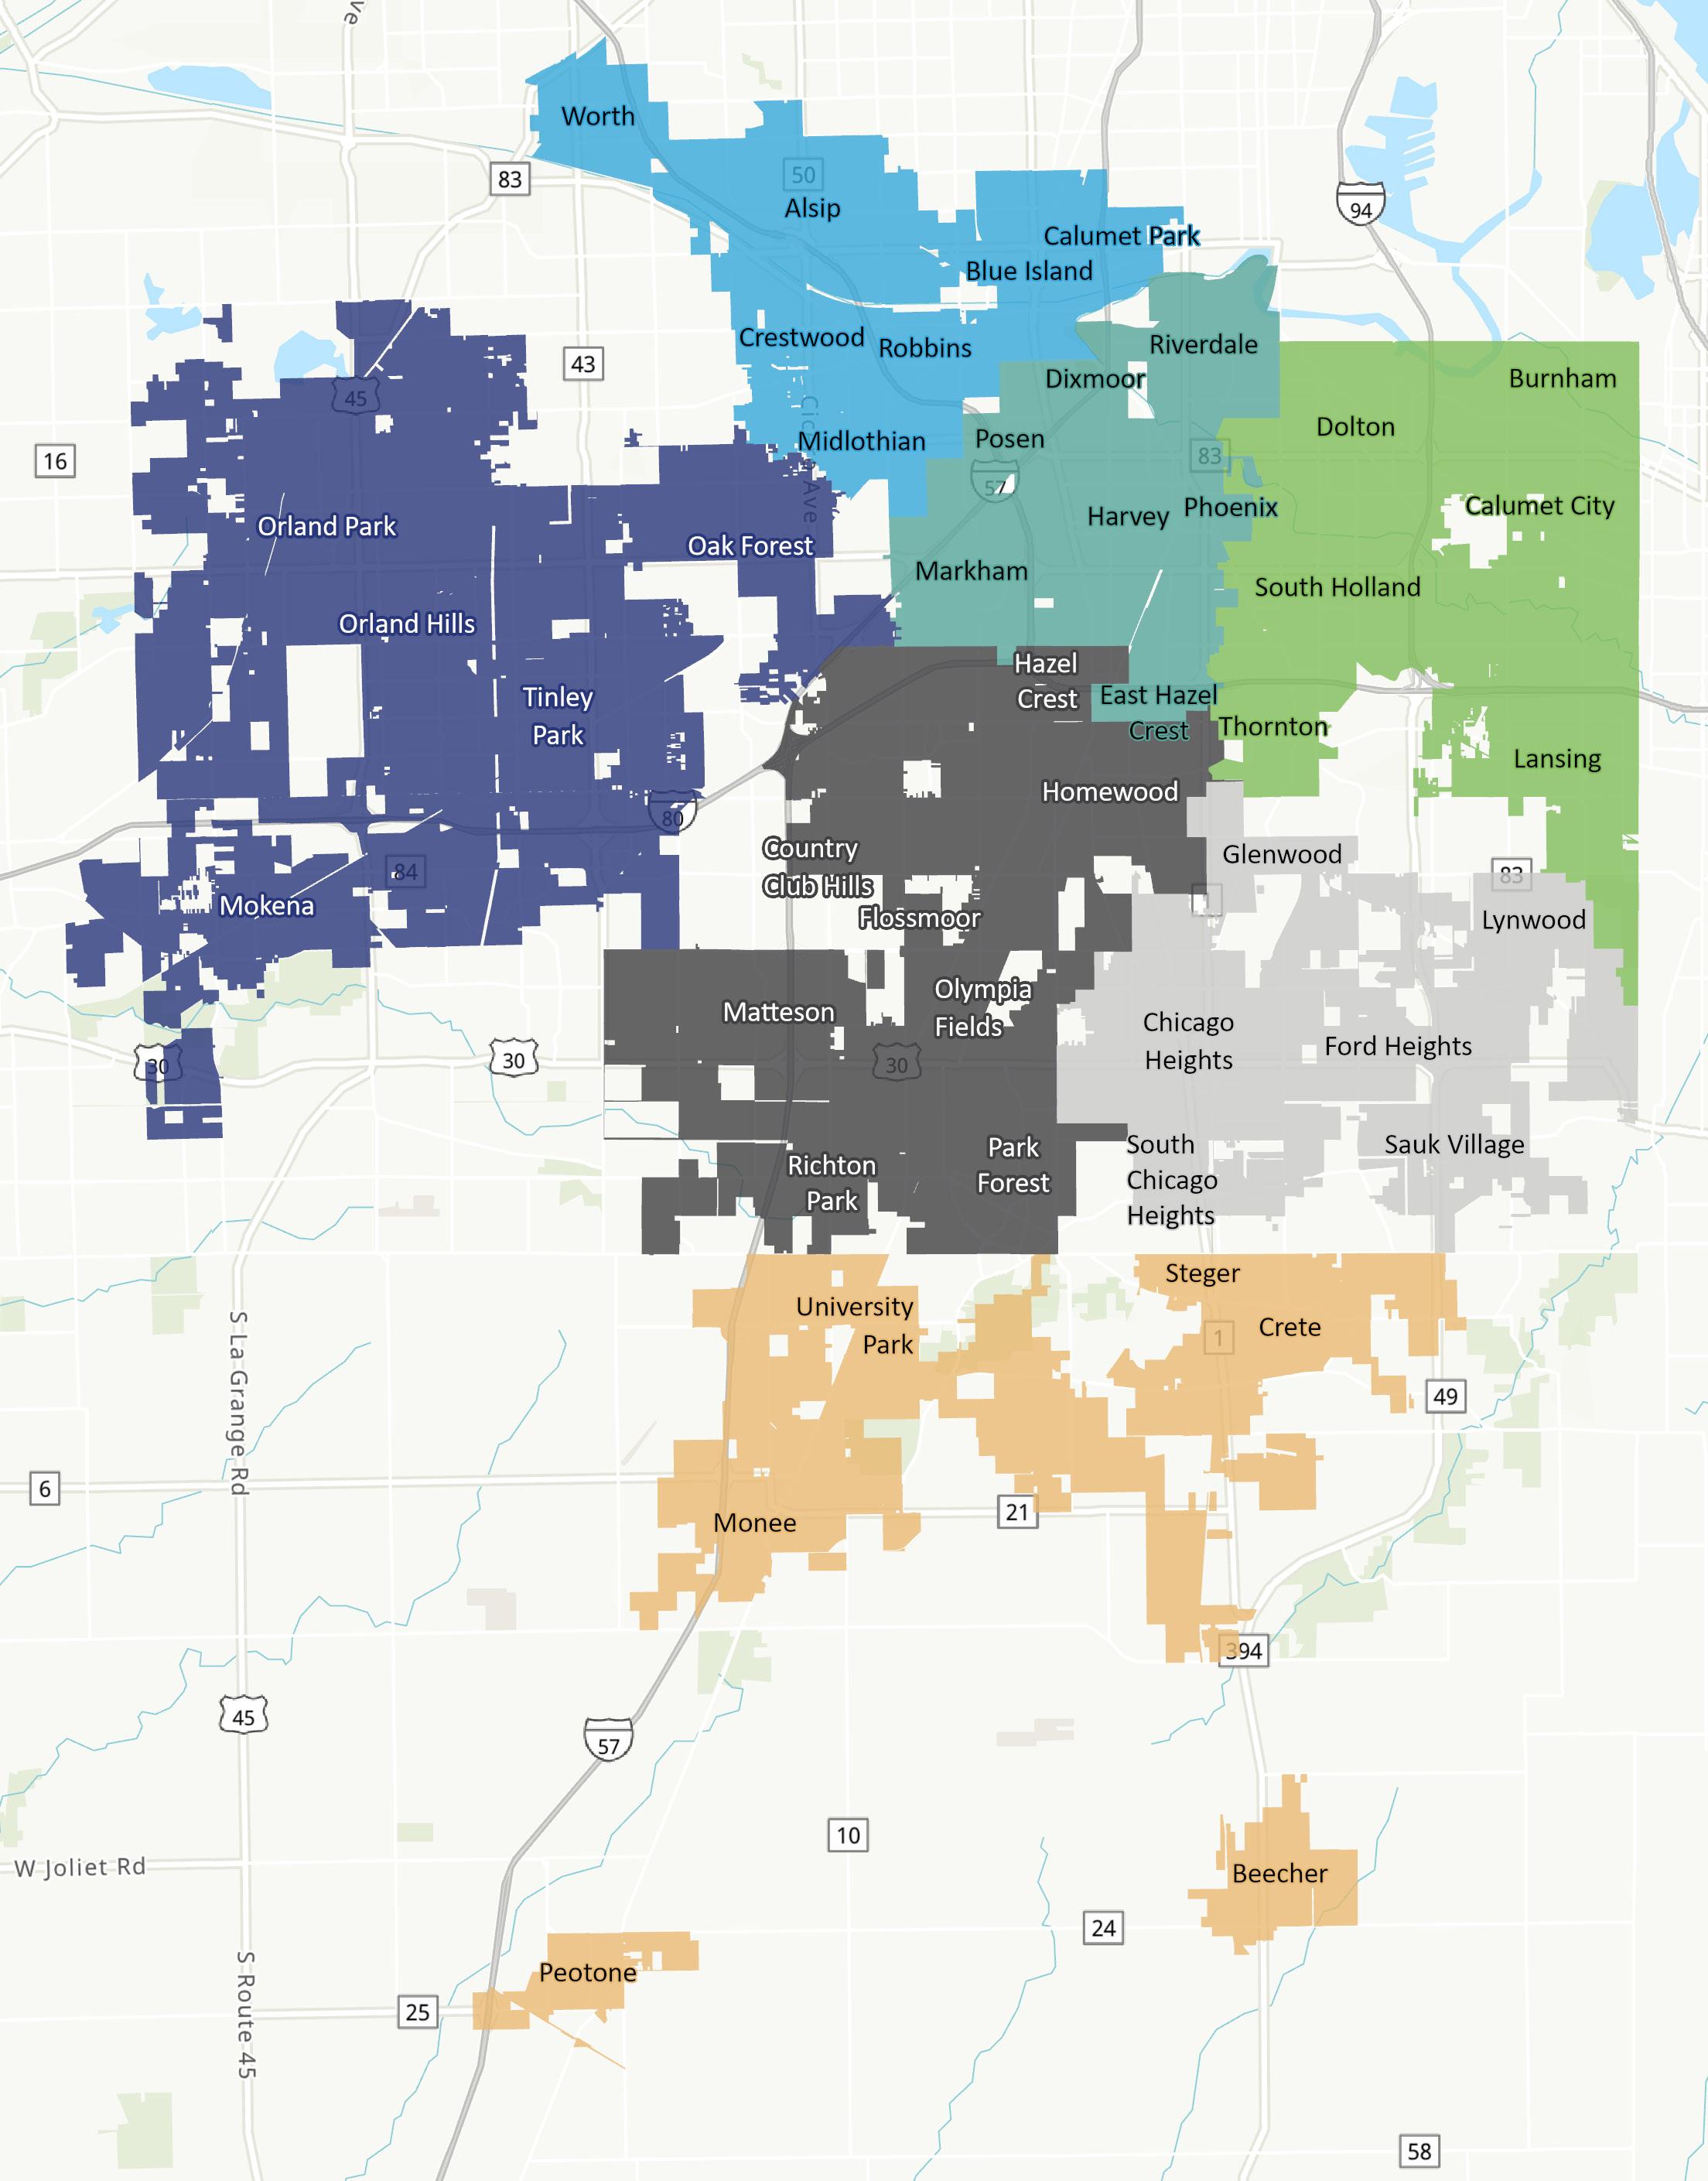
SOUTHLAND SUB-REGIONS
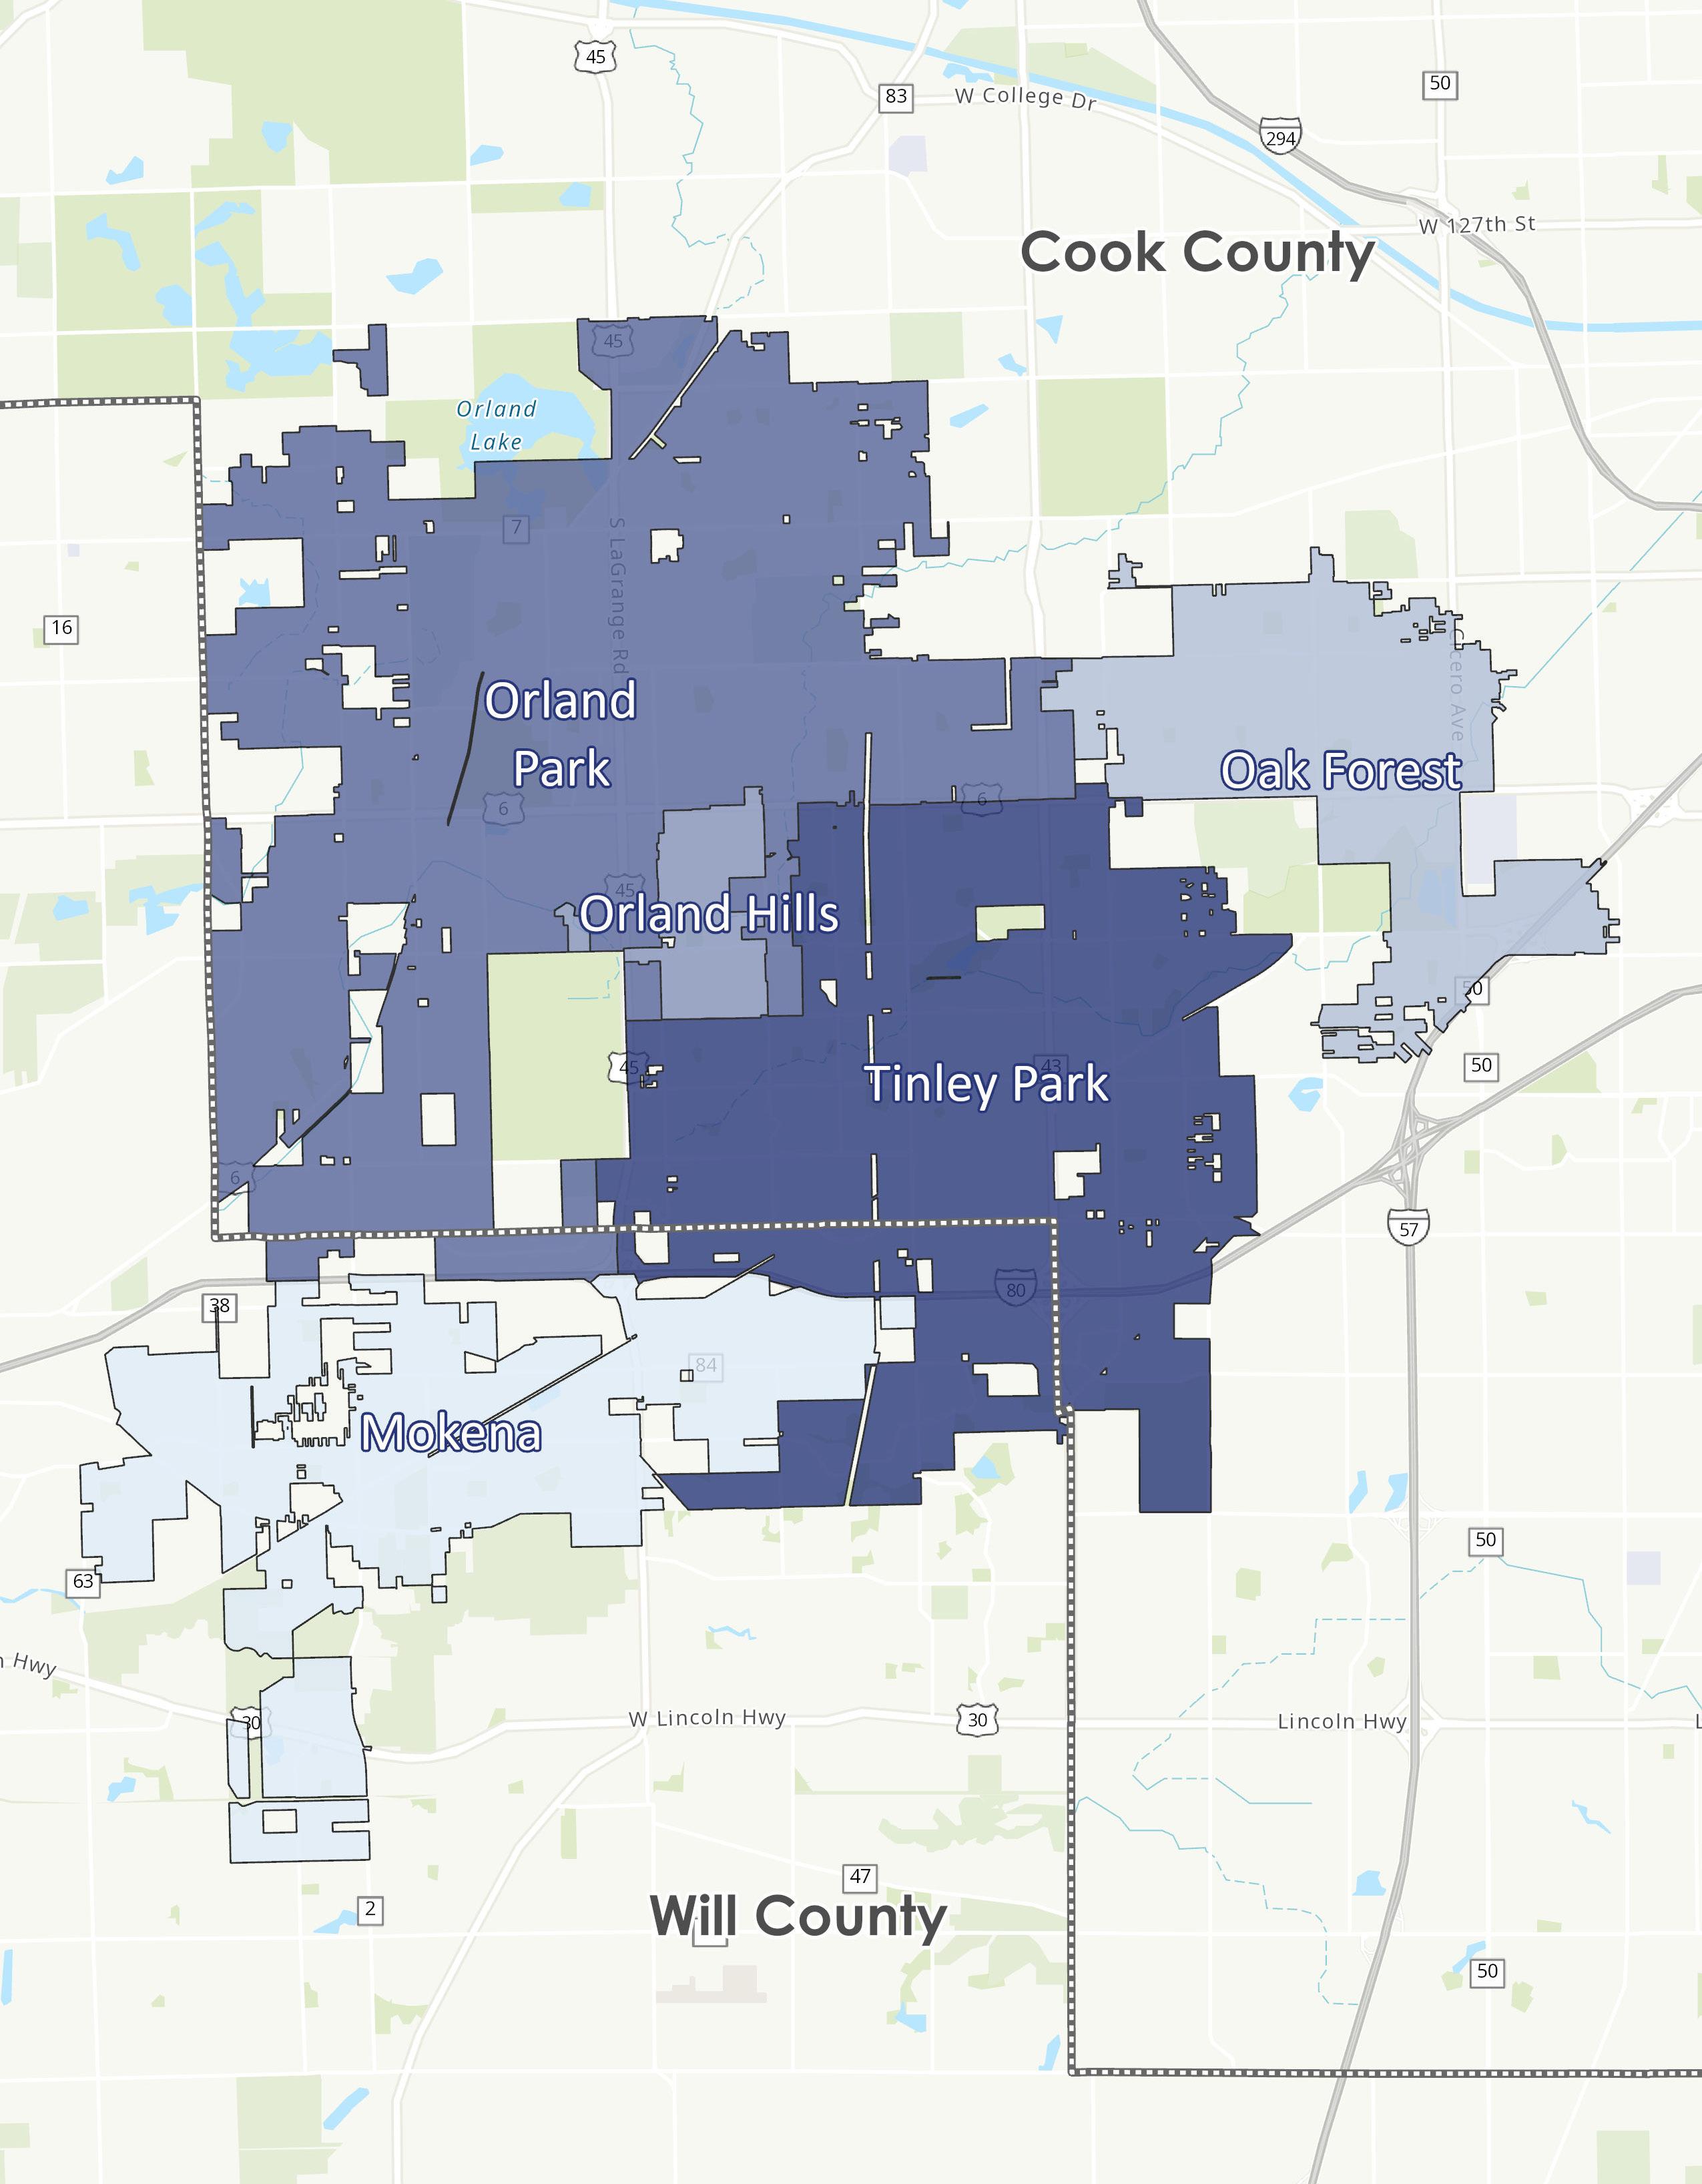
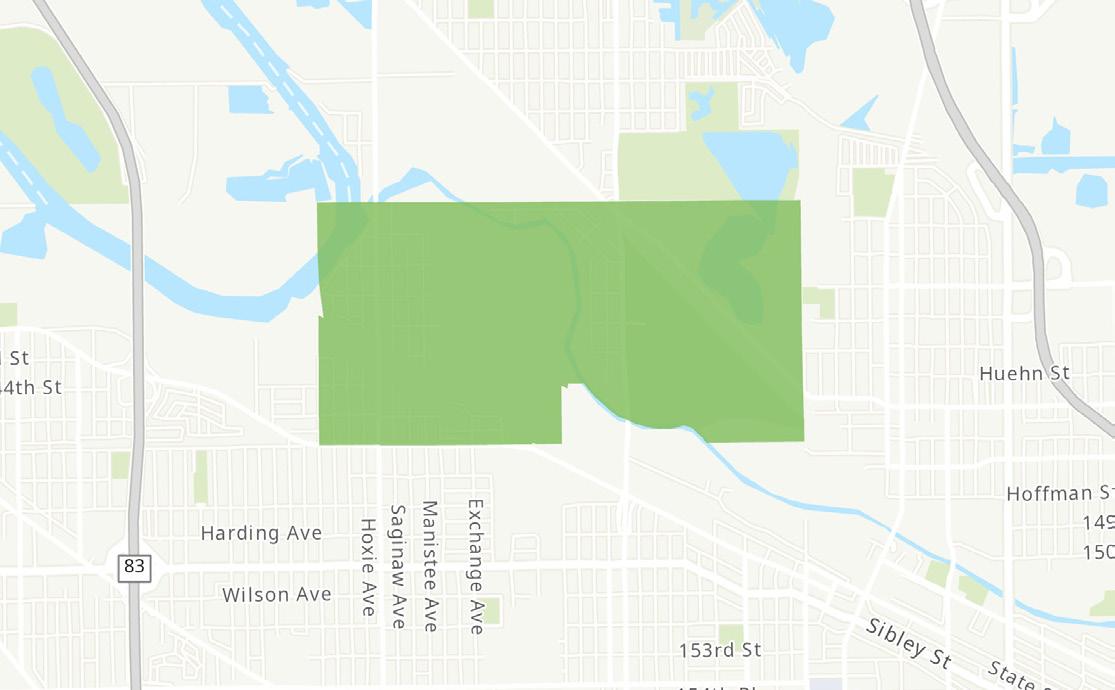
WEST REGION
The West Region is located in the western portion of Southland, generally situated west of Interstate 57 and north of U.S. Route 30. This region encompasses five cities and villages located within Cook and Will Counties—Village of Mokena, Village of Orland Park, Village of Orland Hills, Village of Tinley Park, and City of Oak Forest. Combined, these places total 54.4 square miles, with a population density of 3,098 persons per square mile.
NORTHWEST REGION
NW NC NE SE EC
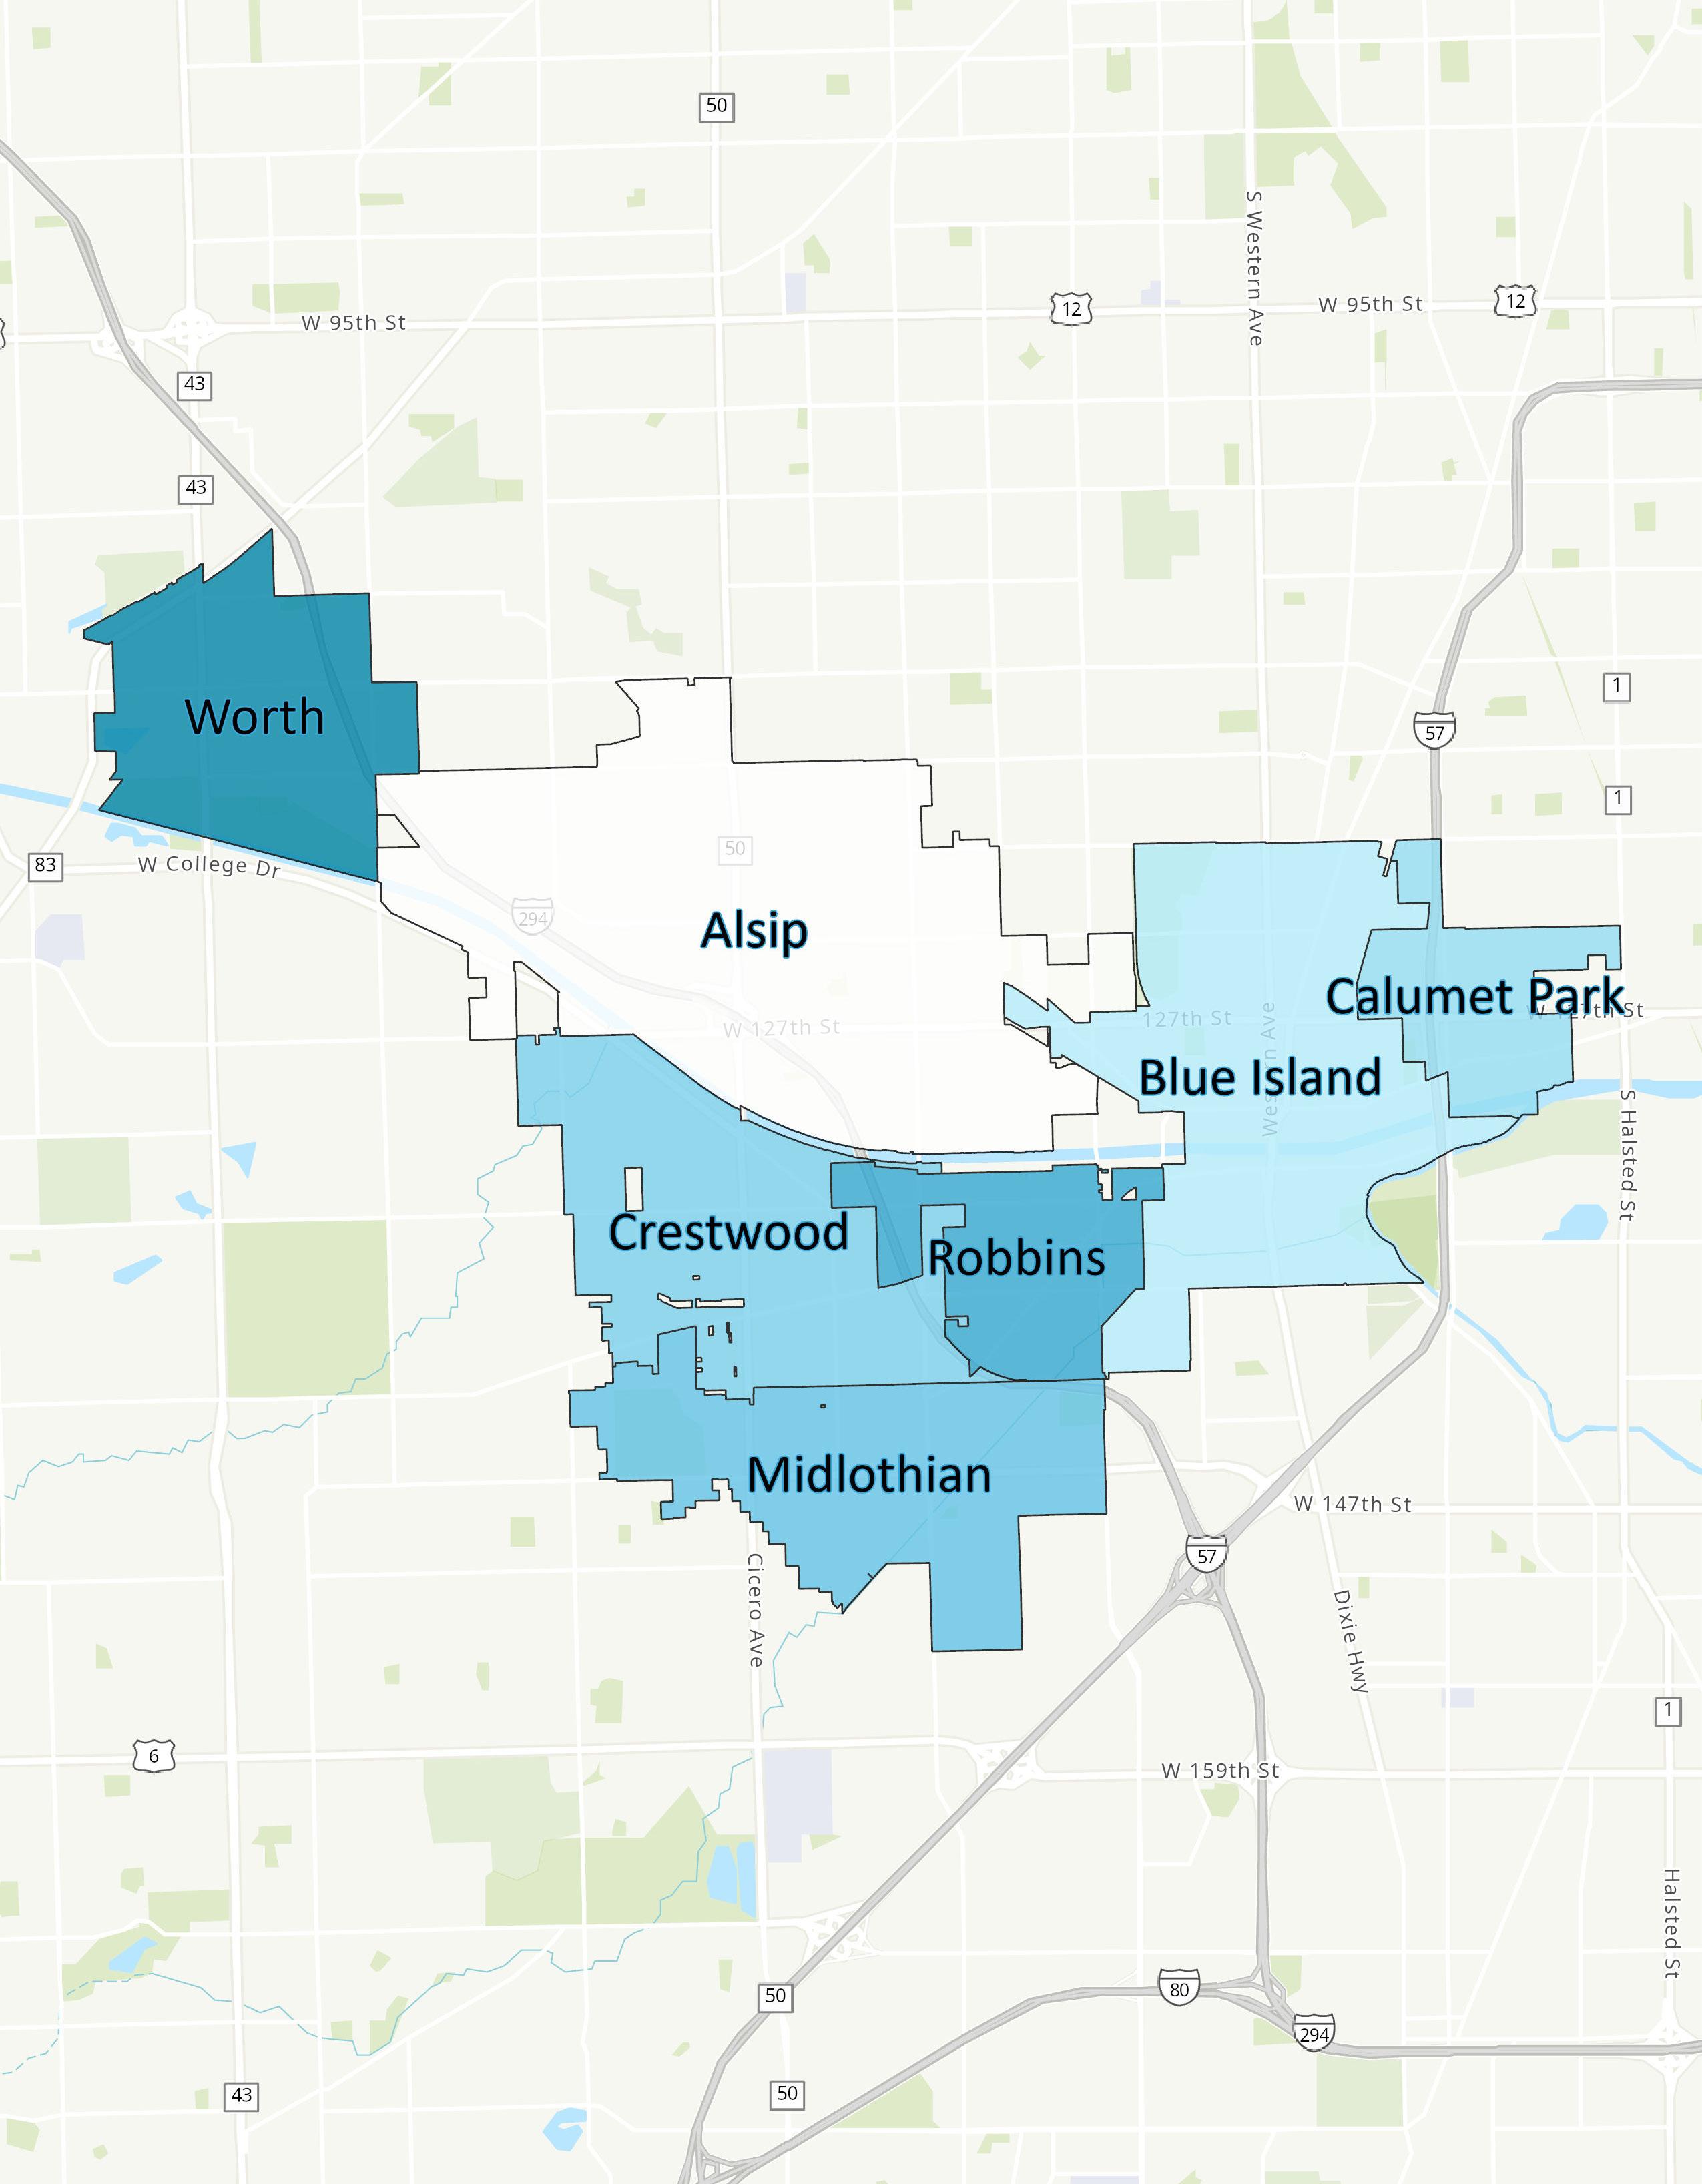
The Northwest Region is located in the northern portion of Southland, generally situated west of Interstate 57 and along Interstate 294 and State Road 50. This region encompasses seven villages and cities all located within Cook County—Village of Worth, Village of Alsip, Village of Crestwood, Village of Midlothian, City of Blue Island, Village of Calumet Park, and Village of Robbins. Combined, these places total 21.7 square miles, with a population density of 4,156 persons per square mile.
NORTH CENTRAL REGION
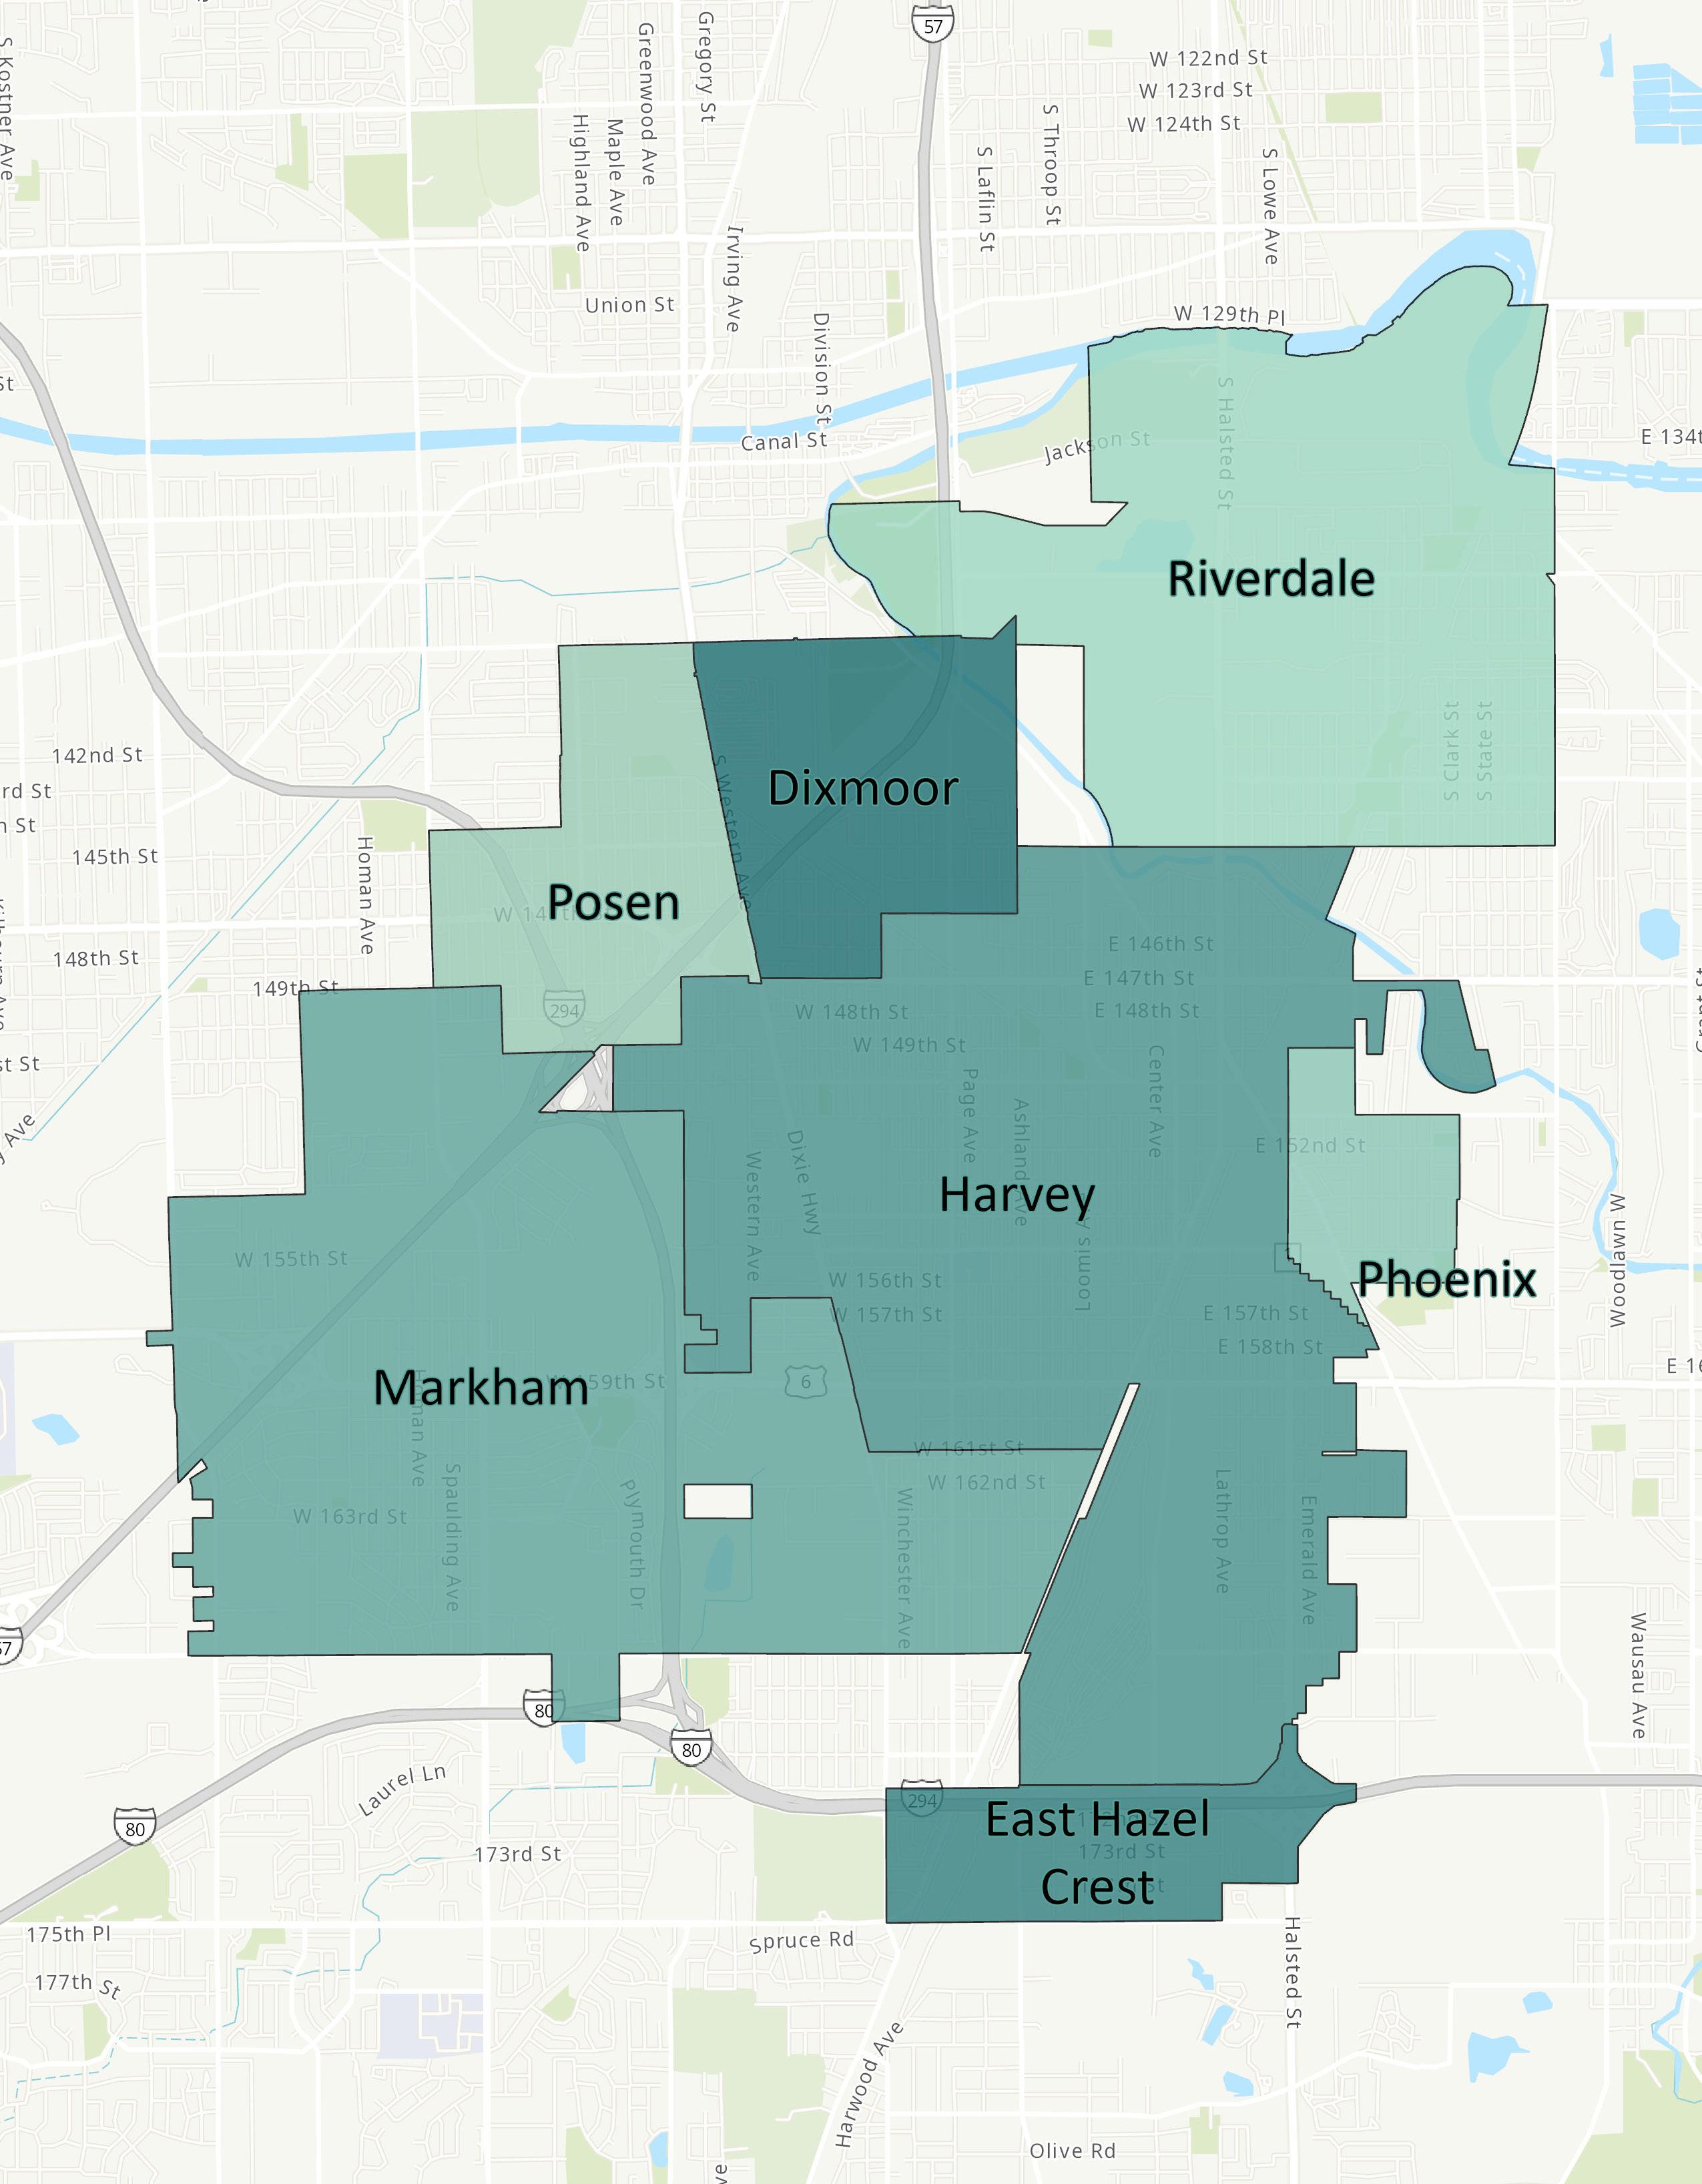
The North Central Region is located in the north central portion of Southland, across major thoroughfares such as Interstate 294, Interstate 57, and U.S. Route 6. This region encompasses seven cities and villages all located within Cook County—Village of Posen, Village of Dixmoor, Village of Riverdale, Village of Phoenix, City of Harvey, City of Markham, Village of East Hazel Crest. Combined, these places total 19.0 square miles, with a population density of 2,838 persons per square mile.
NORTHEAST REGION
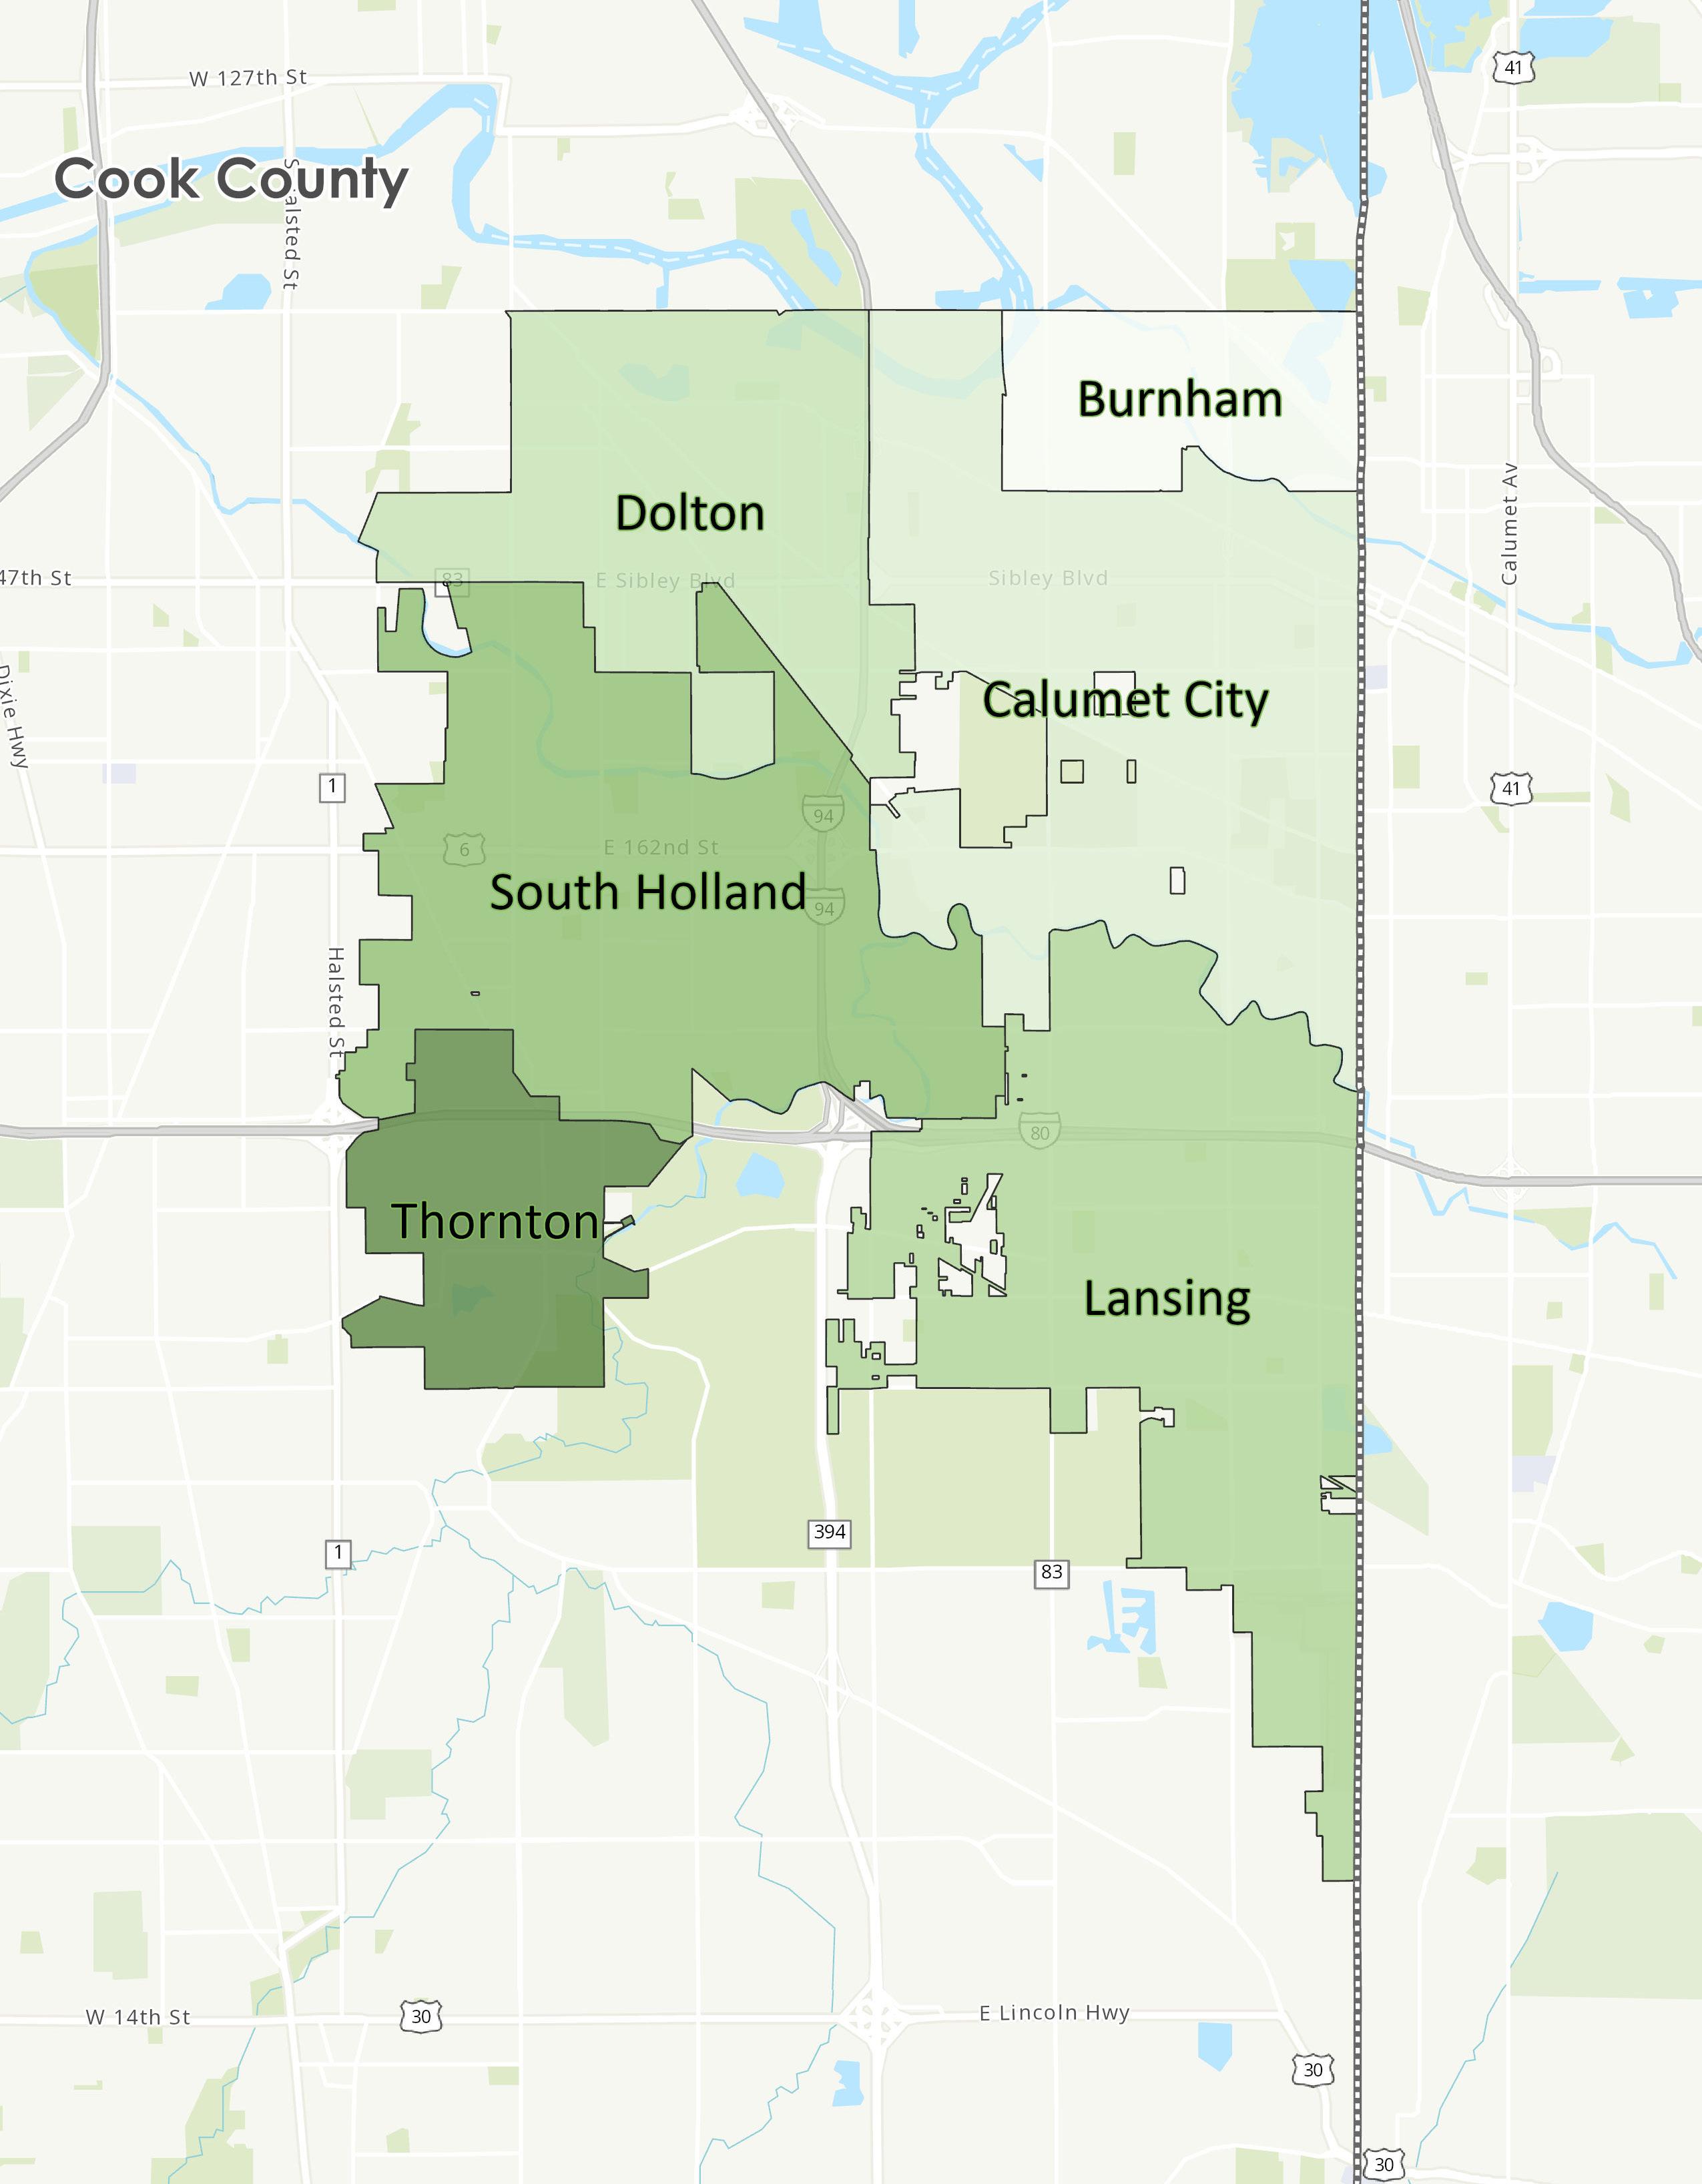
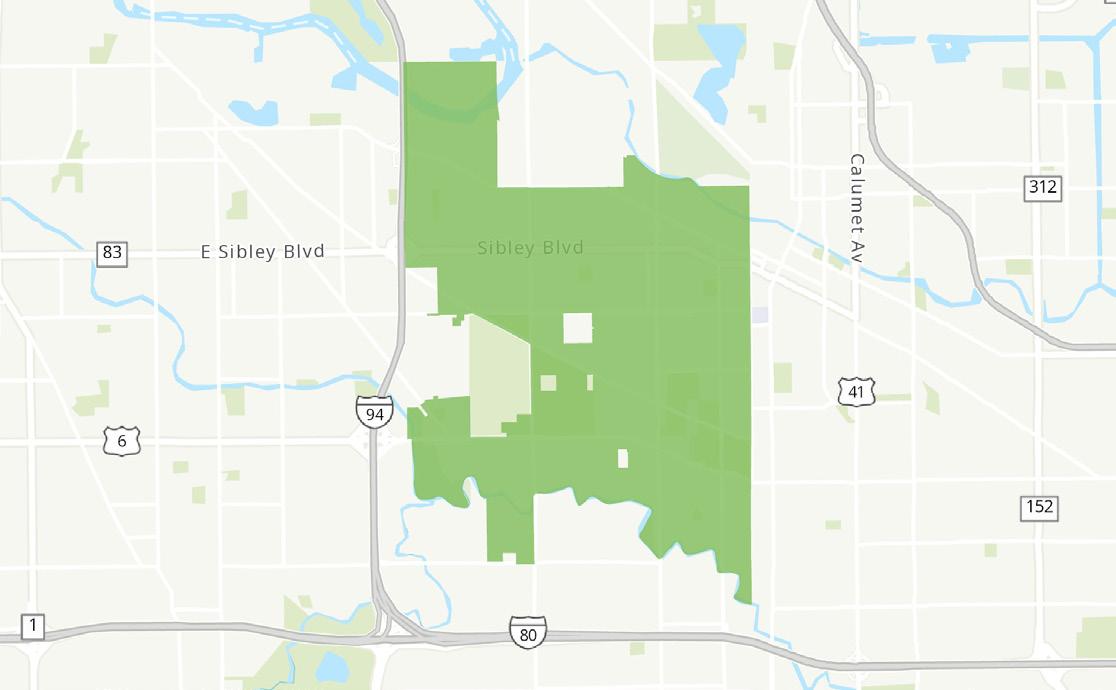
The Northeast Region is located in the northeastern portion of Southland, generally situated along the Cook County border to the north and south. This group encompasses six cities and villages all located within Cook County—Village of Dolton, Village of Burnham, City of Calumet, Village of Lansing, Village of South Holland, and Village of Thornton. Combined, these places total 31.1 square miles with a population density of 3,677 persons per square mile.
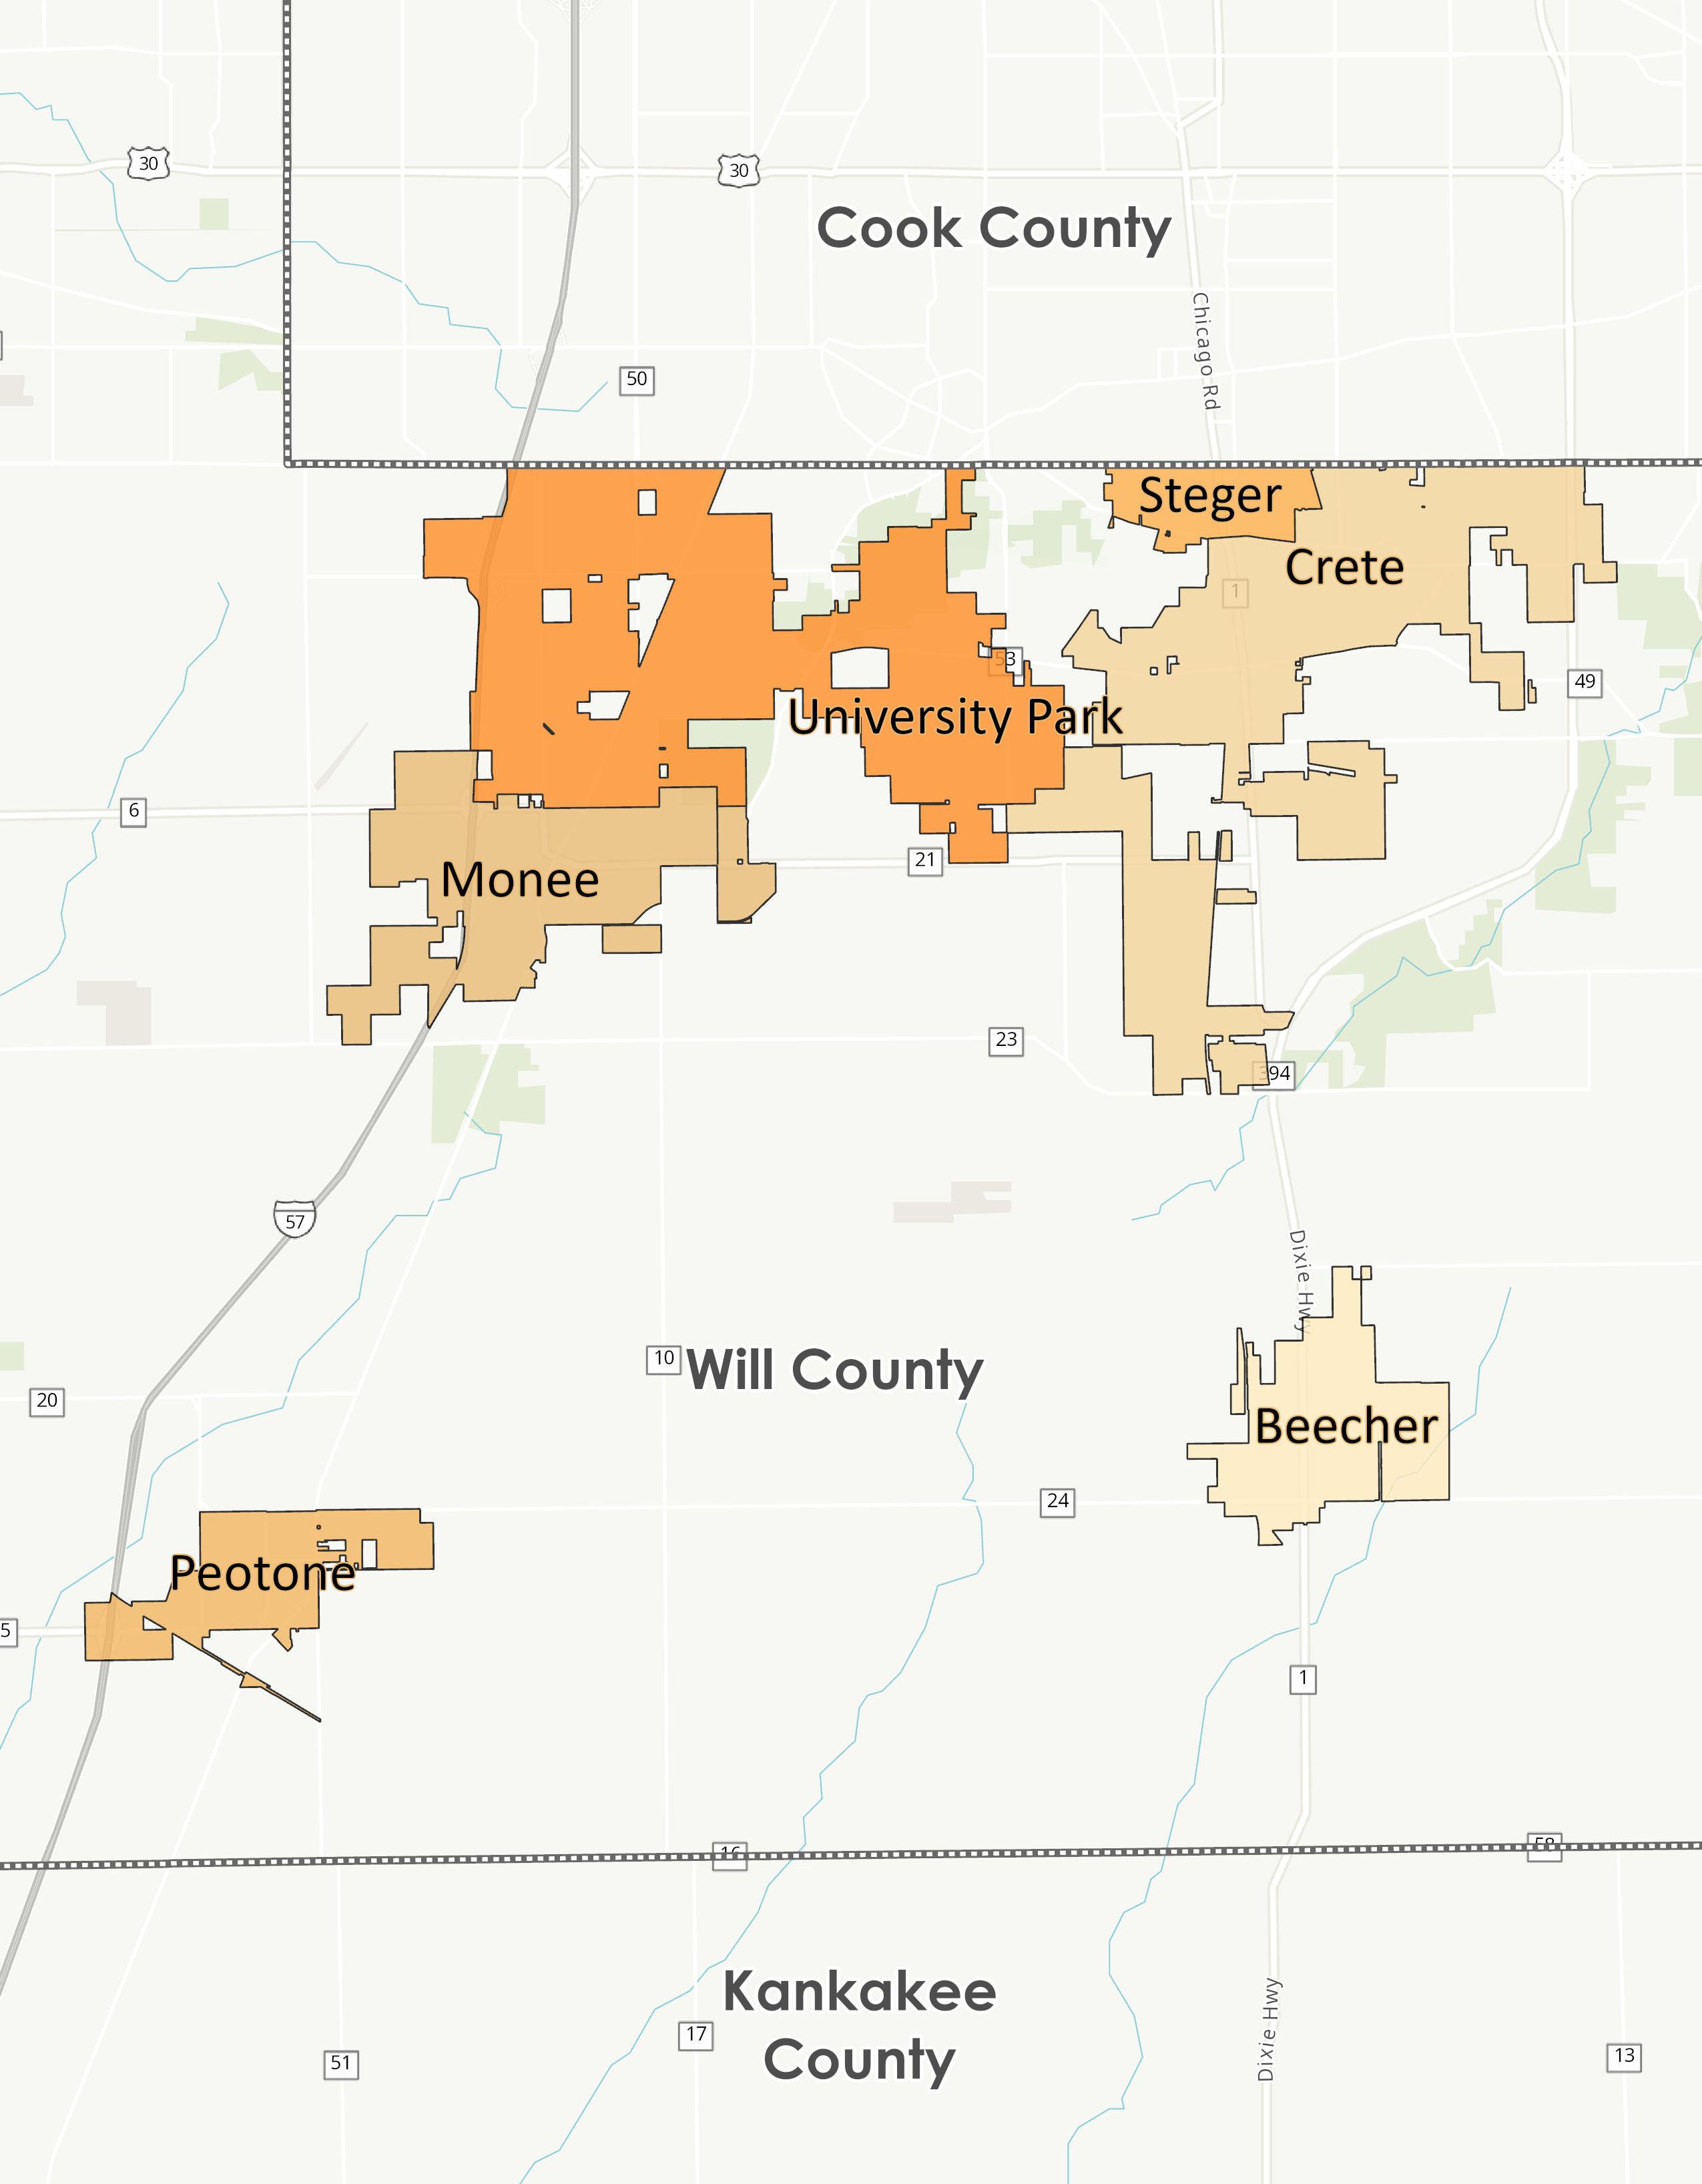
SOUTHEAST REGION
The Southeast Region is located in the southern portion of Southland, generally situated east of Interstate 57 and west of State Road 394. This region encompasses six villages located within Cook and Will Counties—Village of Monee, Village of University Park, Village of Steger, Village of Crete, Village of Peotone, and Village of Beecher. Combined, these places total 32.7 square miles, with a population density of 1,186 persons per square mile.
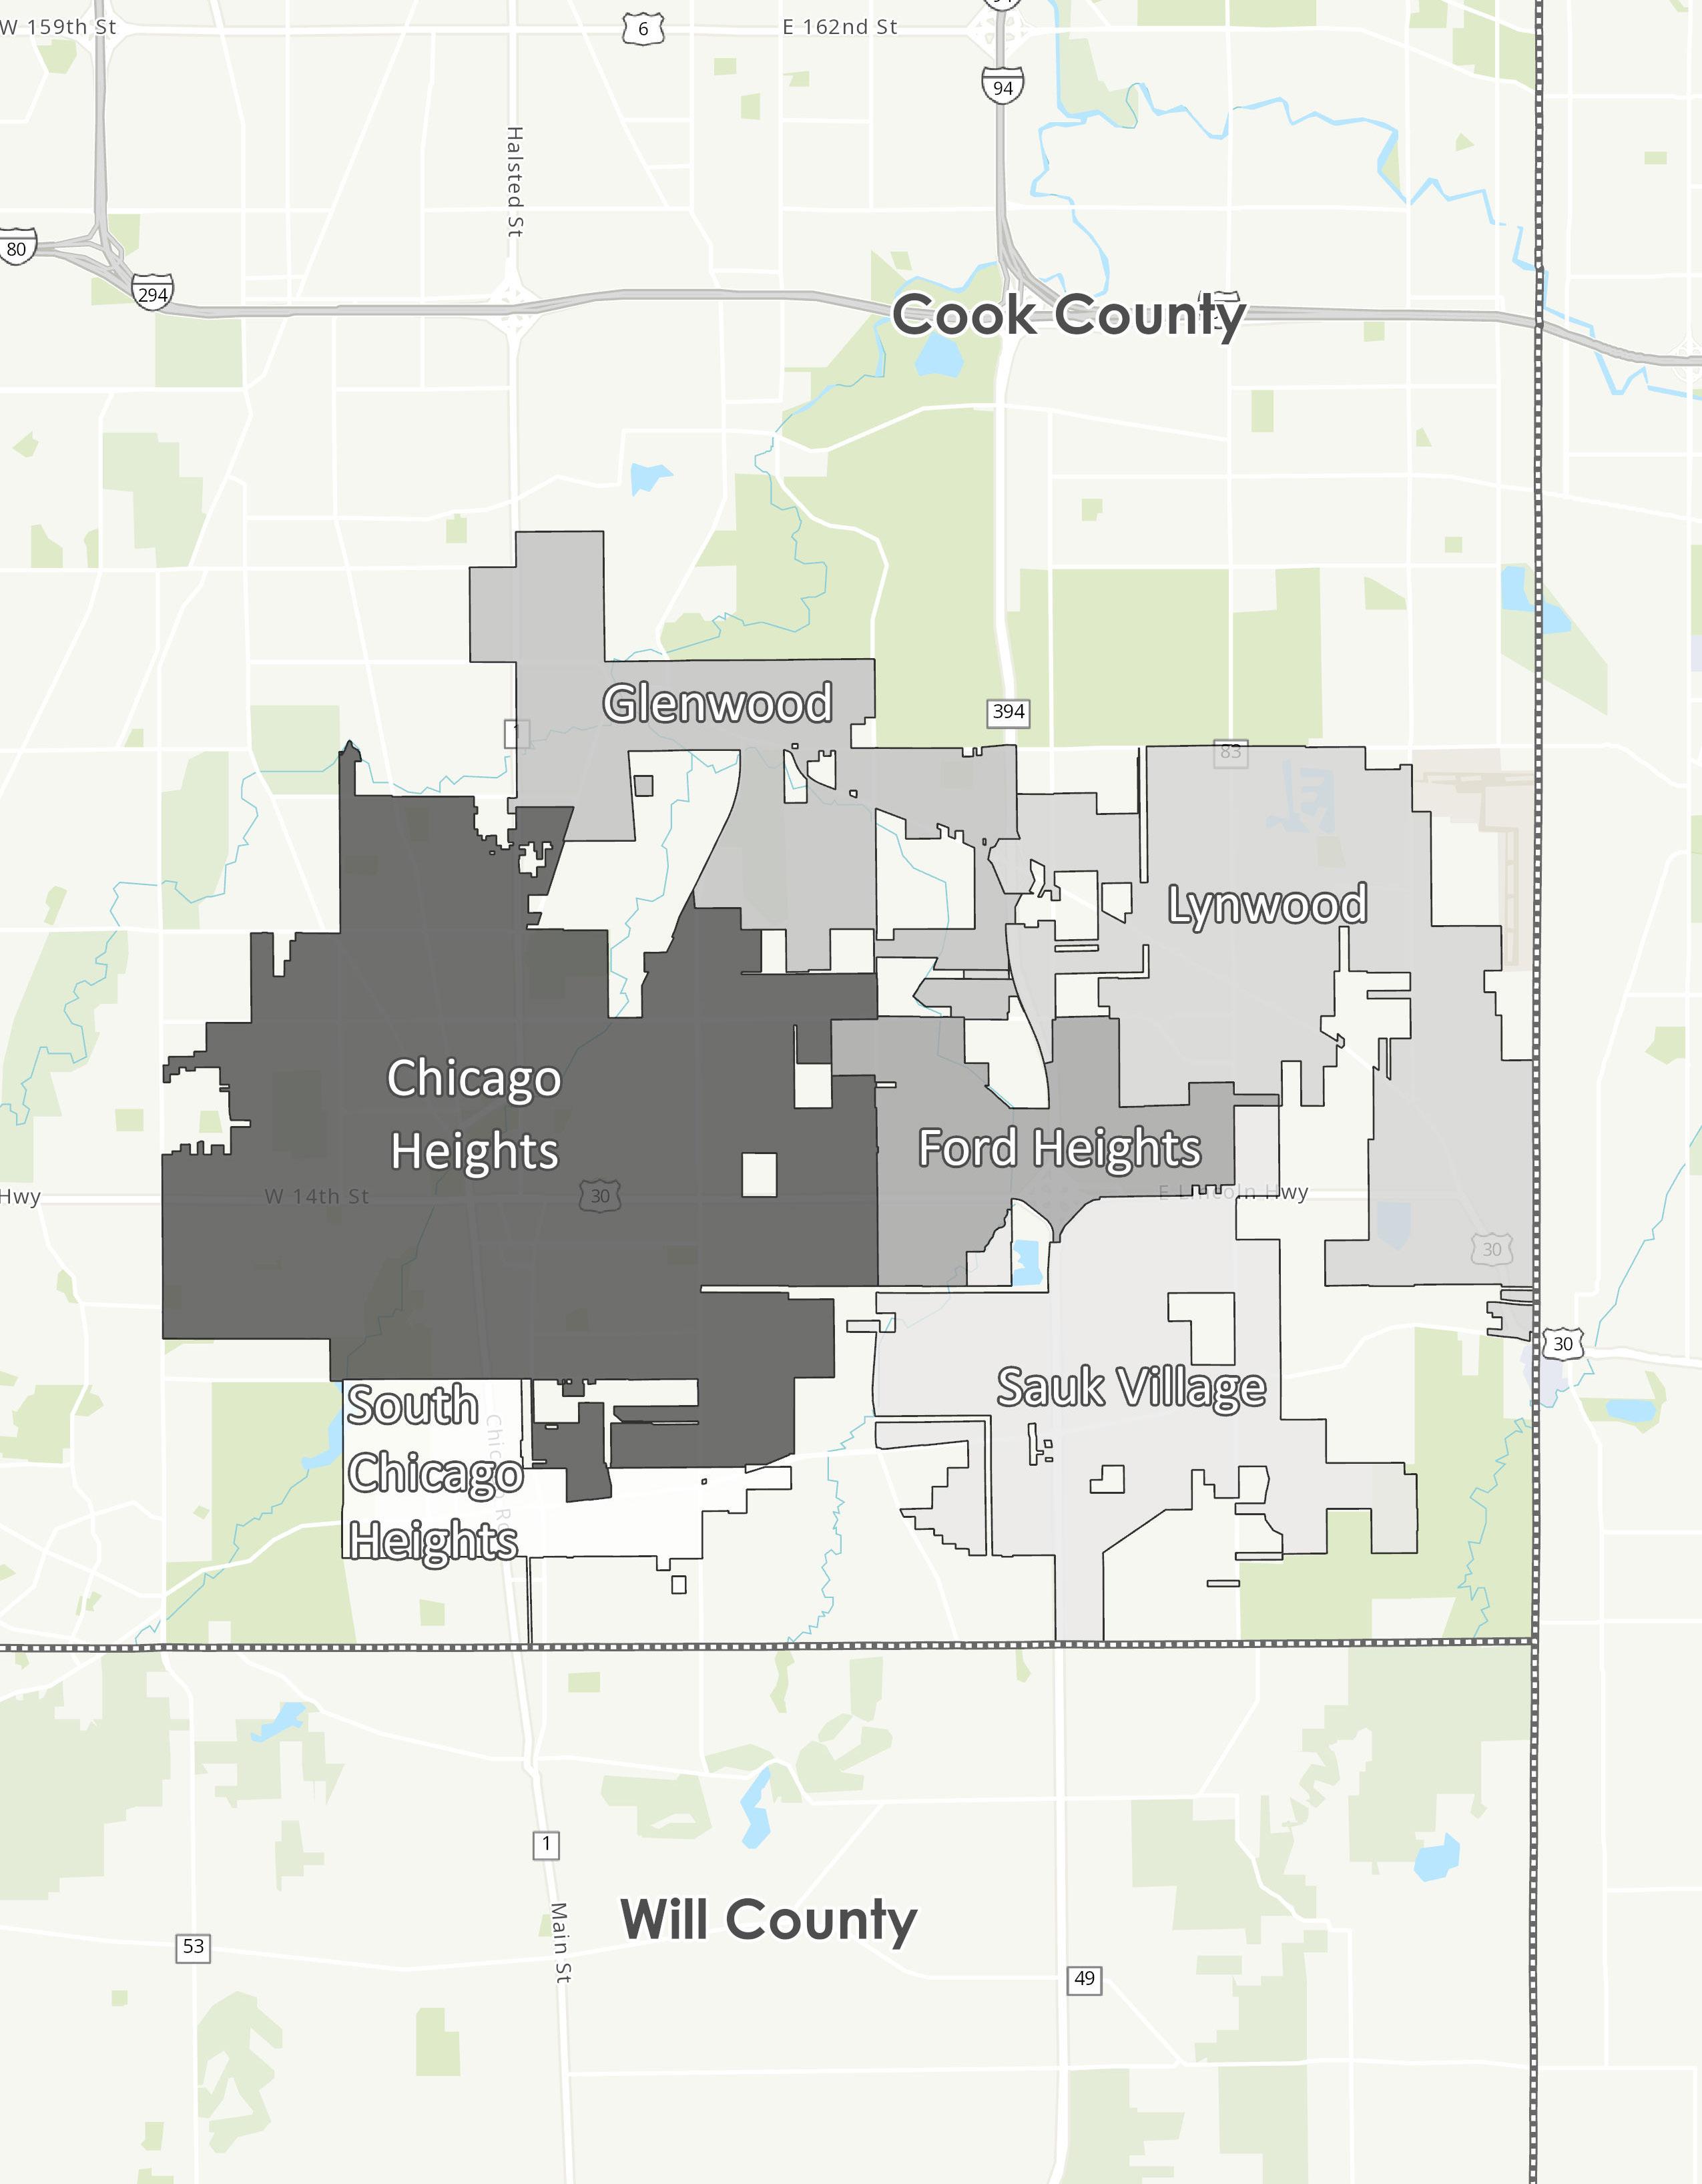
EAST CENTRAL REGION
The East Central Region is bounded by the Cook County border to the east and the Will County border to the south. This region encompasses six cities and villages all located within Cook County— City of Chicago Heights, Village of South Chicago Heights, Village of Ford Heights, Village of Sauk, Village of Lynwood, and Village of Glenwood. Combined, these places total 26.1 square miles, with a population density of 2,328 persons per square mile.
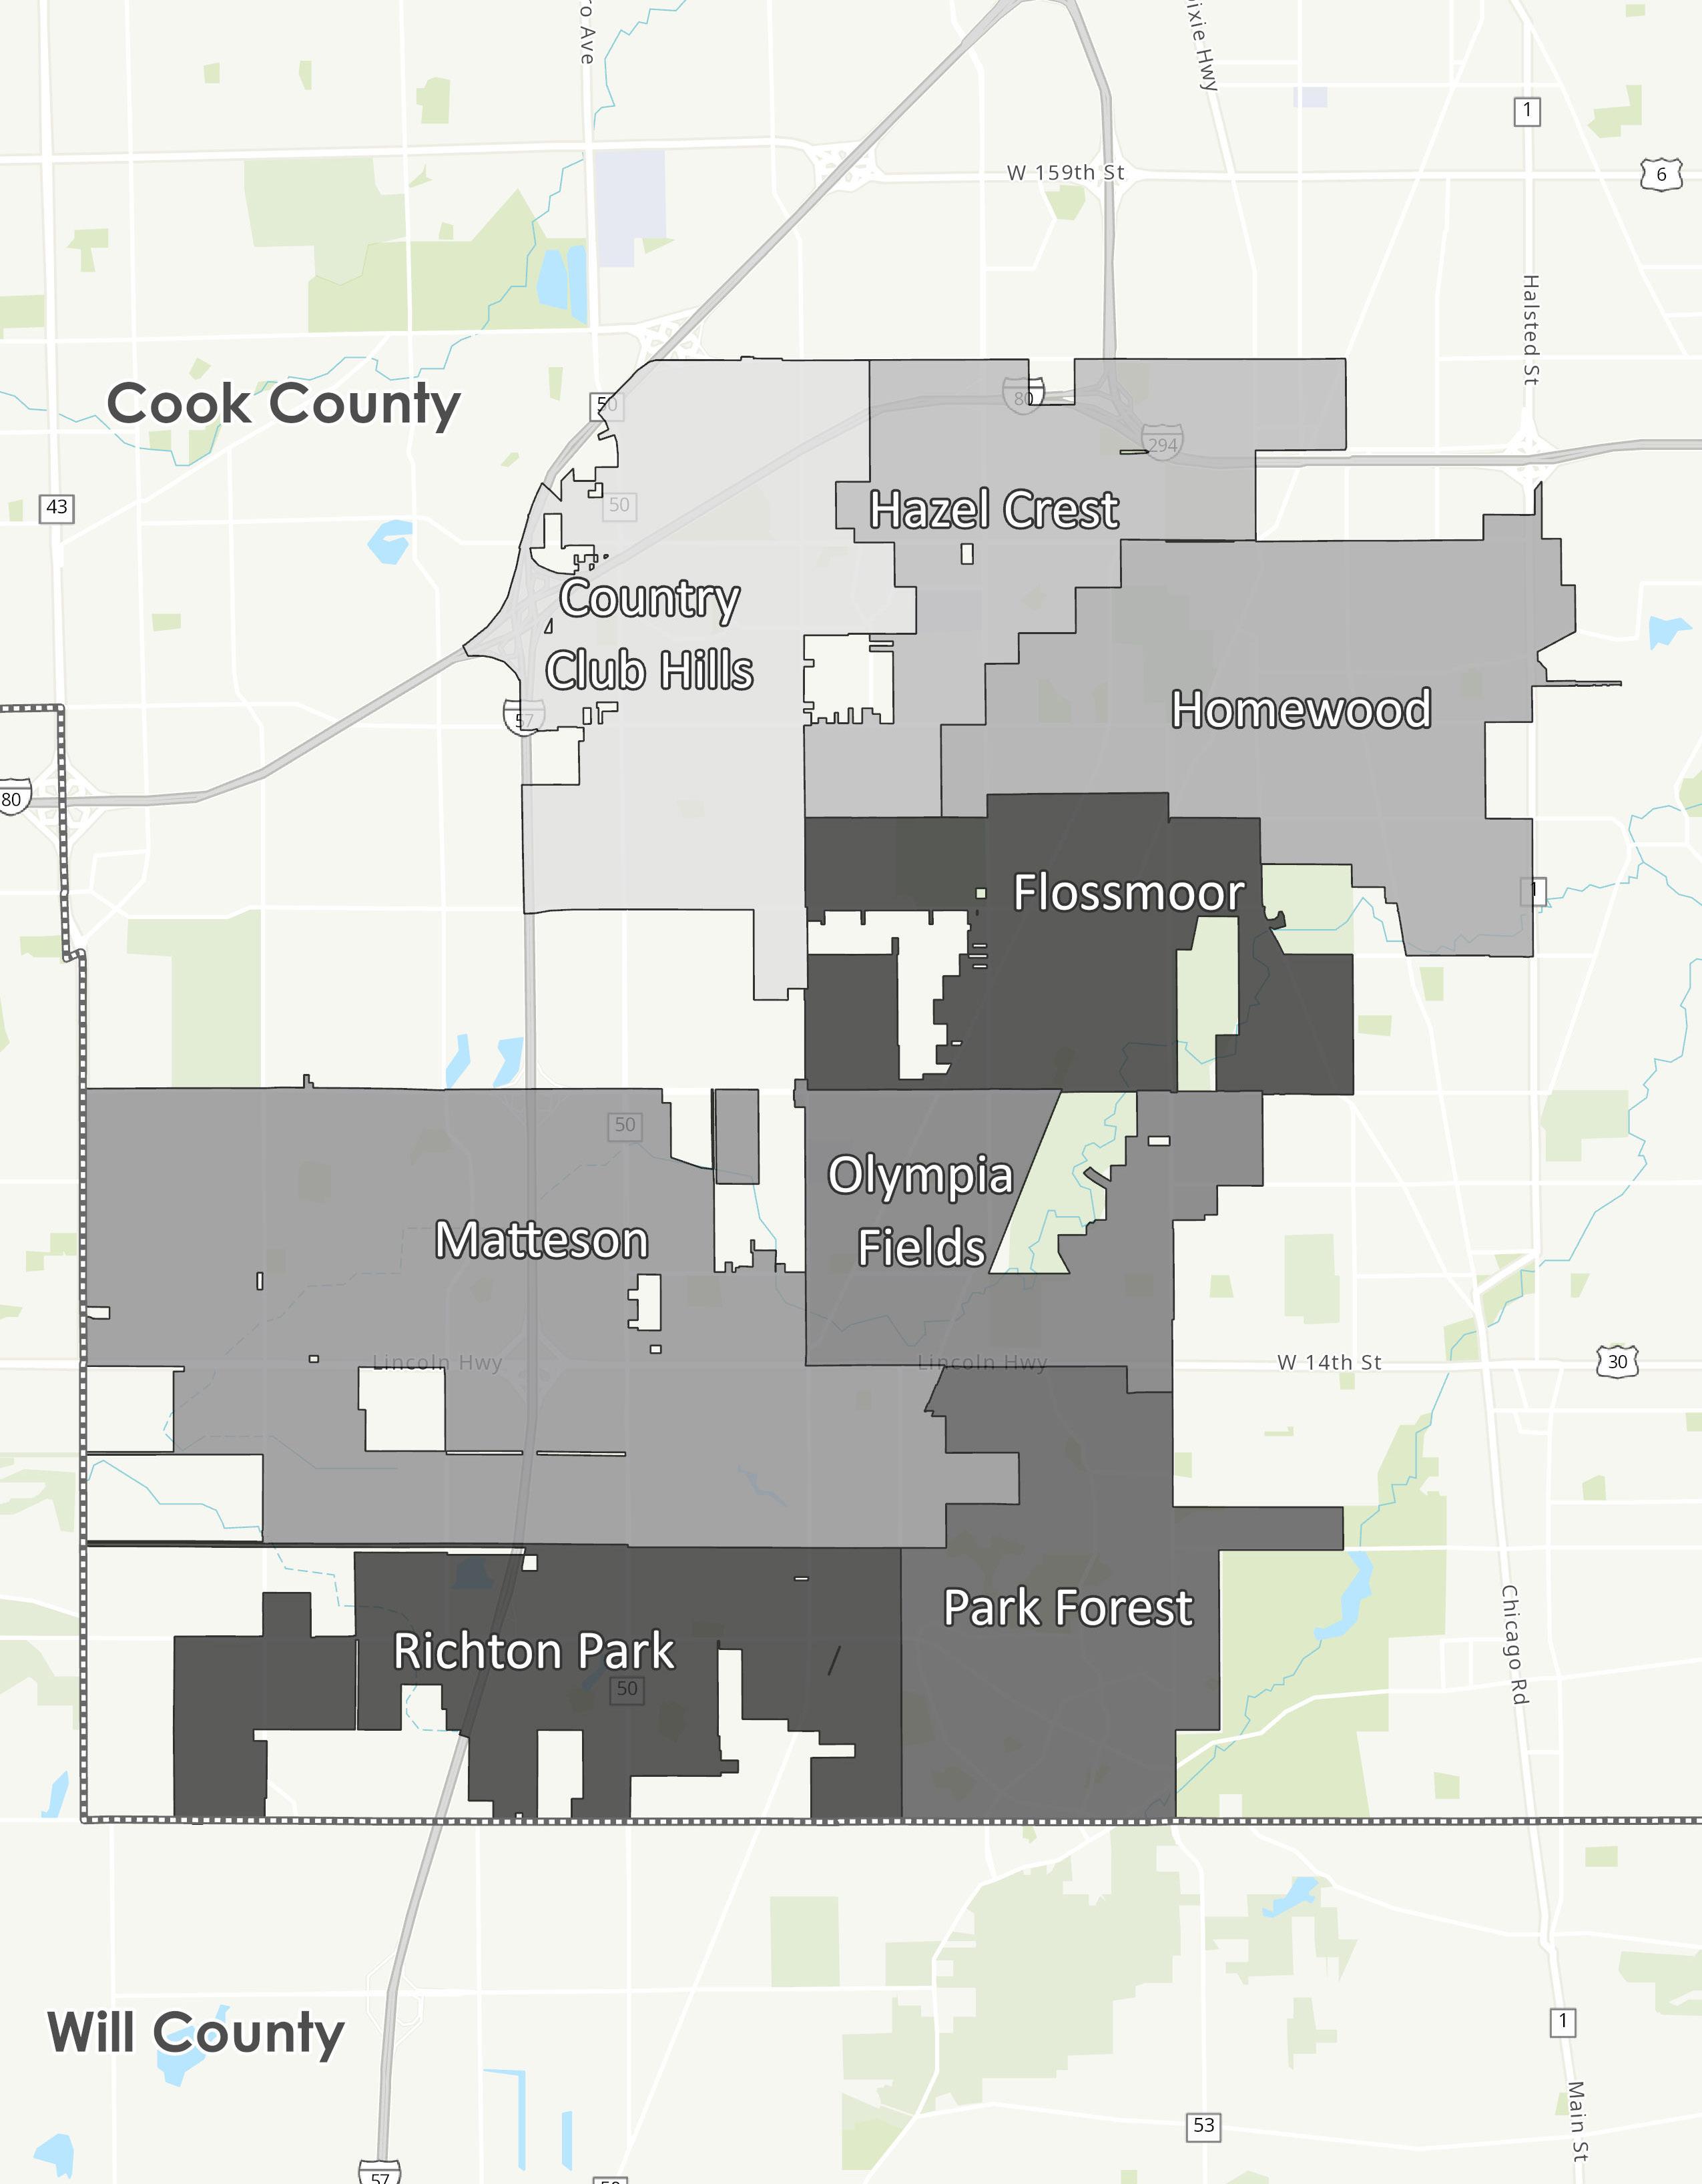
CENTRAL REGION
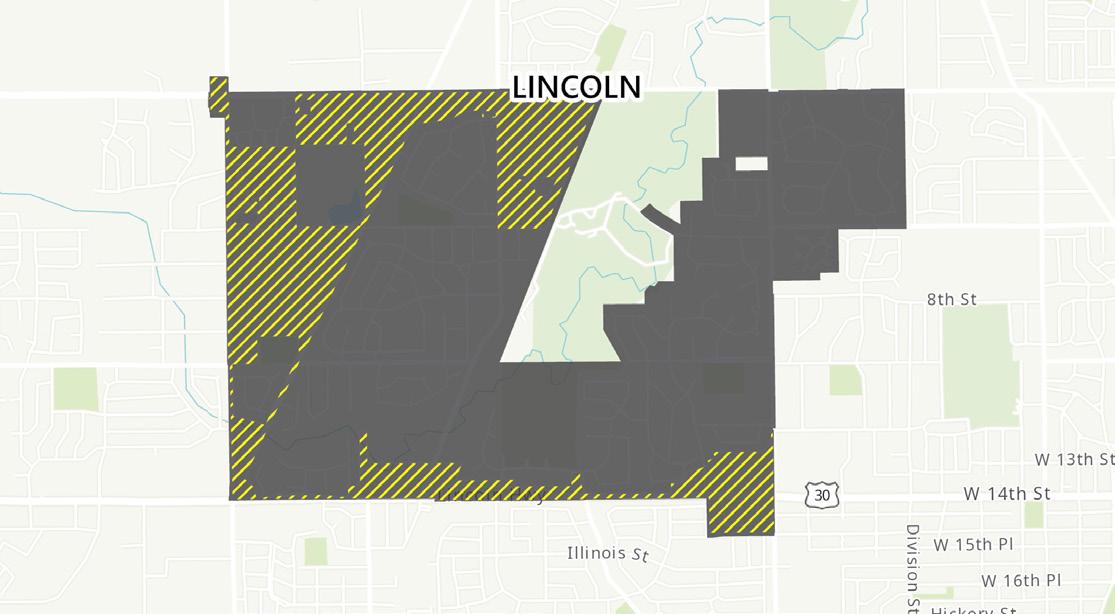
The Central Region is located in the central portion of Southland, generally situated south of Interstate 294 and east of Interstate 80. This region encompasses eight cities and villages located within Cook and Will Counties—Village of Park Forest, Village of Richton Park, Village of Matteson, Village of Olympia Fields, Village of Flossmoor, Village of Homewood, Village of Hazel Crest, and City of Country Club Hills. Combined, these places total 39.0 square miles, with a population density of 3,019 persons per square mile.
West Region
Northwest Region
North Central Region
Northeast Region
Southeast Region
East Central Region
Central Region
EMPLOYMENT TRENDS
EMPLOYMENT AND BUSINESS ACTIVITY | SOUTHLAND
The Southland Development Authority (SDA) is designed to drive comprehensive regional economic development, marshaling resources, managing strategy, and coordinating projects and initiatives in unparalleled ways across the Southland communities.”
Since launching, the SDA has continued to provide expertise and resources to help business owners, investors, and individuals achieve growth and prosperity within the Chicago Southland region. Simultaneously, the SDA has also been engaging in cross-sector collaboration to conceive and execute inclusive growth strategies—from industrial parks to innovation centers to comprehensive community development, offering financial support and guidance. These business strategies have helped attract a robust group of industries to Southland, such as Health Care and Social Assistance, Transportation and Utilities, Manufacturing and Logistics, Retail Trade, and Educational Services.
A diverse workforce and industry base within a market area can indicate healthy economic conditions, as it enhances the variety of available employment and interested companies in an area. The key components to employment to consider when analyzing the overall business and employment market include annual employment trends, jobs by industry sector, unemployment rate, and employee inflow/outflow within the area.
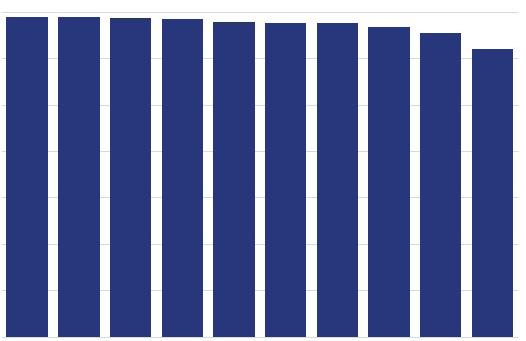
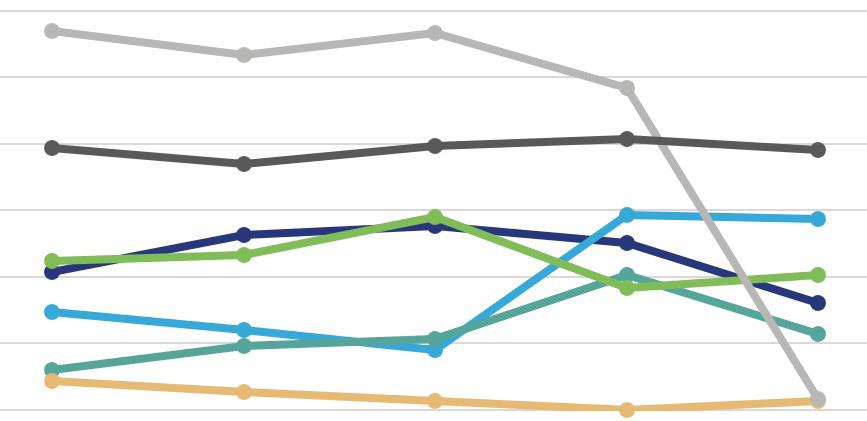
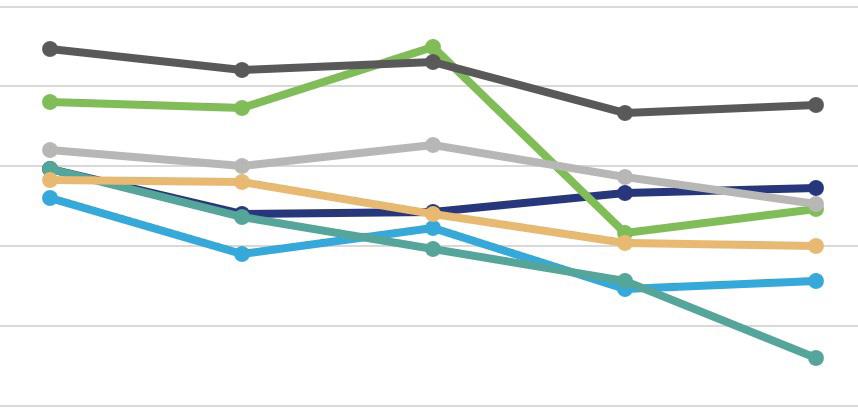
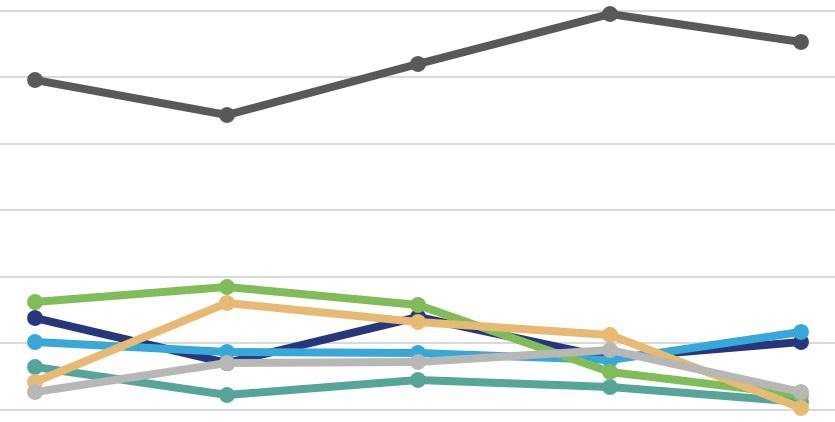
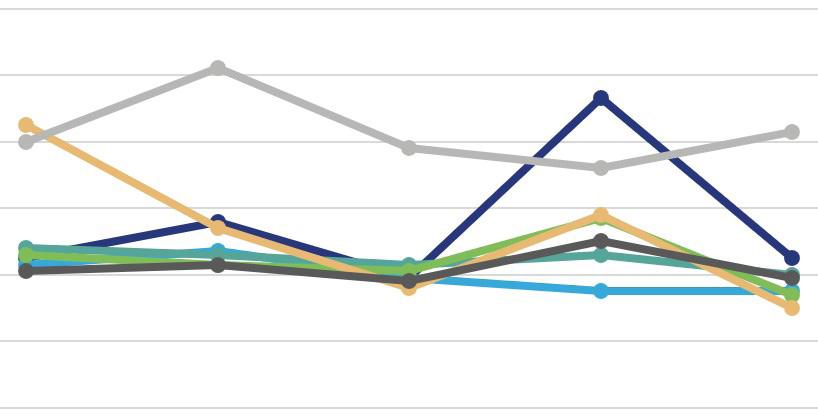
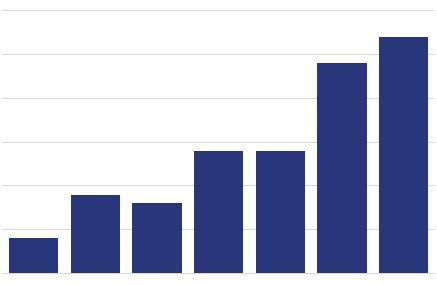
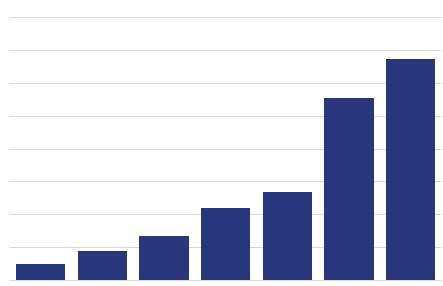
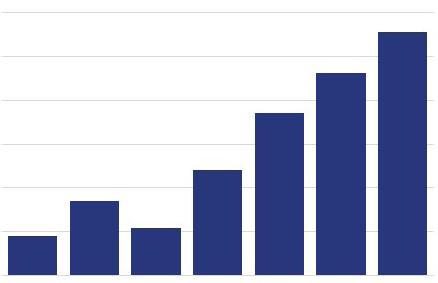
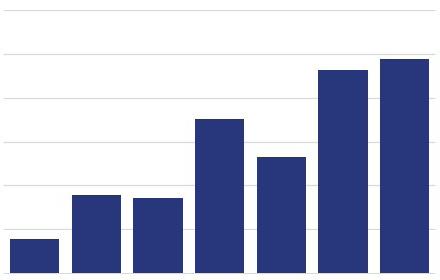
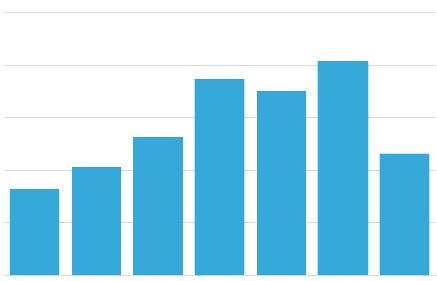
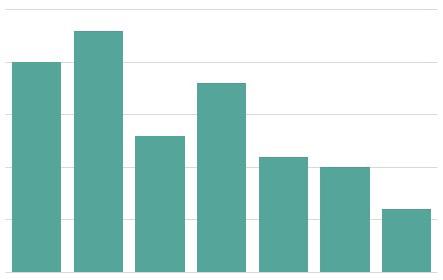
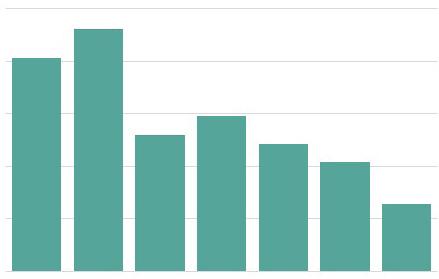
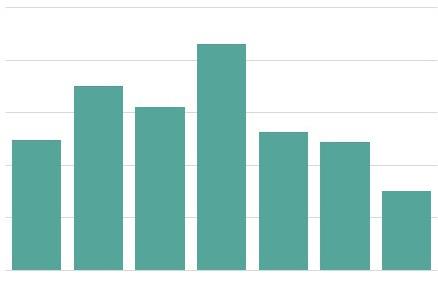
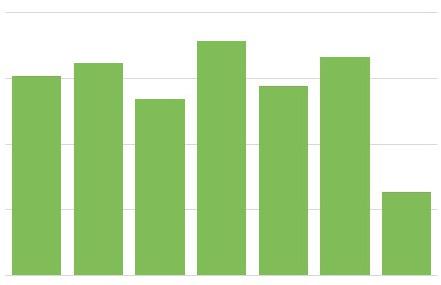
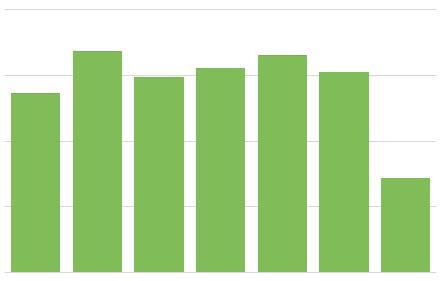
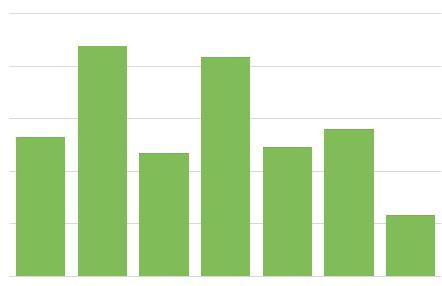
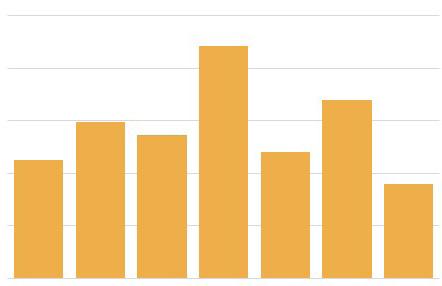
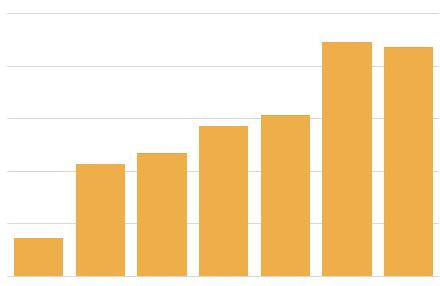
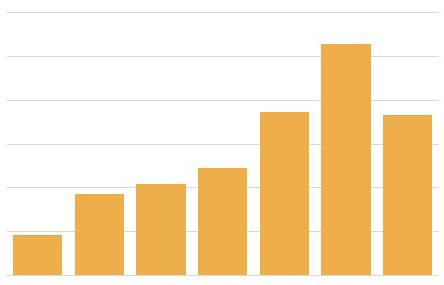
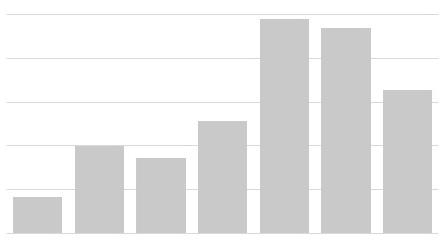
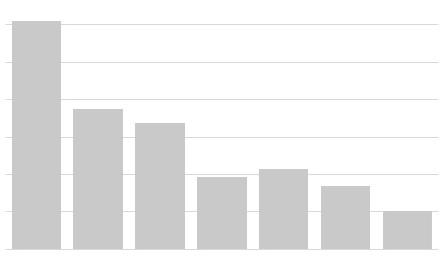
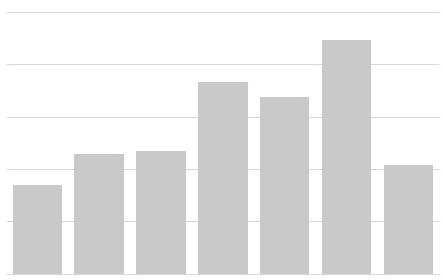
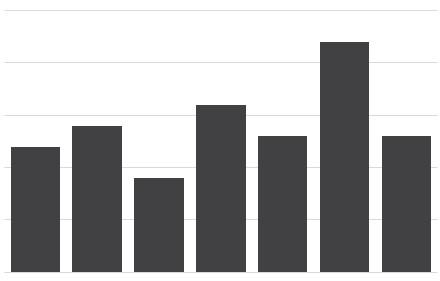
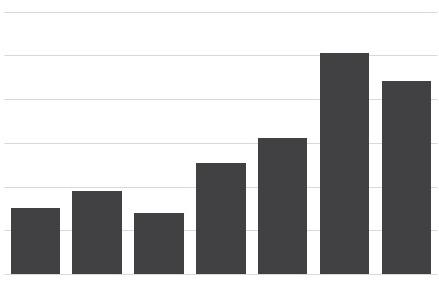
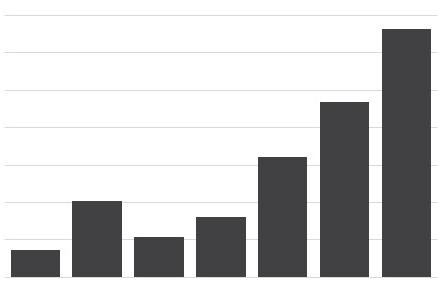
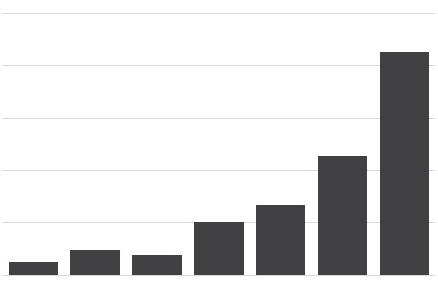
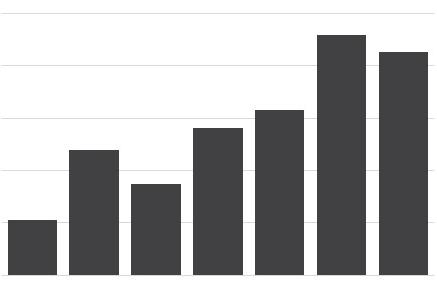
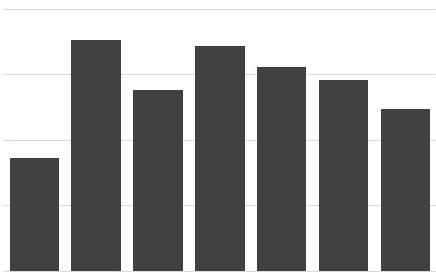
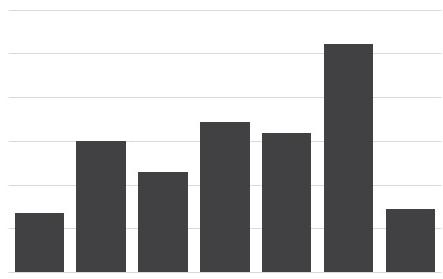
As of year-end 2022, there were nearly 20,000 businesses within Southland, employing over 310,820 persons within the labor force. Over the 10-year period, from 2013 to 2022, employment within Southland decreased by 10%, or 34,589 employees, as illustrated in the following figure.
During this same time frame, total employment experienced a negative compound annual growth rate (“CAGR”) of 1.0% since 2012. In addition, the unemployment rate within Southland—i.e., the total number of unemployed persons as a percentage of the Civilian Labor Force—was nearly 7.7% as of year-end 2022. To note, the unemployment rate within the Chicago MSA is comparable to that of Southland, at 4.7% as of year-end 2022. Additionally, the employment-to-population ratio—i.e., the number of workers currently employed against the total workingage population of a region—was nearly 0.50 within Southland as of year-end 2022; whereas, the employment-to-population ratio within Chicago MSA was almost identical at 0.49 during this same time frame.
The employee inflow/outflow data provided by the U.S. Census Bureau for year-end 2012 to 2019 indicated that Southland is traditionally a labor force provider as opposed to a labor force magnet. Since 2012, an average of 60.6% of Southland’s total employees commuted into the area to work (inflow); whereas, an average of 68.2% of the workers who lived inside Southland were employed elsewhere (outflow). This resulted in an annual average net outflow of 55,287 jobs between 2012 and 2019. This data serves as an indication of the efficiency of the respective area’s labor force.
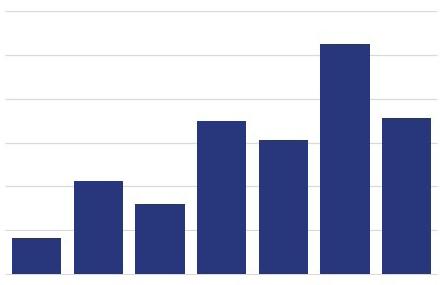
CONSUMER SPENDING | SOUTHLAND
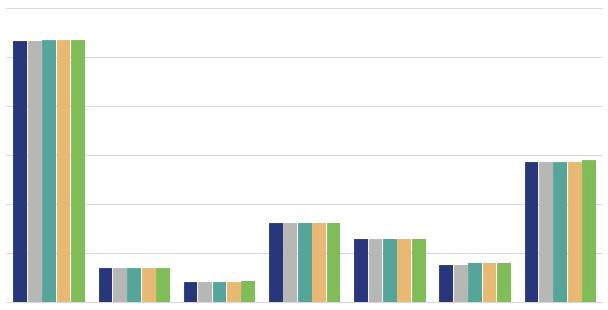
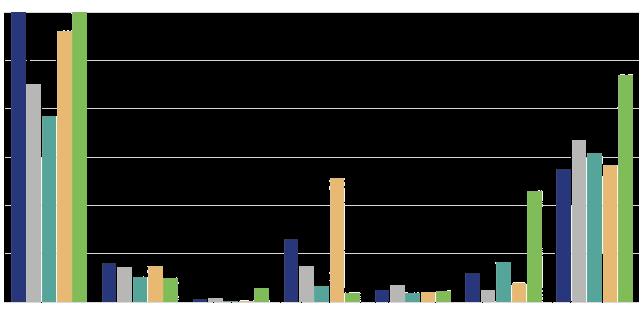
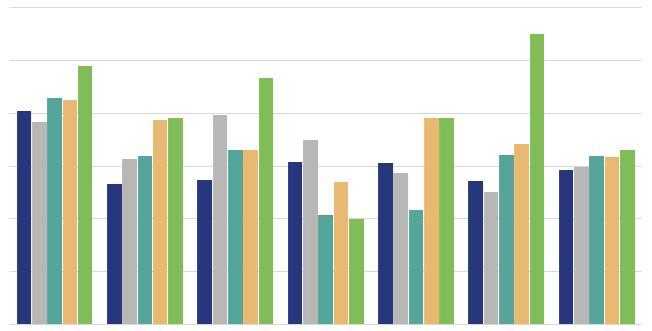
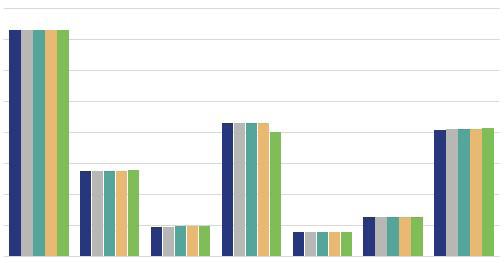
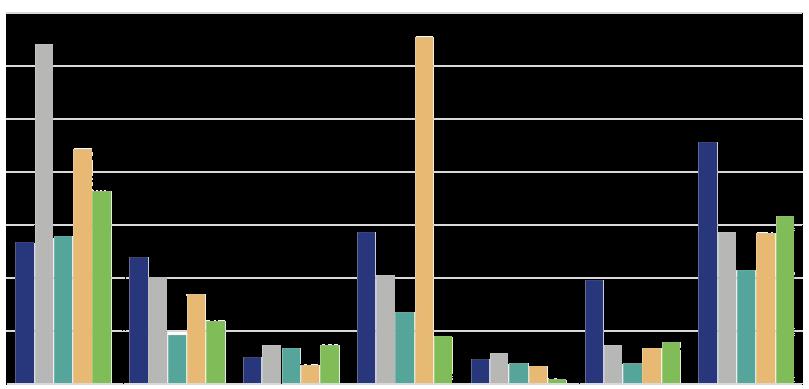
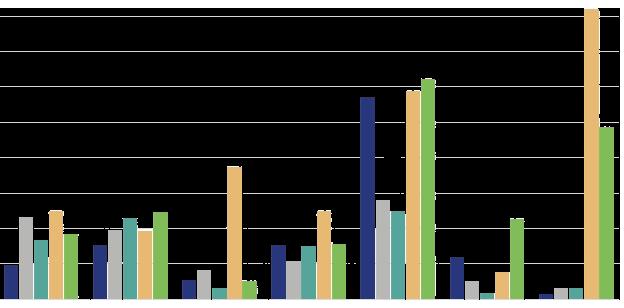
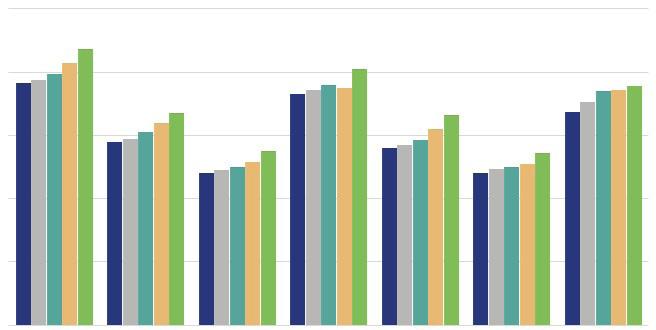
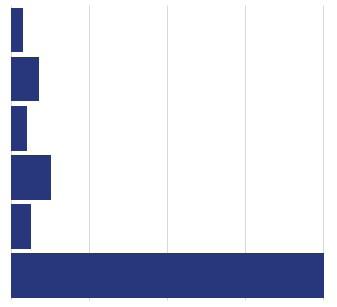
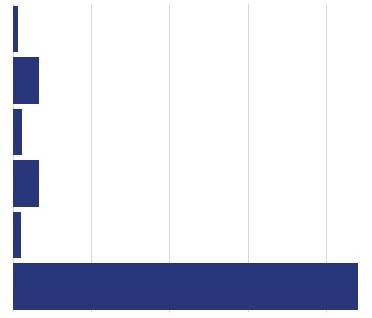
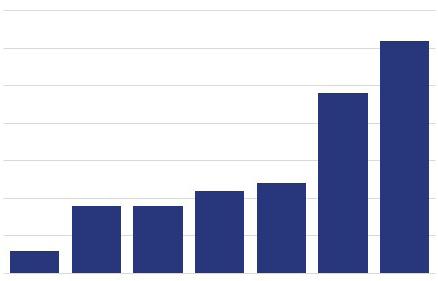
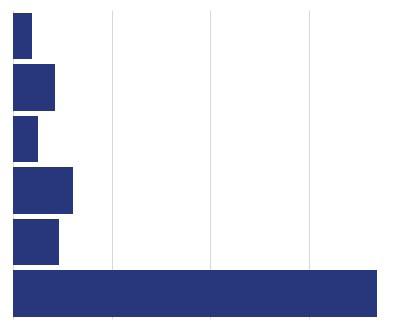
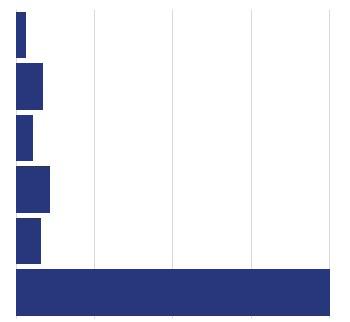
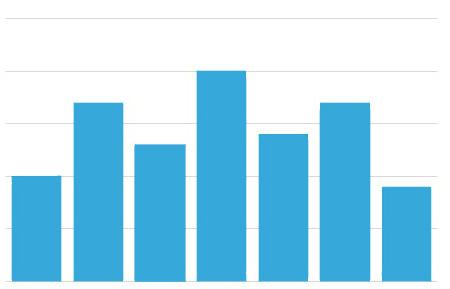
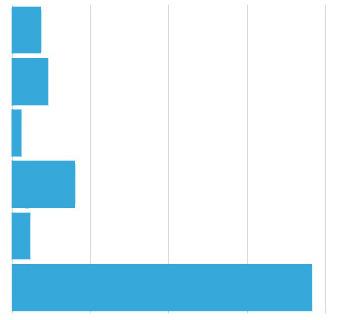
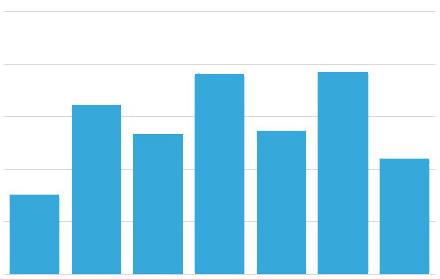
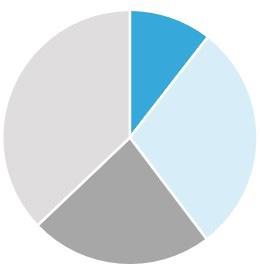
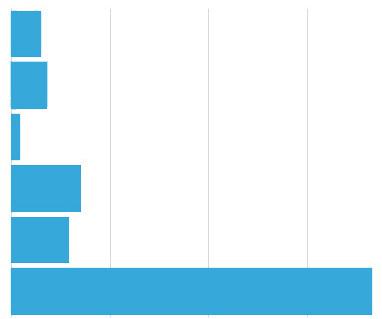
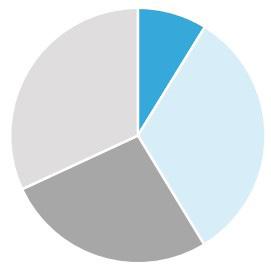
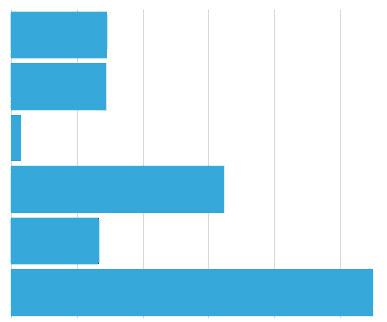
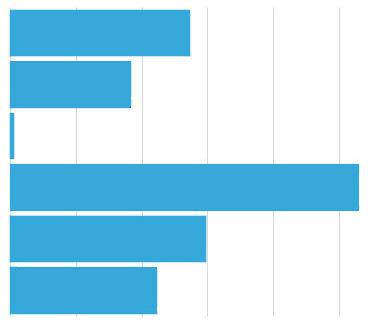
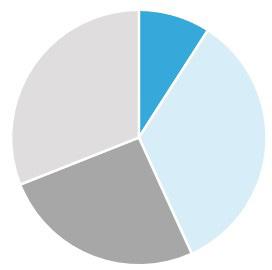
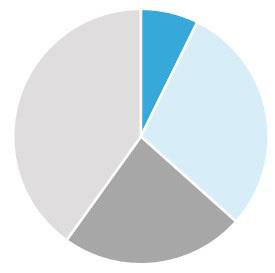
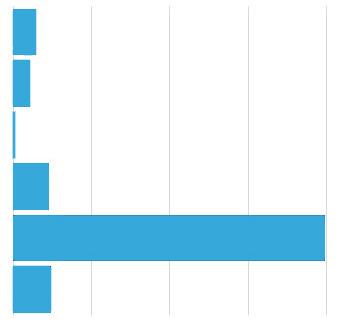
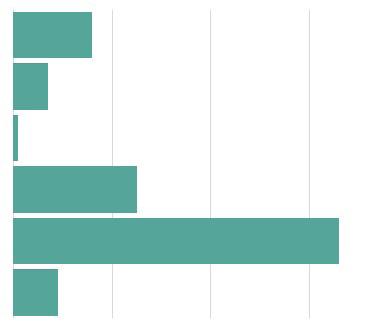
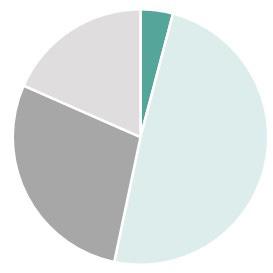
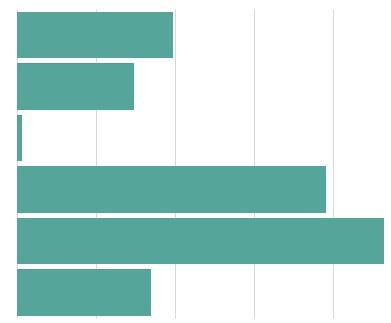
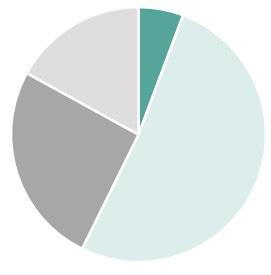
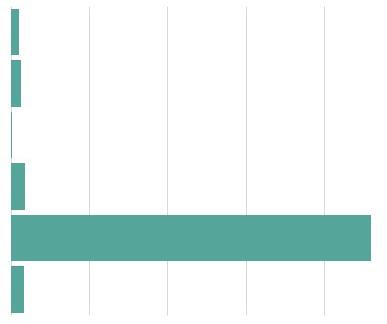
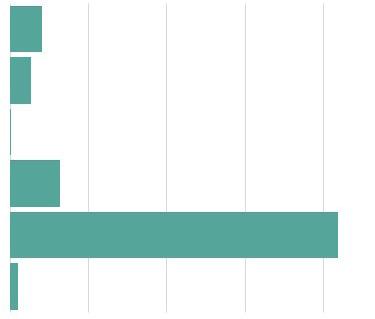
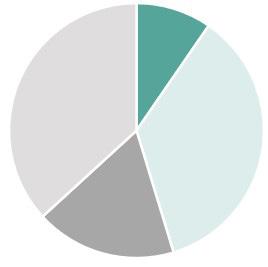
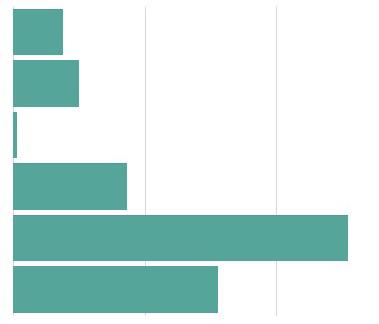
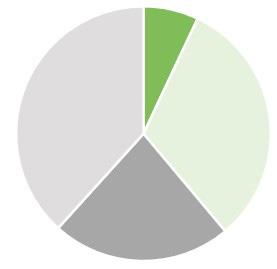
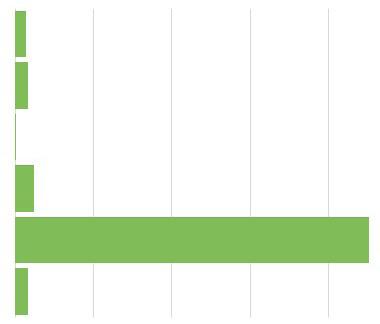
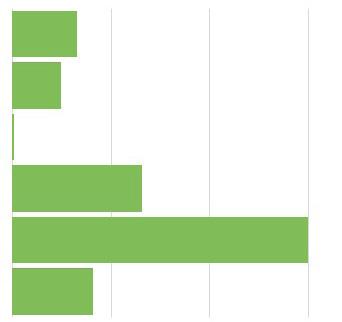
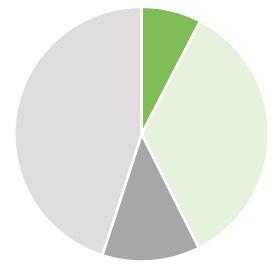
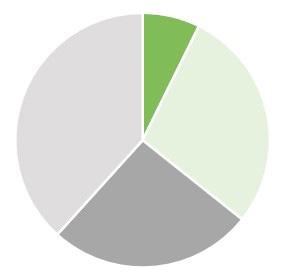
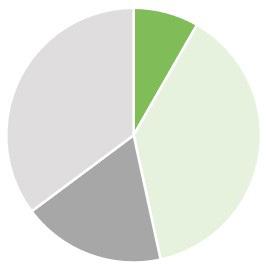
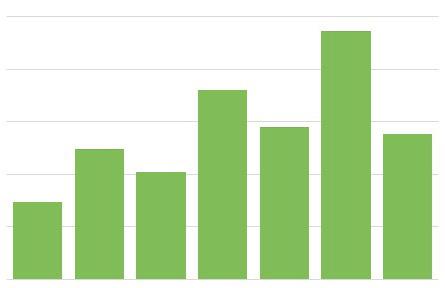
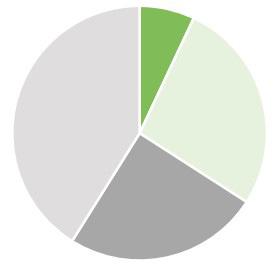
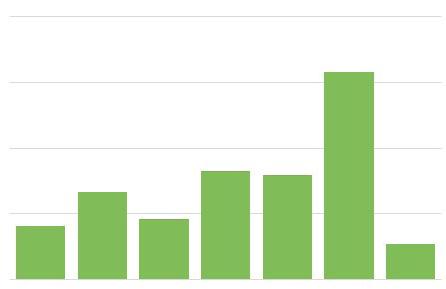
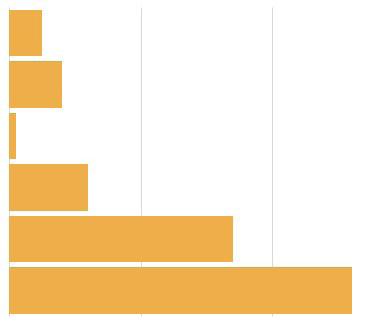
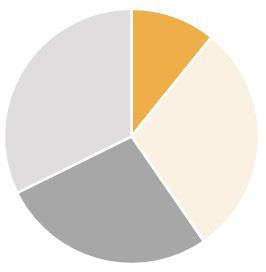
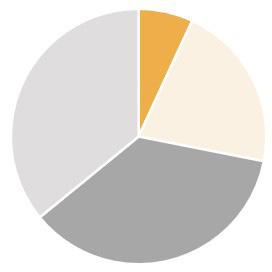
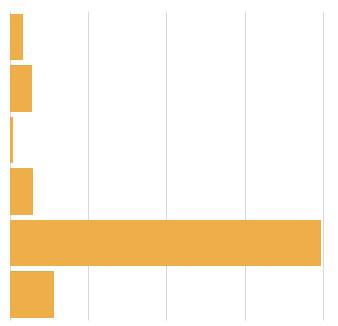
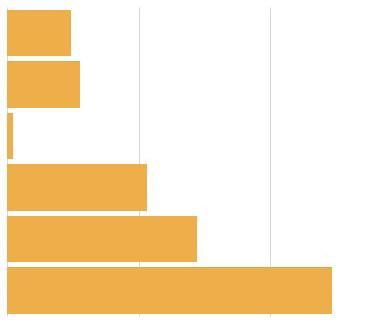
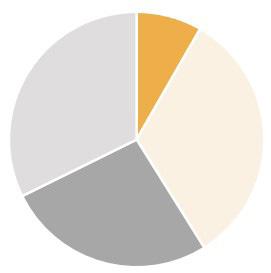
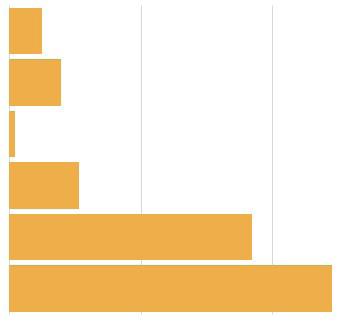
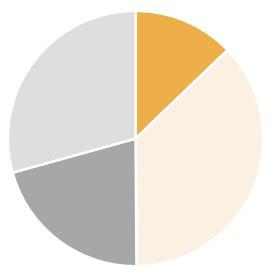
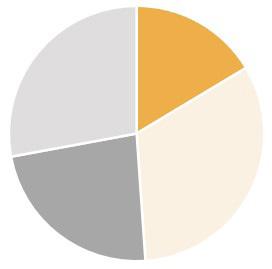
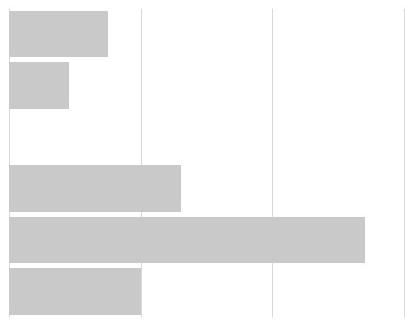
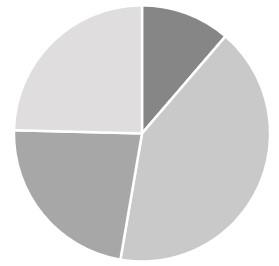
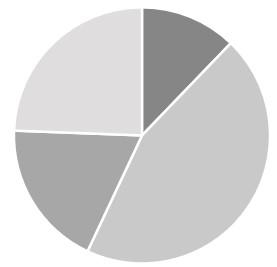
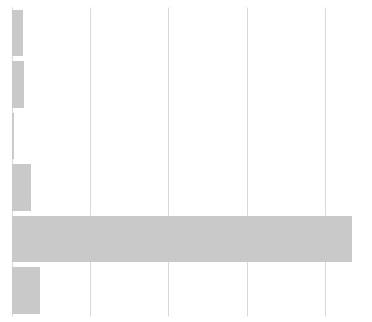
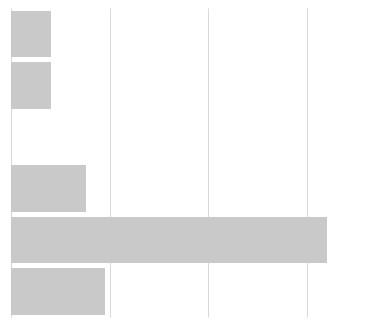
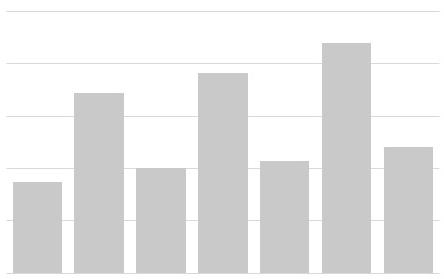
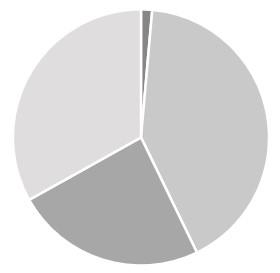
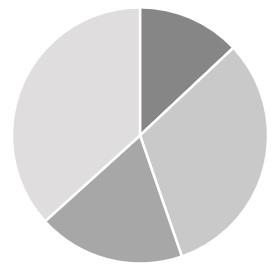
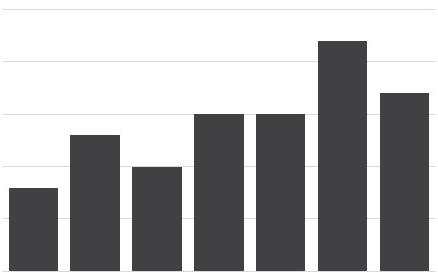
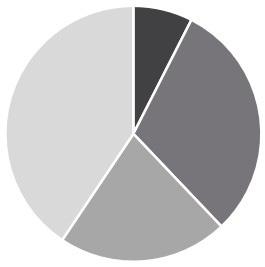
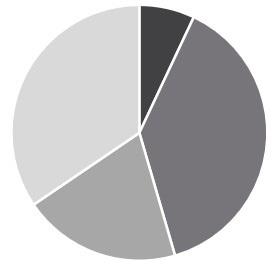
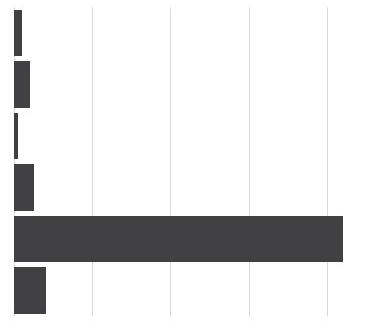
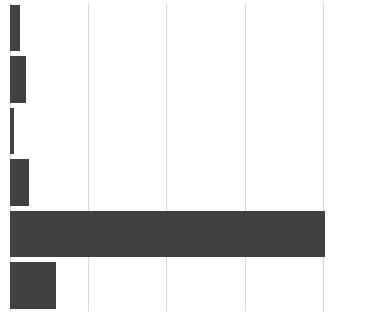
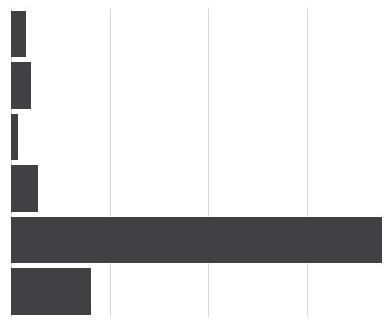
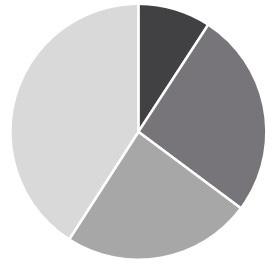
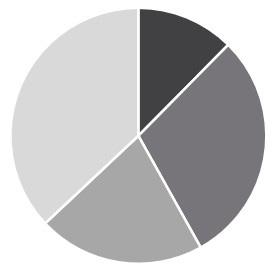
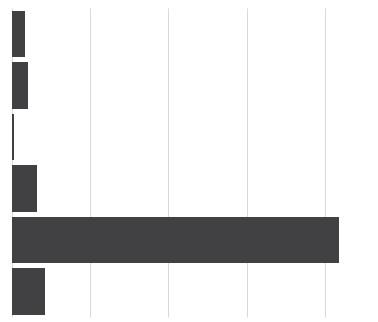
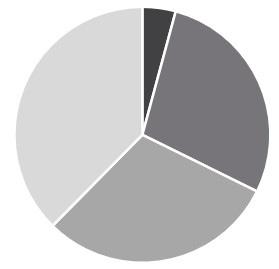
As of year-end 2022, total expenditures by residents within Southland were estimated to be about $19.76 billion—with consumers spending about 32% on housing, 30% on retail goods, 12% on food away and at-home, 11% on transportation and travel, 8% health care and social assistance, and 4.1% on entertainment and recreation. In addition, total expenditures within Southland make up approximately 8.7% of the consumer spending within combined Will County and Cook County, with over $228.3 billion in total expenditures as of year-end 2022.
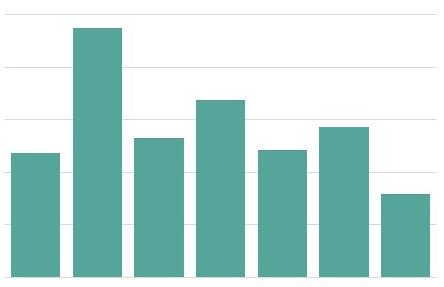
Southland’s average consumer spending for year-end 2022 is represented in millions within the adjacent figure.
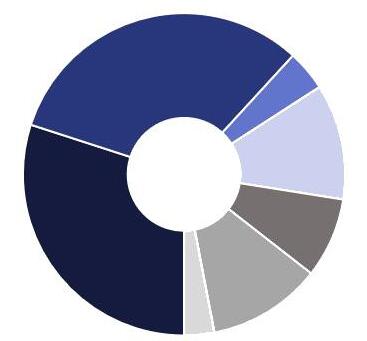
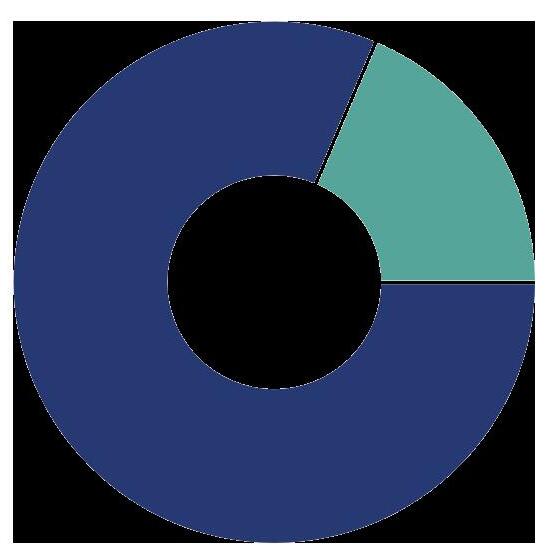
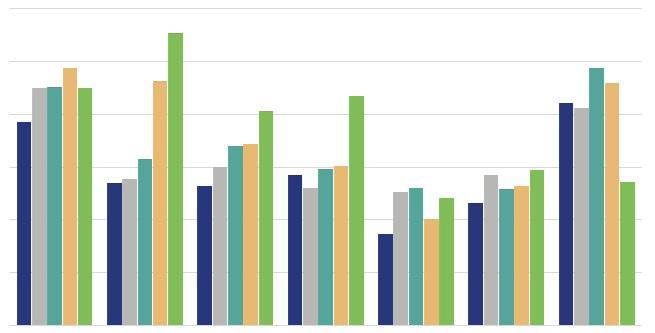
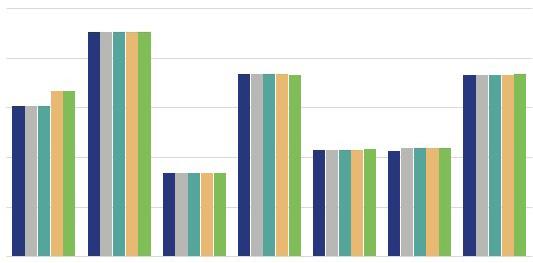
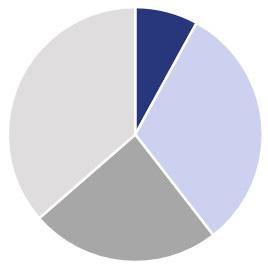
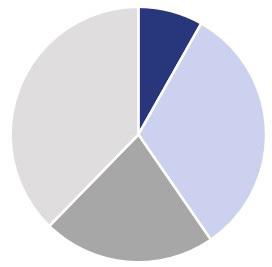
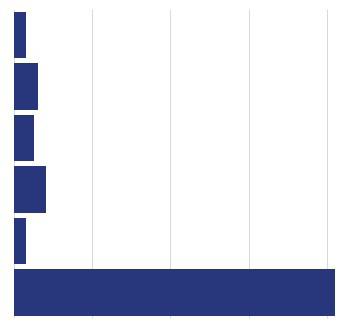
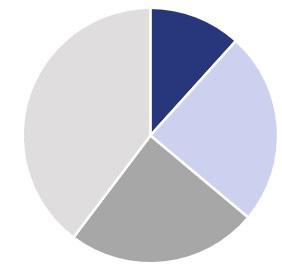
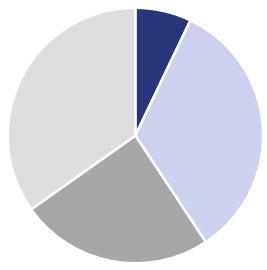
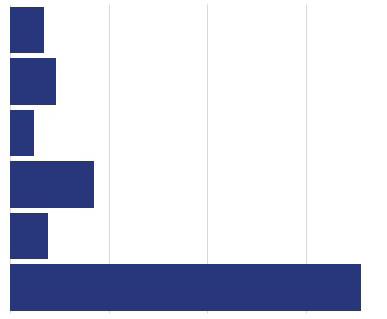
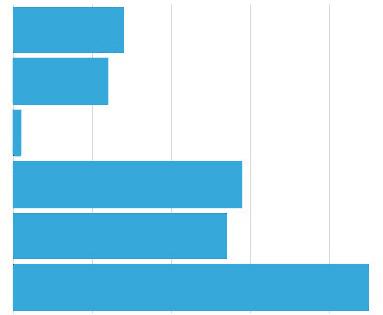
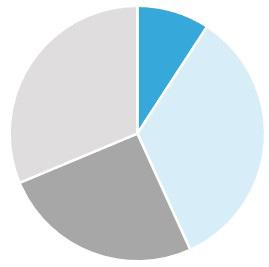
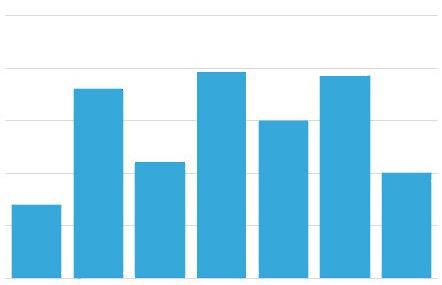
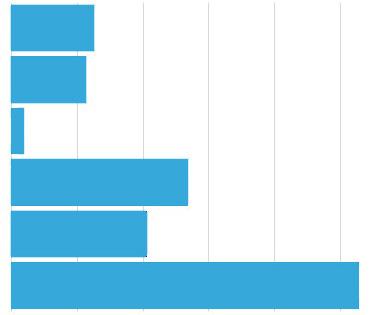
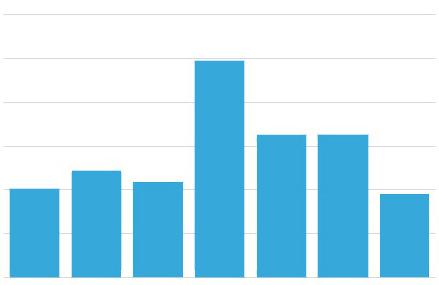
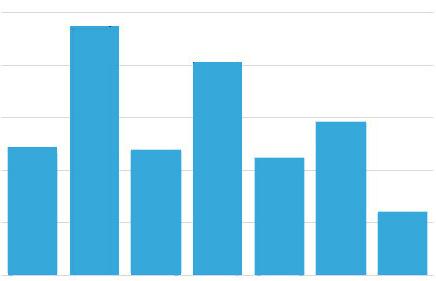
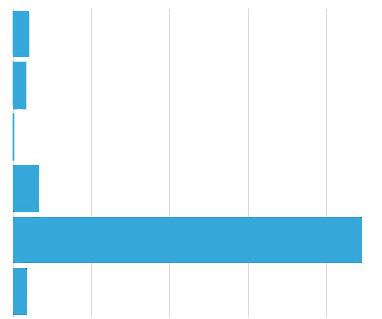
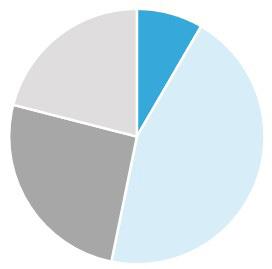
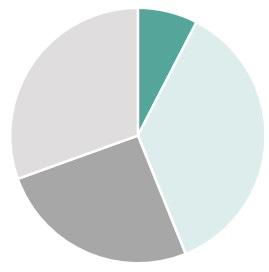
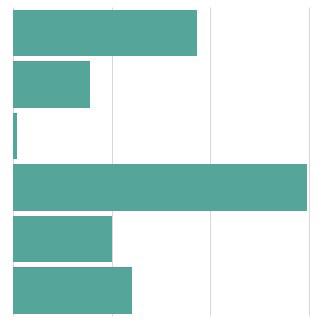
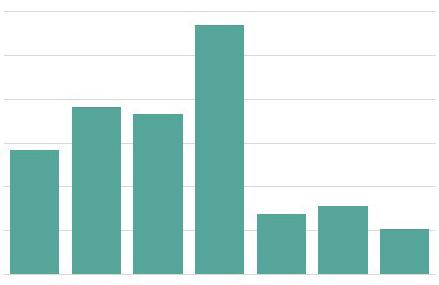
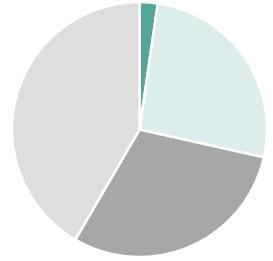
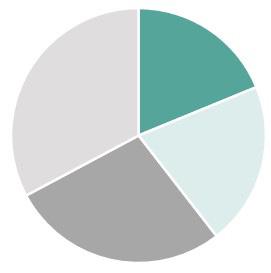
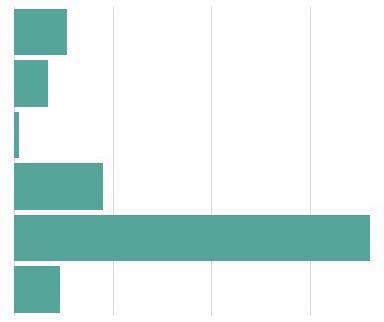
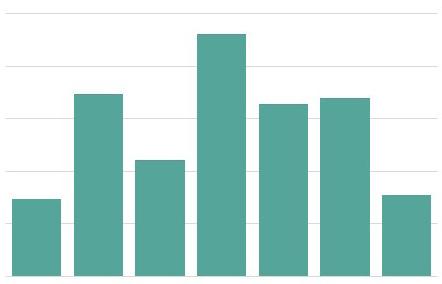
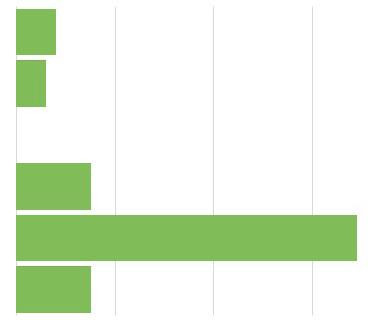
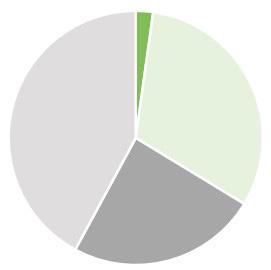
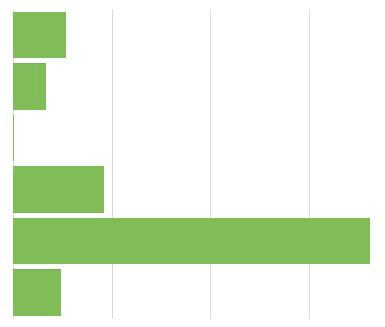
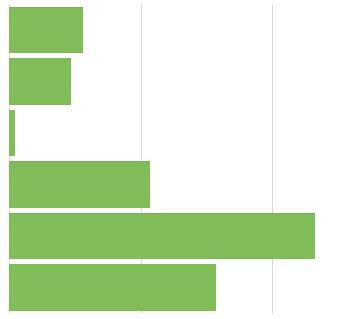
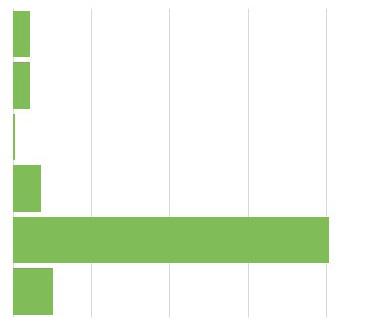
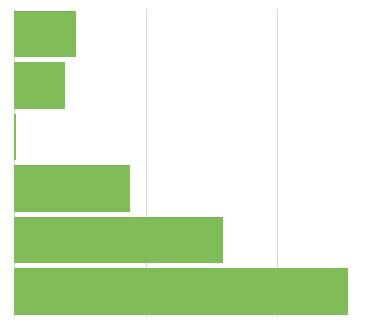
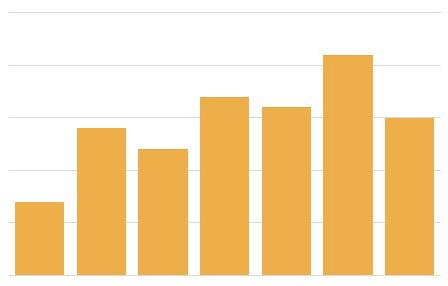
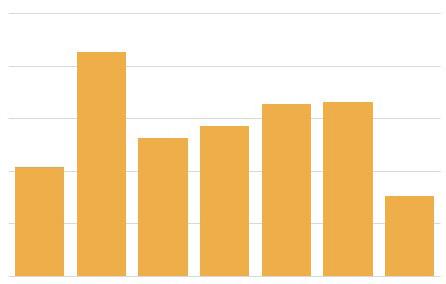
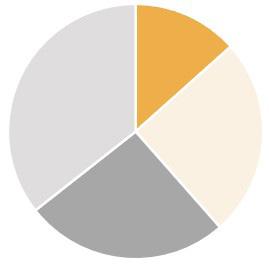
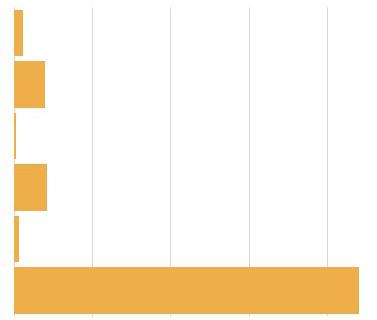
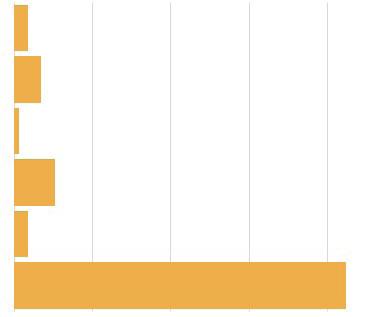
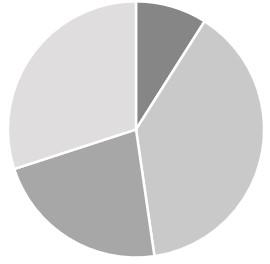
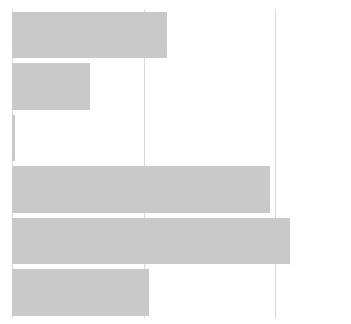
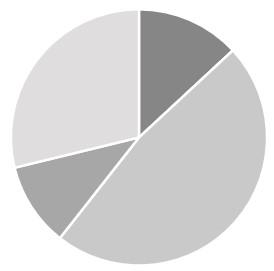
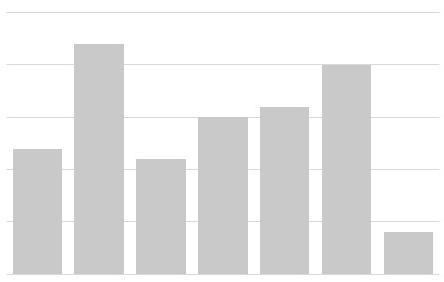
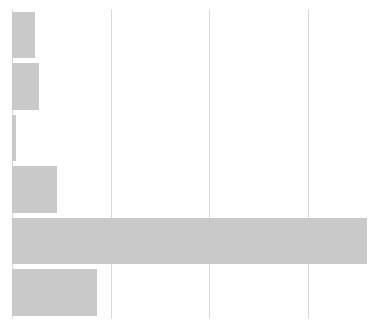
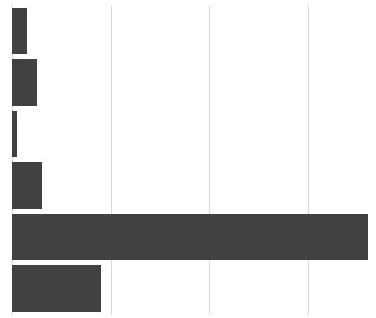
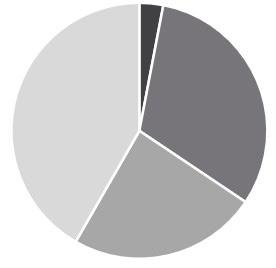
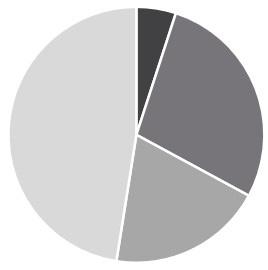
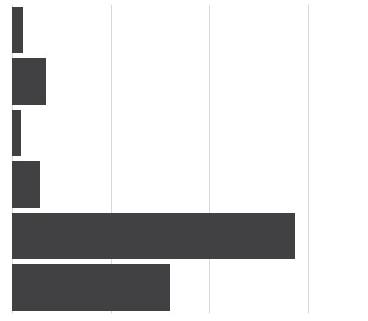
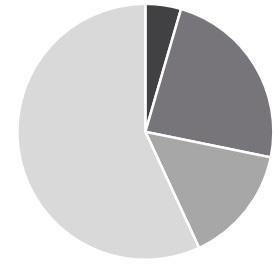
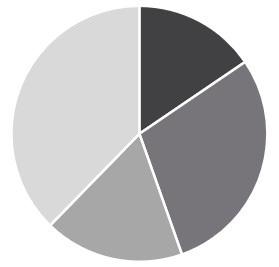
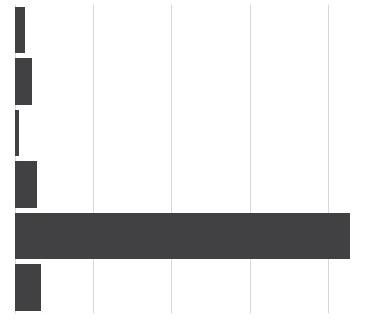
As of year-end 2022, the West Region composed a significantly larger share of total employment within Southland, at 29.9%, followed by the Central Region, Northeast Region, and Northwest Region with 18%, 17%, and 14%, respectively, of the total employment within Southland. The East Central Region and North Central Region composed modest shares at 8.4% and 6.5%, respectively, of Southland’s total employment. The Southeast Region contained the smallest share of total employment within Southland at 6.3%, as illustrated in the table below.
Health care and social assistance, transportation and utilities, retail trade, and educational services are the primary industry sectors within Southland, composing 49.3% of the total share of employment.
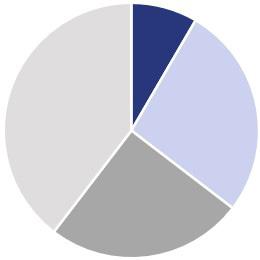
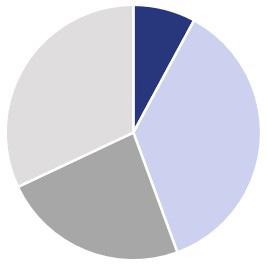
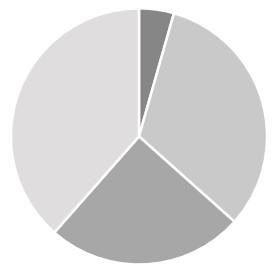
Generally, professional employment includes the following industry sectors—information; finance and insurance; real estate and leasing; professional services; management of companies; administration, support, and waste management; and educational services. Southland’s professional workforce comprised 27% of total employment as of year-end 2022. Comparatively, the construction, manufacturing, transportation and utilities, wholesale trade, retail trade, and health care and social assistance industry sectors composed 57% of total employment, which is consistent with Southland’s image as a major manufacturing, logistics, and service center.
Across Southland’s sub-regions, the major industry sectors include retail trade, manufacturing, and health care and social assistance; these combined industry sectors compose an average
of 38% of the total share of employment in each of Southland’s sub-regions. Comparatively, the smallest industry sectors across Southland’s sub-regions include management of companies and enterprises, agriculture and mining, and arts, entertainment, and recreation. These combined industry sectors compose an average of only 1.6% of the total share of employment in each of Southland’s sub-regions.
In addition, the North Central Region comprises the largest share of construction service employees; the West Region contains the largest share of professional, scientific and technical services employees; the Central Region comprises the greatest share of educational service employees; and the East Central Region contains the largest share of accommodation and waste management service employees.
Utilizing the same metrics for professional employment for Southland within the individual sub-regions, the professional, workforce within the sub-regions average approximately 26%, with the West Region and the Central Region comprising the greatest shares of professional workforce employees, at 30% each. Comparatively, the North Central Region comprises the largest share of manufacturing, logistics, and service industries, at 65%, which is comparable to that of Southland as a whole.
Across Southland’s sub-regions, the share of employed persons relative to all persons within the labor force averages between 88% and 96%, which is comparable to that of Southland as a whole, where approximately 92% of the population within the labor force is actually employed as of year-end 2022.
OFFICE MARKET
OFFICE MARKET OVERVIEW AND CHARACTERISTICS | YEAR-END 2022
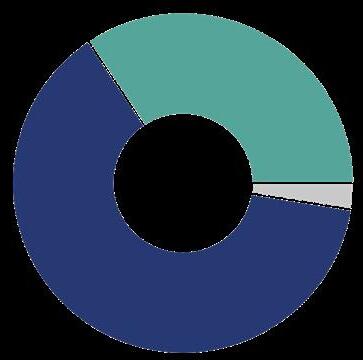
As of year-end 2022, Southland had just over 13.1 million square feet (“SF”) of rentable office space, composing 2.6% of the total office space within the Chicago MSA. The West Region contained the greatest share of office space within Southland, at 41% of the total share, followed by the Central Region, with 22% of the total share of space within Southland’s office market. Comparatively, the North Central Region encompasses the smallest share of office space within Southland, at 3.2%, as of year-end 2022.
The occupancy rates within the Southeast Region, East Central Region, North Central Region, and West Region’s office market were greater than that of Southland as a whole, at 94% as of year-end 2022. During this time period, the Southeast Region had the greatest occupancy rate at nearly 100%; whereas, the Central Region had the lowest occupancy rate at 88%. Year-over-year, from 2021 to 2022, occupancy rates increased for all the Southland sub-regions, except for the North East Region, which experienced a 0.6% decline in occupancy. Occupancy within Southland as a whole also increased 2.3% year-over-year; an increase in occupancy rates indicate strong demand of office space within the defined areas.
In addition, Southland experienced nearly 760,000 SF of office gross absorption in 2022, composing 3.1% of the total gross absorption that occurred in the Chicago MSA's office market during this same time frame. The West Region and Central Region accounted for approximately 46% and 31% of the office gross absorption within Southland as a whole. Year-over-year, gross absorption increased significantly within the North Central Region by 861% and the East Central Region by 483%. An increase in gross absorption may be a result of new inventory coming onto the market
with an already committed tenant, or tenants renewing leases on the properties they previously occupied.
As of year-end 2022, average rental rates within the East Central Region, West Region, and North Central Region were higher than that of Southland as a whole, at $20.24. During this time period, the East Central Region had the highest average rental rate at $27.54; whereas, the North East Region had a significantly smaller average rental rate at $9.94, which may be driven by the lower quality and age of the office buildings within this region. Year-over-year, from 2021 to 2022, average rental rates increased for all Southland’s sub-regions, except for the North East Region. Southland as a whole experienced an increase in average rental rates of 9% year-over-year. An increase in average rental rates may be driven by an increase in demand and supply for desirable office space within the defined areas.
To note, there were zero office properties under construction within Southland as a whole and Southland’s sub-regions as of year-end 2022.
Over the last 5 years, from 2018 to 2022, total inventory of office space increased in the East Central Region by 37,840 SF; by 42,300 SF in the Northwest Region; and by 12,200 SF in the Central Region. The West Region and North Central Region experienced relatively modest growth, while the inventory within the other Southland sub-regions remained unchanged since 2018. Comparatively, total inventory of office space experienced a net increase of 34,251 SF, or 0.3%, within Southland as a whole over the last 5 years.
Southland and its sub-regions have all experienced positive CAGRs during the last 10-year period from 2013 to 2022, ranging between 0.1% and 0.7%; this indicates positive demand for office supply within the Southland market.
SOUTHLAND’S OFFICE MARKET, AT 94.1% OCCUPANCY, HAD NEARLY 760,000 SF OF GROSS ABSORPTION AS OF YEAR-END 2022.
Vacancy rates decreased in all the Southland sub-regions' office markets over the last 5 years, except for the Northwest Region and the North Central Region, which experienced an increase of 4.2 and 1.6 percentage points, respectively, in vacancy rate. The East Central Region experienced the greatest decline in vacancy rates from 17.1% in 2018 to 0.5% in 2022, which is a result of nearly 115,250 SF of gross absorption over the past year. A decline in vacancy rates may be attributed to a rise in building demand for desirable office space within specific areas.
Comparatively, vacancy rates within the Southland’s office market also experienced a decrease of 19% over the last 5 years, from 7.3% in 2018 to 5.9% in 2022.
Over the last 5 years, the West Region and Central Region's office markets have experienced the greatest pace of gross absorption, absorbing an average annual of 273,222 SF and 167,174 SF, respectively. Comparatively, Southland as a whole has experienced an average annual gross absorption of about 585,582 SF over the last 5 years.
Southland as a whole, as well as the West Region, Southeast Region, East Central Region, and Central Region have all experienced positive CAGRs during the last 10-year period, 2013 to 2022; ranging between 1.6% and 23%, indicating there has been more office space being leased or occupied than vacated within these specific regions throughout the last 10 years.
Over the last 5 years, average rental rates increased in all Southland sub-regions, except for the Northeast Region, which experienced a 35% decrease. This may be driven by lower quality and aging buildings. In contrast, the East Central Region experienced the greatest increase in average rental rates by $13.94, which is a result of the nearly 115,250 SF of gross absorption over the past year.
Comparatively, Southland’s office market also experienced a significant increase in average rental rates of 103% over the last 5 years—from $13.60 in 2018 to $27.54 in 2022. An increase in overall office demand within Southland may be driving the higher average rents within the sub-regions.
LEASING ACTIVITY
As of year-end 2022, there were 131 office lease transactions within Southland and its sub-regions, equating to over 308,700 SF of office space. Of these transactions, there were 116 minor lease transactions (less than 5,000 SF), equating to 153,100 SF. In addition, there were 15 major lease transactions (greater than 5,000 SF), equating to nearly 155,610 SF, as detailed below.
MAJOR LEASING ACTI VIT Y Listed by square foot leased, property address, and City/Village.
27,189 SF 18861 S. 90th Avenue, Mokena
17,444 SF 7820 Graphics Drive, Tinley Park
16,150 SF 14300 S. Ravinia Avenue, Orland Park
11,760 SF 7820 Graphics Drive, Tinley Park
10,532 SF 7851 W. 185th Street, Tinley Park
9,698 SF 8505 W. 183rd Street, Tinley Park
6,218 SF 18312 W. Creek Drive, Tinley Park
14,126 SF 4343 Lincoln Highway, Matteson
10,702 SF 5101 Lincoln Highway, Matteson
6,864 SF 2555 Lincoln Highway, Olympia Fields
5,887 SF 3235 Vollmer Road, Flossmoor
5,841 SF 3235 Vollmer Road, Flossmoor
5,142 SF 4801 Southwick Drive, Matteson
5,051 SF 4801 Southwick Drive, Mattson
5,001 SF 17475 Jovanna Drive, Homewood
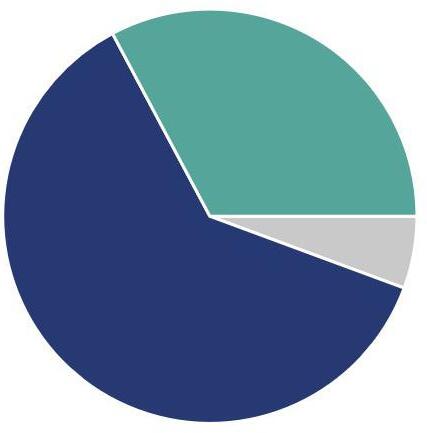
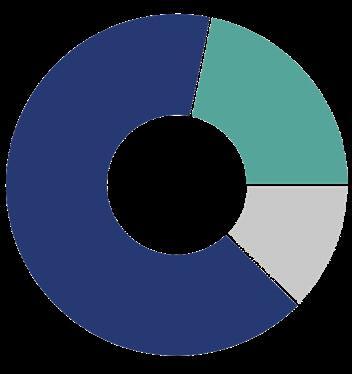
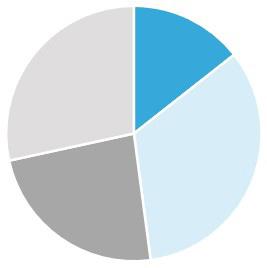
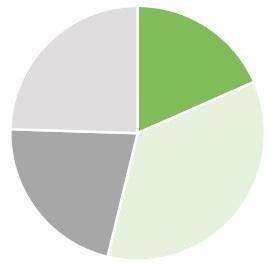
As of year-end 2022, Southland as a whole is primarily made up of Class B office space at 62%, or nearly 8.1 million SF, of the total share of office space within Southland; followed by Class C office space with 33% or 4.3 million SF of the total share. Class A office space composed the smallest share of space within Southland at 6%, or just under 738,000 SF, as of year-end 2022. Comparatively, the office distribution within the Chicago MSA is also primarily made up of Class B office space, with 44% of the total share; closely followed by Class A space, with 40%; and Class C space, with 16% of the total share of office space within the Greater Chicago area.
Within the Southland sub-regions, the West Region and the Central Region were the only two regions that comprised any Class A office space, with 12% and 3% of their respective shares, as of year-end 2022. Class A office space is generally defined as desirable investment-grade properties with the highest-quality construction materials and systems, architectural features, amenities, and available first-rate maintenance and management; these properties also typically have above-average rental rates in a prime location with easy accessibility.
Of the other Southland sub-regions, the Southeast Region contained the largest share of Class B office space at 81%, followed by the West Region at 66%, represented as Class B office space, as illustrated in the adjacent figures. In addition to these two sub-regions, the North Central and Central Regions also contained a larger percentage of Class B office space, compared to Class C space within the respective regions. Class B office space tends to attract a wide range of users due to the average rental rates, and is considered to be a more speculative investment, offering more utilitarian space and average maintenance and management with less amenities.
In contrast, the Northwest Region contained the largest share of Class C office space at 57%, followed by the Northeast Region at 54%, and the East Central Region at 51%, represented as Class C office space.
Class C office space is typically an older building that offers basic space with belowaverage maintenance and management and mechanical/electrical systems. Class C office space attracts tenants and investors by offering lower rental rates, compared to that of Class A and Class B office buildings, as reflected in the tables on the following page.
Within Southland, Class A office space had the greatest average rental rate at $25.29, followed by Class B office space at $21.30, and Class C office space at $18.54, as of year-end 2022. Comparatively, Class C space had the highest occupancy rate within Southland at 95.6%, followed by Class B and Class A space, with 93.4% and 91.6%, respectively. A higher occupancy rate within Class C office space may be driven by the demand for lower average rental rate office space within Southland as a whole.
In addition, Class B office space composed the majority of the total gross absorption that occurred within Southland at 643,020 SF, or 85%, of the total share. Class C office space follows, with 14% or 106,100 SF; and then Class A office space, with 1.4% or 10,850 SF of the total share of gross absorption within Southland as a whole as of year-end 2022.
The adjacent figures, as well as the tables on the following page, summarize the office market by class of space within Southland as a whole, in addition to the individual Southland sub-regions as of year-end 2022.
SOUTHLAND
Class A office space within Southland composed 0.4% of the Class A office space within the Chicago MSA. The West Region made up the majority of Class A office space within Southland at 90% of the total share, followed by the Central Region with nearly 10% of this share. The other Southland subregions did not encompass any Class A office space as of year-end 2022.
The West Region contained 100% of the total gross absorption within Southland’s Class A office market and had the highest occupancy rate at 99%; whereas, the Central Region's occupancy rate, at 24%, may be driving down the overall occupancy rate within Southland to 92%. Class A space within the West Region also had average rental rates $1.46 greater than that of Southland as a whole.
CLASS B OFFICE MARKET CHARACTERISTICS | YEAR-END 2022
Class B office space within Southland composed 3.6% of the Class B office space within the Chicago MSA. The West Region made up nearly 44% of the Class B office space within Southland, followed by the Central Region with 23%, and the Southeast Region with 13% of the total share of Class B office space within Southland.
The West Region contained over 50% of the total gross absorption within Southland's Class B office market. Additionally, the Southeast Region had the highest occupancy rate at 100%, followed by the East Central Region with 99% occupancy for Class B space. Comparatively, the East Central and West Regions had average rental rates greater than that of Southland as a whole as of year-end 2022.
CLASS C OFFICE MARKET CHARACTERISTICS | YEAR-END 2022
Class C office space within Southland composed 5.3% of the Class C office space within the Chicago MSA. The West Region also made up the majority of Class C office space within Southland at 27% of the total share, followed by the Central and Northeast Regions with 23% and 20%, respectively, of this share of Class C office space within Southland.
The Central Region had the greatest amount of gross absorption, at 54% of the total gross absorption within Southland’s Class C office market. Additionally, The North Central and East Central Regions both had the highest occupancy at 100%. Comparatively, the North Central, West, and Northwest Regions had average rental rates greater than that of Southland as a whole as of year-end 2022.
RETAIL MARKET
RETAIL MARKET OVERVIEW
AND CHARACTERISTICS | YEAR-END 2022
As of year-end 2022, Southland had just over 42.7 million square feet (“SF”) of rentable retail space, composing 7.3% of the total retail space within the Chicago MSA. The West Region contained the greatest share of retail space within Southland, at 34% of the total share, closely followed by the Central Region and the Northeast Region, each with 19% of the total share of space within Southland’s retail market. Comparatively, the East Central Region encompasses the smallest share of retail space within Southland, at 3.8%, as of year-end 2022.
The occupancy rates within the North Central, Northwest, Southeast, Northeast, and East Central Regions' retail markets were greater than that of Southland as a whole at 92.2% as of year-end 2022. During this time period, the North Central Region had the greatest occupancy rate at 98.2%; whereas, the Central Region had the lowest occupancy rate at 88.7%. Yearover-year, from 2021 to 2022, occupancy rates increased for the North Central Region and the East Central Region, and remained unchanged for all the other Southland sub-regions and Southland as a whole. An increase in occupancy rates, as well as rates remaining above 90%, indicate strong demand of retail space within the defined regions.
In addition, Southland experienced over 1.3 million SF of retail gross absorption in 2022, composing 7.3% of the total gross absorption that occurred in the Chicago MSA's retail market during this same time frame. The West Region and Central Region accounted for 35% and 30% of the retail gross absorption within Southland as a whole. Year-overyear, gross absorption significantly increased within the North Central Region by 103%, and also within the East Central Region and Central Region by 16% and 11%, respectively.
An increase in gross absorption may be the result of new inventory coming onto the market with an already committed tenant, or tenants renewing leases on previously occupied properties.
As of year-end 2022, average rental rates within the West Region, Northeast Region, and Central Region were higher than that of Southland as a whole, at $15.70. During this time period, the Northeast Region had the highest average rental rate at $16.63; whereas, the East Central Region had the smallest average rental rate at $11.42.
Year-over-year, from 2021 to 2022, average rental rates increased for all Southland sub-regions; Southland as a whole increased significantly at 37% from 2021. An increase in average rental rates may be driven by an increase in demand for desirable retail space within the defined regions.
To note, there were zero retail properties under construction within Southland as a whole and Southland’s sub-regions as of year-end 2022.
Over the last 5 years, from 2018 to 2022, total inventory of retail space increased within all Southland sub-regions, except for the Northeast Region, which experienced a decrease of 6.3%. The Central Region experienced the greatest increase of total office space by 115,500 SF during this same 5-year period. In addition, total inventory of retail space experienced a net decrease of 21,525 SF, or 0.1%, within Southland as a whole since 2018.
Comparatively, Southland as a whole and the Northeast Region experienced negative CAGRs over the last 10 years, from 2013 to 2022; whereas, all the other Southland sub-regions experienced positive CAGRs between 0.1% and 0.9%, indicating positive demand for retail supply within the majority of the Southland sub-regions.
SOUTHLAND’S
RETAIL MARKET, AT 92.2% OCCUPANCY, HAD NEARLY 1.3 MILLION SF OF GROSS ABSORPTION AS OF YEAR-END 2022.
Vacancy rates decreased in all Southland sub-regions' retail markets over the last 5 years. The North Central Region experienced the greatest decline in vacancy rates, from 8.9% in 2018 to 1.8% in 2022; followed by District 2, which experienced a decline from 7.8% vacancy in 2018 to 4.7% in 2022. A decline in vacancy rates may be attributed to an increase in healthy spending behaviors, an increase in the absorption of retail space, and a rise in building demand for desirable rentable retail space within specific regions.
Comparatively, vacancy rates within Southland’s retail market also experienced a decrease of 26% over the last 5 years, from 8.6% in 2018 to 6.4% in 2022.
Over the last 5 years, retail markets in the West Region and Central Region experienced the greatest pace of gross absorption, absorbing an average annual of 499,126 SF and 390,217 SF, respectively. Comparatively, Southland as a whole has experienced an average annual gross absorption of approximately 1.7 million SF during this same time frame.
Southland as a whole, as well as the West, North Central, East Central, and Central Regions all experienced positive CAGRs during the last 10-year period from 2013 to 2022, ranging between 0.3% and 7.6%. This indicates more retail space being leased or occupied than vacated within these specific regions throughout the last 10 years.
Over the last 5 years, average rental rates for retail space increased in all Southland’s sub-districts, except for the East Central Region and Central Region, which experienced a 6% and 4% decrease in average rental rates, respectively. In contrast, the Northeast Region and Northwest Region experienced the greatest increases in average rental rates by $5.57 and $2.04, respectively.
Comparatively, Southland’s retail market experienced a significant increase in average rental rates of 9% over the last 5 years, from $14.36 in 2018 to $15.70 in 2022. An increase in healthy spending behaviors and overall retail demand within Southland may be driving the higher average rents within the sub-regions.
LEASING ACTIVITY
As of year-end 2022, there were 135 retail lease transactions in Southland and its sub-regions, equating to 588,035 SF of retail space. Of these transactions, 125 were minor lease transactions (less than 10,000 SF), equating to 307,010 SF. In addition, there were 10 major lease transactions (greater than 10,000 SF), equating to 281,025 SF, as detailed below.
MAJOR LEASING ACTI VIT Y Listed by square foot leased, property address, and City/Village.
36,000 SF 14812 S. La Grange Road, Orland Park 25,400 SF 15752 S. La Grange Road, Orland Park
16,564 SF 15441 Cicero Avenue, Oak Forest 15,120 SF 7960 W 159th Street, Orland Park
76,493 SF 13130 Rivercrest Drive, Crestwood 19,000 SF 4809 Midlothian Turnpike, Crestwood
14,871 SF 475 E. 162nd Street, South Holland
36,000 SF 20909 S. Cicero Avenue, Matteson
28,500 SF 22240 Governors Highway, Richton Park
13,866 SF 20950 Governors Highway, Olympia Fields
INDUSTRY TRENDS
INDUSTRIAL MARKET
INDUSTRIAL MARKET OVERVIEW AND CHARACTERISTICS | YEAR-END 2022
As of year-end 2022, Southland had over 95.3 million square feet (“SF”) of rentable industrial/flex space, composing 7.0% of the total industrial/flex space within the Chicago MSA. The Southeast and Northwest Regions contained the greatest share of industrial/ flex space within Southland, at nearly 21% each of the total share. Comparatively, the Central Region contains the smallest share of industrial/flex space within Southland as of year-end 2022.
The occupancy rates within the Southeast, North Central, Northeast, and East Central Regions' industrial/flex market were greater than that of Southland as a whole as of year-end 2022. During this time period, the Southeast Region had the greatest occupancy rate at nearly 100%; whereas, the Central Region had the lowest occupancy rate at 77.9%. Year-over-year, from 2021 to 2022, occupancy rates increased for all Southland sub-regions except for the West and Northwest Regions, which experienced declines in occupancy rates of 1.0% and 1.8%, respectively. Occupancy within Southland as a whole increased 1 percentage point year-over-year; an increase in occupancy rates indicates strong demand of industrial/flex space within the defined regions.
In addition, Southland experienced over 4.9 million SF of gross absorption of industrial/flex space in 2022, composing 7.4% of the total gross absorption that occurred in the Chicago MSA's industrial/flex market during this same time frame. The Southeast and Central Regions accounted for approximately 32% and 25% of the gross absorption within Southland. Year-over-year, gross absorption increased within the Northwest Region by 28%, the Southeast Region by 6%, and significantly in the East Central Region by 194%. An increase in gross absorption may be a result of new
inventory coming onto the market with a committed tenant, or tenants renewing leases on previously occupied properties.
As of year-end 2022, average rental rates within the Northwest, West, Northeast, and North Central Regions were higher than that of Southland as a whole, at $6.92. During this time period, the Northwest Region had the highest average rental rate at $11.10; whereas, the Southeast Region had the smallest average rental rate at $4.82. Year-over-year, from 2021 to 2022, average rental rates increased for all Southland sub-regions, except for the West Region and Central Region. Southland as a whole experienced an increase in average rental rates of 2% year-over-year. An increase in average rental rates may be driven by an increase in demand for desirable industrial space within the defined regions.
To note, there were 7 industrial properties equating to nearly 3.3 million SF under construction within Southland as of year-end 2022, with the Southeast, Central, West, and Northwest Regions comprising 47%, 31%, 21%, and 1%, respectively, of the share of industrial/flex construction activity within Southland.
Over the last 5 years, 2018 to 2022, total inventory of industrial /flex space increased significantly in the Central Region by 4.4 million SF; the Southeast Region by 2.2 million SF; and the North Central Region by 755,000 SF. All other Southland sub-regions experienced relatively modest growth or remained unchanged since 2018. Comparatively, total inventory of industrial/flex space experienced a net increase of over 7.7 million SF, or 9%, within Southland as a whole over the last 5 years.
Southland and its sub-regions have all experienced positive CAGRs during the last 10-year period, 2013 to 2022; ranging between 0.1% and 9.6%, indicating there is strong, positive demand for industrial/flex space within the Southland market.
Vacancy rates decreased in all Southland sub-regions' industrial /flex markets over the last 5 years, except for the Central and Northwest Regions, which experienced increases of 2.3 and 0.6 percentage points, respectively. The East Central Region also remained unchanged in vacancy rates during this time. In addition, the Northeast Region experienced the greatest decline in vacancy rate of 5.6 percentage points since 2018. A decline in vacancy rates may be attributed to a rise in building demand for desirable industrial/flex space within specific areas.
Comparatively, vacancy rates within Southland’s industrial/flex market decreased only slightly over the last 5 years—from 3.5% observed in 2018 to 3.4% in 2022.
Over the last 5 years, the Southeast and Central region's industrial/flex market have experienced the greatest pace of gross absorption, absorbing an average annual of 1.2 million SF and 702,685 SF, respectively. Comparatively, Southland as a whole has experienced an average annual gross absorption of approximately 3.8 million SF during this same time frame.
Southland as a whole, as well as the Northwest, North Central, Northeast, and East Central Regions have all experienced negative CAGRs during the last 10-year period, from 2013 to 2022, ranging between 0.3% and 16.9%. This indicates less industrial/flex space being leased or occupied than vacated within these specific regions throughout the last 10 years.
Over the last 5 years, average rental rates for industrial/flex space increased in all Southland sub-regions—specifically within the Northwest Region, which increased by $5.71. In contrast, the Central Region experienced a 36% decrease in average rental rates since 2018 and a 41% decrease from the prior year, which may be attributed to the delivery of new properties still actively in lease-up and not fully occupied as of year-end 2022.
Southland’s industrial/flex market also experienced a significant increase in average rental rates of 35% over the last 5 years— from $5.16 in 2018 to $6.99 in 2022. An increase in overall industrial/flex demand within Southland may be driving the higher average rents within the sub-regions.
LEASING ACTIVITY
As of year-end 2022, there were 90 industrial/flex lease transactions in Southland and its sub-regions, equating to nearly 4 million SF of space. Of these transactions, 82 were minor lease transactions (less than 100,000 SF), equating to 958,190 SF. In addition, there were 8 major lease transactions (greater than 100,000 SF), equating to over 3 million SF, as detailed below.
MAJOR LEASING ACTI VIT Y
Listed by square foot leased, property address, and City/Village.
Region
425 Crossing Drive, University Park
RENTAL MARKET
RENTAL MARKET OVERVIEW AND CHARACTERISTICS | YEAR-END 2022
As of year-end 2022, Southland had approximately 31,922 for-rent residential units, composing 4.6% of the total for-rent residential units within the Chicago MSA. The Northwest Region contained the greatest share of rental units within Southland, at 21.2% of the total share, closely followed by the Central Region and Northeast Region, with 17% each of the total share of rental units within Southland’s for-rent residential market. Comparatively, the North Central Region encompasses the smallest share of rental units within Southland, at 8% as of year-end 2022.
The occupancy rates within the Southeast, Northeast, Northwest, Central, and North Central Regions' for-rent residential market were greater than that of Southland as a whole at 95.8% as of year-end 2022. During this time period, the Southeast Region had the greatest occupancy rate at 97.0%; whereas, the West Region had the lowest occupancy rate at 95.5%. Year-over-year, from 2021 to 2022, occupancy rates increased for all Southland sub-regions, except for the East Central Region. Southland as a whole also experienced an increase in occupancy rates of 1.7% year-over-year, indicating a strong demand for rental units within the defined regions.
In addition, Southland experienced a gross absorption of about 571 rental units in 2022, composing 6.9% of the total gross absorption which occurred in the Chicago MSA's rental market during this same time frame. The West Region and Northeast Region accounted for nearly 43% and 30% of the absorption within Southland as a whole. Year-overyear, gross absorption significantly decreased within all Southland subregions, except for the West Region, which experienced a 44% increase in absorption. A decline in gross absorption may be a result of new
inventory coming onto the market without a committed tenant, or tenants not renewing leases on previously occupied properties.
As of year-end 2022, average rental rates per SF within the West Region and Central Region were higher than that of Southland as a whole at $1.48 per SF. During this time period, the West Region had the highest average rental rate at $1.75 per SF; whereas, the East Central Region had the smallest average rental rate at $1.09 per SF. Year-over-year, 2021 to 2022, average rental rates increased for all Southland sub-regions between 1.3% and 8%. Southland as a whole also experienced an increase in average rental rates per SF by 5% from the prior year. An increase in average rental rates may be driven by an increase in demand for desirable for-rent residential units within the defined regions.
To note, there was one for-rent residential property with 144 units under construction within Southland as of year-end 2022. This multi-family apartment property, the Magnuson, is located within the West Region, specifically within the Village of Tinley Park.
Over the last 5 years, from 2018 to 2022, total inventory of forrent residential units increased significantly in the West Region by 459 units, in the East Central Region by 114 units, and in the Southeast Region by 40 units. All other Southland sub-regions experienced relatively modest growth or remained unchanged since 2018, except for the Northeast Region, which experienced a decrease of 17 units. Comparatively, Southland as a whole also experienced a net increase of 640 units since 2018.
Southland and its sub-regions have all experienced positive CAGRs during the last 10-year period, 2013 to 2022; ranging between 0.1% and 1.5%, indicating there is relatively modest demand for rental units within the Southland market.
SOUTHLAND’S RENTAL MARKET, AT 95.8% OCCUPANCY, HAD OVER 570 UNITS ABSORBED INTO THE MARKET AS OF YEAR-END 2022.
Vacancy rates decreased in all Southland sub-region's for-rent residential markets over the last 5 years, except for the East Central Region, which experienced an increase of 3.8 percentage points, and the West Region which remained unchanged since 2018. The Southeast Region experienced the greatest decline in vacancy rates, from 8.5% in 2018 to 3.0% in 2022, followed by the Northeast Region which experienced a 26% decline since 2018. A decline in vacancy rates may be attributed to a rise in building demand for desirable rental properties within specific regions.
Comparatively, vacancy rates within Southland’s rental market decreased by 21 percentage points over the last 5 years; from 5.2% observed in 2018 to 4.1% in 2022.
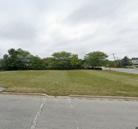
DEVELOPMENT ACTIVITY
Over the last 5 years, from 2018 to 2022, 655 for-rent residential units were constructed within 6 properties located across the Southland sub-regions. As of year-end 2022, one 144-unit property is currently under construction, as well as one proposed property with 39 units, both located within the West Region. The West Region has encompassed the majority of for-rent residential development activity during the last 5 years, capturing 100% of the activity in 2019, 2020, and 2022—equating to nearly 475 market-rate units added to the West Region since 2018.
In addition, 180 affordable rental units were built within 3 properties across Southland since 2018, located specifically within the Northeast, Central, and East Central regions.
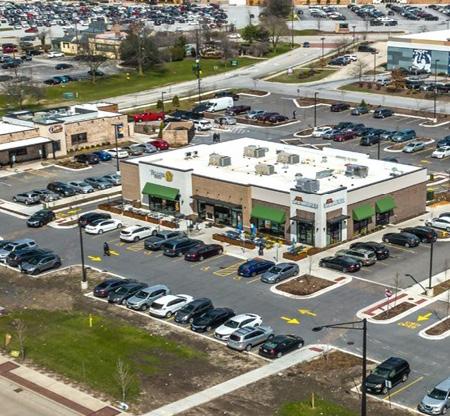
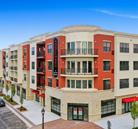
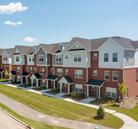
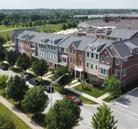
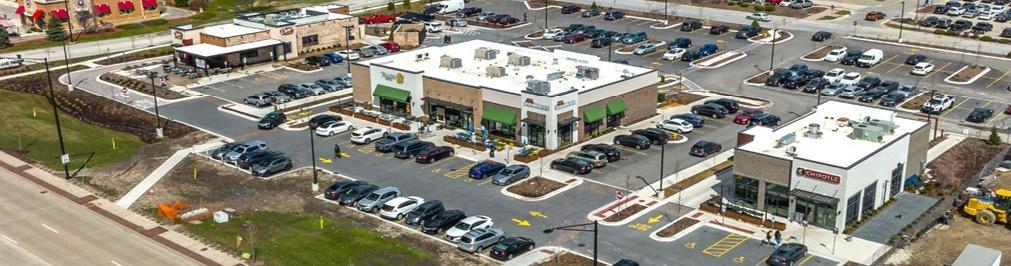
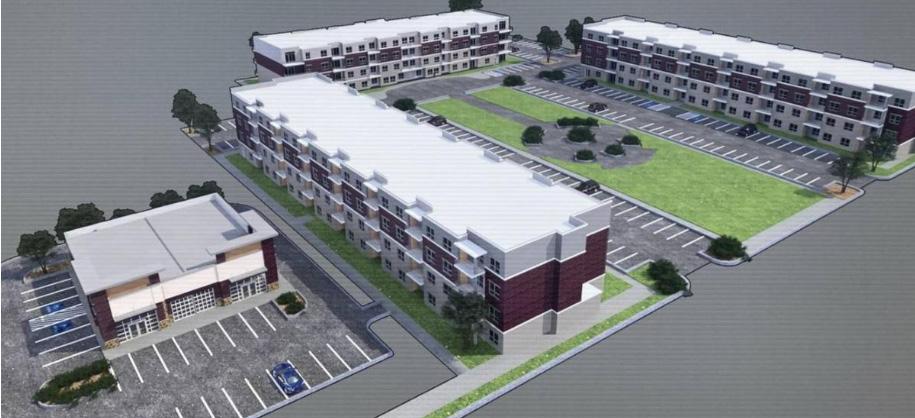
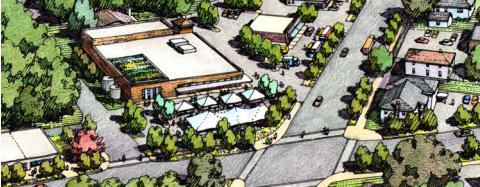
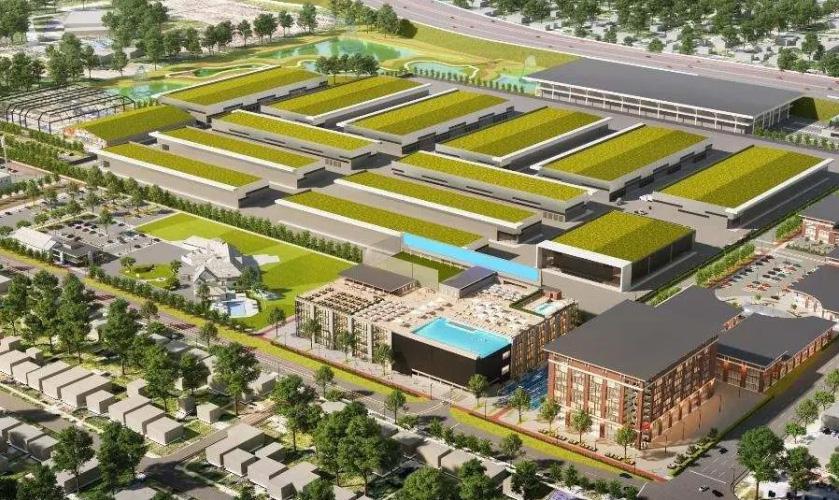
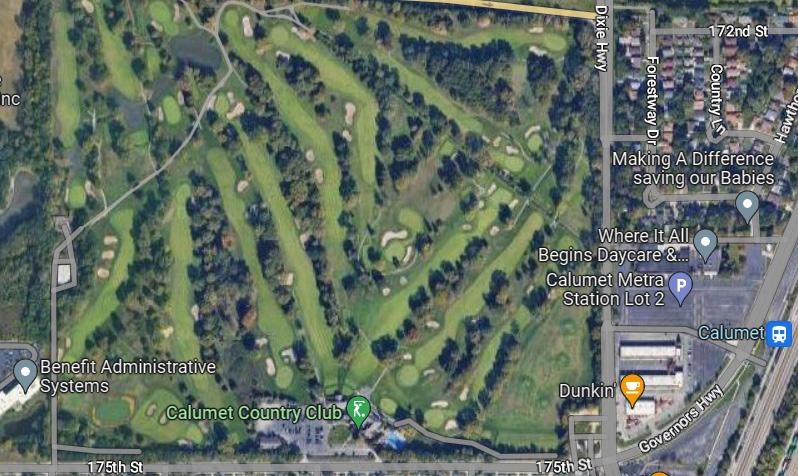
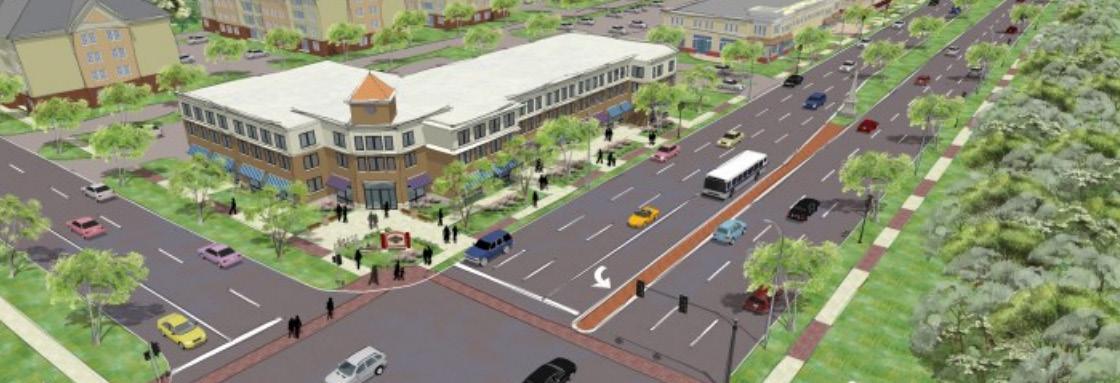
The adjacent figures represent the recent major developments that have occurred within Southland and its sub-regions over the last 5 years
Across all Southland sub-regions, average rental rates per SF increased between 11% and 19% over the last 5 years; significantly within the West Region, Southeast Region, and Northwest Region which experienced the greatest increases in average rental rates per SF of $0.22, $0.21, and $0.18 per SF, respectively, since 2018.
Comparatively, Southland’s for-rent residential market also experienced a significant increase in average rental rates per SF of 14% over the last 5 years; from $1.30 in 2018 to $1.48 in 2022. An increase in overall rental demand within Southland may be driving the higher average rents within the sub-regions.
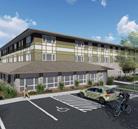
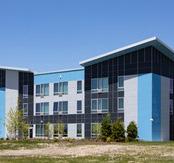
RECENT MAJOR FOR-RENT RESIDENTIAL DEVELOPMENTS
Listed by units constructed/proposed, property name, property address and City/Village, rent type, and construction status or completion date.
West Region
144 Units – The Magnuson 8200 Greenway Boulevard, Tinley Park Market-Rate, Under Construction
39 Units – Bremen Station 6775 South Street, Tinley Park Market-Rate, Proposed
165 Units – Boulevard at Central Station 6725 South Street, Tinley Park Market-Rate, Built 2021
294 Units – Orland Ridge 9414 Trillium Lane, Orland Park Market-Rate, Built 2021
16 Units – Alice Mae Court Townhomes 10600 Alice Mae Court, Orland Park Market-Rate, Built 2018
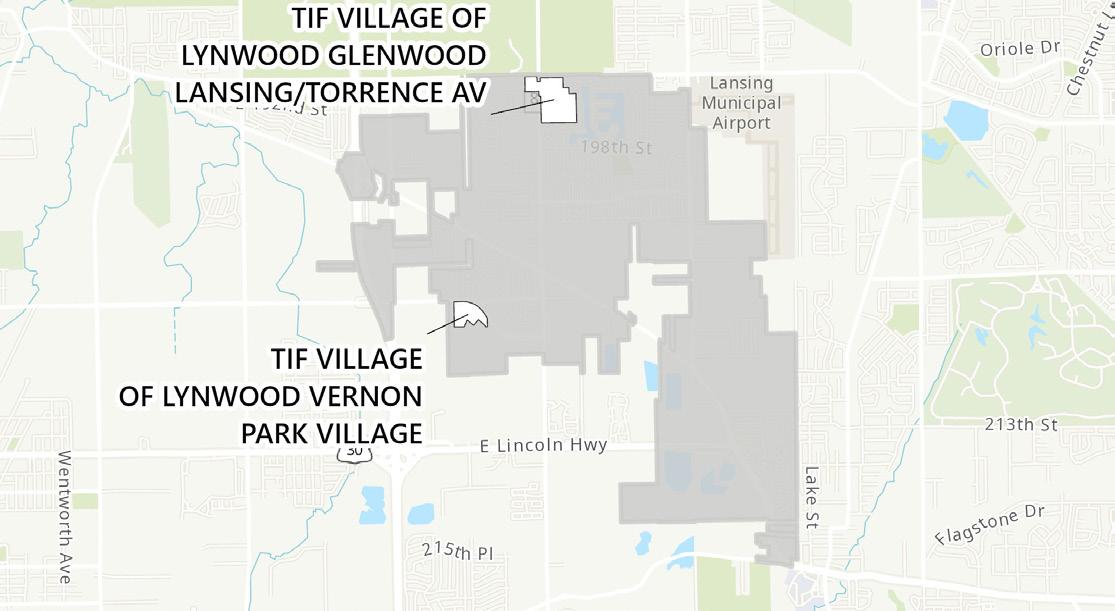
Northeast Region
48 Units – Torrence Place 2320 Thornton Lansing Road, Lansing Affordable, Built 2022
Central Region
16 Units – Mustacchi Manor 5050 Southwick Drive, Matteson Affordable, Built 2022
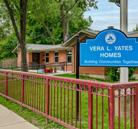
East Central Region
116 Units – Vera L. Yates Homes 1036 Berkeley Avenue, Ford Heights Affordable, Built 2019
SECTION TWO PROSPECTUS
The Southland Development Authority has invested in creating this Market Report and Prospectus to highlight and promote their ongoing efforts to achieve transformative and inclusive economic growth for the region, which consists of 45 cities and villages within the Greater Chicago area.
Included in this Prospectus section is an introduction to the Southland Development Authority and the funding opportunities available. This section also provides an overview of each of Southland’s 7 subregions, as well as the individual cities and villages compromising the unique sub-region, highlighting the community investment, current activity, and priority projects in each area.
This section provides a comparison of demographic and socioeconomic data, business and employment trends, transportation characteristics, existing inventory, and income-related data for each of Southland’s sub-regions and the individual cities and villages contained within the sub-regions.
This purpose of this section within the overall Investor Lookbook publication is to provide a tool to promote and market the Southland’s sub-regions as well as the individual cities and villages; in addition to providing prospective and future investors and developers insight into the current socio-economic characteristics, existing market conditions, and potential development/redevelopment opportunities for each of the areas.
ABOUT THIS MARKET
Southland consists of 45 cities and villages within the Greater Chicago area, and includes parts of Will County and Cook County, Illinois. Southland has a population of nearly 750,000 people, representing a density of roughly 500 persons per square mile. With low unemployment rates, a high diversity index, stable per capita and median household incomes, prominent business, manufacturing, and logistics corridors, and located nearby a major metropolitan area with railway transportation, Southland is an attractive suburban area for all generations.
Southland is also home to many great neighborhoods and unique groups, ranging from large, technical-skilled workforce communities to more relaxed single-family detached neighborhoods nestled between vast agriculture farmland. Current strategies of the Southland Development Authority ("SDA") prioritize Southland’s 45 cities and villages into 7 unique subareas to illustrate where many opportunities for dynamic growth and investment intersect. These sub-areas are described in detail below and illustrated in the map on the following page.
WEST REGION
The West Region is located in the western portion of Southland and encompasses the Village of Mokena, Village of Orland Park, Village of Orland Hills, Village of Tinley Park, and City of Oak Forest.
NORTHWEST REGION
The Northwest Region is located in the northern portion of Southland and encompasses the Village of Worth, Village of Alsip, Village of Crestwood Illinois, Village of Midlothian, City of Blue Island, Village of Calumet Park, and Village of Robbins.
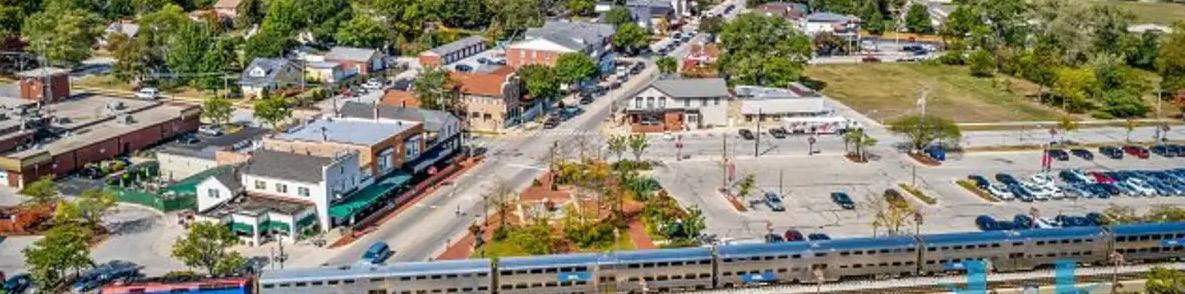
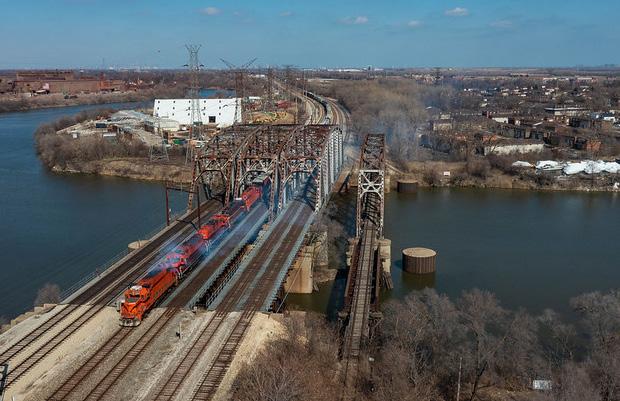
TRANSPORTATION
Illinois is at the center of the nation’s rail network. Its comprehensive rail system consists of approximately 9,982 miles of railroad tracks, of which 7,792 are operated by Class I railroads – primarily BNSF Railway and the Union Pacific Railroad (UP). Class I railroads are large freight companies; Class II and Class III are small regional railroad companies. The remaining 2,190 miles of track are operated by Class III short line or regional railroads.
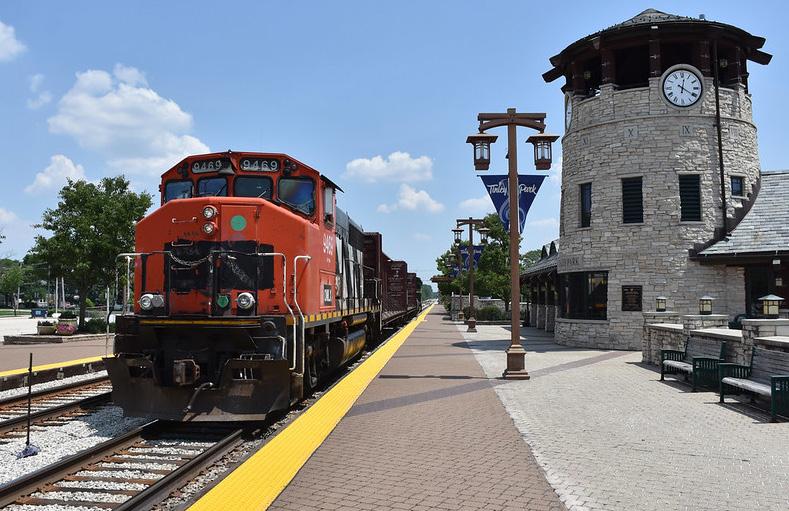
Illinois also boasts 4 intercity passenger rail corridors that make connections to 32 Amtrak stations across the state. Metra is the commuter rail system in the Chicago metropolitan area serving the City of Chicago and its surrounding suburbs via the Union Pacific Railroad, BNSF Railway, and other railroads. The Metra system operates 242 stations on 11 rail lines. In addition, Amtrak offers travelers 14 stations that quickly
NC
NORTH CENTRAL REGION
The North Central Region is located in the north central portion of Southland and encompasses the Village of Posen, Village of Dixmoor, Village of Riverdale, Village of Phoenix, City of Harvey, City of Markham, and Village of East Hazel Crest.
NE
NORTHEAST REGION
The Northeast Region is located in the northeastern portion of Southland and encompasses the Village of Dolton, Village of Burnham, City of Calumet, Village of Lansing, Village of South Holland, and Village of Thornton.
SE
SOUTHEAST REGION
The Southeast Region is located in the southern portion of Southland and encompasses the Village of Monee, Village of University Park, Village of Steger, Village of Crete, Village of Peotone, and Village of Beecher.
EAST CENTRAL REGION
The East Central Region is bounded by the Cook County border to the east and the Will County border to the south. It encompasses the City of Chicago Heights, Village of South Chicago Heights, Village of Ford Heights, Village of Sauk, Village of Lynwood, and Village of Glenwood.
CENTRAL REGION
The Central Region is located in the central portion of Southland and encompasses the Village of Park Forest, Village of Richton Park, Village of Matteson, Village of Olympia Fields, Village of Flossmoor, Village of Homewood, Village of Hazel Crest, and City of Country Club Hills.
connect with bus service, including 2 that connect with ferry service and 6 that connect with the Pace Suburban intercity bus service. Pace Suburban Bus is the premier suburban transit provider - safely and efficiently moving people to work, school, and other regional destinations. Pace's family of public transportation services offer affordable and environmentally responsible transit options for the residents of 274 municipalities in Cook, Will, DuPage, Kane, Lake and McHenry Counties. The backbone of Chicago's suburbs, Pace serves tens of thousands of daily riders.
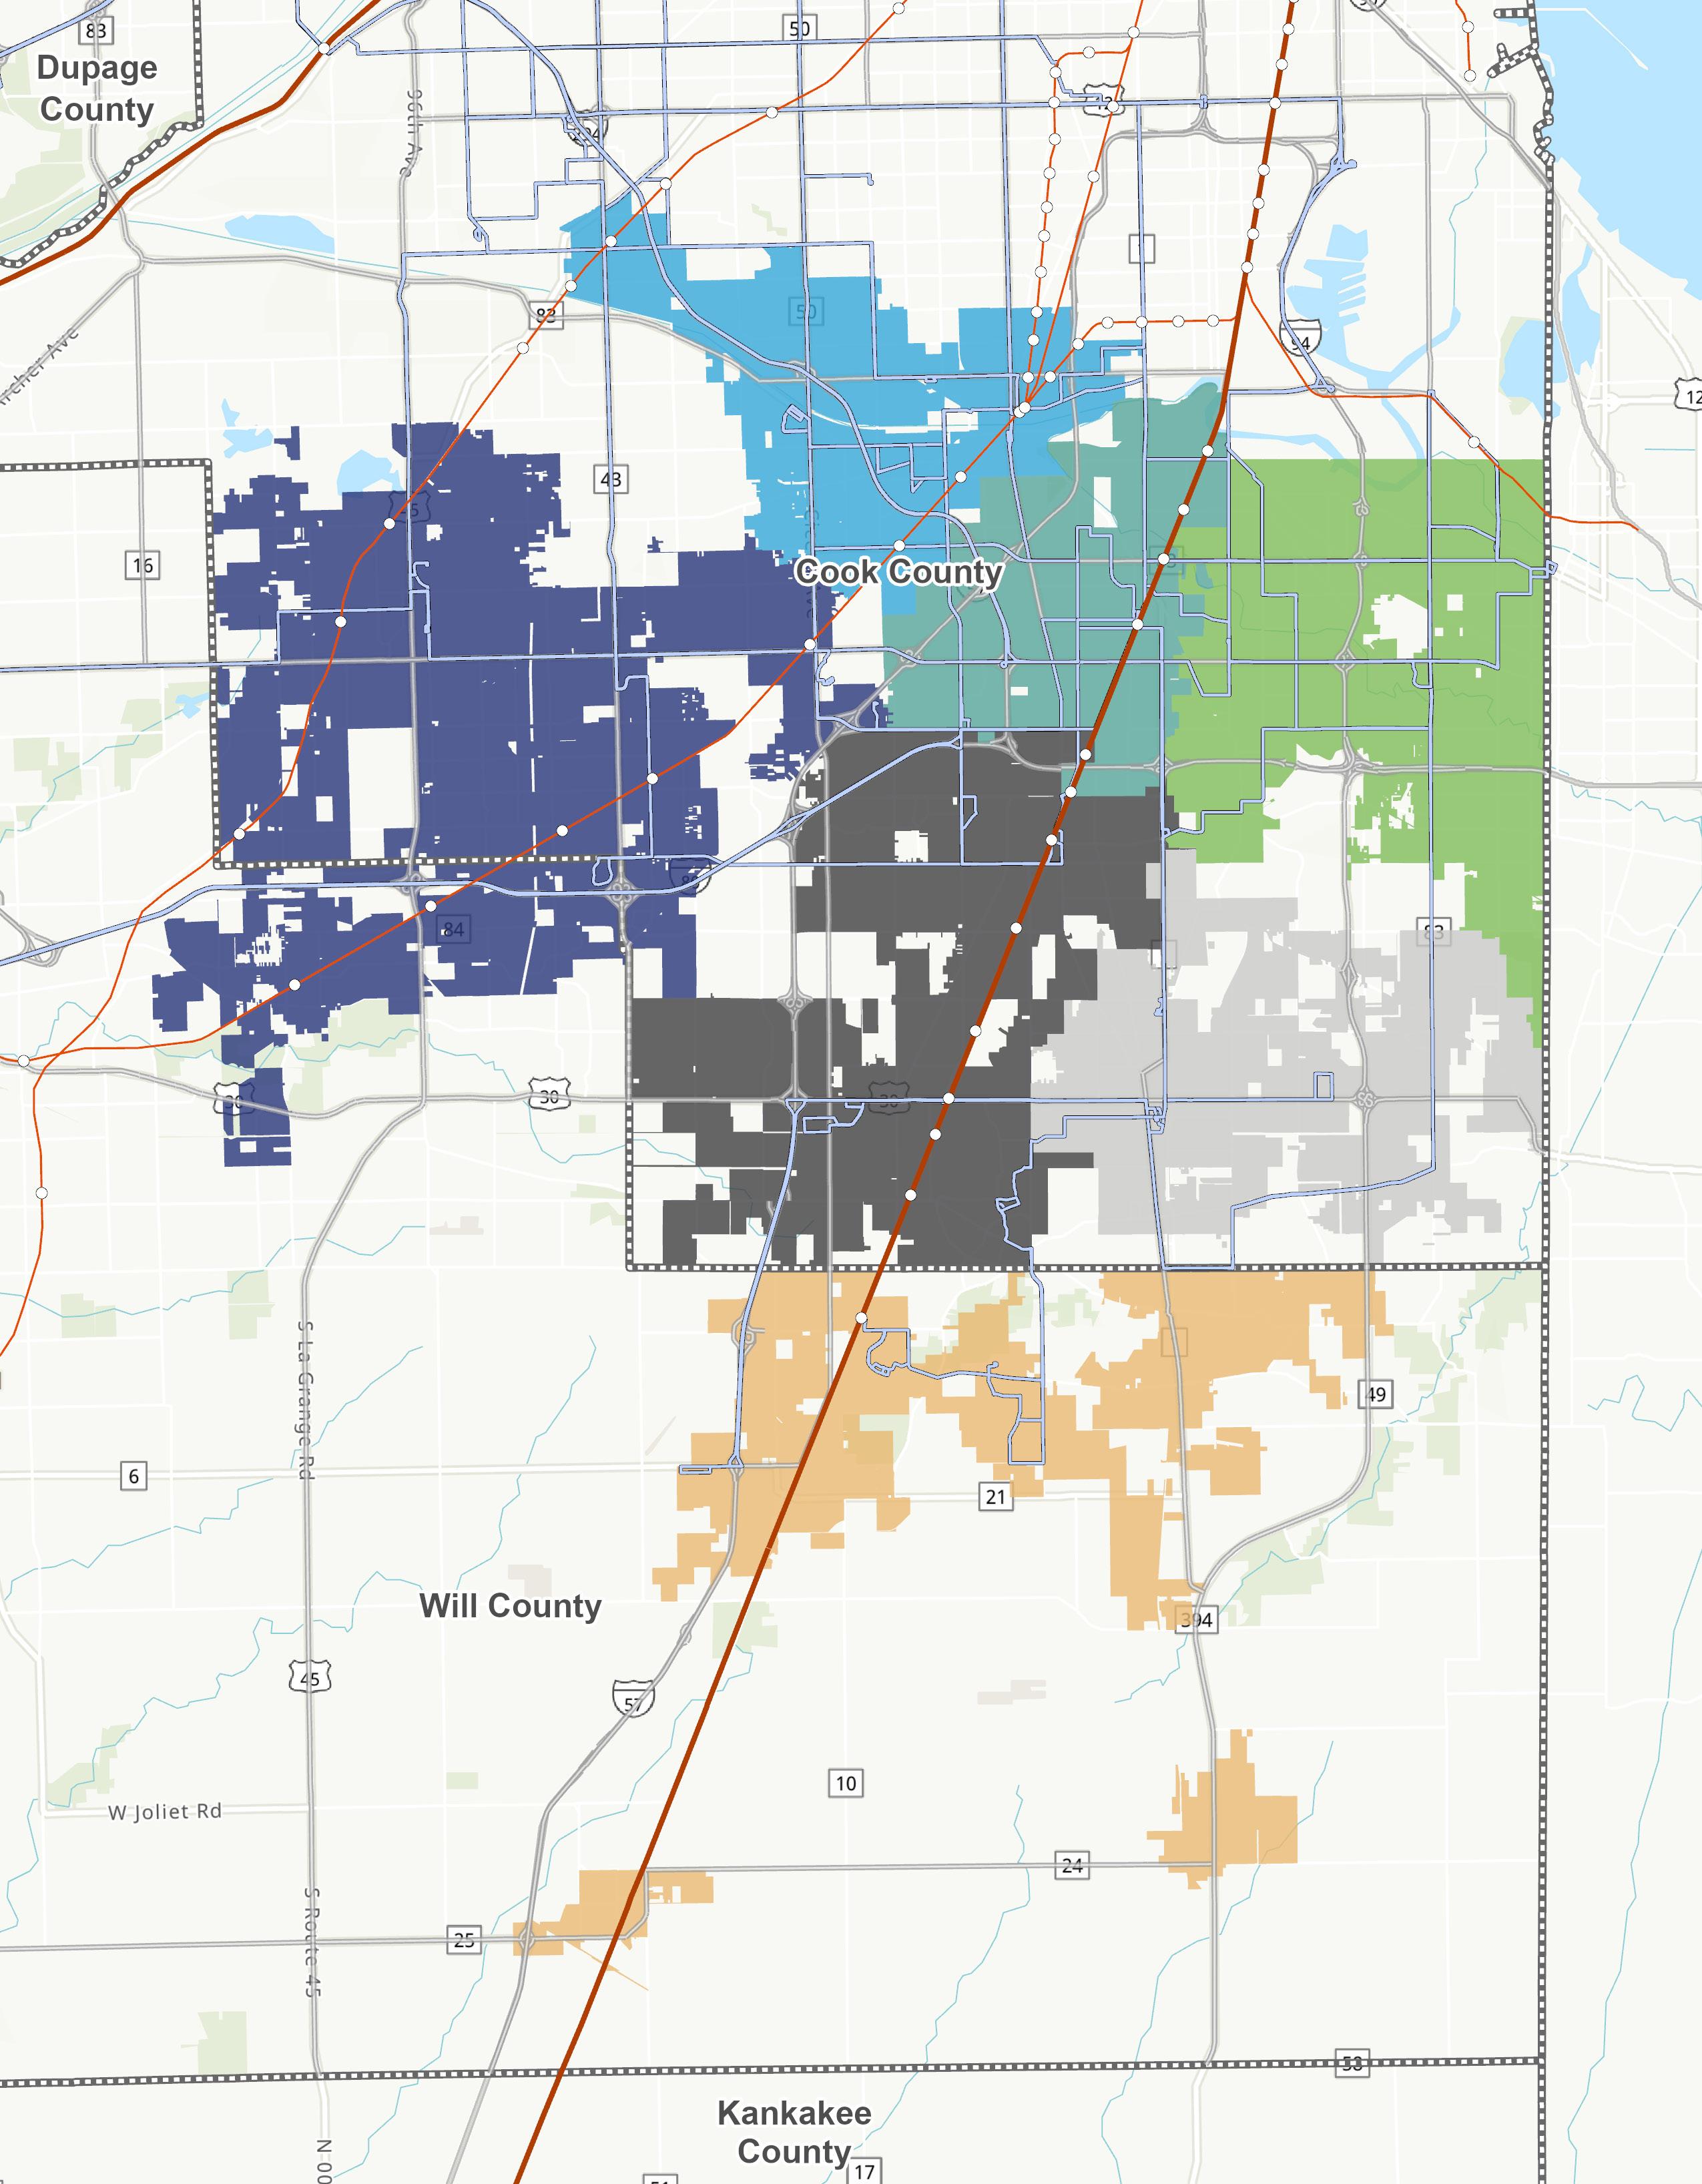
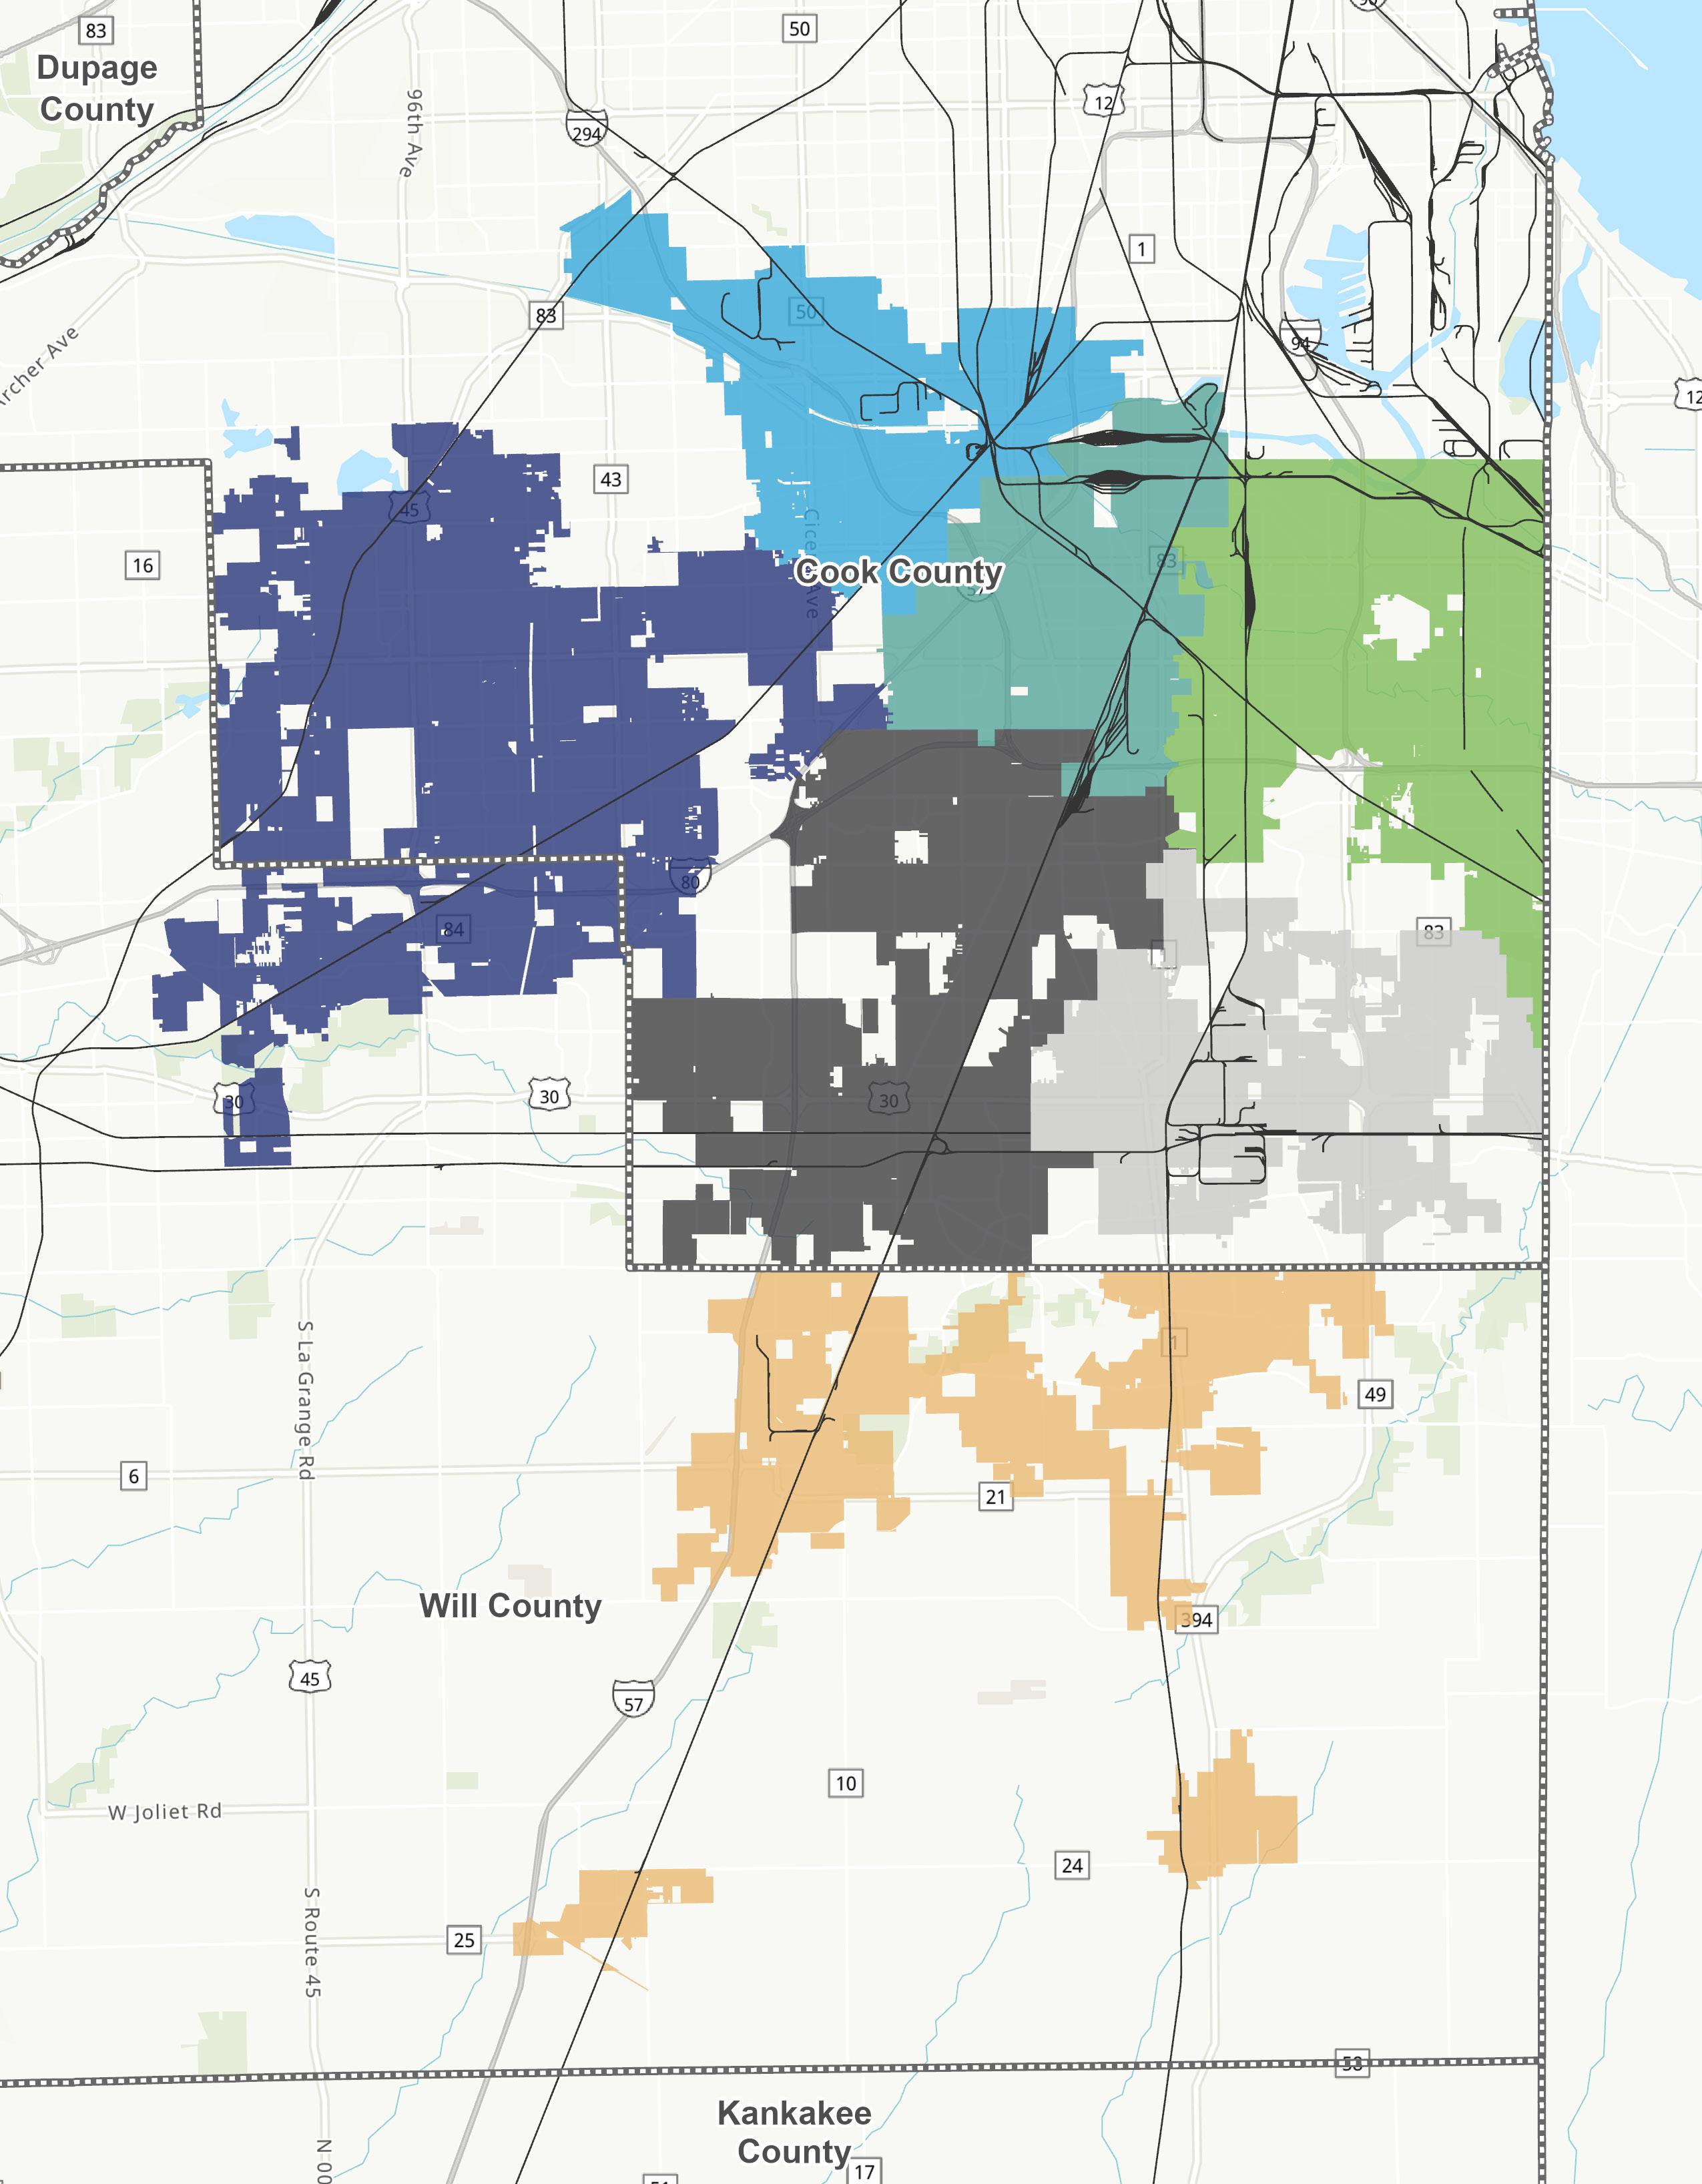
The following maps illustrate the individual cities and villages that make up the Southland sub-regions, as well as the public transit (Metra, Amtrak, Pace) and railway connections located across the Southland area and its sub-regions.
LEGEND
County Boundary
West Region
Northwest Region
North Central Region
Northeast Region
Southeast Region
East Central Region
Central Region
LEGEND
County Boundary
Metra Stations
Metra Rail/Amtrak Routes
Metra Rail Routes
Pace Bus Routes
West Region
Northwest Region
North Central Region
Northeast Region
Southeast Region
East Central Region
Central Region
LEGEND
County Boundary
Railway Lines
West Region
Northwest Region
North Central Region
Northeast Region
Southeast Region
East Central Region
Central Region
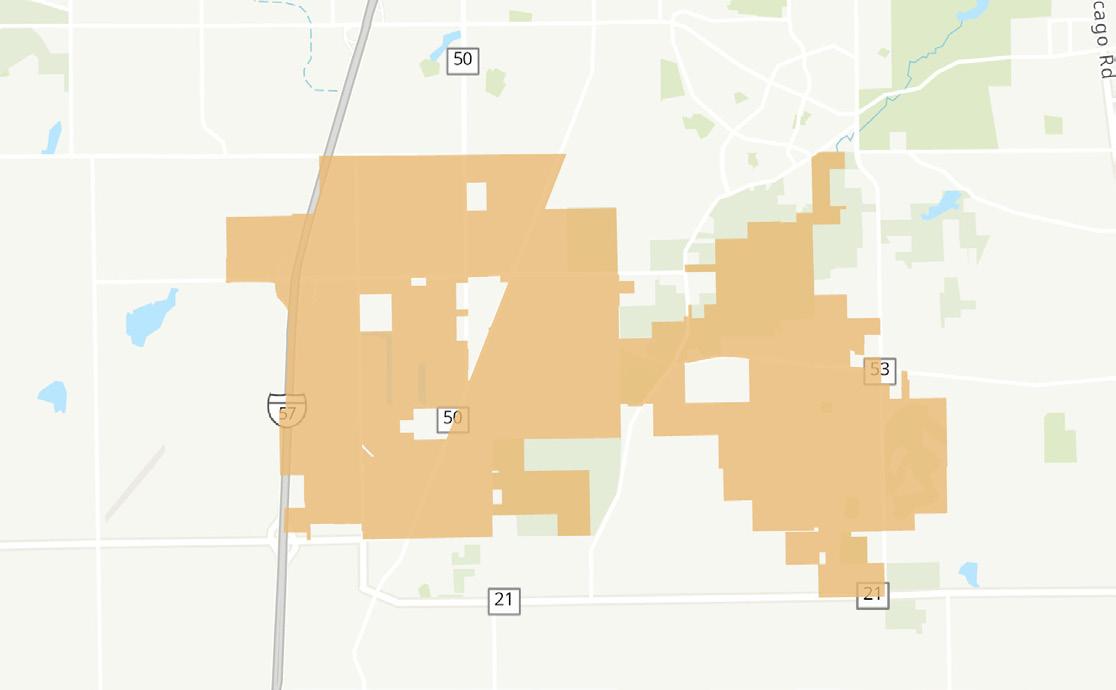
BUSINESS INCENTIVE PROGRAMS
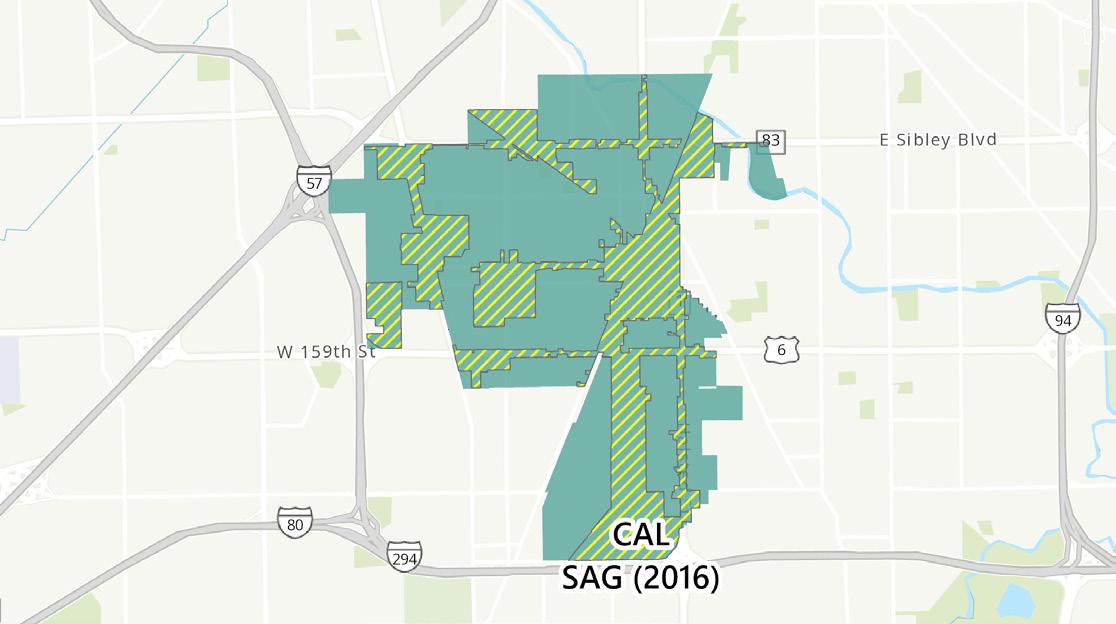
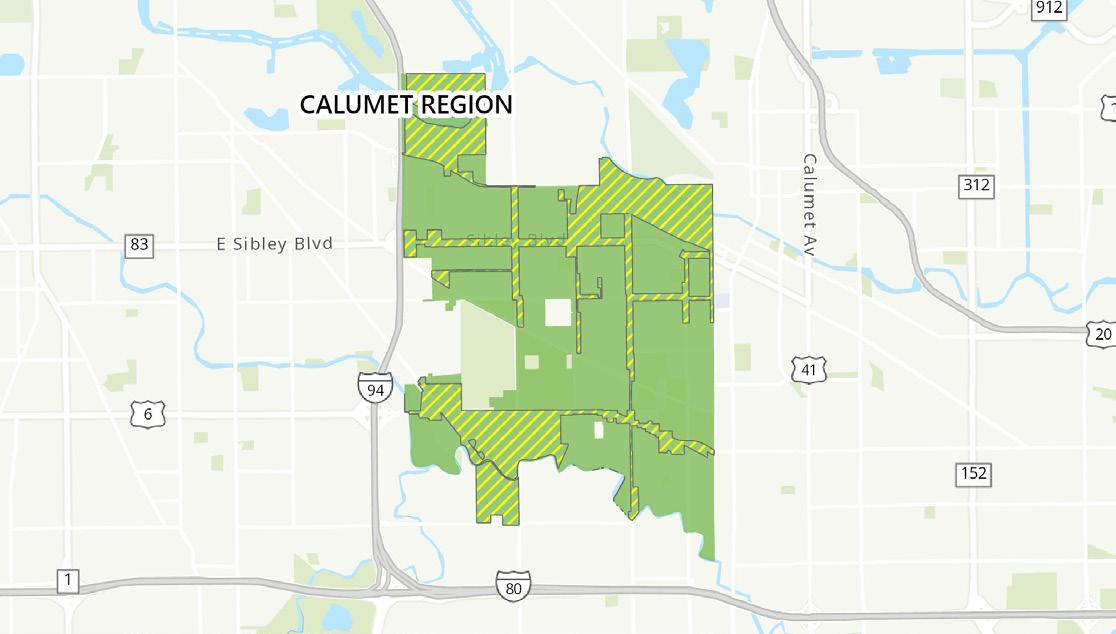
ENTERPRISE ZONE PROGRAM
The Illinois Enterprise Zone Program is designed to stimulate economic growth and neighborhood revitalization in economically depressed areas of the state through state and local tax incentives, regulatory relief, and improved governmental services. Businesses located or expanding in an Illinois enterprise zone may be eligible for the following state and local tax incentives:
▪ Exemption on retailers’ occupation tax paid on building materials.
▪ Expanded state sales tax exemptions on purchases of personal property used or consumed in the manufacturing process or in the operation of a pollution control facility.
▪ An exemption on the state utility tax for electricity and natural gas.
▪ An exemption on the Illinois Commerce Commission’s administrative charge and telecommunication excise tax. Exemptions are available for companies making minimum statutory investments that either create or retain a certain number of jobs. These exemptions require the company to apply to and be certified by, the Illinois Department of Commerce.
HIGH IMPACT BUSINESS PROGRAM
The High Impact Business (HIB) program supports large-scale economic development activities by providing tax incentives (similar to Enterprise Zones) to companies that make substantial capital investments in operations and create or retain an above-average number of jobs.
Eligible projects must invest a minimum of $12 million and create 500 full-time jobs, or invest $30 million investment while retaining 1,500 full-time jobs. Investments must take place at designated locations in Illinois outside of an Enterprise Zone.
The Illinois HIB program offers numerous state incentives to encourage companies to locate or expand their large-scale operations. Currently, the following incentives are available:
▪ HIB Investment Tax Credit
▪ HIB Building Material Exemption (BME)
▪ HIB Utility Tax Exemption
▪ HIB Manufacturing Machinery and Equipment/Pollution Control Facilities Sales Tax Exemption (MM&E)
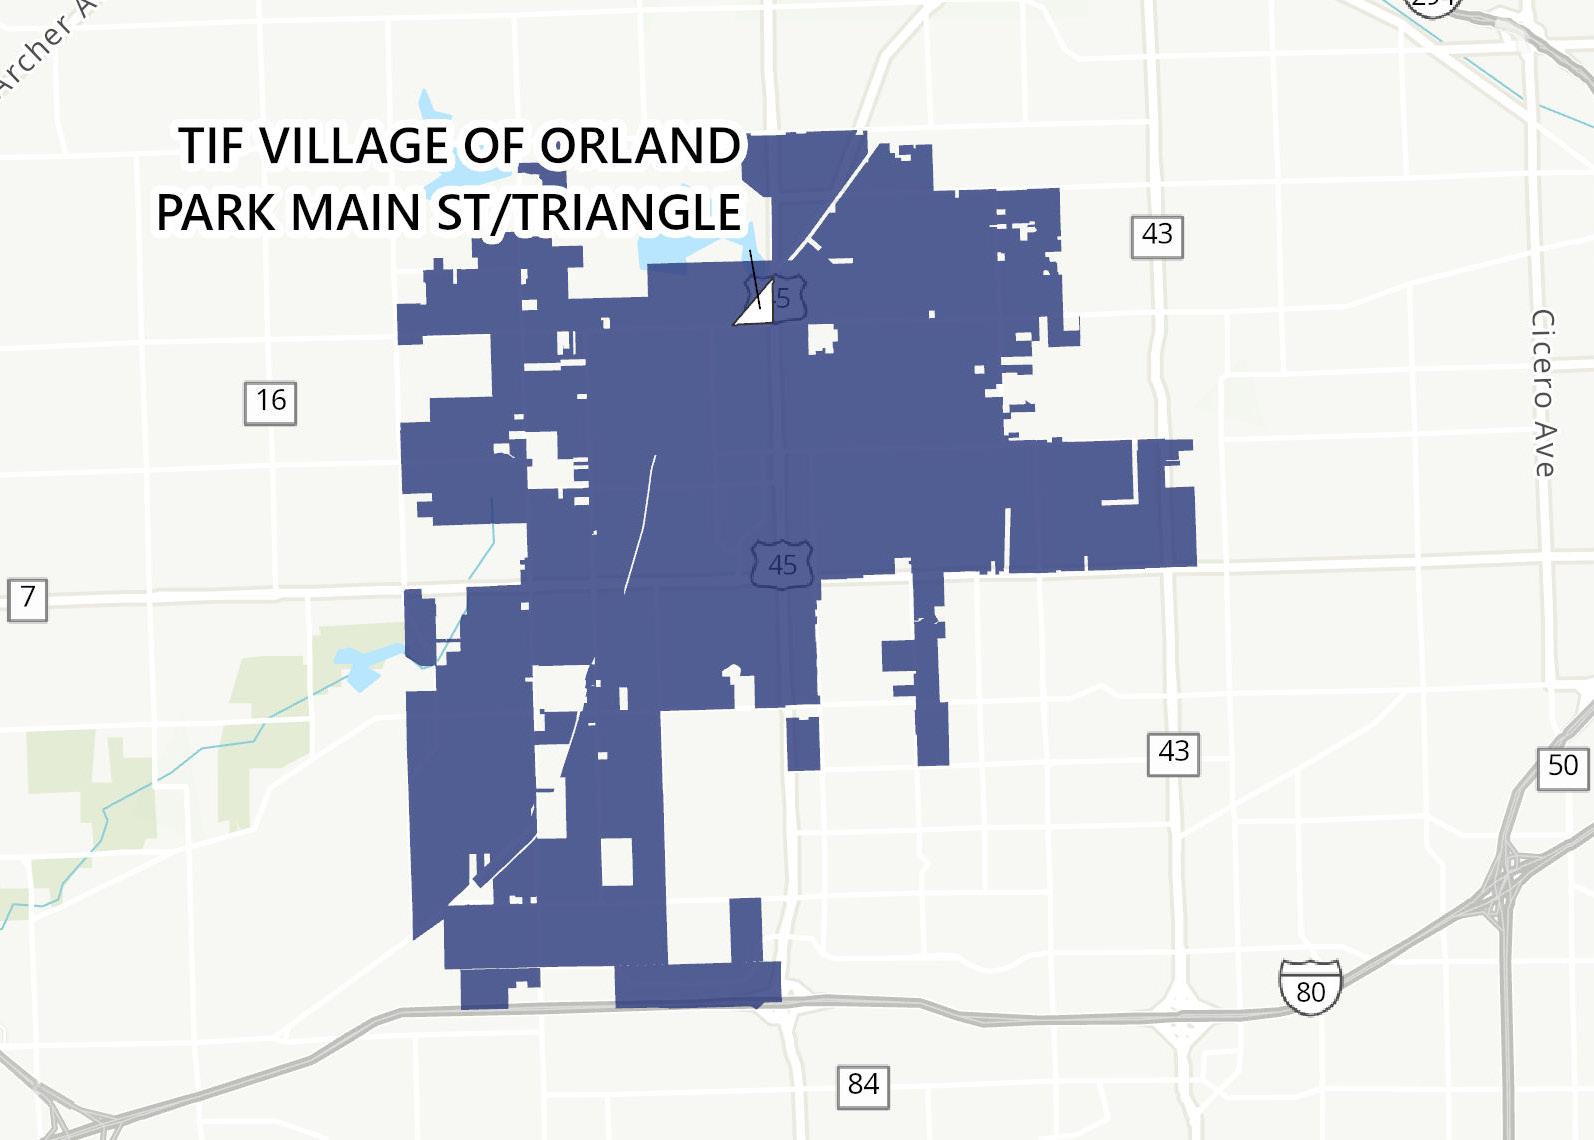
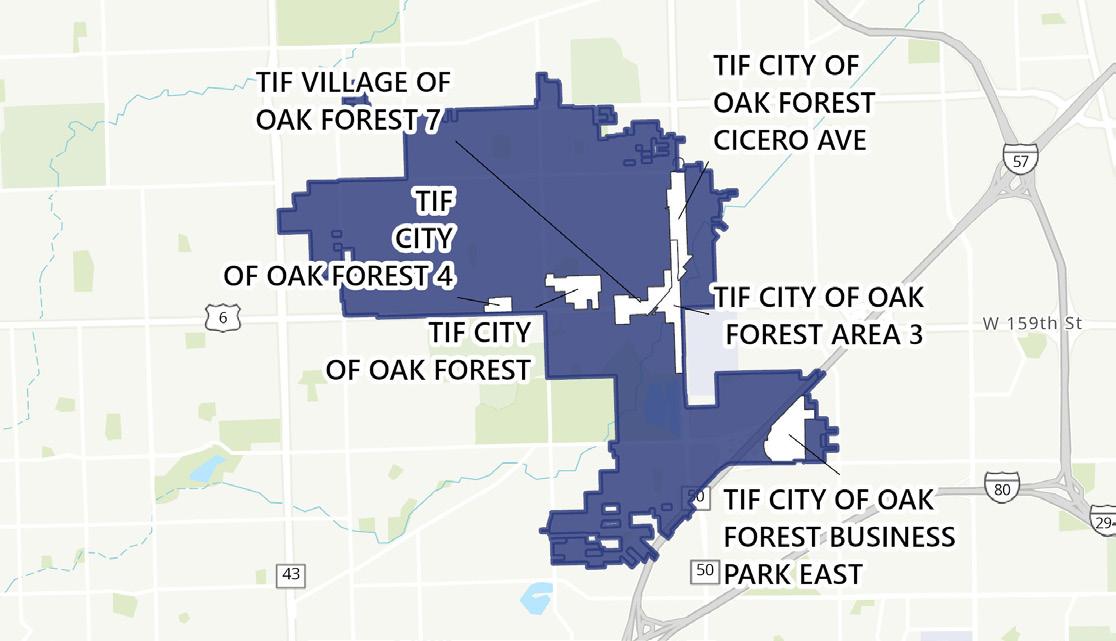
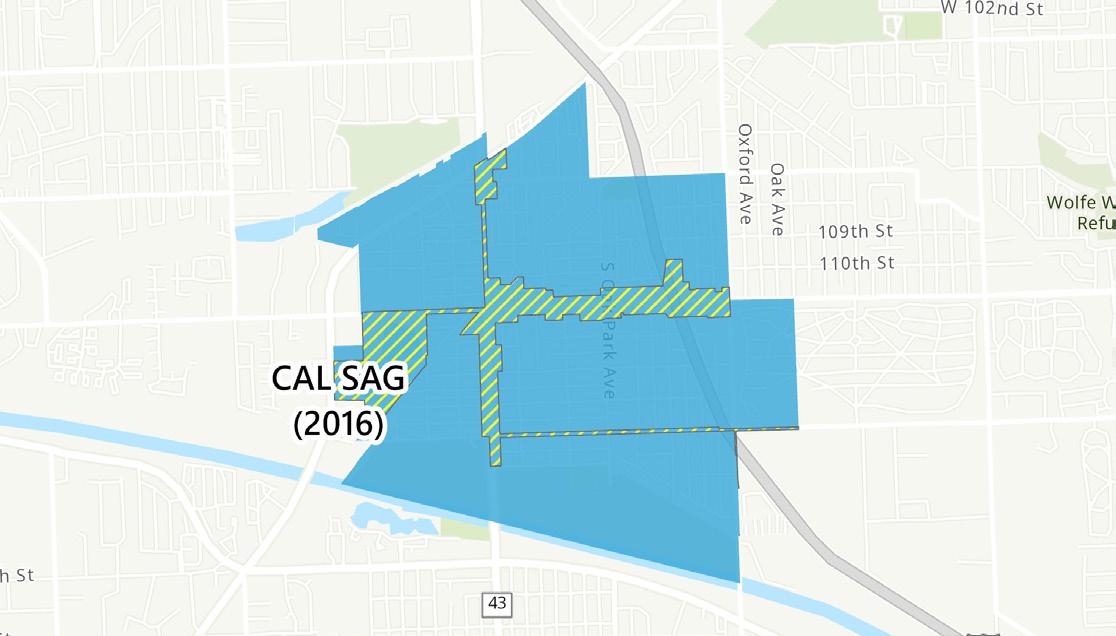
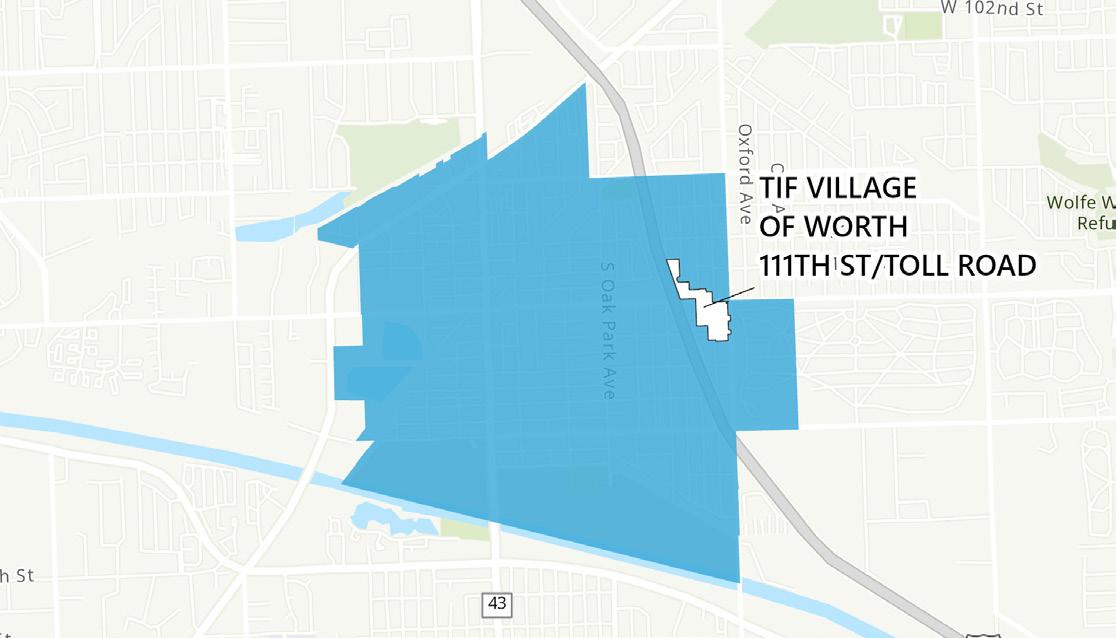
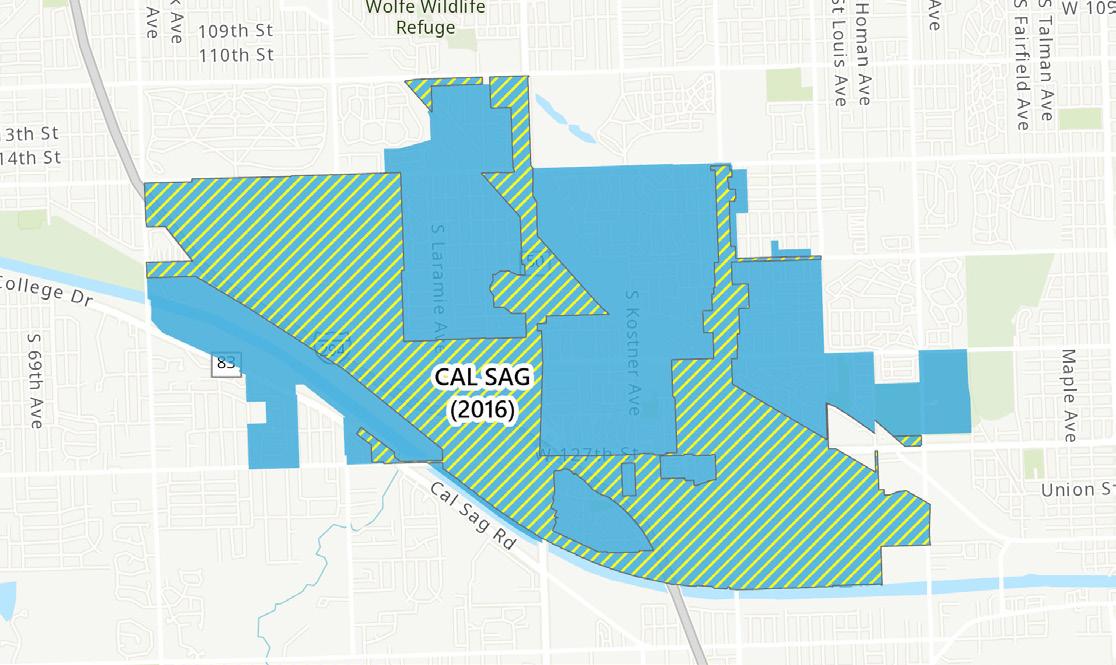
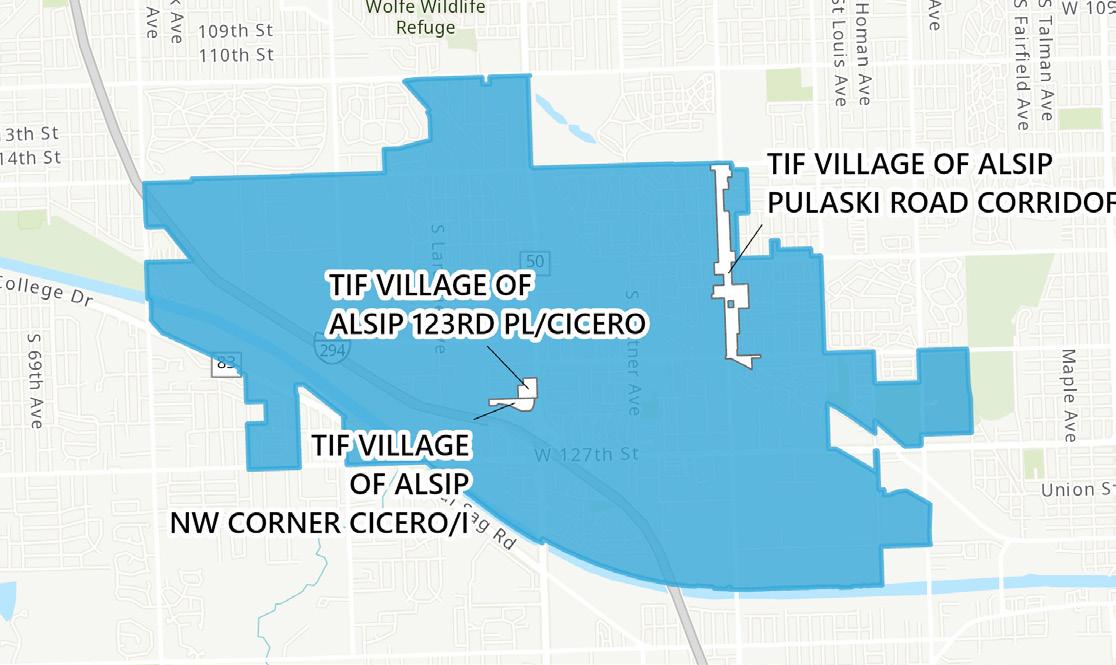
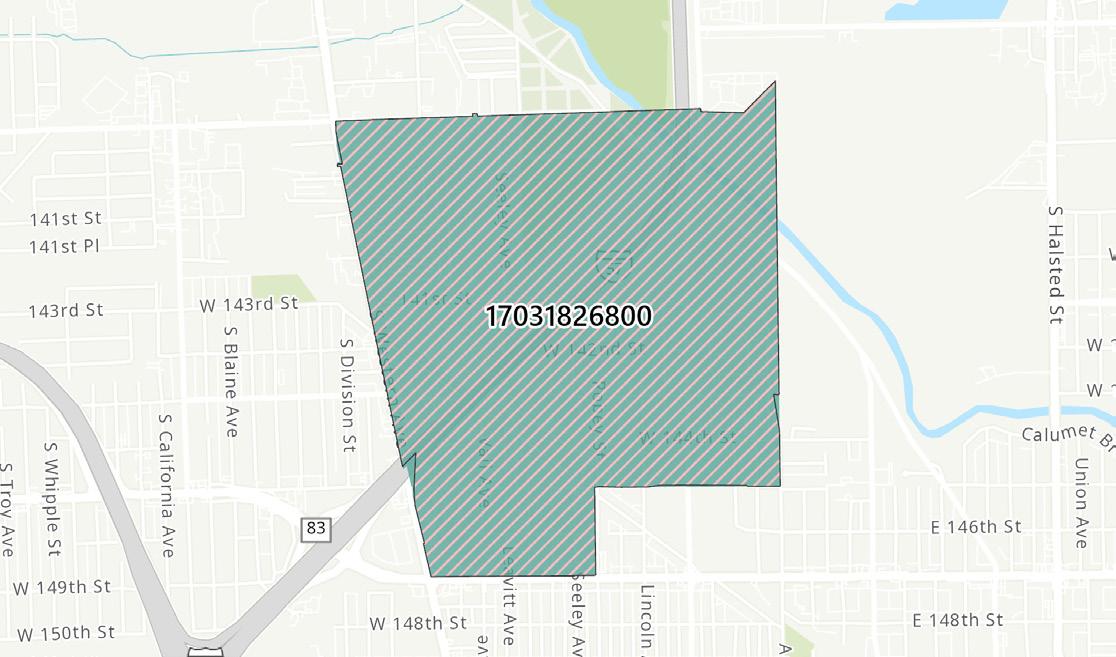
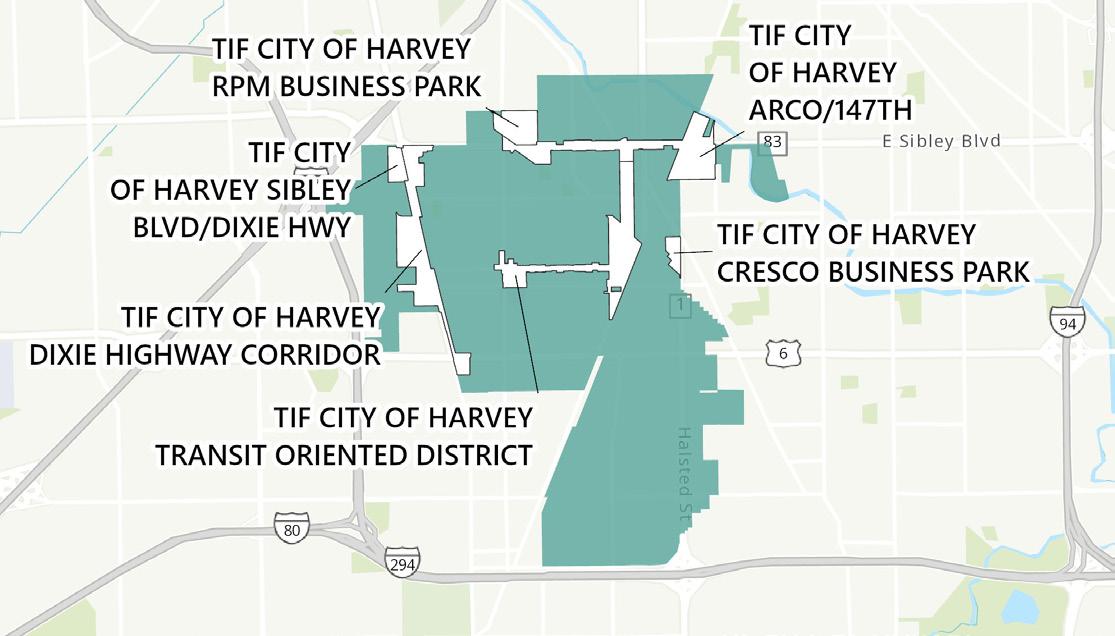
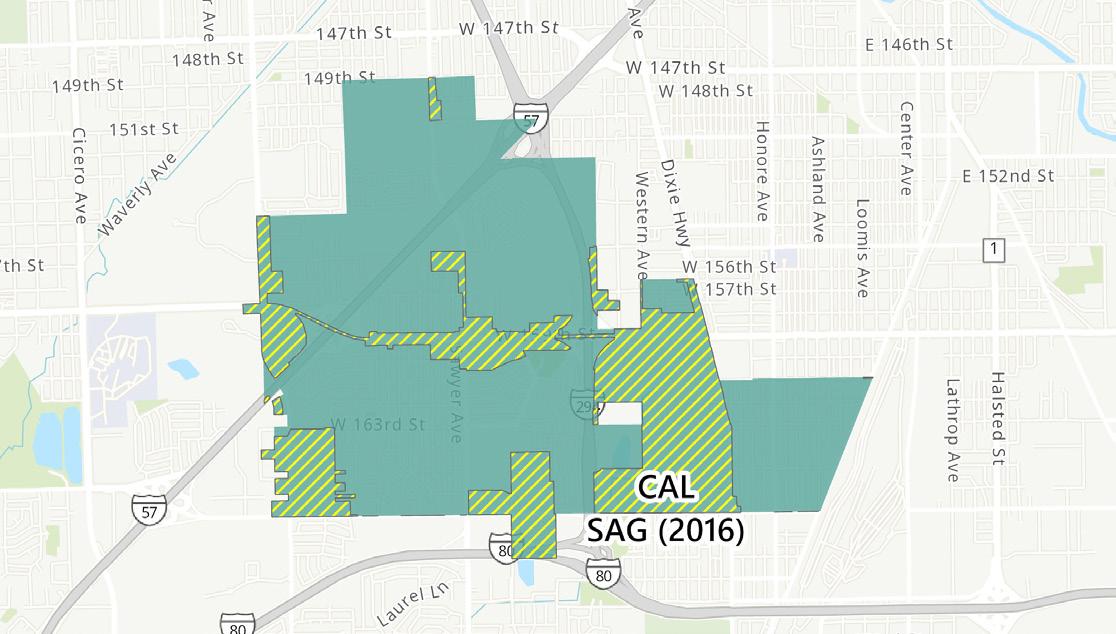
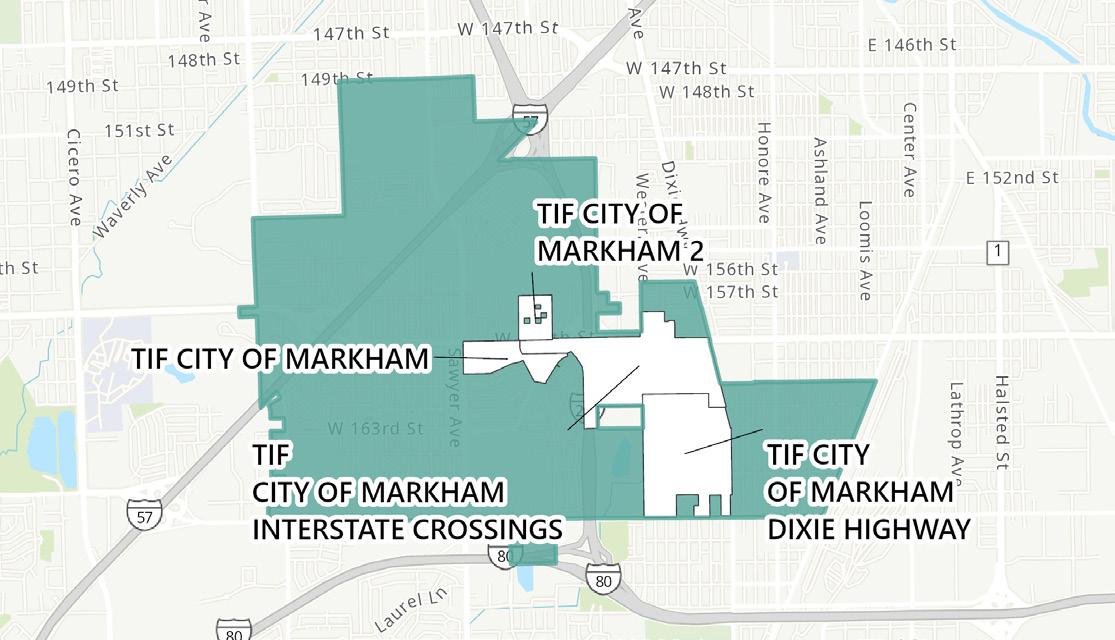
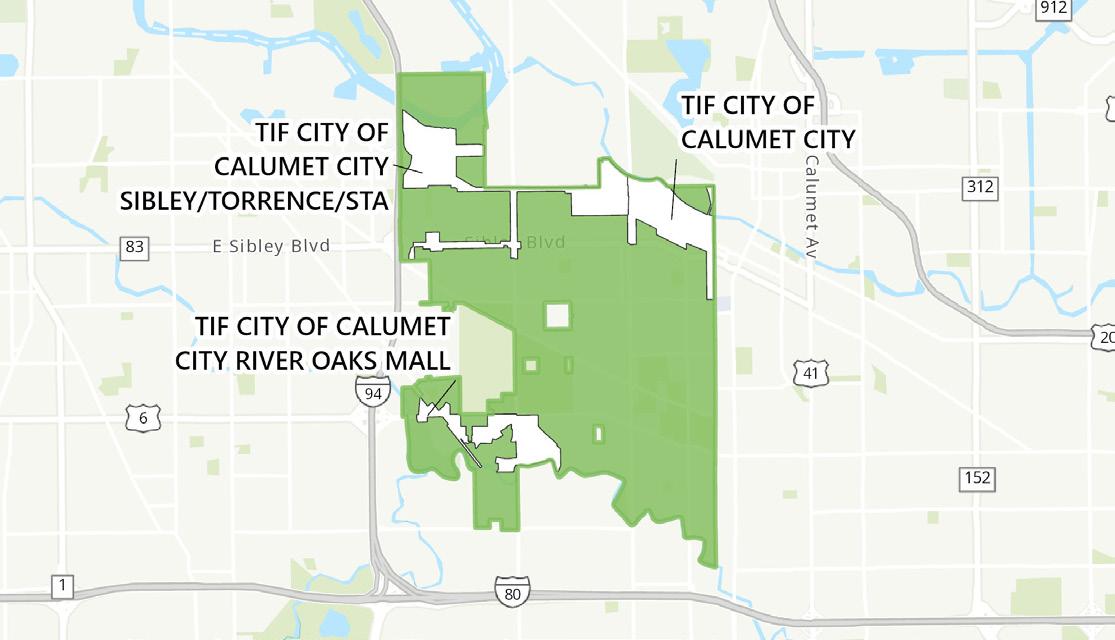
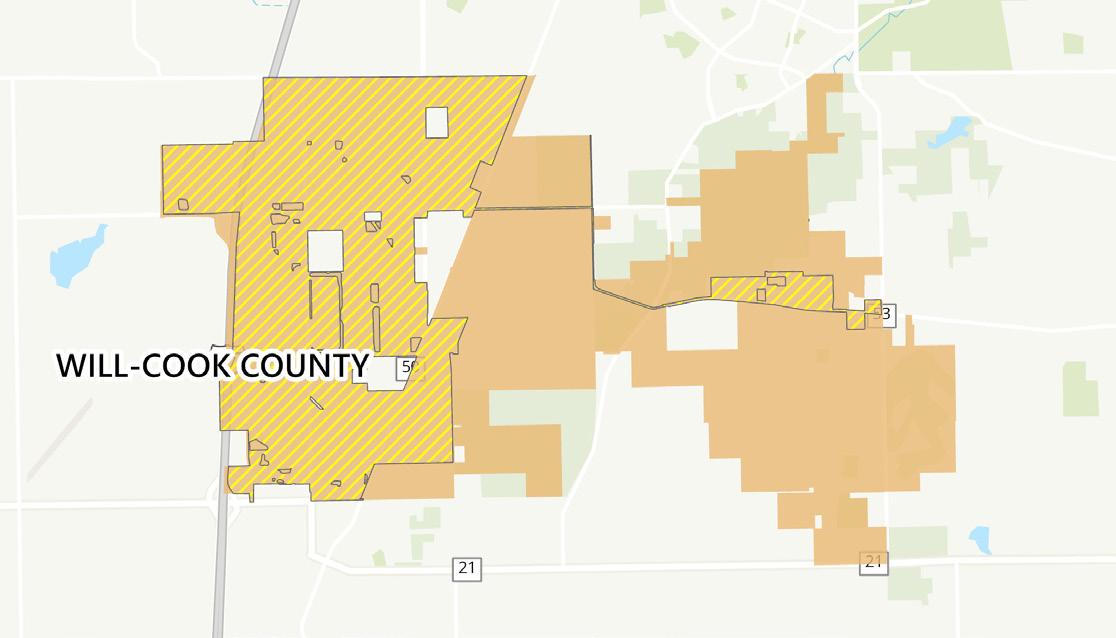
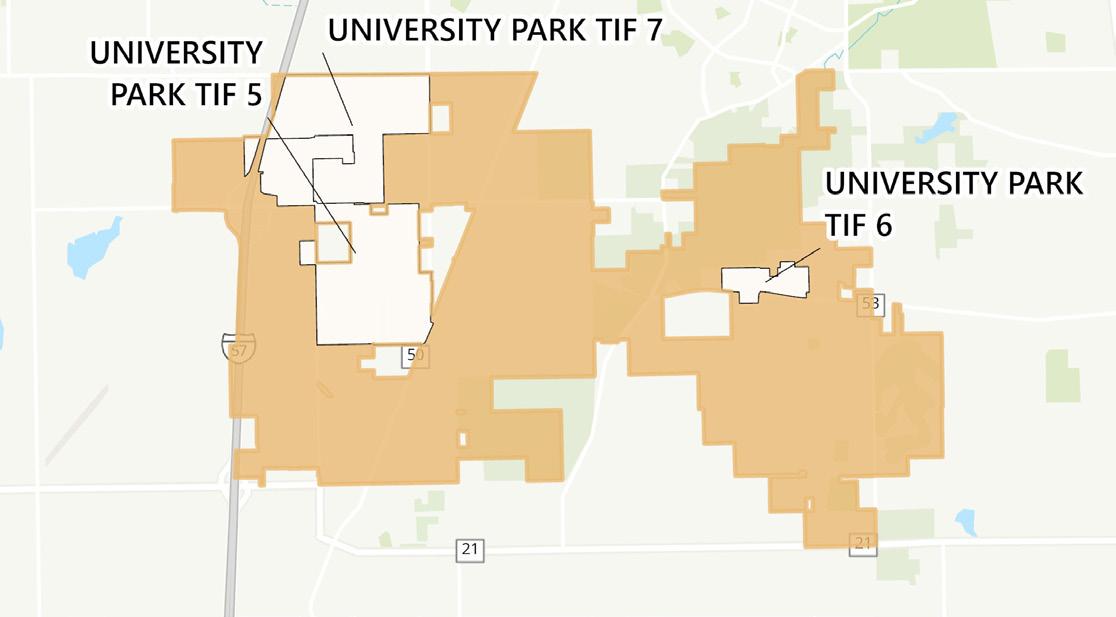
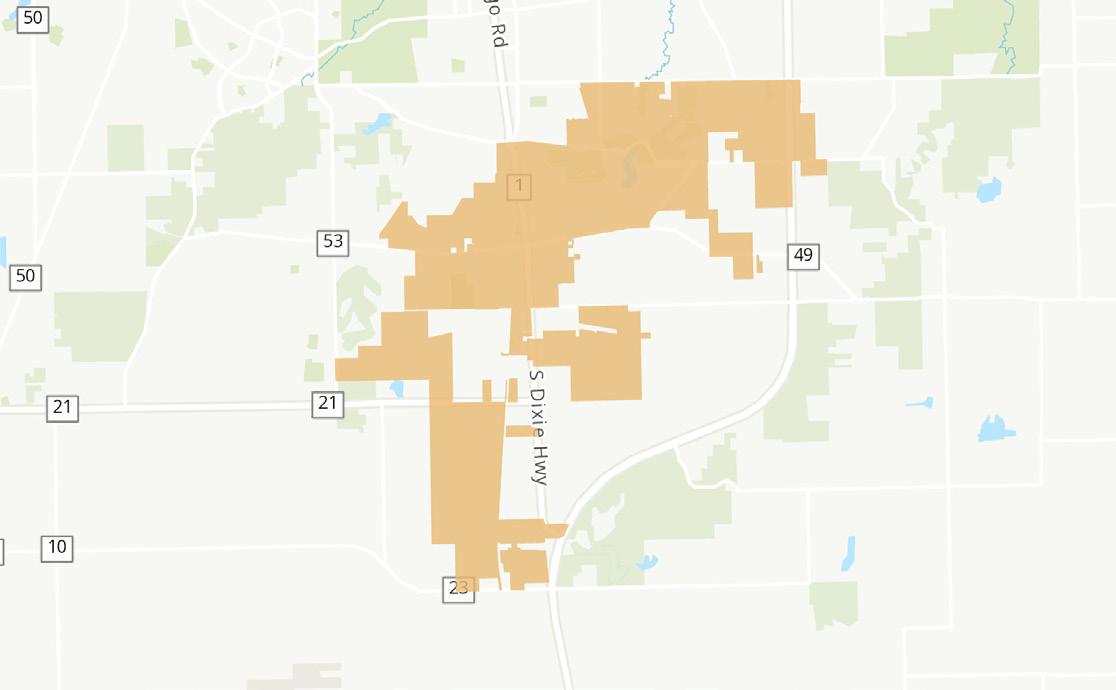
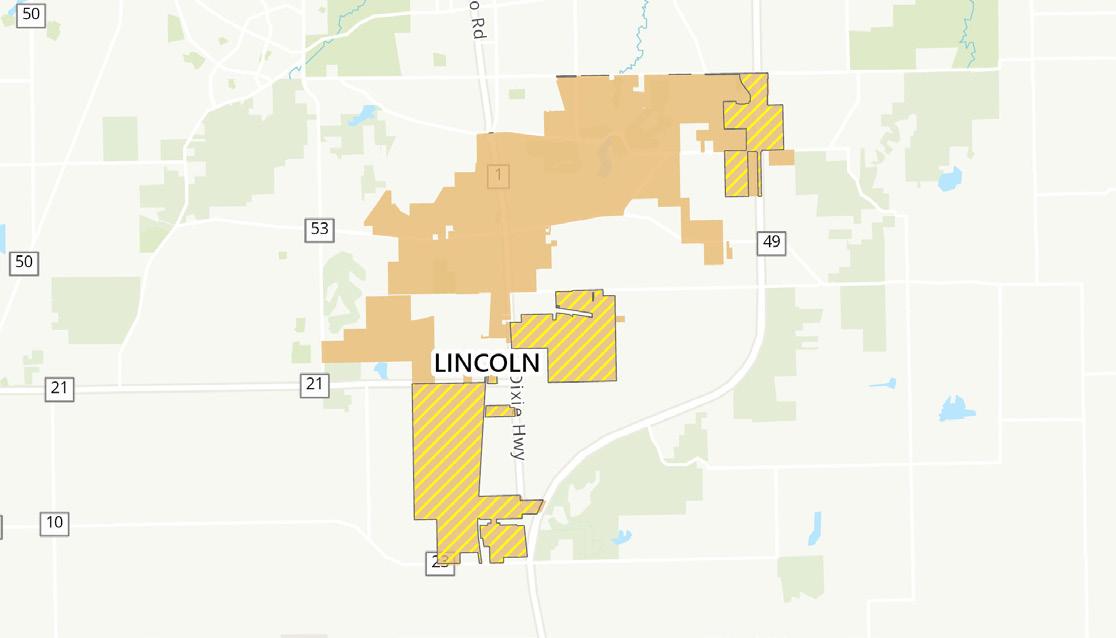
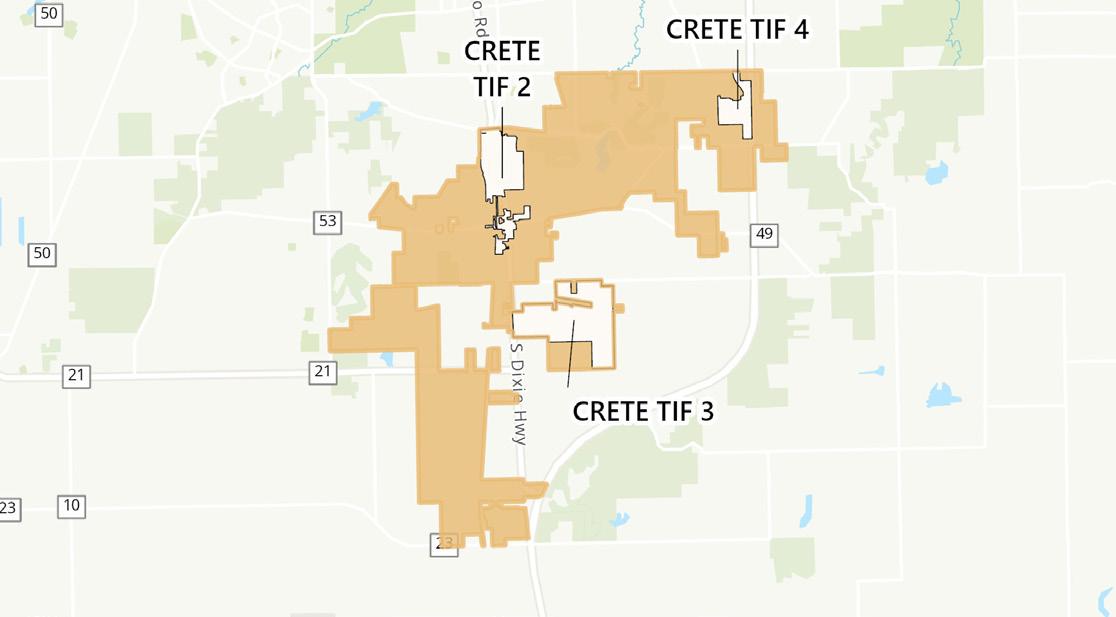
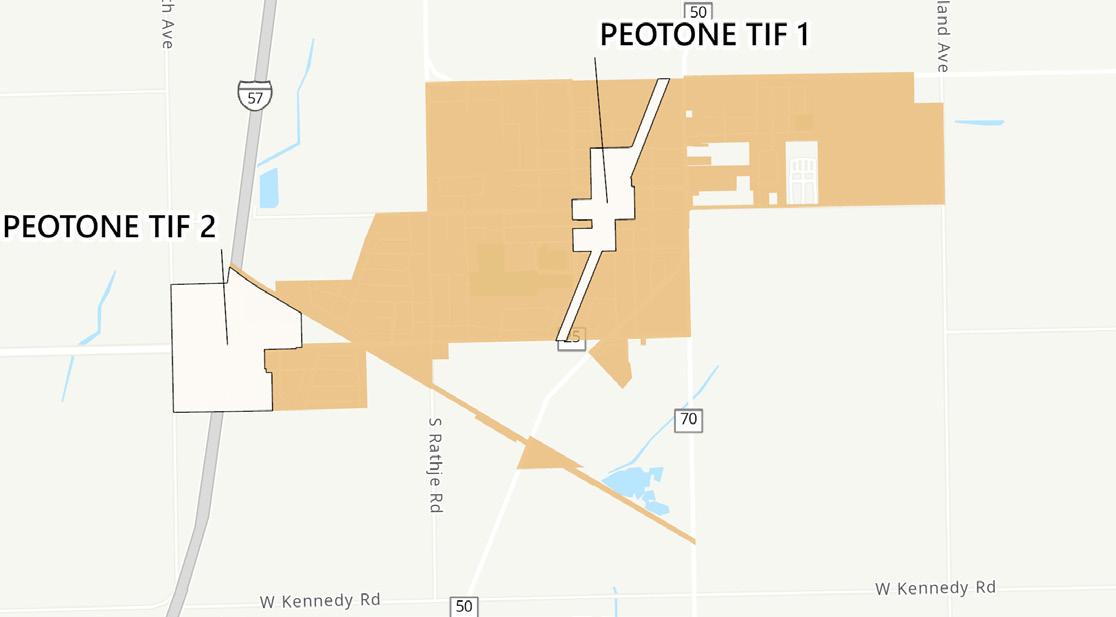
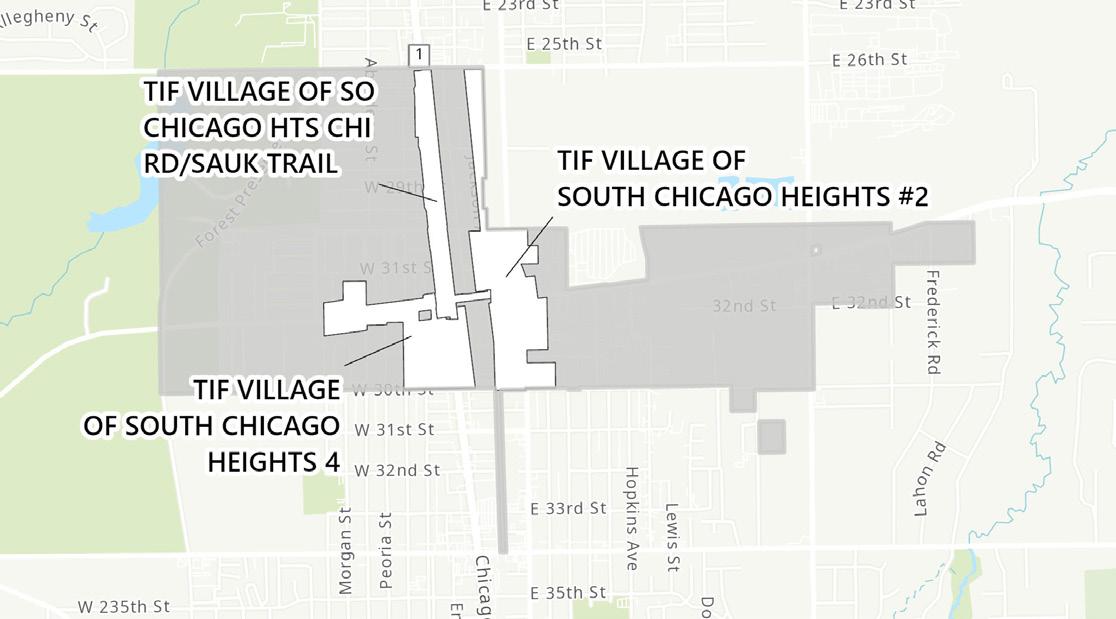
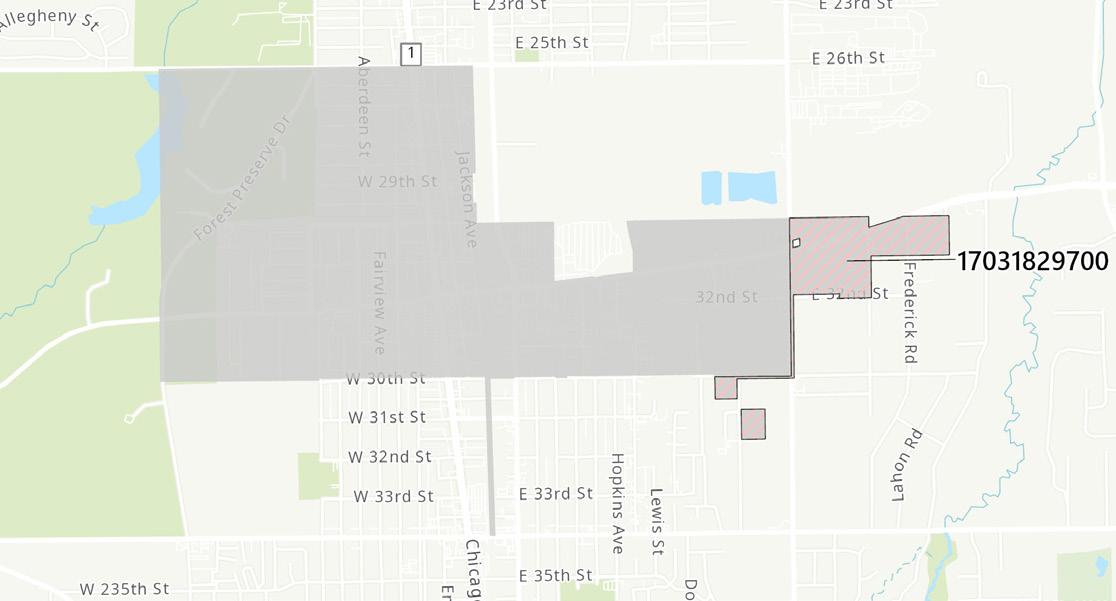
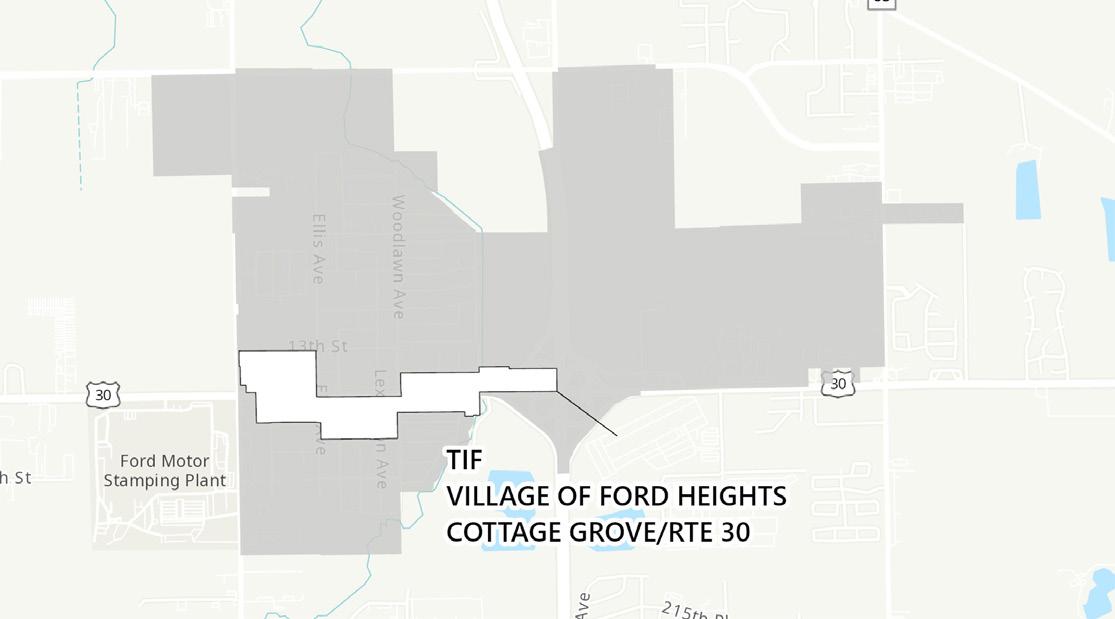
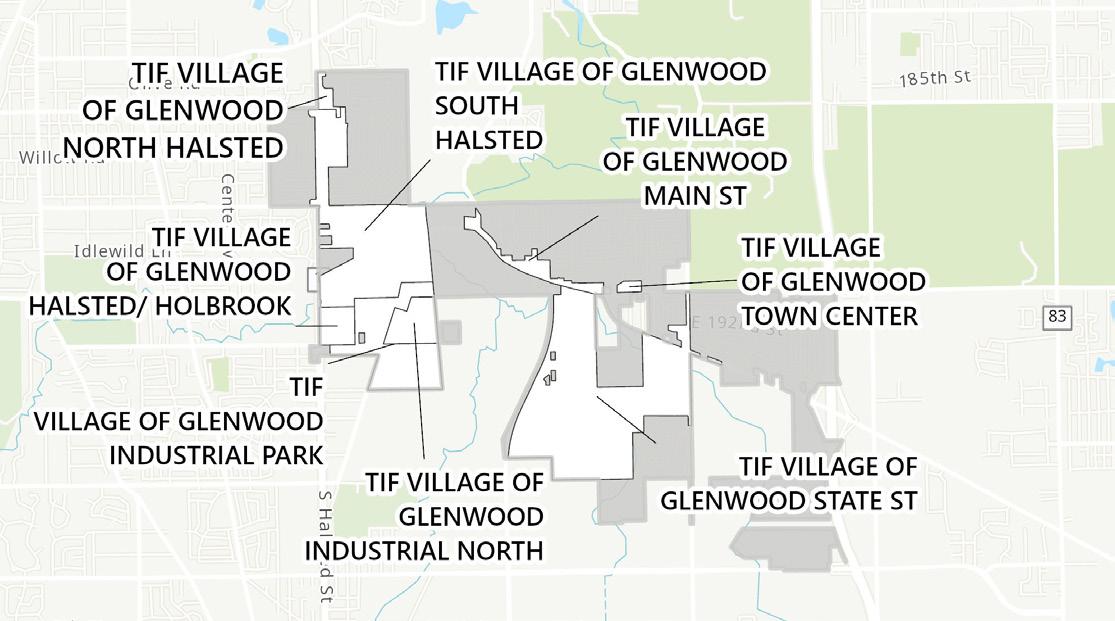
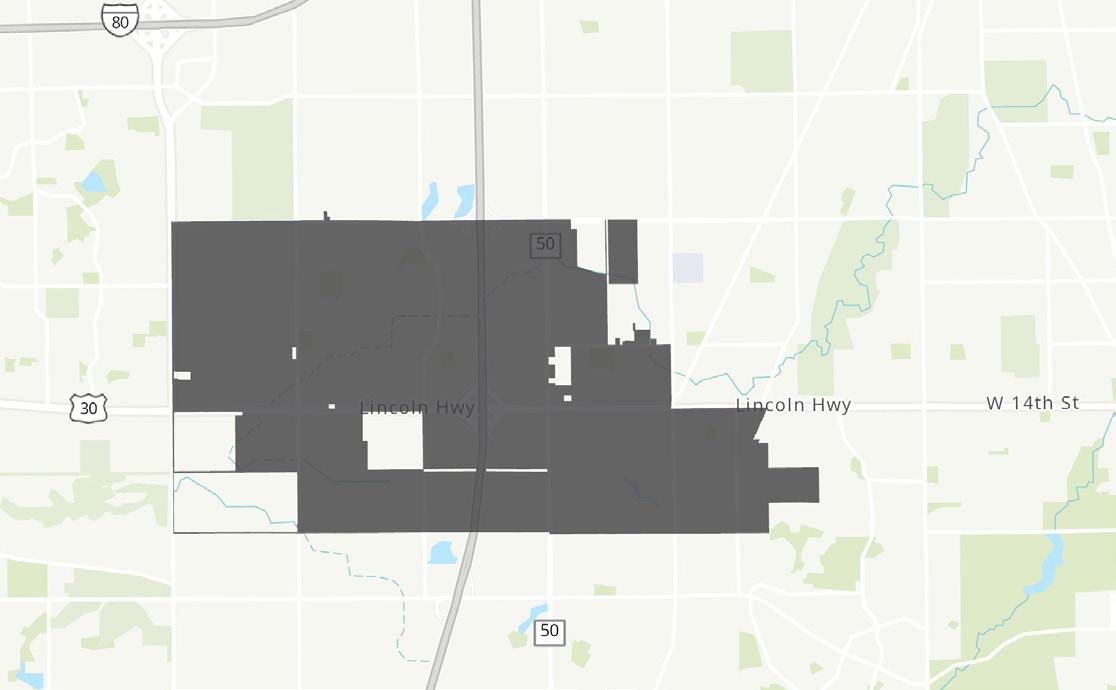
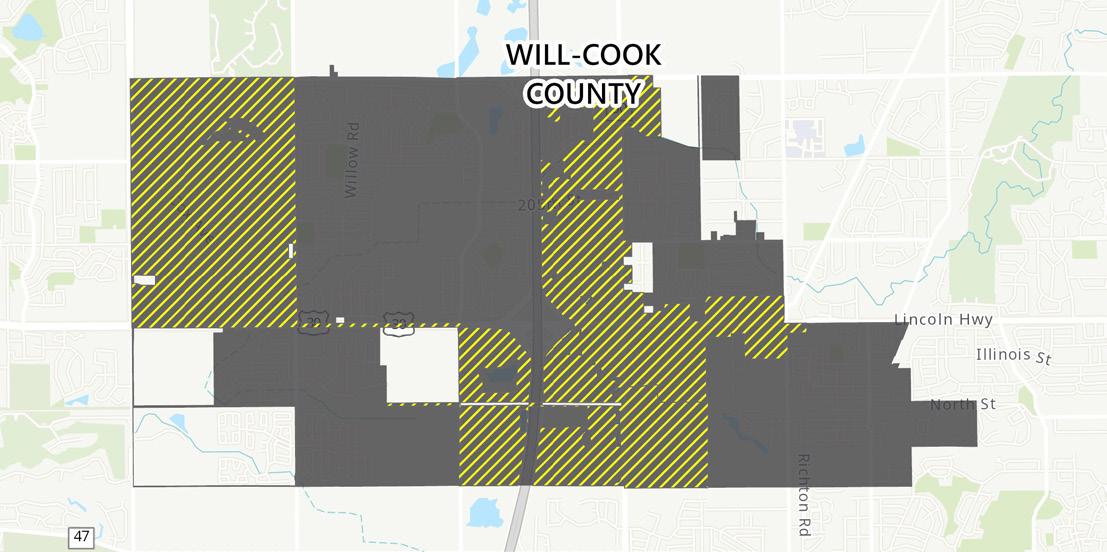
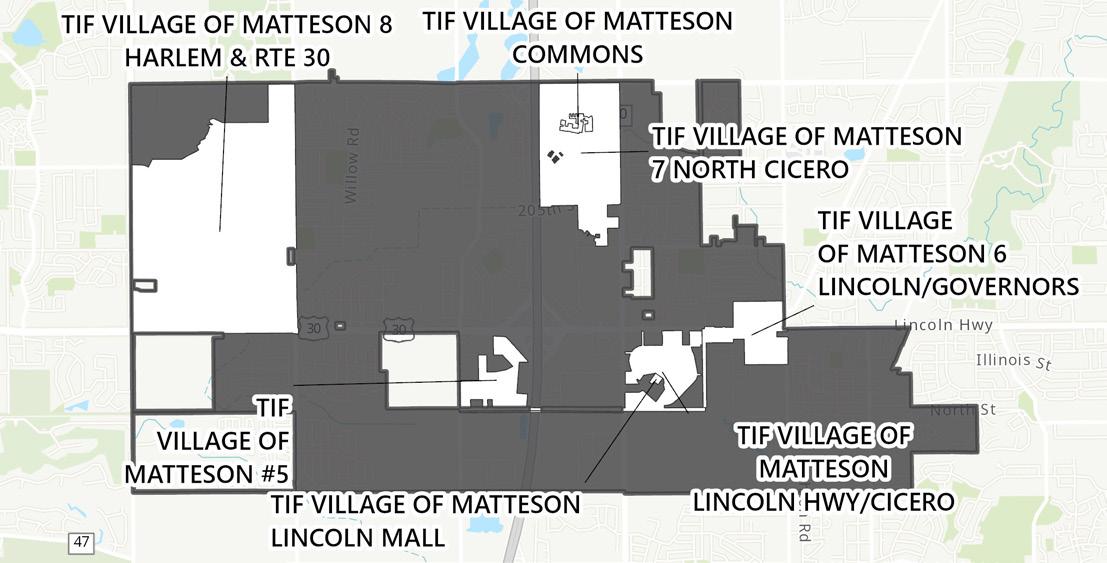
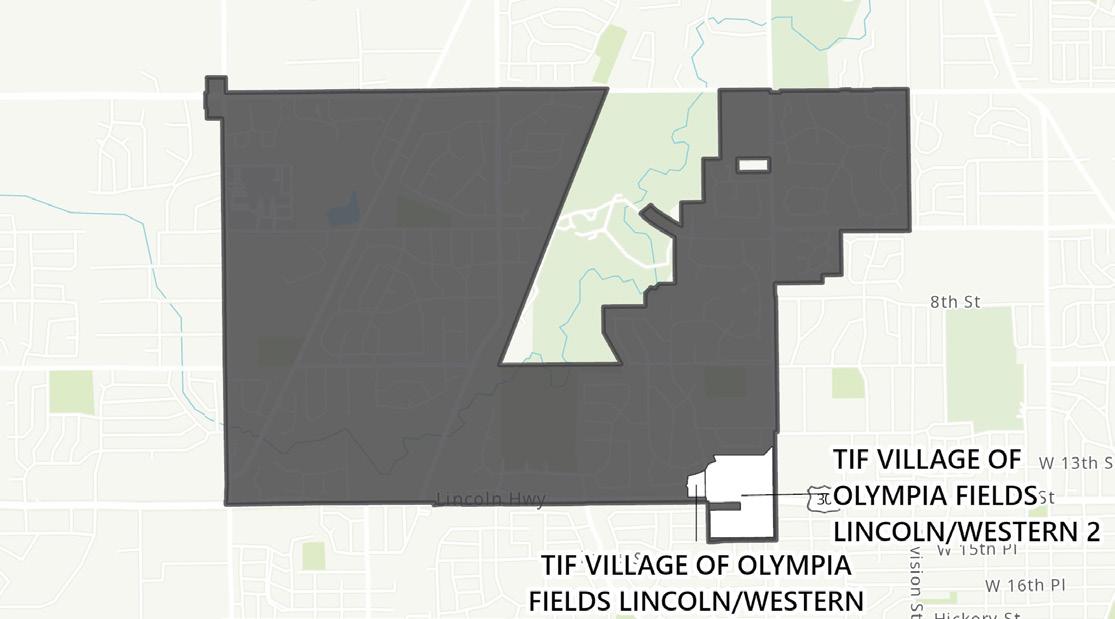
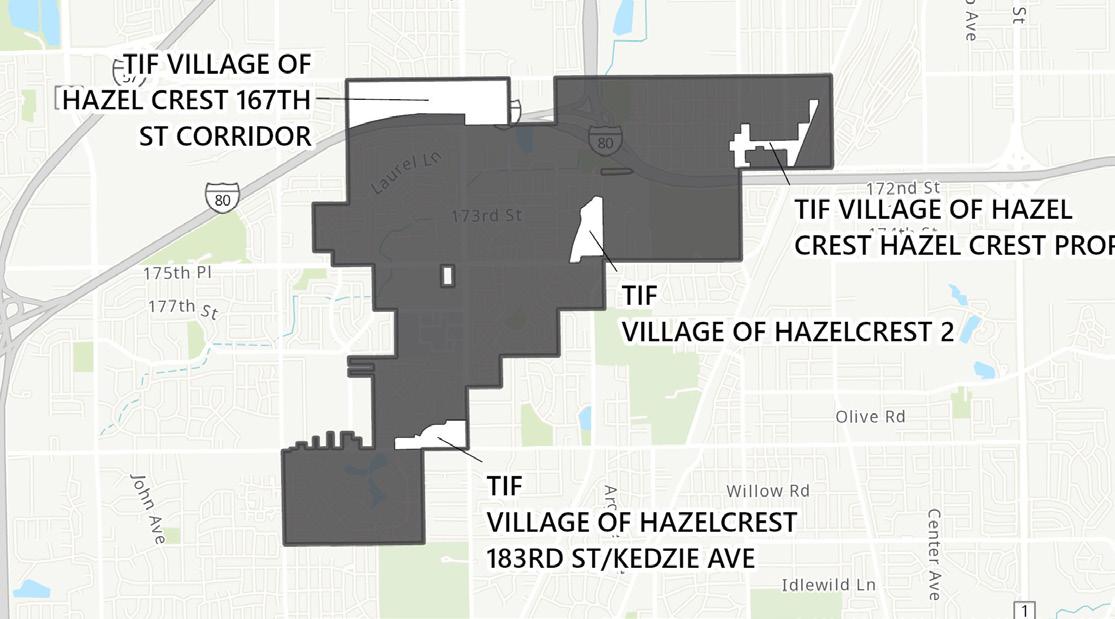
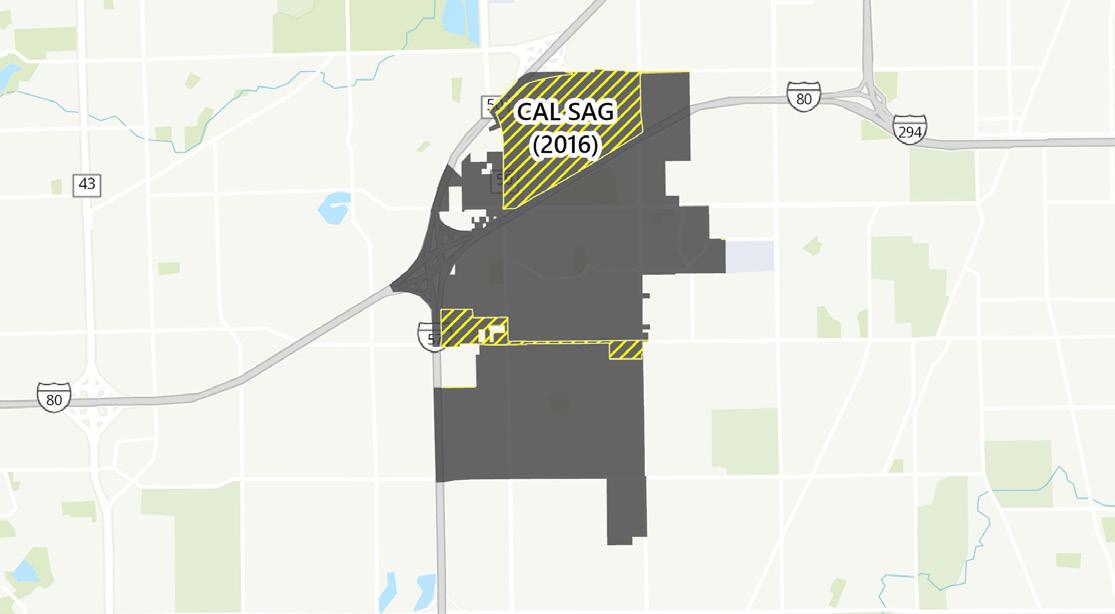
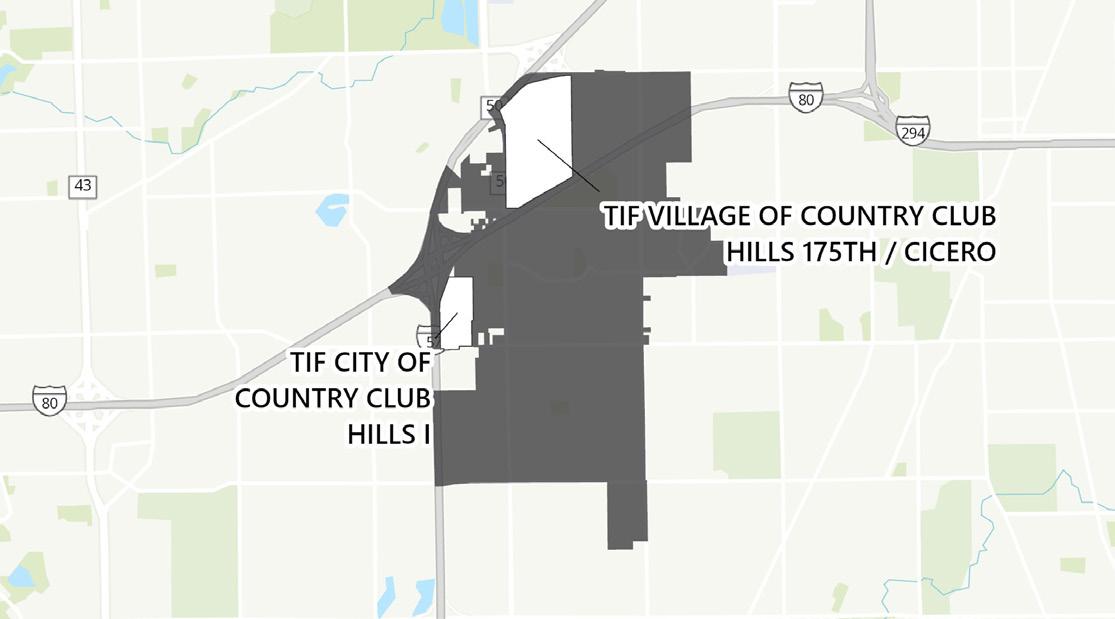
TAX INCREMENT FINANCING DISTRICTS
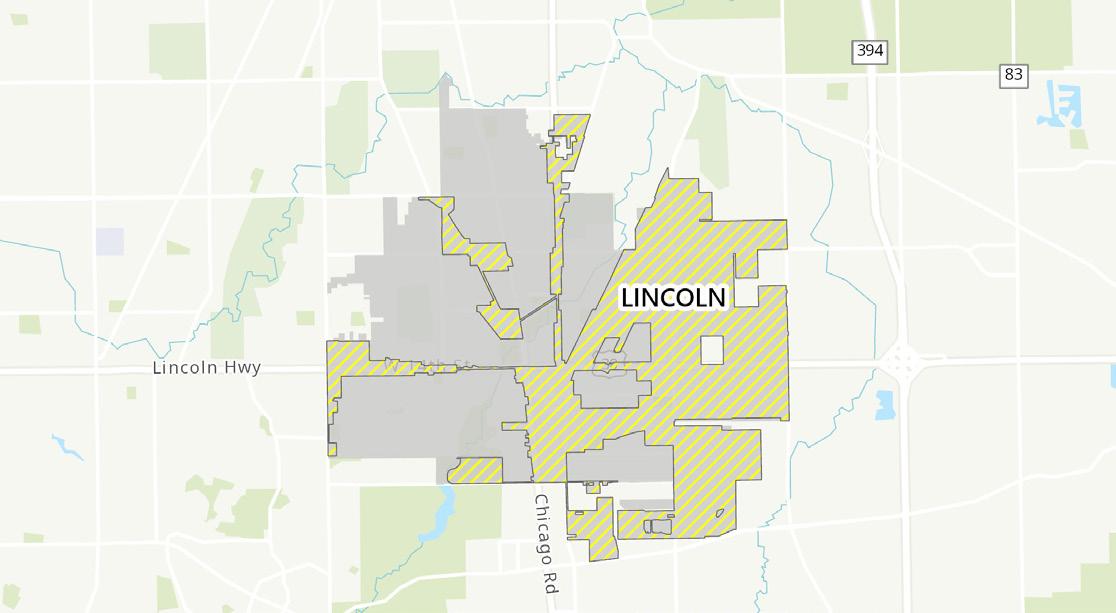
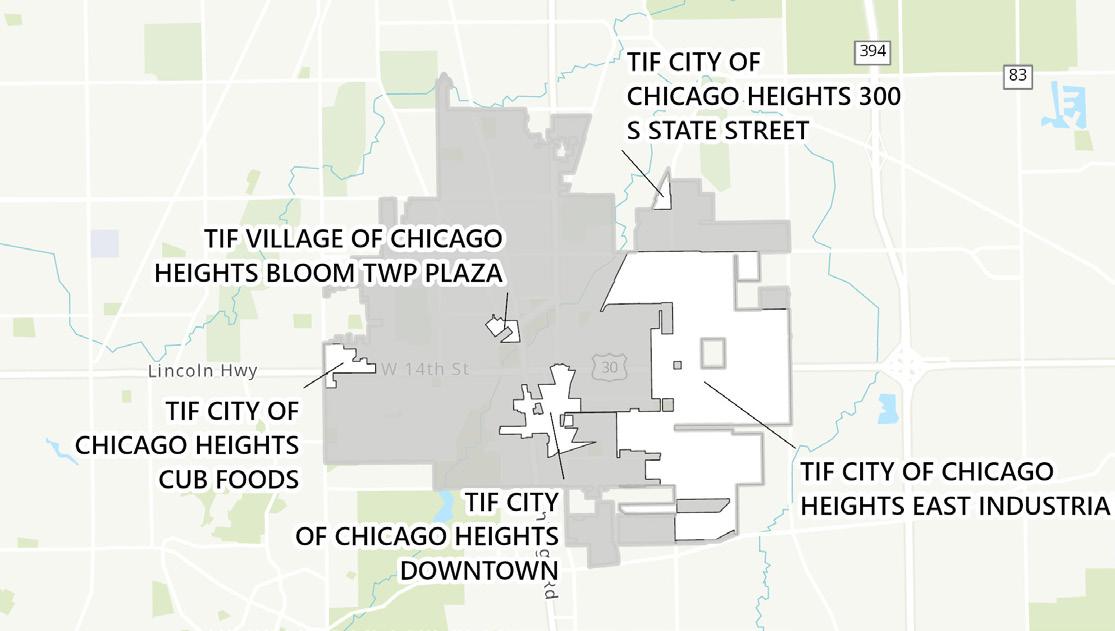
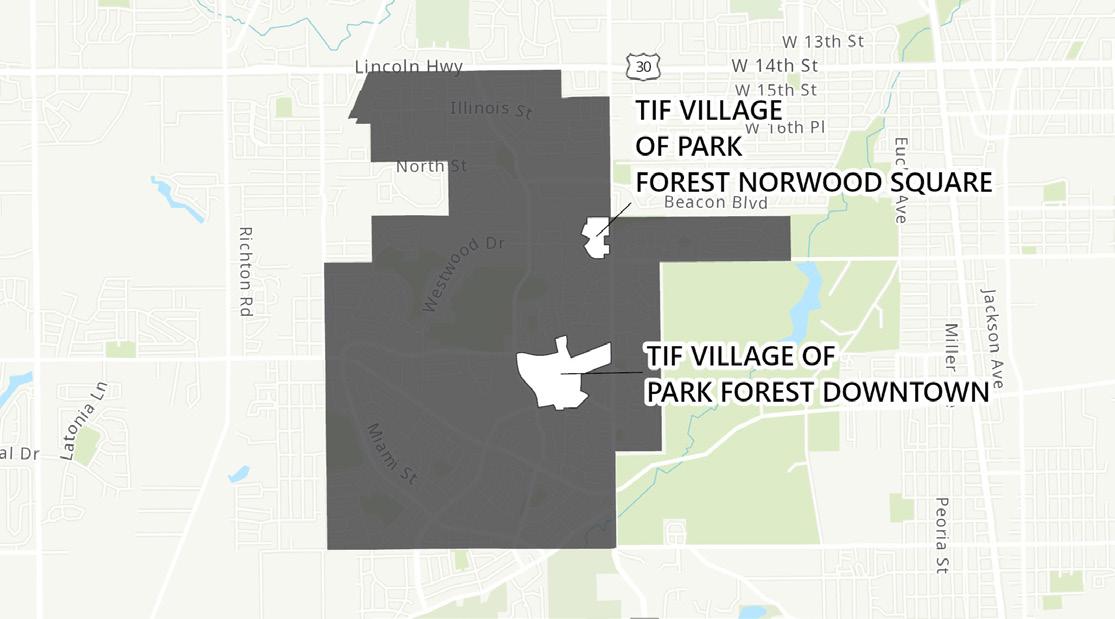
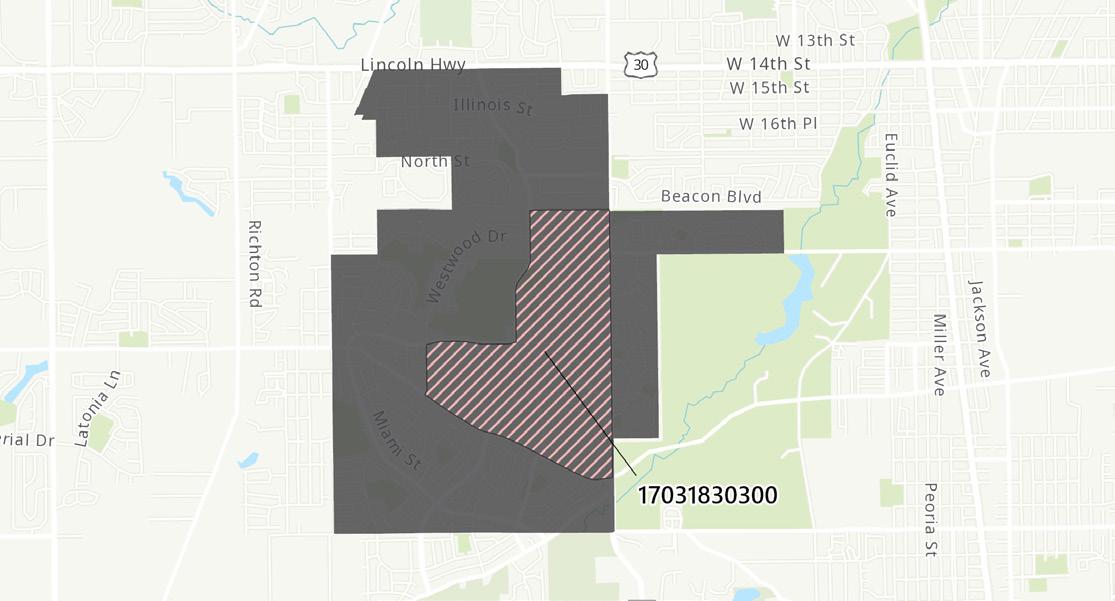
Illinois adopted Tax Increment Financing (TIF) in 1977 to help spur economic development in specific geographic areas that are blighted and deteriorating. Since then, nearly 1,500 TIF Districts have been created within 537 Illinois municipalities. A TIF District, or TIF Redevelopment Project Area, is where the Equalized Assessed Value (EAV) of the property/properties in an area is set at a base amount. Property taxes collected on properties included in the TIF District at the time of its designation continue to be distributed to the school districts and all other affected taxing districts in the same manner as if the district did not exist.
In order to be established as a TIF District, a local government must find that development or redevelopment of the area would not occur “but for” the creation and use of TIF. Illinois law specifies a number of requirements that must be satisfied for an area to qualify as a TIF District, beginning with identifying the district and the physical and economic deficiencies that need to be cured. Specifically, state law requires that the proposed area must meet one or more of three conditions: (1) Blighted conditions; (2) Conservation conditions; and (3) Industrial park conservation conditions. The growth of the EAV of property within the TIF District (the tax increment) is collected into a special fund for use by the municipality to make additional eligible investments in the TIF project areas. The reinvestment generates additional growth in property value, which results in more revenue growth for reinvestment. Once a redevelopment project is completed and has been paid for, the TIF District may be dissolved, and the tax base returned to full use by all eligible taxing bodies.
Under Illinois law, a TIF District may last for up to a maximum of 23 years. This period can be extended by 12 additional years upon approval by the Illinois General Assembly.
TIF funds may be used to reimburse eligible “redevelopment projects costs” as defined under Illinois law. The statute provides a comprehensive list of associated project and reimbursement costs which may include, but are not limited to, the following actions occurring within the TIF District:
▪ Administration of a TIF redevelopment project.
▪ Property acquisition, renovation, rehabilitation, and demolition.
▪ Construction of public works or improvements.
▪ Job training related to the TIF area.
▪ Financing costs, including interest assistance.
▪ Studies, surveys, and plans.
▪ Marketing related to sites within the TIF.
▪ Professional services, such as architecture and design.
OPPORTUNITY ZONE PROGRAM
The Opportunity Zone Program, as established in the Federal Tax Cut and Jobs Act of 2017, was designed to drive long-term capital to rural and low-income urban communities throughout the nation. The program also encourages private investment by providing tax incentives, including temporary deferrals on capital gains taxes when investors reinvest those gains in Qualified Opportunity Funds (QOF). These funds are then invested in low-income communities from designated census tracts, known as Opportunity Zones.
An Opportunity Zone is an economically distressed community where new investments, under certain conditions, may be eligible for preferential tax treatment. Illinois is home to 327 of these Federally Designated Opportunity Zones. The purpose of these zones are to act as an economic development tool by spurring development and job creation in distressed communities, and by providing tax benefits to investors.
Investors receive tax credits when they reinvest capital gains, or profits from the sale of an asset, into Opportunity Zones. Investors may benefit in three ways:
1. They can defer paying taxes on the original capital gain until they dispose of the investment or until 2026.
2. If they hold the investment for at least 5 years, they will have to pay 10% less taxes on the original capital gain.
3. If they hold the investment for at least 10 years, they will not have to pay any capital gains tax on their Opportunity Zone investment.
For example, an investor sells their company stock for $1 million and has $100,000 in capital gains from that sale. The investor puts the $100,000 into a QOF that invests in a new business within an Opportunity Zone. The investor can defer paying capital gains tax until they have disposed of the Opportunity Zone investment or December 31, 2026, whichever comes first. If they hold the investment for 5 years, they can reduce the deferred capital gains tax owed on the original gain by 10%. This would mean that only $90,000 of the $100,000 gain is taxable. Assuming a 20% capital gains tax, they would owe $18,000 instead of $20,000.
If the investor continues to hold the Opportunity Zone investment for another 5 years, they will not have to pay any capital gains tax on that investment. If their $100,000 Opportunity Zone investment appreciates 100% over 10 years, they would owe $0 in capital gains tax instead of $20,000. Investors can hold funds there until 2046 before needing to pay capital gains tax on the Opportunity Zone investment.
QUALIFIED OPPORTUNITY FUNDS
A QOF specializes in attracting investors with similar risk and reward profiles to collect and place capital in rural and lowincome urban communities. Specific requirements of QOFs include the following:
▪ Need to be funded by private capital and guided by market principles.
▪ Need to invest 90% of their assets in Opportunity Zone assets.
▪ May invest in Opportunity Zones via stock, partnership interests, or business property.
▪ Need to use assets to create new business activity.
▪ Need to double the investment basis over 30 months if investing in an existing business.
▪ Can create new businesses or new real estate or infrastructure.
▪ May not invest in certain types of business, such as golf courses, country clubs, gambling establishments, and a few other specifically excluded types of business.
If an investor has realized capital gains, then those gains would need to be invested into a QOF within 180 days. The QOF then needs to place 90% of the funds into a qualified Opportunity Zone property or business within 6 months.
WHAT BUSINESSES ARE ELIGIBLE FOR A QOF INVESTMENT?
A business will need to meet these qualifications to take advantage of the Opportunity Zone program.
70% of the business’ tangible property needs to be:
▪ Acquired after 2017 from an unrelated party.
▪ Used in any Opportunity Zone 70% or more of the time.
Original use property or be substantially improved. A business needs to:
▪ Receive 50% of its revenue from active conduct in any Opportunity Zone.
▪ Use 40% or more of its intangible property in any Opportunity Zone.
▪ Not hold non-qualified financial property beyond reasonable working capital.
▪ Operate in eligible business sectors (ineligible activities include golf courses, country clubs, gambling establishments, and a few other specifically excluded types of business).
These qualifications are defined by U.S. Treasury regulations. For more information, a tax advisor should be consulted.
Investors should also consider the following:
▪ Willingness to give up equity in the business.
▪ Likelihood the business will grow significantly over the next 10 years.
▪ Likelihood of the business remaining within a qualified Opportunity Zone for the 10 years.
Corporate Investors
Gains from Sale of Assets
BUSINESS INCENTIVE PROGRAMS BY SUB-REGION
The following table provides a comprehensive list of the specific business incentive programs available in each of Southland's sub-regions, as well as the individual cities and villages.
Village of Mokena – – Downtown Mokena TIF District
Village of Orland Park – – Main Street/Triangle TIF District
Village of Orland Hills – – –
Village of Tinley Park – –Main Street North, Legacy, New Bremen, Mental Health Center, and 159th/Harlem TIF Districts
City of Oak Forest Cal Sag Enterprise Zone 17031825600, 17031825501 Oak Forest 1, 3 (159th/Cicero Ave), 4, 5 (Business Park East), 6 (Cicero Ave), and 7 TIF Districts
NORTHWEST REGION
Village of Worth Cal Sag Enterprise Zone – 111th Street/Toll Road TIF District
Village of Alsip Cal Sag Enterprise Zone –123rd Place/Cicero, Pulaski Road Corridor, and NW Corner Cicero/I-294 TIF Districts
Village of Crestwood – –Route 83 and 135th Street/Cicero Ave TIF Districts
Village of Midlothian Cal Sag Enterprise Zone – 147th/Cicero Ave and Downtown TIF Districts
City of Blue Island Cal Sag Enterprise Zone 17031821200, 17031826800, 17031824800 Blue Island 2, 4, 5, 6, and 7 TIF Districts
Village of Calumet Park Cal Sag Enterprise Zone 17031821200, 17031821401, 17031821500 Calumet Park 3 (Ashland), 4 (Vermont/Throop), 5, 6 (Train Station) TIF Districts
Village of Robbins Cal Sag Enterprise Zone – Village of Robbins TIF District
NORTH CENTRAL REGION
Village of Posen Cal Sag Enterprise Zone 17031824800, 17031826800 Posen 2 and Sibley Blvd. TIF Districts
Village of Dixmoor
Village of Riverdale
Cal Sag Enterprise Zone 17031826800 Dixmoor 2 and 144th/Wood TIF Districts
The West Region is located in the westernmost portion of Southland, generally situated west of Interstate 57 and north of U.S. Route 30. This region encompasses five cities and villages located within Cook and Will Counties:
▪ Village of Mokena
▪ Village of Orland Park
▪ Village of Orland Hills
▪ Village of Tinley Park
▪ City of Oak Forest
Combined, these places total 54.4 square miles with a population density of 3,098 persons per square mile. In addition, the majority of this region falls within the Orland Township, with Bremen and Frankfort Townships composing the eastern and southern portion of the West Region.
The West Region consists largely of middle- and upper-middle class commuter suburbs with a population of nearly 167,300 persons and 93,000 employees. Due to this commuter lifestyle, these municipalities within the West Region are focusing on Transit Oriented Development (TOD) - building out new housing, offices, and commercial space all within easy walking distance of their respective train and bus stations.
Along with the commuter-focused TOD plans, each municipality within the West Region is also deliberately diversifying economic development rather than relying solely on commuters—several major industrial development projects
have been completed in recent years, and several others are in various stages of planning, approval, and construction as detailed within the following pages.
The West Region contains 5,010 rental apartment units in 243 buildings that meet the minimum size criteria as of yearend 2022. During this same time frame, the West Region also contains 14.6 million square feet of retail space, 5.4 million square feet of office space, and nearly 12.4 million square feet of industrial/flex space, as illustrated in the following table. The West Region comprises the majority of office and retail space within Southland as a whole, compared to the other sub-regions. With high occupancy rates and average rental rates comparable to those of Southland as a whole, this indicates demand is strong within the West Region for commercial and for-rent residential supply.
Image source: Tinley Park
LEGEND
Village
Village
Village
Village
County Boundary
of Mokena
of Orland Park
of Orland Hills
of Tinley Park
City of Oak Forest
COMMUNITY INVESTMENT
The West Region provides a range of business incentive programs to initiate new business and commercial investment into the region. Specifically, the West Region has several TIF Districts that were established to promote private development, as well as assist and encourage economic development, redevelopment, and improvement projects within defined areas throughout the West Region as a whole.
In addition, the West Region also contains the Cal Sag Enterprise Zone, which was created to encourage new construction and expansion of commercial and industrial projects, specifically
PRIORITY PROJECTS
MOKENA TRANSIT-ORIENTED DEVELOPMENT (TOD)
Mokena’s TOD blueprint has identified the potential for mixedused construction and redevelopment opportunities within the vicinity of the Mokena-Front Street Station, located 25 miles southwest of Downtown Chicago. The proposed development area encompasses a half-mile walk circle centered around the Front Street Station, and includes the entire Downtown Mokena area as well as portions of adjacent residential neighborhoods. Currently, there are over 100 units of new residential housing, including mixed-use developments, all under construction in the area immediately surrounding the Metra station. As commuter traffic continues to grow, projections provided by Metra estimate the need for 1,000 new commuter parking spaces by 2030 within the fare zone located at Mokena Front Street and Hickory Creek.
ORLAND PARK PUBLIC-PRIVATE PARTNERSHIP (PPP)
The Orland Park PPP was established to construct Ninety7Fifty apartment complex, the University of Chicago Medical Center (UCMC), and additional mixed-used development directly adjacent to the Metra station.
Phase I of the Orland Park PPP involved the development of Ninety7Fifty, a 295-unit, luxury residential apartment complex with 4,000 square feet of commercial space on the first floor, completed in 2013. Phase II of the Orland Park PPP showcased the UCMC Project, a mixed-use medical facility encompassing 120,000 square feet, of which 3.48 acres are owned by Orland Park. The complex was opened in 2016, and of the $65 million dollar investment into the project, $62 million was fronted by Orland Park.
Future development in the area is promising. Phase III of the Orland Park PPP is already underway, with plans to focus on expanding retail, restaurant, theatre, and other entertainment venues in the downtown area. Further plans envision establishing strong TOD connections, as well as committing to high-quality urban transformation within the downtown area.
within the Oak Forest municipality. Oak Forest within the West Region also contains portions of two Opportunity Zones, which are additional business incentives that provides tax incentives through private investment.
These various business incentive programs should be considered when determining where to invest within the West Region and Southland as a whole; these incentives are further detailed on the subsequent pages.
TINLEY PARK HARMONY SQUARE
Tinley Park is partnering with developers to construct Harmony Square, a planned, mixed-use TOD plaza project. The project, situated at the intersection of Oak Park Avenue and North Street in downtown, will span a total of 1.6 acres. In conjunction with the project’s infrastructure improvements as well as reconstruction of the North and South streets, a new road connecting North and 173rd Streets–tentatively named Festival Street–will be constructed.
Harmony Square was initially conceived in 2017 as part of the Village's “Life Amplified” branding campaign. This initiative focused on improving pedestrian engagement by emphasizing music and interactive events. The proposed project includes brick paving over asphalt and concrete streets, installation of an artificial turf lawn that converts into an ice-skating rink during the winter to preserve foot traffic year-round, and additional amenities such as fire pits and skate rentals for visitors. The project will feature a performance venue and concession stand, which is expected to host programming, such as live music, theater performances, and other festivals, for an estimated 250 days annually.
OAK FOREST TOD AND RESIDENTIAL DEVELOPMENT
Oak Forest is also expanding its TOD footprint, with multiple projects planned for the areas adjacent to the Metra station. The first phase features a residential project with plans to bring both single family and multi-family residential units to the intersection of Cicero Avenue and 157th Street. This residential project has a current budget of $26 million, with construction already underway, to include 15 row houses and a 75-unit mixed-use apartment complex. The second phase features a senior housing complex planned by Carefree Development, which will include a 3-story building with a total of 55 senior residential units.
HOUSING CHARACTERISTICS:
HOUSEHOLD INCOME:
The following top 5 major industries by sector make up the majority of total employees within the West Region, these include:
WEST REGION MOKENA
ABOUT THE VILLAGE OF MOKENA
The Village of Mokena ("Mokena"), incorporated in 1880, is part of the West sub-region within the greater Southland area. Mokena is approximately 5,632 acres and is accessible by major thoroughfares, such as Interstate 80, U.S. Route 45, and U.S. Route 30. As of year-end 2022, the population within Mokena was 19,630 persons, capturing 12% of the population within the West Region as a whole. In addition, there were 7,400 total housing units within Mokena composing 11% of the total housing units within the West Region as a whole during this same time frame.
Since incorporation, Mokena quickly evolved into a regional transit hub with the introduction of the rail line; the village continued to grow as commuter rail services expanded and Interstate 80 was constructed. Today, Mokena is surrounded by the Metra commuter train station and is primed for economic growth and commercial, residential, and mixed-use development. Mokena currently exists as a primarily wealthy commuter suburb of Chicago, with the Metra station serving as a community hub—and economic development plans centering around it.
Direct development currently under construction in the area immediately surrounding the Metra station includes over 100 units of new residential housing as well as mixed-use development. Along with this direct development, Mokena is building and improving commuter parking at the station and expanding the network of bicycle and pedestrian paths that lead toward the Metra station. The result is that the area around the Metra station will be increasingly attractive both to residents staying within Mokena and commuters traveling to and from Chicago.
Although the downtown area of Mokena is not likely to transform into a major commercial hub in the near future, the area stands to benefit from small-scale development oriented toward area residents and commuters - such as full-service and limited service restaurants; small-scale food and beverage stores; local
miscellaneous retailers, including home goods, party goods, and stationary products; and live entertainment venues.
In addition, the average home value in Mokena was one of the highest within the West Region as of year-end 2022, with significantly higher median household incomes and median disposable incomes compared to those of the other cities and villages that make up the West Region. Consumer spending is also strong within Mokena—as of year-end 2022, total expenditures were $877.2 million within Mokena, capturing 13% of the total expenditures within the West Region as a whole.
As of year-end 2022, there were 1,170 total businesses within Mokena, employing nearly 14,650 employees. Total employment within Mokena comprised nearly 16% of the total employees within the West Region as a whole. The major industries within Mokena consisted of health care and social assistance; retail trade, professional, and technical services; accommodation and food services; and construction. Additionally, the household unemployment rate, at 3.1%, was smaller than the 3.6% of the West Region for year-end 2022.
Mokena encompasses 144 rental units, capturing 3% of the rental unit supply within the West Region as a whole as of yearend 2022. During this same time frame, Mokena comprised 1.8 million square feet of retail space, 0.8 million square feet of office space, and 4.1 million square feet of industrial/flex spacecapturing 12%, 15%, and 33% of the retail, office, and industrial/ flex space, respectively, within the West Region as a whole.
COMMUNITY INVESTMENT
The Downtown Mokena TIF District is located within Mokena and was established as a tool to promote private development in the downtown area, as illustrated in the map below. Some of the TIFeligible costs associated with this TIF District include rehab and renovation of private and public buildings, property acquisition, financing costs, and professional services (e.g., architects, engineering and legal). Mokena currently does not contain any Enterprise Zones or Opportunity Zones.
KEY SOCIO-ECONOMIC FACTS | MOKENA
HOUSING CHARACTERISTICS:
HOUSEHOLD INCOME:
459,000 2021 AADT(1)
5.8% Workers 16+ Took Public Transportation
Mokena, these include:
WEST REGION ORLAND PARK
ABOUT THE VILLAGE OF ORLAND PARK
The Village of Orland Park ("Orland Park"), incorporated in 1892, is part of the West sub-region within the greater Southland area. Orland Park is approximately 14,272 acres and is accessible by major thoroughfares, such as U.S. Route 45 and U.S. Route 6. As of year-end 2022, the population within Orland Park was 57,940 persons, capturing 35% of the population within the West Region as a whole. In addition, there were 23,660 total housing units within Orland Park, composing 35% of the total housing units within the West Region as a whole during this same time frame.
Orland Park is a quiet, safe, and wealthy commuter town, with a well-educated population and existing high-value jobs in finance, insurance, and healthcare. The well-educated population, along with the projected population growth in coming years, will support even more high-value jobs in these and related industries.
Infrastructure is also well-maintained and includes anything from street resurfacing to improving water mains, with projected growth over the next few years. The Orland Park PPP was originally established in 2009 to construct Ninety7Fifty apartment complex (completed in 2013), the UCMC (completed in 2016), and additional mixed-use development currently under construction directly adjacent to the Metra station. Further plans for Orland Park envision establishing strong TOD connections, as well as committing to high-quality urban transformation within the downtown area.
The La Grange Road corridor south of Highway 7 is a prime location for new commercial, residential, and mixed-use development. La Grange Road, which connects the thriving Orland Park Mall to 143rd Street just a couple blocks north, was recently expanded to handle more automobile traffic. At the intersection of La Grange and 143rd, there is a Metra commuter rail station connecting Orland Park to downtown Chicago; as well as a variety of attractive new commercial and residential
spaces—including the trendy, recently completed, 295-unit Ninety7Fifty apartment complex and UCMC.
In addition, the average home value in Orland Park was the highest within the West Region as of year-end 2022. Consumer spending is also strong within Orland Park—as of year-end 2022, total expenditures were $2.7 billion, capturing 39% of the total expenditures within the West Region as a whole.
As of year-end 2022, there were 2,415 total businesses within Orland Park, employing nearly 37,930 employees. Total employment within Orland Park comprised nearly 41% of the total employees within the West Region as a whole. The major industries within Orland Park consisted of retail trade, health care and social assistance, accommodation and food service, finance and insurance, and educational services.
Orland Park encompasses 1,330 rental units, capturing 26% of the rental unit supply within the West Region as a whole as of year-end 2022. During this same time frame, Orland Park comprised 7.7 million square feet of retail space, 2.2 million square feet of office space, and 1.9 million square feet of industrial/flex space—capturing 53%, 41%, and 15% of the retail, office, and industrial/flex space, respectively, within the West Region as a whole.
COMMUNITY INVESTMENT
Orland Park contains one TIF District, the Orland Park Main Street/Triangle TIF District. It was established to promote development within the area situated west and northwest of the 143rd street and La Grange Road intersection, as illustrated in the map below. Orland Park currently does not contain any Enterprise Zones or Opportunity Zones.
TIF DISTRICTS
HOUSING CHARACTERISTICS:
HOUSEHOLD INCOME:
WEST REGION ORLAND HILLS
ABOUT THE VILLAGE OF ORLAND HILLS
The Village of Orland Hills ("Orland Hills"), incorporated in 1961, is part of the West sub-region within the greater Southland area. Orland Hills is approximately 768 acres and is accessible by major thoroughfares, such as U.S. Route 45 and U.S. Route 6. As of year-end 2022, the population within Orland Hills was 6,800 persons, capturing 4% of the population within the West Region as a whole. In addition, there were 2,460 total housing units within Orland Hills, composing 4% of the total housing units within the West Region as a whole during this same time frame.
Orland Hills—like its surrounding village and city neighbors—is a small, quiet commuter suburb in Chicago’s Southland. Most of its residents commute to downtown Chicago for work. Orland Hills has also recently launched initiatives aimed at enhancing its image and attracting both businesses and residents. Economics incentives, including a TIF District, offer appealing commercial, industrial, and residential opportunities for developers and investments.
Despite having just under 7,000 residents, Orland Hills boasts two highly rated public high schools, Carl Sandburg High School and Victor J. Andrew High School, as well as another highly ranked Catholic school. Orland Hills is quite small, but is an ideal location for young families looking for a quiet locale close enough to commute to Chicago’s Loop.
In addition, Orland Hills has recently faced deteriorating climate conditions, leading to issues like flooding and stormwater overflow, which has compromised local infrastructure. To address this issue, one of the most recent actions has been the Lake Lorin Restoration Plan. The lake, positioned at the heart of Orland Hills, has suffered significant erosion, which has had a detrimental environmental impact on the community. Current efforts are exploring ways to reconstruct the shoreline while also improving its surroundings to become more recreation friendly and aesthetically pleasing.
Orlando Hills' residents are predominately White, making up 74% of the total population within the area. In addition, 62% of the total population within Orland Hills are of working age, between the ages of 20 and 64. In addition, nearly 40% of the Orland Hills population has a Bachelor's degree or greater, indicating an educated workforce.
The median household incomes and median disposable incomes in Orland Hills were some of the highest compared to the other cities and villages that make up the West Region. Additionally, the majority of the population, at 70%, had median household incomes greater than $75K, with approximately 51% earning household incomes greater than $100K. However, consumer spending in Orland Hills was relatively low, at $247.2 million as of year-end 2022, composing only 4% of the total expenditures within the West Region as a whole. Retail goods and housing comprised the majority of consumer spending within Orland Hills.
As of year-end 2022, there were 127 total businesses within Orland Hills, employing nearly 1,680 employees. Total employment within Orland Hills comprised 2% of the total employees within the West Region as a whole. The major industries within Orland Hills consisted of retail trade, accommodation and food services, professional and technical services, finance and insurance services, and public administration. Additionally, the household unemployment rate, at 6.1%, was greater than that the 3.6% of the West Region for year-end 2022.
Orland Hills encompasses 430 rental units, capturing 9% of the rental unit supply within the West Region as a whole as of yearend 2022. During this same time frame, Orland Hills comprised 441,180 square feet of retail space and 18,480 square feet of office space, capturing 3% and 1% of the retail and office space, respectively, within the West Region as a whole. Orland Hills currently does not contain any industrial/flex space as of yearend 2022.
Orland Hills does not contain any Enterprise Zones, Opportunity Zones, or TIF Districts.
HOUSING CHARACTERISTICS:
HOUSEHOLD INCOME:
WEST REGION TINLEY PARK
ABOUT THE VILLAGE OF TINLEY PARK
The Village of Tinley Park ("Tinley Park"), incorporated in 1892, is part of the West sub-region within the greater Southland area. Tinley Park is approximately 10,304 acres and is accessible by major thoroughfares, such as Interstate 80, U.S. Route 45, and U.S. Route 6. As of year-end 2022, the population within Tinley Park was 55,500 persons, capturing 33% of the population within the West Region as a whole. In addition, there were 22,780 total housing units within Tinley Park, composing 34% of the total housing units within the West Region as a whole during this same time frame.
Tinley Park is one of the fastest growing municipalities in the Southland area both in terms of population and commercial development. Tinley Park has a variety of exciting projects underway right now that will attract new businesses and residents, as well as serve to make the surrounding areas even more attractive development targets.
One of the most exciting development projects is The Boulevard—a mixed-use development with commercial space and 66 residences directly across the street from a Metra station—providing quick and convenient access to Chicago. The residences are already fully leased out, and the commercial space is filling quickly.
Tinley Park has also recently started partnering with developers to construct Harmony Square, a planned mixed-use TOD plaza project. The project, situated at the intersection of Oak Park Avenue and North Street in downtown, will feature brick paving over asphalt and concrete streets, installation of an artificial turf lawn, and additional amenities. The project will also include a performance venue with a concession stand, which is expected to host multiple live music, theater performances, and other festivals annually.
Other notable projects include the Brixmoor redevelopment project, a shopping center with several attractive new tenants; and the Tinley Park Business Center, an industrial development site with prime access to three interstate highways.
In addition, the average home values—as well as the median household income, median disposable income, and per capita income—within Tinley Park were slightly lower than those incomes observed within the West Region as a whole, although still comparable. Consumer spending is robust within Tinley Park; as of year-end 2022, total expenditures were $2.2 billion, capturing 32% of the total expenditures within the West Region as a whole.
As of year-end 2022, there were 1,680 total businesses within Tinley Park, employing nearly 28,960 employees. Total employment within Tinley Park comprised 31% of the total employees within the West Region as a whole. The major industries within Tinley Park consisted of health care and social assistance, retail trade, accommodation and food services, wholesale trade, and educational services. Additionally, the household unemployment rate, at 3.13%, was smaller than that of the West Region at 3.6% for year-end 2022.
Tinley Park encompasses 1,900 rental units, capturing 38% of the rental unit supply within the West Region as a whole as of year-end 2022. During this same time frame, Tinley Park comprised 3.8 million square feet of retail space, 2.0 million square feet of office space, and nearly 5.7 million square feet of industrial/flex space—capturing 26%, 38%, and 46% of the retail, office, and industrial/flex space, respectively, within the West Region as a whole.
COMMUNITY INVESTMENT
Tinley Park has many great business incentive programs, including several TIF Districts established to assist and encourage economic development, redevelopment, and improvement projects to a designated area of Tinley Park. These TIF Districts include: Main Street North, Mental Health Center, Legacy, New Bremen, and 159th and Harlem TIF Districts, as illustrated in the map below. Tinley Park currently does not contain any Enterprise Zones or Opportunity Zones as of year-end 2022.
TIF DISTRICTS
HOUSING CHARACTERISTICS:
HOUSEHOLD INCOME:
The following top 5 major industries by sector make up the majority of total employees within Tinley Park, these include:
WEST REGION OAK FOREST
ABOUT THE CITY OF OAK FOREST
The City of Oak Forest ("Oak Forest"), incorporated in 1971, is part of the West sub-region within the greater Southland area. Oak Forest is approximately 3,904 acres and is accessible by major thoroughfares, such as Interstate 57 and U.S. Route 6. As of year-end 2022, the population within Oak Forest was 27,400 persons, capturing 16% of the population within the West Region as a whole. In addition, there were 10,780 total housing units within Oak Forest, composing 16% of the total housing units within the West Region as a whole during this same time frame.
Oak Forest is one of the most exciting and dynamic south suburbs of Chicago when it comes to economic development. Several major projects are underway currently, with more already planned and approved for 2024. One of the major projects includes a large mixed-use development at the corner of 157th and Cicero, which will consist of 75 multi-family units, commercial first-floor space, and 15 row houses at full buildout. Another major project consists of a 1-million-square-foot industrial property located at 167th and Cicero; this project is anticipated for construction in 2023. Several other major developments are in various stages of construction and planning, including several that are already approved within Oak Forest.
As of year-end 2022, there were 640 total businesses within Oak Forest, employing nearly 9,750 employees. Total employment within Oak Forest comprised 10% of the total employees within the West Region as a whole. The major industries within Oak Forest consisted of administration and support services, educational services, health care and social assistance, accommodation and food services, and retail trade.
Oak Forest encompasses 1,220 rental units, capturing 24% of the rental unit supply within the West Region as a whole as of yearend 2022. During this same time frame, Oak Forest comprised 783,950 square feet of retail space, 266,720 square feet of office space, and 724,750 square feet of industrial/flex space— capturing 5%, 5%, and 6% of the retail, office, and industrial/flex space, respectively, within the West Region as a whole.
COMMUNITY INVESTMENT
Oak Forest has many great business incentive programs, including the Cal Sag Enterprise Zone, which was created to encourage new construction and expansion of commercial and industrial projects. Oak Forest also has several TIF Districts: Oak Forest TIF Districts 1, 3 (159th/Cicero Avenue), 4, 5 (Business Park East), 6 (Cicero Ave), and 7 TIF Districts; as well as contains portions of two Opportunity Zones. The following maps illustrate the business incentive programs available within Oak Forest as of year-end 2022.
HOUSING CHARACTERISTICS:
HOUSEHOLD INCOME:
237,650 2021 AADT(1)
NORTHWEST REGION
ABOUT THE NORTHWEST REGION
The Northwest Region is located in the northern portion of Southland, generally situated west of Interstate 57 and along Interstate 294 and State Road 50. This region encompasses seven villages and cities, all located within Cook County:
▪ Village of Worth
▪ Village of Alsip
▪ Village of Crestwood
▪ Village of Midlothian
▪ City of Blue Island
▪ Village of Calumet Park
▪ Village of Robbins
Combined, these places total 21.7 square miles, with a population density of 4,156 persons per square mile. In addition, the majority of this region falls within the Worth Township, with Calumet and Bremen Townships composing the eastern and southern portion of the Northwest Region.
The Northwest Region is a historically heavily industrialized area, making the area prime for industrial and transportation development and redevelopment. The Northwest Region, like many heavily industrialized areas, is actively diversifying its economy to promote both industrial and logistics development as well as commercial and office space. As new development is contemplated within the Northwest Region, the major focus and priority within the region over the short term should be TOD plans, as well as the construction of new housing, retail, and medical facilities within walking distance from Metra train stations.
The Northwest Region contains 6,780 rental apartment units in 306 buildings that meet the minimum size criteria as of yearend 2022. During this same time frame, the Northwest Region also contains 5.6 million square feet of retail space, 704,260 square feet of office space, and nearly 19.8 million square feet of industrial/flex space, as illustrated in the following table. The Northwest Region comprises the majority of rental units and the second-greatest amount of industrial/flex space within Southland as a whole, compared to the other sub-regions. With high occupancy rates and average rental rates comparable to that of Southland as a whole, this indicates demand is strong within the Northwest Region for commercial and for-rent residential supply.
CoStar Group; ESRI Business Analyst; GAI Consultants.
LEGEND
County
Village
Village
Village
Village
City
Village
Village
Boundary
of Worth
of Alsip
of Crestwood
of Midlothian
of Blue Island
of Calumet Park
of Robbins
COMMUNITY INVESTMENT
The Northwest Region provides a range of business incentive programs to initiate new business and commercial investment into the region. Specifically, the Northwest Region has several TIF Districts that were established to promote private development, as well as assist and encourage economic development, redevelopment, and improvement projects within defined areas throughout the Northwest Region as a whole.
In addition, the Northwest Region also contains the Cal Sag Enterprise Zone, which was created to encourage new construction and expansion of commercial and industrial
PRIORITY PROJECTS
CALUMET PARK TRANSIT-ORIENTED DEVELOPMENT (TOD)
In December 2020, the Village of Calumet Park began to leverage Chicago’s TOD planning efforts to transform a vacant 6-acre site into a mixed-use development. The project site, adjacent to Calumet Park's Ashland Avenue and the Calumet Park Metra Station, is anticipated to host a total of 168 multi-family residential units divided among three 4-story buildings, a 5,000-square-foot medical facility, and lots designated for miscellaneous retailers. The development will also include green, community-oriented spaces for residents to enjoy.
Calumet Park also has an enhanced focus on designing and constructing pedestrian and cyclist infrastructure improvements, and was awarded $475,000 in grant funds for these improvements.
ROBBINS RAINREADY INITIATIVE
The Village of Robbins has recently introduced the RainReady initiative to implement a new climate resilience-oriented comprehensive plan. This project aims to ensure that stormwater runoff is efficiently managed so that future developments in the area are protected from flooding.
Robbins has a significant problem with drainage, leading to increases in combined sewer overflows, polluted waterways, and flood-prone streams. To remedy these issues, Robbins' RainReady initiative has three key solutions to create a more beautiful and flood-resilient community: Robbins Park, Robbins “New Town Center”, and the Robbins Residential Program.
Robbins Park, developed by the Metropolitan Water Reclamation District in conjunction with the Village of Robbins, plans to reduce flooding as well as create new recreational and economic opportunities. Robbins Park is located adjacent Midlothian Creek, which is envisioned to be a place for the community to engage in outdoor activities while maintaining flood waters.
projects, specifically within the Worth, Alsip, Crestwood, Midlothian, Blue Island, Calumet Park, and Robbins municipalities. Blue Island and Calumet Park within the Northwest Region also combined contain five Opportunity Zones, which are additional business incentives that provides tax incentives through private investment.
These various business incentive programs should be considered when determining where to invest within the Northwest Region and Southland as a whole, these incentives are further detailed on the subsequent pages.
In addition, the planned Robbins New Town Center will be designed to capture and dispose of stormwater, while positively contributing to economic development within the area through the creation of complete streets with tree plantings and permeable pavement to help protect businesses from flooding. Lastly, establishing the Robbins Residential Program will create a cost-sharing program to prepare homeowners for storms, while also providing recovery assistance. Residents will receive financial support as well as home inspections geared toward reducing the risk of flooding by checking water valves, sewer systems, and implementing rain gardens.
CRESTWOOD TOWN CENTER
Crestwood has recently partnered with Walpert Properties to redevelop a 47-acre site into the "Crestwood City Center". This project will include a variety of uses, such as a 160,000-squarefoot retail space, several spaces for office and medical buildings, 3 parking garages, and additional amenities, all designed to promote pedestrian safety.
Image source: RTA
Image source: Robbins Town Center | ASLA Illinois
Image source: Robbins Park | ASLA Illinois
Image source: Crestwood City Center Rendering
$259,130 Avg. Home Value
following top 5 major industries by sector make up the majority of total employees within the Northwest Region, these include:
NORTHWEST REGION WORTH
ABOUT THE VILLAGE OF WORTH
The Village of Worth ("Worth"), incorporated in 1914, is part of the Northwest sub-region within the greater Southland area. Worth is approximately 1,536 acres and is accessible by major thoroughfares, such as Interstate 294 and Illinois Route 43. As of year-end 2022, the population within Worth was 10,840 persons, capturing 12% of the population within the Northwest Region as a whole. In addition, there were 4,580 total housing units within Worth, composing 12% of the total housing units within the Northwest Region as a whole during this same time frame.
In anticipation for a variety of development projects, Worth established the Economic Development Committee in 2014 and began evaluating the community's opportunities and needs. Worth aims to create a more pedestrian-friendly area while simultaneously supporting major commercial corridors by developing four districts in Worth. These crucial districts include mixed-use zones, a village center for residents, and corridors to enhance commercial appeal. To implement the comprehensive details of this project, Worth plans to launch zoning reform, introduce streetscaping modifications, and establish a business development team.
Worth's residents are predominantly White, making up 77% of the total population within the area. In addition, 61% of the total population within Worth are of working age, between the ages of 20 and 64. The median household income, median disposable income, and per capita income were greater than those observed within the Northwest Region as of year-end 2022. Consumer spending is strong within Worth—as of year-end 2022, total expenditures were $319.4 million, capturing 14% of the total expenditures within the Northwest Region as a whole. Housing and retail goods compose the majority of consumer spending within Worth.
As of year-end 2022, there were 310 total businesses within Worth, employing nearly 2,800 employees. Total employment within Worth comprised 6% of the total employees within the Northwest Region as a whole. The major industries within Worth
consisted of retail trade, accommodation and food services, educational services, finance and insurance services, and construction.
Worth encompasses nearly 700 rental units, capturing 10% of the rental unit supply within the Northwest Region as of year-end 2022. During this same time frame, Worth comprised 589,330 square feet of retail space, 117,010 square feet of office space, and only 25,300 square feet of industrial/flex space—capturing 11%, 17%, and 0.1% of the retail, office, and industrial/flex space, respectively, within the Northwest Region as a whole.
COMMUNITY INVESTMENT
Although Worth is quite small, the community has put together an attractive package of TIF tax incentives to attract business growth in the municipality. Worths's TIF District, 111th Street/ Toll Road, extends from Ridgeland Avenue on the east to I-294 on the west and slightly north and south of 111th Street. This zone offers some existing buildings as well as some vacant lots, perfect for a variety of businesses. In addition, the Cal Sag Enterprise Zone is located within Worth and was created to encourage new construction and expansion of commercial and industrial projects. Worth currently does not contain any Opportunity Zones. The following maps illustrate the business incentive programs available within Worth as of year-end 2022.
HOUSING CHARACTERISTICS: HOUSEHOLD INCOME:
329,600 2021 AADT(1) 4.2% Workers 16+ Took Public Transportation
NORTHWEST REGION ALSIP
ABOUT THE VILLAGE OF ALSIP
The Village of Alsip ("Alsip"), incorporated in 1840, is part of the Northwest sub-region within the greater Southland area. Alsip is approximately 4,224 acres and is accessible by major thoroughfares, such as Interstate 294 and Illinois Route 83. As of year-end 2022, the population within Alsip was 18,970 persons, capturing 21% of the population within the Northwest Region as a whole. In addition, there were 8,010 total housing units within Alsip composing 21% of the total housing units within the Northwest Region as a whole during this same time frame.
Alsip is a racially diverse village south of Chicago. Its local economy is primarily industrial and is home to Griffith Foods and Quality Snack Food, two large international food product development and manufacturing firms, as well as dozens of other manufacturers. Due to Alsip’s ready workforce, inexpensive land, and proximity to transit arteries—both highways and rail— storage and logistics are expected to be prime growth sectors in the coming years. There is also a burgeoning market for small manufacturers to support and supply the larger multinationals and logistics firms.
There are several major logistics and transportation companies already operating in Alsip, with many redevelopment and development sites prime for new logistics and transportation companies. On the previous site of an abandoned steel mill, Alsip Terminals is in the process of building a multi-million dollar logistics park located at 3600 W. 127th Street. This logistics park and other services and facilities like it continue to make Alsip attractive to manufactures of all sizes and scales. The area immediately surrounding the new logistics park includes many vacant buildings and lots perfect for additional industrial tenants.
In addition, the median household income, median disposable income, and per capita income were greater than those observed within the Northwest Region as of year-end 2022. Consumer spending is very strong within Alsip—as of year-end 2022, total expenditures were $562.3 million within Alsip, capturing 24% of the total expenditures within the Northwest Region as a whole, the greatest capture compared to the other cities and villages that make up the Northwest Region.
As of year-end 2022, there were 950 total businesses within Alsip, employing over 16,700 employees. Total employment within Alsip comprised over 39% of the total employees within the Northwest Region as a whole. The major industries within Alsip consisted of manufacturing, wholesale trade, retail trade, construction, and administration and support services.
Alsip encompasses 1,940 rental units, capturing 29% of the rental unit supply within the Northwest Region as of year-end 2022. During this same time frame, Alsip comprised 1.3 million square feet of retail space, 150,000 square feet of office space, and 14.0 million square feet of industrial/flex space, capturing 23%, 21%, and 71% of the retail, office, and industrial/flex space, respectively, within the Northwest Region as a whole.
COMMUNITY INVESTMENT
Alsip has many great business incentive programs, including the Cal Sag Enterprise Zone, which encourages new construction and expansion of commercial and industrial projects. Alsip also has three TIF Districts: 123rd Place/Cicero, Pulaski Road Corridor, and NW Corner Cicero/I-294 TIF Districts. Alsip currently does not contain any Opportunity Zones. The following maps illustrate the business incentive programs available within Alsip as of year-end 2022.
ENTERPRISE ZONES
HOUSING CHARACTERISTICS:
INCOME:
672,600 2021 AADT(1)
5.5% Workers 16+ Took Public Transportation
NORTHWEST REGION
CRESTWOOD
ABOUT THE VILLAGE OF CRESTWOOD
The Village of Crestwood ("Crestwood"), incorporated in 1928, is part of the Northwest sub-region within the greater Southland area. Crestwood is approximately 1,984 acres and is accessible by major thoroughfares, such as Interstate 294 and Illinois Route 83. As of year-end 2022, the population within Crestwood was 10,740 persons, capturing 12% of the population within the Northwest Region as a whole. In addition, there were 5,180 total housing units within Crestwood composing 14% of the total housing units within the Northwest Region as a whole during this same time frame.
Crestwood has recently partnered with Walpert Properties to redevelop a 47-acre site into the "Crestwood City Center". With a projected cost of $300 million, the Crestwood City Center will include a variety of uses that promote pedestrian safety while also providing ample space for drivers. The project is anticipating multiple developments, including a 160,000-square-foot retail space, several spaces for office and medical buildings, three parking garages, and additional amenities. As Crestwood hopes to entice potential residents to the area, 11 acres of the site will also be designated for multifamily apartments, featuring 225 apartment units.
Crestwood's residents are predominantly White, making up 73% of the total population within the area. In addition, 57% of the total population within Crestwood are of working age, between the ages of 20 and 64. The median household income, median disposable income, and per capita income were greater than those observed within the Northwest Region as of yearend 2022. Consumer spending is strong within Crestwood—as of year-end 2022, total expenditures were $340.4 million within Crestwood, capturing 14% of the total expenditures within the Northwest Region as a whole. Housing and retail goods compose the majority of consumer spending within Crestwood.
As of year-end 2022, there were 620 total businesses within Crestwood, employing just under 9,700 employees. Total employment within Crestwood comprised over 14% of the total employees within the Northwest Region as a whole.
The major industries within Crestwood consisted of retail trade, health care and social assistance, educational services, accommodation and food services, and transportation and utilities.
Crestwood encompasses 240 rental units, capturing only 4% of the rental unit supply within the Northwest Region as of yearend 2022. During this same time frame, Crestwood comprised 1.8 million square feet of retail space, 114,110 square feet of office space, and 1.3 million square feet of industrial/flex space capturing 32%, 16%, and 7% of the retail, office, and industrial/flex space, respectively, within the Northwest Region as a whole.
COMMUNITY INVESTMENT
Crestwood has a couple of great business incentive programs, including two TIF Districts: Route 83 and 135th Street/Cicero Avenue. In addition, Crestwood is directly adjacent to the Cal Sag Enterprise Zone, which encourages new construction and expansion of commercial and industrial projects. Crestwood currently does not contain any Opportunity Zones. The following maps illustrate the business incentive programs available within Crestwood as of year-end 2022.
ENTERPRISE ZONES
164,900 2021 AADT(1) 5.5% Workers 16+ Took Public Transportation
NORTHWEST REGION MIDLOTHIAN
ABOUT THE VILLAGE OF MIDLOTHIAN
The Village of Midlothian ("Midlothian"), incorporated in 1927, is part of the Northwest sub-region within the greater Southland area. Midlothian is approximately 1,792 acres and is accessible by major thoroughfares, such as Interstate 294 and Illinois Route 83. As of year-end 2022, the population within Midlothian was 14,250 persons, capturing 16% of the population within the Northwest Region as a whole. During this same time frame, there were 5,480 total housing units within Midlothian composing 15% of the total housing units within the Northwest Region as a whole.
Midlothian is a racially diverse middle-class village on the upswing. As part of a 2011 Redevelopment Plan, Midlothian attracted several new businesses to the area around the Cicero Avenue and 147th Street intersection. The area was hit hard by the 2008 recession, and many commercial buildings were left vacant. They revitalized the area, making it more pedestrianfriendly, and were able to attract businesses to all of the targeted vacant spaces. Currently, there are three similar revitalization plans within Midlothian; these include (1) the Village Center, (2) the Kedzie Corridor on the eastern edge of the village, and (3) the Cicero Corridor—an adjacent area to the above-mentioned Cicero and 147th intersection. In addition, the largest tract of vacant land in Midlothian, located at 14820 Kedzie Avenue, has recently been purchased by a private developer with the vision to develop a trucking hub and logistics park.
Midlothian's residents are predominantly White, making up 55% of the total population within the area. In addition, 59% of the total population within Midlothian makeup the working-class population, between the ages of 20-64. The median household income, median disposable income, and per capita income were significantly greater than those observed within the Northwest Region as of year-end 2022. Consumer spending is also strong within Midlothian—as of year-end 2022, total expenditures were $386.6 million, capturing 16% of the total expenditures within the Northwest Region as a whole. Housing and retail goods compose the majority of consumer spending within Midlothian
As of year-end 2022, there were 360 total businesses within Midlothian, employing over 3,600 employees. Total employment within Midlothian comprised only 8% of the total employees within the Northwest Region as a whole. The major industries within Midlothian consisted of educational services, retail trade, accommodation and food services, health care and social assistance, and finance and insurance services.
Midlothian encompasses 610 rental units, capturing 9% of the rental unit supply within the Northwest Region as of yearend 2022. During this same time frame, Midlothian comprised 593,390 square feet of retail space, 68,490 square feet of office space—capturing 11% and 10% of the retail and office space, respectively, within the Northwest Region as a whole. There was zero industrial/flex space within Midlothian observed as of yearend 2022.
COMMUNITY INVESTMENT
Midlothian has many great business incentive programs, including the Cal Sag Enterprise Zone, which encourages new construction and expansion of commercial and industrial projects. Midlothian also has two TIF Districts: 147th & Cicero TIF District and Downtown TIF District. Midlothian currently does not contain any Opportunity Zones. The following maps illustrate the business incentive programs available within Midlothian as of year-end 2022.
HOUSING CHARACTERISTICS:
$268,850 Avg. Home Value
87,100 2021 AADT(1)
3.9% Workers 16+ Took Public Transportation
NORTHWEST REGION BLUE ISLAND
ABOUT THE CITY OF BLUE ISLAND
The City of Blue Island ("Blue Island"), incorporated in 1835, is part of the Northwest sub-region within the greater Southland area. Blue Island is approximately 2,688 acres and is accessible by Interstate 57. As of year-end 2022, the population within Blue Island was 22,500 persons, capturing 25% of the population within the Northwest Region as a whole. In addition, there were 5,480 total housing units within Blue Island composing 25% of the total housing units within the Northwest Region as a whole during this same time frame.
Blue Island has a rich industrial history, which makes it an ideal location for redevelopment projects both residential, commercial, and industrial. The municipality borders Chicago directly to the north and has easy commuter access to Chicago’s Downtown Loop via several Metra commuter train stations—providing Blue Island with much more convenient access to Metra trains than most of the Southland.
One of the most exciting incentive programs in Blue Island is the Western Avenue Business Development District. It covers the historic downtown section of Blue Island and offers a variety of grants and incentives to business and property owners. Additionally, Blue Island has current development plans to consolidate the two separate one-way streets along Western Avenue into a single two-way street that will be more business and pedestrian friendly.
As of year-end 2022, there were 602 total businesses within Blue Island, employing over 6,700 employees. Total employment within Blue Island comprised 16% of the total employees within the Northwest Region as a whole. The major industries within Blue Island consisted of educational services, health care and social assistance, manufacturing, retail trade, and public administration.
Blue Island encompasses 2,560 rental units, capturing 38% of the rental unit supply within the Northwest Region as of year-end 2022. During this same time frame, Blue Island comprised 888,380 square feet of retail space, 231,590 square feet of office space, and 3.6 million square feet of industrial/flex space capturing 16%, 33%, and 18% of the retail, office, and industrial/flex space, respectively, within the Northwest Region as a whole.
COMMUNITY INVESTMENT
Blue Island has many great business incentive programs, including the Cal Sag Enterprise Zone, which encourages new construction and expansion of commercial and industrial projects, and is located adjacent to the Chicago III and Calumet Region enterprise zone. Blue Island is also home to three Opportunity Zones and five TIF Districts: Blue Island 2, 4, 5, 6, and 7. The following maps illustrate the business incentive programs available within Blue Island as of year-end 2022.
4.2
326,640 2021 AADT(1)
10.7% Workers 16+ Took Public Transportation
NORTHWEST REGION
CALUMET PARK
ABOUT THE VILLAGE OF CALUMET PARK
The Village of Calumet Park ("Calumet Park"), incorporated in 1912, is part of the Northwest sub-region within the greater Southland area. Calumet Park is approximately 768 acres and is accessible by Interstate 57 and Illinois Route 1. As of year-end 2022, the population within Calumet Park was 6,940 persons, capturing 8% of the population within the Northwest Region as a whole. In addition, there were 3,070 total housing units within Calumet Park, composing 8% of the total housing units within the Northwest Region as a whole during this same time frame.
Like many other south suburbs of Chicago, Calumet Park enjoys quick and convenient access to Chicago’s Loop and beyond via Metra commuter trains. Today, Calumet Park is working diligently to capitalize on transit-oriented development and create greater access throughout the area, as well as designing and constructing pedestrian and cyclist infrastructure throughout the area.
In 2022, Calumet Park broke ground on a new mixed-use development project that will eventually include a single-story medical facility and 168 apartments, across the street from the Ashland Avenue Metra Station. Calumet Park is eager to attract young professionals with easy commuting access to Chicago, as well as new businesses and developments to the area.
As of year-end 2022, there were 202 total businesses within Calumet Park, employing over 1,930 employees. Total employment within Calumet Park comprised 5% of the total employees within the Northwest Region as a whole. The major industries within Calumet Park consisted of educational services, accommodation and food services, retail trade, construction, and arts, entertainment, and recreation services.
Calumet Park encompasses 600 rental units, capturing 9% of the rental unit supply within the Northwest Region as of yearend 2022. During this same time frame, Calumet Park comprised 362,360 square feet of retail space, 23,050 square feet of office space, and 366,170 square feet of industrial/flex space— capturing 7%, 3%, and 2% of the retail, office, and industrial/flex space, respectively, within the Northwest Region as a whole.
COMMUNITY INVESTMENT
Calumet Park has many great business incentive programs, including the Cal Sag Enterprise Zone, which encourages new construction and expansion of commercial and industrial projects, and is located adjacent to the Chicago III and Calumet Region Enterprise Zone. Calumet Park is also home to two Opportunity Zones and four TIF Districts: Calumet Park 3-6 (Train Station). The following maps illustrate the business incentive programs available within Calumet Park as of year-end 2022.
2021 AADT(1) 14.1% Workers 16+ Took Public Transportation
NORTHWEST REGION ROBBINS
ABOUT THE VILLAGE OF ROBBINS
The Village of Robbins ("Robbins"), incorporated in 1917, is part of the Northwest sub-region within the greater Southland area. Robbins is approximately 960 acres and is accessible by I-294. As of year-end 2022, the population within Robbins was 4,700 persons, capturing 5% of the population within the Northwest Region as a whole. During this same time frame, there were 1,960 total housing units within Robbins, composing 5% of the total housing units within the Northwest Region as a whole.
Though Robbins is quite small, it is well-positioned for growth and development, as it becomes an increasingly attractive place to live and conduct business. Like many other municipalities in the Southland, Robbins enjoys fast and reliable transit to downtown Chicago via the Metra commuter rail trains. Robbins is implementing an aggressive TOD strategy, focusing on promoting dense, walkable development of residential, commercial, and mixed-use real-estate within a quarter-mile of the Robbins Metra Station. In conjunction with the development opportunities, Robbins has an available 17-acre parcel just north of the TOD area for industrial development.
In addition, Robbins has introduced the RainReady initiative to implement a new climate resilience-oriented comprehensive plan. This project aims to ensure stormwater runoff is efficiently managed, so that future developments in the area are protected from flooding. Robbins' RainReady initiative has three key solutions to create a more beautiful and flood-resilient community including the Robbins Park, Robbins “New Town Center”, and the Robbins Residential Program.
Robbins' community is predominantly Black, making up 80% of the total population within the area. In addition, 54% of the total population within Robbins are of working age, between the ages of 20 and 64. The median household income, median disposable income, and per capita income were significantly lower than those observed within the Northwest Region as of year-end 2022. Consumer spending is also smaller within Robbins—as of year-end 2022, total expenditures were less than $70 million, capturing only 3% of the total expenditures within the Northwest Region as a whole. Housing and retail goods compose the majority of consumer spending within Robbins.
As of year-end 2022, there were 110 total businesses within Robbins, employing over 1,350 employees. Total employment within Robbins comprised only 3% of the total employees within the Northwest Region as a whole. The major industries within Robbins consisted of health care and social assistance, educational services, retail trade, accommodation and food services, and transportation and utilities services.
Robbins encompasses 150 rental units, capturing 2% of the rental unit supply within the Northwest Region as of year-end 2022. During this same time frame, Robbins comprised 70,290 square feet of retail space and 255,240 square feet of industrial/flex space, capturing 1% each of the retail and industrial/flex space, respectively, within the Northwest Region as a whole. There was zero office space within Robbins observed as of year-end 2022.
COMMUNITY INVESTMENT
Robbins has many great business incentive programs, including the Cal Sag Enterprise Zone, which encourages new construction and expansion of commercial and industrial projects; as well as the Village of Robbins (Kirchoff/Meadow) TIF District. Robbins currently does not have any Opportunity Zones. The following maps illustrate the business incentive programs available within Robbins as of year-end 2022.
ENTERPRISE ZONES
$150,900 Avg. Home Value
35,050 2021 AADT(1)
3.5% Workers 16+ Took Public Transportation
NORTH CENTRAL REGION
ABOUT THE NORTH CENTRAL REGION
The North Central Region is located in the north central portion of Southland, across major thoroughfares such as Interstate 294, Interstate 57, and U.S. Route 6. This region encompasses seven cities and villages, all located within Cook County:
▪ Village of Posen
▪ Village of Dixmoor
▪ Village of Riverdale
▪ Village of Phoenix
▪ City of Harvey
▪ City of Markham
▪ Village of East Hazel Crest
Combined, these places total 19.0 square miles, with a population density of 2,838 persons per square mile. In addition, this region is split between Bremen and Thornton Townships, with the northeast portion of the region located within Calumet Township.
Although North Central was hit hard by the 2008 financial crisis, the area is now recovering rapidly by leveraging its proximity to Chicago by focusing on Transit Oriented Development ("TOD"). This includes constructing more housing, retail, and commercial space near the region's transit hubs, as well as expanding and improving the existing transit hubs. However, the North Central Region's transit access goes beyond just passengers—it has excellent access to freight rail and highways, making the area attractive to industrial and logistics businesses. To support new development, the North Central Region has invested millions into water infrastructure within recent years, ensuring the
region remains a viable, safe, and pleasant community for both businesses and residents.
The North Central Region contains 2,550 rental apartment units in 170 buildings that meet the minimum size criteria as of year-end 2022. During this same time frame, the North Central Region also contains nearly 2.0 million square feet of retail space, 423,490 square feet of office space, and about 9.1 million square feet of industrial/flex space, as illustrated in the following table.
The North Central Region comprises a relatively small share of the rental units, as well as the retail, office, and industrial space within Southland as a whole, compared to the other subregions. Coupled with high occupancy rates and average rental rates comparable to that of Southland as a whole, this indicates there is relatively modest demand in the North Central Region for commercial and for-rent residential supply.
LEGEND
County Boundary
Village of Posen
Village of Dixmoor
Village of Riverdale
Village of Phoenix
City of Harvey
City of Markham
Village of East Hazel Crest
The North Central Region provides a range of business incentive programs to initiate new business and commercial investment into the region. Specifically, the North Central Region has several TIF Districts that were established to promote private development, as well as assist and encourage economic development, redevelopment, and improvement projects within defined areas throughout the North Central Region as a whole. In addition, the North Central Region also contains the Cal Sag Enterprise Zone, which was created to encourage new construction and expansion of commercial and industrial projects, specifically within the Posen, Dixmoor, Phoenix, Harvey, Markham, and East Hazel Crest municipalities. The Calumet
PRIORITY PROJECTS
HARVEY TRANSIT ORIENTED DEVELOPMENT (TOD) PLAN
The Harvey TOD Plan is an investment program introduced in March 2022 with the support of the Regional Transit Authority (RTA) Community Planning program. This program aims to invest in Harvey's transit infrastructure, improve connections for riders, and transform public spaces to stimulate economic development in the southern Cook County suburb. Current estimates put the total project budget at $20 million, with improvements to include better lighting, clear walkways, street crossings that connect Pace and Metra Stations, and landscape that supports multi-modal transportation. By improving transportation infrastructure for commuters, businesses and residential complexes along these transportation hubs will experience higher levels of foot traffic.
This program has had several secondary effects on local businesses, with investors seeking redevelopment and new construction in the area. The recent $13 million renovation to Harvey’s Metra Station is one of several additional improvements underway in the area. This renovation began in the first quarter of 2022, and is expected to be completed by the end of 2023. Other improvements include a $16.4 million “Harvey Lofts” private housing development that is currently under construction and financed with a combination of tax credits, Enterprise Zone incentives, and limited TIF incentives.
Future plans for Harvey include creating green public spaces in the downtown area for both resident and attracting commuters. Current concepts envision a pedestrian walkway connecting 153rd and 154th Streets, featuring city hall and commercial spaces. With a strong desire to see more retail and services in
Region Enterprise Zone is also located within the North Central Region, specifically within Riverdale, and was created to stimulate economic growth and neighborhood revitalization by offering a wide variety of tax incentives in designated areas. Combined, Posen, Dixmoor, Riverdale, Harvey, and Markham also contain 15 Opportunity Zones, which are additional business incentives that provide tax incentives through private investment.
These various business incentive programs should be considered when determining where to invest within the North Central Region and Southland as a whole, these incentives are further detailed on the subsequent pages.
Harvey, creating infills connecting corridors— specially between key points between 154th and 155th Streets—will provide opportunities for additional housing in the area. This housing is a flexible tool that would allow for different types buildings to fit into the variety of lots and sites that are offered in Harvey.
EAST HAZEL CREST WIND CREEK CASINO
Wind Creek Casino was recently approved by the Illinois Gaming Board to develop a casino and entertainment site in East Hazel Crest. The casino will comprise a total of 70,000 square feet, featuring expansive floors with 1,300 slot machines, 56 table games, entertainment, dining, and 252 luxury rooms. Current plans estimate that the casino will employ over 800 people and will indirectly support adjacent commercial and retail businesses. The casino has a projected opening date for early 2024.
Although the casino has not yet been completed, Wind Creek is still an active contributor to the community and an established entity in the entertainment industry. In collaboration with the local community, Wind Creek created the Southland Public Benefit Fund that will distribute $150,000 annually for the next five years to fund scholarships and provide health services to residents in the suburban region. After five years of operation, the fund plans on increasing the distribution to $1 million annually.
Image source: Harvey TOD Plan Update 2022
Image source: Harvey TOD Plan Update 2022
Image source: Wind Creek Hospitality
2,810
HOUSING CHARACTERISTICS: HOUSEHOLD INCOME:
$170,620 Avg. Home Value
1.13M 2021 AADT(1) 9.3% Workers 16+ Took Public Transportation
following top 5 major industries by sector make up the majority of total employees within the North Central Region, these include:
NORTH CENTRAL REGION POSEN
ABOUT THE VILLAGE OF POSEN
The Village of Posen ("Posen"), incorporated in 1900, is part of the North Central sub-region within the greater Southland area. Posen is approximately 12,160 acres and is accessible by major thoroughfares, Interstate 294, Interstate 57, and Illinois Route 83. As of year-end 2022, the population within Posen was 53,500 persons, capturing 10% of the population within the North Central Region as a whole. In addition, there were 22,780 total housing units within Posen, composing 8% of the total housing units within the North Central Region as a whole during this same time frame.
Although Posen is small, the area boasts impressive racial diversity–with 66% of the population identifying as Black, 25% as Hispanic, 16% as Other, and 9% as White. In addition, Posen has relatively robust consumer spending, with total expenditures equating to $104.4 million—capturing 10% of the total expenditures within the North Central Region as of year-end 2022.
Posen is also initiating the critical steps to ensure the area remains a safe and attractive place to live and do business as new development is attracted into the area. For example, Posen has recently installed updated water back flow prevention systems to ensure the drinking water remains safe and secure for all residents and businesses.
As of year-end 2022, there were 170 total businesses within Posen, employing over 1,910 employees. Total employment within Posen comprised 9% of the total employees within the North Central Region as a whole. The major industries within Posen consisted of health care and social assistance, manufacturing services, educational services, public administration, and transportation services.
Posen encompasses 50 rental units, capturing 2% of the rental unit supply within the North Central Region as of year-end 2022. During this same time frame, Posen comprised 174,030 square feet of retail space and 613,980 square feet of industrial/flex space—capturing 9% and 7% of the retail and industrial/flex space, respectively, within the North Central Region as a whole. There was zero office space within Posen observed as of year-end 2022.
COMMUNITY INVESTMENT
Posen has many great business incentive programs, including the Cal Sag Enterprise Zone, which encourages new construction and expansion of commercial and industrial projects. Posen is also home to two Opportunity Zones and two TIF Districts: Posen 2 and Sibley Blvd. The following maps illustrate the business incentive programs available within Posen as of year-end 2022.
HOUSING CHARACTERISTICS: HOUSEHOLD INCOME:
$238,870 Avg. Home Value
78,650 2021 AADT(1)
3.1% Workers 16+ Took Public Transportation
NORTH CENTRAL REGION DIXMOOR
ABOUT THE VILLAGE OF DIXMOOR
The Village of Dixmoor ("Dixmoor"), incorporated in 1929, is part of the North Central sub-region within the greater Southland area. Dixmoor is approximately 832 acres and is accessible by major thoroughfares, Interstate 57 and Illinois Route 83. As of year-end 2022, the population within Dixmoor was 2,920 persons, capturing 5% of the population within the North Central Region as a whole. In addition, there were 1,340 total housing units within Dixmoor composing 6% of the total housing units within the North Central Region as a whole during this same time frame.
Although Dixmoor is small, the area boasts impressive racial diversity–with 46% of the population identifying as �lack, 39% as Hispanic, 20% as Other, and 17% as White. In addition, Dixmoor has relatively modest consumer spending, with total expenditures equating to $59.7 million within Dixmoor, capturing 6% of the total expenditures within the North Central Region as of year-end 2022.
Dixmoor recently received $2 million to upgrade and repair the area’s water infrastructure to ensure that it remains safe and secure going forward for residents and businesses. Additionally, Dixmoor is advantageous in that it has access to transportation infrastructure, such as Dixie Highway and I-57, this provides a potential benefit to new businesses that have substantial transportation needs.
As of year-end 2022, there were 65 total businesses within Dixmoor, employing over 1,210 employees. Total employment within Dixmoor comprised 6% of the total employees within the North Central Region as a whole. The major industries within Dixmoor consisted of manufacturing services, retail trade, educational services, public administration, and wholesale trade.
As of year-end 2022, Dixmoor comprised 71,050 square feet of retail space, 39,850 square feet of office space, and 269,590 square feet of industrial/flex space—capturing 4%, 9%, and 3% of the retail, office, and industrial/flex space, respectively, within the North Central Region as a whole. There were zero rental units within Dixmoor observed as of year-end 2022.
COMMUNITY INVESTMENT
Dixmoor has many great business incentive programs, including the Cal Sag Enterprise Zone, which encourages new construction and expansion of commercial and industrial projects. Dixmoor is also home to two Opportunity Zones and two TIF Districts: 144th and Wood, and Dixmoor 2. The following maps illustrate the business incentive programs available within Dixmoor as of year-end 2022.
HOUSING CHARACTERISTICS: HOUSEHOLD INCOME:
$152,250 Avg. Home Value
90,680 2021 AADT(1) 6.0% Workers 16+ Took Public Transportation
NORTH CENTRAL REGION RIVERDALE
ABOUT THE VILLAGE OF RIVERDALE
The Village of Riverdale ("Riverdale"), incorporated in 1892, is part of the North Central sub-region within the greater Southland area. Riverdale is approximately 2,432 acres and is accessible by Interstate 57 and Illinois Route 83. As of year-end 2022, the population within Riverdale was 10,610 persons, capturing 20% of the population within the North Central Region as a whole. In addition, there were 5,060 total housing units within Riverdale composing 22% of the total housing units within the North Central Region as a whole during this same time frame.
Riverdale is a great location for manufacturing and logistics businesses, as well as for residents who commute to downtown Chicago for work. Riverdale has excellent access to transportation infrastructure, including heavy freight rail, I-57, and the Little Calumet River. Commuters also enjoy quick and convenient transit to Chicago via the Metra Electric line.
Riverdale has launched several development initiatives over the last two decades to help target redevelopment and development in the area. One of the original programs was the Whistler Crossing project in 2003. This project involved the redevelopment of 90 historic mid-century town homes and the construction of 2 mixed use building adhering to Riverdale's green objective, which includes promoting pedestrian traffic and creating energy-efficient utility services. In addition, the more recent RainReady initiative aims to create a more floodresilient community through the creation of more green spaces and marshlands to mitigate flooding, as well repair and maintain outdated drainage systems.
Riverdale's residents are predominantly Black, making up 92% of the total population within the area. In addition, 59% of the total population within Robbins are of working age, between the ages of 20 and 64. The median household income and median disposable income were slightly lower than those observed within the North Central Region as of year-end 2022; whereas, the per capita income was slightly higher in Riverdale compared to that of the North Central Region.
Consumer spending is also robust in Riverdale—as of year-end 2022, total expenditures were $236.1 million, capturing 22%
of the total expenditures within the North Central Region as a whole. Housing and retail goods compose the majority of consumer spending within Riverdale.
As of year-end 2022, there were 190 total businesses within Riverdale, employing nearly 2,350 employees. Total employment comprised 12% of the total employees within the North Central Region as a whole. The major industries within Riverdale consisted of manufacturing services, health care and social assistance, educational services, wholesale trade, and public administration.
Riverdale encompasses 1,730 rental units, capturing 68% of the rental unit supply within the North Central Region as of year-end 2022. During this same time frame, Riverdale comprised 245,160 square feet of retail space, 36,250 square feet of office space, and 1.8 million square feet of industrial/flex space—capturing 13%, 9%, and 20% of the retail, office, and industrial/flex space, respectively, within the North Central Region as a whole.
COMMUNITY INVESTMENT
Riverdale has many great business incentive programs, including the Calumet Region Enterprise Zone, which was established in 2017 to stimulate economic growth and neighborhood revitalization by offering a wide variety of tax incentives in designated areas. Riverdale also comprises four Opportunity Zones, as illustrated in the map below, and does not currently have any TIF Districts.
$191,330 Avg. Home Value
91,150 2021 AADT(1)
15.9% Workers 16+ Took Public Transportation
NORTH CENTRAL REGION
PHOENIX
ABOUT THE VILLAGE OF PHOENIX
The Village of Phoenix ("Phoenix"), incorporated in 1900, is part of the North Central sub-region within the greater Southland area. Phoenix is about 297 acres and is accessible by Illinois Route 1. As of year-end 2022, the population within Phoenix was 1,810 persons, capturing 3% of the population within the North Central Region as a whole. In addition, there were 890 total housing units within Phoenix composing 4% of the total housing units within the North Central Region as a whole during this same time frame.
Although Phoenix is small—both geographically and population based—it has remained an attractive option for many business types due to Phoenix's inexpensive land and easy access to Illinois Route 1 which runs north and south connecting to major interstates across Illinois, as well as have a Metra commuter rail station just outside of the area's boundaries.
Phoenix's residents are predominantly Black, making up 84% of the total population within the area. In addition, 57% of the total population within Phoenix are of working age, between the ages of 20 and 64. The median household income, median disposable income, and per capita income were significantly higher than those observed within the North Central Region as of year-end 2022.
Consumer spending is also small in Phoenix—as of year-end 2022, total expenditures were $51.4 million, capturing only 5% of the total expenditures within the North Central Region as a whole. Housing and retail goods compose the majority of consumer spending within Phoenix.
As of year-end 2022, there were 40 total businesses within Phoenix, employing nearly 460 employees. Total employment within Phoenix comprised 2% of the total employees within the North Central Region as a whole. The major industries within Phoenix consisted of public administration, wholesale trade, real estate, rental, and leasing services, retail trade, and construction services.
Phoenix encompasses only 16 rental units, capturing a small share of 1% of the rental unit supply within the North Central Region as of year-end 2022. During this same time frame, Phoenix comprised 20,620 square feet of retail space and 597,890 square feet of industrial/flex space—capturing 1% and 7% of the retail and industrial/flex space, respectively, within the North Central Region as a whole. There was zero office space within Phoenix observed as of year-end 2022.
COMMUNITY INVESTMENT
Phoenix has many great business incentive programs, including the Cal Sag Enterprise Zone, which encourages new construction and expansion of commercial and industrial projects. Phoenix is also home to three TIF Districts: Village of Phoenix, 151st Street/Wallace Street, and Northern Phoenix. Phoenix does not have any Opportunity Zones. The following maps illustrate the business incentive programs available within Phoenix as of year-end 2022.
ENTERPRISE ZONES
$106,140 Avg. Home Value
3,150
NORTH CENTRAL REGION HARVEY
ABOUT THE CITY OF HARVEY
The City of Harvey ("Harvey"), incorporated in 1891, is part of the North Central sub-region within the greater Southland area. Harvey is approximately 2,972 acres and is accessible by major thoroughfares, such as Interstate 294, U.S. Route 6, and Illinois Route 1. As of year-end 2022, the population within Harvey was 19,790 persons, capturing 37% of the population within the North Central Region as a whole. During this same time frame there were 8,650 total housing units within Harvey, composing 38% of the total housing units within the North Central Region as a whole.
Harvey is one of the south suburbs best positioned for shortterm and long-term development, given its easy access to major thoroughfares, railways, and public transportation. Currently, Harvey is focusing heavily on transit-oriented development–seeking to attract more young professionals who work in downtown Chicago by enhancing their commuting ability.
Two exciting new projects in particular are underway in Harvey, making the area more attractive to both residents and businesses. These include (1) The Harvey Lofts and (2) the 147th Street Metra Station. The Harvey Lofts has been approved for construction, and will ultimately include 51 units of high-quality affordable housing directly across from the 154th Street Metra Station for easy public transportation, as well as being located near the bus station for local transit. In addition, the 147th Street Metra Station is already operational, but its planned redevelopment in 2023 will make for more attractive and accessible transit to and from Chicago for Harvey residents.
As of year-end 2022, there were 620 total businesses within Harvey, employing over 9,000 employees. Total employment within Harvey comprised 45% of the total employees within the North Central Region as a whole. The major industries within Harvey consisted of health care and social assistance, manufacturing services, educational services, public administration, and wholesale trade.
Harvey encompasses 730 rental units, capturing 29% of the rental unit supply within the North Central Region as of year-end 2022. During this same time frame, Harvey comprised 855,300
square feet of retail space, 303,550 square feet of office space, and 3.7 million square feet of industrial/flex space—capturing 44%, 72%, and 41% of the retail, office, and industrial/flex space, respectively, within the North Central Region as a whole.
COMMUNITY INVESTMENT
Harvey has many great business incentive programs, including the Cal Sag Enterprise Zone, which encourages new construction and expansion of commercial and industrial projects. Harvey is also home to six TIF Districts and five Opportunity Zones, as illustrated in the following maps.
Occupied OwnerOccupied
$144,580 Avg. Home Value
589,250 2021 AADT(1)
9.7% Workers 16+ Took Public Transportation
NORTH CENTRAL REGION MARKHAM
ABOUT THE CITY OF MARKHAM
The City of Markham ("Markham"), incorporated in 1925, is part of the North Central sub-region within the greater Southland area. Markham is approximately 3,460 acres and is accessible by major thoroughfares, such as Interstate 294, Interstate 57, and U.S. Route 6. As of year-end 2022, the population within Markham was 11,550 persons, capturing 22% of the population within the North Central Region as a whole. In addition, there were nearly 4,300 total housing units within Markham, composing 19% of the total housing units within the North Central Region as a whole during this same time frame.
Markham is another industrial economy within the south suburbs. With easy access to all of the major interstate highways in the Chicago region as well as access to a large rail hub, the CN Chicago Intermodal Hub, Markham's prime location makes it an area of great investment within the greater Southland area.
One of the most enticing developments for businesses and investors within Markham over the coming years is the potential for warehousing, transportation, and logistics. Markham has been specifically promoting the area between I-294 and the Dixie Highway for logistics businesses over the last couple of years. This area will be a prime location for the logistics parks, since it is well positioned closely to both existing and planned residential neighborhoods—providing plenty of housing for potential workers and any businesses hoping to move into the logistics park area.
As of year-end 2022, there were 350 total businesses within Markham, employing over 4,470 employees. Total employment within Markham comprised 22% of the total employees within the North Central Region as a whole. Markham's residents are predominantly Black, making up 72% of the total population within area. In addition, 56% of the total population within Markham are of working age, between the ages of 20 and 64.
Markham encompasses 20 rental units, capturing only 1% of the rental unit supply within the North Central Region as of year-end 2022. During this same time frame, Markham comprised 570,940 square feet of retail space, 34,640 square feet of office space,
and 1.9 million square feet of industrial/flex space—capturing 29%, 8%, and 20% of the retail, office, and industrial/flex space, respectively, within the North Central Region as a whole.
COMMUNITY INVESTMENT
Markham has many great business incentive programs, including the Cal Sag Enterprise Zone, which encourages new construction and expansion of commercial and industrial projects. Markham is also home to four TIF Districts and two Opportunity Zones, as illustrated in the following maps.
HOUSING CHARACTERISTICS:
169,750 2021 AADT(1) 7.3% Workers 16+ Took Public Transportation
NORTH CENTRAL REGION
EAST HAZEL CREST
ABOUT THE VILLAGE OF EAST HAZEL CREST
The Village of East Hazel Crest ("East Hazel Crest"), incorporated in 1911, is part of the North Central sub-region within the greater Southland area. East Hazel Crest is approximately 502 acres and is accessible by Interstate 294 and Illinois Route 1. As of year-end 2022, the population within East Hazel Crest was nearly 1,300 persons, capturing 2% of the population within the North Central Region as a whole. During this same time frame, there were 630 total housing units within East Hazel Crest, composing 3% of the total housing units within the North Central Region as a whole.
East Hazel Crest will soon boast a large casino, hotel, and venue complex, the Wind Creek Casino. Construction began on the Wind Creek Casino in summer 2022, with an anticipated completion for the end of 2023. The complex will comprise 70,000 square feet and include 252 luxury hotel rooms. This development is anticipated to create several hundred shortterm construction jobs, as well as 800 long-term jobs for casino operations. The Wind Creek Casino is anticipated to attract plenty of additional new development, from workforce housing to satellite businesses to serve the casino clientele within East Hazel Crest over the coming years.
In addition, Wind Creek, in collaboration with the local community, has created the Southland Public Benefit Fund, which will distribute $150,000 annually for the next five years to fund scholarships and provide health services to residents in the suburban region. After five years of operation, the fund plans on increasing the distribution to $1 million annually
East Hazel Crest's residents are predominantly Black, making up 51% of the total population within the area, closely followed by White, which makes up 31% of the total population. In addition, 59% of the total population within East Hazel Crest are of working age, between the ages of 20 and 64. The median household income, median disposable income, and per capita income were significantly higher than those observed within the North Central Region as of year-end 2022. However, consumer spending in East Hazel Crest was relatively low, at $34.9 million as of year-end 2022, composing only 3% of the
total expenditures within the North Central Region as a whole. Housing and retail goods compose the majority of consumer spending within East Hazel Crest.
As of year-end 2022, there were 50 total businesses within East Hazel Crest, employing nearly 730 employees. Total employment within East Hazel Crest comprised 4% of the total employees within the North Central Region as a whole. The major industries within East Hazel Crest consisted of construction services, wholesale trade, manufacturing services, public administration, and administration and support services.
East Hazel Crest comprises 10,100 square feet of retail space, 9,200 square feet of office space, and 137,100 square feet of industrial/flex space—capturing 1%, 2%, and 2% of the retail, office, and industrial/flex space, respectively, within the North Central Region as a whole. There were zero rental units within East Hazel Crest observed as of year-end 2022.
COMMUNITY INVESTMENT
East Hazel Crest has many great business incentive programs, including the Cal Sag Enterprise Zone, which encourages new construction and expansion of commercial and industrial projects. East Hazel Crest is also home to two TIF Districts: Tollway and Halsted Street TIF Districts. East Hazel Crest does not have any Opportunity Zones. The following maps illustrate the business incentive programs available within East Hazel Crest as of year-end 2022.
$260,210 Avg. Home Value
111,250 2021 AADT(1) 9.9% Workers 16+ Took Public Transportation
NORTHEAST REGION
ABOUT THE NORTHEAST REGION
The Northeast Region is located in the northeastern portion of Southland, generally situated along the Cook County border to the north and south. This region encompasses six cities and villages, all located within Cook County:
▪ Village of Dolton
▪ Village of Burnham
▪ City of Calumet
▪ Village of Lansing
▪ Village of South Holland
▪ Village of Thornton
Combined, these places total 31.1 square miles, with a population density of 3,677 persons per square mile. In addition, this region is primarily located within the Thornton Township, with a small portion of the southeastern part of the region located within the Bloom Township.
The Northeast Region has found great economic success in the transportation and logistics spheres over the last couple of years. Although many manufacturing companies have moved across the border into Indiana, these companies still need to access the reliable and available transportation and logistics infrastructure of the Southland. As the transportation and logistics sectors have continued to thrive within the Northeast Region, it has in turn started to attract industrial companies back across the state border into Illinois at a variety of scales, including into the individual municipalities located within the Northeast Region.
The Northeast Region contains nearly 5,490 rental apartment units in 220 buildings that meet the minimum size criteria as of year-end 2022. During this same time frame, the Northeast Region also contains nearly 8.1 million square feet of retail space, 1.6 million square feet of office space, and about 11.1 million square feet of industrial/flex space, as illustrated in the following table.
The Northeast Region comprises some of the largest shares of office and retail space, as well as rental units within Southland as a whole, compared to the other sub-regions. Coupled with high occupancy rates and average rental rates comparable, if not greater, than that of Southland as a whole, this indicates there is relatively robust demand in the Northeast Region for commercial and for-rent residential supply.
LEGEND
County Boundary
Village
Village
City
Village of Lansing
Village
Village
of Dolton
of Burnham
of Calumet
of South Holland
of Thornton
COMMUNITY INVESTMENT
The Northeast Region provides a range of business incentive programs to initiate new business and commercial investment into the region. Specifically, the Northeast Region has several TIF Districts that were established to promote private development, as well as assist and encourage economic development, redevelopment, and improvement projects within defined areas throughout the Northeast Region as a whole.
In addition, the Northeast Region also contains the Calumet Region Enterprise Zone, which was created to stimulate economic growth and neighborhood revitalization by offering a wide variety of tax incentives in designated areas, specifically
PRIORITY PROJECTS
SOUTH HOLLAND HIGHWAY 6 CORRIDOR
South Holland has been recently promoting its commitment to enticing new businesses to the area. South Holland can be accessed along Interstate 80, Interstate 94, Interstate 294, Interstate 80, Interstate 57, and Illinois Route 394—creating easy transit access and commuter environment for residents and employees, as well as many opportunities to attract customers to South Holland's commercial sites and retailers.
In an effort to encourage this investment in the community, South Holland has cleared many of the properties it owns for redevelopment. These properties are specifically reserved for retail, warehouses, offices, and mixed-use commercial development. Many of these properties are concentrated around the South Suburban College and have TIF(s) available to help redevelopment and investment.
Stakeholders in the community are also often focused on South Holland’s key commercial corridor, the Highway 6 Corridor. The high traffic counts provide major benefits to the economy, but some local businesses believe the congestion and traffic promote a negative impact. To alleviate traffic, South Holland has created its Town Center District and purchased a rail-adjacent property as part of a development plan to create a proposed Metra station with a 33-mile service Metra line. This expansion, along with South Holland's strong industrial sector, aligns the area with the prospect for growth.
In addition, another key vision of the community, as further detailed in South Holland's Comprehensive Plan, is to further invest and market the Interstate Zoning District and the Town Center District so that they may help define space for companies in currently underutilized locations.
In addition, South Holland has enhanced bicycle connectivity and safety within the area by investing in bike lanes and multi-use paths to key community destinations, surrounding communities, and forest preserves. Streetscape improvements have also enhanced walkability and created a sense of place in the Town Center District and have laid the groundwork for the highly desired future development of South Holland’s Town Center District.
within the Dolton, Calumet, Lansing, South Holland, and Thornton municipalities. Dolton, Calumet, and South Holland within the Northeast Region combined also contain 11 Opportunity Zones, which are additional business incentives that provide tax incentives through private investment.
These various business incentive programs should be considered when determining where to invest within the Northeast Region and Southland as a whole, these incentives are further detailed on the subsequent pages.
THORNTON DISTILLERY
The Thornton Distillery, located in the Village of Thornton, is a historic site that was originally a brewery in the 19th century. Today, Thornton is working to promote the Thornton Distillery site as an excellent community space that can be rented out for weddings, gatherings, or any other sort of event—thus promoting economic development and tourism within the surrounding area.
Image source: Highway 6 Corridor, CMAP
Image source: Thornton Distilling Co.
$236,900 Avg. Home Value
NORTHEAST REGION DOLTON
ABOUT THE VILLAGE OF DOLTON
The Village of Dolton ("Dolton"), incorporated in 1927, is part of the Northeast sub-region within the greater Southland area. Dolton is approximately 3,000 acres and is accessible by Interstate 94 and Illinois Route 83. As of year-end 2022, the population within Dolton was 21,000 persons, capturing 19% of the population within the Northeast Region as a whole. In addition, there were nearly 8,700 total housing units within Dolton, composing 18% of the total housing units within the Northeast Region as a whole during this same time frame.
Although Dolton is relatively small, economic development and revitalization is robust within the area, due to a variety of programs that focus primarily on attracting new businesses and commuter residents. Current incentive programs within Dolton include community development block grants, a statecertified Enterprise Zone, TIF Districts, and extensive job training. Additionally, Dolton is considering rejoining the South Suburban Land Bank Authority in pursuit of spurring residential redevelopment efforts within the area.
As of year-end 2022, there were over 400 total businesses within Dolton, employing 5,380 employees. Total employment within Dolton comprised 10% of the total employees within the Northeast Region as a whole. Dolton;s residents are predominantly Black, making up 90% of the total population within Dolton are of working age, between the ages of 20 and 64. The median household incomes, median disposable incomes, and per capita incomes in Dolton were slightly smaller than those observed within the Northeast Region as a whole. Comparatively, consumer spending in Dolton, at $471.9 million as of yearend 2022, composed 16% of the total expenditures within the Northeast Region as a whole.
Dolton encompasses 250 rental units, capturing 4% of the rental unit supply within the Northeast Region as of year-end 2022. During this same time frame, Dolton comprised 1.3 million square feet of retail space, 87,650 square feet of office space, and 961,370 square feet of industrial/flex space—capturing 16%, 5%, and 9% of the retail, office, and industrial/flex space, respectively, within the Northeast Region as a whole.
COMMUNITY INVESTMENT
Dolton has many great business incentive programs, including the Calumet Region Enterprise Zone, which was established in 2017 to stimulate economic growth and neighborhood revitalization by offering a wide variety of tax incentives in designated areas of Calumet City, Dolton, Lansing, Riverdale, South Holland, Thornton, and unincorporated Cook County. Dolton also comprises three TIF Districts and four Opportunity Zones, as illustrated in the maps below.
HOUSING CHARACTERISTICS:
351,510 2021 AADT(1)
9.7% Workers 16+ Took Public Transportation
NORTHEAST REGION
BURNHAM
ABOUT THE VILLAGE OF BURNHAM
The Village of Burham ("Burnham"), incorporated in 1907, is part of the Northeast sub-region within the greater Southland area. Burnham is approximately 1,242 acres and is located in between two major thoroughfares, Interstate 94 and Interstate 90. As of year-end 2022, the population within Burnham was 4,010 persons, capturing 4% of the population within the Northeast Region as a whole. In addition, there were 1,580 total housing units within Burnham, composing 3% of the total housing units within the Northeast Region as a whole during this same time frame.
Burnham—like its surrounding village and city neighbors—is a small, quiet commuter suburb in Chicago’s Southland. Most of its residents commute to downtown Chicago for work. Despite having just over 4,000 residents, Burnham boasts two nature preserves, the Burnham Prairie Nature Preserve and the Powderhorn Prairie and Marsh Nature Preserve, as well as a highly rated Burnham Woods Golf Course. Burnham is quite small, but is an ideal location for young families looking for a quiet locale close enough to commute to Chicago’s Loop.
Burnham is the site of several ongoing revitalization projects in Southland. Its position, being a major midpoint for Chicago commuters, makes it an area of strategic importance. Two initiatives are currently underway to enhance multimodal transit connections and revitalize the commercial corridor. The first initiative involves a feasibility study conducted by the Cook County Department of Transportation and Highways in collaboration with Burnham. The initial phase of the study aims to assess the conditions and design of pedestrian and bicycle paths across Burnham's roads and railways. Upon completion of this phase, Burnham hopes to secure government subsidies to attract developers and stimulate area improvements.
Central to the economic enhancement initiative is the Burnham Avenue Corridor Revitalization Plan. Recognizing that the commercial corridor extending from State Street in the north to Michigan City Road in the south along Burnham Avenue is
vital for driving economic and social activity, this project aims to reinvigorate this key arterial road, which has lost its vitality as other parts of Burnham developed. The plan focuses on beautifying and developing the area to increase recreational activity and aesthetic appeal, while also promoting walkability. Measures to achieve this include refurbishing deteriorated streets with brickwork and implementing additional pedestrian safety features.
To simultaneously enhance the quality of life and stimulate economic growth, Burnham has decided to establish more mixed-use zoning and focus on packaging parcels for development. This strategy emphasizes a balance between residential, commercial, and leisure spaces—promoting a more vibrant and sustainable community.
Burnham's residents are predominantly Black, making up 60% of the total population within the area. In addition, 57% of the total population within Burnham are of working age, between the ages of 20 and 64. Nearly 27% of the population within Burnham has an associates degree or greater, with 18% obtaining a bachelor's or more advanced graduate degree.
The median household incomes, median disposable incomes, and per capita incomes in Burnham were slightly smaller than those observed within the Northeast Region as a whole. Comparatively, consumer spending in Burnham was small, at $90.4 million as of year-end 2022, composing only 3% of the total expenditures within the Northeast Region as a whole.
As of year-end 2022, there were 80 total businesses within Burnham, employing nearly 2,160 employees. Total employment within Burnham comprised 4% of the total employees within the Northeast Region as a whole. The major industries within Burnham consisted of wholesale trade, transportation and utilities services, health care and social assistance services, manufacturing services, and public administration. Additionally, the household unemployment rate, at 13.5%, was greater than that of the Northeast Region at 11.5% for year-end 2022.
Burnham encompasses 50 rental units, capturing only 1% of the rental unit supply within the Northeast Region as a whole as of year-end 2022. During this same time frame, Burnham comprised 57,470 square feet of retail space, 2,100 square feet of office space, and 40,740 square feet of industrial/flex space—capturing 1%, 0.1%, and 0.4% of the retail, office, and industrial/flex space, respectively, within the Northeast Region as a whole.
Burnham does not contain any Enterprise Zones, Opportunity Zones, or TIF Districts.
HOUSING CHARACTERISTICS: HOUSEHOLD INCOME:
38,480 2021 AADT(1)
NORTHEAST REGION CALUMET
ABOUT THE CITY OF CALUMET
The City of Calumet ("Calumet"), incorporated in 1893, is part of the Northeast sub-region within the greater Southland area. Calumet is about 4,676 acres and is accessible by major thoroughfares, such as Interstate 94, U.S. Route 6, and Illinois Route 83. As of year-end 2022, the population within Calumet was 35,330 persons, capturing 31% of the population within the Northeast Region as a whole. During this same time frame, there were over 16,180 total housing units within Calumet, composing 34% of the total housing units within the Northeast Region as a whole.
Calumet promotes development as effectively and as aggressively as any other municipality in the Southland. There are a variety of incentive programs for potential developers to take advantage of, including Enterprise Zone, Tax Increment Financing, the Southland Revitalization Act, and the five census tracts in Calumet that are designated as Opportunity Zones. In addition to those incentives, Calumet maintains a database of both privately held and city-owned properties for-sale at discounts and with tax incentives, making these properties extremely attractive to potential developers and investors.
As of year-end 2022, there were over 850 total businesses within Calumet, employing 12,950 employees. Total employment within Calumet comprised 25% of the total employees within the Northeast Region as a whole. Calumet's residents are predominantly Black, making up 72% of the total population within the area. In addition, 57% of the total population within Calumet are of working age, between the ages of 20 and 64.
Calumet encompasses 3,170 rental units as of year-end 2022, capturing the majority of rental unit supply within the Northeast Region, at 58%, compared to the other municipalities within the sub-region. During this same time frame, Calumet comprised nearly 4.0 million square feet of retail space, 377,290 square feet of office space, and 1.2 million square feet of industrial/flex space—capturing 49%, 23%, and 11% of the retail, office, and industrial/flex space, respectively, within the Northeast Region as a whole.
COMMUNITY INVESTMENT
Calumet has many great business incentive programs, including the Calumet Region Enterprise Zone, which was established in 2017 to stimulate economic growth and neighborhood revitalization by offering a wide variety of tax incentives in designated areas of Calumet City, Dolton, Lansing, Riverdale, South Holland, Thornton, and unincorporated Cook County. Calumet is also home to five Opportunity Zones and three TIF Districts: City of Calumet, River Oaks Mall, and Siblet/Torrence/ STA, as illustrated in the maps below.
HOUSING CHARACTERISTICS: HOUSEHOLD INCOME:
$214,010 Avg. Home Value
302,630 2021 AADT(1)
10.2% Workers 16+ Took Public Transportation
NORTHEAST REGION LANSING
ABOUT THE VILLAGE OF LANSING
The Village of Lansing ("Lansing"), incorporated in 1893, is part of the Northeast sub-region within the greater Southland area. Lansing is approximately 4,812 acres and is accessible by Interstate 94 and Illinois Route 83. As of year-end 2022, the population within Lansing was 28,920 persons, capturing 26% of the population within the Northeast Region as a whole. In addition, there were 12,060 total housing units within Lansing, composing 25% of the total housing units within the Northeast Region as a whole during this same time frame.
Lansing is bordered on the west by Wumpum Lake and on the south by Brownell Woods—two popular nature preserve areas— making Lansing a pleasant and attractive place for residents and businesses alike. Like much of the Southland, Lansing is situated well within existing transportation infrastructure, featuring easy access to major thoroughfares, railway lines, and public transportation, and therefore providing convenient access for commuters, businesses, and local transit.
Lansing's residents are predominantly Black, making up 46% of the total population within the area; closely followed by White, which makes up 31%. In addition, 58% of the total population within Lansing are of working age, between the ages of 20 and 64. Nearly 40% of the population within Lansing has an associates degree or greater, with 27% obtaining a bachelor's or more advanced graduate degree.
The median household incomes, median disposable incomes, and per capita incomes in Lansing were slightly higher than those observed within the Northeast Region as a whole. Comparatively, consumer spending in Lansing was robust, at nearly $810.0 million as of year-end 2022, composing 28% of the total expenditures within the Northeast Region as a whole.
As of year-end 2022, there were 890 total businesses within Lansing, employing nearly 13,380 employees. Total employment within Lansing comprised 26% of the total employees within the Northeast Region as a whole. The major industries within Lansing consisted of retail trade, accommodation and food
services, educational services, manufacturing services, and health care and social assistance services.
Lansing encompasses 1,650 rental units, capturing 30% of the rental unit supply within the Northeast Region as a whole as of year-end 2022. During this same time frame, Lansing comprised 2.0 million square feet of retail space, 515,490 square feet of office space, and 2.2 million square feet of industrial/flex space— capturing 25%, 32%, and 20% of the retail, office, and industrial/ flex space, respectively, within the Northeast Region as a whole.
COMMUNITY INVESTMENT
Lansing has many great business incentive programs, including the Calumet Region Enterprise Zone, which was established in 2017 to stimulate economic growth and neighborhood revitalization by offering a wide variety of tax incentives in designated areas of Calumet City, Dolton, Lansing, Riverdale, South Holland, Thornton, and unincorporated Cook County. Lansing is also home to five TIF Districts: Village of Lansing, Bernice Road, Torrance Ave Corridor, Torrence/172nd Street, and West Lansing. Lansing does not have any Opportunity Zones. The following maps illustrate the business incentive programs available within Lansing as of year-end 2022.
ENTERPRISE ZONES
267,630 2021 AADT(1)
5.0% Workers 16+ Took Public Transportation
NORTHEAST REGION
SOUTH HOLLAND
ABOUT THE VILLAGE OF SOUTH HOLLAND
The Village of South Holland ("South Holland"), incorporated in 1894, is part of the Northeast sub-region within the greater Southland area. South Holland is approximately 4,641 acres and is accessible by major thoroughfares, such as Interstate 94, Interstate 294, U.S. Route 6, and Illinois Route 83. As of yearend 2022, the population within South Holland was 21,220 persons, capturing 19% of the population within the Northeast Region as a whole. In addition, there were nearly 7,790 total housing units within South Holland, composing 16% of the total housing units within the Northeast Region as a whole during this same time frame.
South Holland is a racially diverse area with moderate incomes. Like South Holland's surrounding municipalities, the area relies largely on manufacturing, transportation, and logistics. One thing that sets South Holland apart is that it’s home to South Suburban College, giving it greater access to a more highly educated and skilled workforce.
The corridor of U.S. Route 6 between Interstate 94 on the east and south and Park Avenue on the west is a prime location for development and growth within South Holland. South Holland has about a dozen properties immediately available for redevelopment/development. These properties include retail, warehouses, offices, and other mixed-use commercial spaces. In addition, these properties come in a variety of sizes from about 3,000 square feet to over 30,000 square feet. Combined with the well-educated, highly skilled workforce of South Holland—along with the ready transit access to Chicago and beyond via the close connection to I-94—South Holland is a perfect place for new and expanding businesses.
South Holland encompasses nearly 300 rental units as of year-end 2022, capturing 5% of the rental unit supply within the Northeast Region. During this same time frame, South Holland comprised 704,180 square feet of retail space, 704,180 square feet of office space, and nearly 5.8 million square feet of industrial/flex space—capturing 9%, 39%, and 52% of the retail, office, and industrial/flex space, respectively, within the Northeast Region as a whole.
COMMUNITY INVESTMENT
South Holland has many great business incentive programs, including the Calumet Region Enterprise Zone, which was established in 2017 to stimulate economic growth and neighborhood revitalization by offering a wide variety of tax incentives in designated areas of Calumet City, Dolton, Lansing, Riverdale, South Holland, Thornton, and unincorporated Cook County. Calumet also comprises seven TIF Districts and two Opportunity Zones, as illustrated in the maps below.
56% of the total population within South Holland makeup the working-class population, between the ages of 20-64.
314,430 2021 AADT(1)
9.6% Workers 16+ Took Public Transportation
NORTHEAST REGION THORNTON
ABOUT THE VILLAGE OF THORNTON
The Village of Thornton ("Thornton"), incorporated in 1900, is part of the Northeast sub-region within the greater Southland area. Thornton is approximately 1,537 acres and is accessible by Interstate 294 and Illinois Route 1. As of year-end 2022, the population within Thornton was 2,360 persons, capturing 2% of the population within the Northeast Region as a whole. In addition, there were 1,050 total housing units within Thornton, composing 2% of the total housing units within the Northeast Region as a whole during this same time frame.
Although Thornton is relatively small, the area boasts a serious approach to economic development, with a particular eye to longterm and community-oriented development. There are a variety of incentive programs that have been successful at attracting new businesses to the area and helping incumbent businesses grow.
One notable project currently underway within Thornton is the Thornton Distillery. The Thornton Distillery is a historic site that was originally a brewery in the 19th century and produced illicit alcohol under Al Capone’s control during Prohibition. Today, the distillery produces artisan-quality whiskey. Thornton is working to promote the Thornton Distillery site as an excellent space that can be rented out for weddings, community gatherings, or any other sort of event, thus promoting economic development and tourism within the surrounding area.
Thornton's residents are predominantly White, making up 51% of the total population within the area; closely followed by Black, which make up 31%. In addition, 57% of the total population within Thornton are of working age, between the ages of 20 and 64. The median household incomes, median disposable incomes, and per capita incomes in Thornton were significantly higher than those observed within the Northeast Region as a whole. However, consumer spending in Thorton was relatively low, at $74.3 million as of year-end 2022, composing only 4% of the total expenditures within the Northeast Region as a whole.
As of year-end 2022, there were 100 total businesses within Thornton, employing over 1,960 employees. Total employment
within Thornton comprised 4% of the total employees within the Northeast Region as a whole. The major industries within Thornton consisted of manufacturing services, construction services, retail trade, educational services, and public administration.
Thornton encompasses 80 rental units, capturing only 1% of the rental unit supply within the Northeast Region as a whole as of year-end 2022. During this same time frame, Thornton comprised 71,550 square feet of retail space, 5,340 square feet of office space, and 876,040 square feet of industrial/flex space —capturing 1%, 0.3%, and 8% of the retail, office, and industrial/ flex space, respectively, within the Northeast Region as a whole.
COMMUNITY INVESTMENT
Thornton has many great business incentive programs, including the Calumet Region Enterprise Zone, which was established in 2017 to stimulate economic growth and neighborhood revitalization by offering a wide variety of tax incentives in designated areas of Calumet City, Dolton, Lansing, Riverdale, South Holland, Thornton, and unincorporated Cook County. Thornton is also home to two TIF Districts: Blackstone and Downtown. Thornton does not have any Opportunity Zones. The following maps illustrate the business incentive programs available within Thornton as of year-end 2022.
2.4
2,386
994
57% of the total population within Thornton makeup the working-class population, between the ages of 20-64.
59,600 2021 AADT(1)
4.1% Workers 16+ Took Public Transportation
SOUTHEAST REGION
ABOUT THE SOUTHEAST REGION
The Southeast Region is located in the southern portion of Southland, generally situated east of Interstate 57 and west of State Road 394. This region encompasses six villages located within Cook and Will Counties:
▪ Village of Monee
▪ Village of University Park
▪ Village of Steger
▪ Village of Crete
▪ Village of Peotone
▪ Village of Beecher
Combined, these places total 32.7 square miles, with a population density of 1,186 persons per square mile. In addition, this region is located within Monee, Crete, Peotone, and Washington Townships.
The Southeast Region is by far the most rural part of the Southland. As parts of the region are located in Will County rather than Cook County, businesses face lower potential tax burdens, which has served to attract new and existing businesses to the area. The Southeast Region is currently enjoying a boom in transportation and logistics businesses, due to the availability of land, proximity to industrial producers, and easy accessibility to highways and freight rail.
The Southeast Region is also working hard to diversify its economy and workforce away from just logistics businesses. Through a wide variety of clever incentive programs both at the municipal level and above, the Southeast Region is attracting business as well as new residents by focusing on Transit Oriented Development ("TOD"). In addition to low
cost of living, low taxes, access to green space, good jobs, and easy transportation to Chicago, the Southeast Region is well positioned for growth in coming years.
The Southeast Region contains nearly 3,270 rental apartment units in 41 buildings that meet the minimum size criteria as of year-end 2022. During this same time frame, the Southeast Region also contains nearly 1.6 million square feet of retail space, 1.3 million square feet of office space, and about 20.0 million square feet of industrial/flex space, as illustrated in the following table.
The Southeast Region comprises the largest share of industrial / flex space within Southland as a whole, compared to the other sub-regions. Coupled with high occupancy rates and average rental rates comparable to that of Southland as a whole, this indicates there is relatively robust demand in the Southeast Region for commercial and for-rent residential supply.
LEGEND
County Boundary
Village of Monee
Village of University Park
Village of Steger
Village of Crete
Village of Peotone
Village of Beecher
COMMUNITY INVESTMENT
The Southeast Region provides a range of business incentive programs to initiate new business and commercial investment into the region. Specifically, the Southeast Region has several TIF Districts that were established to promote private development, as well as assist and encourage economic development, redevelopment, and improvement projects within defined areas throughout the Southeast Region as a whole.
In addition, the Southeast Region also contains the Will Cook Enterprise Zone, which was created to promote commercial and industrial project expansions and new construction, business development tax incentives, real estate, sales tax and construction cost savings, and utility tax exemptions, specifically
PRIORITY PROJECTS
WILL COUNTY FREIGHT PLAN
Will County’s Community Friendly Freight Mobility Plan (Freight Plan) is a Public-Private Partnership (PPP) between Will County and Will County Center for Economic Development, with additional support from Illinois Department of Transportation, the Workforce Investment Board of Will County, Three River Association of Realtors, Federal Highway Administration, and Chicago Metropolitan Agency for Planning (CMAP).
The Freight Plan is a multimodal freight plan that will provide strategic support and goals for freight policies, programs, projects, and investments throughout Will County. Over the last two decades, Will County has become the nation's largest inland port, with over $65 billion worth of product. Annually, 3 million containers flow through the port, with over 150 million square feet of industrial space acquired for the freight industry over the last 15 years.
The main objectives of the Freight Plan is to create a holistic approach of covering freight mobility, land-use integration, workforce development, education, and improvement of quality of life. The program intends to create a platform for community stakeholders to voice their thoughts and concerns, create freight corridors to reduce truck traffic through neighborhood streets, and develop a system of real-time quantitative metrics to measure Will County’s freight industry to secure additional funding and economic opportunities. By developing this Freight Plan, the community hopes to identify local issues and obtain federal and state grants. Using this funding, the community can incentive economic growth of the industry while also maintaining flourishing and livable communities.
within the Monee and University Park municipalities. The Lincoln 394 Enterprise Zone is also located within the Southeast Region, specifically within the Steger, Crete, and Beecher municipalities, and was established to stimulate economic growth and neighborhood revitalization in key opportunity areas. The Southeast Region does not contain any Opportunity Zones.
These various business incentive programs should be considered when determining where to invest within the Southeast Region and Southland as a whole, these incentives are further detailed on the subsequent pages.
GOVERNORS STATE UNIVERSITY
Governors State University’s (GSU) 750-acre campus is located just 30 miles south of Chicago and has expanded from a 2-year college into a full 4-year university over the last decade. Its degree offerings, student population, and faculty count have steadily increased over the years. The area immediately around GSU is quickly transforming into an anchor institution for the region as new construction and redevelopment begins to pick up. One of the most recent infrastructure improvements has been the adjacent Metra station that is currently being rebuilt, as well as new assisted housing provided to faculty and staff by GSU.
In November 2022, GSU announced its Facilities Master PLAN (FMP), which includes a new library and expanding campus infrastructure as the needs of students and faculty continues to evolve and grow. Potential future investments include new buildings to improve academics, student life, performing arts, and athletics, as well as infrastructure support like parking. At the moment, the Social Justice Institute and soccer field are underway after $1.6 million in funding had been secured. Other facilities that were proposed in the FMP are a new field house, academic extension, and new center for health equity.
As GSU continues to grow in population and infrastructure, business and properties in proximity of GSU stand to gain both directly and indirectly. Increased foot traffic will indirectly result in an increased demand for services and retailers to address the needs of faculty, students, and visitors.
Image source: Will County Freight
Image source: GSU
Image source: GSU
1,190
57% of the total population within the Southeast Region makeup the working-class population, between the ages of 20-64.
$259,630 Avg. Home Value
306,530 2021 AADT(1)
4.4% Workers 16+ Took Public Transportation
The following top 5 major industries by sector make up the majority of total employees within the Southeast Region, these include:
SOUTHEAST REGION MONEE
ABOUT THE VILLAGE OF MONEE
The Village of Monee ("Monee"), incorporated in 1853, is part of the Southeast sub-region within the greater Southland area. Monee is approximately 2,844 acres and is accessible by Interstate 57 and Illinois Route 50. As of year-end 2022, the population within Monee was 5,090 persons, capturing 13% of the population within the Southeast Region as a whole. In addition, there were 2,130 total housing units within Monee, composing 13% of the total housing units within the Southeast Region as a whole during this same time frame.
Monee is an attractive destination for businesses of all types and sizes due to its relatively low tax burden, as well as its intermodal transportation and logistics infrastructure. Monee boasts several million square feet of active industrial space and is experiencing a boom in the logistics and freight sectors. Since 2005, Will County has seen 138% growth in freight industry jobs, compared to just 10% growth for the Chicago metropolitan area as a whole.
Despite this business growth, Monee remains focused on community—Monee is a participant in Will County’s Community Friendly Freight Mobility Plan. Monee’s most recent comprehensive plan includes a new town center featuring walkable mixed-use development, a public square, green space, and bike paths—ensuring that Monee will remain a vibrant and desirable place to live along with its booming business growth.
Monee's residents are predominantly White, making up 56% of the total population within the area; closely followed by Black, which make up 30%. In addition, 54% of the total population within Monee are of working age, between the ages of 20 and 64. The median household incomes, median disposable incomes, and per capita incomes in Monee were significantly higher than those observed within the Southeast Region as a whole. Consumer spending in Monee was also robust as of year-end 2022, at $187.3 million, composing 16% of the total expenditures within the Southeast Region as a whole.
As of year-end 2022, there were 190 total businesses within Monee, employing over 2,680 employees. Total employment
within Monee comprised 14% of the total employees within the Southeast Region as a whole. The major industries within Monee consisted of wholesale trade, accommodation and food services, construction services, retail trade, and health care and social assistance services.
Monee encompasses 410 rental units, capturing 13% of the rental unit supply within the Southeast Region as a whole as of year-end 2022. During this same time frame, Monee comprised 228,600 square feet of retail space, 199,350 square feet of office space, and 7.3 million square feet of industrial/flex space— capturing 14%, 15%, and 37% of the retail, office, and industrial/ flex space, respectively, within the Southeast Region as a whole.
COMMUNITY INVESTMENT
Monee has many great business incentive programs, including the Will Cook Enterprise Zone, which specializes in commercial and industrial project expansions; new construction; business development tax incentives; real estate, sales tax, and construction cost savings; and utility tax exemptions within portions of the Villages of Matteson, Monee Park Forest, Richton Park, and University Park as well as Cook and Will Counties. Monee is also home to four TIF Districts: Monee 3, 4, 5, and 6 TIF Districts. Monee does not have any Opportunity Zones. The following maps illustrate the business incentive programs available within Monee as of year-end 2022.
$239,000 Avg. Home Value
73,250 2021 AADT(1)
5.8% Workers 16+ Took Public Transportation
SOUTHEAST REGION
UNIVERSITY PARK
ABOUT THE VILLAGE OF UNIVERSITY PARK
The Village of University Park ("University Park"), incorporated in 1967, is part of the Southeast sub-region within the greater Southland area. University Park is approximately 6,870 acres and is accessible by Interstate 57 and Illinois Route 50. As of year-end 2022, the population within University Park was 7,170 persons, capturing 18% of the population within the Southeast Region as a whole. In addition, there were 2,780 total housing units within University Park, composing 17% of the total housing units within the Southeast Region as a whole during this same time frame.
University Park is a modest village straddling the line between Cook and Will Counties. Home to Governors State University (GSU) and enjoying ample transportation infrastructure, University Park has an exciting new development plan, with the goal to make University Park one of the most attractive communities in the region in coming years. In addition, GSU recently announced its Facilities Master Plan (FMP), which would include a new library and expanding campus infrastructure as the needs of students and faculty continue to evolve and grow.
Proximity and access to I-57 and freight rail make University Park attractive to transportation, distribution, and logistics businesses. University Park hopes to continue to build on this success while fostering growth in other sectors. University Park is home to a Metra commuter rail line with direct access to Chicago’s Downtown Loop. To capitalize on the Metra line, University Park is implementing a new TOD plan, which includes building out new commercial, retail, mixed-use, and multi-family housing structures all close to the Metra station.
University Park's residents are predominantly Black, making up 79% of the total population within the area. In addition, 58% of the total population within University Park are of working age, between the ages of 20 and 64. The median household incomes, median disposable incomes, and per capita incomes in University Park were slightly lower than those observed within the Southeast Region as a whole. However, consumer spending in University Park was robust as of year-end 2022, at $164.0 million, composing 14% of the total expenditures within the Southeast Region as a whole.
As of year-end 2022, there were 190 total businesses within University Park, employing nearly 6,760 employees. Total employment within University Park comprised 35% of the total employees within the Southeast Region as a whole. The major industries within University Park consisted of manufacturing services, educational services, information services, wholesale trade, and retail trade.
University Park contains 780 rental units, capturing 24% of the rental supply within the Southeast Region as a whole as of yearend 2022. During this same time frame, University Park comprised 134,590 square feet of retail space, 742,910 square feet of office space, and 11.2 million square feet of industrial/flex space— capturing 8%, 57%, and 56% of the retail, office, and industrial/flex space, respectively, within the Southeast Region as a whole.
COMMUNITY INVESTMENT
University Park has many great business incentive programs, including the Will Cook Enterprise Zone, which specializes in commercial and industrial project expansions and new construction, business development tax incentives, real estate, sales tax and construction cost savings, and utility tax exemptions. University Park is also home to three TIF Districts: University Park 5–7. University Park does not have any Opportunity Zones. The following maps illustrate the business incentive programs available within University Park as of year-end 2022.
HOUSING CHARACTERISTICS:
HOUSEHOLD INCOME:
$214,050 Avg. Home Value
103,480 2021 AADT(1) 7.5% Workers 16+ Took Public Transportation
SOUTHEAST REGION STEGER
ABOUT THE VILLAGE OF STEGER
The Village of Steger ("Steger"), incorporated in 1896, is part of the Southeast sub-region within the greater Southland area. Steger is approximately 2,179 acres and is accessible by Illinois Route 1 and Illinois Route 394. As of year-end 2022, the population within Steger was 9,480 persons, capturing 24% of the population within the Southeast Region as a whole. In addition, there were 4,290 total housing units within Steger composing 27% of the total housing units within the Southeast Region as a whole during this same time frame.
Steger is another small, but vibrant community within Southland. Steger strives to support local businesses by employing a variety of incentive plans to ensure that Steger maintains its unique character. Steger is presently working on redevelopment plans aimed at attracting new retailers to this tight-knit town that is supportive of its local businesses; this includes adopting a series of new policies aimed at attracting and incentivizing new business development and promoting sustainable growth.
Working with state authorities and incentive programs, Steger is targeting abandoned and blighted properties for redevelopment and/or development. This pragmatic approach includes a mixture of public- and privately owned properties and structures suitable for a variety of uses. These properties include homes and residential buildings, as well as commercial and even a villageowned industrial park with several attractive sites currently available for revitalization.
Steger's residents are predominantly White, making up 49% of the total population within the area; closely followed by Black, which make up 29%. In addition, 59% of the total population within Steger are of working age, between the ages of 20 and 64. The median household incomes, median disposable incomes, and per capita incomes in Steger were slightly lower than those observed within the Southeast Region as a whole. However, consumer spending in Steger was robust as of year-end 2022, at $248.5 million, composing 21% of the total expenditures within the Southeast Region as a whole.
As of year-end 2022, there were 230 total businesses within Steger, employing over 2,680 employees. Total employment within Steger comprised 14% of the total employees within the Southeast Region as a whole. The major industries within Steger consisted of educational services, retail trade, construction services, accommodation and food services, and public administration.
Steger encompasses 890 rental units, capturing 27% of the rental unit supply within the Southeast Region as a whole as of year-end 2022. During this same time frame, Steger comprised 372,800 square feet of retail space, 50,860 square feet of office space, and 505,280 square feet of industrial/flex space—capturing 23%, 4%, and 3% of the retail, office, and industrial/flex space, respectively, within the Southeast Region as a whole.
COMMUNITY INVESTMENT
Steger has many great business incentive programs, including the Lincoln 394 Enterprise Zone, which was established in 2017 to stimulate economic growth and neighborhood revitalization in key opportunity areas in Beecher, Chicago Heights, Crete, Ford Heights, Glenwood, Olympia Fields, Sauk Village, South Chicago Heights, Steger, unincorporated Cook County, and unincorporated Will County. Steger is also home to two TIF Districts: Steger 2 and 3. Steger does not have any Opportunity Zones. The following maps illustrate the business incentive programs available within Steger as of year-end 2022.
HOUSING CHARACTERISTICS: HOUSEHOLD INCOME:
SOUTHEAST REGION CRETE
ABOUT THE VILLAGE OF CRETE
The Village of Crete ("Crete"), incorporated in 1836, is part of the Southeast sub-region within the greater Southland area. Crete is approximately 6,052 acres and is accessible by Illinois Route 1 and Illinois Route 394. As of year-end 2022, the population within Crete was nearly 8,340 persons, capturing 21% of the population within the Southeast Region as a whole. In addition, there were 3,360 total housing units within Crete, composing 21% of the total housing units within the Southeast Region as a whole during this same time frame.
Crete is located within easy commuting distance of Chicago’s Downtown Loop, but retains its small-town, homey feel. Crete residents have ample green space, farmland, and access to forest preserve. Along with its access to nature, Crete has invested in its public works and utilities infrastructure in the recent years, ensuring that the area has the capacity to grow and support new residents and businesses in an efficient and sustainable manner.
Crete's economic development plans are robust with beneficial programs to help encourage development, including three TIF Districts and an up-to-date database of available real estate suitable for redevelopment and/or development which includes information on zoning, available utility infrastructure, transportation access, and even car counts on adjacent roads for each of the properties within the database.
Crete's residents are predominantly White, making up 49% of the total population within the area; closely followed by Black, which make up 37%. In addition, 57% of the total population within Crete are of working age, between the ages of 20 and 64. The median household incomes, median disposable incomes, and per capita incomes in Crete were significantly higher than those observed within the Southeast Region as a whole. Consumer spending in Crete was also robust as of year-end 2022, at $309.0 million, composing 26% of the total expenditures within the Southeast Region as a whole.
As of year-end 2022, there were 280 total businesses within Crete, employing nearly 4,000 employees. Total employment
within Crete comprised 20% of the total employees within the Southeast Region as a whole. The major industries within Crete consisted of educational services, retail trade, accommodation and food services, wholesale trade, and health care and social assistance services.
Crete encompasses 320 rental units, capturing 10% of the rental unit supply within the Southeast Region as a whole as of yearend 2022. During this same time frame, Crete comprised 459,030 square feet of retail space, 110,860 square feet of office space, and 382,770 square feet of industrial/flex space—capturing 28%, 9%, and 2% of the retail, office, and industrial/flex space, respectively, within the Southeast Region as a whole.
COMMUNITY INVESTMENT
Crete has many great business incentive programs, including the Lincoln 394 Enterprise Zone, which was established in 2017 to stimulate economic growth and neighborhood revitalization in key opportunity areas in Beecher, Chicago Heights, Crete, Ford Heights, Glenwood, Olympia Fields, Sauk Village, South Chicago Heights, Steger, unincorporated Cook County, and unincorporated Will County. Crete is also home to three TIF Districts: Crete 2, 3, and 4 TIF Districts. Crete does not have any Opportunity Zones. The following maps illustrate the business incentive programs available within Crete as of year-end 2022.
880
HOUSING CHARACTERISTICS:
$251,310 Avg. Home Value
52,600 2021 AADT(1)
2.7% Workers 16+ Took Public Transportation
SOUTHEAST REGION PEOTONE
ABOUT THE VILLAGE OF PEOTONE
The Village of Peotone ("Peotone"), incorporated in 1850, is part of the Southeast sub-region within the greater Southland area. Peotone is approximately 1,197 acres and is accessible by Interstate 57 and Illinois Route 50. As of year-end 2022, the population within Peotone was nearly 4,130 persons, capturing 11% of the population within the Southeast Region as a whole. In addition, there were 1,720 total housing units within Peotone, composing 11% of the total housing units within the Southeast Region as a whole during this same time frame.
Peotone is taking an exciting multi-step approach to incentivizing and attracting new private business investment into the community. For example, Peotone has established a Business Development District ("BDD") which gives the municipality expanded authority to use more incentive programs from the local, county, and state levels. As part of this process, Peotone has developed a downtown streetscape plan to build out its downtown area in a manner that is more attractive to businesses and residents alike. This streetscape plan includes building a centrally located festival space for community gatherings, and making the area more amenable to active transportation, including pedestrians and cyclists, without compromising the mobility of motorists. These improvements will address the needs of all residents and businesses, creating easy accessibility to the downtown for all.
Most recently, the Illinois Senate approved a bill that requires the IDOT to begin exploring the possibility of opening a south suburban cargo airport based in Peotone. This would be the third airport in the Chicago area. The proposal emphasizes the possibility of creating tens of thousands of jobs for the cargoonly airport, and would count on the nearby Amazon regional distribution center as well as other warehouses to support the potential transportation hub.
In August 2022, Peotone partnered with developers to begin construction on 22-acres for a proposed travel center. An 80-unit, four-story Holiday Inn Express & Suites is also in the pipeline for construction adjacent to the site. Construction for
the site is expected to be complete in late 2023, with the hotel construction commencing shortly after in 2024.
Peotone's residents are predominantly White, making up 88% of the total population within the area. In addition, 60% of the total population within Peotone are of working age, between the ages of 20 and 64. The median household incomes, median disposable incomes, and per capita incomes in Peotone were significantly higher than those observed within the Southeast Region as a whole. However, consumer spending in Peotone was relatively modest, at $147.7 million as of year-end 2022, composing only 12% of the total expenditures within the Southeast Region as a whole.
As of year-end 2022, there were 140 total businesses within Peotone, employing nearly 1,560 employees. Total employment within Peotone comprised only 8% of the total employees within the Southeast Region as a whole. The major industries within Peotone consisted of educational services, retail trade, health care and social assistance services, manufacturing services, and accommodation and food services.
Peotone encompasses 200 rental units, capturing 6% of the rental unit supply within the Southeast Region as a whole as of year-end 2022. During this same time frame, Peotone comprised 269,190 square feet of retail space, 16,050 square feet of office space, and 411,930 square feet of industrial/flex space—capturing 16%, 1%, and 2% of the retail, office, and industrial/flex space, respectively, within the Southeast Region as a whole.
COMMUNITY INVESTMENT
Peotone is home to the Peotone Downtown TIF District and the Peotone TIF District 2, which were created to provide incentives to owners or prospective owners to foster the development, expansion, and revitalization of certain vacant, underutilized, or undeveloped properties within Peotone. Peotone does not have any Enterprise Zones or Opportunity Zones. The following maps illustrate the TIF Districts available within Peotone as of year-end 2022.
$285,130 Avg. Home Value
16,200 2021 AADT(1)
2.4% Workers 16+ Took Public Transportation
SOUTHEAST REGION BEECHER
ABOUT THE VILLAGE OF BEECHER
The Village of Beecher ("Beecher"), incorporated in 1884, is part of the Southeast sub-region within the greater Southland area. Beecher is approximately 1,778 acres and is accessible by Illinois Route 1. As of year-end 2022, the population within Beecher was nearly 4,660 persons, capturing 12% of the population within the Southeast Region as a whole. In addition, there were 1,760 total housing units within Beecher, composing 11% of the total housing units within the Southeast Region as a whole during this same time frame.
Although Beecher is small, it is full of development potential. Like other municipalities within Southland, Beecher has multiple vacant buildings primed for redevelopment, in addition to a significant amount of vacant land—allowing opportunities for both development and redevelopment within Beecher.
Along with the land and structures available, Beecher also has a generous TIF District covering the downtown and areas along major highways. Paired with unmatched transportation infrastructure of Southland, access to highways and freight rail lines, as well as its proximity to downtown Chicago, Beecher is well-positioned for new residents and businesses.
Beecher's residents are predominantly White, making up 85% of the total population within the area. In addition, 56% of the total population within Beecher are of working age, between the ages of 20 and 64. In addition, nearly 35% of the population within Beecher has an Associates degree or greater, with 22% obtaining a Bachelor's or more advance graduate degree.
The median household incomes, median disposable incomes, and per capita incomes in Beecher were significantly higher than those observed within the Southeast Region as a whole. However, consumer spending in Beecher was relatively modest, at $148.5 million as of year-end 2022, composing only 12% of the total expenditures within the Southeast Region as a whole.
As of year-end 2022, there were 130 total businesses within Beecher, employing over 1,870 employees. Total employment
within Beecher comprised 10% of the total employees within the Southeast Region as a whole. The major industries within Beecher consisted of retail trade, educational services, accommodation and food services, health care and social assistance services, and wholesale trade.
Beecher encompasses 660 rental units, capturing 20% of the rental unit supply within the Southeast Region as a whole as of year-end 2022. During this same time frame, Beecher comprised 169,000 square feet of retail space, 175,900 square feet of office space, and 53,800 square feet of industrial/flex space—capturing 10%, 14%, and 0.3% of the retail, office, and industrial/flex space, respectively, within the Southeast Region as a whole.
COMMUNITY INVESTMENT
Beecher has many great business incentive programs, including the Lincoln 394 Enterprise Zone, which was established in 2017 to stimulate economic growth and neighborhood revitalization in key opportunity areas in Beecher, Chicago Heights, Crete, Ford Heights, Glenwood, Olympia Fields, Sauk Village, South Chicago Heights, Steger, unincorporated Cook County, and unincorporated Will County. Beecher is also home to the Beecher TIF District. Beecher does not have any Opportunity Zones. The following maps illustrate the business incentive programs available within Beecher as of year-end 2022.
17,110 2021 AADT(1)
0.8% Workers 16+ Took Public Transportation
EAST CENTRAL REGION
ABOUT THE EAST CENTRAL REGION
The East Central Region is bounded by the Cook County border to the east and the Will County border to the south. This region encompasses six cities and villages, all located within Cook County:
▪ City of Chicago Heights
▪ Village of South Chicago Heights
▪ Village of Ford Heights
▪ Village of Sauk
▪ Village of Lynwood
▪ Village of Glenwood
Combined, these places total 26.1 square miles, with a population density of 2,328 persons per square mile. In addition, this region is solely located within the Bloom Township.
The East Central Region has perhaps the strongest industrial legacy of anywhere in the overall Southland area. The East Central Region has remained a manufacturing hub, including a large Ford Motors plant for which the Village of Ford Heights is named.
In addition, the East Central Region has started leveraging the finances and resources that the manufacturing base brings in to promote a new wave of diverse sustainable development. This development includes Transit Oriented Development ("TOD") and Cook County’s first community solar project, the Glenwood site, which will produce 2 megawatts of clean energy.
The East Central Region contains 3,300 rental apartment units in 85 buildings that meet the minimum size criteria as of year-end 2022. During this same time frame, the East Central Region also contains nearly 2.6 million square feet of retail space, 794,270 square feet of office space, and over 15.7 million square feet of industrial/flex space, as illustrated in the following table.
The East Central Region comprises a relatively modest share of the industrial/flex space and rental units within Southland as a whole, compared to the other sub-regions. Coupled with high occupancy rates and average rental rates comparable to that of Southland as a whole, this indicates there is relatively robust demand in the East Central Region for commercial and for-rent residential supply.
LEGEND
County Boundary
City of Chicago Heights
Village of South Chicago Heights
Village of Ford Heights
Village of Sauk
Village of Lynwood
Village of Glenwood
The East Central Region provides a range of business incentive programs to initiate new business and commercial investment into the region. Specifically, the East Central Region has several TIF Districts that were established to promote private development, as well as assist and encourage economic development, redevelopment, and improvement projects within defined areas throughout the East Central Region as a whole.
In addition, the East Central Region also contains the Lincoln 394 Enterprise Zone, which was established to stimulate economic growth and neighborhood revitalization in key opportunity areas, specifically within the Chicago Heights, South Chicago Heights, Ford Heights, Sauk, and Glenwood municipalities. The Calumet Region Enterprise Zone is also located in the East Central Region,
PRIORITY PROJECTS
HALSTED PLAZA IN GLENWOOD
The Halsted Plaza is a 17.28-acre site located in the Village of Glenwood and has been the target of extensive redevelopment and beautification over the last couple of years. The site was recently purchased for $6.95 million in a move to enhance Glenwood's image. Glenwood previously had success in the development of other TIF Districts, and by utilizing funds from prior projects, Glenwood established plans to redevelop the Halsted Plaza. Bids for the construction of Halsted Plaza were first received in April 2016, and construction started shortly afterwards.
The once derelict shopping mall now hosts a variety of businesses, including a Burger King, MB Financial Bank, and a trendy new pub, called “Chug-a-lug”. As these businesses attract an increasing number of customers, Halsted Plaza has turned into a lively setting for local and commuters to hang out. Apart from the Halsted Plaza, Glenwood is also the site of seven TIF Districts, including commercial, office, and industrial properties. Glenwood is committed to expanding economic development in the area by fostering partnerships with business and industry while also enhancing the quality of life for its residents.
specifically within Lynwood, and was created to stimulate economic growth and neighborhood revitalization by offering a wide variety of tax incentives in designated areas. Combined, Chicago Heights, South Chicago Heights, Ford Heights, and Sauk contain 8 Opportunity Zones within the East Central Region, which are additional business incentives that provides tax incentives through private investment.
These various business incentive programs should be considered when determining where to invest within the East Central Region and Southland as a whole, these incentives are further detailed on the subsequent pages.
FORD HEIGHTS DEVELOPMENT
In October 2017, the Village of Ford Heights developed a comprehensive plan for revitalization of the community. The result of this has been largely positive, as developers have had increased interest in the community. In the the first 6 months of planning, several reports were created by Ford Heights and other stakeholders. Additionally, Ford Heights has been able to secure multiple new grant-funded projects, including $360,000 in funding to begin implementing priority improvement projects. Since Ford Heights is situated on both sides of Interstate 394, the vision is to develop one side into an industrial and logistical center, as well as a solar farm to promote local green initiatives. By the end of the plan, Ford Heights hopes to have a thriving community with expansive green areas and abundant opportunities for new business owners.
Image source: Google Earth
Image source: Halsted Plaza Flyer
Image source: Deer Creek Greenway, Metroplanning.org
2,320
57% of the total population within the East Central Region makeup the working-class population, between the ages of 20-64.
$203,290 Avg. Home Value
900,270 2021 AADT(1)
4.6% Workers 16+ Took Public Transportation
The following top 5 major industries by sector make up the majority of total employees within the East Central Region, these include:
EAST CENTRAL REGION
CHICAGO HEIGHTS
ABOUT THE CITY OF CHICAGO HEIGHTS
The City of Chicago Heights ("Chicago Heights"), incorporated in 1893, is part of the East Central sub-region within the greater Southland area. Chicago Heights is about 6,589 acres and is accessible by U.S. Route 30 and Illinois Route 1. As of year-end 2022, the population within Chicago Heights was 27,150 persons, capturing 45% of the population within the East Central Region as a whole. In addition, there were over 10,610 total housing units within Chicago Heights, composing 45% of the total housing units within the East Central Region as a whole during this time.
Chicago Heights enjoys many of the same benefits and incentives as other similar municipalities within Southland. Located at the intersection of Dixie and Lincoln Highways, Chicago Heights serves as the crossroads of the Southland, giving it excellent access for transportation and logistics businesses. The majority of Chicago Heights' businesses are in the manufacturing and logistics sectors, including locations for FedEx, Ford Motors, and Behr Paints, along with 60 other manufacturing and logistics companies. Together, with its skilled workforce, business-friendly government, and a wide variety of tax incentives, Chicago Heights makes an excellent opportunity for new residents and businesses.
Chicago Height's residents are predominantly Black, making up 42% of the total population within the area. In addition, 56% of the total population within Chicago Heights are of working age, between the ages of 20 and 64. Nearly 27% of the population within Chicago Heights has an associates degree or greater.
As of year-end 2022, there were 830 total businesses within Chicago Heights, employing over 12,890 employees. Total employment within Chicago Heights comprised 49% of the total employees within the East Central Region as a whole. The major industries within Chicago Heights consisted of educational services, manufacturing services, health care and social assistance services, retail trade, and transportation and utilities services.
Chicago Heights encompasses about 1,170 rental units as of yearend 2022, capturing 36% of the rental unit supply within the East Central Region. During this same time frame, Chicago Heights comprised 1.6 million square feet of retail space, 629,560 square
feet of office space, and over 10.9 million square feet of industrial/ flex space—capturing significant portions of 63%, 79%, and 70% of the retail, office, and industrial/flex space, respectively, within the East Central Region as a whole.
COMMUNITY INVESTMENT
Chicago Heights has many great business incentive programs, including Lincoln 394 Enterprise Zone, which was established in 2017 to stimulate economic growth and neighborhood revitalization in key opportunity areas within Cook and Will Counties. Chicago Heights is also home to five TIF Districts and four Opportunity Zones, as illustrated in the following maps.
10.3
2,640
HOUSING CHARACTERISTICS: HOUSEHOLD INCOME:
$220,480 Avg. Home Value
544,600 2021 AADT(1)
4.1% Workers 16+ Took Public Transportation
EAST CENTRAL REGION
SOUTH CHICAGO HEIGHTS
ABOUT THE VILLAGE OF SOUTH CHICAGO HEIGHTS
The Village of South Chicago Heights ("South Chicago Heights"), incorporated in 1907, is part of the East Central sub-region within the greater Southland area. South Chicago Heights is approximately 1,022 acres and is accessible by Illinois Route 1. As of year-end 2022, the population within South Chicago Heights was 3,980 persons, capturing 7% of the population within the East Central Region as a whole. In addition, there were over 1,630 total housing units within South Chicago Heights, composing 7% of the total housing units within the East Central Region as a whole during this same time frame.
South Chicago Heights is a small, quiet community in Southland. Despite having just under 4,000 residents, South Chicago Heights boasts an exciting community lifestyle. South Chicago Heights offers many community events, senior activities, and services, such as the Well Being Check Program, to encourage residents to take advantage of being a South Chicago Heights' community. South Chicago Heights is an ideal location for seniors and/or young families alike. South Chicago Heights' community is predominantly Hispanic at 48% of the total population within the area. In addition, 58% of the total population makeup the working-class population, between the ages of 20-64.
As of year-end 2022, there were 190 total businesses within South Chicago Heights, employing over 2,000 employees. Total employment within South Chicago Heights comprised 8% of the total employees within the East Central Region as a whole. The major industries within South Chicago Heights consisted of retail trade, manufacturing services, accommodation and food services, wholesale trade, and health care and social assistance services.
South Chicago Heights encompasses about 110 rental units as of year-end 2022, capturing 3% of the rental unit supply within the East Central Region. During this same time frame, South Chicago Heights comprised 214,340 square feet of retail space, 10,000 square feet of office space, and over 747,280 square feet of industrial/flex space—capturing 8%, 1%, and 5% of the retail, office, and industrial/flex space, respectively, within the East Central Region as a whole.
COMMUNITY INVESTMENT
South Chicago Heights has many great business incentive programs, including Lincoln 394 Enterprise Zone, which was established in 2017 to stimulate economic growth and neighborhood revitalization in key opportunity areas in Beecher, Chicago Heights, Crete, Ford Heights, Glenwood, Olympia Fields, Sauk Village, South Chicago Heights, Steger, unincorporated Cook County, and unincorporated Will County. South Chicago Heights is also home to three TIF Districts and one Opportunity Zone, as illustrated in the following maps.
1.6
3,980
2,490
HOUSING CHARACTERISTICS: HOUSEHOLD INCOME:
46,500 2021 AADT(1)
6.6% Workers 16+ Took Public Transportation
EAST CENTRAL REGION FORD HEIGHTS
ABOUT THE VILLAGE OF FORD HEIGHTS
The Village of Ford Heights ("Ford Heights"), incorporated in 1949, is part of the East Central sub-region within the greater Southland area. Ford Heights is approximately 1,250 acres and is accessible by U.S. Route 30 and Illinois Route 394. As of year-end 2022, the population within Ford Heights was 1,780 persons, capturing 3% of the population within the East Central Region as a whole. During this same time frame, there were nearly 700 total housing units within Ford Heights, composing 3% of the total housing units within the East Central Region as a whole.
Ford Height's residents are predominantly White, making up 87% of the total population within the area. In addition, 54% of the total population with Ford Heights are of working age between the ages of 20 and 64. The median household incomes, median disposable incomes, and per capita incomes in Ford Heights were significantly smaller than those observed within the East Central Region as a whole. Consumer spending in Ford Heights was also relatively low, at $40.3 million a of year-end 2022, composing only 2% of the total expenditures within the East Central Region as a whole.
As of year-end 2022, there were 70 total businesses within Ford Heights, employing about 3,070 employees. Total employment within Ford Heights comprised 12% of the total employees within the East Central Region as a whole. The major industries within Ford Heights consisted of manufacturing services, educational services, health care and social assistance services, retail trade, and administration and support services. The unemployment rate within Ford Heights, at 23.5% as of year-end 2022, was also significantly greater than that observed in the East Central Region as a whole at 10.9%.
Ford Heights encompasses about 120 rental units as of yearend 2022, capturing 4% of the rental unit supply within the East Central Region. During this same time frame, Ford Heights comprised 21,950 square feet of retail space, 6,590 square feet of office space, and 52,740 square feet of industrial/flex space— capturing 1%, 1%, and 0.3% of the retail, office, and industrial/ flex space, respectively, within the East Central Region as a whole.
COMMUNITY INVESTMENT
Ford Heights has many great business incentive programs, including Lincoln 394 Enterprise Zone, which was established in 2017 to stimulate economic growth and neighborhood revitalization in key opportunity areas in Beecher, Chicago Heights, Crete, Ford Heights, Glenwood, Olympia Fields, Sauk Village, South Chicago Heights, Steger, unincorporated Cook County, and unincorporated Will County. Ford Heights is also home to the Ford Heights Cottage Grove TIF District and one Opportunity Zone, as illustrated in the following maps.
910
$266,910 Avg. Home Value
33,850 2021 AADT(1) 13.1% Workers 16+ Took Public Transportation
EAST CENTRAL REGION SAUK
ABOUT THE VILLAGE OF SAUK
The Village of Sauk ("Sauk"), incorporated in 1957, is part of the East Central sub-region within the greater Southland area. Sauk is approximately 2,560 acres and is accessible by U.S. Route 30 and Illinois Route 394. As of year-end 2022, the population within Sauk was 9,930 persons, capturing 16% of the population within the East Central Region as a whole. In addition, there were nearly 3,750 total housing units within Sauk, composing 16% of the total housing units within the East Central Region as a whole during this same time frame.
Sauk is a small village actively pursuing a variety of economic development projects. Sauk has direct access to a Canadian National rail spur, as well as local short line railroads, creating easy access to the remaining Class I rail lines. In addition to rail access, Sauk enjoys available accessibility to all of the important surface highways in the region.
This transportation infrastructure, along with access to a skilled workforce and a variety of tax incentives such as a TIF District and an Enterprise Zone, all combine to make Sauk extremely attractive to a variety of businesses—with a primary focus on manufacturing and logistics companies. The existing industrial park located within Sauk, the Sauk Pointe Business Industrial Park, currently has sites available from 6 to 75 acres with flexible zoning.
As of year-end 2022, there were 140 total businesses within Sauk, employing about 4,080 employees. Total employment within Sauk comprised 16% of the total employees within the East Central Region as a whole. The major industries within Sauk consisted of transportation and utilities services, manufacturing services, wholesale trade, educational services, and public administration.
Sauk encompasses nearly 570 rental units as of year-end 2022, capturing 17% of the rental unit supply within the East Central Region. During this same time frame, Sauk comprised 171,000 square feet of retail space, 8,200 square feet of office space, and about 3.2 million square feet of industrial/flex space—capturing 7%, 1%, and 20% of the retail, office, and industrial/flex space, respectively, within the East Central Region as a whole.
COMMUNITY INVESTMENT
Sauk has many great business incentive programs, including Lincoln 394 Enterprise Zone, which was established in 2017 to stimulate economic growth and neighborhood revitalization in key opportunity areas in Beecher, Chicago Heights, Crete, Ford Heights, Glenwood, Olympia Fields, Sauk Village, South Chicago Heights, Steger, unincorporated Cook County, and unincorporated Will County. Sauk is also home to two Opportunity Zones and three TIF Districts: Sauk Villages 2, 3, and 4, as illustrated in the following maps.
HOUSING CHARACTERISTICS: HOUSEHOLD INCOME:
$174,140
Avg. Home Value
79,880 2021 AADT(1)
1.6% Workers 16+ Took Public
EAST CENTRAL REGION LYNWOOD
ABOUT THE VILLAGE OF LYNWOOD
The Village of Lynwood ("Lynwood"), incorporated in 1959, is part of the East Central sub-region within the greater Southland area. Lynwood is approximately 3,205 acres and is accessible by major thoroughfares, such as U.S. Route 30, Illinois Route 394, and Illinois Route 83. As of year-end 2022, the population within Lynwood was 9,140 persons, capturing 15% of the population within the East Central Region as a whole. In addition, there were nearly 3,670 total housing units within Lynwood, composing 15% of the total housing units within the East Central Region as a whole during this same time frame.
Lynwood is a small but hard-working community, striving to become a dynamic destination for businesses. Last year, Lynwood annexed over 100 acres to the east on which developers plan to build a new trucking logistics park and an Islamic cemetery on the current vacant land. These two projects will encourage additional businesses and employment to support the construction and ongoing operations of these projects.
Several smaller developments currently underway within Lynwood are also creating new jobs and subsequently attracting residents to the area. For example, a Dollar General recently opened, and a Dunkin' Donuts is planned. These projects are huge for a small municipality of just over 9,000 residents. Grant funding is also trickling in to further help development in Lynwood. In November 2022, Lynwood was awarded nearly $2.5 million in grants from Cook County to update and upgrade infrastructure in the area, making it more attractive to residents and businesses alike.
As the community experiences a high volume of commuters and freight trucks, Lynwood is looking to construct a transportation project that would extend Joe Orr Road; this would create more convenient access to Chicago as well as lessen the impact transport vehicles. Lynwood has also discussed plans for expansion and future projects, as there is a considerable amount of unincorporated land surrounding Lynwood that can be open for annexation to improve business visibility.
As of year-end 2022, there were 210 total businesses within Lynwood, employing about 1,810 employees. Total employment within Lynwood comprised 7% of the total employees within the East Central Region as a whole. The major industries within Lynwood consisted of retail trade, construction services, arts, recreation and entertainment services, manufacturing services, and accommodation and food services.
Lynwood encompasses nearly 1,130 rental units as of year-end 2022, capturing 34% of the rental unit supply within the East Central Region. During this same time frame, Lynwood comprised 152,230 square feet of retail space, 31,680 square feet of office space, and 327,660 square feet of industrial/flex space— capturing 6%, 4%, and 2% of the retail, office, and industrial/flex space, respectively, within the East Central Region as a whole.
COMMUNITY INVESTMENT
Lynwood has many great business incentive programs, including the Calumet Region Enterprise Zone, which was established in 2017 to stimulate economic growth and neighborhood revitalization by offering a wide variety of tax incentives in designated areas. Lynwood is also home to the Glenwood/ Lansing/Torrence Ave and the Vernon Park Village TIF Districts. Lynwood does not have any Opportunity Zones. The following maps illustrate the business incentive programs available within Lynwood as of year-end 2022.
9,140
1,830
HOUSING CHARACTERISTICS: HOUSEHOLD INCOME:
RenterOccupied OwnerOccupied
CHARACTERISTICS:
146,050 2021 AADT(1)
4.7% Workers 16+ Took Public Transportation
EAST CENTRAL REGION
GLENWOOD
ABOUT THE VILLAGE OF GLENWOOD
The Village of Glenwood ("Glenwood"), incorporated in 1903, is part of the East Central sub-region within the greater Southland area. Glenwood is approximately 2,089 acres and is accessible by Illinois Route 394 and Illinois Route 1. As of year-end 2022, the population within Glenwood was 8,620 persons, capturing 14% of the population within the East Central Region as a whole. In addition, there were nearly 3,470 total housing units within Glenwood, composing 15% of the total housing units within the East Central Region as a whole during this same time frame.
Glenwood has also been in a multi-year redevelopment process, with the Halsted Plaza located on Halsted Street between 183rd and Strieff Streets. Bids for the construction of Halsted Plaza were first received in April 2016, and construction started shortly afterward. The once derelict shopping mall now hosts a variety of businesses including, a Burger King, MB Financial Bank, and a trendy new pub, called “Chug-a-lug”. As these businesses attract an increasing number of customers, Halsted Plaza has turned into a lively setting for local and commuters to hang out. Glenwood is committed to expanding economic development in the area by fostering partnerships with business and industry while also enhancing the quality of life for its residents.
Glenwoods' residents are predominantly Black, making up 72% of the total population within the area. In addition, 56% of the total population within Glenwood are of working age, between the ages of 20 and 64. The median household incomes, median disposable incomes, and per capita incomes in Glenwood were slightly higher than those observed within the East Central Region as a whole. Consumer spending in Glenwood was also relatively modest, at $234.1 million as of year-end 2022, composing 17% of the total expenditures within the East Central Region as a whole.
As of year-end 2022, there were 170 total businesses within Glenwood, employing about 2,340 employees. Total employment within Glenwood comprised 9% of the total employees within the East Central Region as a whole. The major industries within
Glenwood consisted of wholesale trade, educational services, health care and social assistance services, accommodation and food services, and retail trade.
Glenwood encompasses nearly 180 rental units as of yearend 2022, capturing 5% of the rental unit supply within the East Central Region. During this same time frame, Glenwood comprised 401,650 square feet of retail space, 107,520 square feet of office space, and 455,780 square feet of industrial/flex space—capturing 16%, 14%, and 3% of the retail, office, and industrial/flex space, respectively, within the East Central Region as a whole.
COMMUNITY INVESTMENT
Glenwood has many great business incentive programs, including the Lincoln 394 Enterprise Zone, which was established in 2017 to stimulate economic growth and neighborhood revitalization in key opportunity areas in Beecher, Chicago Heights, Crete, Ford Heights, Glenwood, Olympia Fields, Sauk Village, South Chicago Heights, Steger, unincorporated Cook County, and unincorporated Will County. Glenwood is also home to eight TIF Districts: Main Street, State Street, Halsted/Holbrook, Industrial North, Industrial Park, North Halsted, South Halsted, and Town Center. Glenwood does not have any Opportunity Zones. The following maps illustrate the business incentive programs available within Glenwood as of year-end 2022.
ENTERPRISE ZONES
3.3
8,620
2,640
49,400 2021 AADT(1)
Workers 16+ Took Public Transportation
CENTRAL REGION
ABOUT THE CENTRAL REGION
The Central Region is located in the central portion of Southland, generally situated south of Interstate 294 and east of Interstate 80. This region encompasses eight cities and villages located within Cook and Will Counties:
▪ Village of Park Forest
▪ Village of Richton Park
▪ Village of Matteson
▪ Village of Olympia Fields
▪ Village of Flossmoor
▪ Village of Homewood
▪ Village of Hazel Crest
▪ City of Country Club Hills
Combined, these places total 39.0 square miles with a population density of 3,019 persons per square mile. In addition, this region is primarily located within Rich Township, with the northern portions located in Bremen and Thornton Townships.
The Central Region is home to a predominantly middle-toupper-middle class population. The Central Region represents a largely bedroom community to Chicago, but the municipalities in the region are working hard to promote diverse development by incentivizing industrial and logistics development; as well as attracting commercial, retail, and offices to encourage employment within the region, as opposed to Central Region residents commuting into downtown Chicago. However, the Central Region is also focusing on Transit Oriented Development ("TOD") to ensure that residents who do have to commute have a pleasant and easy experience.
In promoting all of this diverse economic development, the municipalities within the Central Region are also taking climate change mitigation and adaptation seriously, ensuring that new
development is reasonably protected from floods, droughts, and storms, thus making the region attractive for long-term development.
The Central Region contains 5,520 rental apartment units in 94 buildings that meet the minimum size criteria as of year-end 2022. During this same time frame, the Central Region also contains nearly 8.3 million square feet of retail space, 2.9 square feet of office space, and about 7.3 million square feet of industrial/flex space, as illustrated in the following table.
The Central Region comprises the second-largest share of office, retail space, as well as rental units within Southland as a whole, compared to the other sub-regions. Coupled with high occupancy rates and average rental rates comparable to that of Southland as a whole, this indicates there is relatively robust demand in the Central Region for for-rent residential supply. However, lower occupancy rate within the Central Region's commercial market may indicate smaller demand for additional space or low-quality of existing space causing tenants to rent elsewhere.
LEGEND
County Boundary
Village of Park Forest
Village of Richton Park
Village of Matteson
Village of Olympia Fields
Village of Flossmoor
Village of Homewood
Village of Hazel Crest
City of Country Club Hills
COMMUNITY INVESTMENT
The Central Region provides a range of business incentive programs to initiate new business and commercial investment into the region. Specifically, the Central Region has several TIF Districts that were established to promote private development, as well as assist and encourage economic development, redevelopment, and improvement projects within defined areas throughout the Central Region as a whole.
revitalization in key opportunity areas; as well as the Cal Sag Enterprise Zone, created to encourage new construction and expansion of commercial and industrial projects, are also located within the Central Region. Combined, Park Forest, Richton Park, Matteson, Hazel Crest, and Country Club Hills contain 5 Opportunity Zones within the Central Region, which are additional business incentives that provides tax incentives through private investment.
PRIORITY PROJECTS
In addition, the Central Region contains the Will Cook Enterprise Zone, which was created to promote commercial and industrial project expansions; as well as new construction, business development tax incentives, real estate, sales tax and construction cost savings, and utility tax exemptions. The Lincoln 394 Enterprise Zone, established to stimulate economic growth and neighborhood CALUMET
COUNTRY CLUB ANNEXATION
The Calumet Country Club has recently evolved into one of the largest potential sites for development in the Chicago metropolitan area. In February 2023, the Hazel Crest trustees voted to annex the Calumet Country Club, adding nearly 130 acres to Hazel Crest. Hazel Crest is located 25 miles south of downtown Chicago, and is strategically positioned along Interstate 57, Interstate 80, and Interstate 294, as well as two state designated truck routes. Hazel Crest offers four TIF Districts, with the goal of retaining and creating full-time permanent jobs for office, industrial, warehouse, and other related businesses, in addition to retail and restaurant businesses.
PARK FOREST LONG-SIGHTED PLANS
In response to worsening climate conditions, Park Forest began participation in a Local Technical Assistance Program run by Chicago in order to develop a Sustainability Plan. In response, Park Forest developed the Growing Green Plan which was completed and adopted by the Village Board of Trustees in early 2012. This climate resilience-oriented plan aims to address several key topics including water, waste, open spaces, and community health. Current actions taken by Park Forest included replacing all the sewer lines to ensure efficiency and developing rain gardens and wetlands to retain excess stormwater.
Park Forest has also taken advantage of TOD to convert a 10.9acre development site into a shovel-ready site for developers. This site, located at the 221st Street Metra Station, includes a 458-space parking lot. Plans for the site include mixed-
These various business incentive programs should be considered when determining where to invest within the Central Region and Southland as a whole, these incentives are further detailed on the subsequent pages.
The property was originally founded in 1901 and was a part of Homewood until 2021, when it was formally disconnected after Homewood refused several plans for industrial redevelopment. As a part of Hazel Crest, plans to transform the site into a commercial/industrial complex was approved. Additionally, the owner of the property, Diversified Partners of Scottsdale, Arizona, has received additional subsidies for water and sewage lines.
Current plans for the site include setting aside roughly 1 million square feet for warehousing in the center of the site and using the surroundings for other commercial prospects, such as an aquaponics facility, a hotel, a condominium complex, sports stadium, water park, walking trails, and a National Association of Minority Contractors training center.
used development, balancing retail, office, and residential complexes with green spaces for residents. Additional incentives, including property tax incentives and subsidies, provide further opportunities for business owners. More opportunities, such as the nearly 60 infill lots available for residential redevelopment, are constantly being promoted by the city to invite further opportunities for investment.
Image source: Google Earth
Image source: Calumet Club Rendering, Suntimes.com
Image source: Park Forest Rendering, Sales Flyer
CENTRAL REGION
PARK FOREST
ABOUT THE VILLAGE OF PARK FOREST
The Village of Park Forest ("Park Forest"), incorporated in 1948, is part of the Central sub-region within the greater Southland area. Park Forest is approximately 3,175 acres and is accessible by U.S. Route 30. As of year-end 2022, the population within Park Forest was over 21,510 persons, capturing 18% of the population within the Central Region as a whole. During this same time frame, there were nearly 9,640 total housing units within Park Forest, composing 20% of the total housing units within the Central Region as a whole.
Park Forest is a relatively wealthy suburb with lots of ongoing and exciting development projects across various industry sectors. Park Forest's approach to development is focused on building housing, commercial, retail, and mixed-use developments, while looking at development projects both through a strictly shortterm economic lens, as well as through an environmental and sustainability lens.
Park Forest has implemented not only a comprehensive economic development plan, but also a sustainable development plan specifically. This plan includes climate change-oriented goals, such as reducing greenhouse gas emissions in the area as well as climate change mitigation targets. These long-sighted plans should be encouraging to developers, as Park Forest is taking steps to ensure that property will be reasonably protected from flooding, drought, and other natural disasters appearing to increase as climate change accelerates.
As of year-end 2022, there were 320 total businesses within Park Forest, employing about 5,680 employees. Total employment within Park Forest comprised 10% of the total employees within the Central Region as a whole.
Park Forest encompasses nearly 1,610 rental units as of year-end 2022, capturing 29% of the rental unit supply within the Central Region. During this same time frame, Park Forest comprised 594,640 square feet of retail space, 49,730 square feet of office space, and 490,820 square feet of industrial/flex space— capturing 7%, 2%, and 7% of the retail, office, and industrial/flex space, respectively, within the Central Region as a whole.
COMMUNITY INVESTMENT
Park Forest has many great business incentive programs, including the Will Cook Enterprise Zone, which specializes in commercial and industrial project expansions; new construction; business development tax incentives; real estate, sales tax, and construction cost savings; and utility tax exemptions within portions of the Villages of Matteson, Monee, Park Forest, Richton Park, and University Park as well as Cook and Will Counties.
Park Forest is also home to one Opportunity Zone and two TIF Districts: Downtown and Norwood Square, as illustrated in the following map.
100,380 2021 AADT(1) 7.0% Workers 16+ Took Public Transportation
CENTRAL REGION
RICHTON PARK
ABOUT THE VILLAGE OF RICHTON PARK
The Village of Richton Park ("Richton Park"), incorporated in 1926, is part of the Central sub-region within the greater Southland area. Richton Park is approximately 2,819 acres and is accessible by Interstate 57 and Illinois Route 50. As of year-end 2022, the population within Richton Park was over 12,680 persons, capturing 11% of the population within the Central Region as a whole. In addition, there were nearly 5,490 total housing units within Richton Park, composing 12% of the total housing units within the Central Region as a whole during this same time frame.
Richton Park, like the other municipalities in the Central Region, is taking a multi-faceted approach to development in the area. Not only is Richton Park using a traditional means of attracting businesses, such as the five TIF Districts it comprises, Rihcton Park is also implementing exciting new green mixed-use development plans for the core downtown area. This includes promoting TOD in which Richton Park is focusing on dense development around the Metra station as well as taking a very intentional approach to active transportation—building robust and safe pedestrian and bicycling infrastructure—in the core downtown area around the Metra station. These plans are being implemented in the form of a large new 55-unit senior housing complex, a new multi-tenant commercial complex, and one of the first Black- and Brown-owned cannabis growing facilities in Illinois, all slated for completion in 2023.
All of these projects combined make Richton Park extremely attractive for retail, offices, and residential development. Not only does Richton Park make itself directly economically attractive via incentive packages, but by creating easy accessibility, Richton Park is ensuring that customers, residents, and employees will want to keep coming back.
In addition, Richton Park encompasses nearly 1,200 rental units as of year-end 2022, capturing 22% of the rental unit supply within the Central Region. During this same time frame, Richton Park comprised 748,100 square feet of retail space, 49,350 square feet of office space, and 109,780 square feet of industrial/flex space— capturing 9%, 2%, and 2% of the retail, office, and industrial/flex space, respectively, within the Central Region as a whole.
COMMUNITY INVESTMENT
Richton Park has many great business incentive programs, including the Will Cook Enteprise Zone, which specializes in commercial and industrial project expansions; new construction; business development tax incentives; real estate, sales tax, and construction cost savings; and utility tax exemption within portions of the Villages of Matteson, Monee, Park Forest, Richton Park, and University Park as well as, Cook and Will Counties. Richton Park is also home to one Opportunity Zone and five TiF Districts: Lakewood, Sauk Trail/Governors Hwy 4, Sauk Trail/I-57, Sauk West Corridor, and Town Center, as illustrated in the following maps.
164,900 2021 AADT(1)
8.3% Workers 16+ Took Public Transportation
CENTRAL REGION MATTESON
ABOUT THE VILLAGE OF MATTESON
The Village of Matteson ("Matteson"), incorporated in 1889, is part of the Central sub-region within the greater Southland area. Matteson is about 5,980 acres and is accessible by major thoroughfares, such as Interstate 57, U.S. Route 30, and Illinois Route 50. As of year-end 2022, the population within Matteson was 19,050 persons, capturing 16% of the population within the Central Region as a whole. During this same time frame, there were 7,450 total housing units within Matteson, composing 16% of the total housing units within the Central Region as a whole.
Home to Prairie State College, Matteson prides itself on being attractive to a wide variety of development—residential, commercial, offices, mixed-use, and industrial—as well as maintaining and preserving open spaces with easy public access.
In recent years, there have been several major new residential, commercial, and industrial developments within Matteson. These projects include large Amazon and Sam’s Club fulfillment centers, new single-family homes and townhouses, as well as new restaurants and shops. In addition, many existing businesses have been renovated, expanded, and revitalized within Matteson, including medical facilities, restaurants, and grocery stores. Most recently, ground was broken on a 760,000-square foot logistics facility and warehouse on Cicero Avenue, just south of Lincoln Highway. Matteson appears to be growing at a sustainable rate in all industry sectors, making it an ideal location for future residents and businesses alike.
As of year-end 2022, there were 570 total businesses within Matteson, employing about 10,770 employees. Total employment within Matteson comprised 19% of the total employees within the Central Region as a whole.
In addition, Matteson encompasses nearly 1,060 rental units as of year-end 2022, capturing 19% of the rental unit supply within the Central Region. During this same time frame, Matteson comprised nearly 2.8 million square feet of retail space, 649,350 square feet of office space, and 1.8 million
square feet of industrial/flex space—capturing 33%, 22%, and 24% of the retail, office, and industrial/flex space, respectively, within the Central Region as a whole.
COMMUNITY INVESTMENT
Matteson has many great business incentive programs, including the Will Cook Enterprise Zone which specializes in commercial and industrial project expansions; new construction; business development tax incentives; real estate, sales tax, and construction cost savings; and utility tax exemptions within portions of the Villages of Matteson, Monee, Park Forest, Richton Park, and University Park as well as Cook and Will Counties. Matteson is also home to seven TIF Districts and one Opportunity Zone. The following maps illustrate the business incentive programs available within Matteson as of year-end 2022.
412,200 2021 AADT(1)
8.2% Workers 16+ Took Public Transportation
CENTRAL REGION
OLYMPIA FIELDS
ABOUT THE VILLAGE OF OLYMPIA FIELDS
The Village of Olympia Fields ("Olympia Fields"), incorporated in 1927, is part of the Central sub-region within the greater Southland area. Olympia Fields is approximately 1,883 acres and is accessible by U.S. Route 30. As of year-end 2022, the population within Olympia Fields was 4,680 persons, capturing 4% of the population within the Central Region as a whole. In addition, there were nearly 1,910 total housing units within Olympia Fields, composing 4% of the total housing units within the Central Region as a whole during this same time frame.
Olympia Fields offers a lot to potential residents and businesses, including, a world-class golf course with amenities, the Olympia Fields Country Club; as well as a large and growing medical campus, Franciscan Health Olympia Fields. Olympia Fields offers plenty of incentives via mechanisms such as TIF Districts and Enterprise Zones, and is actively working to directly benefit the area and its businesses through effective government representation at every level. In the FY2023 Congressional omnibus spending bill, $1 million was awarded to Franciscan Health—the largest employer in Olympia Fields—to build a new medical training facility. This state-of-the-art facility is slated to attracted medical students and further bolster Franciscan Health - One of the keystone institutions of Olympia Fields - as well ass support larger and more businesses to accommodate students and staff.
Olympia Field's residents are predominantly Black, making up 75% of the total population within the area. In addition, 51% of the total population within Olympia Fields are of working age, between the ages of 20 and 64. The median household incomes, median disposable incomes, and per capita incomes in Olympia Fields were significantly higher than those observed within the Central Region as a whole. Comparatively, consumer spending in Olympia Fields was relatively modest, at $218.3 million as of year-end 2022, composing 6% of the total expenditures within the Central Region as a whole.
As of year-end 2022, there were 270 total businesses within Olympia Fields, employing about 5,980 employees. Total employment within Olympia Fields comprised 10% of the total
employees within the Central Region as a whole. The major industries within Olympia Fields consisted of health care and social assistance services, retail trade, educational services, wholesale trade, and accommodation and food services.
Olympia Fields encompasses nearly 210 rental units as of yearend 2022, capturing 4% of the rental unit supply within the Central Region. During this same time frame, Olympia Fields comprised 528,840 square feet of retail space and 456,180 square feet of office space—capturing 6% and 16% of the retail and office, respectively, within the Central Region as a whole. Olympia Fields did not contain any industrial/flex space as of year-end 2022.
COMMUNITY INVESTMENT
Olympia Fields has many great business incentive programs, including the Lincoln 394 Enterprise Zone, which was established in 2017 to stimulate economic growth and neighborhood revitalization in key opportunity areas in Beecher, Chicago Heights, Crete, Ford Heights, Glenwood, Olympia Fields, Sauk Village, South Chicago Heights, Steger, unincorporated Cook County, and unincorporated Will County. Olympia Fields is also home to two TIF Districts: Lincoln/Western and Lincoln/ Western 2. Olympia Fields does not have any Opportunity Zones. The following maps illustrate the business incentive programs available within Olympia Fields as of year-end 2022.
ENTERPRISE ZONES
205,600 2021 AADT(1) 8.2% Workers 16+ Took Public Transportation
CENTRAL REGION FLOSSMOOR
ABOUT THE VILLAGE OF FLOSSMOOR
The Village of Flossmoor ("Flossmoor"), incorporated in 1924, is part of the Central sub-region within the greater Southland area. Flossmoor is approximately 2,343 acres and is located in between four major thoroughfares, Interstate 294 to the north, Illinois Route 1 to the east, U.S. Route to the south, and Interstate 57 to the west. As of year-end 2022, the population within Flossmoor was 9,580 persons, capturing 8% of the population within the Central Region as a whole. In addition, there were 3,670 total housing units within Flossmoor, composing 8% of the total housing units within the Central Region as a whole during this same time frame.
Over the years, Flossmoor has been active in attracting growth and development to its community through its Economic Incentive Program. Flossmoor has four major commercial areas: Downtown Flossmoor, Southwest Flossmoor, Flossmoor Commons, and Governors Triangle. Southwest Flossmoor is its newest commercial area, anchored by a Meijer Superstore that first opened in 2016, and surrounded by several other retailers. The site was a former TIF District and includes several infrastructure improvements to attract future development. Currently, two lots remain undeveloped near the property, including 26 acres of land owned by Flossmoor, and a development proposal is being sought for the lot. The other three commercial areas include similar development opportunities, including the Governors Triangle, which is prime for office and professional services development.
Flossmoor is one of the most flexible and creative municipalities in the region when it comes to economic development incentives. Flossmoor has demonstrated a willingness to create unique solutions fitted to each situation. Recently, there were several ongoing developments in the area. Its Economic Incentive Program reviews projects on a case-by-case basis and has approved several projects in recent years. One of the most recent projects under this initiative includes reimbursing The Center for Dental Excellence, a longstanding Flossmoor
business, for its building permits and occupancy fees in order to expand its footprint and service offerings. Flossmoor has also recently offered a grant to Dunning’s Market & Deli to facilitate this business's move into the municipal boundaries.
Flossmoor’s stated goals for economic development is to improve the quality of life of residents and generate revenue for the area, in addition to providing employment opportunities for residents. This holistic, resident-focused development strategy helps shield Flossmoor from some of the pitfalls other municipalities have fallen into by focusing too much on one industry sector, thus making Flossmoor an attractive area for new businesses and developments of all types, as well as bringing residents into the area.
Flossmoor's residents are predominantly Black, making up 57% of the total population within the area; closely followed by White, which make up 32%. In addition, 55% of the total population within Flossmoor are of working age, between the ages of 20 and 64. The median household incomes, median disposable incomes, and per capita incomes in Flossmoor were significantly greater than those observed within the Central Region as a whole. In addition, these incomes within Flossmoor as of year-end 2022 were the highest compared to the other municipalities within the Central Region. Consumer spending in Flossmoor was also robust, at $516.2 million as of year-end 2022, composing 13% of the total expenditures within the Central Region as a whole.
As of year-end 2022, there were 300 total businesses within Flossmoor, employing nearly 4,640 employees. Total employment within Flossmoor comprised 8% of the total employees within the Central Region as a whole. The major industries within Flossmoor consisted of health care and social assistance services, educational services, retail trade, information services, and professional and technical services. Additionally, the household unemployment rate, at 6.1%, was smaller than that of the Central Region at 8.8% for year-end 2022.
Flossmoor encompasses 50 rental units as of year-end 2022, capturing only 1% of the rental unit supply within the Central Region as a whole. During this same time frame, Flossmoor comprised 392,420 square feet of retail space and 342,080 square feet of office space—capturing 5% and 12% of the retail and office space, respectively, within the Central Region as a whole. Flossmoor contained zero industrial/flex space as of year-end 2022.
Flossmoor does not contain any Enterprise Zones, Opportunity Zones, or TIF Districts.
44,980 2021 AADT(1)
CENTRAL REGION
HOMEWOOD
ABOUT THE VILLAGE OF HOMEWOOD
The Village of Homewood ("Homewood"), incorporated in 1893, is part of the Central sub-region within the greater Southland area. Homewood is approximately 3,368 acres and is accessible by Interstate 294 and Illinois Route 1. As of year-end 2022, the population within Homewood was 19,360 persons, capturing 17% of the population within the Central Region as a whole. In addition, there were nearly 7,980 total housing units within Homewood, composing 17% of the total housing units within the Central Region as a whole during this same time frame.
Homewood offers a wide variety of incentives to both new and existing businesses. Taking a holistic approach to development–Homewood has multiple TIF Districts, as well as offers up to $40,000 in incentives to businesses in non-TIF Districts, including a Go Green Reward Program for environmentally friendly business upgrades; a Retail Enhancement Program to attract new retailers and help existing retailers expand; and a Facade and Property Improvement Program to fund needed face-lifts for businesses.
Like its neighbors, Homewood balances all of these new development programs while taking into account the needs of the community. Although Homewood wants to attract new businesses, the area wants to ensure that the tenor of the community remains, and that new businesses help support residents through retaining high standards in every aspect, which will ultimately create a pleasant, safe, and attractive place for residents and businesses alike.
Homewood's residents are predominantly Black, making up 46% of the total population within the area; closely followed by White, which make up 42%. In addition, 58% of the total population within Homewood are of working age, between the ages of 20 and 64.. The median household incomes, median disposable incomes, and per capita incomes in Homewood were sightly higher than those observed within the Central Region as a whole. In addition, consumer spending in Homewood was robust, at $703.9 million as of year-end 2022, composing 18% of the total expenditures within the Central Region as a whole.
As of year-end 2022, there were 860 total businesses within Homewood, employing about 14,390 employees. Total employment within Homewood comprised 25% of the total employees within the Central Region as a whole. The major industries within Homewood consisted of retail trade, health care and social assistance services, accommodation and food services, manufacturing, and professional and technical services.
Homewood encompasses nearly 590 rental units as of year-end 2022, capturing 11% of the rental unit supply within the Central Region. During this same time frame, Homewood comprised nearly 2.0 million square feet of retail space, 913,680 square feet of office space, and 539,000 square feet of industrial/flex space— capturing 24%, 31%, and 7% of the retail, office, and industrial/ flex space, respectively, within the Central Region as a whole.
COMMUNITY INVESTMENT
Homewood has many great business incentive programs, including the Cal Sag Enterprise Zone, which encourages new construction and expansion of commercial and industrial projects. Homewood is also home to seven TIF Districts: 187th Street/Dixie Highway, Dixie Highway/Miller Court, Downtown TOD, East Central Business District, Kedzie Gateway, Northeast, and Southwest. Homewood does not have any Opportunity Zones. The following maps illustrate the business incentive programs available within Homewood as of year-end 2022.
ENTERPRISE ZONES
CENTRAL REGION
HAZEL CREST
ABOUT THE VILLAGE OF HAZEL CREST
The Village of Hazel Crest ("Hazel Crest"), incorporated in 1911, is part of the Central sub-region within the greater Southland area. Hazel Crest is about 2,183 acres and is accessible by major thoroughfares, such as Interstate 294 and Interstate 80. As of year-end 2022, the population within Hazel Crest was 13,460 persons, capturing 11% of the population within the Central Region as a whole. During this same time frame, there were 5,280 total housing units within Hazel Crest, composing 11% of the total housing units within the Central Region as a whole.
Hazel Crest works diligently to ensure that it remains attractive to businesses and residents alike. Recently, Hazel Crest secured a $4 million Loan Forgiveness Grant from the Illinois Environmental Protection Agency to make necessary water infrastructure upgrades. In addition, Hazel Crest’s stated goal is to attract and maintain high-quality full-time jobs for residents. To that end, Hazel Crest tends to focus on industrial, commercial, and office development, with a healthy mix of retail and restaurants.
In February 2023, Hazel Crest recently annexed in the Calumet Country Club, adding nearly 130 acres to the municipal boundary. Proposed plans for the project include transforming the site into a commercial/industrial complex—setting aside 1 million square feet for warehousing in the center of the site and using the surroundings for other commercial prospects, such as an aquaponics facility, a hotel, a condominium complex, sports stadium, water park, walking trails, and a National Association of Minority Contractors training center.
As of year-end 2022, there were 350 total businesses within Hazel Crest, employing about 7,380 employees. Total employment comprised 13% of the total employees within the Central Region as a whole. The major industries within Hazel Crest consisted of health care and social assistance services, wholesale trade, manufacturing, finance and insurance services, and retail trade.
In addition, Hazel Crest encompasses nearly 660 rental units as of year-end 2022, capturing 12% of the rental unit supply within the Central Region. During this same time frame, Hazel Crest comprised 531,650 square feet of retail space, 323,850 square feet
of office space, and 779,820 square feet of industrial/flex space— capturing 6%, 11%, and 11% of the retail, office, and industrial/flex space, respectively, within the Central Region as a whole.
COMMUNITY INVESTMENT
Hazel Crest has many great business incentive programs, including the Cal Sag Enterprise Zone, which encourages new construction and expansion of commercial and industrial projects. Hazel Crest is also home to four TIF Districts and one Opportunity Zone. The following maps illustrate the business incentive programs available within Hazel Crest as of year-end 2022.
ENTERPRISE ZONES
55%
CENTRAL REGION
COUNTRY CLUB HILLS
ABOUT THE CITY OF COUNTRY CLUB HILLS
The City of Country Club Hills ("Country Club Hills"), incorporated in 1958, is part of the Central sub-region within the greater Southland area. Country Club Hills is approximately 3,196 acres and is accessible by major thoroughfares, such as Interstate 57, Interstate 80, and Illinois Route 50. As of yearend 2022, the population within Country Club Hills was 16,880 persons, capturing 14% of the population within the Central Region as a whole. During this same time frame, there were 6,140 total housing units within Country Club Hills, composing 13% of the total housing units within the Central Region as a whole.
In recent years, Country Club Hills attracted and developed a major logistics park, LogiPark 57-80. Phase 1 of this development is complete and features 1.2 million square feet across three distribution and warehouse buildings. In addition, Country Club Hills has an economic development commission that meets monthly to develop incentive plans to attract new businesses. This commission also serves to return abandoned, blighted, and tax delinquent properties to the productive economy—freeing up otherwise inaccessible properties, structures, and resources within Country Club Hills.
As of year-end 2022, there were 320 total businesses within Country Club Hills , employing about 4,690 employees. Total employment within Country Club Hills comprised 8% of the total employees within the Central Region as a whole. The major industries within Country Club Hills consisted of educational services, retail trade, health care and social assistance services, accommodation and food services, and public administration.
In addition, Country Club Hills encompasses nearly 150 rental units as of year-end 2022, capturing 3% of the rental unit supply within the Central Region. During this same time frame, Country Club Hills comprised 760,490 square feet of retail space, 120,810 square feet of office space, and nearly 3.6 million square feet of industrial/flex space—capturing 9%, 4%, and 49% of the retail, office, and industrial/flex space, respectively, within the Central Region as a whole.
COMMUNITY INVESTMENT
Country Club Hills has many great business incentive programs, including the Cal Sag Enterprise Zone, which was created to encourage new construction and expansion of commercial and industrial projects. Country Club is also home to one Opportunity Zone and two TIF Districts: I-57/183rd Street and 175th/Cicero TIF Districts. The following maps illustrate the business incentive programs available within Country Club Hills as of year-end 2022.
156,900 2021 AADT(1) 6.3% Workers 16+ Took Public Transportation