CITY OF PORT ST. LUCIE PLANNING & INFRASTRUCTURE STUDY


OCTOBER 2024
ACKNOWLEDGMENTS
CITY LEADERSHIP
Jesus Merejo | City Manager
Teresa Lamar-Sarno | Assistant City Manager
Mary F. Savage-Dunham, AICP, CFM | Planning & Zoning Director
City of Port St. Lucie
121 S.W. Port St. Lucie Boulevard
Port St. Lucie, FL 34984
(772) 871.5225
CITY COUNCIL
Shannon M. Martin, Mayor
Jolien Caraballo, Vice Mayor, District 4
Stephanie Morgan, District 1
David Pickett, District 2
Anthony Bonna, Sr., District 3
CONSULTANT TEAM
Owen Beitsch, PhD, FAICP, CRE | Senior Advisor, GAI Consultants
Richard L. Levey, PhD, AICP| Senior Advisor, GAI Consultants
Laura Smith, MPA, FRA-RA | Urban Analytics Director, GAI Consultants
Natalie Frazier, MBA | Urban Analytics Manager, GAI Consultants
Hannah Hollinger, LEED AP O+M | Senior Planner, GAI Consultants
Adam Burghdoff | Principal, Kittelson & Associates, Inc.
GAI Consultants’ Community Solutions Group
618 East South Street, Suite 700
Orlando, FL 32801
(321) 319.3088

This document has been prepared by GAI Consultants, Inc. on behalf of the City of Port St. Lucie, Florida.


St. Lucie County (“County” or “St. Lucie”) and several adjacent counties face extraordinary demands to expand their inventory of developable lands as agricultural interest declines and development pressure increases. Where there has been a long history of agricultural controls on property, demand for alternative property uses is now on an especially steep upward trajectory.
Potential population increases, regulatory conditions, and infrastructure capacity concerns being experienced along Florida’s Treasure Coast Region (“Region”) are acute within the County. Here, limited resources are an obvious impediment to accommodating population gains and positioning rural lands for more intense property uses.
In this Planning and Infrastructure Study (“Study”), the concerns focus on the City of Port St Lucie (“City”), the largest incorporated community within the County. As a result of regional growth pressures, lands or holdings within or most proximate to the City are obvious targets for future development with the City as the primary source of utility infrastructure and other quality municipal services maintained to a high standard. These City services make the community a highly desirable place to live and work. In addition, large tracts of land within the City are currently being developed at an exponential rate as City property is being re-zoned from Agricultural zoning to other zoning designations as part of Development of Regional Impact (“DRI”) build-outs.
As a major population center in an otherwise emerging setting, the City faces the impacts of policy questions stemming from managing growth and other activity just outside its own municipal boundaries. While growth brings potential economic opportunities, it also tasks the City with providing services intended for its residents, property owners, and businesses but often accessed by those residing or operating outside the City’s municipal boundaries. This duality requires the City and by extension, its resident population, property owners, and businesses, to assume the burden of providing or maintaining certain facilities, infrastructure, or services.
Although road and traffic degradations on major roadways tend to be the most visceral and visible issues, financial contributions from the County offer only nominal means to address external impacts on secondary local roads, parks, greenways, drainage associated with road expansions, and other life-safety services dependent upon a burdened highway interchange and surface roadway network. In terms of the major costs that the City might absorb from unincorporated development on its edge, road related items are almost certainly the most expensive and fiscally strained.
GAI’s Community Solutions Group (“CSG”), along with Kittelson & Associates (“Consultant Team”) were retained to explore the advantages and disadvantages of various means to control or enhance the quality and evaluate the impacts of such growth. The Consultant Team was charged with evaluating how these various means or strategies, including annexation, might alter the City’s service levels generally, its costs of specific services, capital and operating needs, potential receipts or income, and its relationship with the County.
Research, data collection, and analysis associated with the production of this Study was conducted in the latter half of 2023 and relies upon data available at that time. Further, to ensure consistency and reliability, this Study relies upon fiscal year 2021/2022 financial reports, 2022 estimates of demographic and socio-economic data, and the St. Lucie County 2022 Final Tax Roll.
While this Study is largely a look forward, it draws upon the outcome(s) of other planning efforts or models addressing the needs of the City. Because the needs of new growth cannot be forced to capitalize the growth of any existing deficiencies, this Study explicitly assumes prior service and capital obligations already called for, stipulated, or officially adopted in major plans, including any long-range transportation plans in particular, have or will be made as contemplated by 2045. Such prior plans have already identified major roadways or roadway
segments which are deficient and suggested budgets and funding options for those required improvements.
To emphasize, this Study is not an assessment or examination of any existing, current, and/ or emerging constraints or deficiencies of the City’s infrastructure, services, or programs. Further, it is important to note that legislation being considered or otherwise progressing through the State of Florida Legislature at the time of this Study may or may not be of significance to the City at some point in the future. The recommendations contained in this Study are made in the context of applicable legislation existing at the time of the Study.
The major tasks conducted as part of this Study included the Consultant Team identifying areas outside of the City’s existing municipal boundaries that would likely impact the City, its existing residents, property owners, and businesses, and any related development in such areas through changes in policy or actions including, but not necessarily limited to, a more thoughtful and targeted annexation strategy.
In total, the Consultant Team identified an estimated 30,900 acres (“Study Area”) tied to the City through patterns of land ownership, roadway corridors, natural features, man-made barriers, and announced or contemplated development that might be strategically considered for enhanced management and control through explicit City growth policies, whether through consideration of voluntary annexation requests or other means and strategies.
several years. The Tradition CDD is dominated by a variety of residential development but also includes a substantial inventory of distribution, medical, and office space creating a concentration of potential employment. Such employment is deemed desirable in future projects and is a planned economic objective supported by both City staff and leadership.
Based on this potential scale of achievable development within the Study Area, the Consultant Team estimated spending for all City controlled financial obligations with and without any newly created development. This financial benchmarking assessment effectively calculated the City’s spending and compared it with the spending of cities of similar density and intensity. In particular, the Consultant Team considered how development in or near the City would impact the existing road network, ultimately identifying broadly conceptual costs for those road segments or intersections becoming deficient as the result of future development and traffic.
To emphasize again, this Study draws upon the outcome of other planning efforts or models that address the needs of the City, and explicitly assumes prior service and capital obligations already called for, stipulated, or officially adopted—including any longrange transportation plans—have or will be constructed, completed, and/or implemented as planned or otherwise contemplated.
This Study documents the City’s fiscal position with and without the Theoretical Transportation Cost estimates and related obligations to cure deficiencies specifically stemming from the estimates of future growth within the Study Area. As an obvious concern, these costs are isolated to show how this discrete set of capital costs affects longer term financial planning as other costs are also absorbed.
These lands could reasonably accommodate a potential population of about 86,560 persons. Upon a reasonable build-out period, these developable lands would likely include a certain mix of commercial and other non-residential uses. Using various spatial measures, the Consultant Team determined the dimensions of those land use requirements, assuming the future mix would largely resemble that which now exists in the Tradition Community Development District (“CDD”) and has been under development for the last
Finally, this Study identifies a series of tools and policies that the City might adopt to control, coordinate or improve growth management related to developments and projects seeking City services, or that might request consideration for annexation. These tools and policies address a variety of issues including the financial obligations which might be absorbed by any developer or project, both short- and long-term, as well as recommendations for improved coordination with the County. SECTION 1.2
The City of Port St. Lucie (“City”) is an incorporated place within St. Lucie County (“County”). The community is bisected by the Florida Turnpike with the City’s municipal boundaries extending east to the coast and south to Martin County. Most development within the County has historically been organized along Interstate-95 (“I-95”), U.S. Highway 1 (“US-1”) and the Florida Turnpike. These major roadways have strongly influenced the north/south pattern of development throughout Florida’s Treasure Coast Region (“Region”) which is rapidly shifting away from its historically dominant agricultural activities. Increasing development interest is now inducing some settlement patterns well outside of historical concentrations.
Total population within the County as of year-end 2022 was estimated to be 358,700 people, with the City composing nearly 65% of that share. Experiencing a compound annual
growth rate (“CAGR”) of 2.3% over the last 10-years, from 2013 to 2022, the County is one of Florida’s fastest growing counties. In 2022 about 231,800 people out of the total County population claimed the City as their place of residence. The figure below illustrates the City and County in relation to the broader Region (see Figure 1).
Like much of the region, certain physical conditions and regulatory constraints existing within the City are driving development activity westward. Other than certain small areas, purposefully targeted expansion options for the City are substantively restricted by the jurisdictional boundaries of nearby Martin County on the south and the municipal limits of the City of Ft. Pierce (“Ft. Pierce”) to the north. Ft. Pierce is the only other incorporated municipality of meaningful population size in the County which may exercise its own, more limited, growth opportunities in the future.

Legend Treasure Coast Region
St. Lucie County City of Port St. Lucie

Source: GAI Consultants, Inc.
While the comments detailed and discussed throughout this Study should absolutely not be construed as legal advice, they do underscore the basic set of recommendations which emerged in the course of and as a result of the analysis undertaken in this Study. Effectively, under Florida law, annexations can occur voluntarily and through referendum. Details of such procedures are, of course, important.
The voluntary arrangement occurs between property owner and the affected jurisdiction and is usually associated with new or undeveloped properties. The involuntary arrangement is typically applicable to older, often infill, situations and neighborhoods. Generally, unless indicated otherwise, this Study focuses on voluntary practices where the advantages of annexation are associated with utility access and controlled patterns of development and growth. Such voluntary strategy largely avoids the provision of utilities without the assurance of annexation.
SECTION 1.5
Based on a variety of information and conditions presented in this Study, the City, by virtue of regional context, will continue to experience growth pressures at the edge of its current municipal boundaries. There may be some smaller opportunities in existing areas within the City’s municipal boundaries but these will not have the same scale of growth implications as development projected within the Study Area may have.
Anticipated and proposed development within the Study Area, just beyond the City’s western boundary, is likely to be approved by the County, following what has been a fairly consistent pattern and procedure. In a very substantive way, the County then receives receipts that might otherwise be controlled by the City in a beneficial way for new development experienced within the City rather than outside of its municipal boundaries. Notwithstanding, some minor conditional improvements or

obligations negotiated with the County, the City will remain reactive to practices often disadvantageous to its position. In the worst of circumstances, the City will be subsidizing development forms which may not comply with the desired development of the City and which are contrary to its own financial benefit and standards of service.
Absent self-imposed financial structures by developers themselves—unless proposed developments and projects are annexed into the City or the County exacts extraordinary requirements from the developer(s) to the benefit of the City—the City will bear an undue burden of service and capital costs resulting from significant development at its edge. Regardless of direct City intervention, the trend of converting historically agricultural or less intense lands to higher value residential and similar uses will persist.
As the Region’s population grows, the City’s job centers, services, and facilities become increasingly attractive to the development community, especially those targeting the southern portion of the County at the edges of the City’s municipal boundaries which

lack similar options. Without some level of control, a substantial portion of the capital and operational costs for these services and responsibilities will continue to fall upon the City.
To address reasonably foreseeable levels and concentrations of development activity, three levels of intervention are addressed, including:
1. Do not accept requests for voluntary annexation of any projects or property within the Study Area;
2. Accept requests for voluntary annexation from proposed developments and/ or projects within the Study Area under existing City planning and fiscal impact policies; and
3. Accept requests for voluntary annexation from proposed developments and/or projects within the Study Area under new City planning and fiscal impact analysis tools.
Among these options, a more active role for City leadership that operates within the existing legal and political framework is described. That framework could be extended to also include a much more robust annexation strategy centered on specific targets (location, uses, etc.) and enhanced by more affirmative policy. While any option explicitly recognizes the need for improved City and Country coordination and collaboration, a decision not to act does not change the more costly disadvantages of the established arrangement.
Consequently, the current situation favors a more aggressive and targeted annexation strategy adhering to several principles outlined in this Study. These principles secure the financial commitments from the development community to address the impacts of these projects on City infrastructure and services.
The research, analysis, issues, and recommendations are further detailed within this Study.

There are many key demographic and socio-economic indicators to consider when determining the market characteristics of a specific area, these include:
▪ Population
▪ Age Distribution
▪ Race and Ethnicity
▪ Academic Achievement
▪ Income Levels
A profile of these demographic and socioeconomic characteristics was necessary to fully understand the unique marketplace and the overall market-supporting demand within the City.
Included in this Existing Conditions assessment is the evaluation of current and historical growth trends within the City, and where relevant, the assessment also identifies the capture of growth to the County, as detailed within the following pages.
According to the U.S. Census Bureau (“Census”) year-end 2022 estimates, the total population of the City is approximately 231,800 persons, which represents roughly 65% of the County’s total population at 358,700 persons. Data subject to Limiting Conditions as described in previous section.
From 2010 to 2022, total population within the City grew at a compound annual growth rate (“CAGR”) of approximately 2.6% annually, increasing over 40% from about 165,150 persons in 2010 to 231,800 persons in 2022. Approximately 33% of this population growth within the City occurred from 2020 to 2021. Although, the population within the County increased 29% from about 278,690 persons in 2010 to 358,700 persons in 2022, the County experienced a slightly lower CAGR than the City, at 2.0% from 2010 to 2022.
During this same time period, the overall capture of the City to the County’s population steadily increased, as illustrated in the following table (see Table 1).
Table 1. Total Population Trends
U.S. Census Bureau, American Community Survey (ACS); GAI Consultants.
Age distribution is another important factor when examining market characteristic. Within the City, the median age is approximately 42 years old; this is marginally lower than the median age of nearly 44 years old observed within the County but consistent with the State of Florida’s average of 43 years old.
In the City, approximately 62% of the population are between the ages of 15 and 64, which represents the typical working-age population. In comparison, about 59% of the County’s population can be classified as in the working-age population. This indicates that the majority of the population within both the City and County is considered to be working-age. In addition, 23% of the population within the City are younger than 20, and 28% are 60 years or older. Whereas, the County has a slightly older population, with about 22% identified as younger than 20, and 31% aged 60 years or older, as illustrated in the Table 2 below.
Understanding the racial and ethnic makeup of an area can provide unique insight into its market characteristics. Within the City, approximately 57% of the population identifies as White, 19% as Black/African American, 2% as Asian, 14% as Two or More Races, and 7% as Other.
The racial composition within the County is similar to that of the City; with 48% White, 17% Black/African American, 1% Asian, 11% Two or More Races, and 6% as Other. The breakdown of the population by racial composition within the City compared to that of the County is represented in Table 3 below.
Additionally, Hispanic origin is defined as an ethnicity, and therefore can be identified as any race. According to 2022 ESRI Estimates, 22% of the total population in the City are of Hispanic ethnicity. Similarly, approximately 17% of the total population within the County are of Hispanic ethnicity.
bachelor’s degree or greater. Comparatively, when considering the population without a high school diploma/GED, about 8% of the total population in the City does not have a high school diploma/GED, which is slightly lower than the 10% observed within the County. The figure below illustrates the breakdown of academic achievement within the City and County (see Figure 2).
Figure 2. Academic Achievement
Academic achievement refers to the level of schooling a person has successfully completed, and only accounts for those 25 years or older. Within the City, 92% of the population have obtained their high school diploma/GED or a more advanced degree, which is also observed at 90% within the County following these same metrics.
In addition, approximately 29% of the population within the City has a bachelor’s degree or higher advanced degree, which is slightly higher compared to the 27% of the population observed within the County with a

County City
Income is another important factor to consider when examining market characteristics as it can be a broad indicator of a household or individual’s spending potential and their general ability to purchase a variety of goods and services within a specific marketplace. As of year-end 2022, median household income within the City is estimated to be about $71,030, which is notably higher than that of the County at $62,900. However, per capita incomes in the City at $33,720 are only marginally higher than that observed within the County at $32,690, as illustrated in the Table 4.
Table 4. Income Characteristics
Sources: U.S. Census Bureau, ACS; ESRI Business Analyst, GAI Consultants.
Within the City, median disposable income is about $58,240, which is higher than that of the County at $53,780. From this incomerelated data, it can be inferred that the City comprises a population with greater incomes and spending potential compared to that of the County.
In addition, the largest concentration of household incomes are households with incomes of $50,000 to $74,999, which account for 23% and 21% in the City and County, respectively. Figure 3 below illustrates the household income composition within the City and County as of year-end 2022 estimates.

SECTION 2.2
A diverse workforce and industry base within a market area can be an indication of healthy economic conditions, as it enhances the variety of available employment and interested companies in an area. The components to employment to consider when analyzing the overall business and employment market include:
▪ Annual employment trends
▪ Jobs by industry sector
▪ Unemployment rate
▪ Employee inflow/outflow
As of year-end 2022 estimates, there are 11,960 businesses within the County; approximately 52% or 6,250 businesses are located within the City. The total businesses within the County employ approximately 90,760 people; whereas, the total businesses within the City employ approximately 43,600 people, or 48% of the County’s total employment.
From 2010 to 2022, total employment within the City and County experienced CAGRs of 5.2% and 2.9%, respectively. Since 2010, the City has experienced an increase of nearly 20,910 employees, capturing approximately 74% of the County’s employment growth during this same time period. The capture of employment within the City to the County has progressively increased year-over-year, from 36% in 2010 to 48% in 2022, as illustrated in the following table (see Table 5).
As of year-end 2022 estimates, within the City, the unemployment rate—i.e., the total number of unemployed persons as a percentage of the Civilian Labor Force—is approximately 5%, which is comparable to the unemployment rate within the County at 4.8%. As more businesses are established within the City, subsequently creating more jobs, the unemployment rate should experience a decrease.
The most current employee inflow/outflow data provided by the Census is for yearend 2021. This data serves as an indication of the efficiency of the respective area’s labor force. As of year-end 2021, there were 32,930 employees within the City. Of these employees, about 42% live within the City, while roughly 58% commute into the City from elsewhere to work (inflow). In addition, 66,470 workers live inside the City, but are employed elsewhere outside of the City (outflow). This condition results in a net outflow of 47,420 jobs from the City. Net job inflow (+)/outflow (-) indicates the area is a labor force provider.
Comparatively, there were 82,900 employees within the County as of year-end 2021. Of these employees, approximately 57% live within the County, while roughly 43% commute into the County from elsewhere to work (inflow). Additionally, 81,160 workers live inside the County, but are employed elsewhere outside (outflow). This condition results in a net outflow of approximately 45,710 jobs from the County.
The most current employment sector data by the Census’ North American Industry Classification System (“NAICS”) is for yearend 2021. NAICS employment industry data for year-end 2021 indicates that Health Care and Social Assistance, Retail Trade, Accommodation and Food Services are the dominant industries within both the City and County. Combined, these three industries comprise approximately 50% and 39% of the total share of the employment within the City and County, respectively, as of year-end 2021. Professional employment includes the following
industry sectors: Information; Finance and Insurance; Real Estate; Professional Services; Management of Companies; Administration, Support, and Waste Management; and Educational Services. The City’s largely white collar, or professional work force, composes 24% of total employment within the City.
In addition, the County’s professional work force composes 29% of the total employment within the County as of year-end 2021. Table 6 below illustrates the breakdown of employment by NAICS’ Industry Sector for year-end 2021.
Source:
Total housing units within the City are estimated to be about 90,760 units, which represents approximately 57% of the total housing units within the County, at 160,610 units, according to the 2022 Census.
Since 2010, total housing units within the City grew at a CAGR of approximately 2%, adding nearly 20,340 new units. Comparatively, the County has experienced a significantly lower CAGR at 1.2% since 2010. During this time, the City’s capture of the County’s total housing units has slowly increased, from 51% in 2010 to 57% as of 2022, as illustrated in Table 7 below.
Comparatively, the average effective rental rate for multi-family residential units within the City was about $1,931 as of year-end 2022, marginally higher than the effective rental rate for multi-family residential units observed within the County at $1,726.
According to the County’s Final 2022 Tax Roll, average market value per dwelling unit within the City was greater within single-family housing units, followed by condominiums and multi-family units. On average, residential properties within the City are achieving market values approximately 19% greater than those observed within the County.
According to the County’s Final 2022 Tax Roll, approximately 22,120 residential dwelling units have been constructed in the City since 2010. Of the residential dwelling units constructed after 2010, single-family composed 93%, followed by multi-family with 7.1% of the total share. Zero condominiums and mobile homes have been constructed within the City since 2010.
As of year-end 2022 estimates, the total households within the City averaged approximately 2.7 persons per household, while the County has a slightly lower persons per households at 2.6. Additionally, the household tenure in both the City and County is predominantly owner-occupied at 81% and 77%, respectively, while the remaining is renter-occupied.
In addition, the percentage of vacant housing units within the City at 6% is significantly lower than that of the County at 11%, as of year-end 2022 estimates. This may be attributed to a greater permanent residential population occurring within the City rather than the County as a whole.
The average home values within the City at nearly $323,610 is marginally higher than the average home values observed in the County at $311,340, as of year-end 2022 estimates.
In addition, approximately 26,044 residential dwelling units have been constructed in the County since 2010. Of the residential dwelling units constructed after 2010, single-family composed 93%, followed by multi-family with 6.7% of the total share. Condominiums and mobile homes composed 0.2% and 0.5%, respectively, of the total residential dwelling units within the County constructed after 2010. Table 8 on the following page illustrates the construction activity by residential producttype within the City from 2010 to 2022.

As of year-end 2022, the City had a total of 7.7 million square feet of retail space—achieving occupancy rates of 96.9%. The average rental rate per square foot experienced an increase of 4% since 2010, from $16.49 in 2010 to $17.14 as of year-end 2022. Additionally, occupancy rates experienced a nearly 0.5% increase during this same time frame from 92.8% in 2010 to 96.9% in 2022. Comparatively, the City composes 56% of the total retail space within the County at 13.8 million square feet. As of year-end 2022, total retail space within the County was achieving occupancy rates of 97% and an average effective rental rate of $17.94 per square foot. Since 2010, the City has added nearly 742,340 square feet of retail space, composing 12% of the total retail space added within the County during this same period at 6.1 million square feet.
As of year-end 2022, the City had a total of 3.9 million square feet of office space—achieving occupancy rates of 94.4%. The average rental rate per square foot experienced an increase of 24% since 2010, from $15.67 in 2010 to $19.35 as of year-end 2022. Additionally, occupancy rates experienced a nearly 12% increase during this same time frame from 84.5% in 2010 to 94.4% in 2022. Comparatively, the City composes 60% of the total office space within the County at 6.6 million square feet. As of year-end 2022, the office space within the County was achieving occupancy rates of 95.9% and an average rental rate of $21.87 per square foot. Since 2010, the City has added about 786,590 square feet of office space, composing 94% of the total office space added within the County during this same period at 835,030 square feet.
As of year-end 2022, the City had a total of 5.9 million square feet of industrial/flex space—achieving occupancy rates of 96.1%. The average rental rate per square foot experienced an increase of 92% since 2010, from $6.66 in 2010 to $12.77 as of yearend 2022. Additionally, occupancy rates experienced an 18% increase during this same time frame from 81.2% in 2010 to 96.1% in 2022. Comparatively, the City composes 37% of the total industrial/flex space within the County at 15.9 million square feet. As of year-end 2022, the industrial/flex space within the County was achieving occupancy rates of 97.1% and an average rental rate of $10.11 per square foot. Since 2010, the City has added over 1.3 million square feet of industrial/flex space, composing 75% of the total industrial/flex space added within the County during this same period at 1.7 million square feet.
As of year-end 2022, the City had a total of 1,692 hotel rooms—achieving occupancy rates of 76.3%. The average daily rate (“ADR”) per room experienced an increase of 66% since 2010, from $84.65 in 2010 to $140.67 as of year-end 2022. Additionally, occupancy rates experienced approximately a 54% increase during this same time frame from 49.5% in 2010 to 76.3% in 2022. Comparatively, the City composes 47% of the total hotel rooms within the County at 3,576 rooms. As of year-end 2022, hotels within the County were achieving occupancy rates of 71% and an ADR of $134.30 per room. Since 2010, the City has added nearly 82 hotel rooms, composing 57% of the total hotel rooms added within the County during this same period at 144 rooms.
The table below illustrates the commercial and non-residential development activity by property use within the City from 2010 to 2022 (see Table 9). To note, all commercial and nonresidential market characteristics are sourced from the CoStar Group, an industry provider of commercial and non-residential real estate information and analytics.
CONCENTRATION OF RESIDENTIAL DEVELOPMENT
Since 2000, roughly 51% of the total residential parcels are located within the 34953 Zip Code, which can be found in the western portion of the City and situated between I-95 and the Florida Turnpike. The residential parcels within this Zip Code are predominately single-
family, at 99.8%. The following figure illustrates the concentration of residential parcels by residential product-type within the County and City as of year-end 2022, according to the County’s Final 2022 Tax Roll (see Figure 4).
4. CONCENTRATION OF RESIDENTIAL DEVELOPMENT

Legend St. Lucie County
City of Port St. Lucie 34953 Zip Code
Single-Family
Condo
Multi-Family
Mobile Homes
The majority of the commercial and nonresidential development within the City has been constructed since 2000 along the major thoroughfares, specifically Florida’s Turnpike, St. Lucie West Boulevard, and Port St. Lucie Boulevard, as illustrated in the map below.
Figure 5 below illustrates the concentration of commercial and non-residential properties by use within the County and City as of year-end 2022, according to the CoStar Group.

Legend St. Lucie County City of Port St. Lucie 34953 Zip Code Hotel Industrial Office Retail
The City and County have been an attractive area for the development community in recent years especially as Florida became the fastest growing state in the country in 2022. More specifically, the southern and southwest portions of the County have been gaining interest from developers for sites both in and around the City.
A few of the major planned residential, commercial, or mixed-use developments and/or Planned Unit Developments (“PUD”) which have been proposed within either the City or the County are detailed along the subsequent pages. With three (3) of the major planned residential, commercial, or mixeduse developments and/or PUDs (i.e., Neil Farm Estates, Rainbow Groves, and Oak Ridge Ranches), described below being within the Study Area and located contiguous to the City’s western municipal boundaries.
Given the City’s well-established utility, transportation, and other related infrastructure which is lacking in the unincorporated portions of the southwestern County, it is not surprising that many of the major planned residential, commercial, or mixed-use developments and/or PUD described are in areas of the unincorporated County that are served by either Port St. Lucie or Ft. Pierce municipal utilities. The map on the following page illustrates the location of the major planned developments listed below relative to the City’s existing municipal boundaries (see Figure 6).
Creekside, PUD (Map ID #1)
Creekside PUD is slated to be a 179-acre residential development that was originally proposed by the home builder D.R. Horton on the southern portion of State Road 70. Initial platting of the Creekside PUD was first requested in November of 2022, and is set to feature 443 single-family homes, 337 townhomes, and 5.5 acres commercial activities and other amenities. As of November 2023, the project is still pending a mining permit to excavate and transport over 900,000 cubic yards of surplus material, or the equivalent of 45,000 dump truck loads. Locals of Creekside are opposed to the project due to environmental and traffic concerns.
Freeman Port Pierce, PUD (Map ID #2)
As of February 2024, the Freeman Planned Unit Development (PUD) on 96.32 acres in St. Lucie County has advanced through critical planning phases and was initially proposed for a 95-unit residential subdivision. The project has sought rezoning and preliminary site plan approval, with a key meeting held with the St. Lucie County Planning and Zoning Commission on March 16, 2023. Despite the lack of publicly disclosed information on architects and contractors, the project, with an estimated value of $38 million, was slated to start construction in November 2023 following its proposal submission in October 2021.
Indrio Groves, PUD (Map ID #3)
Indrio Groves, a proposed residential project proposed for St. Lucie County, aims to transform 792 acres into a large single-family community just east of I-95 along Indrio Road. With a resubmittal on August 15, 2022, the project seeks to rezone to the PUD district within the TVC overlay, with an emphasis on environmental consciousness and community-focused development. The project is set to incorporate affordable workforce housing while promoting internal circulation to reduce traffic impact.
Indrio Woods, PUD (Map ID #4)
Indrio Woods, a proposed Planned Unit Development (PUD), is centered on a 32.4-acre residential site which is undergoing rezoning to align with the Towns, Villages, and Countryside (TVC) land use and zoning compatibility. Submitted on November 29, 2022, the application outlines the potential to achieve a maximum density of 9 dwelling units per acre as permitted. Currently in its fifth re-submittal, the project has undergone multiple review by the county’s planning and zoning committee.
Neill Farms Estates (Sana Vita) (Map ID #5)
Neill Farms Estates is a Residential Urban (RU) master planned community that has recently petitioned to be rezoned from AG-5, featuring 420.96-acres within the Study Area. Located along Range Line Road, the property sits inbetween the proposed Palermo Estates and the already existing Treasure Coast Airpark neighborhood. Current allowance requests
are for up to 5 units per acre, with a maximum potential build out of 2,105 dwelling units to be completed by 2045. Its current developer GT USA suggests that the project may be ultimately titled ‘Sana Vita’.
Oak Ridge Ranches (Map ID #6)
Oak Ridge Ranches, currently owned by Kolter Land, is a 3,250-acre planned project currently undergoing land use and zoning approval from the County. The project is estimated to feature 8,600 single-family homes, 2,000 multifamily units, and up to 650,000 square feet of commercial, as well as additional amenities such as schools and parks for residents. The property has received significant push back from local residents as well as the City of Port Saint Lucie’s Planning and Zoning Commission, who claim that the construction of the project will disrupt the rural lifestyle and congest traffic in the region. This has led to substantial revisions to the original plan, and now ensures that a minimum of at least 80,000 square feet of commercial space will be included on the site. The most recent application for the project was submitted in February 2024. Current projections claim that the master-planned community could house up to 25,189 residents.
Palermo Estates, PUD (Map ID #7)
The Palermo Estates PUD (OMBU Ranch Range Line) is a proposed residential development located on the west side of Range Line Road between southwest Discovery Way and Glades Cut-Off Road. Situated across 235.1-acres, the project proposes a total of 705 dwelling units, split between 515 single-family homes and 190 low-rise multi-family units. Current projections provided by the developer indicate a final build-out year of 2032.
Pineapple Grove, PUD (Map ID #8)
Pineapple Grove is a PUD and rezoning project spanning 200.45 acres, designed as a singlefamily residential community with an array of amenities and associated site improvements set to be executed in phases. The proposal for this residential initiative was submitted on December 13, 2021. As it undergoes its third re-submittal, the resolution on Pine Grove has remained pending.
Rainbow Groves (Map ID #9)
Currently a historical ranching property, Rainbow Groves is a 245.27-acre property along Range Line Road that has recently had its zoning changed from agricultural to mixed-use development (MXD) by the County’s Planning and Zoning Commission. McCarty & Associates, the current principle planners for the project, envision the property being converted into a massive industrial complex with connections to Florida’s seaport and airport infrastructure via a rail line spur off of the Florida East Coast Railway. Although no definitive plans are available to the public at the moment, current narrative includes a combination of heavy industrial, light industrial, and light industrial/commercial land uses, developed in accordance with a Planned Non-Residential Development (PNRD) agreement.
Silver Oaks, PUD (Map ID #10)
The Silver Oaks PUD is a residential project proposed by the Kolter Group, which proposes the platting 127-acre woodland property. First submitted in February of 2023, the project will feature a total of 316 dwelling units, 82 of while would be single-family and the remaining 234 units would be multi-family units. Construction would be split into three phases, with the multifamily lots being completed in the second and third phases. The current submission is still pending review by the County.
Figure 6. Major Planned


Florida has long beckoned to retirees seeking to spend their golden years in the Sunshine State, but for many the dream of owning a home here was financially impossible. That changed in the 1950s, when what has now become known as the “installment land sales industry” appeared seemingly out of nowhere offering billions of dollars of Florida residential property, sight unseen, to out of state retirees.
For only $10 down and $10 a month, workingclass pensioners could buy a piece of the Sunshine State, a graded home site that would be waiting for them in sprawling exurban communities, which typically had no defined downtown, little industry, and combined boasted millions of residential lots. These communities allowed out-of-state retirees to move to Florida cheaply, but at a price— high-pressure sales tactics often led to fraud, weak urban planning led to sprawl, lack of regulatory oversight led to cleared forests, drained wetlands, and thousands of miles of roads built in grid-like subdivisions. The result was places like Cape Coral, Deltona, Port
The City and County have competing perspectives centered on the adequacy of growth management controls and cost burdens of development activity generally. Under such circumstances, achieving balance between the priorities of the County and the City has been challenging even when situations have yielded some mutually beneficial accommodations. Over the last few years in particular, the County has, at least preliminarily, authorized proposals for development(s) just outside the City’s municipal boundaries, without clear acknowledgment of issues related to the flow of traffic into and through the City, as well as use of facilities intended for, and entirely funded by, property and business owners within the City.
Charlotte, Palm Coast, Port St. John, North Port, Spring Hill, Port LaBelle, and Port St. Lucie. In 1958, General Development Corp., the largest land development company in Florida at the time, bought land between Fort Pierce and Stuart and platted 80,000 lots in a community known as Port St. Lucie. By 1961 250 homes had been built in the River Park area, however when General Development Corp. petitioned the State to incorporate the community, then known as Port. St. Lucie, into a City the residents of the River Park area were resistant to incorporating.
Officially incorporated as the City of Port St. Lucie on April 26, 1961, it was a City without residents as the River Park area was not included in the newly incorporated City and today the River Park area remains outside of the incorporated municipal boundaries of the City of Port St. Lucie. Since incorporation, Port. St. Lucie has grown to be the third most populous city in South Florida, after Miami and Hialeah, and the seventh most populous city in Florida based on 2022 estimates.
These spillover effects experienced by the City’s residents and businesses are not unexpected. Given the significant concentration of people living or working within the City, these effects may be more pronounced since there are fewer and much smaller areas elsewhere in the County competing for population or providing services. Traffic and roadway deficiencies within the City spurred by such development outside the City’s municipal boundaries are typically the most visible issues, but there are also environmental and sustainability concerns. Specific to those points, there is some debate on the timing and adequacy of the utility infrastructure intended to address the scale of proposed development(s) being considered by the County at the City’s edge.
While the County allows package plants or other on-site utility options, these are rarely deemed desirable, performing as substitutes for more environmentally sustainable, sophisticated and integrated system. While on-site alternatives may function adequately for the short term, they are not intended for major concentrations of development long term. Thus far, the common response has been for proposed projects and developments to request connection to and service from the City’s utility system. Historically, the City has entertained such requests, a decision partly justified by state law which allows surcharges to be levied against municipal water, electric, or sewer customers located outside of a municipal boundary. For its part, the County has indicated in their evaluations of development proposals at the City edge that it will expand its own utility systems, though the timeframe and budget for such extension may not be sufficient to satisfy the increasing growth interests driving a more aggressive development pace.
By most standards, the preferred solution to accommodating development would be services secured from the City’s legacy water and wastewater system operating at significantly higher level of performance when compared to on-site systems. That preference is what the Consultant Team understands to be the normal circumstance.
If annexation agreements are not fully settled at the outset, such agreements become prohibitive once a project is then fully developed and connected to utilities. At that point, such projects and their residents have reasonable access to other City facilities that are not being funded by the project within which they reside. As these edge locations become increasingly active and densely settled, they have an increased likelihood of spillover effects beyond the financial operations of the utility system. While the materiality of the spillover is a reasonable concern, the implications may not be given adequate attention by the County. Once a neighborhood is established, it becomes increasingly more difficult to annex. While the materiality of the spillover is a reasonable concern, the implications are seemingly less of a concern or priority of the County.
This is specifically evident based on the County’s evaluation of Oak Ridge Ranches, a major planned development within the Study Area which is described in the previous section. As documented on pages 12–14 of the County’s Planning Division Memorandum (“Memorandum”) dated November 23, 2022, which was presented at the December 6, 2022 County Commission Meeting as part of the transmittal hearing for the Oak Ridge Ranches large scale Comprehensive Plan future land use map amendment, the County allocated $34,200,000 to expand water and wastewater lines, and to construct water/wastewater plants. However, beyond reference to funding allocation for a portion of the necessary funds to construct the above referenced water treatment plants within the County’s 5-year capital improvement program, no timeline is offered in the Memorandum for planning, design, construction, or operational condition of the County’s described $34,200,000 utility expansion. However, page 14 of the Memorandum references the location of Oak Ridge Ranches as being,
…adjacent to the planned water and wastewater connections, adjacent to the ongoing growth areas noted in western Port St. Lucie and extending into the unincorporated St. Lucie County, where public facilities and services including, but not limited to, central water and sewer capacity and roads, are already in place or in the planning stage.
The City promotes a higher level of service for most of its activities or facilities including appearance standards, parks, and public safety. Circumstances and proximity naturally induce non-residents to use these services as a rational response to employment options, location generally, convenience, and desirability. In some cases, there may not even be comparable County funded or financed services available to non-residents. To the extent that these services are accessed by non-residents, even for the briefest of periods, they are subsidized by the City.
There is at least some perception that the fiscal relationship between the City and County is not as balanced as it could or should be. The fiscal relationship does not seem to acknowledge the apparent cost burdens carried by City’s residents, property owners, and businesses, largely to the benefit of the County. While this might occur in almost any part of the State, the share of residents and businesses within a single jurisdiction relative to the County population and work locations gives this observation greater significance here where a single incorporated place, the City of Port St. Lucie, accounts for approximately 65% of the total population of St. Lucie County.
Much attention is focused on traffic and transportation issues but, to emphasize, there are other concerns centered on nontransportation services or facilities provided strictly through the City’s leadership and financial resources. While there may not be full consensus on specific strategies to address these particular or related problems, there seems to be agreement that more sophisticated analysis, tools, and objective advice must become a formal part of the City’s planning and regulatory processes when it comes to evaluating potential annexation of new planned or near-term development.


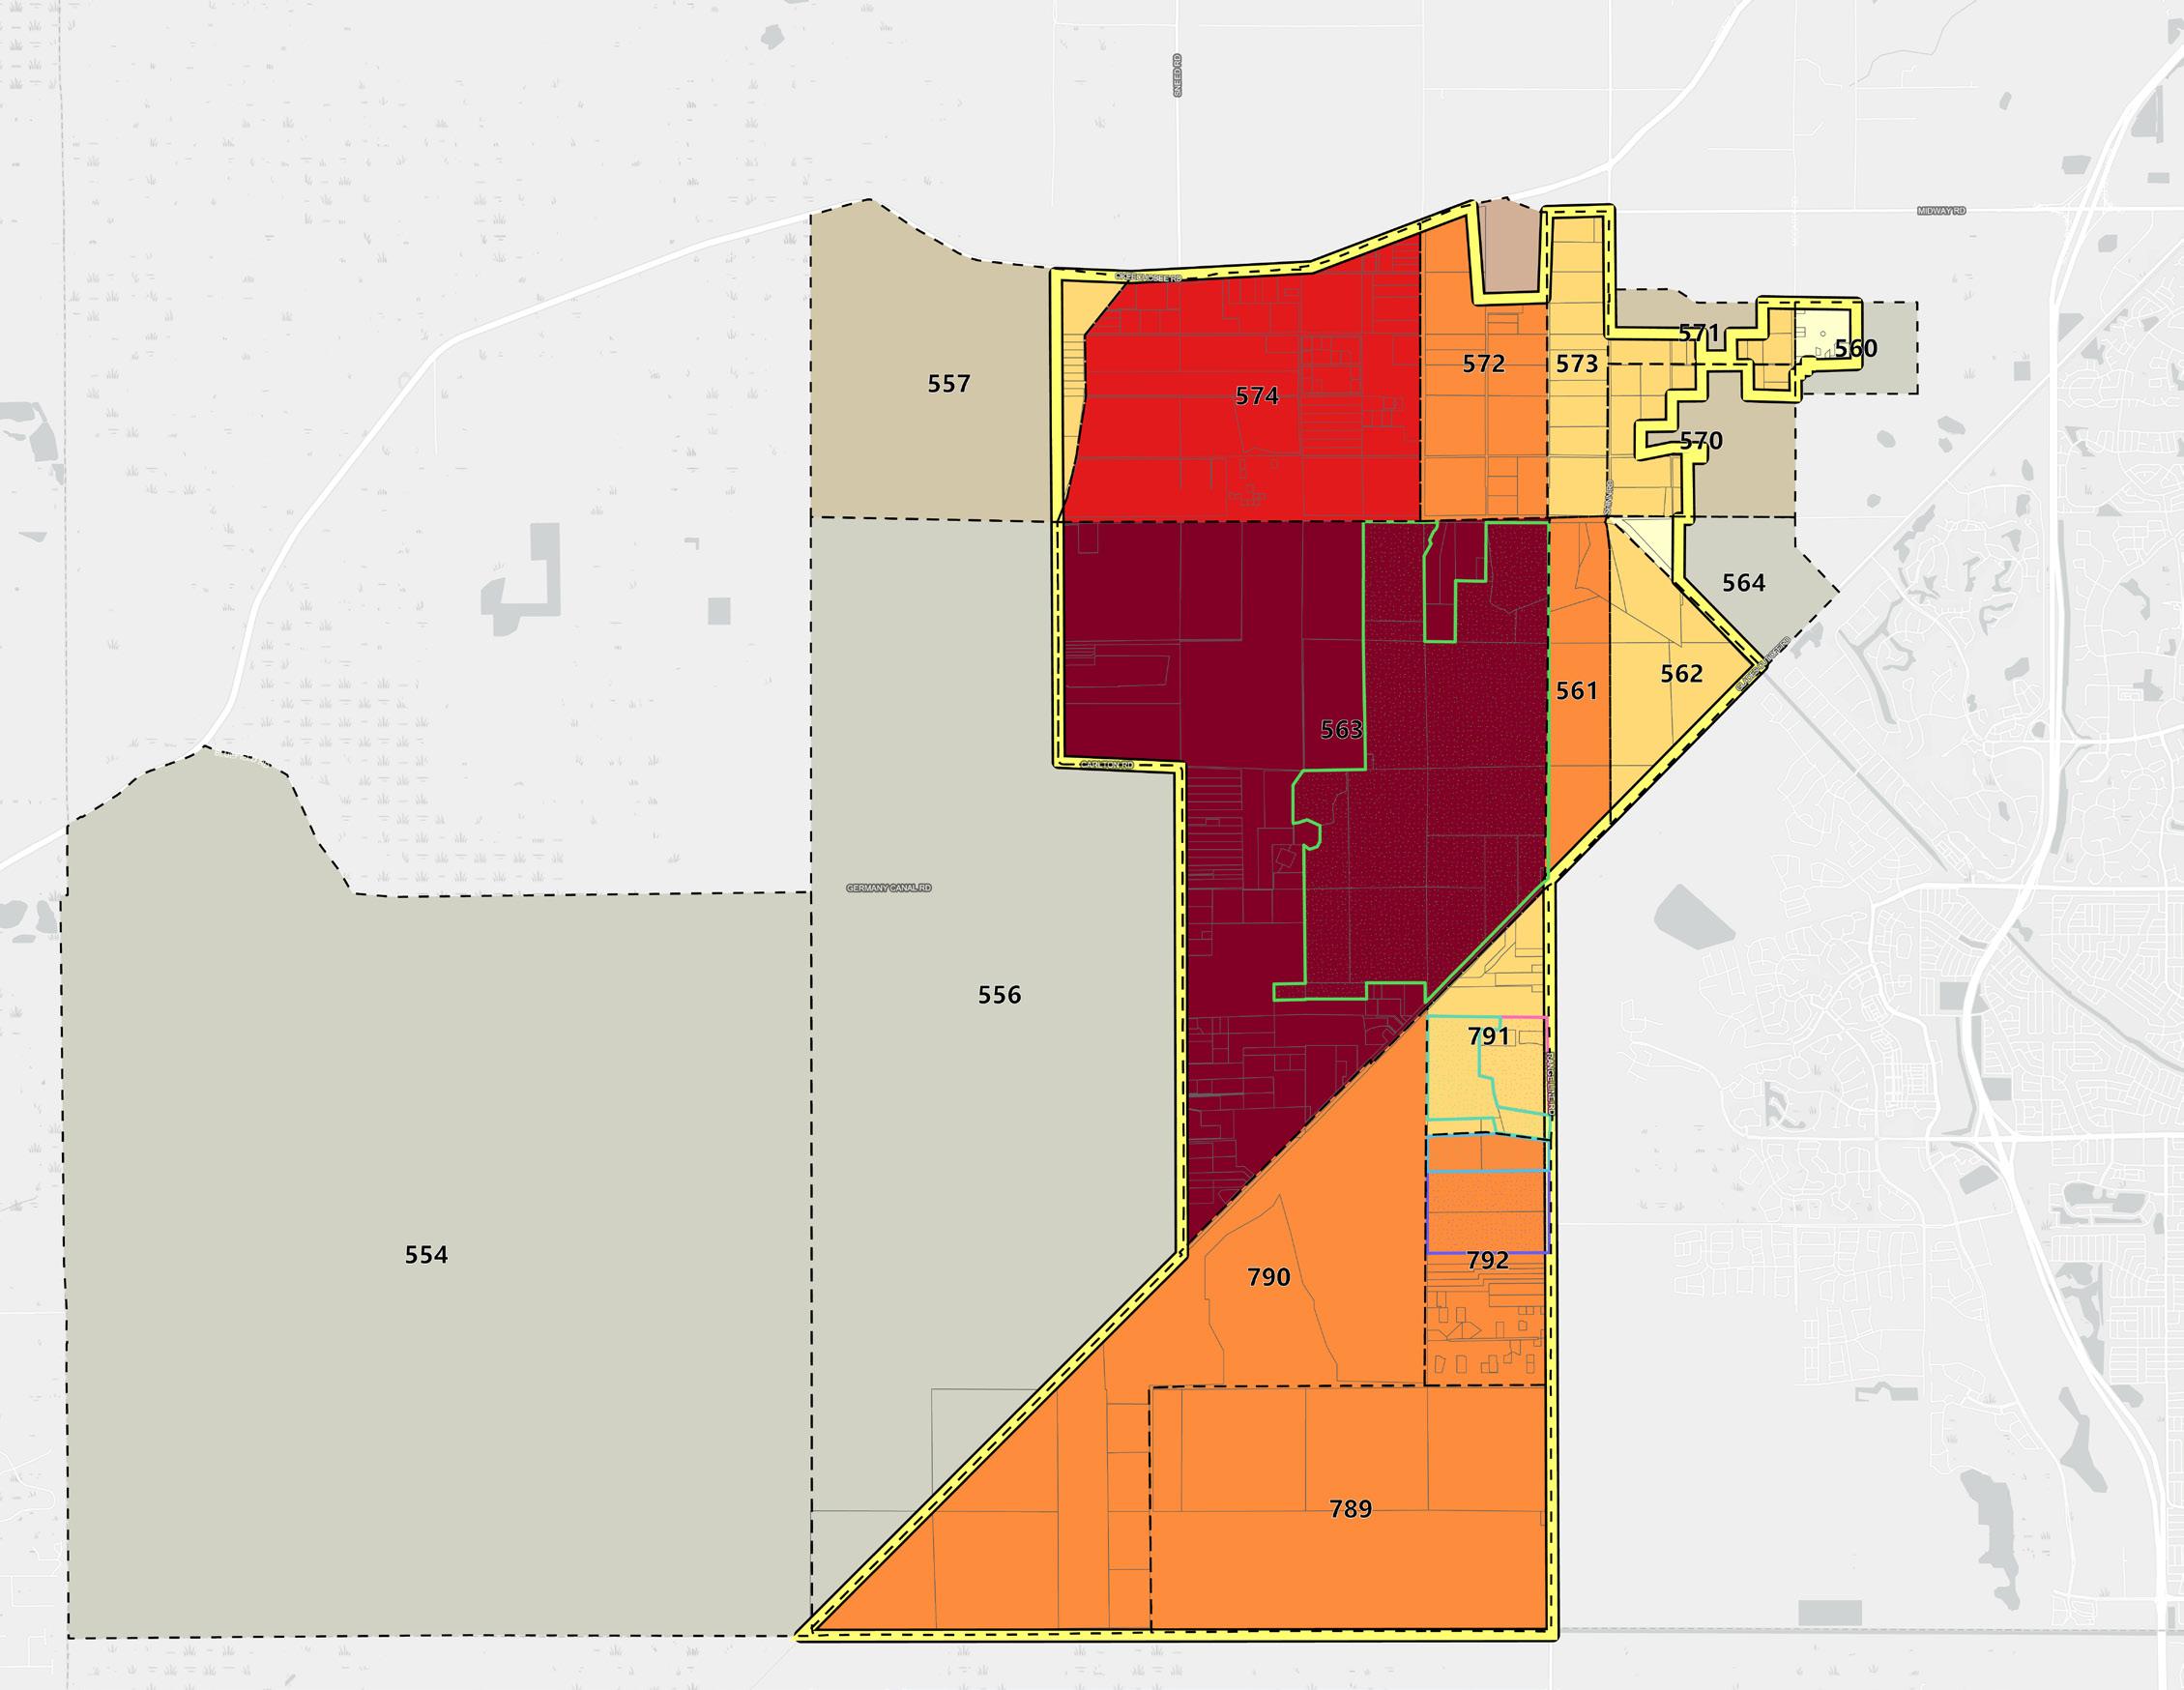
The defined Study Area, generally located west of the City’s existing municipal boundary, is comprised of roughly 30,900 acres which includes approximately 5,100 acres in government ownership restricted for preservation only. The map below illustrates the Study Area as it relates to the City and the broader County (see Figure 7). Other portions of the Study Area are currently improved and operational reducing their likelihood for redevelopment, these include properties developed with light and heavy industrial uses as well as developed residential lots and properties. A significant portion
of the Study Area acreage is currently utilized for agricultural purposes, primarily as “Grazing Land”, which may be well suited for development/redevelopment due to the minimal improvement to the land.
The Study Area, as defined, reflects existing physical constraints created by major roads, currently planned roads, rail lines, canals, and assembled land ownership, and contains adequate lands for future growth or expansion responsibly while also addressing the specific physical considerations and the identified areas of particular interest to the City and County.

Legend
St. Lucie County
City of Port St. Lucie Study Area
City Utility Service Area
Limits
City Utility Service Area
Limits Expansion
City Ownership
County Ownership
Active Development
Projects
Common Ownership (100+ AC)
Based upon the Study Area’s existing land use characteristics three scenarios (Low, Moderate, High) of potential development capacity of the Study Area were created. This range for potential development capacity of the Study Area is instructive in determining the total housing units, population, and employment which might reasonably occur within the Study Area at some point in the future.
▪ High Scenario: assumes roughly 23,900 acres of the Study Area are suitable for development/redevelopment, excluding only existing single-family residential development and government owned lands.
▪ Moderate Scenario: assumes roughly 22,980 acres of the Study Area are suitable for development/redevelopment, excluding the land use types which were excluded in the High Scenario as well as all existing residential development (multi-family, mobile homes, etc.), existing industrial use properties (light manufacturing, heavy industrial, and warehousing/distribution), and other non-agricultural use lands (roads, channels, submerged lands, etc.).
▪ Low Scenario: assumes roughly 18,340 acres of the Study Area are suitable for development/redevelopment, excluding most land use types and only including vacant residential, vacant industrial, agricultural grazing land, non-agricultural acreage, and centrally assessed lands as suitable for development/redevelopment.
The most recent Traffic Analysis Zone (“TAZ”) data indicates that by 2045 the Study Area is projected to contain approximately 10,250 housing units with a total population of approximately 25,600 and reach a total of approximately 1,050 employees. The 2045 TAZ projections equate to roughly 0.37 housing units per acre, 0.92 population per acre, and 0.037 employment per acre. Given the limited amount of development activity that has been fully approved within the Study Area, the 2045 TAZ projections do not seem unreasonable. However, based upon proposed developments being considered by the County within the Study Area and development programs being achieved elsewhere within the region, it is also appropriate to consider densities and intensities
that might be achieved within the Study Area regardless of timeframe or status of proposals/ applications for such development programs.
Therefore, ascertaining potential population, housing units, and employment which might be achieved within the Study Area relied upon aggregated data for larger Development of Regional Impact (“DRI”) project development programs within the region, the City as a whole, and cities similar in total area to the Study Area. The DRI programs are comprised of a total of 18 DRI projects and include the cluster of DRI projects in the City located just west of I-95, and the cities similar in total area to the Study Area include Melbourne, Palm Beach Gardens, St. Petersburg, West Palm Beach. Using the scenarios and aggregated datasets described Table 10 below depicts potential total housing units, population, and employment which might reasonably occur within the Study Area at some point in the future.
Within the developable land in the Study Area, the largest landowner with plans for development is Oak Ridge Ranches LLC, a subsidiary of Kolter Homes, with a total of 16 parcels and 3,257-acres of land. This property is currently slated to include 8,600 single-family homes, 2,000 multi-family units, and up to 650,000 square feet of commercial area. Other notable landowners planning for development within the developable lands of the Study Area include the GT USA and OMBU Ranch Line LLC. The second largest project underway is ‘Sana Vita’, which is a new residential master-planned community presented by GT USA, covering 421-acres and is locally known as Neill Farms. OMBU Ranch Line LLC recently submitted an application to rezone their 236-acre property, also known as Palermo Estates, from its current agricultural zoning to a PUD, as previously identified in the Section 2.6.
Most of the largest property owners within the Study Area are agricultural companies, which have no plans to develop their current properties but could potentially be willing to sell to potential developers if financially advantageous to their individual situation. Some of the largest landowners include Ru-Mar Inc, Southern Fruit Groves Ltd, Evans Properties Inc, and Milk Maid Inc with 1,853-acres, 1,440-acres, 1,418 acres, and 1,360-acres, respectively, as illustrated in Table 11 below. All four of these landowners are agriculture operations, ranging from cattle ranching, orchards, and traditional crop farming.
The largest DOR category designation within the entire Study Area—including developable and non-developable land—is agricultural, composing 80% of the Study Area. Governmental and residential property uses compose 10% and 4%, respectively, of the total acreage within the Study Area. Within the developable portion of the Study Area, about 97% represents agricultural uses including orchard groves, improved agricultural, and farming. The remaining 3% of developable acreage is predominantly residential and miscellaneous property uses.
Within the non-developable portion of the Study Area, composition of DOR designations is more varied across the property use types. The largest DOR category is government land with 39% of the non-developable acreage. A majority of this government land is held within the McCarty Ranch Preserve. Agriculture is the second largest use with the non-developable portion of the Study Area with 29% of the total share, although this acreage is entirely made up of a single 2,254-acre parcel that is designated for livestock grazing and is owned by the City and leased to CMD Cattle. The remaining nondevelopable acreage within the Study Area is divided across miscellaneous, residential, industrial property use designations.
The composition and acreage of the Study Area examined as part of this Study, focused on Department of Revenue (“DOR”) Land Use Codes, as well as the County’s future land use (“FLU”) and zoning designations. The Study Area encompasses a total of 30,898 acres, within which 75% is identified as developable land, amounting to 22,981 acres. This Study breaks down the land by total acres per land use, providing insights into the area’s composition which is further divided into developable and non-developable land uses (see Table 12).
The FLU and zoning are fairly similar within the Study Area—the largest category is AG-5 which refers to agricultural properties of at least 5-acres, which accounts for approximately 84% of the acreage for both FLU and zoning. The second largest category within the Study Area is City Zoning which accounts for 10% of the total land area, and is divided across conservation lands and utilities. Right-of-Way (“ROW”) and public conservation (CPUB) make up the remaining FLU and zoning acreage within the Study Area. The figures on the following page illustrate the FLU and zoning designations within the Study Area (see Figures 8–9).
Legend County Boundary Study Area
AG-5
AG-2.5 CPUB
IND T/U
City-Conservation
City-Utility


Legend County Boundary Study Area
AG-5
AG-2.5 CPUB IH PUD U
City-General Use
To fully understand the potential fiscal impacts, which will be examined in detail in a subsequent section of this Study, that the City might absorb from unincorporated development on its edge, it was necessary to model potential roadway and traffic impacts on major roadways given that transportation related items are almost certainly the most expensive and fiscally strained. Therefore, a travel demand model was prepared for comparison of the 2045 Cost Feasible Plan (“2045 Plan”), adopted by the St. Lucie TPO, roadway network within the City to
identify transportation deficiencies caused by potential occurrence of the moderate scenario within the Study Area, which anticipates approximately 42,320 new housing units and approximately 26,560 new jobs within the Study Area (see Figure 10).
The 2045 Plan network implicitly acknowledges parts or exiting deficiencies and identifies a strategy to address those needs. As a result, those current conditions are not addressed as a part of this forward looking Study.
Boundaries
Development/ Redevelopment Parcels Active
Rainbow Groves Palermo Estates Neill Farm Estates TAZ by Total Population 500 people or less to 3,000 people to 8,000 people to 12,000 people More than 12,000 people Area not included in population count TAZ ID ##
The travel demand model comparison resulted in the identification of roadways with a projected level of service deficiency due to development associated with the moderate development scenario occurring within the
Study Area. The deficient roadway segments stemming from estimates of future growth within the Study Area are summarized in Table 13 and illustrated in Figure 11 below.
13. Deficient Roadway Segments Stemming from Estimates of Future Growth within the Study Area
Roadway Segment From To
1. Commerce Center Dr St Lucie West Blvd Glades Cut-Off Rd
2. Darwin Blvd Becker Rd Paar Dr
3. Gatlin Blvd W OF I-95 E OF I-95 E OF I-95
Savage Blvd
Savage Blvd Rosser Blvd
Rosser Blvd
Savona Blvd
4. Tradition Pkwy
Savona Blvd
Port St Lucie Blvd
Town Park Ave SW Community Blvd Village Pkwy W of I-95
5. Crosstown Pkwy Village Pkwy Publix
6. Glades Cut-Off Rd
Commerce Center Dr Midway Rd
Carlton Rd 0.5 Mile SW
Range Line Rd
Reserve Blvd
Reserve Blvd
Commerce Center Dr
7. Graham Rd Kings Hwy Jenkins Rd
8. Midway Rd Okeechobee Rd Shinn Rd
9. Okeechobee Rd McNeil Rd Virginia Ave
10. Prima Vista Blvd Naranja Ave Rio Mar Dr
11. Shinn Rd Midway Rd Okeechobee Rd
12. U.S. Highway-1 St Lucie Blvd 25TH St 25TH St Indrio Rd
Legend City Boundary Traffic Decrease above 5% Future Development Initiated LOS Failure
Roadway Network Future Development TAZ

Going into the future, there are a number of methods to address the above-described deficiencies stemming from the estimates of future growth within the Study Area associated with the Moderate Scenario, including: roadway widening, construction of parallel roadways, construction of new interchanges, or parallel roadway improvements. To determine the fiscal impacts of these roadway deficiencies stemming from the estimates of future growth within the Study Area, it is first necessary to evaluate the Theoretical Transportation Cost estimates to cure the deficiencies presented in Table 13 and Figure 10 at a planning level based solely on widening each roadway. These and related table(s) show cost by roadway segments for reference purposes. All together about 40% of the total estimated Theoretical Transportation Cost estimates and 48% of the roadway segments identified are related to City owned and operated roadways.
To conduct this evaluation, the historical cost per mile models from the Florida Department of Transportation (“FDOT’) were utilized. The cost per mile models that were selected were for widening from two-to-four lanes, four-to-six lanes, and six-to-eight lanes. Each unit cost per mile was then adjusted to include design, construction inspection, signalization, and right-of-way, as reflected in the Theoretical Roadway Cost Evaluation Subtotals table on the following page (see Table 14).
The following 2023 FDOT historical cost per mile models were selected for use:
▪ Widen 2 Lane Urban Arterial to 4 Lane Divided with 22’ Median, 4’ Bike Lanes: $9,817,228.43.
▪ Widen 4 Lane Urban Divided Arterial to 6 Lane Urban Divided with 22’ Median and 4’ Bike Lanes: $8,699,933.80.
▪ Widen 6 Lane Urban Divided Arterial to 8 Lane Urban Divided with 4’ Bike Lanes: $10,420,188.03.
Signalization–A number of adjustments to existing traffic signals and the construction of new traffic signals will be needed to accommodate the widening of each roadway. The cost per mile models do not
account for signalization. Thus, an assumed $500,000 per mile adjustment was added to each of the models to account for signalization. Actual signalization costs will vary.
Design and Construction Engineering Inspection (“CEI”)–Fifteen percent (15%) for design and fifteen percent 15% for CEI were assumed to be added onto the construction costs (widening and signalization). These rates are typical for planning level estimates. Actual design and CEI costs will vary.

The cost of right of way varies significantly for a number of reasons including, but not be limited to, adjacent land use, dimension of the right of way needed, and property values. Because of these variables, this Study estimated low-, moderate-, and high-ranges for the right of way component of each improvement cost as follows:

For the purposes of this theoretical cost exercise, it was assumed that 24 feet of rightof-way would be needed to accommodate the additional two lanes. Actual right-ofway needs will vary. Right-of-way costs are summarized in Table 15 below. The roadway
costs and right-of-way costs were then combined to evaluate the low, moderate, and high-range costs for correcting the deficient roadways. The total transportation costs are summarized in Table 16 on the following page.

1. Commerce Center Dr
4.
[ THIS PAGE INTENTIONALLY LEFT BLANK ]

This Study applies a proprietary fiscal model which considers a combination of current and longer term operating and capital expenditures. The fiscal model reflects the City’s own financial statements and Annual Comprehensive Financial Report (“ACFR”) as detailed in Section 5.3. As the fiscal model is populated, benchmark and peer communities and their experiences can be valuable reference points, especially if the information deviates substantially from that expected by the fiscal model.
In the present case, a group of benchmark and peer communities were identified for purposes of making certain comparisons. These cities or communities are indicative of the City’s size and character today, as well as the potential size and character if the City were to expand to include the Study Area
While not an exact science, financial benchmarking is a rational means for a city to evaluate its financial obligations relative to other communities of similar density, service area, and population. Despite different service levels among communities, some focus on the cost of services and average expenditures for capital needs, identifying specific figures that might need to be addressed or affirming certain spending decisions.
For the purposes of this Study, Tallahassee, Cape Coral, Lakeland, and Gainesville (“Benchmark Cities”) were examined as part of this financial benchmarking exercise. The Benchmark Cities were selected based on their physical and demographic likeness to the City’s existing municipal boundaries. More specifically, the emphasis of comparison focused on total population and population density as they relate to the City, as illustrated in Table 17 on the following page.
within its municipal boundaries. All together, seven cities were identified as possible points of comparison and, if needed, adjustments. Generally speaking, the City’s current and future expenditures for services and most obligations, net of major transportation costs, align with the experiences of its comparative group. However, these generally favorable future fiscal relationships and comparisons may be challenged by the magnitude of transportation costs associated with extensive new development which could reasonably occur within the Study Area.
In any case, the analysis illustrates that regardless of the challenges confronting the City, a variety of policy and planning tools exist to mitigate a significant portion of the potential financial burden.
In addition, several peer communities are identified which have a population and service area comparable to that expected of the City and the Study Area combined, should the latter be embraced largely as an additional area directly controlled by the City through annexation, joint agreements, or other mechanisms. These peer cities include Orlando, Tampa, and St. Petersburg (“Peer Cities”), and should be view as a possible future or after condition.
Table 17. Benchmark and Peer Cities Profile
To provide further context, the observed Fiscal Year (“FY”) 2022 Millage Rate for the City, as well as the Benchmark and Peer Cities, were examined as part of this financial benchmarking exercise. Amongst all observed municipalities, the City maintained a millage rate of 5.3000, the second lowest of all observed municipalities, as illustrated in Table 18
context of comparable municipalities while providing an overview of the revenue(s) and expenditure(s) which will inform a subsequent fiscal impact analysis. To emphasize, the fiscal activity reported primarily reflects revenues from ad valorem property taxes and other receipts which accrue to the benefit and the use of each municipality offsetting the costs of general governmental and businesstype services provided by the respective municipality itself.
For this exercise, a modified per capita approach was used to determine potential operating and capital costs using projected population, expected employment, and the expected relationships between households and individuals working in their place of residence versus working in another area.
This method utilizes a Full-Time Equivalent (“FTE”) approach since that population imposes demands upon all systems relative to its needs. Using this modified per capita method, expected population (household population, establishment employment, and visitors) are converted to an FTE using a 24-hour and 7-day period representing a “full-time” person impacting potential demands for the operating and capital needs.
Thus, a person residing in a home located in the City and working at a business located in the City would represent a full-time person or 1.0 FTE. Whereas someone residing in a home located in the City and working outside would represent less than a full-time person or 0.74 FTE, as illustrated in Table 19.
ACFR;
This financial benchmarking exercise examines the revenues and expenditures stemming from governmental and business-type activities within the City and each of the Benchmark Cities utilizing each municipality’s respective 2022 ACFR. The purpose of this financial benchmarking exercise is to illustrate the City’s existing operating position in the
Sources: U.S. Census Bureau; GAI Consultants.
This analysis is not a reconciliation of funds and fund balances, but simply an estimate of annual net revenues/expenditures for governmental and business-type activities for planning purposes.
FTE population is intended to reflect the annual, permanent demands on services and infrastructure as opposed to peak demands. As a result, the estimated FTE factor for nonresident workers or visitors declines based on the assumed time spent within a community relative to a resident that both works and lives in a city—theoretically creating a full unit of demand for annual, permanent services and infrastructure.
The FTE population model indirectly accounts for seasonal populations that are different from hotel and day-visitors, which also occur on a seasonal basis. Seasonal residency, which is often referred to as “snowbirds”, is a common factor in the difference between population per housing unit and population per occupied housing units.
One of the most important benefits of a modified per capita approach which utilizes FTE population is that revenues and expenses do not need to be allocated between residential and non-residential uses. The sum of FTE population reflects a common factor with which revenues and costs can be divided and applied back to specific uses based on the underlying population (household population, establishment employment, and visitors).
The following table illustrates the estimated FTE population for the City and the Benchmark Cities based on what the municipalities are currently experiencing in total population, establishment employment, and annual visitors (see Table 20).
This financial benchmarking exercise reflects spending only for governmental and businesstype activities (i.e., expenses and revenues) on a per FTE basis for the City as well as the Benchmark Cities. Governmental and business-type activities have been split into the following sub-categories as they relate to each municipality’s respective 2022 ACFRs:
▪ Governmental Activities: General Government, Public Safety, Physical Environment, Transportation, Economic Environment, Human Services, Culture and Recreation, and Interest on Long-Term Debt.
▪ Business-Type Activities: Utilities and Other due to the various assortment of business endeavors associated with each municipality.
To note, the City is not a provider of Fire Services, which is represented in the Public Safety sub-category. In order to accommodate for this discrepancy, Fire Services has been removed from this sub-category within each of the Benchmark Cities’ Public Safety category where data is available. The addition of Fire Services may result in a corresponding increase in expenditure per FTE for Public Safety.
In addition, capital costs—one-time expenses incurred on the purchase of land, buildings, construction, or equipment—were excluded from this benchmarking exercise specifically to illustrate the City’s current revenue and expenditures for governmental and businesstype activities stemming directly from their current financial position.
The table below illustrates the City’s total operating expenses and general revenues on a per FTE basis compared to the operational spending of the Benchmark Cities. As reflected in Table 21, total operating expenses per FTE for the City as of FY 2022 were $1,154, reflecting spending of $817 for governmental activities and $337 for business-type activities. Attempting to off-set total operating expenditures, the City’s current revenue
sources contributed an average of $714 per FTE. Revenue sources are primarily driven by ad valorem and other taxes, in addition to other miscellaneous revenues and net income transfers into the general fund to subsidize governmental activities. As a result, the City is currently operating with a net expense of $440 per FTE for all governmental and business-type activities, which is significantly lower than all the Benchmark Cities using the same methodology.
The fiscal impact analysis within this Study is based on a series of major assumptions tied to the nature of the proposed development within the Study Area. At this point, the development within the Study Area is expected to achieve pricing and valuations of newer, comparable properties located in the City, specifically within the Tradition CDD. However, much of the outcome realized as a fiscal impact is not directly controlled by the development within the Study Area and is subsequently a result of the final tax treatment of key properties.
The manner of that tax treatment drives the receipts in large measure and is often not proportionate to the perceived value of the underlying property. This issue is more common in the initial years of a newer and higher priced project where the St. Lucie County Property Appraiser is limited by the pool of transactions needed to establish a defensible benchmark for taxable values.
Typically, it takes multiple transactions to establish that pool and identify a “trend”. In this situation, the proposed development within the Study Area may set its own foundation for tax valuation purposes but that will not occur for at least several appraisal cycles. These figures, whatever they may ultimately be, are in some cases further affected by other exemptions, portability rules, and maximum annual valuation increases for all properties.
To deal with the various material considerations associated with achieving a longer-term fiscal outcome, a high, moderate, and low (“H-M-L”) fiscal model has been prepared. The H-M-L fiscal model outlines assumptions that underlie anticipated revenues likely to accrue to the City as a result of various development scenarios of the Study Area at full build-out, as detailed on the subsequent pages.
▪ High Scenario is consistent with, and relies upon, the high scenario of population, housing units, and employment projections for the Study Area. This scenario reflects full build-out of the largest development program is achieved within the Study Area—equating to approximately 44,045 housing units, 760 hotel rooms, and 18.3 million square feet of commercial development (i.e., industrial/flex space, retail/restaurant, office, health care, and other non-residential properties). While this development scenario may be achieved, the number of properties within the City reflecting this scale of concentrated development is small and does not justify an obvious trend or outlook.
▪ Moderate Scenario is consistent with, and relies upon, the moderate scenario of population, housing units, and employment projections for the Study Area. This scenario would result in approximately 42,320 housing units, 730 hotel rooms, and 17.5 million square feet of commercial development constructed within the Study Area. Generally, the Consultant Team believe this scenario represents the development program in which the Study Area is “most likely” to achieve.
▪ Low Scenario is consistent with, and relies upon, the low scenario of population, housing units, and employment projections for the Study Area. This scenario reflects the full-build out scenario resulting in approximately 33,780 housing units, 580 hotel rooms, and 14.0 million square feet of commercial development constructed within the Study Area. The Consultant Team believes the low scenario to be the most conservative development program of the Study Area.
The following details the major assumptions and summary comments utilized within the fiscal impact analysis:
▪ While there are many considerations in this fiscal impact analysis, most costs shown here are exclusively obligations of the City itself. Other taxing authorities, apart from the City, may have other costs or receipts which are worthy of additional consideration and discussion.
▪ The H-M-L scenarios of the proposed development program within the Study Area could yield an estimated taxable value of about $10.1 million to $13.1 million, in 2022 dollars, based on average taxable values reported within the City.
▪ Using a fiscal impact methodology covering both potential of the City’s generalgovernment operating and capital costs needed to support the build-out of the H-M-L proposed development program scenarios, it is estimated that the Study Area could contribute an annual fiscal surplus to the City of between approximately $44.8 million and $58.4 million, as illustrated in Table 22 below. This equates to between about $904.5 million to $1.18 billion over 20 years.
▪ These figures reflect an estimated Full-Time Equivalent (“FTE”) population of between 71,320 and 92,990 persons based on the H-M-L development scenarios for the Study Area.
▪ At full build-out, the Study Area is expected to contribute a taxable value per FTE of $141,070, a significantly higher ratio of property value per FTE compared with the City average.
▪ Sources for prior revenue and expenditure relationships were obtained from the City’s FY 2022 ACFR. Using audited financial statements, operating needs have been based on FY 2022 actual spending.
▪ The approach to fiscal impacts recognizes the importance of excluding existing deficiencies in calculating capital costs since this would impose an unfair burden on new households. As a result, this fiscal impact analysis excludes any existing capacity in capital infrastructure by assuming new FTE population generated by the Study Area would require the same level of capital spending to replace “everything” the City has constructed.
In comparison, this fiscal impact analysis indicates that the balance of the City currently operates at a fiscal surplus of approximately $14.3 million annually without considering the proposed development program of the Study Area or its costs and benefits. As contemplated, the Study Area will positively contribute to the existing fiscal surplus within the City going forward.
Potential fiscal benefits center on the public revenues and public costs expected to be realized (or lost) as the result of activities, generally originating from new residential or non-residential development or from other economic development initiatives. Calculations of potential fiscal benefits could rationally include both direct and indirect impacts for multiple levels of public goods and services. The analysis of the Study Area, however, is more conservative. It is purposefully confined to the direct effects only in the City to avoid misrepresentations about net impacts to municipalities, agencies, or special districts.
Methods for calculating fiscal impacts can vary widely. While there is no industry standard, a common approach reflects activities, receipts, and expenditures “per capita”. The premise in this approach is that new development attracts new population growth and will generally have a consistent cost impact on the basis of public service needs per person.
Following that premise, new development, at a basic level, is expected to generate costs (and most revenues) at the same rate, creating the same levels of service needs being provided to existing residents. Reasonable rates of revenues and costs can be derived for any governmental agency using a per capita measure as the common denominator and existing costs and revenues. In contrast, to assume that new development creates more or less requirements than those imposed by current residents constitutes an obvious positional bias in the information used to make important policy decisions.
As previously referenced, a modified per capita approach was used to determine potential operating and capital costs using projected population, expected employment, and the expected relationships between households and individuals working in their place of residence versus working in another area. This method can still be referred to as a per capita approach, but it uses an FTE population since that population imposes demands upon all systems relative to its needs.
FTE population is intended to reflect the annual, permanent demands on services and infrastructure as opposed to peak demands. The following table illustrates the estimated FTE population for the City and the Study Area based on the H-M-L development scenarios (see Table 23).
Although the financial benchmarking exercise considered business-type activities in examining the net revenues and expenses of the City compared to the other Benchmark Cities, our approach to fiscal impact analyses treats business-type activities as a net transfer Since these activities are generally profit centers and, in theory, run like a business where prices (water rates) are set to meet or exceed operating and capital, a majority of these types of activities provide a net income transfer, reimbursement, or payment into the general fund to offset costs of governmental activities, reimburse for central supplies, or other related activities. The fact is that when a utility system issues debt to fund capital, it is generally required to set utility rates to generate 1.25 to 2.00 times more operating income than annual debt service.
Since average service lines are the costliest components of a system and extend well beyond debt payments, the structure of rates and charges relative to expenses typically creates significant positive cash flow annually. Also, any capital requirements to meet new
Providing public sector services and infrastructure is accomplished on the basis of not-for-profit management of economic and financial resources. Each year, governmental agencies or organizations prepare for meeting service and capital needs with a budget that balances revenues and spending. In other words, allowable annual spending equals expected revenues. In the context of legal constraints to spending, most local governments operate well below what is allowed. The annual budgets adopted do not reflect expected income (profit or losses) in the same way as for-profit enterprises.
The annual budgetary process can make understanding the marginal impacts of new population or new development a challenge. The main challenges are the use of transfers between funds to accommodate “fund
water and sewer demand is generally funded 100% with connection fees and/or water and sewer impact fees because those fees are calculated at full cost of service requirements, unlike many other impact fees or capital charges.
It is prudent for local governments to transfer some excess cash into general government activities as a payment-in-lieu-of-taxes. If utility services were provided by a private company, the City would be allowed to generate revenues through franchise fees on those services, so a transfer accomplishes the same thing. Thus, this analysis includes this net transfer as a revenue off-set after calculating incremental governmental expenses required to serve a new development. In the rare case where general-government activities subsidize a business-type activity, it is still included with revenues, but it would reflect a deduction in general revenues. The rationale is that it is reasonable to assume that new development will generate the same excess (or deficit) water and sewer revenues on a per capita basis as existing development.
accounting” reporting, the use of cash balances in funds as revenues and cash forward as expenses to balance the budget, the recognition of capital as an expense in the year funds are expended, and the recognition of debt proceeds as revenue to also balance capital expenditures. The budgetary process is “cash-basis” accounting.
In addition, every governmental organization in the U.S. prepares a ACFR. While the formats and contents can vary slightly, these reports present the financial statements of the governmental entity, as well as important analysis tools like the management’s discussion and analysis (“MD&A”) and the notes to the financial statements similar to private industry. ACFRs present financial information of accounts for the financial position of the government as a whole. Governments
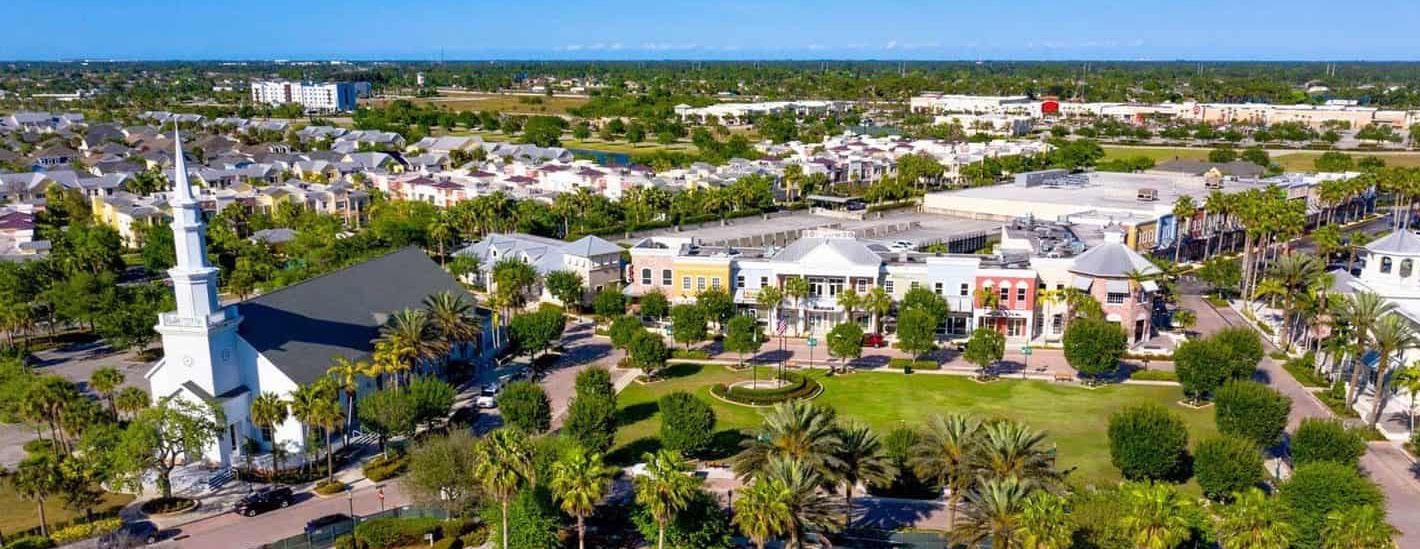
use modified accrual accounting for their statements in the ACFR and include reconciliations explaining how they made the switch from cash-basis accounting to the modified accrual basis they report.
Most importantly, governments are required to present their consolidated financial statements in the ACFR that essentially mirror for-profit financial statements. In particular, the Statement of Activities for a not-for-profit organization is equivalent to an Income Statement for a for-profit enterprise. The main difference is the treatment of capital infrastructure and equipment. On a cashbasis, capital costs are recognized within the year funds are expended. For example, if the City spends funds to build a new City government office in 2023, that expense is a capital item in the same year and it is generally funded through some combination of current revenues, existing cash balances and debt proceeds, or exclusively with debt proceeds. As a result, the cash-basis is faulty because it places the burden of past and future capital needs, funded using past and future revenues, in a single current fiscal period.
Conversely, the Statement of Activities only recognizes current revenues and accounts for capital on a depreciation and amortization basis—matching capital spending with the life cycle of the asset. This fiscal impact analysis utilizes these Governmental Statements of Activities to correct for the challenges associated with governmental budgeting and fund accounting, especially capital spending which can otherwise materially ebb and flow
on an annual basis. Our position is that the reported revenues and expenses, divided by FTE population, provide the best measure of the marginal impacts from new development and new population given the existing financial structure of the City.
Capital expenditures in this fiscal impact analysis are reflected in terms of depreciation and amortizations versus capital requirements (previously referenced in the financial benchmarking section), and are consistent with the Statement of Activities in the ACFR. This approach more appropriately aligns cost with the life cycle of assets. For example, a building built by the City 30-years ago that is still serving the community today would still be accounted for in this analysis because its average service life is generally 50 years or more. However, the capital expenditure for that building would not be recognized, especially if its debt is paid off.
Based on Fiscal Year (“FY”) 2022 audited financial statements from the City’s ACFR and expected property valuation for the H-M-L development scenarios of the Study Area, the table on the following page details the Study Area’s expected net fiscal impact compared to that of the City. In FY 2022, all general government activity within the City reflected an average cost per FTE of $655, including annual capital expenditures of $130 per FTE. Attempting to off-set total operating and capital costs, the current revenue sources contributed an average of $714 per FTE. As a result, the City currently has a slight fiscal surplus of $59 per FTE or approximately $14.3 million annually.
It is important to note that this calculated surplus is based on modified accrual accounting versus cash-basis accounting, therefore the City is not gaining $14.3 million each year on a cash-basis. Given the current levels of spending including interest costs and annual capital requirements, current revenues through taxes, charges, and fees meet current spending in FY 2022. This is the current basis from which types of new development will be measured using assumptions for FTE population and various ad valorem revenues models. In addition, this calculation of net fiscal impact excludes costs from future transportation related activities, which is further detailed in Section 5.4.
Comparatively, the Study Area is expected to create an expense of $498 (operating and capital) per FTE per year in each of the fiscal impact scenarios, significant property
tax contributions of $719 per FTE, along with direct and other revenues, more than off-set those costs and create a significant net fiscal surplus per FTE per year of $628—equating to a total net fiscal surplus of $44.8 million in the low scenario, $56.1 million in the moderate, or “most-likely” scenario, and $58.4 million in the high scenario (see Table 24).
At any calculated level, a municipality can function with a deficit by drawing from existing balances or using debt, and at the same time adopting balanced budgets where expenditures equal revenues. In particular, this analysis is not a substitute for discrete departmental budgeting. More accurately, it is an estimate of the net fiscal impact from current activities which can generate positive or negative cash flow.
Table 24. FY 2022 Net Fiscal Position, City of Port St. Lucie and the Study Area
Net Revenues
Both market forces and Florida Tax Law suggests that the significant gap created in taxable values per capita from new development compared with existing averages is a strong factor in positive fiscal impact from new development. In addition, this gap can be even more pronounced within areas of redevelopment where existing conditions are driven by both age and a relatively depressed market.
Under the premise that existing households would require no more or no less operating and capital needs than those households proposed within the Study Area, this observed relationship between property value and yearbuilt implies a significant positive fiscal impact from the newly developed property. The fiscal impact analysis within this Study also includes a relatively conservative approach to estimating capital requirements for new development. As previously referenced, this approach excludes any existing capacity in capital infrastructure by assuming new FTE population would require the same level of capital spending to replace everything the City has constructed. This method takes all capital assets at original costs in 2022 dollars, as illustrated in Table 25 below.
Based on replacing all capital assets in 2022 dollars, new FTEs would be expected to generate capital needs of $4,570 per FTE. As a comparison to the Benchmark and Peer Cities previously identified in the prior section, Table 26 illustrates the City’s capital requirement per FTE compared with those of the Benchmark and Peer Cities.
As previously stated, the City is not a provider of Fire Services, which is included within the capital expenditures reflected for the Benchmark and Peer Cities of who contain Fire Services. As illustrated in the following table, the capital requirements existing today within the City are predominantly higher than the majority of the other comparable jurisdictions.
It is important to exclude existing deficiencies in calculating capital costs since this would impose an unfair burden on new households. In part, to the degree there are differences, these would be addressed by impact fees which can only apply to new development and capital. Prior, existing, and/or emerging transportation network or system deficiencies, in particular, are obligations which are already called for, stipulated, or officially adopted in major plans, including any long-range transportation plans.
In addition, the table on the following page illustrates the Study Area’s estimated annual capital expense at full build-out on a per FTE basis and as a total for each of the H-M-L development scenarios (see Table 27).
To note, total impact fees for the Study Area were estimated by applying the H-M-L development program to an average rate as provided in the City’s Mobility and Impact Fee Annual FY 2023 Report, as well as the County’s FY 2023 Impact Fee Rate Schedule which a portion of those fees are returned back to the City. Capital costs related to Theoretical Transportation Cost estimates were not included in the calculation of the Study Area’s annual capital expenses depicted on the following page.
Net capital requirements after deduction of impact fees paid to the City results in a net capital requirement of $425 per FTE. Assuming debt service over 30 years and a
4.5% interest results in an annual impact of $26 per FTE, which has been accounted for in the operating and capital costs previously detailed in Table 24.
Table 27. Calculation of the Study Area’s Annual Capital Expense
Multiple fiscal modeling scenarios were prepared to isolate how varying levels of development and population growth could impact the City’s financial position. In these models, the Theoretical Total Transportation Cost estimates and related activities were isolated from other City services and facilities because of the magnitude of these Theoretical Total Transportation Costs stemming directly from extensive new development which could reasonably occur within the Study Area.
This fiscal impact analysis, in its entirety, supports several conclusions. The most obvious is the City currently manages its fiscal responsibilities well for a community of its size and composition based on prior spending. City spending for almost any category of service, program, or facility—including some level of capital and operating expenditures for transportation needs—falls in line with benchmarks from other communities.
Going forward, under the assumptions used within the fiscal impact analysis, it is quite likely that additional residential and non-residential development brought into the City through growth management or annexation practices will significantly enhance the City’s fiscal position. This improved position occurs because the City should receive more substantive ad valorem receipts and other fees or revenues from newly included development, having a
taxable value well above the current City-wide average value. The fiscal model suggests costs in the future, net of these major additional transportation costs, would equate to a fiscal surplus of $56,137,000 stemming from the Study Area’s moderate development scenario.
However, once the magnitude of the Theoretical Total Transportation Cost estimates and related obligations are considered, the data indicates the potential of a substantial impact on the fiscal outcomes achieved in the City. The following sub-sections illustrate how the City’s fiscal position would be impacted if the Study Area were to be developed as described and remain unincorporated.
In addition, the following sub-sections also illustrate how Theoretical Total Transportation Cost estimates of (1) all deficient roadway segments, and (2) only the City-owned deficient roadway segments, could impact the City’s fiscal position. To note, deficient roadway segments stemming from estimates of future growth within the Study Area and Theoretical Total Transportation Cost estimates are previously detailed in Table 13 and Table 16, respectively, within Section 4.4.
If the City decides not to consider or accept requests for voluntary annexation from
proposed development(s) and/or projects within the Study Area, the City’s roadways would still be impacted if and when any of the development contemplated within the Study Area is realized. As a result, the City would be obligated to fund the transportation-related capital costs to City-owned roadways affected by future growth within the Study Area through the City’s general fund exclusively since the City would not be accruing any impacts fees to offset transportation-related costs to Cityowned roadways stemming from future growth within the Study Area.
Applying a range of Theoretical Total Transportation Cost estimates for only the Cityowned deficient roadway segments, stemming from estimates of future growth within the Study Area, to the City’s current fiscal position, excluding any impact fees, the low ($175.9 million), moderate ($228.8 million), and the high ($281.7 million) Theoretical Total Transportation Cost estimates would cause the City’s fiscal position to decline—becoming negative if all of these Theoretical Total Transportation Cost estimates for only City-owned deficient roadway segments are funded by the City’s general fund. In this example, the City would experience a net fiscal deficit between $29,528,000 and $39,708,000.
Assuming the City decides to accept or otherwise favorably consider requests for voluntary annexation from proposed developments and/or projects within the Study Area, applying the range of Theoretical Total Transportation Cost estimates for all of the deficient roadway segments, stemming from estimates of future growth within the Study Area, to the moderate fiscal impact model, the low ($444.5 million), moderate ($579.9 million), and high ($715.4 million) Theoretical Total Transportation Cost estimates would maintain the City’s positive fiscal position— resulting in a net fiscal surplus of the Study Area between $12,117,000 and $28,747,000. The higher range of Theoretical Total Transportation Cost estimates include the maximum cost of road improvements, including lane additions, signalization, and potential acquisition of rightsof way as previously described in Section 4.4.
Assuming the City decides to accept or otherwise favorably consider requests for voluntary annexation from proposed developments and/or projects within the Study Area, applying a range of Theoretical Total Transportation Cost estimates for only the Cityowned deficient roadway segments, stemming from estimates of future growth within the Study Area, to the moderate fiscal impact model, the low ($175.9 million), moderate ($228.8 million), and the high ($281.7million) Theoretical Total Transportation Cost estimates would maintain the City’s positive fiscal position—resulting in a net fiscal surplus of the Study Area between $38,747,000 and $48,917,000.
Unless all, or most of, the transportationrelated capital costs stemming from estimates of future growth within the Study Area can be placed onto new development itself in some way, through policy action and/ or with improved relations with the County, the City’s financial position could, and likely would, begin to erode. Regardless of the development scenario embraced for policy purposes, it is evident that the Study Area at full built-out, net of transportation-related capital costs stemming from estimates of future growth within the Study Area which could reasonably occur will generate very high levels of receipts in either of the H-M-L development program scenarios. These receipts could be well above those produced by other properties on average in the City, assuming the development program(s) are achieved as estimated or described.
Having made the above observation, a variety of policy recommendations and planning tools are available for the City’s use to mitigate a significant portion of the potential financial burden associated with the potential transportation-related capital costs and development stemming from estimates of future growth within the Study Area. These policy recommendations and additional planning tools are further illustrated in the following section of this Study.

It has been concluded in the course of this Study that the City is and likely will continue absorbing more than its fair share of the capital and operating costs created by development occurring at the unincorporated edges of the City. With or without direct intervention from the City, the interest in converting lands, historically available for agricultural and lesser intense purposes, to higher value residential and similar uses will continue. With that interest or pressure likely to grow along with the region’s population, the nature of services and facilities provided by the City will be attractive to developers targeting properties within the adjacent southern and western portions of the County, as well as non-City residents, businesses, and property owners in the unincorporated County who may not have access to similar options within the County or within their own development projects. Absent some level of favorable consideration of requests for voluntary annexation, a
material share of the capital and operational costs of those services will be carried by the City without the benefit of the revenue to pay those costs. As shown in the prior section, most service costs could be absorbed in the future. The value of new development would likely improve the City’s financial capabilities. However, the burden of transportation-related capital costs stemming from estimates of future growth within the Study Area alone would likely have a deleterious effect on the City’s fiscal position if they were to absorb those costs, as described in the prior section.
The table below and continued on the following page summarizes several available policy responses, including a description of what is likely to occur with no intervention from the City, compared with modest or more aggressive action (see Table 28). Thematically, the benefits and cost or risks described in this Study are summarized along the subsequent pages.
Option 1: No Acceptance of Voluntary Annexation requests within Study Area
▪ Limited ‘appetite’ to expand City to include more development potential.
▪ Existing resident perception that growth is already too much in existing City—traffic congestion and taxation.
▪ No need to expand City utilities in area where County has expanded urban service boundary and indicated a desire to serve.
▪ Too much residential and no obligation for developers to include employment uses.
▪ Addresses perception that City can stop or slow growth.
▪ No risk in new growth not paying its way.
▪ Puts obligations on County to solve infrastructure issues in Study Area.
▪ Growth in Study Area will occur with or without the City.
▪ City loses opportunity to address impacts associated with growth in Study Area (land uses, paying for services, etc.).
▪ City loses advantage on utility expansion.
▪ Would likely require City to revisit its infill and redevelopment policies to make it more attractive.
▪ Puts obligations on County to solve infrastructure issues in Study Area.
Option 2: Accept Voluntary Annexation requests for Proposed Development and Projects within Study Area Under Existing City Planning & Fiscal Impact Policies
Option 3: Accept Voluntary Annexation requests for Proposed Development and Projects within Study Area Under New Planning and Fiscal Impact Analysis Tools
▪ Expansion of City to the west is logical response to growth demands.
▪ Approach relies upon existing capital and service delivery model of the City.
▪ Business as usual.
▪ Existing policies defer to the County Comp Plan for urban land uses.
▪ Vacant land analysis within City is a factor.
▪ Existing policies are seemingly permissive of annexation, but may limit the City’s ability to be more entrepreneurial.
▪ Existing City Planning and Fiscal Policies likely do not provide sufficient revenue capture to pay for expected impacts on the City.
▪ City desires to expand but under new land use and fiscal impact approach.
▪ City cannot afford to annex under ‘old’ approach.
▪ Addresses “Do No Harm” approach.
▪ Addresses existing strategy of “not negatively” impacting service delivery within existing City.
▪ Can be net benefit to the City.
▪ Does not defer to County FLU/urban service boundary.
▪ Proactive approach getting infrastructure investments earlier.
▪ Developers may not embrace additional capital and/or operating obligations.
▪ Would require coordination with the County to ensure successful implementation of the approach.
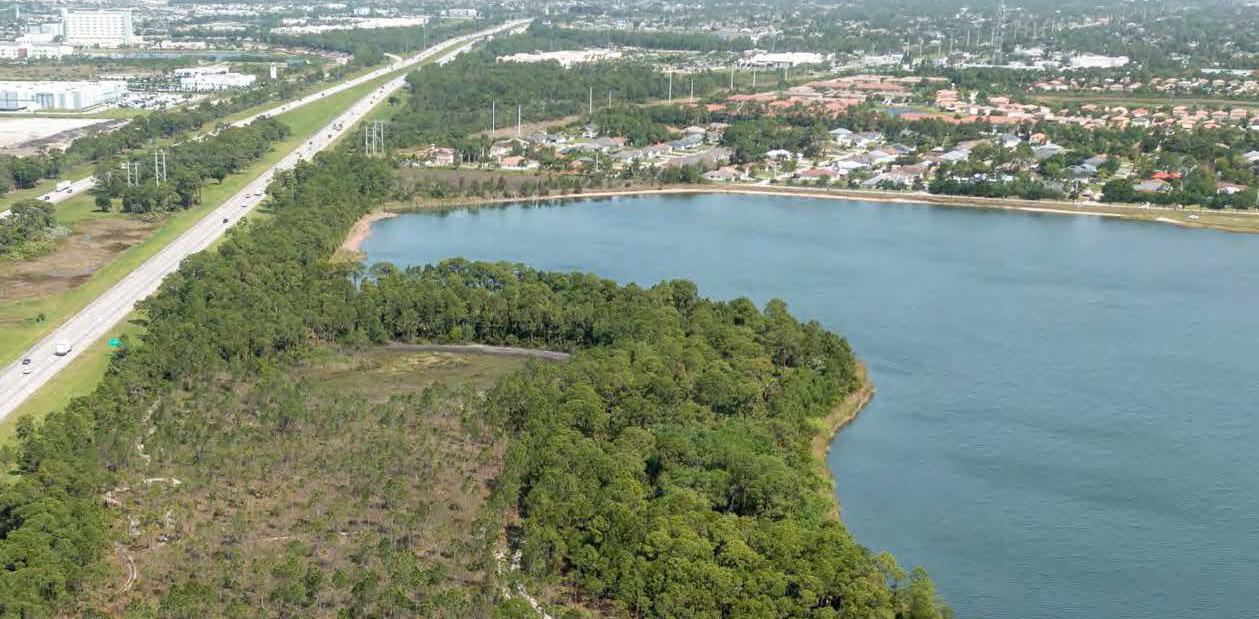
Within each of the policy option recommendations summarized in Table 28 is a mix of very specific actions and tools that are not being used consistently, if at all, today to guide growth and development or to reduce the cost implications of that development. The City might pursue or implement literally all of the items described with greater or lesser effort, subject to input from the City Attorney. In some cases, an item or its objective might modestly overlap with another. Where those overlaps may occur, the item or its objective may also require some level of scrutiny to assure legal sufficiency. For example, Proportionate Share and impact fee arrangements need to be calculated somewhat conservatively and discretely.
Similar to the policy option recommendations, these specific tools are aligned with greater and lesser roles for the City. However, all of these tools intentionally share the specific objectives of (1) identifying critical cost considerations in the regulatory and development processes, then (2) pushing all, or a portion of, these costs back to their source, whether to the County, Unincorporated area developers, and/or future non-residents of the City.
Virtually every option or recommendation dictates that the analysis detailed within this Study be paired with additional evaluation. Notably, the timetable for utility infrastructure is such that actual implementation strategies need to be considered today if facilities are to be operational by 2045. As well, while prior transportation network deficiencies may exist today, any needs which remain unresolved must be carefully explored in the context of future requirements outlined in this Study.
This approach involves undertaking a specific master planning effort which would result in a land use plan change, new policies, and
Land Development Code (“LDC”) provisions unique to the Study Area. Similar to the City of Orlando’s Southeast Sector Plan, Orange County’s Horizons West, and Lake County’s Wellness Way Plan, this work effort would culminate with adoption of the plan into Port St. Lucie’s Comprehensive Plan and LDC.
The effort would be best achieved in collaboration with St. Lucie County, the St. Lucie County School Board, and a robust Stakeholder Group. Issues of utility service delivery and fire station location would best be resolved through this process. The resulting Special Plan and code amendments could address the following issues:
a. Walkable neighborhood form and design;
b. School centered neighborhoods;
c. An economic development/employment component guaranteeing land set asides for non-residential development;
d. Detailed mobility plan with complete street cross sections and interconnectivity standards;
e. Neighborhood and community park standards; and
f. Ensuring that infrastructure financing is appropriately allocated to the benefiting development.
The implementation of a Special Plan would allow for any applicant to propose comparable solutions as an alternative approach as long as the purpose and intent of the Special Plan was met. All development proposals would be required to be zoned ‘Planned Development’.
Special Plans like these often include new planning and design approaches because the land is in a greenfield state. One suggestion might be to create a plan based on the principles of the 15-minute City and incorporate elements of Traditional Neighborhood Design.
Advantages
▪ Explicitly acknowledges the importance of development activities at the edge of the existing City boundaries.
▪ Offers the most comprehensive policy considerations.
▪ Further strengthens Comprehensive Plan directives
▪ Addresses longer term solutions indicative of predictability and political stability.
▪ Provides the policy basis for formal land development adopted standards for new development.
▪ The Special Plan can be a foundation for targeted economic development initiatives.
Disadvantages
▪ Development interests in the community may not embrace additional capital and/ or operating obligations within the Special Plan.
▪ Timeframe to complete a Special Plan may be extensive.
In lieu of a Special Plan, an Implementation Plan would be developed which relied upon the City’s existing FLU and Zoning regime, but would focus on LDC provisions listed below that ensured the delivery of infrastructure at the time of impact of development. The existing development plan review process of the City would be evaluated and modified to allow for the implementation provisions of the Study Area.
Advantages
▪ Codifies all the advantages associated with Special Plan.
▪ Cost to implement may be lower than a Special Plan.
▪ Would be targeted to discrete areas or types of development and action.
Disadvantages
▪ May offer less protection and predictability than a Special Plan.
Every property within the Study Area or any other targeted area would be required to enter into a Development Agreement in accordance with provisions of Florida Statute Chapter 163 commensurate with annexation or other major action. This would be the best mechanism to ensure that the provisions of the Special Plan, Implementation Plan, or compliance with the new LDC provisions would govern.
Advantages
▪ Ties policies of other plans and directives to a specific project or development.
▪ Offers further certainty to a developer and the City about respective obligations.
▪ The content and obligations of a Development Agreement are stipulated under Florida Statute Chapter 163.
Disadvantages
▪ The provisions of a development agreement under Chapter 163 may offer fewer protections and options for a local government than alternatives afforded under the City’s own home rule powers.
SECTION 6.3
The roadway network analysis conducted in the course of this Study reveals impacts from the Study Area on specific existing roadways within the City. An allocation of the costs to address these impacts could be established and implemented by a special assessment or other allocation tool for the Study Area. This assessment would be above and beyond the existing Road and Mobility Impact Fee.
Each project in the Study Area would be required to submit a traffic study prior to rezoning, which would address their fair share cost of network improvements based on the framework established by the City.
Advantages
▪ Explicitly acknowledges the importance of transportation cost and needs.
▪ Focuses on transportation which is the capital item ostensibly of greatest concern.
▪ Focuses on sources of potential receipts that currently accrue advantageous to the County.
▪ Depending on the process through which it is implemented might also play into infill occurring within the City limits.
▪ May provide assurance of capital early in a project’s planning and approval process.
▪ By definition assures a developer what the cost of a shared transportation segment might be, typically will allow a developer to pay the cost and proceed.
▪ Requires careful calculation with each specific road segment and development being considered.
Note: Should this approach be found to be Impact Fee creditable against the existing Road and Mobility Fees, a new Road and Mobility Fee schedule for the Study Area could be established to accurately reflect the total impact on the network due to increased marginal cost of the Study Area’s remote nature.
The City relies upon the conventional approach to the collection of fees and the funding of mobility improvements. The traditional approach to collection is at the time of building permit for each residential unit and individual non-residential building.
An alternative approach to the Study Area implementation could include a negotiated approach for the payment of impact fees at the time of platting of residential subdivisions, which are typically phased. This would infuse larger lump sum revenues to the City earlier in the process to accelerate roadway and mobility fee projects. This approach has worked in other jurisdictions and also provides an incentive for the developer to construct those improvements at the beginning of each phase of development for impact fee credits. The
requisite traffic study would identify required lump sum payments by phase to address the impacts of the project. This approach could be achieved via a voluntary annexation and development agreement or a mobility fee agreement with the developer which would be required at the time of rezoning.
▪ Explicitly acknowledges the importance of transportation cost and needs.
▪ Strong focus on transportation capital which is among the City’s greatest concerns.
▪ Focuses on sources of potential receipts that currently accrue advantageous to the County.
▪ Provides funding for mobility improvements much earlier in the development process to allow capacity improvements to occur as the impacts occur, unlike standard impact fee system.
▪ A mobility fee offers some financial resources for the City that may not require a commitment to road and road construction.
▪ A mobility fee already exists.
▪ Such fees tend to be the highest among impact fees charged.
▪ Such fees are often challenged and resisted by the development community.
▪ As matter of policy, such fees rarely cover full costs.
If the Special Plan approach is not undertaken, a Park Plan would need to be established for the Study Area which will meet the City’s neighborhood and community park standards. Developers could enter into voluntary annexation and development agreement(s) whereby payment of Park Impact Fees in lump sum could be made at the time of platting (residential) or agree to construct and dedicate parks to the City for impact fee credits. The City may choose to have certain neighborhood parks be owned and maintained by a Home Owners Association (“HOA”), Community Development District (“CDD”), or other governance mechanism approved by the City. Neighborhood parks would be required to be completed prior to
the issuance of a certificate of completion of the improvements of the approved phase of a subdivision or development plan.
Advantages
▪ Ensures a character of neighborhood development that includes a robust level of neighborhood parks, but not necessarily requiring any City capital or operating expenditures if, during the entitlement process, HOA or CDD managed/owned parks are required.
▪ Aligns with City’s interest in such services and facilities.
▪ Rarely resisted by existing residents since costs are levied against new development.
Disadvantages
▪ As a matter of policy, rarely recovers full cost and state law limits the level of fee increases.
Given that police patrol is largely delivered without the need for fixed precinct/building locations, no change is recommended in the level or means of collection of the impact fee. Further examination of the structure of the fee basis might result in a future recommendation.
Advantages
▪ Aligns with City’s interest in such services and facilities.
▪ Law Enforcement Impact Fees already exist.
Disadvantages
▪ As a matter of policy rarely recovers full cost.
Pursuant to Chapter 170.01, Florida Statues, the City can levy assessments against benefiting properties to fund capital improvements as long as the rate of assessment is based on the special benefit accruing to any property. This benefit must be different in type or degree from benefits provided to the City as whole.
This tool should be considered only after a capital plan for the Study Area is established and it is confirmed that the required capital improvements differ in type or degree from what would be required in the City. Should a Special Plan for the Study Area be developed, this tool can be very effective in establishing funding mechanisms for any unique capital requirements.
This tool can also be used to bond assessment proceeds to advance capital projects.
Advantages
▪ Legally, special assessment are not taxes.
▪ An additional specific revenue outside of
the existing millage.
▪ Does not require referendum to be adopted.
▪ May be applied exclusively to an area or project.
▪ Assures major costs are focused on area or service in question.
▪ Has broad applicability to a range of services provided by City.
▪ Can be used for operations and well as capital.
▪ Can be combined with existing general fund revenues.
▪ A secure source for bond debt.
Disadvantages
▪ Generates some resentment when services perceived to be paid for through general revenues are addressed instead by special fees or charges, although residents and property owners would be made aware of such assessments at the time of purchase of property.
Based on the extensive information and conditions analyzed and presented in this Study, the City, by virtue of regional context, will continue to experience growth pressures at the edge of its current municipal boundaries. While there are certainly smaller opportunities in existing areas within the City’s municipal boundaries, these do not present the same scale of growth implications as development reasonably anticipated to occur within the Study Area. Regardless of direct City intervention, the trend of converting historically agricultural or less intense lands to higher value residential, mixeduse, and similar uses will persist.
Anticipated and proposed development within the Study Area is likely to continue to be received favorably by the County. Absent self-imposed financial structures by developers, unless proposed developments and projects are annexed into the City or the County exacts extraordinary requirements from the developer to the benefit of the City, the City will bear an undue burden of service and capital costs. As has been extensively documented throughout this Study, without some level of control, a substantial portion of the capital and operational costs associated with service provision will continue to fall upon the City.
This fiscal impact analysis presented in this Study clearly indicates that the City currently manages its fiscal responsibilities well for a community of its size and composition based on prior spending. City spending for almost any category of service, program, or facility falls in line with benchmarks from other communities. Going forward, it is likely that additional residential and non-residential development brought into the City through growth internal to the City’s existing municipal boundaries or annexation practices will significantly enhance the City’s fiscal position.
Though the value of new development would likely improve the City’s financial capabilities relative to most costs, the burden of transportation costs stemming from anticipated reasonable development within the Study Area alone would likely have a deleterious effect on
the City’s fiscal position. Once the magnitude of major new transportation impacts and the associated obligations are considered, the data clearly indicates potential for substantial impacts on the fiscal outcomes achievable in the City. Unless all, or most of, these transportationrelated capital costs can be placed onto new development itself in some way, through policy action and/or with improved cooperation between the City and County, the City’s financial position could, and likely would, begin to erode. Regardless of the density, intensity, and mix of uses embraced for policy purposes, it is evident that the Study Area at full built-out will generate very high levels of receipts.
While several available policy responses have been presented in this Study, including a description of what is likely to occur with no intervention from the City, compared with modest or more aggressive action, all options explicitly recognize the need for improved cooperation and collaboration between the City and County. Further, all of the tools presented intentionally share the specific objectives of (1) identifying critical cost considerations in the regulatory and development processes, and (2) shifting all, or a substantial portion of, these costs back to their source. The options presented underscore the importance of policy intervention at some level, a decision not to act does not change the more costly disadvantages of the established arrangement.
At the very least, concerns or issues raised in the course of this Study need further study and evaluation to assure there are time and resources to advance an appropriate infrastructure response. The options outlined within this Study are basic choices for dealing with future needs but, by themselves, may not be a sufficient platform for dealing with real or perceived prior deficiencies existing today which cannot be accommodated or paid for by future growth. Those prior deficiencies, however, will become more deleterious and burdensome to the City if future needs are not properly addressed.
