

SEBASTIAN CRA
2022–2023
ACKNOWLEDGMENTS
Lisa Frazier | Director, Sebastian Community Redevelopment Agency
City of Sebastian 1225 Main Street
Sebastian, Florida 32958 (772) 388.8228
PROJECT TEAM
Laura Smith, MPA | Urban Analytics Manager
Natalie Frazier, MBA | Senior Analyst
Hannah Hollinger, LEED AP O+M | Project Planner
Andrew Sheppard, ASLA, PLA, LEED AP | Urban Design Manager
Dawn Welsh, CNU-A, LEED AP | Senior Project Planner
Community Solutions Group, GAI Consultants, Inc. 618 East South Street, Suite 700
Orlando, FL 32801
(321) 319.3088 © GAI Consultants, Inc. 2023 This document has been prepared by GAI Consultants, Inc. on behalf of the City of Sebastian Community Redevelopment Agency, FL


EXISTING CONDITIONS & BASELINE EVALUATION

SEBASTIAN CRA HISTORY
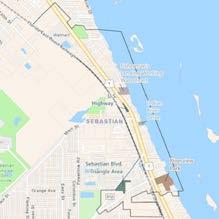
The City of Sebastian (“City”) is a coastal community located on the western shore of the Indian River in Northern Indian River County. The City is accessible by U.S. Highway 1, Interstate 95, and County Roads (“CR”) 512 and 510, and is within minutes of Sebastian Inlet State Park, Pelican Island National Wildlife Refuge, and beautiful east coast beaches.
The City is about 14.8 square miles and is bordered by the Indian River to the east, the St. Sebastian River State Park Preserve to the west,
SEBASTIAN CRA AREA MAP
and surrounded by unincorporated Indian River County. The City has natural charm—boasting many parks, several scenic and wildlife areas, and small town character.
The City recognized significant areas of the downtown that were in need of redevelopment and dedicated investment. In 1995, the City completed a study to identify and delineate the boundaries of a community redevelopment area (“CRA”); this resulted in the City forming the Sebastian Community Redevelopment Agency (“Agency”)
under Chapter 163, Part III, Florida Statutes (“Chapter 163”, or “Redevelopment Act”). The goal of this effort is to establish a coherent community vision and encourage reinvestment and redevelopment throughout the CRA.
The CRA is contained within the City’s municipal limits within Indian River County, Florida (“County”) and is known as a small waterfront fishing community. The adjacent map illustrates the location of the CRA in relation to the City and County.


Legend
Sebastian CRA City of Sebastian Indian River County
The CRA totals 398 land acres and 189 acres of conservation adjacent to or within the Indian River Lagoon. U.S. Highway 1 is the CRA’s primary north-south 4-lane principal arterial connection, and Sebastian Boulevard is its primary east-west 4-lane principal arterial connection. Indian River Drive provides an additional north-south coastline connection, with Main Street acting as an east-west minor arterial connection. Buses access the CRA via U.S. Highway 1; whereas, boats access the CRA via the dock in Riverview Park and public boat ramps along the Indian River.

Generally, Agencies have three primary benefits in promoting redevelopment, such as the following:
1. A master planning approach and implementation strategy for the overall CRA;
2. Tax Increment Financing (“TIF”), which diverts future property tax revenues from the County and City to a trust fund specifically intended for redevelopment projects and programs;
3. Increased eligibility for federal and state grants that can be used for infrastructure improvements, business development, and priority acquisition.
Originally adopted on March 22, 1995 (under Resolution R-95-17), the Sebastian Community Redevelopment Master Plan (“Sebastian CRA Master Plan”) organized the CRA’s vision and implementation strategy. Since then, the Sebastian CRA Master Plan has been updated two more times: (1) on December 10, 2003 (under Resolution R-03-51) to expand the CRA to include the adjacent 95-acre Sebastian Boulevard Triangle Area; and (2) on October 13, 2010 (under Resolution R-10-40) to update its recommendations and capital improvement schedule.
Despite these updates, the 2010 Sebastian CRA Master Plan documents that land use data and maps are outdated, specifically stating, “Due to the limited scope of this (2010 Master Plan) update, data and analysis for the Plan was not generally updated, except where specifically related to the updated capital improvements program. Additionally, it should be noted that several of the plan maps include outdated street names”. As a result, there was a necessity to update the Sebastian CRA Master Plan. It is important to note, the current 30-year operational term of the Agency began in December 2003, therefore the Agency is due to “sunset” in December 2033.
Further, the 2010 Sebastian CRA Master Plan contained incorrect acreage and boundary maps that have since been corrected through a GIS mapping exercise in 2019 to align information received by the Indian River County Property Appraiser’s office. The 2019 GIS mapping exercise correctly identifies the acreage of the expansion area, referred to as “Triangle Area”, as 95 acres; the portion of the CRA adjacent to or within the Indian River as 189 acres; and the net total of acreage of the CRA as 398 land acres, as illustrated in the following map.
As a result, there is a necessity to update the Sebastian CRA Master Plan. This update, the 2023 Sebastian CRA Sustainable Redevelopment Master Plan (“2023 Sebastian CRA Master Plan”), will help further the vision and aid the City and Agency in identifying sustainable strategies and opportunities for the future of its core urban area. This update will also help promote a diverse economy and implement economic strategies that will assist the City and Agency in defining markets, designing infrastructure projects that address growth and climate change, and capturing the CRA’s essence in a comprehensive design.
Currently, the CRA “sunsets” in 2033, unless the City approves its continued existence by a majority vote of the governing body members.


The CRA is generally bound by the Indian River to the east, the Florida East Coast (“FEC”) Railway to the west, and the extent of the City limits to the north and south. Whereas, the CRA Expansion Area is generally bound by the FEC Railway to the east, CR 512 to the north, and CRA boundary to the west and south.
SEBASTIAN CRA MAP
CONCEPTUAL PLANNING DISTRICTS
The CRA is divided into five conceptual planning districts used exclusively for categorizing recommendations, these planning districts are defined in the following district descriptions and illustrated in the adjacent map.

Park District
The Park District is known as the “heart” of the CRA. The district is bound by the City limits to the south, Indian River Lagoon to the east, Main Street to the north, and U.S. Highway 1 to the west. The Park District defines the character of the CRA and encompasses Riverview Park, Main Street Boat Ramp, Old Town Sebastian Historic District, Sebastian Yacht Club, and Indian River Drive filled with many local waterfront restaurants, retail, and businesses.

Sebastian Boulevard Mixed-Use District
The Sebastian Boulevard Mixed-Use District encompasses the Sebastian Boulevard Triangle Area and is part of the CRA expansion area. The district is bound by major thoroughfares, including FEC Railway to the east, and is split between Sebastian Boulevard to the north and the south. This Sebastian Boulevard Mixed-Use District has a mix of uses, such as industrial, general commercial, public service, and residential.

U.S.-1 Commercial District
The U.S.-1 Commercial District is characterized by large-scale autooriented development. The district is bounded by FEC Railway to the west, the CRA boundary to the north, North Central Avenue and U.S. Highway 1 to the east, and the City limits to the south. The U.S.-1 Commercial District comprises the Main Street Historic District, as well as many auto parts stores, big box development, drive-through restaurants, and other linear strip development common on arterial highways.

Riverfront District
The Riverfront District extends along the Indian River Lagoon to the east, and is enclosed by Main Street to the south, the City Limits to the north, and North Central Avenue and U.S. Highway 1 to the west. The Riverfront District also helps define the character of the CRA, as it encompasses Indian River Drive filled with many local riverfront and over-the-river restaurant and retail establishments.

Sebastian Boulevard South District
The Sebastian Boulevard South District is part of the CRA expansion area, and is bound by Sebastian Boulevard eastbound to the north, Old Dixie Highway and the FEC Railway to the east, and the City limits to the south. The Sebastian Boulevard South District resembles a horseshoe-shaped boundary mirroring the City limits, and encompasses light industrial uses such as warehouses, equipment suppliers and rentals, and automotive repair and storage.

SEBASTIAN CRA CONCEPTUAL PLANNING DISTRICTS

U.S.-1 Commercial District
District
Blvd. South District
PRIOR DATA AND ANALYSIS REPORTS
MAJOR OBSERVATIONS
The prior data and analysis reports conducted by the City and Agency reviewed for the existing conditions and baseline evaluation section of the 2023 Sebastian CRA Master Plan, included the following:
2010 SEBASTIAN CRA MASTER PLAN
The purpose of updating the Sebastian CRA Master Plan in 2010 was to reevaluate its recommendations and capital improvement schedule. The 2010 Sebastian CRA Master Plan helped serve as a guide for effective redevelopment and enhancement of the CRA.
SEBASTIAN CRA MARKET ANALYSIS, 2018
The analysis provided a trade area review for the City and the Sebastian CRA. The assessment included a collection of demographic and lifestyle data, retail spending, existing conditions review, real estate and housing market info, and consumer trends organized by their respective influence on key drivers of economic development.
2040 SEBASTIAN COMPREHENSIVE PLAN
Adopted on June 23, 2021, the 2040 Sebastian Comprehensive Plan incorporated an assessment of the City’s existing Comprehensive Plan; an analysis of existing conditions; a series of community meetings; input from City Departments/staff; and work sessions with both the Planning Commission and the City Council. It provides a long-term approach to the City’s vision based on a more realistic analysis of the City’s carrying and development capacities.
RIVERFRONT DISTRICT DRAINAGE STUDY, 2014
Identified two main drainage deficiency areas (Central Avenue and Davis Street and the Presidential Streets) and other capital stormwater projects (along Indian River and the CavCorp Parking lot) through existing drainage outfall assessment. The document also outlines a series of best management practices to remediate these issues.
RIVERFRONT PARKING STUDY, 2011
Evaluated four ‘zones’ in the Sebastian CRA for parking sufficiency. The study found that there is a ‘geographical mismatch’ in underutilized parking and popular destinations as well as a lack of safety, accessibility, and wayfinding to existing parking areas.
In addition to these studies, the Sebastian CRA Annual Activity Reports (2016-2022), Public Input Open House (2018) feedback, and other relevant documents were utilized in this existing conditions evaluation.
HISTORICAL ECONOMIC TRENDS
The 2010 Sebastian CRA Master Plan conducted an economic analysis of the Sebastian Market Area, which composed the City and nearby unincorporated
areas. The analysis revealed that the Sebastian CRA has historically experienced increases in property values; this indicates the area is positively perceived by the overall market, with increases in demand for single-family residential units, and space availability to annually support new commercial space.
The analysis also indicated that higher value singlefamily attached (townhouse) development should be encouraged for the Sebastian Boulevard Triangle Area to enhance land values substantially greater than the existing industrial zoning, as well as indicating that office development and hospitality uses will not likely play a significant role in redevelopment. All of these findings, as well as the financial feasibility described below, helped shape the past 2010 Sebastian CRA Master Plan priorities and recommendations.
In 2018, the Sebastian CRA Market Analysis concluded that the retail sector showed the highest potential and most activity of all major real estate sectors within the Sebastian CRA. Subsequently, branding the Sebastian CRA and enhancing the residential market will help drive this potential for increased retail activity, as well as other commercial uses. The market analysis also revealed five key drivers of economic development, including: land, labor, markets, capital and regulation.
In addition, the market analysis identified the City as featuring a diverse and healthy workforce centered around the services, retail, construction, finance, insurance and real estate industries. Lastly, the analysis identified the following incentives put forth by the Agency to promote economic development; these included a facade, sign, and landscaping grant program, and a septic-to-sewer grant program.
FINANCIAL FEASIBILITY
A significant benefit of any Agency is the ability to manage future incremental ad valorem tax revenues within the CRA from both City and County sources through Tax Increment Financing (“TIF”). TIF is a unique financing tool used to leverage public funds to promote redevelopment activities in community redevelopment areas. A TIF captures the future tax benefits of real estate improvements in a community redevelopment area to pay the current cost of making improvements. A Redevelopment Trust Fund is established for the tax increment revenue as a means of using property taxes from property valuation increases to assist in paying for public improvements that stimulate development and redevelopment.
Upon adoption, the Redevelopment Trust Fund ordinance specifies the base valuation of property located within the boundaries of the CRA. Thereafter,
95% of taxes assessed by qualified taxing authorities on future increases in the value of properties contained within the CRA are reinvested into the respective CRA through the corresponding Redevelopment Trust Funds. The tax increment revenues can be used immediately, saved for particular projects, or can be bonded to provide upfront financing to maximize funds available.
Funds accrued into the Redevelopment Trust Fund, however, must be used for redevelopment projects, programs, and activities as specified in the Redevelopment Plan and not for general governmental purposes. These funds are to be used only for projects, improvements, acquisitions, and programs within the corresponding geographical boundary of the CRA as well as for approved Community Redevelopment Agency administrative expenses as outlined in Chapter 163.370, Florida Statutes.
The tables below illustrate the total taxable value and tax increment collected within the Sebastian CRA over the last 11 years, as well as the past year-end statements for years 2018 to 2022, highlighting specifically the Sebastian CRA fund beginning and end balances.
SEBASTIAN CRA HISTORIC TAXABLE VALUE
Source: Florida Department of Revenue, DR-420TIF Forms, 2012-2022; GAI Consultants.
SEBASTIAN CRA PAST PRIORITIES
The priorities outlined in the 2010 Sebastian CRA Master Plan were guided by input from multiple groups, including the CRA Board, Treasure Coast Regional Planning Council, and those who reside, work, and play within the CRA.
Major priorities identified by the public at large while developing the 2010 Sebastian CRA Master Plan, which have remained a major focus based on project progress within the CRA, included:
1 3 6 2 5 4 7
Preserving the Historic Character and ‘Old Town’ Feel.
Enhancing the Waterfront as a Resource.
Maintaining Low Residential Density and Building Heights.
Encouraging Mixed-Use Development.
Creating Complete Streets to Ease Congestion and Improve Linkages.
Improving Existing and Creating New Recreational Opportunities.
Developing a Marketable Identity for the Overall CRA.
SECTION SUMMARY
The intent of this Existing Conditions section is to develop a baseline evaluation of prior planning exercises, studies, and analyses that have been conducted relating to the Sebastian CRA, and develop a basis of past activities undertaken by the Agency. Essentially summarizing these seemingly disparate components, creating a cogent foundation from which to build upon.
Ultimately, informing elements of the forthcoming Market Assessment and Economic Analysis, serving as a reference tool, and a resource in the formation of this 2023 Sebastian CRA Master Plan.
Source: Sebastian Riverfront Community Redevelopment Agency Annual Reports 2018-2022.

MARKET
ASSESSMENT & ECONOMIC ANALYSIS

MARKET ASSESSMENT & ECONOMIC ANALYSIS
INTRODUCTION
As a part of this 2023 Sebastian CRA Master Plan, a Market Assessment and Economic Analysis was conducted. The main focus of the assessment is to identify the market for potential commercial and residential development opportunities within the CRA.
The analysis included: a parcel inventory report; an assessment of demographic and socio-economic characteristics; an inventory analysis for the commercial and residential markets; a retail gap analysis; and a 15-year future growth projection of commercial and residential uses within the CRA. Characteristics of the City will also be evaluated to show a comparison of capture within the CRA, where data is available.
The analysis is expected to be used as a tool to guide potential commercial and residential development opportunities within the CRA and to provide insight on demographic, socio-economic, and market performance trends within the broader City as a whole.

PARCEL INVENTORY REPORT
IDENTIFICATION OF PARCEL/LOT SIZE
The CRA totals 398 land acres and 189 acres of conservation adjacent to or within the Indian River Lagoon. There are approximately 508 parcels/lots that comprise the land acres within the CRA. Of
SEBASTIAN CRA PARCEL/LOT SIZE
these total parcels, approximately 57% are less than 1 acre, with 21% representing parcels that are 1 to 2 acres and 22% greater than 2 acres. The largest parcel within the CRA is the Walmart Supercenter along U.S. Highway 1 with 22.8 acres. In addition, the average parcel size within the CRA is 1.3 acres.

1/4 to 1/2 acres
1/2 to 1 acres
1 to 2 acres
More than 2 acres
EXISTING LAND USE
The map below illustrates the existing land use of the parcels within the CRA, and the legend details the distribution of the total land area by existing land use designation.
Within the CRA, the commercial/ mixed use land use comprises
SEBASTIAN CRA EXISTING LAND USE
the largest share of total land acres at 30.3%, followed by vacant commercial and municipal lands with 11.9% and 10.0%, respectively, of this total share. Combined residential, including single family, condos, multifamily, and other residential, comprise 15.6% of the
land acres within the CRA.
In addition, combined vacant lands total approximately 18.4% of the land acres within the CRA; with county, state, municipal, and utility and right-of-way comprising 11.7% of the total land acres.

FUTURE LAND USE
The map below illustrates the future land use of the parcels within the CRA, and the legend details the distribution of the total land area by future land use designation.
Within the CRA, the future land use designation of Riverfront Mixed Use
SEBASTIAN CRA FUTURE LAND USE
comprises the largest share of the total land acres at 61.6%, followed by institutional and industrial future land use at 14.6% and 12.0%, respectively, of this total share.
In addition, the future land use designation of conservation and residential low/medium density
are not represented in the map below, since they both comprise a very small share of the total land acres at 0.0025% and 0.0001%, respectively.

ZONING
The map below illustrates the current zoning for all parcels within the CRA, and the legend details the distribution of the total land area by current zoning code.
Commercial riverfront (CR) and commercial waterfront residential (CWR) comprise the majority of
SEBASTIAN CRA ZONING
the zoning within the CRA at 38.9% and 20.2%, respectively, of the total land acres. Combined residential, including multi-family (RM-8) and single family (RS-10), comprise a relatively small share of the zoning within the CRA at 4.0% of the total land acres.
In addition, the CRA Expansion Area is the only area within the overall CRA that includes zoning for industrial, commercial, and mixed use developments.

ANALYSIS OF CURRENT ECONOMIC CONDITIONS
There are many key demographic and socioeconomic indicators to consider when determining the market characteristics of a specific area, these include;
▪ Population
▪ Age Distribution
▪ Race and Ethnicity
▪ Academic Achievement
▪ Income Levels
▪ Employment and Business Activity
A profile of these demographic and socio-economic characteristics was necessary to fully understand the unique marketplace and the overall marketsupporting demand within the CRA.
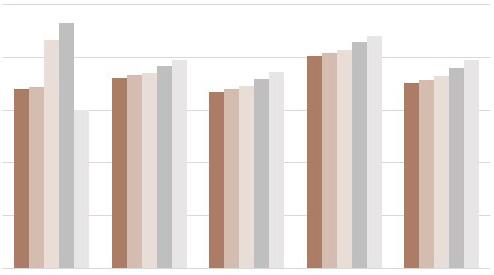
TOTAL POPULATION
Per the most recent 2022 estimates, the total population of the CRA is approximately 206 persons, which represents roughly 0.8% of the City’s total population of 25,438 persons.
From 2010 to 2022, the population within the City grew at a compound annual growth rate (“CAGR”) of approximately 1.0% annually, increasing nearly 15% from about 22,221 persons in 2010 to 25,438 persons in 2022. About 13% of this population growth within the City occurred between 2010 and 2020.
Comparatively, the CRA experienced a greater CAGR, at 1.9%, during this same time period. The population within the CRA increased 27% from about 162 persons in 2010 to 206 persons in 2022, with about 19% of this population growth occurring between 2010 and 2020.
Although population has increased by nearly 3,227 persons within the City and only 44 persons within the CRA since 2010, the overall capture of the CRA to City’s population has remained stable over this time period.
Included in this analysis is the evaluation of current and historical growth trends within the CRA and where relevant, the assessment also identifies the capture of growth to the City, as detailed within the following pages.
To note, there are limitations to data that is used to infer conclusions about a sample population. Most relevant to this is analysis is that the smallest geographic areas for which estimates are available are Census Block Groups. While the data can be used to infer conclusions about large geographic areas with great statistical certainty, the smaller the area of interest the greater the margin of error.
The following figures illustrate the change in total population within the CRA and the capture of total City population from 2010 to 2022 estimates.


2010
AGE DISTRIBUTION
Age distribution is another important factor when examining market characteristics. Within the CRA, the median age is approximately 62 years old; this is notably higher than the median age of 54 years observed within the City.
In the CRA, approximately 49% of the population are between the ages of 15 to 64, which is defined as the typical working-age population. In comparison, about 52% represent the workingage population within the City. This indicates that the majority of the population within the City is considered to be workingage; whereas, less than half of the population within the CRA is identified as working-age.
Additionally, 9% of the population within the CRA are younger than 20, and 54% are 60 years or older. Whereas, the City has a slightly younger population, with about 17% identified as younger than 20, and 41% aged 60 years or older, as illustrated in the adjacent table.
RACE AND ETHNICITY
Understanding the racial and ethnic make-up of an area can provide unique insight into its market characteristics. Within the CRA, approximately 90% of the population identifies as White, with 6% identifying as Two or More Races, 2% identifying as Black/African American, and 2% identifying as Other Race.
The racial composition within the City is relatively comparable; with 83% White, 8% Two or More Races, 5% Black/African American, 2% Other Race, and 1% Asian. The breakdown of the population by racial composition within the CRA compared to that of the City is represented in the adjacent table.
Additionally, Hispanic origin is defined as an ethnicity, and therefore can be identified as any race. According to 2022 ESRI Estimates, 9% of the total population in the City are of Hispanic ethnicity. Whereas, approximately 6% of the total population within the CRA are of Hispanic ethnicity.
ACADEMIC ACHIEVEMENT
Academic achievement refers to the level of schooling a person has successfully completed, and only accounts for those 25 years or older. Within the CRA, 92% of the population have obtained their high school diploma/GED or a more advanced degree, which is similar to the 94% observed within the City following these same metrics.
In addition, approximately 23% of the population within the CRA has a bachelor’s degree or more advanced degree, which is slightly lower compared to the 26% of the population observed within the City with a bachelor’s degree or greater. Comparatively, when considering the population without a high school diploma/GED, about 8% of the total population in the CRA does not have a high school diploma/GED, which is slightly higher than the 7% observed within the City, as illustrated in the following figure.
Source: ESRI 2022 Estimates; GAI Consultants, Inc.
Population by Race (2022)
Source: ESRI 2022 Estimates; GAI Consultants, Inc.
Less than 9th Grade GED 9-12th Grade/ No Diploma
Degree High School Diploma
Some College/ No Degree

Sebastian CRA City of Sebastian
INCOME
Income is another important factor to consider when examining market characteristics, as it can be a broad indicator of a household or individual’s spending potential and their general ability to purchase a variety of goods and services within a specific marketplace. As of 2022 estimates, median household income within the CRA is estimated to be $69,956, which is higher than that of the City, at $62,558. Similarly, per capita incomes at $46,766 within the CRA are also higher than those observed in the City at $35,575, as illustrated in the table below.
Incomes
(2022) City of Sebastian Sebastian CRA
Med. Household
Avg. Household
Within the CRA, the largest concentration of households (approximately 18%) has household incomes of $100,000–$149,999, which is greater than that of the City, wherein the largest concentration of households (23%) has household incomes of $50,000–$74,999. The distribution of household incomes within the City and CRA are illustrated in the following figure.
In addition, average disposable income is about $77,224 within the CRA, which is also substantially higher than that of the City at $65,407. From this income-related data, it can be inferred that the CRA comprises a population with greater incomes and spending potential compared to that of the City.
$62,558 $69,956
$79,228 $96,501 Per Capita
Avg. Disposable
$35,575 $46,766
$65,407 $77,224
Source: ESRI 2022 Estimates; GAI Consultants, Inc.
EMPLOYMENT AND BUSINESS ACTIVITY
ANNUAL EMPLOYMENT TRENDS
A diverse workforce and industry base within a market area can be an indication of healthy economic conditions, as it enhances the variety of available employment and interested companies in an area. The key components to employment to consider when analyzing the overall business and employment market include annual employment trends, jobs by industry sector, unemployment rate, and employee inflow/outflow within the area.
There are currently 925 businesses within the City; approximately 37% or 346 businesses are located within the CRA. The total businesses within the City employ nearly 5,865 people; whereas, the total businesses within the CRA employ approximately 1,464 people, or 25% of the City’s total employment.

From 2010 to 2022 estimates, total employment within the City and CRA have grown at CAGRs of 4.8% and 2.0%, respectively. Since 2010, the City has experienced an increase of nearly 2,960 employees, with the CRA capturing 13% of this increase. The capture of employment within
the CRA to the City has remained relatively stable since 2010, with an average capture of 25%.
The figure below illustrates the annual employment trends for the City and CRA from 2010 to 2022 estimates.

Sebastian CRA City of Sebastian
Sebastian CRA City of Sebastian
UNEMPLOYMENT RATE
As of 2022 estimates, within the CRA, the unemployment rate—i.e., the total number of unemployed persons as a percentage of the Civilian Labor Force—is nearly 17%, which is significantly greater than the unemployment rate within the City at 3.8%. The unemployment rate is the percentage of the labor force within a specified area that does not currently have a job. The unemployment rate generally rises and falls in the wake of changing economic conditions.
The high unemployment rate within the CRA may be a result of the lagging impacts of the COVID-19 pandemic when unemployment across the nation reached an all time high of 14.7%. As more businesses are established within the CRA, subsequently creating more jobs, the unemployment rate should experience a decrease.
EMPLOYEE INFLOW/OUTFLOW
The most current employee inflow/outflow data provided by the U.S. Census Bureau is for yearend 2019. This data serves as an indication of the efficiency of the respective area’s labor force. As of year-end 2019, there were 4,356 employees within the City. Of these employees, about 23% live within the City, while roughly 77% commute into the City from elsewhere to work (inflow). In addition, 7,885 workers live inside the City, but are employed elsewhere outside of the City (outflow). This condition results in a net negative outflow of 4,532 jobs in the City. Net job inflow (+)/outflow (-) indicates where the area is a labor force magnet or provider.
Comparatively, there were 992 employees within the CRA as of year-end 2019. Of these employees, approximately 0.1% live within the CRA, while roughly 99.9% commute into the CRA from elsewhere to work (inflow). Additionally, 33 workers live inside the CRA, but are employed elsewhere outside (outflow). This condition results in a net positive inflow of 958 jobs to the CRA.
The figures below illustrate the employee inflow/ outflow within the City and CRA as of year-end 2019.
JOBS BY INDUSTRY SECTOR
The most current employment estimates by NAICs Industry Sector indicate that Health Care and Social Assistance, Retail Trade, and Accommodation and Food Services are the dominant industries within both the City and CRA. Combined, these three industries comprise approximately 47% and 57% of the total share of employment within the City and CRA, respectively, as of 2022 estimates.
Professional employment includes the following industry sectors: Information; Finance and Insurance; Real Estate; Professional Services; Management of Companies; Administration, Support, and Waste Management; and Educational Services. The CRA’s largely white collar, or professional, work force comprises 20% of total employment; whereas, the City’s professional work force comprises 28% of the total employment as of 2022 estimates.
The table below illustrates the breakdown of employment by NAICs Industry Sector for 2022 estimates.
Source: ESRI 2022 Estimates; GAI Consultants, Inc.
Jobs by NAICs Industry Sector (2022)
INVENTORY ANALYSIS OF COMMERCIAL & RESIDENTIAL MARKETS
The inventory analysis relied upon real estate data to evaluate performance trends for commercial uses, office, retail, and industrial; as well as residential uses, including multifamily, single
Park District
family, and condo residential within the City, the CRA, and the five CRA conceptual planning districts previously identified in Section 1: Existing Conditions and Baseline Evaluation.
The CRA’s conceptual planning districts are identified below and illustrated in the following map.
Sebastian Boulevard Mixed-Use District Riverfront District
U.S.-1 Commercial District Sebastian Boulevard South District
SEBASTIAN CRA CONCEPTUAL PLANNING DISTRICTS

Legend Sebastian CRA Park District
Sebastian Blvd. Mixed-Use District
U.S.-1 Commercial District Riverfront District
Sebastian Blvd. South District
RETAIL MARKET TRENDS
As of year-to-date (“YTD”) 2022, January through November 2022, the CRA has a total 523,490 square feet of retail space, comprising 32% of the total inventory of retail space within the City at 1.65 million square feet. The U.S.-1 Commercial District contains the largest share of retail space within the CRA at 70%; whereas, the Sebastian Blvd. South District comprises the smallest share at 2.1% of the total retail space within the CRA. The table below illustrates the retail market characteristics for YTD 2022.

Over the last 5 years, total inventory of retail space increased 0.5%, or 2,400 square feet, within the CRA: from 521,090 square feet in 2018 to 523,490 square feet in 2022 YTD. The change in inventory within the CRA was driven solely by growth in the U.S.-1 Commercial District. None of the CRA districts experienced any change in inventory over the last 5 years.
Comparatively, the City experienced a 1.3%, or 21,300-square-foot, increase in total retail space during this same time frame, from 1.63 million in 2018 to 1.65 million square feet in 2022 YTD.

Occupancy rates within all CRA districts were 100% as of 2022 YTD, except for the U.S.-1 Commercial District, which had an occupancy of 99.4%. Over the last 5 years, occupancy rates increased 1.3% within the CRA; from 98.1% in 2018 to 99.4% in 2022 YTD. The change in occupancy within the CRA was driven by growth in occupancy rates within the U.S.-1 Commercial District and Park District.
Comparatively, the City experienced a 1.9% increase in occupancy of retail space during this same time frame, from 96.6% in 2018 to 98.4% in 2022 YTD.
Throughout the last 5 years, average rental rates of retail space increased 12.4%, or $2.17, within the CRA: from $17.56 in 2018 to $19.73 in 2022 YTD. All the districts within the CRA experienced an increase in average rental rates over the last 5 years, except for the U.S.-1 Commercial District, which experienced a decrease in average rental rates of nearly 12%.
The retail market within the City experienced a 13.8%, or $2.30, increase in average rental rates during this same time frame, from $16.69 in 2018 to $18.99 in 2022 YTD.
OFFICE MARKET TRENDS
As of YTD 2022, January through November 2022, the CRA has a total 218,800 square feet of office space, comprising 44% of the total inventory of office space within the City at 498,605 square feet. The U.S.-1 Commercial District contains the largest share of office space within the CRA at 81%; whereas, the Sebastian Blvd. MixedUse District comprises the smallest share at nearly 1% of the total office space within the CRA. The table below illustrates the office market characteristics for YTD 2022.

Over the last 5 years, total inventory of office space has remained unchanged within the CRA, at 218,800 square feet. Subsequently, the CRA districts also experienced no changes in inventory over the last 5 years. The newest office building, Sebastian Medical Suites, was built in 2008 and is the largest office property within the CRA, containing 16% of the total share at 34,700 square feet.
Comparatively, the City also experienced zero change in office space during this same time frame, remaining at 498,605 square feet.
Occupancy rates within all CRA districts were 100% as of 2022 YTD, except for the Riverfront District, which experienced a significant decline in occupancy, possibly due to the 5,040-square-foot Medical Office building being vacated and for sale as of 2022 YTD. Over the last 5 years, occupancy rate decreased 0.8% within the CRA: from 98.1% in 2018 to 97.3% in 2022 YTD.
The City also experienced a 0.8% decrease in occupancy of office space during this same time frame, from 98.0% in 2018 to 97.3% in 2022 YTD.

Throughout the last 5 years, average rental rates of office space increased 14.0%, or $2.76, within the CRA: from $19.76 in 2018 to $22.52 in 2022 YTD. All districts within the CRA experienced an increase in average rental rates over the last 5 years, with the Sebastian Blvd. South District experiencing the greatest increase in average rental rates at 15.3%.
Comparatively, the office market within the City experienced a 13.9%, or $2.65, increase in average rental rates during this same time frame, from $19.10 in 2018 to $21.75 in 2022 YTD.
INDUSTRIAL MARKET TRENDS
As of YTD 2022, January through November 2022, the CRA has a total 99,868 square feet of industrial/flex space, comprising 15% of the total inventory of industrial/flex space within the City at 647,343 square feet. The Sebastian Blvd. South District and U.S.-1 Commercial District are the only two districts within the CRA to contain any industrial/ flex space, with 95% and 5%, respectively, of the total share of industrial/flex space within the CRA. The table below illustrates the industrial/flex market characteristics for YTD 2022.

Over the last 5 years, total inventory of industrial/flex space has remained unchanged within the CRA, at nearly 100,000 square feet. Subsequently, the CRA districts also experienced no changes in inventory over the last 5 years. The Sebastian Industrial Park, built in 2005 and located in the Sebastian Blvd. South District, comprises the largest share of industrial/flex space within the CRA at 35%.
The City also experienced zero change in industrial/flex space during this same time frame, remaining at 647,343 square feet.

Occupancy rates within the CRA districts containing industrial/ flex space were 100% as of 2022 YTD. Over the last 5 years, occupancy rates for these districts, as well as the CRA as a whole, have remained at 100% since 2018. Between 2017 and 2018, occupancy within the CRA increased 6%, from 94.7% to 100%, driven by the Sebastian Blvd. South District.
Comparatively, the City experienced a 4.1% increase in occupancy of industrial/flex space during this same time frame, increasing from 96.1% in 2018 to fully occupied at 100.0% in 2022 YTD.

Throughout the last 5 years, average rental rates of industrial/ flex space increased 33.1%, or $2.61, within the CRA: from $7.89 in 2018 to $10.50 in 2022 YTD. The Sebastian Blvd. South District and U.S.-1 Commercial District, the only two districts containing industrial/flex space within the CRA, experienced an increase in average rental rates over the last 5 years of 32.8% and 35.6%, respectively.
The industrial/flex market within the City also experienced a 32.6%, or $2.50, increase of average rental rates during this same time frame, from $7.68 in 2018 to $10.18 in 2022 YTD.
SPACE UTILIZATION
Space utilization per job, particular to specific building types or industries, represents the typical square feet needed per employee and is a commonly used metric for measuring employment intensity and capacity. Although other factors, such as remote work and co-working space, can impact how much square footage is actually needed per employee, space utilization per job is generally a good indicator of space needed for both comfort and productivity in a physical setting.
Within the City and the CRA, the square footage per employee for combined commercial space was approximately 477 square feet and 575 square feet per employee, respectively, with office and industrial space requiring significantly less square footage per employee than retail space. This is not surprising as retail space depends largely on “foot traffic” and requires substantially more accommodation space for customers.
As the CRA continues to grow in terms of population, employment, and inventory of commercial and residential space, it is reasonable to assume the potential development opportunities will support the space utilization per employee currently being achieved in the marketplace. This space utilization analysis is intended to help guide the amount of square footage necessary to accommodate employees in both a comfort and productivity capacity for new commercial developments within the CRA.

Photo Courtesy
TOTAL HOUSING UNITS
As of the most recent 2022 estimates, total housing units within the CRA are estimated to be about 167 units, which represents roughly 1.4% of the total housing units within the City, at 11,845 units.
Since 2010, total housing units within the City grew at a CAGR of approximately 1.6%, adding over 2,267 new units. Comparatively, the CRA has experienced a negative CAGR of 0.5% since 2010. Although the amount of units has decreased by nearly 12 units within the CRA since 2010, the capture of the City’s units has remained relatively stable over this time period at an average of 1.6%.
The following figures illustrate the change in total housing units within the CRA and the capture of total housing units within the City from 2010 to 2022 estimates.
HOUSING UNIT COMPOSITION
Of the 197 housing units within the CRA, condominium units represent the majority at 60% of the total share. Single family, multi-family, and mobile/manufactured homes comprise approximately 28%, 8%, and 4%, respectively, of the total housing units within the CRA, as illustrated in the adjacent figure.
The 100 residential condominium units are contained within the three condominium properties within the CRA; these include:
▪ Oyster Bay Resort, with 37 units, located in the Riverfront District.
▪ Oyster Pointe Resort Condominium, with 52 units, located in the Riverfront District.
▪ River Oaks Townhomes, with 11 units, located in the Park District.
In addition, the 15 multi-family housing units are located in the two multi-family properties within the CRA.
HOUSING TENURE
The households within the City and the CRA average approximately 2.2 persons per household. Additionally, the household tenure in the City and the CRA is predominantly owner-occupied, as illustrated in the adjacent figure.
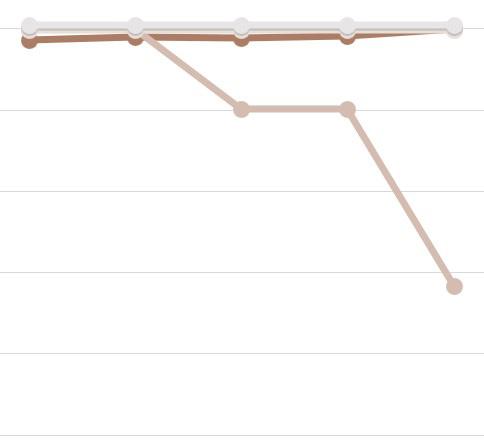
HOUSING UNIT VACANCY RATES
As of most recent 2022 estimates, the percentage of vacant housing units within the CRA at 17% is significantly greater than that of the City at 8%. This may be attributed to the substantial amount of seasonality and/or rotational vacancy occurring within the CRA compared to that of the City. Rotational vacancy includes units currently for rent, rented but not yet occupied, for sale, and sold but not yet occupied.
In addition, since 2010, vacancy rates in housing units have significantly declined in both the City and the CRA by 33% and 39%, respectively, as illustrated in the adjacent figure. A decrease in vacancy rates can be attributed to an increase in quality of housing units, a decrease in seasonality and rotational vacancy, and an increase in demand to reside within the specific area.


UNIT VALUES
The average home values within the CRA at nearly $417,170 are significantly higher than the average home values in the City at $272,730, as of most recent 2022 estimates.
According to the final 2022 Indian River County Tax Roll, the average just/market value per dwelling unit within the CRA was greater within single family units, followed by multi-family and condominium properties. On average, the residential properties within the CRA are achieving just/market values approximately 30% greater than those observed within the City. The following table details the average just/market values for all residential properties within the CRA and the City.
Avg. Just/Market Value
COST TO RENT
Of the total rental dwelling units within the City, approximately 1,623 units in 15 buildings are achieving occupancy rates of 97%. The average asking rent for multi-family properties within the City has increased 7% over the last 5 years, from $1,845 in 2018 to $1,975 in 2022 YTD, January 2022 through November 2022; whereas, the occupancy within the City has also increased 0.31% during this same time frame. Since 2018, the City has absorbed nearly 100 multi-family units.
Comparatively, since the inventory of multi-family properties within the CRA is minimal, the market rent per square foot was used to compare rental rates within this analysis. As a result, the average market asking rent for multi-family properties within the CRA at $1,248 per unit is significantly less than that observed in the City as of 2022 YTD estimates. The adjacent figure illustrates the average market asking rents by unit type within the CRA, as of 2022 YTD estimates.

Source: Indian River County 2022 Tax Roll; GAI Consultants, Inc.

Photo Courtesy of CoStar Group
Source: CoStar Group; GAI Consultants, Inc.
CONCENTRATION MAPPING
The map below illustrates the areas of concentration for commercial uses (i.e., office, retail, and industrial); as well as residential uses, including multi-family, single family, and condo residential within the CRA’s conceptual planning districts.
CONCENTRATION OF PROPERTIES BY USE TYPE

Sebastian CRA
Park District
Sebastian Blvd. Mixed-Use District
U.S.-1 Commercial District
Riverfront District
Sebastian Blvd. South District
Use:
Single Family
MARKET POTENTIAL ANALYSIS
The market potential analysis draws upon the previously described inventory analysis for commercial and residential markets, and comprises the following: (1) population and employment projections for the CRA; (2) consumer spending and retail leakage within the CRA as it relates to the City; (3) potential demand and supply of commercial and residential inventory over the next 15 years; and (4) potential development opportunities within the CRA.
POPULATION AND EMPLOYMENT PROJECTIONS
POPULATION PROJECTIONS
The Bureau of Economic and Business Research (“BEBR”) has been instrumental in providing population projections for Florida and its counties since the 1970s. BEBR provides a high, moderate, and low (“H-M-L”) growth projection extending to 2050 for all Florida counties; these projections are considered an industry standard when approaching population projections for counties in Florida. Although the moderate scenario is considered the most accurate forecast of future population change, the high and low scenarios illustrate a range of possible outcomes. It is important to note the population projections provided through BEBR solely reflect Florida residents, and exclude any seasonal population change as a result of tourism and visitation.
In 2022, total population was estimated to be nearly 154,939 persons within the County, 25,438 within the City, and 206 within the CRA. Over the last 10 years, 2012 to 2022, the City has captured an average of 15.6% of the total population within the County annually. Whereas, the CRA has captured an average of only 0.12% of the total population within the County during this same time frame. Applying these capture rates to the County’s net population change according to BEBR’s population projections, the City and CRA’s H-M-L future population growth can also be estimated throughout the next 15 years. The figure below illustrates current and projected population growth for the CRA through 2037.

Throughout the 15-year projection period, the City is estimated to experience an increase in population between 9% and 37%, resulting in total population between 27,730 and 34,765 persons by 2037. Comparatively, the CRA is estimated to experience an increase between 9% and 35%, resulting in
total population between 225 and 280 persons by 2037. In the moderate scenario, total population is estimated to grow at a CAGR of 1.3% for both the City and the CRA.
EMPLOYMENT PROJECTIONS
The annual average ratio of establishment employment to total population in the County is 32.6 jobs per 100 people. By applying this ratio to the County’s population projections according to BEBR, H-M-L future employment growth can also be estimated throughout the next 15 years.
In 2022, total establishment employment was estimated to be nearly 52,360 persons within the County, 5,865 within the City, and 1,464 within the CRA. Over the last 11 years, 2012 to 2022, the City has captured an average of 11.2% of the total employment within the County annually. Whereas, the CRA has captured an average of 2.8% of the total employment within the County during this same time frame. Applying these capture rates to the County’s employment projections, the City and Sebastian CRA’s H-M-L future employment growth can also be estimated.
Throughout the 15-year projection period, the City is estimated to experience an increase in employment between 0.2% and 42%, resulting in total employment between 5,850 and 8,300 employees by 2037. Comparatively, the CRA is estimated to experience an increase between 0.7% and 41%, resulting in total employment between 1,455 to 2,065 employees by 2037. In the moderate scenario, total employment is estimated to grow at a CAGR of 1.3% for both the City and the CRA. The figure below illustrates current and projected employment growth for the CRA through 2037.

RETAIL GAP ANALYSIS
To assist with the potential positioning of development opportunities within the CRA amongst current and emerging supply of similar commercial uses, a retail gap analysis was conducted to examine the relationship between what households spend their income on and where that spending occurs.
The act of residents within a defined market area leaving that area to purchase certain types of goods because they are not readily or abundantly available locally is commonly referred to as Retail Leakage. The retail gap analysis will examine both consumer spending behaviors and assess Retail Leakage within the City of Sebastian and the CRA to inform types of retail that might be appropriate and supported within the CRA, based on demand and supply.
CONSUMER SPENDING
What individuals and households residing within the CRA spend on retail, restaurants, or other food service provides additional perspective for this consumer spending analysis.
The most current consumer spending data provided by the U.S. Census for the CRA and the City is 2022 estimates. As of 2022 estimates, the CRA had an approximate total of approximately $8.9 million in consumer spending, comprising only 1.03% of the $872.4 billion of consumer spending within the City.
Within the CRA, the largest consumer spending categories are retail goods, housing, and food (away and at-home), comprising 29%, 28%, and 11%, respectively, of the total consumer spending within the area. These large consumer spending categories within the CRA are not surprising,
since the area represents a broad mix of retail and restaurant space, as well as higher valued residential properties along or adjacent to the Indian River Lagoon. The breakdown of consumer spending categories within the CRA is illustrated in the following figure.

Similar to the CRA, the largest consumer spending categories within the City are retail goods, housing, and food (away and at-home), comprising 28%, 27%, and 11%, respectively, of the total consumer spending within the City.
Additionally, the CRA is capturing approximately 1.03% of the total consumer spending occurring within the City as of 2022 estimates. Across every retail category, the CRA is capturing a relatively consistent share of consumer spending within the City, between 0.9% and 1.07% of the spending in each category.
The table below illustrates the total consumer spending by retail category for the City and CRA as of 2022 estimates.
RETAIL LEAKAGE
The retail gap analysis compares and contrasts Retail Leakage occurring within the CRA and the City from permanent and visiting population at each 3-digit NAICs industry code between 44-45 (Retail Trade) and 772 (Food Services and Drinking Places). A Retail Leakage analysis illustrates the dollar value difference between consumer expenditures in a market area (demand) and the corresponding retail sales of the market area stores (supply). The Retail Gap presents a snapshot of retail opportunity, and is a measure of the relationship between supply and demand. A positive Retail Gap value indicates there is greater supply than current demand.
Overall, the CRA is experiencing a retail surplus of nearly $82.4 million per year. Food Services and Drinking Places comprise $12.1 million of the total annual retail surplus; whereas, Retail Trade comprises $70.2 million of this share. This retail surplus occurring within the CRA is primarily driven by an abundance of supply (sales) within Building Material/Garden Equipment and Supply Stores, Food and Alcoholic Drinking Places, and Health and Personal Care stores, which significantly exceed existing demand within the CRA.
Comparatively, the City is experiencing a retail leakage of nearly $132.5 million per year. Food Services and Drinking Places comprise $18.1 million of the total annual retail leakage; whereas, Retail Trade comprises $114.4 million of this share. This retail shortage is primarily driven by a lack of supply (sales) within Health and Personal Care, Motor Vehicle and Parts Dealers, and Food and Alcoholic Drinking Places to meet existing demand within the City.
Based upon analysis of spending patterns, existing inventory, and retail surplus within the CRA, there appears to be very little need for additional retail capacity within the CRA. However, there are important distinctions between need and demand
Need is a relatively static concept, driven primarily by deficient supply. Viewed through such a lens, need is largely a planning and welfare matter often measured exclusively by gains or losses in population. Responses to need typically focus on community priorities without reference to the capacity of the market to provide alternatives through profit-driven transactions. Needs are real and definable, but they cannot always be adequately addressed.
Demand, on the other hand, is a dynamic concept. It is very price and product driven—functionally, the result of choices, age, lifestyle, preferences,
and continued movement of the population. Even when need is limited, demand can be strong in a marketplace that has proven itself a reliable and systematic source for products and services.
In the present case, there are elements of both need and demand within the CRA. To that point in particular, residents outside the CRA are drawn to the area to meet shopping-related needs, as illustrated in the table below. Comparatively, there is need and demand for additional retail capacity within the City to meet shopping-related needs. Although some of this needed demand within the City could be met by additional industry-specific retail capacity within the CRA, development should be conducive to the existing supply of retail in terms of character, space, and scale to the CRA.
Altogether, this retail gap analysis helps identify opportunities for industry-specific retail uses that could be supported by the current demand within the CRA and the City.
COMMERCIAL SPACE DEMAND ANALYSIS
Demand for commercial space is a function of the type and nature of the employment industry it supports. While strong health care and social assistance services, retail trade, and food services industries exist within the CRA, the County is expected to remain the major draw for regional employment. The consequence is that most employment growth and, therefore, demand for commercial space in the CRA would be driven by supporting population needs in services and community and neighborhood retail and restaurants.
NEW COMMERCIAL DEMAND
Based on the H-M-L projections of population and employment through 2037, along with the space utilization per job ratios, CRA would need an increase of between 16,000 and 367,170 square feet of additional commercial space (office, retail, and industrial) to support new demand— roughly an annual rate between 1,100 and 24,500 square feet per year. The table below illustrates the H-M-L estimated total square footage for combined commercial space throughout the 15-year projection period in 5-year increments that is reasonably achievable based on demand projections.
This demand analysis predicts that in the nearterm, 2022 to 2027, the rates of growth will be slightly higher, at a CAGR between 0.5% and 3.5%, as the CRA reacts to potential development opportunities to accommodate new population and employment growth, as well as increases in visitation and the tourism industry resulting from the recovering economy following the latest recession.
Throughout the remaining projection period, the addition of new commercial space is predicted to grow at a slightly slower, steady rate between 0.1% and 1.5% CAGR, as supply of vacant commercial land lessens and redevelopment of existing space comprises the majority of additional growth in commercial space. These rates of growth are similar to what the CRA has previously achieved over the last 10 years.
In the moderate scenario, demand for retail space will comprise the majority of the new commercial development within the CRA at an estimated 66.5% of the share of new commercial growth by 2037. Demand for office and industrial space will comprise a relatively modest share of the new growth by 2037 at 23.0% and 10.5%, respectively.
PROXIMATE COMMERCIAL CAPACITY (SUPPLY)
Although the land needed to accommodate this commercial demand growth is unknown—either because existing vacant lands are not currently planned for development or they exist in a use that does not allow for commercial development. What is known, is that within the CRA exists a stock of 84 parcels with a combined total of 48.4 vacant commercial (office and retail) and industrial acres, as illustrated in the table below.
The figure below illustrates the year-over-year H-M-L demand estimates for total commercial space through 2037.

Applying the average floor area ratio (“FAR”) for existing commercial properties within the CRA, at an FAR of 0.21, it can be estimated that the new commercial demand will need between 91.4 to 129.8 acres of vacant land for development by the end of the 15-year projection period. Given the limited amount of vacant commercial and industrial land existing within the CRA, there is likely not adequate land to accommodate future employment and commercial demand needs through 2037. As a result, redevelopment of existing properties and sites within the CRA at higher densities/intensities should be considered to accommodate this future demand.
Demand for new household formation from population growth is not exclusively a product of the supply and sales of residential housing units, but the ability for an area to accommodate overall demand for housing, which is linked to the steady supply of new housing units. Absent the construction of new housing units, population growth within the CRA is likely to stagnate. Thus, it is important to recognize new housing unit stock as both an opportunity to accommodate new households as well as provide existing households the opportunity for household mobility. The net effect either way is the accommodation of housing supply to meet demand.
The historic housing supply as it relates to historic population within the CRA has remained relatively stable since 2010, as detailed in the following table.
NEW HOUSING DEMAND
Based on the projections of population over the next 15 years, through 2037, as well as considering the average persons per households and the annual vacancy rates attributed to seasonality, the stock of housing units within the CRA would need to grow by about 35 units to support new residential demand. This new demand equates to an annual rate of roughly 2 units per year. The following table illustrates the estimated total households and housing units throughout the 15-year projection period in 5-year increments that is reasonably achievable based on demand projections.
Although total housing units have experienced a slight decline, total households have seen a positive growth of 15 households since 2010. This decline in housing units may be attributed to increases in seasonal and/or vacation housing units. To note, a household includes all the persons who occupy a housing unit as their usual place of residence; whereas, a housing unit is a house, an apartment, a mobile home, a group of rooms, or a single room that is occupied (or if vacant, is intended for occupancy) as separate living quarters.
In addition, residential sales activity within the CRA has also been relatively stable over the past several years; however, 2022 saw a notable increase in both sale activity and average sale price per square foot, specifically for single family, as illustrated in the table below. However, there have not been any new residential units constructed within the CRA since 2008; this may be stimulating sales activity to meet demand to support population growth and new household formation, along with the exchange of housing among existing residents.
Indian River County Tax Roll; ESRI 2022 Estimates; GAI Consultants, Inc. Note: Values are estimates.
PROXIMATE RESIDENTIAL CAPACITY (SUPPLY)
Although the land needed to accommodate this residential demand is unknown—either because existing vacant lands are not currently planned for development or they exist in a use that does not allow for residential development. What is known, is that within the CRA exists a stock of just 2 parcels with a combined total of 3.02 vacant residential acres, as illustrated in the table below. Given the average residential densities existing within the CRA for single family and condominium units are 2 dwelling units per acre and 13 dwelling units per acre, respectively, the limited amount of vacant residential land existing within the CRA is likely not adequate to accommodate future population growth and housing needs through 2037. As a result, redevelopment of existing properties and sites within the CRA at higher densities/intensities should be considered to accommodate this future demand.
Source: Indian River County Tax Roll; GAI Consultants, Inc.
Source:
POTENTIAL DEVELOPMENT OPPORTUNITIES
The potential development opportunities for commercial and residential markets within the CRA are based on existing land use data, current demographic and socio-economic characteristics, market inventory trends, and the retail gap analysis; as well as considering the 15-year future growth in population, employment, and commercial and residential demand. In addition, an Investment and Redevelopment Opportunity Index (“ROI”) model, detailed below, also contributed to defining potential development opportunities within the CRA.
INVESTMENT AND REDEVELOPMENT OPPORTUNITY INDEX
The ROI included in this analysis has been developed using weighted values that can identify potential investment and redevelopment properties located within a specific area. For the purpose of this analysis, investment and redevelopment opportunities were examined for the entire CRA.
The ROI model defines investment opportunities as current forsale commercial properties or available vacant land. Whereas, the ROI model defines redevelopment opportunities as select properties—including commercial, residential, and industrial—based on DOR property use codes, with an opportunity index score greater than 80.
These redevelopment opportunities generally represent developed properties that may be in active use and are, in most cases, not currently on the market for sale. While many legal, physical, and economic factors ultimately play a role in the viability of redeveloping properties, the general factors used in the ROI model include the following:
▪ Property Utilization in terms of Floor Area Ratio (“FAR”).
▪ Age of the Improvements.
▪ Relationship between Land and Improvement Value.
▪ Total Market Value, including Land and Improvements per square foot of Property.
▪ Size of Parcels.
Each of these factors for these properties is weighted to provide a measure between 0 and 100. Values closer to 100 reflect factors in favor of redevelopment, and values closer to 0 reflect less favorable
indicators for redevelopment. For this analysis, properties scoring 80 or above are considered significant redevelopment targets. The potential investment and redevelopment opportunities are identified in the table below. It is important to note, the ROI Model does not consider any other legal, physical, or economic factors that may influence development opportunity.
The following map illustrates the potential development opportunities—investment (for-sale) and redevelopment properties—identified in the prior table, and identifies the conceptual planning district each properties falls within the CRA.
POTENTIAL DEVELOPMENT OPPORTUNITIES

SECTION SUMMARY
Legend
Sebastian CRA Park District
Sebastian Blvd. Mixed-Use District
U.S.-1 Commercial District
Riverfront District
Sebastian Blvd. South District
Development Opportunities
For-Sale Commercial
For-Sale Land
Redevelopment Properties
Investment & Redevelopment Opportunities
The intent of the Market Assessment and Economic Analysis is to identify the market for potential commercial and residential development opportunities within the CRA, and to provide insight on the demographic, socioeconomic, and market performance trends within the CRA and broader City as a whole.
Ultimately, the Market Assessment and Economic Analysis, in combination with Section 1: Existing Conditions and Baseline Evaluation, serve as reference tools. These documents are also used as resources in this 2023 Sebastian CRA Master Plan.

PUBLIC INPUT & PUBLIC WORKSHOPS

PUBLIC INPUT & PUBLIC WORKSHOPS INTRODUCTION
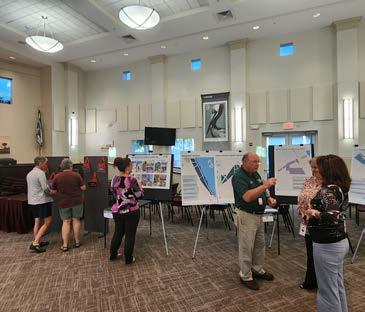
As a part of this 2023 Sebastian CRA Master Plan, public input was gathered and public workshops were conducted. The main focus of these activities and workshops was to listen and learn from various segments of the community.
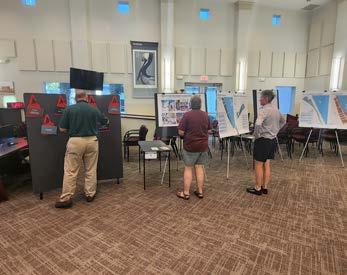
The public workshop activities included conducting two advertised public workshops held in March 2023 to review and seek input for the 2023 Sebastian CRA Master Plan by presenting a PowerPoint, as well as handson exercises, which helped engage the community and draw
additional feedback related to the 2023 Sebastian CRA Master Plan.
Prior to the public input sessions, a Sebastian CRA Master Plan 2023 Update information webpage and project specific community survey was launched to expand the means by which residents and other interested parties could provide their perspective on how the CRA can progress to enhance the redevelopment in a sustainable manner.
The Public Input and Public Workshops Assessment
PUBLIC INPUT PROCESS
identifies the ideas, goals, and aspirations of the residents and businesses within the CRA, which informs community strengths, opportunities, themes, and priorities for development within the CRA and City as a whole. In combination with Section 1: Conditions and Baseline Evaluation Report, as well as Section 2: Market Assessment and Economic Analysis, Section 3: Public Input and Public Workshops Assessment, serves as a resource in this 2023 Sebastian CRA Master Plan.
SEBASTIAN CRA MASTER PLAN INFORMATIONAL WEBPAGE & ANNOUNCEMENTS
An information webpage was launched in early February 2023 to establish a means for residents and businesses to become familiar with the 2023 Sebastian CRA Master Plan, as well as provide announcements for the public workshops and participation in the community survey.
The informational web-page included a general overview of the CRA’s five conceptual planning districts and access to the findings and observations from Section 1: Existing Conditions and Baseline Evaluation and Section 2: Market Assessment and Economic Analysis conducted as part of this 2023 Sebastian CRA Master Plan.
The community survey was also accessible from the informational webpage and sought community input regarding key issues, opportunities, current and potential projects, and current and potential programs within the CRA through a series of questions and freeresponse comments.
Public announcements were made at City public meetings via their marketing platforms to highlight the public workshops and community survey.


PUBLIC WORKSHOPS ENGAGEMENT ACTIVITIES
POWERPOINT PRESENTATION & EXERCISES
Two public workshops were held on March 1, 2023 from 11AM-1PM and 5PM-7PM. The Project Team, made up of CRA staff and GAI Consultants, Inc., presented a PowerPoint related to the 2023 Sebastian CRA Master Plan.
The presentation defined the CRA, illustrated alternative design criteria, identified the location and proposed improvements of potential redevelopment projects, revealed the proposed catalyst sites and opportunities, and identified proposed performance overlay criteria within the CRA.


In addition, there were four exercises conducted at the public workshops to further gain community feedback, these exercises included:
1. Dollar Exercise – Participants indicated how they would allocate $10 “Sebastian” dollars within the CRA.
2. Preserving the Town’s Character – Participants identified which design elements and color schemes within the CRA most accurately represents the “Old Florida Fishing Village”.
3. Conceptual Planning Districts –Participants indicated which major projects from the 2010 Sebastian CRA Master Plan they would like to see continued within each of the CRA’s planning districts.
4. Catalyst Sites – Participants reviewed the conceptual designs for the proposed catalyst sites and provided their feedback.


PUBLIC ENGAGEMENT OBSERVATIONS & FINDINGS
The exercises identified on the prior page, in addition to the community survey, resulted in various observations and findings from the residents, business owners, stakeholders, and other interested parties of the CRA. These observations and findings are highlighted below.
SURVEY
Nearly 150 respondents participated in the community survey. Of these respondents, approximately 60% were older than 55 years of age. The majority of respondents visit the CRA (52%), while the remaining work within the CRA (13%) and live within the CRA (35%).
About 60% of the respondents visit the CRA over the weekdays, with shopping and dining (70%), community events (68%), entertainment (53%), wildlife viewing/fishing (48%), and physical fitness (47%) comprising the majority of activities participants engage in while visiting the CRA.
2/TWO: PRESERVING THE TOWN’S CHARACTER
During the public workshops, participants indicated that the majority believed the community elements and color schemes which best represented the “Old Florida Fishing Village” were Active with Natural Tones and Traditional Iconic Elements, as illustrated in the adjacent figure.
The Active with Natural Tones theme represents an active waterfront with restaurants, boat docks, and social opportunities; wheres, the Traditional and Iconic Elements theme represents traditional coastal buildings with iconic elements and vibrant accents.
The results from this exercise are consistent with the 150 community survey responses—where Traditional Iconic Elements, Active with Natural Tones, and Active Coastal Vibes comprised the majority.
Respondents were most familiar with the Riverfront District as part of the CRA planning districts. Although respondents indicated there were relatively equal improvement needs for each conceptual planning district within the CRA.
The entire community survey results can be found within the Appendix.
EXERCISES
1/ONE: DOLLAR EXERCISE
During the public workshops, participants allocated the majority of their “Sebastian” dollars to drainage and infrastructure, as well as parks and public spaces, as illustrated in the adjacent figure.

The results from this exercise are consistent with the 150 community survey responses—where parks and public spaces, drainage, and parking were some of the local elements which had the highest priorities indicated by the respondents.


3/THREE: CONCEPTUAL PLANNING
DISTRICTS
Highlighted below are the major projects that the majority of the participants at the public workshops would like to see continued from the 2010 CRA Master Plan within each of the CRA’s conceptual planning districts.
Park District
▪ Upgrades and renovations to Riverview Park.
▪ Increased pedestrian connectivity.
▪ New recreational piers.
Sebastian Blvd. Mixed-Use District
▪ Addition of a 10-feet wide walk/ bikeway and large shade trees.
▪ Addition of a new park within the district.
▪ Addition of signage and gateway markers.
U.S.–1 Commercial District
▪ Delineated pedestrian crossways along U.S. Highway 1.
▪ Streetscape improvements, including lighting, median enhancements, and burying utility lines throughout U.S. Highway 1.
Riverfront District
▪ Create pocket parks, wildlife observation areas, and seating
OBSERVATIONS
Participants at the public workshops were able to provide feedback on new projects and/or programs that they would like to see implemented within the CRA, as identified in the list below.
▪ Introduce a trolley business in the CRA to provide transportation to events and/or festivals.
▪ Add compost/recycling/landfill program.
▪ Ensure that air, lagoon, and plant health are a top priority.
▪ Convert all waterfront existing businesses to biodegradable plastic use.
▪ Increase safety of bike paths and crosswalks, especially
opportunities along the east side of Indian River Drive.
▪ Improve walkability through bicycle and pedestrian paths along the roadway.
Sebastian Blvd. South District
▪ Add adequate setbacks and vegetative landscaping to create a boundary from Sebastian Boulevard Mixed-Use District.
Each of these major projects identified by the participants at the public workshop are consistent with the 150 responses from the community survey, as further illustrated within the Appendix.
4/FOUR: CATALYST SITES
Participants at the public workshops were able to view conceptual designs for the five proposed catalyst sites within the CRA. In addition, the 150 community survey responses were also very supportive of the proposed catalyst sites for redevelopment—an average of roughly 40% indicated that they strongly agree with the proposed catalyst sites.
The following highlights the common responses regarding the strengths and concerns related to the conceptual designs.
STRENGTHS:
▪ Expanding the working waterfront and maintaining riverfront views.
▪ A great use of the area to provide more food and entertainment options.
▪ Increasing parking in the area and creating safe crosswalks.
▪ Enhancing the “downtown” with a more natural scene.
▪ Positive responses regarding the kayak beach area and canopy concept.
▪ Keeping traffic away from events but still having a way travel south.
▪ Expanding Riverview park to be more flexible.
CONCERNS:
▪ Moving parking away from the water.
▪ Safer crossing across railroads and U.S. Highway 1.
▪ Increased natural habitats (rooftop gardens, retention pond with fish/wildlife habitat, walking paths, etc.)
▪ Restrict mixed-use to 100% sustainable.
▪ Keep the top of the proposed parking structure at Riverview Park natural with trees, tables and benches for river views.
across the railway, and add more shade along trails.
▪ Increased safety measures within the Sebastian CRA.
In addition, the 150 community survey responses also identified the level of importance each existing project and program within the CRA possessed, which was consistent with the results from the public workshops.
Specifically, property acquisition and revitalization, capital improvements, and special event funding projects were each ranked as very important by the respondents. Additionally, the Clean Water Program and
the Septic-to-Sewer Connection Grant Program were both ranked extremely important by the respondents. These responses are further detailed within the Appendix.

REDEVELOPMENT PLAN


REDEVELOPMENT PLAN INTRODUCTION
As an updated plan, this 2023 Sebastian CRA Master Plan recaps the basic contents, projects, and milestones of the 1995 efforts to strengthen the foundation for renewed objectives, programs, and proposed funding allocations going forward.
The content of this 2023 Sebastian CRA Master Plan includes, but is not necessarily limited to, the following:
▪ An overview of the CRA and conceptual planning districts.
▪ Recommended improvement programs.
▪ Updated and prioritized short- and long-term projects and timelines.
▪ Illustrated conceptual designs for potential projects and opportunity sites within the CRA.
▪ Review of the existing Performance Overlay District criteria and provided recommendations.
▪ Updated tax increment financing projections.
▪ Proposed updates to the Capital Improvements
Plan addressing a 15-year time frame.
▪ Recommended strategies for implementation.
As a result of this 2023 Sebastian CRA Master Plan, whatever programs or improvements are implemented or made, will be consistent with the City and the County’s most recent economic sustainability practices. Indeed, economic sustainability itself needs to be considered in the broadest terms possible as this 2023 Sebastian CRA Master Plan is administrated.
Chapter 163 authorizing this and similar redevelopment plans, makes it clear that sustaining the existing tax base through discrete and purposeful redevelopment actions and investments are desirable and appropriate actions for local governments. In this case, such actions are seen as the means to avoid the decline in competitiveness condition that sometimes challenge tourist areas in Florida and other parts of the country.
Photo Courtesy of Marinas.com
The long-term perspective of this 2023 Sebastian CRA Master Plan, described in some detail on the pages that follow, concludes with a series of recommended investments or activities and a proposed funding allocation for each, consistent with the revenues expected within the CRA over the next several years.
In sum, the analysis underlying this effort extends ideas or concepts introduced in the 1995 Sebastian CRA Master Plan, and subsequently updated in 2003 and 2010. This 2023 Sebastian CRA Master Plan enhances those prior plans with a broader vision, more diverse policy framework, and a heightened awareness of the need for economically sustainable practices.
ACCOMPLISHMENTS OF THE AGENCY
Major activities and accomplishments of the Agency in 2021 and 2022 include the following:
▪ Provided financial support for multiple events within the Riverfront District that attract many participants, providing revenue to local businesses including: Clam Bake, Shrimpfest, Concerts in the Park Series, and Fine Art Festival.
▪ Provided funding for Holiday decorations to enhance attraction to business district during holiday season.
▪ Continued funding grant programs that support public/private projects including: the Septic to Sewer assistance program and the Facade, Sign and Landscape grant program.
▪ Funded Submerged Land Leases for continued waterfront access and riverfront activities.
▪ Continued implementation of the Sign Master Plan for the Working Waterfront and Riverfront District.
▪ Completed Florida Inland Navigation District funds reporting for Fisherman’s Landing Working Waterfront Park.
▪ Provided waterfront/streetscape maintenance & facility improvements.
▪ Continued funding of improvements to Riverfront Park including irrigation and landscape.
▪ Worked with Florida Department of Transportation (“FDOT”) on Complete Streets design for pending improvement project on U.S. Highway 1.
▪ Completed construction of the Working Waterfront Shoreline Protection and Commercial Fishing Distribution Center Parking Lot Improvement Plan.
▪ Completed pedestrian walking trail connection from U.S. Highway 1 to Indian River Drive by
constructing sidewalk on N. Central Avenue as part of the Community Development Block Grant (“CDBG”) action plan.
▪ Secured Florida Department of Economic Opportunity (“DEO”) grant for CRA Master Plan update.
Since the adoption of the Sebastian CRA Master Plan in 1995, numerous other projects have been accomplished, these accomplishments include, but are not limited to, the following:
▪ Completed construction on the Indian River Drive/Main Street intersection project.
▪ Established a Facade, Sign and Landscaping matching grant program.
▪ Updated the Sebastian CRA Master Plan in 2003 and 2010.
▪ Provided matching funds to the Stan Mayfield Grant that was used for the purchase of the Working Waterfront Properties.
▪ Established a Sewer Connection Grant Program in 2015 to encourage septic to sewer conversions and reduce pollution into the Indian River Lagoon. Obtained funding assistance from the Indian River Lagoon National Estuary Program (“IRLNEP”) for the Septic to Sewer assistance program in 2018 to the present.
▪ Completed roadway improvements to the “Presidential Streets” and Baffle Box installation for improved water quality at the outfalls.
▪ Completed repairs to the CavCorp boat parking property.
▪ Completed a Riverfront Parking Study in 2011 resulting in the establishment of the Parking-inlieu program for parking within right-of-way of business district.
▪ Acquired property along the Indian River Lagoon shoreline for preservation as an extension of public property.
▪ Re-paved Indian River Drive and improved drainage swales and provided new enhanced pedestrian cross walks.
▪ Funded necessary repairs to the Working Waterfront historic property including: historic building repairs; new elastic coating roof; new plumbing and dock maintenance.
▪ Initiated Sign Master Plan design by incorporating compatible public property identification signs throughout Riverfront District.
▪ Completed Riverview Park Sidewalks per the Park Master Plan.
PURPOSE OF THE REDEVELOPMENT PLAN & DESCRIPTION OF PLAN POWERS
REVIEW OF CURRENT CONDITIONS AND INFRASTRUCTURE DEVELOPMENT PROGRAMS
The Sebastian CRA Master Plan was adjusted in very modest ways over the years since it’s creation in 1995. While some changes in project priorities may have occurred; there were only nominal shifts from the originally adopted activities and remained centered on sustainable strategies and opportunities to encourage reinvestment and redevelopment within the CRA. Major priorities included in the most recent 2010 Sebastian CRA Master Plan, focused on:
1. Preserving the historic character;
2. Enhancing the waterfront as a resource;
3. Maintaining low residential density and building heights;
4. Encouraging mixed-use development;
5. Creating complete streets to ease congestion and improve linkages;
6. Improving existing and creating new recreational opportunities; and
7. Developing a marketable identity for the CRA.
These priorities remain a large focus within this 2023 Sebastian CRA Master Plan. The Sebastian CRA Master Plan, implemented through a series of ordinances, describes a variety of needs, programs, or projects to be funded primarily through incremental receipts of property tax revenue. Such receipts have generally been referred to as tax increment financing (“TIF”).
This 2023 Sebastian CRA Master Plan recaps the progress made since the Sebastian CRA Master Plan was created in 1995, updating certain infrastructure considerations and much of the socio-economic data to reaffirm the major priorities and focus of the initiatives. The analysis and input of stakeholder or interested parties, along with an extensive series of studies from the County and the City government, have helped to shape the policy context in which the CRA and its planning area’s function.
While more remains to be done throughout the CRA, based on the priorities of the 1995 Sebastian CRA Master Plan, it is obvious these infrastructure and sustainability projects shall remain the subjects and/ or target of redevelopment initiatives. It is the purpose of this 2023 Sebastian CRA Master Plan to describe those issues and create a basis for policies, policy actions, or programs that would occur as the 2023 Sebastian CRA Master Plan is implemented. Although this 2023 Sebastian CRA Master Plan may have new or additional features, it is not a new plan but rather an updated plan as expressly allowed under the Redevelopment Act.
This 2023 Sebastian CRA Master Plan contemplates investments in infrastructure and other related activities but also places an emphasis on roads and pedestrian connectivity, parks, public spaces, housing, public safety, and a variety of other investments.
To emphasize, a community redevelopment plan, like the Sebastian CRA Master Plan, is a framework for future action. It is not a detailed blueprint with a list of stipulations and provisions although those will likely follow as the framework is implemented. Since it is a framework, this 2023 Sebastian CRA Master Plan should not be confused as a master development plan with a discrete set of directives and specifications. In its entirety, the Sebastian CRA Master Plan, formally recorded and adopted, codifies a commitment to thoughtful principles and objectives. These come together as a broadly outlined series of strategic initiatives or general commitments. Viewed as means of establishing priorities within a certain context, the most effective community redevelopment plan is flexible, but coordinated, to achieve a defined mission.
The Redevelopment Act, allowing the creation of redevelopment areas and the agency responsible for the redevelopment plan, along with the local government’s adopted comprehensive plan, serve as external controls and assurances that the undertakings identified in the plan remain in conformance with its broader mission. In effect, only activities identified in a community redevelopment plan, like the Sebastian CRA Master Plan, can benefit from a Redevelopment Trust Fund’s TIF dollars.
REQUIRED CONTENTS OF A REDEVELOPMENT PLAN
In a very simply described and summarized process for adopting and amending a community redevelopment plan, it is necessary that a local government and its Agency evaluate the physical, social and economic attributes of a specific area and make a determination that it satisfies multiple criteria. This determination would allow the local government to adopt and implement a redevelopment strategy and utilize all the powers available to its Agency.
Toward assuring compliance with the larger mission and responsibilities of the Agency and an implementable redevelopment plan, the Redevelopment Act outlines both the contents of the legally sufficient redevelopment plan and the
general framework for its adoption. The particulars of this 2023 Sebastian CRA Master Plan and the means by which it will be adopted, like its predecessor, adhere to the current legal requirements.
The Redevelopment Act, according to Chapter 163.360, Florida Statues, prescribes that each adopted plan:
a. Conform to the comprehensive plan for the county or municipality as prepared by the local planning agency under the Community Planning Act.
b. Be sufficiently complete to indicate such land acquisition, demolition and removal of structures, redevelopment, improvements, and rehabilitation as may be proposed to be carried out in the community redevelopment area; zoning and planning changes, if any; land uses; maximum densities; and building requirements.
c. Provide for the development of affordable housing in the area or state the reasons for not addressing in the plan the development of affordable housing in the area. The county, municipality, or community redevelopment agency shall coordinate with each housing authority or other affordable housing entities functioning within the geographic boundaries of the redevelopment area, concerning the development of affordable housing in the area.
The Redevelopment Act, according to Chapter 163.362, Florida Statues, prescribes that each community redevelopment plan shall:
i. Contain a legal description of the boundaries of the community redevelopment area and the reasons for establishing such boundaries shown in the plan.
ii. Show by diagram and in general terms:
a. The approximate amount of open space to be provided and the street layout.
b. Limitations on the type, size, height, number, and proposed use of buildings.
c. The approximate number of dwelling units.
d. Such property as is intended for use as public parks, recreation areas, streets, public utilities, and public improvements of any nature.
iii. If the redevelopment area contains low or moderate income housing, contain a neighborhood impact element which describes in detail the impact of the redevelopment upon the residents of the redevelopment area and the surrounding areas in terms of relocation,
traffic circulation, environmental quality, availability of community facilities and services, effect on school population, and other matters affecting the physical and social quality of the neighborhood.
iv. Identify specifically any publicly funded capital projects to be undertaken within the community redevelopment area.
v. Contain adequate safeguards that the work of redevelopment will be carried out pursuant to the plan.
vi. Provide for the retention of controls and the establishment of any restrictions or covenants running with land sold or leased for private use for such periods of time and under such conditions as the governing body deems necessary to effectuate the purposes of this part.
vii. Provide assurances that there will be replacement housing for the relocation of persons temporarily or permanently displaced from housing facilities within the community redevelopment area.
viii. Provide an element of residential use in the redevelopment area if such use exists in the area prior to the adoption of the plan or if the plan is intended to remedy a shortage of housing affordable to residents of low or moderate income, including the elderly, or if the plan is not intended to remedy such shortage, the reasons therefore.
ix. Contain a detailed statement of the projected costs of the redevelopment, including the amount to be expended on publicly funded capital projects in the community redevelopment area and any indebtedness of the community redevelopment agency, the county, or the municipality proposed to be incurred for such redevelopment if such indebtedness is to be repaid with increment revenues.
x. Provide a time certain for completing all redevelopment financed by increment revenues. Such time certain shall occur no later than 30 years after the fiscal year in which the plan is approved, adopted, or amended pursuant to s. 163.361(1). However, for any agency created after July 1, 2002, the time certain for completing all redevelopment financed by increment revenues must occur within 40 years after the fiscal year in which the plan is approved or adopted.
This 2023 Sebastian CRA Master Plan documents required compliance with Chapter 163.
To fulfill its many responsibilities, the Agency has many powers. These enumerated powers acknowledge the status of the Agency as a functioning governmental entity but one that stands apart in its supportive mission of the RA. These enumerated powers tend to reaffirm the Agency’s specific duties in the pursuit of development and redevelopment while separating its financial obligations from those of the associated general government.
These enumerated powers for the Agency as outlined in Chapter 163.0370 include, but are not limited to:
▪ To make and execute contracts and other instruments necessary or convenient to the exercise of its powers under this part.
▪ To disseminate slum clearance and community redevelopment information.
▪ To undertake and carry out community redevelopment and related activities within the community redevelopment area.
▪ To provide, or to arrange or contract for, the furnishing or repair by any person or agency, public or private, of services, privileges, works, streets, roads, public utilities, or other facilities for or in connection with a community redevelopment; to install, construct, and reconstruct streets, utilities, parks, playgrounds, and other public improvements; and to agree to any conditions that it deems reasonable and appropriate which are attached to federal financial assistance and imposed pursuant to federal law relating to the determination of prevailing salaries or wages or compliance with labor standards, in the undertaking or carrying out of a community redevelopment and related activities, and to include in any contract let in connection with such redevelopment and related activities or provisions to fulfill such of the conditions as it deems reasonable and appropriate.
Although any associated general-purpose governments and any of its property owners or citizens as tax payers are intended to benefit from the activities of the Agency or the CRA, they are insulated from its financial obligations. Further, certain operating and capital expenses of an associated general government, are not to be absorbed through funds flowing into the Sebastian CRA and it’s Redevelopment Trust Fund. Despite that insularity, the CRA exports many financial and community benefits well beyond its legally defined boundaries.
AUTHORIZED REDEVELOPMENT TRUST FUND EXPENDITURES
After approval of a community redevelopment plan, there may be established for each Agency created under F.S. Chapter 163.356 a redevelopment trust fund. Funds allocated to and deposited into this fund shall be used by the Agency to finance or refinance any community redevelopment it undertakes pursuant to the approved community redevelopment plan. In October 2019, the Redevelopment Act of 1969, was amended to further clarify authorized expenditures of the redevelopment trust fund. One of the most significant components of the 2019 amendment is that funds cannot be spent on promotional and marketing activities.
Per F.S. Chapter 163.387(6),
Effective October 1, 2019, moneys in the redevelopment trust fund may be expended for undertakings of a community redevelopment agency as described in the community redevelopment plan only pursuant to an annual budget adopted by the board of commissioners of the community redevelopment agency and only for the purposes specified…
The annual budget of a community redevelopment agency may provide for payment of the following expenses:
1. Administrative and overhead expenses directly or indirectly necessary to implement a community redevelopment plan adopted by the agency.
2. Expenses of redevelopment planning, surveys, and financial analysis, including the reimbursement of the governing body or the community redevelopment agency for such expenses incurred before the redevelopment plan was approved and adopted.
3. The acquisition of real property in the redevelopment area.
4. The clearance and preparation of any redevelopment area for redevelopment and relocation of site occupants within or outside the community redevelopment area as provided in s. 163.370.
5. The repayment of principal and interest or any redemption premium for loans, advances, bonds, bond anticipation notes, and any other form of indebtedness.
6. All expenses incidental to or connected with the issuance, sale, redemption, retirement, or purchase of bonds, bond anticipation notes, or other form of indebtedness, including funding of any reserve, redemption, or other fund or account provided for in the ordinance or resolution authorizing such bonds, notes, or other form of indebtedness.
7. The development of affordable housing within the community redevelopment area.
8. The development of community policing innovations.
9. Expenses that are necessary to exercise the powers granted under s. 163.370, as delegated under s. 163.358.
COMPREHENSIVE PLAN CONSISTENCY
This 2023 Sebastian CRA Master Plan was prepared in a manner consistent with the Goals, Objectives, and Policies of the Indian River County Comprehensive Plan and City of Sebastian Comprehensive Plan. This 2023 Sebastian CRA Master Plan meets the intent of the following specific Goals, Objectives, and Policies of the Comprehensive Plans of the County and the City:
INDIAN RIVER COUNTY COMPREHENSIVE PLAN 2030 CONSISTENCY
FLUE Policy 4.1: Land use districts shall be located in a manner which concentrates urban uses, thereby discouraging urban sprawl.
FLUE Policy 4.2: By January 2018, Indian River County shall identify and map target areas for redevelopment and infill development.
FLUE Policy 4.3: For the areas targeted for redevelopment and infill development in Future Land Use Element Policy 4.2, Indian River County shall, by 2019, assess the potential for future development, review infrastructure capabilities and needs, and develop special overlay or use districts and regulations, if warranted.
FLUE Policy 4.4: By January 2020, Indian River County shall work with property owners, developers, and the public to develop and implement a plan to promote development of the areas targeted for redevelopment and infill development. That plan shall examine the feasibility of reduced development fees, streamlined application processing, mixed uses, density bonuses, Traditional Neighborhood Design, home/work linkages and other innovative techniques to promote development in those areas.
FLUE Objective 5: Indian River County will have a diverse mix of land uses, development patterns, housing densities, and housing types. By 2030, 25% of the County’s housing units will be in multiple-family, mixed use, or traditional neighborhood design projects.
FLUE Objective 8: Through 2015, at least 95% of unincorporated Indian River County’s historic properties (as identified in “Historic Properties
Survey of Indian River County, Florida”, prepared by Historic Property Associates, Inc., April 1989) will continue to be preserved in fair, good, or excellent condition.
FLUE Policy 8.3: All public and private development or redevelopment proposals shall be reviewed for their impact upon designated historic resources.
FLUE Policy 8.4: Public and private development and redevelopment activities shall cease, at least temporarily, if historic or archaeological artifacts are discovered, in order to allow for evaluation of historic significance.
FLUE Objective 9: Through the implementation of land development regulations, Indian River County will have aesthetically pleasing buildings, signs, landscaping, parking areas, and roads.
FLUE Objective 11: By 2016, Indian River County will have taken action to encourage redevelopment or revitalization in at least three areas.
FLUE Policy 11.1: By 2019, Indian River County shall develop guidelines and regulations to designate areas in need of redevelopment or revitalization.
FLUE Policy 11.2: Within one year of designating a redevelopment or revitalization area, Indian River County shall determine the needs and deficiencies as well as remedies and solutions for that area.
FLUE Policy 16.2: Indian River County shall prohibit land use activity which results in the alteration, degradation or destruction of coastal and estuarine resources except when necessary to prevent a public hazard or provide public benefits which exceed those lost as a result of such activity. Public benefits of such resources include floodplain protection, natural habitat for threatened and endangered plants and animals, natural aquifer groundwater recharge, aquiculture, and recreation.
FLUE Policy 16.5: To improve the Indian River Lagoon’s water quality, the county shall develop additional stormwater projects that reduce the amount of stormwater that flows into the lagoon and/or improve the quality of stormwater flowing into the lagoon. In recent years, successful stormwater treatment projects have included the Sebastian Stormwater Park, the Main Relief Canal filtration system, and the Egret Marsh project.
FLUE Policy 1-2.3.1: The City shall encourage Low-Impact Development (LID) principles for development and redevelopment including those within newly annexed areas. The City shall require new developments to address future nutrient loading and water conservation through principles including but not limited to: LID design practices and technologies that address energy, water, and nutrient conservation; Use of natural, Florida friendly landscaping; and/or reduced, low, or no fertilizer use on greenspaces and yards.
FLUE Policy 1-3.1.1: Good principles of urban design shall be applied through site plan review procedures in order to enhance general community appearance as well as to preserve and enhance open space and landscape. This program shall assist in protecting major natural and man-made resources within the City, including the Indian River Lagoon, the St. Sebastian River, the Collier Creek natural drainage corridor, Schumann Lake, public parks and other public grounds and institutions, as well as developing residential neighborhoods and centers of commercial or institutional activity.
FLUE Policy 1-3.1.4: Non-residential development decisions shall promote the function of the downtown urban core area as a center for government and institutional services as well as a focal point for retail trade, business and professional offices, and civic and cultural enrichment. The City’s Land Development Code (LDC) shall be directed to achieving a mix of land use activities consistent with the future Land Use Map (FLUM). The City shall also continue to enforce the Riverfront design regulations, which provide a physical theme for development and redevelopment opportunities reinforcing the unique waterfront setting of the downtown area.
FLUE Objective 1-3.2: The establishment of procedures for identification and protection of historic properties and structures within the City will provide for the protection of archaeological sites.
FLUE Objective 1-3.3: The City shall maintain procedures in the LDC to limit the proliferation of urban sprawl and encourage redevelopment and revitalization of blighted and economically challenged areas.
FLUE Policy 1-3.3.1: The FLUM depicts the boundaries of the Community Redevelopment Area (CRA). The City shall continue to promote vitality and redevelopment of the five conceptual districts: Park District, Sebastian
Boulevard Mixed Use District, U.S.-1 Commercial District, Riverfront District, and the Sebastian Boulevard South District as directed in the City of Sebastian Community Redevelopment Master Plan included in this Element’s DIA. The City shall update the CRA Master Plan reflecting the principles and strategies contained within this Comprehensive Plan and apply those to the targeted redevelopment areas.
FLUE Policy 1-3.3.2: Consistent with Objectives 1-1.3 and 1-1.5 and their respective policies the City’s LDC shall maintain performance standards for the City’s Mixed Use Districts to ensure that land development activities, resource conservation and infrastructure issues are managed in a manner that will consider the needs of all the citizens of Sebastian.
A. The City shall promote a mixture of uses and a variety of opportunities for recreational, residential and commercial uses; encourage progress while protecting property rights; and protect the environment while fostering compatible uses.
B. The LDC shall encourage a mix of uses and enforce the “Old Florida Fishing Village” design theme within the Riverfront CRA District. Flooding and sea level rise shall be taken into consideration for areas of the Riverfront District located in the Coastal High Hazard Area (CHHA). The City may incentivize redevelopment through the use of TDRs to direct new development and population growth away from natural hazards and environmentally sensitive areas.
FLUE Policy 1-3.3.3: The City shall coordinate redevelopment issues with the private sector in promoting mobilization of public and private resources necessary to effectively carry out redevelopment efforts, especially along the Indian River Drive corridor which borders the Indian River Lagoon. Sea level rise and flooding shall be considered in low-lying areas in regard to limiting the use of public funds to achieve these goals as defined in §163.3178(1), F.S.
FLUE Policy 1-3.3.5: The protection, restoration, and enhancement of existing assets, including historical structures, is important in implementing the “Old Florida Fishing Village” design theme. The City shall continue to enforce the procedures and ordinances adopted for this purpose. The City shall develop programs and identify funding sources to protect, restore, and enhance the historical structures in the Riverfront District. Sea level rise and flooding should be considered in low-lying areas in regard to limiting the use of public funds to achieve these goals as defined in §163.3178(1), F.S.
FLUE Policy 1-3.4.1: The City shall ensure equitably distributed and accessible active transportation facilities (i.e. sidewalks, bike lanes) and recreational opportunities (i.e. parks, greenways) to support healthy lifestyles and physical activity.
FLUE Policy 1-3.4.2: Crime Prevention Through Environmental Design. The City shall encourage crime prevention in public areas through environmental design (CPTED) principles.
EDE Policy 9-1.1.3: Potential incentives for new or expanding businesses in the City include: Upon completion of application materials, the City of Sebastian will offer “fast track” site plan review that guarantees administrative determination, and permit issuance; Permitting assistance and guidance through the Economic Development Office; Ad valorem tax credits, in partnership with Indian River County;
CRA financing of County impact fees (for projects located in the CRA area); and Use of CRA funds to reduce the cost of water/sewer connections and/or local building permit fees.
EDE Policy 9-1.4.3: Protect the character of the City’s stable existing neighborhoods, the Downtown/Riverfront area and the commercial corridors such as CR-512.
EDE Policy 9-1.4.4: Continue the development of greenways as extensions of the City’s park system to increase open space and recreational opportunities throughout the City.
EDE Policy 9-1.6.1: Coordinate with appropriate partners to promote the fishing industry (both commercial and recreational) in Sebastian.
EDE Policy 9-1.6.4: Maintain gateway corridors (primarily 512 and US 1) with landscaping and pedestrian amenities.

Photo Courtesy of CoStar
SEBASTIAN CRA MAJOR THEMES
Throughout the formation of this 2023 Sebastian CRA Master Plan, as well as during the public input and workshop sessions, five overarching themes were identified. These themes are to be used as a planning framework for the Agency to help enhance the character of the downtown and to embrace opportunities that exist within the CRA. These major themes include:

INFRASTRUCTURE & DRAINAGE
A Riverfront Drainage Study performed in 2014 identified a list of stormwater improvement areas within the Sebastian CRA; these included drainage improvements to Indian River, “Presidential Street”, Coolidge Street, Central Avenue/Davis Street, and the CavCorp parking lot. These stormwater facility improvements were completed in 2017 through the installation of baffle boxes at major outfall locations. In addition, the Agency continues plans to address other infrastructure needs relative to septic-to-sewer conversion within the redevelopment area.
The stormwater facilities and water/sewer utility infrastructure may require upgrades within the CRA, especially when anticipating new demand driven by residential, commercial, and mixed-use development.

WATERFRONT, PARKS, & PUBLIC SPACES
The CRA closely identifies with its waterfront, occupying over 47% of its total acreage. The Agency has prioritized access and preservation of its waterfront, as it is vital to the area’s economic success. The CRA’s community continues to support these preservation efforts, subsequently preserving and enhancing the City’s history as a fishing village, contribute to the desired design theme, and make use of the waterfront resource to maximize economic development.
Open space enhancement projects along the water and restoring waterfront properties for new uses were contemplated within the 2010 Sebastian CRA Master Plan and have been continued within this 2023 Sebastian CRA Master Plan.
In 2018, the consensus of community members and key stakeholders was to focus on river views and access, a waterfront pedestrian experience, and open public spaces. Specifically, the “Working Waterfront” initiative has been a high priority of the City and the Agency to promote economic revitalization along the Indian River coast. Subsequently, these efforts have continued to bring activity and regeneration to the Sebastian shoreline.
In addition, enhancing the existing Riverview Park is a prime example of the potential for park revitalization and economic activity in the surrounding vicinity. A Riverview Park Master Plan was completed in 2019 to diversify its current uses and implement best management practices moving forward. The Agency seeks to generate more engagement with its open space by creating connectivity between greenspaces through implementation of a pedestrian pathway system, greenway connectors, and bicycle paths that may provide for future recreation enhancement opportunities. The Agency also seeks to enhance its recreational piers, waterfront boat ramp access, and smaller opportunistic waterfront parks, especially within the Park District.

ROADS, PARKING, & PEDESTRIAN CONNECTIVITY IMPROVEMENTS
The CRA community’s desire for road and pedestrian connectivity improvements along U.S. Highway 1 and Indian River Drive were significant observations during the public input sessions. The CRA is prioritizing pedestrian connectivity and accessibility in order to link west Sebastian to the waterfront by creating a more pedestrian- and bicycle-friendly streetscape environment and providing visual linkages between the riverfront and U.S. Highway 1. These improvements may include, but not be limited to, boulevard landscaping including street trees and sidewalks, widened sidewalks and curbed dedicated bicycling space along Indian River Drive, flashing pedestrian crosswalks across U.S. Highway 1 towards the riverfront, and safer crosswalk areas along the railroad tracks near the Sebastian Boulevard Triangle Area.
In addition, the Land Development Code was updated under Ordinance No. O-10-05 in an effort to encourage public parking use in high-demand/ low-supply areas. The “payment in lieu of parking” program permits the use of City parking areas adjacent to commercial property to satisfy zoning requirements. The Agency envisions increasing public parking in the CRA, and establishing on-street parking and streetscapes adjacent to recreation areas.

PUBLIC SAFETY
Another observation from the community during the public input session was the desire to enhance public safety throughout the CRA, ensuring that everyone can live and work in a safe environment. In doing so, the Agency could develop a comprehensive public safety initiative that addresses public safety needs of the community.
Currently, the City Police Department consists of a road patrol, canine, and marine unit divisions with the main commitment to maintaining a safe and peaceful environment for all residents and visitors within the City. Additional ways the Agency may increase public safety could include increased lighting and safety measures in community spaces, developing public health and prevention strategies, and prioritizing youth development.

PRESERVING THE COMMUNITY CHARACTER
Promoting the community character as “Old Florida Fishing Village” and the CRA as a destination has been a major priority within the CRA since adoption. In doing so, the Agency has prioritized creating a unique brand through signage, wayfinding, and advertising.
In addition, the CRA has prioritized enhancing existing recreation land in the CRA through use of appropriate urban design for parks and open spaces, increasing pedestrian connectivity and walkways, and preserving the character of the existing neighborhoods through proper landscaping, lighting, and signage. All of these practices have helped define the Sebastian CRA’s community character and a coherent sense of place when visiting the CRA.
These five major themes have helped identify the guiding principles, as well as the recommended improvement and redevelopment programs within the CRA, as detailed along the following pages.

GUIDING PRINCIPLES
The principles identified below are derived from public engagement, other plans, and background data utilized. The analysis and feedback suggest a variety of objectives that are the essential elements of this 2023 Sebastian CRA Master Plan structural framework.
I. ENCOURAGE
▪ Residential and mixed-use development within the Sebastian Blvd. Triangle Overlay District.
▪ Retail uses adjacent to Riverview Park.
▪ Compatible infill development.
▪ Enhancement of the character of the CRA with architecture that addresses the community’s “Old Florida Fishing Village” scale and feel.
II. CREATE
▪ Gateway features at west end of Sebastian Blvd. Triangle Overlay District and on U.S. Highway 1
▪ Visual linkages between the riverfront and U.S. Highway 1.
▪ Improved bicycle and pedestrian linkages to the riverfront and between recreation lands.
▪ Additional on-street/off-street parking.
▪ Pocket parks and wildlife observation areas.
▪ Opportunities to facilitate development of catalyst sites and other priorities through property acquisition.
III. PRESERVE
▪ Protect and enhance uses and buildings along and adjacent to one of the area’s most important assets: the Indian River Lagoon.
▪ Important historic resources in the redevelopment area, particularly those that help to illustrate the area’s fishing heritage, as well as those that meaningfully contribute to the “Old Florida Fishing Village” character.
▪ Waterfront access and continued riverfront activities.
IV. PROMOTE
▪ Promote the redevelopment area as a destination for shopping, dining, events, and recreation.
▪ Incentive, Grant, and Assistance Programs available to property owners and businesses within the CRA.
Photo Courtesy of CoStar
RECOMMENDED IMPROVEMENT & REDEVELOPMENT ACTIVITIES AND PROGRAMS WITHIN THE SEBASTIAN CRA
REDEVELOPMENT AND IMPROVEMENT ACTIVITY BY CONCEPTUAL PLANNING DISTRICT
Residential + Mixed Use Development
Retail Uses adjacent to Riverview Park
“Old Florida Fishing Village” Character
Development of Catalyst Sites
Parks + Wildlife Observation Areas
to Recreational “Twin” Piers
Pedestrian Connectivity
Improvements + Vegetative
+ Enhance Indian River Lagoon Frontage
REDEVELOPMENT PROGRAMS
FACADE, SIGN, AND LANDSCAPING MATCHING GRANT PROGRAM – This program provides funds to assist property owners and/or business owners to improve and install new signage and/or landscaping.
SEPTIC TO SEWER CONNECTION GRANT (S2S) – This program is designed to provide individual grants to qualified property owners for costs incurred to remove an operational septic tank system that serves and occupied facility or building and connects to the County sanitary sewer system. SSP is available to businesses or residences located with the Redevelopment Area currently utilizing septic systems.
PARKING-IN-LIEU PROGRAM – This program provides for establishing parking within the right-of-way at a rate of $3,200 per space.
STORMWATER FEE CREDIT PROGRAM – All properties within City, whether or not they discharge stormwater directly into the Sebastian Stormwater Utility (“Utility”) system, will pay a proportionate share of the Utility expenses incurred in providing generalized benefits to the system. Property located within the City from which stormwater runoff is discharged, either directly or indirectly, may be eligible for a reduction in the stormwater fee from the Utility. Single-Family Residential lots are not eligible for this credit. The City shall reasonably determine “fee credit” based upon the savings to the Utility resulting from the property’s stormwater facilities or unique features. Stormwater fee credits include: incorporation of LID/BMP alternative practices such as vegetated swales and buffers, permeable pavers, bioretention and bioswales.
Source: Sebastian Community Redevelopment Agency; GAI Consultants, Inc.
CONCEPTUAL PLANNING DISTRICTS’ PRIORITIES
As a part of the 2023 Sebastian CRA Master Plan, major priorities have been identified for each of the CRA’s conceptual planning districts. These priorities are provided for the short-term (1–5 years) and the long-term (6–10 years), as illustrated below. These projects and associated time frames are consistent with the updated goals and objectives within this 2023 Sebastian CRA Master Plan.
Park District
SHORT-TERM PRIORITIES
Implementation of Riverview Park Master Plan Upgrades and Renovations.
Restoration, as appropriate, of important waterfront properties to enhance their economic viability and maintain and improve the character of the CRA.
Streetscape improvements to Indian River Drive.
Creation of riverfront event space.
Property acquisition to facilitate Catalyst Site development and infill development projects.
LONG-TERM PRIORITIES
Create “local activity center” surrounding the Riverview Park, to include complementary retail uses, connectivity to the riverfront, and streetscape improvements.
Restoration, as appropriate, of important waterfront properties to enhance their economic viability and maintain and improve the character of the CRA.
New sidewalk construction as necessary to provide a continuous sidewalk network.
Sebastian Blvd. Mixed-Use District
SHORT-TERM PRIORITIES
Improvement of the Sebastian Boulevard Triangle Area to provide for mixed-use development, connectivity to adjacent residential communities, and streetscape improvements.
Property acquisition to facilitate Catalyst Site development and infill development projects.
LONG-TERM PRIORITIES
New sidewalk construction as necessary to provide a continuous sidewalk network. Modification of lake to create park/ open space feature.
U.S.–1 Commercial District
SHORT-TERM PRIORITIES
Installation of gateway treatments at entrances to the CRA along U.S. Highway 1.
Property acquisition to facilitate Catalyst Site development and infill commercial development.
LONG-TERM PRIORITIES
New sidewalk construction as necessary to provide a continuous sidewalk network.
Enhancement of the U.S. Highway 1 streetscape to provide for greater pedestrian and bicycle usability, as well as the installation of mature landscaping and trees.
Property acquisition to facilitate infill commercial development.
SHORT-TERM PRIORITIES
Restoration, as appropriate, of important waterfront properties to enhance their economic viability and maintain and improve the character of the CRA.
Streetscape improvements to Indian River Drive.
Property acquisition to facilitate Catalyst Site development and infill development projects.
LONG-TERM PRIORITIES
Restoration, as appropriate, of important waterfront properties to enhance their economic viability and maintain and improve the character of the CRA.
New sidewalk construction as necessary to provide a continuous sidewalk network.
Riverfront District Sebastian Blvd. South District
SHORT-TERM PRIORITIES
Installation of gateway treatments at entrances to the CRA along Sebastian Boulevard.
LONG-TERM PRIORITIES
New sidewalk construction as necessary to provide a continuous sidewalk network.
Property acquisition to facilitate infill development projects.
LOCATION & CONCEPTUAL DESIGN OF OPPORTUNITY SITE’S CATALYST PROJECTS
In the CRA, there are five catalyst sites which have been identified. These catalyst sites, located in opportunity sites previously identified by the 2010 Sebastian CRA Master Plan, are illustrated in the following map. Along the following pages are graphic renderings of these catalyst sites and the potential design and allocation of space these sites could feasibly accommodate which would help encourage redevelopment and reinvestment within the CRA.
SEBASTIAN CRA CATALYST SITES


U.S. HIGHWAY 1 CATALYST PROJECT

RIVERVIEW PARK CATALYST PROJECT


Rendering Source: GAI Consultants’ Community Solutions Group | April 2023 Rendering Source: GAI Consultants’ Community Solutions Group

SEBASTIAN BOULEVARD TRIANGLE AREA CATALYST PROJECT (CONCEPT B)

PROPOSED SEBASTIAN CRA
PERFORMANCE
OVERLAY DESIGN CRITERIA
The CRA comprises of three overlay districts intended to guide architectural principles, these include: (1) the Riverfront Overlay District, located east of the FEC Railroad; (2) the County Road 512 Overlay District, located in properties abutting CR 512 to the properties west of the FEC Railroad with lot frontage on Sebastian Boulevard; and (3) the Sebastian Boulevard Triangle Overlay District, located north of the divided Sebastian Boulevard and west of the FEC Railroad.
The performance overlay design criteria for each of the three districts have been summarized and updated as part of this 2023 Sebastian CRA Master Plan, as detailed along the following pages and illustrated in the following map.
PERFORMANCE OVERLAY DISTRICTS

Legend
Sebastian CRA Riverfront Overlay District County Road 512 Overlay District Sebastian Blvd. Triangle Overlay District
RIVERFRONT OVERLAY DISTRICT
The design criteria for the Riverfront Overlay District can be summarized as follows:
PURPOSE AND OBJECTIVES
▪ Promote development and redevelopment.
▪ Encourage traditional building types with arcades, balconies, and porches.
▪ Create a sense of place and promote social interaction on the streets.
▪ Encourage durable construction with “Old Florida Fishing Village” architecture.
SPECIAL PROVISIONS
The Riverfront Overlay District outlines special design and color requirements to ensure architectural consistency and visual appeal, including:
▪ Equal design considerations for multi-frontage buildings;
▪ Encouraging porches and fences, maintaining open vistas;
▪ Avoiding massive facades;
▪ Regulating siding and roofing materials;
▪ Controlling lighting;
▪ Specifying roof styles;
▪ Addressing site elements and trees; and
▪ Requiring screening for visually offensive elements.
UNDERLYING ZONING DISTRICTS
The Riverfront Overlay District modifies four underlying zoning districts which specify the dimensional regulations for new development, as detailed below and summarized in the following table.
▪ Medium Density Multiple-Family Residential (RM-8)—Allows single-family, duplex, and multifamily dwellings. Intended to maintain a density of up to 8 dwelling units per unit.
▪ Commercial Riverfront (CR)—Intended to preserve the existing character of the area and provide a mixture of uses and opportunities for recreational and commercial uses while protecting the environment.
▪ Commercial Waterfront Residential (CWR) Intended to preserve the existing character of the area while providing a mixture of uses for recreational, residential, and commercial uses while protecting the environment.
▪ Public Service (PS)—Allows institutional uses including parks and recreation areas and churches. Intended to comply with comprehensive plan policies.
Side Setback
Rear Setback
Non-residential: None (with sidewalk) or 10 ft (without sidewalk
Residential: 25 ft With sidewalks: None Without sidewalks: 6 ft
Non-residential: 5 ft (10 ft when abutting residential)
Residential: 15 ft + 1 ft per each additional 2 ft in height above 25 ft 5 ft (10 ft when abutting residential)
Non-residential: 10 ft (30 ft when abutting residential)
Residential: 20 ft 10
(30 ft when abutting residential)
Source: Sebastian Community Redevelopment Agency; GAI Consultants, Inc.
EFFECTIVENESS
The Riverfront Overlay District effectively achieves its objectives by preserving historic structures and promoting architectural consistency. However, there are areas for improvement. Some provisions, such as restrictions on building and roofing materials, may increase development costs, potentially delaying redevelopment efforts in the coming years. Additionally, certain dimensional limitations could contribute to underutilization of land within the overlay
area, particularly along U.S. Highway 1. Furthermore, with the increasing likelihood of extreme weather events and storm surges, high imperviousness allowances may pose challenges for the overlay’s performance, especially in the CWR zoning district.
RECOMMENDATIONS
To offset the costs imposed by the Design Criteria, the City and Agency might consider the following modifications to the Riverfront Overlay (and underlying zoning districts) to increase the flexibility and the likelihood of a successful project:
Define Old Florida Fishing Village
Define “Old Florida Fishing Village” Architecture based on feedback from public input which indicated a preference for architecture themes of Active with Natural Tones and Traditional Iconic Elements. The Active with Natural Tones theme represents an active waterfront with restaurants, boat docks, and social opportunities; wheres, the Traditional and Iconic Elements theme represents traditional coastal buildings with iconic elements and vibrant accents.
Consider removing minimum parking requirements. Minimum parking requirements can result in an overabundance of parking spaces, leading to inefficient land use and excess imperviousness. Moreover, these requirements can significantly

COUNTY ROAD 512 OVERLAY DISTRICT
The design criteria for the County Road 512 (“CR 512”) Overlay District can be summarized as follows:
PURPOSE AND OBJECTIVES
▪ Celebrate the entranceway into the City of Sebastian along the CR 512 corridor.
▪ Maintain an attractive and orderly appearance.
▪ Promote a safe transportation system.
▪ Accommodate multiple modes of transportation (i.e., mass transit, pedestrians, bicycles, and automobiles).
increase the cost of development, particularly in urban areas where land prices are high. The City and Agency should consider removing minimum parking requirements to avoid these inefficiencies. In the absence of minimum parking requirements, developers and property owners are already incentivized to determine the appropriate amount of parking based on market demand. This results in more efficient and context-sensitive parking solutions that better reflect the needs of residents, visitors, and businesses. Landowners can and should be encouraged to enter into shared parking arrangements, such as shared lots for commercial and residential, helping to optimize parking resources and reduce the overall demand for parking spaces.
Additionally, the City and Agency can take further steps to manage parking at a district-wide level, such as implementing dynamic pricing for on-street and public parking areas. This involves adjusting parking prices based on demand, which can help manage the overall demand for parking spaces.
GRAPHIC RENDERING
Examples of the Riverfront Overlay District, incorporating the design criteria and proposed recommendations, are reflected in the following graphic renderings:

SPECIAL PROVISIONS
The CR 512 Overlay District outlines special design and color requirements to ensure architectural consistency and visual appeal, including:
▪ Consistent detailing on street-facing facades.
▪ Consistent detailing of shopping centers and the accompanying out-parcels.
▪ White and light neutral colors in warm range building colors (via Overlay Districts master color list).
UNDERLYING ZONING DISTRICTS
The CR 512 overlay district modifies two underlying zoning districts, as detailed below and summarized in the following table.
▪ Commercial-512 District (C-512)—Various commercial uses such as professional offices, medical services, commercial retail/restaurants.
▪ Industrial (IN)—Permits a variety of uses, including commercial retail, administrative services, marine-related educational institutions, and various industrial activities, among others, subject to specific dimensional regulations. The zoning district also includes certain screening and separation requirements related to the proximity of residential areas and other establishments.
RECOMMENDATIONS
To offset the costs imposed by the Design Criteria, the City and Agency might consider the following modifications to the CR 512 Overlay District to increase the flexibility and the likelihood of a successful project:
Introduce I-MIX Zoning
A mix of land uses promotes walkability, vibrancy, and can contribute to the success of a new development. However, residential uses are effectively excluded from the CR 512 Overlay District except as an accessory use within Commercial-512 zoning, which limits the potential for development in this area.
The City can modify the overlay district to allow for residential use. This would increase the likelihood that property will be developed in the CR 512 district, as it would give developers more options for how to use the land.
In the modern era, industrial uses are no longer as dangerous or disruptive to residential areas as they once were. As a result, cities are increasingly embracing the concept of “Industrial Mixed Use” to blend industrial spaces with opportunities for residential development. This approach creates a unique and dynamic urban tapestry that adds character to the community while also driving economic growth.
Multimodal Enhancements
Setback Requirements
Source:
Front yard: 74 feet if abutting CR 512, otherwise 10 feet; Side yard: none if building is built to side property line(s), otherwise min. of 10 feet; Rear yard: 10 feet
Front yard: 100 feet; Side yard: 25 feet; Rear yard: 50 feet
Sebastian Community Redevelopment Agency; GAI Consultants, Inc.
EFFECTIVENESS
Overall, the zoning code provisions effectively contribute to creating a visually appealing and cohesive corridor along CR 512 by establishing clear guidelines for building aesthetics, materials, and colors. New developments are subject to design criteria and landscaping requirements that promote a harmonious appearance and minimize the impact of visual nuisances. The code addresses functional elements, such as limiting the frequency of curb cuts, to promote safer and more efficient traffic conditions.
Areas for improvement include:
▪ Expanding use allowances to encourage a mix of residential options alongside commercial uses.
▪ Incorporating requirements for multi-modal enhancements, such as wider sidewalks and dedicated bicycle paths, to promote a more accessible and connected transportation network.
The provision of wide sidewalks and space for active and alternative modes of transportation, such as bicycles and scooters, expands mobility options, improves safety, reduces traffic congestion, and enhances overall quality of life. Currently, the overlay district does not directly require or incentivize multimodal enhancements for new developments. The City and Agency can either add these provisions to the overlay code or establish a “complete streets policy,” which would influence new developments citywide. All new developments or substantial redevelopments within the CR 512 Overlay District should provide sidewalks at least 6-feet wide, in addition to off-street bikeways with a minimum width of 10 feet for two-way traffic or 6 feet for oneway traffic.
Consider removing minimum parking requirements in tandem with cross access easement requirements.
As previously mentioned, minimum parking requirements can result in an overabundance of parking spaces, leading to inefficient land use, excess imperviousness, and increased development costs. Removing minimum parking requirements empowers landowners to determine the appropriate amount of parking.
Along corridors like CR 512, better coordinated parking management can be achieved by requiring crossaccess easements. These legal agreements allow
neighboring property owners to share access, such as driveways or parking lots to help reduce the overall number of parking spaces needed, promote more efficient land use, and improve traffic flow and safety.

GRAPHIC RENDERING
Examples of the CR 512 Overlay District, incorporating the design criteria and proposed recommendations, are reflected in the following graphic renderings:

SEBASTIAN BOULEVARD TRIANGLE OVERLAY DISTRICT
The design criteria for the Sebastian Boulevard Triangle Overlay District can be summarized as follows:
PURPOSE AND OBJECTIVES
▪ Encourage traditional building types with arcades, balconies, and porches.
▪ Create a sense of place and promote social interaction at street level.
SPECIAL PROVISIONS
The Sebastian Boulevard Triangle Overlay District adopts by reference the special provisions (design criteria, color, and landscaping requirements) from the Riverfront Overlay District.
UNDERLYING ZONING DISTRICTS
The Sebastian Boulevard Triangle Overlay District modifies two underlying zoning districts, as detailed below and summarized in the following table.
▪ Commercial General (CG)—Established to implement comprehensive plan policies for areas designated “CG” on the comprehensive plan future land use map.
▪ Industrial (IN) Permits a variety of uses, including commercial retail, administrative services, marine-related educational institutions, and various industrial activities, among others, subject to specific dimensional regulations. The district also includes certain screening and separation requirements related to the proximity of residential areas and other establishments.
Setback Requirements
Front yard with sidewalks, curb and gutters: None required.
Front yard without sidewalks, curb and gutters: 6 feet.
Side yard: 5 feet minimum, except 30 feet when abutting a residential district.
Rear yard: 10 feet; except 30 feet when abutting a residential district
Minimum setbacks:
Front yard: 20 feet.
Side interior yard: None.
Rear yard: 10 feet
Source: Sebastian Community Redevelopment Agency; GAI Consultants, Inc.
EFFECTIVENESS
To the extent the Riverfront Overlay District is effective, the Sebastian Boulevard Triangle Overlay District is also effective, as the performance standards are the same. This also means that the Sebastian Boulevard Triangle Overlay District may suffer from some of the limitations imposed by the Riverfront design standards, such as restrictions on building and roofing materials, which may increase development costs.
RECOMMENDATIONS
To offset the costs imposed by the Design Criteria, the City and Agency might consider the following modifications to the Sebastian Boulevard Triangle Overlay District to increase the flexibility and the likelihood of a successful project:
Introduce I-MIX Zoning
As previously mentioned, a mix of land uses promotes walkability, vibrancy, and can contribute to the success of a new development. Today, the Sebastian Boulevard Triangle Overlay District generally allows for residential uses, but as a conditional use within the Industrial district. The City might consider permitting residential uses by-right to reduce barriers to development.
Multimodal Enhancements
As previously mentions, the provision of wide sidewalks and space for active and alternative modes of transportation, such as bicycles and scooters, expands mobility options, improves safety, reduces traffic congestion, and enhances overall quality of life. This is especially relevant along Sebastian Boulevard. The City can either add requirements to the overlay code or establish a “complete streets policy,” which would influence new developments citywide. All new developments or substantial redevelopments along Sebastian Boulevard should provide sidewalks at least 6-feet wide, in addition to off-street bikeways with a minimum width of 10 feet for two-way traffic or 6 feet for one-way traffic.

Define Old Florida Fishing Village
Define “Old Florida Fishing Village” Architecture based on feedback from public input which indicated a preference for architecture themes of Active with Natural Tones and Traditional Iconic Elements. The Active with Natural Tones theme represents an active waterfront with restaurants, boat docks, and social opportunities; wheres, the Traditional and Iconic Elements theme represents traditional coastal buildings with iconic elements and vibrant accents.
Consider removing minimum parking requirements.
As mentioned earlier, minimum parking requirements can impose unnecessary and inefficient regulations on landowners. Removing these requirements will empower landowners to determine the appropriate amount of parking needed based on market demand.
To further optimize parking management, other elements such as cross-access easements and dynamic pricing of public parking spaces can be implemented. Cross-access easements allow neighboring property owners to share access, such as driveways or parking lots, while dynamic pricing can help manage the demand for parking by adjusting prices based on demand.
By combining these approaches, we can maximize the performance of parking spaces and promote more efficient land use. Ultimately, removing minimum parking requirements and implementing other practical solutions can help create more sustainable and functional district.
GRAPHIC RENDERING
Examples of the Sebastian Boulevard Triangle Overlay District, incorporating the design criteria and proposed recommendations, are reflected in the following graphic renderings:

TAX INCREMENT FINANCING PROJECTIONS
OVERVIEW & MAJOR ASSUMPTIONS
The CRA’s total taxable value is estimated to be $69.9 million in 2022, with approximately $435,000 realized as TIF collections to the Redevelopment Trust Fund.
In 2023, the initial year of projections, the CRA’s total taxable value is estimated to be nearly $74.1 million, with about $454,100 realized as TIF collections. Overall, the TIF within the CRA is projected to grow at a CAGR of 4.0% and collect between an estimated $10 million and $12 million in total tax increment over the next 15-years, from 2023 and 2038 (“projection period”). This rate of annual growth is consistent with what the CRA has historically been realizing in tax increment growth since its adoption.
To note, the current 30-year operational term of the Agency began in December 2003, therefore the Agency is due to “sunset” in December 2033. The projection years following 2033 are provided for reference in a future evaluation of extending the Agency’s sunset date.
MAJOR ASSUMPTIONS
The 2023 Sebastian CRA Master Plan reflects a projected level of TIF collections and a manner in which these property values are taxed, evaluated, and collected throughout the CRA’s existence. A reasonable and diligent effort has been made to confirm all assumptions.
In the course of estimating tax increment, data provided by the Florida Department of Revenue (“FDOR”) and the County’s Property Appraiser was considered. The projections reflect levels of tax increment that could be achieved based on the expected development and redevelopment which may occur within the CRA throughout the projection period. The following major assumptions were utilized within the TIF projections:
▪ Average annual increase (appreciation) of existing and new taxable value includes value from residential and commercial development and redevelopment within the tax increment area, including a 1% annual inflation rate.
▪ Assumes full build-out for new development within 15 years and redevelopment construction within 20 years. New development includes converting tax exempt properties to taxable and development on existing undeveloped properties.
▪ The CRA was established in 1995, with a base year value of $34,959,870. In 2003, the CRA was
expanded, the expansion area has a base year value of $6,602,110.
▪ Ad valorem tax millage rates utilized 3.5475 for the County and 2.9050 for the City for 2023 and after.
▪ The Annual TIF Revenues are provided in three scenarios, high-moderate-low (H-M-L). This model provides a range of potential taxable value and annual TIF revenues for the CRA.
▪ The moderate projection is considered the most likely for any given year over the projection period; whereas, the low and high projection scenarios present a range of possible outcomes.
▪ Over the full planning period, the projection model reflects a tax increment CAGR between 3.6%–5.0%.
In addition, the projections take into consideration the likely components of change in total taxable value from the current taxable value given the composition of properties within the CRA. Expected future taxable value is anticipated to be a function of (1) growth in market values of existing improved properties over time (e.g. inflationary growth); (2) redevelopment of some portion of existing improved properties; (3) development of available vacant land area; and (4) additional growth in market value on newly developed or redeveloped properties over time. These causes of change are reflected in the table below.
Cause of Change
Causes of Change
111,457,190
$ 70,249,410
$ 181,706,600
REVIEW OF MILLAGE RATES
The millage rates in both the County and the City have substantially fluctuated over the last 10-years, as illustrated in the following table. In an effort to remain conservative, the tax increment projections apply the 2023 real property millage rates for both the County and City at a constant 3.5475 and 2.9050 per $1,000 of taxable real property value, respectively, throughout the projection period. Although it is likely the millage rates may vary marginally, the moderate projection scenario remains the most likely and reasonable estimate of tax increment anticipated to be collected within the CRA through 2038.
by the governing body that created the trust fund (Chapter 163.387, section b1, F.S.). Therefore, the County may contribute more to the CRA Redevelopment Trust Fund than the City for any given year.
TAX INCREMENT PROJECTIONS
Based on prior rates of growth and change in market driven opportunities throughout the CRA, the projection model takes a conservative approach in providing a H-M-L scenario for tax increment through 2038. While the moderate projection is considered most likely scenario for any given year, the low and high projection scenarios present a range of possible outcomes for the same period. Conditions assumed to create each path of the low and high projection scenarios are not mutually exclusive and do not indicate an either/or path of potential revenue projections through 2038.
The moderate scenario assumes a continuation of historical inflationary growth plus development of vacant land and redevelopment of existing improved properties. Any general disruption of economic activity is considered short-lived and has a minimal impact on the region or the commercial and residential development sector in general.
Source: Sebastian Riverfront Community Redevelopment Agency FY 22/23 Budget Book; GAI Consultants, Inc.
The Sebastian CRA Redevelopment Trust Fund was established in 1995, prior to the Florida Statutes provision stating that a taxing authority may not contribute an amount that exceeds that provided
The low scenario considers a high possibility of a general U.S. economic recession occurring within the initial years of the projection period as a result of the current economic disruptions followed by long-term, slower market performance as a result of relative commercial and residential development market maturity. The low scenario assumes that the CRA will be unable to maintain historical growth rates and should be viewed as a worst-case scenario.

Photo Courtesy of City of Sebastian, FL
The high scenario is the most synergistic of the three scenarios and incorporates the optimal general economic conditions and continued robust market performance. This scenario assumes no disruption of general economic activity in the near-term or an historically short and very shallow U.S. recession followed by relatively robust growth. This scenario also assumes an improved capture of commercial and residential development in the CRA compared with other areas of the City and County.
The projection model predicts that the taxable value for current improved land, existing vacant land, and new development within the CRA will bring in approximately $6.3 million to $7.3 million in tax increment over the next 10 years, 2023 to 2033, the current Agency’s sunset date. In addition, the CRA has the potential to generate, in total, as much as $10 million to $12 million in additional receipts between 2023 and 2038; with an average increment projected to be roughly between $626,630 and $750,610 realized annually.
Over the full planning period, the projections reflect an average annual compound growth rate between 3.6% and 5.0%. By comparison, the historic tax increment average annual growth rate for the CRA over the last 10 years, 2013 to 2022, was about
4.2%. The historic tax increment, as well as the H-M-L increment projections for the CRA from 2010 to 2038 are illustrated in figure below.
Sunset 2033

In addition, the moderate scenario for projected total increment value, as well as the County and City’s contribution to the tax increment revenue is detailed in the table below. Additional detailed tables of the low and high projections can be located in the appendix which accompanies this document.

ALTERNATIVE FUNDING OPTIONS & INCENTIVE PROGRAMS
Identified below are several ways other communities have opted to improve or enhance both operational receipts and capital resources. These alternative funding options could be instrumental in the Agency obtaining additional resources to fund redevelopment projects and programs. Some options, including the general fund, are addressed below.
GENERAL FUND
This is the most common source of budgetary commitments within a community and appears to be the primary means of funding or supporting various redevelopment activities in the City and the CRA today. The issue, of course, is that every citizen claims to want more parks, and there is typically a level of service (“LOS”) standard for parks in each community’s comprehensive plan. Those standards become increasingly prohibitive to absorb through the general fund.
Advantages
▪ Commonly used for both capital and operations.
▪ Subject to annual and continuing reviews.
▪ Any receipts or dollars generated combine well with other resources.
▪ Probably the most reliable financial mechanism.
▪ Dollars can be allocated to almost any purpose.
▪ Already a functioning system in place to address needs.
Disadvantages
▪ May be difficult to justify additional spending for facilities in certain locations.
▪ Whatever the City budget might be, it is limited by law to a certain millage ceiling.
SPECIAL ASSESSMENTS
Special assessments are fees levied to achieve a specific level of benefit or service. They take many forms under various provisions of Florida law. Depending upon their purpose or means of implementation, such assessments may be imposed simply by the City as the controlling legislative body, or could be authorized by referendum in some cases. It is a financial resource with flexible application to absorb or offset both capital and operational costs. They can be applied to the capital or operational costs of parks as well as roads, lighting, and other facilities or infrastructure broadly defined. Assessments must be shown to provide a demonstrable benefit to property and the charge cannot exceed the benefit which reflects considerations more than simply an increase in property value. They can extend citywide or to certain accessible or identifiable areas. Because the idea of a benefit is quite broad, there are then multiple ways of allocating the assessment itself. The manner ultimately applied should satisfy certain tests of reasonableness and logic, but Florida law allows extensive latitude.
Advantages
▪ Commonly used for both capital and operations.
▪ Subject to annual and continuing reviews.
▪ Any receipts or dollars generated combine well with other resources.
▪ Probably the most reliable financial mechanism.
▪ Dollars can be allocated to almost any purpose.
▪ Already a functioning system in place to address needs.
Photo Courtesy of the Sebastian Daily
Disadvantages
▪ An additional charge for services perceived as more properly absorbed by tax (General Fund) dollars.
▪ While there are ways to reduce assessments to specific properties, such as schools or churches, all benefited properties generally must contribute.
▪ May be difficult to justify added charges or fees in disadvantaged neighborhoods.
▪ If subjected to referendum, may not be adopted.
SIMPLE USER FEES
While such fees are typically associated with a controlled gate and for selected facilities, it is not uncommon for them to apply to trails and conservation areas at an obvious access point, often through an honor system. Where there is not an attendant, appropriate in many situations, rates
would be posted and there would be a secure box for collections. These proceeds are generated for a specific park or area deemed to benefit from their imposition and their collection.
Advantages
▪ Tied to specific facilities.
▪ May combine existing workers if maintenance is an issue at a targeted location.
▪ Ease of administration.
▪ Any receipts or dollars generated combine well with other resources.
▪ Dollars can be allocated to site, area, or facility specific or activities.
Disadvantages
▪ Best for modest collections.
▪ Unlikely to offset major costs.
OTHER COMPLEMENTARY PROGRAMS, DOLLARS, OR FUNDS
While assessments, benefit charges, and increment dollars could be extraordinarily effective, there are other funds and financing techniques which should be considered as well. These additional approaches leverage the value of other dollars and have application to specific activities.
GRANT PROGRAMS
Grants are typically performance and/or criteriabased awards directed to a variety of initiatives and originating from many different local, state, and national resources. They are typically competitive although “need” may be a sufficient premise for an award. As well as coming from governmental sources, grants are sometimes provided by major area banks and institutions, foundations, and many smaller nonprofits. Federal and state grant opportunities are highly limited. As such, their value and availability today are highly speculative. Because these dollars are highly speculative, they are not a sturdy foundation for an implementation plan, especially if there are near term objectives which must be satisfied. Grants are better viewed as enhancements to financial options which are imminent and controlled by the parties or groups looking to realize immediate change through a plan.
Advantages
▪ They are often dollars extended without recurring obligations to the recipient.
▪ They can often be paired with, or inserted into, any financial scheme.
▪ They can be available for both capital and operational activities.
▪ May create a long-term partnership with granting entities or institutions.
▪ May be flexible in some cases as circumstances evolve.
Disadvantages
▪ Not likely to be an immediate financial resource.
▪ Usually highly competitive and can be costly.
▪ Major reporting and accountability requirements.
IMPROVED LEVERAGING AND COORDINATION OF EXISTING EFFORTS
In many controlled situations there are likely to be projects, programs, or work which could be coordinated and leveraged to support or implement the development and/or redevelopment activities or management responsibilities associated with potential catalyst site concepts. Here, we are also considering the existing or potential maintenance activities or improvements already occurring within the Sebastian CRA.
All the development and/or redevelopment of the catalyst sites controlled by the Agency, and nearby areas will require coordination, planning, and other efforts that might be funded or supported together such that the cooperative arrangements benefit the City and the Agency in some measurable or reasonable way. Over many projects or programs, careful planning, coordination, and scheduling can save dollars that often may be sufficient in scale to support the equivalent of still other projects.
Advantages
▪ Recognizes and leverages investments in staff and other program resources which have already been committed.
▪ The costs often leverage dollars without recurring additional obligations.
▪ Efforts are wholly marginal costs, so they are extremely efficient from an economic standpoint.
▪ Can literally be paired with, or inserted into, any financial or program scheme.
▪ Flexible in some cases as circumstances evolve.
Disadvantages
▪ Requires very forward-looking thinking.
▪ Rarely aligns perfectly with existing budget priorities.
▪ May alter a preferred sequence of events.
Development incentives are a set of policies which encourage economic development. These incentives take many forms such as: Tax Refunds, Tax Increment Financing, Enterprise Zones, Foreign Trade Zones, Historic Grants and Tax Credits, Interest write down, New Market Tax Credits, the use of Private/Public Partnerships, Predevelopment Loans, Grants, insurance programs, Non Ad-Valorem Loan Guarantees, enhanced public amenities, Brownfield funding and other Municipal Finance Strategies.
The 19 incentives summarized within the following pages may be adopted by the City and provide the Agency the tools necessary to continue to attract quality development projects and investment into the community.
It is critical to note that in any given year any local, state, and federal program may be underfunded or discontinued. The 2023 Sebastian CRA Master Plan has a timeframe for implementation of 2023-2039. It is the responsibility of the Governing Body, Agency, Staff, and downtown developers and residential and retail applicants to be mindful of the health of any such program for which funds are being sought.
1. FLORIDA BROWNFIELD PROGRAM
Brownfield redevelopment is of great importance in Florida where balancing strong economic and community growth with suburban sprawl is an ongoing challenge. The Florida Brownfield Program encourages voluntary cleanup of Brownfield sites by awarding tax credits to partially offset the cost of site rehabilitation or solid waste removal. The following may be available by entering into a Brownfield site rehabilitation agreement (BSRA):
▪ Annual 50% Tax Credit for eligible Site Rehabilitation costs.
▪ One-time 25% Bonus Tax Credit for complete cleanup.
▪ One-time 25% Bonus Tax Credit for development of 100% Affordable Housing or Healthcare Facility/ Providers.
▪ One-time 50% Tax Credit for Solid Waste removal. If the property is located in a designated Brownfield area, then may be eligible for:
▪ Up to $2,500 Job Bonus Tax Refund for each new job created by an eligible business on or abutting a site with a BSRA.
▪ Refunds on Sales Tax paid on the purchase of building materials used for affordable or mixed-use housing projects built on or abutting a BSRA site.
2. ECONOMIC DEVELOPMENT TRANSPORTATION FUNDS
A State of Florida program designed to alleviate transportation problems that adversely impact a specific company’s location or expansion decision. Eligible projects are those that facilitate economic development by eradicating location-specific transportation problems on behalf of a specific eligible company.
3. CAPITAL INVESTMENT TAX CREDIT (CITC)
CITC is used to spur capital investment in Florida’s High Impact Sectors. It is an annual credit, provided for up to 20 years, against the corporate income tax. The amount of the annual credit is based on the eligible capital costs associated with a qualifying project. Eligible capital costs include all expenses incurred in the acquisition, construction, installation, and equipping of a project form the beginning of construction to the commencement of operations.
4. HIGH IMPACT PERFORMANCE INCENTIVE GRANT (HIPI)
Negotiated grant used to attract and grow major high impact facilities in Florida. Grants are provided to preapproved applicants in certain high-impact sectors designated by the Florida Department of Economic Opportunity (DEO).
5.
QUALIFIED TARGET INDUSTRY TAX REFUND (QTI)
Available for companies that create high wage jobs in targeted high value-added industries.
6. LOCAL GOVERNMENT DISTRESSED AREA MATCHING GRANT
Stimulate investment in Florida’s economy by assisting Local Governments in attracting and retaining targeted businesses. The amount awarded by the State of Florida will equal $50,000 or 50% of the local government’s assistance amount, whichever is less, and be provided following the commitment and payment of that assistance.
7. INNOVATION INCENTIVE PROGRAM
This program allows the state to compete effectively for high-value research and development, innovation business, and alternative and renewable energy projects. Long-term investments made by the state in industry clusters critical to Florida’s future of economic diversification.
8. QUALIFIED DEFENSE & SPACE CONTRACTOR TAX REFUND (QDSC)
Pre-approved QDSC projects receive tax refunds of up to $5,000 per job created or saved in FL. There is a cap of $7.5 million per single qualified applicant in all years and no more than $2.5 million in tax refunds may be received in any given fiscal year. Businesses must pay 115 percent of the state average wage and secure a resolution for City of Sebastian 20 percent matching financial support.
9. QUICK ACTION CLOSING FUND (QACF)
This is an up-front discretionary grant incentive that can be accessed by Florida’s Governor, after consultation with the President of the Senate and the Speaker of the House of Representatives and review by the Joint Legislative Budget Commission, to respond to unique requirements of wealthcreating projects. When Florida is vying for intensely competitive projects, Closing Funds may be utilized to overcome a distinct, quantifiable disadvantage after other available resources have been exhausted.
10. SALES AND TAX USE EXEMPTIONS ON MACHINERY AND EQUIPMENT
This exemption is for sales and use taxes paid on the purchase of new machinery and equipment used (directly related) to produce a product for sale. This program is administered through the Florida Department of Revenue. Program is for manufacturing and printing businesses or businesses which use a portion of a manufacturing process that are relocating to the area, opening a new facility or expanding.
11. SALES TAX EXEMPTIONS ON ELECTRICITY USED IN MANUFACTURING PROCESS
There is an exemption on the 7% sales tax for electricity used in the manufacturing process (if 75% or more of electricity is used in manufacturing). Exemption is managed through the Florida Dept. of Revenue.
12. WORK OPPORTUNITY TAX CREDIT (WOTC)
The WOTC is a federal income tax credit that provides incentives to private for-profit employers to encourage the hiring of individuals from certain targeted groups of jobseekers who traditionally have difficulty finding employment. Employers can reduce their federal income tax liability up to $9,600 during the first year of employment of a member of targeted group, depending on the target group. There is no limit to the number of qualified employers for which an employer receives this tax credit.
13. NEW MARKETS TAX CREDITS
The NMTC Program was established to spur new or increased investments into operating businesses and real estate projects located in low-income communities. The NMTC Program attracts investment capital to low-income communities by permitting individual and corporate investors to receive a tax credit against their Federal income tax return in exchange for making equity investments in specialized financial institutions called Community Development Entities (CDEs).
14. HISTORIC REHABILITATION TAX CREDIT
The Federal government encourages the preservation of historic buildings through various means, one of which is the program of Federal tax incentives to support the rehabilitation of historic and older buildings. The National Park Service administers the program with the Internal Revenue Service in partnership with the Florida Division of Historic Preservation. The tax incentives promote the rehabilitation of historic structures of every period, size, style, and type. The tax incentives for preservation attract private investment to the historic cores of cities and towns. They also generate jobs, enhance property values, and augment revenues for state and local governments through increased property, business, and income taxes.
The Preservation Tax Incentives also help create moderate and low-income housing in historic buildings. Through this program, abandoned and underused schools, warehouses, factories, churches,
retail stores, apartments, hotels, houses, and offices throughout the country have been restored to life in a manner that maintains their historic character.
15. HOUSING CREDIT (HC) PROGRAM
The HC Program is governed by the U.S. Department of the Treasury and Florida’s allocation is administered by the Florida Housing Finance Corporation. Under the HC Program, successful applicants are provided with a dollar-for-dollar reduction in federal tax liability in exchange for the development or rehabilitation of units to be occupied by very low- and low-income households. Developers who cannot use the tax reduction may sell credits in exchange for equity to the development. On a project basis, the amount of credits available is approximately equal to 9% of the cost of building each very low-income unit, including a developer fee but excluding land cost. For certain federally assisted projects (Mortgage Revenue Bonds and Rural Housing) this translates into 4% of building costs. Syndication of the credits to investors can raise equity to pay for 40% or more of a project’s costs.
16. PRE-DEVELOPMENT LOAN PROGRAM (PLP)
The PLP Program provides below market interest rate financing and technical advisory services to nonprofit organizations and public entities for preliminary development activities necessary to obtain the requisite financing to construct home ownership or rental housing developments.
17. RENTAL HOUSING MORTGAGE REVENUE BONDS (MRB)
The Multifamily Bond Program utilizes funds generated from the sale of both taxable and taxexempt bonds to make below-market interest rate loans to non-profit and for-profit developers of rental housing. Developments that receive tax exempt financing also receive automatic 4% Housing Credits directly from the federal government.
18. STATE HOUSING INITIATIVE PARTNERSHIP (SHIP)
The SHIP Program’s mission is threefold: (1) provide funding to eligible local governments for the implementation of programs that create and preserve affordable housing; (2) foster public-private partnerships to create and preserve affordable housing; and, (3) encourage local governments to implement regulatory reforms and promote the development of affordable housing in their communities by using funds as an incentive for private development. Funds are allocated to every Florida County as well as municipalities which receive CDBG funds.
19. STATE APARTMENT INCENTIVE LOAN PROGRAM (SAIL)
The SAIL Program provides low-interest rate mortgage loans to developers who build or rehabilitate rental developments, made affordable to very low (50% or less of area median) income households. The SAIL loan bridges the gap between a development’s primary financing and total development costs.
PROPOSED UPDATES TO THE CAPITAL IMPROVEMENT PLAN
The intent of the proposed funding allocation is to recognize the relative importance of the already identified or contemplated activities or programs. The proposed funding allocation is a tool to focus decision making and actual implementation as resources become available. The activities and proposed funding allocation recognize discrete and particular plans, timetables, policies, and policy criteria or program content will be completed in accordance with these priorities. To emphasize again, a community redevelopment plan is not a detailed blueprint with a list of stipulations and provision. These will emerge in accord with this 2023 Sebastian CRA Master Plan as the framework outlined in it is implemented.
While it is the purpose this 2023 Sebastian CRA Master Plan to direct resources to those listed, it is
also the intention that funds should be allocated with some flexibility, in part, because funds from other sources could be leveraged and directed to many of the same focus areas. As a part of that flexibility, it is expressly the intent of this 2023 Sebastian CRA Master Plan that the allocation of resources between and among activities should be fungible such that adjustments in sums do not require a plan amendment/modification.
As long as the overarching objectives and related principles that guide this plan are maintained, spending should be consistent and in accordance with projects and programs of this 2023 Sebastian CRA Master Plan. The funds for implementation could come from a variety of resources, just as they have in the past.
Short-Term Funding Allocation (1-5 Years)
RECOMMENDED STRATEGIES FOR REDEVELOPMENT PLAN IMPLEMENTATION
The objective of a redevelopment plan is to provide direction, identify resources, and define projects and programs that remove the slum and blighting influences identified in the 1995, 2003, and 2010 Sebastian CRA Master Plans and that have been highlighted in subsequent planning initiatives. This 2023 Sebastian CRA Master Plan continues to address many of those priorities as well as focus on the five overarching Major Themes which were identified through the most recent public engagement efforts, these Major Themes include:
▪ Infrastructure & Drainage
▪ Waterfront, Parks and Public Spaces
▪ Roads, Parking, and Pedestrian Connectivity Improvements
▪ Public Safety
▪ Preserving Community Character
The identification of these Major Themes was highly influential in developing the recommended strategies for implementation described below.
ADMINISTRATION OF THE REDEVELOPMENT PLAN
▪ Evaluate and update the Sebastian CRA Master Plan every 10-years.
▪ Monitor amendments to Chapter 163 of Florida Statutes to ensure that all programs, projects, activities, and expenditures of funds from the redevelopment trust fund undertaken by the Agency are in compliance with the Redevelopment Act.
▪ Update Capital Improvement Program as well as all other project and program funding allocations on an annual basis.
▪ Comply with all annual reporting requirements as stipulated under Chapter 163.371 of Florida Statutes.
▪ Provide for a financial audit of the redevelopment trust fund to be conducted each fiscal year by an independent certified public accountant or firm as required by Chapter 163.387(8)(a) of Florida Statutes
▪ The current 30-year operational term of the Agency began in December 2003, therefore the Agency will “sunset” in December 2033. The Agency may continue beyond its original 30-year term for a period of no more than 60-years, but only by majority vote of the City Council subject to other provisions of the Redevelopment Act. An assessment of the CRA projects, programs, and related activities should be conducted within the first 5-years following adoption of this 2023 Sebastian CRA Master Plan to determine if continuation of the Agency for a period in excess of 30-years is necessary.
OVERLAY DISTRICTS
▪ Adopt a formal definition for “Old Florida Fishing Village” – Both the Riverfront Overlay District and Sebastian Boulevard Triangle Overlay District “encourage durable construction that is harmonious with the architectural heritage known as the ‘Old Florida Fishing Village’ of Sebastian”. However, this type of architecture is not currently defined. Based upon feedback from public engagement conducted as part of this 2023 Sebastian CRA Master Plan, the following definition is recommended:
“Old Florida Fishing Village” Architecture has themes of Active with Natural Tones and Traditional Iconic Elements. The Active with Natural Tones theme represents an active waterfront with restaurants, boat docks, and social opportunities; whereas, the Traditional and Iconic Elements theme represents traditional coastal buildings with iconic elements and vibrant accents.


In addition to defining “Old Florida Fishing Village”, it is recommended that a formal style guide be commissioned. The style guide should be both highly visual, providing abundant examples of desirable architectural treatments, and technical, providing clear and easy to follow criteria. An effective style guide will be beneficial to anyone seeking to build or renovate within the CRA and the Overlay Districts and reduce potential delays in development and redevelopment.
▪ To offset the costs imposed by the Overlay Districts’ design criteria, the following modifications to the each of the Overlay Districts (and underlying zoning districts) are recommended to increase the flexibility and the likelihood of successful projects.
RIVERFRONT OVERLAY DISTRICT
- Consider removing minimum parking requirements.
COUNTY
ROAD 512 OVERLAY DISTRICT
- Introduce I-MIX Zoning.
- Multimodal Enhancements.
- Consider removing minimum parking requirements in tandem with cross access easement requirements.
SEBASTIAN BOULEVARD TRIANGLE OVERLAY DISTRICT
- Introduce I-MIX Zoning.
- Multimodal Enhancements.
- Consider removing minimum parking requirements.
CATALYST SITES
Prioritize the catalyst projects within the Sebastian CRA, including Fisherman’s Landing Working Waterfront, Indian River Drive, U.S. Highway 1, Riverview Park, and the Sebastian Boulevard Triangle Area, over the short-term (1-5 years) and longer-term (6-10 years).

OPPORTUNITY SITES
Prioritize the opportunity sites, previously identified in the 2010 Sebastian CRA Master Plan, that could be ripe for redevelopment and reinvestment within the CRA.
RIVERVIEW PARK – The Riverview Park Master Plan was completed in 2019. To date, many of the projects identified within that Master Plan have been completed or are underway.
▪ Riverview Park is also a catalyst project; continued implementation of the Riverview Park Master Plan is a short-term priority within the Park District.
FISHERMAN’S LANDING WORKING WATERFRONT –
The vision for this project, which is located along the Indian River Lagoon, is to link several parcels together to educate the public about the commercial fishing heritage of the community through a retail/wholesale seafood house, exhibitions, educational venues, and events.
▪ This site is a catalyst for new economic activity and a tourist anchor within the CRA and the Riverfront District specifically.
▪ Property acquisition to facilitate development of catalyst projects is a short-term priority within the Riverfront District.
SEBASTIAN BOULEVARD TRIANGLE AREA –
This area is an important gateway to Downtown Sebastian. The vision for this area is to create a vibrant small-town neighborhood that integrates well with the adjacent residential communities.
▪ This area contains a catalyst project which would be beneficial towards improvement of the area for mixed use development, connectivity to adjacent residential communities, and street scape improvements.
▪ Property acquisition to facilitate development of catalyst projects is a short-term priority within the Sebastian Blvd Mixed-Use District.
INDIAN RIVER DRIVE – Improved pedestrian experience through pedestrian connectivity, streetscape, and pocket parks is a Major Theme within the CRA and consistent with the Guiding Principles of the CRA.
▪ Indian River Drive also contains a catalyst project just south of the boat ramp.
▪ Property acquisition to facilitate development of catalyst projects is a short-term priority within the Park District.
U.S. HIGHWAY 1 – Improving activity through the development of commercial properties, updating lighting, landscaping improvements to landscaping, pedestrian crossings, and a gateway entrance are essential element of the Guiding Principles of the CRA.
▪ U.S. Highway 1 also contains a catalyst project near the intersection of U.S. Highway 1 and Main Street.
▪ Installation of gateway features and property acquisition to facilitate development of catalyst projects are short-term priority within the U.S.-1 Commercial District.
Photo Courtesy of City of Sebastian

APPENDIX

SEBASTIAN CRA LEGAL DESCRIPTION
SEBASTIAN CRA
Begin at the northeast comer of the municipal limits of the City of Sebastian; run west following the city limits to a point of intersection of the eastern right-of-way line of the Florida East Coast Railroad; run southeast following the east right-of-way line of the Florida East Coast Railroad to the point of intersection of the City of Sebastian’s southern municipal limits; run east following the City of Sebastian’s municipal limits; run northwest following the same city limits to the point of beginning.
EXPANSION AREA LEGAL DESCRIPTION
Begin at the intersection of the east right-of-way line of the Florida East Coast Railroad and the western right-of-way line of westbound Sebastian Boulevard (CR 512 west); run southwest along the western rightof-way line of westbound Sebastian Boulevard (CR 512 west) to the southeast point of intersection of the right-of-way lines of Calamondin Street and Temple Avenue; run west along the south right-of-way line .of Calamondin Street to its southwest limit; run west following the north boundary of Parcel# I of the Coy A. Clark Company Plat; run south following the west boundary of Parcel # I of the Coy A. Clark Company Plat to the western right-of-way line of Sebastian Boulevard (CR 512 west); run southwest along the western rightof-way line of Sebastian Boulevard (CR 512 west) approximately 200 feet; run southeast perpendicular to the right-of-way of Sebastian Boulevard (CR 512) to the northernmost limit of the boundary between Lots 48 and 49, Sebastian Highlands Unit 12 subdivision, Plat Book 7, Page 57A, of the Public Records of Indian County, Florida; run northeast along the eastern right-of-way of Sebastian Boulevard (CR 512 east) to the easternmost right-of-way of the alley running through Lot 58, Sebastian Highlands Unit 12 subdivision; run southeast along said alley right-of-way line to a point’ of intersection at the southernmost boundary of Lot 58; run northeast along the southernmost boundary of Lots 58-71, Sebastian Highlands Unit 12 subdivision to a point of intersection with the west right-of-way line of South Wimbrow Drive; continue northeast from the right-of-way of South Wimbrow Drive to the southwest comer of Lot 5, Sebastian Highlands Unit 12 subdivision; continue northeast along the southernmost boundary of Lots 5 through 12, Sebastian Highlands Unit 12 subdivision and continue to a point of intersection at the eastern right-of-way line of the drainage right-of-way, as identified on Plat Book 8, Page 44D, of the Public Records of Indian River County, Florida; run south along the east side of the drainage right-of-way line and continue following the said right-of-way eastward; continue to follow the same right-of-way southward to a point of intersection at the southern municipal limits of the City of Sebastian; run east following the southern municipal limits of the City of Sebastian to a point of intersection with the western right-of-way line of the Florida East Coast Railroad; run northwest following the municipal limits of the City of Sebastian; continue westward following the said municipal limits of the City of Sebastian; continue northward following the same municipal limits of the City of Sebastian; continue northeast following the municipal limits of the City of Sebastian to a point of intersection of the eastern right-of-way line of the Florida East Coast Railroad; follow the east right-ofway line of the Florida East Coast Railroad to the point of beginning.
COMMUNITY SURVEY RESULTS
Q5 Which activities do you typically participate in when visiting the CRA? Select all that apply.
Answered: 148 Skipped: 1
Q6 Are you aware that the CRA has different districts? Please select all the ones you recognize.
Answered: 141 Skipped: 8
Q7 How much do you agree with the following statement? The Sebastian Riverfront CRA needs improvement.
Answered: 148 Skipped: 1
3
4
1
Q8 Which areas need more improvement? Please rank the districts below by improvement needs, 1 being the one that needs the most improvements and 5 the one that needs the least.
Answered: 140 Skipped: 9
12
15
16
17
20
Q9 What local elements within the CRA would you say are the highest priorities for you? Select all that apply.
Answered: 147 Skipped: 2
2/19/2023
2/18/2023 11:12 PM
Q10 A major initiative for the Sebastian CRA is promoting the community character as “Old Florida Fishing Village”. When you hear the term “Fishing Village”, which of the following images would you say describe the preferred character of the community? Select the two (2) that best apply. Answered: 146 Skipped: 3
Q11
Answered:
Q12 What would you like to see as major projects within the Sebastian Blvd. Mixed-Use District? Select all that apply.
Answered:
Q15 What would you like to see as major projects within the Sebastian Blvd. South District? Select all that apply.
Answered: 137 Skipped: 12
Q16 From the following list of projects within the Sebastian CRA, which are of most importance to you?
Answered: 147 Skipped: 2
Total Respondents: 137
Q17 From the following list of programs within the Sebastian CRA, which are of most importance to you?
Answered: 145 Skipped: 4
1
2 traughley@gmail.com
3 brendajudy722@gmail.com
4
5 xjomxx@aol.com
6 Gladd651@gmail.com
7 bernstein.wendy@gmail.com
Q19 Please provide additional comments or remarks.
Answered: 38 Skipped: 111
Riverview Park
Fisherman’s
Sebastian Blvd. Triang... IndianRiver
TAX INCREMENT DETAILED TABLES
HIGH PROJECTION SCENARIO


1
Contextual Plan
Located in Sebastian’s Riverfront Business District, the Riverview Park Complex is situated along the shores of the Indian River, and brings the community together with a variety of uses for all residents and visitors alike. Consisting of 12.21 acres of recreation and open space, unique features include biking/walking pathways and resting nodes; a kayak launch; 26 boat day slips; fishing piers; a splash pad; a veterans memorial and plenty of accessible parking!
In addition, the Riverview Park Complex hosts many events throughout the year including the ever popular Fine Arts & Music Festival, Shrimpfest & Craft Brew Hullabaloo, 4th of July Freedom Festival, and The Clambake.
Handicap Spaces
Restrooms
Roadways
Pathways / Resting Nodes
Crosswalks
Footbridges / Piers Structures
iverview Park itself is a meeting place for residents, providing recreational opportunities through playgrounds, volleyball courts, a restroom, pavilions, and an abundance of shady spots!


Footbridge Twin Piers
Benches
Electric Access
Picnic Tables
Pavilions
Landscape Maintenance Plan
Introduction
Urban Tree Best Management Practices (BMP) Guide
Riverview Park is located in the City of Sebastian, Florida, in a suburban/urban context, and the trees within the park experience the daily effects of human activity. This Best Management Practices (BMP) guide will consider the care for park trees, which are defined as large, woody, long-lived perennials plants with a single main trunk.
Riverview Park has an extensive existing tree canopy primarily consisting of Live Oaks, Quercus virginiana. The park also has large woody grasses (monocots) primarily consisting of Sabal Palms, Sabal palmetto. The BMP guide will take human activities into account and provide recommendations to protect the life and lifespan of park trees.
Roots
Roots are the foundations of trees and often the unseen and forgotten portion of tree anatomy that suffers the most from urban conditions which leads to the decline of trees. Roots provide anchorage, wind resistance, nutrient storage, water absorption, and conduction of resources to other parts of the tree. Roots grow where oxygen and water are available, primarily in the first 12” to 18” of soil with the potential of extending three times the tree crown limited by the environment and not genetics. The roots of urban trees like those found in Riverview Park are affected by soil compaction, mechanical damage and environmental barriers such as paving and buildings.


Landscape Maintenance Plan

Trunk
The trunk is the central elongated portion of the tree conducting water and nutrients absorbed by the roots to branches and leaves. The trunk supports the entire crown of the tree and is therefore a foundational tree structure. The trunks of urban trees like those found in Riverview Park are affected by

The following recommendations are provided to promote root health:
Limit Soil Compaction
Limit soil compaction in root zones by restricting pedestrian and vehicular traffic, equipment storage, and mowing activities especially with riding mowers.
To limit soil compacting activity within root zones,
• mowing can be eliminated,
• mulched beds and shallow landscape beds can be introduced,
• compost can be added to amend soils and
• mechanical aeriation can be implemented.
Mulch in root zones can have a depth of 3” and should not bury the trunk flare or be mounded at the tree trunk.
Test the Soil
Soil testing can be conducted to determine amendments needed to reduce nutrient deficiencies.
Mycorrhizal inoculations can be considered to improve the soil ecosystem. Soil moisture content can be tested or observed to provide adjustments to the existing irrigation system to prevent moisture extremes of desiccation or over saturation.

The following recommendations are provided to promote trunk health:
Selective Pruning Trunks should be protected from wound-creating mechanical damage from activities such as mowing and poorly implemented pruning. Selective pruning should create a dominant central leader to improve the tree’s structure. This does not apply to palm trees. Pruning should be approved by an International Society of Arboriculture (ISA) certified arborist. Severe pruning techniques like topping and pollarding should be avoided.

Prevent Mechanical Damage
Mowing and other activities should be limited in root zones to prevent cuts and wounds to roots.
Avoid the Root Zone
Lastly, future park improvements can either be sited outside of root zones or in a careful manner to minimize root pruning. Tree protection barriers should be in place prior to all construction activity. Temporary tree barriers can also be considered during park events. Permanent barriers like bollards, fencing, shallow groundcover beds can protect roots.

Palm Tree Roots
Palm tree roots primarily form a root ball that is often lesser in width than the crown of the tree and does not grow deep beneath the tree. Palm roots are also affected by urban conditions such as soil compaction, poor soil structure and mechanical damage from practices like mowing. Limiting soil compacting activities and introducing fertilization, composting, and mulching can improve soils proximate to root balls.


Encourage Healing
Dicots like Live Oaks will generally heal damage to trunks by compartmentalizing wounded tissue. The removal of large lateral branches should occur above the branch collar to promote healing.
Trunk damage to monocots like Sabal Palms will leave internal vascular tissue exposed, and do not heal. Scarring remains for the life of the palm tree.
Monitor Pests
Damaged trunks open trees up to disease, insect and other pests and can make trees less structurally sound. Limit mowing at the base of trees or provide a barrier. Monitor trees of pests and treat accordingly.
Sidewalks and curbs form root barriers.
Above is an example of a Live Oak with a dominant central leader.
Right: Lawn mower tracks adjacent to trunk shows that maintenance activities have a great potential of damaging existing trees.
Above: Do not permit temporary attachments to trucks which may cause permanent damage. Right: Examples of mechanical & palm trunk wounds.
Landscape Maintenance Plan

Stems & Branches
Stems and branches support leaves, flowers and fruit. Each branch of the tree is autonomous, producing and storing enough carbohydrates to sustain itself and exports some to the trunk and roots as well. Pruning should be carefully considered since nutrients available to the tree are reduced upon the removal of branches. The stems and brances of urban trees like those found in Riverview Park are affected by
The following recommendations are provided to promote stem and branch health:
Selective Pruning Pruning should follow the specifications provided in the American National Standards Institute (ANSI) A300. Pruning can be implemented to reduce the potential for tree or branch failure, provide pedestrian, vehicular and utility clearance, reduce shade and wind resistance, maintain health, and mechanical impacts.
Other Recommendations
• Irrigation should not be applied directly to the tree trunks since this can cause chronic stress that may lead to both abiotic and biotic problems.
• Organic matter including mulch should not be stored at the trunk flare.
UF IFAS FOR118 by Mary L. Duryea and Eliana Kampf


improve views etc. Pruning should primarily focus on the removal of dead branches, watersprouts and stubs. Pruning of Live Oaks can occur any time of year.
Pruning of palms should be limited to the removal of flower stalk, fruit and older fronds as needed, avoiding removing fronds that initiate above 90 degrees from the trunk. Sabal Palms flower in early summer and can be pruned at this time. Pruning tools should be clean and cuts should be clean.
• No mow areas can be created at the base of tree groupings. Refer to the Tree Succession Plan for recommended landscape bed areas. These beds can be mulched or planted with Florida Friendly, shade tolerant, shallow rooted plants such as:
• Ajuga reptans ‘Black Scallop’ Carpet Bugleweed
• Cyrtomium falcatum Japanese Holly Fern
• Dianella tasmanica Flax Lily
• Ficus microcarpa ‘Green Island’ Ficus ‘Green Island’
• Gardenia taitensis ‘Mini’ Dwarf Tahitian Gardenia
• Liriope muscari Lily Turf
• Ophiopogon japonicus Mondo Grass
• Osmunda cinnamomea Cinnamon Ferm
• Pittosporum tobira ‘Wheeleri’ Japanese Cheesewood ‘Wheeler’s Dwarf’
• Schefflera arboricola ‘Trinette’ Variegated Schefflera
• Trachelospermum asiaticum ‘Minima’ Asiatic Jasmine
• Pedestrian and vehicular barriers that are either temporary or permanent can be erected around tree groupings to help prevent compaction.
The Tree Succession Plan shows potential planting sites for
trees,
understory trees and palm trees. Approximately 120 potential tree planting sites are identified. It also illustrates potential landscape and mulch beds to reduce the impact of
Example of poor lateral branch pruning
International Society of Arboriculture (ISA) Arborists Certification Study Guide by Sharon J. Lilly, 2010 Developing a Preventative Pruning Program In Your Community: Mature Trees UF IFAS EHN 1063 by Edward F. Gilman and Amanda Bisson Wind and Trees: Lessons Learned from Hurricanes
5
Conceptual Master Plan
Strengthens
Enhances

Conceptual Master Plan
Strengthens


SEBASTIAN BLVD.
HARRISON
Conceptual Master Plan
Event Overlay Plan
The Event Overlay Plan illustrates the staging of Riverview Park for existing events such as the Fine Arts & Music Festival, Shrimpfest & Craft Brew Hullabaloo, 4th of July Freedom Festival, and The Clambake. Anticipating the growth in popularity of these existing events, and the possibility of new events, such as community 5Ks, augmented reality events and more, the plan locates potential sites for tents, food trucks and Port-O-Lets. The layout is adaptable for a range of event
Phasing Plan


SEBASTIAN
HARRISON
[ THIS PAGE INTENTIONALLY LEFT BLANK ]
Prepared By:
